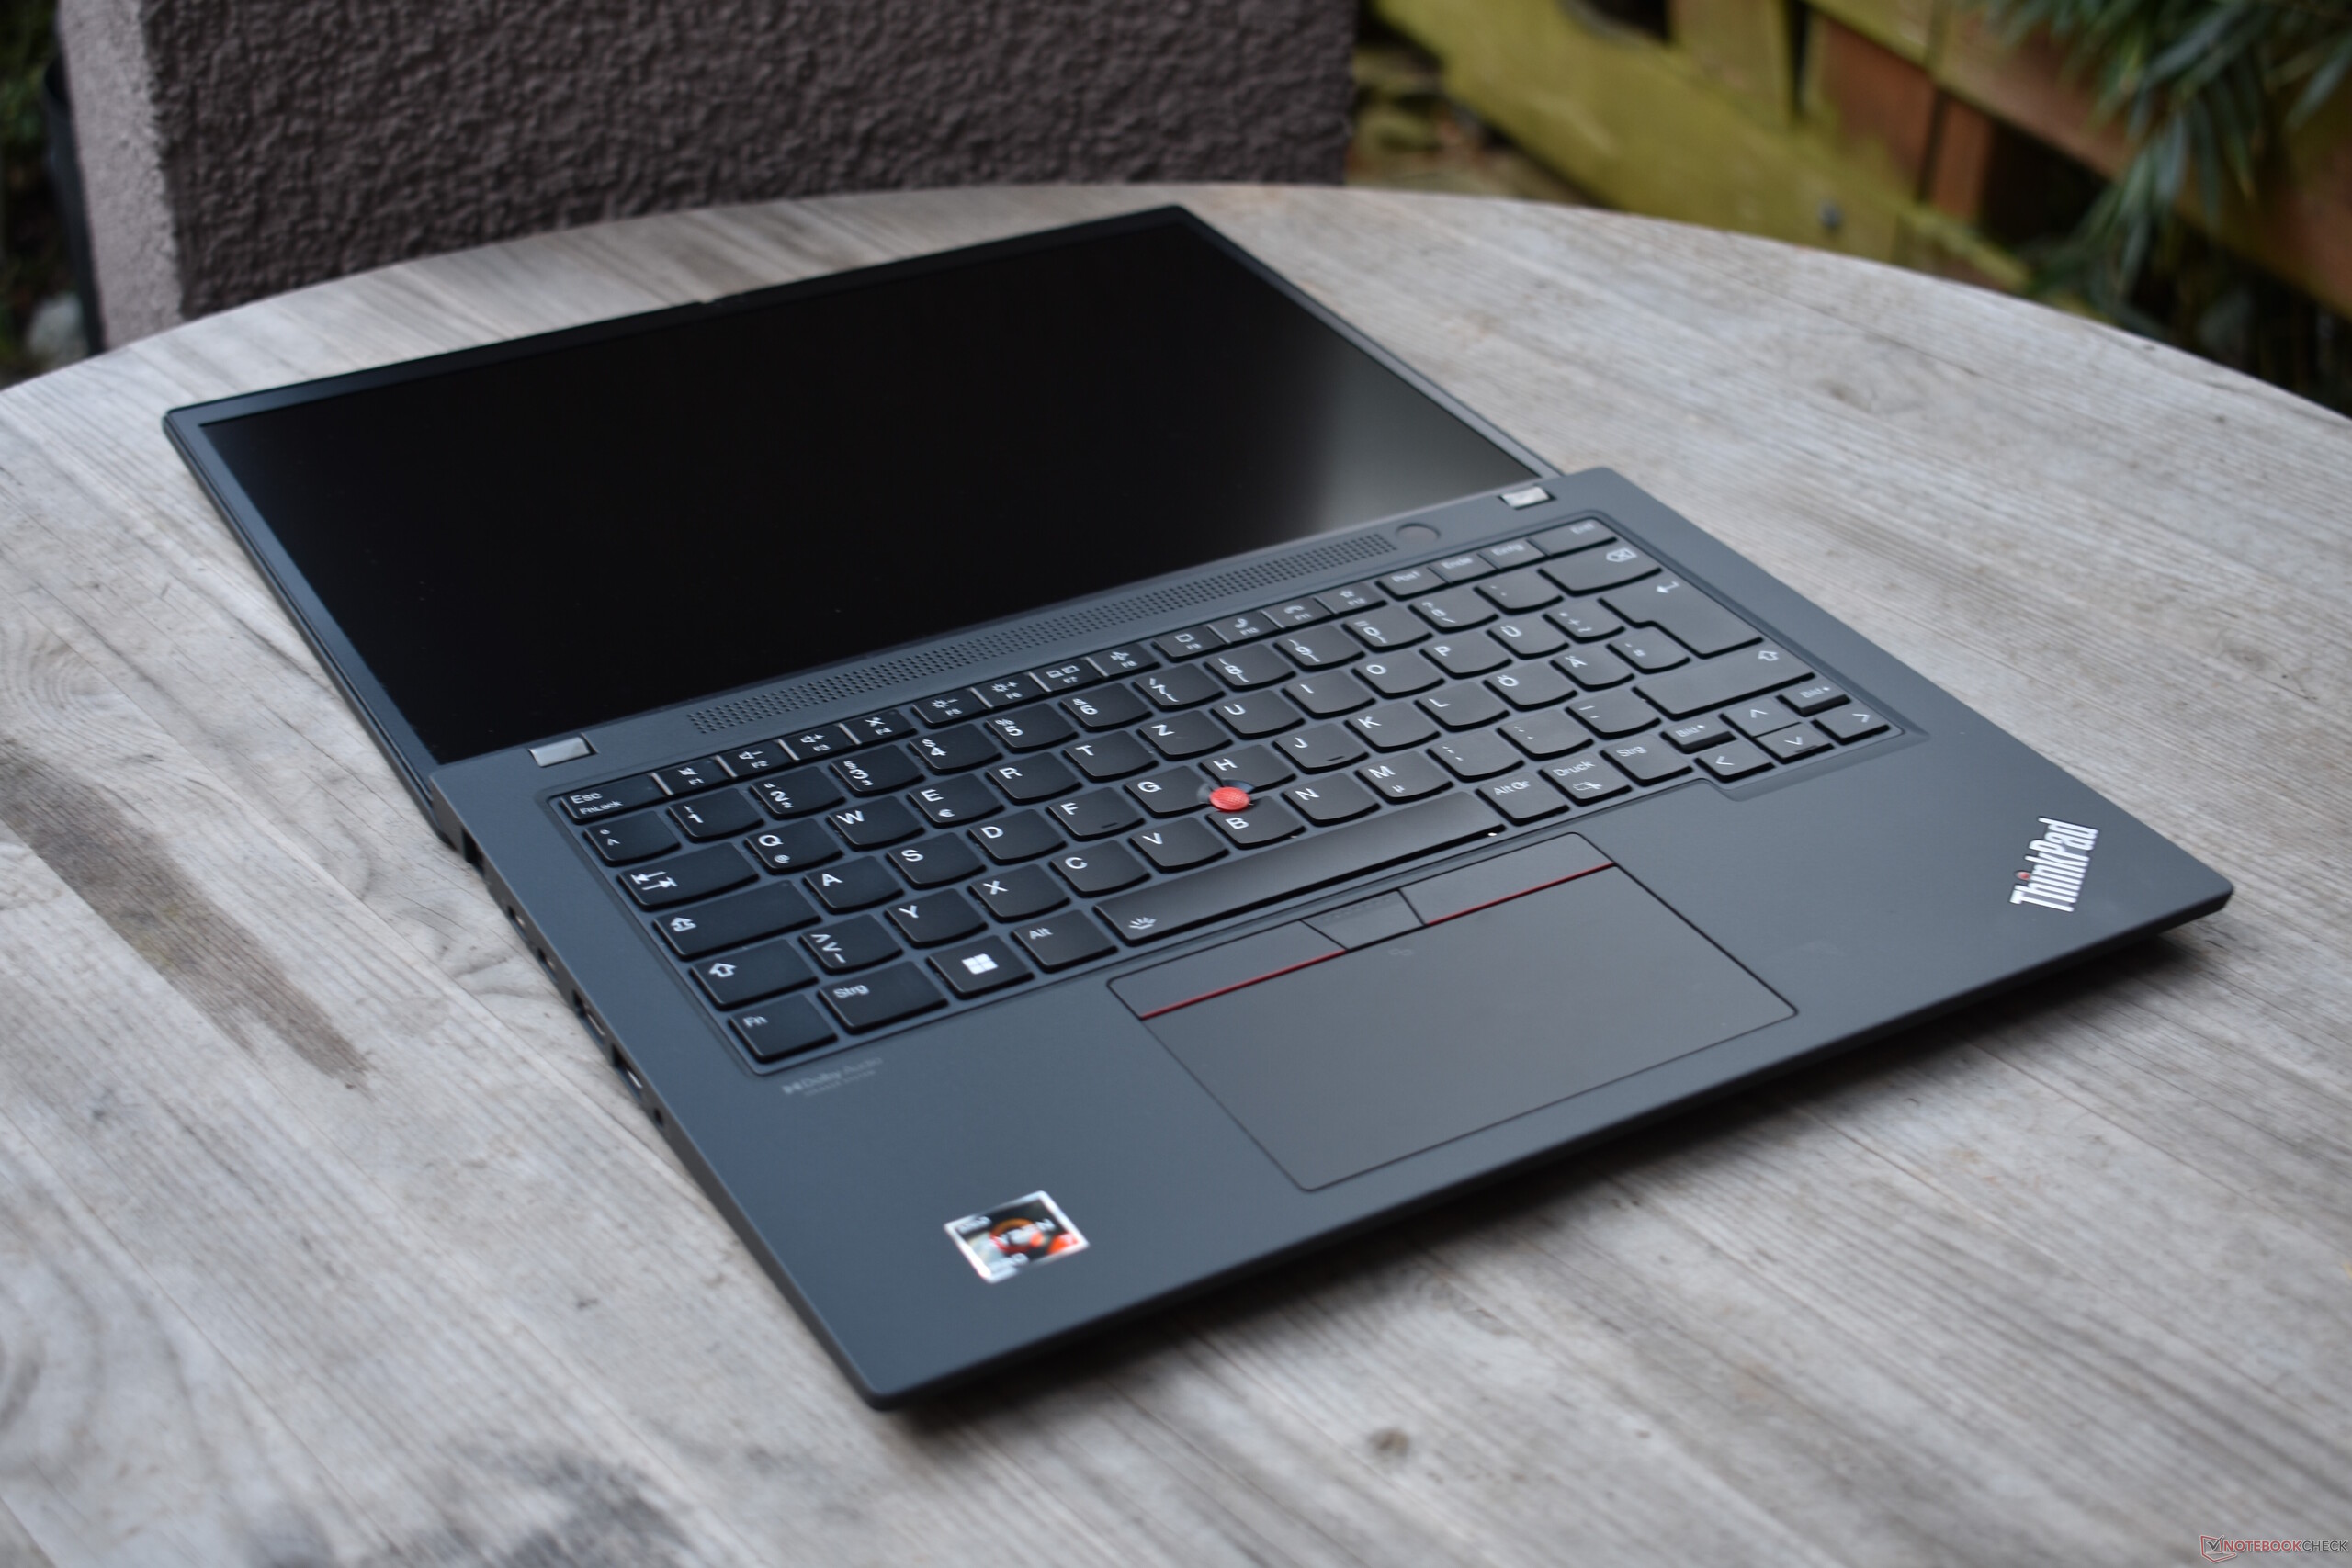
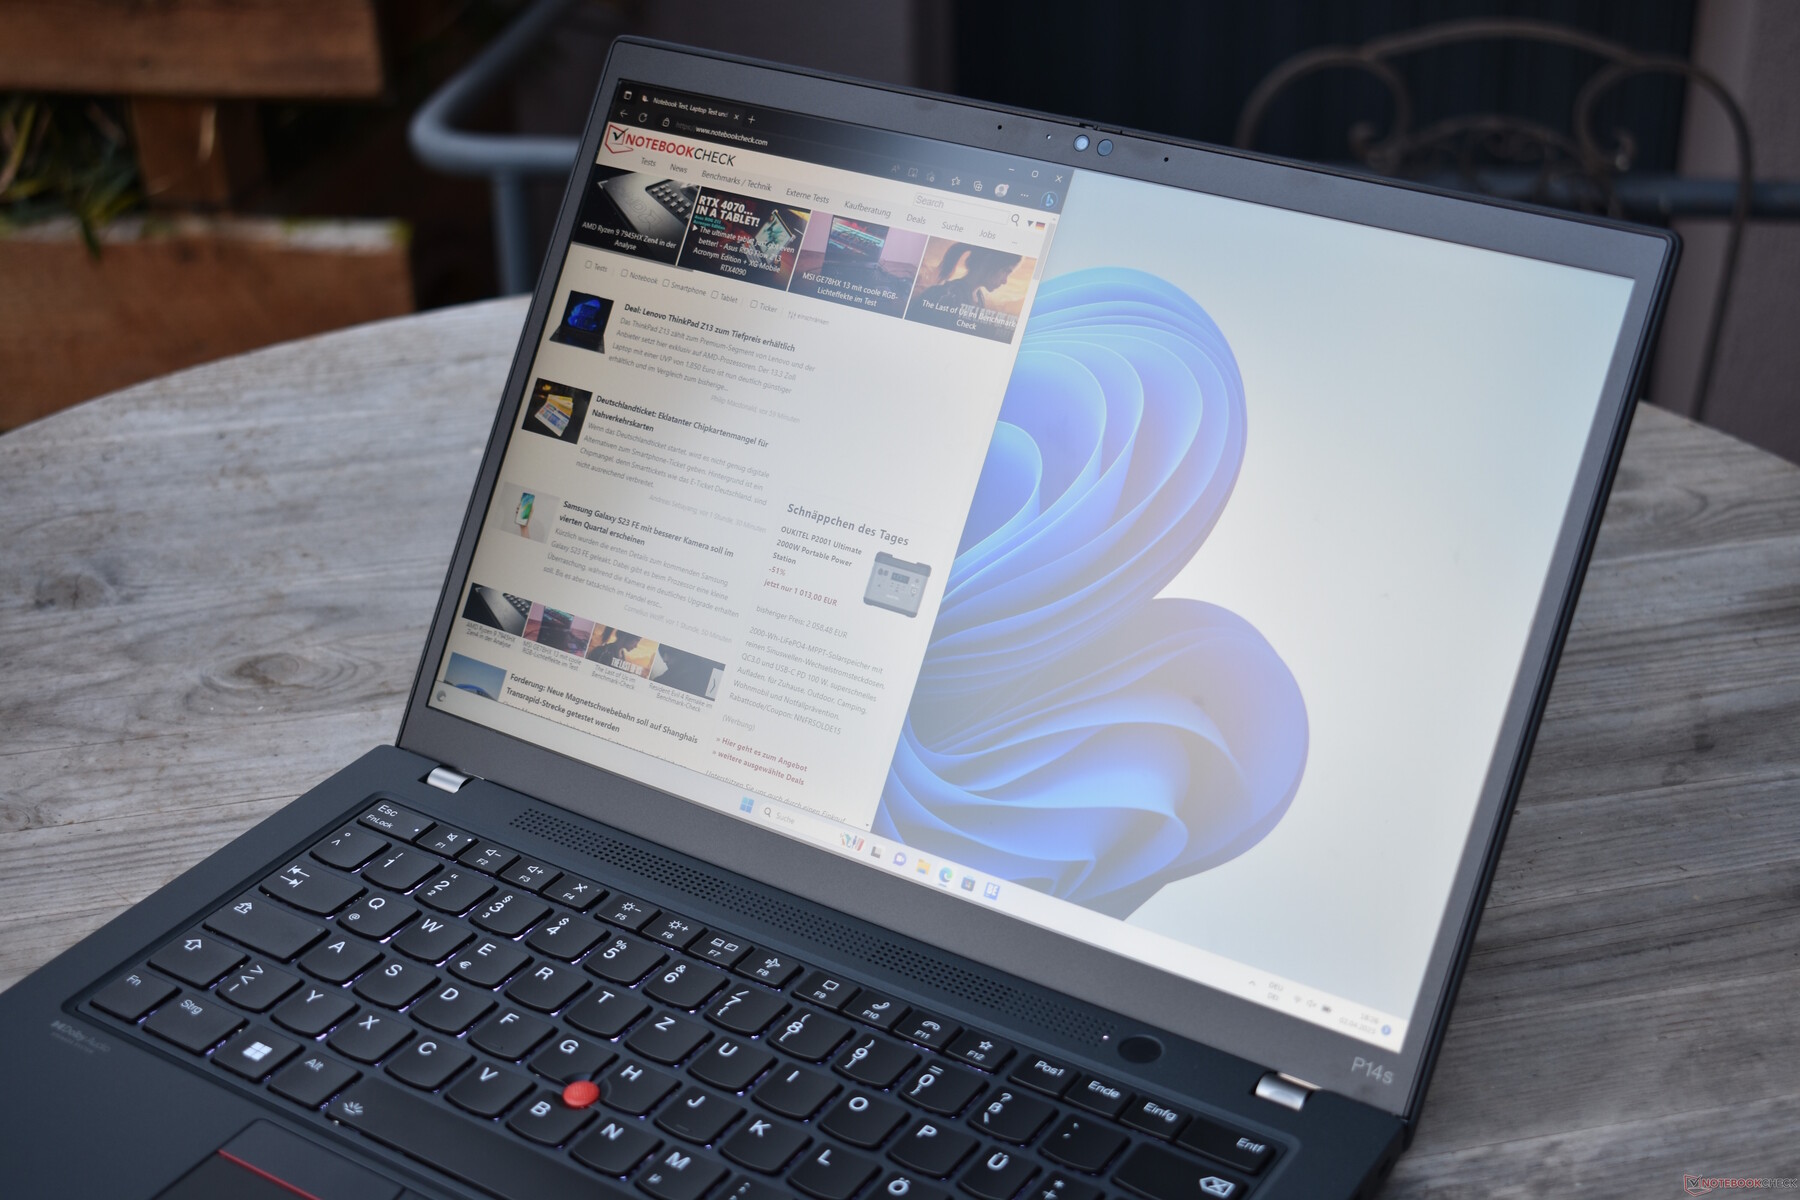
Recensione del portatile Lenovo ThinkPad P14s G3 AMD: Workstation leggera senza dGPU
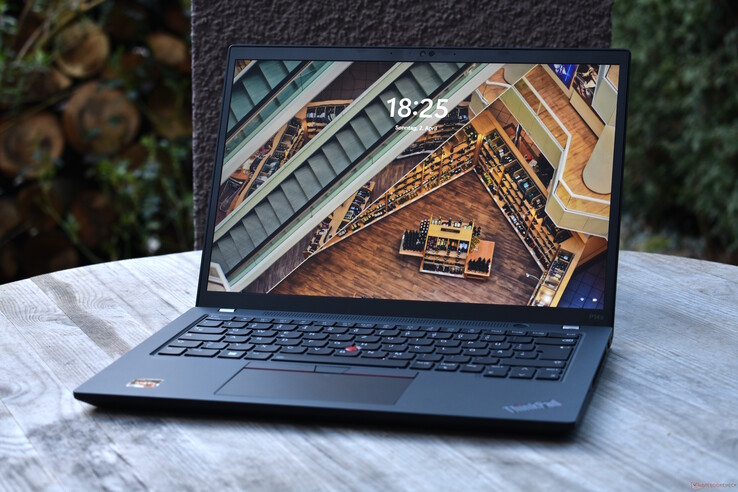
Le workstation mobili sono tradizionalmente dotate di schermi relativamente grandi (15 pollici e oltre), mentre le workstation da 14 pollici sono piuttosto rare. Il Lenovo ThinkPad P14s G3 è uno di questi ultimi modelli. Questa serie di prodotti non è nuova, ma le varianti AMD del P14s sono abbastanza nuove in confronto. Oggi ne testeremo una.
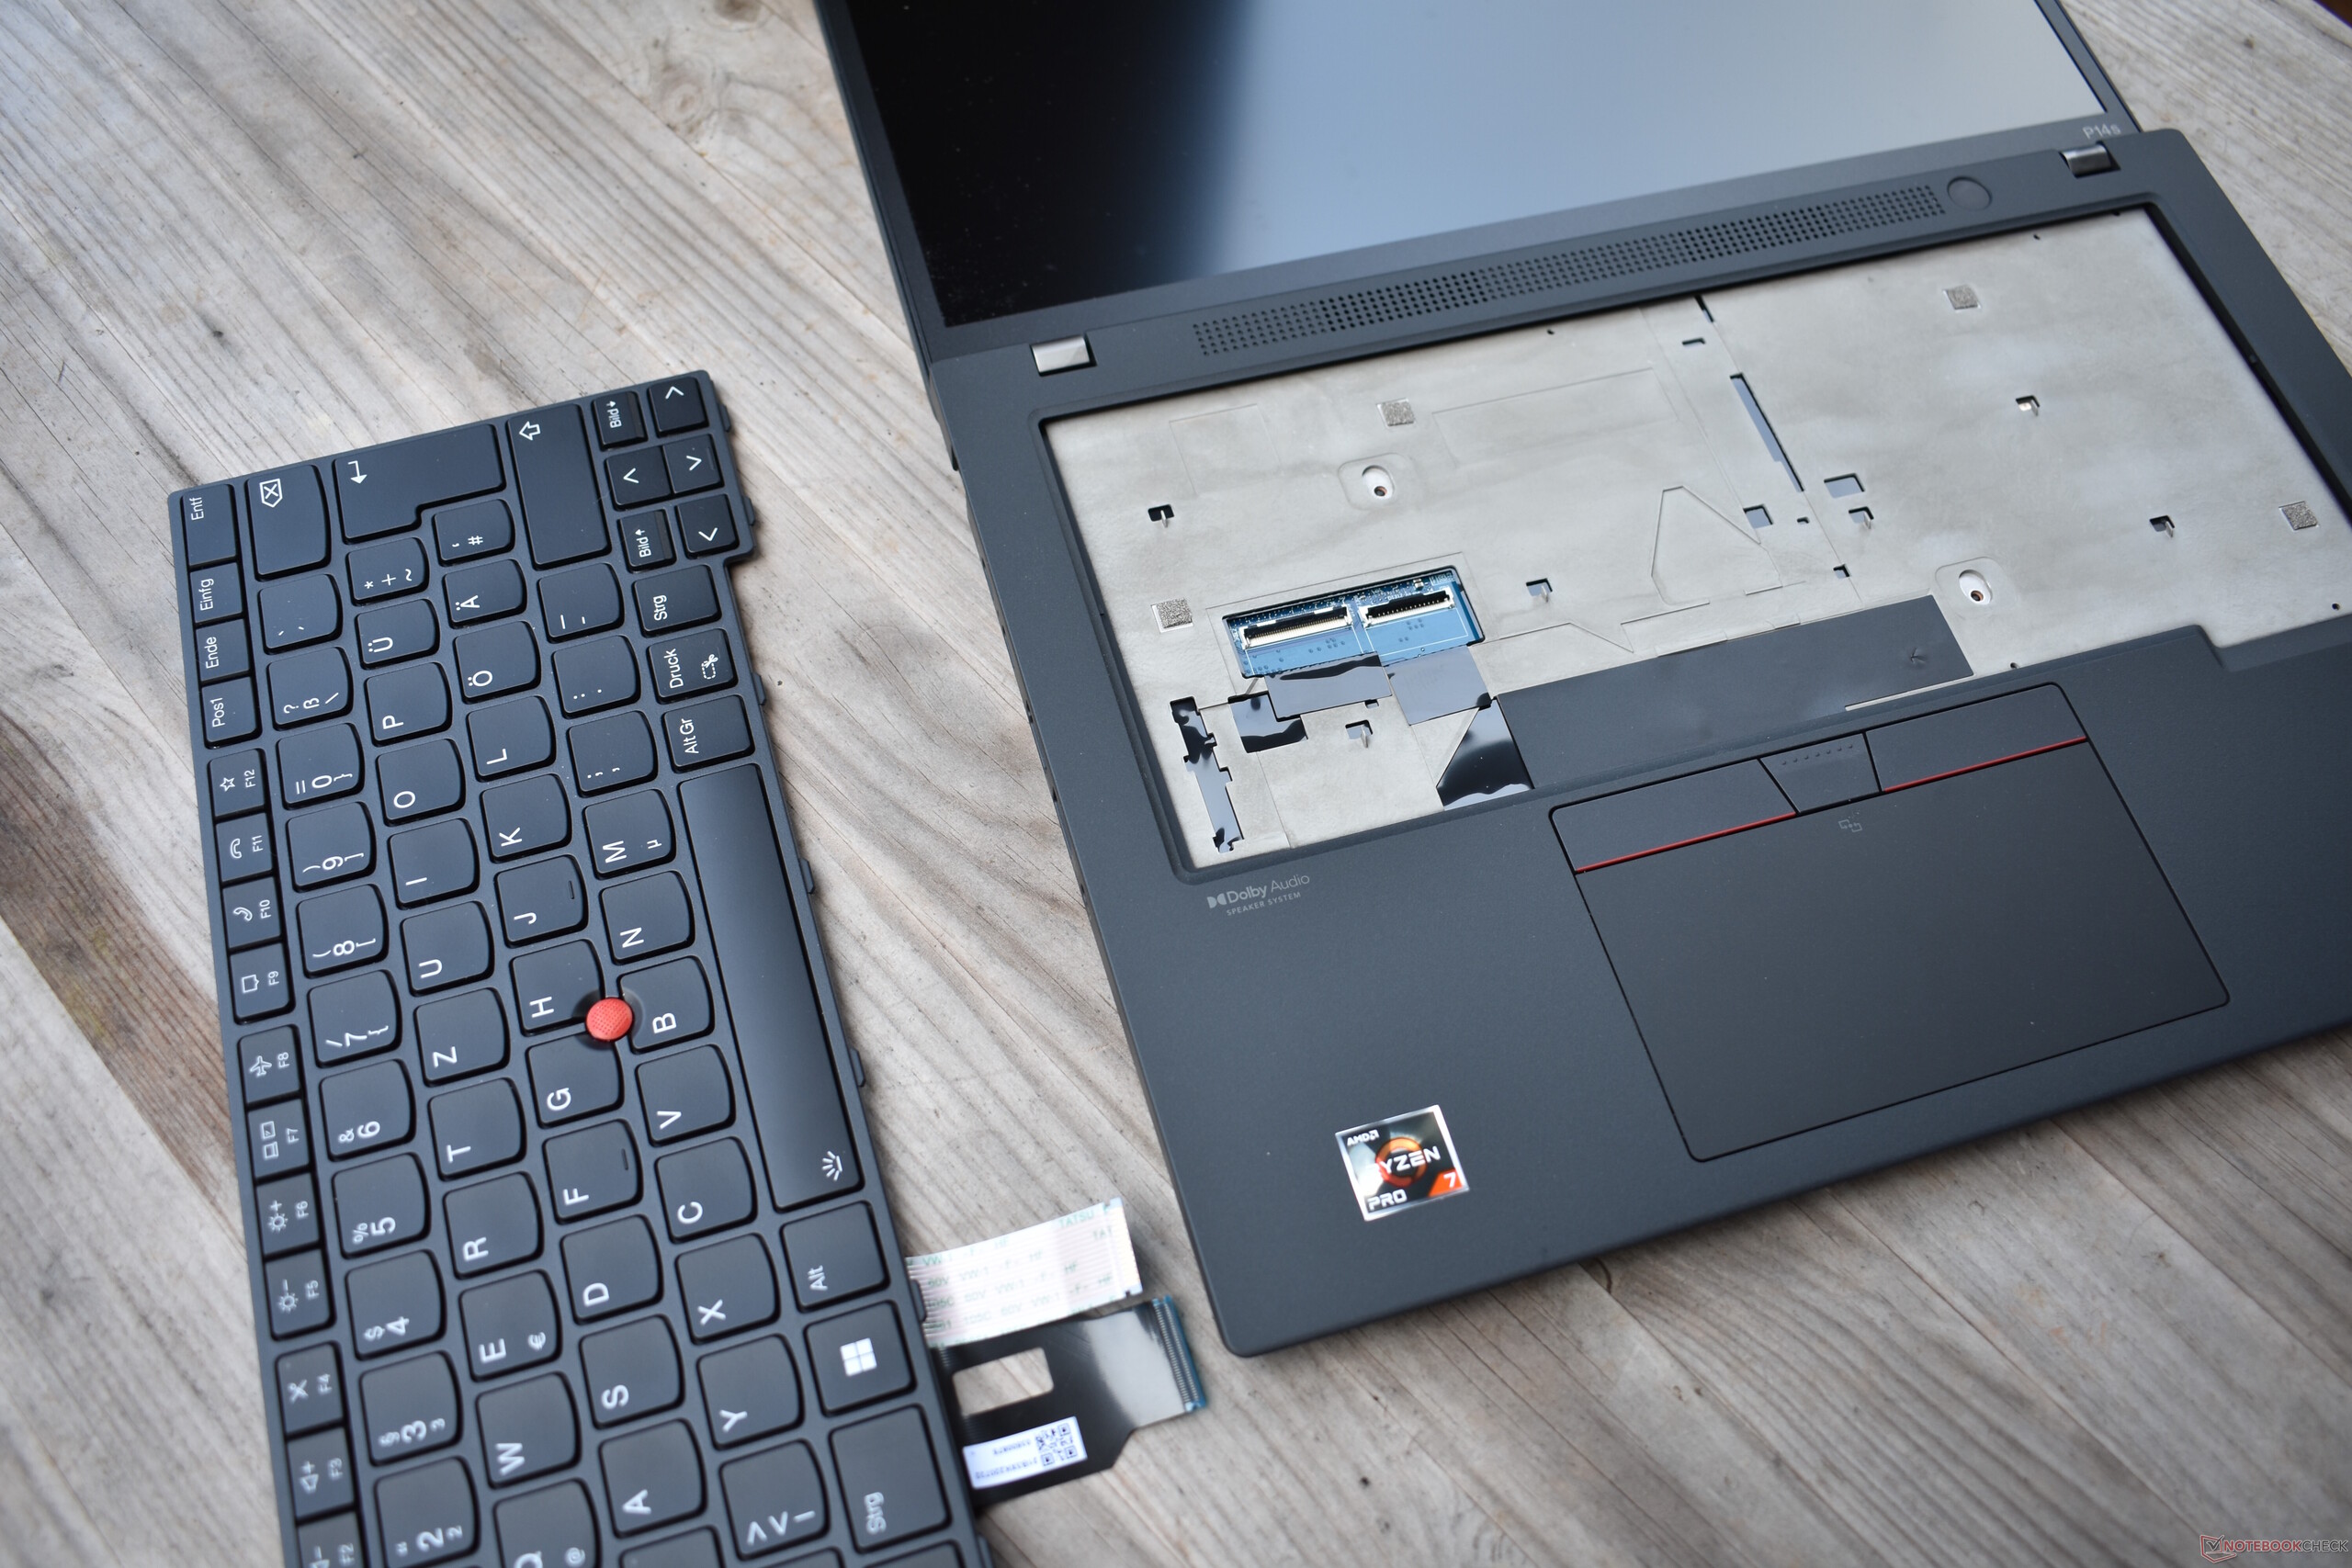
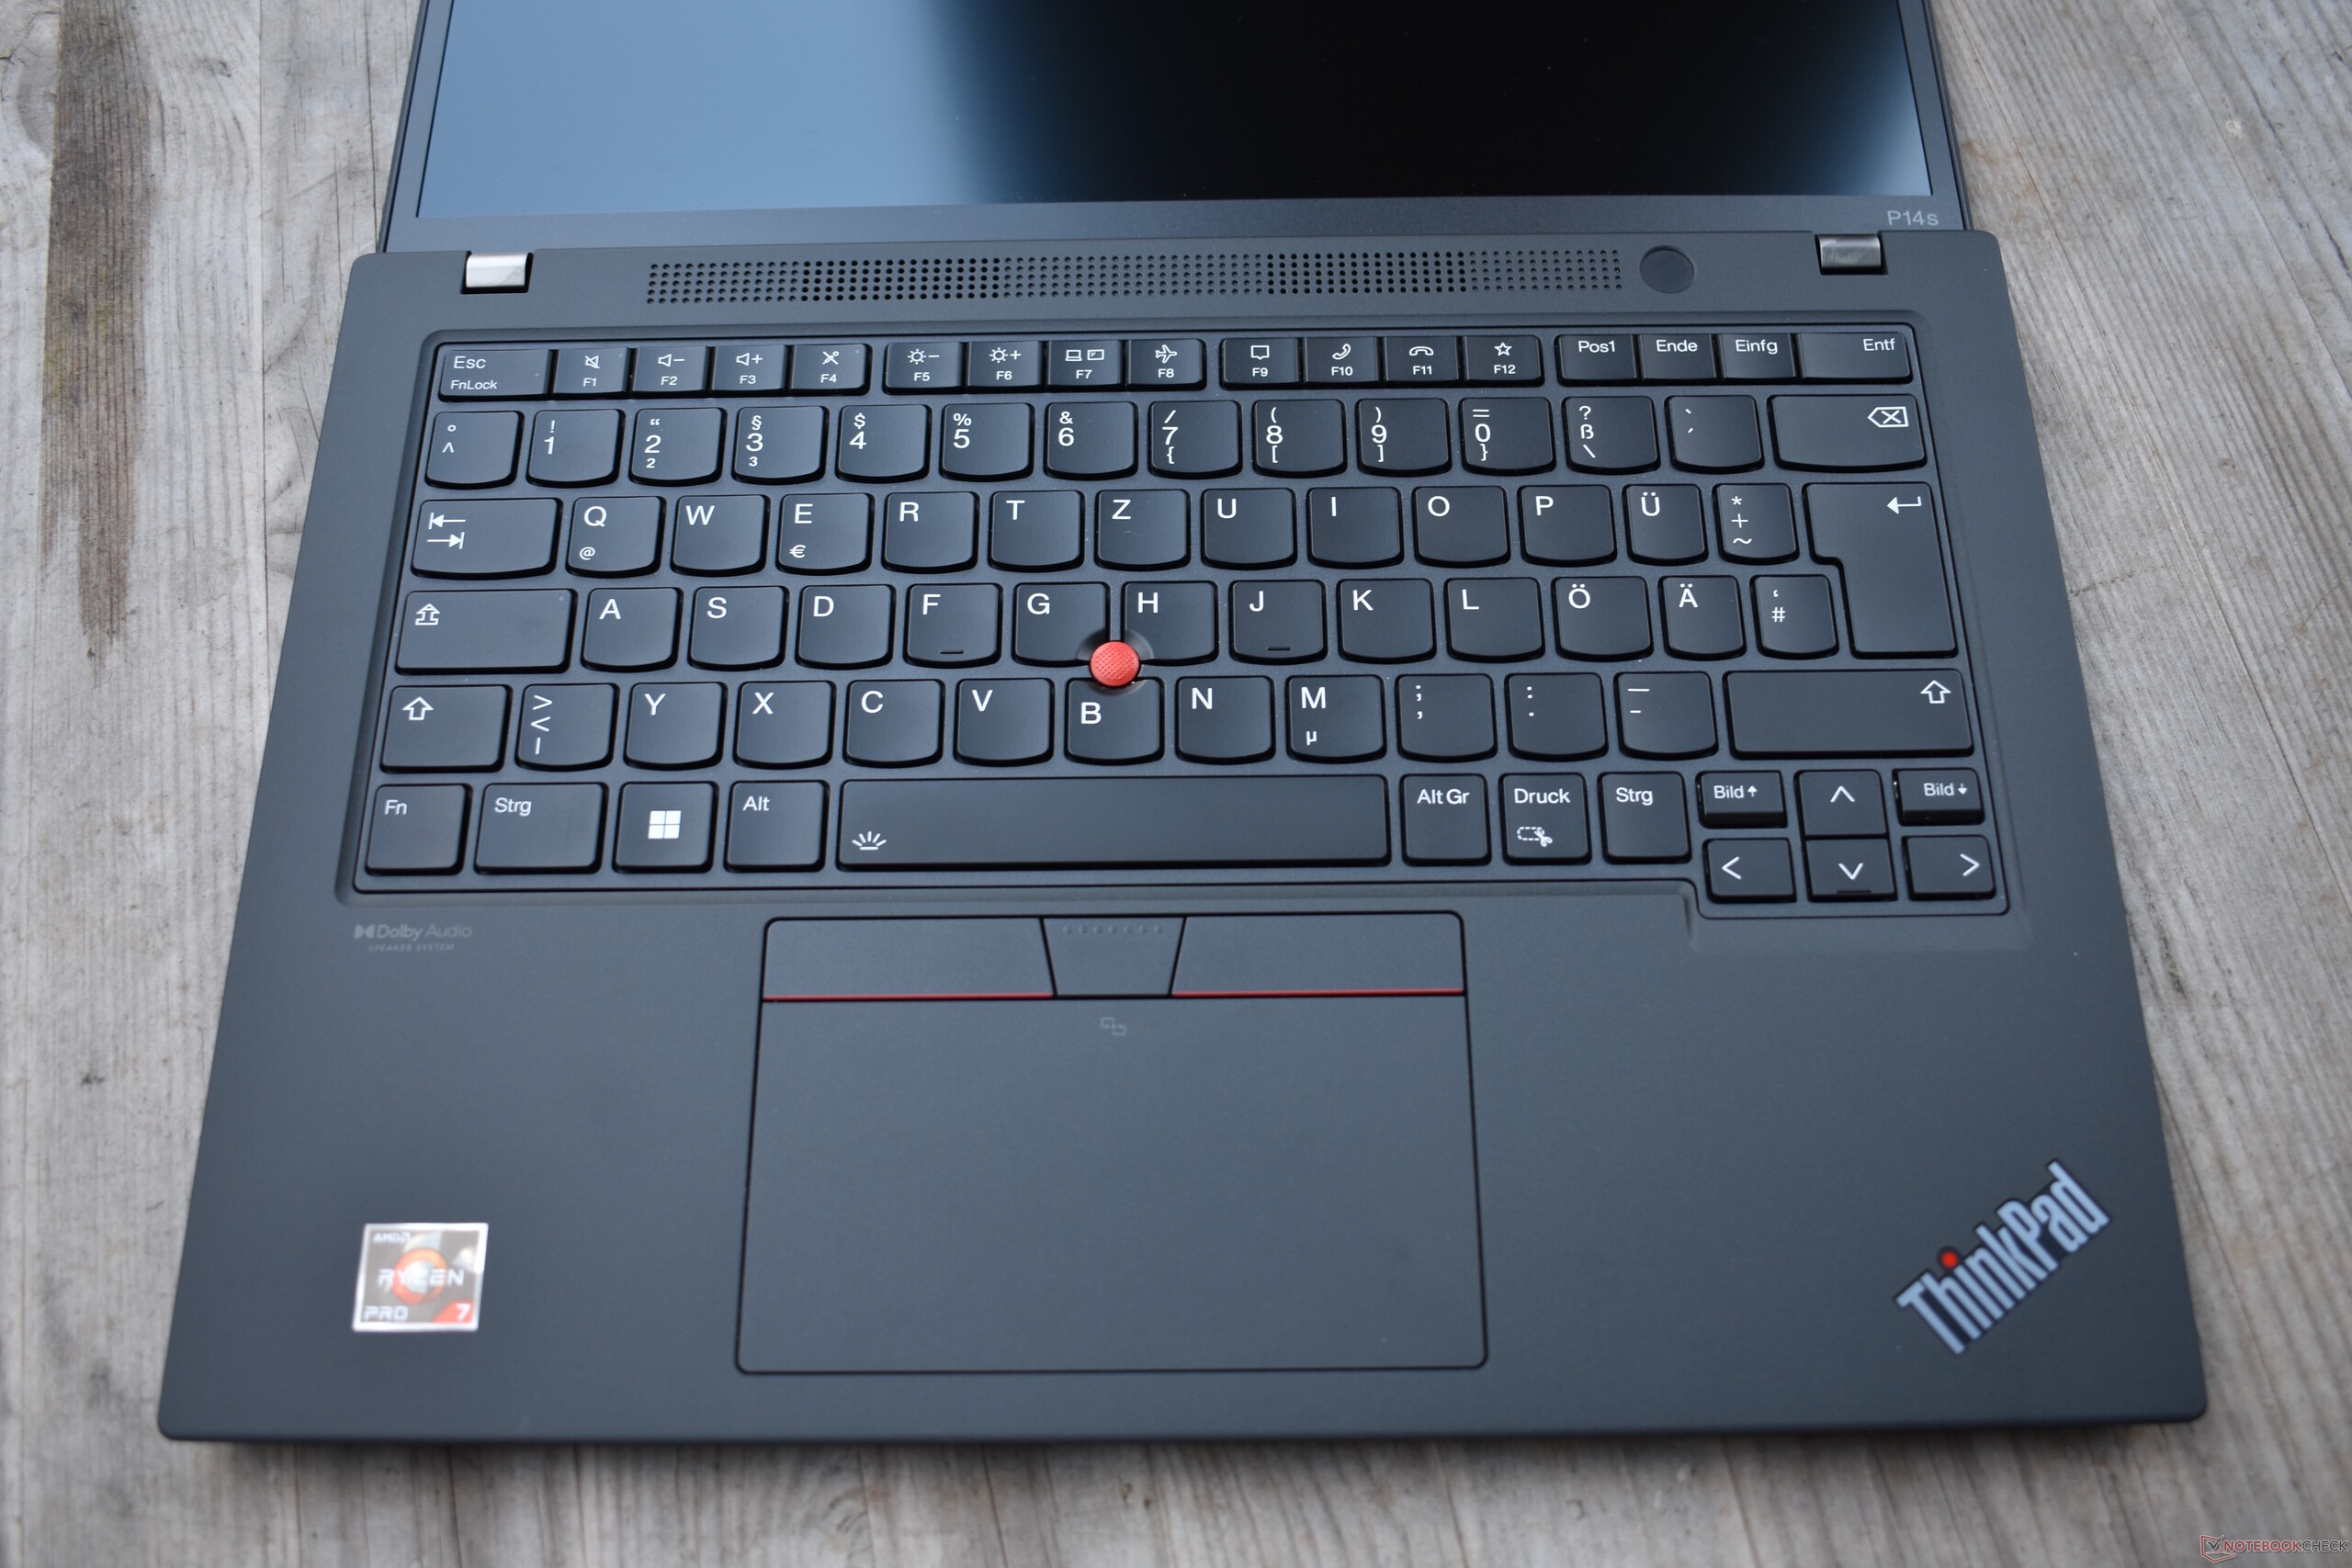
Il ThinkPad P14s è un modello gemello del ThinkPad T14 di Lenovo. Esternamente, entrambi hanno lo stesso aspetto, il che significa che potete dare un'occhiata alla nostra recensione del ThinkPad T14 di Lenovo.ThinkPad T14 Gen 3 di Lenovo se siete interessati a leggerne il design, le caratteristiche e i dispositivi di input.
Potenziali concorrenti a confronto
Punteggio | Data | Modello | Peso | Altezza | Dimensione | Risoluzione | Prezzo |
|---|---|---|---|---|---|---|---|
| 86.9 % v7 (old) | 04/2023 | Lenovo ThinkPad P14s G3 AMD 21J6S05000 R7 PRO 6850U, Radeon 680M | 1.5 kg | 17.9 mm | 14.00" | 1920x1200 | |
| 85.1 % v7 (old) | 06/2021 | Lenovo ThinkPad P14s Gen2-20VX000GGE i7-1185G7, T500 Laptop GPU | 1.5 kg | 18 mm | 14.00" | 1920x1080 | |
| 88.8 % v7 (old) | 09/2022 | Lenovo ThinkPad T14 G3-21CF004NGE R7 PRO 6850U, Radeon 680M | 1.4 kg | 17.9 mm | 14.00" | 1920x1200 | |
| 87.6 % v7 (old) | 09/2022 | Dell Precision 5000 5470 i9-12900H, RTX A1000 Laptop GPU | 1.6 kg | 18.95 mm | 14.00" | 2560x1600 | |
| 83.6 % v7 (old) | 10/2022 | HP ZBook Firefly 14 G9-6B8A2EA i7-1265U, T550 Laptop GPU | 1.5 kg | 19.9 mm | 14.00" | 1920x1200 |
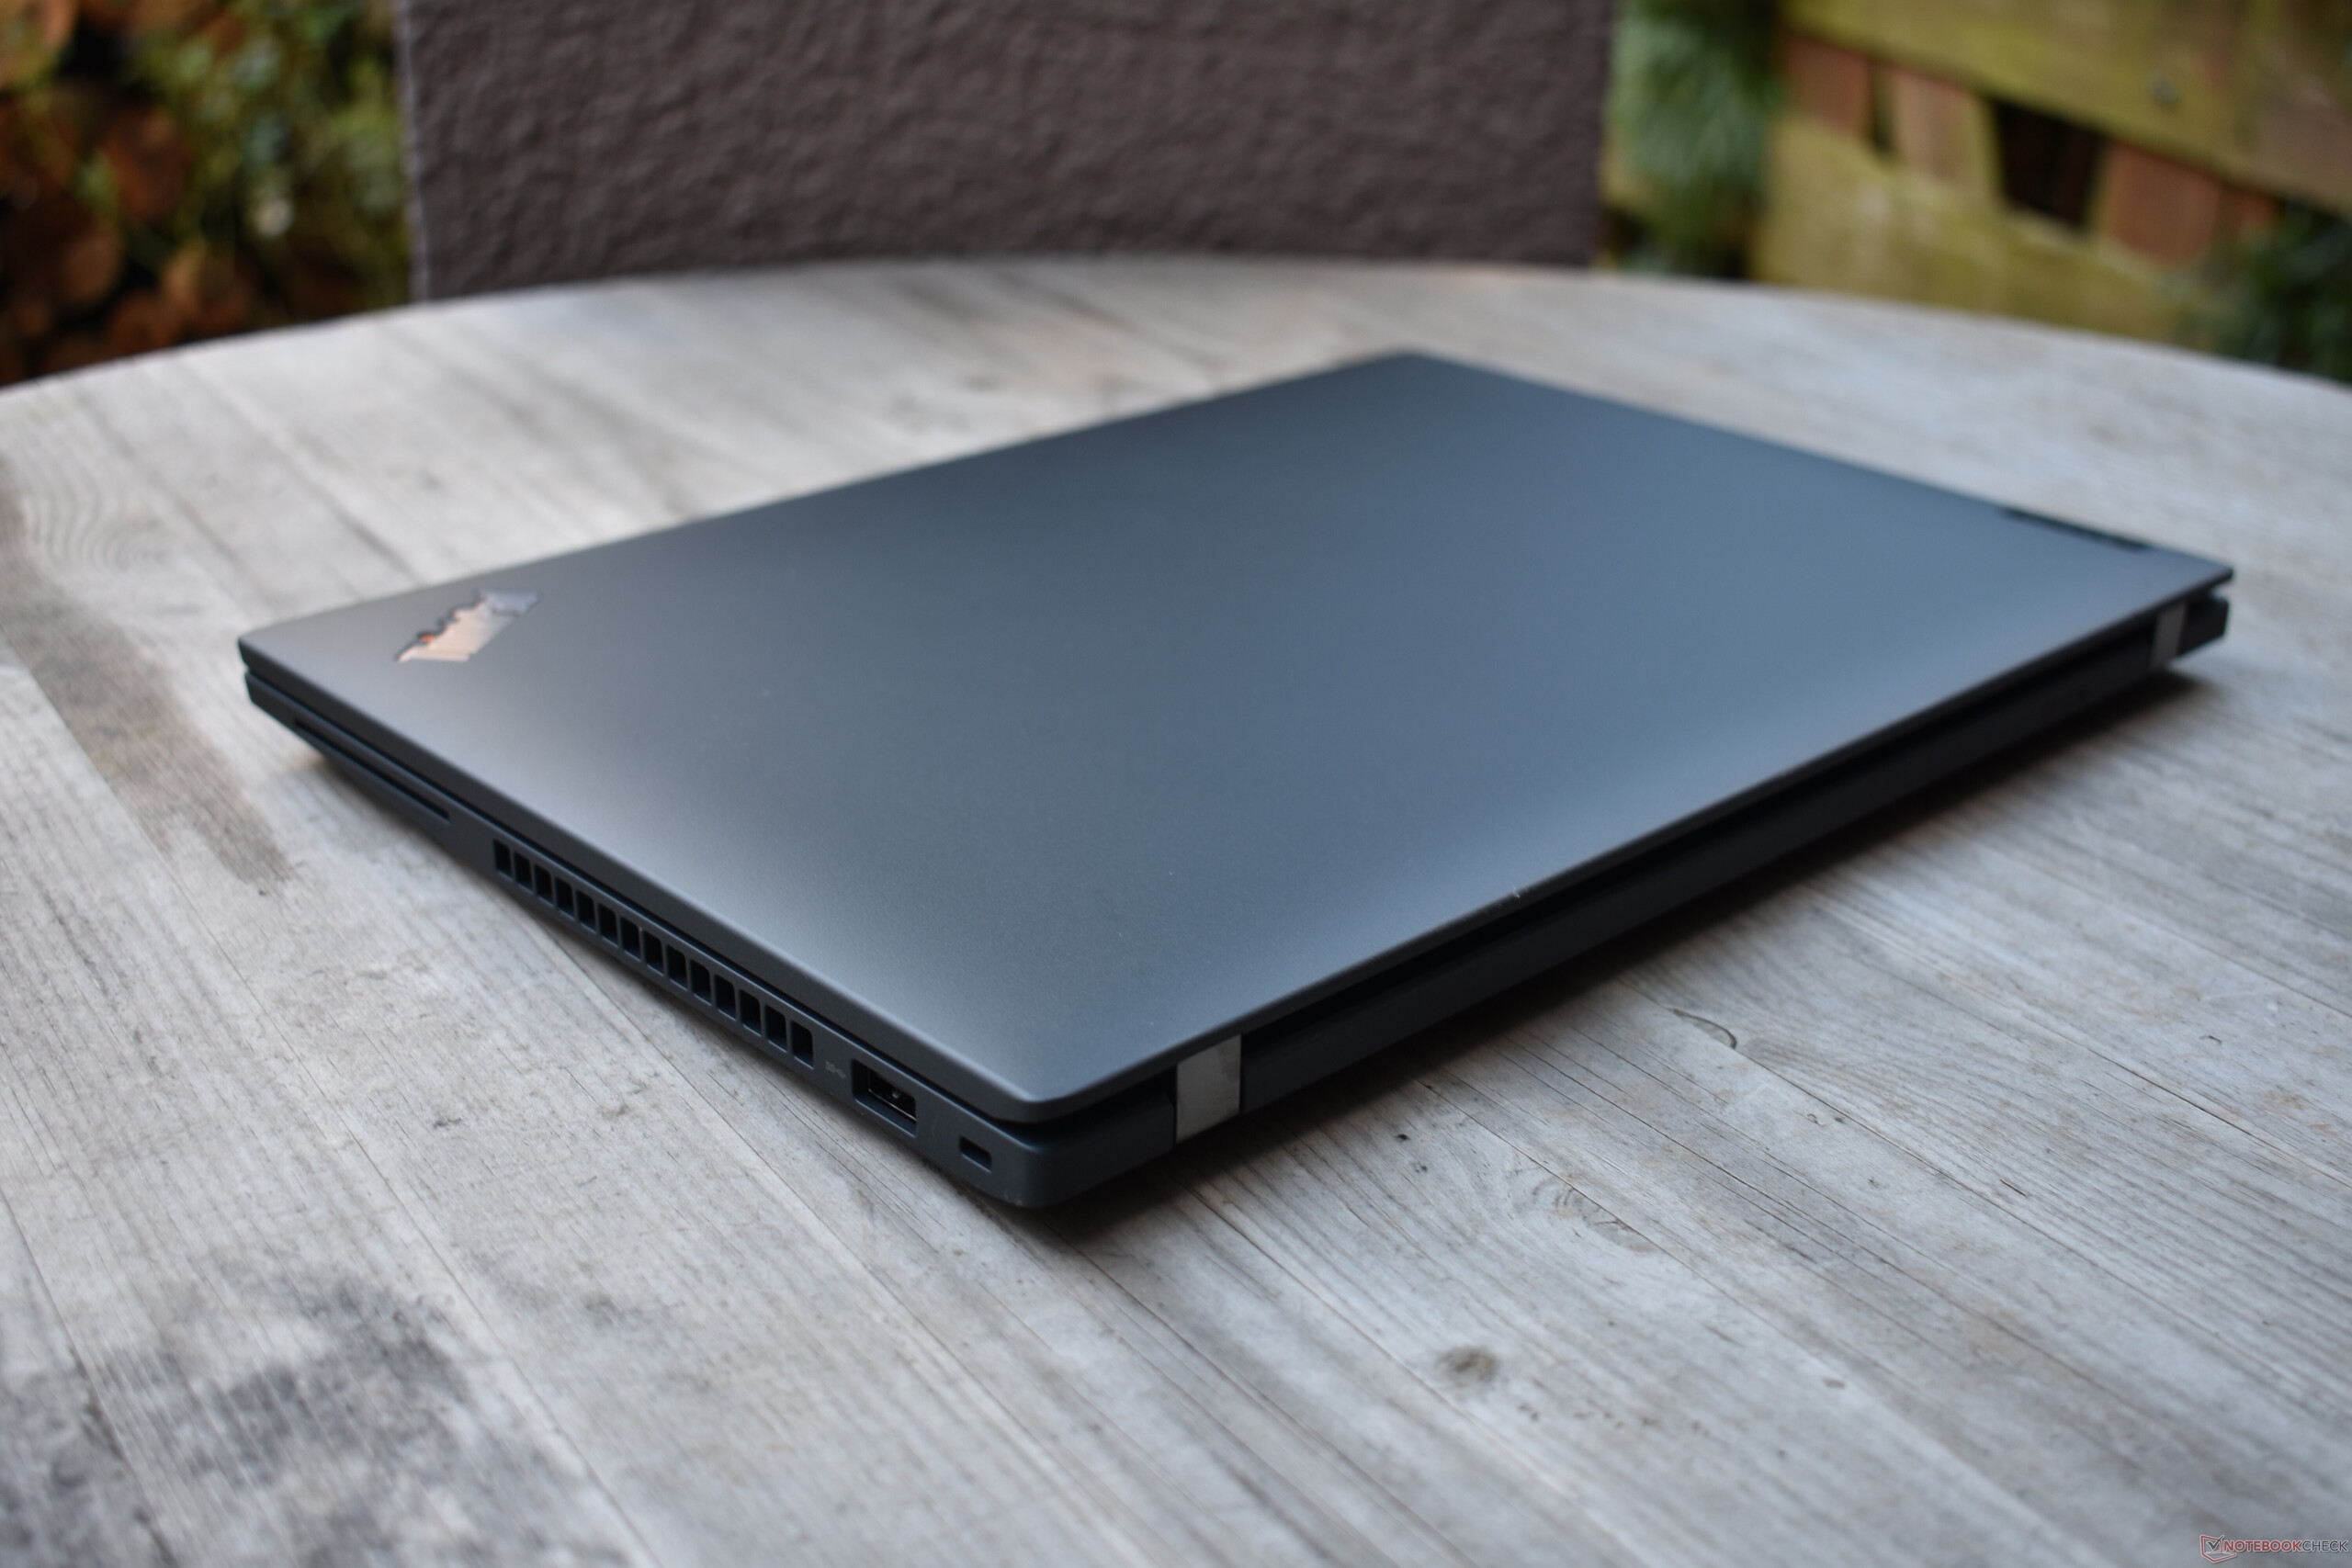
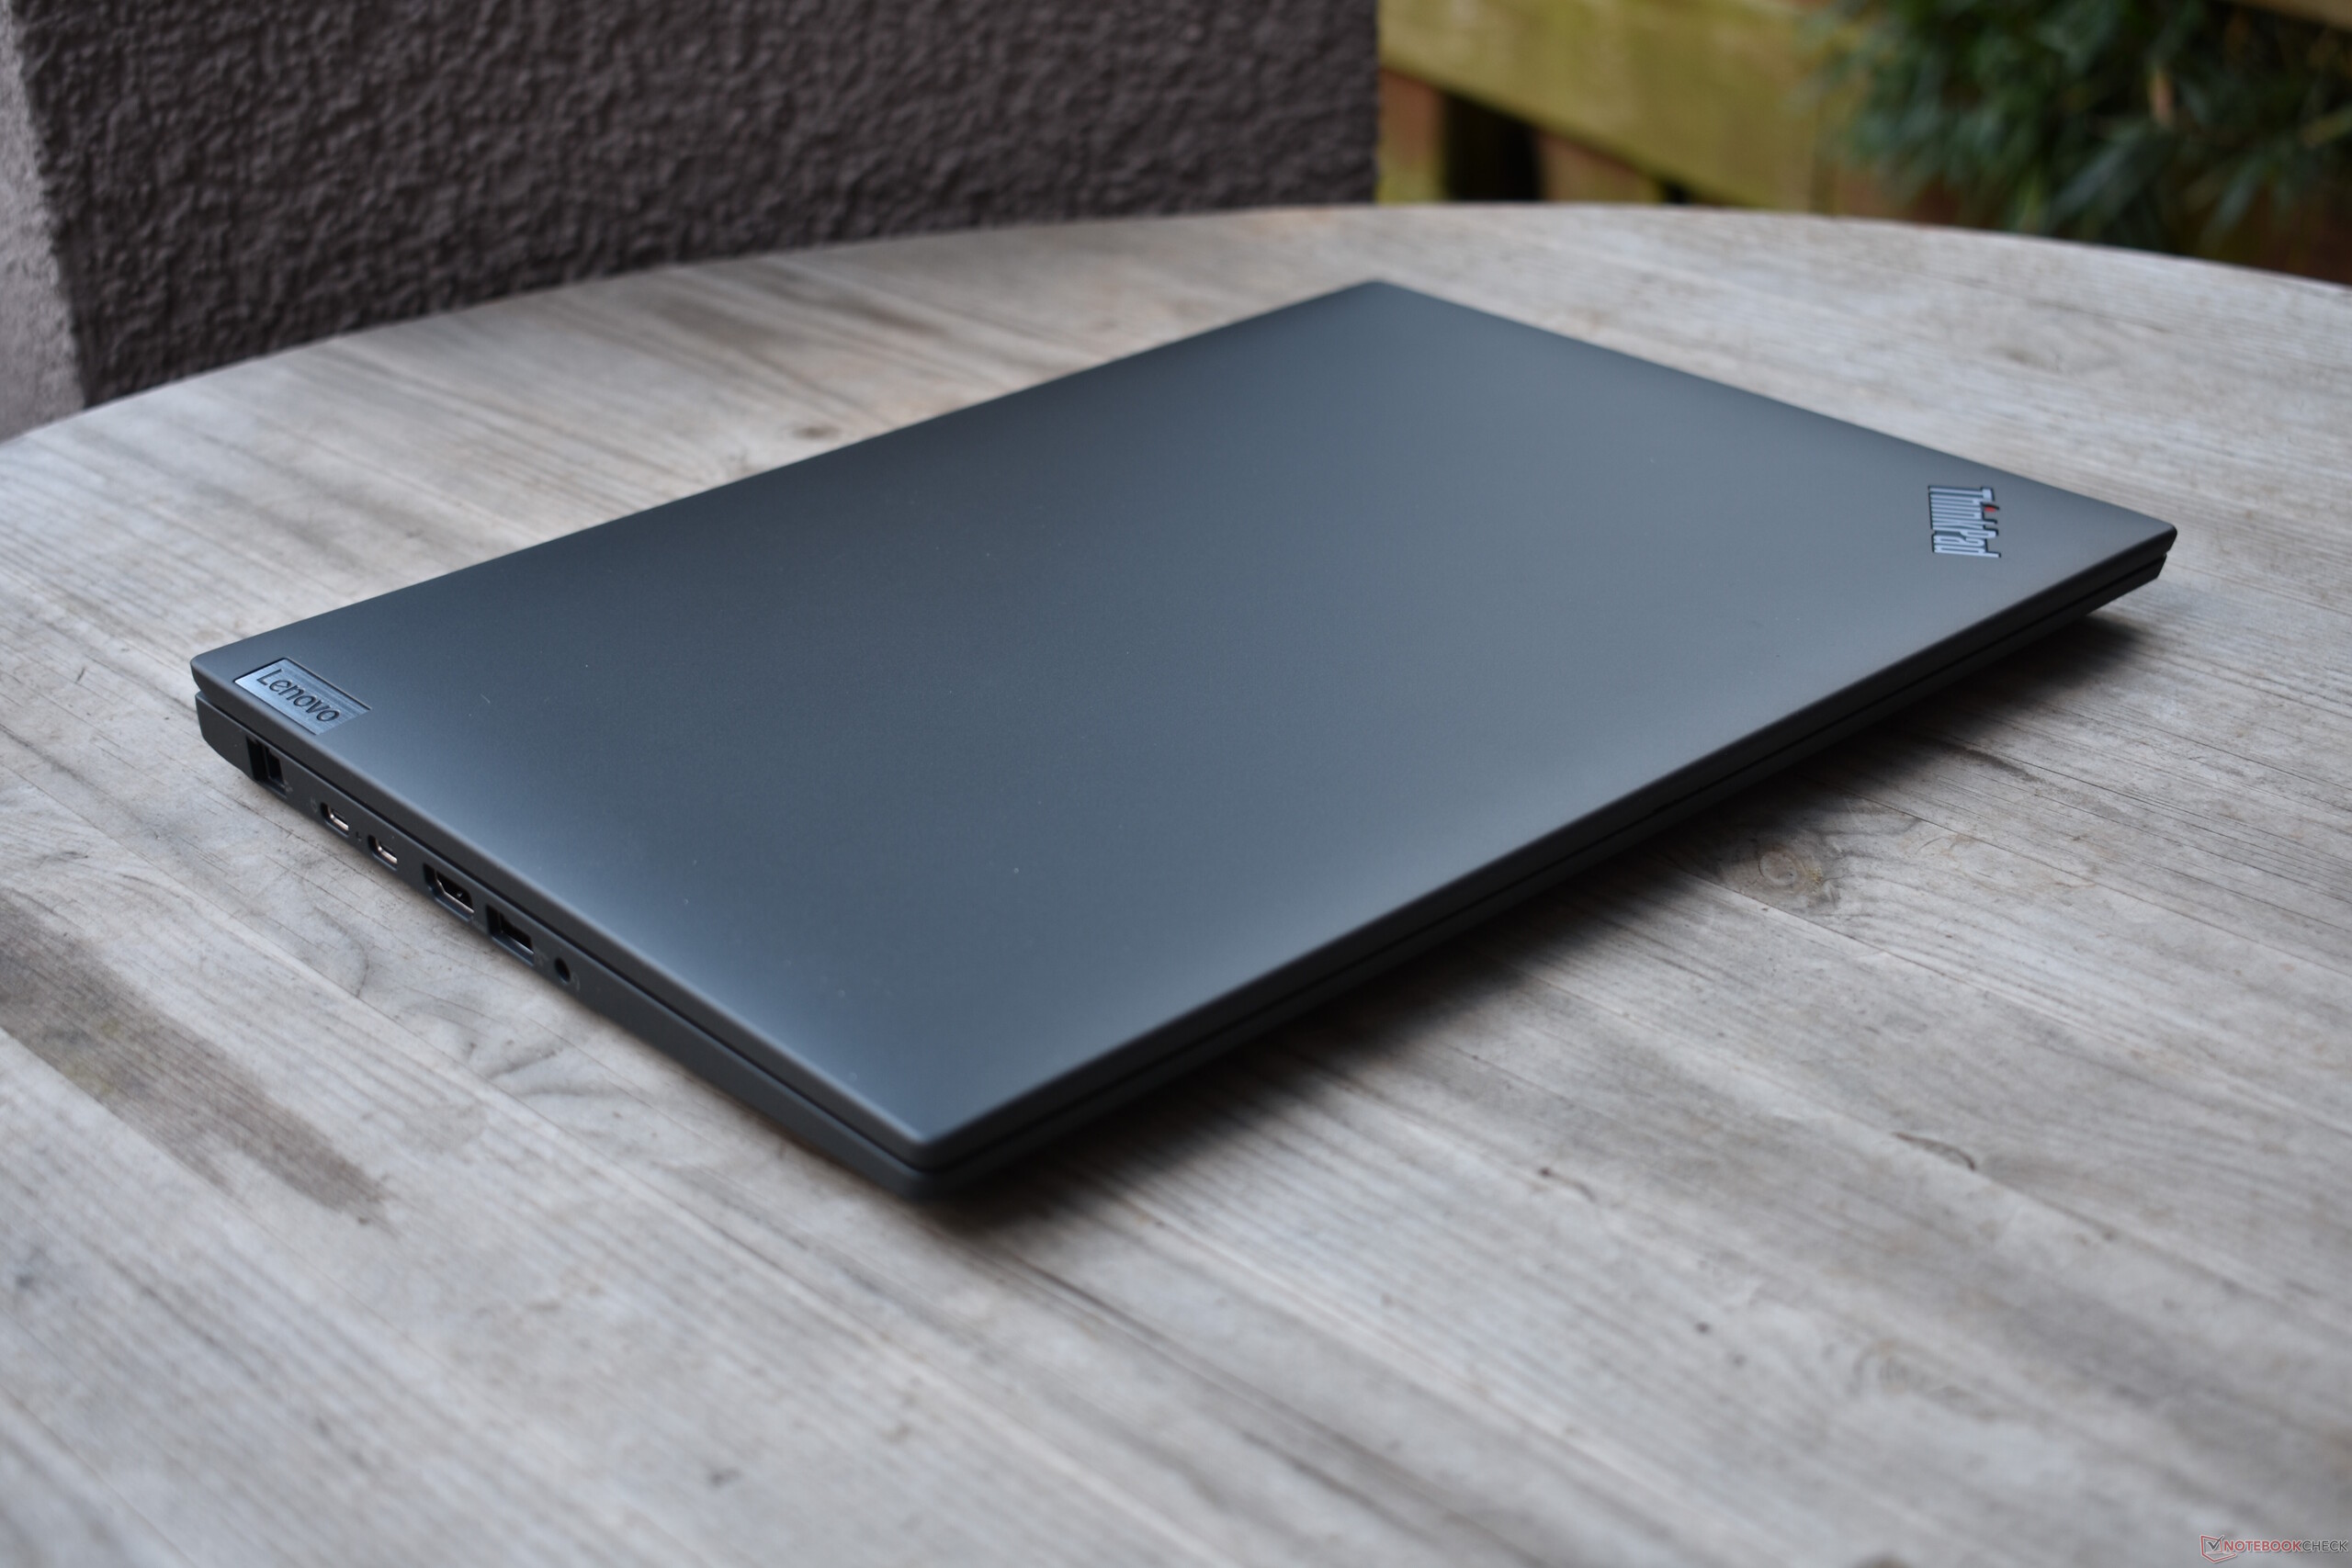
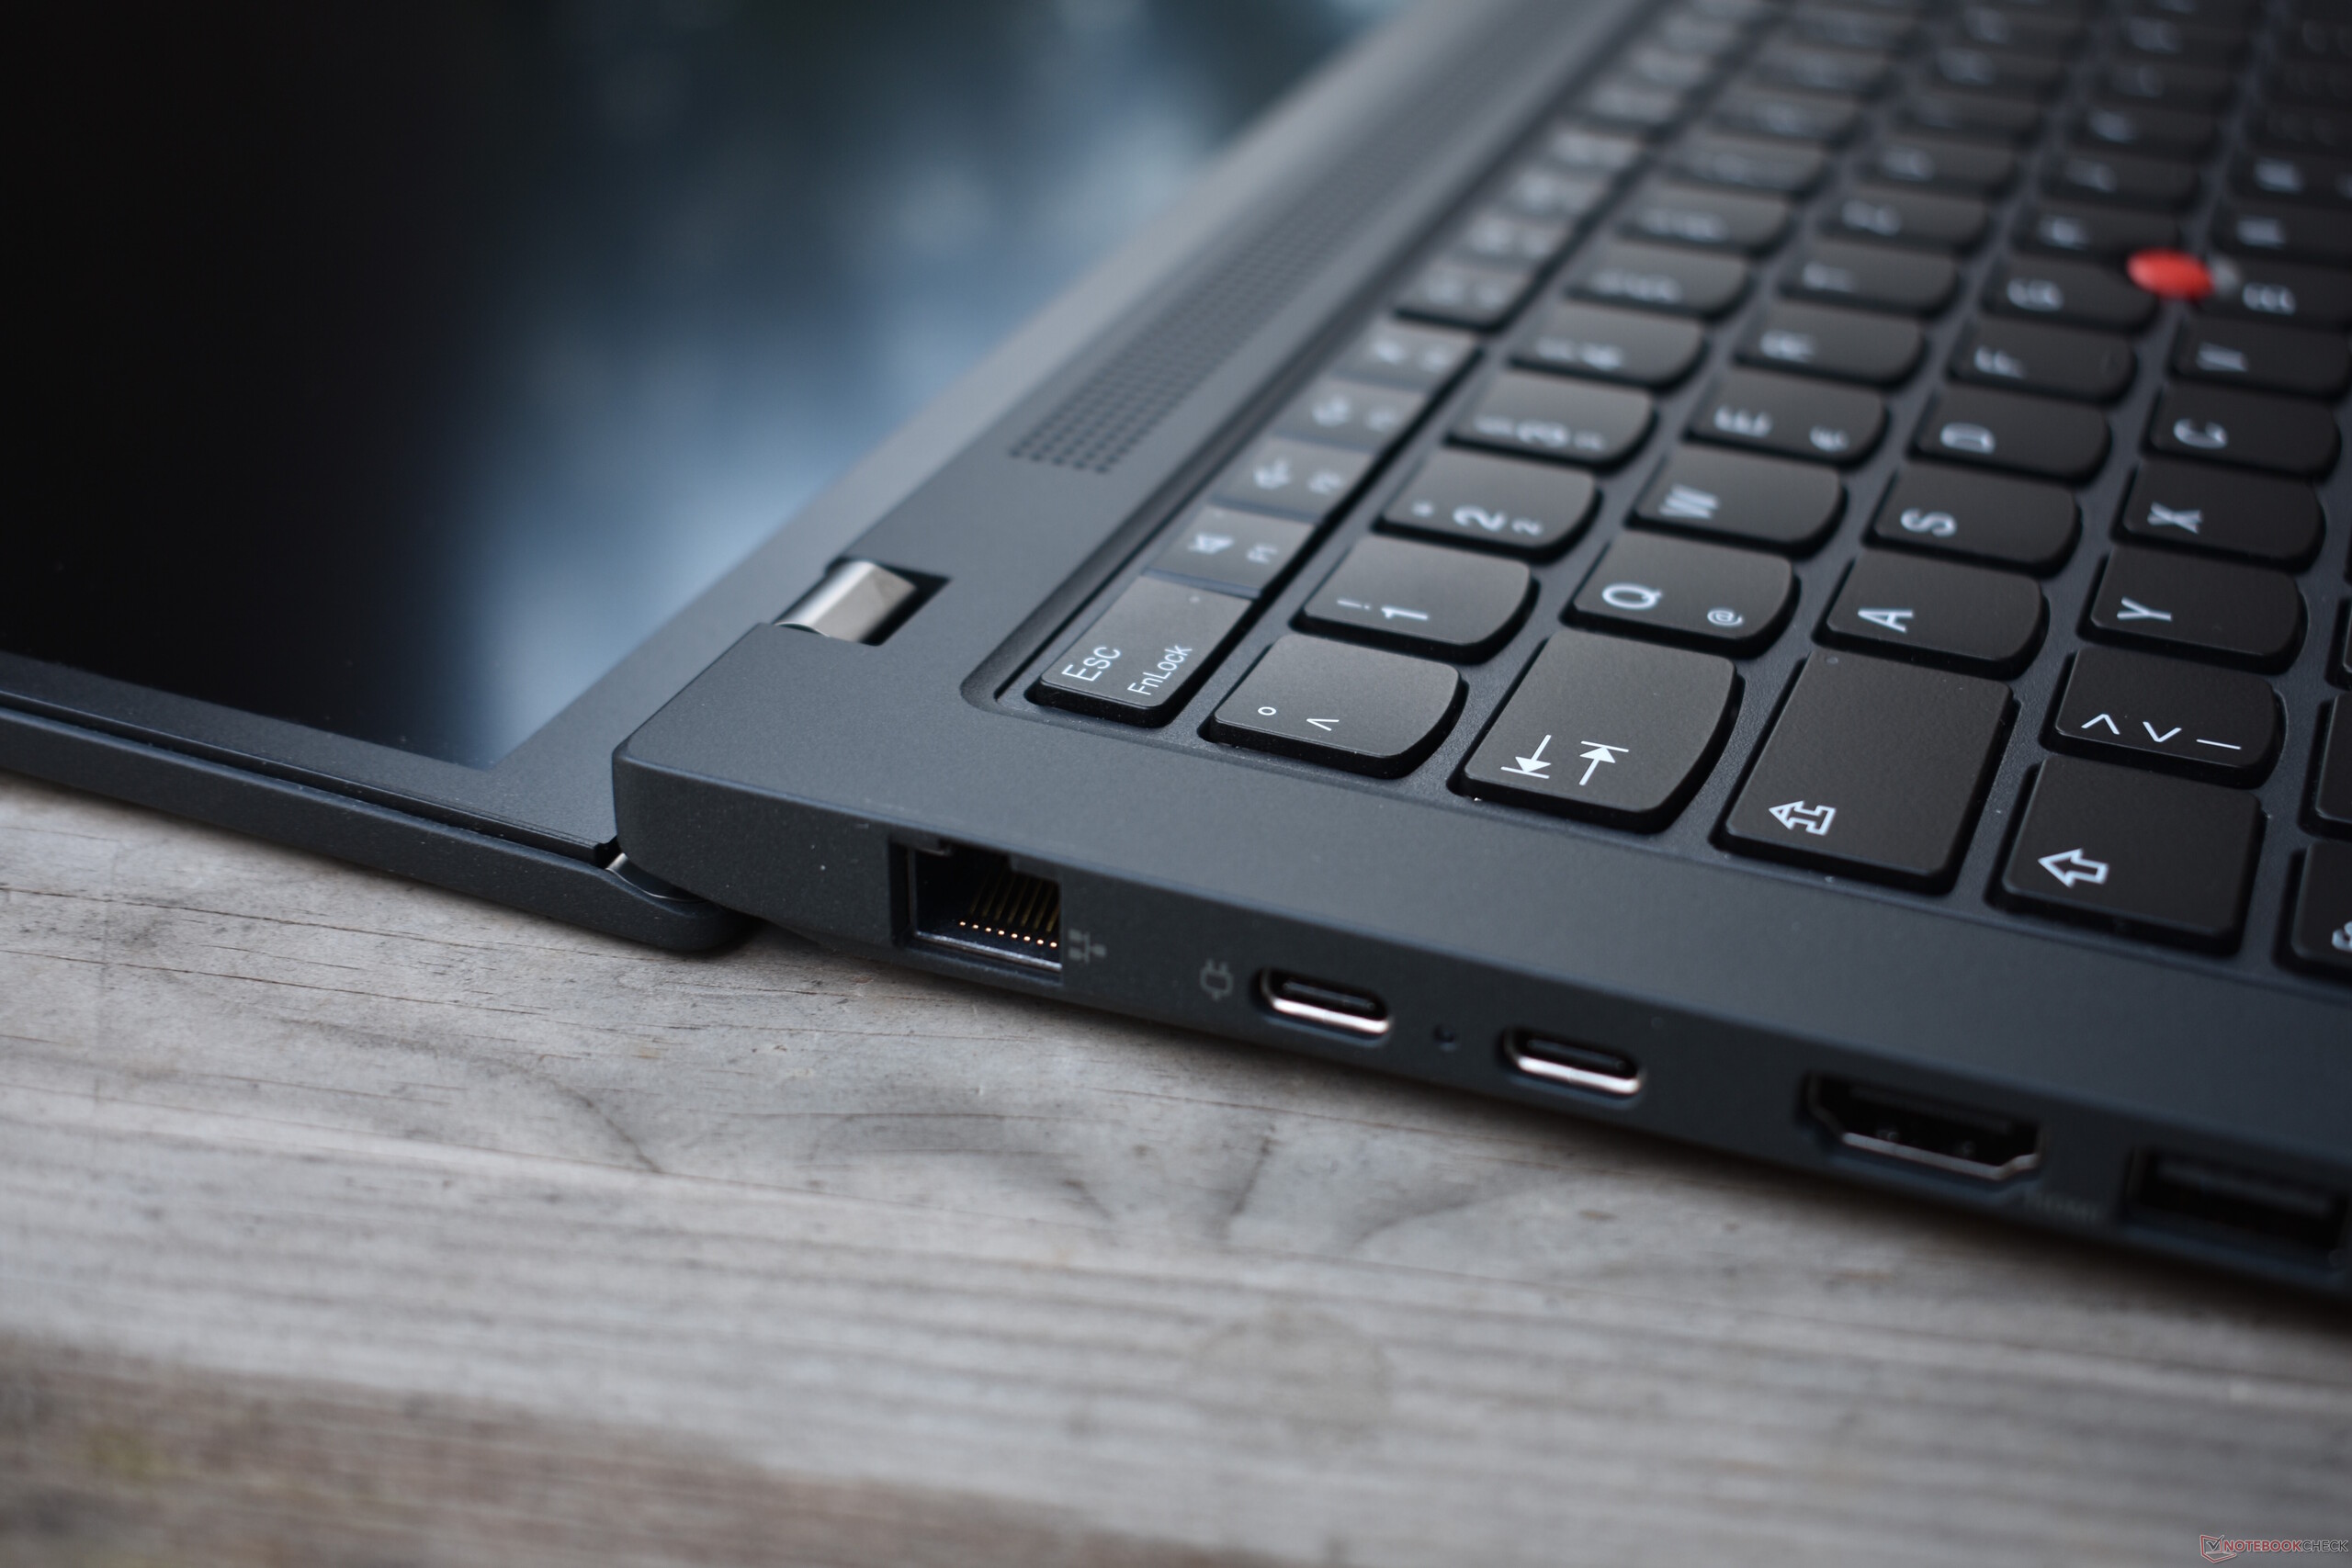
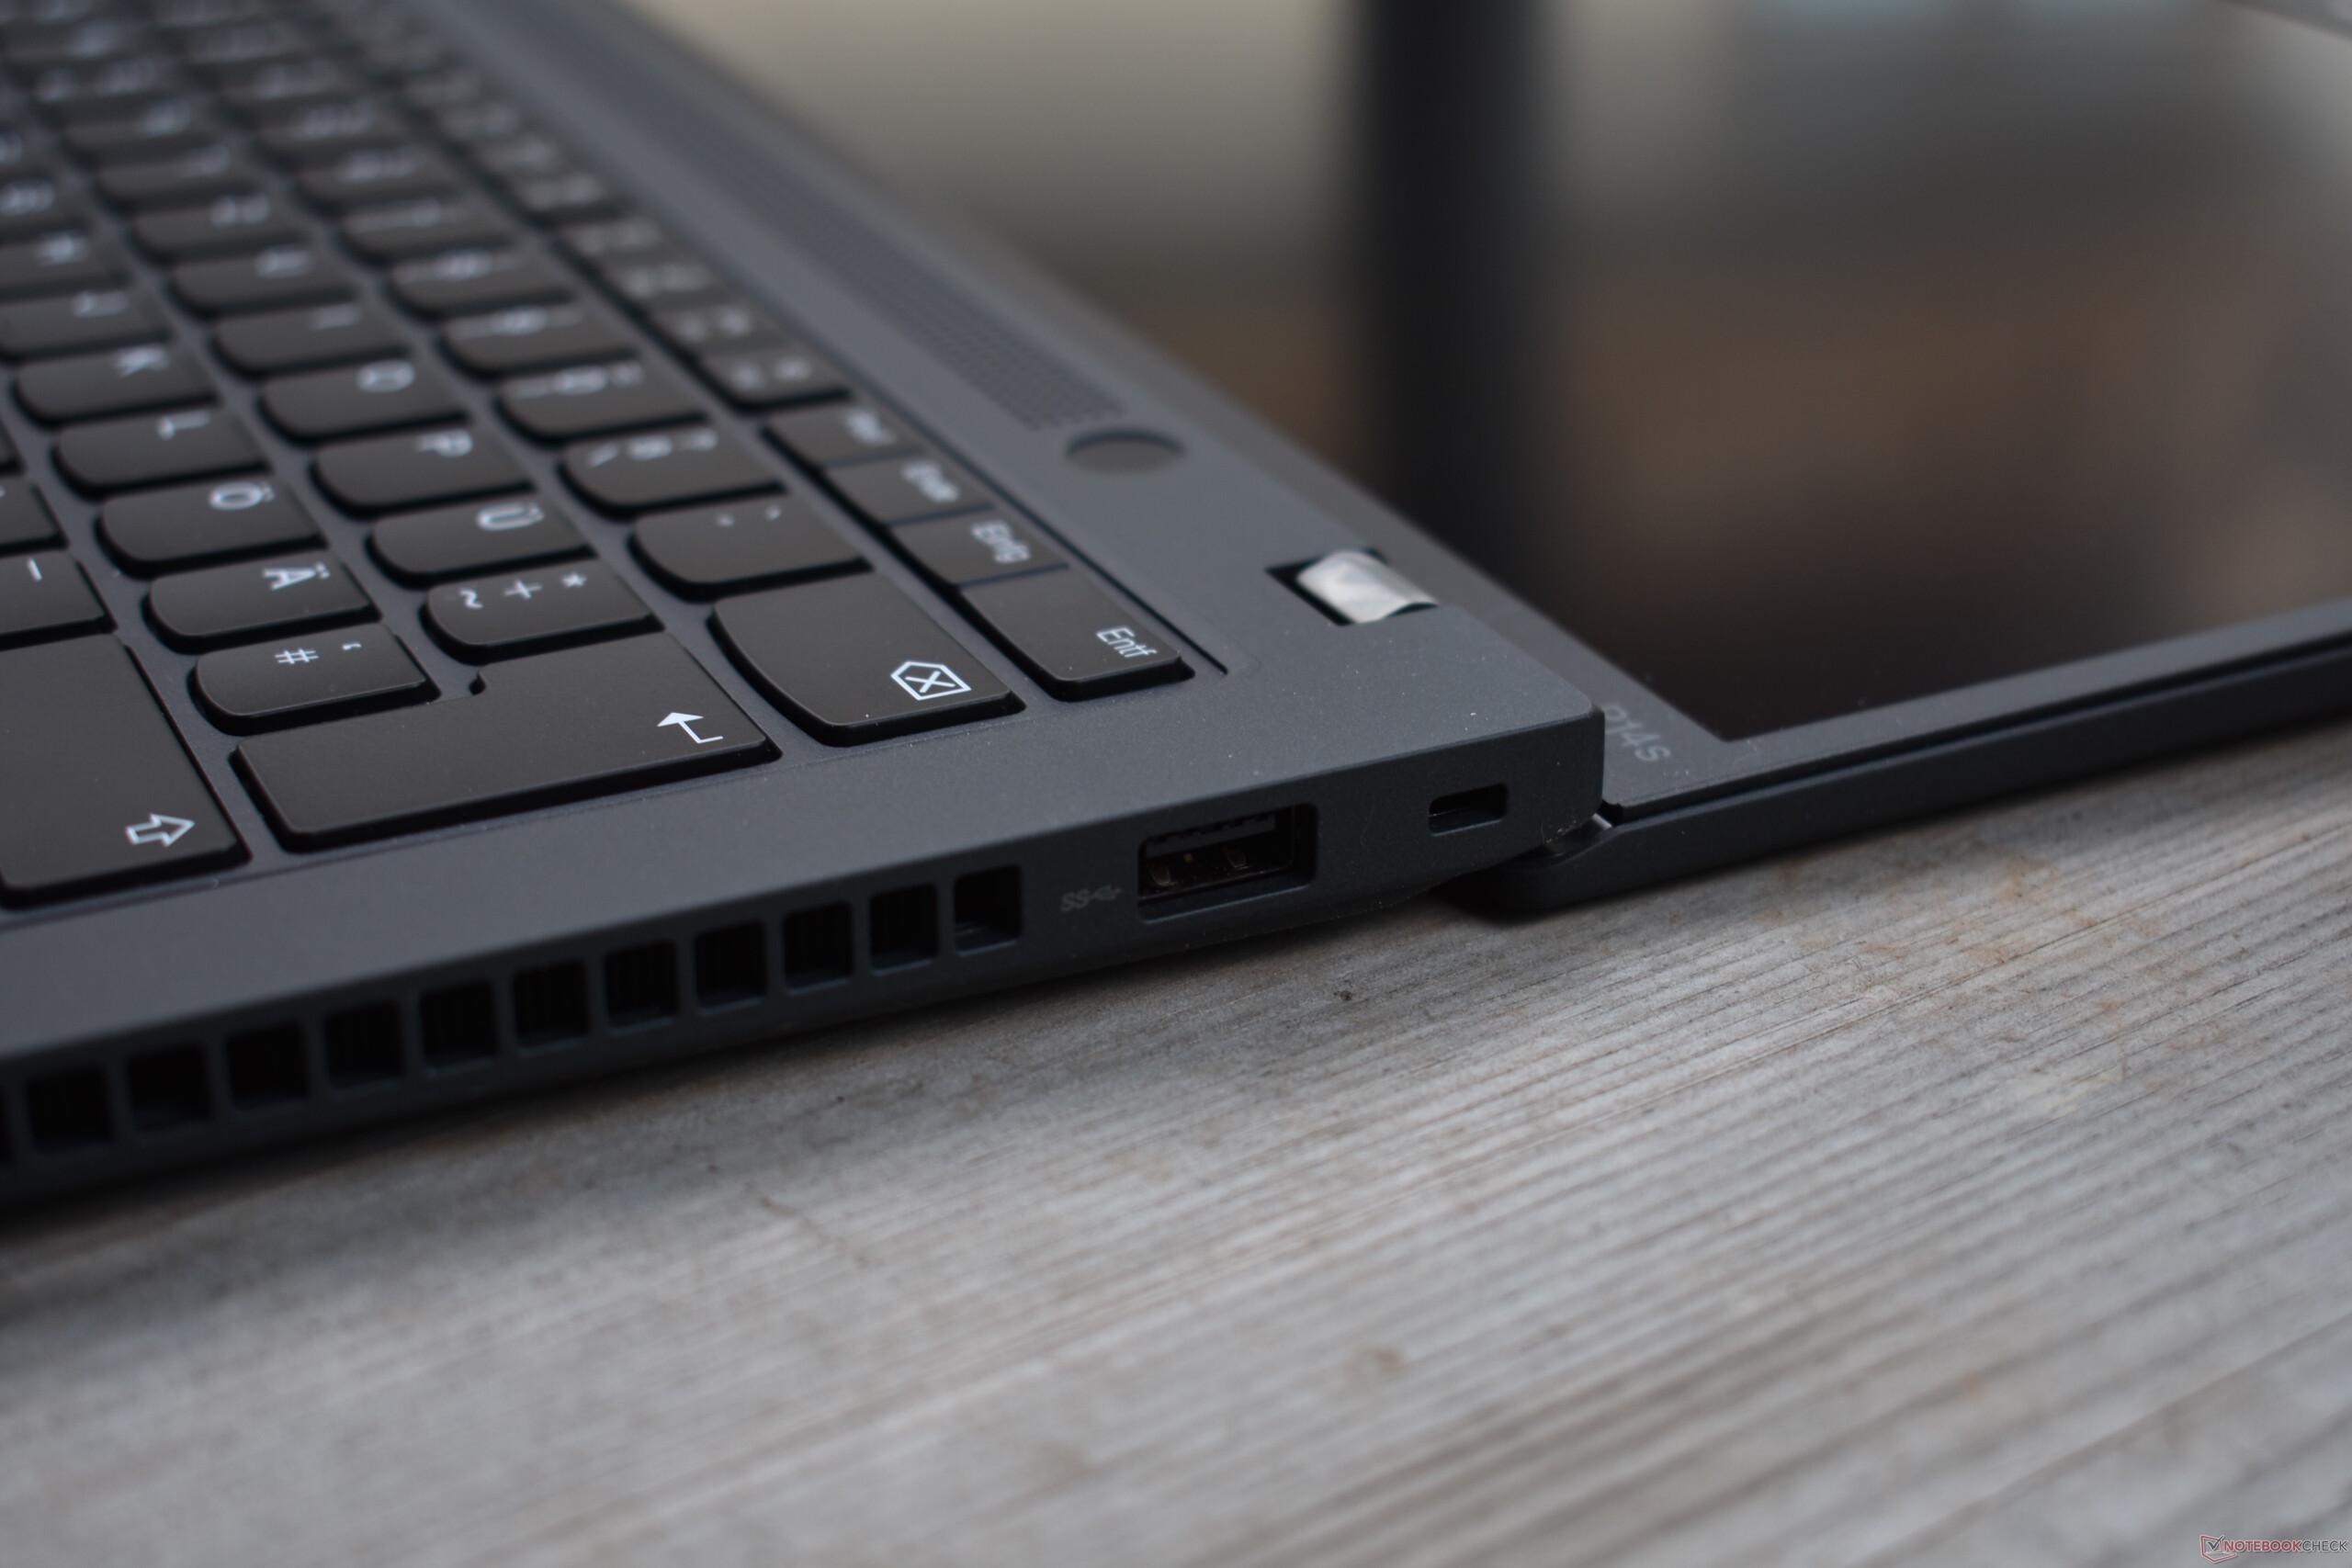
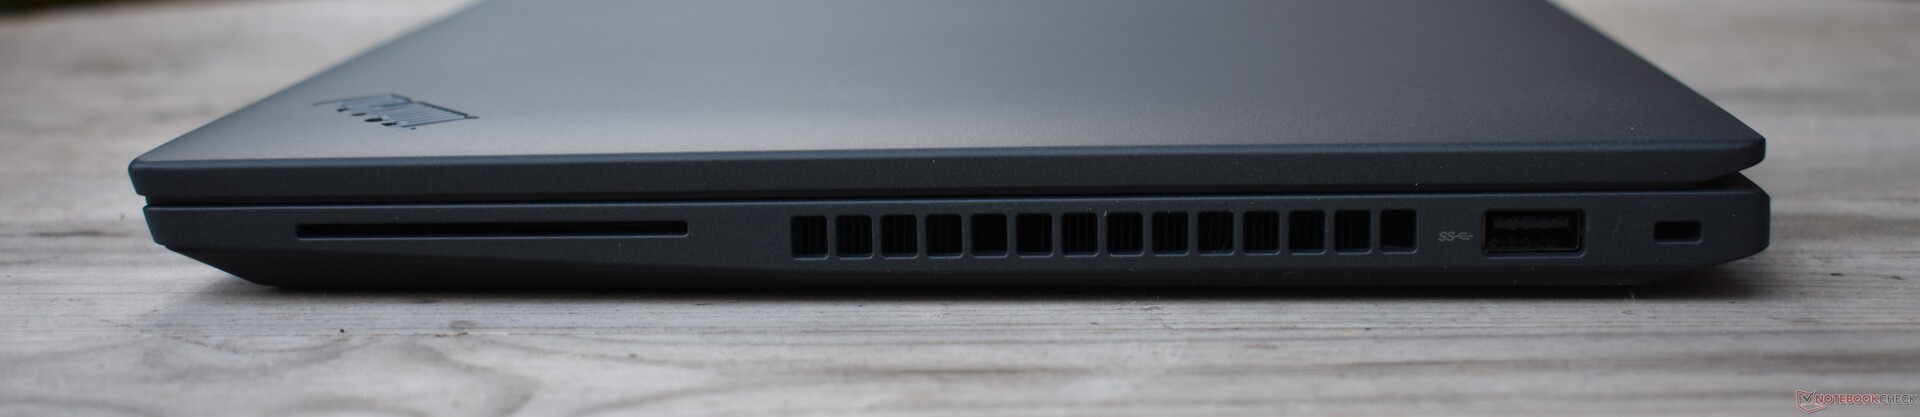
Porti
Le sue ampie opzioni di connettività sono identiche a quelle del ThinkPad T14 Gen 3. La mancanza di USB4 e, di conseguenza, di Thunderbolt, è deludente. In compenso, il Lenovo ThinkPad P14s G3 è dotato di Ethernet RJ45 - le workstation da 14 pollici di Dell e HP non hanno questa porta. Tuttavia, uno slot per schede SD o almeno microSD sarebbe ideale in questo tipo di laptop.
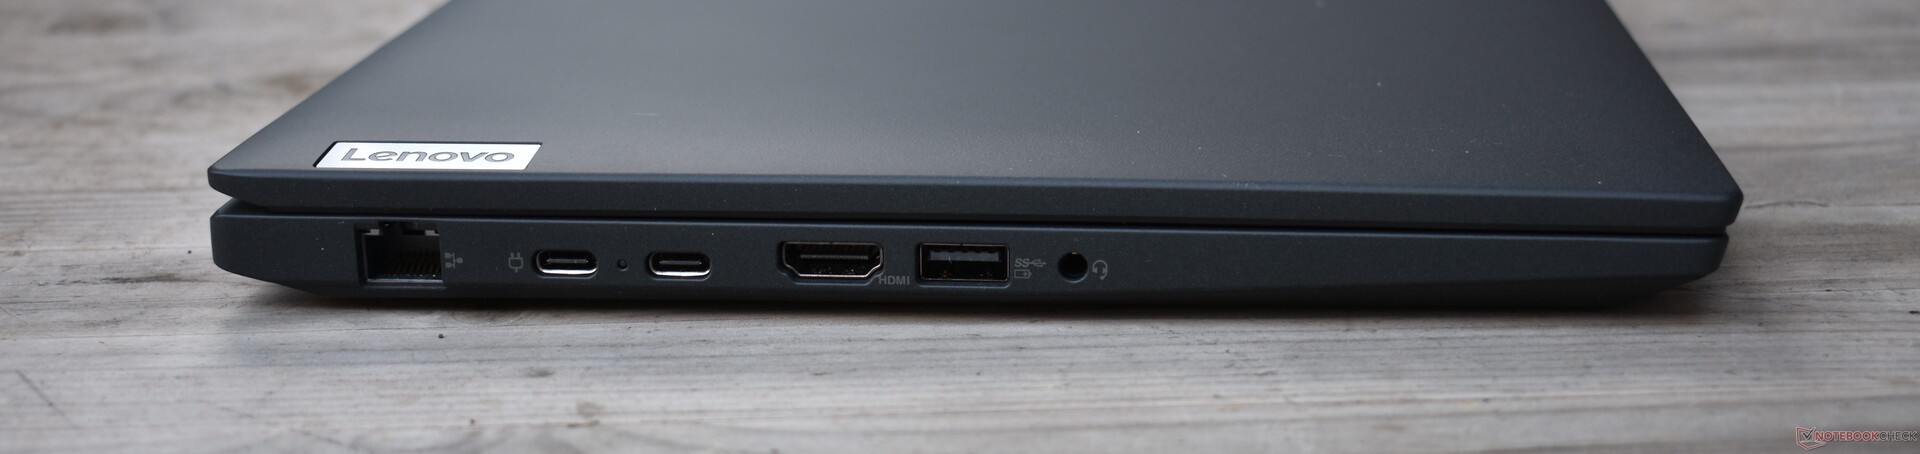
Connettività
Come tutti gli altri ThinkPad AMD attuali, il Lenovo ThinkPad P14s Gen 3 si affida a una soluzione Wi-Fi di Qualcomm. Questa soluzione consente di raggiungere velocità di trasferimento elevate, ma la connessione non era molto stabile durante l'invio dei dati.


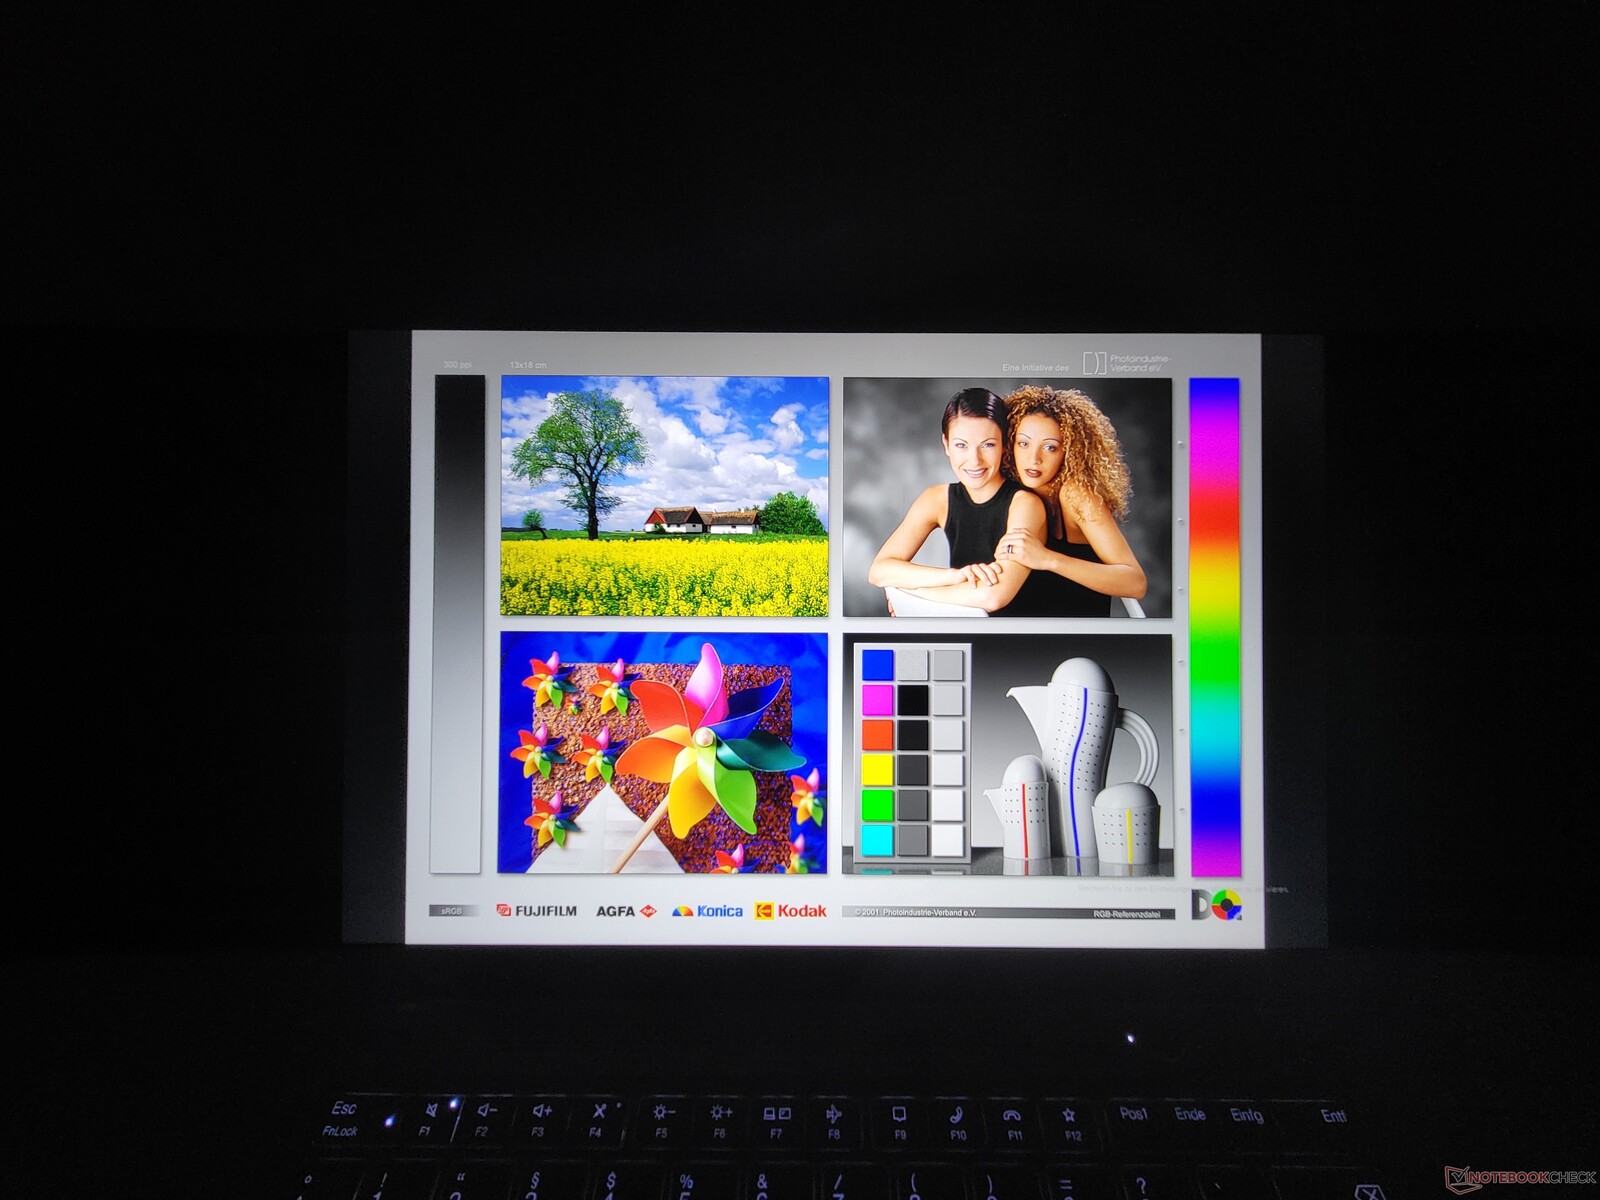
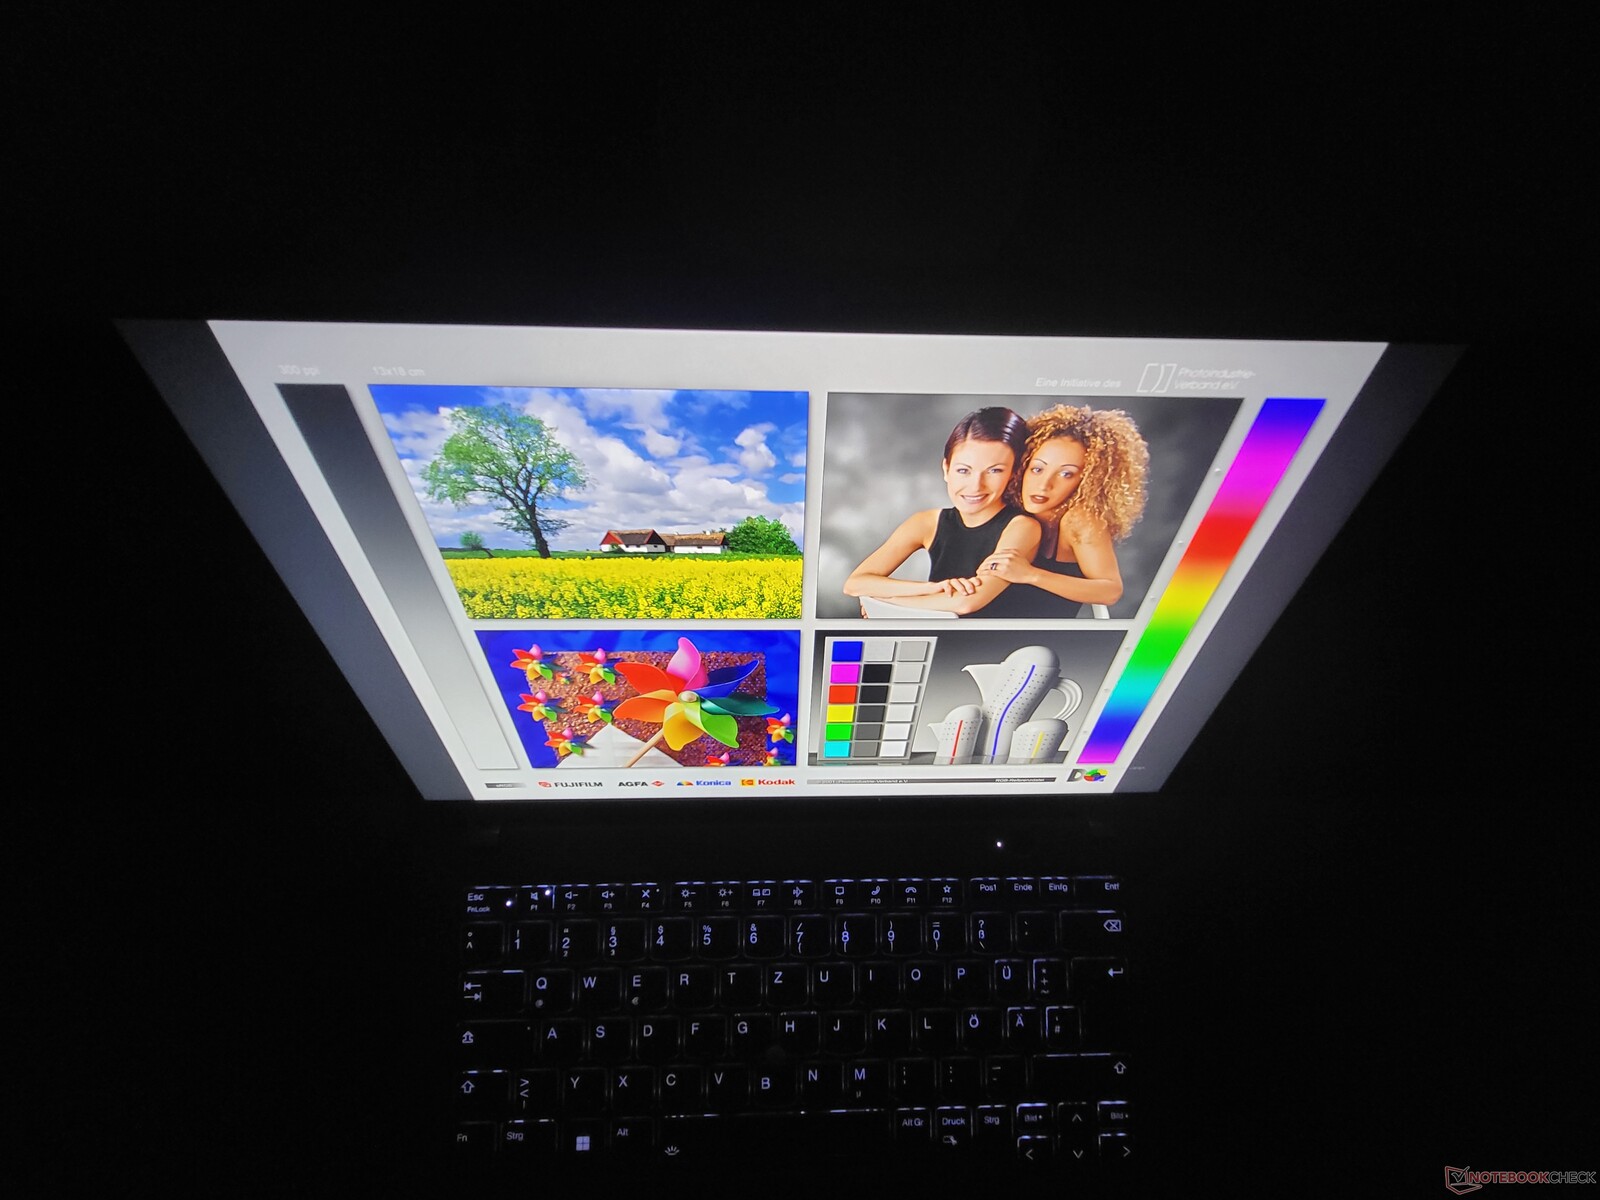
Display: Il pannello opaco a basso consumo del ThinkPad
Come spesso accade con i portatili Lenovo ThinkPad e con i portatili business in generale, anche il ThinkPad P14s Gen 3 ha diverse opzioni di display. Le caratteristiche di questi schermi sono tutte comuni: la diagonale di 14 pollici, il formato 16:10 e la tecnologia IPS-LCD:
- WUXGA (1.920 x 1.200), 300 cd/m², 45% NTSC, antiriflesso
- WUXGA (1.920 x 1.200), 400 cd/m², 100 % sRGB, antiriflesso, basso consumo energetico
- WUXGA (1.920 x 1.200), 300 cd/m², 45 % NTSC, antiriflesso, On-Cell-Multitouch
- WQUXGA (3.840 x 2.400), 500 cd/m², 100 % DCI-P3, Antiriflesso, Add-On-Film-Multitouch
Abbiamo già testato il display a basso consumo di LG sul ThinkPad T14 Gen 3. Ha superato il valore di luminosità dichiarato di 400 cd/m² - la sua luminosità media è stata di 422 cd/m². Questo non è l'unico pannello che Lenovo commercializza come "display a basso consumo": sul ThinkPad T14s Gen 3, ad esempio, abbiamo testato un pannello CSOT che offriva una luminosità leggermente inferiore. Questa "lotteria di display" è presente anche nel ThinkPad P14s G3.
| |||||||||||||||||||||||||
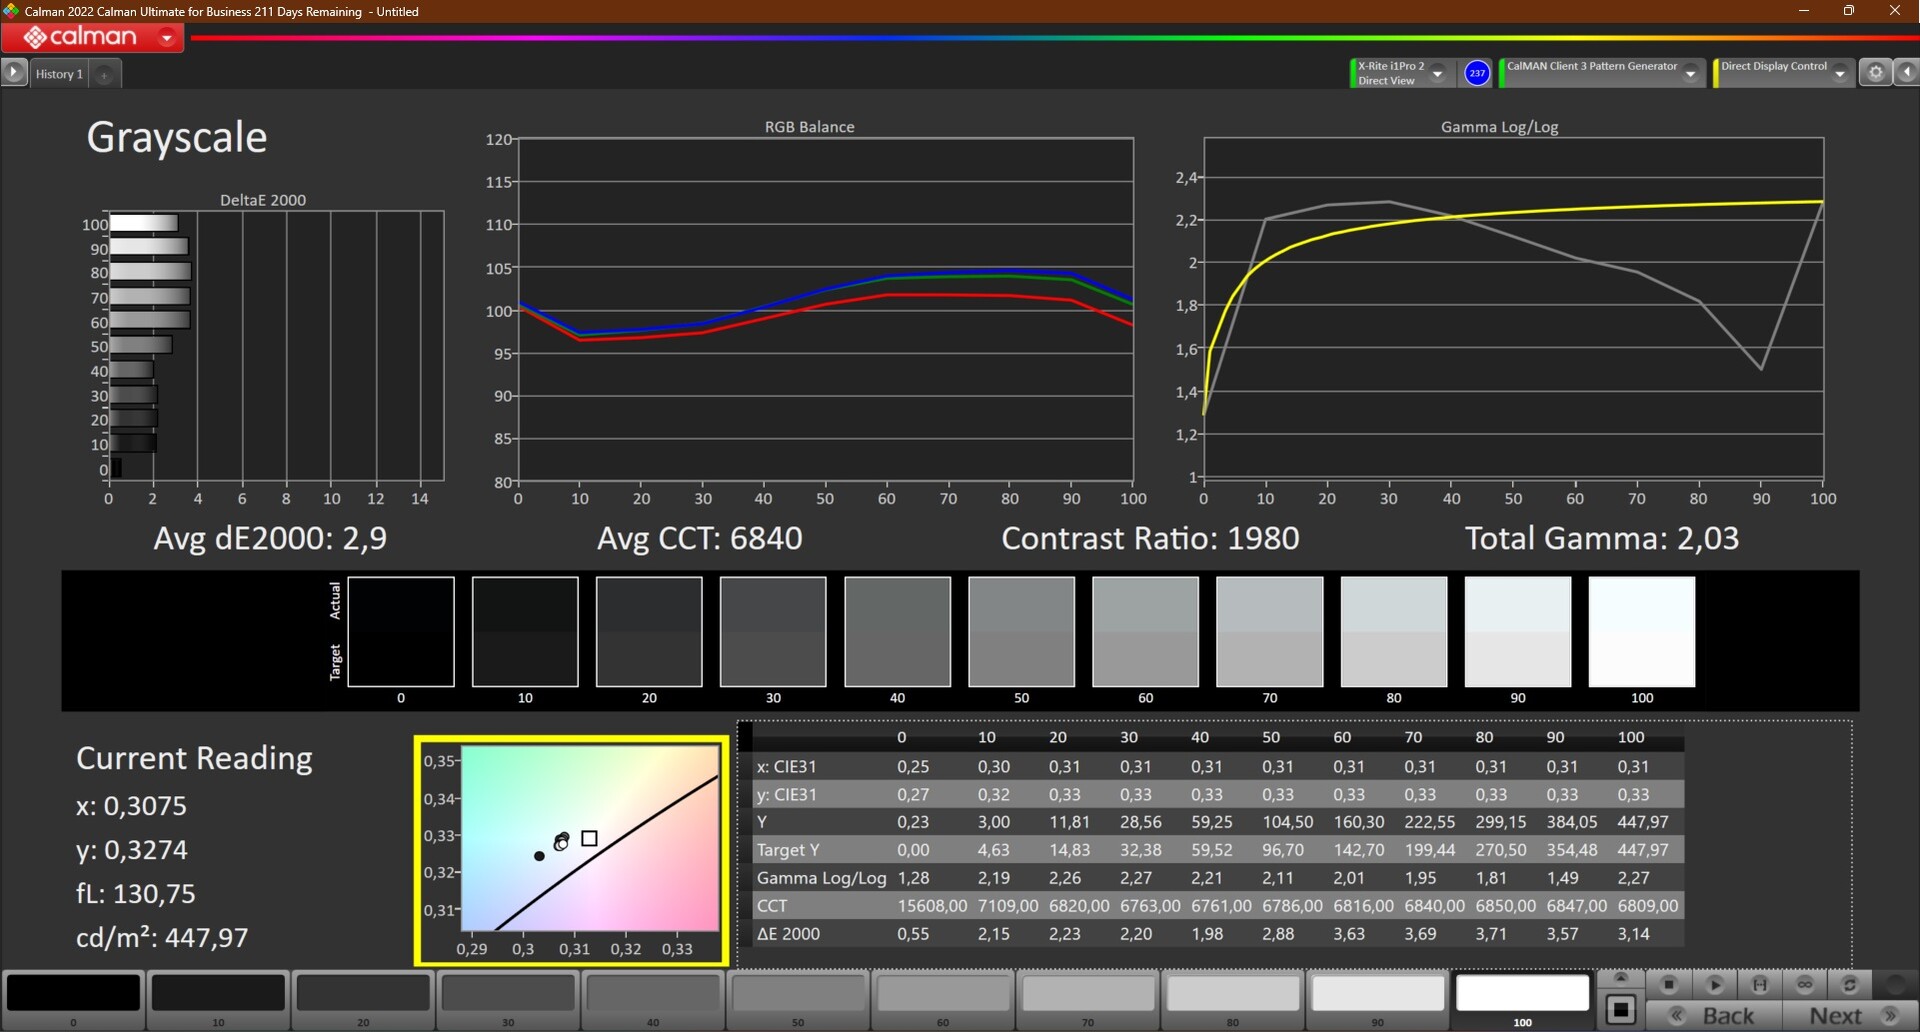
Distribuzione della luminosità: 85 %
Al centro con la batteria: 448 cd/m²
Contrasto: 1948:1 (Nero: 0.23 cd/m²)
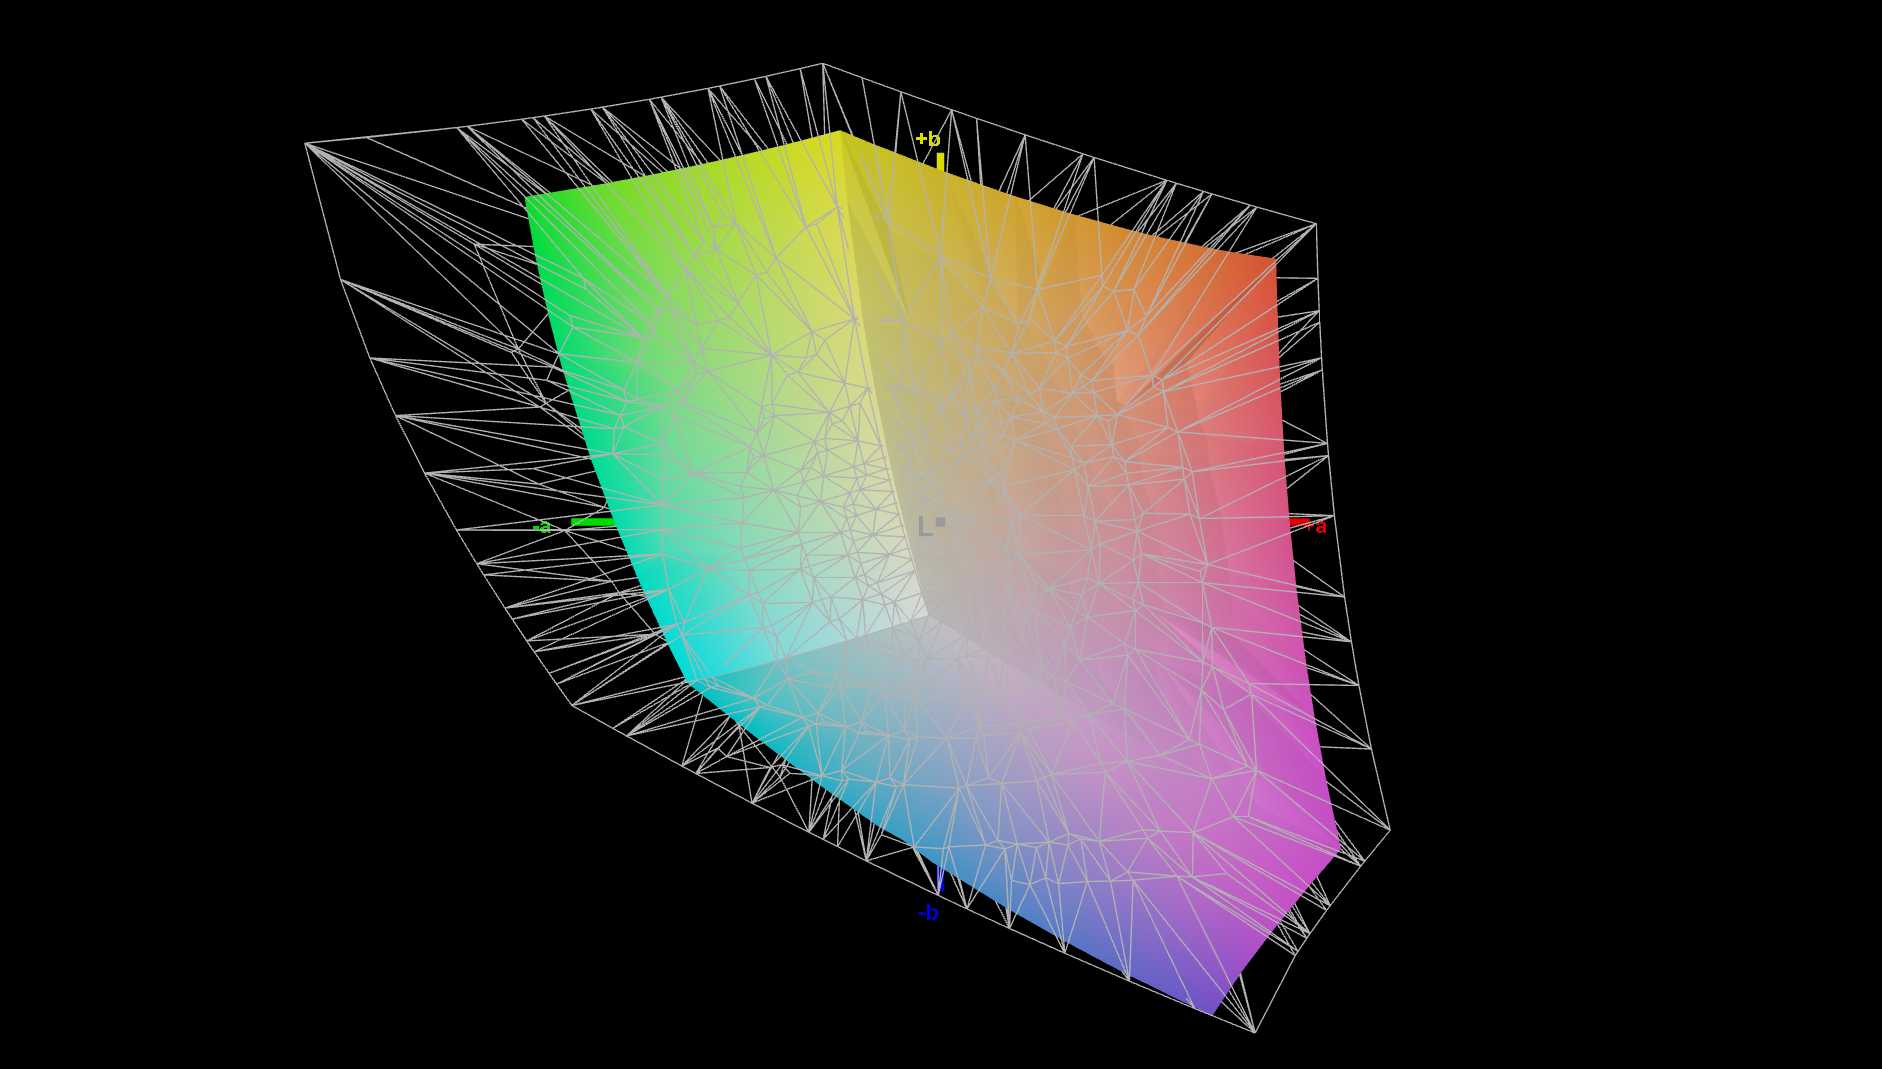
ΔE ColorChecker Calman: 2.5 | ∀{0.5-29.43 Ø4.71}
calibrated: 1.3
ΔE Greyscale Calman: 2.9 | ∀{0.09-98 Ø4.96}
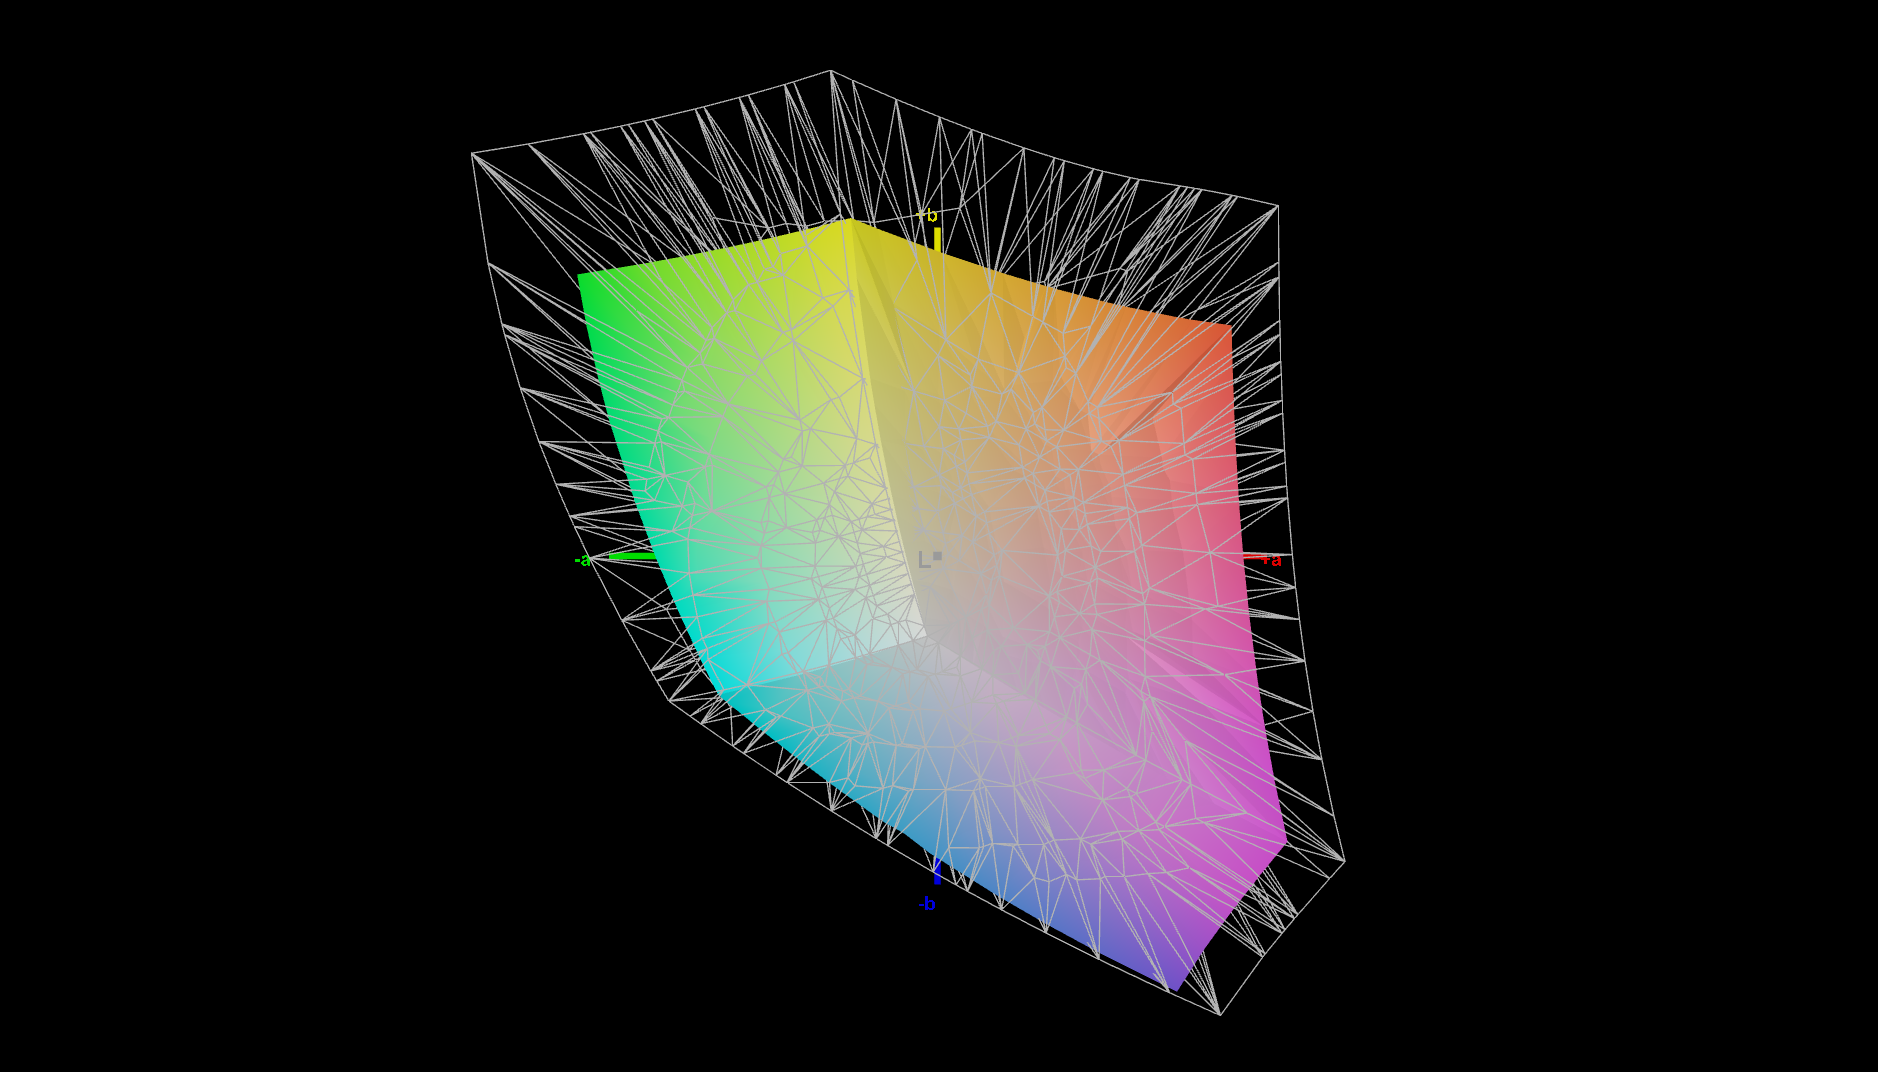
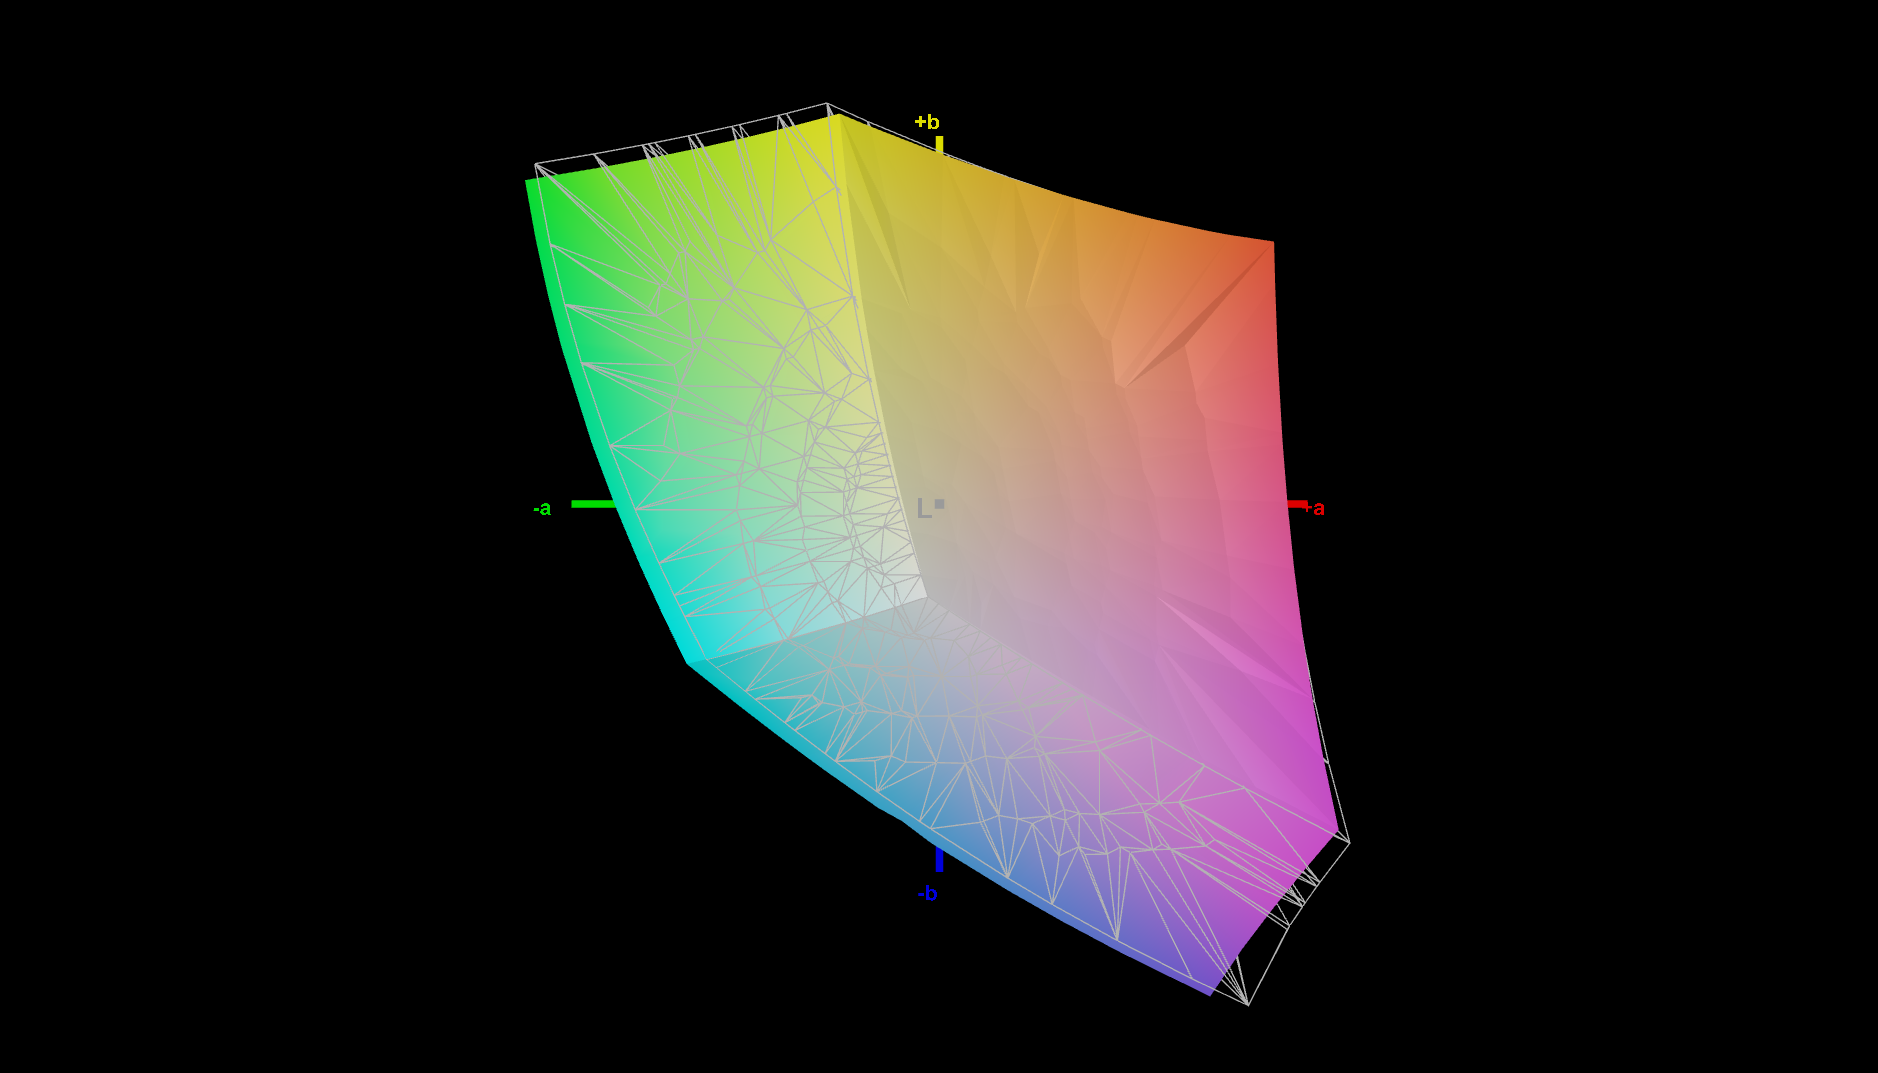
68.2% AdobeRGB 1998 (Argyll 3D)
94.3% sRGB (Argyll 3D)
65.9% Display P3 (Argyll 3D)
Gamma: 2.03
CCT: 6840 K
| Lenovo ThinkPad P14s G3 AMD 21J6S05000 LP140WU1-SPB2, IPS LED, 1920x1200, 14" | Lenovo ThinkPad P14s Gen2-20VX000GGE B140HAN05.7, IPS, 1920x1080, 14" | Lenovo ThinkPad T14 G3-21CF004NGE LP140WU1-SPB2, IPS, 1920x1200, 14" | Dell Precision 5000 5470 AU Optronics B140QAN, IPS, 2560x1600, 14" | HP ZBook Firefly 14 G9-6B8A2EA CMN1435, IPS, 1920x1200, 14" | Lenovo ThinkPad T14s G3 21CQ002LGE MNE007JA1-1, LTPS IPS LED, 1920x1200, 14" | |
|---|---|---|---|---|---|---|
| Display | -0% | 4% | 14% | 5% | 5% | |
| Display P3 Coverage (%) | 65.9 | 65.4 -1% | 69.2 5% | 79.3 20% | 69.6 6% | 69.4 5% |
| sRGB Coverage (%) | 94.3 | 96.6 2% | 97.4 3% | 100 6% | 99.9 6% | 99.8 6% |
| AdobeRGB 1998 Coverage (%) | 68.2 | 66.5 -2% | 71.5 5% | 78.7 15% | 71.1 4% | 71.4 5% |
| Response Times | -54% | -1% | -43% | -37% | -1% | |
| Response Time Grey 50% / Grey 80% * (ms) | 33.5 ? | 58.8 ? -76% | 41.4 ? -24% | 52.4 ? -56% | 56.3 ? -68% | 36.3 ? -8% |
| Response Time Black / White * (ms) | 24.9 ? | 32.8 ? -32% | 19.2 ? 23% | 32.4 ? -30% | 26.2 ? -5% | 23.1 ? 7% |
| PWM Frequency (Hz) | ||||||
| Screen | -24% | 1% | -2% | -15% | 13% | |
| Brightness middle (cd/m²) | 448 | 350 -22% | 451 1% | 537 20% | 432 -4% | 396 -12% |
| Brightness (cd/m²) | 422 | 348 -18% | 435 3% | 518 23% | 407 -4% | 379 -10% |
| Brightness Distribution (%) | 85 | 94 11% | 94 11% | 94 11% | 91 7% | 92 8% |
| Black Level * (cd/m²) | 0.23 | 0.14 39% | 0.21 9% | 0.33 -43% | 0.28 -22% | 0.26 -13% |
| Contrast (:1) | 1948 | 2500 28% | 2148 10% | 1627 -16% | 1543 -21% | 1523 -22% |
| Colorchecker dE 2000 * | 2.5 | 4.3 -72% | 2.4 4% | 2.97 -19% | 3.1 -24% | 1.3 48% |
| Colorchecker dE 2000 max. * | 3.7 | 6.7 -81% | 4.1 -11% | 5.33 -44% | 5.6 -51% | 2.7 27% |
| Colorchecker dE 2000 calibrated * | 1.3 | 1.5 -15% | 1.3 -0% | 0.88 32% | 0.8 38% | 0.7 46% |
| Greyscale dE 2000 * | 2.9 | 5.3 -83% | 3.3 -14% | 2.4 17% | 4.5 -55% | 1.6 45% |
| Gamma | 2.03 108% | 2.42 91% | 2.13 103% | 2.06 107% | 2 110% | 2.14 103% |
| CCT | 6840 95% | 7631 85% | 6848 95% | 6668 97% | 6528 100% | 6554 99% |
| Color Space (Percent of AdobeRGB 1998) (%) | 61.1 | |||||
| Color Space (Percent of sRGB) (%) | 96.4 | |||||
| Media totale (Programma / Settaggio) | -26% /
-23% | 1% /
2% | -10% /
-5% | -16% /
-14% | 6% /
9% |
* ... Meglio usare valori piccoli
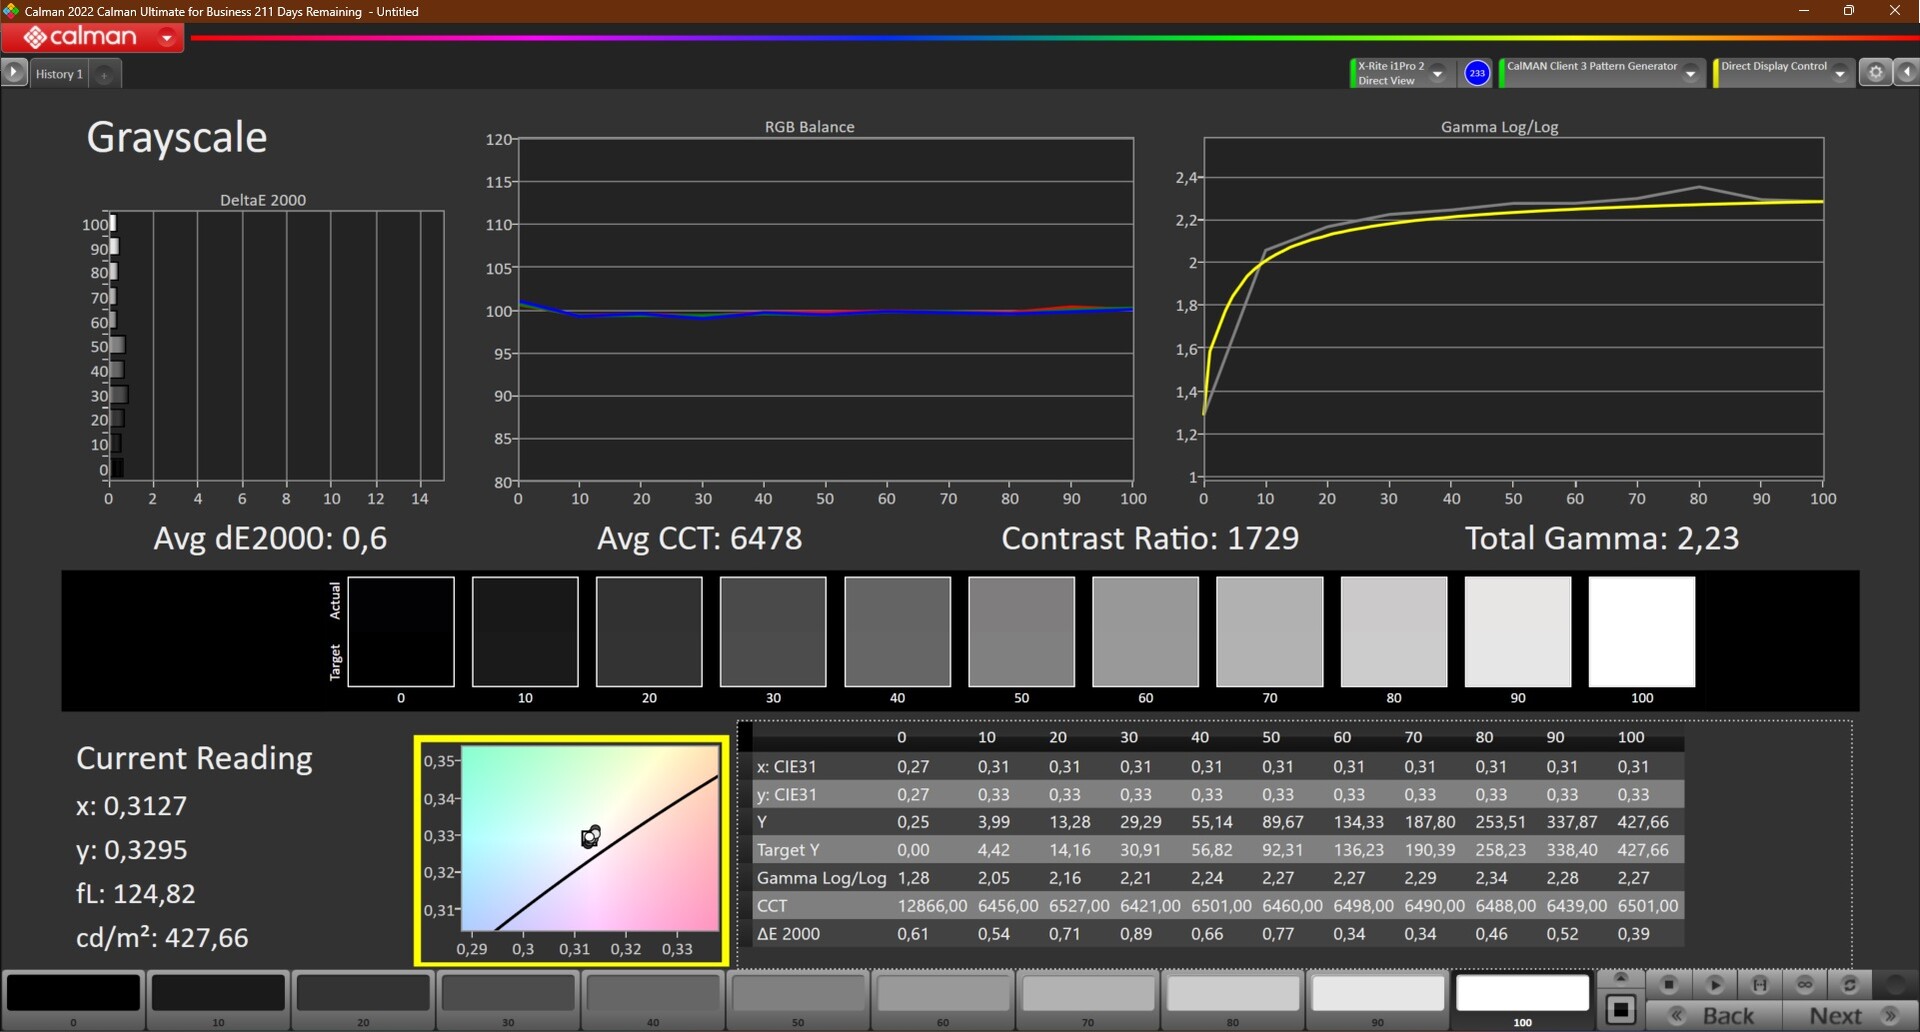
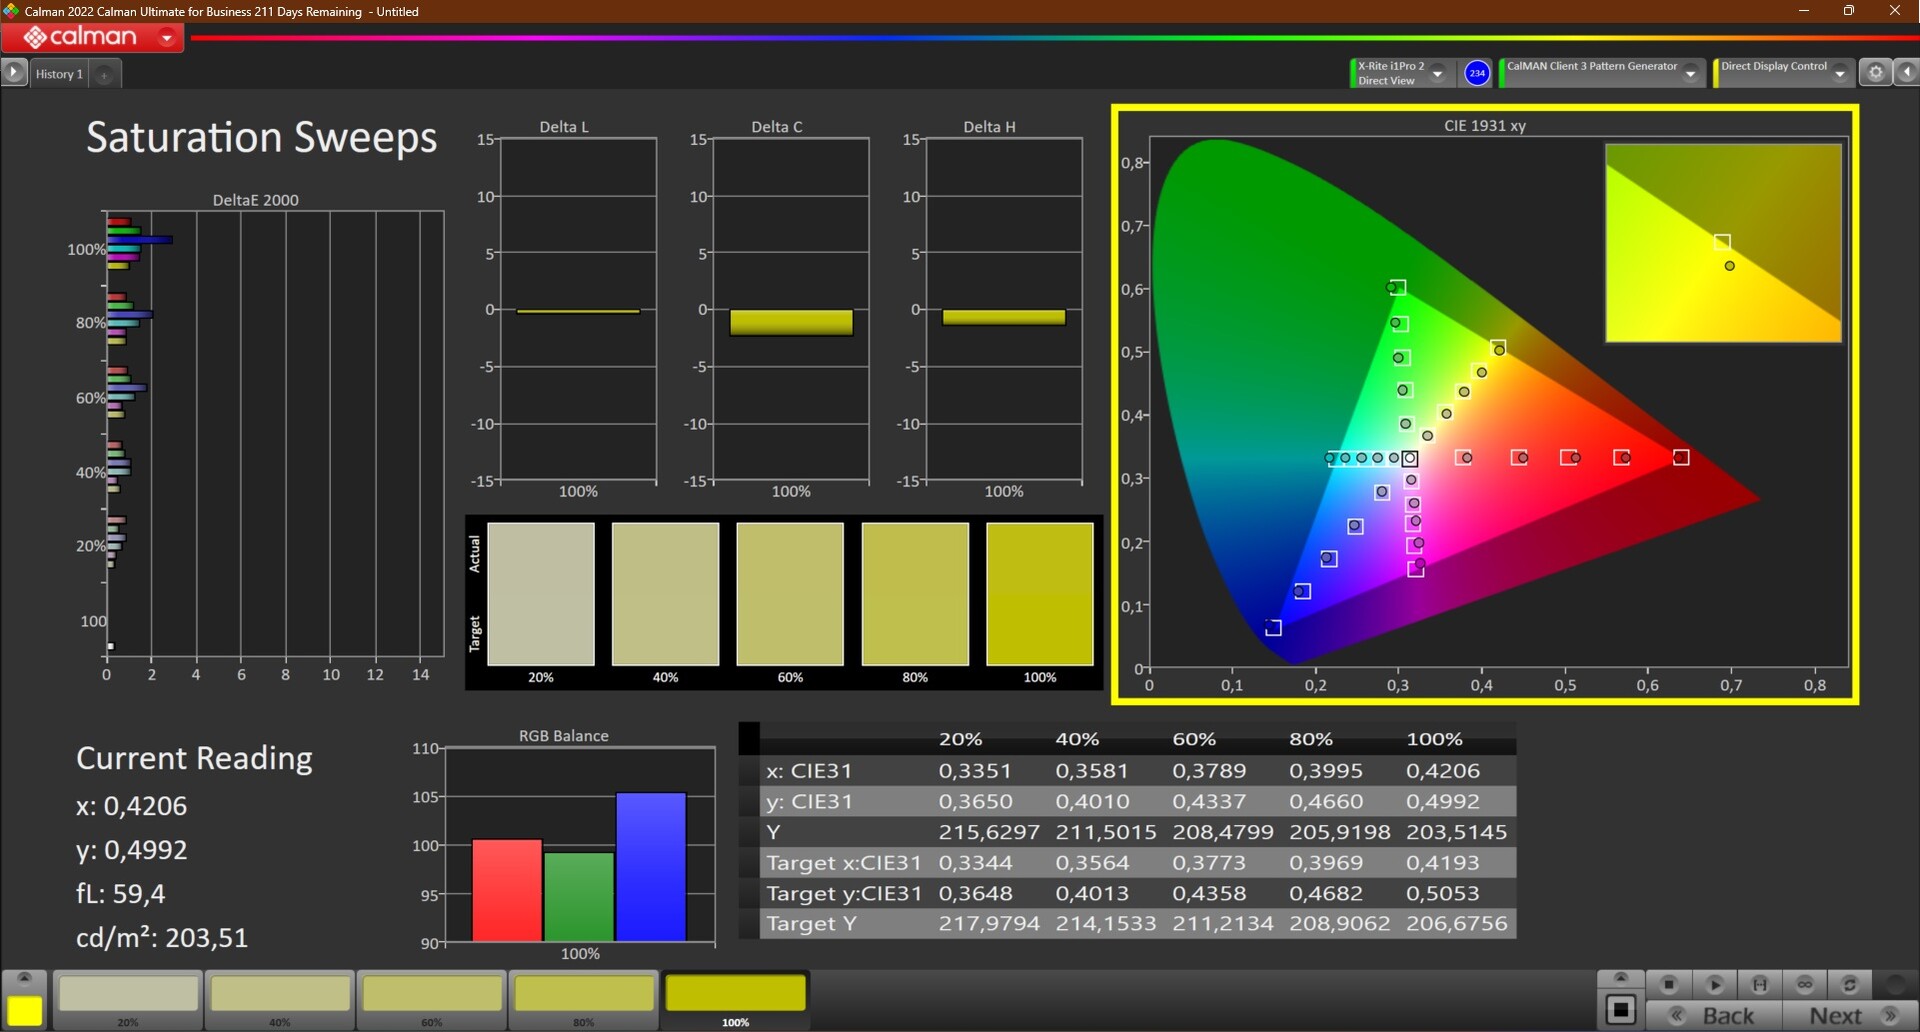
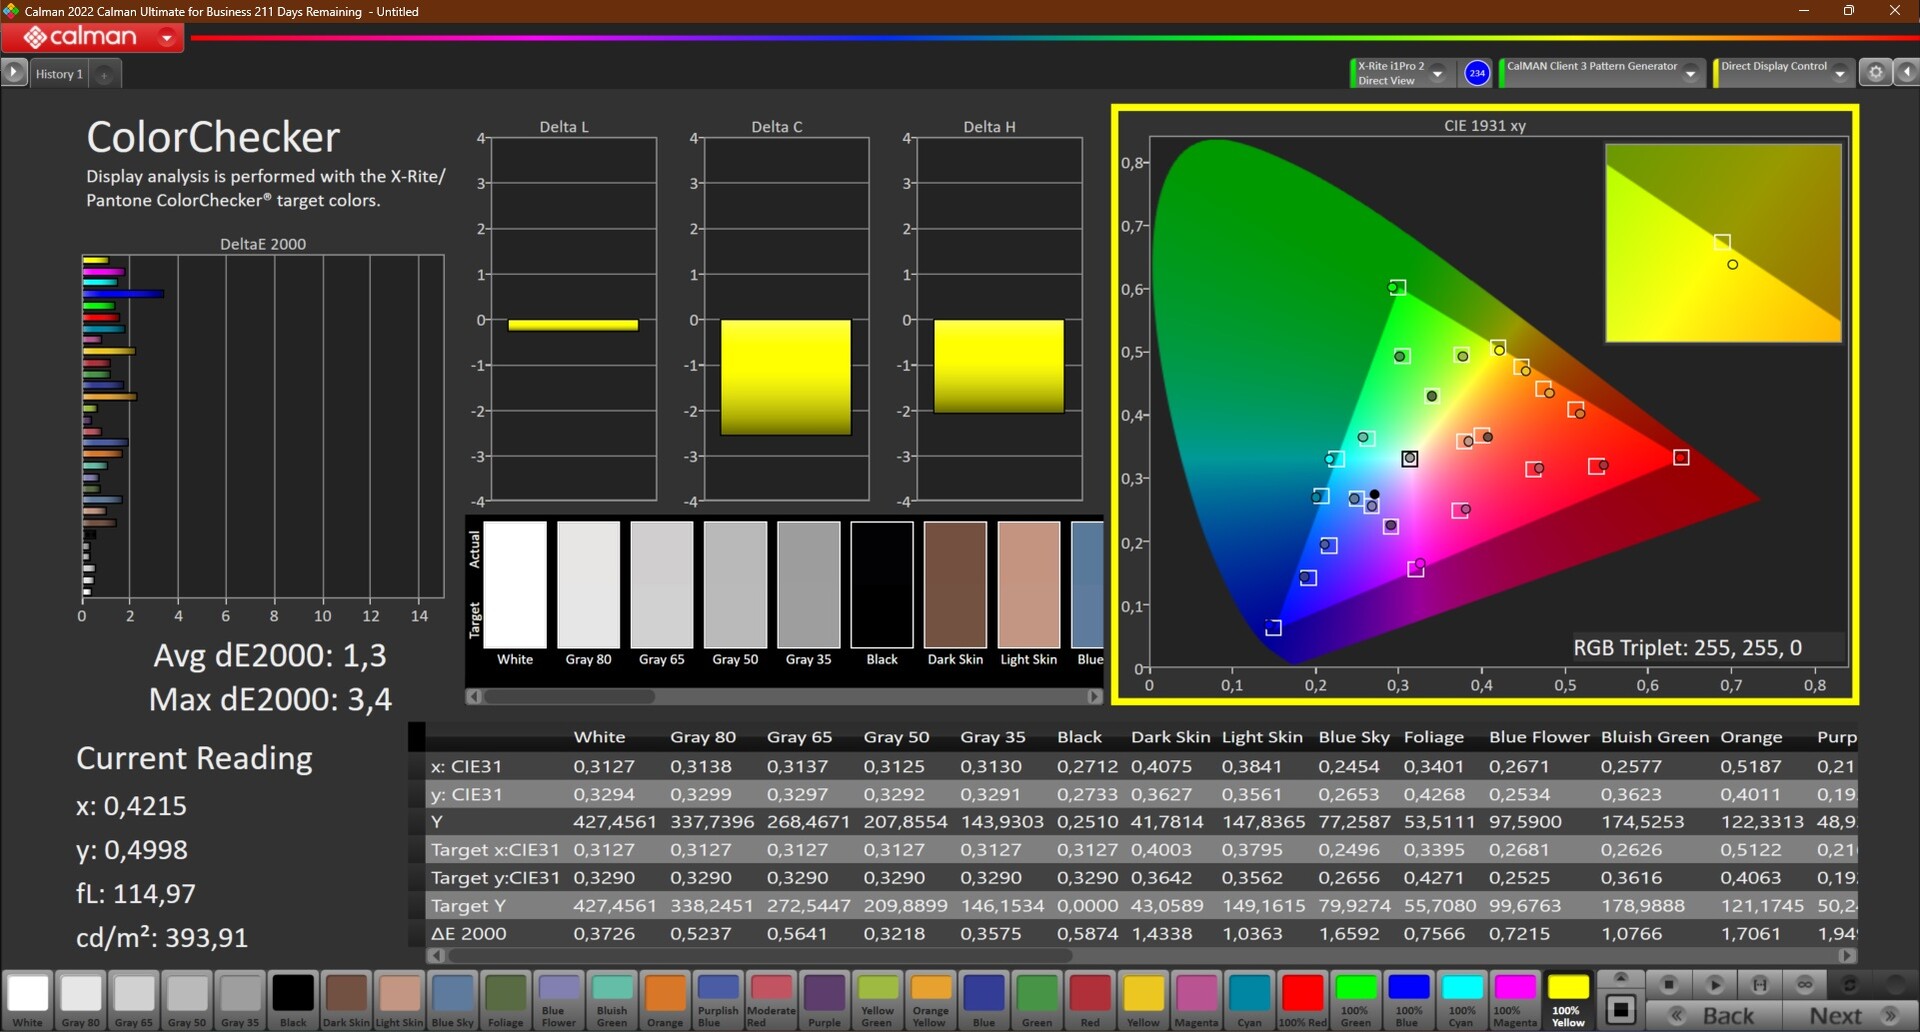
I colori dello schermo erano un po' freddi fin dall'inizio, come abbiamo misurato utilizzando il software Calman e il colorimetro X-Rite i1Pro 2. Una calibrazione con i1Profiler è stata in grado di correggere questo squilibrio cromatico. Come sempre, il profilo corrispondente è disponibile per il download gratuito nel riquadro grigio con i valori misurati. Il valore deltaE--Colorchecker ha raggiunto un ottimo 1,3 nello stato calibrato.
Il display LG non è stato in grado di raggiungere il valore pubblicizzato del 100% sRGB: con il 94,3%, l'obiettivo è stato mancato di poco. Di conseguenza, il pannello del Lenovo ThinkPad P14s Gen 3 non può essere consigliato per l'editing di immagini. Gli utenti che desiderano farlo farebbero meglio a scegliere lo schermo WQUXGA.
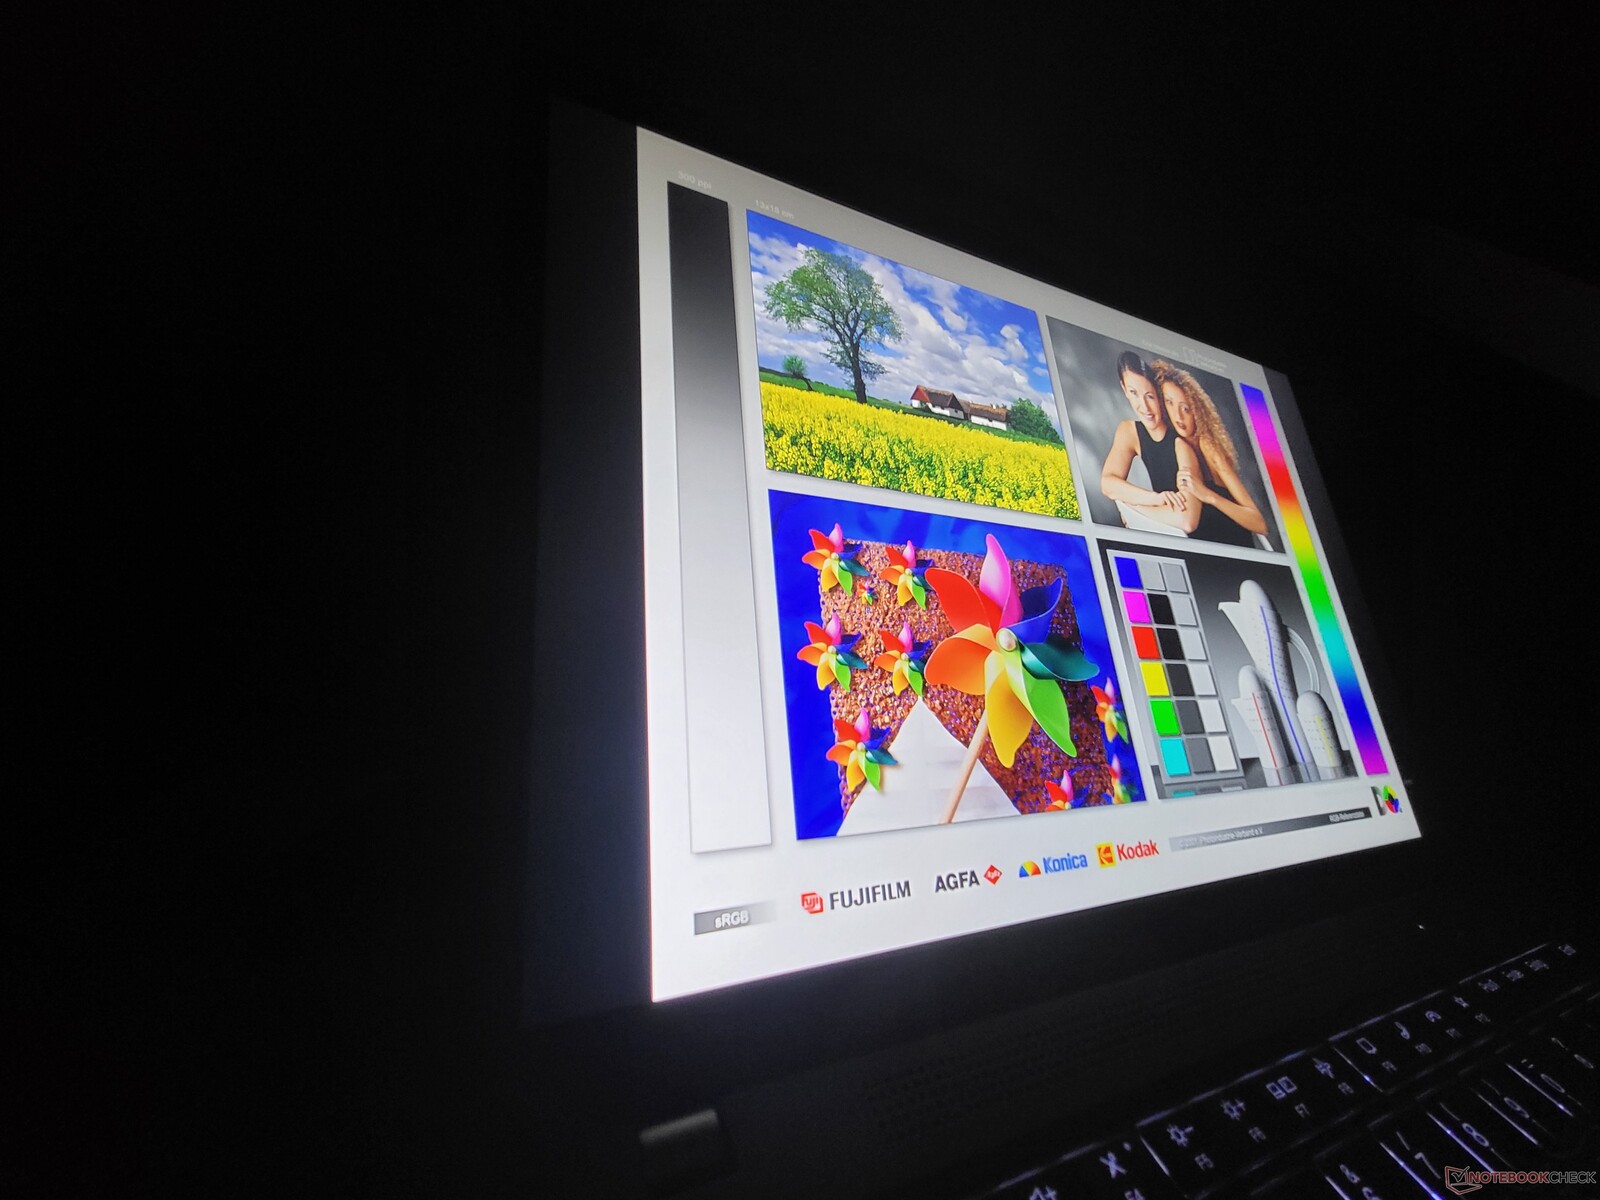
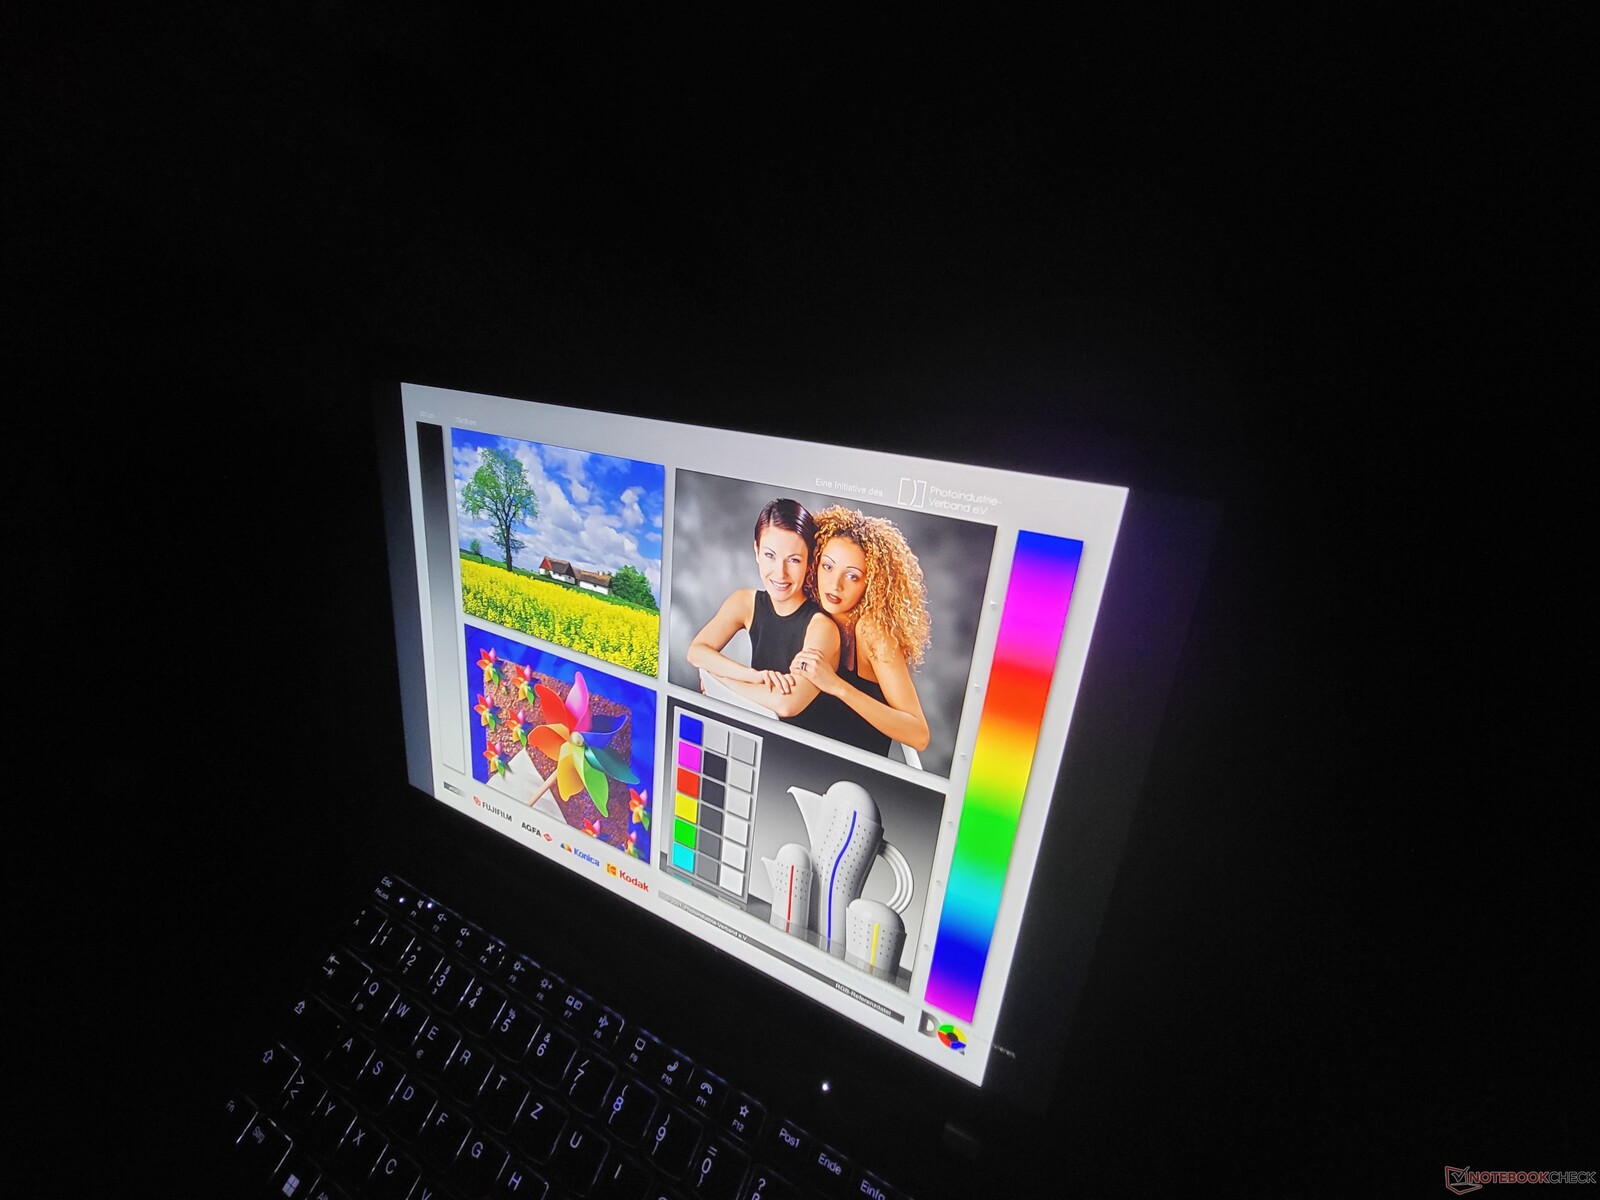
Il portatile ThinkPad si è comportato in modo accettabile nell'uso all'aperto, il che potrebbe essere attribuito alla combinazione di una buona luminosità del display e della sua superficie opaca (definita antiriflesso da Lenovo).
Tempi di risposta del Display
| ↔ Tempi di risposta dal Nero al Bianco | ||
|---|---|---|
| 24.9 ms ... aumenta ↗ e diminuisce ↘ combinato | ↗ 11.6 ms Incremento | 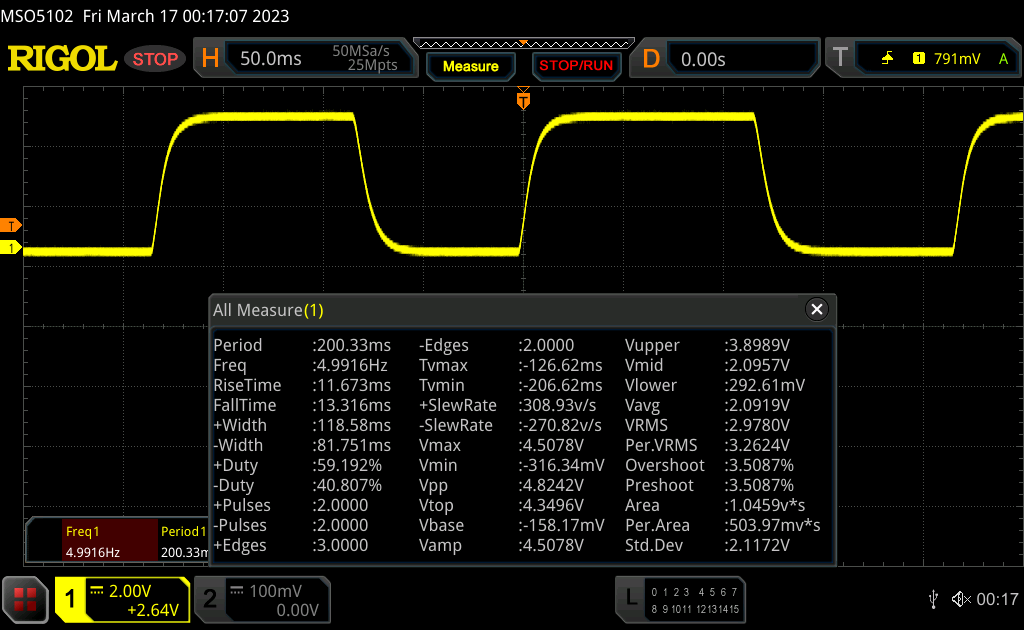 |
| ↘ 13.3 ms Calo | ||
| Lo schermo mostra buoni tempi di risposta durante i nostri tests, ma potrebbe essere troppo lento per i gamers competitivi. In confronto, tutti i dispositivi di test variano da 0.1 (minimo) a 240 (massimo) ms. » 59 % di tutti i dispositivi è migliore. Questo significa che i tempi di risposta rilevati sono peggiori rispetto alla media di tutti i dispositivi testati (19.8 ms). | ||
| ↔ Tempo di risposta dal 50% Grigio all'80% Grigio | ||
| 33.5 ms ... aumenta ↗ e diminuisce ↘ combinato | ↗ 14.9 ms Incremento | 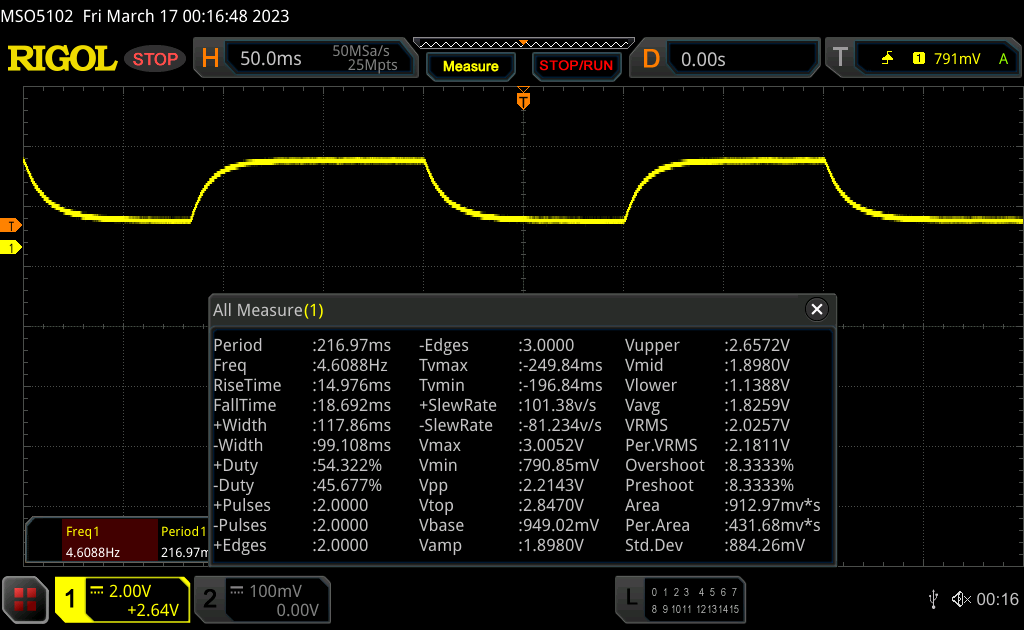 |
| ↘ 18.6 ms Calo | ||
| Lo schermo mostra tempi di risposta lenti nei nostri tests e sarà insoddisfacente per i gamers. In confronto, tutti i dispositivi di test variano da 0.165 (minimo) a 636 (massimo) ms. » 46 % di tutti i dispositivi è migliore. Questo significa che i tempi di risposta rilevati sono simili alla media di tutti i dispositivi testati (31 ms). | ||
Sfarfallio dello schermo / PWM (Pulse-Width Modulation)
| flickering dello schermo / PWM non rilevato |  | ||
In confronto: 52 % di tutti i dispositivi testati non utilizza PWM per ridurre la luminosita' del display. Se è rilevato PWM, una media di 7754 (minimo: 5 - massimo: 343500) Hz è stata rilevata. | |||
Prestazioni: AMD Ryzen 6000U con ottime prestazioni
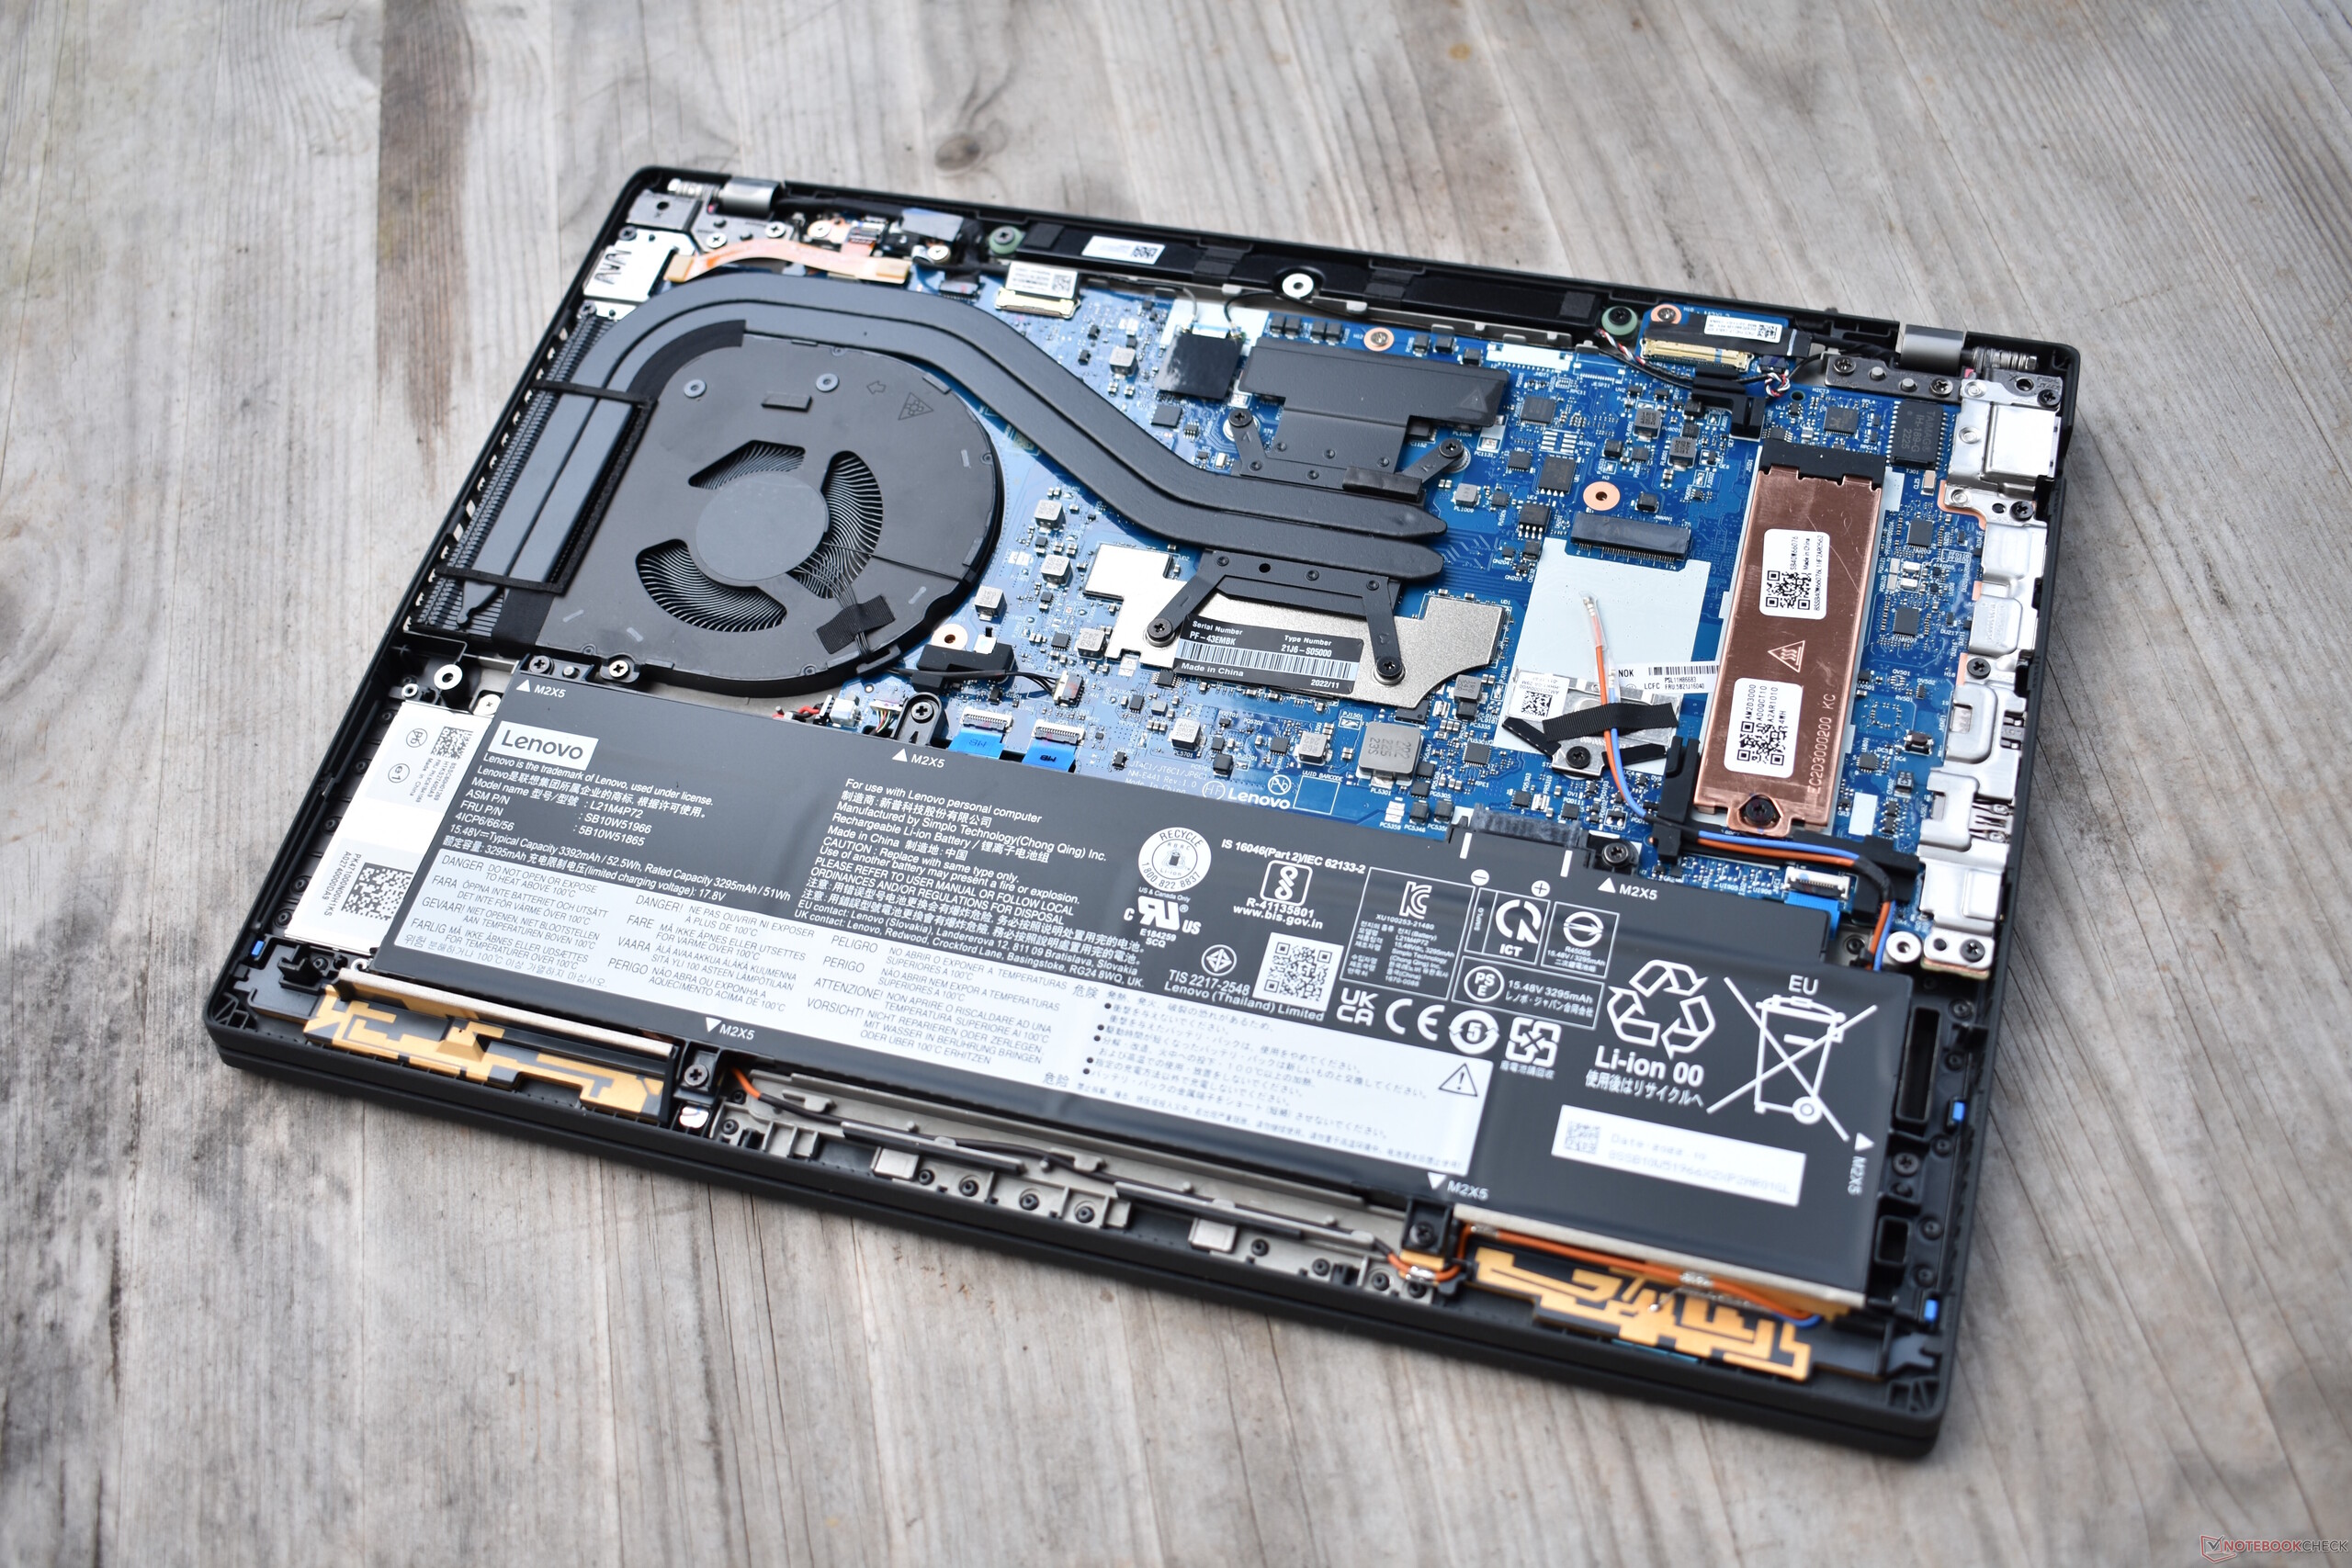
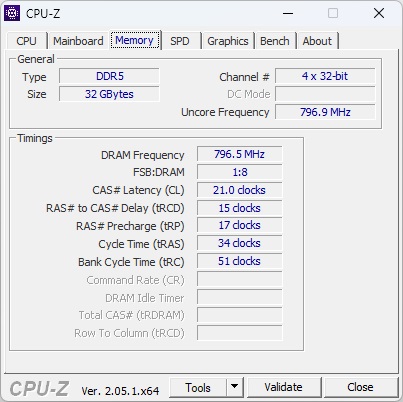
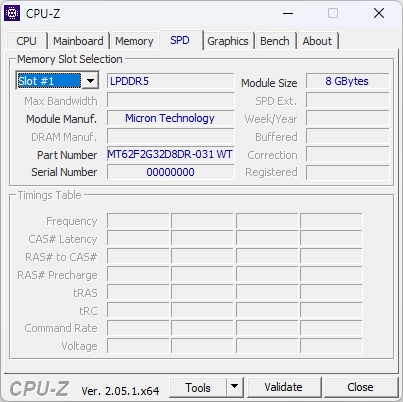
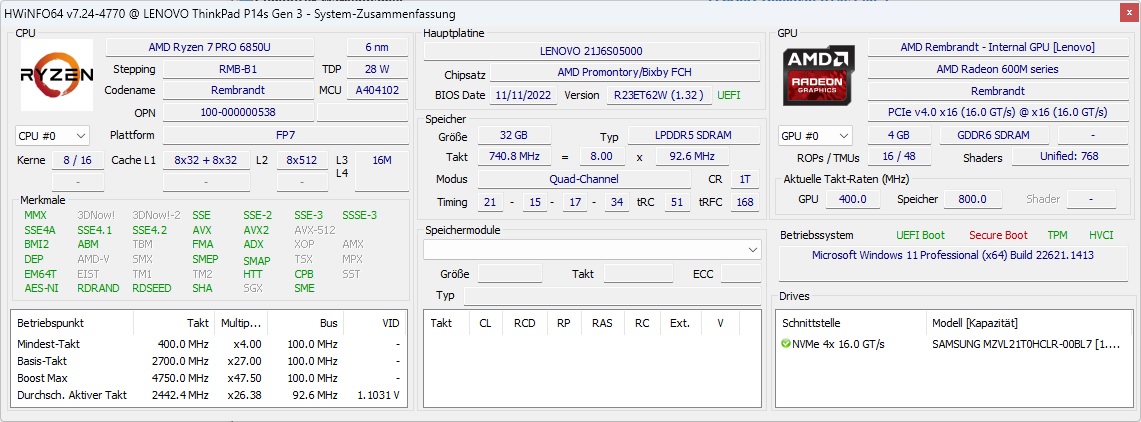
Il Lenovo ThinkPad P14s Gen 3 è disponibile in diverse configurazioni. Tutte utilizzano le CPU Ryzen di AMD, con Ryzen 5 Pro 6650U e Ryzen 7 Pro 6850U .Ryzen 7 Pro 6850U tra cui scegliere. Il Ryzen 5 è dotato di AMD Radeon 660Me il Ryzen 7 ha la più potente Radeon 680M. La RAM è generalmente saldata sulla versione AMD dei P14, con Lenovo che offre 16 o 32 GB di LPDDR5-6400. L'archiviazione è affidata a una singola unità SSD M.2-2280; in fabbrica, Lenovo offre un massimo di 2 TB.
Condizioni di prova
Sui laptop ThinkPad, Lenovo ha intrecciato i propri profili energetici interni con il controllo energetico di Windows. In questo modo, nell'applicazione delle impostazioni di Windows è possibile selezionare tre diversi profili che influiscono sulle prestazioni:
- Miglior risparmio energetico: 30 watt (limite di potenza a breve termine) / 25 watt (limite di potenza a lungo termine).
- Bilanciato: 36 watt (limite di potenza a breve termine) / 31 watt (limite di potenza a lungo termine)
- Migliore potenza: 40 watt (limite di potenza a breve termine) / 31 watt (limite di potenza a lungo termine)
Processore
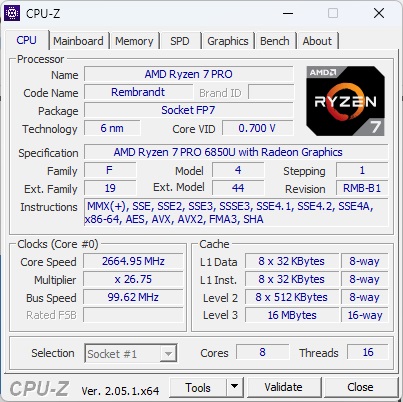
IlAMD Ryzen 7 Pro 6850U è il processore "U" più veloce della serie Ryzen 6000 (oltre al modello 6860Z, disponibile solo nel ThinkPad Z13Recensione del Lenovo ThinkPad Z13 G1 OLED - Laptop business con AMD Ryzen 7 Pro 6860Z). Come U-CPU, è ottimizzato per un consumo compreso tra 15 e 25 watt. Gli otto core con 16 thread funzionano a una frequenza compresa tra 2,7 e 4,7 GHz. È possibile dare un'occhiata al nostro Elenco dei benchmark delle CPU per un confronto più approfondito con altri processori.
Rispetto al ThinkPad T14 G3 con la stessa CPU, i suoi limiti di potenza sono leggermente superiori. Questo si può osservare, ad esempio, nel ciclo multicore di Cinebench R15, dove il ThinkPad P14 ha ottenuto un punteggio migliore rispetto al T14. Tuttavia, la differenza non è grande. Se lo si confronta con i suoi concorrenti, le prestazioni della CPU sono rispettabili. Il ThinkPad P14s Gen 3 è significativamente più veloce delloZBook Firefly 14 G9 e non molto distante dal Dell Precision 5470nonostante la CPU H45 nominalmente più performante. Solo in termini di prestazioni single-core i modelli Intel sono in vantaggio.
La CPU si comporta bene anche con la sola alimentazione a batteria.
Cinebench R15 multi continuous test
Cinebench R23: Multi Core | Single Core
Cinebench R20: CPU (Multi Core) | CPU (Single Core)
Cinebench R15: CPU Multi 64Bit | CPU Single 64Bit
Blender: v2.79 BMW27 CPU
7-Zip 18.03: 7z b 4 | 7z b 4 -mmt1
Geekbench 5.5: Multi-Core | Single-Core
HWBOT x265 Benchmark v2.2: 4k Preset
LibreOffice : 20 Documents To PDF
R Benchmark 2.5: Overall mean
| CPU Performance rating | |
| Media della classe Workstation | |
| Dell Precision 5000 5470 | |
| Lenovo ThinkPad T14 G3-21CF004NGE | |
| Media AMD Ryzen 7 PRO 6850U | |
| HP ZBook Firefly 14 G9-6B8A2EA | |
| Lenovo ThinkPad P14s G3 AMD 21J6S05000 | |
| Lenovo ThinkPad P14s Gen2-20VX000GGE | |
| Cinebench R23 / Multi Core | |
| Media della classe Workstation (14621 - 38520, n=23, ultimi 2 anni) | |
| Dell Precision 5000 5470 | |
| Lenovo ThinkPad P14s G3 AMD 21J6S05000 | |
| Media AMD Ryzen 7 PRO 6850U (9923 - 12945, n=7) | |
| Lenovo ThinkPad T14 G3-21CF004NGE | |
| HP ZBook Firefly 14 G9-6B8A2EA | |
| Lenovo ThinkPad P14s Gen2-20VX000GGE | |
| Cinebench R23 / Single Core | |
| Media della classe Workstation (1712 - 2228, n=23, ultimi 2 anni) | |
| Dell Precision 5000 5470 | |
| HP ZBook Firefly 14 G9-6B8A2EA | |
| Lenovo ThinkPad P14s G3 AMD 21J6S05000 | |
| Media AMD Ryzen 7 PRO 6850U (1409 - 1536, n=7) | |
| Lenovo ThinkPad P14s Gen2-20VX000GGE | |
| Lenovo ThinkPad T14 G3-21CF004NGE | |
| Cinebench R20 / CPU (Multi Core) | |
| Media della classe Workstation (5760 - 15043, n=23, ultimi 2 anni) | |
| Dell Precision 5000 5470 | |
| Lenovo ThinkPad P14s G3 AMD 21J6S05000 | |
| Media AMD Ryzen 7 PRO 6850U (3784 - 5022, n=7) | |
| Lenovo ThinkPad T14 G3-21CF004NGE | |
| HP ZBook Firefly 14 G9-6B8A2EA | |
| Lenovo ThinkPad P14s Gen2-20VX000GGE | |
| Cinebench R20 / CPU (Single Core) | |
| Media della classe Workstation (671 - 857, n=23, ultimi 2 anni) | |
| Dell Precision 5000 5470 | |
| HP ZBook Firefly 14 G9-6B8A2EA | |
| Lenovo ThinkPad P14s G3 AMD 21J6S05000 | |
| Media AMD Ryzen 7 PRO 6850U (587 - 596, n=7) | |
| Lenovo ThinkPad T14 G3-21CF004NGE | |
| Lenovo ThinkPad P14s Gen2-20VX000GGE | |
| Cinebench R15 / CPU Multi 64Bit | |
| Media della classe Workstation (2489 - 5810, n=23, ultimi 2 anni) | |
| Dell Precision 5000 5470 | |
| Lenovo ThinkPad P14s G3 AMD 21J6S05000 | |
| Media AMD Ryzen 7 PRO 6850U (1652 - 2092, n=7) | |
| Lenovo ThinkPad T14 G3-21CF004NGE | |
| HP ZBook Firefly 14 G9-6B8A2EA | |
| Lenovo ThinkPad P14s Gen2-20VX000GGE | |
| Cinebench R15 / CPU Single 64Bit | |
| Media della classe Workstation (191.4 - 328, n=23, ultimi 2 anni) | |
| HP ZBook Firefly 14 G9-6B8A2EA | |
| Dell Precision 5000 5470 | |
| Lenovo ThinkPad P14s G3 AMD 21J6S05000 | |
| Lenovo ThinkPad T14 G3-21CF004NGE | |
| Media AMD Ryzen 7 PRO 6850U (228 - 244, n=7) | |
| Lenovo ThinkPad P14s Gen2-20VX000GGE | |
| Blender / v2.79 BMW27 CPU | |
| Lenovo ThinkPad P14s Gen2-20VX000GGE | |
| HP ZBook Firefly 14 G9-6B8A2EA | |
| Lenovo ThinkPad T14 G3-21CF004NGE | |
| Lenovo ThinkPad P14s G3 AMD 21J6S05000 | |
| Media AMD Ryzen 7 PRO 6850U (241 - 307, n=7) | |
| Dell Precision 5000 5470 | |
| Media della classe Workstation (91 - 222, n=23, ultimi 2 anni) | |
| 7-Zip 18.03 / 7z b 4 | |
| Media della classe Workstation (60489 - 116969, n=23, ultimi 2 anni) | |
| Dell Precision 5000 5470 | |
| Lenovo ThinkPad T14 G3-21CF004NGE | |
| Media AMD Ryzen 7 PRO 6850U (44011 - 59045, n=7) | |
| Lenovo ThinkPad P14s G3 AMD 21J6S05000 | |
| HP ZBook Firefly 14 G9-6B8A2EA | |
| Lenovo ThinkPad P14s Gen2-20VX000GGE | |
| 7-Zip 18.03 / 7z b 4 -mmt1 | |
| Media della classe Workstation (5126 - 6960, n=23, ultimi 2 anni) | |
| HP ZBook Firefly 14 G9-6B8A2EA | |
| Lenovo ThinkPad P14s Gen2-20VX000GGE | |
| Dell Precision 5000 5470 | |
| Media AMD Ryzen 7 PRO 6850U (5057 - 5662, n=7) | |
| Lenovo ThinkPad T14 G3-21CF004NGE | |
| Lenovo ThinkPad P14s G3 AMD 21J6S05000 | |
| Geekbench 5.5 / Multi-Core | |
| Media della classe Workstation (11542 - 25554, n=23, ultimi 2 anni) | |
| Dell Precision 5000 5470 | |
| HP ZBook Firefly 14 G9-6B8A2EA | |
| Lenovo ThinkPad P14s G3 AMD 21J6S05000 | |
| Media AMD Ryzen 7 PRO 6850U (7044 - 9241, n=7) | |
| Lenovo ThinkPad T14 G3-21CF004NGE | |
| Lenovo ThinkPad P14s Gen2-20VX000GGE | |
| Geekbench 5.5 / Single-Core | |
| Media della classe Workstation (1783 - 2183, n=23, ultimi 2 anni) | |
| Dell Precision 5000 5470 | |
| HP ZBook Firefly 14 G9-6B8A2EA | |
| Lenovo ThinkPad P14s Gen2-20VX000GGE | |
| Lenovo ThinkPad T14 G3-21CF004NGE | |
| Lenovo ThinkPad P14s G3 AMD 21J6S05000 | |
| Media AMD Ryzen 7 PRO 6850U (1433 - 1533, n=7) | |
| HWBOT x265 Benchmark v2.2 / 4k Preset | |
| Media della classe Workstation (17.8 - 40.5, n=23, ultimi 2 anni) | |
| Dell Precision 5000 5470 | |
| Lenovo ThinkPad T14 G3-21CF004NGE | |
| Lenovo ThinkPad P14s G3 AMD 21J6S05000 | |
| Media AMD Ryzen 7 PRO 6850U (11.7 - 16.3, n=7) | |
| HP ZBook Firefly 14 G9-6B8A2EA | |
| Lenovo ThinkPad P14s Gen2-20VX000GGE | |
| LibreOffice / 20 Documents To PDF | |
| Lenovo ThinkPad P14s G3 AMD 21J6S05000 | |
| Media AMD Ryzen 7 PRO 6850U (46.3 - 74, n=7) | |
| Lenovo ThinkPad T14 G3-21CF004NGE | |
| Media della classe Workstation (37.1 - 74.7, n=23, ultimi 2 anni) | |
| Dell Precision 5000 5470 | |
| HP ZBook Firefly 14 G9-6B8A2EA | |
| Lenovo ThinkPad P14s Gen2-20VX000GGE | |
| R Benchmark 2.5 / Overall mean | |
| Lenovo ThinkPad P14s Gen2-20VX000GGE | |
| Lenovo ThinkPad P14s G3 AMD 21J6S05000 | |
| Lenovo ThinkPad T14 G3-21CF004NGE | |
| Media AMD Ryzen 7 PRO 6850U (0.4932 - 0.544, n=7) | |
| HP ZBook Firefly 14 G9-6B8A2EA | |
| Dell Precision 5000 5470 | |
| Media della classe Workstation (0.3825 - 0.603, n=23, ultimi 2 anni) | |
* ... Meglio usare valori piccoli
AIDA64: FP32 Ray-Trace | FPU Julia | CPU SHA3 | CPU Queen | FPU SinJulia | FPU Mandel | CPU AES | CPU ZLib | FP64 Ray-Trace | CPU PhotoWorxx
| Performance rating | |
| Media della classe Workstation | |
| Media AMD Ryzen 7 PRO 6850U | |
| Lenovo ThinkPad P14s G3 AMD 21J6S05000 | |
| Dell Precision 5000 5470 | |
| Lenovo ThinkPad T14 G3-21CF004NGE | |
| HP ZBook Firefly 14 G9-6B8A2EA | |
| AIDA64 / FP32 Ray-Trace | |
| Media della classe Workstation (16730 - 61611, n=23, ultimi 2 anni) | |
| Dell Precision 5000 5470 | |
| Media AMD Ryzen 7 PRO 6850U (11272 - 14704, n=8) | |
| Lenovo ThinkPad P14s G3 AMD 21J6S05000 | |
| Lenovo ThinkPad T14 G3-21CF004NGE | |
| HP ZBook Firefly 14 G9-6B8A2EA | |
| AIDA64 / FPU Julia | |
| Media della classe Workstation (89597 - 186971, n=23, ultimi 2 anni) | |
| Media AMD Ryzen 7 PRO 6850U (72242 - 92957, n=8) | |
| Lenovo ThinkPad P14s G3 AMD 21J6S05000 | |
| Lenovo ThinkPad T14 G3-21CF004NGE | |
| Dell Precision 5000 5470 | |
| HP ZBook Firefly 14 G9-6B8A2EA | |
| AIDA64 / CPU SHA3 | |
| Media della classe Workstation (4178 - 8975, n=23, ultimi 2 anni) | |
| Dell Precision 5000 5470 | |
| Media AMD Ryzen 7 PRO 6850U (2419 - 3104, n=8) | |
| Lenovo ThinkPad P14s G3 AMD 21J6S05000 | |
| Lenovo ThinkPad T14 G3-21CF004NGE | |
| HP ZBook Firefly 14 G9-6B8A2EA | |
| AIDA64 / CPU Queen | |
| Dell Precision 5000 5470 | |
| Media della classe Workstation (60778 - 144411, n=23, ultimi 2 anni) | |
| Lenovo ThinkPad P14s G3 AMD 21J6S05000 | |
| Media AMD Ryzen 7 PRO 6850U (86644 - 96912, n=7) | |
| Lenovo ThinkPad T14 G3-21CF004NGE | |
| HP ZBook Firefly 14 G9-6B8A2EA | |
| AIDA64 / FPU SinJulia | |
| Media della classe Workstation (8165 - 29343, n=23, ultimi 2 anni) | |
| Lenovo ThinkPad P14s G3 AMD 21J6S05000 | |
| Media AMD Ryzen 7 PRO 6850U (10917 - 12571, n=8) | |
| Lenovo ThinkPad T14 G3-21CF004NGE | |
| Dell Precision 5000 5470 | |
| HP ZBook Firefly 14 G9-6B8A2EA | |
| AIDA64 / FPU Mandel | |
| Media della classe Workstation (44497 - 98153, n=23, ultimi 2 anni) | |
| Media AMD Ryzen 7 PRO 6850U (39609 - 51296, n=8) | |
| Lenovo ThinkPad P14s G3 AMD 21J6S05000 | |
| Lenovo ThinkPad T14 G3-21CF004NGE | |
| Dell Precision 5000 5470 | |
| HP ZBook Firefly 14 G9-6B8A2EA | |
| AIDA64 / CPU AES | |
| Media della classe Workstation (73133 - 187841, n=23, ultimi 2 anni) | |
| Media AMD Ryzen 7 PRO 6850U (45568 - 60867, n=8) | |
| Lenovo ThinkPad T14 G3-21CF004NGE | |
| Lenovo ThinkPad P14s G3 AMD 21J6S05000 | |
| HP ZBook Firefly 14 G9-6B8A2EA | |
| Dell Precision 5000 5470 | |
| AIDA64 / CPU ZLib | |
| Media della classe Workstation (929 - 2148, n=23, ultimi 2 anni) | |
| Lenovo ThinkPad P14s G3 AMD 21J6S05000 | |
| Media AMD Ryzen 7 PRO 6850U (641 - 805, n=8) | |
| Lenovo ThinkPad T14 G3-21CF004NGE | |
| HP ZBook Firefly 14 G9-6B8A2EA | |
| Dell Precision 5000 5470 | |
| AIDA64 / FP64 Ray-Trace | |
| Media della classe Workstation (8545 - 32891, n=23, ultimi 2 anni) | |
| Dell Precision 5000 5470 | |
| Media AMD Ryzen 7 PRO 6850U (5967 - 7821, n=8) | |
| Lenovo ThinkPad P14s G3 AMD 21J6S05000 | |
| Lenovo ThinkPad T14 G3-21CF004NGE | |
| HP ZBook Firefly 14 G9-6B8A2EA | |
| AIDA64 / CPU PhotoWorxx | |
| Media della classe Workstation (37151 - 93684, n=23, ultimi 2 anni) | |
| Dell Precision 5000 5470 | |
| HP ZBook Firefly 14 G9-6B8A2EA | |
| Media AMD Ryzen 7 PRO 6850U (19707 - 27840, n=8) | |
| Lenovo ThinkPad T14 G3-21CF004NGE | |
| Lenovo ThinkPad P14s G3 AMD 21J6S05000 | |
Prestazioni del sistema
Le prestazioni del sistema sono leggermente peggiori rispetto a quelle dei suoi diretti rivali, ma non sono così evidenti nell'uso quotidiano. Una caratteristica tipica degli attuali sistemi AMD è la scarsa prestazione della memoria rispetto ai modelli Intel.
CrossMark: Overall | Productivity | Creativity | Responsiveness
| PCMark 10 / Score | |
| Media della classe Workstation (6563 - 10409, n=19, ultimi 2 anni) | |
| Dell Precision 5000 5470 | |
| HP ZBook Firefly 14 G9-6B8A2EA | |
| Media AMD Ryzen 7 PRO 6850U, AMD Radeon 680M (5873 - 6311, n=7) | |
| Lenovo ThinkPad T14 G3-21CF004NGE | |
| Lenovo ThinkPad P14s G3 AMD 21J6S05000 | |
| Lenovo ThinkPad P14s Gen2-20VX000GGE | |
| PCMark 10 / Essentials | |
| Dell Precision 5000 5470 | |
| Media della classe Workstation (9622 - 11157, n=19, ultimi 2 anni) | |
| HP ZBook Firefly 14 G9-6B8A2EA | |
| Lenovo ThinkPad T14 G3-21CF004NGE | |
| Media AMD Ryzen 7 PRO 6850U, AMD Radeon 680M (9151 - 10263, n=7) | |
| Lenovo ThinkPad P14s Gen2-20VX000GGE | |
| Lenovo ThinkPad P14s G3 AMD 21J6S05000 | |
| PCMark 10 / Productivity | |
| Media della classe Workstation (8789 - 20616, n=19, ultimi 2 anni) | |
| HP ZBook Firefly 14 G9-6B8A2EA | |
| Lenovo ThinkPad P14s Gen2-20VX000GGE | |
| Media AMD Ryzen 7 PRO 6850U, AMD Radeon 680M (8435 - 8891, n=7) | |
| Lenovo ThinkPad T14 G3-21CF004NGE | |
| Dell Precision 5000 5470 | |
| Lenovo ThinkPad P14s G3 AMD 21J6S05000 | |
| PCMark 10 / Digital Content Creation | |
| Media della classe Workstation (8108 - 15631, n=19, ultimi 2 anni) | |
| Dell Precision 5000 5470 | |
| Lenovo ThinkPad P14s G3 AMD 21J6S05000 | |
| Media AMD Ryzen 7 PRO 6850U, AMD Radeon 680M (6796 - 8422, n=7) | |
| Lenovo ThinkPad T14 G3-21CF004NGE | |
| HP ZBook Firefly 14 G9-6B8A2EA | |
| Lenovo ThinkPad P14s Gen2-20VX000GGE | |
| CrossMark / Overall | |
| Media della classe Workstation (1307 - 2267, n=22, ultimi 2 anni) | |
| Dell Precision 5000 5470 | |
| HP ZBook Firefly 14 G9-6B8A2EA | |
| Lenovo ThinkPad T14 G3-21CF004NGE | |
| Media AMD Ryzen 7 PRO 6850U, AMD Radeon 680M (1154 - 1442, n=7) | |
| Lenovo ThinkPad P14s G3 AMD 21J6S05000 | |
| CrossMark / Productivity | |
| Media della classe Workstation (1130 - 2122, n=22, ultimi 2 anni) | |
| Dell Precision 5000 5470 | |
| HP ZBook Firefly 14 G9-6B8A2EA | |
| Lenovo ThinkPad T14 G3-21CF004NGE | |
| Media AMD Ryzen 7 PRO 6850U, AMD Radeon 680M (1188 - 1444, n=7) | |
| Lenovo ThinkPad P14s G3 AMD 21J6S05000 | |
| CrossMark / Creativity | |
| Media della classe Workstation (1657 - 2725, n=22, ultimi 2 anni) | |
| Dell Precision 5000 5470 | |
| HP ZBook Firefly 14 G9-6B8A2EA | |
| Lenovo ThinkPad T14 G3-21CF004NGE | |
| Media AMD Ryzen 7 PRO 6850U, AMD Radeon 680M (1180 - 1523, n=7) | |
| Lenovo ThinkPad P14s G3 AMD 21J6S05000 | |
| CrossMark / Responsiveness | |
| Media della classe Workstation (993 - 2096, n=22, ultimi 2 anni) | |
| Dell Precision 5000 5470 | |
| HP ZBook Firefly 14 G9-6B8A2EA | |
| Lenovo ThinkPad T14 G3-21CF004NGE | |
| Media AMD Ryzen 7 PRO 6850U, AMD Radeon 680M (990 - 1282, n=7) | |
| Lenovo ThinkPad P14s G3 AMD 21J6S05000 | |
| PCMark 10 Score | 5953 punti | |
Aiuto | ||
| AIDA64 / Memory Copy | |
| Media della classe Workstation (56003 - 164795, n=23, ultimi 2 anni) | |
| Dell Precision 5000 5470 | |
| HP ZBook Firefly 14 G9-6B8A2EA | |
| Lenovo ThinkPad T14 G3-21CF004NGE | |
| Lenovo ThinkPad P14s G3 AMD 21J6S05000 | |
| Media AMD Ryzen 7 PRO 6850U (31003 - 48605, n=8) | |
| AIDA64 / Memory Read | |
| Media della classe Workstation (55795 - 121563, n=23, ultimi 2 anni) | |
| Dell Precision 5000 5470 | |
| HP ZBook Firefly 14 G9-6B8A2EA | |
| Media AMD Ryzen 7 PRO 6850U (34682 - 45912, n=8) | |
| Lenovo ThinkPad T14 G3-21CF004NGE | |
| Lenovo ThinkPad P14s G3 AMD 21J6S05000 | |
| AIDA64 / Memory Write | |
| Media della classe Workstation (55663 - 214520, n=23, ultimi 2 anni) | |
| HP ZBook Firefly 14 G9-6B8A2EA | |
| Dell Precision 5000 5470 | |
| Lenovo ThinkPad P14s G3 AMD 21J6S05000 | |
| Lenovo ThinkPad T14 G3-21CF004NGE | |
| Media AMD Ryzen 7 PRO 6850U (34532 - 51096, n=8) | |
| AIDA64 / Memory Latency | |
| Media della classe Workstation (84.5 - 165.2, n=23, ultimi 2 anni) | |
| Lenovo ThinkPad P14s G3 AMD 21J6S05000 | |
| Lenovo ThinkPad T14 G3-21CF004NGE | |
| Dell Precision 5000 5470 | |
| Media AMD Ryzen 7 PRO 6850U (86.1 - 135.3, n=8) | |
| HP ZBook Firefly 14 G9-6B8A2EA | |
* ... Meglio usare valori piccoli
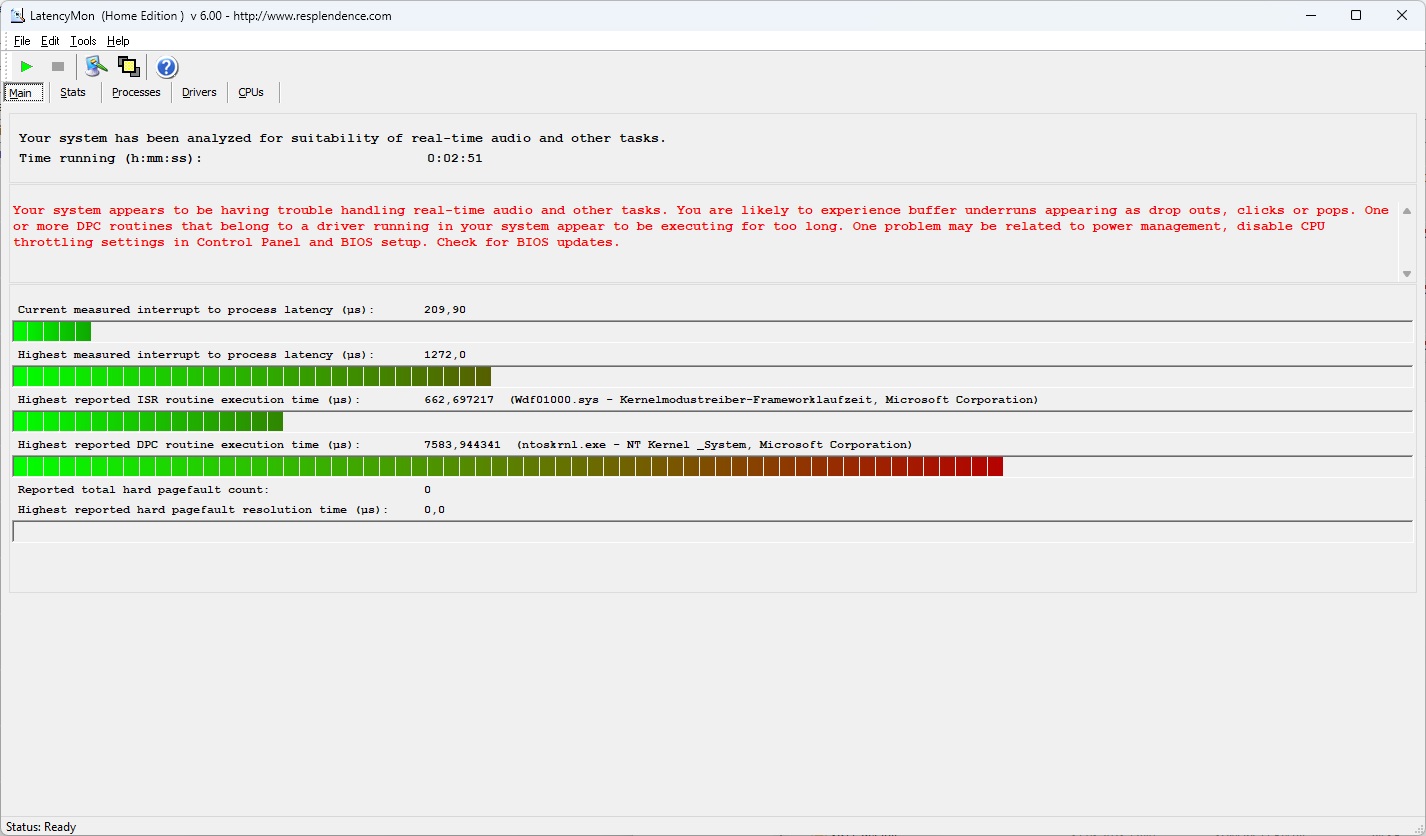
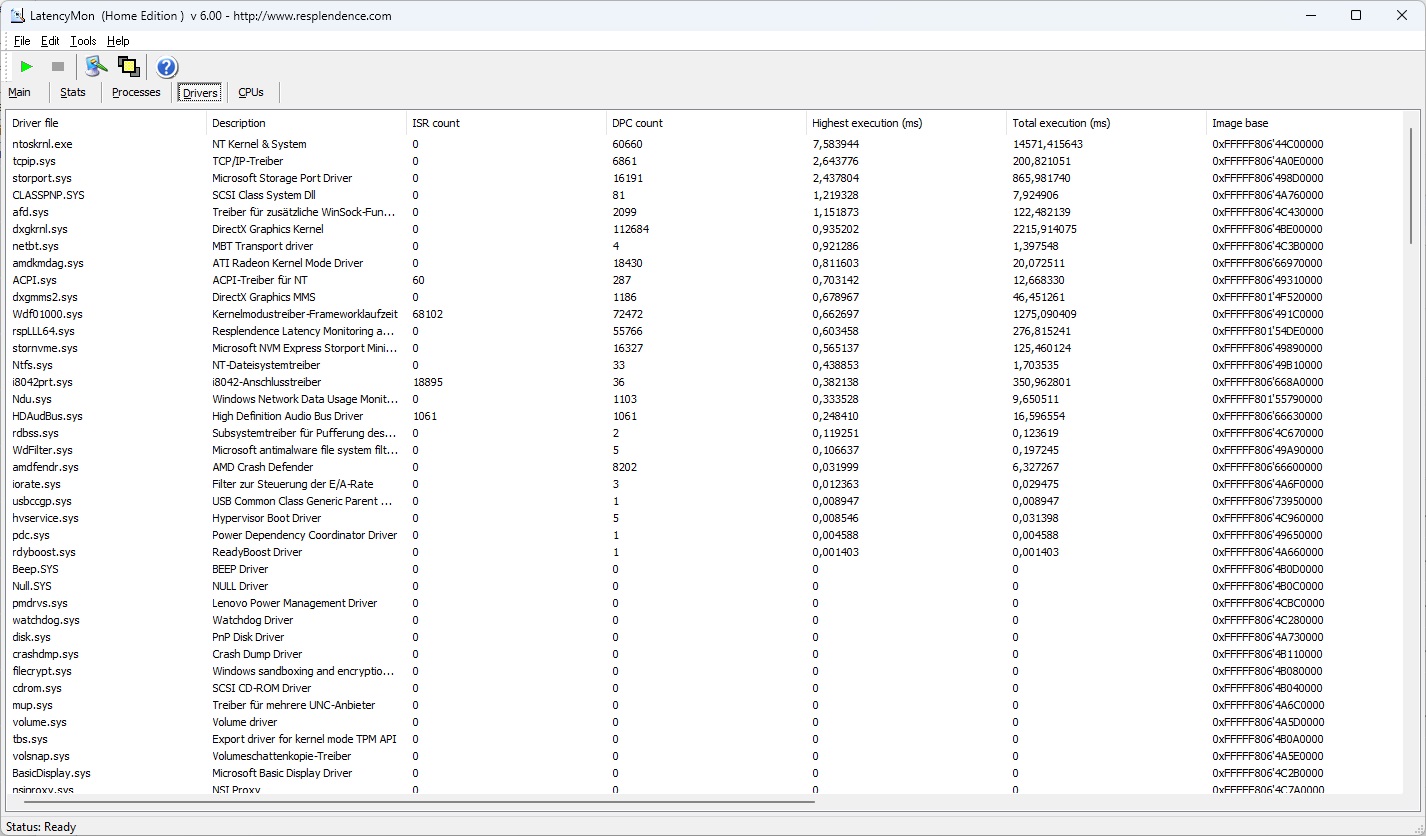
Latenza DPC
Il ThinkPad P14s Gen 3 ha problemi di latenze DPC nella configurazione presentata. Ciò potrebbe essere dovuto a un problema di driver e potrebbe essere risolto con un futuro aggiornamento del software.
| DPC Latencies / LatencyMon - interrupt to process latency (max), Web, Youtube, Prime95 | |
| Dell Precision 5000 5470 | |
| Lenovo ThinkPad P14s G3 AMD 21J6S05000 | |
| Lenovo ThinkPad P14s Gen2-20VX000GGE | |
| HP ZBook Firefly 14 G9-6B8A2EA | |
| Lenovo ThinkPad T14 G3-21CF004NGE | |
* ... Meglio usare valori piccoli
Dispositivi di archiviazione
Il Samsung PM9A1 nel Lenovo ThinkPad P14s G3 offre prestazioni elevate, tipiche di un'unità SSD PCIe 4.0. L'SSD M.2-2280 single-sided funziona molto velocemente anche sotto carico continuo e senza throttling.

* ... Meglio usare valori piccoli
Reading continuous performance: DiskSpd Read Loop, Queue Depth 8
Scheda grafica
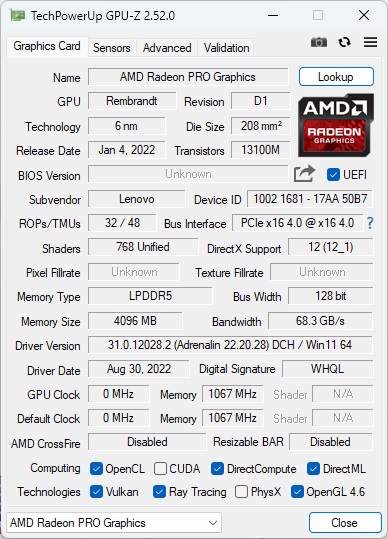
Un tratto distintivo delle workstation mobili è che, a differenza dei portatili da ufficio, la loro grafica è in grado di svolgere bene attività CAD e altre attività ad alta intensità di GPU. Per questo motivo, di solito viene installata una GPU dedicata. Tuttavia, Lenovo ha deciso di non installarne una nel ThinkPad P14s Gen 3. Invece, il portatile Lenovo si affida esclusivamente alla GPU integrata AMD Radeon 680M.
Il risultato è una prestazione della GPU debole per una workstation, molto al di sotto della media. A onor del vero, però, laNvidia T550 nel modelloZBook Firefly 14 non è affatto migliore. Solo la Nvidia RTX A1000 nel DellPrecision 5470 inizia a mostrare prestazioni significativamente migliori. Una cosa dovrebbe essere chiara se state pensando di acquistare il P14: si tratta di un modello assolutamente entry-level che rinuncia alle prestazioni della GPU in nome della mobilità.
Per i giochi, il P14s G3 è adatto come tutti gli altri portatili AMD attuali con una Radeon 680M: Molti giochi vengono eseguiti senza problemi in Full HD, ma con impostazioni di dettaglio ridotte.
Come per il processore, non abbiamo notato alcuna limitazione della GPU in modalità batteria.
| 3DMark Performance rating - Percent | |
| Media della classe Workstation | |
| Dell Precision 5000 5470 | |
| Lenovo ThinkPad P14s G3 AMD 21J6S05000 | |
| Lenovo ThinkPad T14 G3-21CF004NGE | |
| Media AMD Radeon 680M | |
| HP ZBook Firefly 14 G9-6B8A2EA -1! | |
| Lenovo ThinkPad P14s Gen2-20VX000GGE | |
| 3DMark 11 - 1280x720 Performance GPU | |
| Media della classe Workstation (12535 - 69594, n=23, ultimi 2 anni) | |
| Dell Precision 5000 5470 | |
| Lenovo ThinkPad P14s G3 AMD 21J6S05000 | |
| Lenovo ThinkPad T14 G3-21CF004NGE | |
| Media AMD Radeon 680M (6858 - 11755, n=39) | |
| HP ZBook Firefly 14 G9-6B8A2EA | |
| Lenovo ThinkPad P14s Gen2-20VX000GGE | |
| 3DMark | |
| 1280x720 Cloud Gate Standard Graphics | |
| Media della classe Workstation (58392 - 152418, n=14, ultimi 2 anni) | |
| Dell Precision 5000 5470 | |
| Lenovo ThinkPad T14 G3-21CF004NGE | |
| Lenovo ThinkPad P14s G3 AMD 21J6S05000 | |
| Media AMD Radeon 680M (24634 - 50120, n=31) | |
| Lenovo ThinkPad P14s Gen2-20VX000GGE | |
| 1920x1080 Fire Strike Graphics | |
| Media della classe Workstation (8293 - 52560, n=23, ultimi 2 anni) | |
| Dell Precision 5000 5470 | |
| Lenovo ThinkPad P14s G3 AMD 21J6S05000 | |
| Lenovo ThinkPad T14 G3-21CF004NGE | |
| Media AMD Radeon 680M (3791 - 7706, n=41) | |
| HP ZBook Firefly 14 G9-6B8A2EA | |
| Lenovo ThinkPad P14s Gen2-20VX000GGE | |
| 2560x1440 Time Spy Graphics | |
| Media della classe Workstation (2725 - 24806, n=23, ultimi 2 anni) | |
| Dell Precision 5000 5470 | |
| Lenovo ThinkPad P14s G3 AMD 21J6S05000 | |
| Lenovo ThinkPad T14 G3-21CF004NGE | |
| HP ZBook Firefly 14 G9-6B8A2EA | |
| Media AMD Radeon 680M (1359 - 2607, n=41) | |
| Lenovo ThinkPad P14s Gen2-20VX000GGE | |
| SPECviewperf Performance rating - Percent | |
| Media della classe Workstation | |
| Dell Precision 5000 5470 | |
| HP ZBook Firefly 14 G9-6B8A2EA | |
| Lenovo ThinkPad P14s G3 AMD 21J6S05000 | |
| Media AMD Radeon 680M | |
| Lenovo ThinkPad T14 G3-21CF004NGE | |
| Lenovo ThinkPad P14s Gen2-20VX000GGE -1! | |
| 3DMark 11 Performance | 10377 punti | |
| 3DMark Cloud Gate Standard Score | 30226 punti | |
| 3DMark Fire Strike Score | 6722 punti | |
| 3DMark Time Spy Score | 2724 punti | |
Aiuto | ||
| Blender | |
| v3.3 Classroom HIP/AMD | |
| Media AMD Radeon 680M (270 - 555, n=34) | |
| Lenovo ThinkPad T14 G3-21CF004NGE | |
| Lenovo ThinkPad P14s G3 AMD 21J6S05000 | |
| Lenovo ThinkPad P14s G3 AMD 21J6S05000 | |
| v3.3 Classroom OPTIX/RTX | |
| HP ZBook Firefly 14 G9-6B8A2EA | |
| Dell Precision 5000 5470 | |
| Media della classe Workstation (10 - 43, n=17, ultimi 2 anni) | |
| v3.3 Classroom CUDA | |
| HP ZBook Firefly 14 G9-6B8A2EA | |
| Dell Precision 5000 5470 | |
| Media della classe Workstation (16 - 74, n=17, ultimi 2 anni) | |
| v3.3 Classroom CPU | |
| HP ZBook Firefly 14 G9-6B8A2EA | |
| Lenovo ThinkPad T14 G3-21CF004NGE | |
| Media AMD Radeon 680M (389 - 980, n=37) | |
| Lenovo ThinkPad P14s G3 AMD 21J6S05000 | |
| Dell Precision 5000 5470 | |
| Media della classe Workstation (148 - 364, n=23, ultimi 2 anni) | |
* ... Meglio usare valori piccoli
| Performance rating - Percent | |
| Media della classe Workstation | |
| Dell Precision 5000 5470 | |
| HP ZBook Firefly 14 G9-6B8A2EA | |
| Lenovo ThinkPad T14 G3-21CF004NGE | |
| Lenovo ThinkPad P14s G3 AMD 21J6S05000 | |
| Lenovo ThinkPad P14s Gen2-20VX000GGE | |
| The Witcher 3 - 1920x1080 Ultra Graphics & Postprocessing (HBAO+) | |
| Media della classe Workstation (n=1ultimi 2 anni) | |
| Dell Precision 5000 5470 | |
| Lenovo ThinkPad P14s G3 AMD 21J6S05000 | |
| Lenovo ThinkPad T14 G3-21CF004NGE | |
| HP ZBook Firefly 14 G9-6B8A2EA | |
| Lenovo ThinkPad P14s Gen2-20VX000GGE | |
| GTA V - 1920x1080 Highest AA:4xMSAA + FX AF:16x | |
| Media della classe Workstation (18.1 - 156.1, n=23, ultimi 2 anni) | |
| Dell Precision 5000 5470 | |
| HP ZBook Firefly 14 G9-6B8A2EA | |
| Lenovo ThinkPad P14s G3 AMD 21J6S05000 | |
| Lenovo ThinkPad T14 G3-21CF004NGE | |
| Lenovo ThinkPad P14s Gen2-20VX000GGE | |
| Final Fantasy XV Benchmark - 1920x1080 High Quality | |
| Media della classe Workstation (26.4 - 197.6, n=23, ultimi 2 anni) | |
| Dell Precision 5000 5470 | |
| Lenovo ThinkPad P14s G3 AMD 21J6S05000 | |
| Lenovo ThinkPad T14 G3-21CF004NGE | |
| HP ZBook Firefly 14 G9-6B8A2EA | |
| Lenovo ThinkPad P14s Gen2-20VX000GGE | |
| Strange Brigade - 1920x1080 ultra AA:ultra AF:16 | |
| Media della classe Workstation (93.2 - 418, n=17, ultimi 2 anni) | |
| Dell Precision 5000 5470 | |
| Lenovo ThinkPad T14 G3-21CF004NGE | |
| HP ZBook Firefly 14 G9-6B8A2EA | |
| Lenovo ThinkPad P14s G3 AMD 21J6S05000 | |
| Lenovo ThinkPad P14s Gen2-20VX000GGE | |
| Dota 2 Reborn - 1920x1080 ultra (3/3) best looking | |
| Dell Precision 5000 5470 | |
| Media della classe Workstation (50.7 - 178.4, n=23, ultimi 2 anni) | |
| HP ZBook Firefly 14 G9-6B8A2EA | |
| Lenovo ThinkPad P14s Gen2-20VX000GGE | |
| Lenovo ThinkPad T14 G3-21CF004NGE | |
| Lenovo ThinkPad P14s G3 AMD 21J6S05000 | |
| X-Plane 11.11 - 1920x1080 high (fps_test=3) | |
| Media della classe Workstation (30.5 - 139.7, n=23, ultimi 2 anni) | |
| Dell Precision 5000 5470 | |
| HP ZBook Firefly 14 G9-6B8A2EA | |
| Lenovo ThinkPad P14s Gen2-20VX000GGE | |
| Lenovo ThinkPad T14 G3-21CF004NGE | |
| Lenovo ThinkPad P14s G3 AMD 21J6S05000 | |
Witcher 3 fps diagram
| basso | medio | alto | ultra | |
|---|---|---|---|---|
| GTA V (2015) | 123.2 | 110.2 | 47.6 | 23.8 |
| The Witcher 3 (2015) | 111.1 | 42.6 | 26.8 | |
| Dota 2 Reborn (2015) | 90.2 | 84.7 | 67.4 | 57.8 |
| Final Fantasy XV Benchmark (2018) | 61.3 | 36.1 | 25.4 | |
| X-Plane 11.11 (2018) | 52 | 39.3 | 31.9 | |
| Far Cry 5 (2018) | 60 | 38 | 35 | 33 |
| Strange Brigade (2018) | 106.8 | 49.1 | 39.9 | 34.1 |
| F1 22 (2022) | 53.1 | 49.1 | 35.4 | 8.32 |
Emissioni: Un po' più rumoroso del ThinkPad T14 G3 AMD
Emissioni acustiche
Rispetto al ThinkPad T14 Gen 3, il ThinkPad P14s Gen 3 tende a diventare un po' più rumoroso, soprattutto durante il test Witcher 3 test. Tuttavia, i livelli di rumorosità massima sono paragonabili. I concorrenti Dell e HP hanno sistemi di raffreddamento attivo molto più rumorosi.
Nel P14s G3 non abbiamo notato alcun fruscio della bobina, ma abbiamo osservato una sorta di crepitio silenzioso, probabilmente dovuto all'SSD.
Rumorosità
| Idle |
| 22.9 / 22.9 / 22.9 dB(A) |
| Sotto carico |
| 30.8 / 39.5 dB(A) |
 | ||
30 dB silenzioso 40 dB(A) udibile 50 dB(A) rumoroso |
||
min: | ||
| Lenovo ThinkPad P14s G3 AMD 21J6S05000 Radeon 680M, R7 PRO 6850U, Samsung PM9A1 MZVL21T0HCLR | Lenovo ThinkPad P14s Gen2-20VX000GGE T500 Laptop GPU, i7-1185G7, Toshiba XG6 KXG6AZNV1T02 | Lenovo ThinkPad T14 G3-21CF004NGE Radeon 680M, R7 PRO 6850U, Kioxia BG5 KBG5AZNV512G | Dell Precision 5000 5470 RTX A1000 Laptop GPU, i9-12900H, Samsung PM9A1 MZVL21T0HCLR | HP ZBook Firefly 14 G9-6B8A2EA T550 Laptop GPU, i7-1265U, Micron 3400 1TB MTFDKBA1T0TFH | |
|---|---|---|---|---|---|
| Noise | -9% | -3% | -16% | -9% | |
| off /ambiente * (dB) | 22.9 | 24.6 -7% | 24.2 -6% | 23 -0% | 23.6 -3% |
| Idle Minimum * (dB) | 22.9 | 24.6 -7% | 24.2 -6% | 23.3 -2% | 23.6 -3% |
| Idle Average * (dB) | 22.9 | 24.6 -7% | 24.2 -6% | 23.3 -2% | 23.6 -3% |
| Idle Maximum * (dB) | 22.9 | 24.6 -7% | 25.8 -13% | 23.3 -2% | 23.6 -3% |
| Load Average * (dB) | 30.8 | 38.9 -26% | 32.2 -5% | 48.5 -57% | 42.5 -38% |
| Witcher 3 ultra * (dB) | 39.4 | 34.1 13% | 48.6 -23% | 42.5 -8% | |
| Load Maximum * (dB) | 39.5 | 38.9 2% | 38.8 2% | 50.4 -28% | 42.5 -8% |
* ... Meglio usare valori piccoli
Temperatura
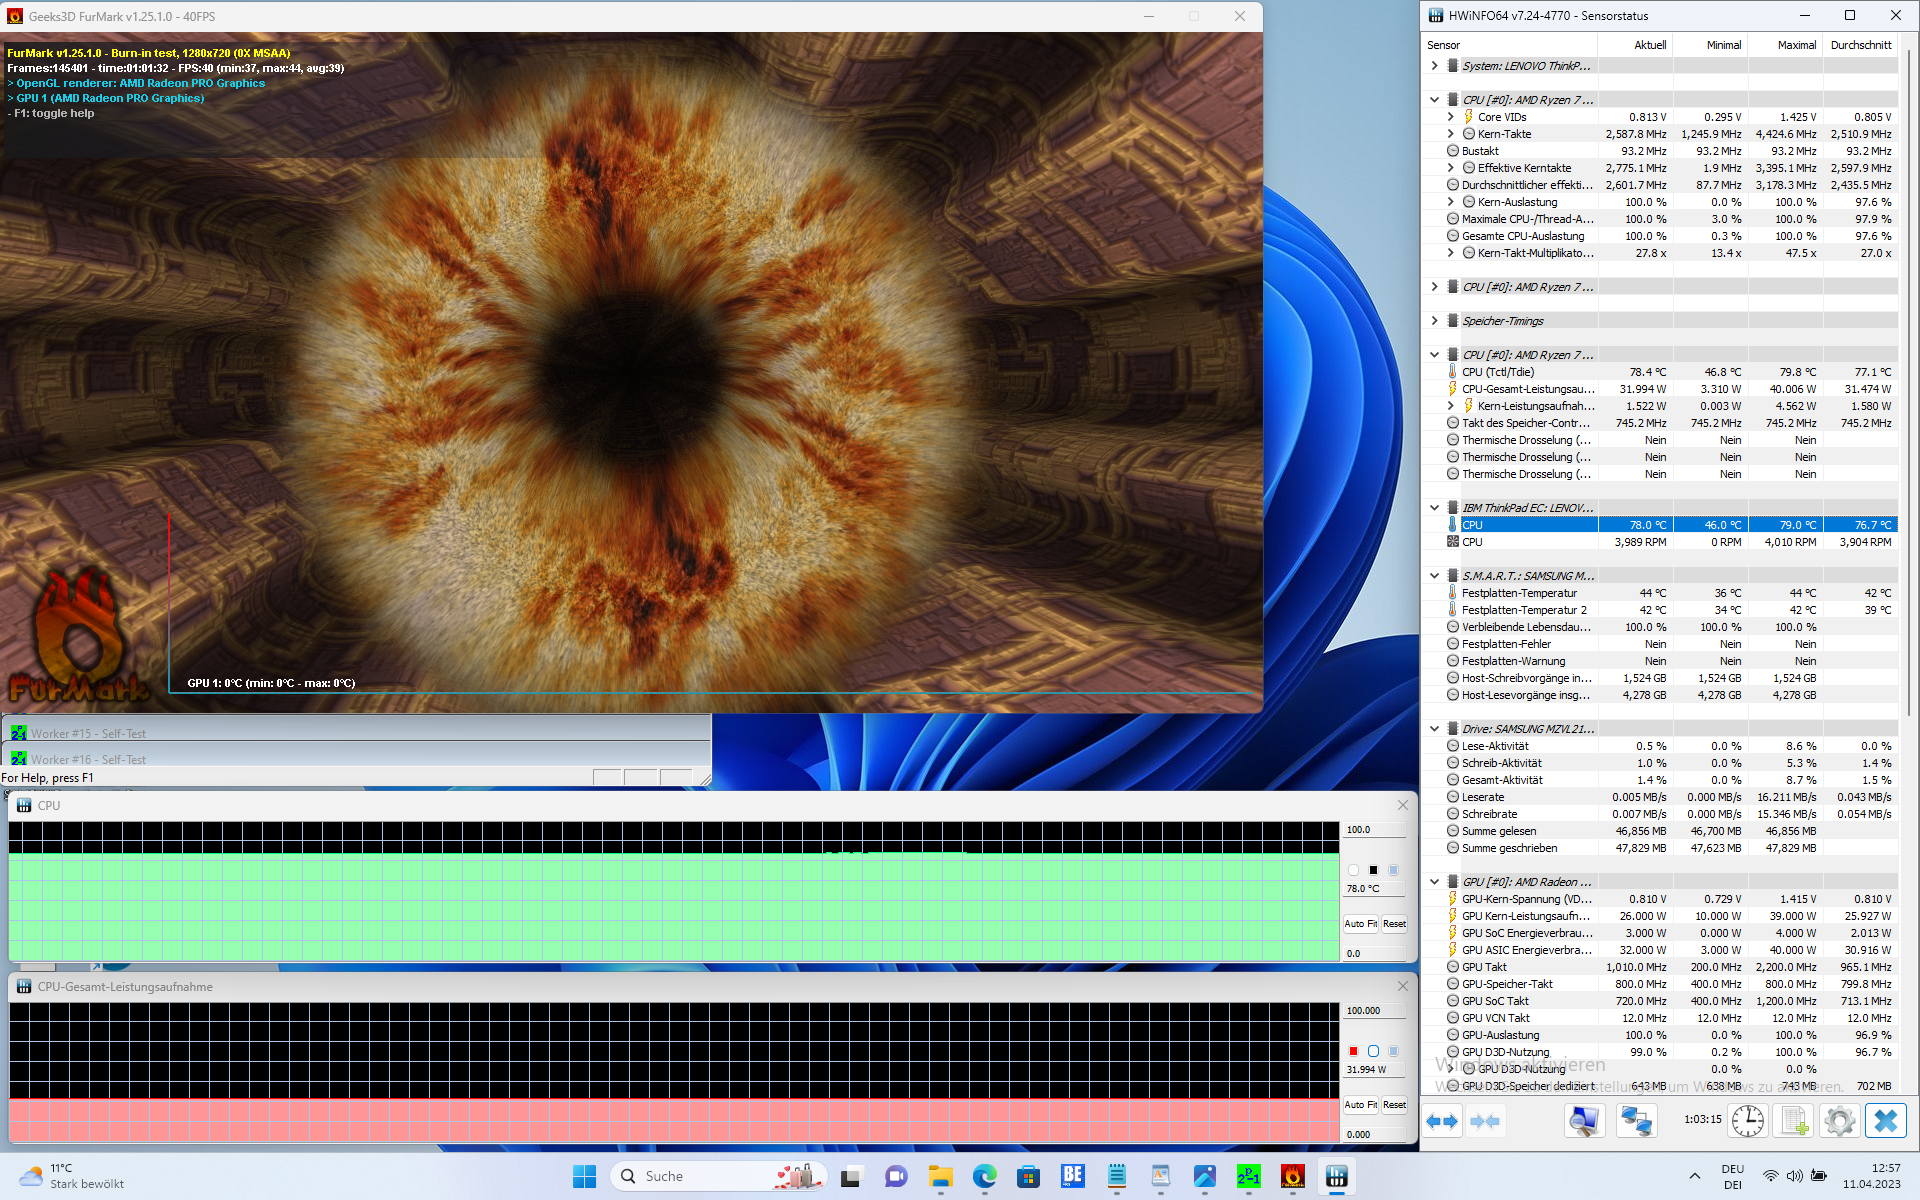
Il P14s G3 AMD è un portatile relativamente fresco. Il predecessore P14s Gen 2 basato su Intel, in particolare, era molto più caldo. Abbiamo misurato un massimo di 43,1 gradi Celsius nel P14s, che è anche inferiore alla temperatura massima del T14 Gen 3 AMD - presumibilmente a causa della sua ventola un po' più attiva.
Non c'è stato assolutamente alcun throttling nello stress test, il processore è stato in grado di mantenere stabili le sue prestazioni.
(±) La temperatura massima sul lato superiore è di 42.7 °C / 109 F, rispetto alla media di 38.2 °C / 101 F, che varia da 22.2 a 69.8 °C per questa classe Workstation.
(±) Il lato inferiore si riscalda fino ad un massimo di 43.1 °C / 110 F, rispetto alla media di 41.1 °C / 106 F
(+) In idle, la temperatura media del lato superiore è di 24.6 °C / 76 F, rispetto alla media deld ispositivo di 32 °C / 90 F.
(±) Riproducendo The Witcher 3, la temperatura media per il lato superiore e' di 32.3 °C / 90 F, rispetto alla media del dispositivo di 32 °C / 90 F.
(+) I poggiapolsi e il touchpad sono piu' freddi della temperatura della pelle con un massimo di 26.8 °C / 80.2 F e sono quindi freddi al tatto.
(±) La temperatura media della zona del palmo della mano di dispositivi simili e'stata di 27.8 °C / 82 F (+1 °C / 1.8 F).
| Lenovo ThinkPad P14s G3 AMD 21J6S05000 AMD Ryzen 7 PRO 6850U, AMD Radeon 680M | Lenovo ThinkPad P14s Gen2-20VX000GGE Intel Core i7-1185G7, NVIDIA T500 Laptop GPU | Lenovo ThinkPad T14 G3-21CF004NGE AMD Ryzen 7 PRO 6850U, AMD Radeon 680M | Dell Precision 5000 5470 Intel Core i9-12900H, NVIDIA RTX A1000 Laptop GPU | HP ZBook Firefly 14 G9-6B8A2EA Intel Core i7-1265U, NVIDIA T550 Laptop GPU | |
|---|---|---|---|---|---|
| Heat | -16% | -6% | -11% | -3% | |
| Maximum Upper Side * (°C) | 42.7 | 52.4 -23% | 48.2 -13% | 41.8 2% | 41.2 4% |
| Maximum Bottom * (°C) | 43.1 | 63.7 -48% | 52.8 -23% | 36 16% | 47.9 -11% |
| Idle Upper Side * (°C) | 25.7 | 24.6 4% | 24.4 5% | 34.6 -35% | 26.5 -3% |
| Idle Bottom * (°C) | 26.4 | 26 2% | 24.5 7% | 33.6 -27% | 27 -2% |
* ... Meglio usare valori piccoli
Altoparlanti
Gli altoparlanti del ThinkPad P14s Gen 3, posizionati sopra la tastiera, non sono particolarmente buoni. Sono troppo silenziosi e non abbastanza bassi. Per l'ascolto della musica è consigliabile una soluzione esterna.
Lenovo ThinkPad P14s G3 AMD 21J6S05000 analisi audio
(-) | altoparlanti non molto potenti (69.6 dB)
Bassi 100 - 315 Hz
(-) | quasi nessun basso - in media 20.4% inferiori alla media
(-) | bassi non lineari (15.1% delta rispetto alla precedente frequenza)
Medi 400 - 2000 Hz
(+) | medi bilanciati - solo only 1.6% rispetto alla media
(+) | medi lineari (5.8% delta rispetto alla precedente frequenza)
Alti 2 - 16 kHz
(+) | Alti bilanciati - appena 2% dalla media
(+) | alti lineari (6.1% delta rispetto alla precedente frequenza)
Nel complesso 100 - 16.000 Hz
(±) | la linearità complessiva del suono è media (18.7% di differenza rispetto alla media
Rispetto alla stessa classe
» 63% di tutti i dispositivi testati in questa classe è stato migliore, 8% simile, 29% peggiore
» Il migliore ha avuto un delta di 7%, medio di 17%, peggiore di 35%
Rispetto a tutti i dispositivi testati
» 43% di tutti i dispositivi testati in questa classe è stato migliore, 8% similare, 49% peggiore
» Il migliore ha avuto un delta di 4%, medio di 23%, peggiore di 134%
HP ZBook Firefly 14 G9-6B8A2EA analisi audio
(+) | gli altoparlanti sono relativamente potenti (84.5 dB)
Bassi 100 - 315 Hz
(-) | quasi nessun basso - in media 19.6% inferiori alla media
(±) | la linearità dei bassi è media (13% delta rispetto alla precedente frequenza)
Medi 400 - 2000 Hz
(+) | medi bilanciati - solo only 2.5% rispetto alla media
(+) | medi lineari (3.5% delta rispetto alla precedente frequenza)
Alti 2 - 16 kHz
(+) | Alti bilanciati - appena 1.9% dalla media
(+) | alti lineari (3.2% delta rispetto alla precedente frequenza)
Nel complesso 100 - 16.000 Hz
(+) | suono nel complesso lineare (12.7% differenza dalla media)
Rispetto alla stessa classe
» 21% di tutti i dispositivi testati in questa classe è stato migliore, 4% simile, 74% peggiore
» Il migliore ha avuto un delta di 7%, medio di 17%, peggiore di 35%
Rispetto a tutti i dispositivi testati
» 12% di tutti i dispositivi testati in questa classe è stato migliore, 3% similare, 86% peggiore
» Il migliore ha avuto un delta di 4%, medio di 23%, peggiore di 134%
Gestione dell'energia: L'efficienza di AMD garantisce buoni tempi di esecuzione
Consumo di energia
Il consumo energetico è molto simile a quello del ThinkPad T14 G3, con la differenza che il ThinkPad P14s G3 consuma un po' di più sotto carico. Tuttavia, il suo consumo è ancora così basso che un alimentatore da 65 watt è più che sufficiente. Questo non è il caso dei suoi concorrenti Dell e HP.
| Off / Standby | |
| Idle | |
| Sotto carico |
|
Leggenda:
min: | |
| Lenovo ThinkPad P14s G3 AMD 21J6S05000 R7 PRO 6850U, Radeon 680M, Samsung PM9A1 MZVL21T0HCLR, IPS LED, 1920x1200, 14" | Lenovo ThinkPad P14s Gen2-20VX000GGE i7-1185G7, T500 Laptop GPU, Toshiba XG6 KXG6AZNV1T02, IPS, 1920x1080, 14" | Lenovo ThinkPad T14 G3-21CF004NGE R7 PRO 6850U, Radeon 680M, Kioxia BG5 KBG5AZNV512G, IPS, 1920x1200, 14" | Dell Precision 5000 5470 i9-12900H, RTX A1000 Laptop GPU, Samsung PM9A1 MZVL21T0HCLR, IPS, 2560x1600, 14" | HP ZBook Firefly 14 G9-6B8A2EA i7-1265U, T550 Laptop GPU, Micron 3400 1TB MTFDKBA1T0TFH, IPS, 1920x1200, 14" | Media AMD Radeon 680M | Media della classe Workstation | |
|---|---|---|---|---|---|---|---|
| Power Consumption | -34% | 9% | -110% | -19% | -72% | -187% | |
| Idle Minimum * (Watt) | 2.6 | 4.5 -73% | 2.4 8% | 4.3 -65% | 4.2 -62% | 6.93 ? -167% | 9.11 ? -250% |
| Idle Average * (Watt) | 5 | 7.1 -42% | 5.3 -6% | 8.9 -78% | 6.5 -30% | 8.98 ? -80% | 13.8 ? -176% |
| Idle Maximum * (Watt) | 5.6 | 9.7 -73% | 5.6 -0% | 18.9 -238% | 7.2 -29% | 10.5 ? -88% | 17.9 ? -220% |
| Load Average * (Watt) | 49.7 | 37.8 24% | 39.7 20% | 94 -89% | 47.7 4% | 53.5 ? -8% | 96 ? -93% |
| Witcher 3 ultra * (Watt) | 50.6 | 42.8 15% | 83.2 -64% | 42.9 15% | |||
| Load Maximum * (Watt) | 61.1 | 64.7 -6% | 50.6 17% | 137.5 -125% | 68.2 -12% | 70.5 ? -15% | 180.3 ? -195% |
* ... Meglio usare valori piccoli
Power consumption Witcher 3 / stress test
Power consumption with external monitor
Durata della batteria
Come il ThinkPad T14 Gen 3 di Lenovo, il ThinkPad P14s G3 riesce a ottenere molto dalla sua batteria da 52,5 wattora. Dodici ore nel test Wi-Fi (150 cd/m²) sono un risultato di tutto rispetto. Anche con la massima luminosità del display, il portatile ThinkPad ha funzionato per quasi dieci ore nel test Wi-Fi. I suoi rivali basati su Intel, Dell e HP, possono solo sognare questo risultato.
| Lenovo ThinkPad P14s G3 AMD 21J6S05000 R7 PRO 6850U, Radeon 680M, 52.5 Wh | Lenovo ThinkPad P14s Gen2-20VX000GGE i7-1185G7, T500 Laptop GPU, 50 Wh | Lenovo ThinkPad T14 G3-21CF004NGE R7 PRO 6850U, Radeon 680M, 52.5 Wh | Dell Precision 5000 5470 i9-12900H, RTX A1000 Laptop GPU, 72 Wh | HP ZBook Firefly 14 G9-6B8A2EA i7-1265U, T550 Laptop GPU, 51 Wh | Media della classe Workstation | |
|---|---|---|---|---|---|---|
| Autonomia della batteria | -25% | 20% | -11% | -28% | -5% | |
| H.264 (h) | 12 | 16.4 37% | 10.1 ? -16% | |||
| WiFi v1.3 (h) | 12.2 | 9.2 -25% | 12.9 6% | 9.6 -21% | 8.8 -28% | 8.55 ? -30% |
| Load (h) | 1.1 | 1.3 18% | 1.1 0% | 1.441 ? 31% |
Pro
Contro
Verdetto: il Lenovo ThinkPad P14s G3 AMD è un'ottima workstation entry-level

Una workstation mobile in grado di eseguire il rendering di elaborati progetti CAD per ore e ore o di essere utilizzata per lo sviluppo di giochi: questo è esattamente ciò che il Lenovo ThinkPad P14s Gen 3 AMD non è. Si tratta piuttosto di un modello entry-level che offre principalmente buone prestazioni della CPU, ma è molto indietro rispetto ai laptop workstation più grandi in termini di prestazioni della GPU. Il portatile Lenovo compensa queste prestazioni inferiori con un'ottima mobilità.
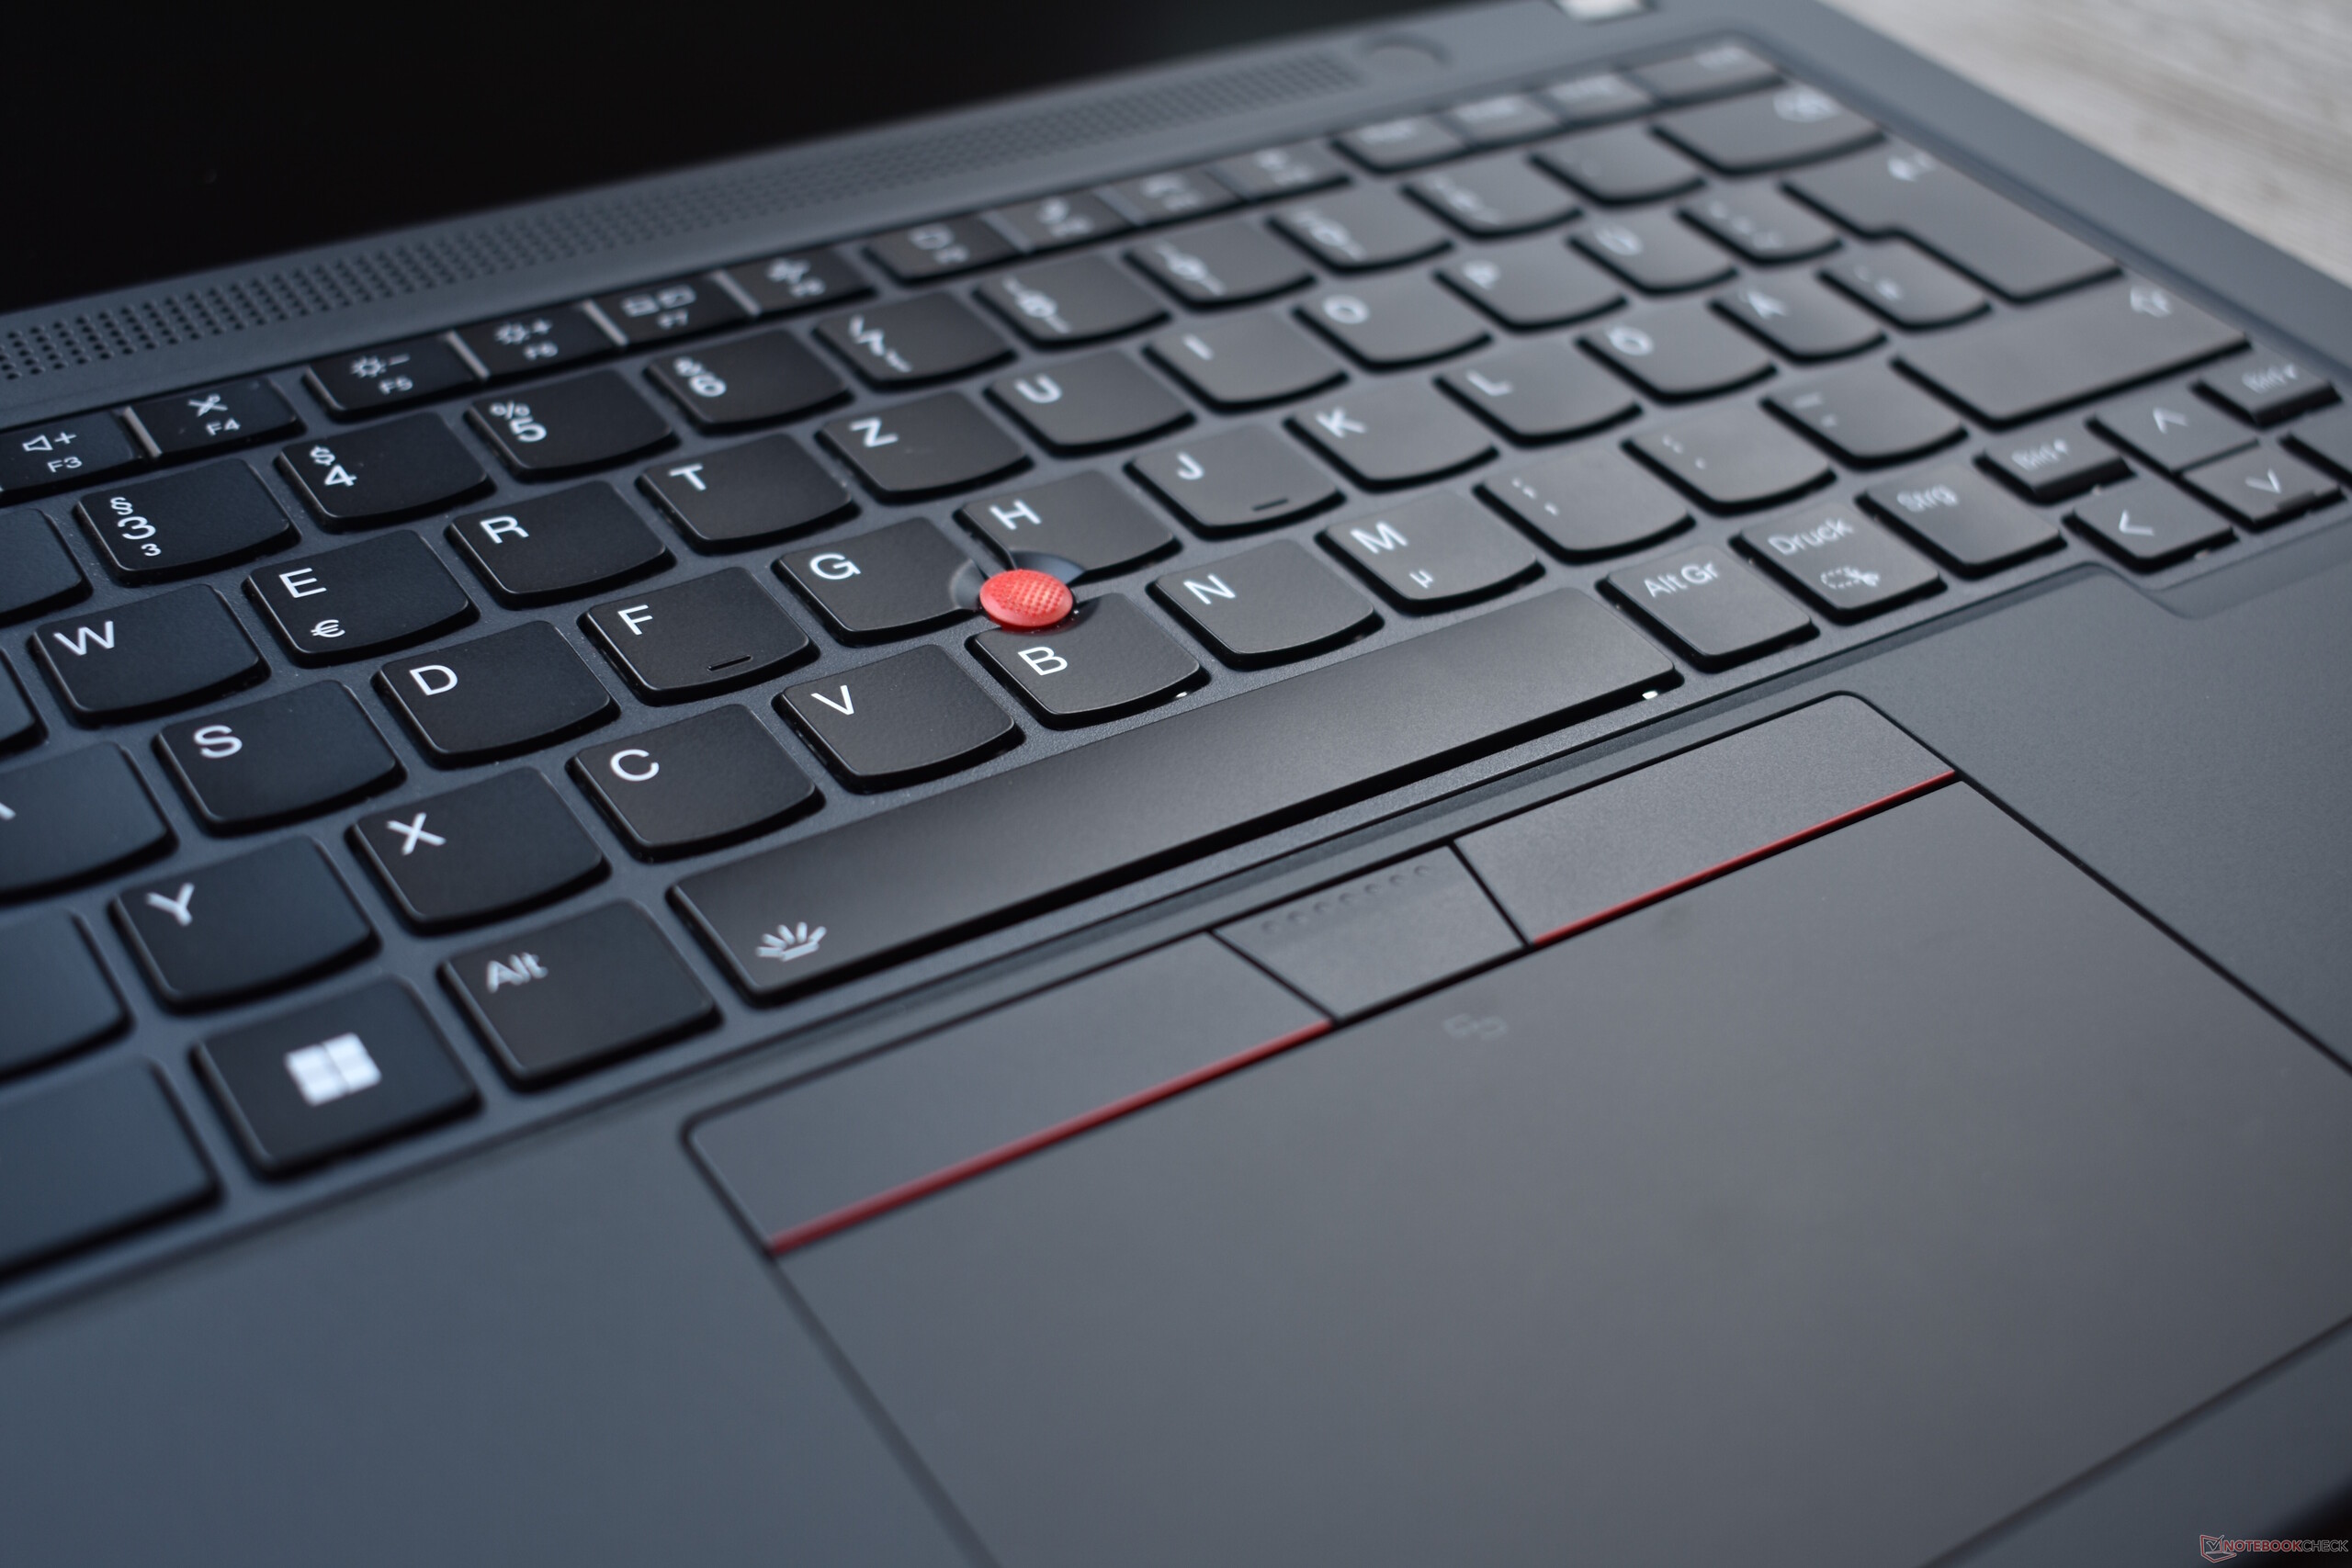
Questo dovrebbe anche chiarire che non è destinato a sostituire le "grandi" workstation come il ThinkPad P16. Si tratta di una variante del ThinkPad T14 G3, un portatile da ufficio commercializzato anche per i clienti delle workstation. Logicamente, condivide punti di forza e di debolezza simili a quelli del ThinkPad T14 G3 AMD. L'assenza di uno slot per schede SD è uno dei punti deboli, così come lo standard USB4 non supportato. La RAM saldata è ancora più fastidiosa in un dispositivo workstation e la tastiera non è allo stesso livello di quella del P14 Gen 2 P14s Gen 2anche se è ancora molto buona. La presenza di Ethernet e la tastiera facilmente sostituibile sono altri aspetti positivi.
Buone le prestazioni della CPU e l'autonomia della batteria, basse le prestazioni della GPU per una workstation: Il Lenovo ThinkPad P14s Gen 3 AMD
Il Lenovo ThinkPad P14s Gen 3 AMD è un'eccellente workstation mobile per le attività che richiedono prestazioni della CPU. I suoi principali concorrenti sono HP ZBook Firefly 14 G9che offre Thunderbolt ma ha prestazioni multicore inferiori e una minore durata della batteria grazie al più inefficiente processore Intel. Un'altra alternativa è il Dell Precision 5470che si distingue soprattutto per le prestazioni della GPU nettamente superiori, ma fa grandi sacrifici in termini di porte (a parte la presenza di Thunderbolt e di un lettore di schede SD).
Prezzo e disponibilità
Il modello che abbiamo testato con Ryzen 7, display WUXGA, 32 GB di RAM e 1 TB di SSD con il numero di modello 21J6S05000 è un modello speciale disponibile solo nel programma Campus di Lenovo per gli acquirenti idonei. Costa circa 1.640 dollari e viene fornito senza sistema operativo. Per tutti gli altri clienti, questo modello con Windows 11 Pro(21J5002FGE) è disponibile a circa 1.900 dollari. Su Amazon il ThinkPad P14s Gen 3 AMD con schermo WQUXGA a risoluzione più elevata è in offerta a circa 1.661 dollari.
Lenovo ThinkPad P14s G3 AMD 21J6S05000
- 04/17/2023 v7 (old)
Benjamin Herzig
Transparency
La selezione dei dispositivi da recensire viene effettuata dalla nostra redazione. Il campione di prova è stato fornito all'autore come prestito dal produttore o dal rivenditore ai fini di questa recensione. L'istituto di credito non ha avuto alcuna influenza su questa recensione, né il produttore ne ha ricevuto una copia prima della pubblicazione. Non vi era alcun obbligo di pubblicare questa recensione. In quanto società mediatica indipendente, Notebookcheck non è soggetta all'autorità di produttori, rivenditori o editori.
Ecco come Notebookcheck esegue i test
Ogni anno, Notebookcheck esamina in modo indipendente centinaia di laptop e smartphone utilizzando procedure standardizzate per garantire che tutti i risultati siano comparabili. Da circa 20 anni sviluppiamo continuamente i nostri metodi di prova e nel frattempo stabiliamo gli standard di settore. Nei nostri laboratori di prova, tecnici ed editori esperti utilizzano apparecchiature di misurazione di alta qualità. Questi test comportano un processo di validazione in più fasi. Il nostro complesso sistema di valutazione si basa su centinaia di misurazioni e parametri di riferimento ben fondati, che mantengono l'obiettività.Price comparison

