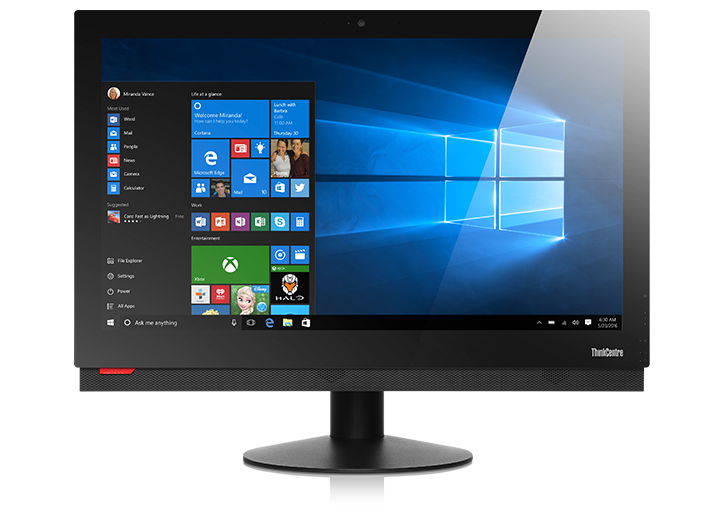
Recensione breve del Lenovo ThinkCentre M910z All-in-One Desktop
| SD Card Reader | |
| average JPG Copy Test (av. of 3 runs) | |
| Dell Latitude 5580 | |
| HP Z1 G2 G1X47EA | |
| Lenovo ThinkPad T470p-20J7S00000 | |
| Lenovo ThinkCentre M910z-10NR000KUS | |
| maximum AS SSD Seq Read Test (1GB) | |
| Dell Latitude 5580 | |
| Lenovo ThinkPad T470p-20J7S00000 | |
| HP Z1 G2 G1X47EA | |
| Lenovo ThinkCentre M910z-10NR000KUS | |
| Networking | |
| iperf3 transmit AX12 | |
| Lenovo ThinkCentre M910z-10NR000KUS | |
| Lenovo ThinkPad T470p-20J7S00000 | |
| Dell Latitude 5580 | |
| iperf3 receive AX12 | |
| Lenovo ThinkCentre M910z-10NR000KUS | |
| Lenovo ThinkPad T470p-20J7S00000 | |
| Dell Latitude 5580 | |
| |||||||||||||||||||||||||
Distribuzione della luminosità: 93 %
Contrasto: 961:1 (Nero: 0.23 cd/m²)
ΔE ColorChecker Calman: 3.8 | ∀{0.5-29.43 Ø4.71}
ΔE Greyscale Calman: 3.7 | ∀{0.09-98 Ø4.96}
90.3% sRGB (Argyll 1.6.3 3D)
58.44% AdobeRGB 1998 (Argyll 1.6.3 3D)
65.6% AdobeRGB 1998 (Argyll 3D)
90.3% sRGB (Argyll 3D)
64.4% Display P3 (Argyll 3D)
Gamma: 2.38
CCT: 6701 K
| Lenovo ThinkCentre M910z-10NR000KUS LEN-M910z-B, IPS, 23.8", 1920x1080 | HP Z1 G2 G1X47EA HWP192F, IPS LED, 27", 2560x1440 | Apple iMac Retina 5K 27 Late 2015 3.2 GHz M390 MK472D/A 27", 5120x2880 | |
|---|---|---|---|
| Display | 14% | 33% | |
| Display P3 Coverage (%) | 64.4 | 76.8 19% | 99.3 54% |
| sRGB Coverage (%) | 90.3 | 99.7 10% | 100 11% |
| AdobeRGB 1998 Coverage (%) | 65.6 | 74.4 13% | 88.2 34% |
| Response Times | -49% | -2% | |
| Response Time Grey 50% / Grey 80% * (ms) | 35.2 ? | 44.4 ? -26% | 30.4 ? 14% |
| Response Time Black / White * (ms) | 17.6 ? | 30.2 ? -72% | 20.8 ? -18% |
| PWM Frequency (Hz) | 21740 ? | 200 ? | |
| Screen | -3% | 15% | |
| Brightness middle (cd/m²) | 221 | 365 65% | 429 94% |
| Brightness (cd/m²) | 214 | 367 71% | 424 98% |
| Brightness Distribution (%) | 93 | 87 -6% | 95 2% |
| Black Level * (cd/m²) | 0.23 | 0.4 -74% | 0.58 -152% |
| Contrast (:1) | 961 | 913 -5% | 740 -23% |
| Colorchecker dE 2000 * | 3.8 | 4.68 -23% | 2.8 26% |
| Colorchecker dE 2000 max. * | 7.3 | ||
| Greyscale dE 2000 * | 3.7 | 6.6 -78% | 1.97 47% |
| Gamma | 2.38 92% | 2.34 94% | 2.13 103% |
| CCT | 6701 97% | 6094 107% | 6889 94% |
| Color Space (Percent of AdobeRGB 1998) (%) | 58.44 | 66.26 13% | 79 35% |
| Color Space (Percent of sRGB) (%) | 90.3 | 99.69 10% | 99.97 11% |
| Media totale (Programma / Settaggio) | -13% /
-6% | 15% /
17% |
* ... Meglio usare valori piccoli
Tempi di risposta del Display
| ↔ Tempi di risposta dal Nero al Bianco | ||
|---|---|---|
| 17.6 ms ... aumenta ↗ e diminuisce ↘ combinato | ↗ 10.8 ms Incremento | 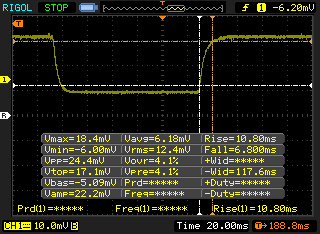 |
| ↘ 6.8 ms Calo | ||
| Lo schermo mostra buoni tempi di risposta durante i nostri tests, ma potrebbe essere troppo lento per i gamers competitivi. In confronto, tutti i dispositivi di test variano da 0.1 (minimo) a 240 (massimo) ms. » 40 % di tutti i dispositivi è migliore. Questo significa che i tempi di risposta rilevati sono migliori rispettto alla media di tutti i dispositivi testati (19.8 ms). | ||
| ↔ Tempo di risposta dal 50% Grigio all'80% Grigio | ||
| 35.2 ms ... aumenta ↗ e diminuisce ↘ combinato | ↗ 15.2 ms Incremento | 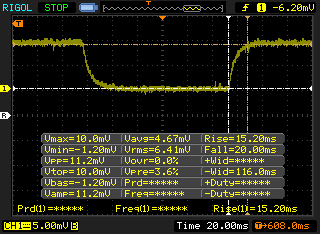 |
| ↘ 20 ms Calo | ||
| Lo schermo mostra tempi di risposta lenti nei nostri tests e sarà insoddisfacente per i gamers. In confronto, tutti i dispositivi di test variano da 0.165 (minimo) a 636 (massimo) ms. » 49 % di tutti i dispositivi è migliore. Questo significa che i tempi di risposta rilevati sono peggiori rispetto alla media di tutti i dispositivi testati (31 ms). | ||
Sfarfallio dello schermo / PWM (Pulse-Width Modulation)
| flickering dello schermo / PWM rilevato | 21740 Hz | ≤ 20 % settaggio luminosita' | 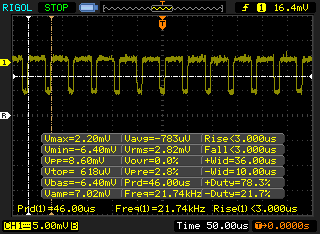 |
Il display sfarfalla a 21740 Hz (Probabilmente a causa dell'uso di PWM) Flickering rilevato ad una luminosita' di 20 % o inferiore. Non dovrebbe verificarsi flickering o PWM sopra questo valore di luminosita'. La frequenza di 21740 Hz è abbastanza alta, quindi la maggioranza degli utenti sensibili al PWM non dovrebbero notare alcun flickering. In confronto: 52 % di tutti i dispositivi testati non utilizza PWM per ridurre la luminosita' del display. Se è rilevato PWM, una media di 7754 (minimo: 5 - massimo: 343500) Hz è stata rilevata. | |||
| Cinebench R11.5 | |
| CPU Single 64Bit | |
| Lenovo ThinkCentre M910z-10NR000KUS | |
| Lenovo ThinkPad T470p-20J7S00000 | |
| CPU Multi 64Bit | |
| Lenovo ThinkPad T470p-20J7S00000 | |
| Lenovo ThinkCentre M910z-10NR000KUS | |
| wPrime 2.10 - 1024m | |
| HP Z1 G2 G1X47EA | |
| Lenovo ThinkCentre M910z-10NR000KUS | |
* ... Meglio usare valori piccoli
| PCMark 8 | |
| Home Score Accelerated v2 | |
| Lenovo ThinkCentre M910z-10NR000KUS | |
| Lenovo ThinkPad T470p-20J7S00000 | |
| HP Z1 G2 G1X47EA | |
| Dell Latitude 5580 | |
| Work Score Accelerated v2 | |
| Lenovo ThinkCentre M910z-10NR000KUS | |
| Lenovo ThinkPad T470p-20J7S00000 | |
| HP Z1 G2 G1X47EA | |
| Creative Score Accelerated v2 | |
| Lenovo ThinkCentre M910z-10NR000KUS | |
| Lenovo ThinkPad T470p-20J7S00000 | |
| HP Z1 G2 G1X47EA | |
| PCMark 8 Home Score Accelerated v2 | 3916 punti | |
| PCMark 8 Creative Score Accelerated v2 | 5077 punti | |
| PCMark 8 Work Score Accelerated v2 | 5053 punti | |
| PCMark 10 Score | 3910 punti | |
Aiuto | ||

| 3DMark 11 | |
| 1280x720 Performance GPU | |
| Lenovo ThinkPad T470p-20J7S00000 | |
| Lenovo ThinkCentre M910z-10NR000KUS | |
| Dell Latitude 5580 | |
| 1280x720 Performance Combined | |
| Lenovo ThinkPad T470p-20J7S00000 | |
| Lenovo ThinkCentre M910z-10NR000KUS | |
| Dell Latitude 5580 | |
| 3DMark | |
| 1280x720 Cloud Gate Standard Graphics | |
| Lenovo ThinkPad T470p-20J7S00000 | |
| HP Z1 G2 G1X47EA | |
| Lenovo ThinkCentre M910z-10NR000KUS | |
| 1920x1080 Fire Strike Graphics | |
| Lenovo ThinkPad T470p-20J7S00000 | |
| HP Z1 G2 G1X47EA | |
| Lenovo ThinkCentre M910z-10NR000KUS | |
| 1920x1080 Ice Storm Extreme Graphics | |
| Lenovo ThinkPad T470p-20J7S00000 | |
| 3DMark 06 Standard Score | 10165 punti | |
| 3DMark 11 Performance | 1782 punti | |
| 3DMark Cloud Gate Standard Score | 7160 punti | |
| 3DMark Fire Strike Score | 907 punti | |
Aiuto | ||
| basso | medio | alto | ultra | |
|---|---|---|---|---|
| BioShock Infinite (2013) | 52 | 35 | 23 | 8 |
Rumorosità
| Idle |
| 34.5 / 34.6 / 34.6 dB(A) |
| Sotto carico |
| 34.6 / 34.6 dB(A) |
 | ||
30 dB silenzioso 40 dB(A) udibile 50 dB(A) rumoroso |
||
min: | ||
| Lenovo ThinkCentre M910z-10NR000KUS HD Graphics 630, i5-7500, Toshiba NVMe THNSF5512GPUK | HP Z1 G2 G1X47EA Quadro K2100M, E3-1226 v3, Micron M600 MTFDDAT256MBF mSATA | Apple iMac Retina 5K 27 Late 2015 3.2 GHz M390 MK472D/A Radeon R9 M390, 6500, Apple Fusion Drive 1TB (24 GB SSD + 1 TB HDD) | Lenovo ThinkPad T470p-20J7S00000 GeForce 940MX, i7-7700HQ, Samsung PM961 NVMe MZVLW512HMJP | Dell Latitude 5580 HD Graphics 620, i5-7300U, Toshiba MQ01ACF050 | |
|---|---|---|---|---|---|
| Noise | 5% | -7% | 4% | -2% | |
| off /ambiente * (dB) | 28 | 30 -7% | 29 -4% | 30.6 -9% | |
| Idle Minimum * (dB) | 34.5 | 32.4 6% | 32.5 6% | 29 16% | 32.8 5% |
| Idle Average * (dB) | 34.6 | 32.4 6% | 32.5 6% | 29 16% | 32.8 5% |
| Idle Maximum * (dB) | 34.6 | 32.4 6% | 32.5 6% | 29 16% | 33.6 3% |
| Load Average * (dB) | 34.6 | 33.7 3% | 39 -13% | 35.6 -3% | 37.6 -9% |
| Load Maximum * (dB) | 34.6 | 33.7 3% | 48.2 -39% | 39.7 -15% | 37.6 -9% |
* ... Meglio usare valori piccoli
(+) La temperatura massima sul lato superiore è di 39.8 °C / 104 F, rispetto alla media di 33.9 °C / 93 F, che varia da 25 a 47 °C per questa classe Desktop.
(-) Il lato inferiore si riscalda fino ad un massimo di 54.8 °C / 131 F, rispetto alla media di 33.6 °C / 92 F
(+) In idle, la temperatura media del lato superiore è di 26.6 °C / 80 F, rispetto alla media deld ispositivo di 29.5 °C / 85 F.
Lenovo ThinkCentre M910z-10NR000KUS analisi audio
(±) | potenza degli altiparlanti media ma buona (79.4 dB)
Bassi 100 - 315 Hz
(+) | bassi buoni - solo 4.7% dalla media
(-) | bassi non lineari (15.9% delta rispetto alla precedente frequenza)
Medi 400 - 2000 Hz
(±) | medi elevati - circa 5.7% superiore alla media
(±) | linearità dei medi adeguata (9.1% delta rispetto alla precedente frequenza)
Alti 2 - 16 kHz
(±) | alti ridotti - circa 6.8% inferiori alla media
(±) | la linearità degli alti è media (11% delta rispetto alla precedente frequenza)
Nel complesso 100 - 16.000 Hz
(±) | la linearità complessiva del suono è media (19.9% di differenza rispetto alla media
Rispetto alla stessa classe
» 67% di tutti i dispositivi testati in questa classe è stato migliore, 22% simile, 11% peggiore
» Il migliore ha avuto un delta di 6%, medio di 16%, peggiore di 46%
Rispetto a tutti i dispositivi testati
» 51% di tutti i dispositivi testati in questa classe è stato migliore, 7% similare, 42% peggiore
» Il migliore ha avuto un delta di 4%, medio di 23%, peggiore di 134%
Lenovo ThinkPad T470p-20J7S00000 analisi audio
(+) | gli altoparlanti sono relativamente potenti (83.1 dB)
Bassi 100 - 315 Hz
(-) | quasi nessun basso - in media 18.1% inferiori alla media
(±) | la linearità dei bassi è media (14.6% delta rispetto alla precedente frequenza)
Medi 400 - 2000 Hz
(+) | medi bilanciati - solo only 4.2% rispetto alla media
(+) | medi lineari (5.9% delta rispetto alla precedente frequenza)
Alti 2 - 16 kHz
(+) | Alti bilanciati - appena 3.3% dalla media
(+) | alti lineari (6.5% delta rispetto alla precedente frequenza)
Nel complesso 100 - 16.000 Hz
(±) | la linearità complessiva del suono è media (19.6% di differenza rispetto alla media
Rispetto alla stessa classe
» 41% di tutti i dispositivi testati in questa classe è stato migliore, 8% simile, 51% peggiore
» Il migliore ha avuto un delta di 7%, medio di 21%, peggiore di 53%
Rispetto a tutti i dispositivi testati
» 49% di tutti i dispositivi testati in questa classe è stato migliore, 7% similare, 44% peggiore
» Il migliore ha avuto un delta di 4%, medio di 23%, peggiore di 134%
| Off / Standby | |
| Idle | |
| Sotto carico |
|
Leggenda:
min: | |
| Lenovo ThinkCentre M910z-10NR000KUS i5-7500, HD Graphics 630, Toshiba NVMe THNSF5512GPUK, IPS, 1920x1080, 23.8" | HP Z1 G2 G1X47EA E3-1226 v3, Quadro K2100M, Micron M600 MTFDDAT256MBF mSATA, IPS LED, 2560x1440, 27" | Apple iMac Retina 5K 27 Late 2015 3.2 GHz M390 MK472D/A 6500, Radeon R9 M390, Apple Fusion Drive 1TB (24 GB SSD + 1 TB HDD), , 5120x2880, 27" | Lenovo ThinkPad T470p-20J7S00000 i7-7700HQ, GeForce 940MX, Samsung PM961 NVMe MZVLW512HMJP, IPS, 2560x1440, 14" | Dell Latitude 5580 i5-7300U, HD Graphics 620, Toshiba MQ01ACF050, IPS, 1920x1080, 15.6" | |
|---|---|---|---|---|---|
| Power Consumption | -109% | -119% | 43% | 63% | |
| Idle Minimum * (Watt) | 14.4 | 36.8 -156% | 29.5 -105% | 3.8 74% | 4.3 70% |
| Idle Average * (Watt) | 29.4 | 65.3 -122% | 59.2 -101% | 6.5 78% | 10.1 66% |
| Idle Maximum * (Watt) | 29.7 | 67 -126% | 68 -129% | 7.2 76% | 11.8 60% |
| Load Average * (Watt) | 64.1 | 114 -78% | 126 -97% | 62.5 2% | 32 50% |
| Load Maximum * (Watt) | 88.4 | 142 -61% | 231 -161% | 99.6 -13% | 29 67% |
* ... Meglio usare valori piccoli
Pro
Contro
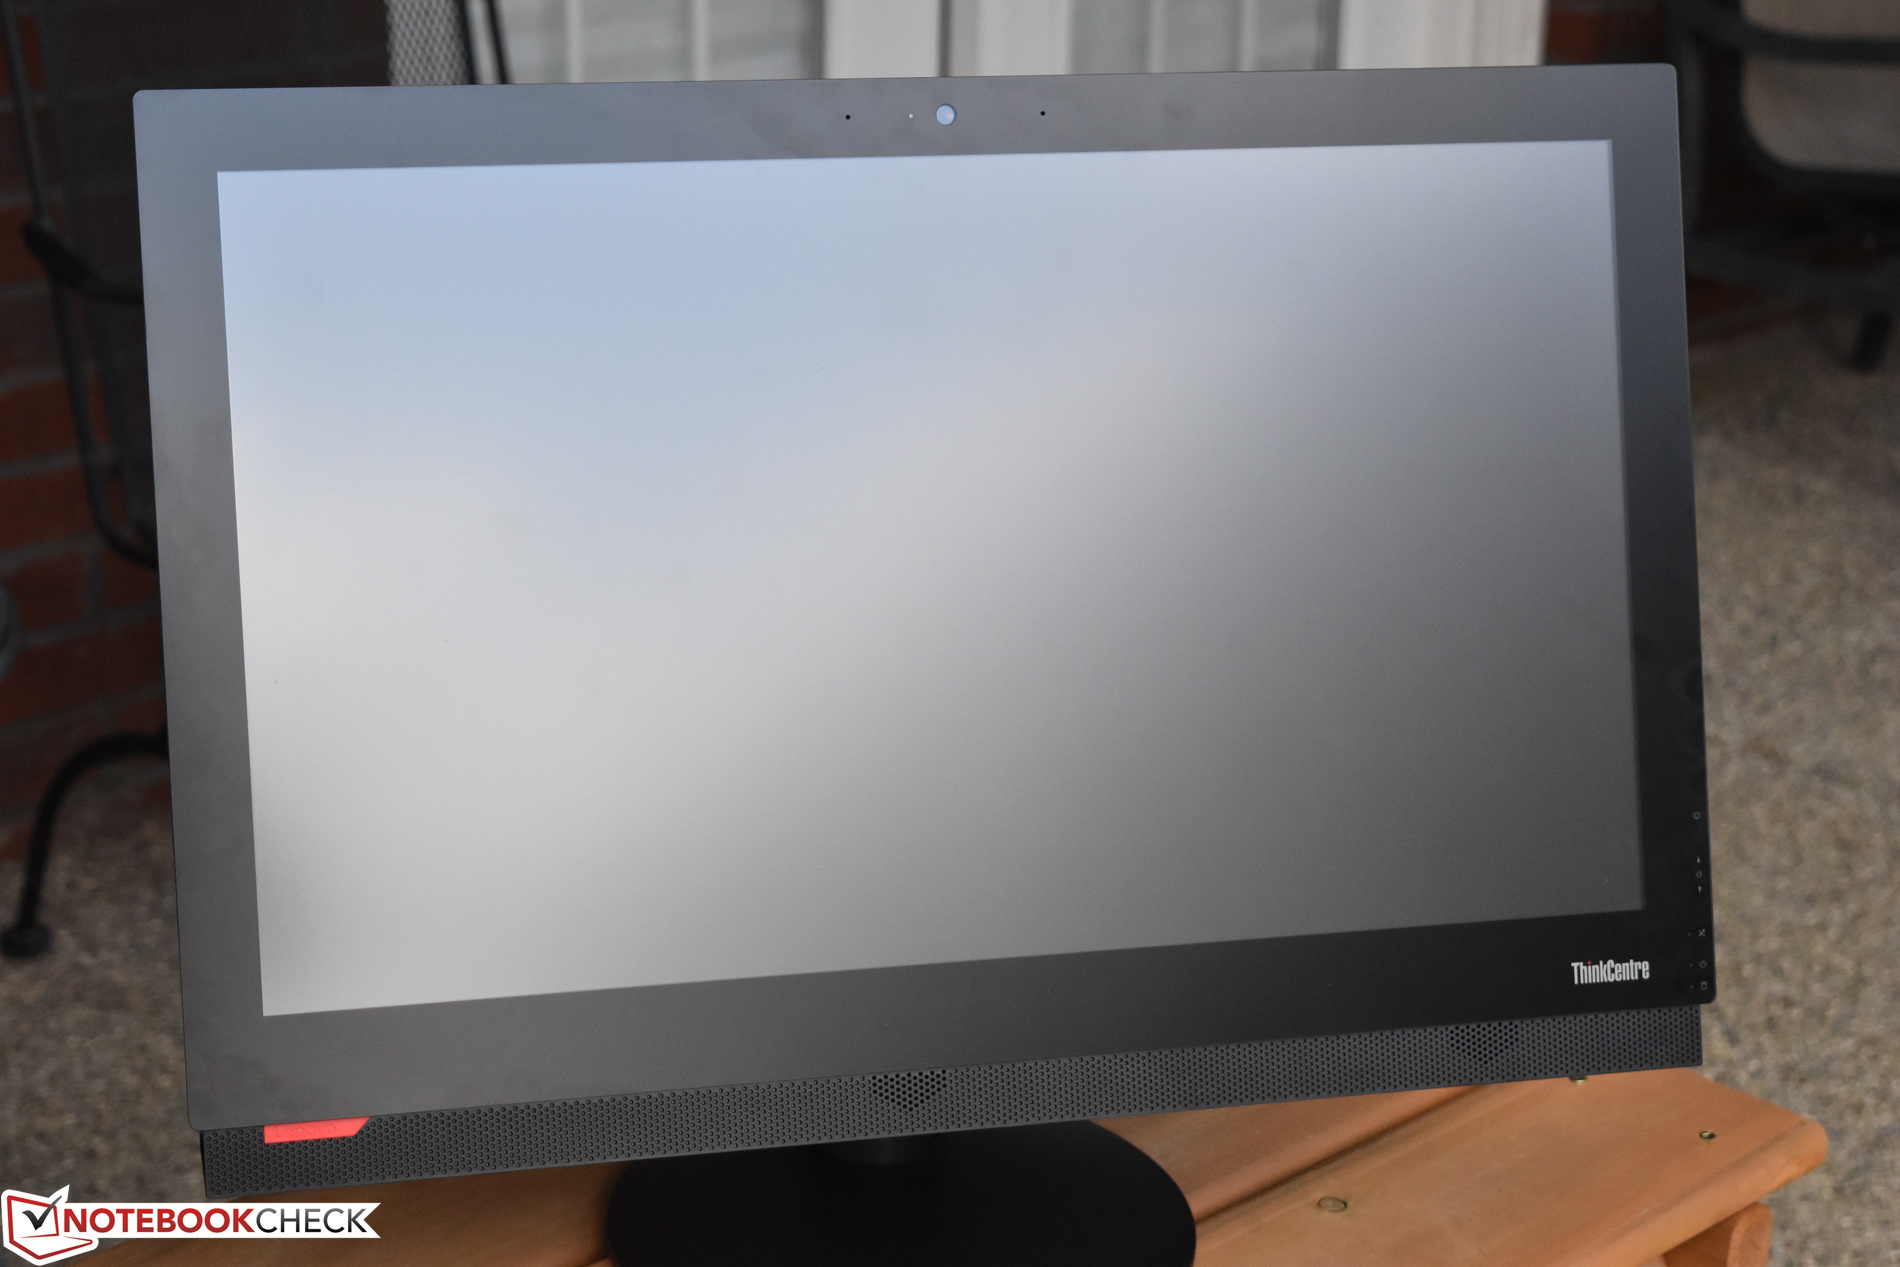
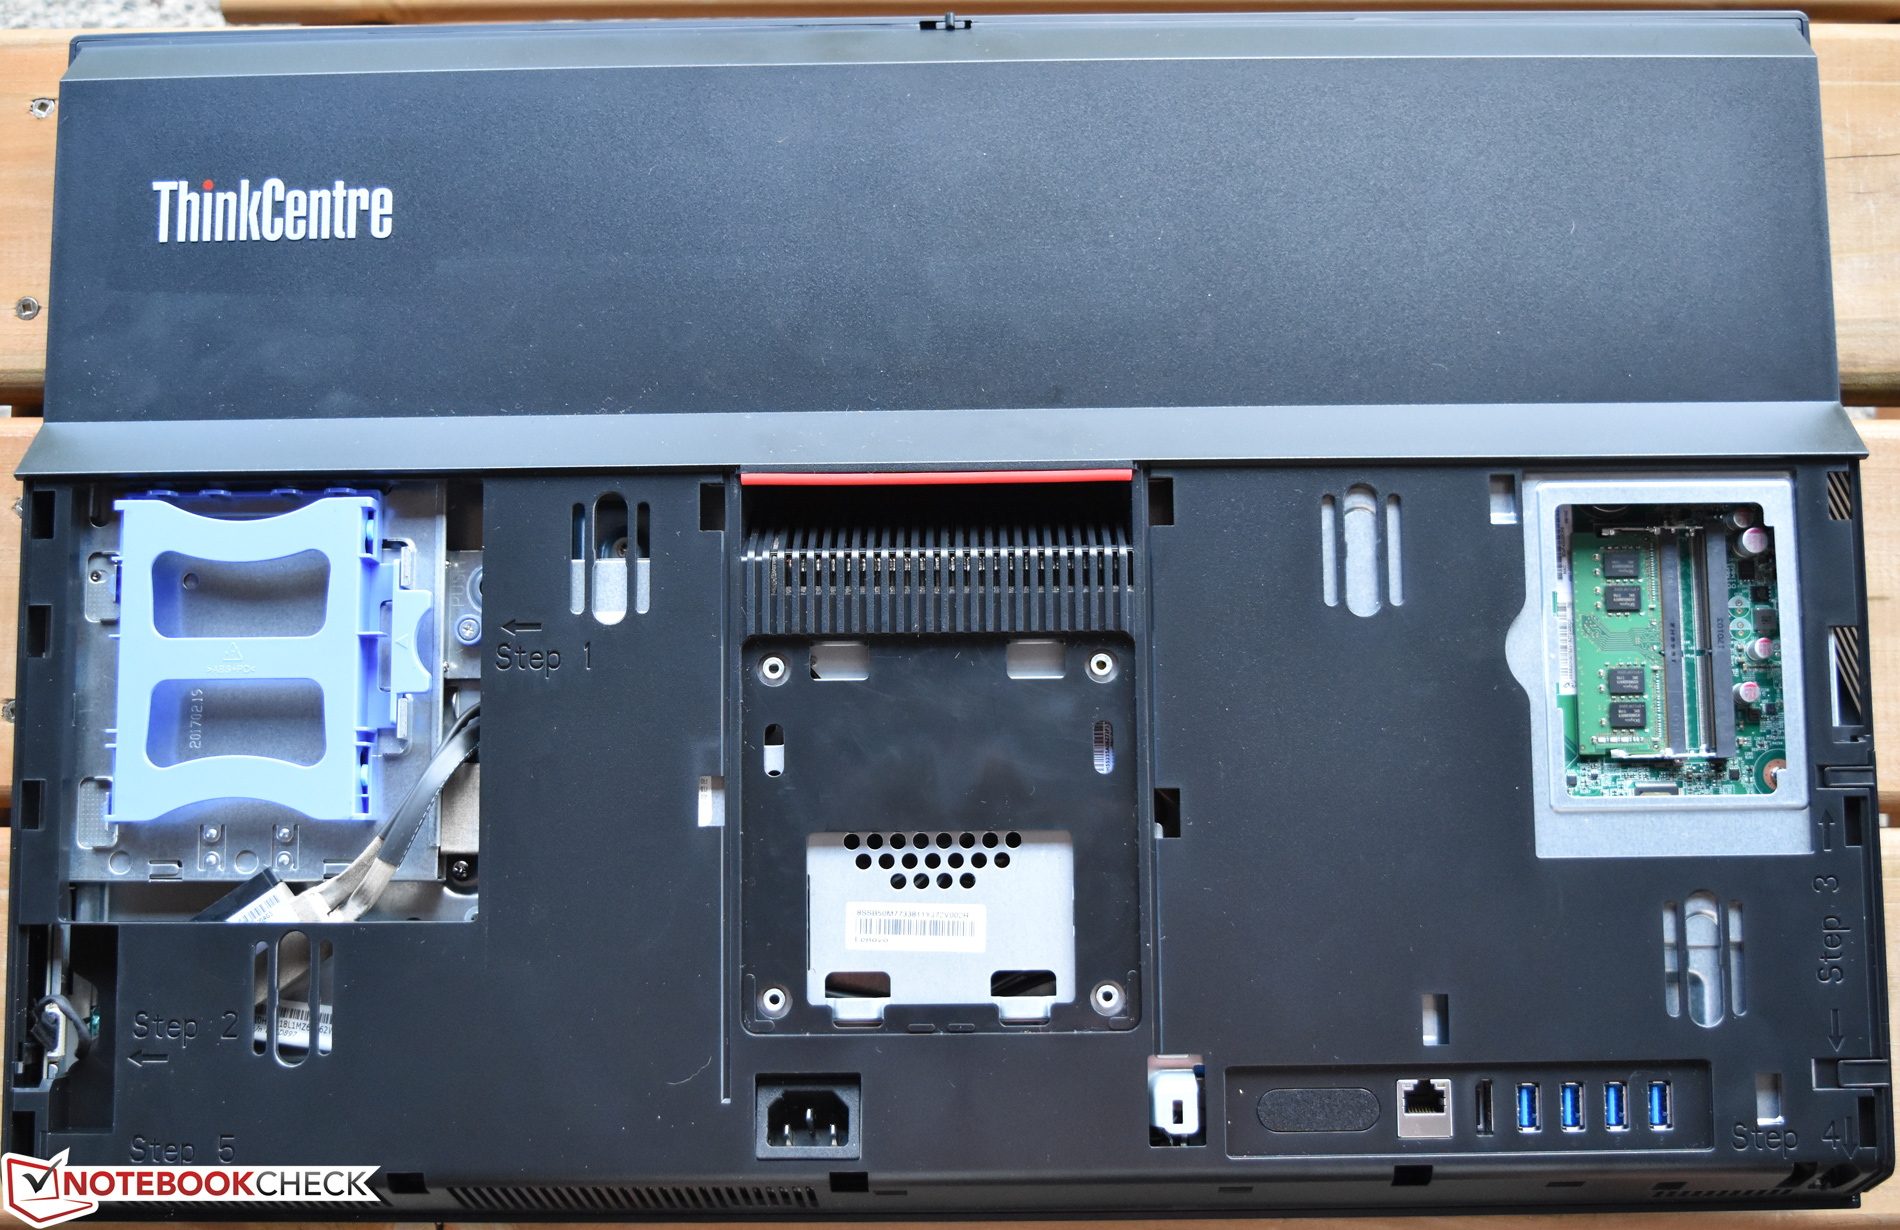
I desktops business, compresi gli all-in-ones, sono parte del mercato che è più semplice notare rispetto all'affollato settore business. Di base non c'è niente di eccitante nel ThinkCentre M910z (la nostra confugurazione: $1,285), ha un design funzionale e sobrio e ha tutto ciò che occorre per una macchina da ufficio.
Ma non è una cosa negativa: mantenendo fede alla sua eredita, il ThinkCentre fa un buon lavoro con un design e features apprezzate come la (quasi) facile manutenzione e possibilità di upgrades oltre alla versatilità. Ma è anche silenzioso (anche sotto carico), veloce nelle operazioni generiche grazie alla sua CPU quad-core ed all'SSD NVMe, ed ha delle casse che smentiscono la classica brutta reputazione dei dispositivi business. Il display lascia sensazioni miste, la luminosità è scarsa e il touchscreen lascia desiderare (perché usarlo se non va bene?) - ma è antiriflesso! Infine i consumi sono bassi.
Non c'è nulla di particolarmente eccitante nel ThinkCentre M910z, ma non è un male; è funzionale, con un design sobrio e spunta tutte le caselle di una macchina da ufficio convenzionale.
In definitiva non ci sono molte grosse pecche nel ThinkCentre M910z—è un buon dispositivo business desktop che copre tutti gli aspetti base nel mercato business ed è facile da manutenere.
Nota: si tratta di una recensione breve, con alcune sezioni non tradotte, per la versione integrale in inglese guardate qui.
Lenovo ThinkCentre M910z-10NR000KUS
- 09/22/2017 v6 (old)
Steve Schardein
Price comparison
