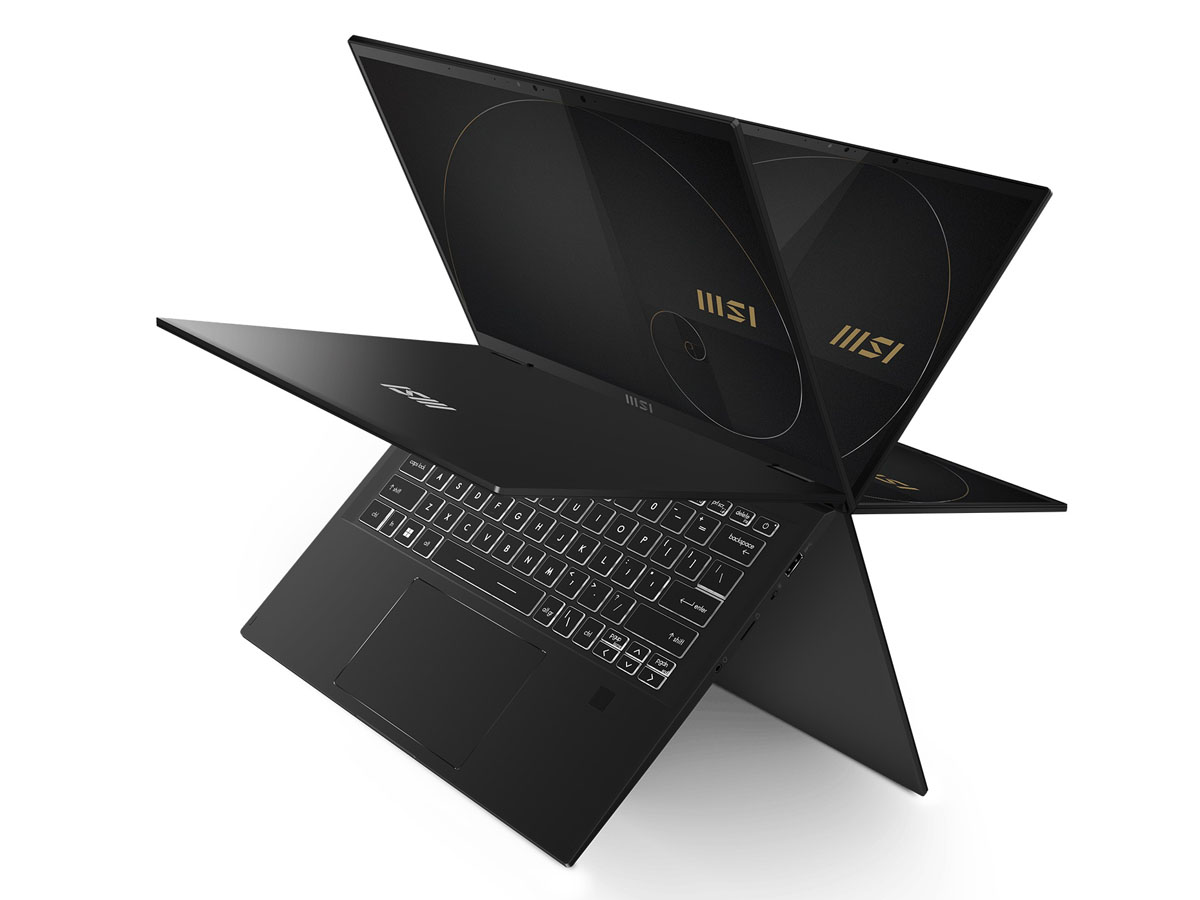
Recensione del convertibile MSI Summit E14 Flip Evo A12M: Un'alternativa legittima a HP, Dell o Lenovo
Da non confondere con il modello Summit E14 a conchigliail Summit E14 Flip è la versione convertibile con cerniere a 360 gradi e un design dello chassis complessivamente diverso. Il modello ha fatto il suo debutto a marzo insieme al più piccolo e rinnovato Summit E13 Flip da 13 pollici.
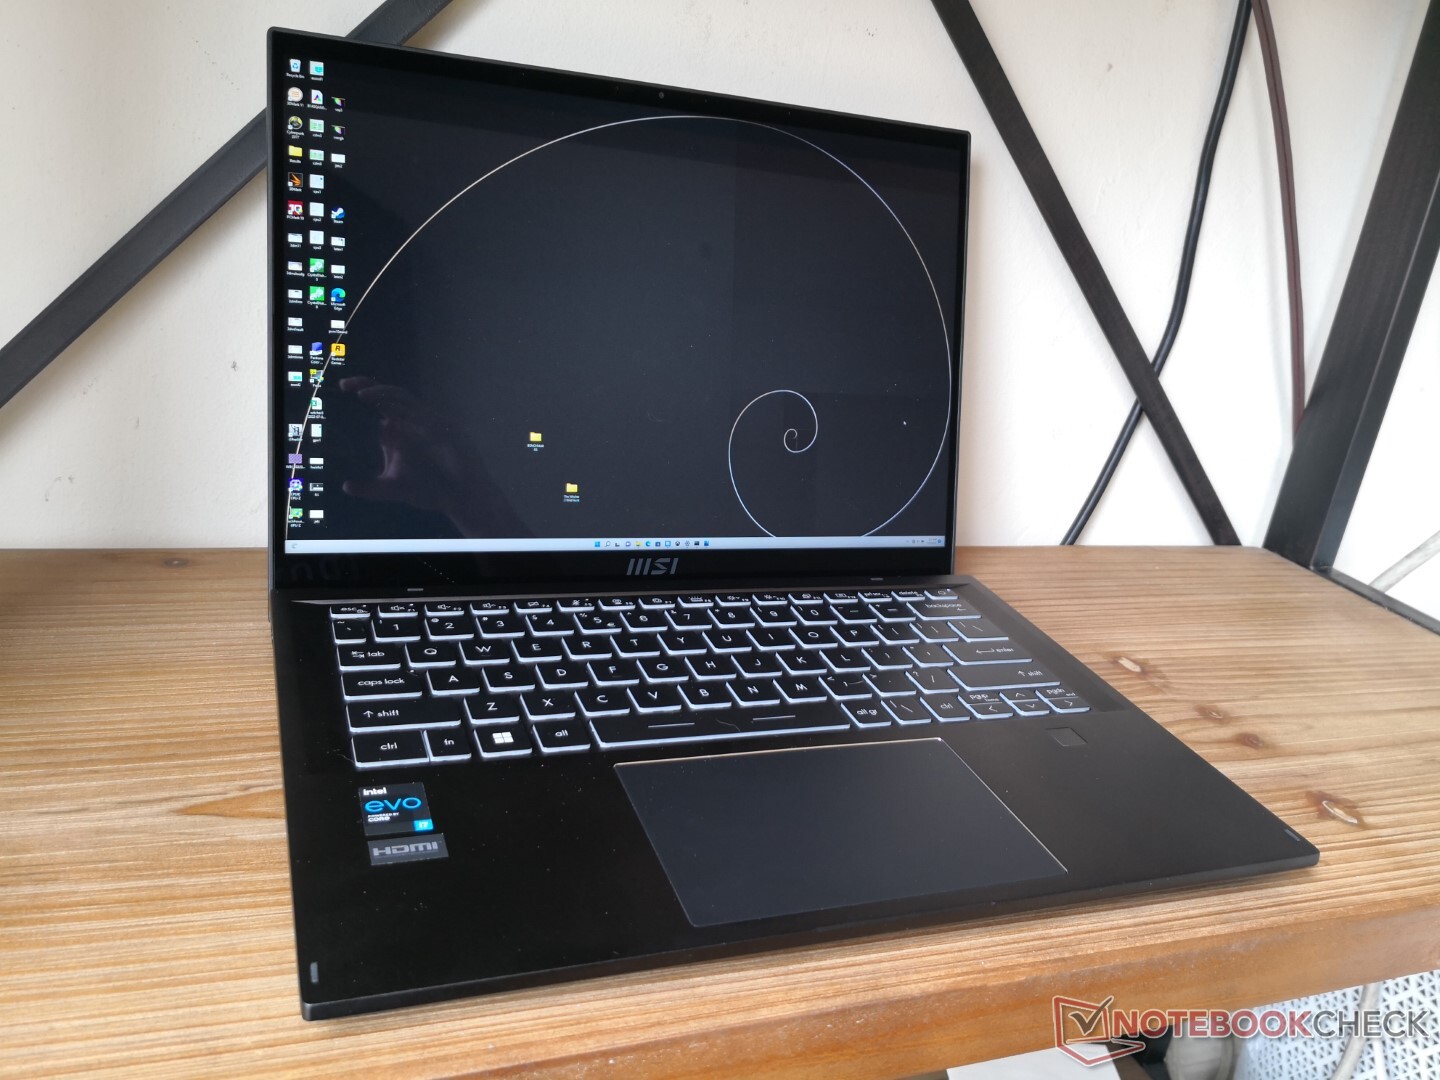
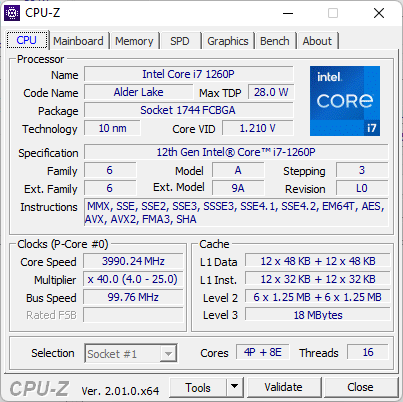
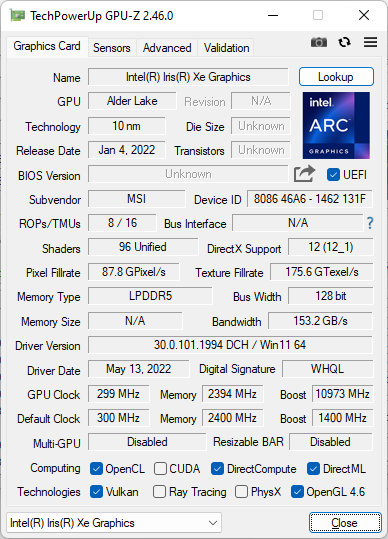
L'unità oggetto della nostra recensione è configurata con CPU Intel Alder Lake-P Core i7-1260P, 32 GB di RAM LPDDR5, schermo touchscreen IPS 16:10 QHD+ e un'unità SSD NVMe da 1 TB per un prezzo al dettaglio compreso tra i 1600 e i 1700 dollari. Nel prossimo futuro sono previste altre SKU con opzioni discrete GeForce MX.
Il Summit E14 Flip è in concorrenza con altri convertibili di fascia alta di tipo prosumer o business, come ilLenovo Yoga 9i 14,Dell Latitude 9420 2-in-1,LG Gram 14T90P, o Asus ExpertBook B7 Flip.
Altre recensioni di MSI:
Potenziali concorrenti a confronto
Punteggio | Data | Modello | Peso | Altezza | Dimensione | Risoluzione | Prezzo |
|---|---|---|---|---|---|---|---|
| 86.1 % v7 (old) | 07/2022 | MSI Summit E14 Flip Evo A12MT i7-1260P, Iris Xe G7 96EUs | 1.6 kg | 17.9 mm | 14.00" | 2880x1800 | |
| 82.3 % v7 (old) | 07/2021 | MSI Summit E14 A11SCS i7-1185G7, GeForce GTX 1650 Ti Max-Q | 1.3 kg | 16 mm | 14.00" | 3840x2160 | |
| 84.1 % v7 (old) | 07/2022 | Asus VivoBook S 14X S5402Z i7-12700H, Iris Xe G7 96EUs | 1.6 kg | 17.9 mm | 14.50" | 2880x1800 | |
| 87.5 % v7 (old) | 05/2022 | LG Gram 14T90P i5-1135G7, Iris Xe G7 80EUs | 1.2 kg | 17 mm | 14.00" | 1900x1200 | |
| 87.6 % v7 (old) | 06/2022 | Lenovo Yoga Slim 7i Pro 14IAP G7 i5-1240P, Iris Xe G7 80EUs | 1.3 kg | 14.6 mm | 14.00" | 2880x1800 | |
| 89 % v7 (old) | 07/2021 | Dell Latitude 9420 2-in-1 i7-1185G7, Iris Xe G7 96EUs | 1.5 kg | 13.94 mm | 14.00" | 2560x1600 |
Caso - Più difficile di prima
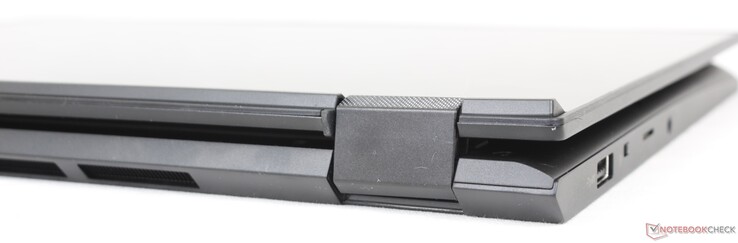
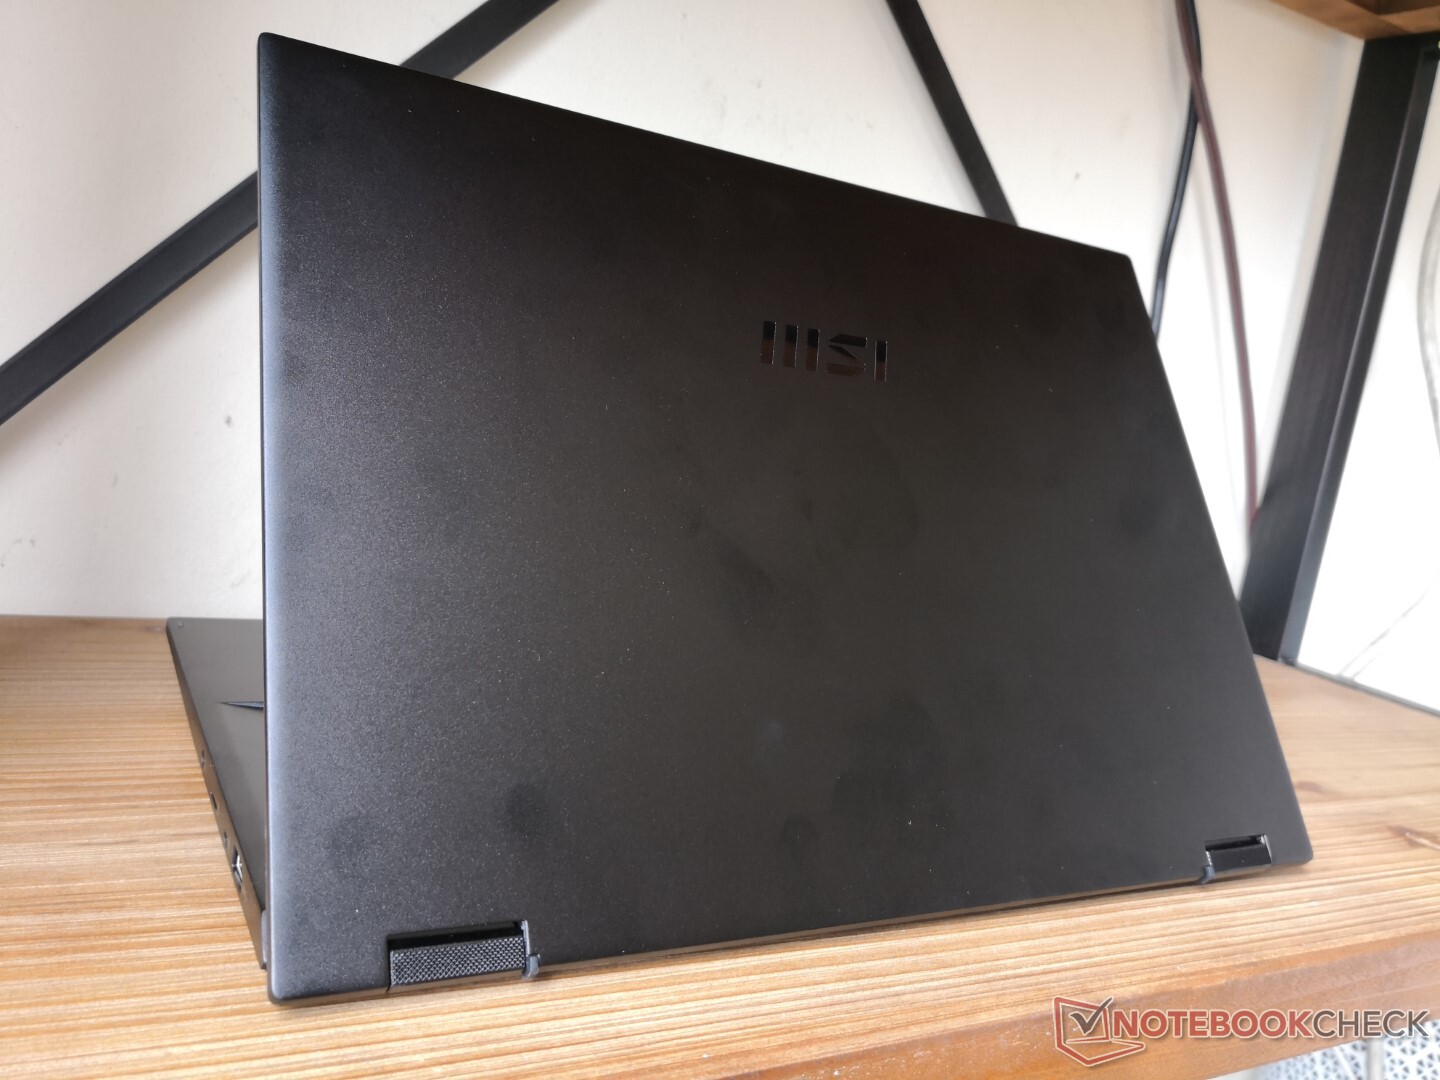
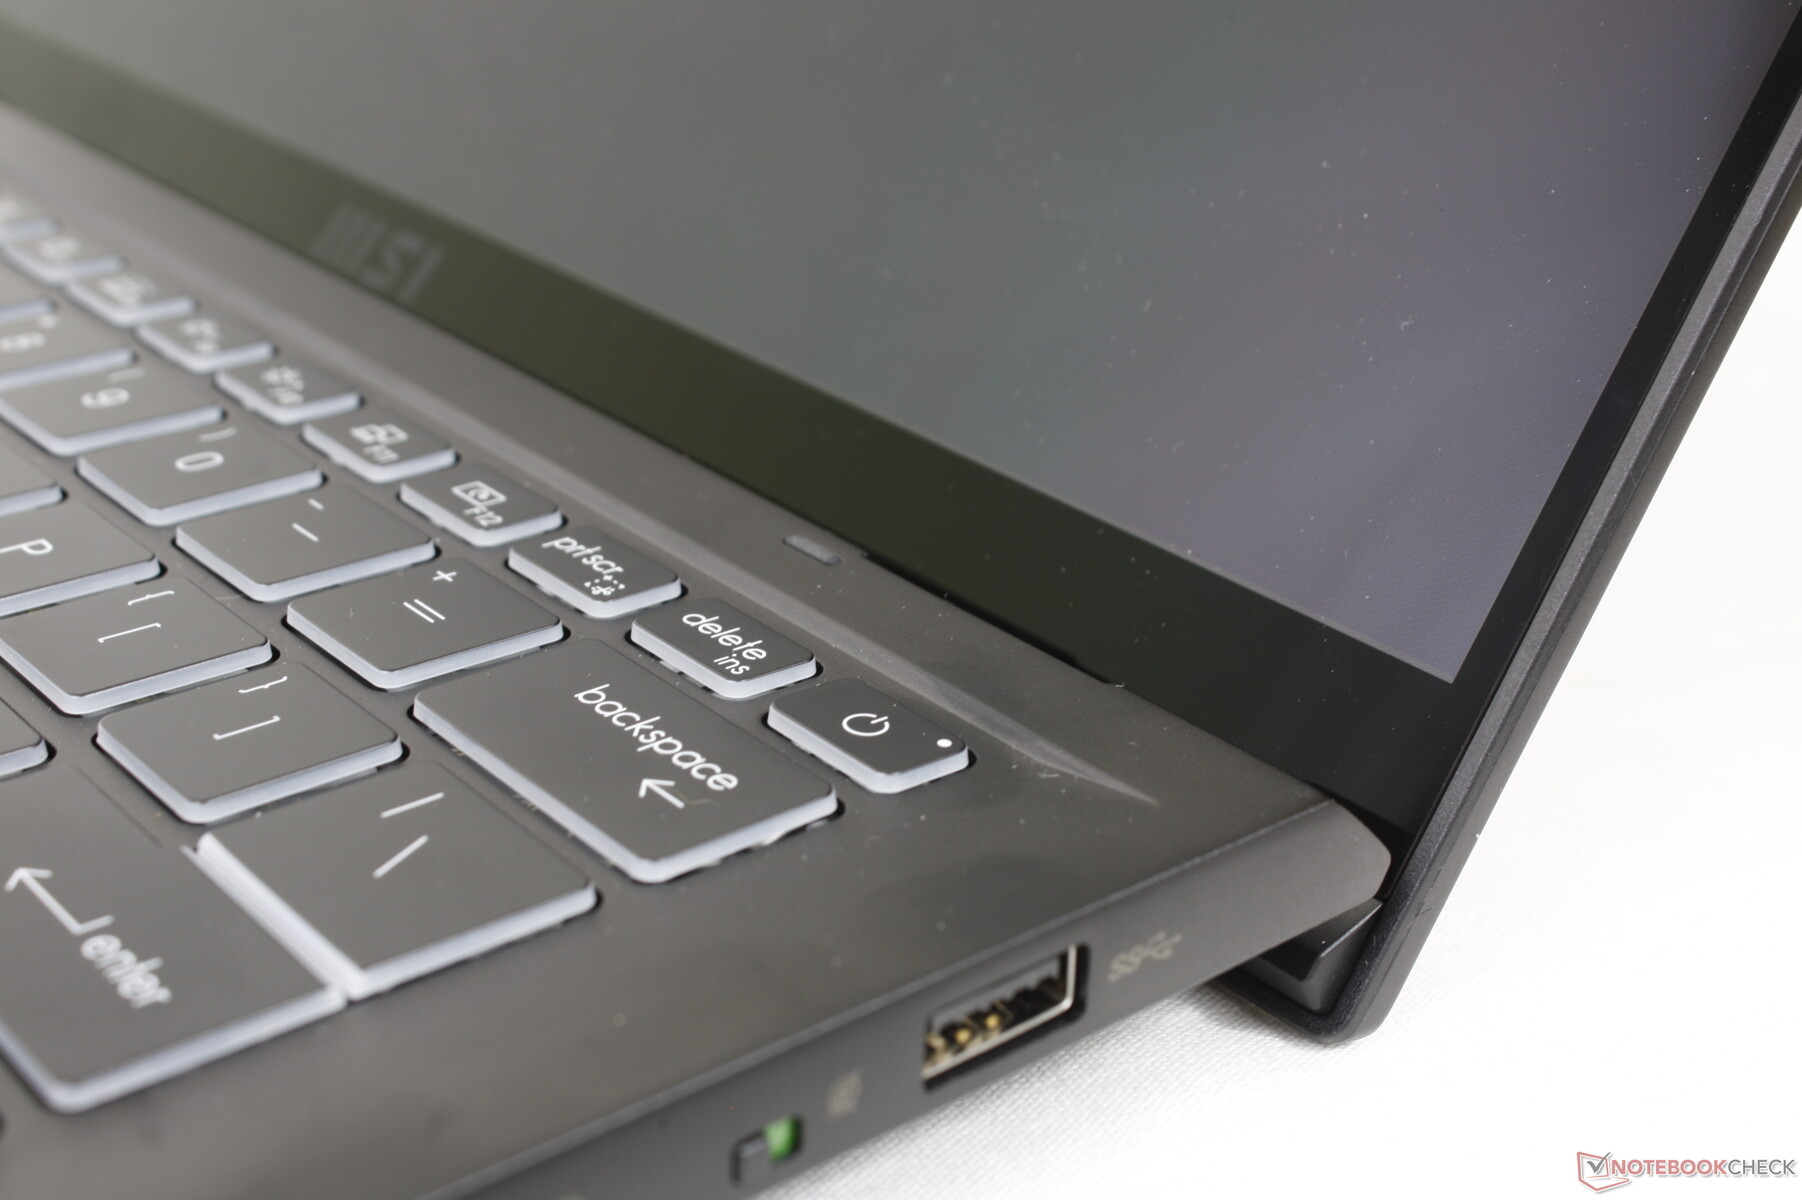
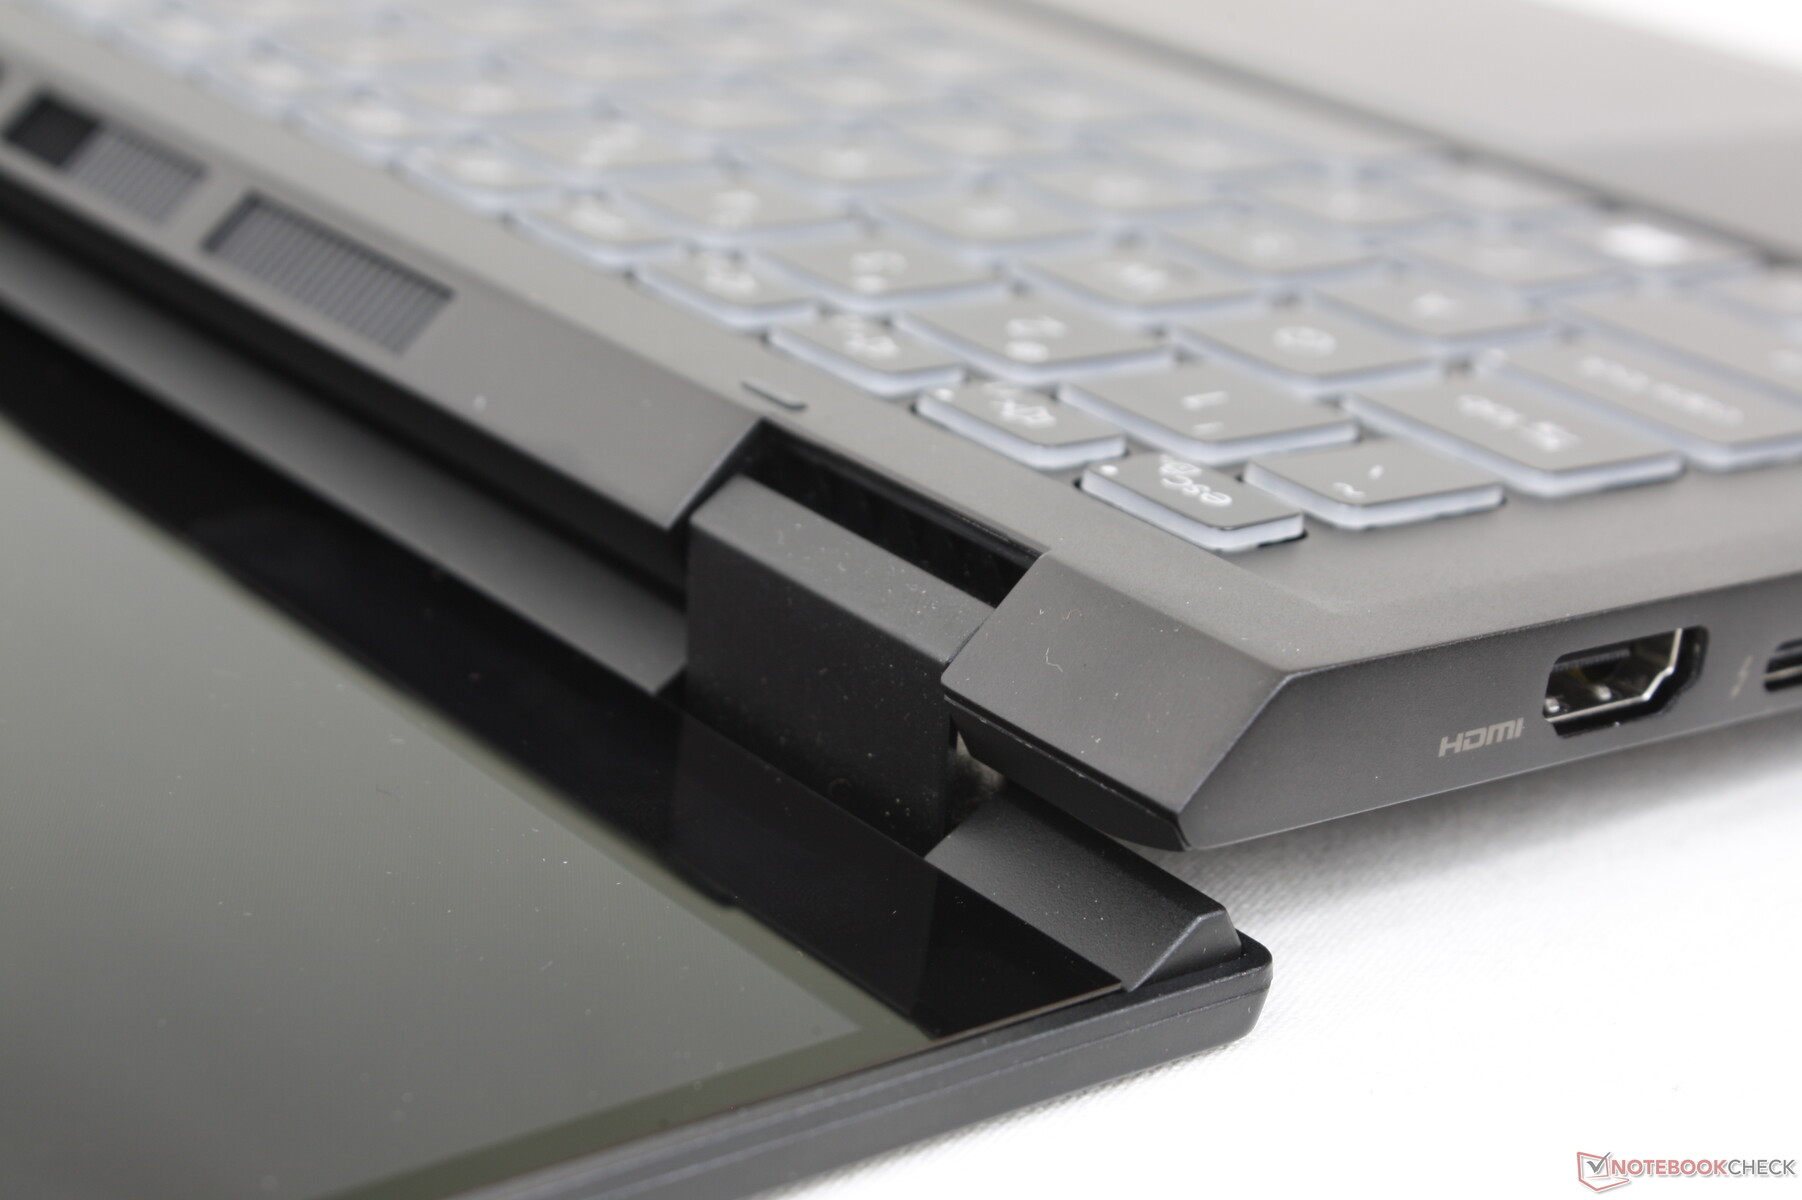
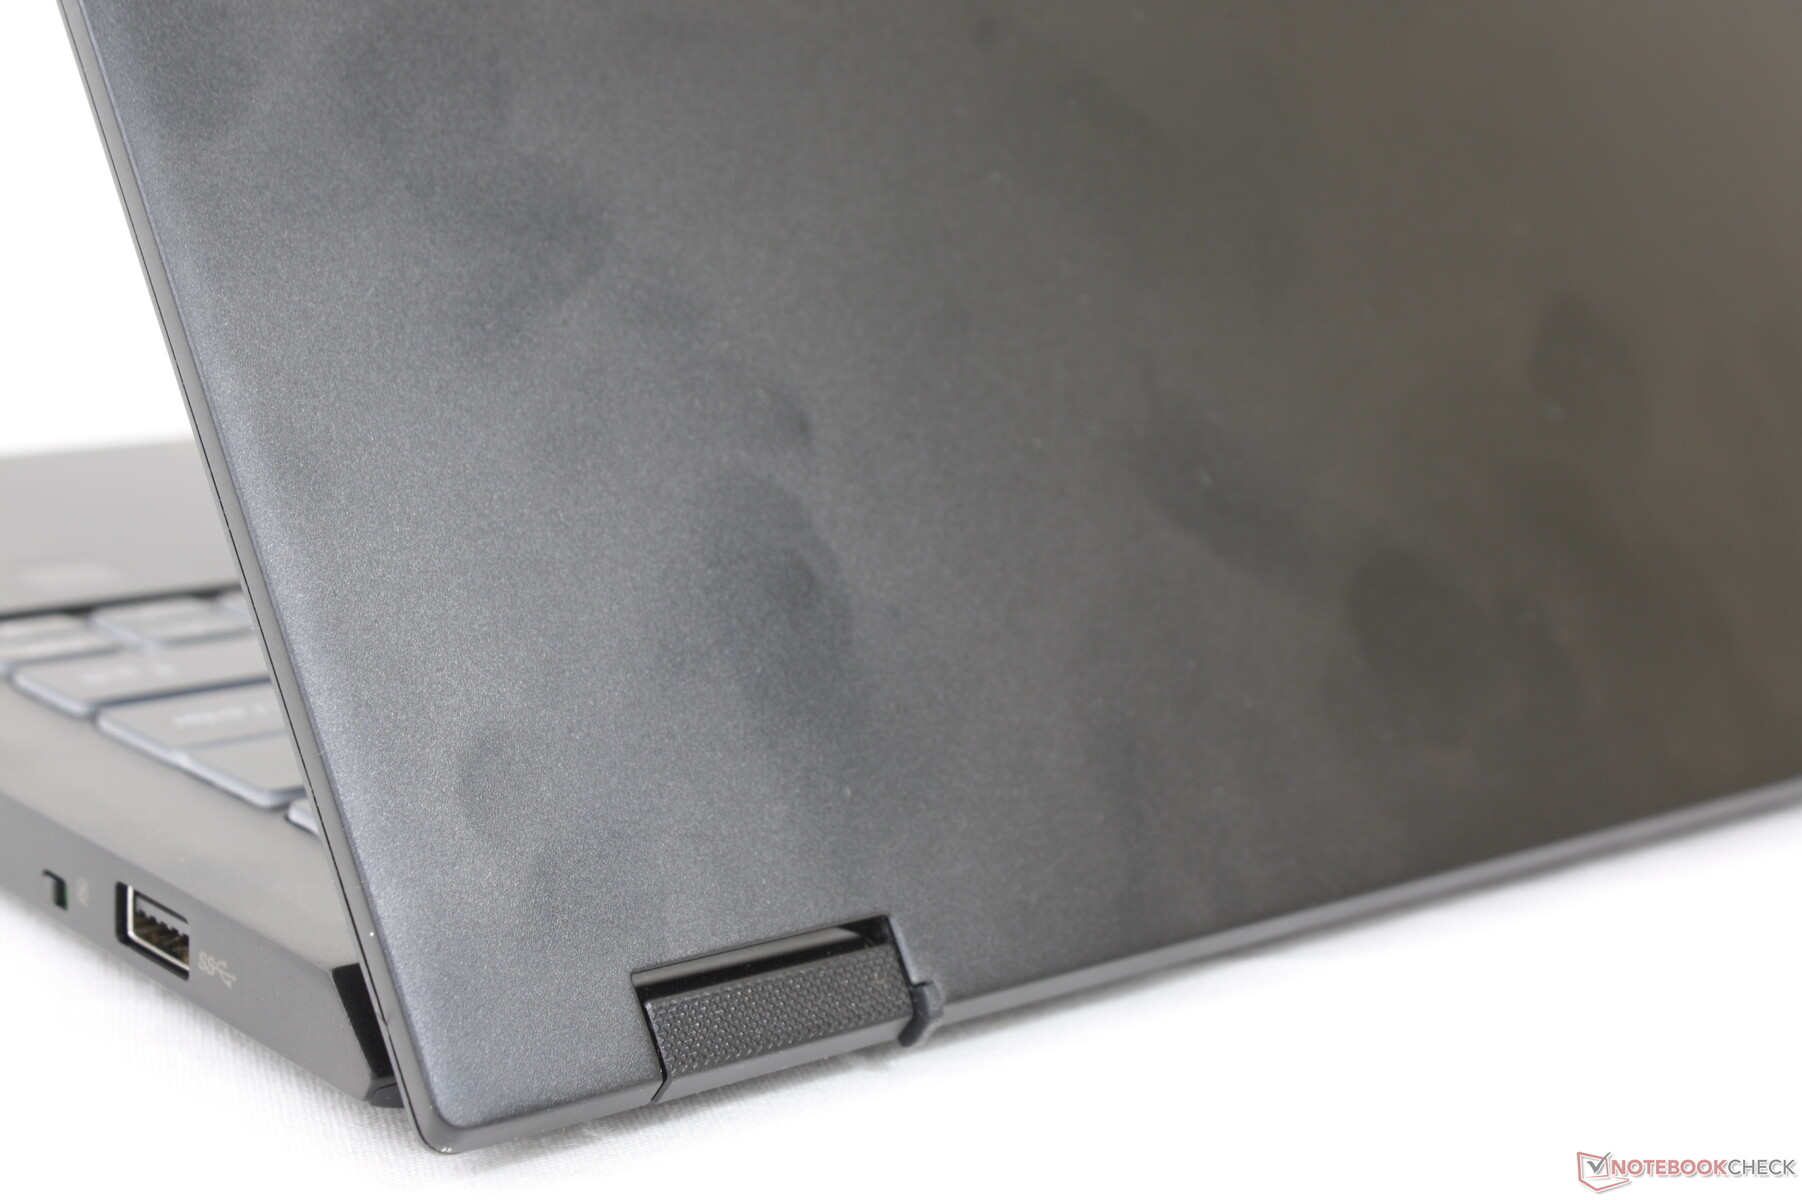
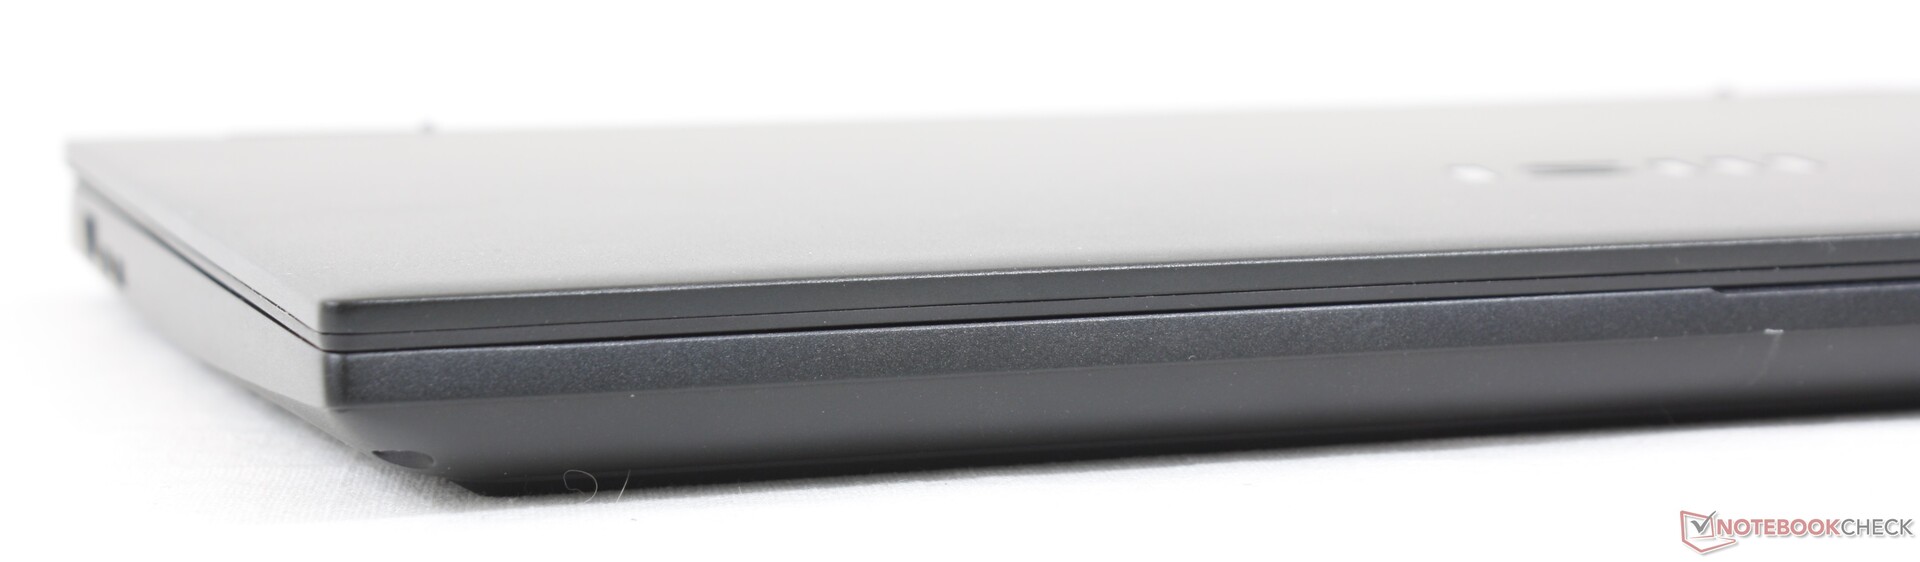
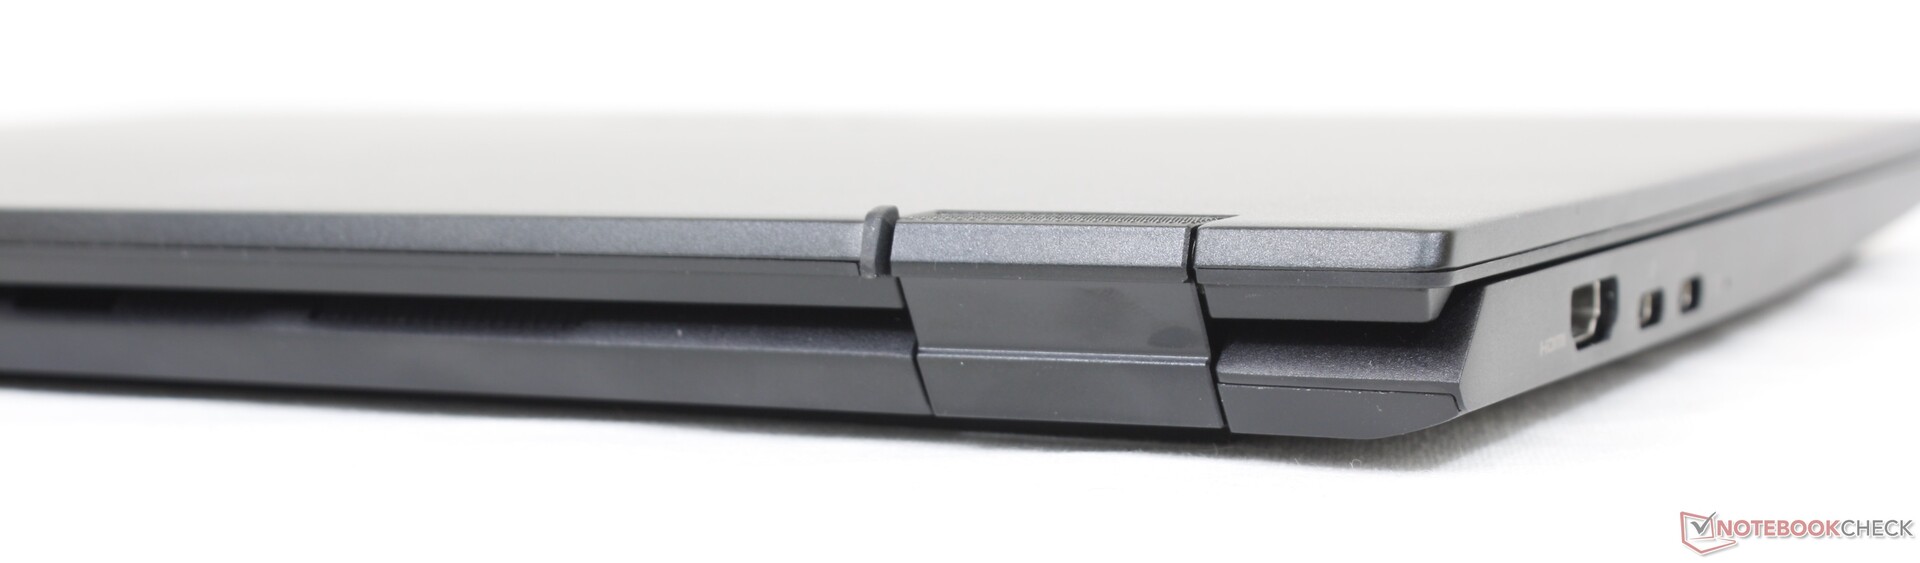
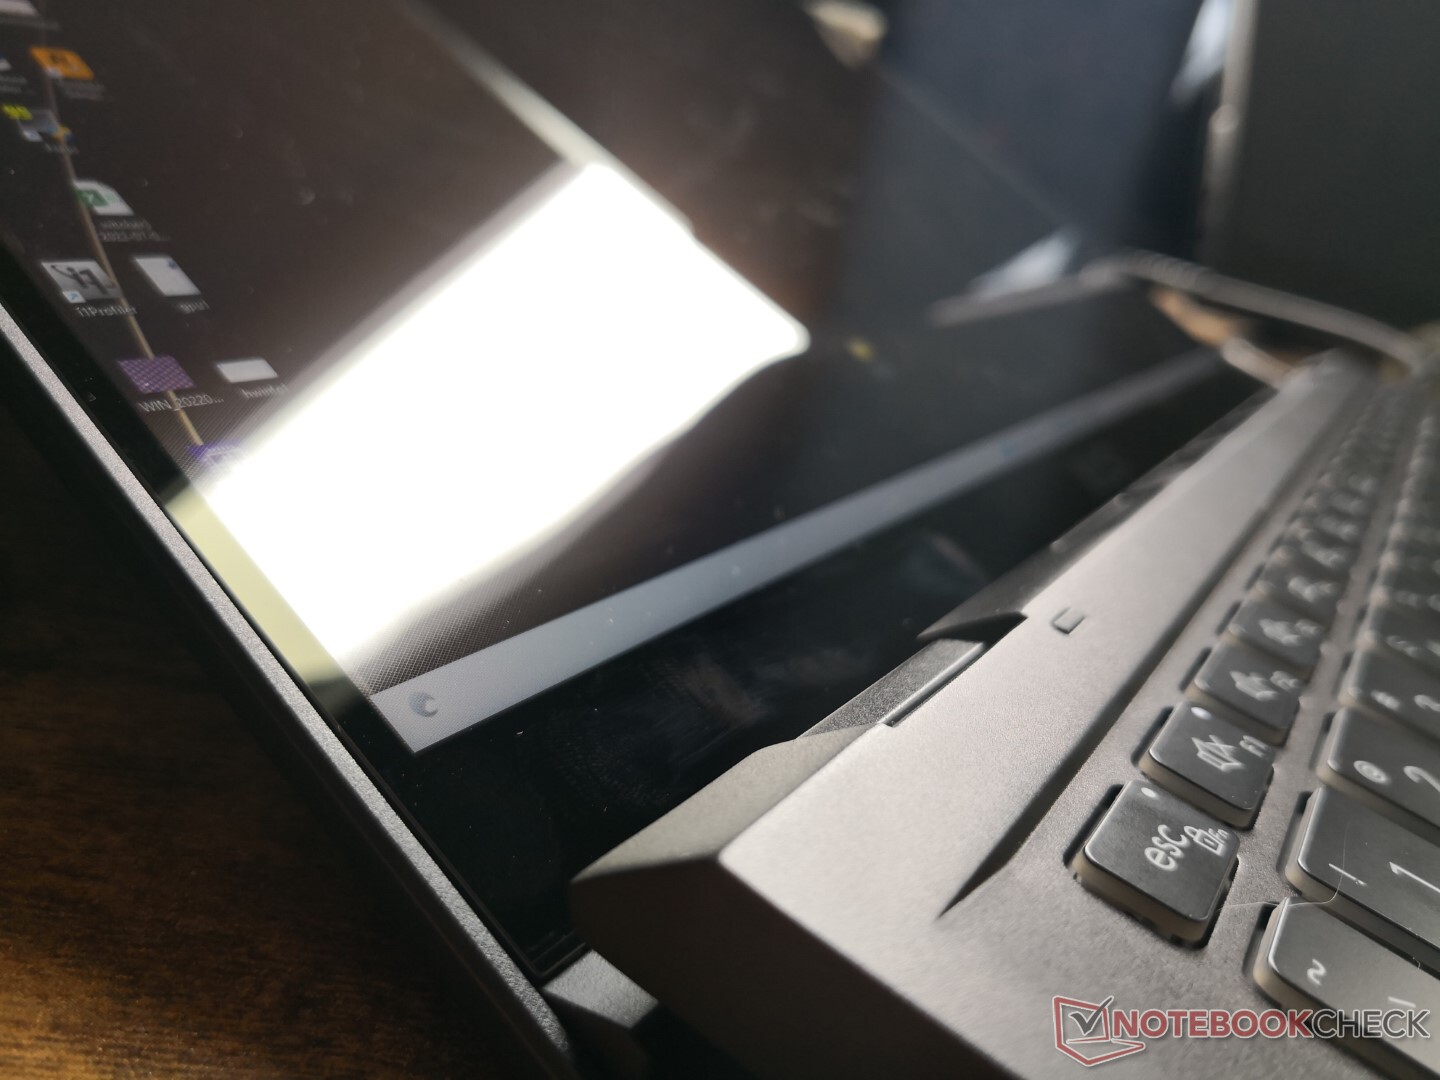
Sebbene il Summit E14 Flip convertibile possa sembrare a prima vista simile al Summit E14 clamshell per via del rivestimento nero opaco, in realtà è molto diverso sia all'interno che all'esterno. Sono spariti il logo dorato e le rifiniture intorno al clickpad per un look più discreto. Il vetro da bordo a bordo è ora di serie per rafforzare la rigidità del coperchio e consentire l'input tramite touchscreen/penna. Le cerniere, che nel modello a conchiglia sono limitate a 180 gradi, sono state completamente ridisegnate per essere più grandi e resistenti per il nuovo fattore di forma a 360 gradi. Tuttavia, riteniamo che le cerniere potrebbero essere più rigide ad alcuni angoli, in particolare tra i 150 e i 180 gradi, per una maggiore longevità
Il modello mantiene la certificazione MIL-STD-810G che condivide con il clamshell originale. La base è rigida e resistente alle torsioni e agli avvallamenti, tanto da essere allo stesso livello di molti altri convertibili prosumer come Asus Zenbook Flip, XPS 13 2-in-1, o Lenovo Yoga 9i 14. Si tratta di un notevole miglioramento rispetto ai più economici laptop MSI Modern che abbiamo sempre trovato più fragili rispetto alla concorrenza.
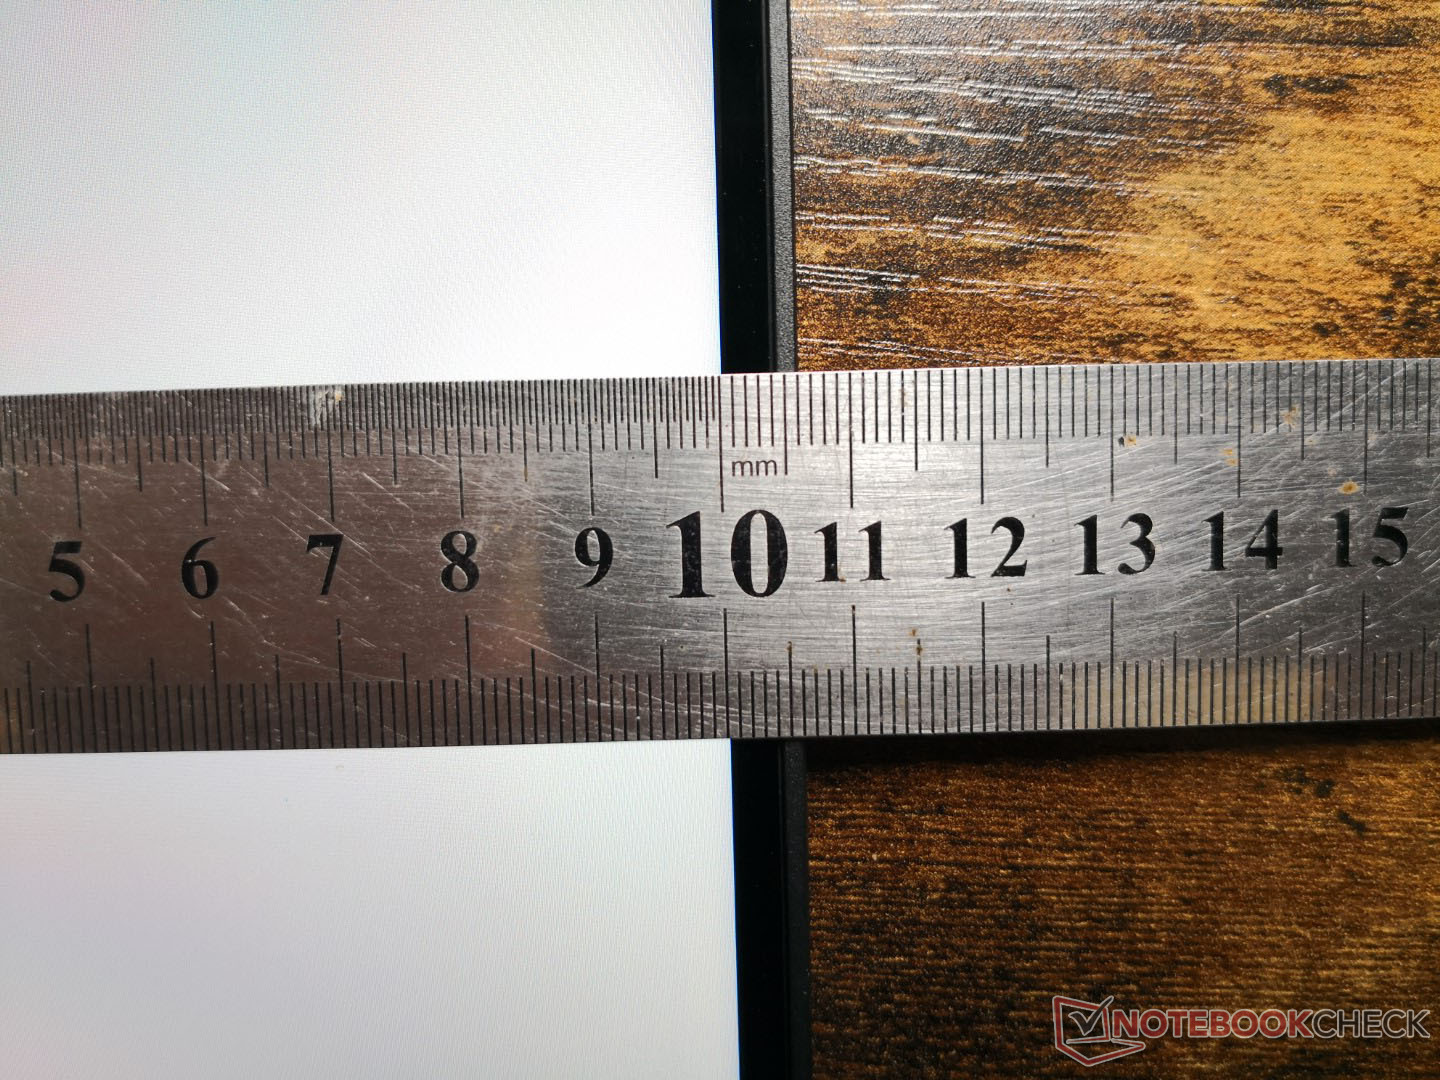
In termini di dimensioni e peso, il modello MSI è più grande e più pesante di molti altri convertibili da 14 pollici. IllG Gram 14T90P e Latitude 9420 2-in-1, ad esempio, sono più leggeri, più piccoli e persino più sottili del nostro Summit E14 Flip. Il convertibile Lenovo Yoga 9i 14 ha un ingombro leggermente maggiore, ma è comunque più sottile e più leggero, rispettivamente di circa 3 mm e 200 grammi.
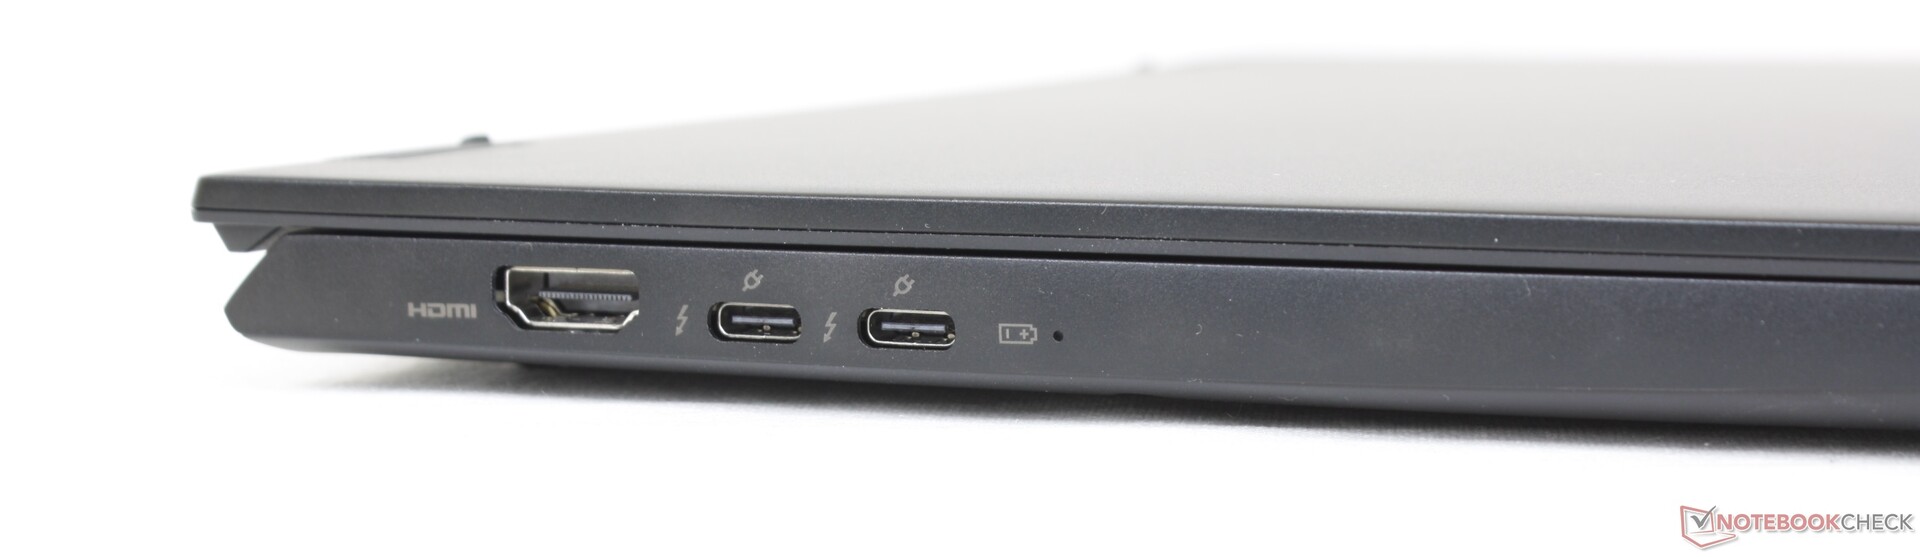
Connettività - Supporto Thunderbolt 4
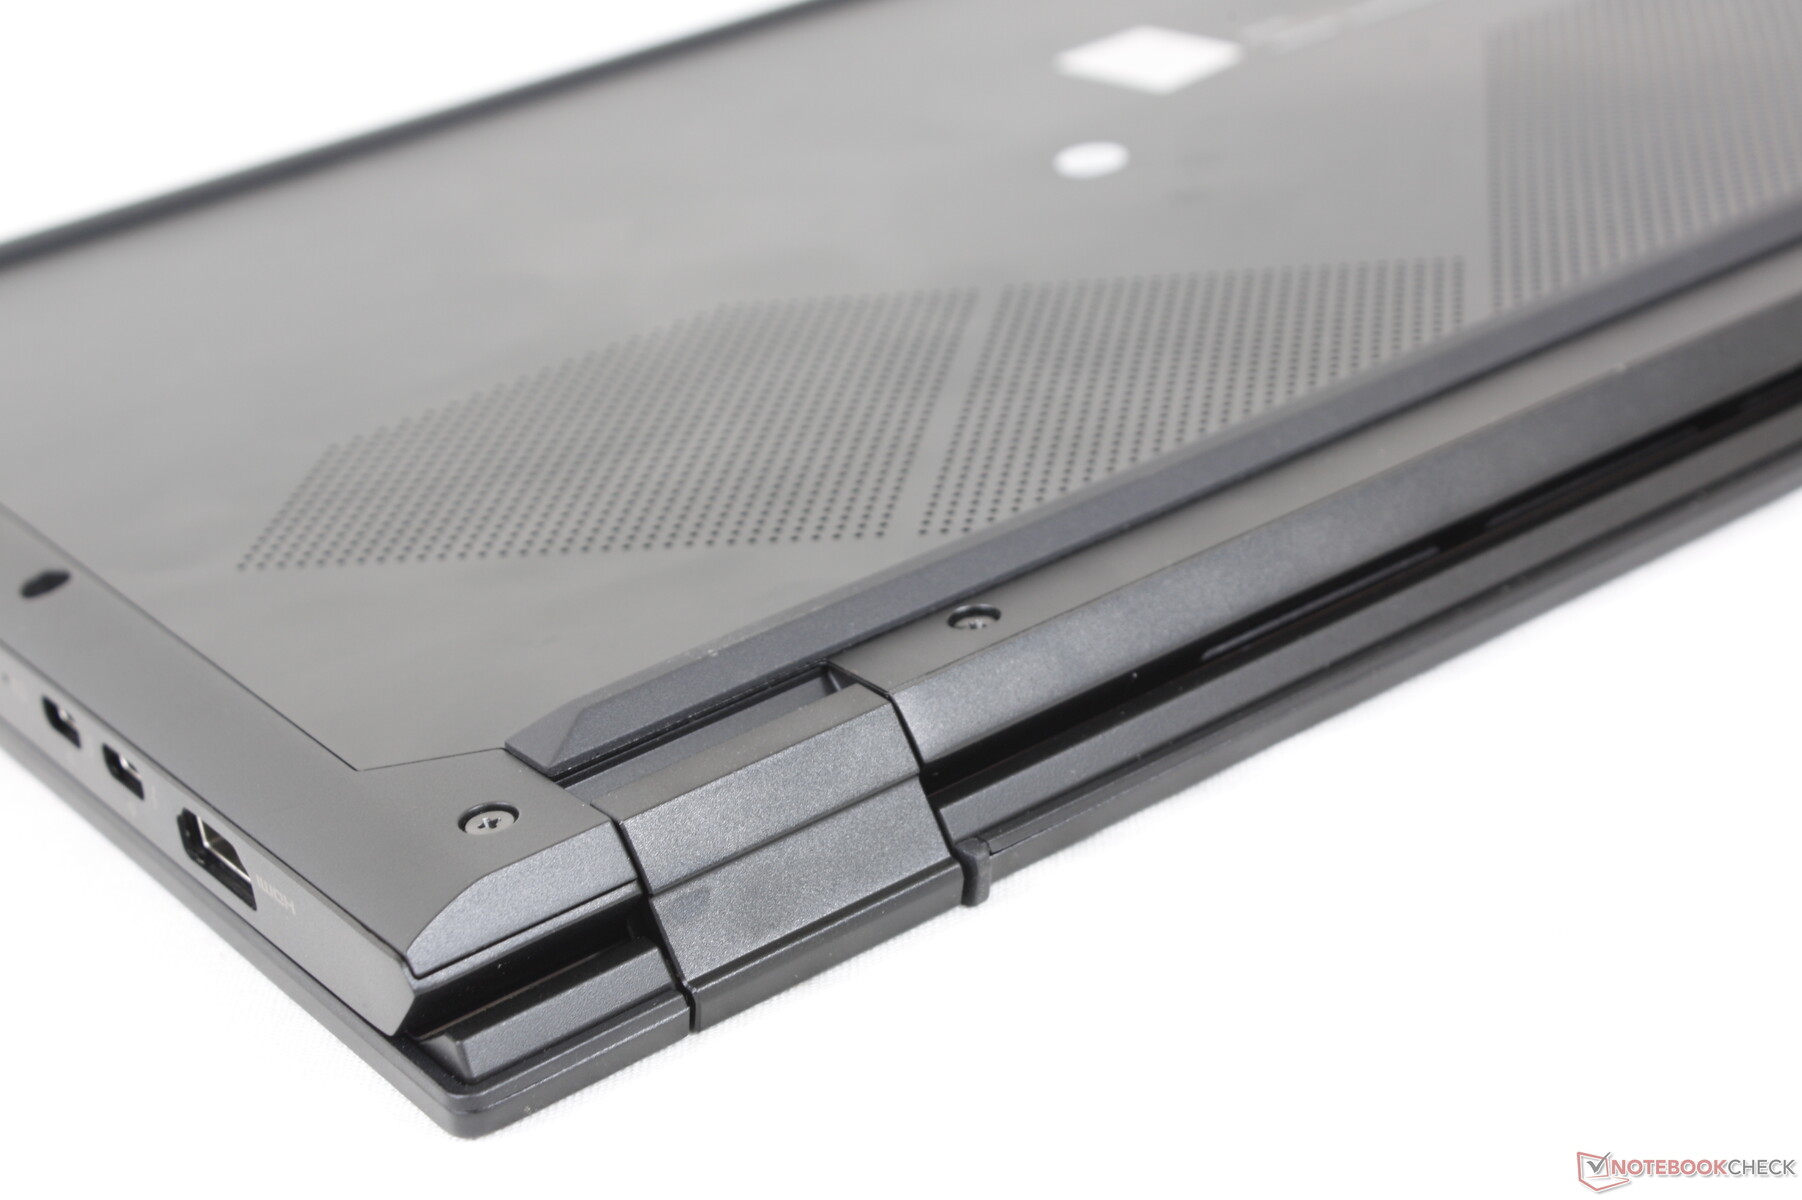
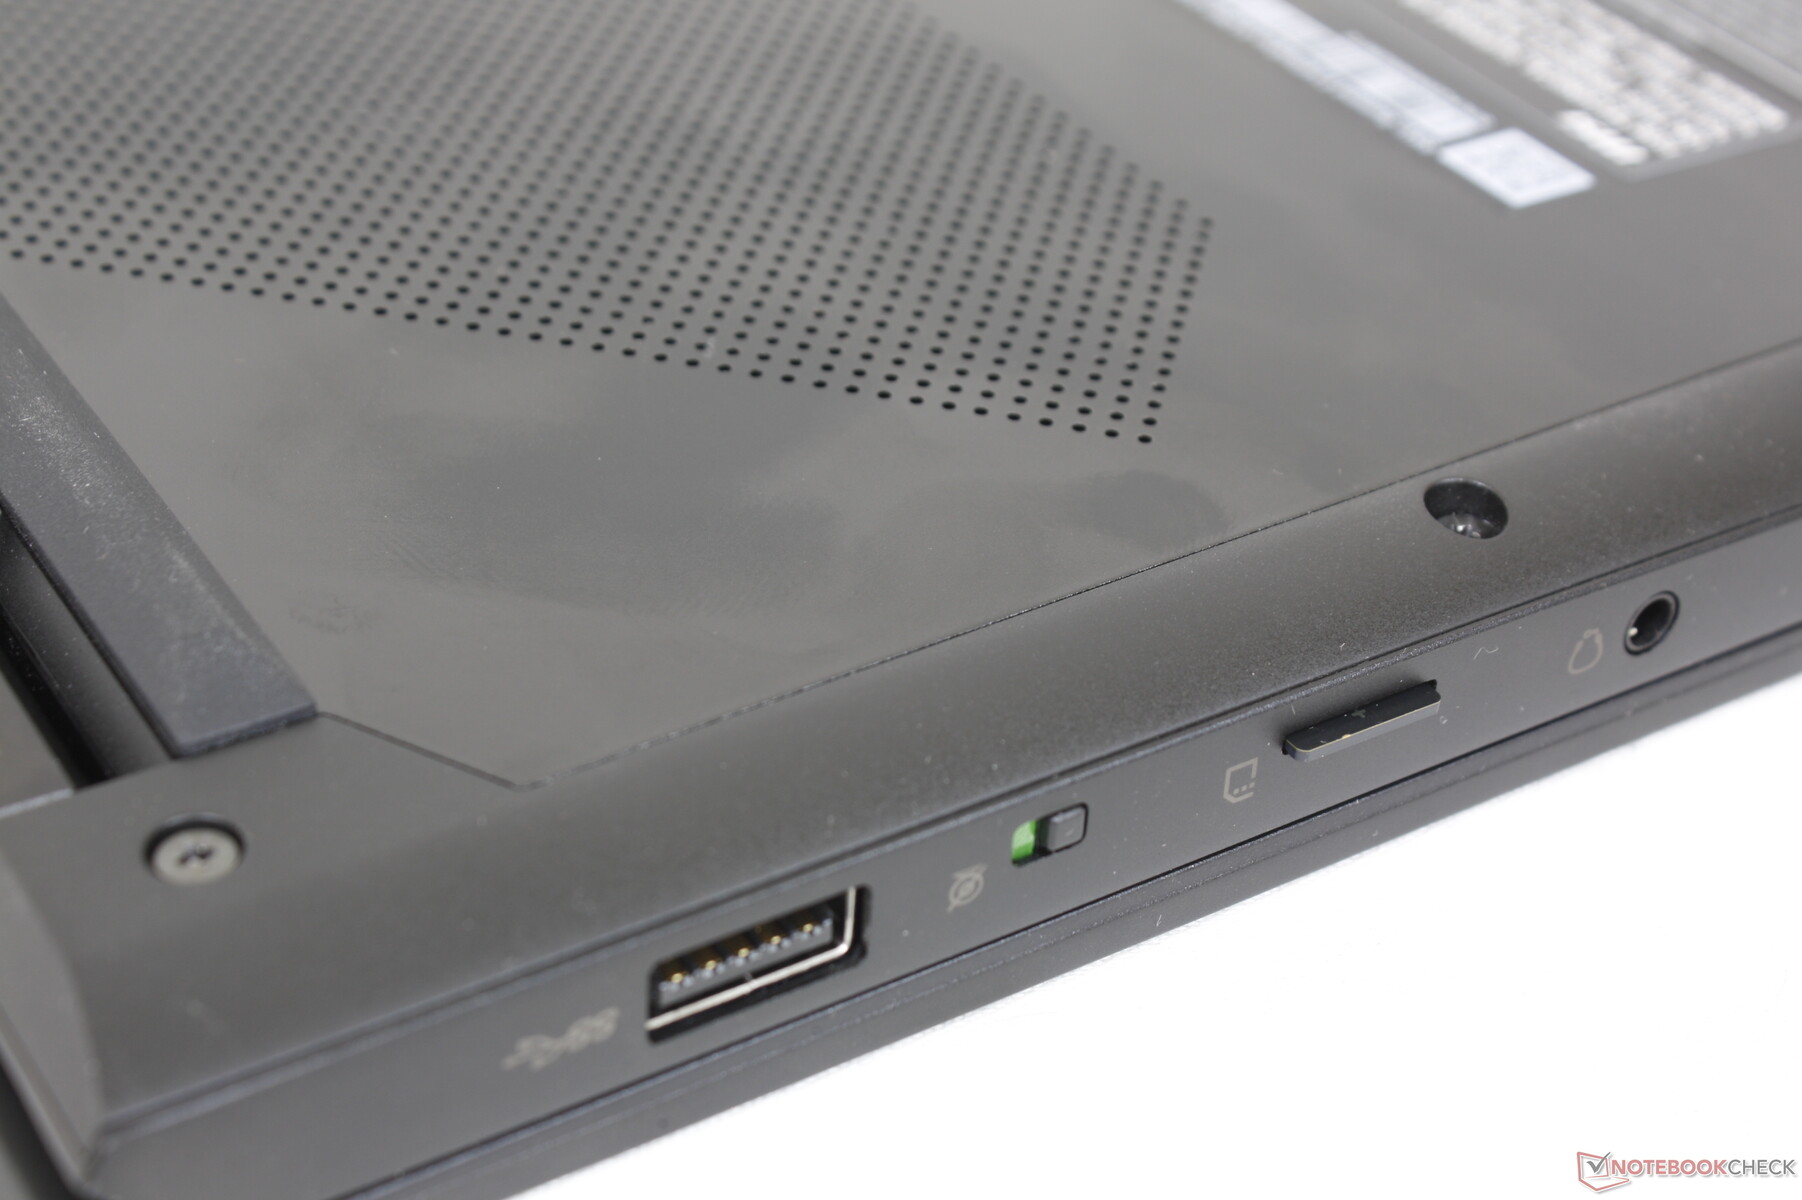
Questo modello convertibile include tutte le porte della versione originale a conchiglia, più una HDMI full-size e uno switch per la webcam. Tuttavia, sarebbe stato bello vedere un lucchetto Kensington, dato che la serie Summit è più orientata al settore professionale. Il posizionamento delle porte avrebbe potuto essere migliore lungo il bordo sinistro, dove le tre porte sono un po' troppo ravvicinate.
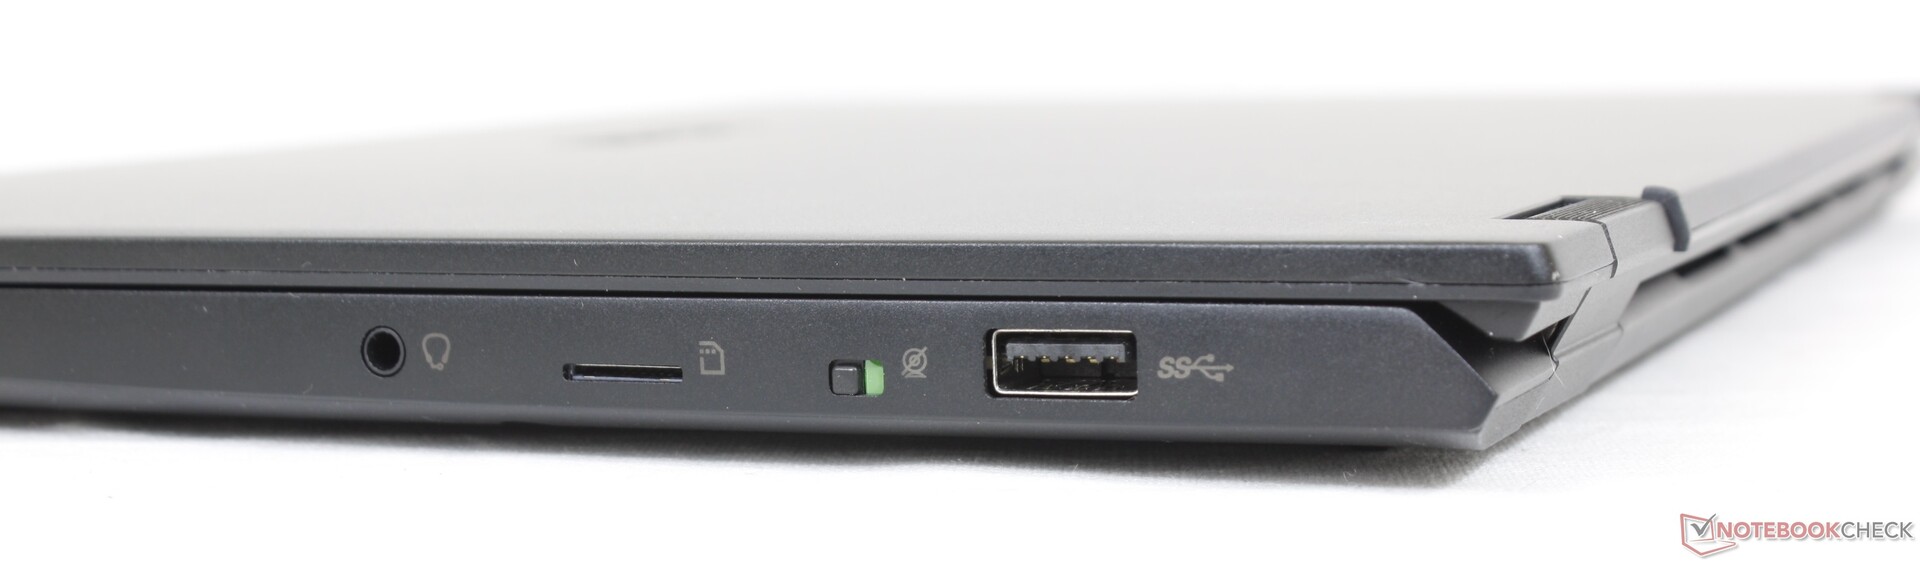
Lettore di schede SD
Purtroppo, il lettore MicroSD a molla integrato è più lento di quello del Summit E14 a conchiglia. Lo spostamento di 1 GB di immagini dalla nostra scheda di prova UHS-II sul desktop richiede circa 21 secondi, contro i 6-7 secondi del Summit E14.
| SD Card Reader | |
| average JPG Copy Test (av. of 3 runs) | |
| MSI Summit E14 A11SCS (AV Pro V60) | |
| Dell Latitude 9420 2-in-1 (AV PRO microSD 128 GB V60) | |
| LG Gram 14T90P (AV Pro V60) | |
| MSI Summit E14 Flip Evo A12MT (AV Pro V60) | |
| maximum AS SSD Seq Read Test (1GB) | |
| MSI Summit E14 A11SCS (AV Pro V60) | |
| Dell Latitude 9420 2-in-1 (AV PRO microSD 128 GB V60) | |
| LG Gram 14T90P (AV Pro V60) | |
| MSI Summit E14 Flip Evo A12MT (AV Pro V60) | |
Comunicazione
Un Intel AX1675s è fornito di serie per la connettività Wi-Fi 6E e Bluetooth 5.2. Non abbiamo riscontrato alcun problema durante l'accoppiamento con la nostra rete a 6 GHz.
| Networking | |
| iperf3 transmit AX12 | |
| MSI Summit E14 A11SCS | |
| Dell Latitude 9420 2-in-1 | |
| iperf3 receive AX12 | |
| MSI Summit E14 A11SCS | |
| Dell Latitude 9420 2-in-1 | |
| iperf3 receive AXE11000 6GHz | |
| Asus VivoBook S 14X S5402Z | |
| MSI Summit E14 Flip Evo A12MT | |
| iperf3 transmit AXE11000 6GHz | |
| MSI Summit E14 Flip Evo A12MT | |
| Asus VivoBook S 14X S5402Z | |
Webcam
La webcam è da 2 MP, a differenza della maggior parte degli altri computer portatili in cui i sensori da 1 MP sono ancora comuni. È supportato Windows Hello.
Per quanto riguarda la privacy, il modello si affida a un interruttore elettronico per disabilitare la webcam invece di un otturatore fisico.


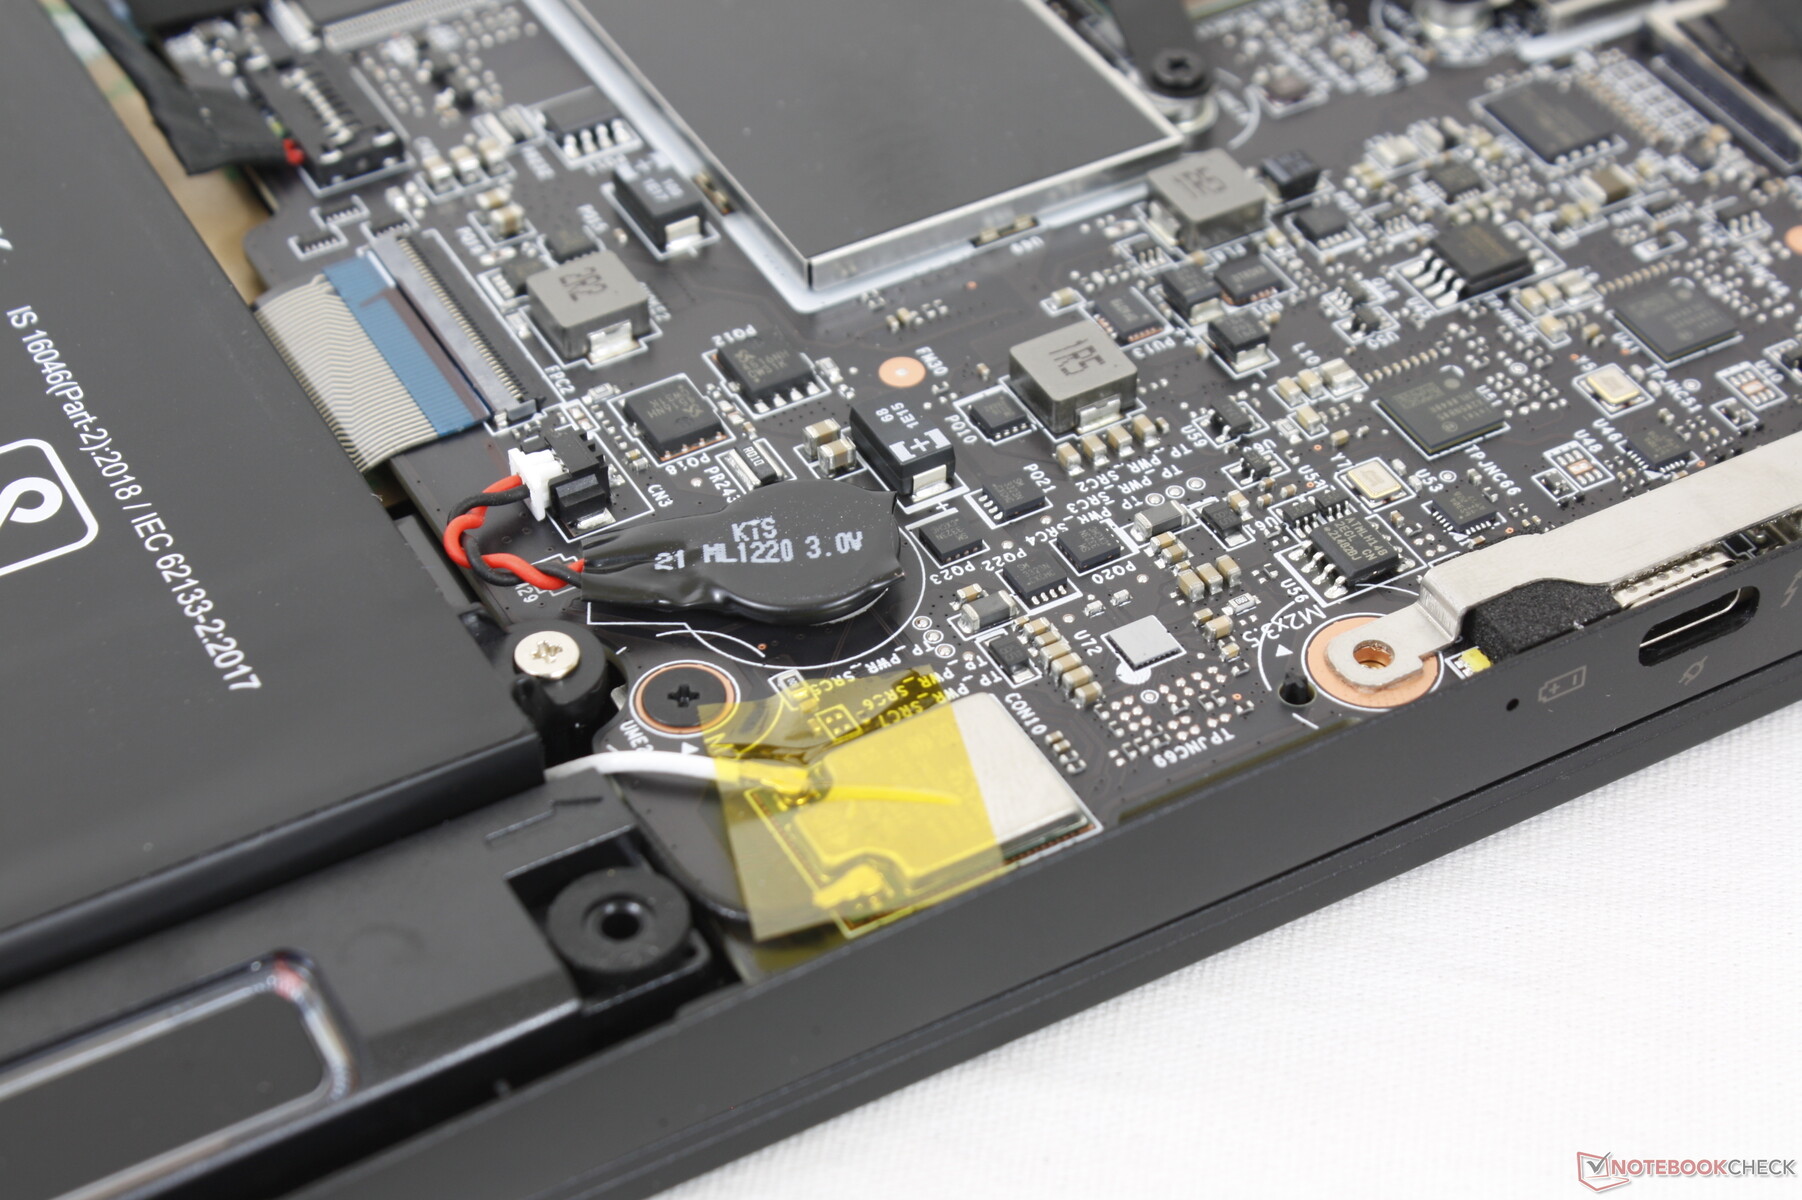
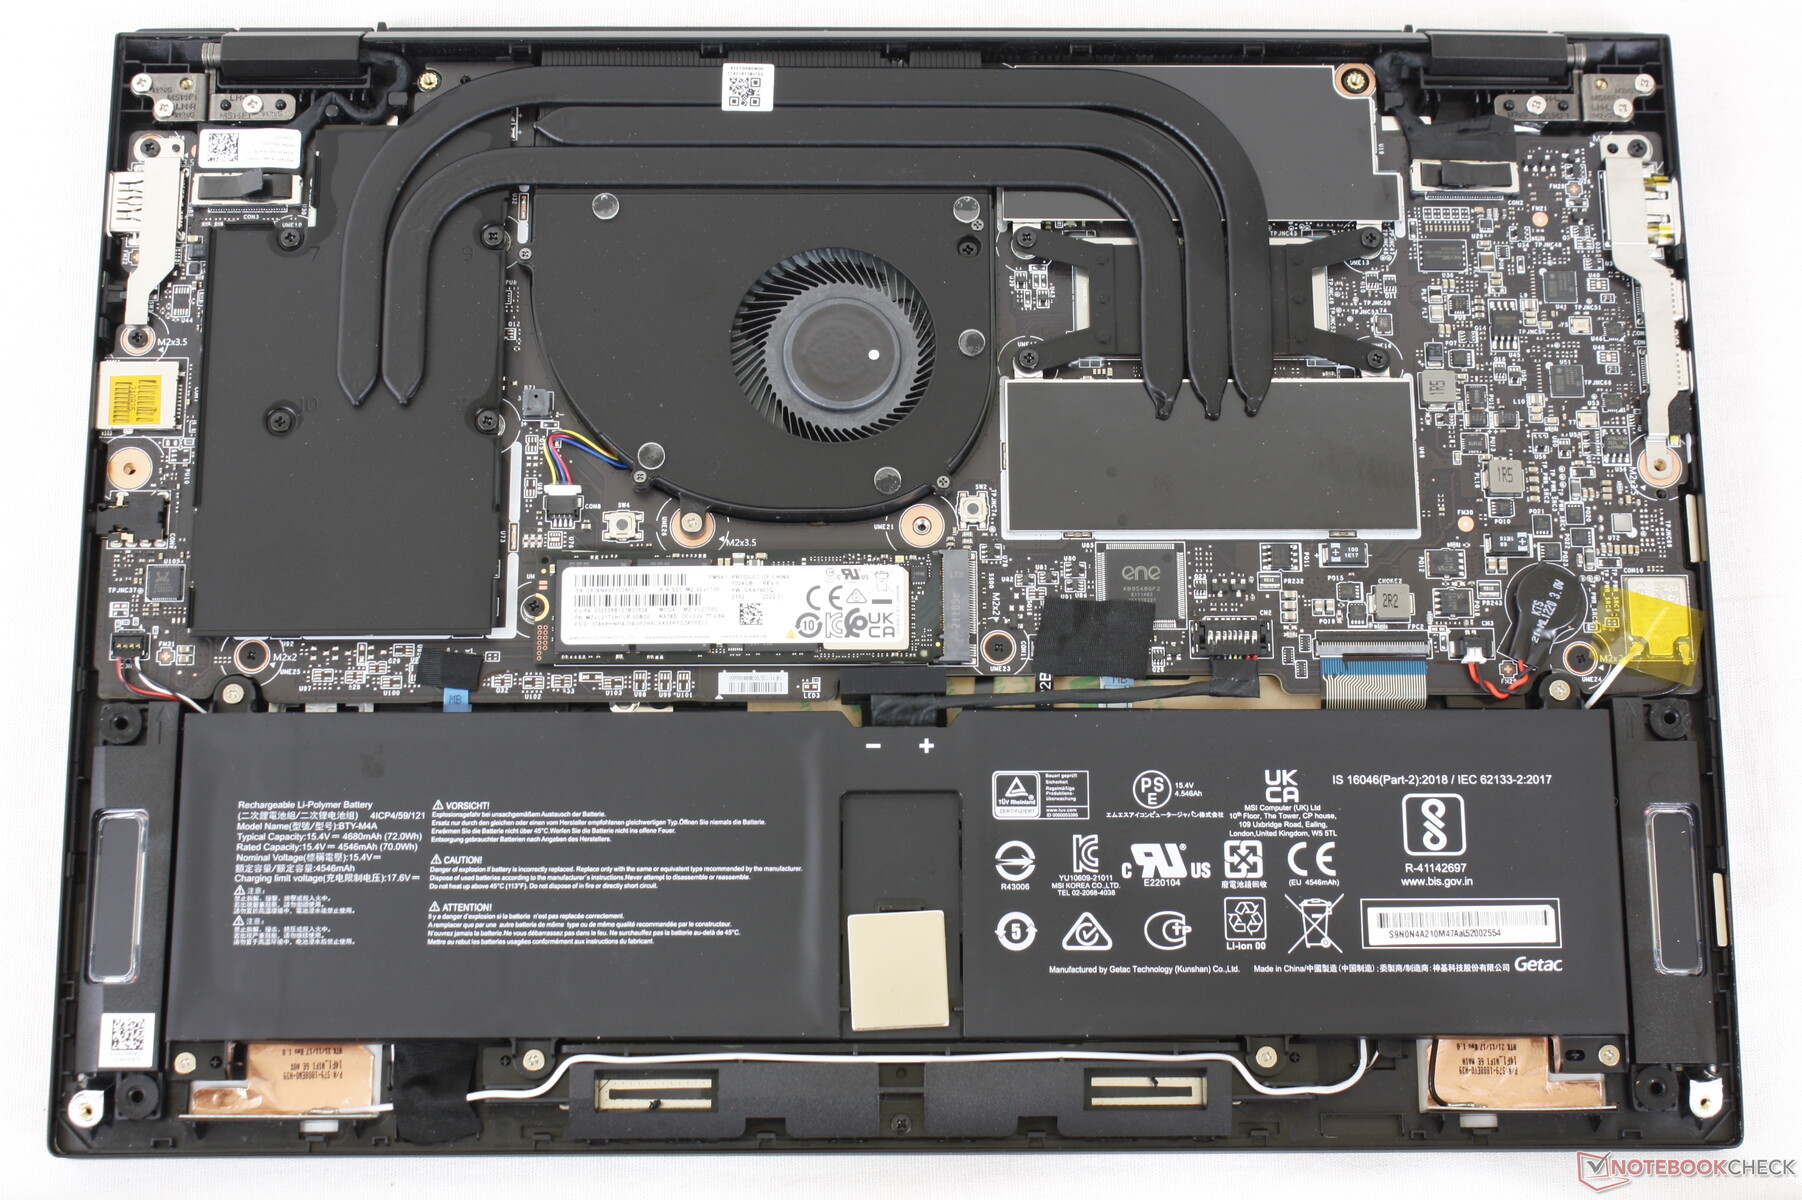
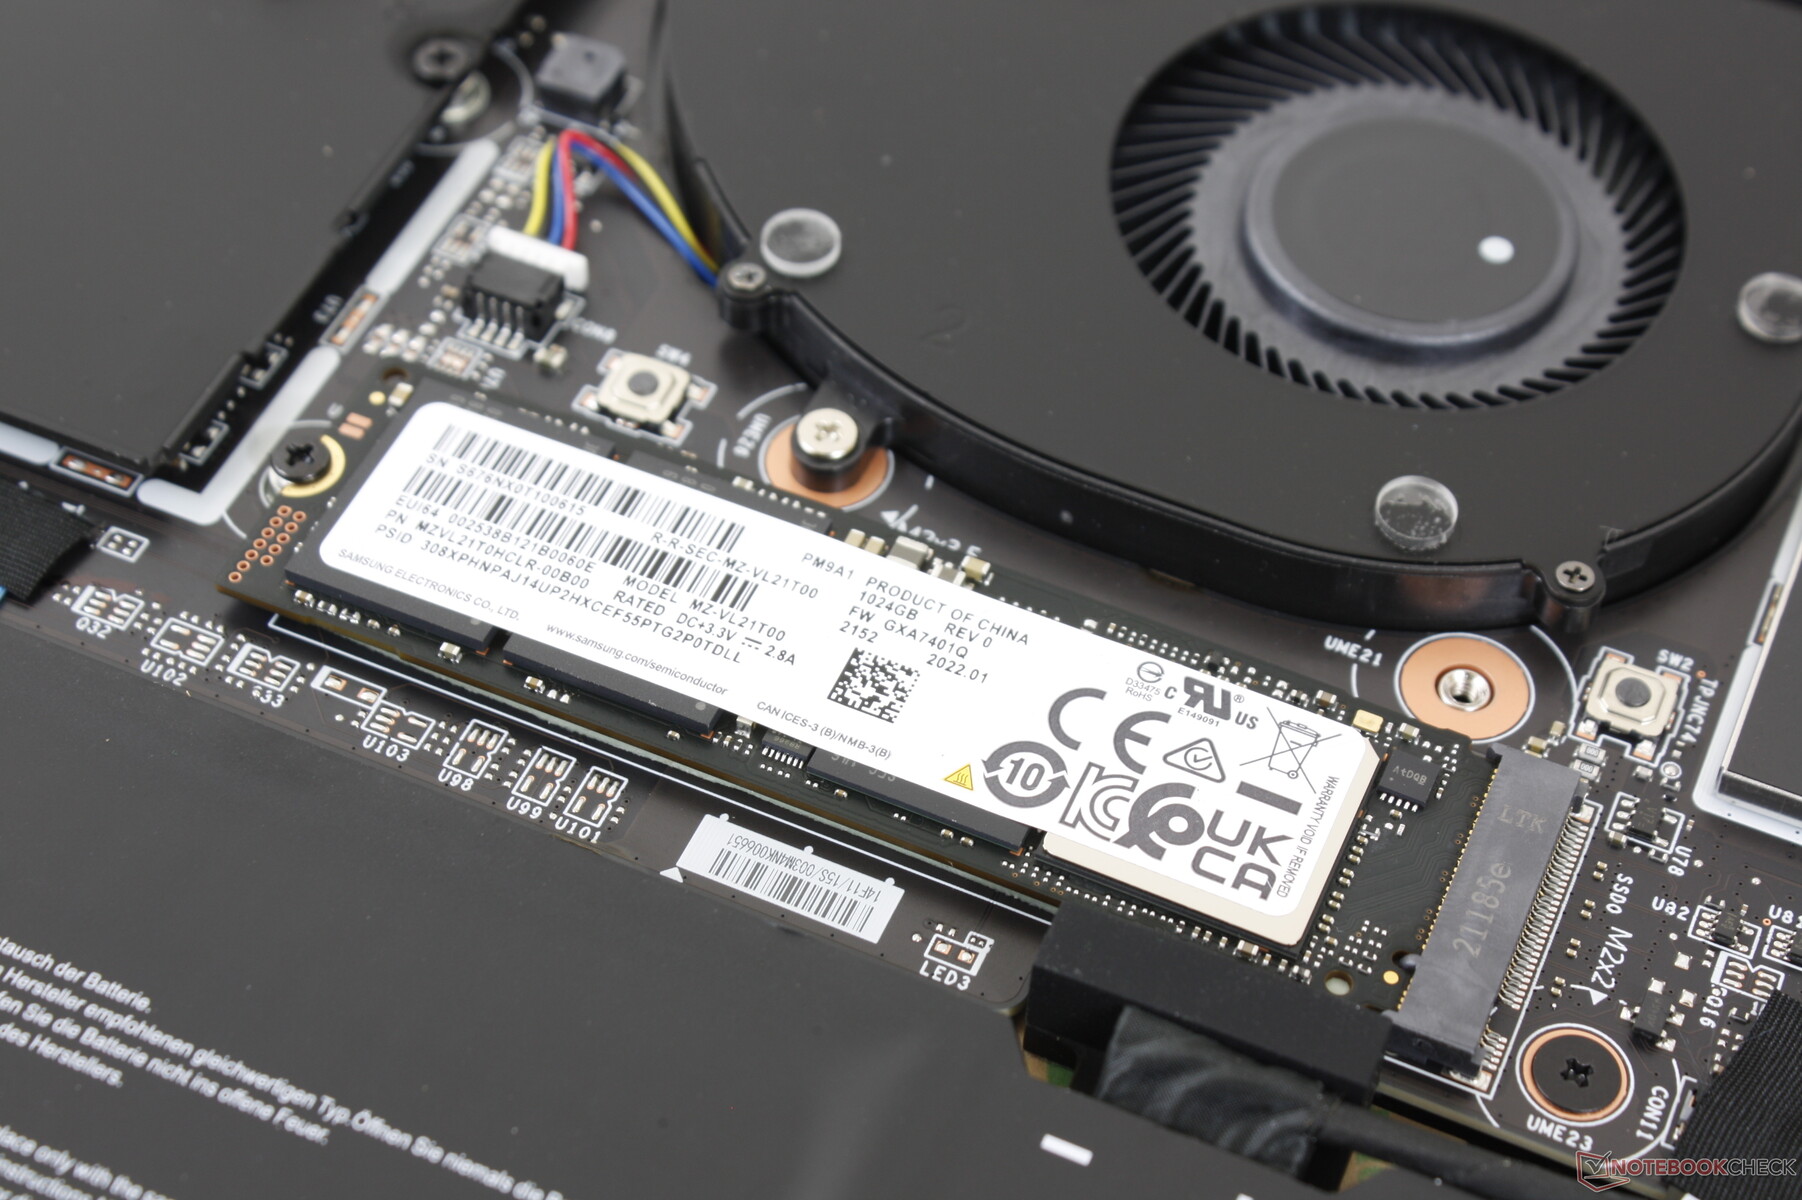
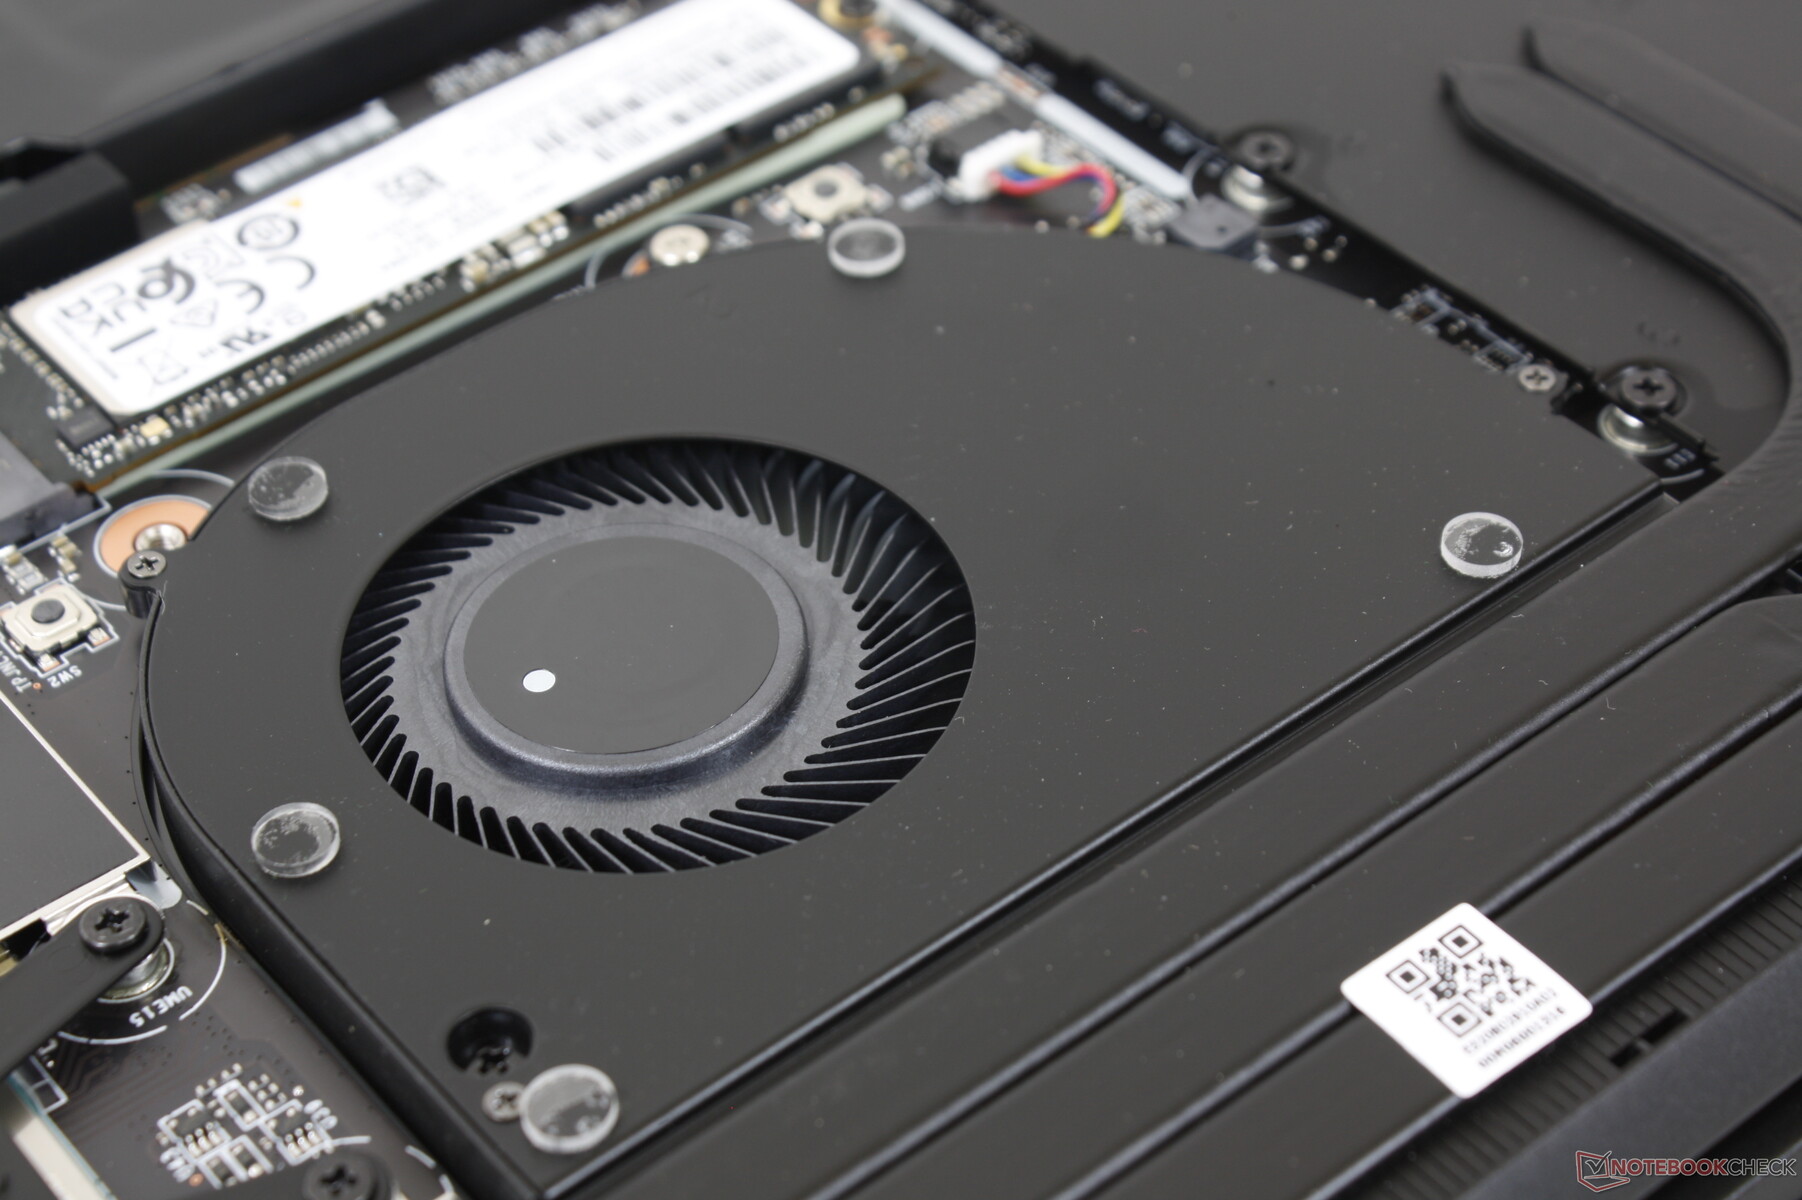
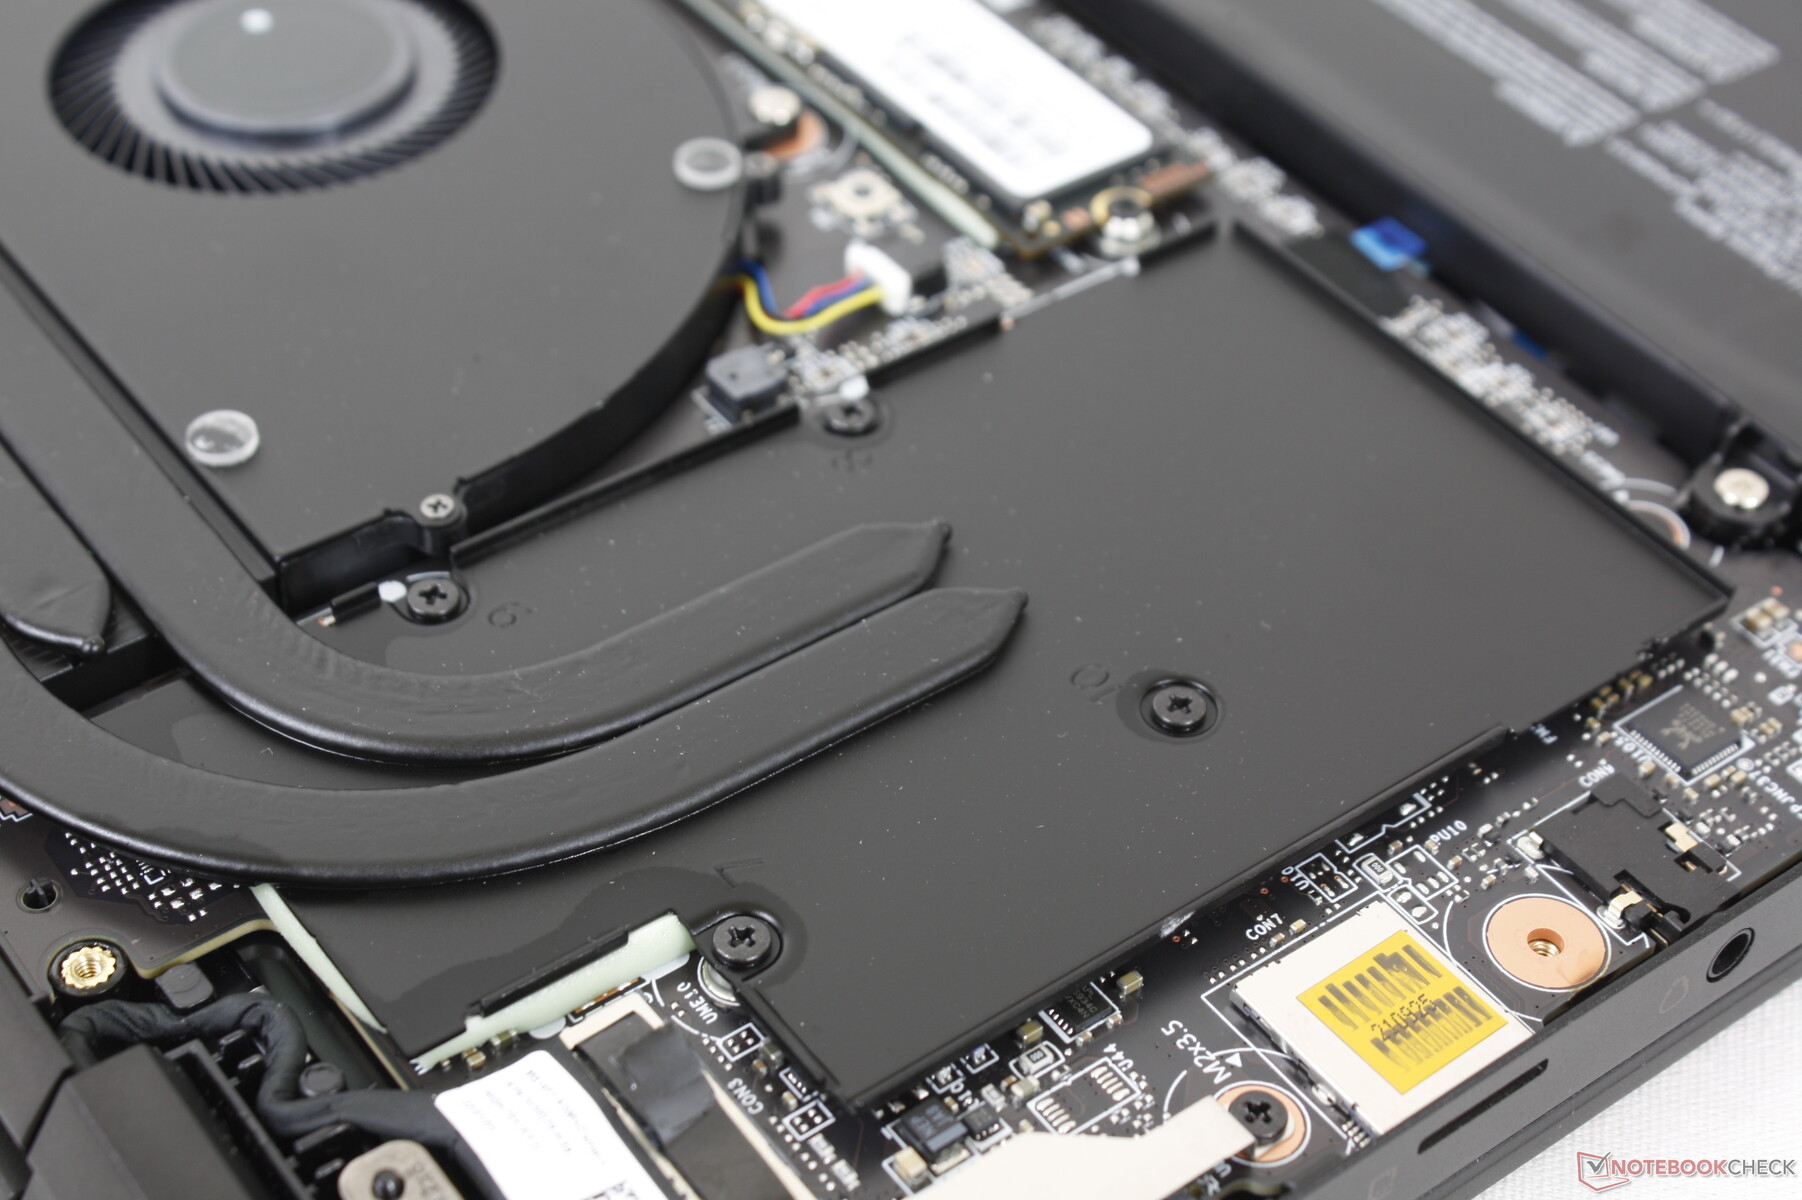
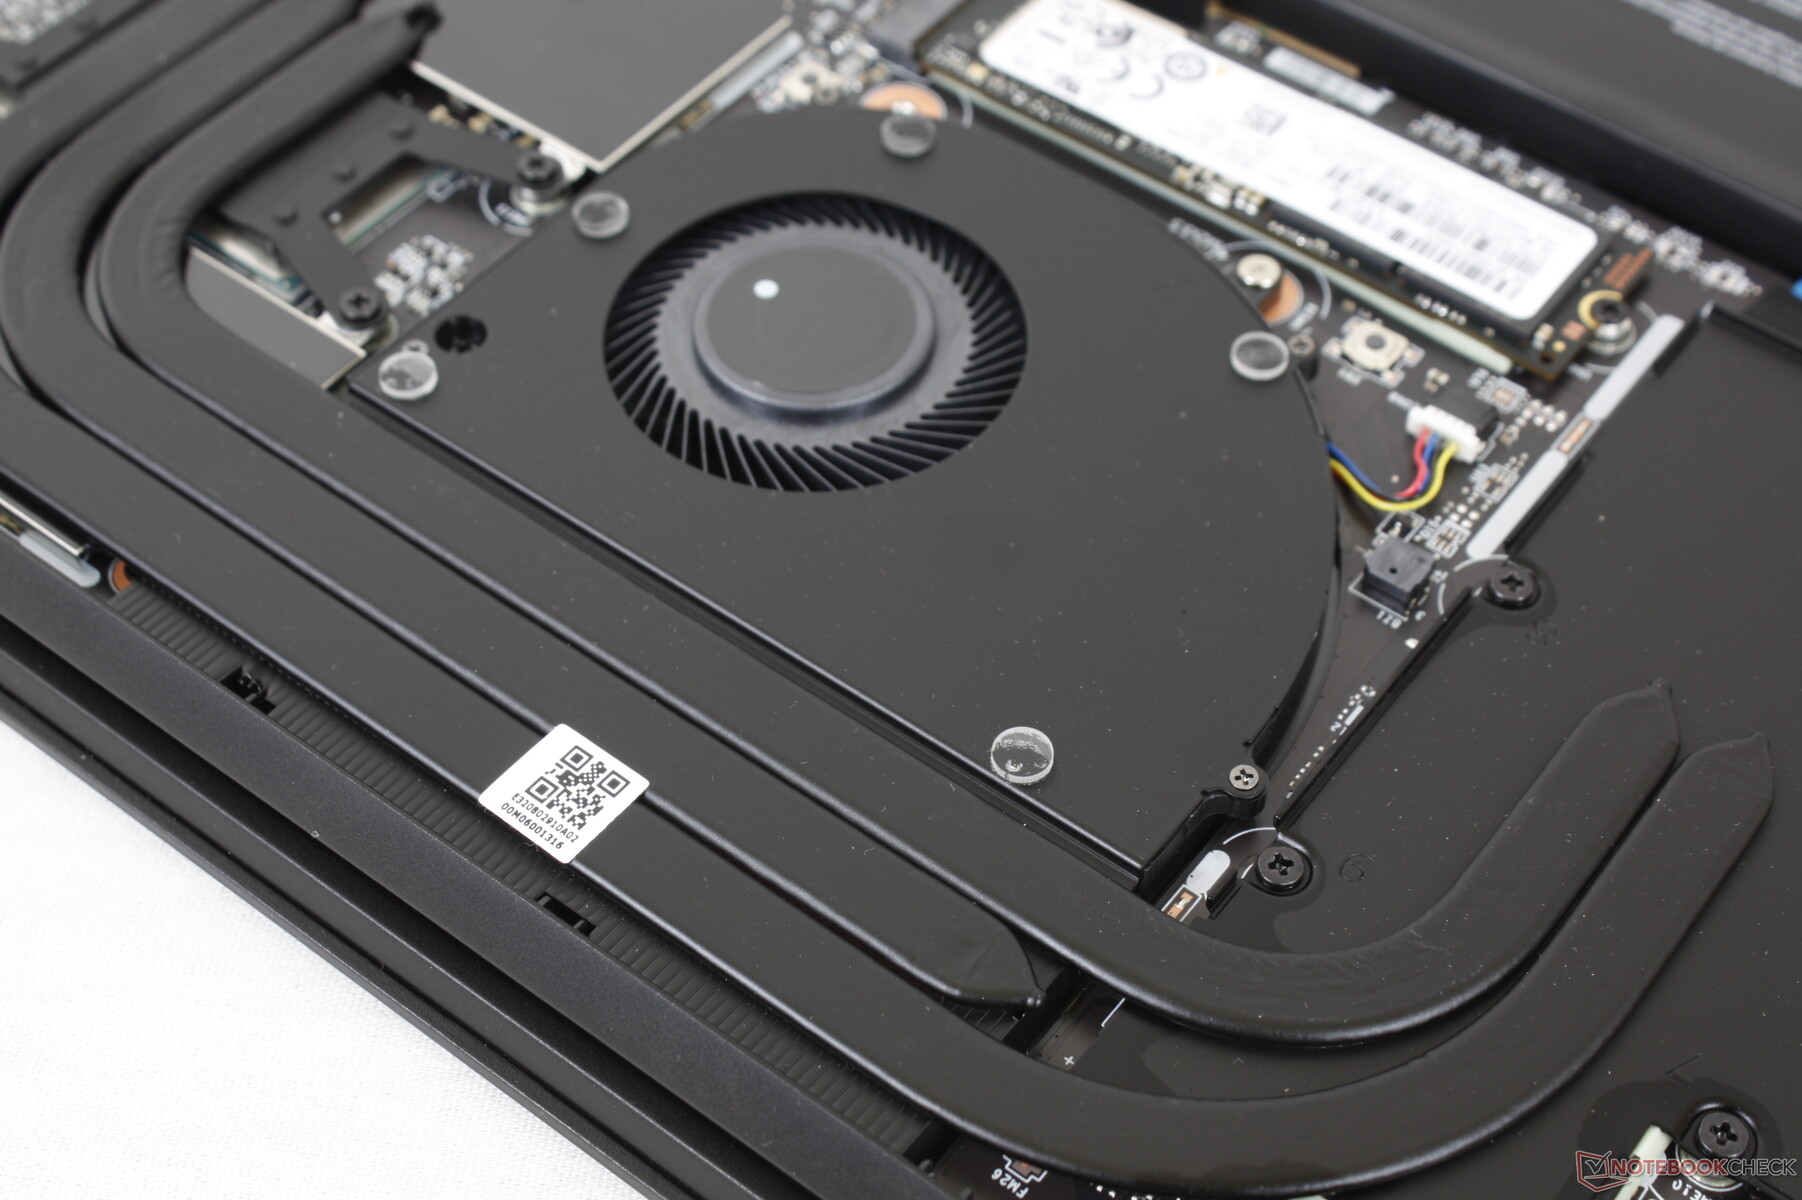
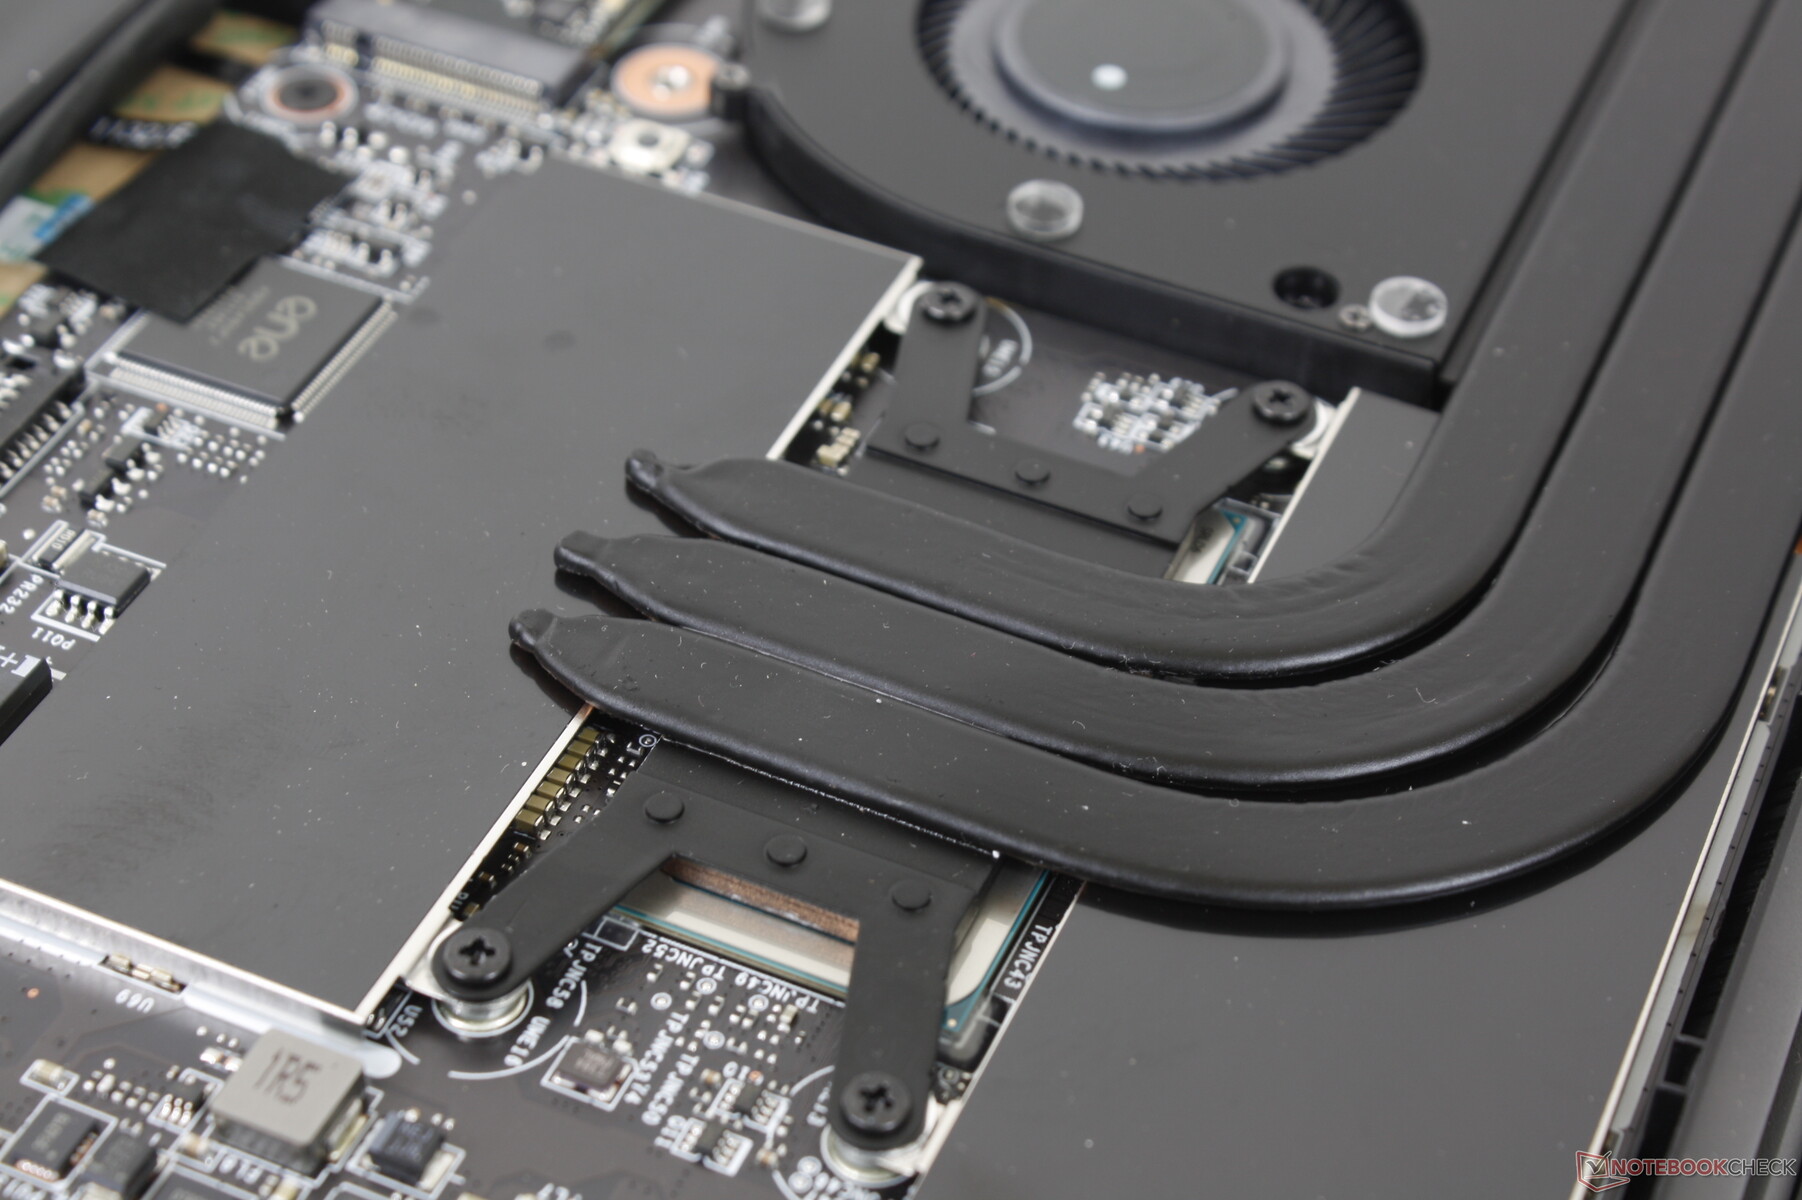
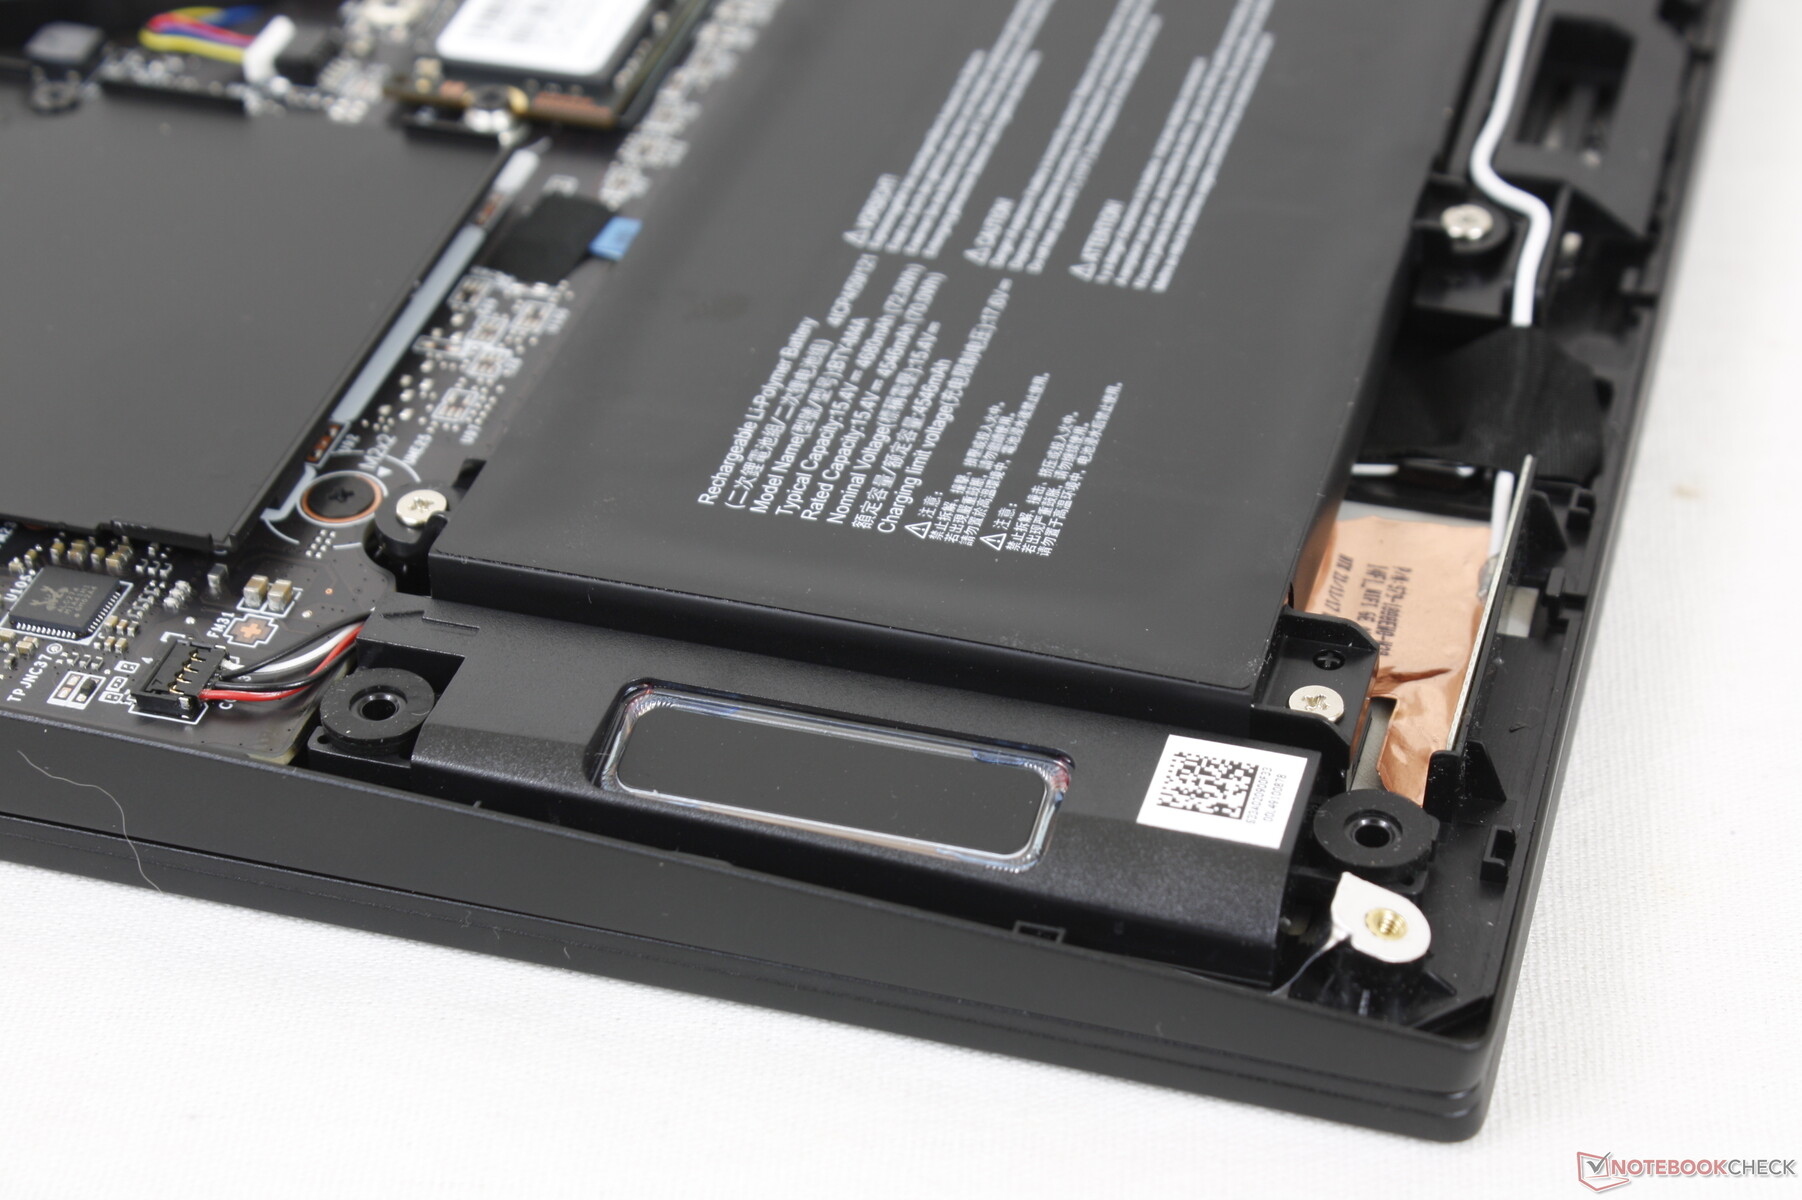
Manutenzione
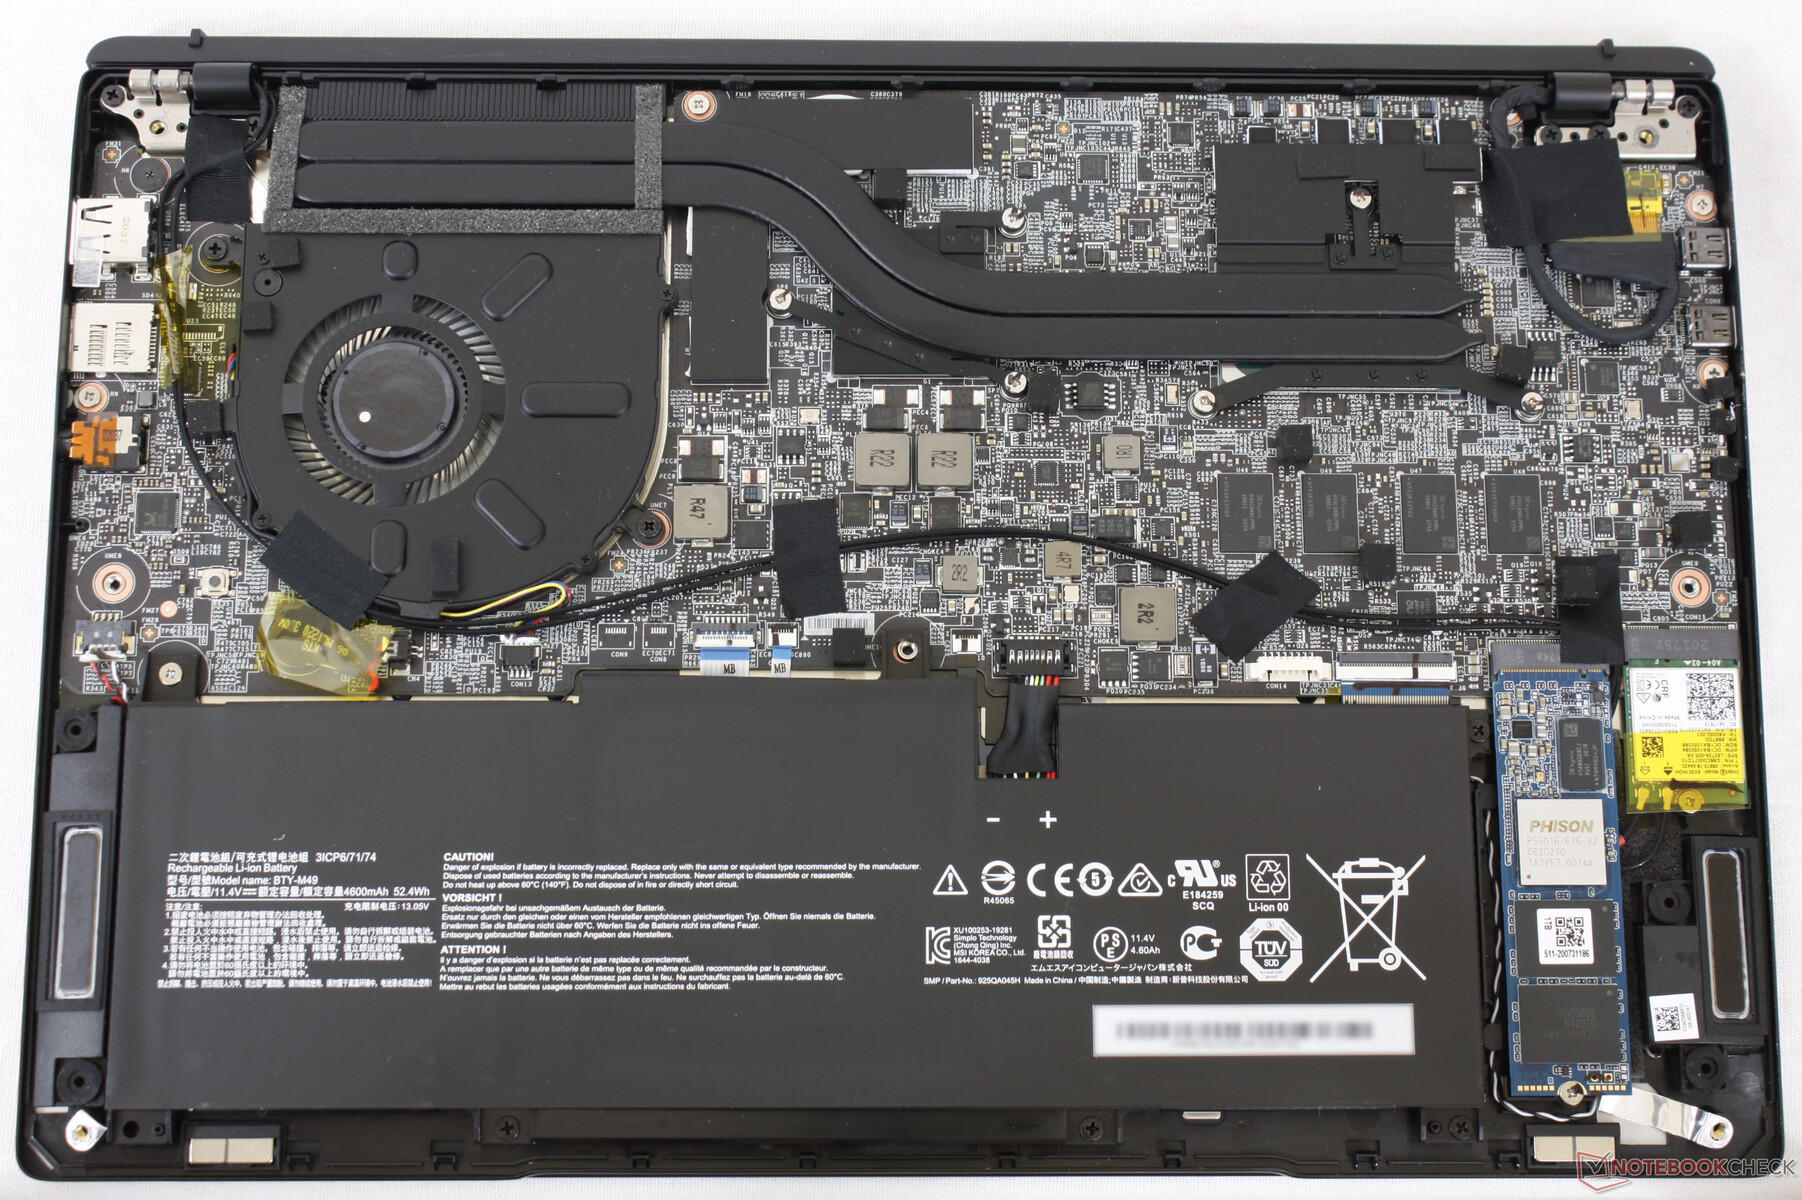
Il pannello inferiore è fissato da 9 viti Philips per una facile rimozione. Tuttavia, bisogna tenere presente che per accedere a una delle viti è necessario rompere l'adesivo del sigillo di fabbrica. Non c'è molto da aggiornare, dato che c'è solo uno slot di memoria e i moduli RAM e WLAN sono saldati sulla scheda.
Il layout e il design della scheda madre sono completamente diversi da quelli del Summit E14 clamshell, come mostrano le immagini di confronto qui sotto.
Accessori e garanzia
La confezione di vendita include la penna MSI attiva, che attualmente ha un prezzo di oltre 100 dollari. Si applica la garanzia standard limitata di un anno del produttore.
Dispositivi di input - Nessuna modifica importante al vertice
Tastiera
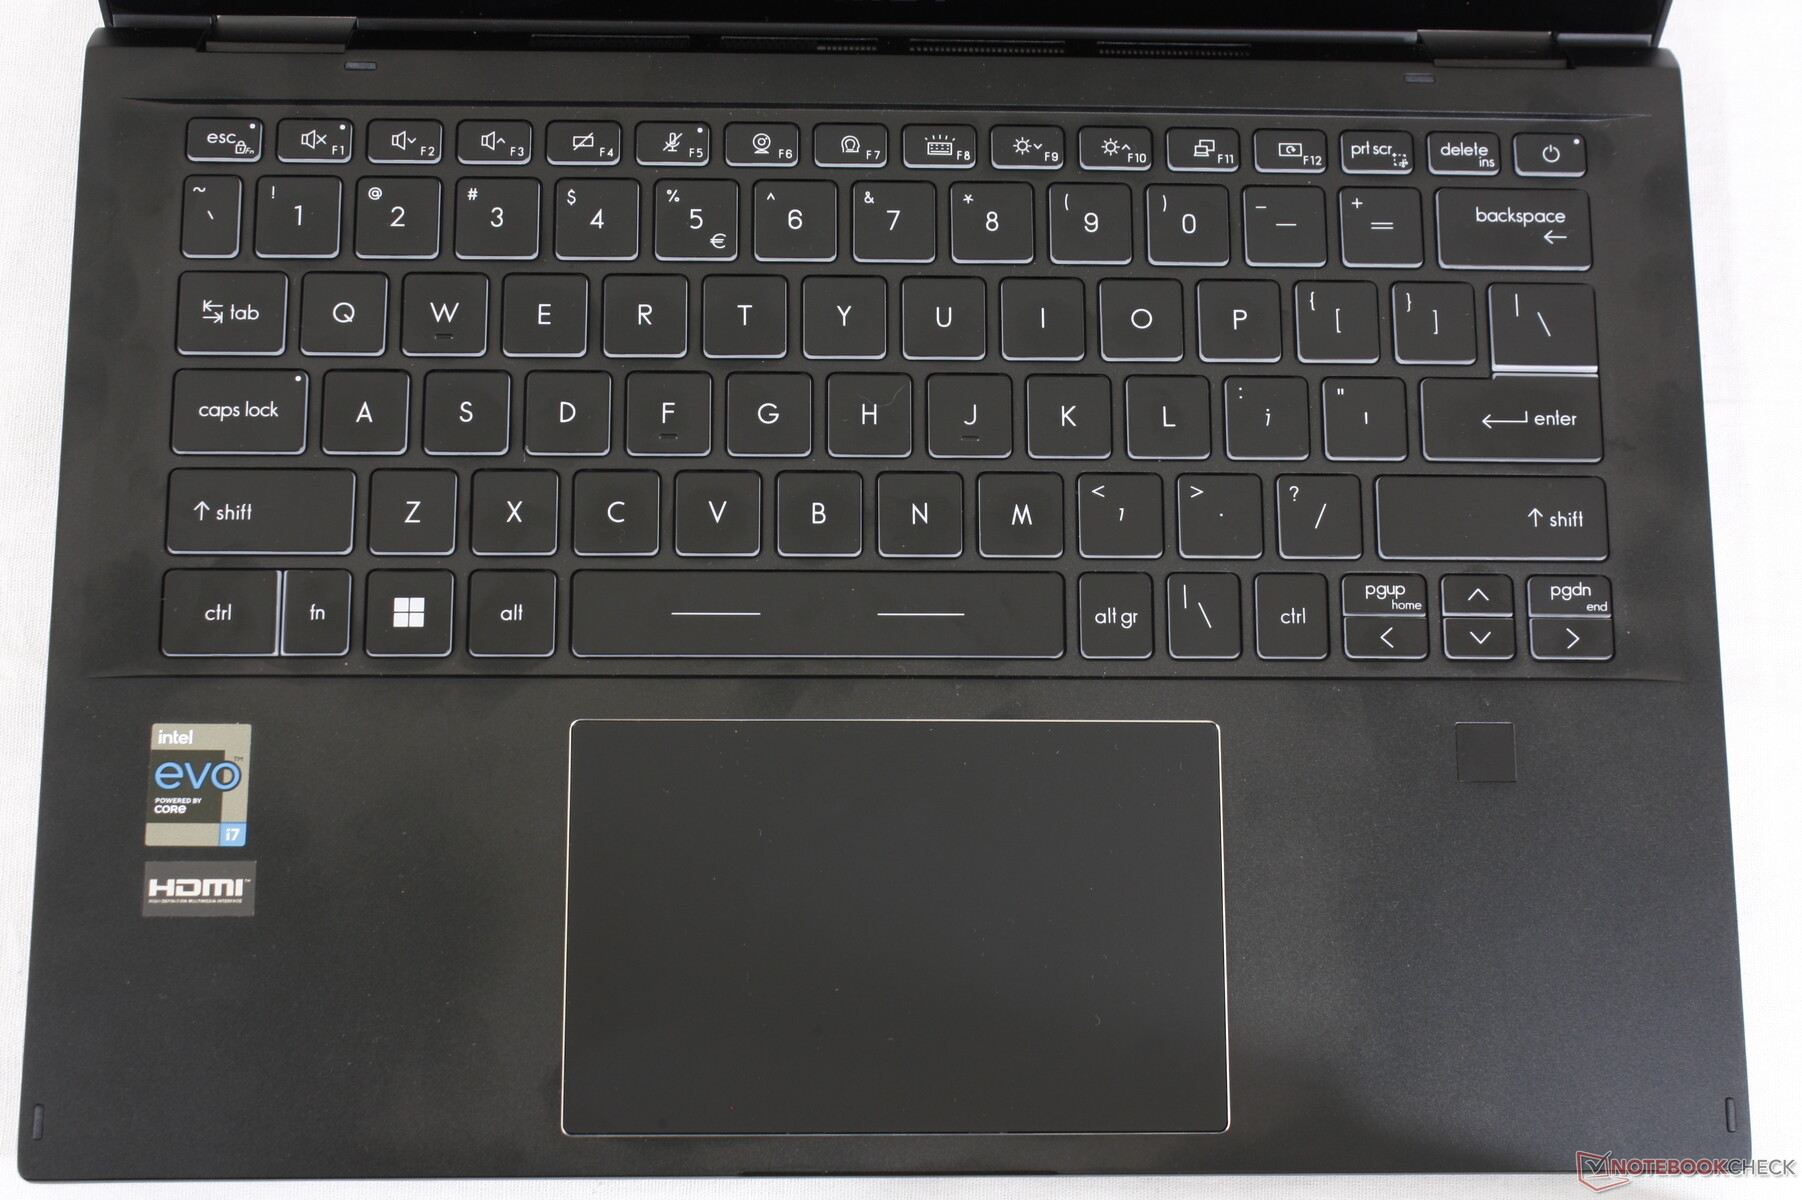
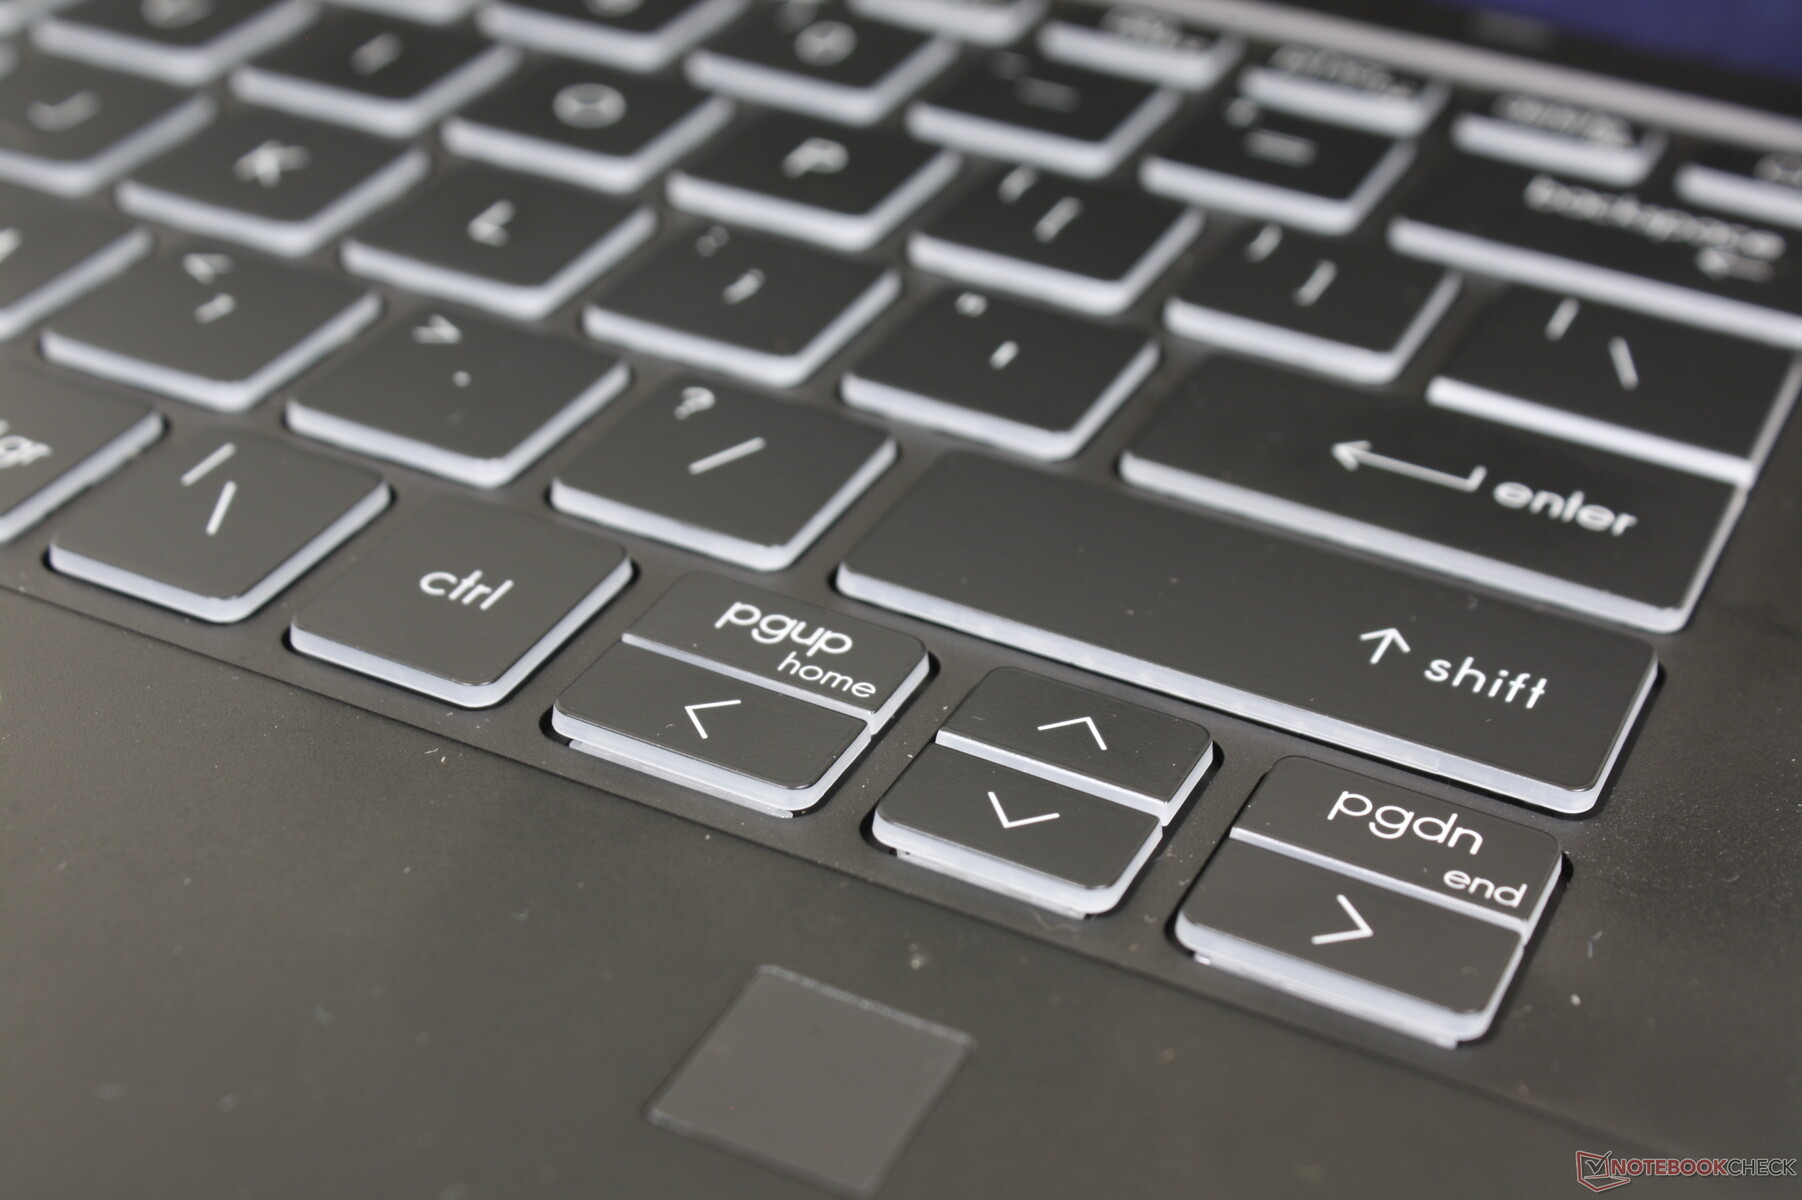
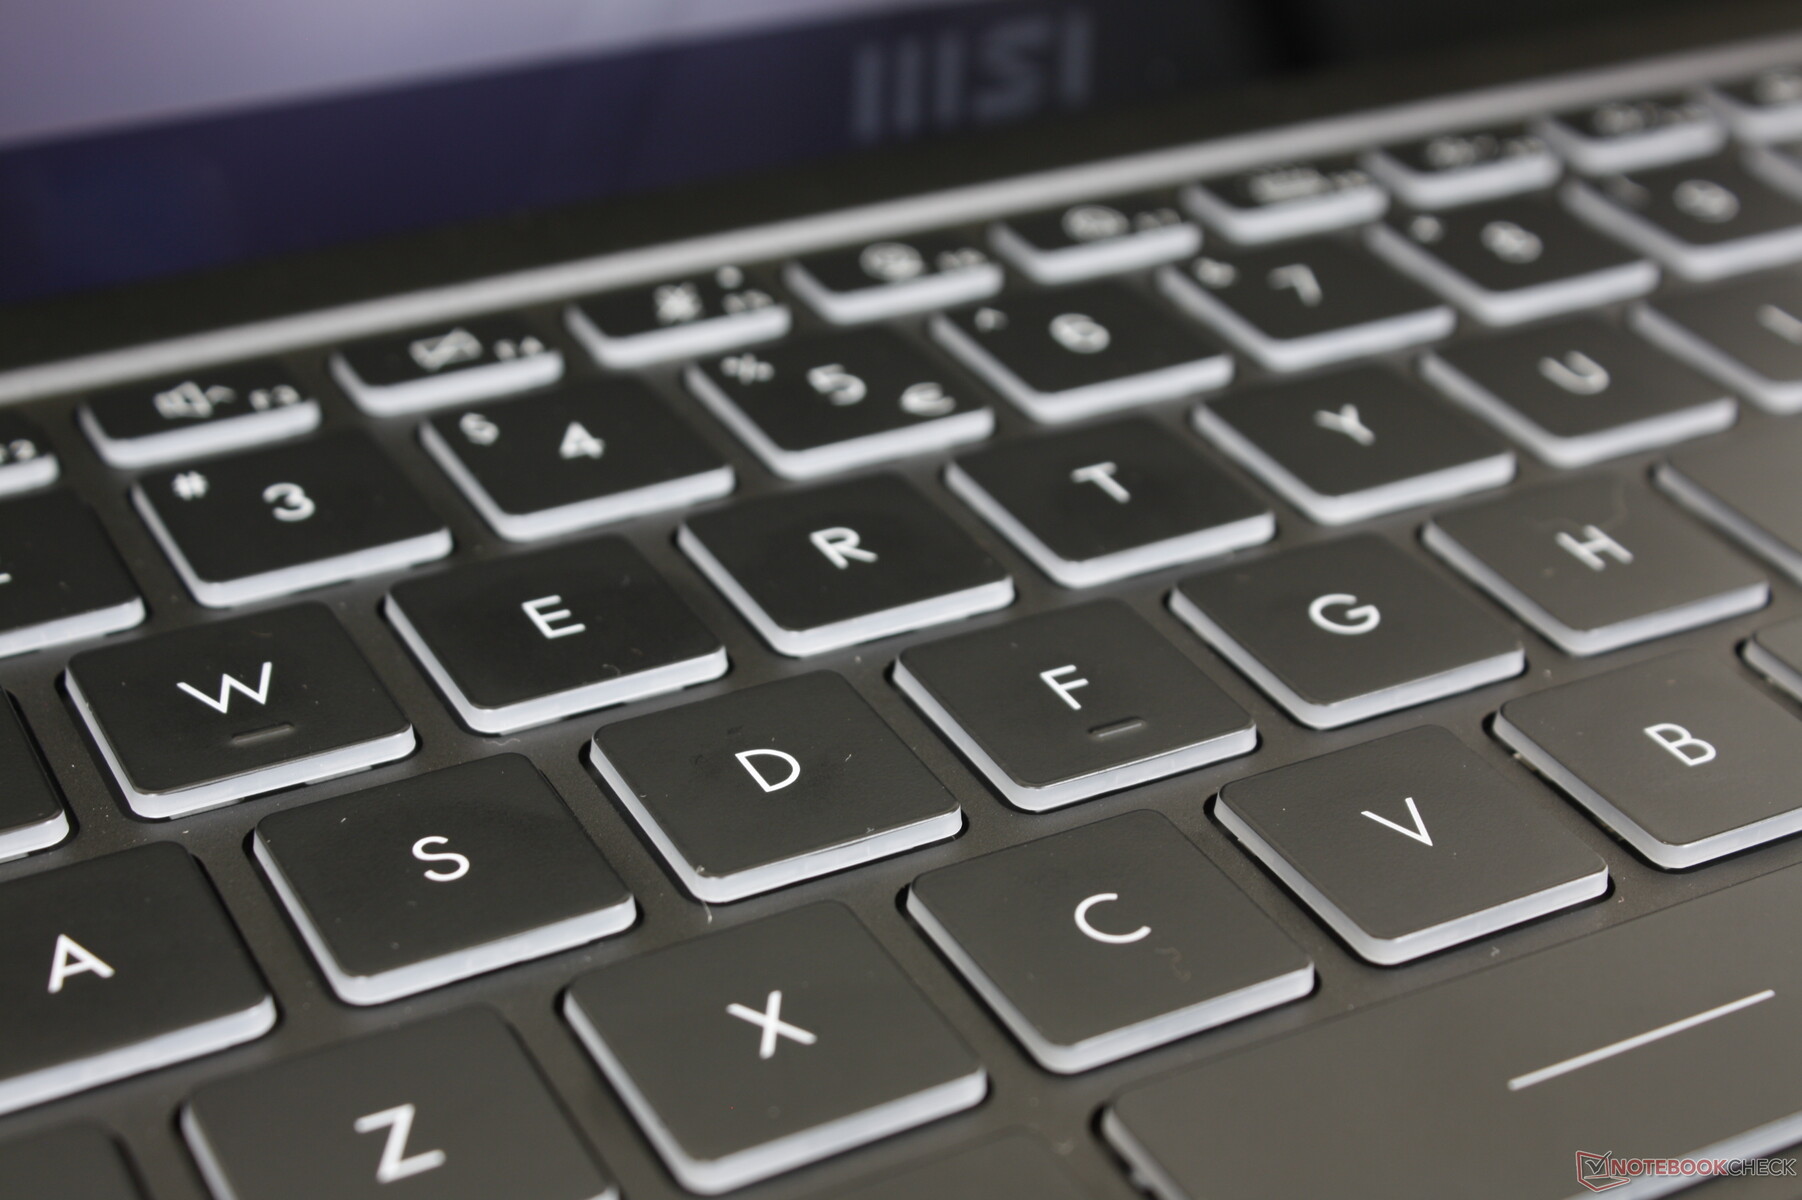
Il layout della tastiera è diverso da quello del Summit E14 a conchiglia. La colonna destra dei tasti Del, Insert, PgDn e PgUp, ad esempio, è stata eliminata per una tastiera complessivamente più corta. L'esperienza di digitazione rimane soddisfacente, con un rumore dei tasti superiore alla media e un feedback leggermente più morbido rispetto a quello dei tasti di un HP Spectre x360 14.
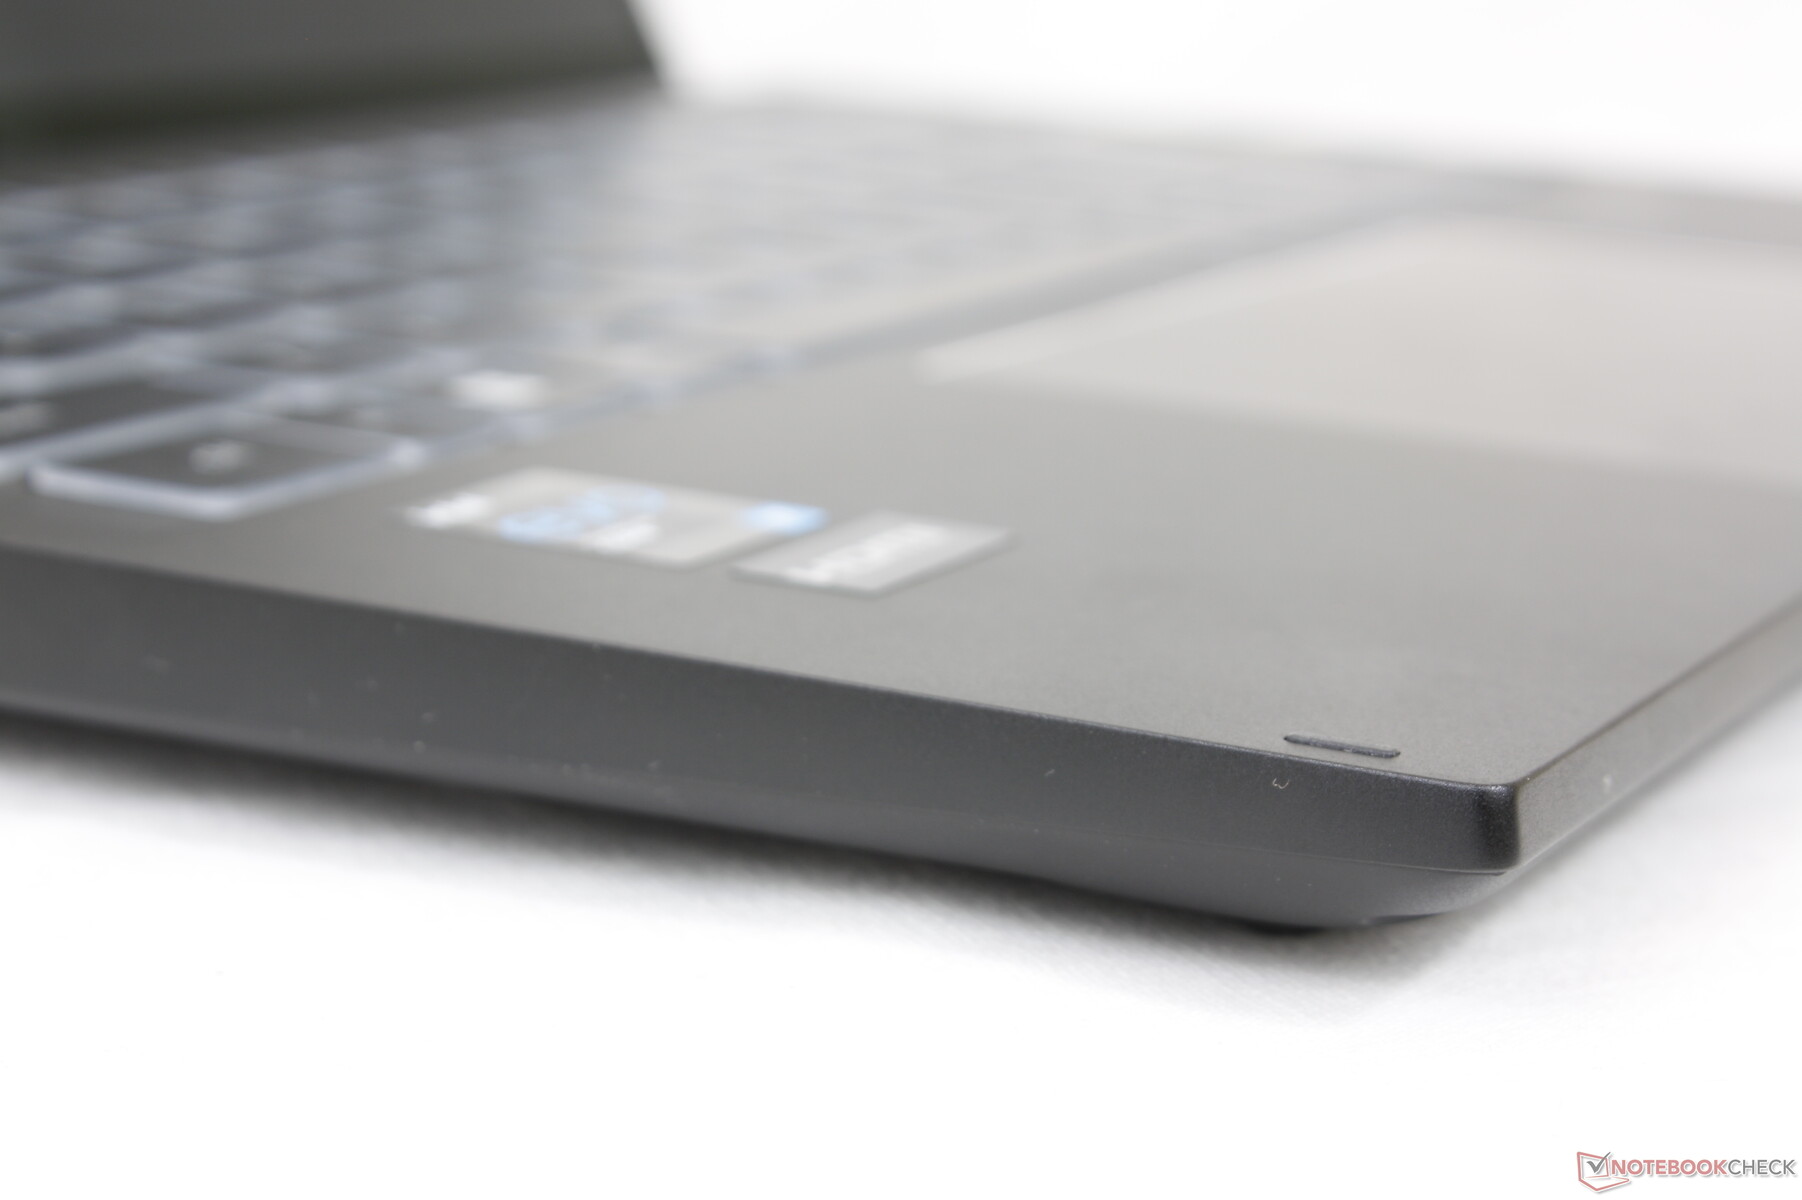
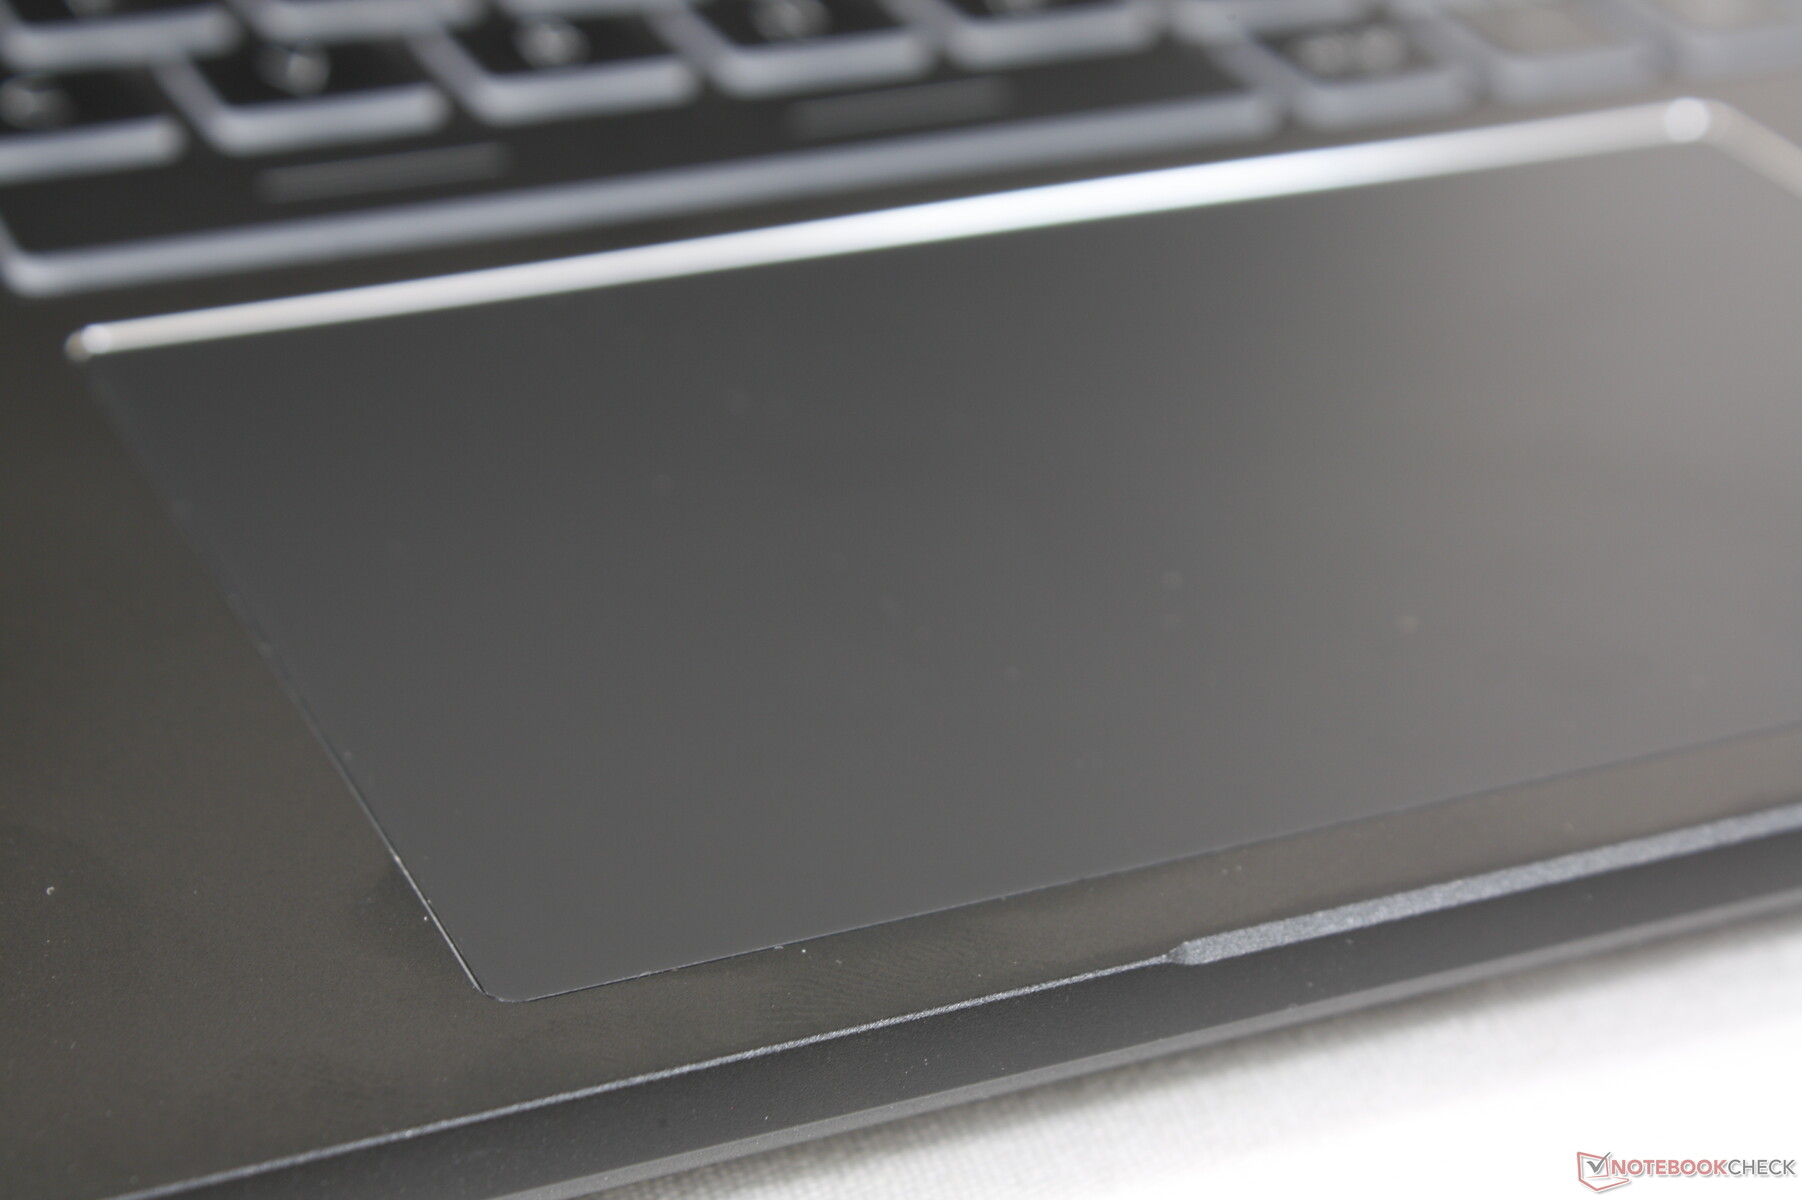
Touchpad
MSI ha aumentato le dimensioni del clickpad da 10,5 x 6,5 cm sul Summit E14 clamshell a 12 x 7,5 cm sulla versione convertibile per rendere più confortevoli gli input multi-touch. Le sue proprietà di scorrimento sono estremamente fluide anche quando si muovono a bassa velocità, il che può rendere un po' difficili i clic più fini del cursore. Nel frattempo, il feedback dei clic sul clickpad è adeguato e facile da premere in rapida successione senza affaticare il dito
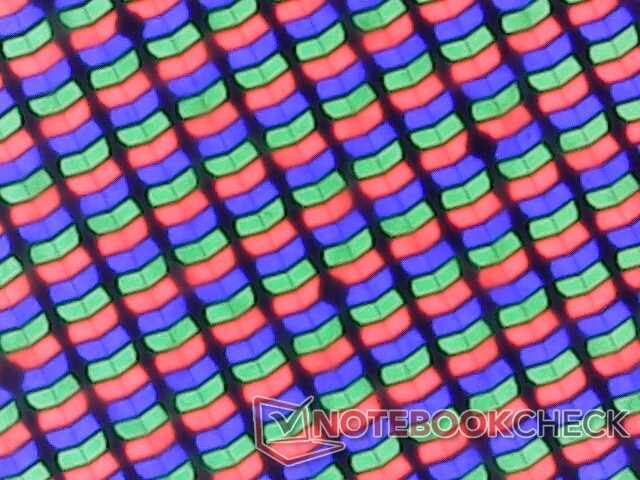
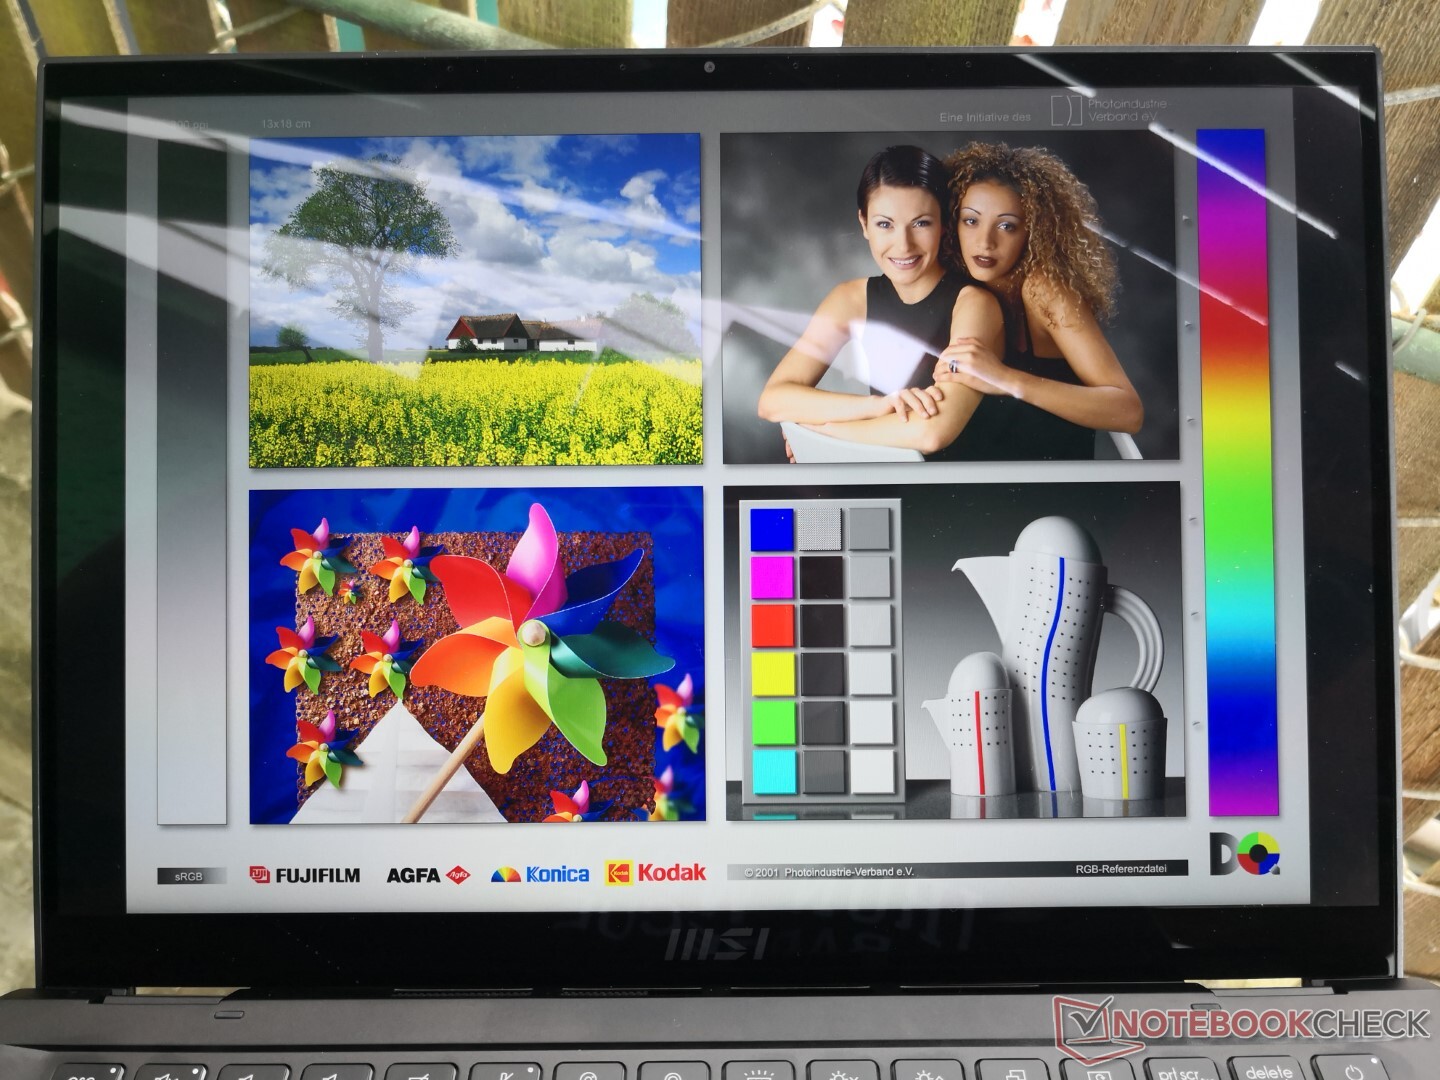
Display: ottimi colori, ma bloccato a 60 Hz
Il modello offre la stessa risoluzione nativa delLenovo Yoga Slim 7i Pro ma con colori più ampi per supportare lo standard DCI-P3. I tempi di risposta del bianco e del nero e del grigio, sebbene non siano così veloci come quelli dell'OLED, sono comunque più rapidi di quelli dell'LG Gram 14T90P o del Latitude 9420 2-in-1, con un'evidente riduzione del ghosting. Il display funziona molto bene sia per i giochi che per le attività d'ufficio, grazie ai colori intensi, alla retroilluminazione da 500 nit e ai tempi di risposta ragionevoli
Un limite fondamentale del display è la frequenza di aggiornamento nativa di 60 Hz, dato che altri subnotebook stanno iniziando a offrire frequenze di aggiornamento di 90 Hz o superiori. Alternative come il Lenovo IdeaPad Slim 7i Pro o Asus VivoBook S 14X possono offrire un'esperienza dell'interfaccia utente sensibilmente più fluida grazie alle loro frequenze di aggiornamento più elevate. Gli input tramite penna, in particolare, avrebbero beneficiato di una frequenza di aggiornamento del display superiore ai 60 Hz tipici.
| |||||||||||||||||||||||||
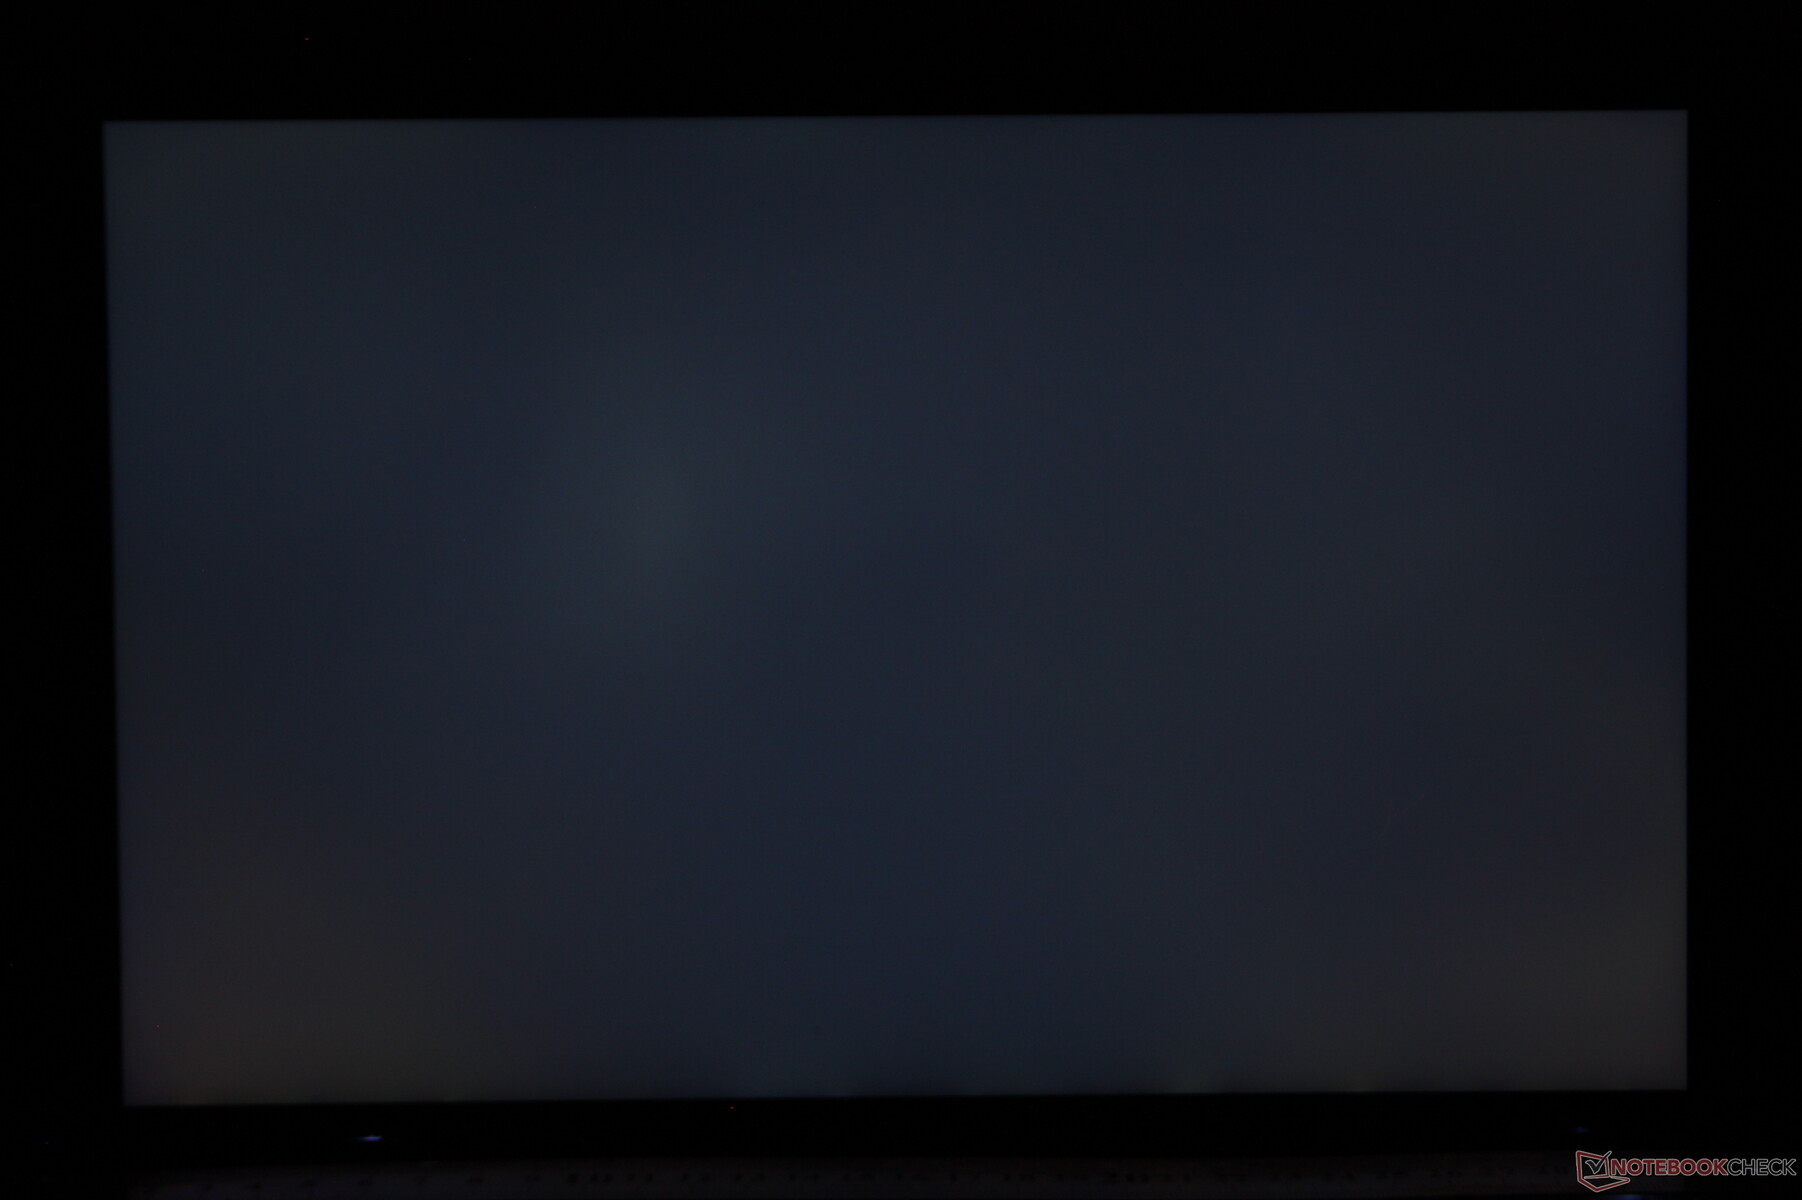
Distribuzione della luminosità: 87 %
Al centro con la batteria: 496.7 cd/m²
Contrasto: 1656:1 (Nero: 0.3 cd/m²)
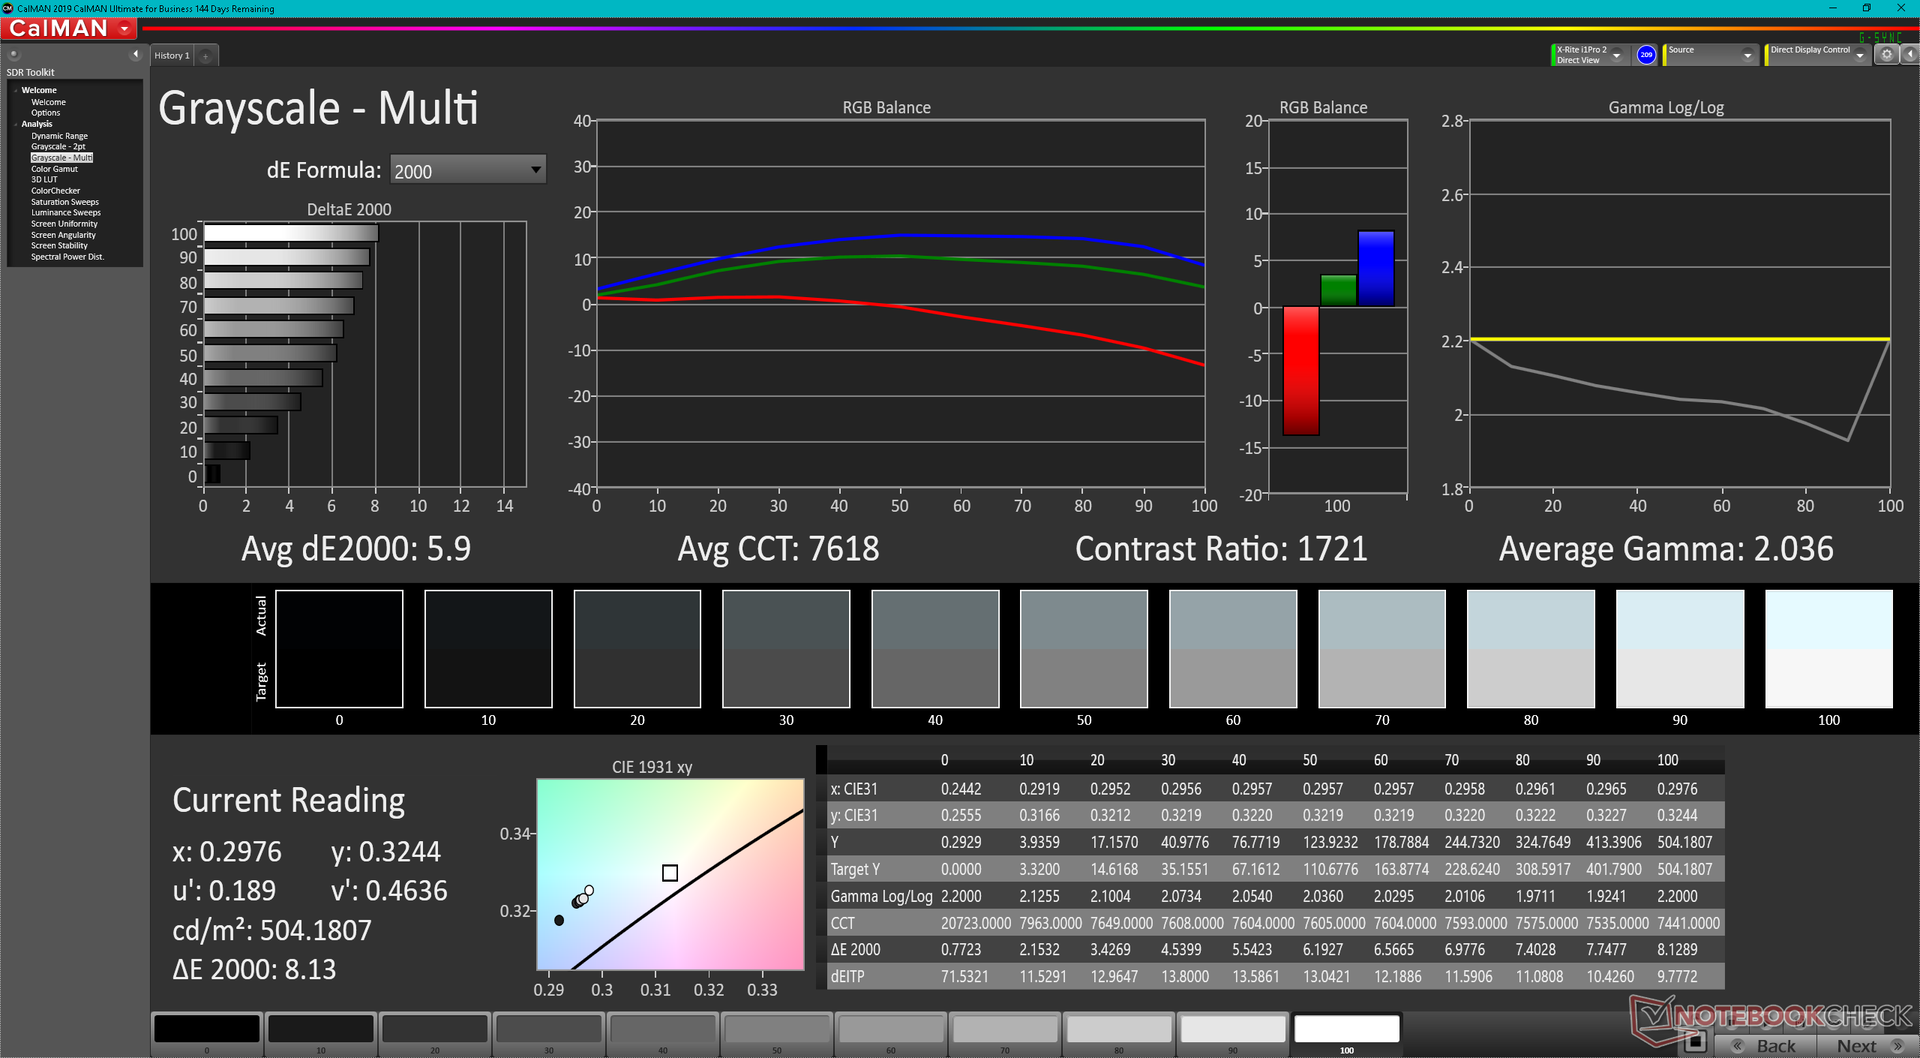
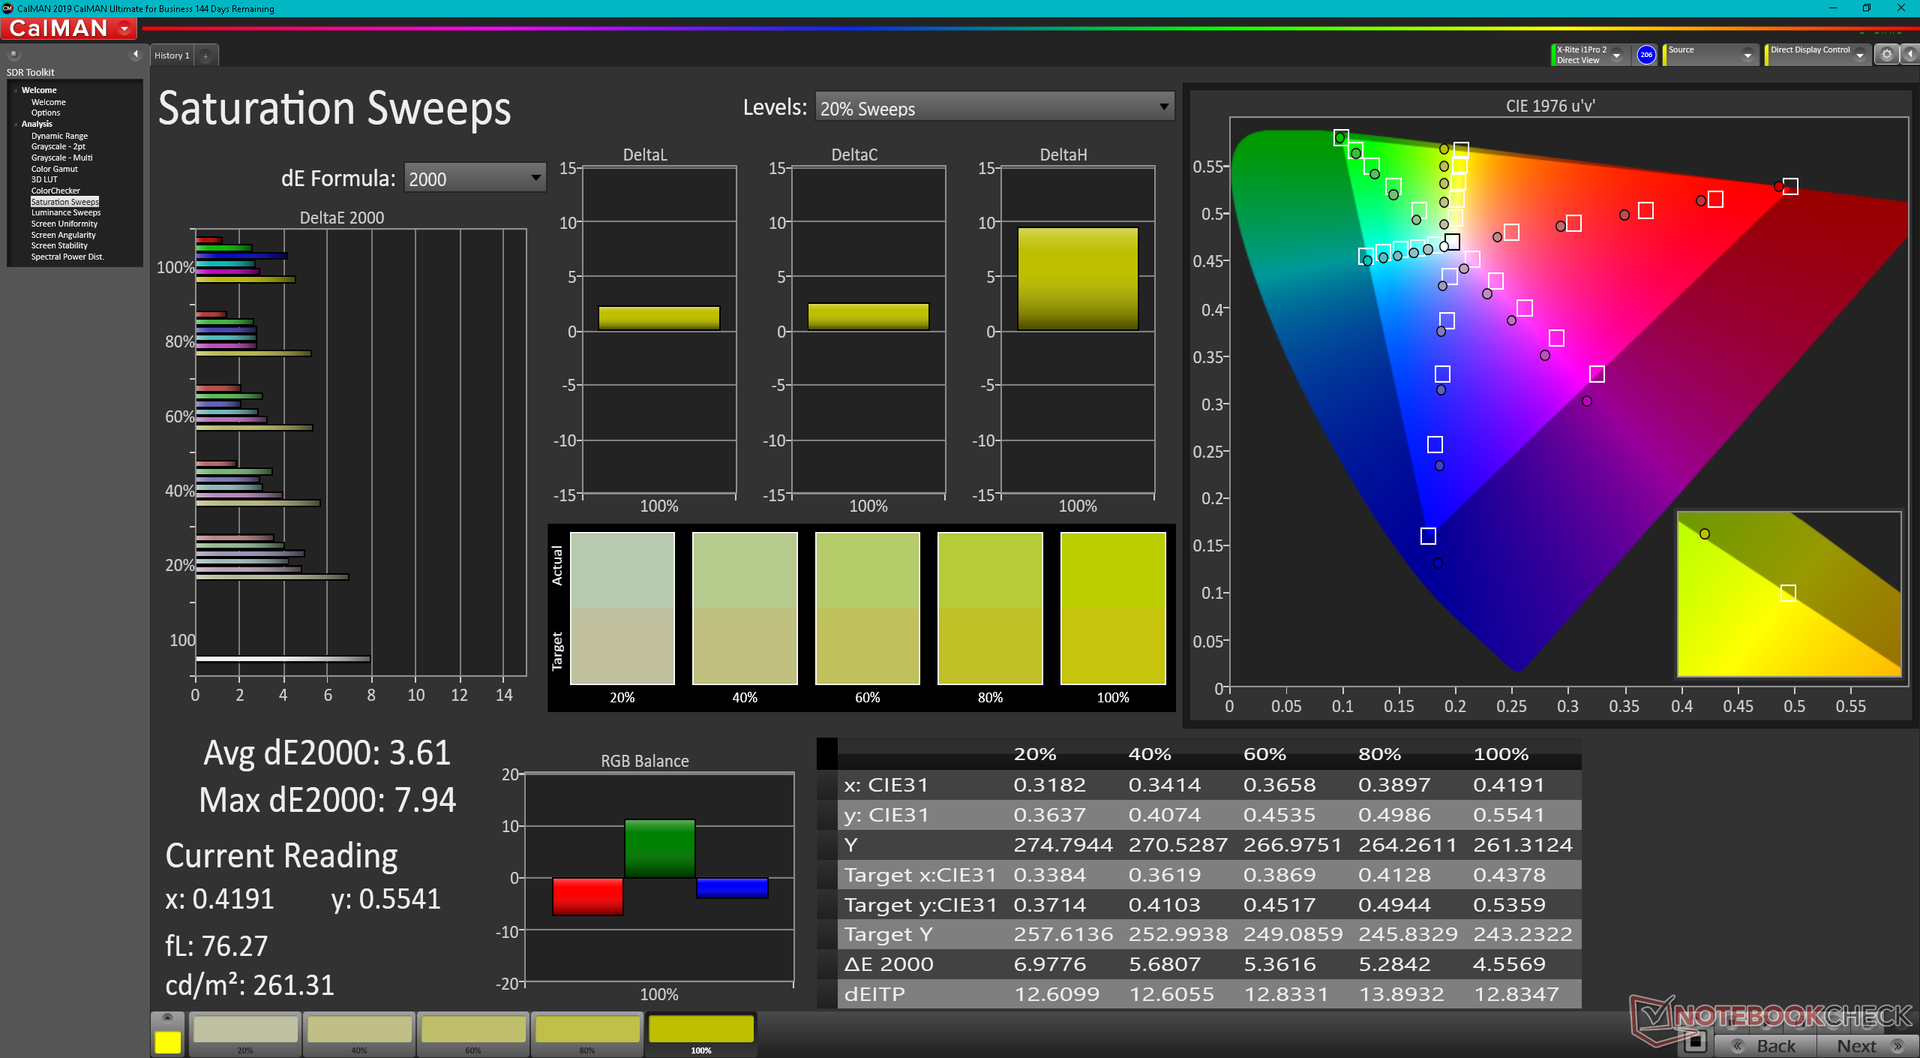
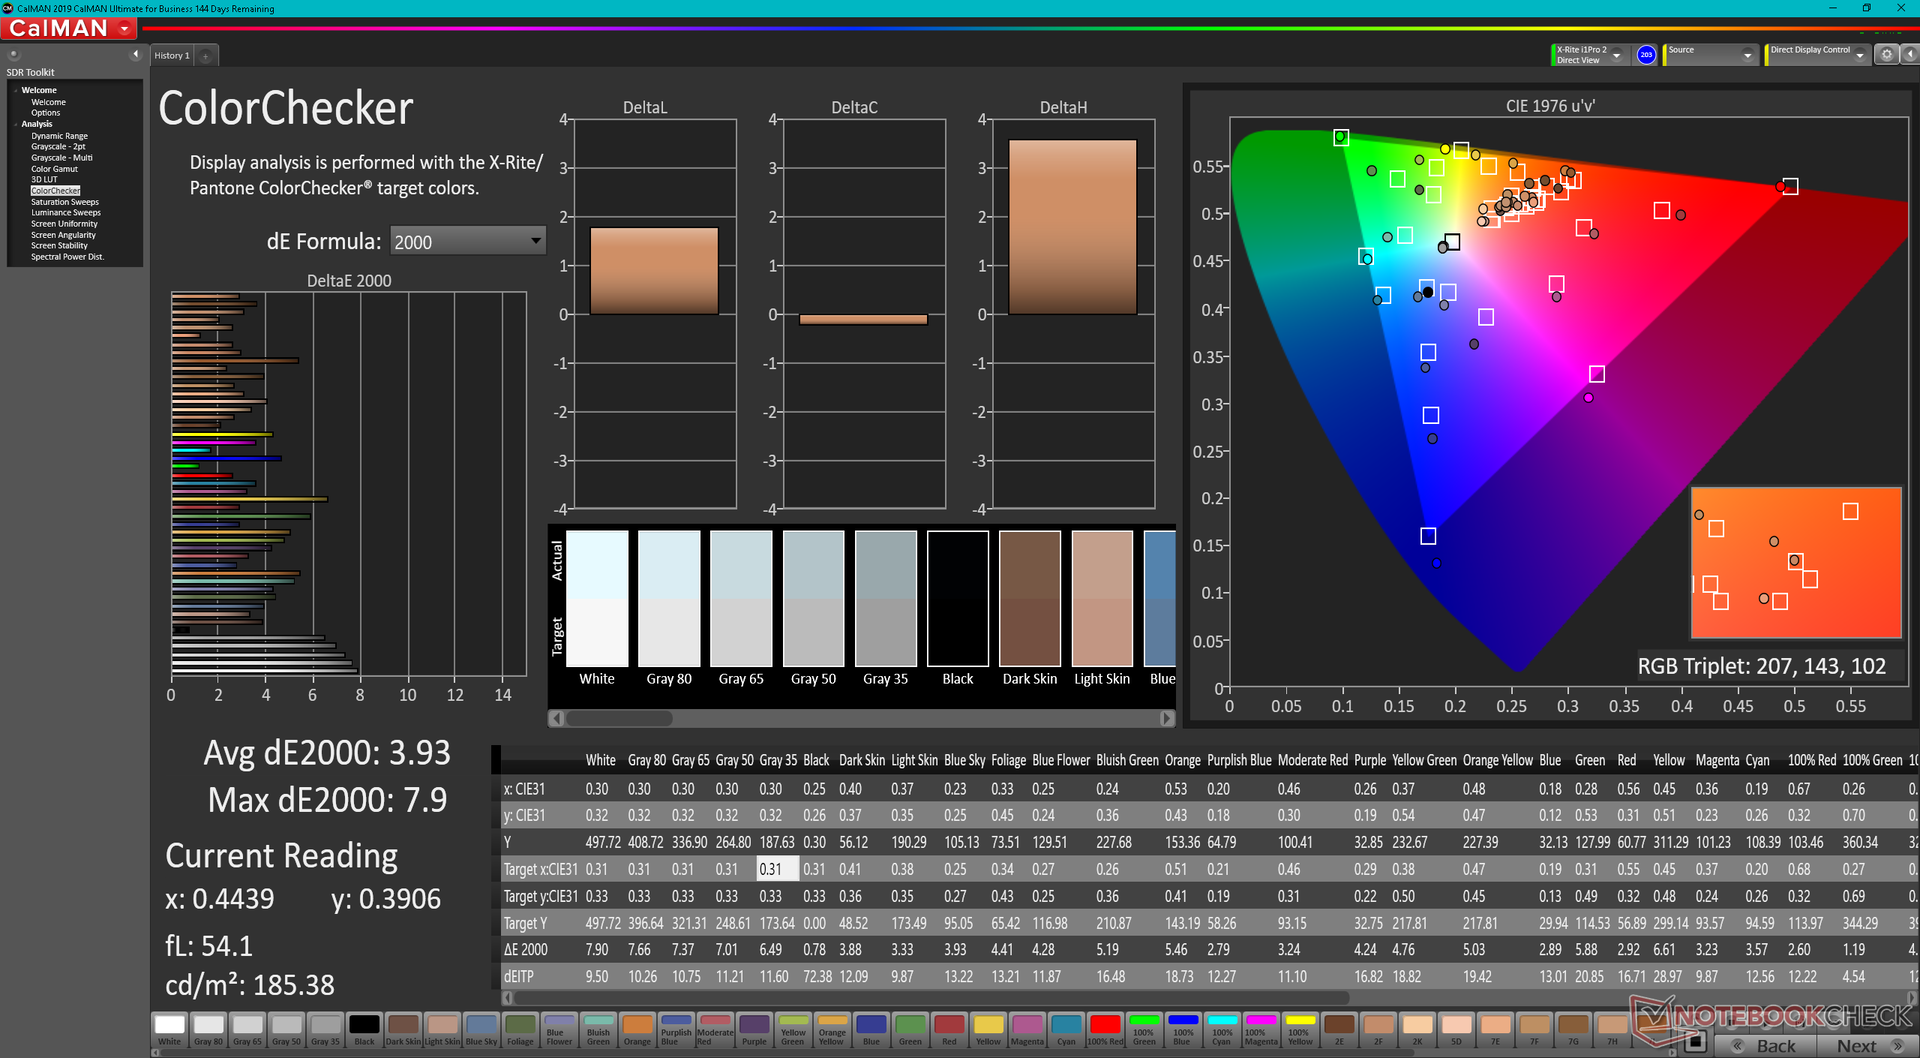
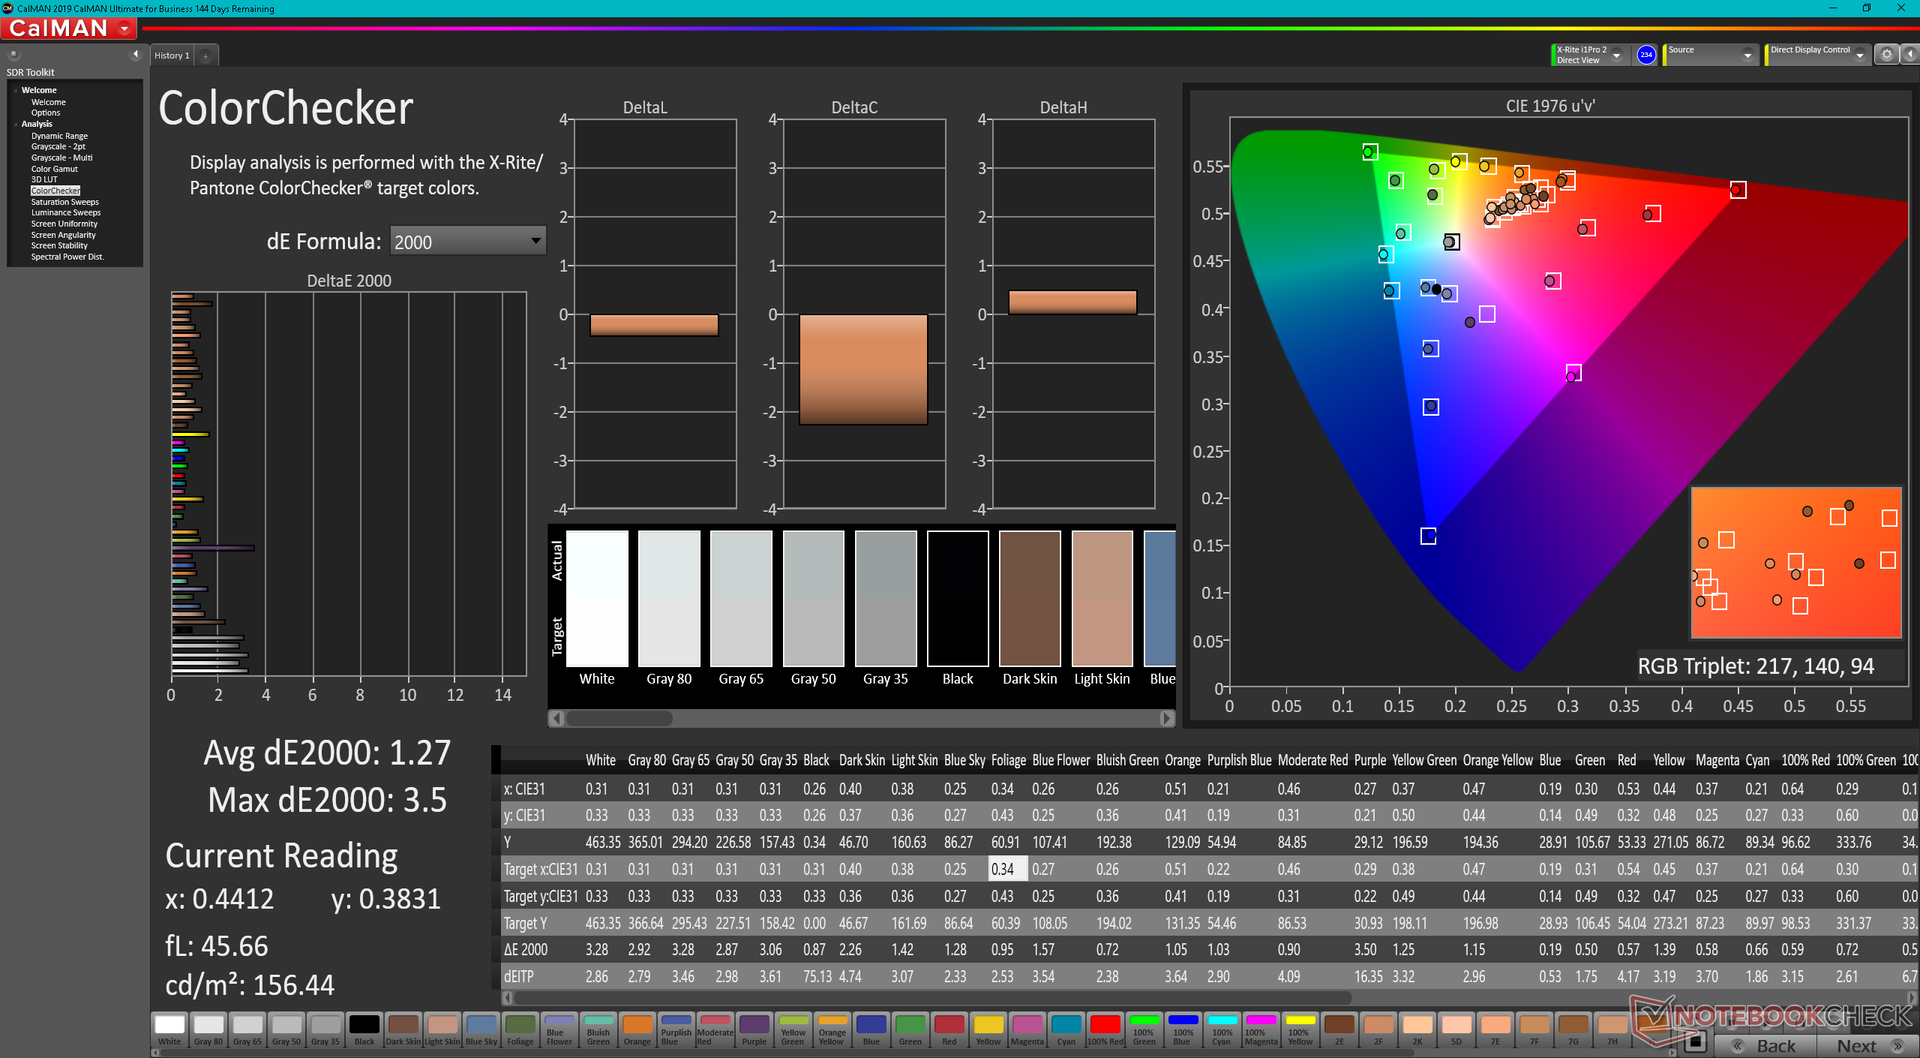
ΔE ColorChecker Calman: 3.93 | ∀{0.5-29.43 Ø4.71}
calibrated: 1.27
ΔE Greyscale Calman: 5.9 | ∀{0.09-98 Ø4.96}
85.9% AdobeRGB 1998 (Argyll 3D)
99.9% sRGB (Argyll 3D)
97.8% Display P3 (Argyll 3D)
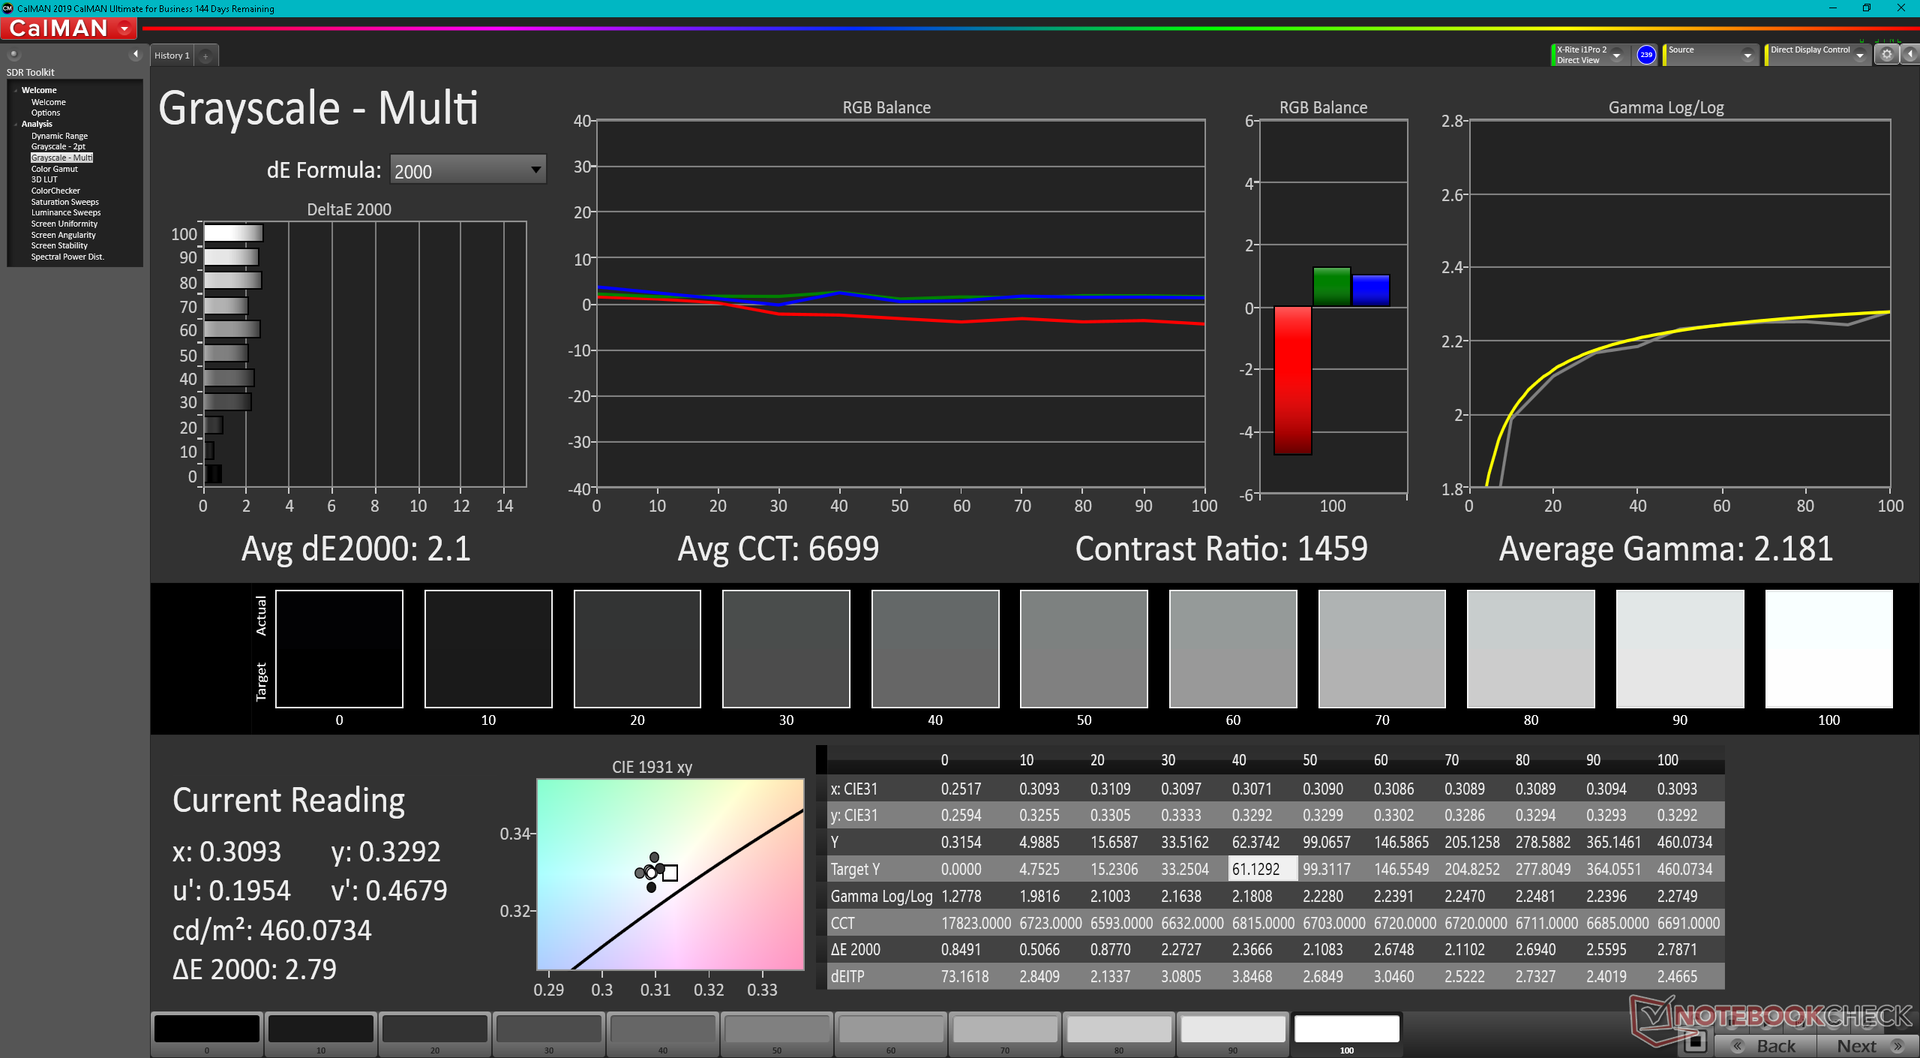
Gamma: 2.04
CCT: 7618 K
| MSI Summit E14 Flip Evo A12MT AU Optronics B140QAN04.R, IPS, 2880x1800, 14" | MSI Summit E14 A11SCS AU Optronics AUO123B, IPS, 3840x2160, 14" | Asus VivoBook S 14X S5402Z Samsung ATNA45AF01-0, OLED, 2880x1800, 14.5" | LG Gram 14T90P LG Philips LP140WU1-SPA1, IPS, 1900x1200, 14" | Lenovo Yoga Slim 7i Pro 14IAP G7 LEN140WQ+, IPS, 2880x1800, 14" | Dell Latitude 9420 2-in-1 AU Optronics B140QAN, IPS, 2560x1600, 14" | |
|---|---|---|---|---|---|---|
| Display | 2% | 4% | 1% | -10% | -8% | |
| Display P3 Coverage (%) | 97.8 | 87.5 -11% | 99.9 2% | 98.8 1% | 77.7 -21% | 80.7 -17% |
| sRGB Coverage (%) | 99.9 | 100 0% | 100 0% | 100 0% | 100 0% | 100 0% |
| AdobeRGB 1998 Coverage (%) | 85.9 | 99.4 16% | 95.5 11% | 78.4 -9% | 79.7 -7% | |
| Response Times | -154% | 95% | -128% | -61% | -167% | |
| Response Time Grey 50% / Grey 80% * (ms) | 16.9 ? | 52 ? -208% | 0.73 ? 96% | 44 ? -160% | 35.2 ? -108% | 54 ? -220% |
| Response Time Black / White * (ms) | 15.4 ? | 30.8 ? -100% | 1 ? 94% | 30 ? -95% | 17.6 ? -14% | 32.8 ? -113% |
| PWM Frequency (Hz) | 240.4 ? | |||||
| Screen | -29% | 18% | 1% | 7% | -0% | |
| Brightness middle (cd/m²) | 496.7 | 593.3 19% | 373 -25% | 305.5 -38% | 469 -6% | 483.6 -3% |
| Brightness (cd/m²) | 468 | 571 22% | 375 -20% | 289 -38% | 445 -5% | 465 -1% |
| Brightness Distribution (%) | 87 | 87 0% | 99 14% | 87 0% | 90 3% | 92 6% |
| Black Level * (cd/m²) | 0.3 | 0.53 -77% | 0.27 10% | 0.32 -7% | ||
| Contrast (:1) | 1656 | 1119 -32% | 1131 -32% | 1511 -9% | ||
| Colorchecker dE 2000 * | 3.93 | 4.42 -12% | 2.26 42% | 3.31 16% | 3.5 11% | 3.69 6% |
| Colorchecker dE 2000 max. * | 7.9 | 7.16 9% | 6.22 21% | 6.12 23% | 5.3 33% | 5.97 24% |
| Colorchecker dE 2000 calibrated * | 1.27 | 4.3 -239% | 1.7 -34% | 2.05 -61% | ||
| Greyscale dE 2000 * | 5.9 | 3.2 46% | 1.4 76% | 1.9 68% | 3.3 44% | 3.5 41% |
| Gamma | 2.04 108% | 2.04 108% | 2.22 99% | 2.04 108% | 1.97 112% | 2.04 108% |
| CCT | 7618 85% | 6737 96% | 6417 101% | 6706 97% | 6512 100% | 6158 106% |
| Media totale (Programma / Settaggio) | -60% /
-41% | 39% /
28% | -42% /
-20% | -21% /
-9% | -58% /
-26% |
* ... Meglio usare valori piccoli
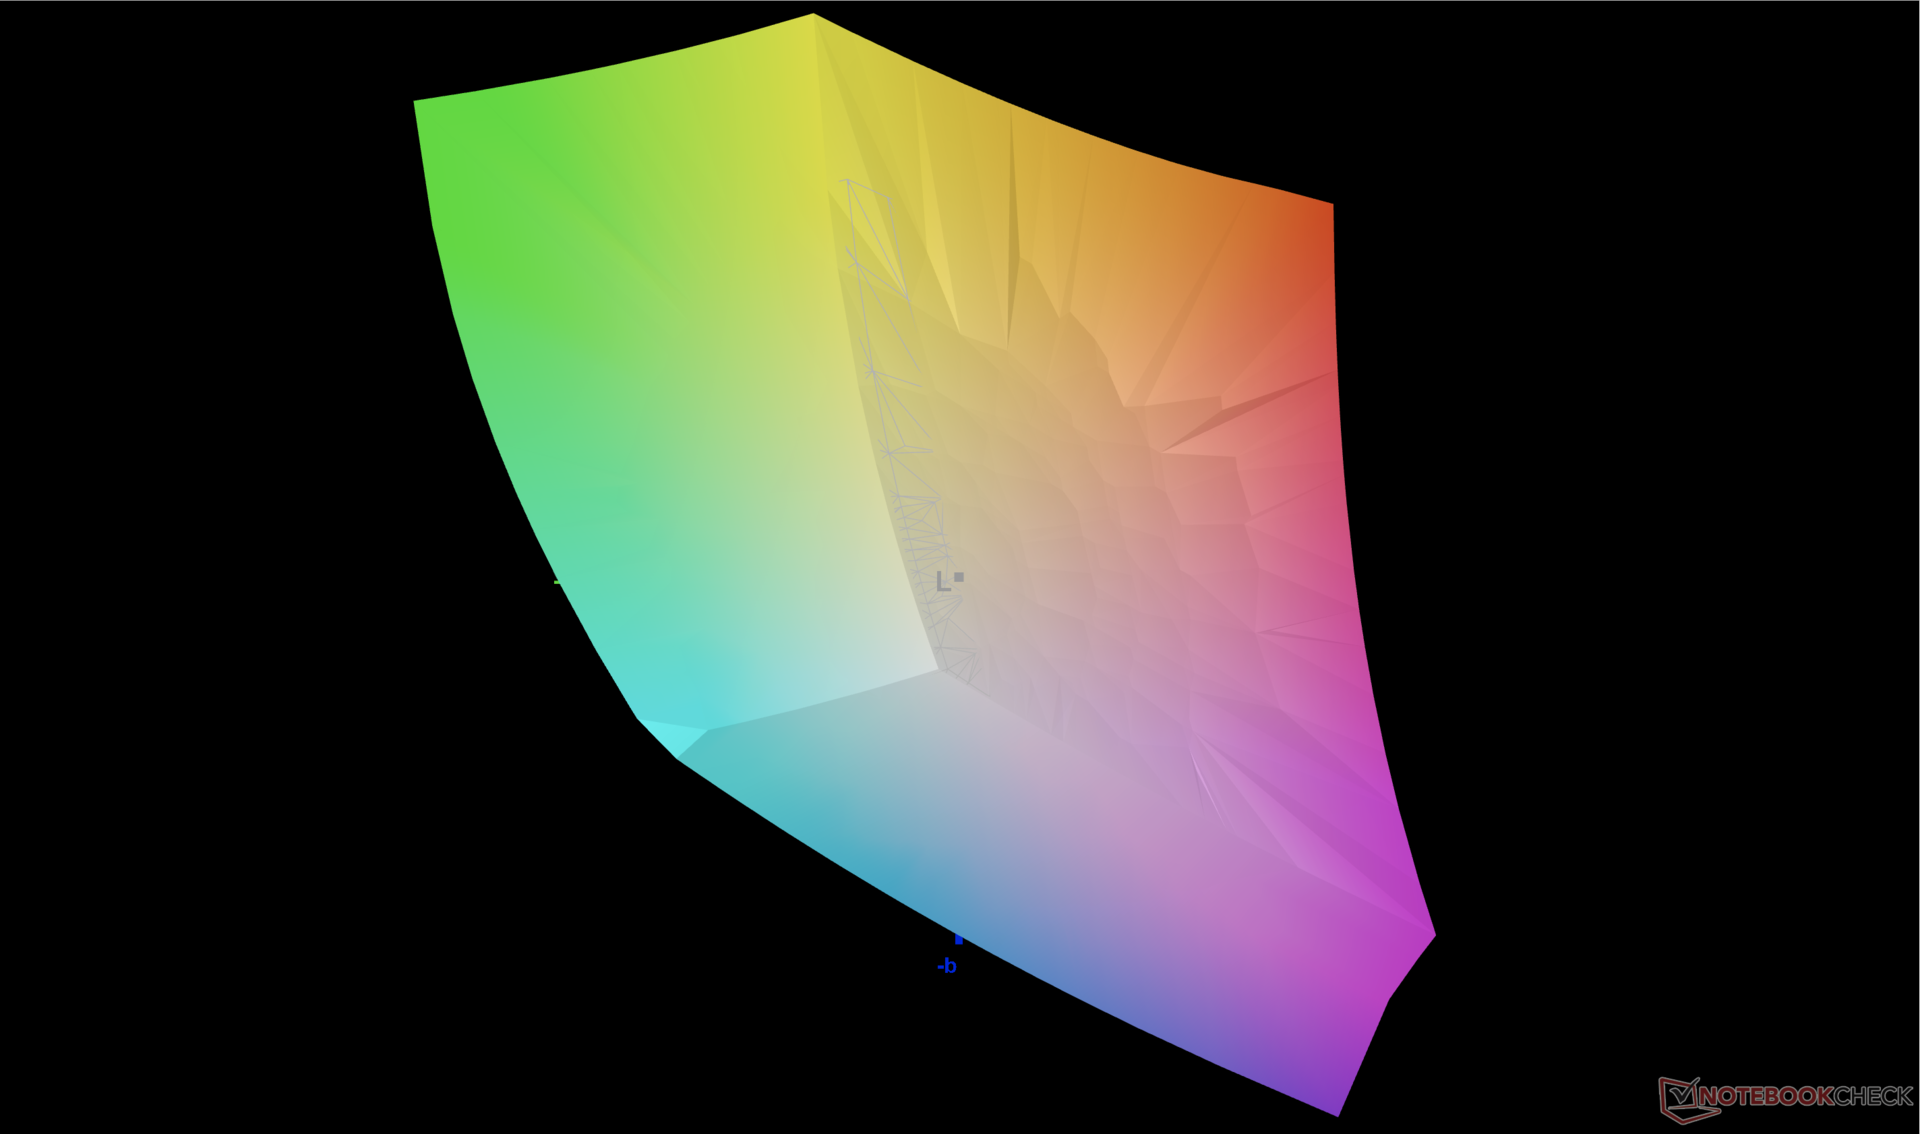
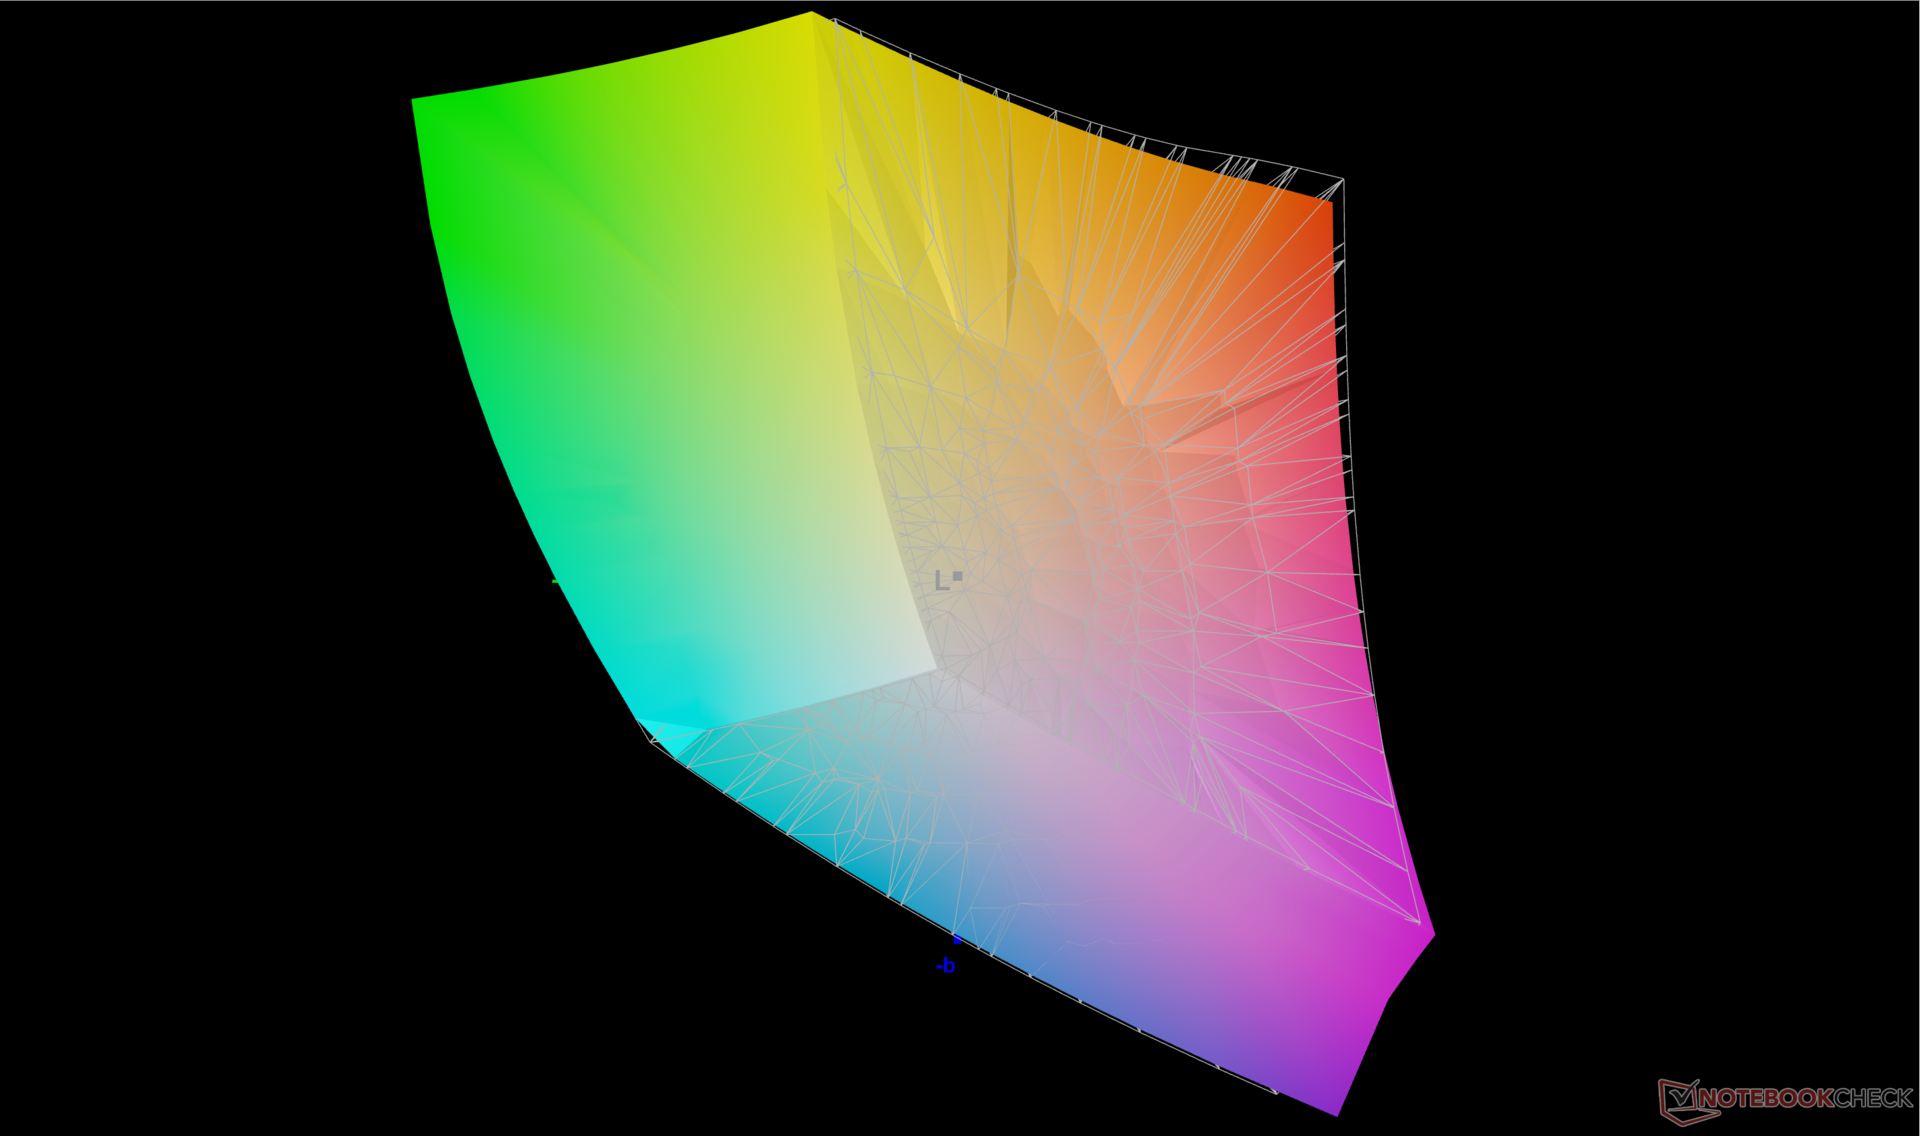
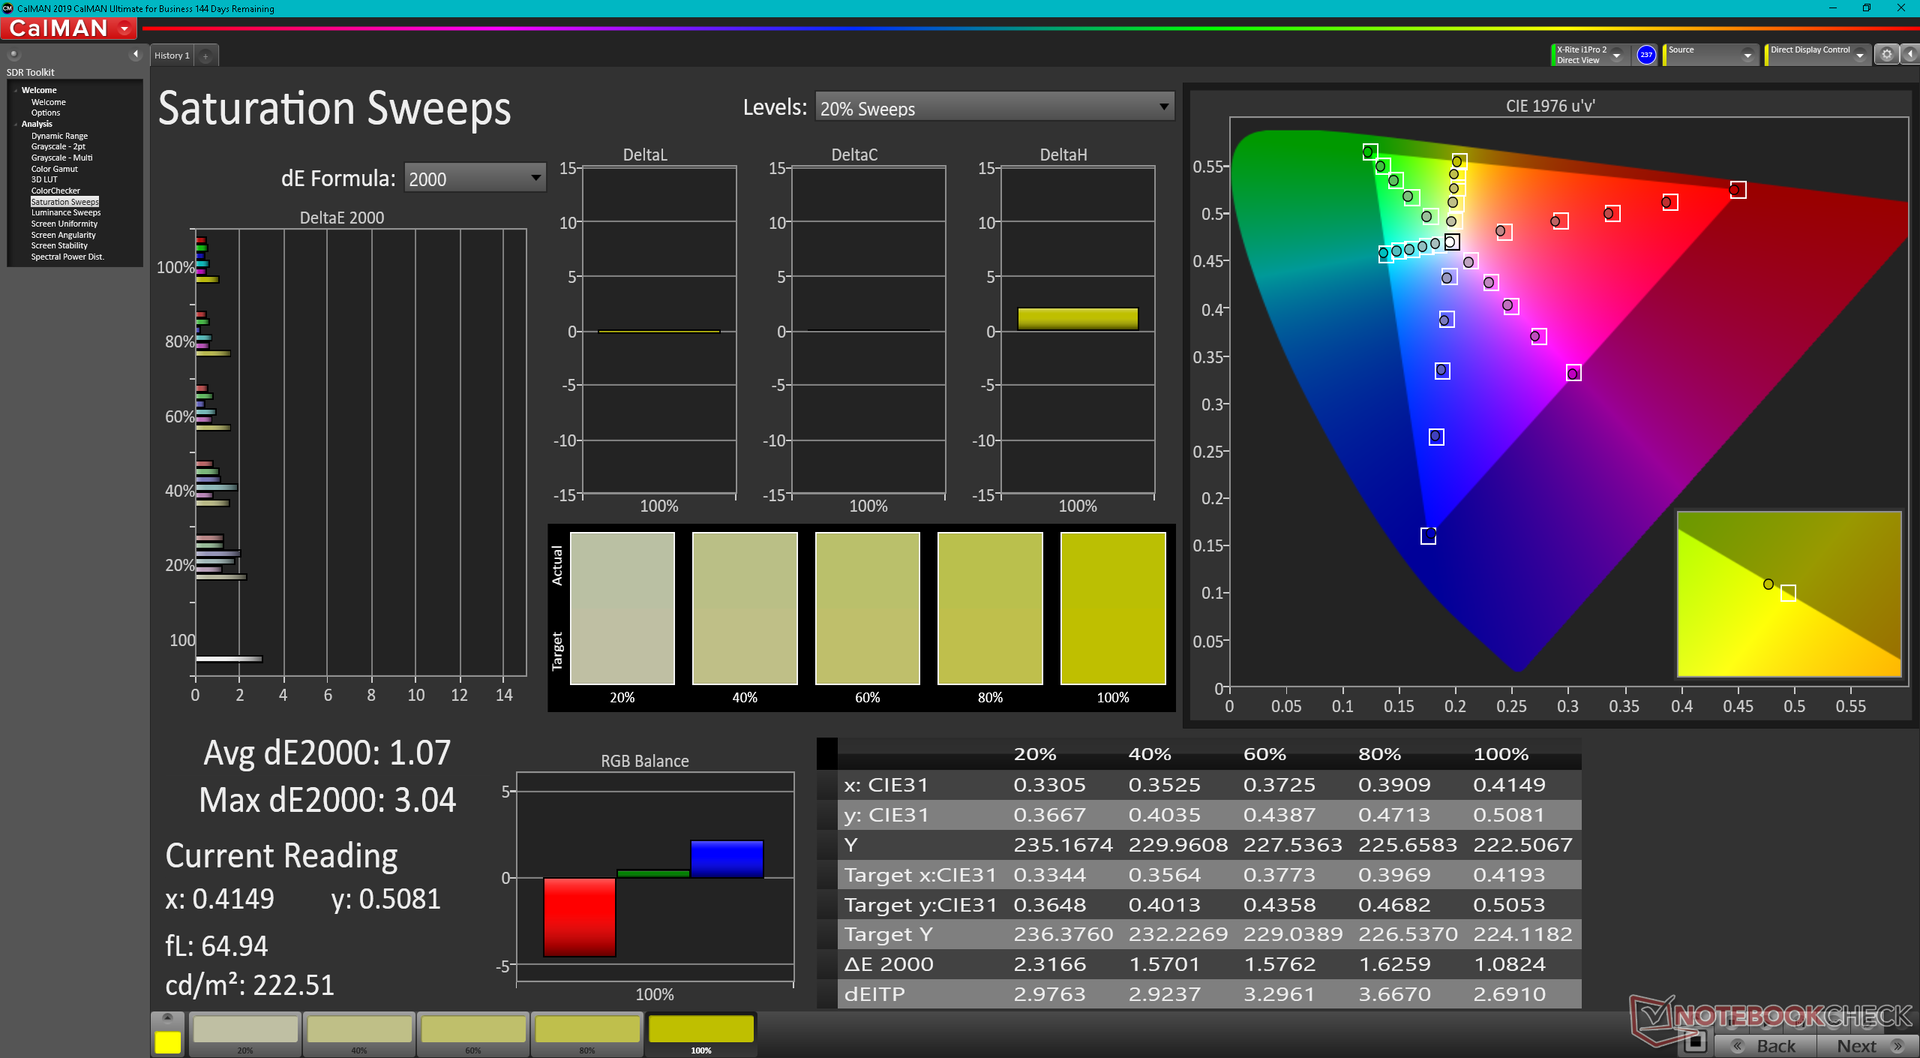
Il display del nostro Summit non è calibrato in fabbrica, a differenza di molti modelli MSI Creator, nonostante il pannello offra una copertura completa DCI-P3. Pertanto, i valori medi del DeltaE della scala di grigi e del colore sono mediocri, rispettivamente 5,9 e 3,93, rispetto allo standard P3. La temperatura del colore, in particolare, è più fredda di quanto vorremmo a 7618. Gli utenti dovranno calibrare i propri display per sfruttare al meglio la gamma cromatica.
Tempi di risposta del Display
| ↔ Tempi di risposta dal Nero al Bianco | ||
|---|---|---|
| 15.4 ms ... aumenta ↗ e diminuisce ↘ combinato | ↗ 7.3 ms Incremento | 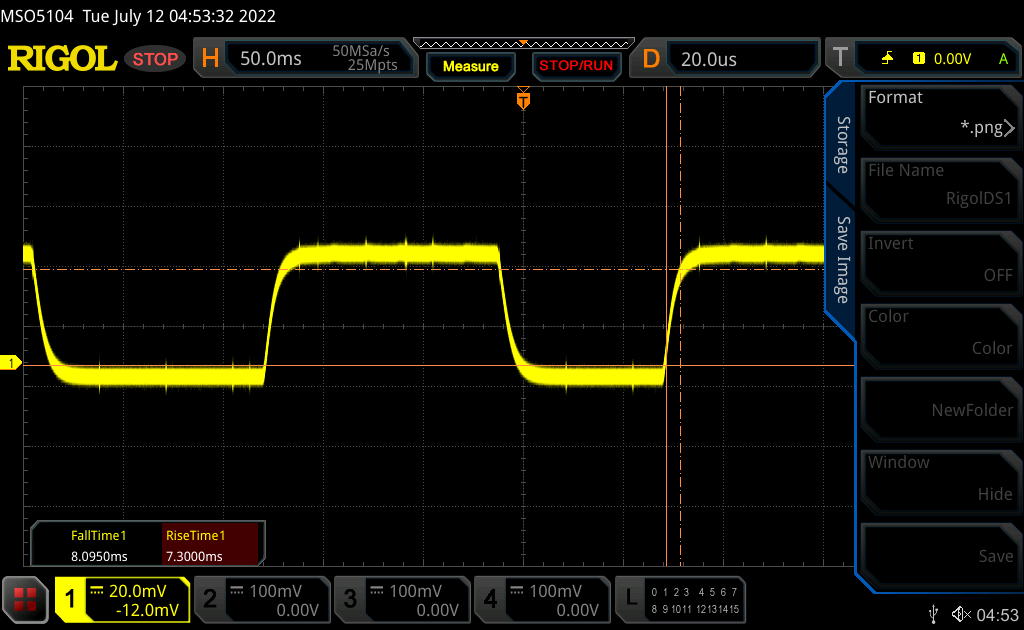 |
| ↘ 8.1 ms Calo | ||
| Lo schermo mostra buoni tempi di risposta durante i nostri tests, ma potrebbe essere troppo lento per i gamers competitivi. In confronto, tutti i dispositivi di test variano da 0.1 (minimo) a 240 (massimo) ms. » 37 % di tutti i dispositivi è migliore. Questo significa che i tempi di risposta rilevati sono migliori rispettto alla media di tutti i dispositivi testati (19.8 ms). | ||
| ↔ Tempo di risposta dal 50% Grigio all'80% Grigio | ||
| 16.9 ms ... aumenta ↗ e diminuisce ↘ combinato | ↗ 7.3 ms Incremento | 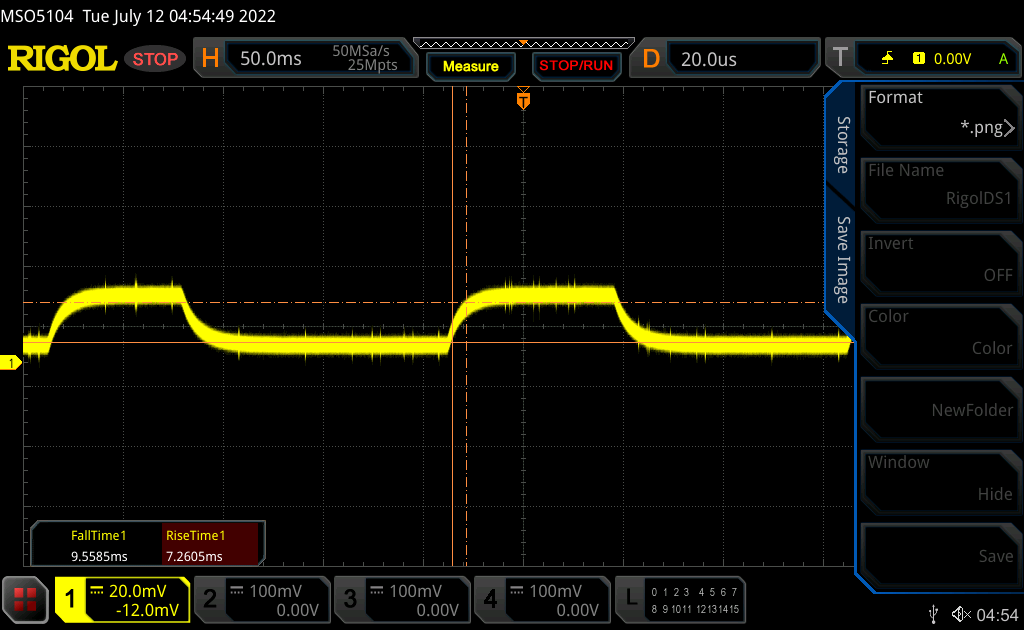 |
| ↘ 9.6 ms Calo | ||
| Lo schermo mostra buoni tempi di risposta durante i nostri tests, ma potrebbe essere troppo lento per i gamers competitivi. In confronto, tutti i dispositivi di test variano da 0.165 (minimo) a 636 (massimo) ms. » 31 % di tutti i dispositivi è migliore. Questo significa che i tempi di risposta rilevati sono migliori rispettto alla media di tutti i dispositivi testati (31 ms). | ||
Sfarfallio dello schermo / PWM (Pulse-Width Modulation)
| flickering dello schermo / PWM non rilevato | 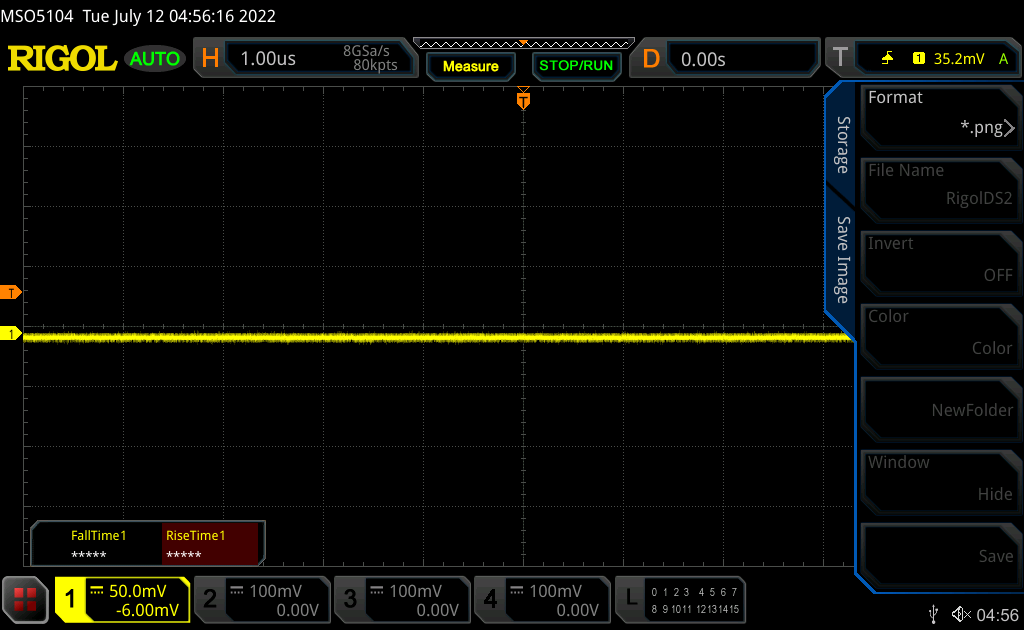 | ||
In confronto: 52 % di tutti i dispositivi testati non utilizza PWM per ridurre la luminosita' del display. Se è rilevato PWM, una media di 7747 (minimo: 5 - massimo: 343500) Hz è stata rilevata. | |||
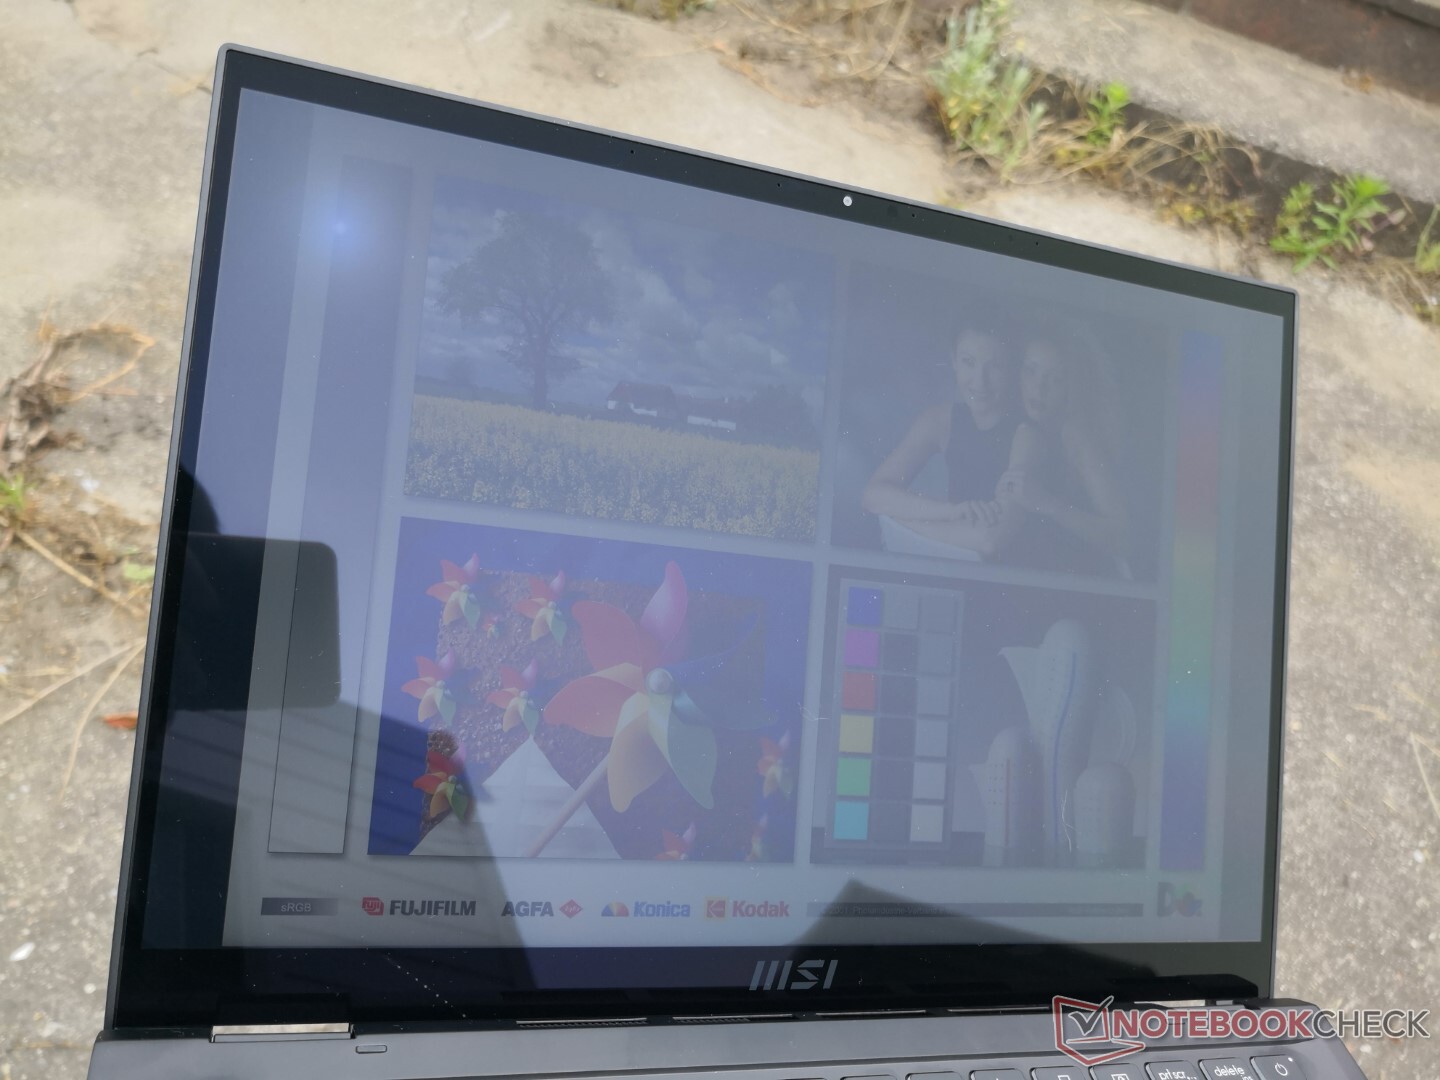
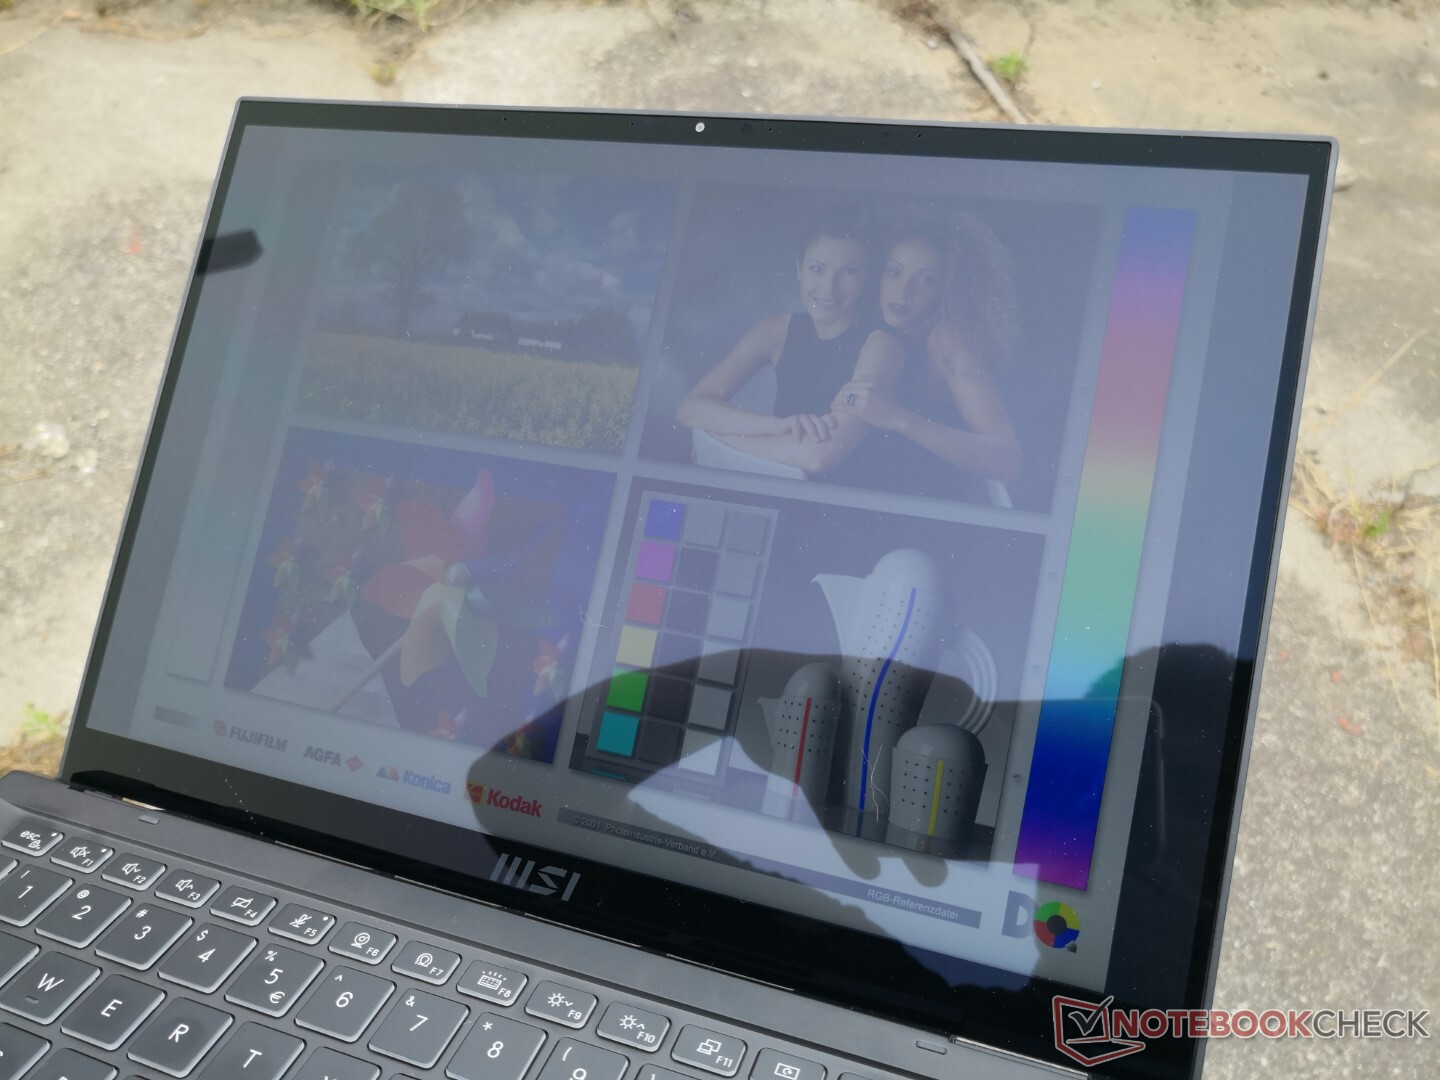
I riflessi sono inevitabili sullo schermo lucido, ma la retroilluminazione da 500 nit, più luminosa della media, aiuta a ridurre i riflessi a livelli più tollerabili. Si consiglia comunque di evitare di lavorare sotto la luce diretta del sole.
Prestazioni - La serie Intel Core-P convince
Condizioni di test
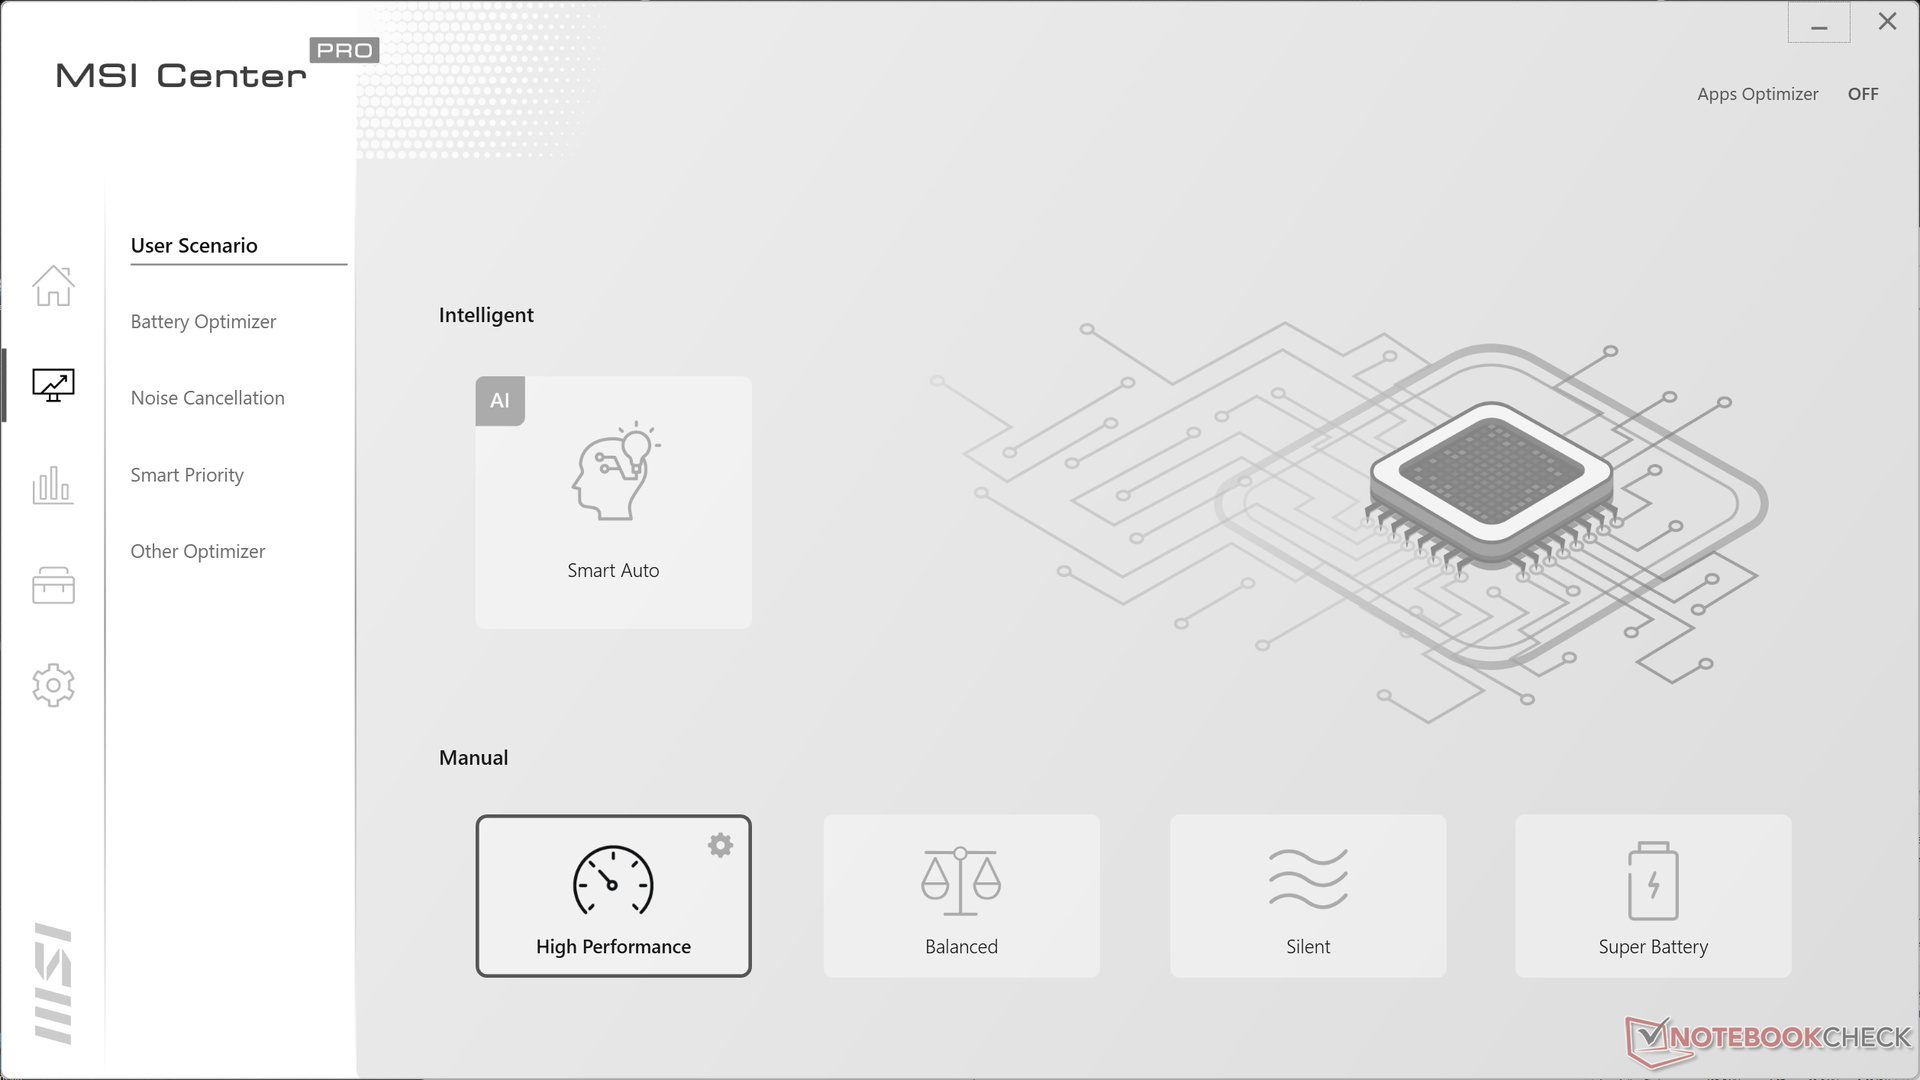
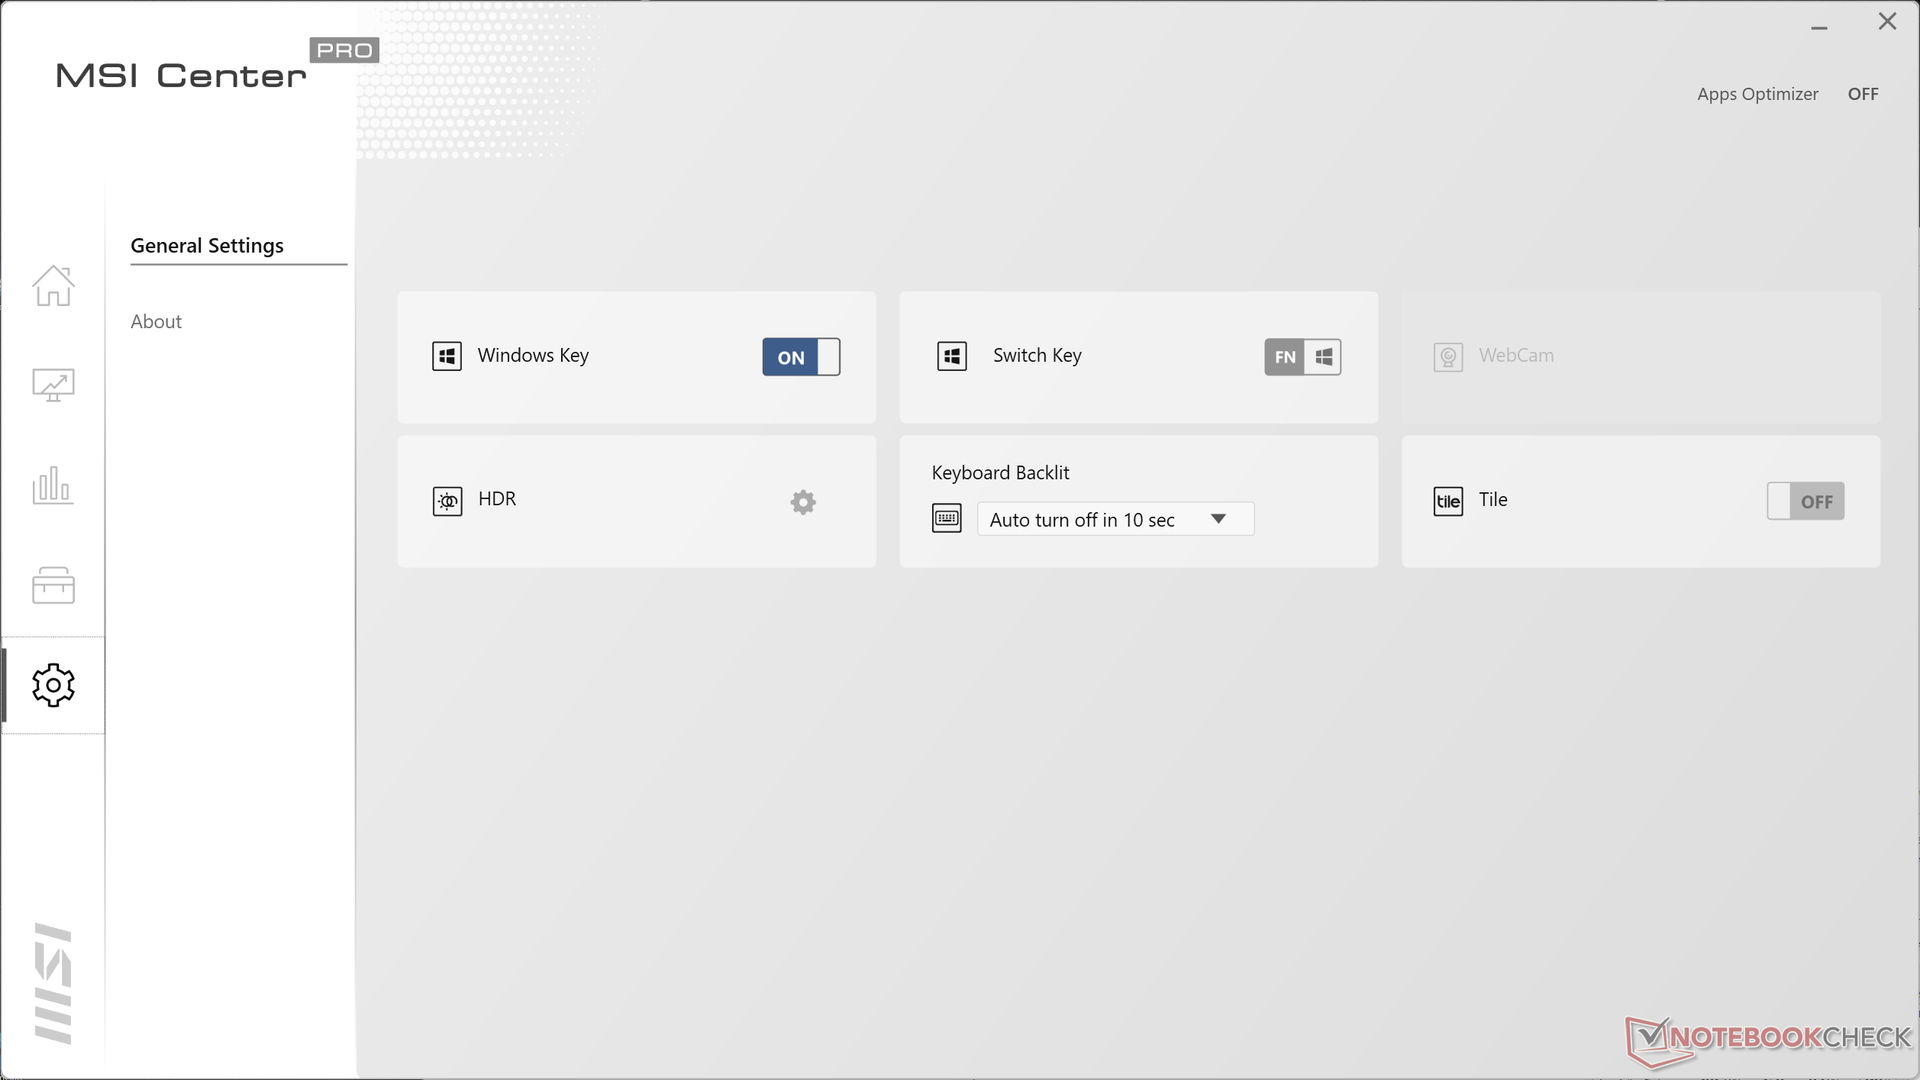
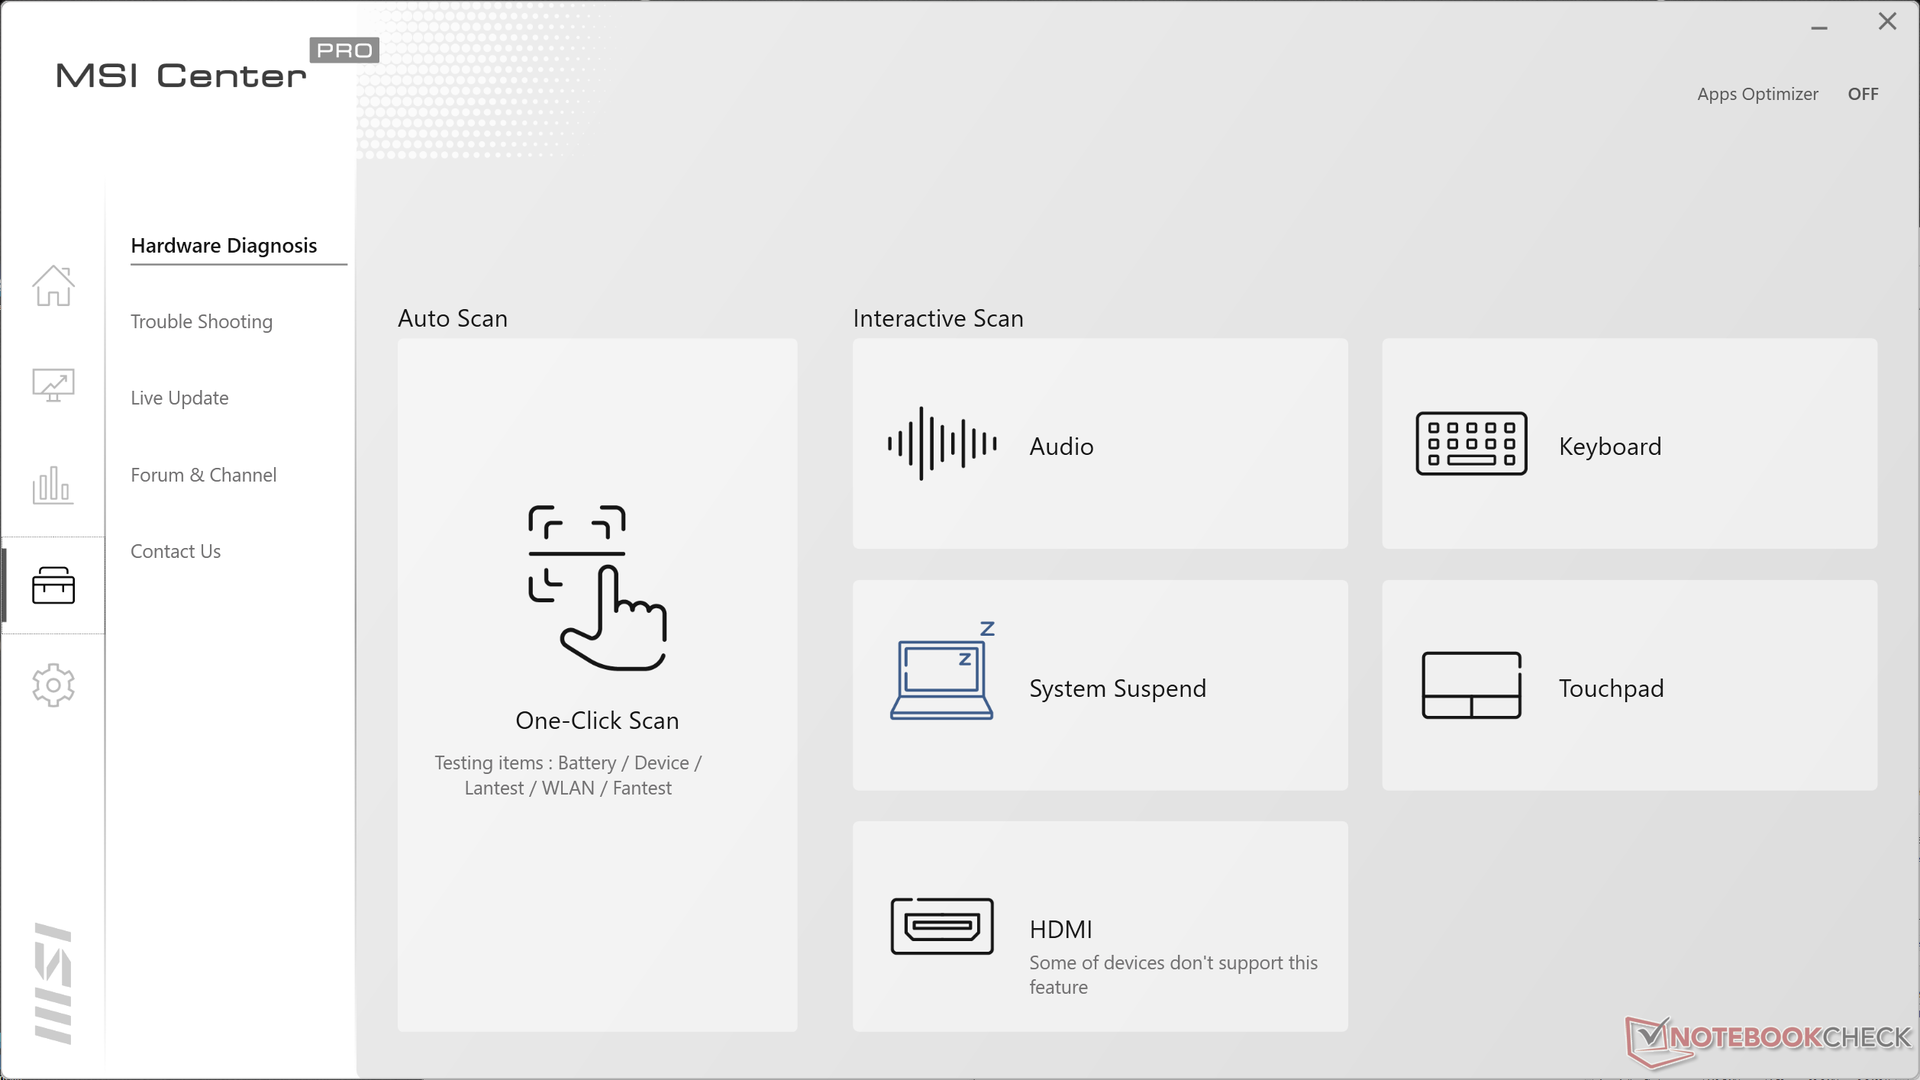
Abbiamo impostato la nostra unità in modalità High Performance tramite il software MSI Center preinstallato prima di eseguire i benchmark delle prestazioni riportati di seguito. Si consiglia di familiarizzare con questo software, che è essenzialmente il centro di comando per la regolazione della maggior parte delle impostazioni di sistema, degli aggiornamenti e dei profili di prestazioni.
Processore
Le prestazioni della CPU sono eccellenti, con risultati superiori del 5-10% rispetto alla media dei laptop del nostro database equipaggiati con lo stesso Core i7-1260P Core i7-1260P CORE I7-1260P. La nostra unità riesce persino a superare in modo consistente il Core i7-1270P delLenovo ThinkPad X1 Yoga G7 sia nei carichi di lavoro single-threaded che in quelli multi-threaded. Gli utenti che passano dall'ultima generazione di Core i7-1165G7 possono aspettarsi un incremento significativo fino all'80% nelle applicazioni multi-thread.
Il concorrente Ryzen 7 6800U è in grado di superare il nostro Core i7-1260P fino al 15-20% nei carichi di lavoro multi-thread, mentre il contrario avviene nei carichi di lavoro single-thread.
Cinebench R15 Multi Loop
Cinebench R23: Multi Core | Single Core
Cinebench R15: CPU Multi 64Bit | CPU Single 64Bit
Blender: v2.79 BMW27 CPU
7-Zip 18.03: 7z b 4 | 7z b 4 -mmt1
Geekbench 5.5: Multi-Core | Single-Core
HWBOT x265 Benchmark v2.2: 4k Preset
LibreOffice : 20 Documents To PDF
R Benchmark 2.5: Overall mean
Cinebench R23: Multi Core | Single Core
Cinebench R15: CPU Multi 64Bit | CPU Single 64Bit
Blender: v2.79 BMW27 CPU
7-Zip 18.03: 7z b 4 | 7z b 4 -mmt1
Geekbench 5.5: Multi-Core | Single-Core
HWBOT x265 Benchmark v2.2: 4k Preset
LibreOffice : 20 Documents To PDF
R Benchmark 2.5: Overall mean
* ... Meglio usare valori piccoli
AIDA64: FP32 Ray-Trace | FPU Julia | CPU SHA3 | CPU Queen | FPU SinJulia | FPU Mandel | CPU AES | CPU ZLib | FP64 Ray-Trace | CPU PhotoWorxx
| Performance rating | |
| Asus VivoBook S 14X S5402Z | |
| Lenovo Yoga Slim 7i Pro 14IAP G7 | |
| Dell Latitude 9420 2-in-1 | |
| Media Intel Core i7-1260P | |
| MSI Summit E14 A11SCS | |
| LG Gram 14T90P | |
| MSI Summit E14 Flip Evo A12MT | |
| AIDA64 / FP32 Ray-Trace | |
| Dell Latitude 9420 2-in-1 | |
| MSI Summit E14 A11SCS | |
| LG Gram 14T90P | |
| Asus VivoBook S 14X S5402Z | |
| Media Intel Core i7-1260P (2176 - 10898, n=26) | |
| Lenovo Yoga Slim 7i Pro 14IAP G7 | |
| MSI Summit E14 Flip Evo A12MT | |
| AIDA64 / FPU Julia | |
| Asus VivoBook S 14X S5402Z | |
| Media Intel Core i7-1260P (11015 - 56906, n=26) | |
| Dell Latitude 9420 2-in-1 | |
| MSI Summit E14 A11SCS | |
| Lenovo Yoga Slim 7i Pro 14IAP G7 | |
| LG Gram 14T90P | |
| MSI Summit E14 Flip Evo A12MT | |
| AIDA64 / CPU SHA3 | |
| Asus VivoBook S 14X S5402Z | |
| Lenovo Yoga Slim 7i Pro 14IAP G7 | |
| Dell Latitude 9420 2-in-1 | |
| MSI Summit E14 A11SCS | |
| LG Gram 14T90P | |
| Media Intel Core i7-1260P (669 - 2709, n=26) | |
| MSI Summit E14 Flip Evo A12MT | |
| AIDA64 / CPU Queen | |
| Asus VivoBook S 14X S5402Z | |
| MSI Summit E14 Flip Evo A12MT | |
| Lenovo Yoga Slim 7i Pro 14IAP G7 | |
| Media Intel Core i7-1260P (42571 - 82493, n=26) | |
| Dell Latitude 9420 2-in-1 | |
| MSI Summit E14 A11SCS | |
| LG Gram 14T90P | |
| AIDA64 / FPU SinJulia | |
| Asus VivoBook S 14X S5402Z | |
| Lenovo Yoga Slim 7i Pro 14IAP G7 | |
| MSI Summit E14 Flip Evo A12MT | |
| Media Intel Core i7-1260P (2901 - 6975, n=26) | |
| Dell Latitude 9420 2-in-1 | |
| MSI Summit E14 A11SCS | |
| LG Gram 14T90P | |
| AIDA64 / FPU Mandel | |
| Asus VivoBook S 14X S5402Z | |
| MSI Summit E14 A11SCS | |
| Dell Latitude 9420 2-in-1 | |
| LG Gram 14T90P | |
| Media Intel Core i7-1260P (5950 - 26376, n=26) | |
| Lenovo Yoga Slim 7i Pro 14IAP G7 | |
| MSI Summit E14 Flip Evo A12MT | |
| AIDA64 / CPU AES | |
| Dell Latitude 9420 2-in-1 | |
| LG Gram 14T90P | |
| Asus VivoBook S 14X S5402Z | |
| Media Intel Core i7-1260P (16041 - 92356, n=26) | |
| Lenovo Yoga Slim 7i Pro 14IAP G7 | |
| MSI Summit E14 A11SCS | |
| MSI Summit E14 Flip Evo A12MT | |
| AIDA64 / CPU ZLib | |
| Asus VivoBook S 14X S5402Z | |
| Lenovo Yoga Slim 7i Pro 14IAP G7 | |
| MSI Summit E14 Flip Evo A12MT | |
| Media Intel Core i7-1260P (259 - 771, n=26) | |
| Dell Latitude 9420 2-in-1 | |
| MSI Summit E14 A11SCS | |
| LG Gram 14T90P | |
| AIDA64 / FP64 Ray-Trace | |
| Asus VivoBook S 14X S5402Z | |
| Dell Latitude 9420 2-in-1 | |
| MSI Summit E14 A11SCS | |
| LG Gram 14T90P | |
| Media Intel Core i7-1260P (1237 - 5858, n=26) | |
| Lenovo Yoga Slim 7i Pro 14IAP G7 | |
| MSI Summit E14 Flip Evo A12MT | |
| AIDA64 / CPU PhotoWorxx | |
| MSI Summit E14 A11SCS | |
| Dell Latitude 9420 2-in-1 | |
| LG Gram 14T90P | |
| MSI Summit E14 Flip Evo A12MT | |
| Lenovo Yoga Slim 7i Pro 14IAP G7 | |
| Media Intel Core i7-1260P (13261 - 43652, n=26) | |
| Asus VivoBook S 14X S5402Z | |
Prestazioni del sistema
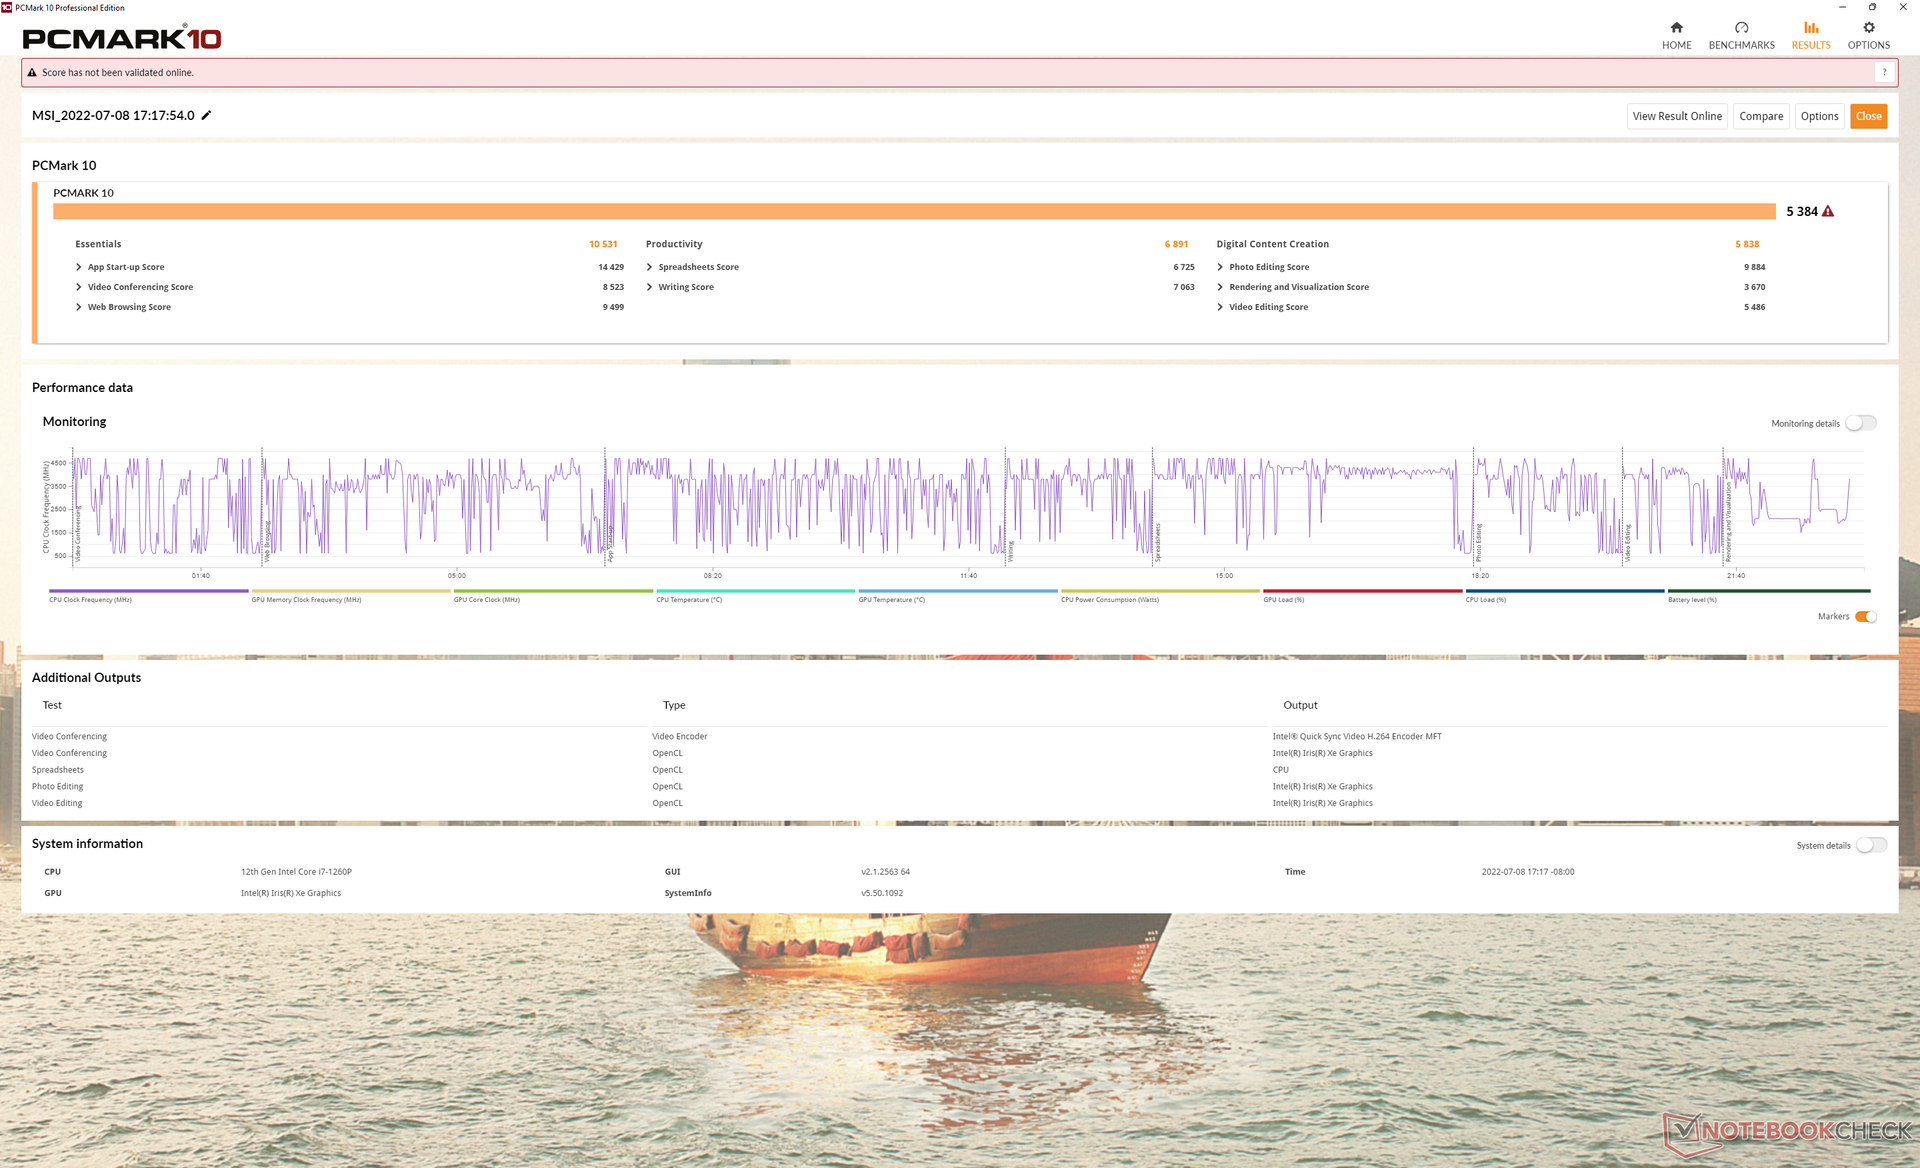
I punteggi di PCMark 10 sono paragonabili a quelli di altri portatili con la stessa CPU Core i7-1260P. Nel frattempo, i punteggi di CrossMark sono costantemente superiori a quelli di molte altre alternative da 14 pollici, tra cui anche il Core H-series powered Asus VivoBook S 14.
CrossMark: Overall | Productivity | Creativity | Responsiveness
| PCMark 10 / Score | |
| Asus VivoBook S 14X S5402Z | |
| Media Intel Core i7-1260P, Intel Iris Xe Graphics G7 96EUs (4796 - 6068, n=17) | |
| MSI Summit E14 Flip Evo A12MT | |
| MSI Summit E14 A11SCS | |
| Dell Latitude 9420 2-in-1 | |
| Lenovo Yoga Slim 7i Pro 14IAP G7 | |
| LG Gram 14T90P | |
| PCMark 10 / Essentials | |
| Asus VivoBook S 14X S5402Z | |
| MSI Summit E14 Flip Evo A12MT | |
| Dell Latitude 9420 2-in-1 | |
| Media Intel Core i7-1260P, Intel Iris Xe Graphics G7 96EUs (9260 - 11251, n=17) | |
| Lenovo Yoga Slim 7i Pro 14IAP G7 | |
| LG Gram 14T90P | |
| MSI Summit E14 A11SCS | |
| PCMark 10 / Productivity | |
| MSI Summit E14 A11SCS | |
| Asus VivoBook S 14X S5402Z | |
| Media Intel Core i7-1260P, Intel Iris Xe Graphics G7 96EUs (6167 - 8629, n=17) | |
| Dell Latitude 9420 2-in-1 | |
| MSI Summit E14 Flip Evo A12MT | |
| LG Gram 14T90P | |
| Lenovo Yoga Slim 7i Pro 14IAP G7 | |
| PCMark 10 / Digital Content Creation | |
| Asus VivoBook S 14X S5402Z | |
| Media Intel Core i7-1260P, Intel Iris Xe Graphics G7 96EUs (5231 - 6908, n=17) | |
| Lenovo Yoga Slim 7i Pro 14IAP G7 | |
| MSI Summit E14 Flip Evo A12MT | |
| MSI Summit E14 A11SCS | |
| Dell Latitude 9420 2-in-1 | |
| LG Gram 14T90P | |
| CrossMark / Overall | |
| MSI Summit E14 Flip Evo A12MT | |
| Media Intel Core i7-1260P, Intel Iris Xe Graphics G7 96EUs (1484 - 1811, n=16) | |
| Lenovo Yoga Slim 7i Pro 14IAP G7 | |
| Asus VivoBook S 14X S5402Z | |
| LG Gram 14T90P | |
| CrossMark / Productivity | |
| MSI Summit E14 Flip Evo A12MT | |
| Media Intel Core i7-1260P, Intel Iris Xe Graphics G7 96EUs (1486 - 1755, n=16) | |
| Asus VivoBook S 14X S5402Z | |
| Lenovo Yoga Slim 7i Pro 14IAP G7 | |
| LG Gram 14T90P | |
| CrossMark / Creativity | |
| MSI Summit E14 Flip Evo A12MT | |
| Media Intel Core i7-1260P, Intel Iris Xe Graphics G7 96EUs (1451 - 1872, n=16) | |
| Lenovo Yoga Slim 7i Pro 14IAP G7 | |
| Asus VivoBook S 14X S5402Z | |
| LG Gram 14T90P | |
| CrossMark / Responsiveness | |
| MSI Summit E14 Flip Evo A12MT | |
| Media Intel Core i7-1260P, Intel Iris Xe Graphics G7 96EUs (1253 - 1807, n=16) | |
| Asus VivoBook S 14X S5402Z | |
| Lenovo Yoga Slim 7i Pro 14IAP G7 | |
| LG Gram 14T90P | |
| PCMark 10 Score | 5384 punti | |
Aiuto | ||
| AIDA64 / Memory Copy | |
| MSI Summit E14 Flip Evo A12MT | |
| Dell Latitude 9420 2-in-1 | |
| LG Gram 14T90P | |
| MSI Summit E14 A11SCS | |
| Lenovo Yoga Slim 7i Pro 14IAP G7 | |
| Media Intel Core i7-1260P (25125 - 71544, n=25) | |
| Asus VivoBook S 14X S5402Z | |
| AIDA64 / Memory Read | |
| MSI Summit E14 Flip Evo A12MT | |
| Dell Latitude 9420 2-in-1 | |
| Lenovo Yoga Slim 7i Pro 14IAP G7 | |
| LG Gram 14T90P | |
| MSI Summit E14 A11SCS | |
| Media Intel Core i7-1260P (24983 - 72065, n=25) | |
| Asus VivoBook S 14X S5402Z | |
| AIDA64 / Memory Write | |
| LG Gram 14T90P | |
| Dell Latitude 9420 2-in-1 | |
| MSI Summit E14 A11SCS | |
| MSI Summit E14 Flip Evo A12MT | |
| Lenovo Yoga Slim 7i Pro 14IAP G7 | |
| Media Intel Core i7-1260P (23512 - 66799, n=25) | |
| Asus VivoBook S 14X S5402Z | |
| AIDA64 / Memory Latency | |
| MSI Summit E14 A11SCS | |
| Dell Latitude 9420 2-in-1 | |
| LG Gram 14T90P | |
| Media Intel Core i7-1260P (77.9 - 118.4, n=21) | |
| Asus VivoBook S 14X S5402Z | |
| MSI Summit E14 Flip Evo A12MT | |
* ... Meglio usare valori piccoli
Latenza DPC
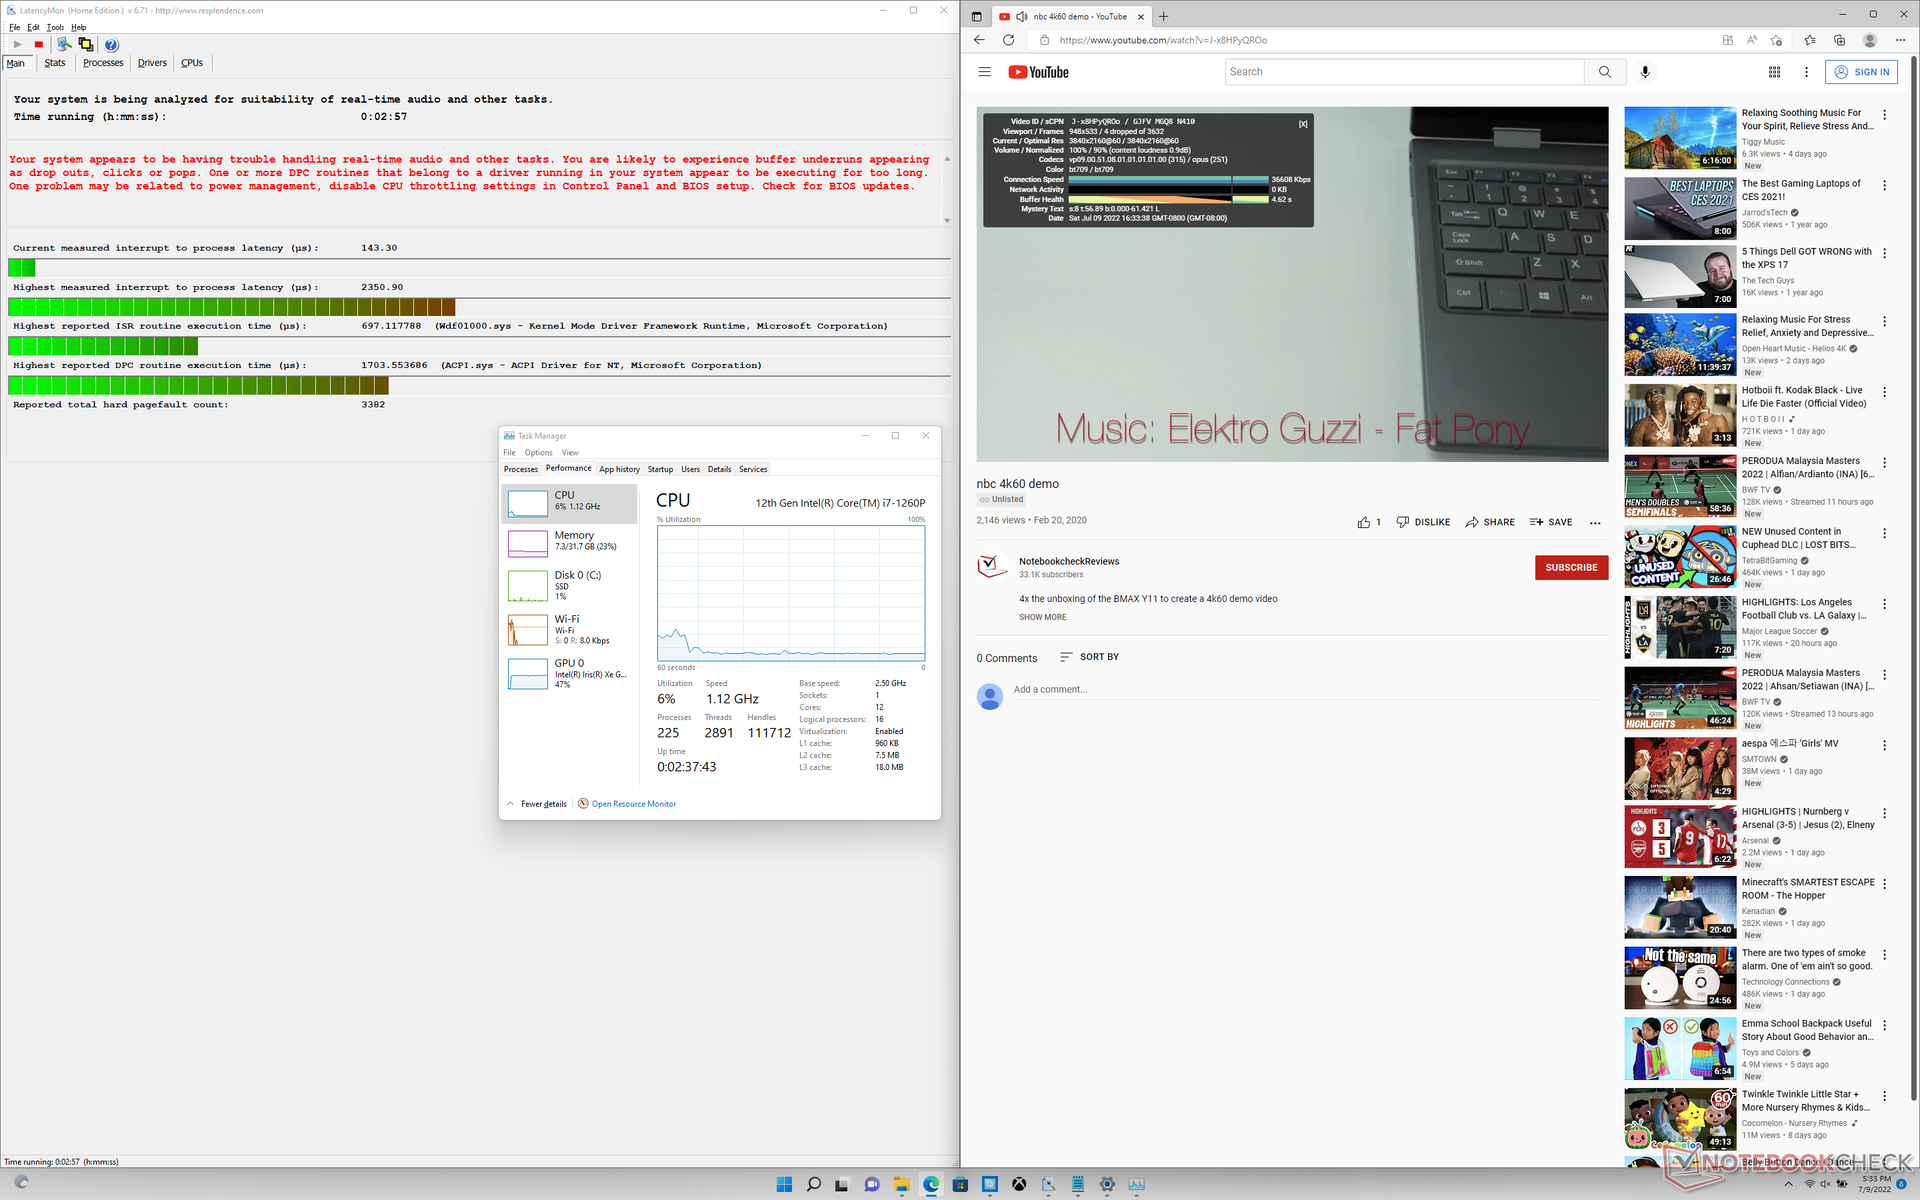
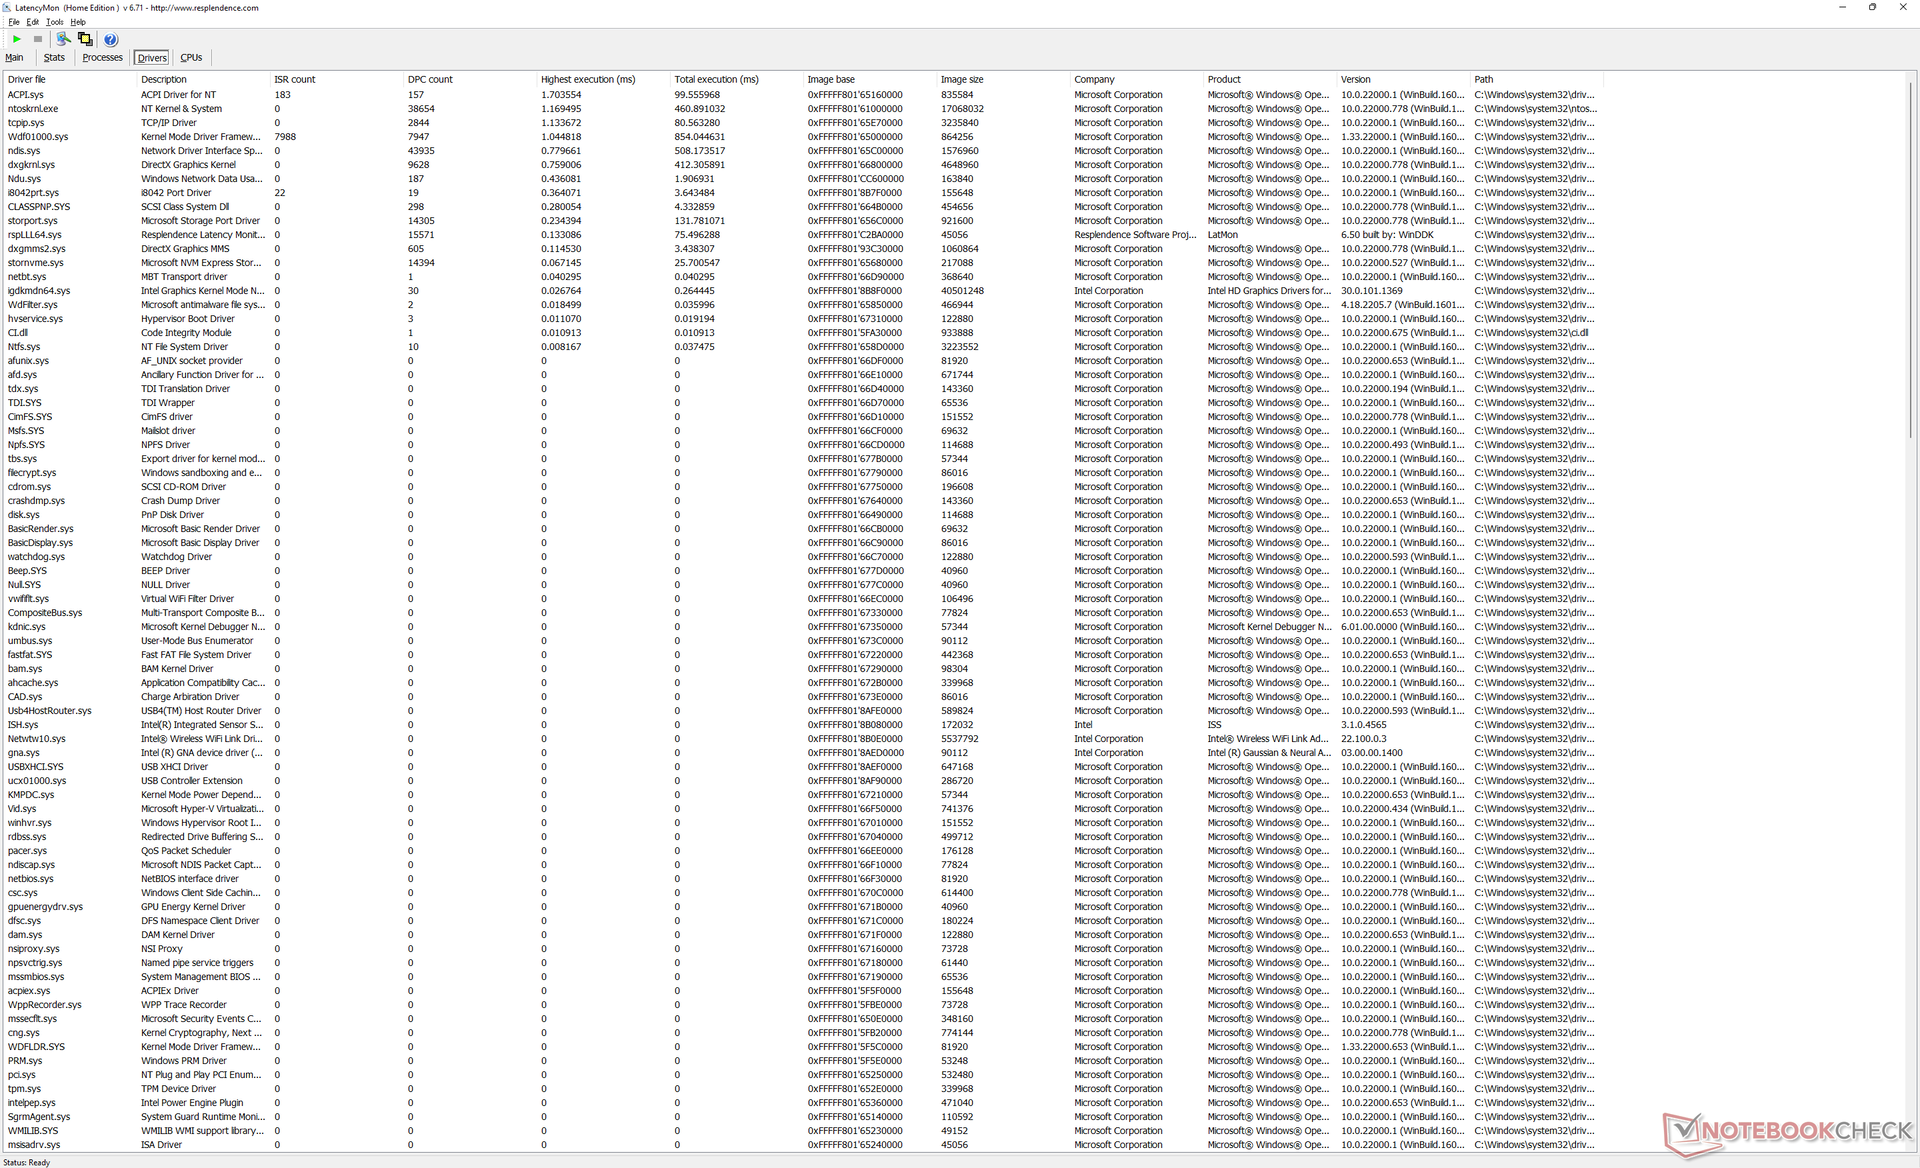
LatencyMon rivela problemi di DPC quando si aprono più schede del browser della nostra homepage. anche la riproduzione di video in 4K a 60 FPS non è perfetta, con 4 fotogrammi caduti durante il nostro test video di un minuto.
| DPC Latencies / LatencyMon - interrupt to process latency (max), Web, Youtube, Prime95 | |
| MSI Summit E14 Flip Evo A12MT | |
| Asus VivoBook S 14X S5402Z | |
| LG Gram 14T90P | |
| MSI Summit E14 A11SCS | |
| Lenovo Yoga Slim 7i Pro 14IAP G7 | |
| Dell Latitude 9420 2-in-1 | |
* ... Meglio usare valori piccoli
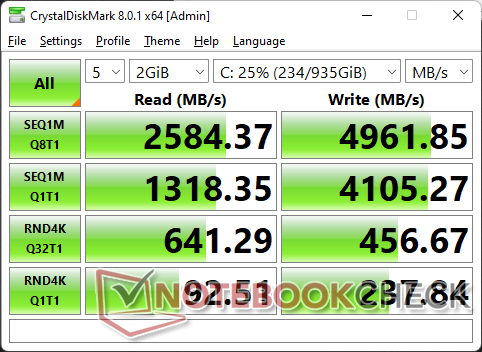
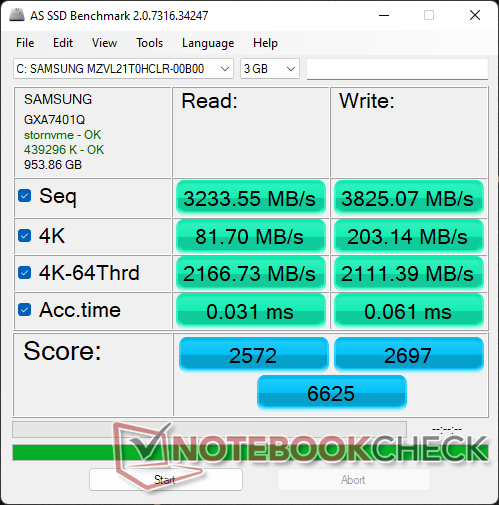
Dispositivi di archiviazione - Strozzatura delle prestazioni di PCIe4 x4
La nostra unità di prova è dotata di un disco da 1 TBSamsung PM9A1 PCIe4 x4 NVMe per velocità di lettura e scrittura sequenziali fino a 7000 MB/s e 5200 MB/s, rispettivamente. Sfortunatamente, non aspettatevi velocità di trasferimento simili nella maggior parte degli scenari reali a causa della mancanza di raffreddamento dell'SSD nel Summit E14 Flip. Quando si esegue DiskSpd in loop, le velocità di trasferimento crollano quasi istantaneamente a soli 1700 MB/s, che è già più lento della maggior parte delle unità SSD PCIe3 NVMe. Eseguendo lo stesso test sulLenovo Yoga Slim 7i Pro equipaggiato con un'unità SSD Samsung PM9A1 simile, mostrava anch'esso un comportamento di strozzatura delle prestazioni, ma le velocità di trasferimento medie erano comunque superiori a quelle dell'MSI.

| Drive Performance rating - Percent | |
| MSI Summit E14 Flip Evo A12MT | |
| MSI Summit E14 A11SCS | |
| Lenovo Yoga Slim 7i Pro 14IAP G7 | |
| LG Gram 14T90P | |
| Asus VivoBook S 14X S5402Z | |
| Dell Latitude 9420 2-in-1 | |
* ... Meglio usare valori piccoli
Disk Throttling: DiskSpd Read Loop, Queue Depth 8
Prestazioni della GPU - Iris Xe è ancora molto buona
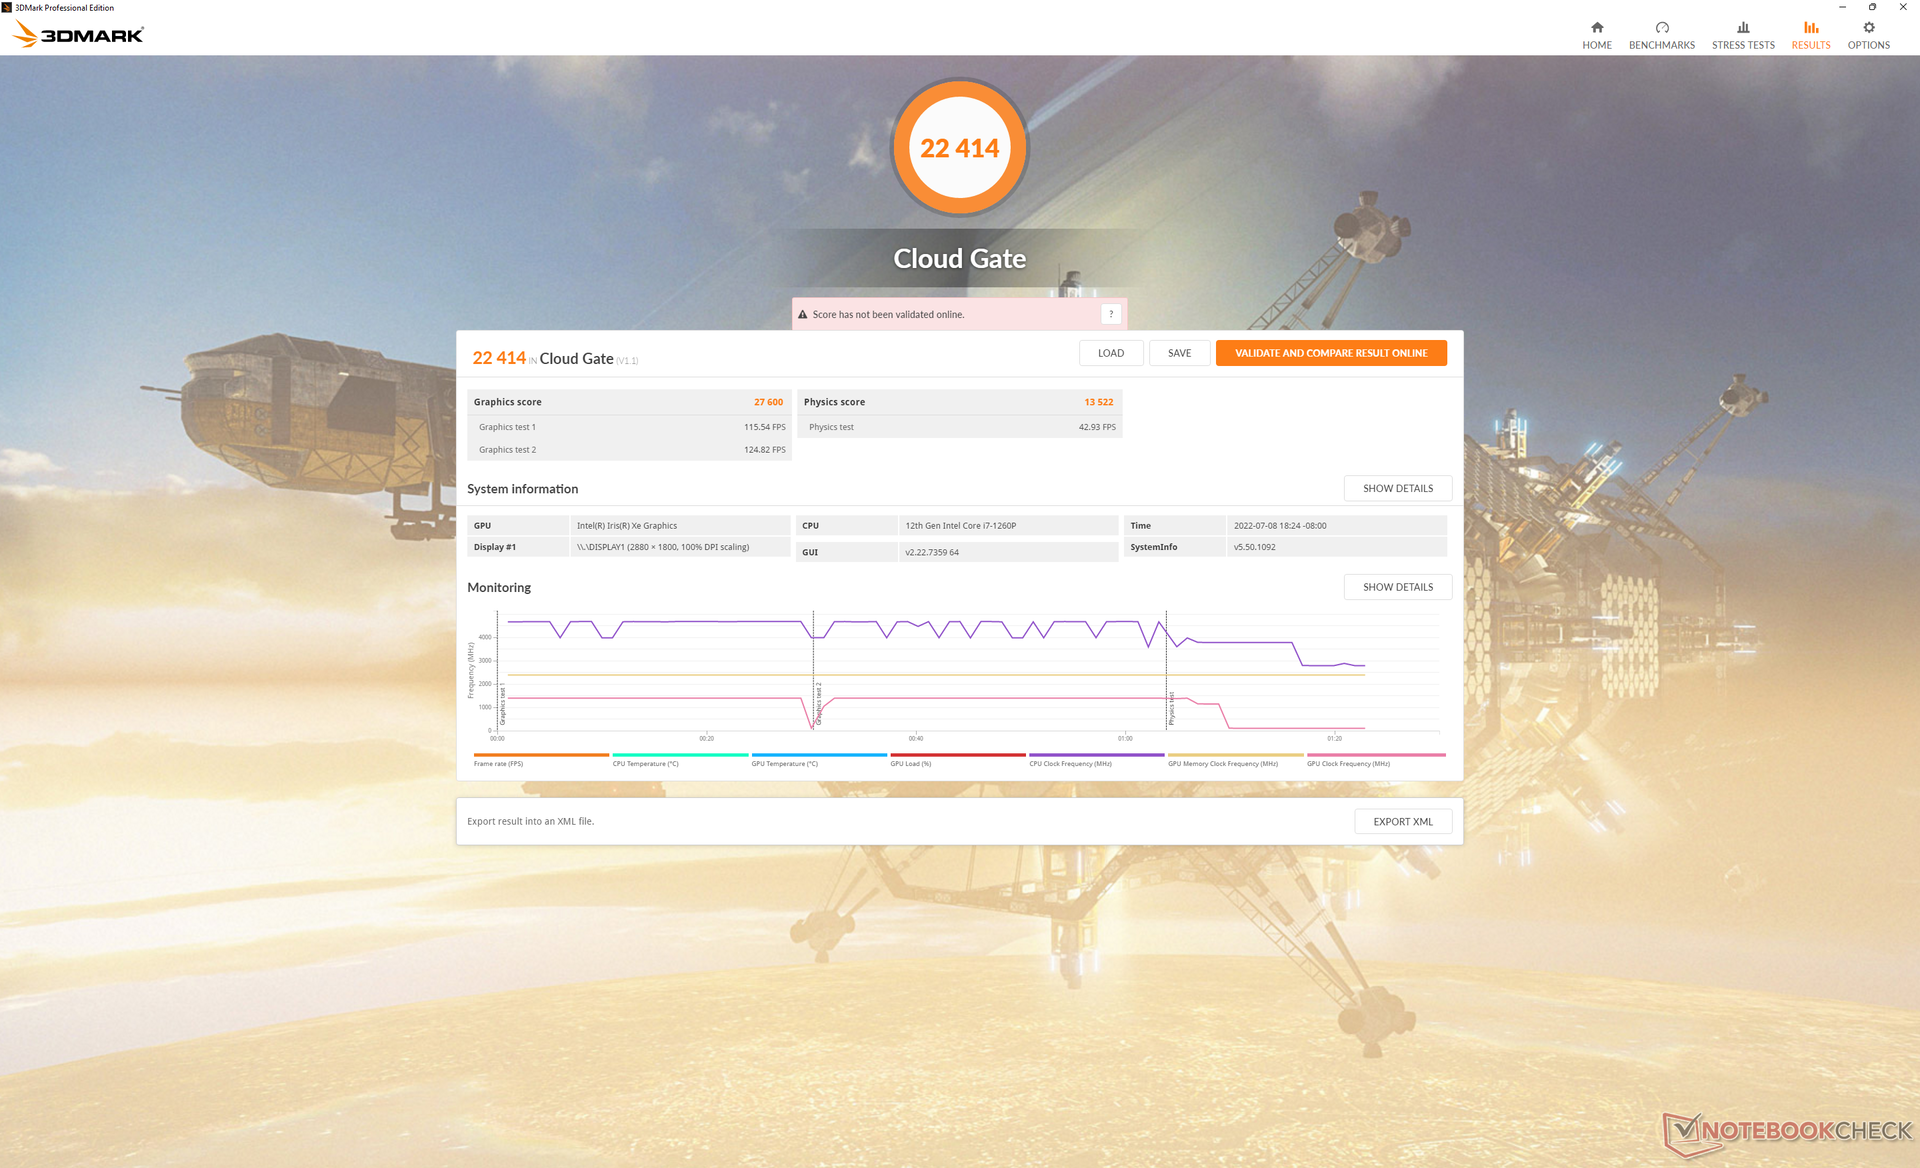
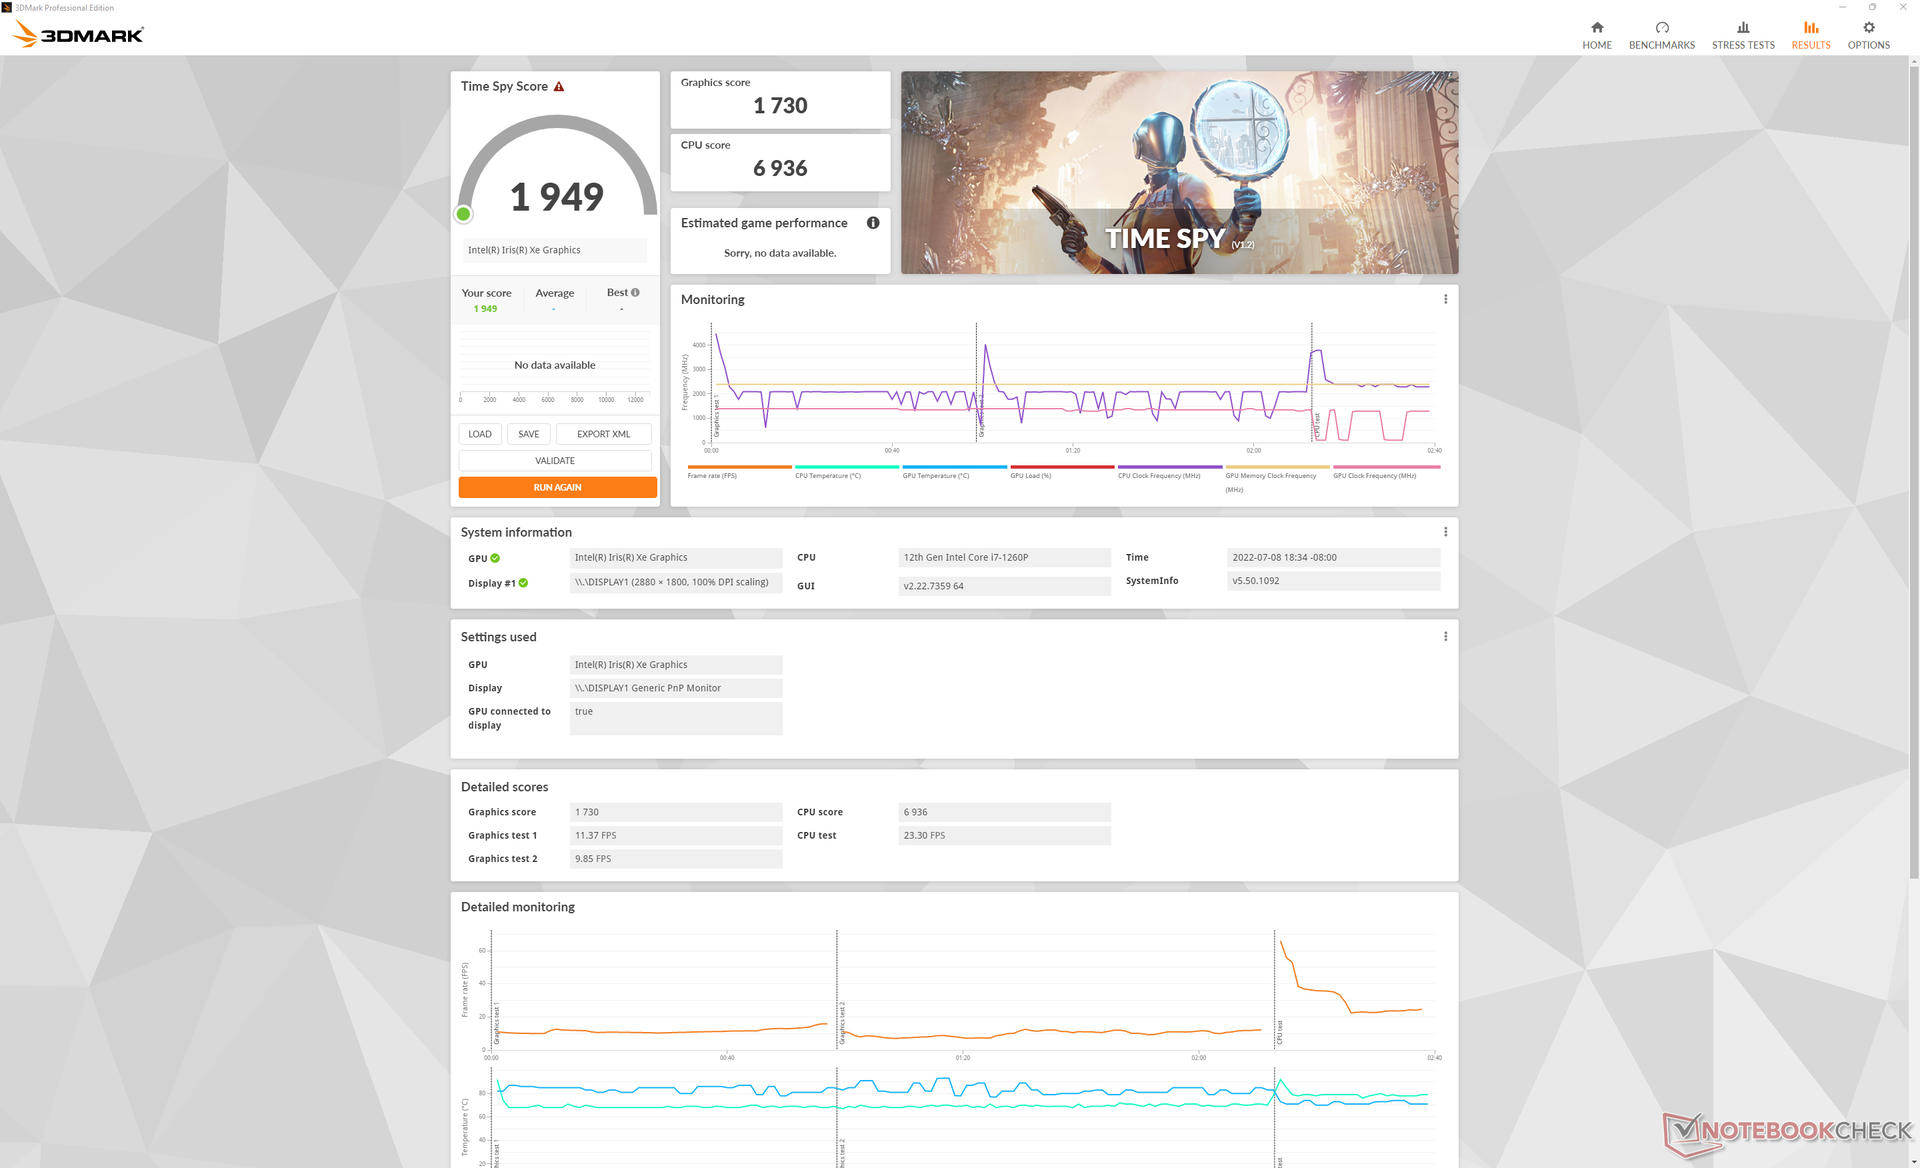
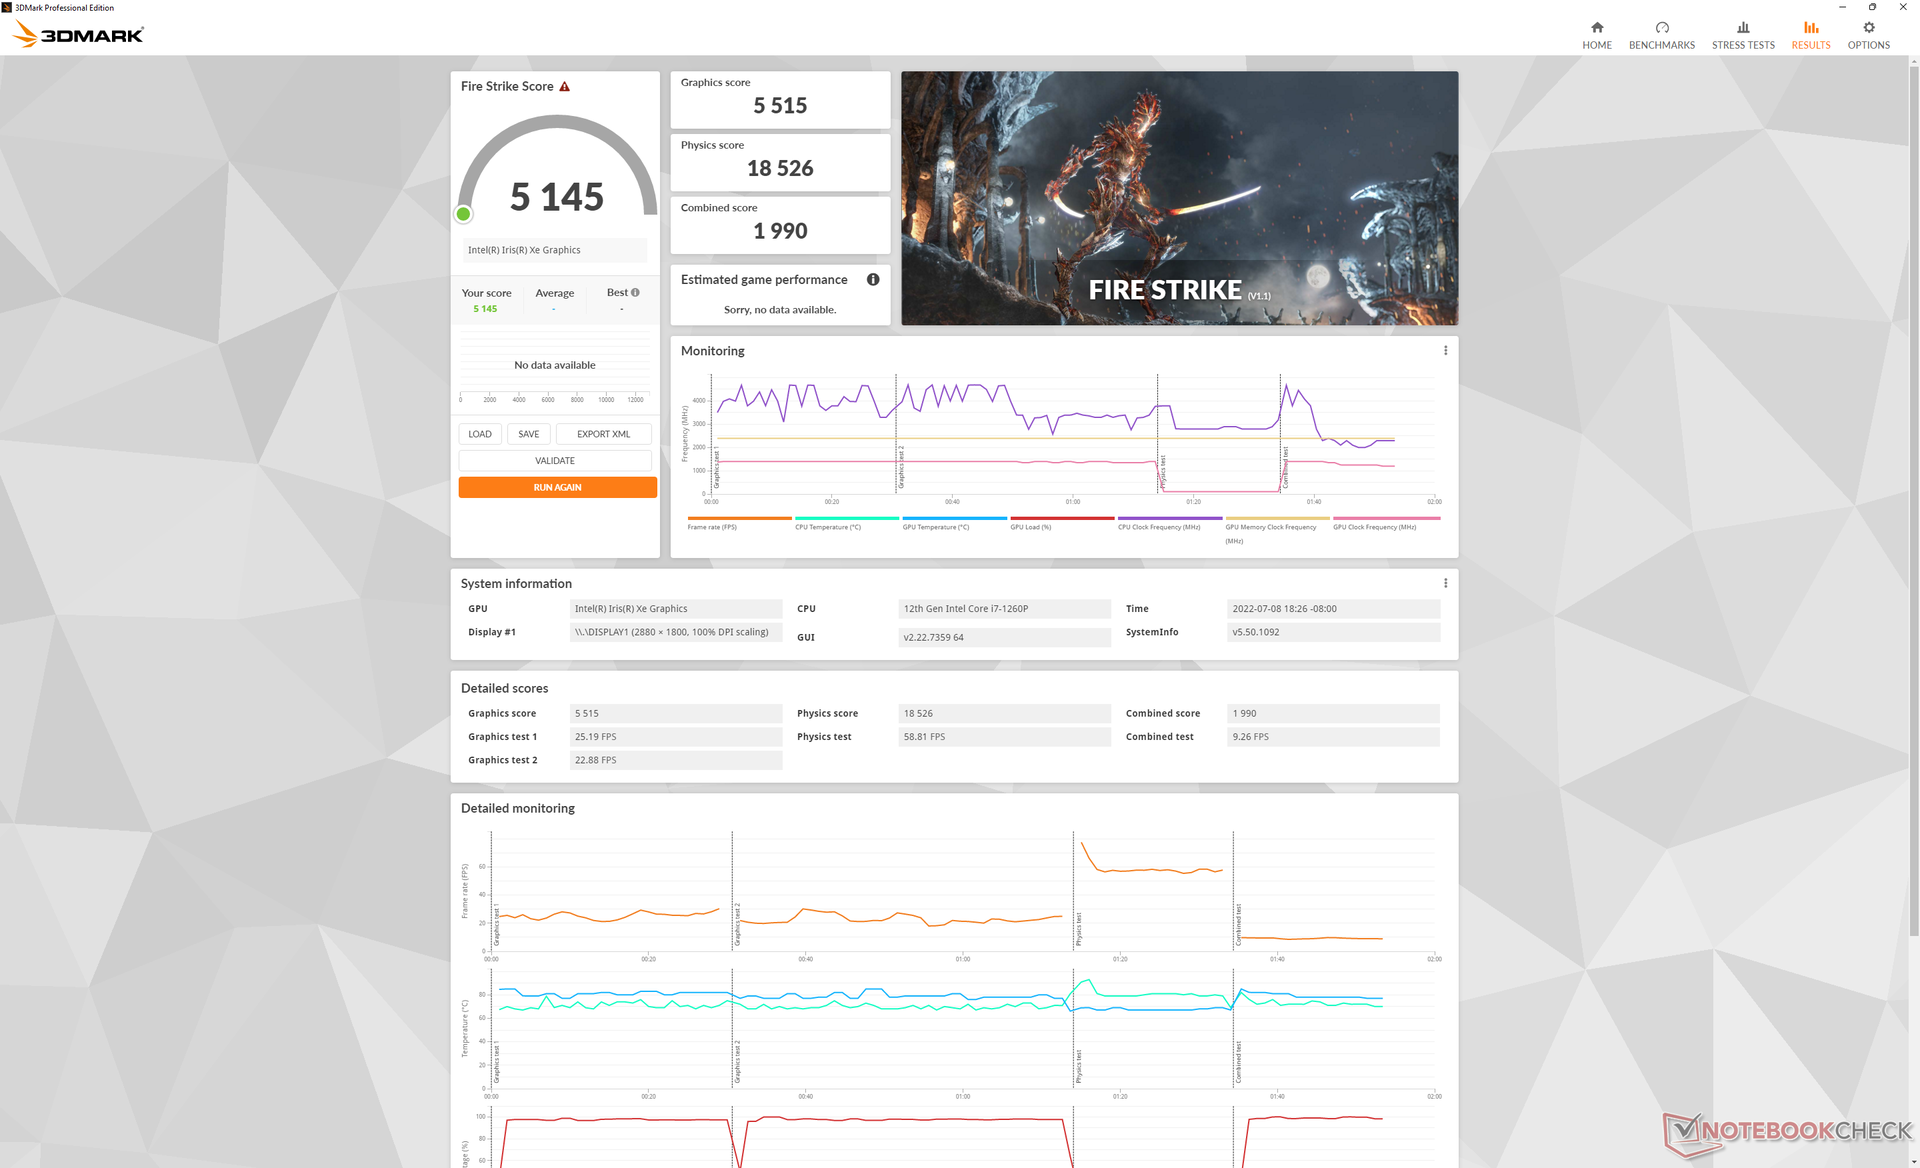
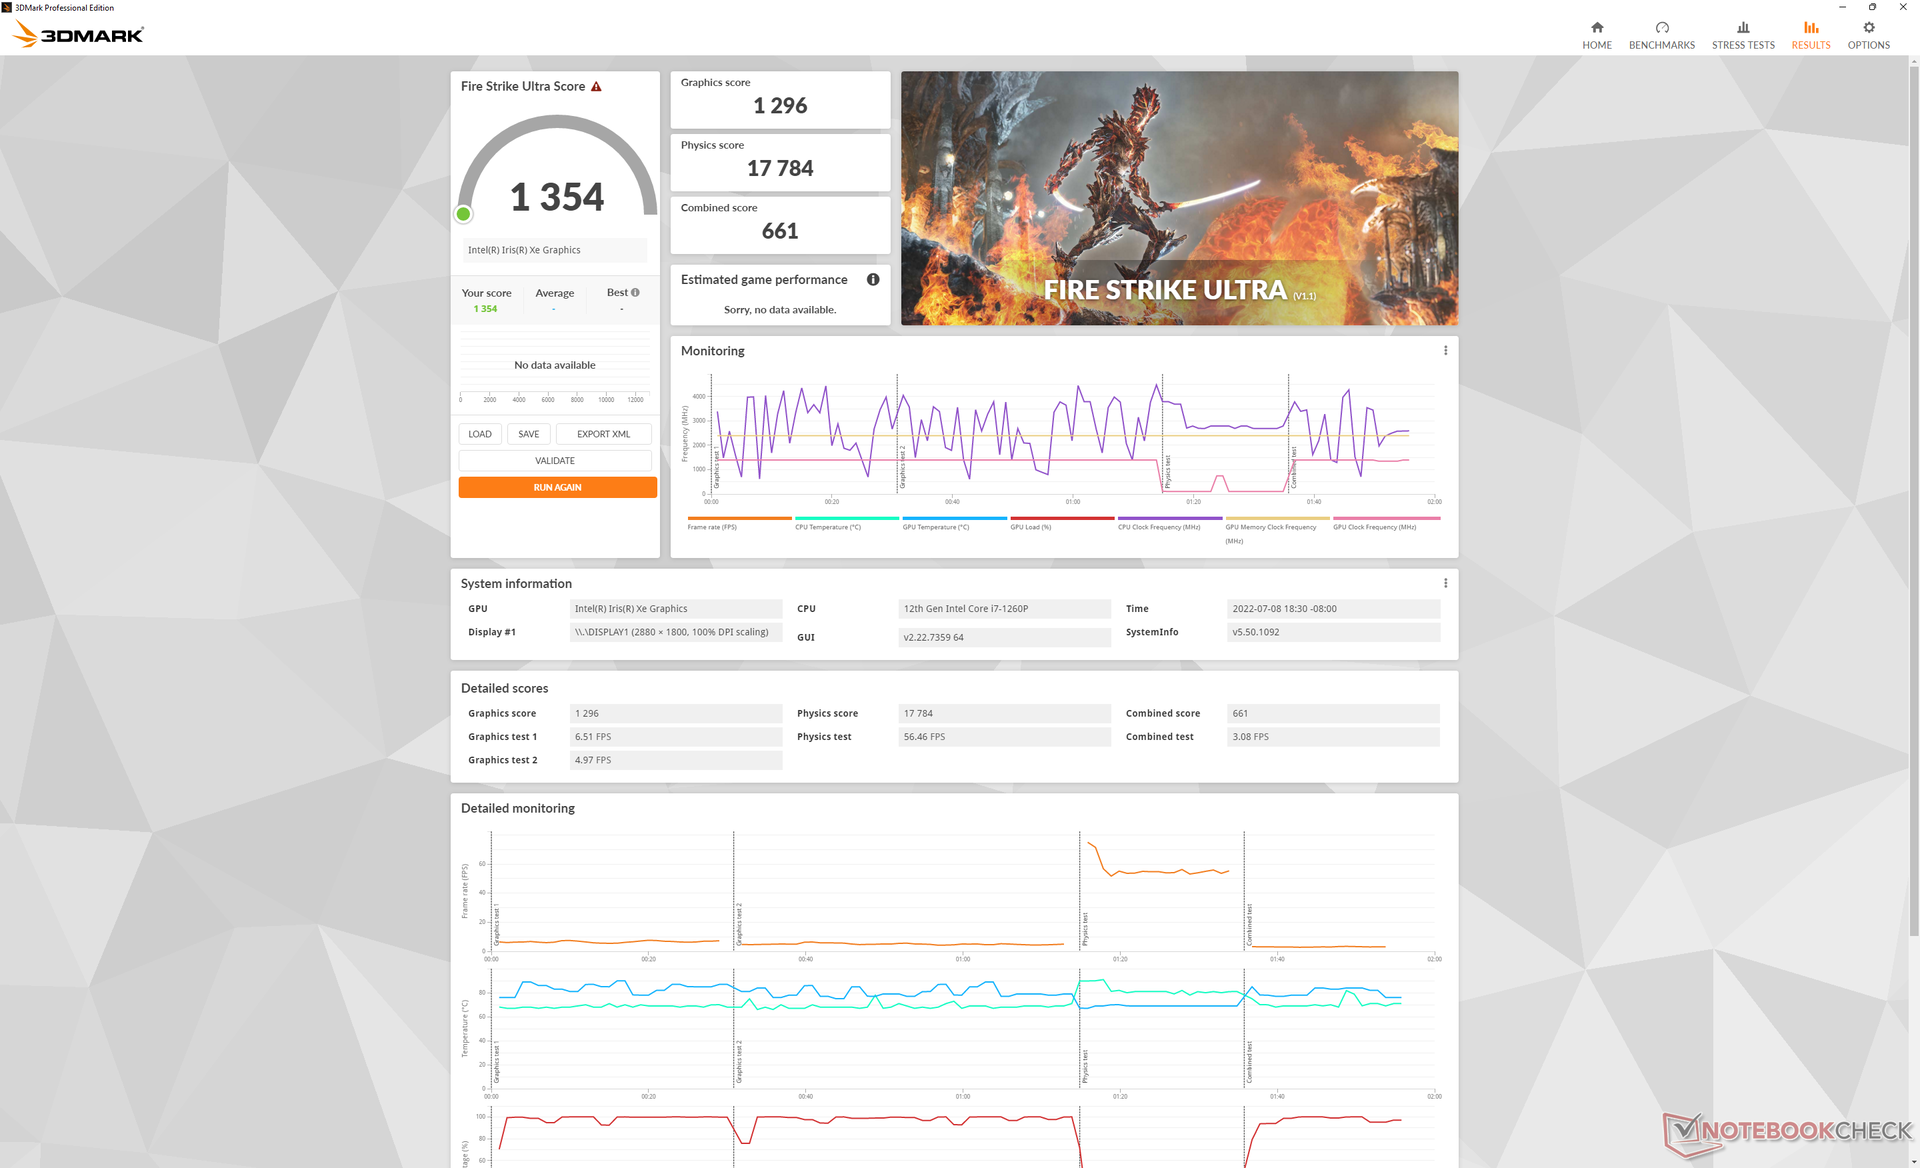
Le prestazioni grafiche sono più veloci del 15-20% rispetto alla media delle schede grafiche Iris Xe 96 EU nel nostro database, risultando uno dei più veloci convertibili da 14 pollici con grafica integrata. Il leggero incremento può essere in parte attribuito alla RAM LPDDR5, mentre la maggior parte degli altri Ultrabook utilizza ancora DDR4 o LPDDR4. LaAMD Radeon 680M è comunque più veloce nella maggior parte dei casi, ma questa opzione non è disponibile sulla serie Summit. Il sistema è comunque sufficientemente veloce per giocare a giochi impegnativi a risoluzioni basse di 720p o 900p o a giochi meno impegnativi come DOTA 2 a 1080p.
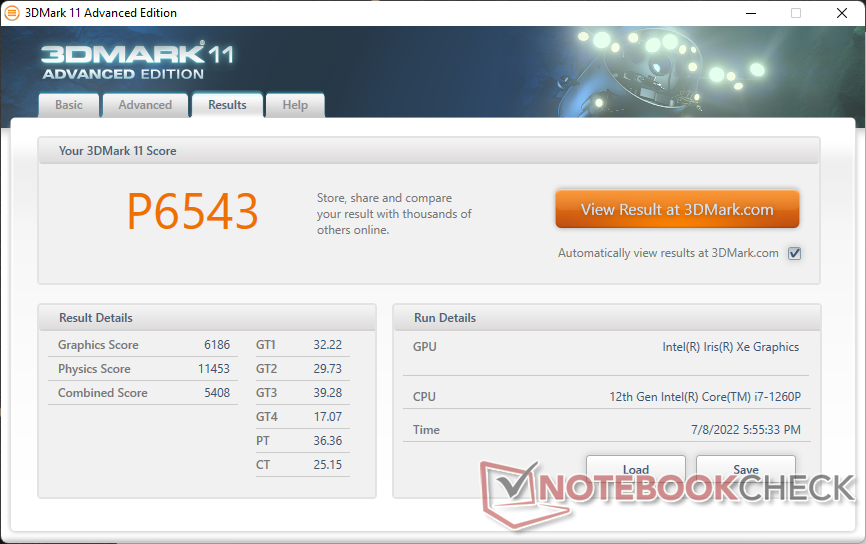
| 3DMark 11 Performance | 6543 punti | |
| 3DMark Cloud Gate Standard Score | 22414 punti | |
| 3DMark Fire Strike Score | 5145 punti | |
| 3DMark Time Spy Score | 1949 punti | |
Aiuto | ||
Witcher 3 FPS Chart
| basso | medio | alto | ultra | |
|---|---|---|---|---|
| GTA V (2015) | 121.6 | 101.4 | 20.5 | 9.75 |
| The Witcher 3 (2015) | 96.9 | 62.9 | 34.7 | 15.8 |
| Dota 2 Reborn (2015) | 122.1 | 93.5 | 66.2 | 59.8 |
| Final Fantasy XV Benchmark (2018) | 44.4 | 24.8 | 24.8 | |
| X-Plane 11.11 (2018) | 47.8 | 34.9 | 32.1 | |
| Strange Brigade (2018) | 95.2 | 44.5 | 35.8 | 29 |
| Cyberpunk 2077 1.6 (2022) | 22.6 | 19.1 | 14.5 | 11.6 |
Emissioni
Rumore del sistema - Silenzioso nella maggior parte degli scenari medio-bassi
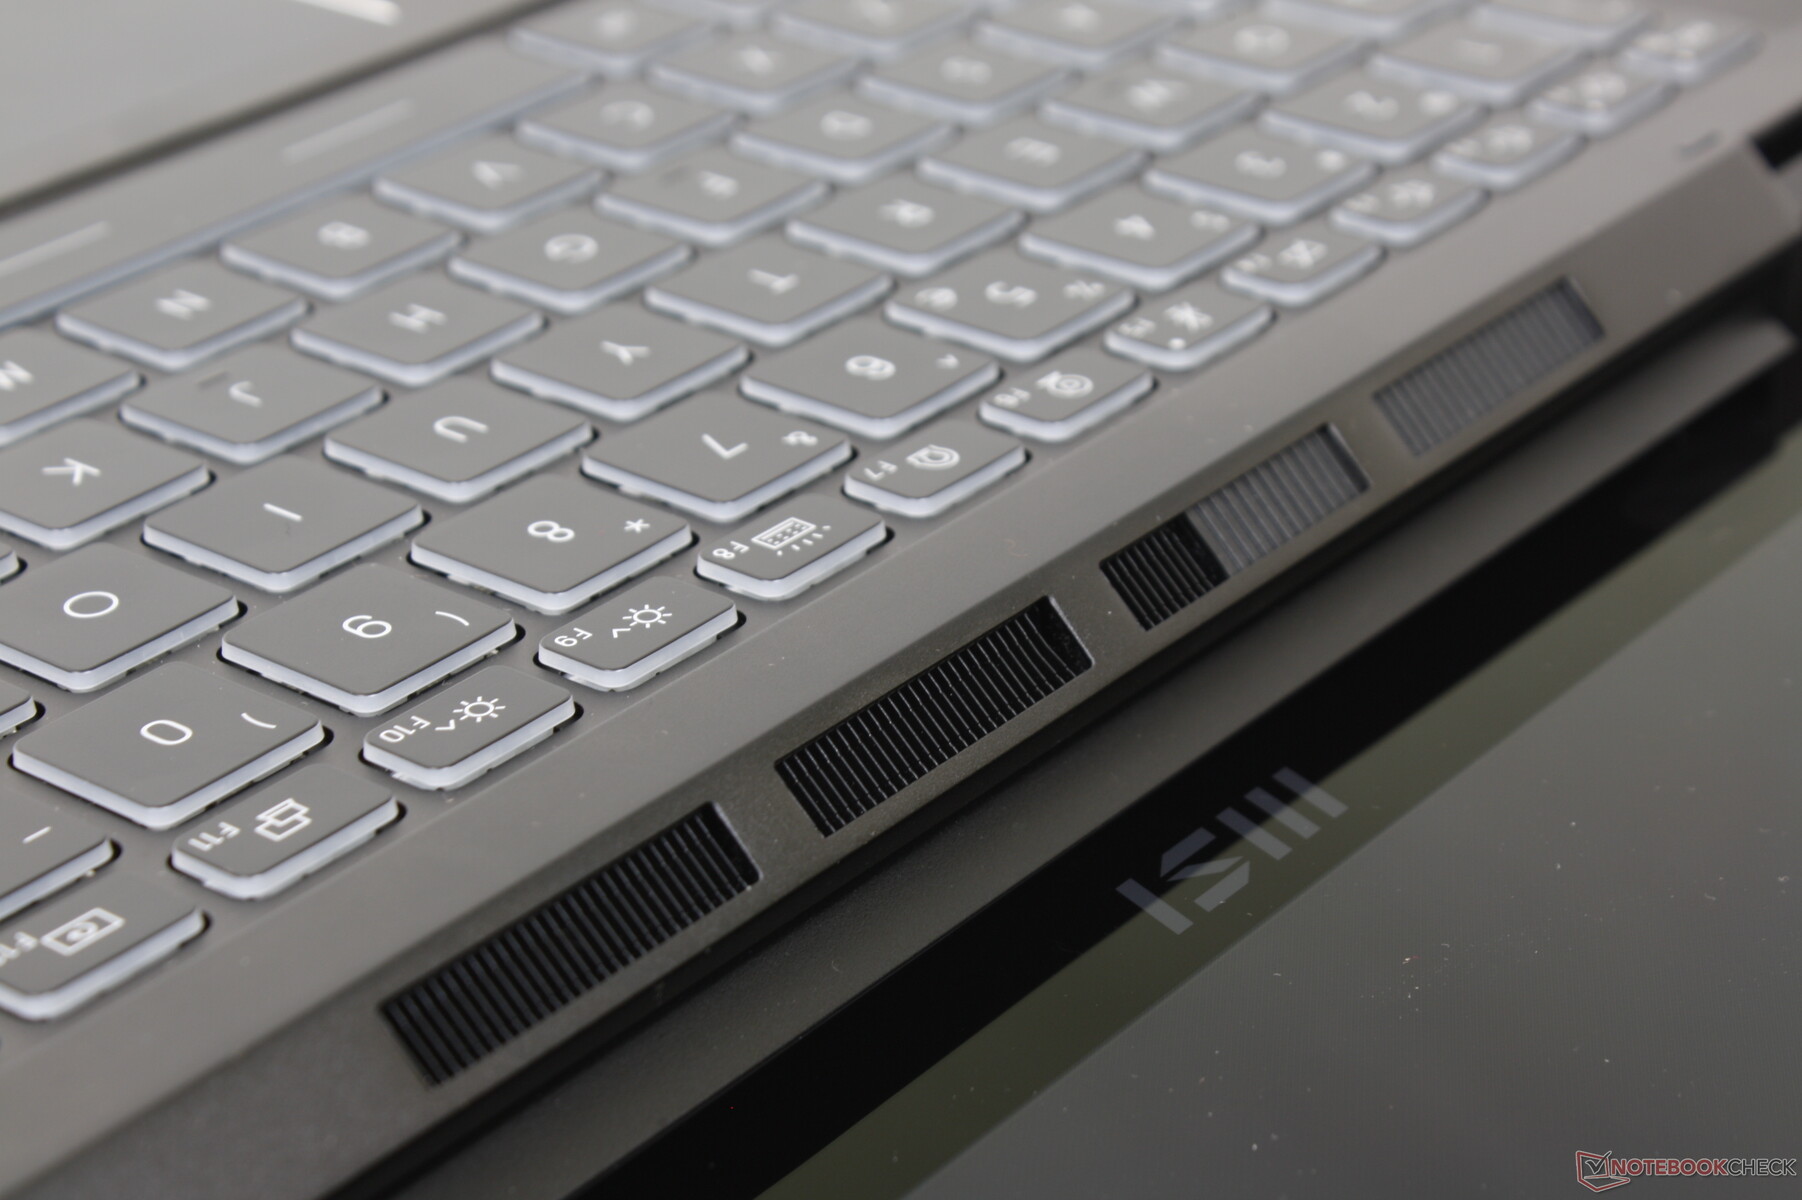
Lo chassis è stato costruito per supportare le opzioni Core-H e GeForce MX discrete più esigenti. Non sorprende quindi che la nostra configurazione con CPU Core-P sia relativamente silenziosa. Quando si esegue la prima scena di benchmark di 3DMark 06 in modalità Balanced, ad esempio, il rumore della ventola è appena udibile, con soli 24 dB(A) a fronte di uno sfondo silenzioso di 23,3 dB(A). Gli utenti possono aspettarsi che il rumore della ventola rimanga al di sotto dei 24,7 dB(A) in scenari di navigazione tipici.
In caso di funzionamento Witcher 3 con carichi elevati, il rumore della ventola è tipicamente compreso tra 35 e 43 dB(A). Abilitando la modalità Cooler Boost (cioè la modalità con la ventola al massimo), il rumore della ventola sarebbe di quasi 56 dB(A), più forte della maggior parte dei subnotebook. Fortunatamente tale modalità non è necessaria nella maggior parte dei casi per la nostra particolare configurazione.
Rumorosità
| Idle |
| 23.3 / 23.3 / 23.3 dB(A) |
| Sotto carico |
| 24 / 55.8 dB(A) |
 | ||
30 dB silenzioso 40 dB(A) udibile 50 dB(A) rumoroso |
||
min: | ||
| MSI Summit E14 Flip Evo A12MT Iris Xe G7 96EUs, i7-1260P, Samsung PM9A1 MZVL21T0HCLR | MSI Summit E14 A11SCS GeForce GTX 1650 Ti Max-Q, i7-1185G7, Phison 1TB SM2801T24GKBB4S-E162 | Asus VivoBook S 14X S5402Z Iris Xe G7 96EUs, i7-12700H, Micron 2450 512GB MTFDKBA512TFK | LG Gram 14T90P Iris Xe G7 80EUs, i5-1135G7, Samsung SSD PM981a MZVLB512HBJQ | Lenovo Yoga Slim 7i Pro 14IAP G7 Iris Xe G7 80EUs, i5-1240P, Samsung PM9A1 MZVL2512HCJQ | Dell Latitude 9420 2-in-1 Iris Xe G7 96EUs, i7-1185G7, WDC PC SN530 SDBPNPZ-512G | |
|---|---|---|---|---|---|---|
| Noise | -21% | -20% | -2% | -8% | -5% | |
| off /ambiente * (dB) | 23.3 | 23.9 -3% | 22.7 3% | 25.4 -9% | 23.7 -2% | 25.4 -9% |
| Idle Minimum * (dB) | 23.3 | 24.2 -4% | 23.2 -0% | 25.5 -9% | 23.7 -2% | 25.4 -9% |
| Idle Average * (dB) | 23.3 | 24.2 -4% | 23.2 -0% | 25.5 -9% | 25.1 -8% | 25.4 -9% |
| Idle Maximum * (dB) | 23.3 | 24.2 -4% | 27.2 -17% | 25.5 -9% | 25.1 -8% | 25.4 -9% |
| Load Average * (dB) | 24 | 50.2 -109% | 43.2 -80% | 28.3 -18% | 38.4 -60% | 25.4 -6% |
| Witcher 3 ultra * (dB) | 35.6 | 47 -32% | 52.8 -48% | 35 2% | 38.4 -8% | 41.3 -16% |
| Load Maximum * (dB) | 55.8 | 51.7 7% | 52.8 5% | 35 37% | 39.4 29% | 41.3 26% |
* ... Meglio usare valori piccoli
Temperatura
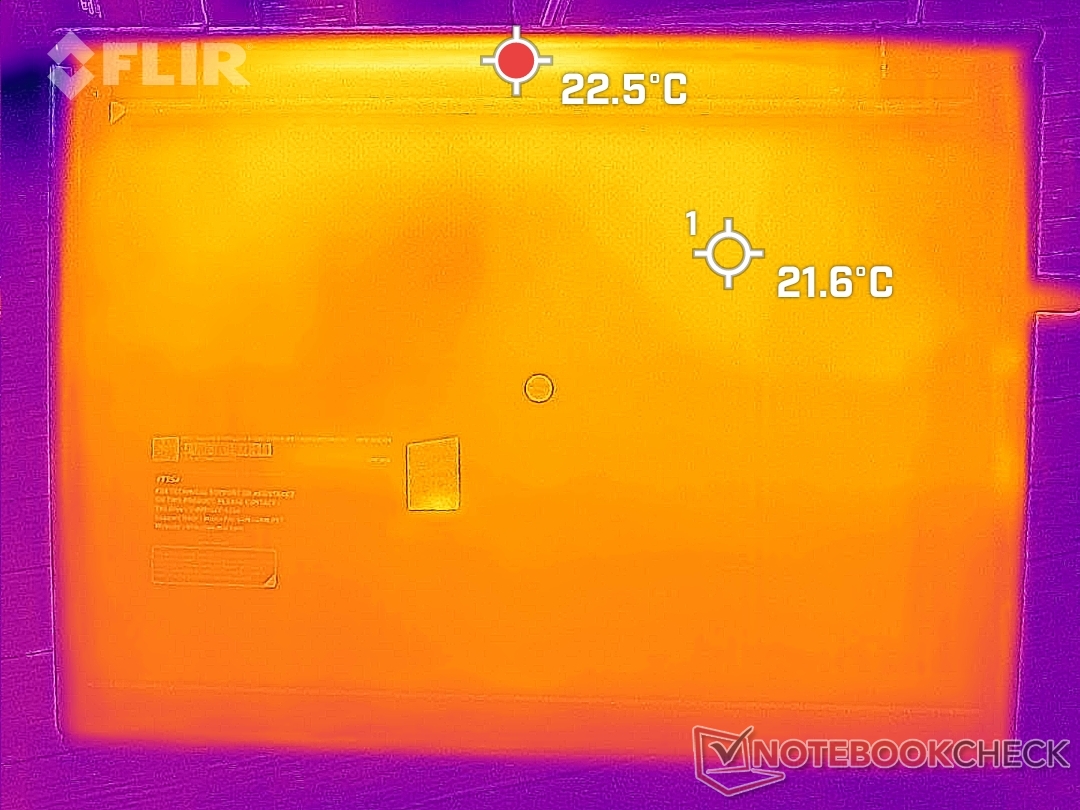
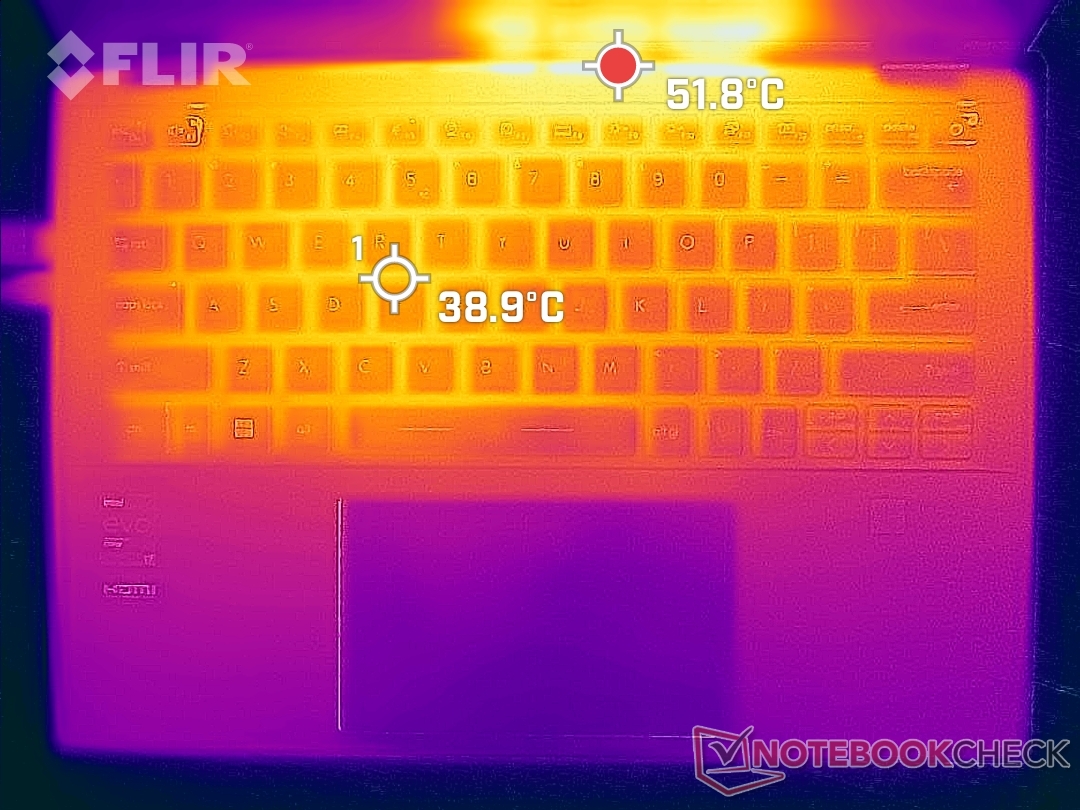
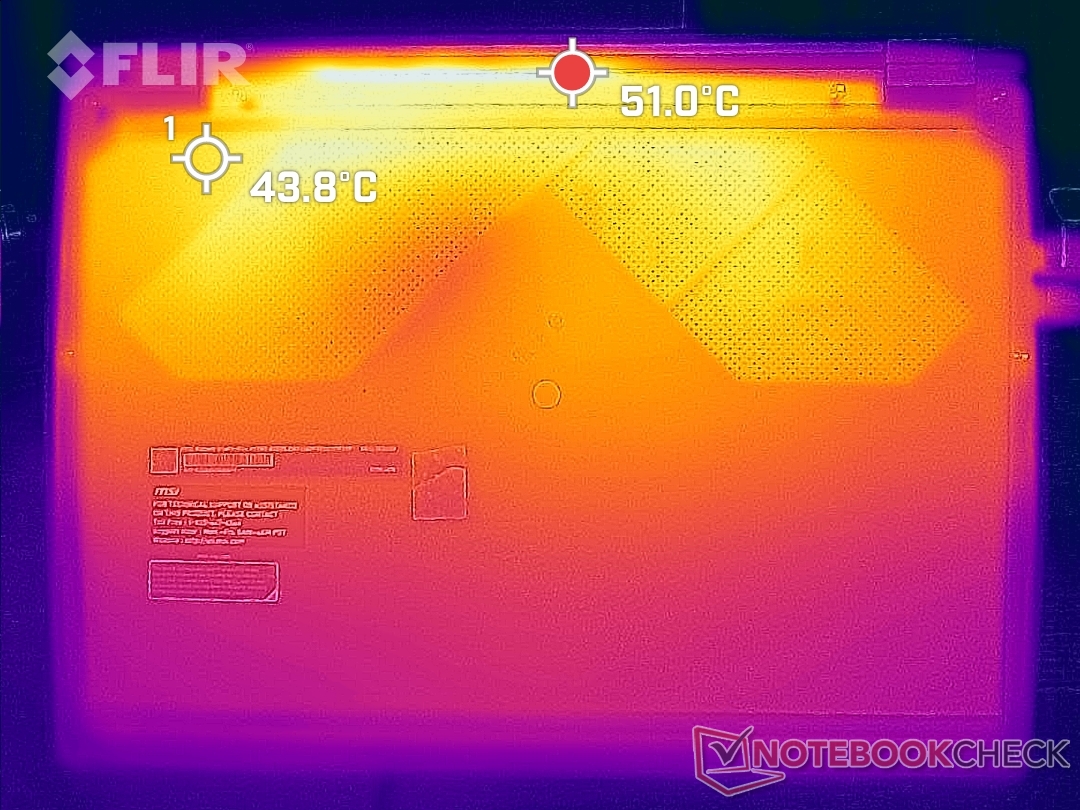
Le temperature superficiali durante il funzionamento al minimo o la navigazione sul web rimangono confortevoli e talvolta persino fresche al tatto, dato che la maggior parte dello chassis è in metallo. Quando si eseguono carichi più impegnativi come i giochi, tuttavia, i punti caldi sulla parte superiore e inferiore possono raggiungere i 52 C vicino alle griglie di ventilazione. Anche i poggiapolsi diventano più caldi a 27 C e si notano sui palmi delle mani. Risultati simili si osservano anche sul rivestimento metallicoDell Latitude 9420 2-in-1e quindi le temperature superficiali molto calde dell'MSI non sono rare.
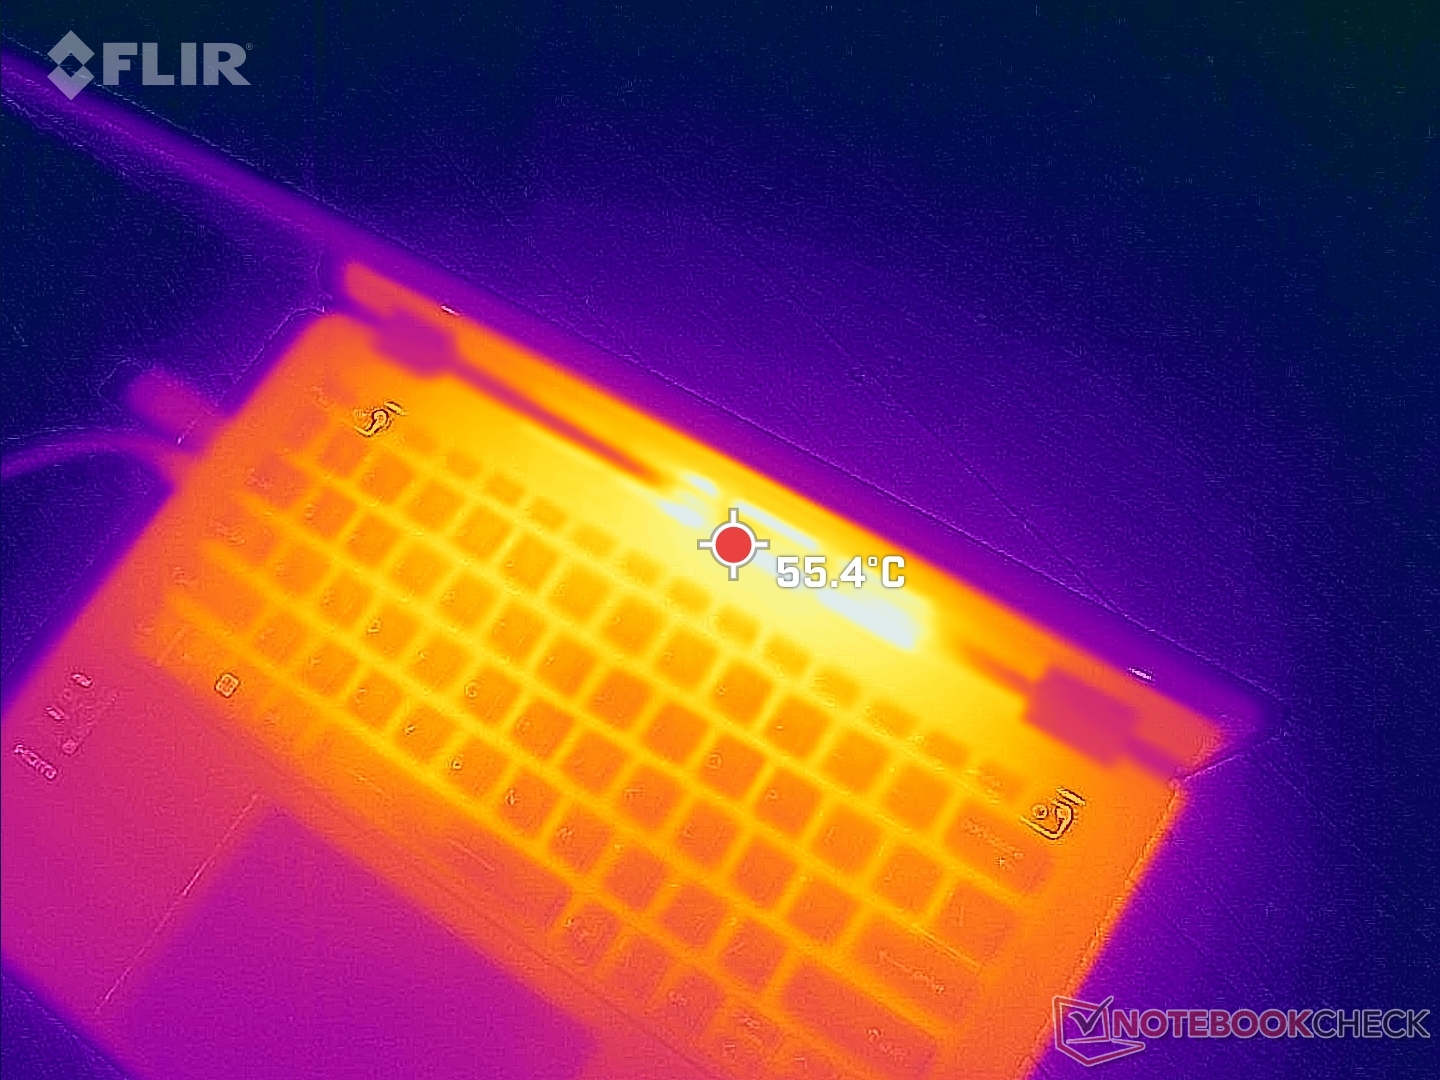
(±) La temperatura massima sul lato superiore è di 44.2 °C / 112 F, rispetto alla media di 35.4 °C / 96 F, che varia da 19.6 a 60 °C per questa classe Convertible.
(-) Il lato inferiore si riscalda fino ad un massimo di 45.8 °C / 114 F, rispetto alla media di 36.9 °C / 98 F
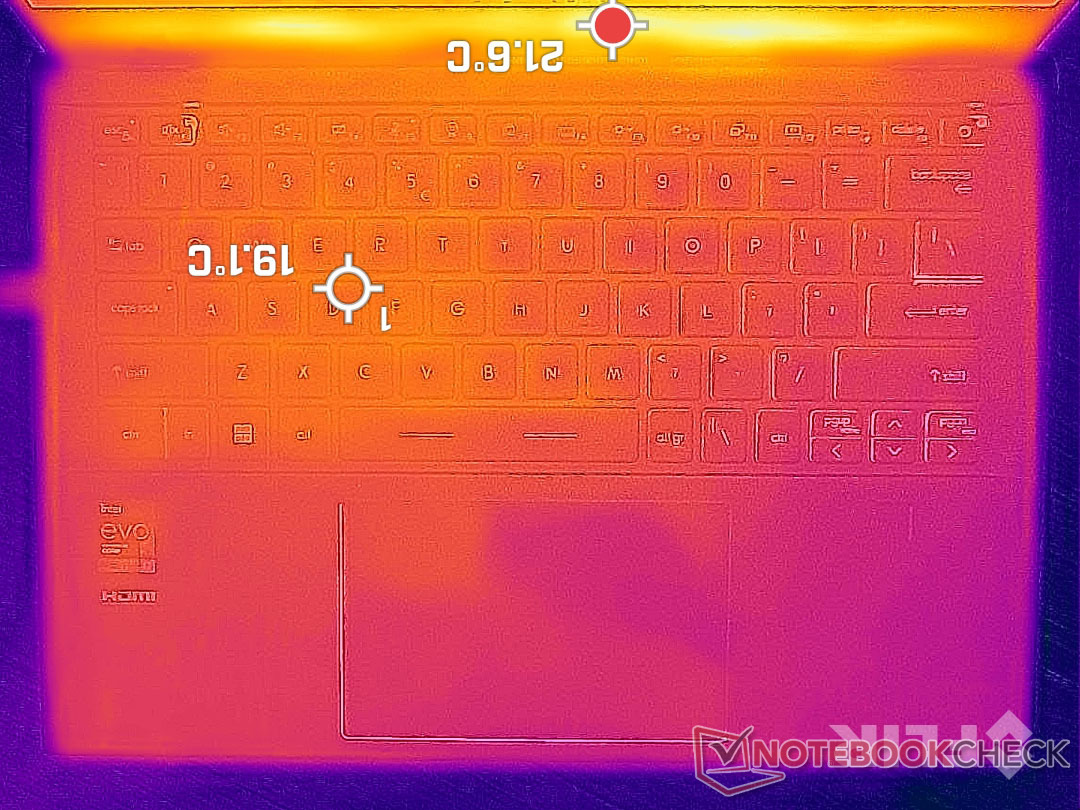
(+) In idle, la temperatura media del lato superiore è di 19.2 °C / 67 F, rispetto alla media deld ispositivo di 30.3 °C / 87 F.
(+) I poggiapolsi e il touchpad sono piu' freddi della temperatura della pelle con un massimo di 27.2 °C / 81 F e sono quindi freddi al tatto.
(±) La temperatura media della zona del palmo della mano di dispositivi simili e'stata di 28 °C / 82.4 F (+0.8 °C / 1.4 F).
| MSI Summit E14 Flip Evo A12MT Intel Core i7-1260P, Intel Iris Xe Graphics G7 96EUs | MSI Summit E14 A11SCS Intel Core i7-1185G7, NVIDIA GeForce GTX 1650 Ti Max-Q | Asus VivoBook S 14X S5402Z Intel Core i7-12700H, Intel Iris Xe Graphics G7 96EUs | LG Gram 14T90P Intel Core i5-1135G7, Intel Iris Xe Graphics G7 80EUs | Lenovo Yoga Slim 7i Pro 14IAP G7 Intel Core i5-1240P, Intel Iris Xe Graphics G7 80EUs | Dell Latitude 9420 2-in-1 Intel Core i7-1185G7, Intel Iris Xe Graphics G7 96EUs | |
|---|---|---|---|---|---|---|
| Heat | -43% | -17% | -4% | -20% | -21% | |
| Maximum Upper Side * (°C) | 44.2 | 49.4 -12% | 37.2 16% | 41.6 6% | 42.3 4% | 43.4 2% |
| Maximum Bottom * (°C) | 45.8 | 60.6 -32% | 39.2 14% | 46.2 -1% | 52.8 -15% | 48 -5% |
| Idle Upper Side * (°C) | 19.6 | 30.6 -56% | 30.4 -55% | 22.6 -15% | 27.1 -38% | 29.8 -52% |
| Idle Bottom * (°C) | 22 | 37.4 -70% | 31.6 -44% | 23.2 -5% | 29.1 -32% | 28 -27% |
* ... Meglio usare valori piccoli
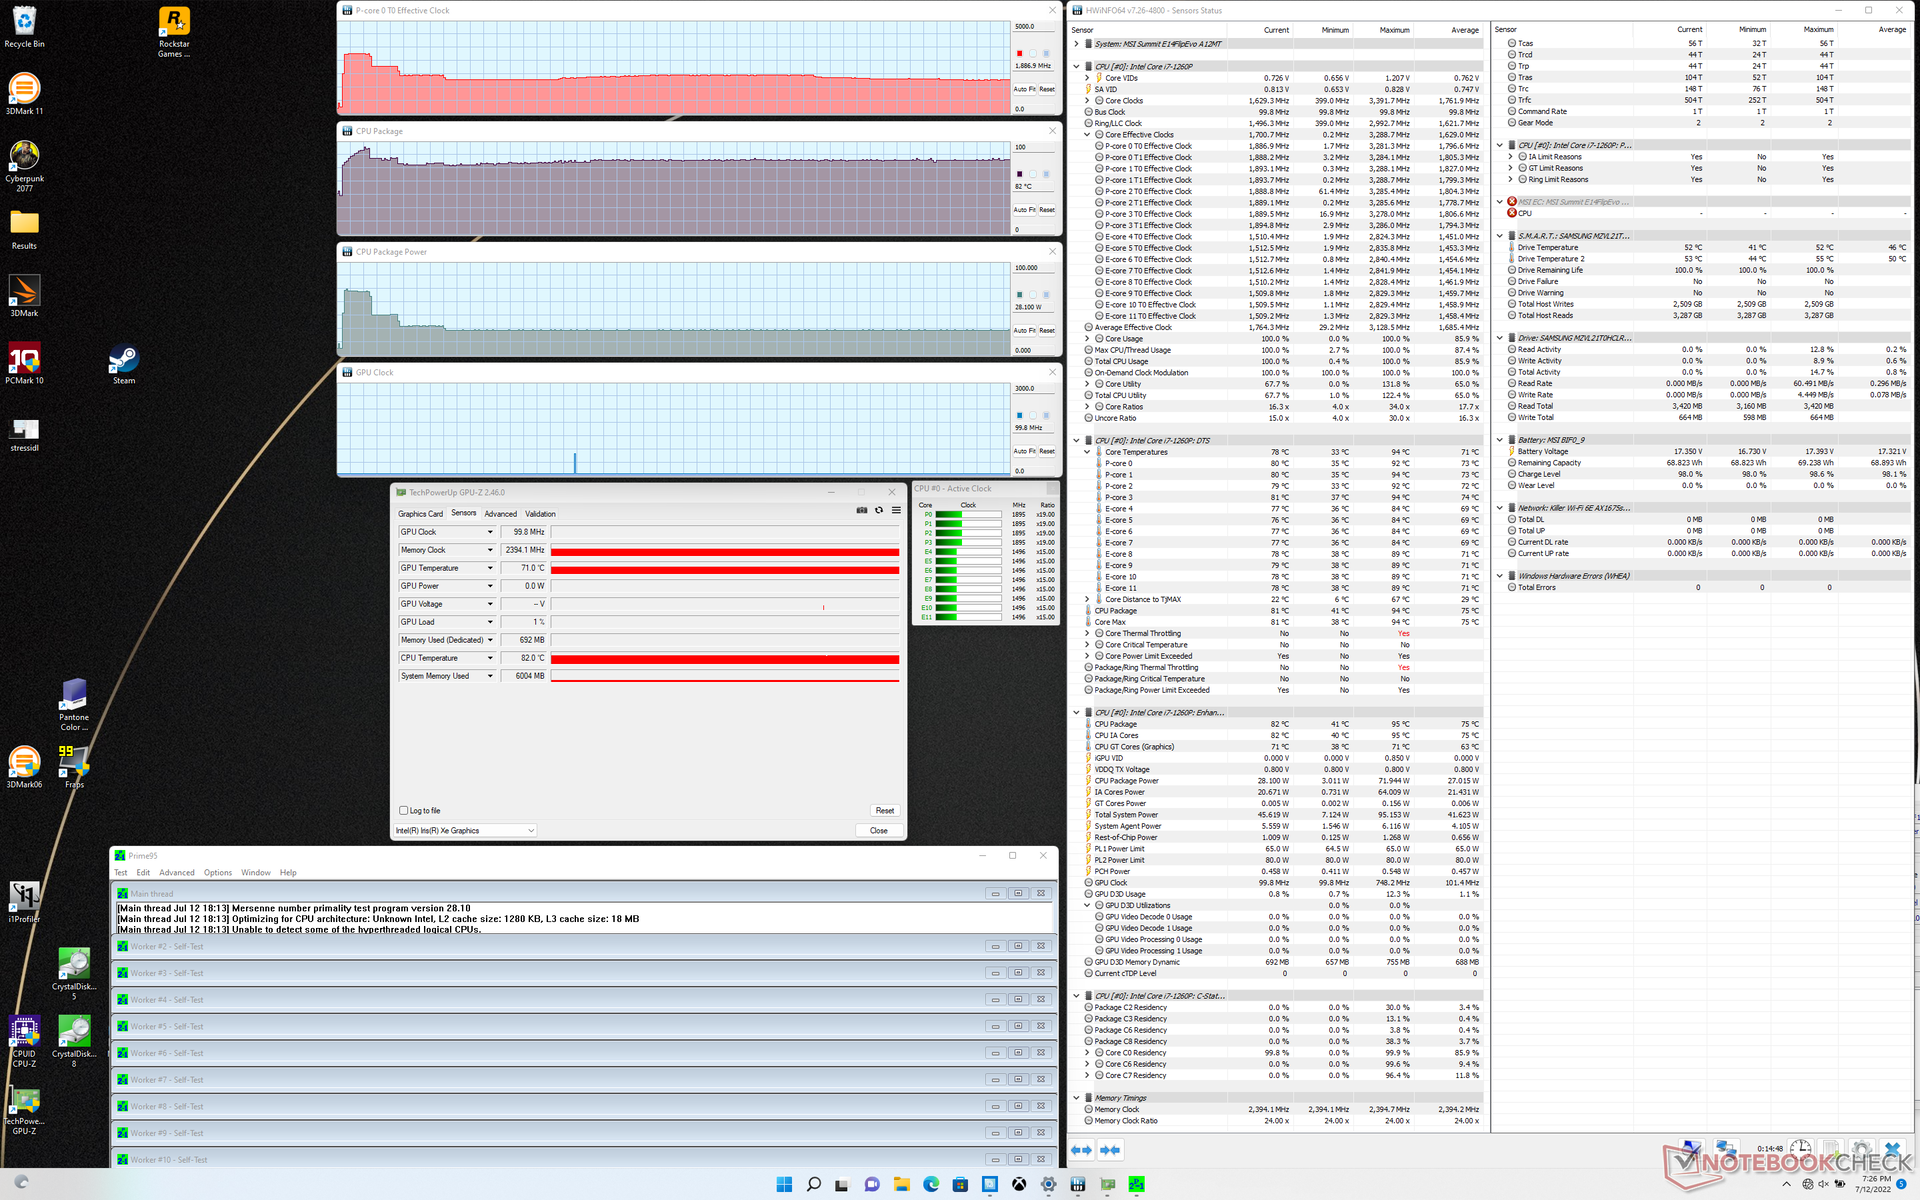
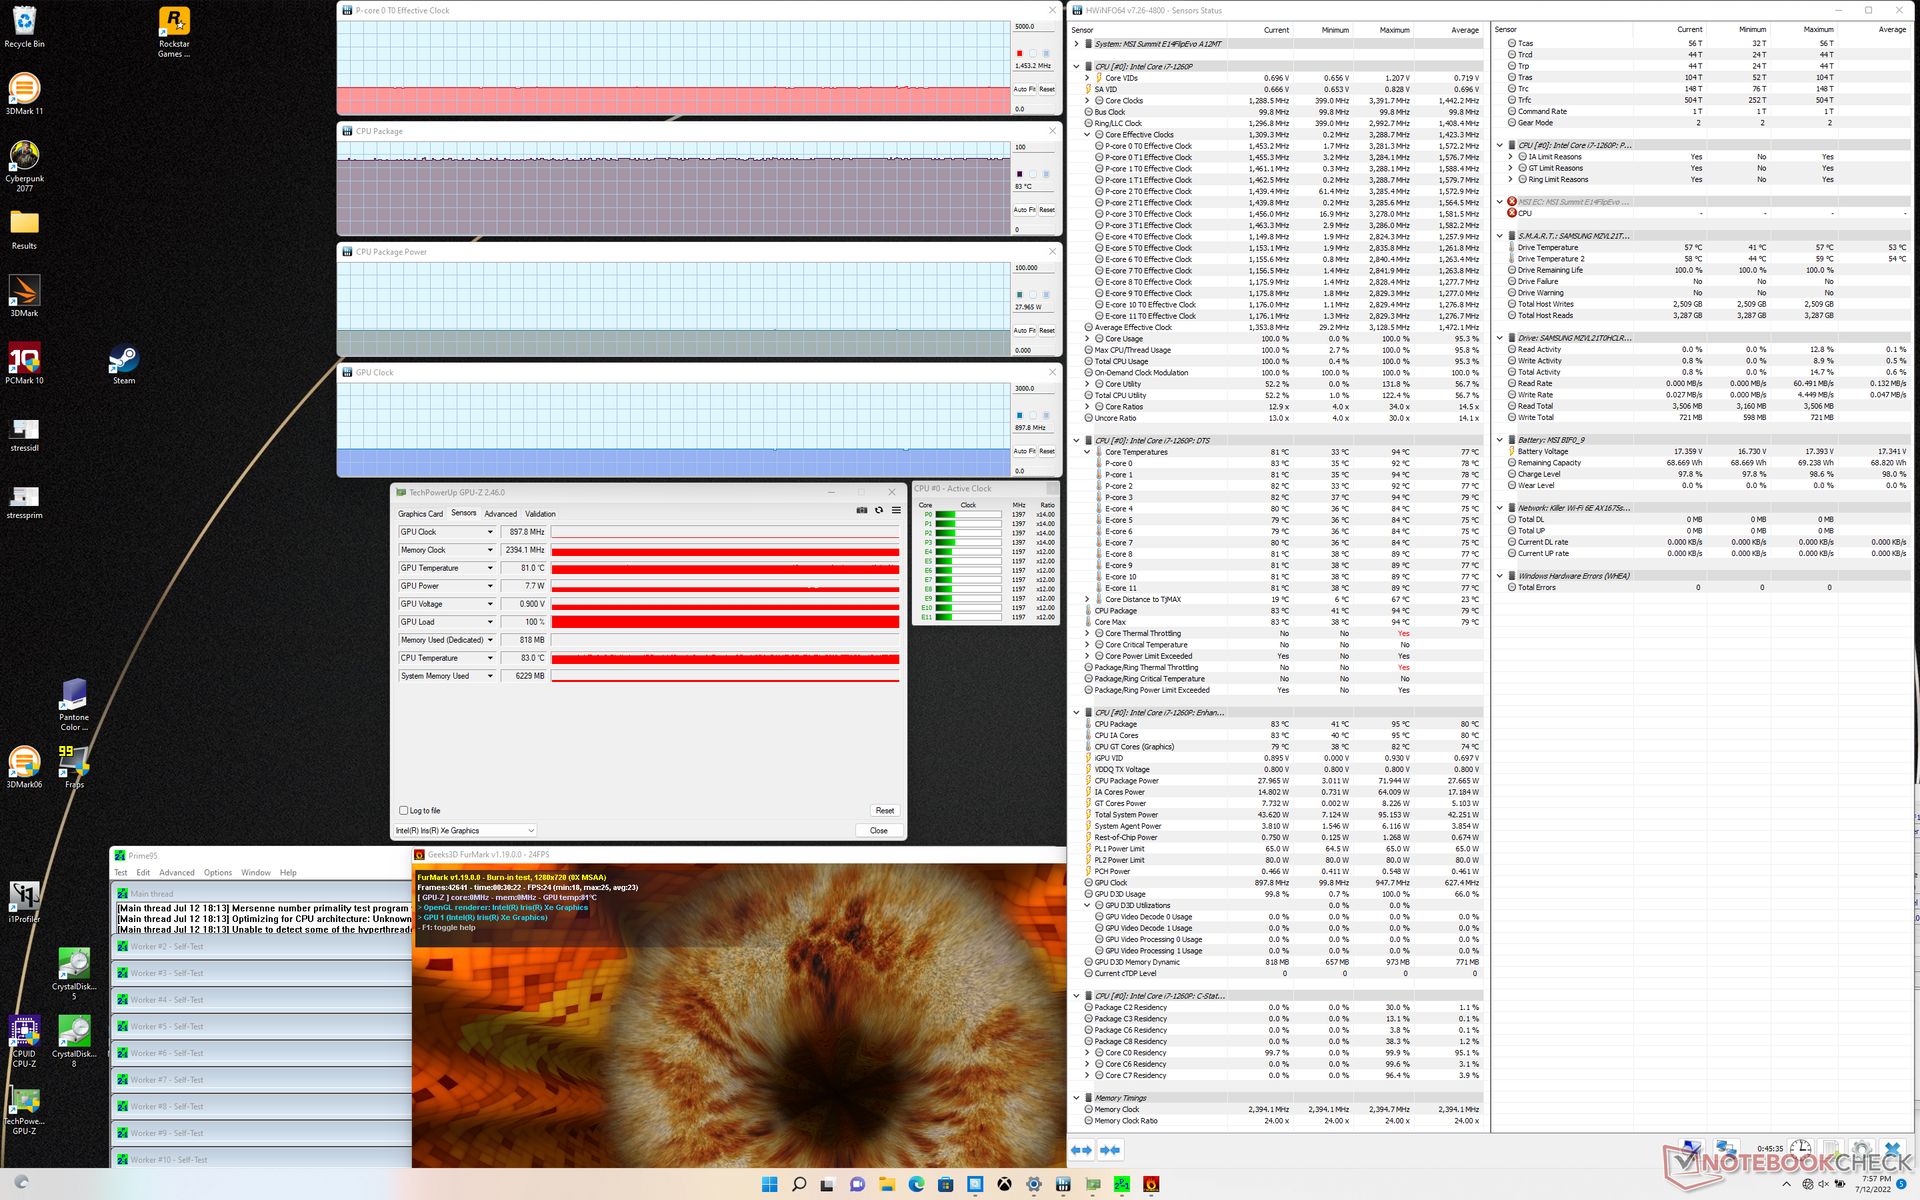
Stress test - Temperature elevate del core
Durante l'esecuzione di Prime95, le frequenze di clock della CPU aumentavano fino a 3,3 GHz per meno di un minuto prima di raggiungere una temperatura del nucleo di 95 C. Successivamente, le frequenze di clock scendevano a 2,6 GHz prima di scendere e stabilizzarsi a 1,9 GHz e a una temperatura di 82 C. L'assorbimento di potenza della CPU raggiungeva i 72 W all'inizio del test prima di stabilizzarsi a 28 W. Eseguendo questo stesso test sullo Yoga 9 14 con la stessa CPU, si otterrebbe una frequenza di clock stabile simile a 2,0 GHz e un assorbimento di potenza della CPU di 28 W, ma la temperatura del nucleo sarebbe più bassa (66 C).
L'esecuzione Witcher 3 si otterrebbe una temperatura media del core di 85 C, che è un po' alta per un convertibile da 14 pollici. Eseguendo lo stesso test sulDell Latitude 9420 2-in-1 o sul già citato Lenovo, ad esempio, si otterrebbe una temperatura del nucleo più bassa, rispettivamente di ~73 C e 65 C. L'attivazione della modalità Cooler Boost aiuterebbe a ridurre le temperature al di sotto dei 70 C se le alte temperature sono un problema.
Il funzionamento a batteria non limita le prestazioni. Un test 3DMark 11 a batteria restituisce punteggi simili a quelli della rete elettrica.
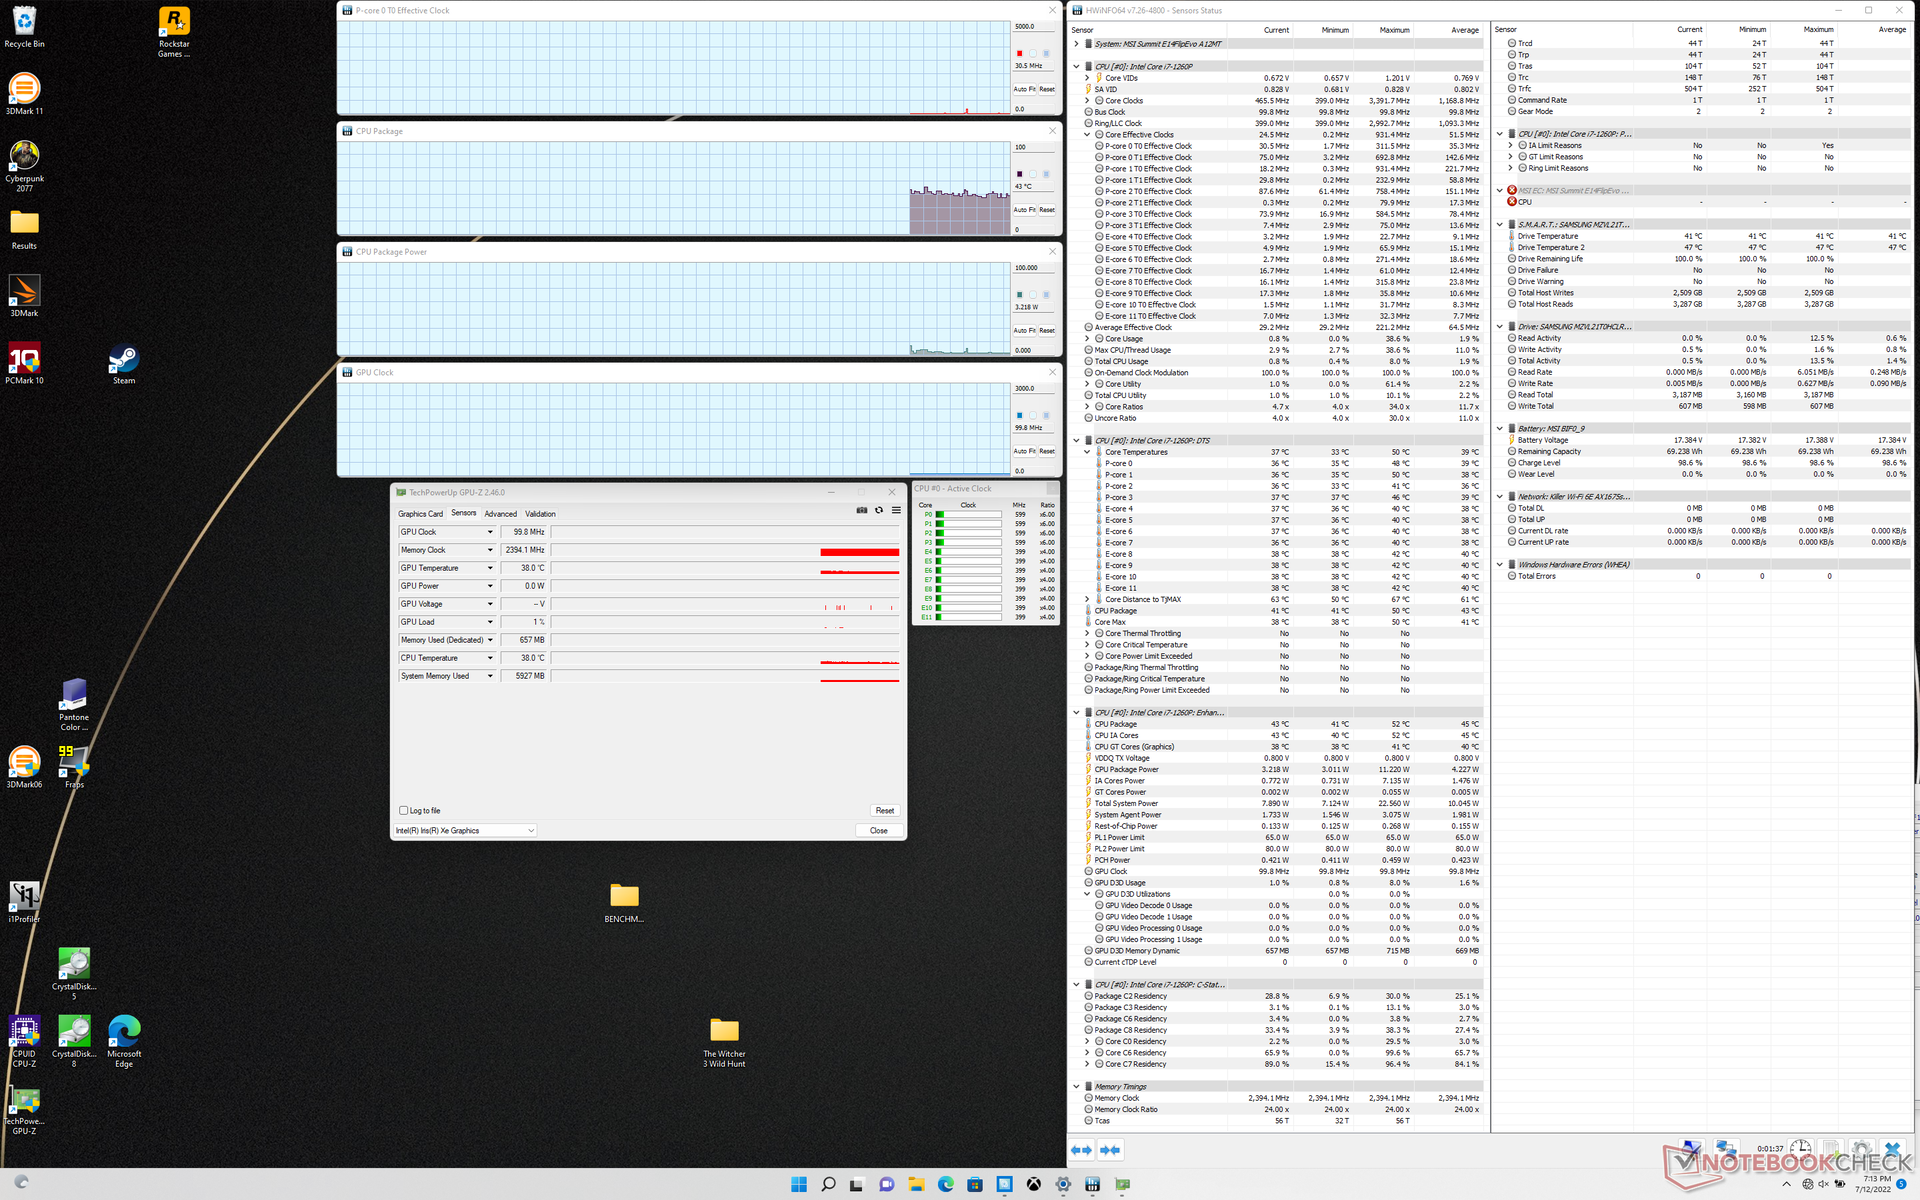
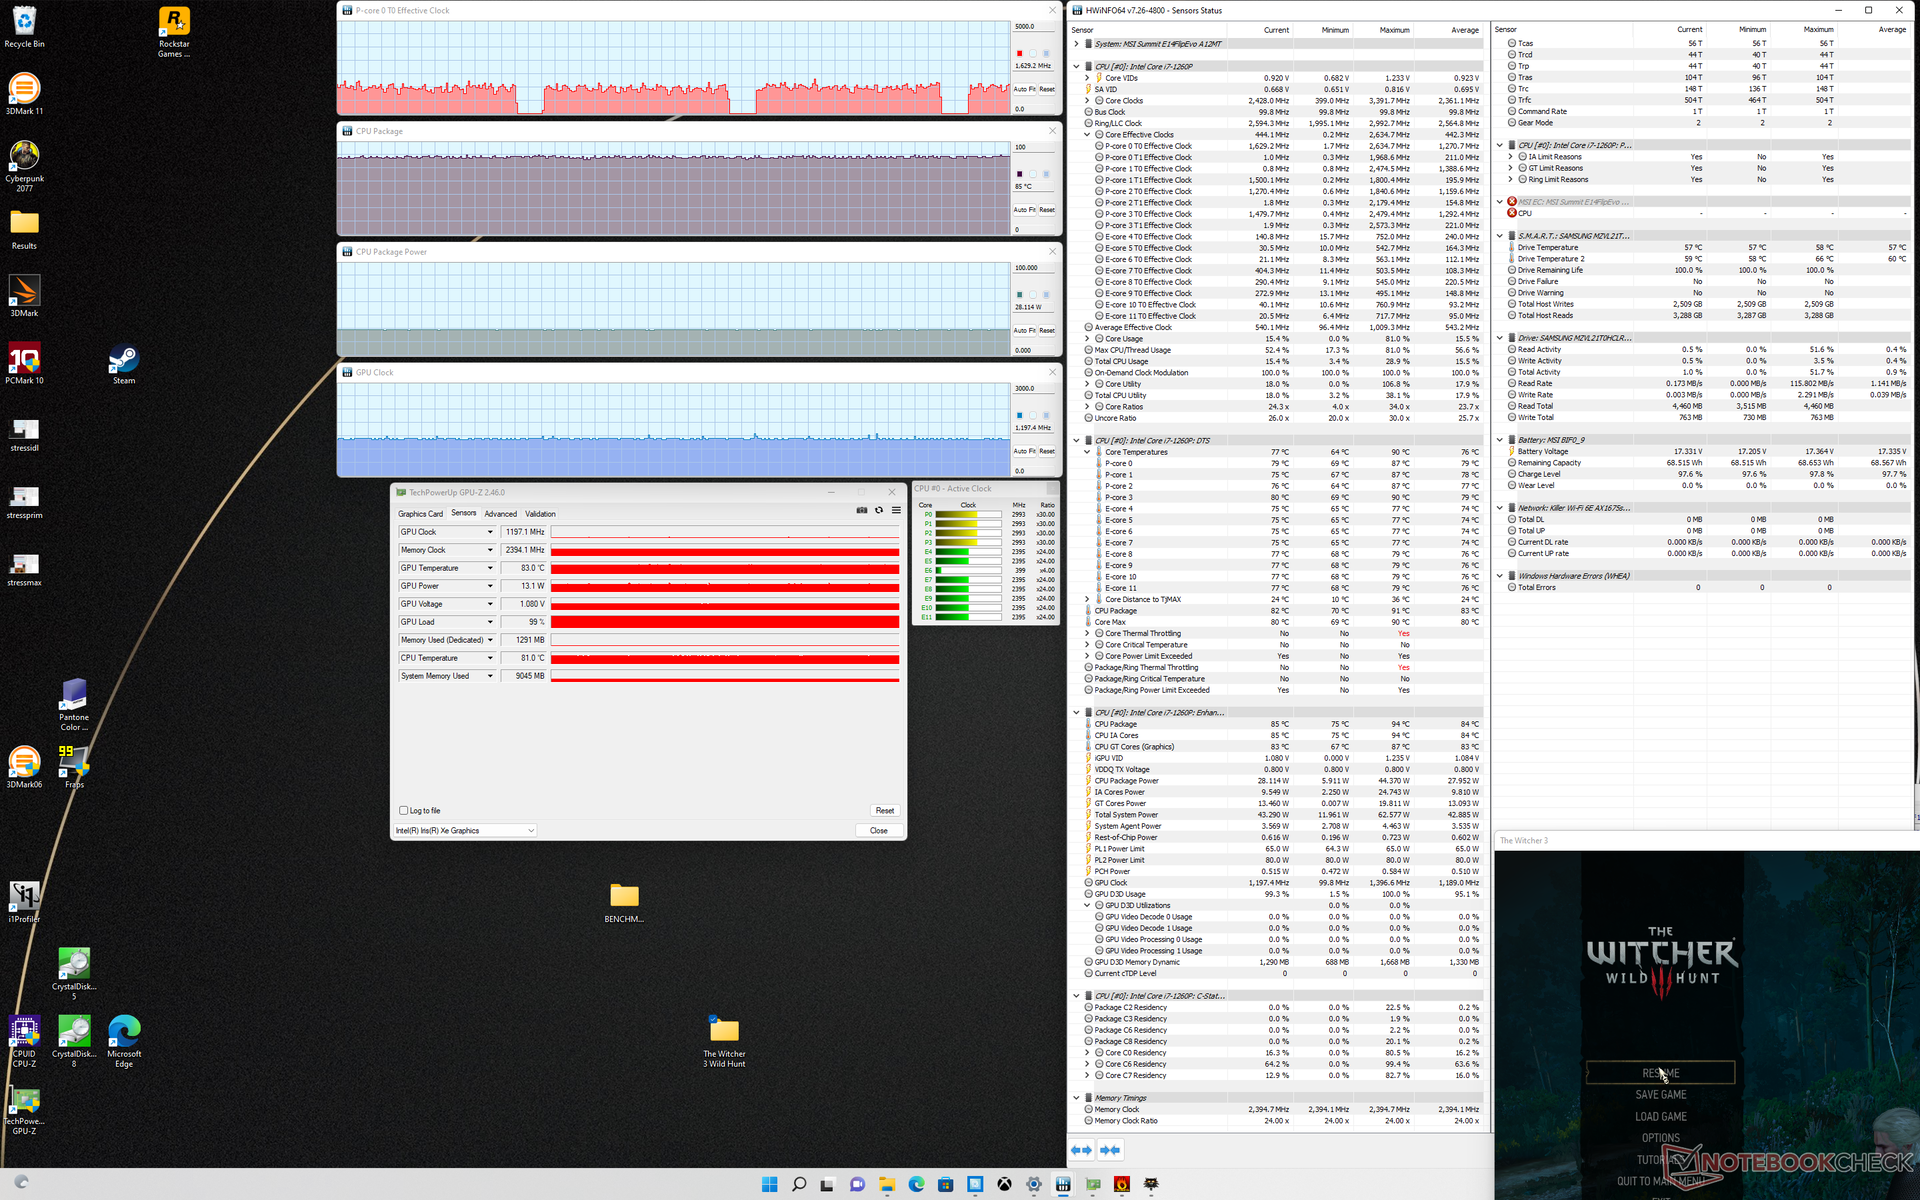
| Orologio della CPU (GHz) | Orologio della GPU (MHz) | Temperatura media della CPU (°C) | |
| Sistema inattivo | -- | -- | 43 |
| Prime95 Stress | 1,9 - 2,0 | -- | 82 |
| Prime95 + FurMark Stress | 1,5 | 898 | 83 |
| Witcher 3 Stress | ~1,6 | 1197 | 85 |
Altoparlanti
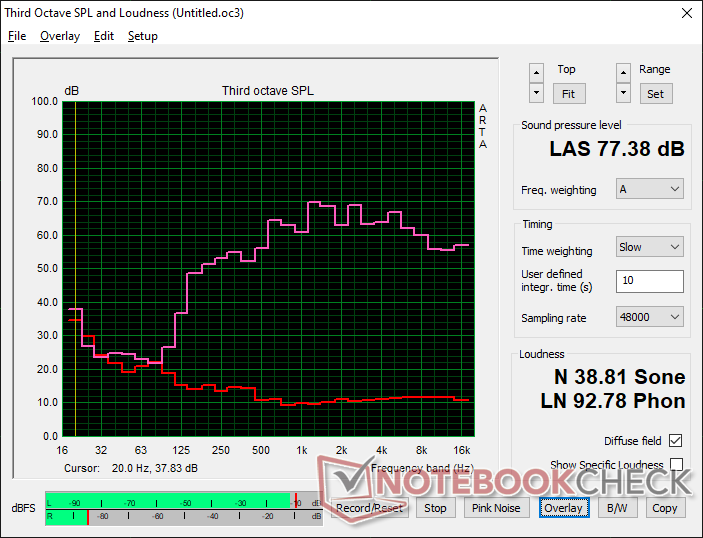
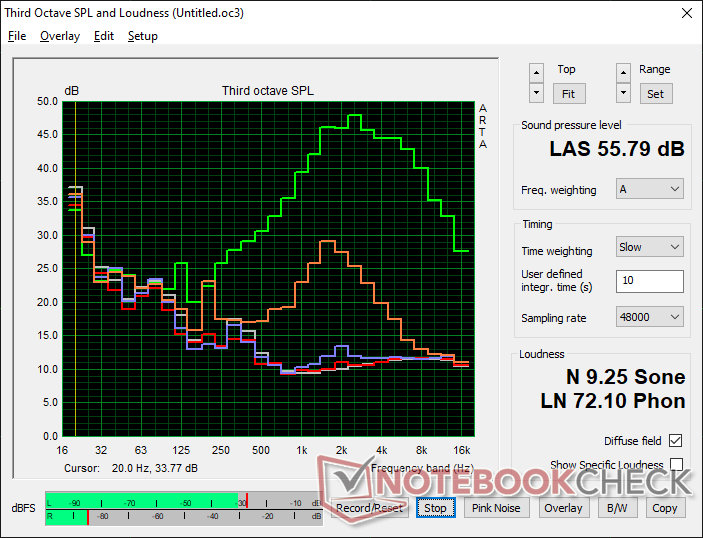
MSI Summit E14 Flip Evo A12MT analisi audio
(±) | potenza degli altiparlanti media ma buona (77.4 dB)
Bassi 100 - 315 Hz
(±) | bassi ridotti - in media 14.7% inferiori alla media
(±) | la linearità dei bassi è media (11.4% delta rispetto alla precedente frequenza)
Medi 400 - 2000 Hz
(±) | medi elevati - circa 5.2% superiore alla media
(±) | linearità dei medi adeguata (8.7% delta rispetto alla precedente frequenza)
Alti 2 - 16 kHz
(+) | Alti bilanciati - appena 4.3% dalla media
(±) | la linearità degli alti è media (7.7% delta rispetto alla precedente frequenza)
Nel complesso 100 - 16.000 Hz
(±) | la linearità complessiva del suono è media (17% di differenza rispetto alla media
Rispetto alla stessa classe
» 32% di tutti i dispositivi testati in questa classe è stato migliore, 8% simile, 61% peggiore
» Il migliore ha avuto un delta di 6%, medio di 20%, peggiore di 57%
Rispetto a tutti i dispositivi testati
» 31% di tutti i dispositivi testati in questa classe è stato migliore, 8% similare, 62% peggiore
» Il migliore ha avuto un delta di 4%, medio di 23%, peggiore di 134%
Apple MacBook Pro 16 2021 M1 Pro analisi audio
(+) | gli altoparlanti sono relativamente potenti (84.7 dB)
Bassi 100 - 315 Hz
(+) | bassi buoni - solo 3.8% dalla media
(+) | bassi in lineaa (5.2% delta rispetto alla precedente frequenza)
Medi 400 - 2000 Hz
(+) | medi bilanciati - solo only 1.3% rispetto alla media
(+) | medi lineari (2.1% delta rispetto alla precedente frequenza)
Alti 2 - 16 kHz
(+) | Alti bilanciati - appena 1.9% dalla media
(+) | alti lineari (2.7% delta rispetto alla precedente frequenza)
Nel complesso 100 - 16.000 Hz
(+) | suono nel complesso lineare (4.6% differenza dalla media)
Rispetto alla stessa classe
» 0% di tutti i dispositivi testati in questa classe è stato migliore, 0% simile, 100% peggiore
» Il migliore ha avuto un delta di 5%, medio di 17%, peggiore di 45%
Rispetto a tutti i dispositivi testati
» 0% di tutti i dispositivi testati in questa classe è stato migliore, 0% similare, 100% peggiore
» Il migliore ha avuto un delta di 4%, medio di 23%, peggiore di 134%
Gestione dell'energia
Consumo di energia - Core-P è molto esigente
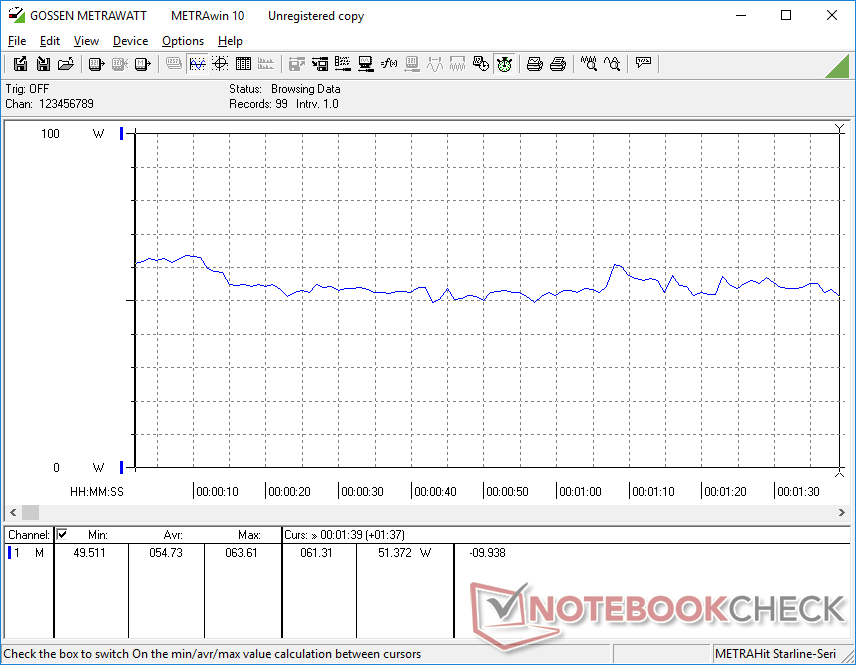
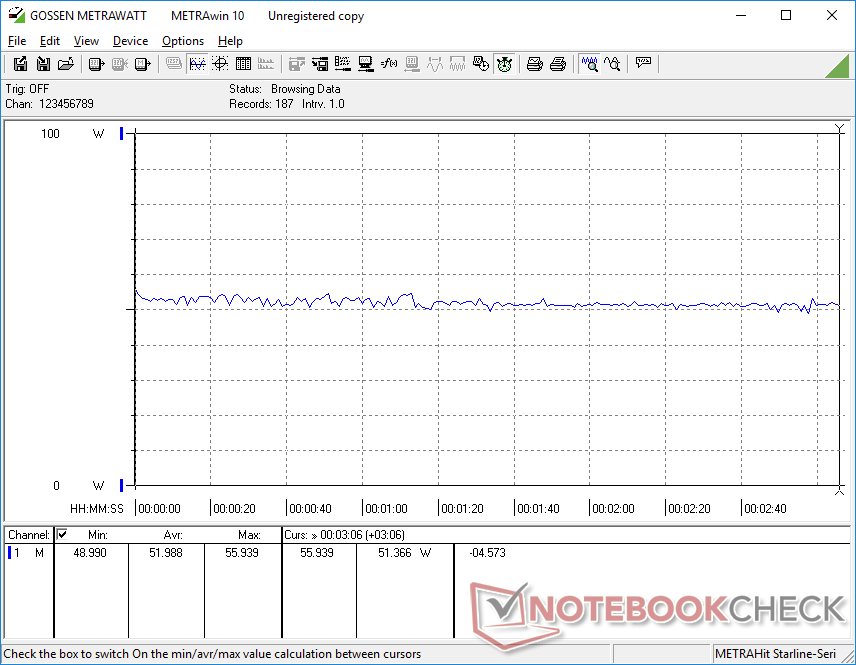
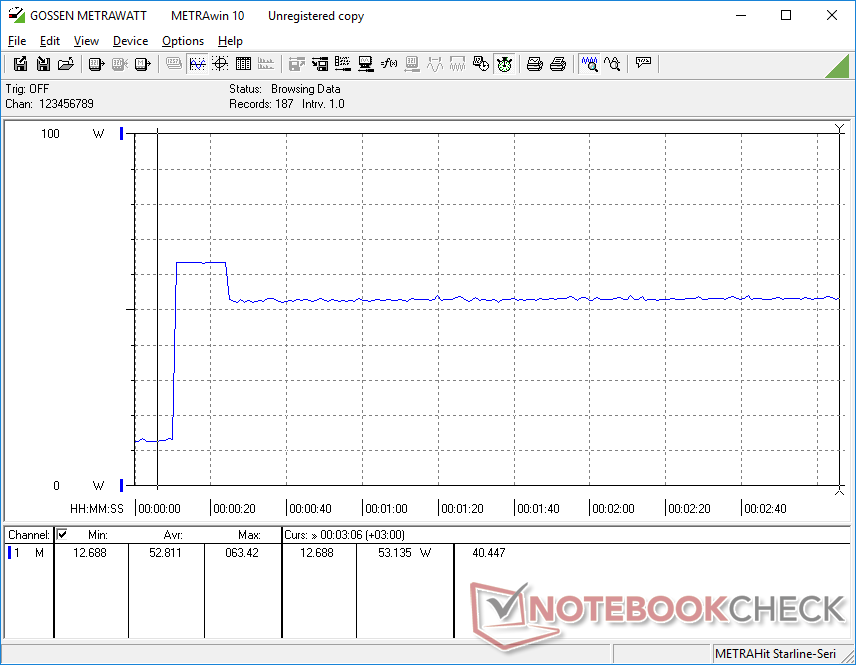
Il consumo di energia è più elevato rispetto ai sistemi con CPU Intel Core serie U di 11a generazione, come l'LG Gram 14T90P o il Dell Latitude 9420 2-in-1. Eseguendo Witcher 3 o Prime95 sul nostro MSI, ad esempio, consumerebbe rispettivamente il 37% e il 47% in più di energia rispetto al Dell citato. In altre parole, i miglioramenti di CPU e GPU menzionati in precedenza rispetto alle CPU Intel di precedente generazione hanno un costo nettamente superiore in termini di consumo energetico.
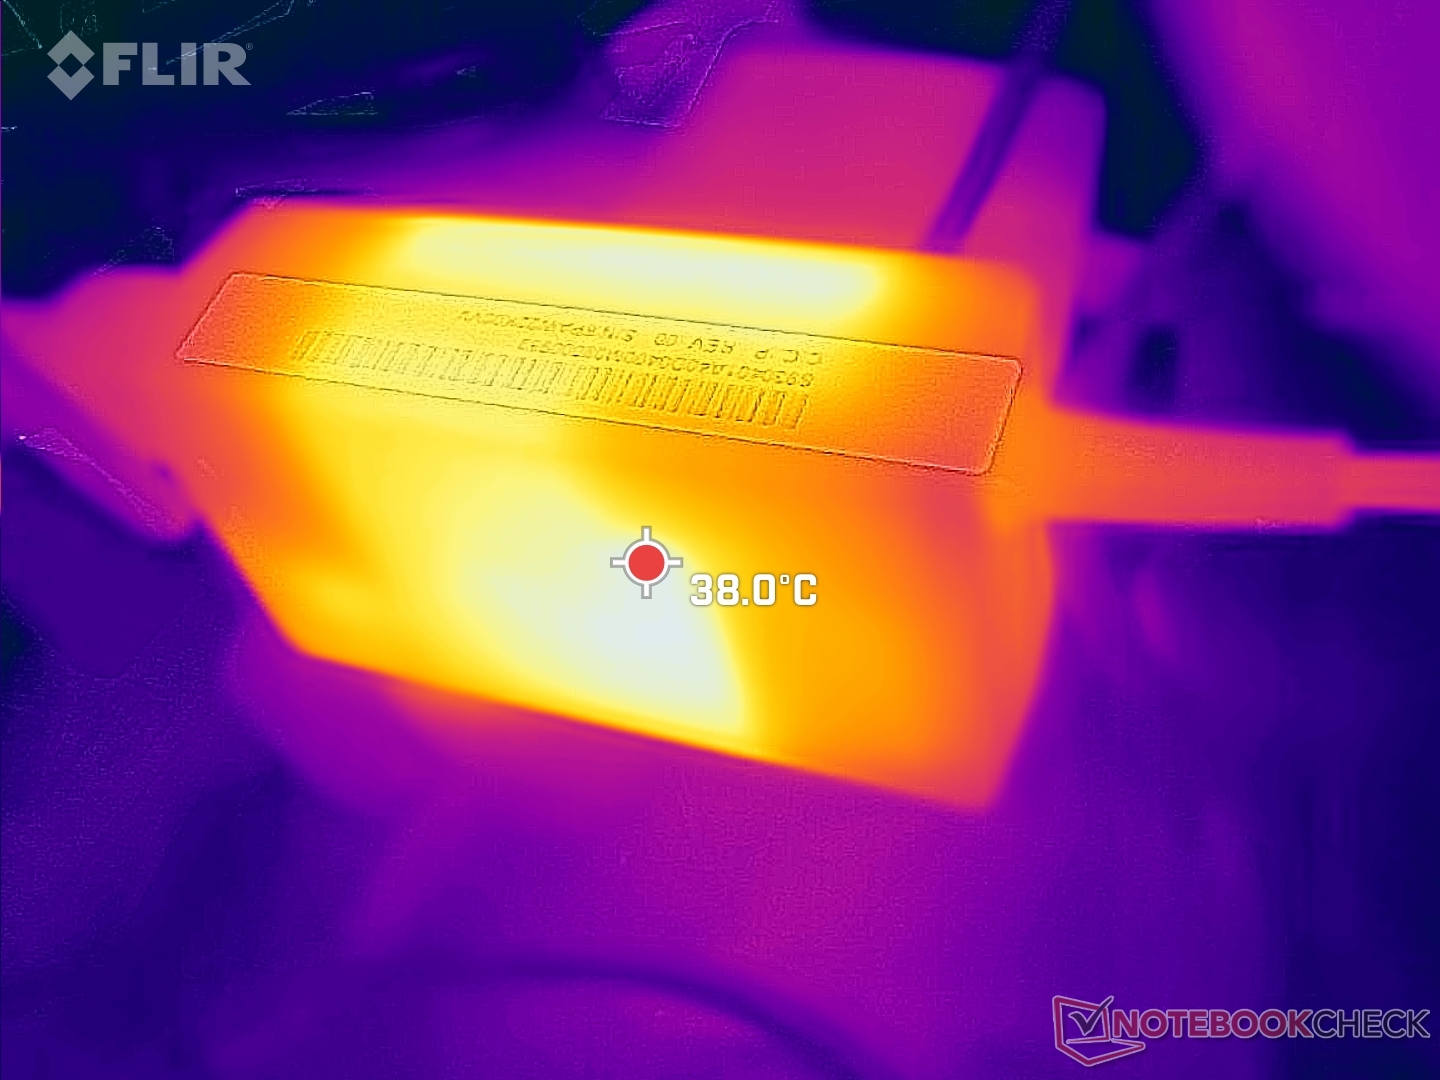
Siamo riusciti a registrare un assorbimento massimo di 63,4 W dal piccolo adattatore CA da 65 W (~8,8 x 4,9 x 3 cm). L'assorbimento totale tende a stabilizzarsi a 53 W quando la CPU è completamente sollecitata, lasciando uno spazio di manovra di soli 12 W.

| Off / Standby | |
| Idle | |
| Sotto carico |
|
Leggenda:
min: | |
| MSI Summit E14 Flip Evo A12MT i7-1260P, Iris Xe G7 96EUs, Samsung PM9A1 MZVL21T0HCLR, IPS, 2880x1800, 14" | MSI Summit E14 A11SCS i7-1185G7, GeForce GTX 1650 Ti Max-Q, Phison 1TB SM2801T24GKBB4S-E162, IPS, 3840x2160, 14" | Asus VivoBook S 14X S5402Z i7-12700H, Iris Xe G7 96EUs, Micron 2450 512GB MTFDKBA512TFK, OLED, 2880x1800, 14.5" | LG Gram 14T90P i5-1135G7, Iris Xe G7 80EUs, Samsung SSD PM981a MZVLB512HBJQ, IPS, 1900x1200, 14" | Lenovo Yoga Slim 7i Pro 14IAP G7 i5-1240P, Iris Xe G7 80EUs, Samsung PM9A1 MZVL2512HCJQ, IPS, 2880x1800, 14" | Dell Latitude 9420 2-in-1 i7-1185G7, Iris Xe G7 96EUs, WDC PC SN530 SDBPNPZ-512G, IPS, 2560x1600, 14" | |
|---|---|---|---|---|---|---|
| Power Consumption | -64% | -5% | 31% | 9% | 11% | |
| Idle Minimum * (Watt) | 5.4 | 9.9 -83% | 5.1 6% | 2.8 48% | 5.6 -4% | 4.6 15% |
| Idle Average * (Watt) | 9.5 | 17.4 -83% | 7.7 19% | 5.5 42% | 9.3 2% | 7.8 18% |
| Idle Maximum * (Watt) | 12.4 | 22.5 -81% | 11 11% | 6.4 48% | 9.6 23% | 8.2 34% |
| Load Average * (Watt) | 54.7 | 85.6 -56% | 73.9 -35% | 45.4 17% | 49 10% | 47.9 12% |
| Witcher 3 ultra * (Watt) | 52 | 70.9 -36% | 42.7 18% | 34 35% | 38.2 27% | 38.8 25% |
| Load Maximum * (Watt) | 63.4 | 91.1 -44% | 93 -47% | 65.9 -4% | 65.2 -3% | 87.1 -37% |
* ... Meglio usare valori piccoli
Power Consumption Witcher 3 / Stresstest
Power Consumption external Monitor
Durata della batteria
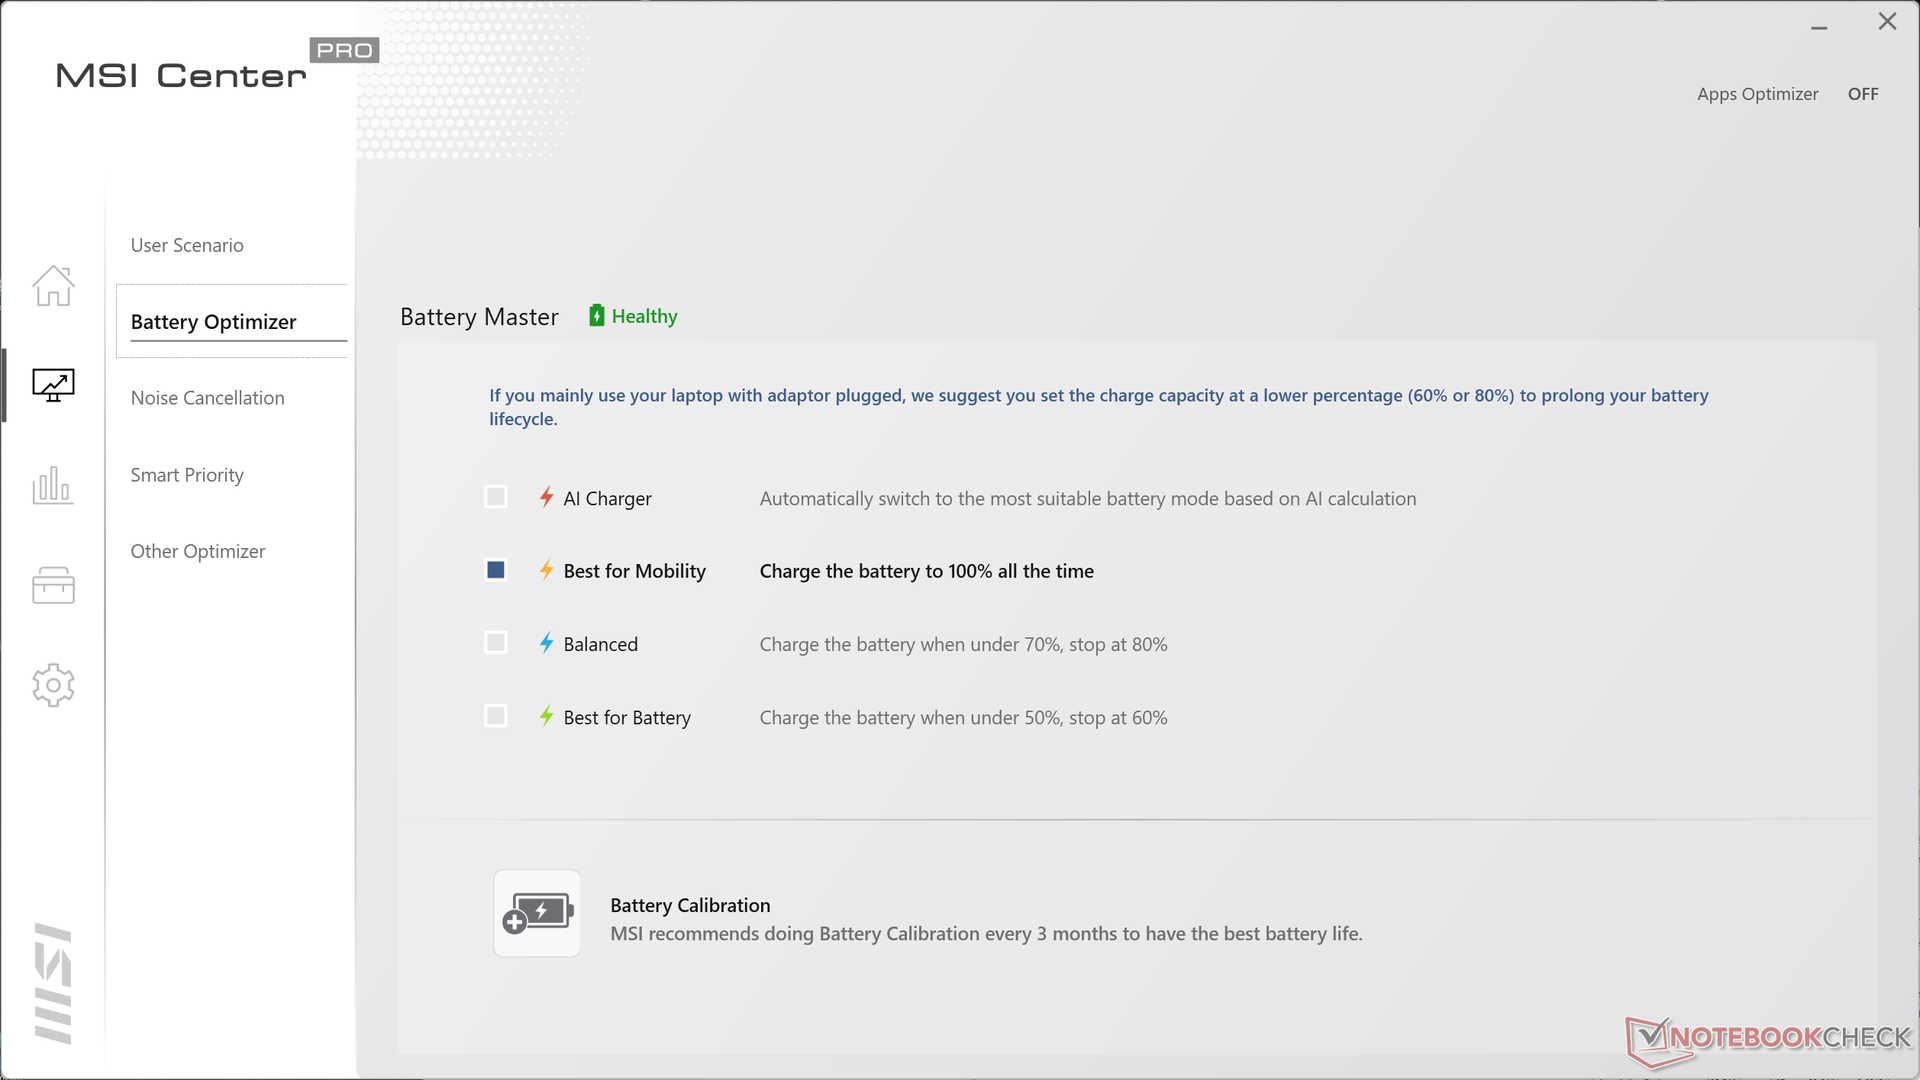
La capacità della batteria è simile a quella dei concorrenti Asus VivoBook S 14X o LG Gram 14T90P, con 70 Wh. Gli utenti possono aspettarsi poco più di 8 ore di navigazione WLAN nel mondo reale prima di doverlo ricaricare.
La ricarica da vuoto a pieno regime con l'adattatore in dotazione richiede poco meno di 90 minuti, un tempo paragonabile a quello della maggior parte degli Ultrabook. Per ricaricare il sistema è possibile utilizzare anche adattatori USB-C di terze parti.
| MSI Summit E14 Flip Evo A12MT i7-1260P, Iris Xe G7 96EUs, 72 Wh | MSI Summit E14 A11SCS i7-1185G7, GeForce GTX 1650 Ti Max-Q, 52 Wh | Asus VivoBook S 14X S5402Z i7-12700H, Iris Xe G7 96EUs, 70 Wh | LG Gram 14T90P i5-1135G7, Iris Xe G7 80EUs, 72 Wh | Lenovo Yoga Slim 7i Pro 14IAP G7 i5-1240P, Iris Xe G7 80EUs, 61 Wh | Dell Latitude 9420 2-in-1 i7-1185G7, Iris Xe G7 96EUs, 60 Wh | |
|---|---|---|---|---|---|---|
| Autonomia della batteria | -54% | -27% | 35% | -21% | 33% | |
| Reader / Idle (h) | 22.1 | 6.6 -70% | 13.1 -41% | 28.7 30% | ||
| WiFi v1.3 (h) | 8.2 | 4.5 -45% | 7.1 -13% | 12.1 48% | 8.6 5% | 11.7 43% |
| Load (h) | 1.9 | 1 -47% | 2.3 21% | 1 -47% | 2.4 26% | |
| H.264 (h) | 10.7 |
Pro
Contro
Verdetto - Il miglior MSI Summit finora
Invece di prendere il 13 pollici Summit E13 Flip e di ingrandirlo semplicemente per un fattore di forma da 14 pollici, il Summit E14 Flip è la riprogettazione completa dello chassis che stavamo cercando. Perde alcune delle rifiniture dorate del fratello minore, ma il guadagno in termini di rigidità e qualità costruttiva ne vale la pena, soprattutto dal punto di vista professionale, dove l'affidabilità ha la priorità. Non ha la stessa solidità del modello HP Spectre ma ci si sta avvicinando.
Il Summit E14 Flip è destinato a professionisti e studenti che desiderano la versatilità di un subnotebook convertibile senza dover sacrificare le prestazioni.
Le prestazioni sono di altissimo livello e non si riscontrano grossi rallentamenti della CPU o della GPU, a differenza di quanto accade in alcuni modelli di HP EliteBook Dragonfly modelli HP EliteBook Dragonfly. Nel frattempo, il display è in grado di competere con i display di altri subnotebook prosumer di Dell, HP o Asus sulla maggior parte dei fronti. Speriamo di vedere in futuro opzioni OLED o a 90+ Hz, che sembrano essere la tendenza attuale.
La mancanza di opzioni WAN significa che alcuni utenti avranno ancora un motivo per optare per i modelli delle famiglie Lenovo ThinkPad, Dell Latitude o HP Spectre. Inoltre, se da un lato le prestazioni sono eccellenti e lo chassis è robusto, dall'altro comportano rispettivamente temperature molto elevate e un design più grande. Scegliere il Summit E14 Flip significa sacrificare un po' di portabilità per una CPU veloce.
Prezzo e disponibilità
Amazon ha in stock diverse configurazioni che vanno dal Core i5-1240P a 1300 dollari al Core i7-1260P a 1700 dollari.
MSI Summit E14 Flip Evo A12MT
- 07/15/2022 v7 (old)
Allen Ngo
Price comparison

