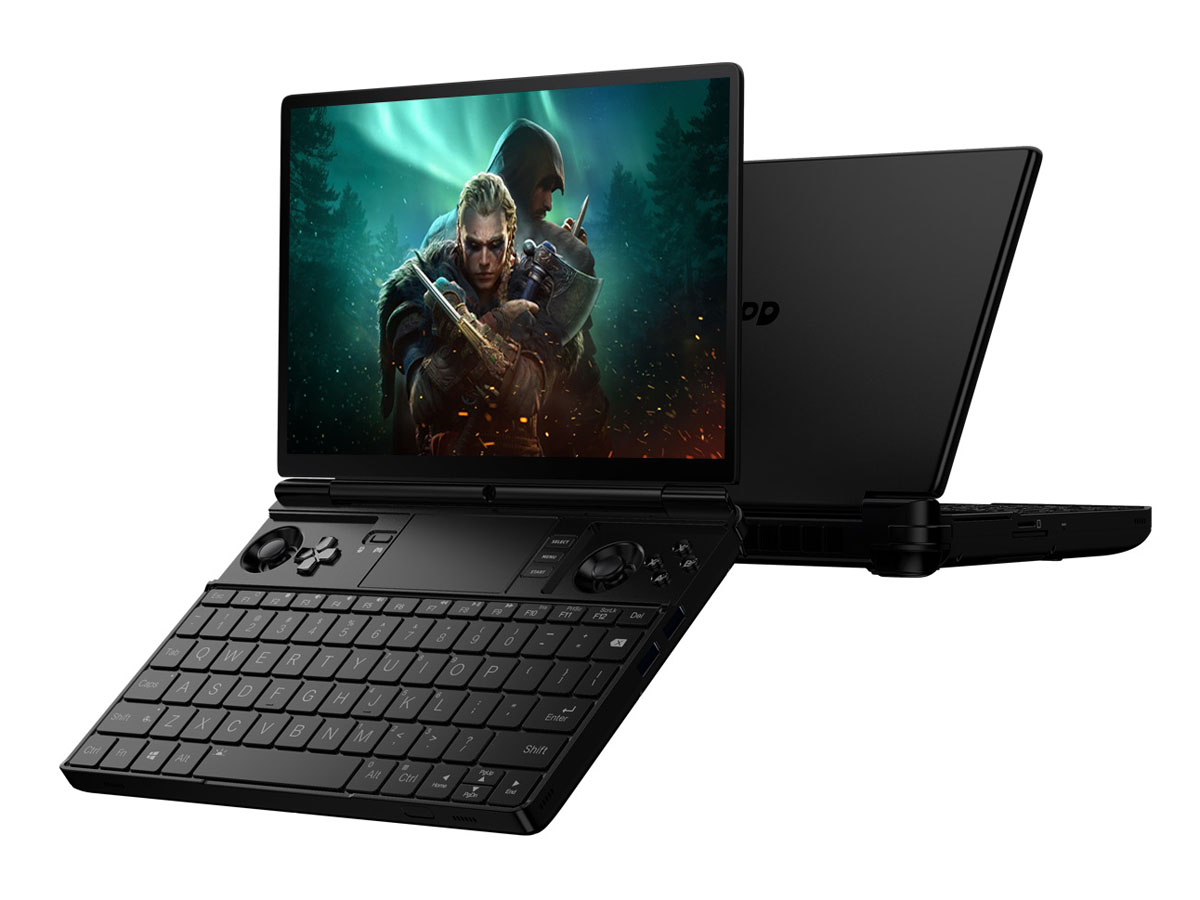
Recensione del PC portatile GPD Win Max 2: Intel Core i7-1260P o AMD Ryzen 7 6800U?
GPD ha fatto parlare di sé con la sua crescente linea di PC portatili dotati di hardware sufficientemente veloce per il gioco. Solo l'anno scorso sono stati lanciati tre modelli di questo tipo: Win 3, Win Max e Pocket 3, ognuno con un design unico e con un'interpretazione del gioco in movimento.
Per il 2022, GPD ha presentato il Win Max 2, che sostituisce direttamente la prima generazione del Win Max 2021. Quest'ultimo modello è una riprogettazione completa del primo modello con ancora più funzioni ausiliarie e hardware più veloce. Gli utenti possono scegliere tra i processori Intel 12th gen Core i7-1260P o AMD Ryzen 7 6800U con grafica integrata Iris Xe o Radeon 680M, rispettivamente. Ogni versione dovrebbe essere venduta al prezzo di 1000 dollari
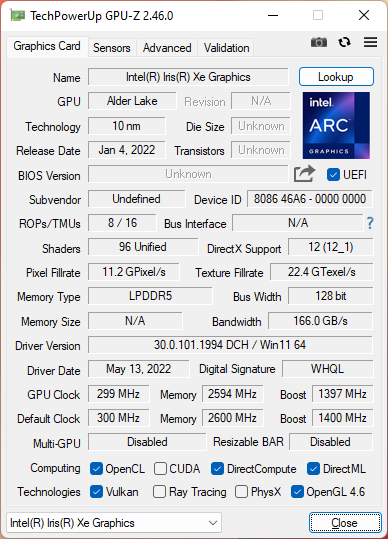
Il Win Max 2 è unico nel suo genere, in quanto è uno degli unici portatili da 10,1 pollici ad essere dotato di una CPU Intel Alder Lake-P, per un livello di prestazioni molto elevato rispetto alla sua categoria di dimensioni. Ulteriori informazioni e specifiche sono disponibili sulla pagina ufficiale del prodotto https://gpd.hk/gpdwinmax2techspecs. Questa recensione si concentra sulla versione Intel del modello.
Altre recensioni di GPD:
Potenziali concorrenti a confronto
Punteggio | Data | Modello | Peso | Altezza | Dimensione | Risoluzione | Prezzo |
|---|---|---|---|---|---|---|---|
| 84.5 % v7 (old) | 07/2022 | GPD Win Max 2 i7-1260P, Iris Xe G7 96EUs | 1 kg | 23 mm | 10.10" | 2560x1600 | |
| 86.3 % v7 (old) | 11/2021 | GPD Pocket 3 i7-1195G7, Iris Xe G7 96EUs | 730 gr | 20 mm | 8.00" | 1920x1200 | |
| 79.3 % v7 (old) | 09/2021 | GPD Win Max 2021 R7 4800U, Vega 8 | 850 gr | 26 mm | 8.00" | 1280x800 | |
v (old) | 01/2021 | GPD Win 3 i5-1135G7, Iris Xe G7 80EUs | 553 gr | 27 mm | 5.50" | 1280x720 | |
| 85.3 % v7 (old) | 10/2021 | Microsoft Surface Go 3 Core i3 i3-10100Y, UHD Graphics 615 | 783 gr | 8.3 mm | 10.50" | 1920x1280 | |
| 78.1 % v7 (old) | 07/2020 | Lenovo IdeaPad Flex 3 11IGL05 Celeron N4020, UHD Graphics 600 | 1.1 kg | 17.5 mm | 11.60" | 1366x768 |
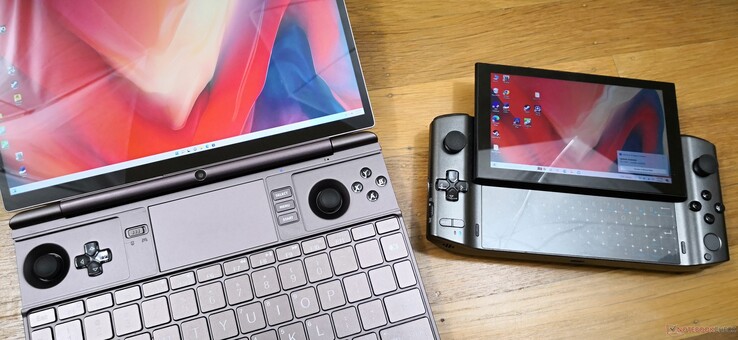
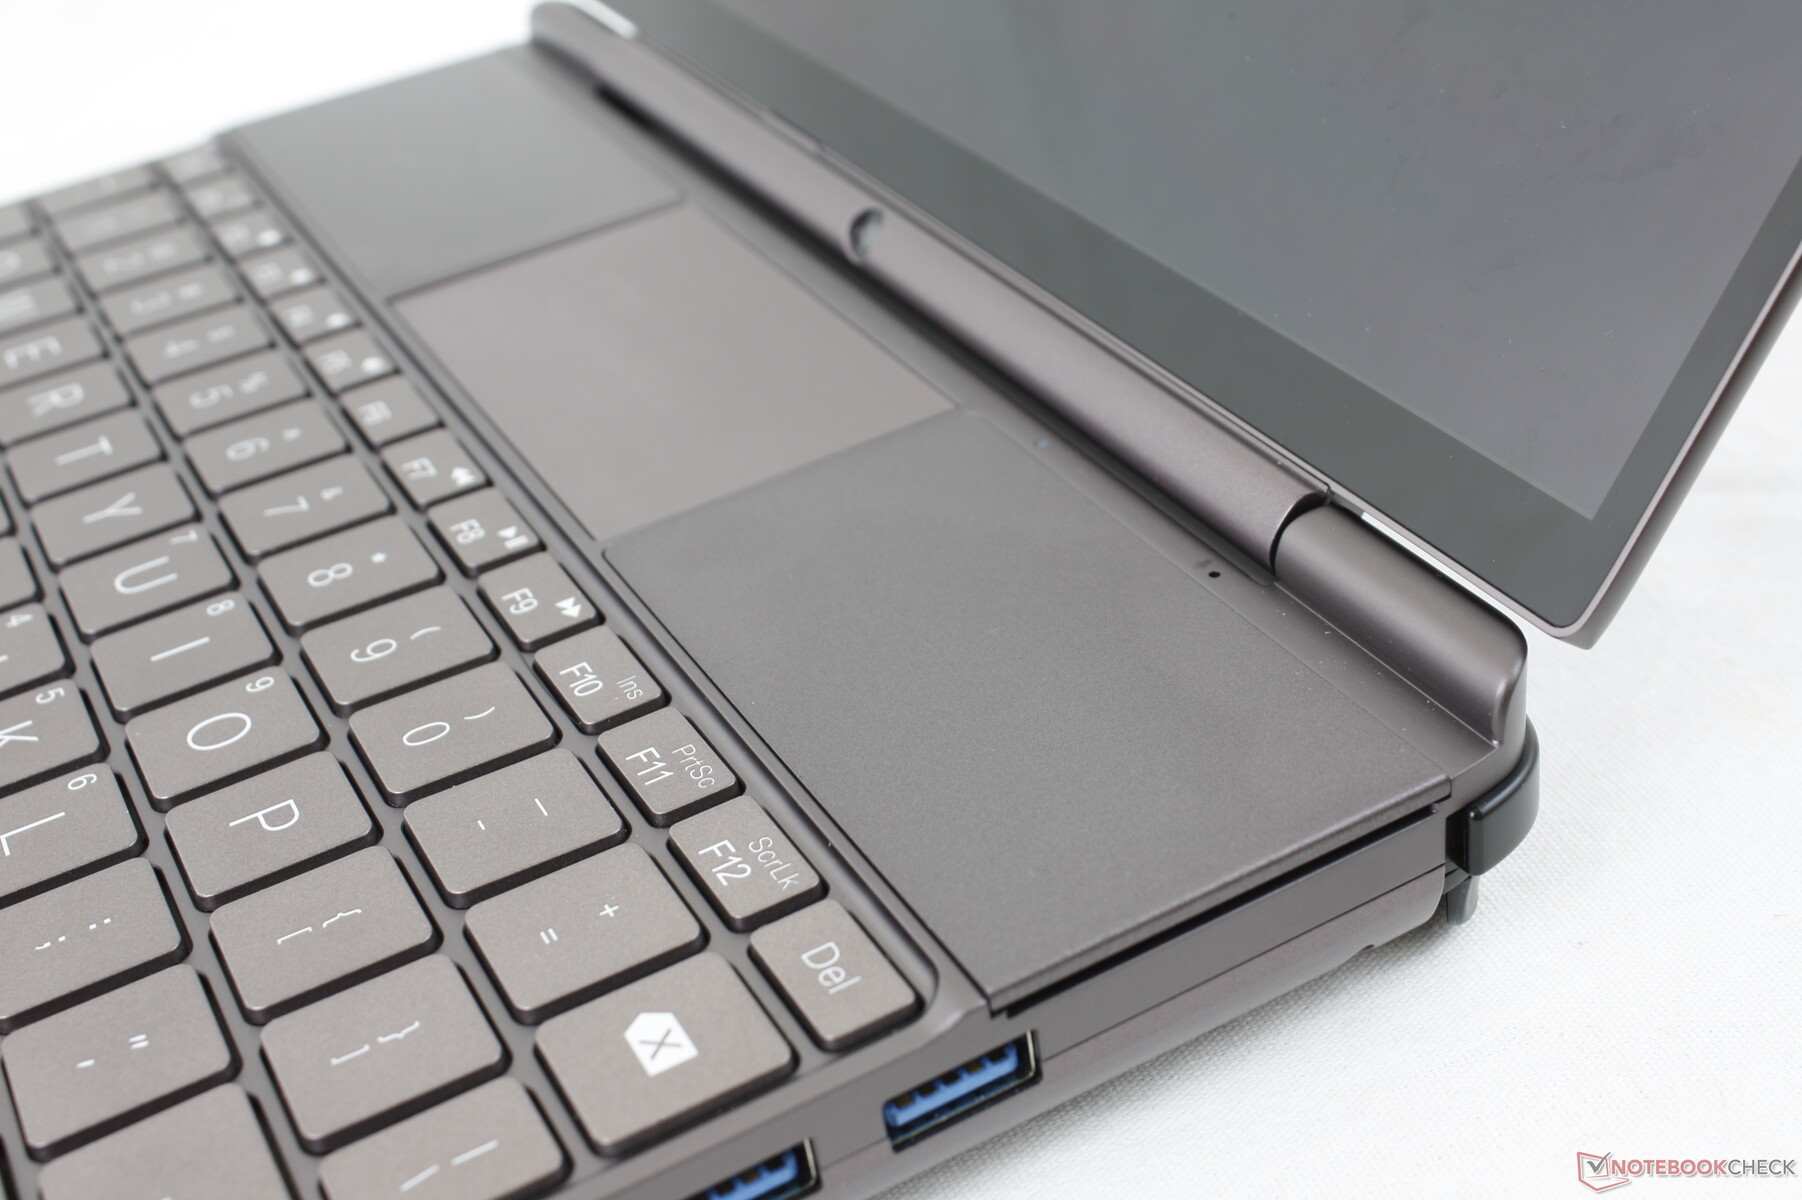
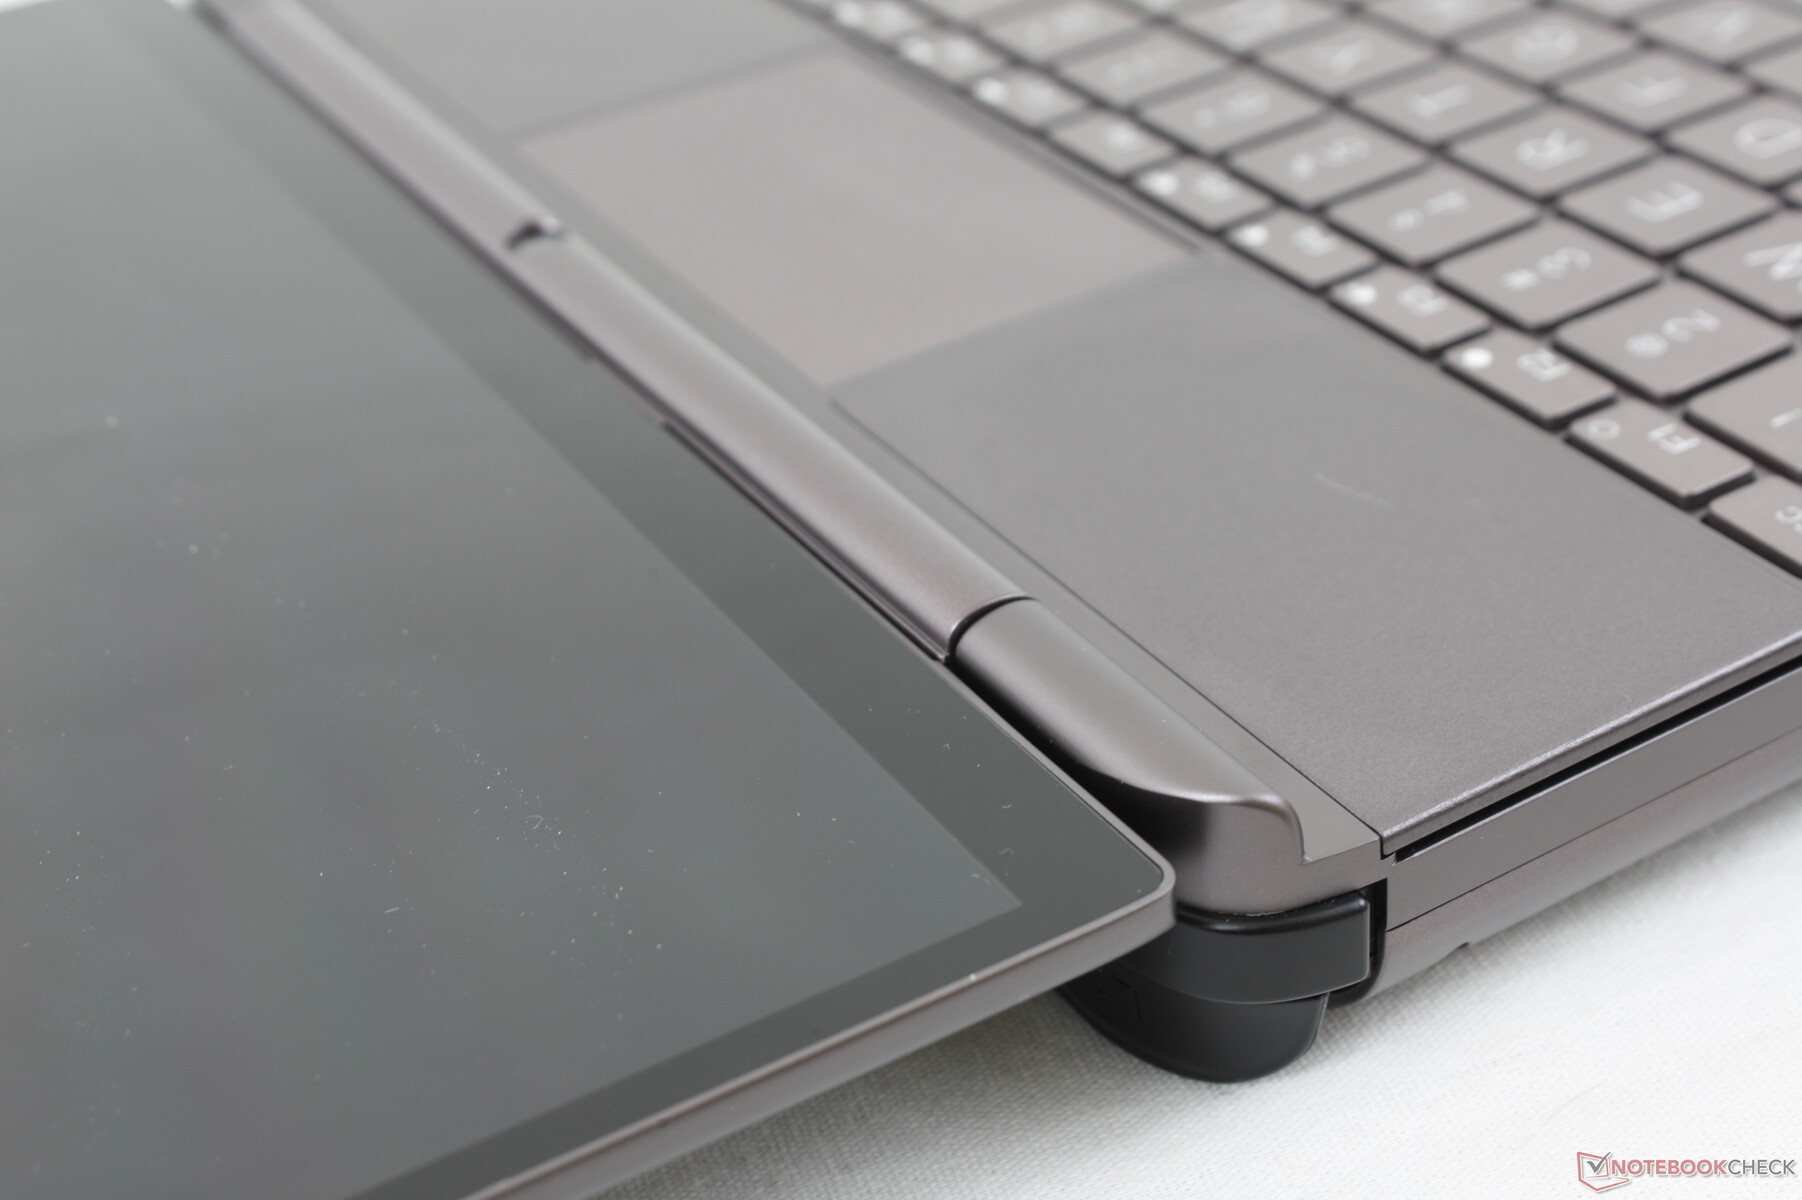
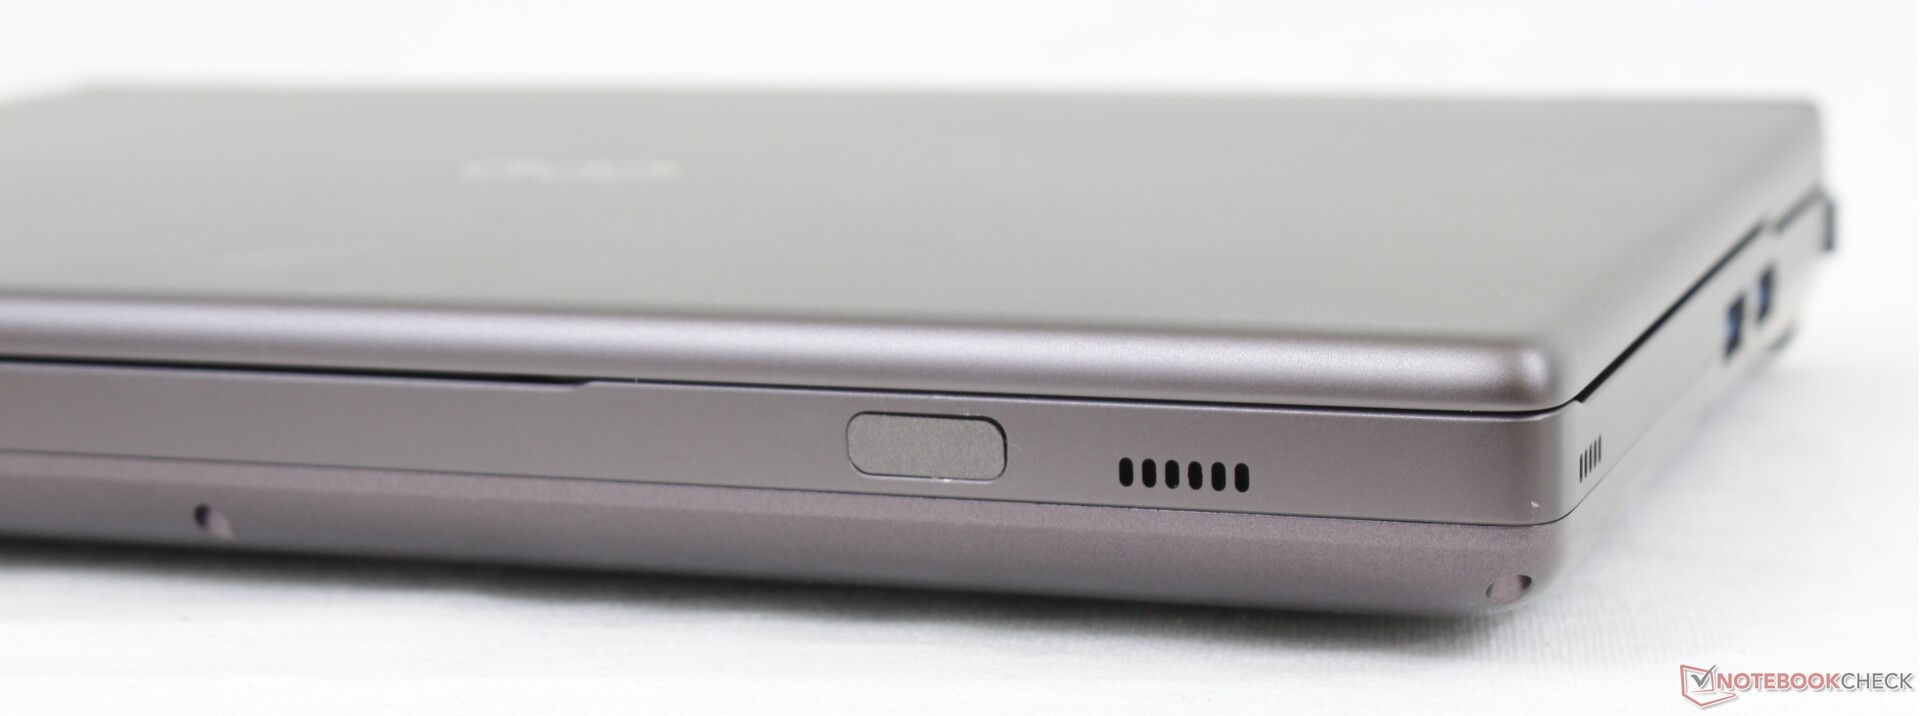
Caso - Sensazione di familiarità
GPD utilizza materiali metallici simili per tutti i suoi prodotti e quindi tutti hanno la stessa consistenza, sensazione e aspetto. Tuttavia, la qualità costruttiva è migliore rispetto al Win Max originale, poiché sia la base che il coperchio presentano solo una minima flessione e quasi nessuno scricchiolio. È anche un miglioramento rispetto al Win 3, che abbiamo trovato un po' fragile per quanto riguarda il meccanismo di scorrimento
Una novità della serie sono le due coperture magnetiche rimovibili per i joystick. La loro utilità è per lo più superficiale per gli utenti che vogliono coprire i pulsanti del controller durante le lezioni o le riunioni.
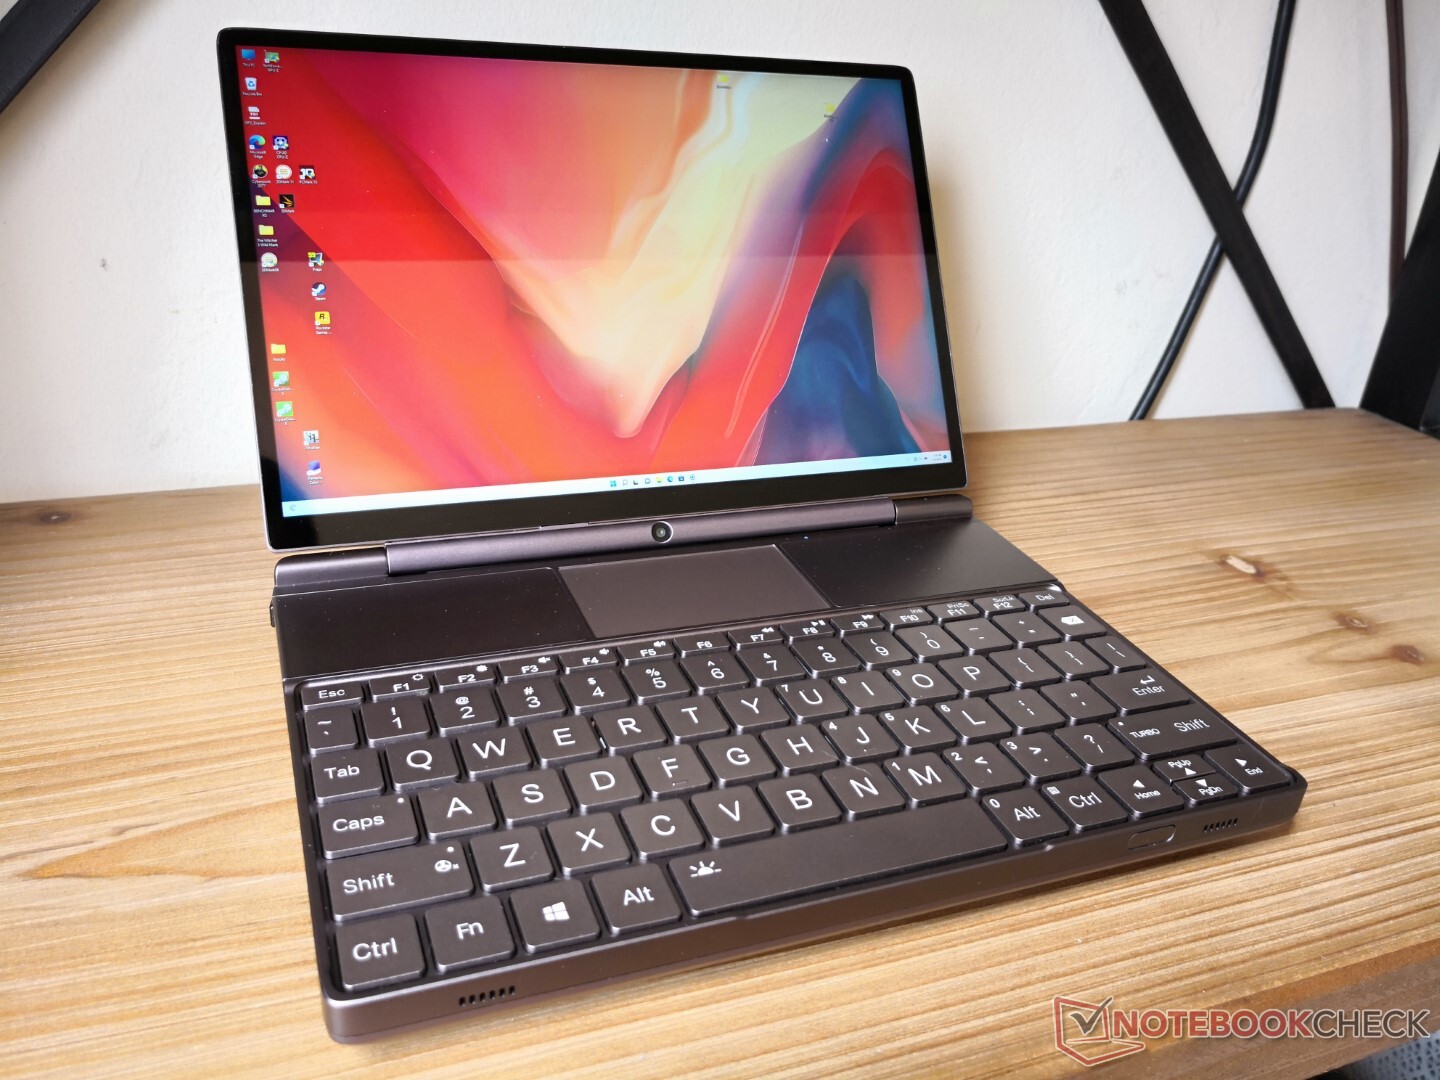
Le dimensioni dello schermo molto più grandi del Win Max 2 rispetto al Win Max originale fanno sì che il nuovo modello sia più pesante e più grande del suo predecessore, anche dopo aver tenuto conto delle cornici più strette del display. Tuttavia, con un peso di poco superiore a 1 kg, è ancora più leggero della maggior parte dei computer portatili e la sua portabilità non può essere sottovalutata.
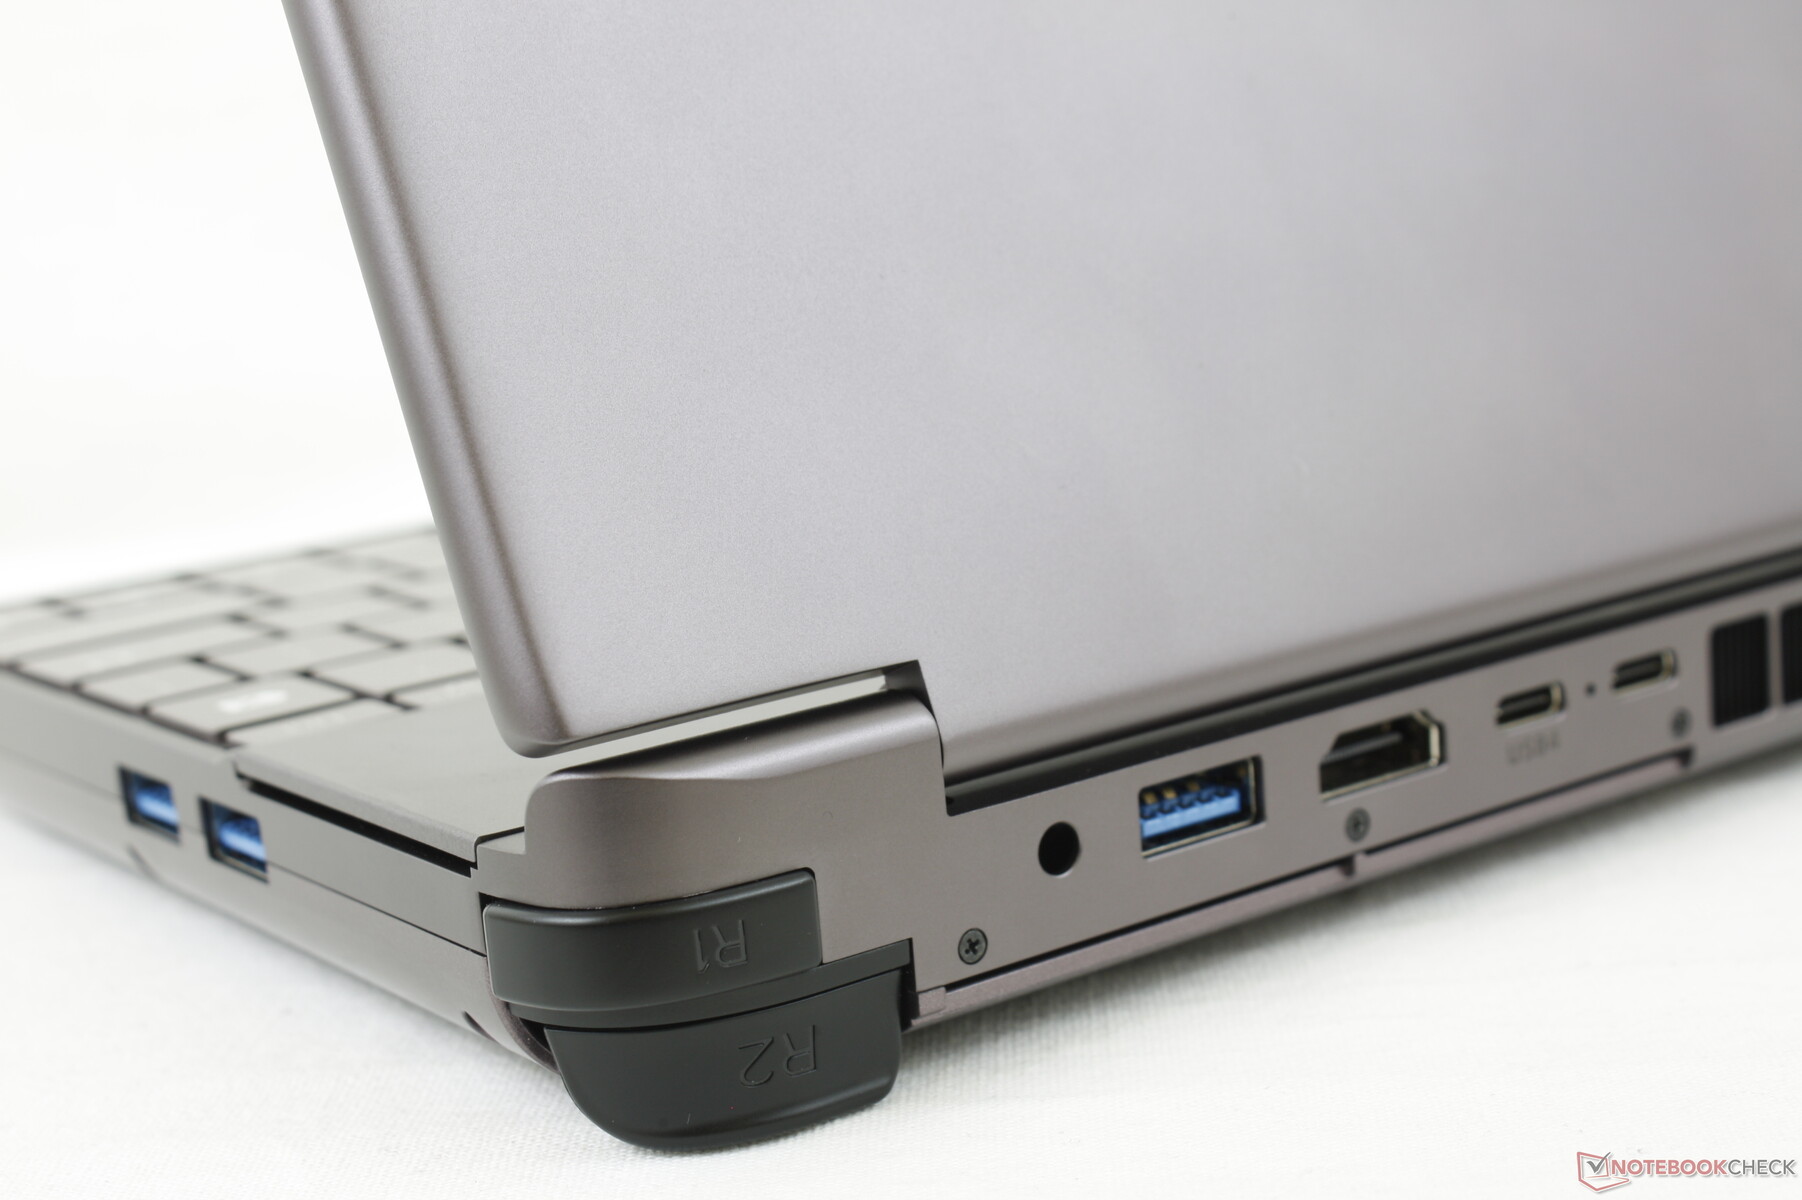
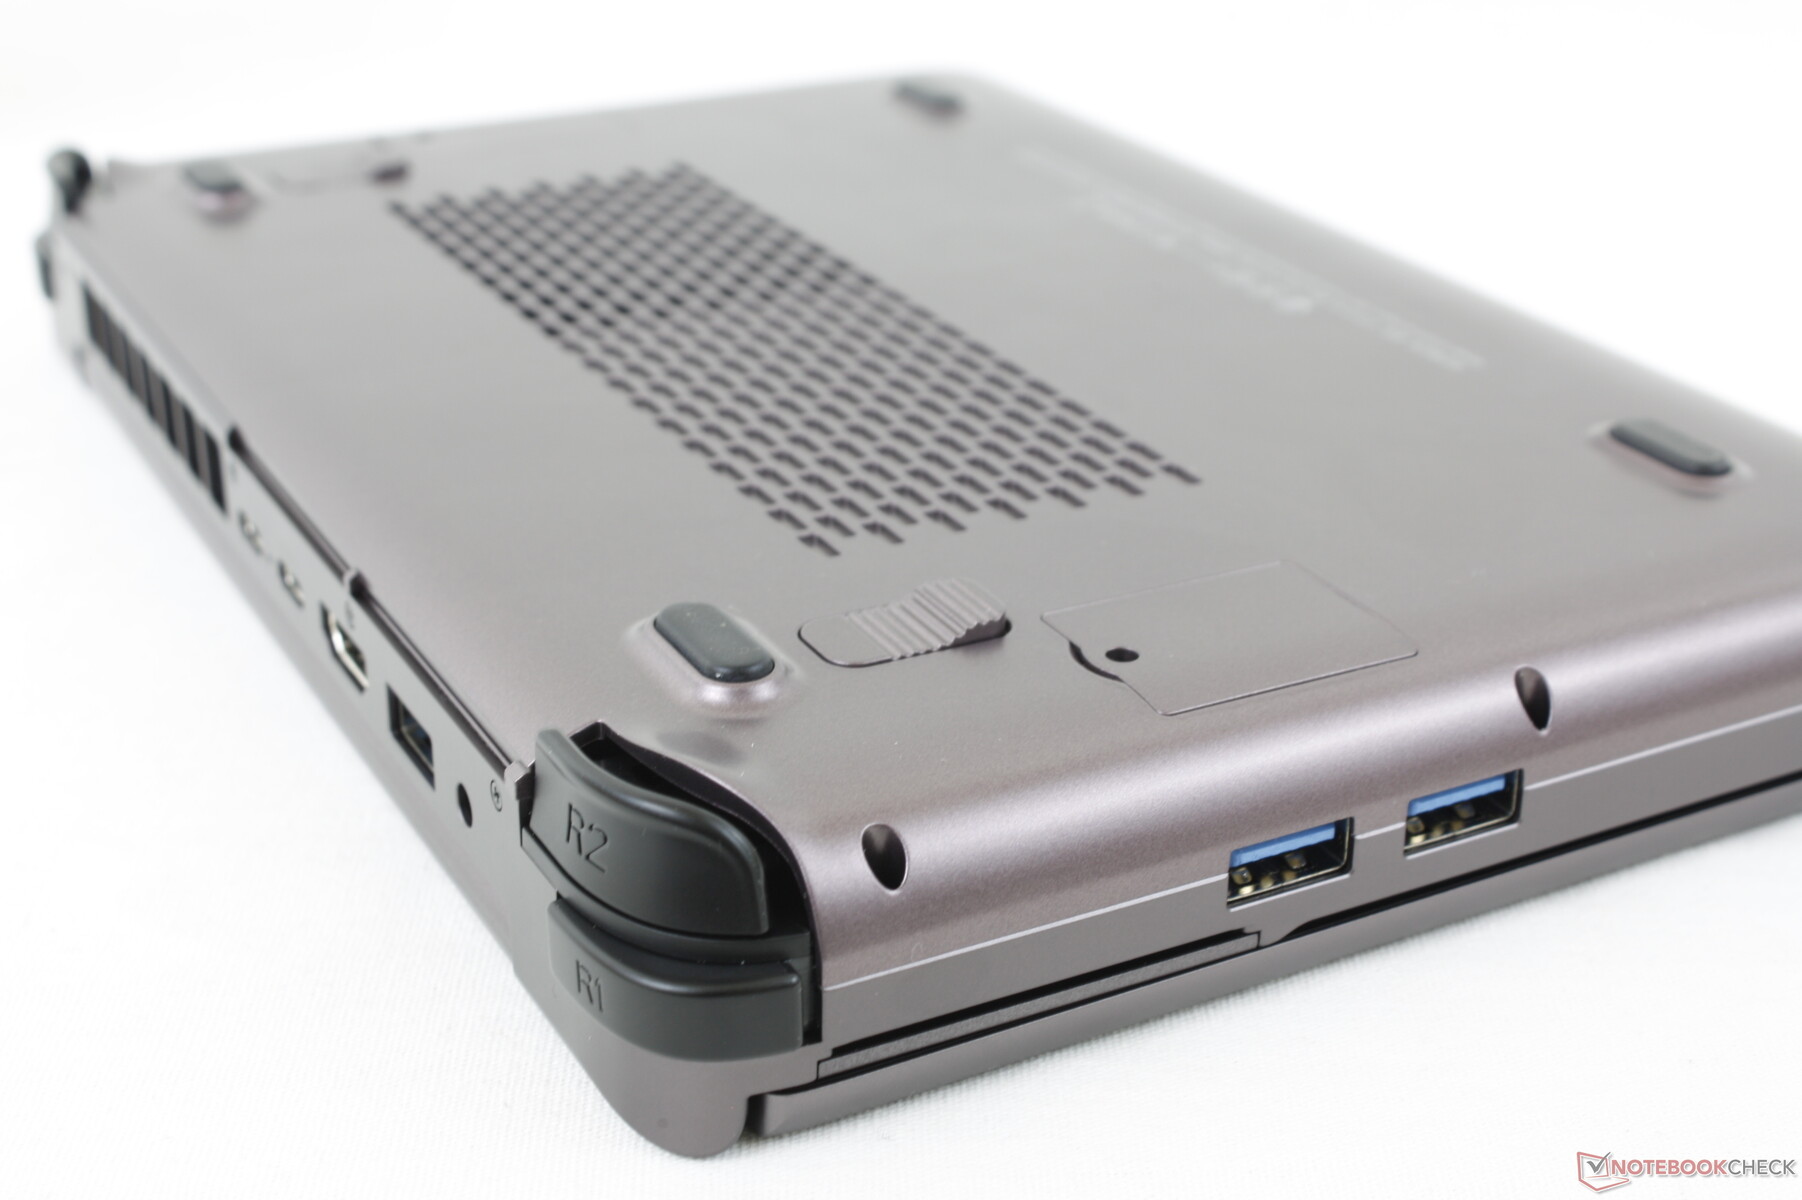
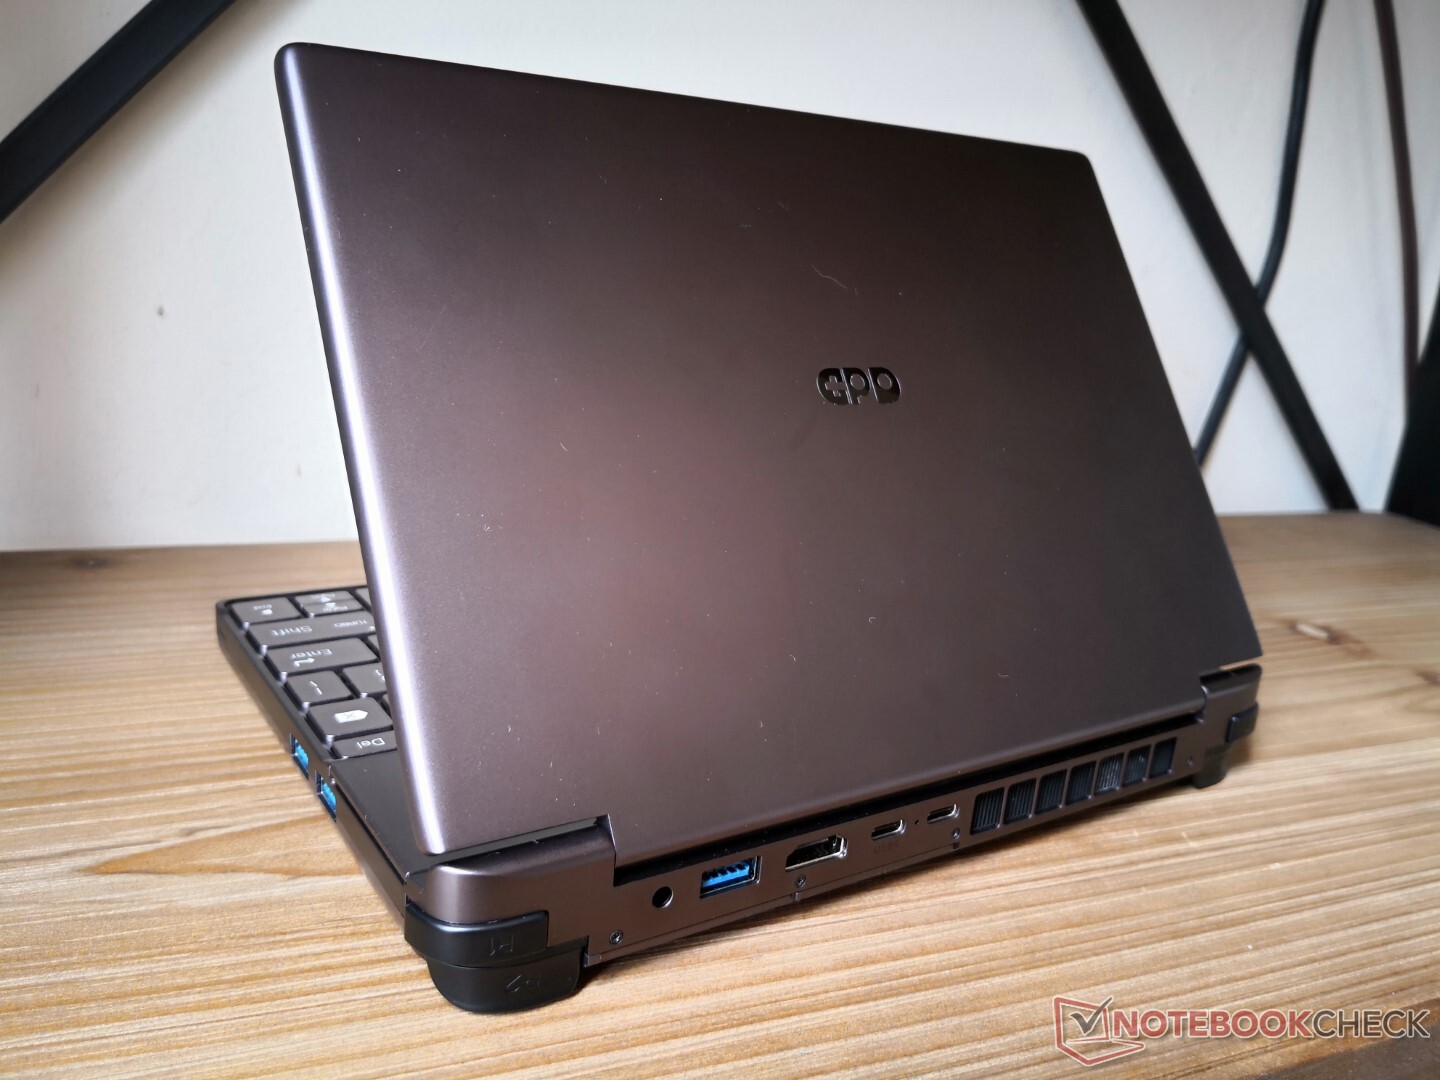
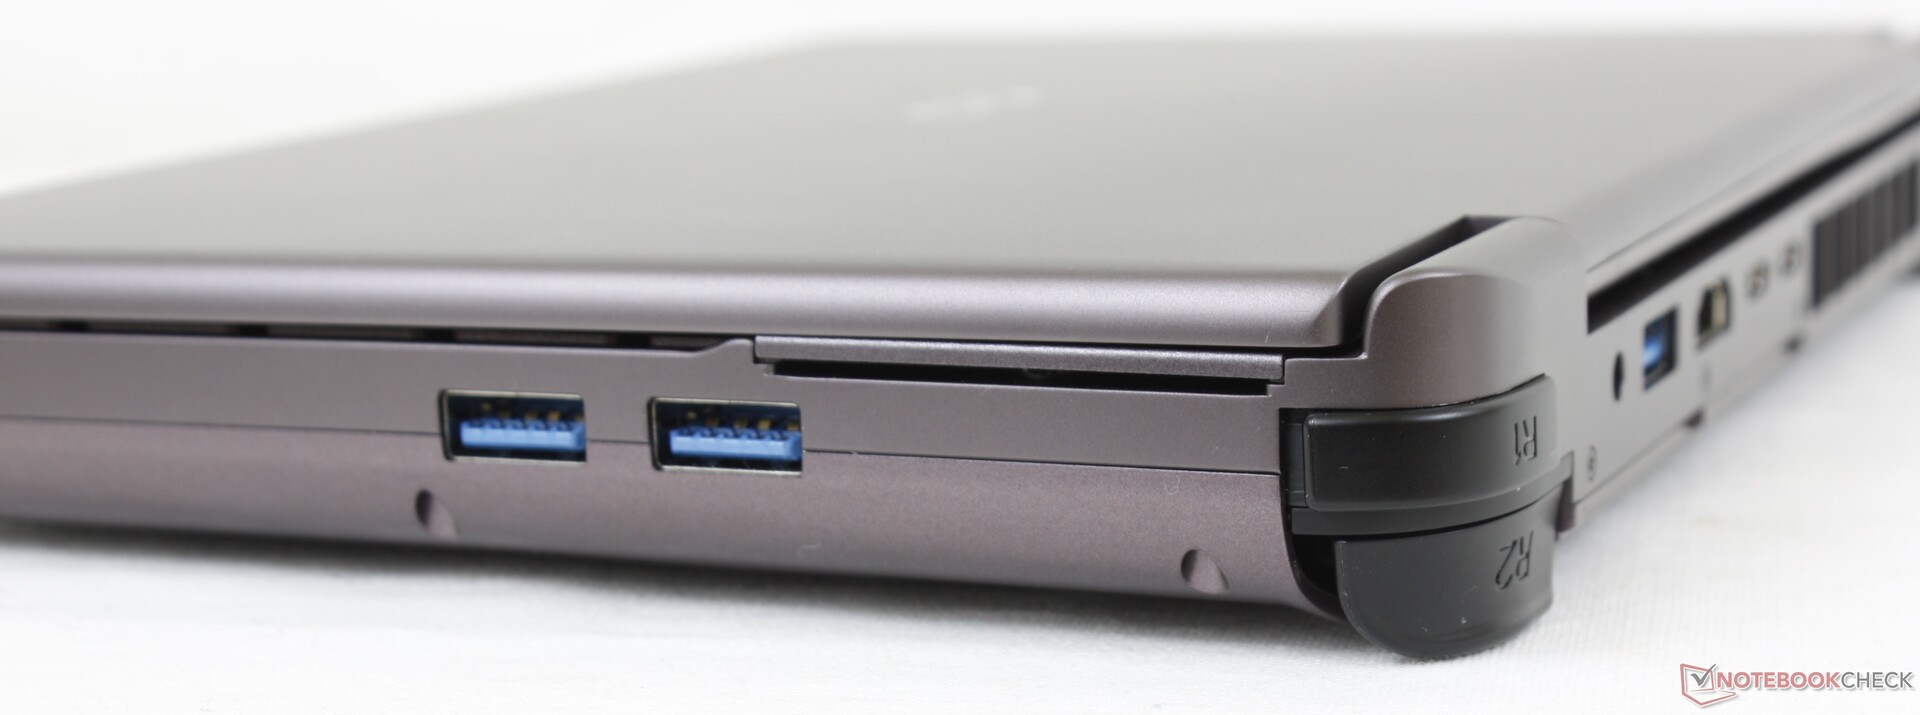
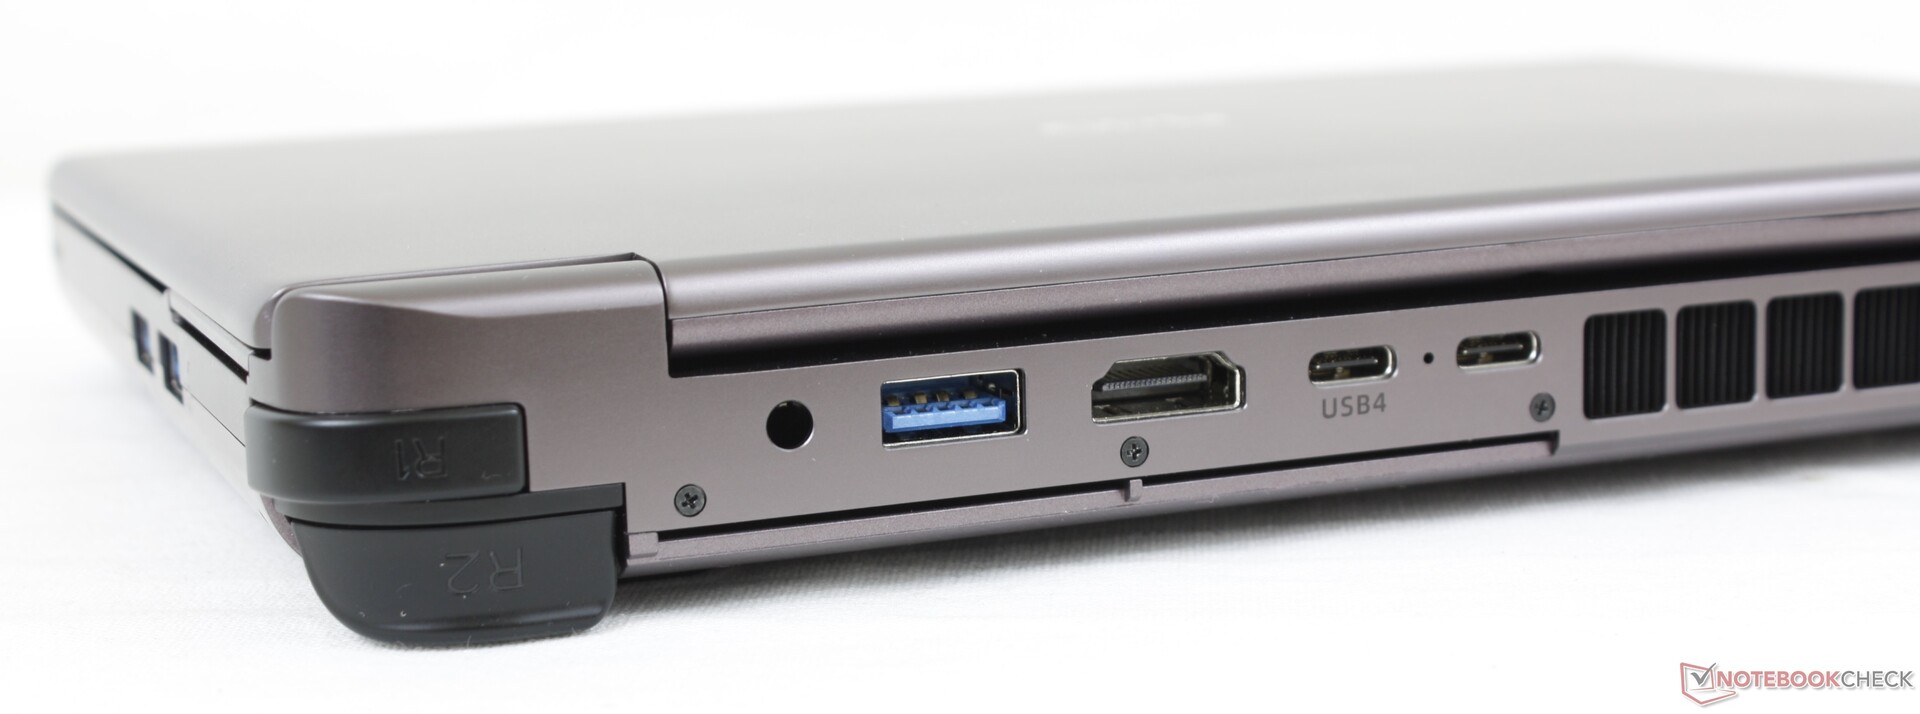
Connettività - Niente Thunderbolt per la versione AMD
Il Win Max 2 ha abbandonato la porta RJ-45 presente sul Win Max originale per una porta USB-A aggiuntiva e un lettore di schede SD full-size. La Thunderbolt 4 è supportata solo per la SKU Intel.
Si noti che le porte HDMI e USB-A sono capovolte, il che può essere un po' fastidioso dato che sui portatili sono quasi sempre rivolte verso destra.
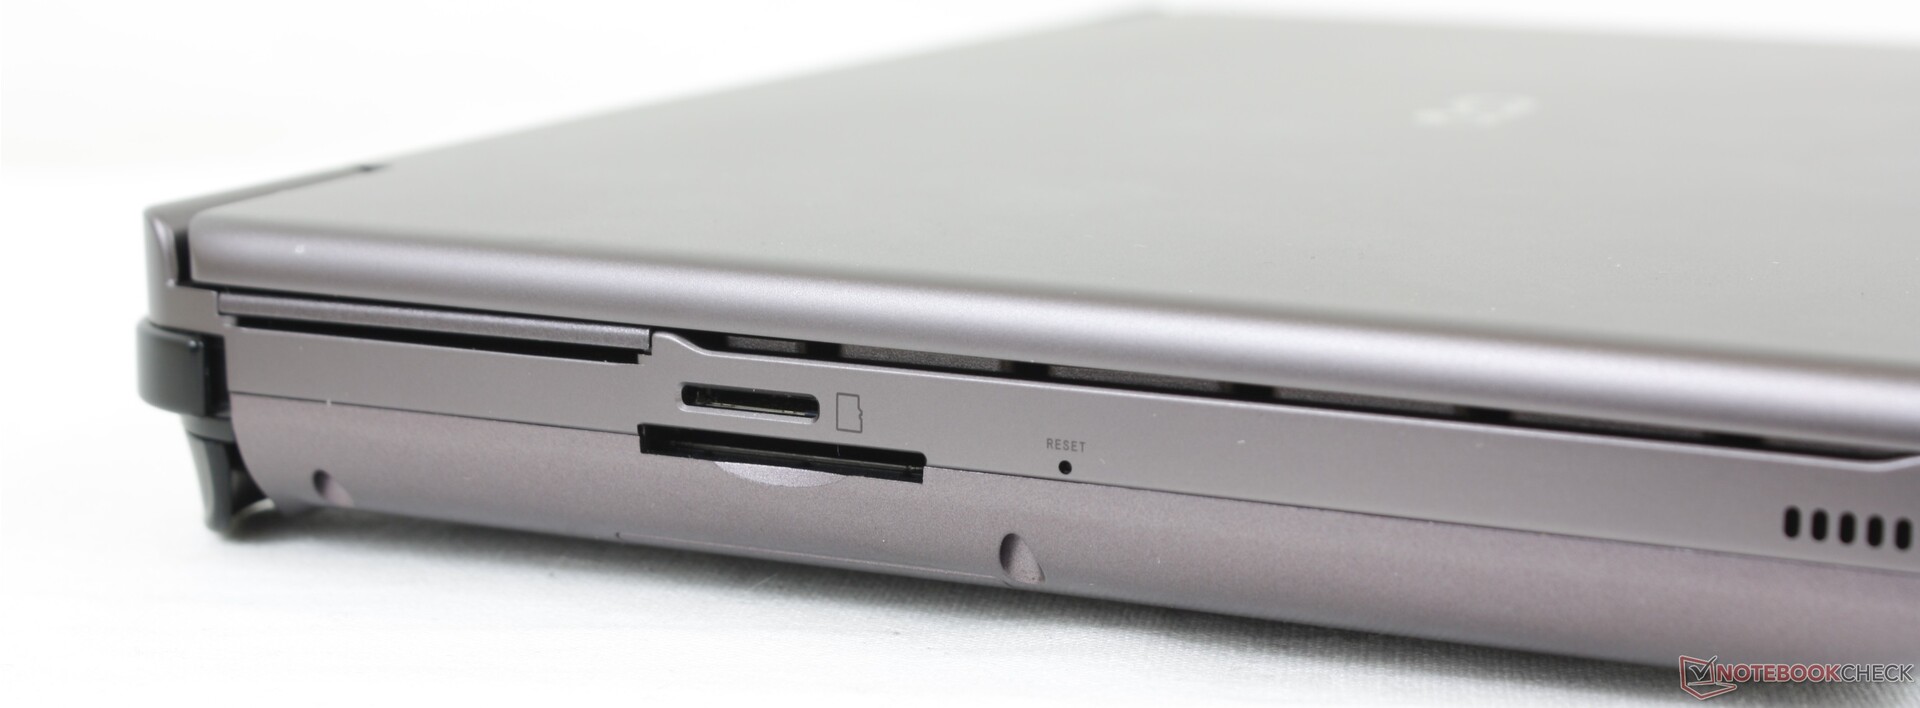
Lettore di schede SD: due da scegliere
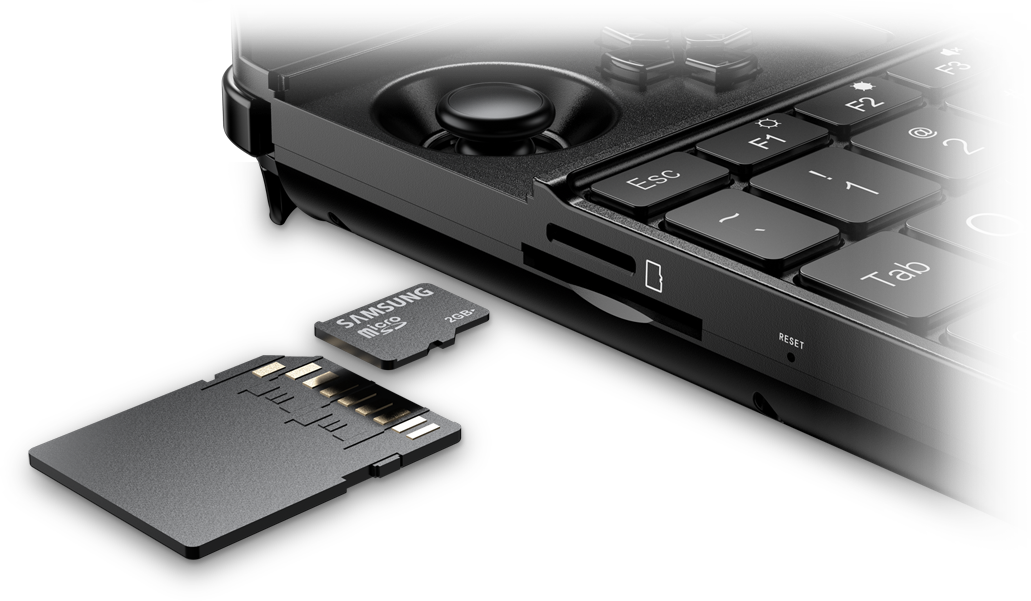
Il Win Max 2 è uno dei pochi dispositivi con lettori MicroSD e SD di dimensioni standard. Non solo, ma anche le loro velocità di trasferimento differiscono l'una dall'altra. La nostra scheda di prova UHS-II sul lettore full-size mostra una velocità di trasferimento di 239 MB/s rispetto ai soli 91 MB/s del lettore MicroSD. Pertanto, per il trasferimento di file di grandi dimensioni è preferibile utilizzare lo slot SD full-size.
Tenete presente che la scheda SD full-size deve essere inserita a testa in giù, mentre la scheda MicroSD deve essere inserita a destra in su, come mostra l'immagine ufficiale di GPD.
| SD Card Reader | |
| average JPG Copy Test (av. of 3 runs) | |
| GPD Win Max 2 (Toshiba Exceria Pro SDXC 64 GB UHS-II) | |
| GPD Win 3 (Toshiba Exceria Pro M501 32 GB UHS-II) | |
| Microsoft Surface Go 3 Core i3 (AV Pro V60) | |
| Lenovo IdeaPad Flex 3 11IGL05 (Toshiba Exceria Pro SDXC 64 GB UHS-II) | |
| maximum AS SSD Seq Read Test (1GB) | |
| GPD Win Max 2 (Toshiba Exceria Pro SDXC 64 GB UHS-II) | |
| GPD Win 3 (Toshiba Exceria Pro M501 32 GB UHS-II) | |
| Lenovo IdeaPad Flex 3 11IGL05 (Toshiba Exceria Pro SDXC 64 GB UHS-II) | |
| Microsoft Surface Go 3 Core i3 (AV Pro V60) | |
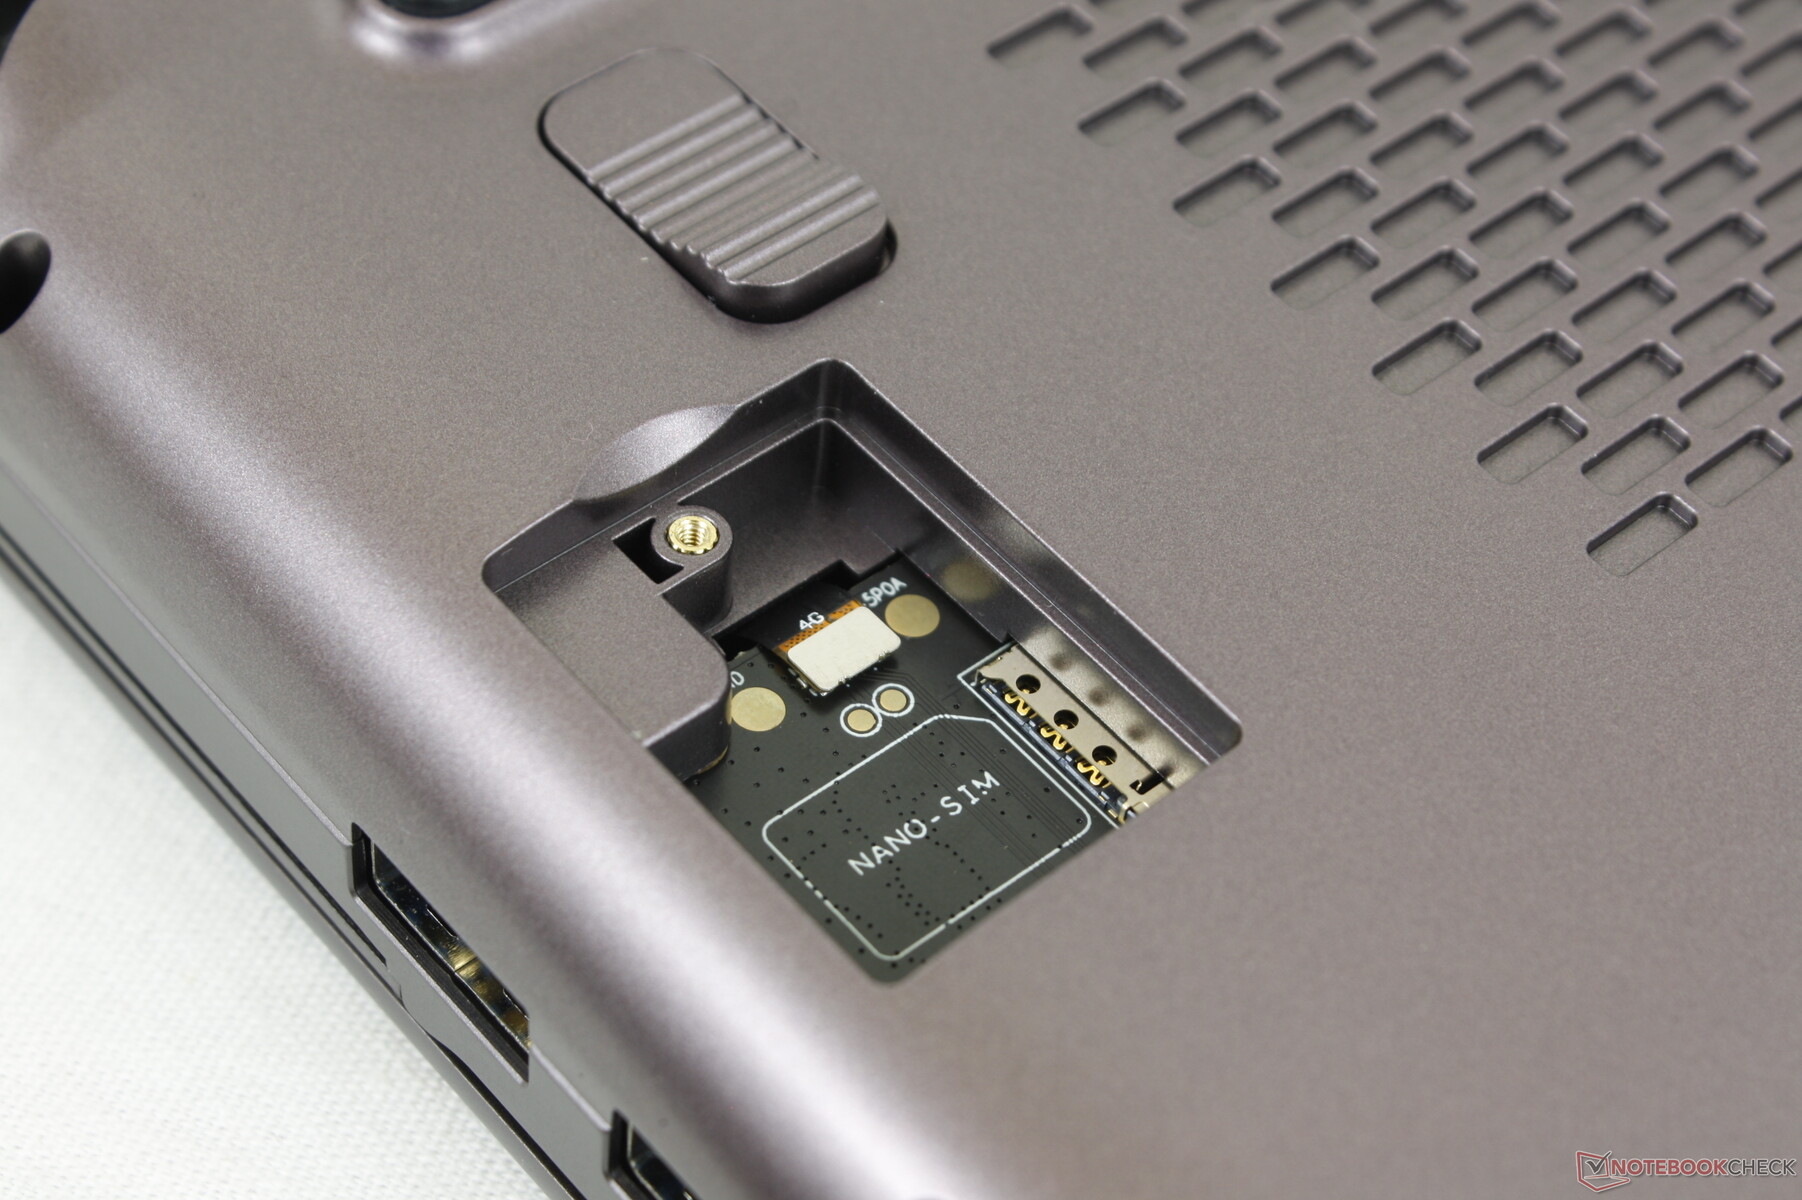
Comunicazione - Wi-Fi 6E Standard
Non abbiamo riscontrato alcun problema di prestazioni quando siamo stati collegati alla nostra rete a 6 GHz. L'AX210 è un enorme miglioramento rispetto all'Intel 7265 del Win Max dell'anno scorso, che era limitato alla sola velocità del Wi-Fi 5.
| Networking | |
| iperf3 transmit AX12 | |
| Microsoft Surface Go 3 Core i3 | |
| GPD Win 3 | |
| GPD Pocket 3 | |
| Lenovo IdeaPad Flex 3 11IGL05 | |
| GPD Win Max 2021 | |
| iperf3 receive AX12 | |
| GPD Win 3 | |
| Microsoft Surface Go 3 Core i3 | |
| GPD Pocket 3 | |
| Lenovo IdeaPad Flex 3 11IGL05 | |
| GPD Win Max 2021 | |
| iperf3 receive AXE11000 6GHz | |
| GPD Win Max 2 | |
| iperf3 transmit AXE11000 6GHz | |
| GPD Win Max 2 | |
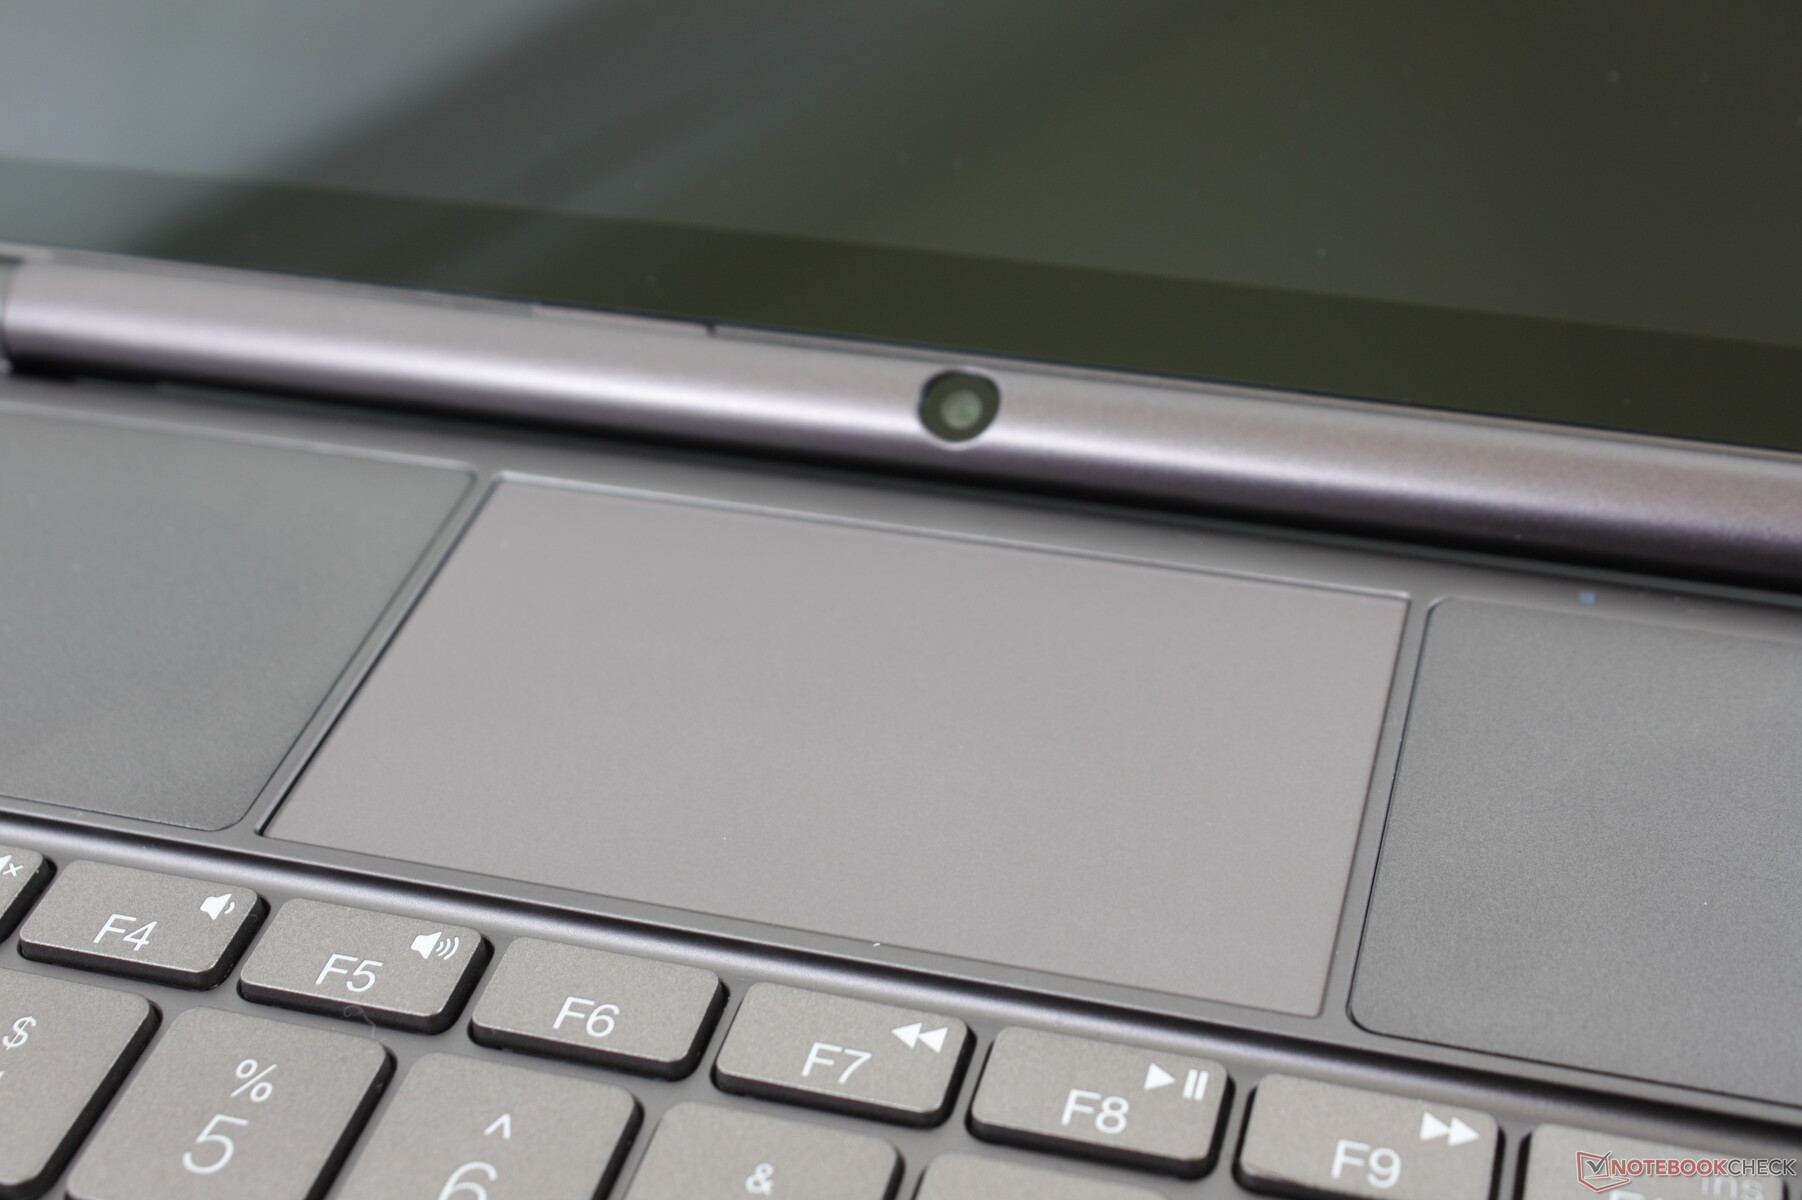
Webcam
La fotocamera da 2 MP è deludente sia per la qualità dell'immagine che per il posizionamento non ottimale lungo il bordo inferiore dello schermo anziché superiore. Si tratta essenzialmente della "telecamera del naso". Inoltre, non è presente l'otturatore per la privacy né il supporto IR di Windows Hello.


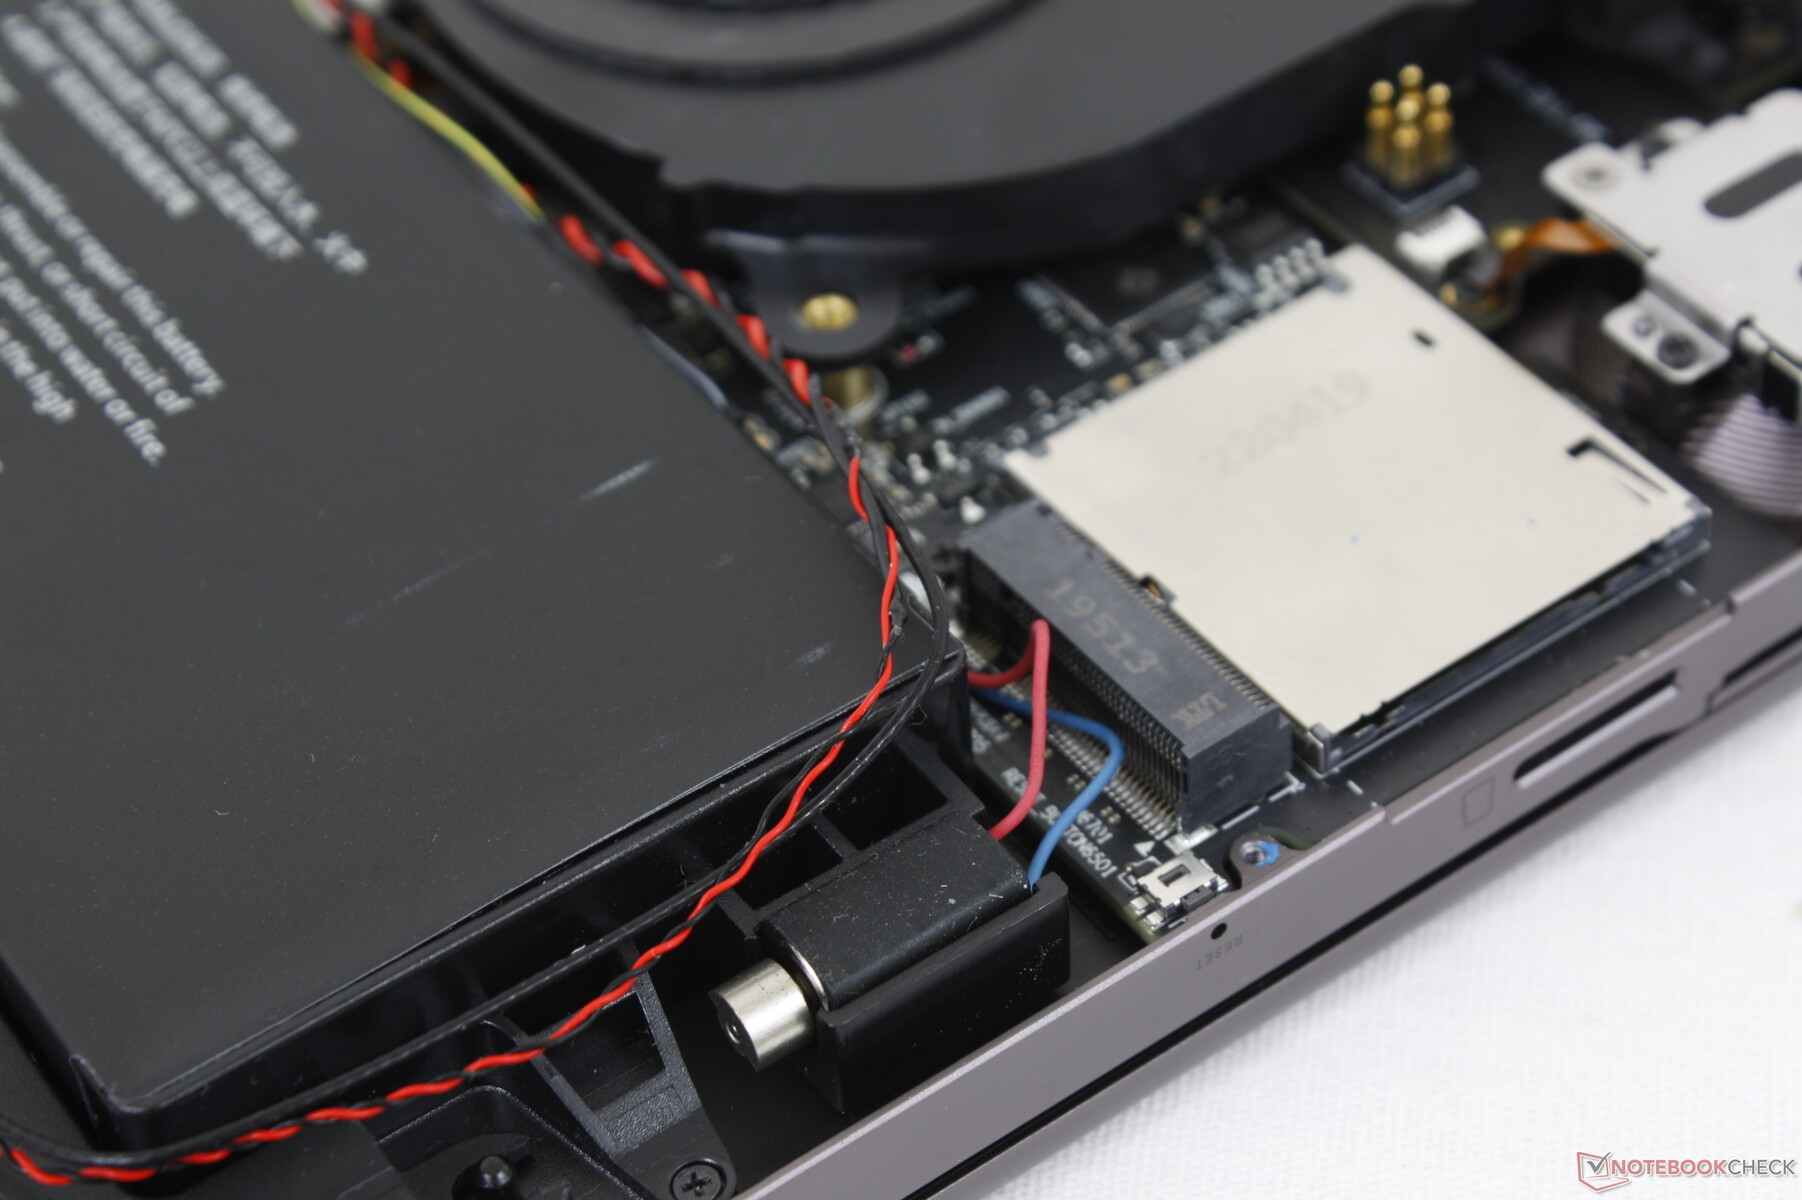
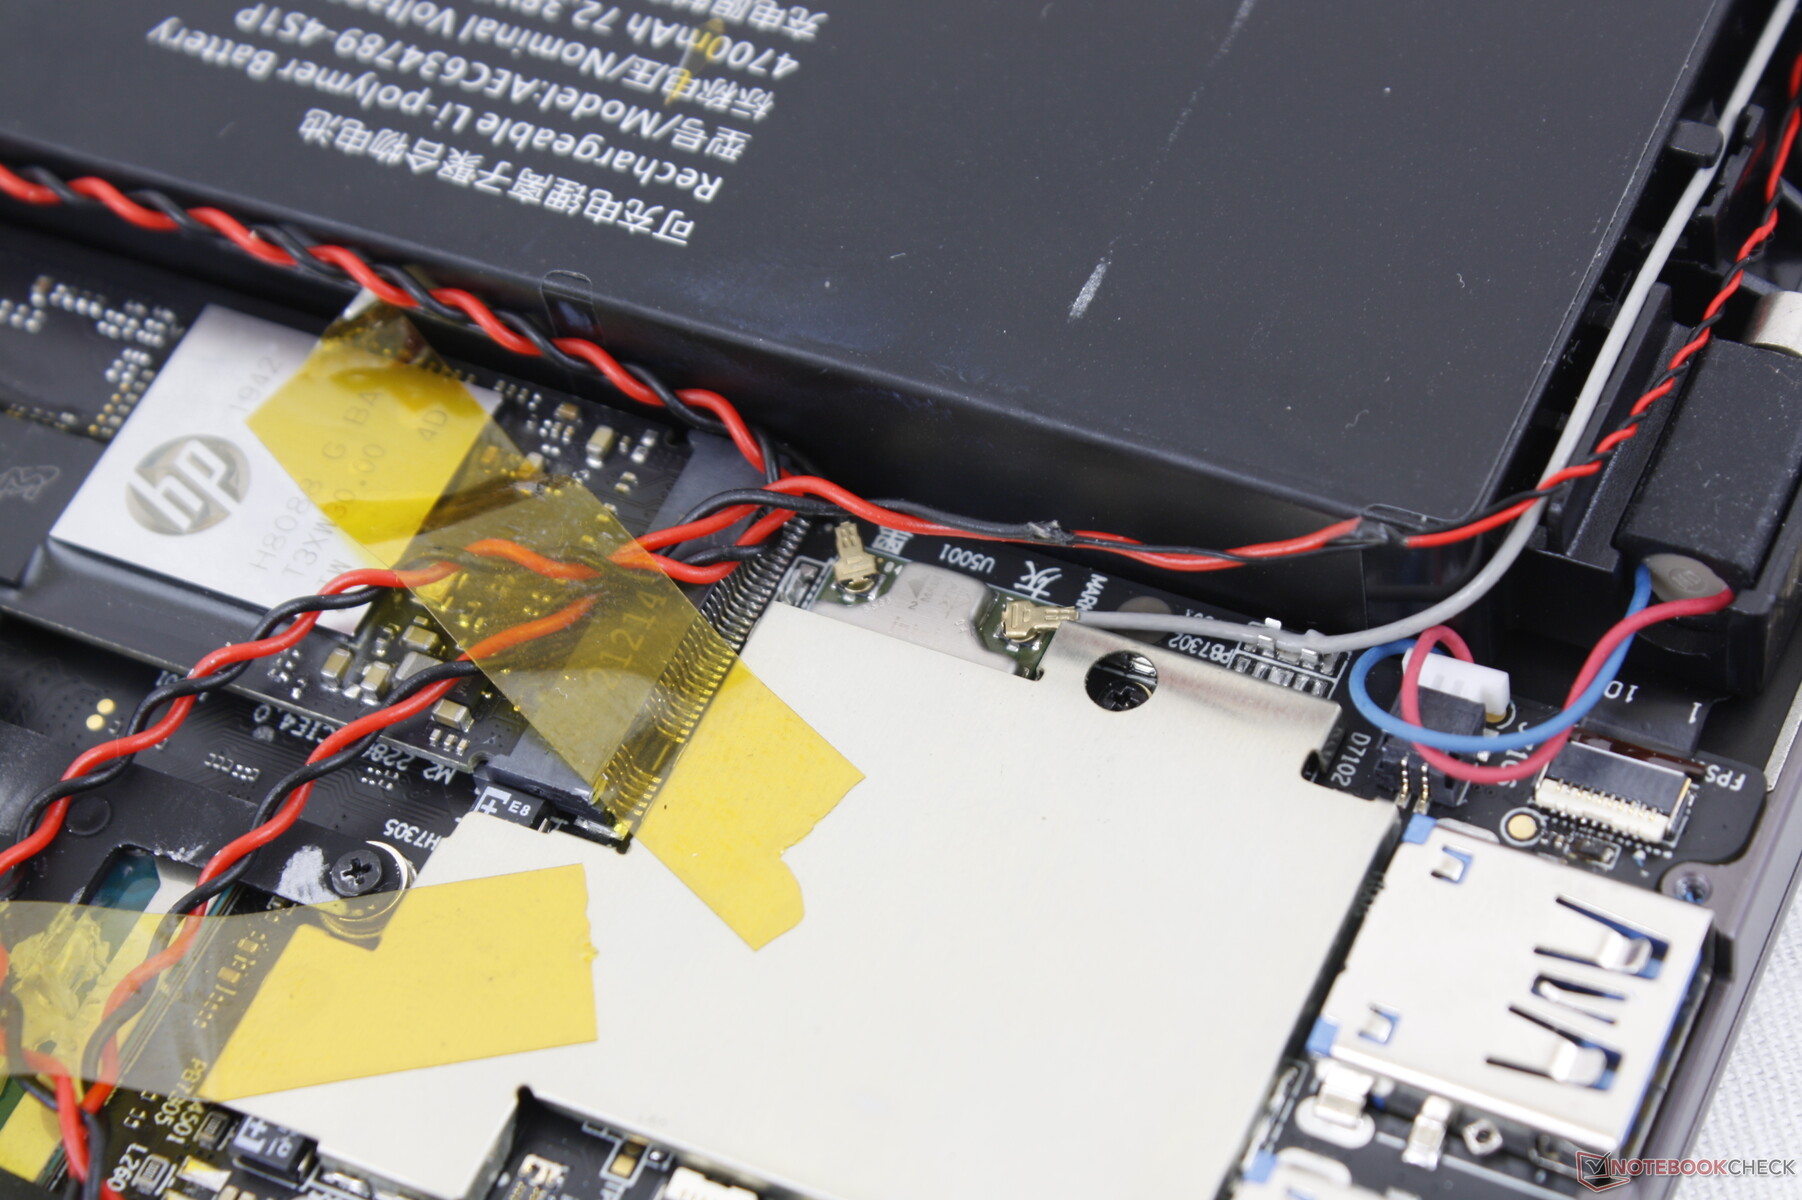
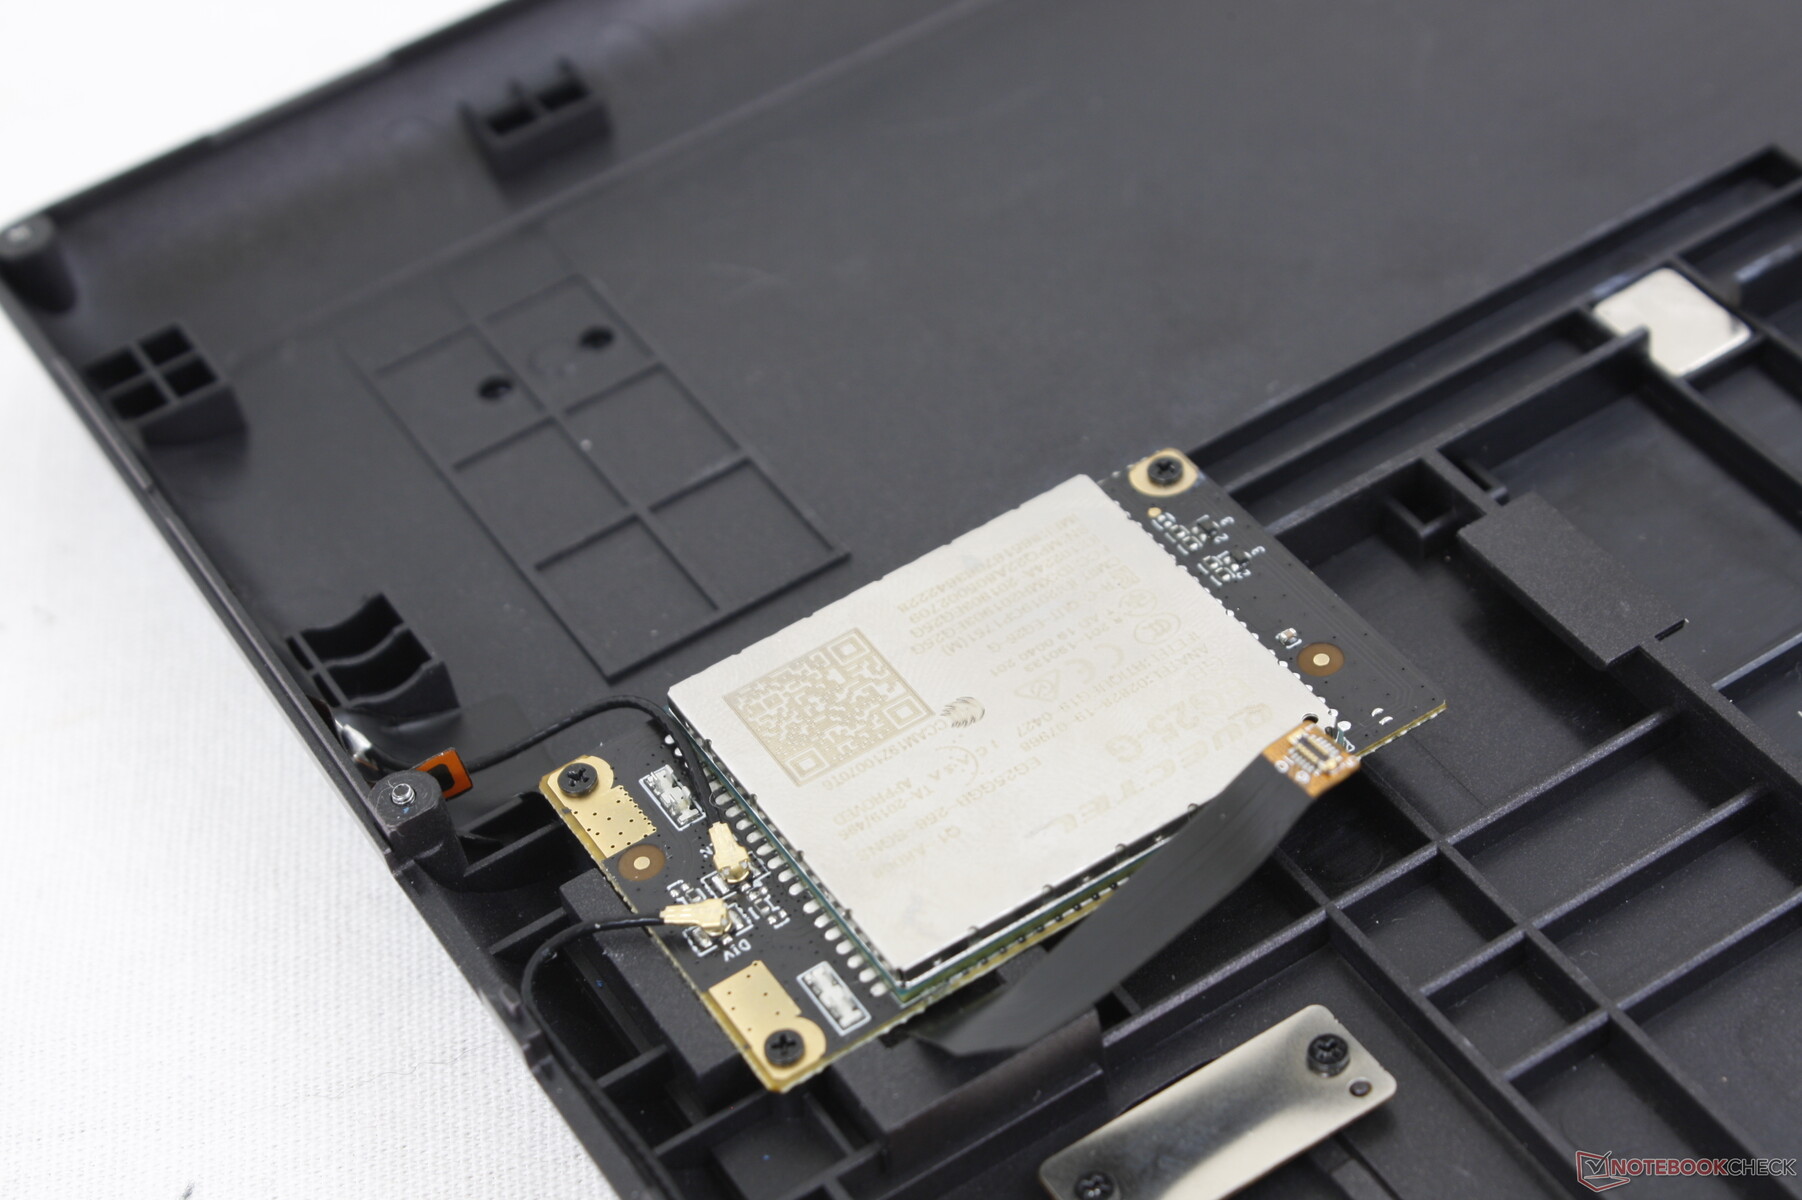
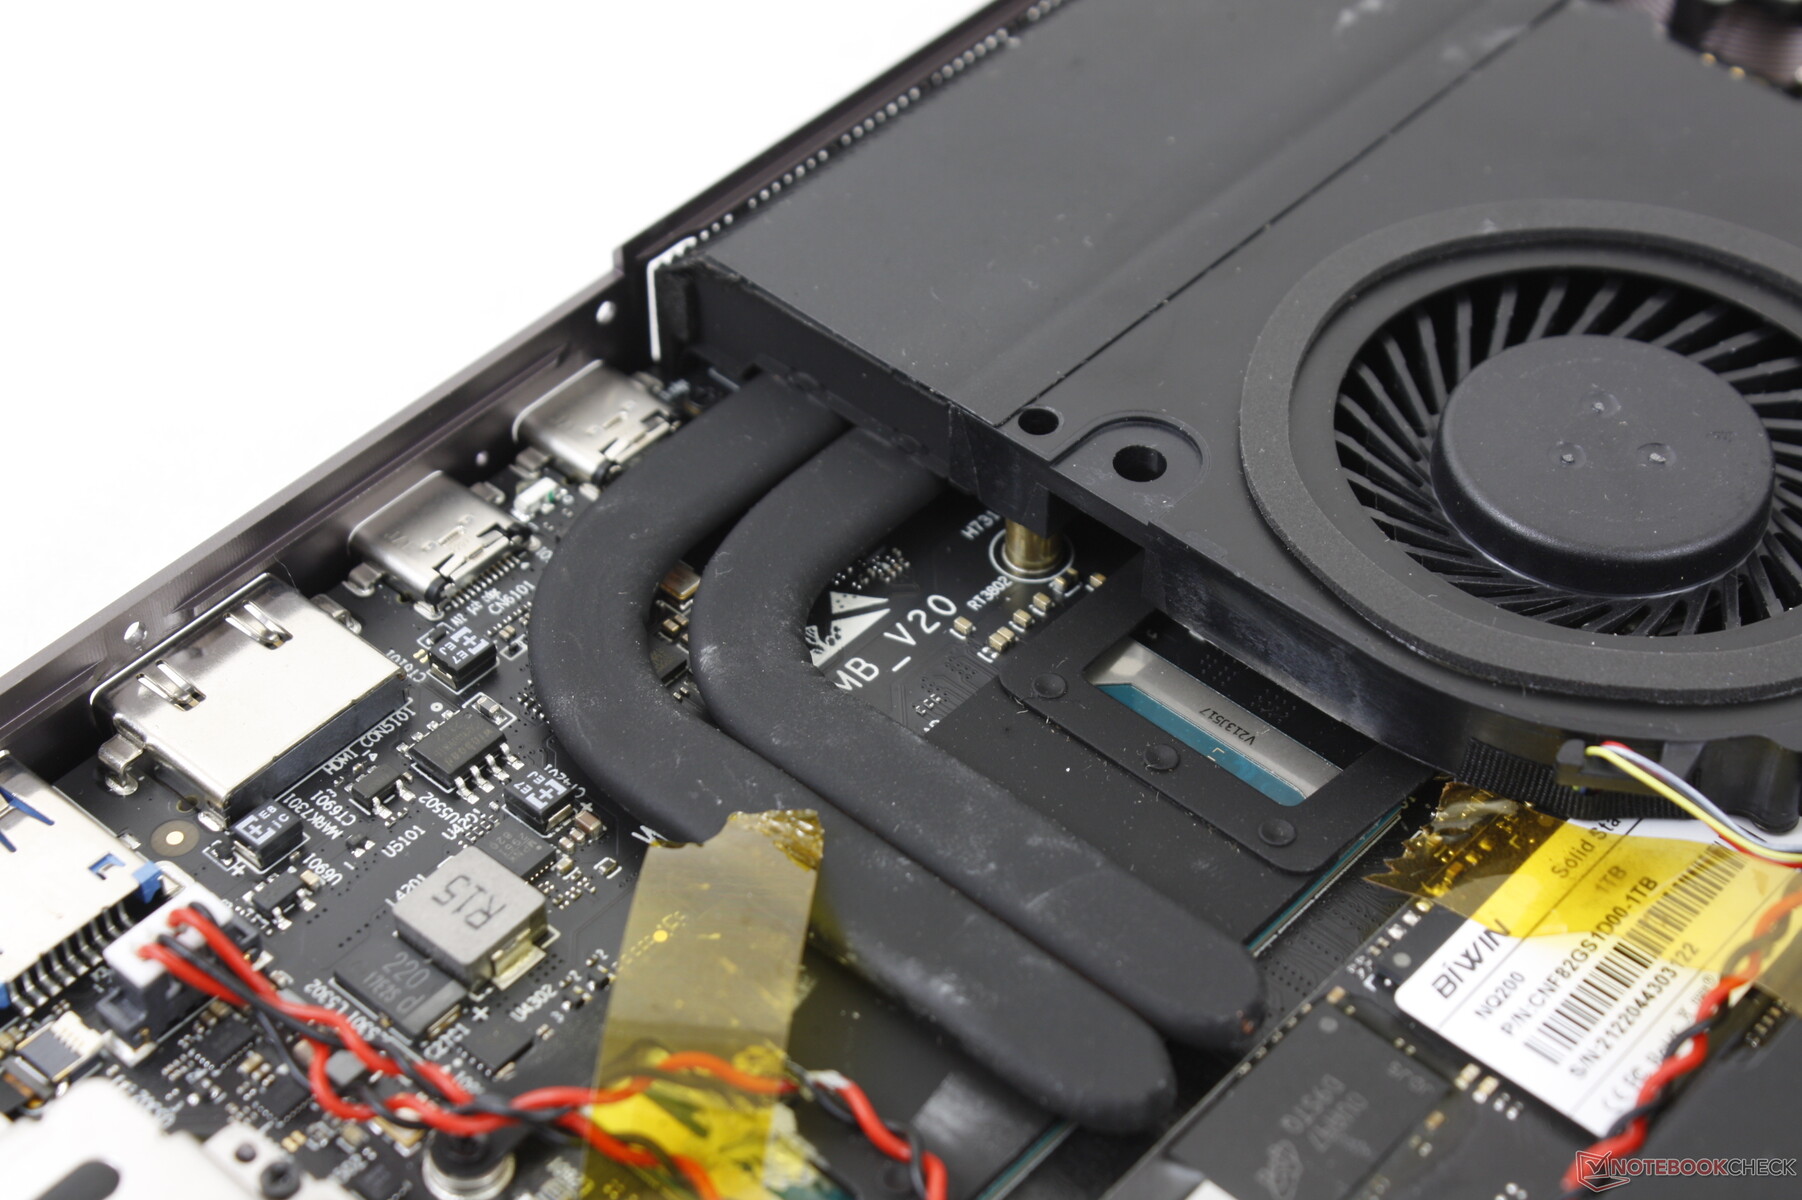
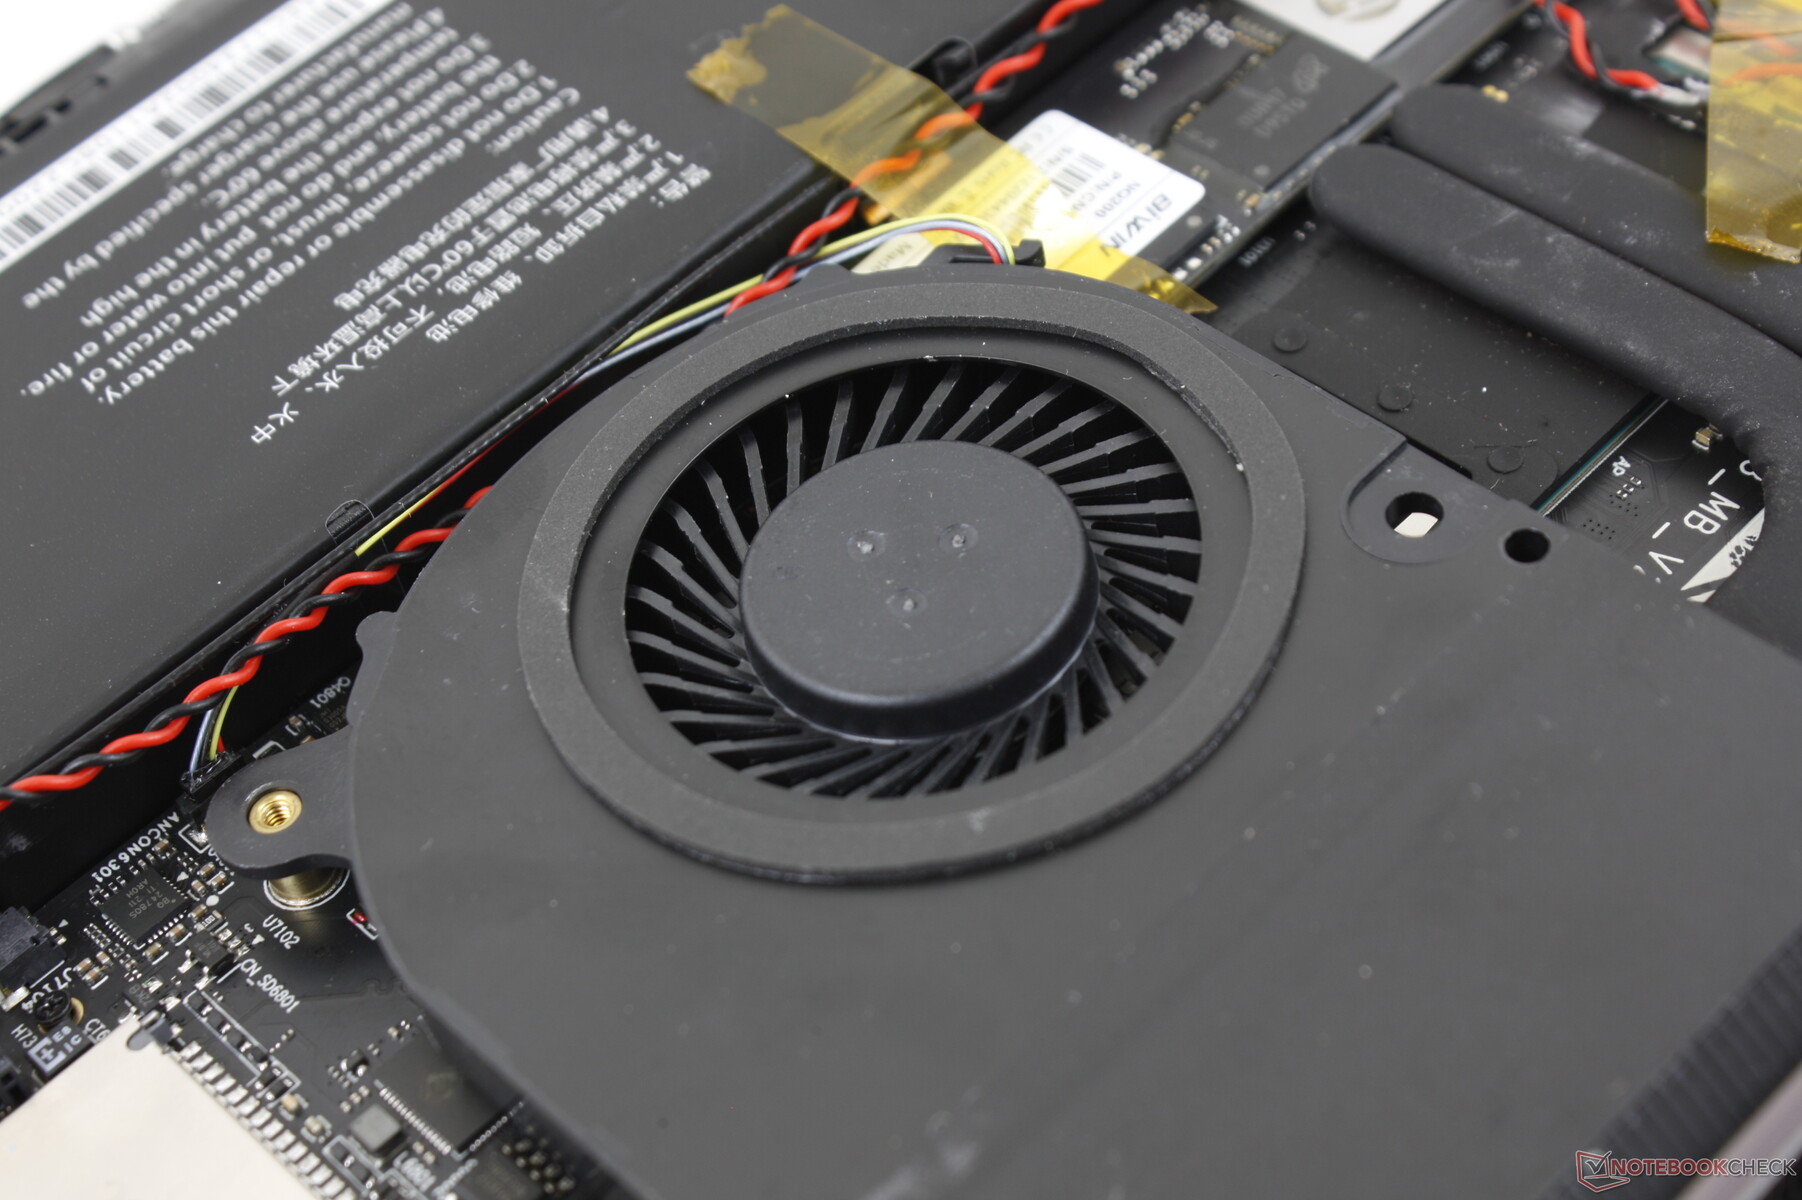
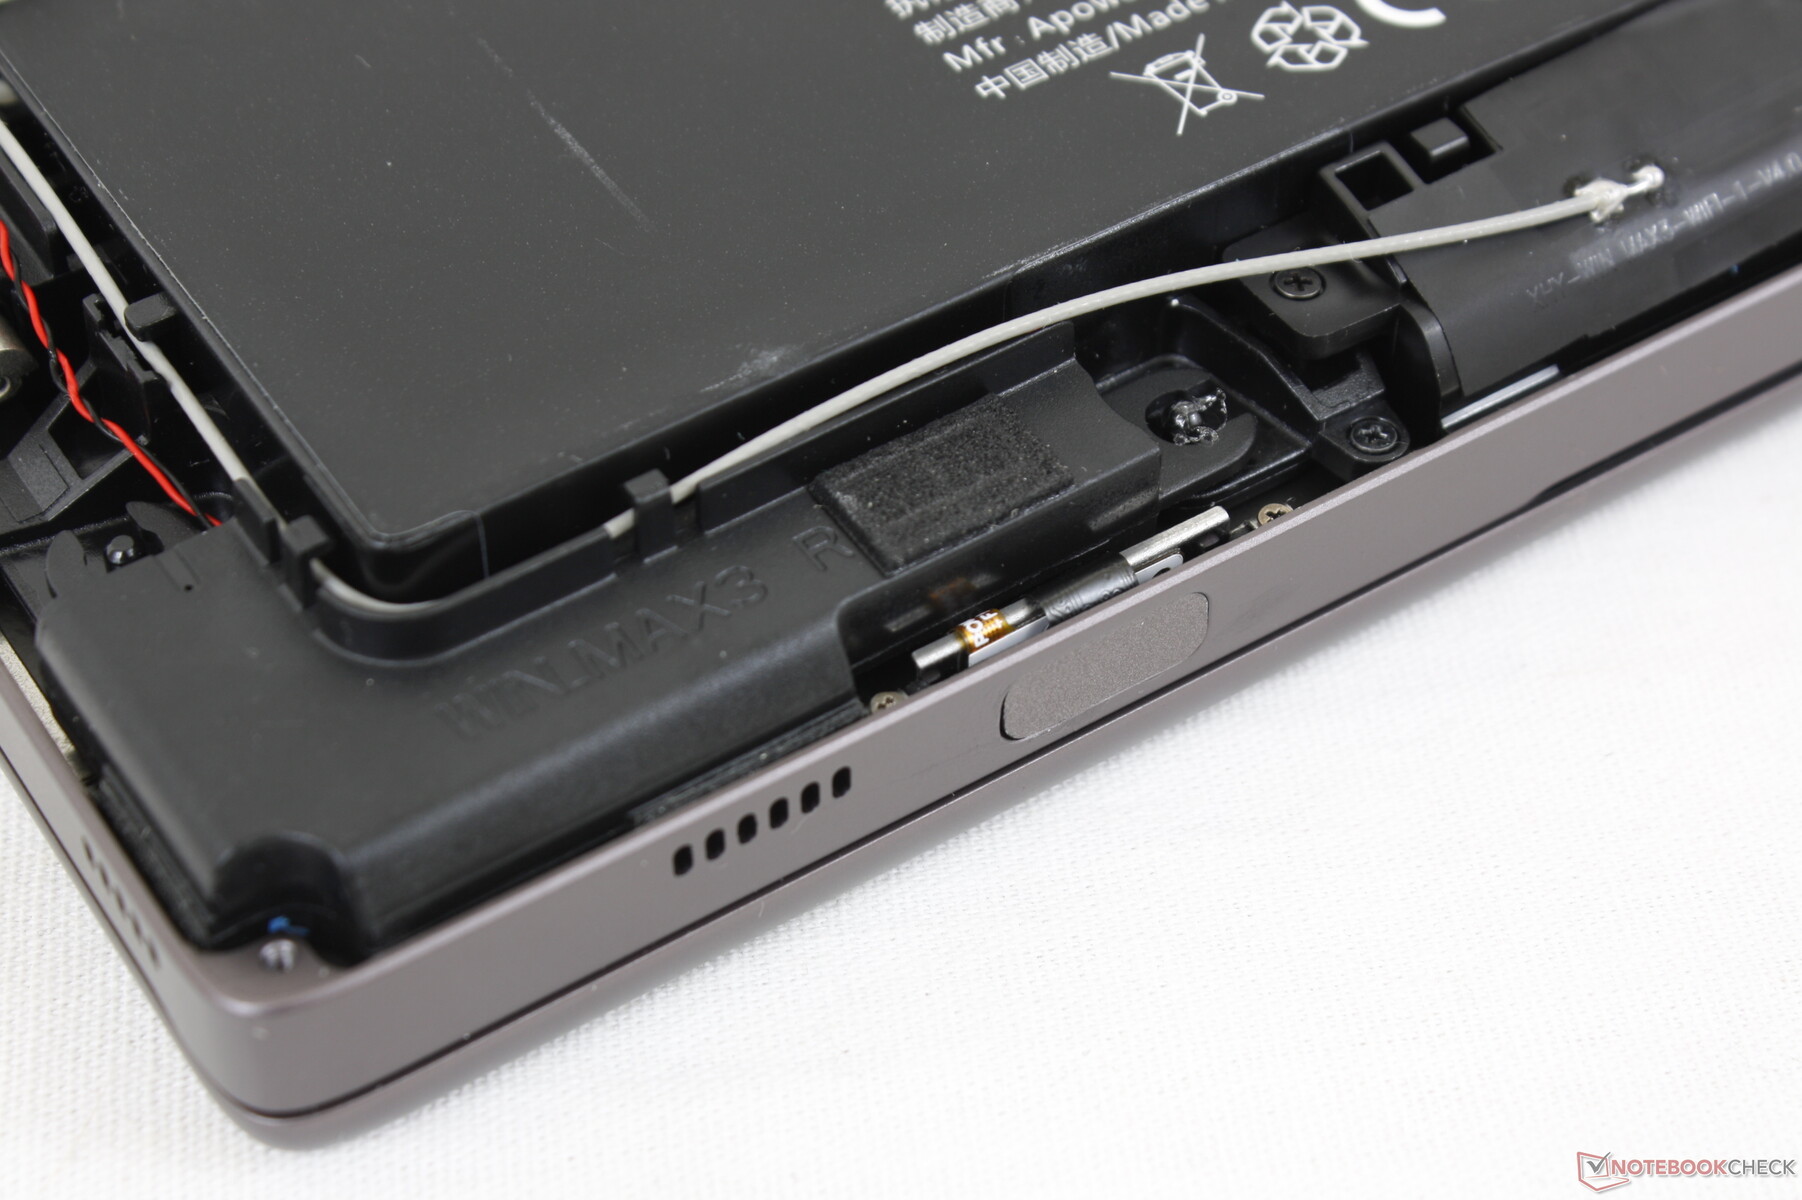
Manutenzione
Il pannello inferiore è fissato da 13 viti Philips molto piccole, relativamente facili da rimuovere. Il problema principale, tuttavia, è che il modulo WAN poggia sul pannello inferiore anziché sulla scheda madre. Il cavo a nastro che collega il modulo WAN alla scheda madre deve quindi essere staccato ogni volta che si rimuove il pannello inferiore. Il riattacco di questo cavo alla scheda madre durante il riassemblaggio è estremamente difficile a causa della sua lunghezza.
Accessori e garanzia
La confezione non contiene altri extra oltre all'adattatore CA e alla documentazione. La garanzia limitata di un anno è valida se acquistata negli Stati Uniti, ma GPD dichiara che le spese di spedizione per la restituzione non saranno coperte.
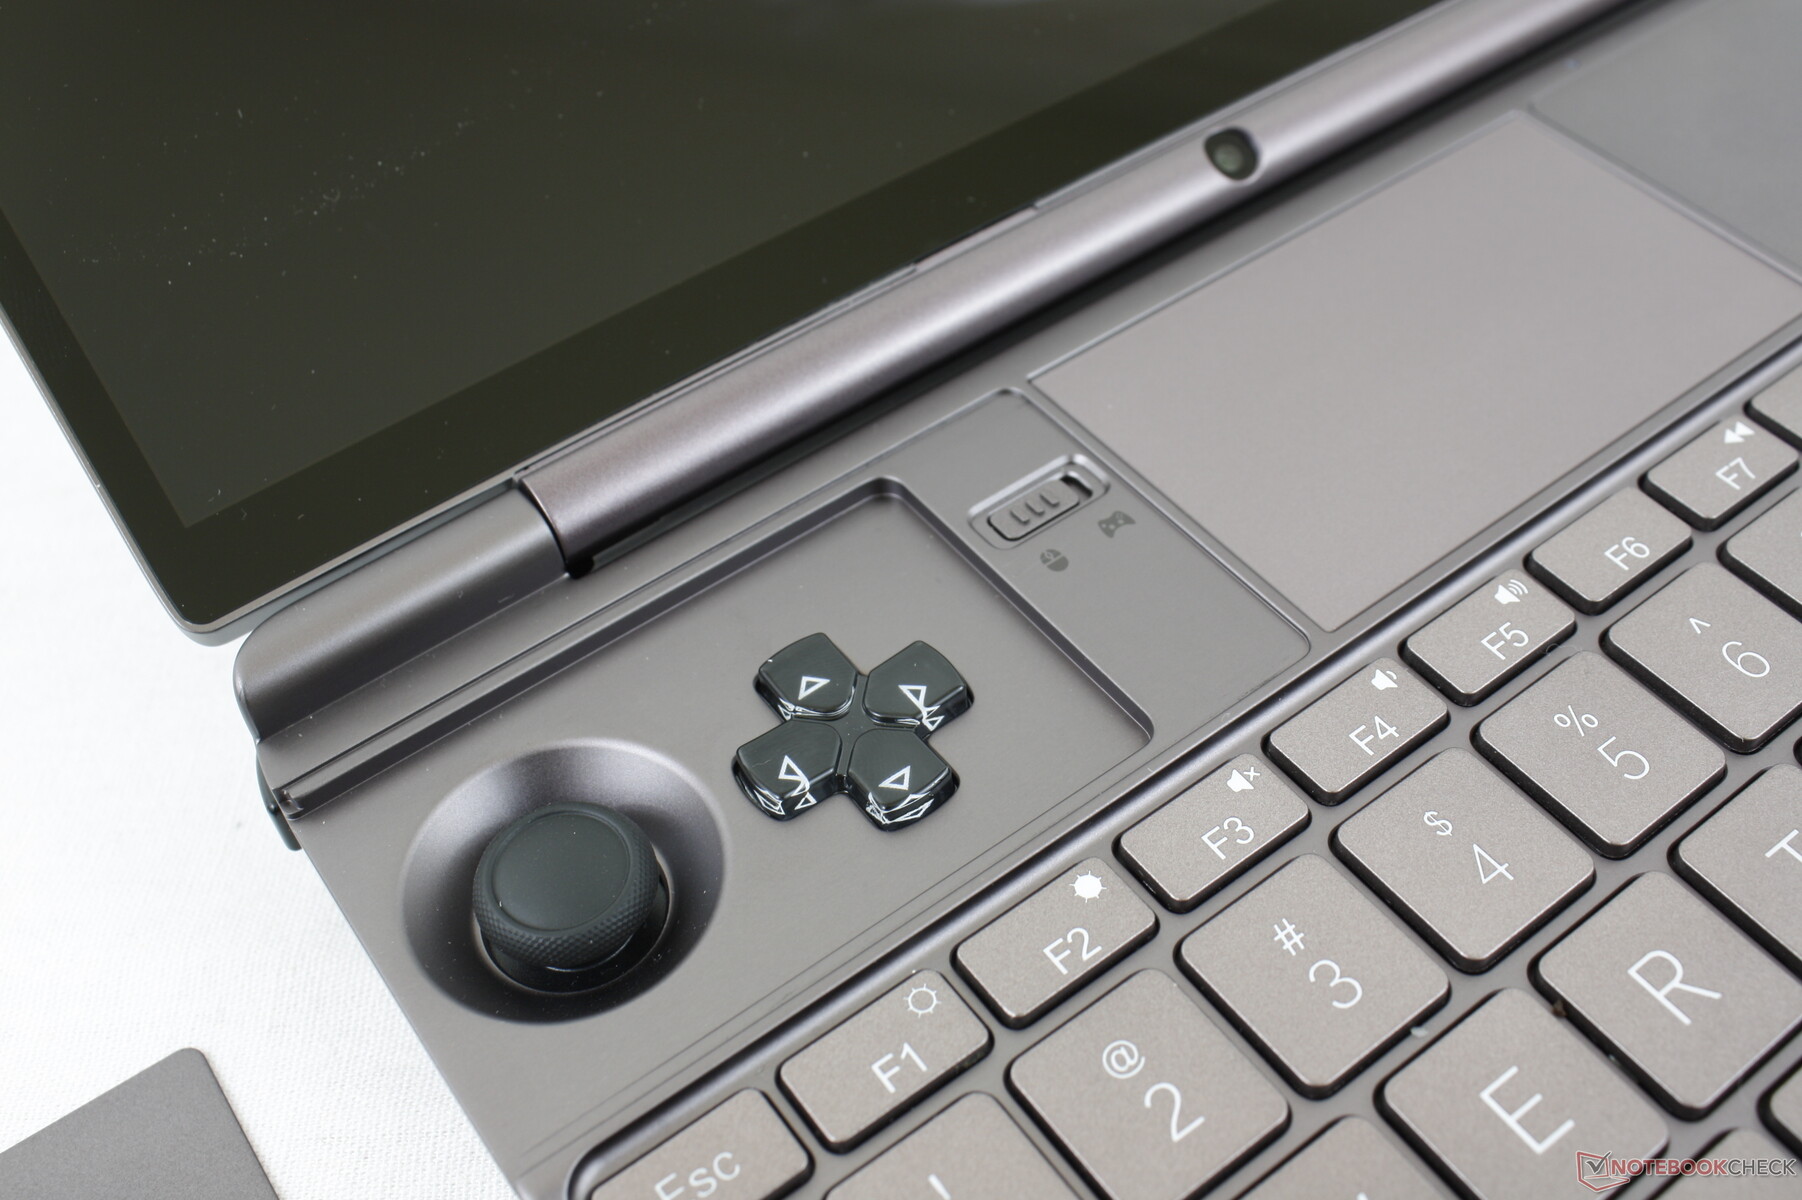
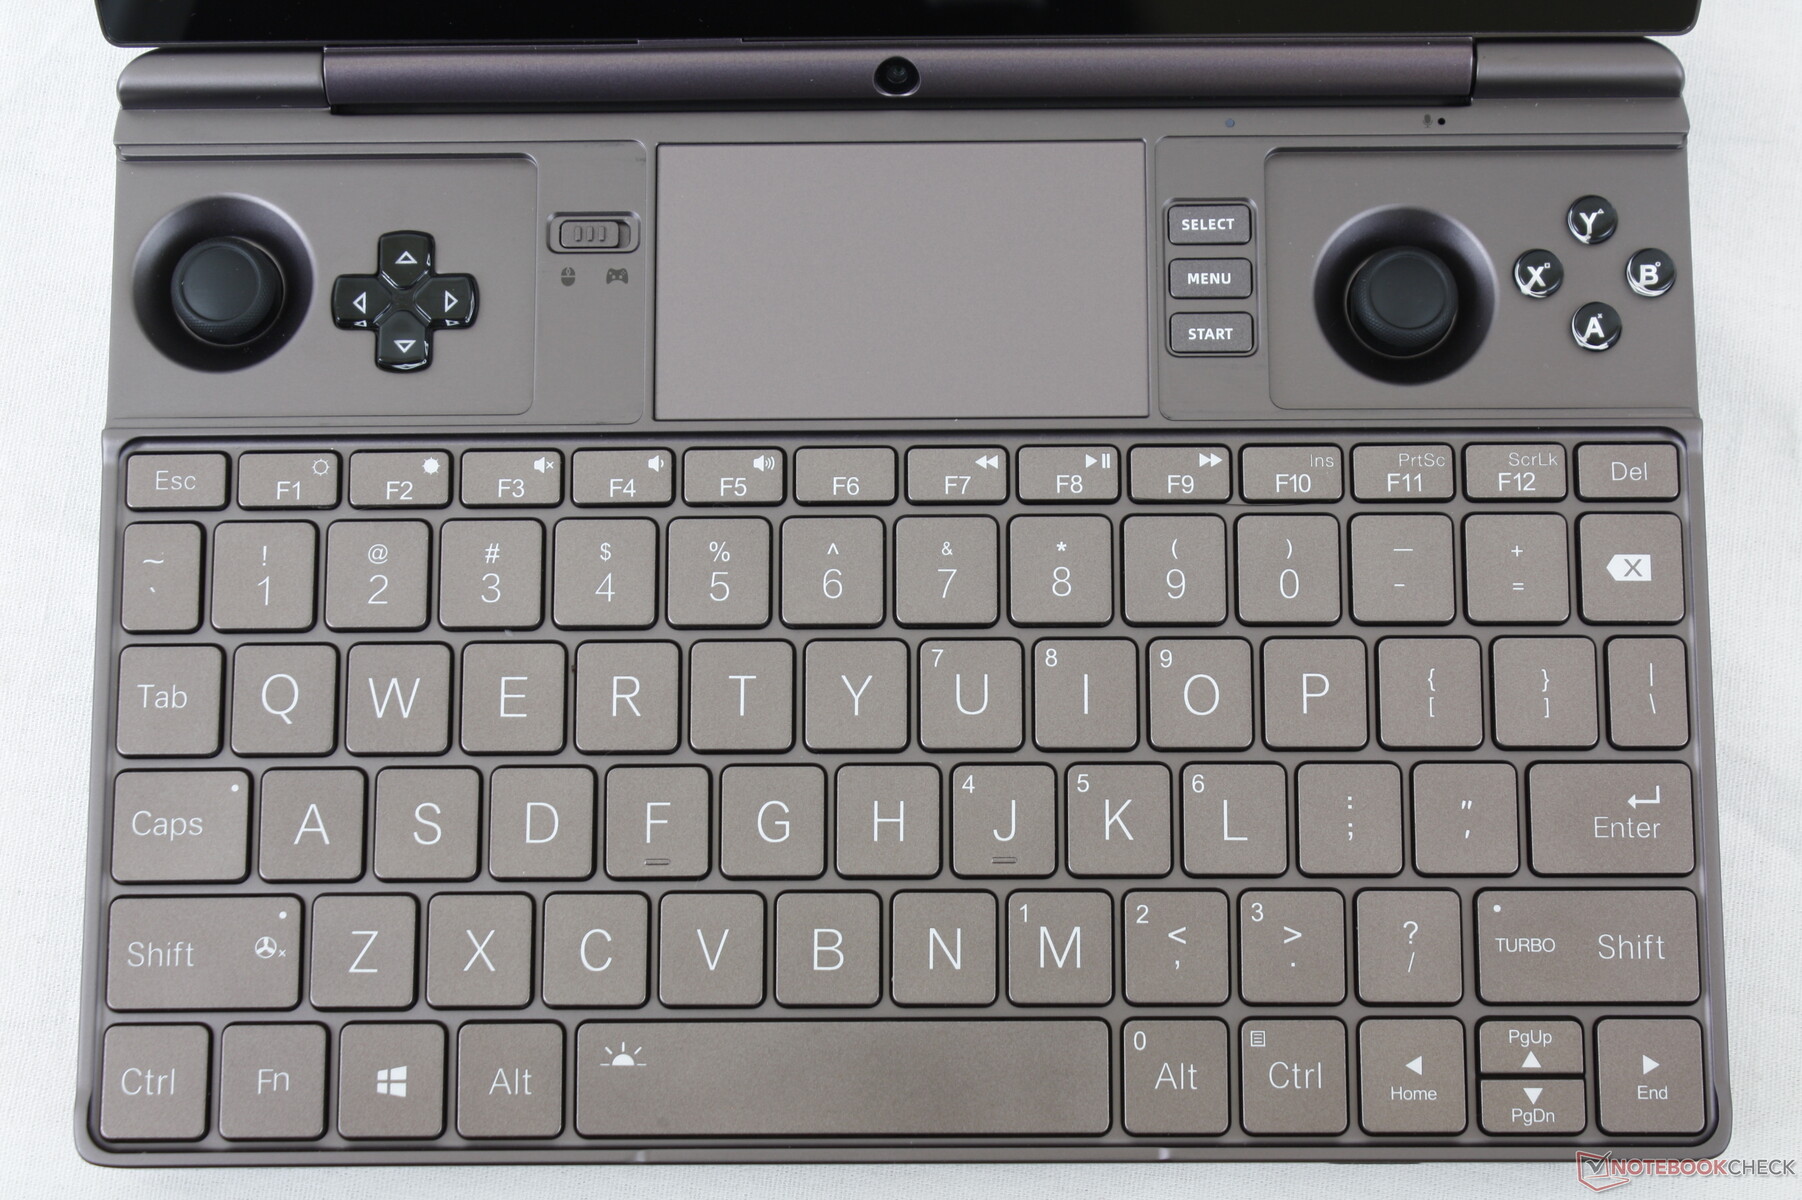
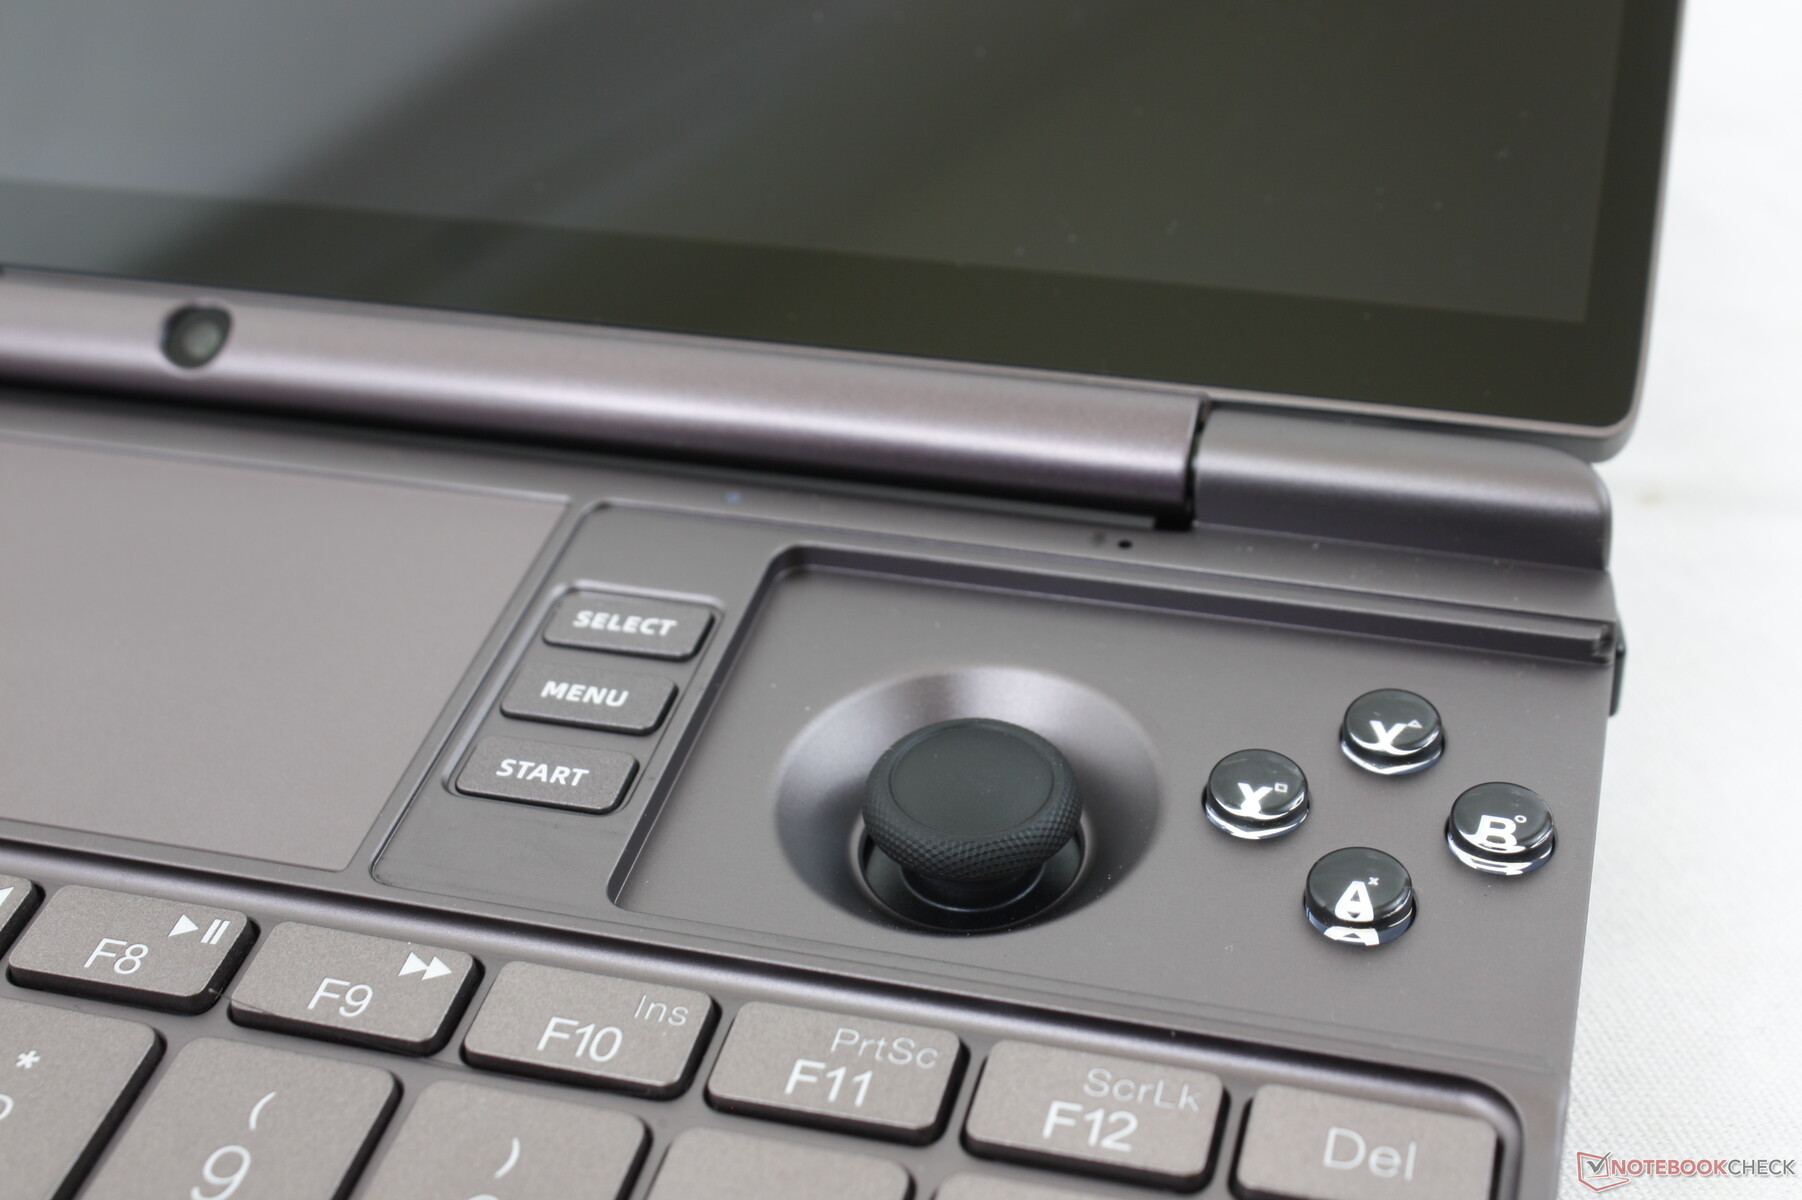
Dispositivi di input - Faticoso da tenere in mano per lunghi periodi
Controllore
Il controller può passare da una modalità all'altra tramite un interruttore: Standard e Gioco. In modalità Standard, i pulsanti sono impostati di default come segue:
- Joystick sinistro: W, A, S, D
- Joystick destro: Controllo del cursore
- Pad direzionale sinistro: Casa
- Pad direzionale destro: Fine
- Pad direzionale su e pulsanti Y: Su
- Pad direzionale giù e pulsanti A: Giù
- Pulsante X: Sinistra
- Tasto B: Destra
Anche i tasti della spalla hanno le loro funzioni, tra cui Ctrl+Alt+Del per il grilletto destro. Il problema è che è facile premere accidentalmente un tasto della spalla e inserire qualcosa di non voluto. Non esiste un software speciale preinstallato per rimappare o disabilitare facilmente i pulsanti. Sarebbe stata utile una terza modalità per disabilitare completamente il controller
In modalità Gioco, i tasti vengono riconosciuti da Windows come un generico controller XBox e quindi vengono trattati e mappati come tali. I tasti e i joystick si avvicinano di più alla sensazione, alle dimensioni e al feedback dei Joy-cons Nintendo piuttosto che ai più comodi controller PS o XBox.
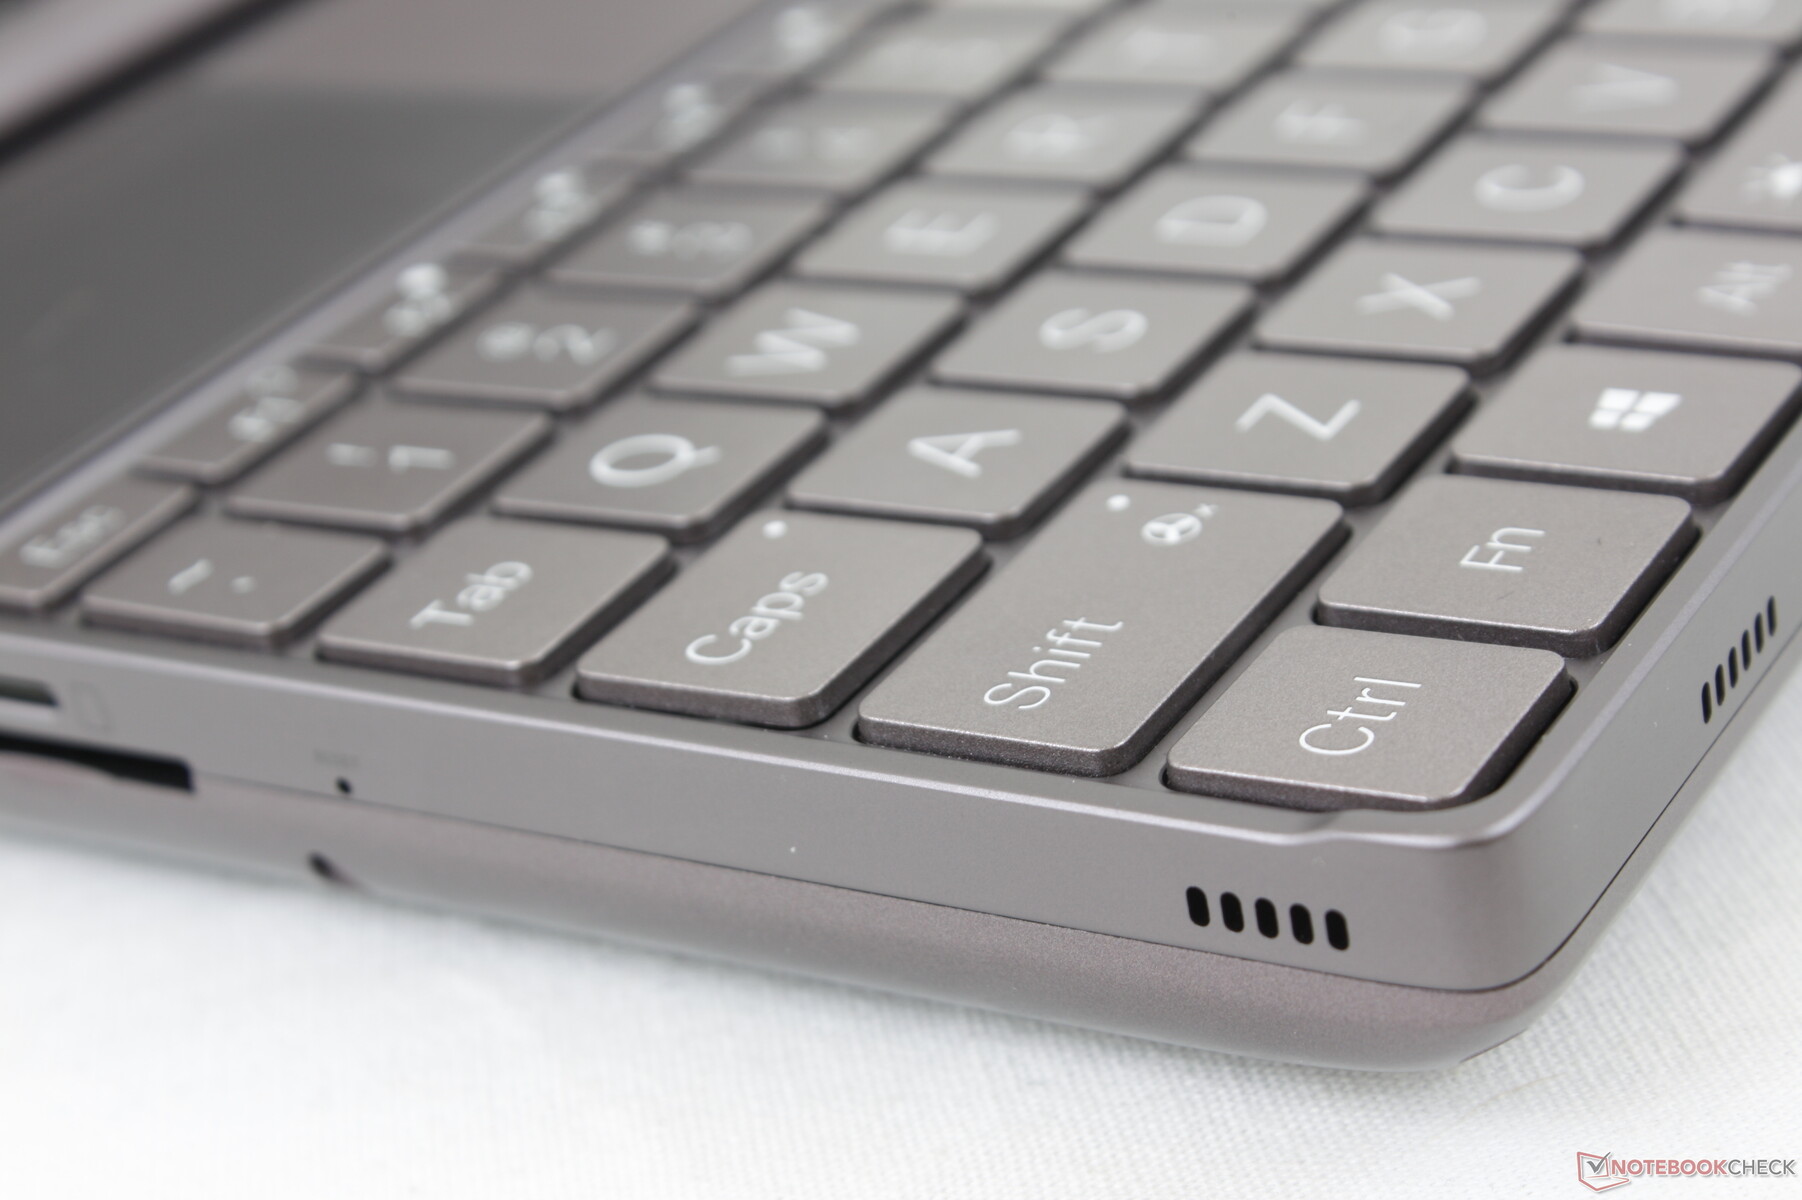
Tastiera
La tastiera è un miglioramento rispetto all'originale Win Max in termini di dimensioni e layout. I tasti numerici, il Caps Lock e il tasto Shift, ad esempio, sono ora più grandi e più vicini a ciò che gli utenti si aspettano da un layout QWERTY. Il feedback è simile a quello della maggior parte degli Ultrabook più grandi, anche se ovviamente più angusto
La tastiera sembra avere problemi a riconoscere più di due tasti contemporaneamente. Fn+Alt+PrtSc, ad esempio, non sono stati registrati sulla nostra unità.
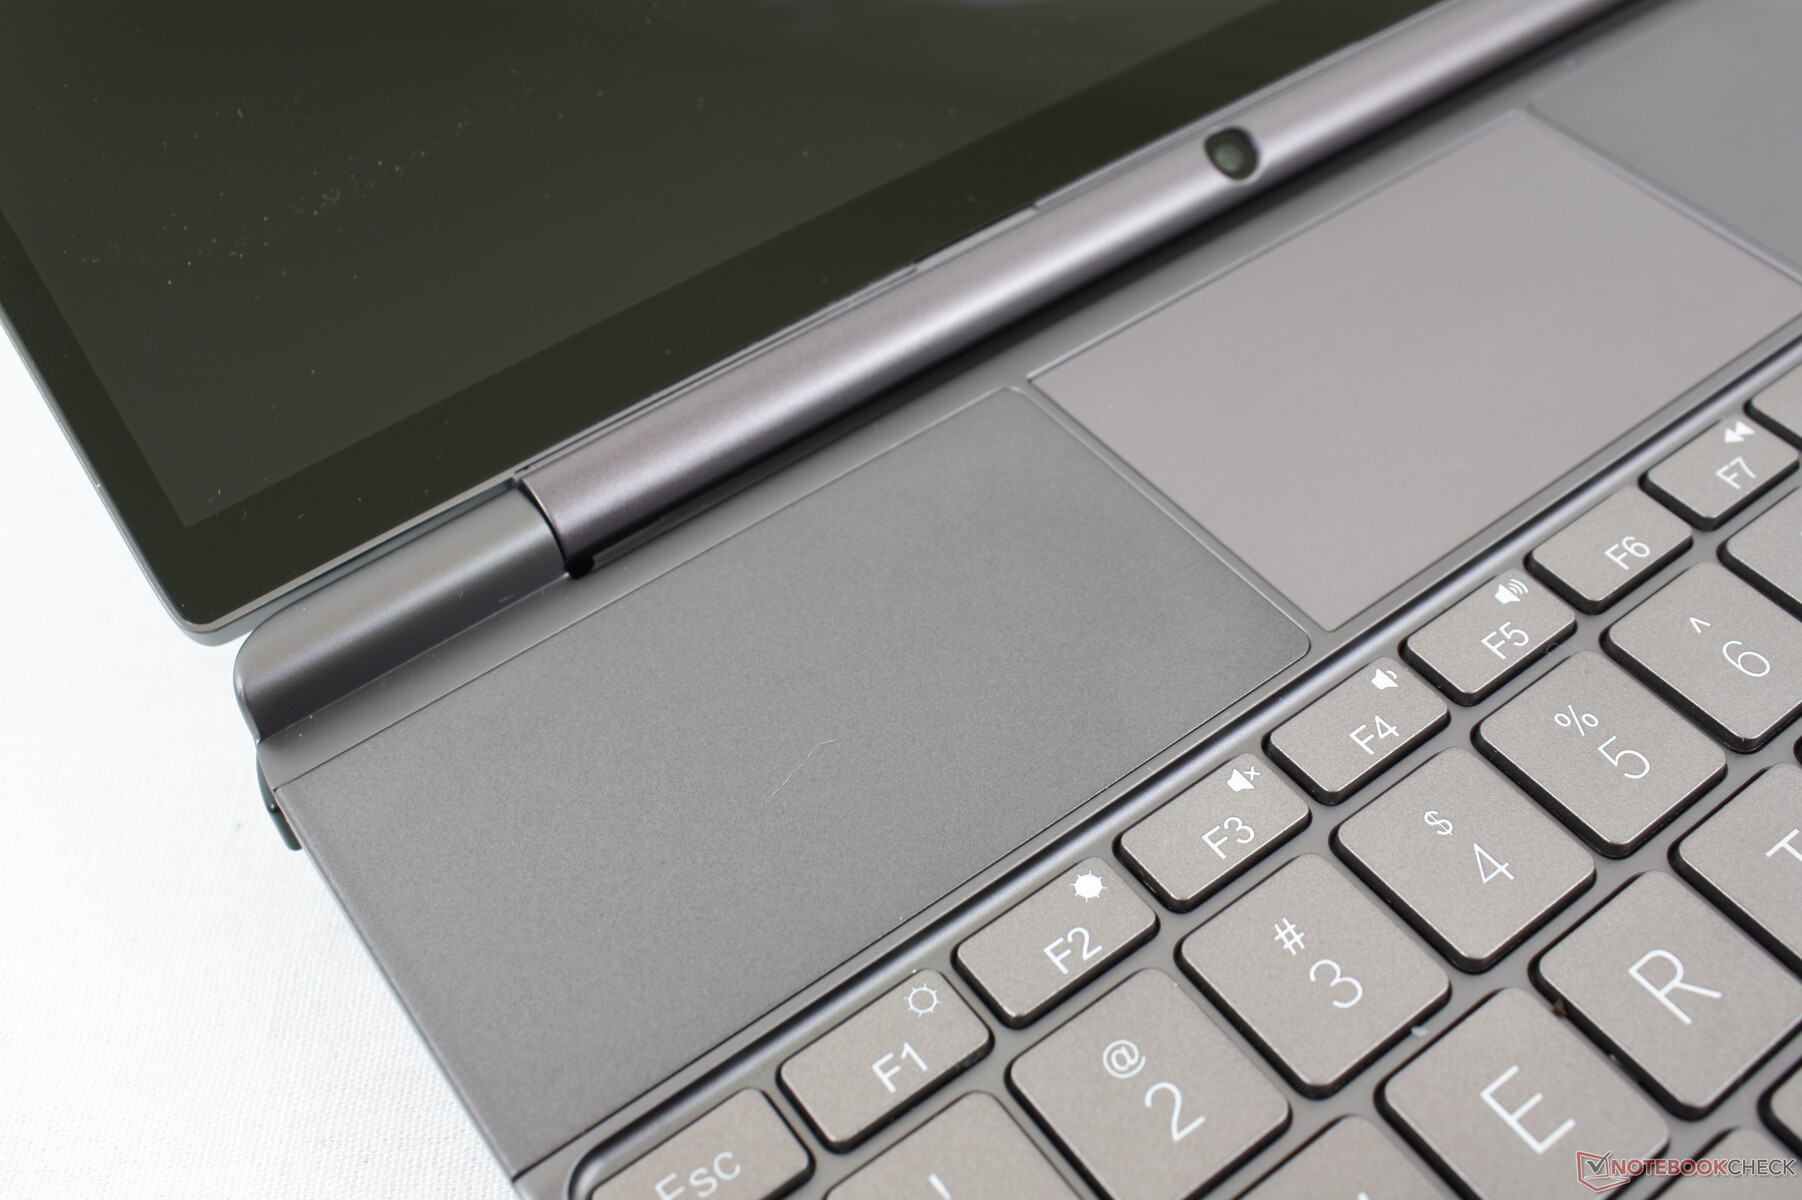
Touchpad
Il clickpad è prevedibilmente piccolo, appena 7,0 x 4,1 cm, ma è comunque più grande del clickpad da 5,8 x 3,3 cm del Win Max 2021. La trazione è fluida quando si scivola a velocità medie o elevate, mentre c'è un po' di impuntamento a velocità più basse per i clic più precisi. I clic sul clickpad sono sorprendentemente decisi e con un feedback forte, ma di conseguenza sono rumorosi.

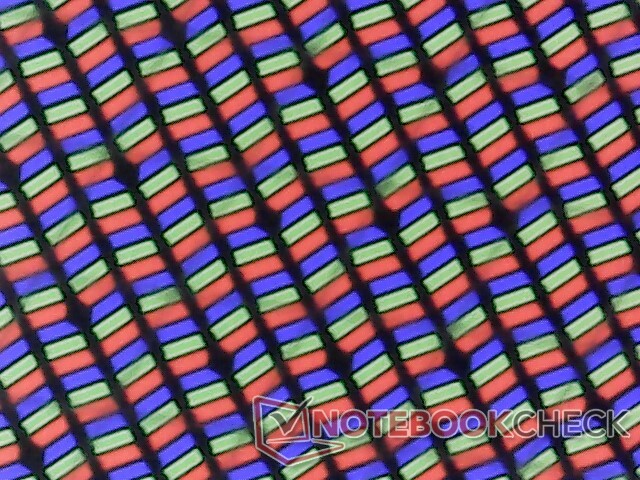
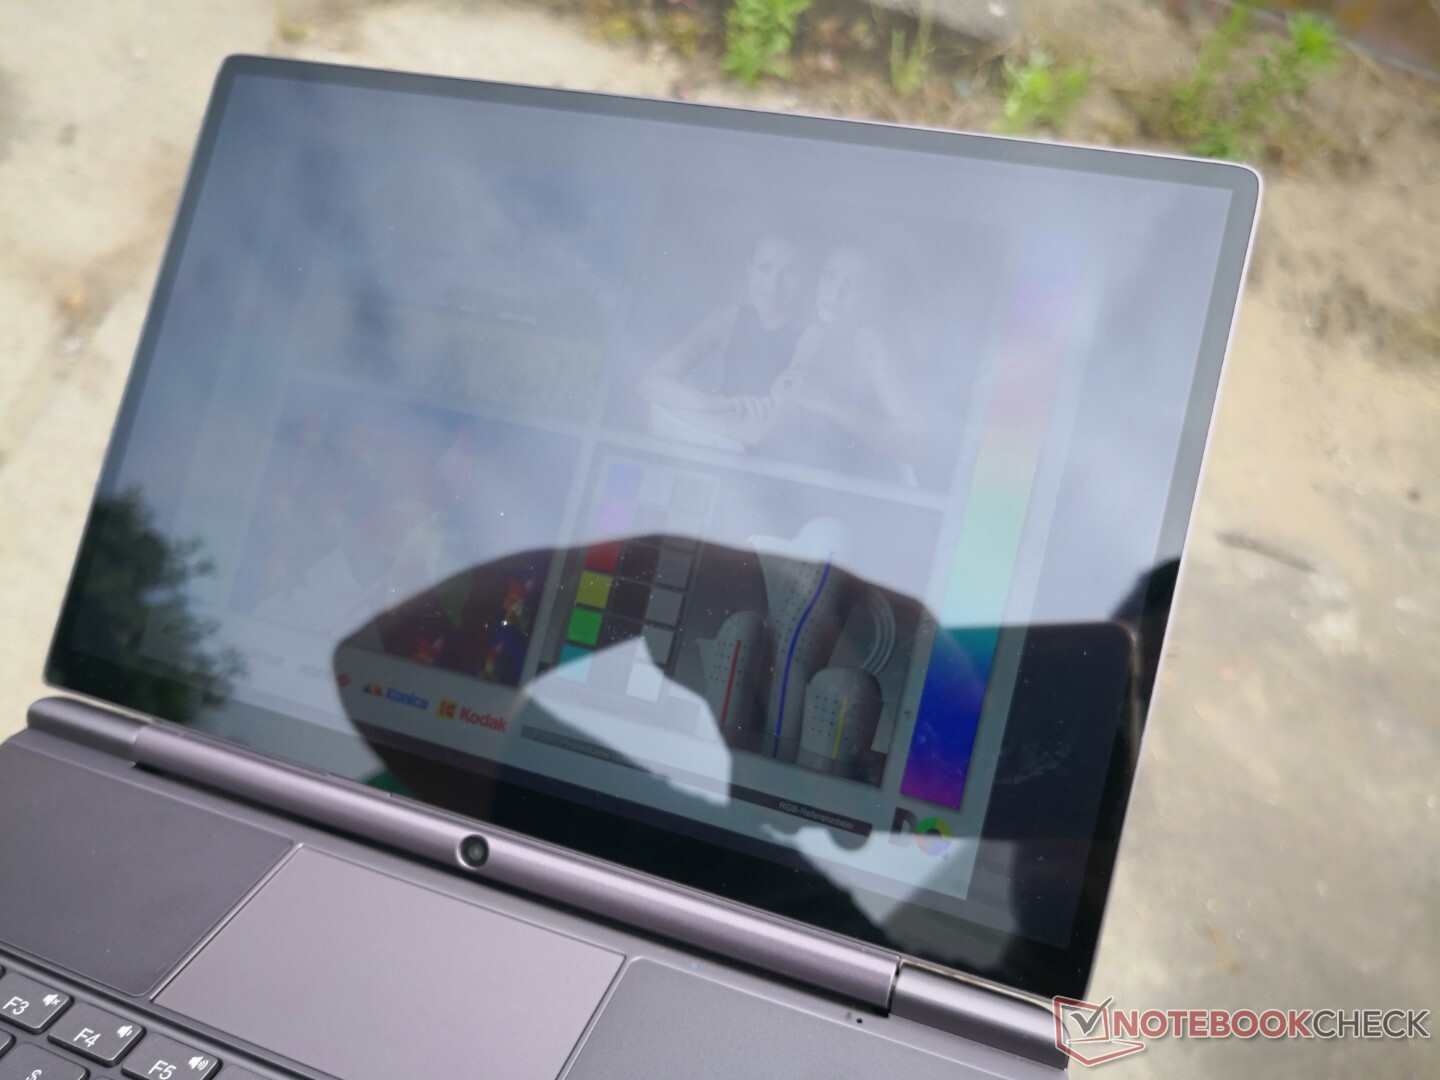
Display - Alta risoluzione con colori sRGB
Il touchscreen da 10,1 pollici è un altro enorme miglioramento rispetto a quello da 8 pollici del Win Max 2021. Non solo le cornici sono più strette, ma il pannello offre colori migliori e tempi di risposta in bianco e nero più rapidi, per un'esperienza visiva di qualità superiore. Tuttavia, il contrasto e la frequenza di aggiornamento non sono cambiati. Sarebbe bello vedere nei prossimi modelli le opzioni 90 Hz o 120 Hz e il supporto della sincronizzazione adattiva
Sebbene il display sia molto nitido alla risoluzione nativa di 2560 x 1600, è bene tenere presente che la GPU integrata non è abbastanza potente per eseguire senza problemi la maggior parte dei titoli a risoluzioni così elevate.


| |||||||||||||||||||||||||
Distribuzione della luminosità: 89 %
Al centro con la batteria: 396.7 cd/m²
Contrasto: 1102:1 (Nero: 0.36 cd/m²)
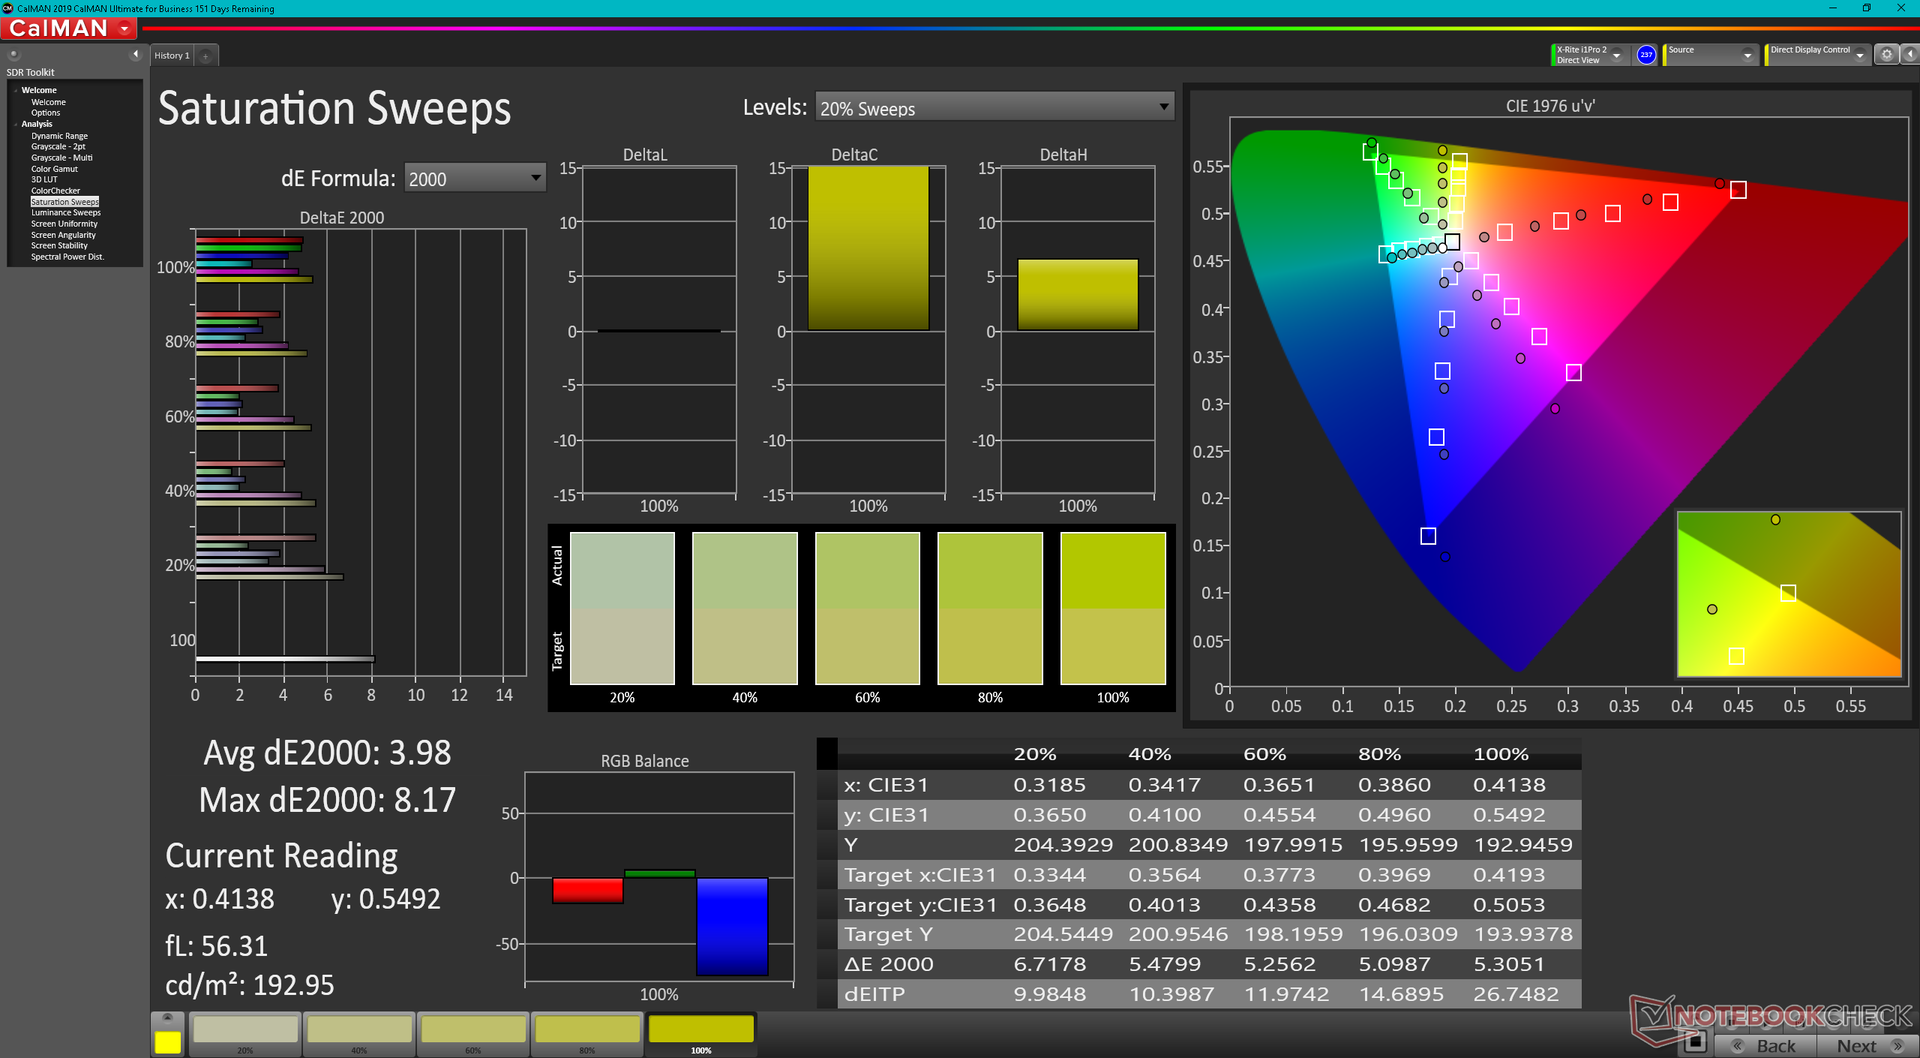
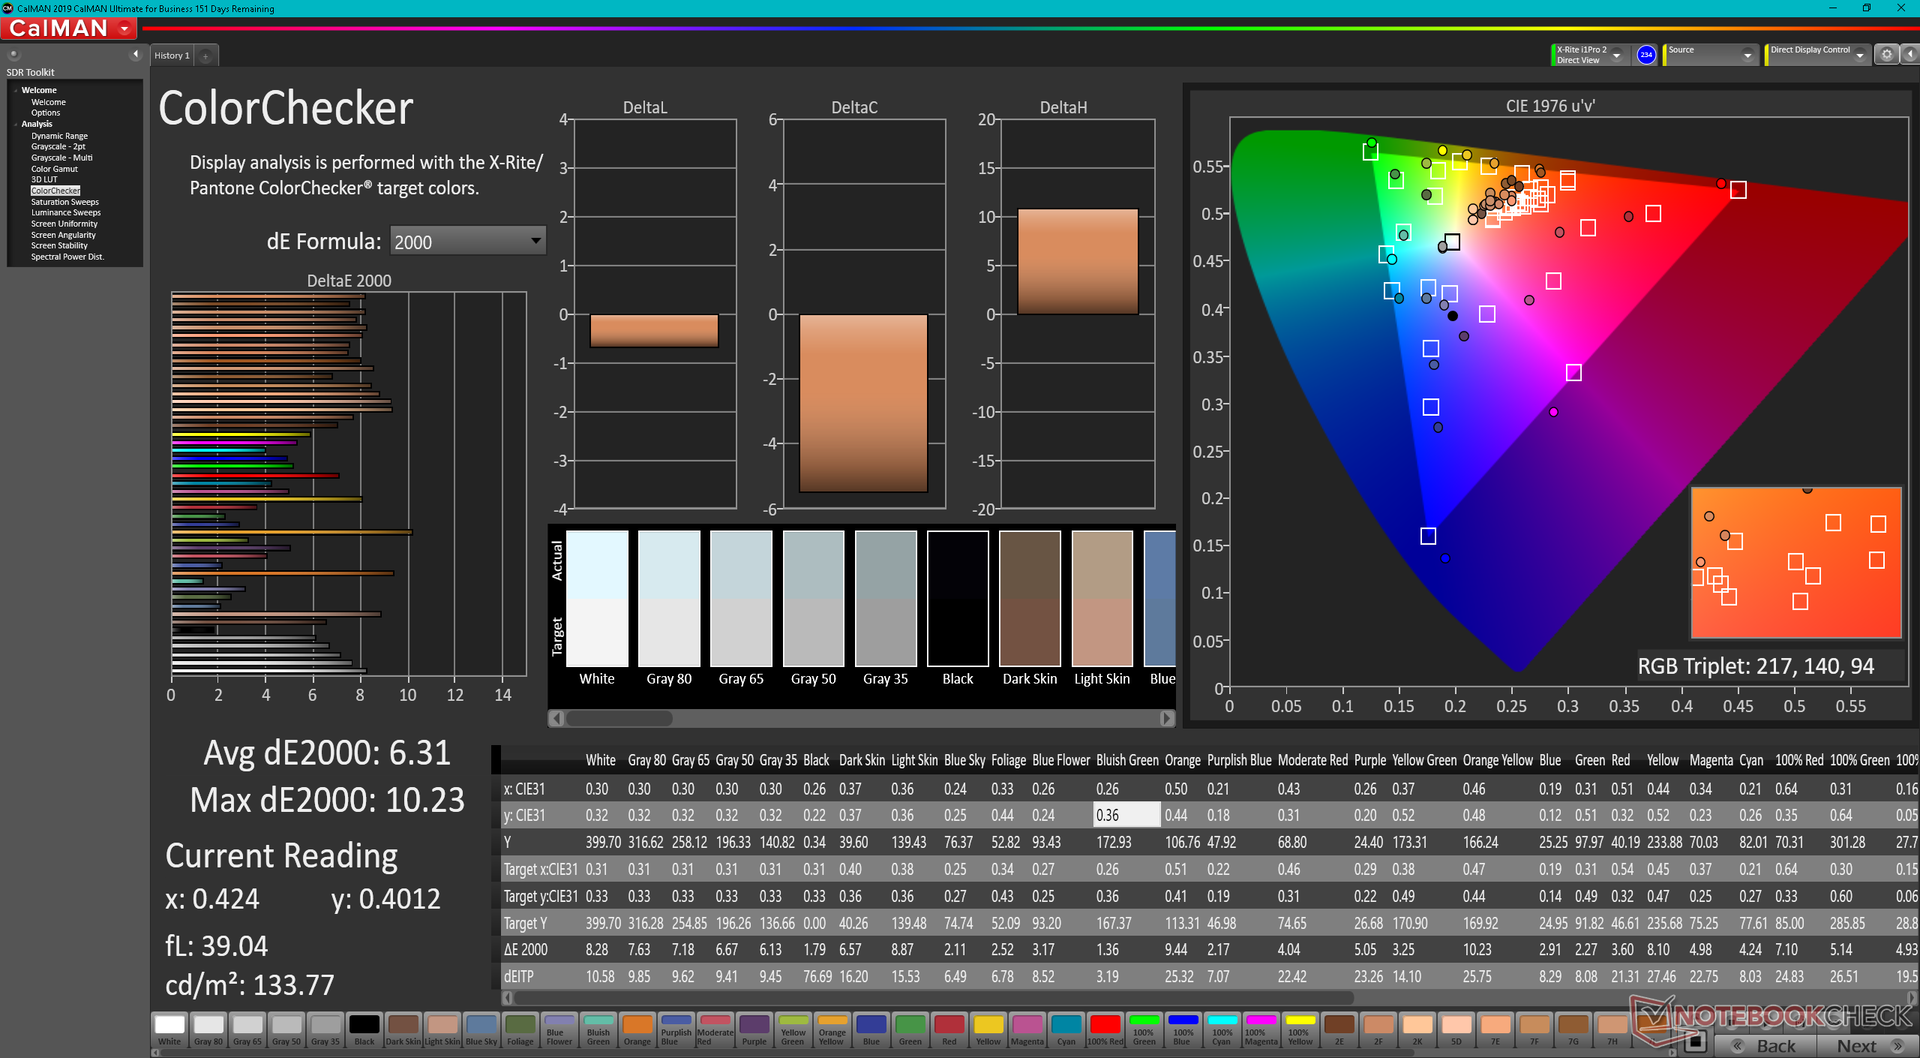
ΔE ColorChecker Calman: 6.31 | ∀{0.5-29.43 Ø4.71}
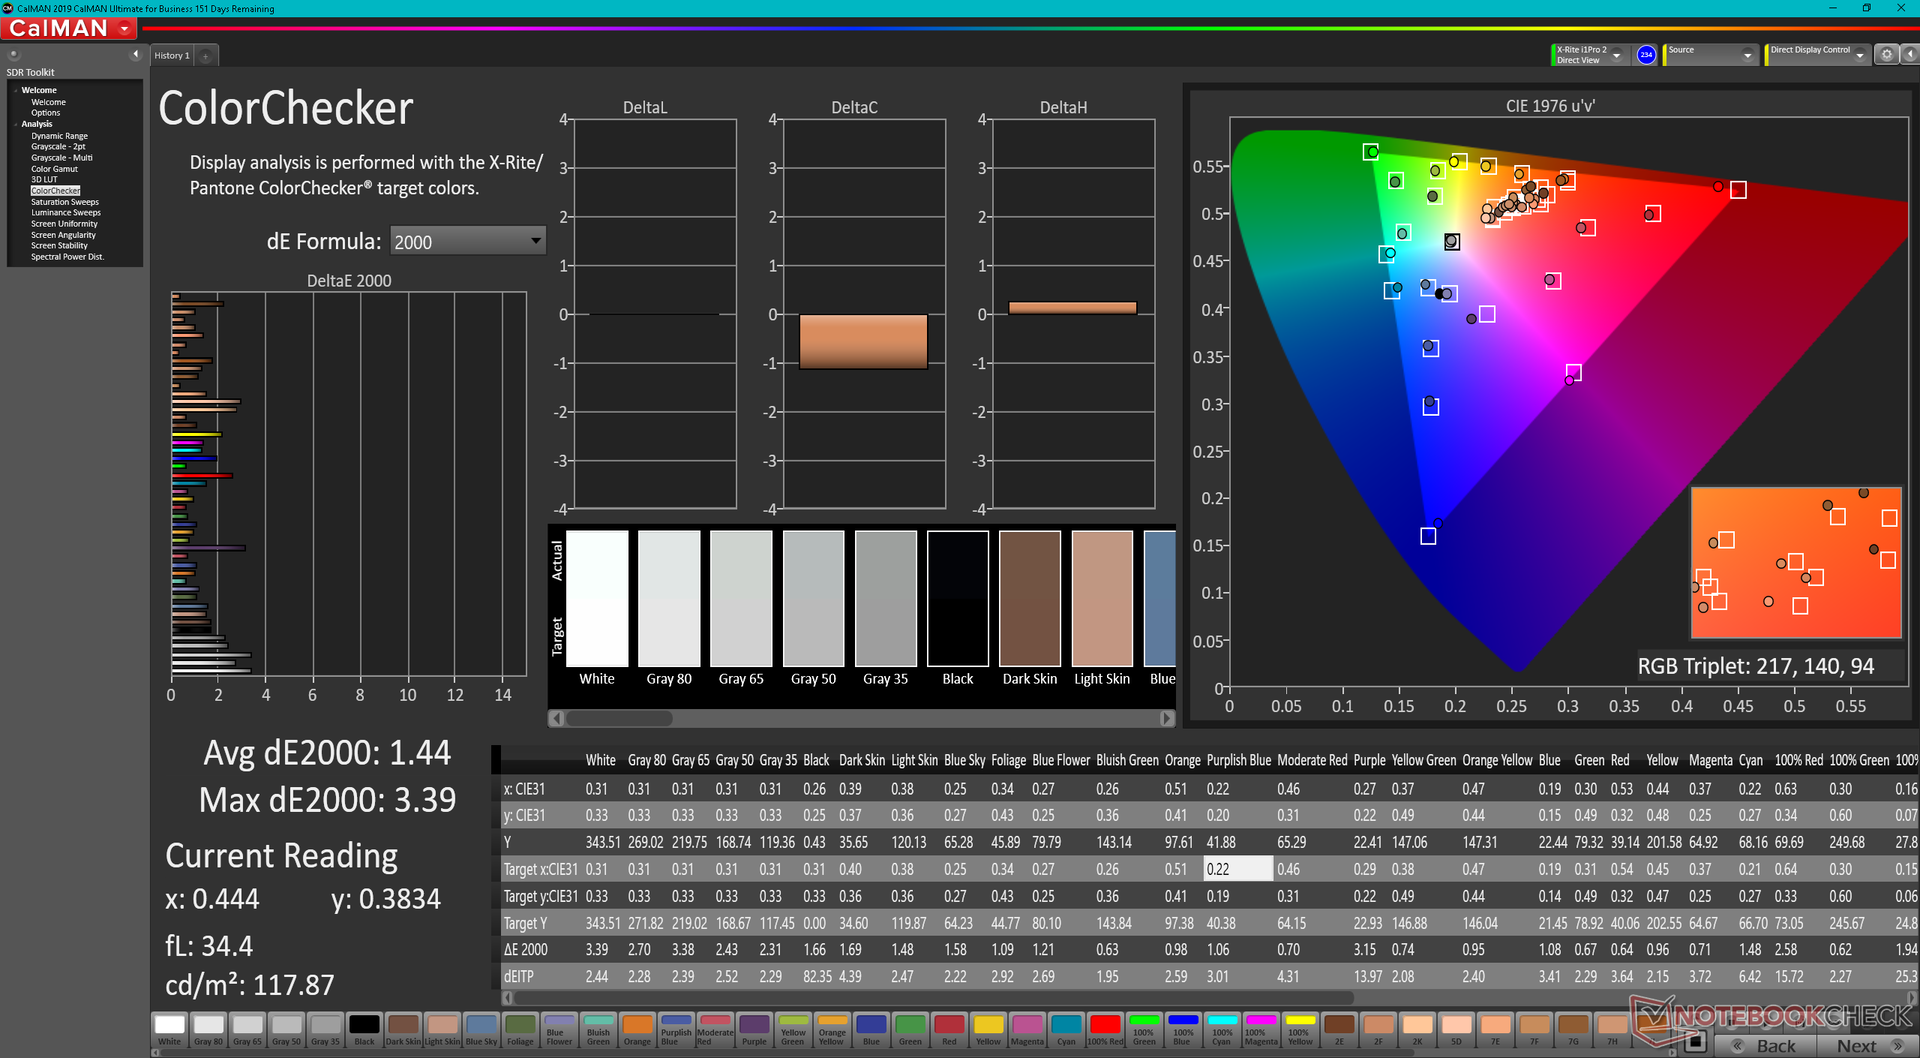
calibrated: 1.44
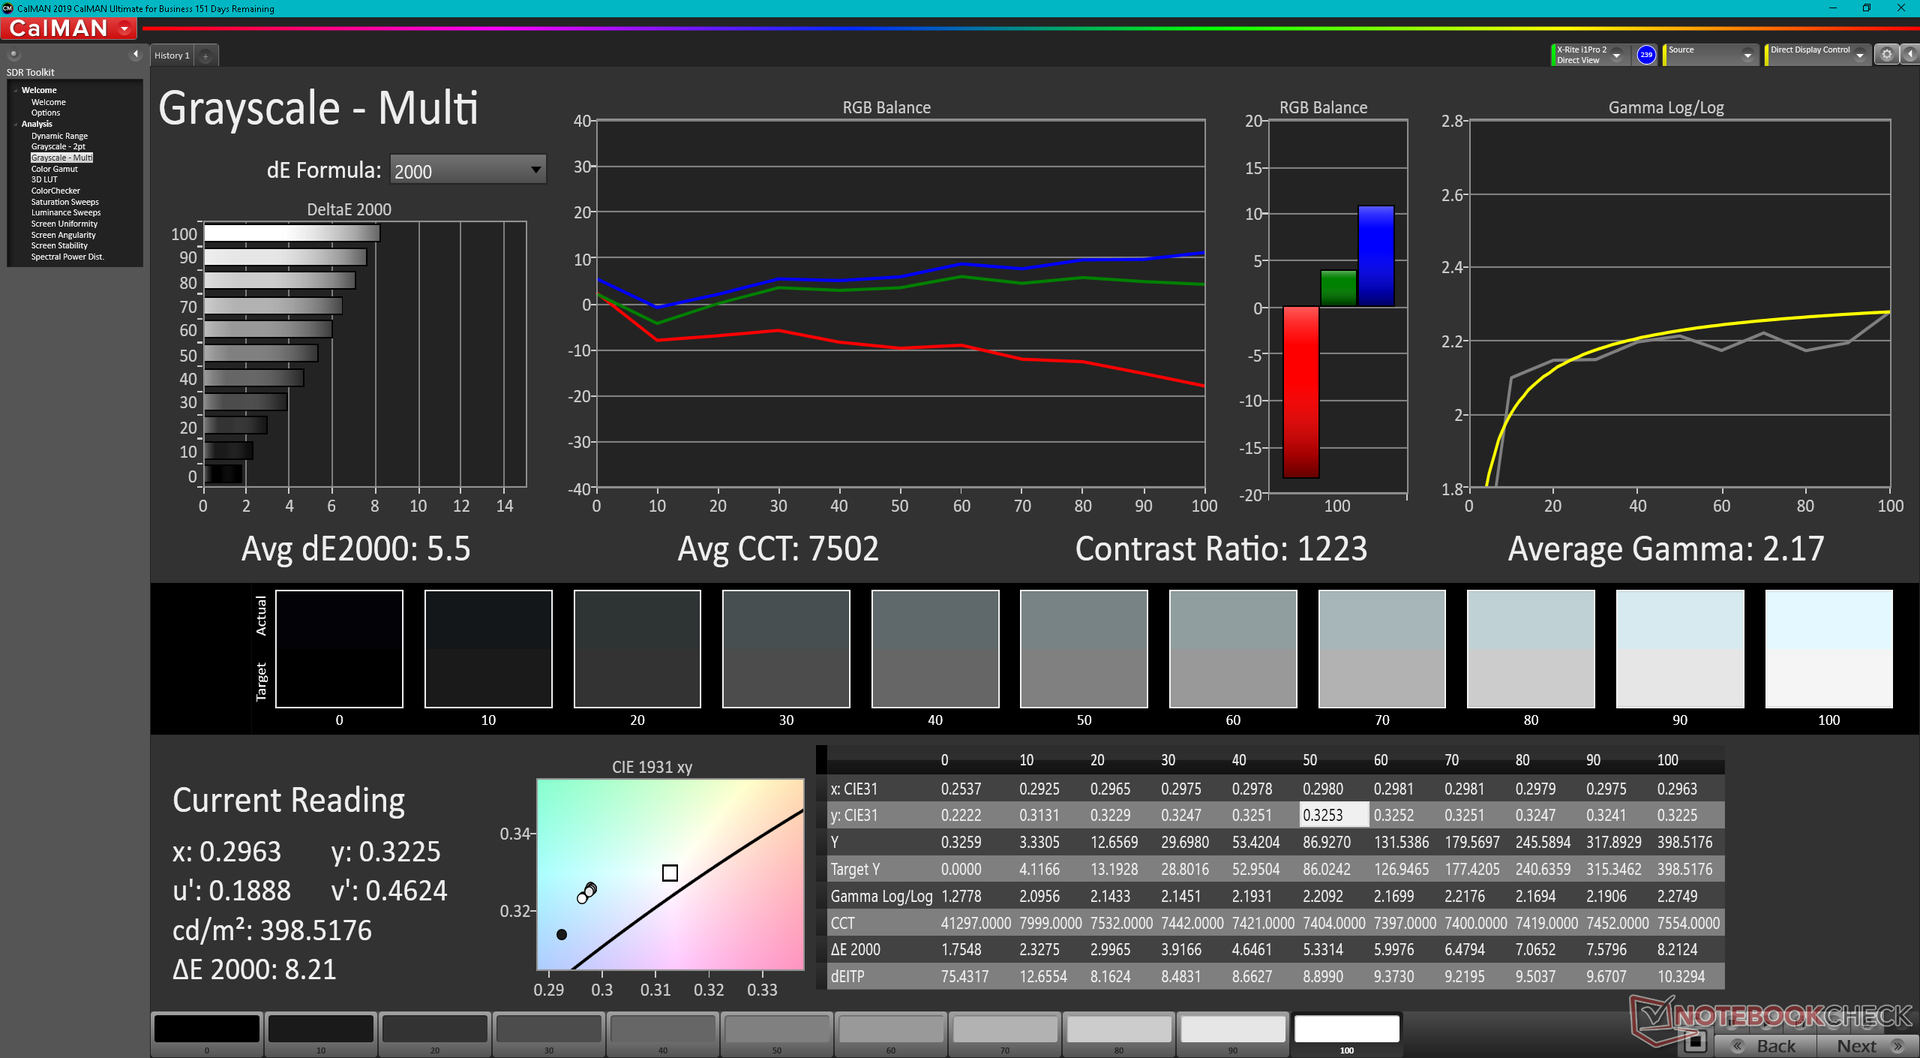
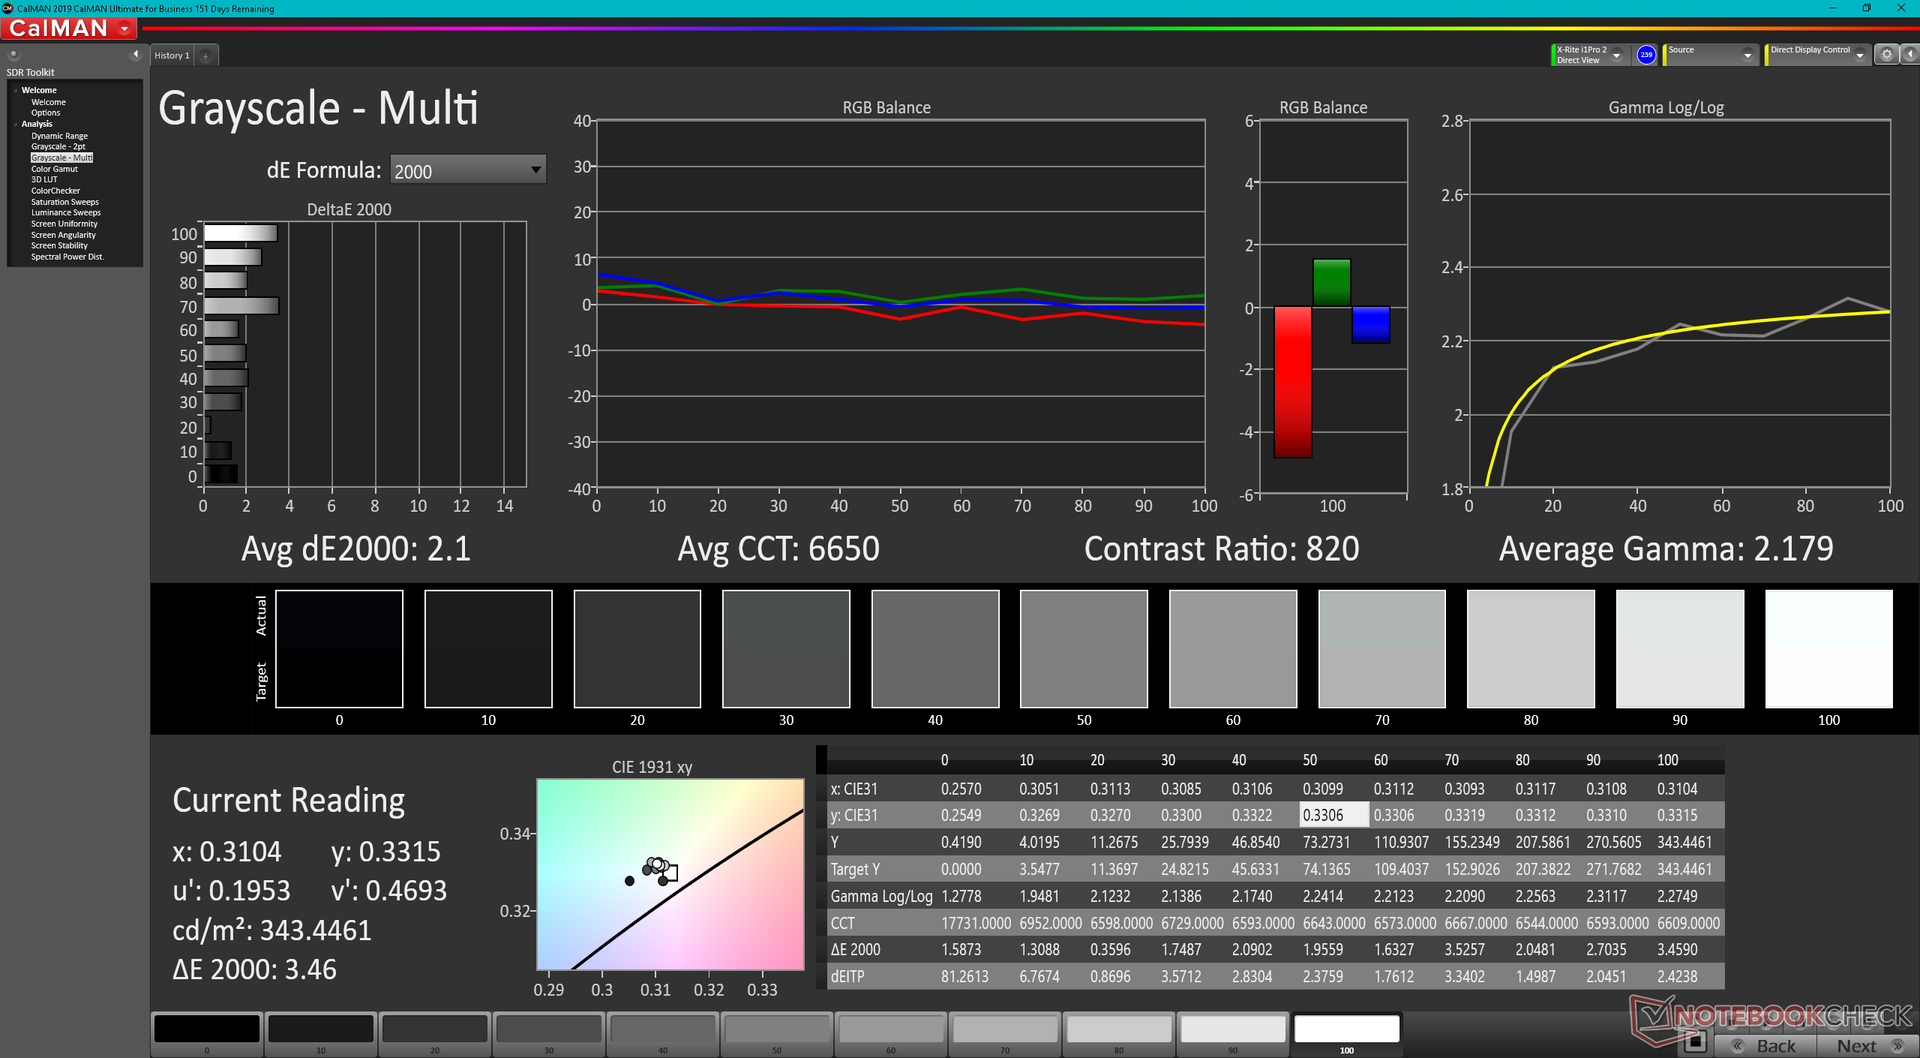
ΔE Greyscale Calman: 5.5 | ∀{0.09-98 Ø4.96}
66.6% AdobeRGB 1998 (Argyll 3D)
91% sRGB (Argyll 3D)
69.8% Display P3 (Argyll 3D)
Gamma: 2.17
CCT: 7502 K
| GPD Win Max 2 Toshiba HX_10.1_LCD, IPS, 2560x1600, 10.1" | GPD Pocket 3 Digital Flat Panel, IPS, 1920x1200, 8" | GPD Win Max 2021 LT7911D, IPS, 1280x800, 8" | GPD Win 3 IPS, 1280x720, 5.5" | Microsoft Surface Go 3 Core i3 NV105WAM-N31, IPS , 1920x1280, 10.5" | Lenovo IdeaPad Flex 3 11IGL05 N116BCA-EA1, IPS LED, 1366x768, 11.6" | |
|---|---|---|---|---|---|---|
| Display | -22% | -30% | -8% | 4% | -30% | |
| Display P3 Coverage (%) | 69.8 | 51.1 -27% | 47.2 -32% | 59.5 -15% | 69 -1% | 45.35 -35% |
| sRGB Coverage (%) | 91 | 74.7 -18% | 65.2 -28% | 89.6 -2% | 99.1 9% | 67.7 -26% |
| AdobeRGB 1998 Coverage (%) | 66.6 | 52.8 -21% | 47.6 -29% | 61.4 -8% | 69.8 5% | 46.93 -30% |
| Response Times | -71% | -135% | -63% | -49% | -57% | |
| Response Time Grey 50% / Grey 80% * (ms) | 21.2 ? | 37.2 ? -75% | 56.8 ? -168% | 40 ? -89% | 37.2 ? -75% | 38 ? -79% |
| Response Time Black / White * (ms) | 18.7 ? | 31.2 ? -67% | 37.6 ? -101% | 25.6 ? -37% | 22.8 ? -22% | 25 ? -34% |
| PWM Frequency (Hz) | 201.6 ? | 962 ? | 250 ? | |||
| Screen | -13% | -34% | -24% | 36% | -9% | |
| Brightness middle (cd/m²) | 396.7 | 438.4 11% | 374.6 -6% | 468.8 18% | 418 5% | 270 -32% |
| Brightness (cd/m²) | 381 | 421 10% | 361 -5% | 460 21% | 415 9% | 259 -32% |
| Brightness Distribution (%) | 89 | 92 3% | 92 3% | 93 4% | 90 1% | 76 -15% |
| Black Level * (cd/m²) | 0.36 | 0.4 -11% | 0.45 -25% | 0.45 -25% | 0.28 22% | 0.195 46% |
| Contrast (:1) | 1102 | 1096 -1% | 832 -25% | 1042 -5% | 1493 35% | 1385 26% |
| Colorchecker dE 2000 * | 6.31 | 5.02 20% | 6.21 2% | 9 -43% | 1.2 81% | 3.98 37% |
| Colorchecker dE 2000 max. * | 10.23 | 9.59 6% | 9.89 3% | 15.5 -52% | 2.6 75% | 8.46 17% |
| Colorchecker dE 2000 calibrated * | 1.44 | 4.05 -181% | 5.4 -275% | 1.91 -33% | 1 31% | 4 -178% |
| Greyscale dE 2000 * | 5.5 | 4 27% | 4.5 18% | 10.9 -98% | 1.8 67% | 2.57 53% |
| Gamma | 2.17 101% | 2.29 96% | 2.49 88% | 2.13 103% | 2.21 100% | 2.3 96% |
| CCT | 7502 87% | 7087 92% | 6726 97% | 10972 59% | 6225 104% | 6332 103% |
| Color Space (Percent of AdobeRGB 1998) (%) | 56.6 | 43 | ||||
| Color Space (Percent of sRGB) (%) | 89.2 | 67 | ||||
| Media totale (Programma / Settaggio) | -35% /
-23% | -66% /
-48% | -32% /
-26% | -3% /
17% | -32% /
-20% |
* ... Meglio usare valori piccoli
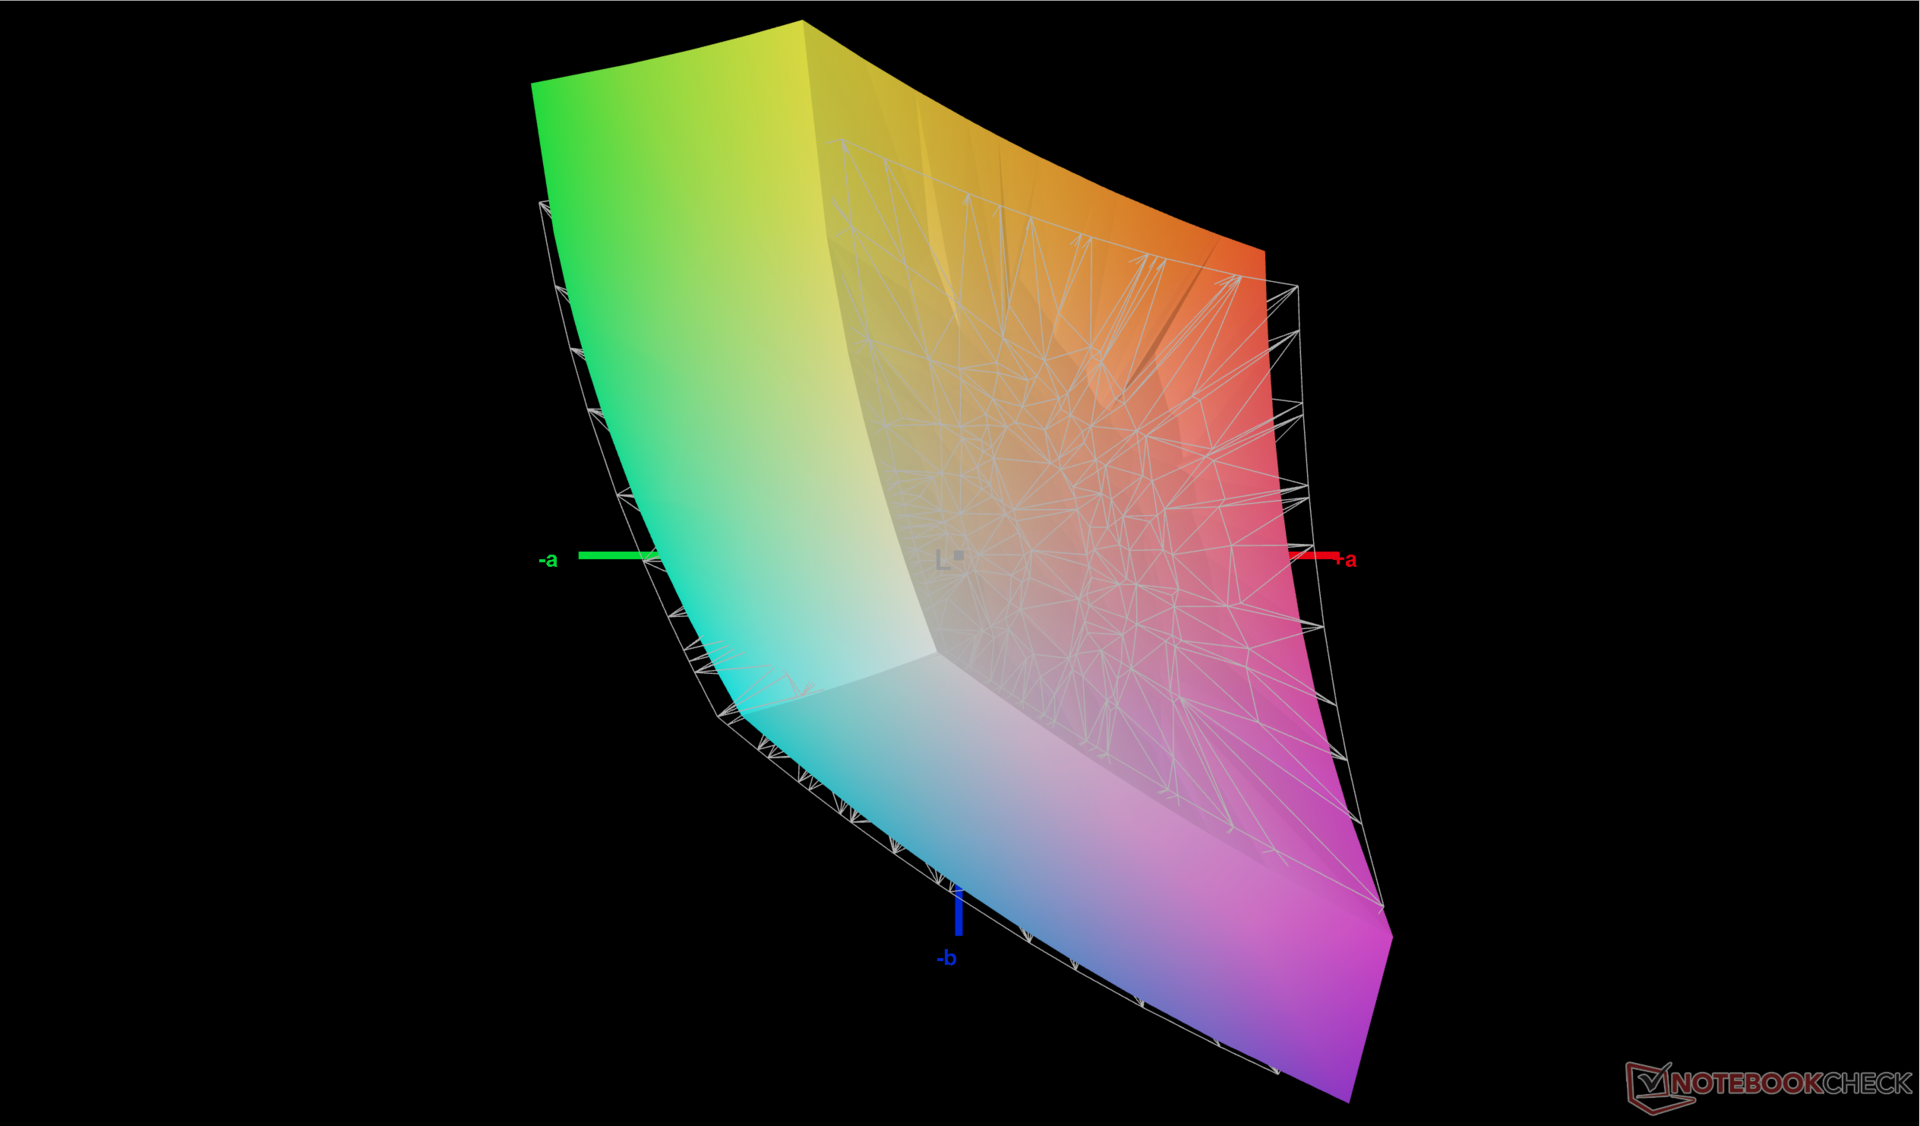
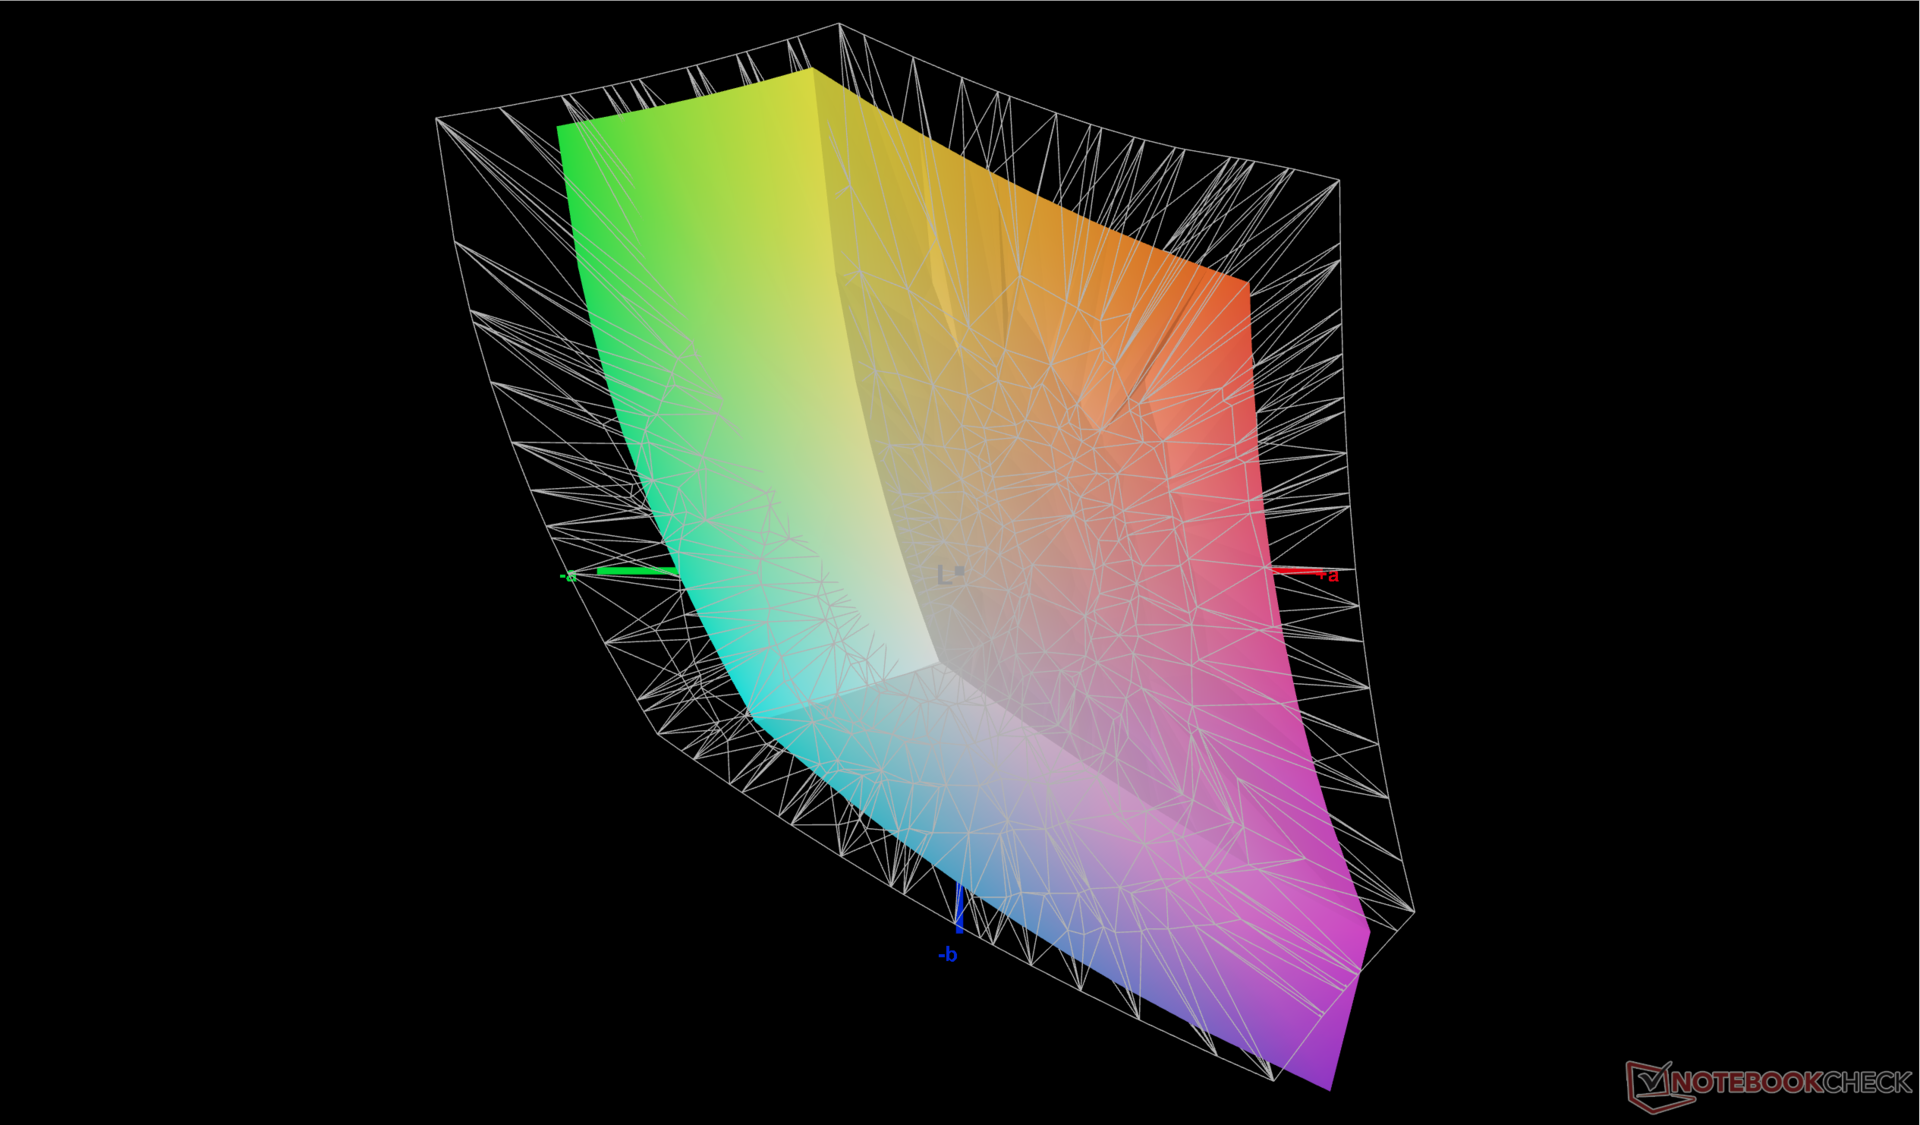
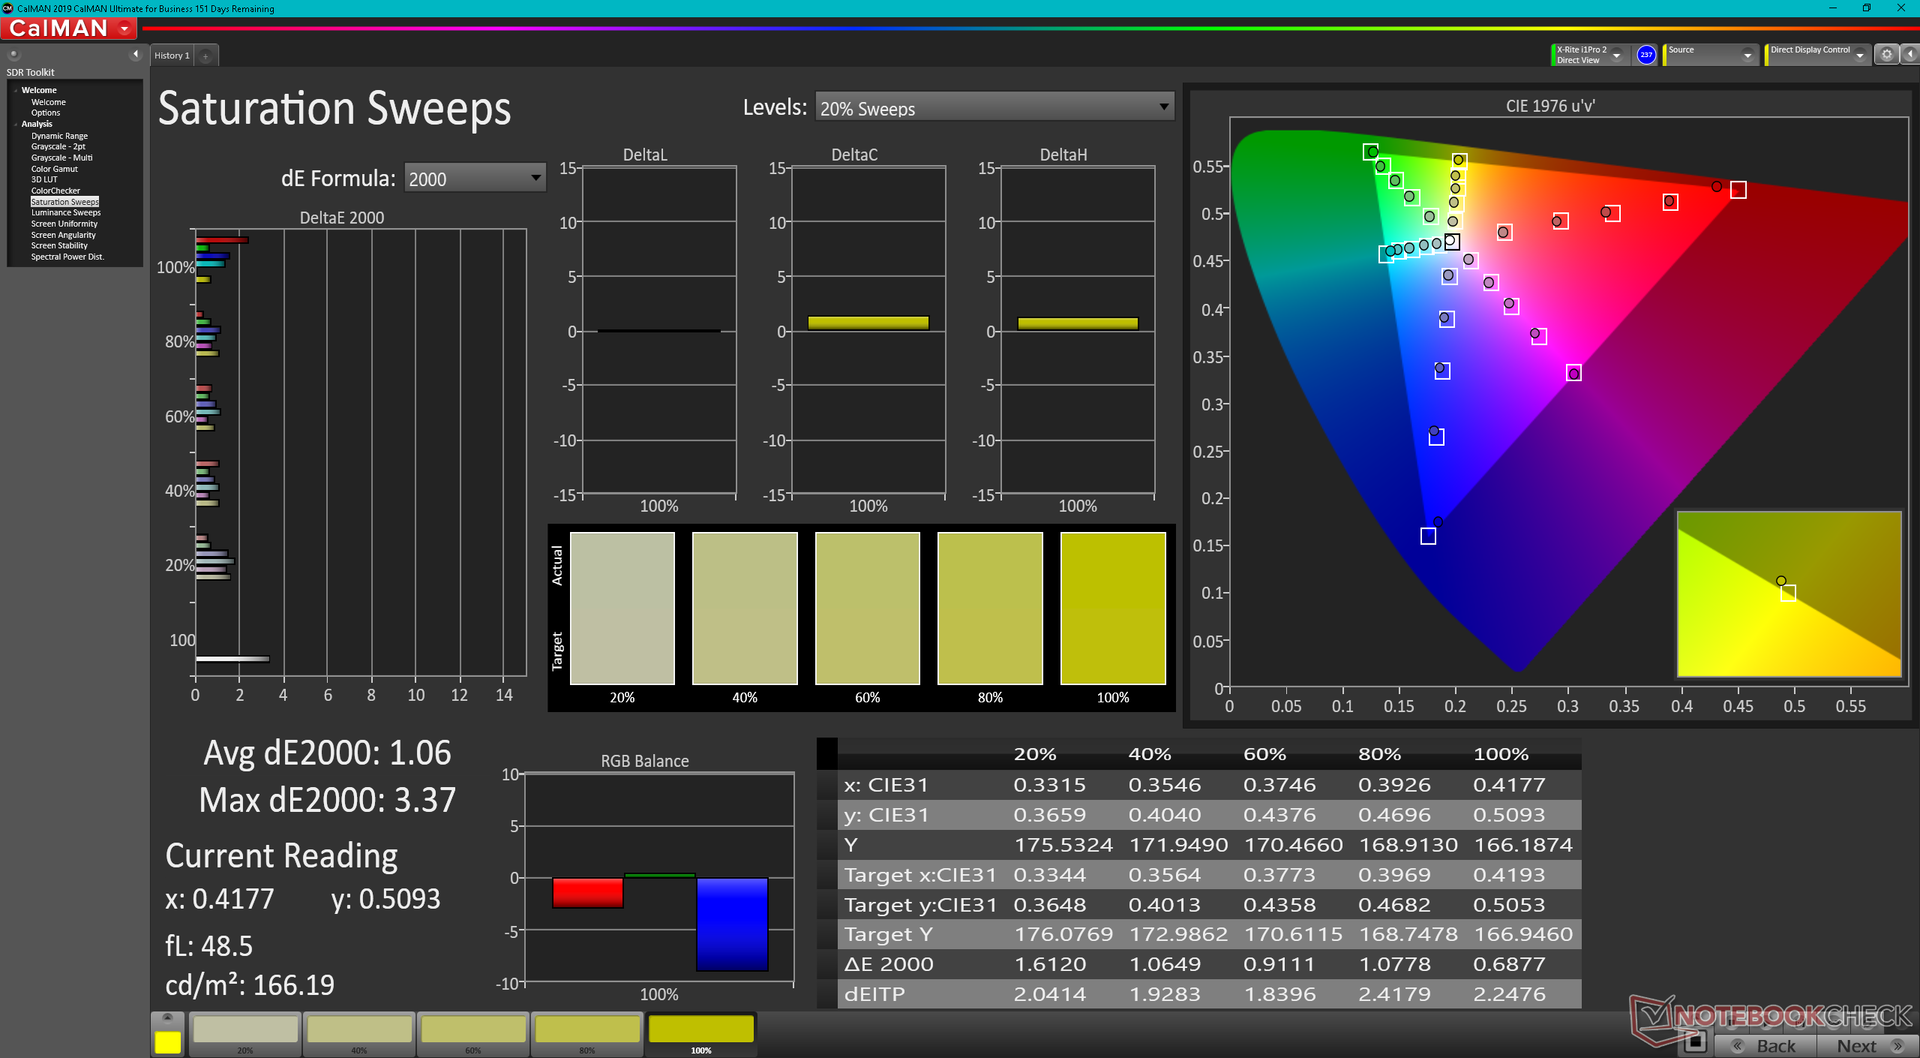
Il display non è calibrato molto bene, il che è un peccato vista la copertura sRGB relativamente ampia >90%. I valori medi predefiniti del DeltaE della scala di grigi e del colore, pari a 5,5 e 6,31, migliorano rispettivamente a 2,1 e 1,44 dopo aver calibrato il pannello. Consigliamo di applicare il nostro profilo ICM calibrato sopra per ottenere colori più accurati dal display.
Tempi di risposta del Display
| ↔ Tempi di risposta dal Nero al Bianco | ||
|---|---|---|
| 18.7 ms ... aumenta ↗ e diminuisce ↘ combinato | ↗ 9.1 ms Incremento | 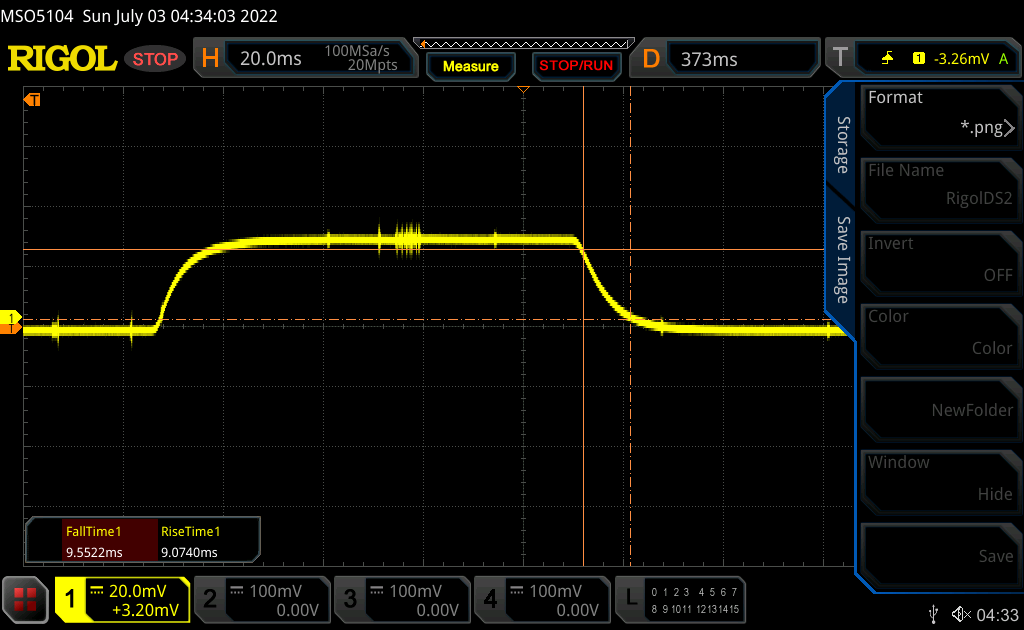 |
| ↘ 9.6 ms Calo | ||
| Lo schermo mostra buoni tempi di risposta durante i nostri tests, ma potrebbe essere troppo lento per i gamers competitivi. In confronto, tutti i dispositivi di test variano da 0.1 (minimo) a 240 (massimo) ms. » 42 % di tutti i dispositivi è migliore. Questo significa che i tempi di risposta rilevati sono simili alla media di tutti i dispositivi testati (19.8 ms). | ||
| ↔ Tempo di risposta dal 50% Grigio all'80% Grigio | ||
| 21.2 ms ... aumenta ↗ e diminuisce ↘ combinato | ↗ 9.5 ms Incremento | 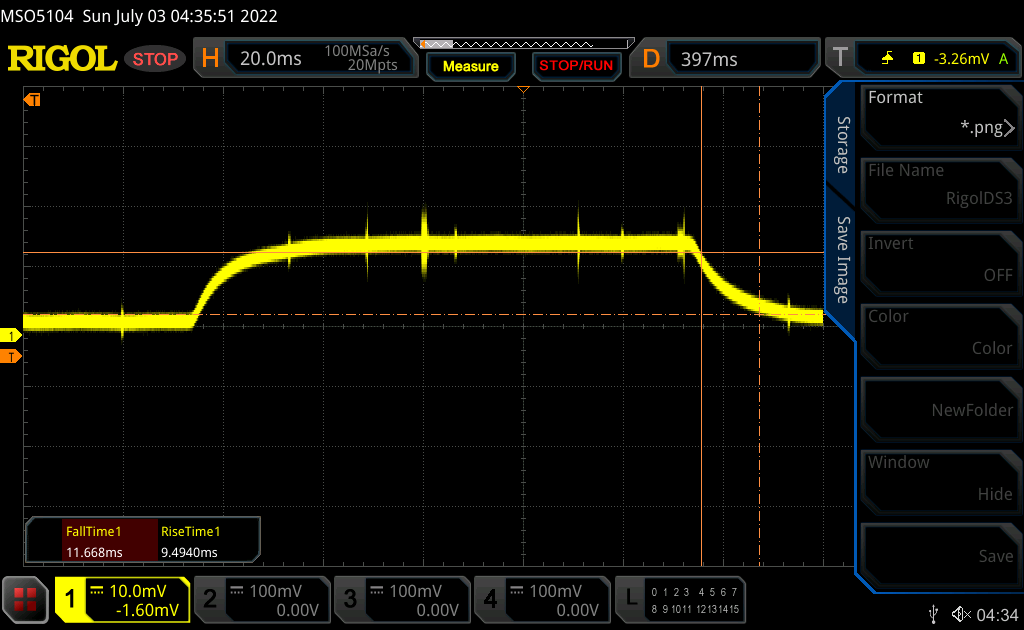 |
| ↘ 11.7 ms Calo | ||
| Lo schermo mostra buoni tempi di risposta durante i nostri tests, ma potrebbe essere troppo lento per i gamers competitivi. In confronto, tutti i dispositivi di test variano da 0.165 (minimo) a 636 (massimo) ms. » 33 % di tutti i dispositivi è migliore. Questo significa che i tempi di risposta rilevati sono migliori rispettto alla media di tutti i dispositivi testati (31 ms). | ||
Sfarfallio dello schermo / PWM (Pulse-Width Modulation)
| flickering dello schermo / PWM non rilevato | 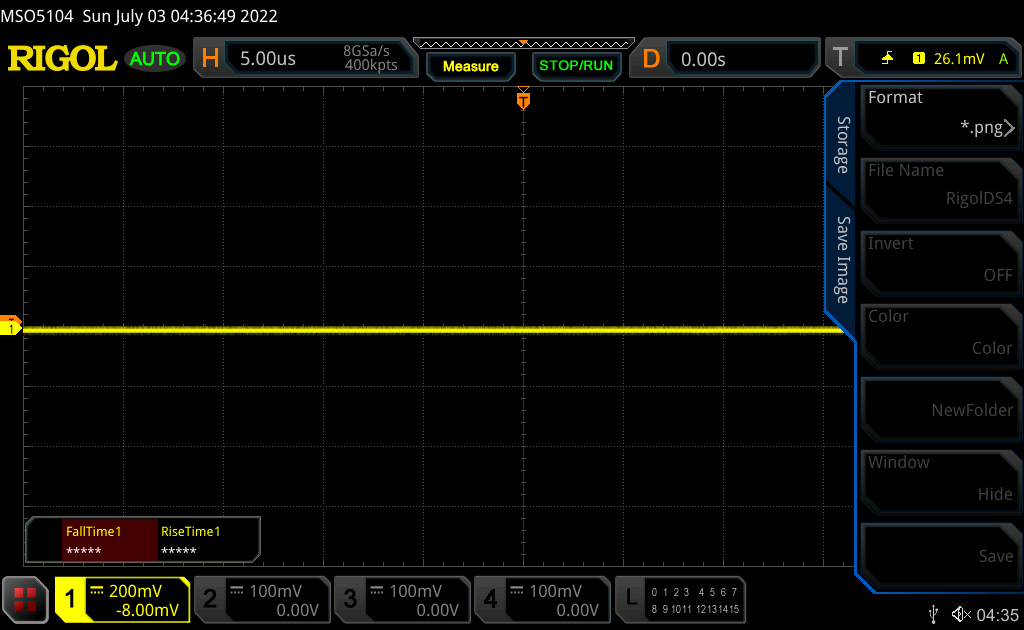 | ||
In confronto: 52 % di tutti i dispositivi testati non utilizza PWM per ridurre la luminosita' del display. Se è rilevato PWM, una media di 7747 (minimo: 5 - massimo: 343500) Hz è stata rilevata. | |||
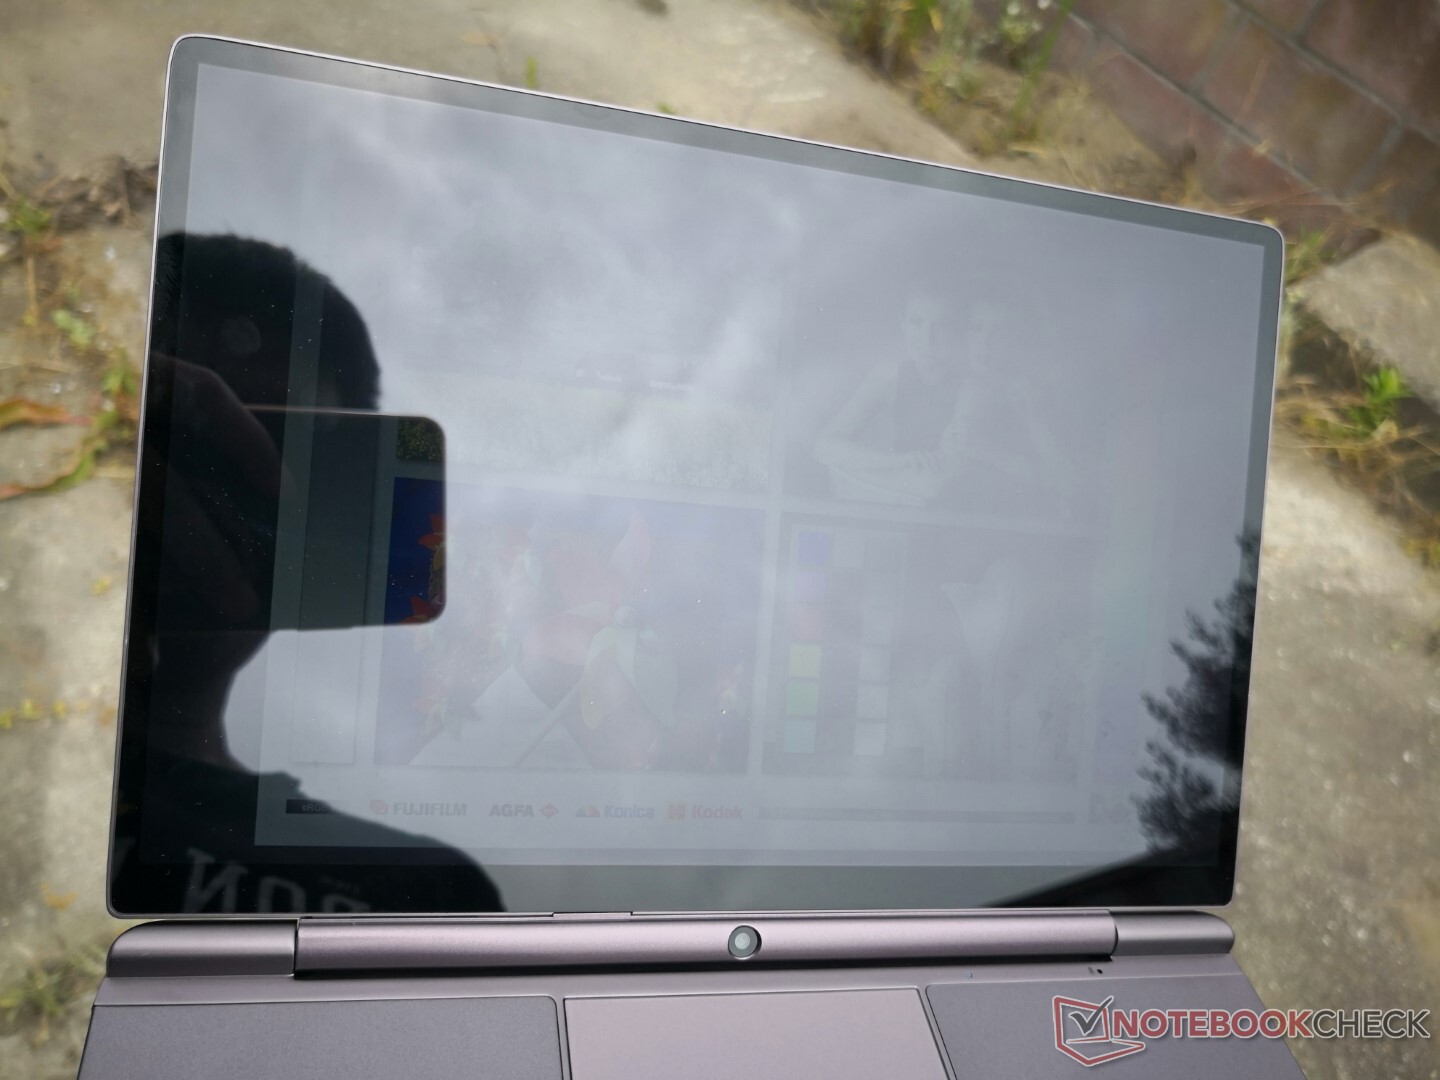
Con una luminosità massima di 400 nit, il display è abbastanza luminoso da poter essere visto comodamente anche all'ombra. L'illuminazione ambientale più intensa sbiadisce i colori o produce riflessi troppo forti sul touchscreen lucido.


Prestazioni: rosso o blu?
Condizioni di test
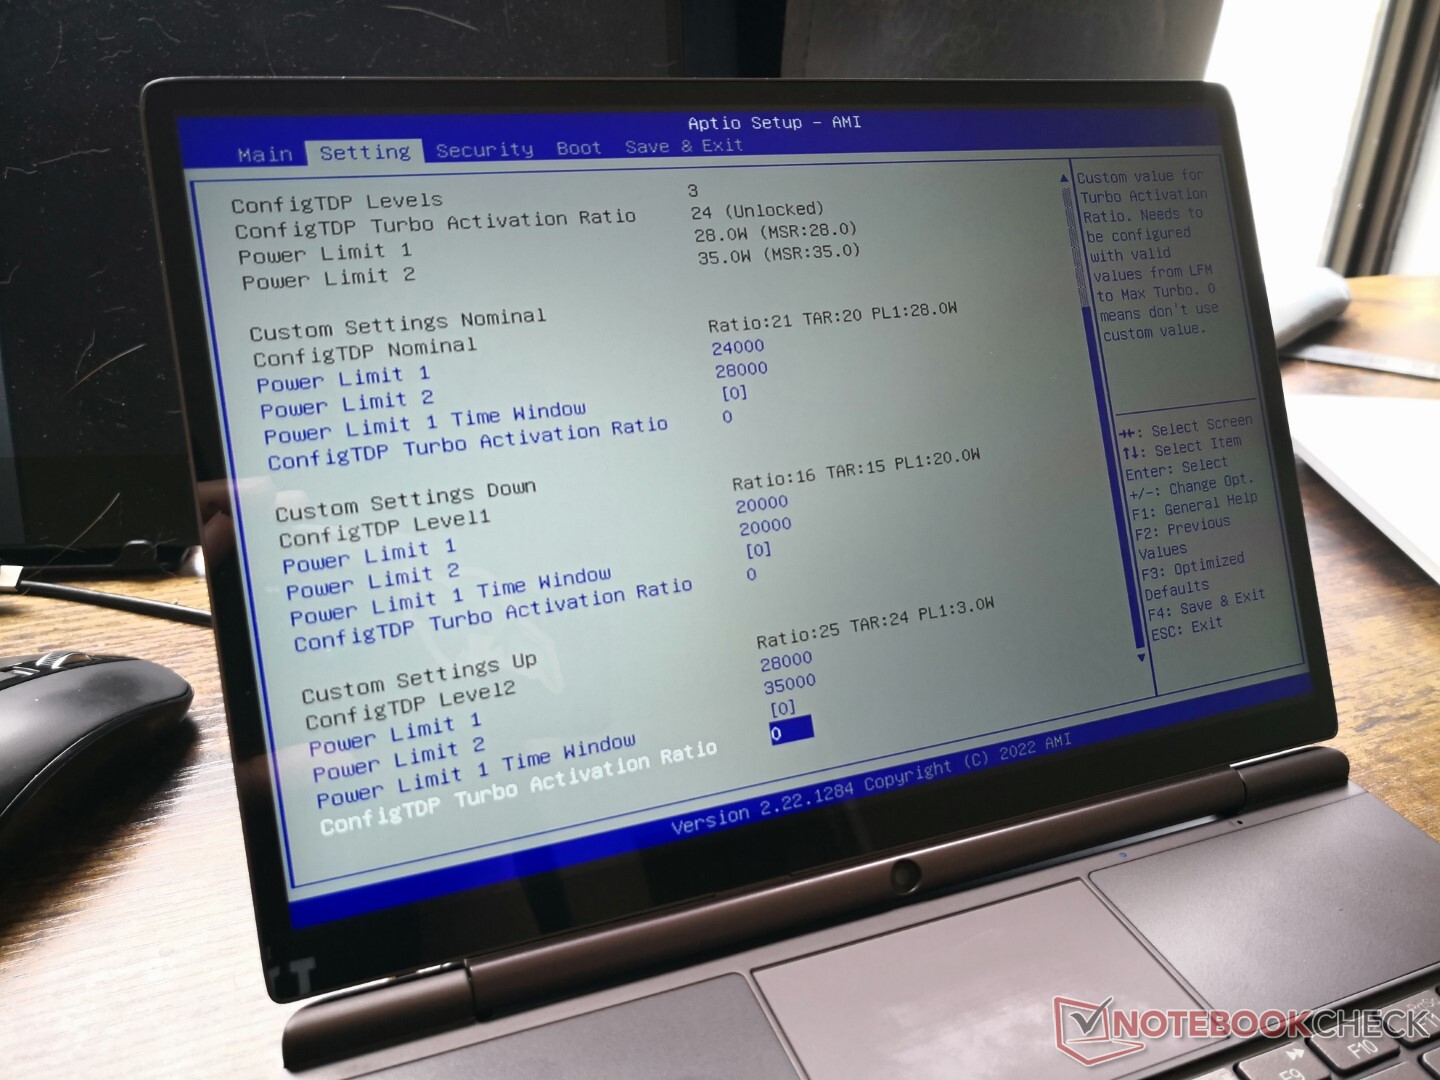
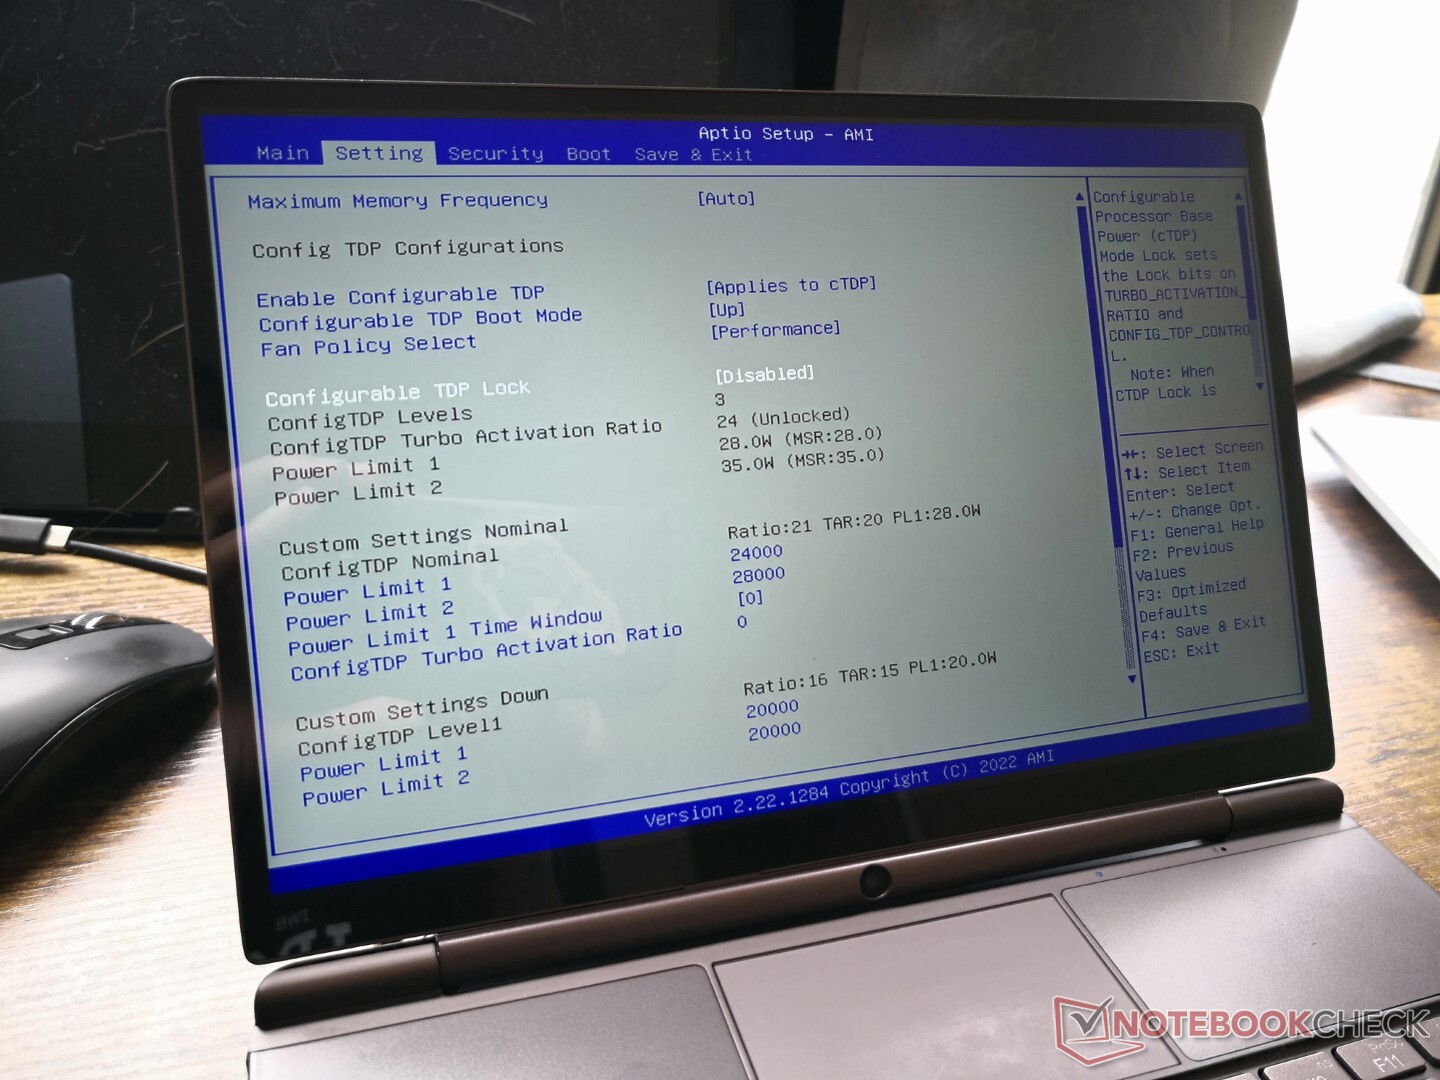
Come in altri prodotti GPD, la schermata del BIOS offre impostazioni TDP configurabili. Le tre modalità preimpostate sono Nominal, Down e Up, ciascuna con livelli diversi di obiettivi PL1 e PL2, come descritto di seguito
- Nominale: PL1=24 W, PL2=28 W
- In basso: PL1=20 W, PL2=20 W
- Su: PL1=28 W, PL2=35 W
Abbiamo impostato la nostra unità sulla modalità Up e la politica della ventola su Performance prima di eseguire i benchmark sulle prestazioni. Abbiamo anche attivato l'impostazione "Turbo" sulla tastiera e ci siamo assicurati che anche Windows fosse in modalità Prestazioni.
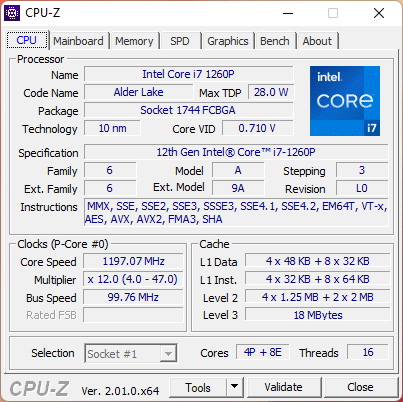
Processore
Le prestazioni della CPU multi-thread sono più lente di circa il 15% rispetto alla media dei laptop del nostro database equipaggiati con lo stesso Core i760P Core i7-1260P core i7-1260P. Al contrario, le prestazioni in single-thread sono più veloci del 10-15% rispetto alla media. Si ha sicuramente la sensazione che il Win Max 2 non stia sfruttando appieno le capacità della nuova CPU di 12a generazione di Intel in questo senso, ma è comunque significativamente più veloce delle vecchie opzioni di CPU di 11a generazione, come quelle presenti sul GPD Win 3 o sul Pocket 3, del 50% o più. Tuttavia, se si desidera il meglio che il Core i7-1260P ha da offrire, è consigliabile rivolgersi a computer portatili completi come il modello Dell Inspiron 16 7620 2-in-1 che può utilizzare la stessa CPU con una velocità fino al 40% superiore.
Molte CPU AMD Zen 3 sono in grado di offrire prestazioni multi-thread leggermente più veloci ma prestazioni single-thread più lente rispetto al nostro Core i7-1260P nel Win Max 2, tra cui il modelloRyzen 5 5500Uryzen 7 5700U, o anche il più vecchio Zen 2 Ryzen 7 4800U. Optando per il Ryzen 7 6800U Aumenterà le prestazioni multi-thread del 50%, mentre le prestazioni single-thread diminuiranno di quasi il 20%.
Cinebench R15 Multi Loop
Cinebench R23: Multi Core | Single Core
Cinebench R15: CPU Multi 64Bit | CPU Single 64Bit
Blender: v2.79 BMW27 CPU
7-Zip 18.03: 7z b 4 | 7z b 4 -mmt1
Geekbench 5.5: Multi-Core | Single-Core
HWBOT x265 Benchmark v2.2: 4k Preset
LibreOffice : 20 Documents To PDF
R Benchmark 2.5: Overall mean
Cinebench R23: Multi Core | Single Core
Cinebench R15: CPU Multi 64Bit | CPU Single 64Bit
Blender: v2.79 BMW27 CPU
7-Zip 18.03: 7z b 4 | 7z b 4 -mmt1
Geekbench 5.5: Multi-Core | Single-Core
HWBOT x265 Benchmark v2.2: 4k Preset
LibreOffice : 20 Documents To PDF
R Benchmark 2.5: Overall mean
* ... Meglio usare valori piccoli
AIDA64: FP32 Ray-Trace | FPU Julia | CPU SHA3 | CPU Queen | FPU SinJulia | FPU Mandel | CPU AES | CPU ZLib | FP64 Ray-Trace | CPU PhotoWorxx
| Performance rating | |
| GPD Win Max 2021 | |
| Media Intel Core i7-1260P | |
| Lenovo Yoga 9 14IAP7 82LU0001US | |
| GPD Win Max 2 | |
| GPD Pocket 3 | |
| AIDA64 / FP32 Ray-Trace | |
| GPD Win Max 2021 | |
| Media Intel Core i7-1260P (2176 - 10898, n=26) | |
| Lenovo Yoga 9 14IAP7 82LU0001US | |
| GPD Pocket 3 | |
| GPD Win Max 2 | |
| AIDA64 / FPU Julia | |
| GPD Win Max 2021 | |
| Media Intel Core i7-1260P (11015 - 56906, n=26) | |
| Lenovo Yoga 9 14IAP7 82LU0001US | |
| GPD Pocket 3 | |
| GPD Win Max 2 | |
| AIDA64 / CPU SHA3 | |
| Lenovo Yoga 9 14IAP7 82LU0001US | |
| Media Intel Core i7-1260P (669 - 2709, n=26) | |
| GPD Win Max 2021 | |
| GPD Pocket 3 | |
| GPD Win Max 2 | |
| AIDA64 / CPU Queen | |
| GPD Win Max 2021 | |
| Lenovo Yoga 9 14IAP7 82LU0001US | |
| Media Intel Core i7-1260P (42571 - 82493, n=26) | |
| GPD Win Max 2 | |
| GPD Pocket 3 | |
| AIDA64 / FPU SinJulia | |
| GPD Win Max 2021 | |
| Lenovo Yoga 9 14IAP7 82LU0001US | |
| GPD Win Max 2 | |
| Media Intel Core i7-1260P (2901 - 6975, n=26) | |
| GPD Pocket 3 | |
| AIDA64 / FPU Mandel | |
| GPD Win Max 2021 | |
| Media Intel Core i7-1260P (5950 - 26376, n=26) | |
| Lenovo Yoga 9 14IAP7 82LU0001US | |
| GPD Pocket 3 | |
| GPD Win Max 2 | |
| AIDA64 / CPU AES | |
| GPD Pocket 3 | |
| GPD Win Max 2021 | |
| GPD Win Max 2 | |
| Media Intel Core i7-1260P (16041 - 92356, n=26) | |
| Lenovo Yoga 9 14IAP7 82LU0001US | |
| AIDA64 / CPU ZLib | |
| Lenovo Yoga 9 14IAP7 82LU0001US | |
| Media Intel Core i7-1260P (259 - 771, n=26) | |
| GPD Win Max 2021 | |
| GPD Win Max 2 | |
| GPD Pocket 3 | |
| AIDA64 / FP64 Ray-Trace | |
| GPD Win Max 2021 | |
| Media Intel Core i7-1260P (1237 - 5858, n=26) | |
| Lenovo Yoga 9 14IAP7 82LU0001US | |
| GPD Pocket 3 | |
| GPD Win Max 2 | |
| AIDA64 / CPU PhotoWorxx | |
| Lenovo Yoga 9 14IAP7 82LU0001US | |
| GPD Win Max 2 | |
| GPD Pocket 3 | |
| Media Intel Core i7-1260P (13261 - 43652, n=26) | |
| GPD Win Max 2021 | |
Prestazioni del sistema
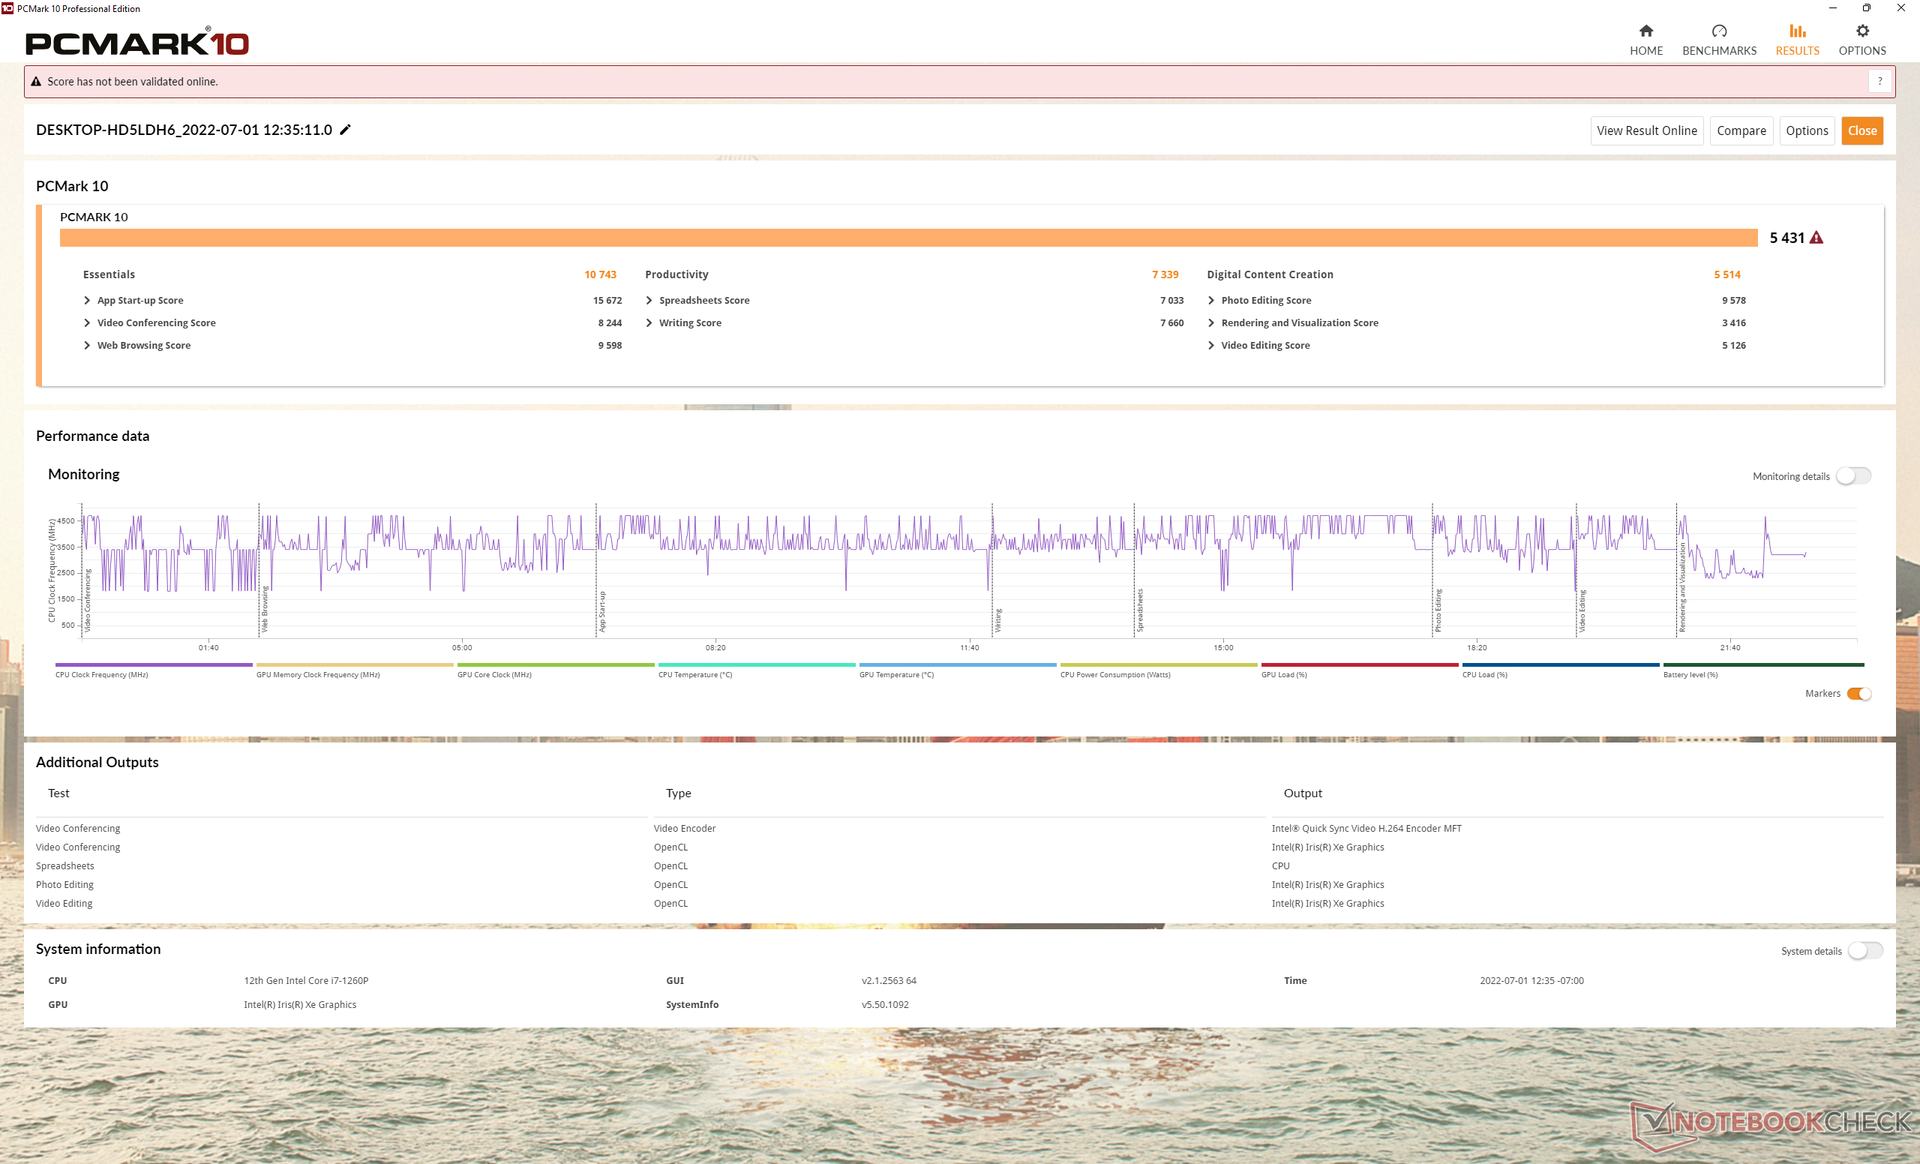
I punteggi di PCMark 10 sono generalmente superiori a quelli di qualsiasi prodotto GPD precedente al Win Max 2, per essere essenzialmente alla pari con computer portatili full-size come il Dell Inspiron 16 7620 2-in-1. È interessante notare che il Win Max originale, alimentato da AMD, ha un sottopunteggio di produttività più alto, probabilmente grazie alle prestazioni più veloci della CPU multi-thread.
CrossMark: Overall | Productivity | Creativity | Responsiveness
| PCMark 10 / Score | |
| Media Intel Core i7-1260P, Intel Iris Xe Graphics G7 96EUs (4796 - 6068, n=17) | |
| GPD Win Max 2 | |
| GPD Win Max 2021 | |
| GPD Pocket 3 | |
| GPD Win 3 | |
| Microsoft Surface Go 3 Core i3 | |
| Lenovo IdeaPad Flex 3 11IGL05 | |
| PCMark 10 / Essentials | |
| GPD Win Max 2 | |
| GPD Pocket 3 | |
| Media Intel Core i7-1260P, Intel Iris Xe Graphics G7 96EUs (9260 - 11251, n=17) | |
| GPD Win 3 | |
| GPD Win Max 2021 | |
| Microsoft Surface Go 3 Core i3 | |
| Lenovo IdeaPad Flex 3 11IGL05 | |
| PCMark 10 / Productivity | |
| GPD Win Max 2021 | |
| GPD Pocket 3 | |
| GPD Win Max 2 | |
| Media Intel Core i7-1260P, Intel Iris Xe Graphics G7 96EUs (6167 - 8629, n=17) | |
| GPD Win 3 | |
| Microsoft Surface Go 3 Core i3 | |
| Lenovo IdeaPad Flex 3 11IGL05 | |
| PCMark 10 / Digital Content Creation | |
| Media Intel Core i7-1260P, Intel Iris Xe Graphics G7 96EUs (5231 - 6908, n=17) | |
| GPD Win Max 2 | |
| GPD Win Max 2021 | |
| GPD Pocket 3 | |
| GPD Win 3 | |
| Microsoft Surface Go 3 Core i3 | |
| Lenovo IdeaPad Flex 3 11IGL05 | |
| CrossMark / Overall | |
| GPD Win Max 2 | |
| Media Intel Core i7-1260P, Intel Iris Xe Graphics G7 96EUs (1484 - 1811, n=16) | |
| CrossMark / Productivity | |
| GPD Win Max 2 | |
| Media Intel Core i7-1260P, Intel Iris Xe Graphics G7 96EUs (1486 - 1755, n=16) | |
| CrossMark / Creativity | |
| Media Intel Core i7-1260P, Intel Iris Xe Graphics G7 96EUs (1451 - 1872, n=16) | |
| GPD Win Max 2 | |
| CrossMark / Responsiveness | |
| GPD Win Max 2 | |
| Media Intel Core i7-1260P, Intel Iris Xe Graphics G7 96EUs (1253 - 1807, n=16) | |
| PCMark 10 Score | 5431 punti | |
Aiuto | ||
| AIDA64 / Memory Copy | |
| GPD Win Max 2 | |
| GPD Pocket 3 | |
| Media Intel Core i7-1260P (25125 - 71544, n=25) | |
| GPD Win Max 2021 | |
| AIDA64 / Memory Read | |
| GPD Win Max 2 | |
| Media Intel Core i7-1260P (24983 - 72065, n=25) | |
| GPD Pocket 3 | |
| GPD Win Max 2021 | |
| AIDA64 / Memory Write | |
| GPD Win Max 2 | |
| GPD Pocket 3 | |
| Media Intel Core i7-1260P (23512 - 66799, n=25) | |
| GPD Win Max 2021 | |
| AIDA64 / Memory Latency | |
| GPD Win Max 2021 | |
| GPD Win Max 2 | |
| GPD Pocket 3 | |
| Media Intel Core i7-1260P (77.9 - 118.4, n=21) | |
| Microsoft Surface Go 3 Core i3 | |
* ... Meglio usare valori piccoli
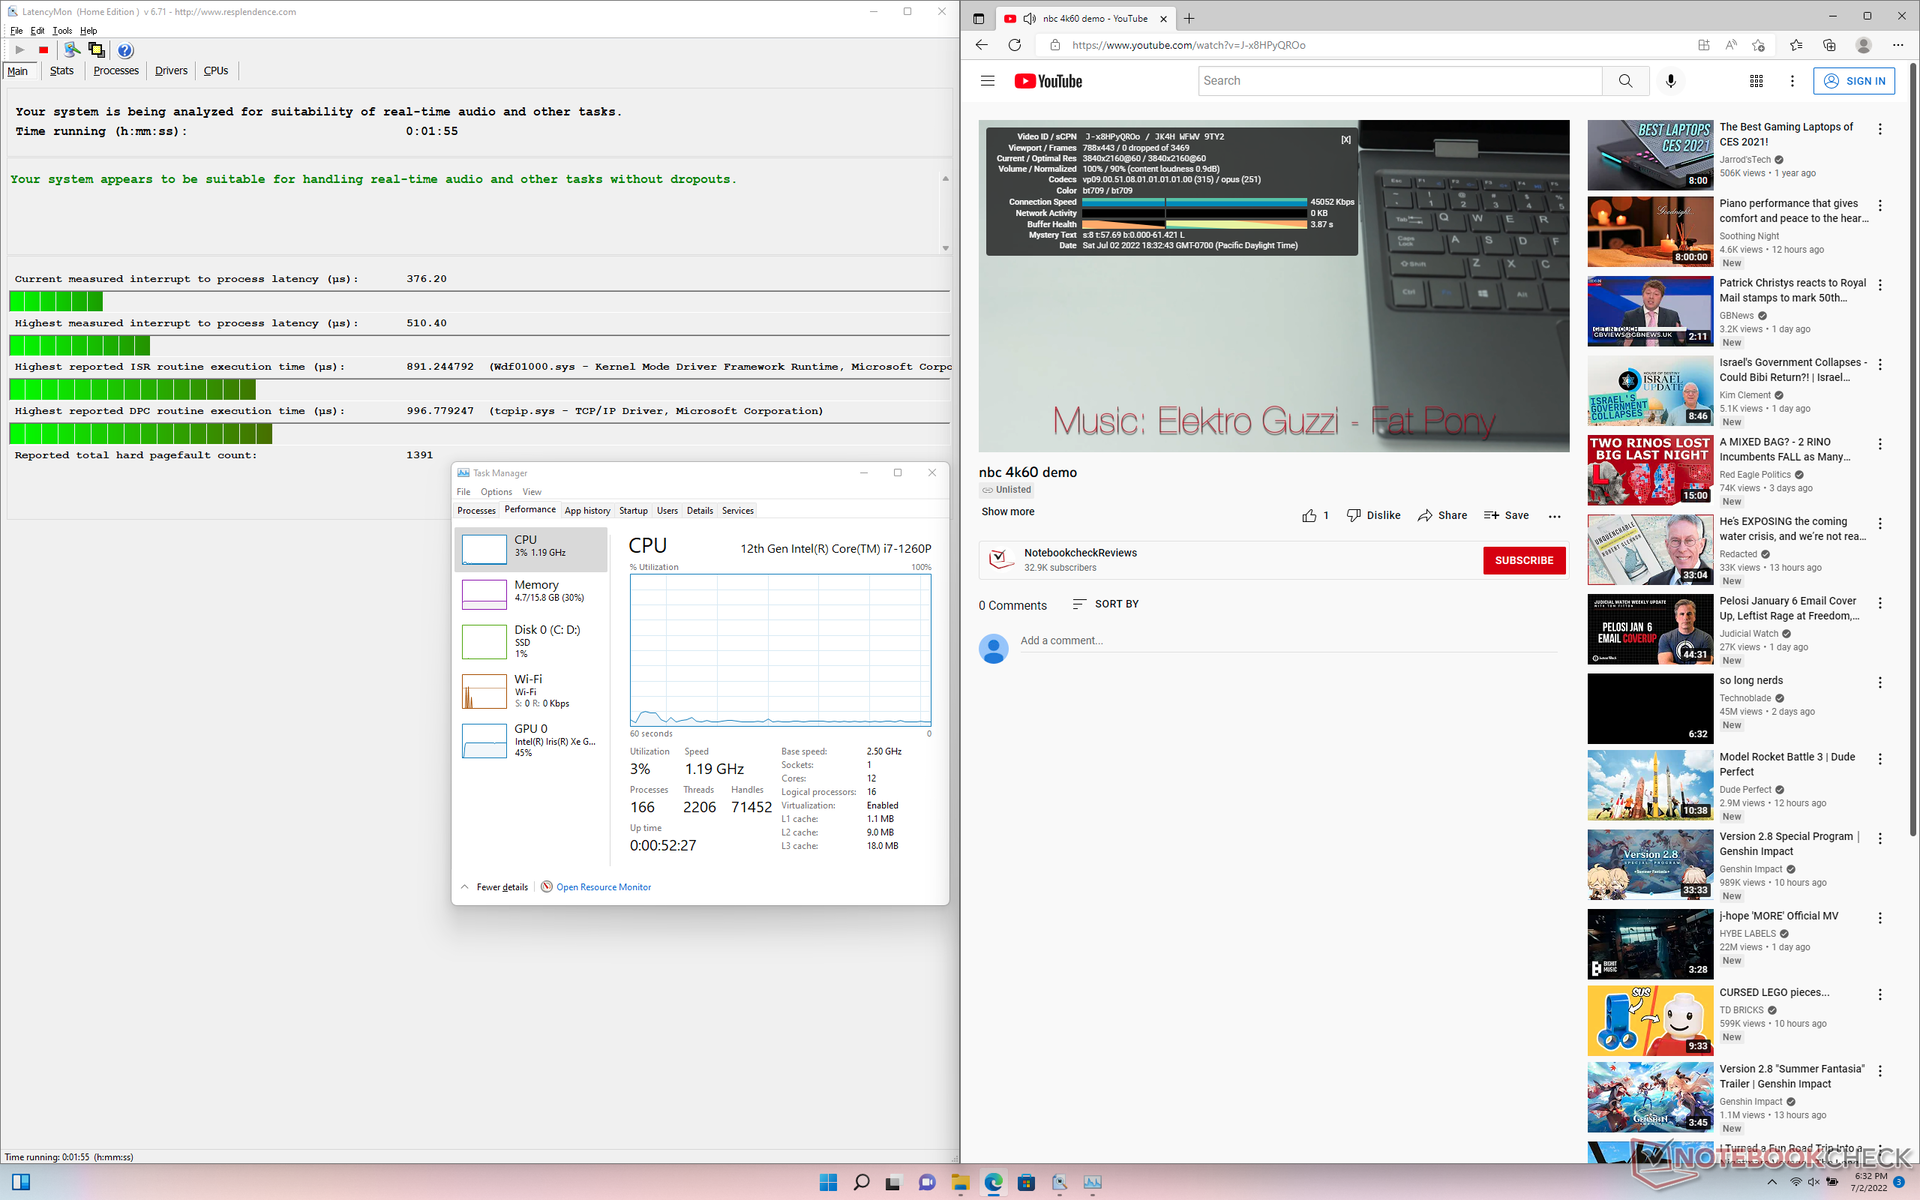
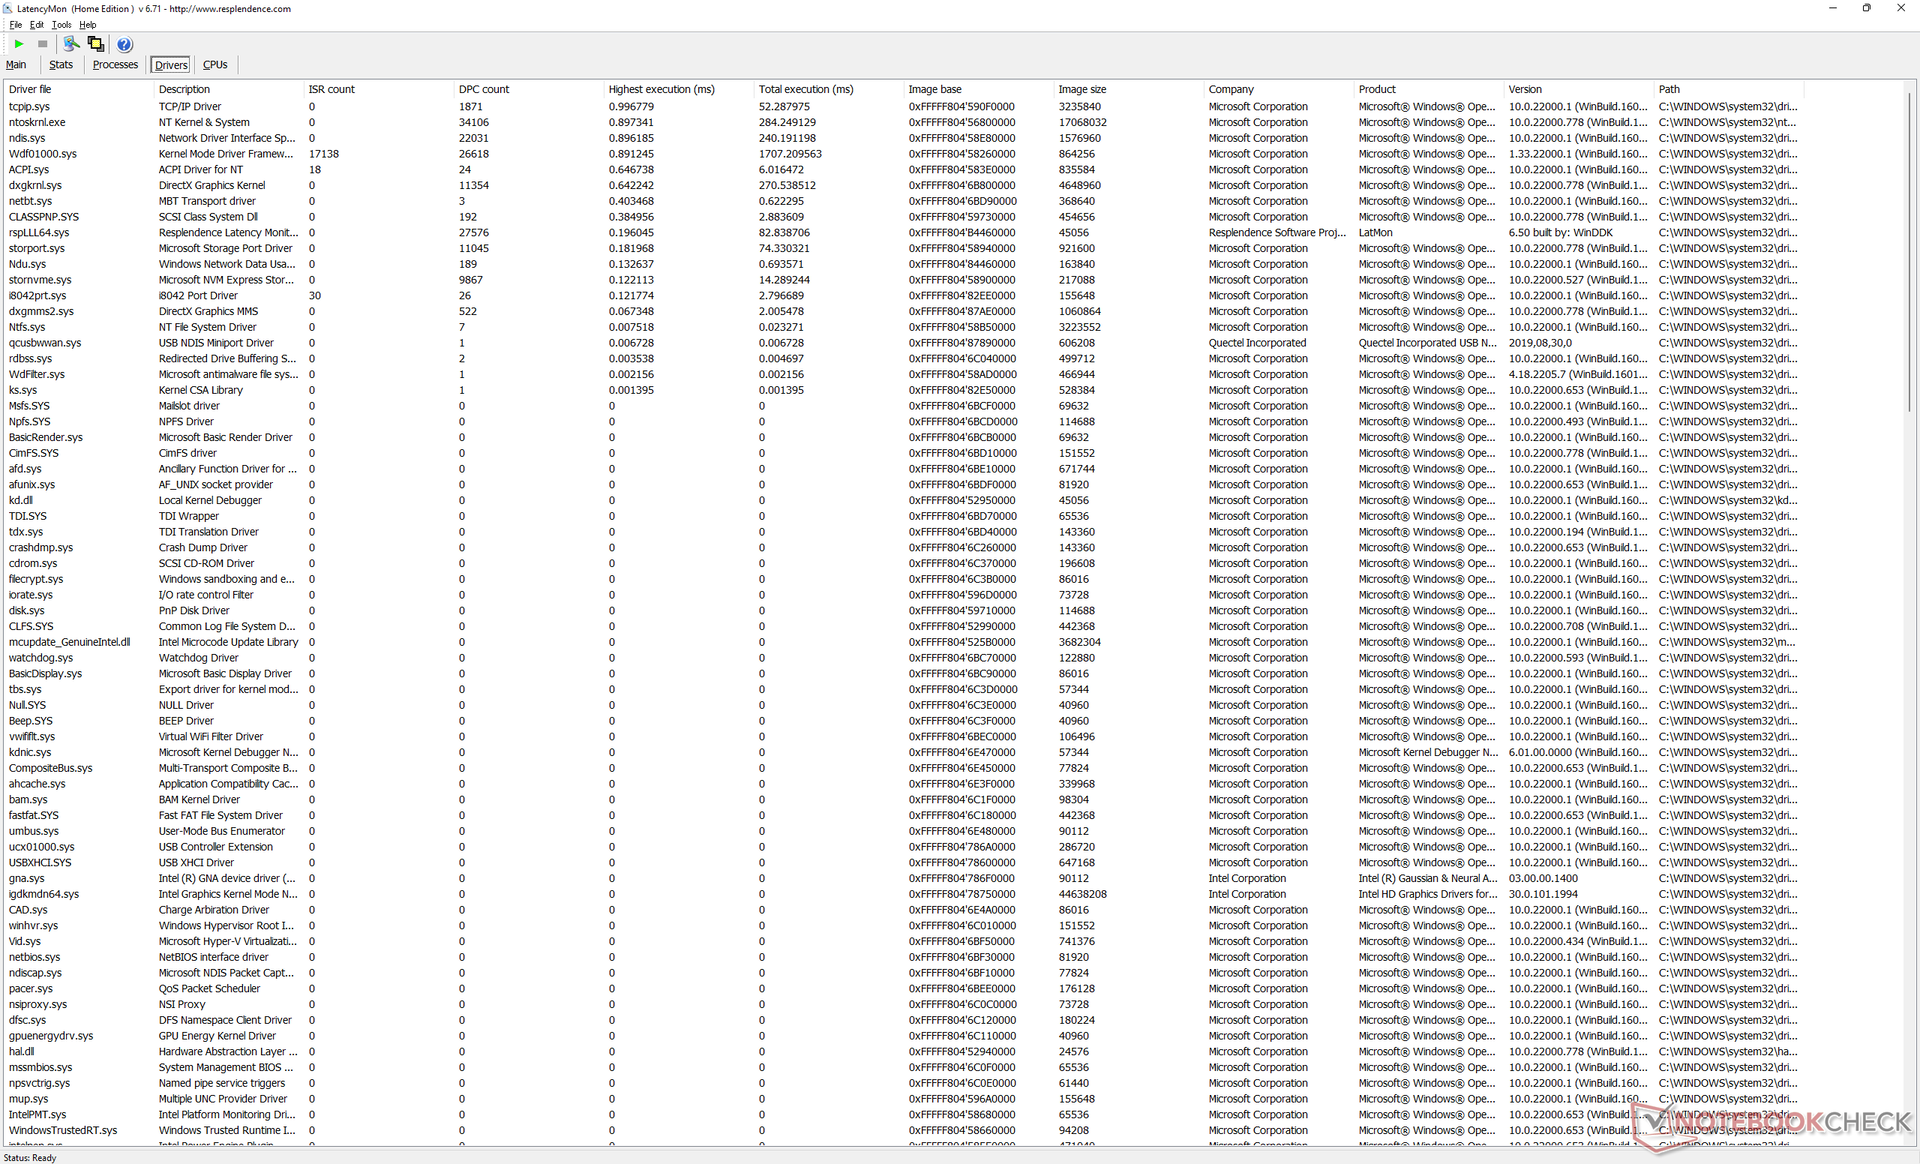
Latenza DPC
LatencyMon non mostra problemi di DPC quando si aprono più schede del browser sulla nostra homepage o quando si esegue Prime95. anche la riproduzione di video 4K a 60 FPS è fluida e non presenta cadute di fotogrammi.
| DPC Latencies / LatencyMon - interrupt to process latency (max), Web, Youtube, Prime95 | |
| Microsoft Surface Go 3 Core i3 | |
| GPD Win Max 2021 | |
| Lenovo IdeaPad Flex 3 11IGL05 | |
| GPD Win 3 | |
| GPD Pocket 3 | |
| GPD Win Max 2 | |
* ... Meglio usare valori piccoli
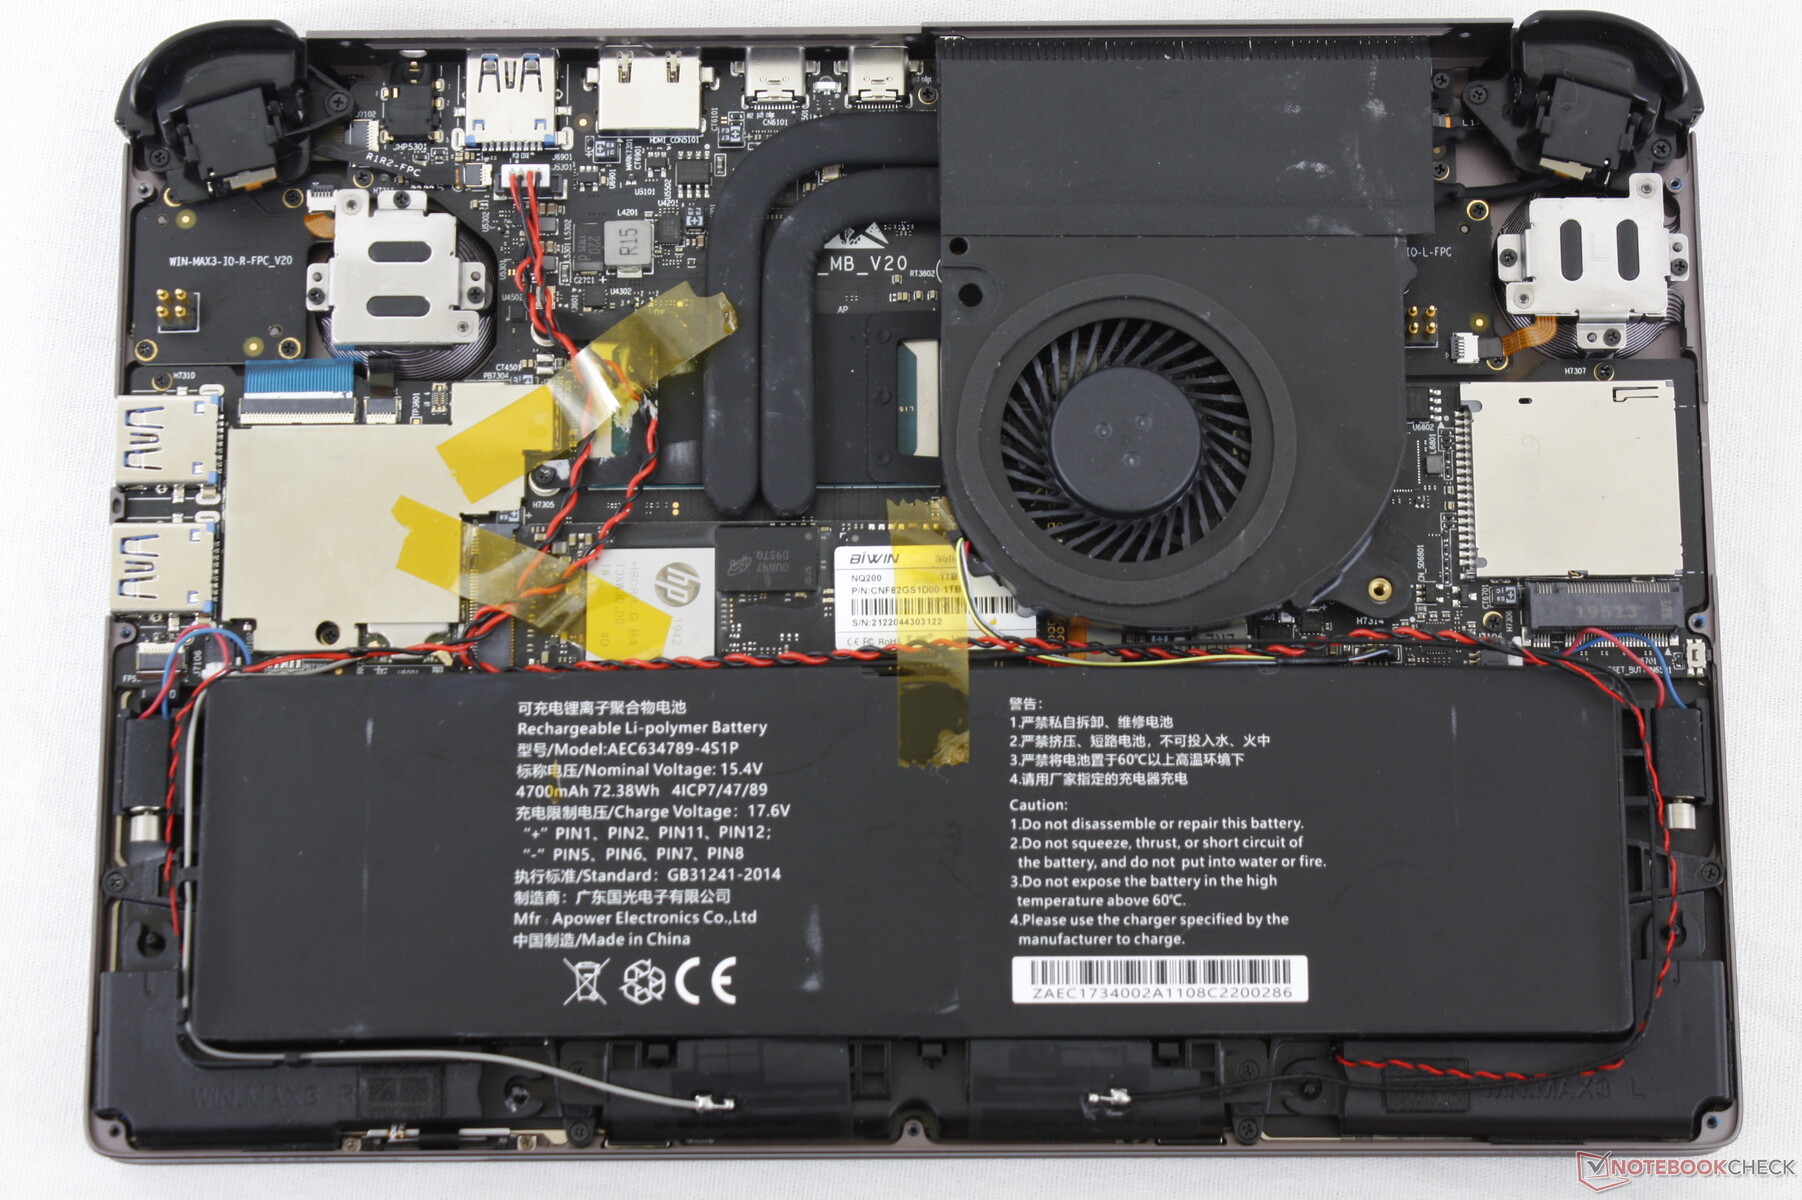
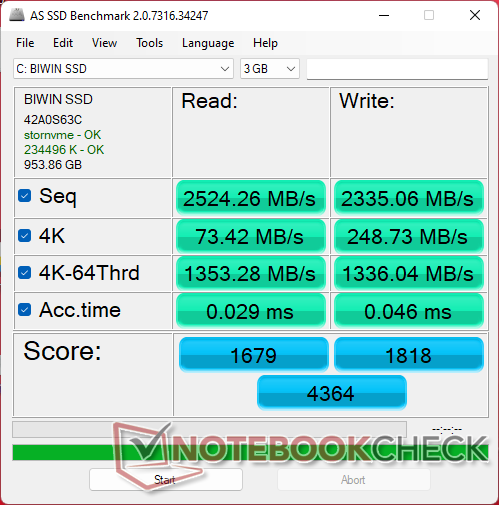
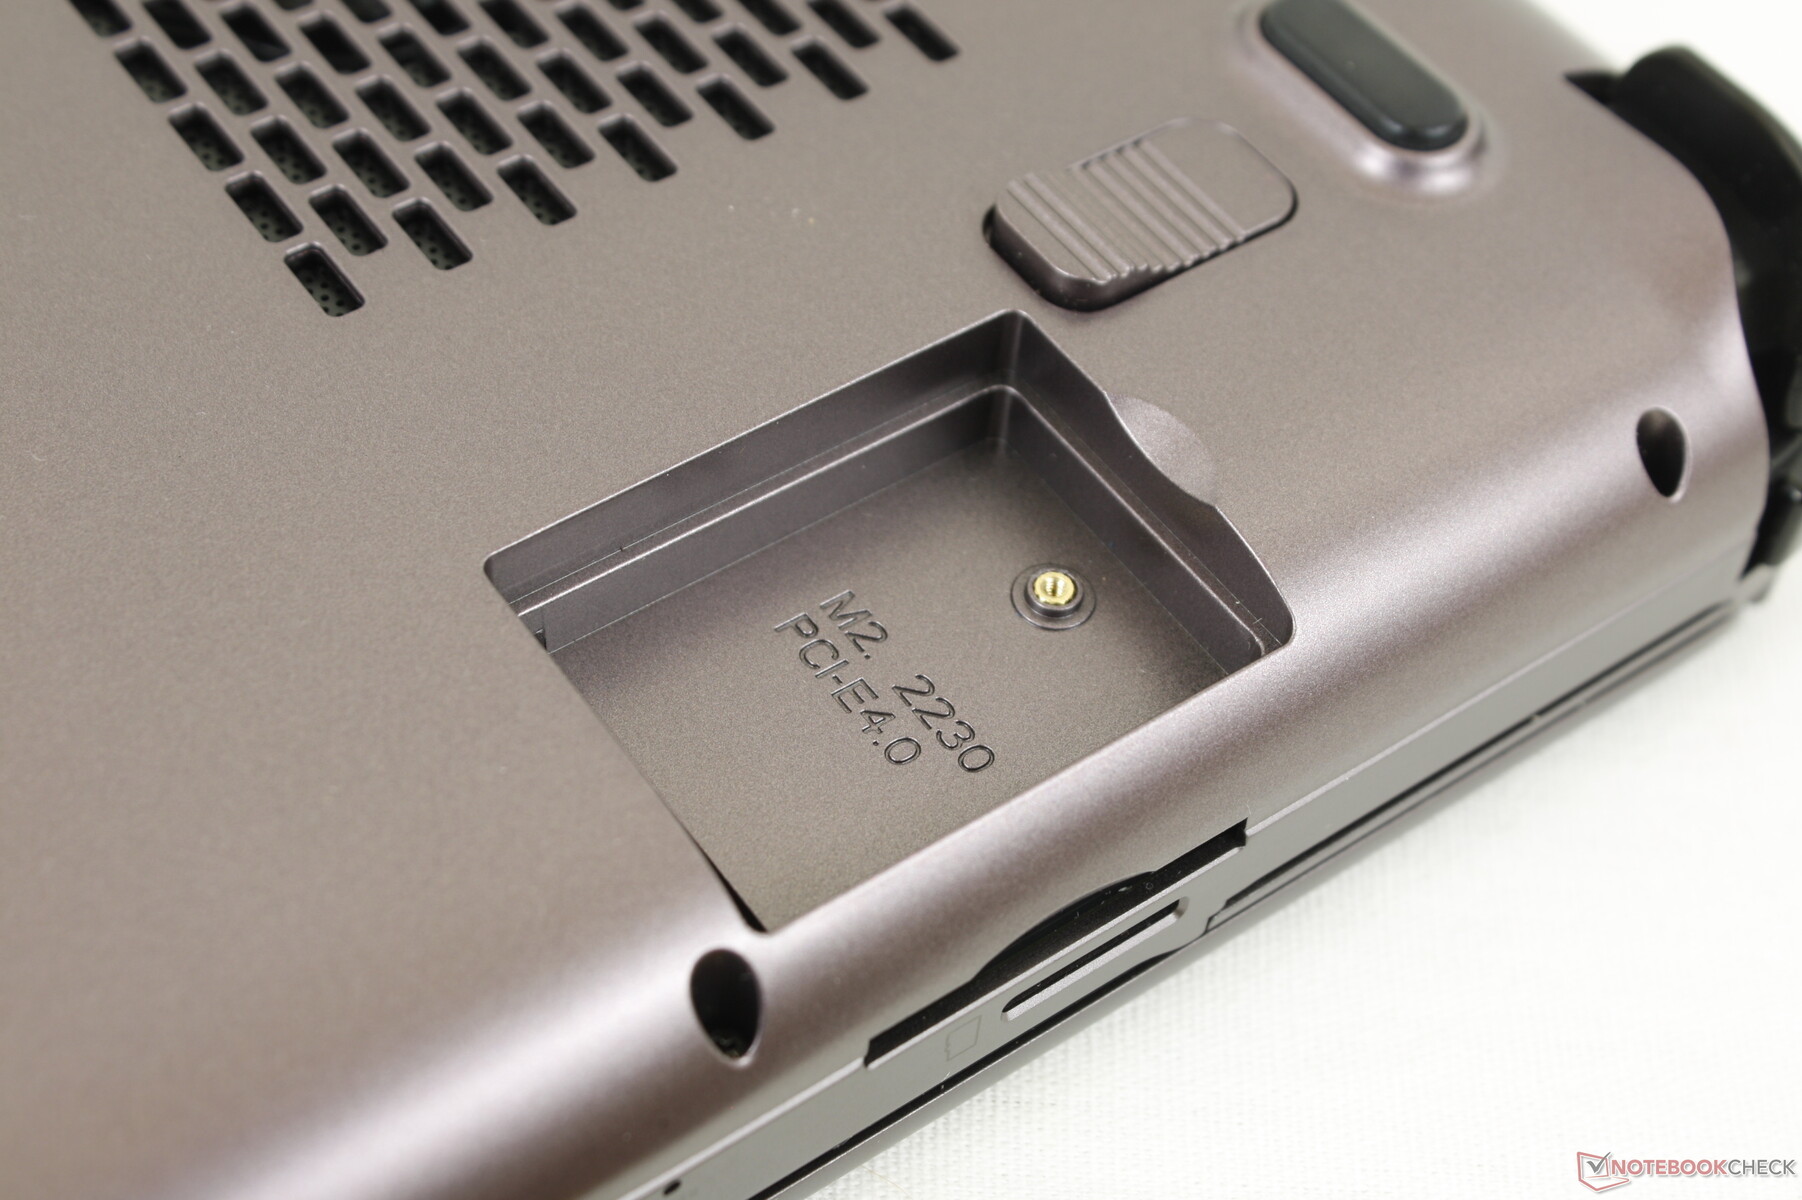
Dispositivi di archiviazione - Supporto PCIe3 e PCIe4
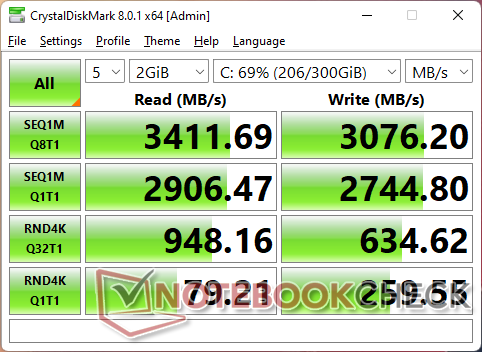
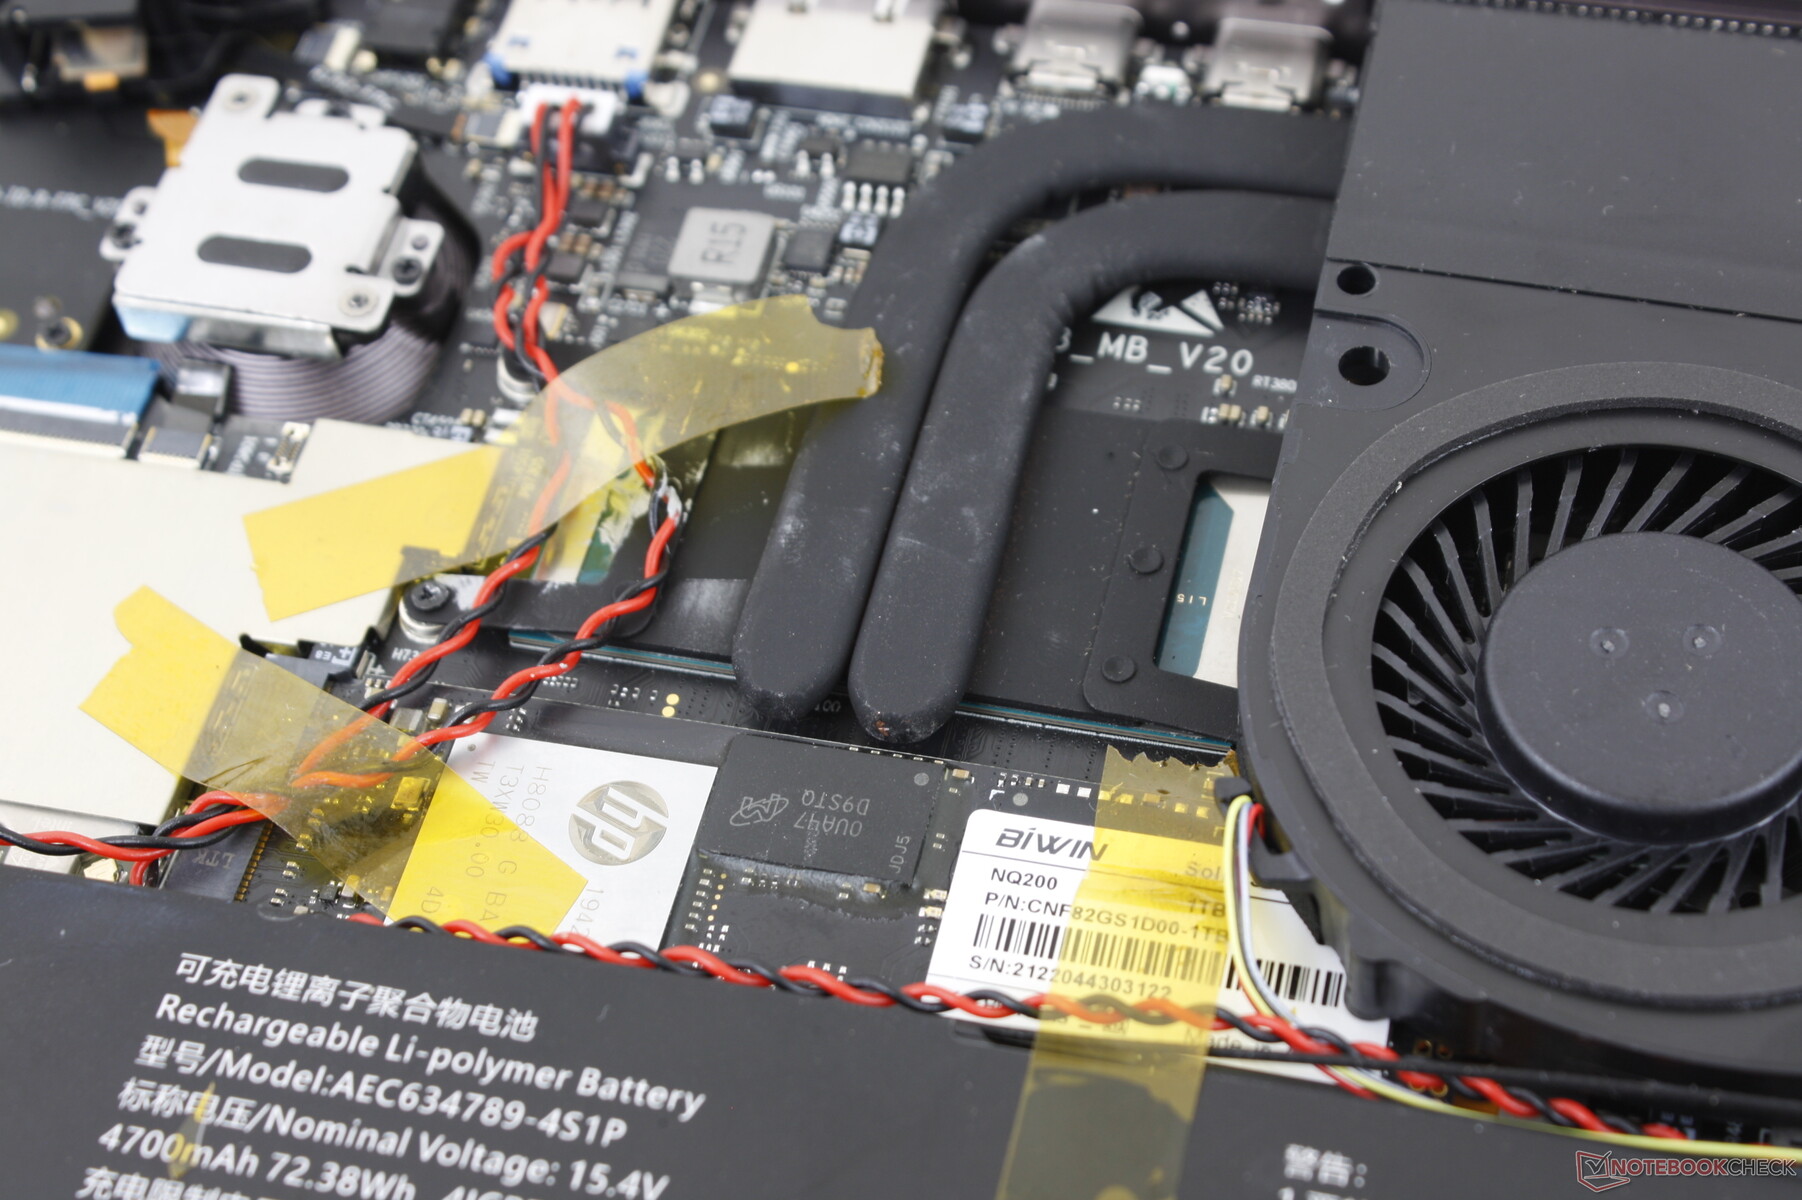
Il modello può supportare fino a due unità SSD PCIe4 x4, anche se la nostra unità è stata fornita con un'unità BiWin NQ200 da 1 TB 1 TB BiWin NQ200 PCIe3 x4 da 1 TB. Nonostante ciò, la nostra unità PCIe3 avrebbe avuto problemi a sostenere velocità di trasferimento superiori a 3300 MB/s, come mostrato dal nostro test DiskSpd loop qui sotto, a causa dei limiti termici. Se decidete di installare un'unità PCIe4 x4, non aspettatevi che funzioni alle specifiche massime pubblicizzate per lunghi periodi.

| Drive Performance rating - Percent | |
| GPD Win Max 2 | |
| Media BiWin NQ200 1TB CNF82GS1D00-1TB | |
| GPD Pocket 3 | |
| GPD Win 3 | |
| GPD Win Max 2021 | |
| Microsoft Surface Go 3 Core i3 | |
| Lenovo IdeaPad Flex 3 11IGL05 | |
* ... Meglio usare valori piccoli
Disk Throttling: DiskSpd Read Loop, Queue Depth 8
Prestazioni della GPU - Iris Xe è più lenta della Radeon 680M
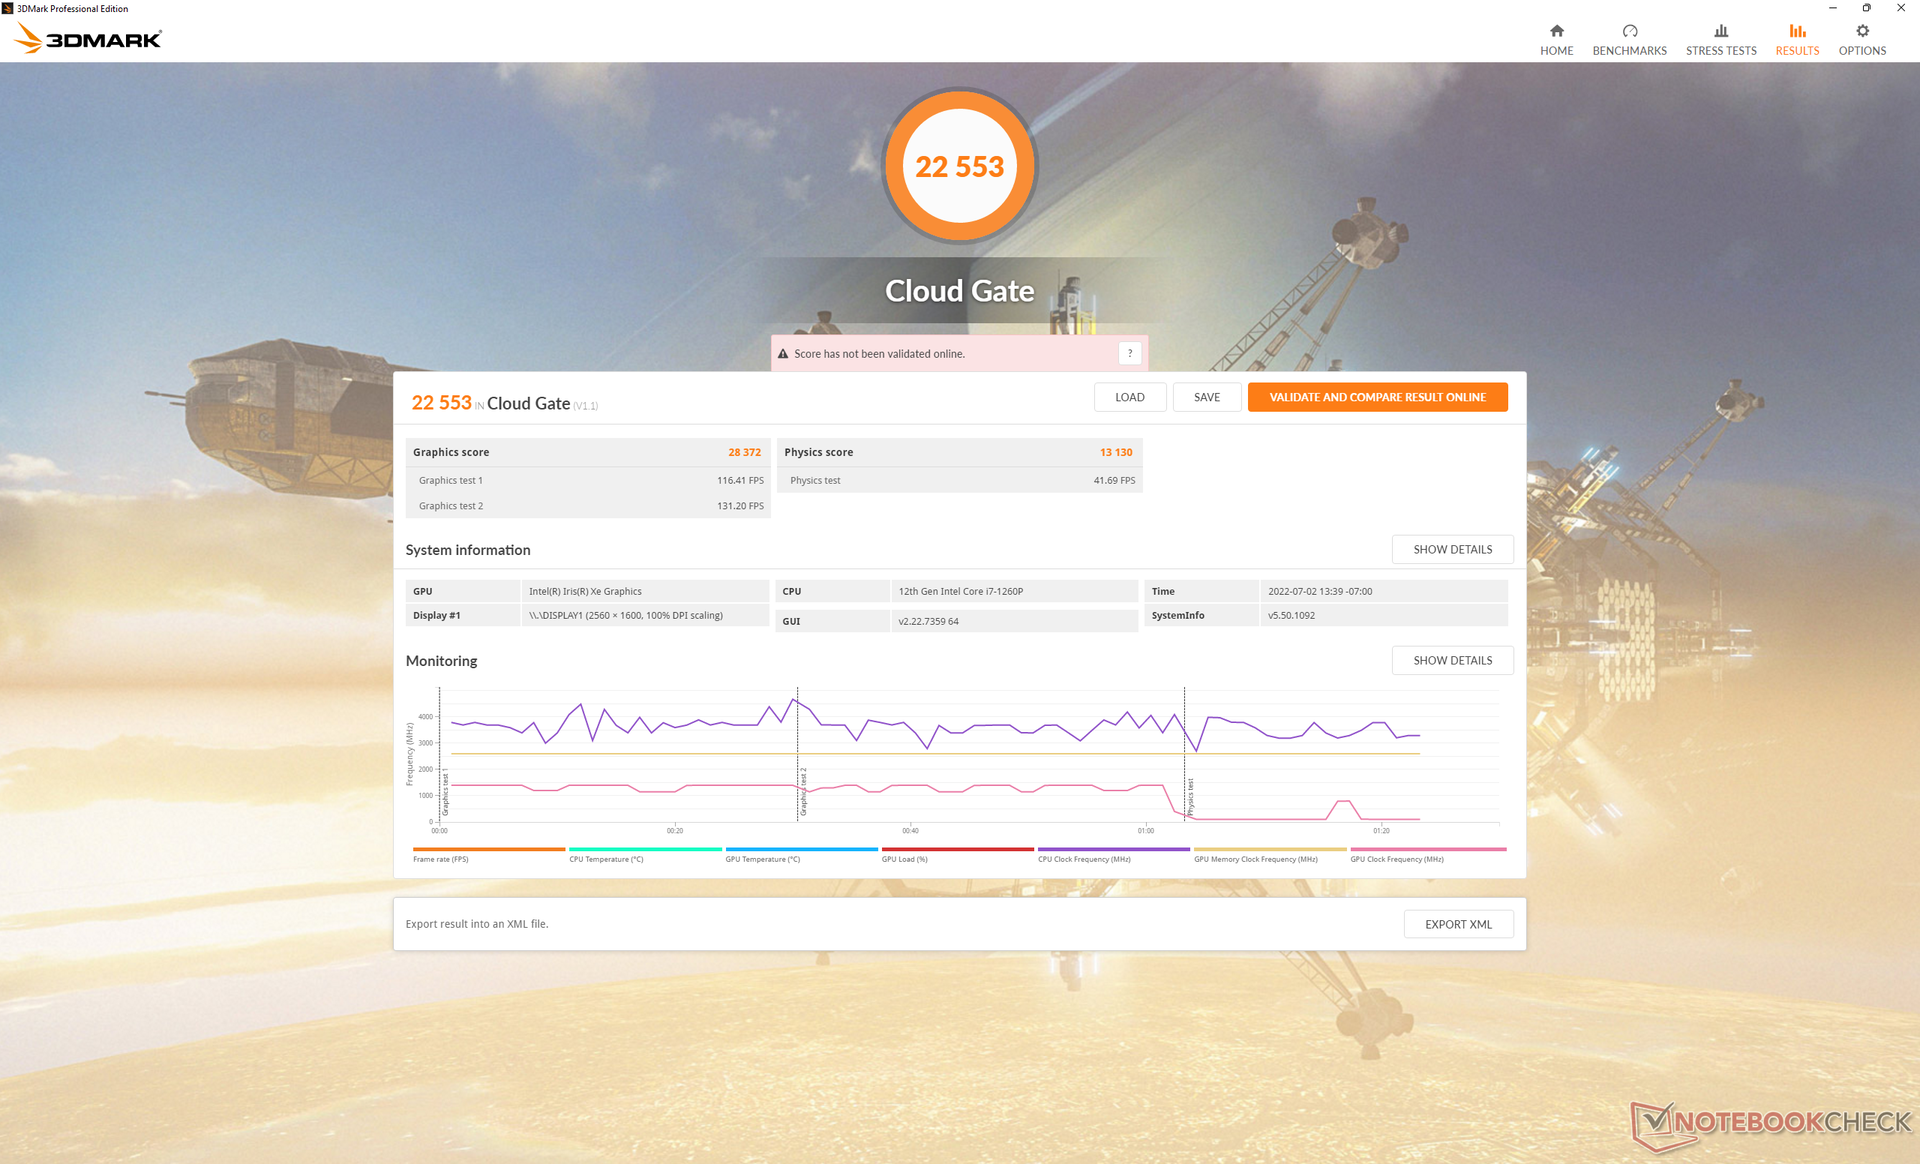
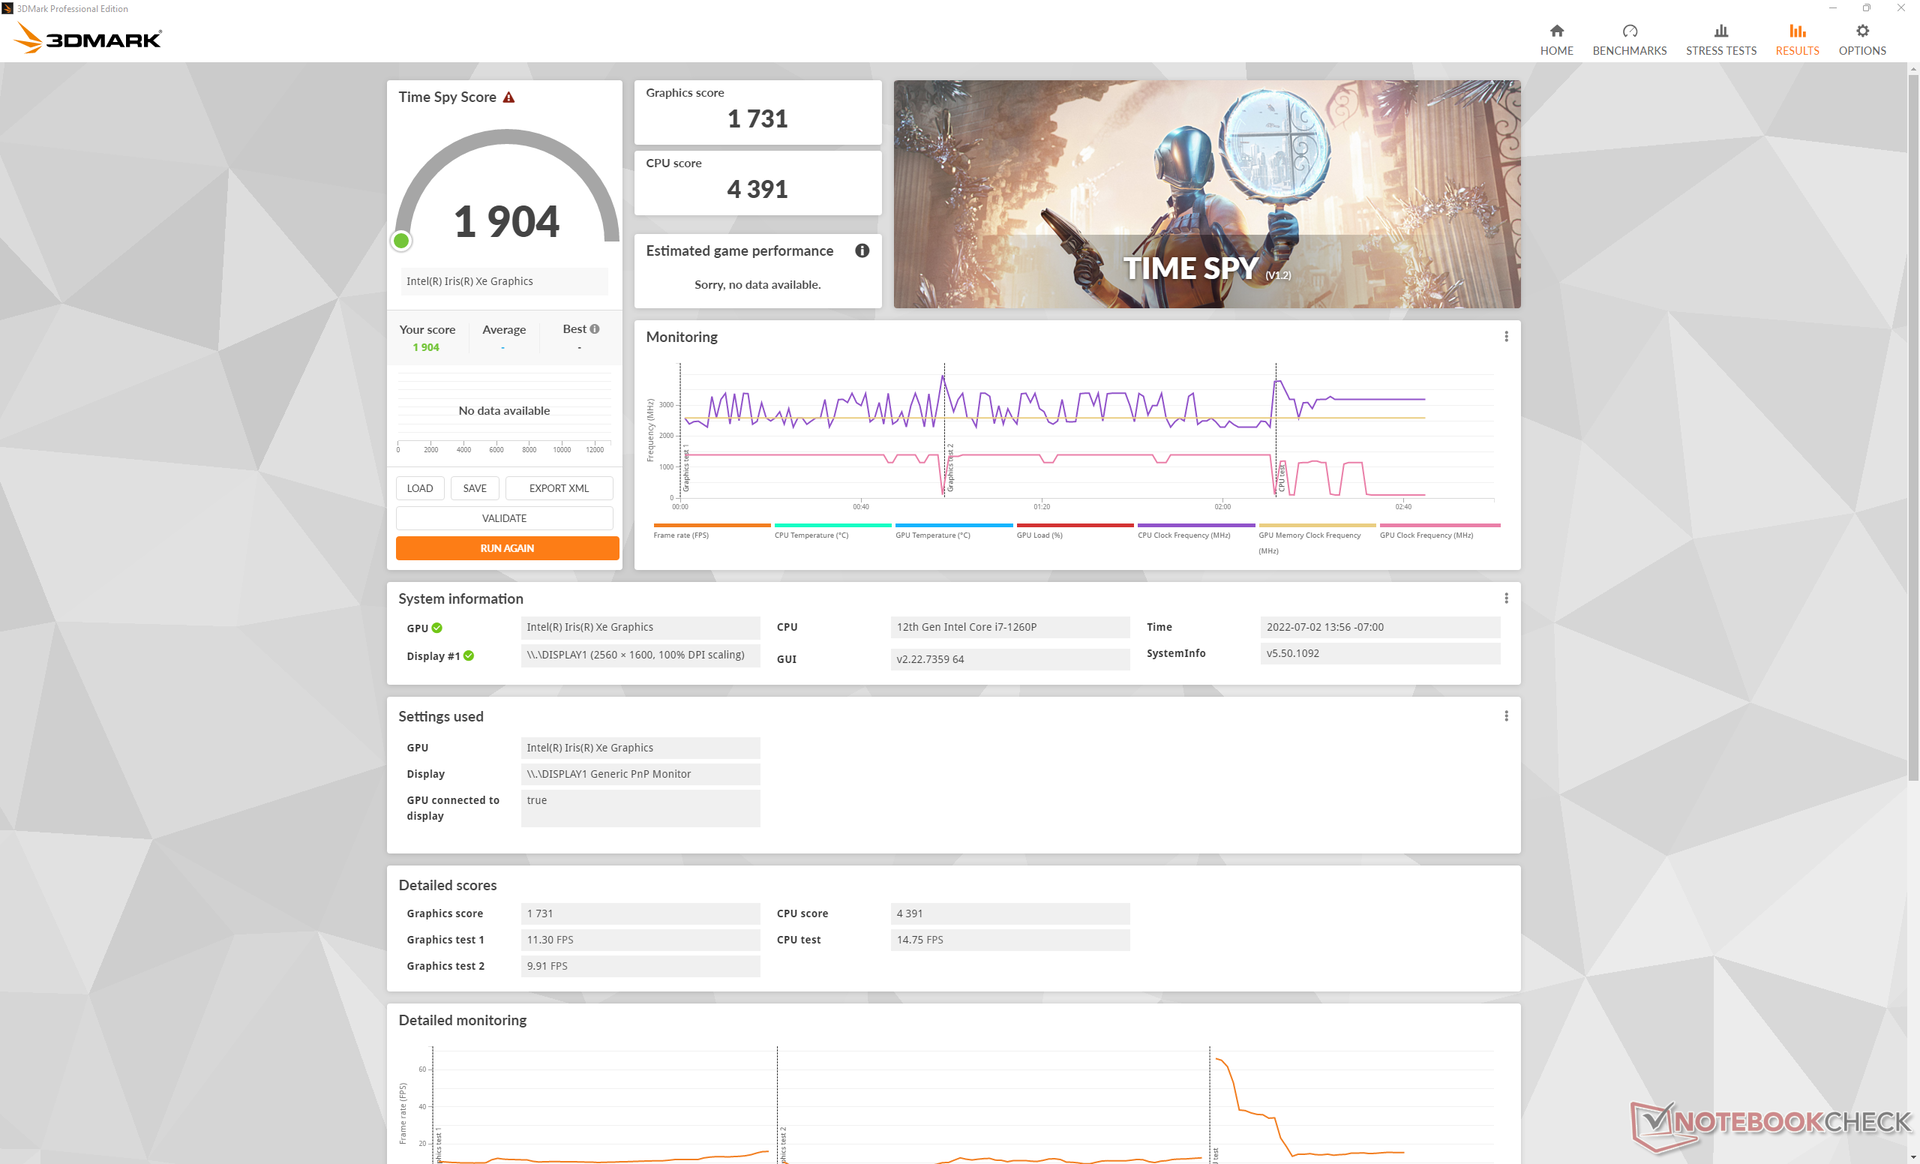
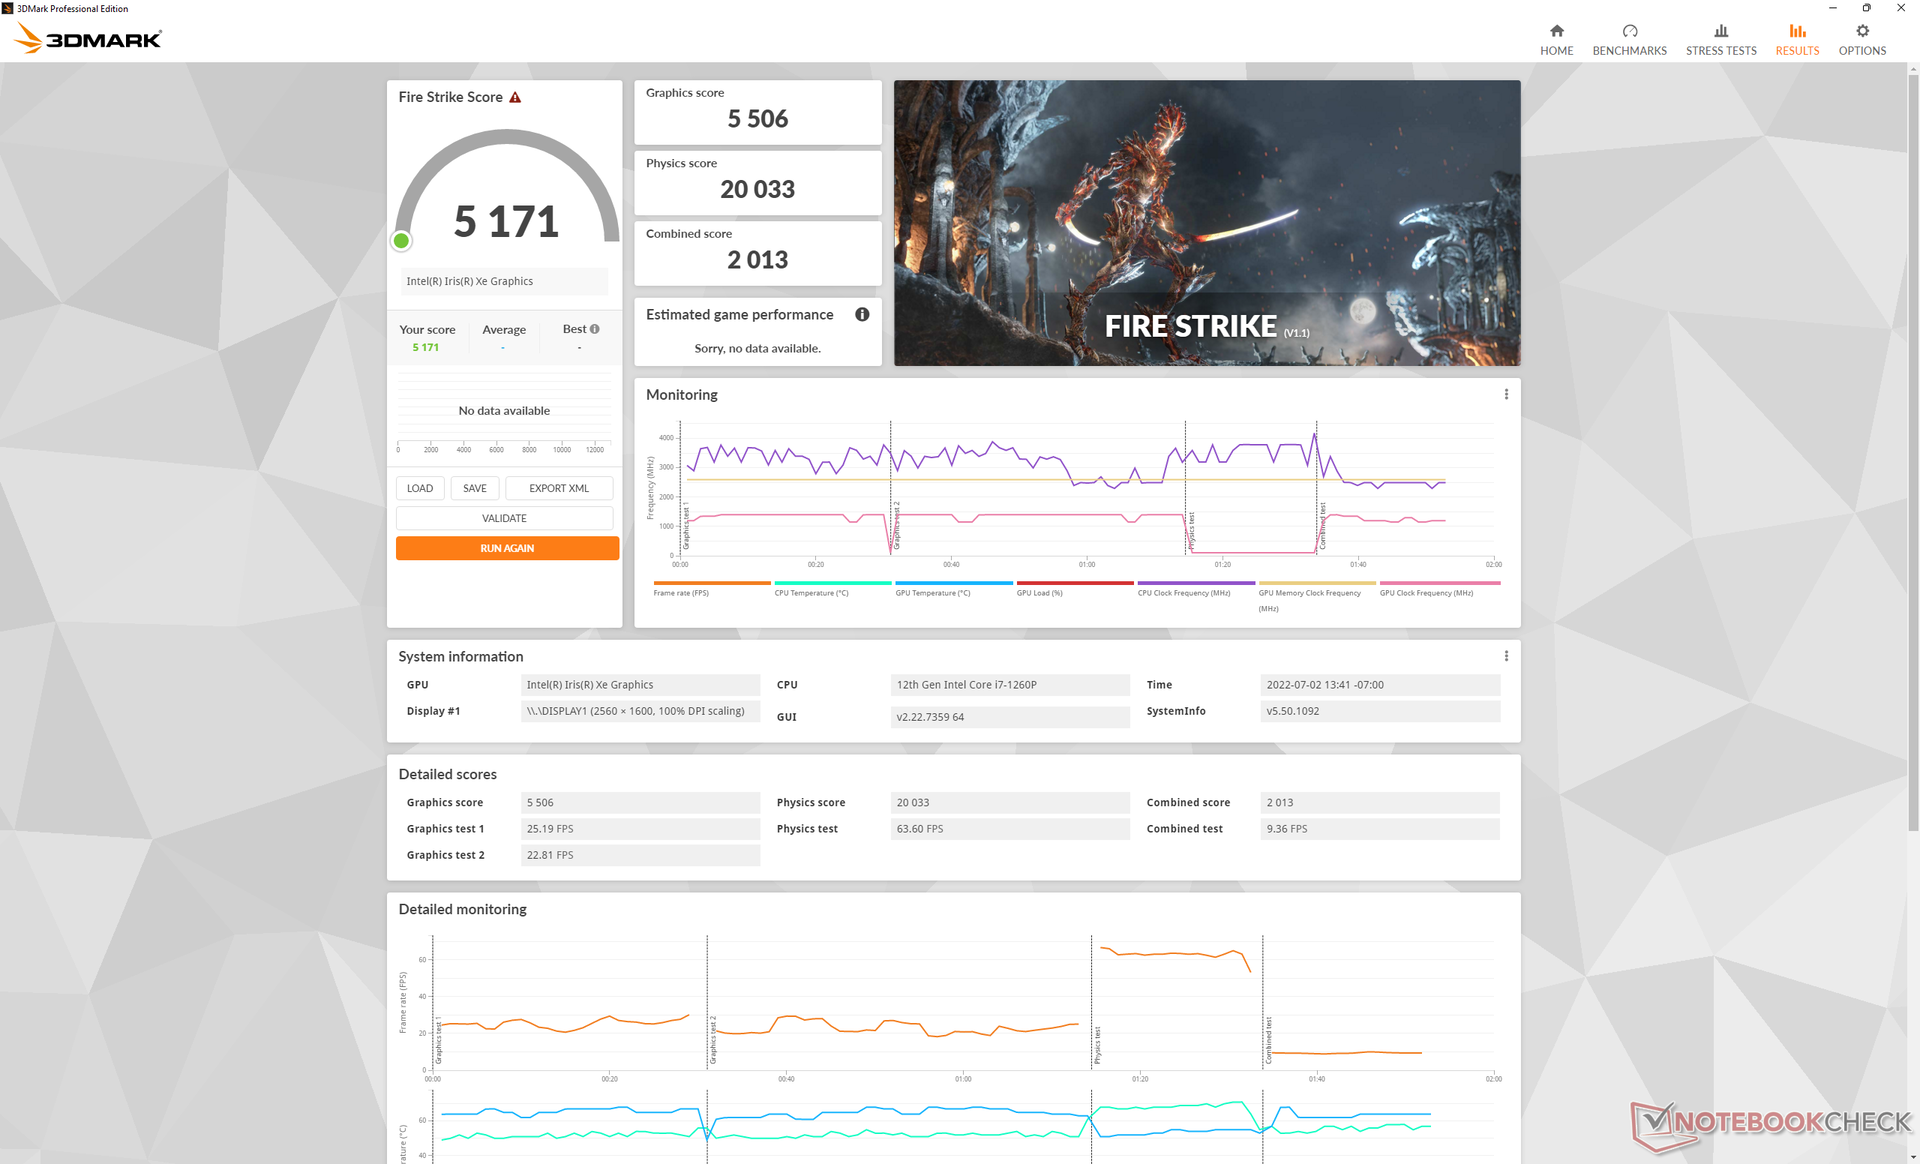
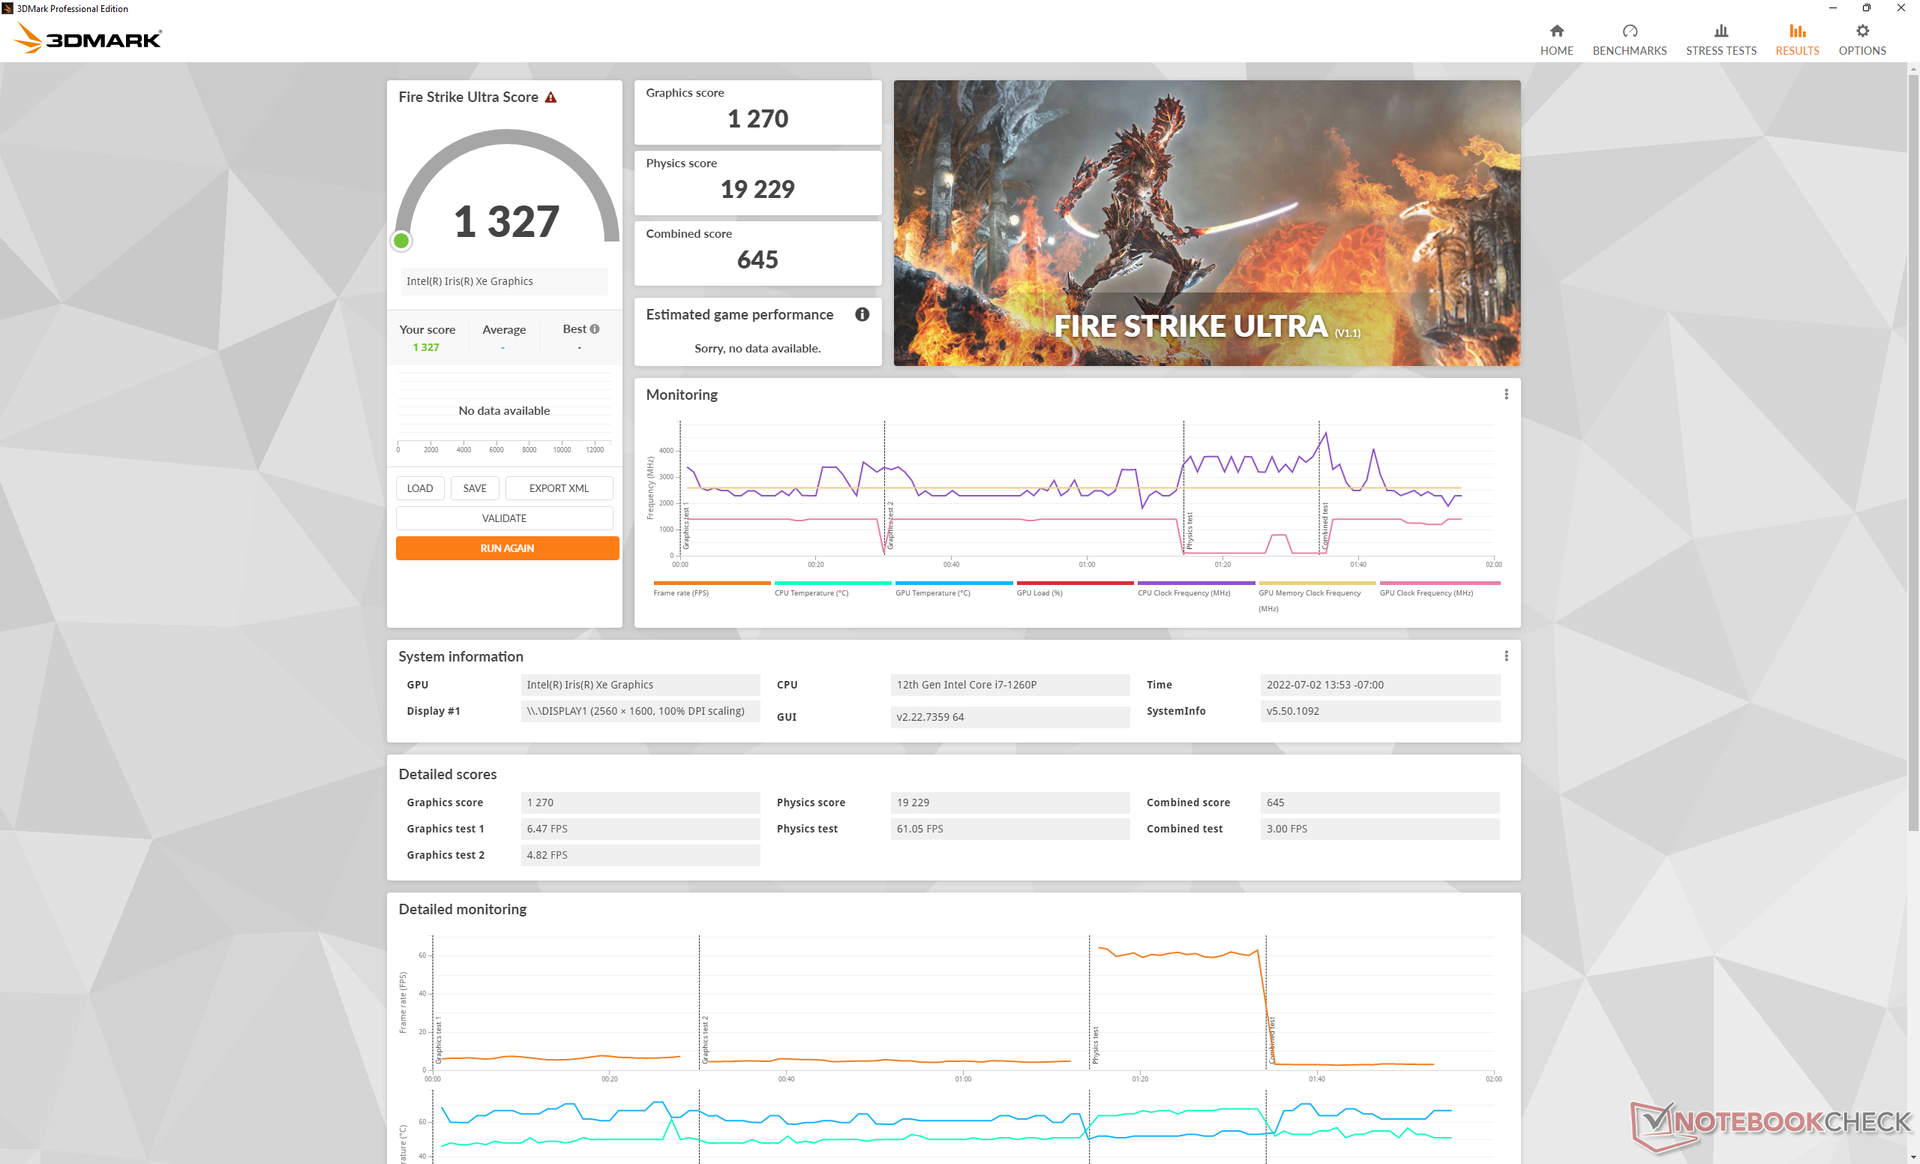
Nonostante le prestazioni della CPU siano più lente del previsto, le prestazioni grafiche rimangono eccellenti. i risultati di 3DMark sono superiori del 15-20% rispetto alla media dei portatili del nostro database equipaggiati con la stessa scheda grafica integrata Iris Xe 96 EUs GPU. Questo è sufficiente per poter eseguire alcuni vecchi giochi 3D a 1080p e 30 FPS con impostazioni medio-alte Witcher 3ma consigliamo di abbassare le impostazioni e di attivare il vsync per rendere più fluida l'esperienza di gioco. È un peccato che il display non supporti la sincronizzazione adattiva, perché questa funzione sarebbe stata di grande aiuto durante il gioco.
Se confrontato con il GPD Win 3 che funziona con la Iris Xe 80 EU, il nostro Win Max 2 può offrire prestazioni grafiche più veloci del 15-30%. Optando per la AMD Radeon 680M Aumenterà le prestazioni grafiche del 20-30% rispetto alla nostra SKU Intel.
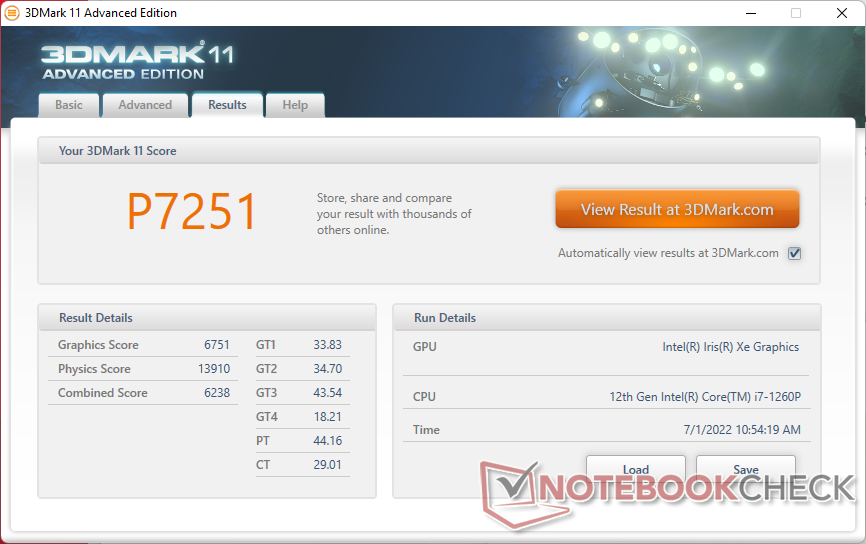
| 3DMark 11 Performance | 7251 punti | |
| 3DMark Cloud Gate Standard Score | 22553 punti | |
| 3DMark Fire Strike Score | 5171 punti | |
| 3DMark Time Spy Score | 1904 punti | |
Aiuto | ||
| Cyberpunk 2077 1.6 | |
| 1280x720 Low Preset | |
| Asus Zenbook S 13 OLED | |
| GPD Win Max 2 | |
| Media Intel Iris Xe Graphics G7 96EUs (20.6 - 44.7, n=17) | |
| 1920x1080 Low Preset | |
| Asus Zenbook S 13 OLED | |
| GPD Win Max 2 | |
| Media Intel Iris Xe Graphics G7 96EUs (13 - 25.9, n=42) | |
| 1920x1080 Medium Preset | |
| Asus Zenbook S 13 OLED | |
| GPD Win Max 2 | |
| Media Intel Iris Xe Graphics G7 96EUs (10.8 - 21.7, n=37) | |
| 1920x1080 High Preset | |
| Asus Zenbook S 13 OLED | |
| GPD Win Max 2 | |
| Media Intel Iris Xe Graphics G7 96EUs (9.8 - 16.9, n=34) | |
| 1920x1080 Ultra Preset | |
| Asus Zenbook S 13 OLED | |
| GPD Win Max 2 | |
| Media Intel Iris Xe Graphics G7 96EUs (7.4 - 16.8, n=32) | |
Witcher 3 FPS Chart
| basso | medio | alto | ultra | QHD | |
|---|---|---|---|---|---|
| GTA V (2015) | 107.9 | 95.2 | 23 | 9.96 | 6.6 |
| The Witcher 3 (2015) | 84.7 | 57 | 31.4 | 14.6 | |
| Dota 2 Reborn (2015) | 105.9 | 80.8 | 63.5 | 58.2 | |
| Final Fantasy XV Benchmark (2018) | 43.1 | 24.3 | 17.5 | ||
| X-Plane 11.11 (2018) | 47.7 | 35 | 32.2 | ||
| Strange Brigade (2018) | 85.1 | 42.1 | 33.8 | 27.3 | 20.1 |
| Cyberpunk 2077 1.6 (2022) | 20.4 | 17.3 | 13.3 | 10.7 |
Emissioni
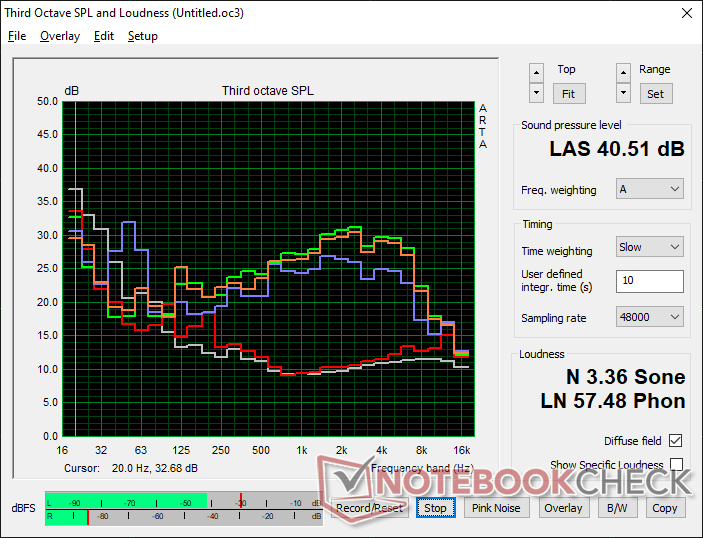
Rumore di sistema: decisamente più forte di quello di Nintendo Switch
Il rumore della ventola tende a rimanere tra i 22,7 dB(A) e i 28,5 dB(A) contro uno sfondo di 22,6 dB(A) durante la navigazione o lo streaming video. Sebbene non sia rumoroso o particolarmente fastidioso, le variazioni di RPM possono essere improvvise e percepibili.
Quando è in funzione Witcher 3 in modalità Turbo, il rumore della ventola raggiunge un massimo di 40 dB(A), molto più silenzioso rispetto a quello che abbiamo riscontrato sul Win Max 2021, dove il rumore della ventola poteva raggiungere i 49 dB(A). Il valore di 40 dB(A) è tipico di molti portatili della serie U quando vengono eseguiti carichi pesanti, ma il rumore è ancora più evidente sul Win Max 2 a causa dell'alta frequenza della ventola di piccolo diametro e del fatto che il dispositivo viene tenuto più vicino all'utente durante il gioco. Riteniamo che il livello di rumore sia accettabile in spazi pubblici come i treni.
Rumorosità
| Idle |
| 23.7 / 23.7 / 28.5 dB(A) |
| Sotto carico |
| 36.5 / 40.5 dB(A) |
 | ||
30 dB silenzioso 40 dB(A) udibile 50 dB(A) rumoroso |
||
min: | ||
| GPD Win Max 2 Iris Xe G7 96EUs, i7-1260P, BiWin NQ200 1TB CNF82GS1D00-1TB | GPD Pocket 3 Iris Xe G7 96EUs, i7-1195G7, BiWin NQ200 1TB CNF82GS1D00-1TB | GPD Win Max 2021 Vega 8, R7 4800U, BIWIN NS200 512GB CNF82GS1G00-512 | GPD Win 3 Iris Xe G7 80EUs, i5-1135G7, BIWIN NS200 1TB CNF82GS1G02-1TB | Lenovo Yoga 9 14IAP7 82LU0001US Iris Xe G7 96EUs, i7-1260P, Samsung PM9A1 MZVL2512HCJQ | |
|---|---|---|---|---|---|
| Noise | -2% | -13% | -15% | 1% | |
| off /ambiente * (dB) | 22.6 | 23.4 -4% | 23.3 -3% | 27.4 -21% | 22.9 -1% |
| Idle Minimum * (dB) | 23.7 | 24.3 -3% | 26.6 -12% | 29.1 -23% | 23.3 2% |
| Idle Average * (dB) | 23.7 | 25.6 -8% | 26.6 -12% | 29.1 -23% | 23.5 1% |
| Idle Maximum * (dB) | 28.5 | 25.6 10% | 26.6 7% | 29.1 -2% | 23.5 18% |
| Load Average * (dB) | 36.5 | 38.3 -5% | 46.9 -28% | 40.7 -12% | 33.2 9% |
| Witcher 3 ultra * (dB) | 39.8 | 40.7 -2% | 49 -23% | 42.8 -8% | 44.9 -13% |
| Load Maximum * (dB) | 40.5 | 40.7 -0% | 49.2 -21% | 46.3 -14% | 44.6 -10% |
* ... Meglio usare valori piccoli
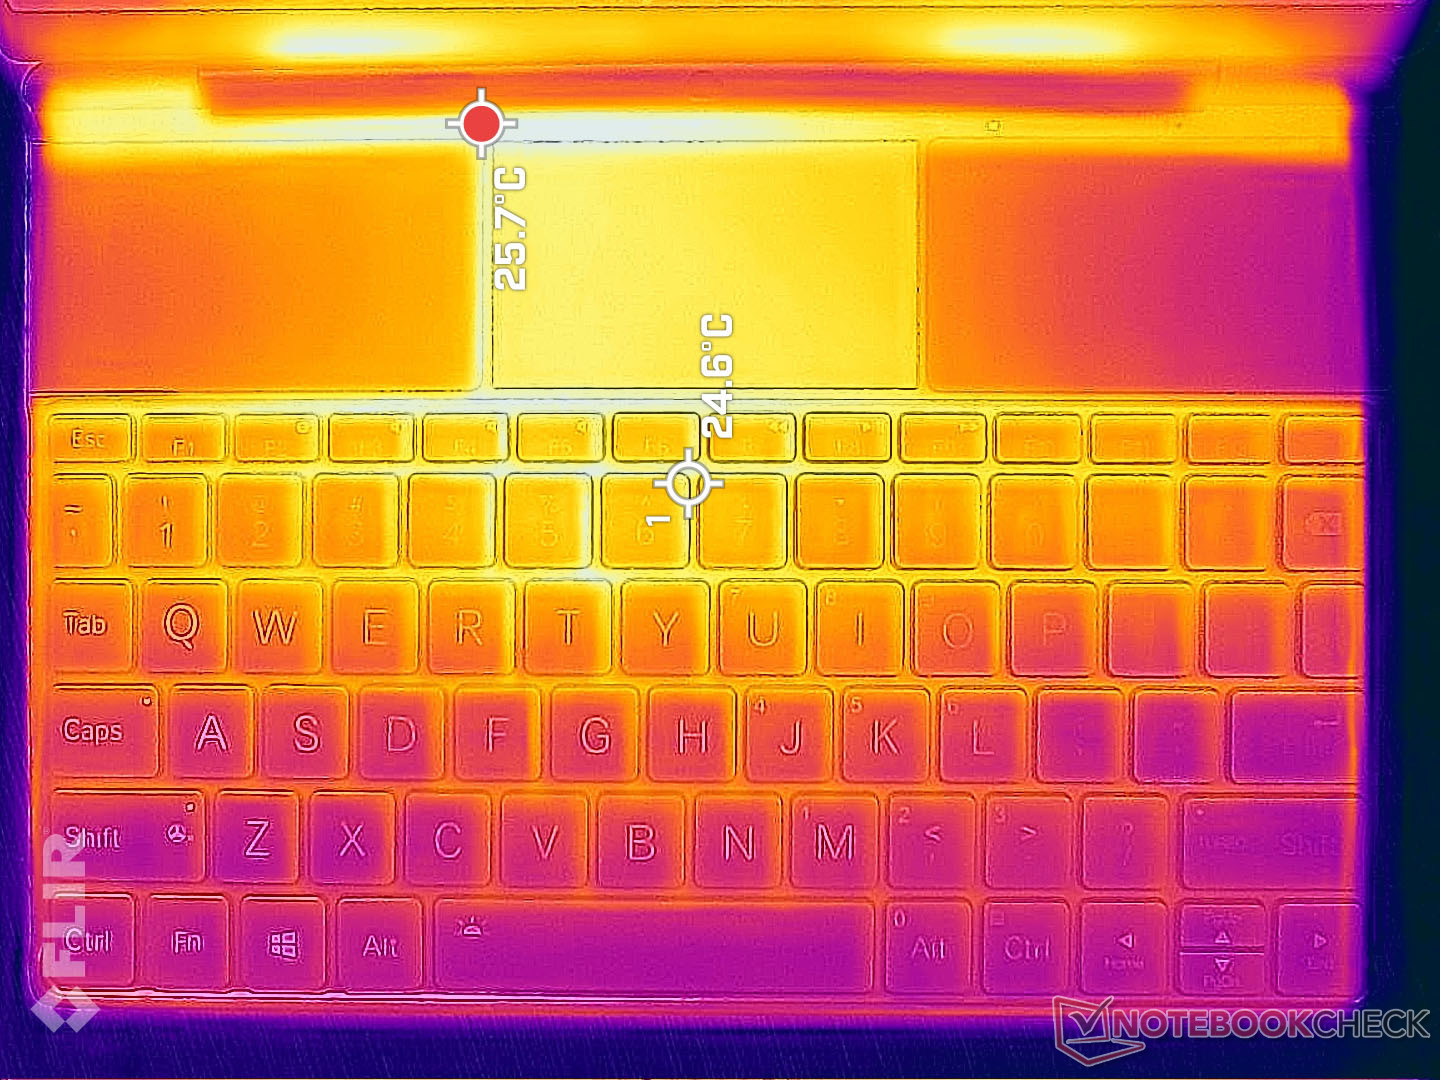
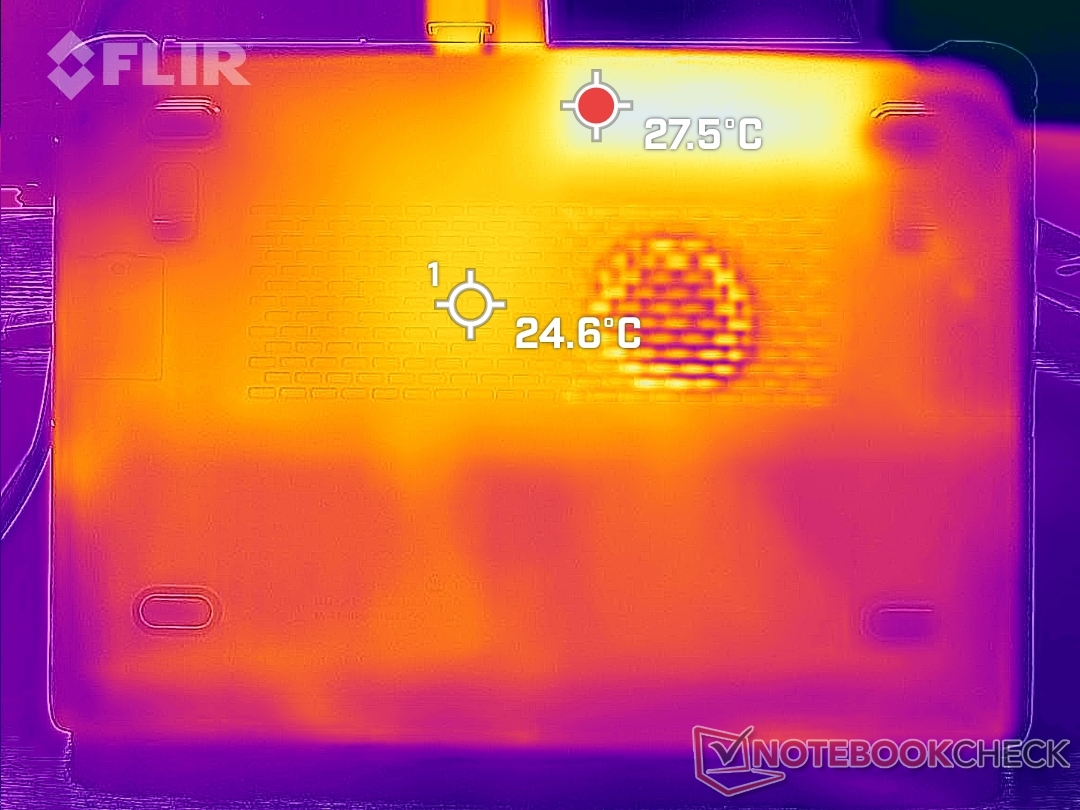
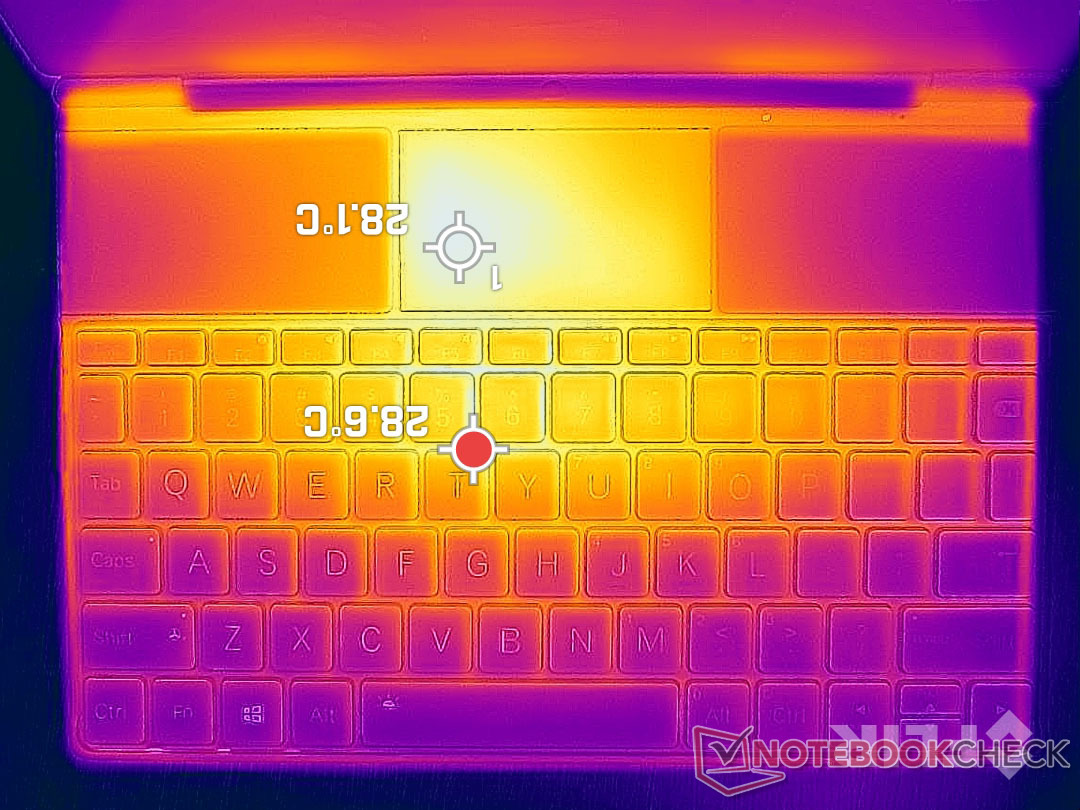
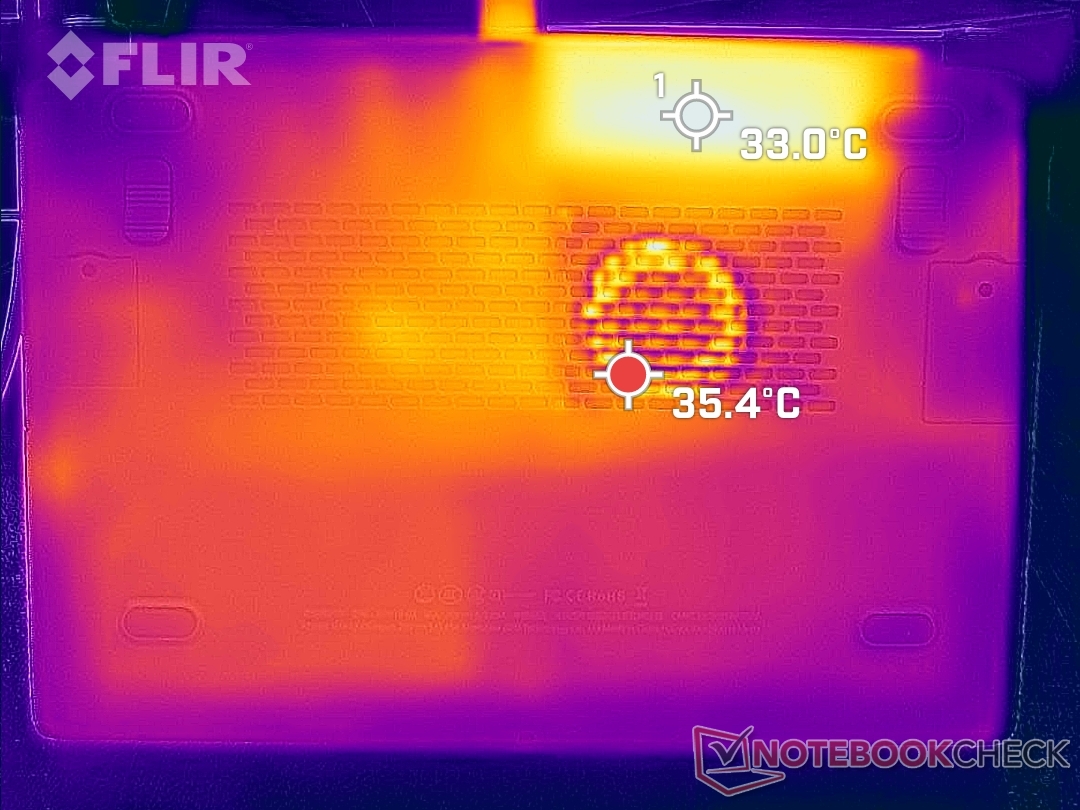
Temperatura: mai troppo calda
Proprio come abbiamo osservato sul Win Max 2021, il Win Max 2 2022 funziona in modo sorprendentemente fresco rispetto alle sue dimensioni ridotte e alla CPU della serie Core-P di 12a generazione. Durante il gioco, i punti caldi vicino alla parte posteriore dell'unità raggiungono rispettivamente 28 C e 33 C sui lati superiore e inferiore. Siamo in grado di gestire i joystick e i pulsanti integrati senza che questi risultino fastidiosamente caldi.
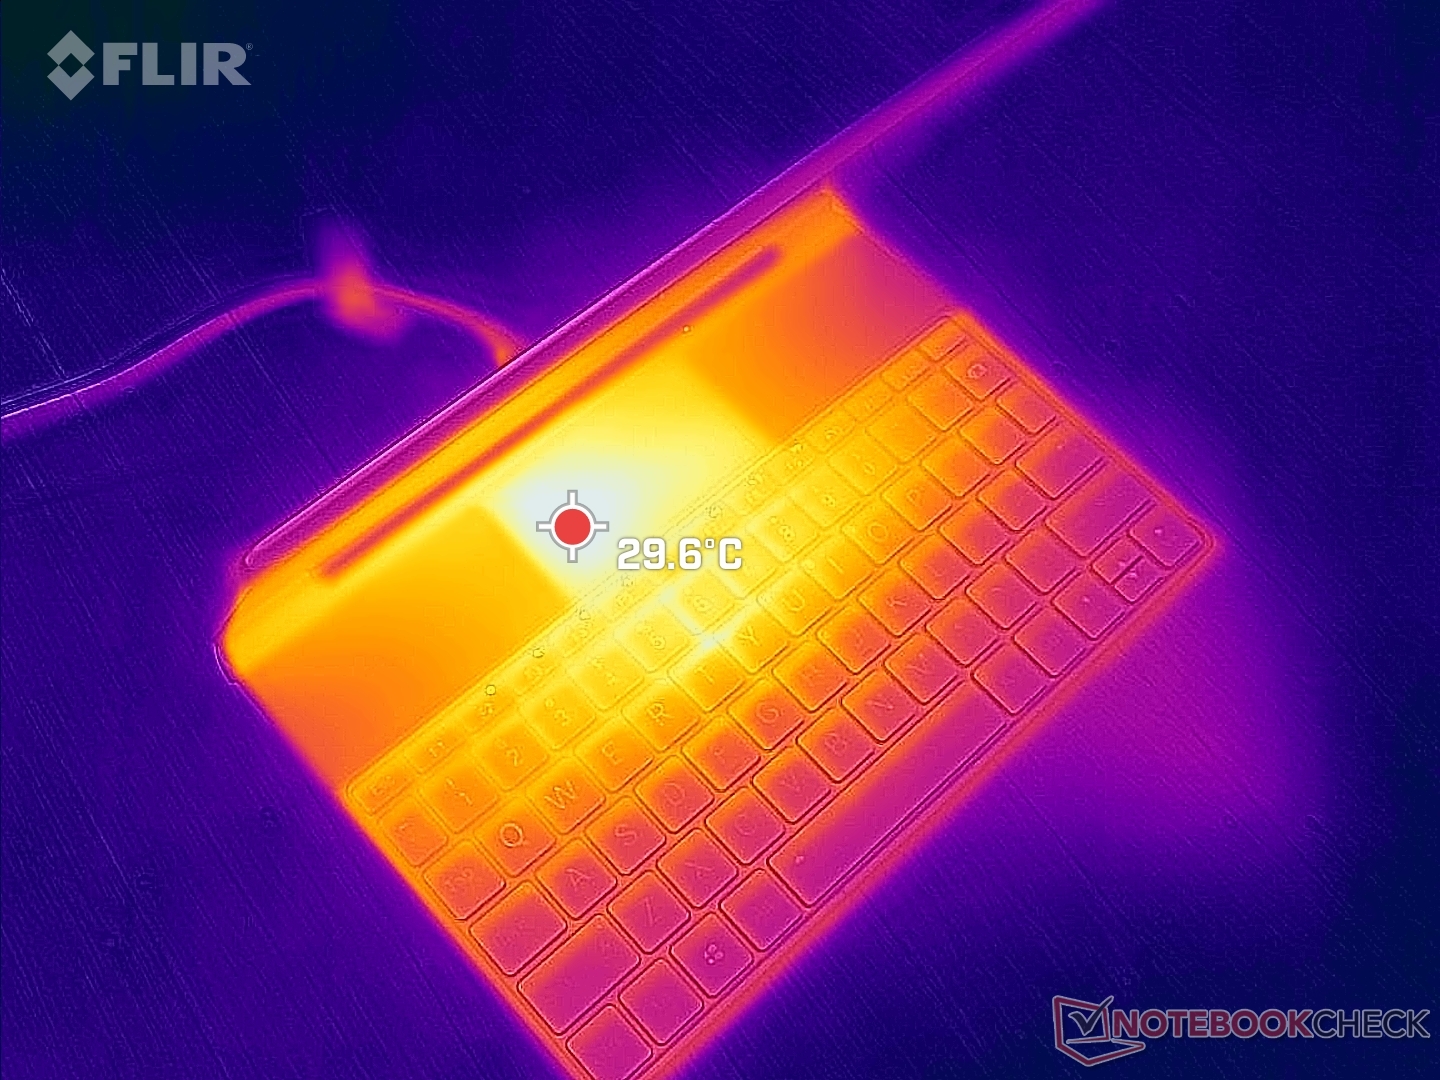
(+) La temperatura massima sul lato superiore è di 28.6 °C / 83 F, rispetto alla media di 35.9 °C / 97 F, che varia da 21.4 a 59 °C per questa classe Subnotebook.
(+) Il lato inferiore si riscalda fino ad un massimo di 33 °C / 91 F, rispetto alla media di 39.2 °C / 103 F
(+) In idle, la temperatura media del lato superiore è di 22.3 °C / 72 F, rispetto alla media deld ispositivo di 30.8 °C / 87 F.
(+) I poggiapolsi e il touchpad sono piu' freddi della temperatura della pelle con un massimo di 21.4 °C / 70.5 F e sono quindi freddi al tatto.
(+) La temperatura media della zona del palmo della mano di dispositivi simili e'stata di 28.2 °C / 82.8 F (+6.8 °C / 12.3 F).
| GPD Win Max 2 Intel Core i7-1260P, Intel Iris Xe Graphics G7 96EUs | GPD Pocket 3 Intel Core i7-1195G7, Intel Iris Xe Graphics G7 96EUs | GPD Win Max 2021 AMD Ryzen 7 4800U, AMD Radeon RX Vega 8 (Ryzen 4000/5000) | Microsoft Surface Go 3 Core i3 Intel Core i3-10100Y, Intel UHD Graphics 615 | Lenovo IdeaPad Flex 3 11IGL05 Intel Celeron N4020, Intel UHD Graphics 600 | |
|---|---|---|---|---|---|
| Heat | -30% | -17% | -21% | -16% | |
| Maximum Upper Side * (°C) | 28.6 | 40.4 -41% | 38 -33% | 46.1 -61% | 37.4 -31% |
| Maximum Bottom * (°C) | 33 | 39.4 -19% | 36.4 -10% | 42.7 -29% | 41.4 -25% |
| Idle Upper Side * (°C) | 24.6 | 32.6 -33% | 30 -22% | 25 -2% | 27.2 -11% |
| Idle Bottom * (°C) | 27.6 | 34.4 -25% | 28 -1% | 25 9% | 27 2% |
* ... Meglio usare valori piccoli
Stress test
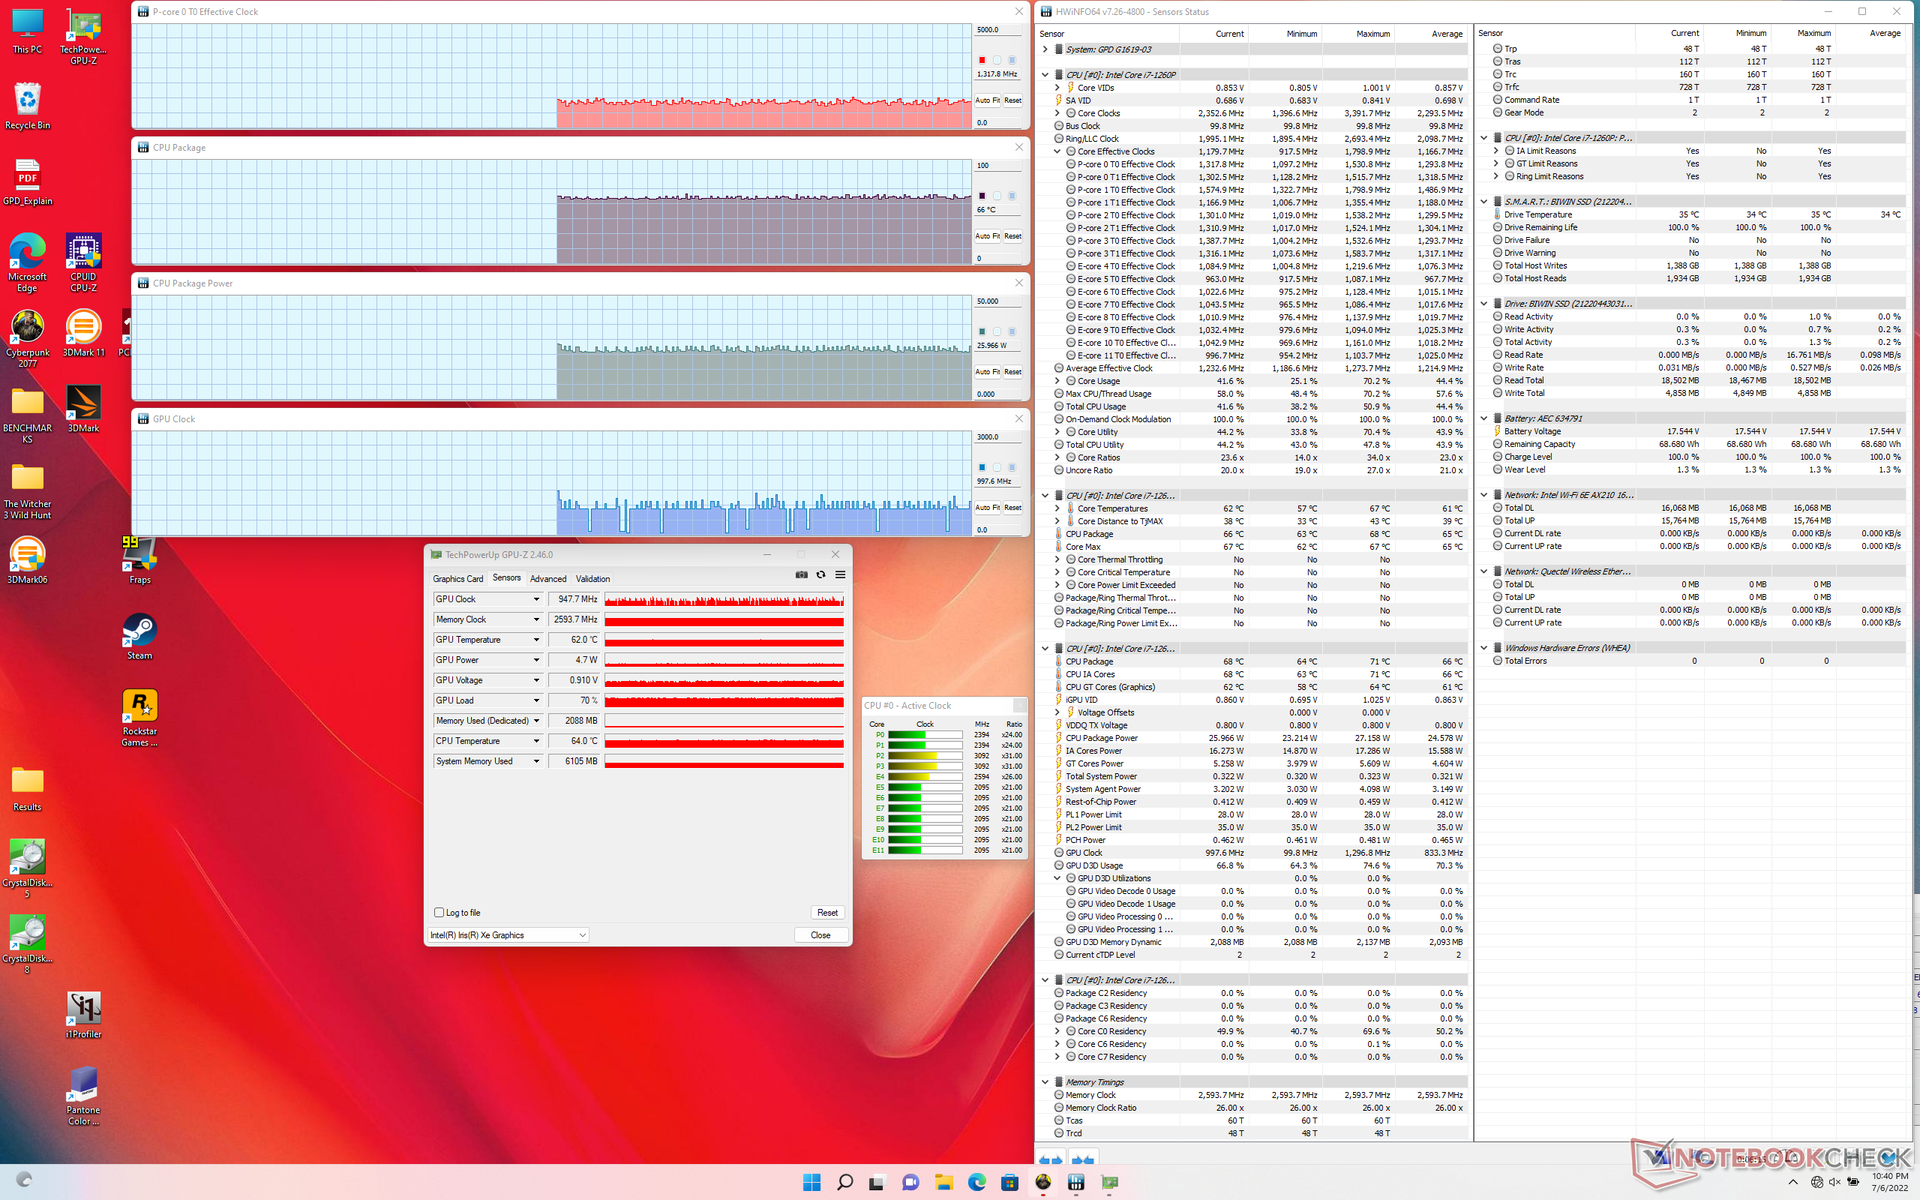
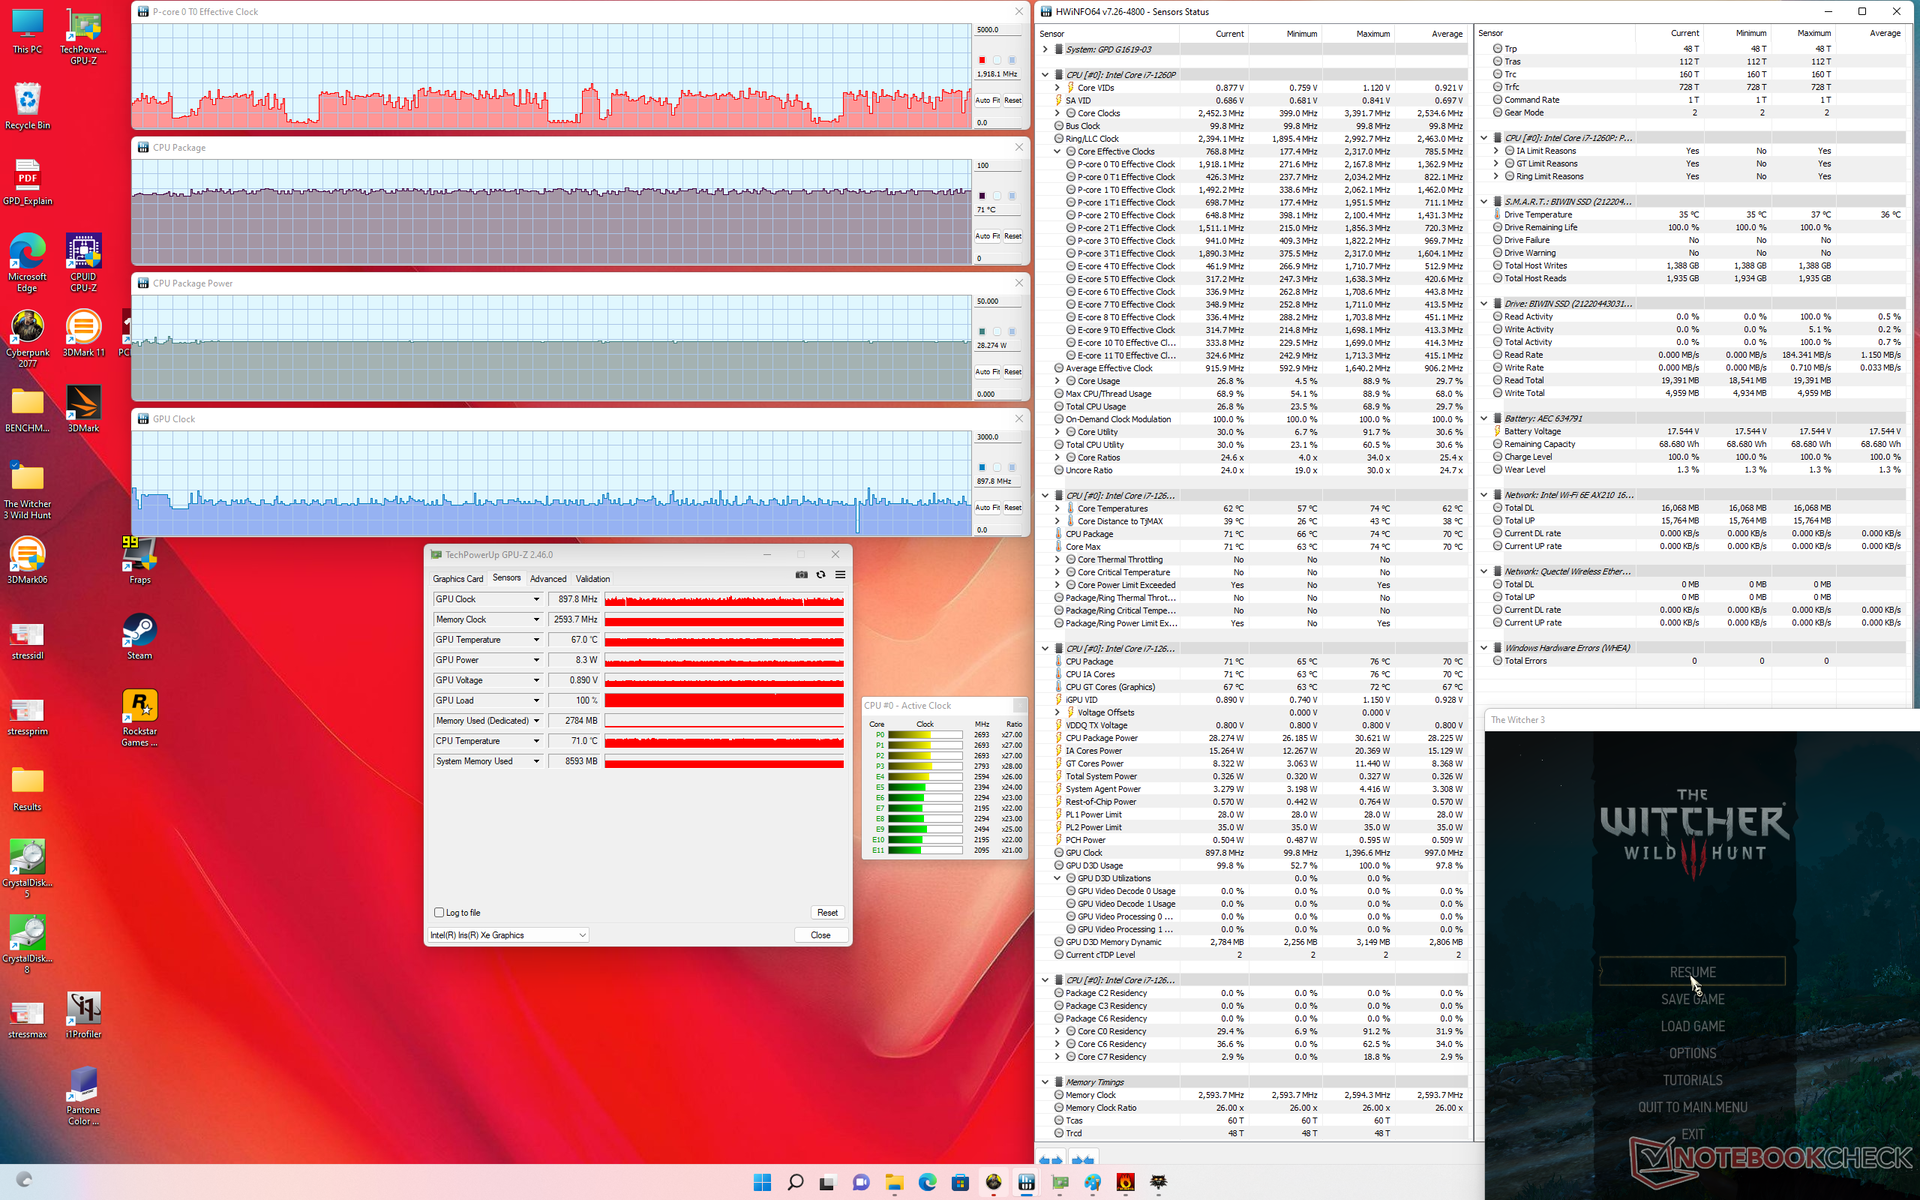
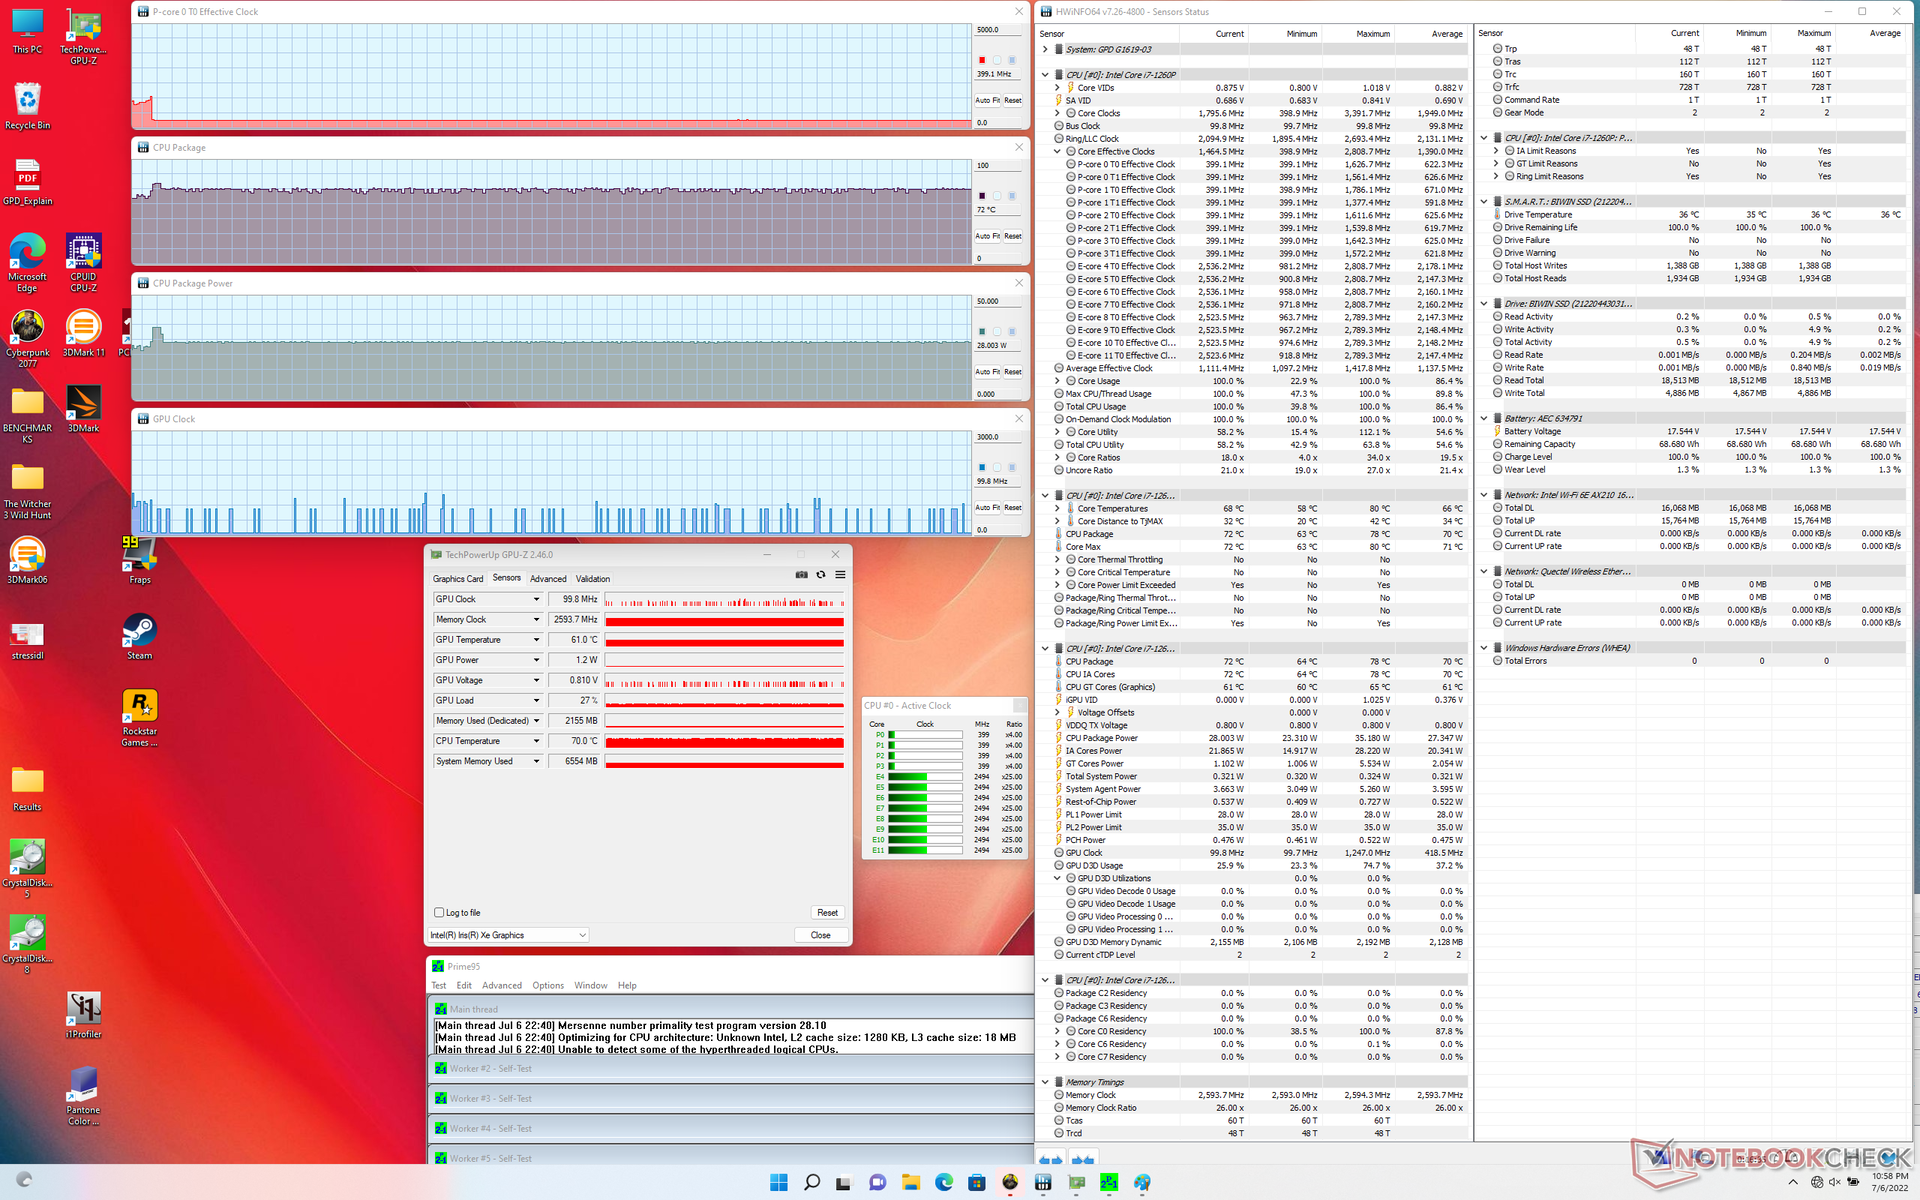
L'avvio di Prime95 per stressare la CPU rivela qualcosa di insolito: i core P ad alte prestazioni si abbassano a soli 400 MHz, mentre gli efficienti core E funzionano a 2,5 GHz. In confronto, eseguendo lo stesso test sul Lenovo Yoga 9 14 equipaggiato con la stessa CPU, tutti i core P e i core E girerebbero tra 1,7 e 1,9 GHz. Questo comportamento è la probabile causa delle prestazioni multi-thread più lente della media registrate sopra.
L'assorbimento di potenza del pacchetto CPU raggiunge i 35 W nei primi secondi, per poi stabilizzarsi a 28 W, in linea con le impostazioni preimpostate del BIOS. In confronto, la stessa CPU nel sistema Lenovo di cui sopra raggiunge i 64 W prima di stabilizzarsi a 28 W.
Quando è in funzione Witcher 3, le velocità di clock della GPU e la temperatura si stabilizzano rispettivamente a 898 MHz e 71 C, rispetto ai 1147 MHz e 65 C del Lenovo. Di conseguenza, il Lenovo è in grado di offrire risultati 3DMark superiori del 3-5% rispetto al nostro GPD.
Il funzionamento a batteria non riduce le prestazioni della CPU o della GPU. I punteggi di 3DMark 11 rimangono sostanzialmente invariati tra batteria e rete elettrica.
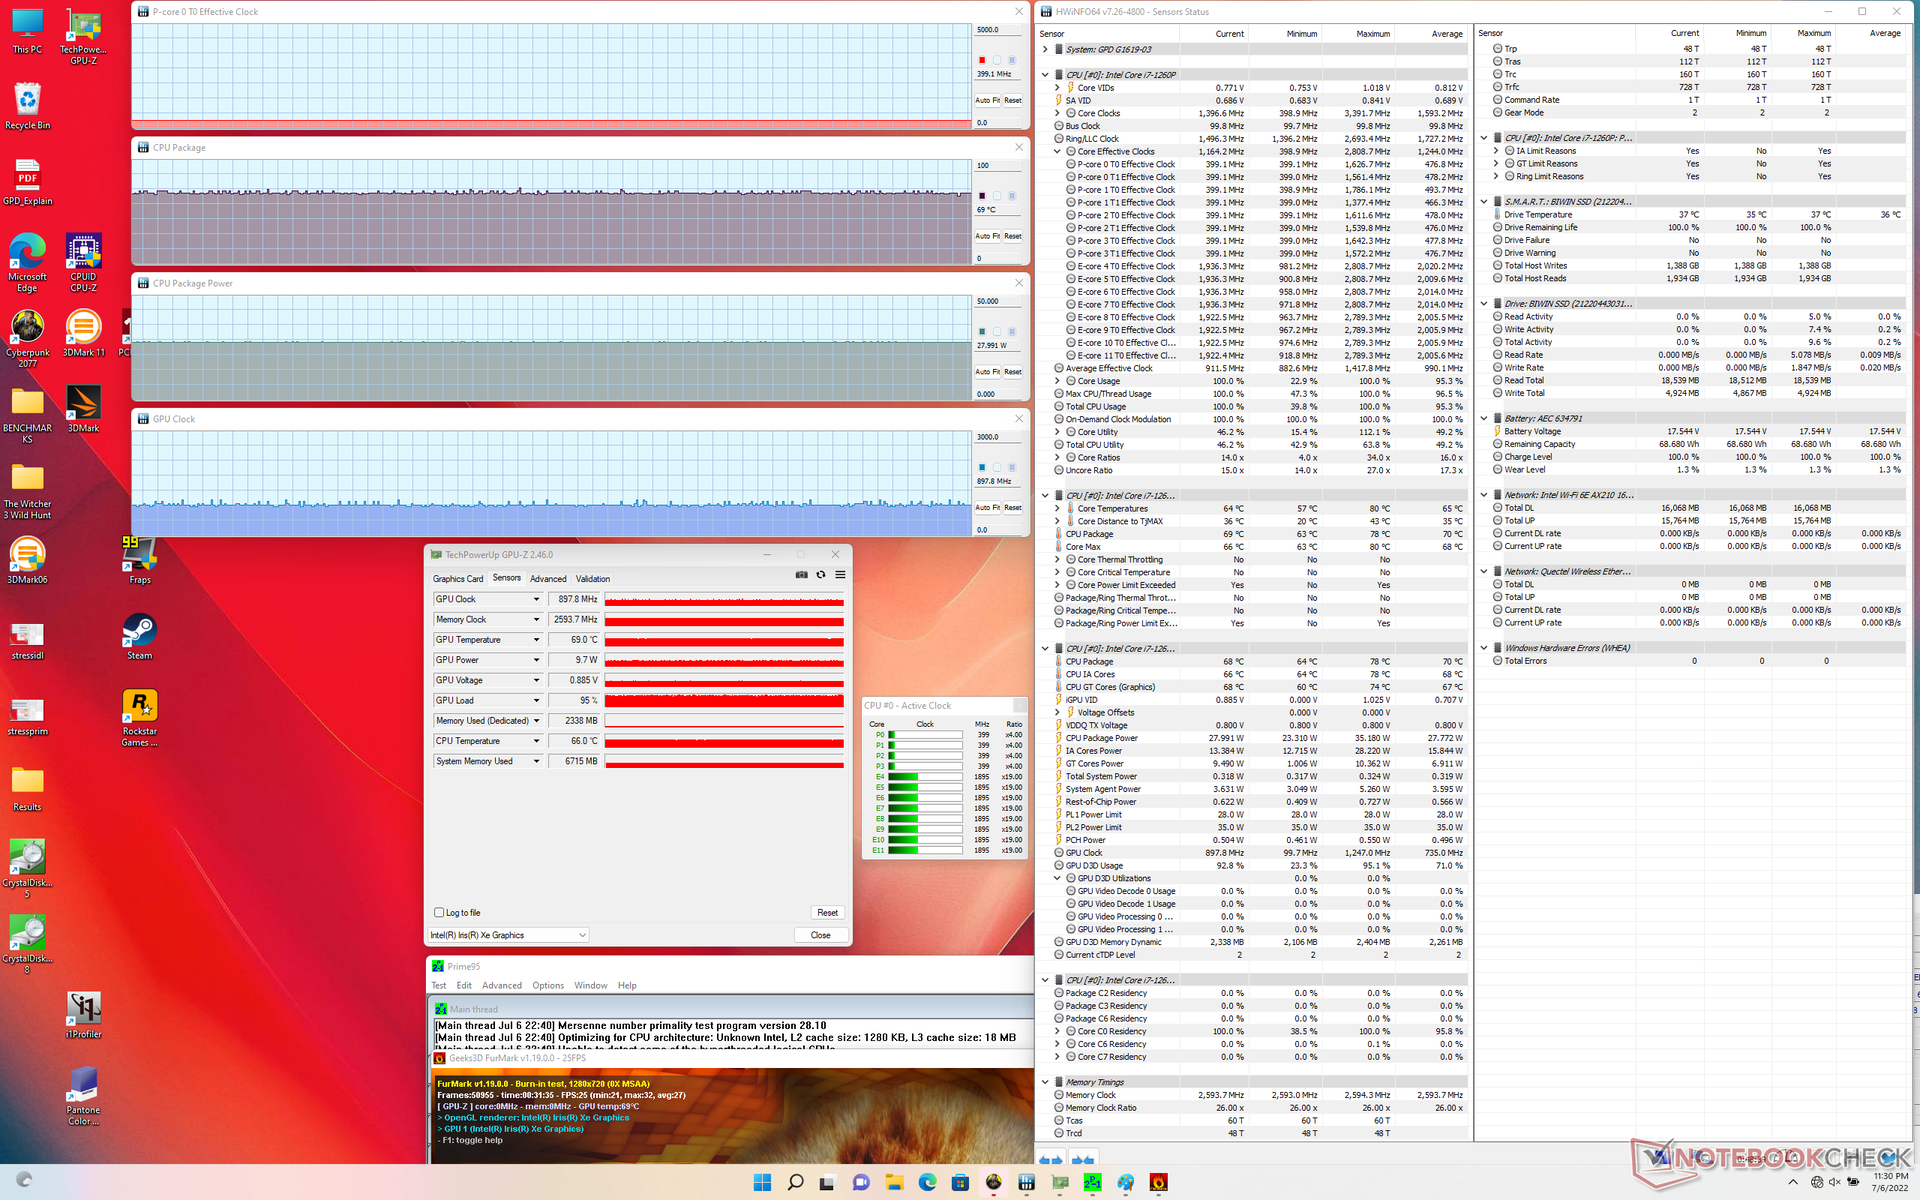
| Clock della CPU (GHz) | Clock della GPU (MHz) | Temperatura media della CPU (°C) | |
| Sistema inattivo | -- | -- | 66 |
| Stress Prime95 | 0,4 | -- | 72 |
| Prime95 + FurMark Stress | 0,4 | 898 | 69 |
| Witcher 3 Stress | ~0,4 - 2,0 | 898 | 71 |
Altoparlanti
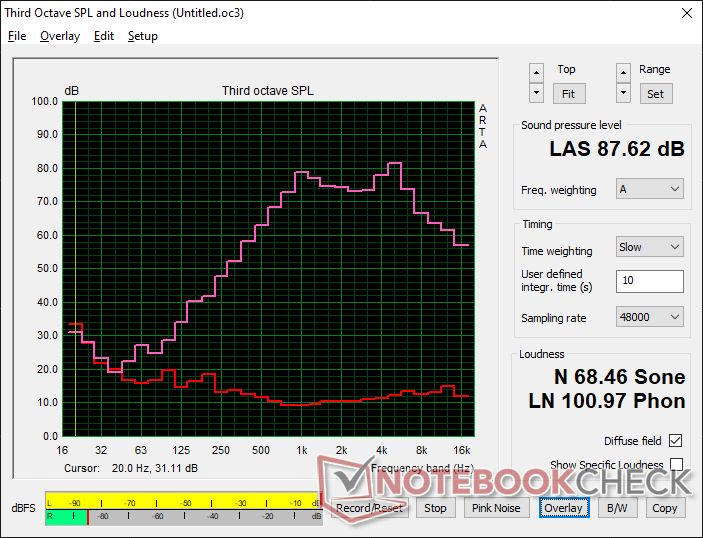
GPD Win Max 2 analisi audio
(+) | gli altoparlanti sono relativamente potenti (87.6 dB)
Bassi 100 - 315 Hz
(-) | quasi nessun basso - in media 27.6% inferiori alla media
(±) | la linearità dei bassi è media (8.2% delta rispetto alla precedente frequenza)
Medi 400 - 2000 Hz
(±) | medi elevati - circa 6.4% superiore alla media
(+) | medi lineari (6.9% delta rispetto alla precedente frequenza)
Alti 2 - 16 kHz
(±) | alti elevati - circa 6.4% superiori alla media
(±) | la linearità degli alti è media (7% delta rispetto alla precedente frequenza)
Nel complesso 100 - 16.000 Hz
(±) | la linearità complessiva del suono è media (21.3% di differenza rispetto alla media
Rispetto alla stessa classe
» 72% di tutti i dispositivi testati in questa classe è stato migliore, 5% simile, 23% peggiore
» Il migliore ha avuto un delta di 5%, medio di 18%, peggiore di 53%
Rispetto a tutti i dispositivi testati
» 59% di tutti i dispositivi testati in questa classe è stato migliore, 7% similare, 33% peggiore
» Il migliore ha avuto un delta di 4%, medio di 23%, peggiore di 134%
Apple MacBook Pro 16 2021 M1 Pro analisi audio
(+) | gli altoparlanti sono relativamente potenti (84.7 dB)
Bassi 100 - 315 Hz
(+) | bassi buoni - solo 3.8% dalla media
(+) | bassi in lineaa (5.2% delta rispetto alla precedente frequenza)
Medi 400 - 2000 Hz
(+) | medi bilanciati - solo only 1.3% rispetto alla media
(+) | medi lineari (2.1% delta rispetto alla precedente frequenza)
Alti 2 - 16 kHz
(+) | Alti bilanciati - appena 1.9% dalla media
(+) | alti lineari (2.7% delta rispetto alla precedente frequenza)
Nel complesso 100 - 16.000 Hz
(+) | suono nel complesso lineare (4.6% differenza dalla media)
Rispetto alla stessa classe
» 0% di tutti i dispositivi testati in questa classe è stato migliore, 0% simile, 100% peggiore
» Il migliore ha avuto un delta di 5%, medio di 17%, peggiore di 45%
Rispetto a tutti i dispositivi testati
» 0% di tutti i dispositivi testati in questa classe è stato migliore, 0% similare, 100% peggiore
» Il migliore ha avuto un delta di 4%, medio di 23%, peggiore di 134%
Gestione dell'energia
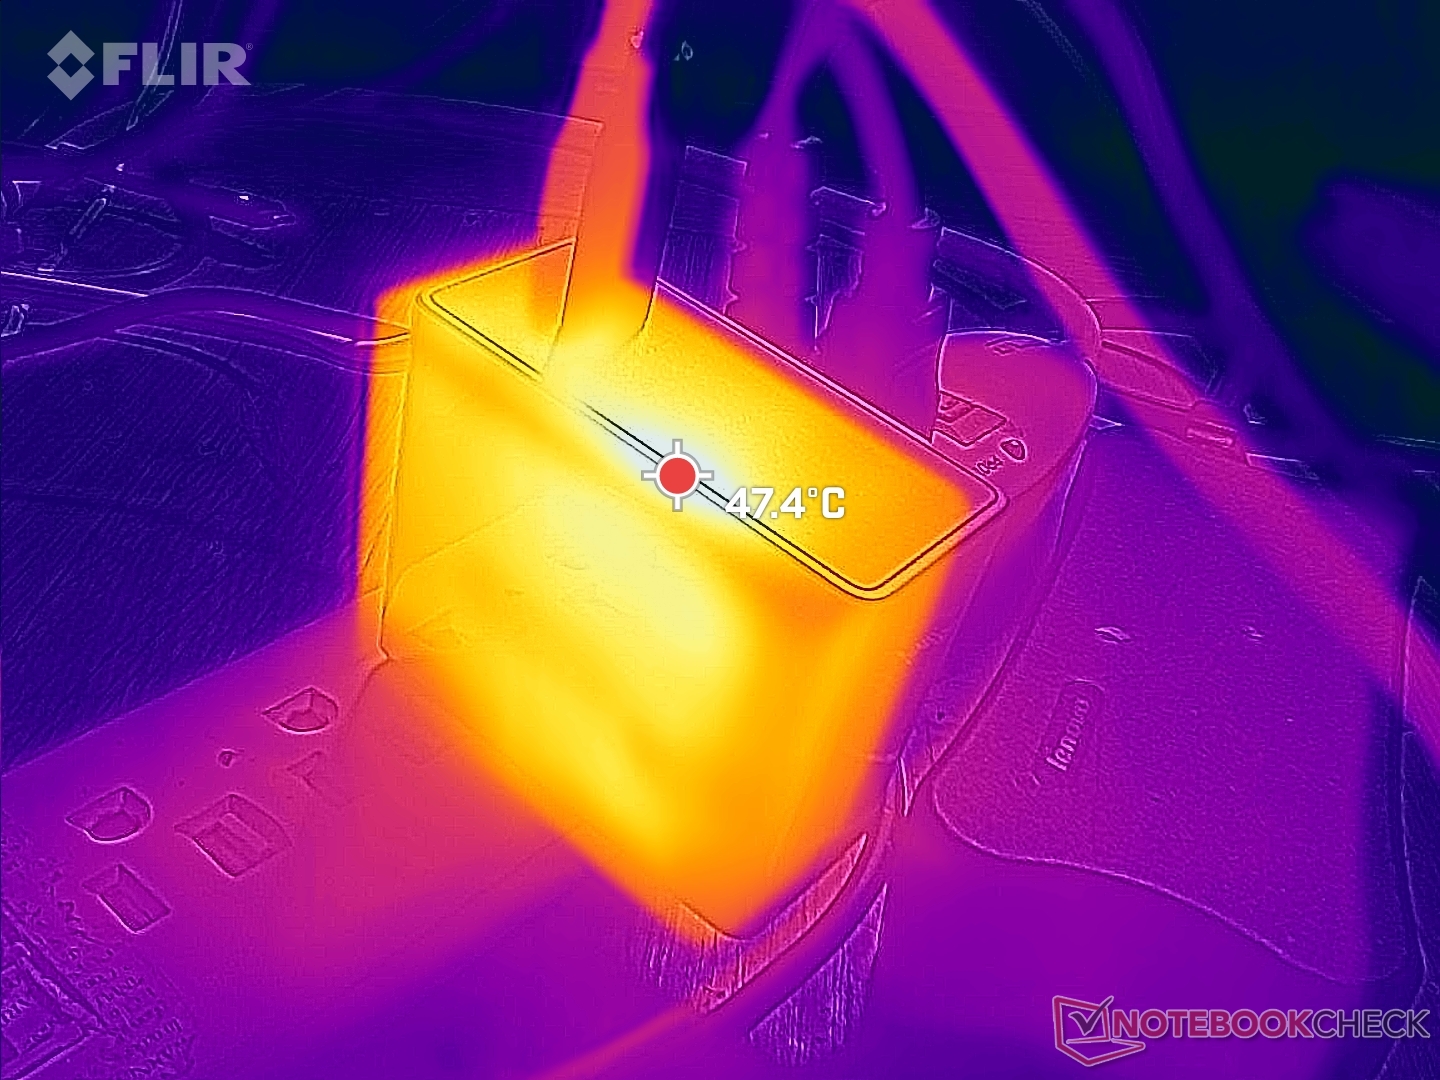
Consumo di energia: alte prestazioni, alti costi di alimentazione
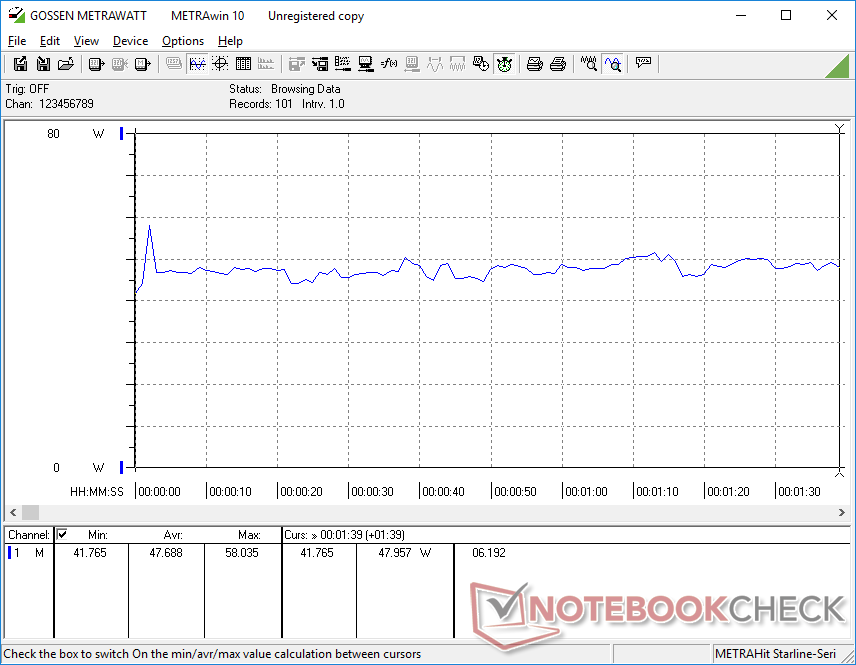
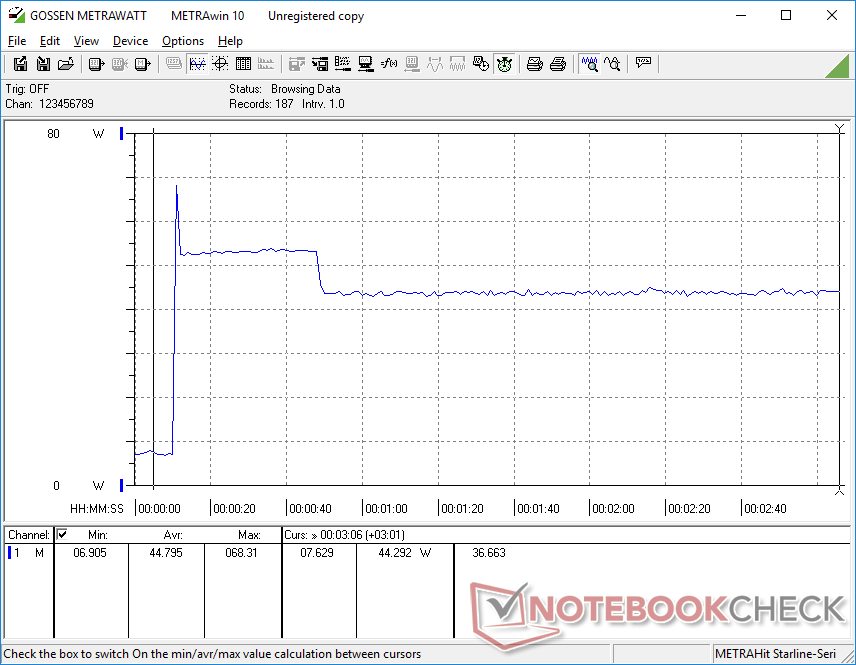
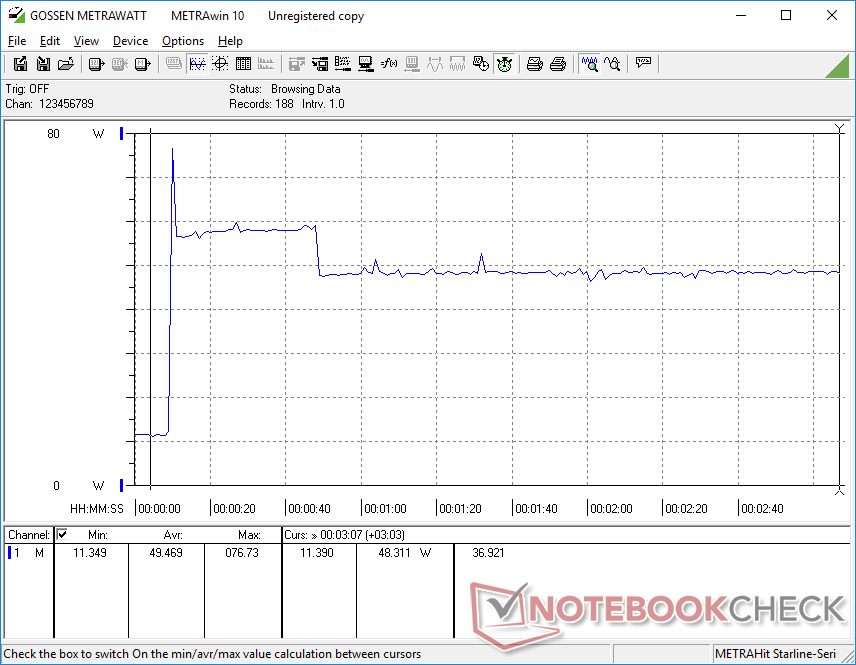
Il consumo di energia è più elevato rispetto ai prodotti GPD dello scorso anno a causa delle maggiori dimensioni dello schermo, della risoluzione nativa più alta e del processore Intel 12th gen più esigente. L'esecuzione Witcher 3 consumerebbe circa 46 W, quasi il 60% in più rispetto al Win 3 con CPU Tiger Lake-U di 11a generazione. Fortunatamente, il produttore ha tenuto conto del maggiore consumo energetico installando una batteria più grande nel Win Max 2, come mostra la sezione successiva
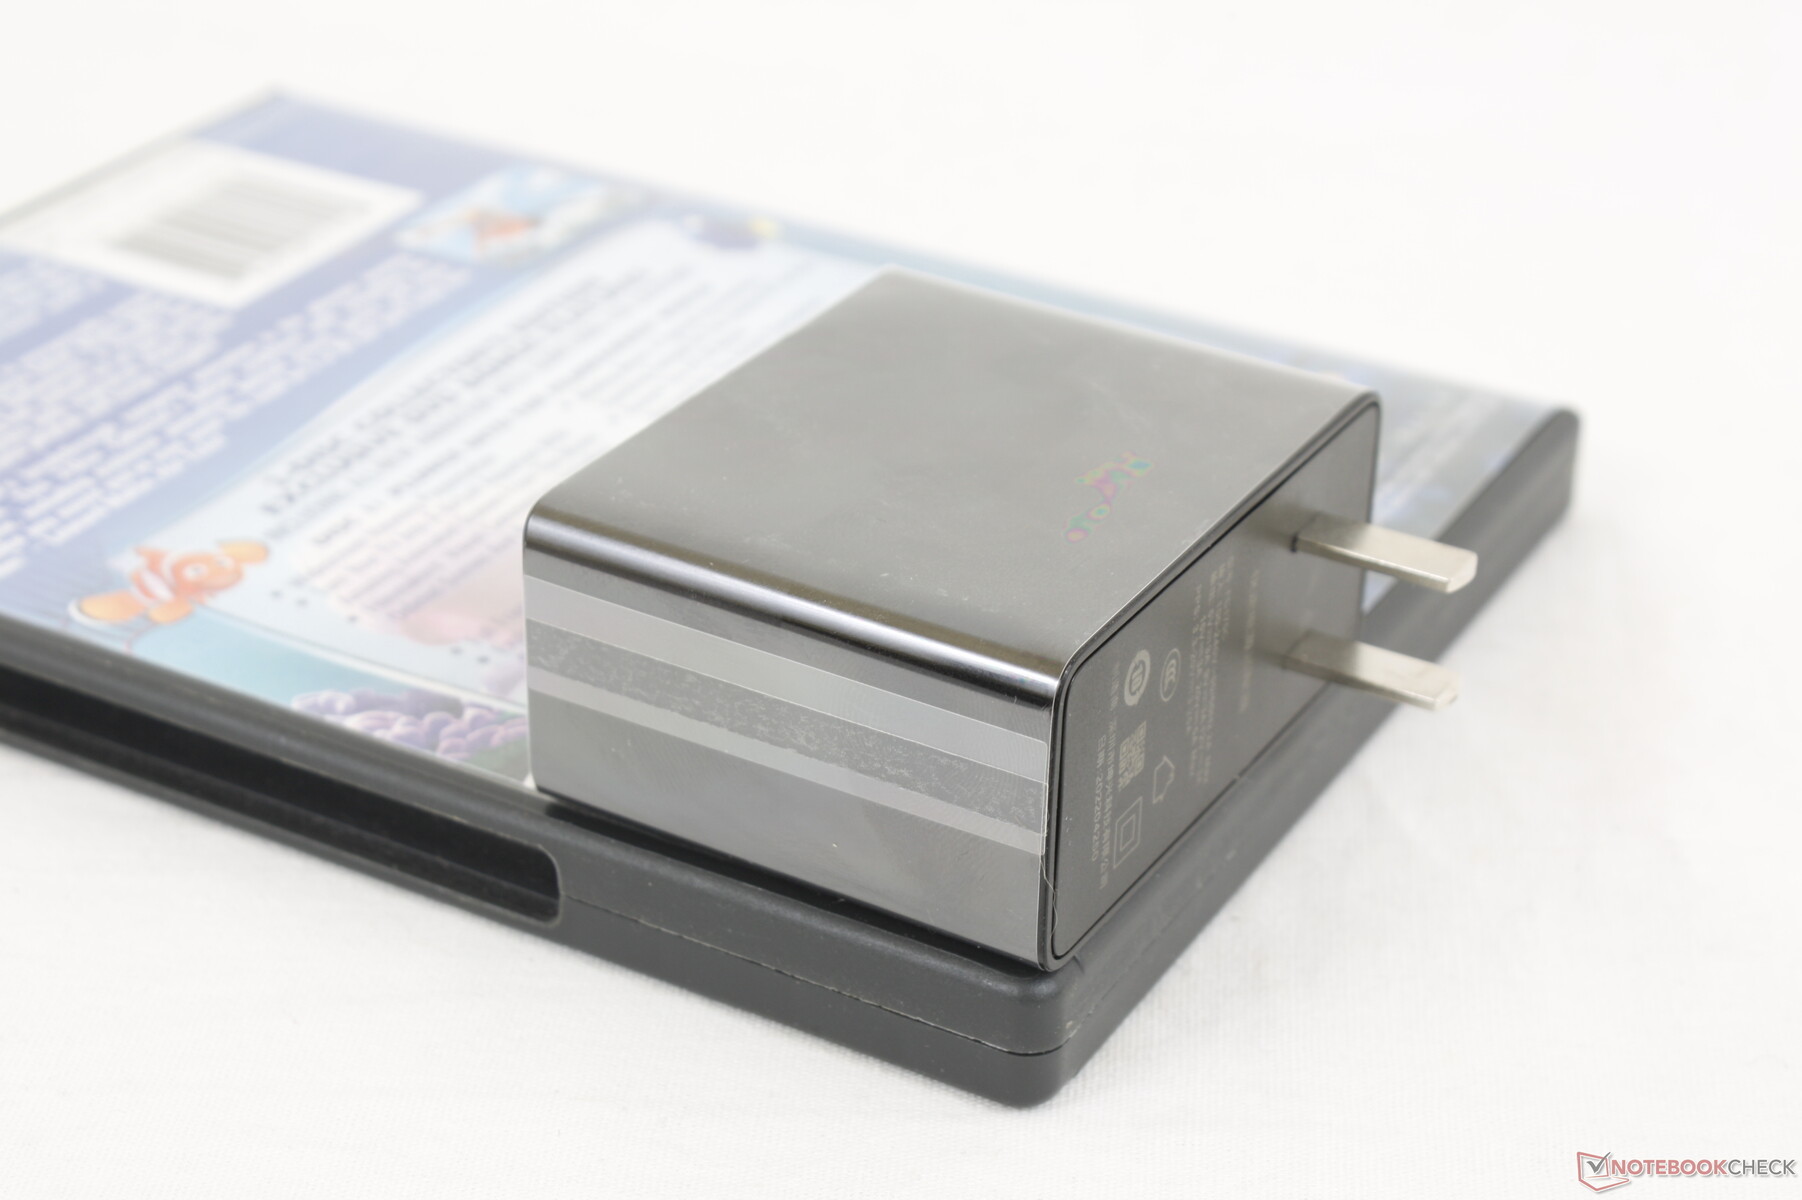
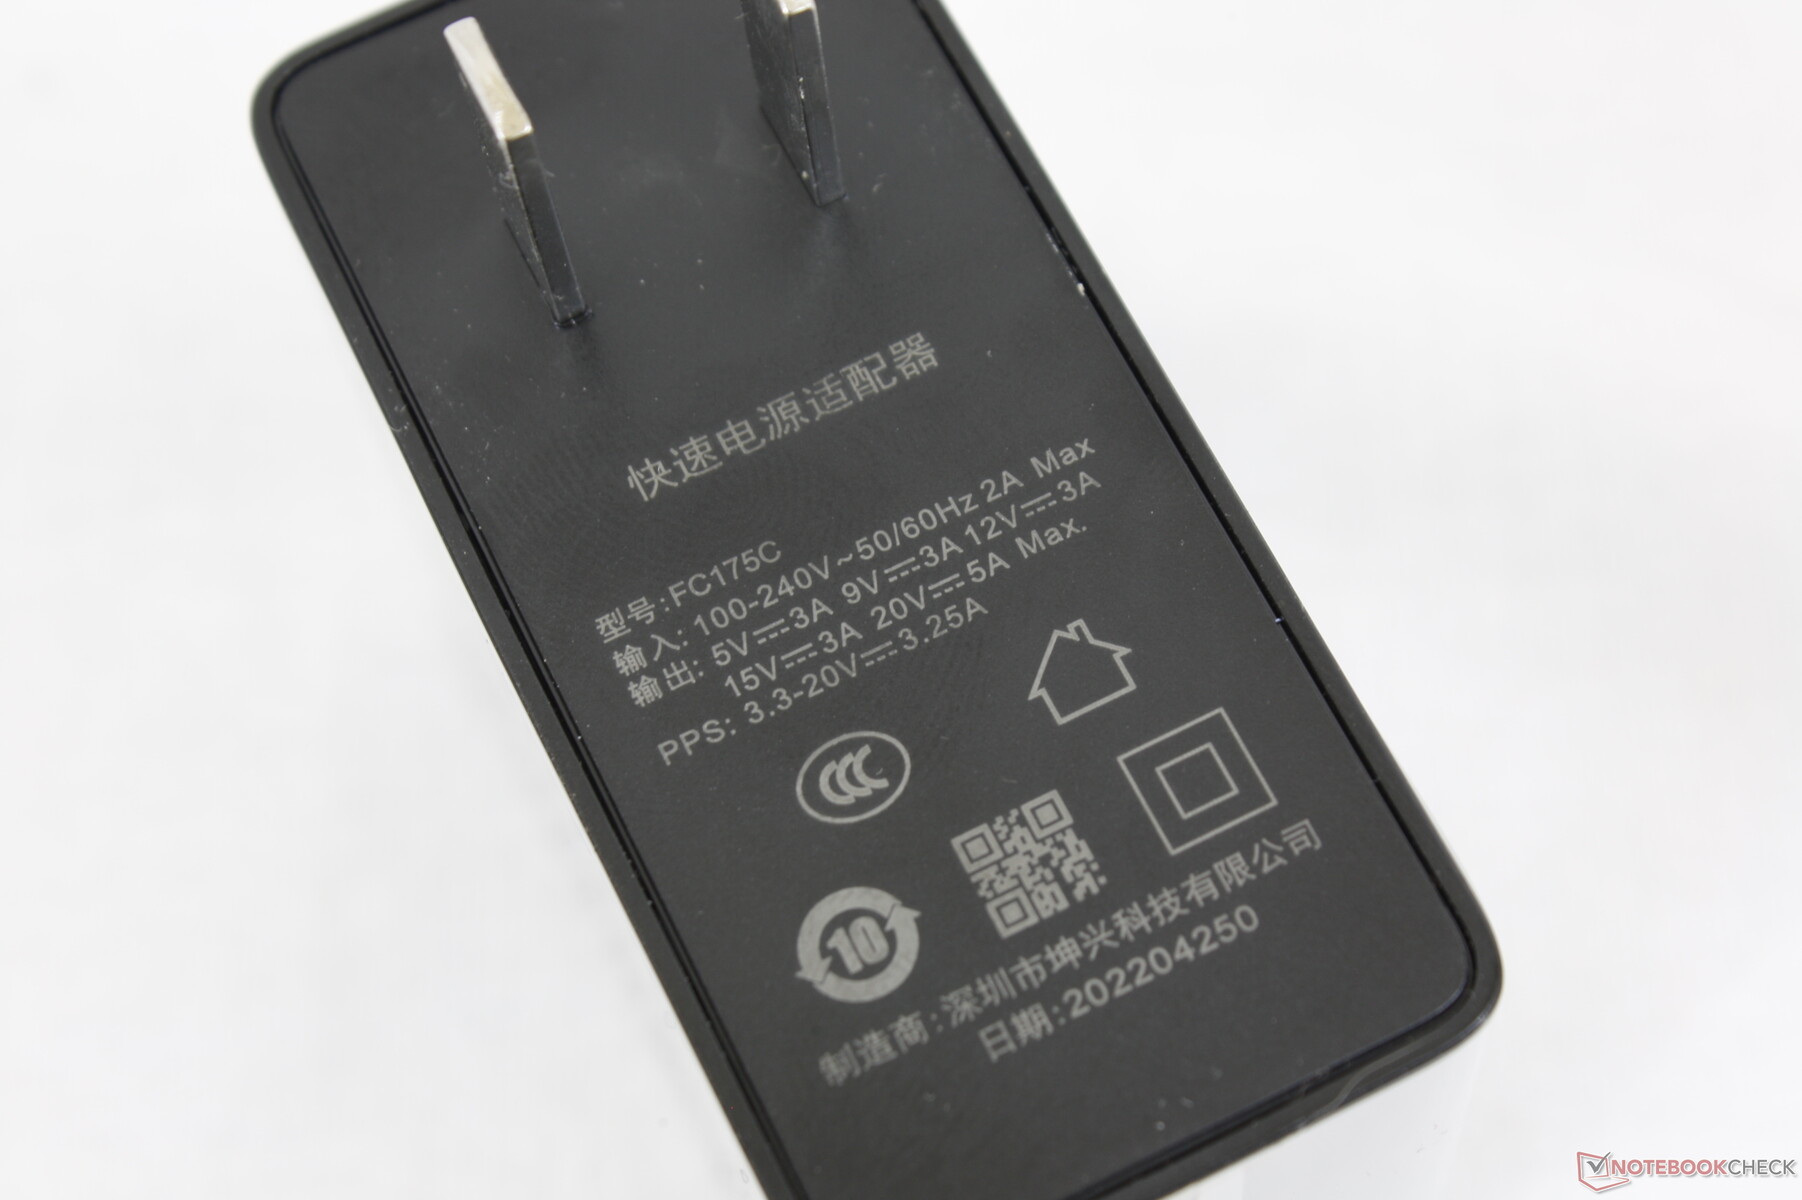
Siamo riusciti a registrare un consumo massimo temporaneo di 76 W dal piccolo adattatore CA USB-C da 100 W (~6,6 x 5,3 x 3,2 cm). L'adattatore può essere utilizzato anche per ricaricare rapidamente la maggior parte degli altri dispositivi USB-C.

| Off / Standby | |
| Idle | |
| Sotto carico |
|
Leggenda:
min: | |
| GPD Win Max 2 i7-1260P, Iris Xe G7 96EUs, BiWin NQ200 1TB CNF82GS1D00-1TB, IPS, 2560x1600, 10.1" | GPD Pocket 3 i7-1195G7, Iris Xe G7 96EUs, BiWin NQ200 1TB CNF82GS1D00-1TB, IPS, 1920x1200, 8" | GPD Win Max 2021 R7 4800U, Vega 8, BIWIN NS200 512GB CNF82GS1G00-512, IPS, 1280x800, 8" | GPD Win 3 i5-1135G7, Iris Xe G7 80EUs, BIWIN NS200 1TB CNF82GS1G02-1TB, IPS, 1280x720, 5.5" | Microsoft Surface Go 3 Core i3 i3-10100Y, UHD Graphics 615, SK hynix HFB1M8MQ331C0MR, IPS , 1920x1280, 10.5" | Lenovo IdeaPad Flex 3 11IGL05 Celeron N4020, UHD Graphics 600, SanDisk DA4064, IPS LED, 1366x768, 11.6" | |
|---|---|---|---|---|---|---|
| Power Consumption | 1% | 28% | 45% | 55% | 66% | |
| Idle Minimum * (Watt) | 5.8 | 9.6 -66% | 5.2 10% | 2.9 50% | 2.6 55% | 2.4 59% |
| Idle Average * (Watt) | 10.2 | 11 -8% | 6.5 36% | 4.5 56% | 5.1 50% | 4.5 56% |
| Idle Maximum * (Watt) | 11.5 | 11.8 -3% | 7.4 36% | 4.5 61% | 5.9 49% | 4.6 60% |
| Load Average * (Watt) | 47.7 | 39 18% | 37.2 22% | 38.5 19% | 22.9 52% | 12.8 73% |
| Witcher 3 ultra * (Watt) | 45.6 | 36.4 20% | 38.1 16% | 28.9 37% | ||
| Load Maximum * (Watt) | 76.8 | 42 45% | 39 49% | 41.4 46% | 24.6 68% | 14.3 81% |
* ... Meglio usare valori piccoli
Power Consumption Witcher 3 / Stresstest
Power Consumption external Monitor
Durata della batteria: ottima per le dimensioni
La batteria da 70 Wh è grande per un formato così piccolo. In confronto, l'originale 2021 Win Max o l'11,6 pollici Lenovo IdeaPad Flex 3 11 hanno batterie più piccole, rispettivamente da 57 Wh e 37 Wh
Gli utenti possono aspettarsi quasi 9 ore di navigazione nel mondo reale, una durata pari o superiore a quella della maggior parte degli Ultrabook attuali con carichi simili. Il tempo di gioco è invece molto più breve, solo 2 o 3 ore
La ricarica da vuoto a pieno regime con l'adattatore CA in dotazione richiede circa 1,5 ore.
| GPD Win Max 2 i7-1260P, Iris Xe G7 96EUs, 70 Wh | GPD Pocket 3 i7-1195G7, Iris Xe G7 96EUs, 39 Wh | GPD Win Max 2021 R7 4800U, Vega 8, 57 Wh | GPD Win 3 i5-1135G7, Iris Xe G7 80EUs, 44 Wh | Microsoft Surface Go 3 Core i3 i3-10100Y, UHD Graphics 615, 28 Wh | Lenovo IdeaPad Flex 3 11IGL05 Celeron N4020, UHD Graphics 600, 37.5 Wh | |
|---|---|---|---|---|---|---|
| Autonomia della batteria | -31% | 7% | 3% | -20% | 7% | |
| Reader / Idle (h) | 15.4 | |||||
| WiFi v1.3 (h) | 8.7 | 6 -31% | 9.3 7% | 11.3 30% | 7 -20% | 9.3 7% |
| Load (h) | 1.7 | 1.3 -24% |
Pro
Contro
Verdetto - Buono con Intel, migliore con AMD
Non siamo rimasti molto colpiti dal 2021 Win Max originale. Sebbene fosse divertente giocarci, era anche difficile guardare oltre la sua gamma di colori ristretta, il notevole ghosting, il layout scomodo della tastiera, il design scricchiolante dello chassis, il Wi-Fi lento e la mancanza di una webcam integrata. Il Win Max 2 2022 ha risolto tutti questi problemi per un'esperienza degna del suo prezzo. Gli utenti ottengono molto di più da uno chassis così piccolo in termini di prestazioni, qualità del display e connettività. Anche se non avete intenzione di giocare molto con il Win Max 2, il suo schermo touchscreen ad alta risoluzione, il 4G LTE, le eccellenti capacità di aggancio e le dimensioni compatte possono sicuramente essere utili per altri scenari di utilizzo
Il GPD Win Max 2 fa molte cose per bene, offrendo sia opzioni Intel che AMD e uno chassis di qualità superiore con un vibrante schermo touchscreen IPS da 1600p.
Se avete intenzione di giocare, tuttavia, dovrete tenere presente che la SKU AMD può offrire prestazioni più elevate allo stesso prezzo, a costo di rinunciare al supporto Thunderbolt. Il sistema relativamente pesante e il posizionamento non ottimale dei joystick rendono la manipolazione più faticosa rispetto a quella di un Nintendo Switch più leggero o di un Win 3. Alcune strane scelte di design, come le porte USB e HDMI capovolte, il cavo a nastro WAN difficile da collegare e l'impossibilità di disattivare facilmente i pulsanti a spalla sono alcuni piccoli fastidi da affrontare. Ci piacerebbe vedere un OLED a 120 Hz in futuro e forse anche un design più leggero per un gioco portatile più confortevole.
Prezzo e disponibilità
Al momento in cui scriviamo, GPD sta gestendo un Indiegogo per il Win Max 2. Entrambe le SKU Intel e AMD dovrebbero essere lanciate entro settembre al prezzo di 1.000 dollari ciascuna.
GPD Win Max 2
- 07/09/2022 v7 (old)
Allen Ngo
Price comparison

