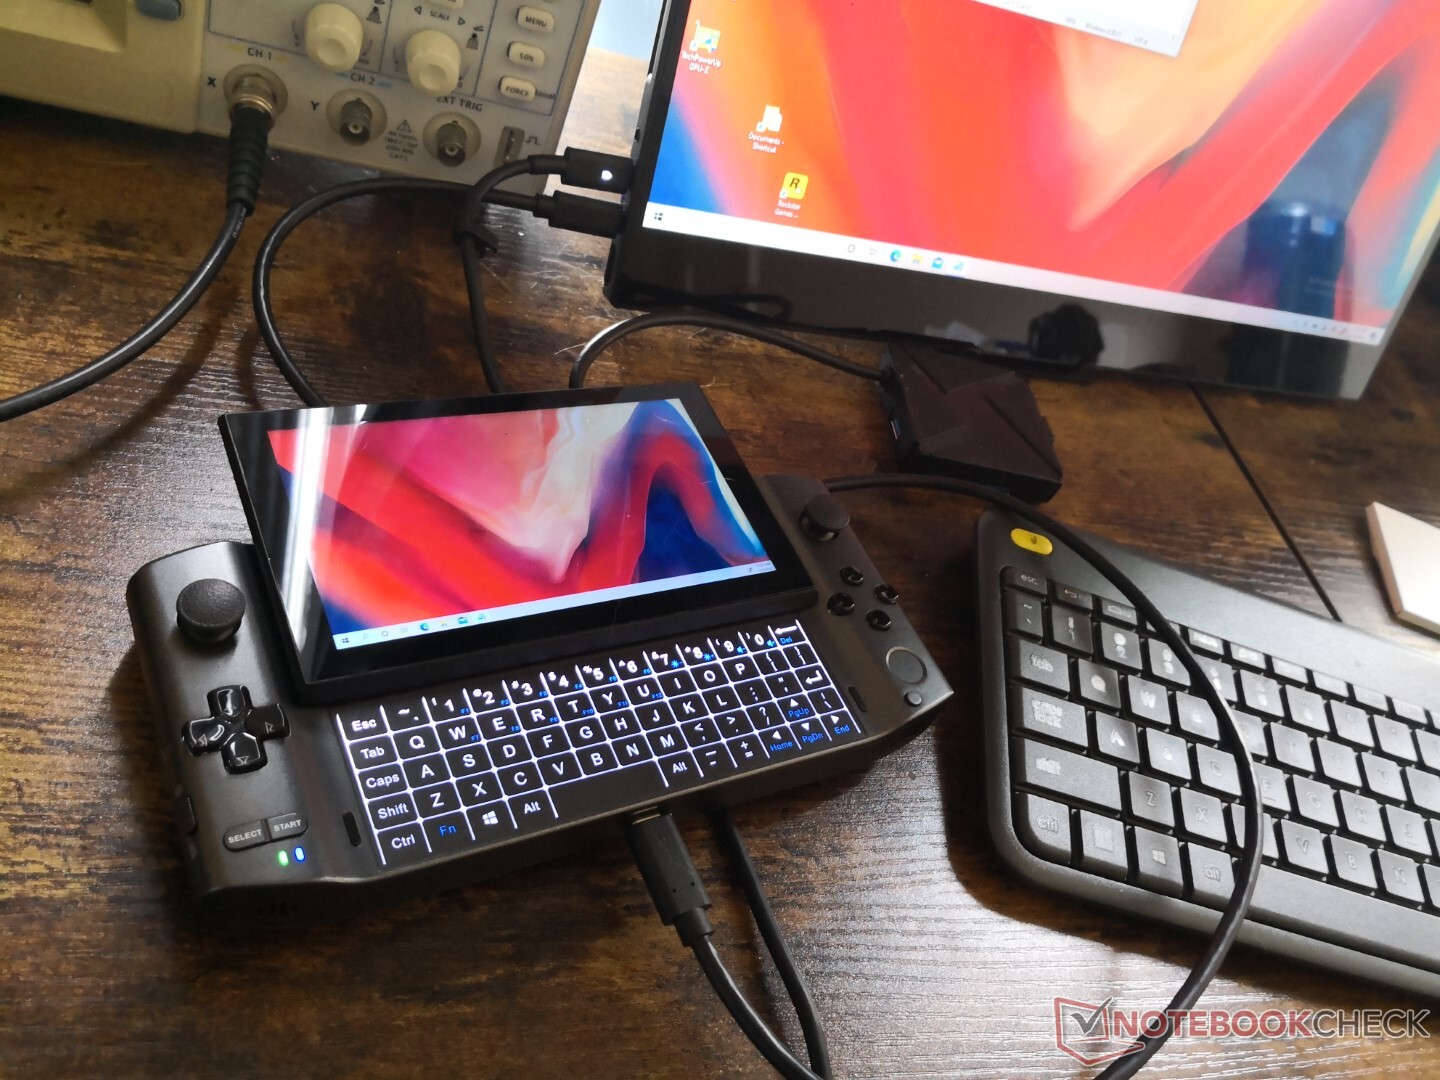
Recensione del GPD Win 3: Lo switch non ufficiale di Microsoft
Confronto con i possibili concorrenti
Punteggio | Data | Modello | Peso | Altezza | Dimensione | Risoluzione | Prezzo |
|---|---|---|---|---|---|---|---|
v (old) | 01/2021 | GPD Win 3 i5-1135G7, Iris Xe G7 80EUs | 553 gr | 27 mm | 5.50" | 1280x720 | |
| 88.1 % v7 (old) | 10/2020 | Dell XPS 13 9310 Core i7 FHD i7-1165G7, Iris Xe G7 96EUs | 1.3 kg | 14.8 mm | 13.40" | 1920x1200 | |
| 91.1 % v7 (old) | 12/2020 | Apple MacBook Air 2020 M1 Entry M1, M1 7-Core GPU | 1.3 kg | 16.1 mm | 13.30" | 2560x1600 | |
| 88.4 % v7 (old) | 12/2019 | HP Spectre x360 13-aw0013dx i7-1065G7, Iris Plus Graphics G7 (Ice Lake 64 EU) | 1.2 kg | 16.9 mm | 13.30" | 1920x1080 | |
| 87.5 % v7 (old) | 08/2020 | Asus ZenBook 13 UX325JA i7-1065G7, Iris Plus Graphics G7 (Ice Lake 64 EU) | 1.1 kg | 13.9 mm | 13.30" | 1920x1080 | |
| 84 % v7 (old) | 02/2020 | Microsoft Surface Laptop 3 13 Core i5-1035G7 i5-1035G7, Iris Plus Graphics G7 (Ice Lake 64 EU) | 1.3 kg | 14.5 mm | 13.50" | 2256x1504 |
| SD Card Reader | |
| average JPG Copy Test (av. of 3 runs) | |
| Dell XPS 13 9310 Core i7 FHD (Toshiba Exceria Pro M501 64 GB UHS-II) | |
| HP Spectre x360 13-aw0013dx (Toshiba Exceria Pro M501 microSDXC 64GB) | |
| GPD Win 3 (Toshiba Exceria Pro M501 32 GB UHS-II) | |
| Asus ZenBook 13 UX325JA (Toshiba Exceria Pro M501 microSDXC 64GB) | |
| maximum AS SSD Seq Read Test (1GB) | |
| Dell XPS 13 9310 Core i7 FHD (Toshiba Exceria Pro M501 64 GB UHS-II) | |
| HP Spectre x360 13-aw0013dx (Toshiba Exceria Pro M501 microSDXC 64GB) | |
| GPD Win 3 (Toshiba Exceria Pro M501 32 GB UHS-II) | |
| Asus ZenBook 13 UX325JA (Toshiba Exceria Pro M501 microSDXC 64GB) | |
| |||||||||||||||||||||||||
Distribuzione della luminosità: 93 %
Al centro con la batteria: 468.8 cd/m²
Contrasto: 1042:1 (Nero: 0.45 cd/m²)
ΔE ColorChecker Calman: 9 | ∀{0.5-29.43 Ø4.71}
calibrated: 1.91
ΔE Greyscale Calman: 10.9 | ∀{0.09-98 Ø4.96}
89.2% sRGB (Argyll 1.6.3 3D)
56.6% AdobeRGB 1998 (Argyll 1.6.3 3D)
61.4% AdobeRGB 1998 (Argyll 3D)
89.6% sRGB (Argyll 3D)
59.5% Display P3 (Argyll 3D)
Gamma: 2.13
CCT: 10972 K
| GPD Win 3 IPS, 5.5", 1280x720 | Dell XPS 13 9310 Core i7 FHD Sharp LQ134N1, IPS, 13.4", 1920x1200 | Apple MacBook Air 2020 M1 Entry IPS, 13.3", 2560x1600 | HP Spectre x360 13-aw0013dx AU Optronics AUO5E2D, IPS, 13.3", 1920x1080 | Asus ZenBook 13 UX325JA Sharp LQ133M1JW40, IPS, 13.3", 1920x1080 | Microsoft Surface Laptop 3 13 Core i5-1035G7 Sharp LQ135P1JX51, IPS, 13.5", 2256x1504 | |
|---|---|---|---|---|---|---|
| Display | 16% | 39% | 14% | 6% | 10% | |
| Display P3 Coverage (%) | 59.5 | 70.9 19% | 98.6 66% | 69.6 17% | 63.8 7% | 65.7 10% |
| sRGB Coverage (%) | 89.6 | 99.1 11% | 100 12% | 98.9 10% | 94.5 5% | 98.6 10% |
| AdobeRGB 1998 Coverage (%) | 61.4 | 72.9 19% | 85.9 40% | 71.5 16% | 64.9 6% | 67.8 10% |
| Response Times | -30% | 10% | -48% | 0% | -56% | |
| Response Time Grey 50% / Grey 80% * (ms) | 40 ? | 52 ? -30% | 31 ? 22% | 60.8 ? -52% | 47 ? -18% | 59.2 ? -48% |
| Response Time Black / White * (ms) | 25.6 ? | 33.2 ? -30% | 26.1 ? -2% | 36.8 ? -44% | 21 ? 18% | 41.6 ? -63% |
| PWM Frequency (Hz) | 2475 ? | 118000 ? | 250 ? | 21740 ? | ||
| Screen | 29% | 34% | 22% | 16% | 31% | |
| Brightness middle (cd/m²) | 468.8 | 543.3 16% | 417 -11% | 447.4 -5% | 435 -7% | 403.4 -14% |
| Brightness (cd/m²) | 460 | 524 14% | 395 -14% | 420 -9% | 404 -12% | 397 -14% |
| Brightness Distribution (%) | 93 | 92 -1% | 91 -2% | 85 -9% | 83 -11% | 89 -4% |
| Black Level * (cd/m²) | 0.45 | 0.38 16% | 0.39 13% | 0.31 31% | 0.565 -26% | 0.34 24% |
| Contrast (:1) | 1042 | 1430 37% | 1069 3% | 1443 38% | 770 -26% | 1186 14% |
| Colorchecker dE 2000 * | 9 | 3.02 66% | 1.12 88% | 4.23 53% | 2.66 70% | 0.94 90% |
| Colorchecker dE 2000 max. * | 15.5 | 7.61 51% | 2.71 83% | 9.34 40% | 4.73 69% | 2.92 81% |
| Colorchecker dE 2000 calibrated * | 1.91 | 1.23 36% | 0.77 60% | 1.32 31% | 1.19 38% | 0.99 48% |
| Greyscale dE 2000 * | 10.9 | 5 54% | 1.7 84% | 6.1 44% | 3.65 67% | 0.9 92% |
| Gamma | 2.13 103% | 2.02 109% | 2207 0% | 2.11 104% | 2.34 94% | 2.13 103% |
| CCT | 10972 59% | 6550 99% | 6870 95% | 6136 106% | 7109 91% | 6620 98% |
| Color Space (Percent of AdobeRGB 1998) (%) | 56.6 | 66.8 18% | 64.8 14% | 60 6% | 62.3 10% | |
| Color Space (Percent of sRGB) (%) | 89.2 | 99.6 12% | 98.9 11% | 95 7% | 98.7 11% | |
| Media totale (Programma / Settaggio) | 5% /
19% | 28% /
32% | -4% /
12% | 7% /
12% | -5% /
16% |
* ... Meglio usare valori piccoli
Tempi di risposta del Display
| ↔ Tempi di risposta dal Nero al Bianco | ||
|---|---|---|
| 25.6 ms ... aumenta ↗ e diminuisce ↘ combinato | ↗ 13.6 ms Incremento | 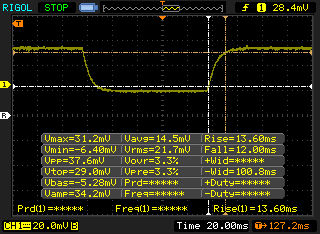 |
| ↘ 12 ms Calo | ||
| Lo schermo mostra tempi di risposta relativamente lenti nei nostri tests e potrebbe essere troppo lento per i gamers. In confronto, tutti i dispositivi di test variano da 0.1 (minimo) a 240 (massimo) ms. » 61 % di tutti i dispositivi è migliore. Questo significa che i tempi di risposta rilevati sono peggiori rispetto alla media di tutti i dispositivi testati (19.8 ms). | ||
| ↔ Tempo di risposta dal 50% Grigio all'80% Grigio | ||
| 40 ms ... aumenta ↗ e diminuisce ↘ combinato | ↗ 22 ms Incremento | 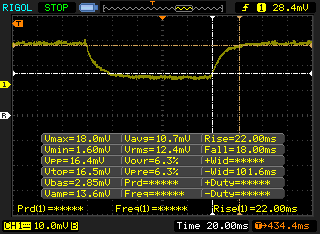 |
| ↘ 18 ms Calo | ||
| Lo schermo mostra tempi di risposta lenti nei nostri tests e sarà insoddisfacente per i gamers. In confronto, tutti i dispositivi di test variano da 0.165 (minimo) a 636 (massimo) ms. » 61 % di tutti i dispositivi è migliore. Questo significa che i tempi di risposta rilevati sono peggiori rispetto alla media di tutti i dispositivi testati (30.9 ms). | ||
Sfarfallio dello schermo / PWM (Pulse-Width Modulation)
| flickering dello schermo / PWM non rilevato | 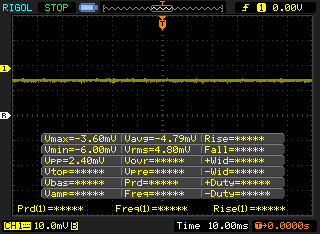 | ||
In confronto: 52 % di tutti i dispositivi testati non utilizza PWM per ridurre la luminosita' del display. Se è rilevato PWM, una media di 7744 (minimo: 5 - massimo: 343500) Hz è stata rilevata. | |||
Cinebench R15: CPU Multi 64Bit | CPU Single 64Bit
Blender: v2.79 BMW27 CPU
7-Zip 18.03: 7z b 4 -mmt1 | 7z b 4
Geekbench 5.5: Single-Core | Multi-Core
HWBOT x265 Benchmark v2.2: 4k Preset
LibreOffice : 20 Documents To PDF
R Benchmark 2.5: Overall mean
| Cinebench R20 / CPU (Multi Core) | |
| Lenovo Yoga Slim 7 14ARE05 82A20008GE | |
| Razer Book 13 FHD | |
| Media Intel Core i7-1165G7 (1060 - 2657, n=81) | |
| Dell XPS 13 9310 Core i7 4K | |
| GPD Win 3 | |
| Media Intel Core i5-1135G7 (979 - 2382, n=62) | |
| Acer Swift 3 SF314-42-R27B | |
| Asus ZenBook 13 UX325JA | |
| Samsung Galaxy Book Flex 13.3 | |
| Lenovo ThinkBook 13s-20R90071GE | |
| HP Envy 13-aq0003ng | |
| Dynabook Portege A30-E-174 | |
| Cinebench R20 / CPU (Single Core) | |
| Razer Book 13 FHD | |
| Dell XPS 13 9310 Core i7 4K | |
| Media Intel Core i7-1165G7 (442 - 589, n=81) | |
| GPD Win 3 | |
| Media Intel Core i5-1135G7 (375 - 527, n=62) | |
| Lenovo Yoga Slim 7 14ARE05 82A20008GE | |
| Asus ZenBook 13 UX325JA | |
| Acer Swift 3 SF314-42-R27B | |
| Samsung Galaxy Book Flex 13.3 | |
| Lenovo ThinkBook 13s-20R90071GE | |
| Dynabook Portege A30-E-174 | |
| HP Envy 13-aq0003ng | |
| Cinebench R15 / CPU Multi 64Bit | |
| Lenovo Yoga Slim 7 14ARE05 82A20008GE | |
| Razer Book 13 FHD | |
| Dell XPS 13 9310 Core i7 4K | |
| Media Intel Core i7-1165G7 (553 - 1027, n=86) | |
| Media Intel Core i5-1135G7 (431 - 941, n=65) | |
| Asus ZenBook 13 UX325JA | |
| GPD Win 3 | |
| Lenovo ThinkBook 13s-20R90071GE | |
| Acer Swift 3 SF314-42-R27B | |
| Samsung Galaxy Book Flex 13.3 | |
| HP Envy 13-aq0003ng | |
| Dynabook Portege A30-E-174 | |
| Cinebench R15 / CPU Single 64Bit | |
| Razer Book 13 FHD | |
| Dell XPS 13 9310 Core i7 4K | |
| Media Intel Core i7-1165G7 (115 - 230, n=78) | |
| GPD Win 3 | |
| Media Intel Core i5-1135G7 (141.4 - 205, n=61) | |
| Asus ZenBook 13 UX325JA | |
| Lenovo Yoga Slim 7 14ARE05 82A20008GE | |
| HP Envy 13-aq0003ng | |
| Acer Swift 3 SF314-42-R27B | |
| Samsung Galaxy Book Flex 13.3 | |
| Lenovo ThinkBook 13s-20R90071GE | |
| Dynabook Portege A30-E-174 | |
| Blender / v2.79 BMW27 CPU | |
| Samsung Galaxy Book Flex 13.3 | |
| Asus ZenBook 13 UX325JA | |
| Acer Swift 3 SF314-42-R27B | |
| Lenovo ThinkBook 13s-20R90071GE | |
| HP Envy x360 13-ay0359ng | |
| Media Intel Core i5-1135G7 (499 - 1044, n=60) | |
| Dell XPS 13 9310 Core i7 4K | |
| GPD Win 3 | |
| Media Intel Core i7-1165G7 (468 - 1138, n=80) | |
| Razer Book 13 FHD | |
| Lenovo Yoga Slim 7 14ARE05 82A20008GE | |
| 7-Zip 18.03 / 7z b 4 -mmt1 | |
| Razer Book 13 FHD | |
| Media Intel Core i7-1165G7 (4478 - 5507, n=80) | |
| Dell XPS 13 9310 Core i7 4K | |
| GPD Win 3 | |
| Media Intel Core i5-1135G7 (3924 - 4921, n=62) | |
| Lenovo Yoga Slim 7 14ARE05 82A20008GE | |
| Asus ZenBook 13 UX325JA | |
| HP Envy x360 13-ay0359ng | |
| Samsung Galaxy Book Flex 13.3 | |
| Acer Swift 3 SF314-42-R27B | |
| Lenovo ThinkBook 13s-20R90071GE | |
| 7-Zip 18.03 / 7z b 4 | |
| Lenovo Yoga Slim 7 14ARE05 82A20008GE | |
| Razer Book 13 FHD | |
| Media Intel Core i7-1165G7 (15347 - 27405, n=80) | |
| HP Envy x360 13-ay0359ng | |
| GPD Win 3 | |
| Media Intel Core i5-1135G7 (14745 - 24873, n=62) | |
| Dell XPS 13 9310 Core i7 4K | |
| Lenovo ThinkBook 13s-20R90071GE | |
| Acer Swift 3 SF314-42-R27B | |
| Asus ZenBook 13 UX325JA | |
| Samsung Galaxy Book Flex 13.3 | |
| Geekbench 5.5 / Single-Core | |
| Razer Book 13 FHD | |
| Dell XPS 13 9310 Core i7 4K | |
| Media Intel Core i7-1165G7 (1302 - 1595, n=77) | |
| GPD Win 3 | |
| Media Intel Core i5-1135G7 (1147 - 1428, n=58) | |
| Asus ZenBook 13 UX325JA | |
| Samsung Galaxy Book Flex 13.3 | |
| Lenovo Yoga Slim 7 14ARE05 82A20008GE | |
| Acer Swift 3 SF314-42-R27B | |
| Geekbench 5.5 / Multi-Core | |
| Lenovo Yoga Slim 7 14ARE05 82A20008GE | |
| Razer Book 13 FHD | |
| Dell XPS 13 9310 Core i7 4K | |
| Media Intel Core i7-1165G7 (3078 - 5926, n=77) | |
| GPD Win 3 | |
| Media Intel Core i5-1135G7 (3475 - 5472, n=58) | |
| Asus ZenBook 13 UX325JA | |
| Samsung Galaxy Book Flex 13.3 | |
| Acer Swift 3 SF314-42-R27B | |
| HWBOT x265 Benchmark v2.2 / 4k Preset | |
| Lenovo Yoga Slim 7 14ARE05 82A20008GE | |
| Razer Book 13 FHD | |
| Media Intel Core i7-1165G7 (1.39 - 8.47, n=80) | |
| GPD Win 3 | |
| HP Envy x360 13-ay0359ng | |
| Media Intel Core i5-1135G7 (3.57 - 7.6, n=57) | |
| Dell XPS 13 9310 Core i7 4K | |
| Lenovo ThinkBook 13s-20R90071GE | |
| Acer Swift 3 SF314-42-R27B | |
| Asus ZenBook 13 UX325JA | |
| Samsung Galaxy Book Flex 13.3 | |
| LibreOffice / 20 Documents To PDF | |
| HP Envy x360 13-ay0359ng | |
| Lenovo Yoga Slim 7 14ARE05 82A20008GE | |
| Acer Swift 3 SF314-42-R27B | |
| Samsung Galaxy Book Flex 13.3 | |
| Media Intel Core i5-1135G7 (44.2 - 62.9, n=60) | |
| Asus ZenBook 13 UX325JA | |
| Razer Book 13 FHD | |
| Media Intel Core i7-1165G7 (21.5 - 88.1, n=78) | |
| GPD Win 3 | |
| Dell XPS 13 9310 Core i7 4K | |
| R Benchmark 2.5 / Overall mean | |
| Samsung Galaxy Book Flex 13.3 | |
| Acer Swift 3 SF314-42-R27B | |
| Asus ZenBook 13 UX325JA | |
| Media Intel Core i5-1135G7 (0.619 - 0.727, n=59) | |
| HP Envy x360 13-ay0359ng | |
| GPD Win 3 | |
| Lenovo Yoga Slim 7 14ARE05 82A20008GE | |
| Dell XPS 13 9310 Core i7 4K | |
| Media Intel Core i7-1165G7 (0.552 - 1.002, n=80) | |
| Razer Book 13 FHD | |
* ... Meglio usare valori piccoli
| PCMark 8 Home Score Accelerated v2 | 4463 punti | |
| PCMark 8 Work Score Accelerated v2 | 3214 punti | |
| PCMark 10 Score | 4663 punti | |
Aiuto | ||
| DPC Latencies / LatencyMon - interrupt to process latency (max), Web, Youtube, Prime95 | |
| Asus ZenBook 13 UX325JA | |
| Razer Book 13 FHD | |
| Dell XPS 13 9310 Core i7 4K | |
| Lenovo Yoga 9i 14ITL5 | |
| Dell XPS 13 9310 Core i7 FHD | |
| Samsung Galaxy Book Flex 13.3 | |
| GPD Win 3 | |
| Lenovo ThinkBook 13s-ITL-20V90003GE | |
| Acer Swift 3 SF314-42-R27B | |
| Lenovo Yoga 7 14ITL5 | |
* ... Meglio usare valori piccoli
| GPD Win 3 BIWIN NS200 1TB CNF82GS1G02-1TB | Dell XPS 13 9310 Core i7 FHD Micron 2300 512GB MTFDHBA512TDV | HP Spectre x360 13-aw0013dx Intel Optane Memory H10 with Solid State Storage 32GB + 512GB HBRPEKNX0202A(L/H) | Asus ZenBook 13 UX325JA Intel SSD 660p 1TB SSDPEKNW010T8 | Microsoft Surface Laptop 3 13 Core i5-1035G7 SK hynix BC501 HFM256GDGTNG | |
|---|---|---|---|---|---|
| AS SSD | -38% | -54% | -40% | -53% | |
| Seq Read (MB/s) | 1585 | 2091 32% | 1039 -34% | 1587 0% | 1387 -12% |
| Seq Write (MB/s) | 1776 | 1396 -21% | 310.1 -83% | 938 -47% | 504 -72% |
| 4K Read (MB/s) | 61.6 | 49.29 -20% | 76 23% | 51 -17% | 42.35 -31% |
| 4K Write (MB/s) | 208.9 | 104.2 -50% | 118 -44% | 141.9 -32% | 120 -43% |
| 4K-64 Read (MB/s) | 1142 | 827 -28% | 371.8 -67% | 576 -50% | 497.4 -56% |
| 4K-64 Write (MB/s) | 1103 | 1636 48% | 469.5 -57% | 584 -47% | 354.9 -68% |
| Access Time Read * (ms) | 0.03 | 0.066 -120% | 0.067 -123% | 0.083 -177% | 0.055 -83% |
| Access Time Write * (ms) | 0.074 | 0.365 -393% | 0.138 -86% | 0.04 46% | 0.093 -26% |
| Score Read (Points) | 1362 | 1086 -20% | 552 -59% | 785 -42% | 678 -50% |
| Score Write (Points) | 1489 | 1880 26% | 618 -58% | 820 -45% | 525 -65% |
| Score Total (Points) | 3573 | 3499 -2% | 1448 -59% | 1990 -44% | 1520 -57% |
| Copy ISO MB/s (MB/s) | 1741 | 1544 -11% | 764 -56% | 1311 -25% | 764 -56% |
| Copy Program MB/s (MB/s) | 543 | 613 13% | 465.8 -14% | 310.3 -43% | 256.1 -53% |
| Copy Game MB/s (MB/s) | 1318 | 1451 10% | 764 -42% | 801 -39% | 368.4 -72% |
| CrystalDiskMark 5.2 / 6 | -4% | -20% | -25% | -42% | |
| Write 4K (MB/s) | 223 | 97.5 -56% | 112.6 -50% | 139.7 -37% | 112.3 -50% |
| Read 4K (MB/s) | 66.5 | 50.9 -23% | 131 97% | 56.4 -15% | 42.13 -37% |
| Write Seq (MB/s) | 1857 | 1811 -2% | 458.9 -75% | 1265 -32% | 630 -66% |
| Read Seq (MB/s) | 1737 | 1836 6% | 1355 -22% | 1492 -14% | 1023 -41% |
| Write 4K Q32T1 (MB/s) | 611 | 521 -15% | 341.3 -44% | 402.5 -34% | 336.6 -45% |
| Read 4K Q32T1 (MB/s) | 688 | 357.5 -48% | 320.6 -53% | 329.3 -52% | 399.6 -42% |
| Write Seq Q32T1 (MB/s) | 1948 | 2879 48% | 1219 -37% | 1786 -8% | 821 -58% |
| Read Seq Q32T1 (MB/s) | 1995 | 3204 61% | 2462 23% | 1923 -4% | 2030 2% |
| Media totale (Programma / Settaggio) | -21% /
-26% | -37% /
-42% | -33% /
-34% | -48% /
-49% |
* ... Meglio usare valori piccoli

Throttling Disco: DiskSpd Read Loop, Queue Depth 8
| 3DMark 11 Performance | 6290 punti | |
| 3DMark Cloud Gate Standard Score | 18709 punti | |
| 3DMark Fire Strike Score | 4395 punti | |
| 3DMark Time Spy Score | 1506 punti | |
Aiuto | ||
| basso | medio | alto | ultra | |
|---|---|---|---|---|
| GTA V (2015) | 73.6 | 60.9 | 23.5 | |
| The Witcher 3 (2015) | 90.6 | 55.6 | 31.7 | 14.1 |
| Dota 2 Reborn (2015) | 81.4 | 64.2 | 44.3 | 44.2 |
| Final Fantasy XV Benchmark (2018) | 38.9 | 21 | 16.5 | |
| X-Plane 11.11 (2018) | 26.6 | 35.6 | 31.6 | |
| Strange Brigade (2018) | 87.7 | 36.2 | 28 | 22.8 |
| GPD Win 3 Iris Xe G7 80EUs, i5-1135G7, BIWIN NS200 1TB CNF82GS1G02-1TB | Dell XPS 13 9310 Core i7 FHD Iris Xe G7 96EUs, i7-1165G7, Micron 2300 512GB MTFDHBA512TDV | HP Spectre x360 13-aw0013dx Iris Plus Graphics G7 (Ice Lake 64 EU), i7-1065G7, Intel Optane Memory H10 with Solid State Storage 32GB + 512GB HBRPEKNX0202A(L/H) | Asus ZenBook 13 UX325JA Iris Plus Graphics G7 (Ice Lake 64 EU), i7-1065G7, Intel SSD 660p 1TB SSDPEKNW010T8 | Microsoft Surface Laptop 3 13 Core i5-1035G7 Iris Plus Graphics G7 (Ice Lake 64 EU), i5-1035G7, SK hynix BC501 HFM256GDGTNG | |
|---|---|---|---|---|---|
| Noise | 16% | 11% | 4% | 7% | |
| off /ambiente * (dB) | 27.4 | 25.7 6% | 28.5 -4% | 30.1 -10% | 28.5 -4% |
| Idle Minimum * (dB) | 29.1 | 25.7 12% | 28.5 2% | 30.1 -3% | 28.5 2% |
| Idle Average * (dB) | 29.1 | 25.7 12% | 28.5 2% | 30.1 -3% | 28.5 2% |
| Idle Maximum * (dB) | 29.1 | 25.9 11% | 28.5 2% | 30.1 -3% | 28.5 2% |
| Load Average * (dB) | 40.7 | 26.2 36% | 28.5 30% | 32.7 20% | 28.5 30% |
| Witcher 3 ultra * (dB) | 42.8 | 36.5 15% | 35.3 18% | 38.6 10% | 40.4 6% |
| Load Maximum * (dB) | 46.3 | 36.6 21% | 35.3 24% | 38.5 17% | 40.4 13% |
* ... Meglio usare valori piccoli
Rumorosità
| Idle |
| 29.1 / 29.1 / 29.1 dB(A) |
| Sotto carico |
| 40.7 / 46.3 dB(A) |
 | ||
30 dB silenzioso 40 dB(A) udibile 50 dB(A) rumoroso |
||
min: | ||
GPD Win 3 analisi audio
(+) | gli altoparlanti sono relativamente potenti (92.6 dB)
Bassi 100 - 315 Hz
(-) | quasi nessun basso - in media 22.3% inferiori alla media
(+) | bassi in lineaa (5.8% delta rispetto alla precedente frequenza)
Medi 400 - 2000 Hz
(±) | medi elevati - circa 6% superiore alla media
(+) | medi lineari (6% delta rispetto alla precedente frequenza)
Alti 2 - 16 kHz
(±) | alti elevati - circa 7.5% superiori alla media
(±) | la linearità degli alti è media (7.4% delta rispetto alla precedente frequenza)
Nel complesso 100 - 16.000 Hz
(±) | la linearità complessiva del suono è media (21.6% di differenza rispetto alla media
Rispetto alla stessa classe
» 83% di tutti i dispositivi testati in questa classe è stato migliore, 8% simile, 8% peggiore
» Il migliore ha avuto un delta di 12%, medio di 17%, peggiore di 23%
Rispetto a tutti i dispositivi testati
» 61% di tutti i dispositivi testati in questa classe è stato migliore, 7% similare, 32% peggiore
» Il migliore ha avuto un delta di 4%, medio di 23%, peggiore di 134%
Apple MacBook 12 (Early 2016) 1.1 GHz analisi audio
(+) | gli altoparlanti sono relativamente potenti (83.6 dB)
Bassi 100 - 315 Hz
(±) | bassi ridotti - in media 11.3% inferiori alla media
(±) | la linearità dei bassi è media (14.2% delta rispetto alla precedente frequenza)
Medi 400 - 2000 Hz
(+) | medi bilanciati - solo only 2.4% rispetto alla media
(+) | medi lineari (5.5% delta rispetto alla precedente frequenza)
Alti 2 - 16 kHz
(+) | Alti bilanciati - appena 2% dalla media
(+) | alti lineari (4.5% delta rispetto alla precedente frequenza)
Nel complesso 100 - 16.000 Hz
(+) | suono nel complesso lineare (10.2% differenza dalla media)
Rispetto alla stessa classe
» 7% di tutti i dispositivi testati in questa classe è stato migliore, 2% simile, 90% peggiore
» Il migliore ha avuto un delta di 5%, medio di 18%, peggiore di 53%
Rispetto a tutti i dispositivi testati
» 5% di tutti i dispositivi testati in questa classe è stato migliore, 1% similare, 94% peggiore
» Il migliore ha avuto un delta di 4%, medio di 23%, peggiore di 134%
| Off / Standby | |
| Idle | |
| Sotto carico |
|
Leggenda:
min: | |
| GPD Win 3 i5-1135G7, Iris Xe G7 80EUs, BIWIN NS200 1TB CNF82GS1G02-1TB, IPS, 1280x720, 5.5" | Dell XPS 13 9310 Core i7 FHD i7-1165G7, Iris Xe G7 96EUs, Micron 2300 512GB MTFDHBA512TDV, IPS, 1920x1200, 13.4" | Apple MacBook Air 2020 M1 Entry M1, M1 7-Core GPU, Apple SSD AP0256Q, IPS, 2560x1600, 13.3" | HP Spectre x360 13-aw0013dx i7-1065G7, Iris Plus Graphics G7 (Ice Lake 64 EU), Intel Optane Memory H10 with Solid State Storage 32GB + 512GB HBRPEKNX0202A(L/H), IPS, 1920x1080, 13.3" | Asus ZenBook 13 UX325JA i7-1065G7, Iris Plus Graphics G7 (Ice Lake 64 EU), Intel SSD 660p 1TB SSDPEKNW010T8, IPS, 1920x1080, 13.3" | Microsoft Surface Laptop 3 13 Core i5-1035G7 i5-1035G7, Iris Plus Graphics G7 (Ice Lake 64 EU), SK hynix BC501 HFM256GDGTNG, IPS, 2256x1504, 13.5" | |
|---|---|---|---|---|---|---|
| Power Consumption | -24% | -0% | -24% | -10% | -49% | |
| Idle Minimum * (Watt) | 2.9 | 3.9 -34% | 1.9 34% | 3.9 -34% | 2.4 17% | 4.4 -52% |
| Idle Average * (Watt) | 4.5 | 5.9 -31% | 6.4 -42% | 6.3 -40% | 4.6 -2% | 7.5 -67% |
| Idle Maximum * (Watt) | 4.5 | 6.3 -40% | 7 -56% | 6.8 -51% | 9 -100% | 7.8 -73% |
| Load Average * (Watt) | 38.5 | 39.7 -3% | 25 35% | 32.6 15% | 36 6% | 41.9 -9% |
| Witcher 3 ultra * (Watt) | 28.9 | 34.8 -20% | 25.6 11% | 27 7% | 40.8 -41% | |
| Load Maximum * (Watt) | 41.4 | 47.5 -15% | 30.3 27% | 59 -43% | 36 13% | 63.9 -54% |
* ... Meglio usare valori piccoli
| GPD Win 3 i5-1135G7, Iris Xe G7 80EUs, 44 Wh | Dell XPS 13 9310 Core i7 FHD i7-1165G7, Iris Xe G7 96EUs, 52 Wh | Apple MacBook Air 2020 M1 Entry M1, M1 7-Core GPU, 49.9 Wh | HP Spectre x360 13-aw0013dx i7-1065G7, Iris Plus Graphics G7 (Ice Lake 64 EU), 60 Wh | Asus ZenBook 13 UX325JA i7-1065G7, Iris Plus Graphics G7 (Ice Lake 64 EU), 67 Wh | Microsoft Surface Laptop 3 13 Core i5-1035G7 i5-1035G7, Iris Plus Graphics G7 (Ice Lake 64 EU), 45 Wh | |
|---|---|---|---|---|---|---|
| Autonomia della batteria | 72% | 42% | 48% | 80% | 10% | |
| WiFi v1.3 (h) | 11.3 | 11 -3% | 16 42% | 9.9 -12% | 13.8 22% | 8.3 -27% |
| Load (h) | 1.3 | 3.2 146% | 2.7 108% | 3.1 138% | 1.9 46% | |
| Reader / Idle (h) | 30 | 37.1 | 26.6 | 34.4 |
Pro
Contro
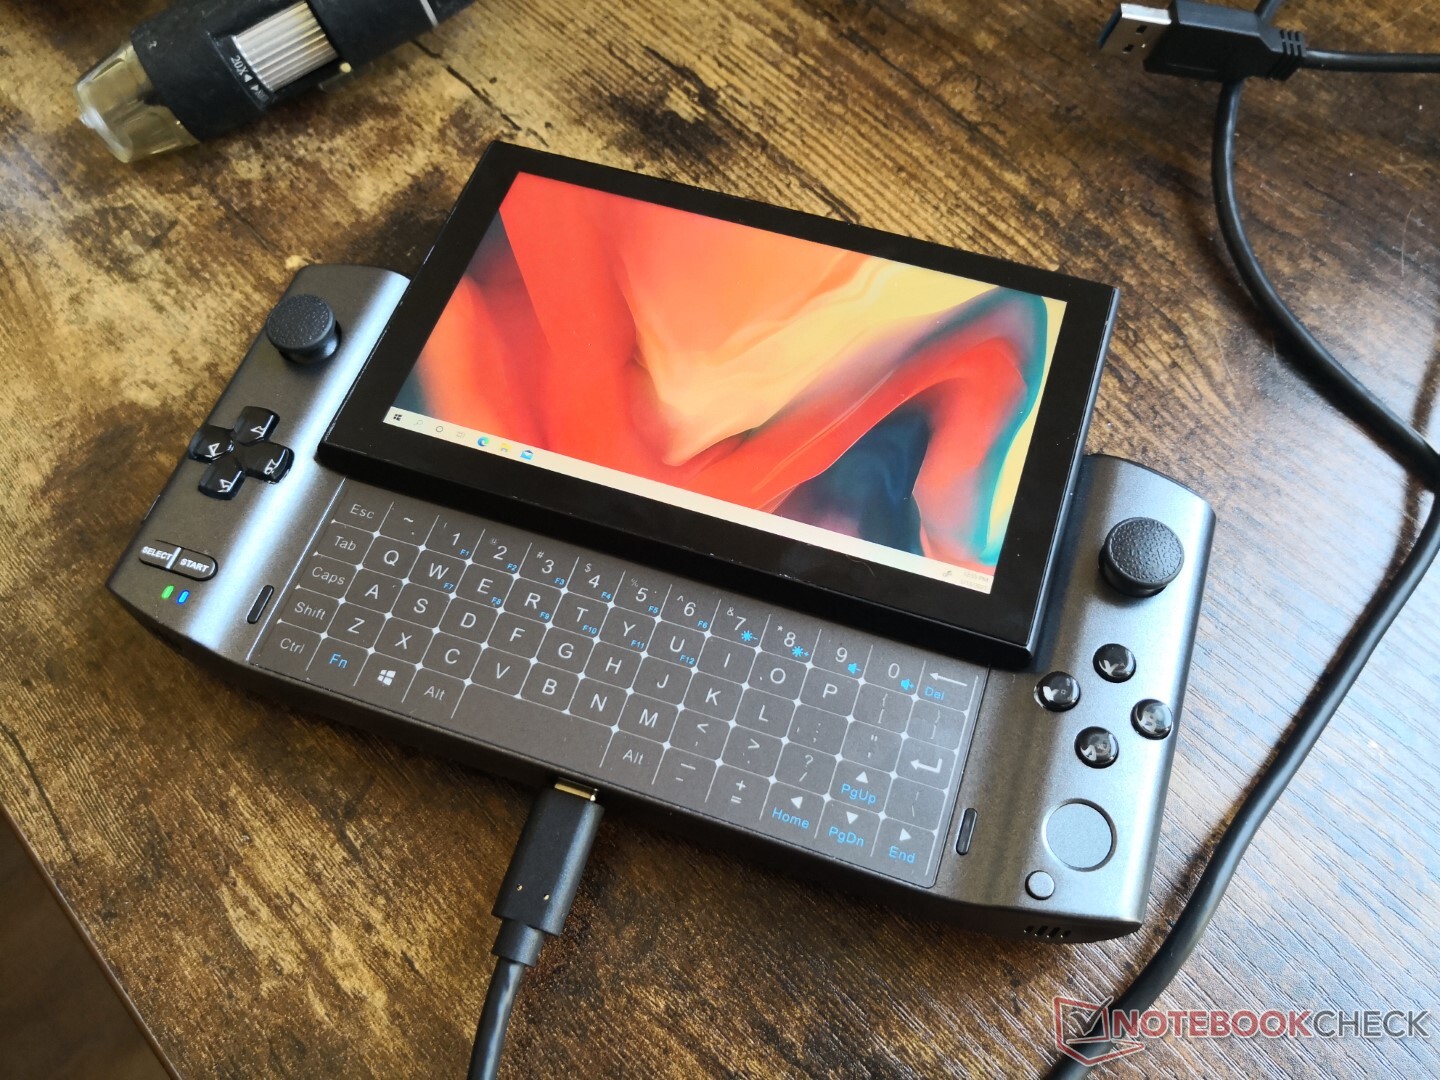
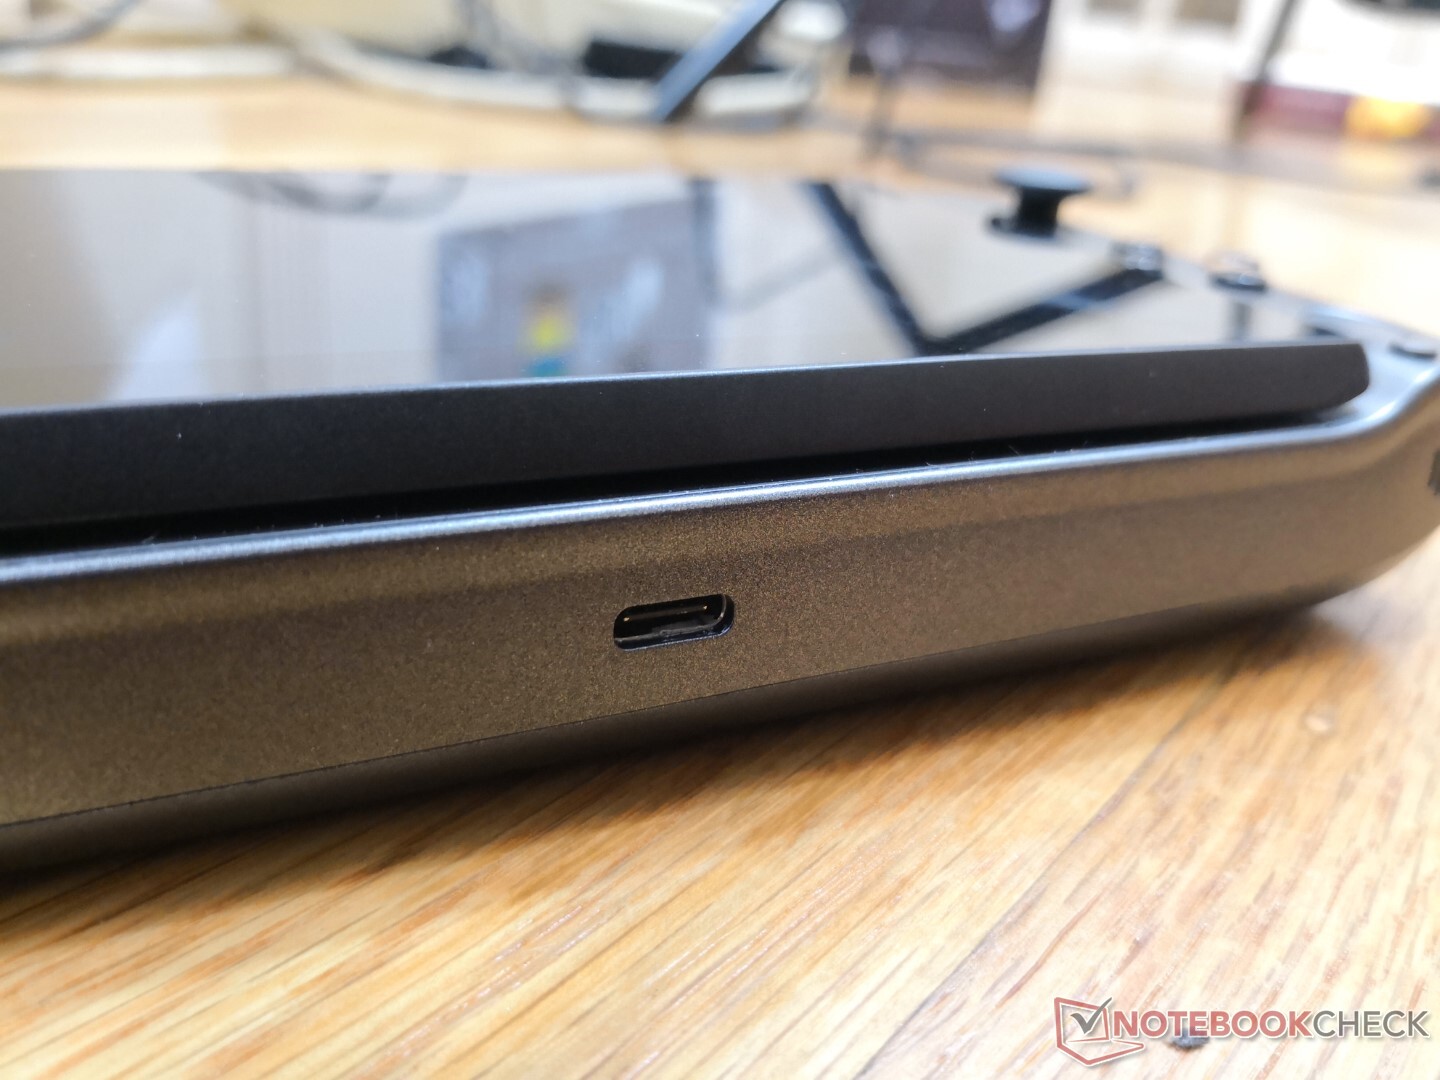
Il Win 3 è più potente di quanto sembri, poiché funziona essenzialmente con lo stesso hardware che alimenta gli ultimi Ultrabooks Intel Evo a grandezza naturale. Le sue capacità di docking integrate Thunderbolt 4 e l'SSD M.2 NVMe aggiornabile non fanno che aumentare la versatilità del dispositivo.
Un dispositivo potente che potrebbe utilizzare pulsanti migliori.
Ci sono caratteristiche che ci piacerebbe vedere sulle potenziali revisioni. Il supporto per la sincronizzazione adattiva, il riconoscimento del controller XBox-DualShock, il rapporto schermo/corpo più alto, la webcam e il peso più leggero renderebbero il dispositivo ancora migliore da usare.
Detto questo, ci sono una alcuni fastidi che dovrebbero essere risolti. Gli inputs casuali della tastiera, i pulsanti spugnosi del controller, la sveglia casuale dal sonno e l'occasionale pulsante bloccato fanno sì che il Win 3 non faccia una bella figura, nonostante l'hardware capace al suo interno. Non è impossibile abituarsi, ma se siete già abituati a un controller XBox, Playstation o Switch standard, allora probabilmente vorrete che questi pulsanti del Win 3 abbiano più profondità e feedback.
Price comparison
