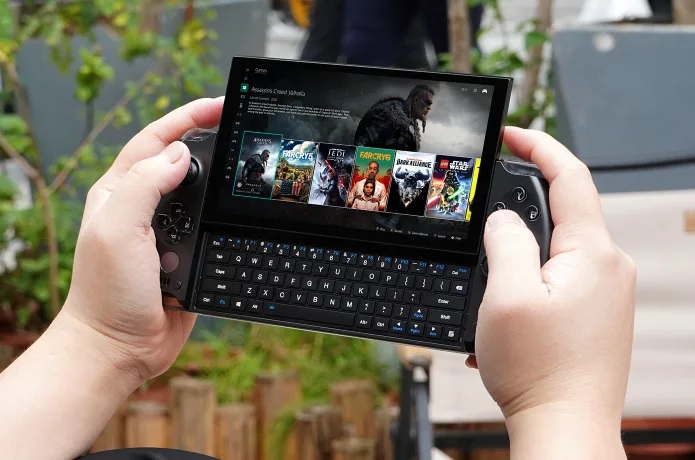
Recensione del PC portatile GPD Win 4: gaming con Ryzen 7 a 1080p nel palmo della mano
Il PC portatile Windows 2023 GPD Win 4 è il diretto successore del Win 3 del 2021. Oltre al passaggio dal processore Intel di 11a generazione al più potente AMD Zen 3+, il suo design è stato completamente rinnovato da zero per essere una macchina complessivamente più robusta, come dimostrerà la nostra recensione.
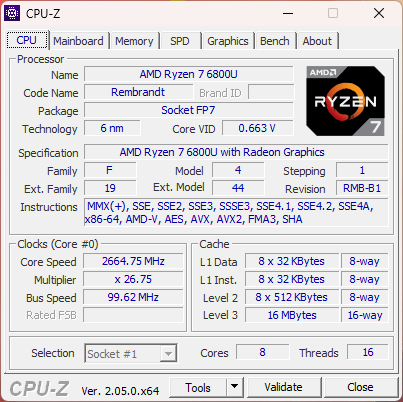
Il Win 4 utilizza lo stesso Ryzen 7 6800U che si trova sugli Ultrabook di punta come l'Asus ZenBook S13. Tutte le configurazioni al momento differiscono solo per la RAM (16 o 32 GB LPDDR5-6400) e la capacità dell'SSD (1 o 2 TB), mentre il processore AMD e lo schermo touchscreen IPS da 6 pollici a 1080p rimangono invariati. Ulteriori informazioni sul Win 4 sono disponibili sulla pagina Indiegogo https://www.indiegogo.com/projects/gpd-win-4-smallest-6800u-handheld-console#/.
I concorrenti includono Steam Deck, Nintendo Switch e OneXPlayer. I nostri confronti di seguito includono anche i subnotebook della serie U.
Altre recensioni di GPD:
Potenziali concorrenti a confronto
Punteggio | Data | Modello | Peso | Altezza | Dimensione | Risoluzione | Prezzo |
|---|---|---|---|---|---|---|---|
| 80.3 % v7 (old) | 03/2023 | GPD Win 4 R7 6800U, Radeon 680M | 607 gr | 28 mm | 6.00" | 1920x1080 | |
| 84.5 % v7 (old) | 07/2022 | GPD Win Max 2 i7-1260P, Iris Xe G7 96EUs | 1 kg | 23 mm | 10.10" | 2560x1600 | |
v (old) | 01/2021 | GPD Win 3 i5-1135G7, Iris Xe G7 80EUs | 553 gr | 27 mm | 5.50" | 1280x720 | |
| 85.5 % v7 (old) | 11/2020 | Razer Blade Stealth i7-1165G7 GTX 1650 Ti Max-Q i7-1165G7, GeForce GTX 1650 Ti Max-Q | 1.4 kg | 15.3 mm | 13.30" | 1920x1080 | |
| 90.1 % v7 (old) | 11/2022 | Dell XPS 13 9315 2-in-1 Core i5-1230U i5-1230U, Iris Xe G7 80EUs | 764 gr | 7.4 mm | 13.00" | 2880x1920 | |
| 90.1 % v7 (old) | 07/2022 | Asus Zenbook S 13 OLED R7 6800U, Radeon 680M | 1.1 kg | 14.9 mm | 13.30" | 2880x1800 |
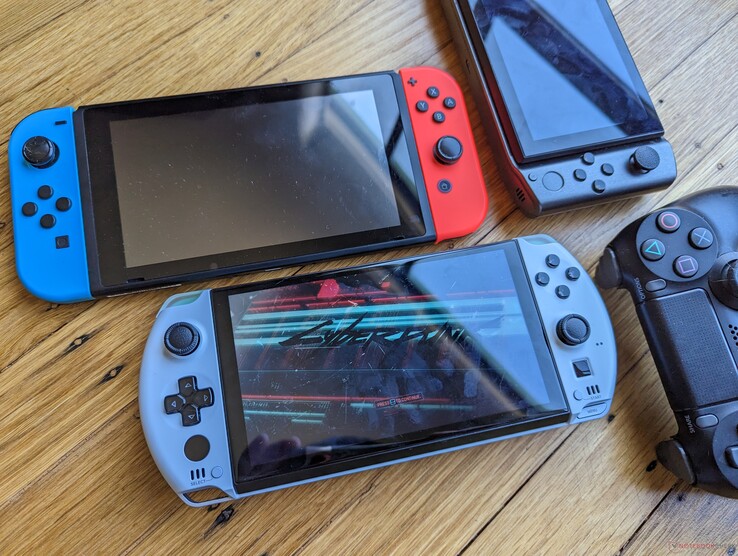
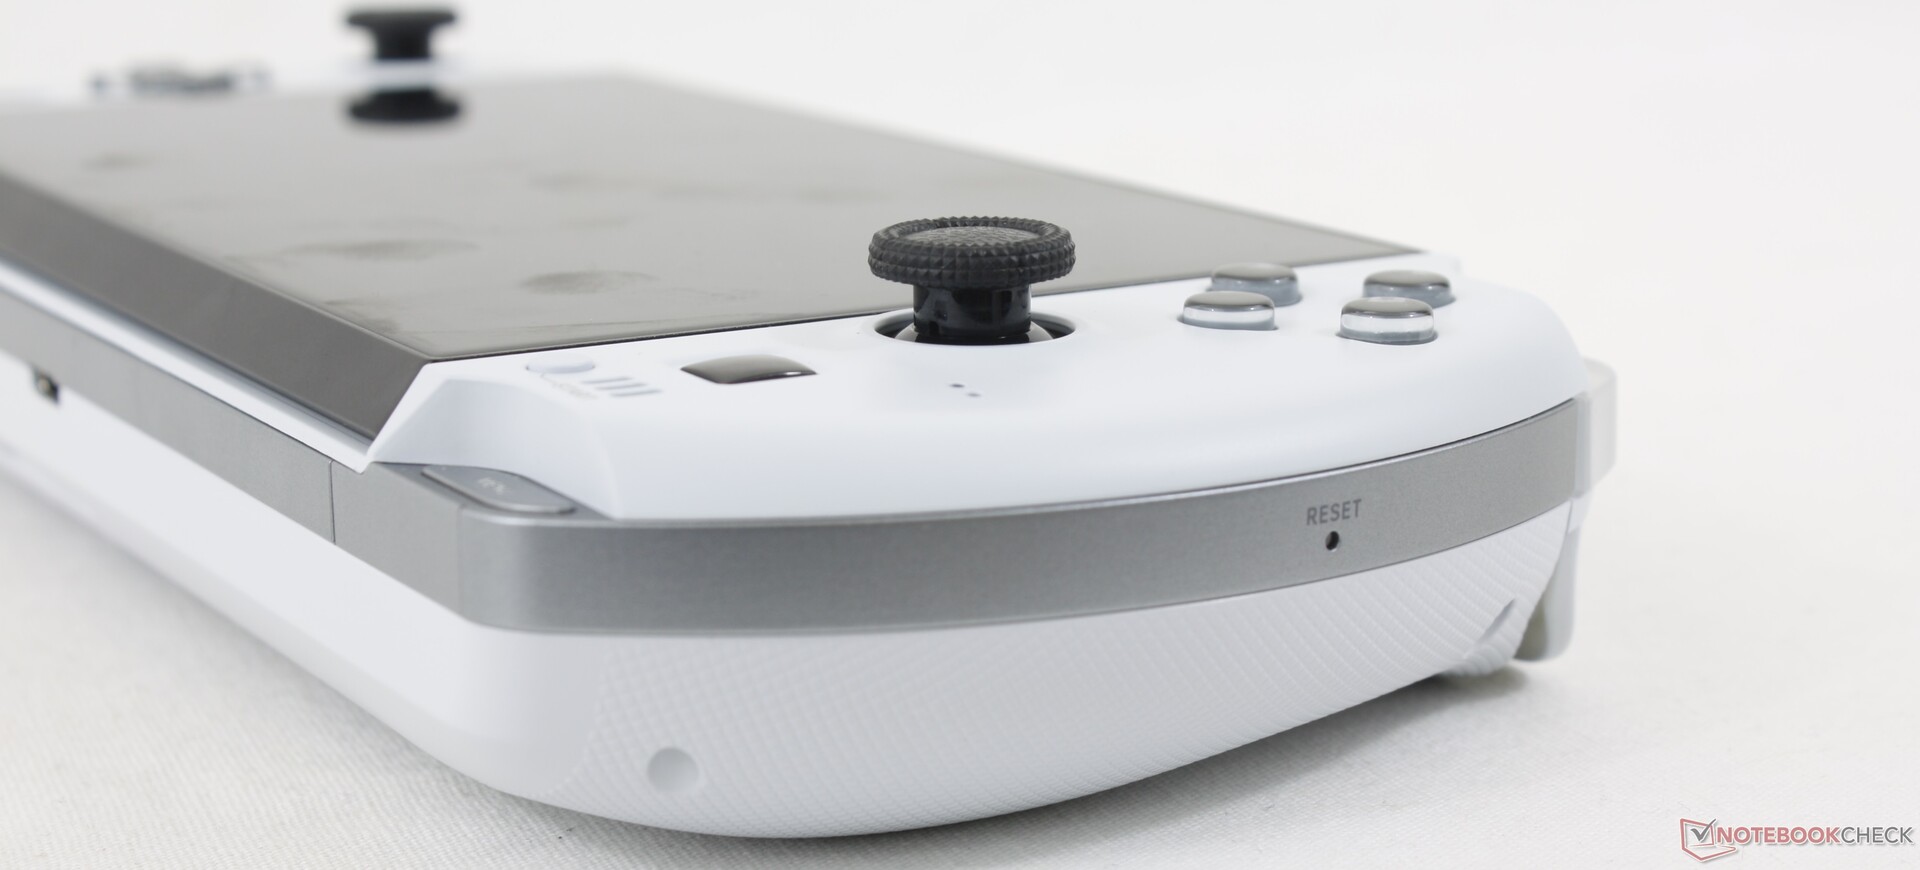
Caso - Sembra una Vita, stona come uno Switch
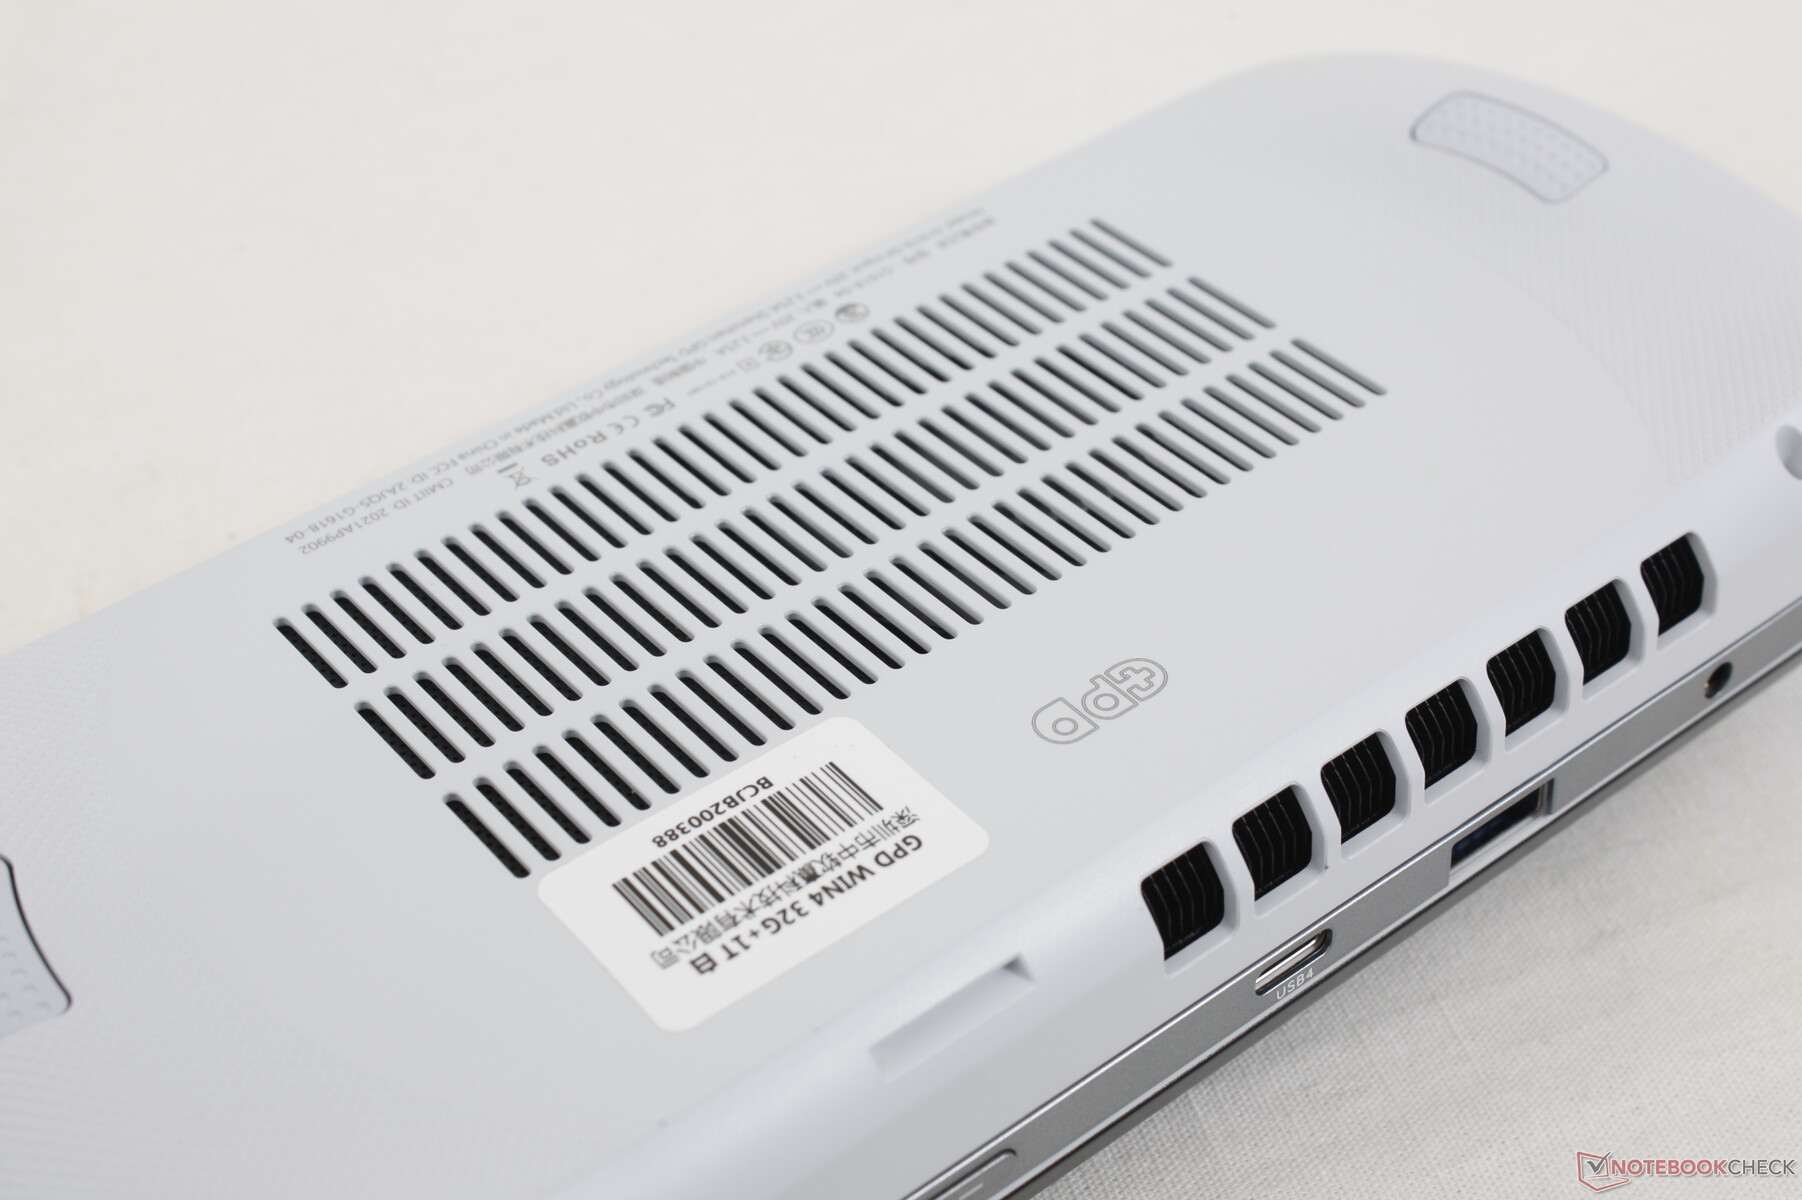
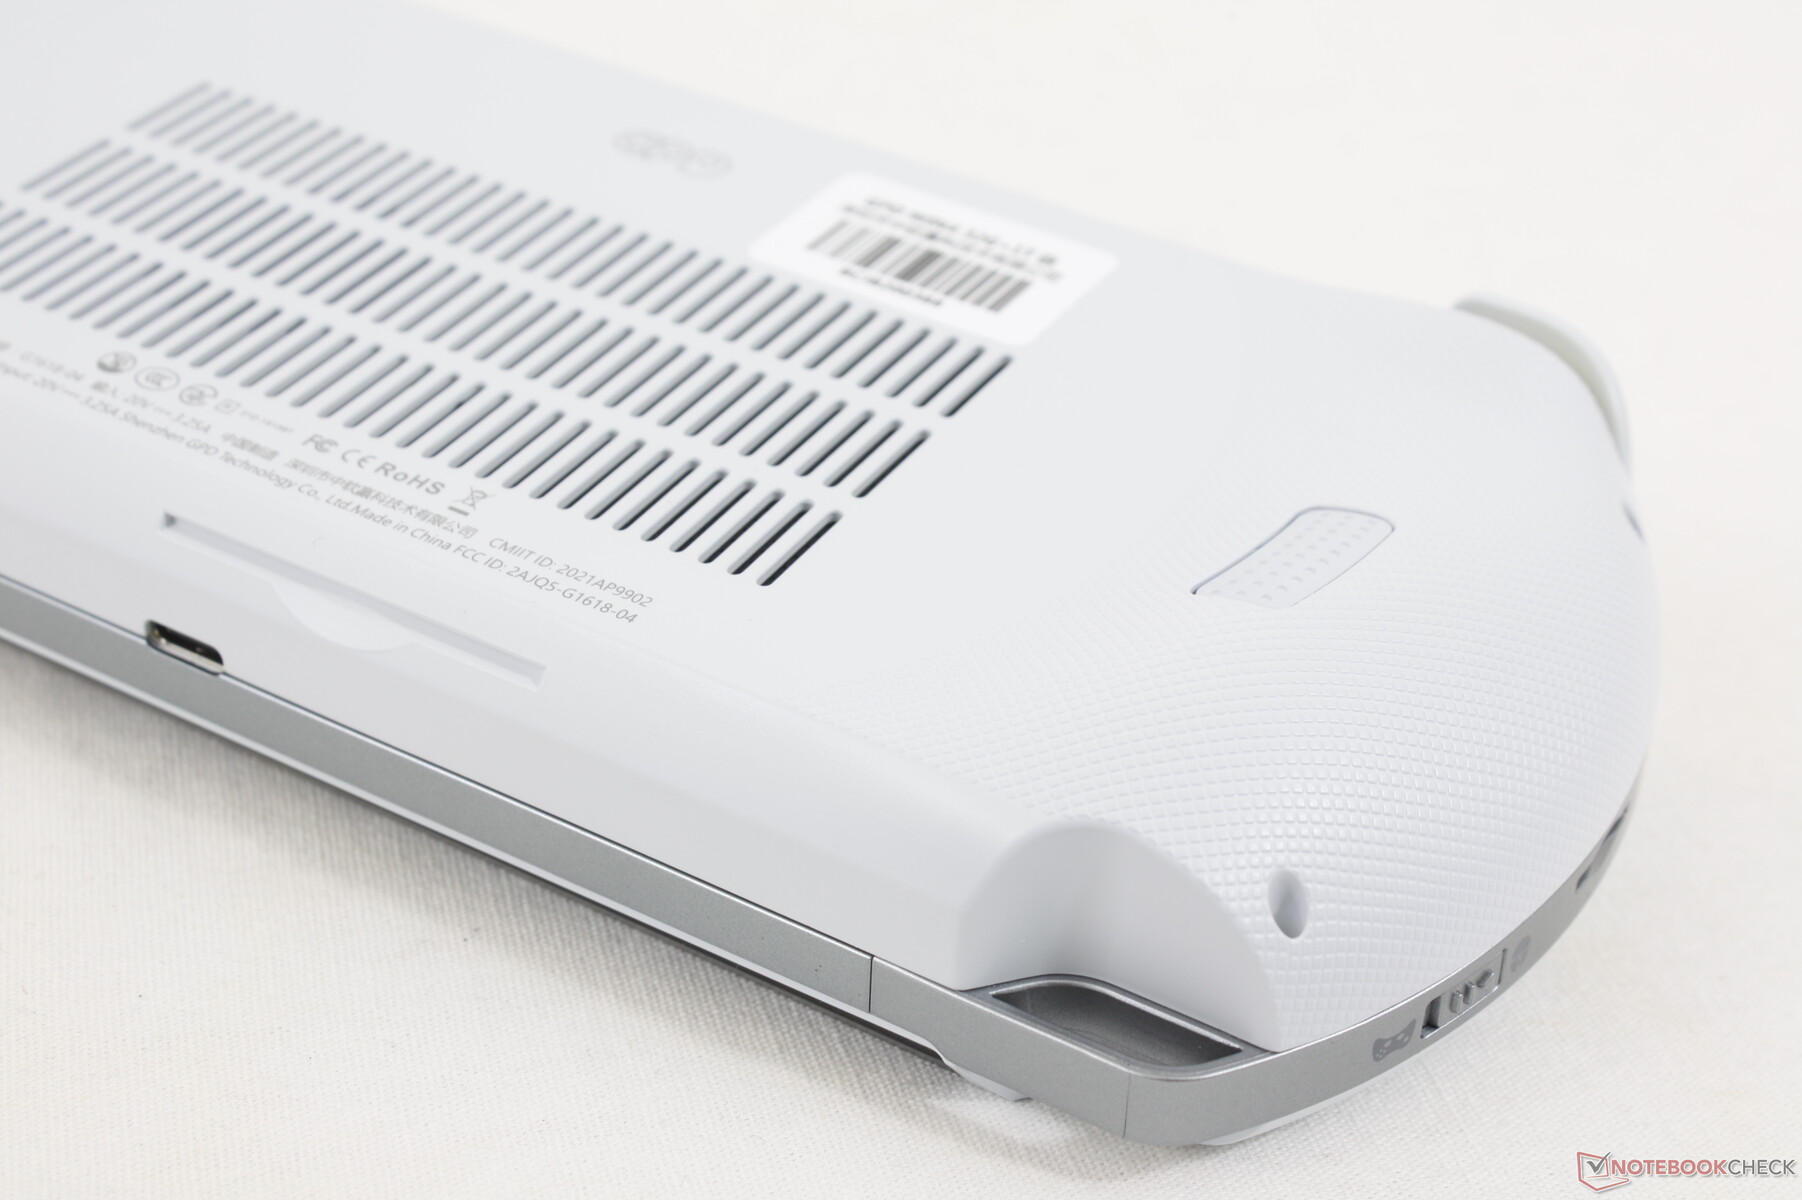
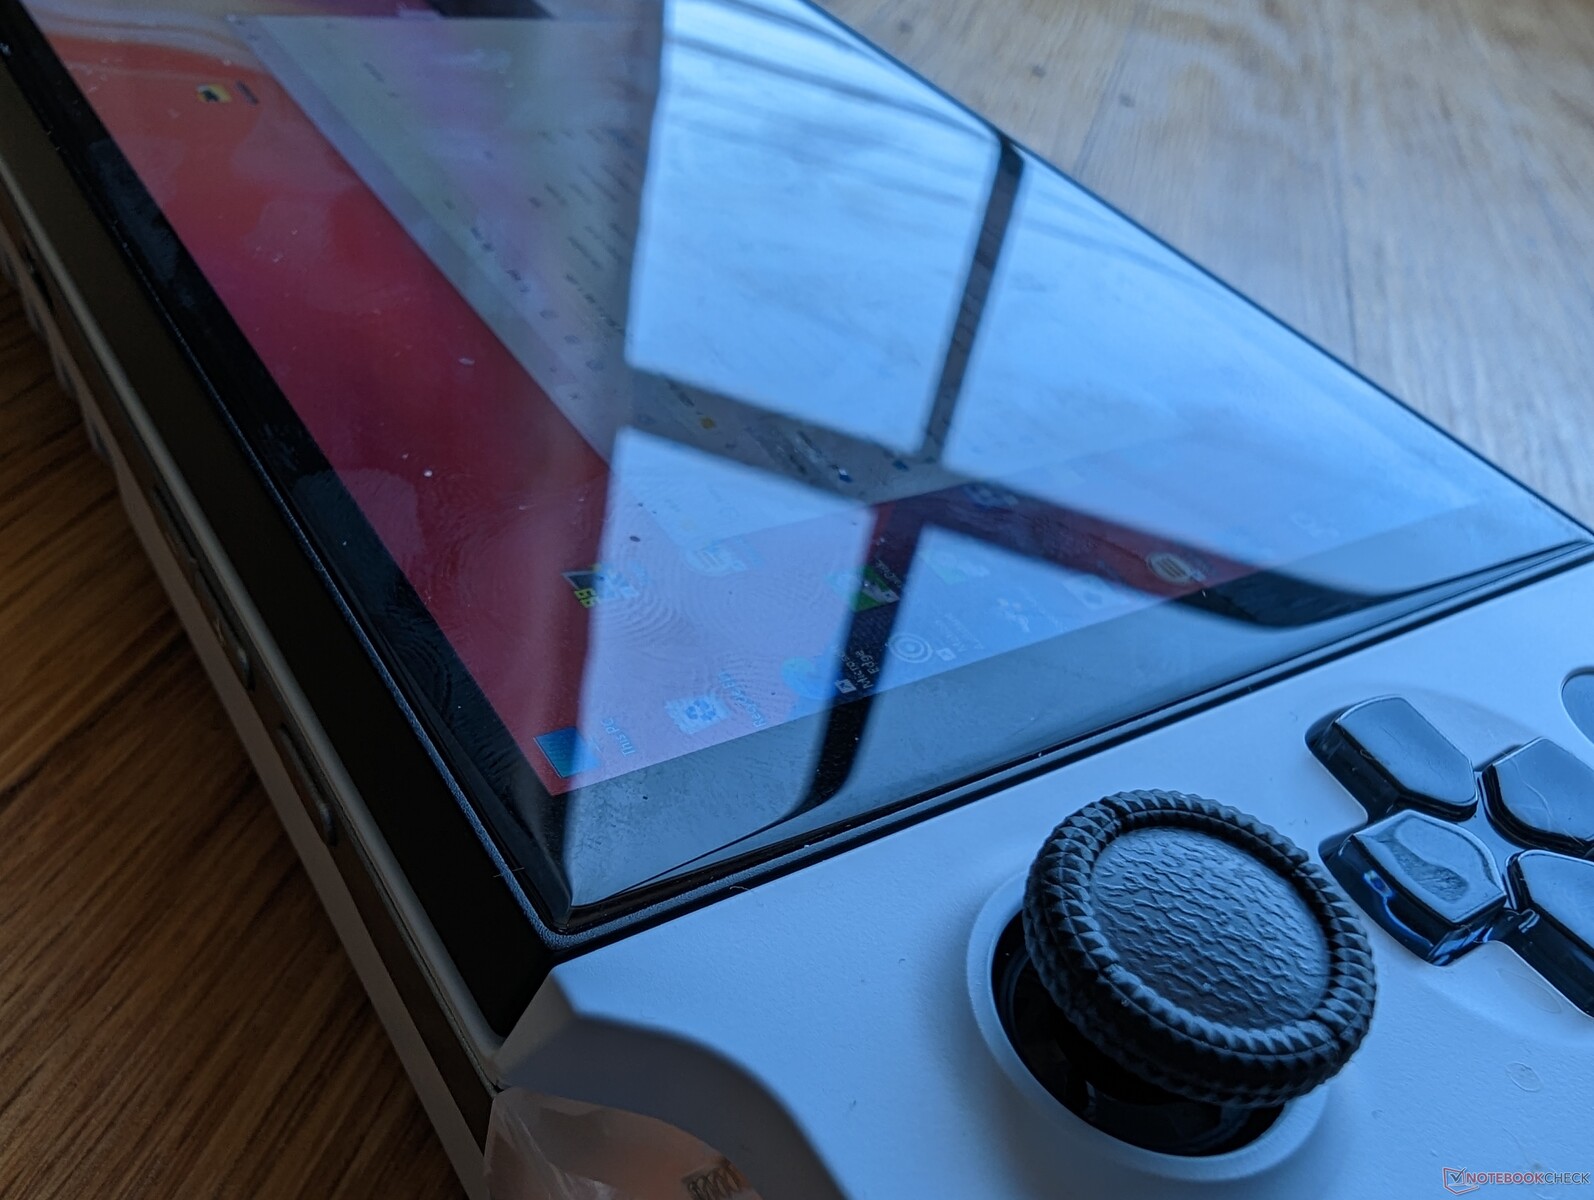
Lo chassis è composto da lega di magnesio grigia, plastica ABS in opzioni di colore bianco o nero e protezione Gorilla Glass 5 edge-to-edge per il touchscreen. Il design complessivo è un'evoluzione del Win 3 e incorpora caratteristiche delle console portatili di Sony e Nintendo. La forma e le dimensioni del gamepad, ad esempio, sono simili a quelle della PSP e dello Switch, rispettivamente. Il risultato finale è un look più attraente e da giocatore rispetto al Win 3 uscente.
La rigidità del telaio era buona sul Win 3 ed è ora ancora migliore sul Win 4. La nostra unità ha mostrato flessioni o torsioni minime e nessun difetto di assemblaggio o lacuna, nonostante tutti i diversi materiali e le parti mobili che compongono il case. C'è qualche scricchiolio udibile quando si esercita una pressione sul retro, ma non è di grande preoccupazione. Nel complesso, la qualità costruttiva potrebbe passare per una console ufficiale di uno dei principali sviluppatori di videogiochi.
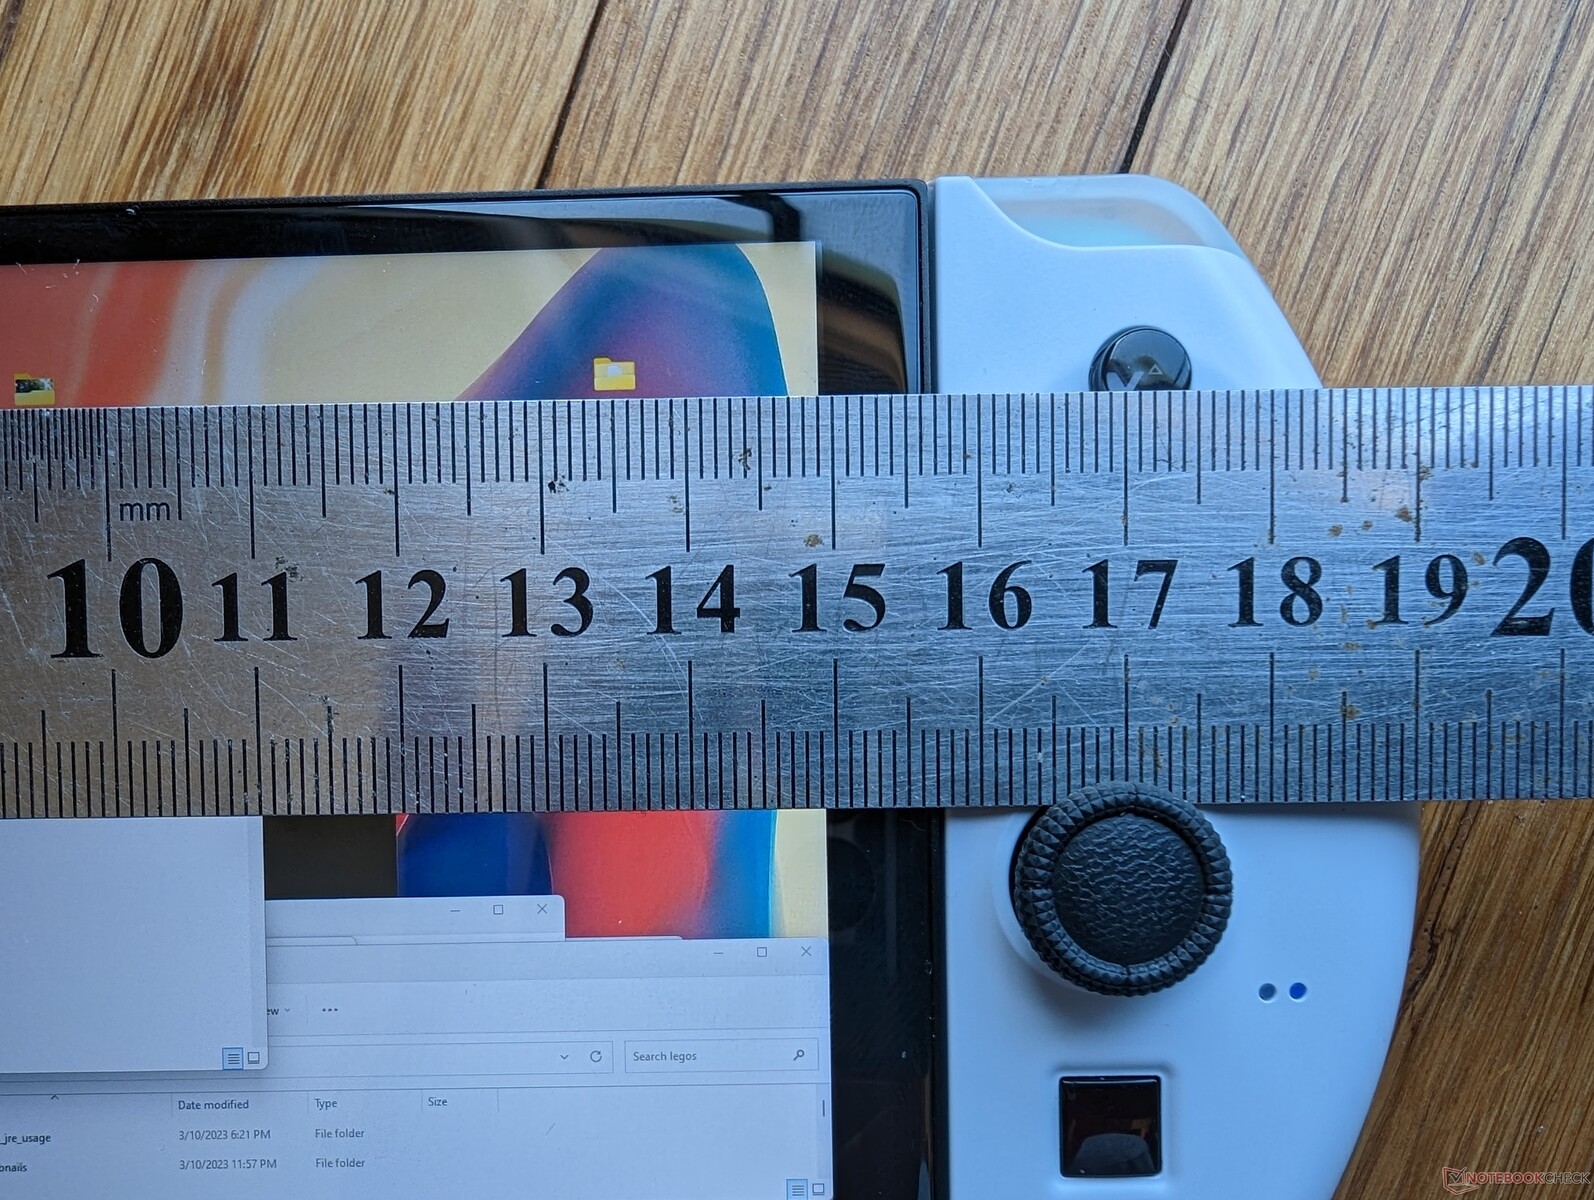
Il modello è più spesso, più grande e più pesante del vecchio Win 3, come mostra la nostra tabella di confronto delle dimensioni qui sotto. In cambio, gli utenti ottengono uno schermo più grande da 6 pollici, un hardware molto più potente, un maggior numero di porte e una struttura più robusta. Si tratta certamente di un palmare più adatto a una borsa o a un borsello piuttosto che a una tasca dei pantaloni.
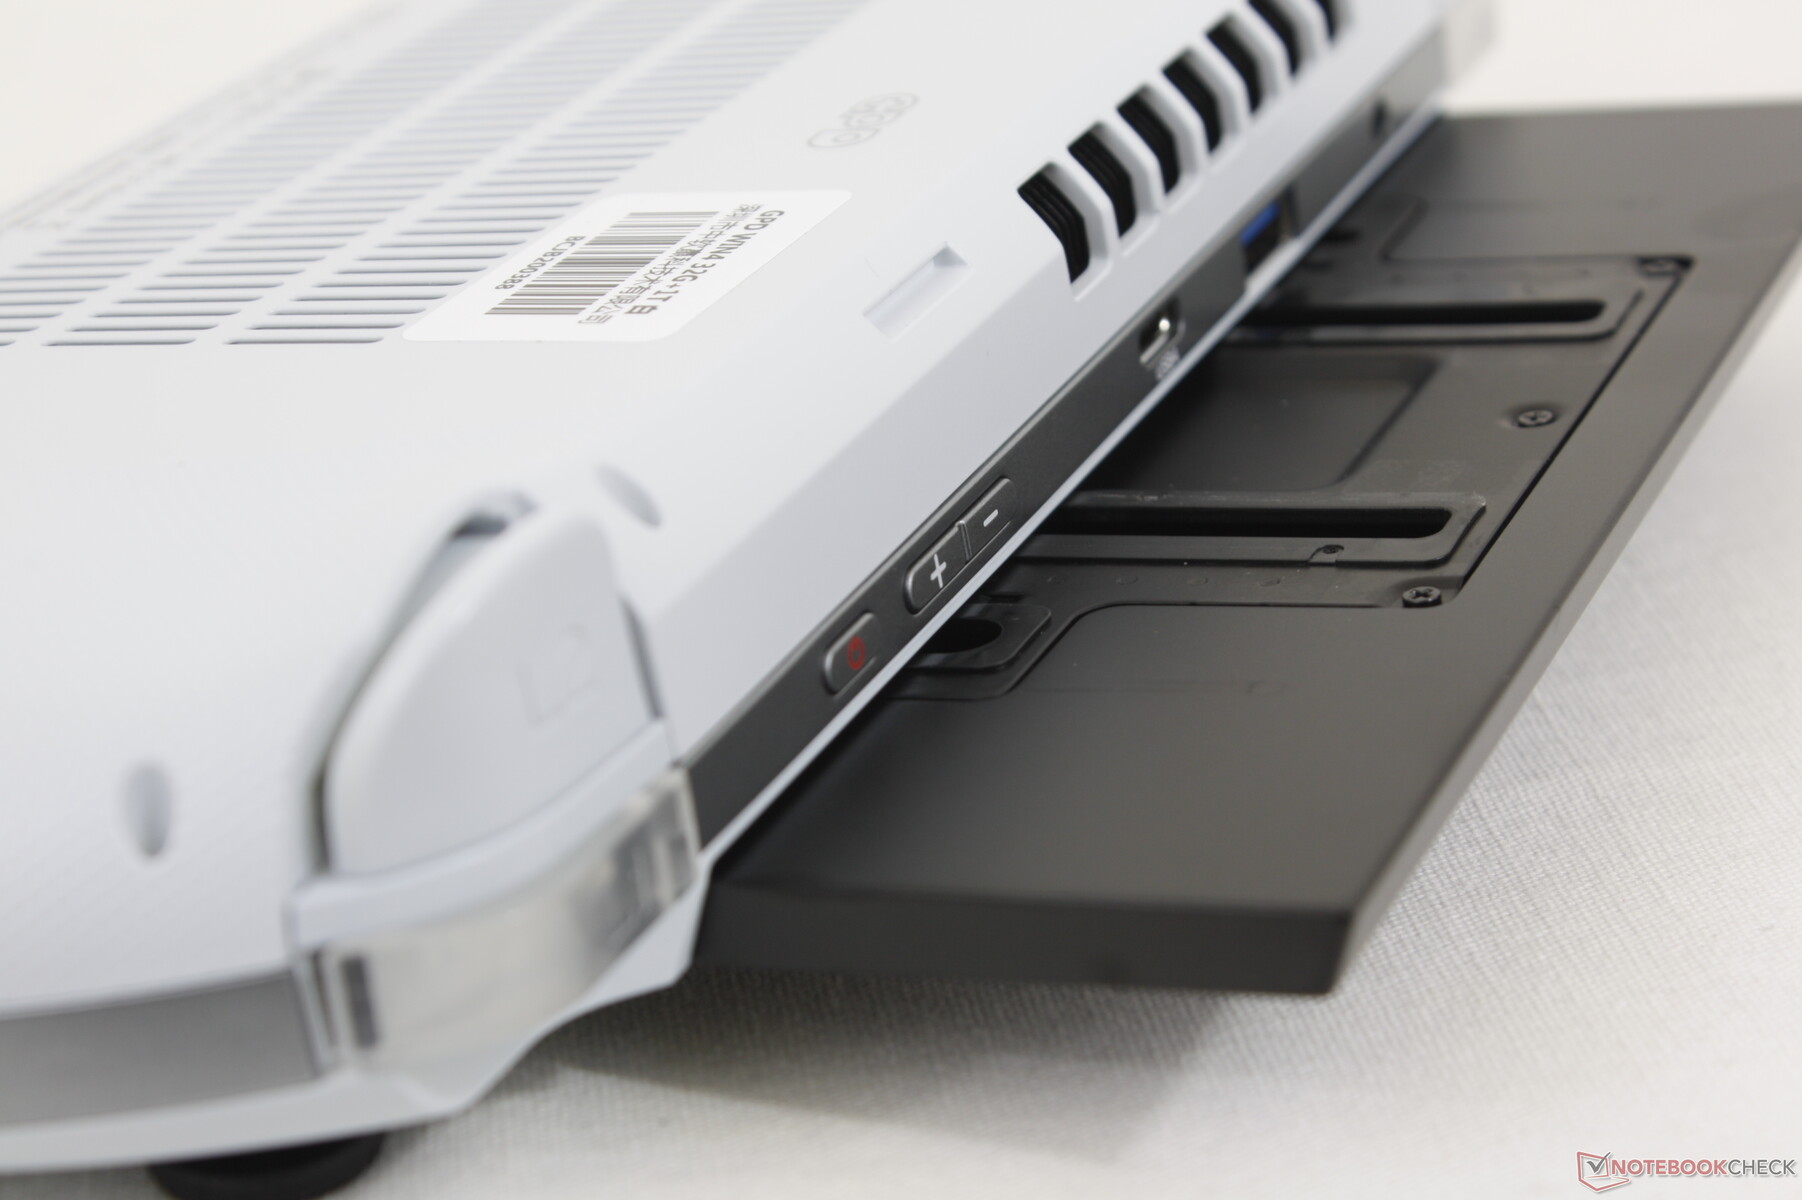
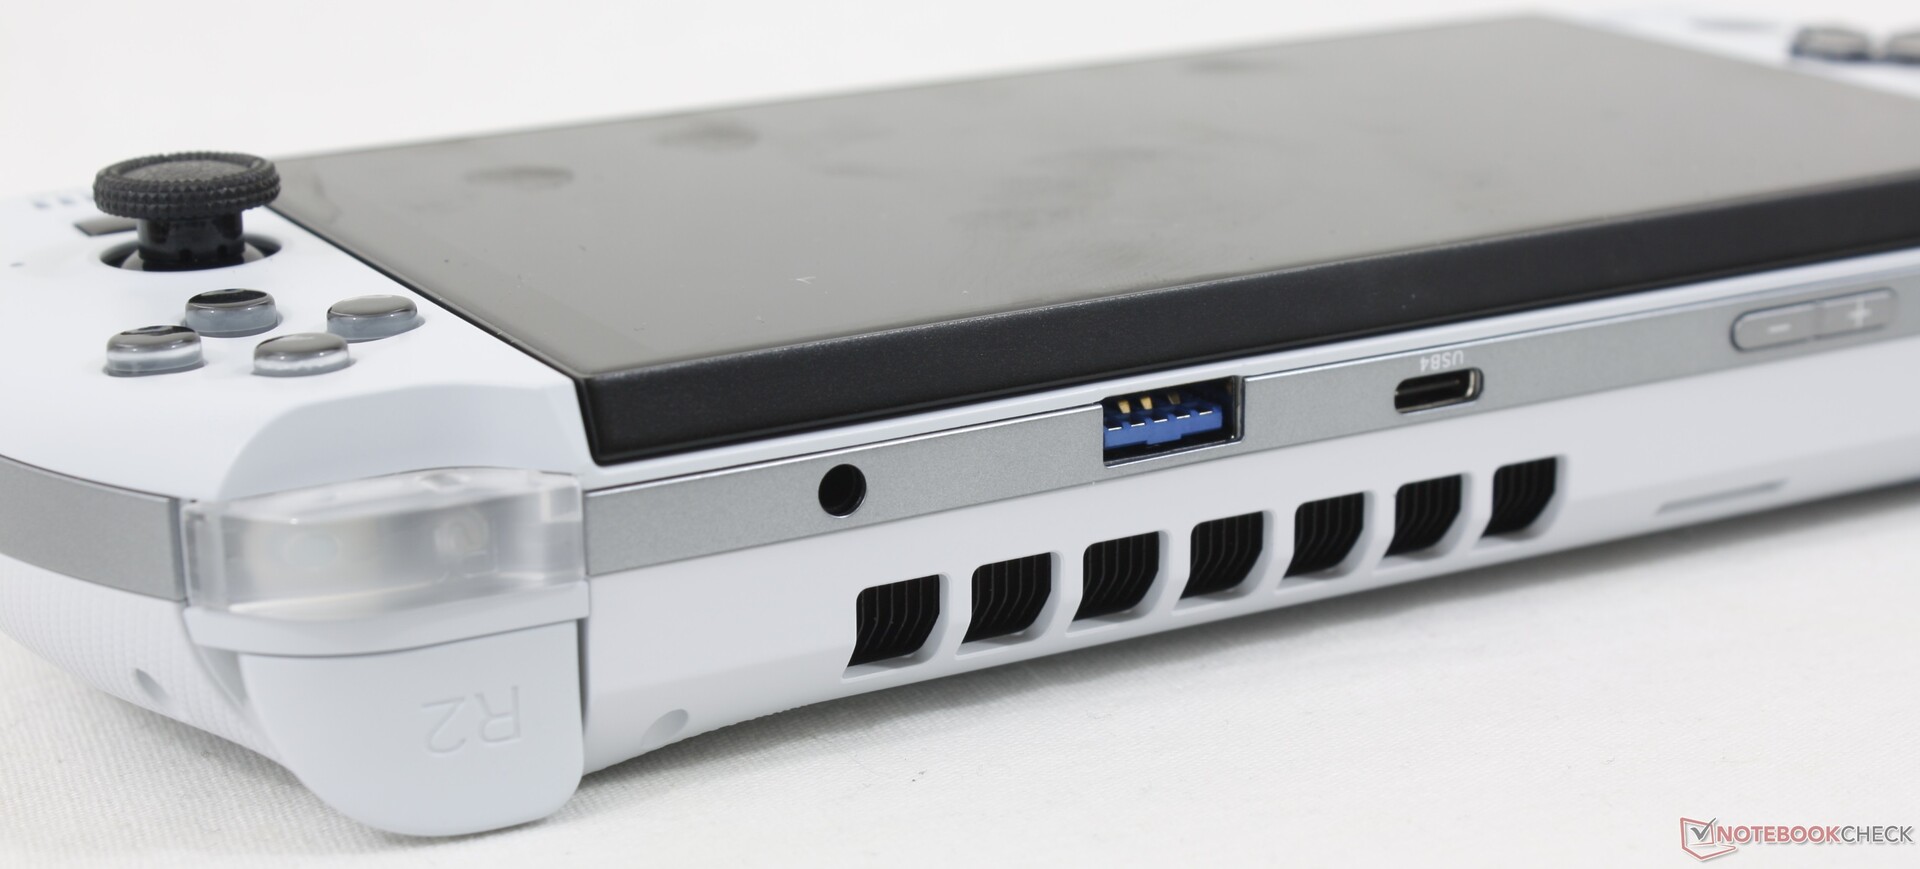
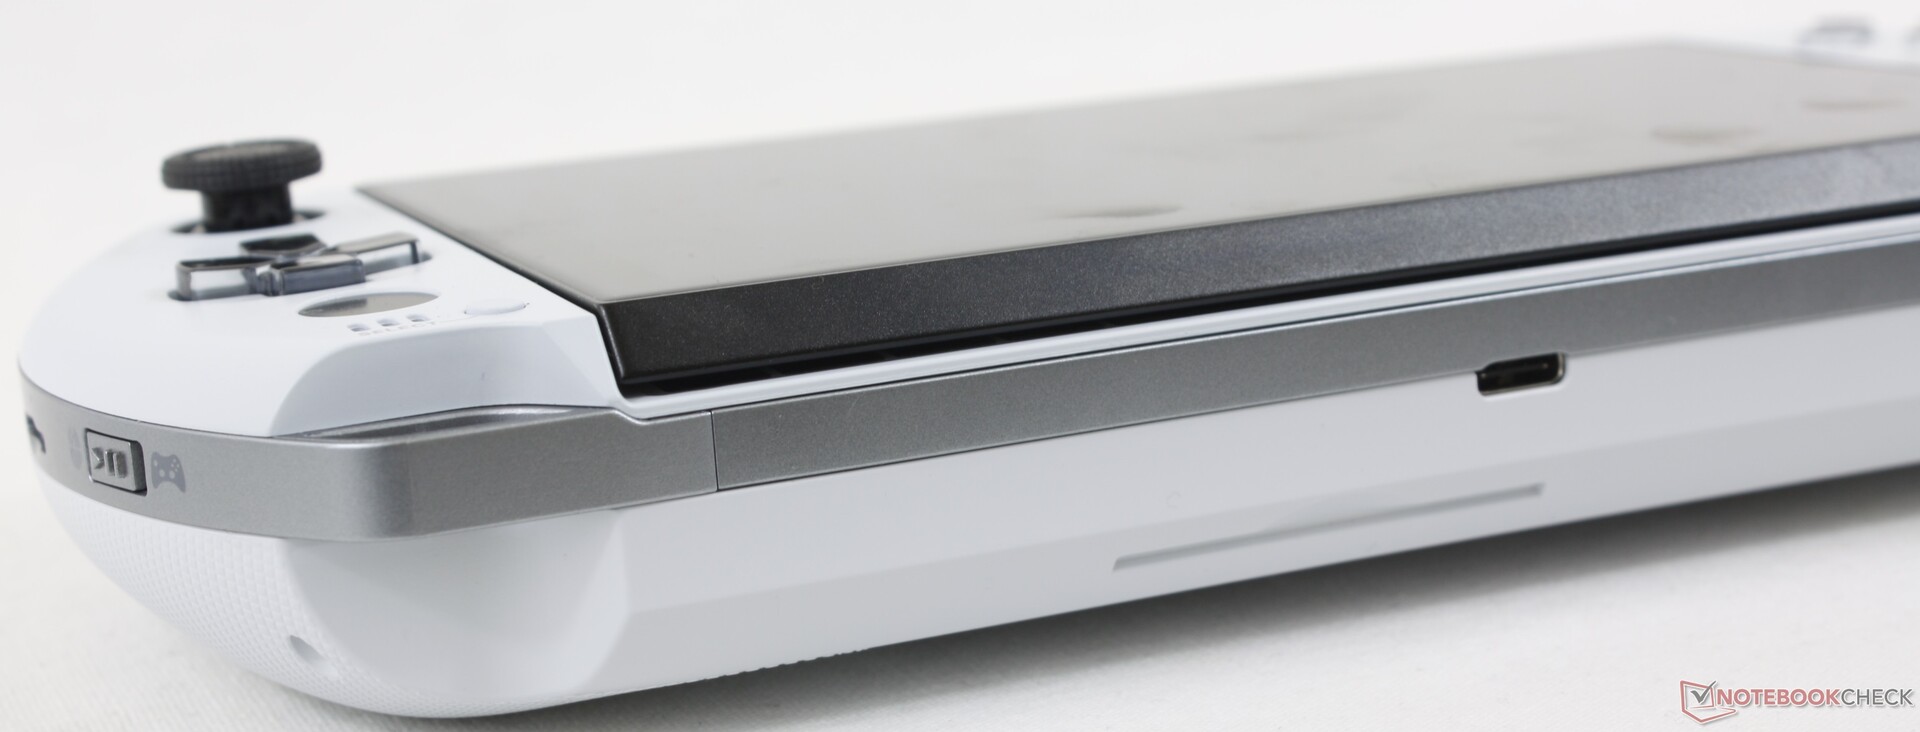
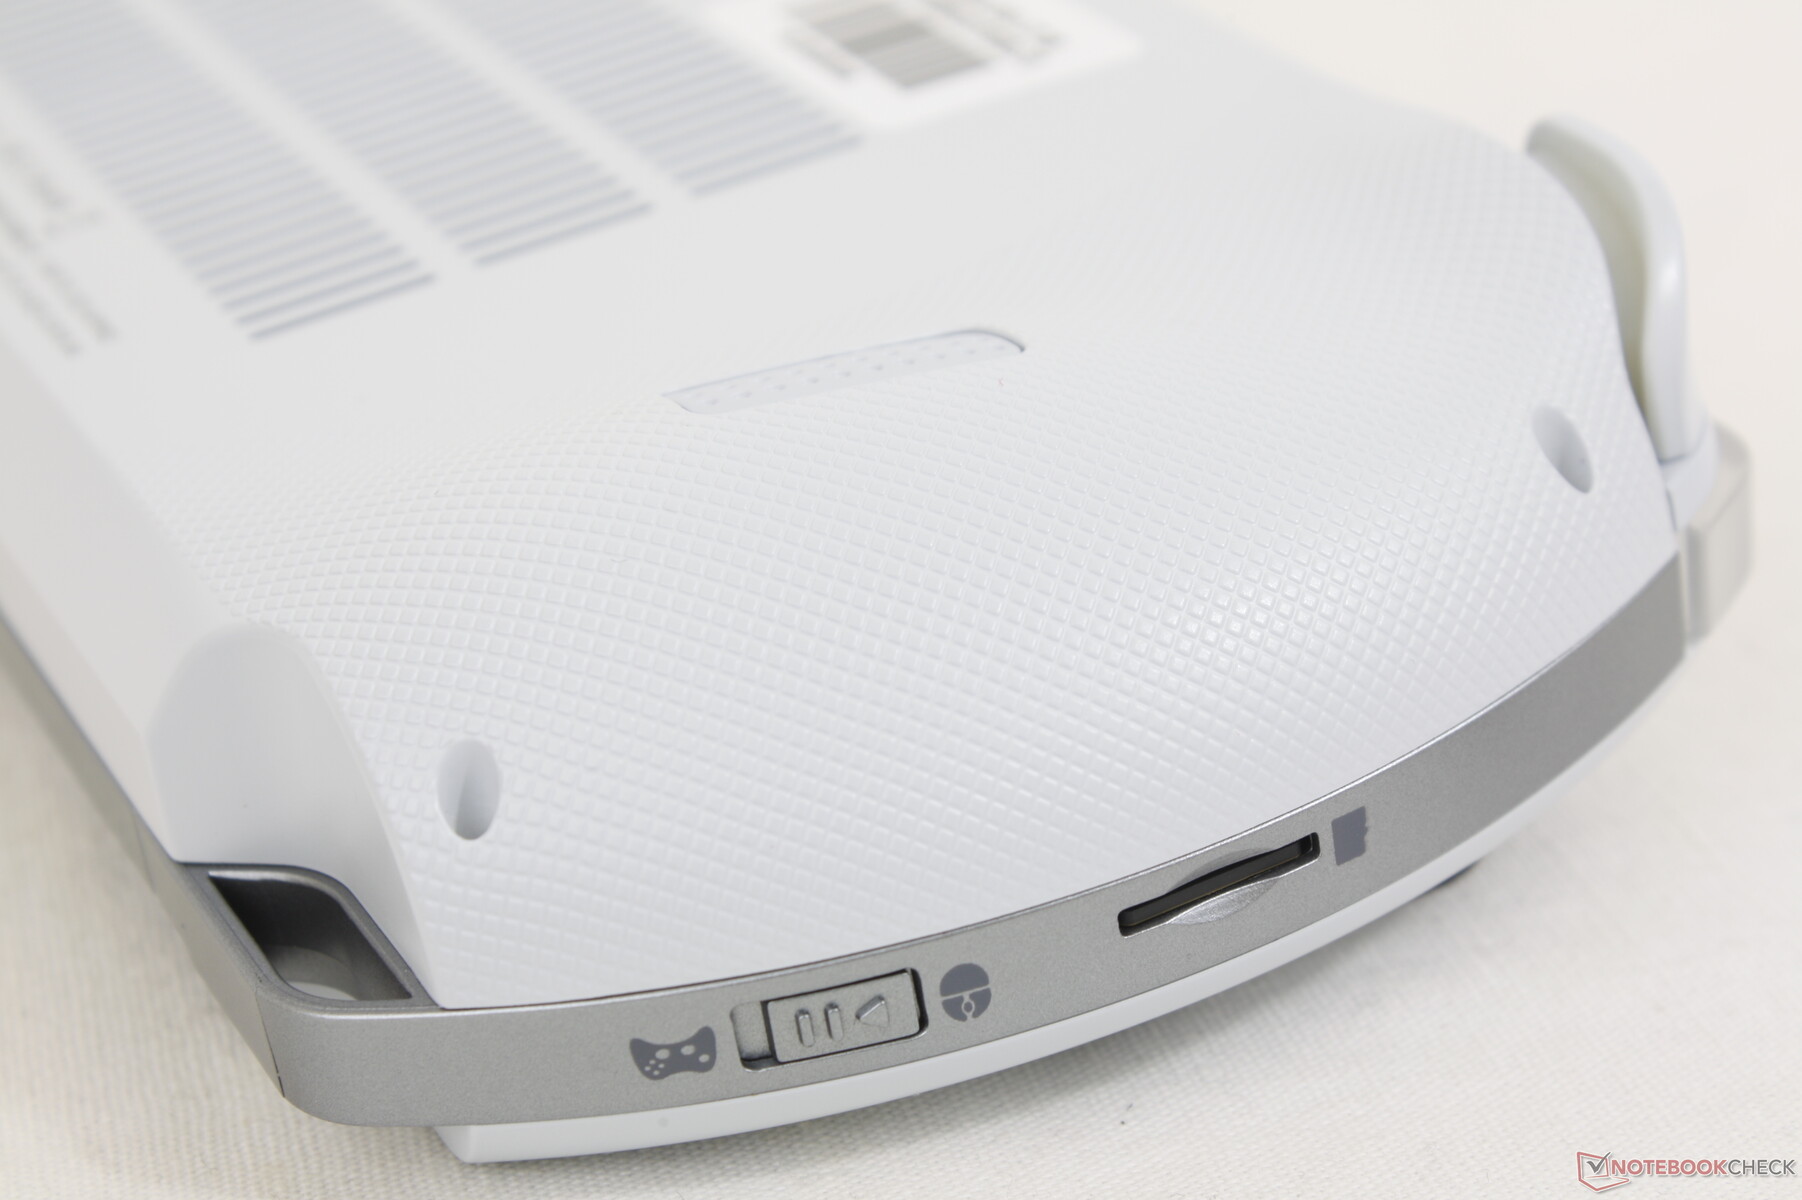
Connettività - Sì, le eGPU sono supportate!
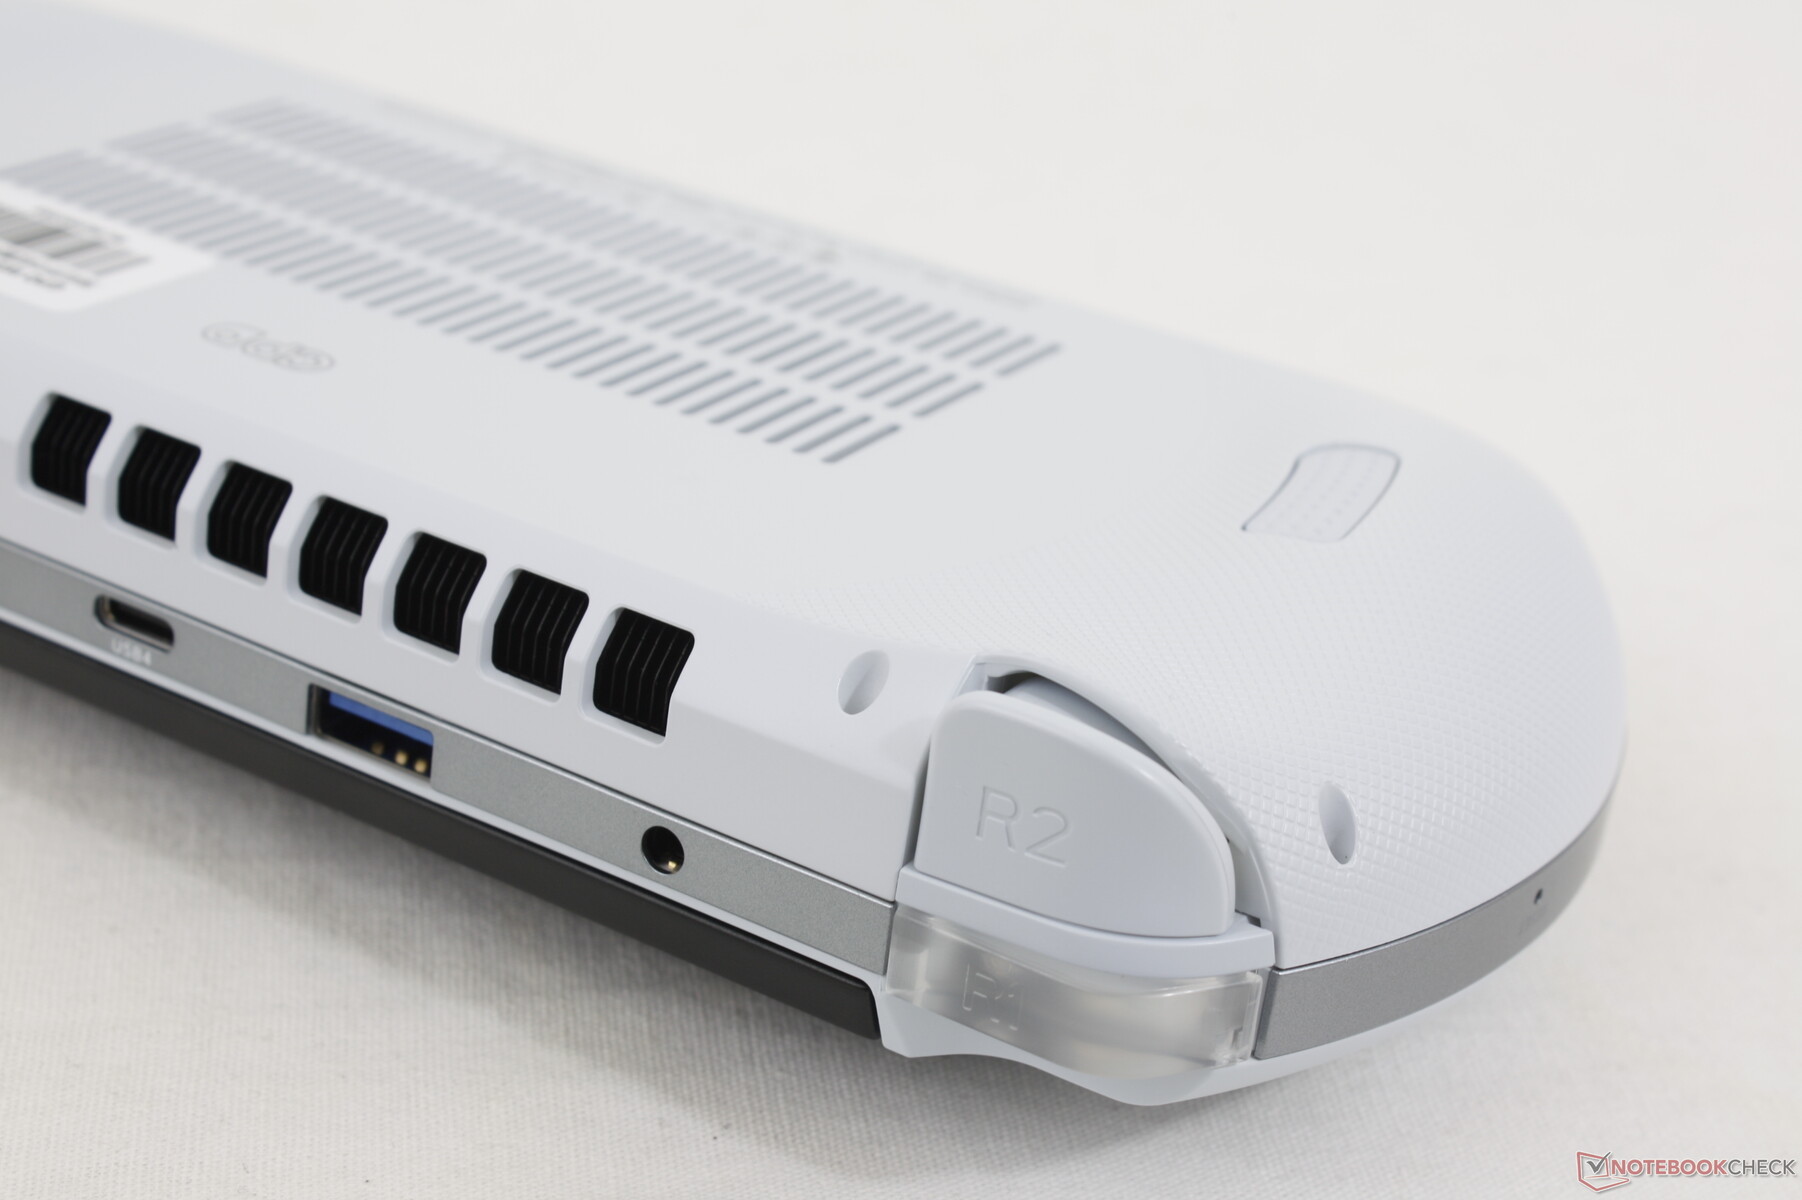
Il modello integra due porte USB-C e una USB-A. La porta USB-C superiore supporta l'USB4, il che significa che la console è compatibile con le docking station per GPU esterne. Per il resto, entrambe le porte USB-C possono essere utilizzate per la ricarica o il collegamento a monitor esterni, mentre il Nintendo Switch può essere ricaricato solo tramite la porta USB-C sul fondo.
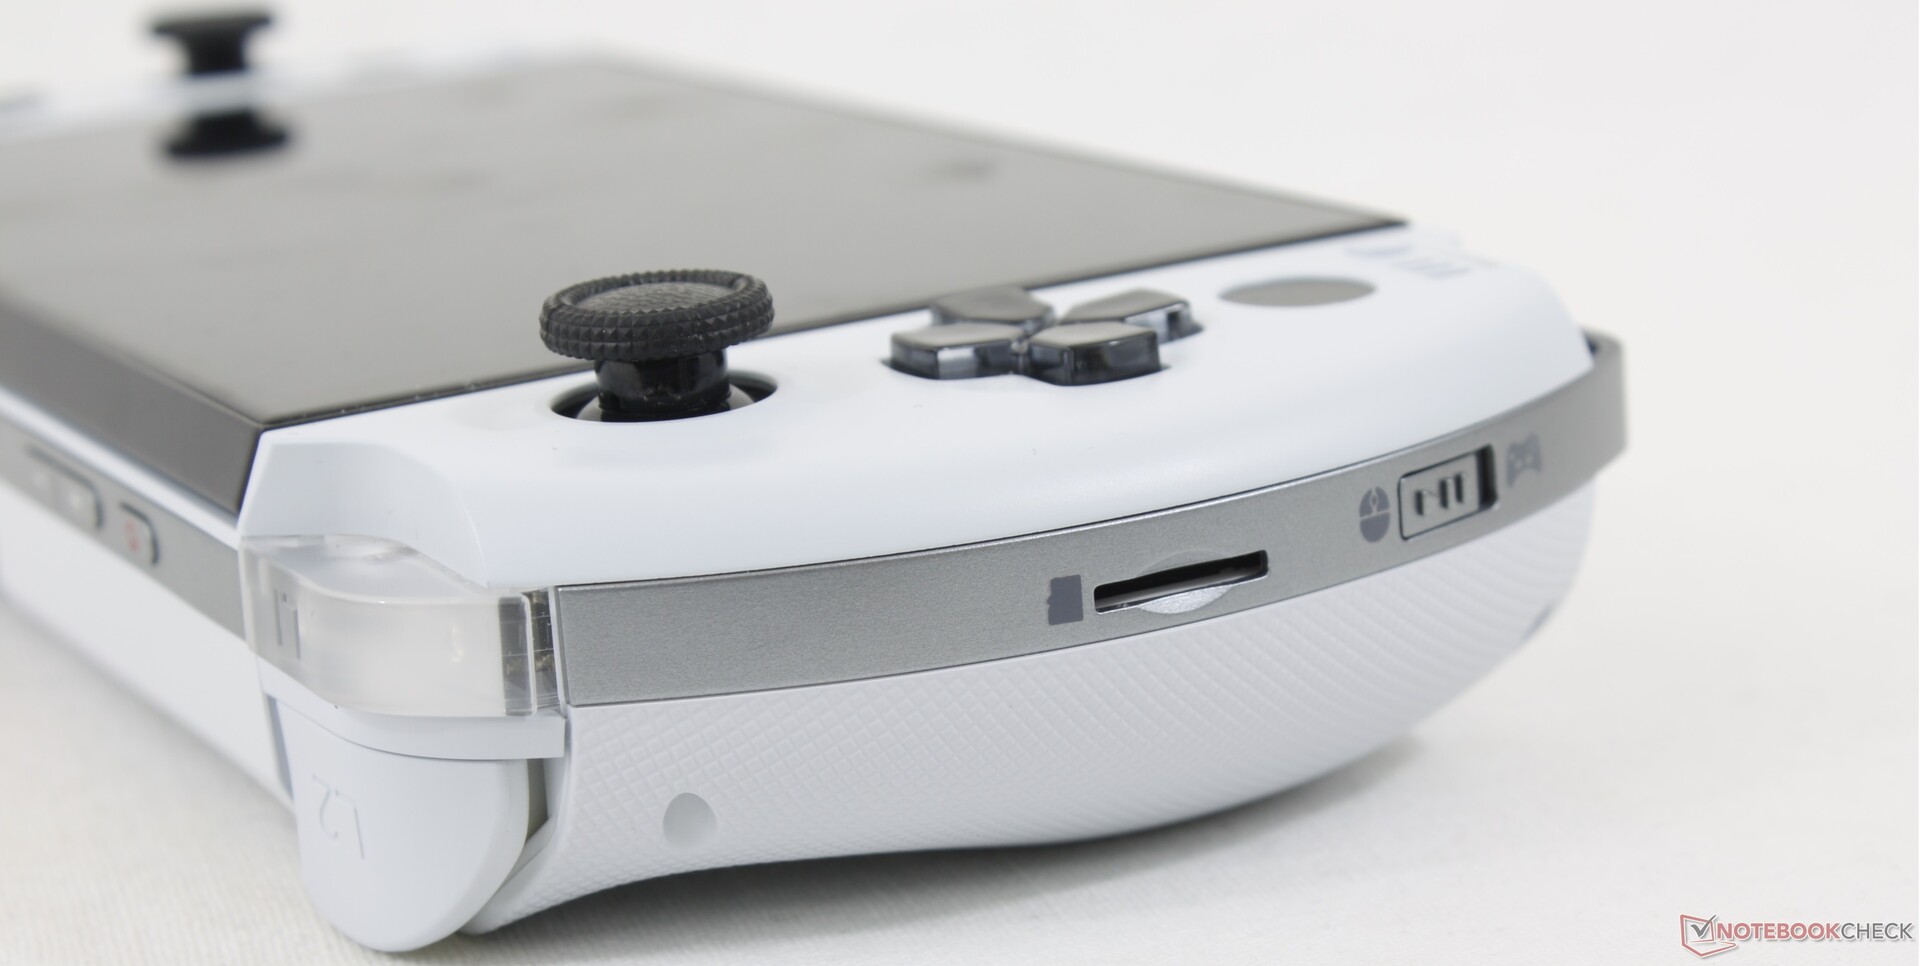
Lettore di schede SD
Il lettore MicroSD a molla ritorna dal Win 3. Le prestazioni sono discrete, anche se la velocità è la metà di quella del lettore MicroSD del Win 3 Win MAX 2. È comunque utile per trasferire giochi sul Win 4.
| SD Card Reader | |
| average JPG Copy Test (av. of 3 runs) | |
| GPD Win Max 2 (Toshiba Exceria Pro SDXC 64 GB UHS-II) | |
| GPD Win 3 (Toshiba Exceria Pro M501 32 GB UHS-II) | |
| GPD Win 4 (AV Pro SD microSD 128 GB V60) | |
| maximum AS SSD Seq Read Test (1GB) | |
| GPD Win Max 2 (Toshiba Exceria Pro SDXC 64 GB UHS-II) | |
| GPD Win 4 (AV Pro SD microSD 128 GB V60) | |
| GPD Win 3 (Toshiba Exceria Pro M501 32 GB UHS-II) | |
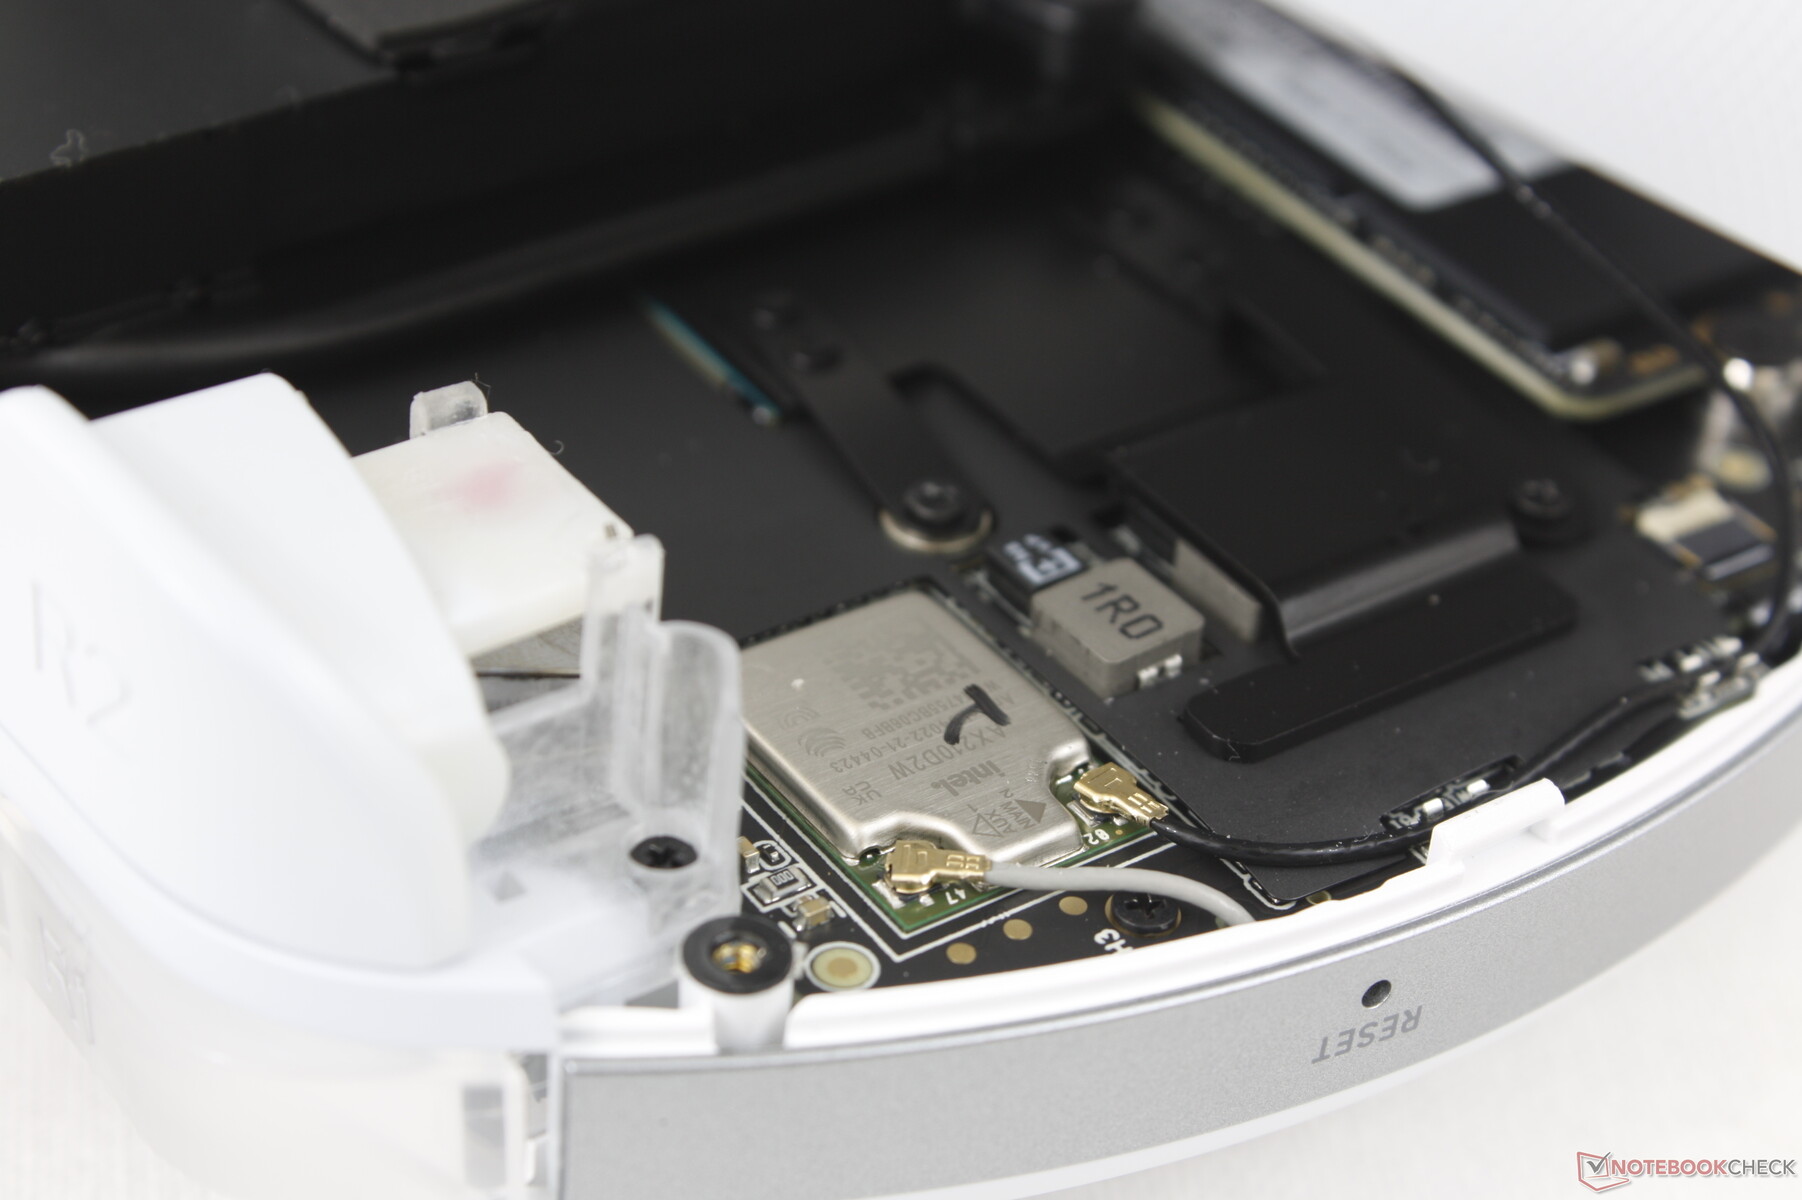
Comunicazione
L'Intel AX210 è di serie per la compatibilità con il Wi-Fi 6E. Il Wi-Fi 6E non è necessariamente sempre più veloce del Wi-Fi 6 in termini di velocità di trasferimento reale, ma beneficia di una latenza ridotta che può essere utile per lo streaming dei giochi.
| Networking | |
| iperf3 transmit AX12 | |
| GPD Win 3 | |
| Razer Blade Stealth i7-1165G7 GTX 1650 Ti Max-Q | |
| iperf3 receive AX12 | |
| Razer Blade Stealth i7-1165G7 GTX 1650 Ti Max-Q | |
| GPD Win 3 | |
| iperf3 transmit AXE11000 | |
| Asus Zenbook S 13 OLED | |
| GPD Win 4 | |
| iperf3 receive AXE11000 | |
| Asus Zenbook S 13 OLED | |
| GPD Win 4 | |
| iperf3 transmit AXE11000 6GHz | |
| GPD Win Max 2 | |
| Dell XPS 13 9315 2-in-1 Core i5-1230U | |
| GPD Win 4 | |
| iperf3 receive AXE11000 6GHz | |
| GPD Win Max 2 | |
| Dell XPS 13 9315 2-in-1 Core i5-1230U | |
| GPD Win 4 | |
Manutenzione
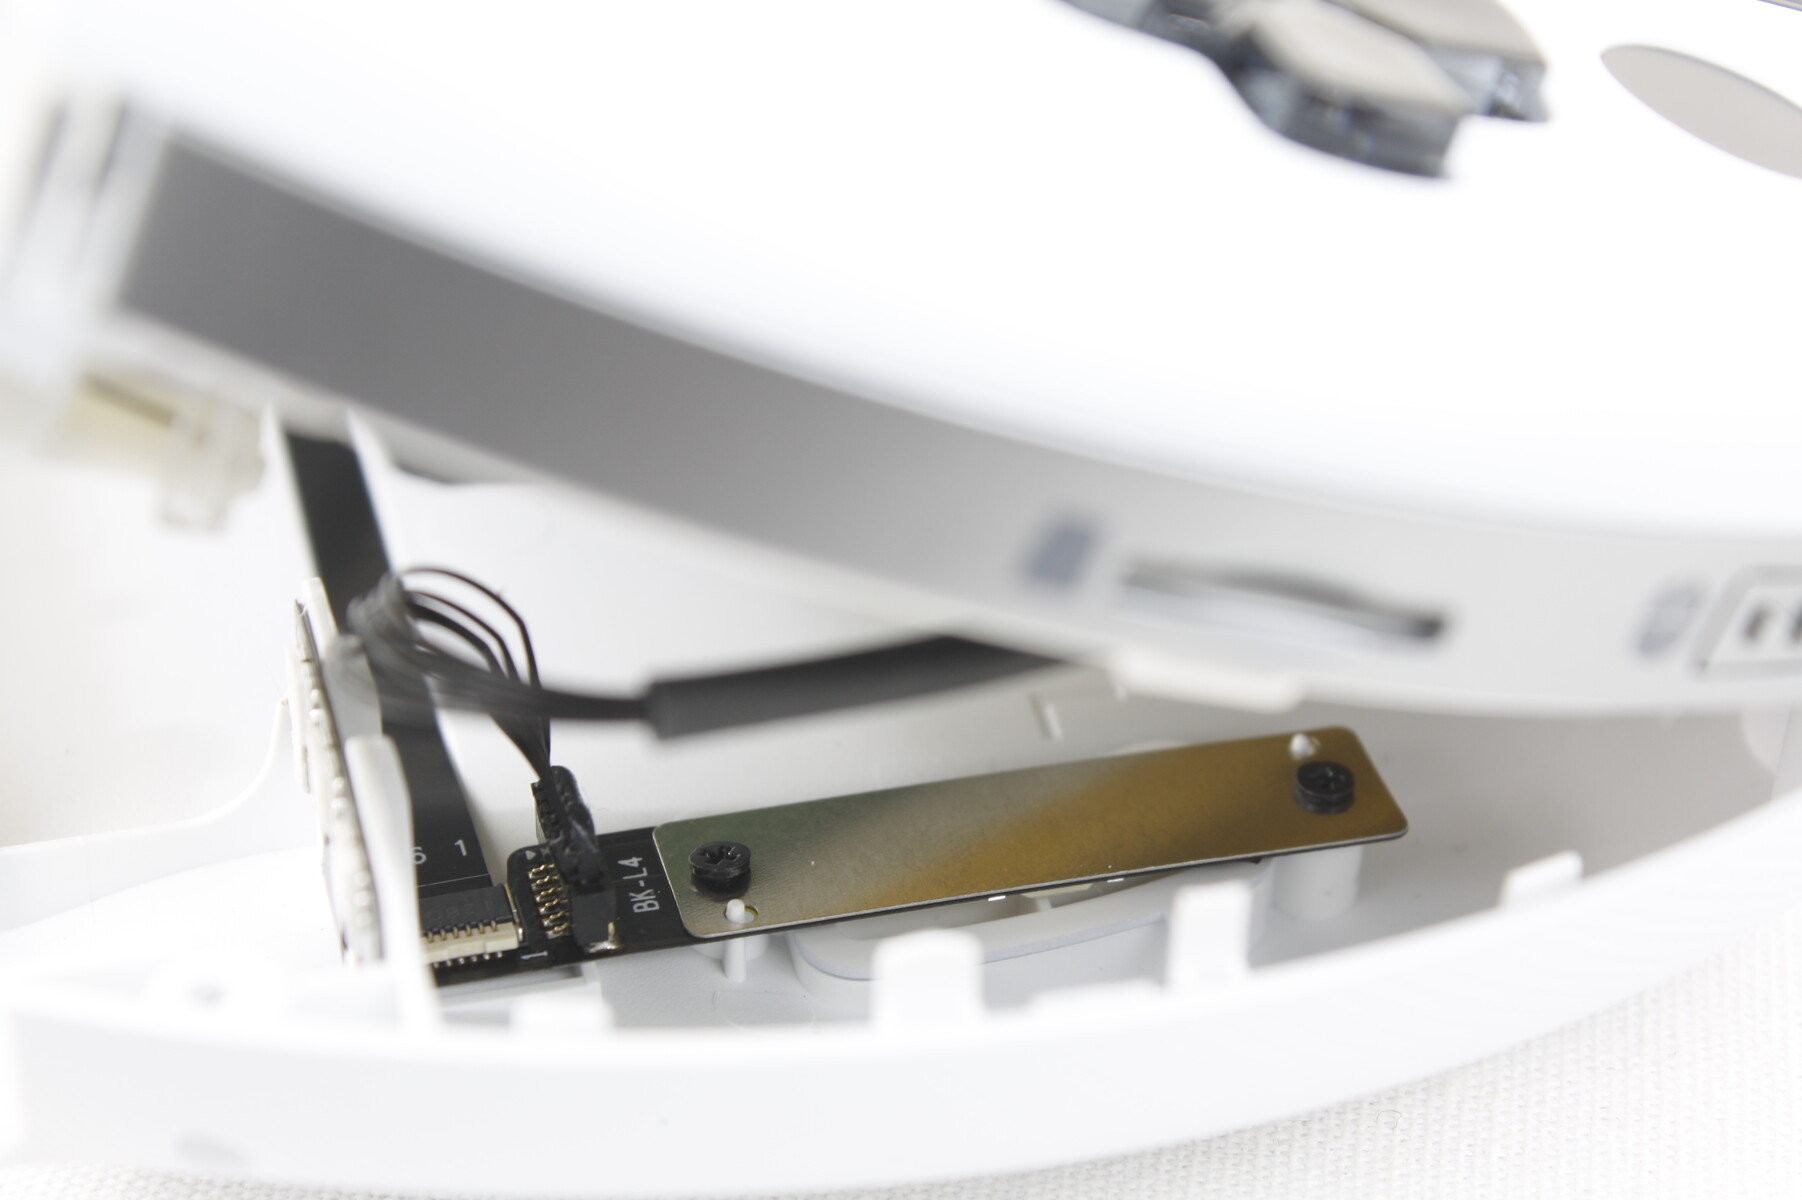
Il pannello posteriore in plastica è fissato da sei viti Philips molto piccole. Sfortunatamente sulla nostra unità, le chiusure intorno ai bordi del pannello posteriore sono estremamente strette e difficili da rimuovere senza danneggiare l'unità, un vero peccato perché il GPD Win 3 era altrimenti facile da riparare. Possiamo notare che l'SSD M.2 2280 è rimovibile, mentre i moduli WLAN e RAM sono saldati.
Tenete presente che il pannello posteriore è collegato alla scheda madre tramite un fragile cavo a nastro a causa dei pulsanti posteriori. Pertanto, è necessario fare attenzione a non strappare il pannello posteriore o rischiare di danneggiare i pulsanti.
Accessori e garanzia
La confezione non contiene altri accessori oltre all'adattatore CA e alla documentazione cartacea. Tra gli extra opzionali figurano un adattatore 4G LTE montato sul retro e una docking station USB-C ufficiale. È un peccato che il modello non venga fornito con una custodia per il trasporto o una protezione per lo schermo in omaggio.
La garanzia standard limitata di un anno del produttore si applica se acquistato negli Stati Uniti.
Dispositivi di ingresso
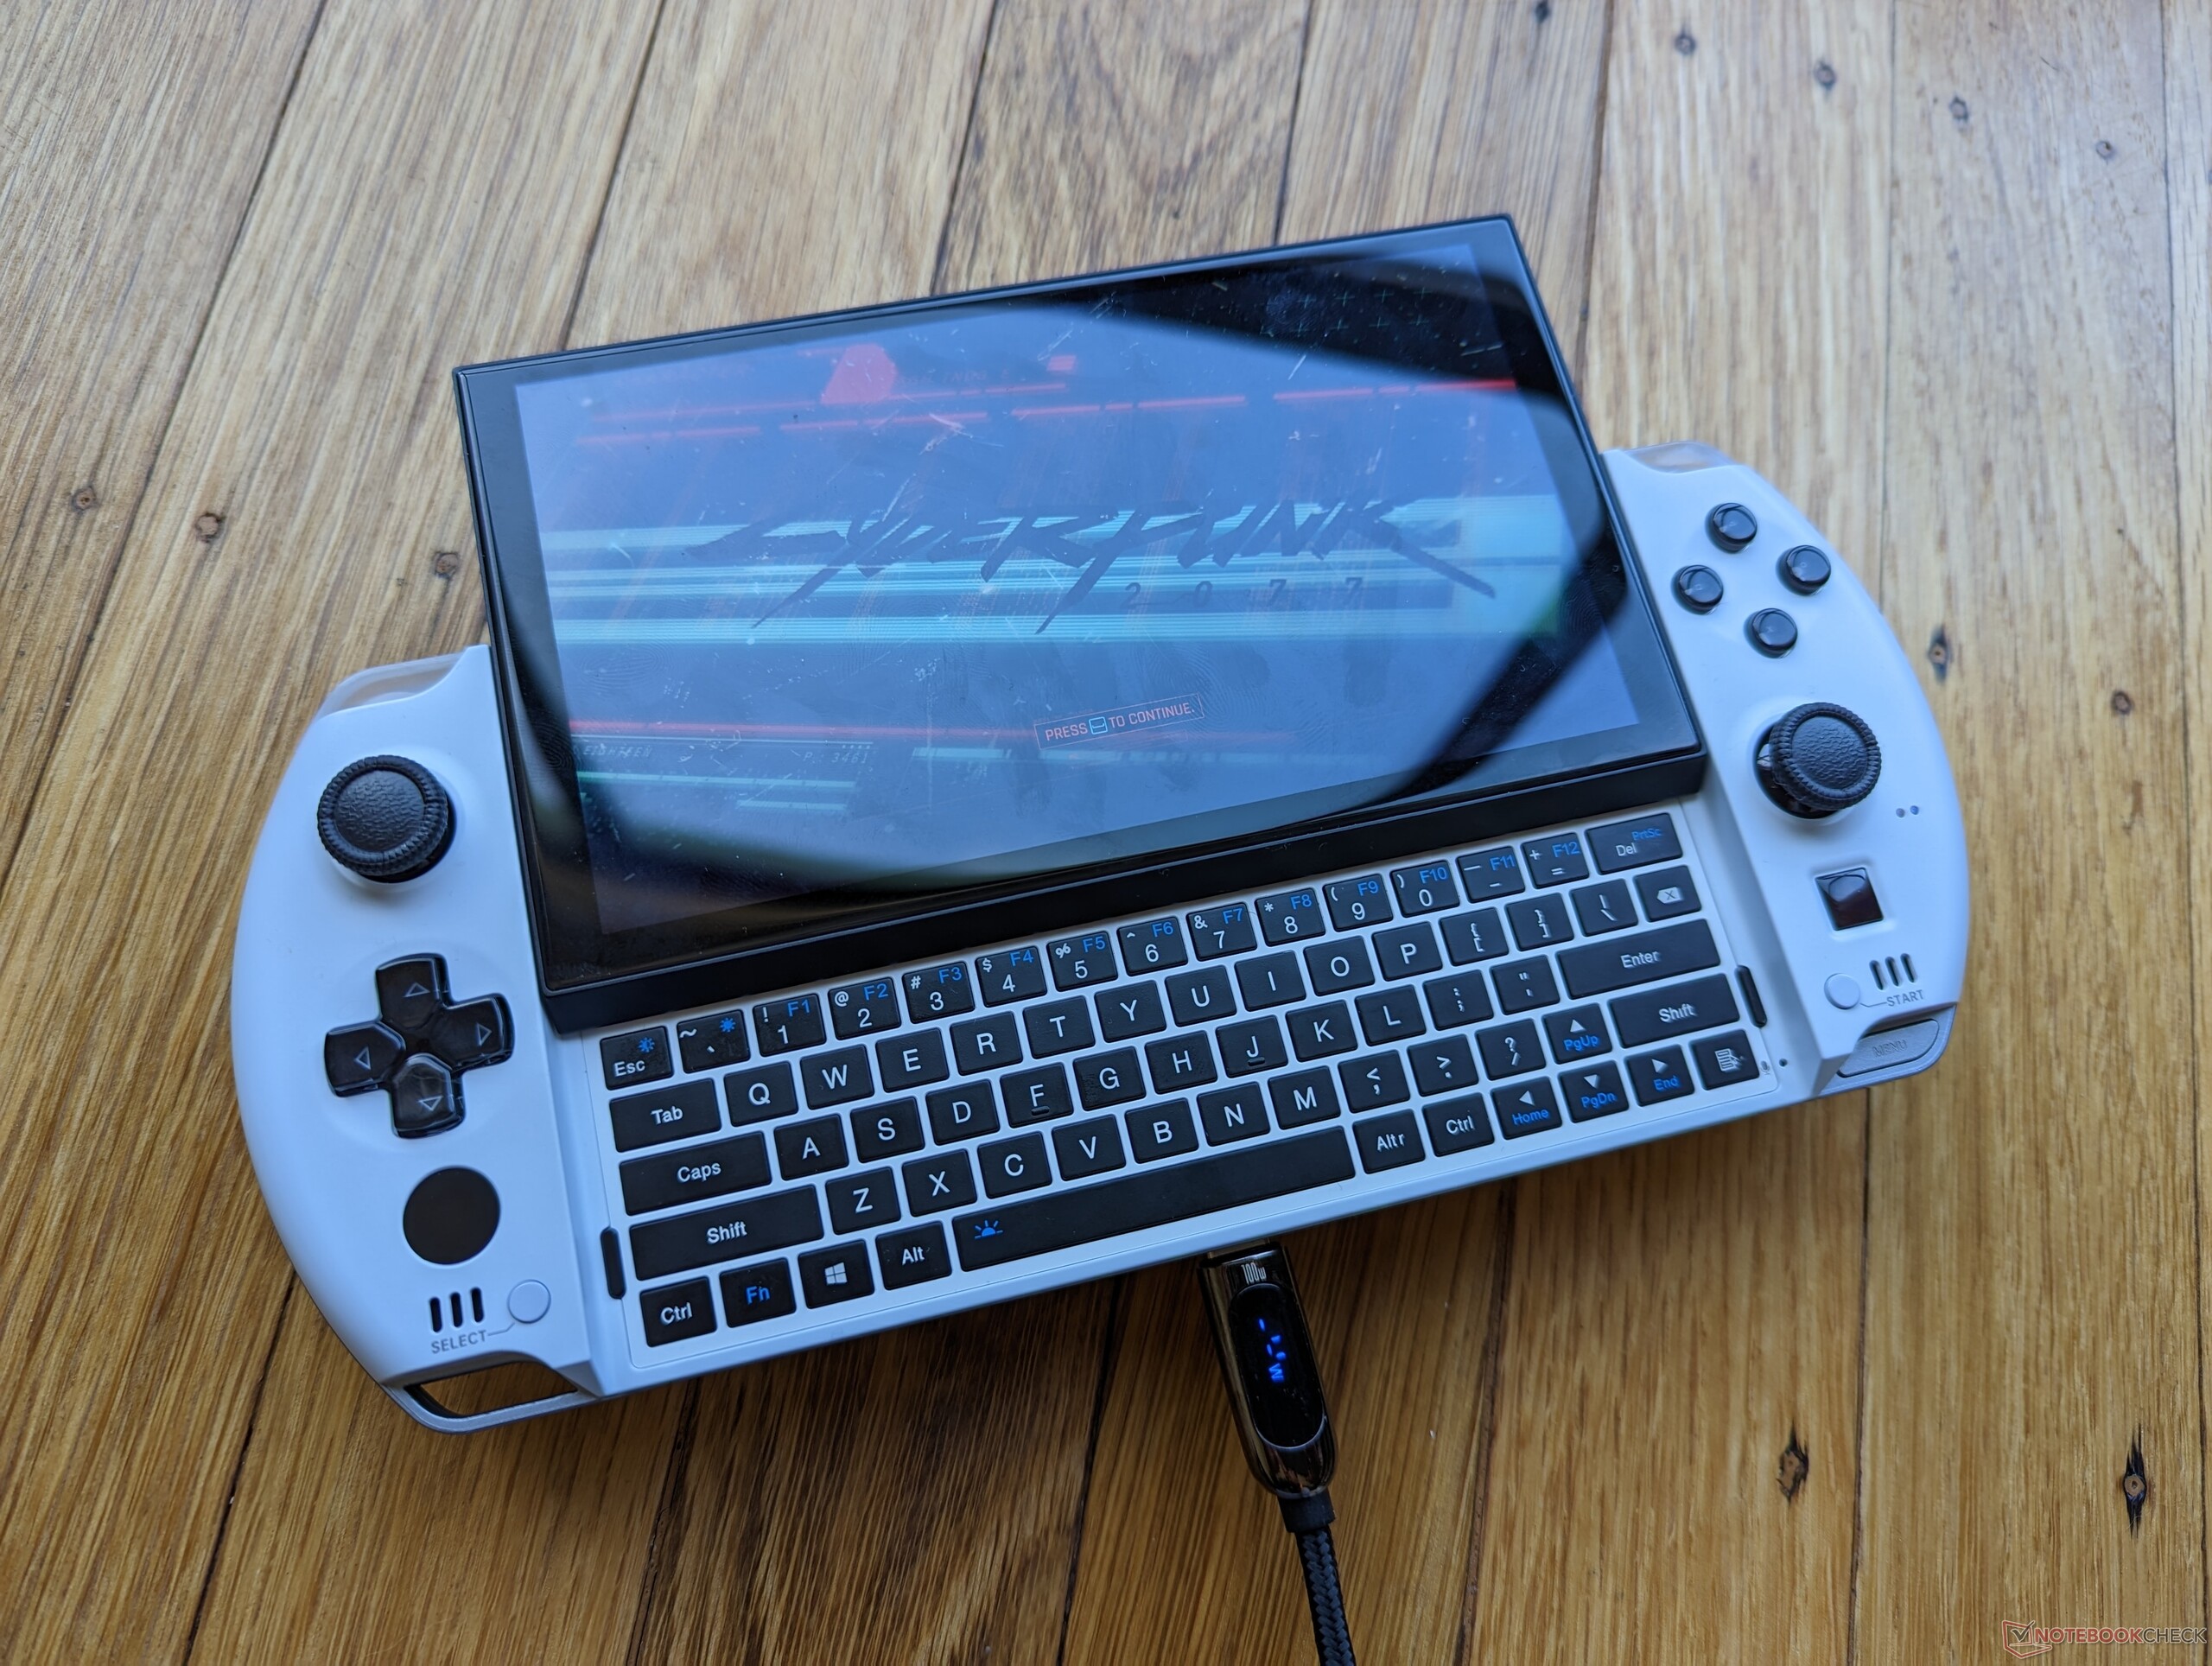
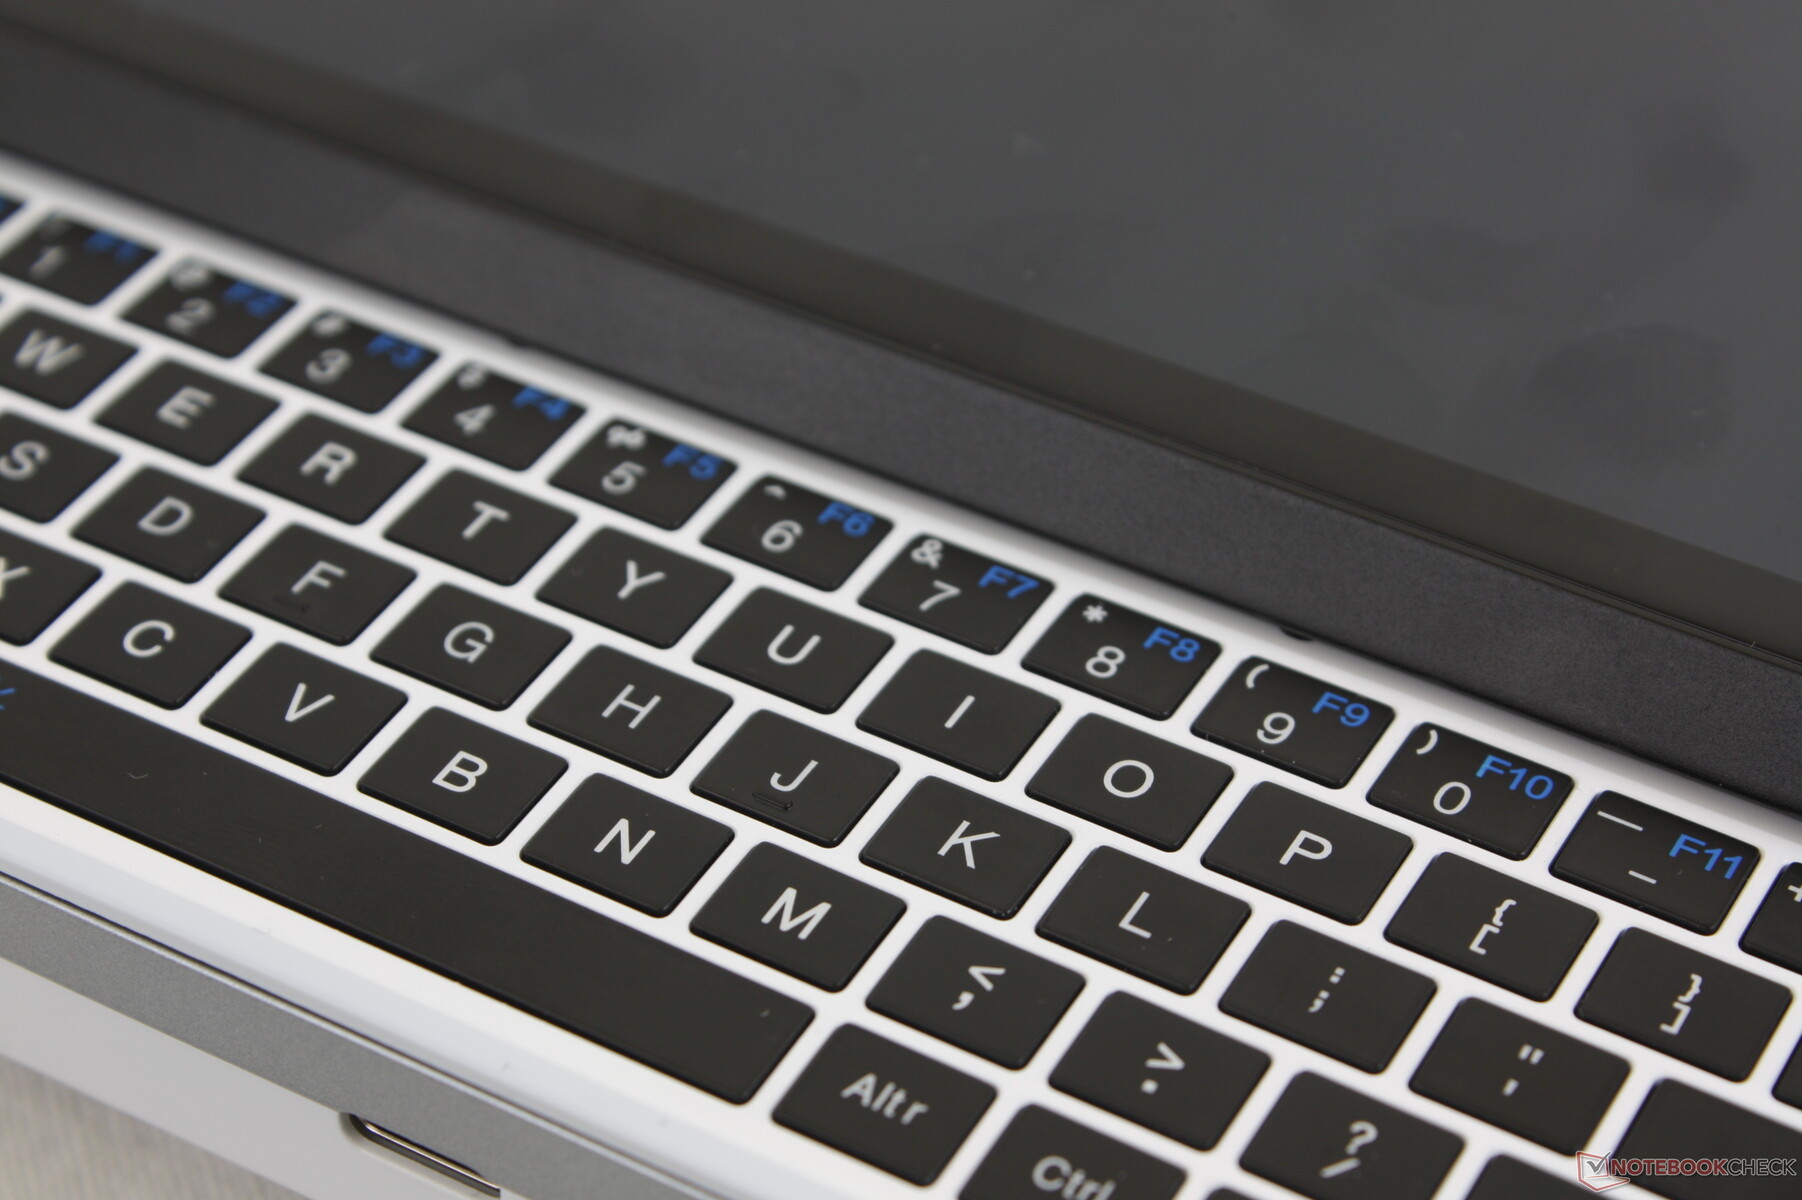
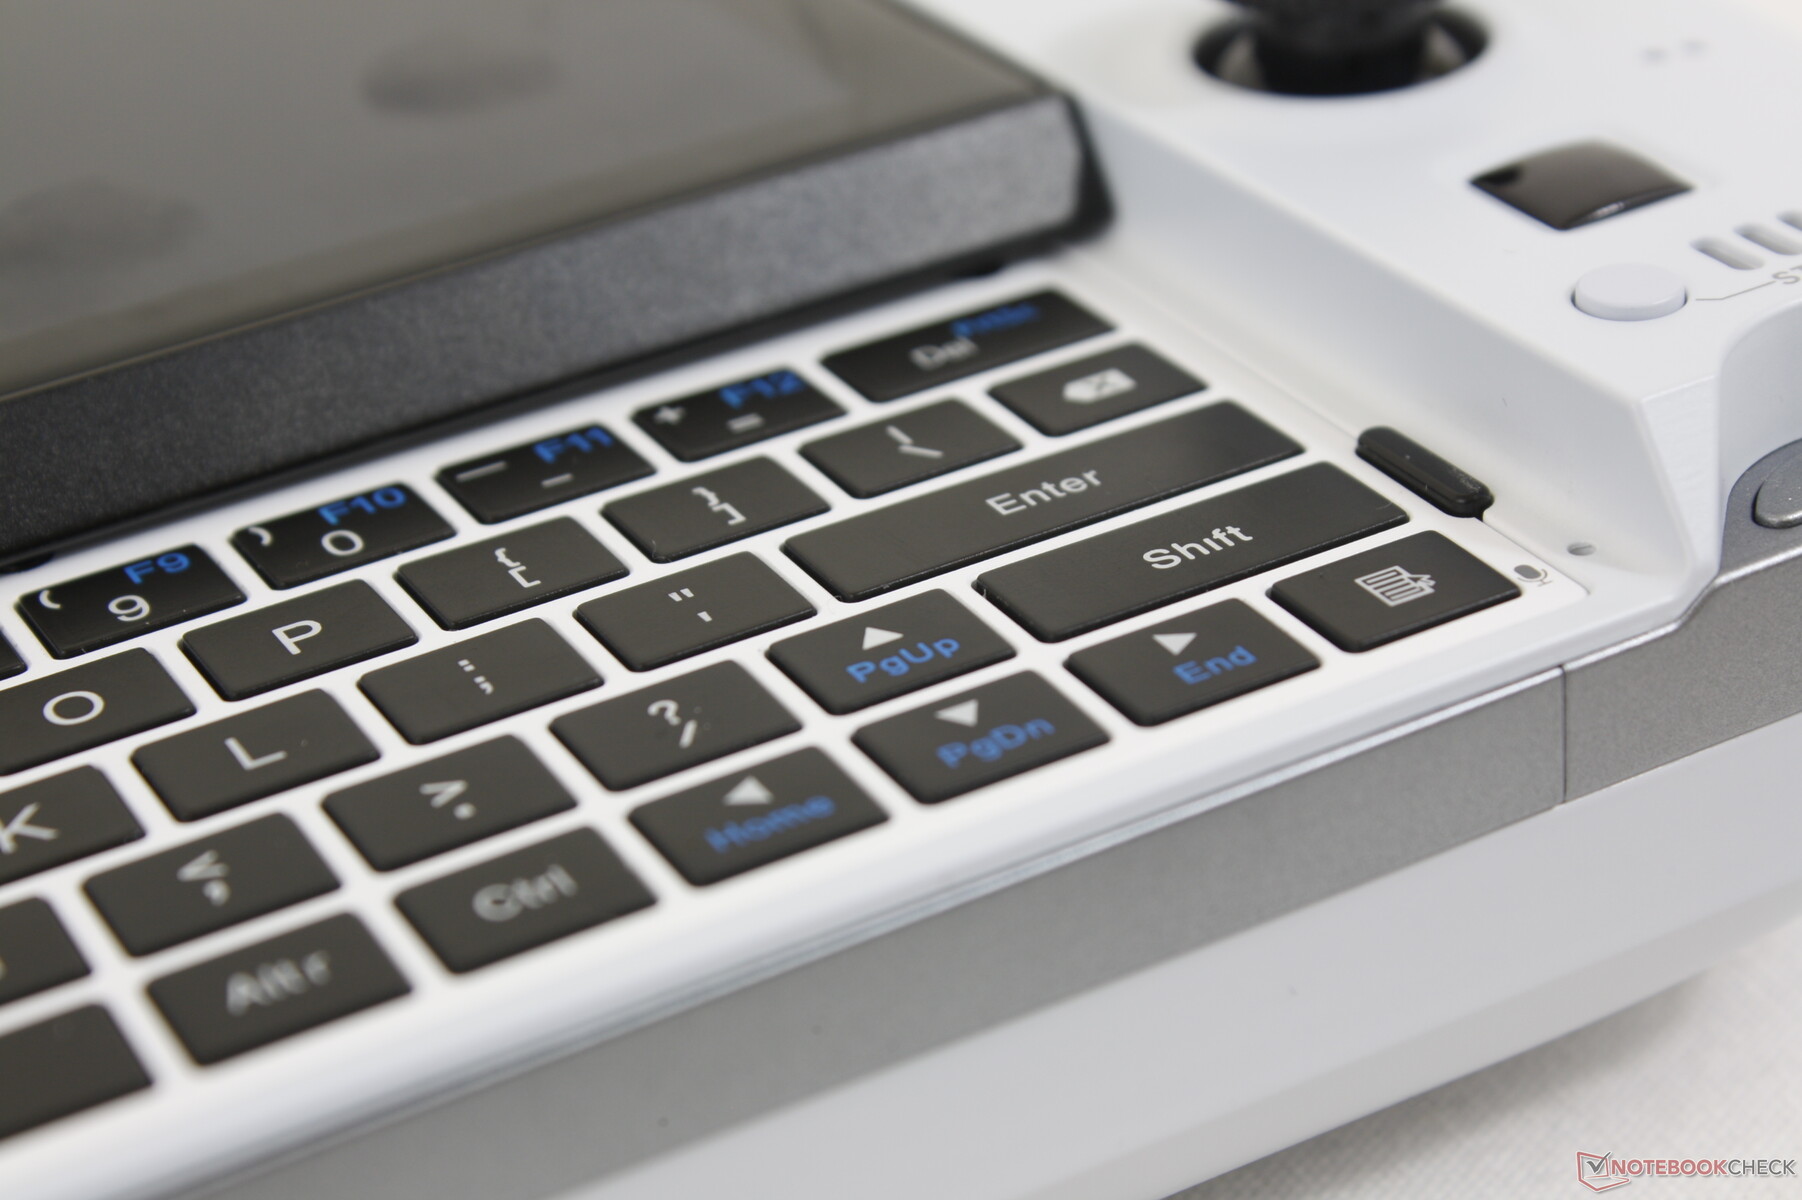
Tastiera - Più affidabile della Win 3
La tastiera è stata completamente rinnovata, passando dai tasti sensibili al tocco del Win 3 ai tasti fisici tattili del Win 4. Il feedback è migliore, ma la velocità di digitazione è ancora molto inferiore a quella di una tipica tastiera touchscreen o di uno smartphone. Sono sufficienti solo per gli input occasionali.
Si noti che il bug che abbiamo riscontrato sul Win 3 è stato risolto sul Win 4; scorrendo lo schermo verso l'alto e verso il basso non si preme più alcun tasto della tastiera.

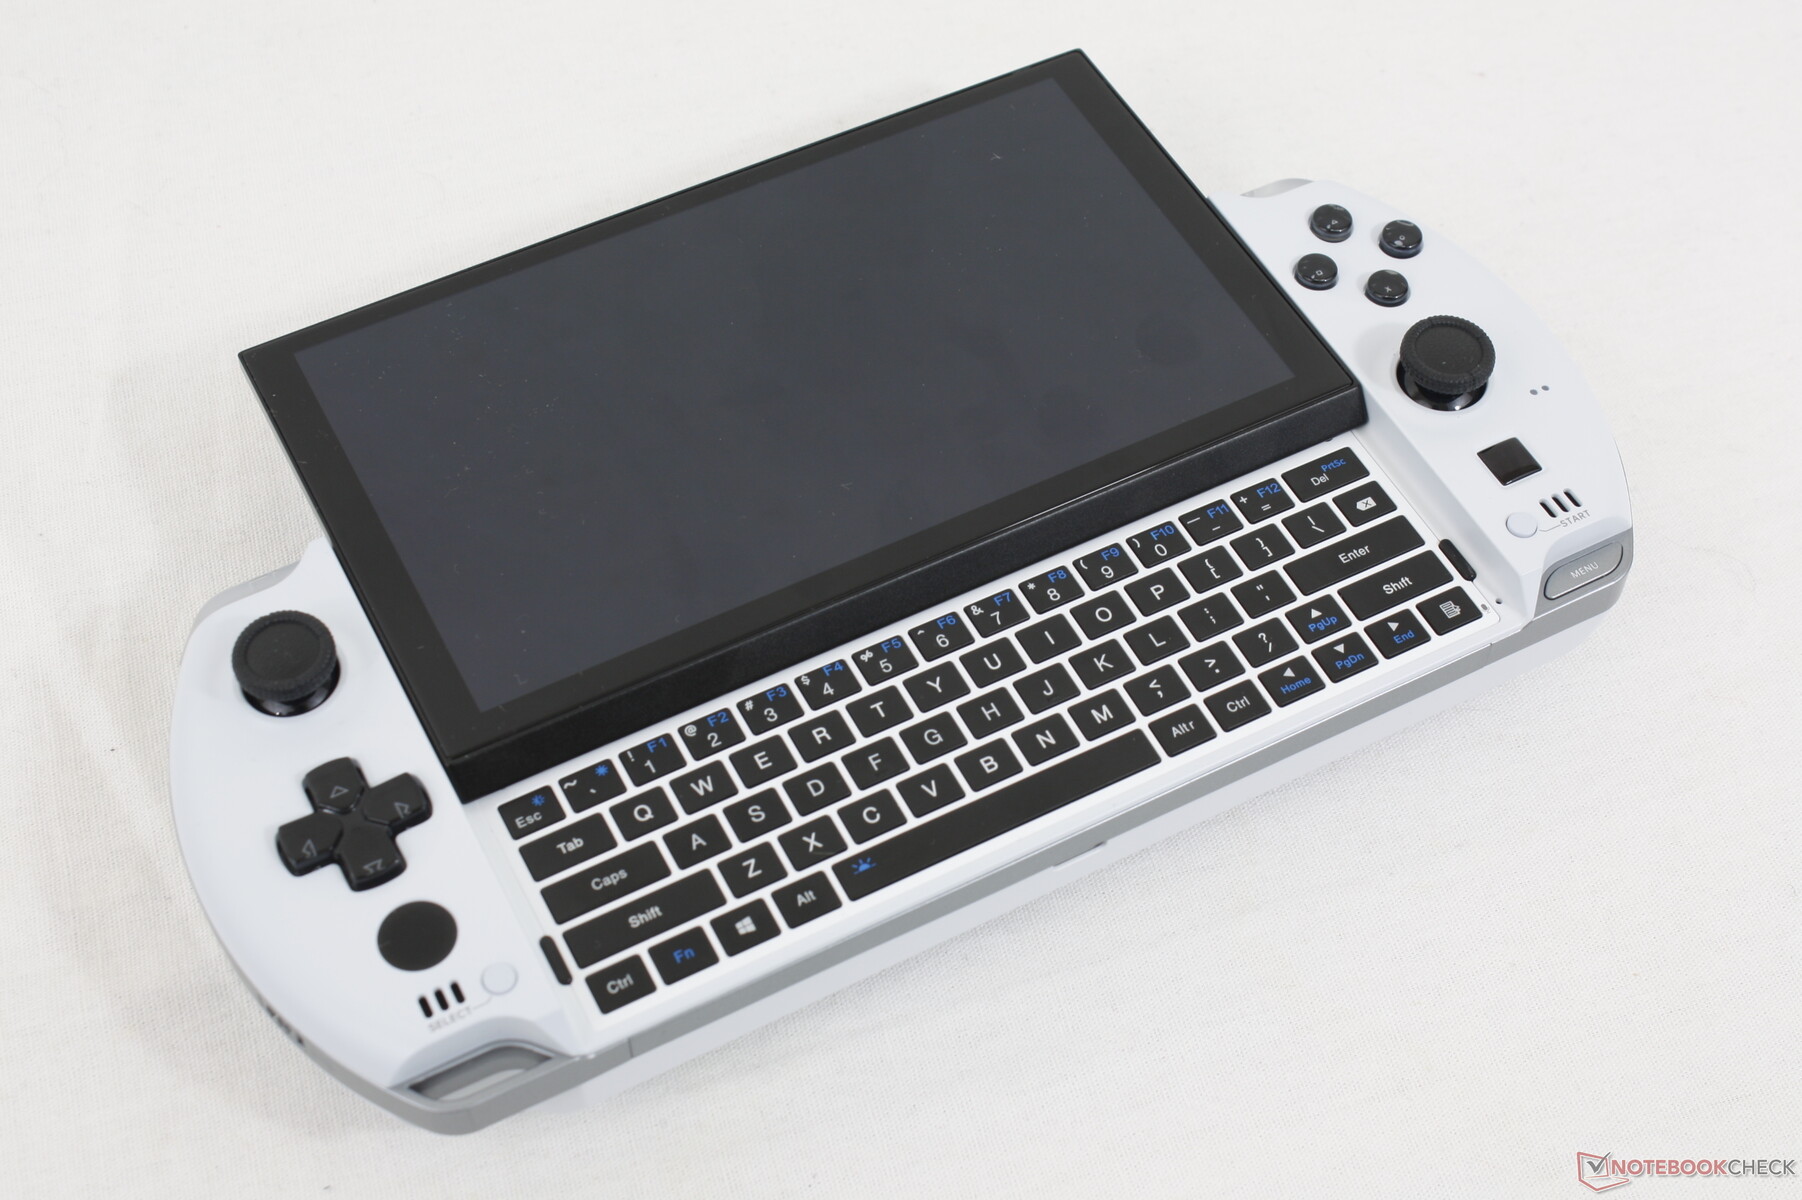
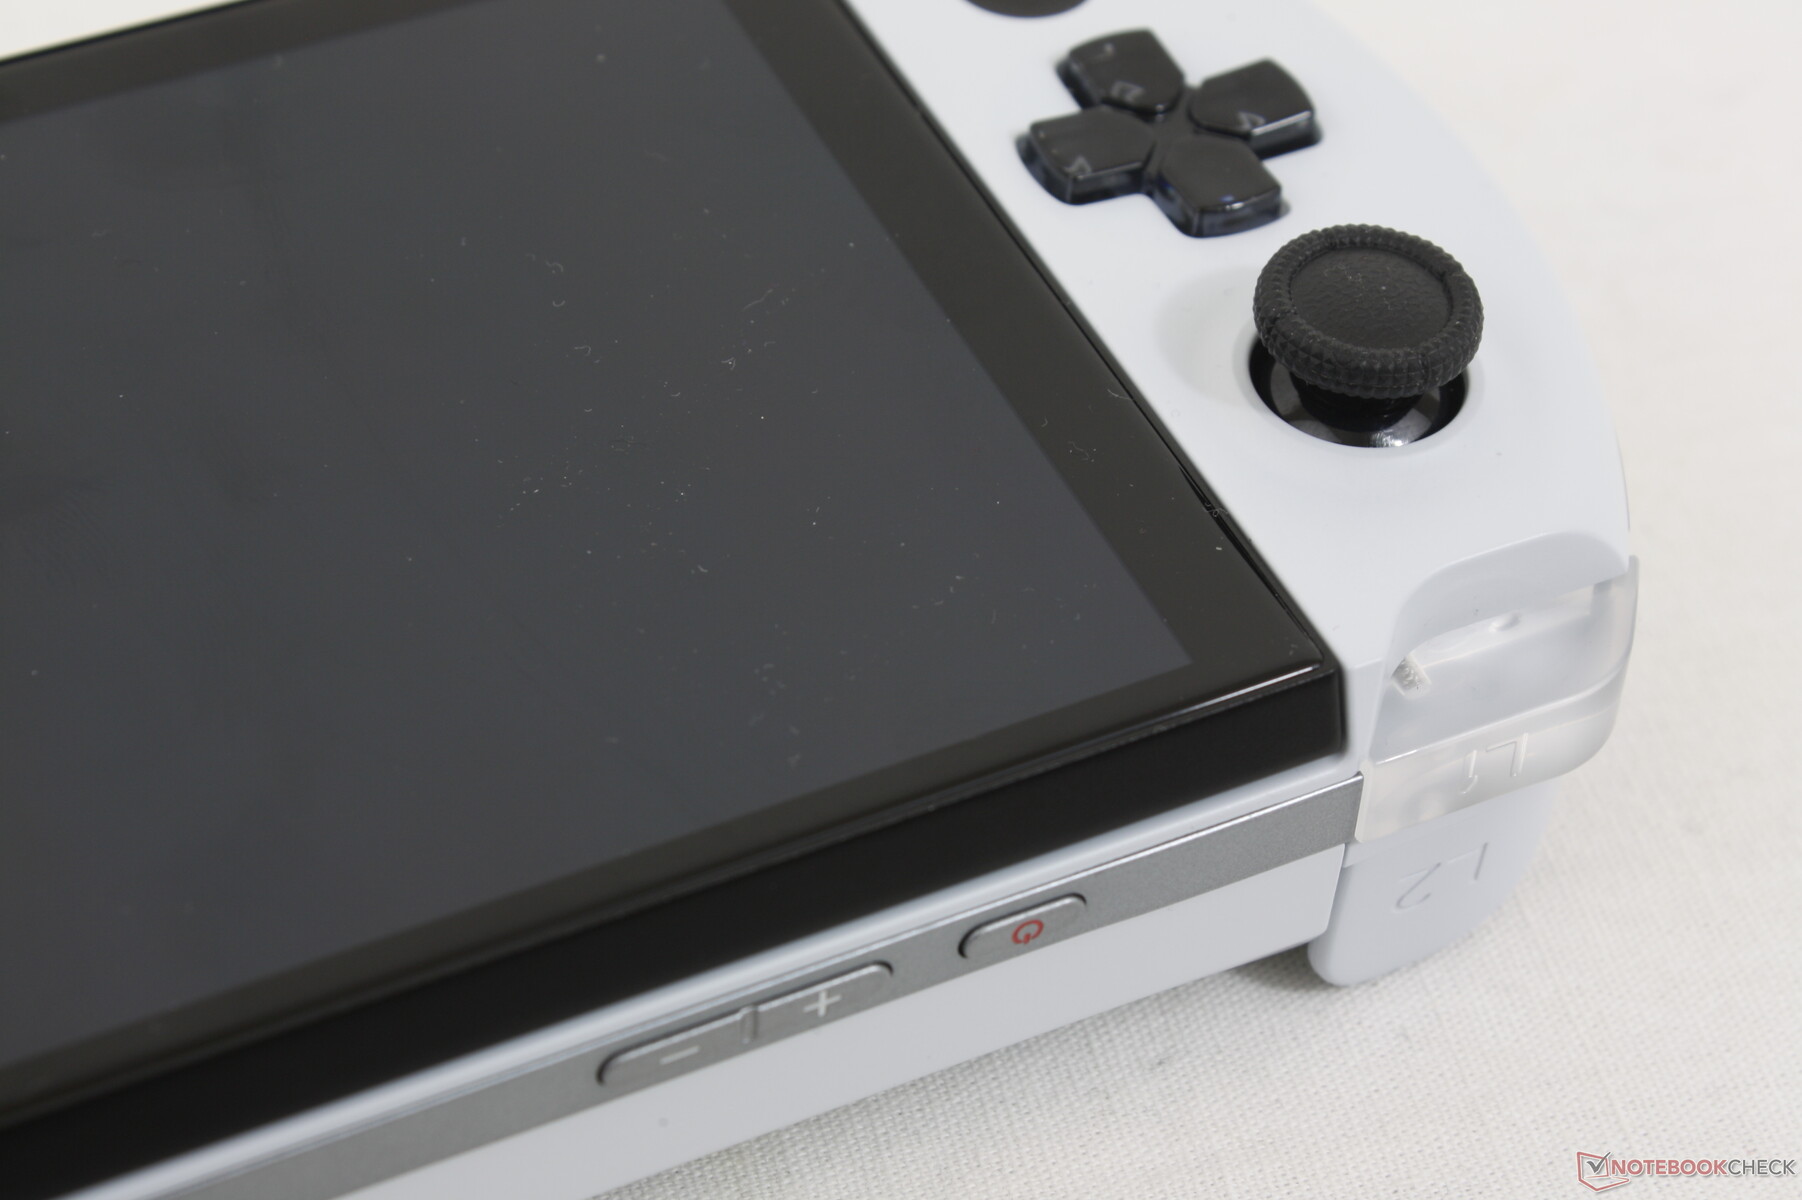
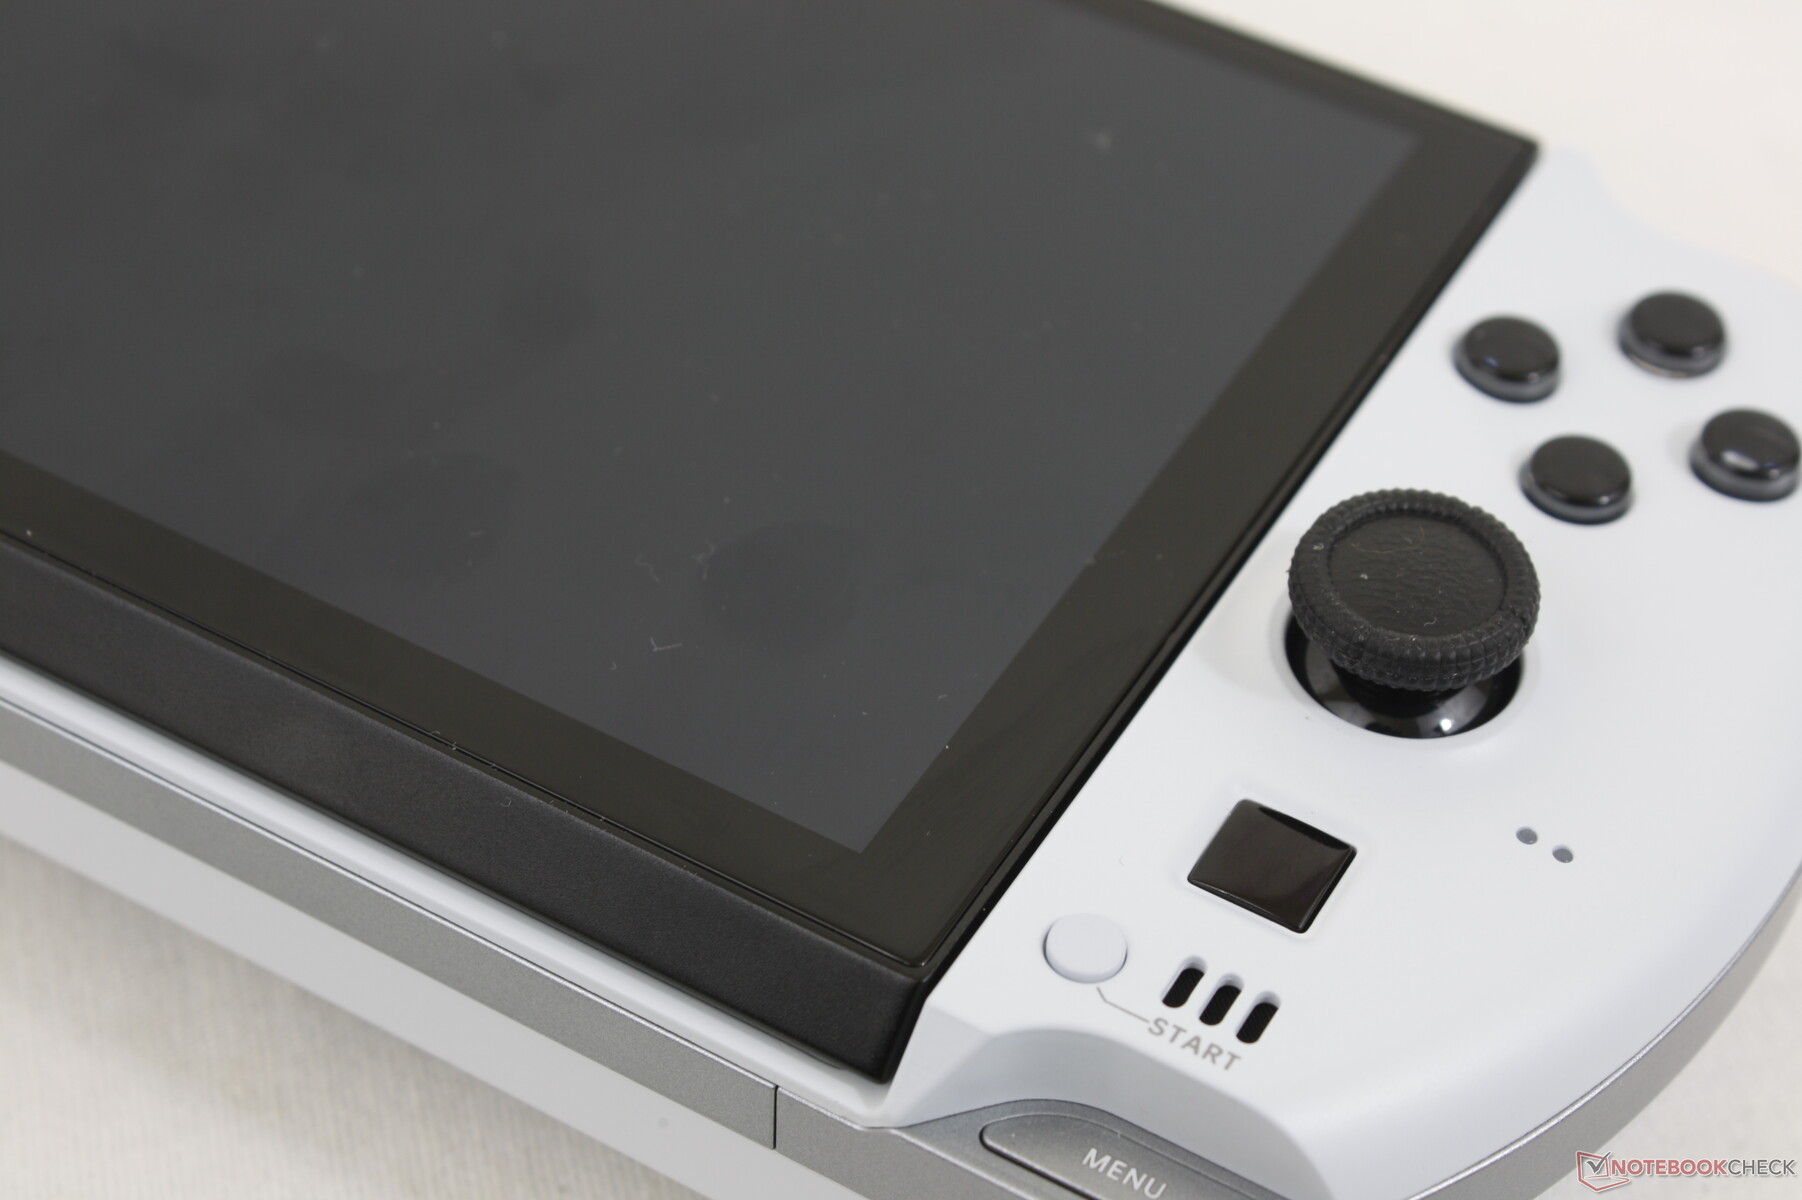
Gamepad - Come giocare su uno Switch
Non è una coincidenza che i joystick e i pulsanti del Win 4 abbiano esattamente le stesse dimensioni di quelli del Nintendo Switch. Dopo tutto, perché cambiare qualcosa che funziona già sulla console portatile più popolare? Il vantaggio principale è che se vi sentite a vostro agio con la Switch, il gamepad del Win 4 vi risulterà molto familiare. D'altra parte, gli utenti che trovano i pulsanti dello Switch troppo piccoli o angusti non troveranno un'esperienza migliore sul Win 4. La nostra preoccupazione principale è invece che i pulsanti del gamepad non sono rimovibili e quindi un'eventuale usura nel tempo può essere difficile da riparare, mentre i controller delle console possono essere sostituiti a basso costo.
I due pulsanti posteriori della spalla (L2, R2) hanno una corsa maggiore rispetto agli stessi pulsanti dello Switch. Si tratta di un miglioramento piccolo ma evidente che avvicina l'esperienza del controller a quella di un normale gamepad XBox o PS.
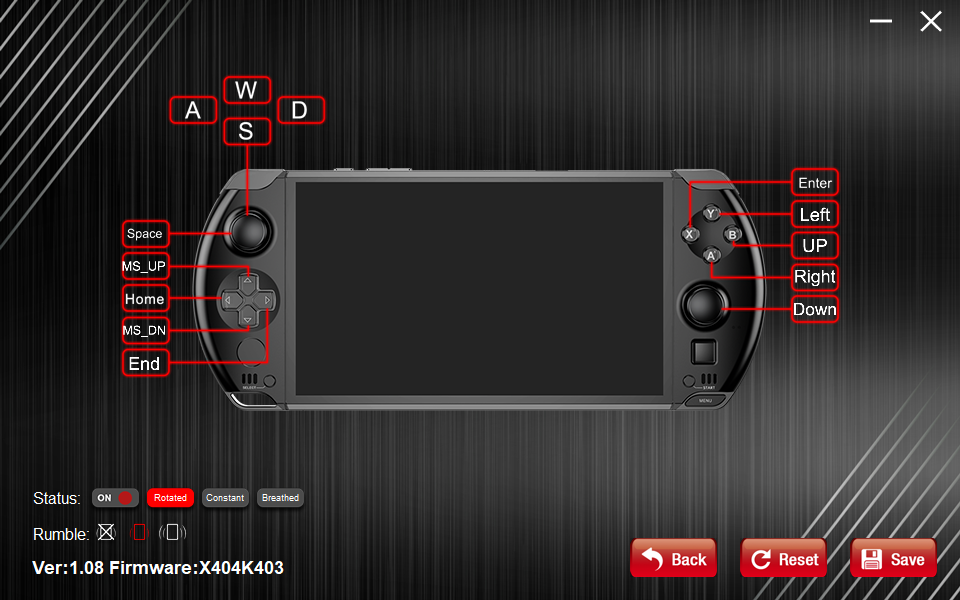
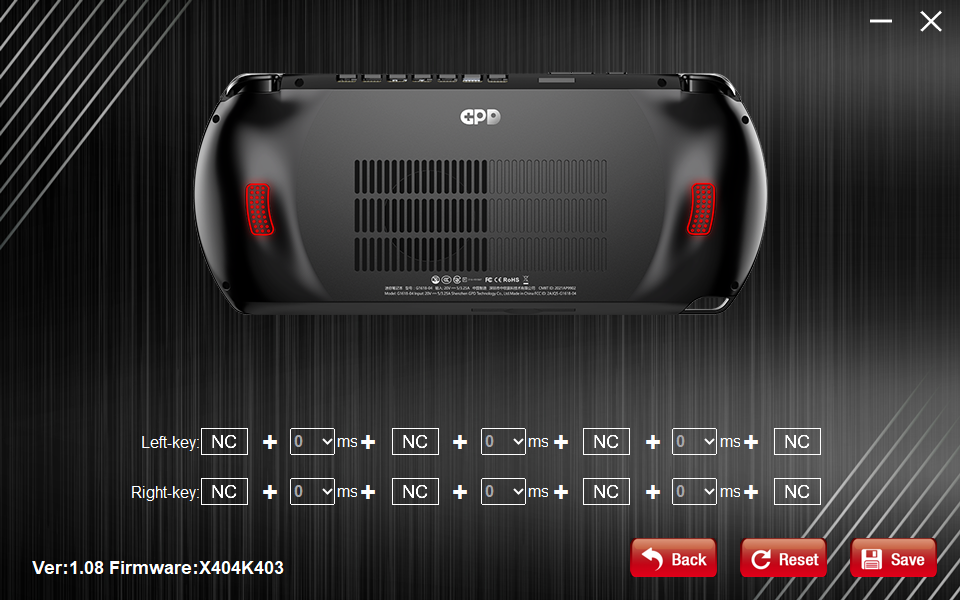
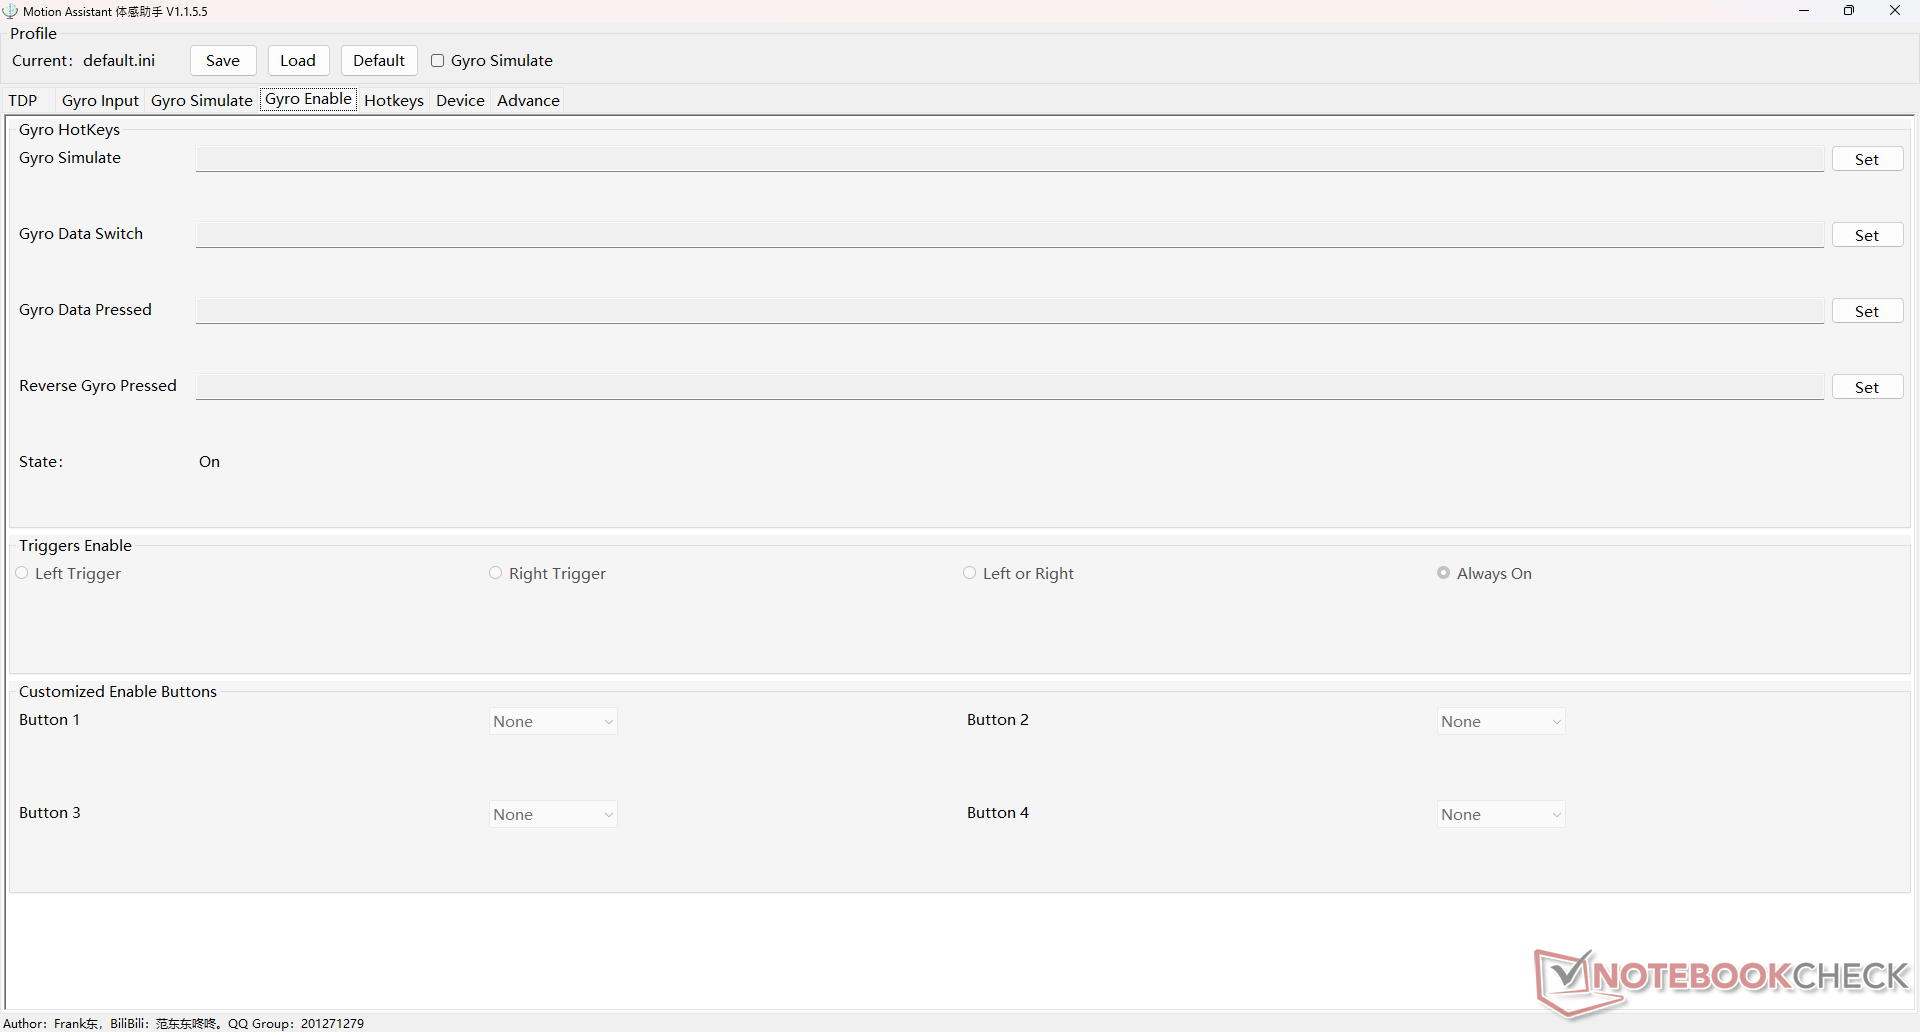
Il gamepad può essere utilizzato in due modalità, come nel Win 3: mouse e gamepad. Se si sceglie la modalità Mouse, i pulsanti del gamepad sono premappati sui tasti seguenti, come mostra lo screenshot qui sotto. Se si attiva la modalità Gamepad, Windows riconoscerà il gamepad come un controller XBox standard per la compatibilità automatica con Steam e altri titoli. In entrambi i casi, il software preinstallato WinControls consente agli utenti di rimappare i tasti secondo le necessità.
Nessuno dei pulsanti del gamepad è retroilluminato, tranne i pulsanti L1 e R1.
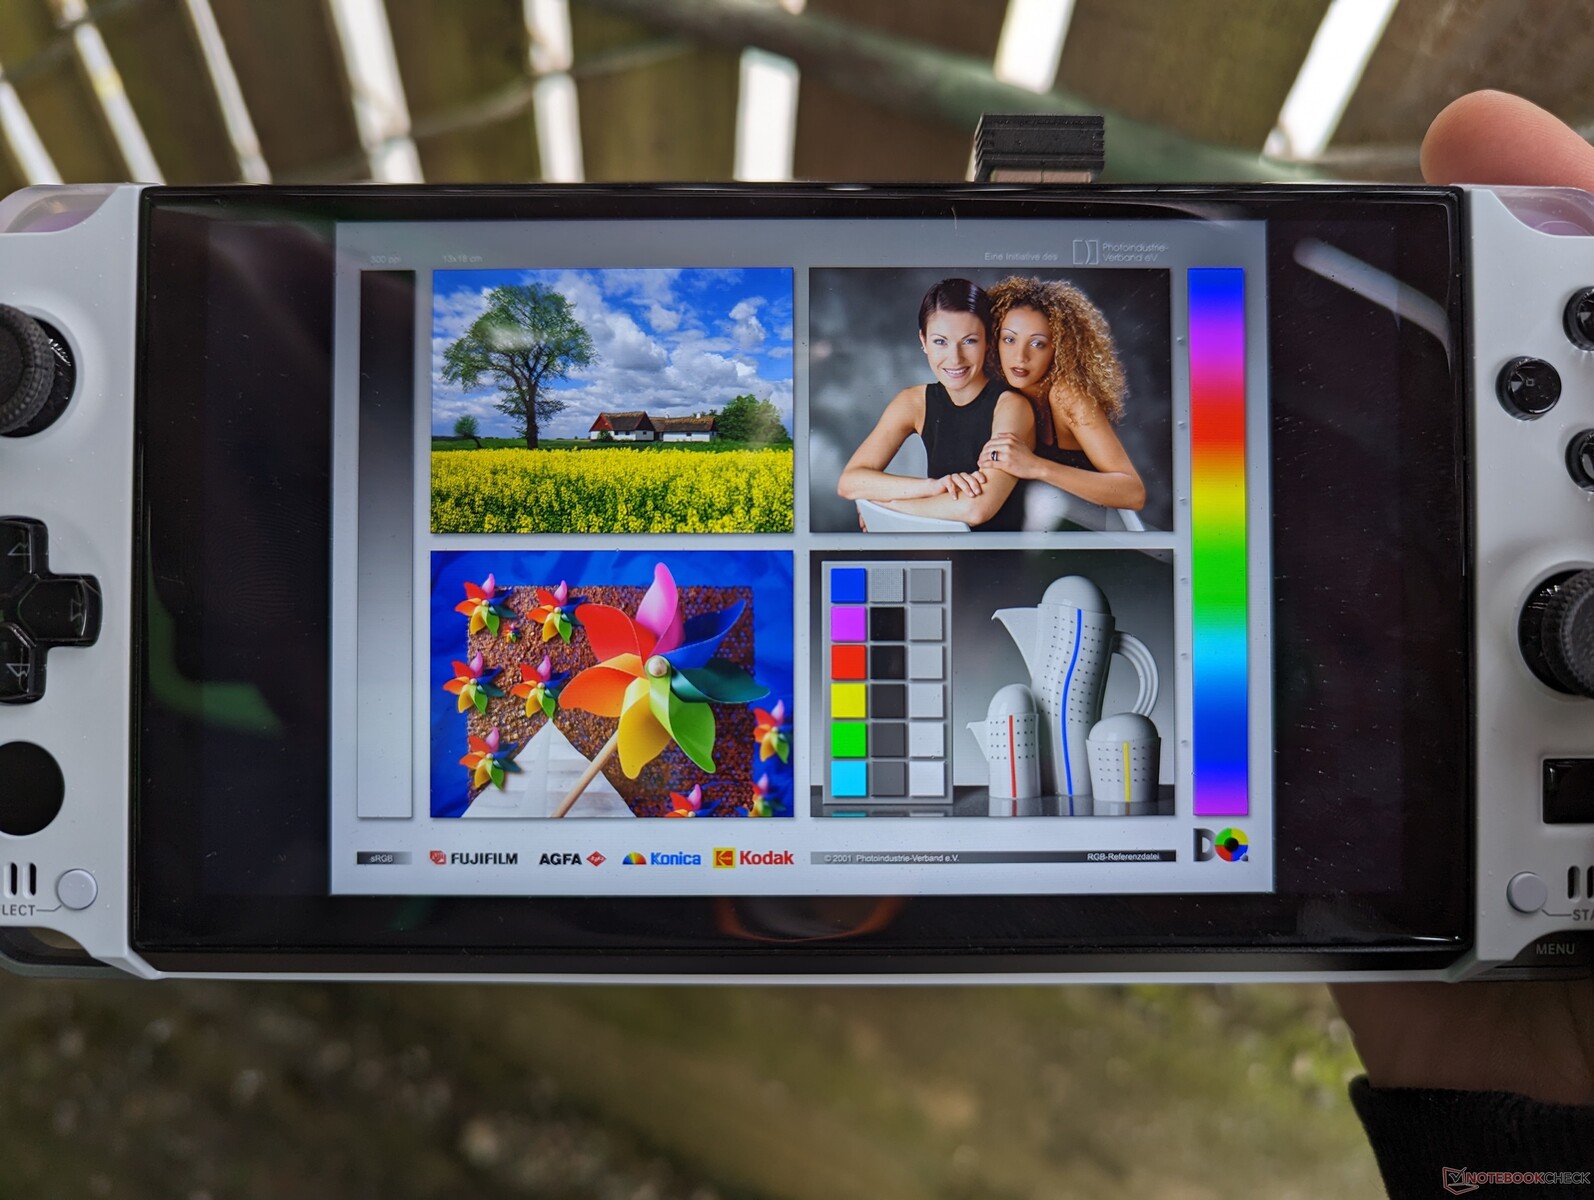
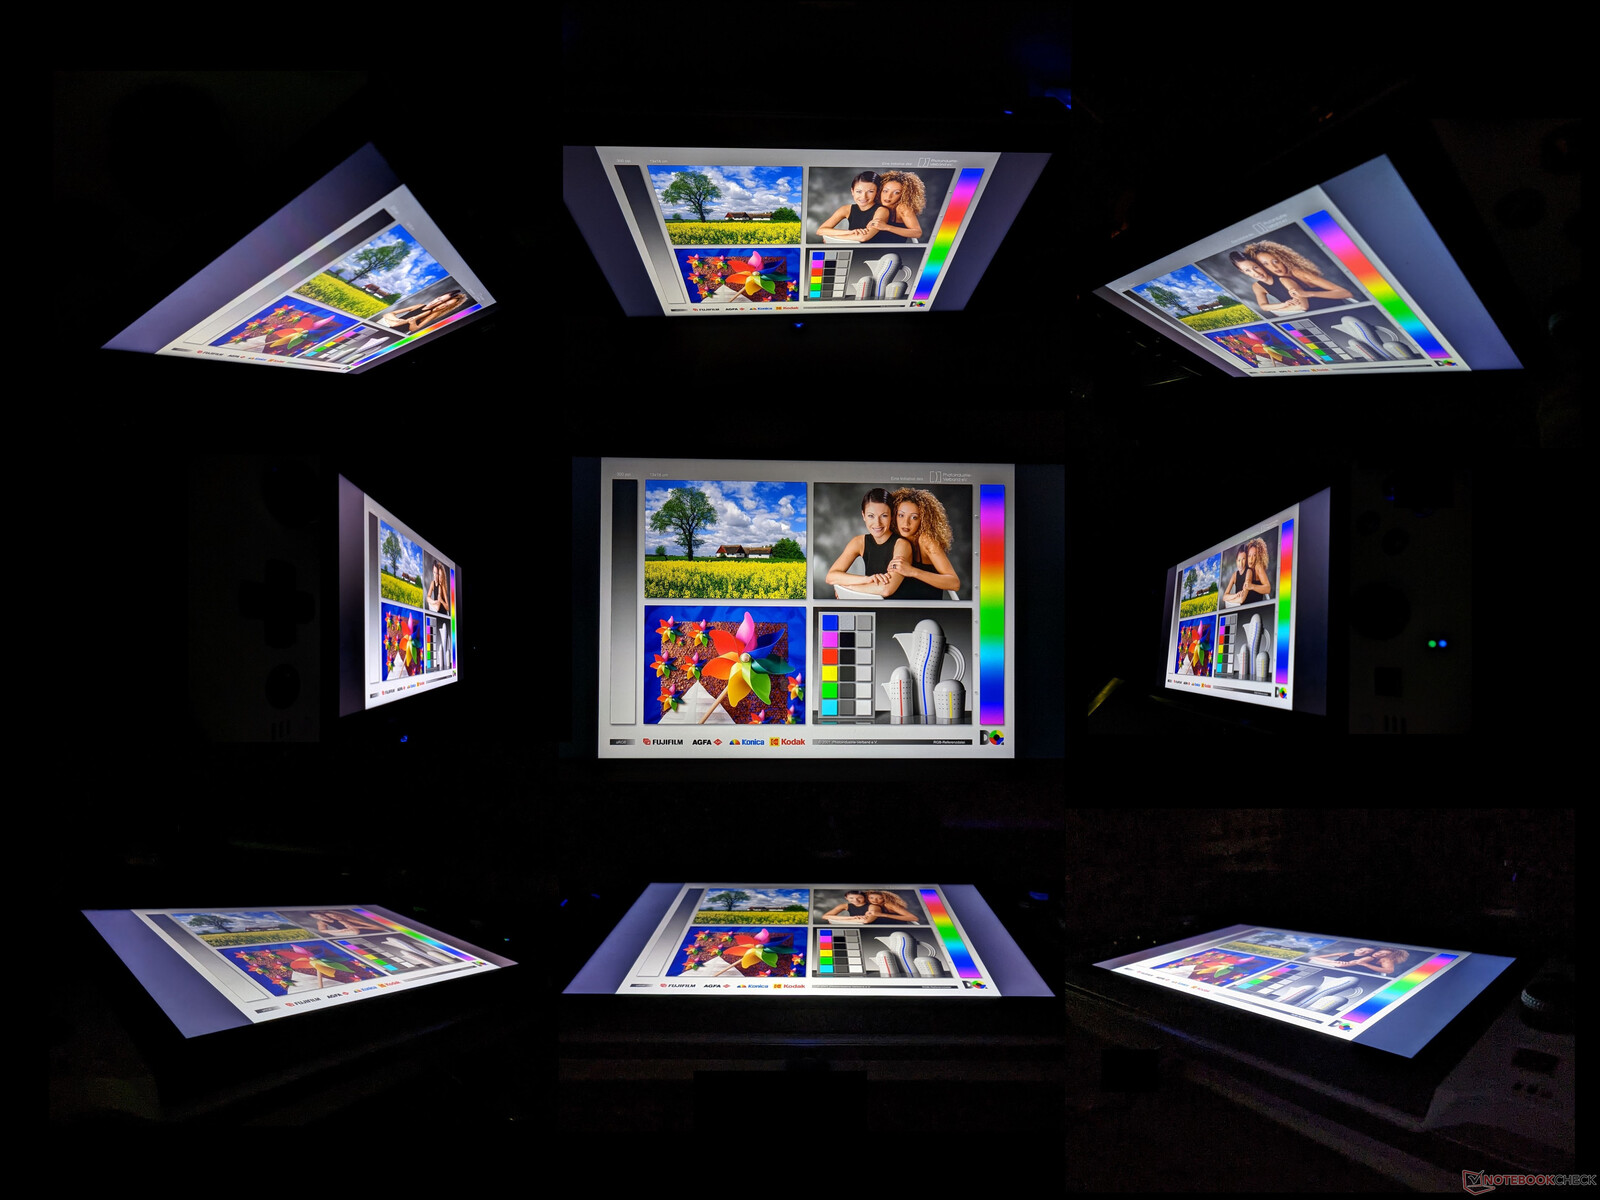
Display - IPS a 1080p a 60 Hz
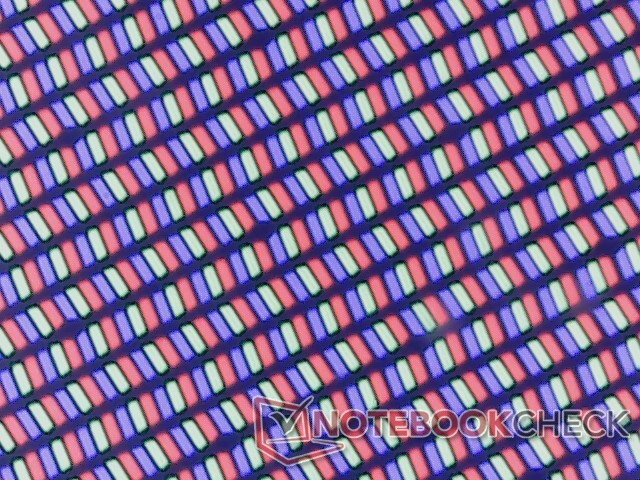
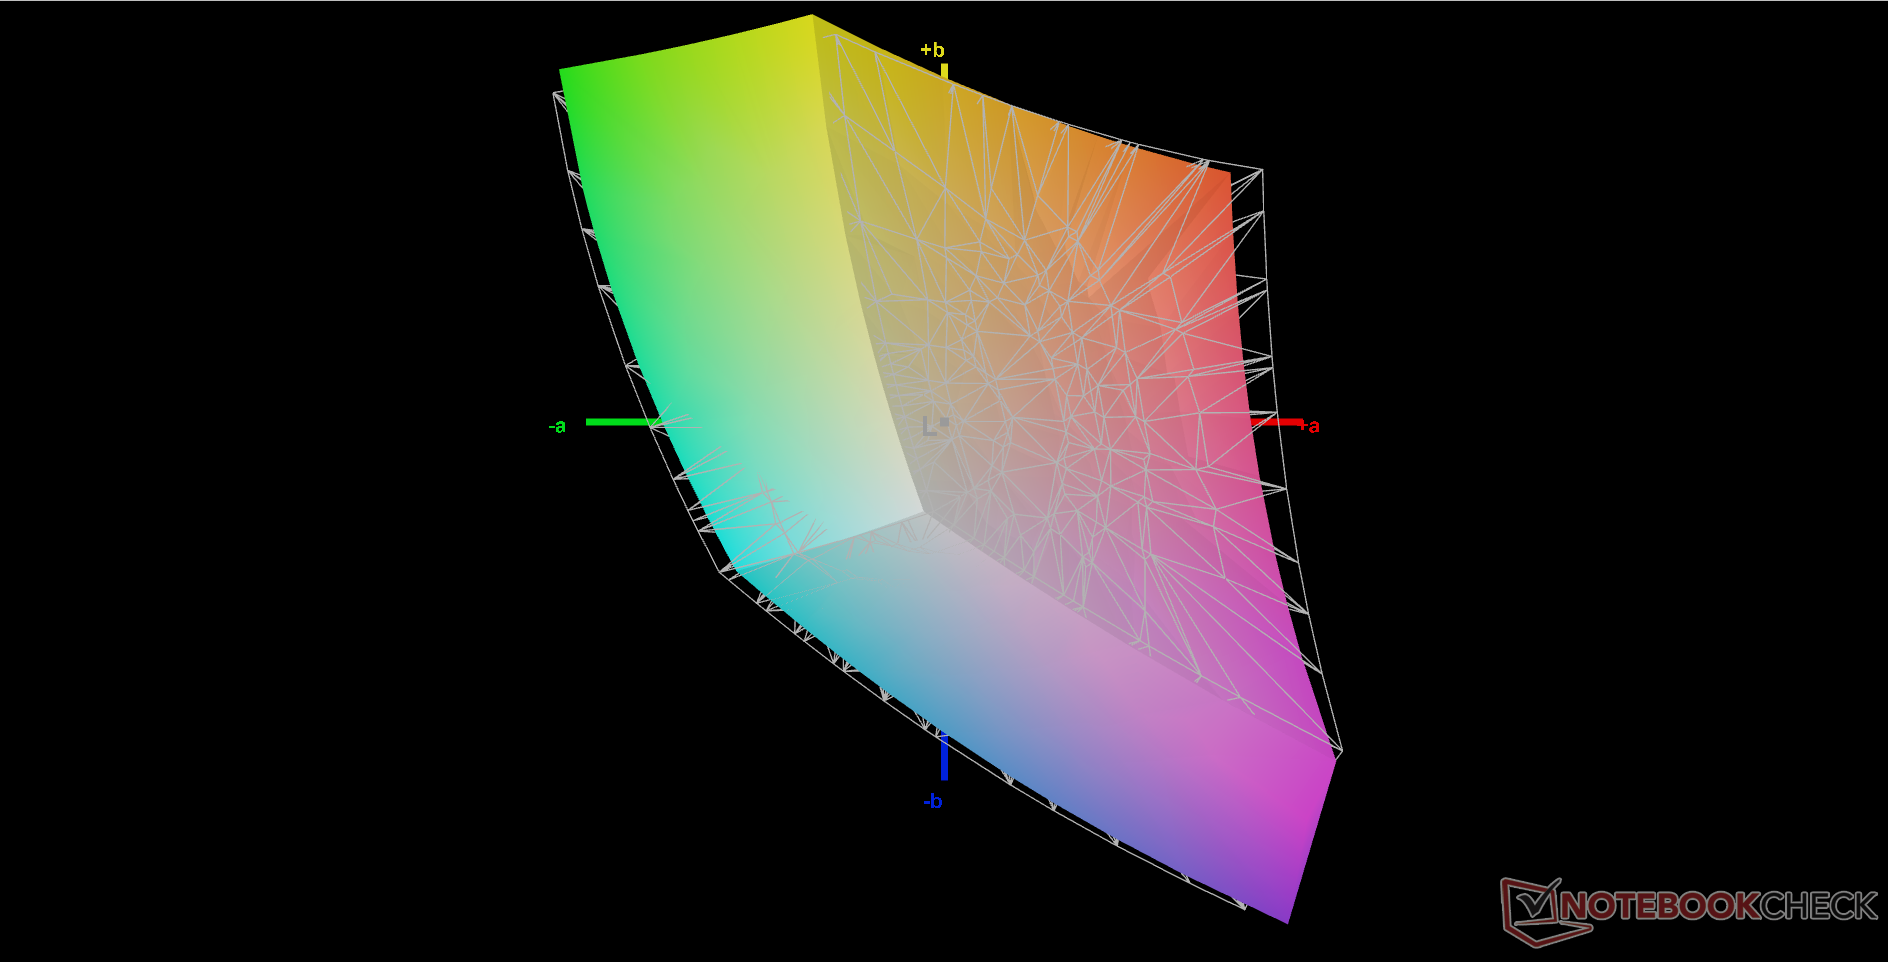
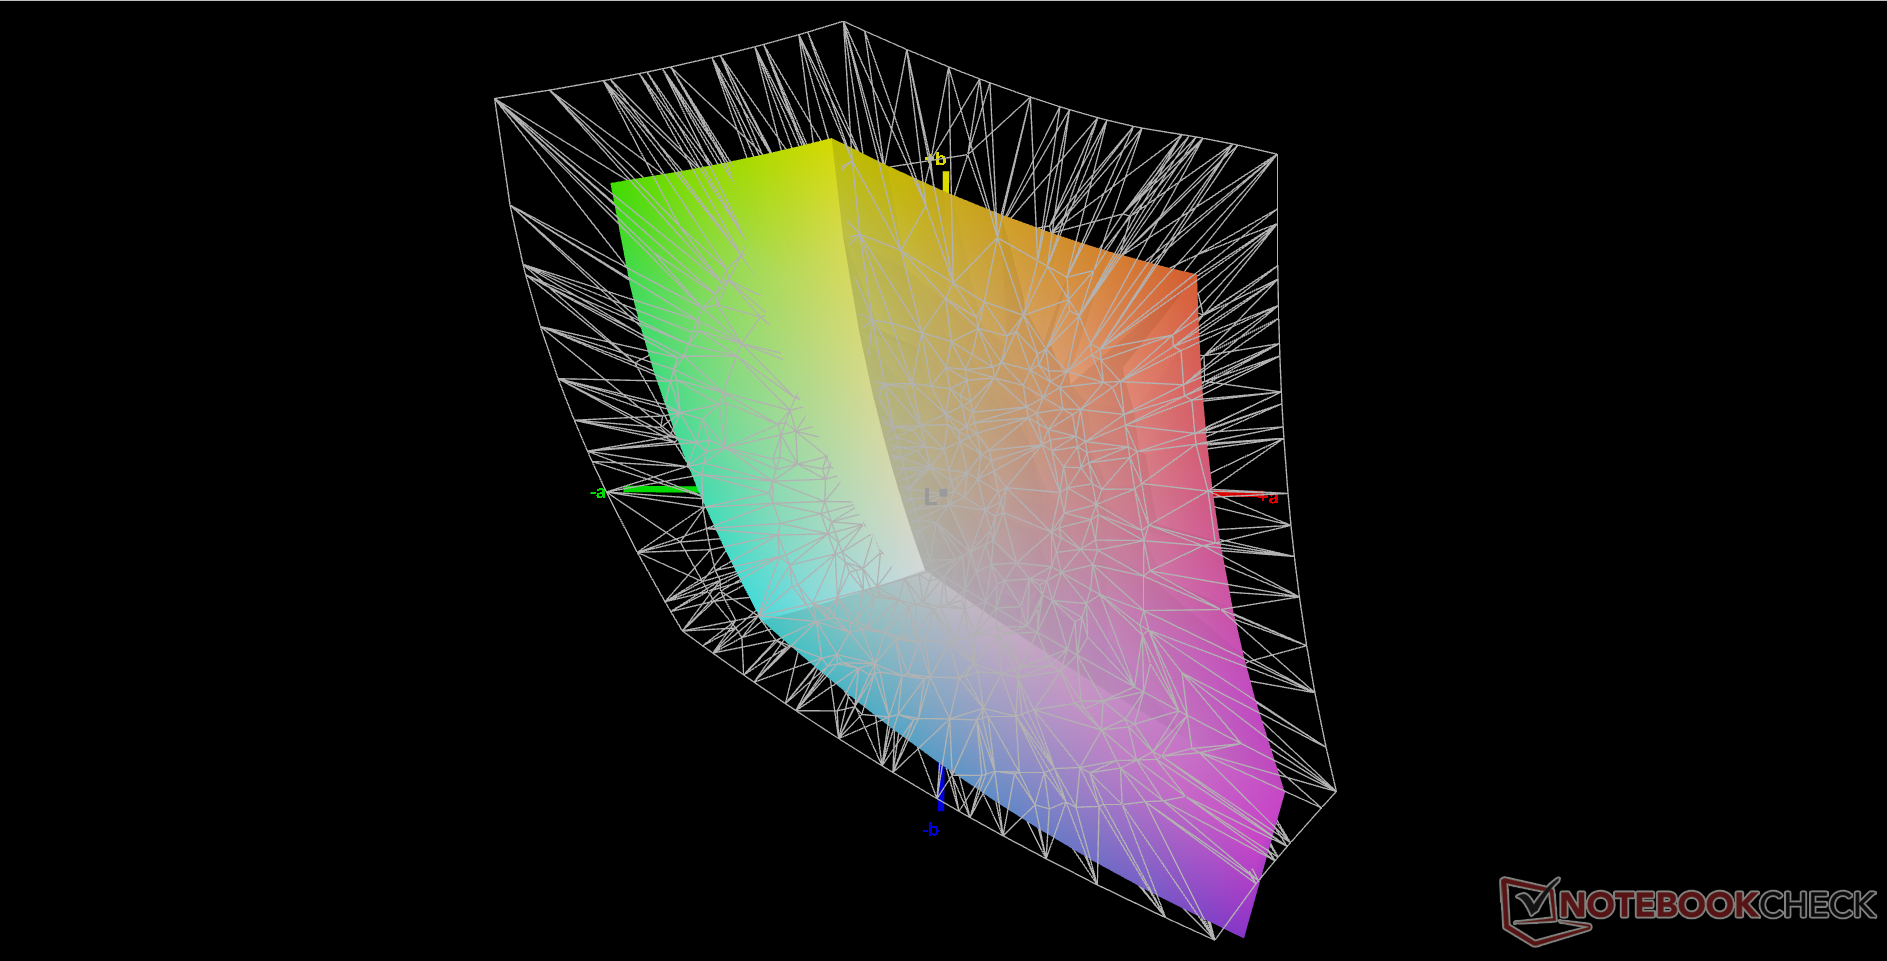
Uno dei principali svantaggi del Win 3 era la dimensione ridotta dello schermo di soli 5,5 pollici. Molti titoli per PC non sono ottimizzati per schermi così piccoli e quindi gli HUD e le icone dell'interfaccia utente apparivano spesso minuscoli. Il Win 4 risolve questo problema con uno schermo più grande da 6 pollici e una risoluzione nativa di 1080p. Anche i tempi di risposta del bianco e nero sono più rapidi, mentre la gamma cromatica e il rapporto di contrasto rimangono più o meno gli stessi del Win 3. Il display IPS non è laminato come quello dell'iPad Pro, ma è comunque molto nitido e di alta qualità.
Il gamut sRGB di circa il 90% consente di ottenere colori profondi che rivaleggiano con quelli di molti computer portatili di fascia media e superiore. Purtroppo non ci sono opzioni OLED che avrebbero ampliato ulteriormente i colori per coprire il P3.
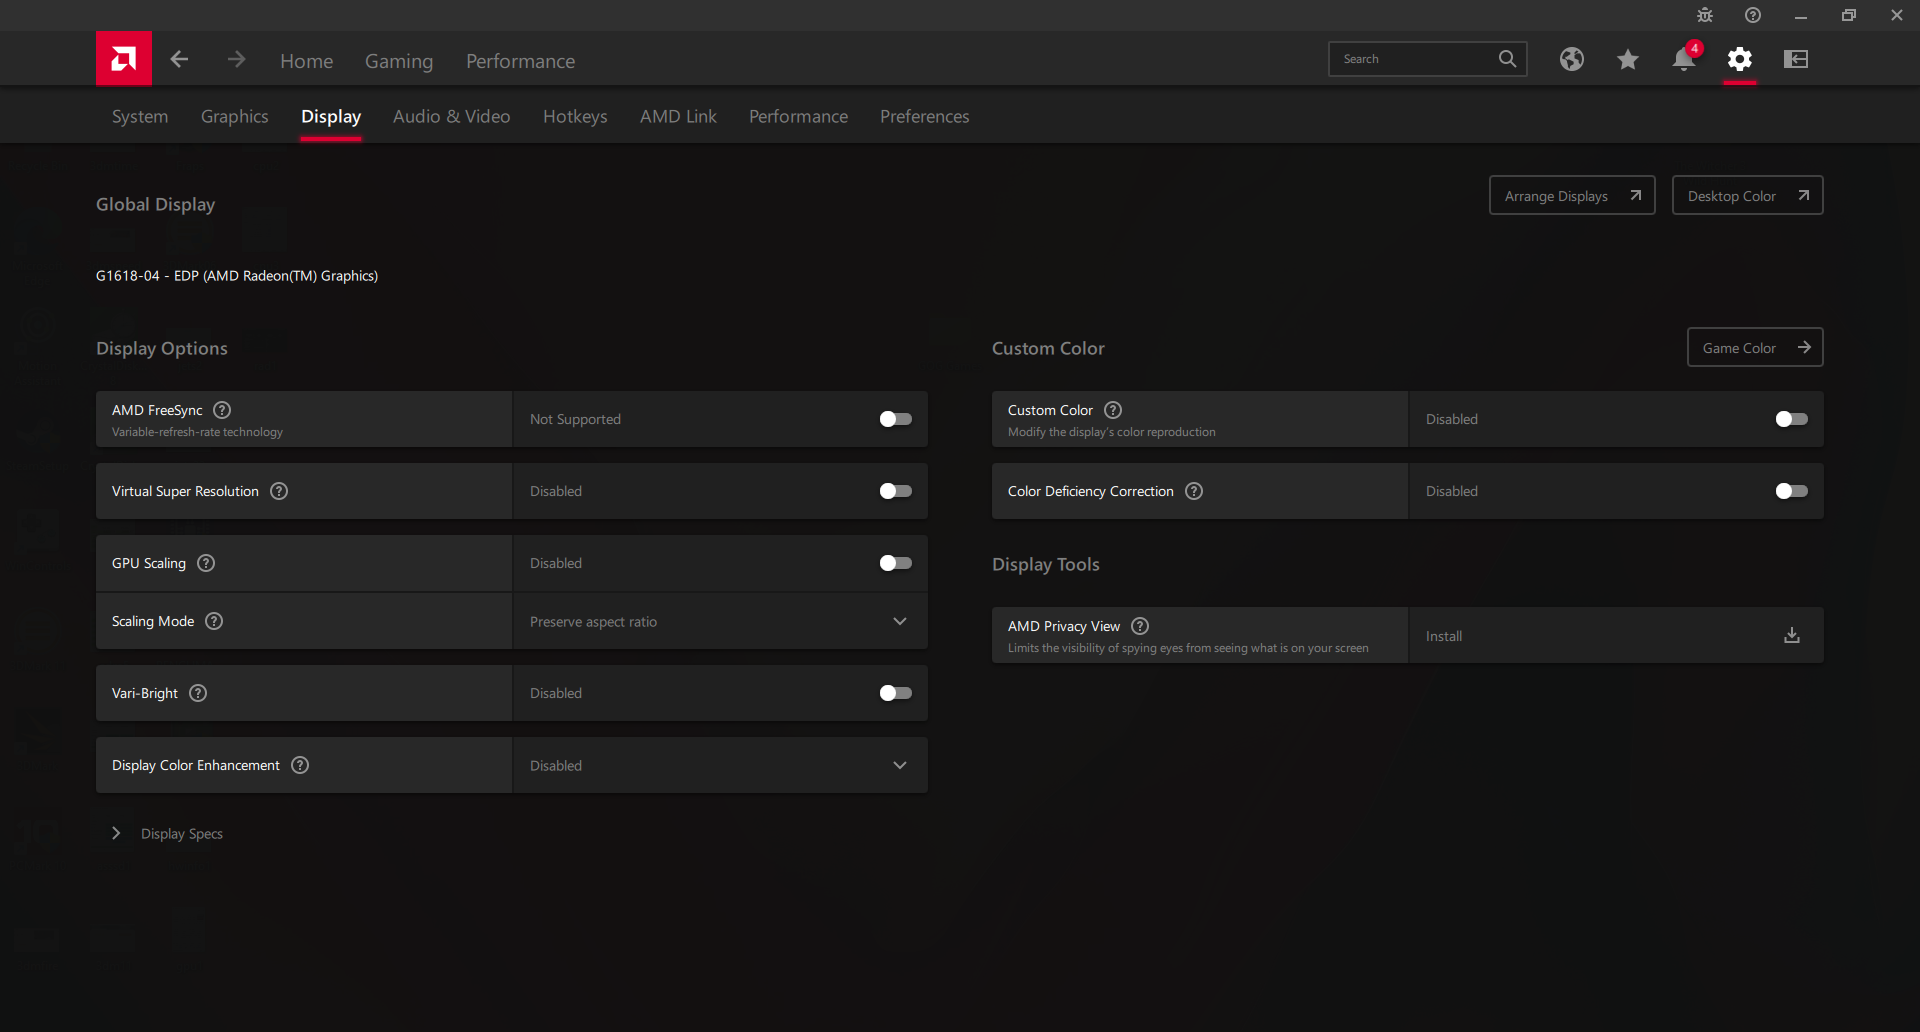
Vale la pena notare che il display non supporta la sincronizzazione adattiva o FreeSync. Questa funzione sarebbe stata perfetta per il sistema, considerando che la Radeon 680M ha spesso prestazioni comprese tra 40 e 60 FPS a 1080p.
| |||||||||||||||||||||||||
Distribuzione della luminosità: 81 %
Al centro con la batteria: 413.1 cd/m²
Contrasto: 1059:1 (Nero: 0.39 cd/m²)
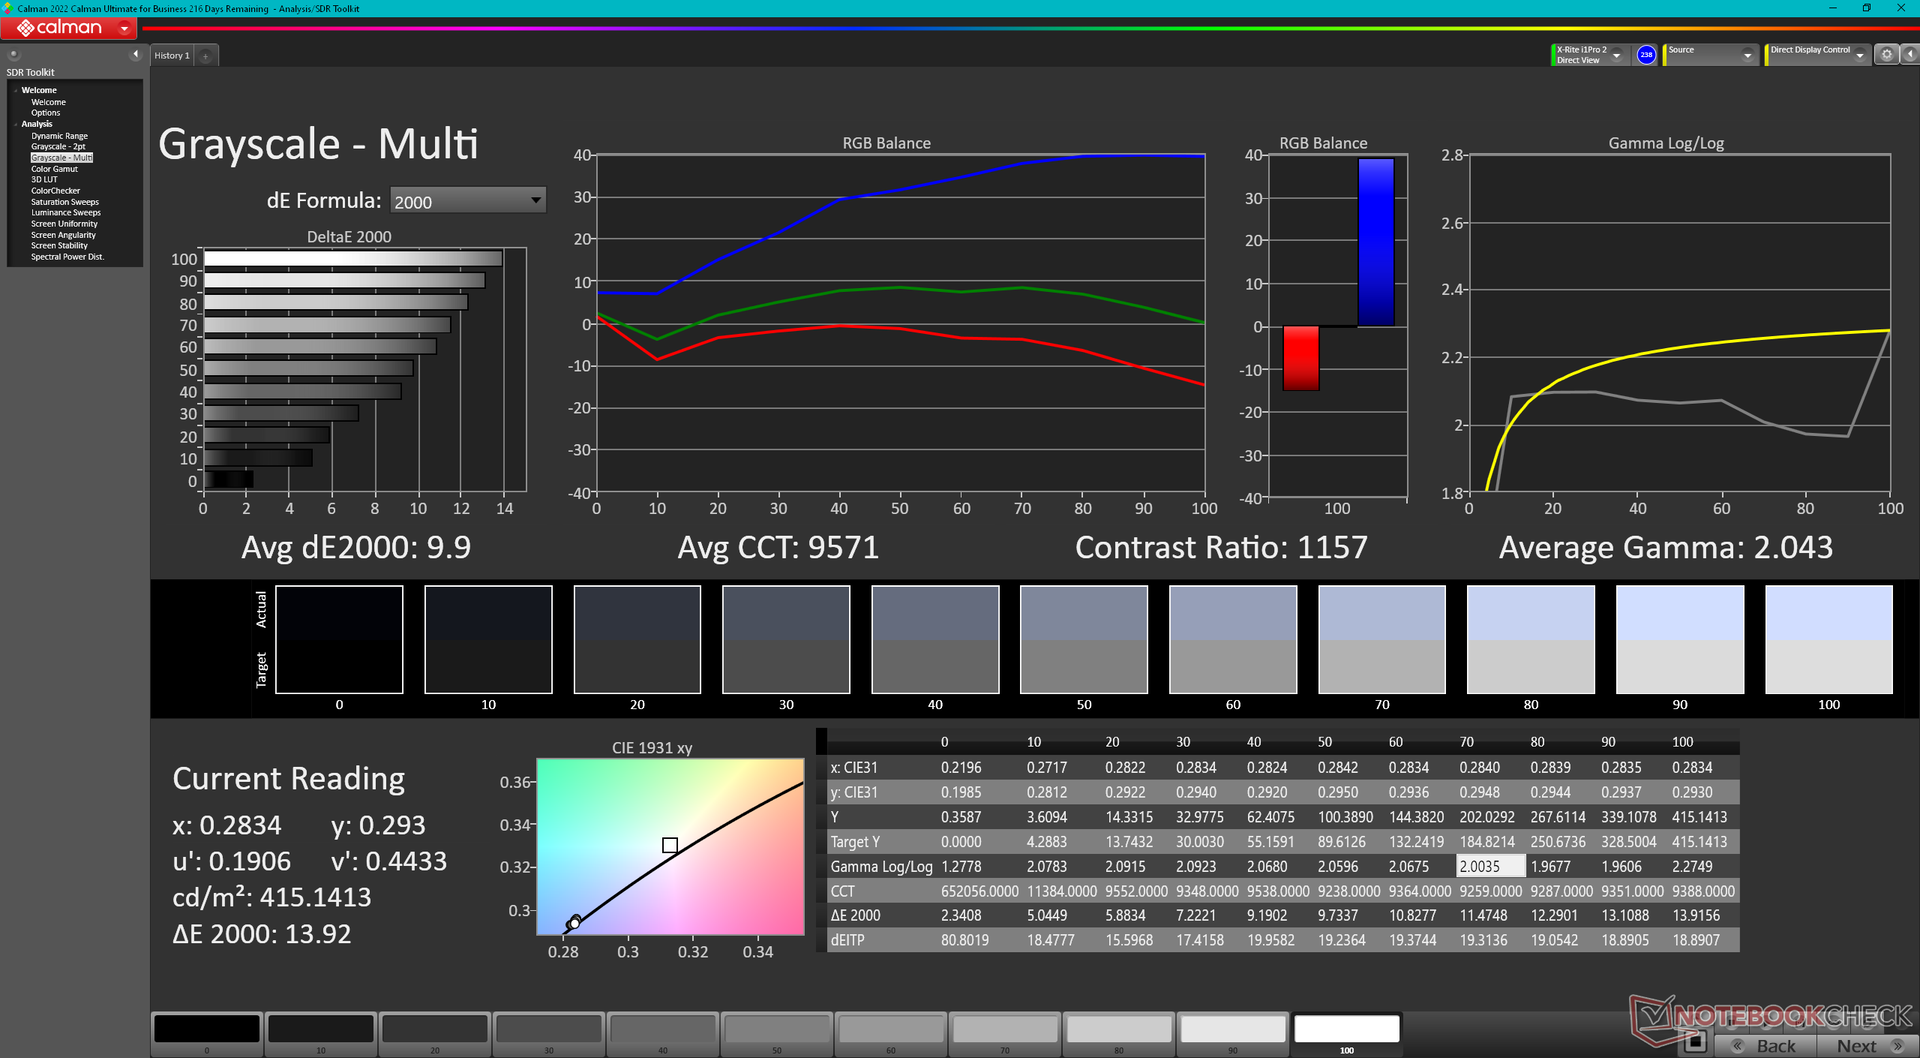
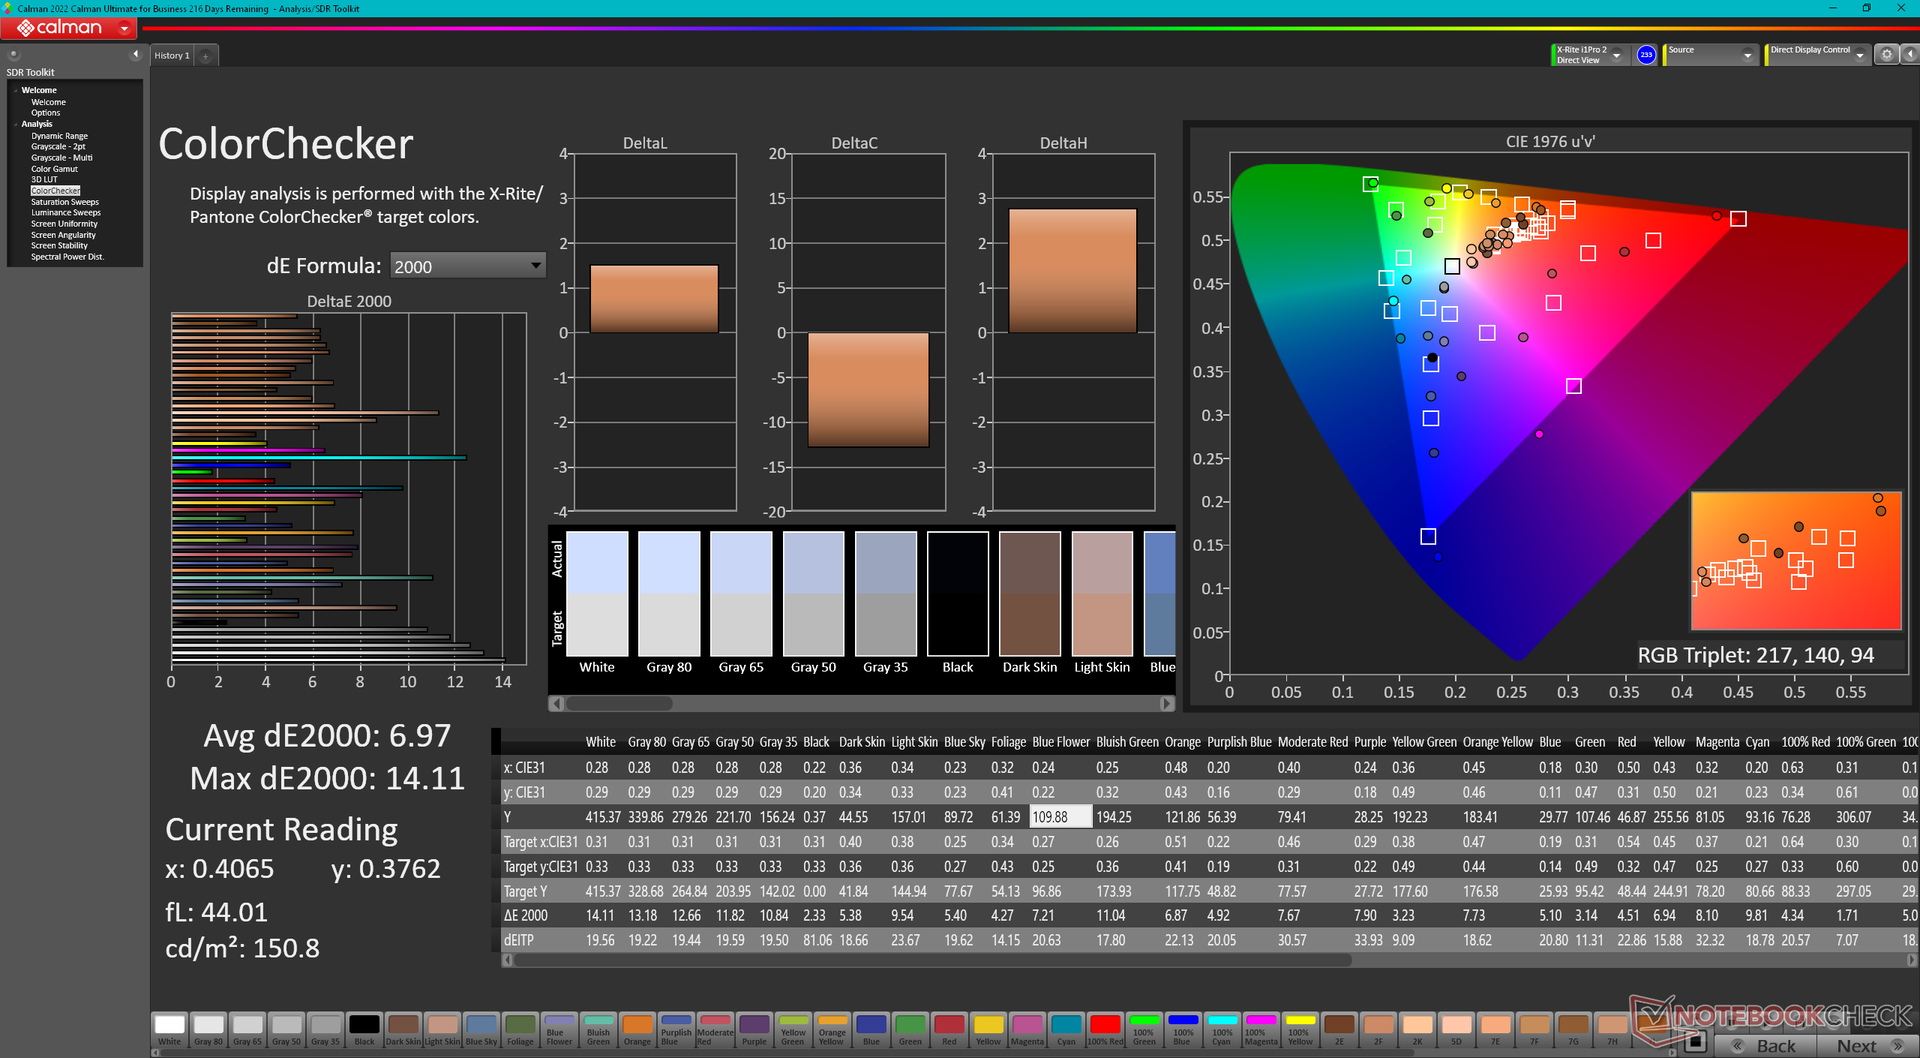
ΔE ColorChecker Calman: 6.97 | ∀{0.5-29.43 Ø4.71}
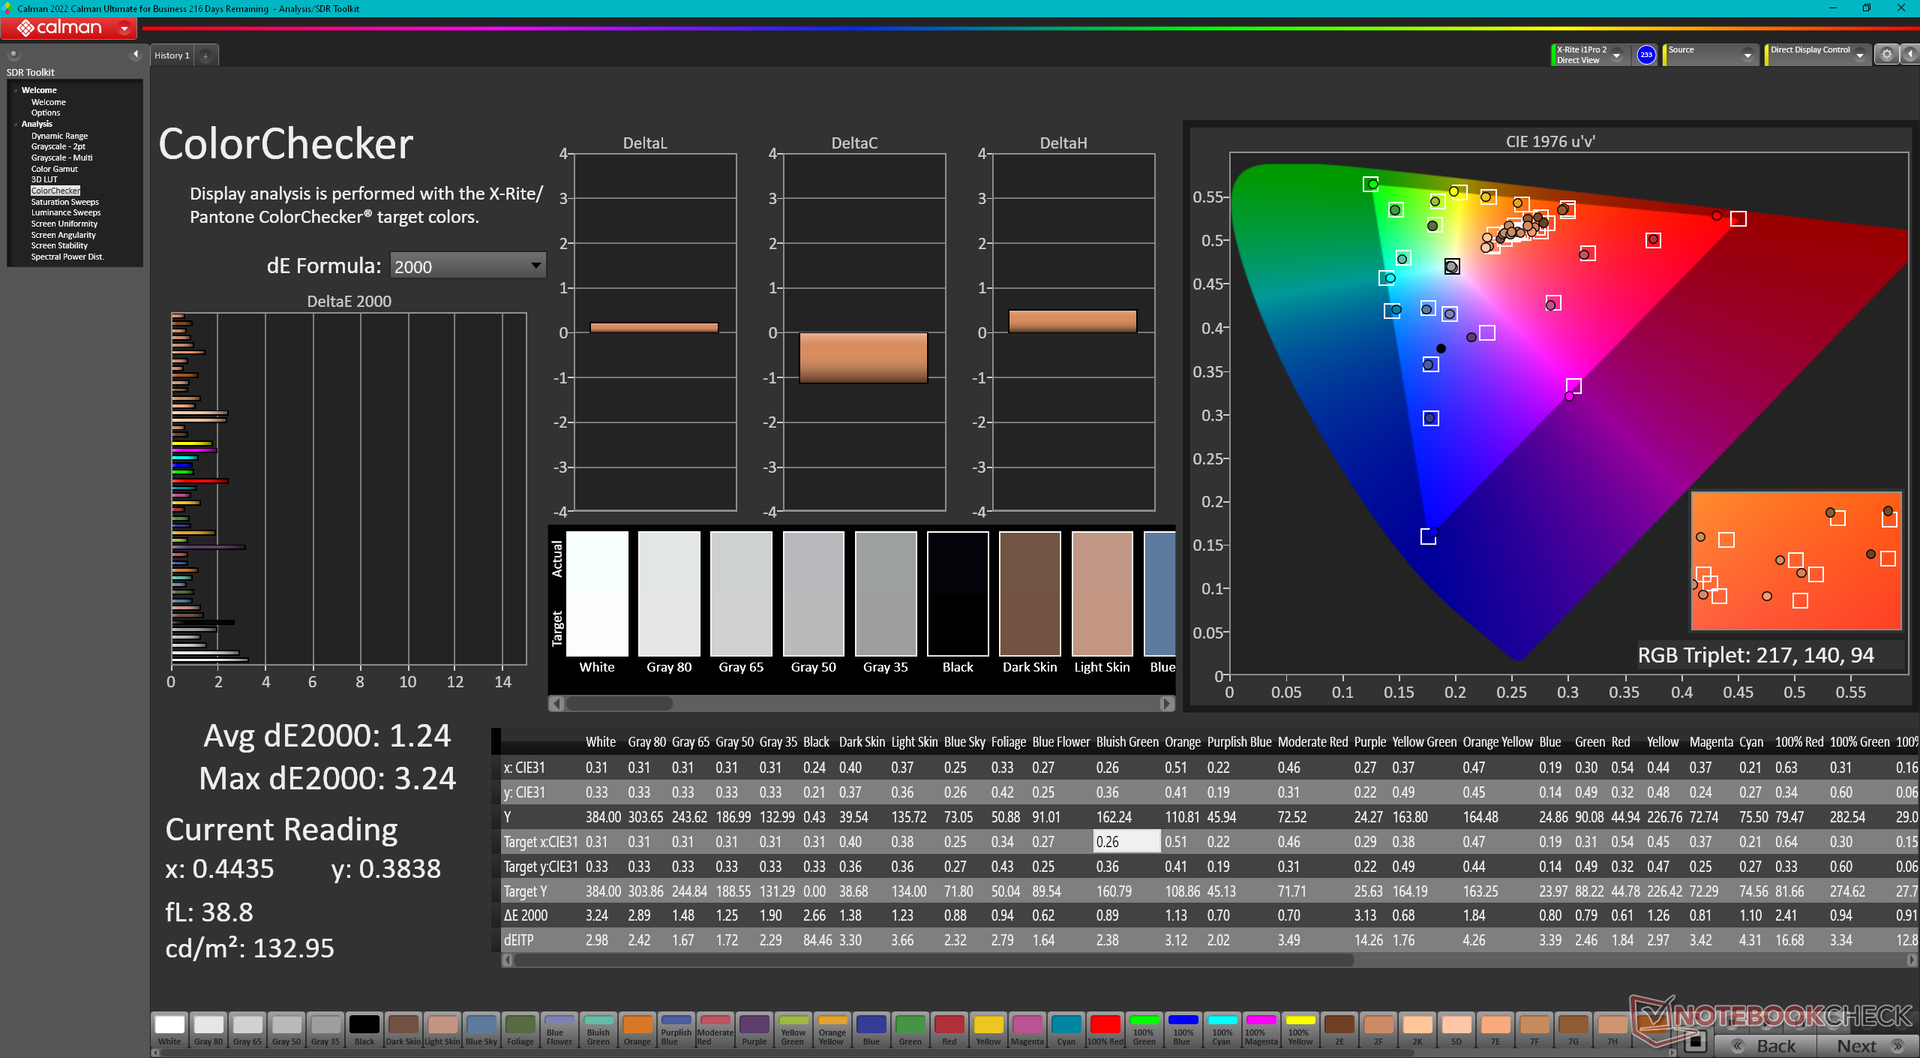
calibrated: 1.24
ΔE Greyscale Calman: 9.9 | ∀{0.09-98 Ø4.96}
64.6% AdobeRGB 1998 (Argyll 3D)
92% sRGB (Argyll 3D)
63.1% Display P3 (Argyll 3D)
Gamma: 2.04
CCT: 9571 K
| GPD Win 4 G1618-04, IPS, 1920x1080, 6" | GPD Win Max 2 Toshiba HX_10.1_LCD, IPS, 2560x1600, 10.1" | GPD Win 3 IPS, 1280x720, 5.5" | Razer Blade Stealth i7-1165G7 GTX 1650 Ti Max-Q Sharp LQ133M1JW46, IPS, 1920x1080, 13.3" | Dell XPS 13 9315 2-in-1 Core i5-1230U BOE NE13A1M, IPS, 2880x1920, 13" | Asus Zenbook S 13 OLED SDC4172, OLED, 2880x1800, 13.3" | |
|---|---|---|---|---|---|---|
| Display | 4% | -5% | 5% | 11% | 39% | |
| Display P3 Coverage (%) | 63.1 | 69.8 11% | 59.5 -6% | 66 5% | 70.7 12% | 99.8 58% |
| sRGB Coverage (%) | 92 | 91 -1% | 89.6 -3% | 97.4 6% | 99.8 8% | 100 9% |
| AdobeRGB 1998 Coverage (%) | 64.6 | 66.6 3% | 61.4 -5% | 67.1 4% | 72.6 12% | 97.8 51% |
| Response Times | 16% | -36% | -98% | -42% | 92% | |
| Response Time Grey 50% / Grey 80% * (ms) | 26.8 ? | 21.2 ? 21% | 40 ? -49% | 57.6 ? -115% | 44 ? -64% | 2.1 ? 92% |
| Response Time Black / White * (ms) | 20.9 ? | 18.7 ? 11% | 25.6 ? -22% | 37.6 ? -80% | 24.8 ? -19% | 1.68 ? 92% |
| PWM Frequency (Hz) | 240.4 ? | |||||
| Screen | 8% | -9% | 24% | 41% | 196% | |
| Brightness middle (cd/m²) | 413.1 | 396.7 -4% | 468.8 13% | 356.8 -14% | 507 23% | 336 -19% |
| Brightness (cd/m²) | 407 | 381 -6% | 460 13% | 336 -17% | 486 19% | 338 -17% |
| Brightness Distribution (%) | 81 | 89 10% | 93 15% | 88 9% | 87 7% | 99 22% |
| Black Level * (cd/m²) | 0.39 | 0.36 8% | 0.45 -15% | 0.34 13% | 0.34 13% | 0.02 95% |
| Contrast (:1) | 1059 | 1102 4% | 1042 -2% | 1049 -1% | 1491 41% | 16800 1486% |
| Colorchecker dE 2000 * | 6.97 | 6.31 9% | 9 -29% | 1.63 77% | 2.04 71% | 1.8 74% |
| Colorchecker dE 2000 max. * | 14.11 | 10.23 27% | 15.5 -10% | 5.03 64% | 3.1 78% | 3.8 73% |
| Colorchecker dE 2000 calibrated * | 1.24 | 1.44 -16% | 1.91 -54% | 1.08 13% | 0.86 31% | 1.8 -45% |
| Greyscale dE 2000 * | 9.9 | 5.5 44% | 10.9 -10% | 3 70% | 1.8 82% | 0.9 91% |
| Gamma | 2.04 108% | 2.17 101% | 2.13 103% | 2.23 99% | 2.12 104% | 2.22 99% |
| CCT | 9571 68% | 7502 87% | 10972 59% | 6434 101% | 6561 99% | 6580 99% |
| Color Space (Percent of AdobeRGB 1998) (%) | 56.6 | 62 | ||||
| Color Space (Percent of sRGB) (%) | 89.2 | 97.6 | ||||
| Media totale (Programma / Settaggio) | 9% /
9% | -17% /
-12% | -23% /
2% | 3% /
22% | 109% /
147% |
* ... Meglio usare valori piccoli
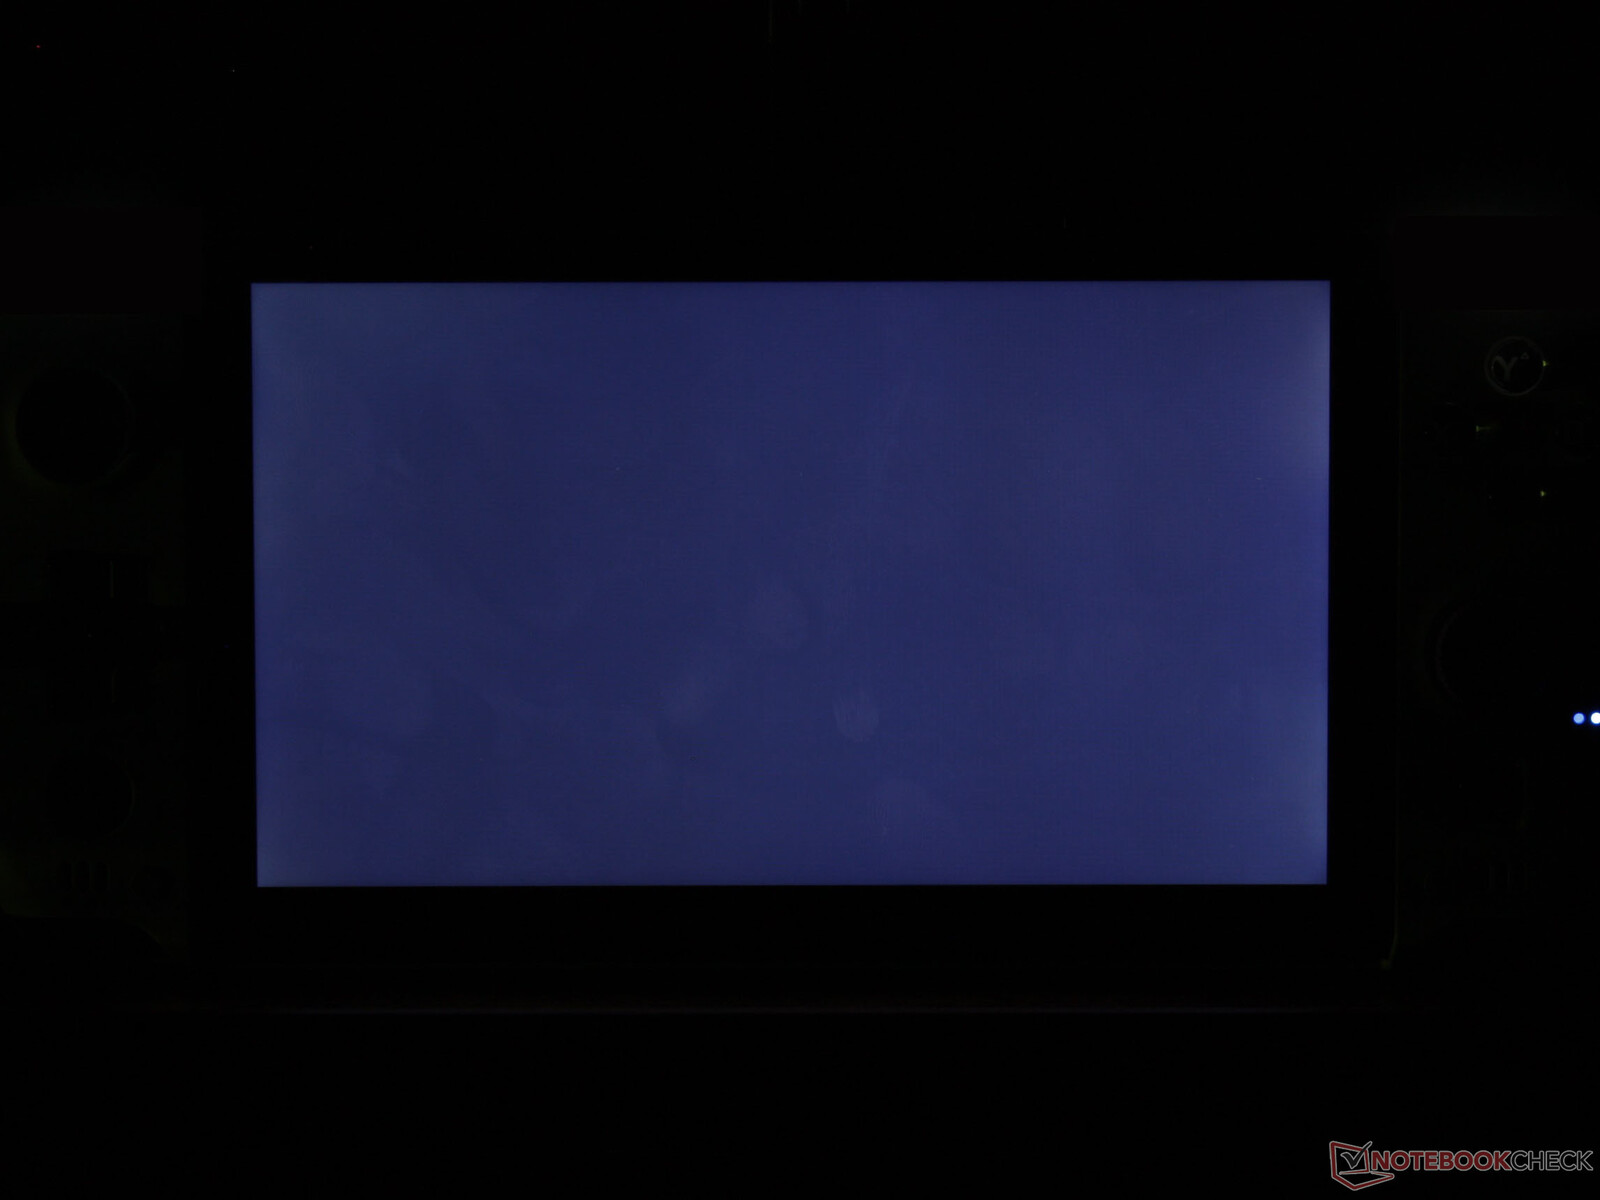
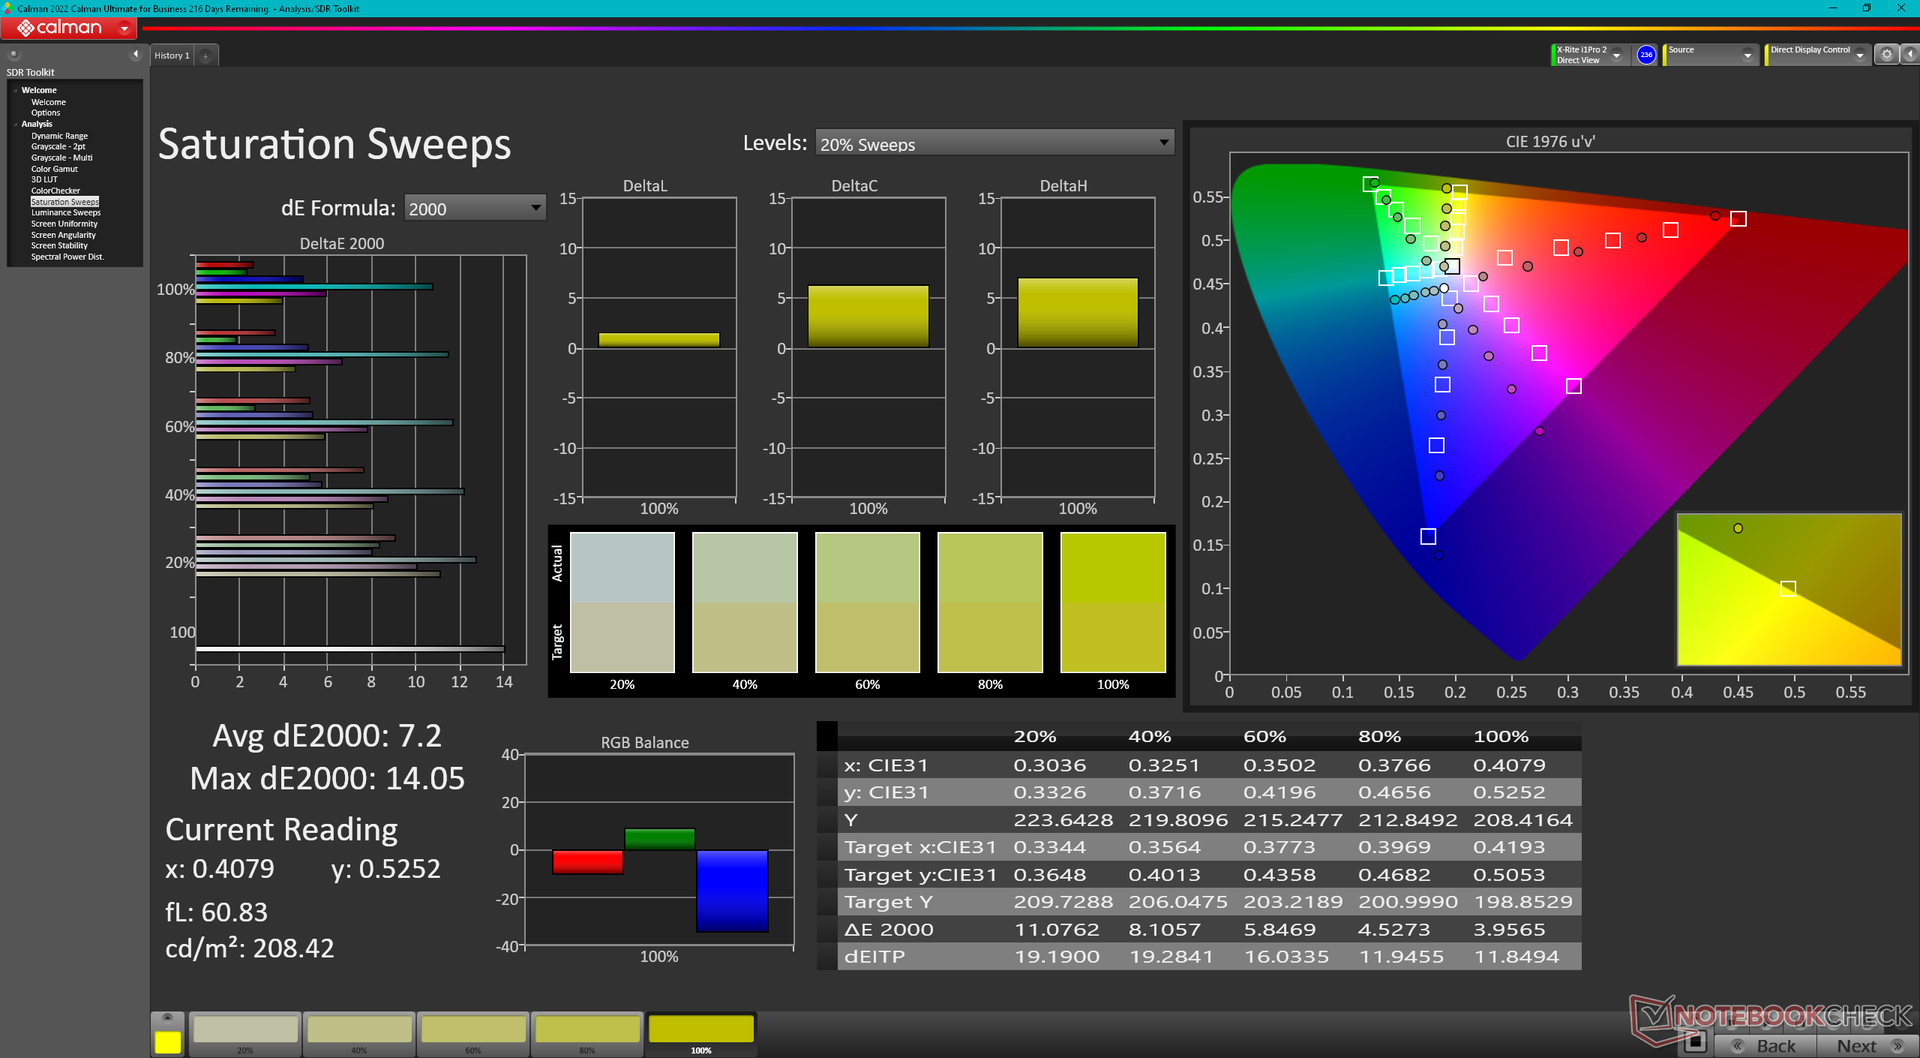
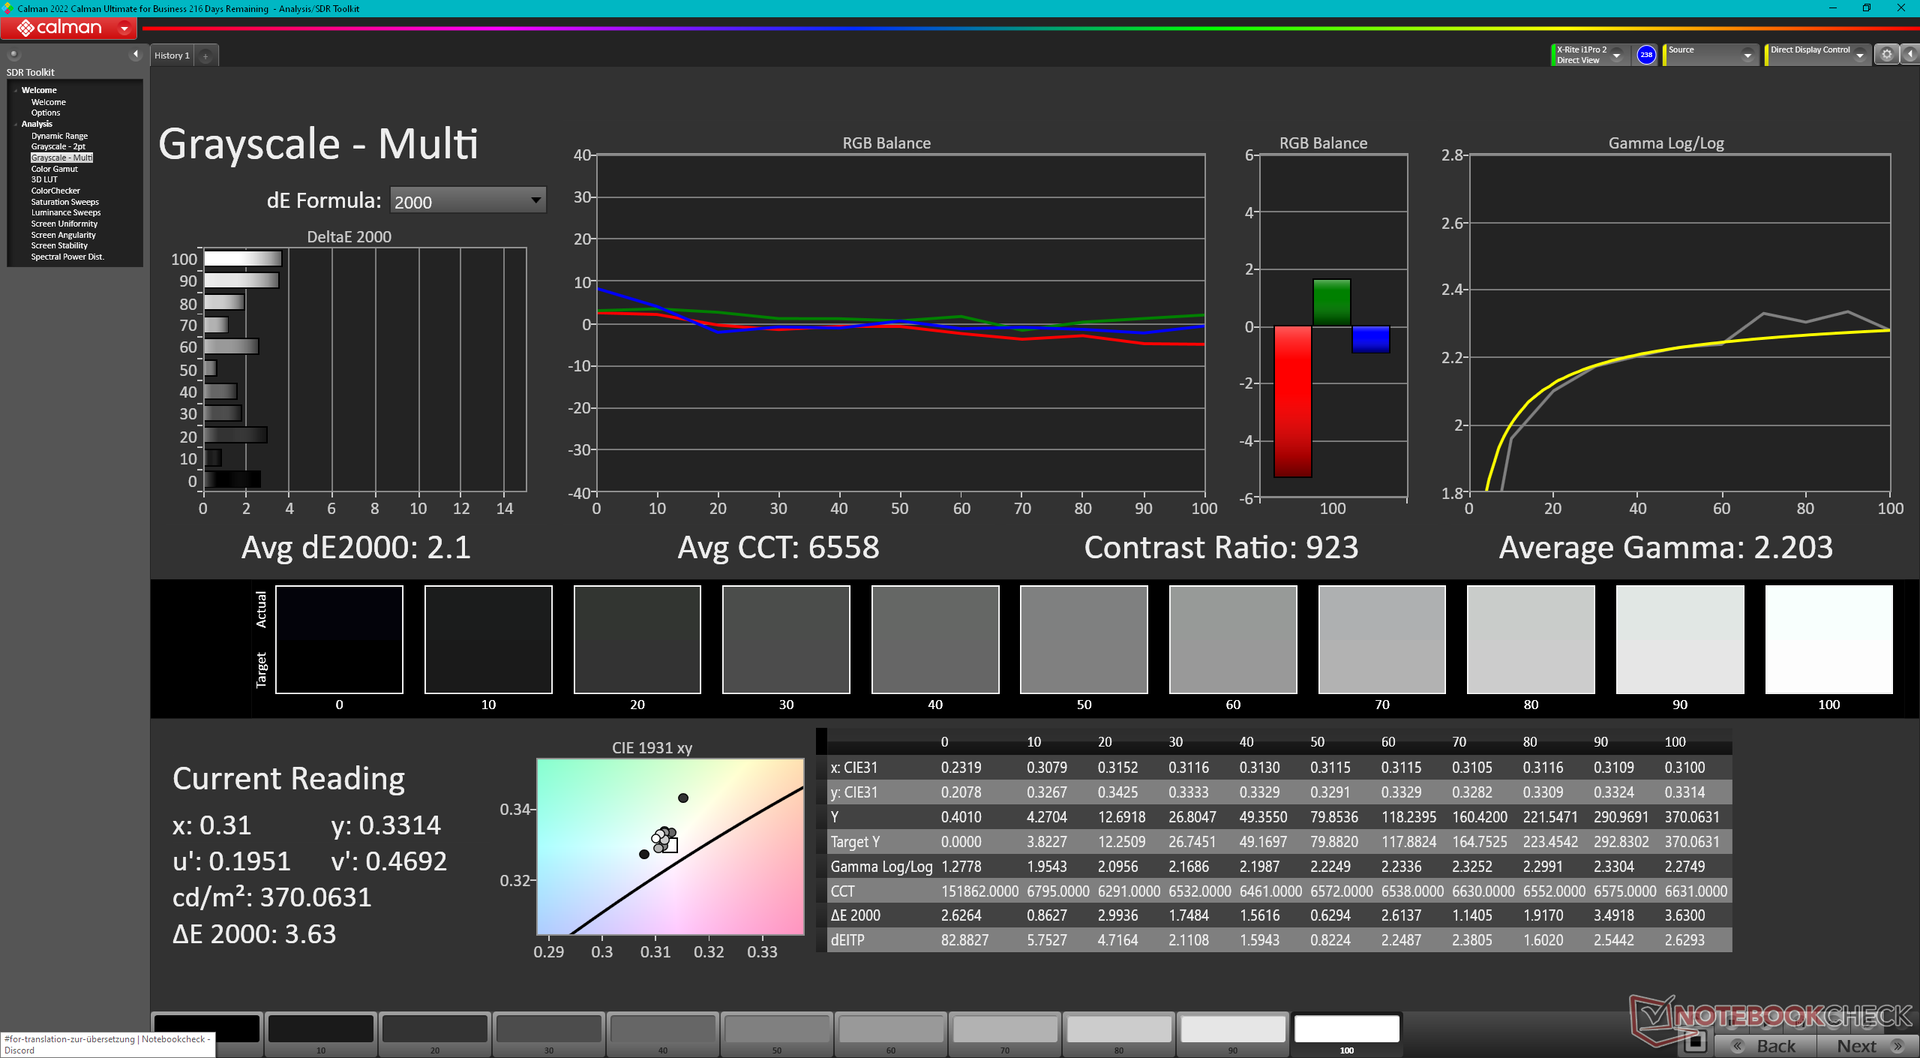
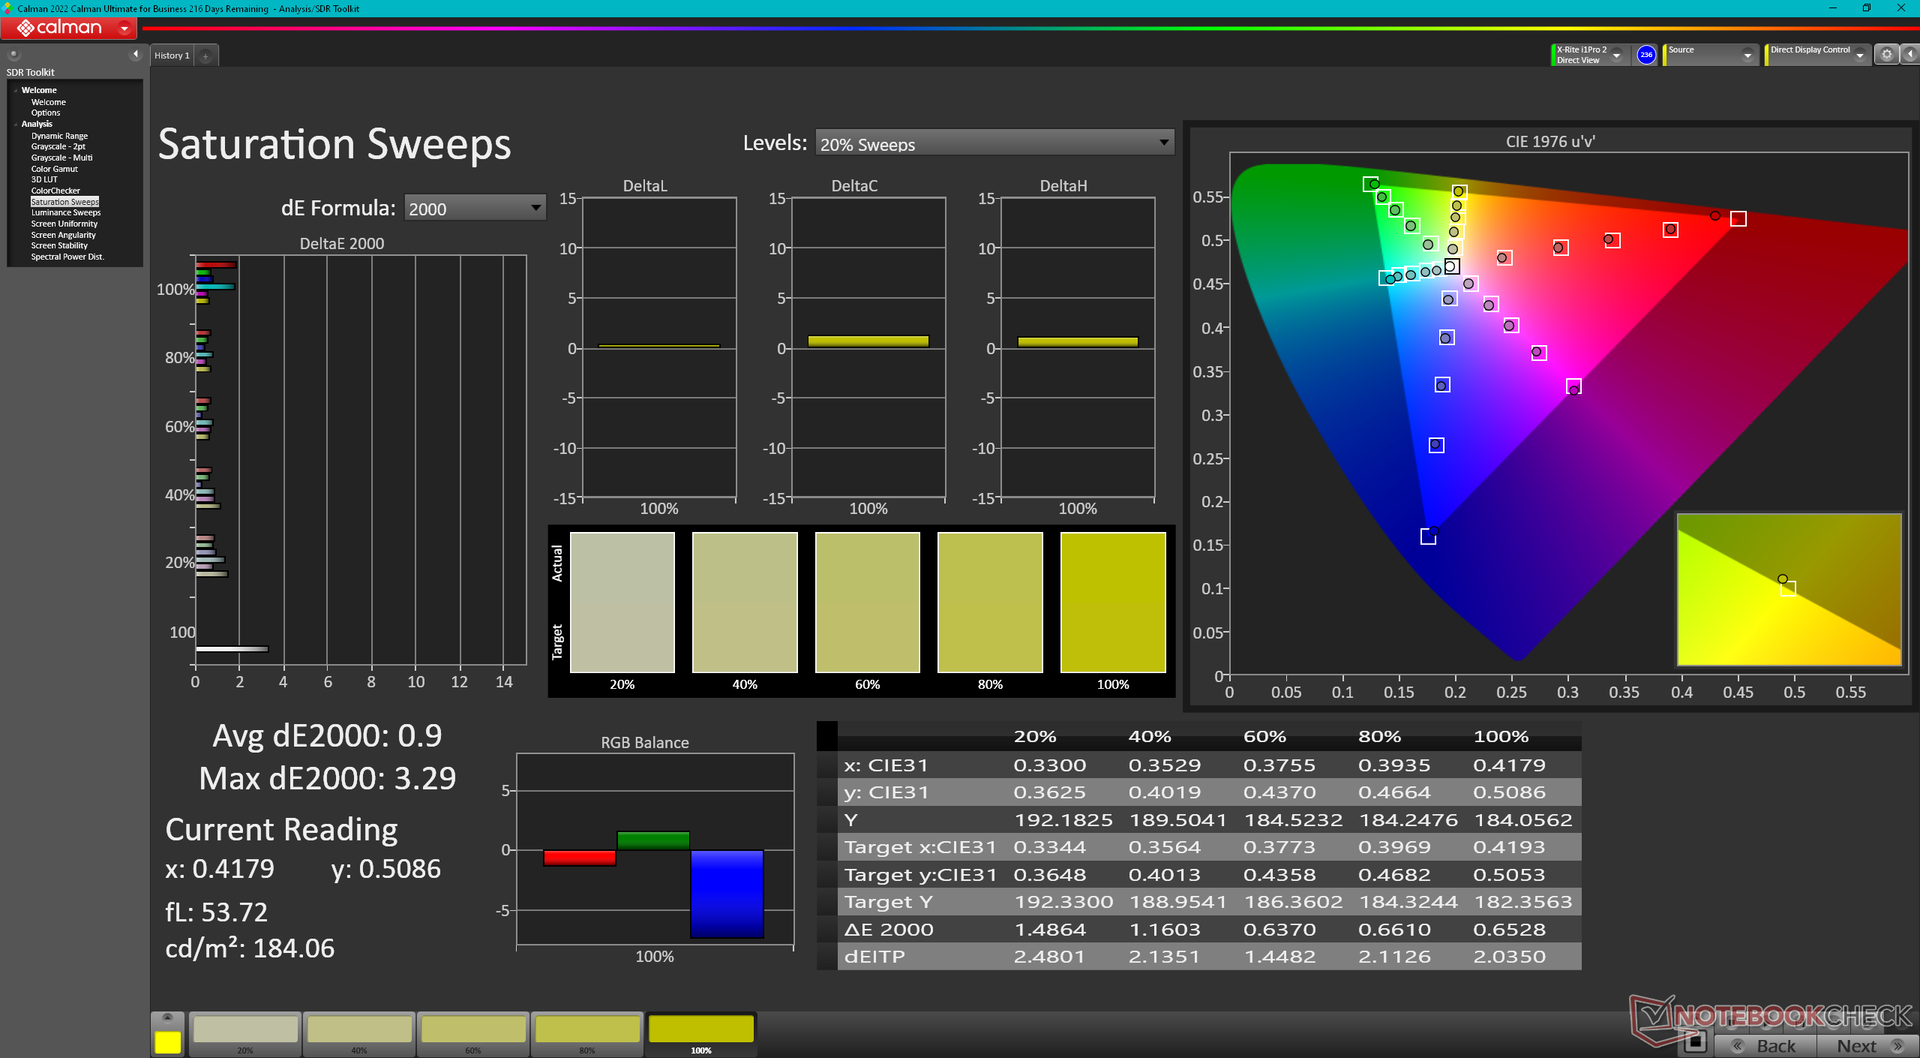
Il display è mal calibrato. La temperatura del colore, in particolare, è troppo fredda (9571) e quindi lo schermo appare eccessivamente blu. Calibrando il display con un colorimetro X-Rite, i valori medi deltaE della scala di grigi e del colore sarebbero migliorati in modo significativo, passando da 9,9 e 6,97 a soli 2,1 e 1,24, rispettivamente. Consigliamo di applicare il nostro profilo ICM calibrato di cui sopra per ottenere dal display colori più accurati di sRGB.
Tempi di risposta del Display
| ↔ Tempi di risposta dal Nero al Bianco | ||
|---|---|---|
| 20.9 ms ... aumenta ↗ e diminuisce ↘ combinato | ↗ 11.4 ms Incremento | 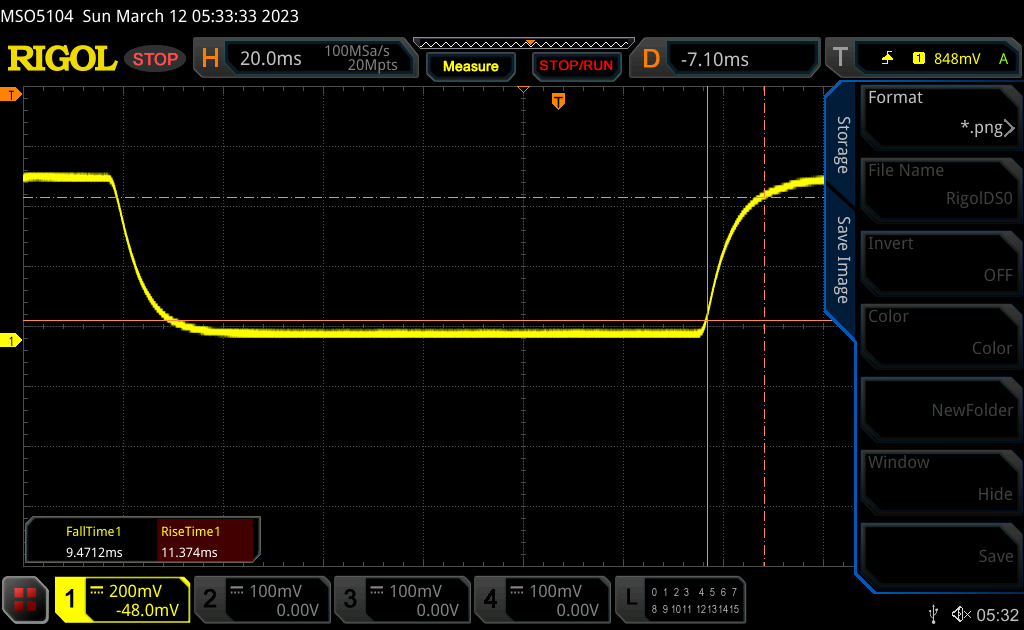 |
| ↘ 9.5 ms Calo | ||
| Lo schermo mostra buoni tempi di risposta durante i nostri tests, ma potrebbe essere troppo lento per i gamers competitivi. In confronto, tutti i dispositivi di test variano da 0.1 (minimo) a 240 (massimo) ms. » 47 % di tutti i dispositivi è migliore. Questo significa che i tempi di risposta rilevati sono simili alla media di tutti i dispositivi testati (19.8 ms). | ||
| ↔ Tempo di risposta dal 50% Grigio all'80% Grigio | ||
| 26.8 ms ... aumenta ↗ e diminuisce ↘ combinato | ↗ 12.5 ms Incremento | 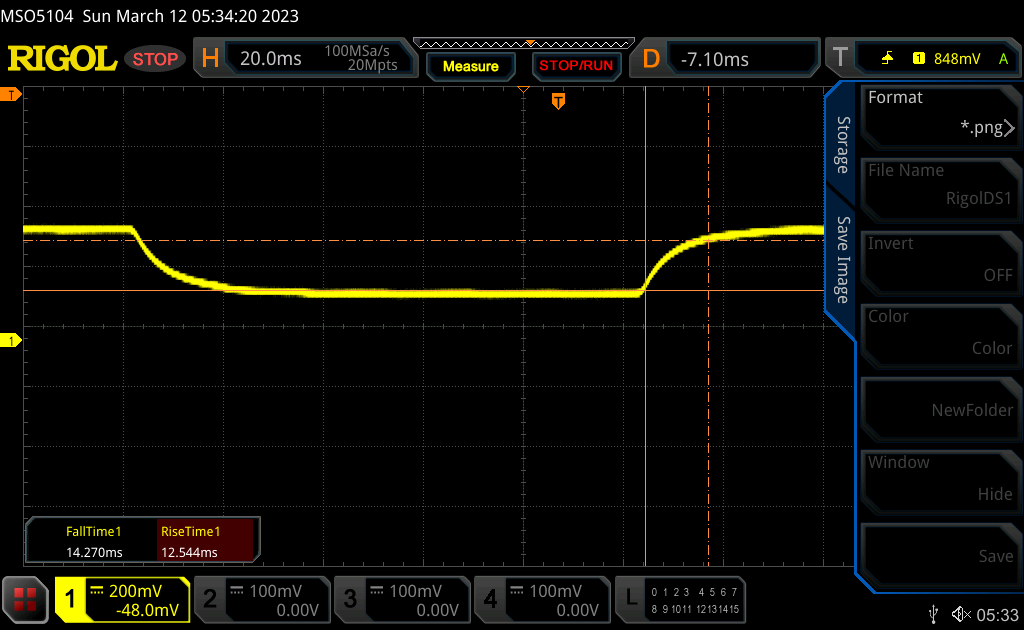 |
| ↘ 14.3 ms Calo | ||
| Lo schermo mostra tempi di risposta relativamente lenti nei nostri tests e potrebbe essere troppo lento per i gamers. In confronto, tutti i dispositivi di test variano da 0.165 (minimo) a 636 (massimo) ms. » 37 % di tutti i dispositivi è migliore. Questo significa che i tempi di risposta rilevati sono migliori rispettto alla media di tutti i dispositivi testati (30.9 ms). | ||
Sfarfallio dello schermo / PWM (Pulse-Width Modulation)
| flickering dello schermo / PWM non rilevato | 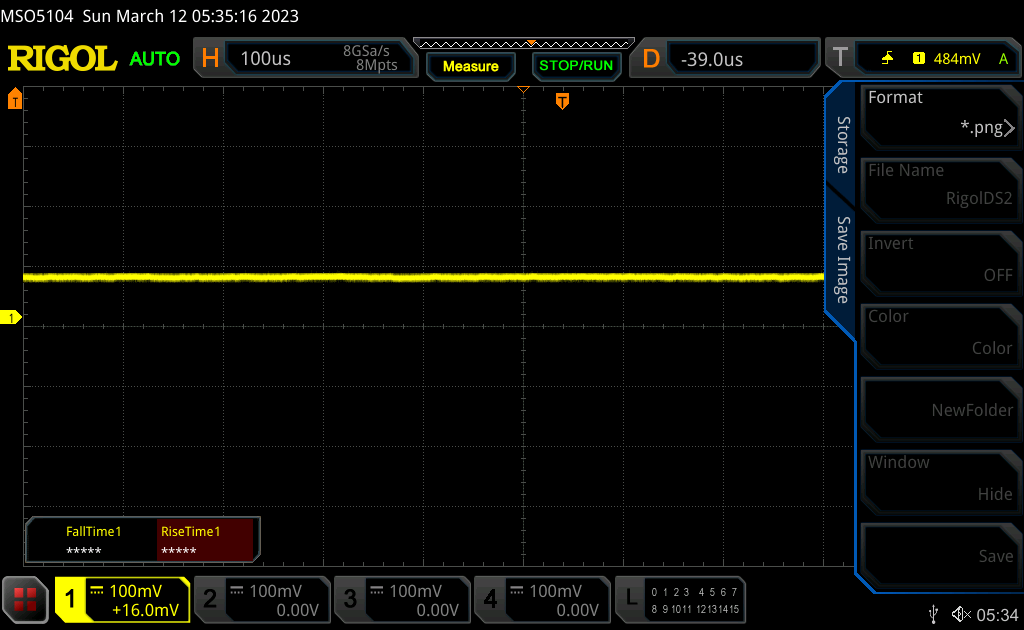 | ||
In confronto: 52 % di tutti i dispositivi testati non utilizza PWM per ridurre la luminosita' del display. Se è rilevato PWM, una media di 7741 (minimo: 5 - massimo: 343500) Hz è stata rilevata. | |||
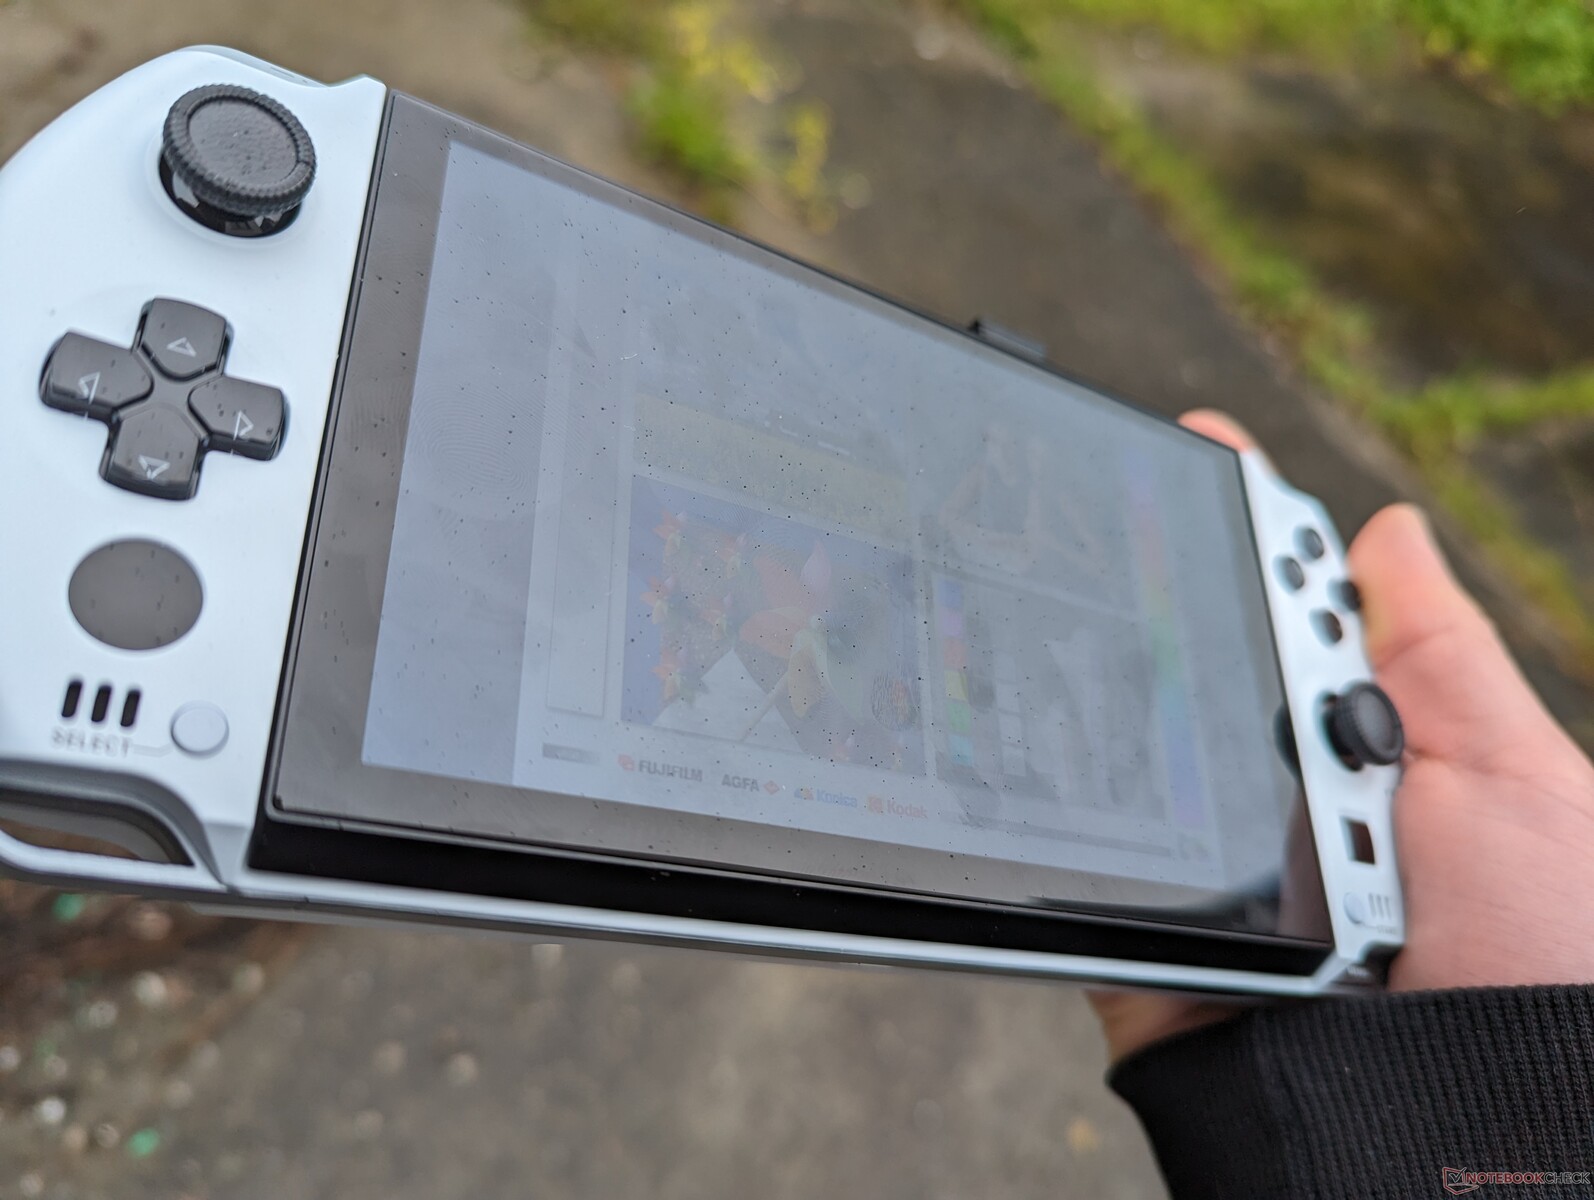
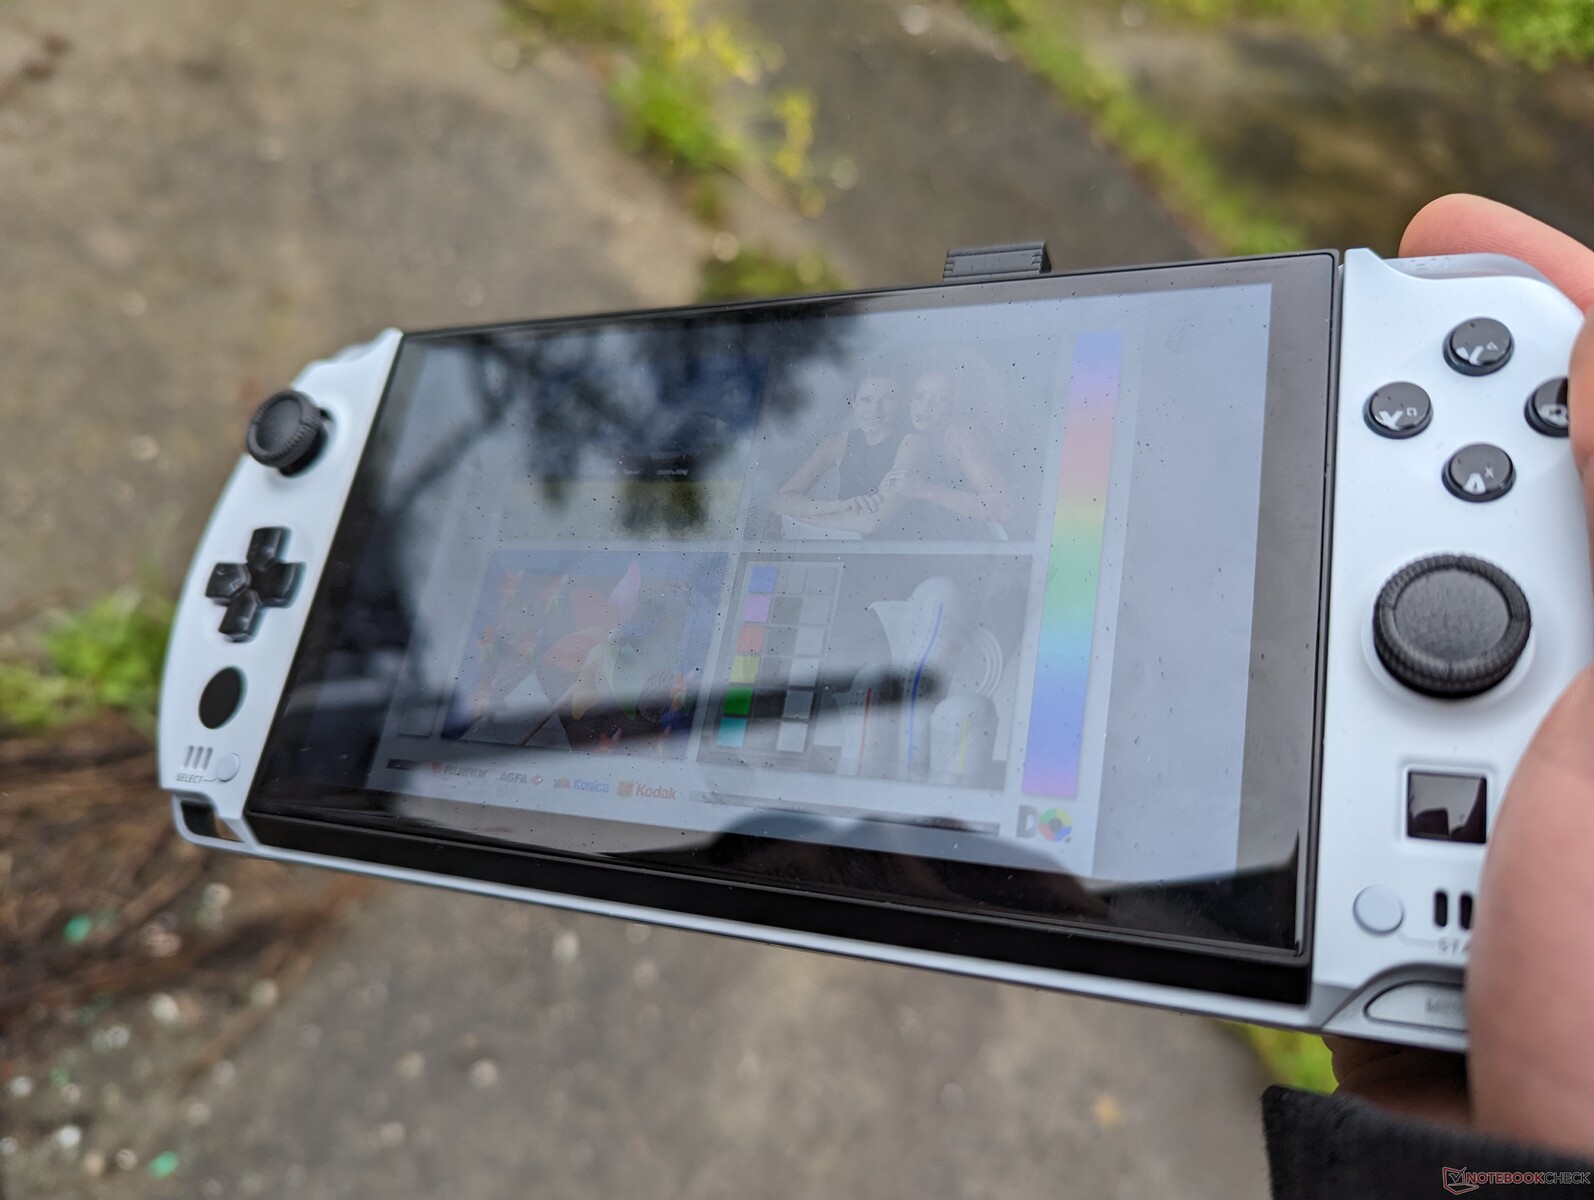
La visibilità all'aperto è abbastanza buona se all'ombra. Tuttavia, se la luminosità è maggiore, i riflessi sullo schermo lucido diventano un problema. Lo schermo da 400 nit non è così luminoso come quello degli smartphone più diffusi, i cui display raggiungono i 1000 nit o più.
Prestazioni: la stessa potenza dei più recenti Ultrabook
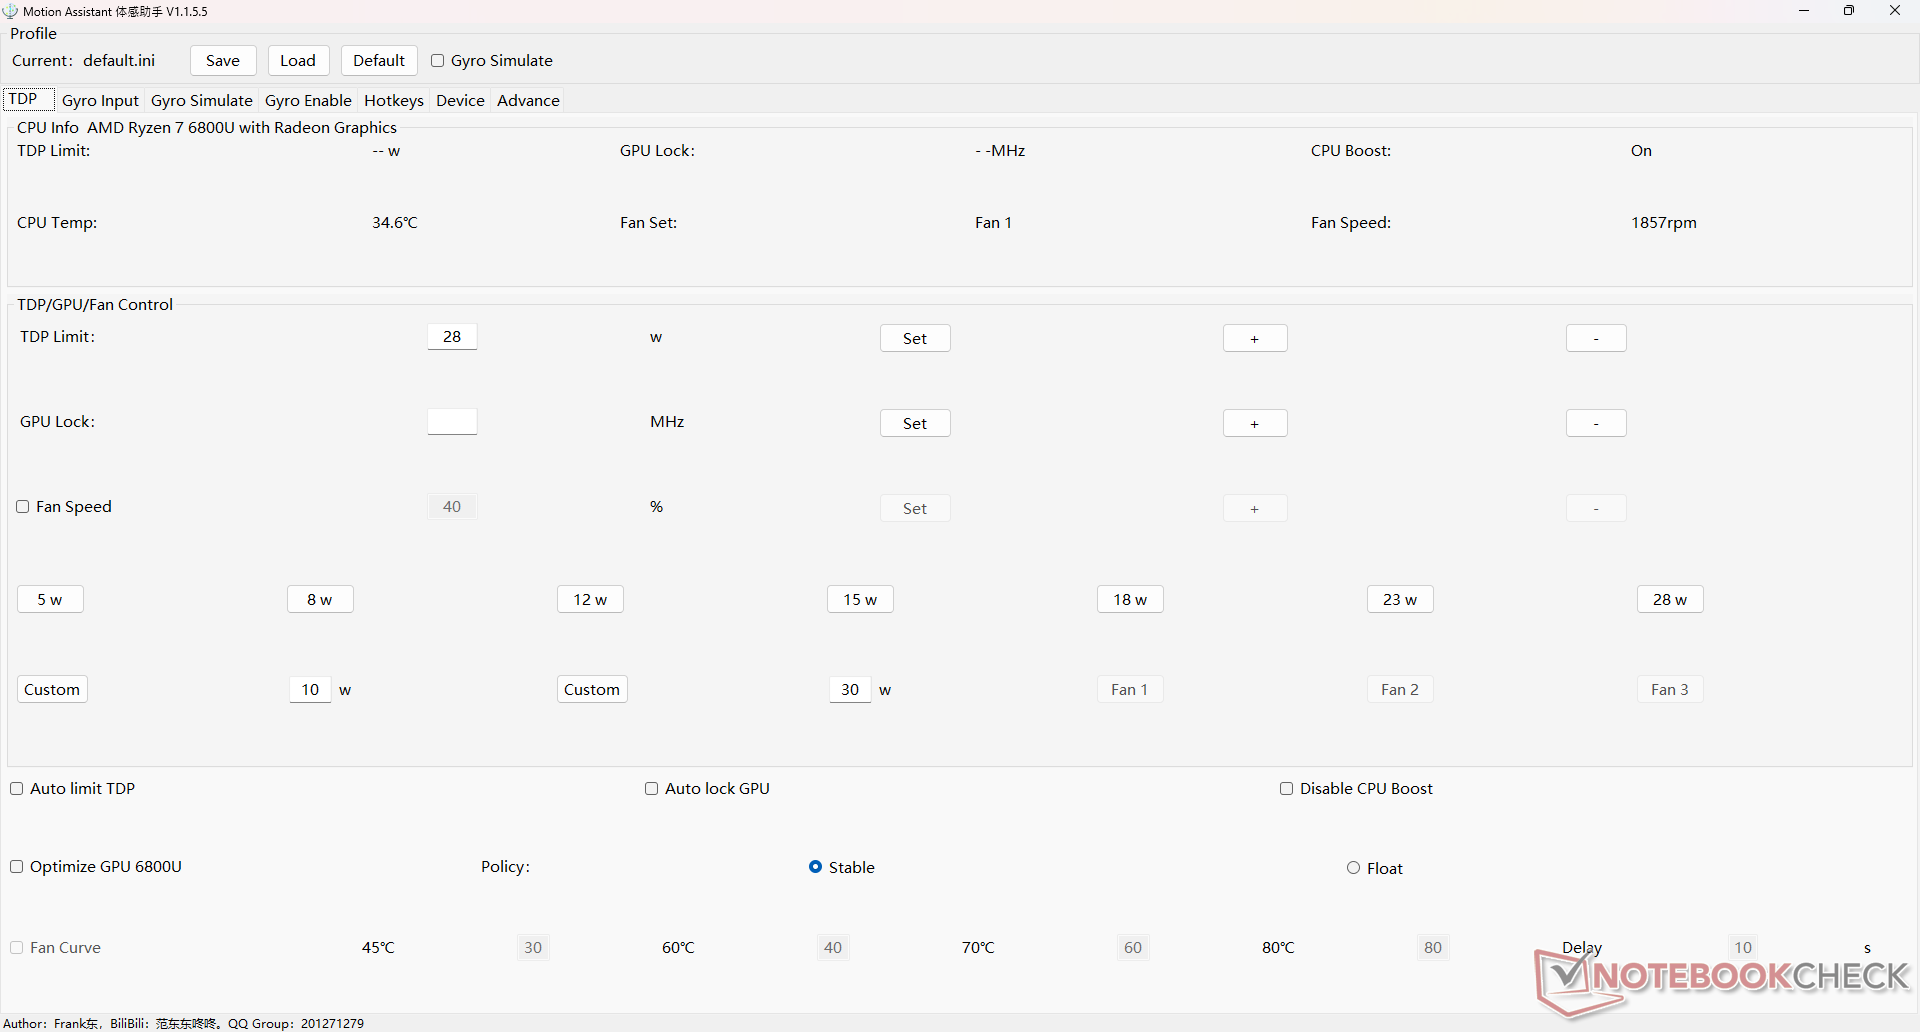
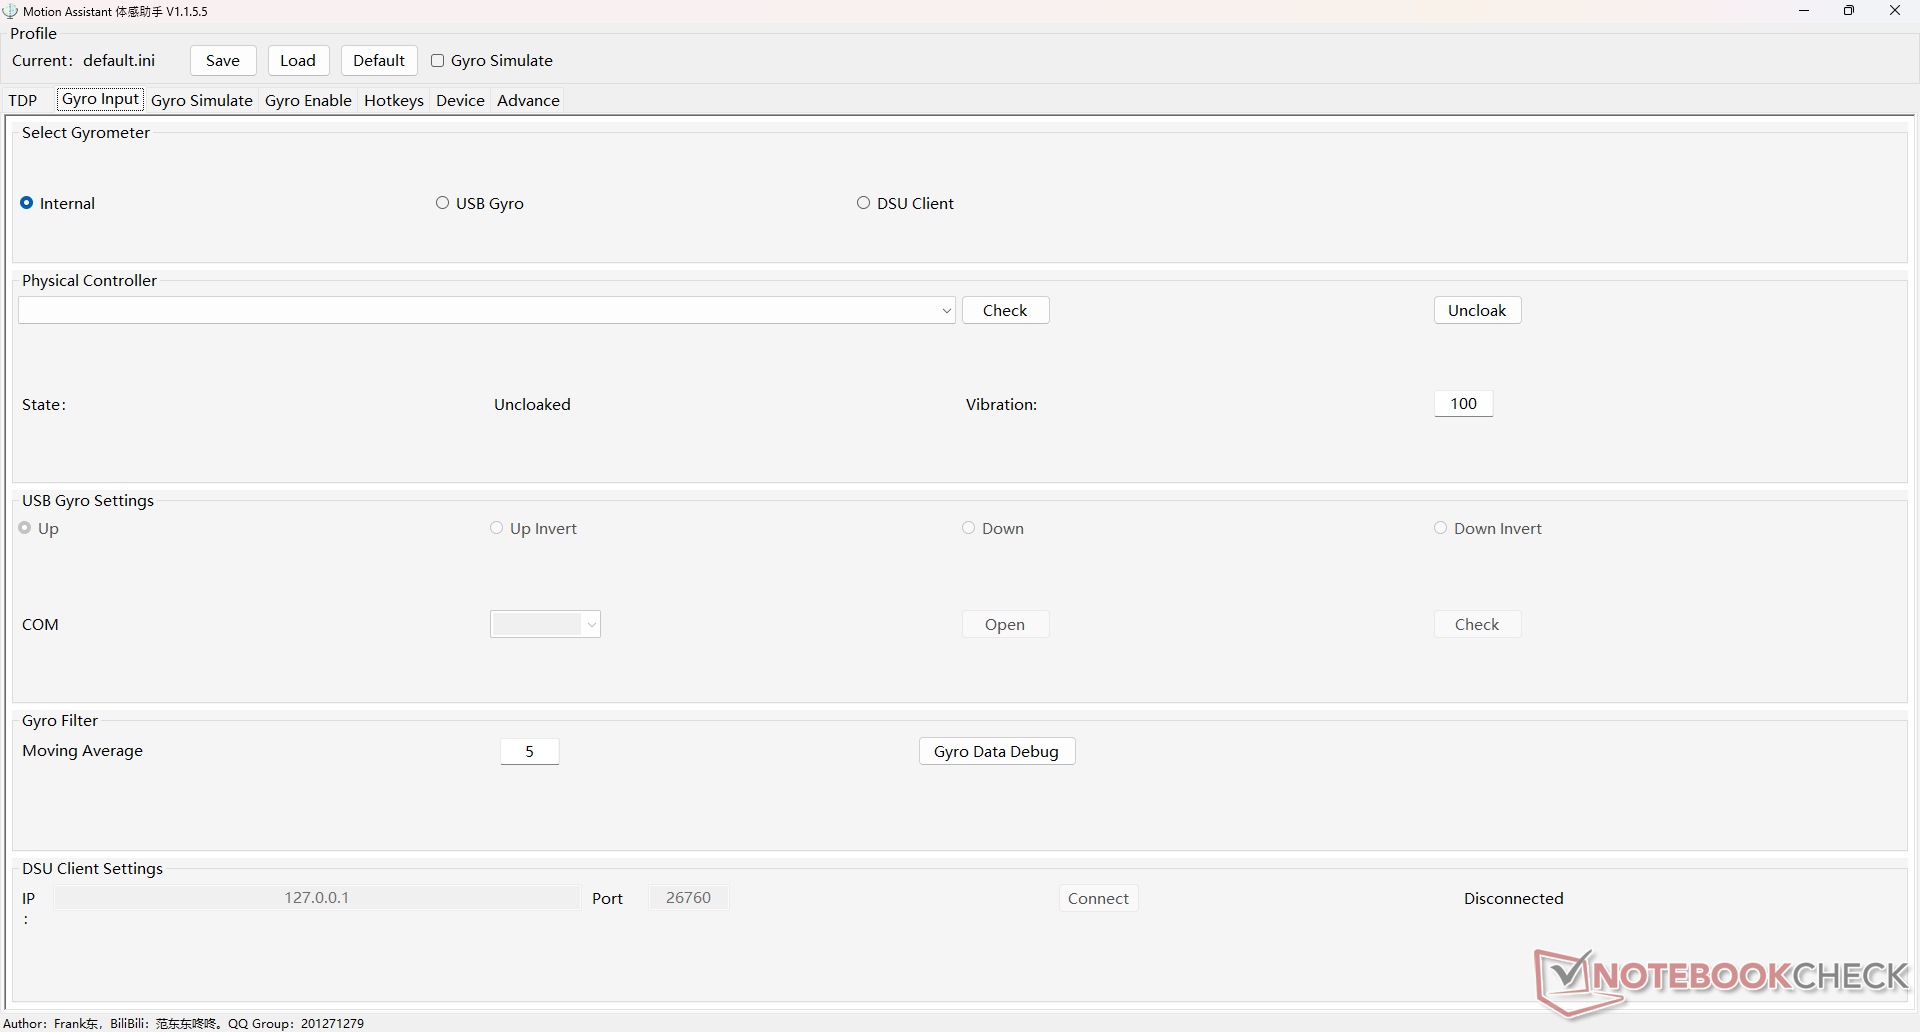
Condizioni di test
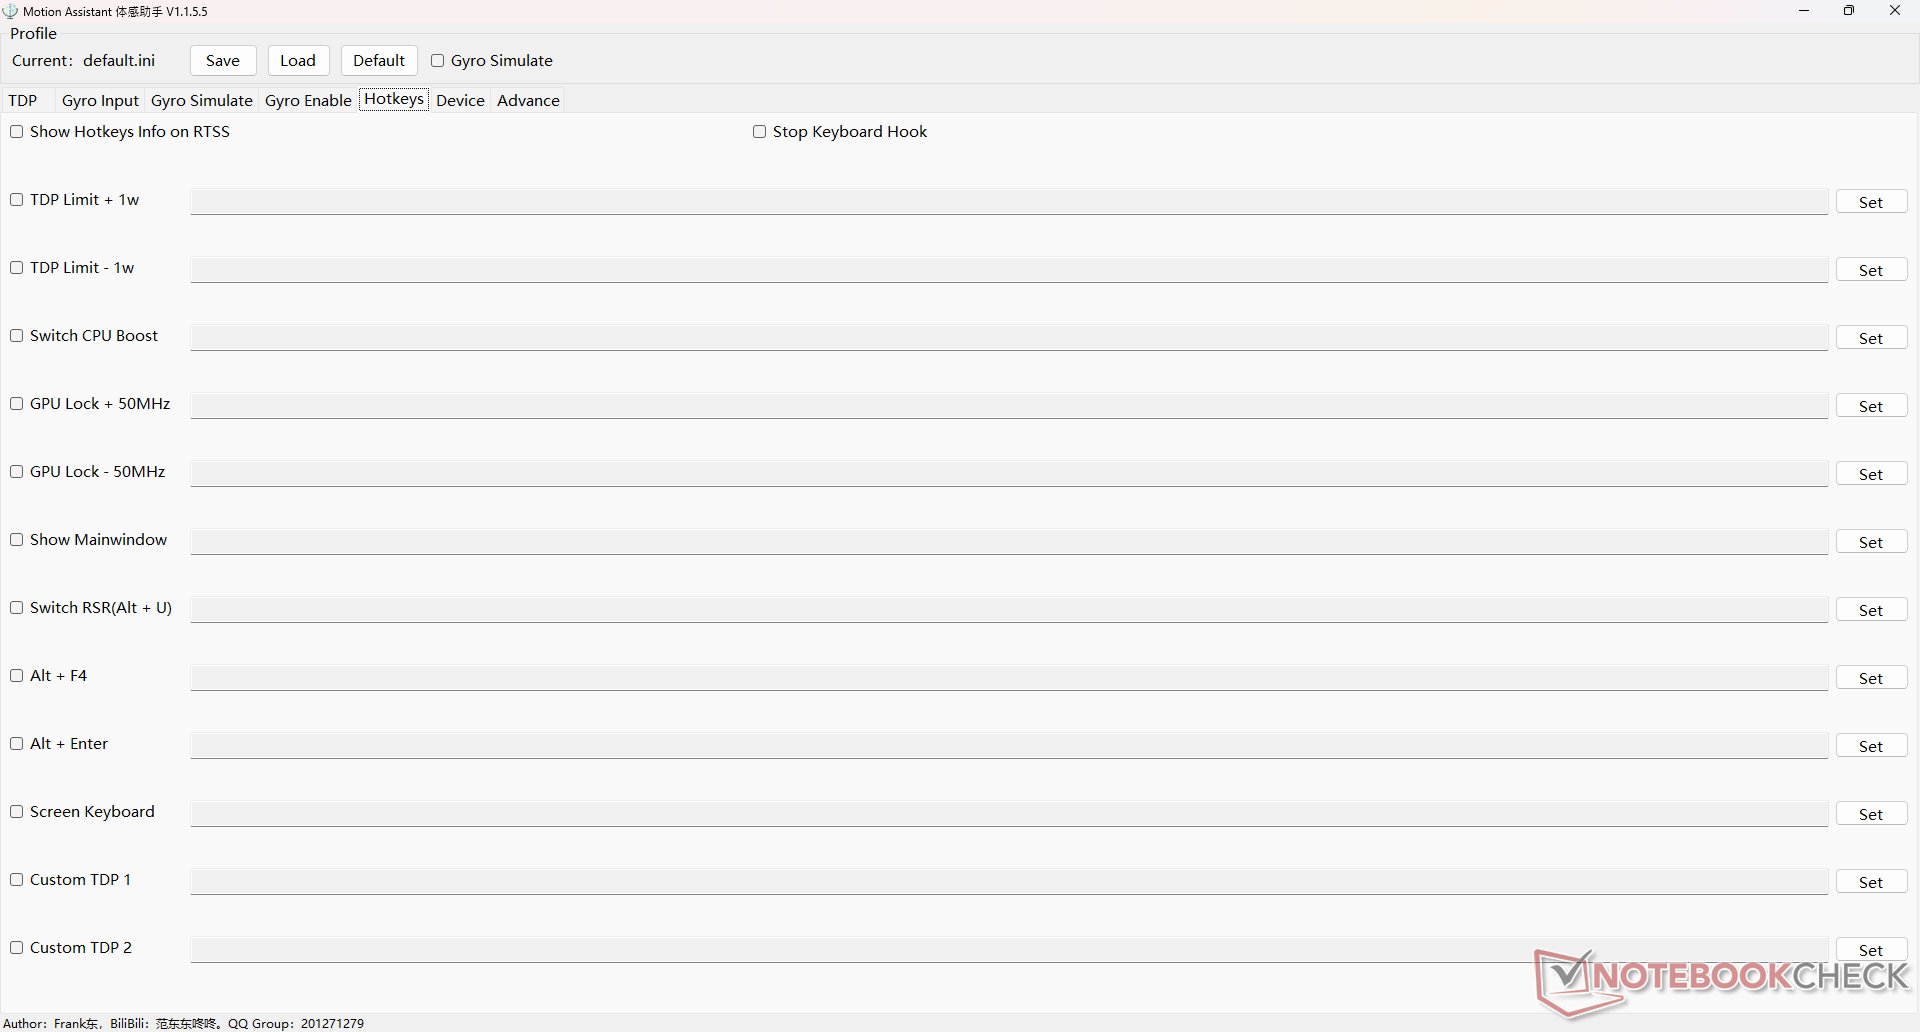
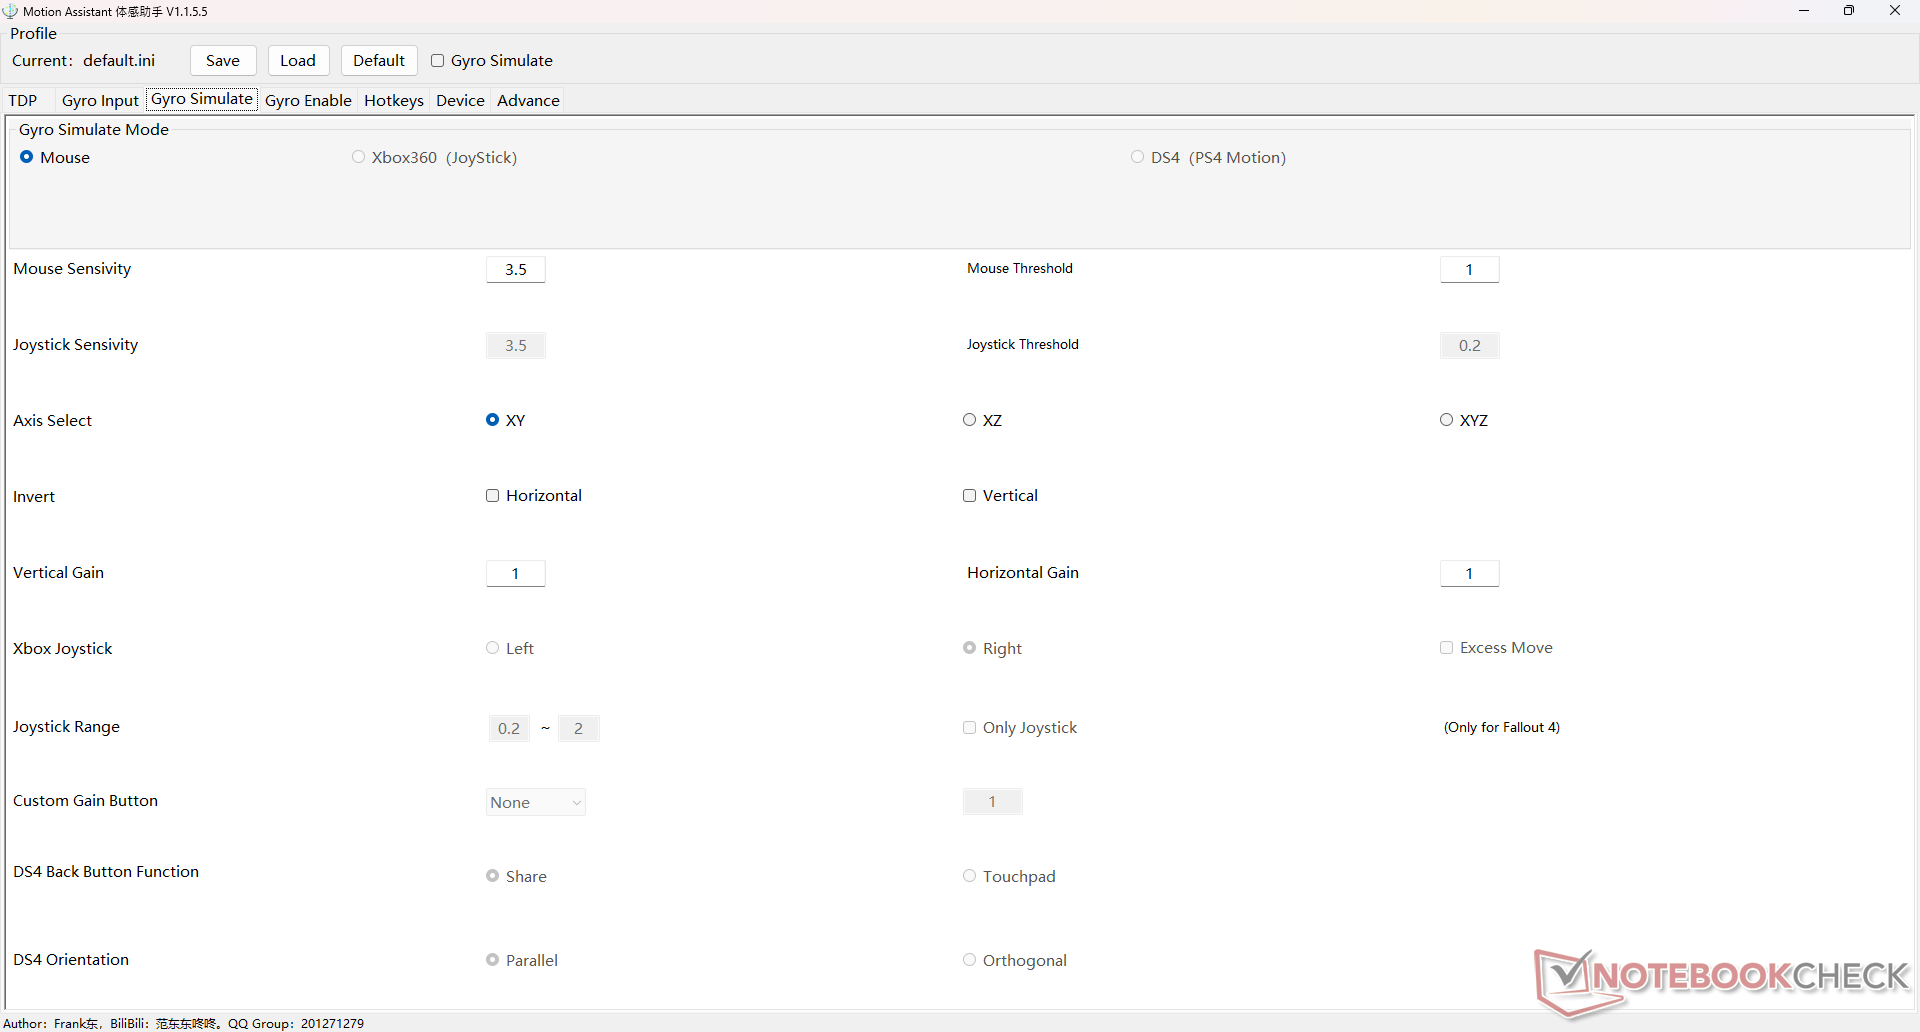
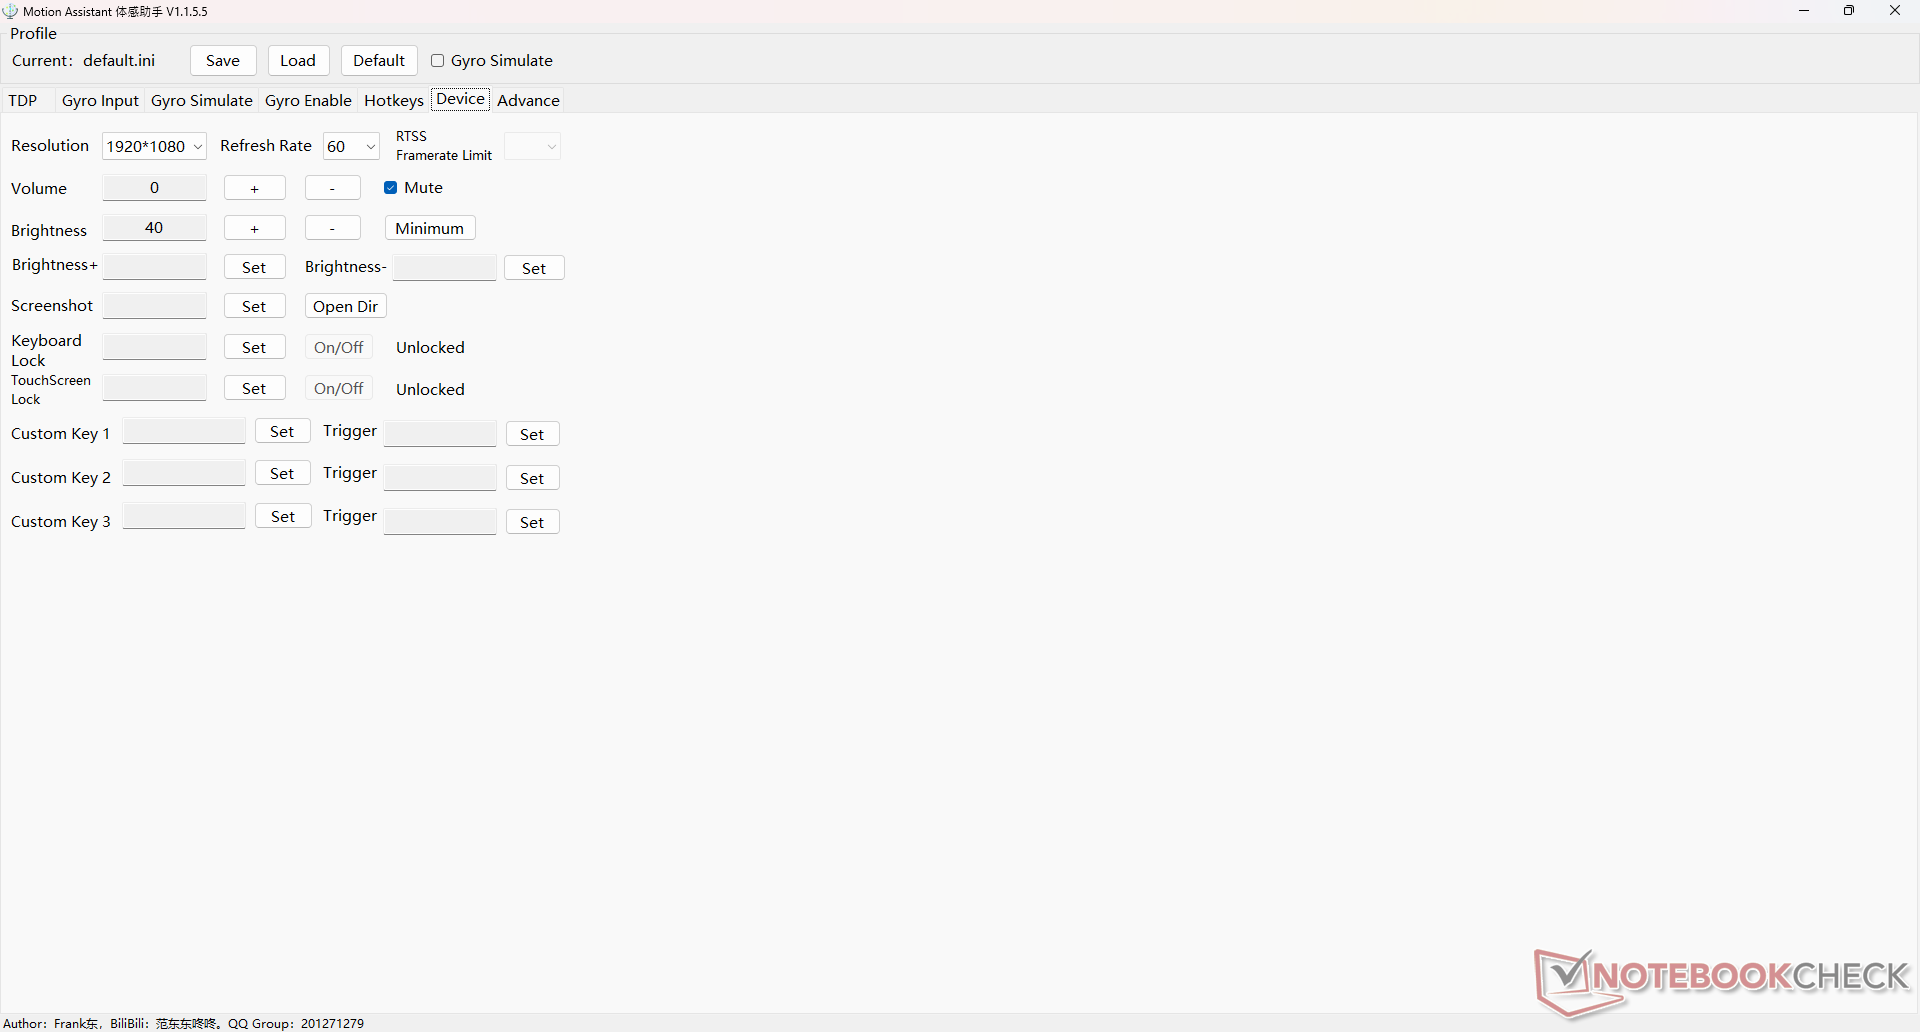
Abbiamo impostato Windows in modalità Prestazioni e Motion Assistant a 28 W prima di eseguire i benchmark qui sotto. Consigliamo vivamente agli utenti di abituarsi a Motion Assistant, in quanto è il software di controllo del Win 4. Le schermate seguenti mostrano le opzioni che Motion Assistant ha da offrire.
Processore
Il Ryzen 7 6800U è uno dei processori della serie U più veloci sul mercato. È la stessa CPU che alimenta molti dei più recenti Ultrabook, tra cui ilLenovo Yoga 7 14 oHP EliteBook 845 G9. Le prestazioni multi-thread grezze sono due volte più veloci rispetto alCore i5-1135G7 nella precedente generazione di GPD Win 3.
La sostenibilità delle prestazioni, tuttavia, potrebbe essere leggermente migliore. Eseguendo CineBench R15 xT in loop si ottiene un punteggio iniziale di 1776 punti prima di scendere costantemente e stabilizzarsi a un deficit di prestazioni del 18%. IlAsus Zenbook S13che monta la stessa CPU, è in grado di mantenere frequenze di clock più elevate per periodi più lunghi.
Cinebench R15 Multi Loop
Cinebench R23: Multi Core | Single Core
Cinebench R20: CPU (Multi Core) | CPU (Single Core)
Cinebench R15: CPU Multi 64Bit | CPU Single 64Bit
Blender: v2.79 BMW27 CPU
7-Zip 18.03: 7z b 4 | 7z b 4 -mmt1
Geekbench 5.5: Multi-Core | Single-Core
HWBOT x265 Benchmark v2.2: 4k Preset
LibreOffice : 20 Documents To PDF
R Benchmark 2.5: Overall mean
* ... Meglio usare valori piccoli
AIDA64: FP32 Ray-Trace | FPU Julia | CPU SHA3 | CPU Queen | FPU SinJulia | FPU Mandel | CPU AES | CPU ZLib | FP64 Ray-Trace | CPU PhotoWorxx
| Performance rating | |
| Media AMD Ryzen 7 6800U | |
| GPD Win 4 | |
| Asus Zenbook S 13 OLED | |
| Dell XPS 13 9315 2-in-1 Core i5-1230U | |
| GPD Win Max 2 | |
| AIDA64 / FP32 Ray-Trace | |
| Media AMD Ryzen 7 6800U (10902 - 12818, n=6) | |
| GPD Win 4 | |
| Asus Zenbook S 13 OLED | |
| Dell XPS 13 9315 2-in-1 Core i5-1230U | |
| GPD Win Max 2 | |
| AIDA64 / FPU Julia | |
| Media AMD Ryzen 7 6800U (67503 - 84031, n=6) | |
| GPD Win 4 | |
| Asus Zenbook S 13 OLED | |
| Dell XPS 13 9315 2-in-1 Core i5-1230U | |
| GPD Win Max 2 | |
| AIDA64 / CPU SHA3 | |
| Media AMD Ryzen 7 6800U (2296 - 2818, n=6) | |
| GPD Win 4 | |
| Asus Zenbook S 13 OLED | |
| Dell XPS 13 9315 2-in-1 Core i5-1230U | |
| GPD Win Max 2 | |
| AIDA64 / CPU Queen | |
| GPD Win 4 | |
| Media AMD Ryzen 7 6800U (62082 - 96306, n=6) | |
| Asus Zenbook S 13 OLED | |
| GPD Win Max 2 | |
| Dell XPS 13 9315 2-in-1 Core i5-1230U | |
| AIDA64 / FPU SinJulia | |
| GPD Win 4 | |
| Media AMD Ryzen 7 6800U (7753 - 11982, n=6) | |
| Asus Zenbook S 13 OLED | |
| GPD Win Max 2 | |
| Dell XPS 13 9315 2-in-1 Core i5-1230U | |
| AIDA64 / FPU Mandel | |
| Media AMD Ryzen 7 6800U (37417 - 45748, n=6) | |
| GPD Win 4 | |
| Asus Zenbook S 13 OLED | |
| Dell XPS 13 9315 2-in-1 Core i5-1230U | |
| GPD Win Max 2 | |
| AIDA64 / CPU AES | |
| GPD Win 4 | |
| Asus Zenbook S 13 OLED | |
| Media AMD Ryzen 7 6800U (50547 - 115681, n=6) | |
| GPD Win Max 2 | |
| Dell XPS 13 9315 2-in-1 Core i5-1230U | |
| AIDA64 / CPU ZLib | |
| Media AMD Ryzen 7 6800U (554 - 755, n=6) | |
| GPD Win 4 | |
| Asus Zenbook S 13 OLED | |
| GPD Win Max 2 | |
| Dell XPS 13 9315 2-in-1 Core i5-1230U | |
| AIDA64 / FP64 Ray-Trace | |
| Media AMD Ryzen 7 6800U (5825 - 6694, n=6) | |
| GPD Win 4 | |
| Asus Zenbook S 13 OLED | |
| Dell XPS 13 9315 2-in-1 Core i5-1230U | |
| GPD Win Max 2 | |
| AIDA64 / CPU PhotoWorxx | |
| Dell XPS 13 9315 2-in-1 Core i5-1230U | |
| GPD Win Max 2 | |
| GPD Win 4 | |
| Media AMD Ryzen 7 6800U (24728 - 27274, n=6) | |
| Asus Zenbook S 13 OLED | |
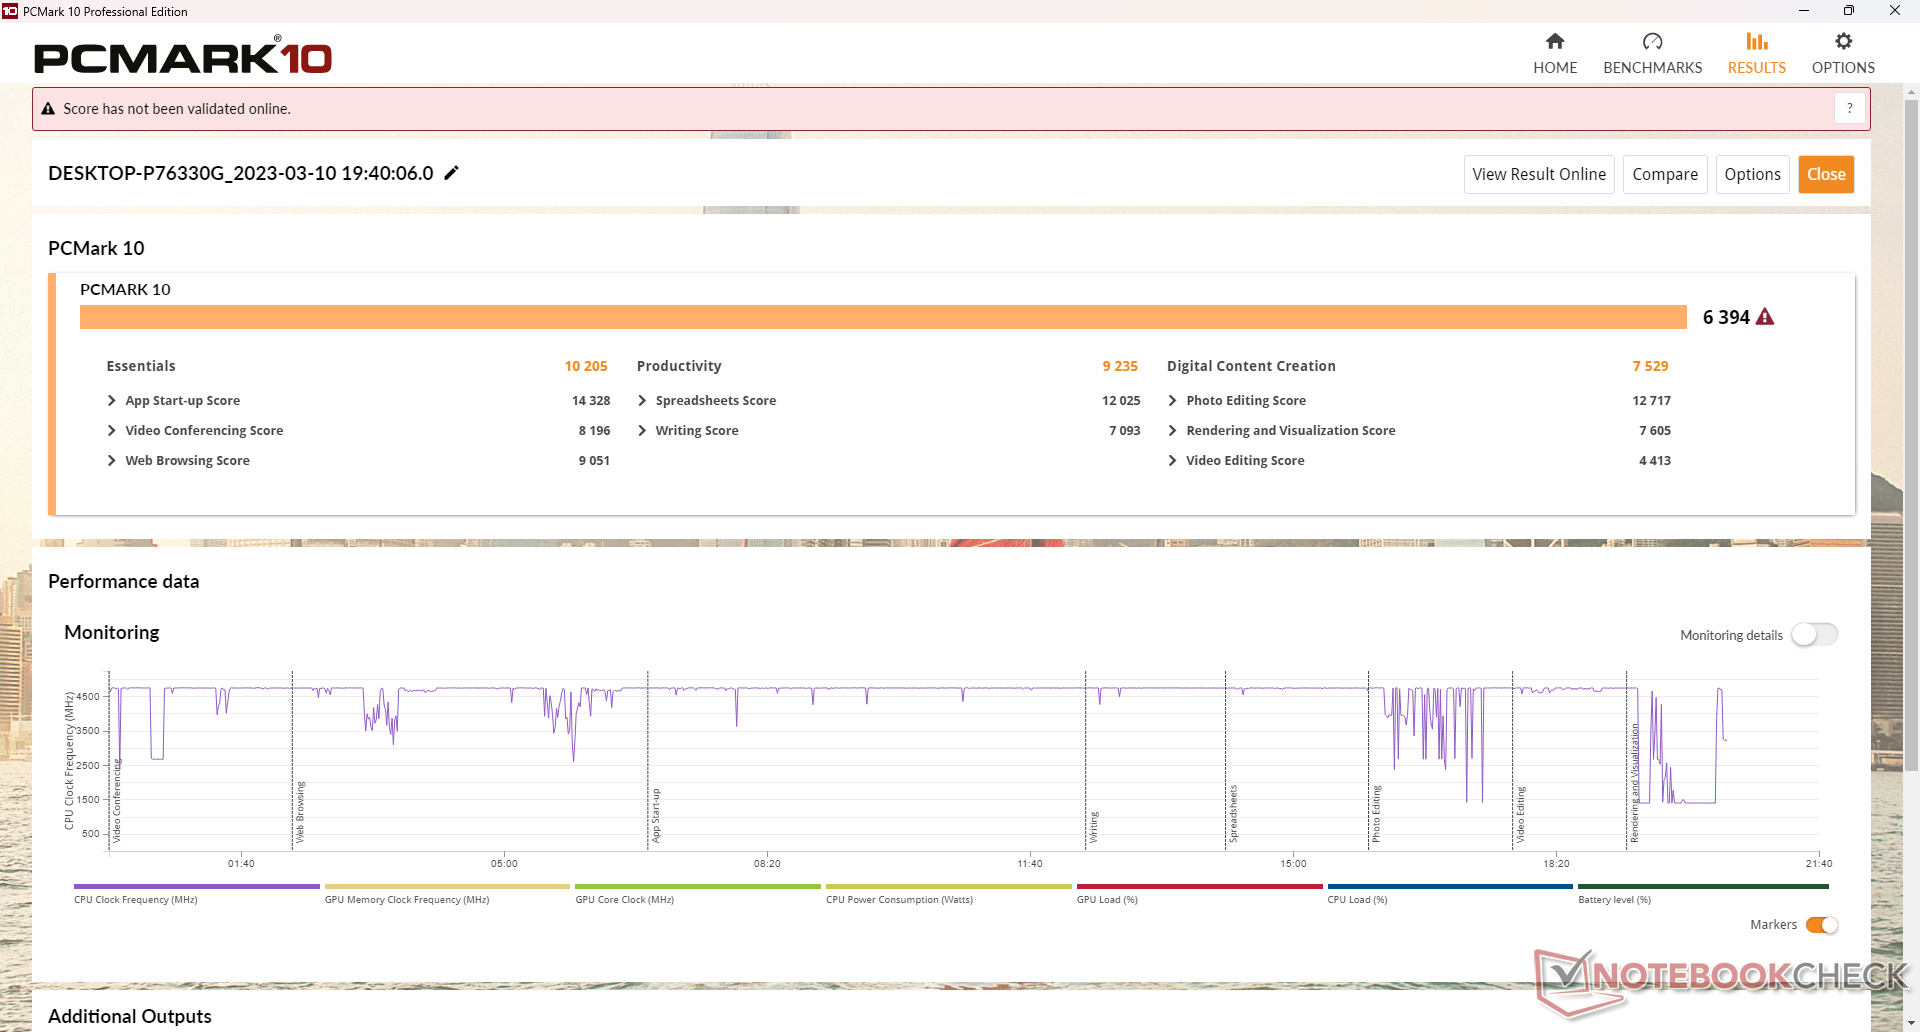
Prestazioni del sistema
I risultati di PCMark 10 sono paragonabili a quelli dei più recenti Ultrabook della serie U, mentre sono nettamente superiori a quelli del più vecchio Win 3.
CrossMark: Overall | Productivity | Creativity | Responsiveness
| PCMark 10 / Score | |
| GPD Win 4 | |
| Asus Zenbook S 13 OLED | |
| Media AMD Ryzen 7 6800U, AMD Radeon 680M (5057 - 6639, n=7) | |
| Razer Blade Stealth i7-1165G7 GTX 1650 Ti Max-Q | |
| GPD Win Max 2 | |
| Dell XPS 13 9315 2-in-1 Core i5-1230U | |
| GPD Win 3 | |
| PCMark 10 / Essentials | |
| GPD Win Max 2 | |
| Asus Zenbook S 13 OLED | |
| GPD Win 4 | |
| Dell XPS 13 9315 2-in-1 Core i5-1230U | |
| Media AMD Ryzen 7 6800U, AMD Radeon 680M (8143 - 10766, n=6) | |
| GPD Win 3 | |
| Razer Blade Stealth i7-1165G7 GTX 1650 Ti Max-Q | |
| PCMark 10 / Productivity | |
| GPD Win 4 | |
| Asus Zenbook S 13 OLED | |
| Razer Blade Stealth i7-1165G7 GTX 1650 Ti Max-Q | |
| Media AMD Ryzen 7 6800U, AMD Radeon 680M (6089 - 9328, n=6) | |
| GPD Win Max 2 | |
| Dell XPS 13 9315 2-in-1 Core i5-1230U | |
| GPD Win 3 | |
| PCMark 10 / Digital Content Creation | |
| GPD Win 4 | |
| Media AMD Ryzen 7 6800U, AMD Radeon 680M (6066 - 8144, n=6) | |
| Asus Zenbook S 13 OLED | |
| Razer Blade Stealth i7-1165G7 GTX 1650 Ti Max-Q | |
| GPD Win Max 2 | |
| Dell XPS 13 9315 2-in-1 Core i5-1230U | |
| GPD Win 3 | |
| CrossMark / Overall | |
| GPD Win Max 2 | |
| GPD Win 4 | |
| Asus Zenbook S 13 OLED | |
| Media AMD Ryzen 7 6800U, AMD Radeon 680M (1009 - 1575, n=7) | |
| Dell XPS 13 9315 2-in-1 Core i5-1230U | |
| CrossMark / Productivity | |
| GPD Win Max 2 | |
| GPD Win 4 | |
| Asus Zenbook S 13 OLED | |
| Media AMD Ryzen 7 6800U, AMD Radeon 680M (971 - 1596, n=7) | |
| Dell XPS 13 9315 2-in-1 Core i5-1230U | |
| CrossMark / Creativity | |
| GPD Win Max 2 | |
| GPD Win 4 | |
| Asus Zenbook S 13 OLED | |
| Media AMD Ryzen 7 6800U, AMD Radeon 680M (1054 - 1686, n=7) | |
| Dell XPS 13 9315 2-in-1 Core i5-1230U | |
| CrossMark / Responsiveness | |
| GPD Win Max 2 | |
| GPD Win 4 | |
| Media AMD Ryzen 7 6800U, AMD Radeon 680M (994 - 1473, n=7) | |
| Asus Zenbook S 13 OLED | |
| Dell XPS 13 9315 2-in-1 Core i5-1230U | |
| PCMark 10 Score | 6394 punti | |
Aiuto | ||
| AIDA64 / Memory Copy | |
| GPD Win Max 2 | |
| Dell XPS 13 9315 2-in-1 Core i5-1230U | |
| GPD Win 4 | |
| Media AMD Ryzen 7 6800U (47010 - 52159, n=6) | |
| Asus Zenbook S 13 OLED | |
| AIDA64 / Memory Read | |
| GPD Win Max 2 | |
| Dell XPS 13 9315 2-in-1 Core i5-1230U | |
| GPD Win 4 | |
| Media AMD Ryzen 7 6800U (39197 - 45084, n=6) | |
| Asus Zenbook S 13 OLED | |
| AIDA64 / Memory Write | |
| Dell XPS 13 9315 2-in-1 Core i5-1230U | |
| GPD Win Max 2 | |
| GPD Win 4 | |
| Media AMD Ryzen 7 6800U (48723 - 51117, n=6) | |
| Asus Zenbook S 13 OLED | |
| AIDA64 / Memory Latency | |
| Asus Zenbook S 13 OLED | |
| Media AMD Ryzen 7 6800U (106.3 - 123.1, n=6) | |
| GPD Win 4 | |
| GPD Win Max 2 | |
| Dell XPS 13 9315 2-in-1 Core i5-1230U | |
* ... Meglio usare valori piccoli
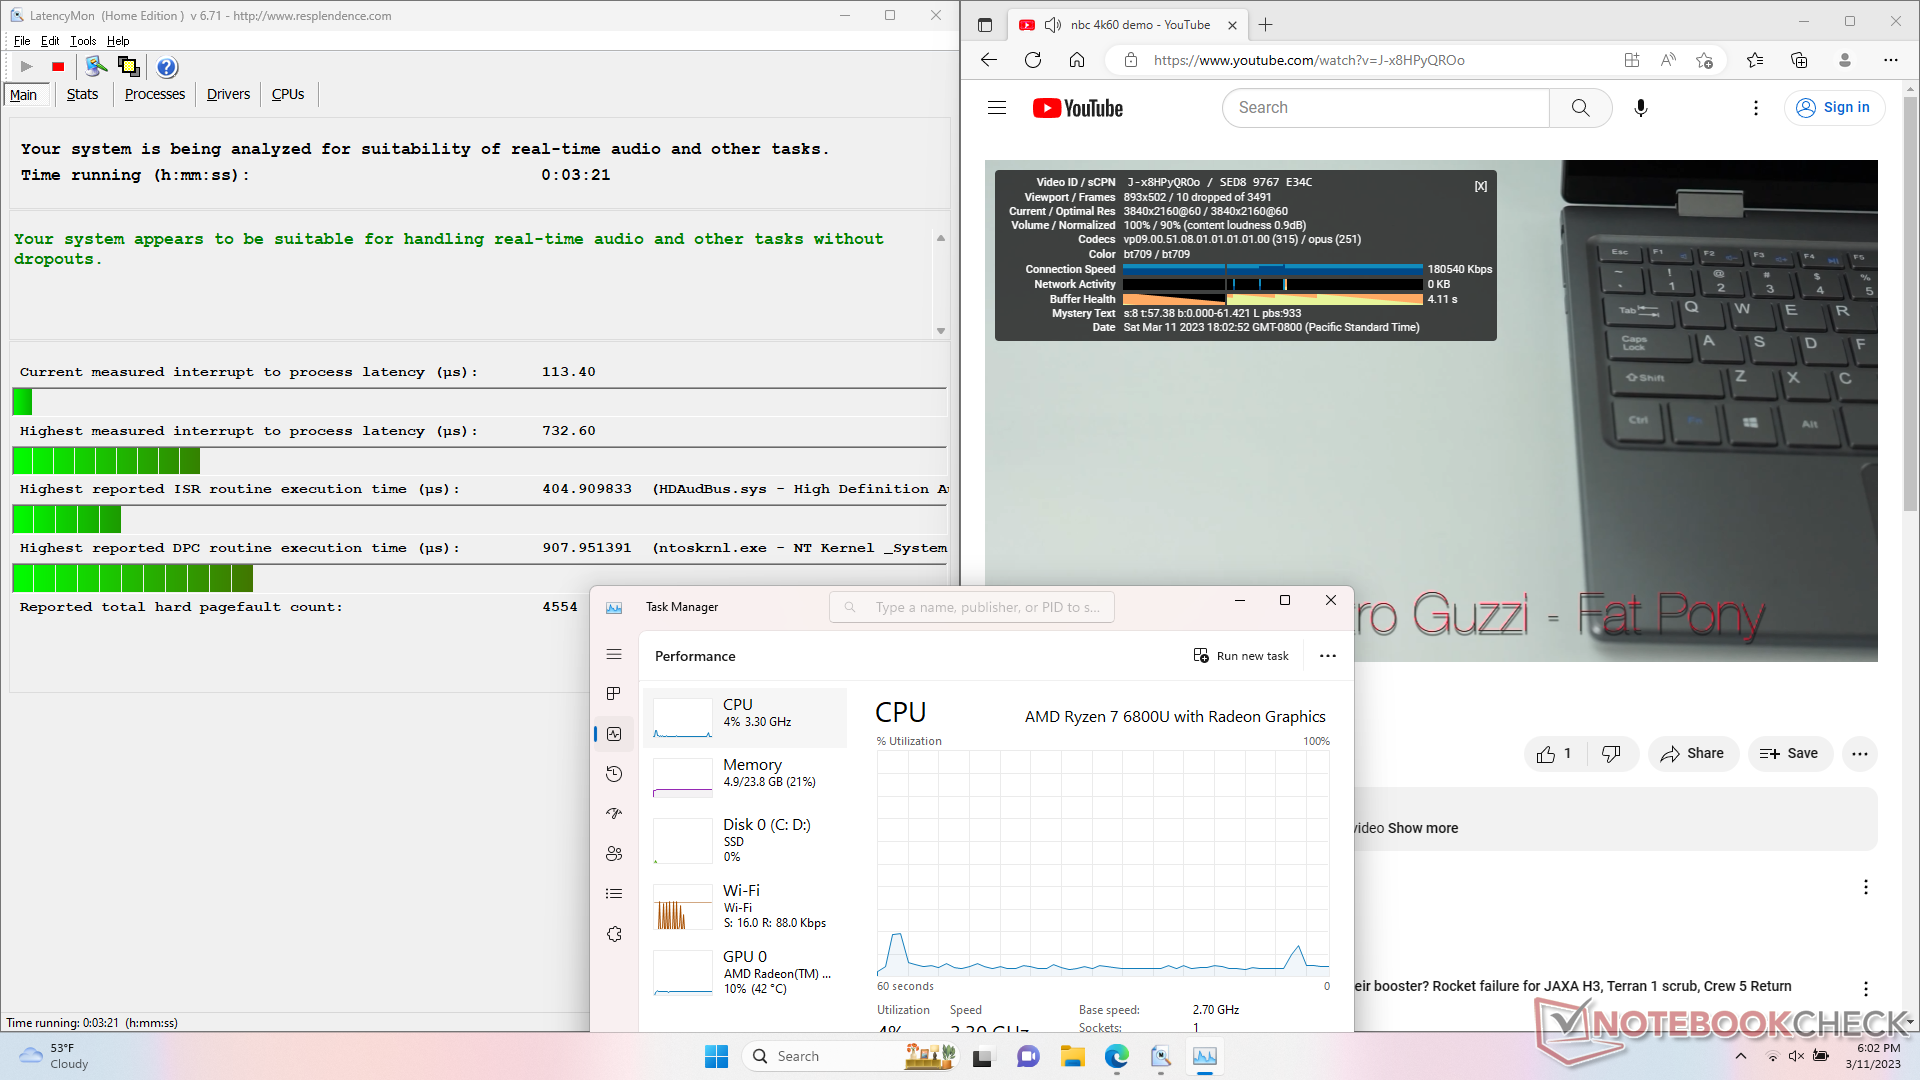
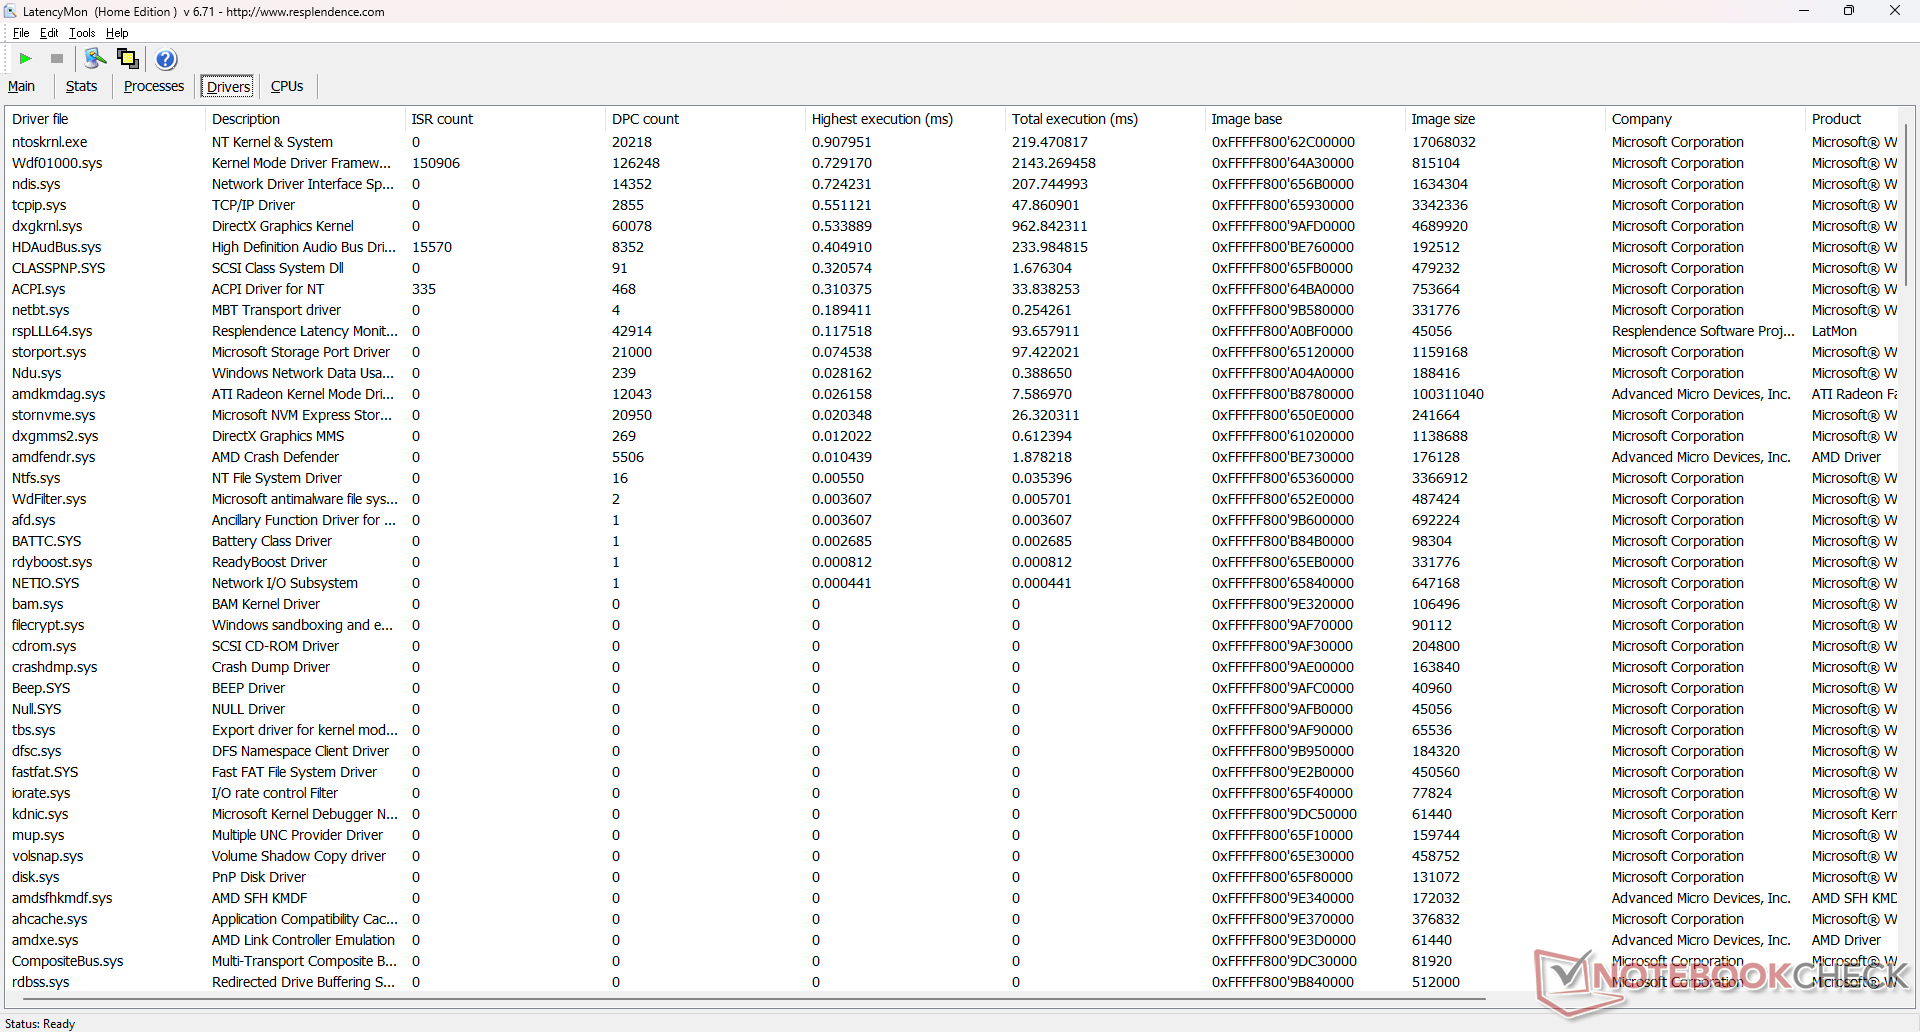
Latenza DPC
LatencyMon non mostra alcun problema di DPC quando si aprono più schede del browser della nostra homepage. Tuttavia, abbiamo registrato alcune cadute di fotogrammi durante il test di riproduzione di video 4K60, anche dopo vari tentativi. Le cadute sono infrequenti e per lo più impercettibili, ma non dovrebbero verificarsi affatto dato l'hardware sottostante.
| DPC Latencies / LatencyMon - interrupt to process latency (max), Web, Youtube, Prime95 | |
| Dell XPS 13 9315 2-in-1 Core i5-1230U | |
| Razer Blade Stealth i7-1165G7 GTX 1650 Ti Max-Q | |
| GPD Win 3 | |
| GPD Win 4 | |
| Asus Zenbook S 13 OLED | |
| GPD Win Max 2 | |
* ... Meglio usare valori piccoli
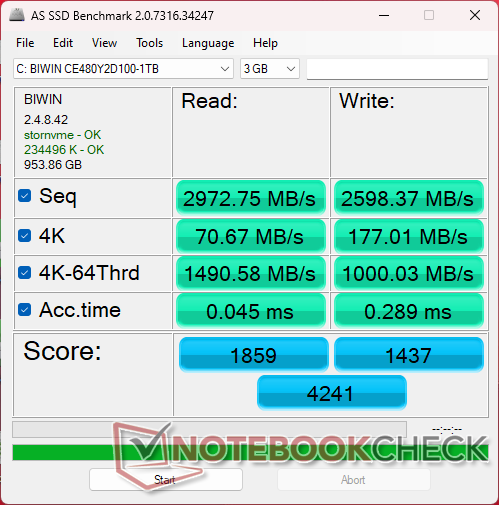
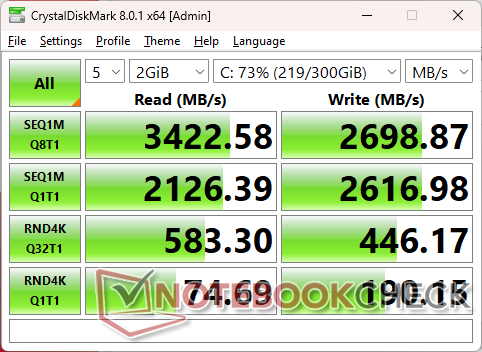
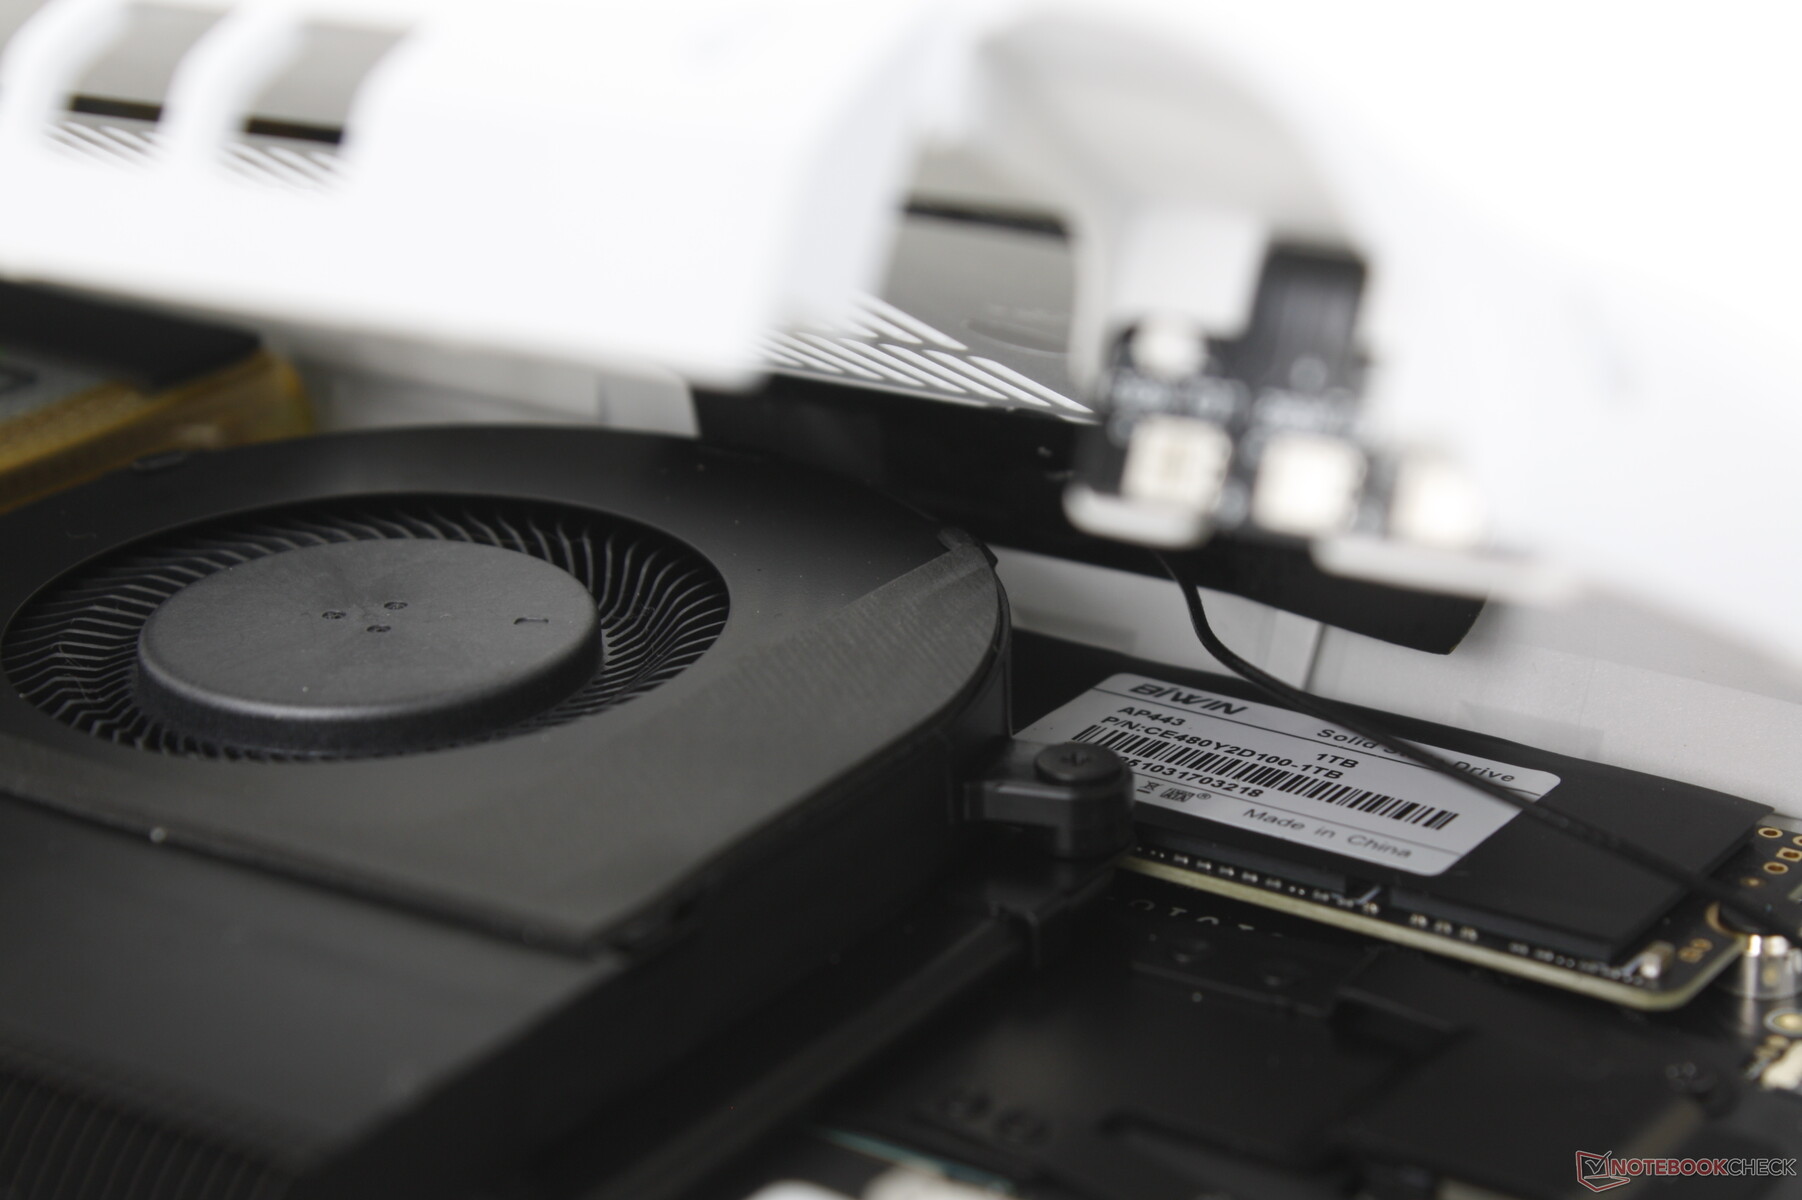
Dispositivi di archiviazione
Sebbene il chipset della scheda madre supporti le unità PCIe4 x4 M.2 2280 NVMe, l'unità viene fornita con un'unità PCIe3 più lenta. Questo non è un problema, dato che il modello non include alcuno spargi-calore per l'unità SSD e quindi un'unità PCIe4 x4 veloce avrebbe probabilmente subito un throttling sotto stress. L'unità sSD Biwin PCIe3 da 1 TB biwin PCIe3 da 1 TB nella nostra unità non mostra alcun rallentamento delle prestazioni nel tempo.

| Drive Performance rating - Percent | |
| Asus Zenbook S 13 OLED | |
| GPD Win Max 2 | |
| GPD Win 4 | |
| GPD Win 3 | |
| Razer Blade Stealth i7-1165G7 GTX 1650 Ti Max-Q | |
| Dell XPS 13 9315 2-in-1 Core i5-1230U | |
* ... Meglio usare valori piccoli
Disk Throttling: DiskSpd Read Loop, Queue Depth 8
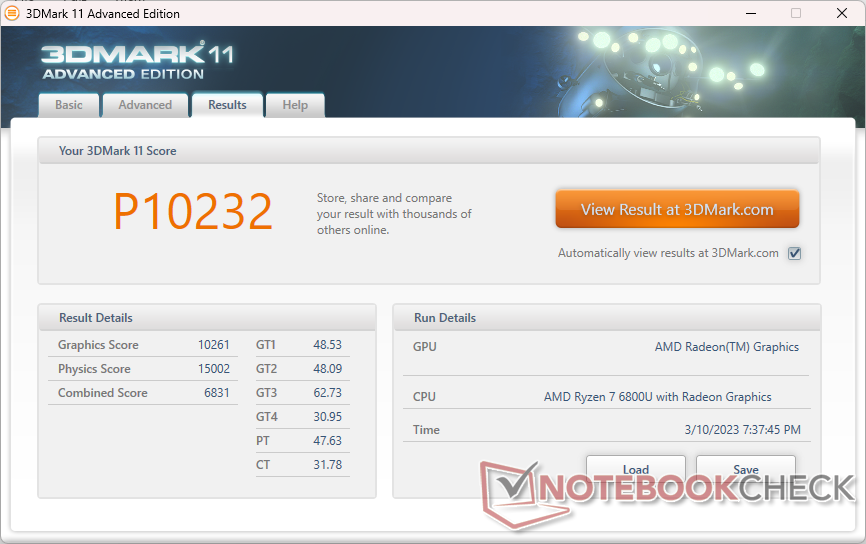
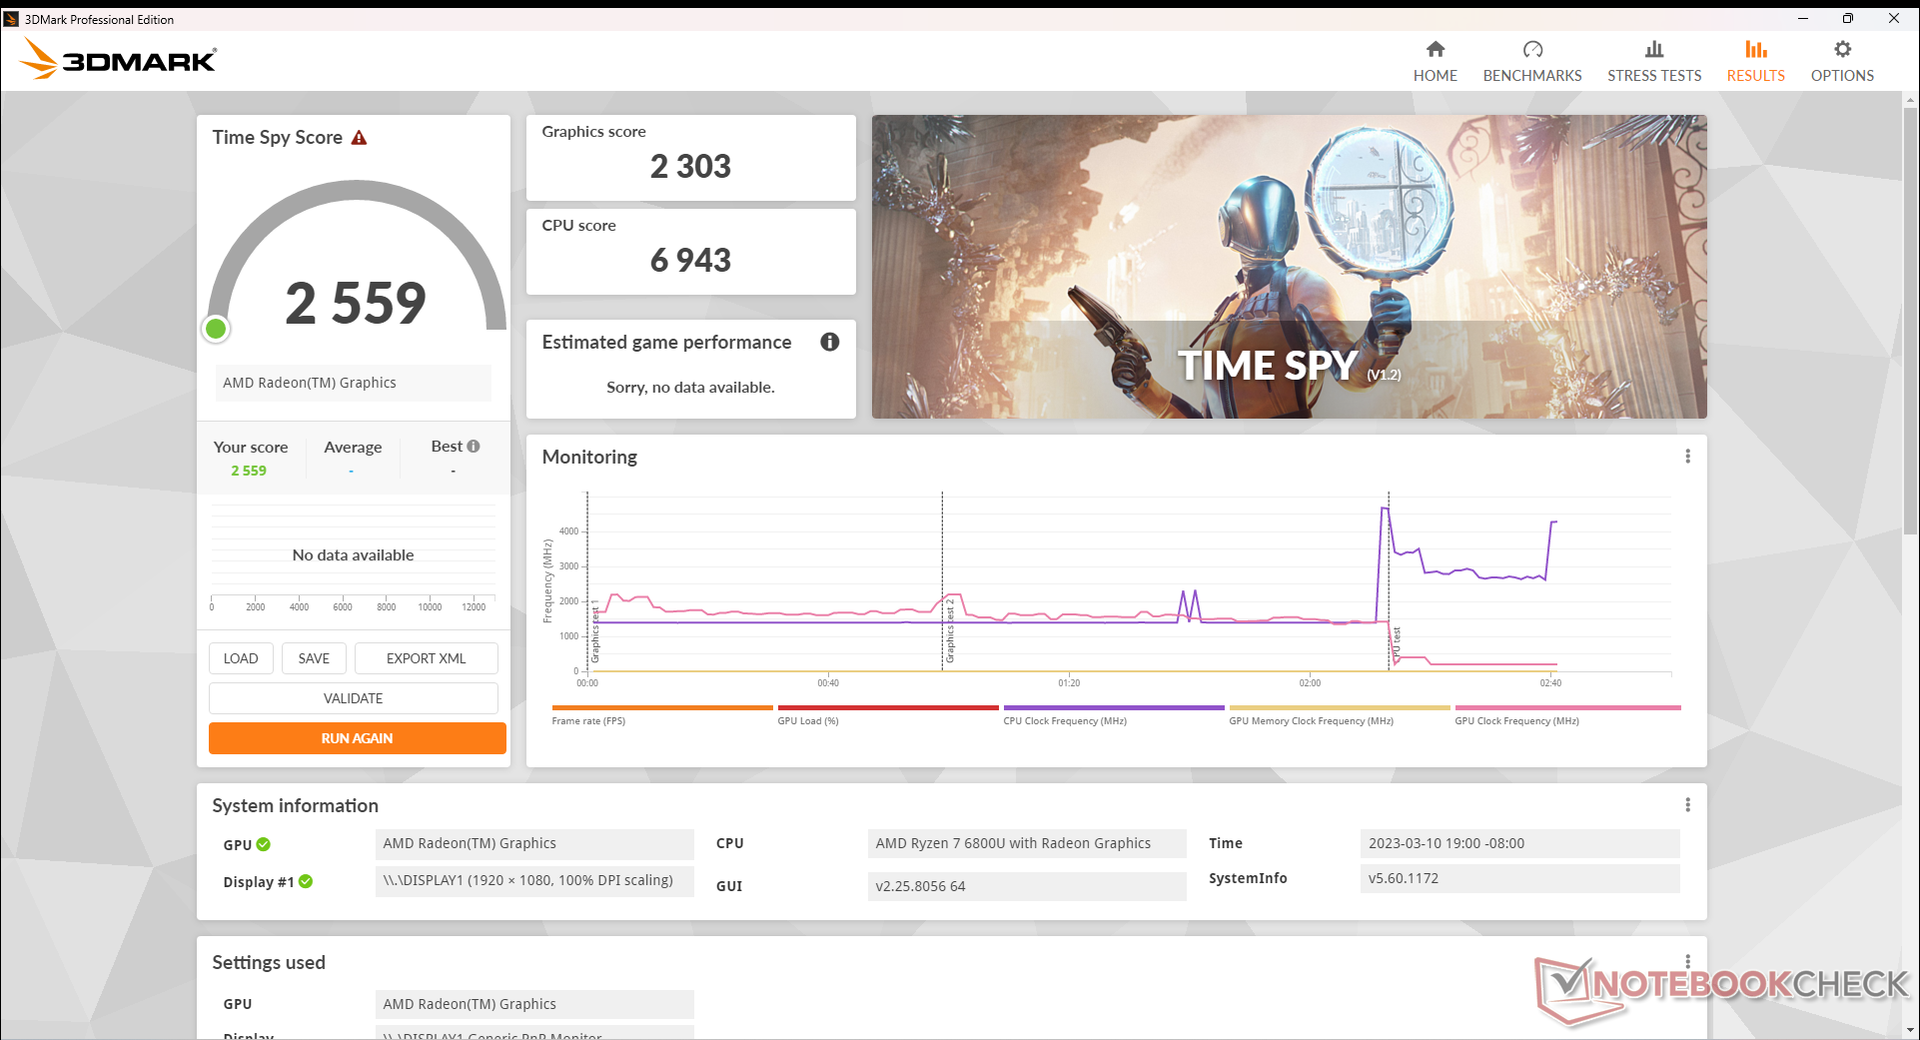
Prestazioni della GPU - La Radeon 680M è eccellente per il gioco portatile
La Radeon 680M è attualmente la GPU integrata più veloce del mercato. Se confrontata con la concorrenteIris Xe Graphics G7 96EUsla soluzione AMD è dal 40 al 45% più veloce, ovvero circa l'80% in più rispetto all'ultima generazione di Radeon RX Vega serie 8.
La maggior parte dei giochi è giocabile (>30 FPS) alla risoluzione nativa di 1080p, compresi quelli più impegnativi come Cyberpunk 2077 o Final Fantasy XV a impostazioni inferiori. Si consiglia di ridurre la qualità delle texture e/o l'anti-aliasing per migliorare la velocità dei fotogrammi, poiché queste caratteristiche grafiche hanno un impatto minore sugli schermi di piccole dimensioni.

| 3DMark 11 - 1280x720 Performance GPU | |
| MSI RTX 2060 Gaming Z 6G | |
| Desktop PC Intel Xeon E5 2680v4 KFA2 GTX 1060 6GB | |
| Lenovo Slim 7 Pro X 14ARH7 | |
| Razer Blade Stealth i7-1165G7 GTX 1650 Ti Max-Q | |
| GPD Win 4 | |
| Media AMD Radeon 680M (6858 - 11755, n=39) | |
| Asus Zenbook S 13 OLED | |
| GPD Win Max 2 | |
| HP Spectre x360 2-in-1 16-f1075ng | |
| HP Spectre x360 13.5 14t-ef000 | |
| GPD Win 3 | |
| HP Pavilion Aero 13 be0097nr | |
| Infinix INBook X2 | |
| Dell XPS 13 9315 2-in-1 Core i5-1230U | |
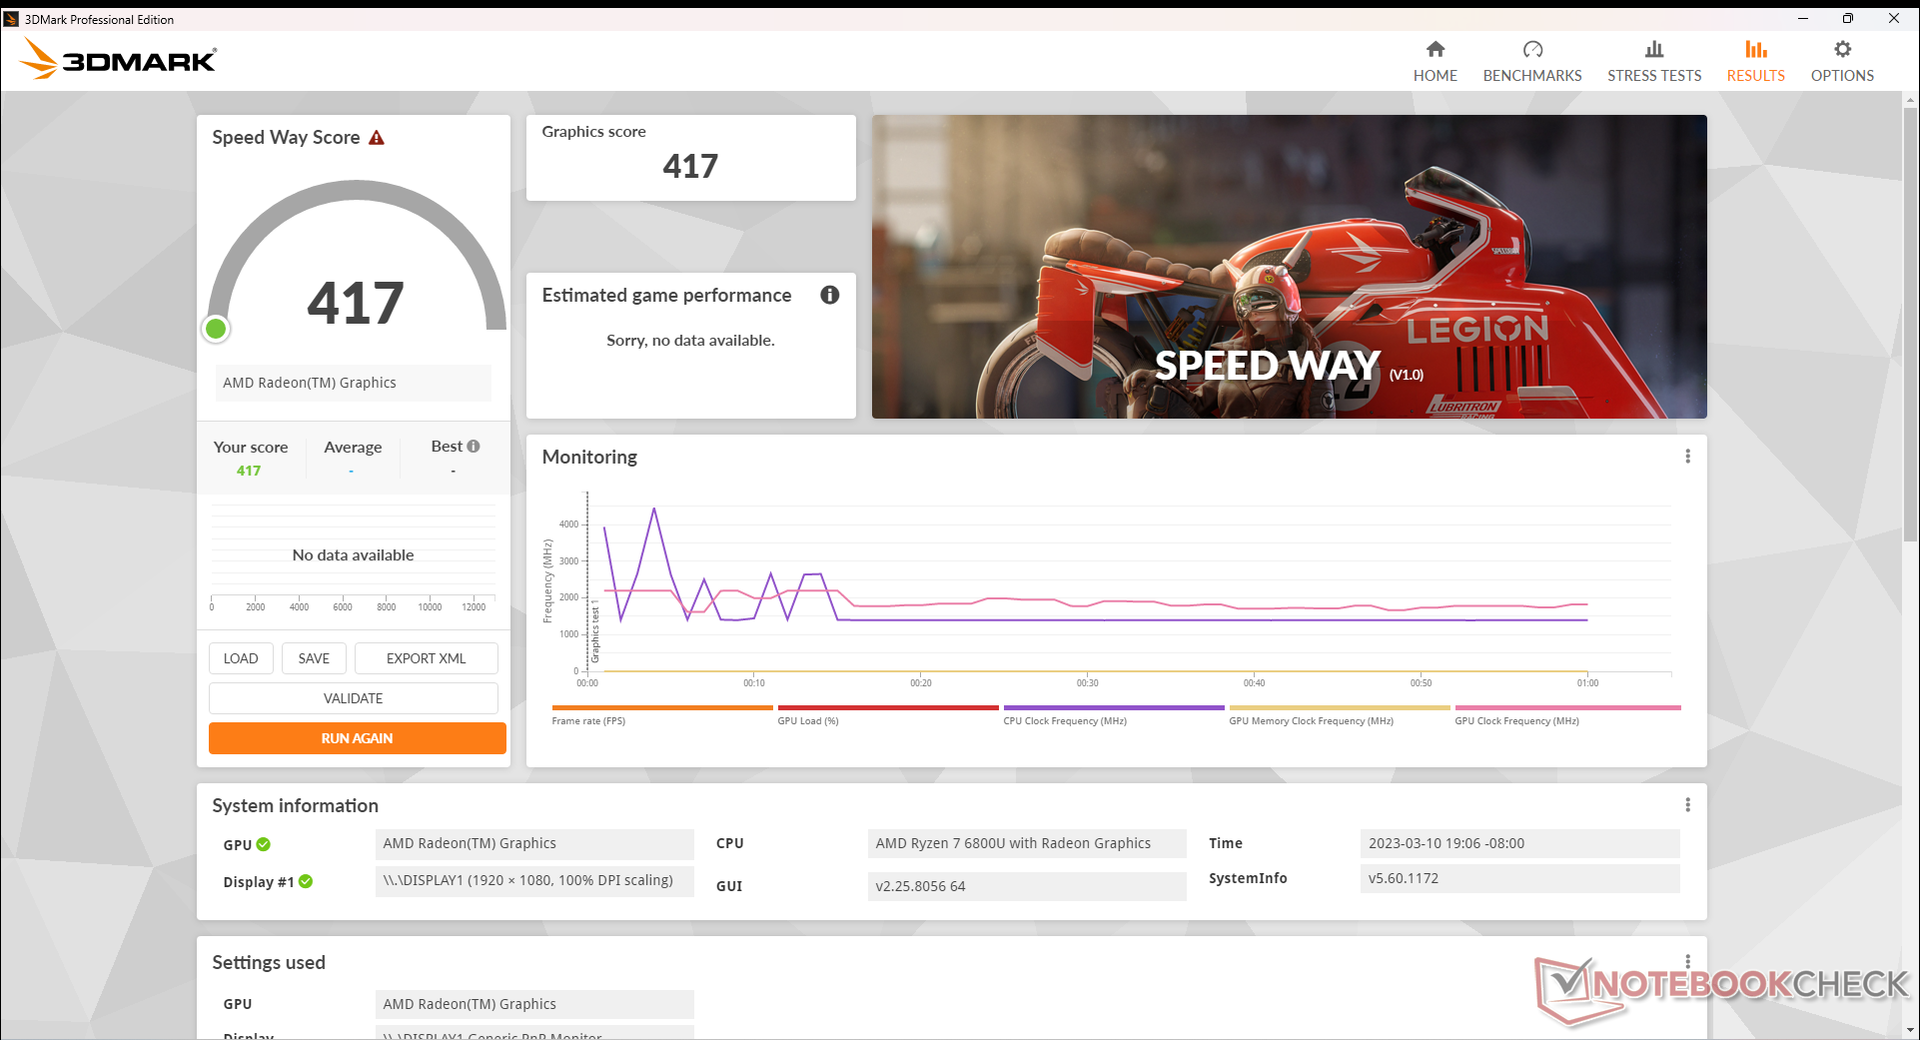
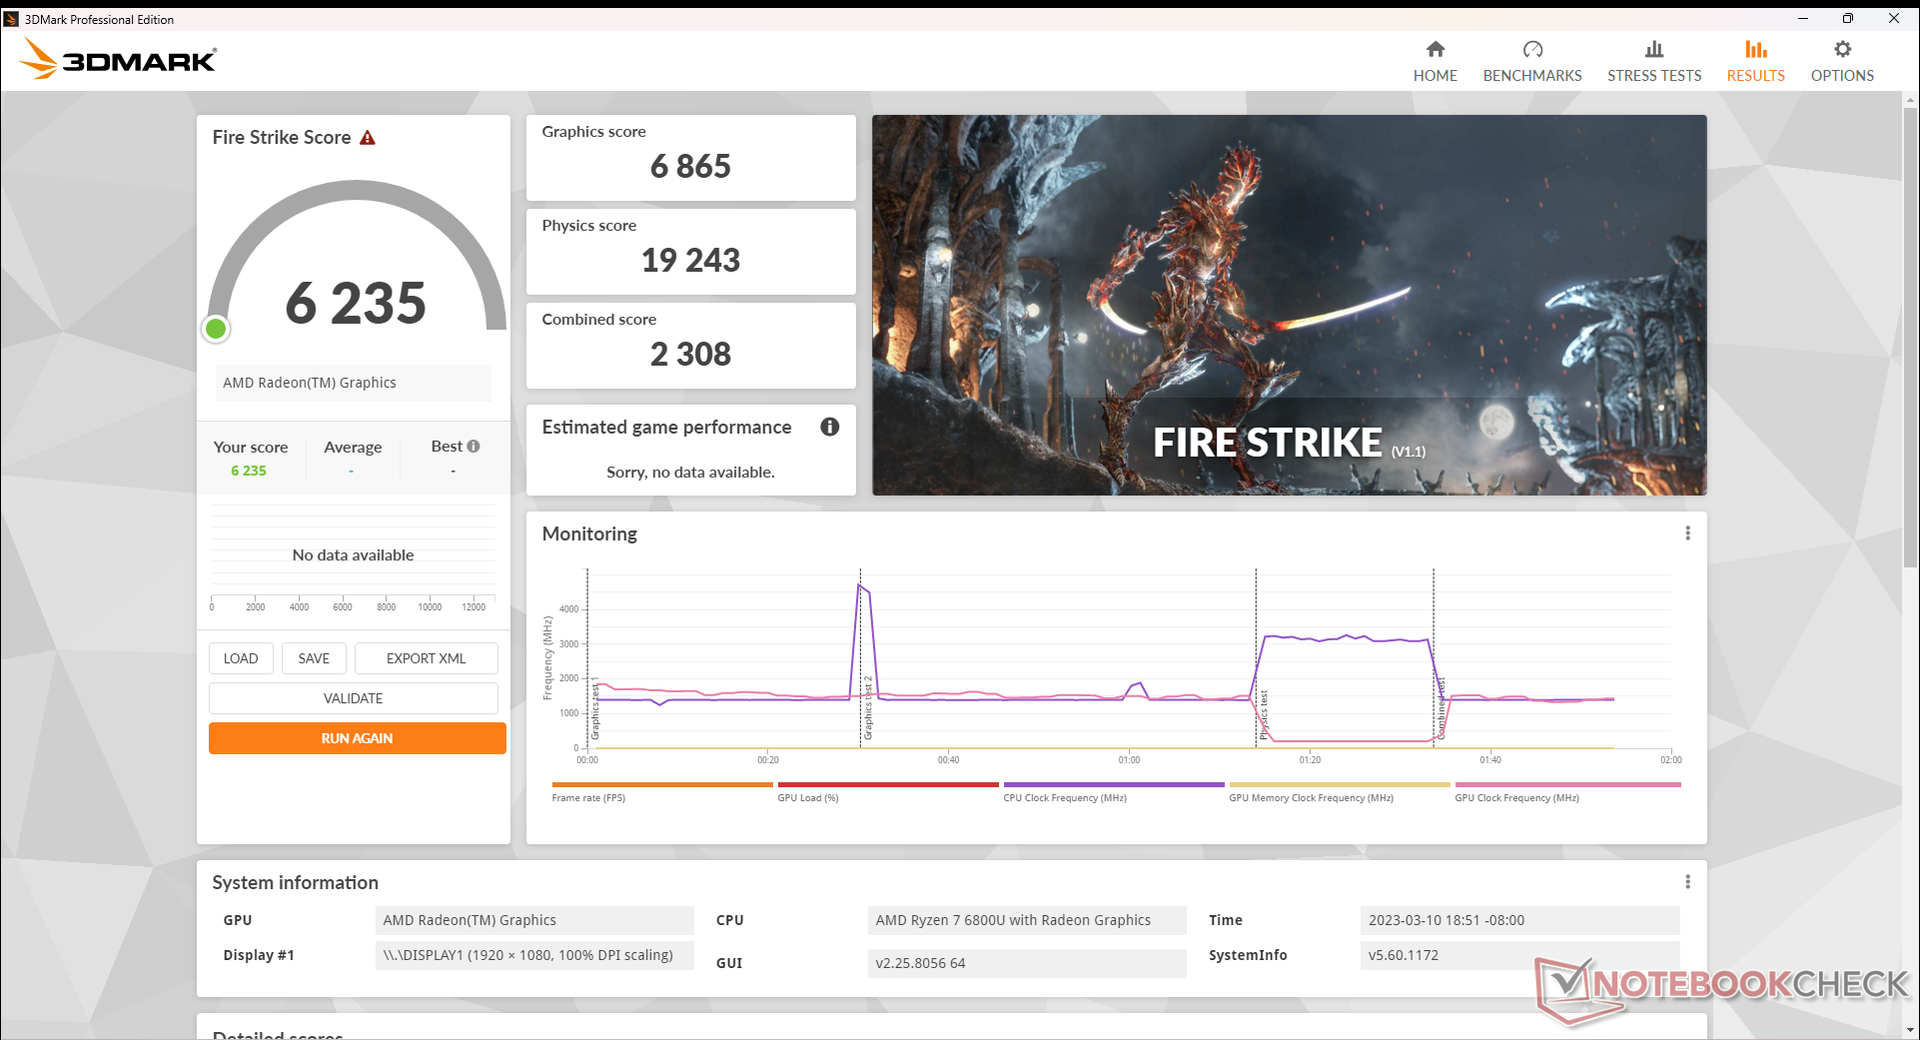
| 3DMark 11 Performance | 10232 punti | |
| 3DMark Fire Strike Score | 6235 punti | |
| 3DMark Time Spy Score | 2559 punti | |
Aiuto | ||
| Blender | |
| v3.3 Classroom HIP/AMD | |
| Media AMD Radeon 680M (270 - 555, n=34) | |
| GPD Win 4 | |
| v3.3 Classroom OPTIX/RTX | |
| Lenovo Slim 7 Pro X 14ARH7 | |
| MSI Summit E16 Flip A12UDT-031 | |
| v3.3 Classroom CUDA | |
| Lenovo Slim 7 Pro X 14ARH7 | |
| MSI Summit E16 Flip A12UDT-031 | |
| v3.3 Classroom CPU | |
| Dell XPS 13 9315 2-in-1 Core i5-1230U | |
| HP Spectre x360 13.5 14t-ef000 | |
| MSI Summit E16 Flip A12UDT-031 | |
| GPD Win 4 | |
| Media AMD Radeon 680M (389 - 980, n=37) | |
| HP Spectre x360 2-in-1 16-f1075ng | |
| Lenovo Slim 7 Pro X 14ARH7 | |
* ... Meglio usare valori piccoli
| F1 22 | |
| 1280x720 Ultra Low Preset AA:T AF:16x | |
| GPD Win 4 | |
| Media AMD Radeon 680M (75.5 - 147.3, n=19) | |
| HP Spectre x360 2-in-1 16-f1075ng | |
| 1920x1080 Low Preset AA:T AF:16x | |
| GPD Win 4 | |
| Media AMD Radeon 680M (44.1 - 85.4, n=25) | |
| HP Spectre x360 2-in-1 16-f1075ng | |
| 1920x1080 Medium Preset AA:T AF:16x | |
| GPD Win 4 | |
| Media AMD Radeon 680M (38 - 75.1, n=25) | |
| HP Spectre x360 2-in-1 16-f1075ng | |
| 1920x1080 High Preset AA:T AF:16x | |
| GPD Win 4 | |
| Media AMD Radeon 680M (30 - 56.2, n=25) | |
| HP Spectre x360 2-in-1 16-f1075ng | |
| 1920x1080 Ultra High Preset AA:T AF:16x | |
| HP Spectre x360 2-in-1 16-f1075ng | |
| GPD Win 4 | |
| Media AMD Radeon 680M (7.85 - 14.7, n=22) | |
Il funzionamento al minimo su Witcher 3 per verificare la stabilità della frequenza dei fotogrammi ha rivelato problemi significativi. Come mostra il grafico sottostante, le prestazioni iniziano con oltre 80 FPS prima di scendere costantemente a 65 FPS con fluttuazioni costanti. Sebbene il calo delle prestazioni nel tempo non sia insolito, le fluttuazioni sono anormali e provocano un microstuttering periodico durante il gioco. Abbiamo effettuato due test per essere sicuri e i risultati non sono migliorati. L'utilizzo non ottimizzato della CPU da parte di attività o applicazioni in background è in genere la causa di questo comportamento durante il gioco.
Witcher 3 FPS Chart
| basso | medio | alto | ultra | |
|---|---|---|---|---|
| GTA V (2015) | 140.3 | 127.6 | 51.4 | 24.8 |
| The Witcher 3 (2015) | 94.3 | 63.8 | 37.5 | 22.8 |
| Dota 2 Reborn (2015) | 120.2 | 100.1 | 76.4 | 67.2 |
| Final Fantasy XV Benchmark (2018) | 57.1 | 32.7 | 23.9 | |
| X-Plane 11.11 (2018) | 56.2 | 41.4 | 33.5 | |
| Strange Brigade (2018) | 145.7 | 57.5 | 47.8 | 41.5 |
| Cyberpunk 2077 1.6 (2022) | 37.7 | 28.9 | 21.6 | 16.7 |
| F1 22 (2022) | 78.1 | 70.4 | 51.5 | 12.6 |
Emissioni: quasi sempre udibili
Rumore del sistema
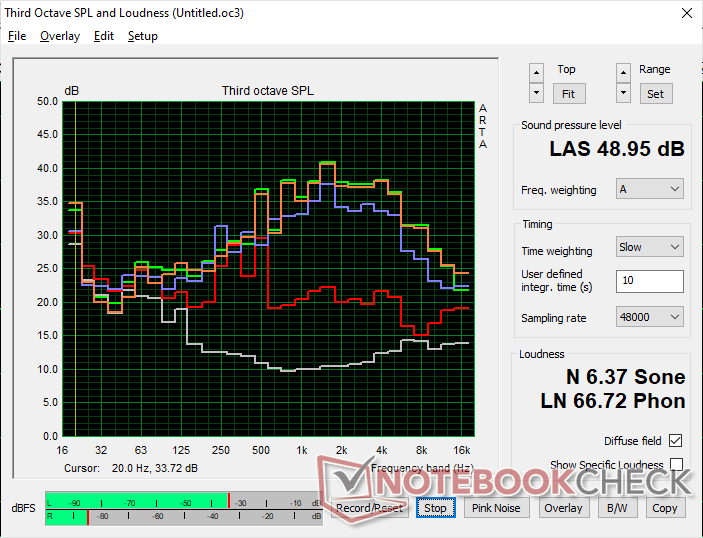
La ventola interna è sempre in funzione, indipendentemente dal carico sullo schermo. Quando è al minimo su un desktop, ad esempio, il rumore della ventola si aggira intorno ai 31 dB(A) contro uno sfondo di 24 dB(A), che è già più forte di quello di molti computer portatili in condizioni simili di funzionamento al minimo. Gli utenti dovrebbero aspettarsi un fruscio silenzioso ma percepibile durante la navigazione o la visione di video.
L'esecuzione di carichi più elevati, come ad esempio i giochi, indurrà un rumore della ventola di poco inferiore a 49 dB(A). Se si considera che la maggior parte degli Ultrabook e dei portatili da gioco raggiungono rispettivamente i 40 dB(A) e i 50 dB(A), il Win 4 è purtroppo più vicino a un portatile da gioco che a un Ultrabook in termini di rumore. Non raccomandiamo di intrufolarsi in una sessione di gioco con il Win 4 durante le lezioni.
Rumorosità
| Idle |
| 31.2 / 31.2 / 33.5 dB(A) |
| Sotto carico |
| 45.5 / 49 dB(A) |
 | ||
30 dB silenzioso 40 dB(A) udibile 50 dB(A) rumoroso |
||
min: | ||
| GPD Win 4 Radeon 680M, R7 6800U, BiWin CE480Y2D100-1TB | GPD Win Max 2 Iris Xe G7 96EUs, i7-1260P, BiWin NQ200 1TB CNF82GS1D00-1TB | GPD Win 3 Iris Xe G7 80EUs, i5-1135G7, BIWIN NS200 1TB CNF82GS1G02-1TB | Razer Blade Stealth i7-1165G7 GTX 1650 Ti Max-Q GeForce GTX 1650 Ti Max-Q, i7-1165G7, Samsung SSD PM981a MZVLB512HBJQ | Dell XPS 13 9315 2-in-1 Core i5-1230U Iris Xe G7 80EUs, i5-1230U | Asus Zenbook S 13 OLED Radeon 680M, R7 6800U, Samsung PM9A1 MZVL21T0HCLR | |
|---|---|---|---|---|---|---|
| Noise | 18% | 6% | 11% | 19% | ||
| off /ambiente * (dB) | 24 | 22.6 6% | 27.4 -14% | 25.3 -5% | 24 -0% | |
| Idle Minimum * (dB) | 31.2 | 23.7 24% | 29.1 7% | 25.3 19% | 24 23% | |
| Idle Average * (dB) | 31.2 | 23.7 24% | 29.1 7% | 25.3 19% | 24 23% | |
| Idle Maximum * (dB) | 33.5 | 28.5 15% | 29.1 13% | 27 19% | 24 28% | |
| Load Average * (dB) | 45.5 | 36.5 20% | 40.7 11% | 47.9 -5% | 33.1 27% | |
| Witcher 3 ultra * (dB) | 48.6 | 39.8 18% | 42.8 12% | 38.4 21% | 40.2 17% | |
| Load Maximum * (dB) | 49 | 40.5 17% | 46.3 6% | 45.9 6% | 41.7 15% |
* ... Meglio usare valori piccoli
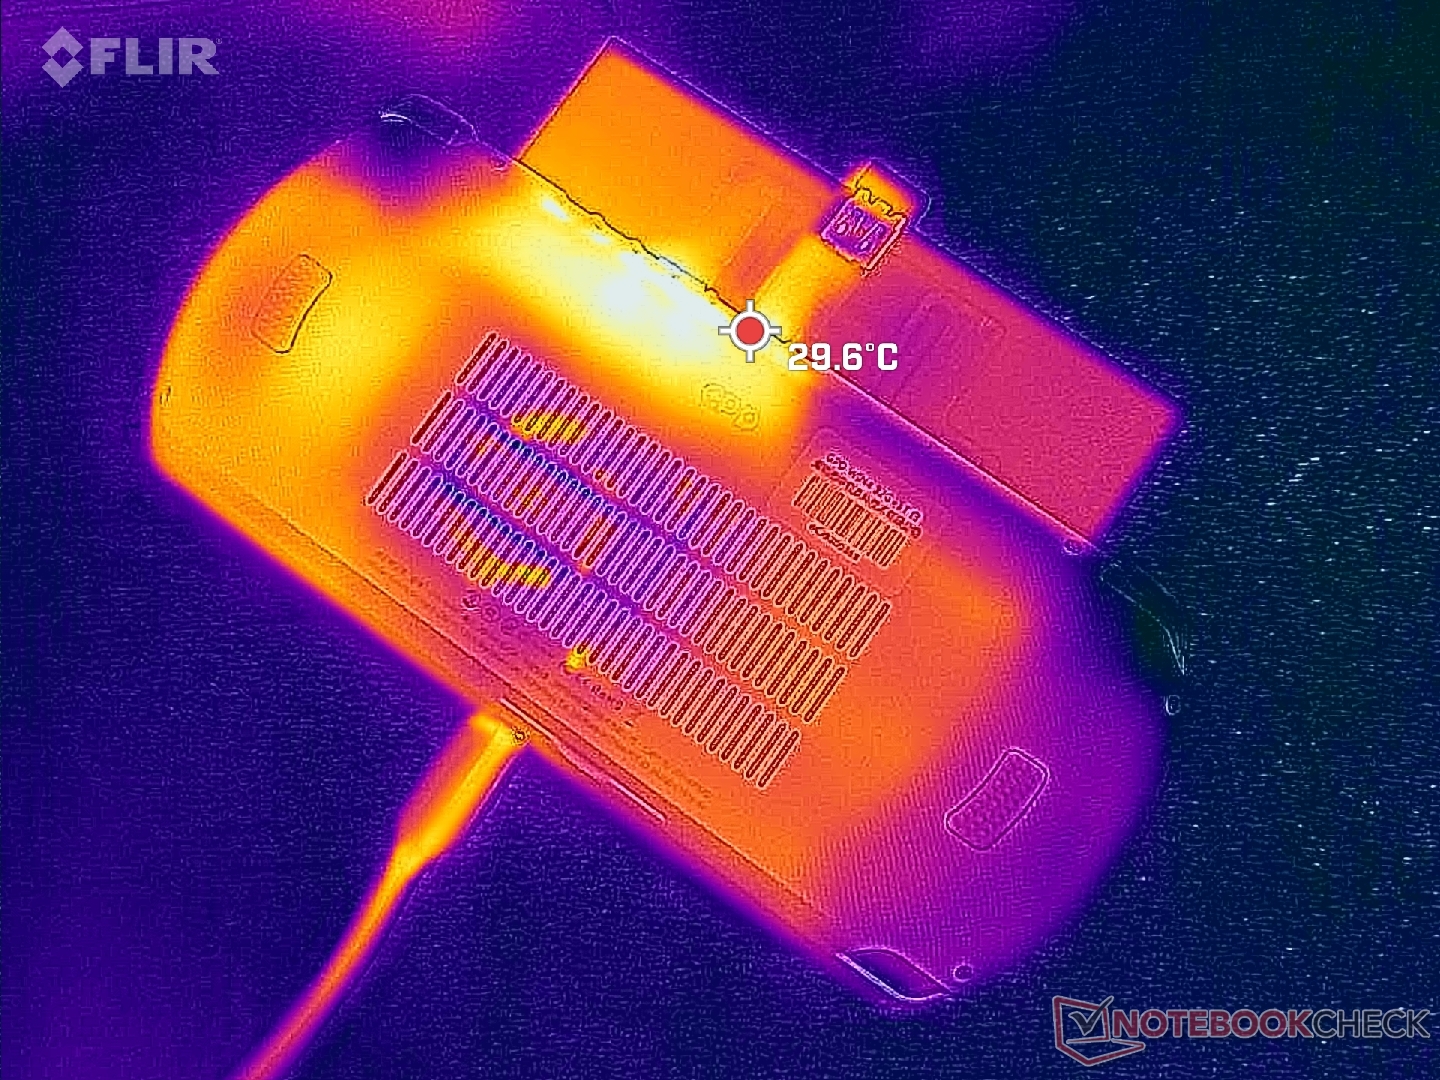
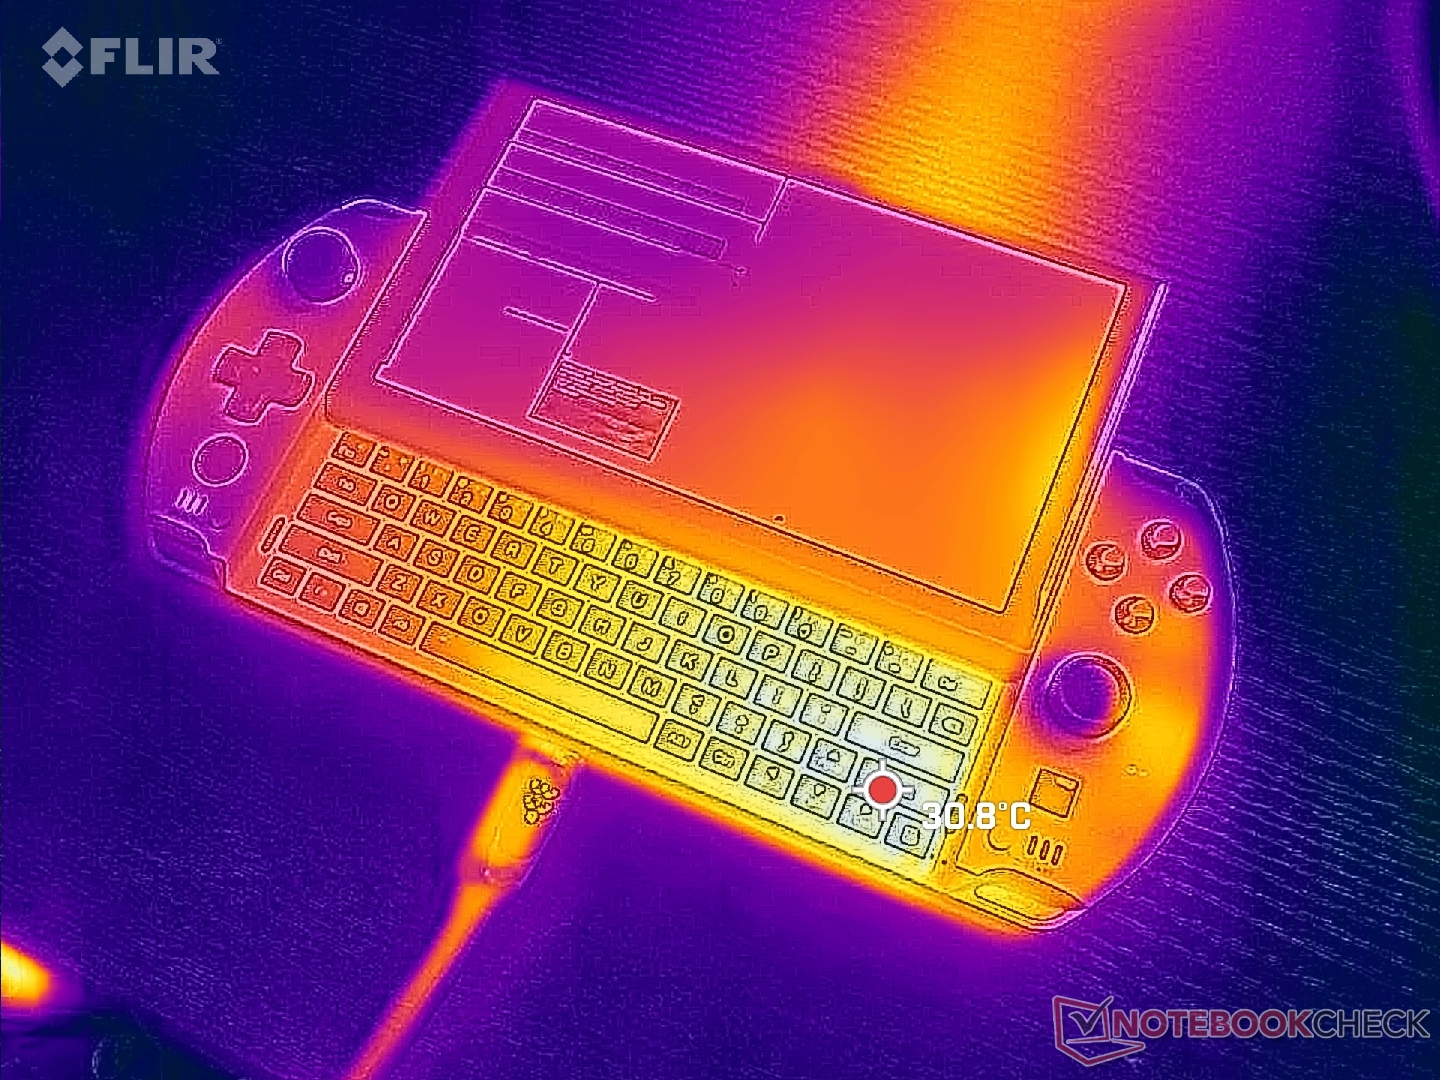
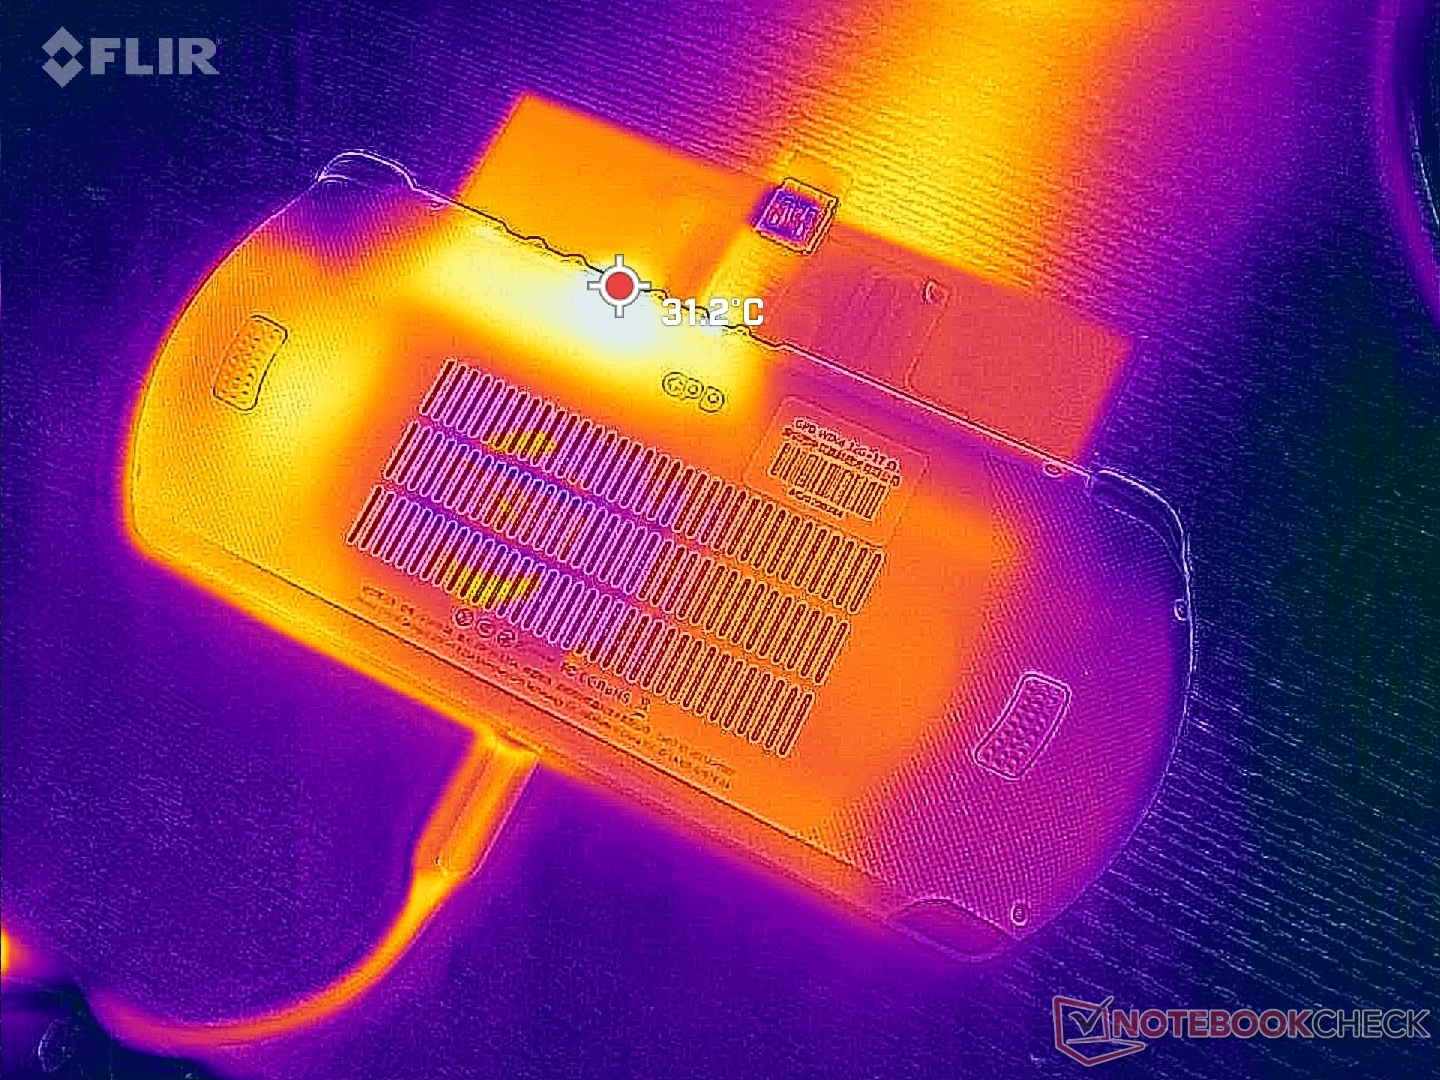
Temperatura
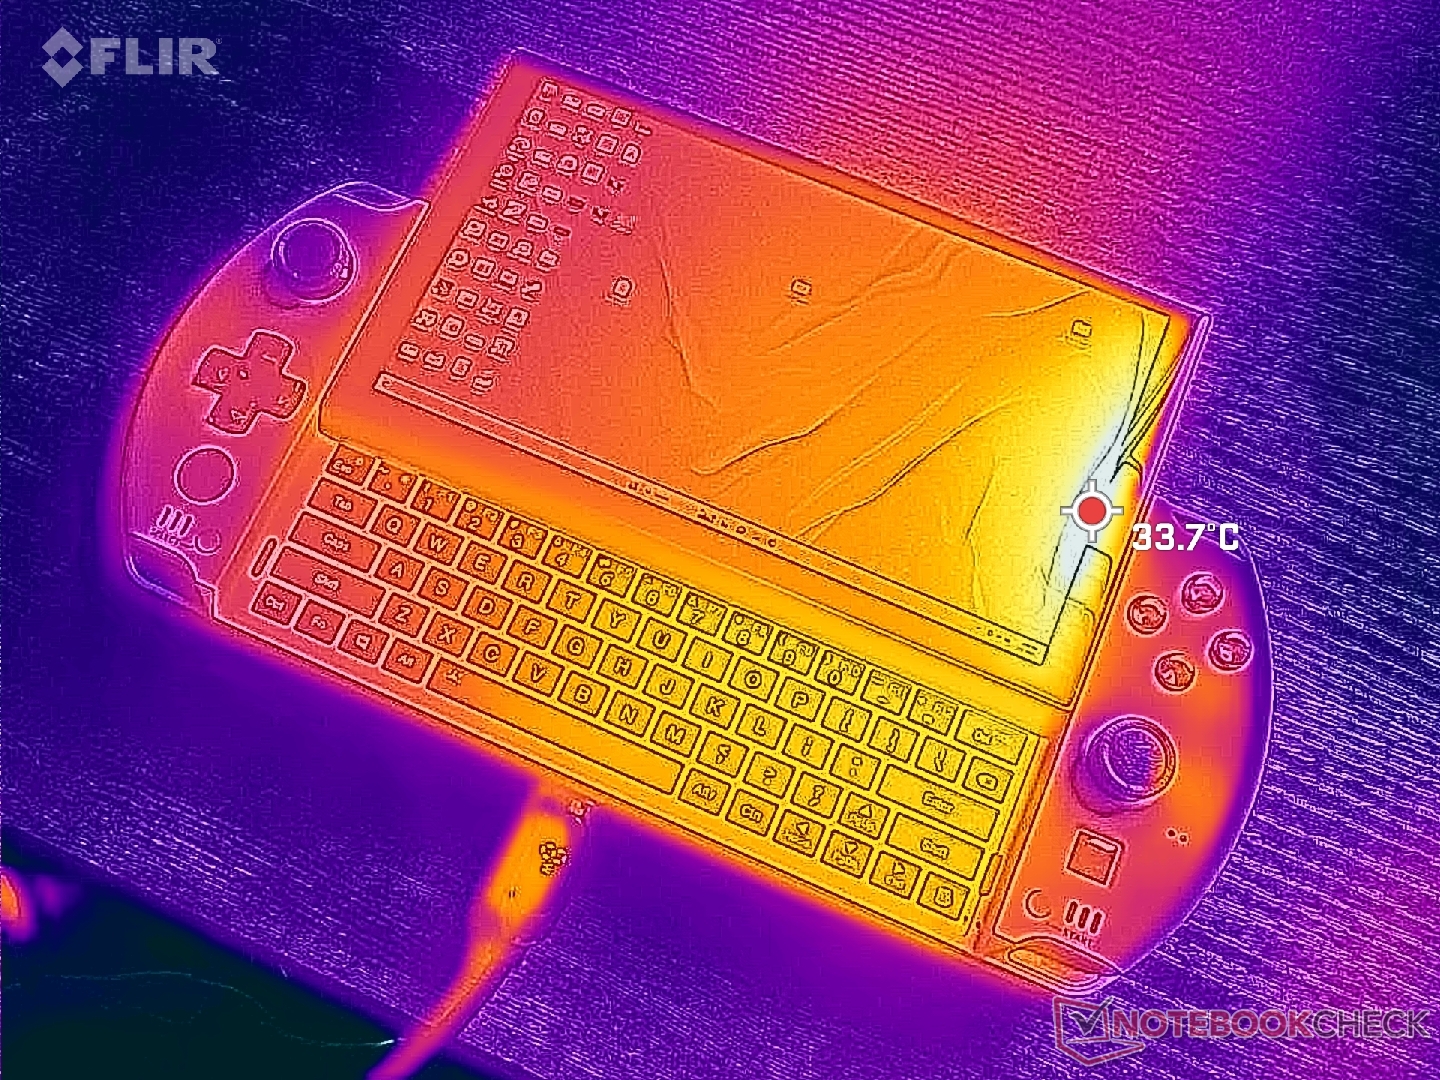
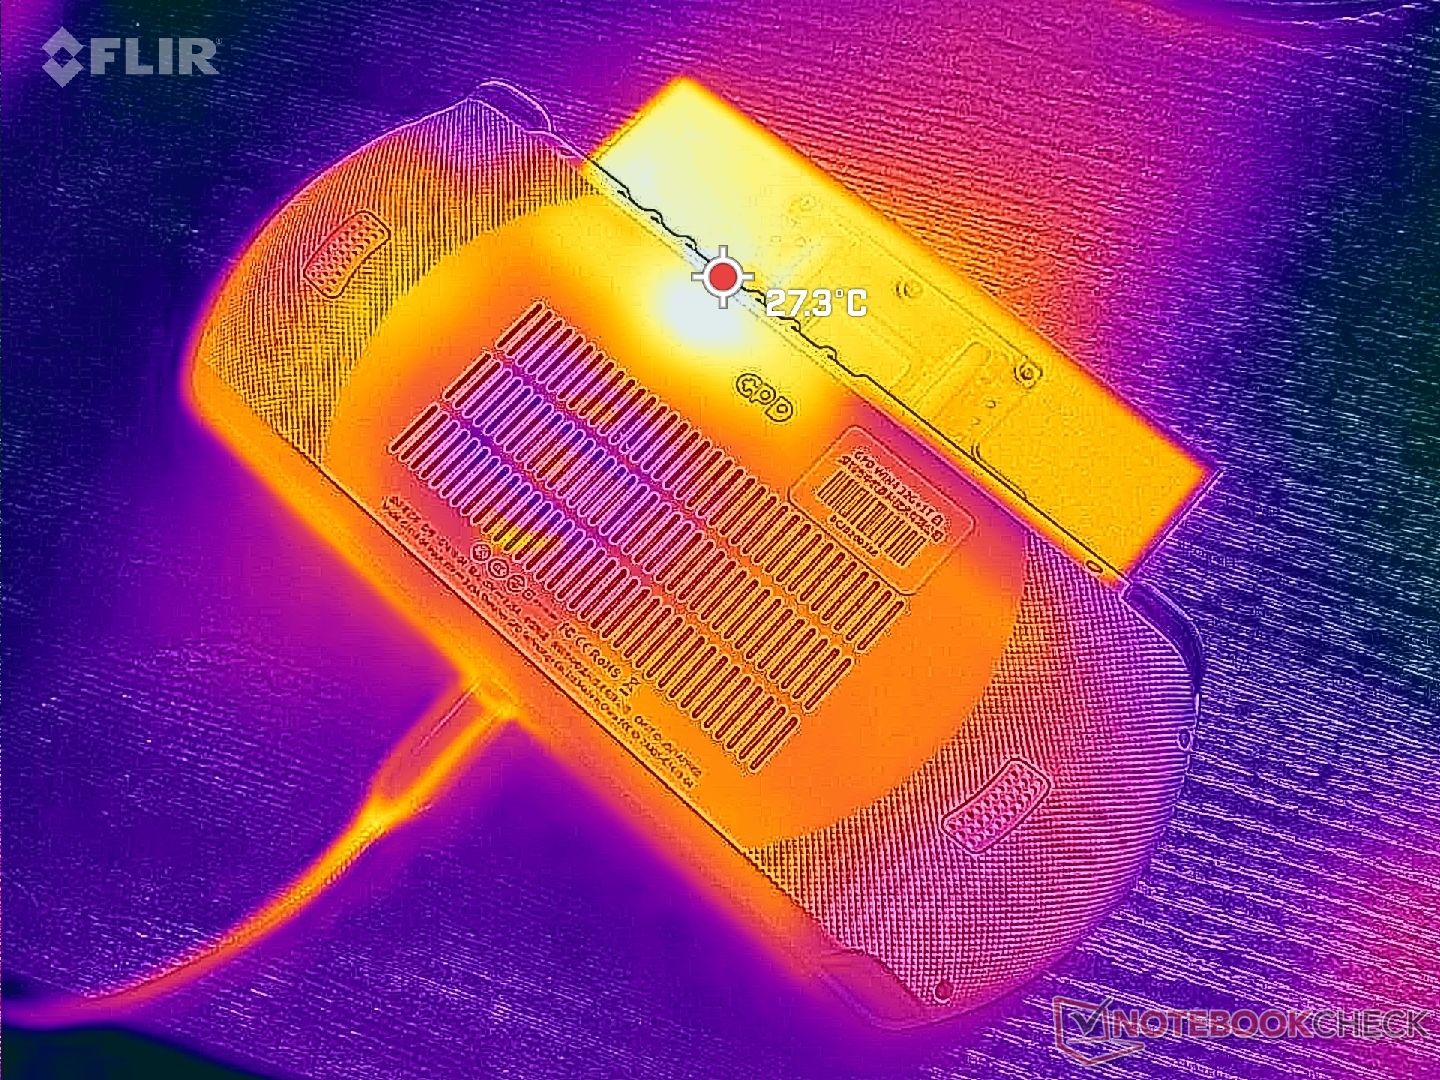
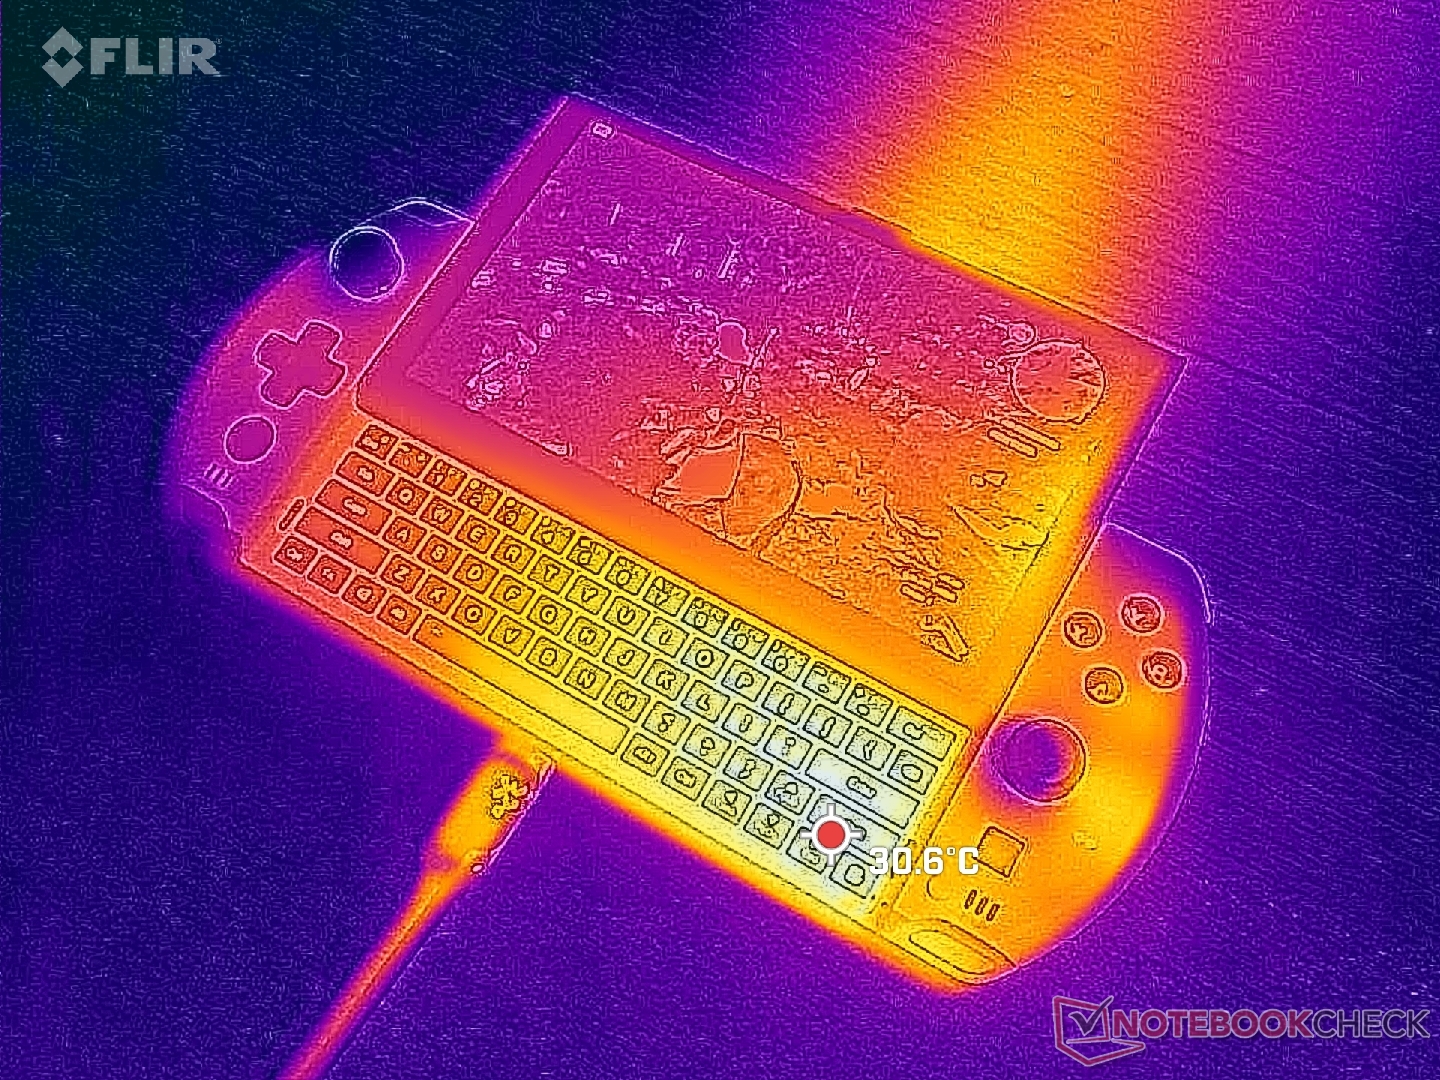
Le temperature di superficie non sono mai fastidiosamente calde, nonostante le elevate prestazioni per volume. Sebbene il sistema sia più piccolo di un portatile tradizionale, è comunque piuttosto spesso e quindi le temperature di superficie non sono così calde come ci si potrebbe aspettare.
Il lato destro dell'unità è sempre più caldo di quello sinistro di qualche grado C. Non è fastidioso, ma si nota comunque durante il gioco. Il calore in eccesso fuoriesce dal bordo superiore dell'unità, come nel caso dello Switch.
(+) La temperatura massima sul lato superiore è di 35 °C / 95 F, rispetto alla media di 35.9 °C / 97 F, che varia da 21.4 a 59 °C per questa classe Subnotebook.
(+) Il lato inferiore si riscalda fino ad un massimo di 26.8 °C / 80 F, rispetto alla media di 39.2 °C / 103 F
(+) In idle, la temperatura media del lato superiore è di 26 °C / 79 F, rispetto alla media deld ispositivo di 30.8 °C / 87 F.
(+) Riproducendo The Witcher 3, la temperatura media per il lato superiore e' di 28.1 °C / 83 F, rispetto alla media del dispositivo di 30.8 °C / 87 F.
(+) I poggiapolsi e il touchpad raggiungono la temperatura massima della pelle (32.2 °C / 90 F) e quindi non sono caldi.
(-) La temperatura media della zona del palmo della mano di dispositivi simili e'stata di 28.2 °C / 82.8 F (-4 °C / -7.2 F).
| GPD Win 4 AMD Ryzen 7 6800U, AMD Radeon 680M | GPD Win Max 2 Intel Core i7-1260P, Intel Iris Xe Graphics G7 96EUs | Razer Blade Stealth i7-1165G7 GTX 1650 Ti Max-Q Intel Core i7-1165G7, NVIDIA GeForce GTX 1650 Ti Max-Q | Dell XPS 13 9315 2-in-1 Core i5-1230U Intel Core i5-1230U, Intel Iris Xe Graphics G7 80EUs | Asus Zenbook S 13 OLED AMD Ryzen 7 6800U, AMD Radeon 680M | |
|---|---|---|---|---|---|
| Heat | -1% | -40% | -17% | -37% | |
| Maximum Upper Side * (°C) | 35 | 28.6 18% | 44 -26% | 41.8 -19% | 47.9 -37% |
| Maximum Bottom * (°C) | 26.8 | 33 -23% | 47.4 -77% | 38.2 -43% | 56.1 -109% |
| Idle Upper Side * (°C) | 28.4 | 24.6 13% | 32.2 -13% | 27.4 4% | 26.8 6% |
| Idle Bottom * (°C) | 25 | 27.6 -10% | 36 -44% | 27.2 -9% | 27.3 -9% |
* ... Meglio usare valori piccoli
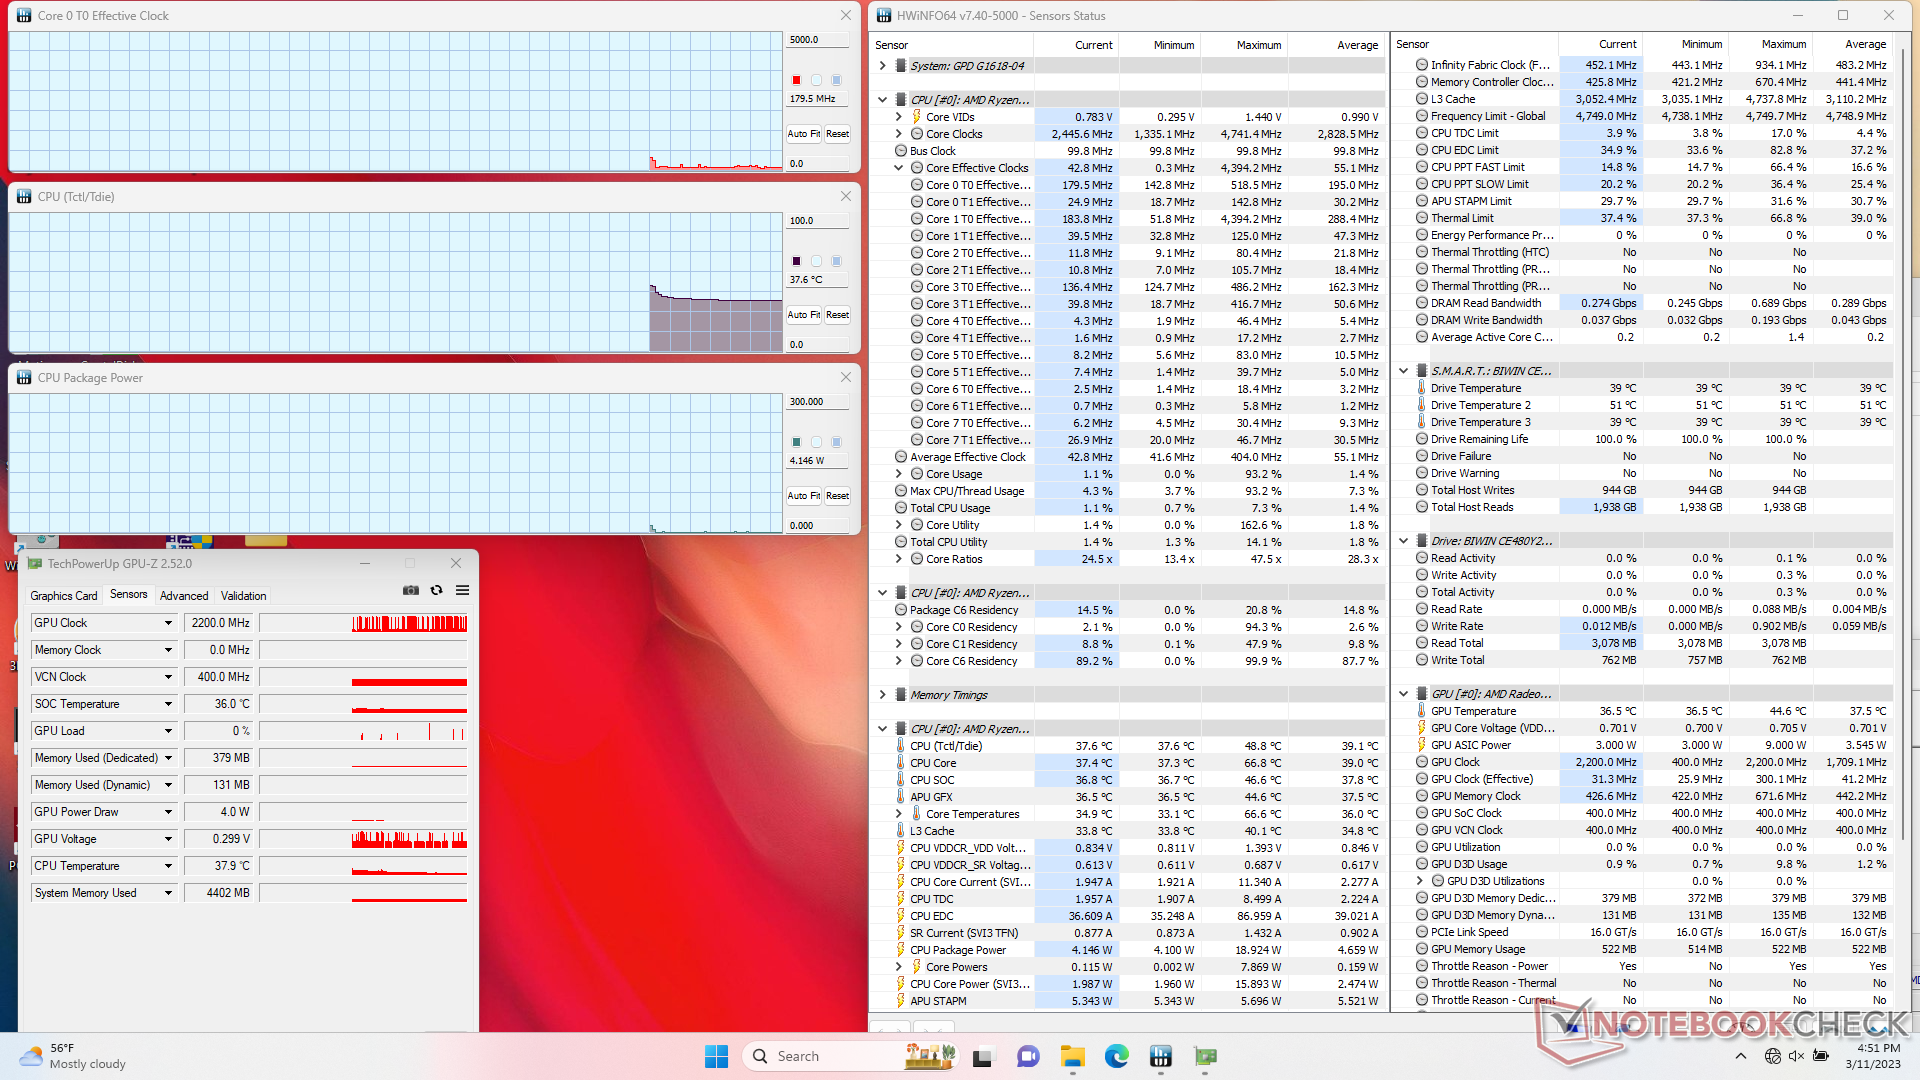
Stress test
Quando si esegue Prime95 per stressare la CPU, le frequenze di clock e l'assorbimento di potenza della scheda aumentano fino a 2,9 GHz e 28 W, rispettivamente, e durano per circa 30 secondi o fino a quando la temperatura del nucleo raggiunge i 63 C. Successivamente, le frequenze di clock e l'assorbimento di potenza della scheda diminuiscono costantemente prima di stabilizzarsi a circa 2,3 GHz e 18 W, rispettivamente. La temperatura del core è relativamente bassa, 57 C, nonostante gli elevati livelli di stress; ripetendo questo test su un computer con processore Intel, la temperatura del core è di 57 C Lenovo IdeaPad Flex 7i 14 avrebbe portato a una temperatura stabile del core più alta, pari a 71 C.
La velocità di clock della GPU e la temperatura si stabilizzerebbero rispettivamente a 1316 MHz e 55 C, quando si esegue Witcher 3. Le temperature del core sono sorprendentemente conservative anche quando si imposta la modalità Performance.
Il funzionamento a batteria non limita le prestazioni. Un test 3DMark 11 eseguito a batteria restituirebbe essenzialmente gli stessi punteggi di CPU e GPU di quelli ottenuti con l'alimentazione di rete.
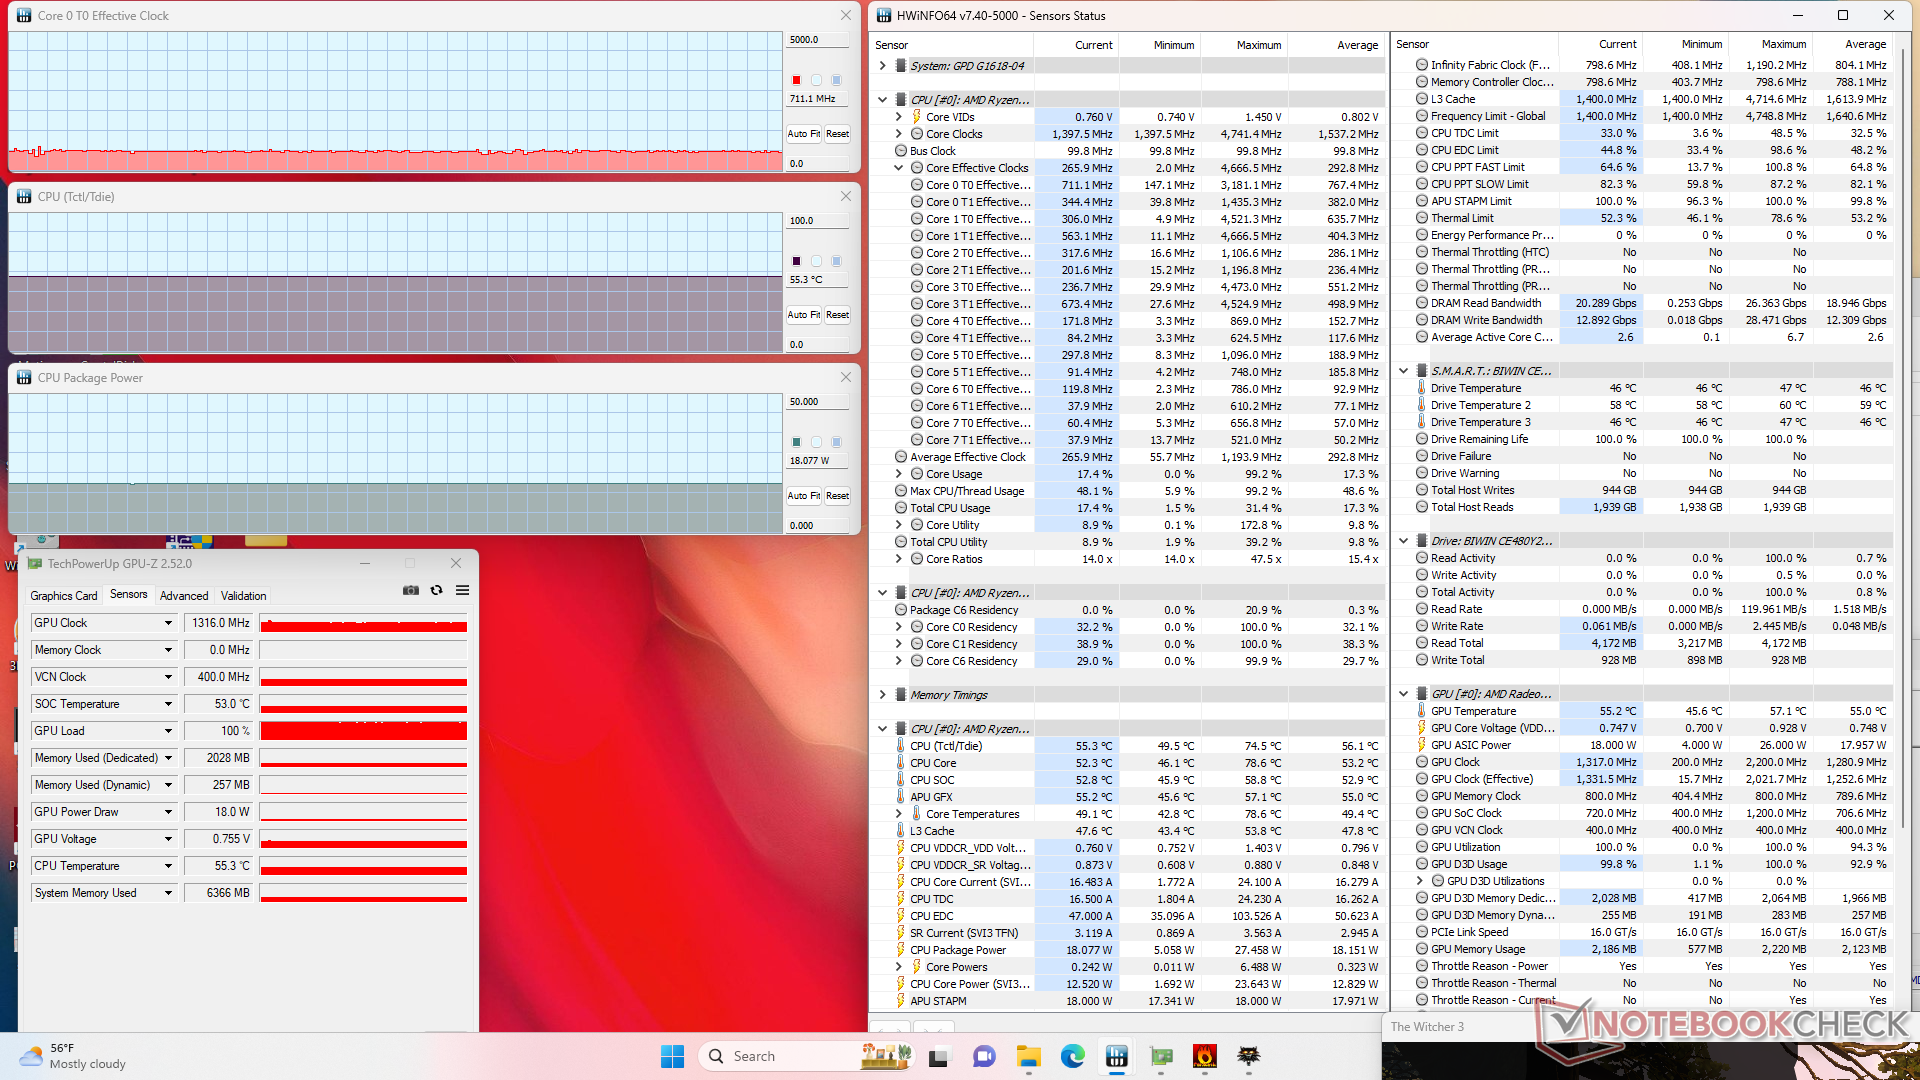
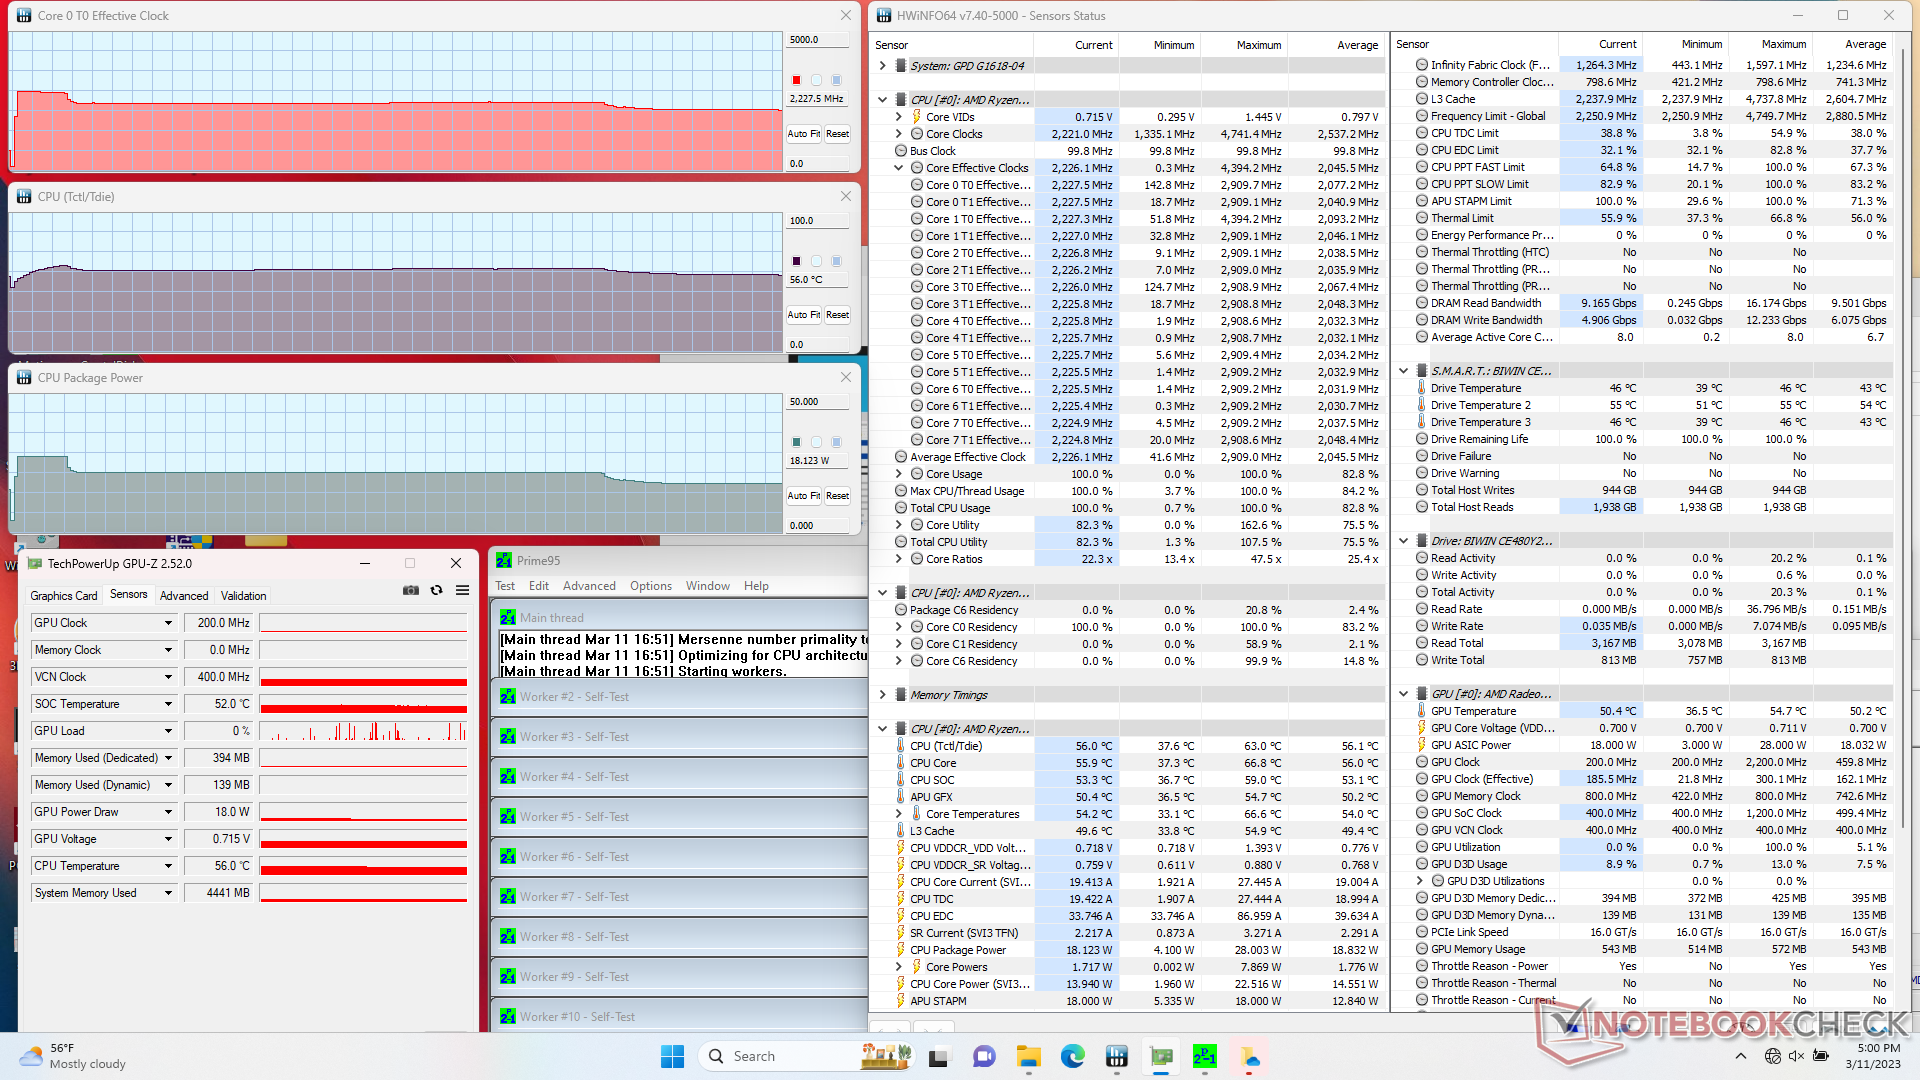
| Clock della CPU (GHz) | Clock della GPU (MHz) | Temperatura media della CPU (°C) | |
| Sistema inattivo | -- | -- | 38 |
| Stress Prime95 | 2,2 | -- | 56 |
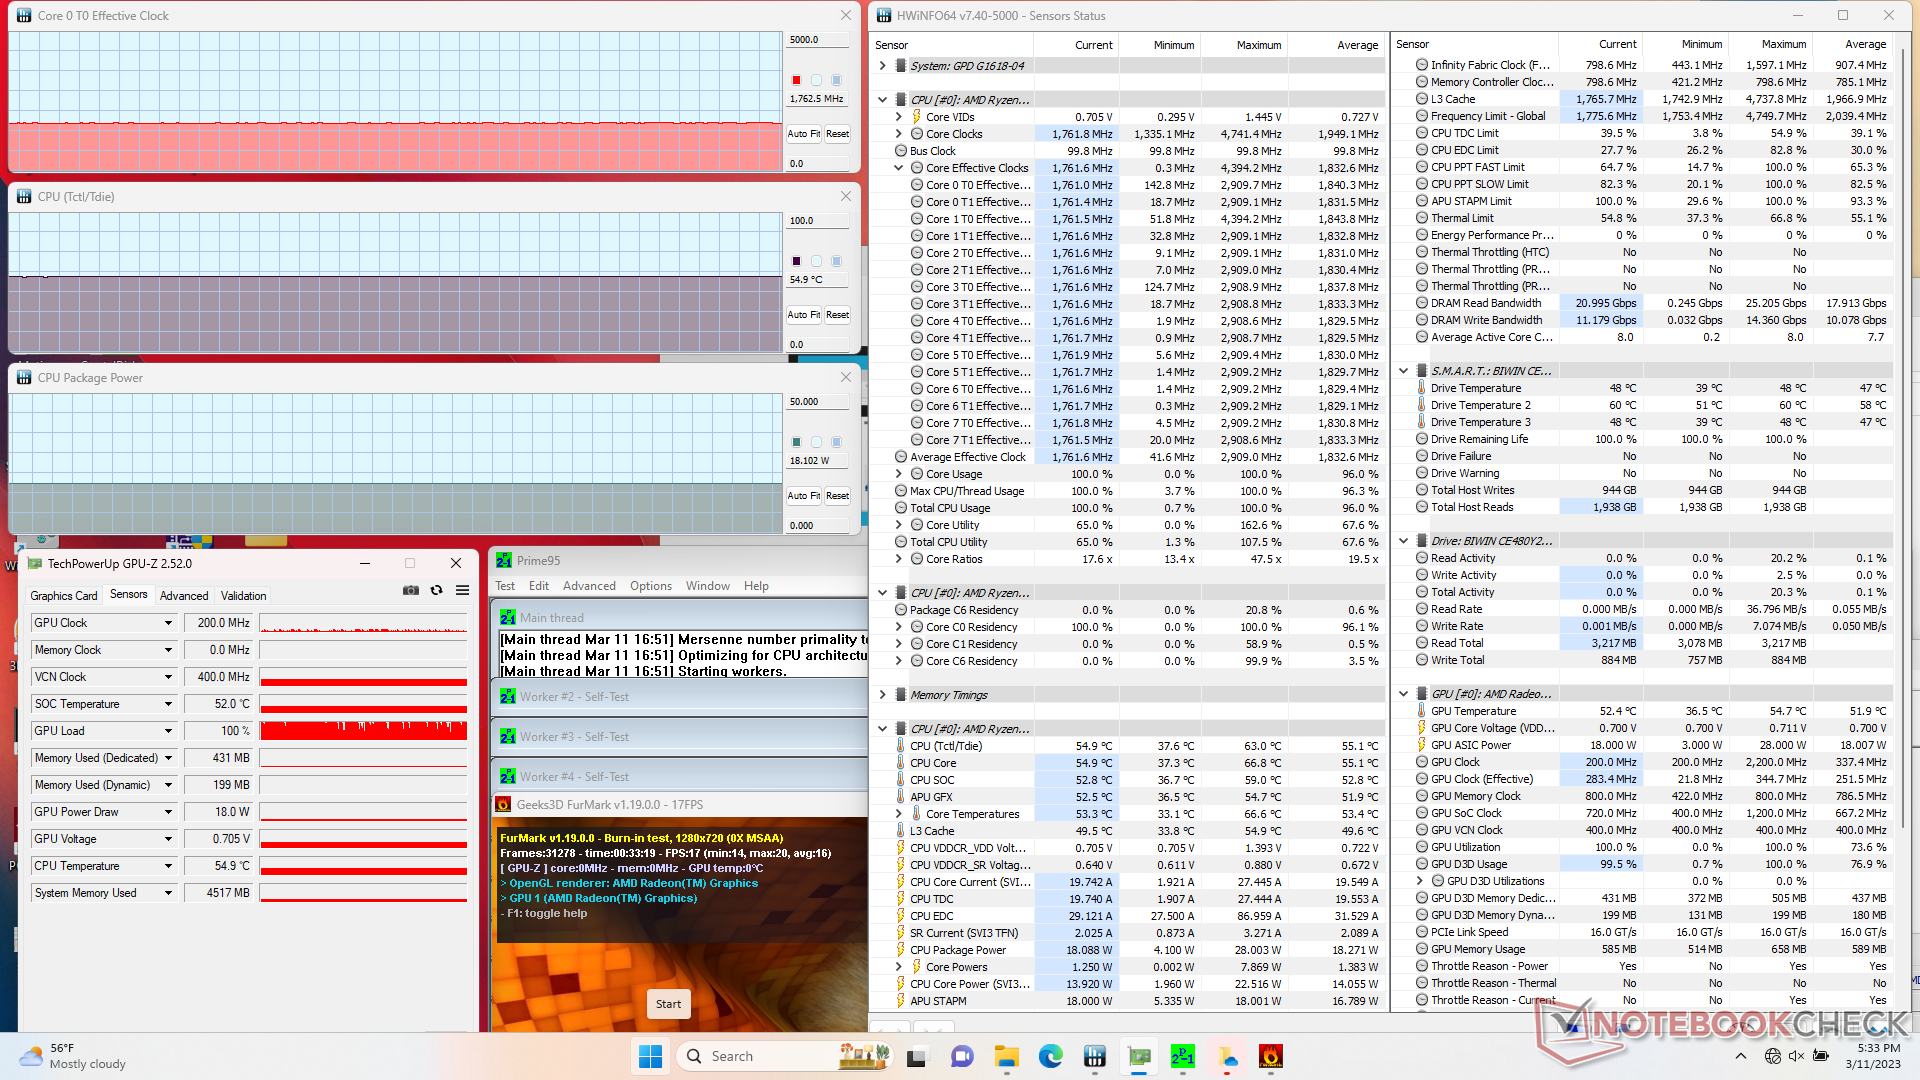
| Prime95 + FurMark Stress | 1,8 | 200 | 55 |
| Witcher 3 Stress | 0,7 | 1316 | 55 |
Altoparlanti
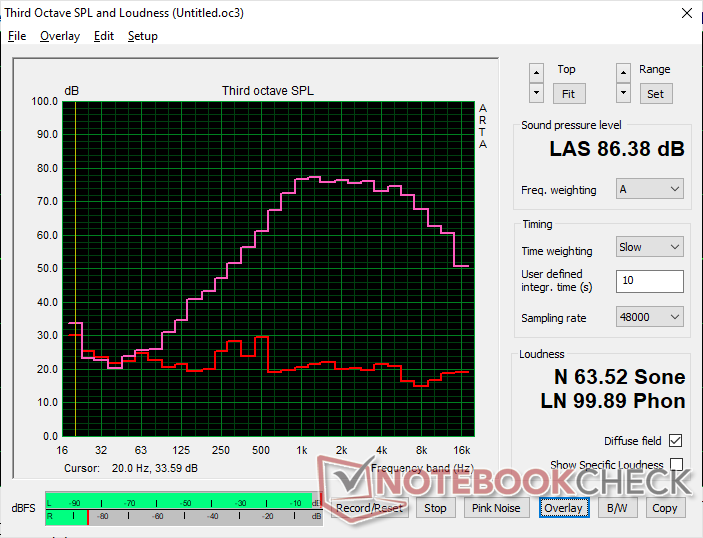
GPD Win 4 analisi audio
(+) | gli altoparlanti sono relativamente potenti (86.4 dB)
Bassi 100 - 315 Hz
(-) | quasi nessun basso - in media 26.1% inferiori alla media
(±) | la linearità dei bassi è media (9.1% delta rispetto alla precedente frequenza)
Medi 400 - 2000 Hz
(±) | medi elevati - circa 7.3% superiore alla media
(±) | linearità dei medi adeguata (7.4% delta rispetto alla precedente frequenza)
Alti 2 - 16 kHz
(±) | alti elevati - circa 5.6% superiori alla media
(+) | alti lineari (5.4% delta rispetto alla precedente frequenza)
Nel complesso 100 - 16.000 Hz
(±) | la linearità complessiva del suono è media (25.6% di differenza rispetto alla media
Rispetto alla stessa classe
» 86% di tutti i dispositivi testati in questa classe è stato migliore, 3% simile, 11% peggiore
» Il migliore ha avuto un delta di 5%, medio di 18%, peggiore di 53%
Rispetto a tutti i dispositivi testati
» 79% di tutti i dispositivi testati in questa classe è stato migliore, 4% similare, 17% peggiore
» Il migliore ha avuto un delta di 4%, medio di 23%, peggiore di 134%
Apple MacBook Pro 16 2021 M1 Pro analisi audio
(+) | gli altoparlanti sono relativamente potenti (84.7 dB)
Bassi 100 - 315 Hz
(+) | bassi buoni - solo 3.8% dalla media
(+) | bassi in lineaa (5.2% delta rispetto alla precedente frequenza)
Medi 400 - 2000 Hz
(+) | medi bilanciati - solo only 1.3% rispetto alla media
(+) | medi lineari (2.1% delta rispetto alla precedente frequenza)
Alti 2 - 16 kHz
(+) | Alti bilanciati - appena 1.9% dalla media
(+) | alti lineari (2.7% delta rispetto alla precedente frequenza)
Nel complesso 100 - 16.000 Hz
(+) | suono nel complesso lineare (4.6% differenza dalla media)
Rispetto alla stessa classe
» 0% di tutti i dispositivi testati in questa classe è stato migliore, 0% simile, 100% peggiore
» Il migliore ha avuto un delta di 5%, medio di 17%, peggiore di 45%
Rispetto a tutti i dispositivi testati
» 0% di tutti i dispositivi testati in questa classe è stato migliore, 0% similare, 100% peggiore
» Il migliore ha avuto un delta di 4%, medio di 23%, peggiore di 134%
Gestione dell'energia - Affamato di energia per le sue dimensioni
Consumo di energia
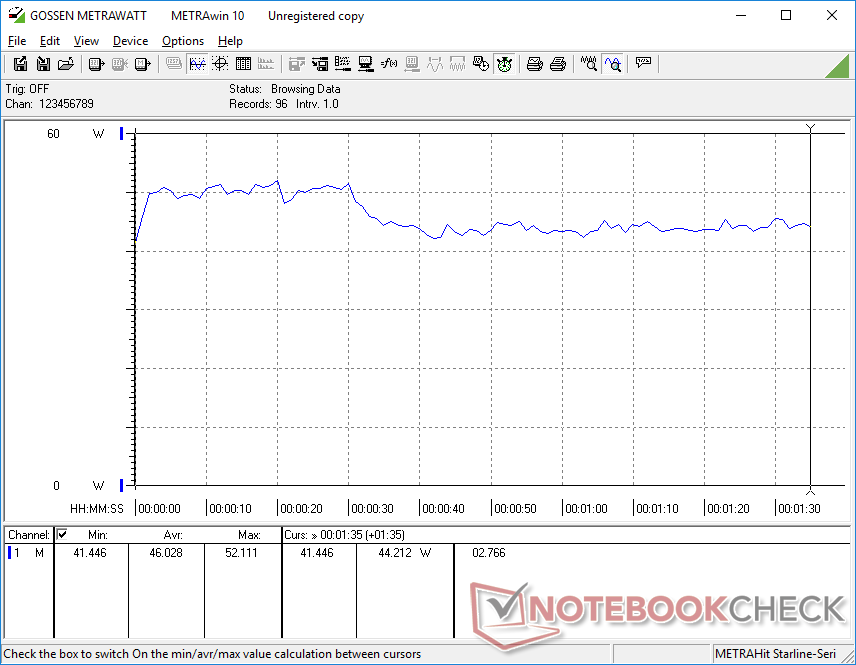
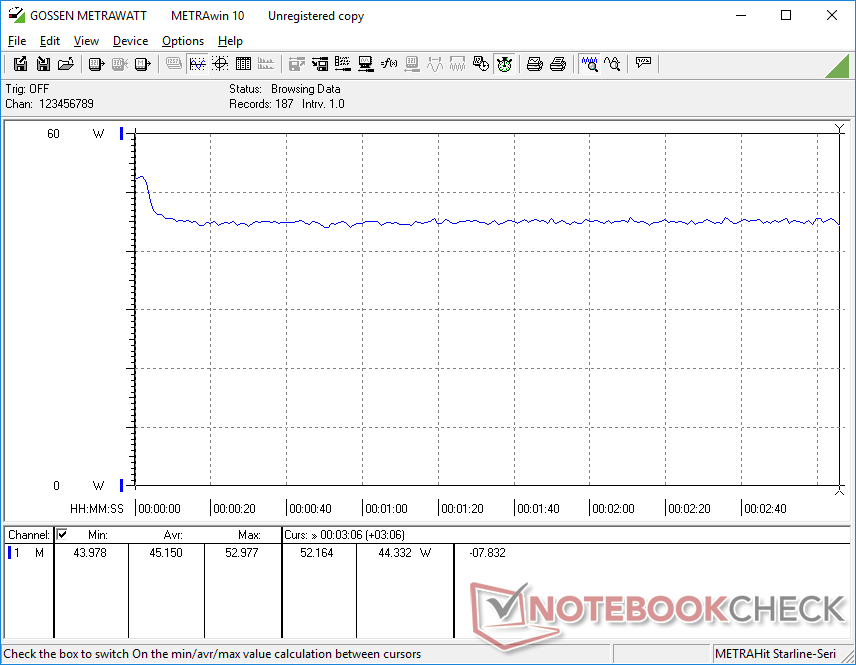
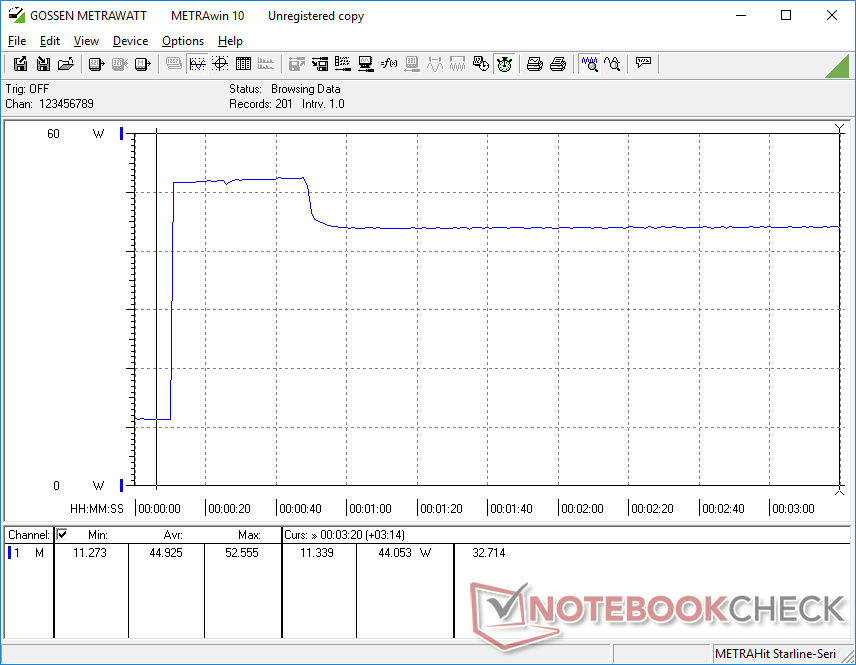
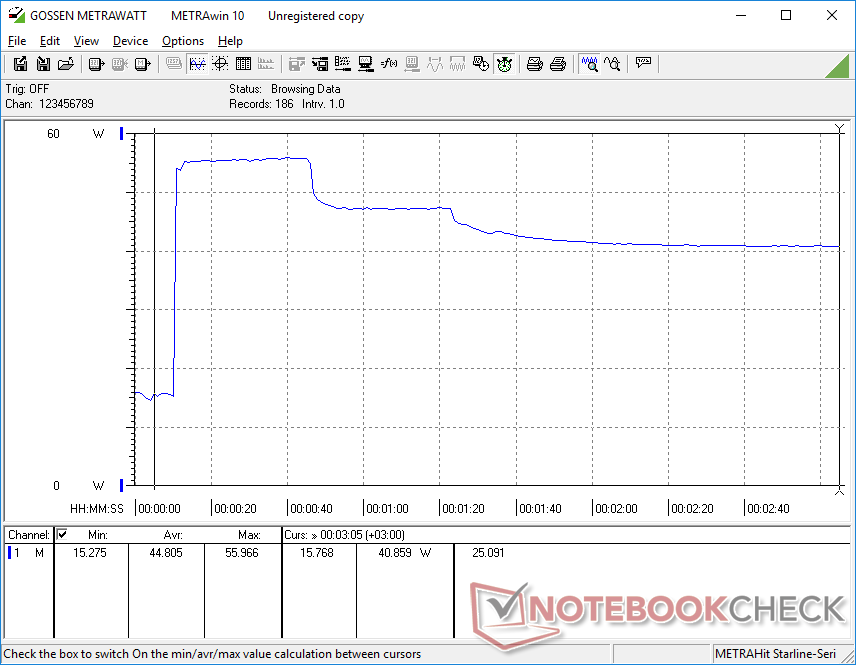
Il consumo energetico complessivo è superiore a quello del Win 3 e di molti Ultrabook della serie U, soprattutto a causa della CPU Ryzen 7 e del touchscreen più grande e ad alta risoluzione. Ad esempio, i giochi richiedono dal 20 al 55% di energia in più rispetto al Win 3 con Core i5, ma ciò è compensato dalle prestazioni due volte superiori della CPU e 1,5 volte superiori della GPU rispetto all'i5-1135G7. Il semplice funzionamento al minimo sul desktop richiede tra i 7 e i 13 W, un valore simile a quello di molti Ultrabook.
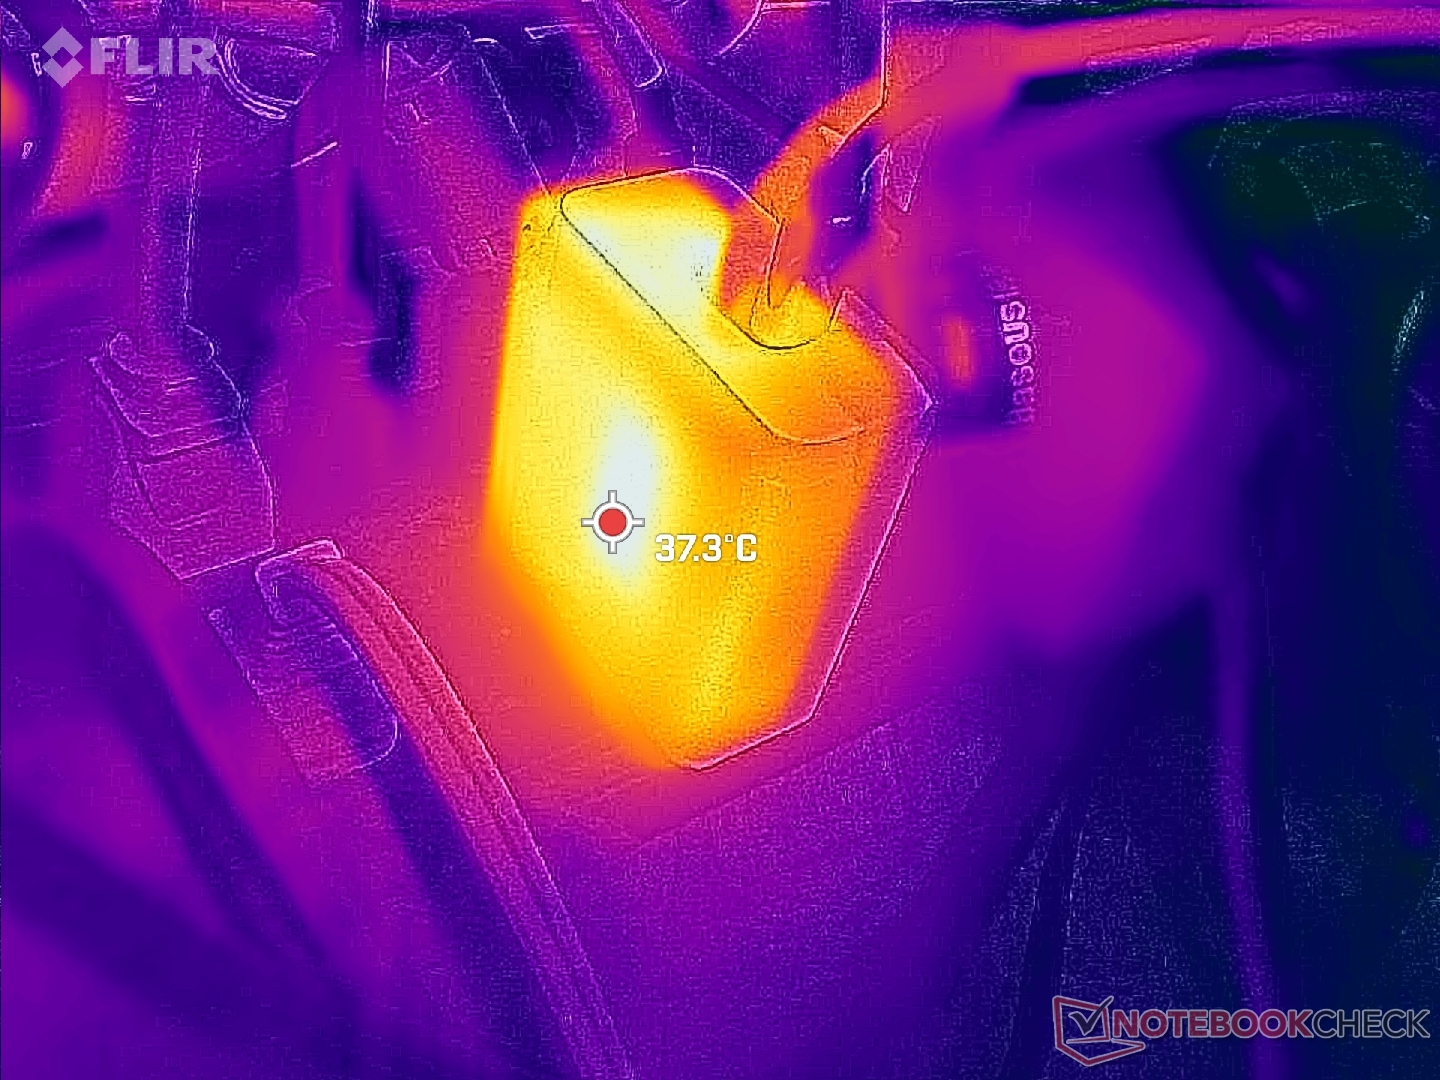
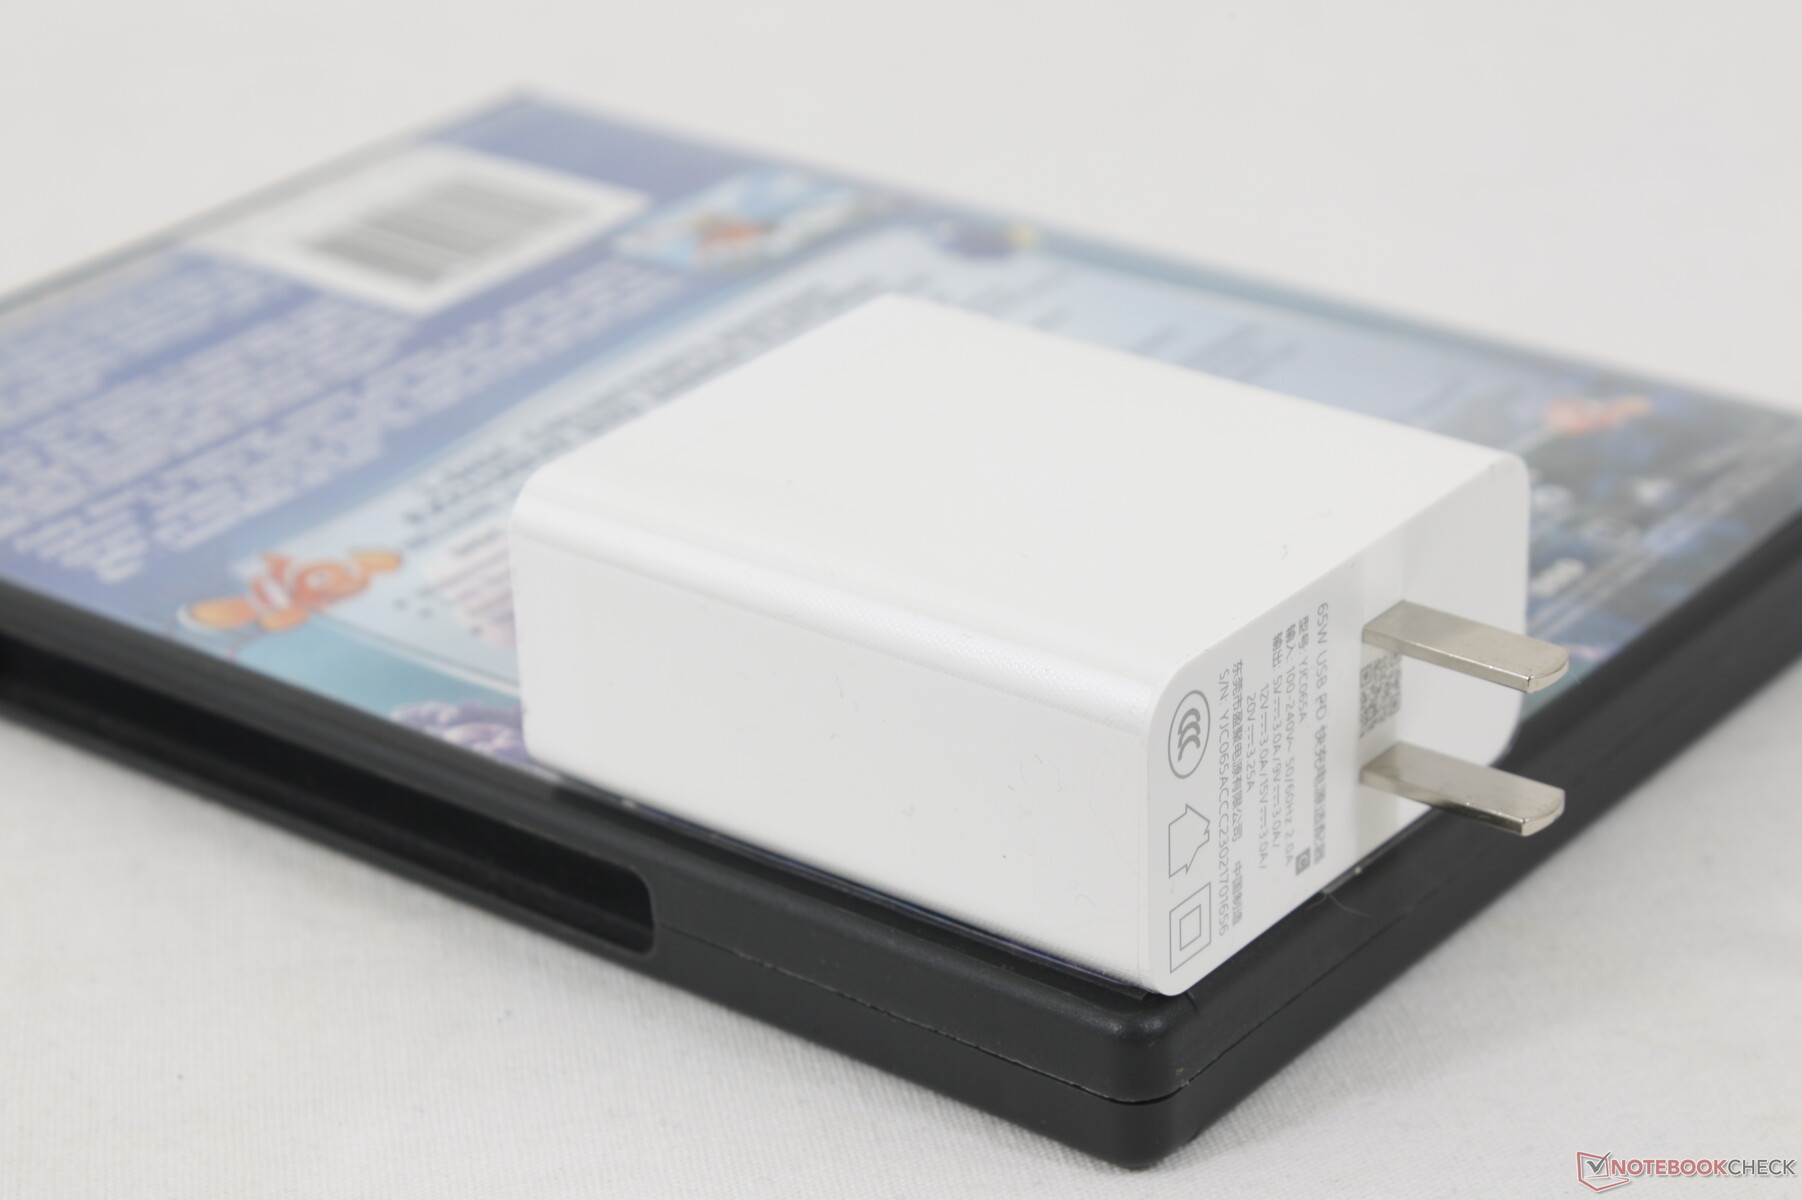
Siamo riusciti a misurare un consumo massimo temporaneo di 56 W dal piccolo (~6,4 x 5,5 x 2,8 cm) adattatore CA USB-C da 65 W quando il processore è al 100% di utilizzo. Questo valore scende dopo pochi secondi di stress, come mostrano i grafici sottostanti, a causa del limitato potenziale di boost della CPU del modello. Purtroppo i poli dell'adattatore CA non sono retrattili.
| Off / Standby | |
| Idle | |
| Sotto carico |
|
Leggenda:
min: | |
| GPD Win 4 R7 6800U, Radeon 680M, BiWin CE480Y2D100-1TB, IPS, 1920x1080, 6" | GPD Win Max 2 i7-1260P, Iris Xe G7 96EUs, BiWin NQ200 1TB CNF82GS1D00-1TB, IPS, 2560x1600, 10.1" | GPD Win 3 i5-1135G7, Iris Xe G7 80EUs, BIWIN NS200 1TB CNF82GS1G02-1TB, IPS, 1280x720, 5.5" | Razer Blade Stealth i7-1165G7 GTX 1650 Ti Max-Q i7-1165G7, GeForce GTX 1650 Ti Max-Q, Samsung SSD PM981a MZVLB512HBJQ, IPS, 1920x1080, 13.3" | Dell XPS 13 9315 2-in-1 Core i5-1230U i5-1230U, Iris Xe G7 80EUs, , IPS, 2880x1920, 13" | Asus Zenbook S 13 OLED R7 6800U, Radeon 680M, Samsung PM9A1 MZVL21T0HCLR, OLED, 2880x1800, 13.3" | |
|---|---|---|---|---|---|---|
| Power Consumption | 2% | 45% | -20% | 32% | 18% | |
| Idle Minimum * (Watt) | 7.5 | 5.8 23% | 2.9 61% | 4 47% | 5.2 31% | 4.8 36% |
| Idle Average * (Watt) | 12.4 | 10.2 18% | 4.5 64% | 6.3 49% | 7.9 36% | 8.7 30% |
| Idle Maximum * (Watt) | 13 | 11.5 12% | 4.5 65% | 14.5 -12% | 8 38% | 10.1 22% |
| Load Average * (Watt) | 46 | 47.7 -4% | 38.5 16% | 79.2 -72% | 31.2 32% | 45.6 1% |
| Witcher 3 ultra * (Watt) | 45.2 | 45.6 -1% | 28.9 36% | 68.2 -51% | 28.2 38% | 42.4 6% |
| Load Maximum * (Watt) | 56 | 76.8 -37% | 41.4 26% | 99.4 -78% | 47.6 15% | 49.5 12% |
* ... Meglio usare valori piccoli
Power Consumption Witcher 3 / Stresstest
Power Consumption external Monitor
Durata della batteria
La capacità della batteria rimane quasi identica a quella del Win 3, nonostante le prestazioni più veloci e le dimensioni più grandi del Win 4. Pertanto, non sorprende che la durata della batteria del Win 4 sia inferiore di diverse ore. Siamo riusciti a registrare un'autonomia totale di 7,5 ore durante la navigazione sul web con una luminosità di 150 nit e di soli 77 minuti durante l'esecuzione di giochi impegnativi con l'impostazione di luminosità massima.
La ricarica da vuoto a pieno regime richiede circa 90 minuti, come nella maggior parte degli Ultrabook. Tenere presente che la velocità di ricarica rallenta se si gioca contemporaneamente.
| GPD Win 4 R7 6800U, Radeon 680M, 46 Wh | GPD Win Max 2 i7-1260P, Iris Xe G7 96EUs, 70 Wh | GPD Win 3 i5-1135G7, Iris Xe G7 80EUs, 44 Wh | Razer Blade Stealth i7-1165G7 GTX 1650 Ti Max-Q i7-1165G7, GeForce GTX 1650 Ti Max-Q, 53.1 Wh | Dell XPS 13 9315 2-in-1 Core i5-1230U i5-1230U, Iris Xe G7 80EUs, 49.5 Wh | Asus Zenbook S 13 OLED R7 6800U, Radeon 680M, 67 Wh | |
|---|---|---|---|---|---|---|
| Autonomia della batteria | 35% | 26% | 66% | 38% | 54% | |
| Reader / Idle (h) | 9.7 | 15.4 59% | 20.6 112% | 13.6 40% | ||
| WiFi v1.3 (h) | 7.5 | 8.7 16% | 11.3 51% | 9 20% | 9 20% | 9.2 23% |
| Load (h) | 1.3 | 1.7 31% | 1.3 0% | 2 54% | 2.4 85% | |
| H.264 (h) | 15.2 |
Pro
Contro
Verdetto - Fa sembrare il mazzo di vapore obsoleto
Il Win 4 è un enorme miglioramento rispetto al Win 3 sotto quasi tutti gli aspetti. Il display è più grande, i comandi sono più tattili, il design è più robusto e attraente, la tastiera è più affidabile e le prestazioni sono nettamente più veloci. È possibile applicare un logo PS sulla parte anteriore e probabilmente ingannerebbe più di qualche occhio.
Il nuovo schermo, le prestazioni e la tastiera fisica integrata contribuiscono al peso maggiore, al profilo più spesso e al rumore più forte della ventola del Win 4, che sono i tre principali svantaggi del modello. La sua costruzione è solida, ma altri portatili da gioco come lo Switch o il OneXPlayer sono più sottili e leggeri e consentono di giocare più facilmente in movimento. Nonostante ciò, ha ancora una marcia in più rispetto a Steam Deck, che è più lento e più ingombrante della soluzione GPD.
Il Win 4 di GPD combina la potente GPU AMD Radeon 680M con una qualità costruttiva di prim'ordine per un portatile che mette in ombra lo Steam Deck sotto quasi ogni aspetto.
Le due caratteristiche mancanti del Win 4 sono la scarsa manutenibilità da parte dell'utente finale e la mancanza del supporto FreeSync. Il design densamente impacchettato rende difficile la sostituzione dell'SSD interno o di qualsiasi pulsante potenzialmente rotto, mentre il FreeSync avrebbe migliorato l'esperienza di gioco senza alcun hardware aggiuntivo. Per quel che vale, il display ha una modalità nativa a 40 Hz se gli utenti vogliono puntare a 40 FPS per ridurre il tearing dello schermo.
Un aspetto che dovrebbe essere assolutamente risolto è la scarsa stabilità del frame rate o il microstuttering durante il gioco. La maggior parte degli Ultrabook e soprattutto dei portatili da gioco non presentano questo problema e ci aspettiamo lo stesso da un portatile in cui il gioco è il punto di forza.
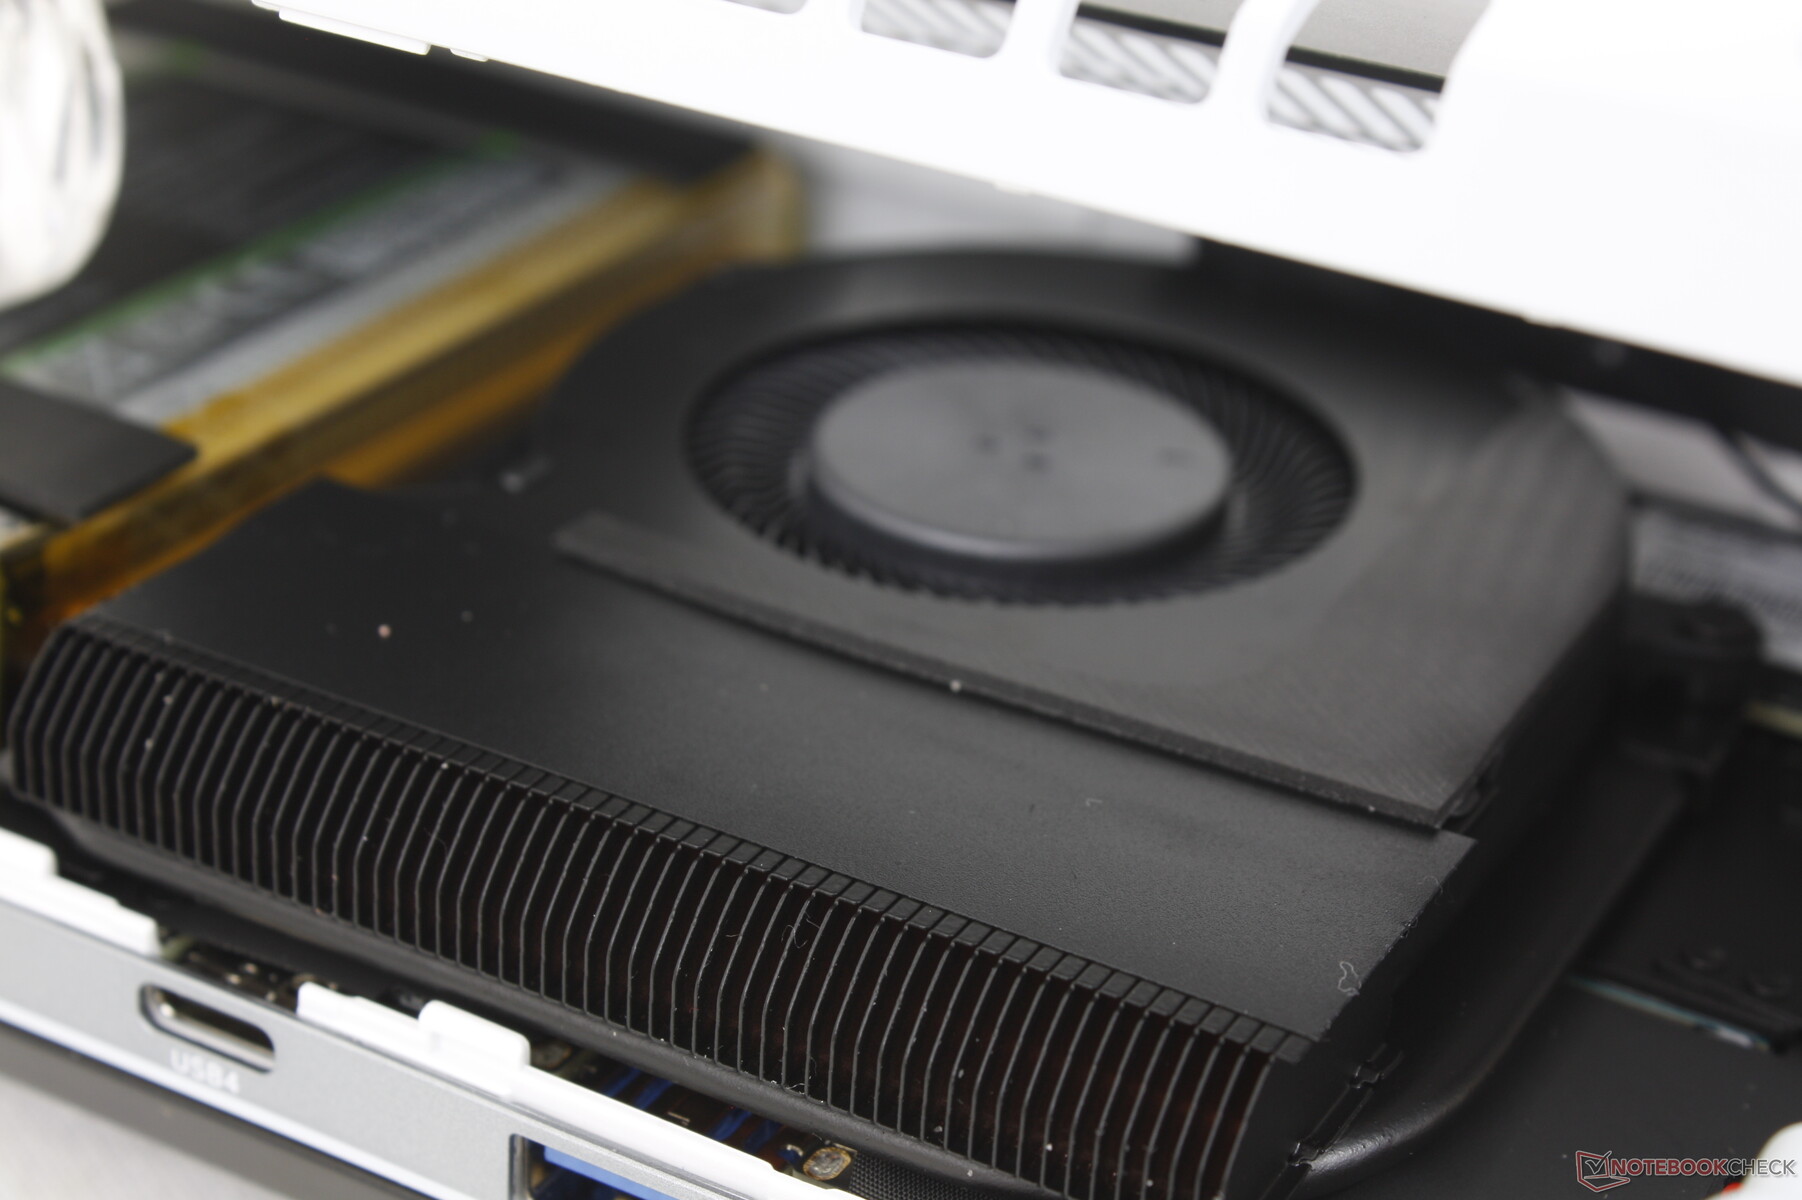
Per i modelli futuri, ci piacerebbe vedere GPD incorporare ancora più tecnologia dai portatili da gioco di attuale generazione per ridurre al minimo lo spessore e potenzialmente il peso. Un passaggio alla pasta termica in metallo liquido, al raffreddamento a camera di vapore e a una ventola interna di diametro maggiore, ad esempio, potrebbe consentire di ottenere maggiori prestazioni per volume. Fino ad allora, il GPD Win 4 è uno dei migliori e più veloci portatili da gioco basati su Windows attualmente disponibili.
Prezzo e disponibilità
La pagina Indiegogo per il Win 4 è ora attiva e le spedizioni iniziali inizieranno a marzo 2023. Le configurazioni partono da poco meno di 1000 dollari per 16 GB di RAM e 1 TB di SSD fino a 1300 dollari per il doppio della RAM e dello storage.
Transparency
La selezione dei dispositivi da recensire viene effettuata dalla nostra redazione. Il campione di prova è stato fornito all'autore come prestito dal produttore o dal rivenditore ai fini di questa recensione. L'istituto di credito non ha avuto alcuna influenza su questa recensione, né il produttore ne ha ricevuto una copia prima della pubblicazione. Non vi era alcun obbligo di pubblicare questa recensione. In quanto società mediatica indipendente, Notebookcheck non è soggetta all'autorità di produttori, rivenditori o editori.
Ecco come Notebookcheck esegue i test
Ogni anno, Notebookcheck esamina in modo indipendente centinaia di laptop e smartphone utilizzando procedure standardizzate per garantire che tutti i risultati siano comparabili. Da circa 20 anni sviluppiamo continuamente i nostri metodi di prova e nel frattempo stabiliamo gli standard di settore. Nei nostri laboratori di prova, tecnici ed editori esperti utilizzano apparecchiature di misurazione di alta qualità. Questi test comportano un processo di validazione in più fasi. Il nostro complesso sistema di valutazione si basa su centinaia di misurazioni e parametri di riferimento ben fondati, che mantengono l'obiettività.Price comparison

