100 W Core i7-8809G contro 28 W Core i7-1165G7: Tiger Lake può superare l'esotico chipset Intel-AMD?
Intel e AMD hanno fatto increspature nel loro settore quando hanno annunciato una partnership nel 2017 per co-sviluppare la piattaforma Kaby Lake-G. Era un chipset unico nel suo genere che ha sposato una CPU quad-core Kaby Lake-H con una GPU Radeon RX Vega, il tutto avvolto sotto un involucro di 100 W TDP. Non è durato molto a lungo sul mercato, tuttavia, in parte a causa del suo supporto molto limitato da parte dei principali produttori di PC
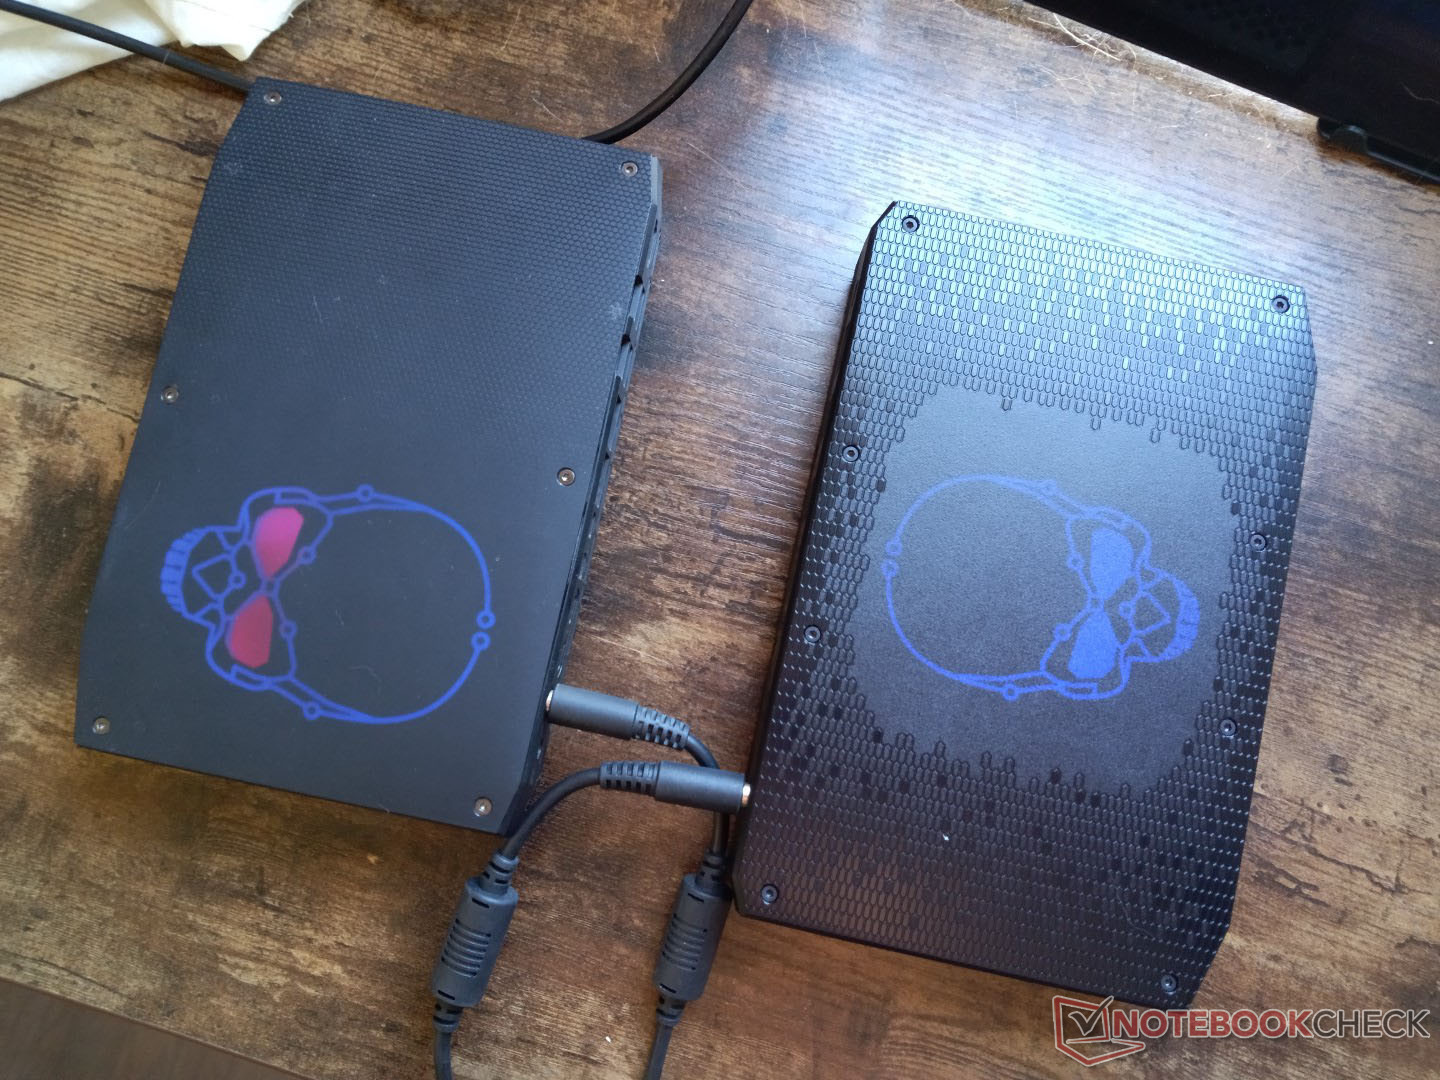
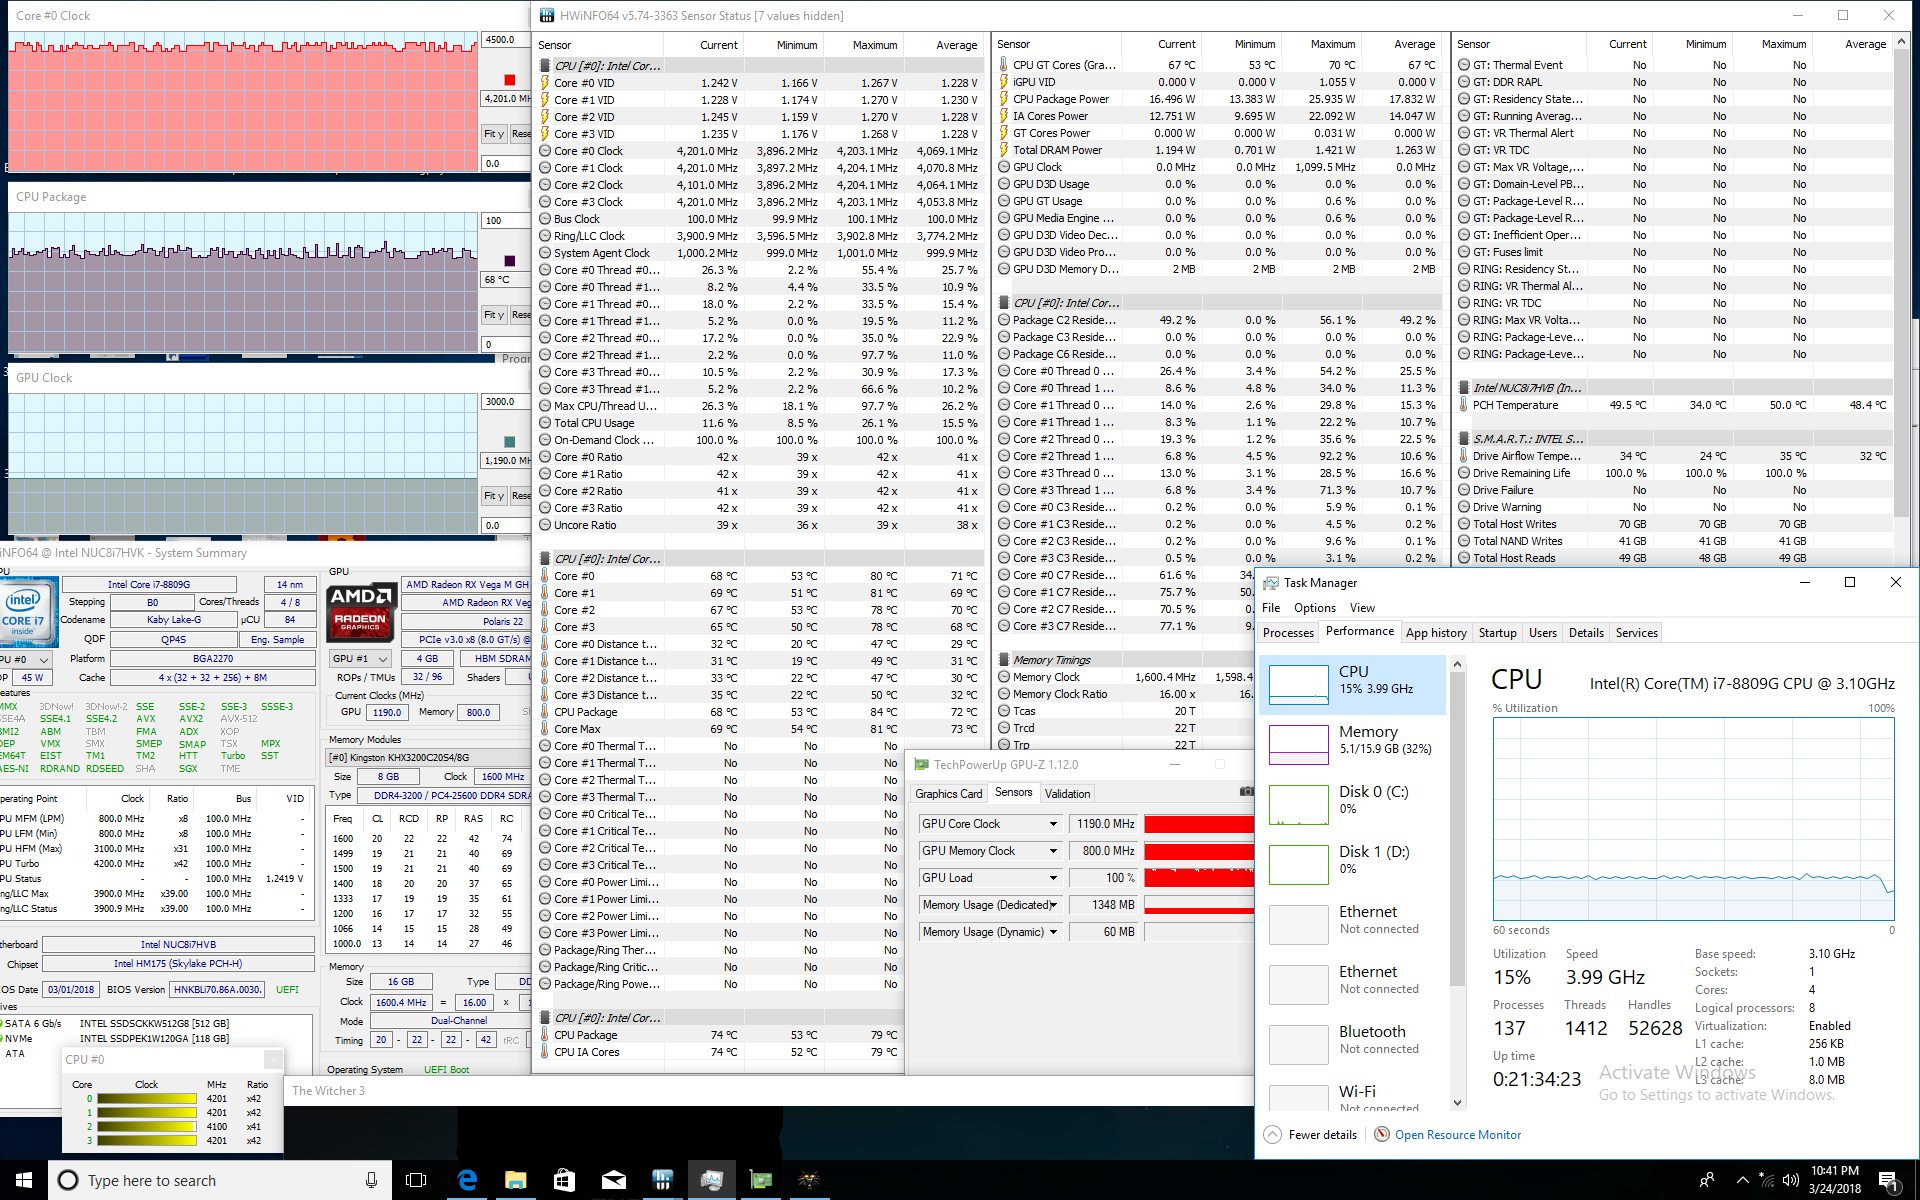
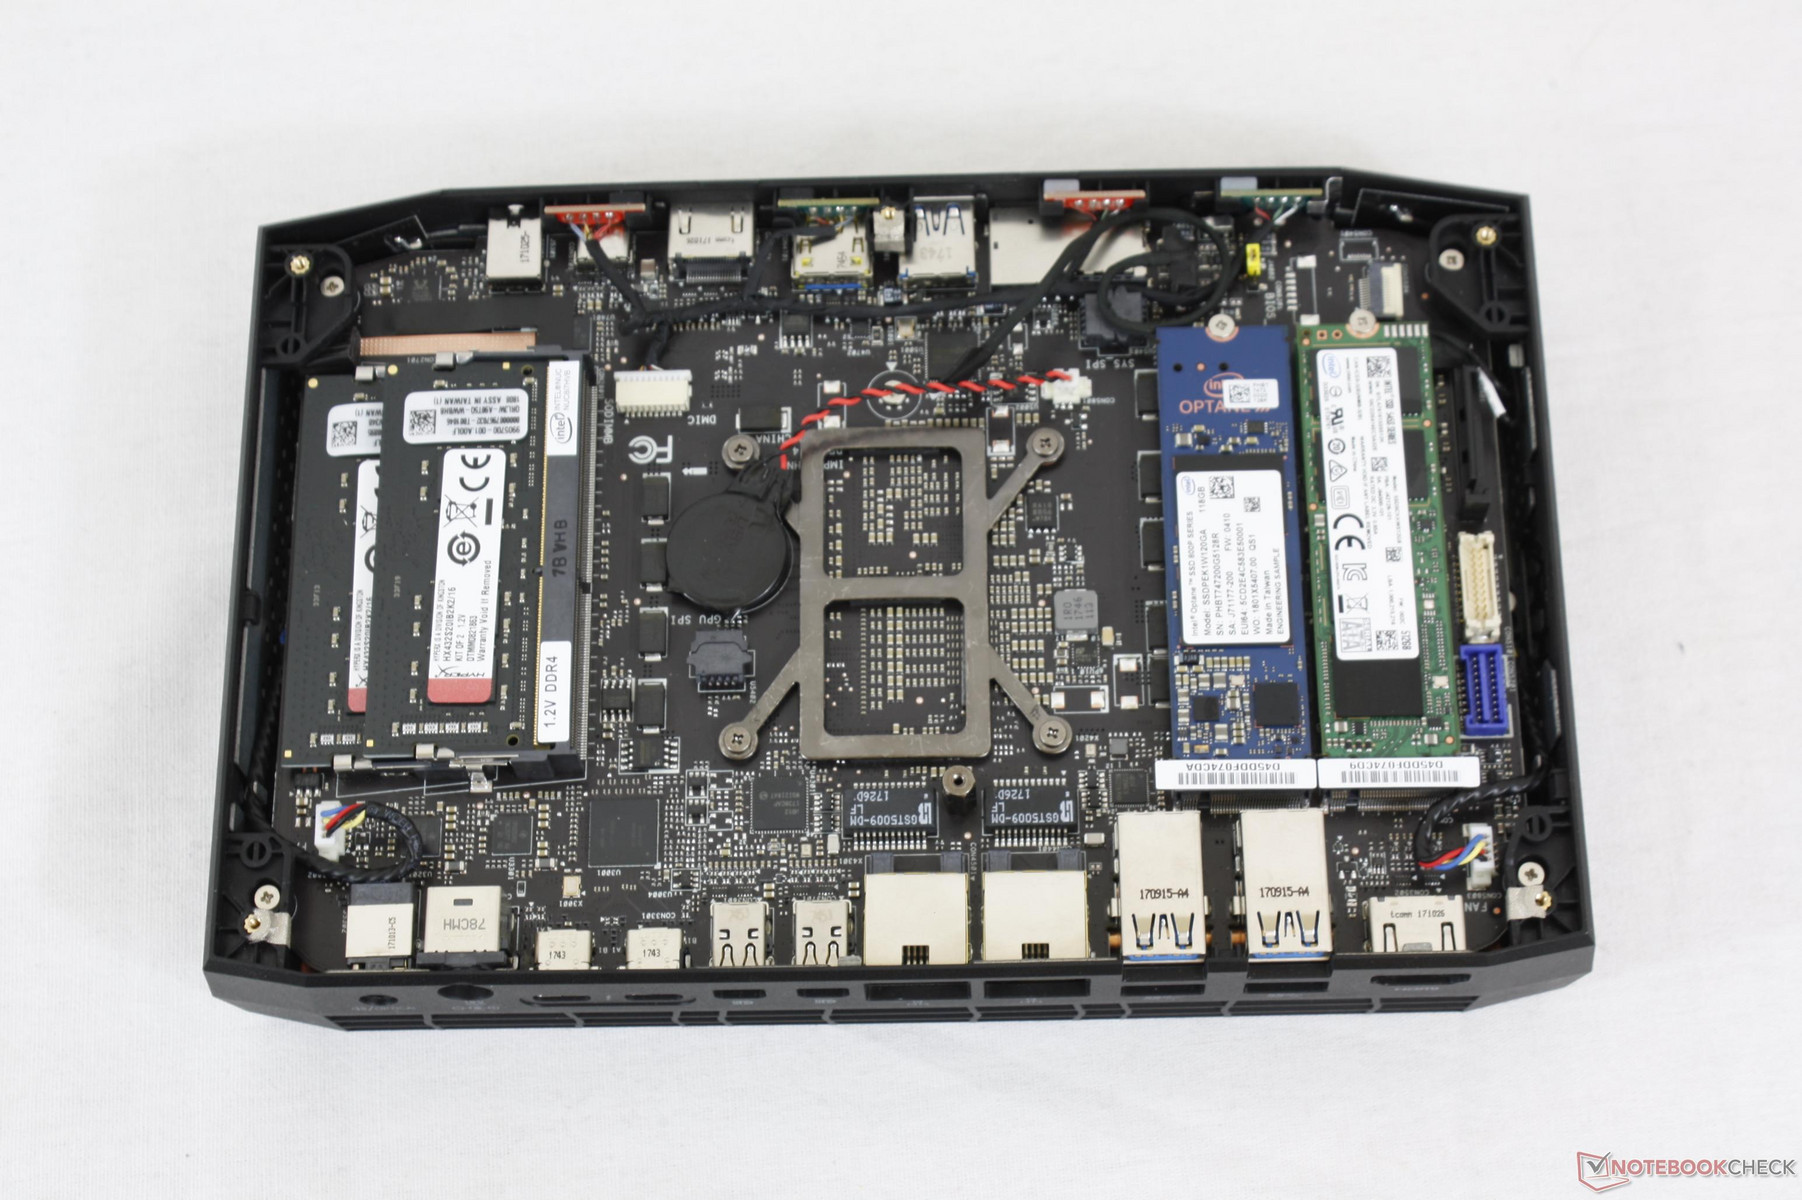
Il NUC 2018 Hades Canyon rimane il solo e unico campione del Kaby Lake-G Core i7-8809G processore. Mentre sarebbe sciocco aspettarsi che corra veloce come le ultime soluzioni del 2021, siamo ancora interessati a vedere quanto divario di prestazioni esiste tra il raro Core i7-8809G da 100 W e l'attuale piattaforma Tiger Lake-U da 28 W
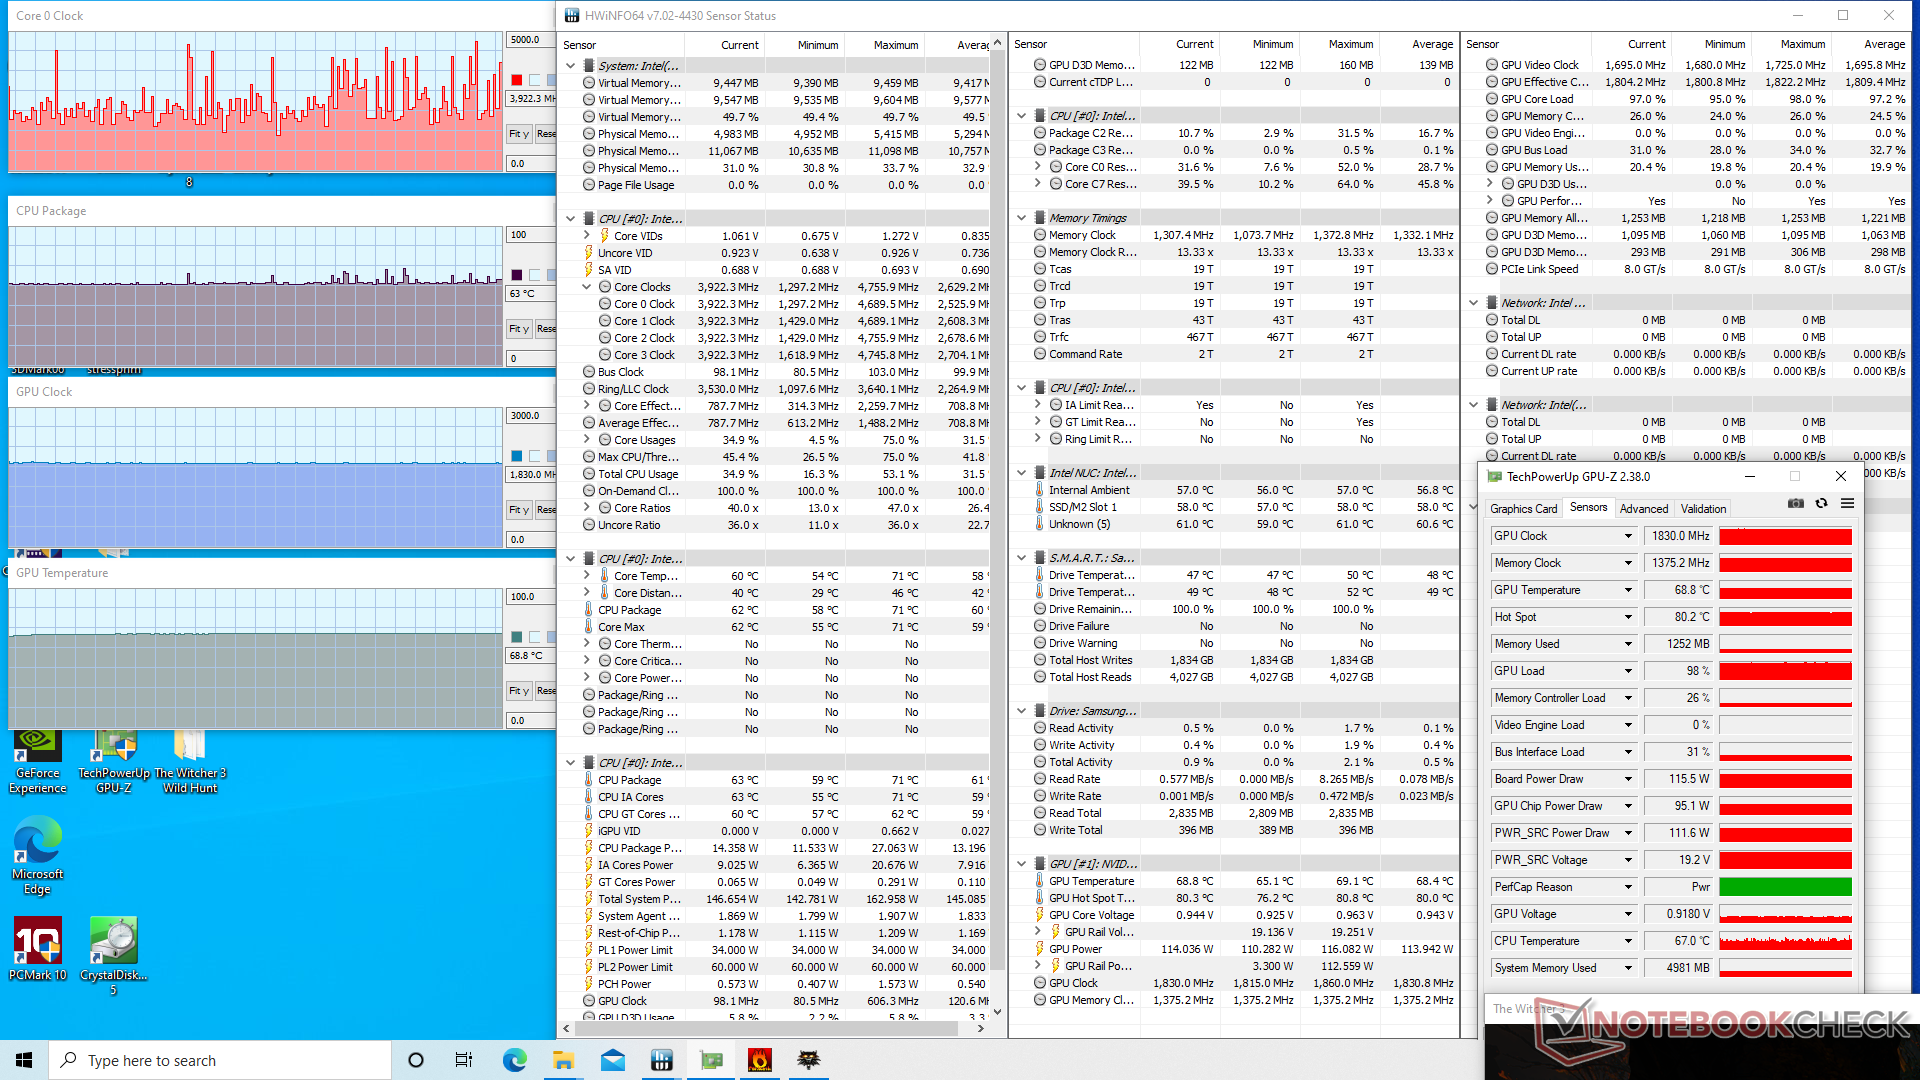
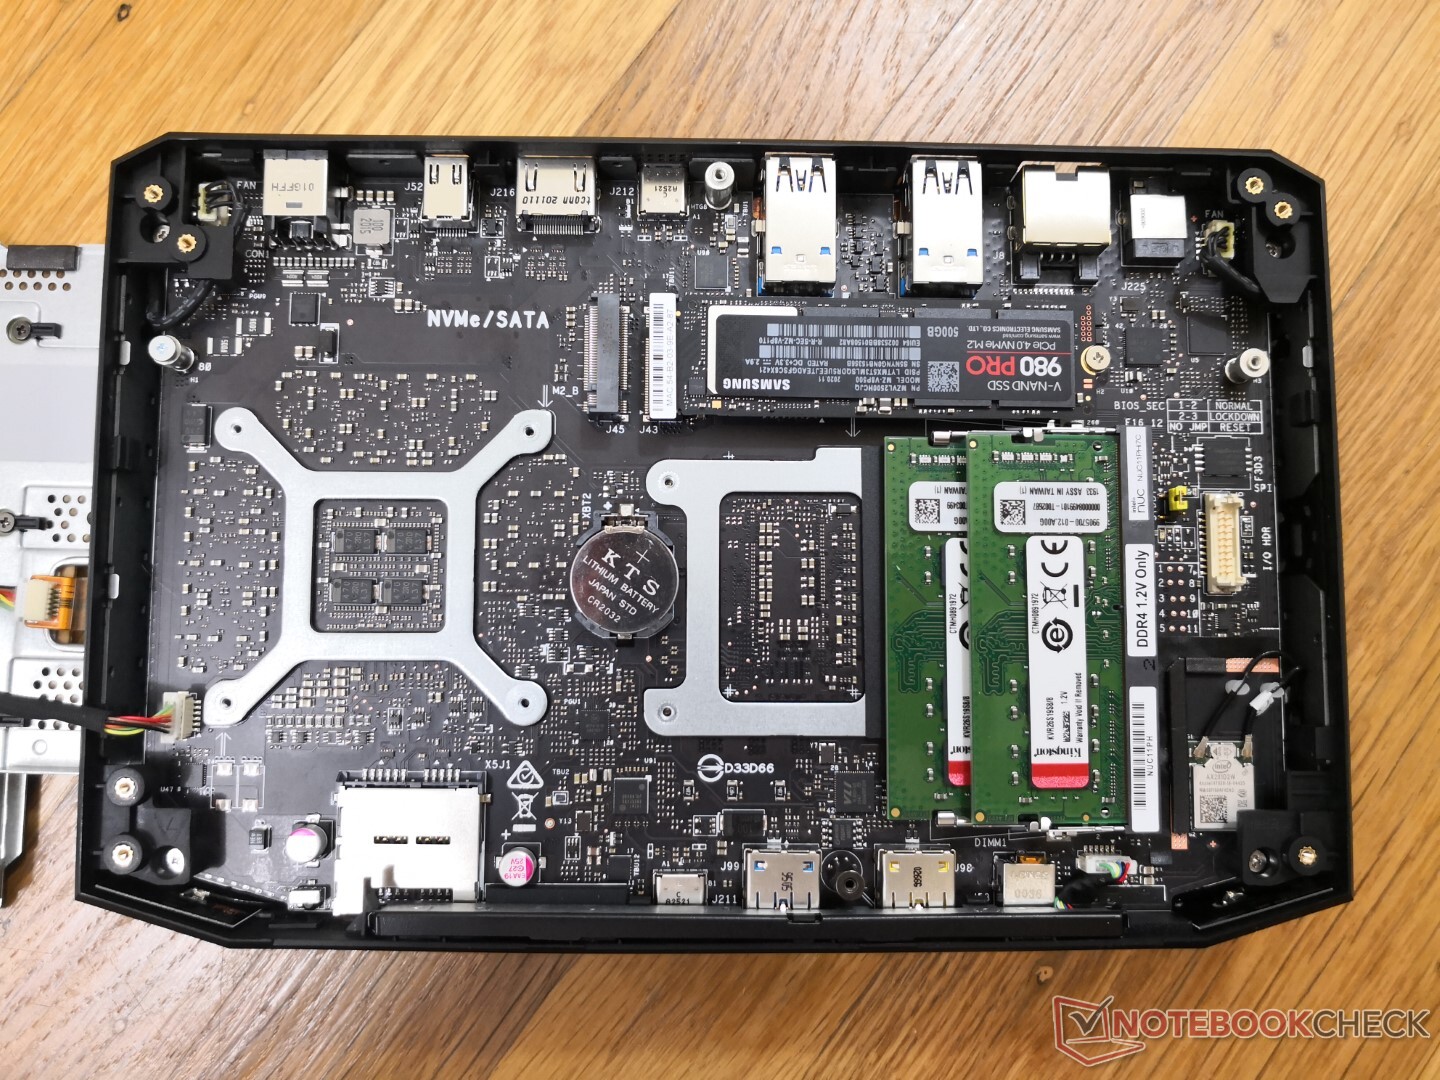
Il NUC11 Phantom Canyon succede direttamente al NUC8 Hades Canyon per renderlo il sistema perfetto per un confronto testa a testa. I benchmark multi-thread come CineBench, Blender e HWBOT x265 mostrano che il Core i7-8809G e il Core i7-1165G7 sono molto vicini l'uno all'altro nonostante le enormi differenze nei livelli di TDP. Tuttavia, la CPU più recente supera di gran lunga la CPU Intel-AMD quando si tratta di carichi single-threaded
Quando si guarda la Radeon RX Vega M GH e mobile GeForce RTX 2060quest'ultima offre frame rate significativamente più veloci soprattutto quando si eseguono titoli DX12 esigenti a risoluzioni più elevate, dove le prestazioni diventano più legate alla GPU
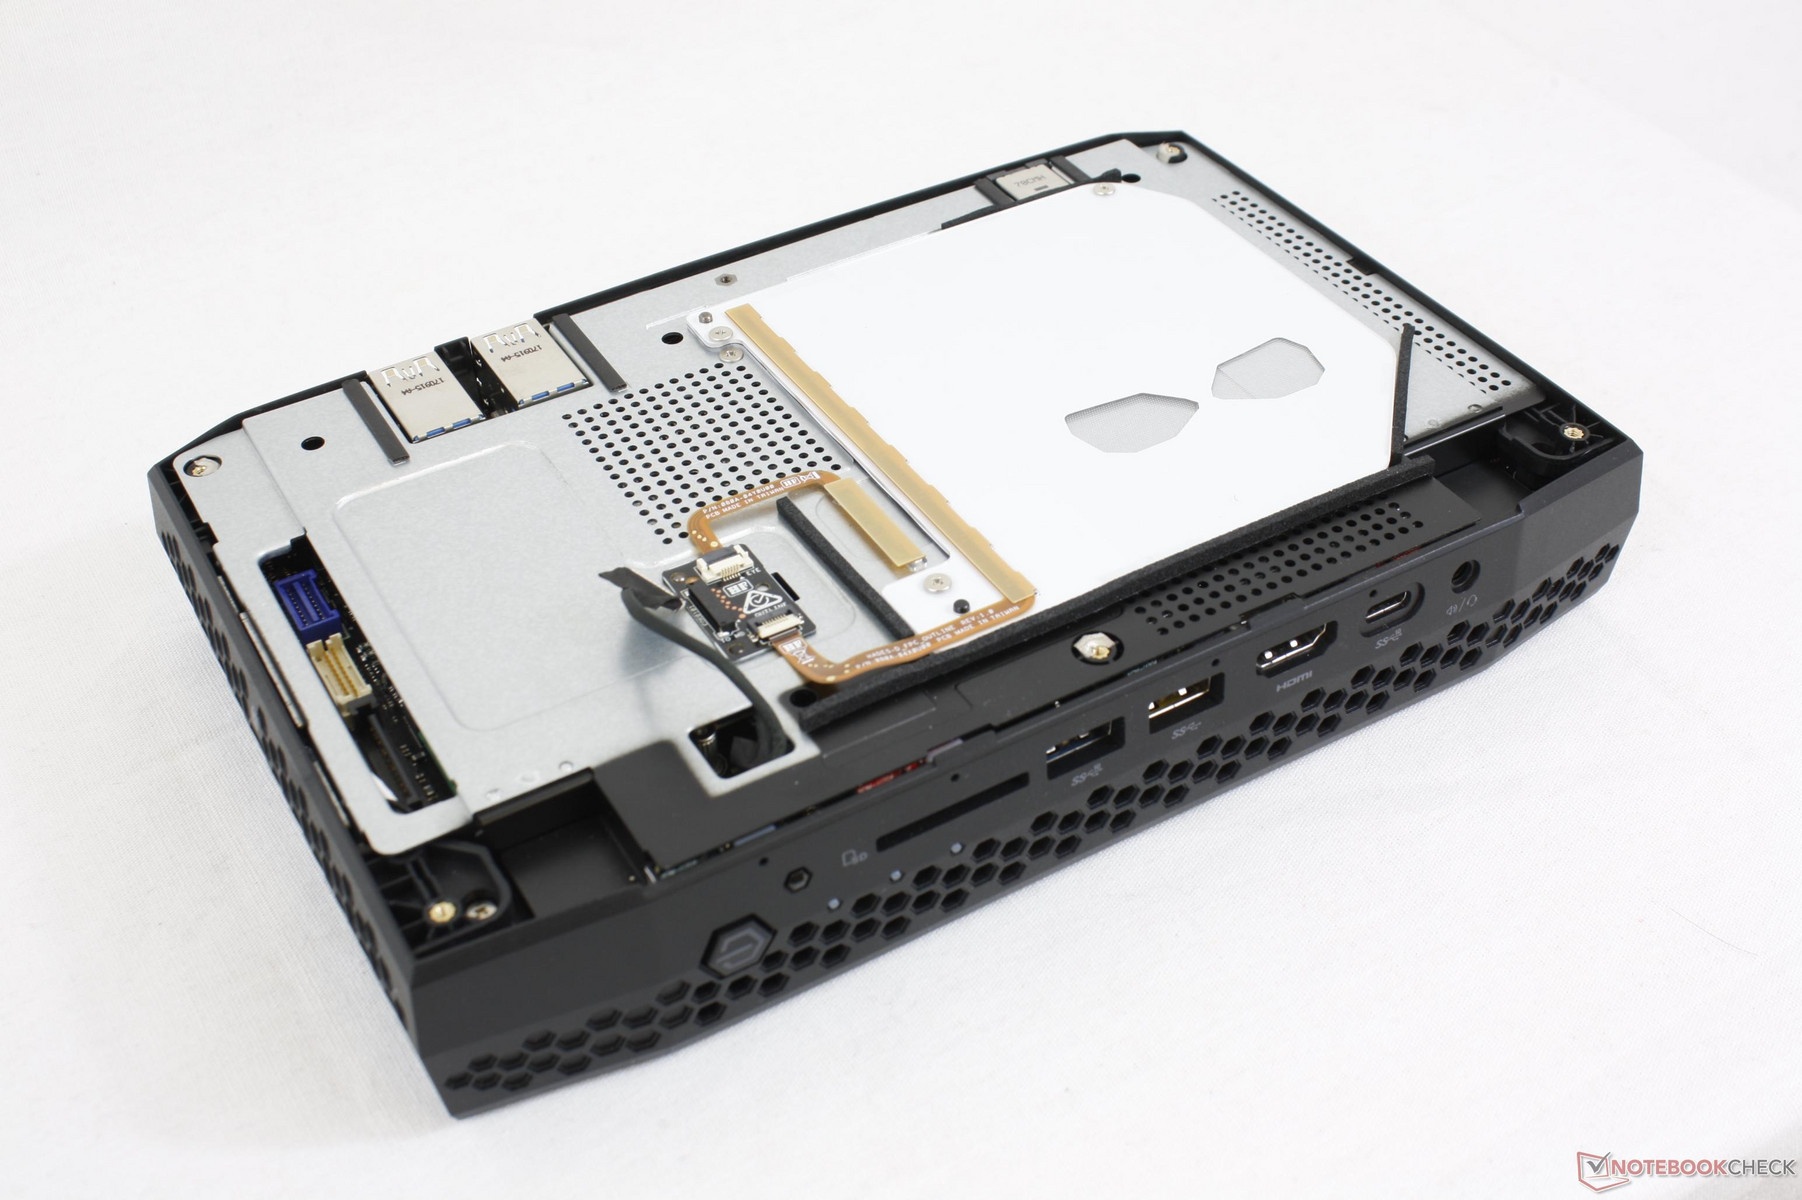
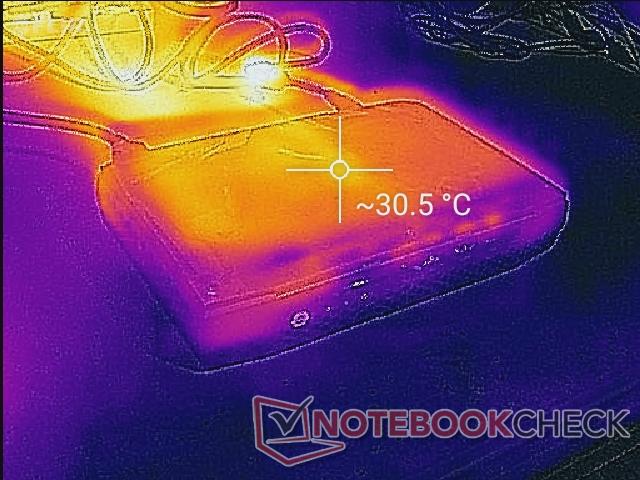
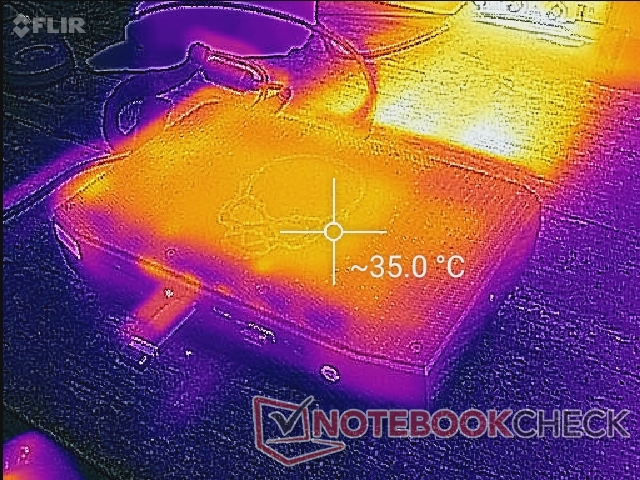
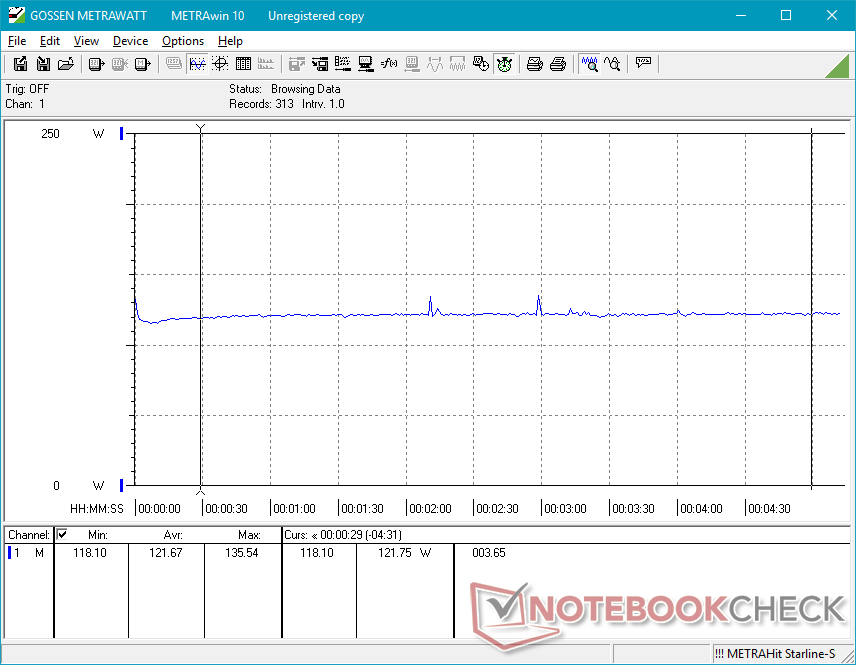
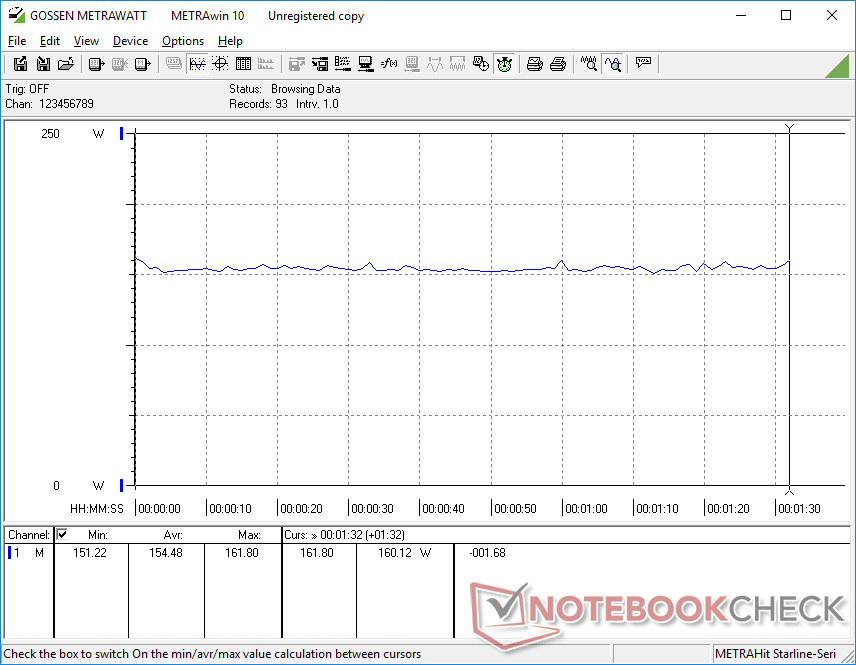
Il consumo complessivo di energia è più alto su Phantom Canyon che su Hades Canyon, il che significa che l'aumento delle prestazioni non è gratuito. Tuttavia, l'aumento del consumo è molto più piccolo rispetto all'aumento delle prestazioni in termini percentuali per prestazioni gen-to-gen più elevate per watt. Inoltre, le temperature del nucleo e il rumore della ventola rimarrebbero relativamente coerenti tra i due NUCs nonostante i grandi divari di prestazioni. Gli utenti stanno ottenendo più prestazioni senza che la macchina sia più rumorosa o più calda.
Kaby Lake-G è stato divertente finché è durato, ma Phantom Canyon è la prova che non c'è bisogno di un'architettura esotica quando CPU e GPU "stock" possono fare lo stesso e con un migliore supporto software.
Vedi le nostre recensioni complete sul NUC8 Hades Canyon e NUC11 Phantom Canyon per saperne di più su questi NUC da gioco.
| Intel NUC8 Hades Canyon Core Specifiche tecniche | Intel NUC11 Phantom Canyon Specifiche del nucleo |
|---|---|
| 8° gen Intel Core i7-8809G CPU Kaby Lake-G 100 W TDP combinato CPU e GPU GPU discreta Radeon RX Vega M GH 4 GB HBM2 VRAM lancio 2018 | CPU Intel Core i7-1165G7 di 11a generazione Tiger Lake-U 28 W TDP CPU + 80 W - 90 W TGP GPU Discreto GeForce RTX 2060 mobile GPU 6 GB GDDR6 VRAM 2021 lancio |
| Intel NUC8 Hades Canyon Porte | Intel NUC11 Phantom Canyon Porte |
|---|---|
| 2x mini-DisplayPort 1.3 2x 1 Gbps RJ-45 6x USB-A 3x USB-C (2x Thunderbolt 3) 2x HDMI 2.0a 1x ottica 1x 3.5 mm audio | 1x mini-DisplayPort 1.4 1x 2.5 Gbps RJ-45 6x USB-A 2x USB-C (2x Thunderbolt 4) 1x HDMI 2.0b 1x Optical 1x 3.5 mm audio |
Cinebench R15: CPU Multi 64Bit | CPU Single 64Bit
Blender: v2.79 BMW27 CPU
7-Zip 18.03: 7z b 4 -mmt1 | 7z b 4
Geekbench 5.5: Single-Core | Multi-Core
HWBOT x265 Benchmark v2.2: 4k Preset
LibreOffice : 20 Documents To PDF
R Benchmark 2.5: Overall mean
| Cinebench R20 / CPU (Multi Core) | |
| Intel Hades Canyon NUC8i7HVK | |
| Intel NUC11PHKi7C | |
| Cinebench R20 / CPU (Single Core) | |
| Intel NUC11PHKi7C | |
| Intel Hades Canyon NUC8i7HVK | |
| Cinebench R15 / CPU Multi 64Bit | |
| Intel NUC11PHKi7C | |
| Intel Hades Canyon NUC8i7HVK | |
| Cinebench R15 / CPU Single 64Bit | |
| Intel NUC11PHKi7C | |
| Intel Hades Canyon NUC8i7HVK | |
| Blender / v2.79 BMW27 CPU | |
| Intel NUC11PHKi7C | |
| Intel Hades Canyon NUC8i7HVK | |
| 7-Zip 18.03 / 7z b 4 -mmt1 | |
| Intel NUC11PHKi7C | |
| Intel Hades Canyon NUC8i7HVK | |
| 7-Zip 18.03 / 7z b 4 | |
| Intel NUC11PHKi7C | |
| Intel Hades Canyon NUC8i7HVK | |
| Geekbench 5.5 / Single-Core | |
| Intel NUC11PHKi7C | |
| Geekbench 5.5 / Multi-Core | |
| Intel NUC11PHKi7C | |
| HWBOT x265 Benchmark v2.2 / 4k Preset | |
| Intel NUC11PHKi7C | |
| Intel Hades Canyon NUC8i7HVK | |
| LibreOffice / 20 Documents To PDF | |
| Intel NUC11PHKi7C | |
| R Benchmark 2.5 / Overall mean | |
| Intel NUC11PHKi7C | |
* ... Meglio usare valori piccoli
| 3DMark | |
| 1920x1080 Fire Strike Graphics | |
| Intel NUC11PHKi7C | |
| Intel Hades Canyon NUC8i7HVK | |
| Media Intel Iris Xe Graphics G7 96EUs (2286 - 6624, n=222) | |
| 2560x1440 Time Spy Graphics | |
| Intel NUC11PHKi7C | |
| Intel Hades Canyon NUC8i7HVK | |
| Media Intel Iris Xe Graphics G7 96EUs (707 - 1890, n=218) | |
| 2560x1440 Time Spy Score | |
| Intel NUC11PHKi7C | |
| Intel Hades Canyon NUC8i7HVK | |
| Media Intel Iris Xe Graphics G7 96EUs (789 - 2159, n=215) | |
| 3840x2160 Fire Strike Ultra Graphics | |
| Intel NUC11PHKi7C | |
| Intel Hades Canyon NUC8i7HVK | |
| Media Intel Iris Xe Graphics G7 96EUs (599 - 1458, n=94) | |
| 3DMark 11 | |
| 1280x720 Performance GPU | |
| Intel NUC11PHKi7C | |
| Intel Hades Canyon NUC8i7HVK | |
| Media Intel Iris Xe Graphics G7 96EUs (2867 - 7676, n=209) | |
| 1280x720 Performance Combined | |
| Intel NUC11PHKi7C | |
| Intel Hades Canyon NUC8i7HVK | |
| Media Intel Iris Xe Graphics G7 96EUs (1926 - 7661, n=208) | |
| Final Fantasy XV Benchmark | |
| 1280x720 Lite Quality | |
| Intel NUC11PHKi7C | |
| Intel Hades Canyon NUC8i7HVK | |
| Media Intel Iris Xe Graphics G7 96EUs (14.9 - 56.5, n=189) | |
| 1920x1080 Standard Quality | |
| Intel NUC11PHKi7C | |
| Intel Hades Canyon NUC8i7HVK | |
| Media Intel Iris Xe Graphics G7 96EUs (10.5 - 31.2, n=185) | |
| 1920x1080 High Quality | |
| Intel NUC11PHKi7C | |
| Intel Hades Canyon NUC8i7HVK | |
| Media Intel Iris Xe Graphics G7 96EUs (8.15 - 27.8, n=178) | |
| GTA V | |
| 1024x768 Lowest Settings possible | |
| Intel NUC11PHKi7C | |
| Intel Hades Canyon NUC8i7HVK | |
| Media Intel Iris Xe Graphics G7 96EUs (52 - 166.4, n=168) | |
| 1920x1080 Lowest Settings possible | |
| Intel Hades Canyon NUC8i7HVK | |
| Intel NUC11PHKi7C | |
| Media Intel Iris Xe Graphics G7 96EUs (34.7 - 132.1, n=141) | |
| 1366x768 Normal/Off AF:4x | |
| Intel Hades Canyon NUC8i7HVK | |
| Intel NUC11PHKi7C | |
| Media Intel Iris Xe Graphics G7 96EUs (24.1 - 152.7, n=169) | |
| 1920x1080 Normal/Off AF:4x | |
| Intel Hades Canyon NUC8i7HVK | |
| Intel NUC11PHKi7C | |
| Media Intel Iris Xe Graphics G7 96EUs (20 - 119.3, n=142) | |
| 1920x1080 High/On (Advanced Graphics Off) AA:2xMSAA + FX AF:8x | |
| Intel NUC11PHKi7C | |
| Intel Hades Canyon NUC8i7HVK | |
| Media Intel Iris Xe Graphics G7 96EUs (9.39 - 51.6, n=162) | |
| 1920x1080 Highest AA:4xMSAA + FX AF:16x | |
| Intel NUC11PHKi7C | |
| Intel Hades Canyon NUC8i7HVK | |
| Media Intel Iris Xe Graphics G7 96EUs (4.13 - 22.9, n=156) | |
| Dota 2 Reborn | |
| 1280x720 min (0/3) fastest | |
| Intel NUC11PHKi7C | |
| Intel Hades Canyon NUC8i7HVK | |
| Media Intel Iris Xe Graphics G7 96EUs (36 - 148, n=221) | |
| 1366x768 med (1/3) | |
| Intel NUC11PHKi7C | |
| Intel Hades Canyon NUC8i7HVK | |
| Media Intel Iris Xe Graphics G7 96EUs (31.6 - 108.5, n=221) | |
| 1920x1080 high (2/3) | |
| Intel NUC11PHKi7C | |
| Intel Hades Canyon NUC8i7HVK | |
| Media Intel Iris Xe Graphics G7 96EUs (23.2 - 88.1, n=221) | |
| 1920x1080 ultra (3/3) best looking | |
| Intel NUC11PHKi7C | |
| Intel Hades Canyon NUC8i7HVK | |
| Media Intel Iris Xe Graphics G7 96EUs (20.6 - 78.5, n=221) | |
| The Witcher 3 | |
| 1024x768 Low Graphics & Postprocessing | |
| Intel NUC11PHKi7C | |
| Intel Hades Canyon NUC8i7HVK | |
| Media Intel Iris Xe Graphics G7 96EUs (28.9 - 117.2, n=188) | |
| 1366x768 Medium Graphics & Postprocessing | |
| Intel NUC11PHKi7C | |
| Intel Hades Canyon NUC8i7HVK | |
| Media Intel Iris Xe Graphics G7 96EUs (21.4 - 77.8, n=185) | |
| 1920x1080 High Graphics & Postprocessing (Nvidia HairWorks Off) | |
| Intel NUC11PHKi7C | |
| Intel Hades Canyon NUC8i7HVK | |
| Media Intel Iris Xe Graphics G7 96EUs (10.6 - 45.9, n=191) | |
| 1920x1080 Ultra Graphics & Postprocessing (HBAO+) | |
| Intel NUC11PHKi7C | |
| Intel Hades Canyon NUC8i7HVK | |
| Media Intel Iris Xe Graphics G7 96EUs (8.79 - 20.1, n=181) | |
| X-Plane 11.11 | |
| 1280x720 low (fps_test=1) | |
| Intel NUC11PHKi7C | |
| Intel Hades Canyon NUC8i7HVK | |
| Media Intel Iris Xe Graphics G7 96EUs (13.4 - 88.4, n=213) | |
| 1920x1080 med (fps_test=2) | |
| Intel NUC11PHKi7C | |
| Intel Hades Canyon NUC8i7HVK | |
| Media Intel Iris Xe Graphics G7 96EUs (11.6 - 69.5, n=214) | |
| 1920x1080 high (fps_test=3) | |
| Intel NUC11PHKi7C | |
| Intel Hades Canyon NUC8i7HVK | |
| Media Intel Iris Xe Graphics G7 96EUs (11.1 - 59.8, n=213) | |
| Strange Brigade | |
| 1280x720 lowest AF:1 | |
| Intel NUC11PHKi7C | |
| Intel Hades Canyon NUC8i7HVK | |
| Media Intel Iris Xe Graphics G7 96EUs (48.5 - 115.1, n=172) | |
| 1920x1080 medium AA:medium AF:4 | |
| Intel NUC11PHKi7C | |
| Intel Hades Canyon NUC8i7HVK | |
| Media Intel Iris Xe Graphics G7 96EUs (18.2 - 51.4, n=170) | |
| 1920x1080 high AA:high AF:8 | |
| Intel NUC11PHKi7C | |
| Intel Hades Canyon NUC8i7HVK | |
| Media Intel Iris Xe Graphics G7 96EUs (15.4 - 39.8, n=169) | |
| 1920x1080 ultra AA:ultra AF:16 | |
| Intel NUC11PHKi7C | |
| Intel Hades Canyon NUC8i7HVK | |
| Media Intel Iris Xe Graphics G7 96EUs (13.2 - 31.7, n=167) | |
| Networking | |
| iperf3 transmit AX12 | |
| Intel NUC11PHKi7C | |
| Intel Hades Canyon NUC8i7HVK | |
| iperf3 receive AX12 | |
| Intel NUC11PHKi7C | |
| Intel Hades Canyon NUC8i7HVK | |
| SD Card Reader | |
| average JPG Copy Test (av. of 3 runs) | |
| Intel NUC11PHKi7C (Toshiba Exceria Pro SDXC 64 GB UHS-II) | |
| Intel Hades Canyon NUC8i7HVK (Toshiba Exceria Pro SDXC 64 GB UHS-II) | |
| maximum AS SSD Seq Read Test (1GB) | |
| Intel NUC11PHKi7C (Toshiba Exceria Pro SDXC 64 GB UHS-II) | |
| Intel Hades Canyon NUC8i7HVK (Toshiba Exceria Pro SDXC 64 GB UHS-II) | |
| Intel NUC11PHKi7C GeForce RTX 2060 Mobile, i7-1165G7, Samsung SSD 980 Pro 500GB MZ-V8P500BW | Intel Hades Canyon NUC8i7HVK Vega M GH, i7-8809G, Intel Optane 120 GB SSDPEK1W120GA | |
|---|---|---|
| Noise | -10% | |
| off /ambiente * (dB) | 24.5 | 28.7 -17% |
| Idle Minimum * (dB) | 25.3 | 29 -15% |
| Idle Average * (dB) | 25.3 | 29 -15% |
| Idle Maximum * (dB) | 25.3 | 29 -15% |
| Load Average * (dB) | 36.4 | 36 1% |
| Witcher 3 ultra * (dB) | 39.7 | 42 -6% |
| Load Maximum * (dB) | 47.9 | 49.4 -3% |
* ... Meglio usare valori piccoli
| Intel NUC11PHKi7C i7-1165G7, GeForce RTX 2060 Mobile, Samsung SSD 980 Pro 500GB MZ-V8P500BW, , x, | Intel Hades Canyon NUC8i7HVK i7-8809G, Vega M GH, Intel Optane 120 GB SSDPEK1W120GA, , x, | |
|---|---|---|
| Power Consumption | -40% | |
| Idle Minimum * (Watt) | 5.8 | 15.5 -167% |
| Idle Average * (Watt) | 5.9 | 16.2 -175% |
| Idle Maximum * (Watt) | 20.7 | 16.5 20% |
| Load Average * (Watt) | 130.8 | 83.4 36% |
| Witcher 3 ultra * (Watt) | 154.4 | 121.7 21% |
| Load Maximum * (Watt) | 225.2 | 173.5 23% |
* ... Meglio usare valori piccoli

Price comparison

