Recensione dell'Aorus 16X (2024): Core i9 e RTX 4070 per US$2.000
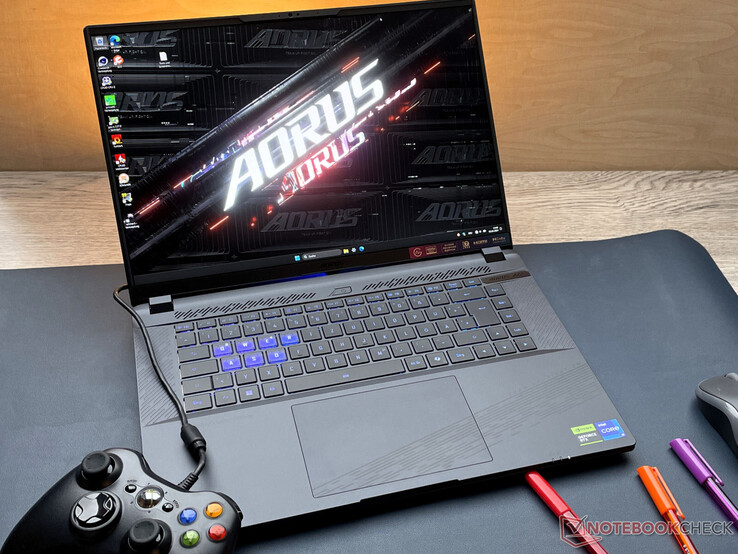
Il gioco, il rendering e la creazione di contenuti sono pubblicizzati come i principali punti di forza di Aorus 16X ASG. Raptor Lake e Ada Lovelace forniscono le prestazioni richieste. I suoi concorrenti includono dispositivi come Alienware m16 R2, HP Omen Transcend 16, XMG Pro 16 Studio (Mid 23), Asus TUF Gaming A17 FA707XI e il Lenovo Legion Pro 5 16IRX9.
Potenziali concorrenti a confrontos
Punteggio | Data | Modello | Peso | Altezza | Dimensione | Risoluzione | Prezzo |
|---|---|---|---|---|---|---|---|
| 87.4 % v7 (old) | 04/2024 | Aorus 16X 2024 i9-14900HX, GeForce RTX 4070 Laptop GPU | 2.3 kg | 20 mm | 16.00" | 2560x1600 | |
| 90.2 % v7 (old) | 03/2024 | Alienware m16 R2 Ultra 7 155H, GeForce RTX 4070 Laptop GPU | 2.5 kg | 23.5 mm | 16.00" | 2560x1600 | |
| 88.4 % v7 (old) | 02/2024 | HP Omen Transcend 16-u1095ng i9-14900HX, GeForce RTX 4070 Laptop GPU | 2.3 kg | 20 mm | 16.00" | 2560x1600 | |
| 85.6 % v7 (old) | 01/2024 | Asus TUF Gaming A17 FA707XI-NS94 R9 7940HS, GeForce RTX 4070 Laptop GPU | 2.5 kg | 25.4 mm | 17.30" | 1920x1080 | |
| 87.9 % v7 (old) | 10/2023 | Schenker XMG Pro 16 Studio (Mid 23) i9-13900H, GeForce RTX 4070 Laptop GPU | 2.6 kg | 19.9 mm | 16.00" | 2560x1600 | |
| 89.3 % v7 (old) | 04/2024 | Lenovo Legion Pro 5 16IRX9 i9-14900HX, GeForce RTX 4070 Laptop GPU | 2.5 kg | 26.95 mm | 16.00" | 2560x1600 |
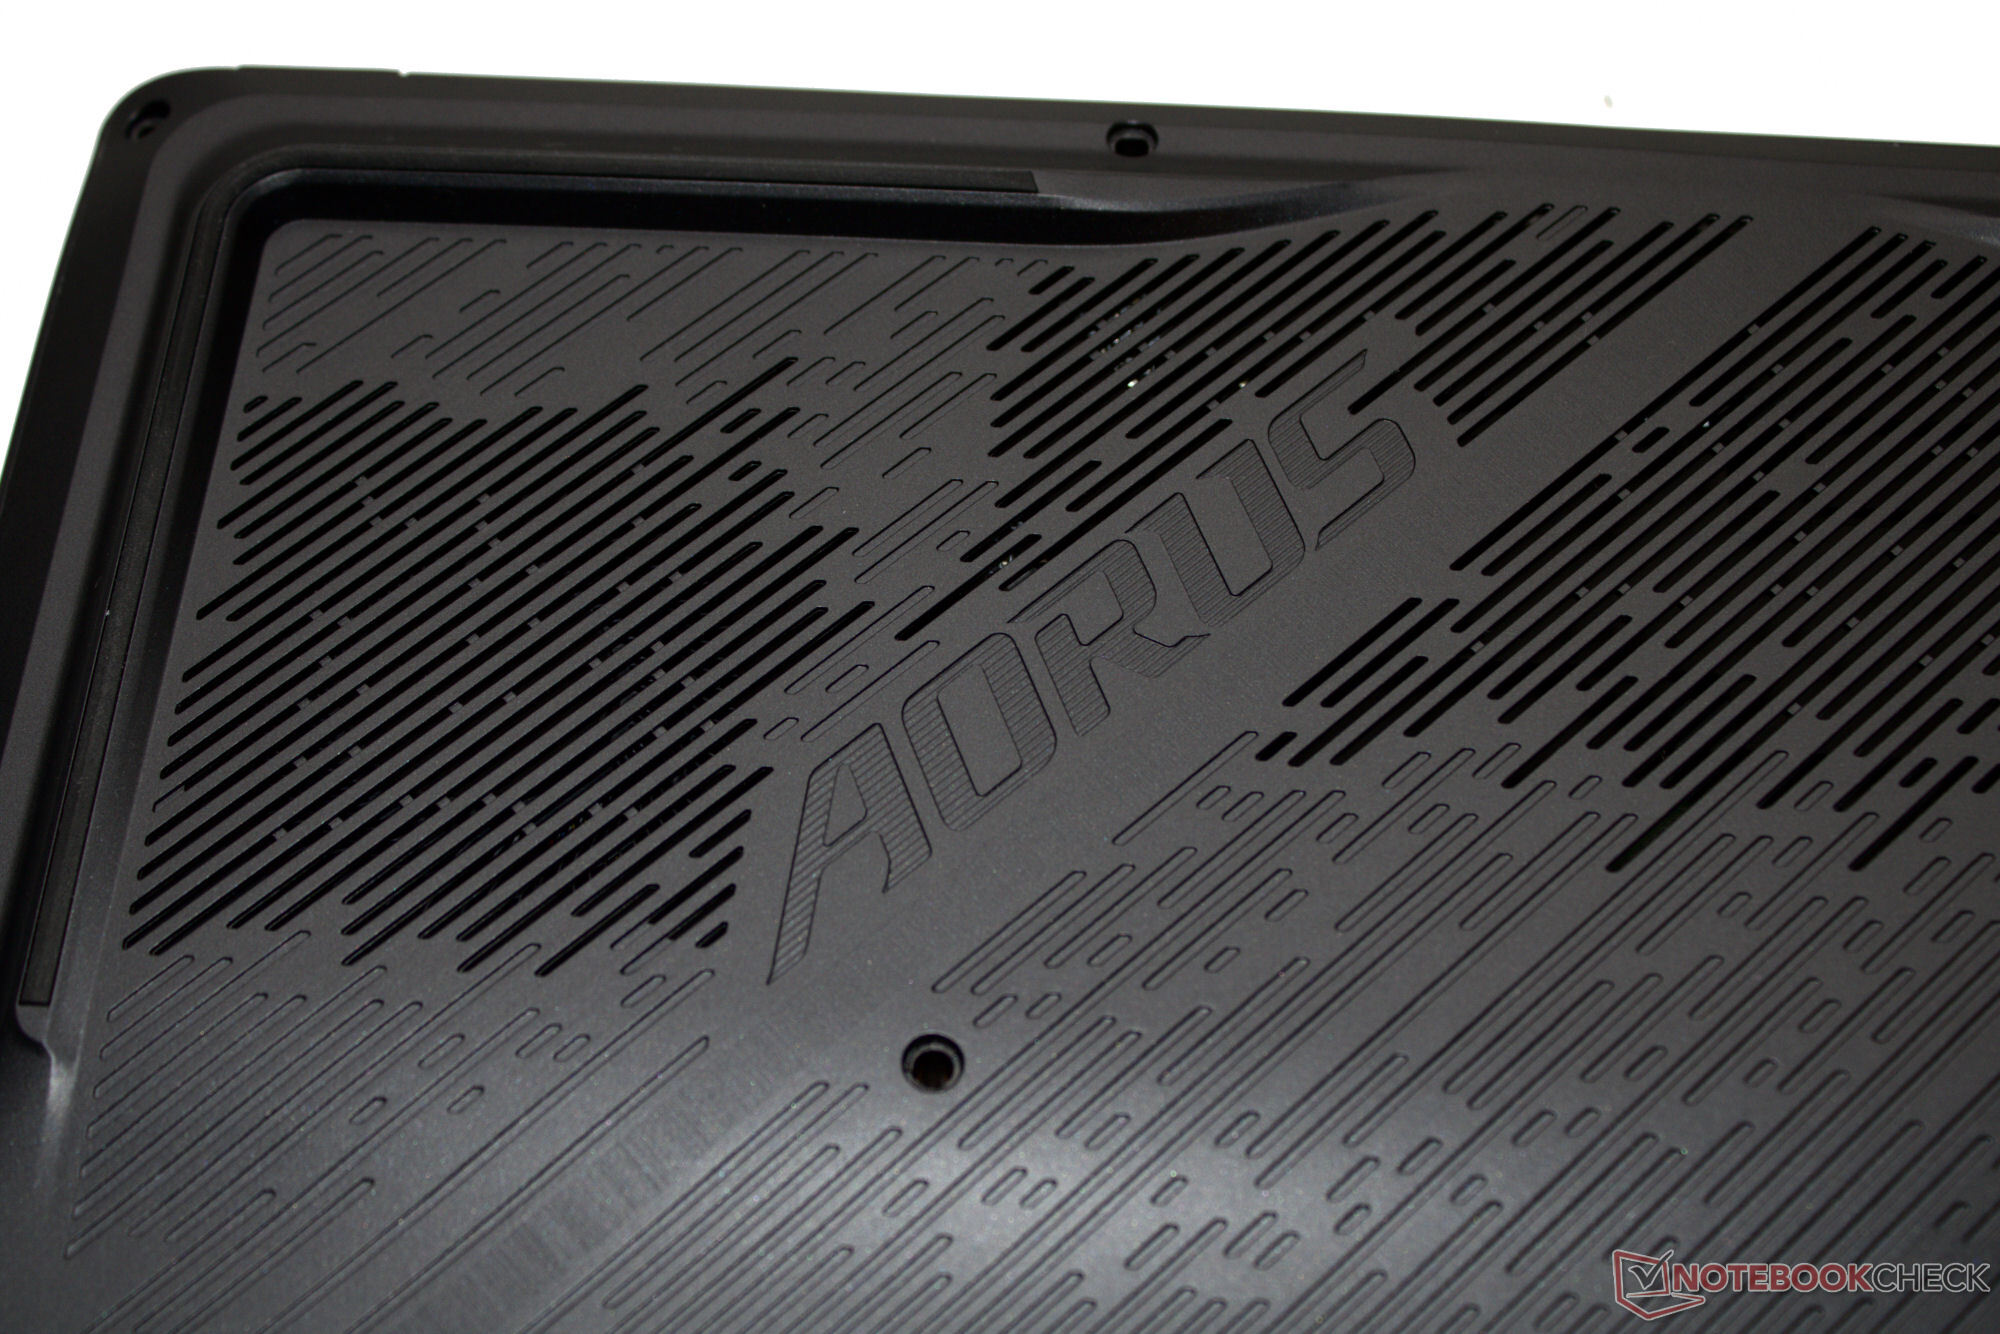
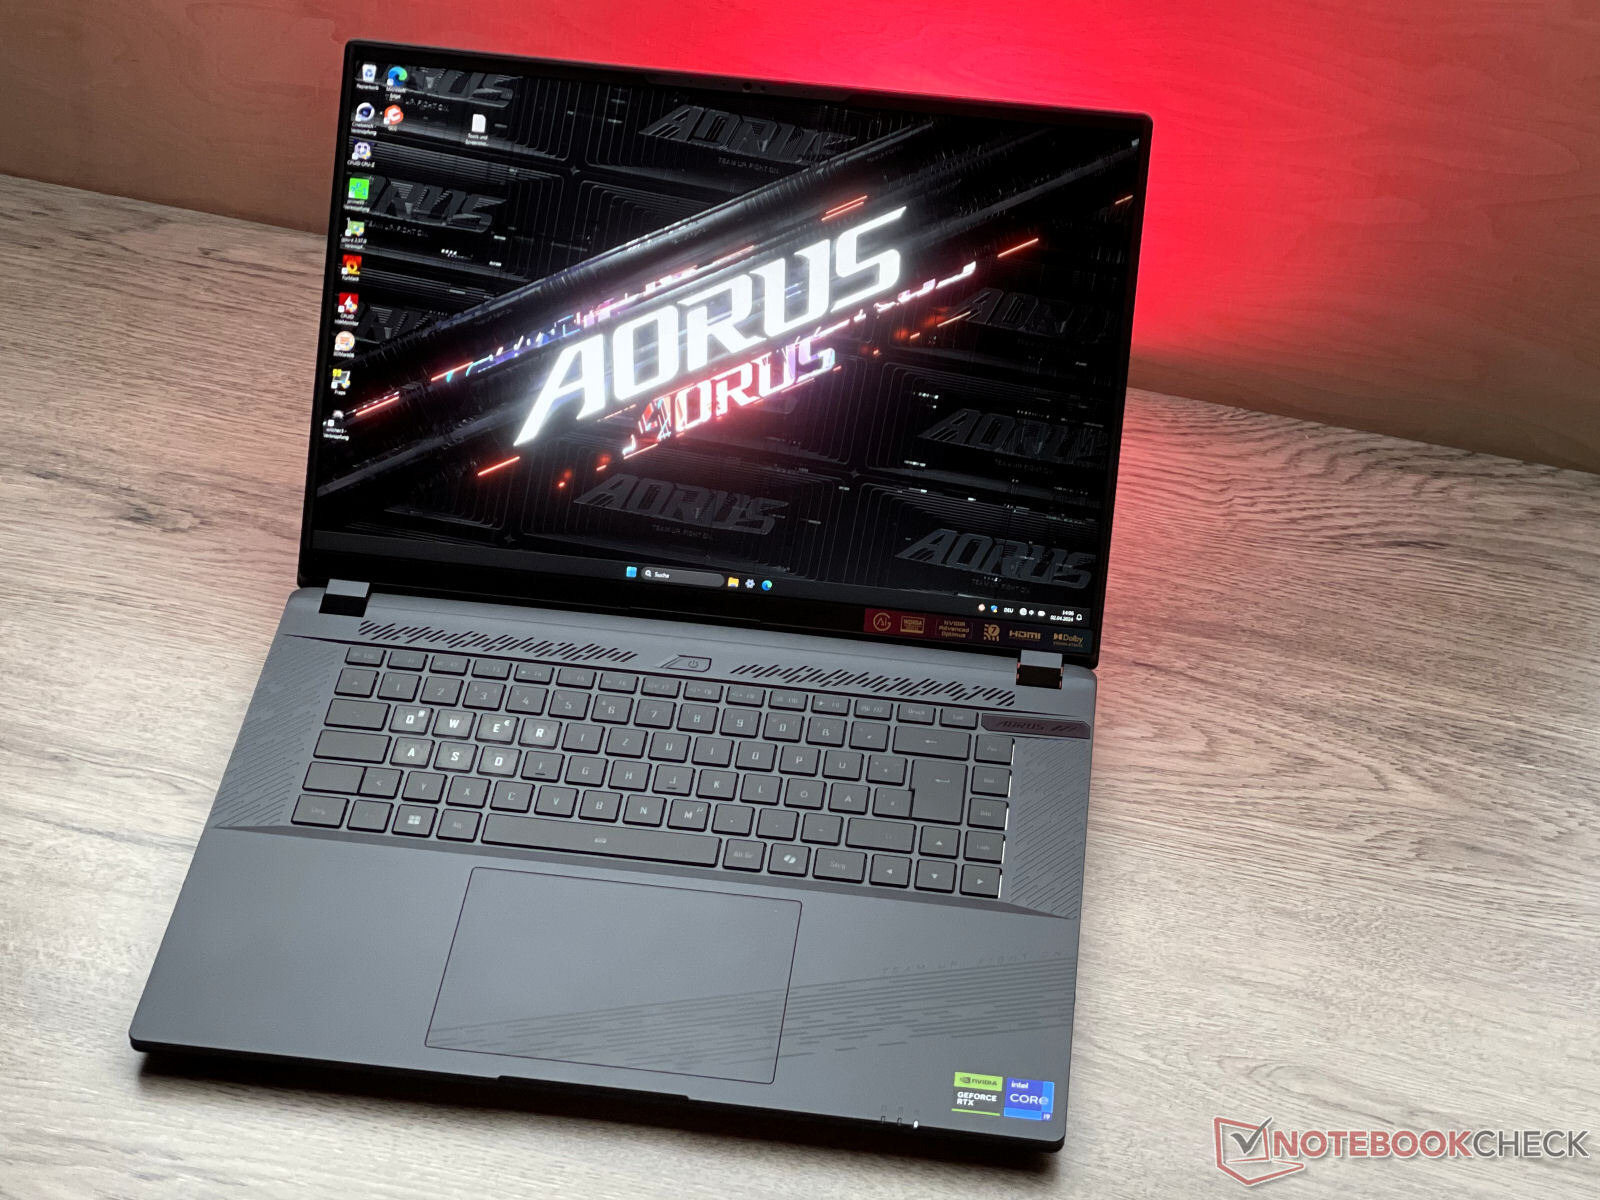
Custodia - Le strisce LED aggiungono un tocco di divertimento
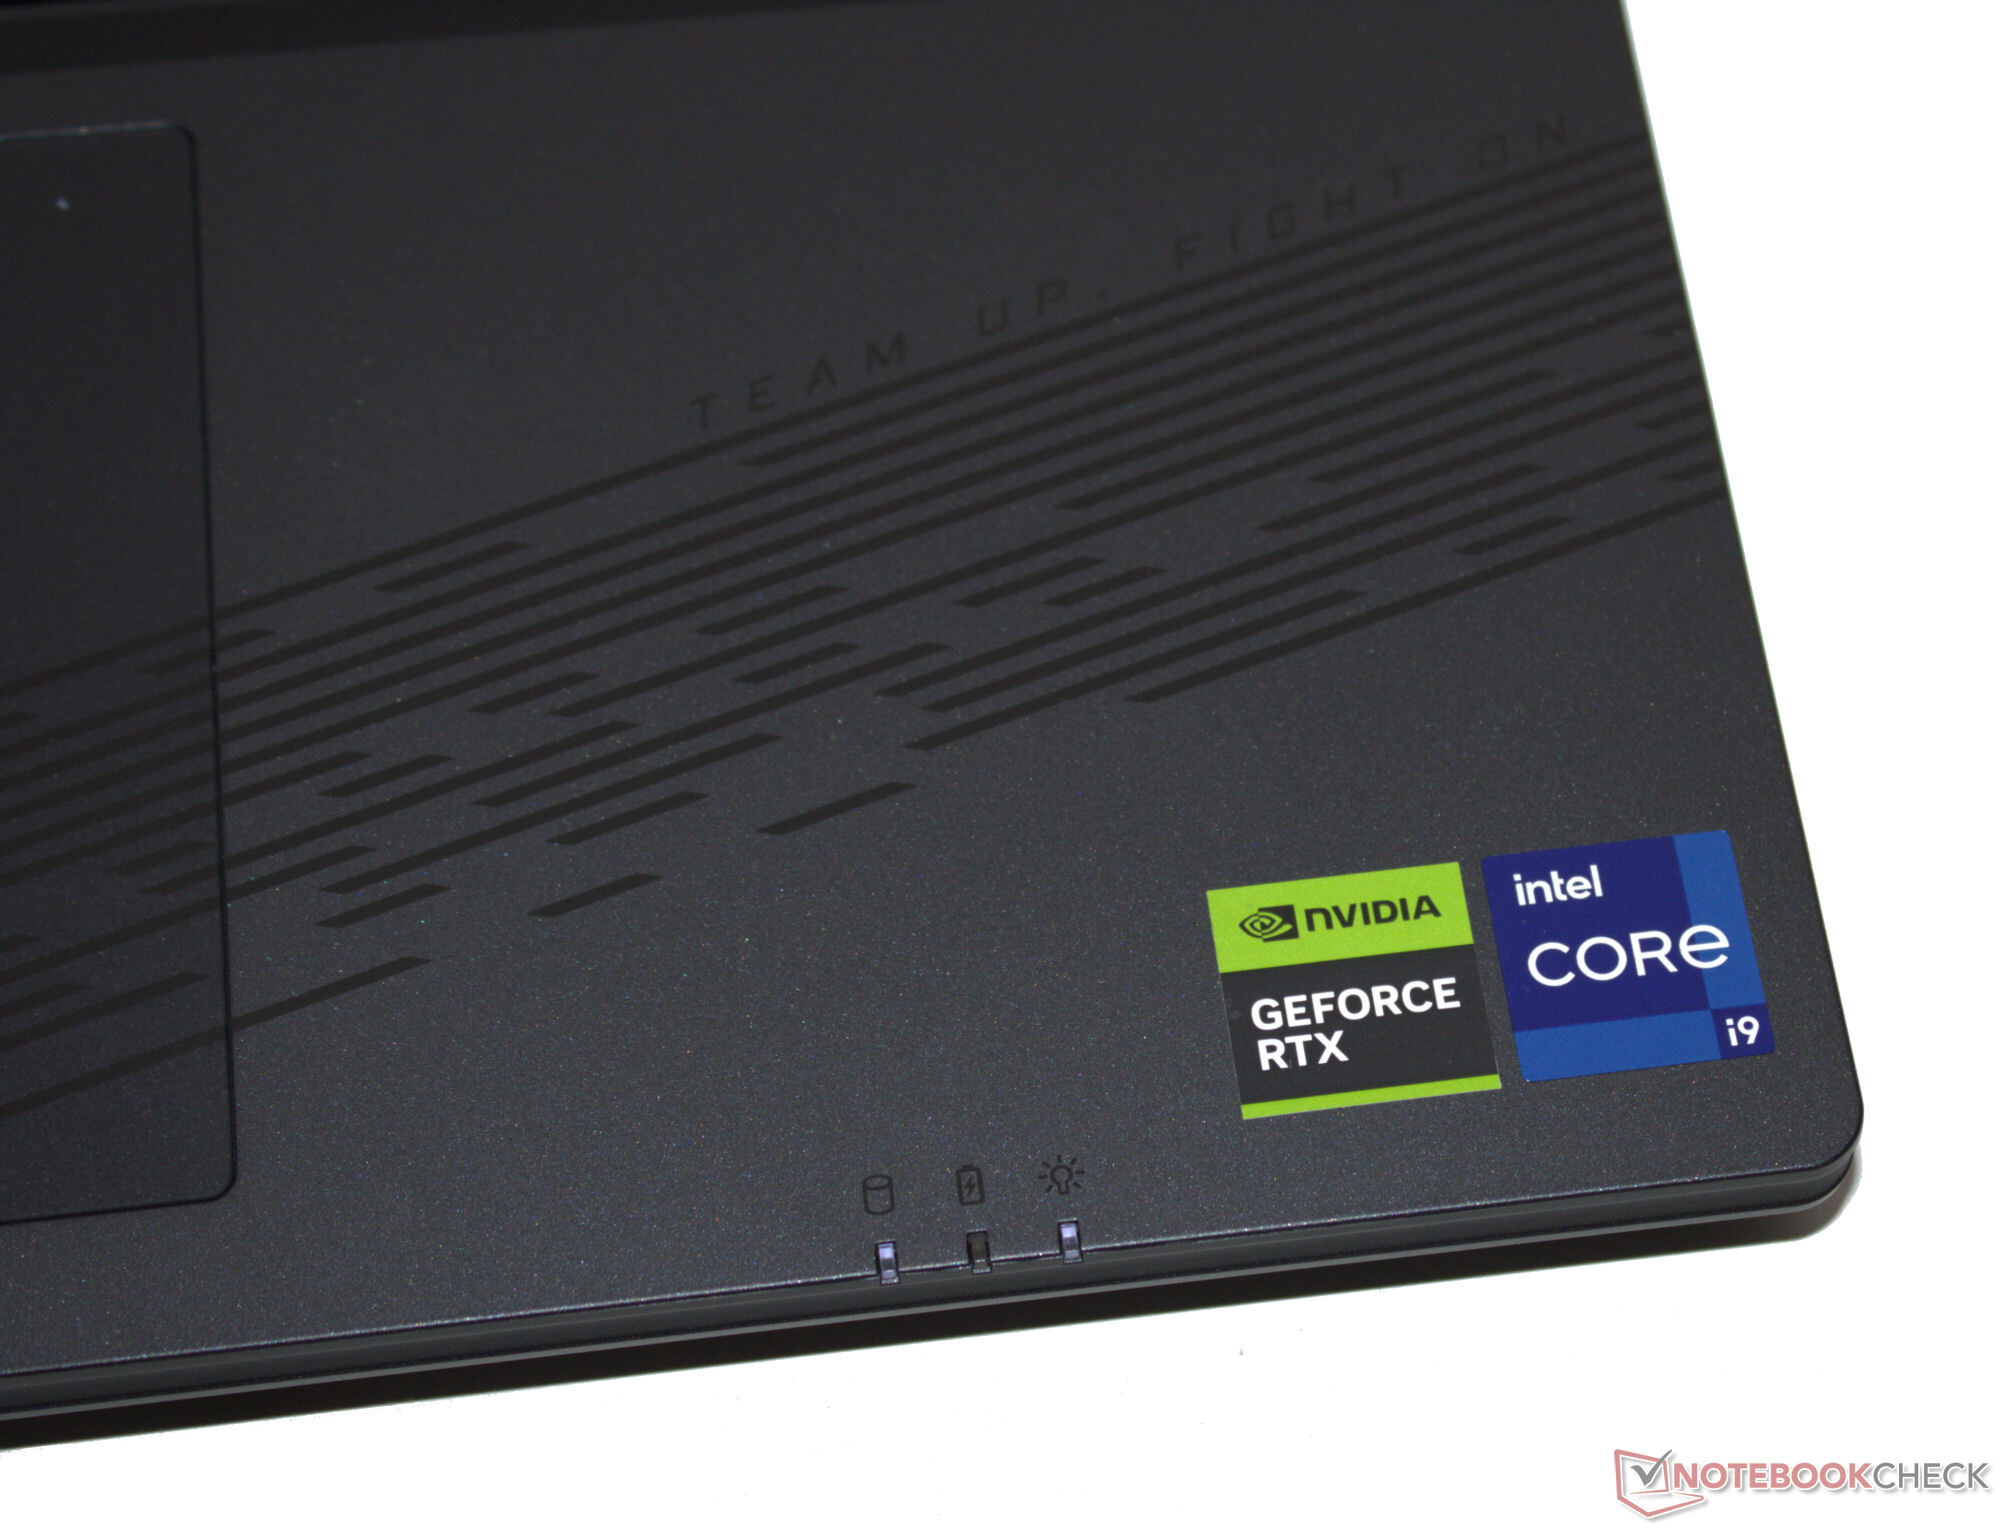
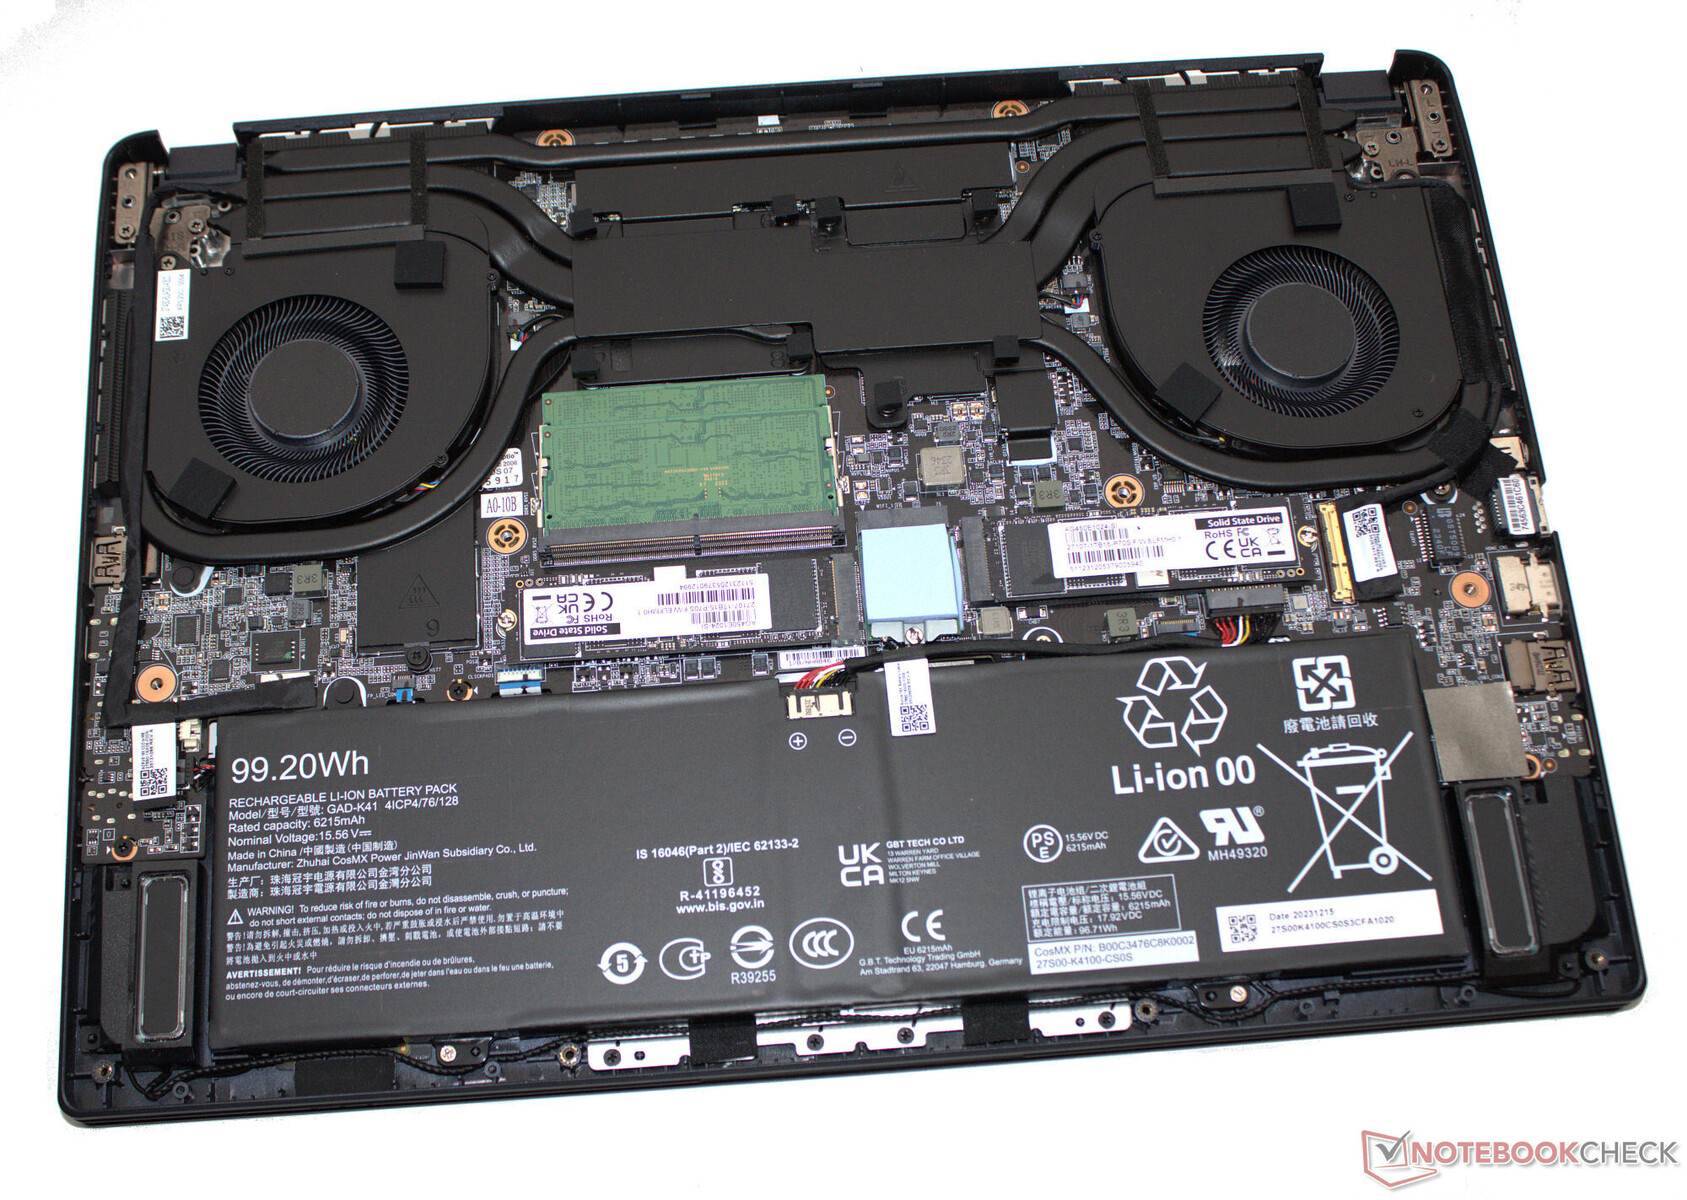
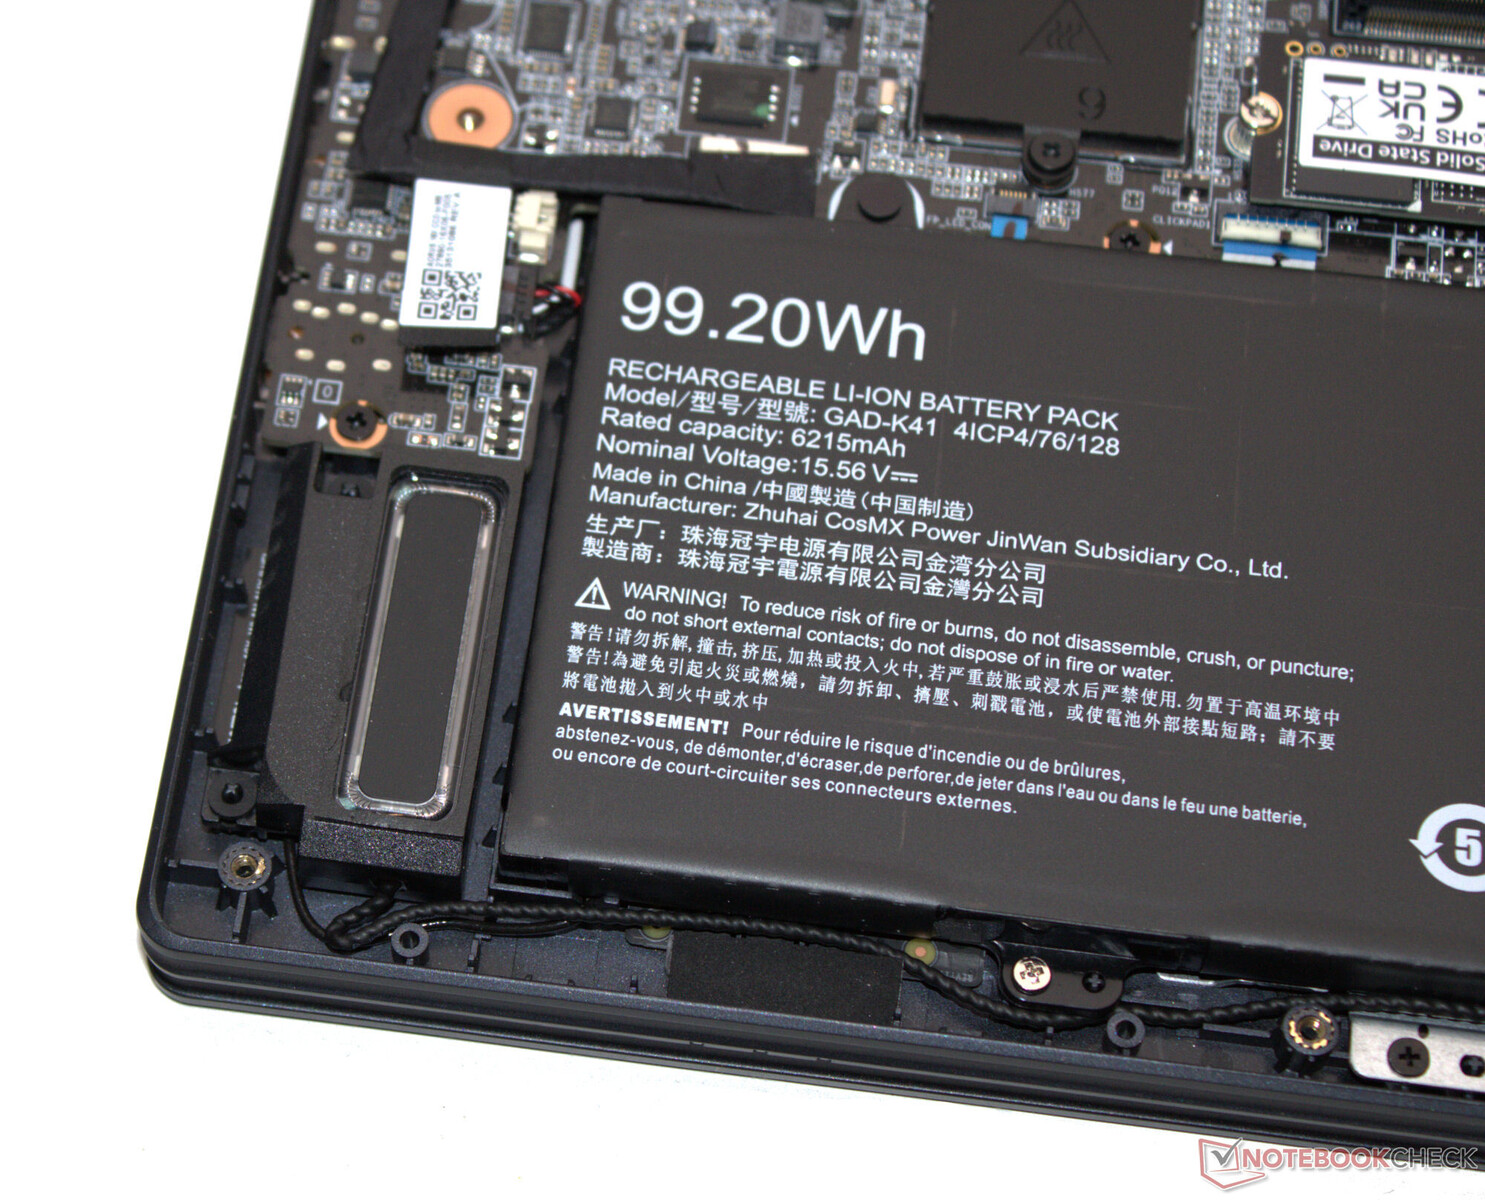
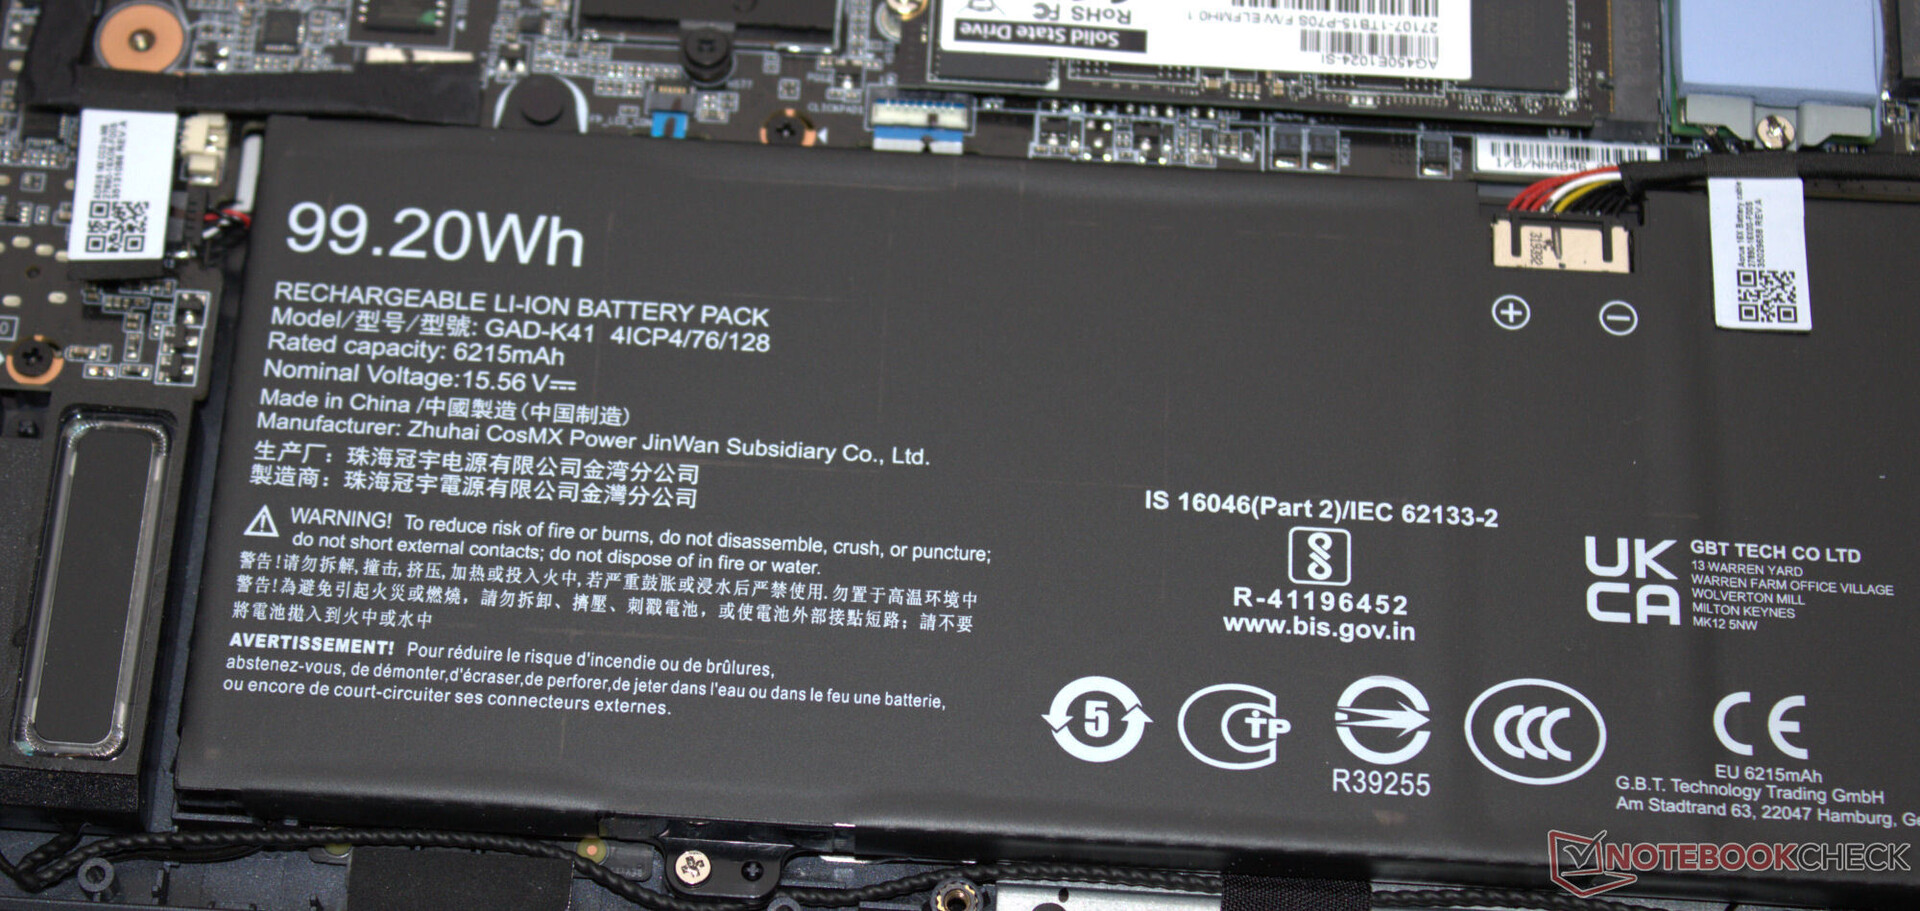
La tecnologia del portatile si trova all'interno di un case grigio scuro con superfici opache. In totale, Gigabyte ha optato per un look più spoglio. Oltre alla retroilluminazione della tastiera, due strisce LED sul retro del dispositivo aggiungono un po' di divertimento colorato al suo aspetto. Mentre l'unità di base è realizzata in plastica, il coperchio si affida all'alluminio. La batteria (avvitata, non incollata) e il resto dei componenti interni del portatile sono accessibili una volta rimossa la parte inferiore del case.
Non abbiamo notato alcun errore di costruzione e tutti gli spazi sono ben allineati. Il coperchio e l'unità di base possono essere leggermente ruotati, ma non è nulla di eccezionale. Le cerniere mantengono il coperchio saldamente in posizione, ma il coperchio rimbalza un po' quando si regola l'angolo. L'angolo di apertura massimo è di circa 130 gradi. Può essere aperto con una sola mano.
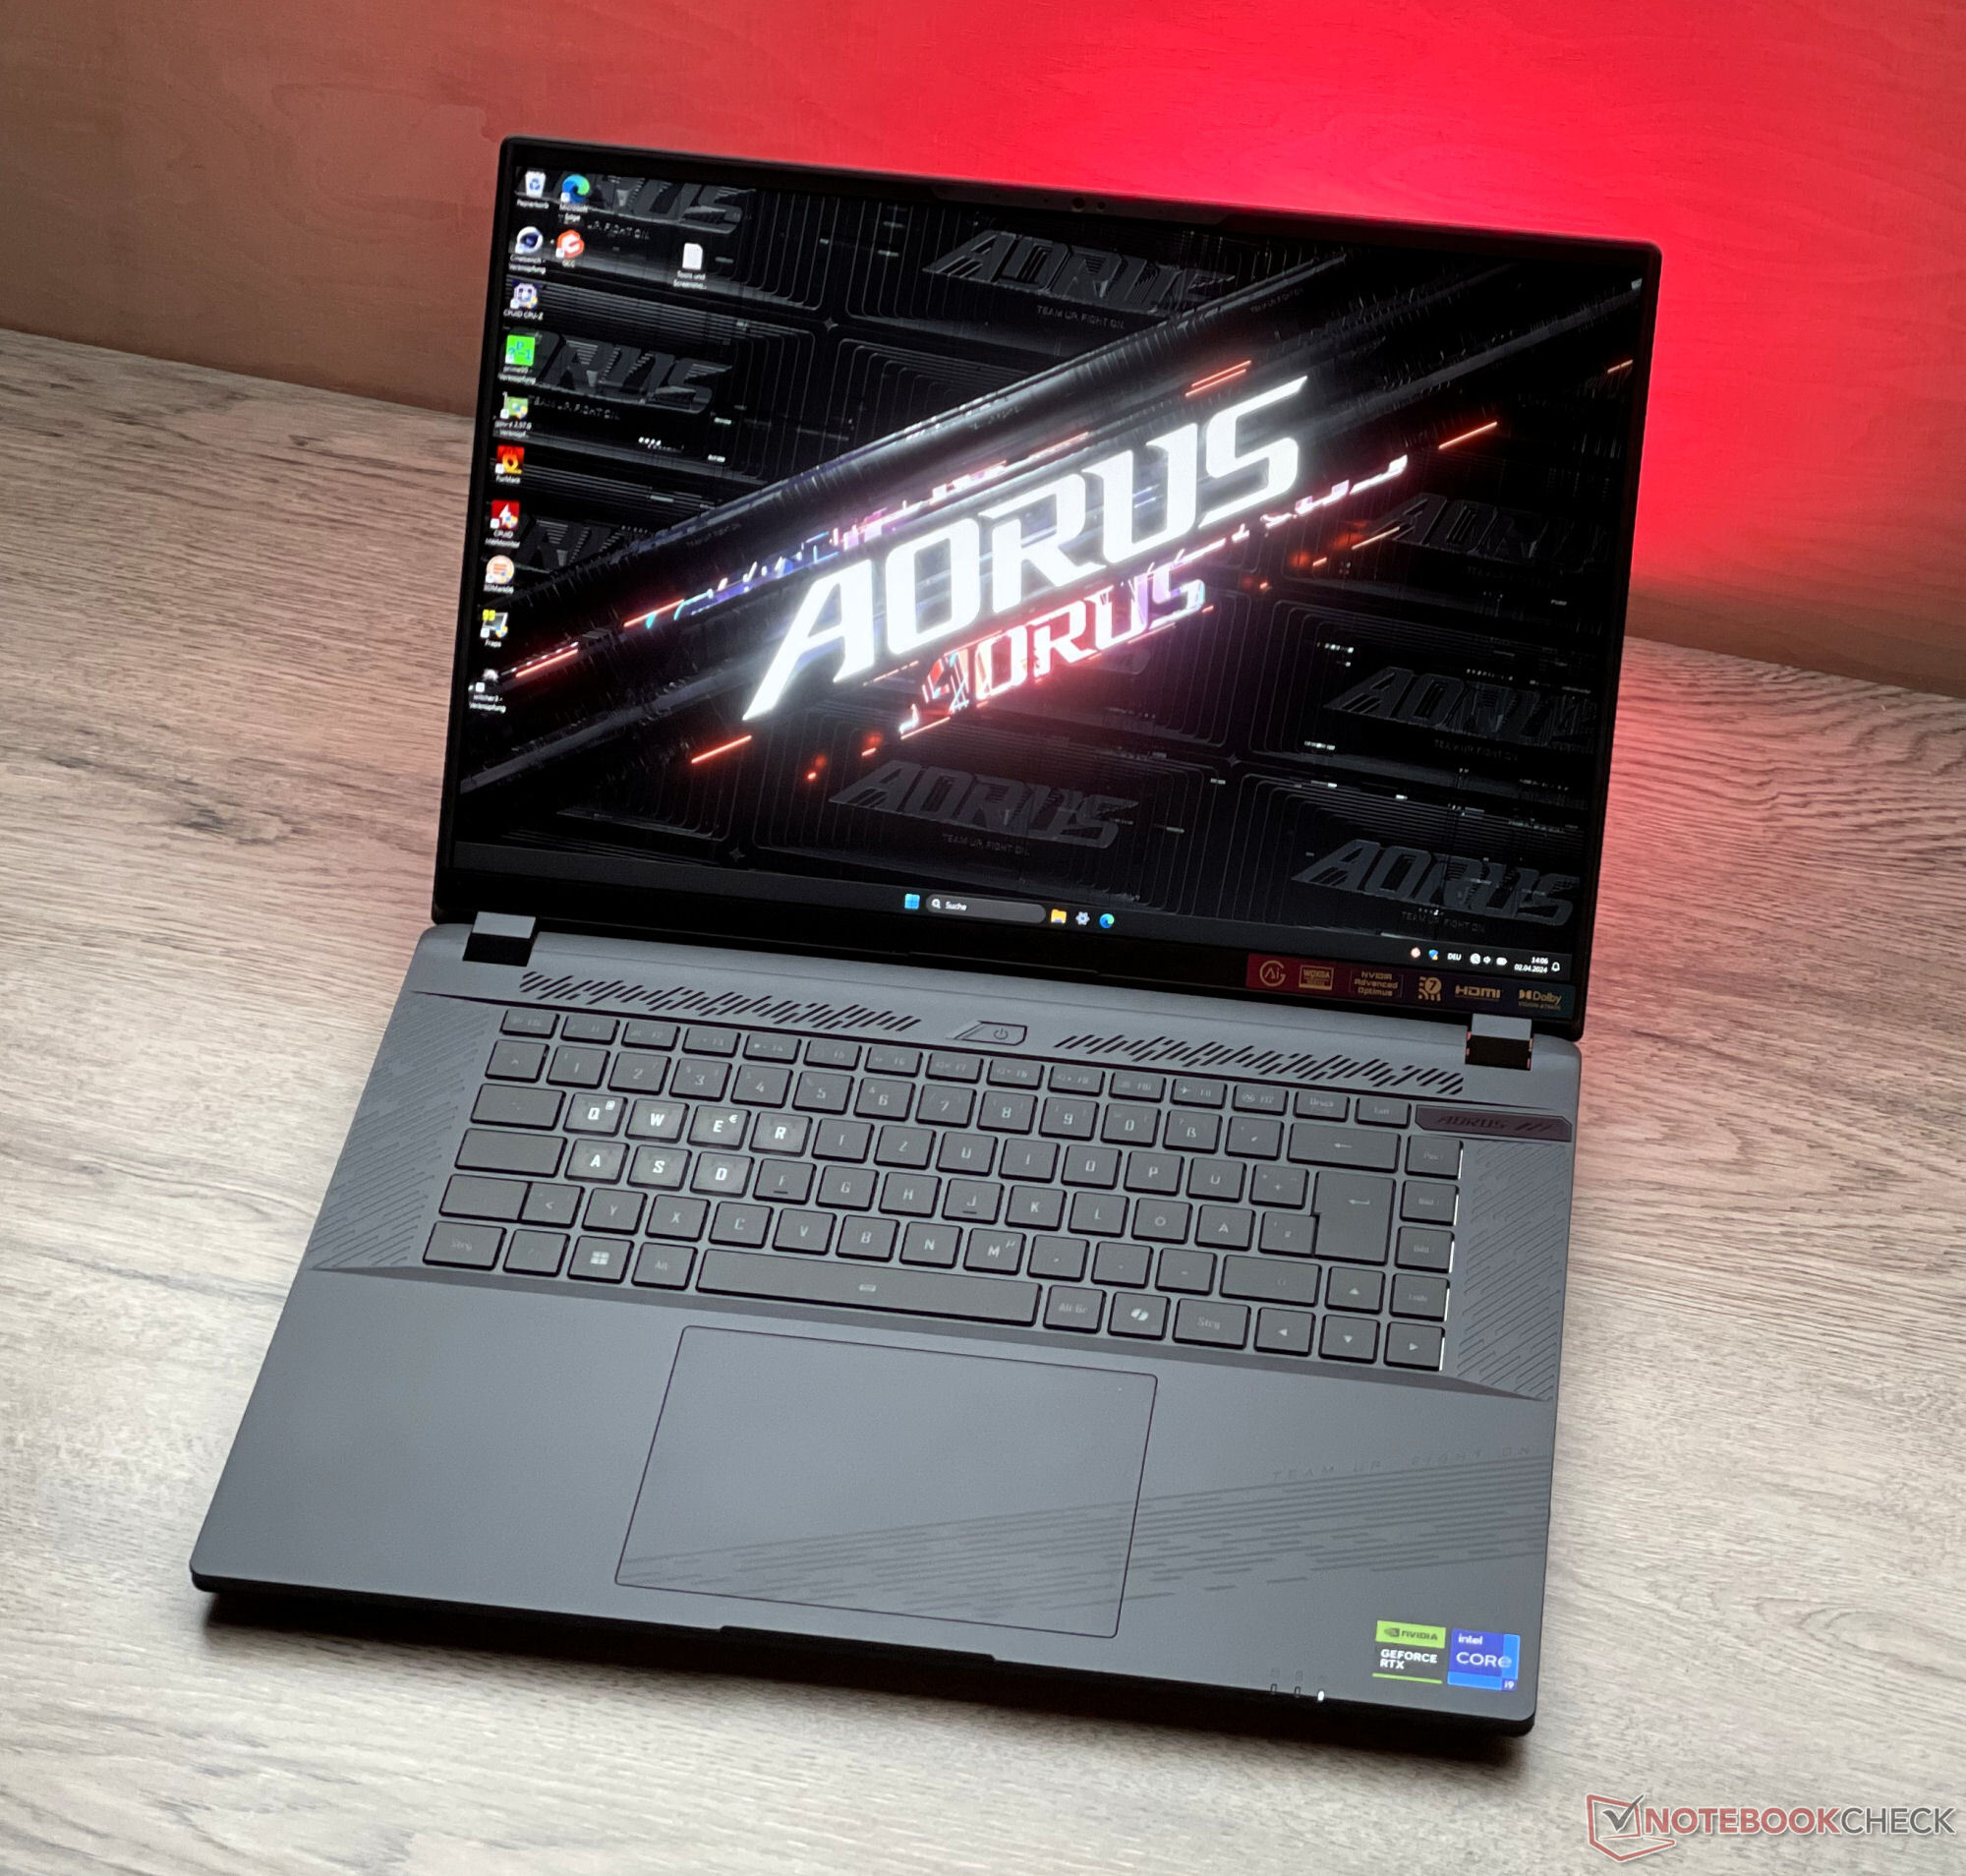
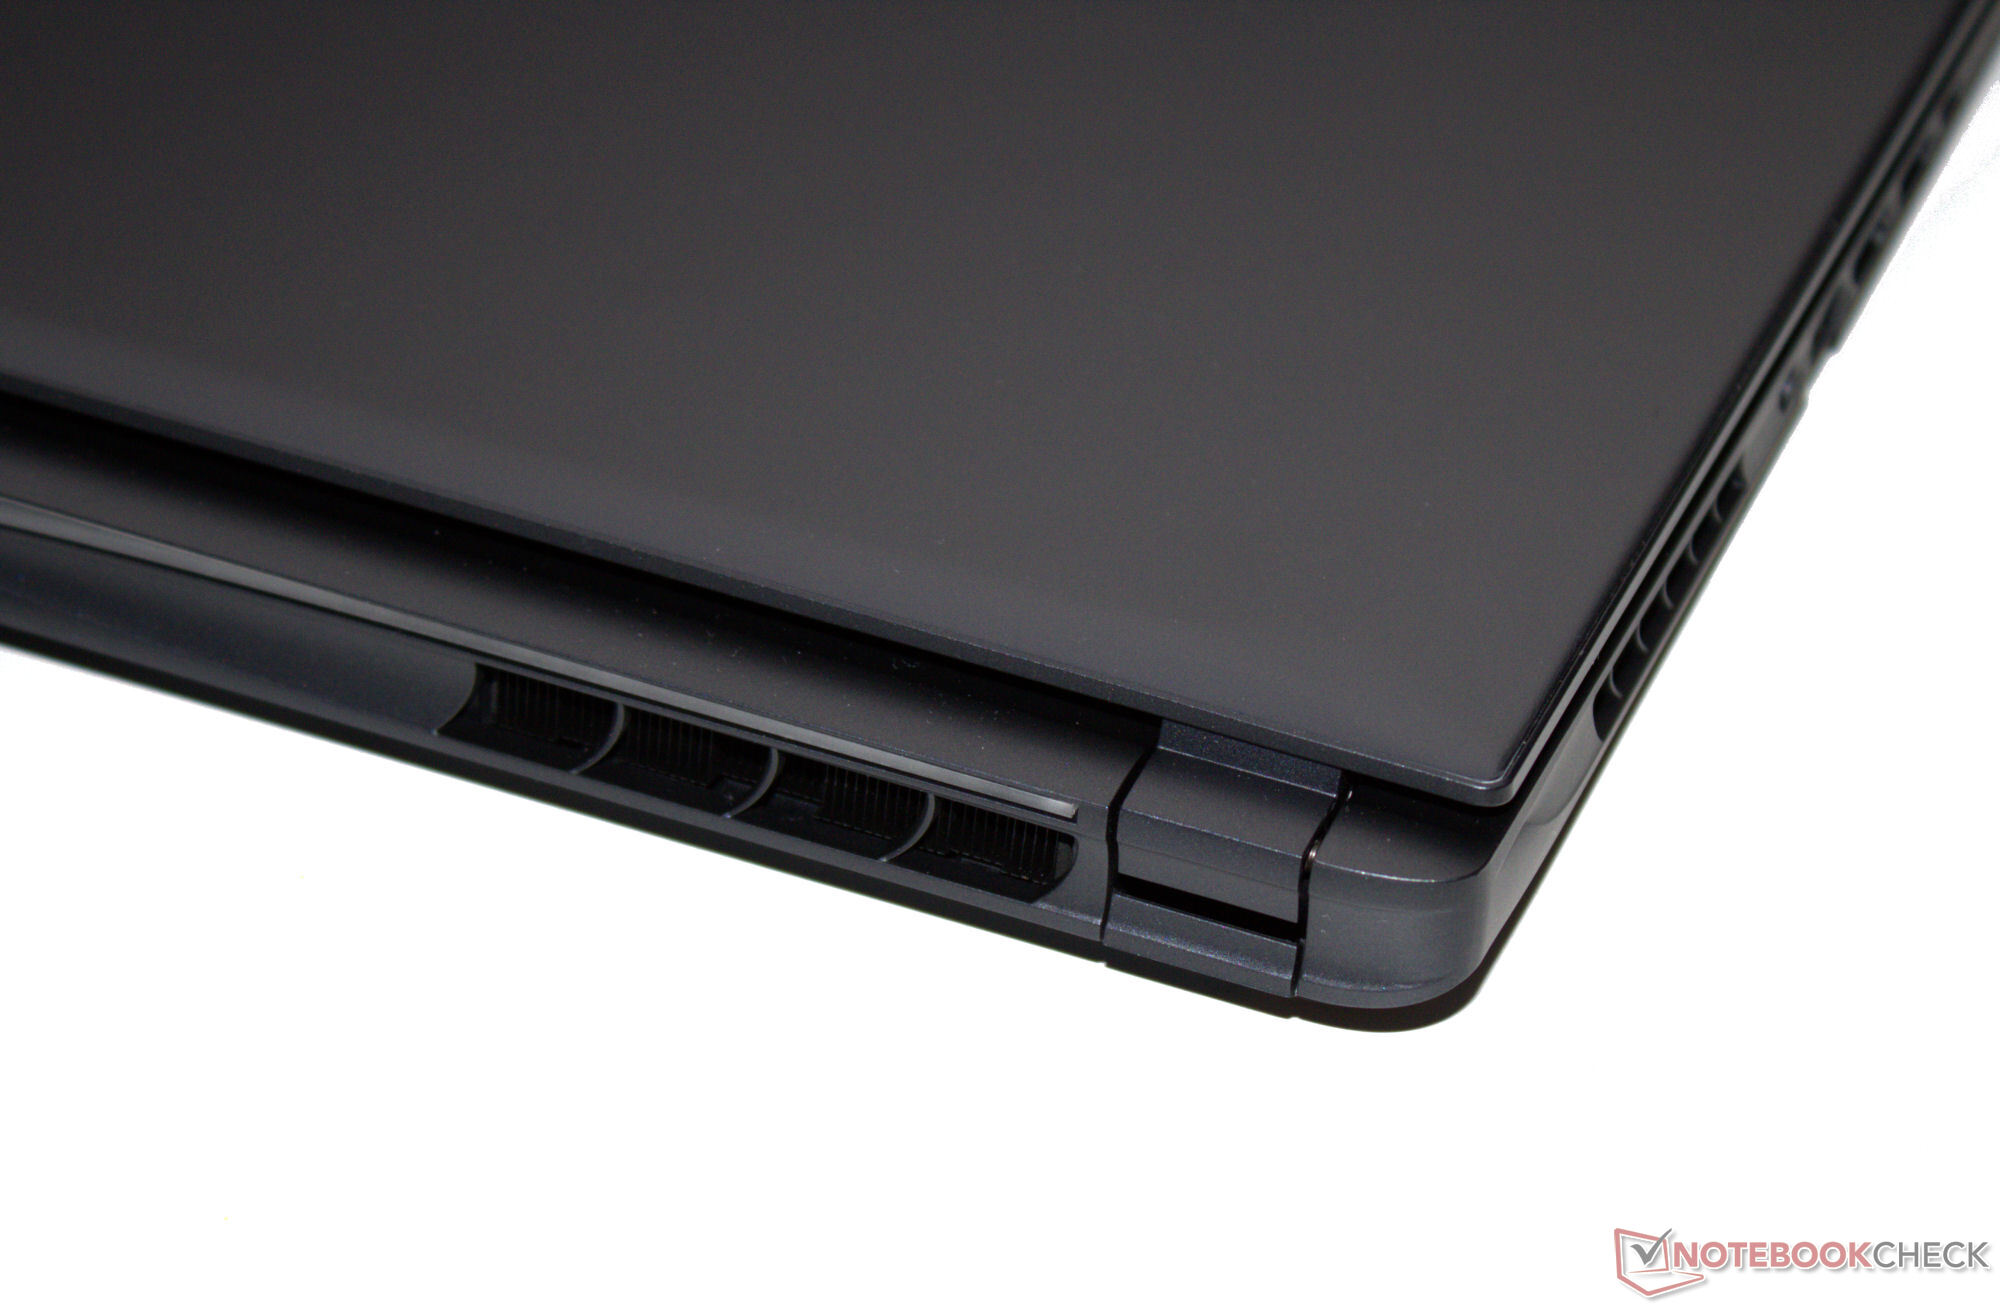
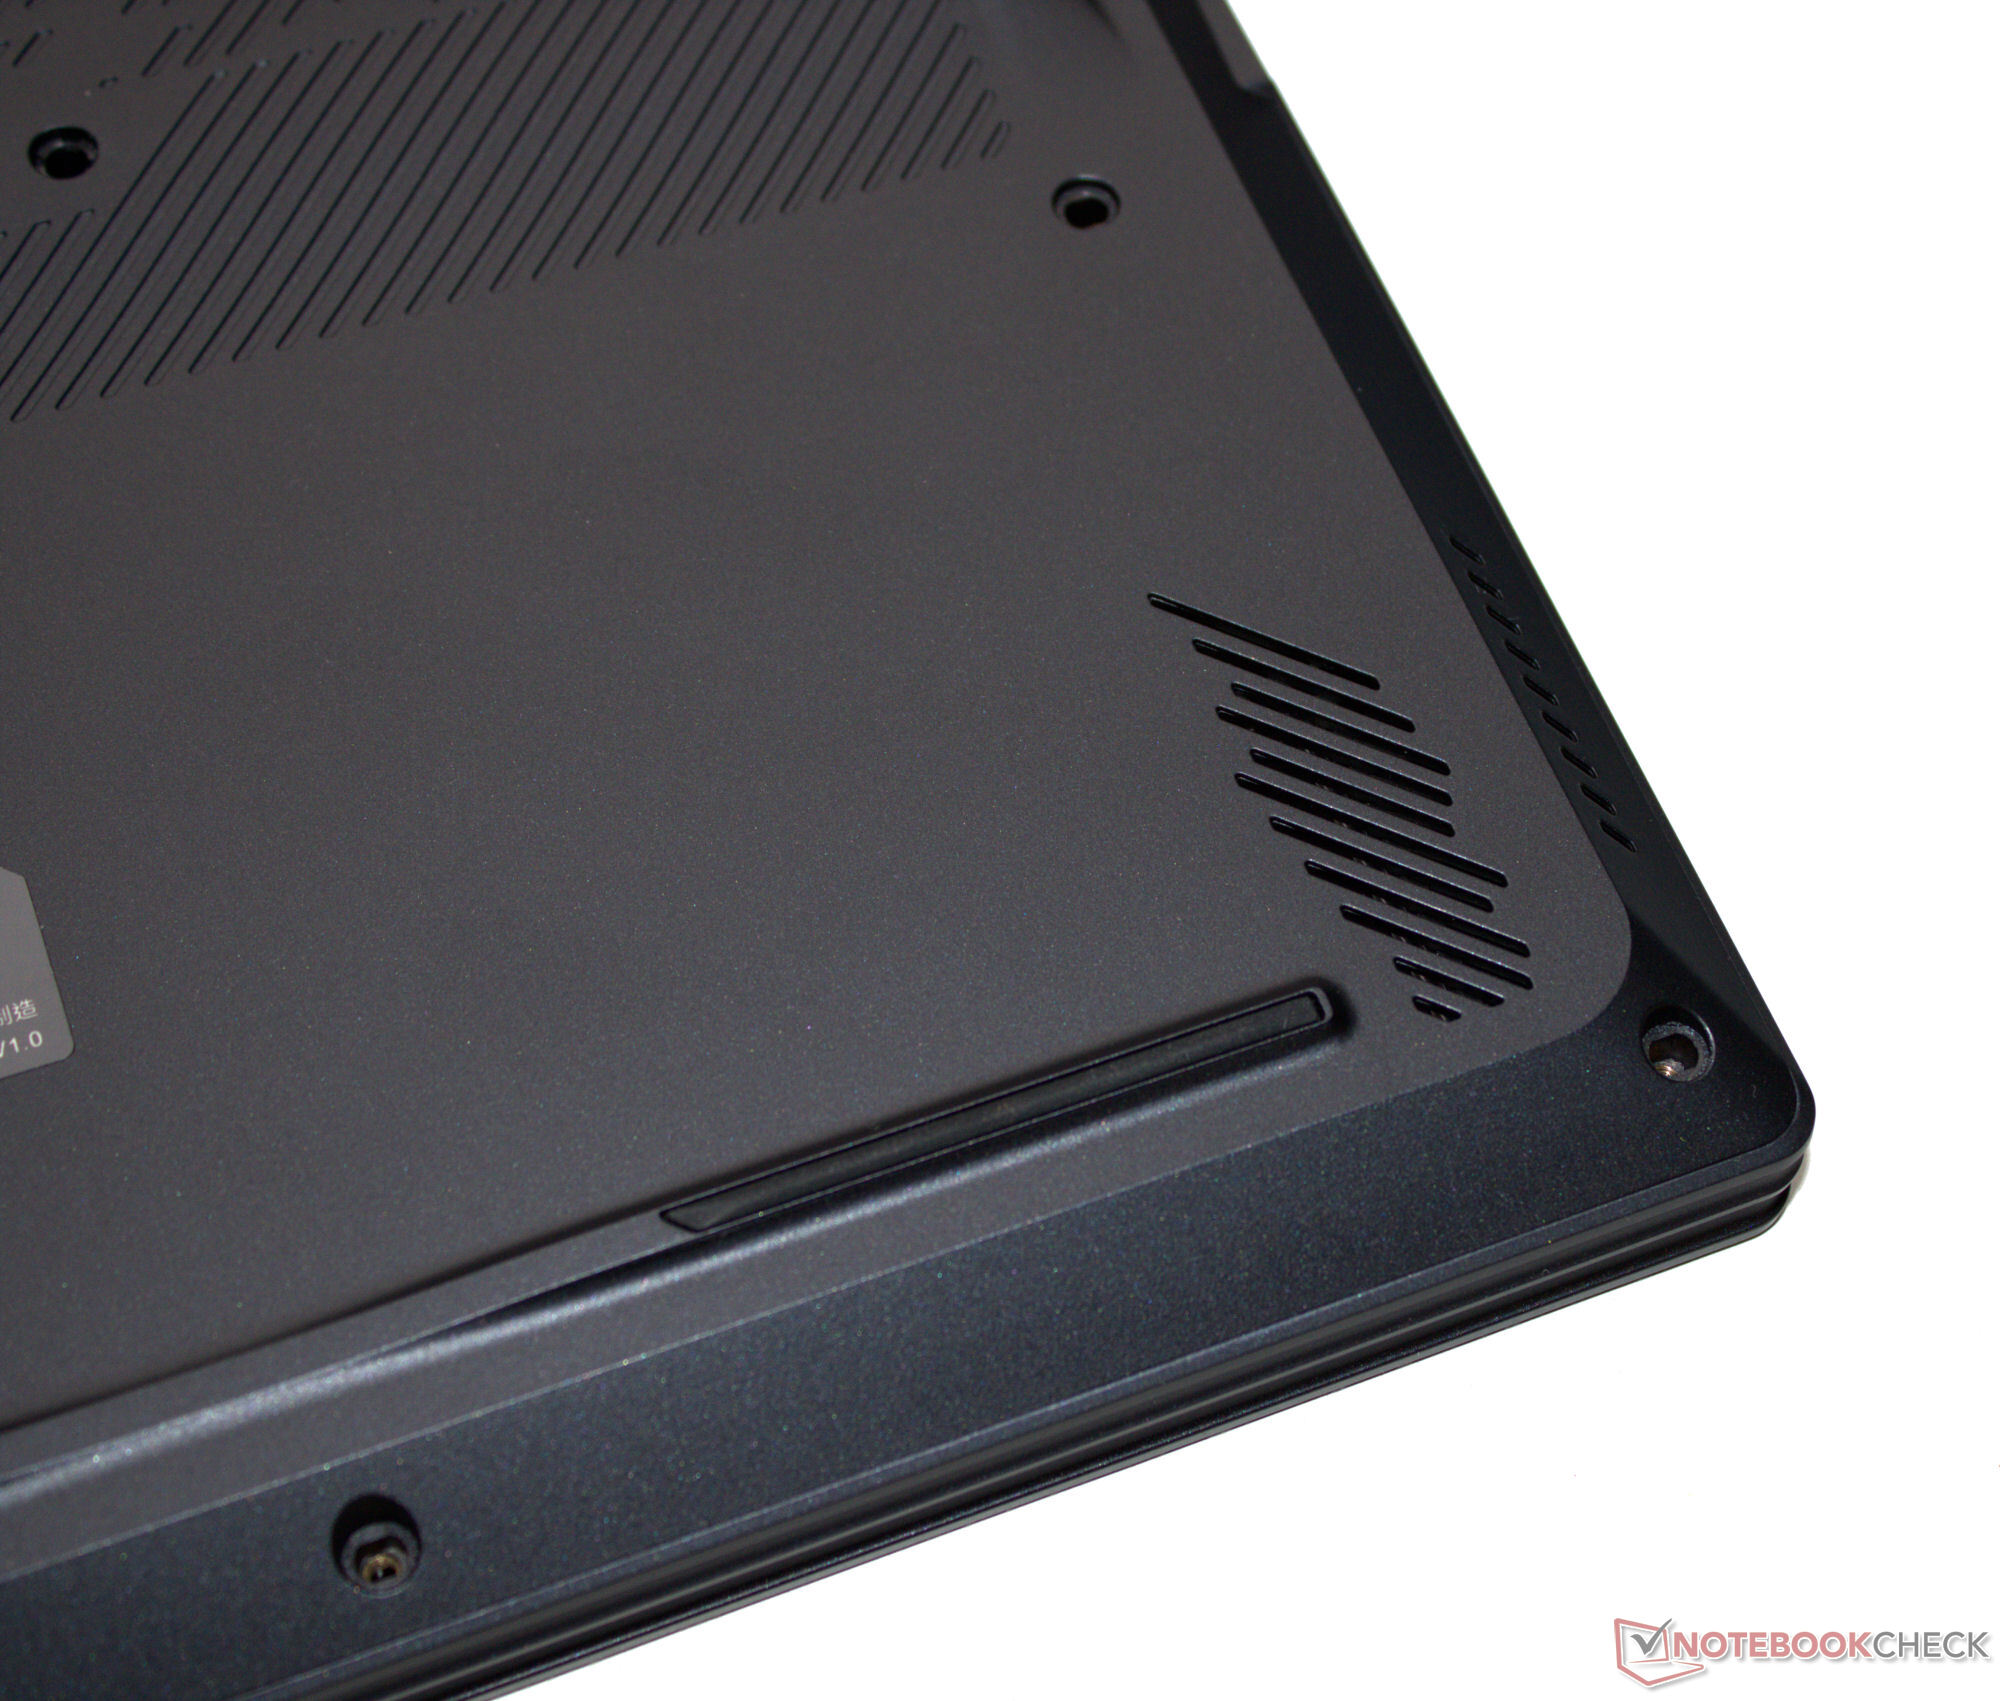
Aorus 16X è uno dei dispositivi più compatti e leggeri nel campo del confronto.
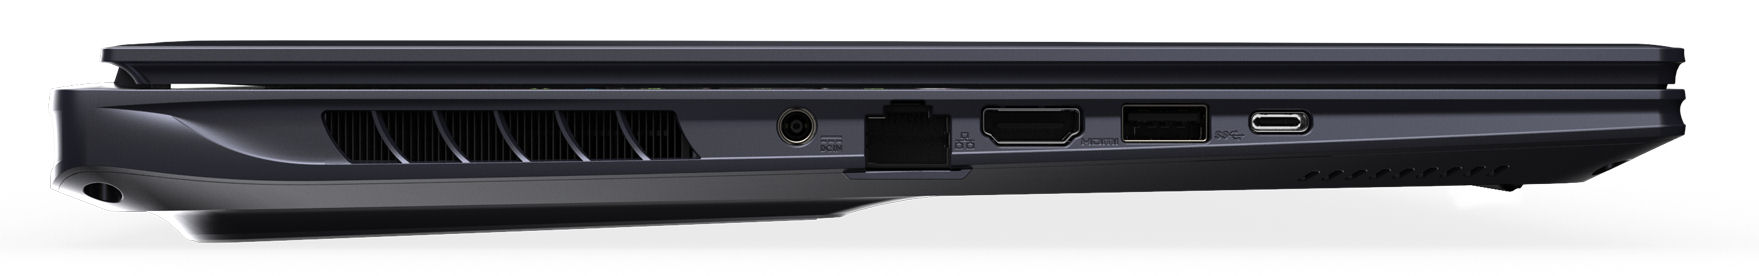
Connettività - Il portatile Gigabyte è dotato di Thunderbolt 4
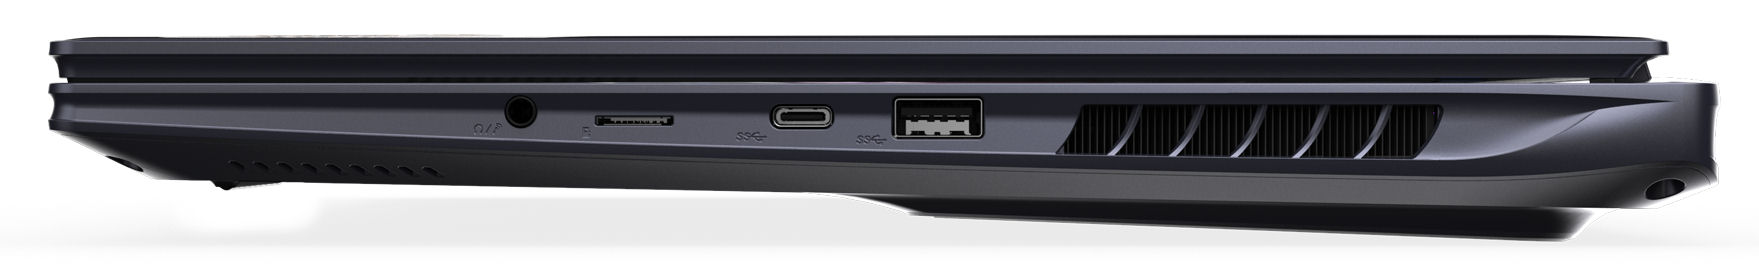
Il 16X ha due porte USB-A (USB 3.2 Gen 2) e due porte USB-C (1x USB 3.2 Gen 2, 1x Thunderbolt 4). La porta TB4 supporta Power Delivery ed entrambe le connessioni USB-C possono emettere un segnale DisplayPort. In totale, il portatile è dotato di tre uscite video (1x HDMI, 2x DP). Un jack audio e una porta Gigabit Ethernet completano il pacchetto.
Gigabyte ha posizionato tutte le connessioni al centro dei lati destro e sinistro del dispositivo. Le aree accanto al pam rest rimangono generalmente libere da cavi.
Lettore di schede SD
Il lettore di schede MicroSD del dispositivo (scheda di riferimento: AV PRO microSD 128 GB V60) è uno dei modelli più veloci, raggiungendo velocità di trasferimento massime di 186 MB/s (trasferimento di 250 immagini jpg, ciascuna di circa 5 MB) e 188 MB/s (copia di blocchi di dati più grandi).
| SD Card Reader | |
| average JPG Copy Test (av. of 3 runs) | |
| Aorus 16X 2024 (AV PRO microSD 128 GB V60) | |
| Media della classe Gaming (20.9 - 210, n=54, ultimi 2 anni) | |
| Schenker XMG Pro 16 Studio (Mid 23) (AV PRO microSD 128 GB V60) | |
| Alienware m16 R2 (AV PRO microSD 128 GB V60) | |
| maximum AS SSD Seq Read Test (1GB) | |
| Alienware m16 R2 (AV PRO microSD 128 GB V60) | |
| Aorus 16X 2024 (AV PRO microSD 128 GB V60) | |
| Media della classe Gaming (25.5 - 261, n=51, ultimi 2 anni) | |
| Schenker XMG Pro 16 Studio (Mid 23) (AV PRO microSD 128 GB V60) | |
Comunicazione
In condizioni ottimali (nessun dispositivo WLAN nelle vicinanze, breve distanza tra il portatile e il PC server), abbiamo notato ottime velocità di trasmissione dati WiFi. Gli scarsi valori del 16X durante l'invio di dati sono probabilmente dovuti a problemi di driver. Il portatile Gigabyte utilizza un chip WiFi 7 (Intel BE200). Le connessioni cablate sono gestite da un controller (RTL8168/8111; 1 GBit/s) di Realtek.
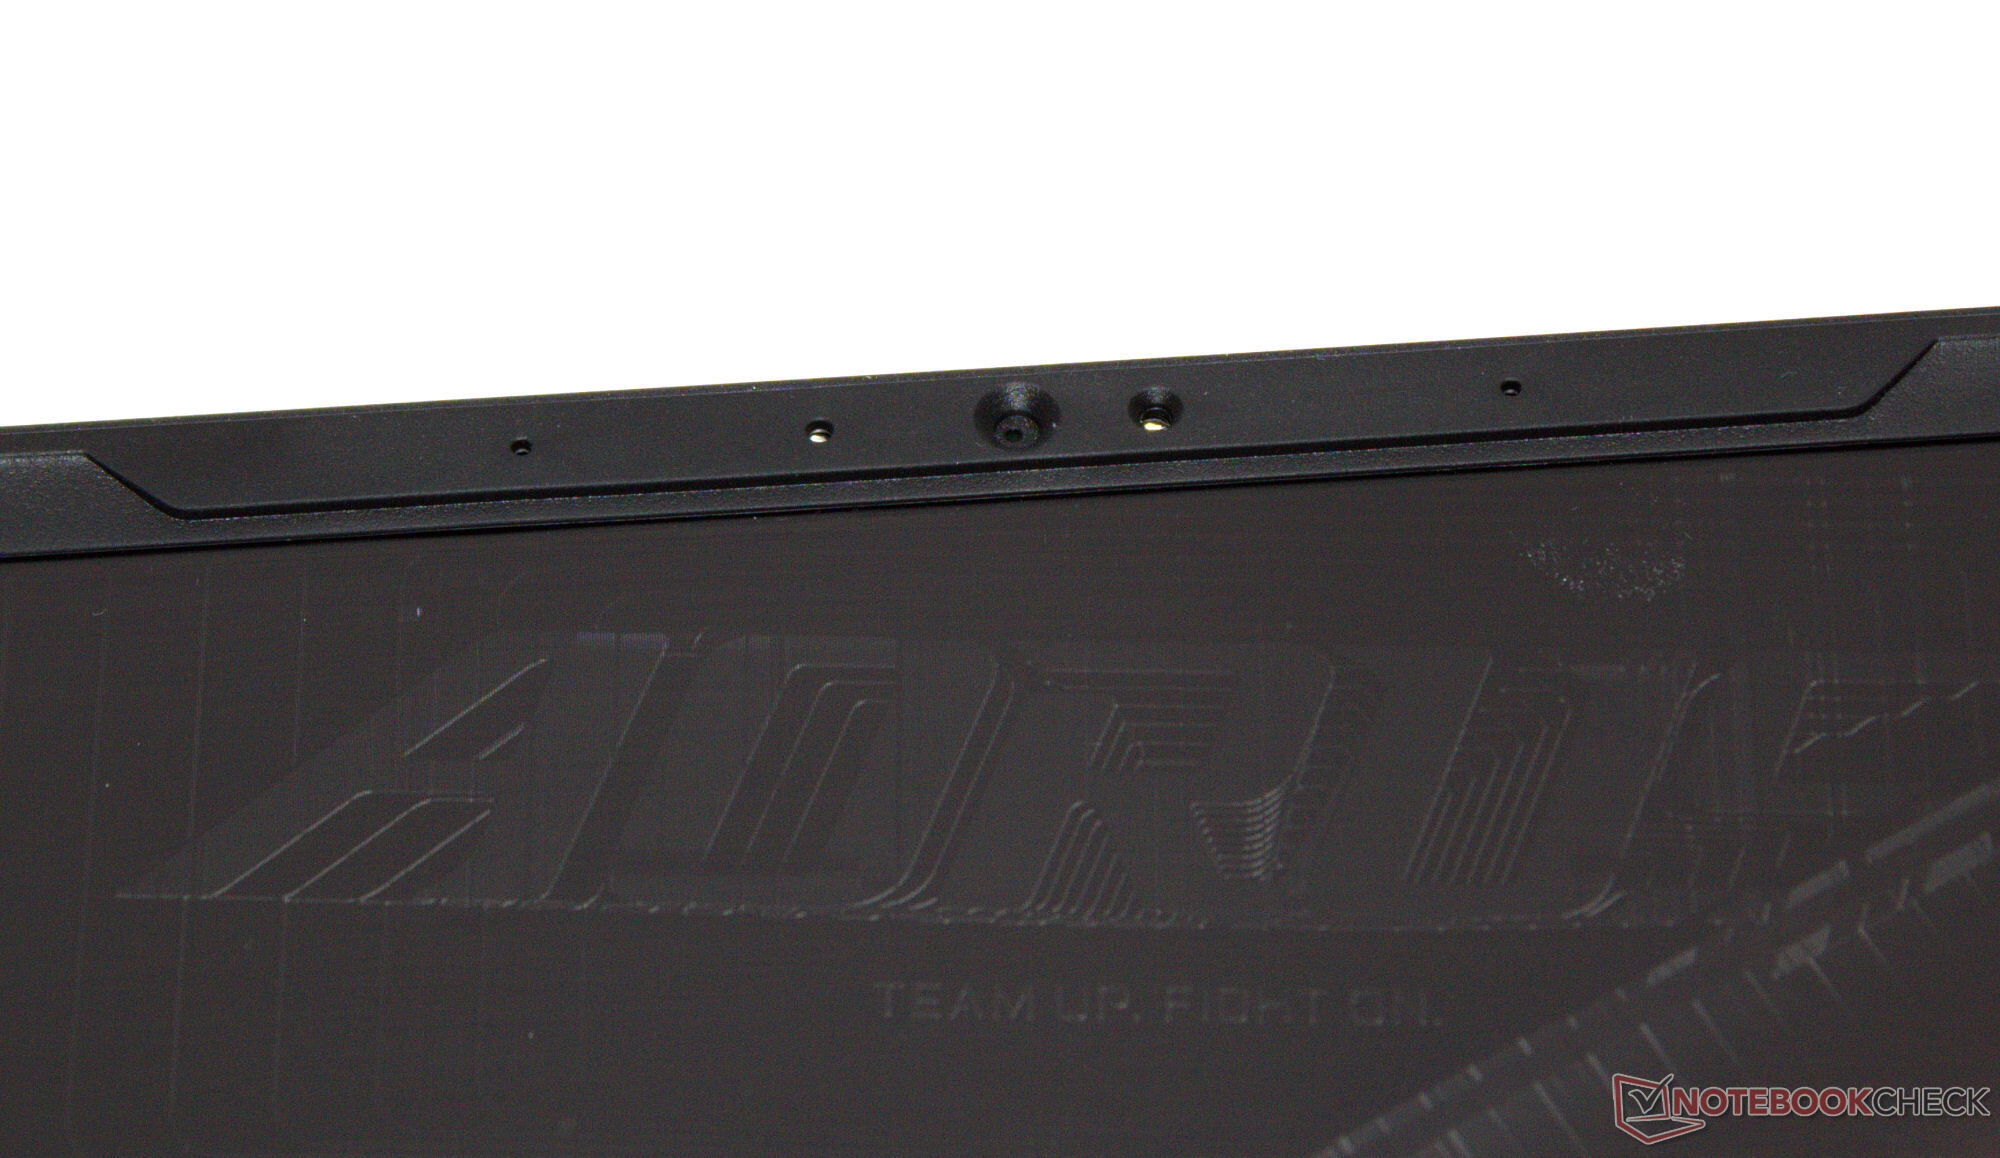
Webcam
La webcam (2,1 MP, max. 1.920 x 1.080 pixel, IR) offre solo immagini di qualità media. La precisione del colore è il punto debole: Con una deviazione di circa 10, il valore target (DeltaE inferiore a 3) è stato mancato. Tuttavia, supporta Windows Hello. A sua volta, non dispone di una copertura meccanica.


Accessori
A parte i soliti documenti (guida rapida e informazioni sulla garanzia), il portatile non viene fornito con ulteriori accessori.
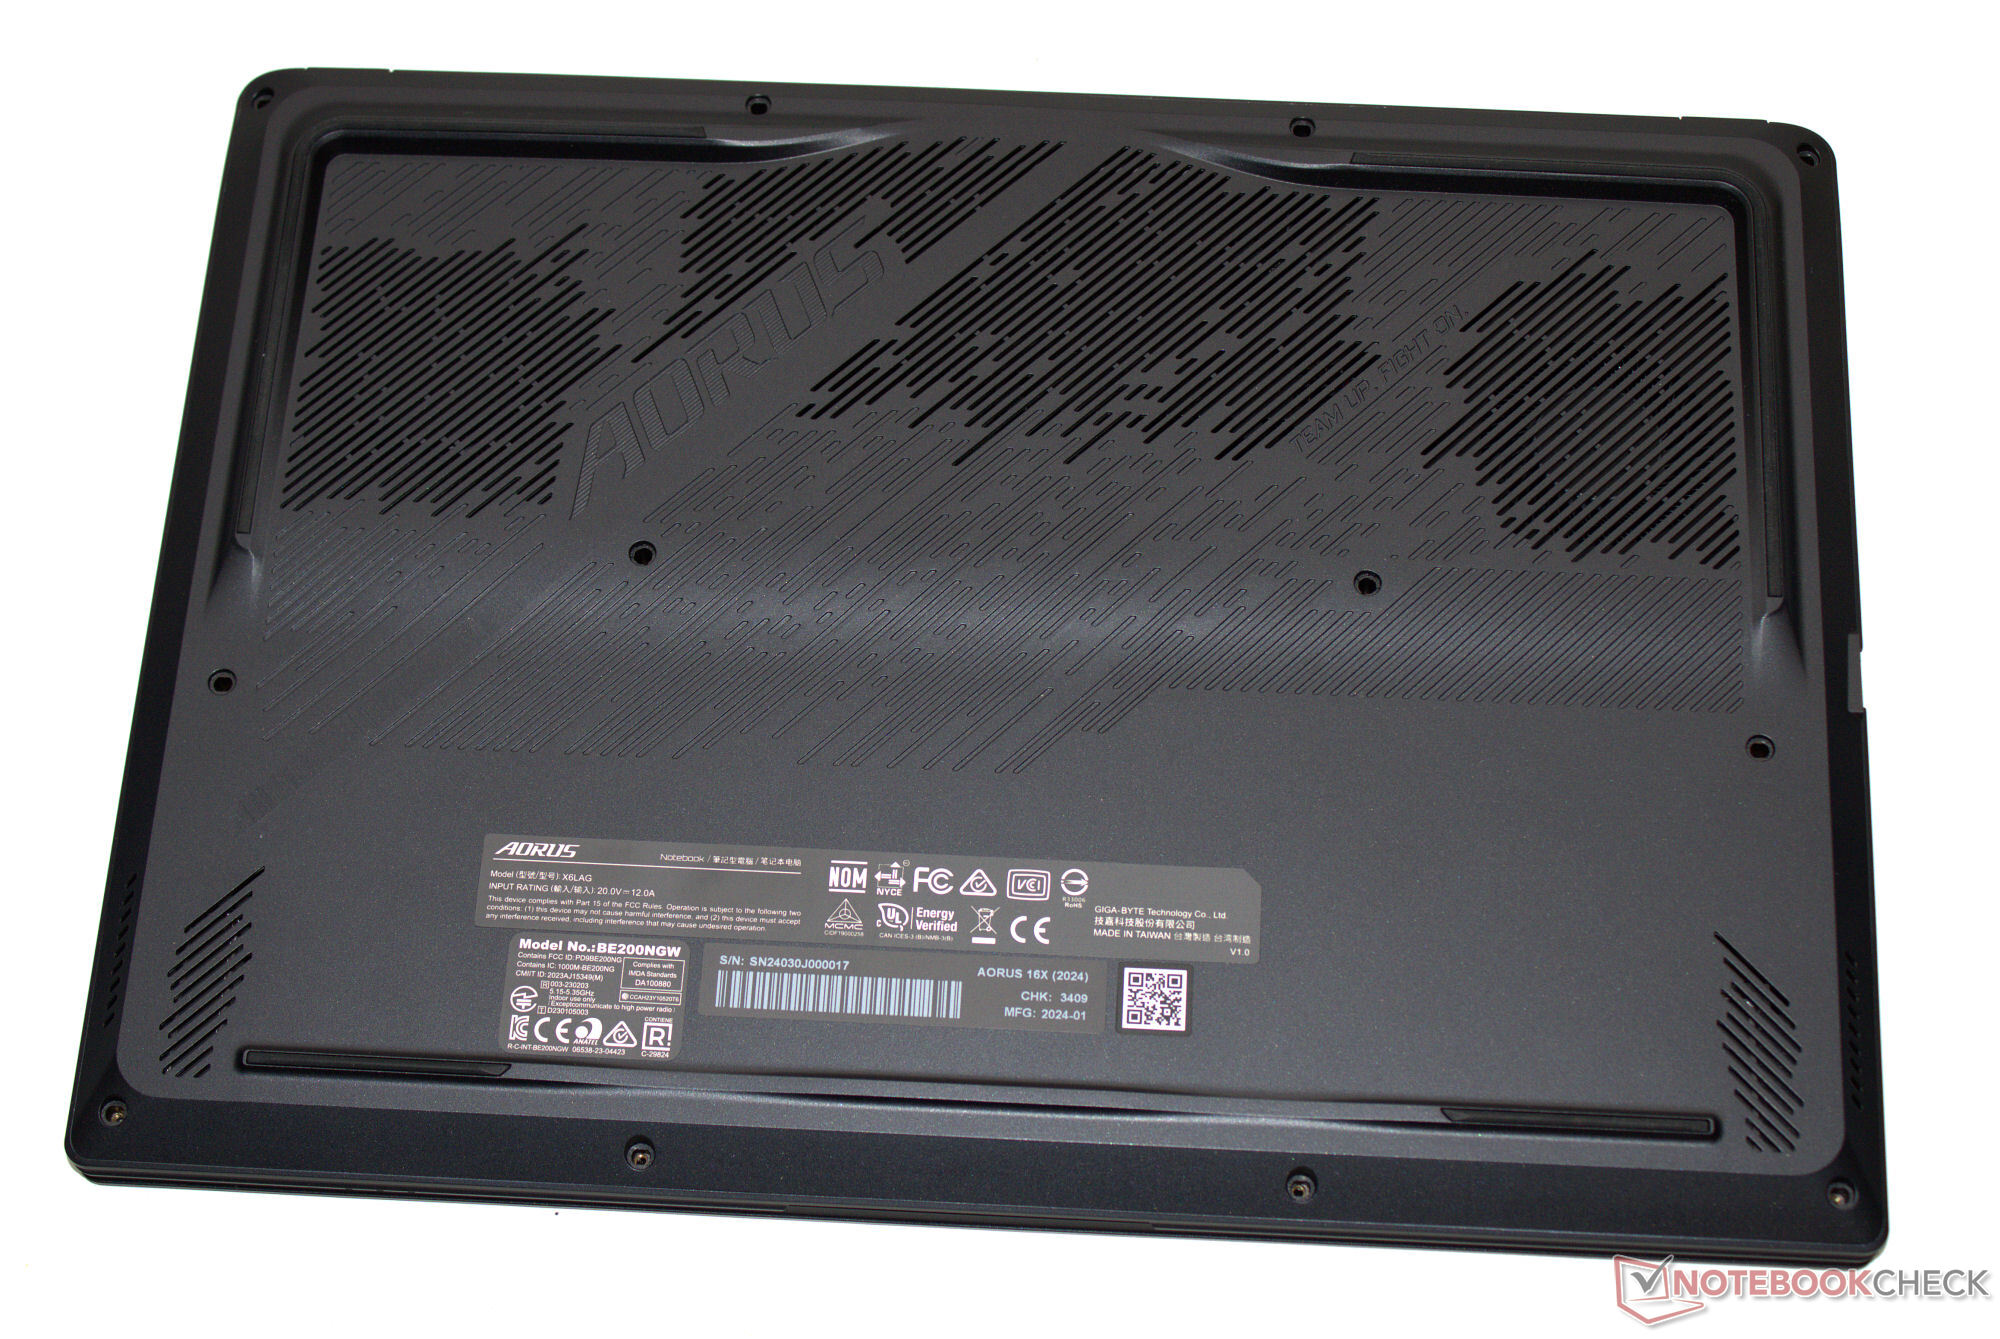
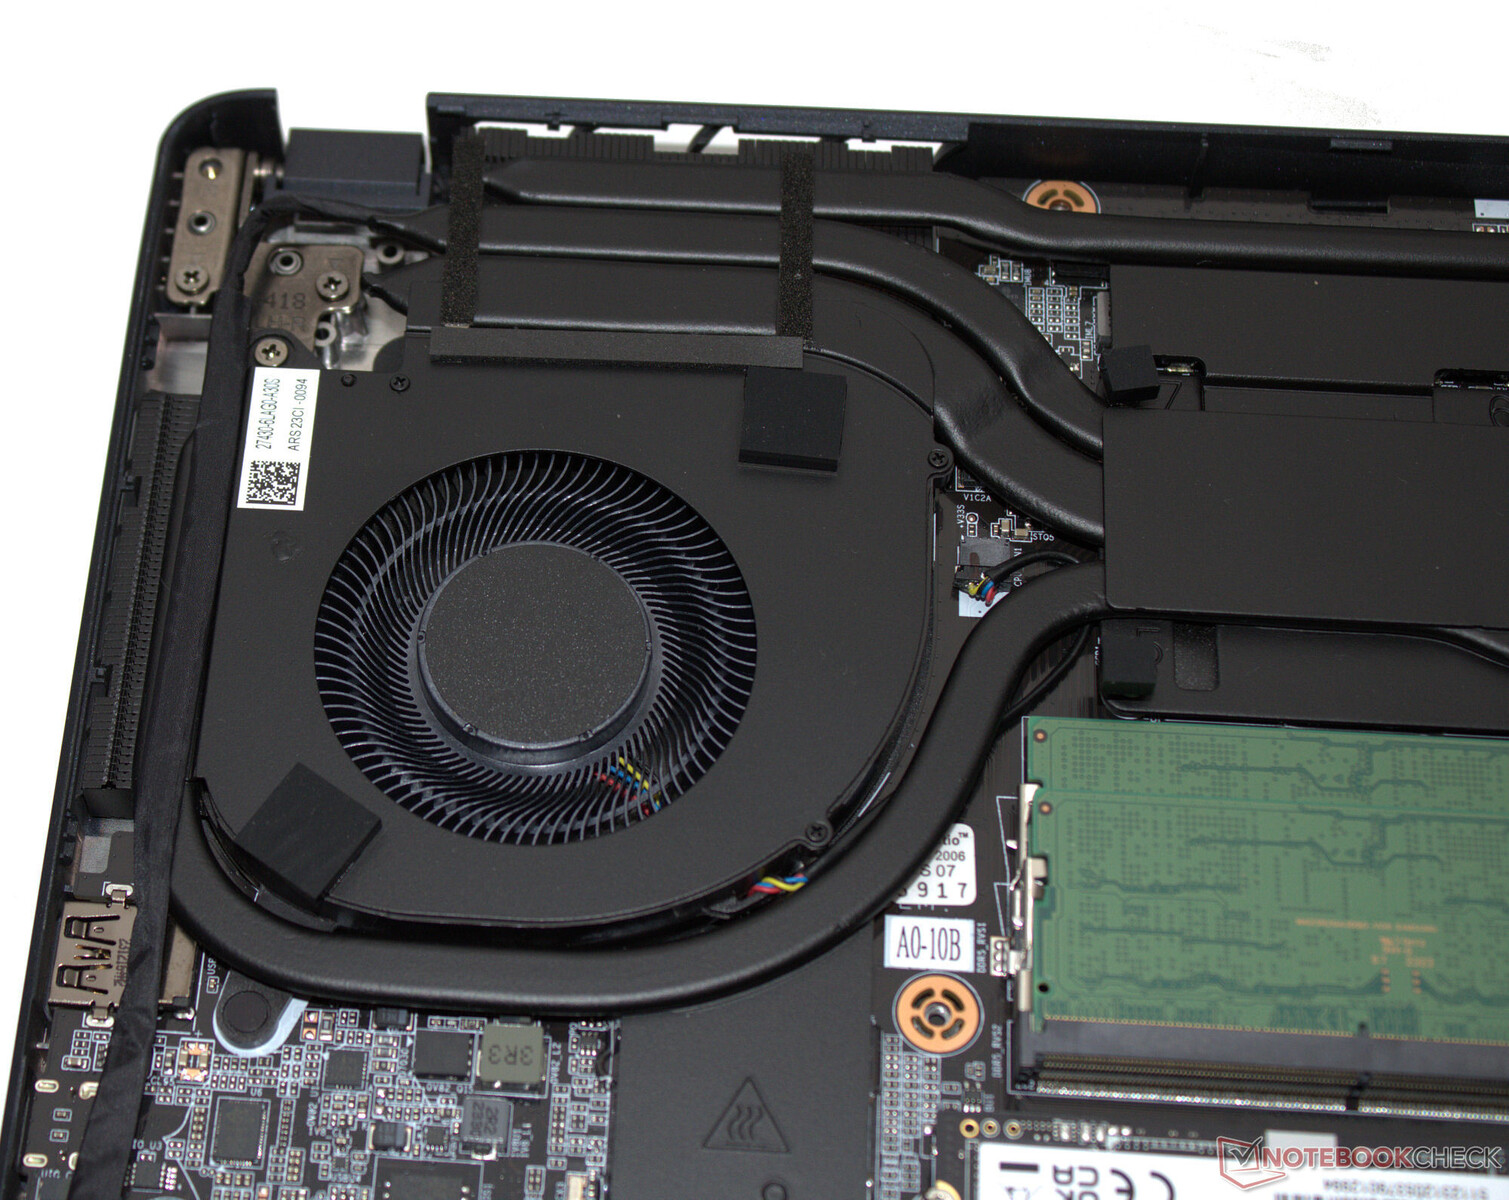
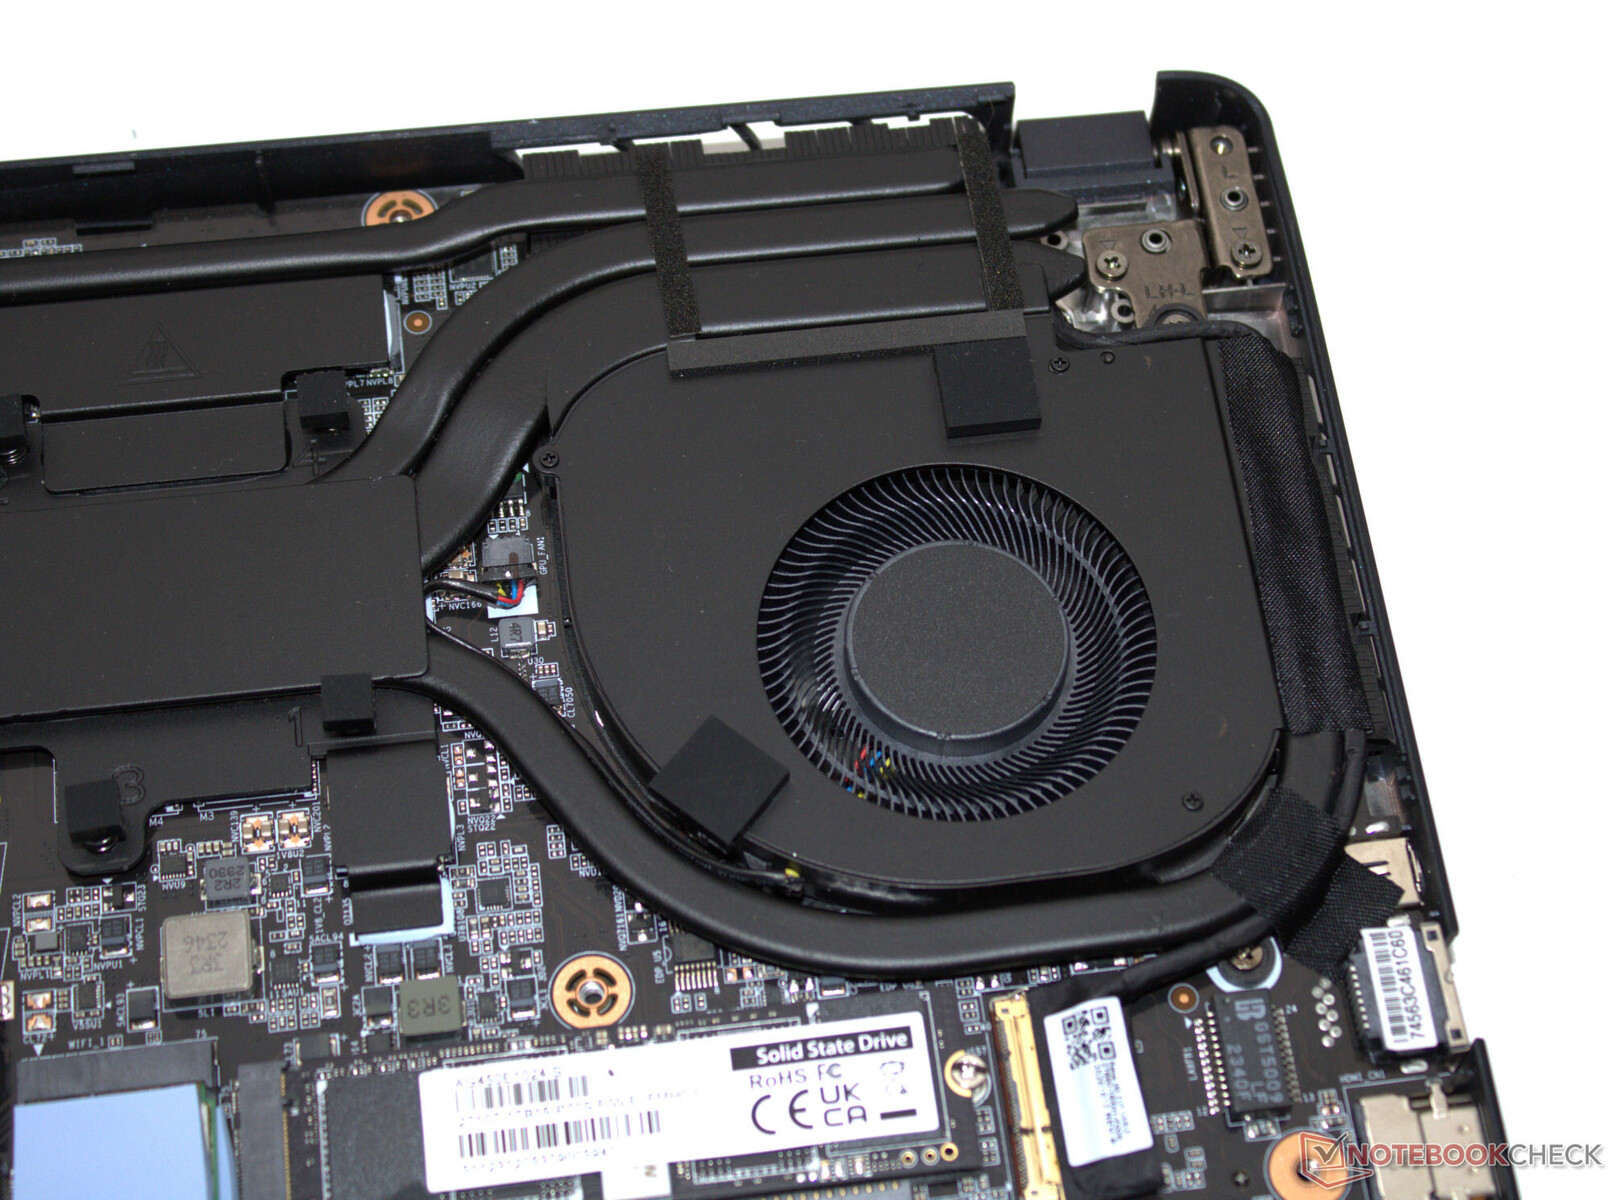
Manutenzione
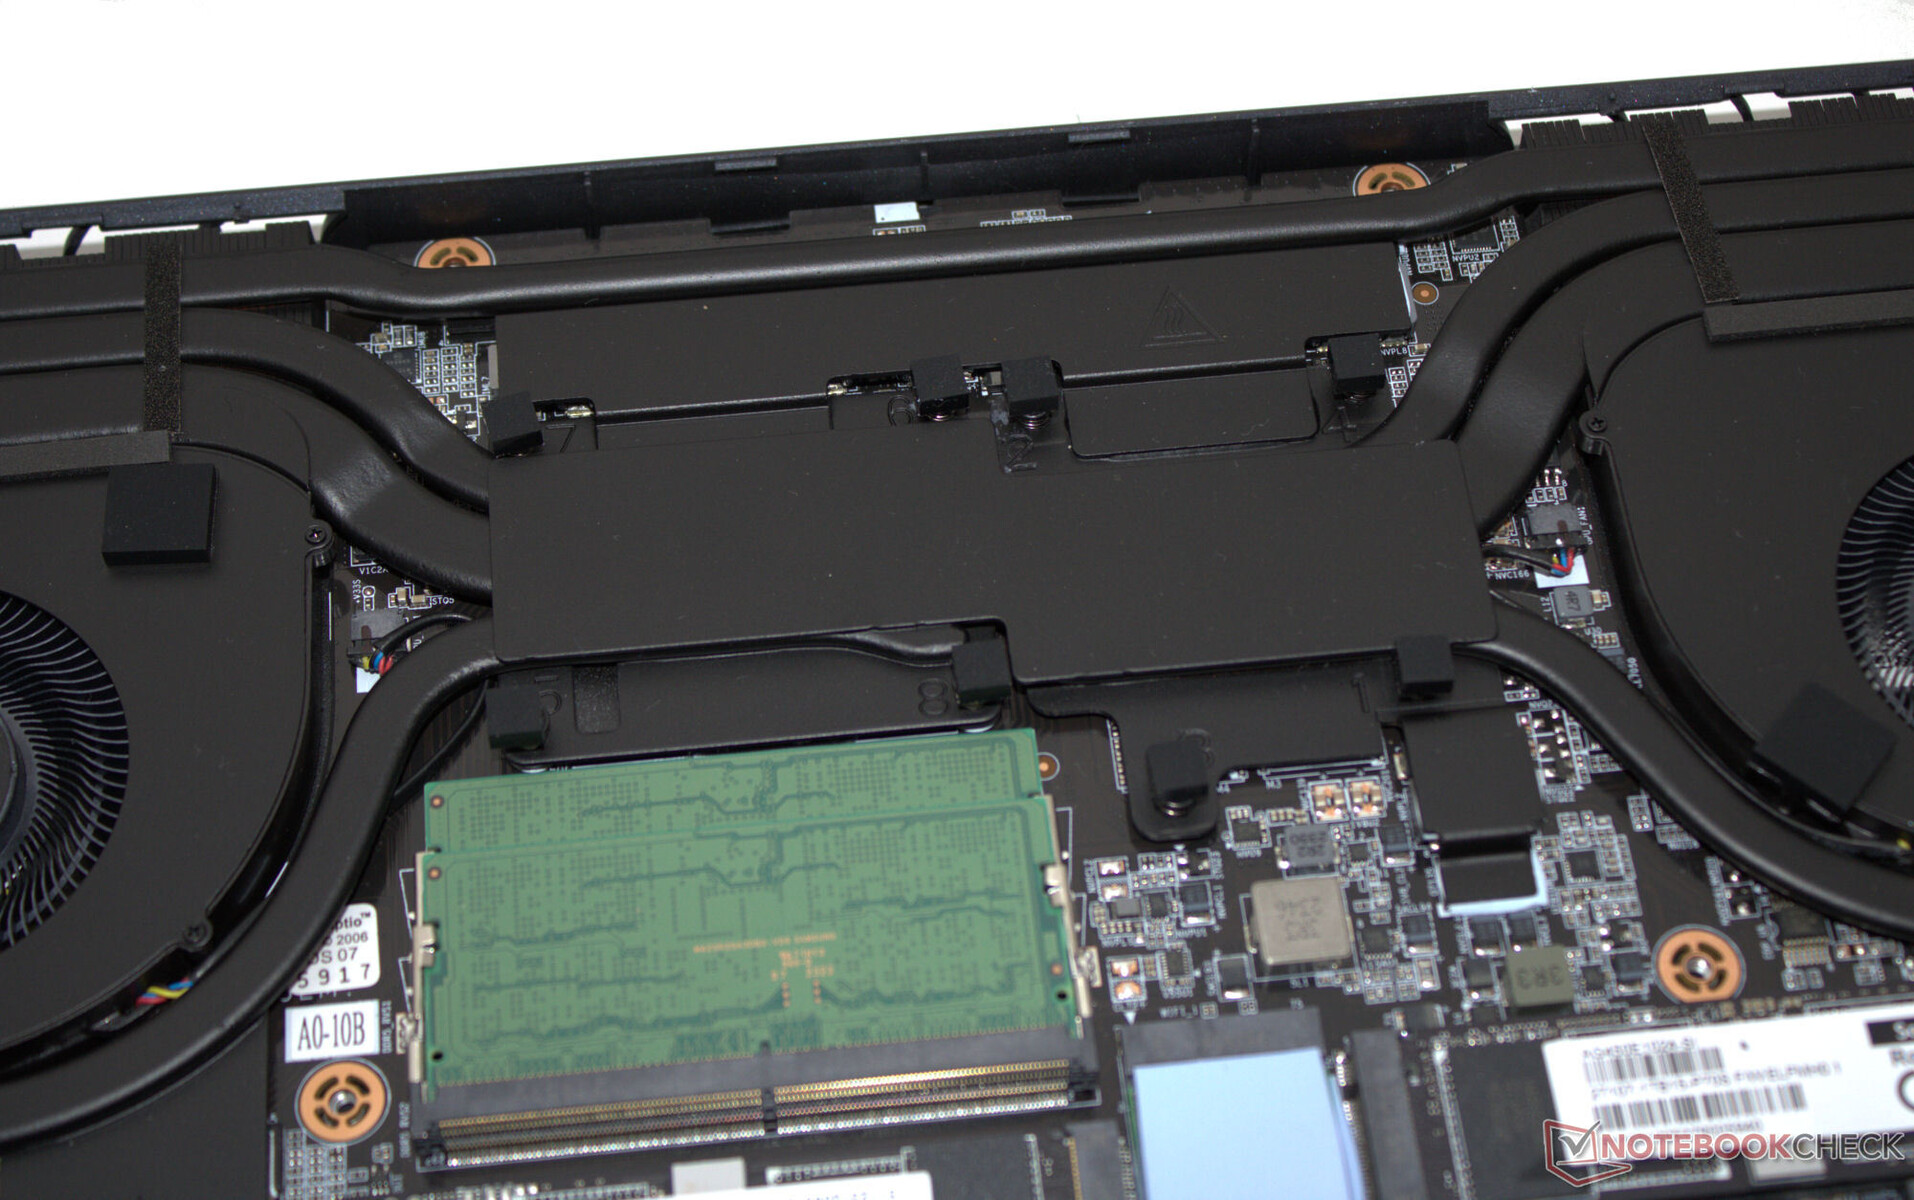
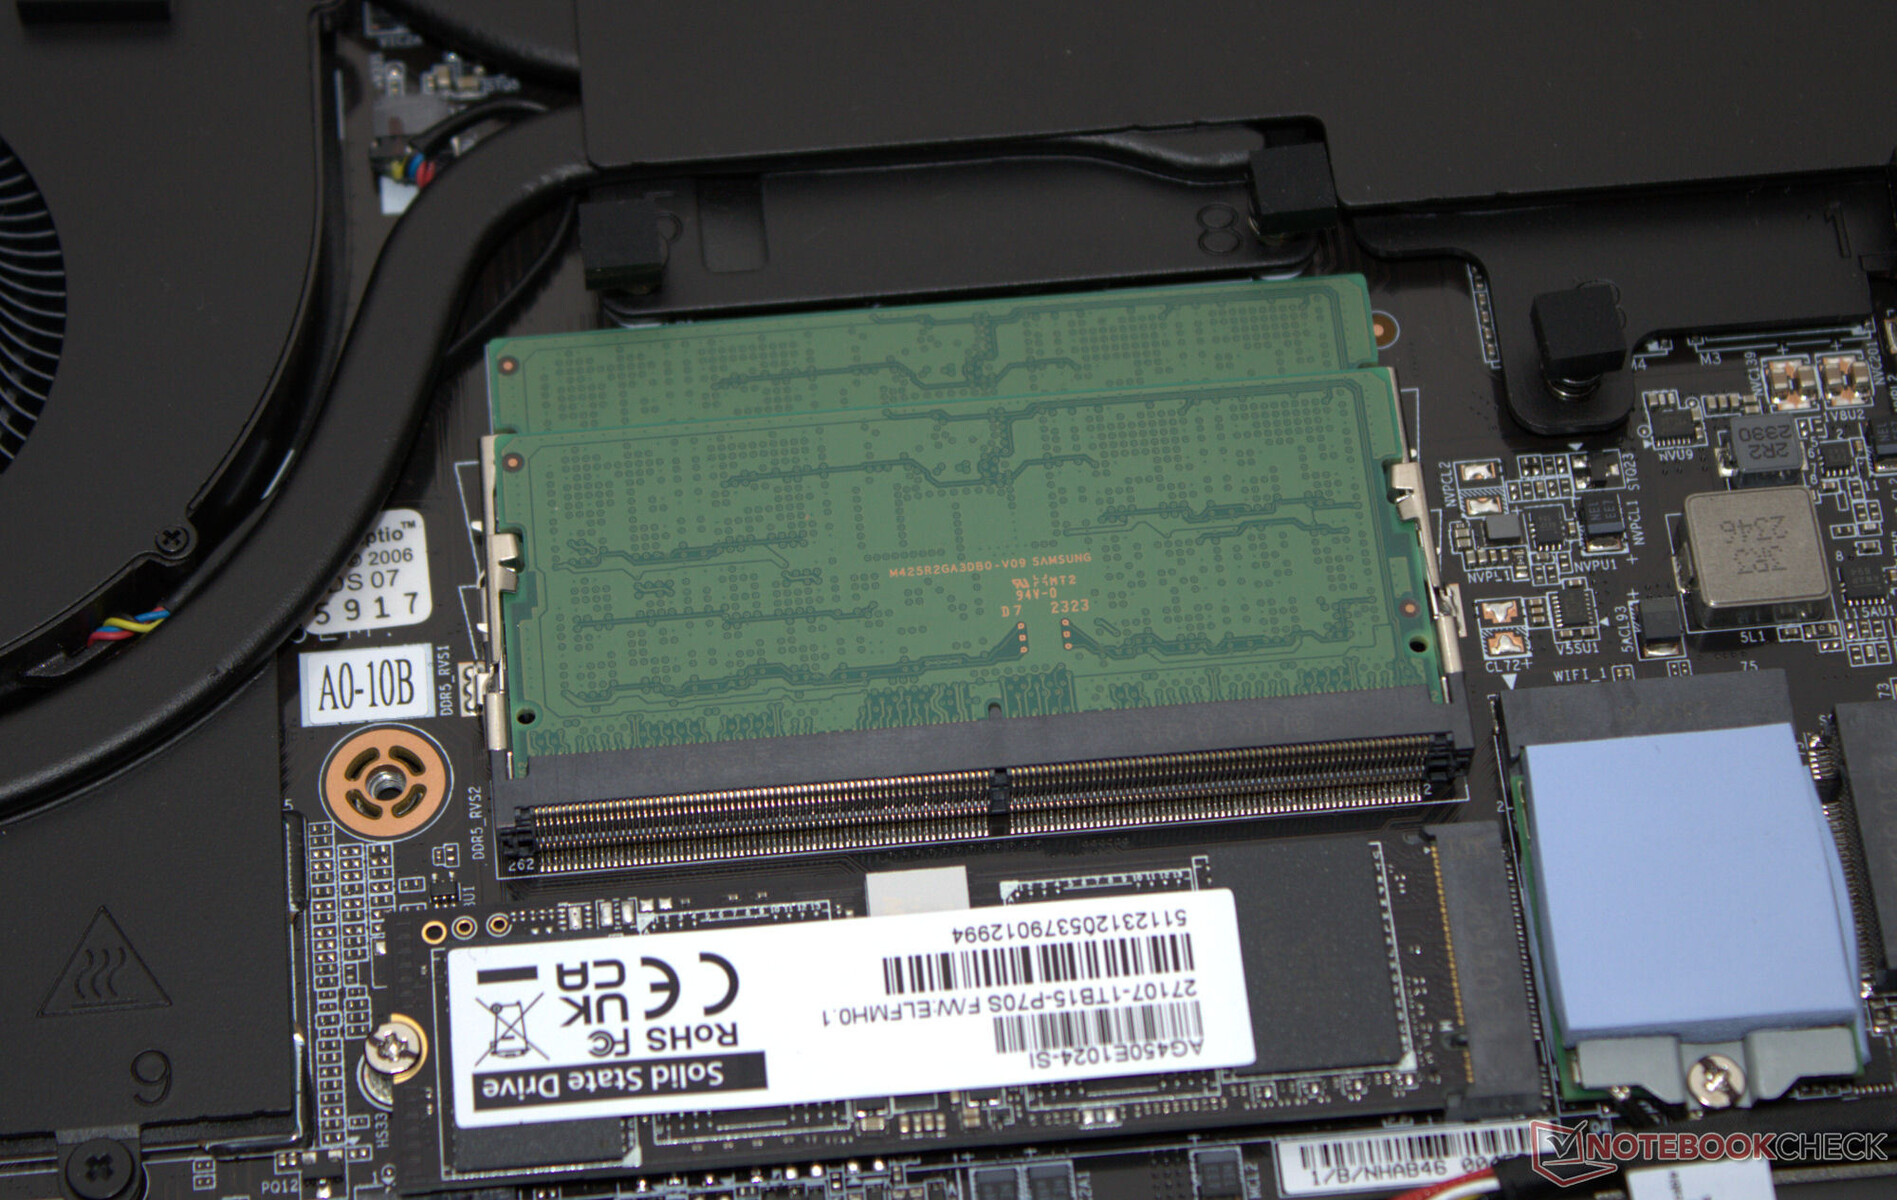
Dopo aver rimosso tutte le viti sul fondo del dispositivo, può utilizzare una spatola piatta o un plettro per aiutare a rimuovere la parte inferiore del case. Successivamente, potrà accedere ai banchi di memoria (entrambi occupati), a entrambe le SSD (PCIe 4, M.2-2280), al modulo WLAN, alle ventole, alla batteria del BIOS e alla batteria normale.
Garanzia
Il dispositivo da 16 pollici è coperto da una garanzia standard di 12 mesi. Non sono disponibili opzioni per estenderla.
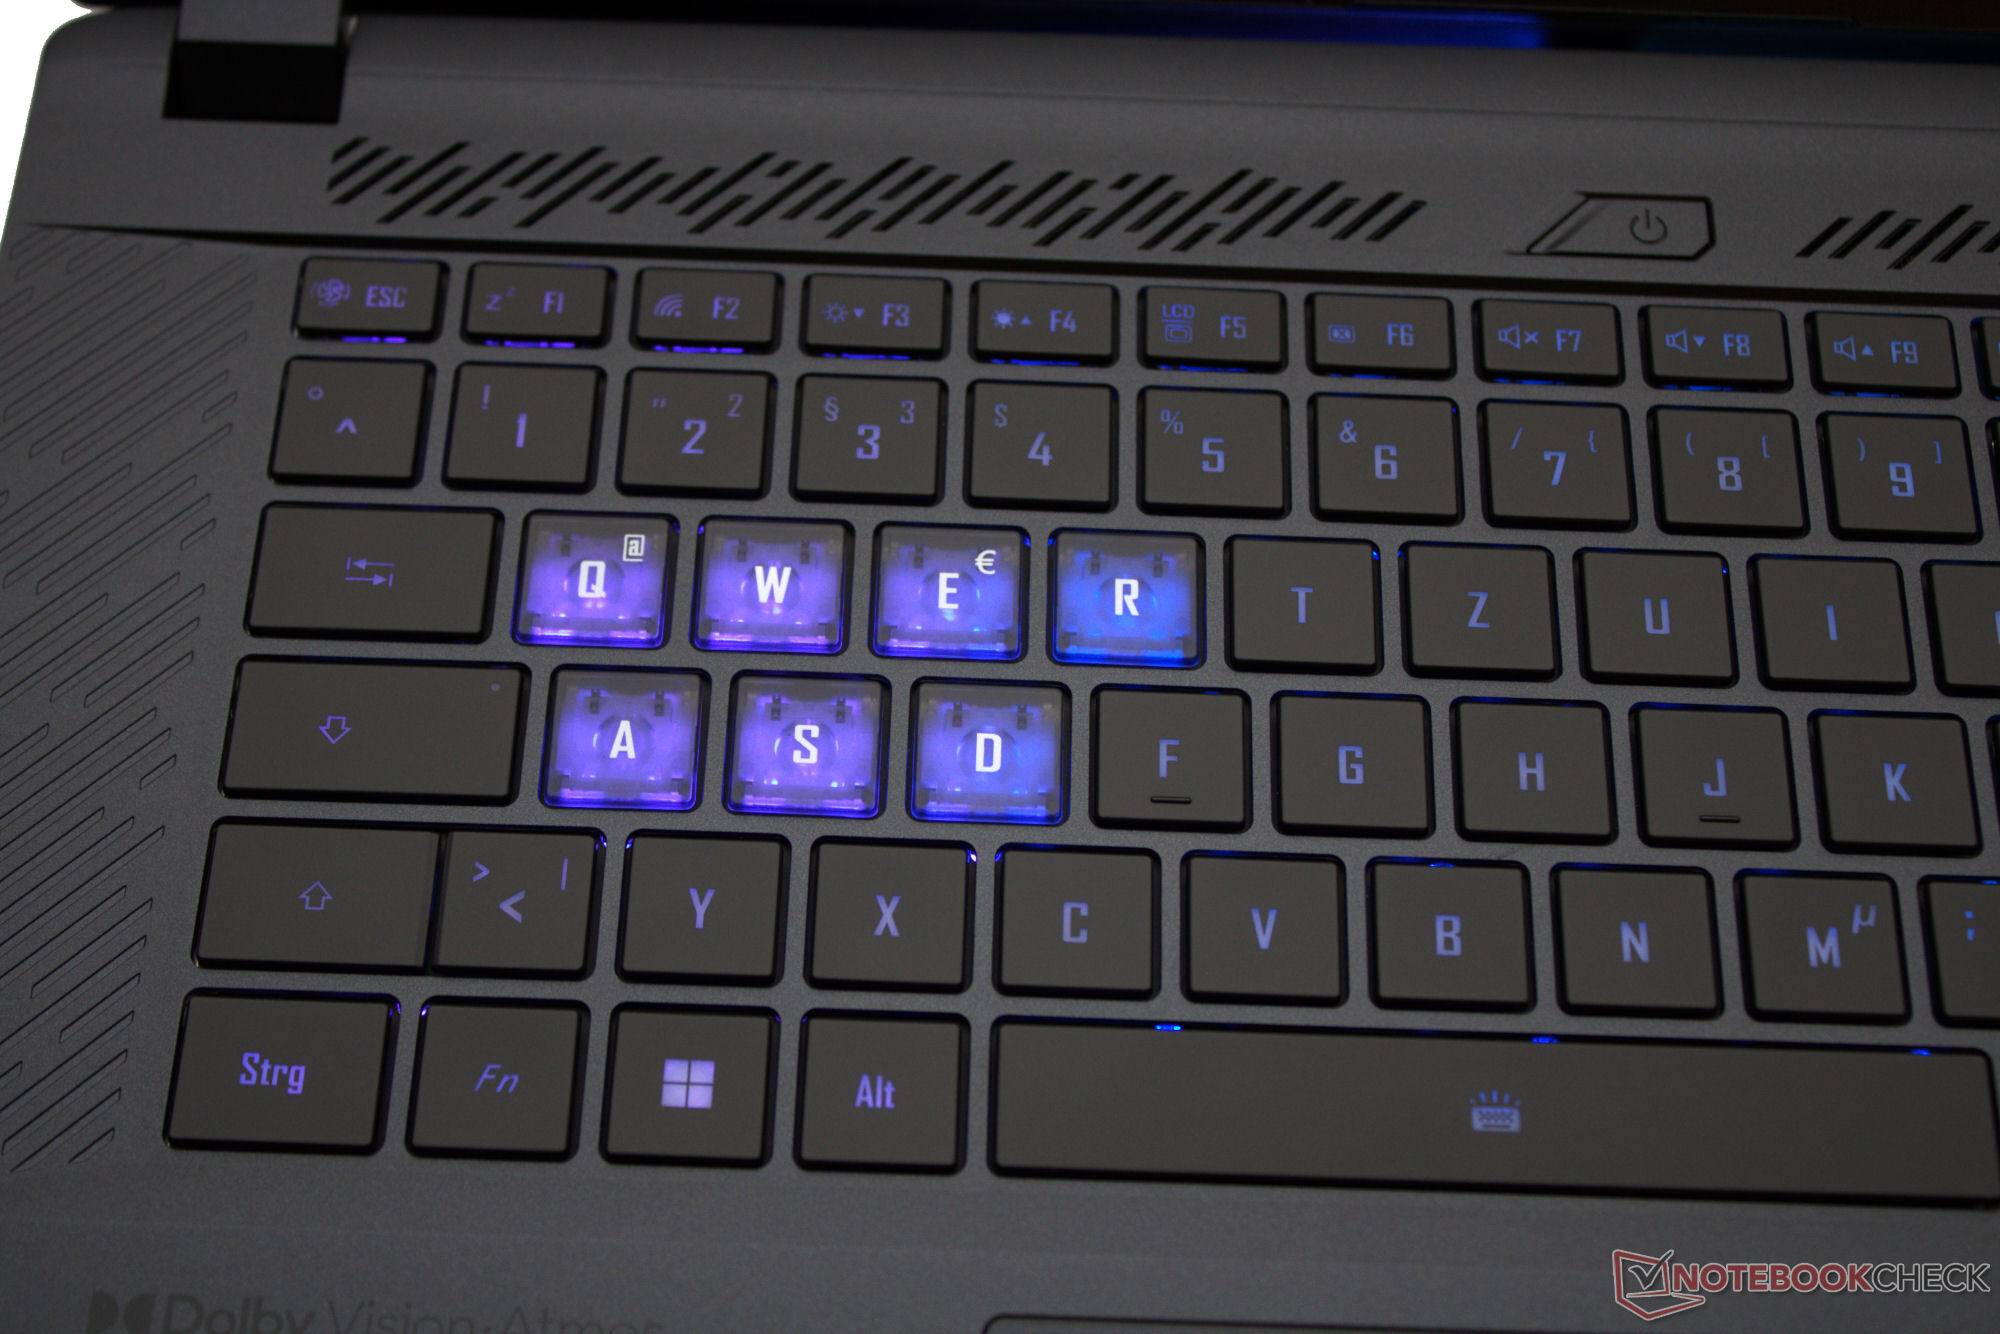
Dispositivi di input - Il portatile Aorus ha una tastiera retroilluminata
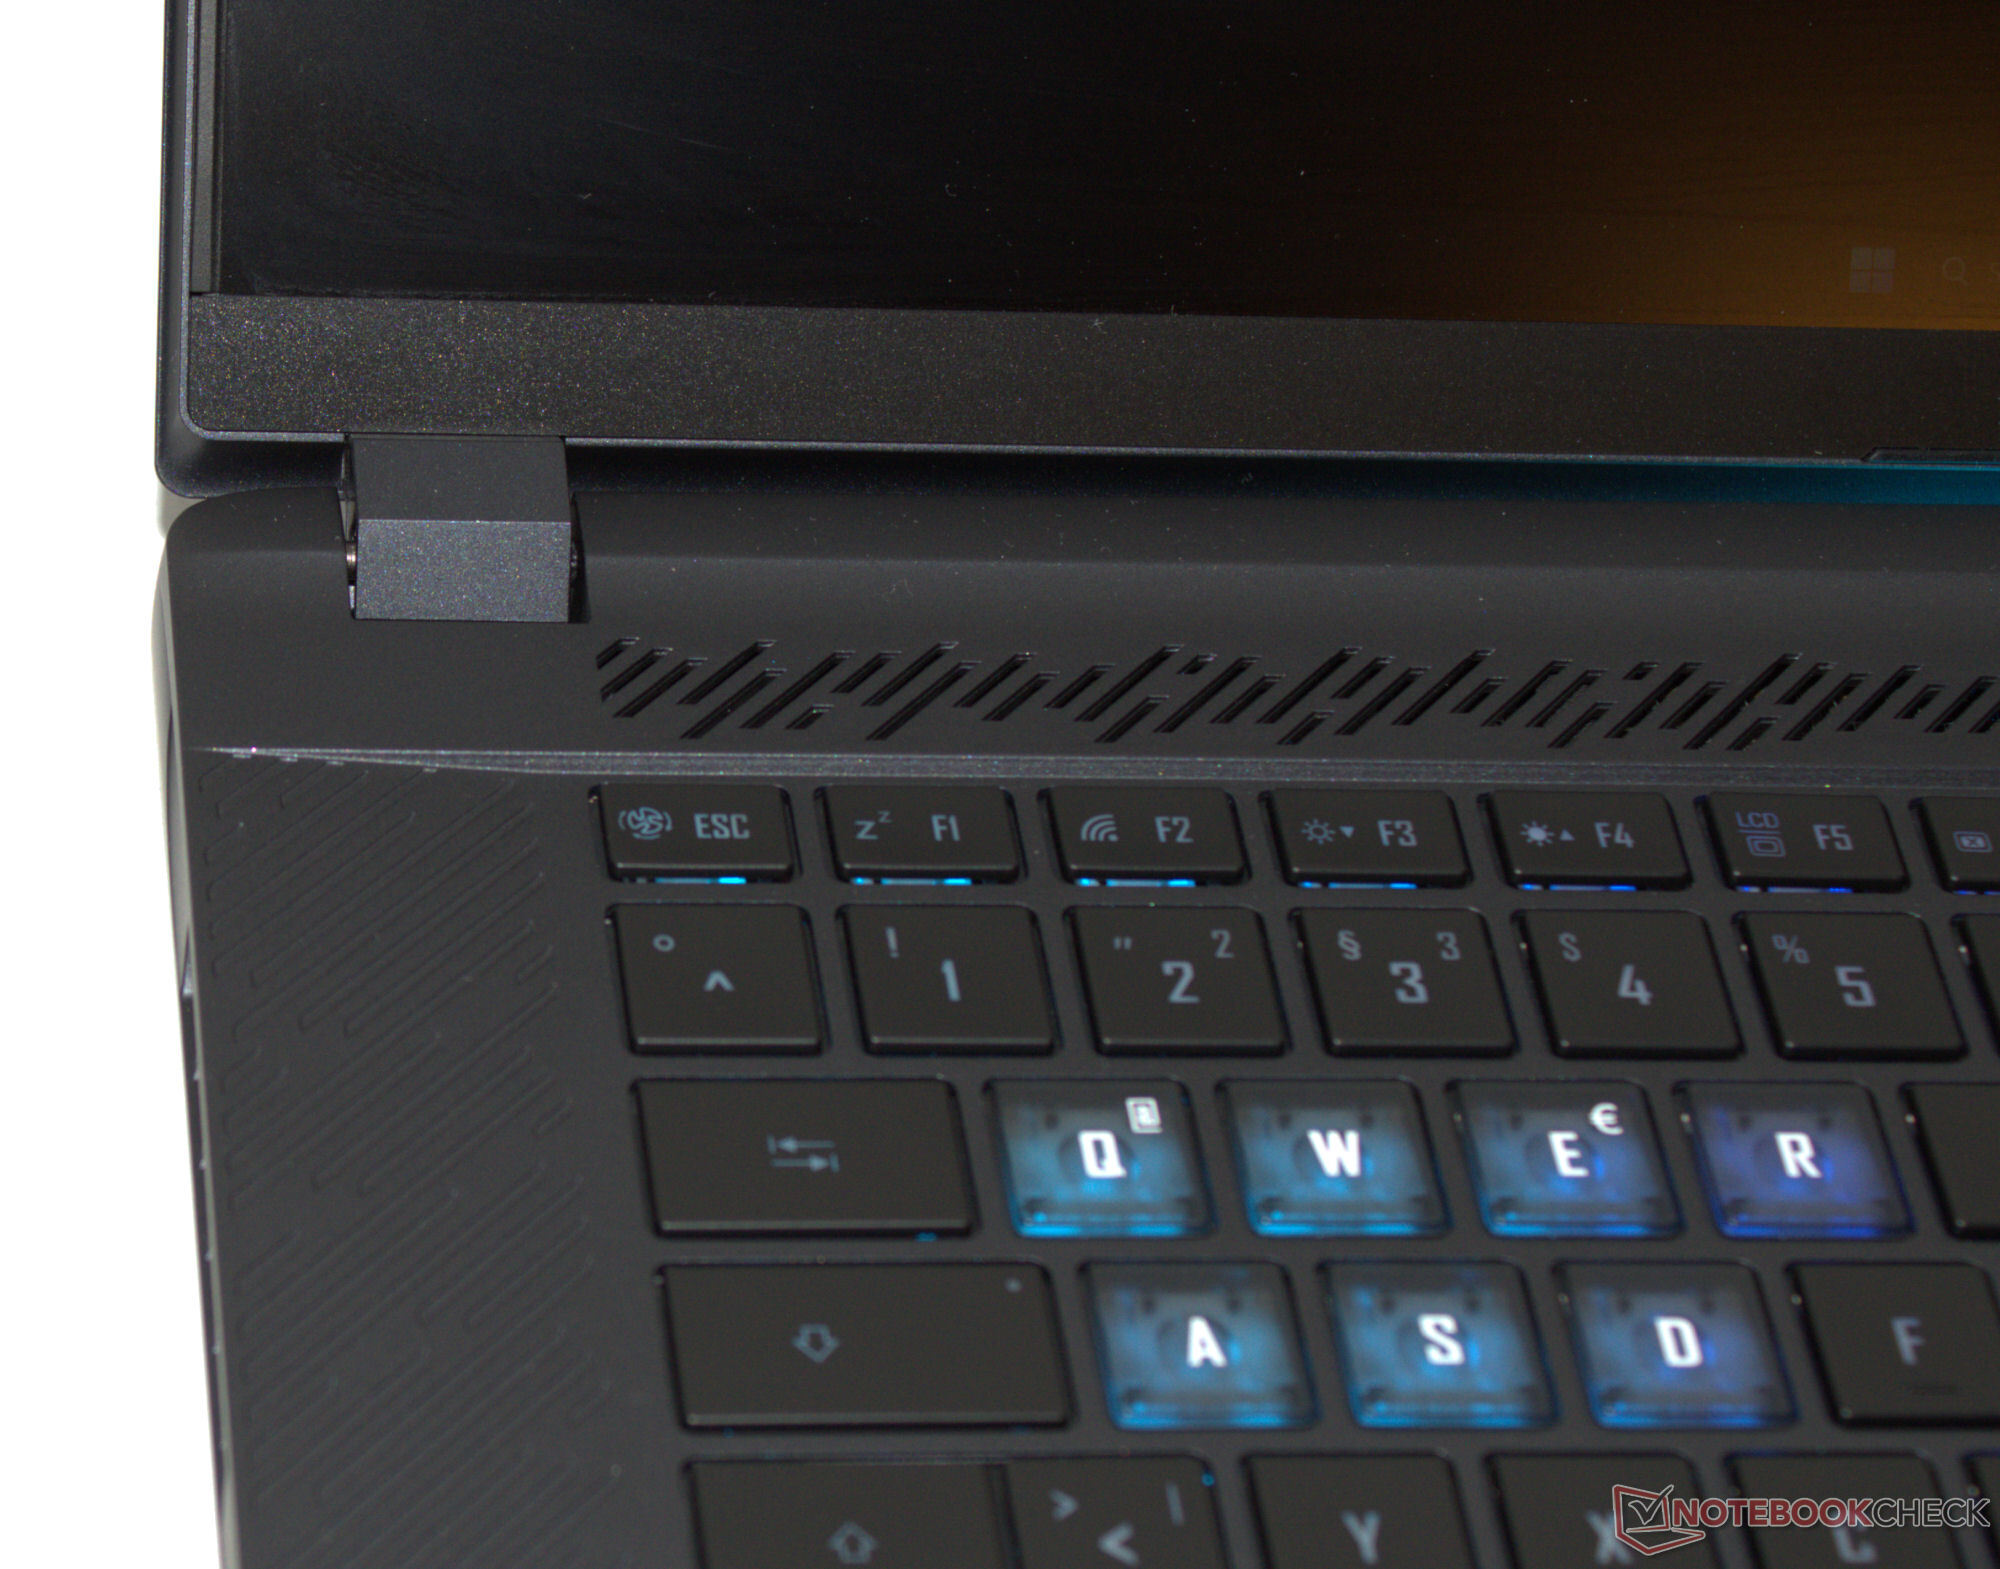
Tastiera
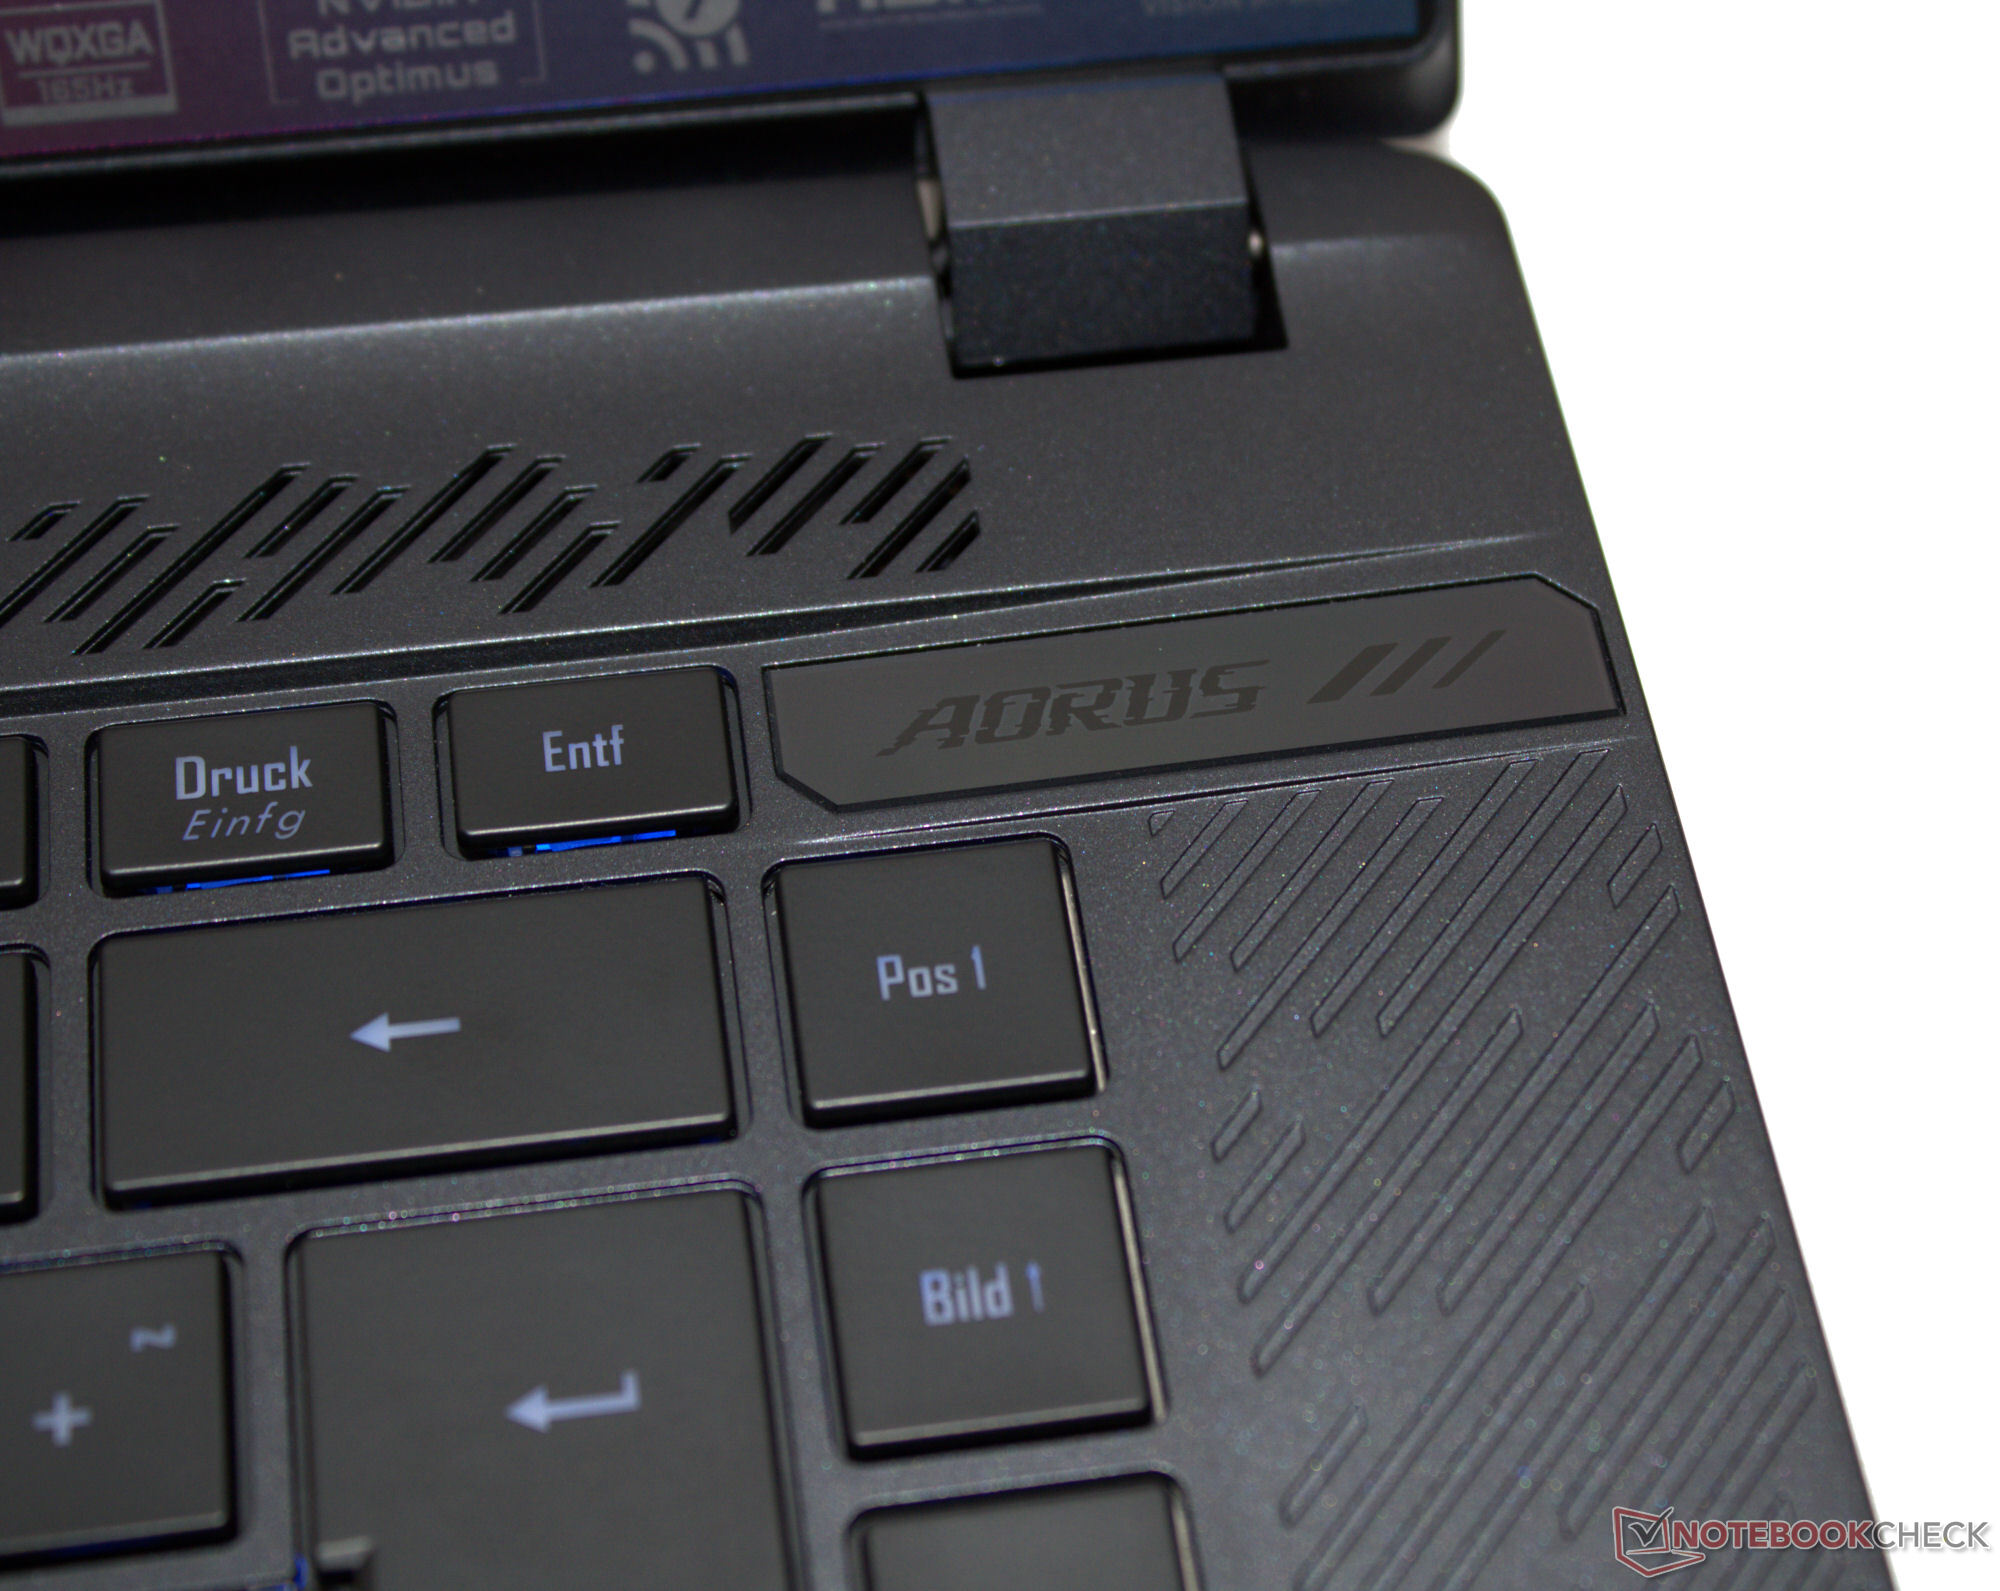
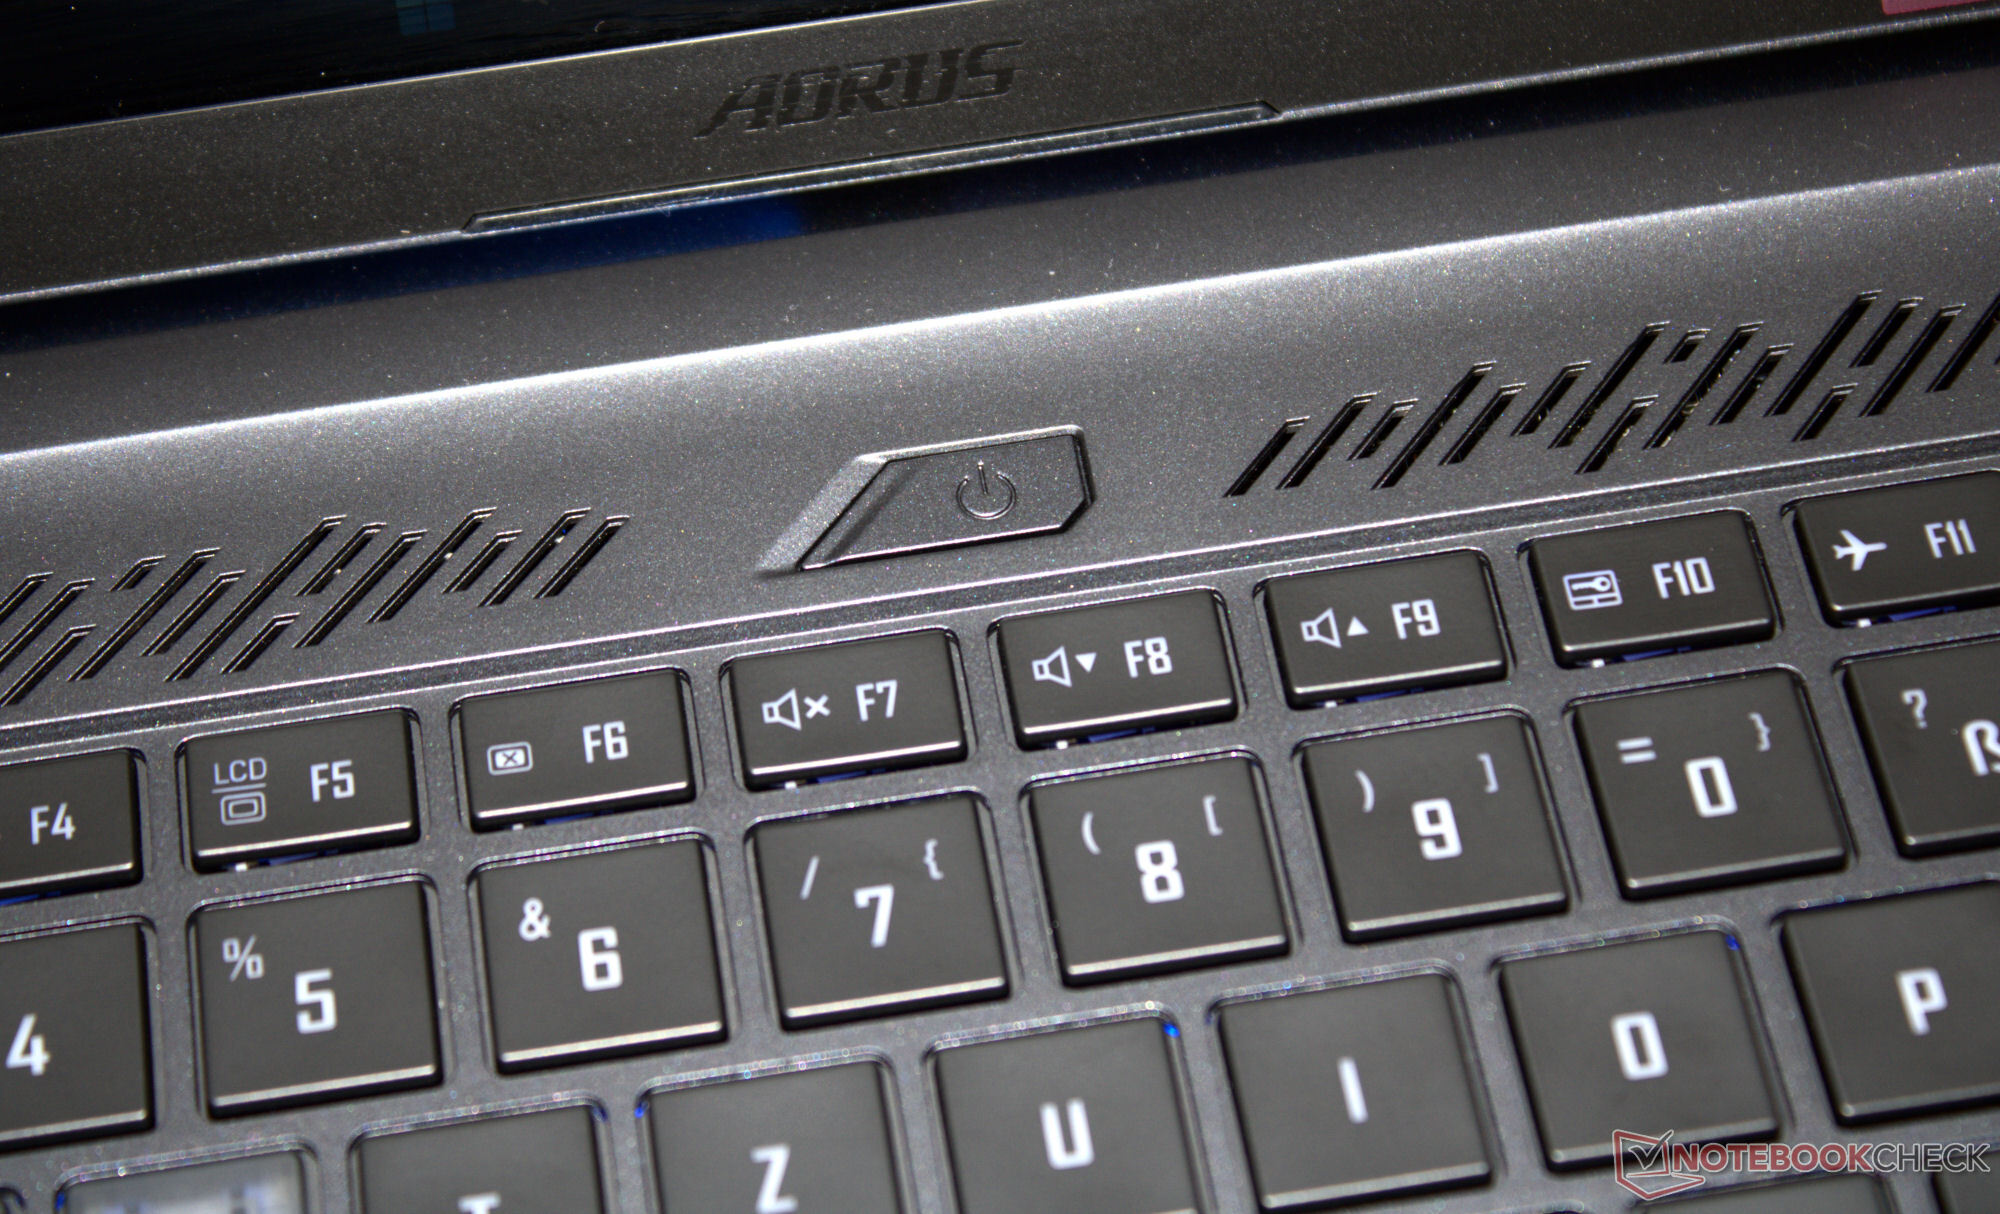
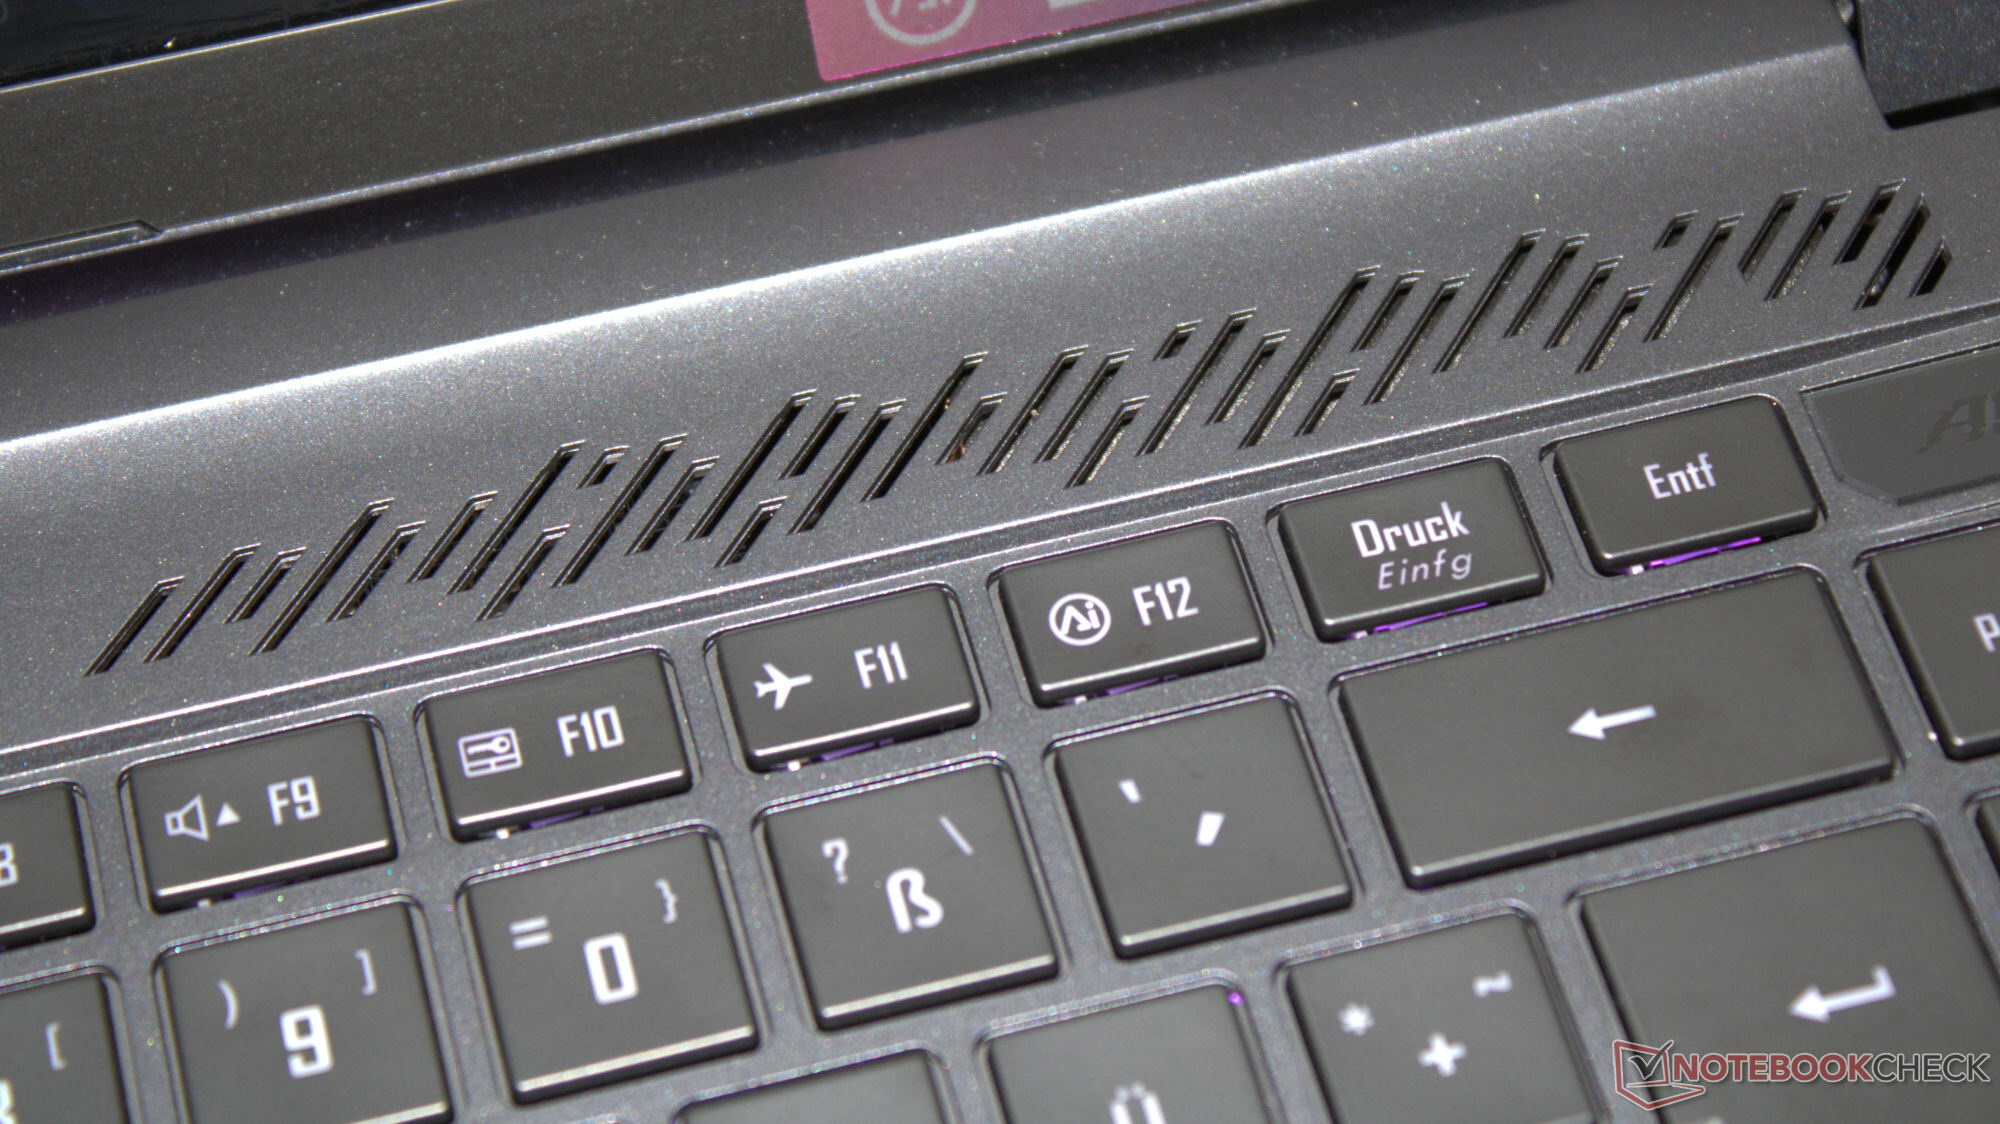
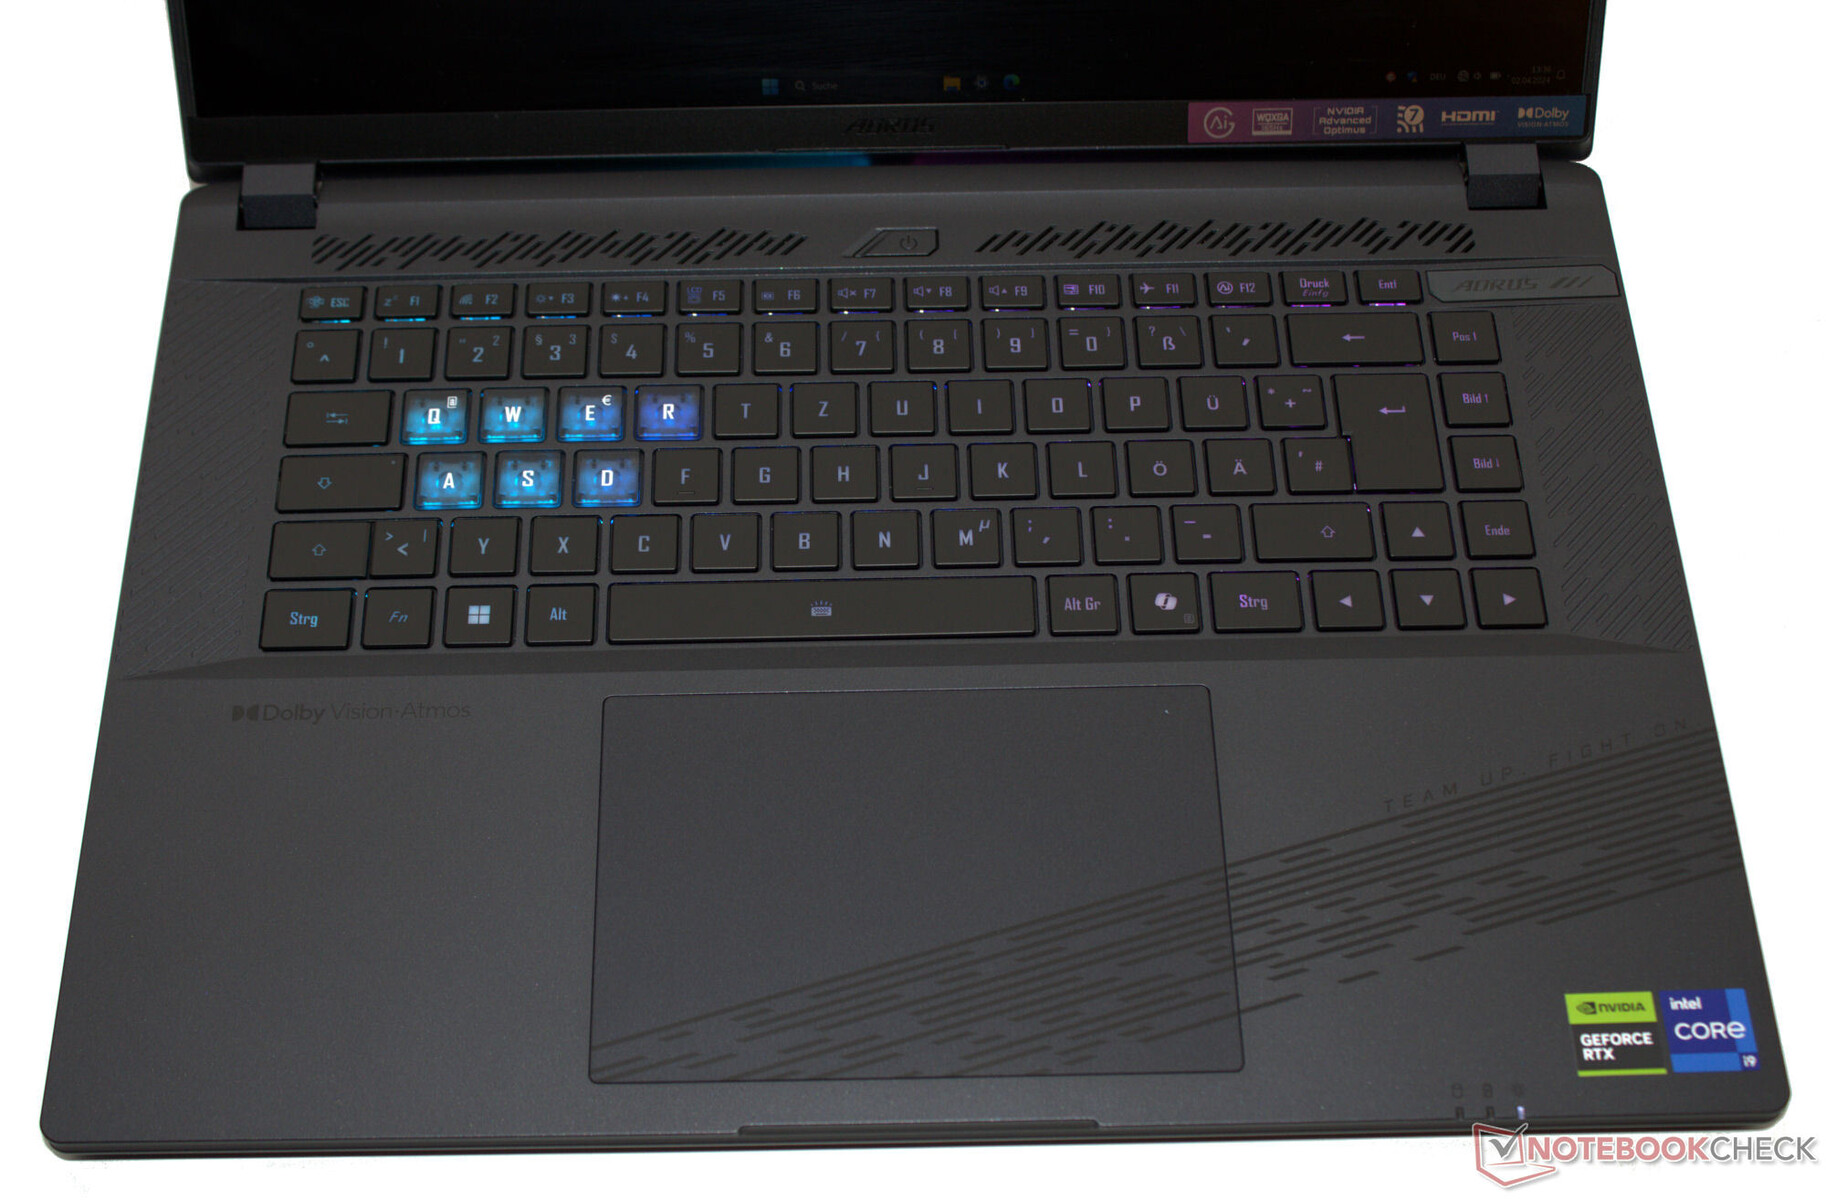
I tasti della tastiera chiclet (illuminazione RGB a tre livelli) hanno un'inclinazione media e un punto di pressione chiaro. La loro resistenza è buona. La tastiera cede leggermente durante la digitazione, ma questo non si è ancora rivelato fastidioso. Bene: I quattro tasti freccia sono a grandezza naturale. Gigabyte ha deciso di non installare un tastierino numerico. Nel complesso, il produttore ha fornito una tastiera adatta all'uso quotidiano.
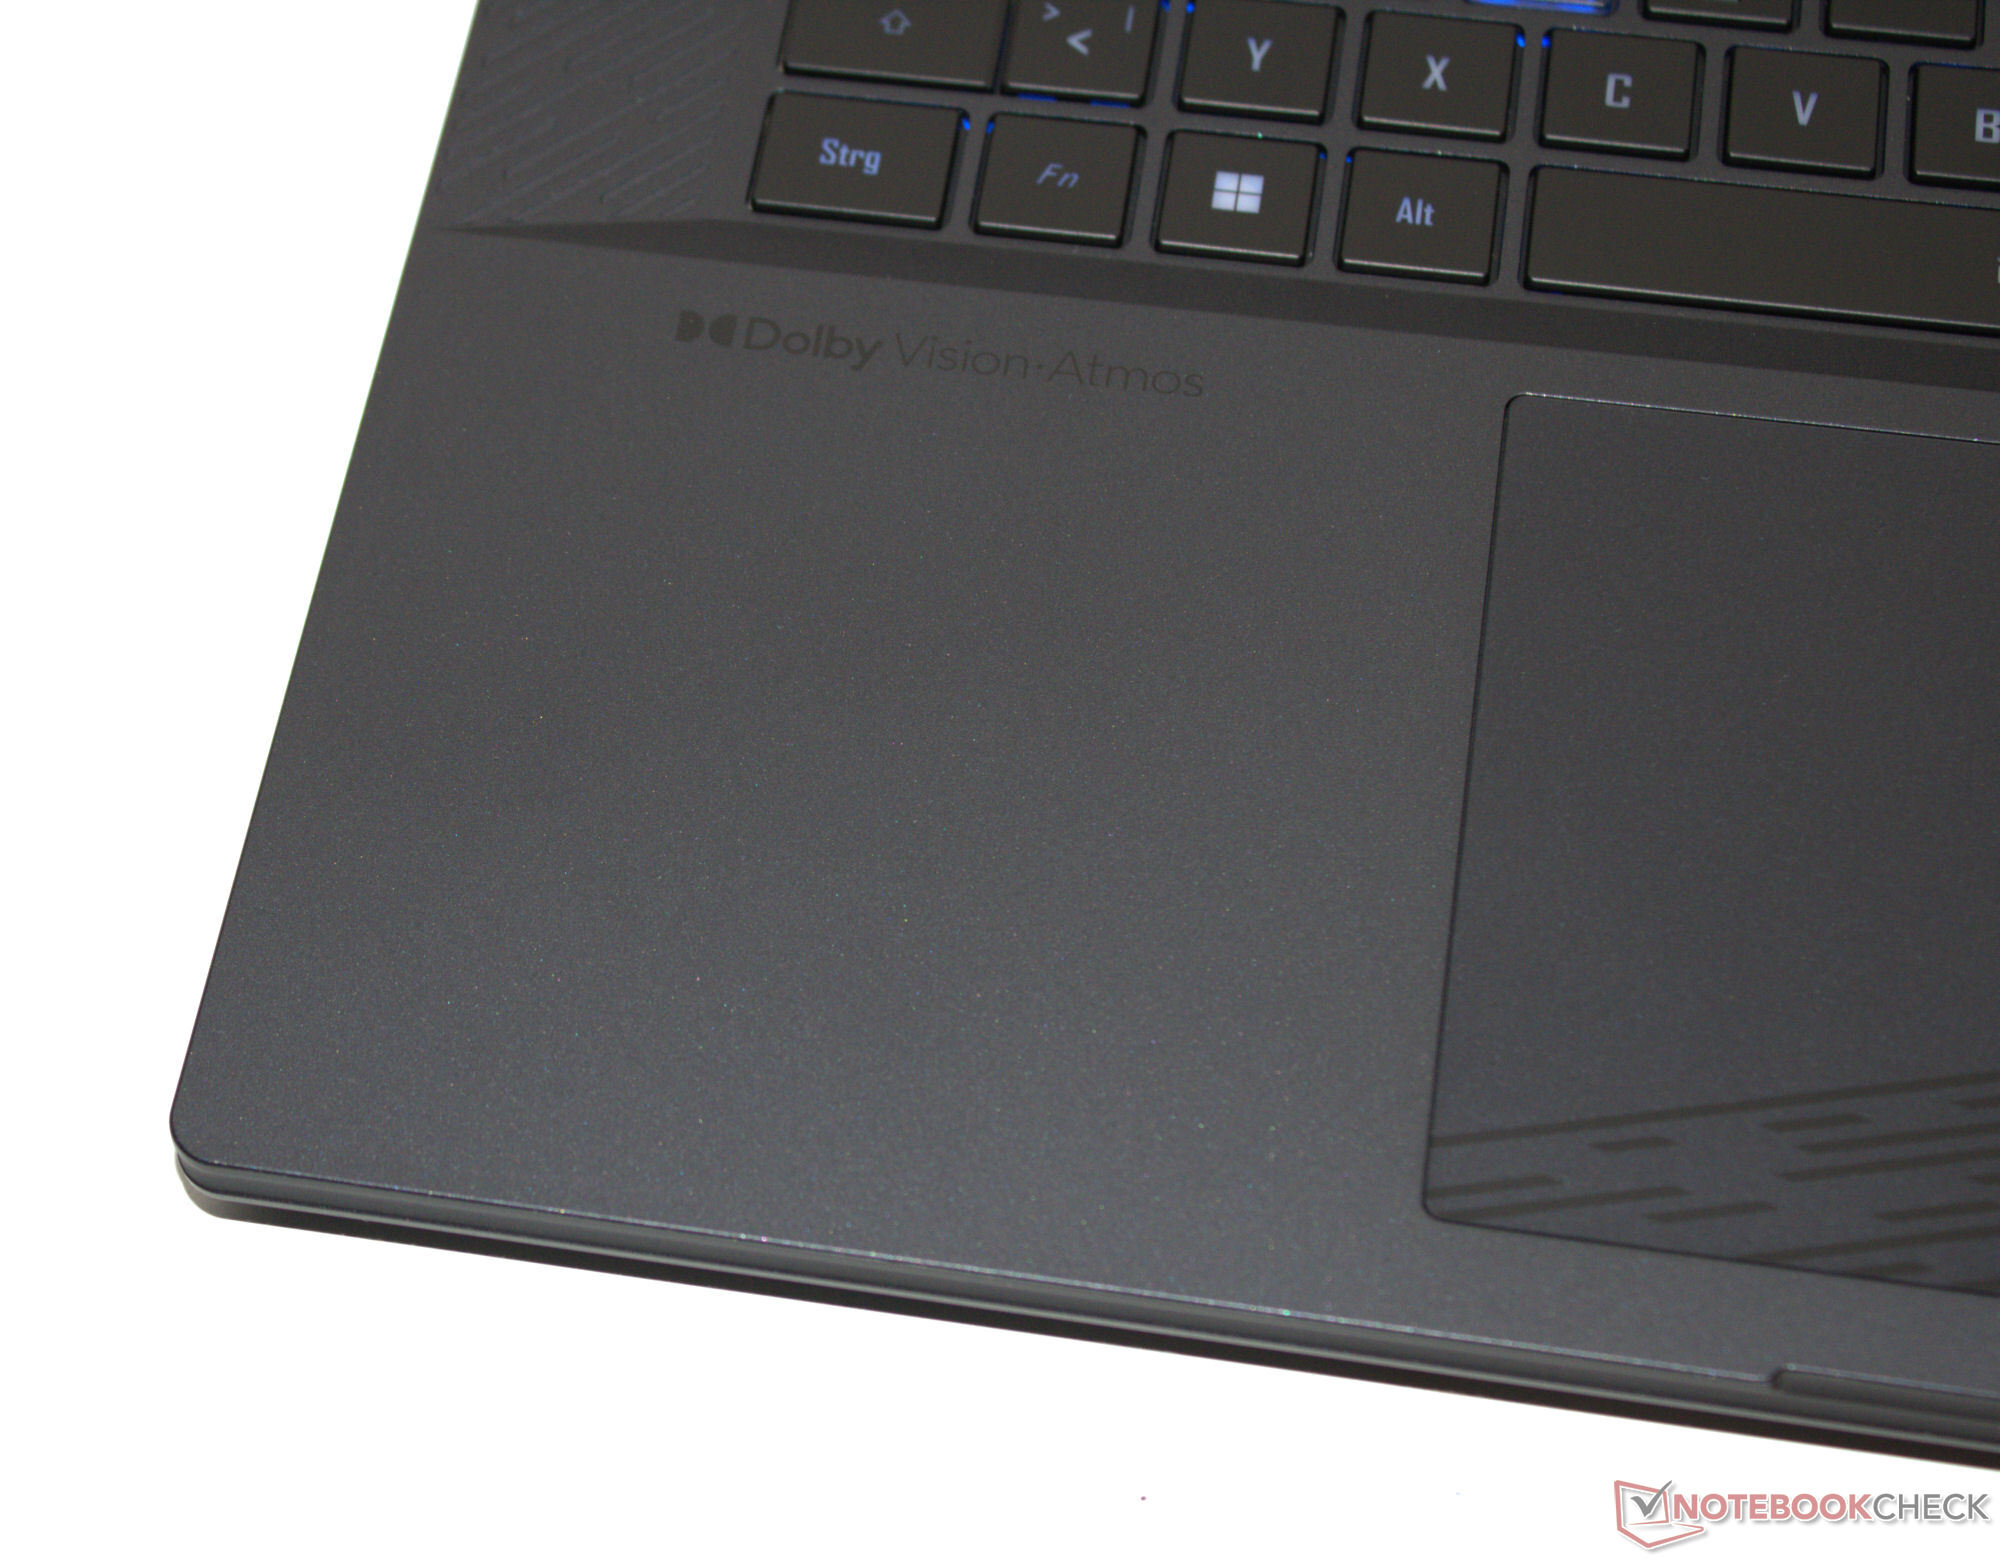
Touchpad
Un clickpad multi-touch (circa 13,3 x 9 cm) funge da sostituto del mouse, la cui superficie liscia facilita lo scorrimento delle dita. Presenta un'alzata breve e un punto di pressione chiaro.
Display - Luminoso, 16:10, sRGB
Gigabyte ha installato un pannello a 165 Hz che include il supporto G-Sync. Quest'ultimo regola dinamicamente le frequenze di aggiornamento del display e della GPU per creare l'immagine più fluida possibile, soprattutto durante i giochi.
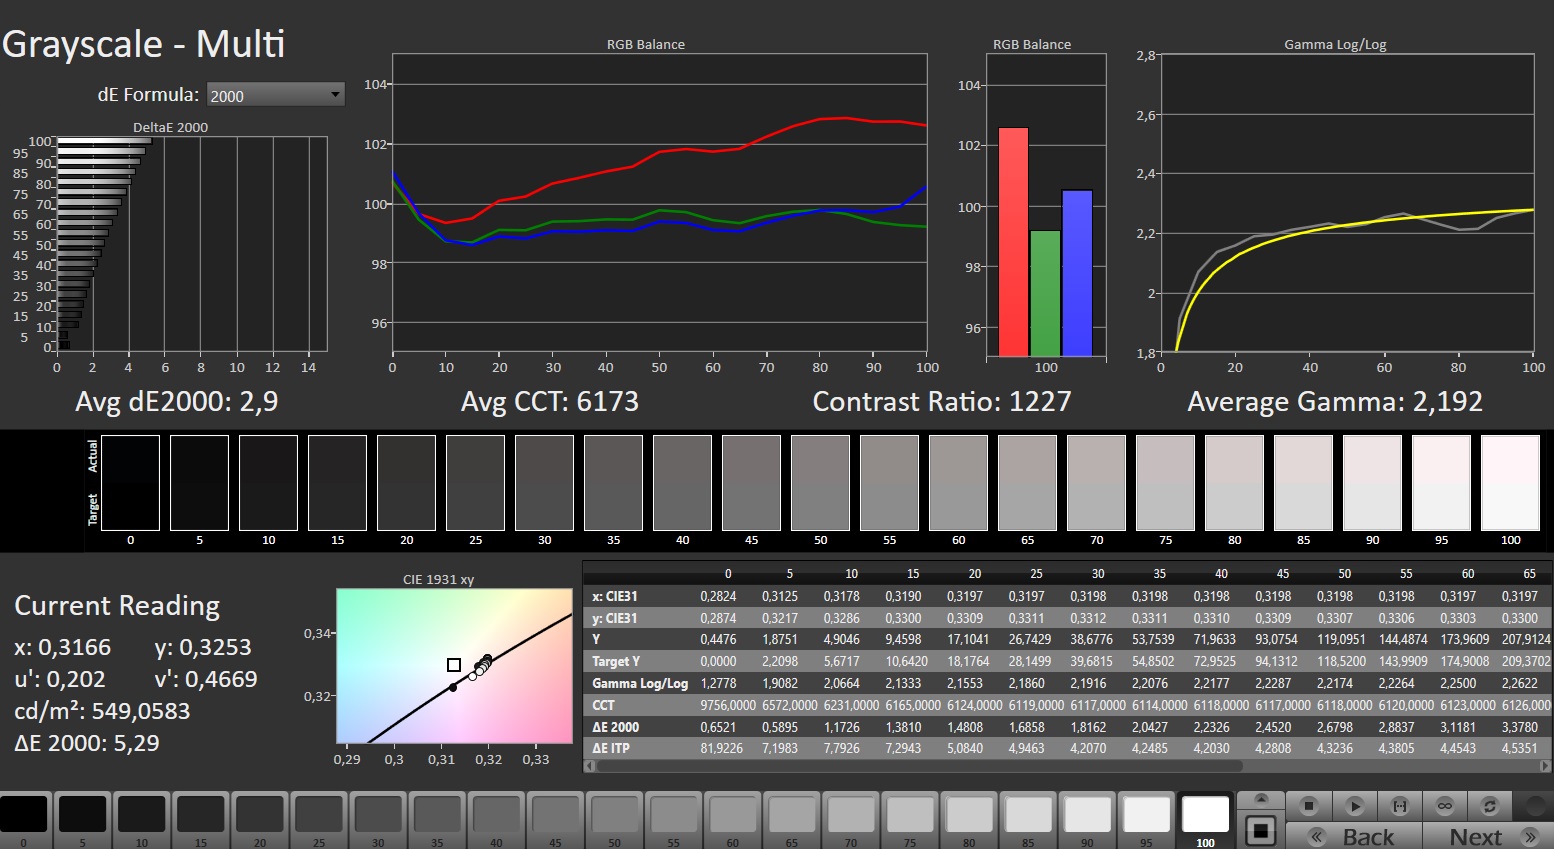
Non abbiamo notato alcun segno di sfarfallio PWM a qualsiasi impostazione di luminosità. La luminosità e il contrasto del pannello opaco 16:10 da 16 pollici (2.560 x 1.600 pixel) soddisfano i rispettivi obiettivi (> 300 cd/m² o 1.000:1). La sua elevata luminosità è particolarmente degna di nota.
| |||||||||||||||||||||||||
Distribuzione della luminosità: 86 %
Al centro con la batteria: 542 cd/m²
Contrasto: 1204:1 (Nero: 0.45 cd/m²)
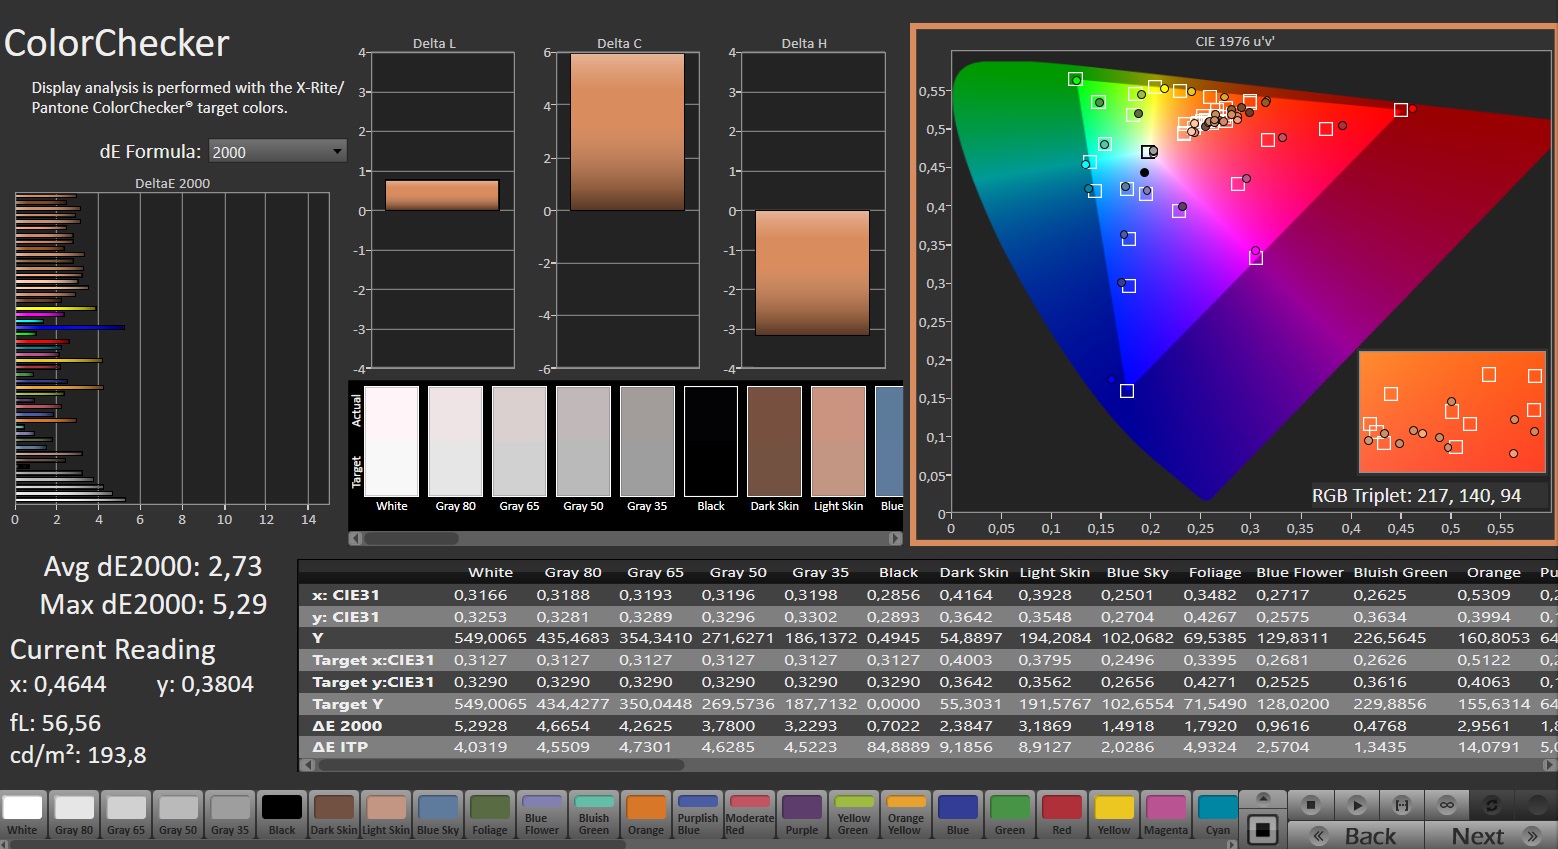
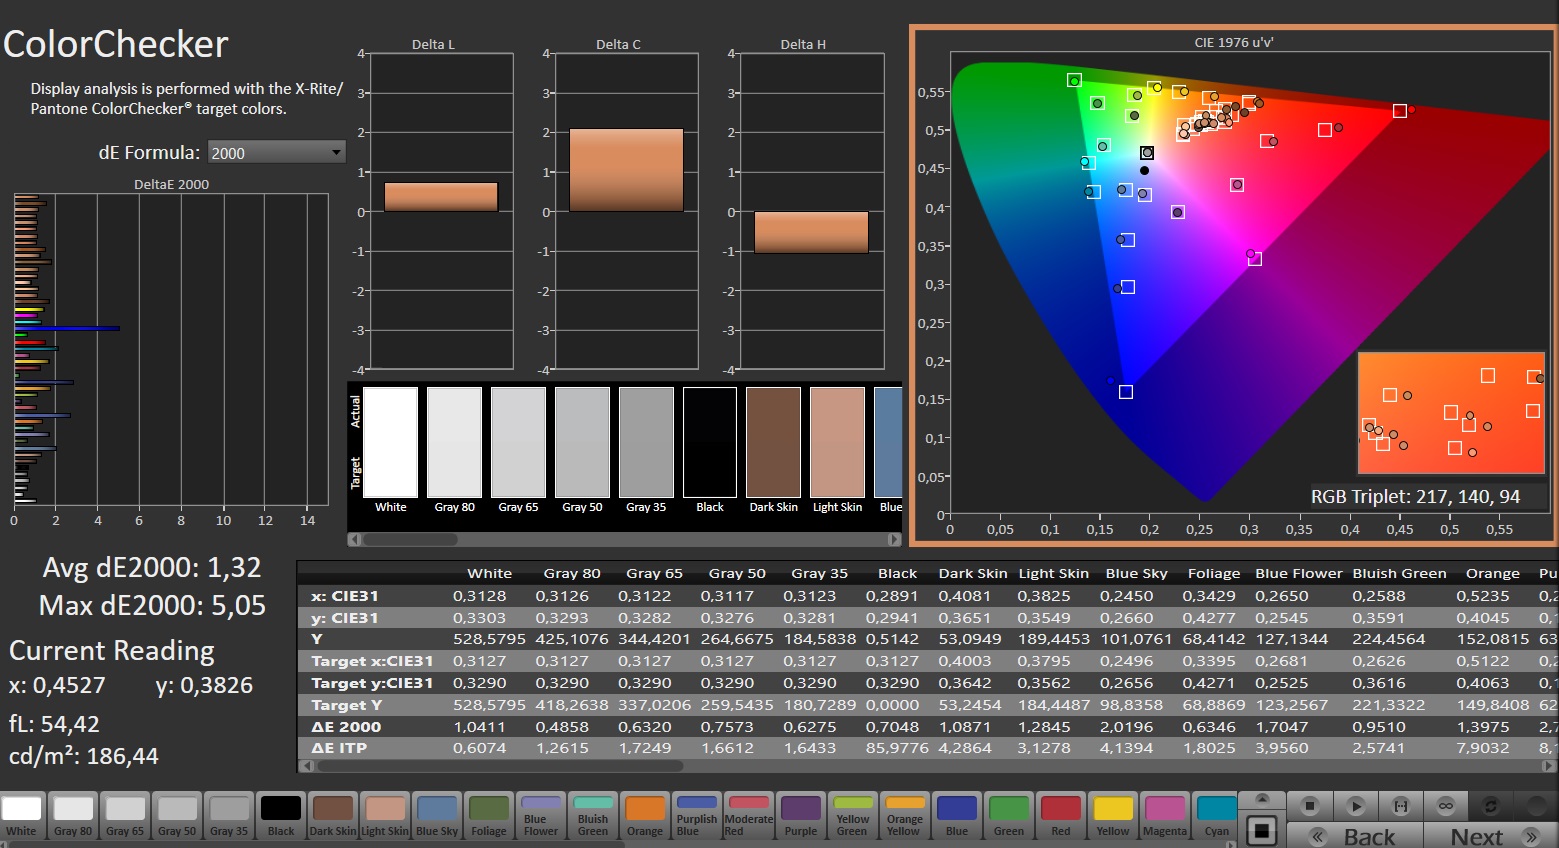
ΔE ColorChecker Calman: 2.73 | ∀{0.5-29.43 Ø4.71}
calibrated: 1.32
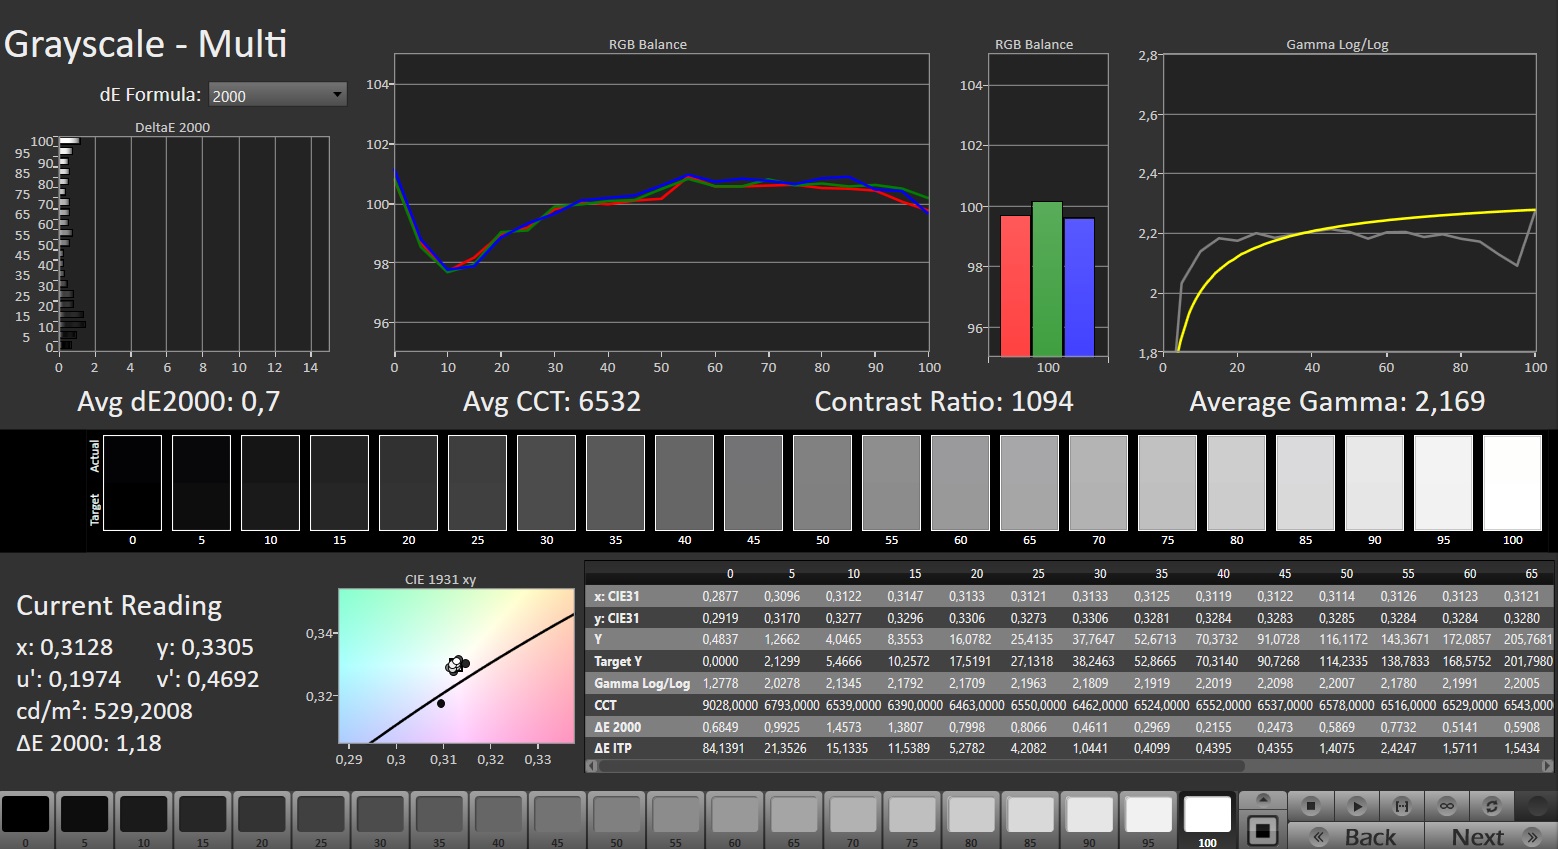
ΔE Greyscale Calman: 2.9 | ∀{0.09-98 Ø4.96}
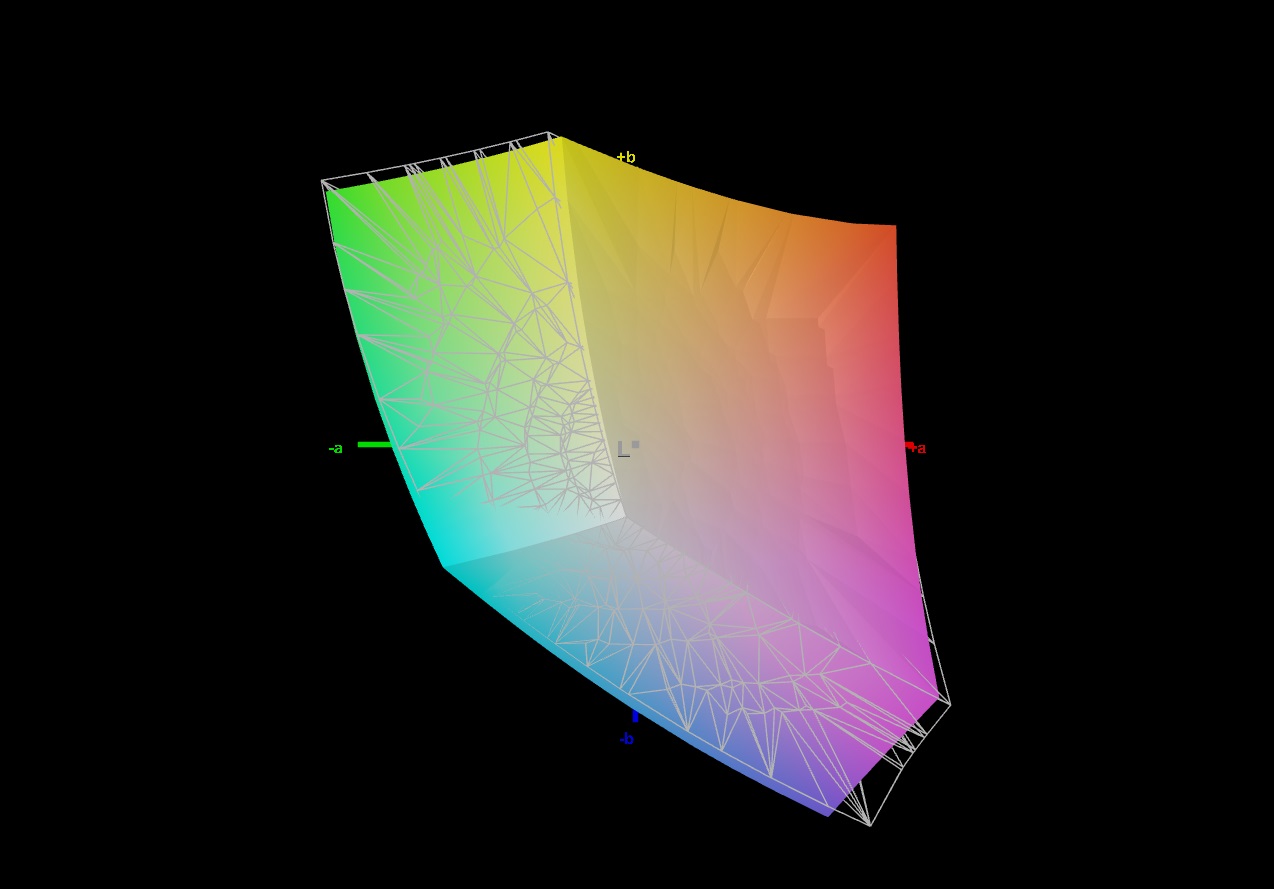
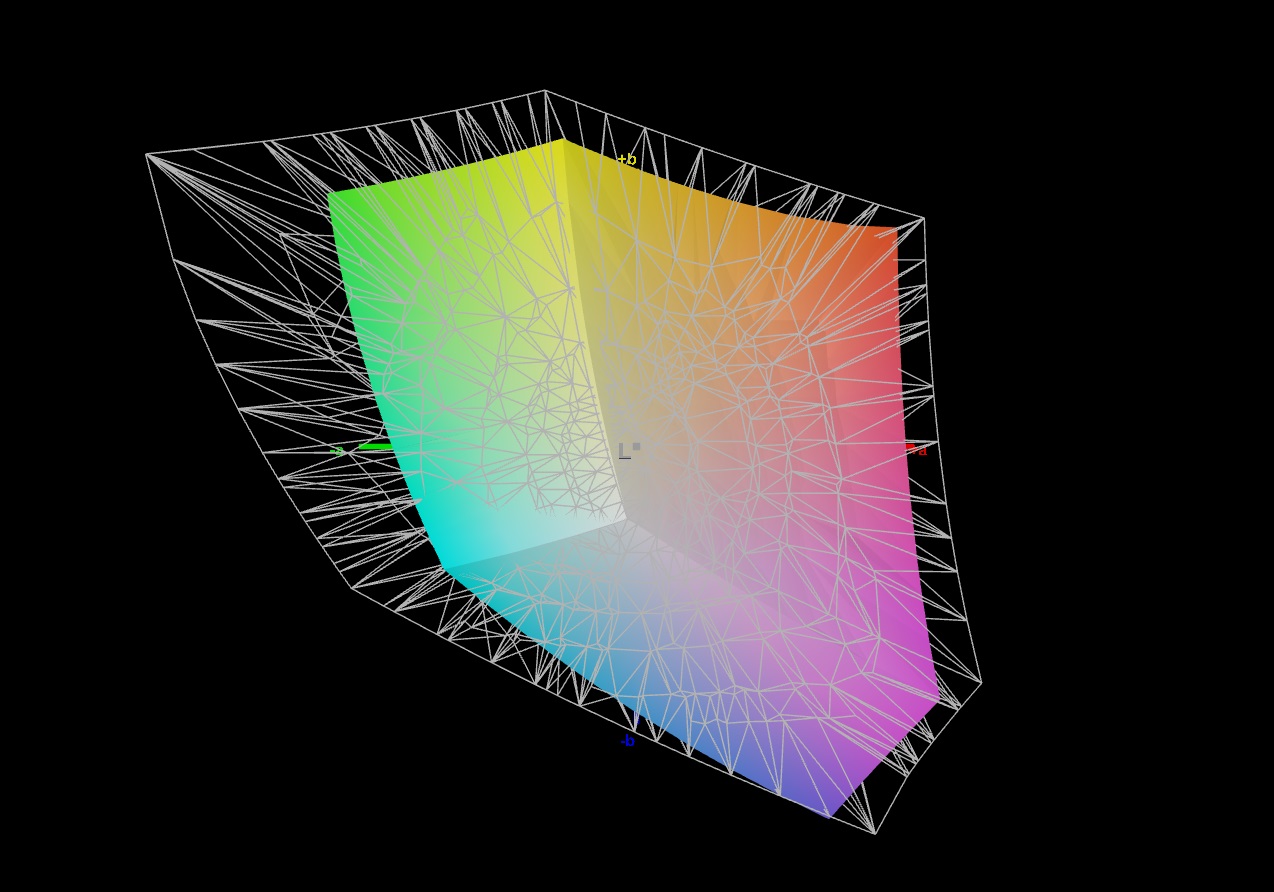
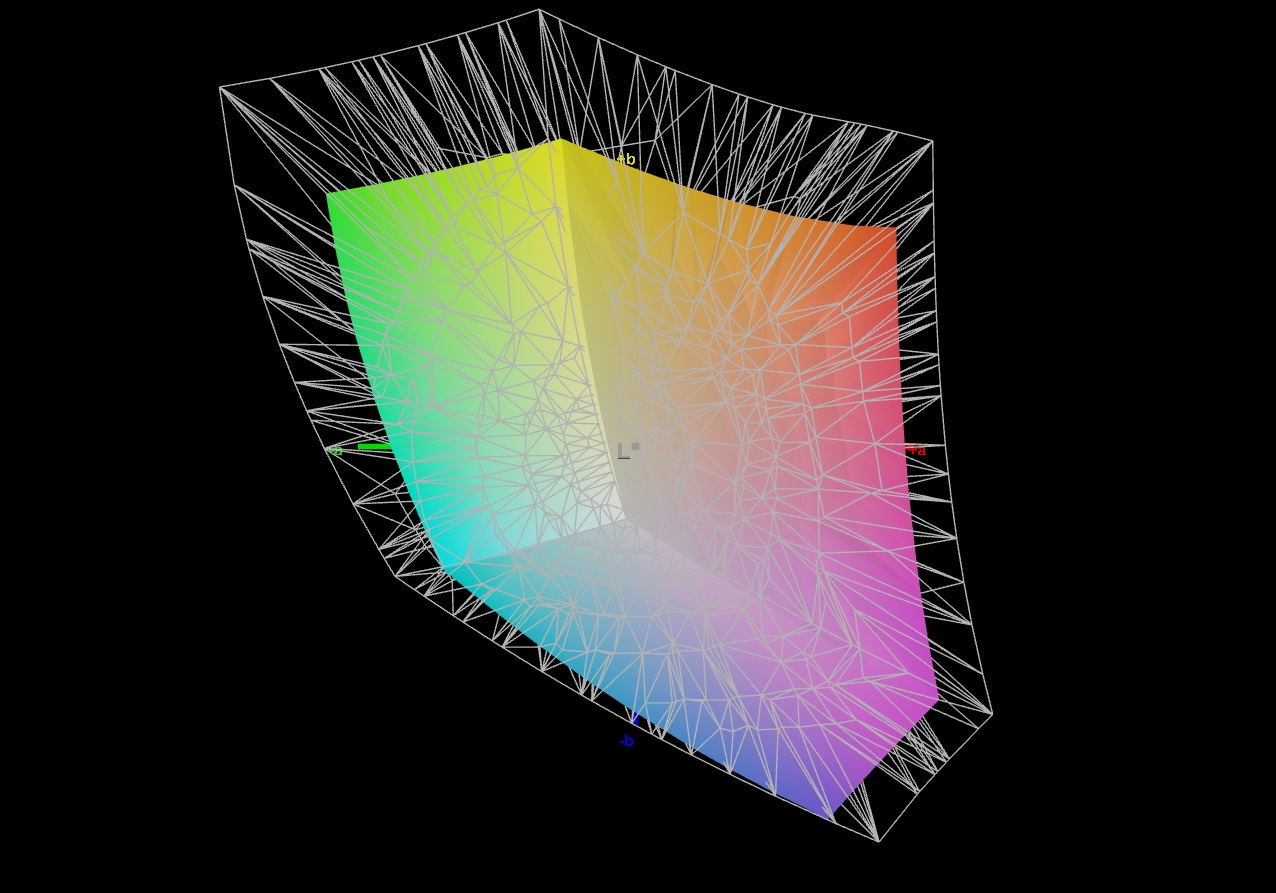
69.3% AdobeRGB 1998 (Argyll 3D)
96.7% sRGB (Argyll 3D)
67.2% Display P3 (Argyll 3D)
Gamma: 2.192
CCT: 6173 K
| Aorus 16X 2024 BOE CQ NE160QDM-NY1, IPS, 2560x1600, 16" | Alienware m16 R2 BOE NE16NYH, IPS, 2560x1600, 16" | HP Omen Transcend 16-u1095ng ATNA60DL02-0 (SDC41A4), OLED, 2560x1600, 16" | Asus TUF Gaming A17 FA707XI-NS94 AU Optronics B173HAN04.9, IPS, 1920x1080, 17.3" | Schenker XMG Pro 16 Studio (Mid 23) BOE CQ NE160QDM-NZ1, IPS, 2560x1600, 16" | Lenovo Legion Pro 5 16IRX9 BOE NE160QDM-NYC, IPS, 2560x1600, 16" | |
|---|---|---|---|---|---|---|
| Display | 4% | 31% | -40% | 2% | 2% | |
| Display P3 Coverage (%) | 67.2 | 71 6% | 99.8 49% | 39.7 -41% | 69.4 3% | 69.3 3% |
| sRGB Coverage (%) | 96.7 | 100 3% | 100 3% | 59.1 -39% | 98.2 2% | 99.4 3% |
| AdobeRGB 1998 Coverage (%) | 69.3 | 71.4 3% | 97 40% | 41 -41% | 70.1 1% | 70.1 1% |
| Response Times | -19% | 97% | -409% | -53% | -62% | |
| Response Time Grey 50% / Grey 80% * (ms) | 7.5 ? | 5.7 ? 24% | 0.2 ? 97% | 39 ? -420% | 12.2 ? -63% | 11.9 ? -59% |
| Response Time Black / White * (ms) | 5.4 ? | 8.7 ? -61% | 0.2 ? 96% | 26.9 ? -398% | 7.7 ? -43% | 8.9 ? -65% |
| PWM Frequency (Hz) | 120 ? | |||||
| Screen | 11% | 162% | -50% | -9% | 17% | |
| Brightness middle (cd/m²) | 542 | 345.8 -36% | 390 -28% | 255.9 -53% | 349 -36% | 384 -29% |
| Brightness (cd/m²) | 504 | 337 -33% | 392 -22% | 248 -51% | 348 -31% | 366 -27% |
| Brightness Distribution (%) | 86 | 87 1% | 98 14% | 91 6% | 93 8% | 91 6% |
| Black Level * (cd/m²) | 0.45 | 0.3 33% | 0.02 96% | 0.21 53% | 0.32 29% | 0.35 22% |
| Contrast (:1) | 1204 | 1153 -4% | 19500 1520% | 1219 1% | 1091 -9% | 1097 -9% |
| Colorchecker dE 2000 * | 2.73 | 1.99 27% | 1.94 29% | 4.51 -65% | 1.98 27% | 0.97 64% |
| Colorchecker dE 2000 max. * | 5.29 | 3.52 33% | 4.26 19% | 20.77 -293% | 7.56 -43% | 3.57 33% |
| Colorchecker dE 2000 calibrated * | 1.32 | 0.62 53% | 4.21 -219% | 1.82 -38% | 1.45 -10% | 0.77 42% |
| Greyscale dE 2000 * | 2.9 | 2.1 28% | 1.5 48% | 3.2 -10% | 3.3 -14% | 1.5 48% |
| Gamma | 2.192 100% | 2.32 95% | 2.221 99% | 2.08 106% | 2.137 103% | 2.24 98% |
| CCT | 6173 105% | 6369 102% | 6395 102% | 6054 107% | 6672 97% | 6709 97% |
| Media totale (Programma / Settaggio) | -1% /
6% | 97% /
124% | -166% /
-99% | -20% /
-13% | -14% /
2% |
* ... Meglio usare valori piccoli
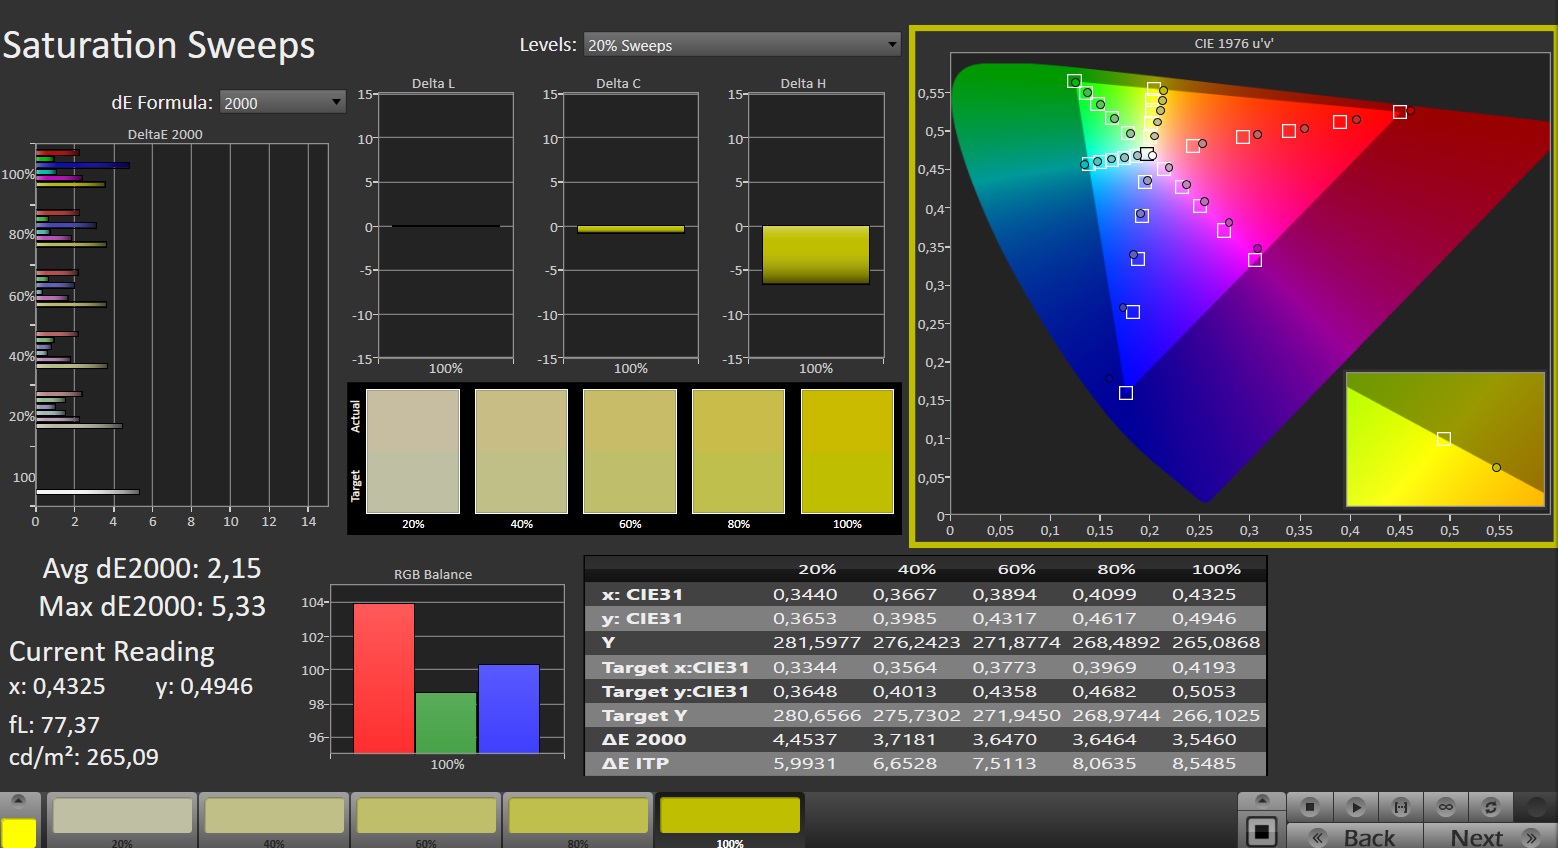
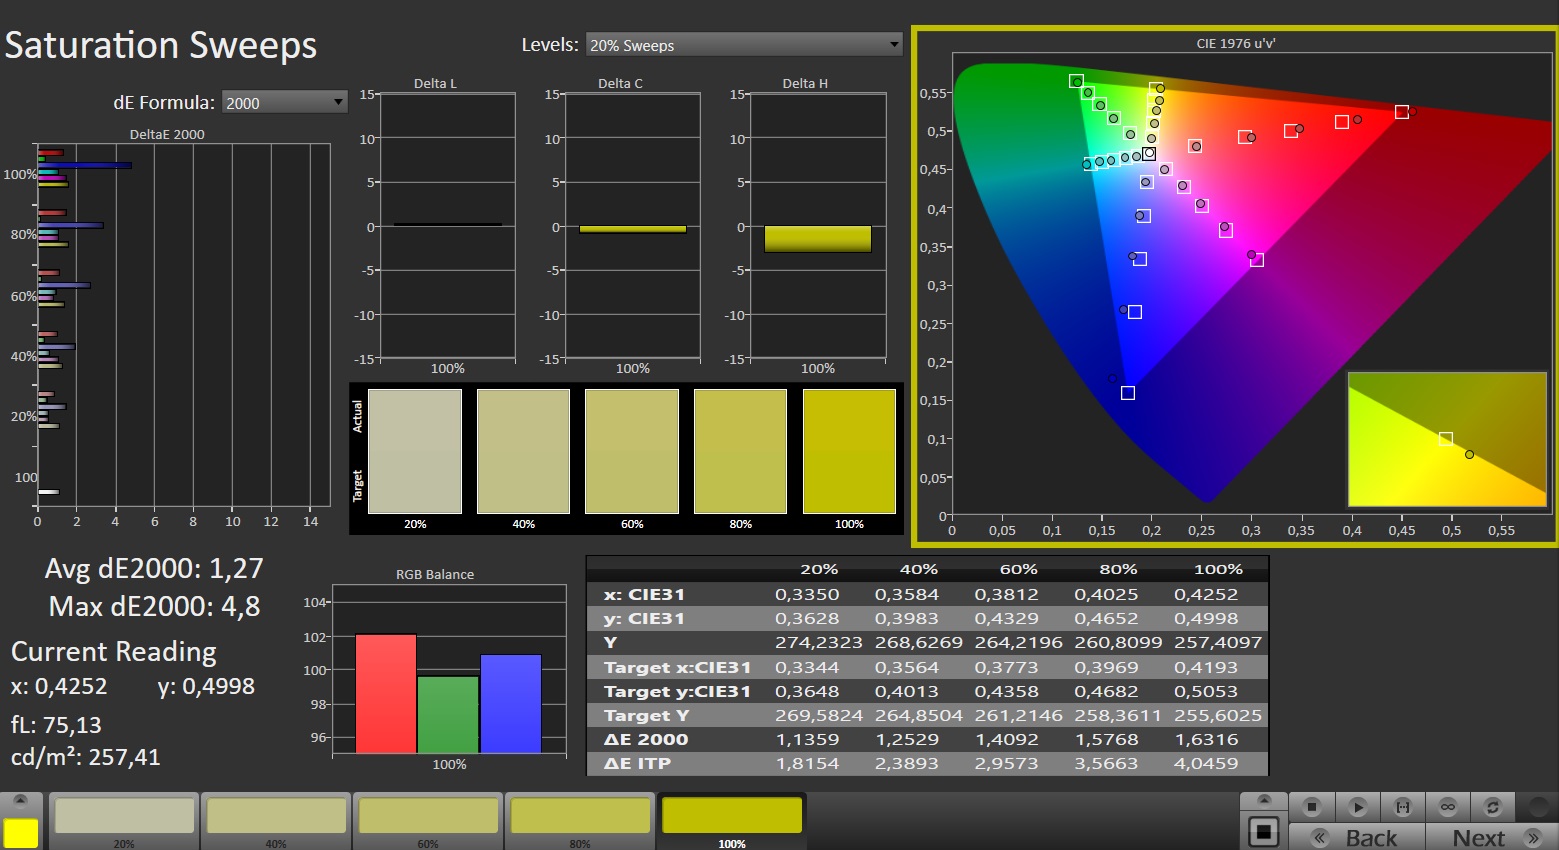
Lo schermo mostrava già una buona rappresentazione dei colori subito dopo l'acquisto: Con una deviazione di circa 2,7, l'obiettivo (DeltaE < 3) è stato raggiunto. La calibrazione riduce la deviazione a 1,3 e garantisce sfumature di grigio più equilibrate. Il pannello è in grado di riprodurre completamente lo spazio colore sRGB, ma non gli spazi colore AdobeRGB e DCI P3. Questo non è diverso per i display della maggior parte dei concorrenti.
Tempi di risposta del Display
| ↔ Tempi di risposta dal Nero al Bianco | ||
|---|---|---|
| 5.4 ms ... aumenta ↗ e diminuisce ↘ combinato | ↗ 1.5 ms Incremento | 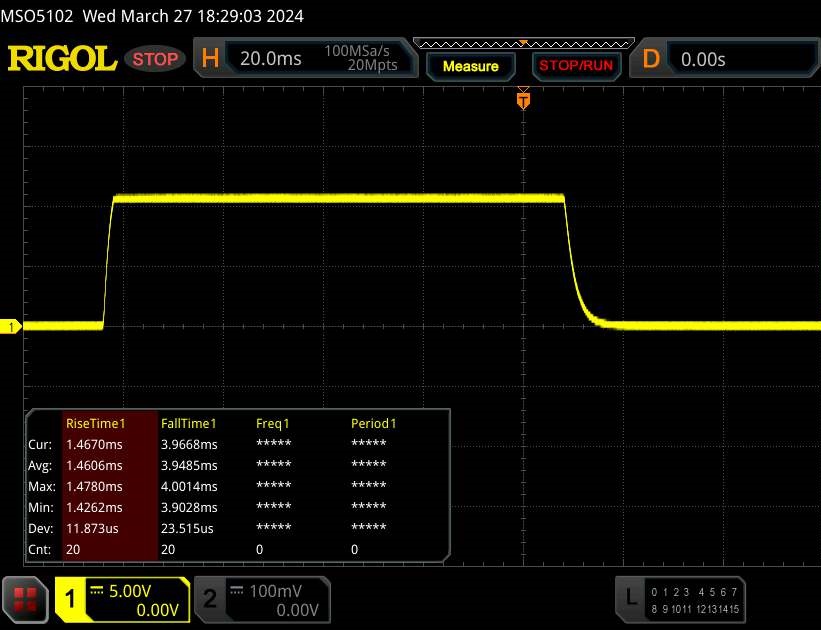 |
| ↘ 3.9 ms Calo | ||
| Lo schermo ha mostrato valori di risposta molto veloci nei nostri tests ed è molto adatto per i gaming veloce. In confronto, tutti i dispositivi di test variano da 0.1 (minimo) a 240 (massimo) ms. » 18 % di tutti i dispositivi è migliore. Questo significa che i tempi di risposta rilevati sono migliori rispettto alla media di tutti i dispositivi testati (19.8 ms). | ||
| ↔ Tempo di risposta dal 50% Grigio all'80% Grigio | ||
| 7.5 ms ... aumenta ↗ e diminuisce ↘ combinato | ↗ 3.3 ms Incremento | 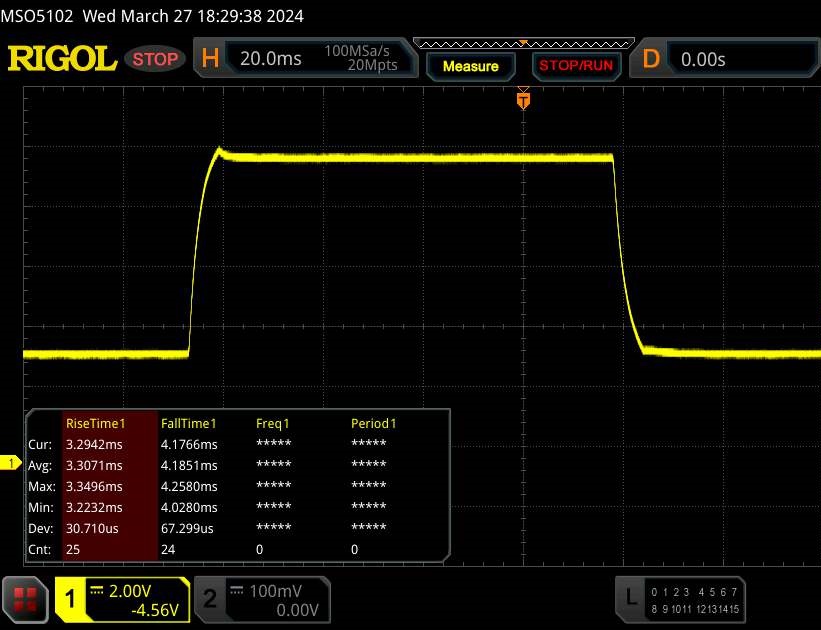 |
| ↘ 4.2 ms Calo | ||
| Lo schermo ha mostrato valori di risposta molto veloci nei nostri tests ed è molto adatto per i gaming veloce. In confronto, tutti i dispositivi di test variano da 0.165 (minimo) a 636 (massimo) ms. » 20 % di tutti i dispositivi è migliore. Questo significa che i tempi di risposta rilevati sono migliori rispettto alla media di tutti i dispositivi testati (31 ms). | ||
Sfarfallio dello schermo / PWM (Pulse-Width Modulation)
| flickering dello schermo / PWM non rilevato | 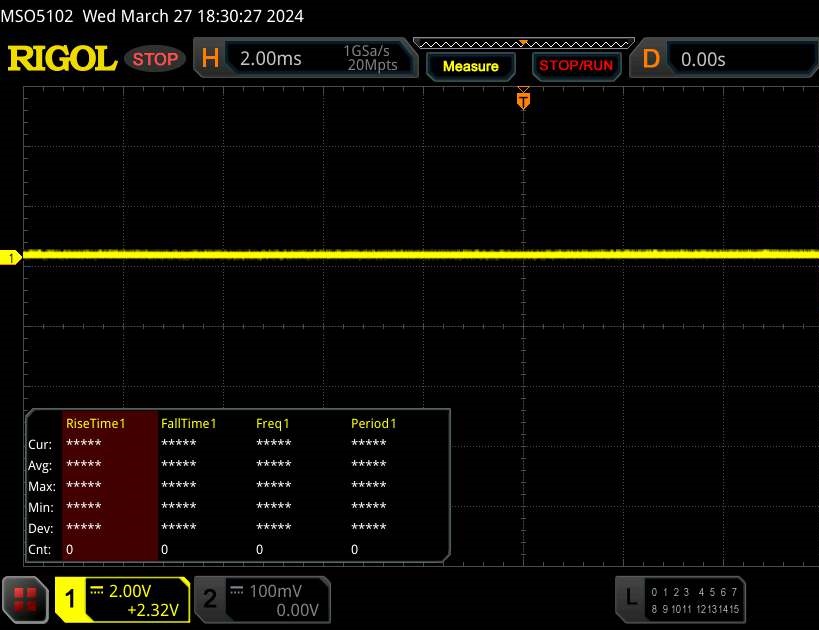 | ||
In confronto: 52 % di tutti i dispositivi testati non utilizza PWM per ridurre la luminosita' del display. Se è rilevato PWM, una media di 7757 (minimo: 5 - massimo: 343500) Hz è stata rilevata. | |||
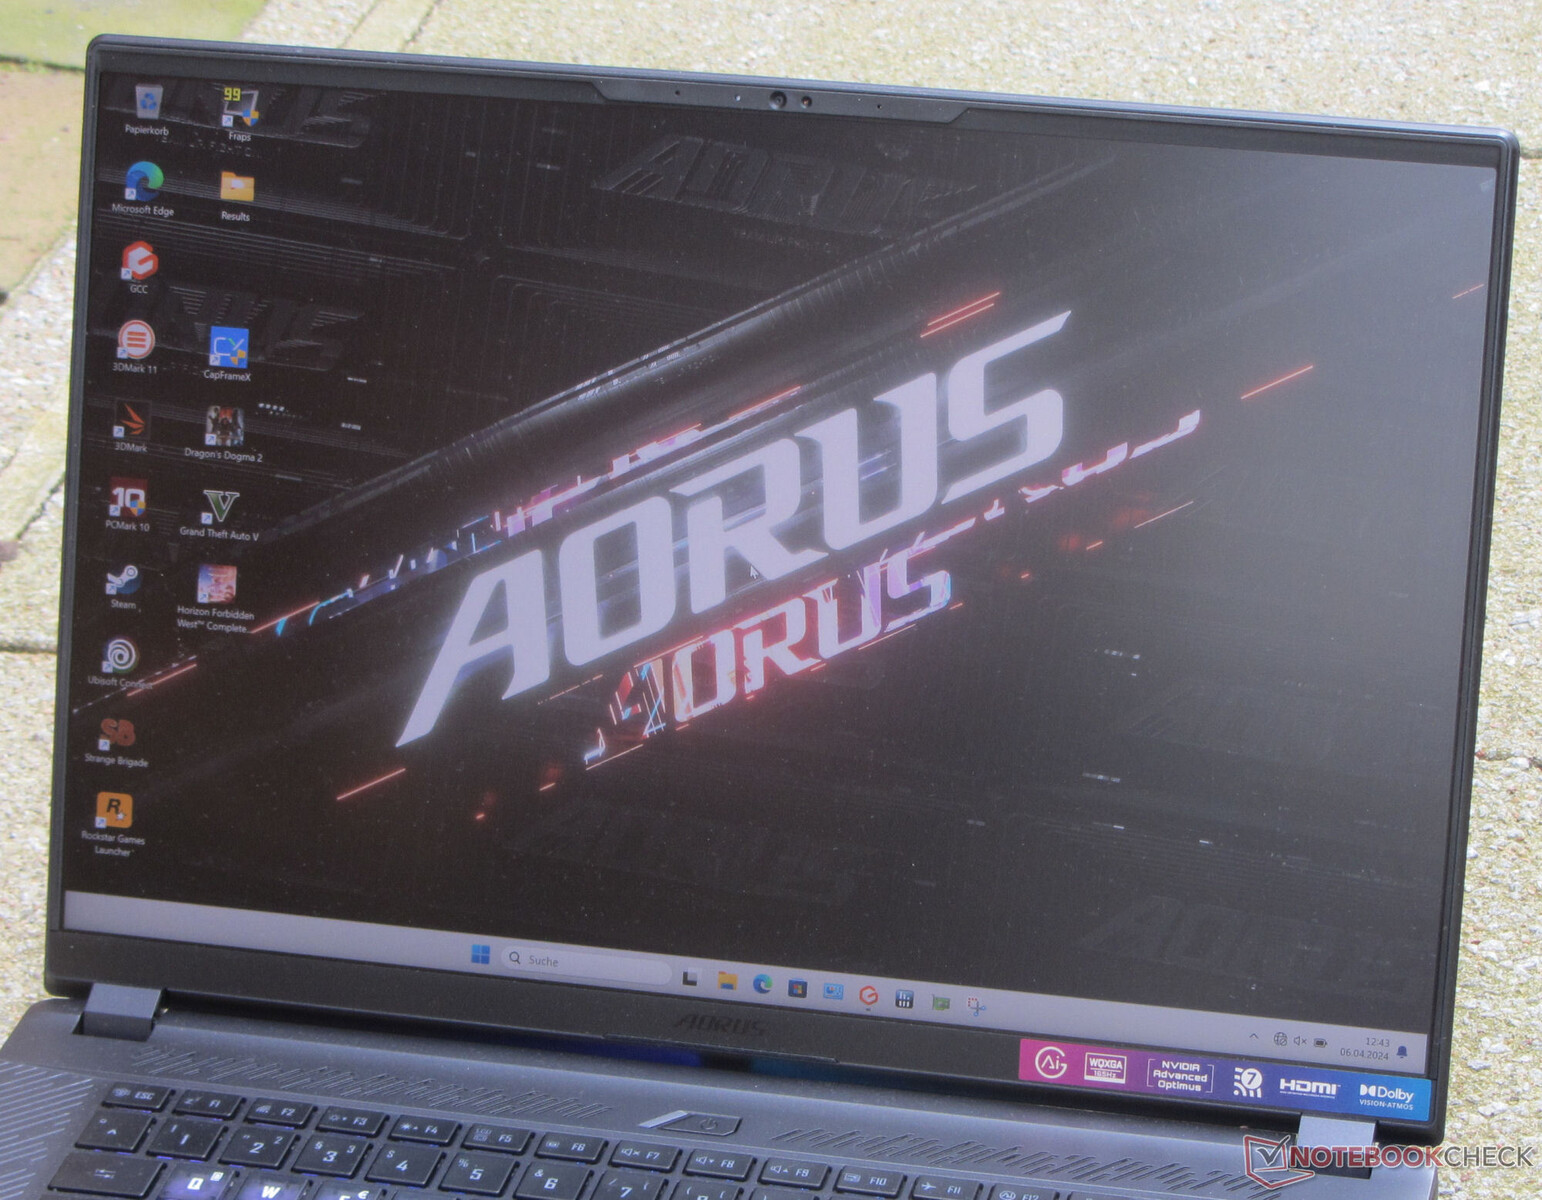
Il pannello IPS, stabile nell'angolo di visione, rimane leggibile da ogni angolazione. All'esterno, può leggere dal pannello a condizione che il sole non sia troppo intenso.

Prestazioni - Raptor Lake e Ada Lovelace alimentano il dispositivo
L'Aorus 16X di Gigabyte è un computer portatile per giocatori e creatori. La potenza di calcolo necessaria è fornita da Raptor Lake e Ada Lovelace. Il modello attuale può essere acquistato a circa 2.000 dollari. Sono disponibili anche varianti più economiche.
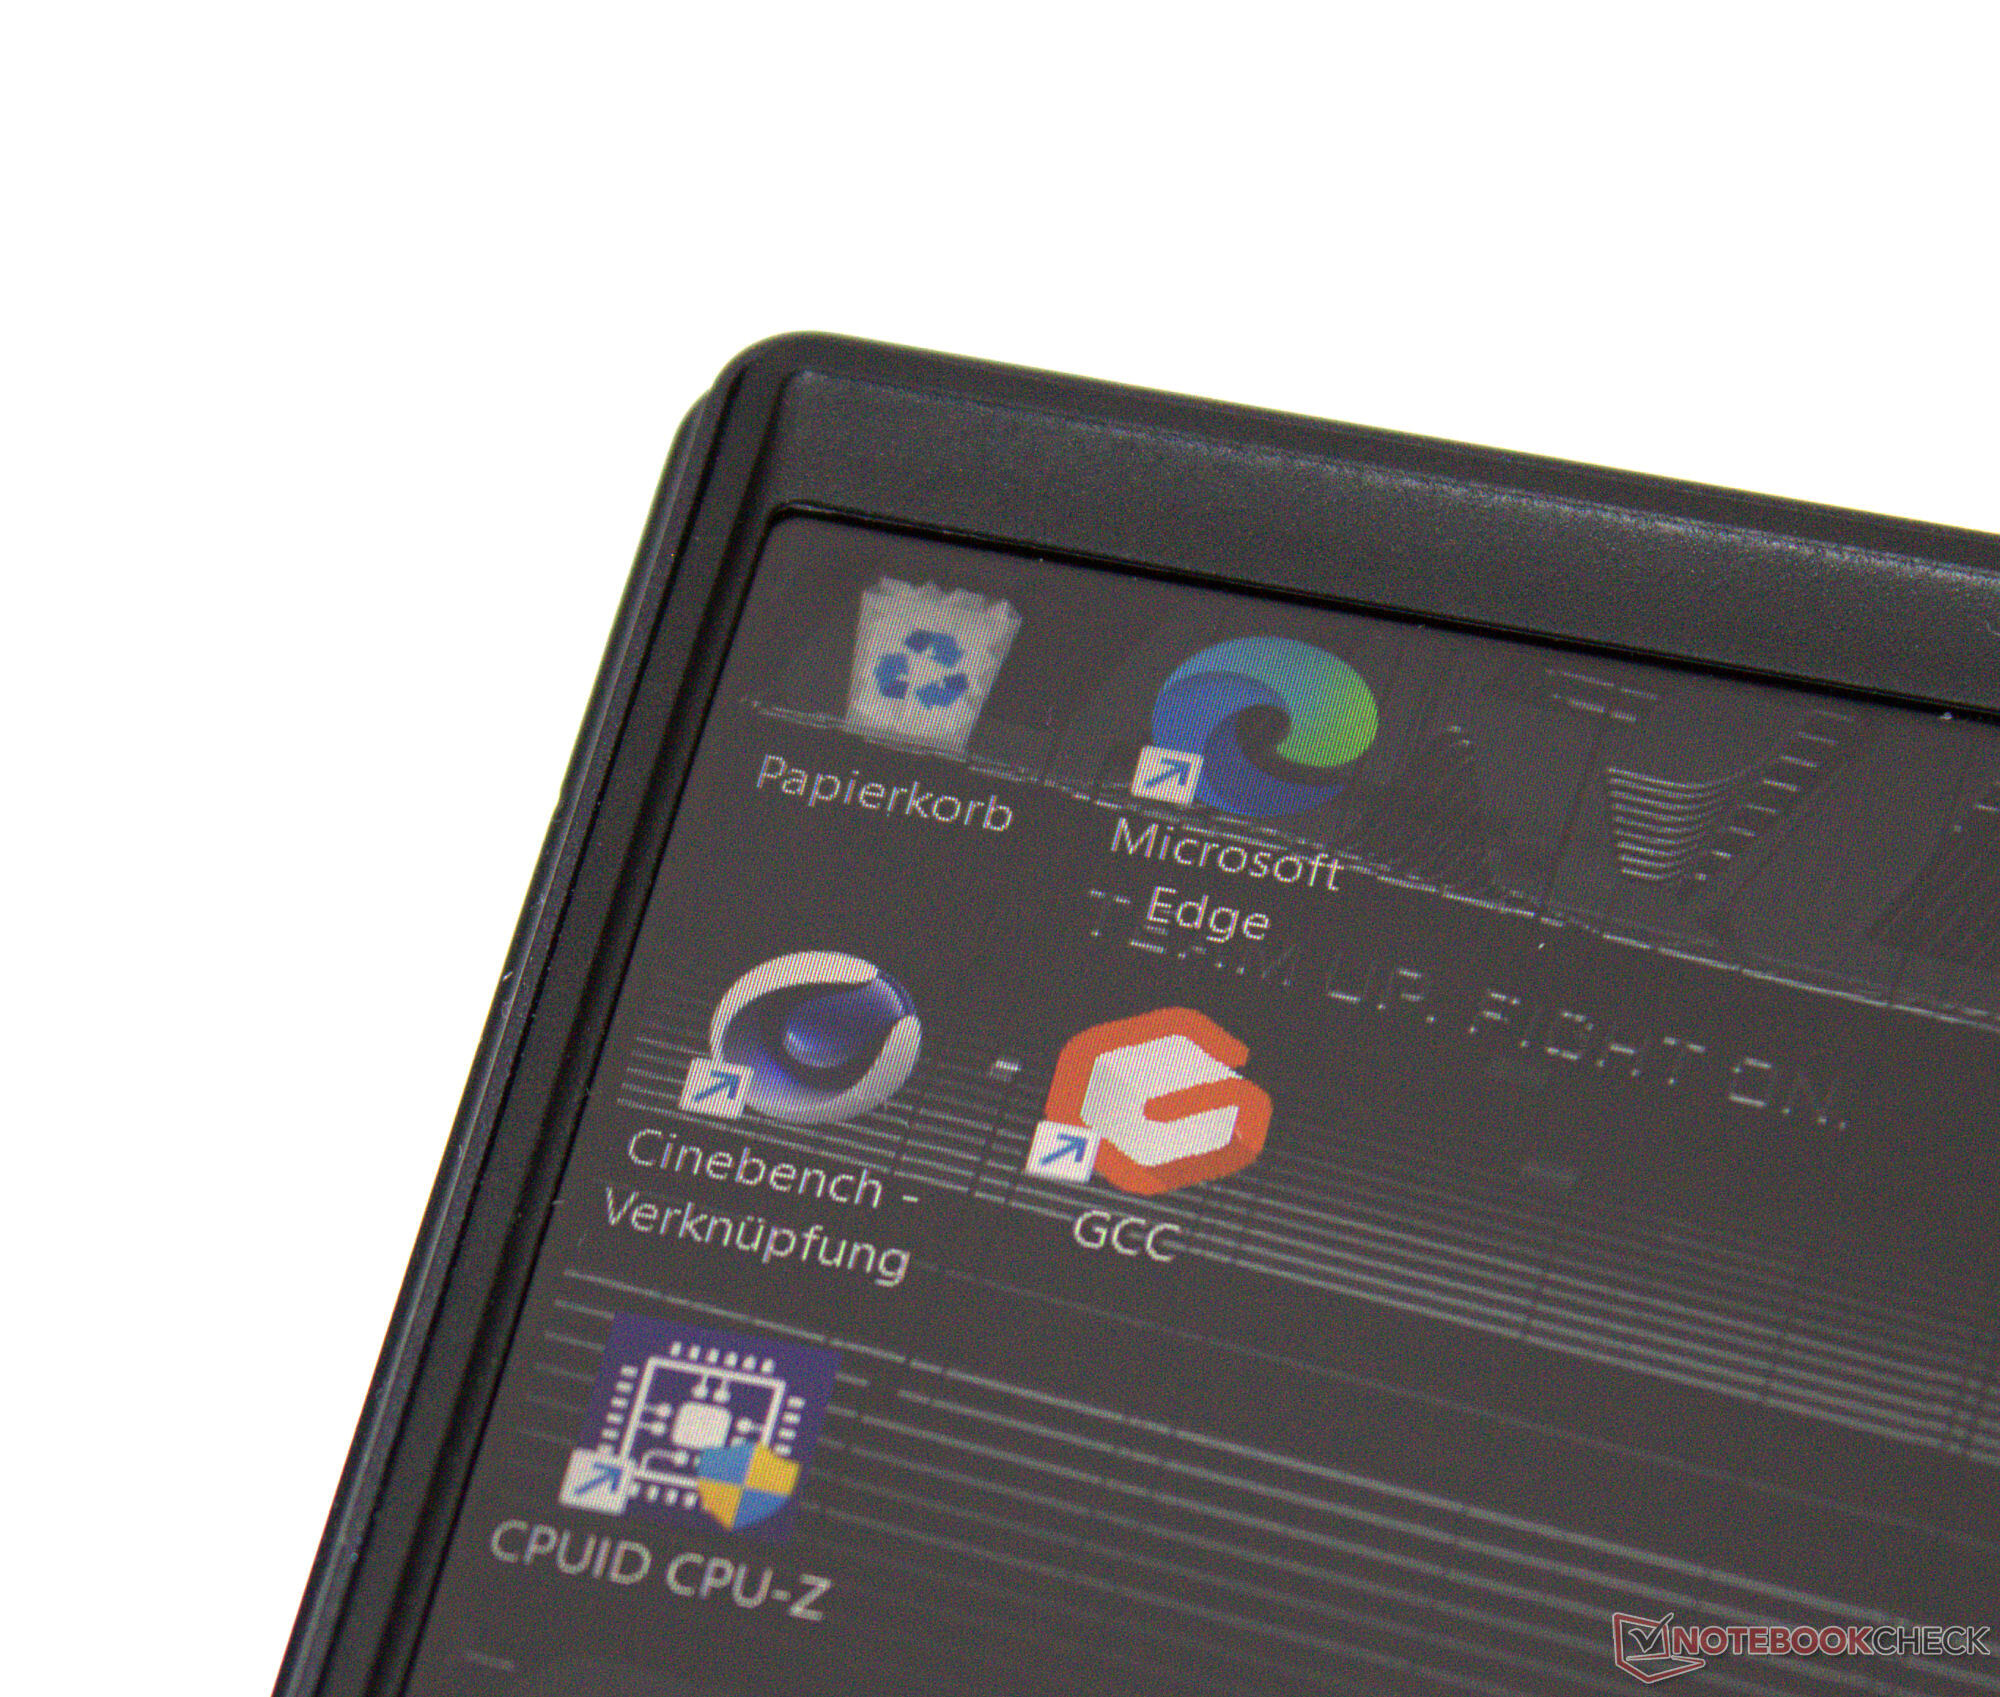
Condizioni di test
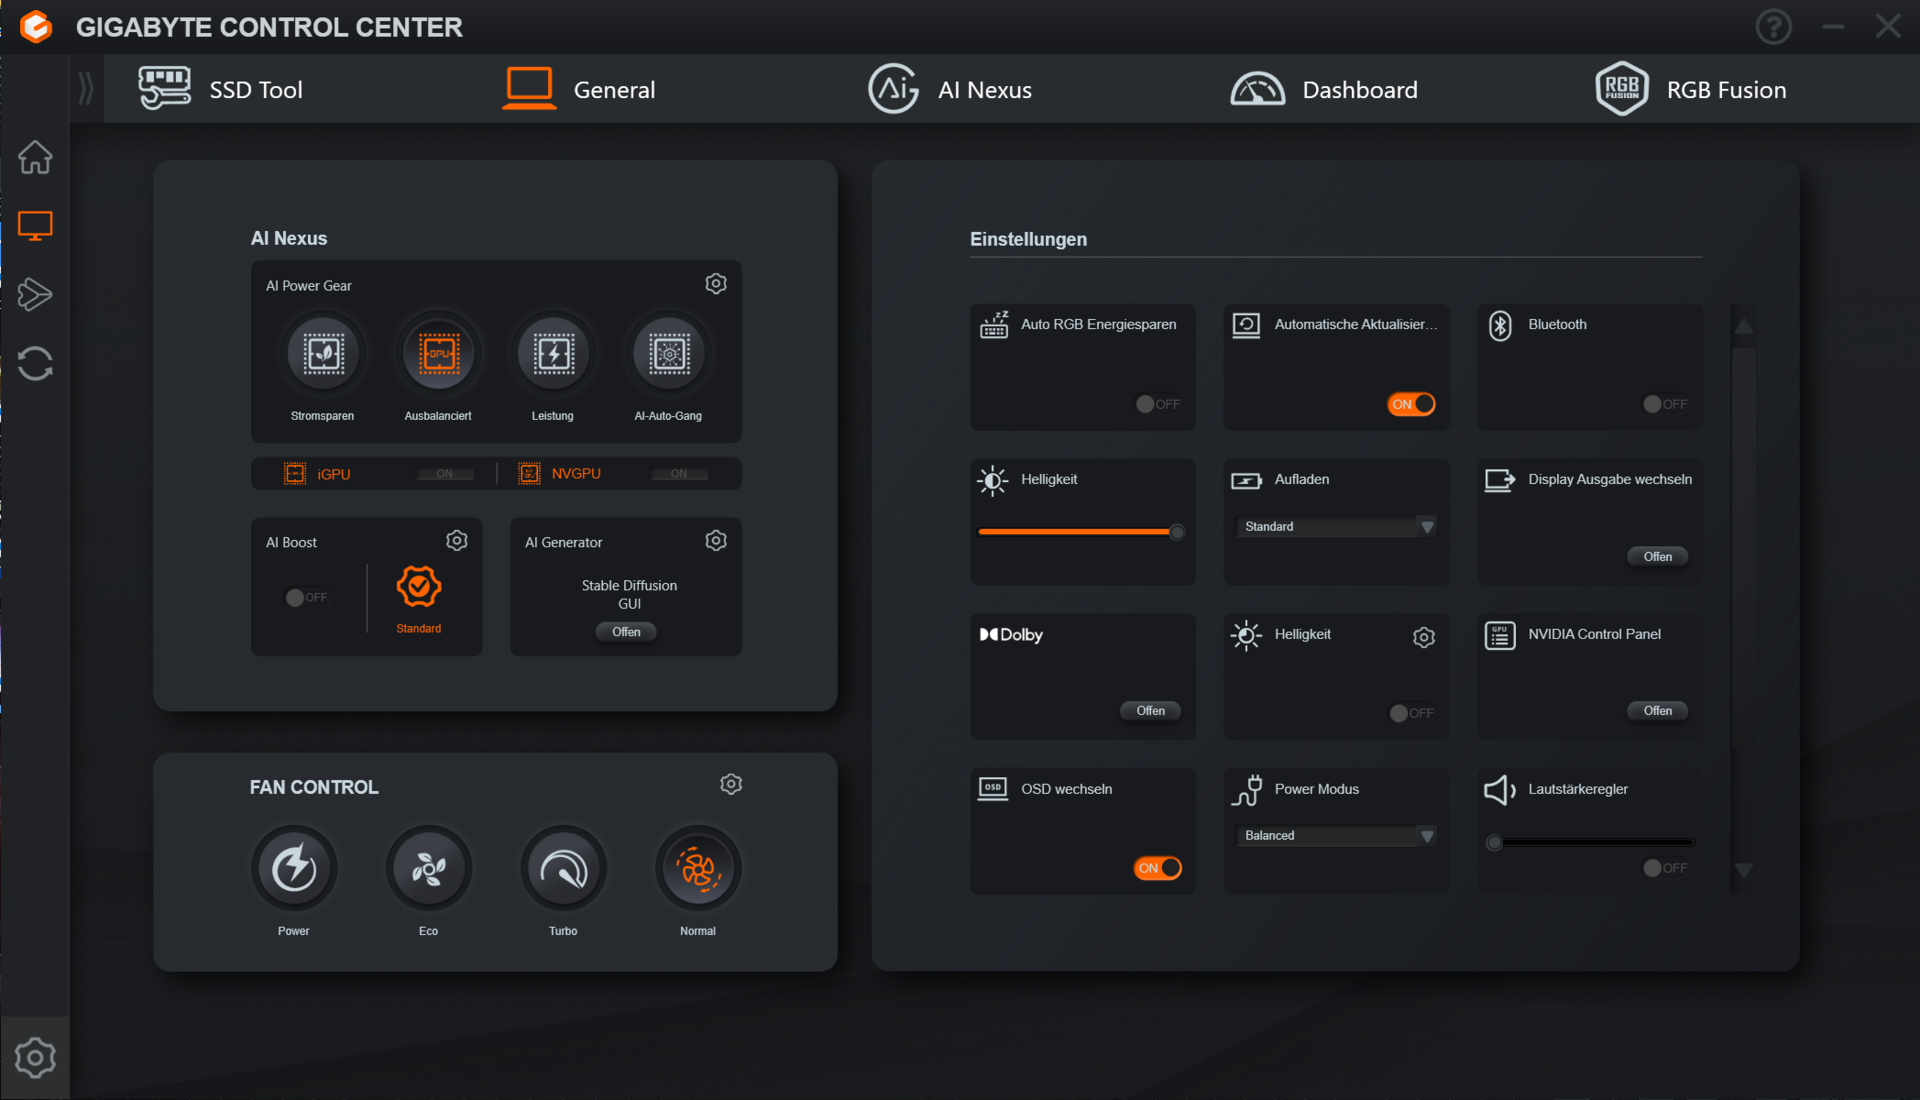
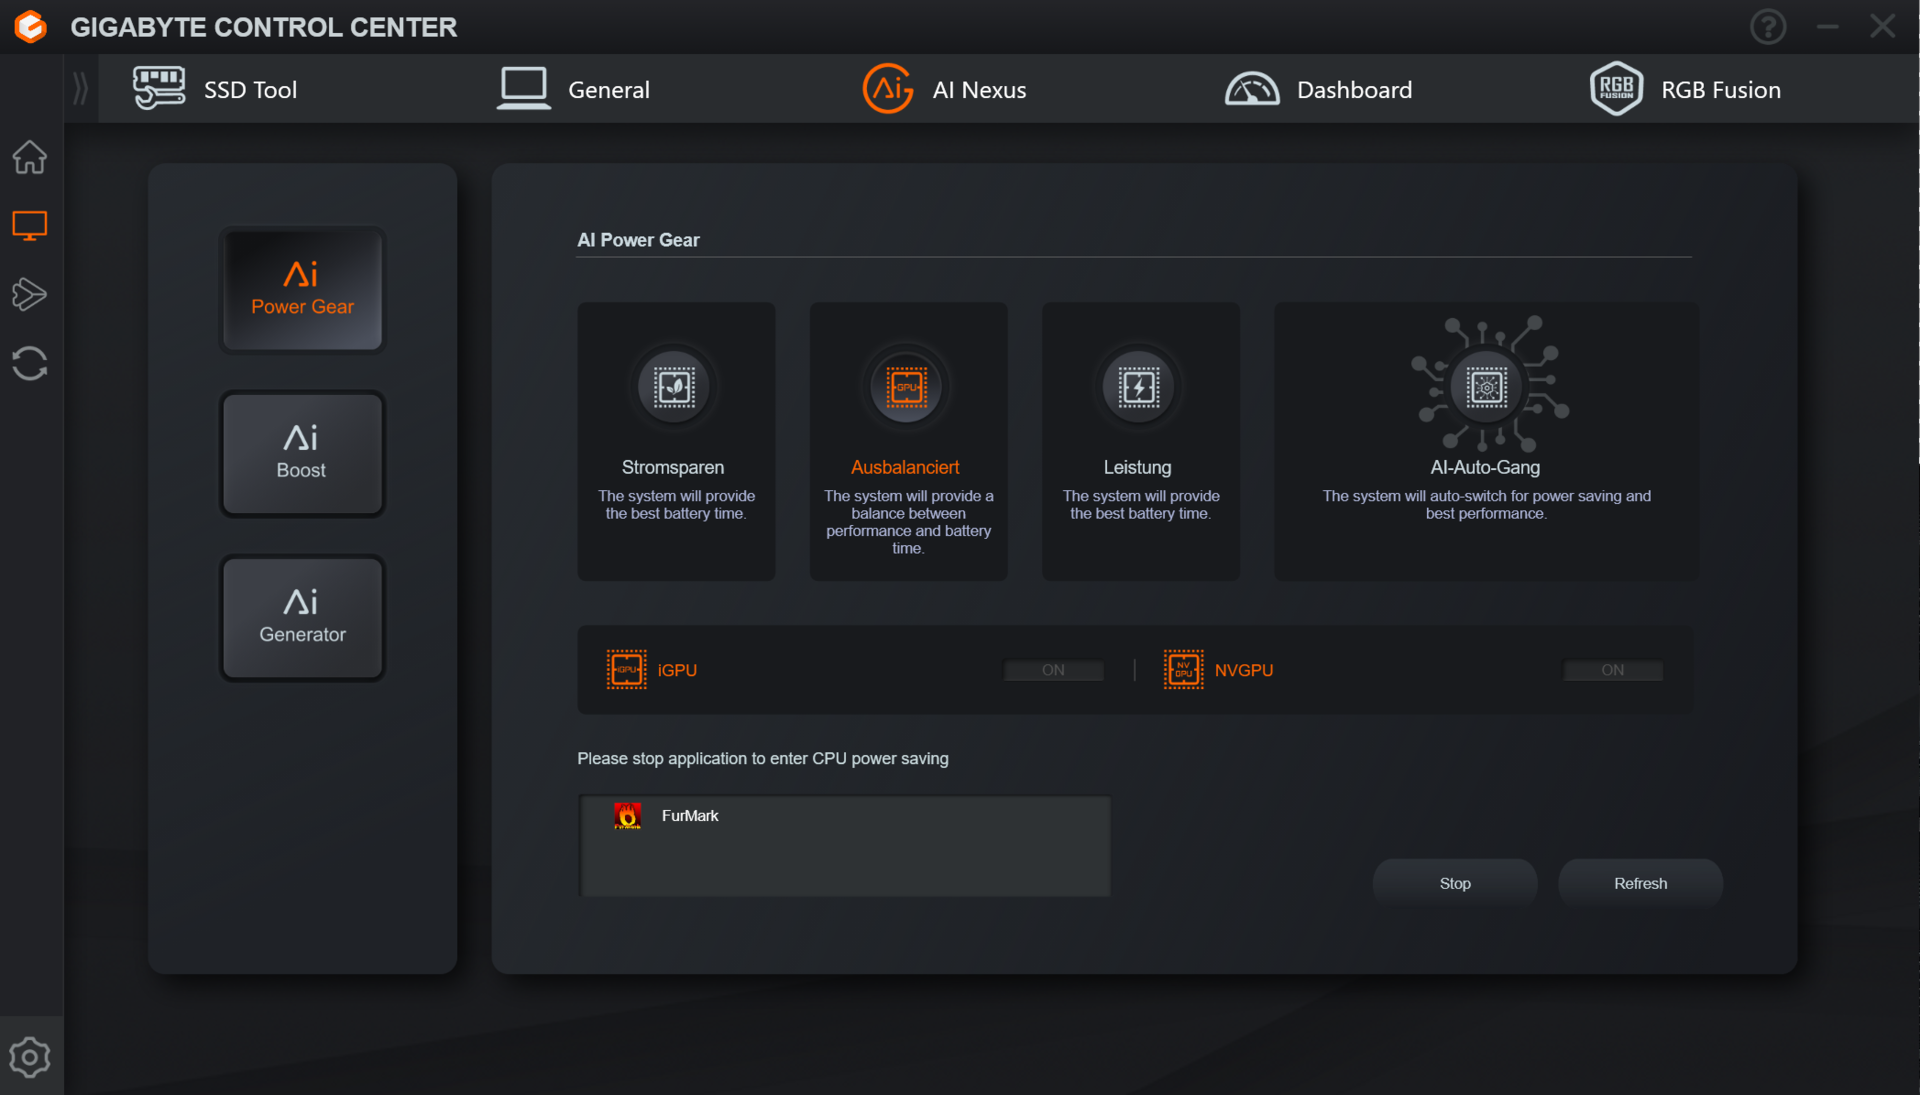
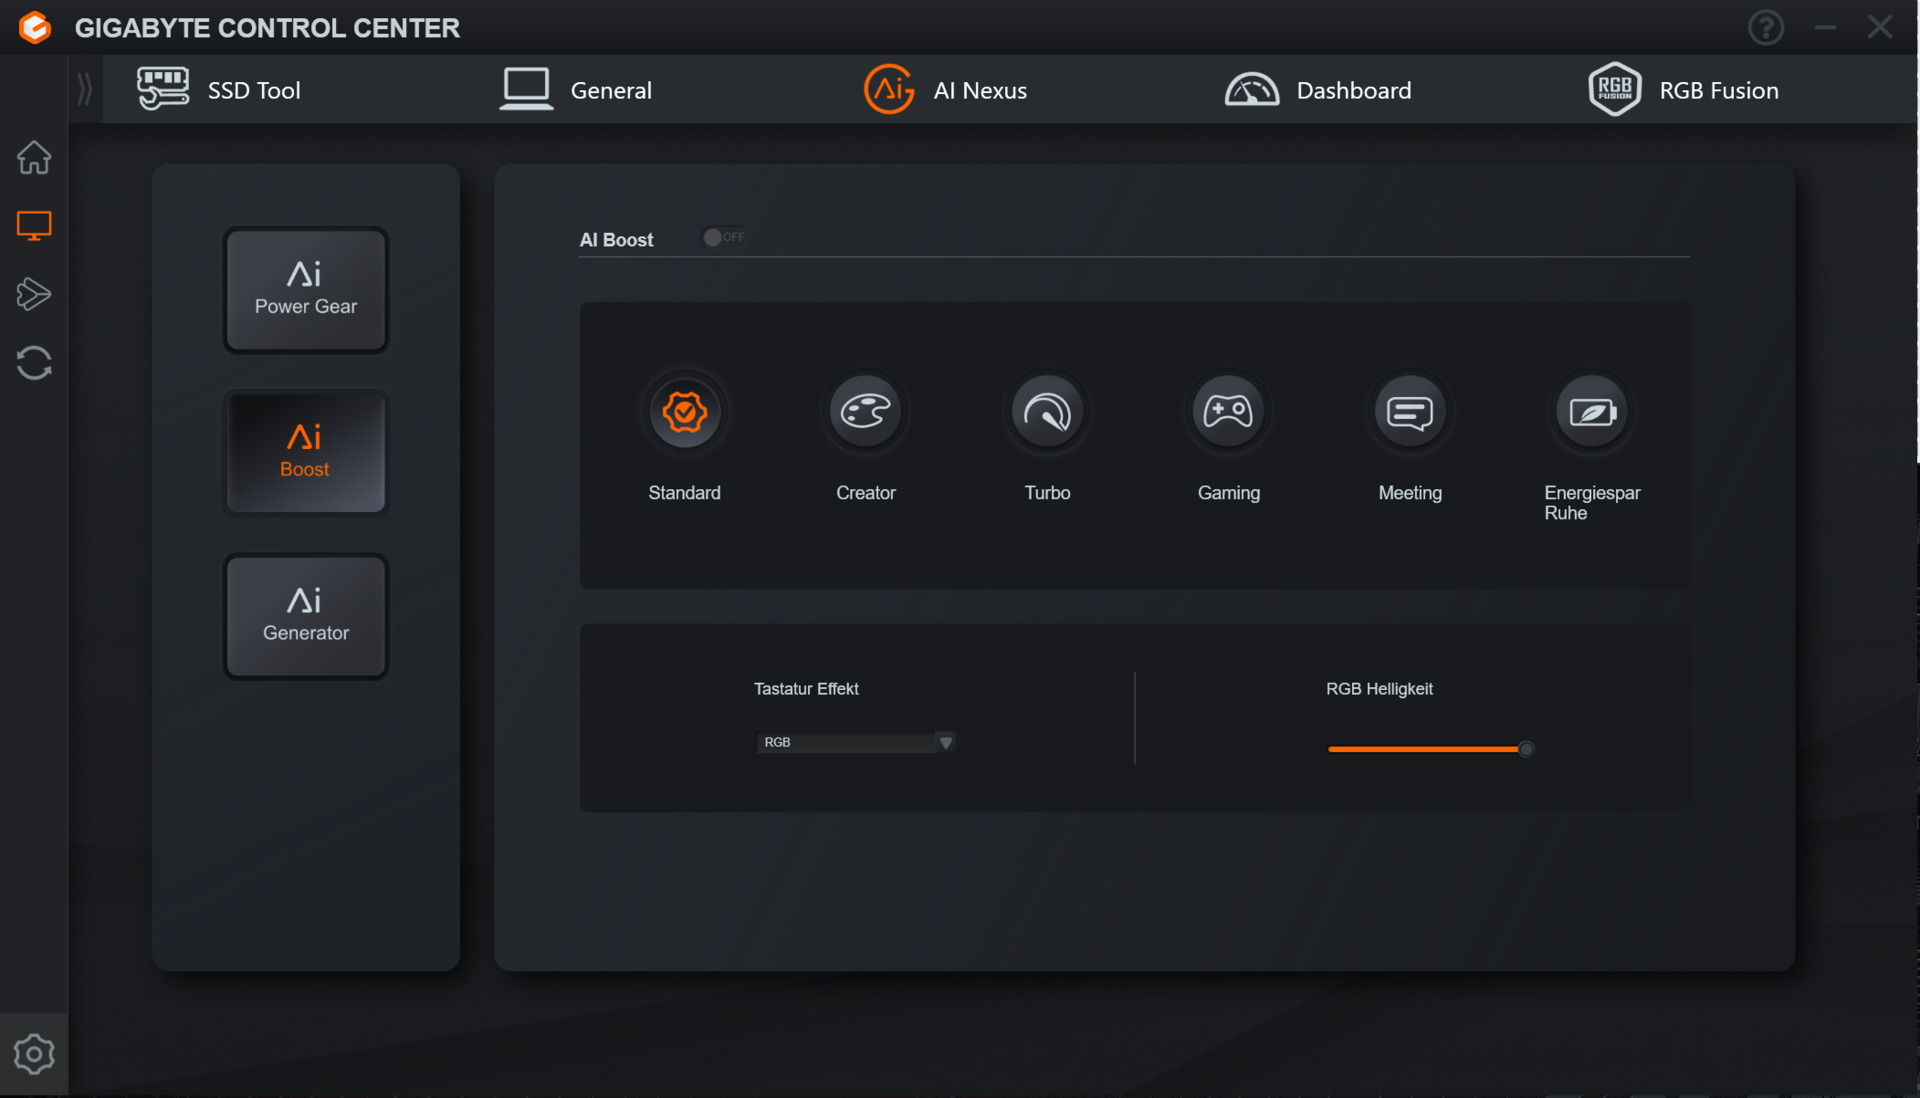
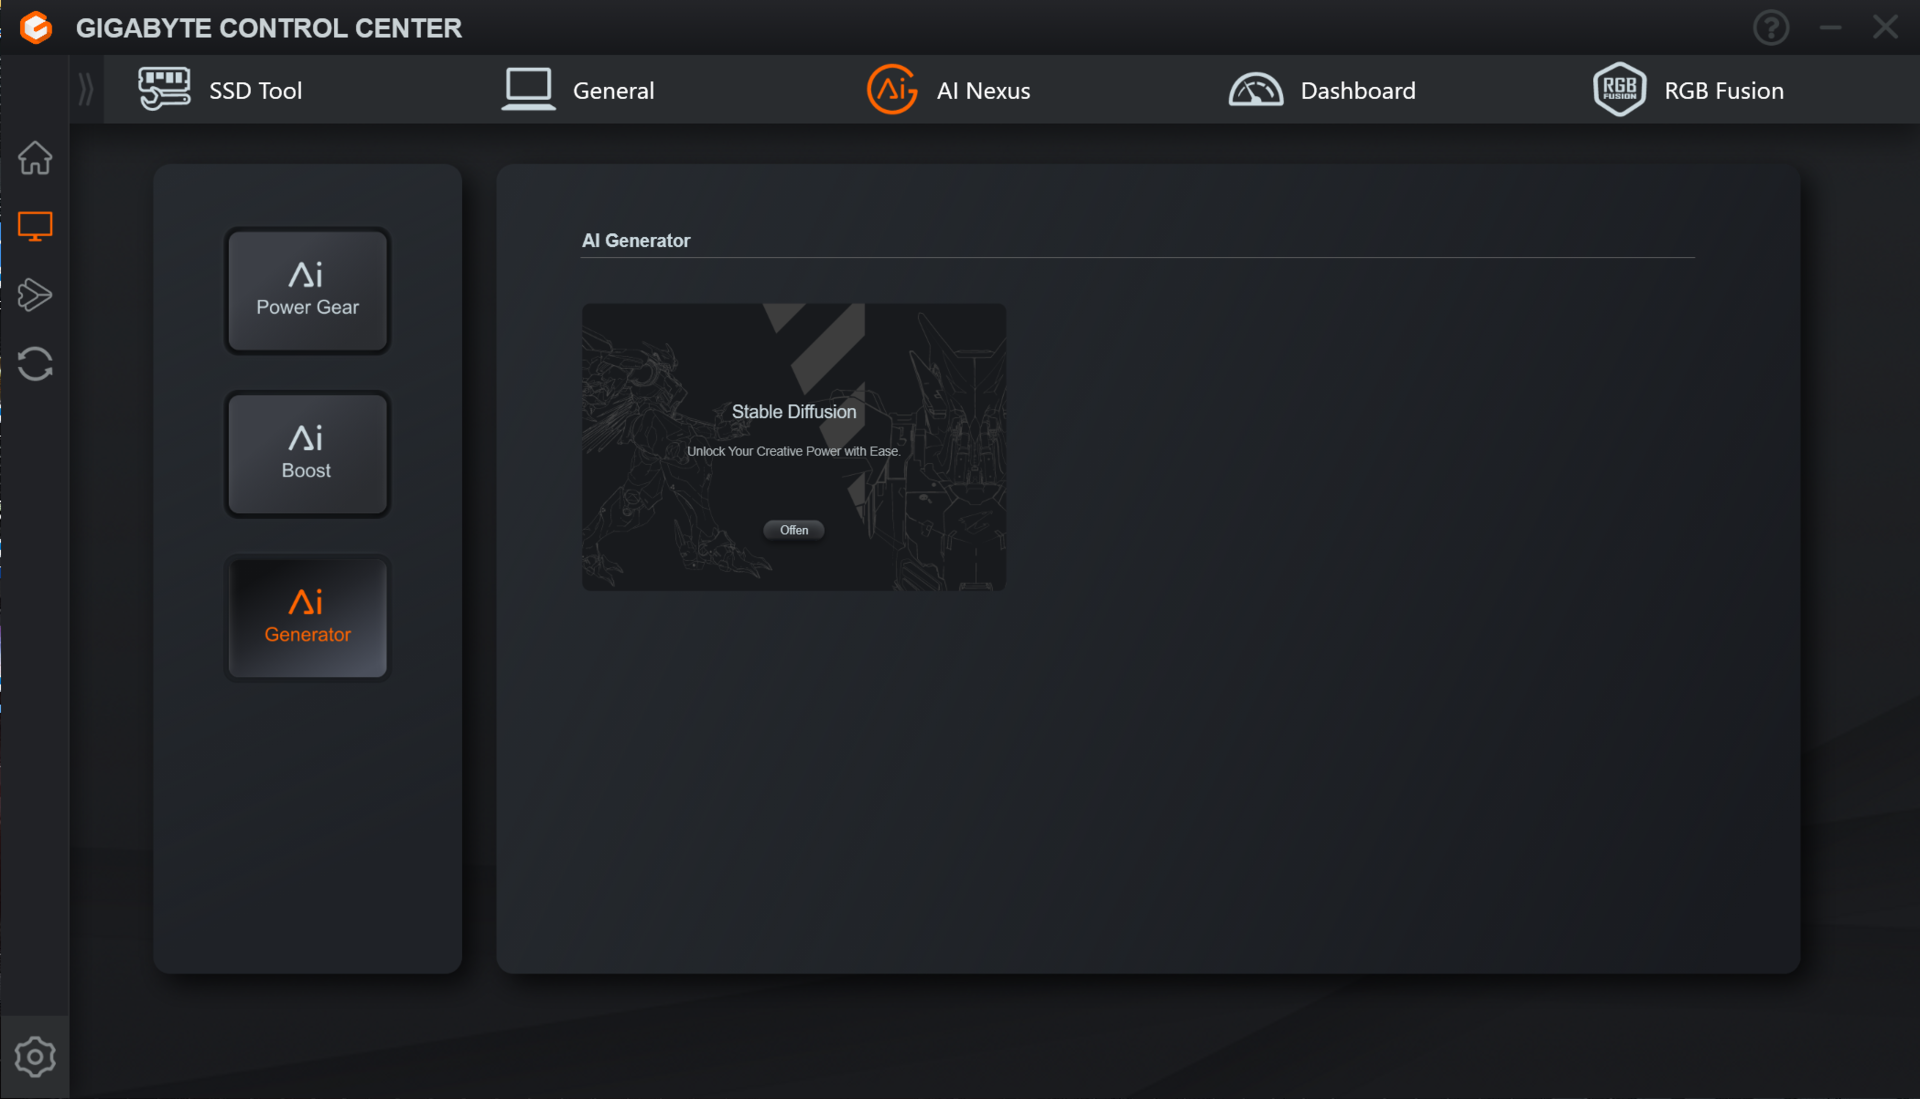
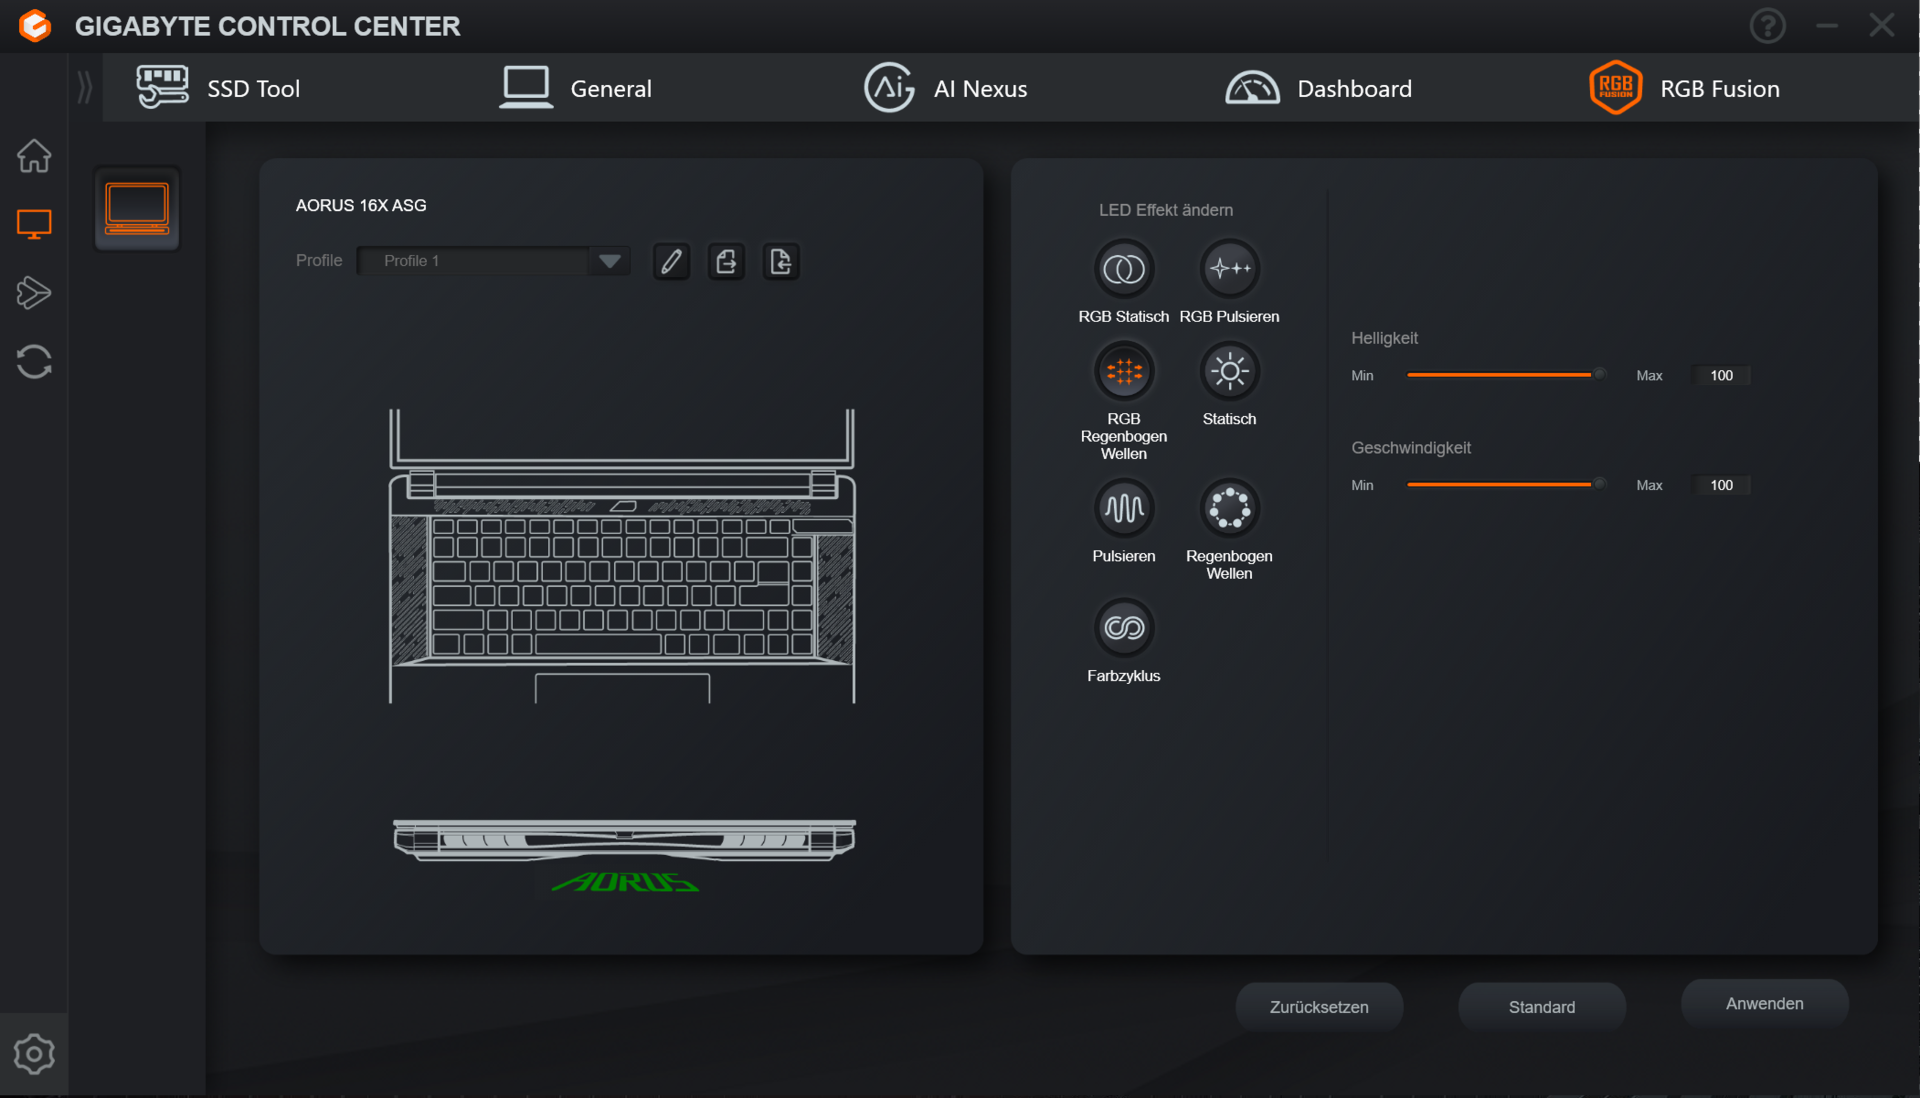
Il 16X offre sei modalità di prestazioni specifiche del produttore (vedere tabella), che possono essere alternate tramite il Gigabyte Control Center (il centro di controllo del portatile). Abbiamo utilizzato le modalità Standard (benchmark) e Risparmio energetico silenzioso (test della batteria). Turbo, Gaming e Creator possono essere utilizzate solo con il portatile collegato alla rete elettrica.
Nota: le impostazioni delle prestazioni disponibili non sono comunicate molto chiaramente all'interno del Gigabyte Control Center. I profili di prestazioni a livello di sistema si trovano nella sezione "AI Boost". La sezione "AI Power Gear" si riferisce solo allo stato operativo della dGPU (solo dGPU o off, commutazione grafica).
| Standard | Creator | Turbo | Gaming | Meeting | Risparmio Energetico Silenzioso | |
|---|---|---|---|---|---|---|
| Limite di potenza 1 (HWInfo) | 90 watt | 110 watt | 125 watt | 110 watt | 65 watt | 65 watt |
| Limite di potenza 2 (HWInfo) | 120 watt | 135 watt | 150 watt | 135 watt | 100 watt | 100 watt |
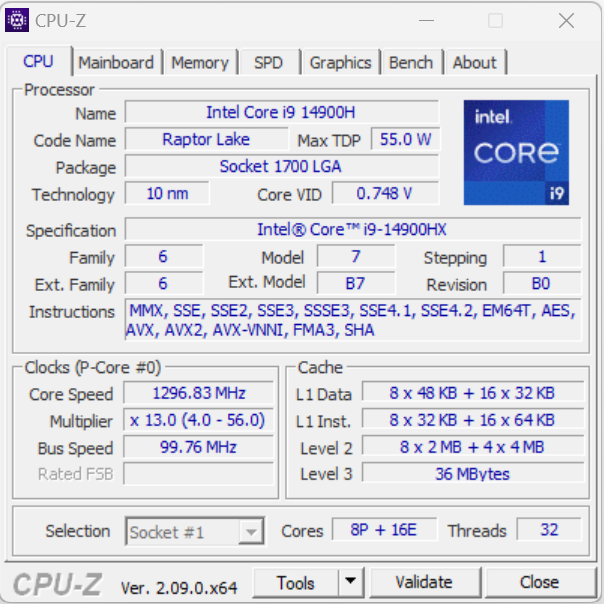
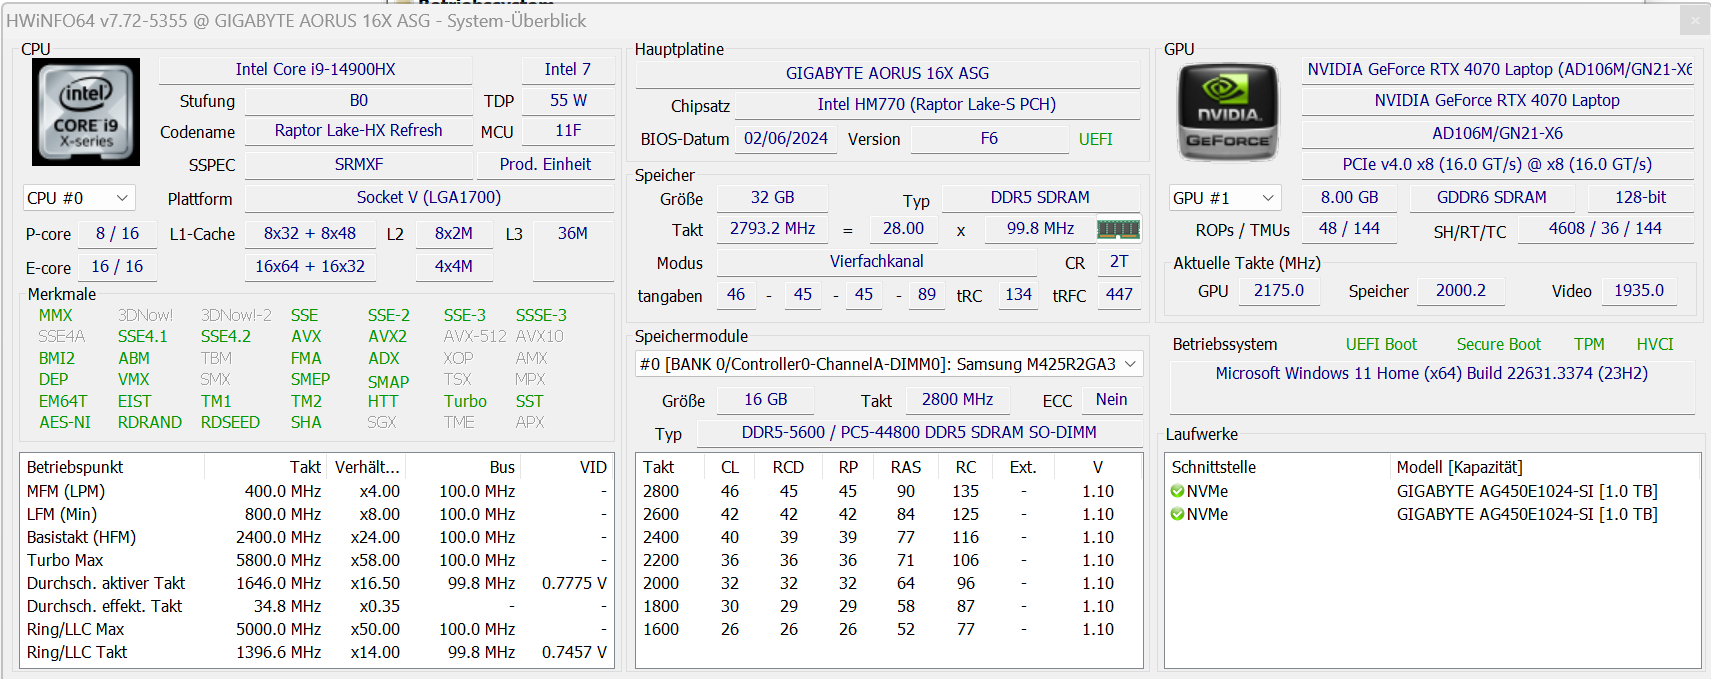
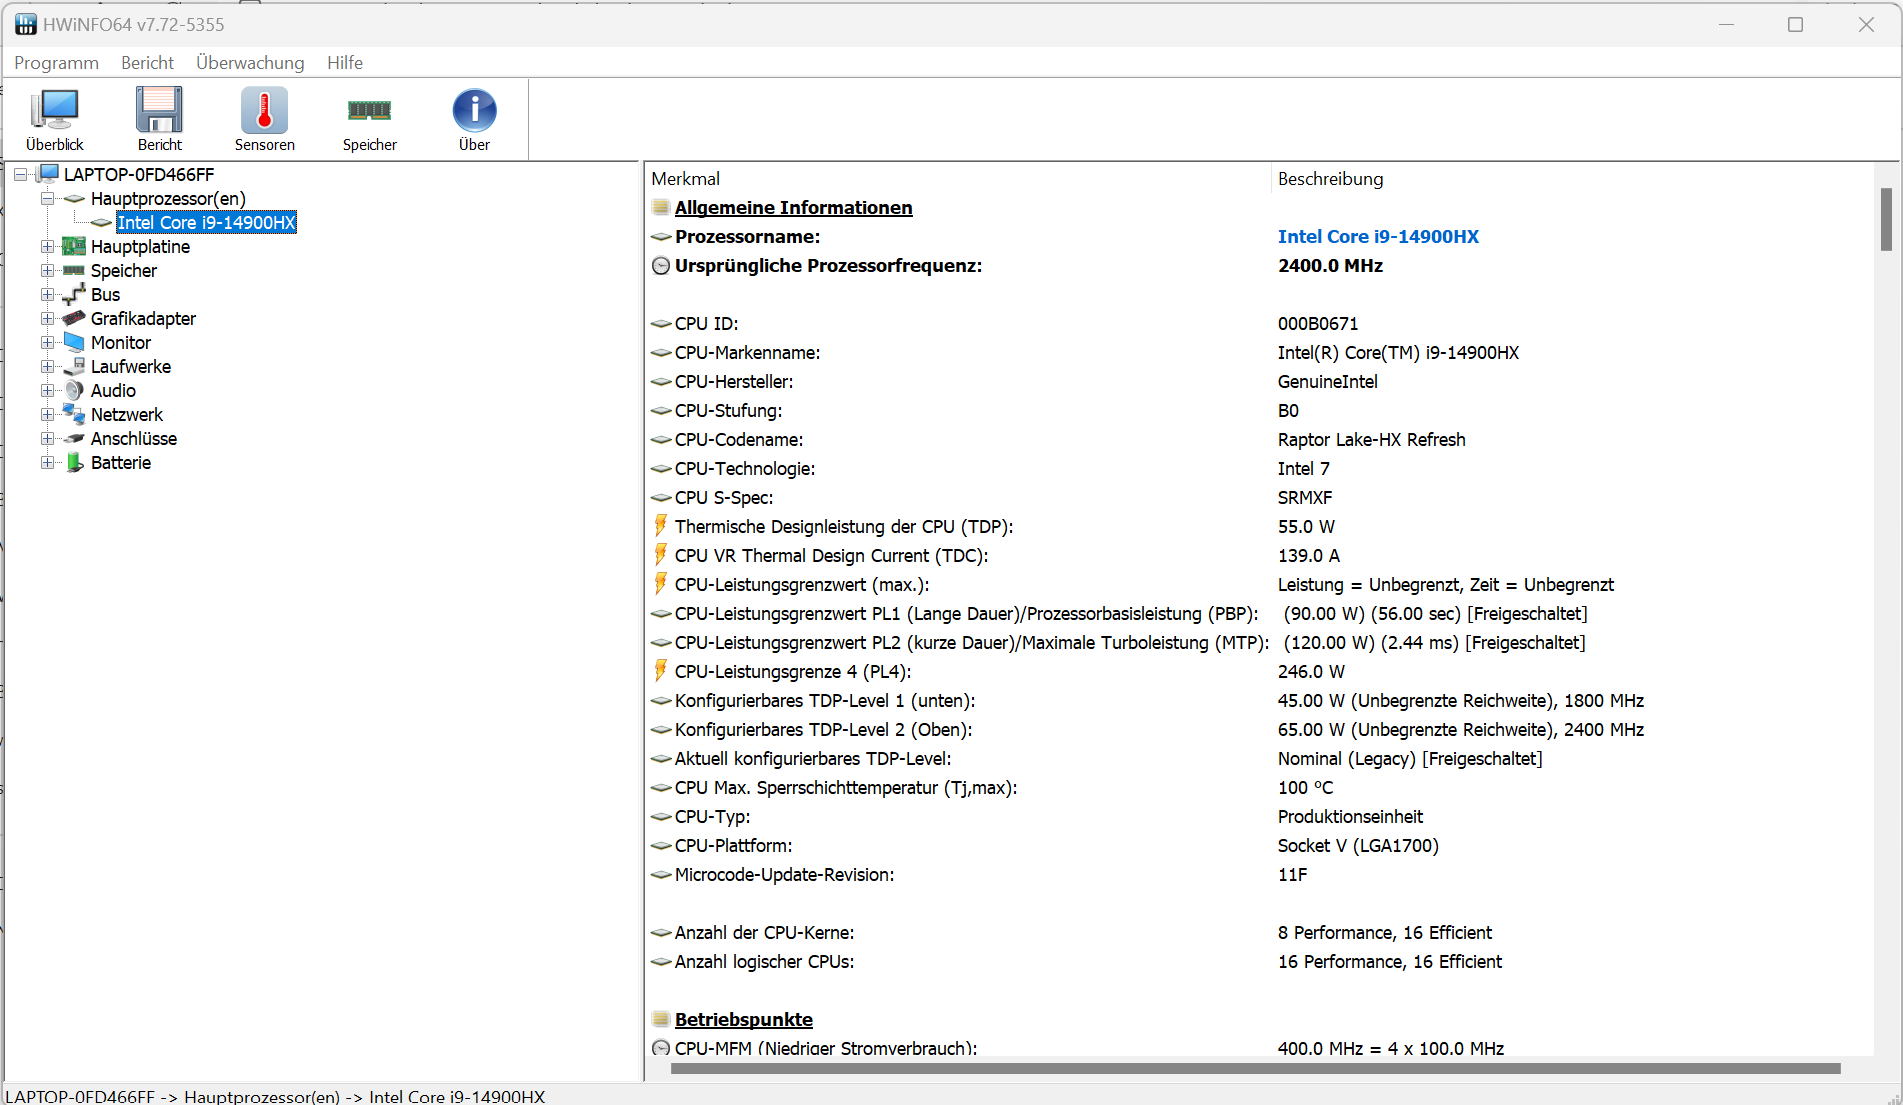
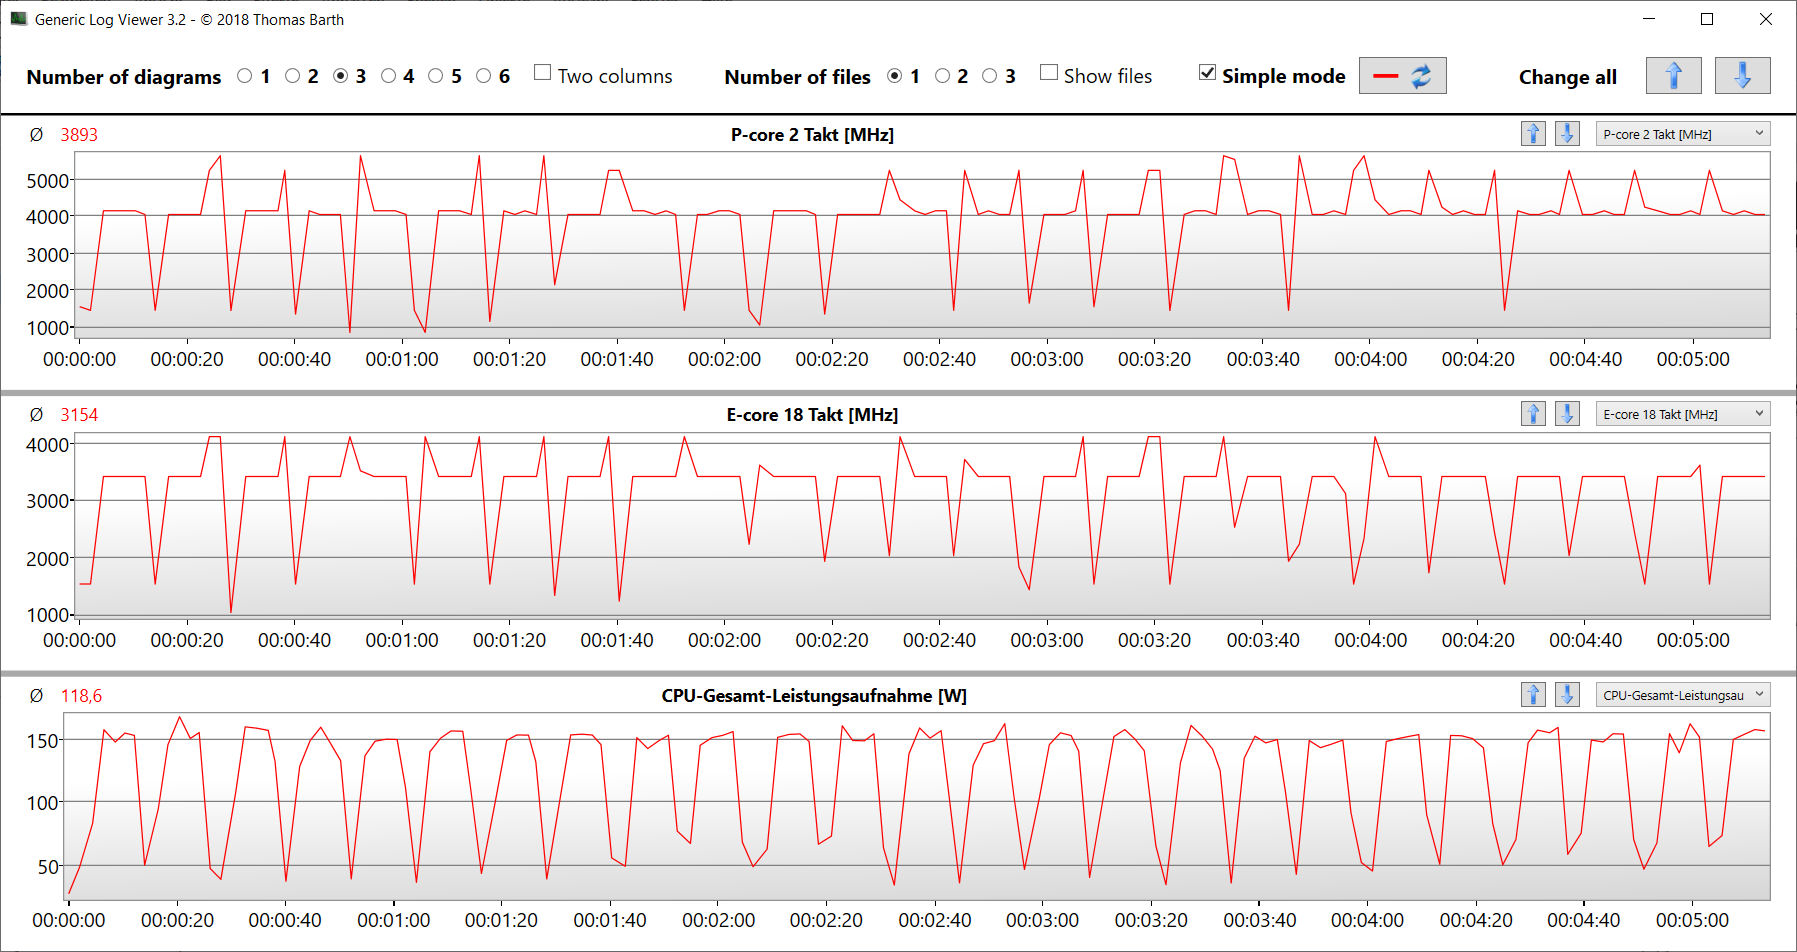
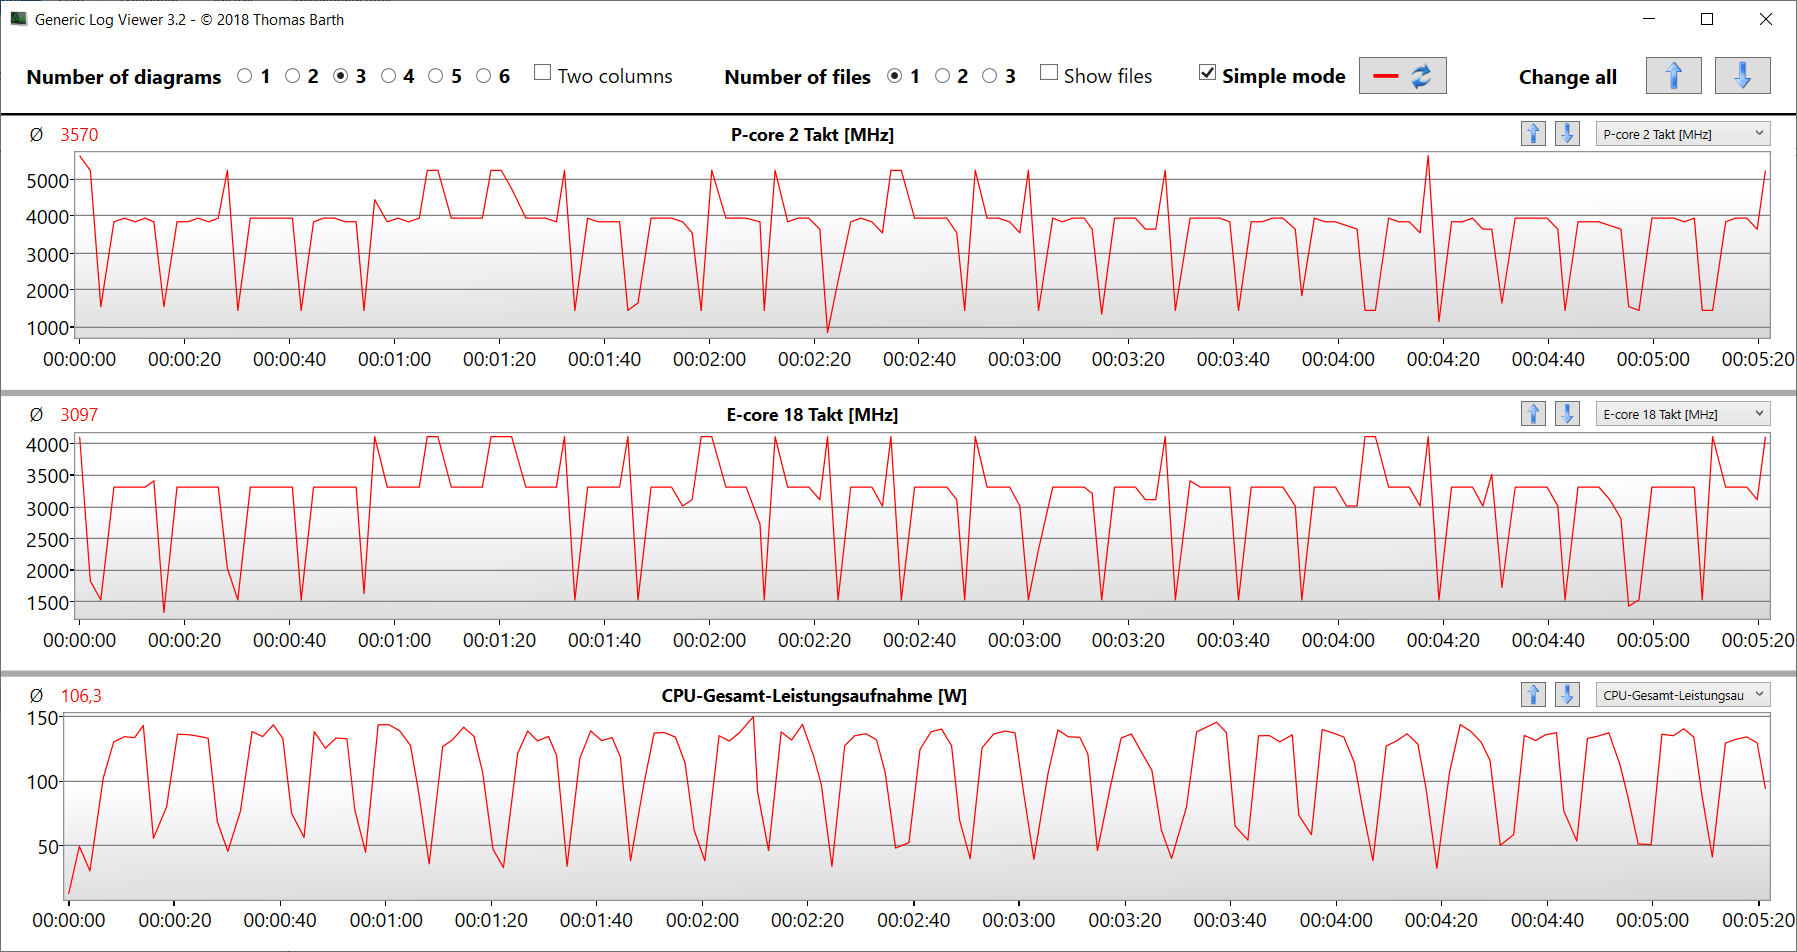
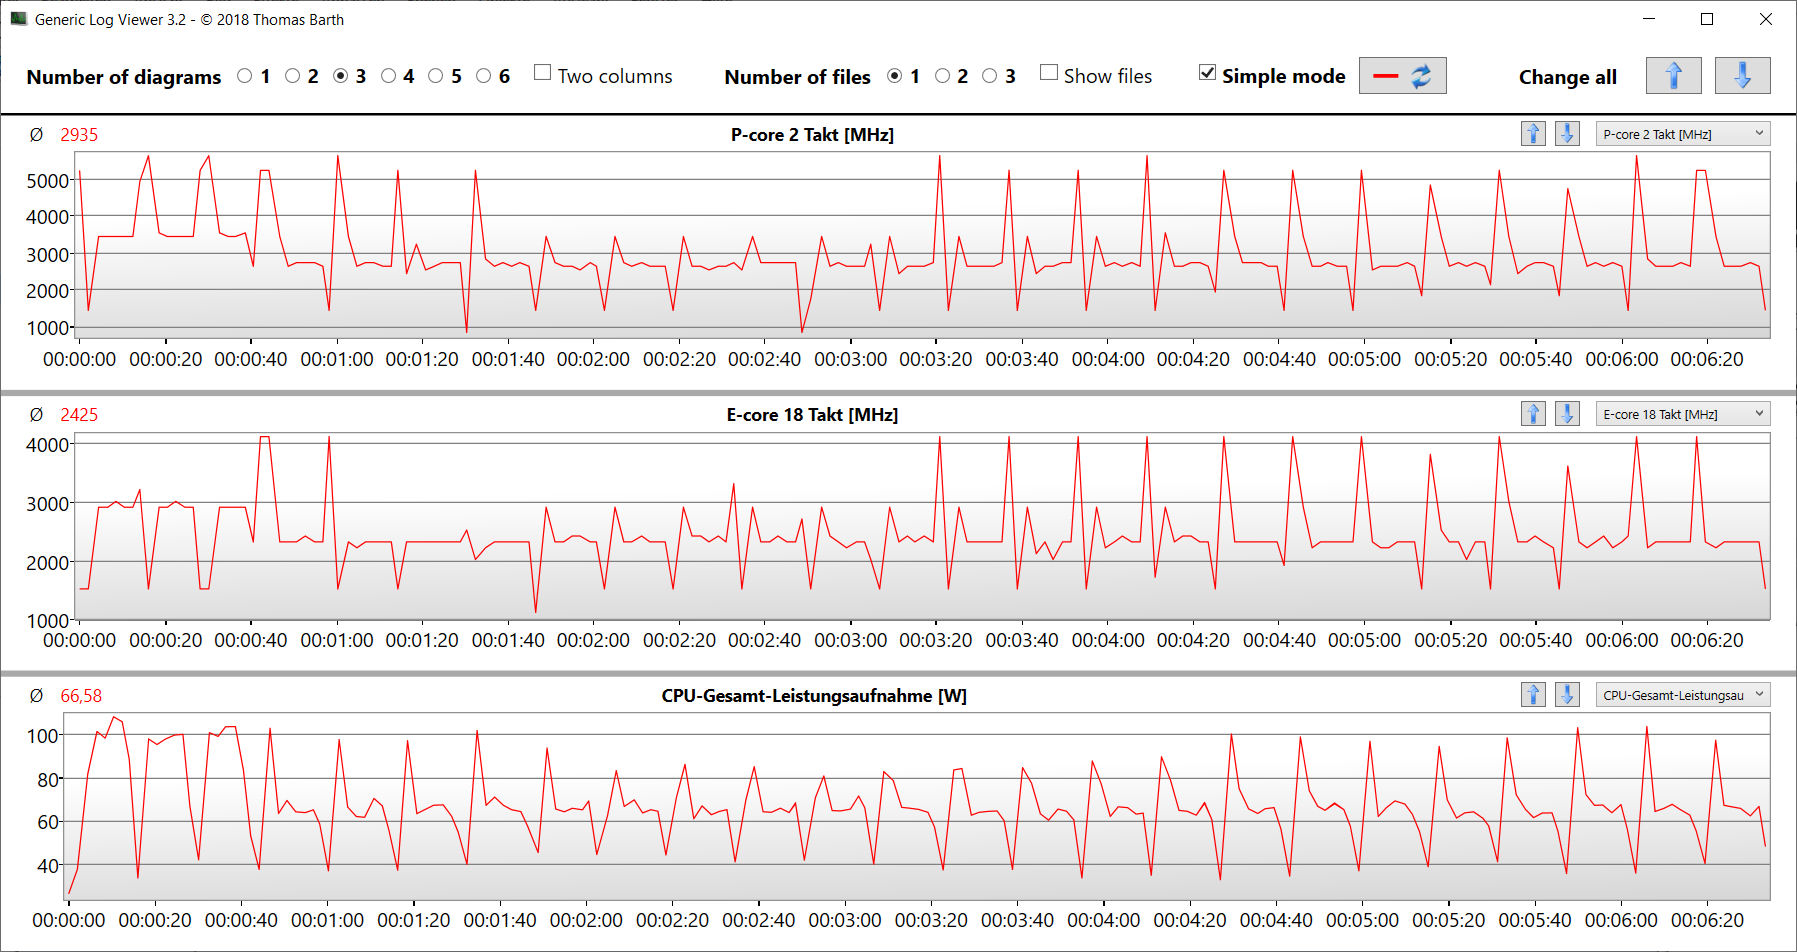
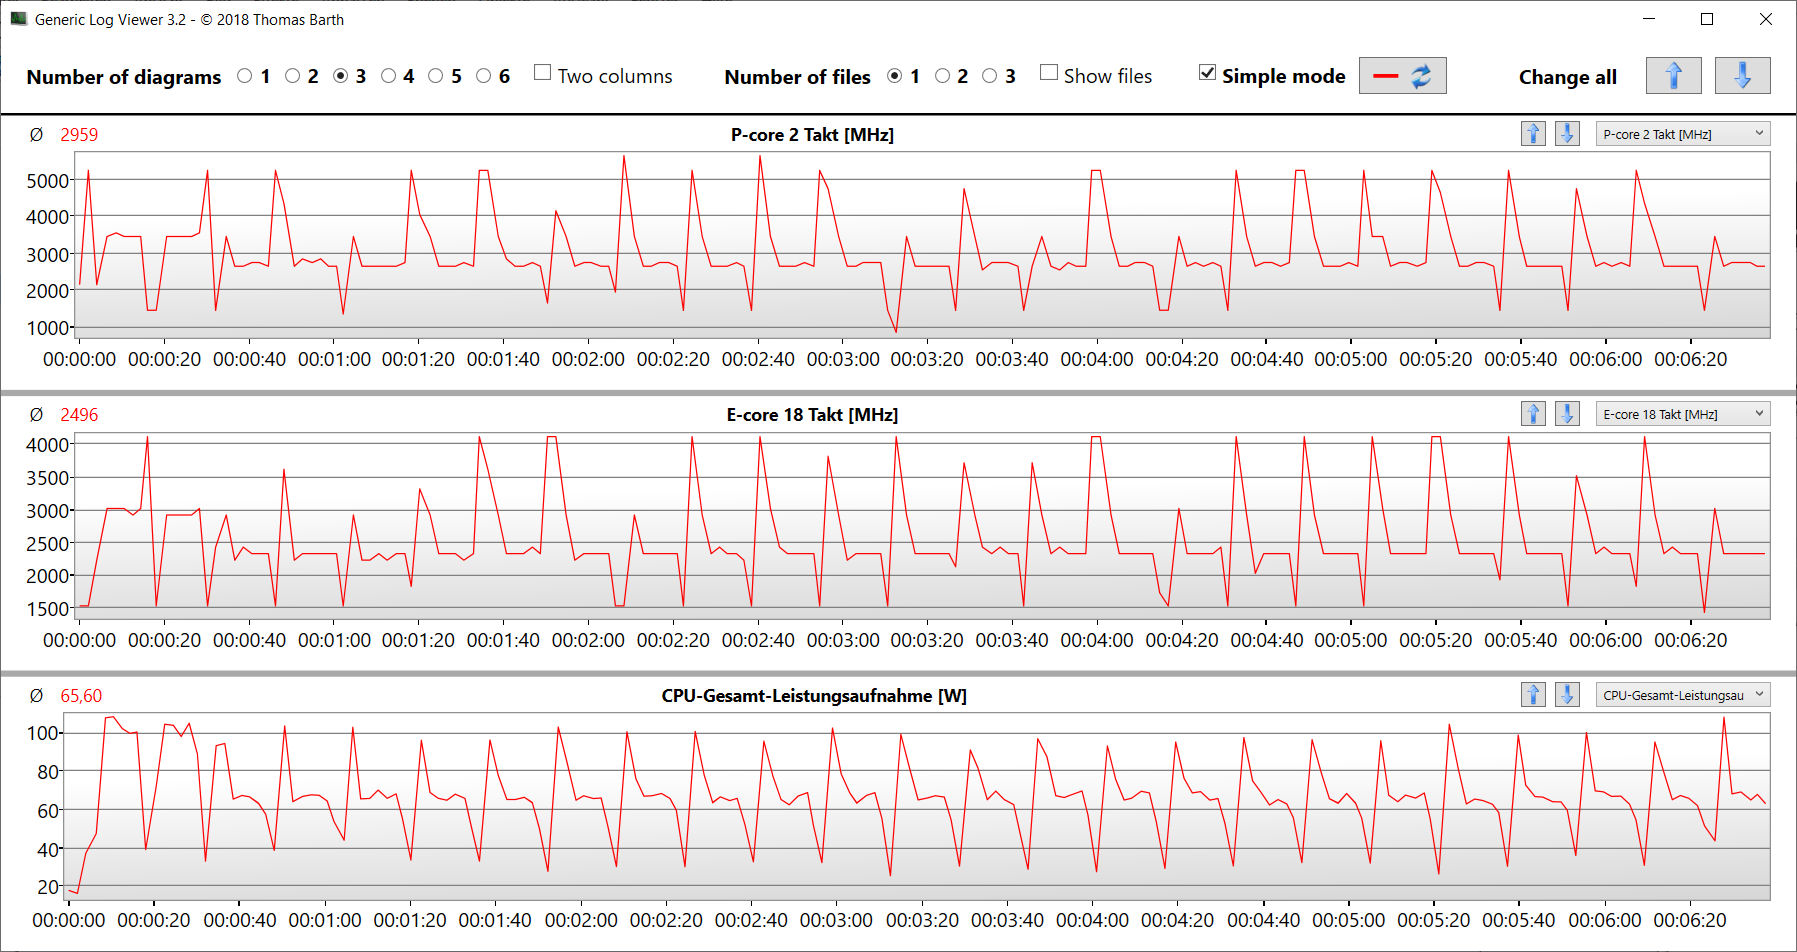
Processore
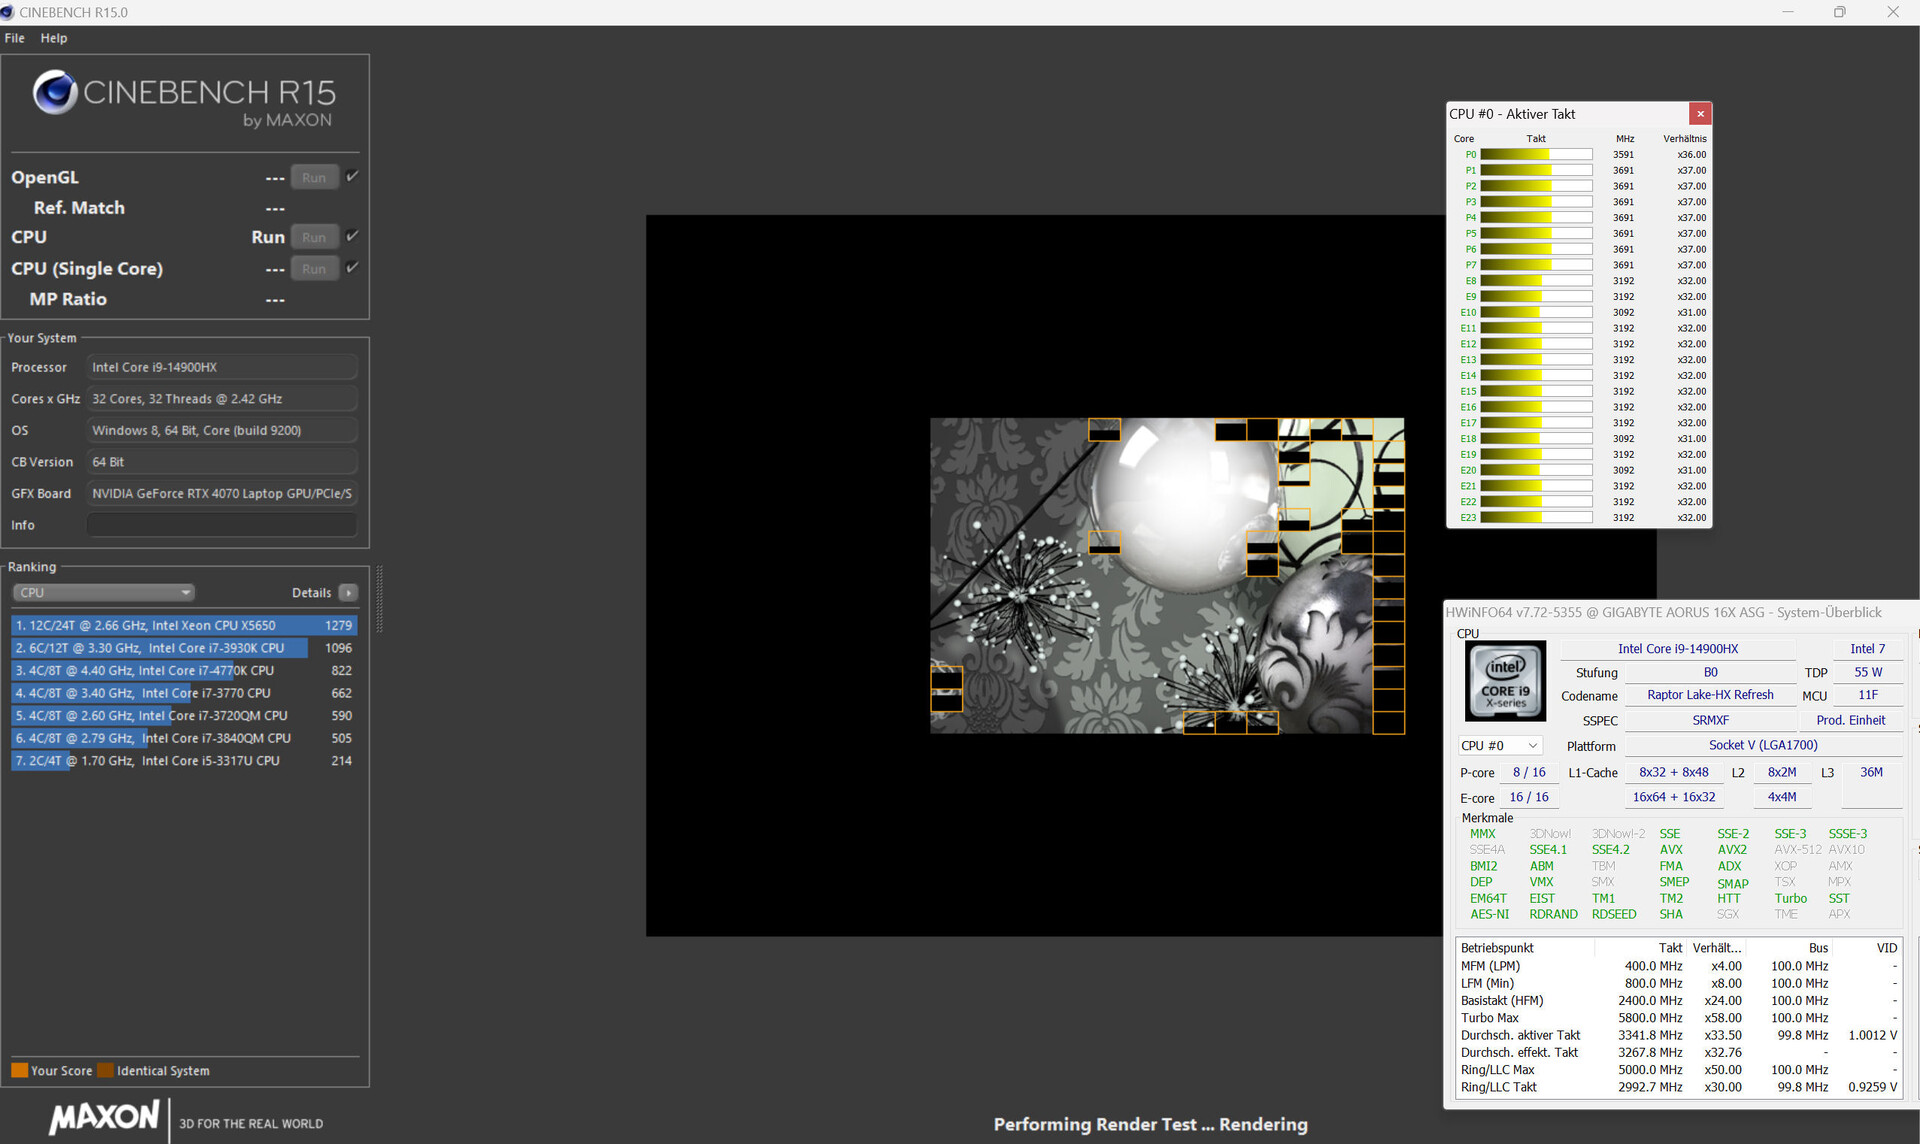
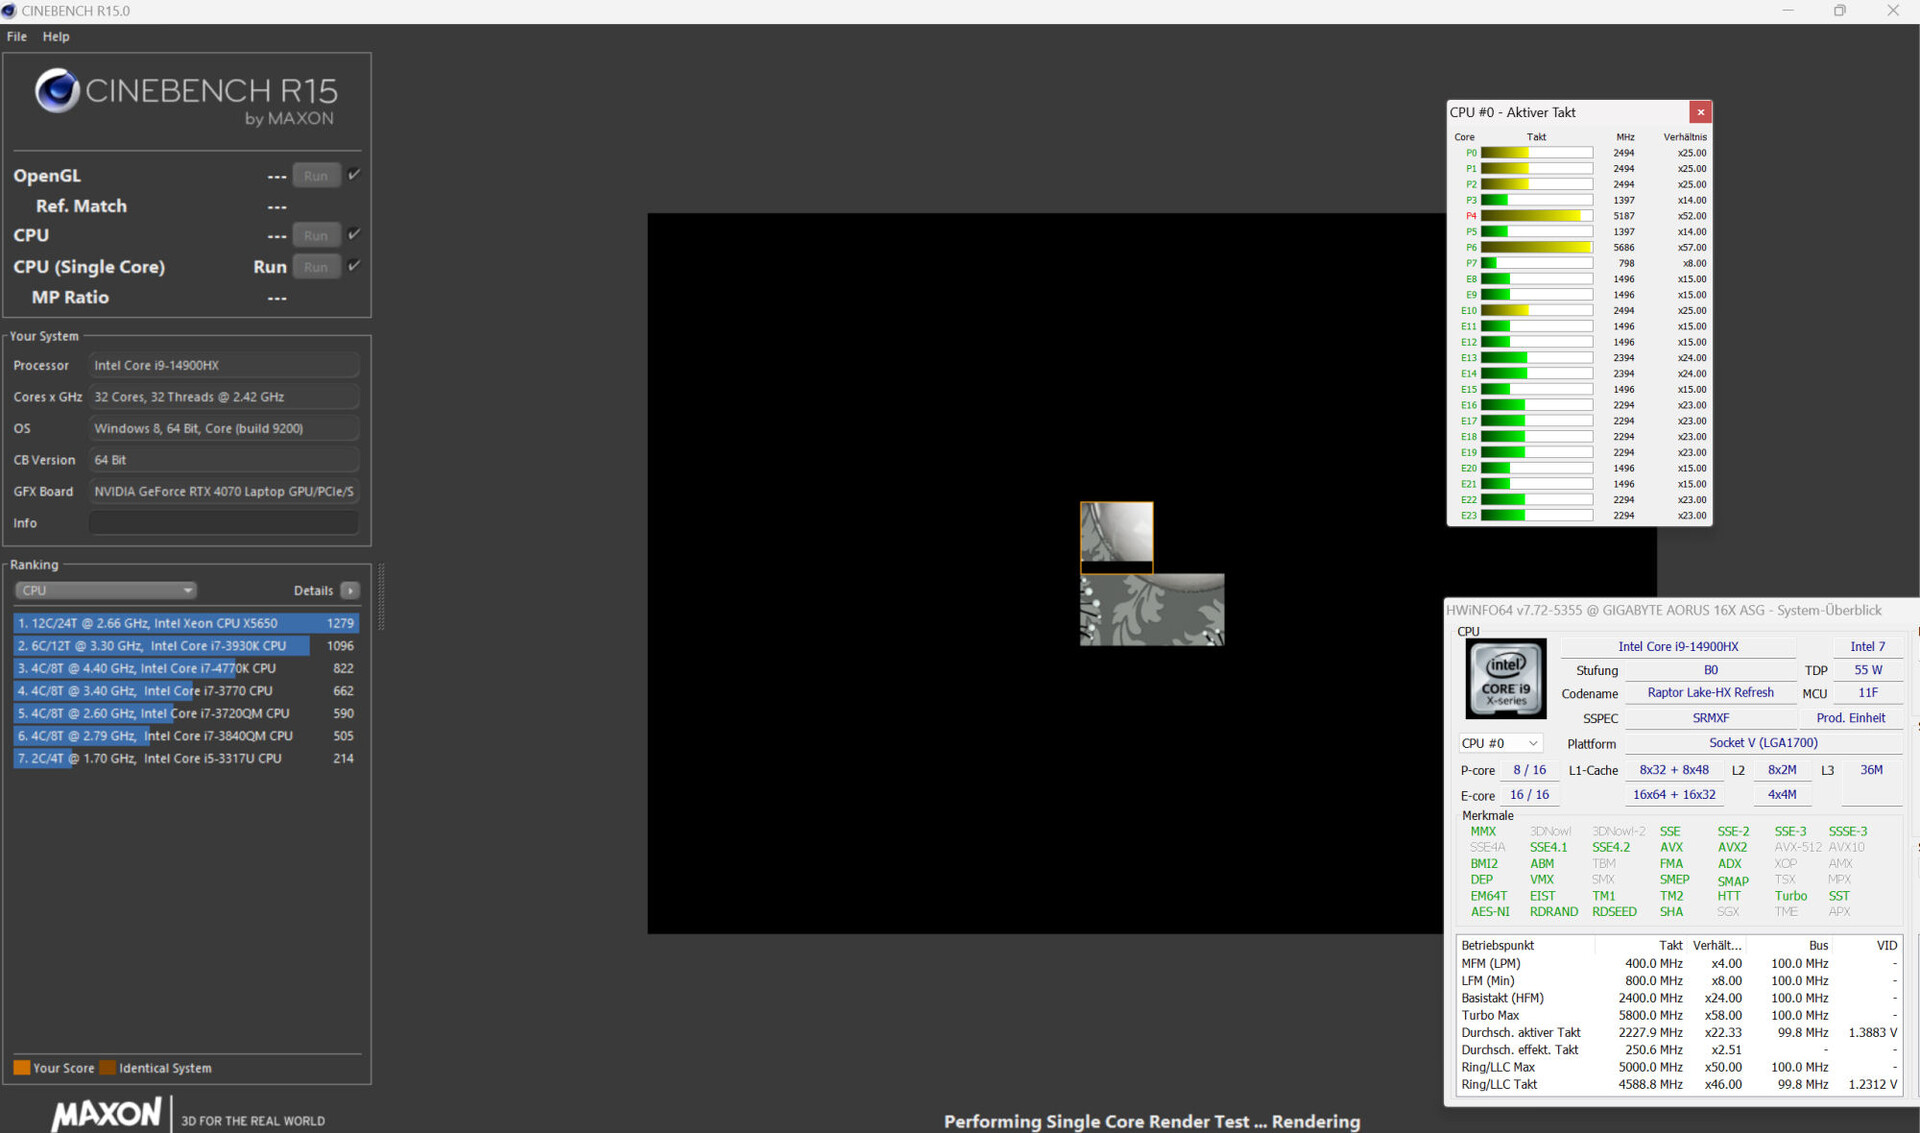
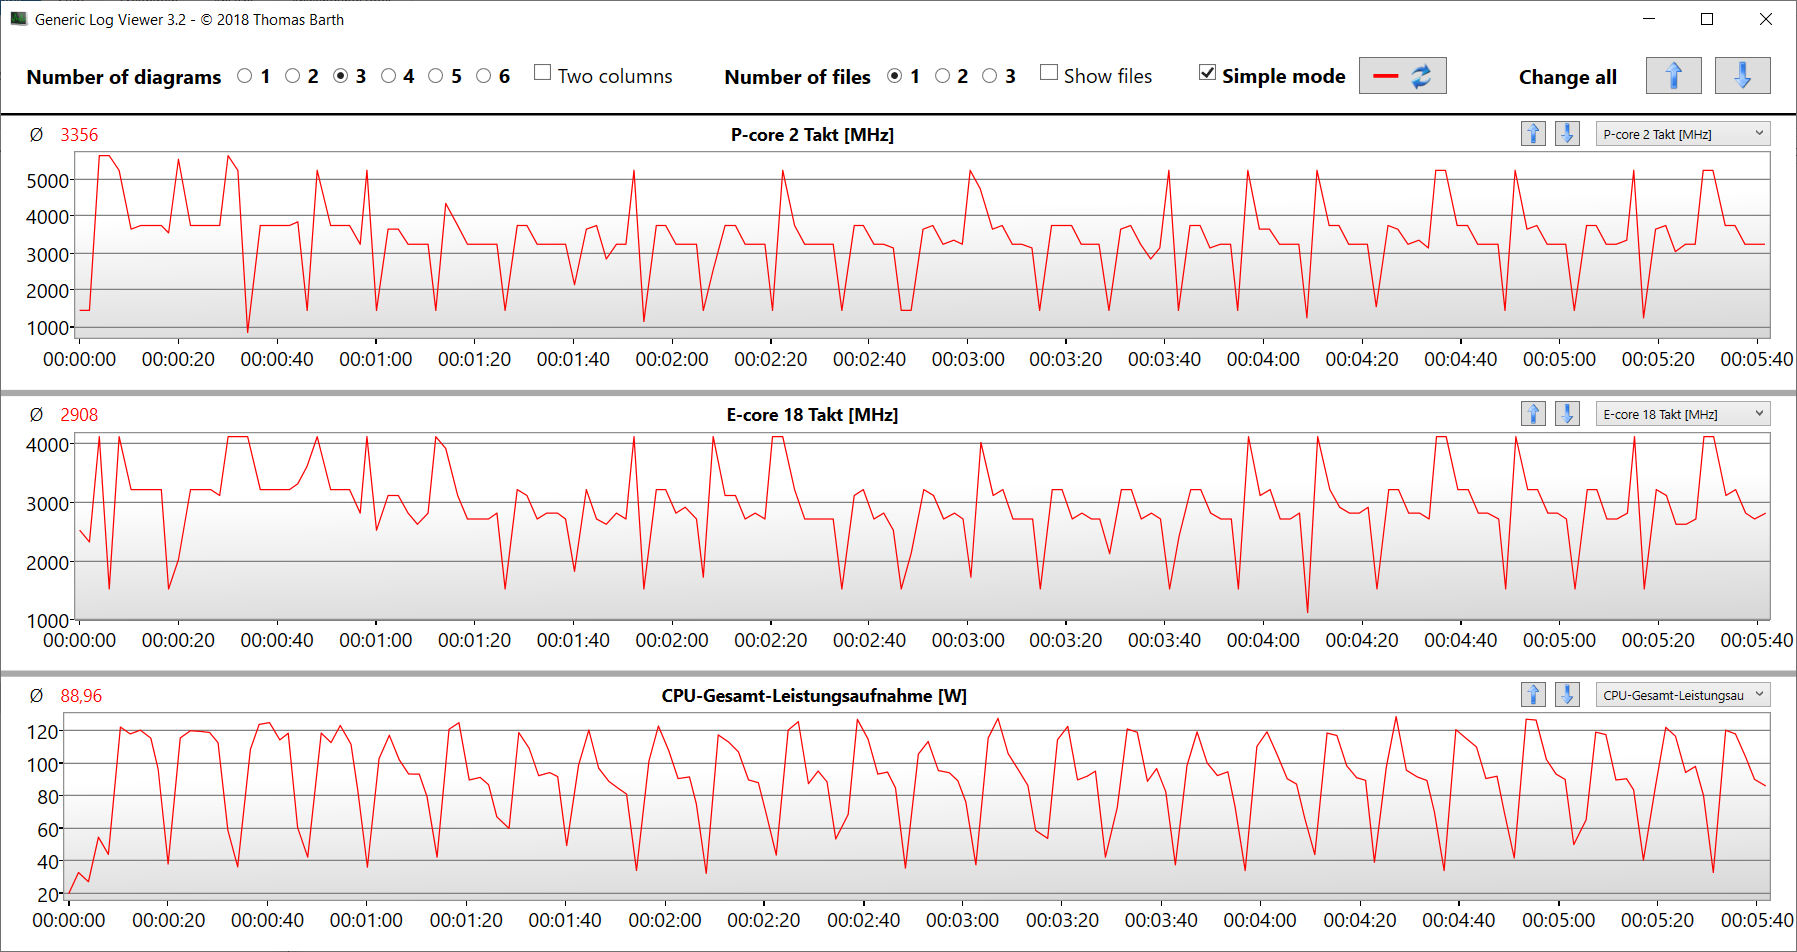
Il Core i9-14900HX(Raptor Lake) 24 core della CPU (8P + 16E = 32 thread) raggiungono velocità di clock massime di 5,8 GHz (P) e 4,1 GHz (E). Il carico continuo multi-thread (CB15 Loop) ha fatto sì che la sua velocità di clock scendesse dal quarto al quinto run. In seguito, ha mantenuto un livello abbastanza stabile. I profili Turbo, Gaming e Creator portano a un livello di prestazioni costantemente superiore.
I suoi punteggi nei benchmark sono in linea con la media della CPU. In modalità batteria, le sue prestazioni single-thread più rilevanti (187 punti; CB15) sono diminuite in misura minore rispetto alle prestazioni multi-thread (1.533 punti; CB15).
Maggiori informazioni sul Core i9 sono disponibili nel nostro articolo di analisi.
Cinebench R15 Multi continuous test
| CPU Performance rating - Percent | |
| Aorus 16X 2024 | |
| Lenovo Legion Pro 5 16IRX9 | |
| Aorus 16X 2024 | |
| Media Intel Core i9-14900HX | |
| Media della classe Gaming | |
| HP Omen Transcend 16-u1095ng | |
| Asus TUF Gaming A17 FA707XI-NS94 | |
| Schenker XMG Pro 16 Studio (Mid 23) | |
| Alienware m16 R2 -1! | |
| Geekbench 6.7 | |
| Multi-Core | |
| Lenovo Legion Pro 5 16IRX9 (6.2.1) | |
| Aorus 16X 2024 (6.2.1, Turbo) | |
| Aorus 16X 2024 (6.2.1) | |
| Media Intel Core i9-14900HX (13158 - 19665, n=37) | |
| HP Omen Transcend 16-u1095ng (6.2.1) | |
| Media della classe Gaming (6625 - 22850, n=106, ultimi 2 anni) | |
| Schenker XMG Pro 16 Studio (Mid 23) | |
| Alienware m16 R2 (6.2.1) | |
| Asus TUF Gaming A17 FA707XI-NS94 (6.2.1) | |
| Single-Core | |
| Aorus 16X 2024 (6.2.1, Turbo) | |
| Aorus 16X 2024 (6.2.1) | |
| Media Intel Core i9-14900HX (2419 - 3129, n=37) | |
| Lenovo Legion Pro 5 16IRX9 (6.2.1) | |
| Media della classe Gaming (1490 - 3259, n=106, ultimi 2 anni) | |
| HP Omen Transcend 16-u1095ng (6.2.1) | |
| Asus TUF Gaming A17 FA707XI-NS94 (6.2.1) | |
| Schenker XMG Pro 16 Studio (Mid 23) | |
| Alienware m16 R2 (6.2.1) | |
| HWBOT x265 Benchmark v2.2 - 4k Preset | |
| Aorus 16X 2024 (Turbo) | |
| Lenovo Legion Pro 5 16IRX9 | |
| Media Intel Core i9-14900HX (16.8 - 38.9, n=37) | |
| Media della classe Gaming (11.5 - 44.4, n=105, ultimi 2 anni) | |
| Aorus 16X 2024 | |
| HP Omen Transcend 16-u1095ng | |
| Asus TUF Gaming A17 FA707XI-NS94 | |
| Alienware m16 R2 | |
| Schenker XMG Pro 16 Studio (Mid 23) | |
| LibreOffice - 20 Documents To PDF | |
| HP Omen Transcend 16-u1095ng (6.3.4.2) | |
| Alienware m16 R2 (6.3.4.2) | |
| Media della classe Gaming (33.2 - 88.8, n=105, ultimi 2 anni) | |
| Asus TUF Gaming A17 FA707XI-NS94 (6.3.4.2) | |
| Schenker XMG Pro 16 Studio (Mid 23) | |
| Media Intel Core i9-14900HX (19 - 85.1, n=37) | |
| Lenovo Legion Pro 5 16IRX9 (6.3.4.2) | |
| Aorus 16X 2024 (6.3.4.2) | |
| Aorus 16X 2024 (6.3.4.2, Turbo) | |
* ... Meglio usare valori piccoli
AIDA64: FP32 Ray-Trace | FPU Julia | CPU SHA3 | CPU Queen | FPU SinJulia | FPU Mandel | CPU AES | CPU ZLib | FP64 Ray-Trace | CPU PhotoWorxx
| Performance rating | |
| Aorus 16X 2024 | |
| Media della classe Gaming | |
| Lenovo Legion Pro 5 16IRX9 | |
| Media Intel Core i9-14900HX | |
| Aorus 16X 2024 | |
| Asus TUF Gaming A17 FA707XI-NS94 | |
| HP Omen Transcend 16-u1095ng | |
| Schenker XMG Pro 16 Studio (Mid 23) | |
| Alienware m16 R2 | |
| AIDA64 / FP32 Ray-Trace | |
| Media della classe Gaming (10227 - 85542, n=105, ultimi 2 anni) | |
| Asus TUF Gaming A17 FA707XI-NS94 (v6.92.6600) | |
| Aorus 16X 2024 (v6.92.6600, Turbo) | |
| Lenovo Legion Pro 5 16IRX9 (v6.92.6600) | |
| Media Intel Core i9-14900HX (13098 - 33474, n=36) | |
| Aorus 16X 2024 (v6.92.6600) | |
| Alienware m16 R2 (v6.92.6600) | |
| HP Omen Transcend 16-u1095ng (v6.92.6600) | |
| Schenker XMG Pro 16 Studio (Mid 23) (v6.75.6100) | |
| AIDA64 / FPU Julia | |
| Media della classe Gaming (51376 - 238426, n=105, ultimi 2 anni) | |
| Aorus 16X 2024 (v6.92.6600, Turbo) | |
| Lenovo Legion Pro 5 16IRX9 (v6.92.6600) | |
| Media Intel Core i9-14900HX (67573 - 166040, n=36) | |
| Asus TUF Gaming A17 FA707XI-NS94 (v6.92.6600) | |
| Aorus 16X 2024 (v6.92.6600) | |
| Alienware m16 R2 (v6.92.6600) | |
| HP Omen Transcend 16-u1095ng (v6.92.6600) | |
| Schenker XMG Pro 16 Studio (Mid 23) (v6.75.6100) | |
| AIDA64 / CPU SHA3 | |
| Aorus 16X 2024 (v6.92.6600, Turbo) | |
| Media della classe Gaming (2180 - 10115, n=105, ultimi 2 anni) | |
| Lenovo Legion Pro 5 16IRX9 (v6.92.6600) | |
| Media Intel Core i9-14900HX (3589 - 7979, n=36) | |
| Aorus 16X 2024 (v6.92.6600) | |
| Asus TUF Gaming A17 FA707XI-NS94 (v6.92.6600) | |
| HP Omen Transcend 16-u1095ng (v6.92.6600) | |
| Alienware m16 R2 (v6.92.6600) | |
| Schenker XMG Pro 16 Studio (Mid 23) (v6.75.6100) | |
| AIDA64 / CPU Queen | |
| Lenovo Legion Pro 5 16IRX9 (v6.92.6600) | |
| Aorus 16X 2024 (v6.92.6600, Turbo) | |
| Aorus 16X 2024 (v6.92.6600) | |
| Media Intel Core i9-14900HX (118405 - 148966, n=36) | |
| Asus TUF Gaming A17 FA707XI-NS94 (v6.92.6600) | |
| HP Omen Transcend 16-u1095ng (v6.92.6600) | |
| Media della classe Gaming (49785 - 173351, n=90, ultimi 2 anni) | |
| Schenker XMG Pro 16 Studio (Mid 23) (v6.75.6100) | |
| Alienware m16 R2 (v6.92.6600) | |
| AIDA64 / FPU SinJulia | |
| Aorus 16X 2024 (v6.92.6600, Turbo) | |
| Asus TUF Gaming A17 FA707XI-NS94 (v6.92.6600) | |
| Lenovo Legion Pro 5 16IRX9 (v6.92.6600) | |
| Media Intel Core i9-14900HX (10475 - 18517, n=36) | |
| Aorus 16X 2024 (v6.92.6600) | |
| Media della classe Gaming (4424 - 33636, n=105, ultimi 2 anni) | |
| HP Omen Transcend 16-u1095ng (v6.92.6600) | |
| Alienware m16 R2 (v6.92.6600) | |
| Schenker XMG Pro 16 Studio (Mid 23) (v6.75.6100) | |
| AIDA64 / FPU Mandel | |
| Media della classe Gaming (25115 - 128721, n=105, ultimi 2 anni) | |
| Aorus 16X 2024 (v6.92.6600, Turbo) | |
| Asus TUF Gaming A17 FA707XI-NS94 (v6.92.6600) | |
| Lenovo Legion Pro 5 16IRX9 (v6.92.6600) | |
| Media Intel Core i9-14900HX (32543 - 83662, n=36) | |
| Aorus 16X 2024 (v6.92.6600) | |
| Alienware m16 R2 (v6.92.6600) | |
| HP Omen Transcend 16-u1095ng (v6.92.6600) | |
| Schenker XMG Pro 16 Studio (Mid 23) (v6.75.6100) | |
| AIDA64 / CPU AES | |
| Schenker XMG Pro 16 Studio (Mid 23) (v6.75.6100) | |
| Media Intel Core i9-14900HX (86964 - 241777, n=36) | |
| Aorus 16X 2024 (v6.92.6600, Turbo) | |
| Lenovo Legion Pro 5 16IRX9 (v6.92.6600) | |
| Aorus 16X 2024 (v6.92.6600) | |
| Media della classe Gaming (39258 - 247074, n=105, ultimi 2 anni) | |
| Asus TUF Gaming A17 FA707XI-NS94 (v6.92.6600) | |
| HP Omen Transcend 16-u1095ng (v6.92.6600) | |
| Alienware m16 R2 (v6.92.6600) | |
| AIDA64 / CPU ZLib | |
| Aorus 16X 2024 (v6.92.6600, Turbo) | |
| Lenovo Legion Pro 5 16IRX9 (v6.92.6600) | |
| Media Intel Core i9-14900HX (1054 - 2292, n=36) | |
| Aorus 16X 2024 (v6.92.6600) | |
| Media della classe Gaming (574 - 2531, n=105, ultimi 2 anni) | |
| HP Omen Transcend 16-u1095ng (v6.92.6600) | |
| Alienware m16 R2 (v6.92.6600) | |
| Asus TUF Gaming A17 FA707XI-NS94 (v6.92.6600) | |
| Schenker XMG Pro 16 Studio (Mid 23) (v6.75.6100) | |
| AIDA64 / FP64 Ray-Trace | |
| Media della classe Gaming (5509 - 45446, n=105, ultimi 2 anni) | |
| Asus TUF Gaming A17 FA707XI-NS94 (v6.92.6600) | |
| Aorus 16X 2024 (v6.92.6600, Turbo) | |
| Lenovo Legion Pro 5 16IRX9 (v6.92.6600) | |
| Media Intel Core i9-14900HX (6809 - 18349, n=36) | |
| Aorus 16X 2024 (v6.92.6600) | |
| Alienware m16 R2 (v6.92.6600) | |
| HP Omen Transcend 16-u1095ng (v6.92.6600) | |
| Schenker XMG Pro 16 Studio (Mid 23) (v6.75.6100) | |
| AIDA64 / CPU PhotoWorxx | |
| Lenovo Legion Pro 5 16IRX9 (v6.92.6600) | |
| HP Omen Transcend 16-u1095ng (v6.92.6600) | |
| Aorus 16X 2024 (v6.92.6600, Turbo) | |
| Aorus 16X 2024 (v6.92.6600) | |
| Schenker XMG Pro 16 Studio (Mid 23) (v6.75.6100) | |
| Media Intel Core i9-14900HX (23903 - 54702, n=36) | |
| Media della classe Gaming (12271 - 89891, n=105, ultimi 2 anni) | |
| Alienware m16 R2 (v6.92.6600) | |
| Asus TUF Gaming A17 FA707XI-NS94 (v6.92.6600) | |
Prestazioni del sistema
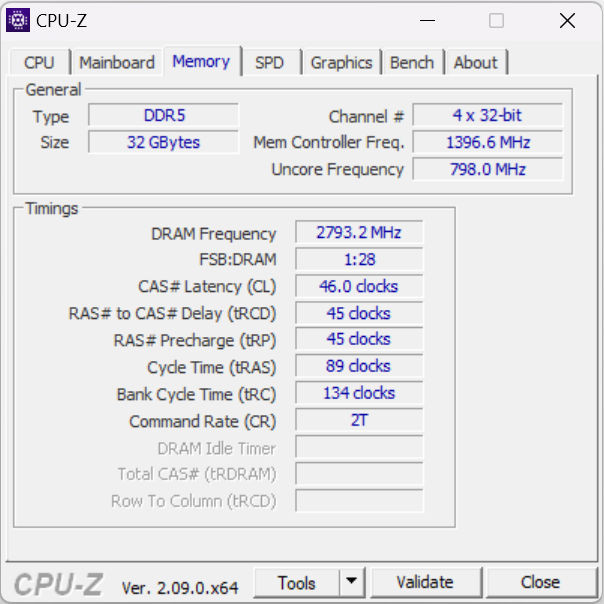
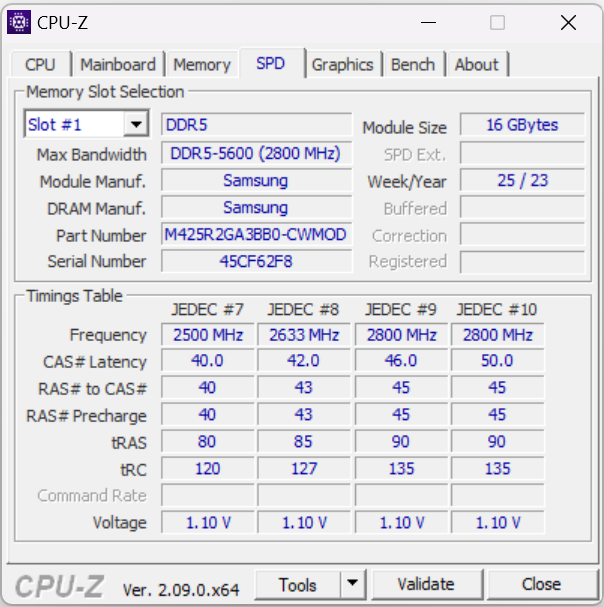
Il sistema fluido non manca di potenza di calcolo. Il gioco, lo streaming e il rendering non rappresentano una sfida importante per il portatile. Le velocità di trasferimento della RAM sono nella norma per una RAM DDR5-5600.
CrossMark: Overall | Productivity | Creativity | Responsiveness
WebXPRT 3: Overall
WebXPRT 4: Overall
Mozilla Kraken 1.1: Total
| PCMark 10 / Score | |
| Lenovo Legion Pro 5 16IRX9 | |
| Media della classe Gaming (5828 - 12414, n=93, ultimi 2 anni) | |
| Aorus 16X 2024 | |
| Media Intel Core i9-14900HX, NVIDIA GeForce RTX 4070 Laptop GPU (7768 - 8550, n=8) | |
| Asus TUF Gaming A17 FA707XI-NS94 | |
| Schenker XMG Pro 16 Studio (Mid 23) | |
| HP Omen Transcend 16-u1095ng | |
| Alienware m16 R2 | |
| PCMark 10 / Essentials | |
| Schenker XMG Pro 16 Studio (Mid 23) | |
| Lenovo Legion Pro 5 16IRX9 | |
| Aorus 16X 2024 | |
| Asus TUF Gaming A17 FA707XI-NS94 | |
| Media Intel Core i9-14900HX, NVIDIA GeForce RTX 4070 Laptop GPU (10104 - 11815, n=8) | |
| Media della classe Gaming (8810 - 11935, n=97, ultimi 2 anni) | |
| HP Omen Transcend 16-u1095ng | |
| Alienware m16 R2 | |
| PCMark 10 / Productivity | |
| Media della classe Gaming (6845 - 25323, n=95, ultimi 2 anni) | |
| Aorus 16X 2024 | |
| Media Intel Core i9-14900HX, NVIDIA GeForce RTX 4070 Laptop GPU (9577 - 11103, n=8) | |
| Schenker XMG Pro 16 Studio (Mid 23) | |
| HP Omen Transcend 16-u1095ng | |
| Lenovo Legion Pro 5 16IRX9 | |
| Asus TUF Gaming A17 FA707XI-NS94 | |
| Alienware m16 R2 | |
| PCMark 10 / Digital Content Creation | |
| Lenovo Legion Pro 5 16IRX9 | |
| Media della classe Gaming (7602 - 19954, n=95, ultimi 2 anni) | |
| Asus TUF Gaming A17 FA707XI-NS94 | |
| Media Intel Core i9-14900HX, NVIDIA GeForce RTX 4070 Laptop GPU (12114 - 14827, n=8) | |
| Aorus 16X 2024 | |
| Alienware m16 R2 | |
| HP Omen Transcend 16-u1095ng | |
| Schenker XMG Pro 16 Studio (Mid 23) | |
| CrossMark / Overall | |
| Aorus 16X 2024 | |
| Media Intel Core i9-14900HX, NVIDIA GeForce RTX 4070 Laptop GPU (2002 - 2312, n=7) | |
| Lenovo Legion Pro 5 16IRX9 | |
| Media della classe Gaming (1366 - 2409, n=94, ultimi 2 anni) | |
| Schenker XMG Pro 16 Studio (Mid 23) | |
| Asus TUF Gaming A17 FA707XI-NS94 | |
| Alienware m16 R2 | |
| CrossMark / Productivity | |
| Aorus 16X 2024 | |
| Media Intel Core i9-14900HX, NVIDIA GeForce RTX 4070 Laptop GPU (1827 - 2191, n=7) | |
| Schenker XMG Pro 16 Studio (Mid 23) | |
| Media della classe Gaming (1386 - 2254, n=94, ultimi 2 anni) | |
| Lenovo Legion Pro 5 16IRX9 | |
| Asus TUF Gaming A17 FA707XI-NS94 | |
| Alienware m16 R2 | |
| CrossMark / Creativity | |
| Aorus 16X 2024 | |
| Media Intel Core i9-14900HX, NVIDIA GeForce RTX 4070 Laptop GPU (2258 - 2458, n=7) | |
| Lenovo Legion Pro 5 16IRX9 | |
| Media della classe Gaming (1343 - 2786, n=94, ultimi 2 anni) | |
| Schenker XMG Pro 16 Studio (Mid 23) | |
| Asus TUF Gaming A17 FA707XI-NS94 | |
| Alienware m16 R2 | |
| CrossMark / Responsiveness | |
| Aorus 16X 2024 | |
| Media Intel Core i9-14900HX, NVIDIA GeForce RTX 4070 Laptop GPU (1734 - 2330, n=7) | |
| Schenker XMG Pro 16 Studio (Mid 23) | |
| Lenovo Legion Pro 5 16IRX9 | |
| Media della classe Gaming (1226 - 2334, n=94, ultimi 2 anni) | |
| Alienware m16 R2 | |
| Asus TUF Gaming A17 FA707XI-NS94 | |
| WebXPRT 3 / Overall | |
| HP Omen Transcend 16-u1095ng | |
| Aorus 16X 2024 | |
| Lenovo Legion Pro 5 16IRX9 | |
| Media Intel Core i9-14900HX, NVIDIA GeForce RTX 4070 Laptop GPU (269 - 342, n=8) | |
| Schenker XMG Pro 16 Studio (Mid 23) | |
| Asus TUF Gaming A17 FA707XI-NS94 | |
| Media della classe Gaming (220 - 532, n=98, ultimi 2 anni) | |
| Alienware m16 R2 | |
| WebXPRT 4 / Overall | |
| Media Intel Core i9-14900HX, NVIDIA GeForce RTX 4070 Laptop GPU (291 - 304, n=6) | |
| Lenovo Legion Pro 5 16IRX9 | |
| Media della classe Gaming (165 - 354, n=98, ultimi 2 anni) | |
| Asus TUF Gaming A17 FA707XI-NS94 | |
| Alienware m16 R2 | |
| Mozilla Kraken 1.1 / Total | |
| Alienware m16 R2 | |
| Schenker XMG Pro 16 Studio (Mid 23) | |
| Asus TUF Gaming A17 FA707XI-NS94 | |
| Media della classe Gaming (391 - 590, n=100, ultimi 2 anni) | |
| Lenovo Legion Pro 5 16IRX9 | |
| Media Intel Core i9-14900HX, NVIDIA GeForce RTX 4070 Laptop GPU (431 - 469, n=8) | |
| HP Omen Transcend 16-u1095ng | |
| Aorus 16X 2024 | |
* ... Meglio usare valori piccoli
| PCMark 10 Score | 8389 punti | |
Aiuto | ||
| AIDA64 / Memory Copy | |
| Lenovo Legion Pro 5 16IRX9 | |
| Aorus 16X 2024 | |
| HP Omen Transcend 16-u1095ng | |
| Media Intel Core i9-14900HX (38028 - 83392, n=36) | |
| Media della classe Gaming (21750 - 129946, n=105, ultimi 2 anni) | |
| Schenker XMG Pro 16 Studio (Mid 23) | |
| Alienware m16 R2 | |
| Asus TUF Gaming A17 FA707XI-NS94 | |
| AIDA64 / Memory Read | |
| Aorus 16X 2024 | |
| Lenovo Legion Pro 5 16IRX9 | |
| HP Omen Transcend 16-u1095ng | |
| Media Intel Core i9-14900HX (43306 - 87568, n=36) | |
| Alienware m16 R2 | |
| Schenker XMG Pro 16 Studio (Mid 23) | |
| Media della classe Gaming (22956 - 118858, n=105, ultimi 2 anni) | |
| Asus TUF Gaming A17 FA707XI-NS94 | |
| AIDA64 / Memory Write | |
| HP Omen Transcend 16-u1095ng | |
| Aorus 16X 2024 | |
| Lenovo Legion Pro 5 16IRX9 | |
| Media della classe Gaming (22297 - 135096, n=105, ultimi 2 anni) | |
| Asus TUF Gaming A17 FA707XI-NS94 | |
| Media Intel Core i9-14900HX (37146 - 80589, n=36) | |
| Schenker XMG Pro 16 Studio (Mid 23) | |
| Alienware m16 R2 | |
| AIDA64 / Memory Latency | |
| Alienware m16 R2 | |
| Media della classe Gaming (75.3 - 259, n=105, ultimi 2 anni) | |
| Asus TUF Gaming A17 FA707XI-NS94 | |
| Schenker XMG Pro 16 Studio (Mid 23) | |
| HP Omen Transcend 16-u1095ng | |
| Media Intel Core i9-14900HX (76.1 - 105, n=36) | |
| Lenovo Legion Pro 5 16IRX9 | |
| Aorus 16X 2024 | |
* ... Meglio usare valori piccoli
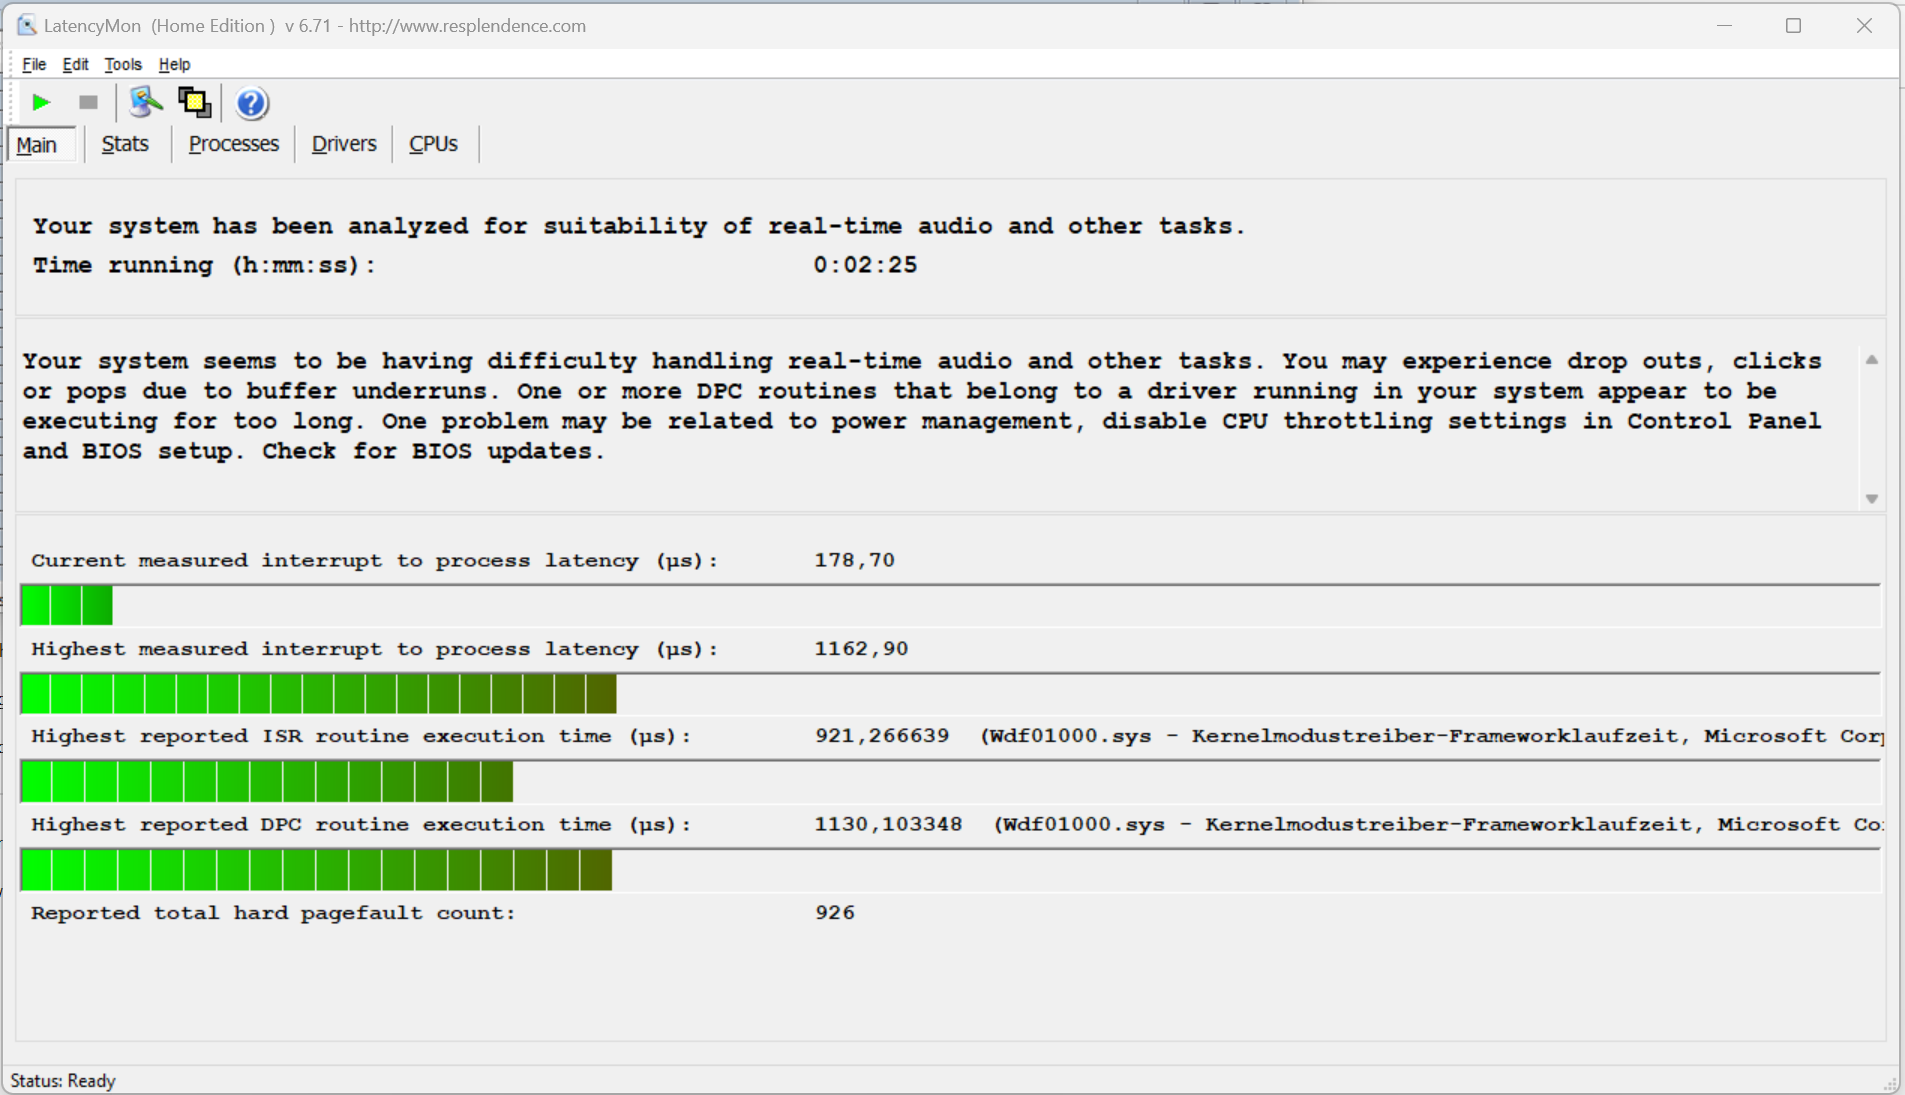
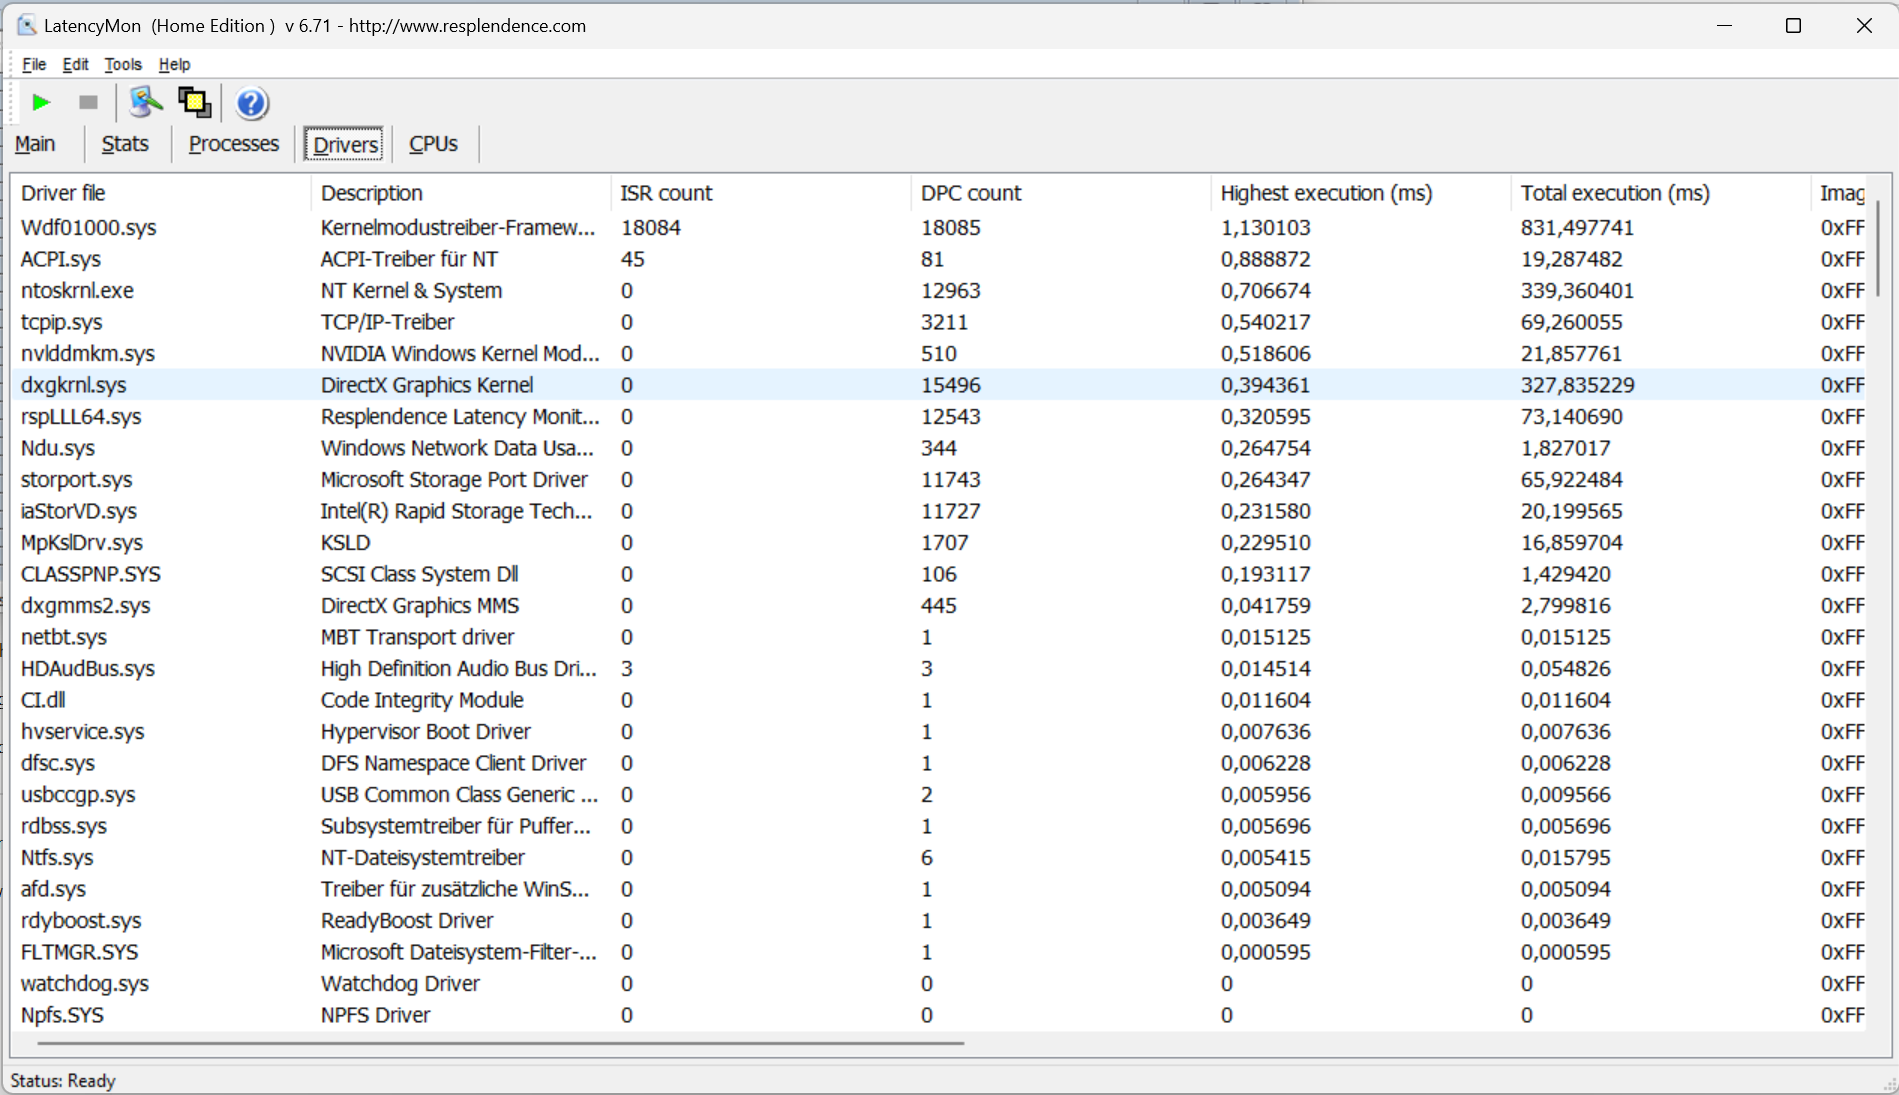
Latenze DPC
Il test standardizzato Latency Monitor (navigazione web, riproduzione video 4k, Prime95 ad alto carico) ha rivelato alcune anomalie. Il sistema non sembra essere adatto all'editing video e audio in tempo reale. I futuri aggiornamenti del software potrebbero portare a miglioramenti o addirittura a peggioramenti.
| DPC Latencies / LatencyMon - interrupt to process latency (max), Web, Youtube, Prime95 | |
| Alienware m16 R2 | |
| Schenker XMG Pro 16 Studio (Mid 23) | |
| Asus TUF Gaming A17 FA707XI-NS94 | |
| HP Omen Transcend 16-u1095ng | |
| Aorus 16X 2024 | |
| Lenovo Legion Pro 5 16IRX9 | |
* ... Meglio usare valori piccoli
Dispositivi di archiviazione
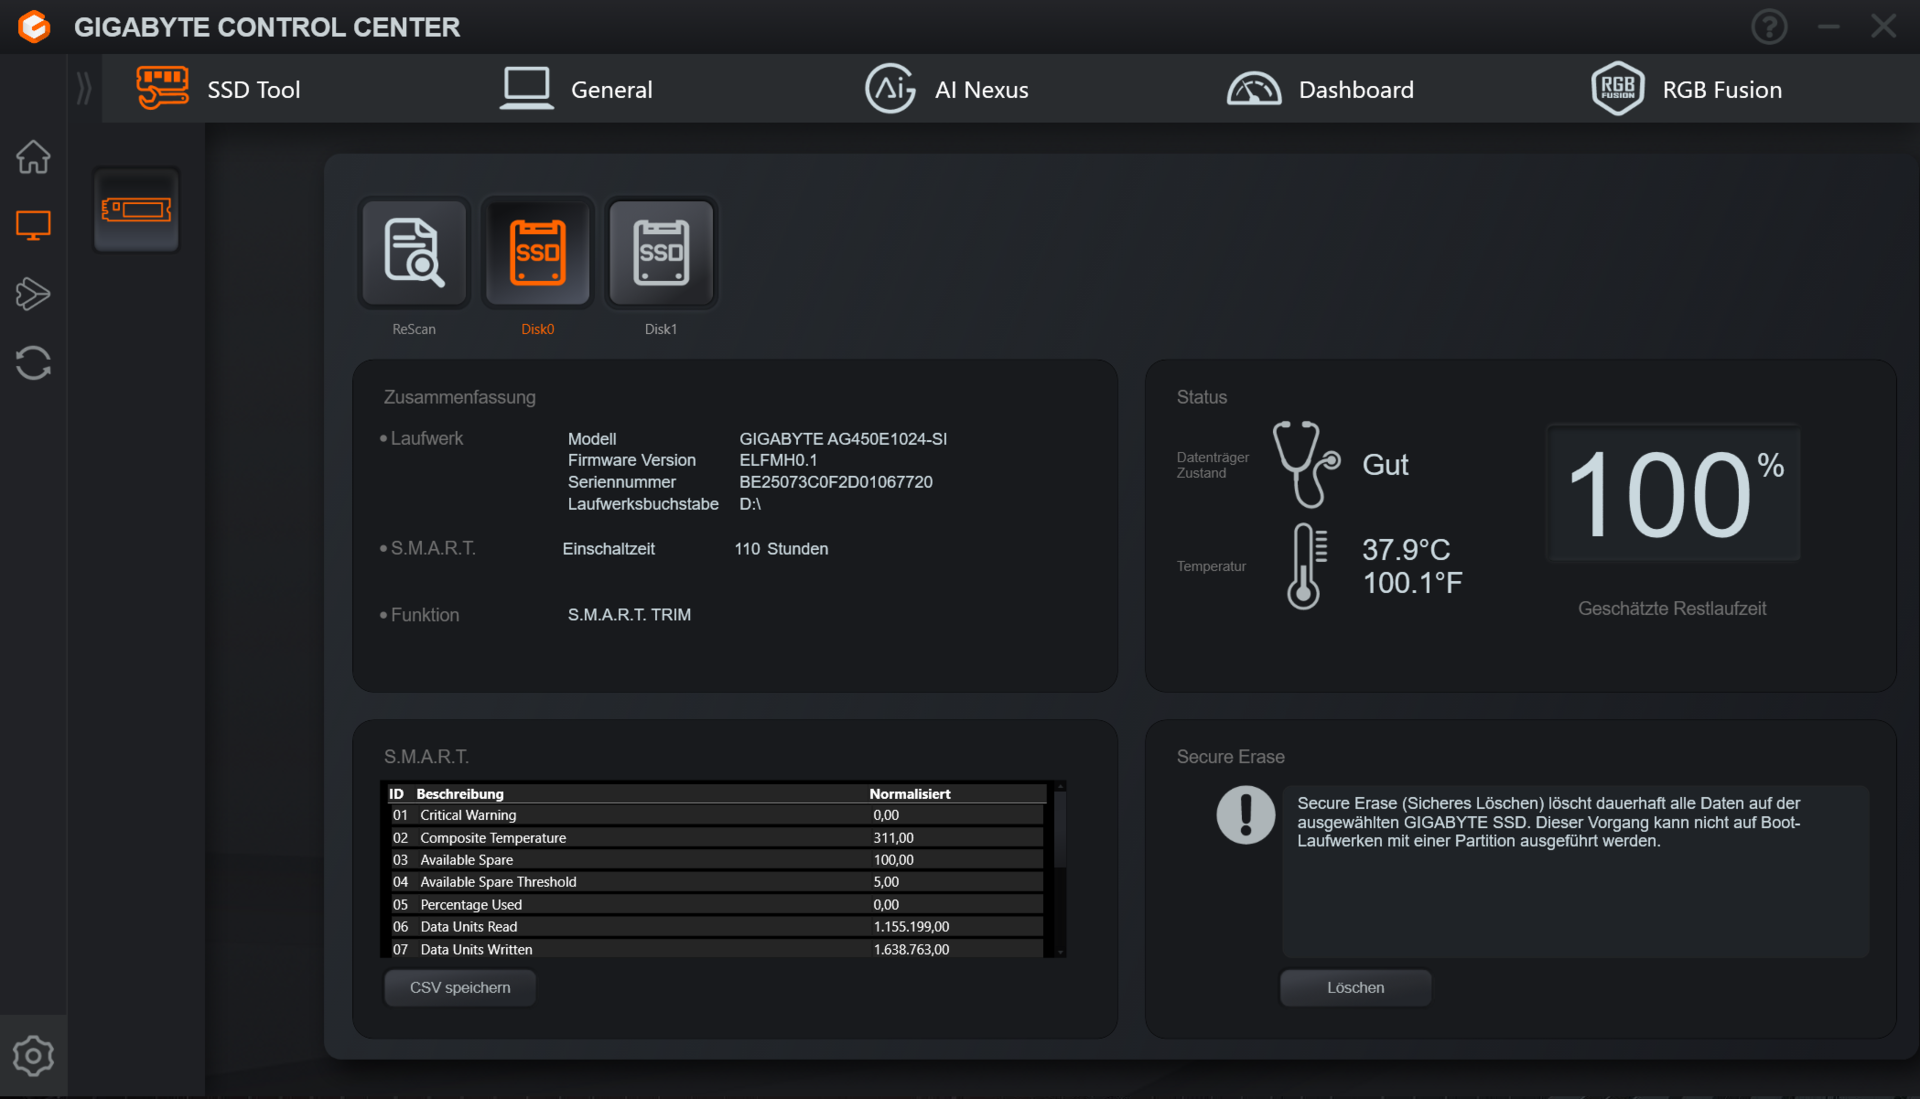
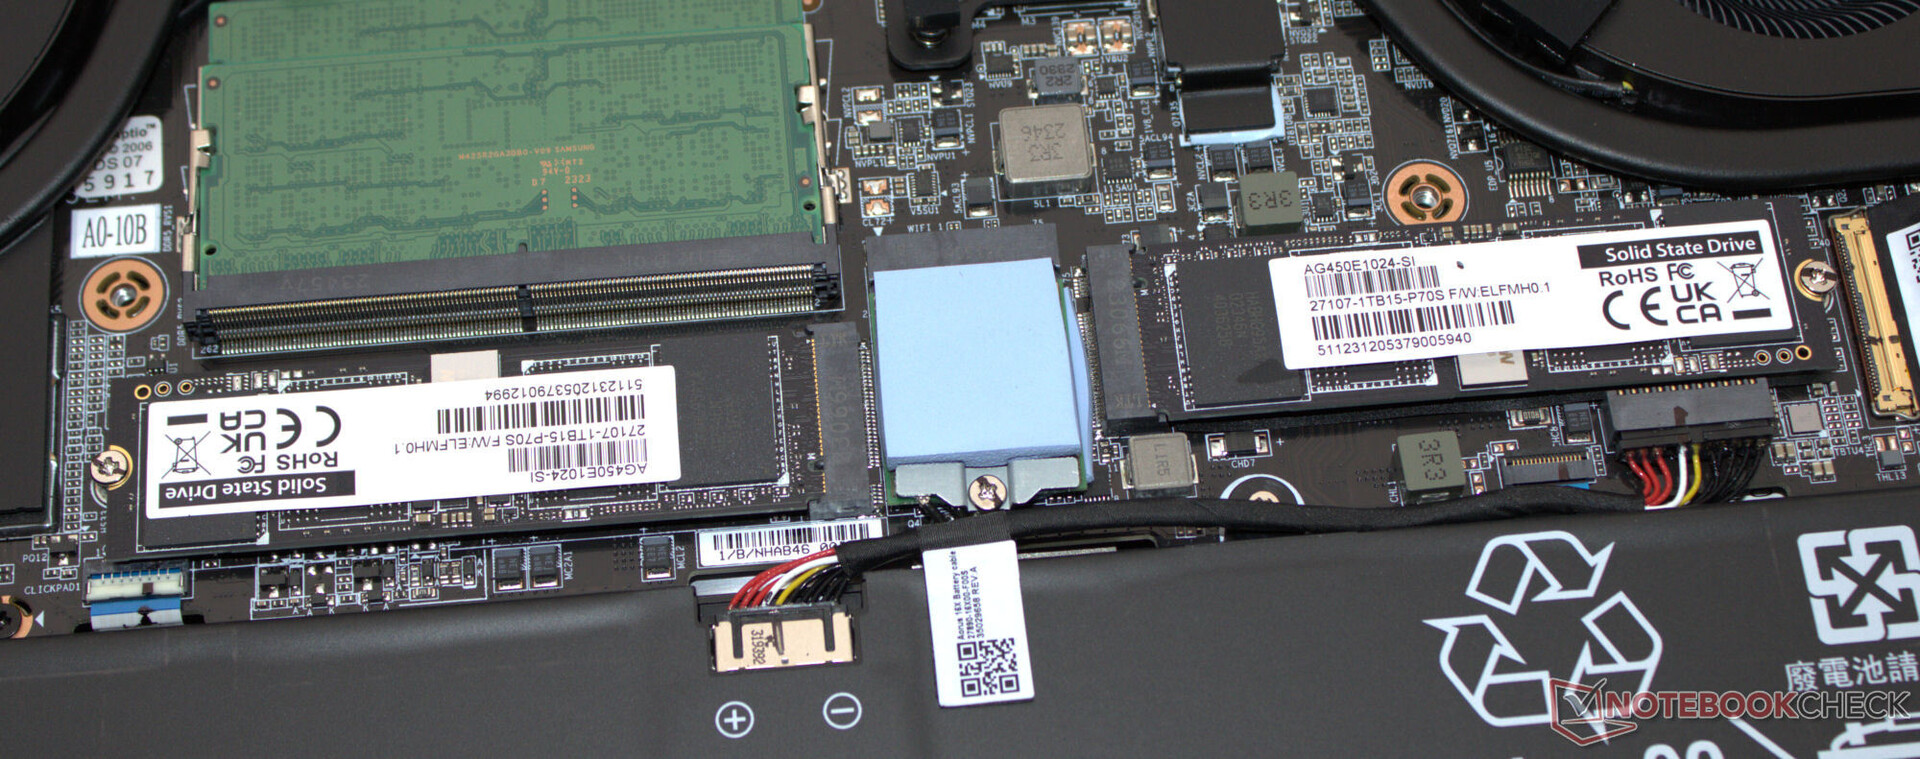
Il modello 16X dispone di due SSD PCIe 4 con 1 TB di spazio di archiviazione ciascuno (M.2-2280) - non formano un array RAID. Un SSD funge da unità di sistema, l'altro da archiviazione dati: entrambi raggiungono ottime velocità di trasferimento dati. Non abbiamo notato cali dovuti al throttling termico.
Il modello 16X supporta generalmente il RAID. Tuttavia, l'opzione corrispondente deve essere attivata nel BIOS, dopodiché è necessario reinstallare Windows. Questa procedura non è consigliata ai non esperti.

* ... Meglio usare valori piccoli
Reading continuous performance: DiskSpd Read Loop, Queue Depth 8
Scheda grafica
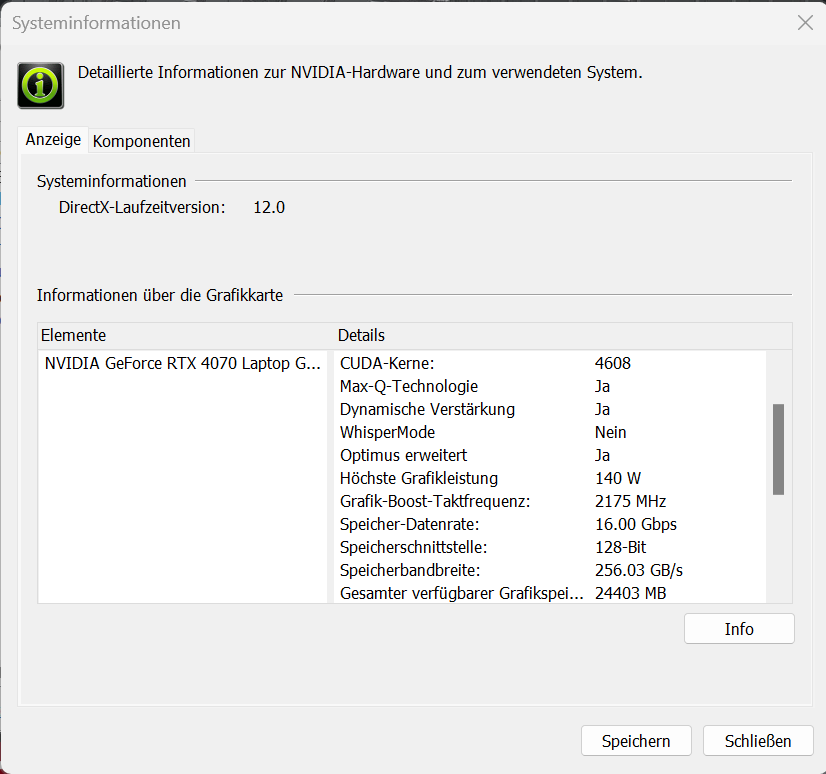
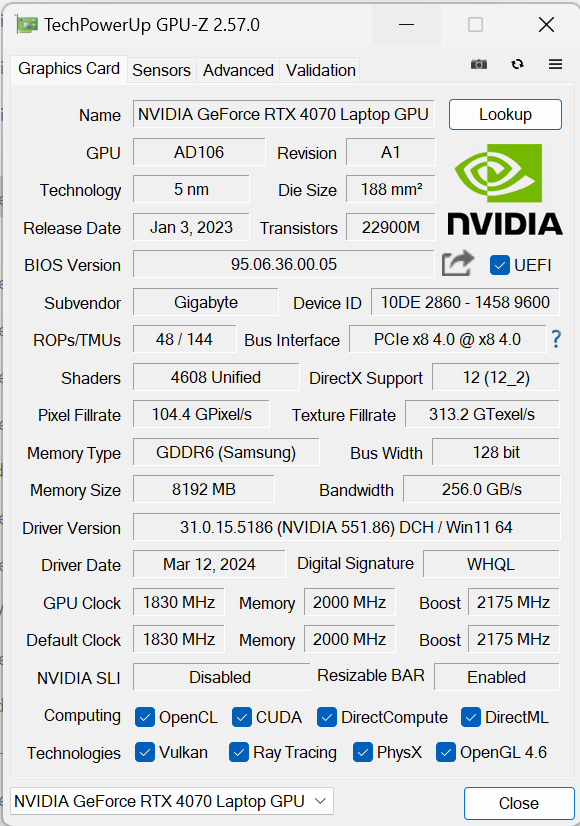
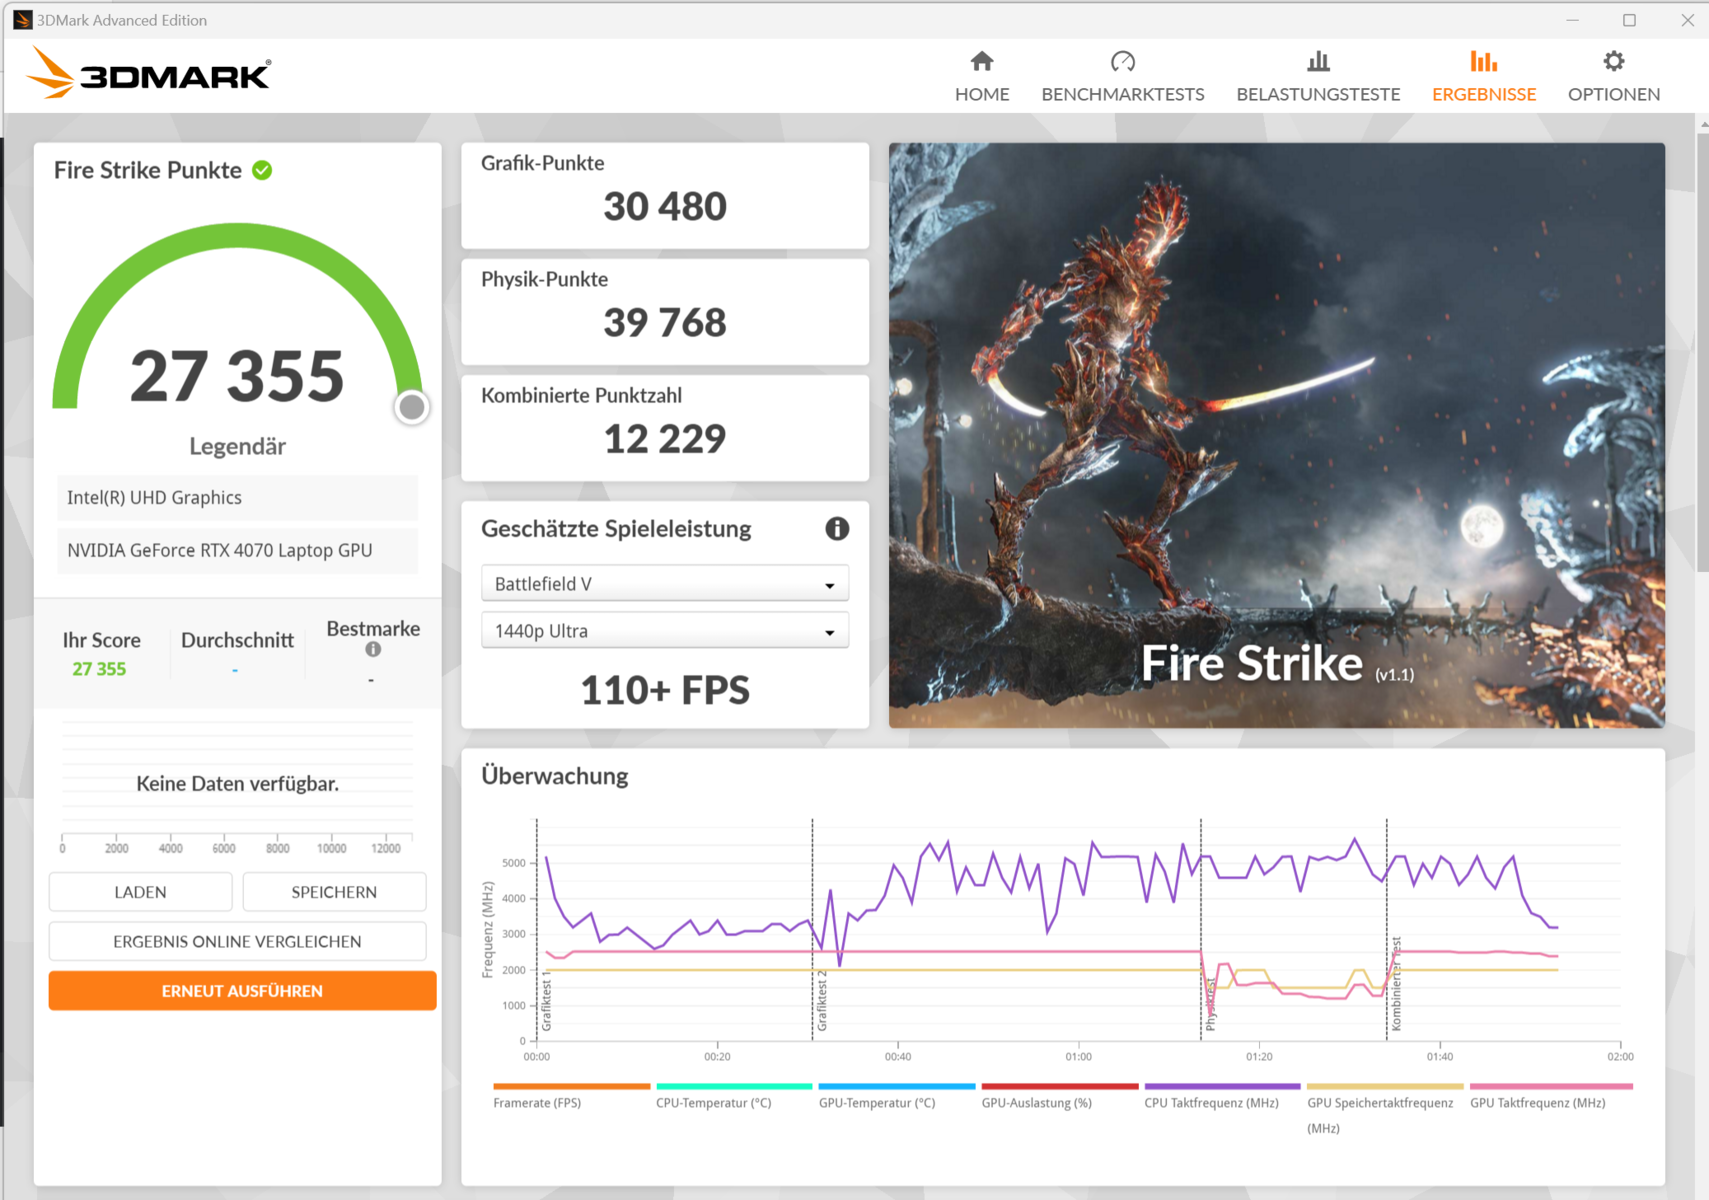
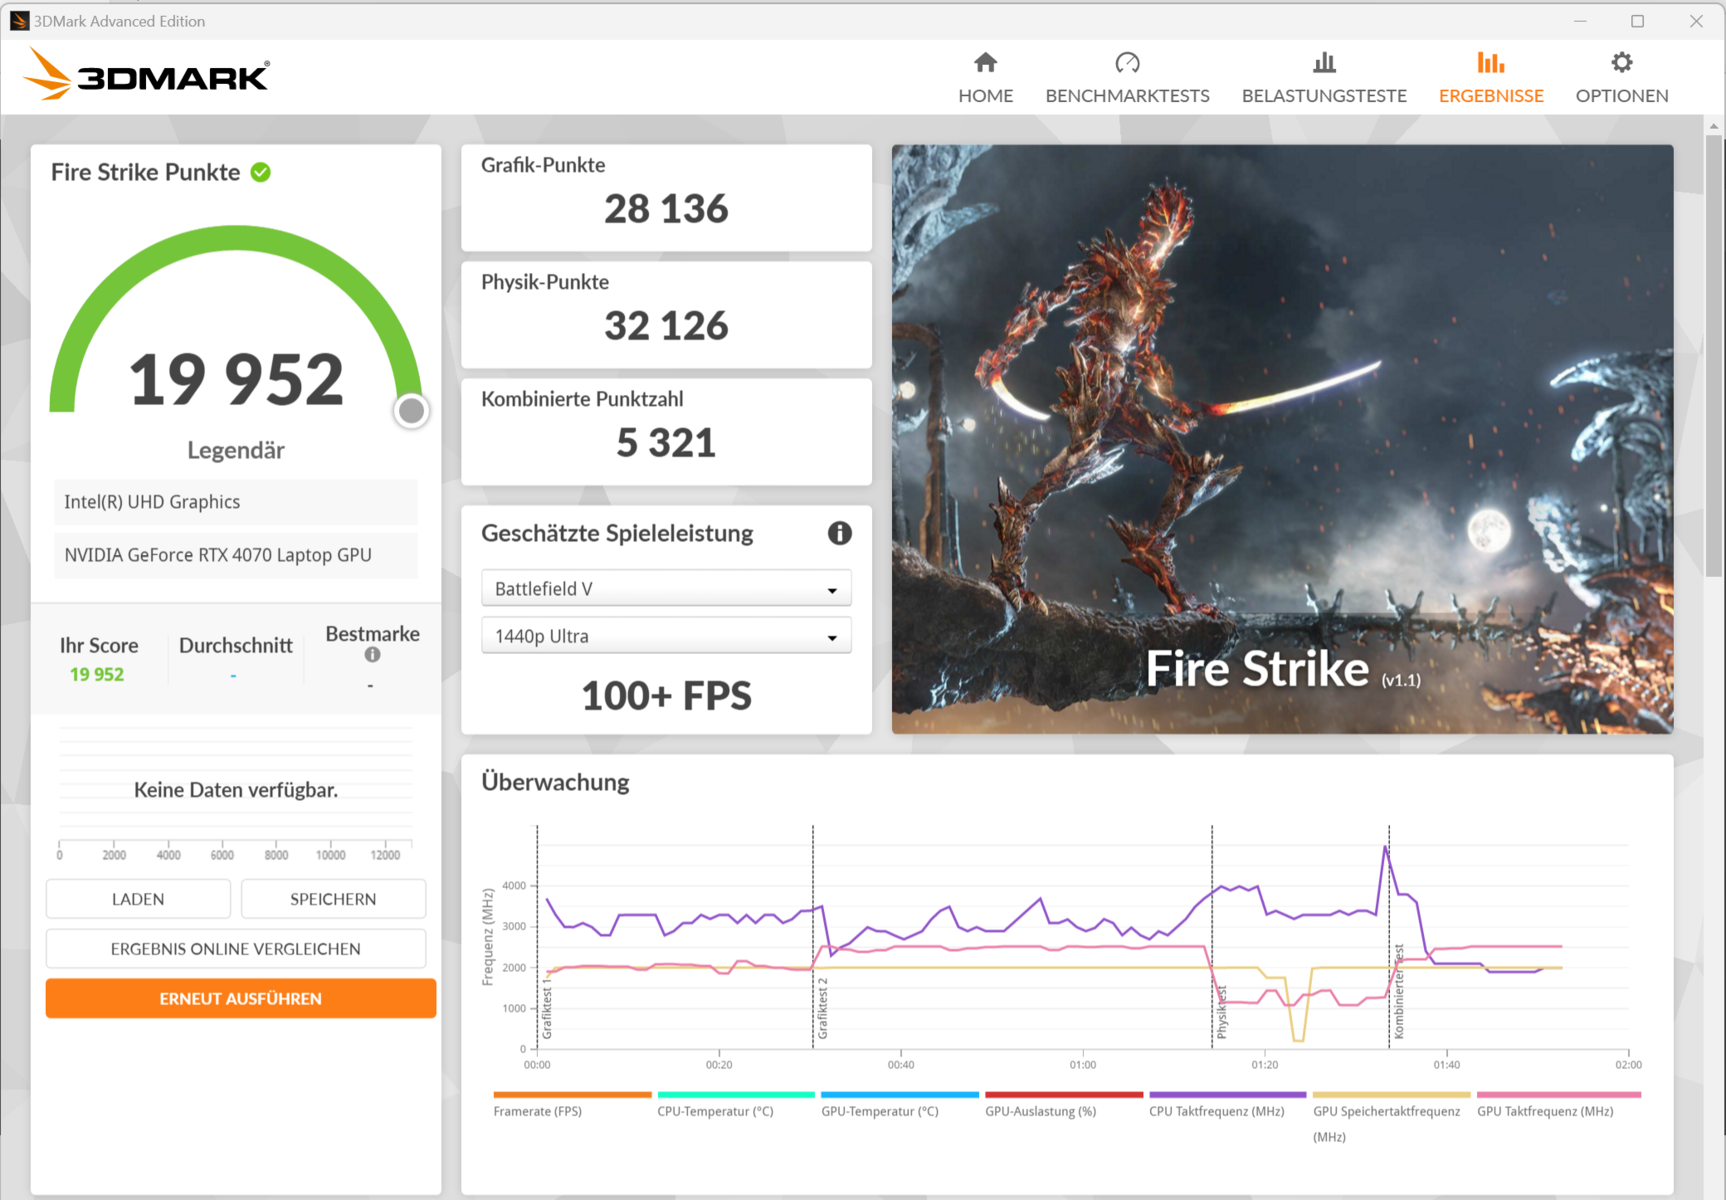
Gigabyte ha impostato l'installazione della GeForce RTX 4070a 140 watt (115 watt + 25 watt di Dynamic Boost) - Nvidia non ha specificato di più. La GPU ha 8 GB di VRAM (GDDR6) disponibili, un po' pochi per le esigenze di oggi. I suoi risultati di benchmark sono stati leggermente superiori alla media di RTX-4070(Standard); i profili più potenti offrono al massimo un piccolo incremento. La commutazione tra dGPU e Optimus non richiede il riavvio del sistema. Optimus avanzato è supportato.
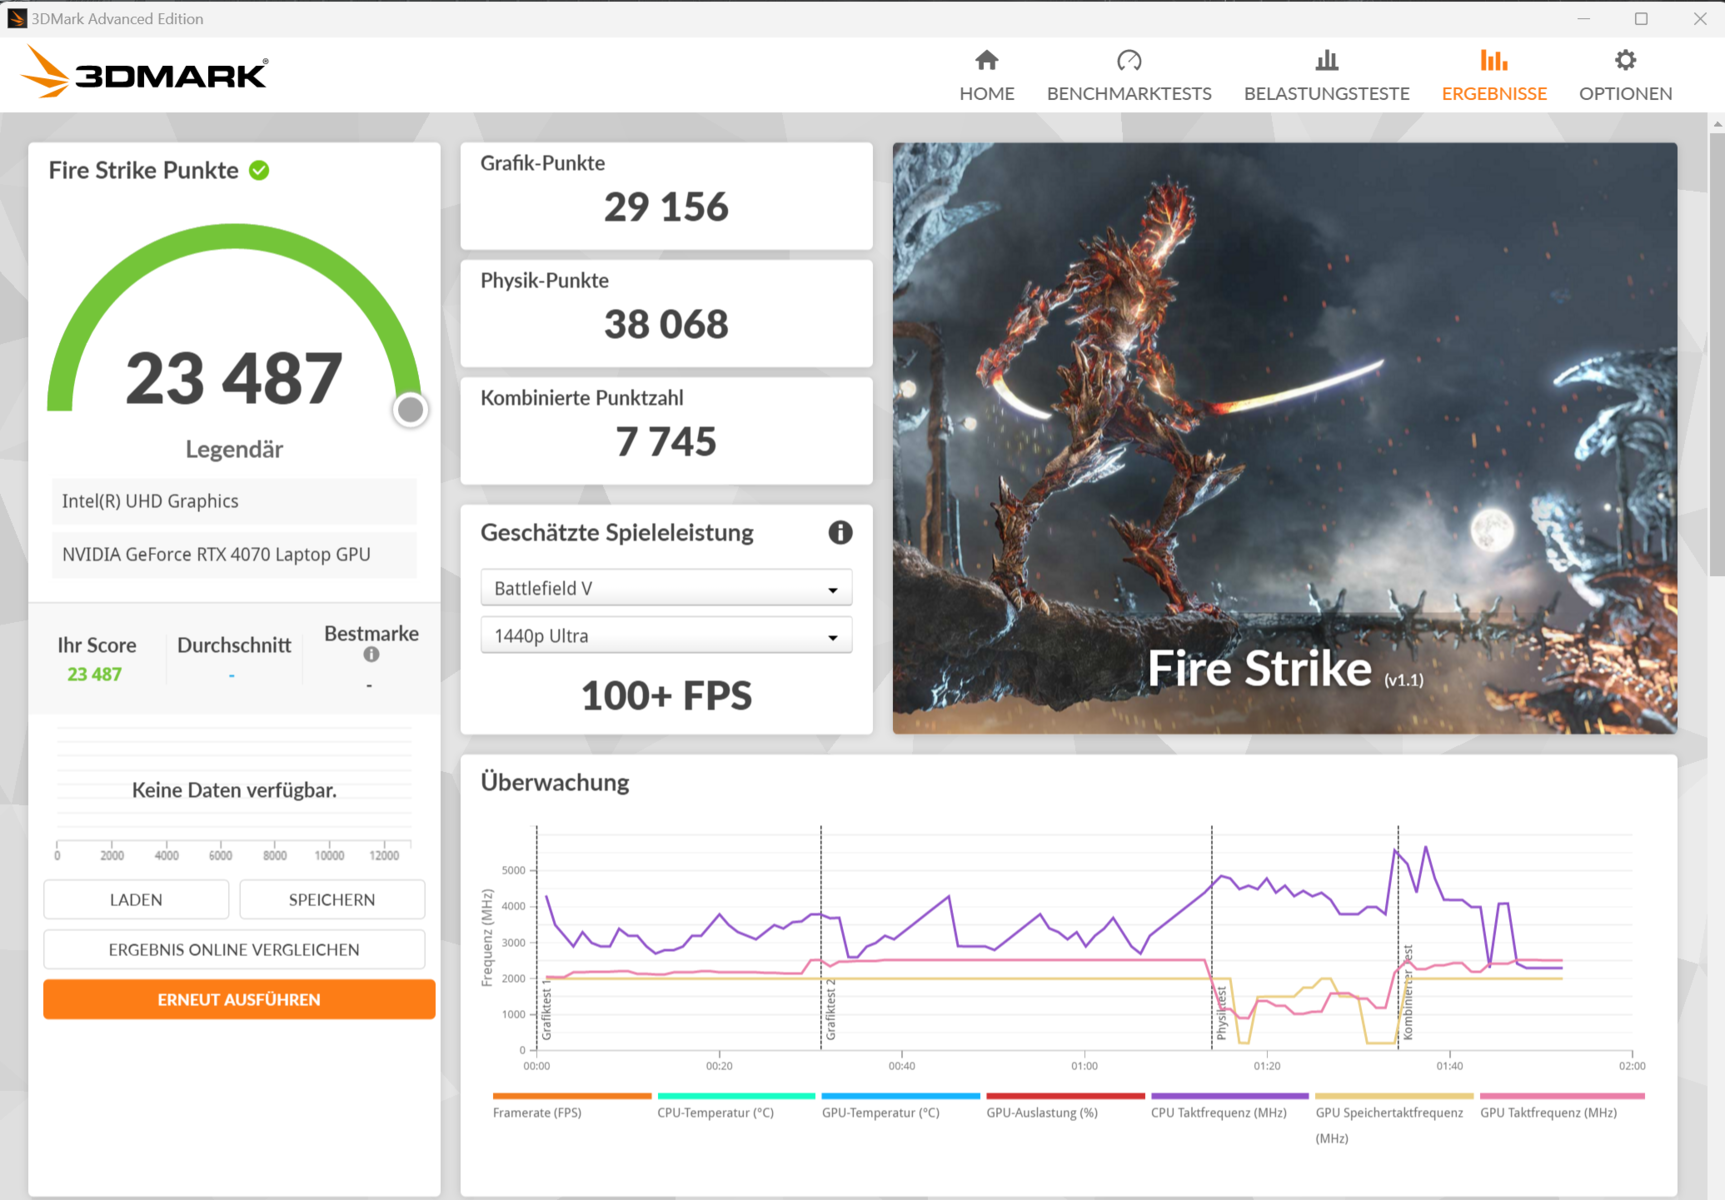


| 3DMark 11 Performance | 35473 punti | |
| 3DMark Fire Strike Score | 23487 punti | |
| 3DMark Time Spy Score | 12612 punti | |
Aiuto | ||
* ... Meglio usare valori piccoli
Prestazioni di gioco
Il core grafico consente di giocare in QHD con impostazioni da alte a massime. Questo si traduce in tassi di frame rate superiori alla media della precedente RTX 4070(Standard); i profili più potenti possono portare a un piccolo aumento nel migliore dei casi. Utilizzando DLSS 3 e Frame Generation, le impostazioni massime, incluso il ray tracing, potrebbero essere possibili anche a risoluzioni più elevate, ma solo per i giochi che le supportano.
| The Witcher 3 - 1920x1080 Ultra Graphics & Postprocessing (HBAO+) | |
| Media della classe Gaming (104.7 - 240, n=7, ultimi 2 anni) | |
| Lenovo Legion Pro 5 16IRX9 | |
| Aorus 16X 2024 | |
| Alienware m16 R2 | |
| Asus TUF Gaming A17 FA707XI-NS94 | |
| Schenker XMG Pro 16 Studio (Mid 23) | |
| HP Omen Transcend 16-u1095ng | |
| Media NVIDIA GeForce RTX 4070 Laptop GPU (69.8 - 133.7, n=57) | |
| Horizon Forbidden West | |
| 1920x1080 Very High Preset AA:T | |
| Media della classe Gaming (14.7 - 140.3, n=12, ultimi 2 anni) | |
| Aorus 16X 2024 | |
| XMG Pro 15 E23 | |
| Media NVIDIA GeForce RTX 4070 Laptop GPU (53.2 - 76.7, n=10) | |
| 2560x1440 Very High Preset AA:T | |
| Media della classe Gaming (45.7 - 100.9, n=9, ultimi 2 anni) | |
| Aorus 16X 2024 | |
| XMG Pro 15 E23 | |
| Media NVIDIA GeForce RTX 4070 Laptop GPU (40.3 - 59.1, n=9) | |
| Alone in the Dark | |
| 1920x1080 High Preset | |
| XMG Pro 15 E23 | |
| Media NVIDIA GeForce RTX 4070 Laptop GPU (125.8 - 196.5, n=5) | |
| Aorus 16X 2024 | |
| 2560x1440 Cinematic Preset | |
| XMG Pro 15 E23 | |
| Media NVIDIA GeForce RTX 4070 Laptop GPU (37.4 - 76.6, n=5) | |
| Aorus 16X 2024 | |
| Skull & Bones | |
| 1920x1080 Ultra High Preset AA:T | |
| Aorus 16X 2024 | |
| Media NVIDIA GeForce RTX 4070 Laptop GPU (75 - 81, n=3) | |
| XMG Pro 15 E23 | |
| 2560x1440 Ultra High Preset AA:T | |
| Aorus 16X 2024 | |
| Media NVIDIA GeForce RTX 4070 Laptop GPU (56 - 63, n=3) | |
| XMG Pro 15 E23 | |
| Last Epoch | |
| 1920x1080 Ultra Preset AA:T | |
| XMG Pro 15 E23 | |
| Media NVIDIA GeForce RTX 4070 Laptop GPU (133.8 - 140, n=2) | |
| Aorus 16X 2024 | |
| Media della classe Gaming (n=1ultimi 2 anni) | |
| 2560x1440 Ultra Preset AA:T | |
| XMG Pro 15 E23 | |
| Media NVIDIA GeForce RTX 4070 Laptop GPU (80.4 - 81.1, n=2) | |
| Aorus 16X 2024 | |
| Media della classe Gaming (n=1ultimi 2 anni) | |
Per verificare se la frequenza dei fotogrammi del dispositivo rimane sostanzialmente costante per un periodo di tempo più lungo, abbiamo eseguito il gioco The Witcher 3 per circa 60 minuti in risoluzione Full HD e con le impostazioni di qualità massime. Il personaggio del gioco non è stato spostato. Non c'è stato alcun calo evidente della frequenza dei fotogrammi.
Witcher 3 FPS diagram
| basso | medio | alto | ultra | QHD | |
|---|---|---|---|---|---|
| GTA V (2015) | 187.5 | 187 | 176.5 | 107.2 | 90.5 |
| The Witcher 3 (2015) | 435 | 338 | 223 | 122 | 88.5 |
| Dota 2 Reborn (2015) | 233 | 208 | 199.1 | 180.9 | |
| Final Fantasy XV Benchmark (2018) | 176.6 | 139.1 | 111.5 | 85.8 | |
| X-Plane 11.11 (2018) | 194.4 | 163 | 126.4 | ||
| Far Cry 5 (2018) | 184 | 124 | 114 | 109 | 98 |
| Strange Brigade (2018) | 455 | 277 | 233 | 204 | 136.2 |
| Cyberpunk 2077 (2023) | 90.2 | 81.6 | 76.9 | 75.8 | 49.4 |
| Skull & Bones (2024) | 107 | 101 | 94 | 81 | 63 |
| Last Epoch (2024) | 169.7 | 156 | 155.9 | 133.8 | 80.4 |
| Alone in the Dark (2024) | 185.9 | 157.3 | 151.1 | 124.7 | 64.7 |
| Horizon Forbidden West (2024) | 92.3 | 77.3 | 73.4 | 71.1 | 54.5 |
Emissioni - Il computer portatile Aorus non si scalda eccessivamente
Emissioni di rumore
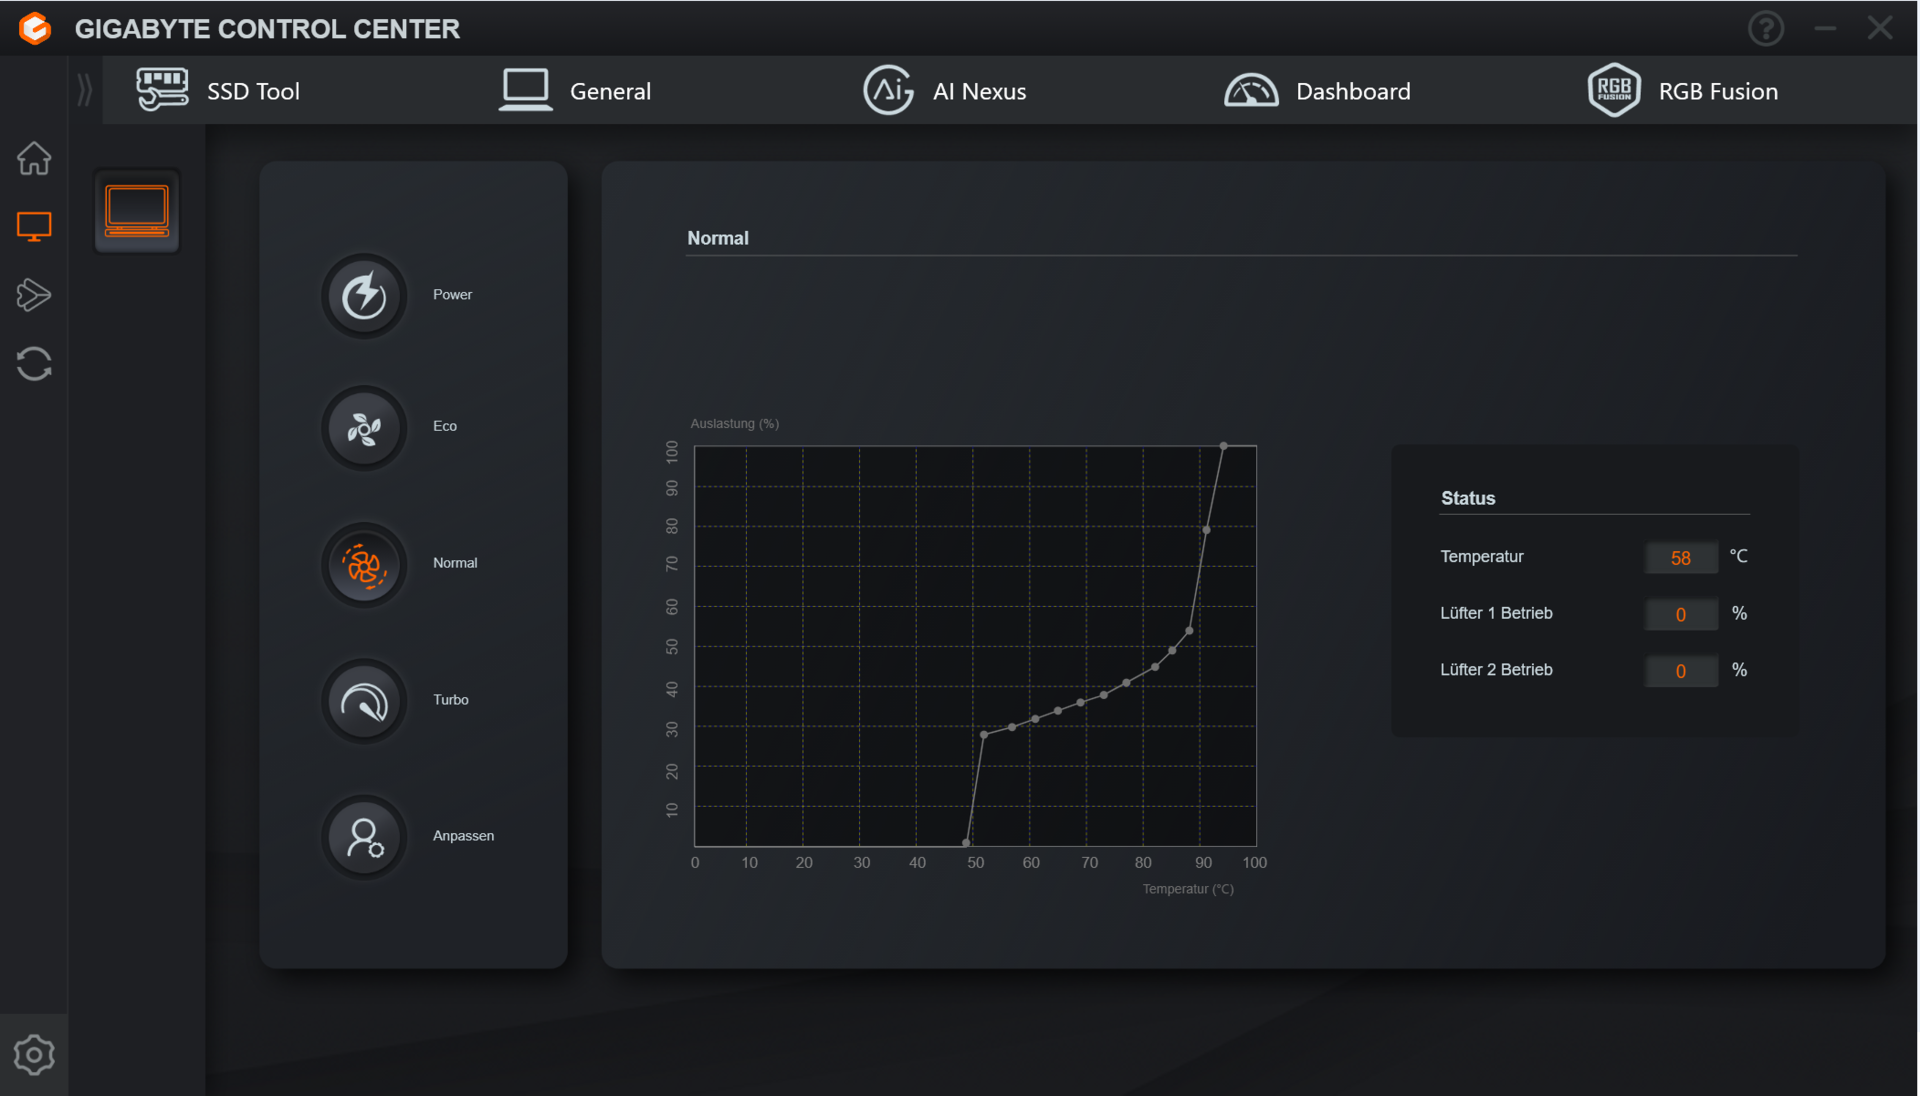
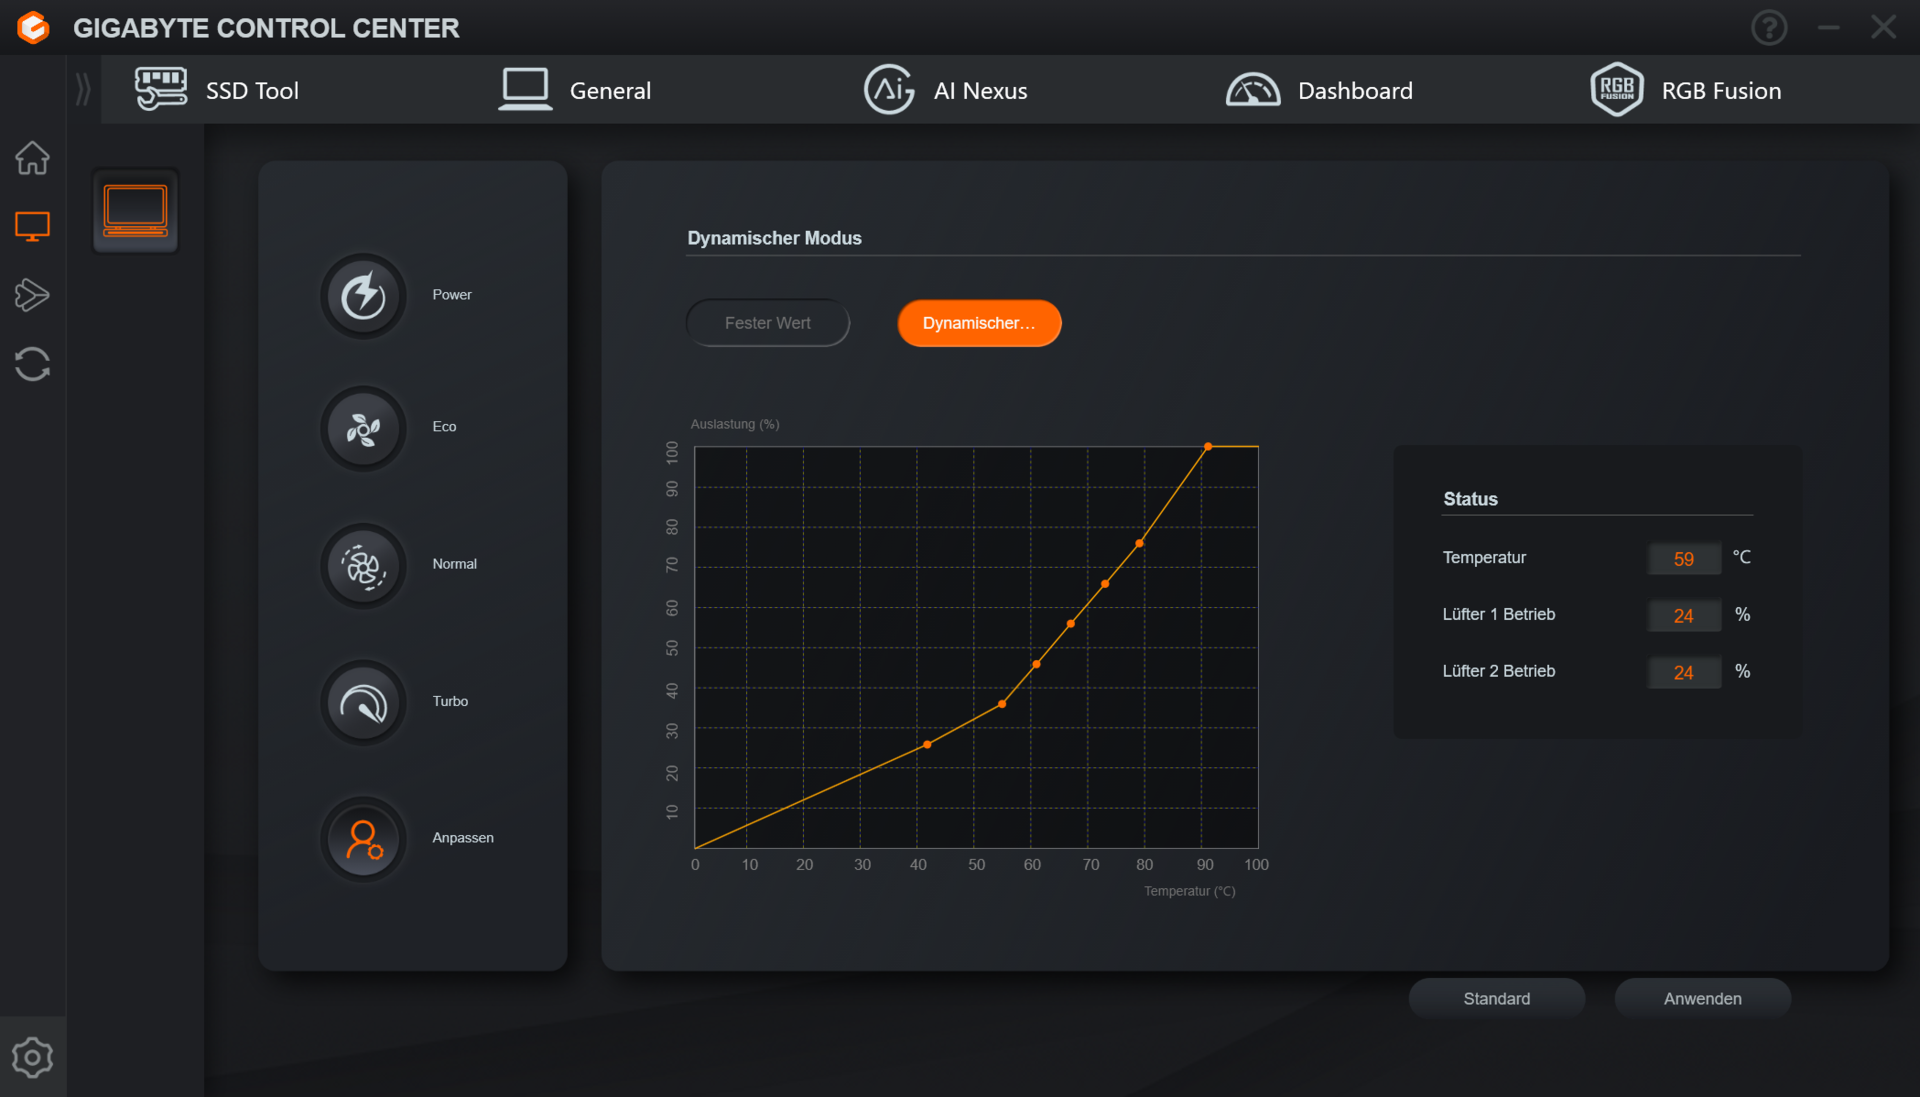
A pieno carico, il portatile produce emissioni acustiche fino a 55 dB(A). I profili energetici Meeting e Energy-Saving Quiet consentono di ottenere un'esperienza complessivamente più silenziosa, al costo di alcune prestazioni. In alternativa, l'attività della ventola può essere controllata tramite quattro profili di ventola (all'interno del Gigabyte Control Center). Se lo desidera, può anche creare una curva della ventola personalizzata. Quando è inattivo e durante l'uso quotidiano (ufficio, internet), il computer portatile funziona generalmente in modo silenzioso, a volte persino in silenzio. A volte, le ventole iniziano a girare abbastanza velocemente.
Rumorosità
| Idle |
| 26 / 32 / 38 dB(A) |
| Sotto carico |
| 54 / 55 dB(A) |
 | ||
30 dB silenzioso 40 dB(A) udibile 50 dB(A) rumoroso |
||
min: | ||
| Aorus 16X 2024 i9-14900HX, GeForce RTX 4070 Laptop GPU | Alienware m16 R2 Ultra 7 155H, GeForce RTX 4070 Laptop GPU | HP Omen Transcend 16-u1095ng i9-14900HX, GeForce RTX 4070 Laptop GPU | Asus TUF Gaming A17 FA707XI-NS94 R9 7940HS, GeForce RTX 4070 Laptop GPU | Schenker XMG Pro 16 Studio (Mid 23) i9-13900H, GeForce RTX 4070 Laptop GPU | Lenovo Legion Pro 5 16IRX9 i9-14900HX, GeForce RTX 4070 Laptop GPU | |
|---|---|---|---|---|---|---|
| Noise | 12% | 9% | 4% | 9% | 10% | |
| off /ambiente * (dB) | 26 | 24.7 5% | 24 8% | 27.9 -7% | 25 4% | 23.9 8% |
| Idle Minimum * (dB) | 26 | 25.3 3% | 29 -12% | 28.5 -10% | 26 -0% | 24.3 7% |
| Idle Average * (dB) | 32 | 25.3 21% | 30 6% | 29.8 7% | 29 9% | 24.3 24% |
| Idle Maximum * (dB) | 38 | 25.3 33% | 31 18% | 29.8 22% | 34 11% | 28.9 24% |
| Load Average * (dB) | 54 | 31.7 41% | 45 17% | 34.8 36% | 43 20% | 45.8 15% |
| Witcher 3 ultra * (dB) | 50 | 53.8 -8% | 44 12% | 57.1 -14% | 48 4% | 51 -2% |
| Load Maximum * (dB) | 55 | 62 -13% | 47 15% | 57.3 -4% | 48 13% | 56.6 -3% |
* ... Meglio usare valori piccoli
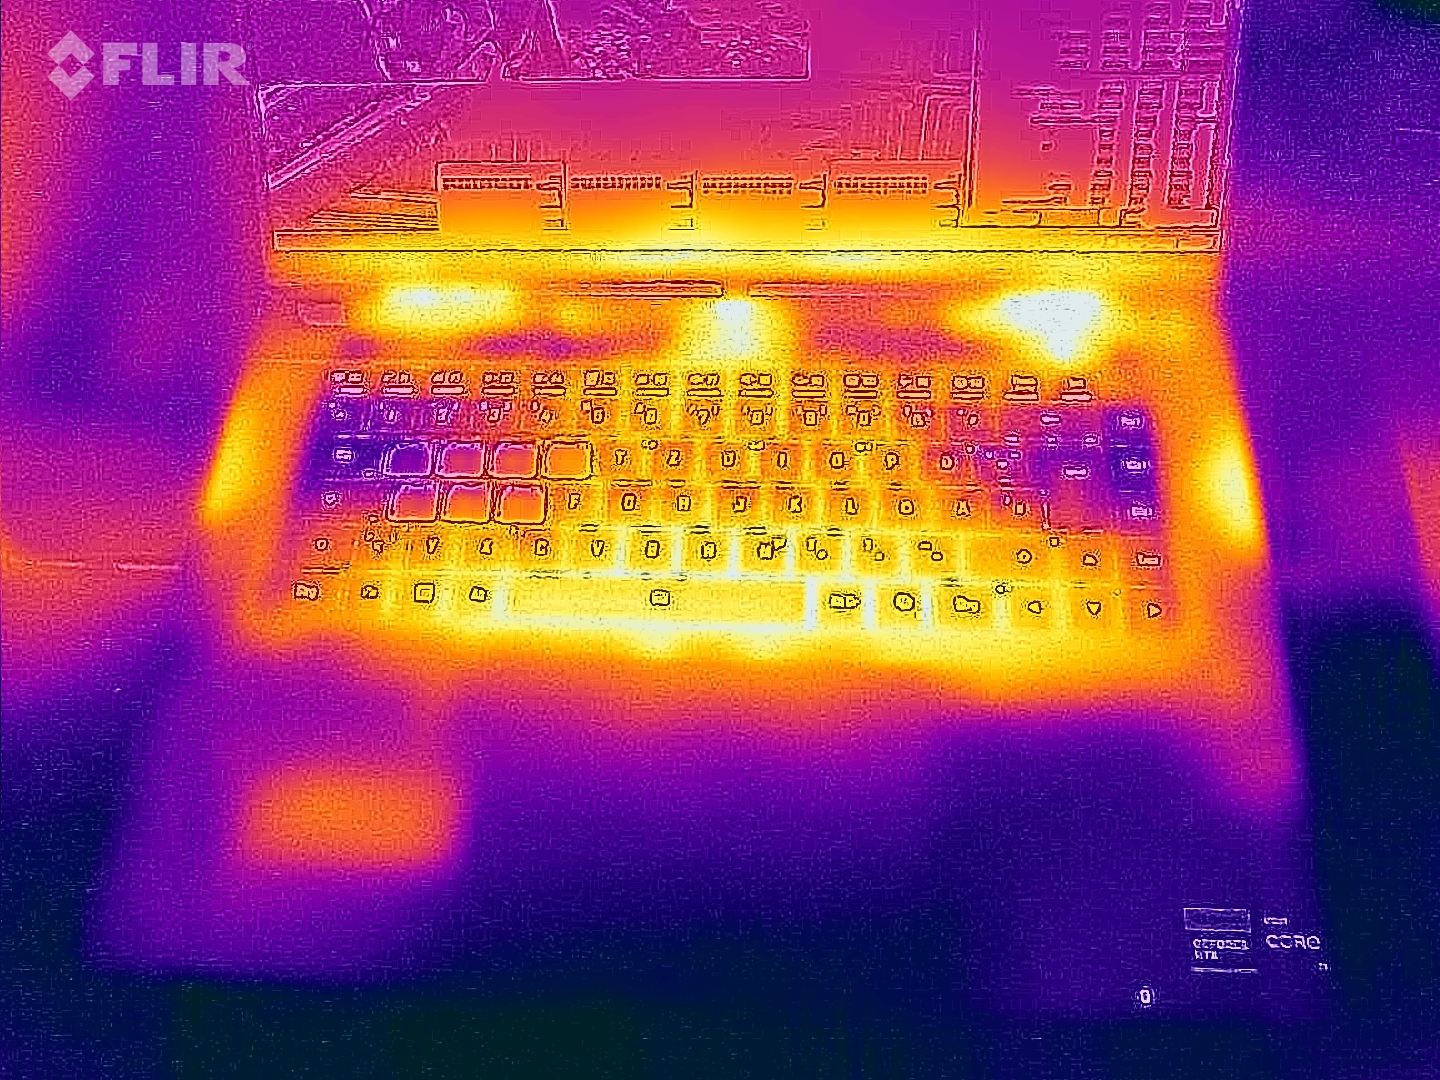
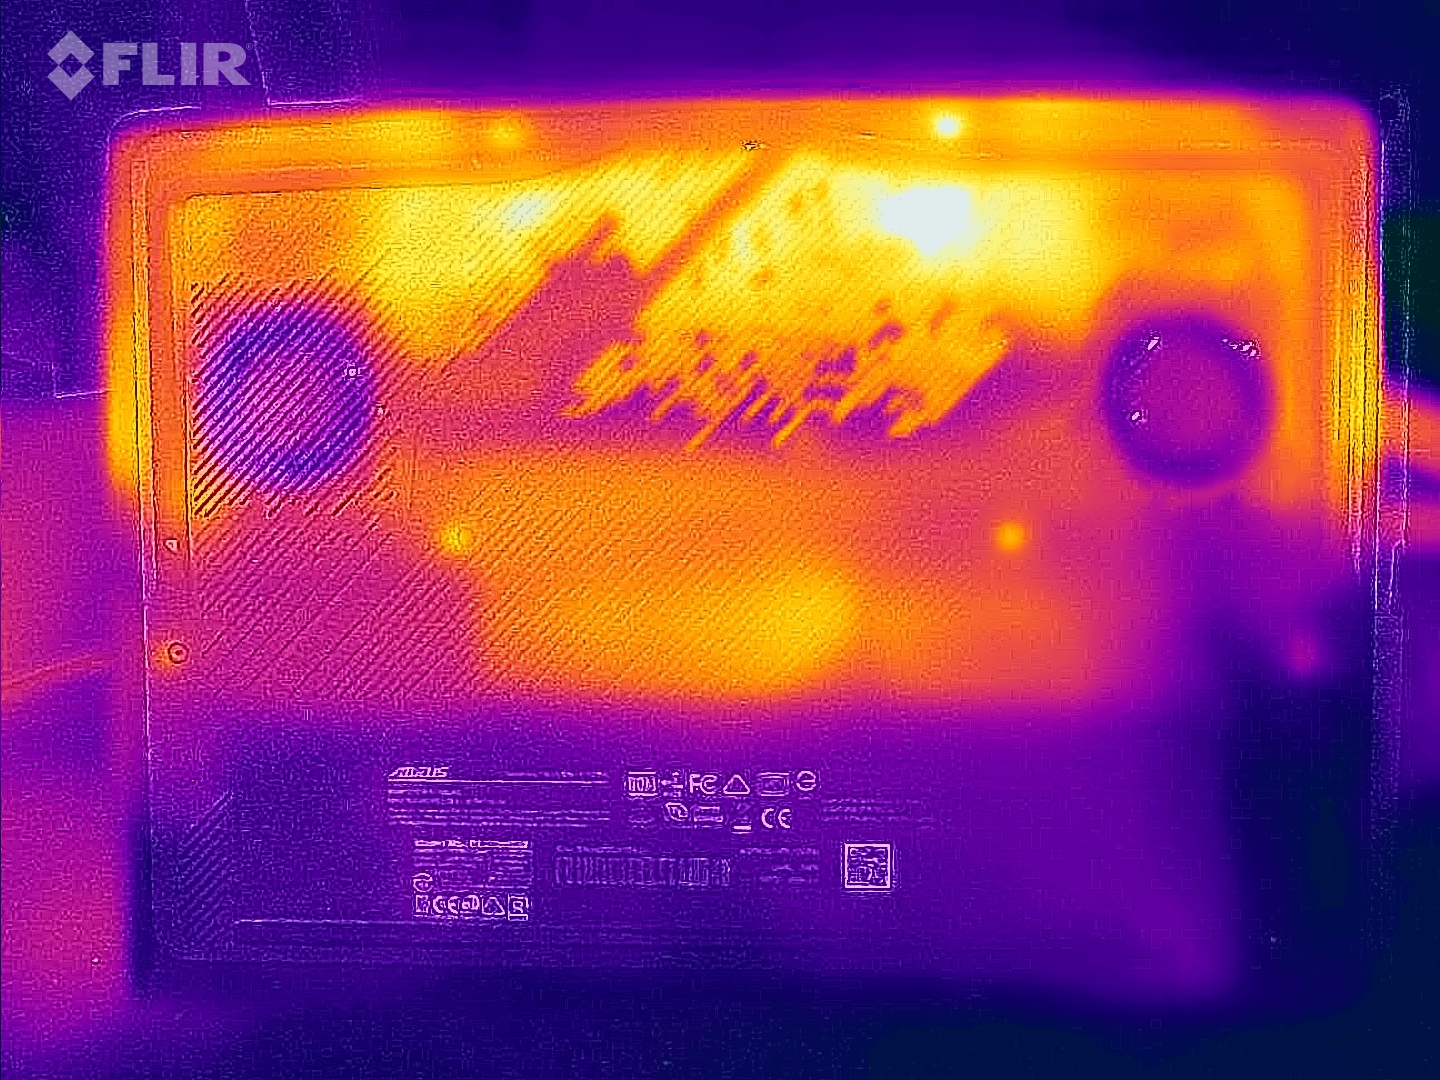
Temperatura
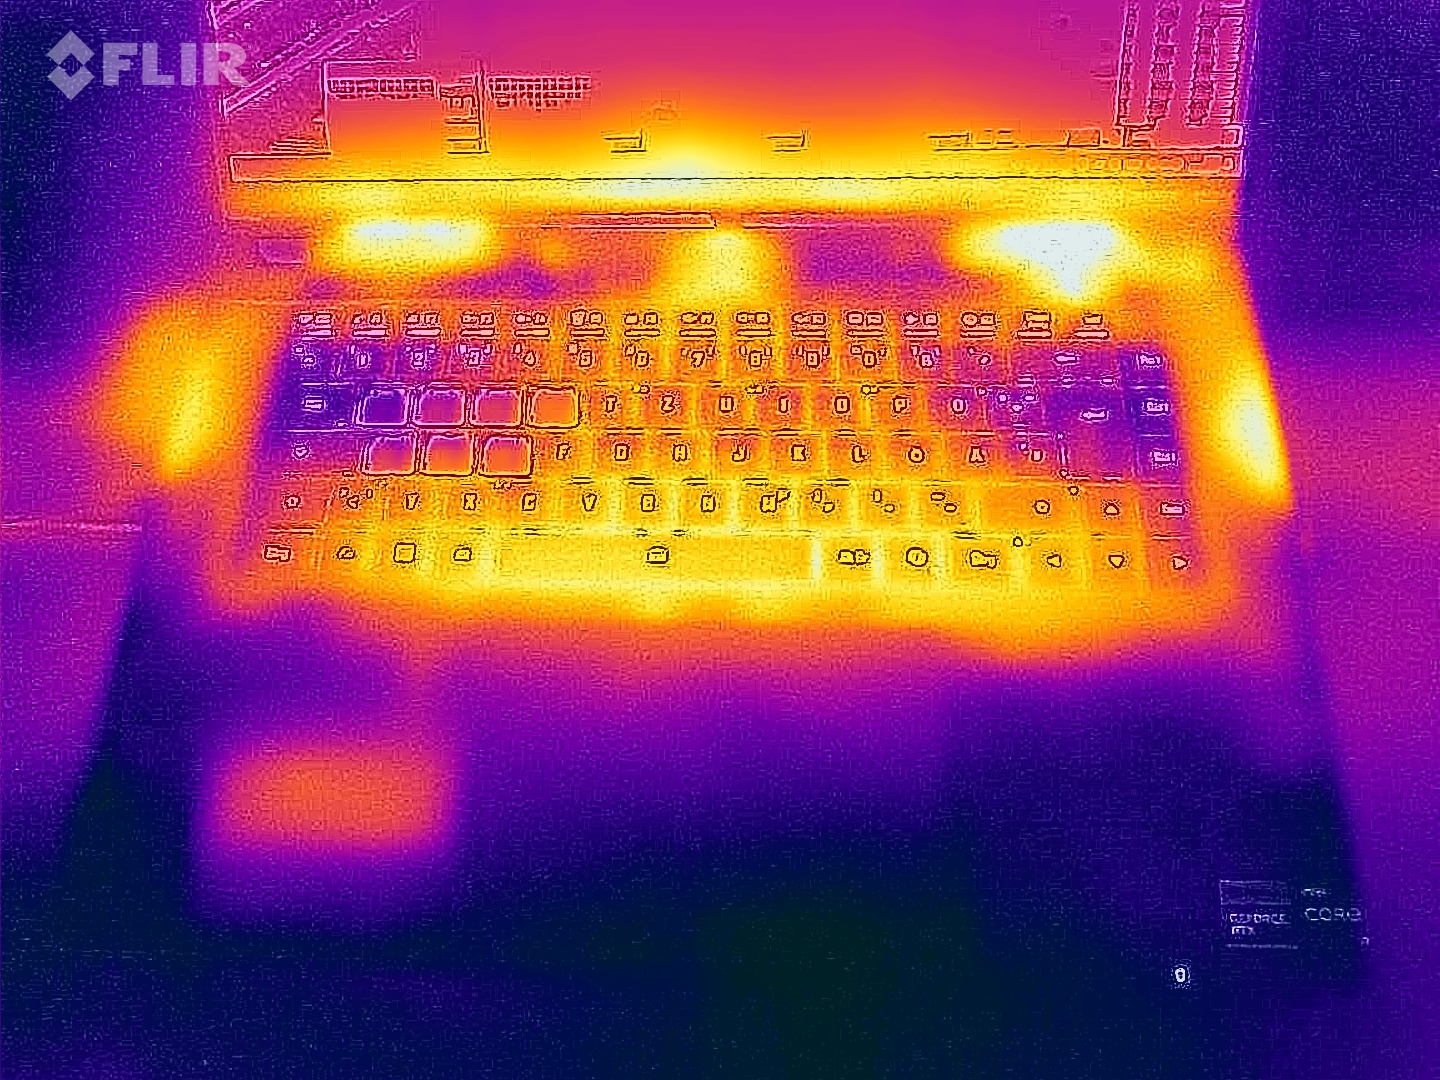
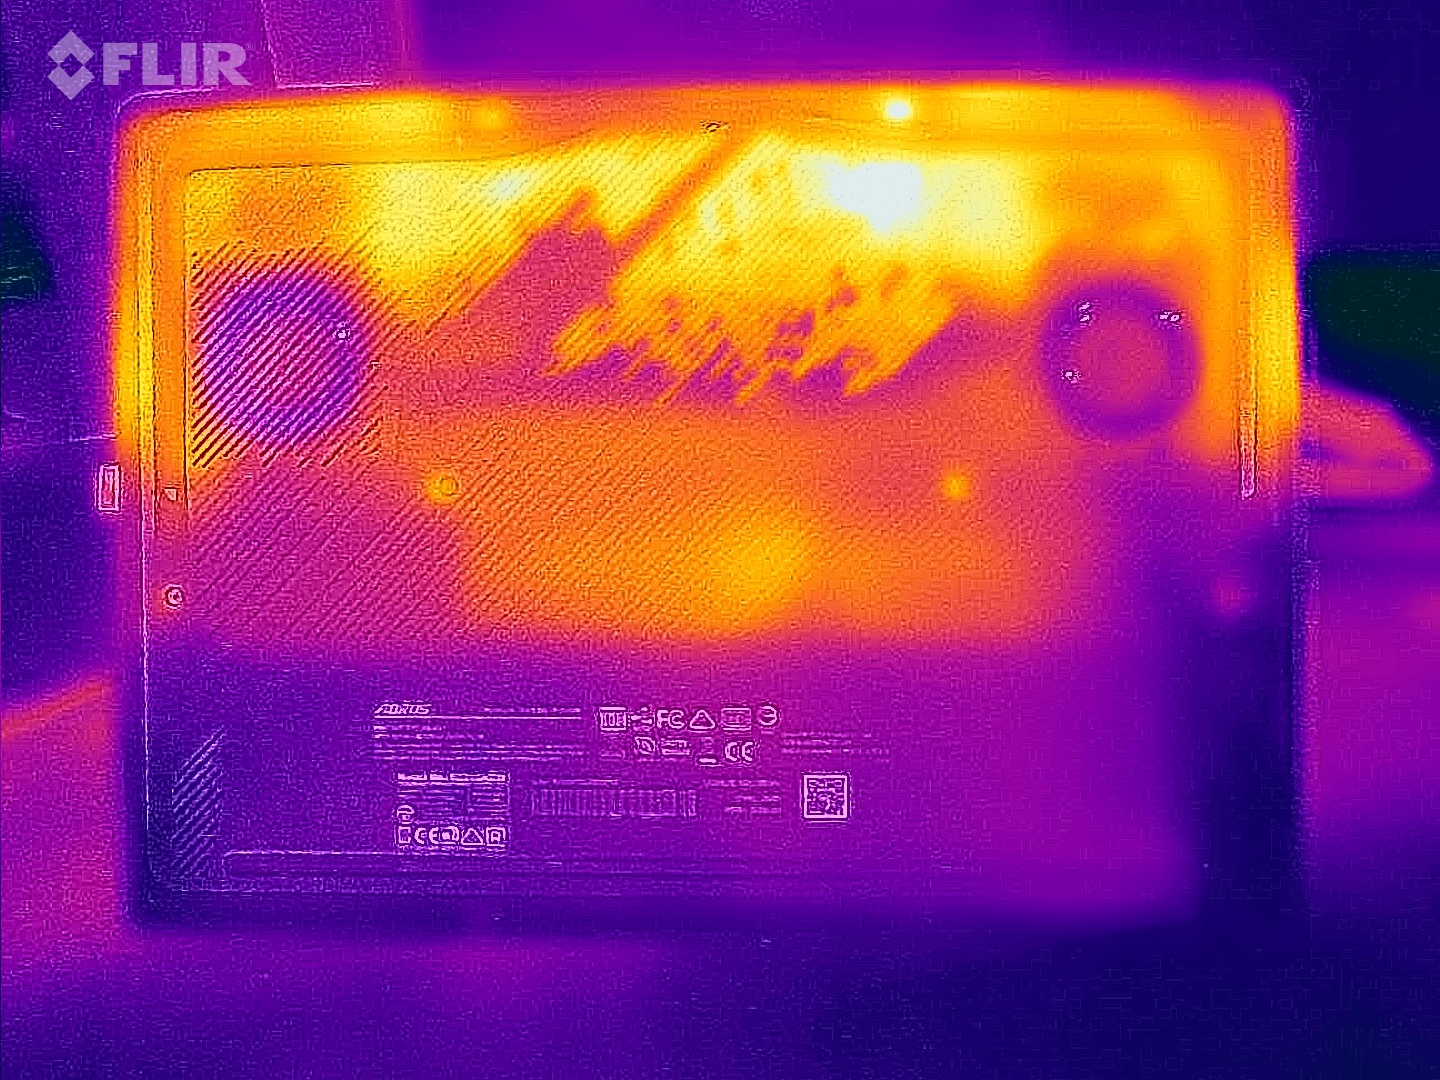
Lo stress test e il Witcher 3 test hanno causato solo un leggero riscaldamento del portatile. In alcuni casi, abbiamo misurato valori nella fascia bassa e media dei 40 gradi Celsius. Nell'uso quotidiano (ufficio, internet), i valori rimarranno in gran parte nella zona verde, tuttavia sono superiori alla media.
(±) La temperatura massima sul lato superiore è di 41 °C / 106 F, rispetto alla media di 40.4 °C / 105 F, che varia da 21.2 a 68.8 °C per questa classe Gaming.
(±) Il lato inferiore si riscalda fino ad un massimo di 41 °C / 106 F, rispetto alla media di 43.2 °C / 110 F
(±) In idle, la temperatura media del lato superiore è di 33.2 °C / 92 F, rispetto alla media deld ispositivo di 33.9 °C / 93 F.
(±) Riproducendo The Witcher 3, la temperatura media per il lato superiore e' di 35.7 °C / 96 F, rispetto alla media del dispositivo di 33.9 °C / 93 F.
(+) I poggiapolsi e il touchpad sono piu' freddi della temperatura della pelle con un massimo di 30 °C / 86 F e sono quindi freddi al tatto.
(±) La temperatura media della zona del palmo della mano di dispositivi simili e'stata di 28.8 °C / 83.8 F (-1.2 °C / -2.2 F).
| Aorus 16X 2024 i9-14900HX, GeForce RTX 4070 Laptop GPU | Alienware m16 R2 Ultra 7 155H, GeForce RTX 4070 Laptop GPU | HP Omen Transcend 16-u1095ng i9-14900HX, GeForce RTX 4070 Laptop GPU | Asus TUF Gaming A17 FA707XI-NS94 R9 7940HS, GeForce RTX 4070 Laptop GPU | Schenker XMG Pro 16 Studio (Mid 23) i9-13900H, GeForce RTX 4070 Laptop GPU | Lenovo Legion Pro 5 16IRX9 i9-14900HX, GeForce RTX 4070 Laptop GPU | |
|---|---|---|---|---|---|---|
| Heat | -10% | -8% | 21% | -19% | -7% | |
| Maximum Upper Side * (°C) | 41 | 44.8 -9% | 49 -20% | 40 2% | 55 -34% | 43.8 -7% |
| Maximum Bottom * (°C) | 41 | 48 -17% | 63 -54% | 33.6 18% | 66 -61% | 55.4 -35% |
| Idle Upper Side * (°C) | 37 | 37.2 -1% | 30 19% | 26.6 28% | 33 11% | 32.8 11% |
| Idle Bottom * (°C) | 38 | 42 -11% | 29 24% | 24.4 36% | 35 8% | 36 5% |
* ... Meglio usare valori piccoli
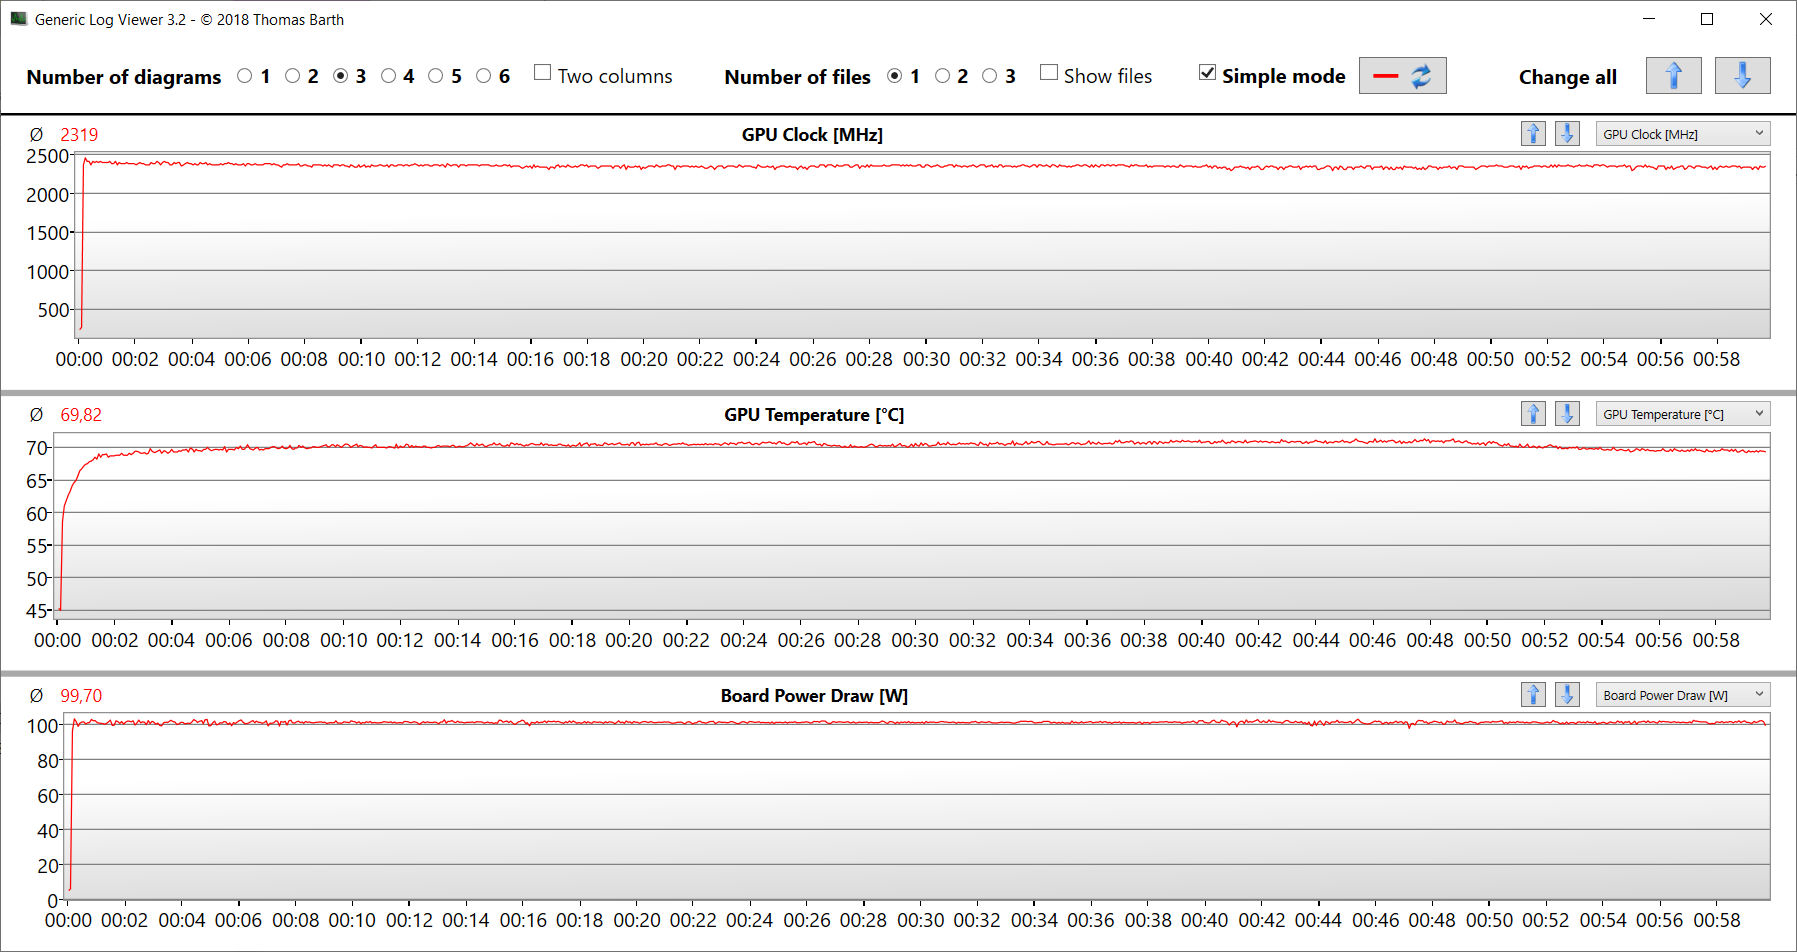
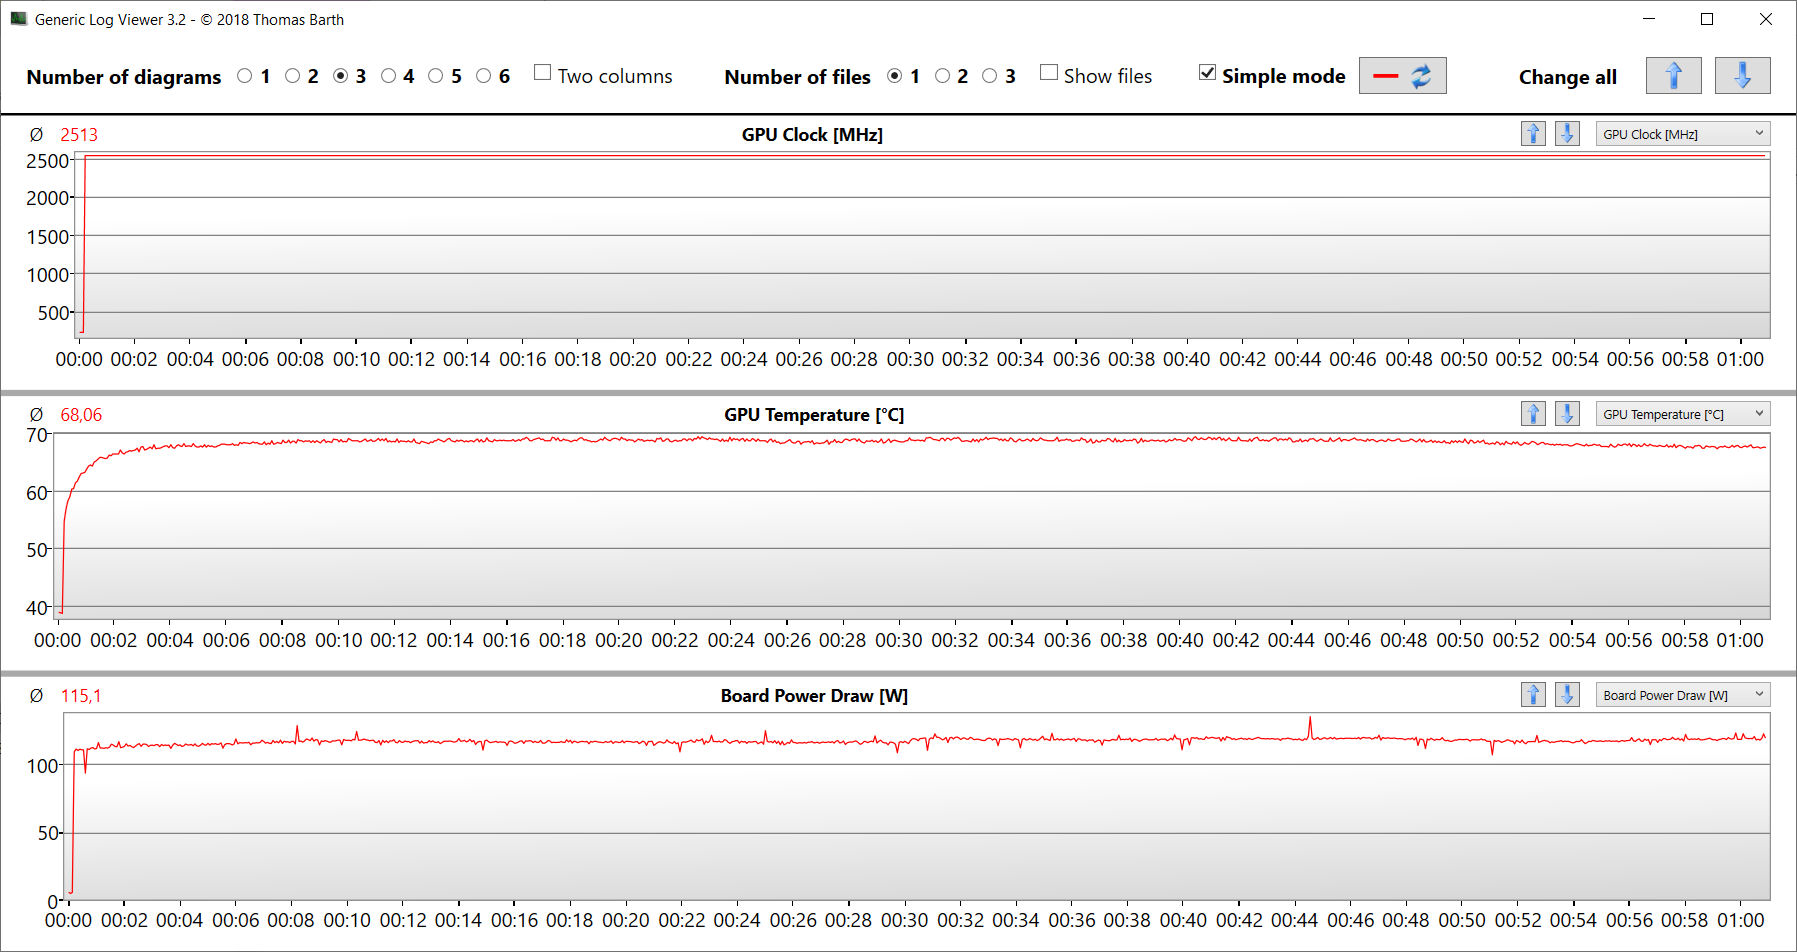
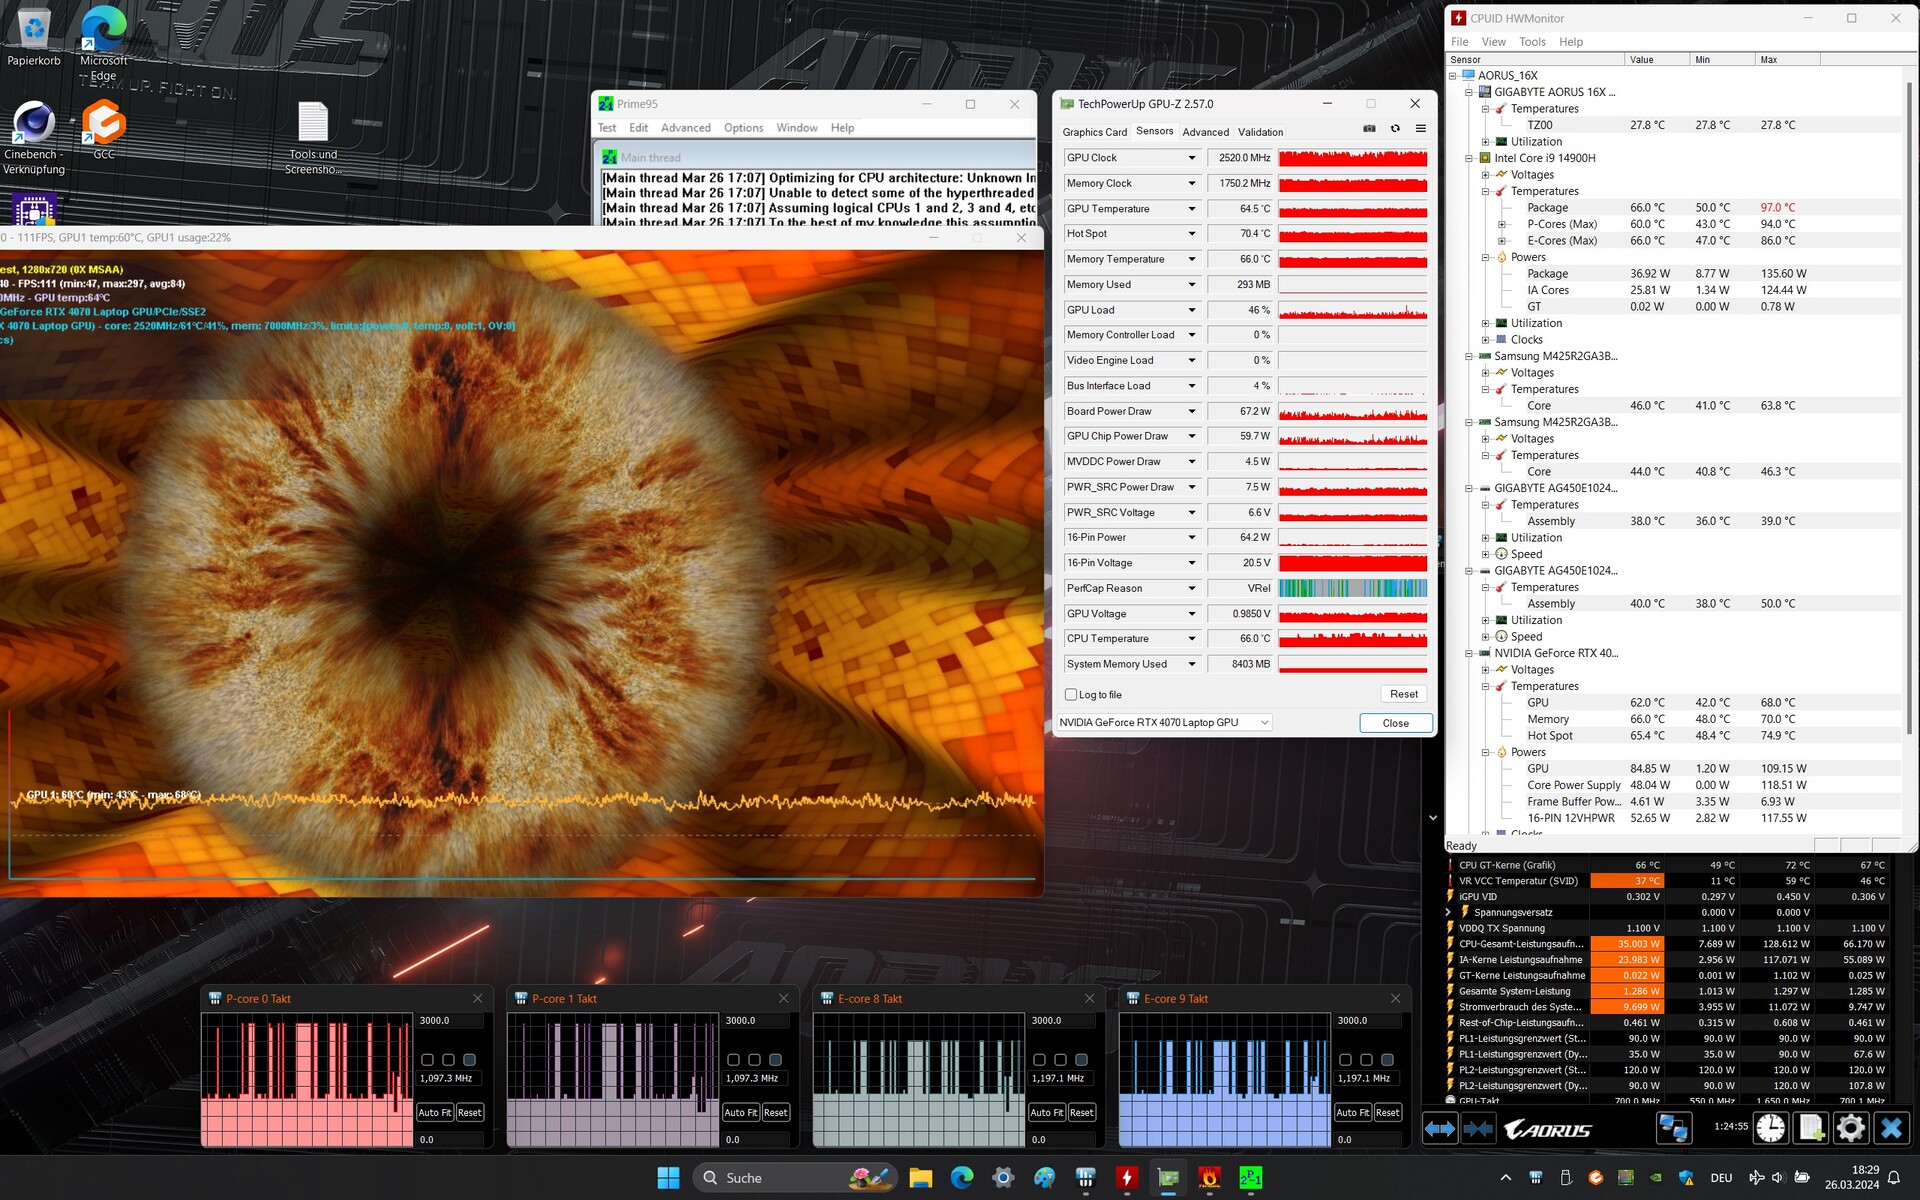
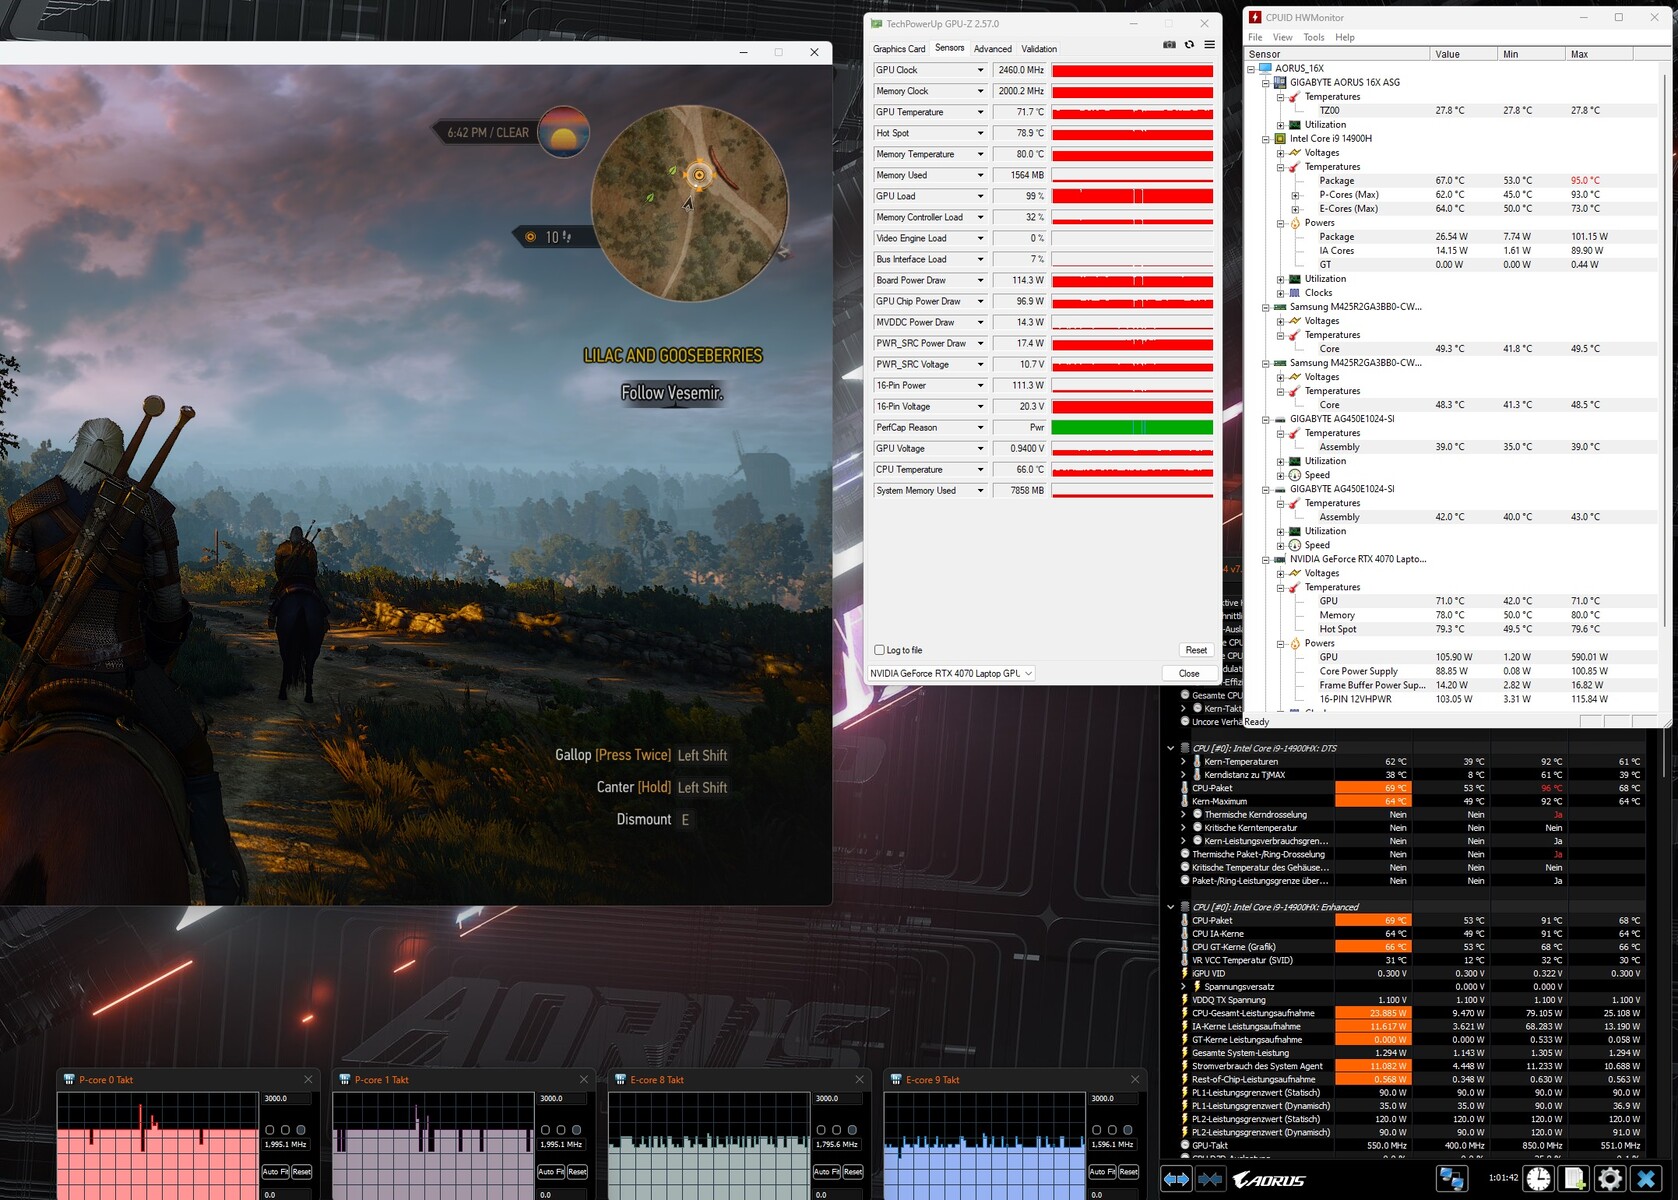
Test da sforzo
Lo scenario di stress test estremo (Prime95 e Furmark in funzionamento continuo) verifica la stabilità del sistema a pieno carico. Il clock della CPU ha oscillato tra 1 e 3 GHz per molto tempo, ma poi si è stabilizzato a un livello basso dopo un po'. Il core grafico ha funzionato ad alta velocità.
Altoparlanti
Gli altoparlanti stereo del portatile producono un suono complessivamente buono. Un'esperienza sonora ancora migliore può essere ottenuta utilizzando delle cuffie o degli altoparlanti esterni.
Aorus 16X 2024 analisi audio
(+) | gli altoparlanti sono relativamente potenti (85 dB)
Bassi 100 - 315 Hz
(±) | bassi ridotti - in media 8.5% inferiori alla media
(±) | la linearità dei bassi è media (8.3% delta rispetto alla precedente frequenza)
Medi 400 - 2000 Hz
(+) | medi bilanciati - solo only 3.1% rispetto alla media
(+) | medi lineari (5.8% delta rispetto alla precedente frequenza)
Alti 2 - 16 kHz
(+) | Alti bilanciati - appena 2.5% dalla media
(±) | la linearità degli alti è media (7% delta rispetto alla precedente frequenza)
Nel complesso 100 - 16.000 Hz
(+) | suono nel complesso lineare (8.4% differenza dalla media)
Rispetto alla stessa classe
» 2% di tutti i dispositivi testati in questa classe è stato migliore, 1% simile, 97% peggiore
» Il migliore ha avuto un delta di 6%, medio di 18%, peggiore di 132%
Rispetto a tutti i dispositivi testati
» 2% di tutti i dispositivi testati in questa classe è stato migliore, 1% similare, 97% peggiore
» Il migliore ha avuto un delta di 4%, medio di 23%, peggiore di 134%
Alienware m16 R2 analisi audio
(+) | gli altoparlanti sono relativamente potenti (82.4 dB)
Bassi 100 - 315 Hz
(-) | quasi nessun basso - in media 20.1% inferiori alla media
(±) | la linearità dei bassi è media (11.1% delta rispetto alla precedente frequenza)
Medi 400 - 2000 Hz
(+) | medi bilanciati - solo only 2.2% rispetto alla media
(+) | medi lineari (3.1% delta rispetto alla precedente frequenza)
Alti 2 - 16 kHz
(+) | Alti bilanciati - appena 2.2% dalla media
(+) | alti lineari (3.5% delta rispetto alla precedente frequenza)
Nel complesso 100 - 16.000 Hz
(+) | suono nel complesso lineare (12.9% differenza dalla media)
Rispetto alla stessa classe
» 17% di tutti i dispositivi testati in questa classe è stato migliore, 4% simile, 79% peggiore
» Il migliore ha avuto un delta di 6%, medio di 18%, peggiore di 132%
Rispetto a tutti i dispositivi testati
» 12% di tutti i dispositivi testati in questa classe è stato migliore, 3% similare, 85% peggiore
» Il migliore ha avuto un delta di 4%, medio di 23%, peggiore di 134%
Gestione dell'energia - Il portatile da gioco con una discreta resistenza
Consumo di energia
Il consumo energetico del dispositivo è a un livello normale per l'hardware installato. Mentre il Witcher 3 test ha funzionato con un consumo energetico costante, la richiesta del portatile ha fluttuato in modo significativo nei primi minuti dello stress test. L'alimentatore (240 watt) è sufficientemente dimensionato.
| Off / Standby | |
| Idle | |
| Sotto carico |
|
Leggenda:
min: | |
| Aorus 16X 2024 i9-14900HX, GeForce RTX 4070 Laptop GPU | Alienware m16 R2 Ultra 7 155H, GeForce RTX 4070 Laptop GPU | HP Omen Transcend 16-u1095ng i9-14900HX, GeForce RTX 4070 Laptop GPU | Asus TUF Gaming A17 FA707XI-NS94 R9 7940HS, GeForce RTX 4070 Laptop GPU | Schenker XMG Pro 16 Studio (Mid 23) i9-13900H, GeForce RTX 4070 Laptop GPU | Media della classe Gaming | |
|---|---|---|---|---|---|---|
| Power Consumption | 12% | 7% | 17% | 23% | 5% | |
| Idle Minimum * (Watt) | 13 | 8.1 38% | 10 23% | 6.2 52% | 8 38% | 13 ? -0% |
| Idle Average * (Watt) | 18 | 13 28% | 18 -0% | 21.8 -21% | 12 33% | 19 ? -6% |
| Idle Maximum * (Watt) | 35 | 40.3 -15% | 32 9% | 22 37% | 23 34% | 24.6 ? 30% |
| Load Average * (Watt) | 138 | 79 43% | 128 7% | 59.2 57% | 94 32% | 110.7 ? 20% |
| Witcher 3 ultra * (Watt) | 172.6 | 188.1 -9% | 148.4 14% | 189.7 -10% | 181.5 -5% | |
| Load Maximum * (Watt) | 222 | 254.9 -15% | 242 -9% | 247.8 -12% | 215 3% | 259 ? -17% |
* ... Meglio usare valori piccoli
Power consumption Witcher 3 / stress test
Power consumption with external monitor
Tempi di esecuzione
Il dispositivo da 16 pollici ha ottenuto tempi di esecuzione di 8:01 h e 9:01 h durante il test WLAN (accesso a siti web utilizzando uno script) e il test video (cortometraggio Big Buck Bunny (codifica H.264, FHD) in loop). Nel complesso, l'Aorus 16X ha fornito risultati molto buoni. Tuttavia, nessuno dei computer di confronto si è avvicinato alla resistenza dell'Asus A17.
| Aorus 16X 2024 i9-14900HX, GeForce RTX 4070 Laptop GPU, 99 Wh | Alienware m16 R2 Ultra 7 155H, GeForce RTX 4070 Laptop GPU, 90 Wh | HP Omen Transcend 16-u1095ng i9-14900HX, GeForce RTX 4070 Laptop GPU, 97 Wh | Asus TUF Gaming A17 FA707XI-NS94 R9 7940HS, GeForce RTX 4070 Laptop GPU, 90 Wh | Schenker XMG Pro 16 Studio (Mid 23) i9-13900H, GeForce RTX 4070 Laptop GPU, 73 Wh | Lenovo Legion Pro 5 16IRX9 i9-14900HX, GeForce RTX 4070 Laptop GPU, 80 Wh | Media della classe Gaming | |
|---|---|---|---|---|---|---|---|
| Autonomia della batteria | -13% | -39% | 23% | -15% | -41% | -16% | |
| Reader / Idle (h) | 12.6 | 12.6 0% | 19.7 56% | 6.7 -47% | 8.27 ? -34% | ||
| H.264 (h) | 9 | 8.32 ? -8% | |||||
| WiFi v1.3 (h) | 8 | 8.1 1% | 4.9 -39% | 9.1 14% | 6.8 -15% | 4.8 -40% | 7.11 ? -11% |
| Load (h) | 1.7 | 1 -41% | 1.7 0% | 1.1 -35% | 1.502 ? -12% |
Pro
Contro
Verdetto - Un portatile da gioco di fascia medio-alta ben assortito
Aorus 16X è ottimizzato per i giochi, lo streaming e il rendering QHD+. Il Core i9-14900HX e la GeForce RTX 4070 offrono le prestazioni necessarie. La CPU e il core grafico funzionano a velocità di clock costantemente elevate. Due veloci SSD PCIe-4 (1 TB ciascuno) assicurano tempi di caricamento brevi.
L'Aorus 16X (2024) di Gigabyte è un computer portatile potente e ben equipaggiato per i giocatori e i creatori, che non sembra avere grandi difetti.
Il computer portatile non si scalda particolarmente sotto carico, ma può produrre una certa rumorosità. Il funzionamento più silenzioso va a scapito di alcune prestazioni di calcolo. Lo schermo IPS installato (16 pollici, 2.560 x 1.600 pixel, 165 Hz) presenta un rapporto di aspetto 16:10 adatto al lavoro e ci ha lasciato una buona impressione generale. In particolare, vanta una luminosità estremamente buona.
Due porte USB-C (1x Thunderbolt 4, 1x USB 3.2 Gen 2) facilitano l'integrazione del portatile nelle configurazioni esistenti del posto di lavoro e aprono ulteriori opzioni di espansione (GPU esterna, docking). Entrambe le porte possono emettere un segnale DisplayPort e inoltre una supporta Power Delivery. I tempi di esecuzione del dispositivo sono impressionanti.
Un'alternativa all'Aorus 16X potrebbe essere il modello Lenovo Legion Pro 5 16IRX9. Offre prestazioni grafiche leggermente migliori utilizzando la stessa configurazione CPU/GPU, ma dispone di un solo SSD e utilizza ancora un modulo WiFi 6E (Aorus: WiFi 7).
Prezzo e disponibilità
Attualmente, Aorus 16X ASG può essere acquistato a 1.949,99 dollari su Amazon.
Aorus 16X 2024
- 04/09/2024 v7 (old)
Sascha Mölck
Transparency
La selezione dei dispositivi da recensire viene effettuata dalla nostra redazione. Il campione di prova è stato fornito all'autore come prestito dal produttore o dal rivenditore ai fini di questa recensione. L'istituto di credito non ha avuto alcuna influenza su questa recensione, né il produttore ne ha ricevuto una copia prima della pubblicazione. Non vi era alcun obbligo di pubblicare questa recensione. In quanto società mediatica indipendente, Notebookcheck non è soggetta all'autorità di produttori, rivenditori o editori.
Ecco come Notebookcheck esegue i test
Ogni anno, Notebookcheck esamina in modo indipendente centinaia di laptop e smartphone utilizzando procedure standardizzate per garantire che tutti i risultati siano comparabili. Da circa 20 anni sviluppiamo continuamente i nostri metodi di prova e nel frattempo stabiliamo gli standard di settore. Nei nostri laboratori di prova, tecnici ed editori esperti utilizzano apparecchiature di misurazione di alta qualità. Questi test comportano un processo di validazione in più fasi. Il nostro complesso sistema di valutazione si basa su centinaia di misurazioni e parametri di riferimento ben fondati, che mantengono l'obiettività.Price comparison

