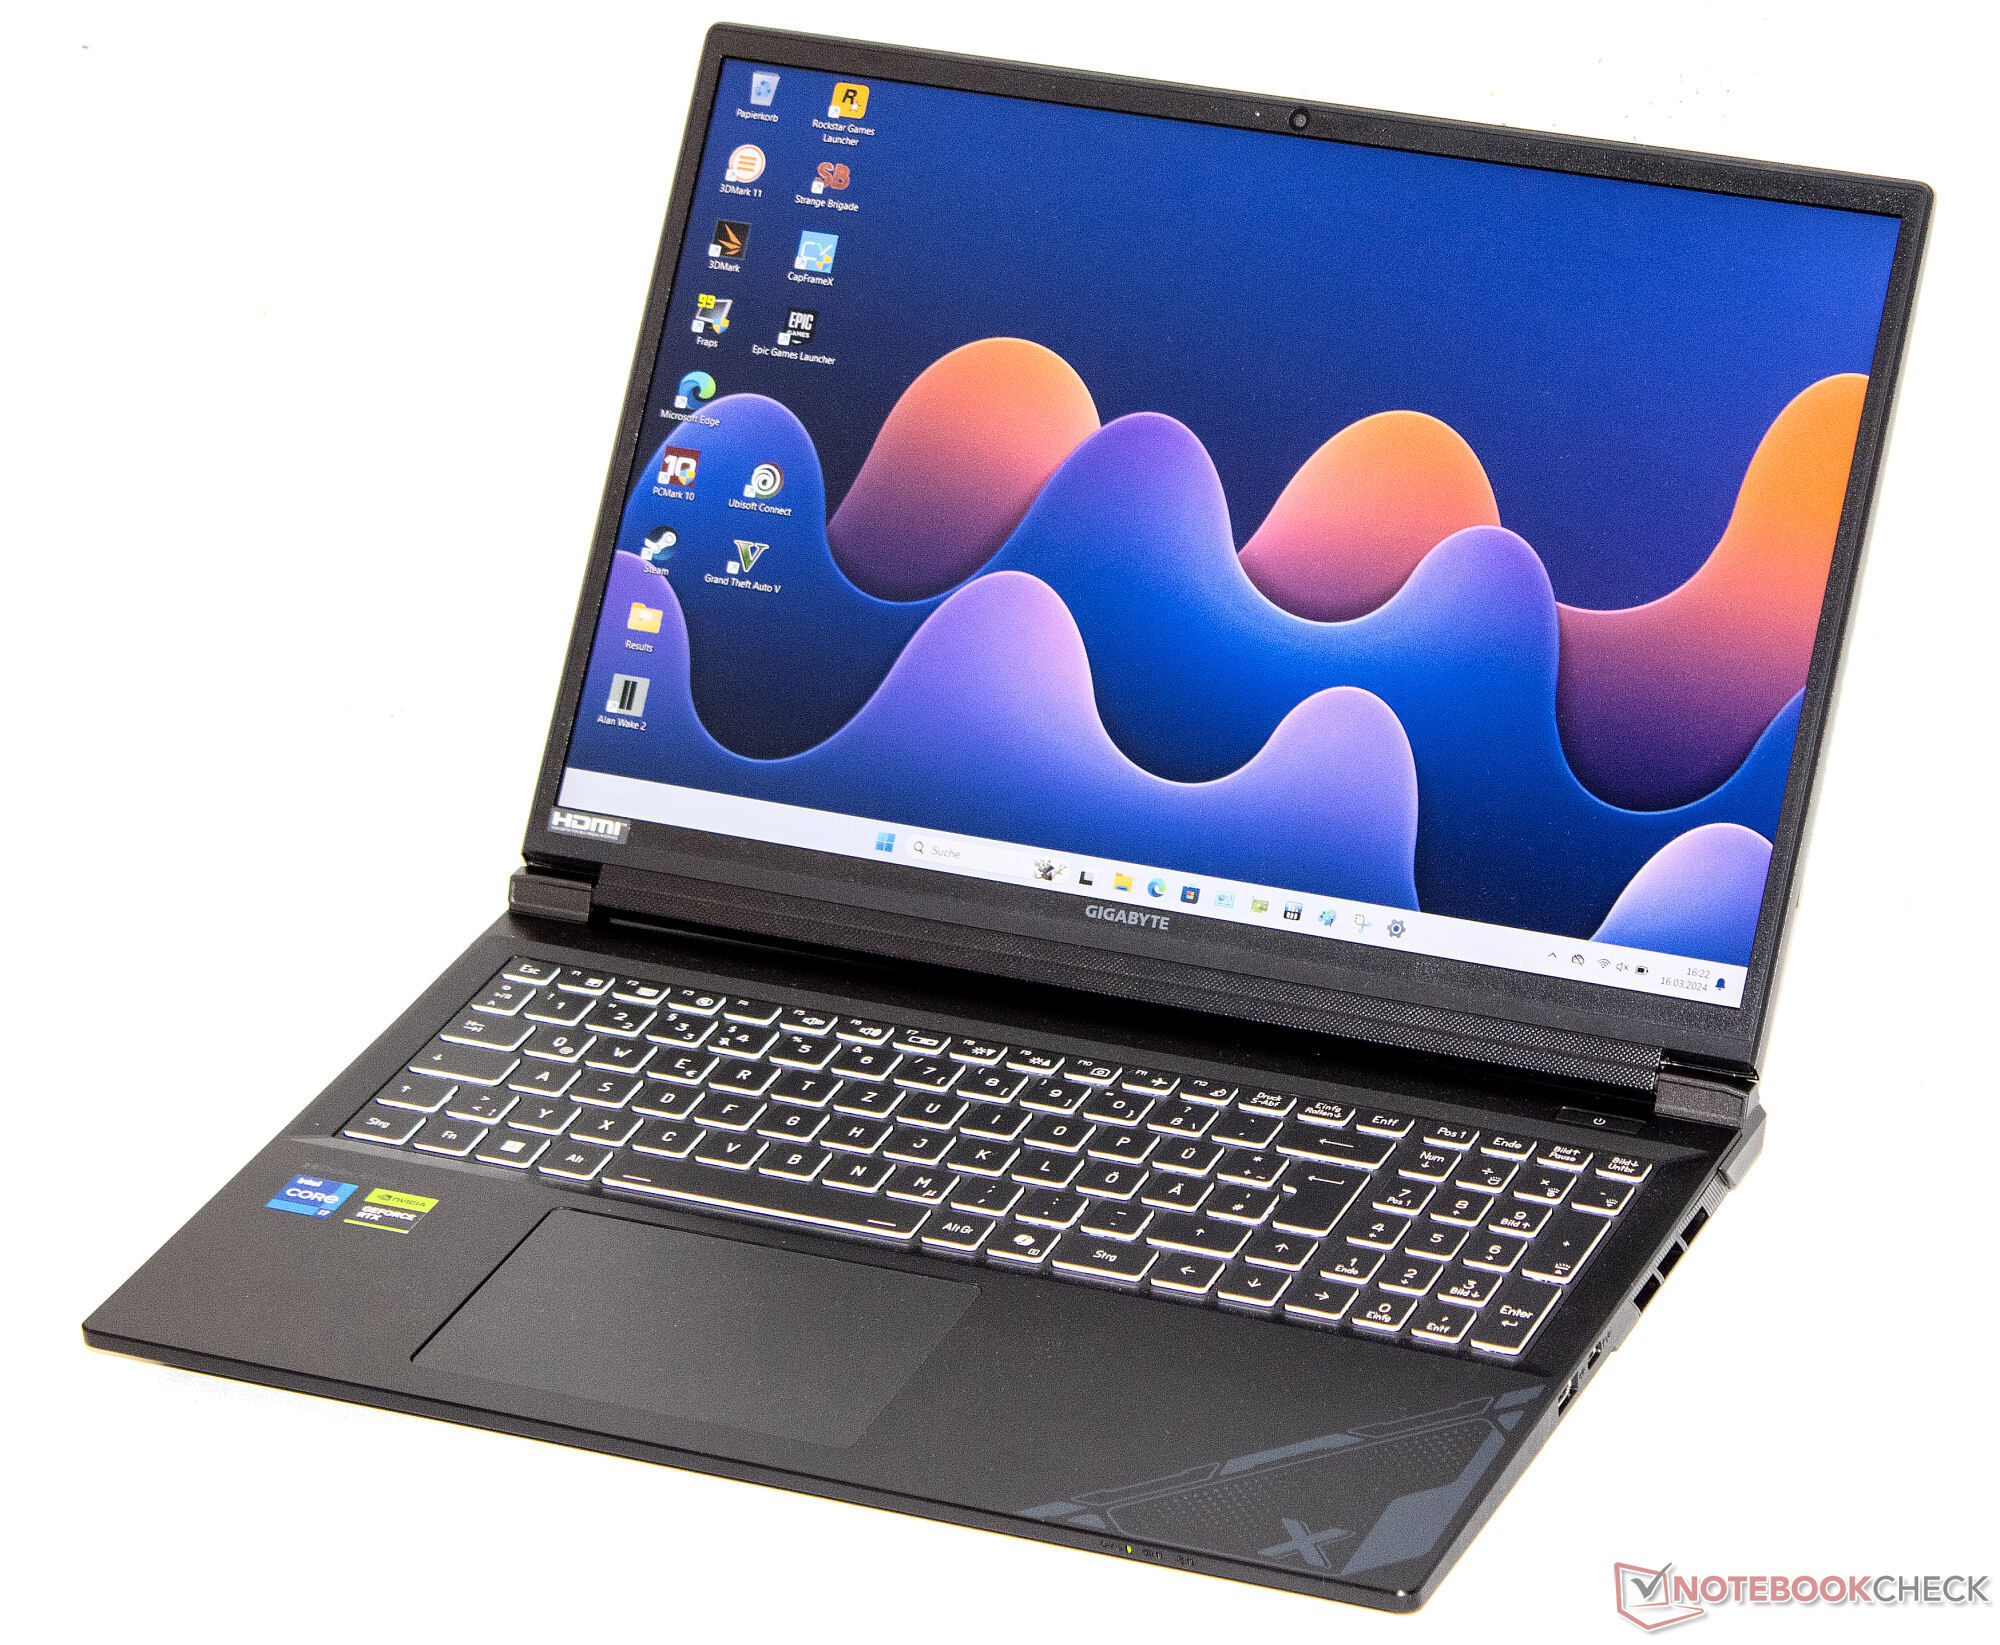
Recensione del Gigabyte G6X 9KG (2024): economico Notebook per gaming con RTX 4060

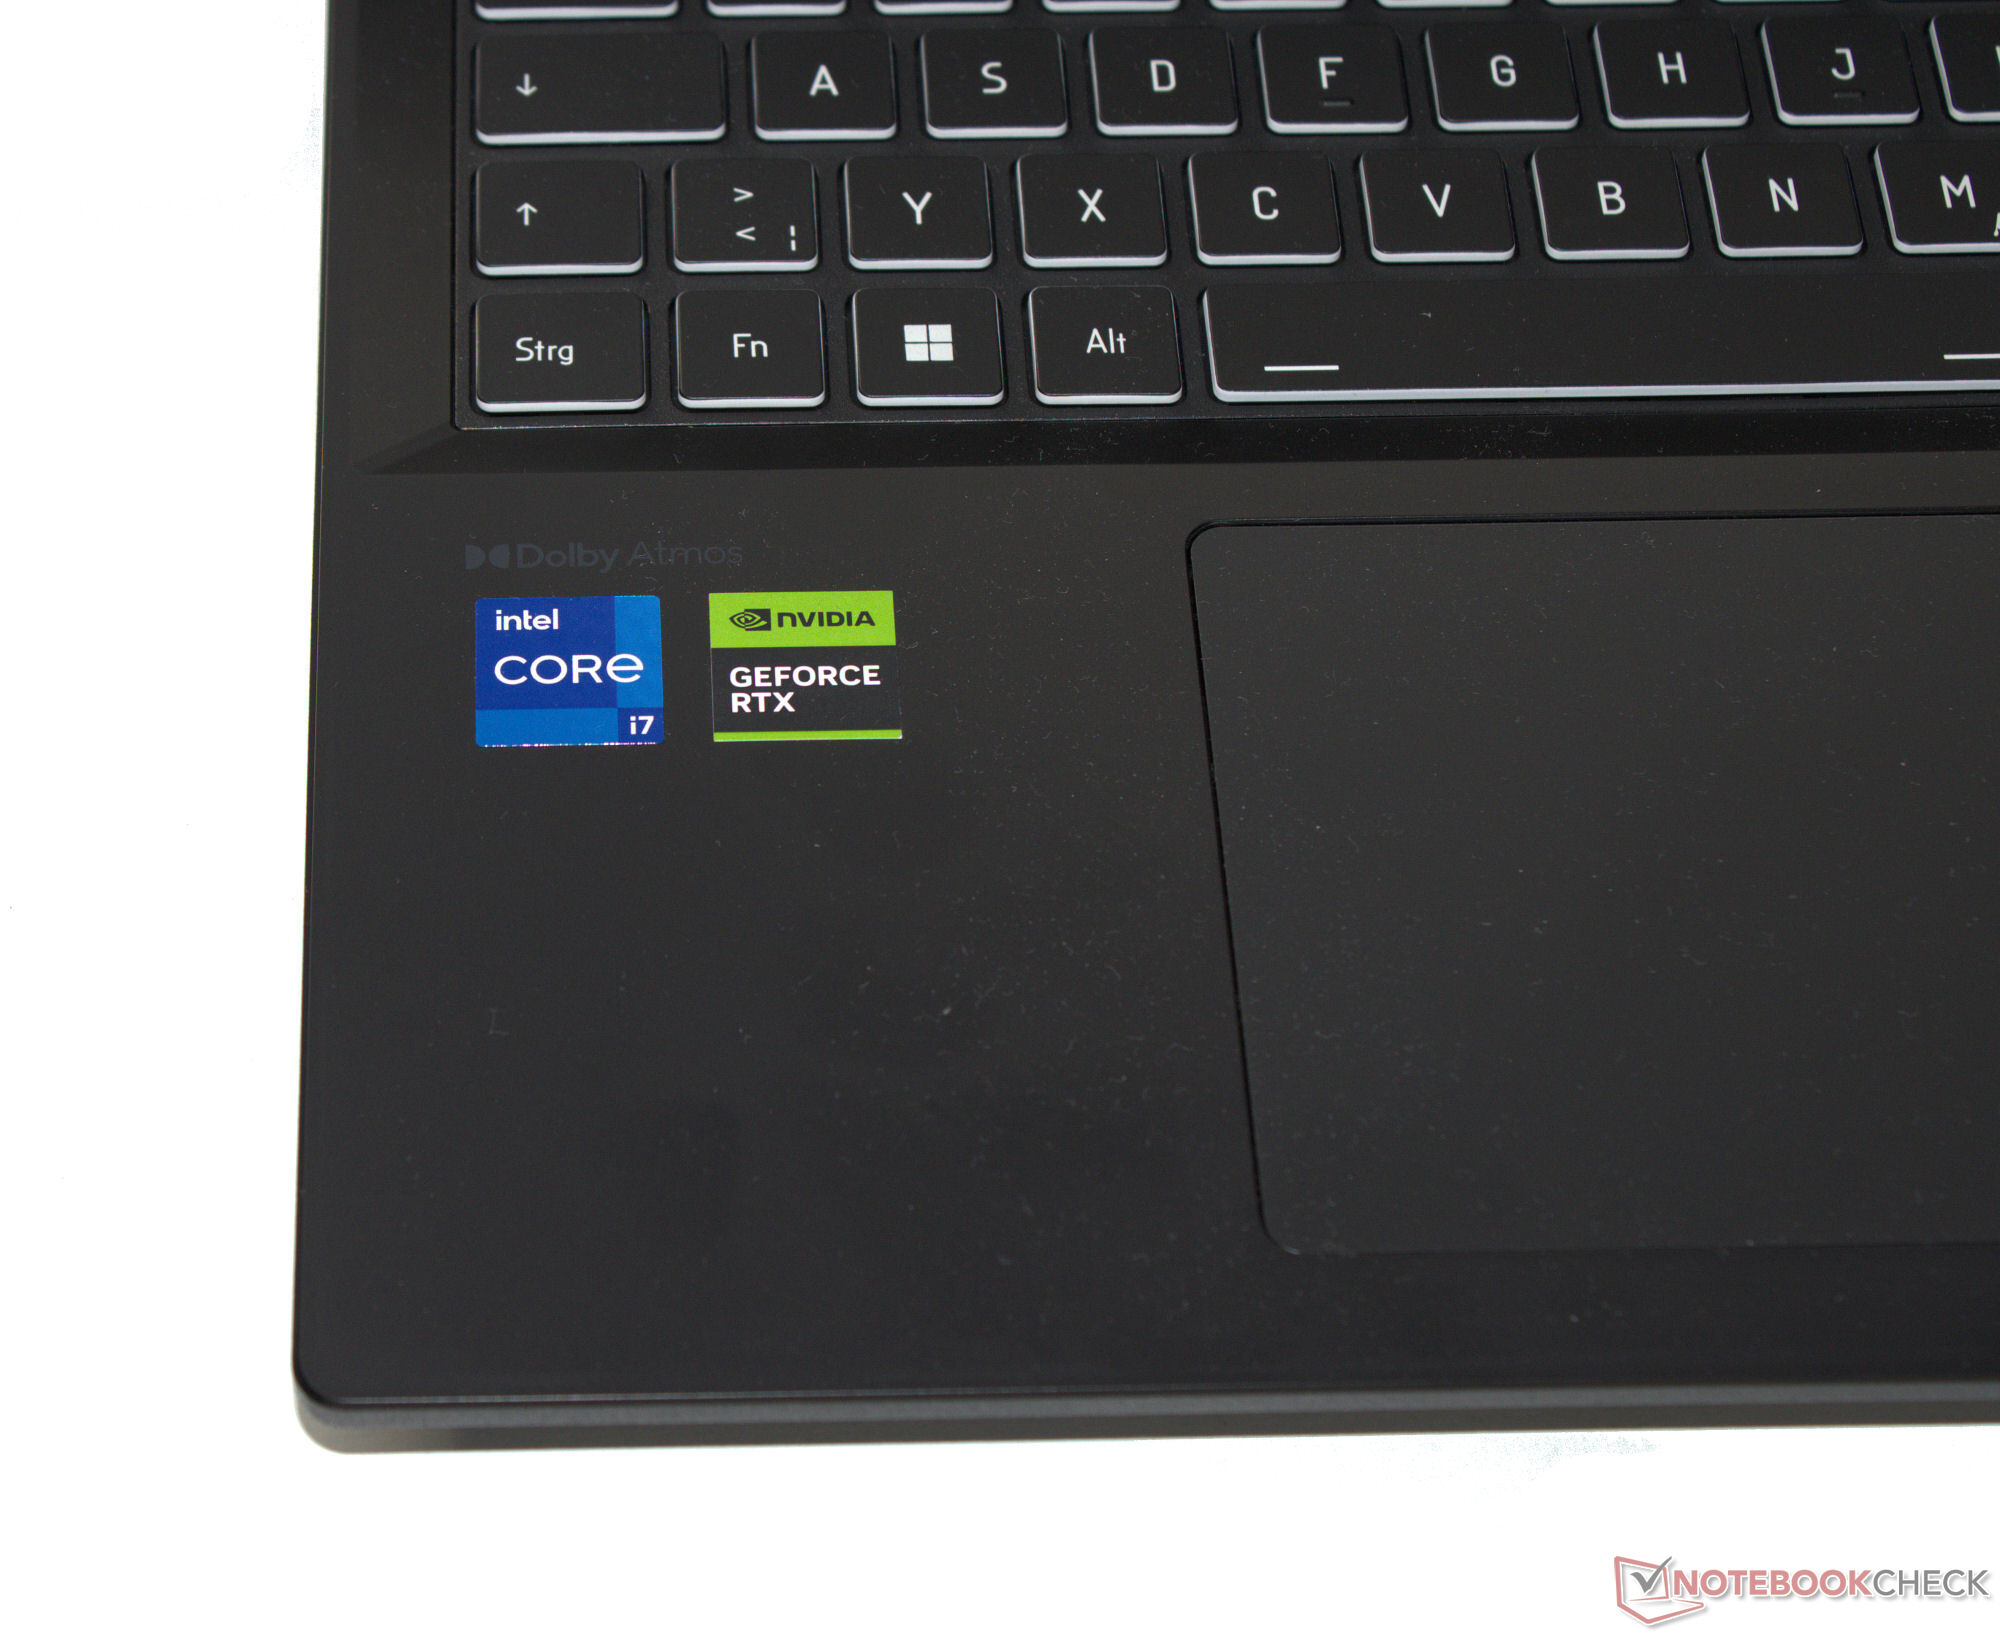
Gigabyte G6X 9KG è uno dei notebook da gioco più accessibili, con un prezzo di poco inferiore a 1.350 euro. Il portatile è alimentato dal Intel Core i7-13650HX Raptor Lake-HX e da una Nvidia GeForce RTX 4060 GPU Ada Lovelace Laptop.
La concorrenza comprende laptop come il Dell G16, Lenovo Legion 5 16IRX G9, MSI Raider GE68HX 13VFe Asus TUF Gaming A16 FA617XS.
Potenziali concorrenti a confrontos
Punteggio | Data | Modello | Peso | Altezza | Dimensione | Risoluzione | Prezzo |
|---|---|---|---|---|---|---|---|
| 83.2 % v7 (old) | 03/2024 | Gigabyte G6X 9KG (2024) i7-13650HX, GeForce RTX 4060 Laptop GPU | 2.6 kg | 25.1 mm | 16.00" | 1920x1200 | |
| 85.5 % v7 (old) | 02/2024 | Dell G16, i7-13650HX, RTX 4060 i7-13650HX, GeForce RTX 4060 Laptop GPU | 2.8 kg | 25.65 mm | 16.00" | 2560x1600 | |
| 89.1 % v7 (old) | 02/2024 | Lenovo Legion 5 16IRX G9 i7-14650HX, GeForce RTX 4060 Laptop GPU | 2.4 kg | 25.2 mm | 16.00" | 2560x1600 | |
| 86.9 % v7 (old) | 10/2023 | MSI Raider GE68HX 13VF i9-13950HX, GeForce RTX 4060 Laptop GPU | 2.7 kg | 27.9 mm | 16.00" | 1900x1200 | |
| 86.9 % v7 (old) | 06/2023 | Asus TUF Gaming A16 FA617XS R9 7940HS, Radeon RX 7600S | 2.2 kg | 22.1 mm | 16.00" | 1920x1200 |
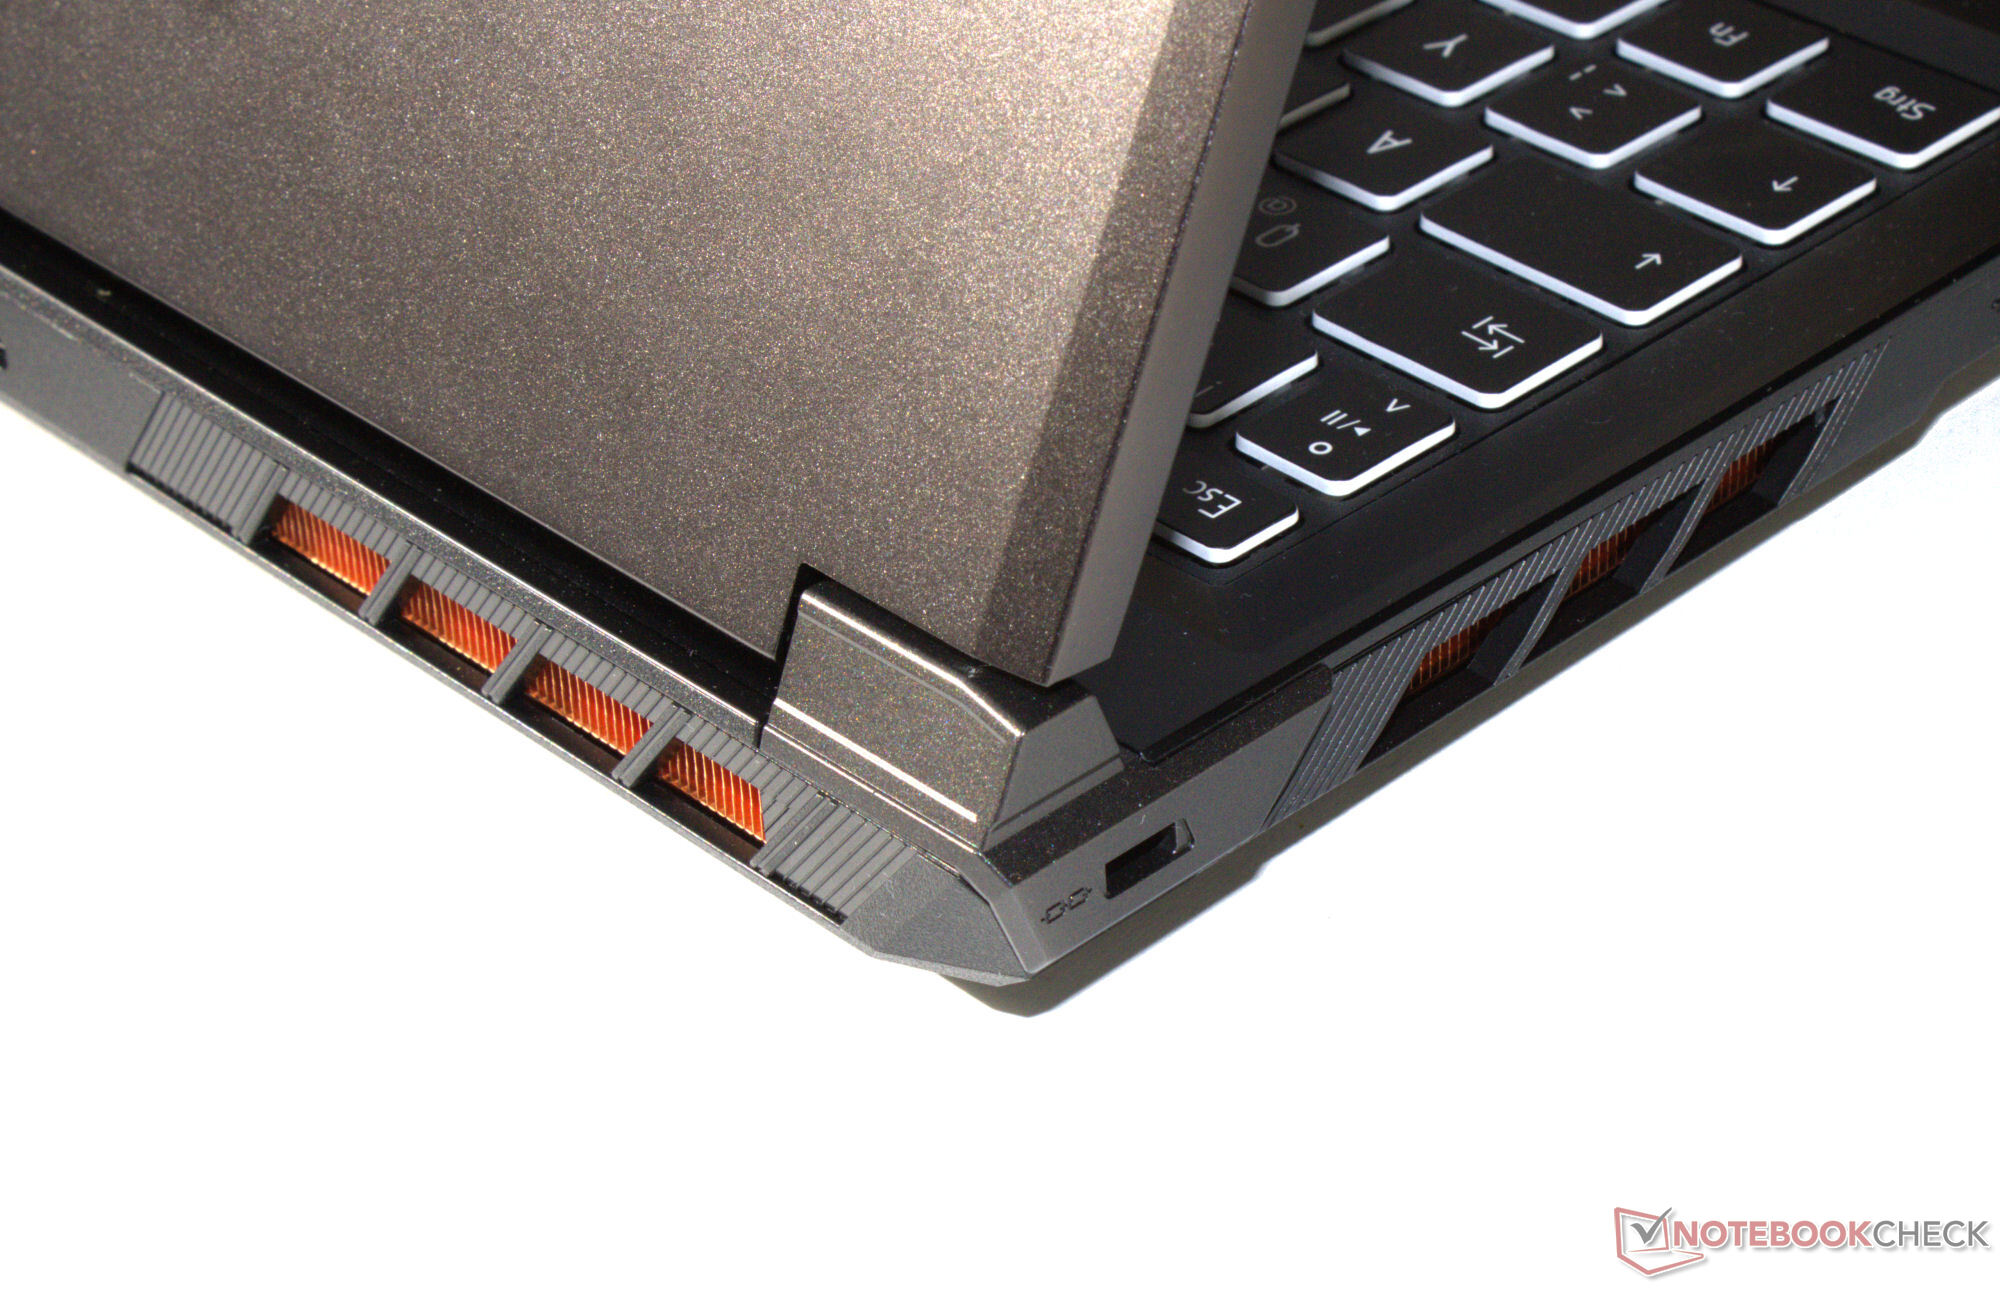
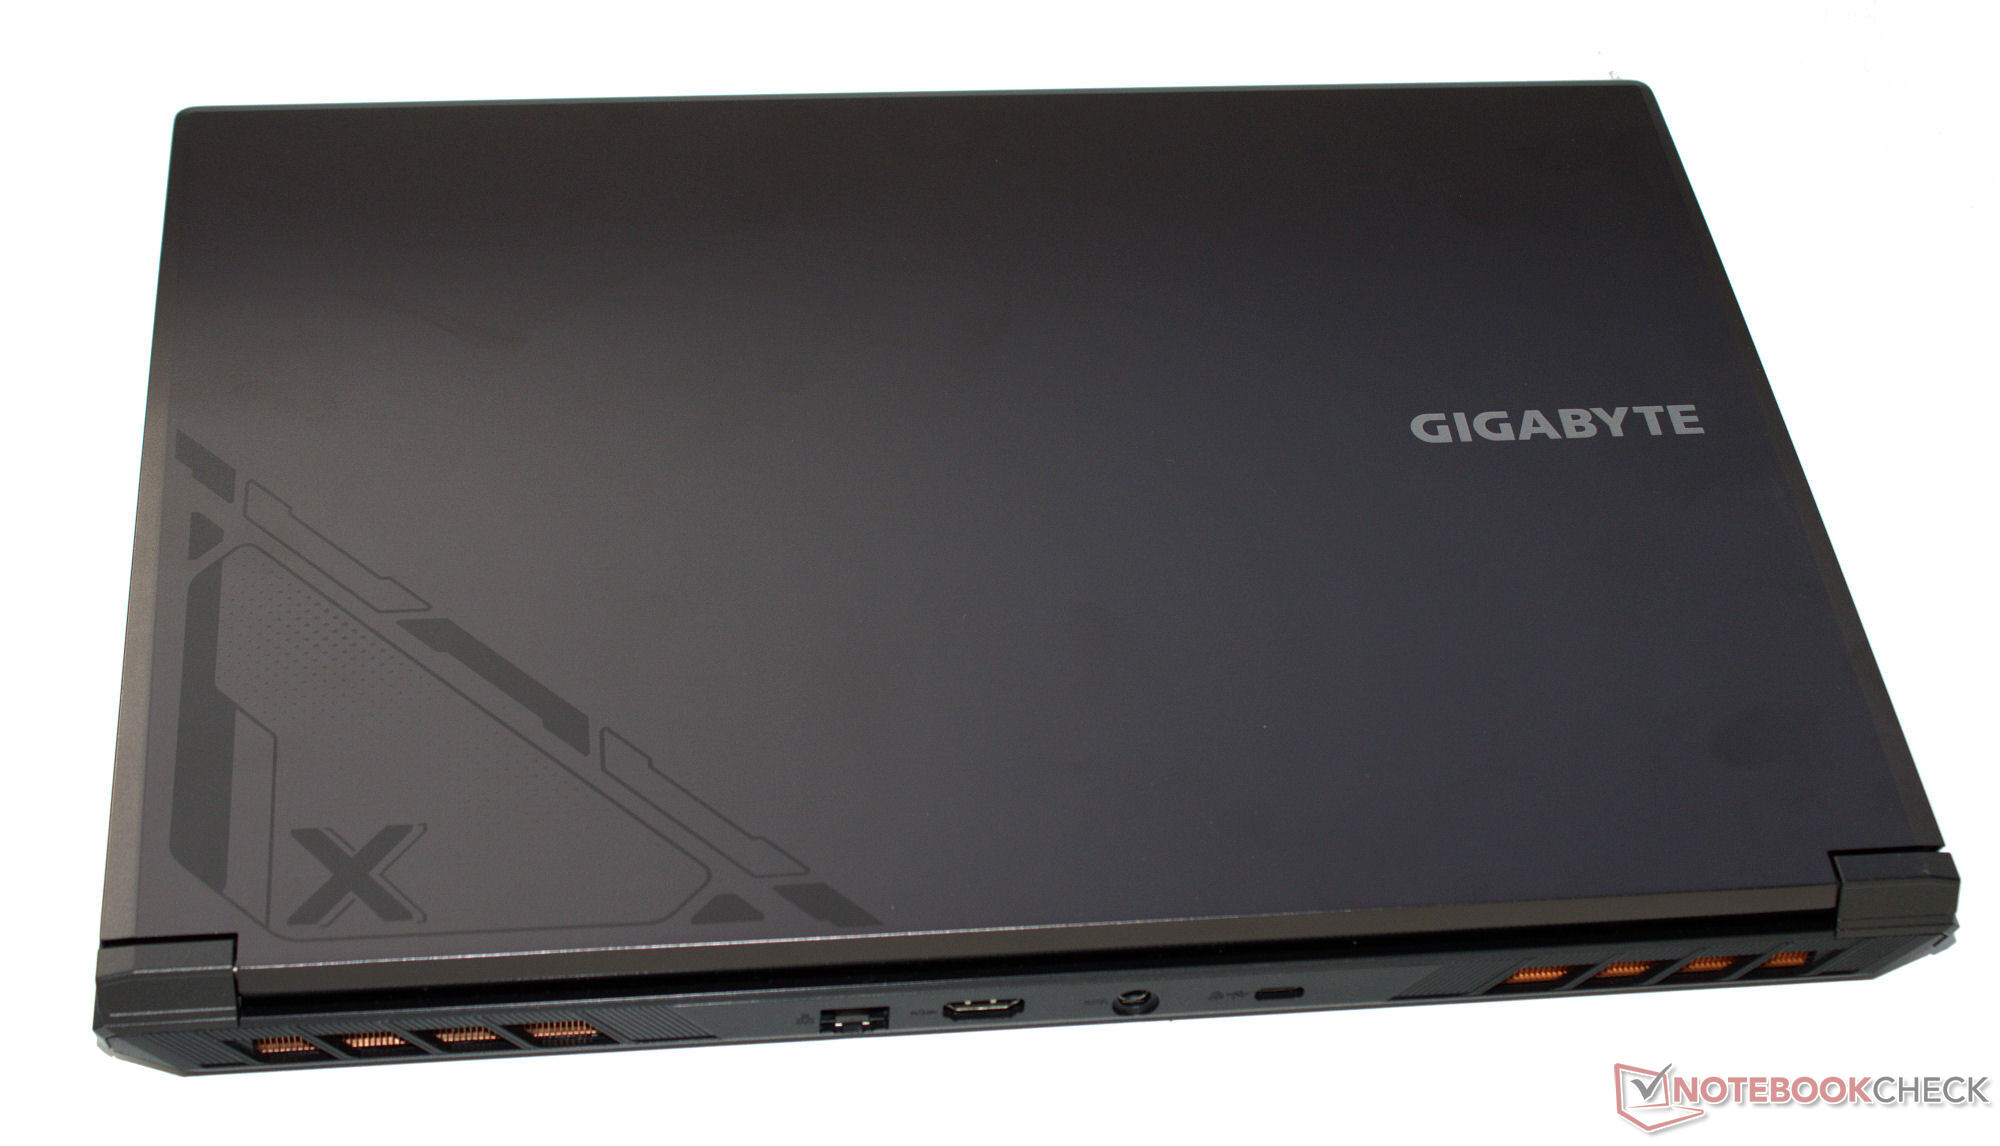
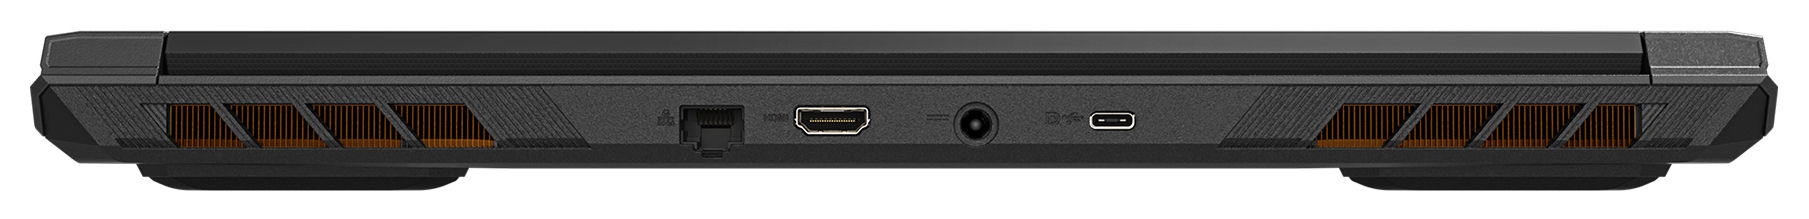
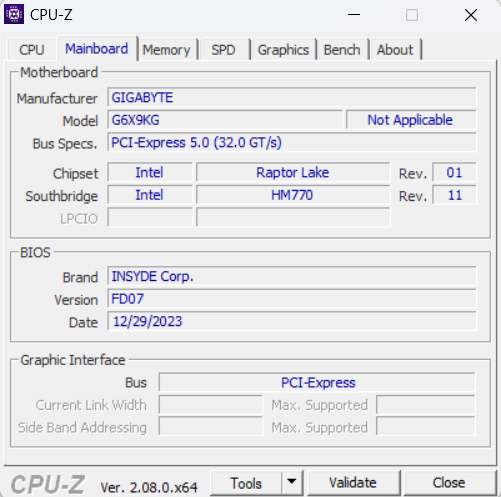
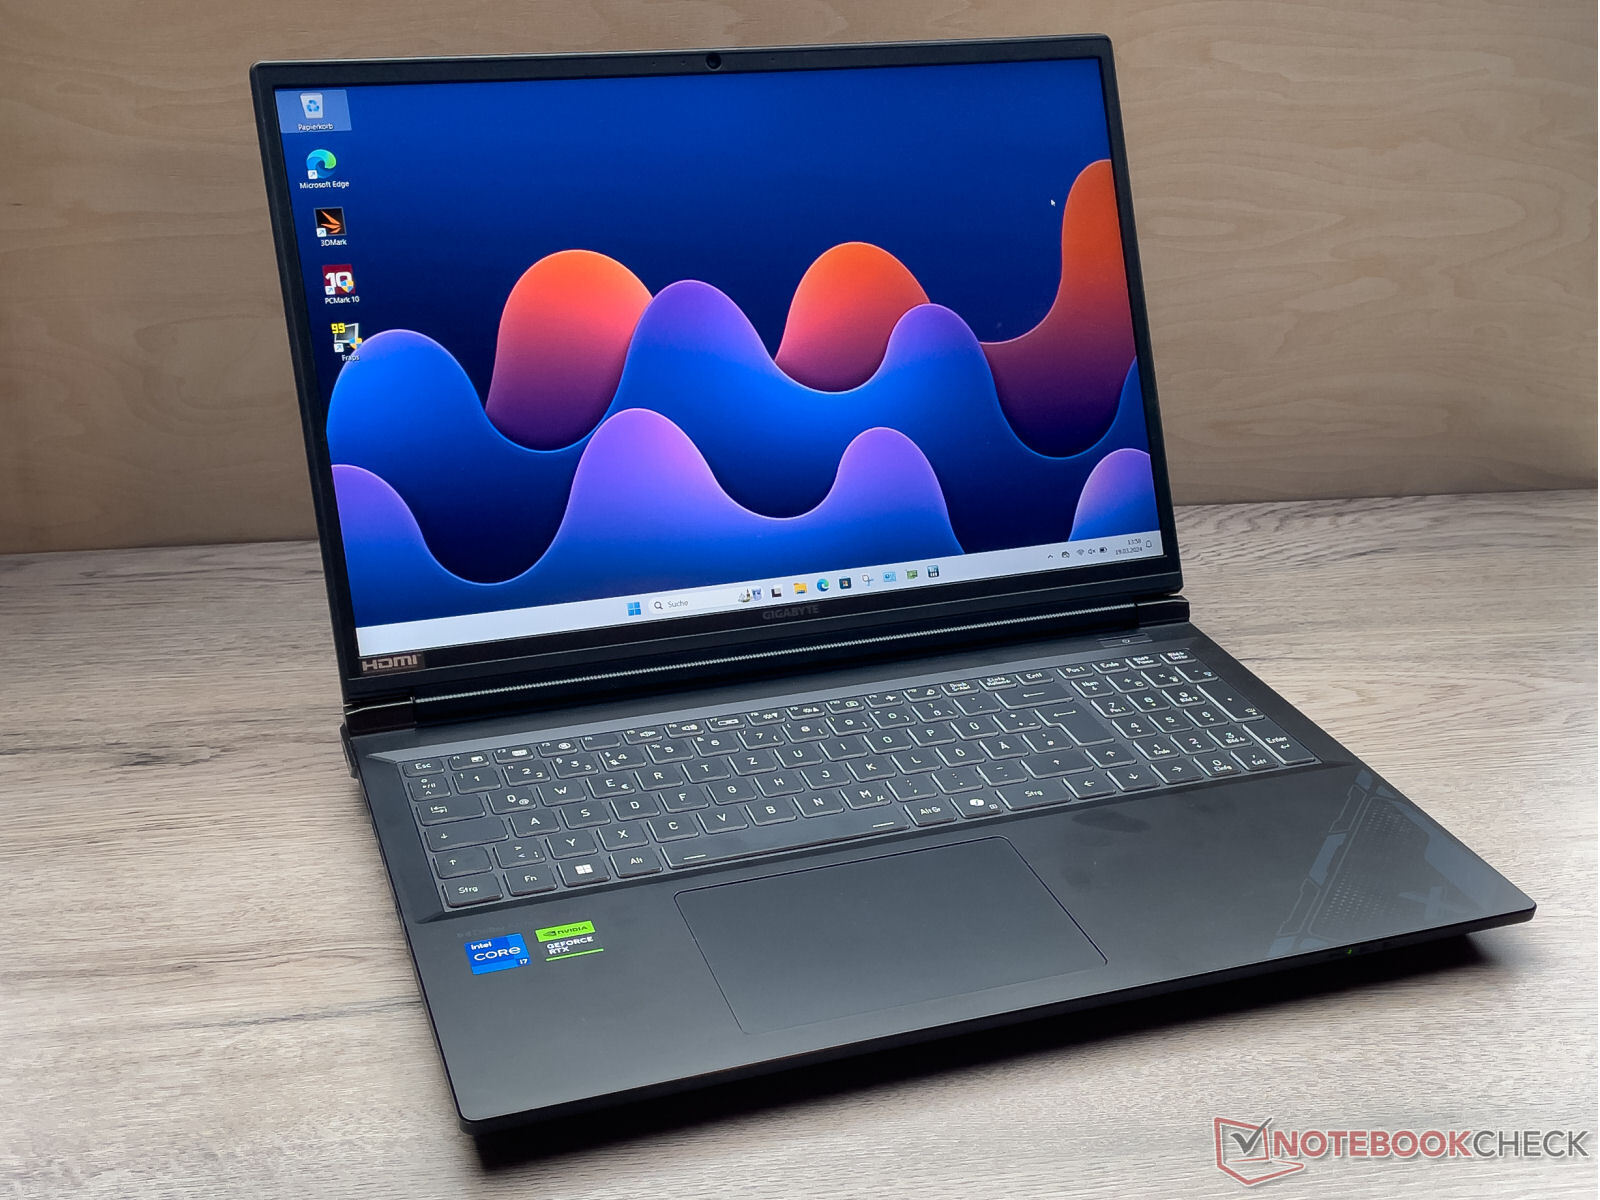
Case e caratteristiche: Il G6X non dispone di Thunderbolt 4
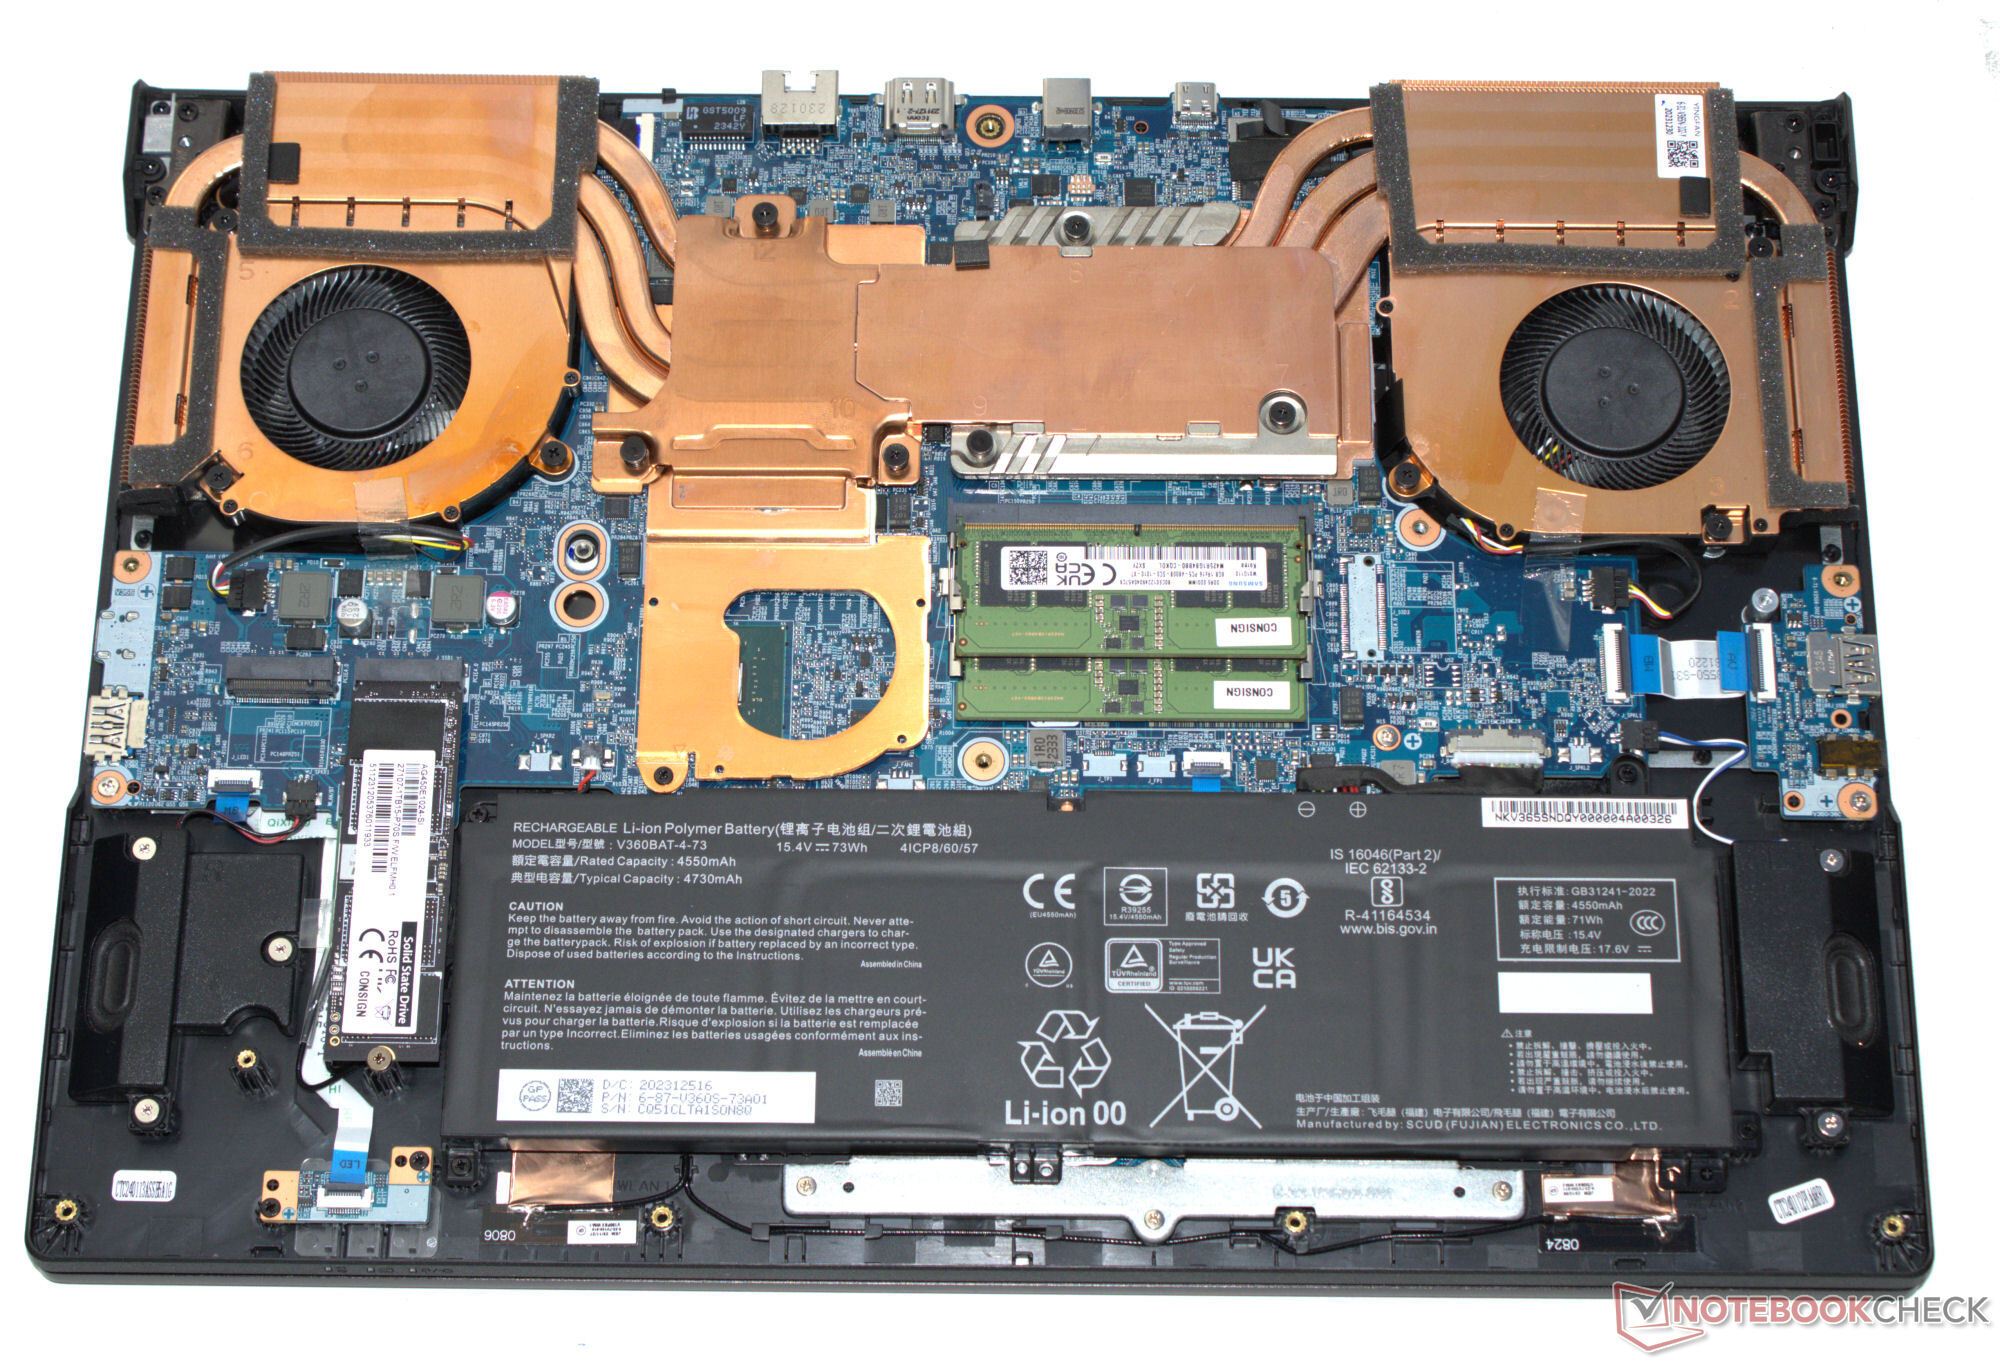
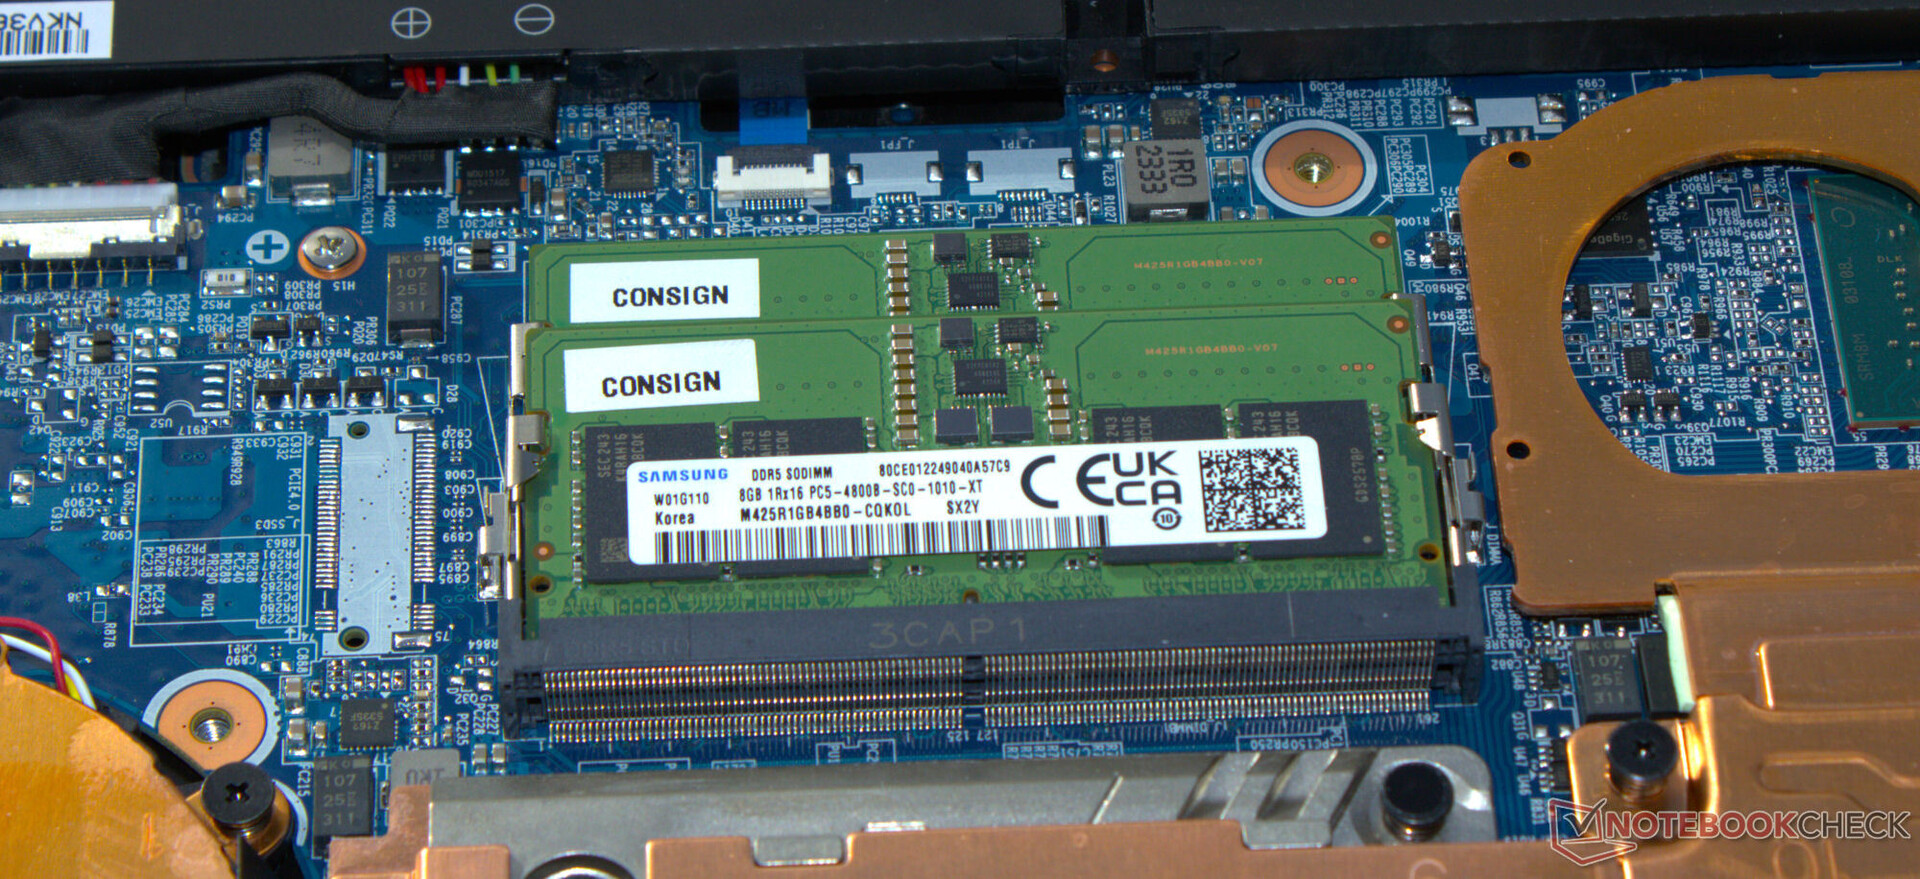
L'unità di base dello chassis grigio opaco ("Gunmetal Grey") del G6X è realizzata in plastica, mentre l'alluminio è utilizzato per il retro del coperchio. Non si notano difetti di lavorazione; la stabilità e la rigidità sembrano buone. La batteria e gli altri componenti interni sono accessibili dopo aver rimosso il guscio di base.
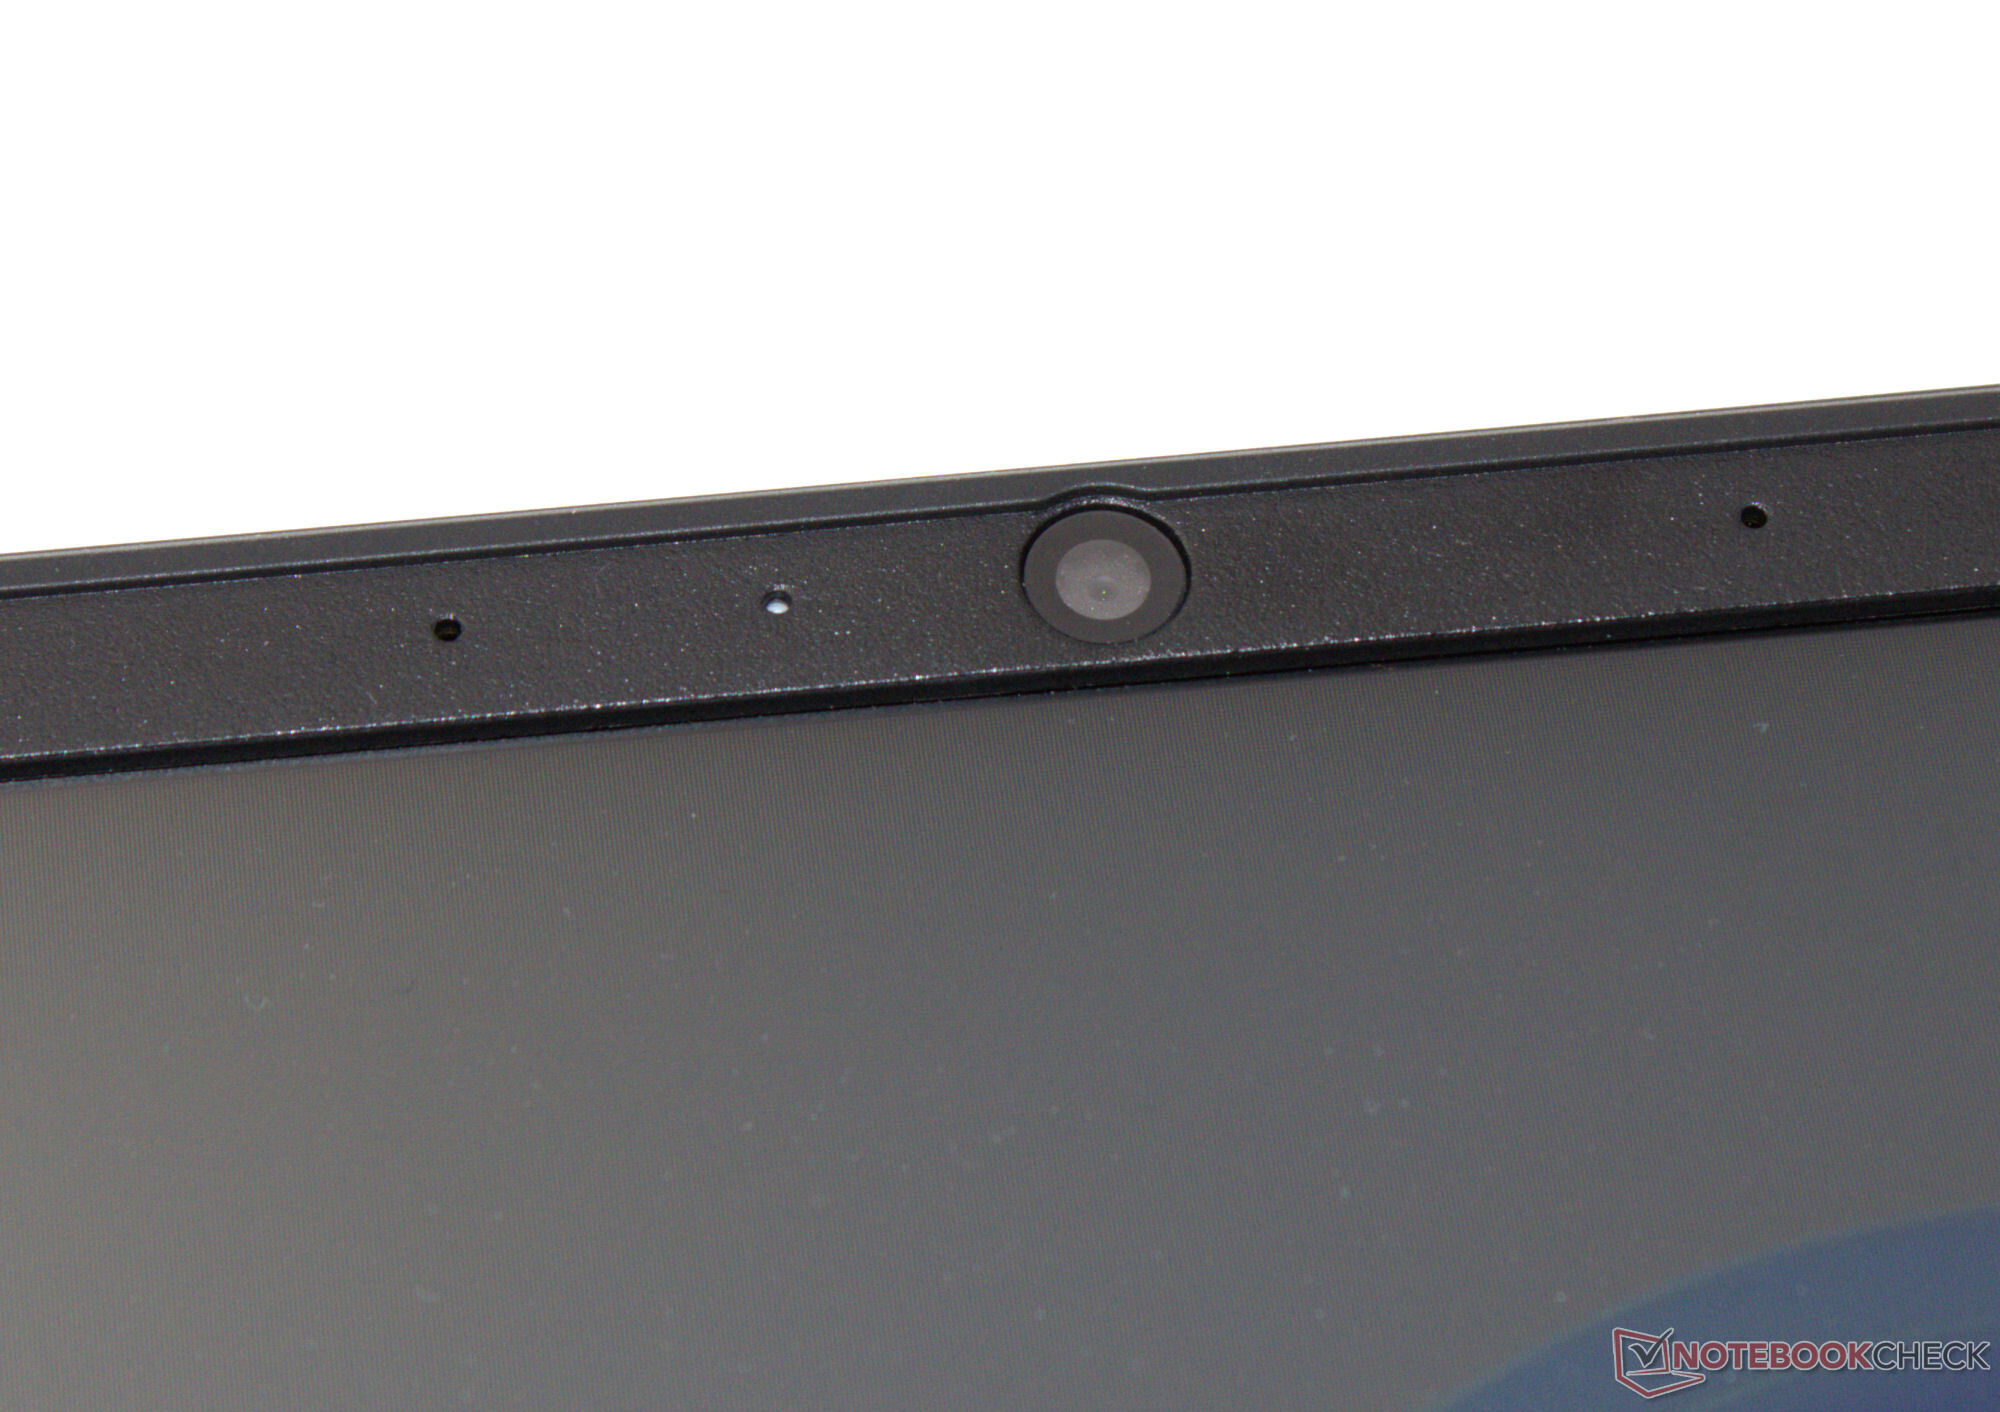
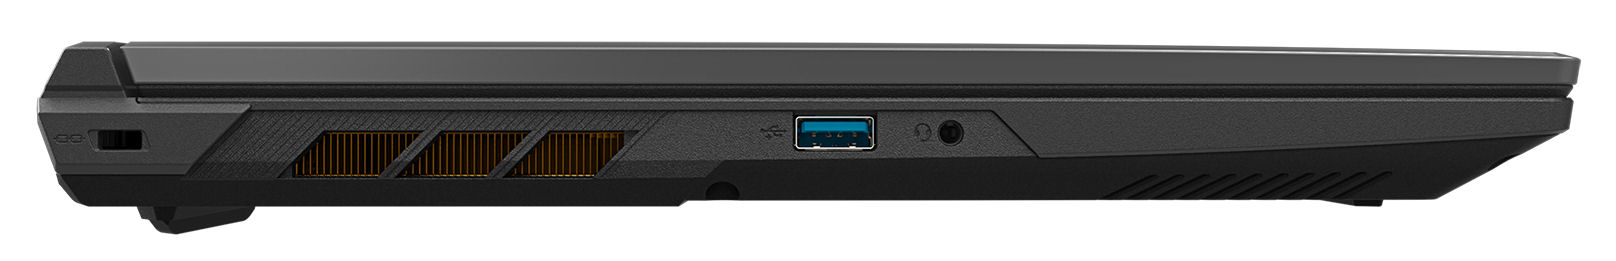
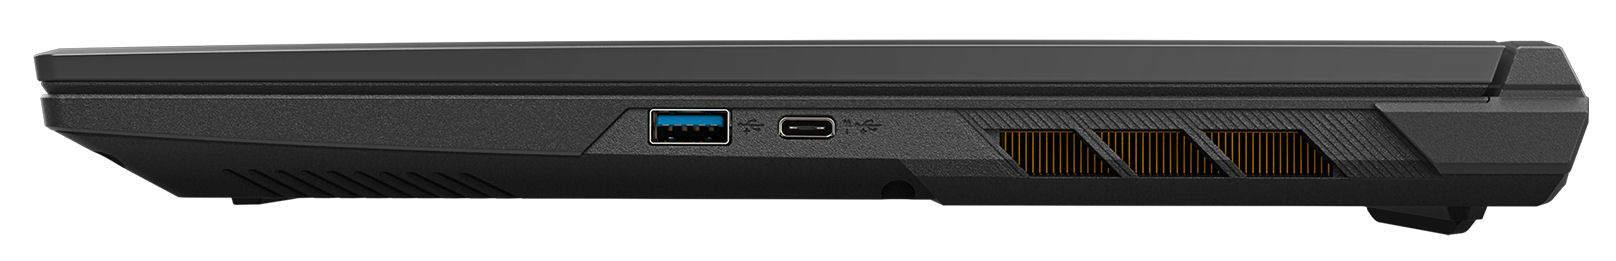
Gigabyte G6X 9KG dispone di una porta USB 3.2 Gen 1 e 1x USB 3.2 Gen 2 Type-A e di due porte USB 3.2 Gen 2 Type-C che offrono singolarmente Power Delivery e DisplayPort-out. Nel complesso, G6X dispone di due uscite video (1x HDMI, 1x DP). Non c'è un lettore di schede di memoria. La webcam 1280 x 720 da 0,9 MP offre prestazioni standard.
Abbiamo ottenuto un'eccellente velocità di trasmissione dei dati Wi-Fi in condizioni di test ottimali, in cui non c'erano dispositivi Wi-Fi nelle immediate vicinanze e a una breve distanza di 1 m tra il portatile e il PC server. Il notebook utilizza un chip Intel AX211 Wi-Fi 6E. Le connessioni cablate sono gestite da un controller Realtek RTL8168/8111.

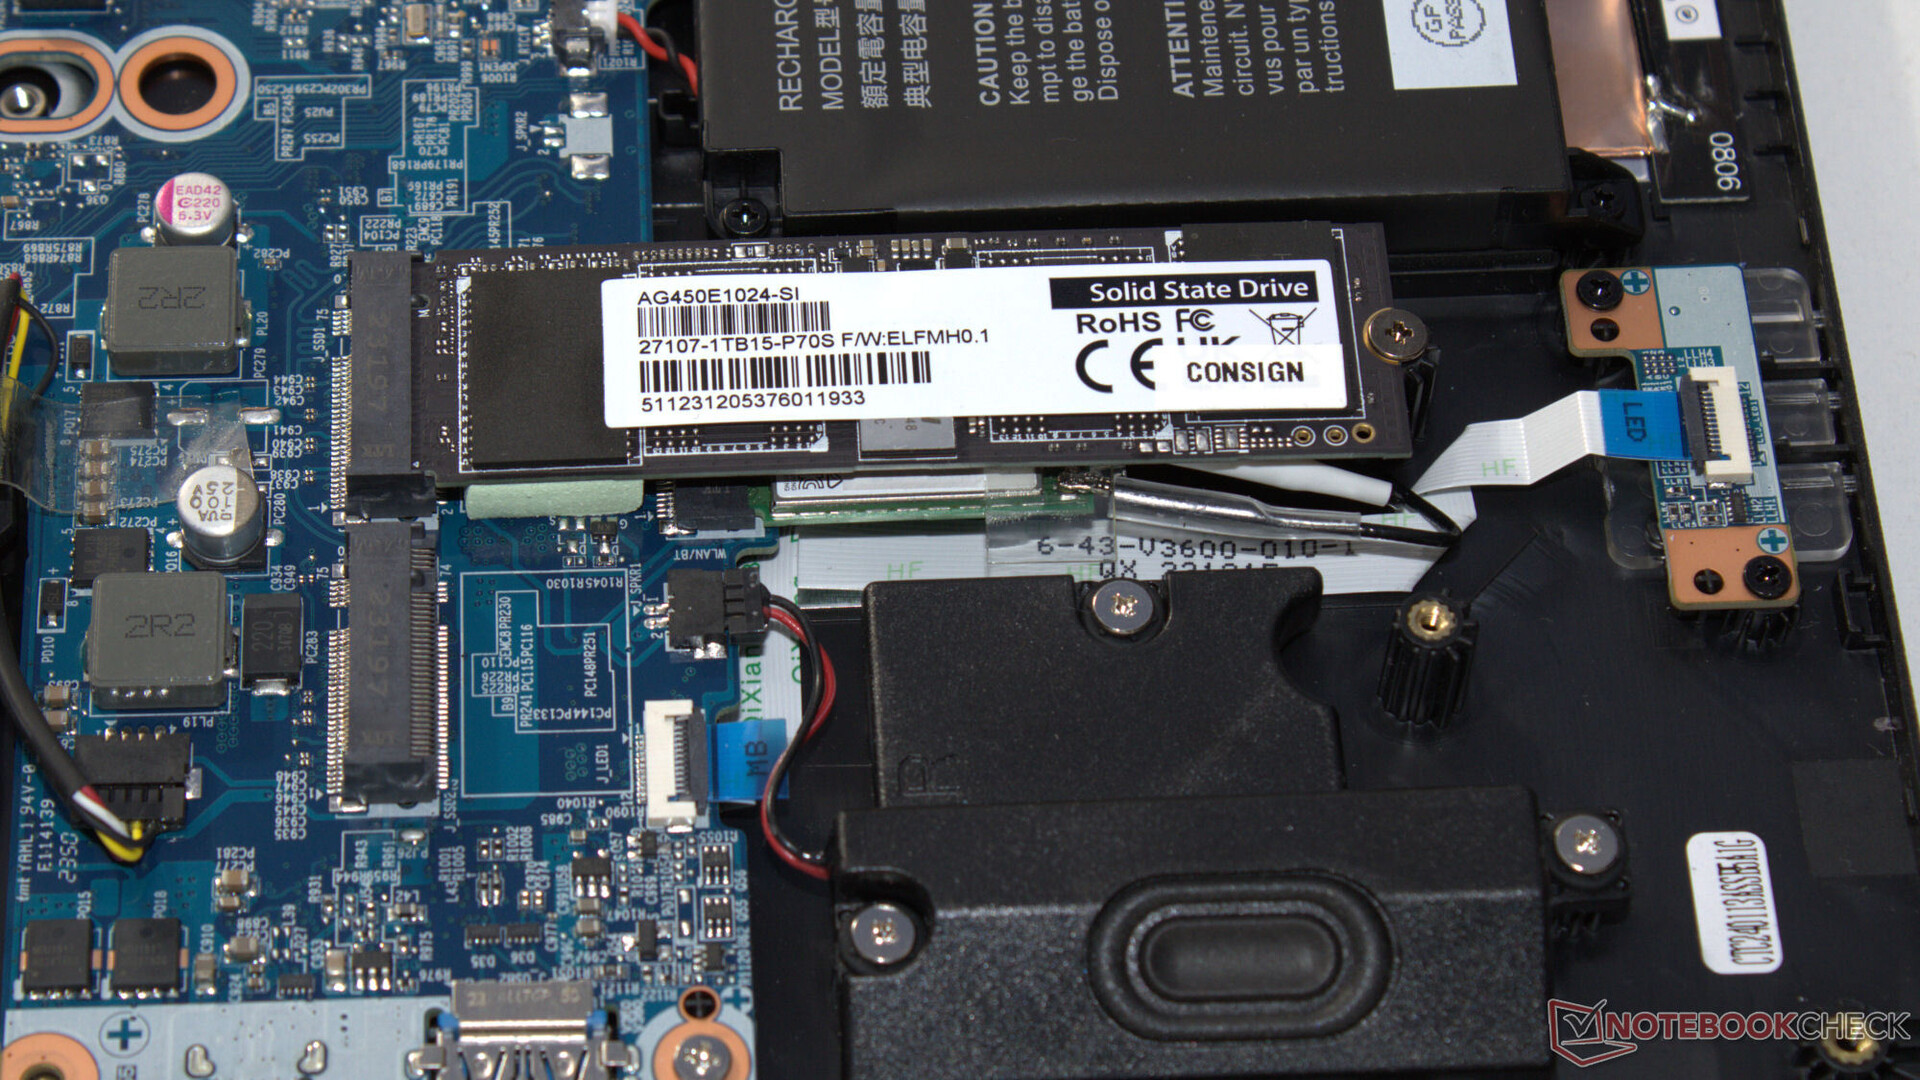
 GeForce RTX 4060 Laptop GPU, i7-13650HX, Gigabyte AG450E1024-SI")
 GeForce RTX 4060 Laptop GPU, i7-13650HX, Gigabyte AG450E1024-SI")
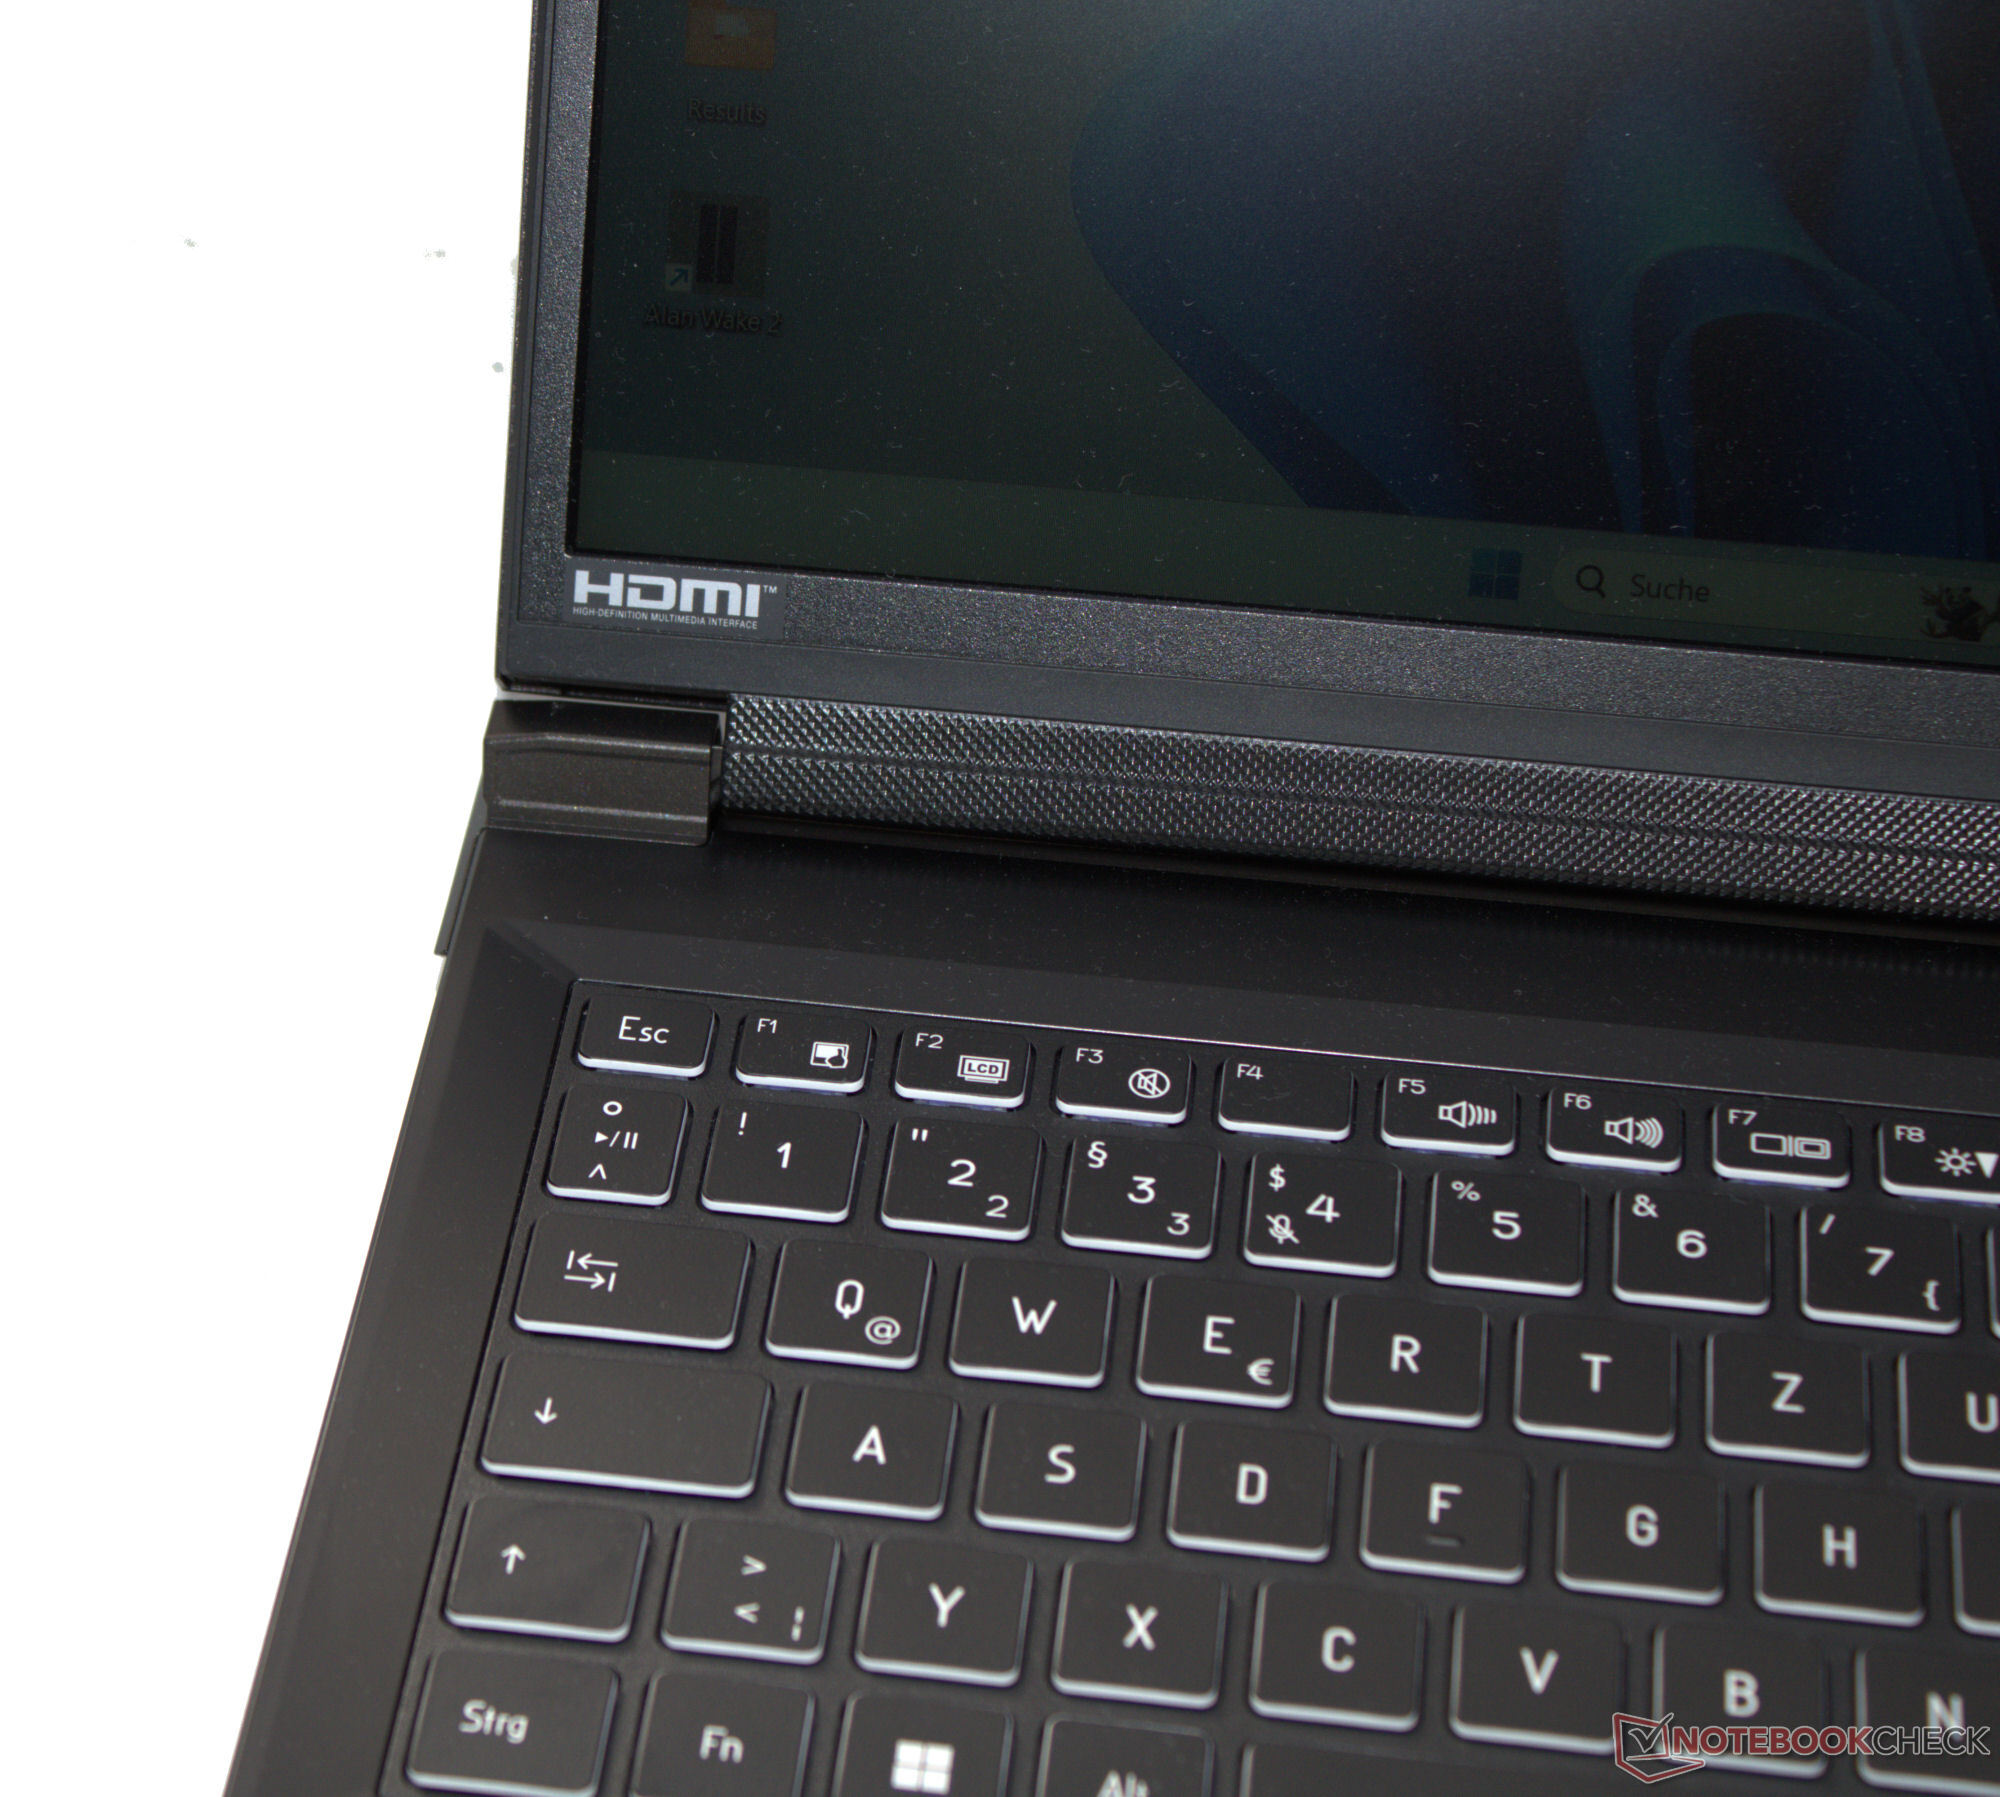
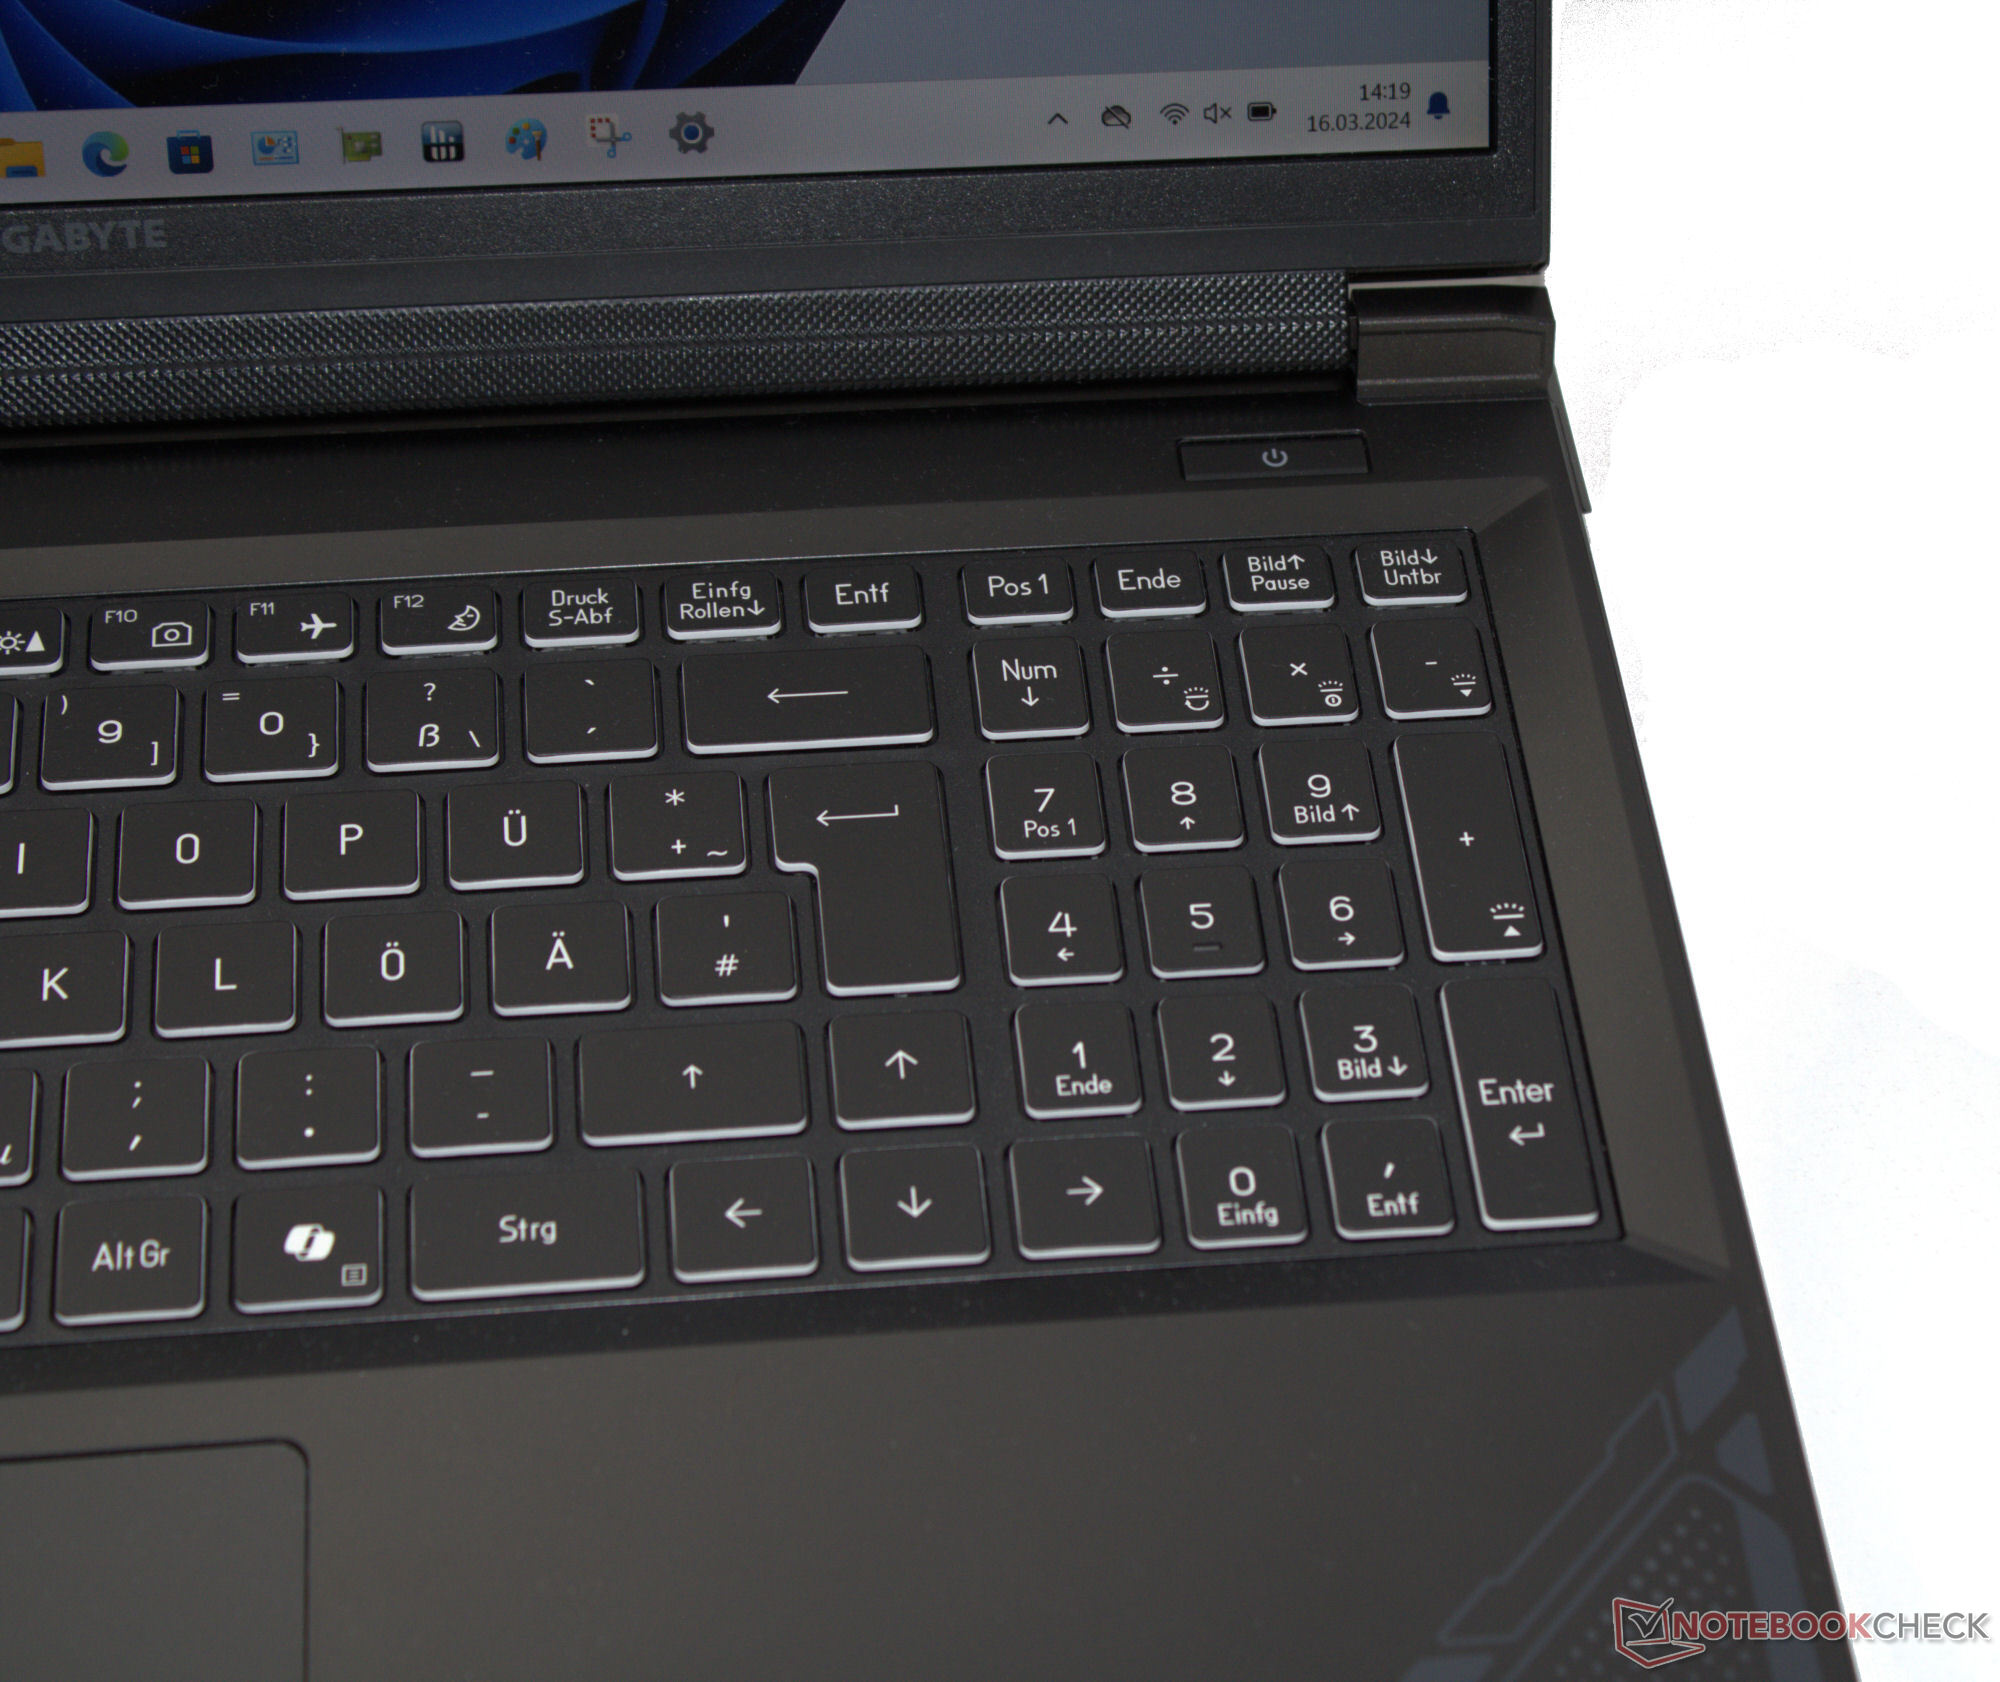
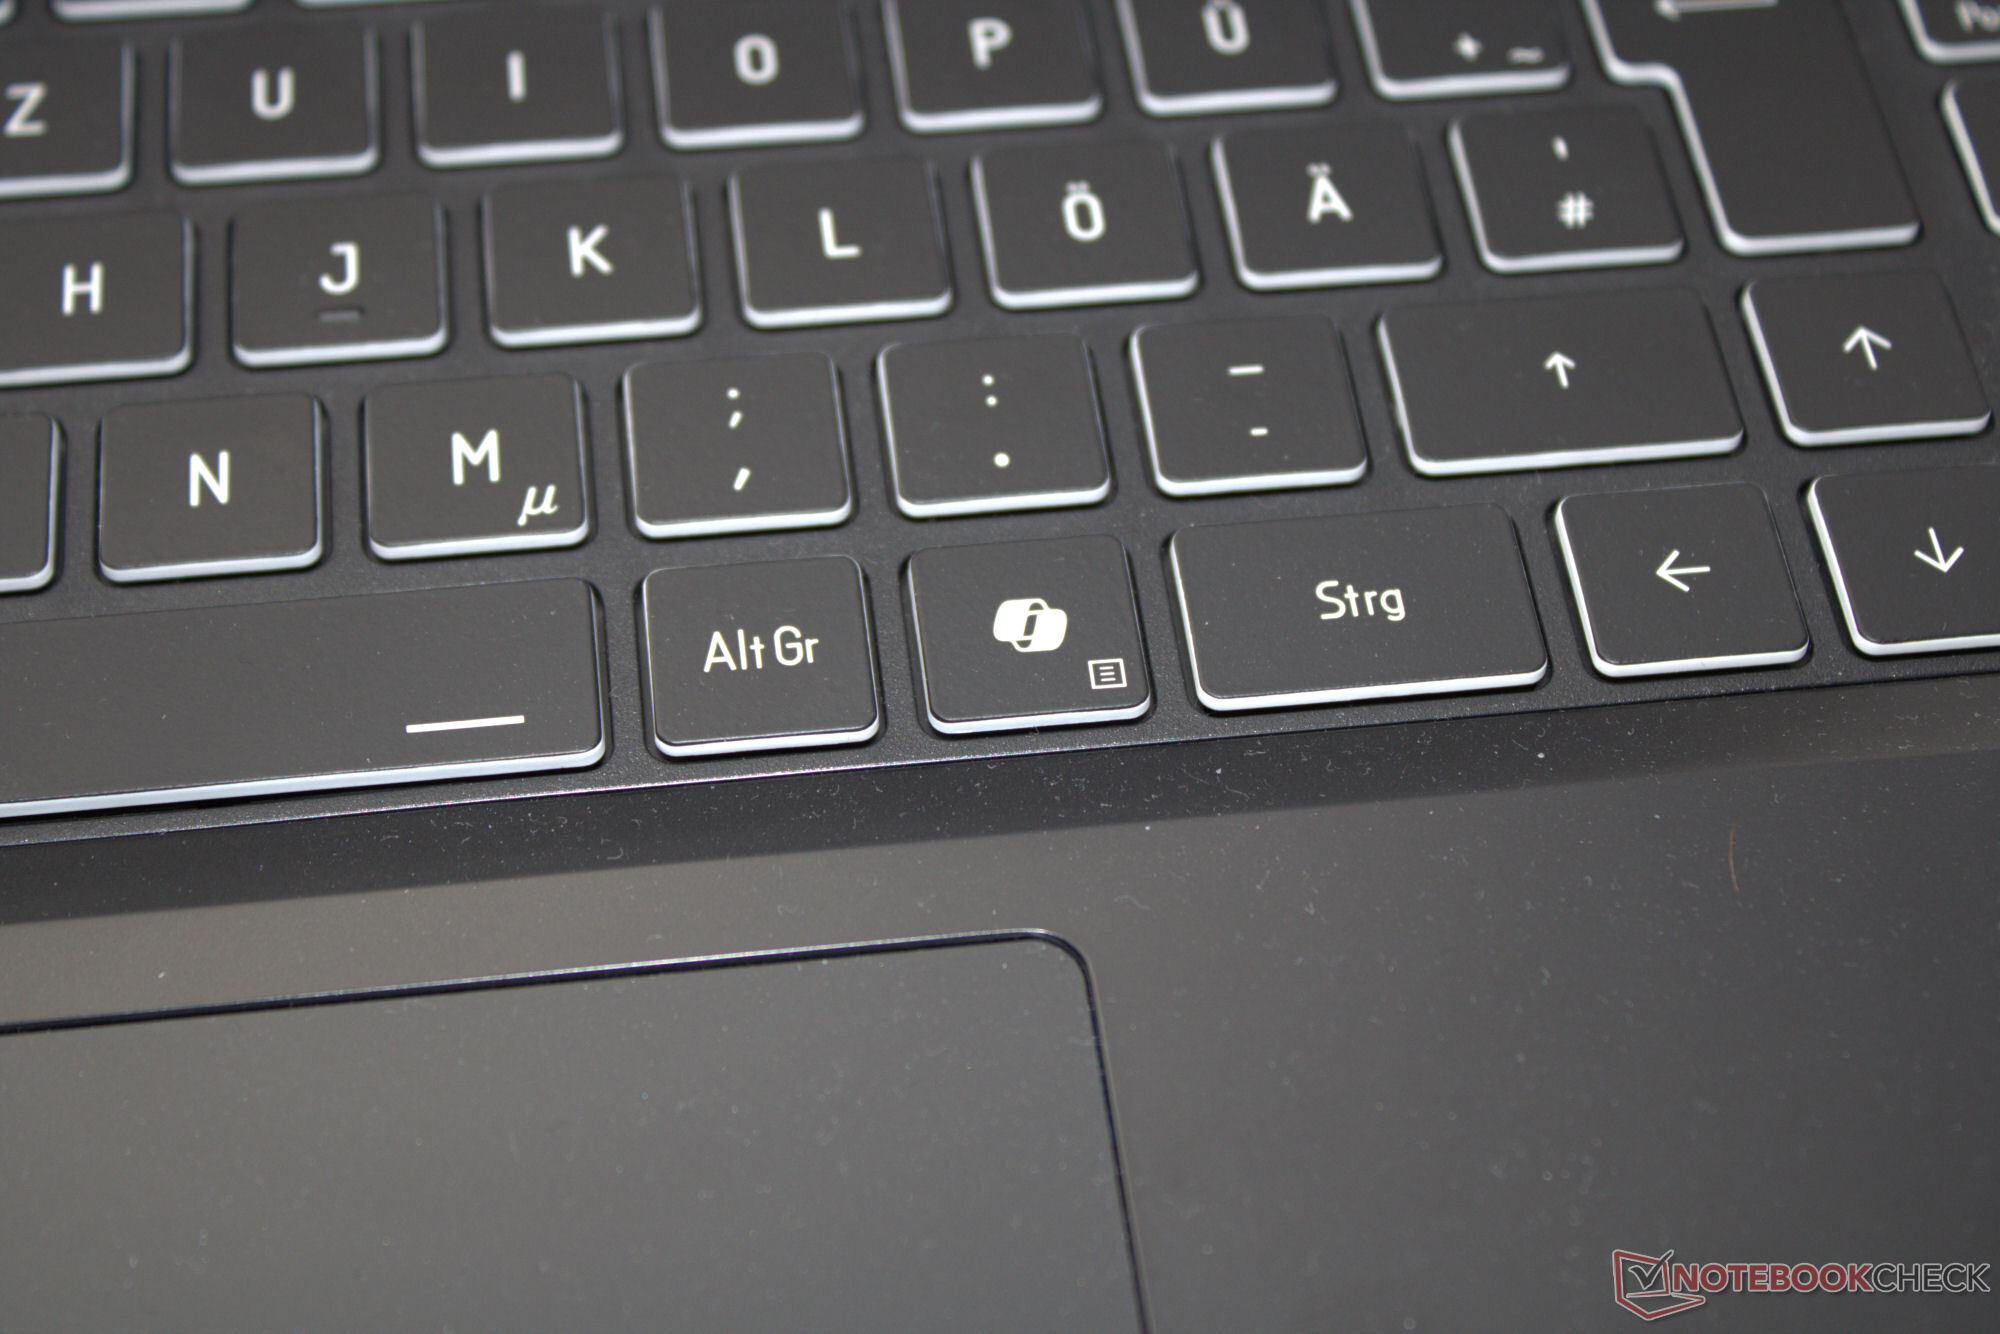
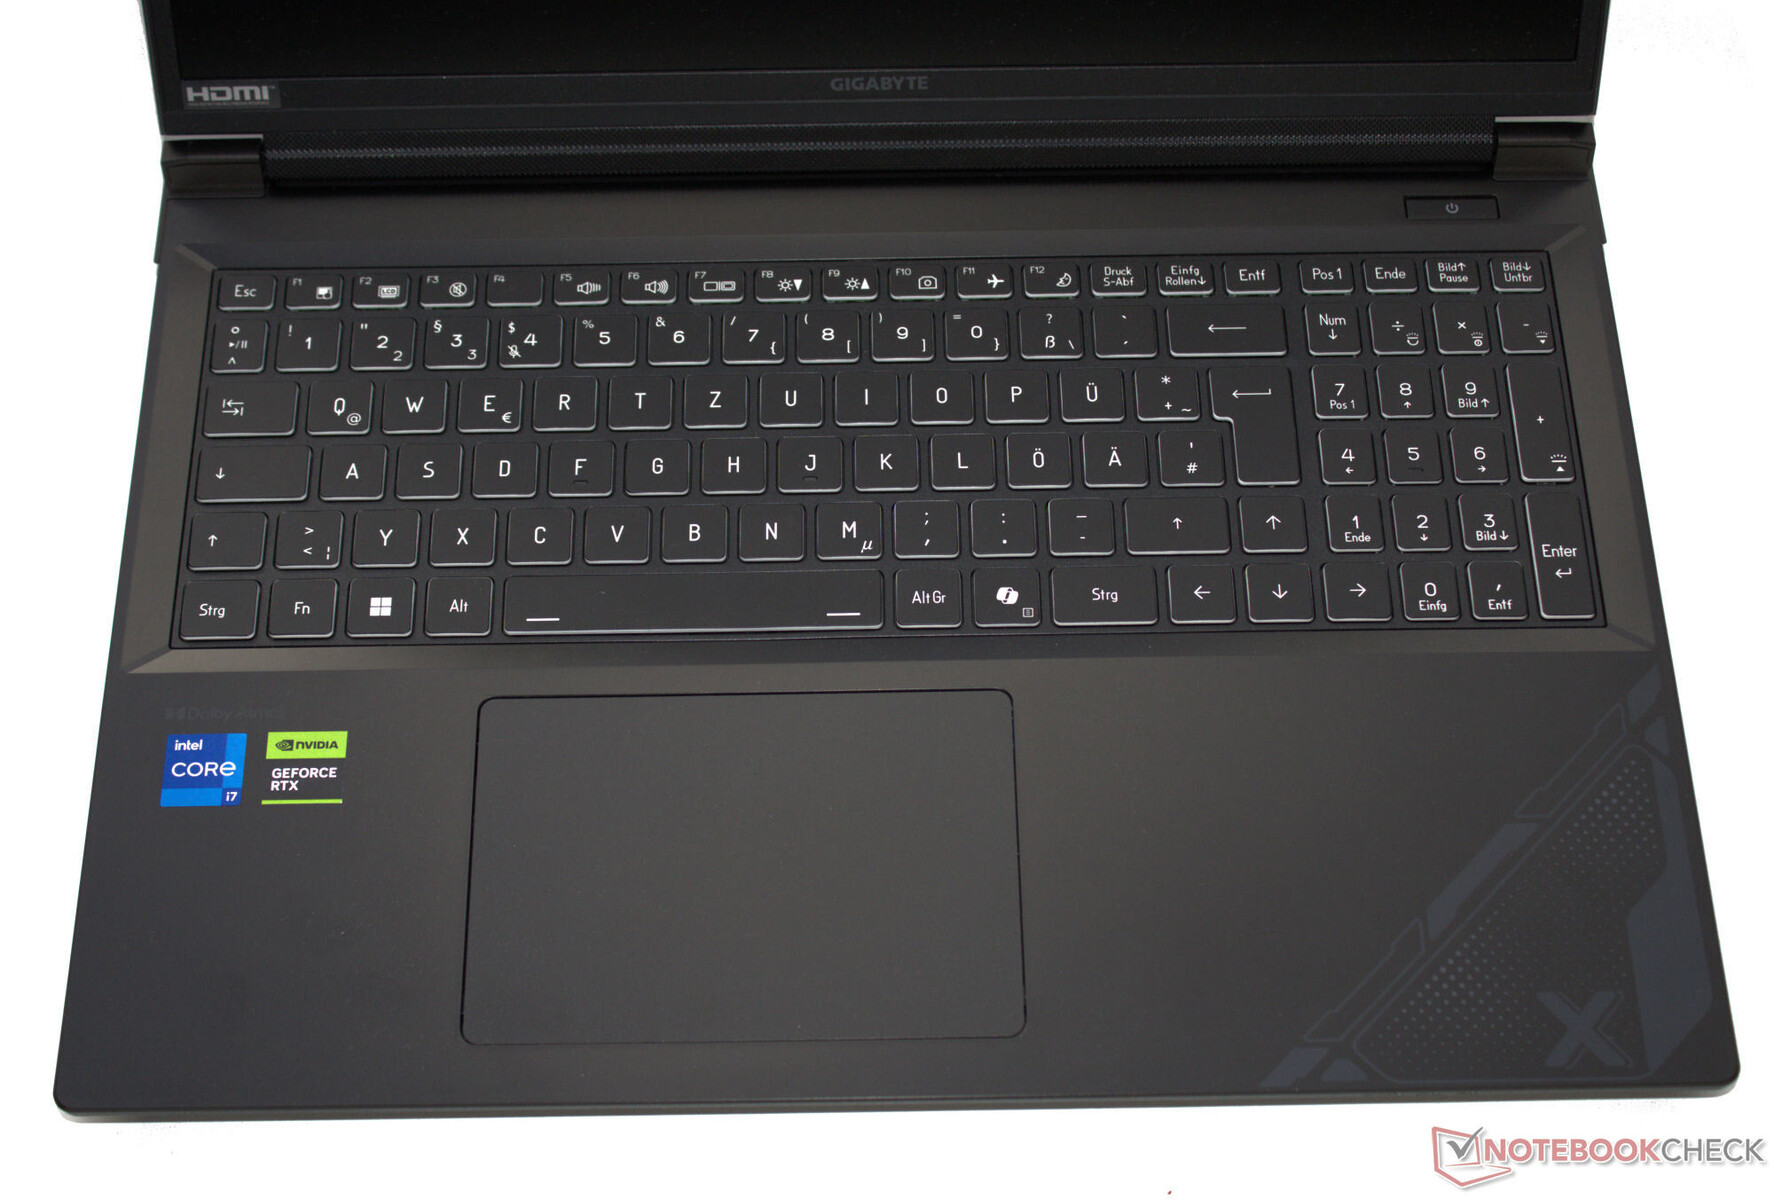
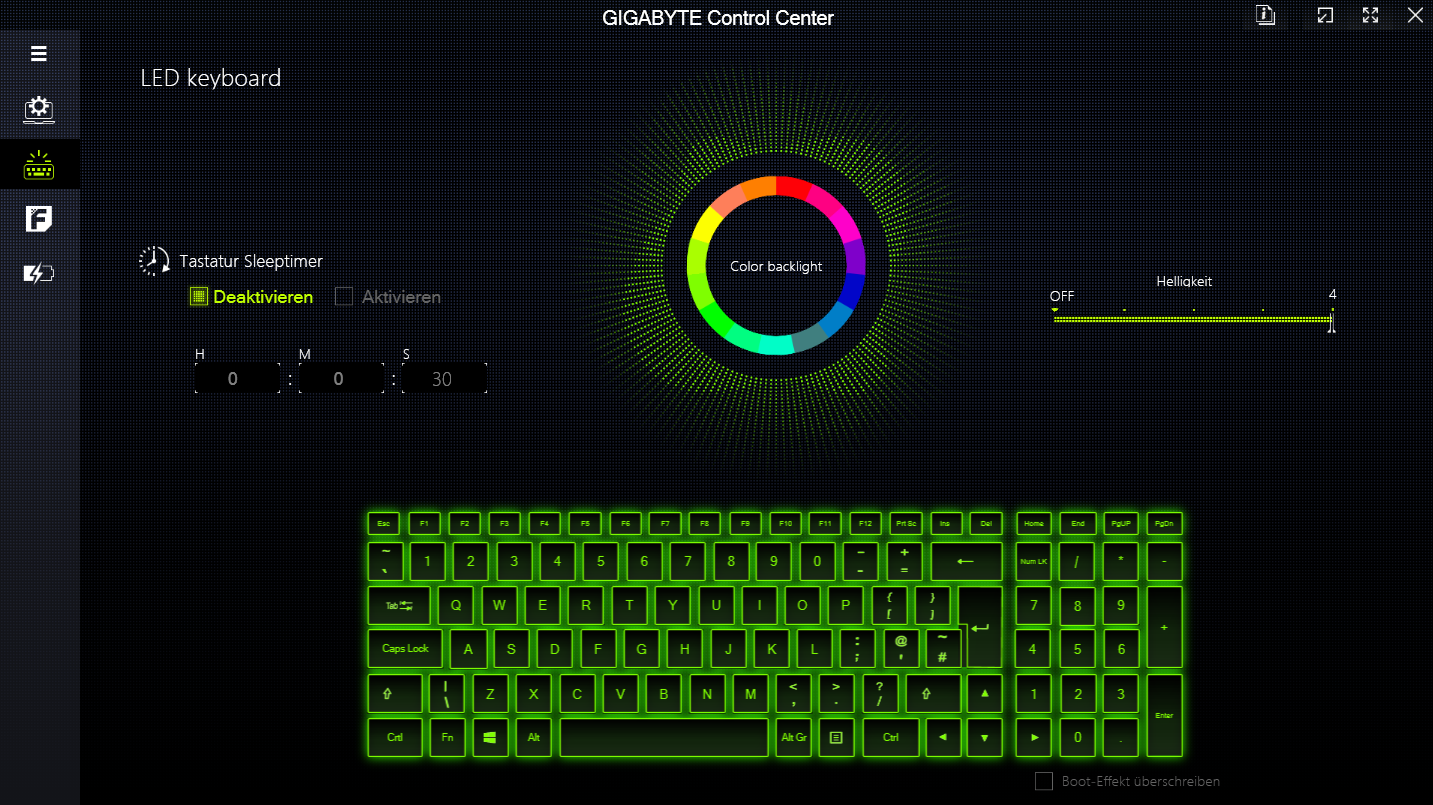
Dispositivi di input: Tastiera retroilluminata adatta all'uso quotidiano
Il G6X ha una tastiera chiclet con tastierino numerico, illuminazione RGB e tasti piatti e lisci, adatti alle esigenze di digitazione quotidiana. La tastiera cede leggermente durante la digitazione, ma non è un problema.
La resistenza dei tasti è nitida. Un aspetto positivo è che i tasti freccia sono a grandezza naturale.
Un touchpad multi-touch (12,1 cm x 8,5 cm) con una corsa breve e un punto di pressione chiaro funge da sostituto del mouse.
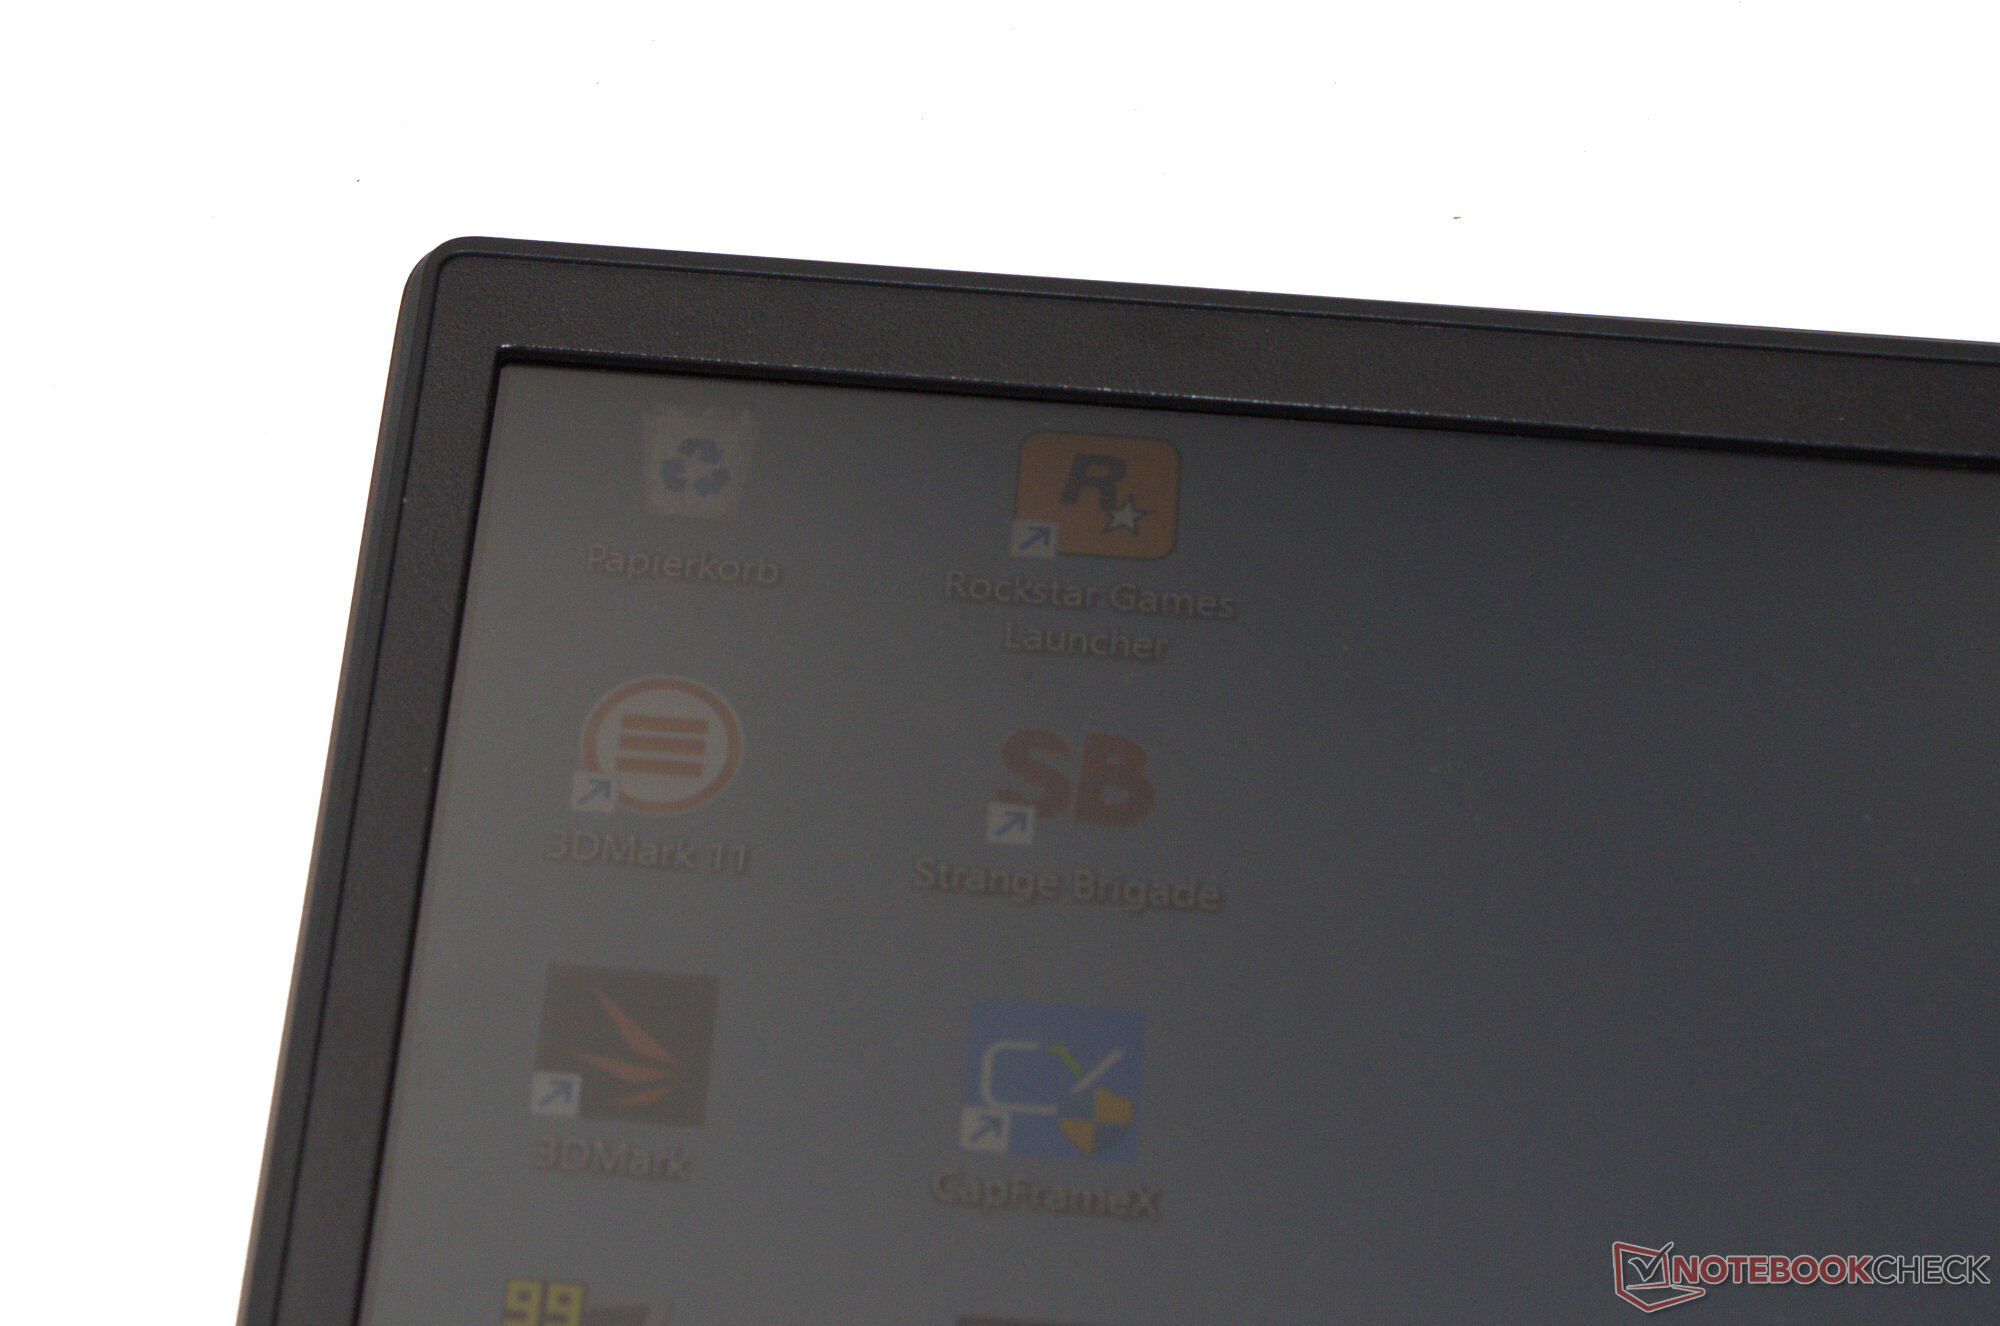
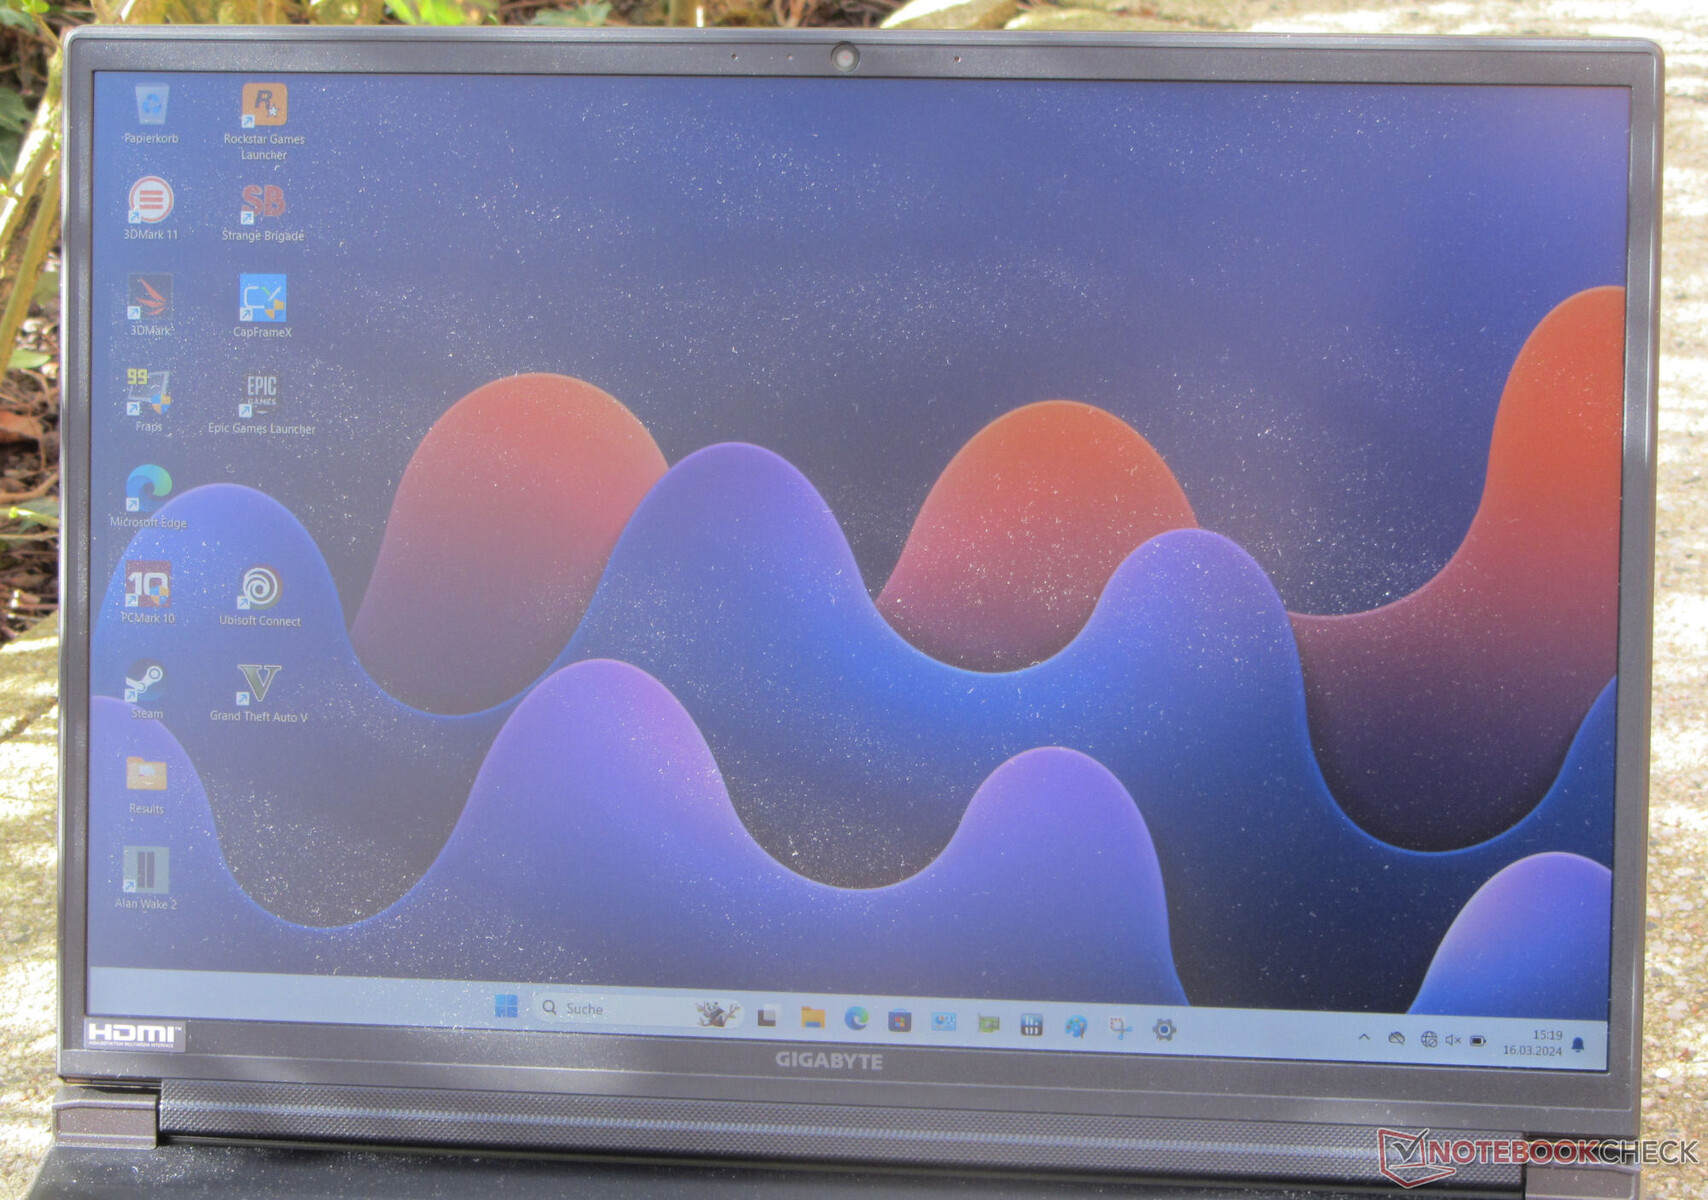
Display: FHD+ 165 Hz senza PWM
Il pannello 16:10 reattivo a 165 Hz con una risoluzione di 1920 x 1200 non presenta sfarfallii PWM in nessuna impostazione di luminosità.
La luminosità e il contrasto del display opaco da 16 pollici soddisfano i rispettivi obiettivi pubblicizzati (> 300 cd/m² e 1.000:1). Gigabyte non offre altre opzioni di display per il G6X.
| |||||||||||||||||||||||||
Distribuzione della luminosità: 81 %
Al centro con la batteria: 353 cd/m²
Contrasto: 1681:1 (Nero: 0.21 cd/m²)
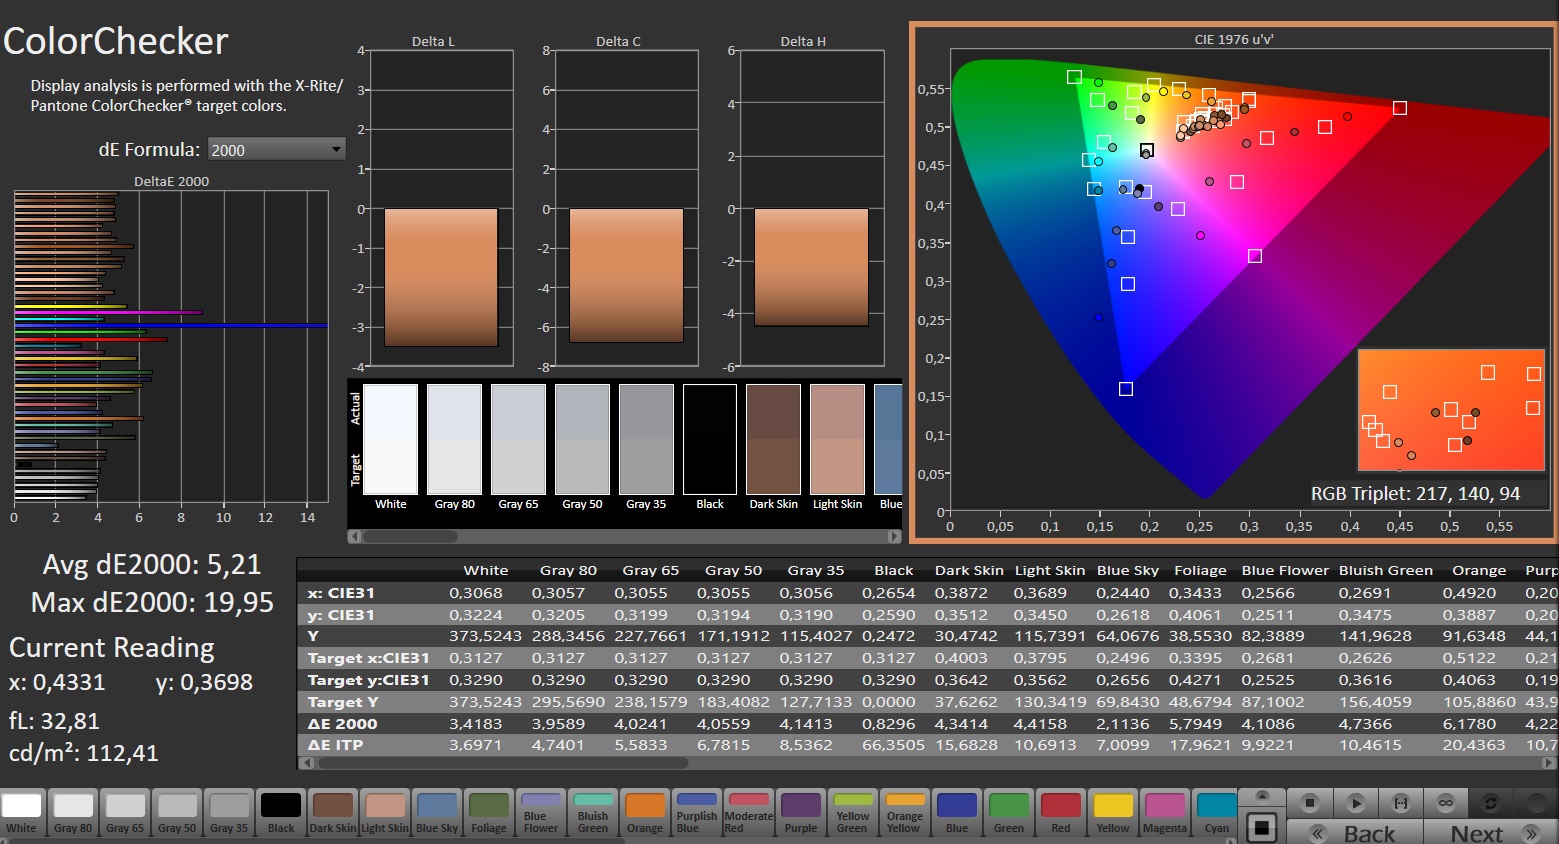
ΔE ColorChecker Calman: 5.21 | ∀{0.5-29.43 Ø4.72}
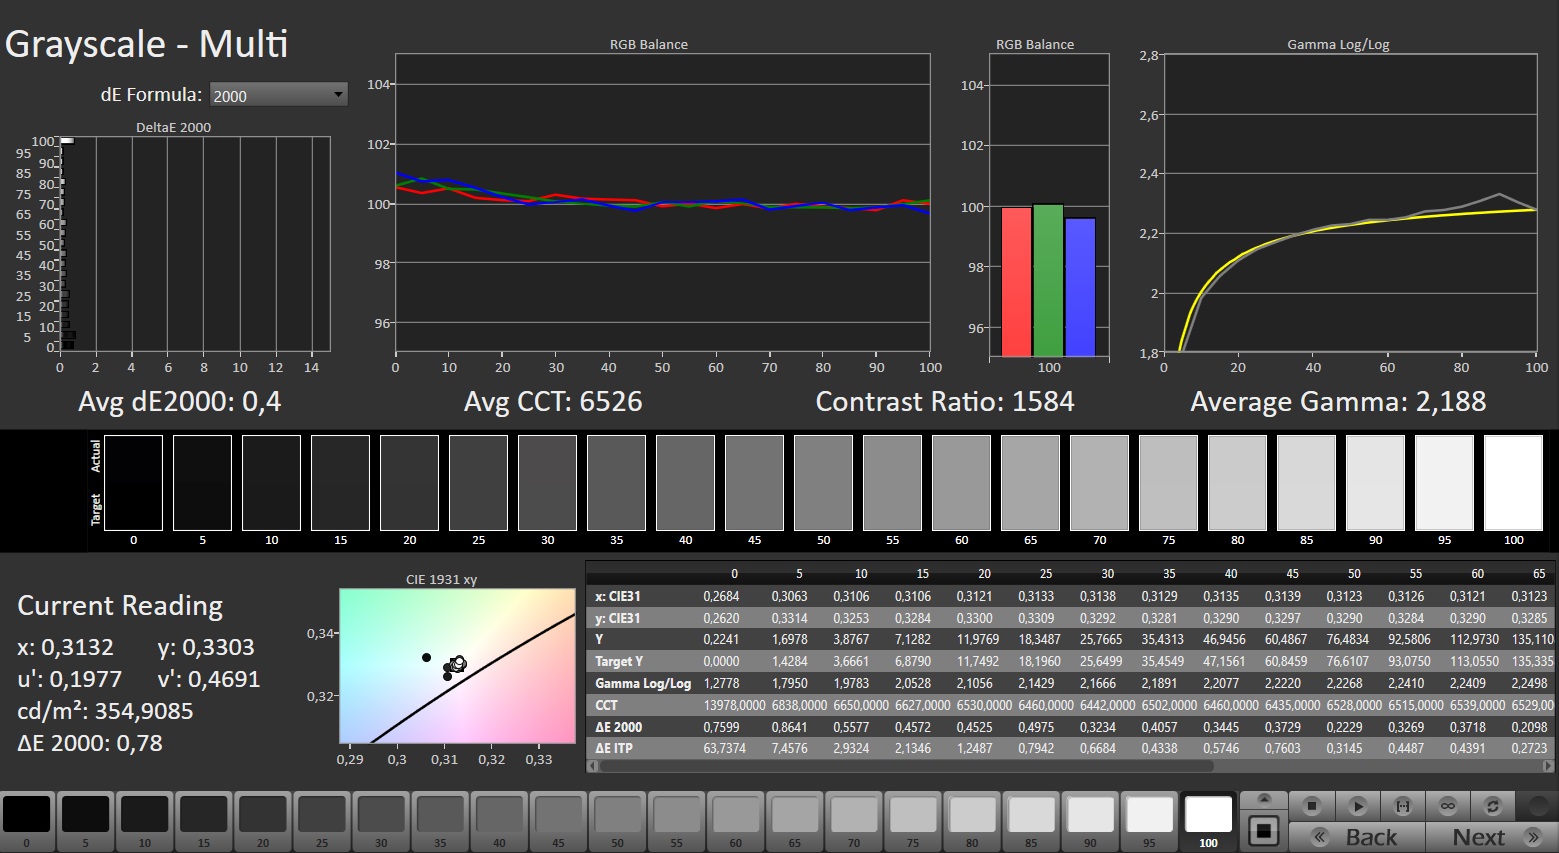
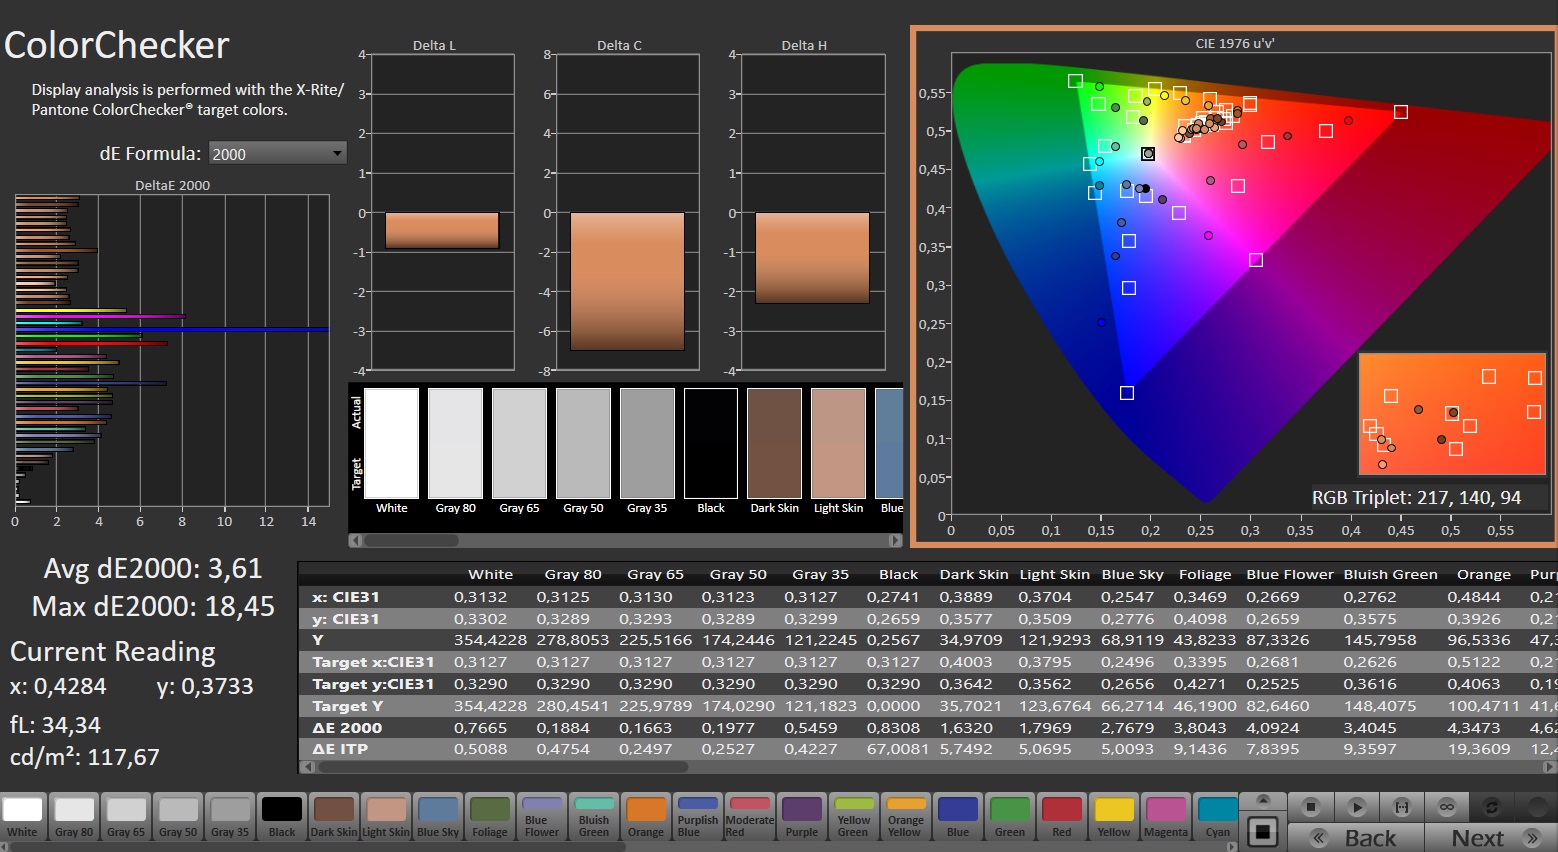
calibrated: 3.61
ΔE Greyscale Calman: 3.6 | ∀{0.09-98 Ø4.97}
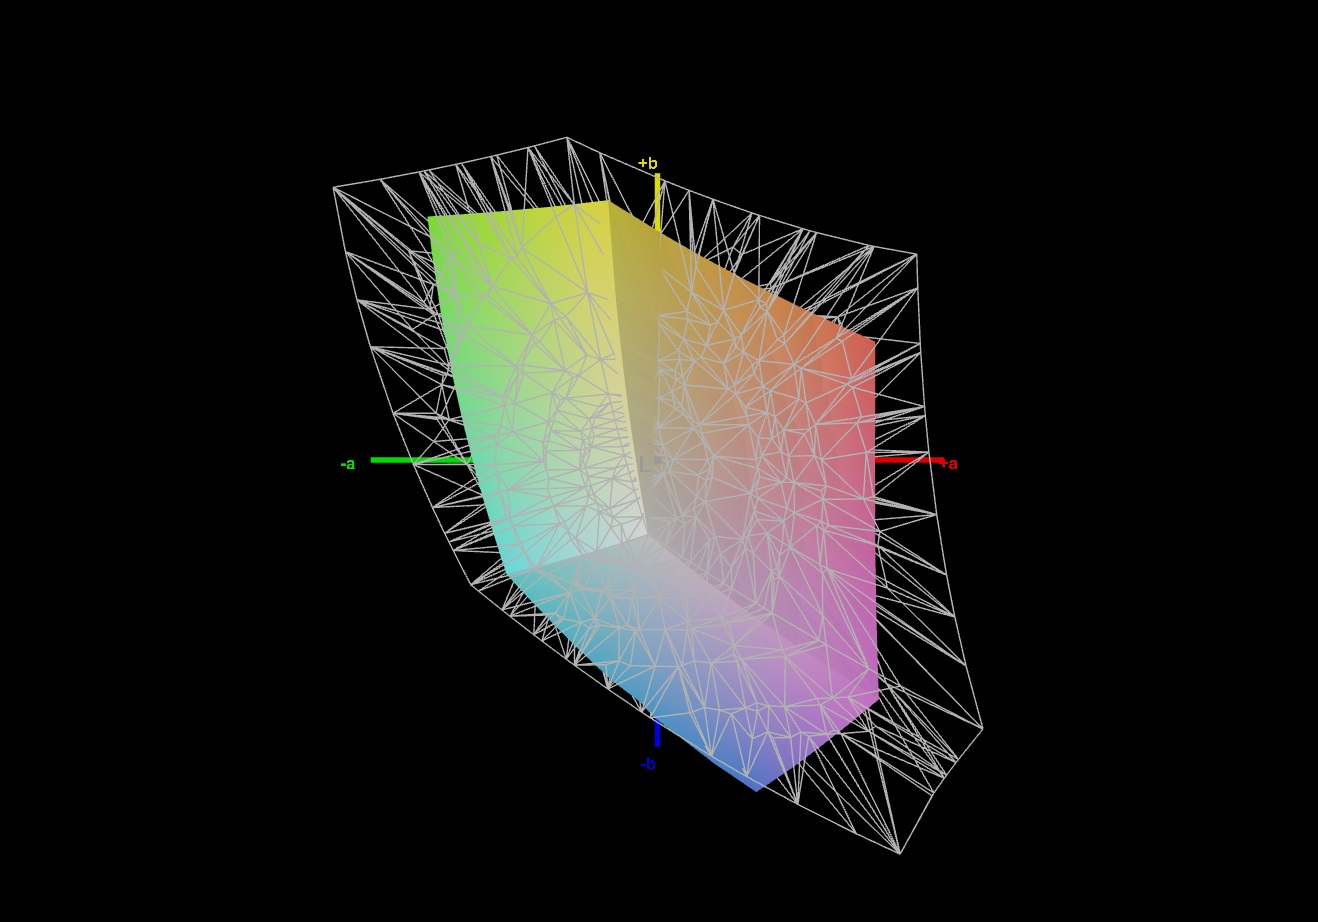
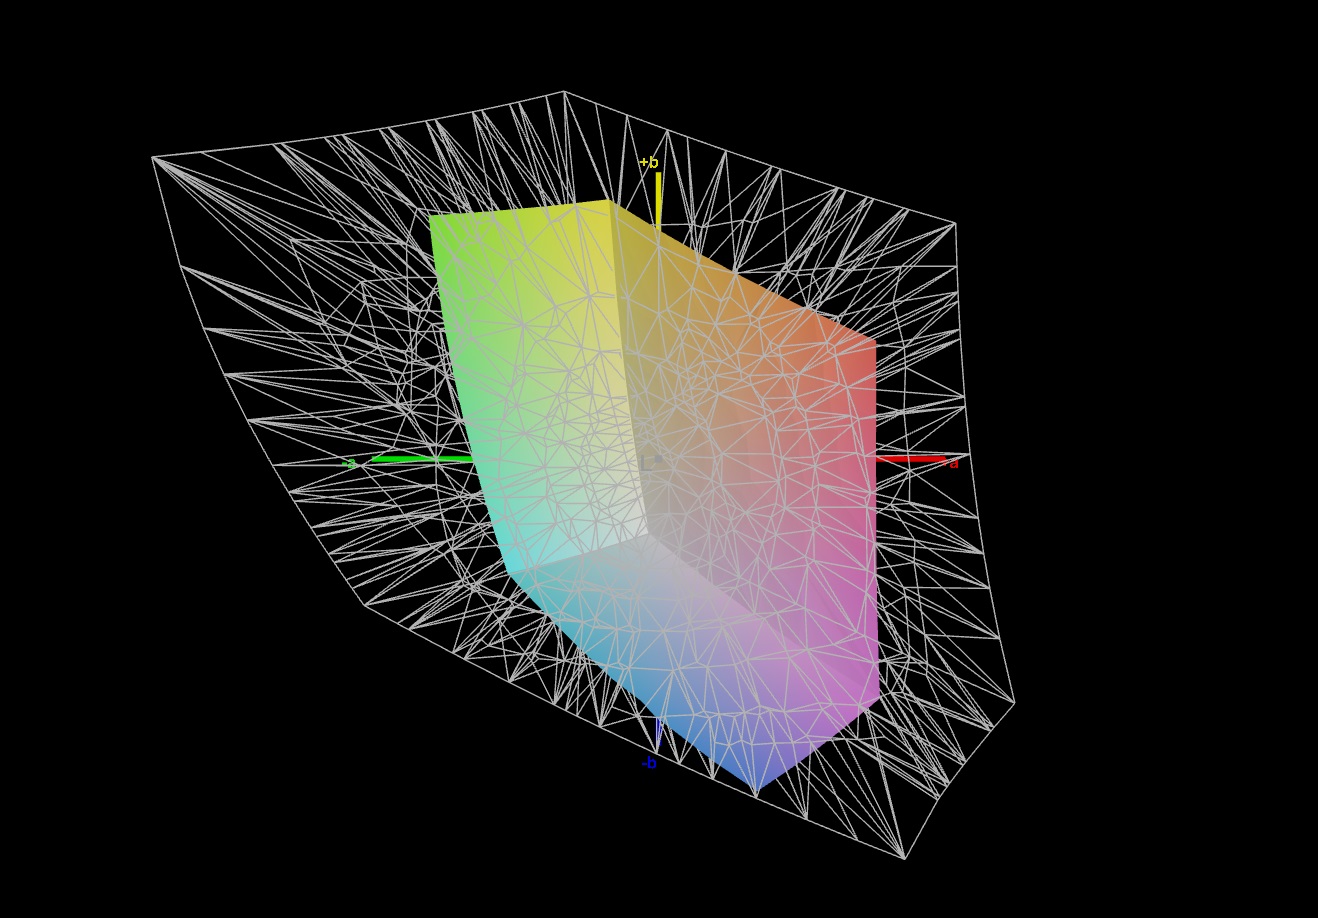
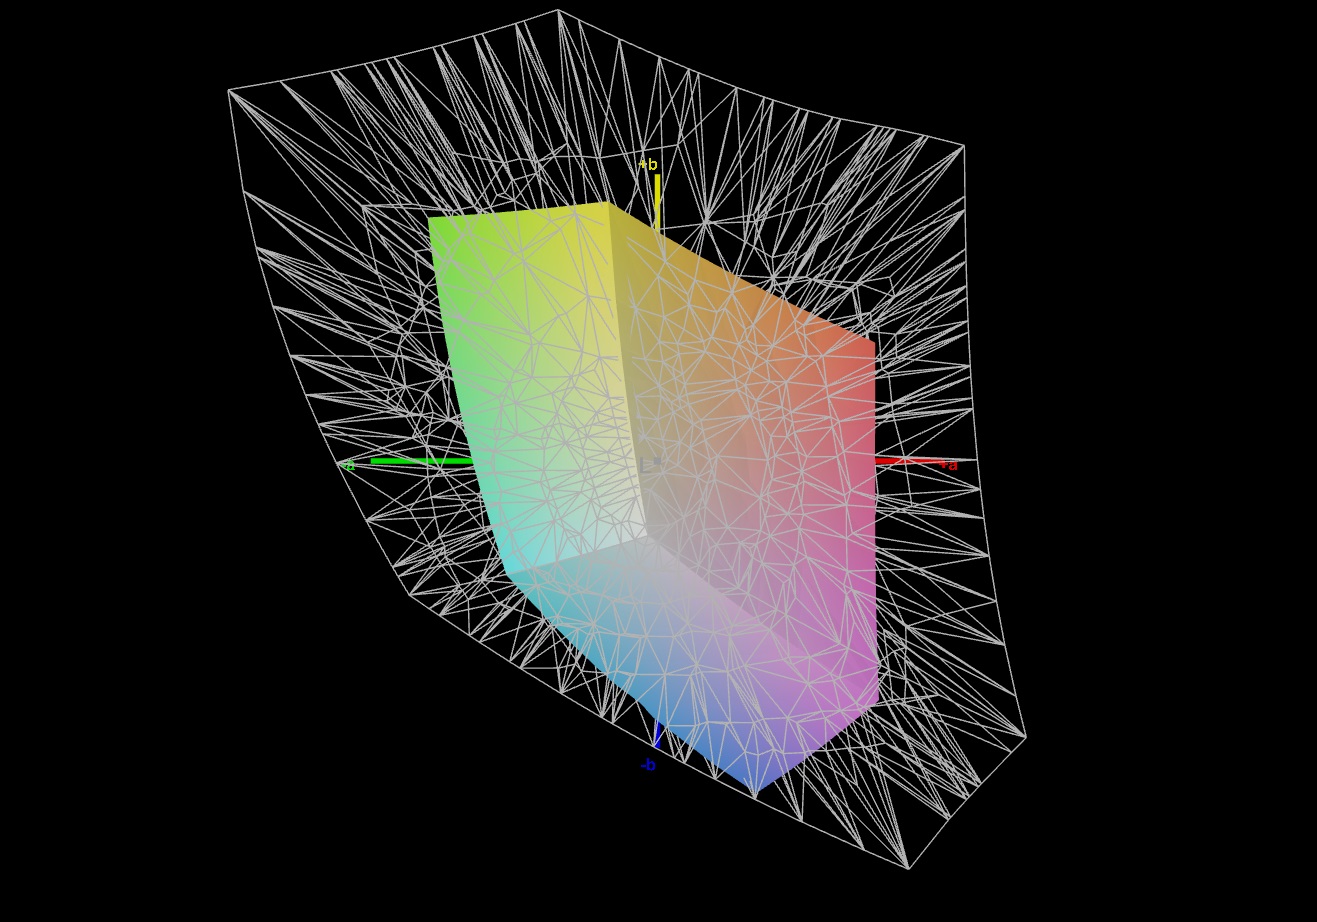
43.3% AdobeRGB 1998 (Argyll 3D)
62.4% sRGB (Argyll 3D)
41.8% Display P3 (Argyll 3D)
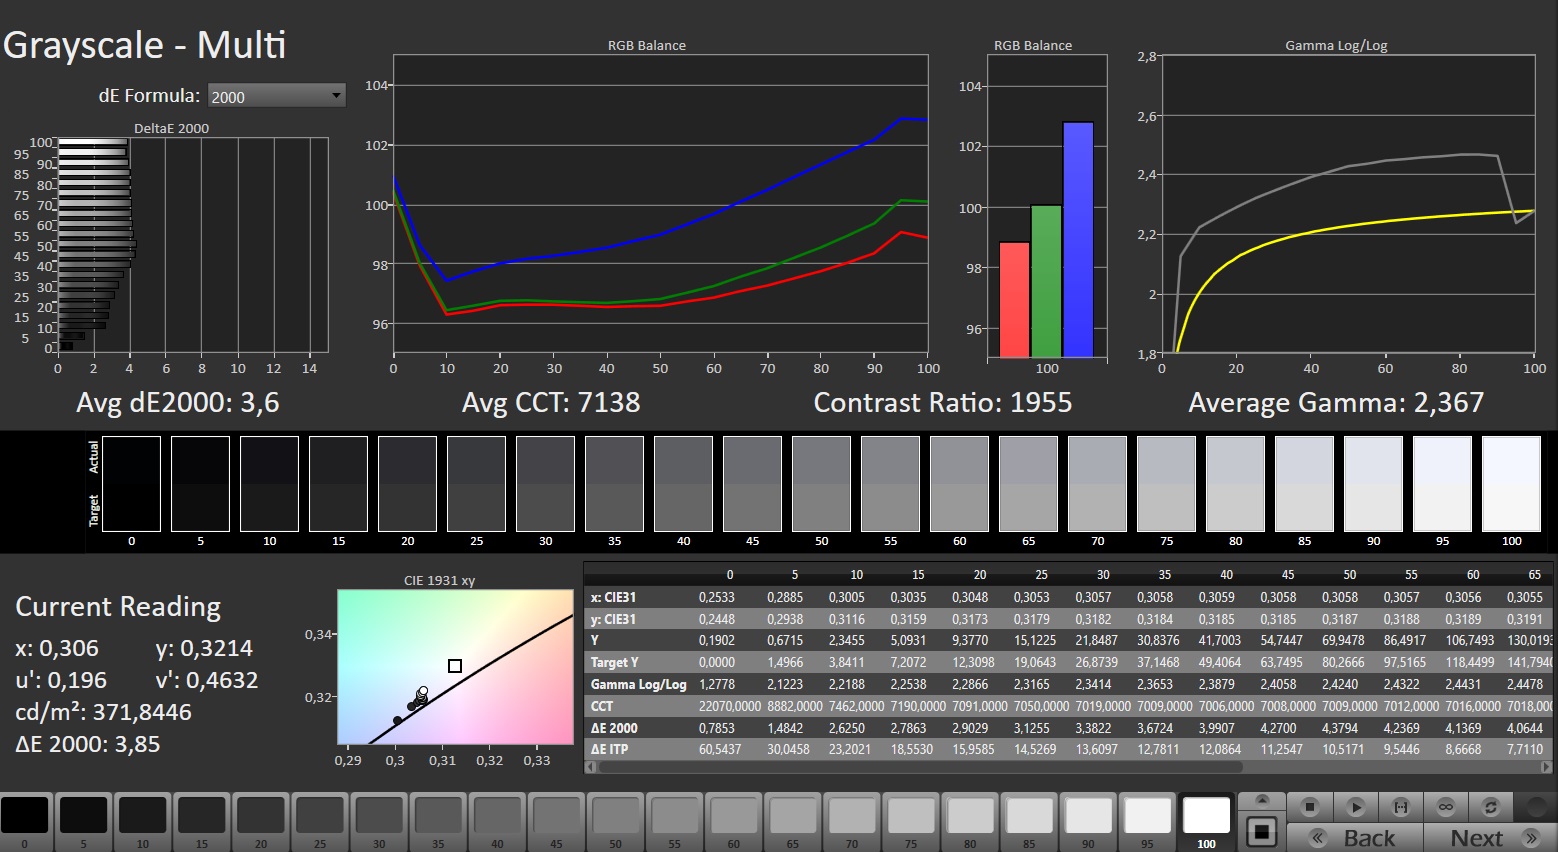
Gamma: 2.367
CCT: 7138 K
| Gigabyte G6X 9KG (2024) BOE NE160WUM-NX6, IPS, 1920x1200, 16" | Dell G16, i7-13650HX, RTX 4060 Chi Mei CMN161D (160GME), IPS, 2560x1600, 16" | Lenovo Legion 5 16IRX G9 NE160QDM-NZ3, IPS, 2560x1600, 16" | MSI Raider GE68HX 13VF Chi Mei N160JME-GTK, IPS, 1900x1200, 16" | Asus TUF Gaming A16 FA617XS BOE NE160WUM-NX2, IPS, 1920x1200, 16" | |
|---|---|---|---|---|---|
| Display | 60% | 68% | -0% | 62% | |
| Display P3 Coverage (%) | 41.8 | 67.5 61% | 72.4 73% | 41.6 0% | 69.3 66% |
| sRGB Coverage (%) | 62.4 | 98.5 58% | 100 60% | 62.2 0% | 97.3 56% |
| AdobeRGB 1998 Coverage (%) | 43.3 | 69.3 60% | 74.1 71% | 43 -1% | 70.7 63% |
| Response Times | 67% | 65% | 23% | 58% | |
| Response Time Grey 50% / Grey 80% * (ms) | 40.5 ? | 7.6 ? 81% | 12.5 ? 69% | 17.3 ? 57% | 15.6 ? 61% |
| Response Time Black / White * (ms) | 21.6 ? | 10.4 ? 52% | 8.7 ? 60% | 24.2 ? -12% | 10 ? 54% |
| PWM Frequency (Hz) | |||||
| Screen | 15% | 39% | -2% | 25% | |
| Brightness middle (cd/m²) | 353 | 369 5% | 526 49% | 300.9 -15% | 301 -15% |
| Brightness (cd/m²) | 318 | 344 8% | 500 57% | 302 -5% | 294 -8% |
| Brightness Distribution (%) | 81 | 89 10% | 87 7% | 93 15% | 94 16% |
| Black Level * (cd/m²) | 0.21 | 0.26 -24% | 0.33 -57% | 0.31 -48% | 0.21 -0% |
| Contrast (:1) | 1681 | 1419 -16% | 1594 -5% | 971 -42% | 1433 -15% |
| Colorchecker dE 2000 * | 5.21 | 3.04 42% | 1.2 77% | 4.6 12% | 1.79 66% |
| Colorchecker dE 2000 max. * | 19.95 | 5.56 72% | 2.1 89% | 17.6 12% | 3.48 83% |
| Colorchecker dE 2000 calibrated * | 3.61 | 2.35 35% | 1 72% | 2.04 43% | 1.2 67% |
| Greyscale dE 2000 * | 3.6 | 3.38 6% | 1.3 64% | 3.3 8% | 2.5 31% |
| Gamma | 2.367 93% | 2.47 89% | 2.23 99% | 2.09 105% | 2.265 97% |
| CCT | 7138 91% | 6040 108% | 6391 102% | 7151 91% | 6157 106% |
| Media totale (Programma / Settaggio) | 47% /
32% | 57% /
49% | 7% /
2% | 48% /
38% |
* ... Meglio usare valori piccoli
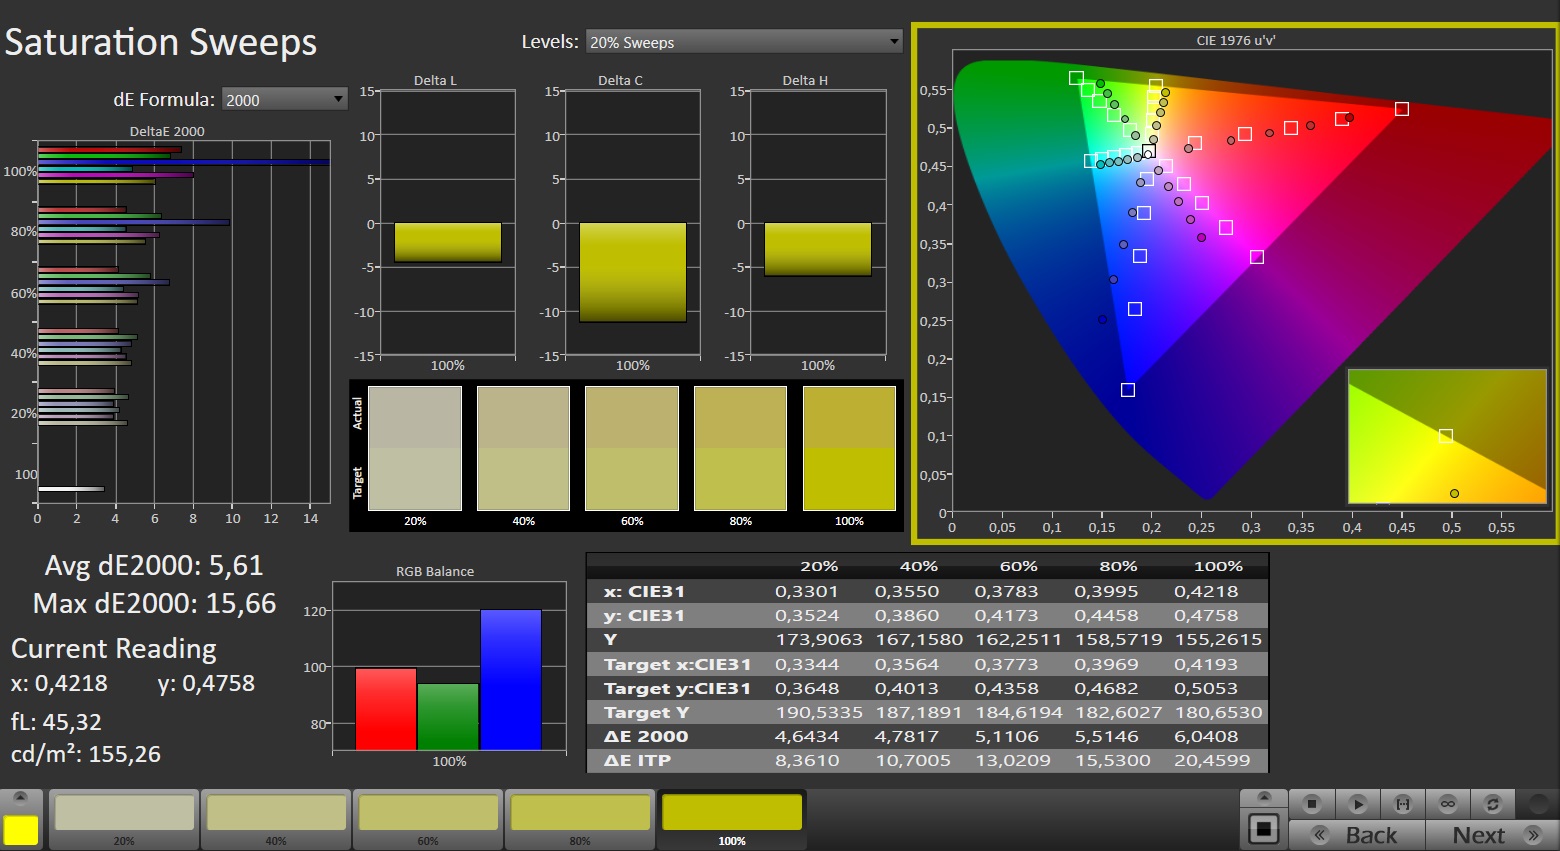
Il display mostra una riproduzione dei colori mediocre, ex-lavoro: Con una deviazione di circa 5,2, l'obiettivo deltaE 2000 di < 3 non viene raggiunto. La calibrazione riduce la deviazione a 3,6 e garantisce sfumature di grigio più equilibrate.
Il pannello non è in grado di riprodurre completamente gli spazi di colore AdobeRGB, sRGB e DCI-P3. A questo proposito, i concorrenti del G6X offrono schermi migliori.

Tempi di risposta del Display
| ↔ Tempi di risposta dal Nero al Bianco | ||
|---|---|---|
| 21.6 ms ... aumenta ↗ e diminuisce ↘ combinato | ↗ 11.1 ms Incremento | 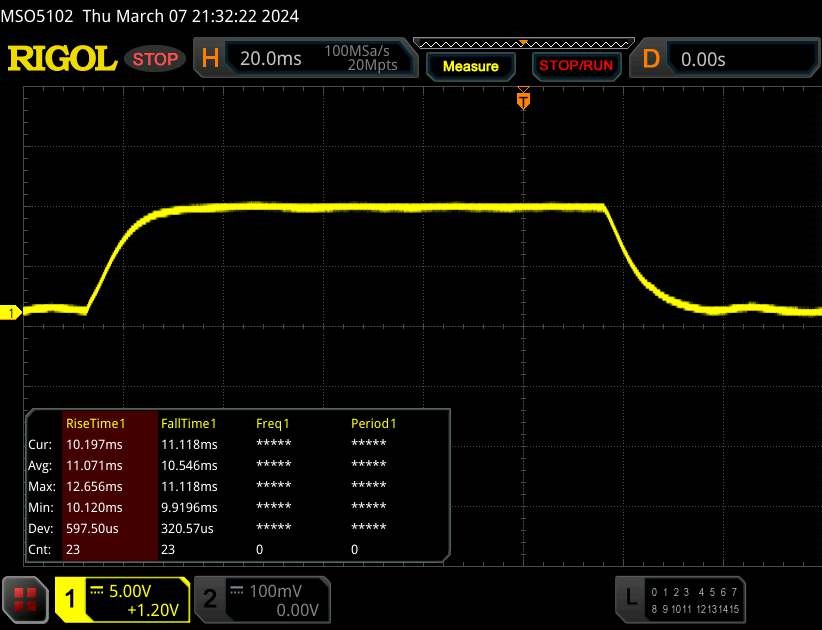 |
| ↘ 10.5 ms Calo | ||
| Lo schermo mostra buoni tempi di risposta durante i nostri tests, ma potrebbe essere troppo lento per i gamers competitivi. In confronto, tutti i dispositivi di test variano da 0.1 (minimo) a 240 (massimo) ms. » 48 % di tutti i dispositivi è migliore. Questo significa che i tempi di risposta rilevati sono simili alla media di tutti i dispositivi testati (19.8 ms). | ||
| ↔ Tempo di risposta dal 50% Grigio all'80% Grigio | ||
| 40.5 ms ... aumenta ↗ e diminuisce ↘ combinato | ↗ 19 ms Incremento | 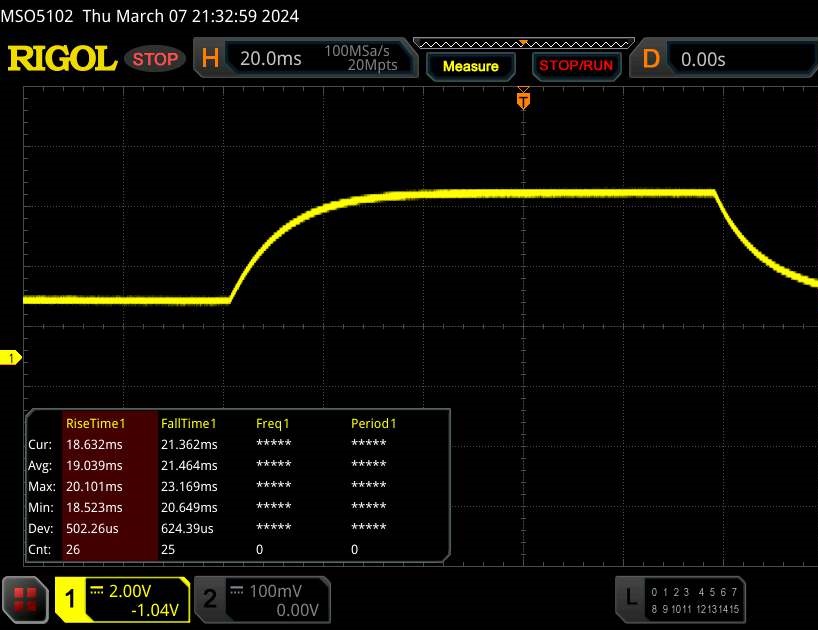 |
| ↘ 21.5 ms Calo | ||
| Lo schermo mostra tempi di risposta lenti nei nostri tests e sarà insoddisfacente per i gamers. In confronto, tutti i dispositivi di test variano da 0.165 (minimo) a 636 (massimo) ms. » 64 % di tutti i dispositivi è migliore. Questo significa che i tempi di risposta rilevati sono peggiori rispetto alla media di tutti i dispositivi testati (31 ms). | ||
Sfarfallio dello schermo / PWM (Pulse-Width Modulation)
| flickering dello schermo / PWM non rilevato |  | ||
In confronto: 52 % di tutti i dispositivi testati non utilizza PWM per ridurre la luminosita' del display. Se è rilevato PWM, una media di 7778 (minimo: 5 - massimo: 343500) Hz è stata rilevata. | |||
Il pannello IPS offre angoli di visione relativamente stabili che possono essere letti da posizioni estreme. È possibile utilizzare il display all'aperto se il sole non è troppo luminoso.
Prestazioni: Raptor Lake e Ada Lovelace alimentano il 16 pollici
Gigabyte offre un notebook da gioco di fascia media con il G6X 9KG. Raptor Lake-HX e Ada Lovelace forniscono la potenza di calcolo necessaria.
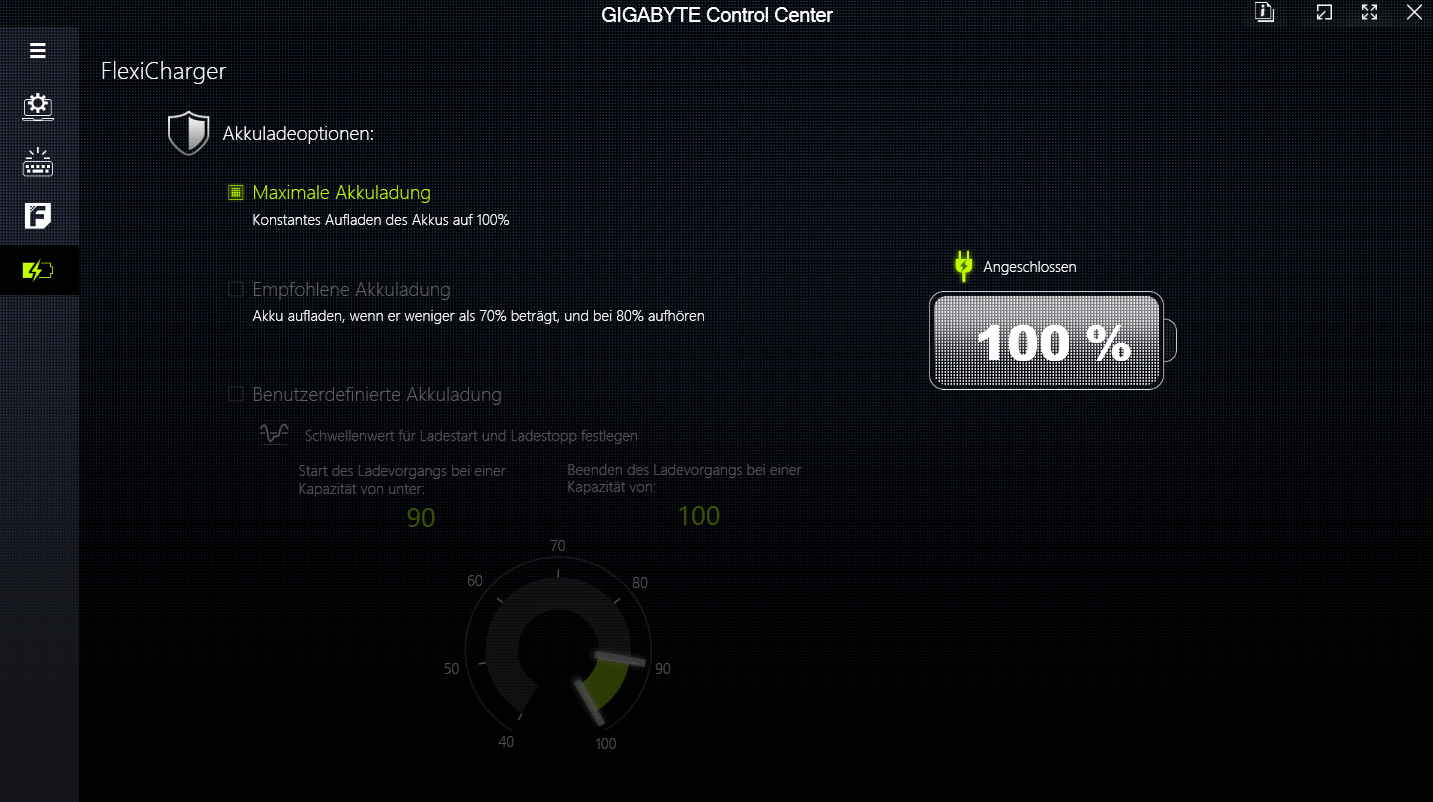
Condizioni del test
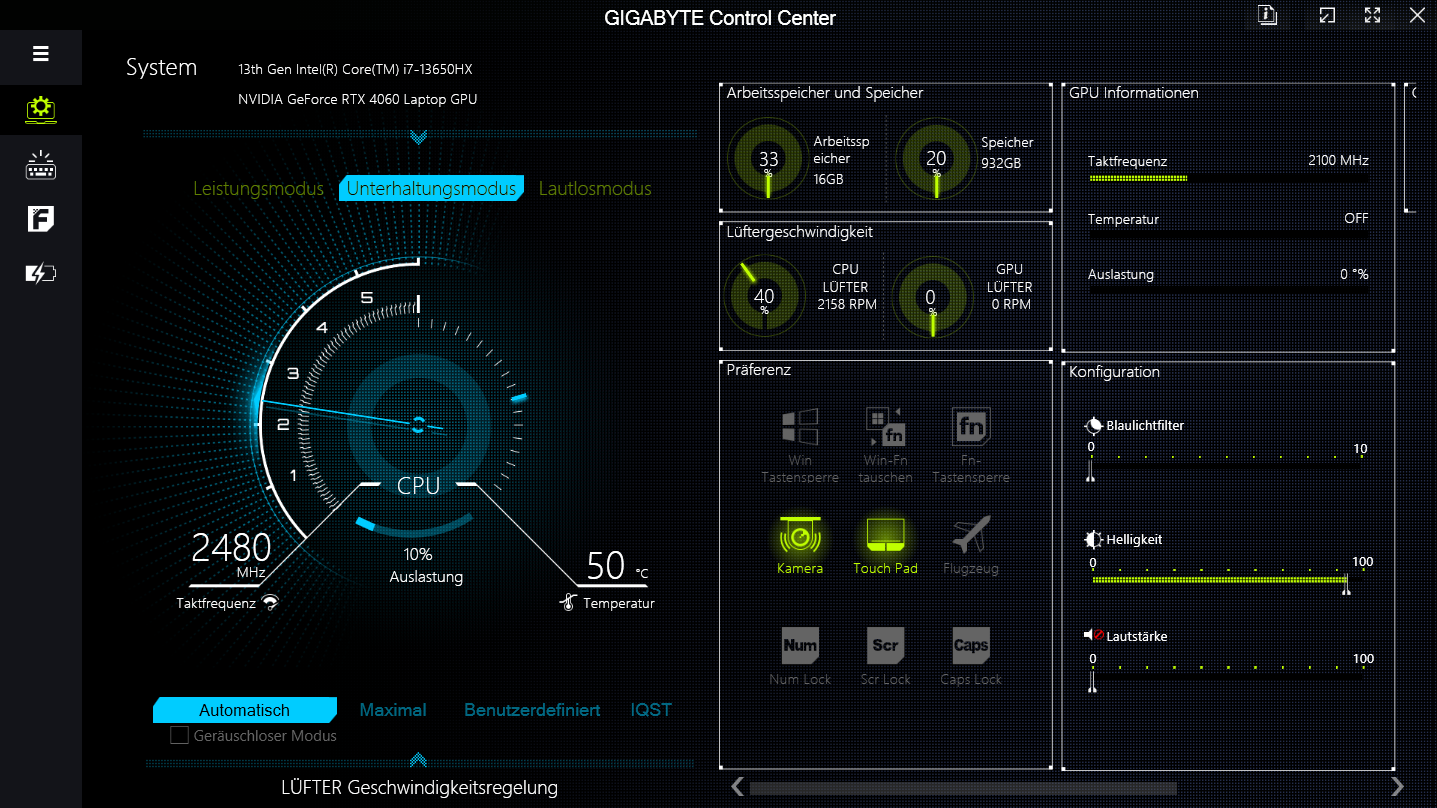
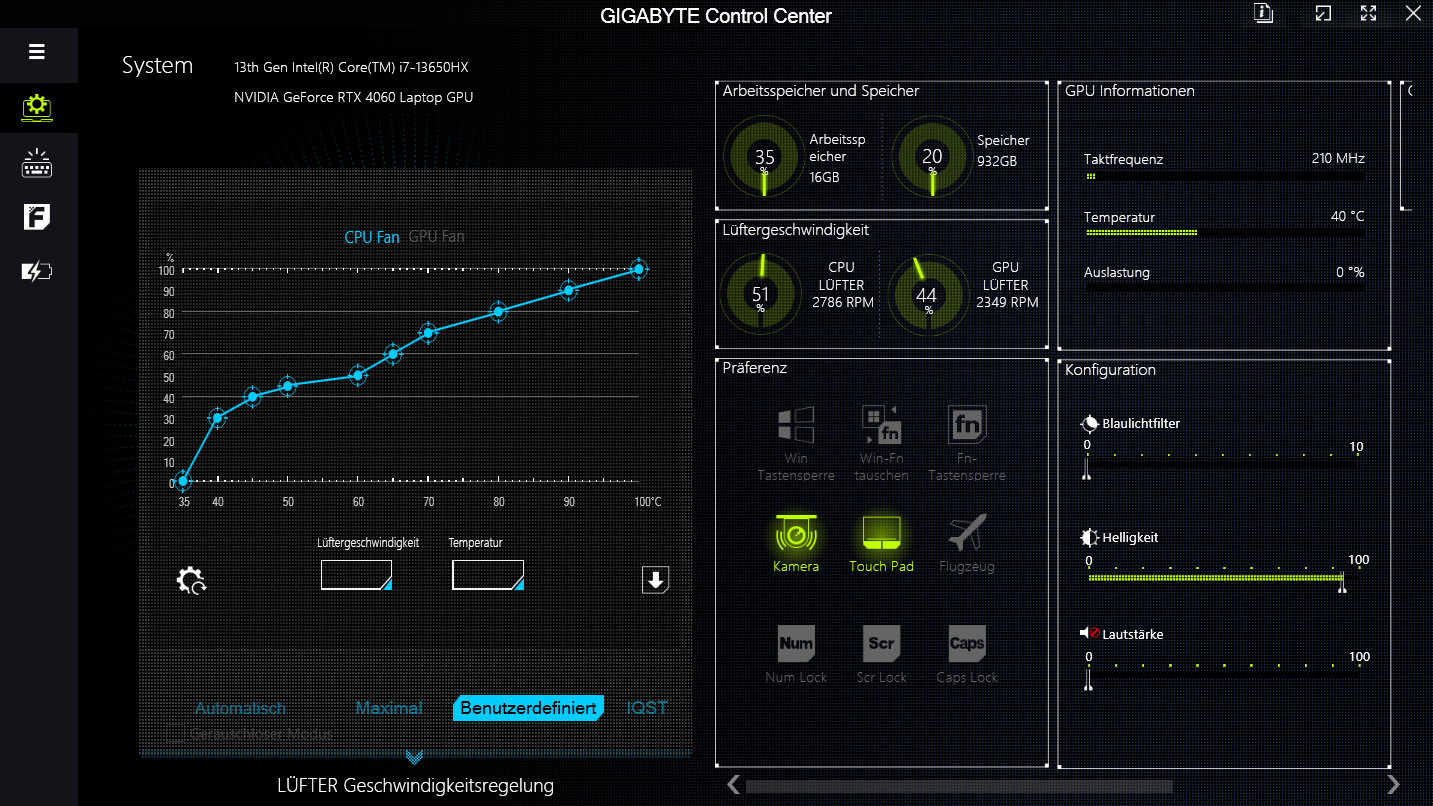
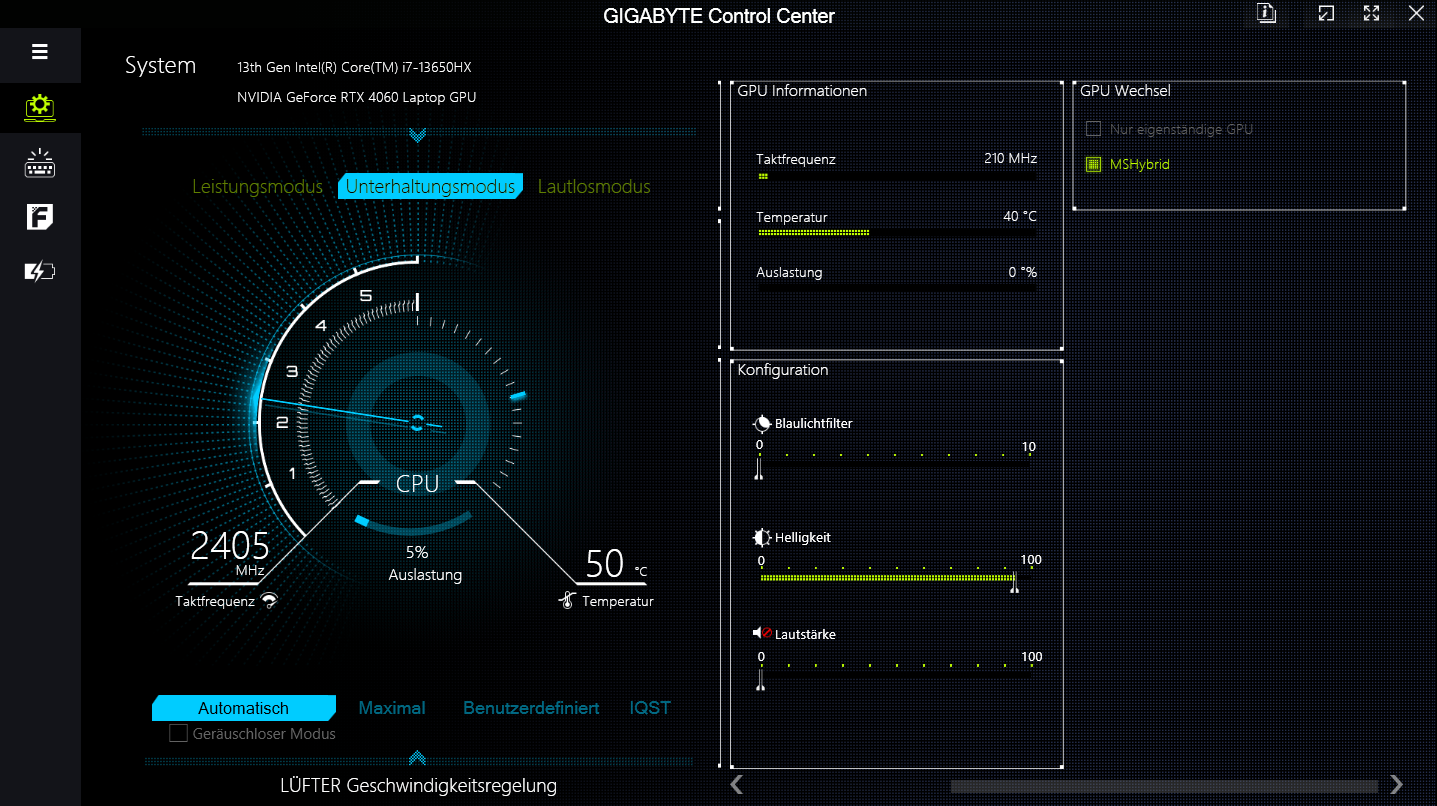
Il G6X offre tre modalità di prestazioni specifiche del produttore (vedere la tabella sottostante), che possono essere alternate tramite l'applicazione Control Center. La modalità "Intrattenimento" è stata utilizzata per i benchmark, mentre la modalità "Silenzioso" è stata impiegata per i test della batteria. Entrambe le modalità offrono il controllo automatico della ventola.
| Modalità prestazioni | Modalità intrattenimento | Modalità silenziosa (= dGPU disattivata) | |
|---|---|---|---|
| Limite di potenza 1 (HWInfo) | 135 W | 55 W | 25 W |
| Limite di potenza 2 (HWInfo) | 155 W | 115 W | 30 W |
| Rumore ( Witcher 3 1080p Ultra) | 55 dB(A) | 51 dB(A) | 33 dB(A) |
| Prestazioni ( Witcher 3 1080p Ultra) | ~102 fps | ~100 fps | 4 fps |
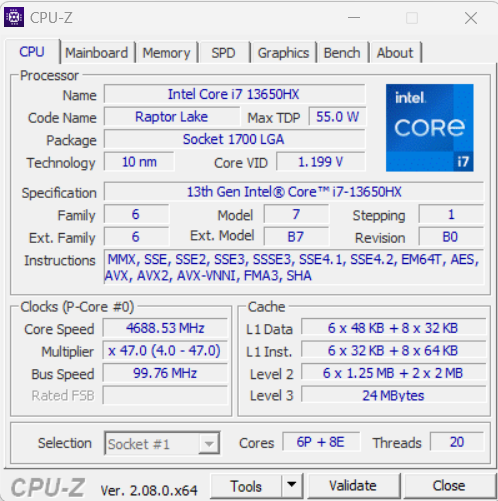
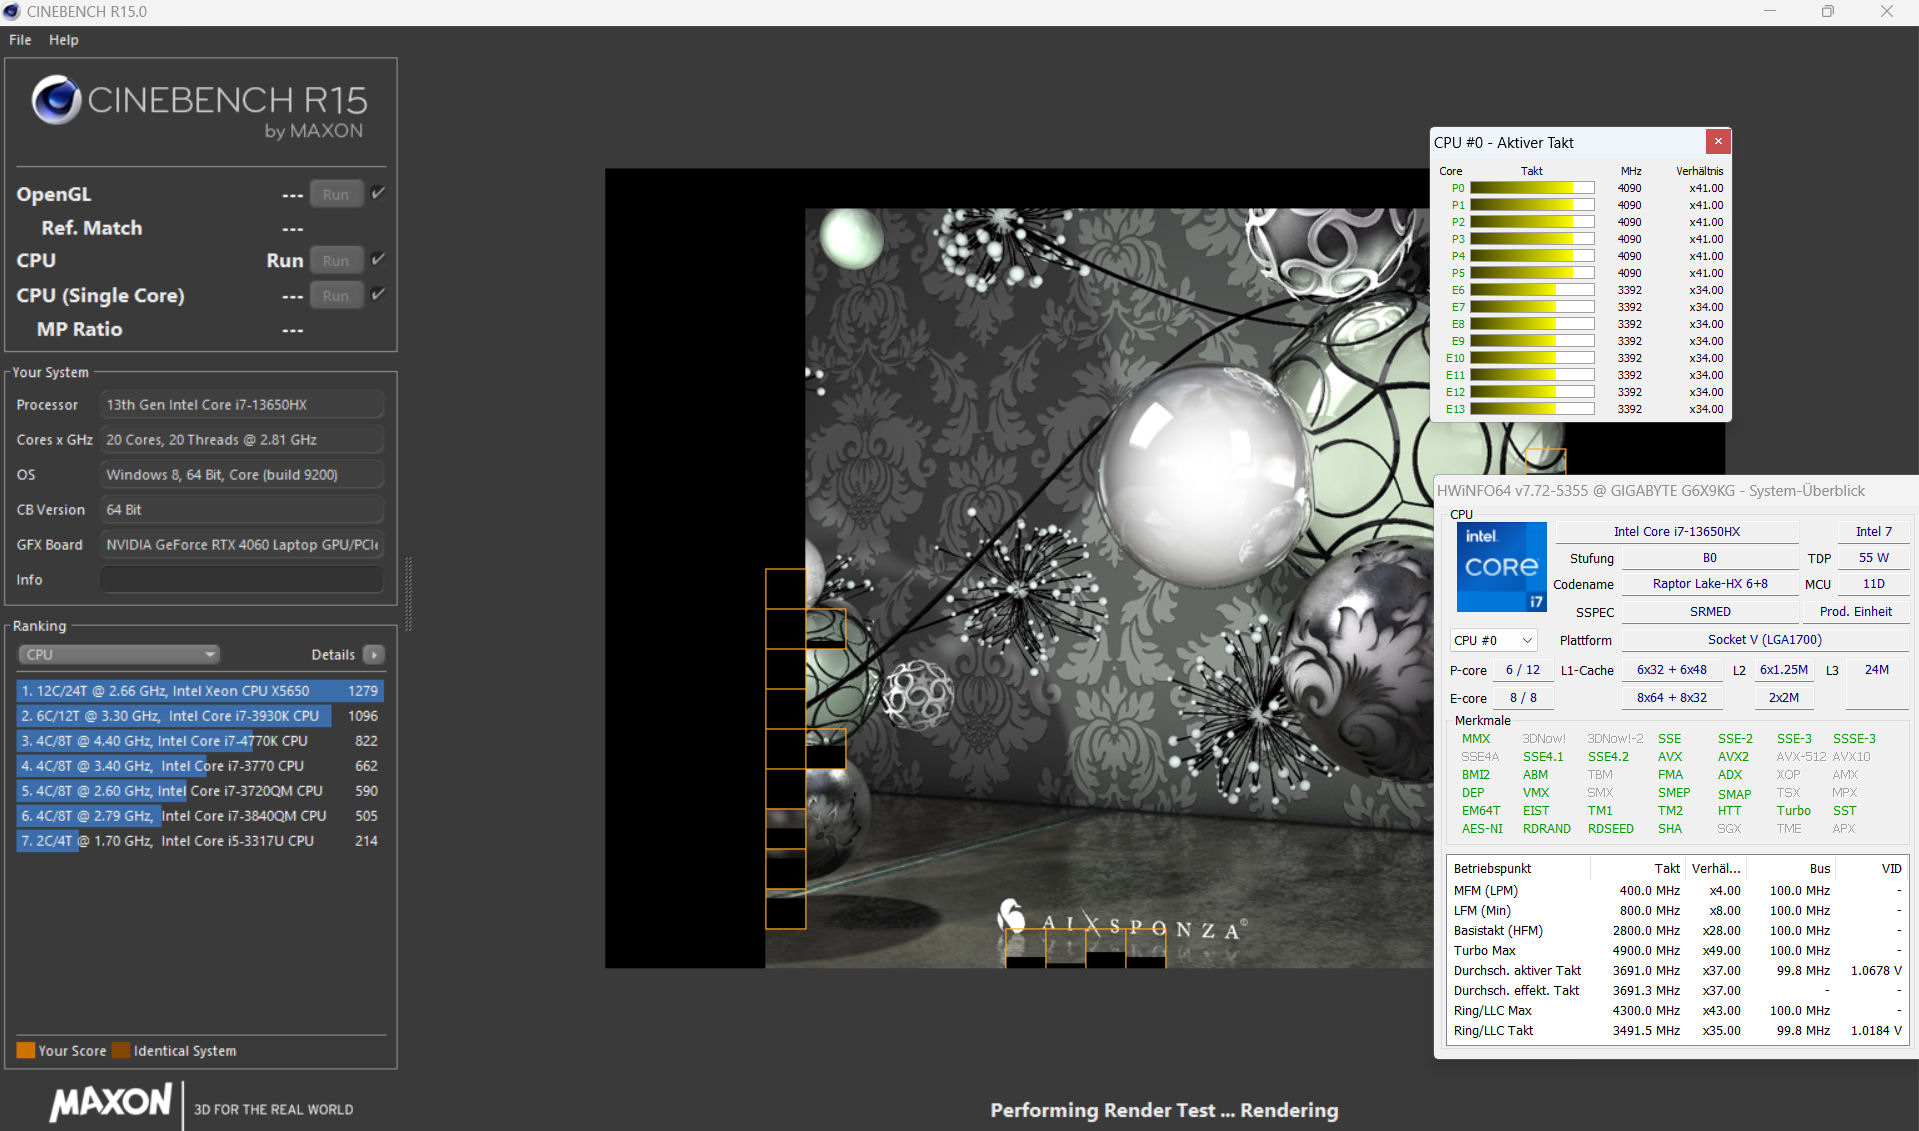
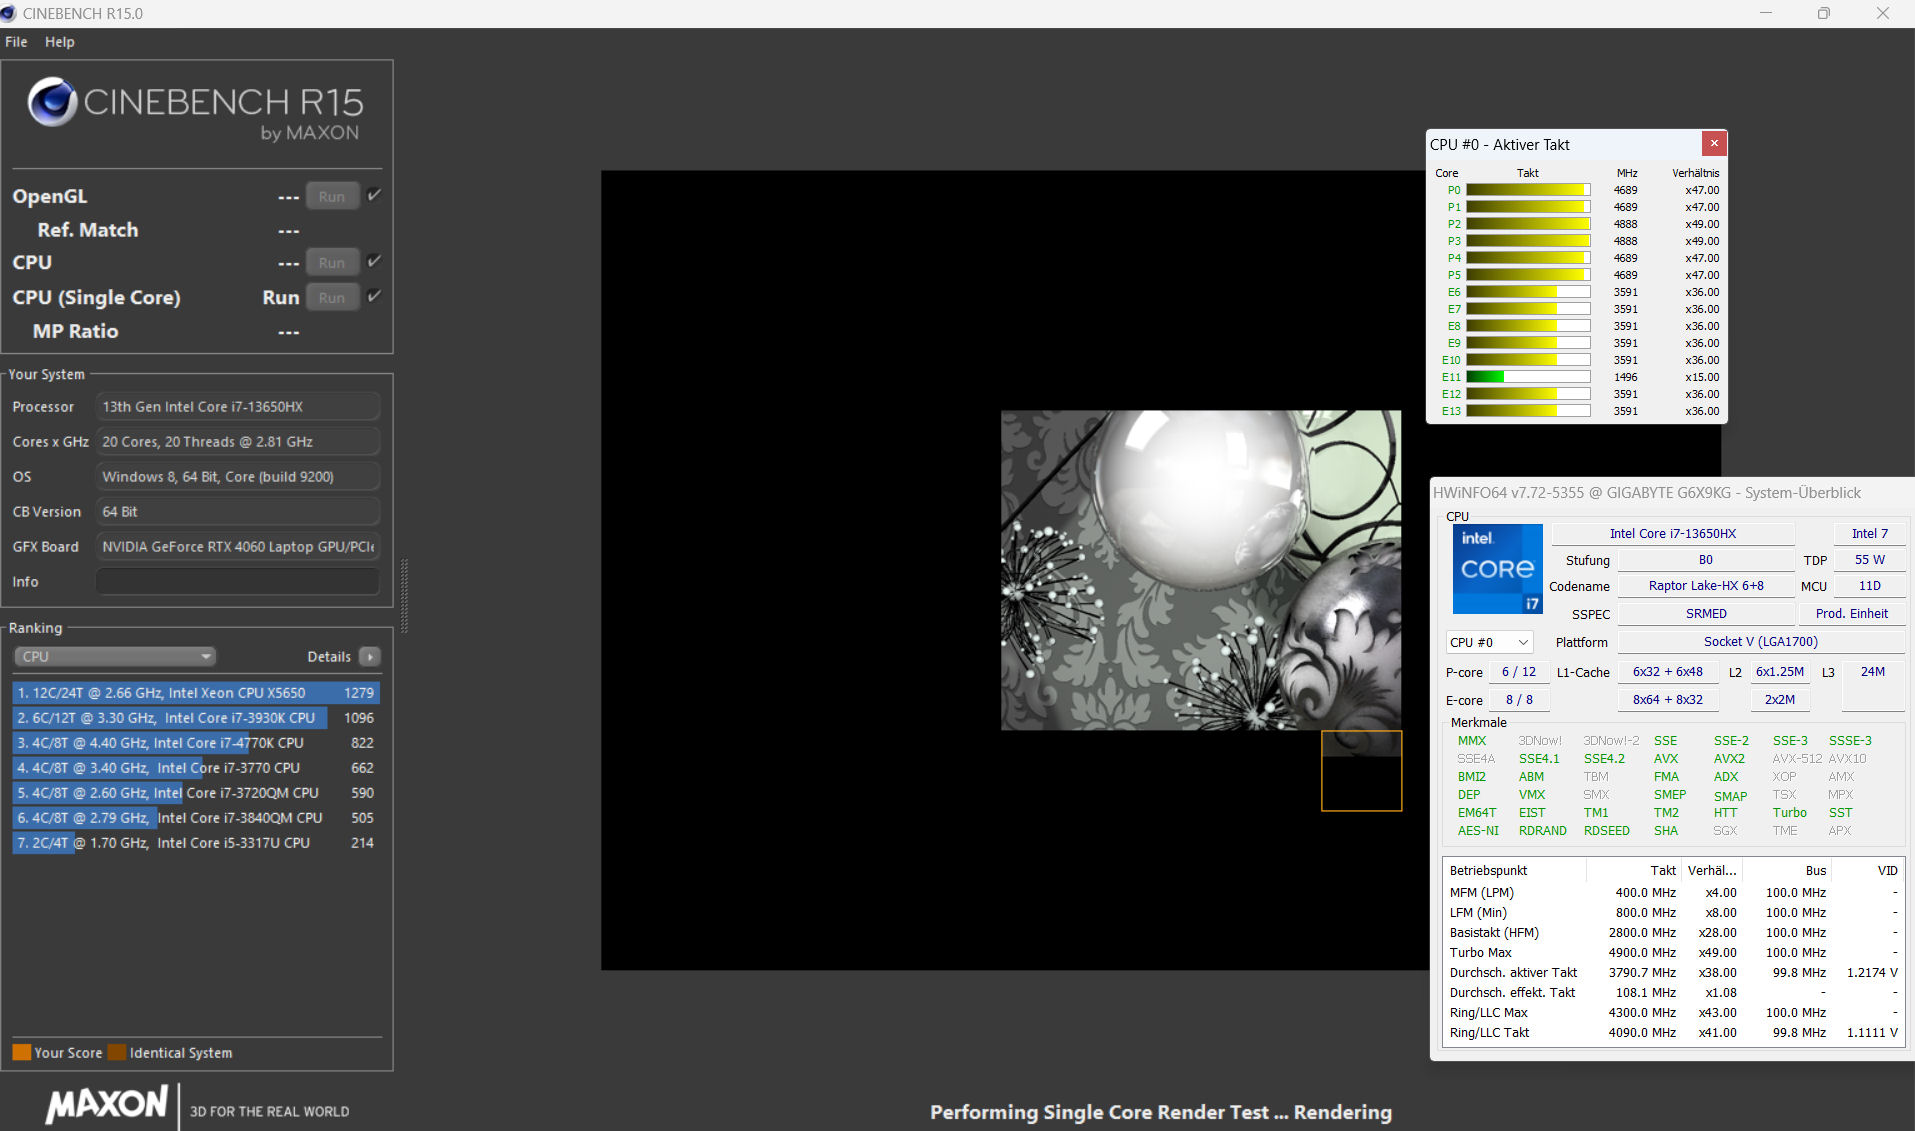
Processore
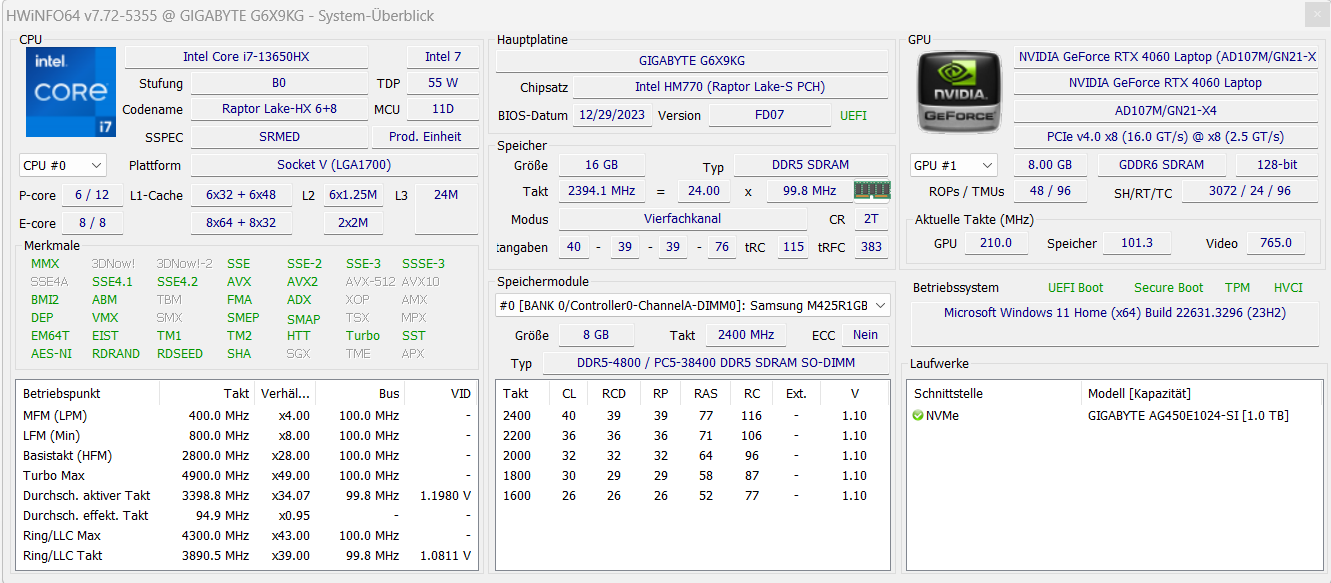
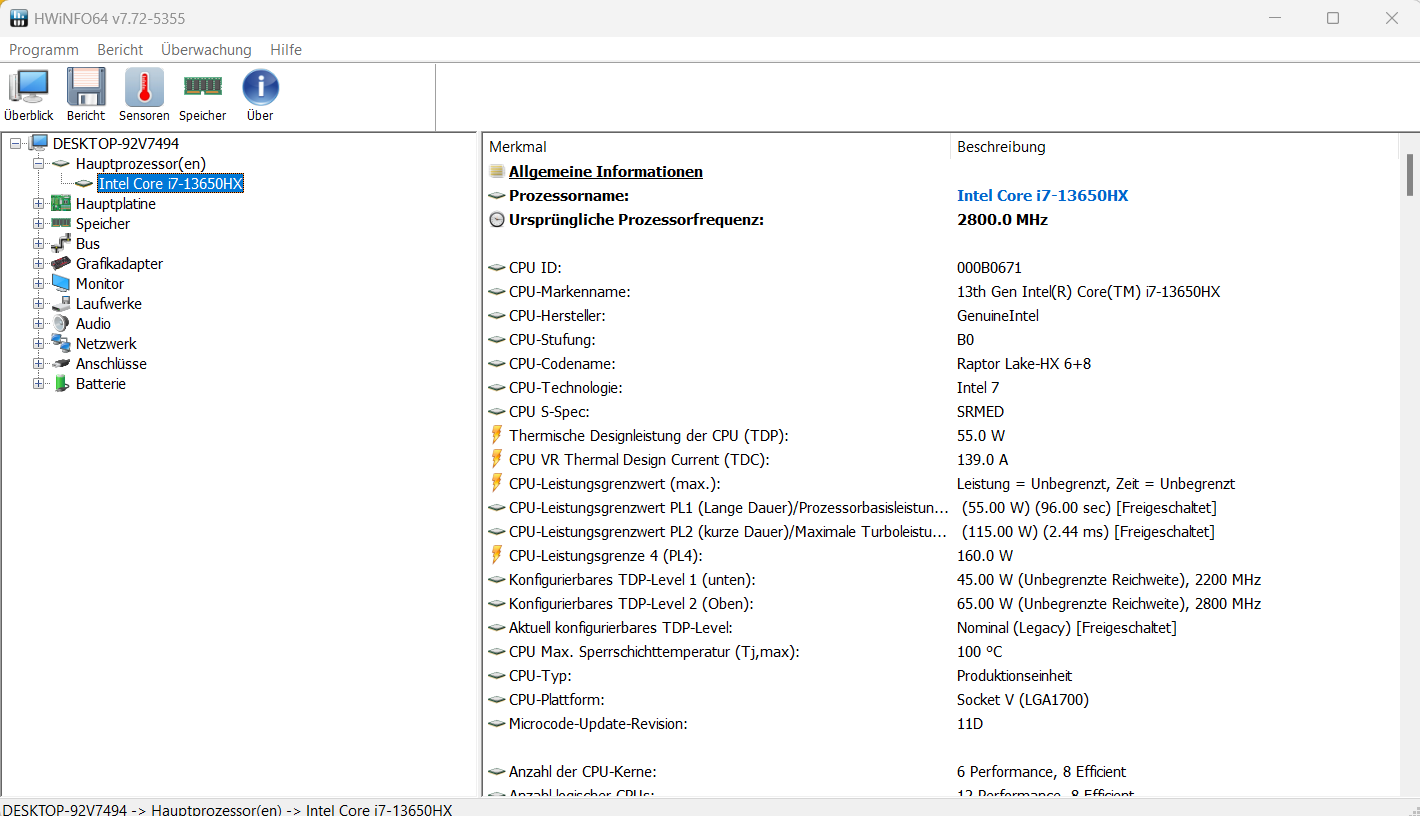
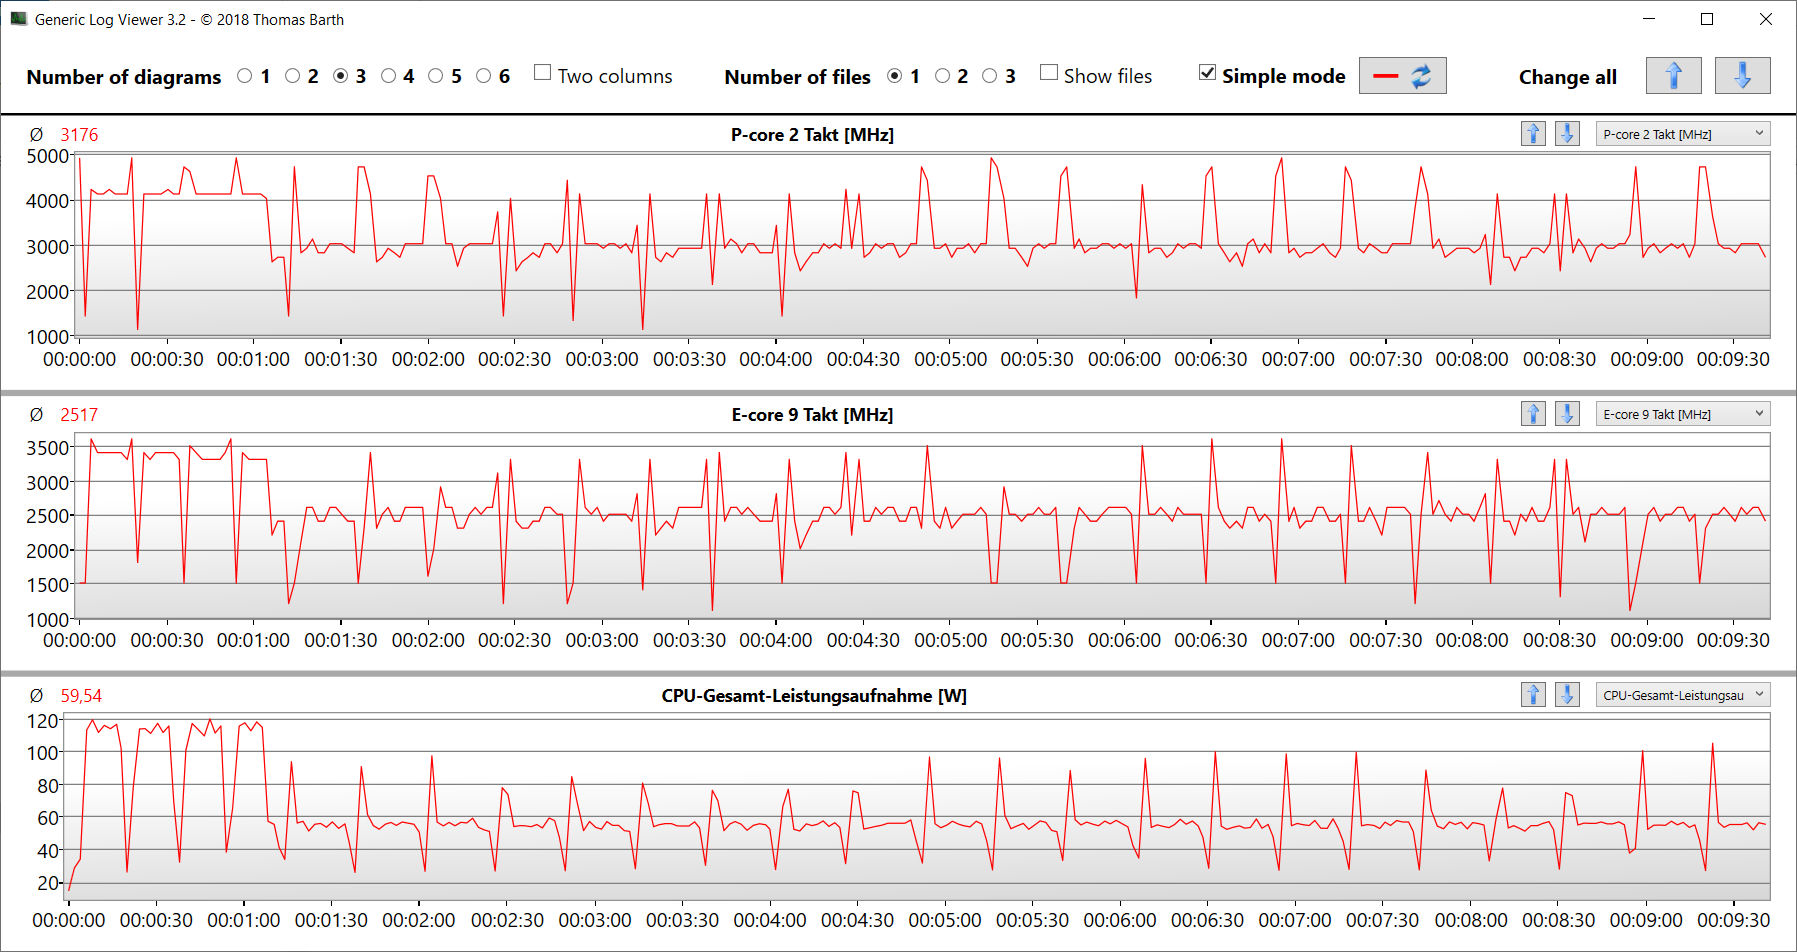
I 14 core della CPU del Core i7-13650HX (6P+8E) raggiungono velocità di clock massime di 4,9 GHz (P) e 3,6 GHz (E). Il carico continuo multi-thread (ciclo multi-core di Cinebench R15) fa sì che la velocità di clock diminuisca dal quarto al quinto ciclo. Successivamente, viene mantenuto un livello abbastanza costante. La modalità Performance assicura valori permanentemente più elevati.
I valori del benchmark sono leggermente inferiori alla media della CPU, ma la modalità Prestazioni porta a piccoli guadagni. In modalità batteria, le prestazioni single-thread più rilevanti di Cinebench R15 diminuiscono in misura minore (168 punti) rispetto alle prestazioni multi-thread (1.225 punti).
Cinebench R15 Multi-core loop test
| LibreOffice - 20 Documents To PDF | |
| Dell G16, i7-13650HX, RTX 4060 (6.3.4.2) | |
| Media della classe Gaming (19 - 88.8, n=110, ultimi 2 anni) | |
| Media Intel Core i7-13650HX (38.9 - 58.8, n=5) | |
| Lenovo Legion 5 16IRX G9 (6.3.4.2) | |
| Asus TUF Gaming A16 FA617XS | |
| Gigabyte G6X 9KG (2024) (6.3.4.2) | |
| MSI Raider GE68HX 13VF | |
* ... Meglio usare valori piccoli
AIDA64: FP32 Ray-Trace | FPU Julia | CPU SHA3 | CPU Queen | FPU SinJulia | FPU Mandel | CPU AES | CPU ZLib | FP64 Ray-Trace | CPU PhotoWorxx
| Performance rating | |
| MSI Raider GE68HX 13VF | |
| Media della classe Gaming | |
| Asus TUF Gaming A16 FA617XS | |
| Lenovo Legion 5 16IRX G9 | |
| Dell G16, i7-13650HX, RTX 4060 | |
| Media Intel Core i7-13650HX | |
| Gigabyte G6X 9KG (2024) | |
| AIDA64 / FP32 Ray-Trace | |
| Media della classe Gaming (10227 - 85542, n=109, ultimi 2 anni) | |
| Asus TUF Gaming A16 FA617XS (v6.75.6100) | |
| MSI Raider GE68HX 13VF (v6.85.6300) | |
| Lenovo Legion 5 16IRX G9 (v6.92.6600) | |
| Dell G16, i7-13650HX, RTX 4060 (v6.92.6600) | |
| Media Intel Core i7-13650HX (13404 - 20012, n=5) | |
| Gigabyte G6X 9KG (2024) (v6.92.6600) | |
| AIDA64 / FPU Julia | |
| Media della classe Gaming (51376 - 238426, n=109, ultimi 2 anni) | |
| MSI Raider GE68HX 13VF (v6.85.6300) | |
| Asus TUF Gaming A16 FA617XS (v6.75.6100) | |
| Lenovo Legion 5 16IRX G9 (v6.92.6600) | |
| Dell G16, i7-13650HX, RTX 4060 (v6.92.6600) | |
| Media Intel Core i7-13650HX (68241 - 97317, n=5) | |
| Gigabyte G6X 9KG (2024) (v6.92.6600) | |
| AIDA64 / CPU SHA3 | |
| MSI Raider GE68HX 13VF (v6.85.6300) | |
| Media della classe Gaming (2180 - 9817, n=109, ultimi 2 anni) | |
| Asus TUF Gaming A16 FA617XS (v6.75.6100) | |
| Dell G16, i7-13650HX, RTX 4060 (v6.92.6600) | |
| Lenovo Legion 5 16IRX G9 (v6.92.6600) | |
| Media Intel Core i7-13650HX (3127 - 4487, n=5) | |
| Gigabyte G6X 9KG (2024) (v6.92.6600) | |
| AIDA64 / CPU Queen | |
| MSI Raider GE68HX 13VF (v6.85.6300) | |
| Asus TUF Gaming A16 FA617XS (v6.75.6100) | |
| Media della classe Gaming (49785 - 173351, n=98, ultimi 2 anni) | |
| Gigabyte G6X 9KG (2024) (v6.92.6600) | |
| Media Intel Core i7-13650HX (108627 - 110589, n=5) | |
| Dell G16, i7-13650HX, RTX 4060 (v6.92.6600) | |
| Lenovo Legion 5 16IRX G9 (v6.92.6600) | |
| AIDA64 / FPU SinJulia | |
| MSI Raider GE68HX 13VF (v6.85.6300) | |
| Asus TUF Gaming A16 FA617XS (v6.75.6100) | |
| Media della classe Gaming (4424 - 33636, n=109, ultimi 2 anni) | |
| Lenovo Legion 5 16IRX G9 (v6.92.6600) | |
| Dell G16, i7-13650HX, RTX 4060 (v6.92.6600) | |
| Media Intel Core i7-13650HX (9134 - 10887, n=5) | |
| Gigabyte G6X 9KG (2024) (v6.92.6600) | |
| AIDA64 / FPU Mandel | |
| Media della classe Gaming (25115 - 128721, n=109, ultimi 2 anni) | |
| MSI Raider GE68HX 13VF (v6.85.6300) | |
| Asus TUF Gaming A16 FA617XS (v6.75.6100) | |
| Lenovo Legion 5 16IRX G9 (v6.92.6600) | |
| Dell G16, i7-13650HX, RTX 4060 (v6.92.6600) | |
| Media Intel Core i7-13650HX (33391 - 48323, n=5) | |
| Gigabyte G6X 9KG (2024) (v6.92.6600) | |
| AIDA64 / CPU AES | |
| MSI Raider GE68HX 13VF (v6.85.6300) | |
| Media della classe Gaming (39258 - 247074, n=109, ultimi 2 anni) | |
| Lenovo Legion 5 16IRX G9 (v6.92.6600) | |
| Asus TUF Gaming A16 FA617XS (v6.75.6100) | |
| Dell G16, i7-13650HX, RTX 4060 (v6.92.6600) | |
| Media Intel Core i7-13650HX (64436 - 85343, n=5) | |
| Gigabyte G6X 9KG (2024) (v6.92.6600) | |
| AIDA64 / CPU ZLib | |
| MSI Raider GE68HX 13VF (v6.85.6300) | |
| Media della classe Gaming (574 - 2531, n=109, ultimi 2 anni) | |
| Lenovo Legion 5 16IRX G9 (v6.92.6600) | |
| Dell G16, i7-13650HX, RTX 4060 (v6.92.6600) | |
| Media Intel Core i7-13650HX (1136 - 1285, n=5) | |
| Gigabyte G6X 9KG (2024) (v6.92.6600) | |
| Asus TUF Gaming A16 FA617XS (v6.75.6100) | |
| AIDA64 / FP64 Ray-Trace | |
| Media della classe Gaming (5509 - 45446, n=109, ultimi 2 anni) | |
| Asus TUF Gaming A16 FA617XS (v6.75.6100) | |
| MSI Raider GE68HX 13VF (v6.85.6300) | |
| Dell G16, i7-13650HX, RTX 4060 (v6.92.6600) | |
| Lenovo Legion 5 16IRX G9 (v6.92.6600) | |
| Media Intel Core i7-13650HX (7270 - 10900, n=5) | |
| Gigabyte G6X 9KG (2024) (v6.92.6600) | |
| AIDA64 / CPU PhotoWorxx | |
| MSI Raider GE68HX 13VF (v6.85.6300) | |
| Media della classe Gaming (12271 - 89891, n=109, ultimi 2 anni) | |
| Media Intel Core i7-13650HX (36170 - 43289, n=5) | |
| Gigabyte G6X 9KG (2024) (v6.92.6600) | |
| Dell G16, i7-13650HX, RTX 4060 (v6.92.6600) | |
| Lenovo Legion 5 16IRX G9 (v6.92.6600) | |
| Asus TUF Gaming A16 FA617XS (v6.75.6100) | |
Prestazioni del sistema
Gigabyte G6X funziona in modo fluido e non manca di potenza di calcolo. Il notebook gestisce i giochi, lo streaming e il rendering senza problemi.
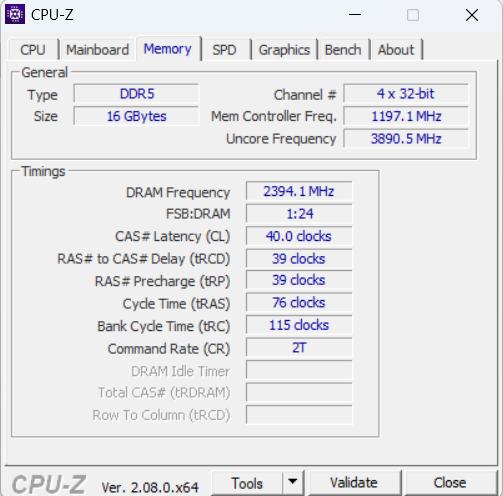
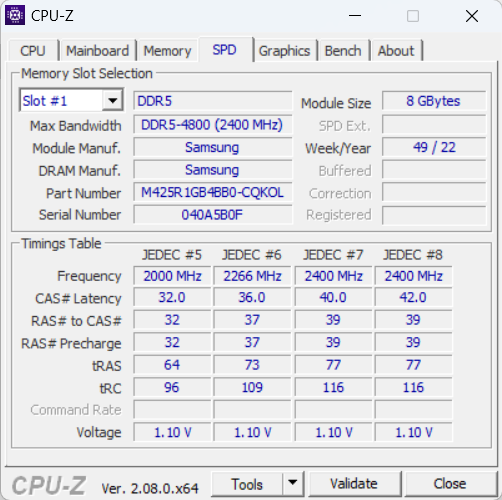
Le velocità di trasferimento della RAM sono a un livello normale per una RAM DDR5-4800.
CrossMark: Overall | Productivity | Creativity | Responsiveness
WebXPRT 3: Overall
WebXPRT 4: Overall
Mozilla Kraken 1.1: Total
| PCMark 10 / Score | |
| Media della classe Gaming (5828 - 11574, n=96, ultimi 2 anni) | |
| MSI Raider GE68HX 13VF | |
| Asus TUF Gaming A16 FA617XS | |
| Lenovo Legion 5 16IRX G9 | |
| Gigabyte G6X 9KG (2024) | |
| Dell G16, i7-13650HX, RTX 4060 | |
| Media Intel Core i7-13650HX, NVIDIA GeForce RTX 4060 Laptop GPU (6984 - 7613, n=3) | |
| PCMark 10 / Essentials | |
| MSI Raider GE68HX 13VF | |
| Asus TUF Gaming A16 FA617XS | |
| Lenovo Legion 5 16IRX G9 | |
| Media della classe Gaming (8810 - 12600, n=100, ultimi 2 anni) | |
| Media Intel Core i7-13650HX, NVIDIA GeForce RTX 4060 Laptop GPU (9532 - 11151, n=3) | |
| Gigabyte G6X 9KG (2024) | |
| Dell G16, i7-13650HX, RTX 4060 | |
| PCMark 10 / Productivity | |
| Media della classe Gaming (6845 - 21327, n=98, ultimi 2 anni) | |
| Asus TUF Gaming A16 FA617XS | |
| Gigabyte G6X 9KG (2024) | |
| Media Intel Core i7-13650HX, NVIDIA GeForce RTX 4060 Laptop GPU (9961 - 10204, n=3) | |
| Dell G16, i7-13650HX, RTX 4060 | |
| MSI Raider GE68HX 13VF | |
| Lenovo Legion 5 16IRX G9 | |
| PCMark 10 / Digital Content Creation | |
| Media della classe Gaming (7602 - 19657, n=98, ultimi 2 anni) | |
| MSI Raider GE68HX 13VF | |
| Lenovo Legion 5 16IRX G9 | |
| Asus TUF Gaming A16 FA617XS | |
| Dell G16, i7-13650HX, RTX 4060 | |
| Gigabyte G6X 9KG (2024) | |
| Media Intel Core i7-13650HX, NVIDIA GeForce RTX 4060 Laptop GPU (8323 - 11686, n=3) | |
| CrossMark / Overall | |
| Lenovo Legion 5 16IRX G9 | |
| Media della classe Gaming (1366 - 2409, n=97, ultimi 2 anni) | |
| MSI Raider GE68HX 13VF | |
| Gigabyte G6X 9KG (2024) | |
| Media Intel Core i7-13650HX, NVIDIA GeForce RTX 4060 Laptop GPU (1839 - 1951, n=3) | |
| Dell G16, i7-13650HX, RTX 4060 | |
| Asus TUF Gaming A16 FA617XS | |
| CrossMark / Productivity | |
| Lenovo Legion 5 16IRX G9 | |
| Gigabyte G6X 9KG (2024) | |
| Media della classe Gaming (1386 - 2254, n=97, ultimi 2 anni) | |
| MSI Raider GE68HX 13VF | |
| Media Intel Core i7-13650HX, NVIDIA GeForce RTX 4060 Laptop GPU (1730 - 1864, n=3) | |
| Dell G16, i7-13650HX, RTX 4060 | |
| Asus TUF Gaming A16 FA617XS | |
| CrossMark / Creativity | |
| Lenovo Legion 5 16IRX G9 | |
| MSI Raider GE68HX 13VF | |
| Media della classe Gaming (1343 - 2729, n=97, ultimi 2 anni) | |
| Gigabyte G6X 9KG (2024) | |
| Media Intel Core i7-13650HX, NVIDIA GeForce RTX 4060 Laptop GPU (2020 - 2063, n=3) | |
| Dell G16, i7-13650HX, RTX 4060 | |
| Asus TUF Gaming A16 FA617XS | |
| CrossMark / Responsiveness | |
| Gigabyte G6X 9KG (2024) | |
| Lenovo Legion 5 16IRX G9 | |
| Media Intel Core i7-13650HX, NVIDIA GeForce RTX 4060 Laptop GPU (1544 - 1907, n=3) | |
| Media della classe Gaming (1226 - 2334, n=97, ultimi 2 anni) | |
| Dell G16, i7-13650HX, RTX 4060 | |
| MSI Raider GE68HX 13VF | |
| Asus TUF Gaming A16 FA617XS | |
| WebXPRT 3 / Overall | |
| MSI Raider GE68HX 13VF | |
| Media della classe Gaming (242 - 532, n=101, ultimi 2 anni) | |
| Lenovo Legion 5 16IRX G9 | |
| Gigabyte G6X 9KG (2024) | |
| Media Intel Core i7-13650HX, NVIDIA GeForce RTX 4060 Laptop GPU (268 - 302, n=3) | |
| Dell G16, i7-13650HX, RTX 4060 | |
| WebXPRT 4 / Overall | |
| MSI Raider GE68HX 13VF | |
| Media della classe Gaming (176.4 - 354, n=101, ultimi 2 anni) | |
| Lenovo Legion 5 16IRX G9 | |
| Media Intel Core i7-13650HX, NVIDIA GeForce RTX 4060 Laptop GPU (260 - 276, n=2) | |
| Asus TUF Gaming A16 FA617XS | |
| Gigabyte G6X 9KG (2024) | |
| Mozilla Kraken 1.1 / Total | |
| Gigabyte G6X 9KG (2024) | |
| Media Intel Core i7-13650HX, NVIDIA GeForce RTX 4060 Laptop GPU (507 - 511, n=3) | |
| Dell G16, i7-13650HX, RTX 4060 | |
| Asus TUF Gaming A16 FA617XS | |
| Lenovo Legion 5 16IRX G9 | |
| Media della classe Gaming (391 - 590, n=106, ultimi 2 anni) | |
| MSI Raider GE68HX 13VF | |
* ... Meglio usare valori piccoli
| PCMark 10 Score | 7613 punti | |
Aiuto | ||
| AIDA64 / Memory Copy | |
| MSI Raider GE68HX 13VF | |
| Media della classe Gaming (21750 - 129946, n=109, ultimi 2 anni) | |
| Media Intel Core i7-13650HX (59266 - 66372, n=5) | |
| Gigabyte G6X 9KG (2024) | |
| Lenovo Legion 5 16IRX G9 | |
| Asus TUF Gaming A16 FA617XS | |
| Dell G16, i7-13650HX, RTX 4060 | |
| AIDA64 / Memory Read | |
| MSI Raider GE68HX 13VF | |
| Media della classe Gaming (22956 - 118858, n=109, ultimi 2 anni) | |
| Lenovo Legion 5 16IRX G9 | |
| Media Intel Core i7-13650HX (67305 - 71022, n=5) | |
| Gigabyte G6X 9KG (2024) | |
| Dell G16, i7-13650HX, RTX 4060 | |
| Asus TUF Gaming A16 FA617XS | |
| AIDA64 / Memory Write | |
| MSI Raider GE68HX 13VF | |
| Media della classe Gaming (22297 - 135096, n=109, ultimi 2 anni) | |
| Asus TUF Gaming A16 FA617XS | |
| Media Intel Core i7-13650HX (58028 - 68225, n=5) | |
| Gigabyte G6X 9KG (2024) | |
| Dell G16, i7-13650HX, RTX 4060 | |
| Lenovo Legion 5 16IRX G9 | |
| AIDA64 / Memory Latency | |
| Media della classe Gaming (75.3 - 259, n=109, ultimi 2 anni) | |
| Dell G16, i7-13650HX, RTX 4060 | |
| Asus TUF Gaming A16 FA617XS | |
| Gigabyte G6X 9KG (2024) | |
| Lenovo Legion 5 16IRX G9 | |
| Media Intel Core i7-13650HX (83.7 - 90.8, n=5) | |
| MSI Raider GE68HX 13VF | |
* ... Meglio usare valori piccoli
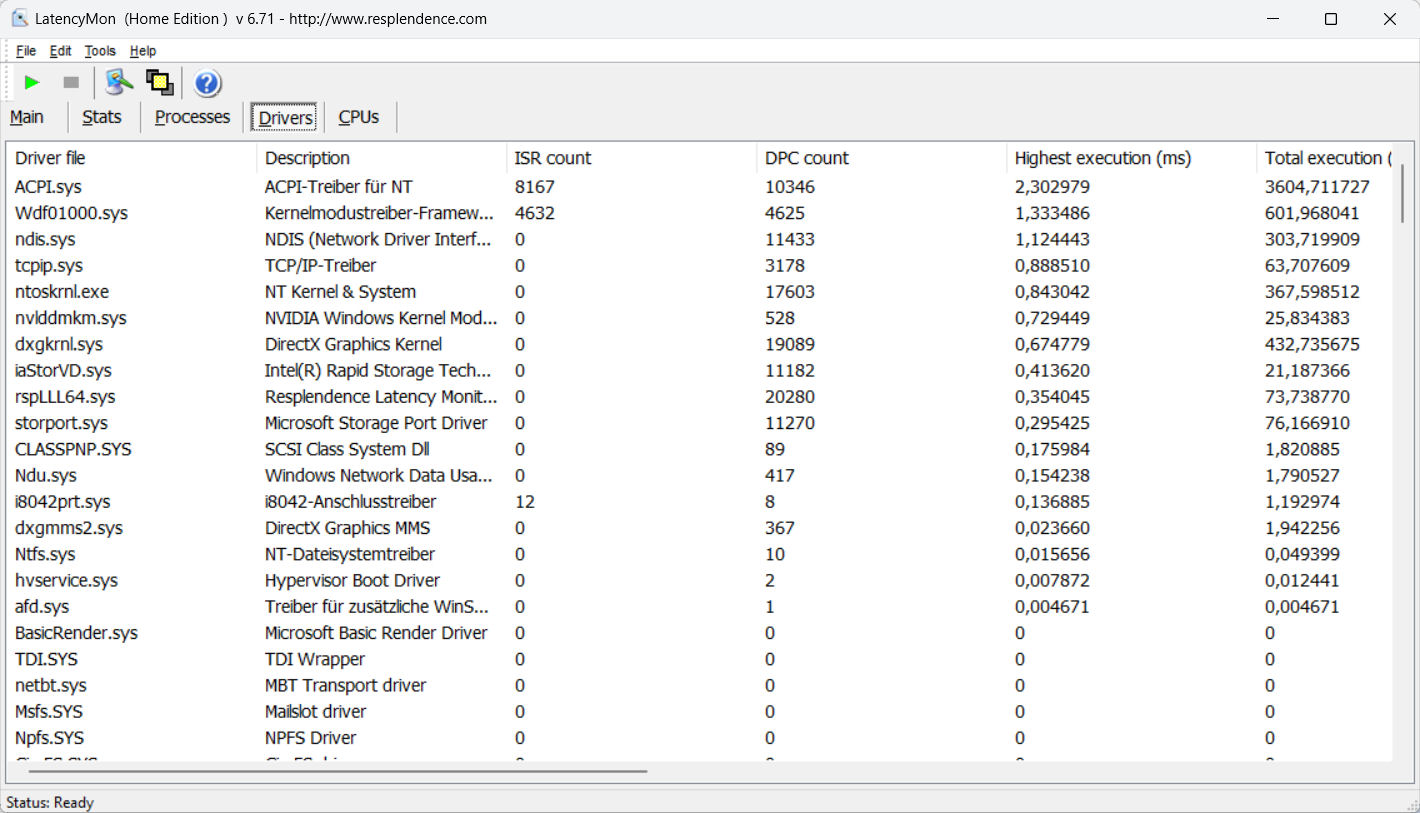
Latenza DPC
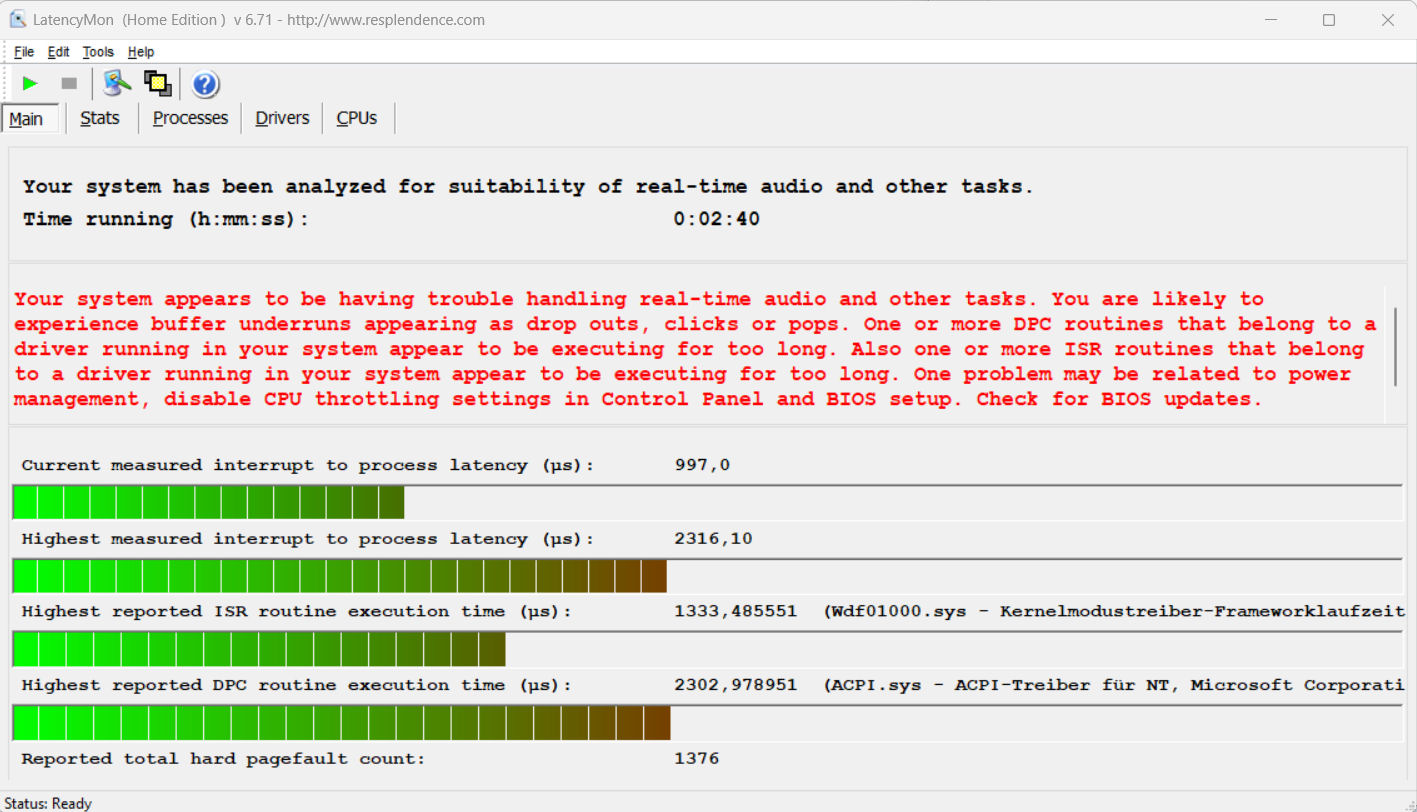
Il test standardizzato LatencyMon (navigazione web, riproduzione video 4k, Prime95 High-Load) ha rivelato delle anomalie. Il sistema non sembra essere adatto all'editing video e audio in tempo reale. I futuri aggiornamenti del software potrebbero portare a miglioramenti o addirittura a peggioramenti.
| DPC Latencies / LatencyMon - interrupt to process latency (max), Web, Youtube, Prime95 | |
| MSI Raider GE68HX 13VF | |
| Gigabyte G6X 9KG (2024) | |
| Lenovo Legion 5 16IRX G9 | |
| Asus TUF Gaming A16 FA617XS | |
| Dell G16, i7-13650HX, RTX 4060 | |
* ... Meglio usare valori piccoli
Memoria di massa
Il G6X può ospitare un totale di due unità SSD M.2 2280 PCIe Gen 4. Il RAID non è supportato. L'SSD Gigabyte da 1 TB nel nostro dispositivo di prova offre ottime velocità di trasferimento dati.
Non abbiamo osservato alcun problema di throttling termico, il che è positivo.

* ... Meglio usare valori piccoli
Disk Throttling: DiskSpd Read Loop, Queue Depth 8
Scheda grafica
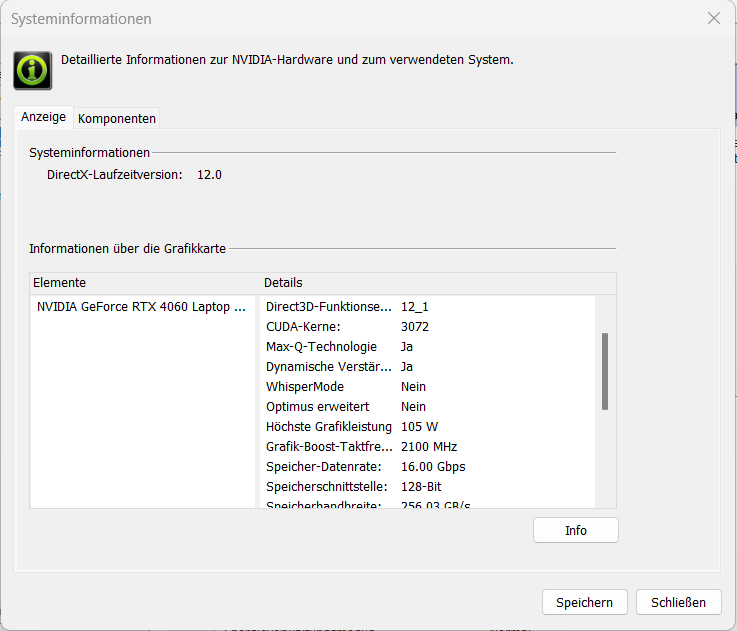
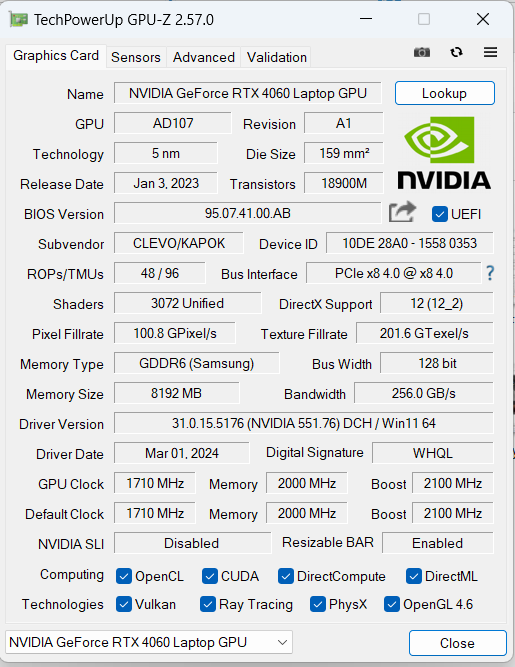
Gigabyte installa una GPU da 105 W GeForce RTX 4060 Laptop GPU (3.424 shader, bus a 128 bit, 8 GB GDDR6) nel G6X 9KG. La RTX 4060 è un modello di fascia media dell'attuale gamma di GPU di Nvidia.
I valori di benchmark e i frame rate sono superiori alla media della RTX 4060. La modalità prestazioni offre al massimo un piccolo vantaggio. Il passaggio tra le modalità dGPU e Optimus richiede un riavvio, poiché Advanced Optimus non è supportato.
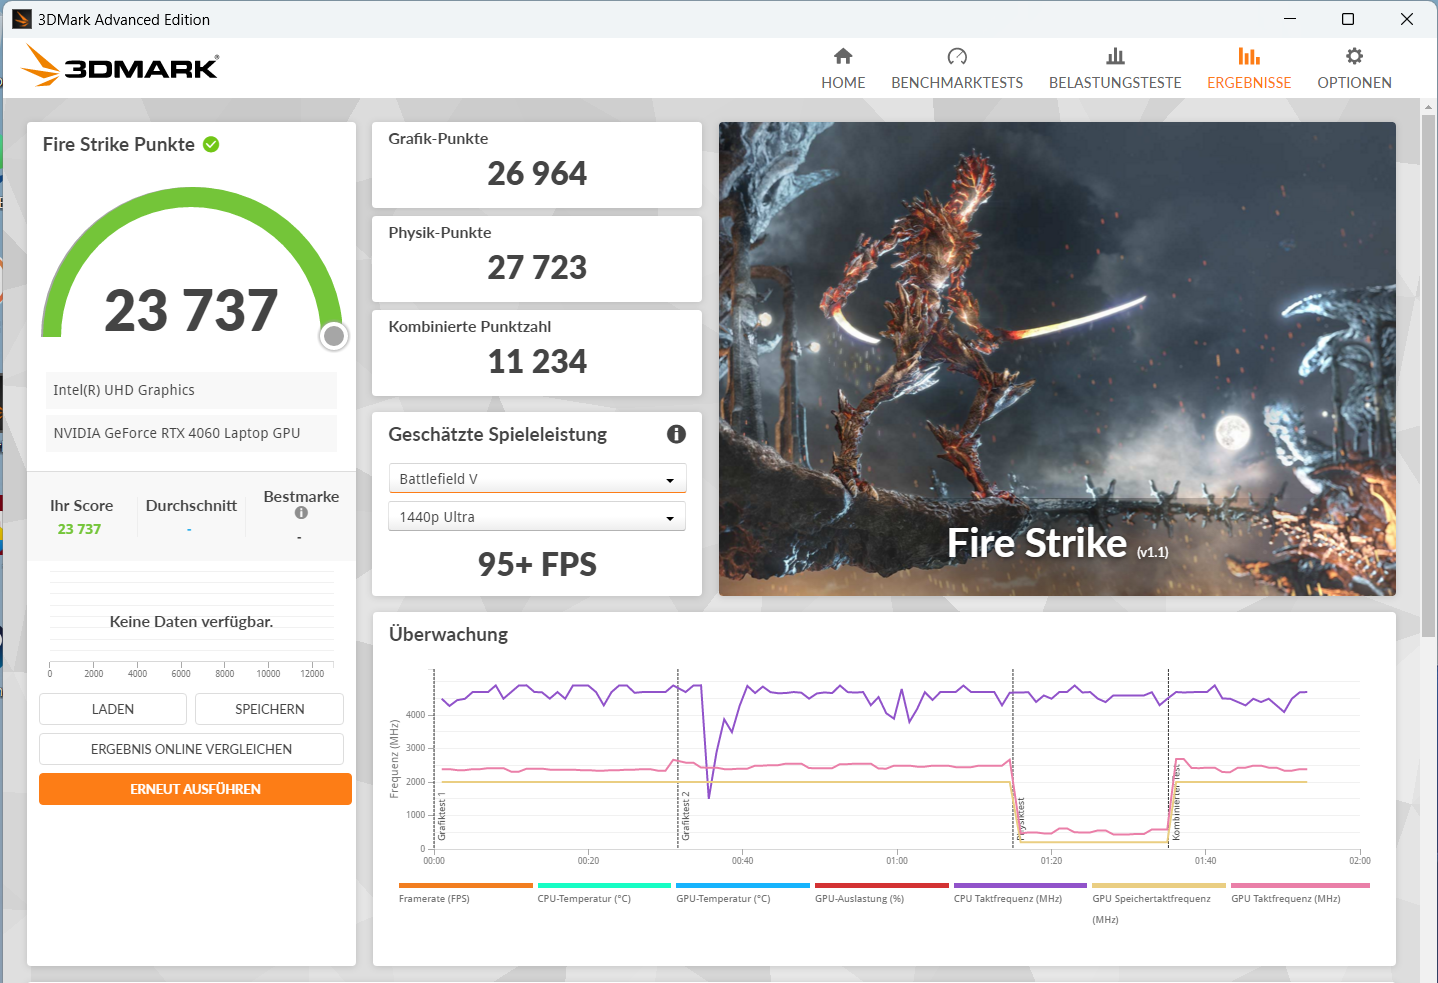
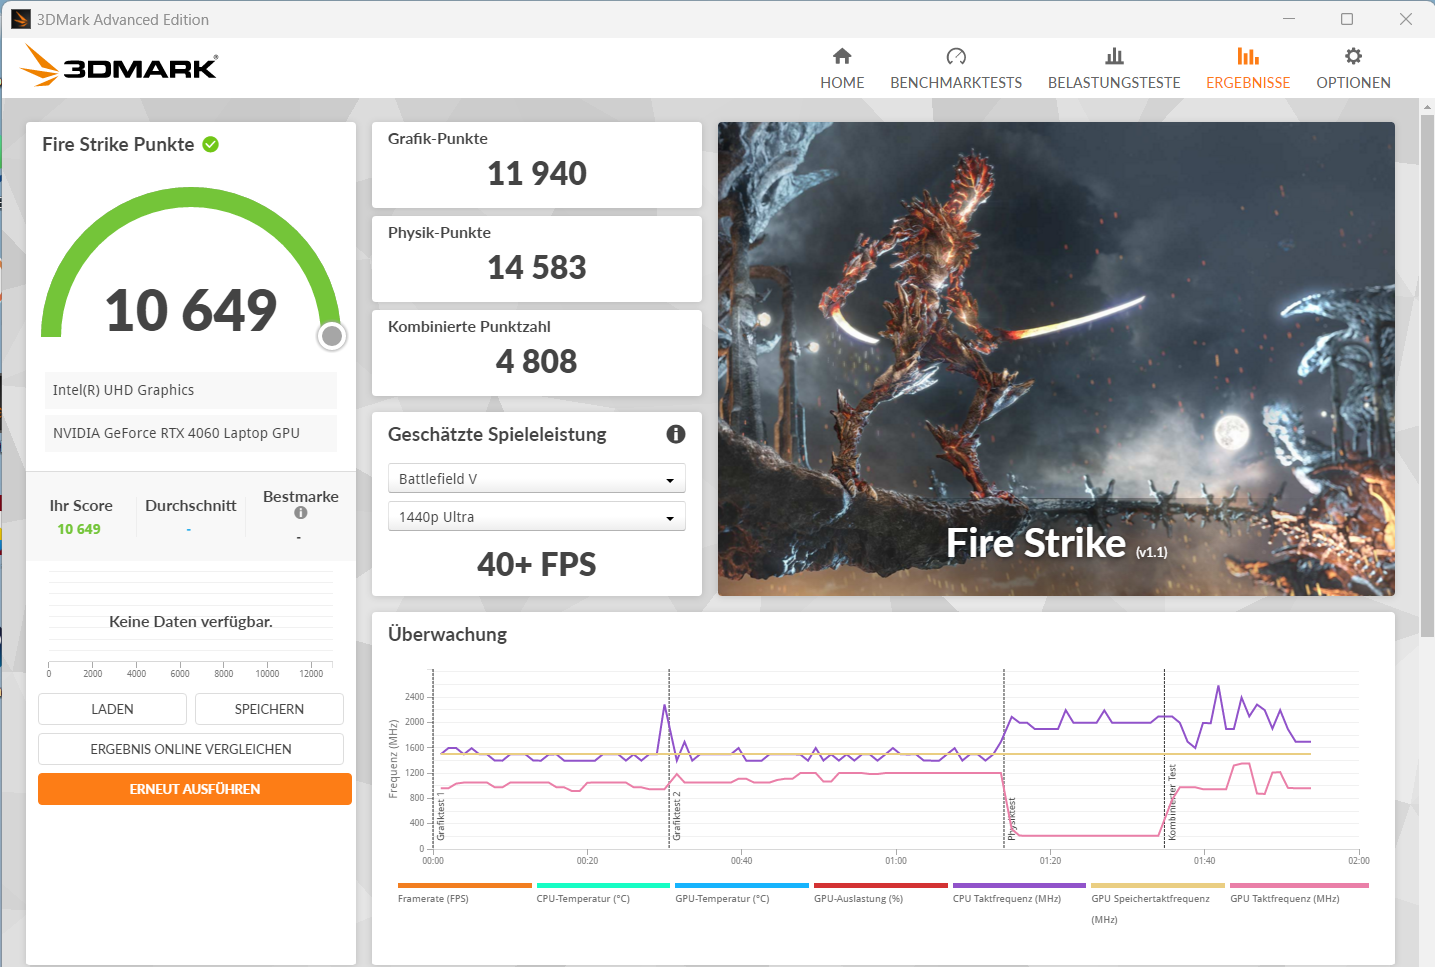
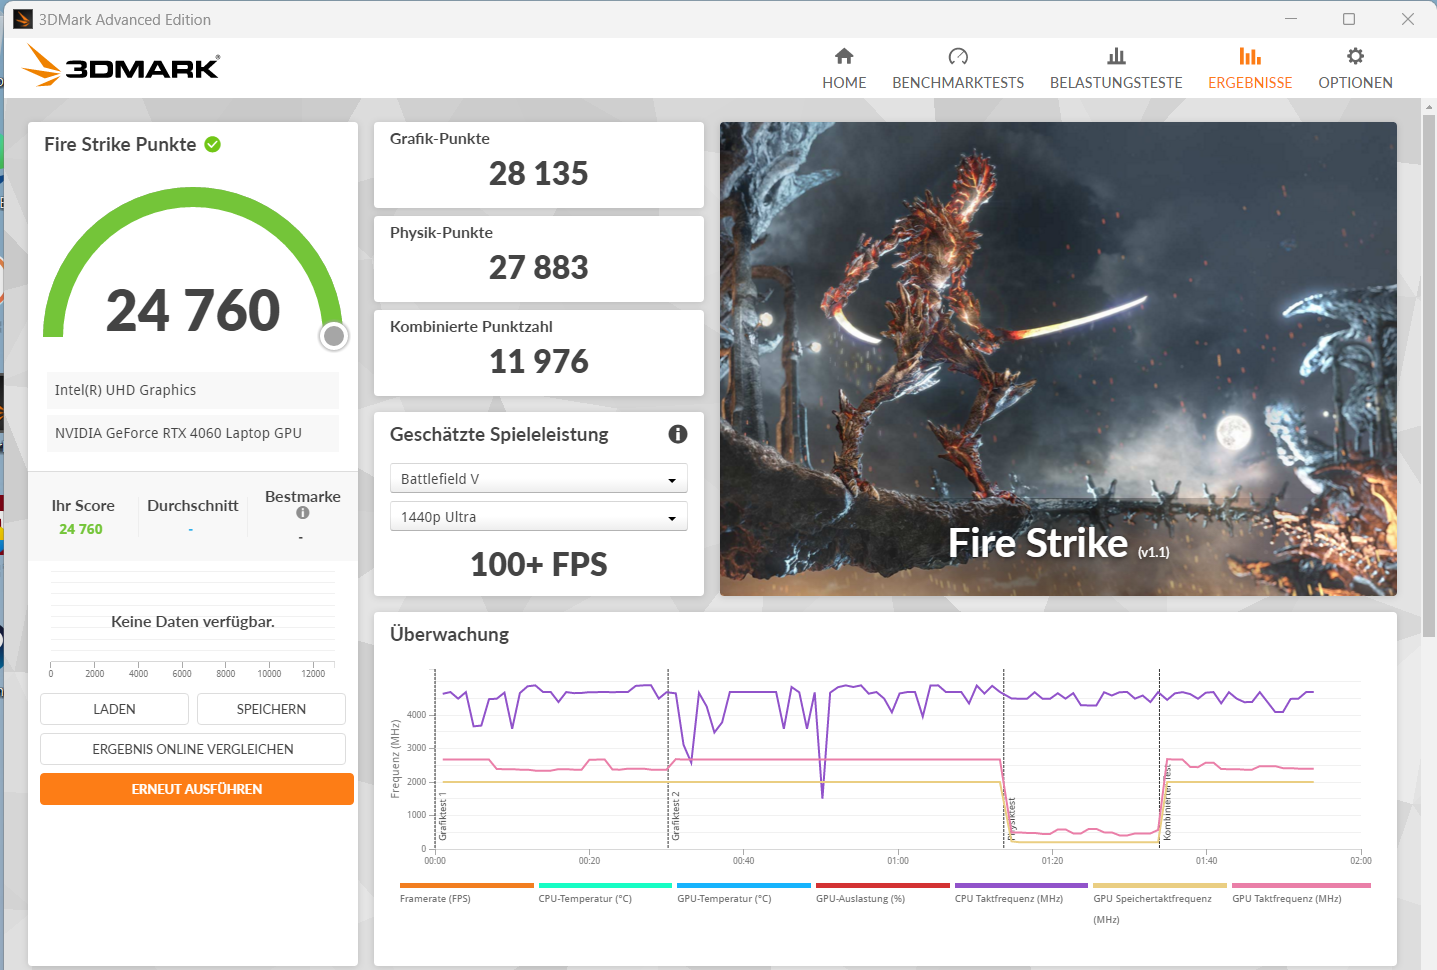
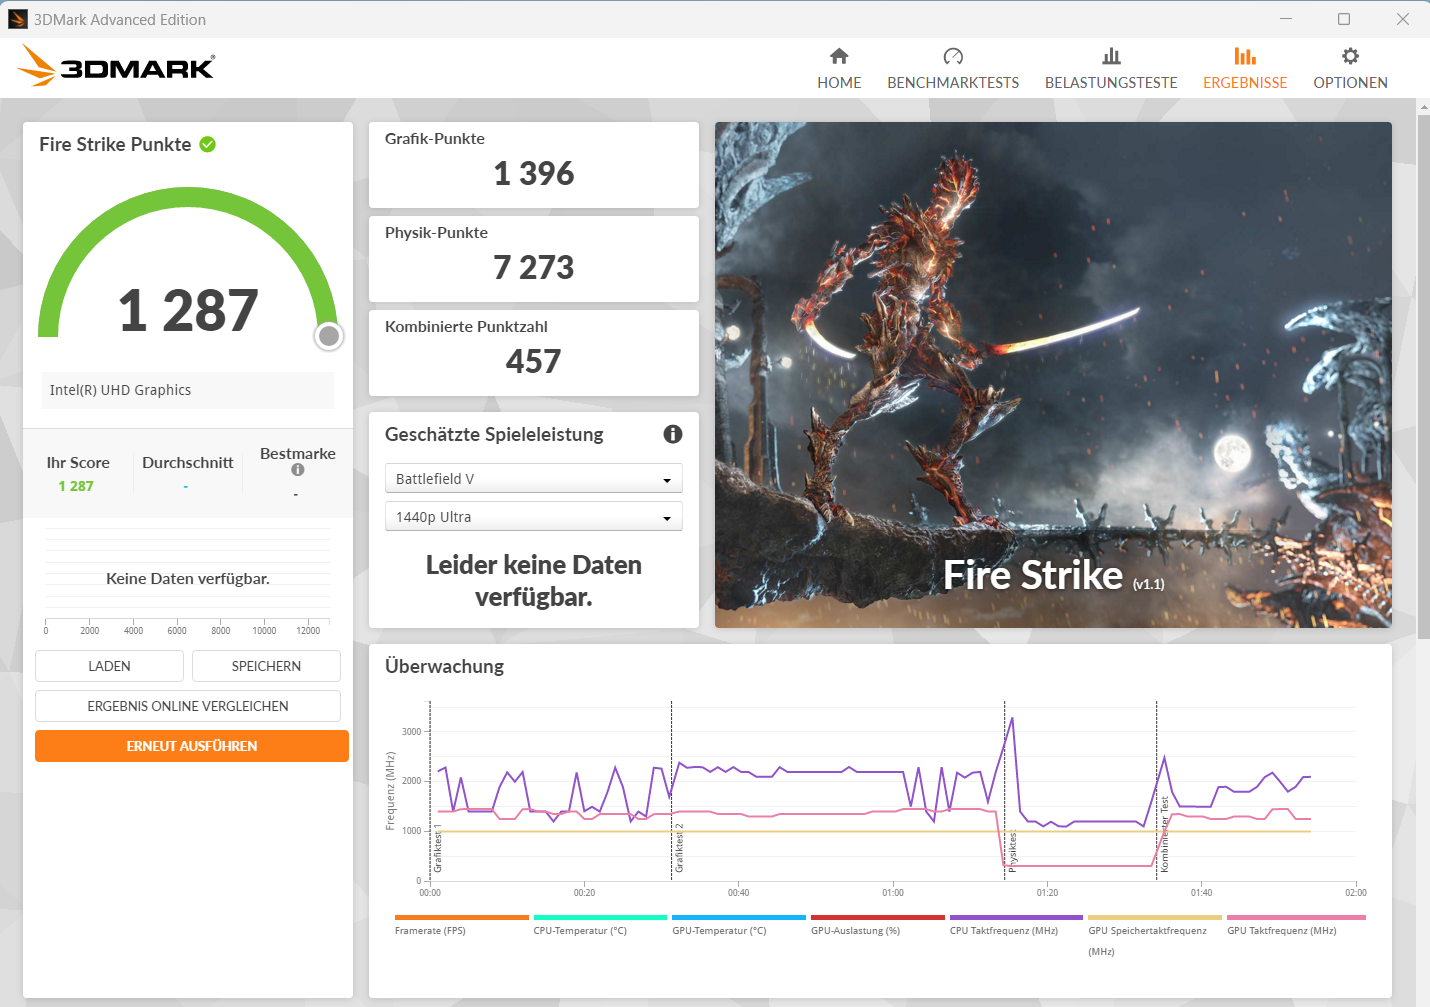
| 3DMark 11 Performance | 30293 punti | |
| 3DMark Fire Strike Score | 23737 punti | |
| 3DMark Time Spy Score | 10260 punti | |
Aiuto | ||
* ... Meglio usare valori piccoli
| The Witcher 3 - 1920x1080 Ultra Graphics & Postprocessing (HBAO+) | |
| Media della classe Gaming (95 - 240, n=8, ultimi 2 anni) | |
| Dell G16, i7-13650HX, RTX 4060 | |
| MSI Raider GE68HX 13VF | |
| Media NVIDIA GeForce RTX 4060 Laptop GPU (77 - 159.7, n=42) | |
| Gigabyte G6X 9KG (2024) | |
| Asus TUF Gaming A16 FA617XS (neu) | |
| Lenovo Legion 5 16IRX G9 | |
| Final Fantasy XV Benchmark - 1920x1080 High Quality | |
| Media della classe Gaming (41 - 215, n=102, ultimi 2 anni) | |
| Lenovo Legion 5 16IRX G9 (1.3) | |
| Dell G16, i7-13650HX, RTX 4060 (1.3) | |
| MSI Raider GE68HX 13VF (1.3) | |
| Gigabyte G6X 9KG (2024) (1.3) | |
| Media NVIDIA GeForce RTX 4060 Laptop GPU (75.1 - 109.8, n=51) | |
| Asus TUF Gaming A16 FA617XS (1.3) | |
| Strange Brigade - 1920x1080 ultra AA:ultra AF:16 | |
| Media della classe Gaming (76.3 - 456, n=92, ultimi 2 anni) | |
| Lenovo Legion 5 16IRX G9 | |
| Dell G16, i7-13650HX, RTX 4060 (1.47.22.14 D3D12) | |
| MSI Raider GE68HX 13VF (1.47.22.14 D3D12) | |
| Gigabyte G6X 9KG (2024) (1.47.22.14 D3D12) | |
| Media NVIDIA GeForce RTX 4060 Laptop GPU (135.3 - 210, n=50) | |
| Asus TUF Gaming A16 FA617XS (1.47.22.14 D3D12) | |
| Cyberpunk 2077 | |
| 1920x1080 Ultra Preset (FSR off) | |
| Media della classe Gaming (17.7 - 169.9, n=120, ultimi 2 anni) | |
| Lenovo Legion 5 16IRX G9 | |
| Media NVIDIA GeForce RTX 4060 Laptop GPU (56.4 - 93.1, n=31) | |
| Dell G16, i7-13650HX, RTX 4060 | |
| Gigabyte G6X 9KG (2024) | |
| 1920x1080 Ray Tracing Ultra Preset (DLSS off) | |
| Media della classe Gaming (19.1 - 84.9, n=42, ultimi 2 anni) | |
| Media NVIDIA GeForce RTX 4060 Laptop GPU (23.6 - 37.4, n=21) | |
| Gigabyte G6X 9KG (2024) | |
| 1920x1080 Ultra Preset (FSR2 on) | |
| Media della classe Gaming (58 - 173.1, n=7, ultimi 2 anni) | |
| Gigabyte G6X 9KG (2024) | |
| Media NVIDIA GeForce RTX 4060 Laptop GPU (68.5 - 92.4, n=4) | |
| Skull & Bones - 1920x1080 Ultra High Preset AA:T | |
| Gigabyte G6X 9KG (2024) | |
| Media NVIDIA GeForce RTX 4060 Laptop GPU (65 - 73, n=5) | |
| Last Epoch - 1920x1080 Ultra Preset AA:T | |
| Gigabyte G6X 9KG (2024) | |
| Media NVIDIA GeForce RTX 4060 Laptop GPU (120.4 - 122.8, n=2) | |
| Media della classe Gaming (n=1ultimi 2 anni) | |
| Helldivers 2 - 1920x1080 Ultra Preset | |
| Media della classe Gaming (18.4 - 153.8, n=5, ultimi 2 anni) | |
| Gigabyte G6X 9KG (2024) | |
| Media NVIDIA GeForce RTX 4060 Laptop GPU (82.3 - 85.6, n=2) | |
| Ready or Not - 1920x1080 Epic Preset | |
| Media NVIDIA GeForce RTX 4060 Laptop GPU (131.5 - 133.7, n=2) | |
| Gigabyte G6X 9KG (2024) | |
The Witcher 3 FPS chart
| basso | medio | alto | ultra | |
|---|---|---|---|---|
| GTA V (2015) | 183.6 | 180.4 | 174.6 | 115.2 |
| The Witcher 3 (2015) | 400.9 | 306.6 | 186.5 | 100 |
| Dota 2 Reborn (2015) | 183.7 | 164.4 | 157.6 | 142.4 |
| Final Fantasy XV Benchmark (2018) | 186.5 | 139.3 | 101.5 | |
| X-Plane 11.11 (2018) | 155.1 | 132.7 | 107.1 | |
| Strange Brigade (2018) | 473 | 263 | 209 | 182.2 |
| Cyberpunk 2077 (2023) | 118.3 | 94.8 | 81.1 | 69.7 |
| Ready or Not (2023) | 218 | 152.4 | 147.6 | 131.5 |
| Helldivers 2 (2024) | 123.9 | 97.6 | 88.5 | 85.6 |
| Skull & Bones (2024) | 125 | 111 | 97 | 73 |
| Last Epoch (2024) | 195.5 | 184.6 | 164.1 | 122.8 |
Emissioni ed energia: G6X offre buoni tempi di esecuzione
Emissioni di rumore
Il livello di pressione sonora (SPL) sale fino a 54 dB(A) a pieno carico (modalità Entertainment). L'SPL può aumentare in modalità Performance. Con la modalità Silent è possibile ottenere un funzionamento significativamente più silenzioso.
Tuttavia, ciò va a discapito delle prestazioni, in quanto la dGPU non funziona in questo modo. In generale, la modalità Intrattenimento è consigliata per l'uso quotidiano. Oltre il pieno carico, lo sviluppo del rumore rimane a un livello moderato.
Rumorosità
| Idle |
| 30 / 32 / 35 dB(A) |
| Sotto carico |
| 51 / 54 dB(A) |
 | ||
30 dB silenzioso 40 dB(A) udibile 50 dB(A) rumoroso |
||
min: | ||
| Gigabyte G6X 9KG (2024) i7-13650HX, GeForce RTX 4060 Laptop GPU | Dell G16, i7-13650HX, RTX 4060 i7-13650HX, GeForce RTX 4060 Laptop GPU | Lenovo Legion 5 16IRX G9 i7-14650HX, GeForce RTX 4060 Laptop GPU | MSI Raider GE68HX 13VF i9-13950HX, GeForce RTX 4060 Laptop GPU | Asus TUF Gaming A16 FA617XS R9 7940HS, Radeon RX 7600S | |
|---|---|---|---|---|---|
| Noise | 21% | 7% | 2% | 11% | |
| off /ambiente * (dB) | 26 | 23 12% | 24 8% | 23.3 10% | 25 4% |
| Idle Minimum * (dB) | 30 | 23 23% | 24 20% | 25 17% | 25 17% |
| Idle Average * (dB) | 32 | 23 28% | 28.8 10% | 31.3 2% | 26 19% |
| Idle Maximum * (dB) | 35 | 27.96 20% | 32 9% | 37.5 -7% | 28 20% |
| Load Average * (dB) | 51 | 27.96 45% | 45.5 11% | 44 14% | 43 16% |
| Witcher 3 ultra * (dB) | 51 | 47.89 6% | 53.1 -4% | 57 -12% | 51 -0% |
| Load Maximum * (dB) | 54 | 47.89 11% | 55.7 -3% | 60.1 -11% | 53 2% |
* ... Meglio usare valori piccoli
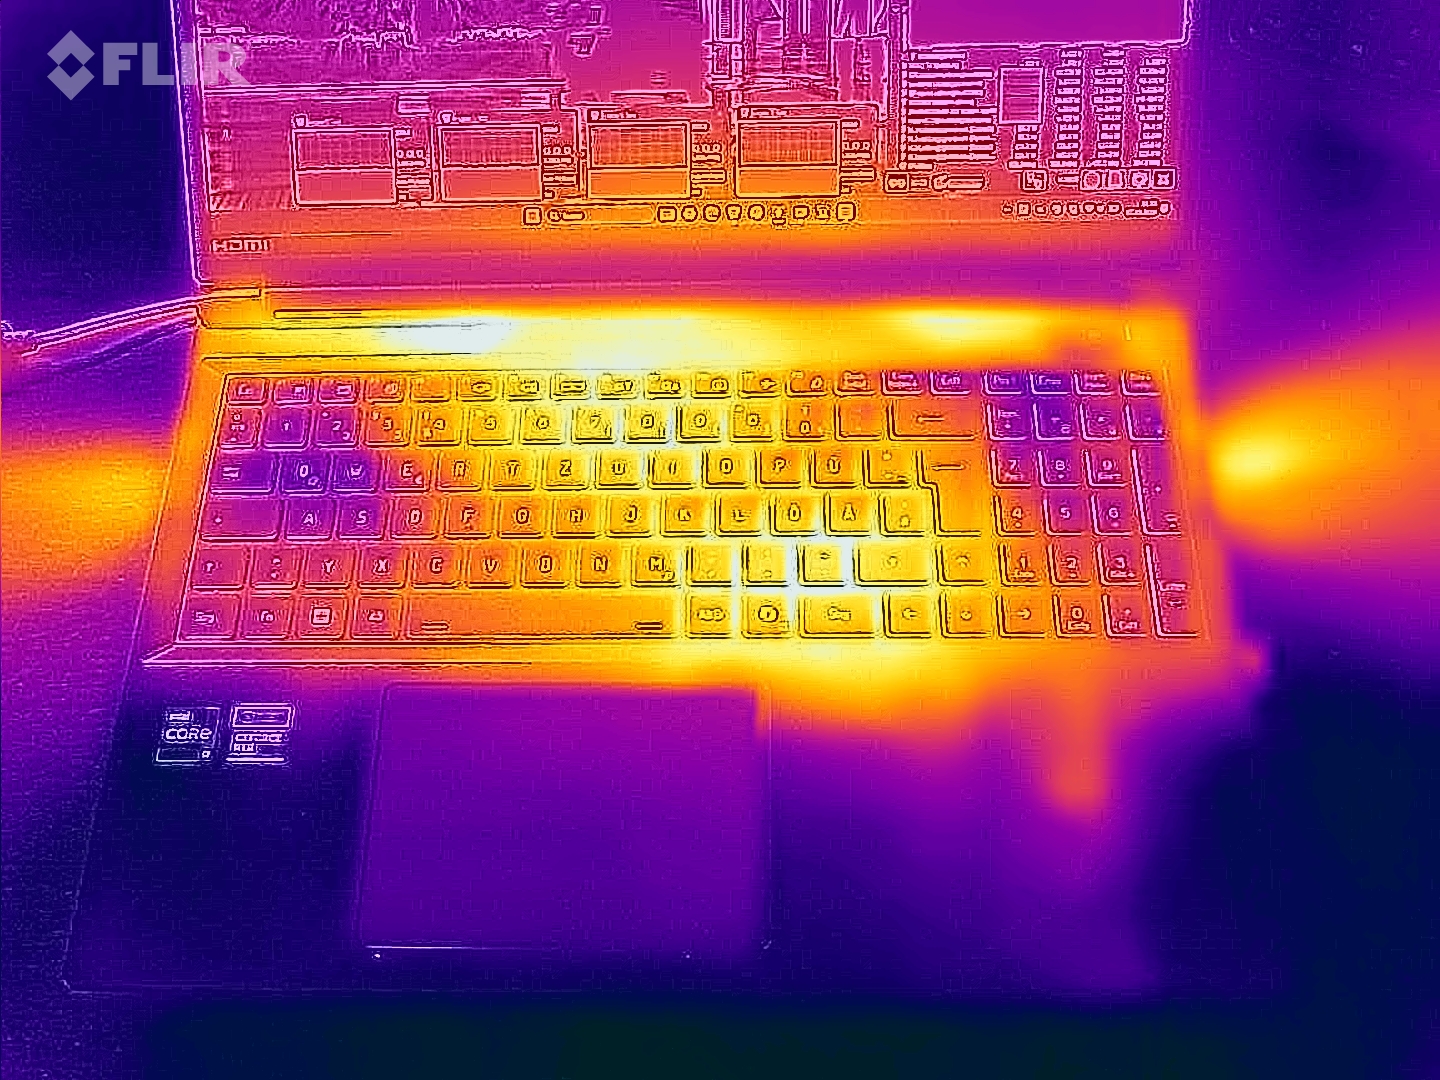
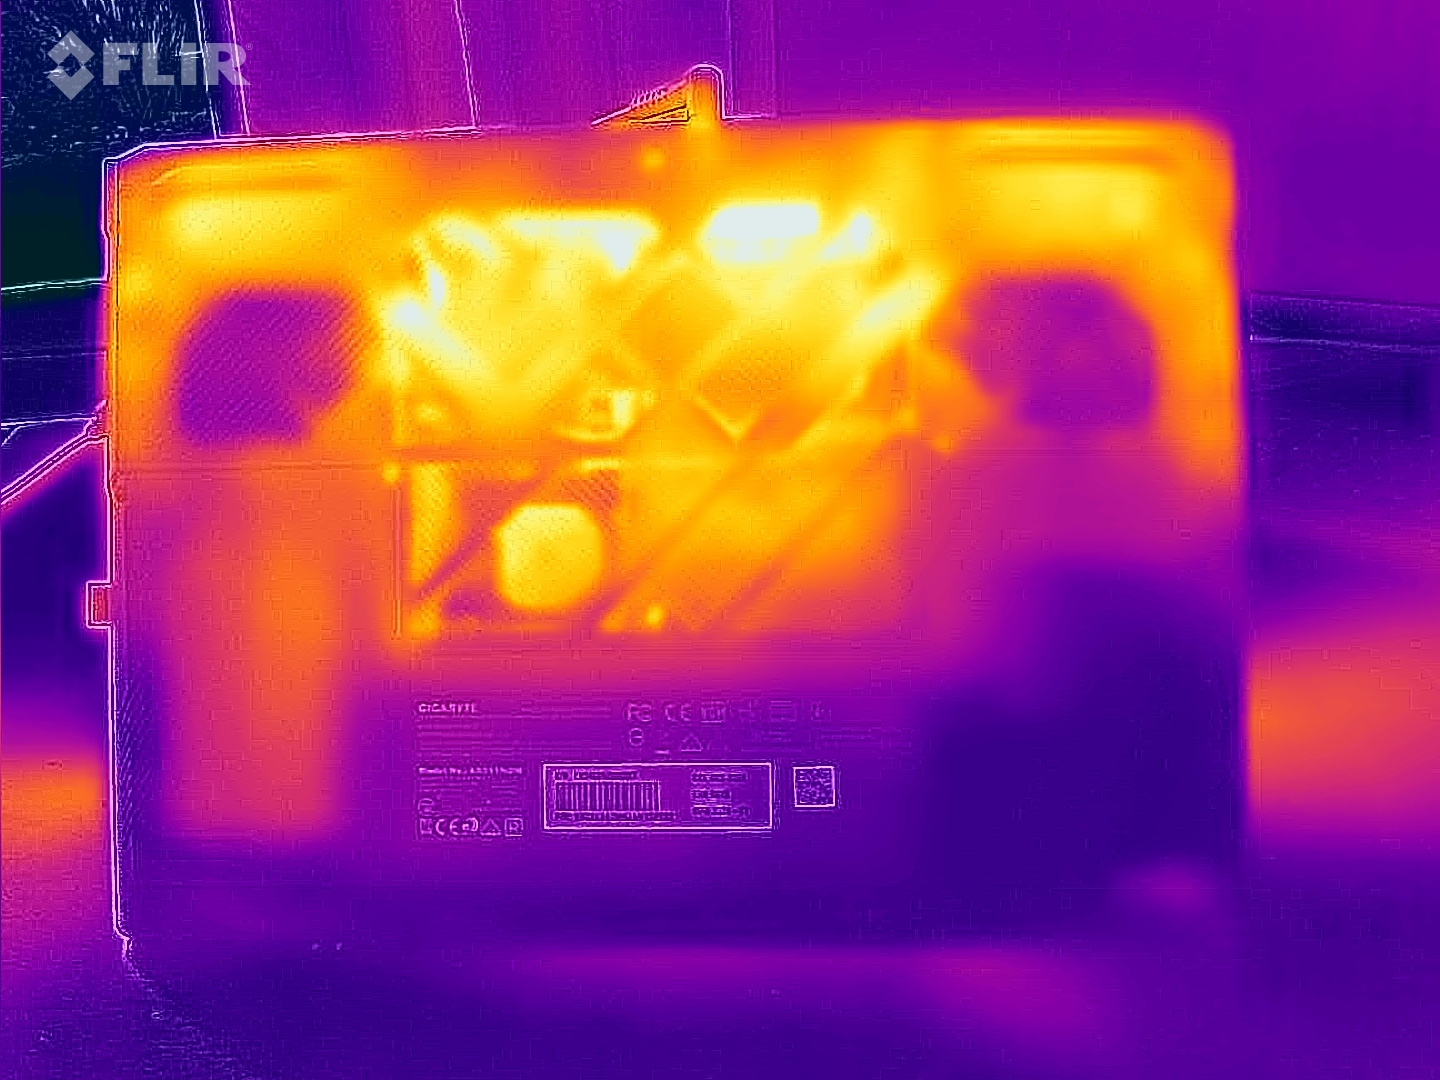
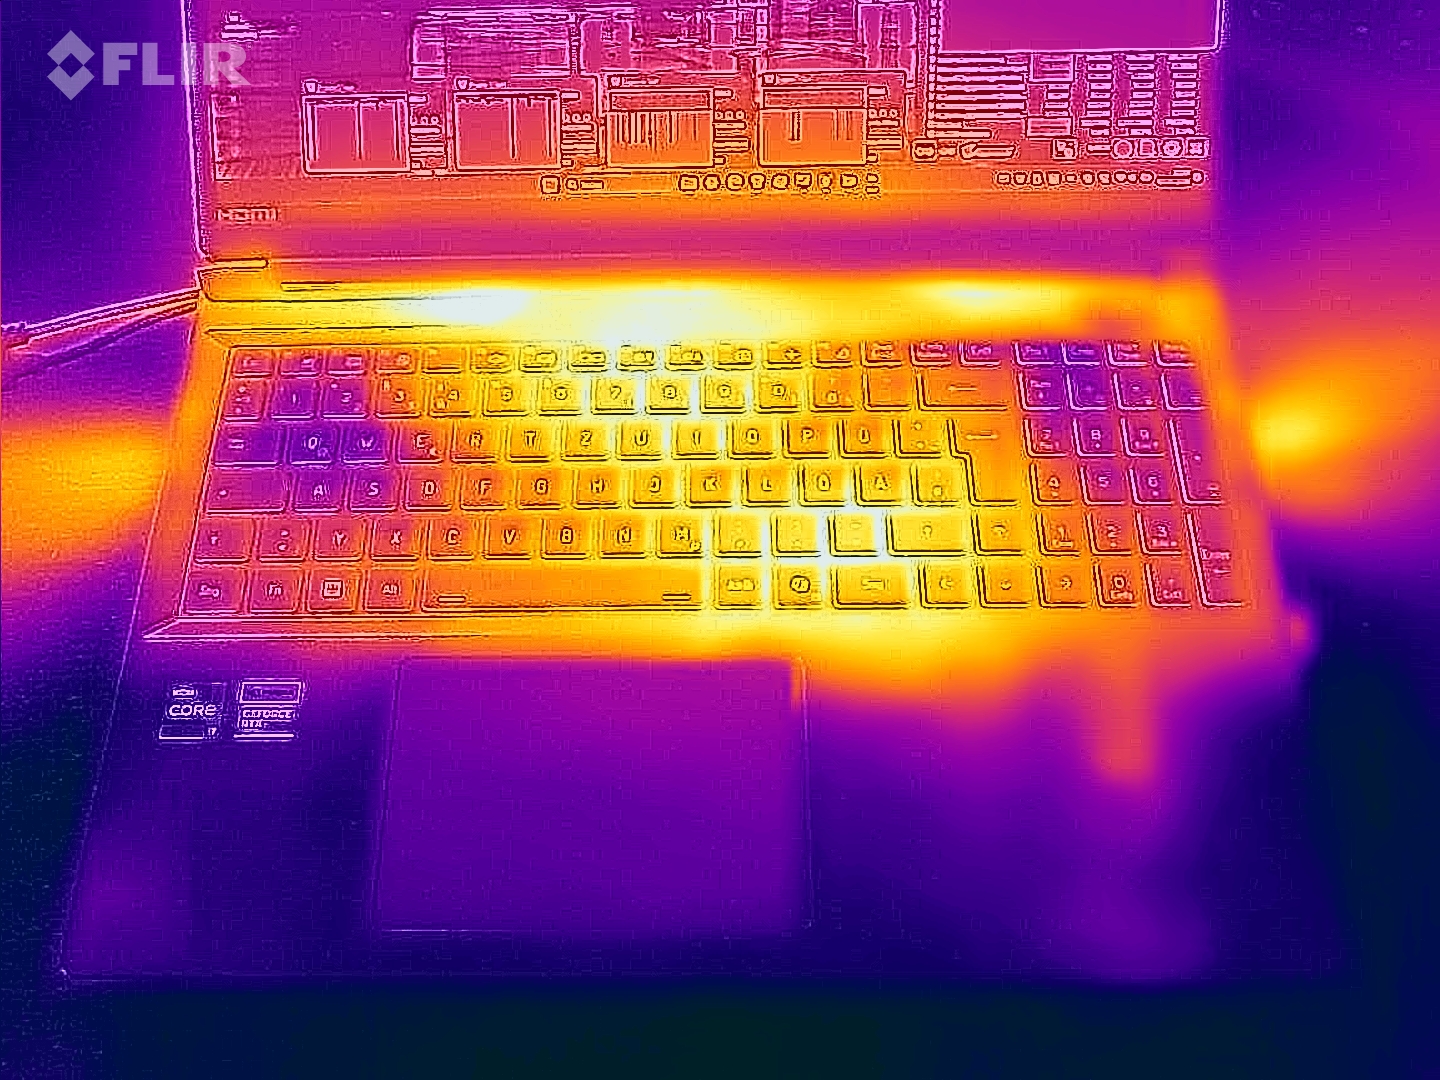
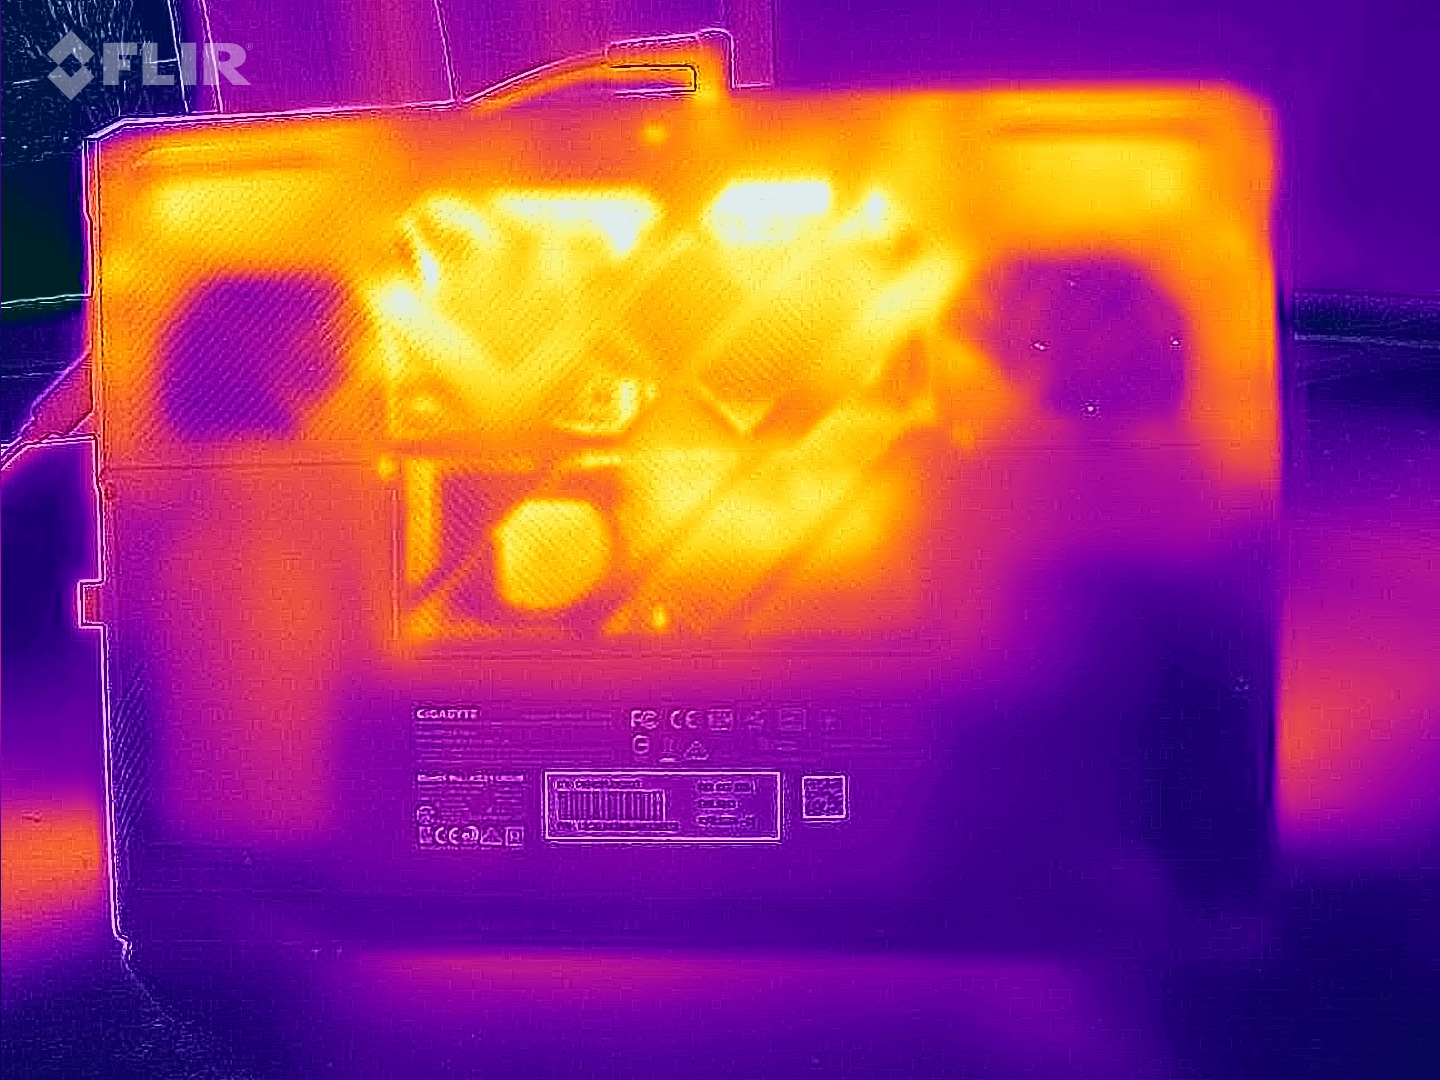
Temperatura
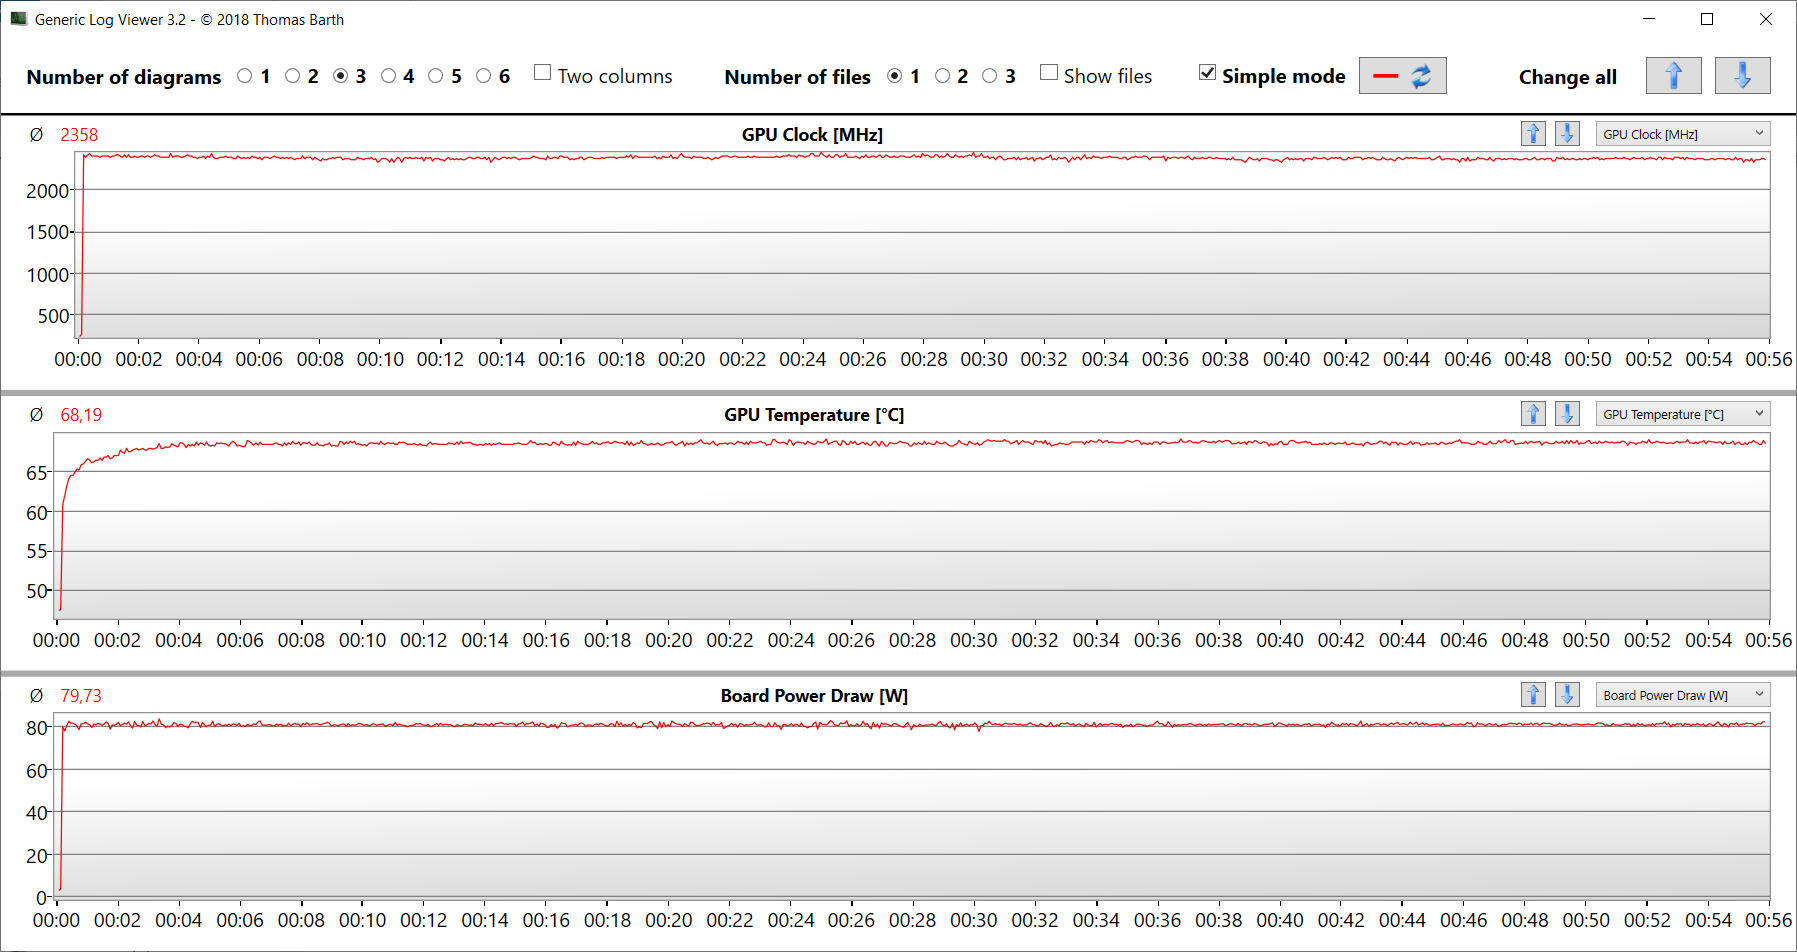
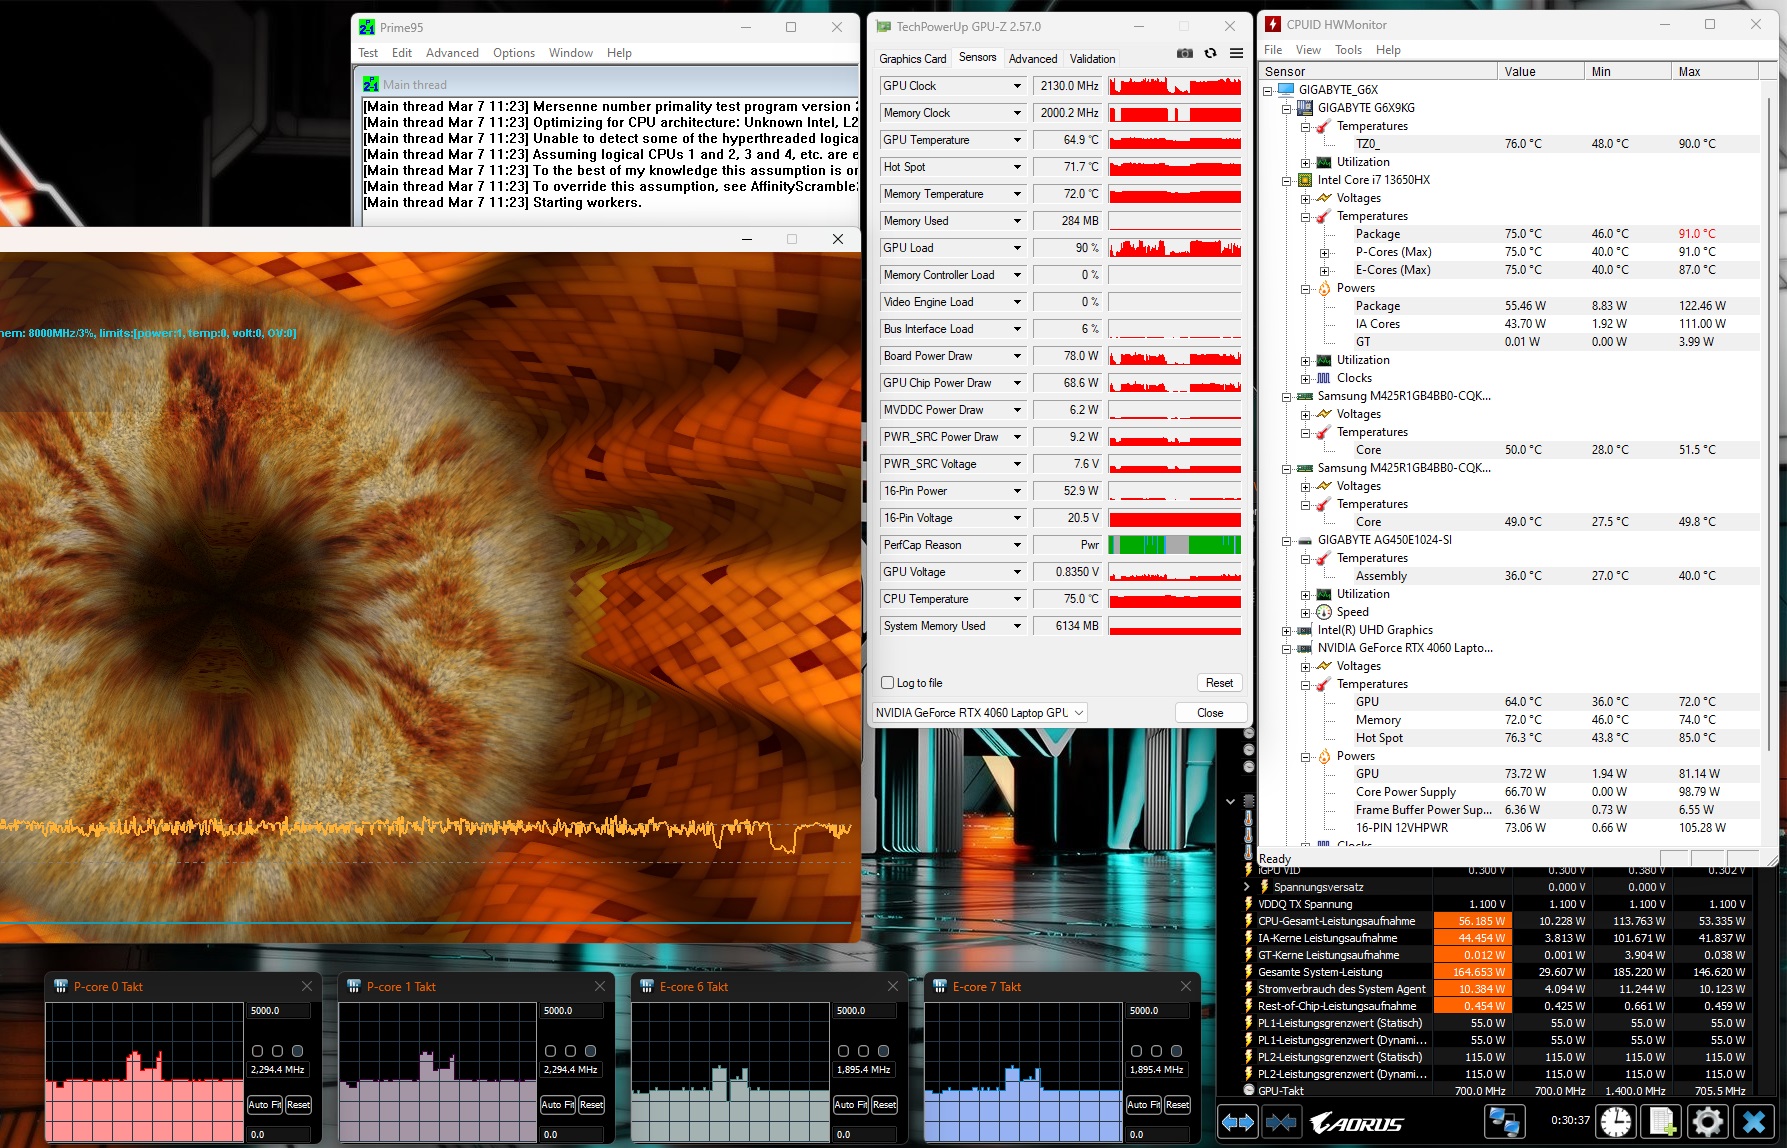
Il test di stress e i test di Witcher 3 garantiscono al massimo un riscaldamento moderato del portatile. Occasionalmente si raggiungono valori nella fascia inferiore ai 40 °C. Nell'uso quotidiano (Office, navigazione in Internet), i valori rimangono nella fascia verde.
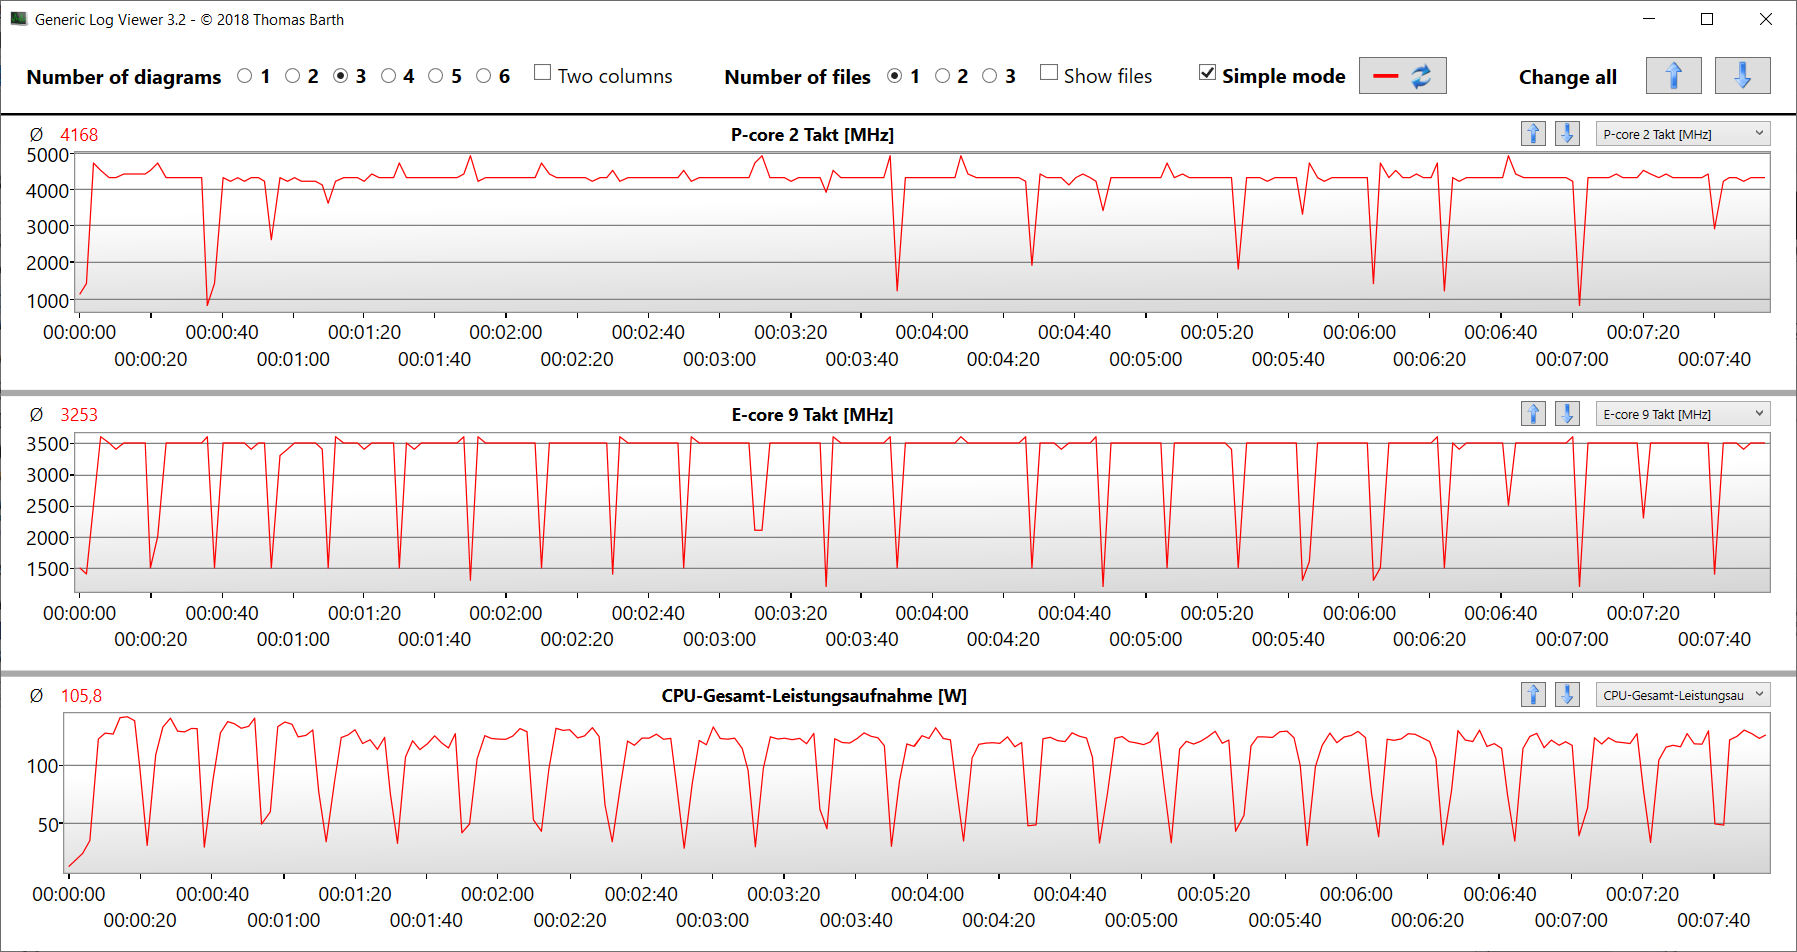
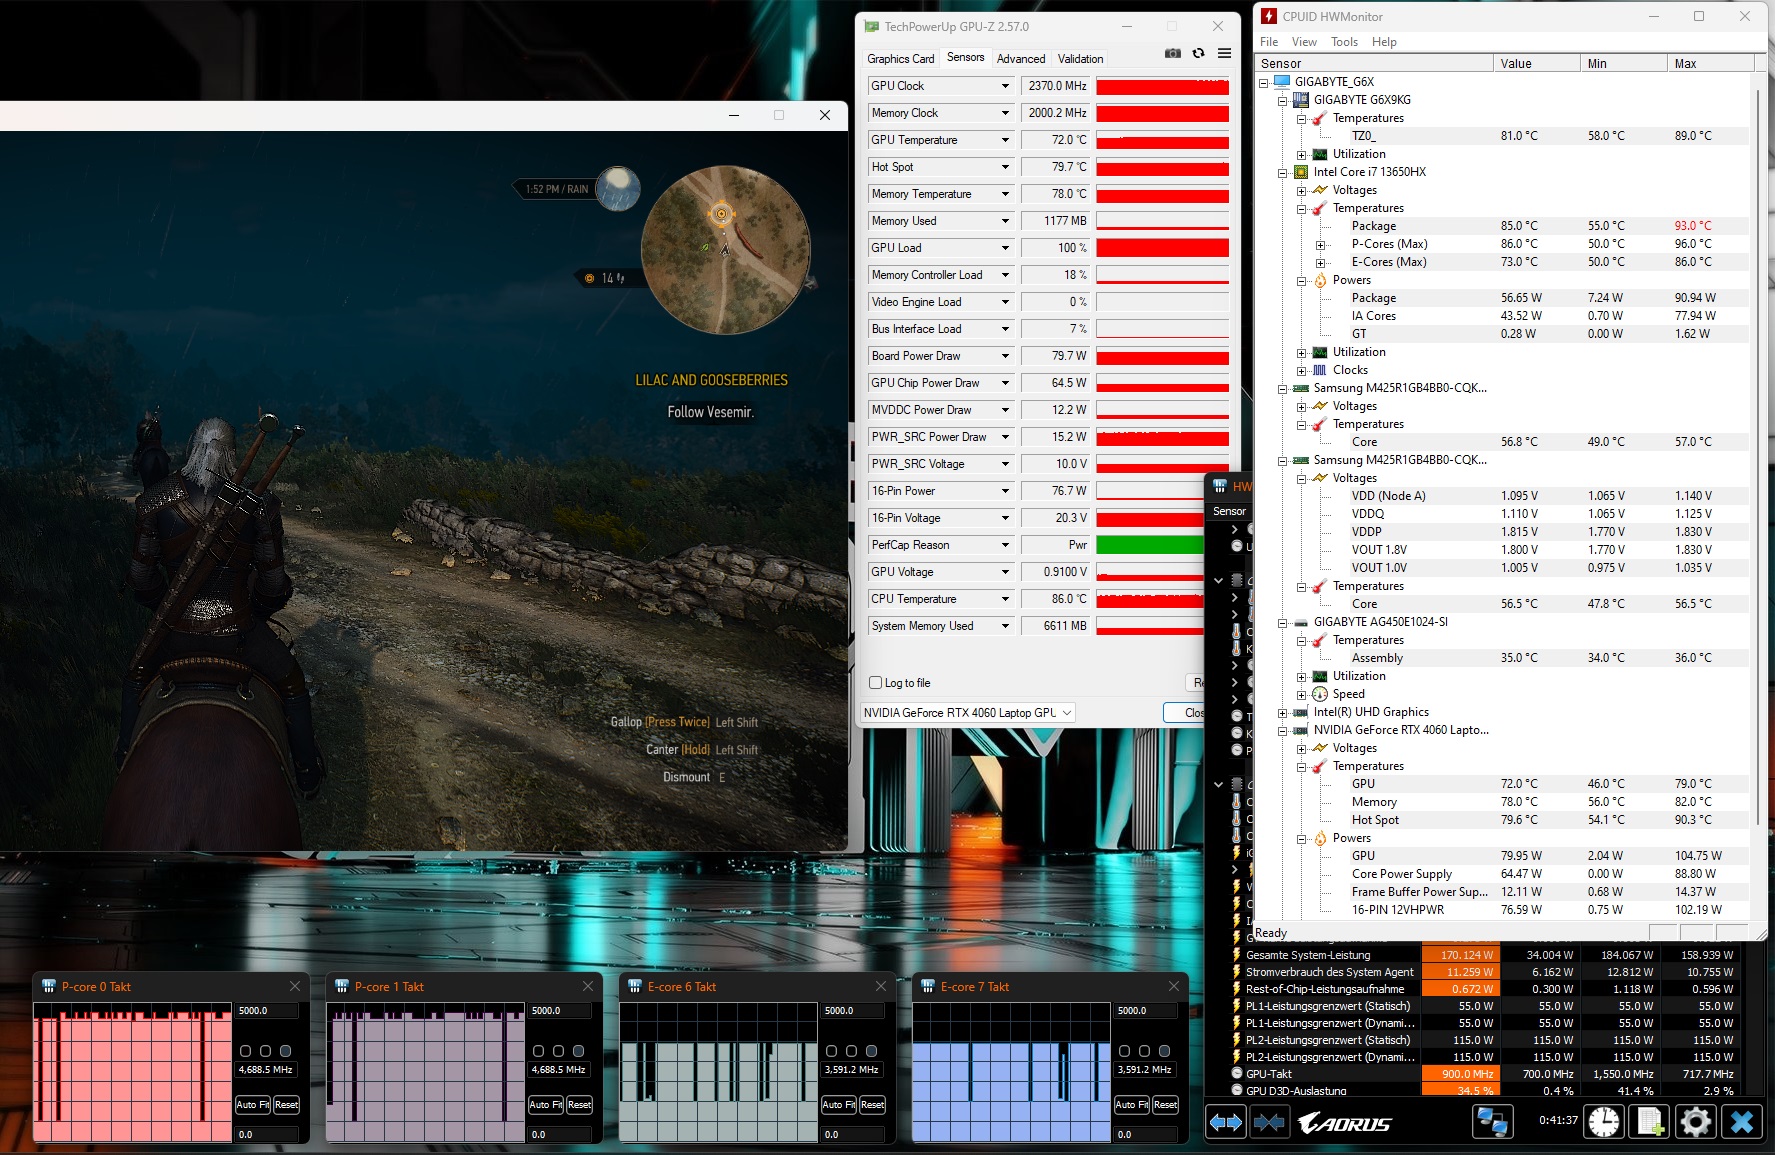
Lo scenario di stress test estremo (Prime95 e FurMark in funzionamento continuo) verifica la stabilità del sistema a pieno carico. La CPU del G6X lavora inizialmente alla massima potenza, ma riduce rapidamente la velocità di clock al livello di clock di base. La frequenza di clock della GPU scende da 2,3 GHz-2,6 GHz a 1,9-2,1 GHz.
(±) La temperatura massima sul lato superiore è di 41 °C / 106 F, rispetto alla media di 40.4 °C / 105 F, che varia da 21.2 a 68.8 °C per questa classe Gaming.
(±) Il lato inferiore si riscalda fino ad un massimo di 43 °C / 109 F, rispetto alla media di 43.2 °C / 110 F
(+) In idle, la temperatura media del lato superiore è di 29.6 °C / 85 F, rispetto alla media deld ispositivo di 33.9 °C / 93 F.
(±) Riproducendo The Witcher 3, la temperatura media per il lato superiore e' di 34.9 °C / 95 F, rispetto alla media del dispositivo di 33.9 °C / 93 F.
(+) I poggiapolsi e il touchpad sono piu' freddi della temperatura della pelle con un massimo di 28 °C / 82.4 F e sono quindi freddi al tatto.
(±) La temperatura media della zona del palmo della mano di dispositivi simili e'stata di 28.8 °C / 83.8 F (+0.8 °C / 1.4 F).
| Gigabyte G6X 9KG (2024) i7-13650HX, GeForce RTX 4060 Laptop GPU | Dell G16, i7-13650HX, RTX 4060 i7-13650HX, GeForce RTX 4060 Laptop GPU | Lenovo Legion 5 16IRX G9 i7-14650HX, GeForce RTX 4060 Laptop GPU | MSI Raider GE68HX 13VF i9-13950HX, GeForce RTX 4060 Laptop GPU | Asus TUF Gaming A16 FA617XS R9 7940HS, Radeon RX 7600S | |
|---|---|---|---|---|---|
| Heat | -15% | 2% | 4% | -4% | |
| Maximum Upper Side * (°C) | 41 | 49 -20% | 40.4 1% | 41.4 -1% | 53 -29% |
| Maximum Bottom * (°C) | 43 | 58 -35% | 43.8 -2% | 45.4 -6% | 48 -12% |
| Idle Upper Side * (°C) | 32 | 35 -9% | 30.3 5% | 29.8 7% | 30 6% |
| Idle Bottom * (°C) | 37 | 35 5% | 35.3 5% | 31.4 15% | 30 19% |
* ... Meglio usare valori piccoli
Altoparlante
Gli altoparlanti stereo producono un suono complessivamente decente. Tuttavia, mancano i bassi.
Gigabyte G6X 9KG (2024) analisi audio
(+) | gli altoparlanti sono relativamente potenti (82 dB)
Bassi 100 - 315 Hz
(-) | quasi nessun basso - in media 24.9% inferiori alla media
(±) | la linearità dei bassi è media (13.7% delta rispetto alla precedente frequenza)
Medi 400 - 2000 Hz
(+) | medi bilanciati - solo only 4.1% rispetto alla media
(+) | medi lineari (5.4% delta rispetto alla precedente frequenza)
Alti 2 - 16 kHz
(+) | Alti bilanciati - appena 2.2% dalla media
(±) | la linearità degli alti è media (7.4% delta rispetto alla precedente frequenza)
Nel complesso 100 - 16.000 Hz
(±) | la linearità complessiva del suono è media (17.2% di differenza rispetto alla media
Rispetto alla stessa classe
» 46% di tutti i dispositivi testati in questa classe è stato migliore, 11% simile, 42% peggiore
» Il migliore ha avuto un delta di 6%, medio di 18%, peggiore di 132%
Rispetto a tutti i dispositivi testati
» 32% di tutti i dispositivi testati in questa classe è stato migliore, 8% similare, 60% peggiore
» Il migliore ha avuto un delta di 4%, medio di 24%, peggiore di 134%
Dell G16, i7-13650HX, RTX 4060 analisi audio
(±) | potenza degli altiparlanti media ma buona (80.55 dB)
Bassi 100 - 315 Hz
(-) | quasi nessun basso - in media 25.1% inferiori alla media
(-) | bassi non lineari (18.9% delta rispetto alla precedente frequenza)
Medi 400 - 2000 Hz
(±) | medi elevati - circa 8% superiore alla media
(+) | medi lineari (5.9% delta rispetto alla precedente frequenza)
Alti 2 - 16 kHz
(+) | Alti bilanciati - appena 3.5% dalla media
(±) | la linearità degli alti è media (8.6% delta rispetto alla precedente frequenza)
Nel complesso 100 - 16.000 Hz
(±) | la linearità complessiva del suono è media (23.4% di differenza rispetto alla media
Rispetto alla stessa classe
» 85% di tutti i dispositivi testati in questa classe è stato migliore, 4% simile, 11% peggiore
» Il migliore ha avuto un delta di 6%, medio di 18%, peggiore di 132%
Rispetto a tutti i dispositivi testati
» 70% di tutti i dispositivi testati in questa classe è stato migliore, 6% similare, 24% peggiore
» Il migliore ha avuto un delta di 4%, medio di 24%, peggiore di 134%
Consumo di energia
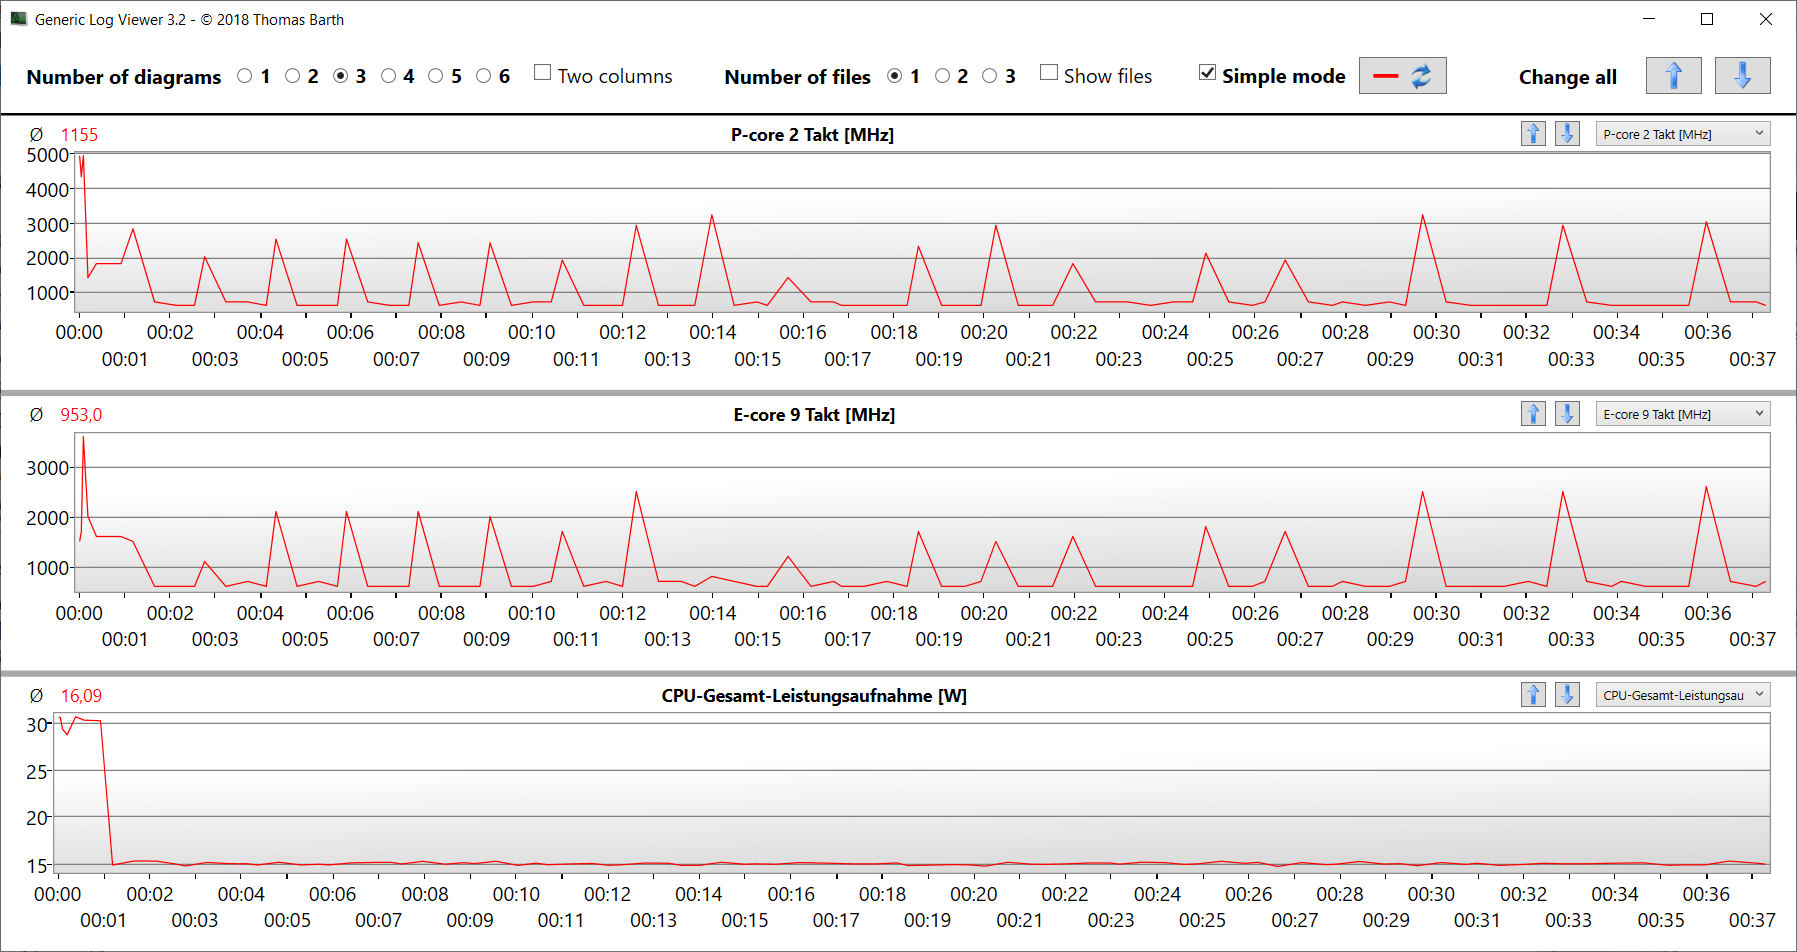
Il consumo energetico è a un livello normale per l'hardware installato. Mentre il test Witcher 3 viene eseguito con un consumo energetico costante, la richiesta fluttua leggermente durante lo stress test.
La potenza di uscita dell'alimentatore supera la potenza nominale (180 W) per alcuni minuti, ma poi viene ridotta al livello di potenza nominale.
| Off / Standby | |
| Idle | |
| Sotto carico |
|
Leggenda:
min: | |
Energieaufnahme Witcher 3 / Stresstest
Power consumption: External monitor
Durata della batteria
Gigabyte G6X raggiunge un tempo di esecuzione di 7:54 ore nel test pratico WLAN (mappatura del carico quando si accede ai siti web utilizzando uno script), che è un buon valore ed è il secondo miglior tempo di esecuzione nel confronto.
Pro
Contro
Verdetto: Pacchetto complessivo ben assortito
Gigabyte G6X 9KG è progettato per il gioco FHD con impostazioni elevate o massime, ma il suo Core i7-13650HX e GeForce RTX 4060 dovrebbero essere in grado di dare risultati anche in altre aree, come l'editing video e il rendering. Un veloce SSD PCIe Gen 4 da 1 TB assicura tempi di caricamento brevi.
Gigabyte offre un notebook da gioco coerente di fascia media con il G6X 9KG (2024)"
Il notebook non si riscalda molto sotto carico, ma può produrre molto rumore. Il profilo di alimentazione Silent può contrastare questo fenomeno, ma ciò comporta la disattivazione della dGPU. Il buon tempo di funzionamento del Wi-Fi di poco meno di 8 ore, quindi, non è una sorpresa.
Il G6X non dispone di porte Thunderbolt o USB4 moderne. Con una delle USB Type-C che supporta Power Delivery, l'alimentatore proprietario può rimanere a casa per lavorare regolarmente. Le due porte USB 3.2 Gen 2 Type-C consentono inoltre una facile integrazione nelle configurazioni di workstation esistenti.
Il display opaco da 16 pollici WUXGA 165 Hz IPS fa una buona impressione nel complesso, ma offre una copertura dello spazio colore insufficiente.
In alternativa, il display Lenovo Legion 5 16IRX G9 potrebbe essere preso in considerazione. Offre maggiori prestazioni della GPU e uno schermo più luminoso con una migliore copertura dello spazio colore.
Prezzo e disponibilità
Negli Stati Uniti, Gigabyte G6X 9KG (2024) è disponibile su Amazon a circa 1.350 dollari.
Gigabyte G6X 9KG (2024)
- 03/22/2024 v7 (old)
Sascha Mölck
Transparency
La selezione dei dispositivi da recensire viene effettuata dalla nostra redazione. Il campione di prova è stato fornito all'autore come prestito dal produttore o dal rivenditore ai fini di questa recensione. L'istituto di credito non ha avuto alcuna influenza su questa recensione, né il produttore ne ha ricevuto una copia prima della pubblicazione. Non vi era alcun obbligo di pubblicare questa recensione. In quanto società mediatica indipendente, Notebookcheck non è soggetta all'autorità di produttori, rivenditori o editori.
Ecco come Notebookcheck esegue i test
Ogni anno, Notebookcheck esamina in modo indipendente centinaia di laptop e smartphone utilizzando procedure standardizzate per garantire che tutti i risultati siano comparabili. Da circa 20 anni sviluppiamo continuamente i nostri metodi di prova e nel frattempo stabiliamo gli standard di settore. Nei nostri laboratori di prova, tecnici ed editori esperti utilizzano apparecchiature di misurazione di alta qualità. Questi test comportano un processo di validazione in più fasi. Il nostro complesso sistema di valutazione si basa su centinaia di misurazioni e parametri di riferimento ben fondati, che mantengono l'obiettività.Price comparison
