Recensione di EVOL X15 AT 23 colorato: Impressionante gamer QHD con Raptor Lake-HX e alcune imperdibili stranezze

Più popolare per la sua gamma di schede madri e GPU per PC, Colorful ha iniziato ad espandere i suoi orizzonti per includere i laptop Alder Lake di 12esima generazione di Intel. Quest'anno, il gigante tecnologico cinese ha aggiornato la sua linea per offrire diverse offerte Raptor Lake di 13a generazione.
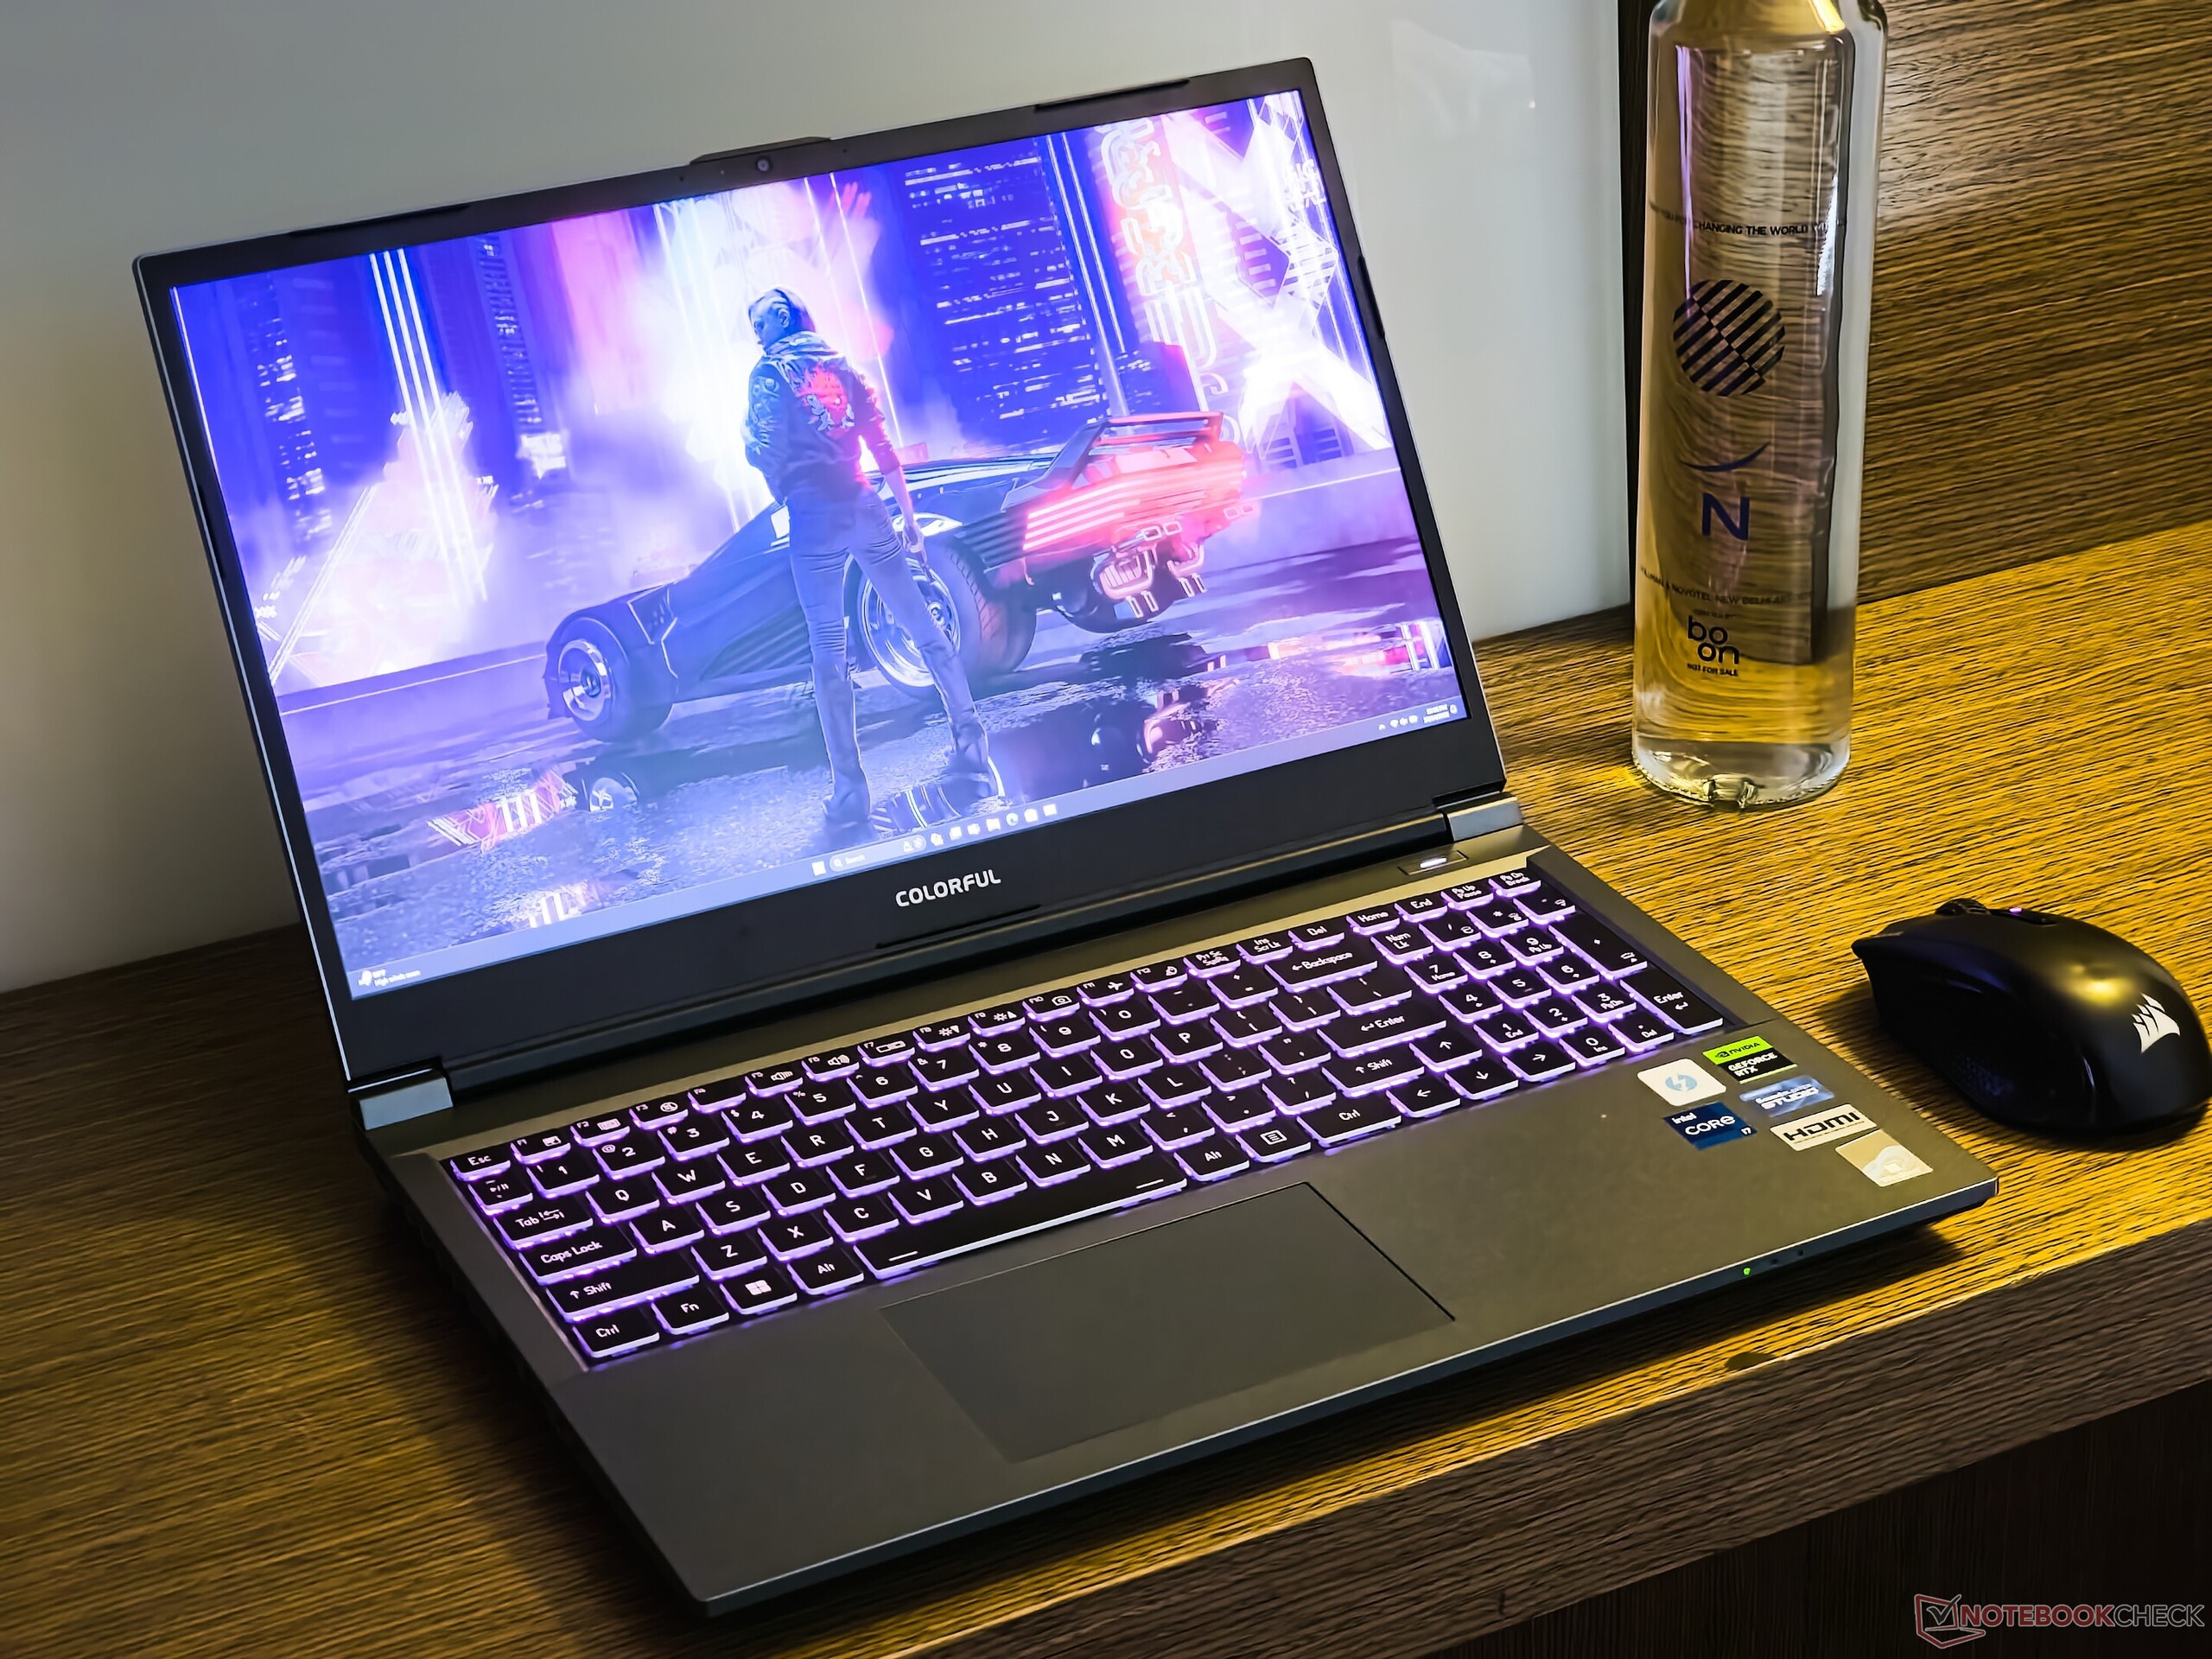
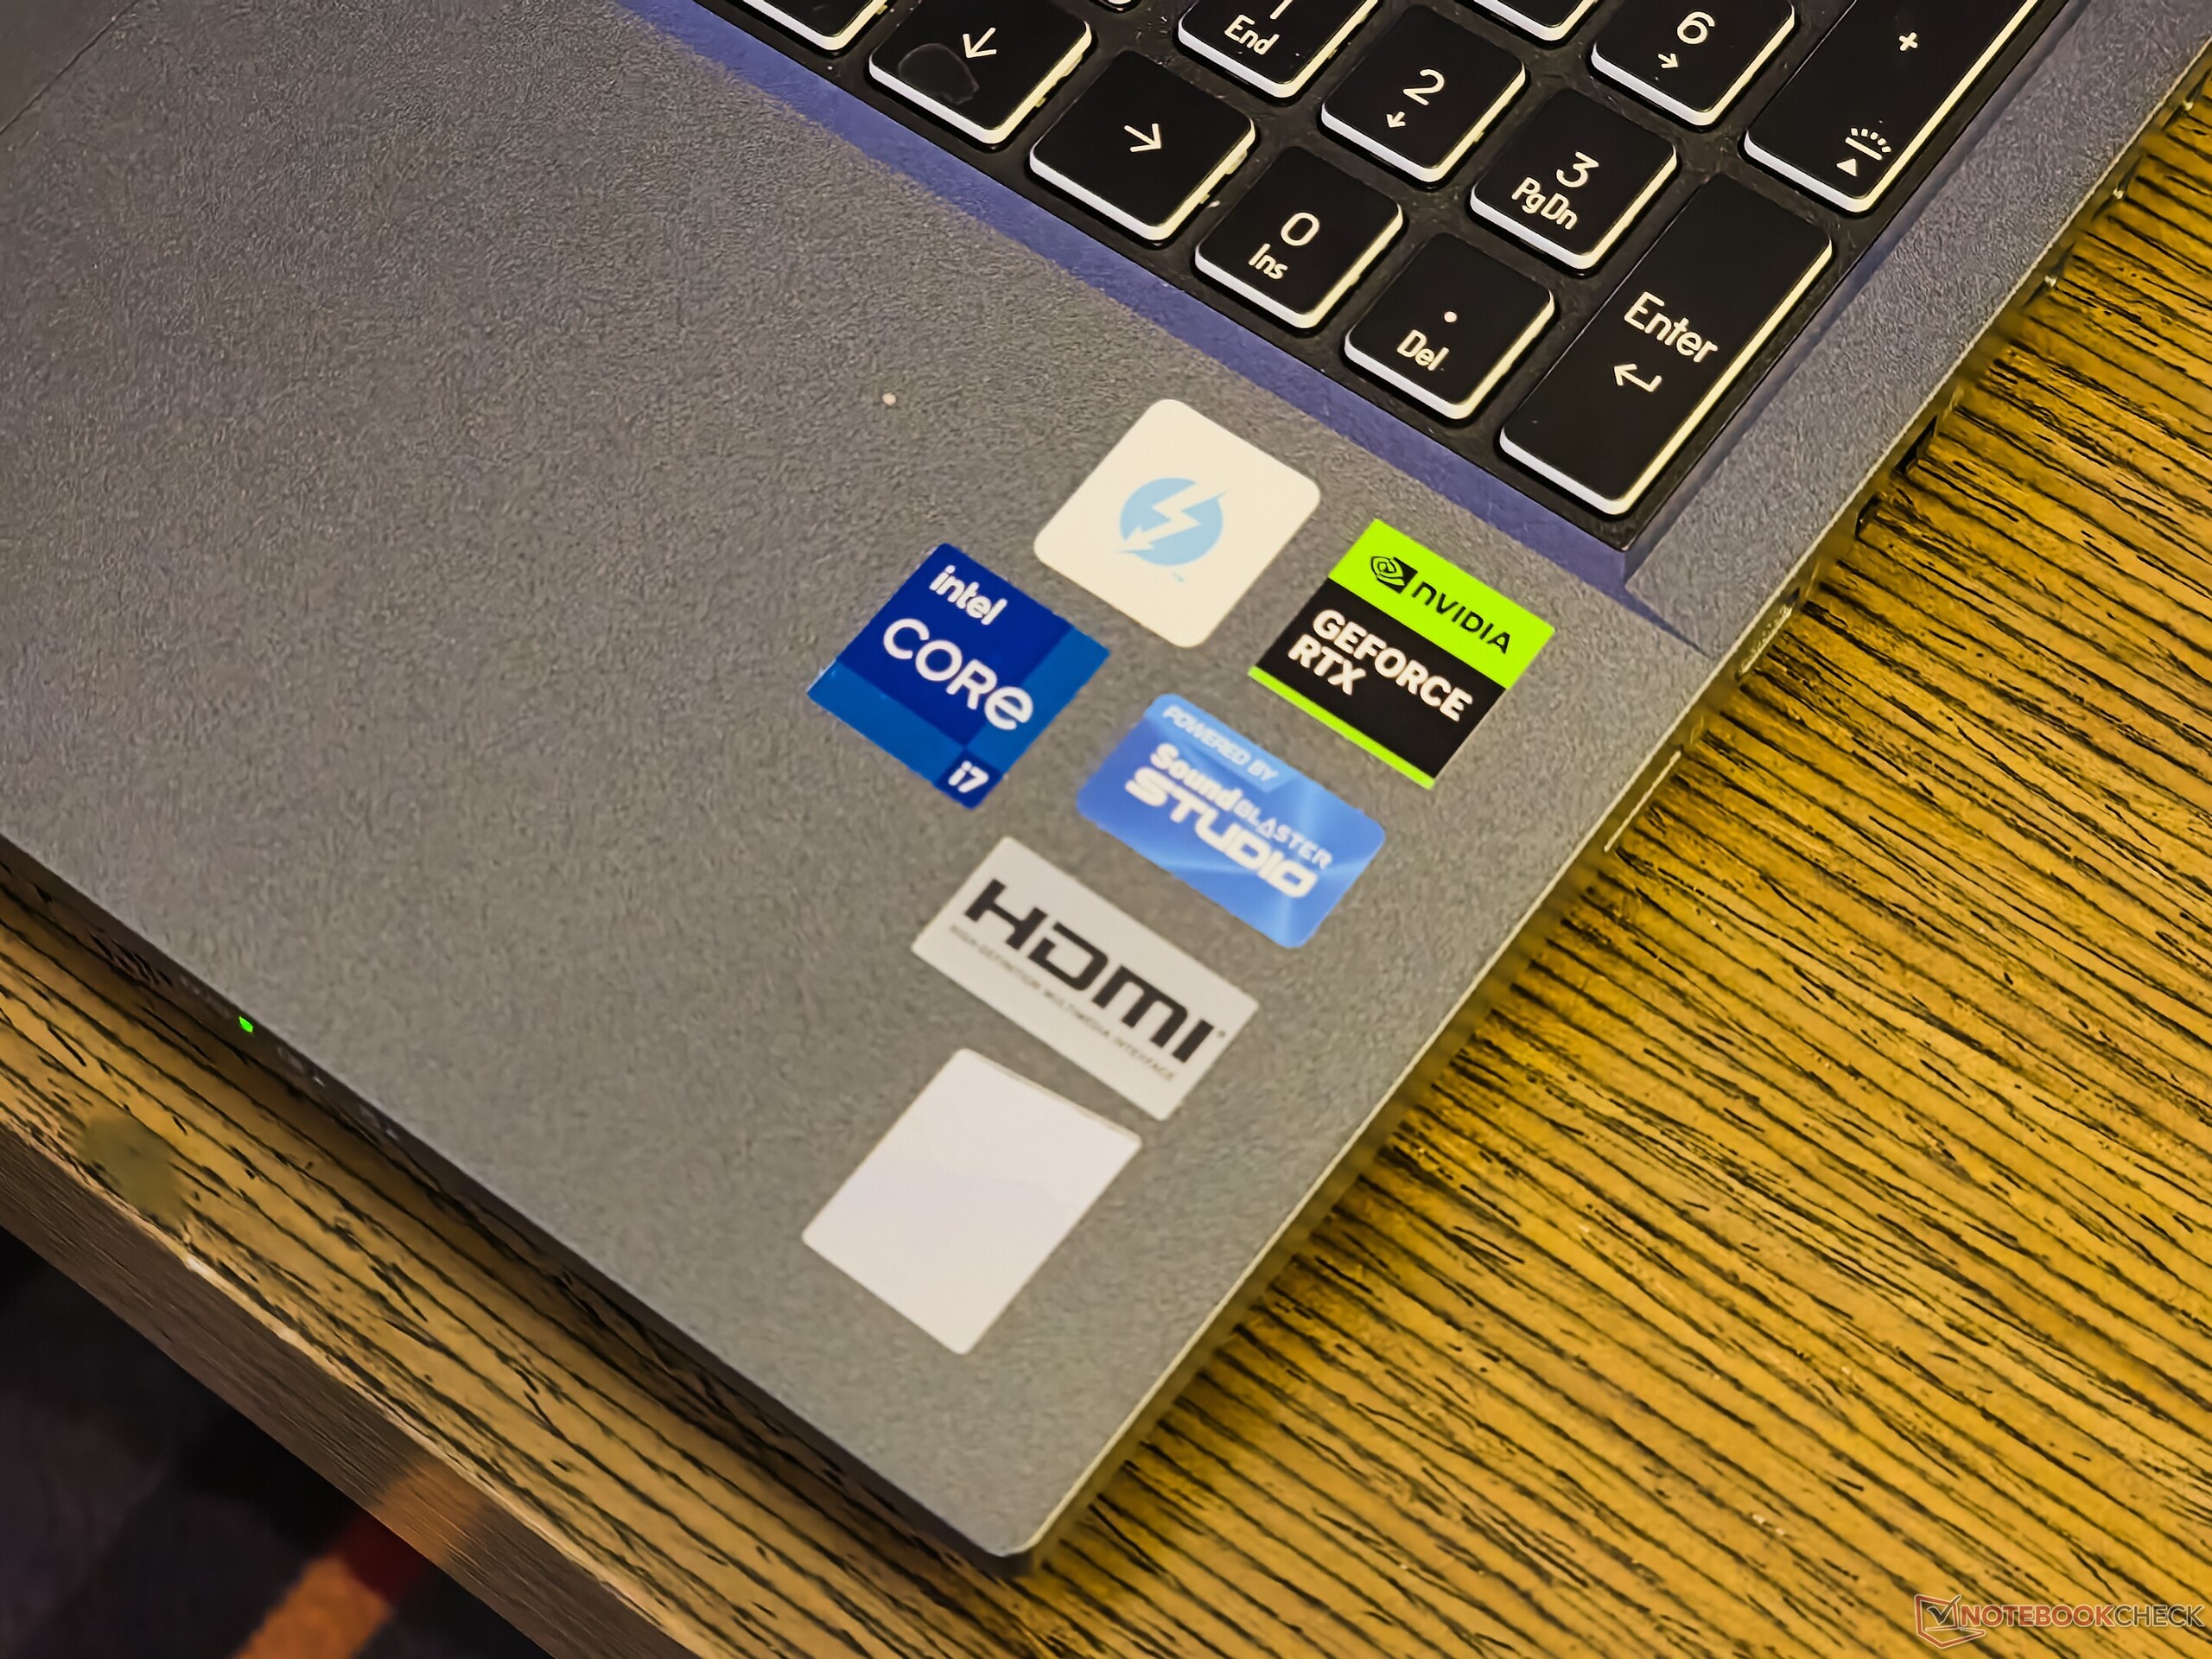
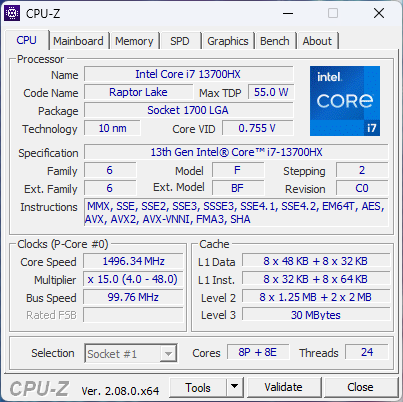
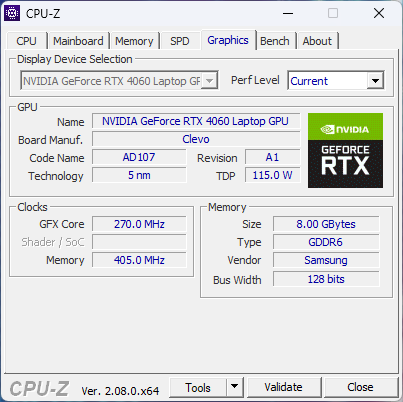
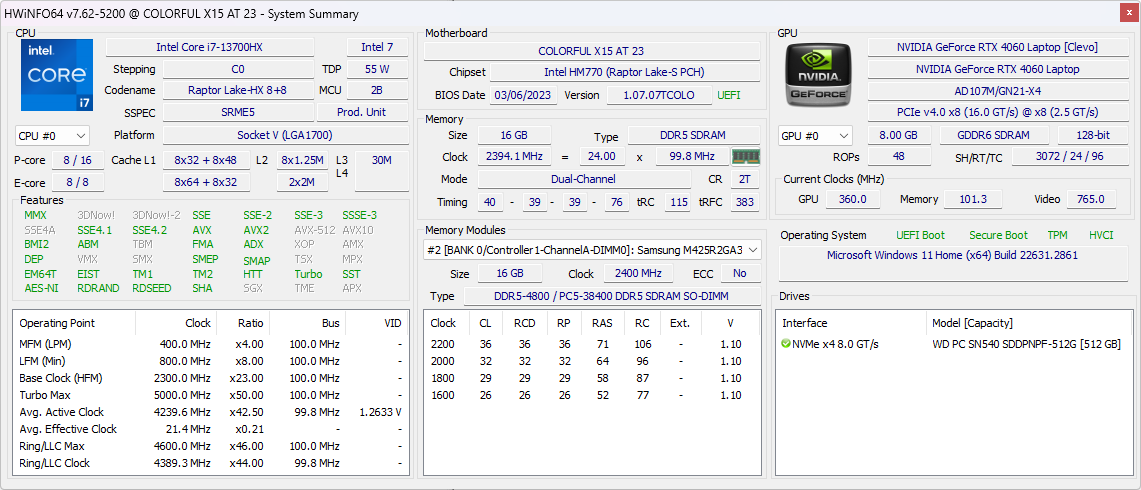
A questo proposito, il nuovo Colorful EVOL X15 AT 23 è arrivato di recente nei nostri laboratori di prova. Il nostro campione EVOL X15 AT è alimentato dall'unità Intel Core i7-13700HX, GPU Nvidia GeForce RTX 4060 Laptop, 16 GB di memoria DDR5-4800 (stick singolo) e un SSD NVMe da 512 GB.
Il dispositivo offre specifiche impressionanti, tra cui un display QHD 165 Hz e una batteria da 73 WHr, ed è disponibile in mercati asiatici selezionati come Cina, Tailandia, Malesia, Indonesia, Filippine e in Russia presso Ozon a circa 969 dollari. Newegg vende questa SKU negli Stati Uniti con un sovrapprezzo di 1.759 dollari.
In questa recensione, diamo un'occhiata al nuovo Colorful EVOL X15 AT e vediamo se può competere con alcuni dei suoi concorrenti più affermati.
Potenziali concorrenti a confronto
Punteggio | Data | Modello | Peso | Altezza | Dimensione | Risoluzione | Prezzo |
|---|---|---|---|---|---|---|---|
| 84.9 % v7 (old) | 12/2023 | Colorful EVOL X15 AT 23 i7-13700HX, GeForce RTX 4060 Laptop GPU | 2.3 kg | 26.9 mm | 15.60" | 2560x1440 | |
| 88.3 % v7 (old) | 09/2023 | Alienware m16 R1 Intel i7-13700HX, GeForce RTX 4060 Laptop GPU | 3 kg | 25.4 mm | 16.00" | 2560x1600 | |
| 87.4 % v7 (old) | 07/2023 | HP Omen 16-wf000 i7-13700HX, GeForce RTX 4080 Laptop GPU | 2.4 kg | 23.6 mm | 16.10" | 2560x1440 | |
| 89.5 % v7 (old) | 07/2023 | Acer Predator Helios 16 PH16-71-731Q i7-13700HX, GeForce RTX 4060 Laptop GPU | 2.6 kg | 26.9 mm | 16.00" | 2560x1600 | |
| 84.2 % v7 (old) | 06/2023 | Dell G15 5530 i7-13650HX, GeForce RTX 4060 Laptop GPU | 3 kg | 26.95 mm | 15.60" | 1920x1080 | |
| 86.2 % v7 (old) | 07/2023 | Schenker XMG Pro 15 (E23) i9-13900HX, GeForce RTX 4060 Laptop GPU | 2.4 kg | 24.9 mm | 15.60" | 2560x1440 | |
| 89.2 % v7 (old) | 08/2023 | Alienware m16 R1 AMD R9 7845HX, GeForce RTX 4080 Laptop GPU | 3.1 kg | 25.4 mm | 16.00" | 2560x1600 | |
| 88.2 % v7 (old) | 03/2023 | Uniwill GM6PX7X RTX 4070 i7-13700HX, GeForce RTX 4070 Laptop GPU | 2.2 kg | 22 mm | 16.00" | 2560x1600 |
Telaio: La funzione prevale sulla forma nell'estetica Clevo in plastica
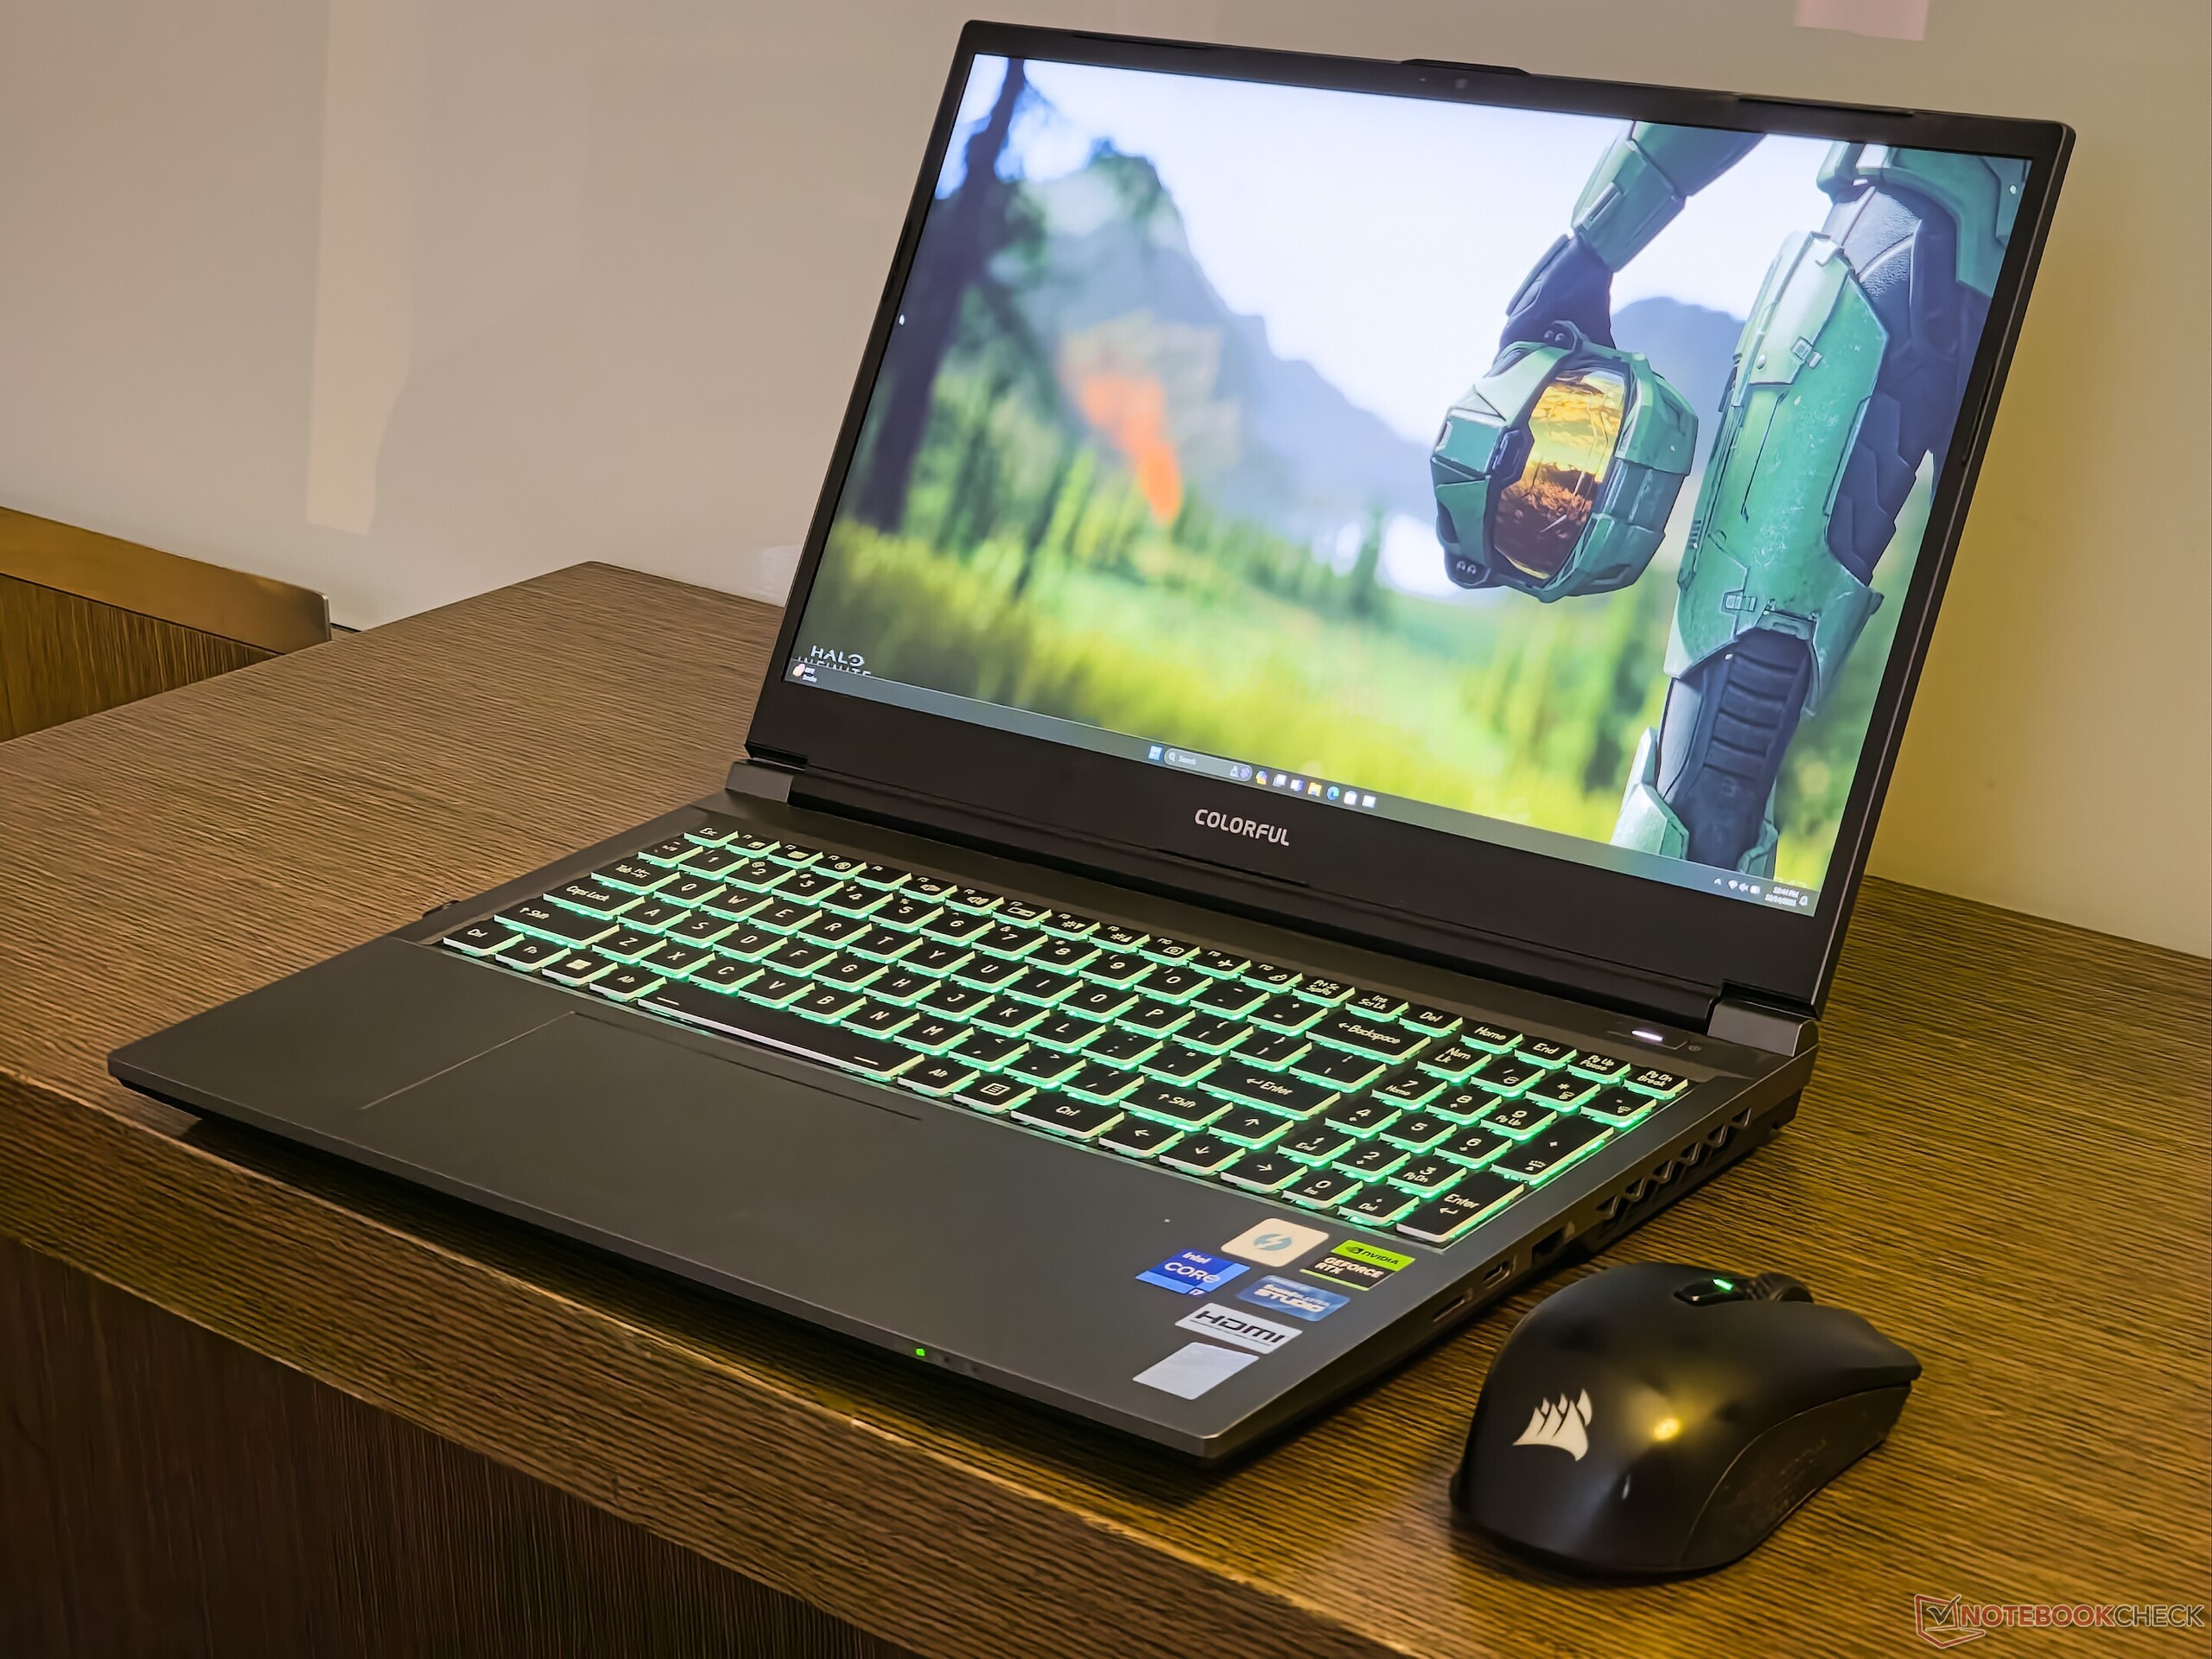
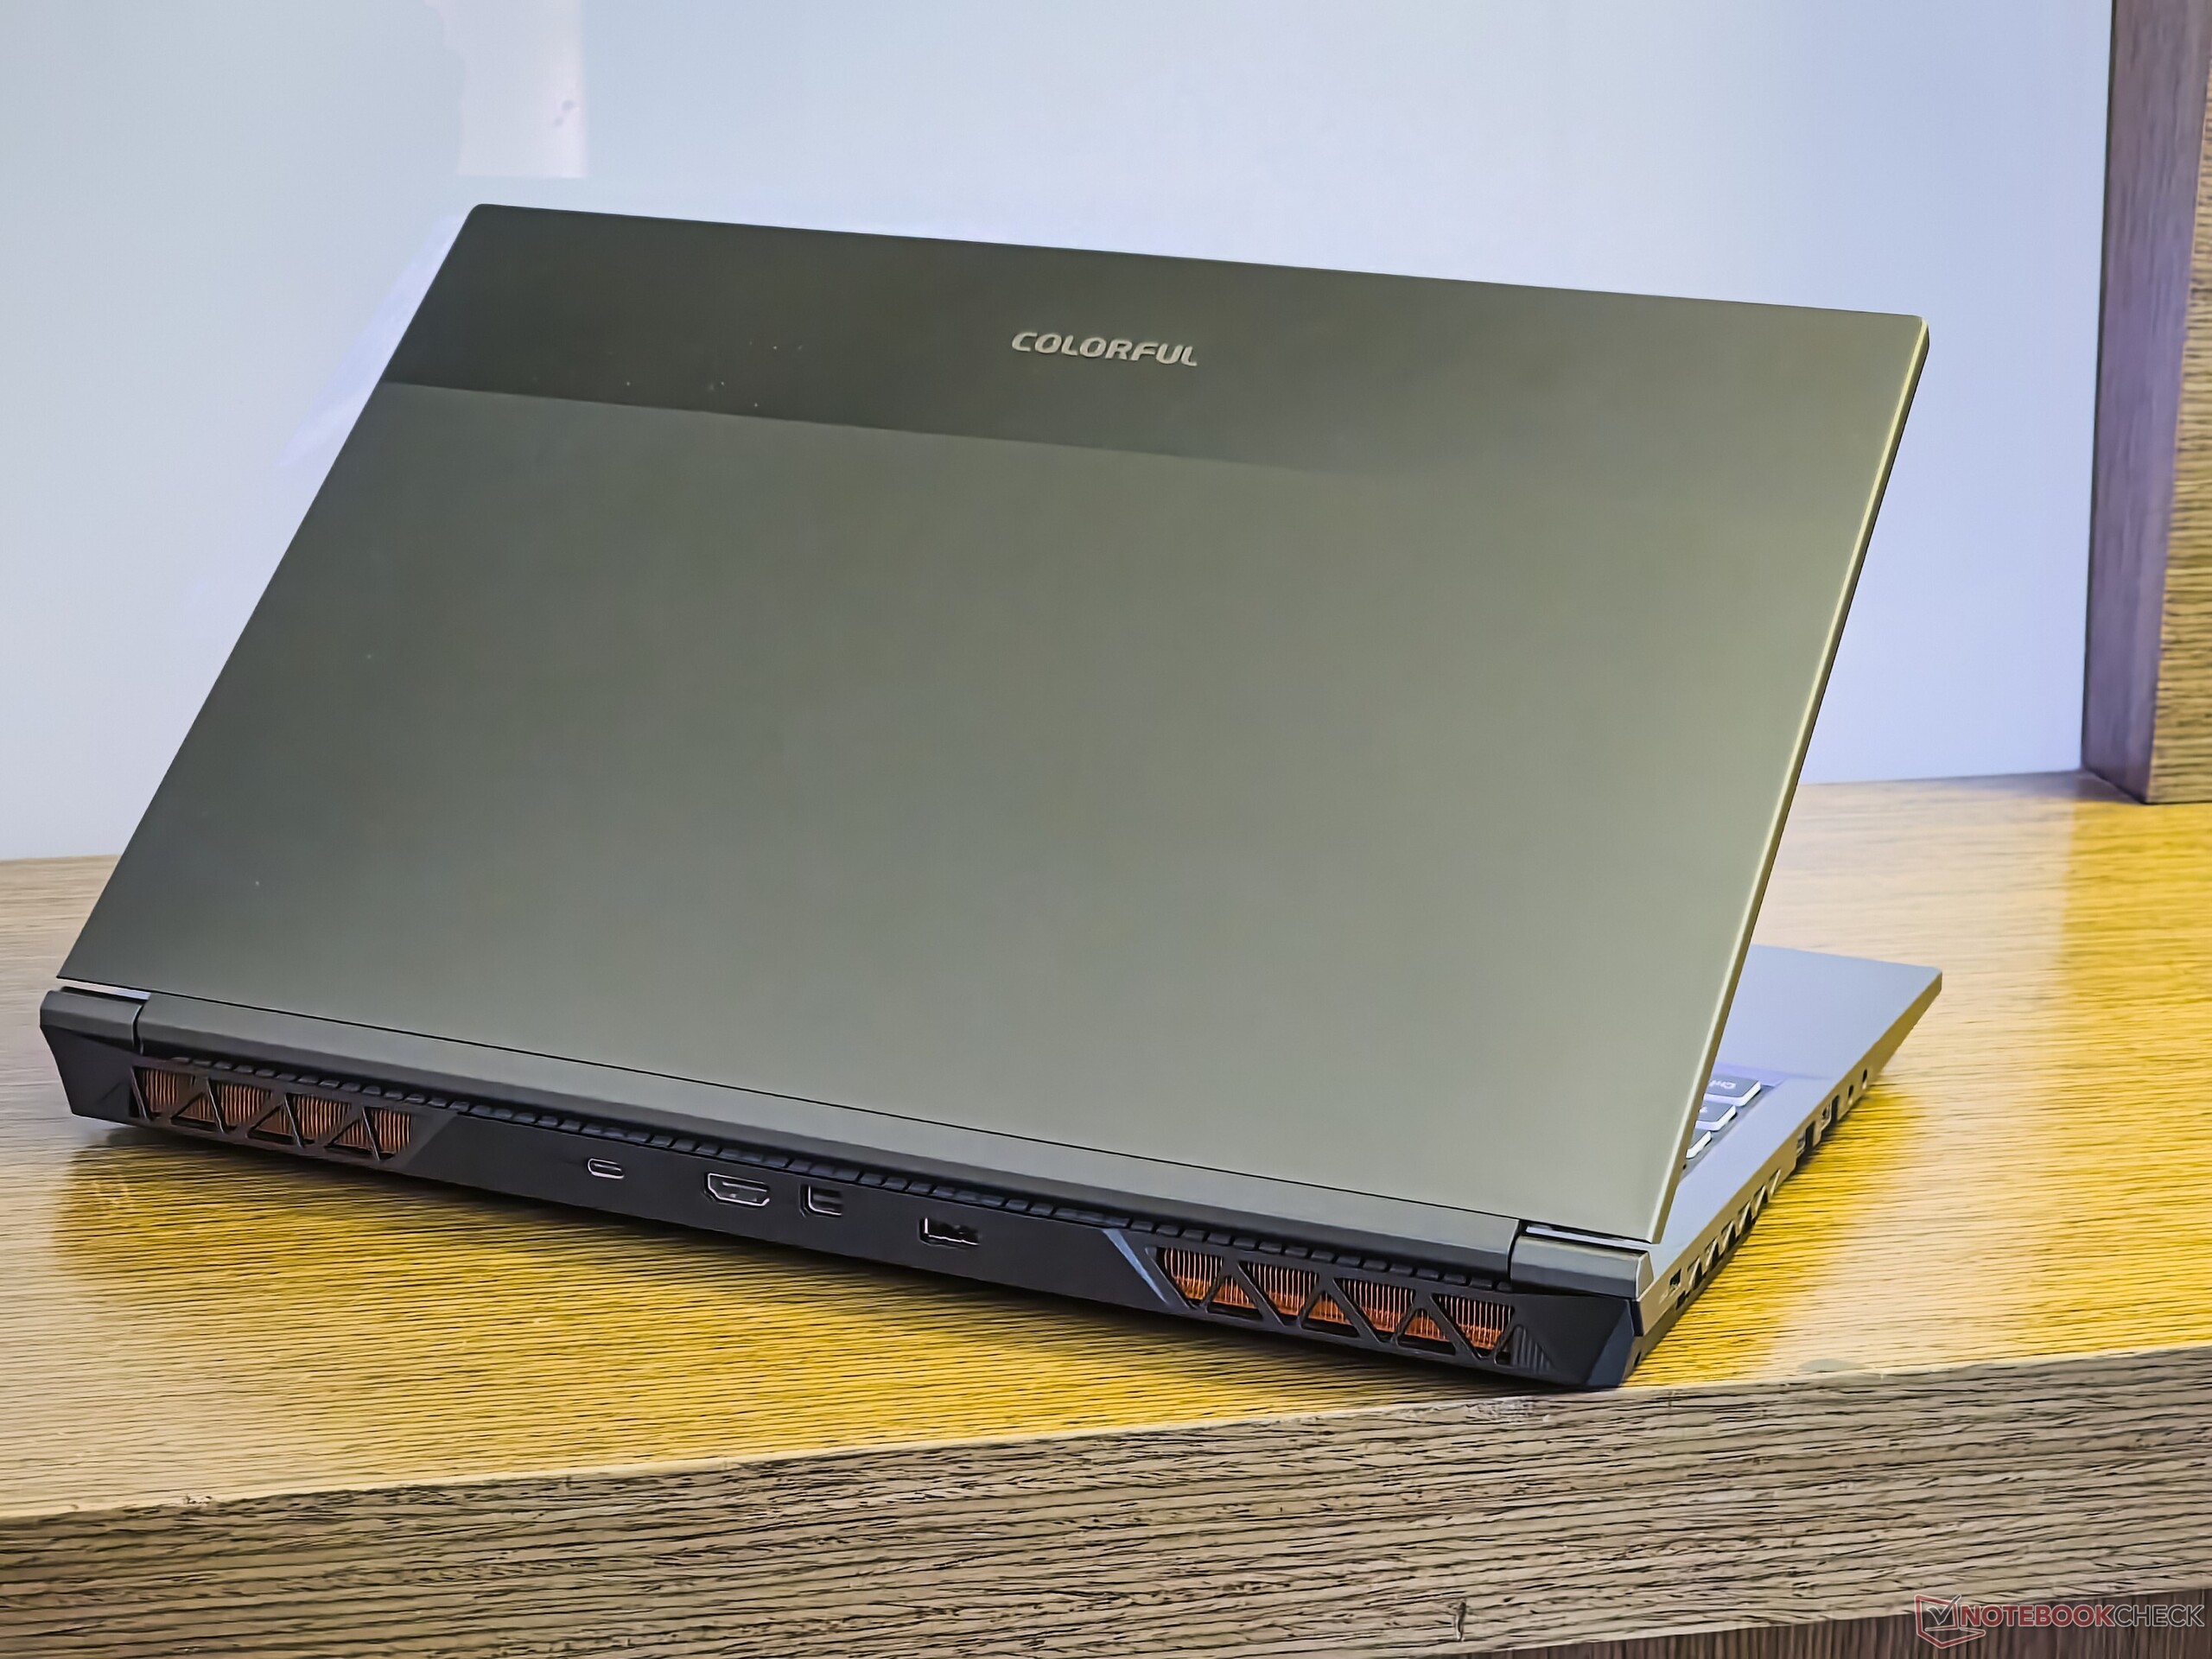
Colorful offre l'EVOL X15 AT in tre tonalità: Grape Purple, Pine Blue e Mist Grey (la nostra unità di recensione). Con uno spessore di 27,1 mm e un peso di 2,3 kg, l'EVOL XT15 AT non vincerà alcun premio per la sottigliezza. Tuttavia, è significativamente più portatile del Dell G15 5530 e dell' Alienware m16 R1.
L'EVOL X15 AT, essendo un design Clevo, sfoggia principalmente un robusto chassis in plastica. La costruzione ricorda in gran parte il Gigabyte G5 KE, anch'esso un rebrand Clevo. Nonostante la robustezza della costruzione, abbiamo osservato una notevole flessione nel piano della tastiera.
Il coperchio del display è in metallo e non traballa molto. Le cerniere hanno una tensione ideale, che consente di aprire il coperchio con un solo dito senza far scivolare la base
Nel complesso, EVOL X15 AT non mira a conquistare con un linguaggio di design elegante, ma è sufficientemente utilitaristico come computer portatile da gioco.
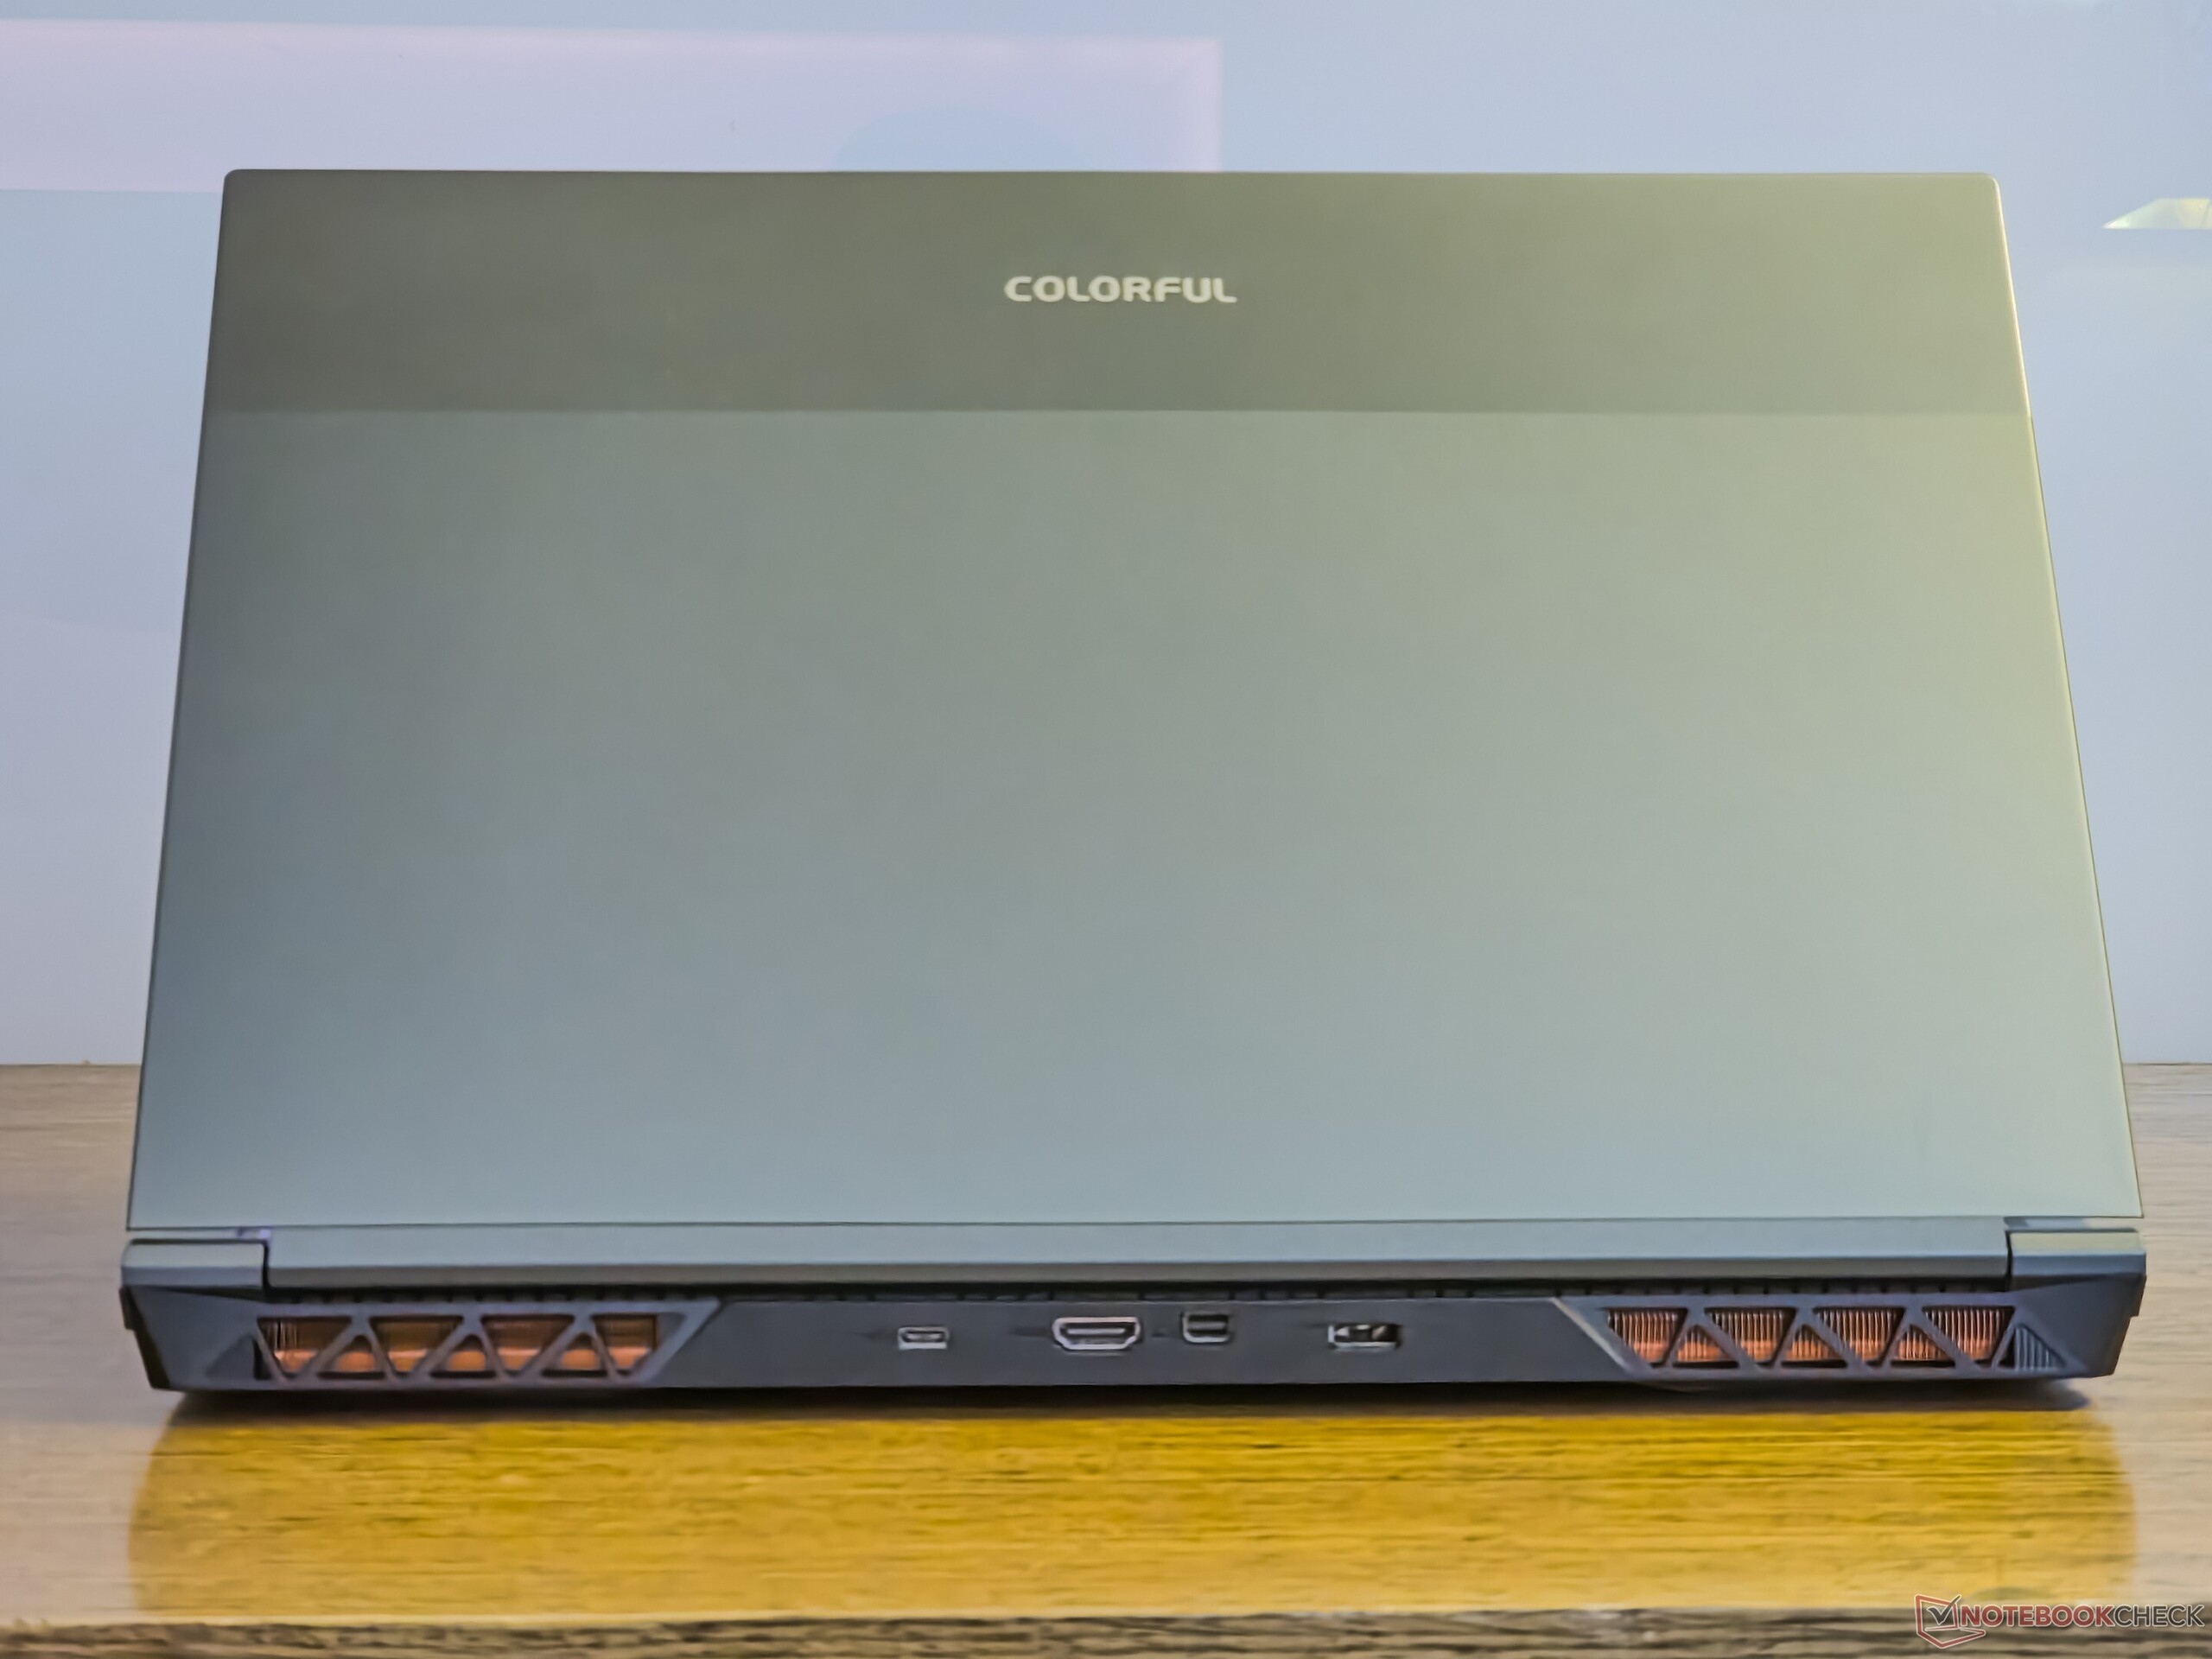
Connettività: Porte Type-C senza alimentazione
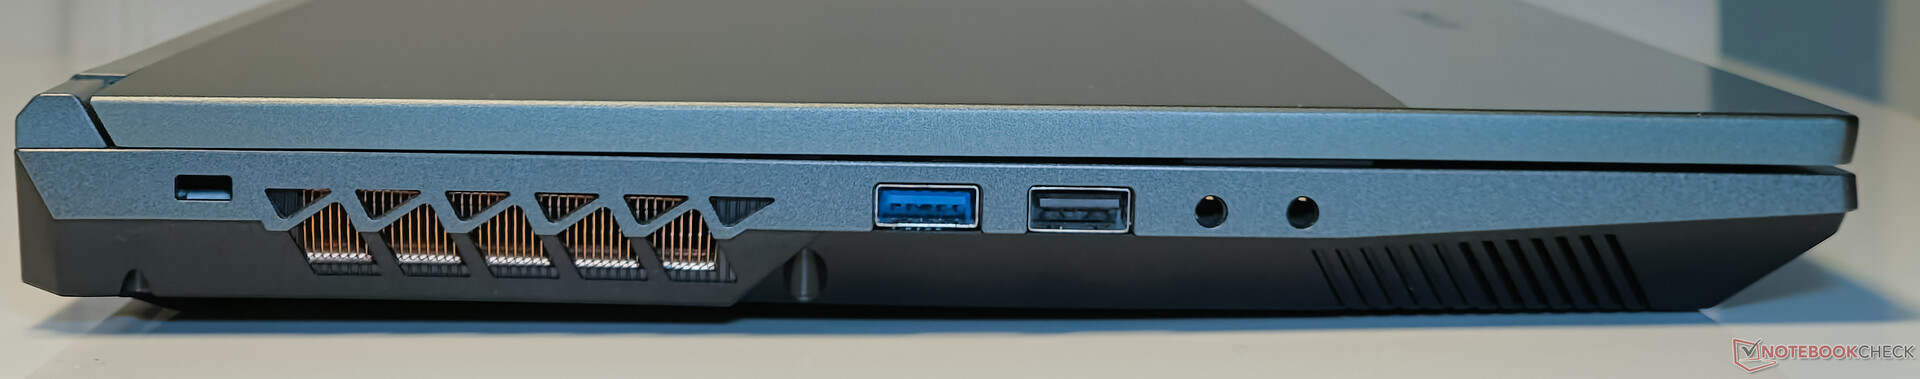
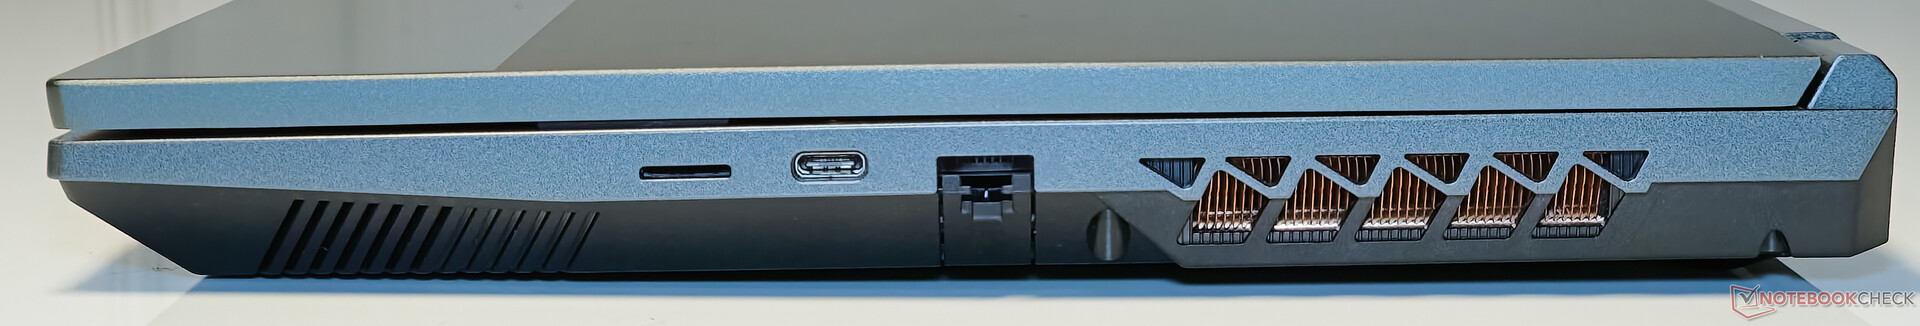
Colorful ha dotato EVOL X15 AT di una selezione di porte abbastanza decente. Il lato sinistro ospita due opzioni USB-A (USB 2.0 e USB 3.2 Gen 1) più un jack line-in dedicato per l'ingresso audio analogico. Sul lato destro si trovano uno slot microSD, Thunderbolt 4 e Gigabit LAN.
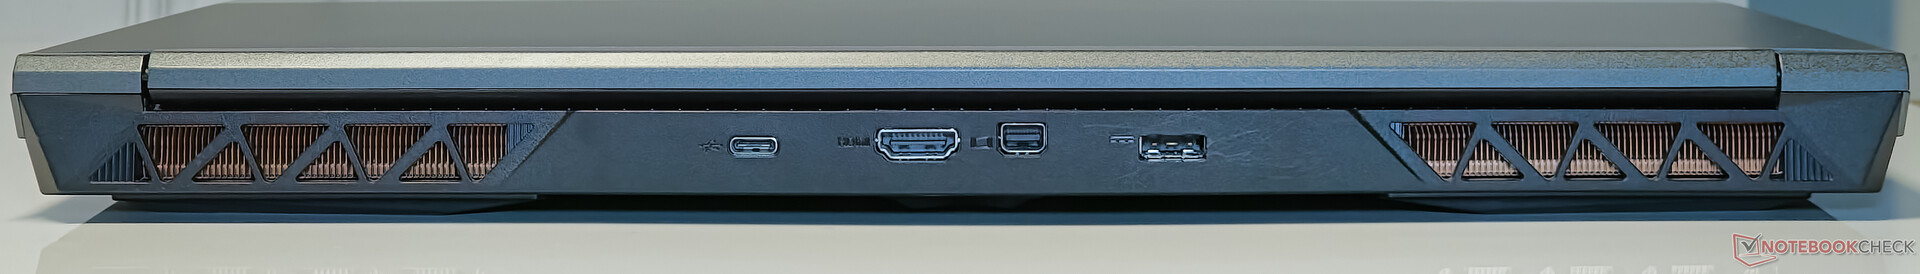
A destra, troviamo un lettore di schede microSD, Thunderbolt 4 e Gigabit LAN. Infine, la parte posteriore ospita USB 3.2 Gen2 Type-C, mini-DisplayPort-out e HDMI-out.
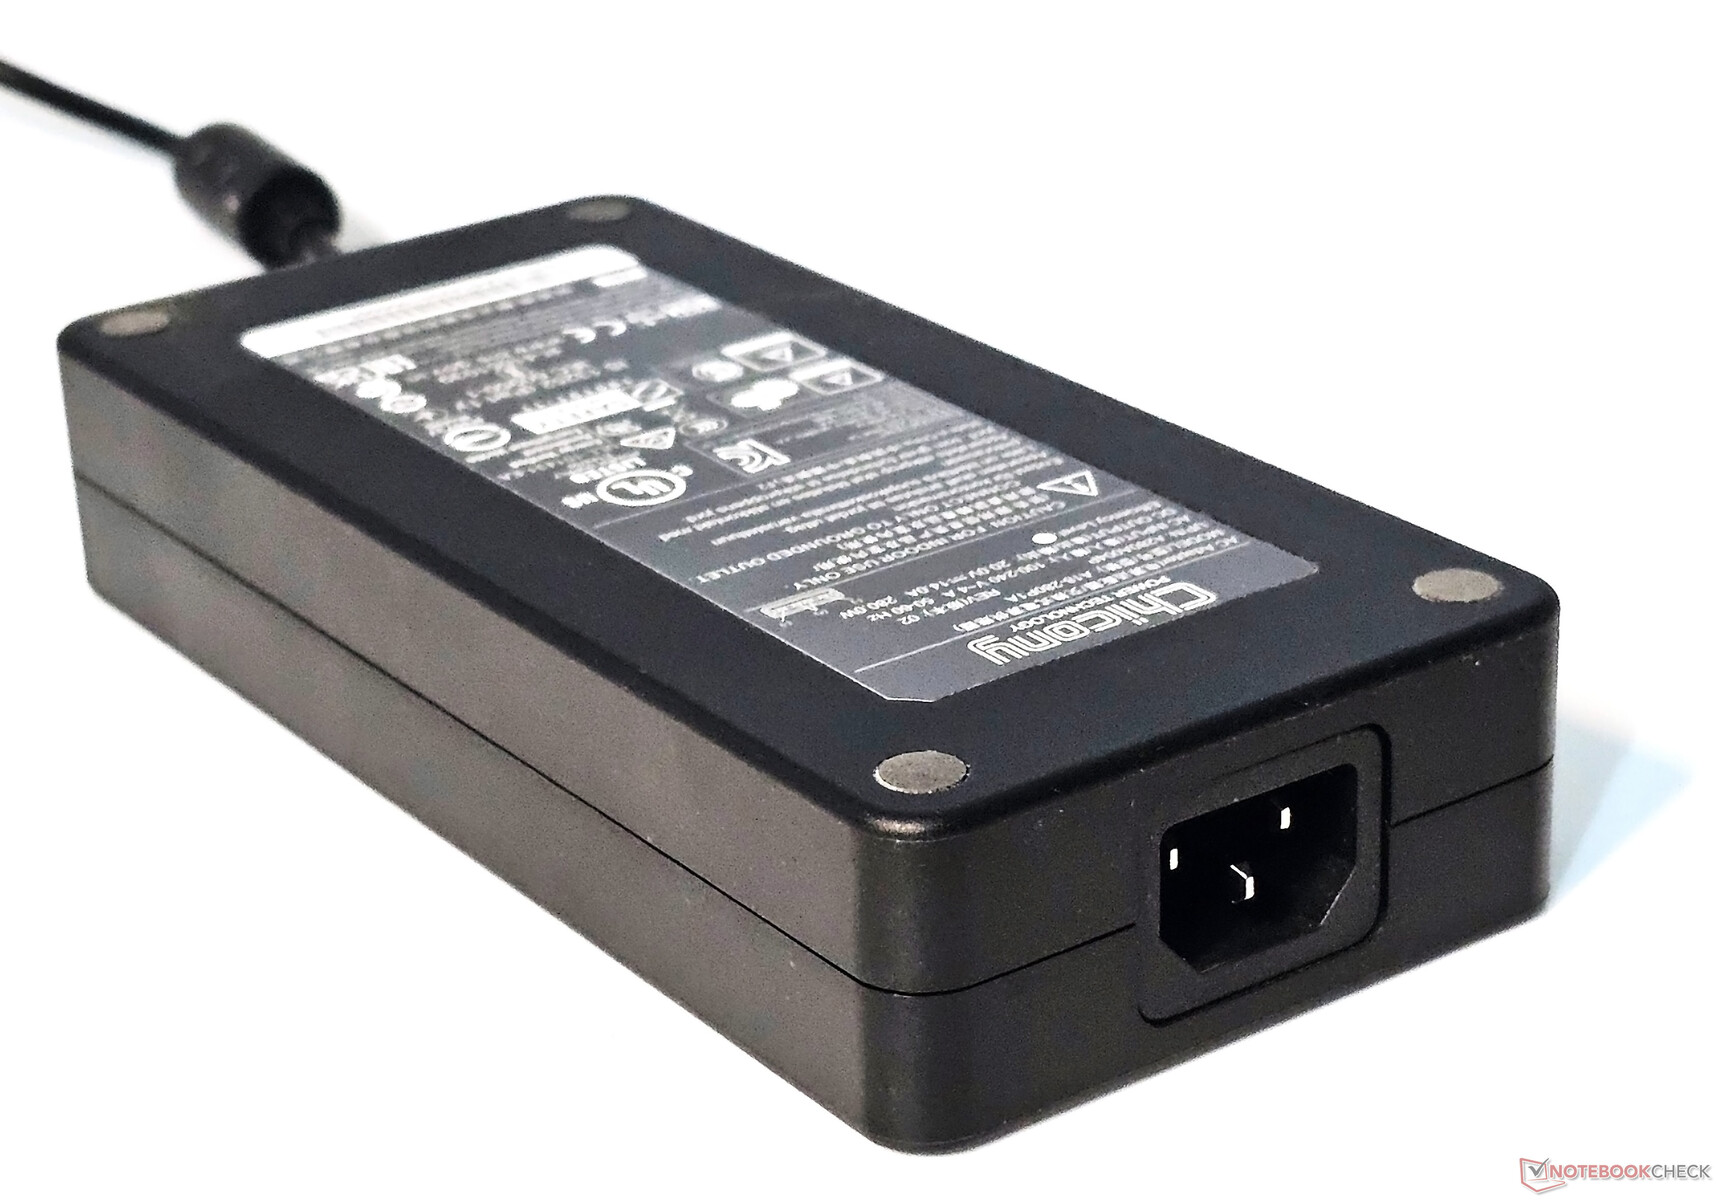
Le porte Type-C, purtroppo, supportano solo l'uscita di alimentazione, per cui dovrà inevitabilmente trascinare ovunque il mattone di alimentazione di quasi 1 kg per mantenere il portatile alimentato.
Lettore di schede SD
Il lettore di schede microSD dell'EVOL X15 non batte alcun record di velocità ed è circa il 28% più lento della media della classe nei test di copia JPG e di lettura sequenziale AS SSD.
| SD Card Reader | |
| average JPG Copy Test (av. of 3 runs) | |
| Alienware m16 R1 AMD (Toshiba Exceria Pro SDXC 64 GB UHS-II) | |
| Alienware m16 R1 Intel (AV PRO microSD 128 GB V60) | |
| Media della classe Gaming (20.9 - 210, n=54, ultimi 2 anni) | |
| Schenker XMG Pro 15 (E23) | |
| Colorful EVOL X15 AT 23 (AV PRO microSD 128 GB V60) | |
| Acer Predator Helios 16 PH16-71-731Q | |
| Uniwill GM6PX7X RTX 4070 (AV PRO microSD 128 GB V60) | |
| maximum AS SSD Seq Read Test (1GB) | |
| Alienware m16 R1 AMD (Toshiba Exceria Pro SDXC 64 GB UHS-II) | |
| Alienware m16 R1 Intel (AV PRO microSD 128 GB V60) | |
| Media della classe Gaming (25.5 - 261, n=51, ultimi 2 anni) | |
| Schenker XMG Pro 15 (E23) | |
| Colorful EVOL X15 AT 23 (AV PRO microSD 128 GB V60) | |
| Uniwill GM6PX7X RTX 4070 (AV PRO microSD 128 GB V60) | |
| Acer Predator Helios 16 PH16-71-731Q | |
Comunicazione
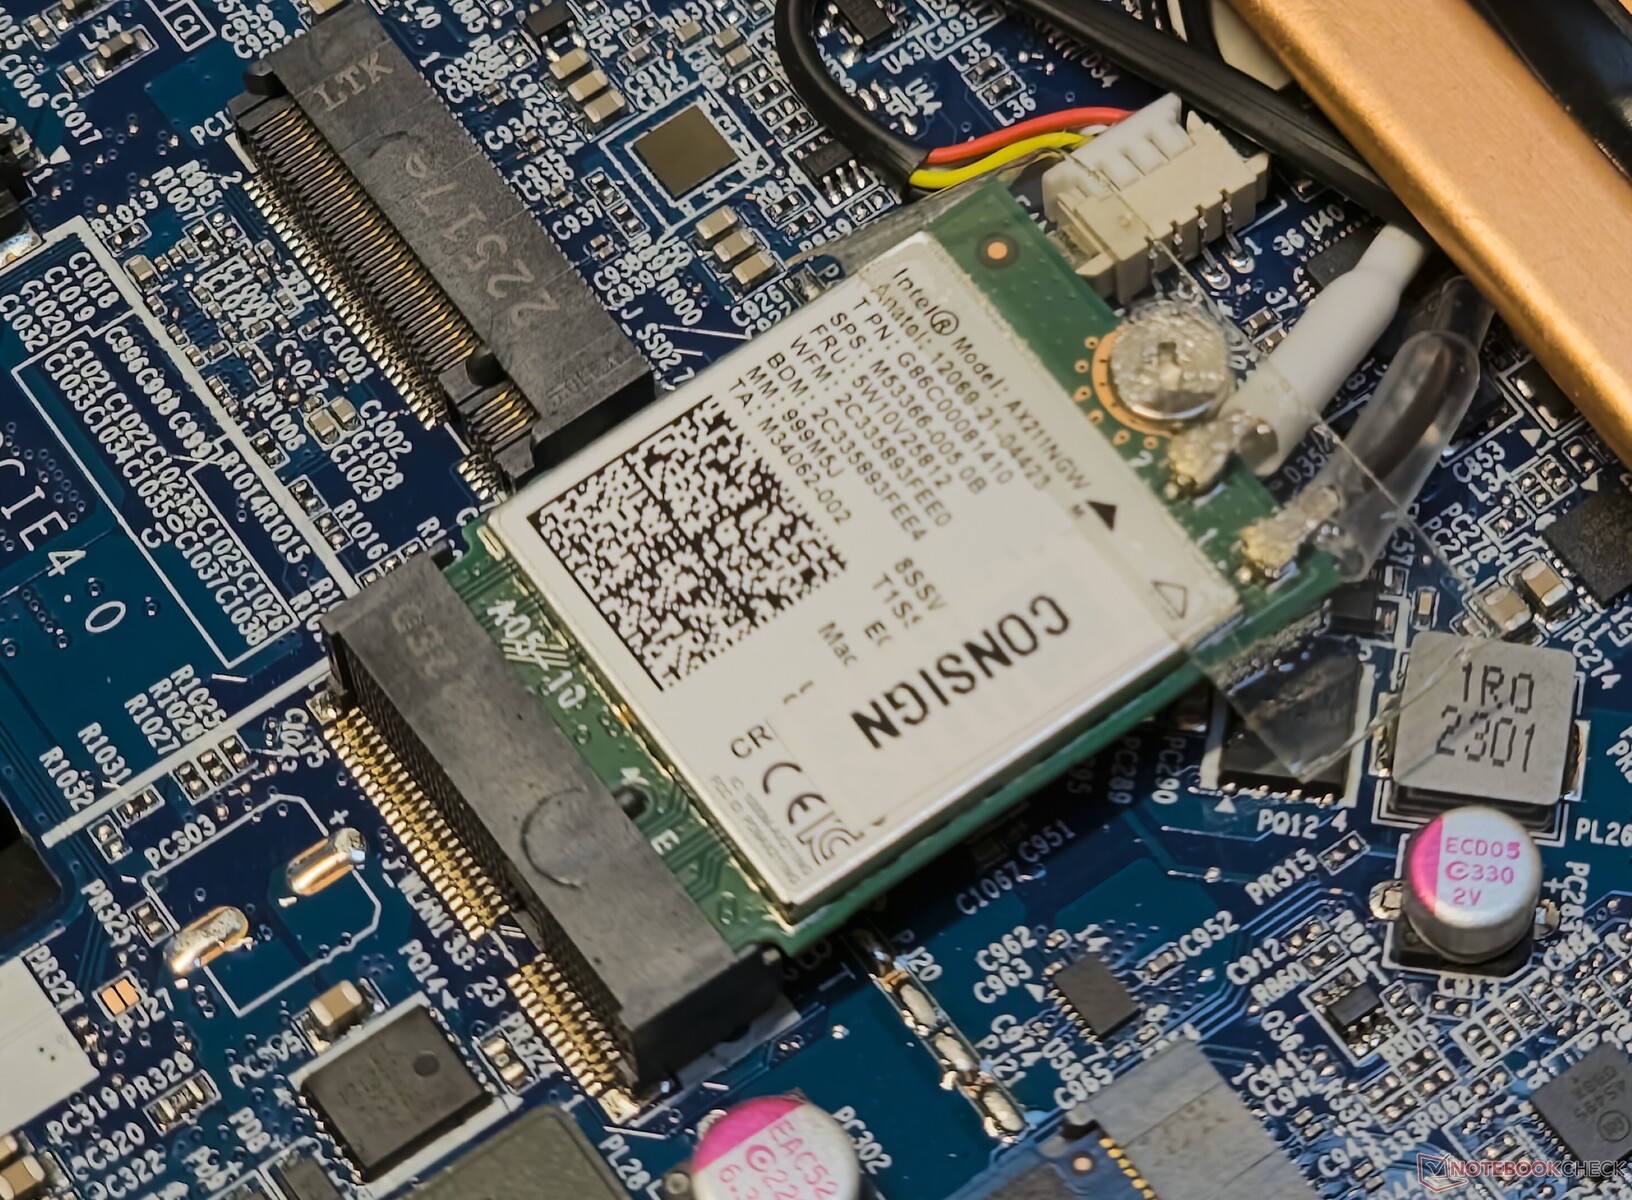
L'EVOL X15 AT è dotato di un chip WLAN Intel Wi-Fi 6E AX211. Le velocità di trasferimento sono abbastanza coerenti sia nelle bande a 5 GHz che a 6 GHz, quando vengono testate con il nostro router di riferimento Asus ROG Rapture GT-AXE11000.
Il portatile offre un eccellente throughput di trasmissione e ricezione nella banda dei 5 GHz. Nella banda a 6 GHz, l'EVOL X15 è inferiore al Alienware m16 R1 AMD nei test di trasmissione iPerf3, ma compensa la carenza nei test di ricezione con un picco di throughput di 1,7 Gbps.
| Networking / iperf3 transmit AXE11000 | |
| Colorful EVOL X15 AT 23 | |
| Dell G15 5530 | |
| Alienware m16 R1 AMD | |
| Acer Predator Helios 16 PH16-71-731Q | |
| Alienware m16 R1 Intel | |
| Media della classe Gaming (560 - 1862, n=87, ultimi 2 anni) | |
| Media Intel Wi-Fi 6E AX211 (64 - 1921, n=276) | |
| Uniwill GM6PX7X RTX 4070 | |
| HP Omen 16-wf000 | |
| Schenker XMG Pro 15 (E23) | |
| Networking / iperf3 receive AXE11000 | |
| Colorful EVOL X15 AT 23 | |
| Alienware m16 R1 Intel | |
| Dell G15 5530 | |
| Media della classe Gaming (680 - 1745, n=87, ultimi 2 anni) | |
| Acer Predator Helios 16 PH16-71-731Q | |
| Alienware m16 R1 AMD | |
| Media Intel Wi-Fi 6E AX211 (582 - 1890, n=276) | |
| HP Omen 16-wf000 | |
| Uniwill GM6PX7X RTX 4070 | |
| Schenker XMG Pro 15 (E23) | |
| Networking / iperf3 transmit AXE11000 6GHz | |
| Alienware m16 R1 AMD | |
| Acer Predator Helios 16 PH16-71-731Q | |
| Schenker XMG Pro 15 (E23) | |
| Colorful EVOL X15 AT 23 | |
| Media della classe Gaming (723 - 1868, n=36, ultimi 2 anni) | |
| Media Intel Wi-Fi 6E AX211 (385 - 1851, n=226) | |
| HP Omen 16-wf000 | |
| Networking / iperf3 receive AXE11000 6GHz | |
| Colorful EVOL X15 AT 23 | |
| Schenker XMG Pro 15 (E23) | |
| Media della classe Gaming (975 - 1775, n=35, ultimi 2 anni) | |
| Alienware m16 R1 AMD | |
| Media Intel Wi-Fi 6E AX211 (700 - 1857, n=226) | |
| Acer Predator Helios 16 PH16-71-731Q | |
| HP Omen 16-wf000 | |
Webcam
Dato che l'obiettivo principale è il gioco, l'EVOL X15 si accontenta di una webcam convenzionale a 720p. La webcam è adeguata per le chat video veloci, ma manca di accuratezza del colore, riproduzione dei dettagli e nitidezza generale.


Sicurezza
Non ci sono funzioni di sicurezza dedicate, come i login biometrici integrati. È presente un modulo TPM 2.0 per soddisfare i requisiti di sicurezza di Windows 11.
Accessori e garanzia
Nella confezione non ci sono accessori separati, a parte l'adattatore da 280 W e la solita documentazione. Colorful EVOL X15 AT viene fornito con una garanzia standard di due anni.
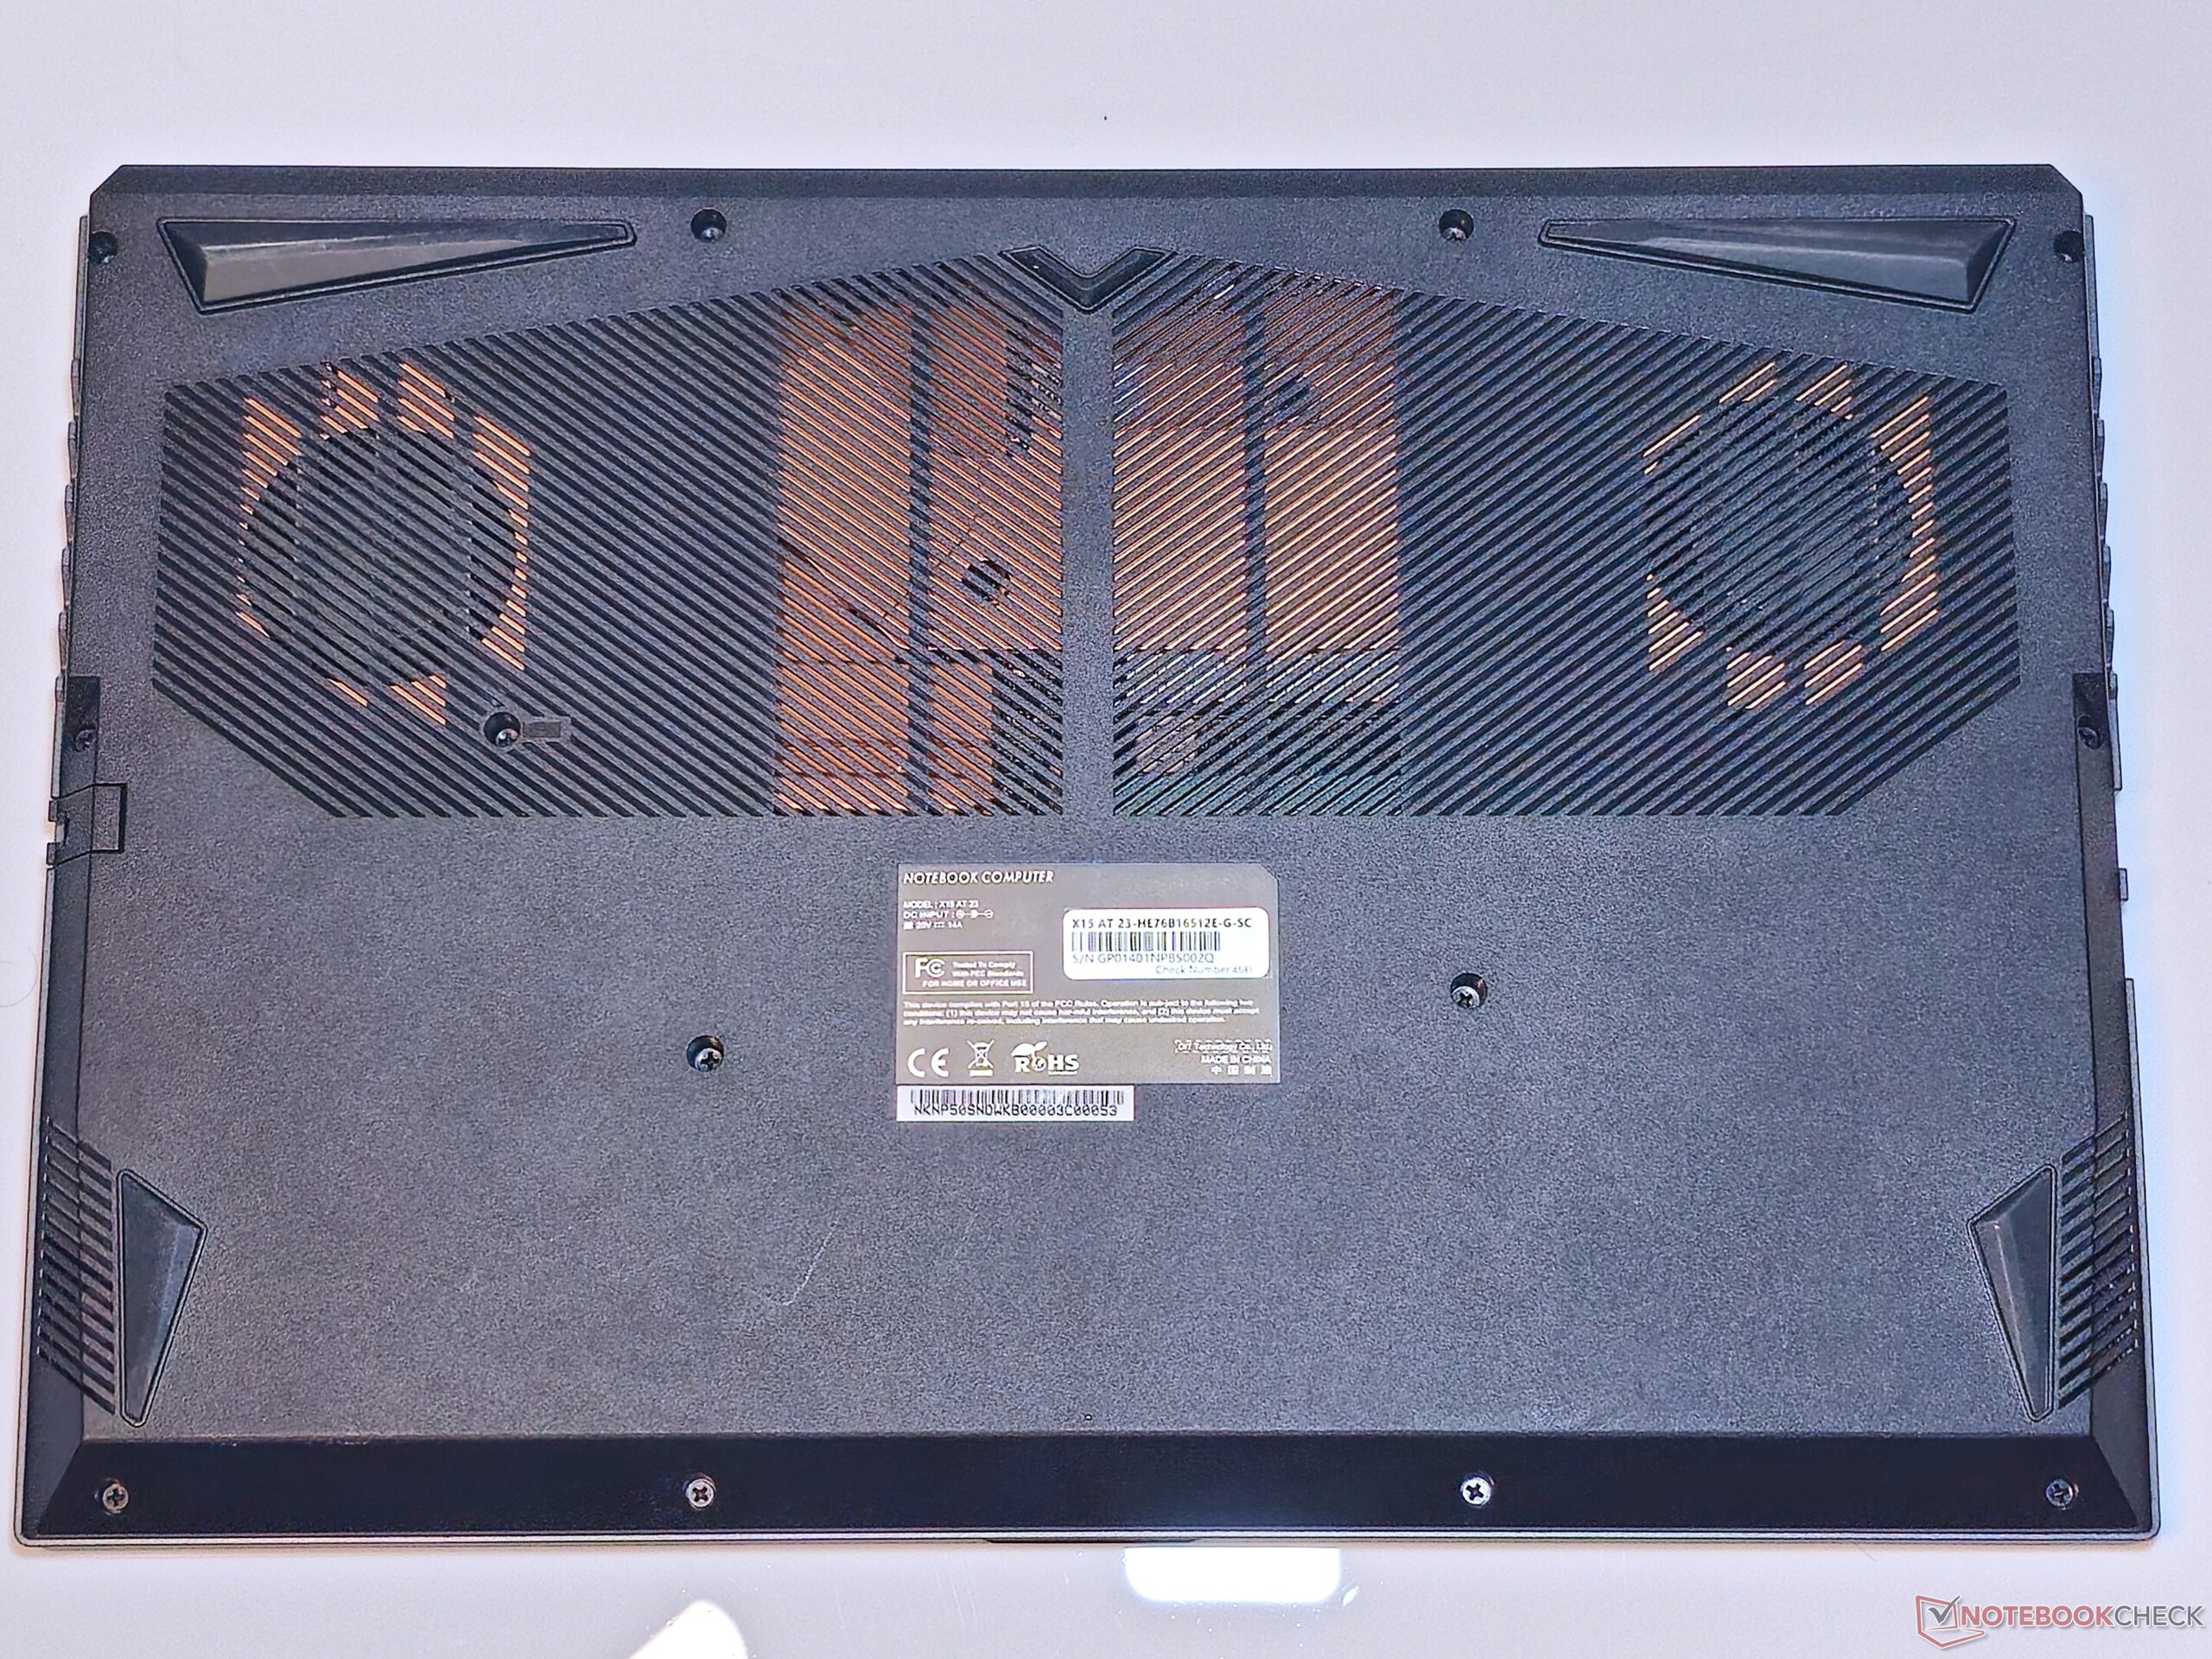
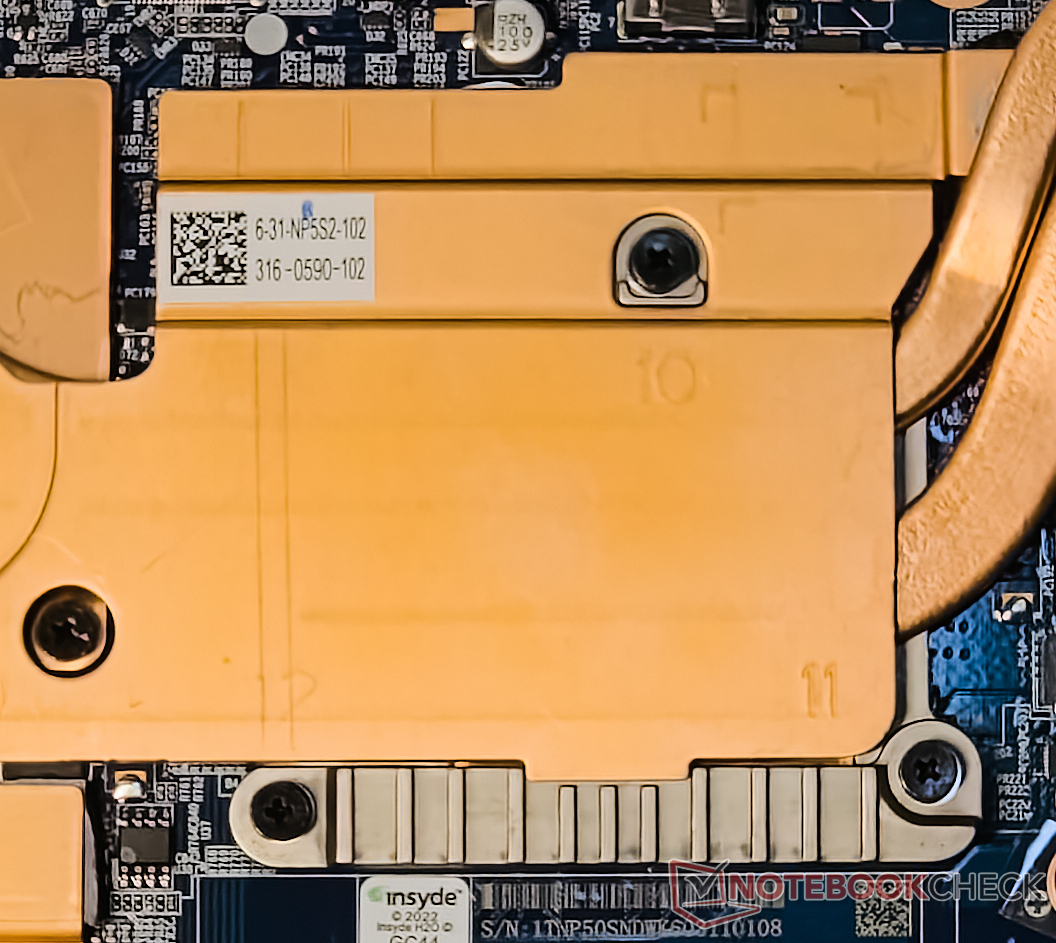
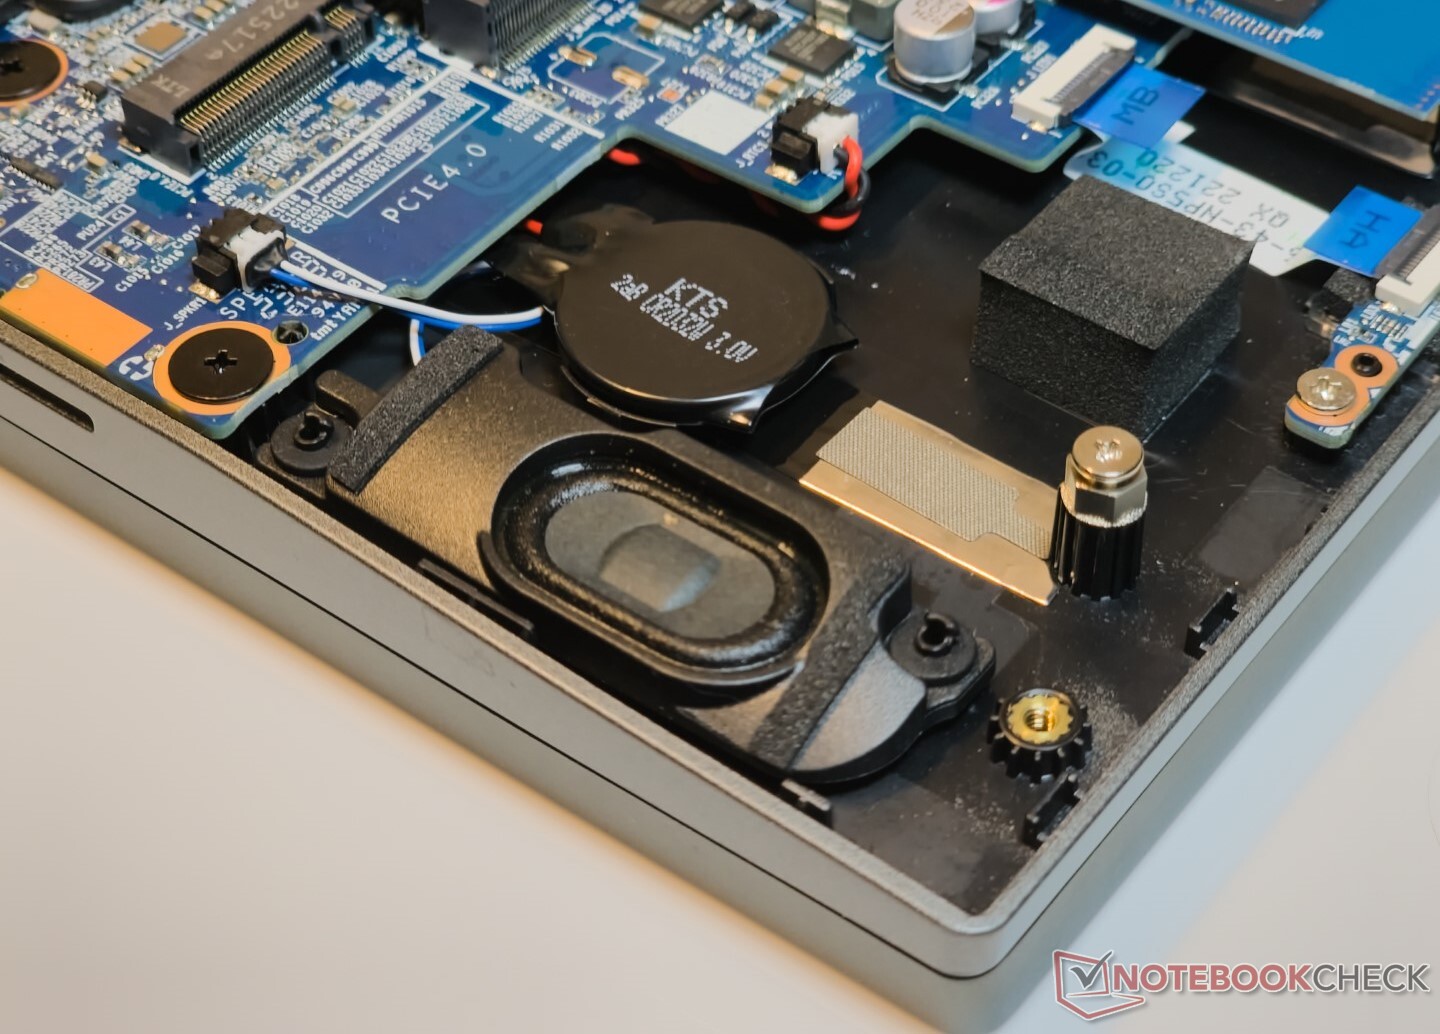
Manutenzione
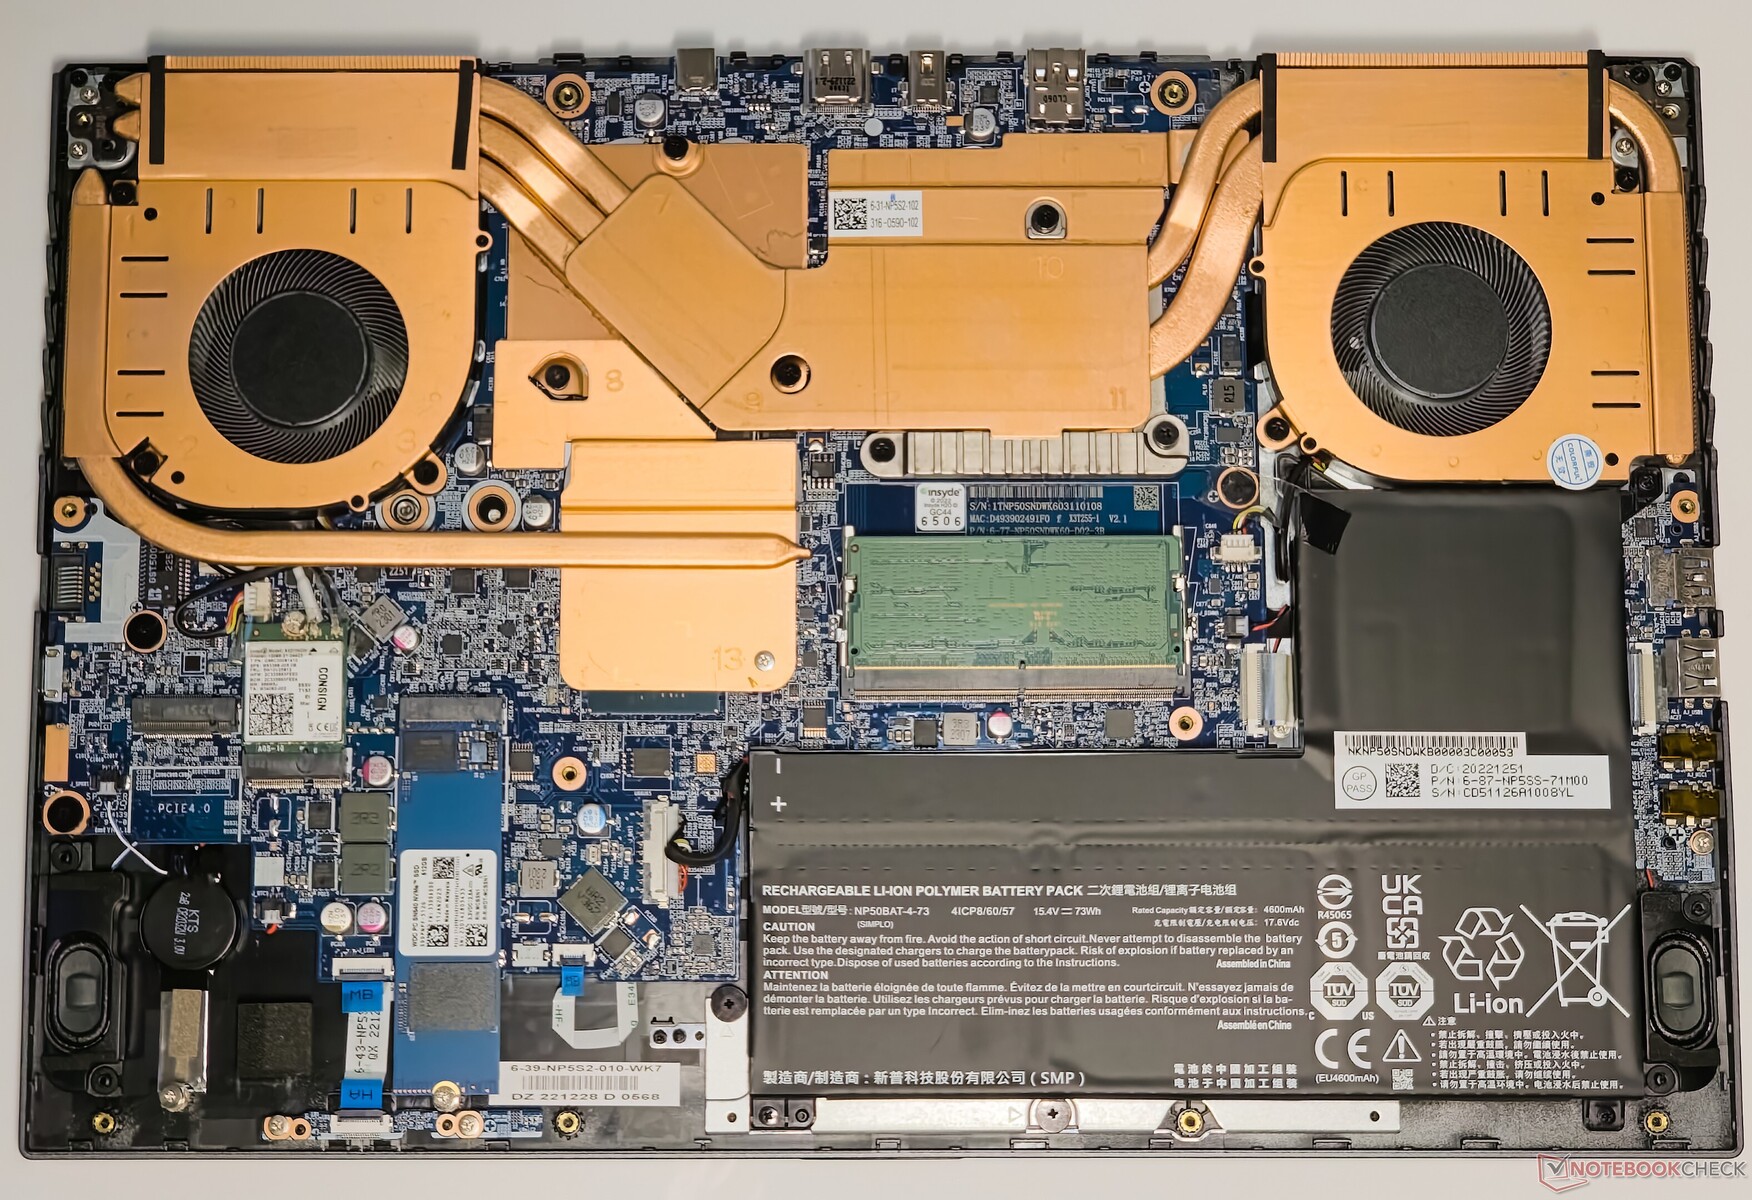
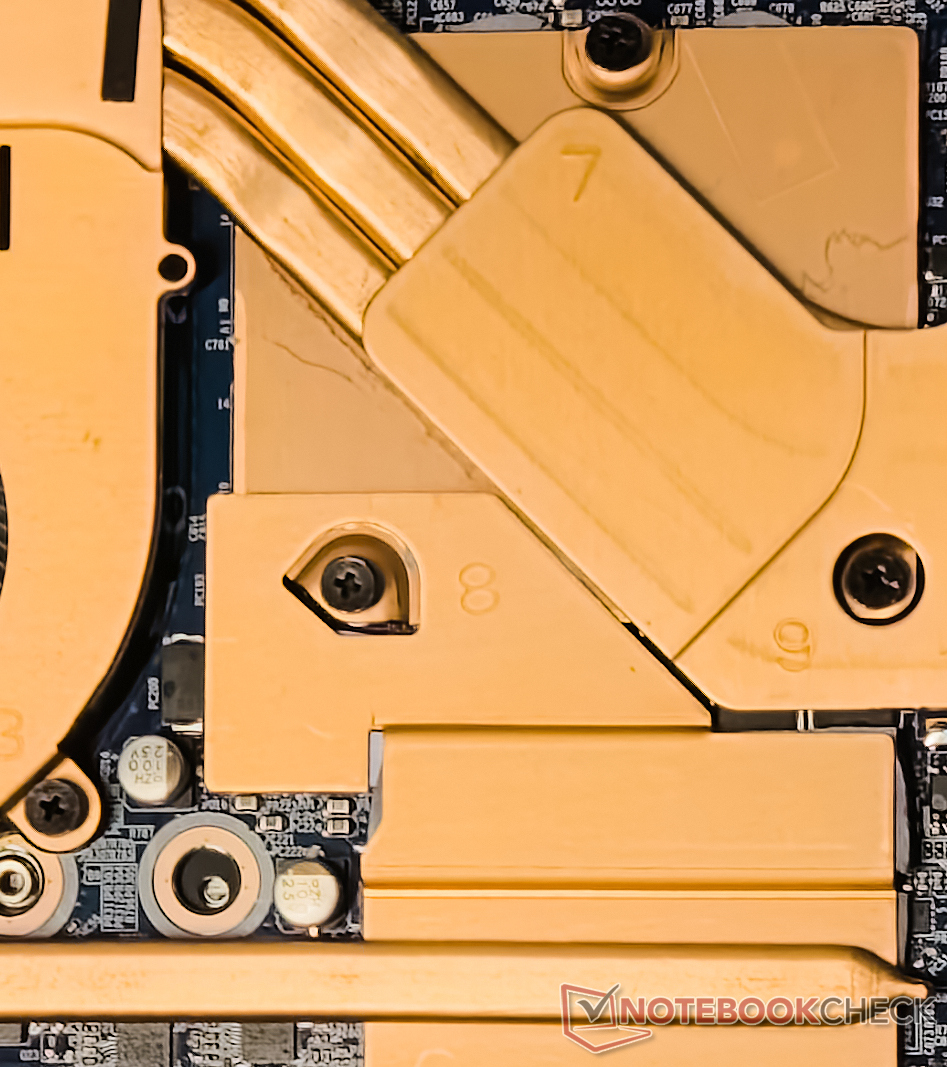
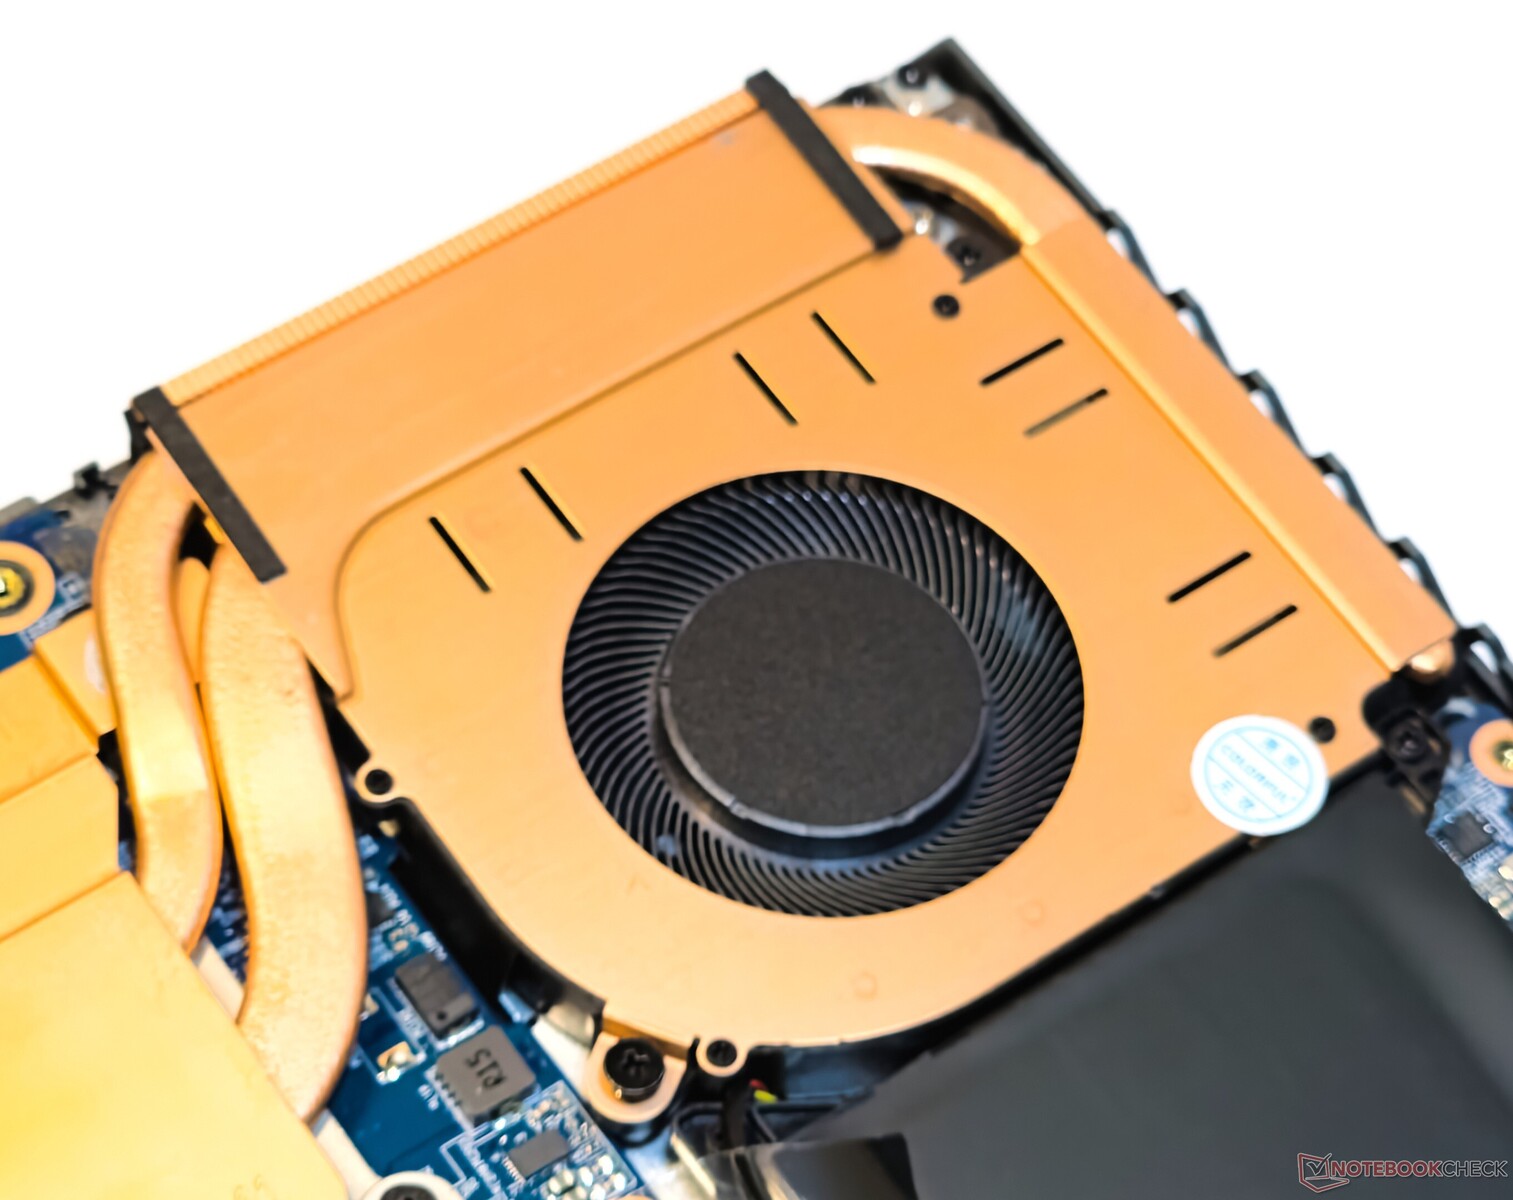
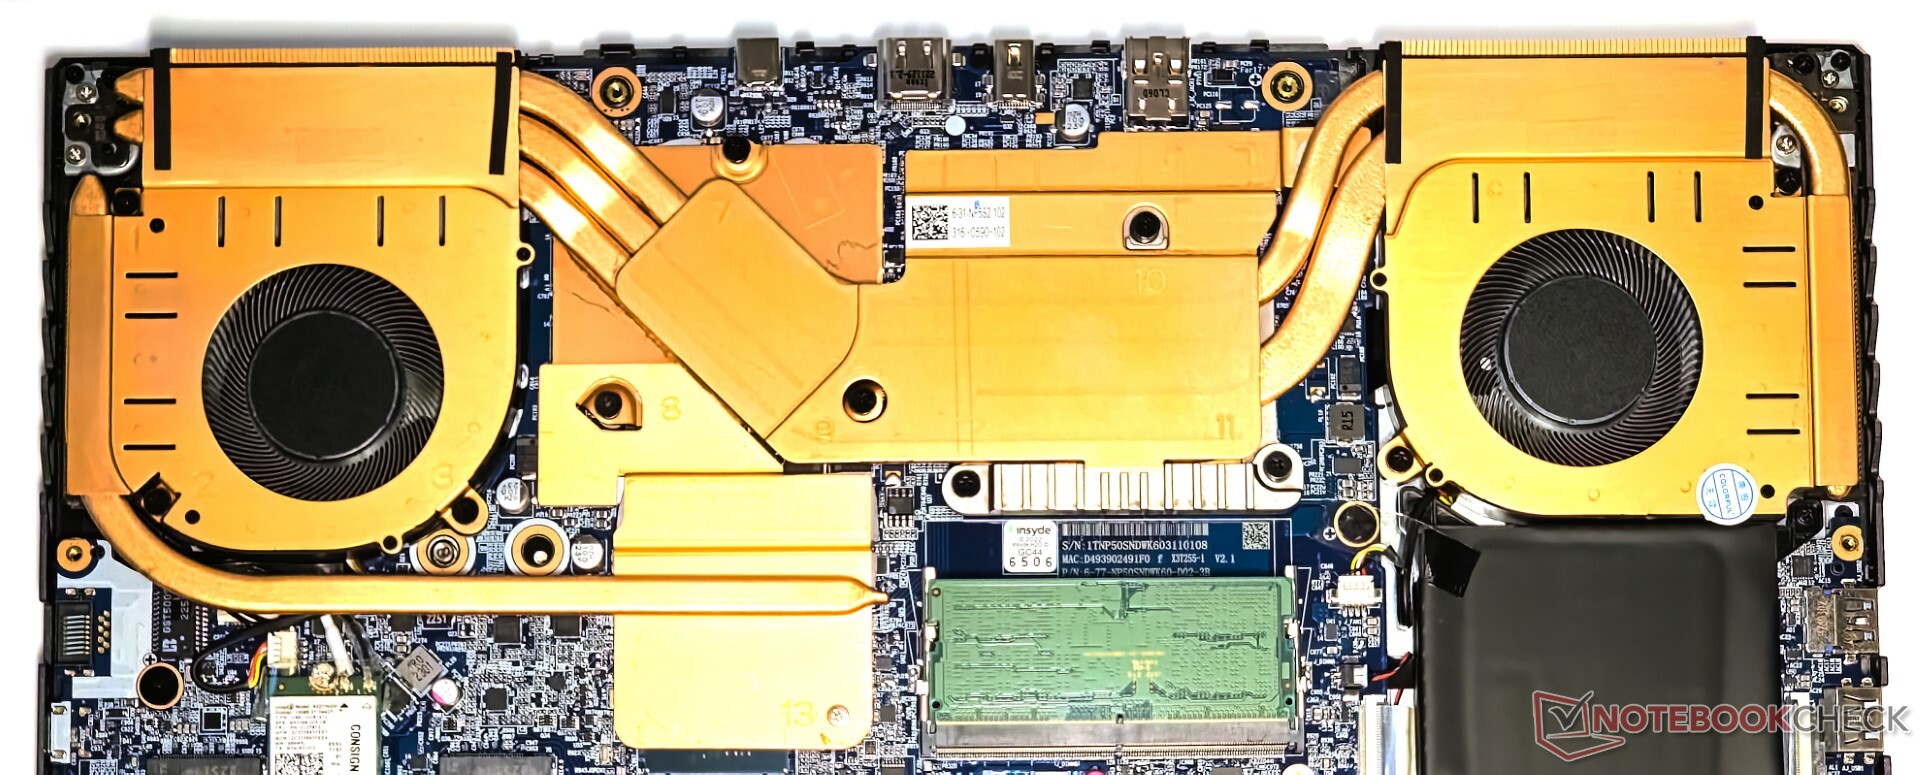
Il pannello posteriore si stacca facilmente dopo aver rimosso le 13 viti PH0. L'EVOL X15 mostra un layout interno molto impegnativo, insieme a un esteso sistema di raffreddamento interamente in rame per la CPU e la GPU.
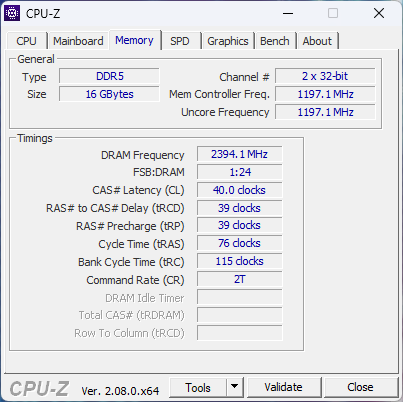
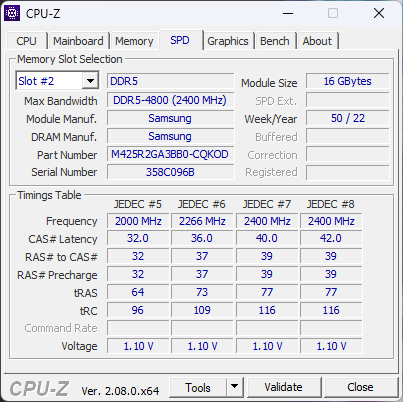
La nostra unità era dotata di un solo stick da 16 GB DDR5-4800 configurato in modalità dual-channel. La scheda WLAN, la RAM e l'SSD NVMe possono essere sostituiti o aggiornati a seconda delle necessità, e il pacco batteria a forma di L può essere svitato.
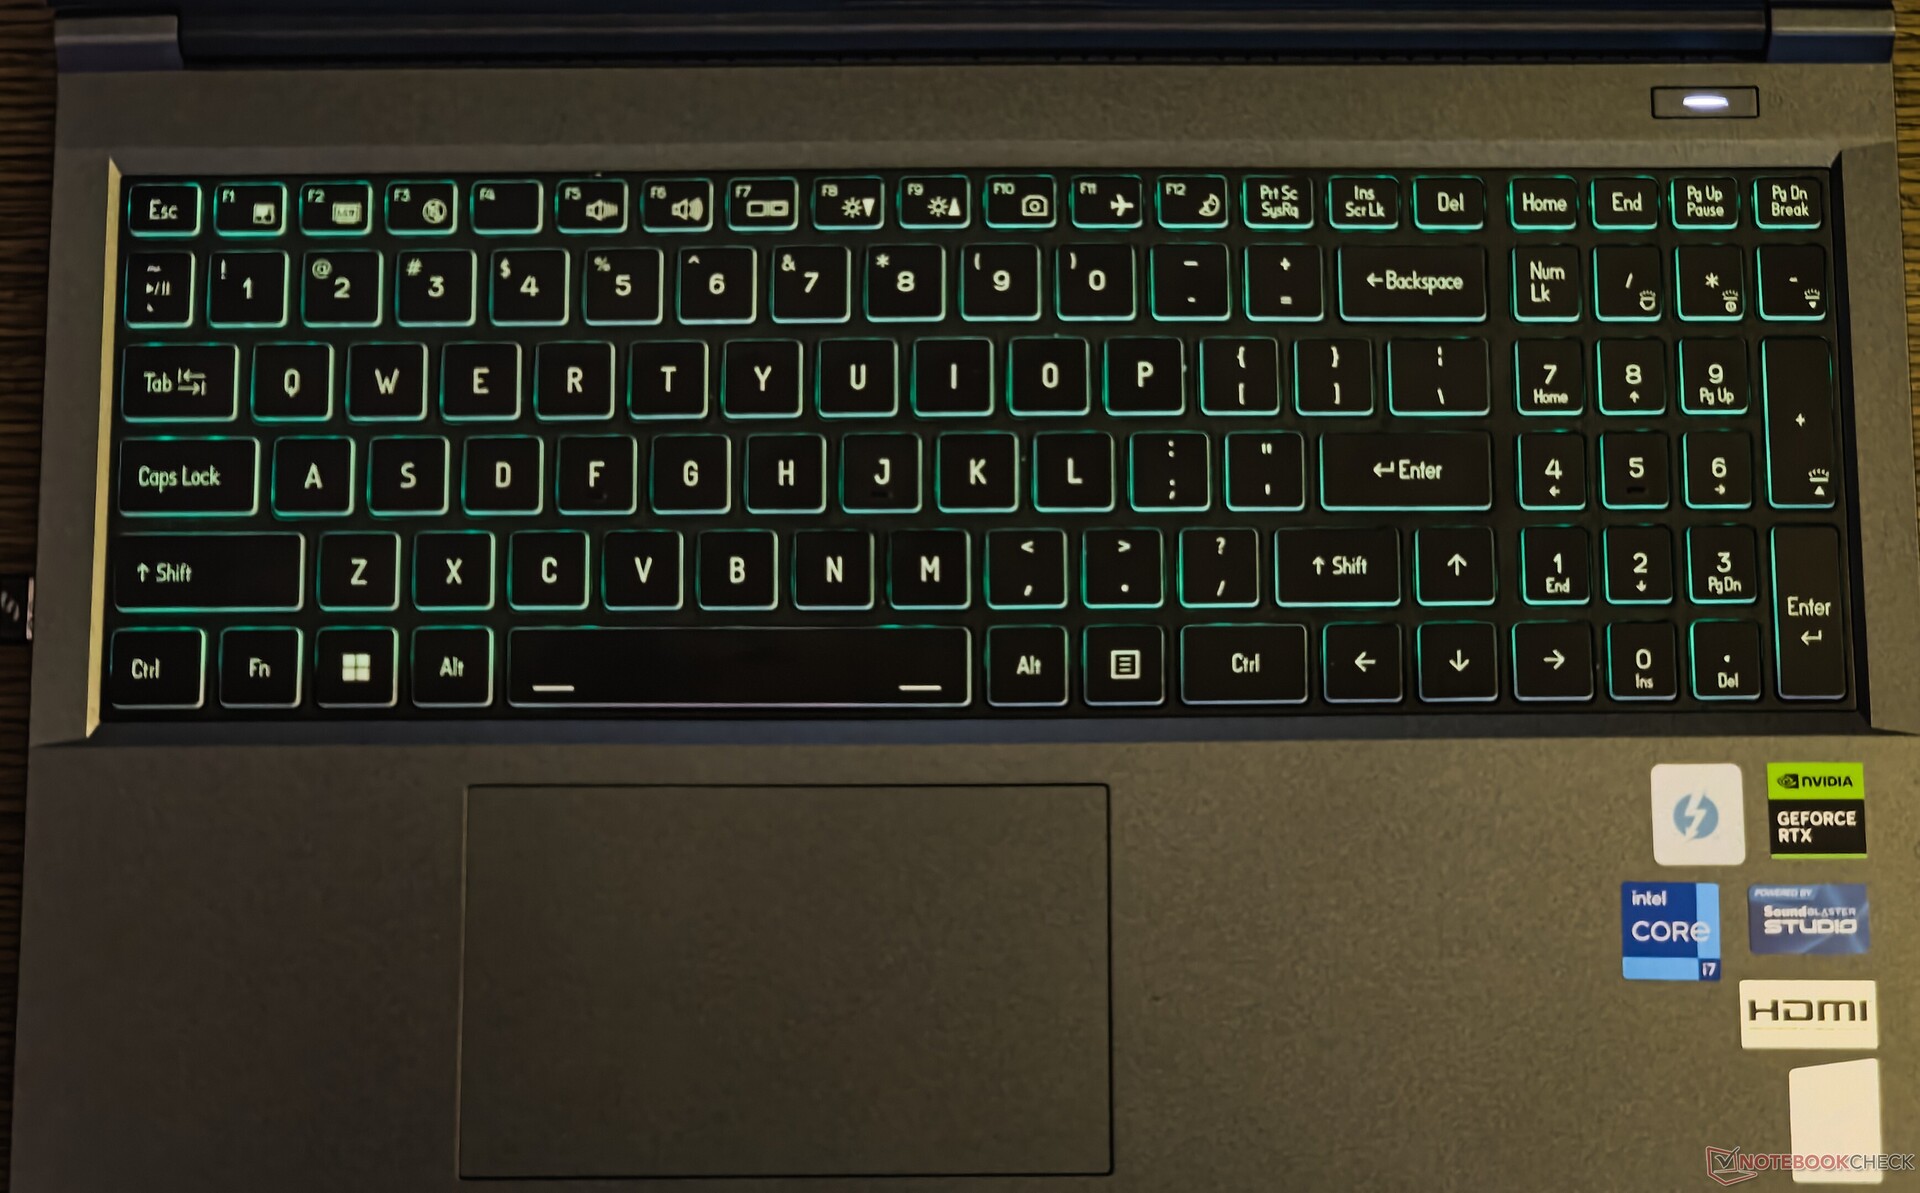
Dispositivi di input: Tasti morbidi con una discreta tattilità
Tastiera
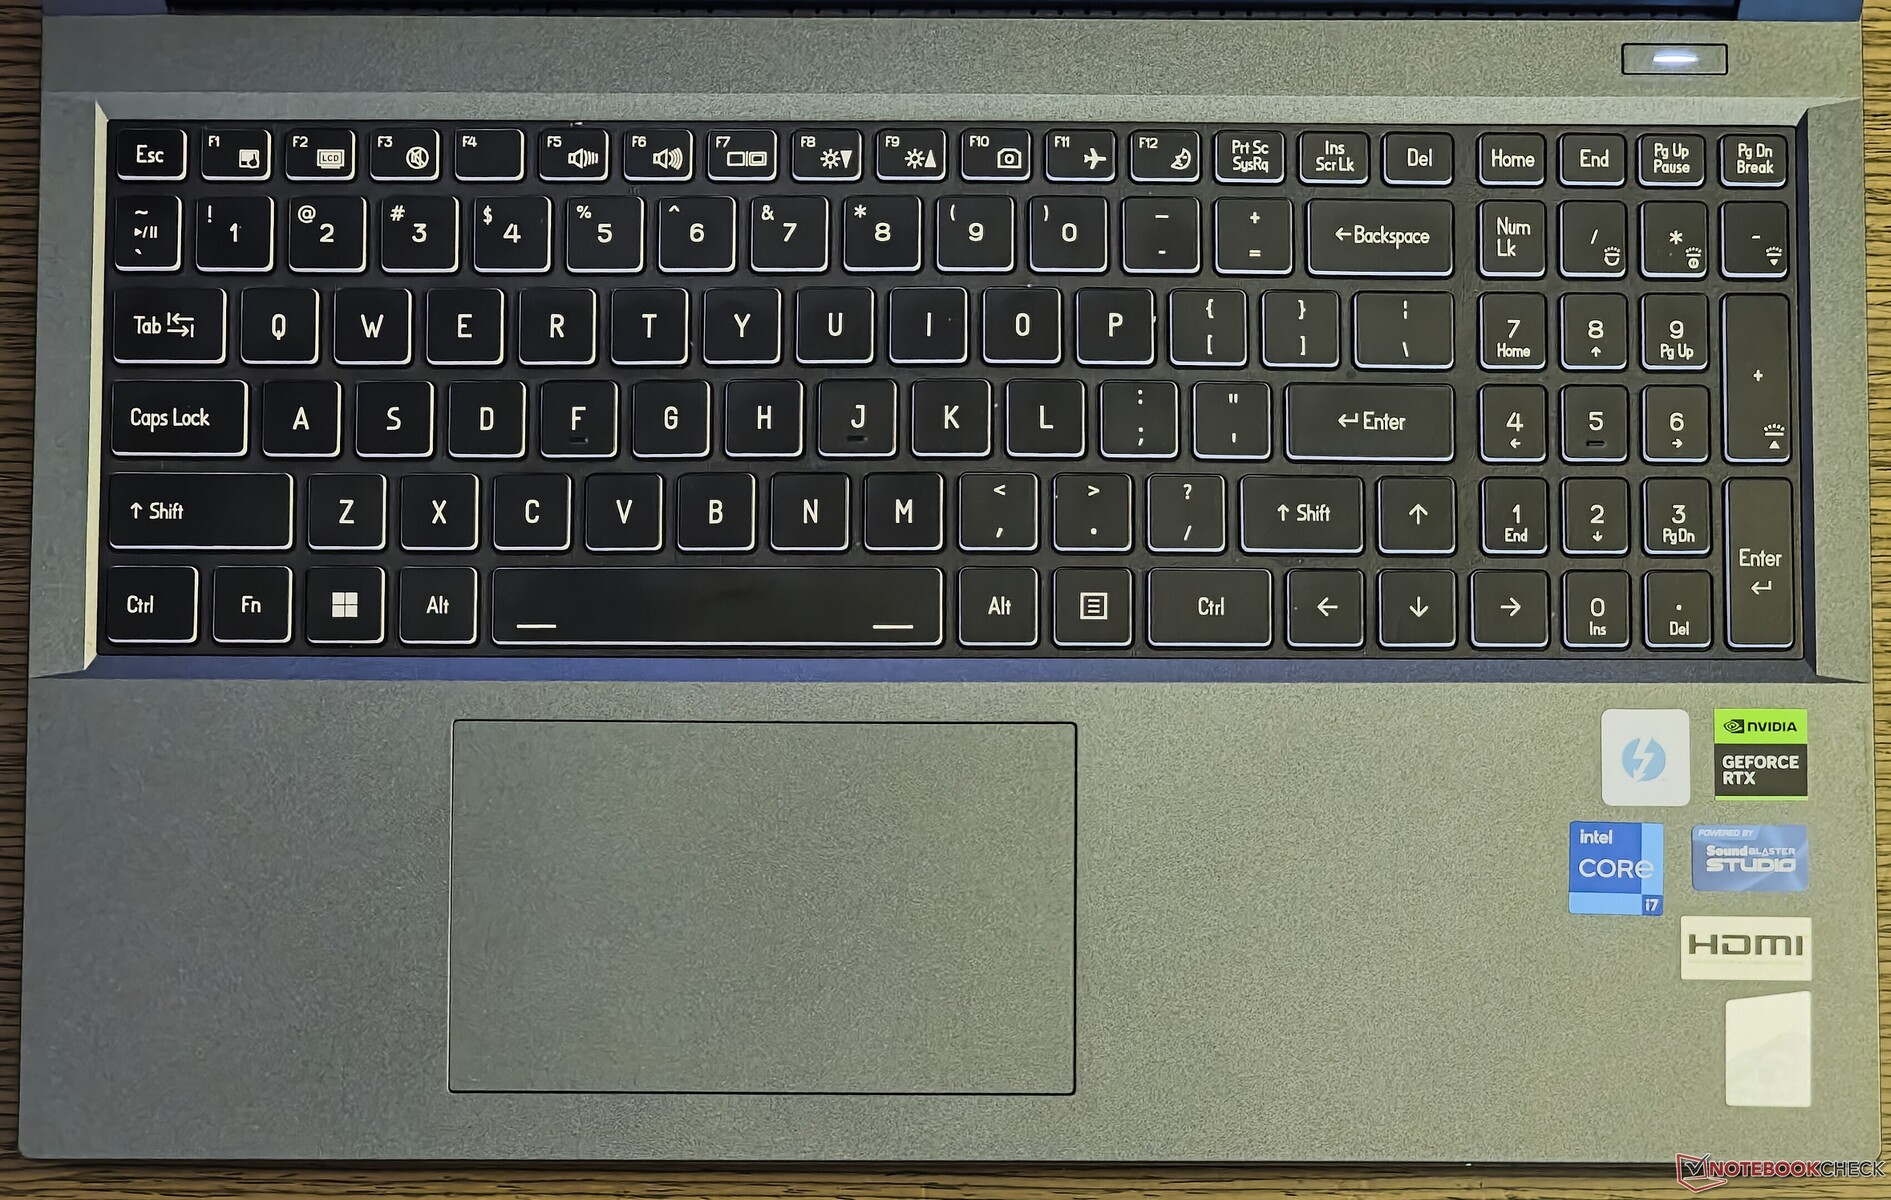
La tastiera full-size di EVOL X15 include un tastierino numerico e uno spazio per i tasti freccia di dimensioni adeguate - un vantaggio per i titoli di corse. Uno svantaggio di questo layout è il tasto Shift destro accorciato, che potrebbe far inciampare gli utenti che passano da una tastiera tipica di un desktop o addirittura di un portatile.
La corsa dei tasti inizialmente è un po' molle, ma la tattilità è sufficiente per il gioco e la digitazione. L'applicazione Control Center di Colorful (leggi Clevo) consente la registrazione di macro da tastiera e mouse, che dovrebbe essere utile per i giocatori di MMORPG e MOBA.
Non c'è una retroilluminazione RGB multi-zona o per tasto, quindi dovrà fare i conti con una tavolozza di colori limitata nell'app Control Center. La retroilluminazione può essere regolata in quattro fasi, ma i tasti filtrano una buona quantità di luce dal passaggio.
Touchpad
Il touchpad da 12 cm x 7 cm non è il più grande che abbiamo visto nei portatili da gioco quest'anno, ma offre un'esperienza di scorrimento relativamente fluida e supporta pienamente i gesti di Windows Precision.
L'intera superficie del touchpad funge da pulsante sinistro del mouse. Tuttavia, i clic sono più facili e meno rumorosi nelle regioni centrali e inferiori del touchpad rispetto agli angoli superiori.
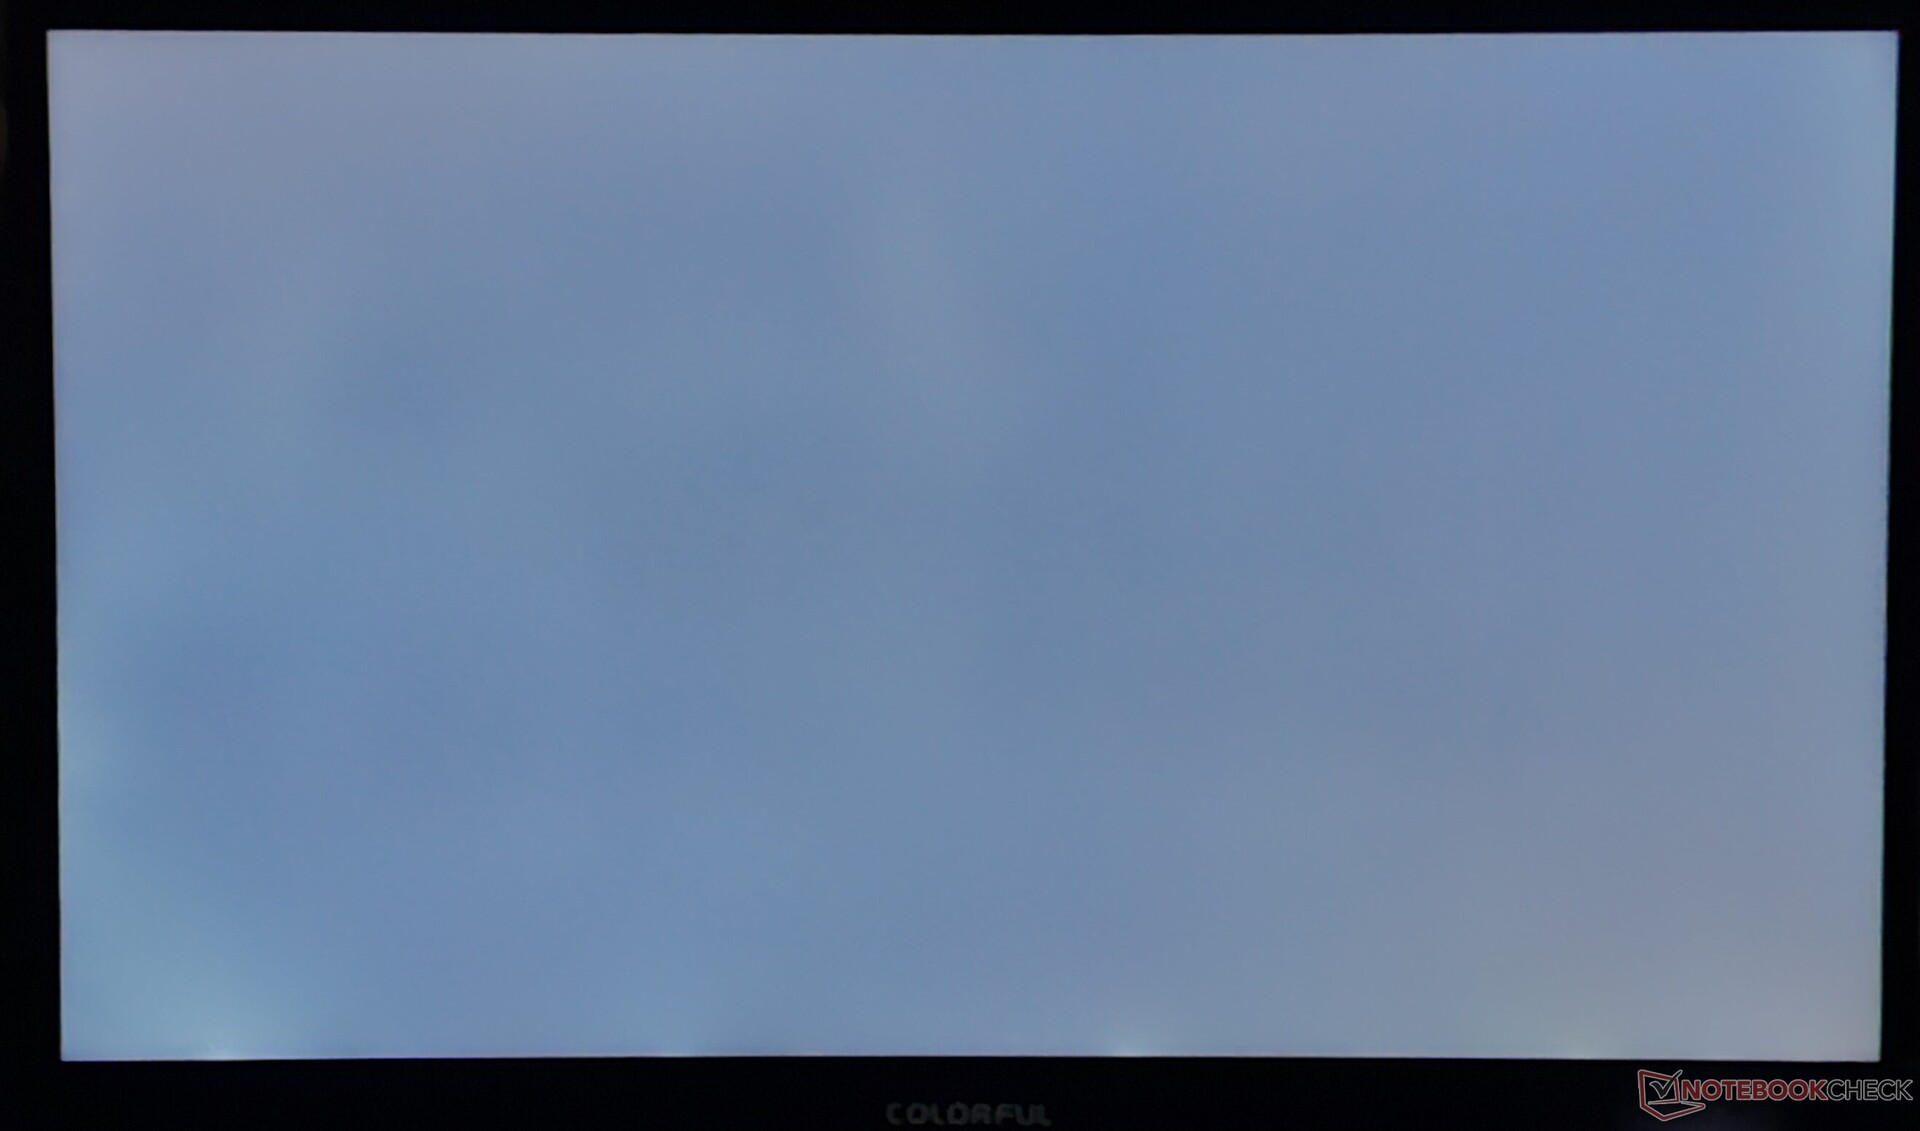
Display: pannello QHD da 165 Hz senza PWM
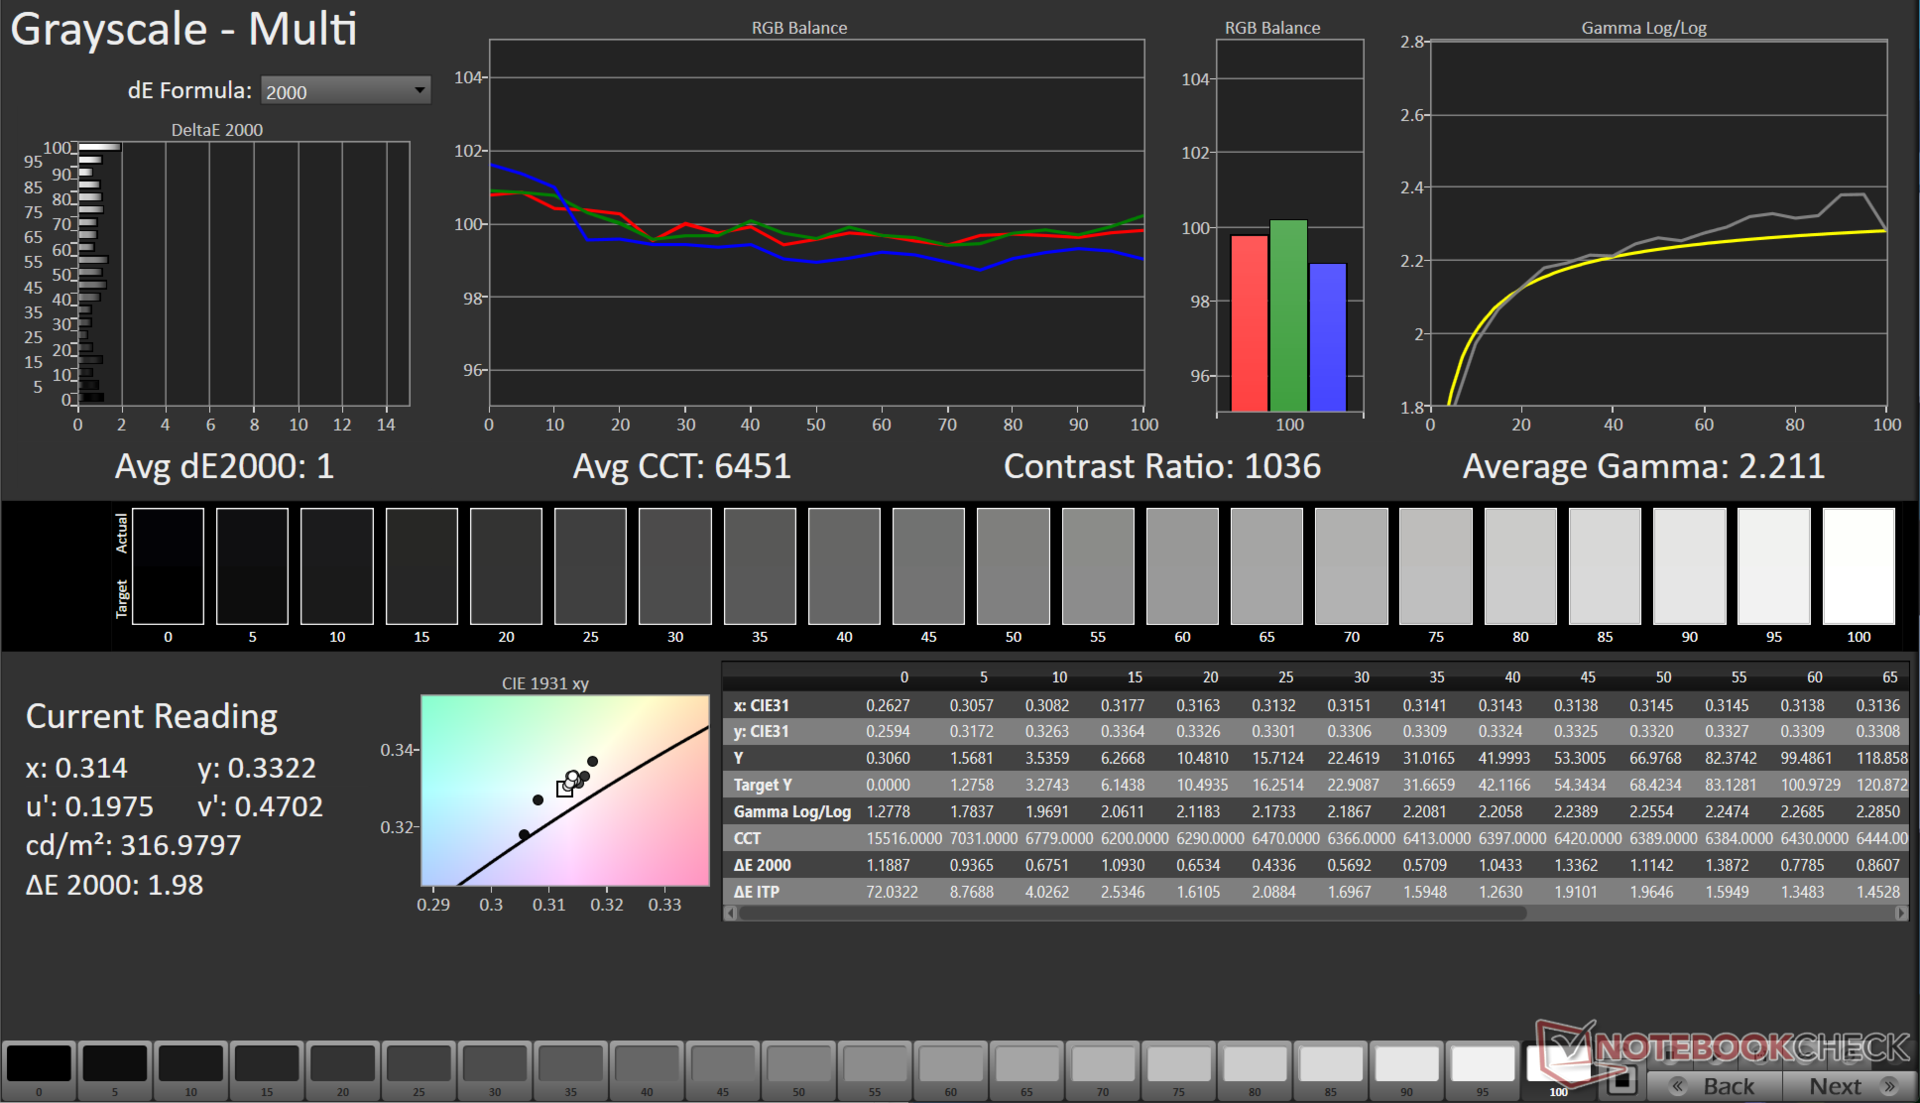
EVOL X15 AT è dotato di un pannello BOE da 15,6 pollici QHD 165 Hz. Il display non stupisce esattamente con i suoi 345 nits di picco e 318 nits di luminanza media, ma è alla pari con la maggior parte dei portatili da gioco a questo prezzo. Agli angoli si nota una minima perdita di luce posteriore.
Il pannello presenta una distribuzione della luminosità decente dell'81%, ma il rapporto di contrasto misurato di 607:1 è nella fascia bassa, soprattutto se confrontato con altri pannelli BOE in questo confronto.

| |||||||||||||||||||||||||
Distribuzione della luminosità: 81 %
Al centro con la batteria: 251 cd/m²
Contrasto: 607:1 (Nero: 0.57 cd/m²)
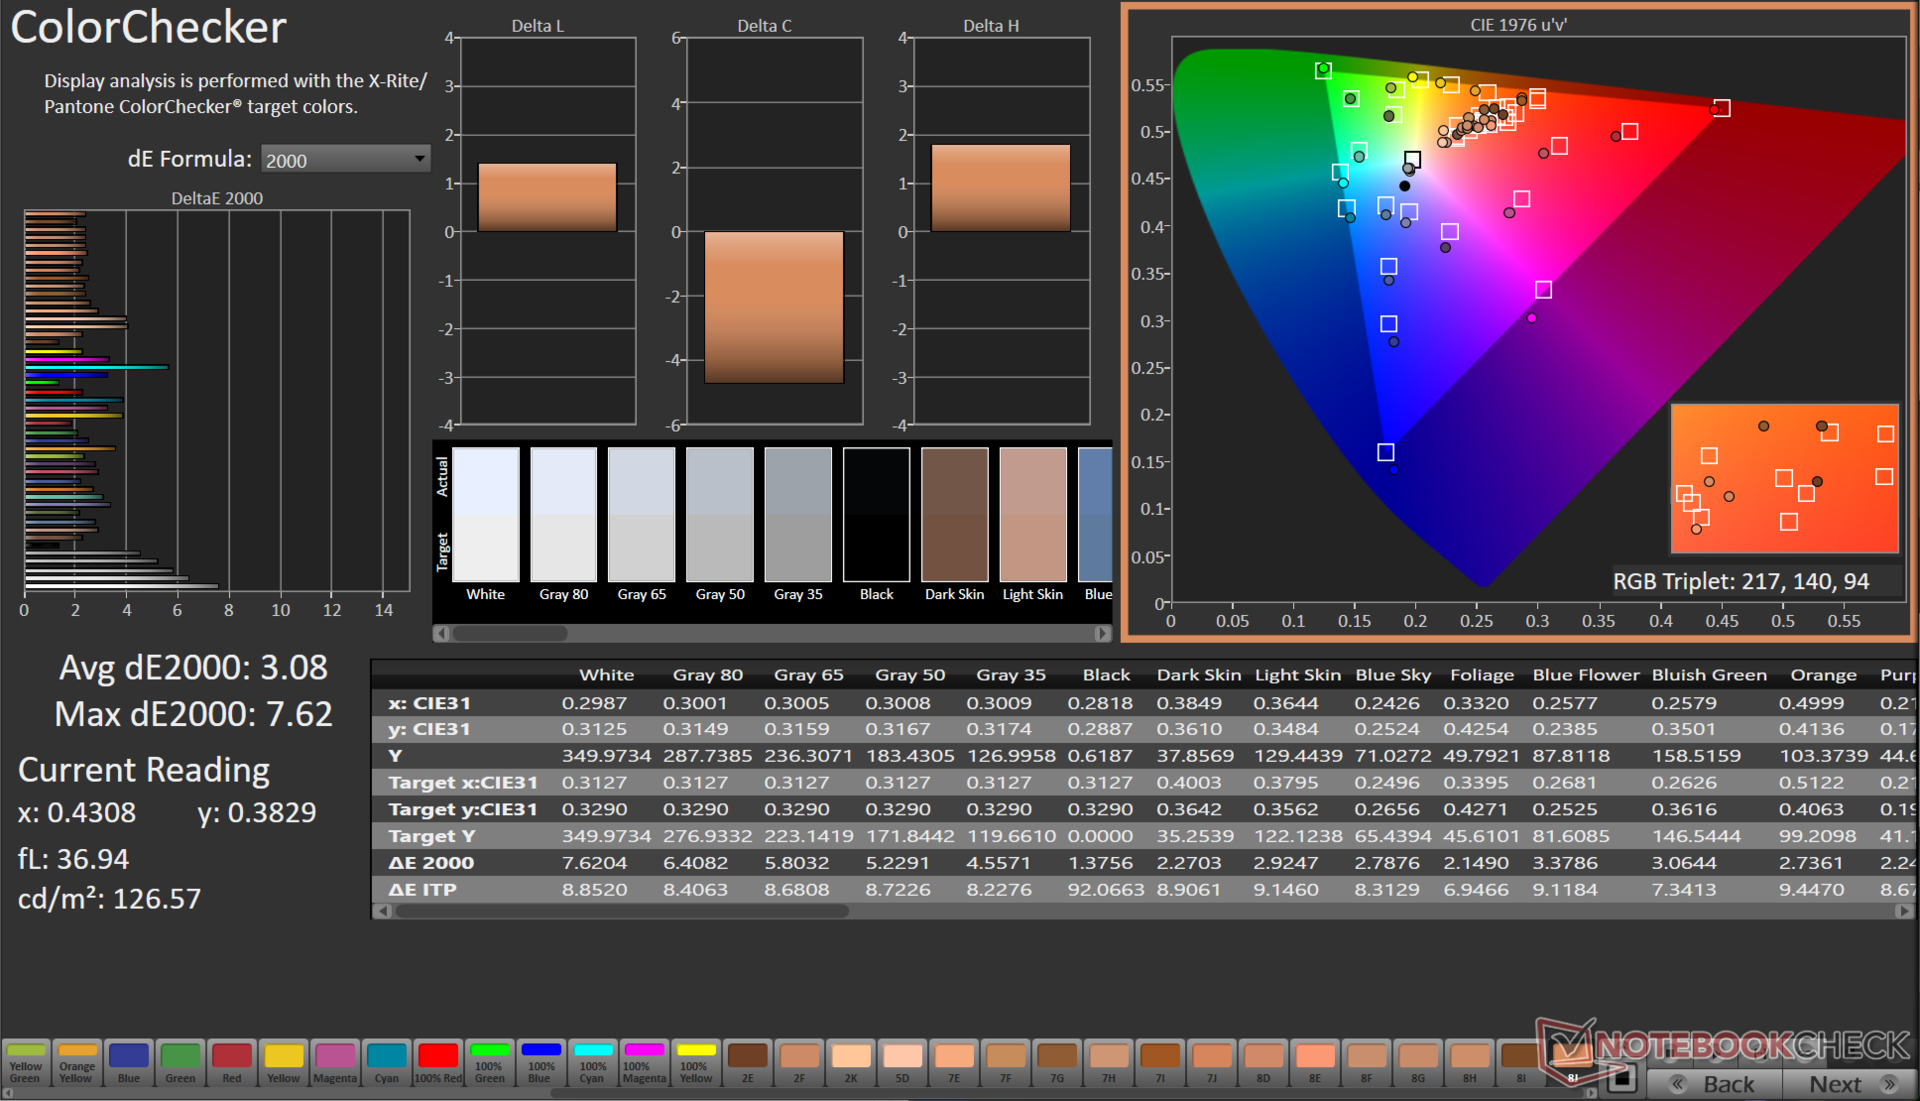
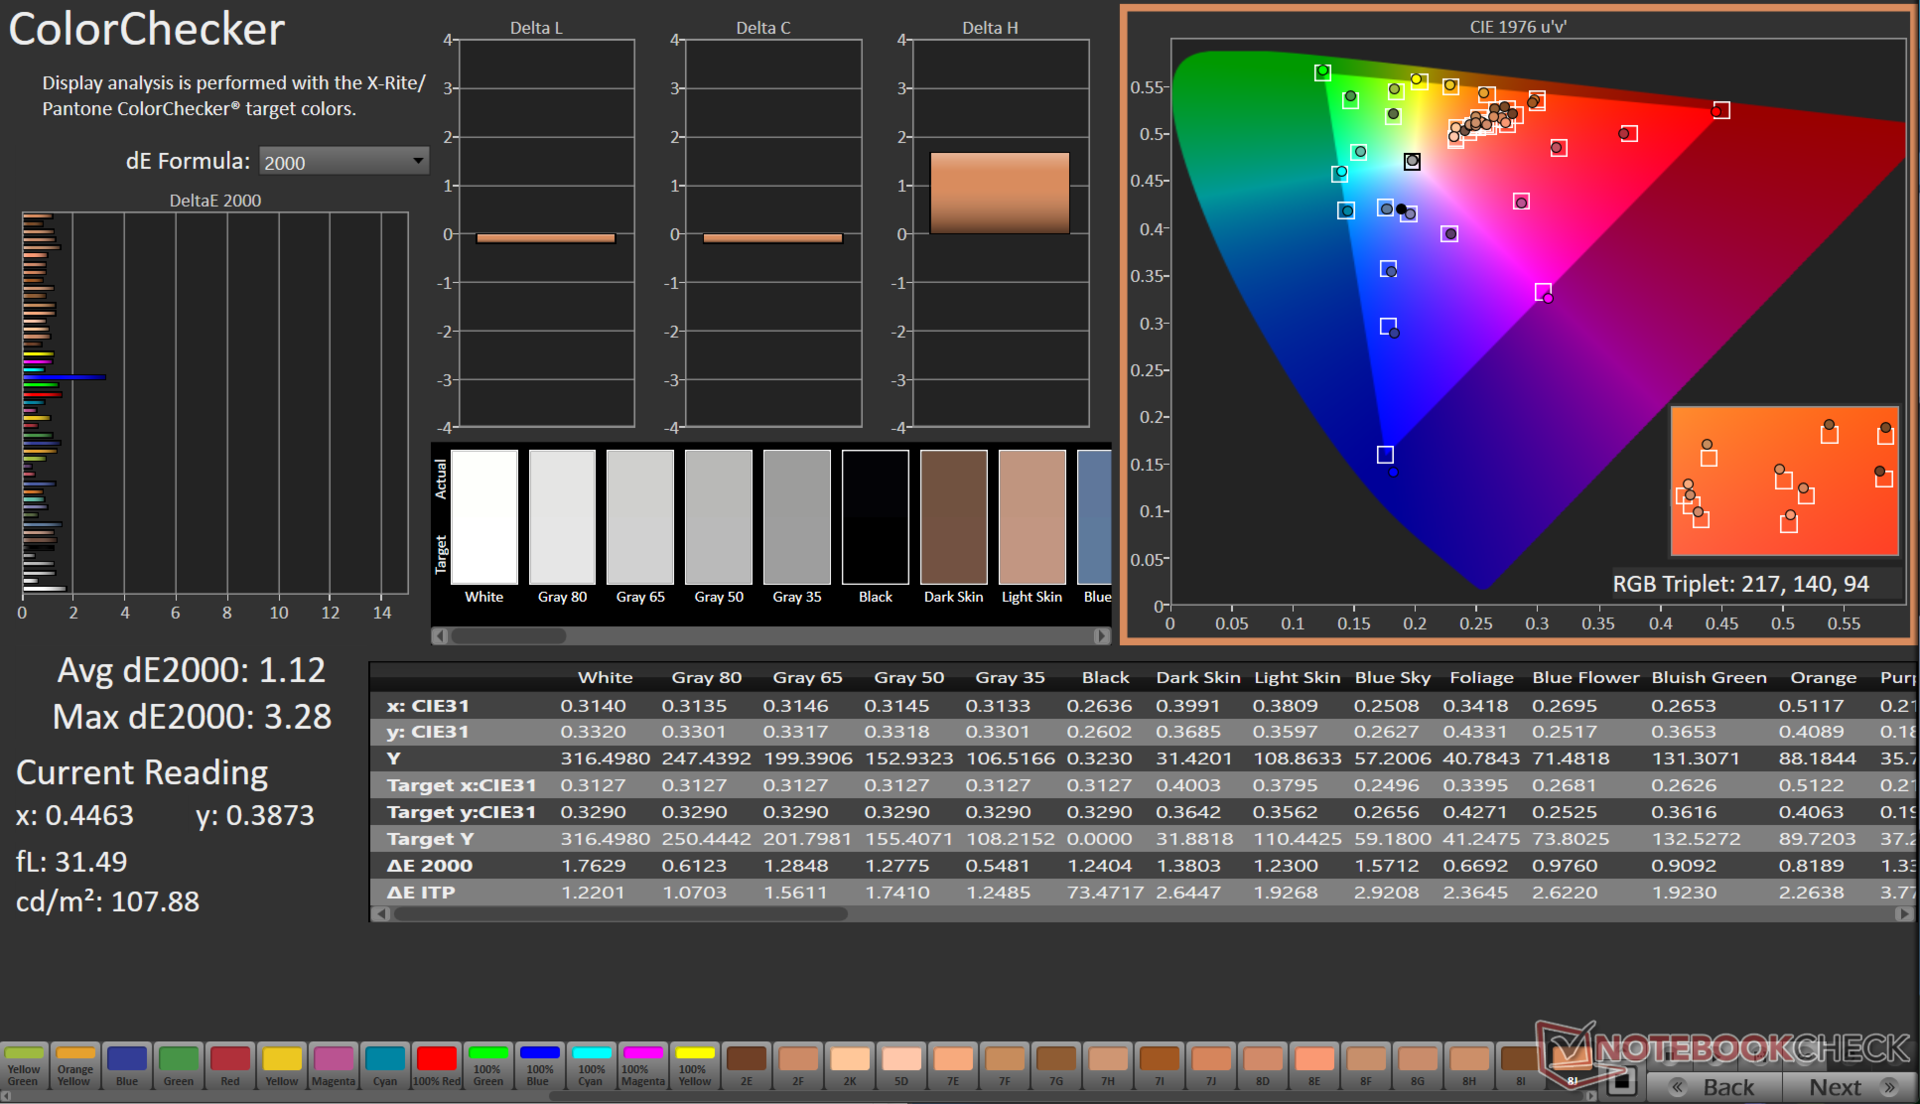
ΔE ColorChecker Calman: 3.08 | ∀{0.5-29.43 Ø4.71}
calibrated: 1.12
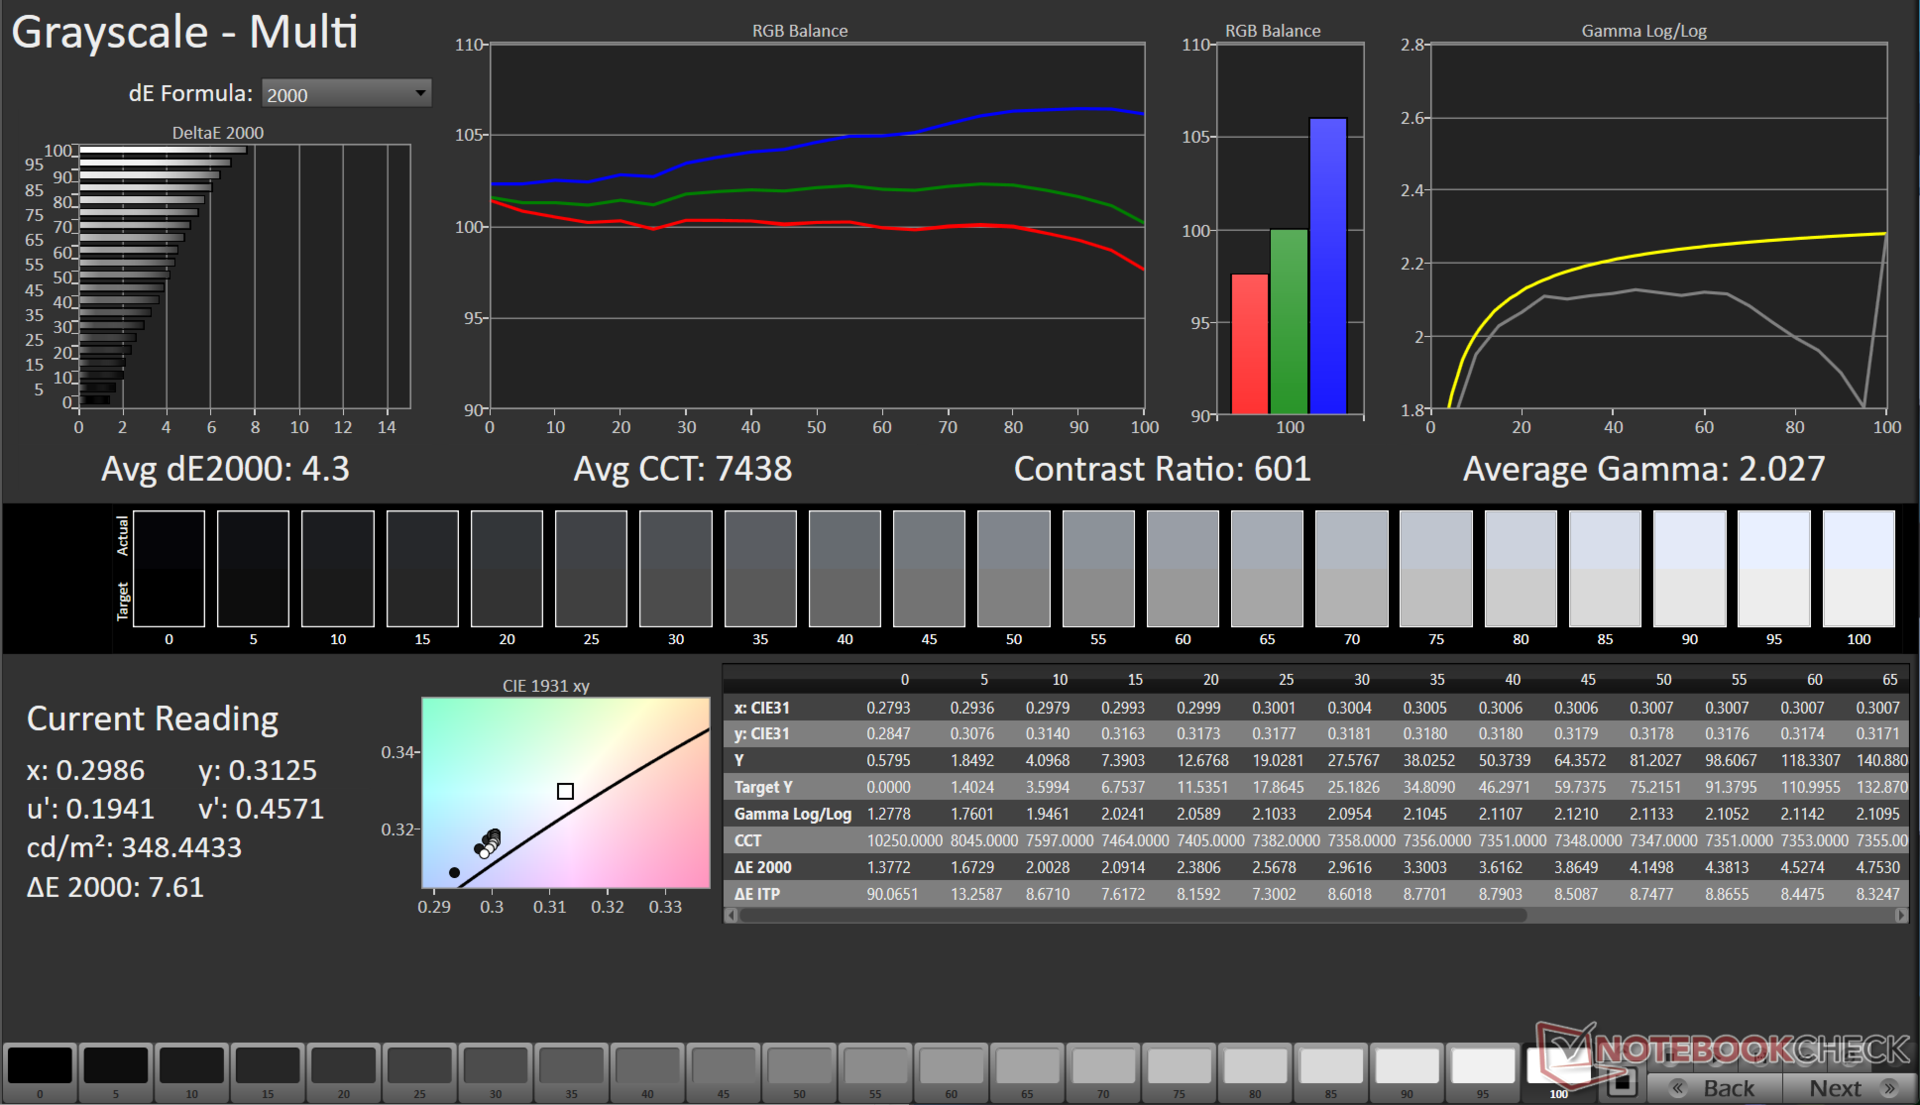
ΔE Greyscale Calman: 4.3 | ∀{0.09-98 Ø4.96}
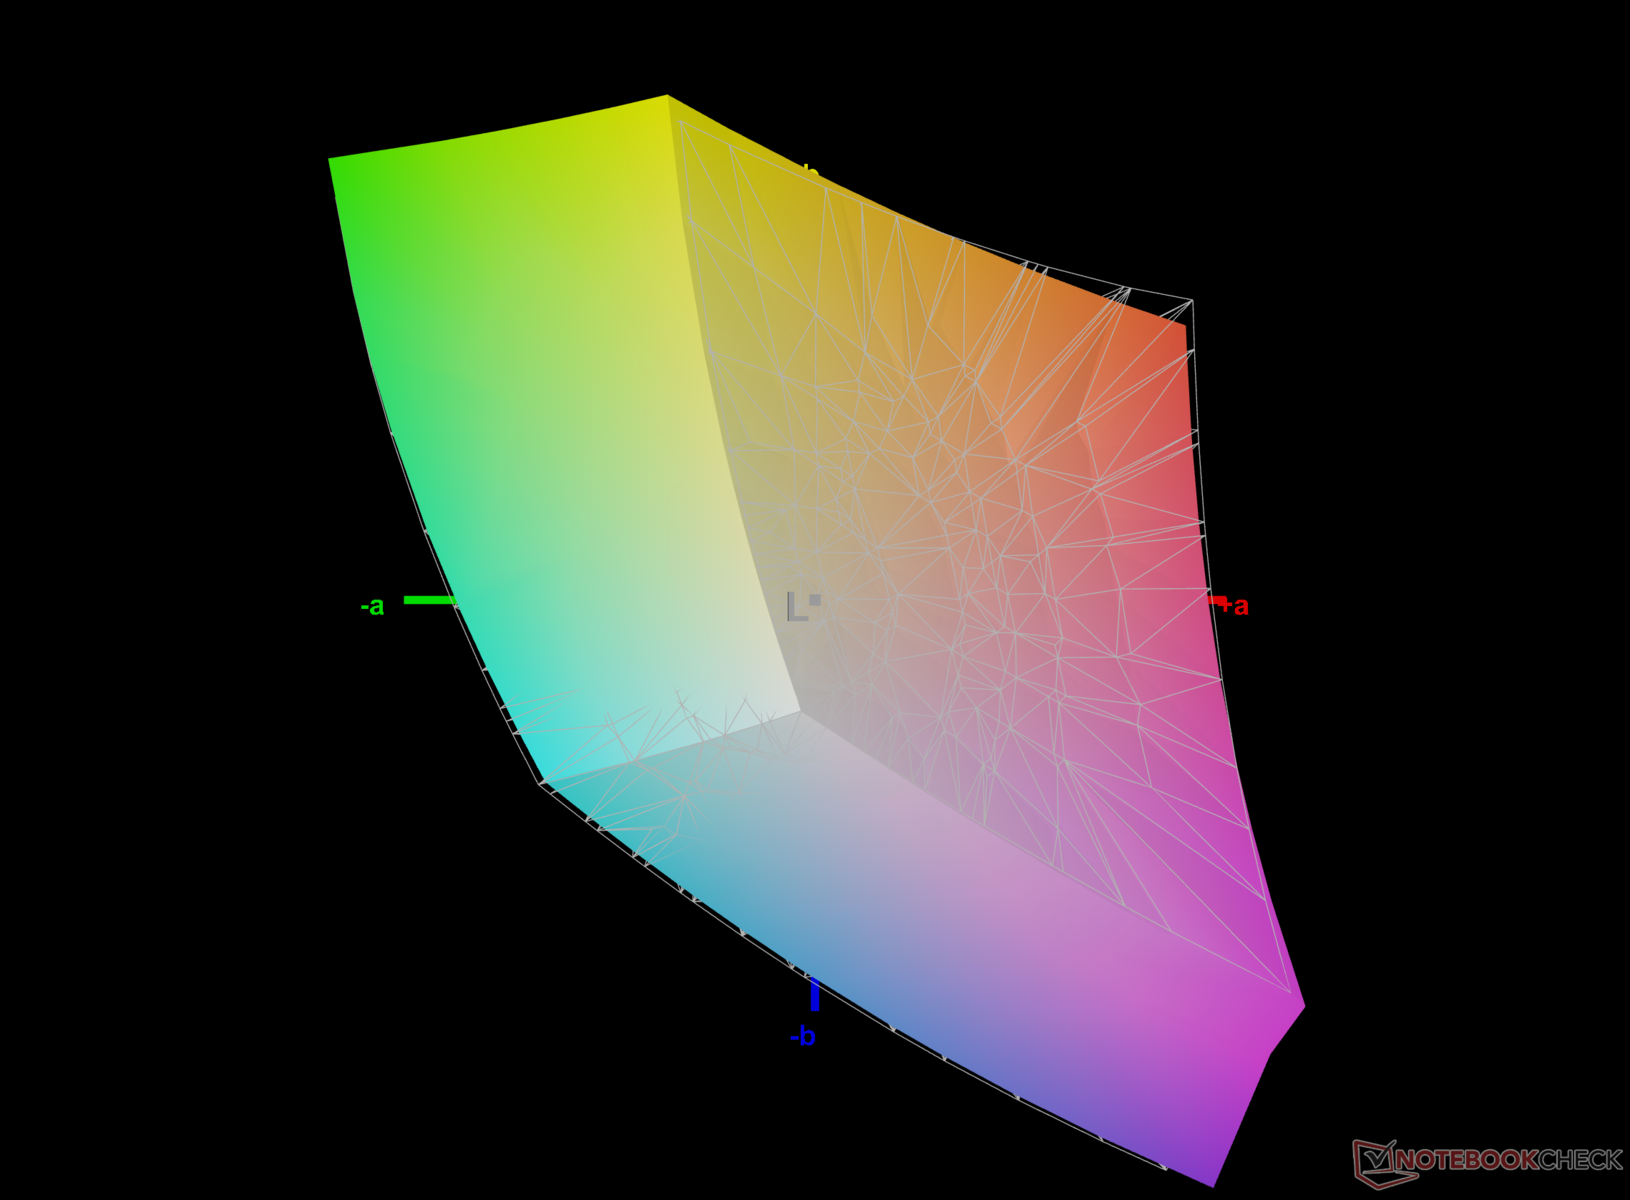
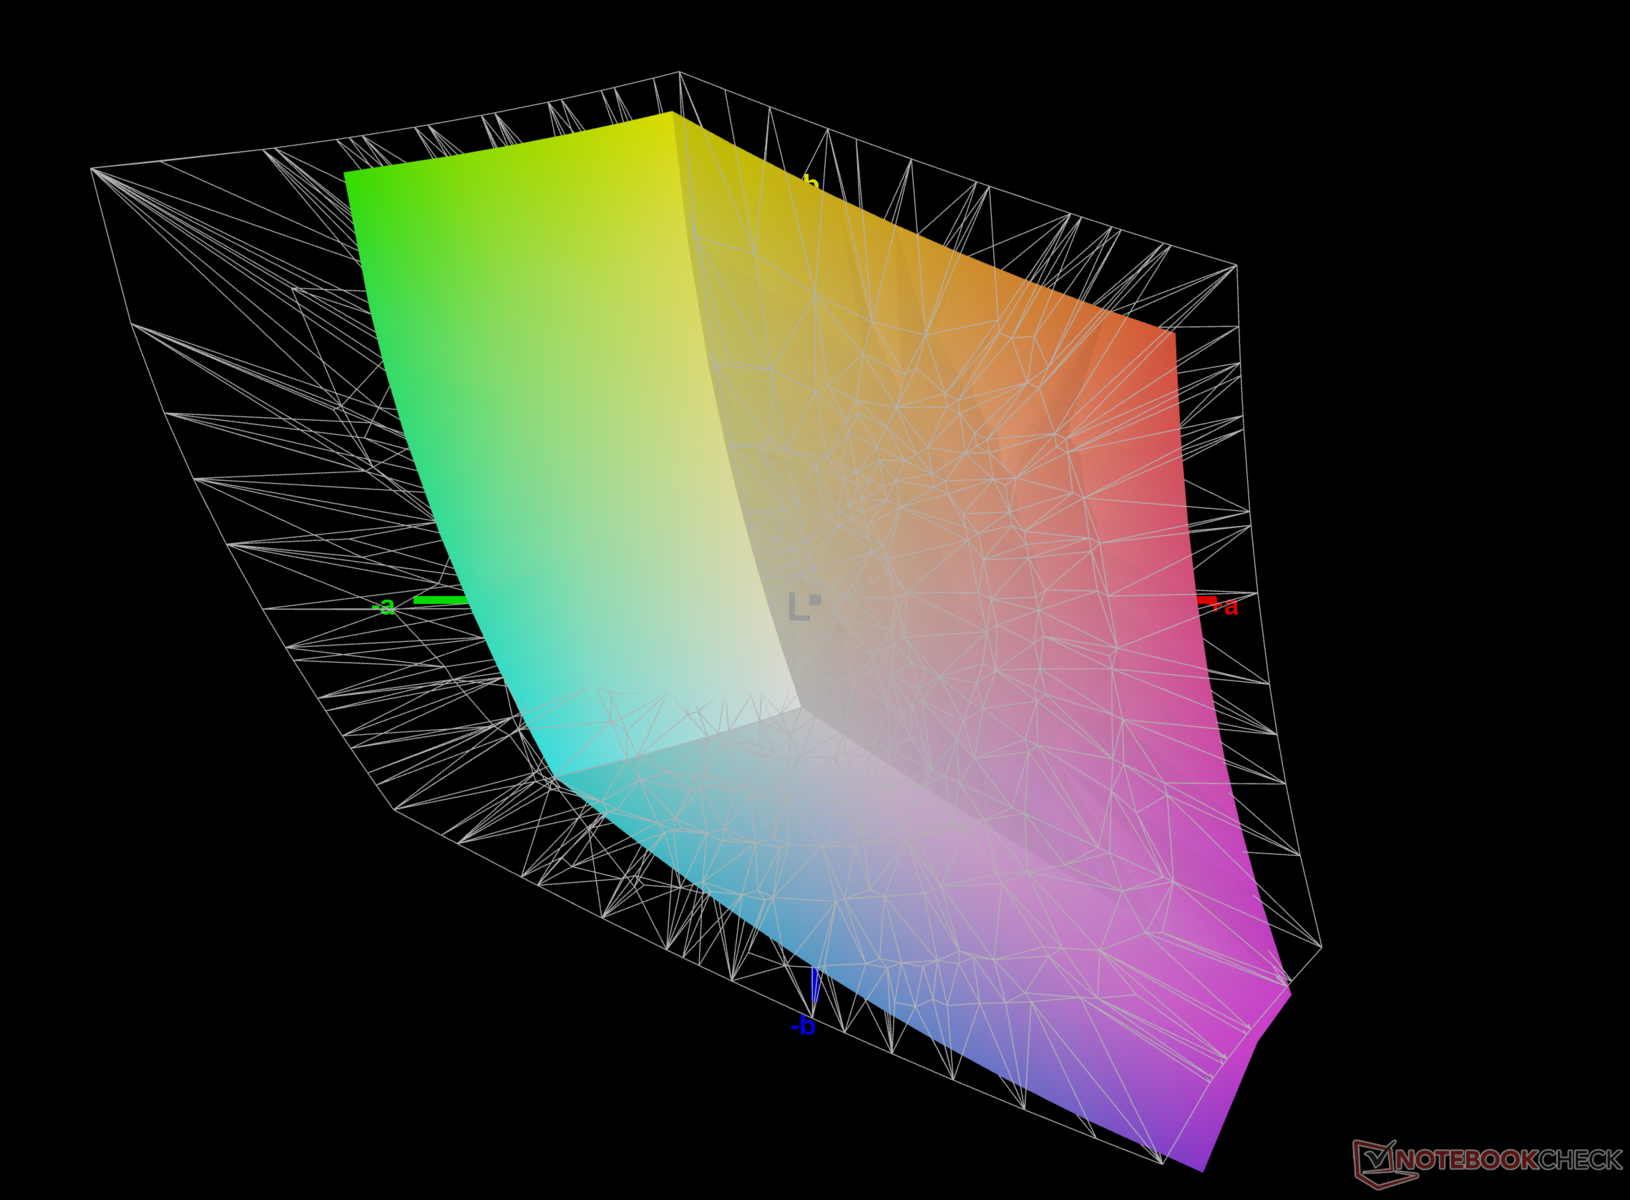
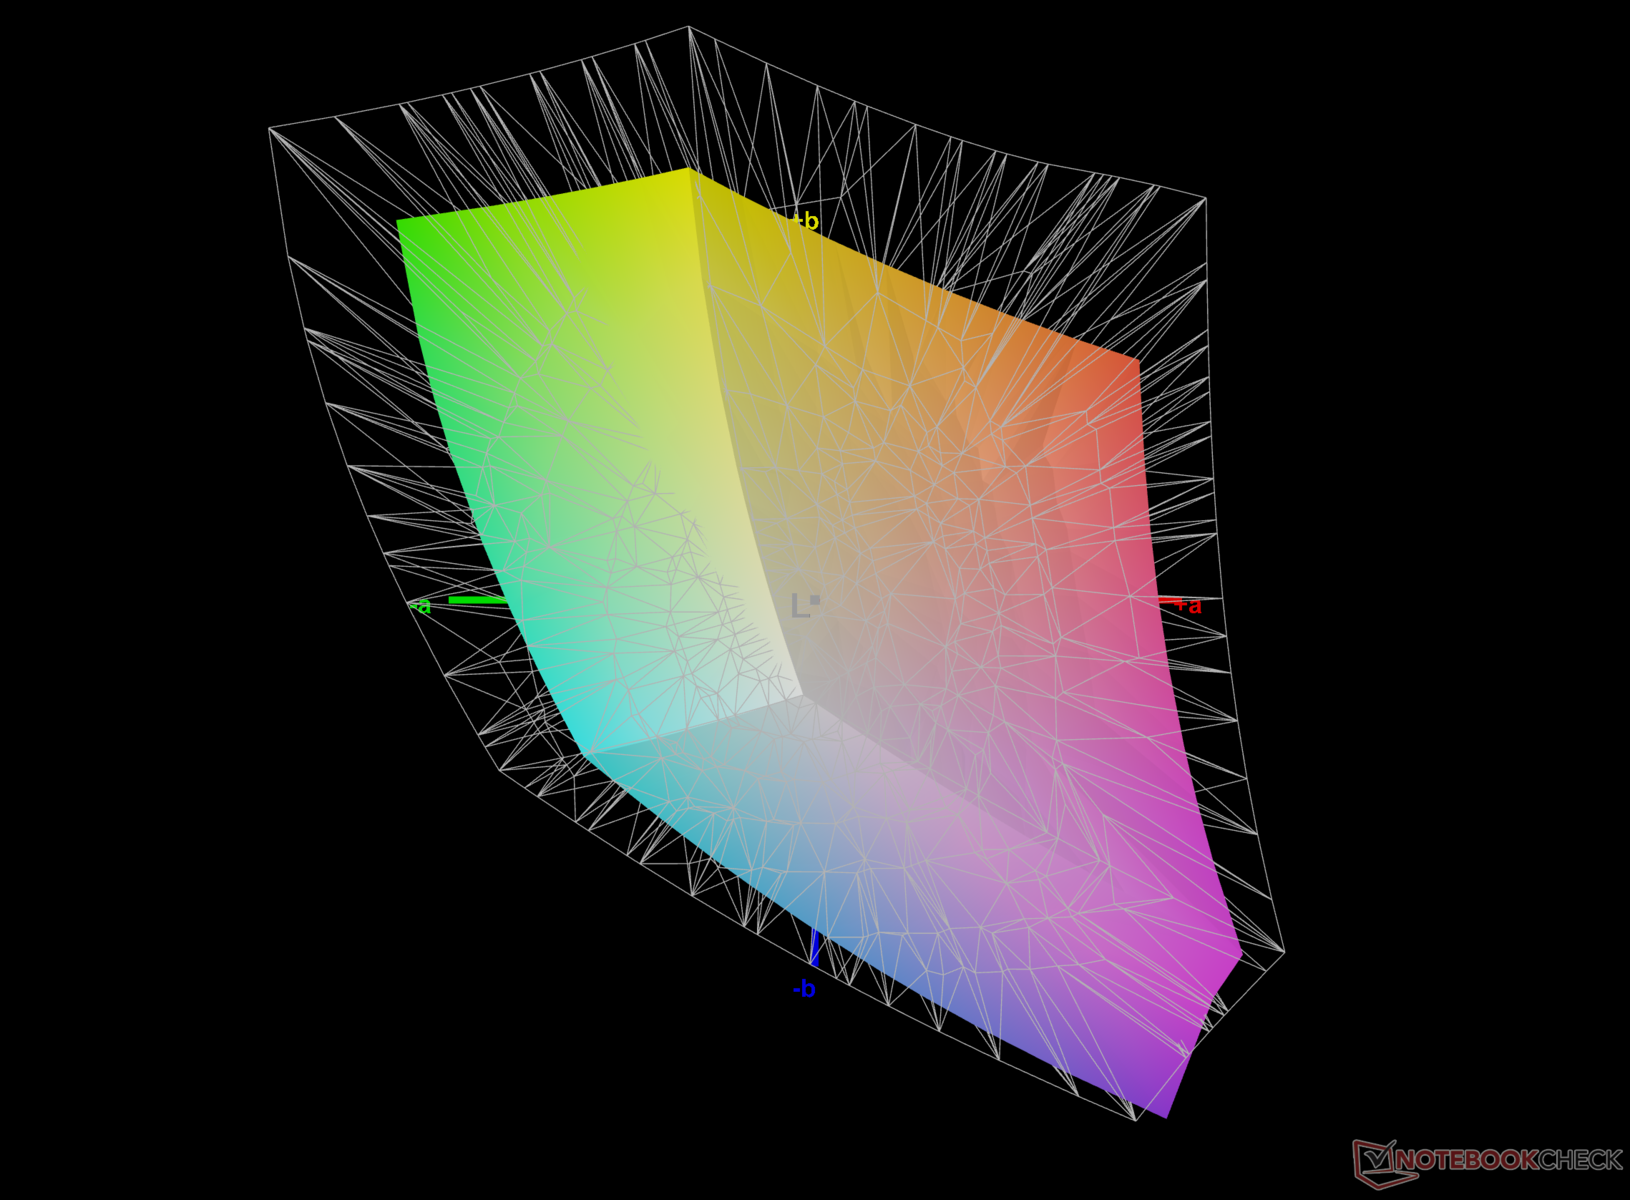
68.2% AdobeRGB 1998 (Argyll 3D)
97.4% sRGB (Argyll 3D)
66.9% Display P3 (Argyll 3D)
Gamma: 2.02
CCT: 7438 K
| Colorful EVOL X15 AT 23 BOE CQ NE156QHM-NY2, IPS, 2560x1440, 15.6" | Alienware m16 R1 Intel BOE NE16NYB, IPS, 2560x1600, 16" | HP Omen 16-wf000 BOE0B7D, IPS, 2560x1440, 16.1" | Acer Predator Helios 16 PH16-71-731Q BOE NE160QDM-NZ2, IPS-LED, 2560x1600, 16" | Dell G15 5530 AUO B156HAN, IPS, 1920x1080, 15.6" | Schenker XMG Pro 15 (E23) BOE0AD1, IPS, 2560x1440, 15.6" | Alienware m16 R1 AMD BOE NE16NZ4, IPS, 2560x1600, 16" | Uniwill GM6PX7X RTX 4070 BOE CQ NE160QDM-NZ1, IPS, 2560x1600, 16" | |
|---|---|---|---|---|---|---|---|---|
| Display | 1% | 3% | 24% | 6% | 25% | 27% | 0% | |
| Display P3 Coverage (%) | 66.9 | 67.7 1% | 69 3% | 97.1 45% | 73.1 9% | 97.8 46% | 98.6 47% | 67.5 1% |
| sRGB Coverage (%) | 97.4 | 97.2 0% | 99.2 2% | 100 3% | 98.4 1% | 99.9 3% | 99.9 3% | 96.4 -1% |
| AdobeRGB 1998 Coverage (%) | 68.2 | 70 3% | 71.2 4% | 84.7 24% | 74.4 9% | 85.4 25% | 88.9 30% | 68.6 1% |
| Response Times | 35% | 16% | -7% | 49% | -29% | 18% | -23% | |
| Response Time Grey 50% / Grey 80% * (ms) | 10.42 ? | 4 ? 62% | 4.6 ? 56% | 13.6 ? -31% | 3.39 ? 67% | 14 ? -34% | 5.1 ? 51% | 12.6 ? -21% |
| Response Time Black / White * (ms) | 7.81 ? | 7.3 ? 7% | 9.7 ? -24% | 6.4 ? 18% | 5.35 ? 31% | 9.6 ? -23% | 9 ? -15% | 9.8 ? -25% |
| PWM Frequency (Hz) | 21620 ? | |||||||
| Screen | 24% | 28% | 42% | 7% | 12% | 0% | 22% | |
| Brightness middle (cd/m²) | 346 | 306 -12% | 310.9 -10% | 511 48% | 320 -8% | 322 -7% | 329 -5% | 338.6 -2% |
| Brightness (cd/m²) | 318 | 302 -5% | 296 -7% | 498 57% | 316 -1% | 301 -5% | 317 0% | 328 3% |
| Brightness Distribution (%) | 81 | 89 10% | 91 12% | 94 16% | 94 16% | 85 5% | 89 10% | 89 10% |
| Black Level * (cd/m²) | 0.57 | 0.3 47% | 0.35 39% | 0.36 37% | 0.21 63% | 0.36 37% | 0.32 44% | 0.32 44% |
| Contrast (:1) | 607 | 1020 68% | 888 46% | 1419 134% | 1524 151% | 894 47% | 1028 69% | 1058 74% |
| Colorchecker dE 2000 * | 3.08 | 2.57 17% | 2.18 29% | 1.76 43% | 4.55 -48% | 1.98 36% | 3.71 -20% | 2.18 29% |
| Colorchecker dE 2000 max. * | 7.62 | 4.26 44% | 3.58 53% | 3.7 51% | 9.83 -29% | 5.24 31% | 7.23 5% | 7.14 6% |
| Colorchecker dE 2000 calibrated * | 1.12 | 0.85 24% | 0.52 54% | 1.56 -39% | 1.51 -35% | 1.98 -77% | 2.82 -152% | 0.93 17% |
| Greyscale dE 2000 * | 4.3 | 3.3 23% | 2.8 35% | 3 30% | 6.2 -44% | 2.44 43% | 2.2 49% | 3.7 14% |
| Gamma | 2.02 109% | 1.997 110% | 2.18 101% | 2.33 94% | 2.07 106% | 2.42 91% | 2.3 96% | 2.18 101% |
| CCT | 7438 87% | 6895 94% | 6002 108% | 6341 103% | 6479 100% | 6984 93% | 6270 104% | 7245 90% |
| Media totale (Programma / Settaggio) | 20% /
21% | 16% /
21% | 20% /
31% | 21% /
13% | 3% /
9% | 15% /
8% | -0% /
11% |
* ... Meglio usare valori piccoli
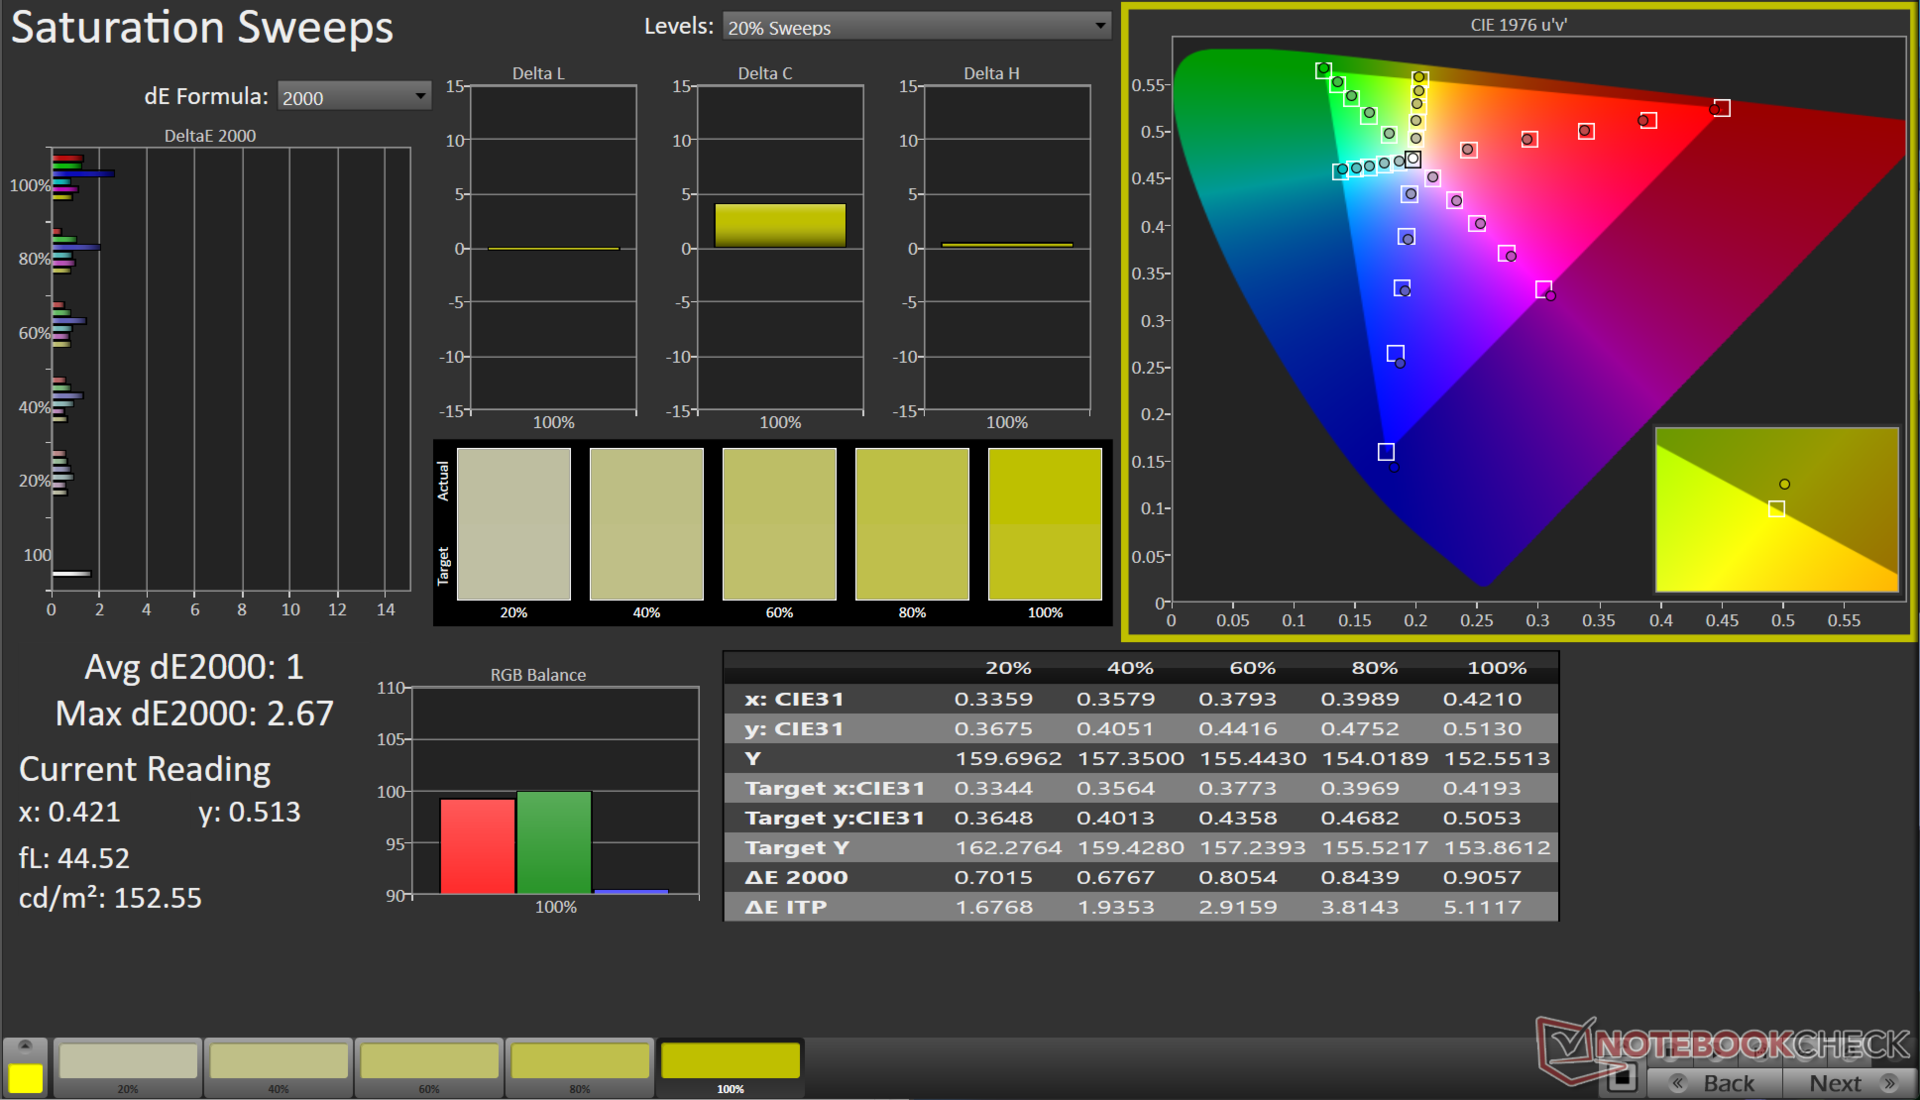
EVOL X15 non è destinato ai creatori di contenuti, ma la copertura sRGB del 97% è di buon auspicio per i giochi, il web e le modifiche di base. I creatori che desiderano sfruttare le capacità hardware di EVOL X15 possono utilizzare un display esterno per aumentare le prestazioni cromatiche.
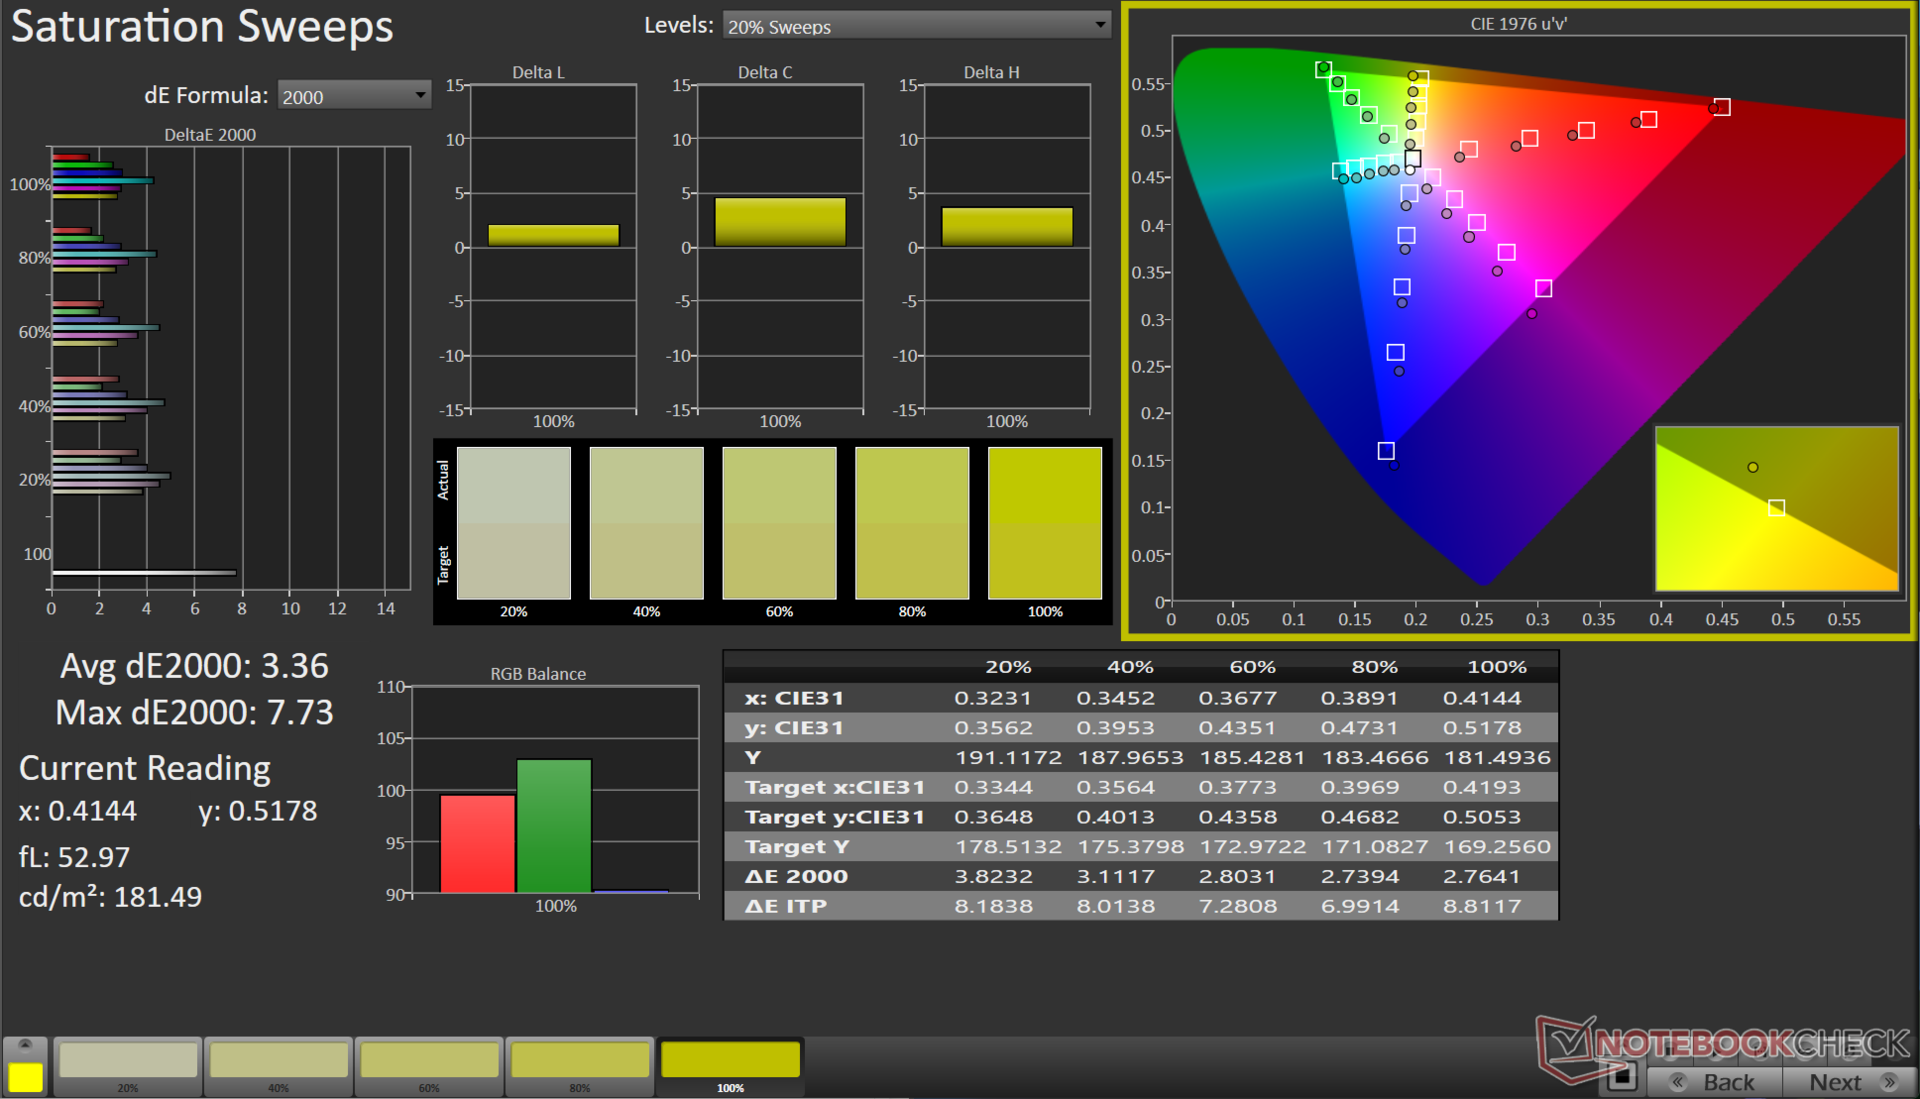
La riproduzione dei colori del display è per lo più affidabile, con valori medi di Scala di grigi e ColorChecker Delta E 2000 di 4,3 e 3,08, rispettivamente.
La nostra routine di calibrazione, utilizzando lo spettrofotometro X-Rite i1Basic Pro 3 e il software Calman Ultimate di Portrait Display, migliora notevolmente questi valori corrispondenti, portandoli a 1 e 1,12.
Il file ICC calibrato può essere scaricato dal link qui sopra.
Tempi di risposta del Display
| ↔ Tempi di risposta dal Nero al Bianco | ||
|---|---|---|
| 7.81 ms ... aumenta ↗ e diminuisce ↘ combinato | ↗ 4.01 ms Incremento | 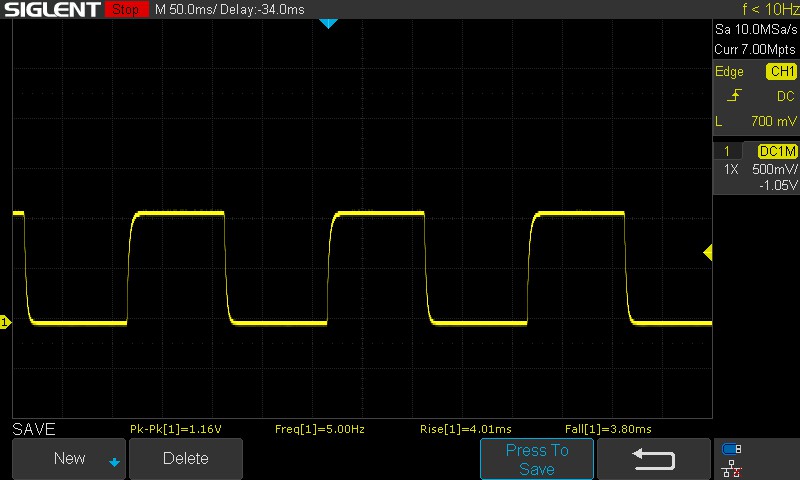 |
| ↘ 3.8 ms Calo | ||
| Lo schermo ha mostrato valori di risposta molto veloci nei nostri tests ed è molto adatto per i gaming veloce. In confronto, tutti i dispositivi di test variano da 0.1 (minimo) a 240 (massimo) ms. » 22 % di tutti i dispositivi è migliore. Questo significa che i tempi di risposta rilevati sono migliori rispettto alla media di tutti i dispositivi testati (19.8 ms). | ||
| ↔ Tempo di risposta dal 50% Grigio all'80% Grigio | ||
| 10.42 ms ... aumenta ↗ e diminuisce ↘ combinato | ↗ 4.73 ms Incremento | 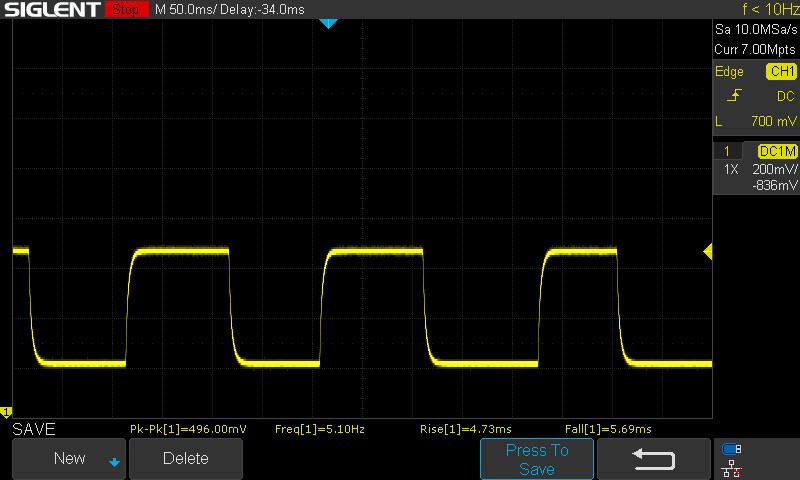 |
| ↘ 5.69 ms Calo | ||
| Lo schermo mostra buoni tempi di risposta durante i nostri tests, ma potrebbe essere troppo lento per i gamers competitivi. In confronto, tutti i dispositivi di test variano da 0.165 (minimo) a 636 (massimo) ms. » 24 % di tutti i dispositivi è migliore. Questo significa che i tempi di risposta rilevati sono migliori rispettto alla media di tutti i dispositivi testati (30.9 ms). | ||
I tempi di risposta sono decenti per la maggior parte delle esigenze di gioco. Il pannello di EVOL X15 AT non utilizza l'overdrive e non c'è un'opzione per attivarlo, che avrebbe contribuito a ridurre ulteriormente i tempi di transizione dal 50% di grigio all'80% di grigio.
Sfarfallio dello schermo / PWM (Pulse-Width Modulation)
| flickering dello schermo / PWM non rilevato | ≤ 100 % settaggio luminosita' | 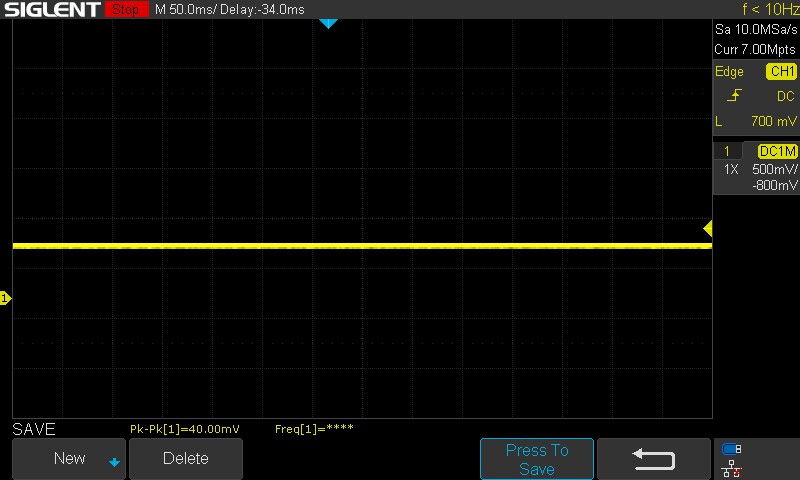 | |
In confronto: 52 % di tutti i dispositivi testati non utilizza PWM per ridurre la luminosita' del display. Se è rilevato PWM, una media di 7741 (minimo: 5 - massimo: 343500) Hz è stata rilevata. | |||
Non abbiamo rilevato PWM o sfarfallio a nessuno dei livelli di luminosità testati.
Per maggiori informazioni, consulti il nostro articolo, "Perché il PWM è un problema"e anche la nostra Tabella di classificazione PWM.
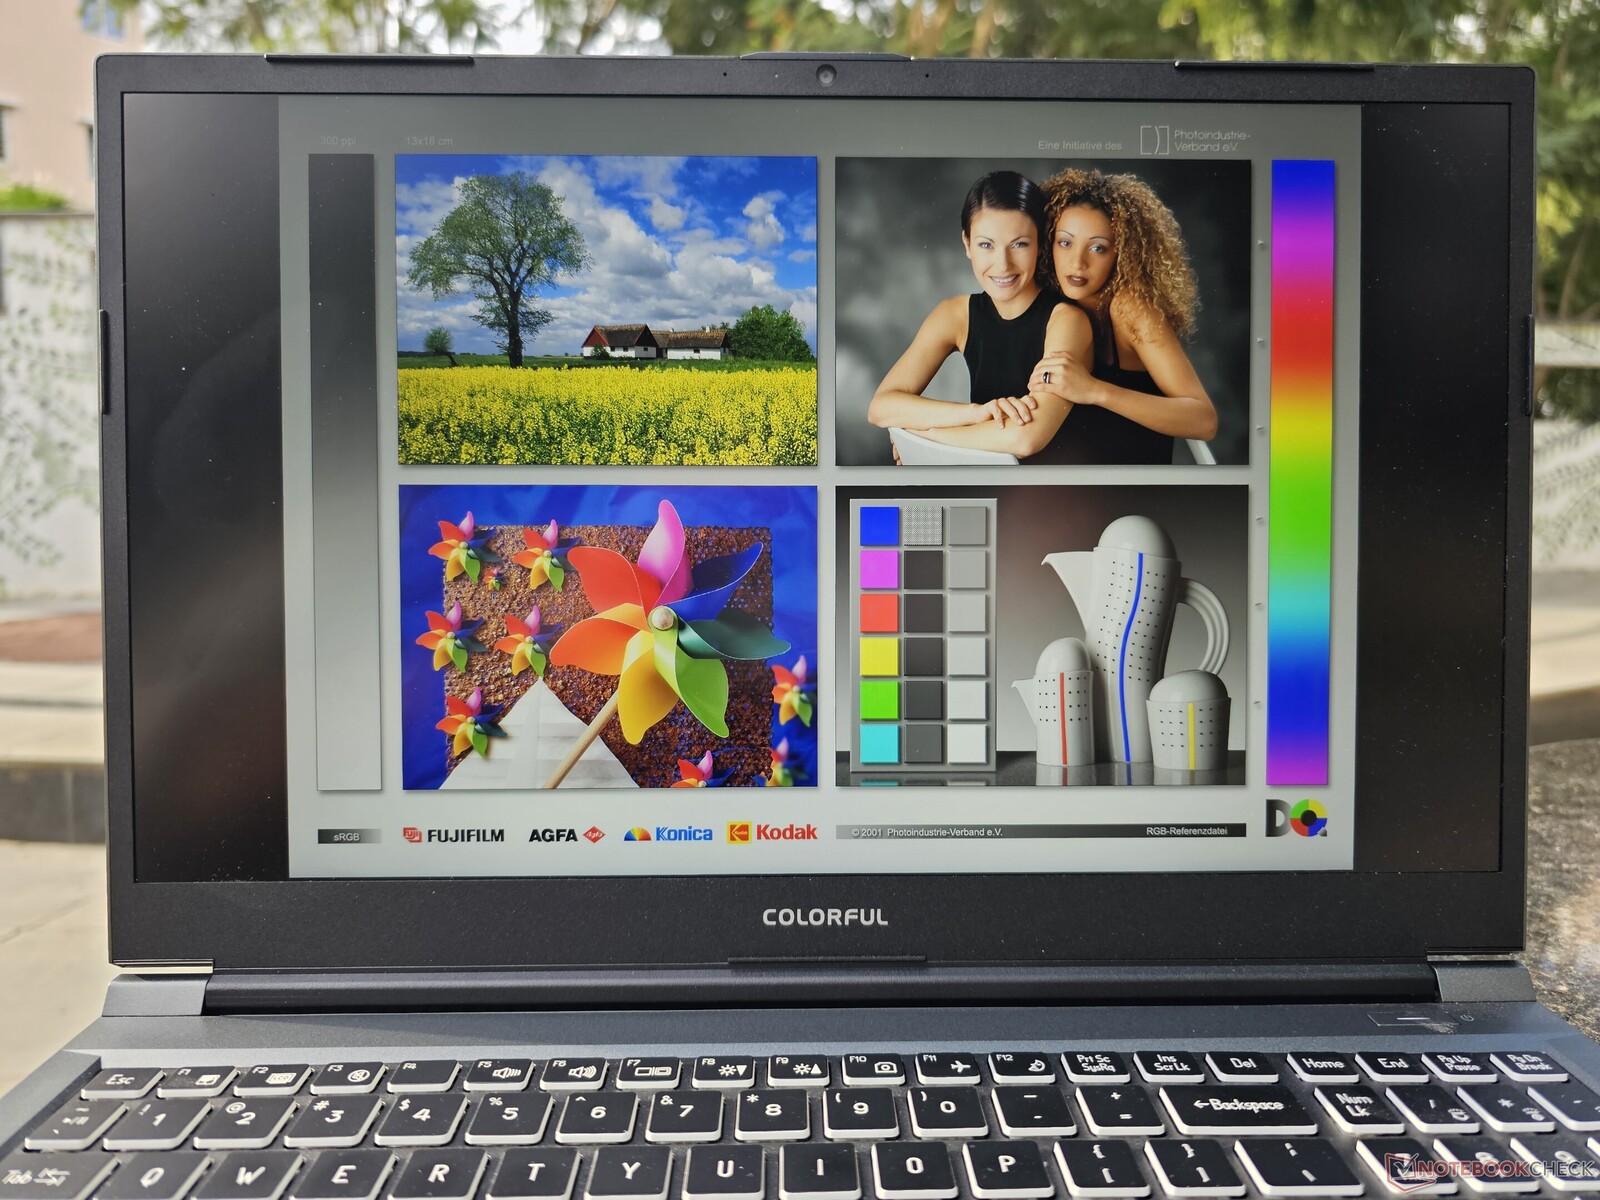
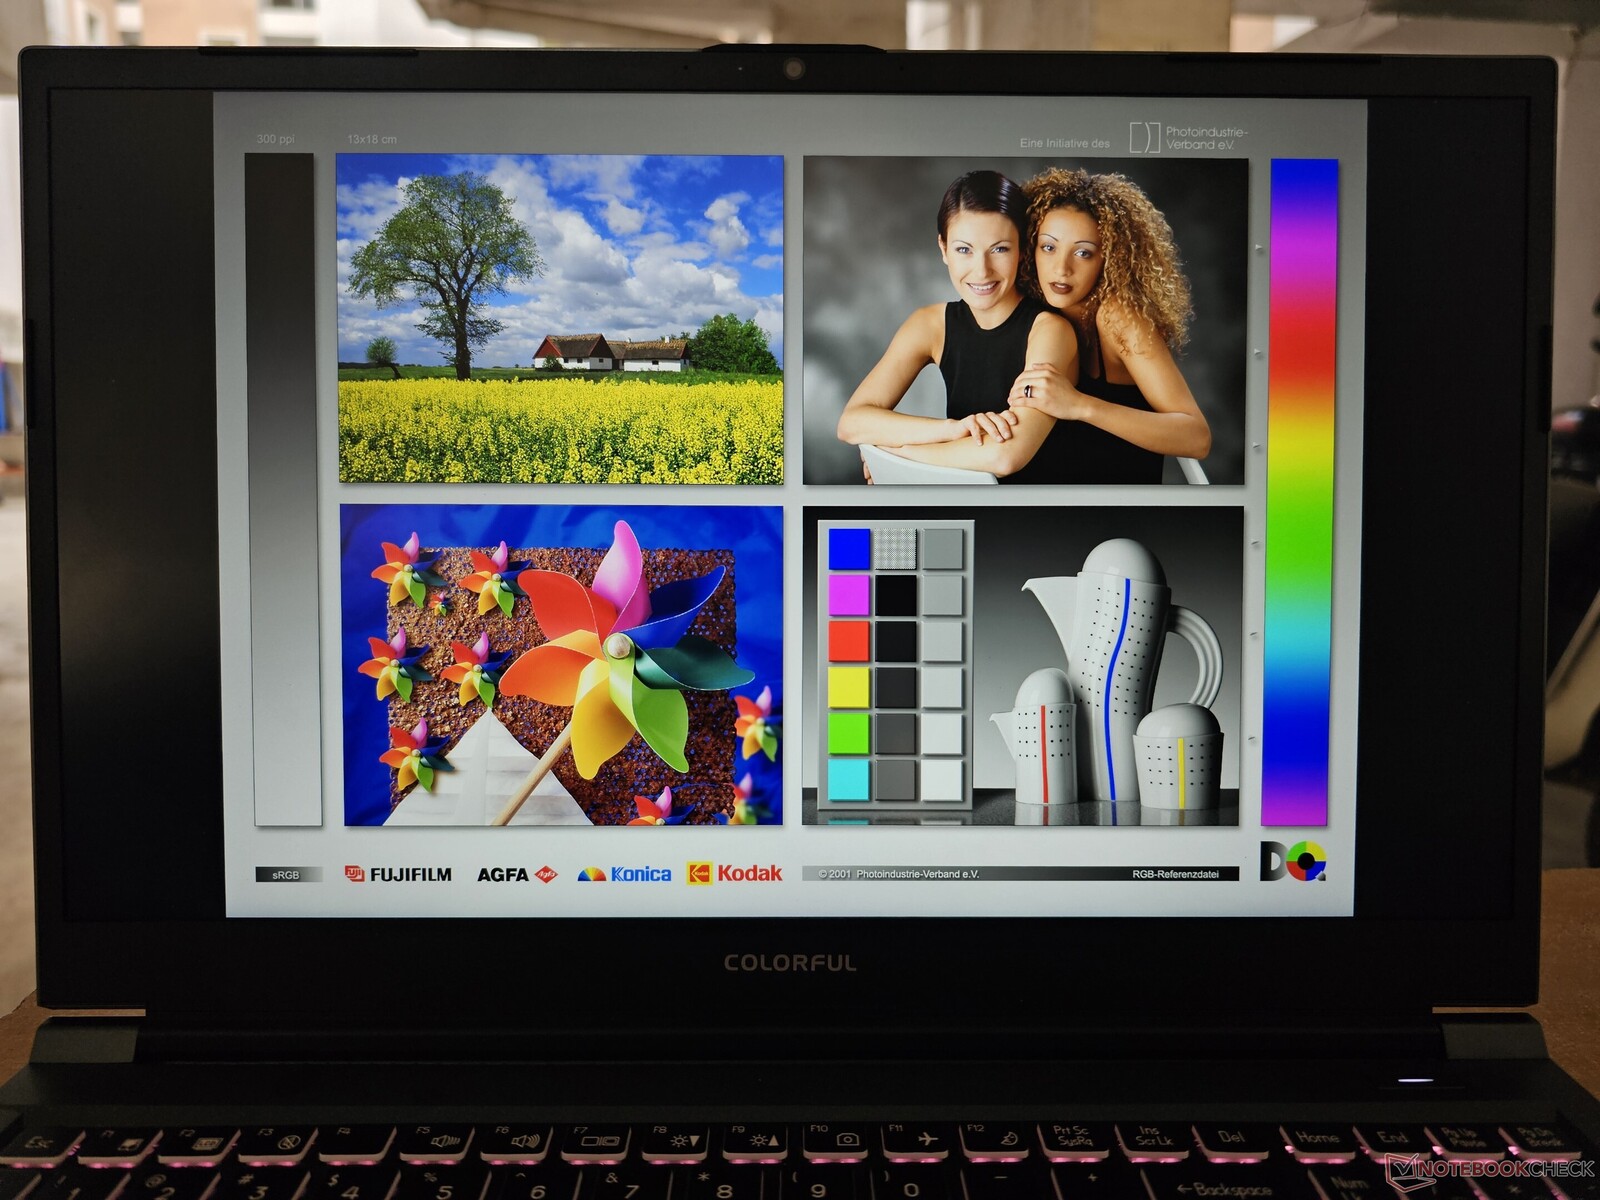
La visione all'aperto è buona, ma la luminosità del display potrebbe non essere adeguata per l'uso sotto la luce diretta del sole. Gli angoli di visione sono relativamente stabili, con solo una piccola perdita di luminosità agli estremi.

Prestazioni: Core i7-13700HX e RTX 4060 sono di buon auspicio per i giochi AAA di fascia media
Il Colorful EVOL X15 AT è disponibile sia con Intel Core i5-13500HX e Core i7-13700HX, con opzioni di GPU corrispondenti che sono la GPU GPU Nvidia GeForce RTX 4050 Laptop e la GPU RTX 4060 Laptop.
Condizioni del test
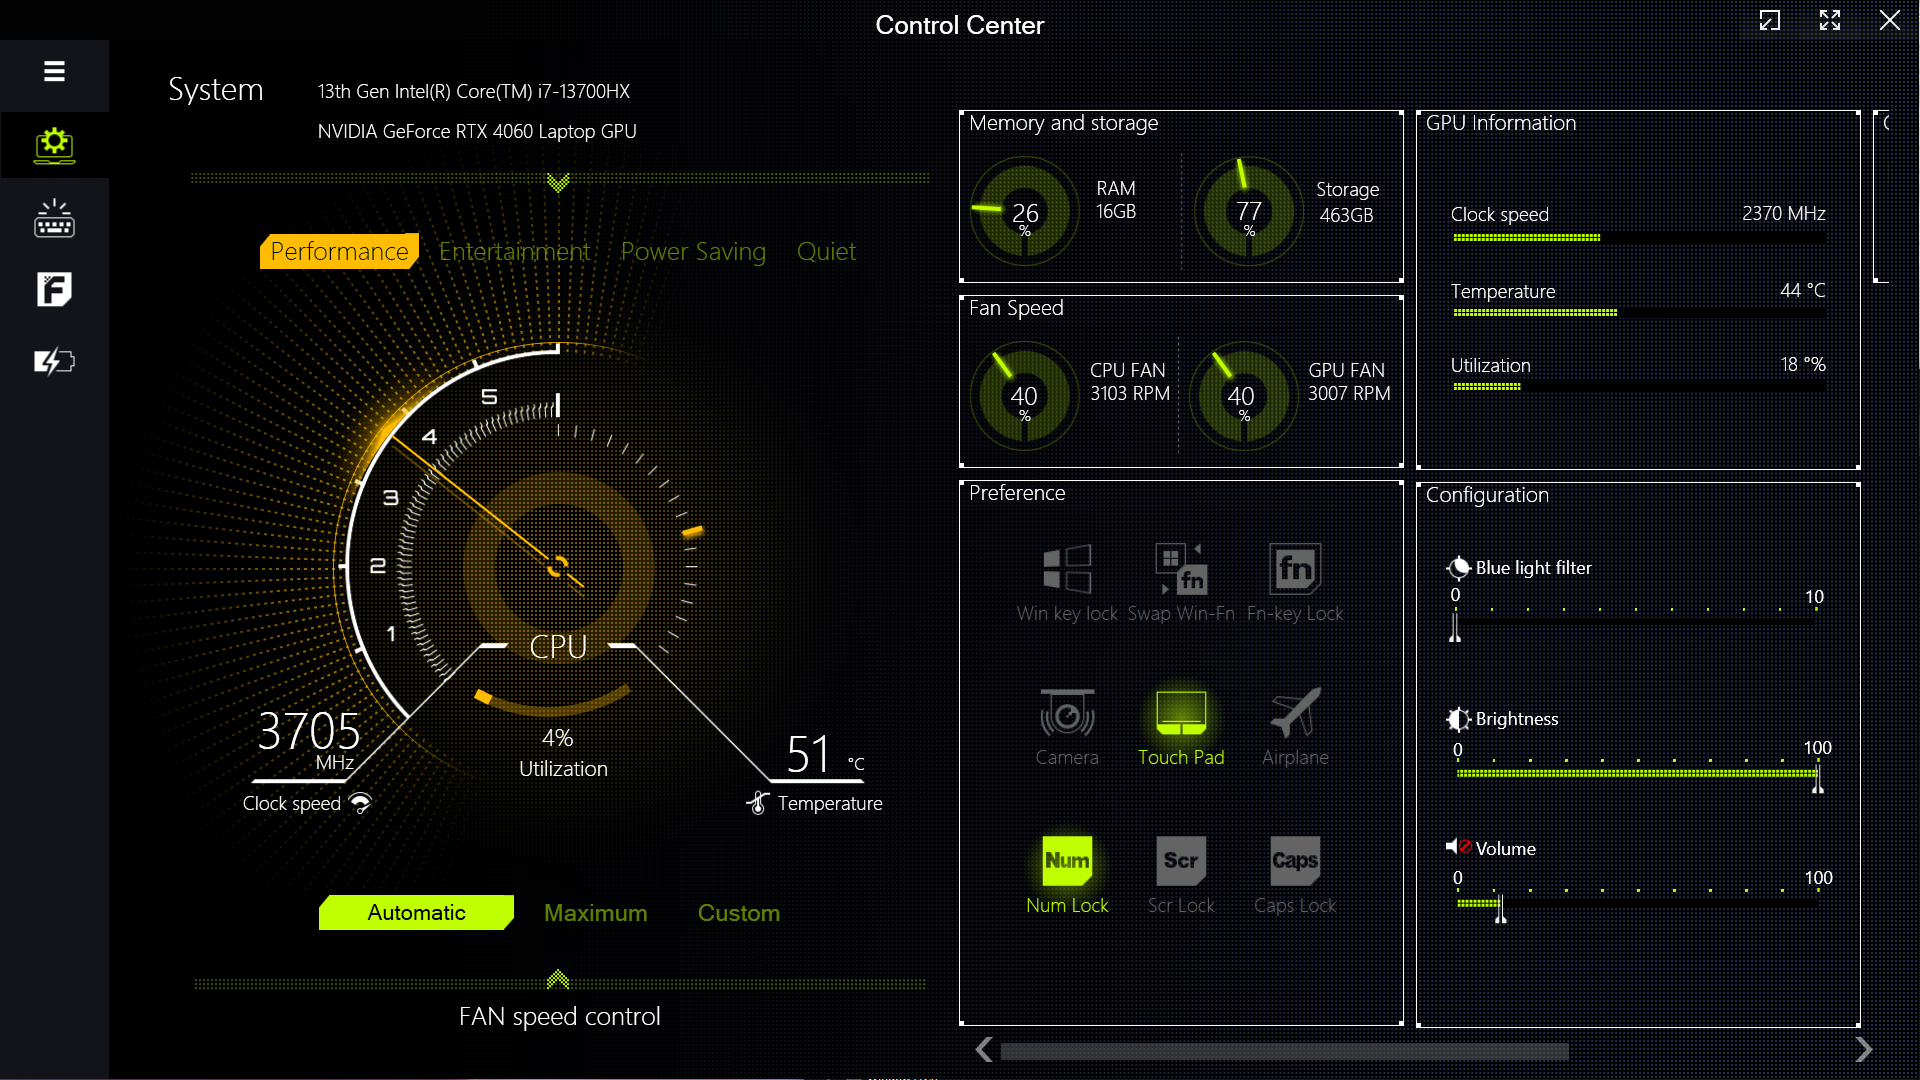
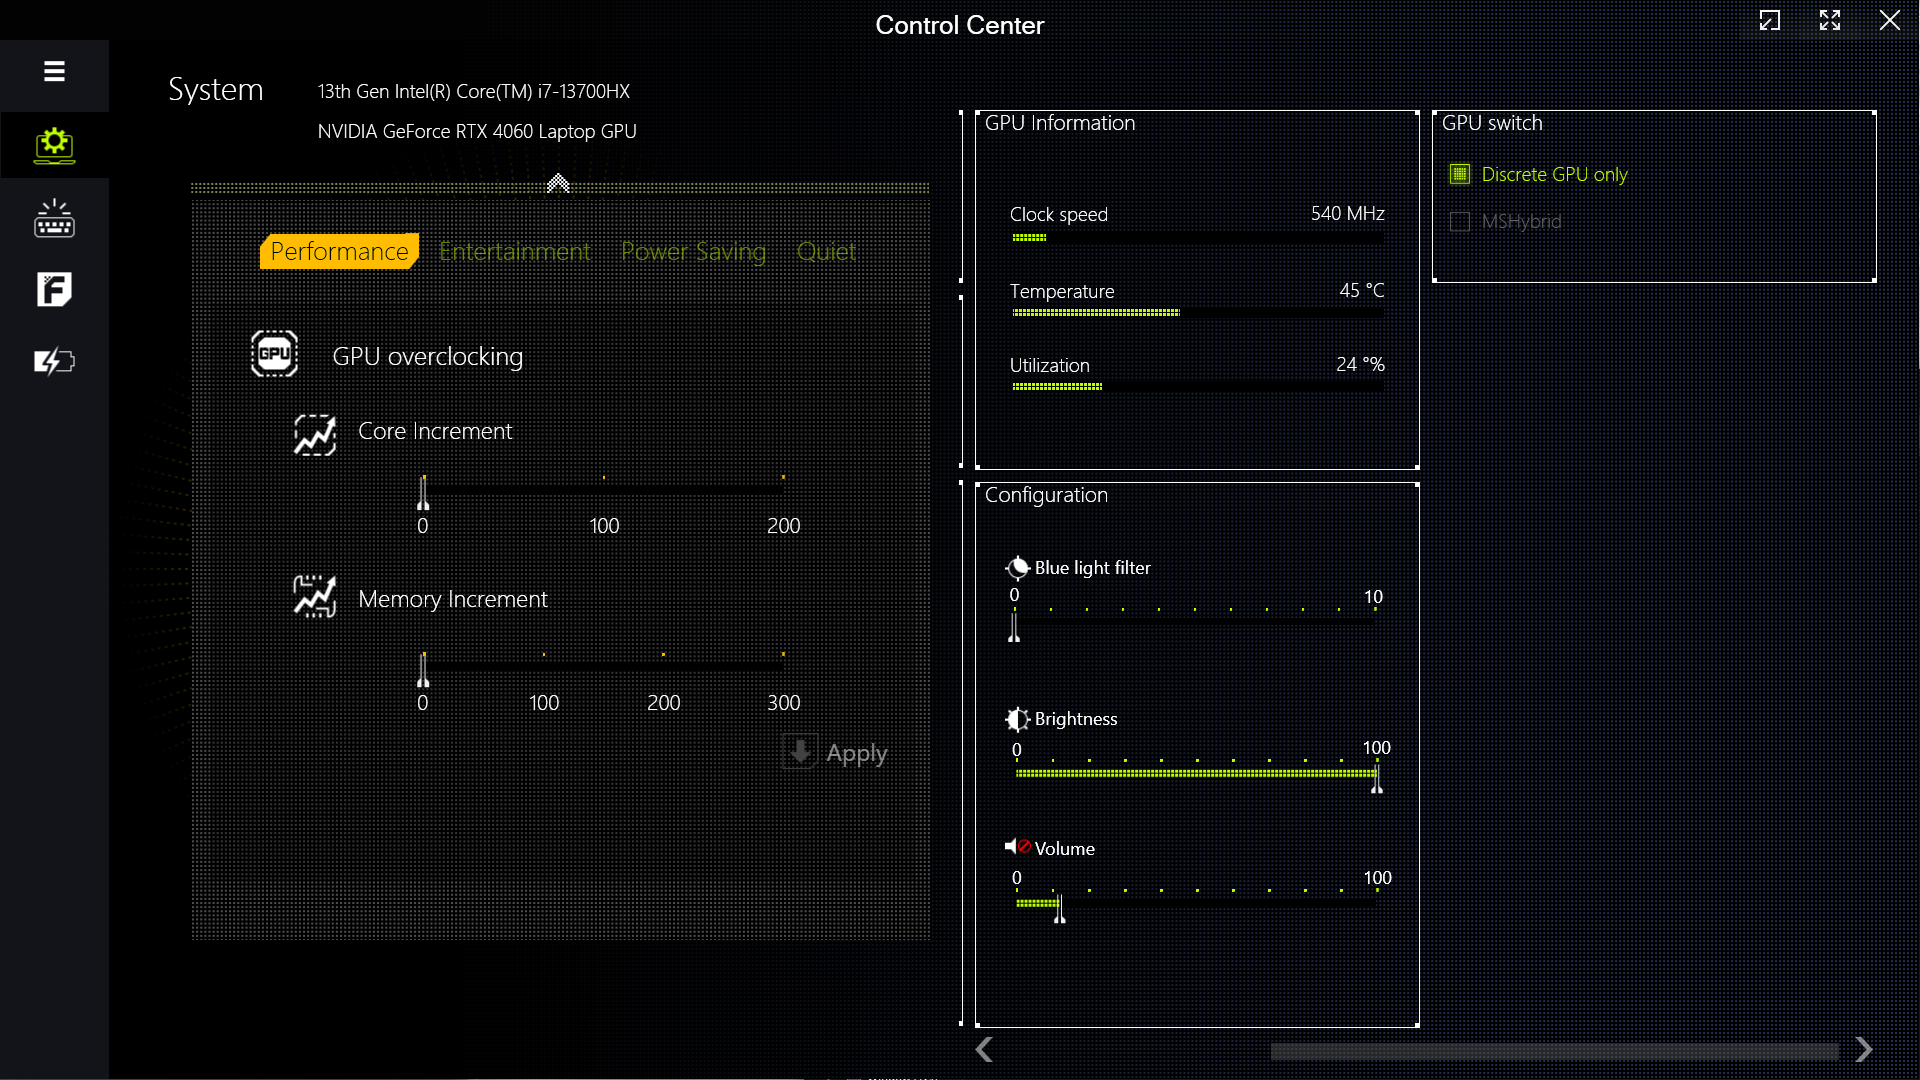
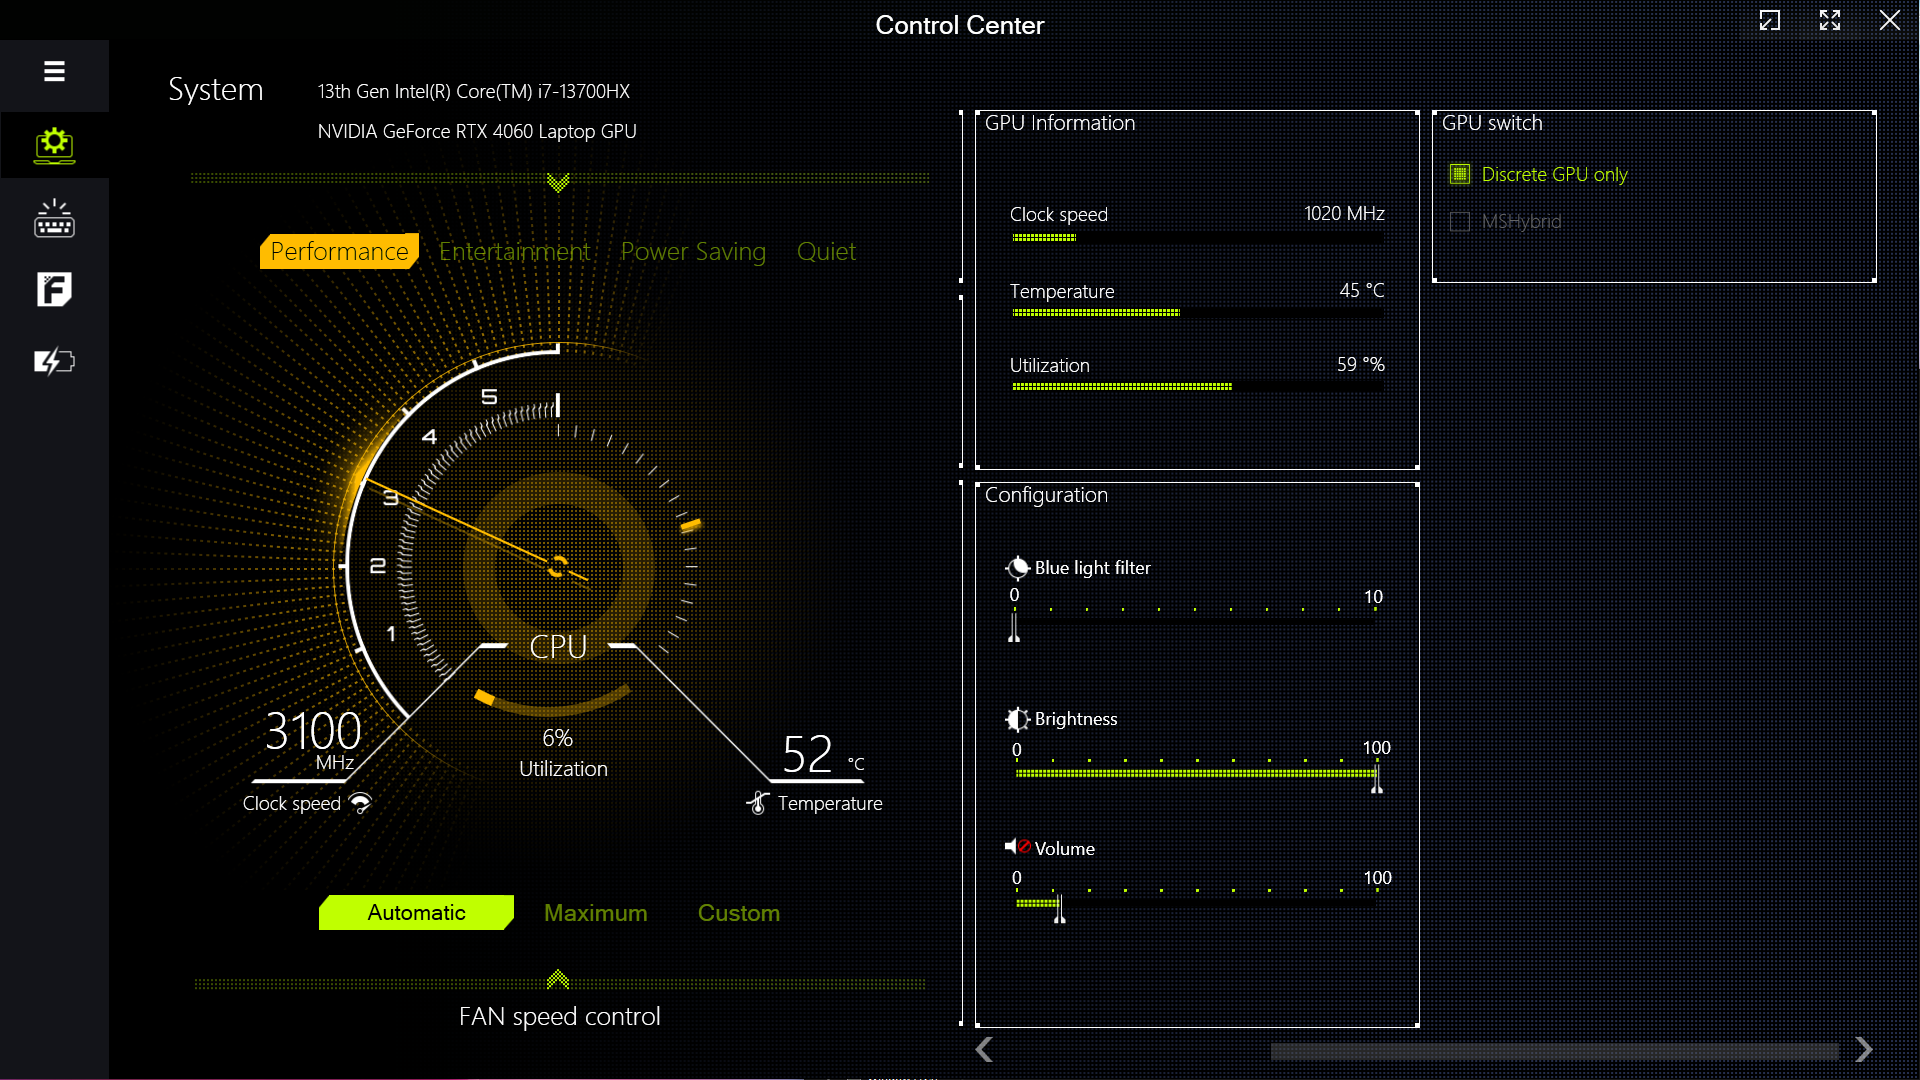
Colorful offre l'applicazione Control Center di Clevo per la regolazione delle prestazioni e la regolazione di vari effetti RGB. In totale vengono offerte quattro modalità di prestazioni.
Tutti i benchmark sono stati eseguiti nella modalità Performance, che consente al Core i7-13700HX di mostrare tutti i suoi muscoli. La modalità GPU discreta è stata utilizzata per i test grafici e di gioco.
I test della batteria sono stati eseguiti nel profilo Quiet con MSHybrid abilitato.
Colorful limita il PL2 a 30 W nelle modalità Quiet e Power Saving, il che rappresenta una riduzione significativa dell'energia rispetto alle altre modalità. Ciò si riflette nel drastico calo dei punteggi di Cinebench R15, come illustrato nella tabella sottostante.
| Modalità prestazioni | PL1 (PBP) / Tau | PL2 (MTP) / Tau | Cinebench R15 Multi score | Cinebench R15 Multi score (30 loop) |
|---|---|---|---|---|
| Silenzioso | 15 W / 8 s | 30 W / 2,44 ms | 567 (-83%) | 542 (-82,28%) |
| Risparmio energetico | 45 W / 8 s | 30 W / 2,44 ms | 557 (-84%) | 548 (-82,08%) |
| Intrattenimento | 65 W / 56 s | 130 W / 2,44 ms | 2814 (-19,18%) | 2168 (-29,12%) |
| Prestazioni | 135 W / 96 s | 162 W / 2,44 ms | 3482 (100%) | 3059 (100%) |
Processore
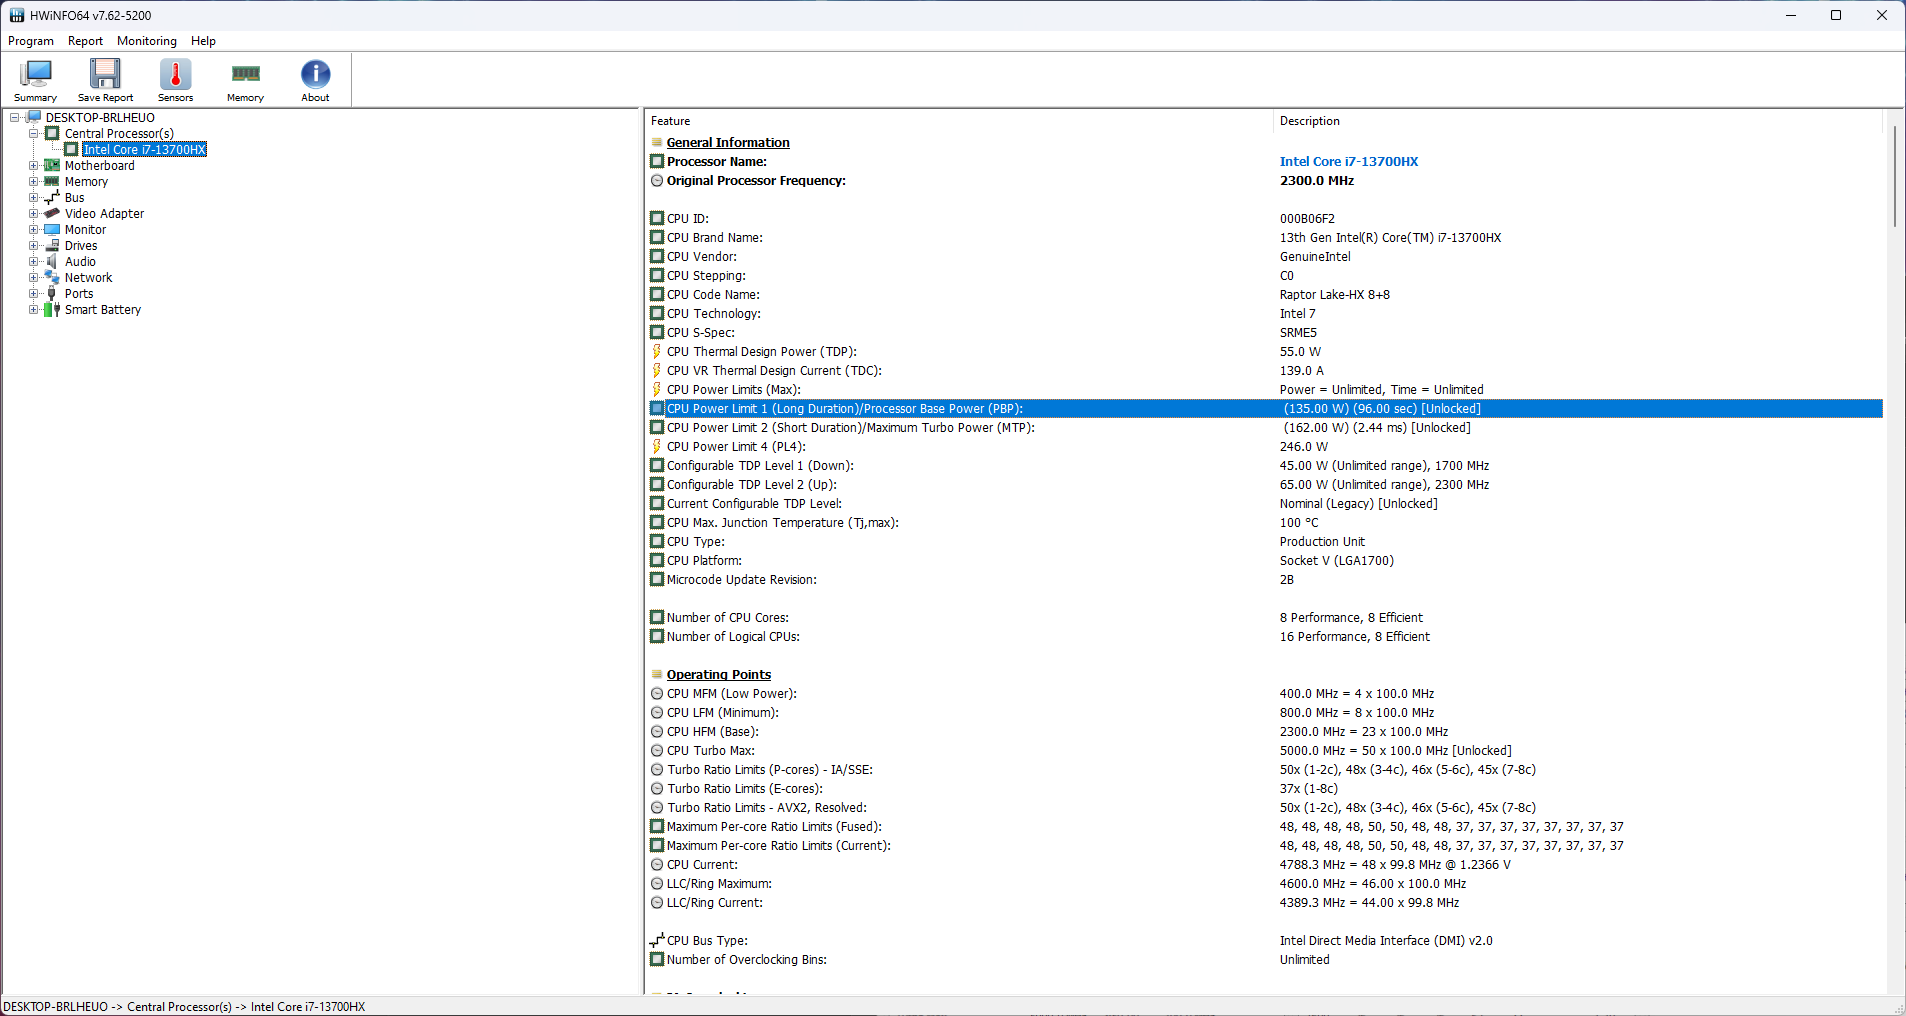
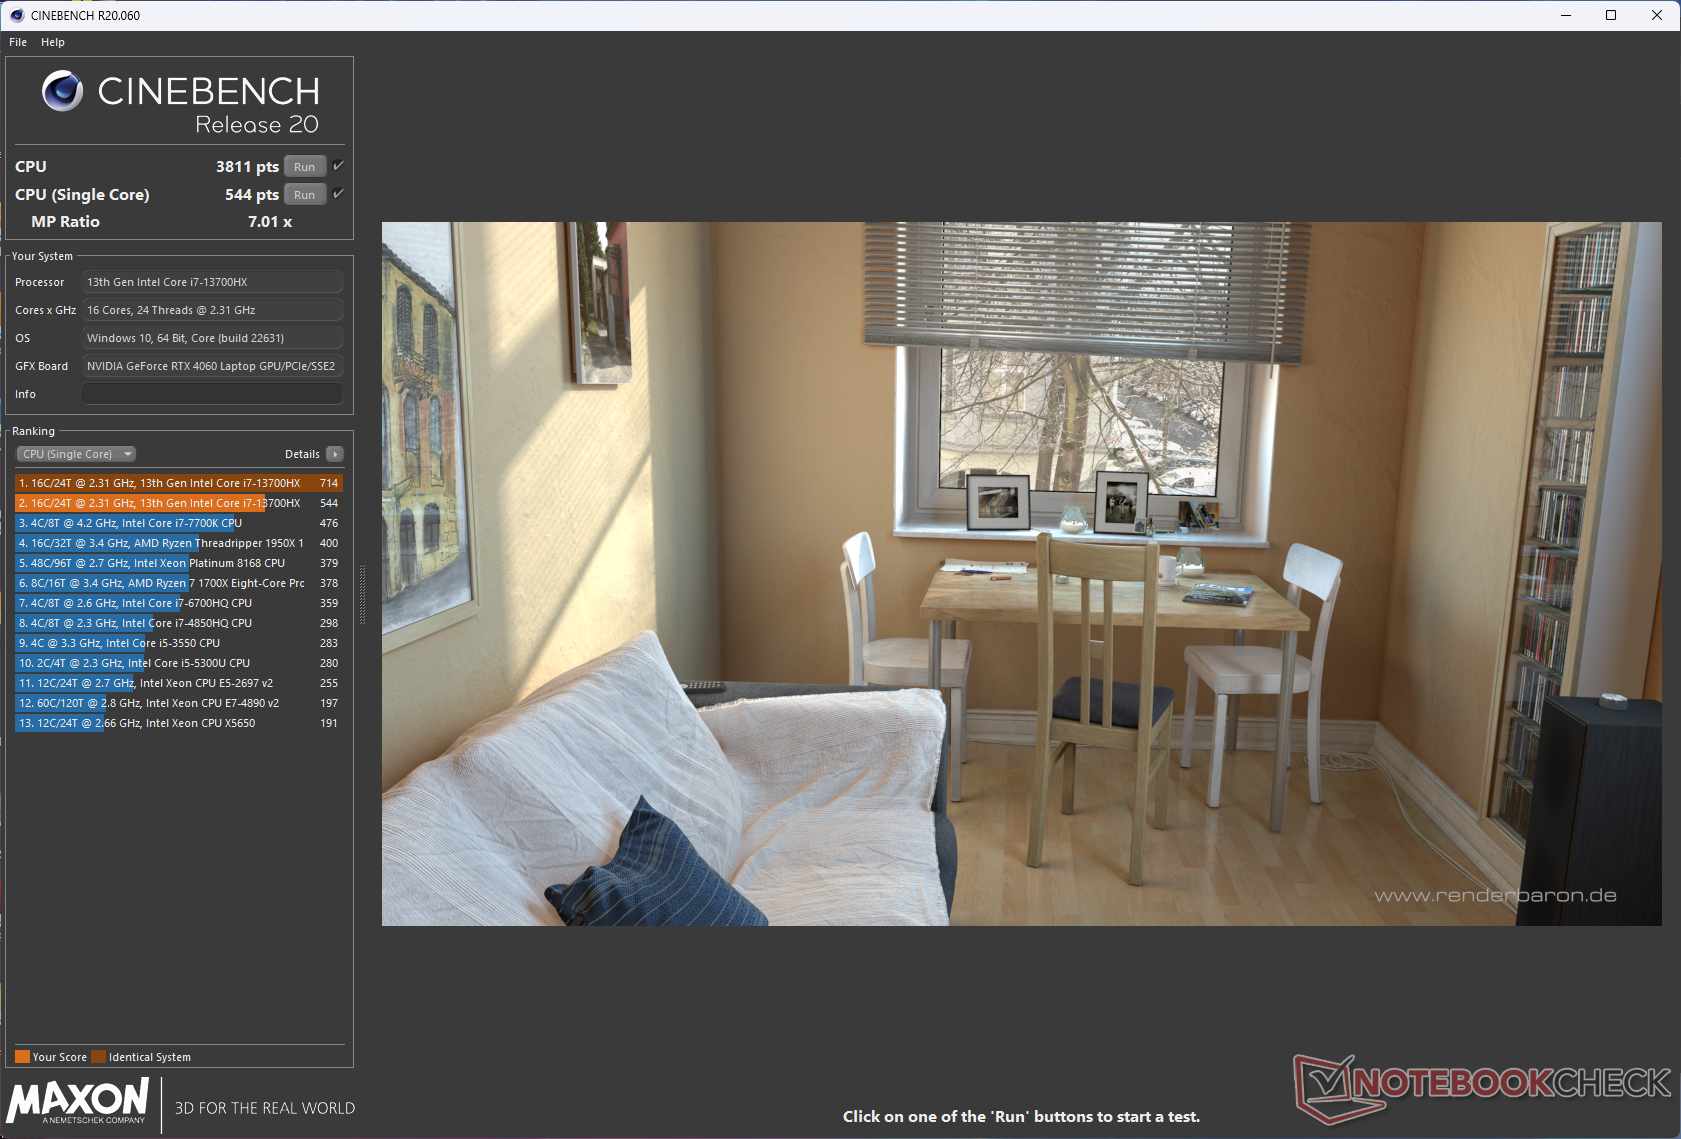
Il Core i7-13700HX è dotato di 16 core e 24 thread con un boost clock fino a 5 GHz. Questa CPU nell'EVOL X15 AT ha generalmente prestazioni pari a quelle della sua controparte nell'Alienware m16 R1 e di altri computer portatili in generale. Tuttavia, è significativamente in ritardo rispetto al 12-core 24-thread AMD Ryzen 9 7845HX nei test multi-core.
Sebbene sia valutato a 162 W, il Core i7-13700HX può utilizzare fino a 145 W in modalità Performance. Tuttavia, questo offre solo un vantaggio minimo nelle prestazioni single-core rispetto ai 115 W del PL2 nel modello HP Omen 16 HP Omen 16.
A parte la graduale diminuzione iniziale dei punteggi, non si percepisce alcun throttling durante il test multi-core Cinebench R15.
Cinebench R15 Multi Loop
Cinebench R23: Multi Core | Single Core
Cinebench R20: CPU (Multi Core) | CPU (Single Core)
Cinebench R15: CPU Multi 64Bit | CPU Single 64Bit
Blender: v2.79 BMW27 CPU
7-Zip 18.03: 7z b 4 | 7z b 4 -mmt1
Geekbench 5.5: Multi-Core | Single-Core
HWBOT x265 Benchmark v2.2: 4k Preset
LibreOffice : 20 Documents To PDF
R Benchmark 2.5: Overall mean
| CPU Performance rating | |
| Alienware m16 R1 AMD | |
| Media della classe Gaming | |
| Schenker XMG Pro 15 (E23) | |
| Acer Predator Helios 16 PH16-71-731Q | |
| HP Omen 16-wf000 -1! | |
| Uniwill GM6PX7X RTX 4070 | |
| Alienware m16 R1 Intel | |
| Dell G15 5530 | |
| Colorful EVOL X15 AT 23 | |
| Media Intel Core i7-13700HX | |
| Cinebench R23 / Multi Core | |
| Alienware m16 R1 AMD | |
| Media della classe Gaming (10488 - 42661, n=104, ultimi 2 anni) | |
| Schenker XMG Pro 15 (E23) | |
| Acer Predator Helios 16 PH16-71-731Q | |
| Colorful EVOL X15 AT 23 | |
| Alienware m16 R1 Intel | |
| Uniwill GM6PX7X RTX 4070 | |
| Dell G15 5530 | |
| Media Intel Core i7-13700HX (15558 - 22598, n=11) | |
| HP Omen 16-wf000 | |
| Cinebench R23 / Single Core | |
| Media della classe Gaming (1601 - 2415, n=104, ultimi 2 anni) | |
| Alienware m16 R1 Intel | |
| Colorful EVOL X15 AT 23 | |
| Acer Predator Helios 16 PH16-71-731Q | |
| Schenker XMG Pro 15 (E23) | |
| HP Omen 16-wf000 | |
| Alienware m16 R1 AMD | |
| Dell G15 5530 | |
| Media Intel Core i7-13700HX (1666 - 1933, n=11) | |
| Uniwill GM6PX7X RTX 4070 | |
| Cinebench R20 / CPU (Multi Core) | |
| Alienware m16 R1 AMD | |
| Media della classe Gaming (4029 - 16433, n=103, ultimi 2 anni) | |
| Schenker XMG Pro 15 (E23) | |
| Acer Predator Helios 16 PH16-71-731Q | |
| Colorful EVOL X15 AT 23 | |
| Uniwill GM6PX7X RTX 4070 | |
| Alienware m16 R1 Intel | |
| Dell G15 5530 | |
| Media Intel Core i7-13700HX (6160 - 8610, n=11) | |
| HP Omen 16-wf000 | |
| Cinebench R20 / CPU (Single Core) | |
| Media della classe Gaming (622 - 913, n=103, ultimi 2 anni) | |
| Colorful EVOL X15 AT 23 | |
| Alienware m16 R1 Intel | |
| Acer Predator Helios 16 PH16-71-731Q | |
| Schenker XMG Pro 15 (E23) | |
| HP Omen 16-wf000 | |
| Alienware m16 R1 AMD | |
| Dell G15 5530 | |
| Uniwill GM6PX7X RTX 4070 | |
| Media Intel Core i7-13700HX (644 - 740, n=11) | |
| Cinebench R15 / CPU Multi 64Bit | |
| Alienware m16 R1 AMD | |
| Media della classe Gaming (1578 - 6330, n=102, ultimi 2 anni) | |
| Schenker XMG Pro 15 (E23) | |
| Colorful EVOL X15 AT 23 | |
| Acer Predator Helios 16 PH16-71-731Q | |
| Acer Predator Helios 16 PH16-71-731Q | |
| Uniwill GM6PX7X RTX 4070 | |
| Media Intel Core i7-13700HX (2548 - 3482, n=12) | |
| Alienware m16 R1 Intel | |
| Dell G15 5530 | |
| HP Omen 16-wf000 | |
| Cinebench R15 / CPU Single 64Bit | |
| Media della classe Gaming (188.8 - 350, n=103, ultimi 2 anni) | |
| Alienware m16 R1 AMD | |
| Alienware m16 R1 Intel | |
| Colorful EVOL X15 AT 23 | |
| Dell G15 5530 | |
| Acer Predator Helios 16 PH16-71-731Q | |
| Media Intel Core i7-13700HX (243 - 279, n=11) | |
| HP Omen 16-wf000 | |
| Uniwill GM6PX7X RTX 4070 | |
| Schenker XMG Pro 15 (E23) | |
| Blender / v2.79 BMW27 CPU | |
| Media Intel Core i7-13700HX (138 - 207, n=10) | |
| Dell G15 5530 | |
| Acer Predator Helios 16 PH16-71-731Q | |
| Alienware m16 R1 Intel | |
| Colorful EVOL X15 AT 23 | |
| Uniwill GM6PX7X RTX 4070 | |
| Schenker XMG Pro 15 (E23) | |
| Media della classe Gaming (79 - 330, n=101, ultimi 2 anni) | |
| Alienware m16 R1 AMD | |
| 7-Zip 18.03 / 7z b 4 | |
| Alienware m16 R1 AMD | |
| Media della classe Gaming (33491 - 148086, n=102, ultimi 2 anni) | |
| Schenker XMG Pro 15 (E23) | |
| Uniwill GM6PX7X RTX 4070 | |
| Alienware m16 R1 Intel | |
| Acer Predator Helios 16 PH16-71-731Q | |
| HP Omen 16-wf000 | |
| Dell G15 5530 | |
| Media Intel Core i7-13700HX (58912 - 89294, n=11) | |
| Colorful EVOL X15 AT 23 | |
| 7-Zip 18.03 / 7z b 4 -mmt1 | |
| Alienware m16 R1 AMD | |
| Media della classe Gaming (4824 - 7436, n=102, ultimi 2 anni) | |
| Alienware m16 R1 Intel | |
| Colorful EVOL X15 AT 23 | |
| Schenker XMG Pro 15 (E23) | |
| Acer Predator Helios 16 PH16-71-731Q | |
| Media Intel Core i7-13700HX (5552 - 6409, n=11) | |
| Uniwill GM6PX7X RTX 4070 | |
| HP Omen 16-wf000 | |
| Dell G15 5530 | |
| Geekbench 5.5 / Multi-Core | |
| Schenker XMG Pro 15 (E23) | |
| Media della classe Gaming (6460 - 28263, n=102, ultimi 2 anni) | |
| Acer Predator Helios 16 PH16-71-731Q | |
| Uniwill GM6PX7X RTX 4070 | |
| Alienware m16 R1 AMD | |
| HP Omen 16-wf000 | |
| Alienware m16 R1 Intel | |
| Dell G15 5530 | |
| Media Intel Core i7-13700HX (10156 - 15850, n=12) | |
| Colorful EVOL X15 AT 23 | |
| Geekbench 5.5 / Single-Core | |
| Media della classe Gaming (1403 - 2474, n=102, ultimi 2 anni) | |
| Alienware m16 R1 AMD | |
| Acer Predator Helios 16 PH16-71-731Q | |
| HP Omen 16-wf000 | |
| Dell G15 5530 | |
| Alienware m16 R1 Intel | |
| Colorful EVOL X15 AT 23 | |
| Uniwill GM6PX7X RTX 4070 | |
| Schenker XMG Pro 15 (E23) | |
| Media Intel Core i7-13700HX (1666 - 1899, n=12) | |
| HWBOT x265 Benchmark v2.2 / 4k Preset | |
| Alienware m16 R1 AMD | |
| Media della classe Gaming (11.5 - 44.4, n=102, ultimi 2 anni) | |
| Uniwill GM6PX7X RTX 4070 | |
| Acer Predator Helios 16 PH16-71-731Q | |
| Schenker XMG Pro 15 (E23) | |
| Dell G15 5530 | |
| Alienware m16 R1 Intel | |
| Media Intel Core i7-13700HX (17.1 - 25.5, n=11) | |
| Colorful EVOL X15 AT 23 | |
| HP Omen 16-wf000 | |
| LibreOffice / 20 Documents To PDF | |
| Colorful EVOL X15 AT 23 | |
| Schenker XMG Pro 15 (E23) | |
| Media della classe Gaming (33.2 - 88.8, n=102, ultimi 2 anni) | |
| Dell G15 5530 | |
| HP Omen 16-wf000 | |
| Alienware m16 R1 Intel | |
| Media Intel Core i7-13700HX (36.5 - 52.9, n=11) | |
| Alienware m16 R1 AMD | |
| Uniwill GM6PX7X RTX 4070 | |
| Acer Predator Helios 16 PH16-71-731Q | |
| R Benchmark 2.5 / Overall mean | |
| Uniwill GM6PX7X RTX 4070 | |
| Media Intel Core i7-13700HX (0.4274 - 0.513, n=11) | |
| Schenker XMG Pro 15 (E23) | |
| HP Omen 16-wf000 | |
| Colorful EVOL X15 AT 23 | |
| Alienware m16 R1 Intel | |
| Acer Predator Helios 16 PH16-71-731Q | |
| Dell G15 5530 | |
| Alienware m16 R1 AMD | |
| Media della classe Gaming (0.3439 - 0.59, n=102, ultimi 2 anni) | |
* ... Meglio usare valori piccoli
Il Core i7-13700HX di EVOL X15 può utilizzare un massimo di 145 W con boost fino a 4,2 GHz durante l'esecuzione del loop multi-core Cinebench R15 in modalità Performance. In modalità Intrattenimento, il Core i7-13700HX riesce ancora a raggiungere i 4,2 GHz a 113 W, ma la potenza media scende a circa 21 W durante l'esecuzione.
La modalità Quiet vede l'EVOL X15 raggiungere un picco di 4 GHz con un consumo di soli 30 W. Tuttavia, i clock medi scendono a poco meno di 1 GHz, con un consumo di 15 W.
I punteggi di Cinebench R20 sulla batteria scendono del 26,5% e del 54% rispettivamente in single-core e multi-core.
AIDA64: FP32 Ray-Trace | FPU Julia | CPU SHA3 | CPU Queen | FPU SinJulia | FPU Mandel | CPU AES | CPU ZLib | FP64 Ray-Trace | CPU PhotoWorxx
| Performance rating | |
| Alienware m16 R1 AMD | |
| Media della classe Gaming | |
| Uniwill GM6PX7X RTX 4070 | |
| Alienware m16 R1 Intel | |
| Acer Predator Helios 16 PH16-71-731Q | |
| Schenker XMG Pro 15 (E23) | |
| Media Intel Core i7-13700HX | |
| HP Omen 16-wf000 | |
| Colorful EVOL X15 AT 23 | |
| Dell G15 5530 | |
| AIDA64 / FP32 Ray-Trace | |
| Alienware m16 R1 AMD | |
| Media della classe Gaming (10227 - 85542, n=102, ultimi 2 anni) | |
| Uniwill GM6PX7X RTX 4070 | |
| Alienware m16 R1 Intel | |
| Acer Predator Helios 16 PH16-71-731Q | |
| Colorful EVOL X15 AT 23 | |
| Media Intel Core i7-13700HX (14261 - 21999, n=11) | |
| HP Omen 16-wf000 | |
| Dell G15 5530 | |
| Schenker XMG Pro 15 (E23) | |
| AIDA64 / FPU Julia | |
| Alienware m16 R1 AMD | |
| Media della classe Gaming (51376 - 372155, n=102, ultimi 2 anni) | |
| Uniwill GM6PX7X RTX 4070 | |
| Alienware m16 R1 Intel | |
| Colorful EVOL X15 AT 23 | |
| Acer Predator Helios 16 PH16-71-731Q | |
| HP Omen 16-wf000 | |
| Media Intel Core i7-13700HX (74636 - 109364, n=11) | |
| Schenker XMG Pro 15 (E23) | |
| Dell G15 5530 | |
| AIDA64 / CPU SHA3 | |
| Alienware m16 R1 AMD | |
| Media della classe Gaming (2180 - 10115, n=102, ultimi 2 anni) | |
| Uniwill GM6PX7X RTX 4070 | |
| Alienware m16 R1 Intel | |
| Schenker XMG Pro 15 (E23) | |
| Colorful EVOL X15 AT 23 | |
| Acer Predator Helios 16 PH16-71-731Q | |
| Dell G15 5530 | |
| Media Intel Core i7-13700HX (3359 - 5053, n=11) | |
| HP Omen 16-wf000 | |
| AIDA64 / CPU Queen | |
| Alienware m16 R1 AMD | |
| Schenker XMG Pro 15 (E23) | |
| Media della classe Gaming (49785 - 173351, n=86, ultimi 2 anni) | |
| Alienware m16 R1 Intel | |
| Acer Predator Helios 16 PH16-71-731Q | |
| Colorful EVOL X15 AT 23 | |
| Uniwill GM6PX7X RTX 4070 | |
| Media Intel Core i7-13700HX (86532 - 114717, n=11) | |
| Dell G15 5530 | |
| HP Omen 16-wf000 | |
| AIDA64 / FPU SinJulia | |
| Alienware m16 R1 AMD | |
| Media della classe Gaming (4424 - 33636, n=102, ultimi 2 anni) | |
| Alienware m16 R1 Intel | |
| Uniwill GM6PX7X RTX 4070 | |
| Acer Predator Helios 16 PH16-71-731Q | |
| Colorful EVOL X15 AT 23 | |
| Schenker XMG Pro 15 (E23) | |
| Media Intel Core i7-13700HX (9290 - 13519, n=11) | |
| HP Omen 16-wf000 | |
| Dell G15 5530 | |
| AIDA64 / FPU Mandel | |
| Alienware m16 R1 AMD | |
| Media della classe Gaming (25115 - 196829, n=102, ultimi 2 anni) | |
| Uniwill GM6PX7X RTX 4070 | |
| Alienware m16 R1 Intel | |
| Acer Predator Helios 16 PH16-71-731Q | |
| Colorful EVOL X15 AT 23 | |
| HP Omen 16-wf000 | |
| Media Intel Core i7-13700HX (35751 - 53484, n=11) | |
| Schenker XMG Pro 15 (E23) | |
| Dell G15 5530 | |
| AIDA64 / CPU AES | |
| Uniwill GM6PX7X RTX 4070 | |
| Alienware m16 R1 Intel | |
| Acer Predator Helios 16 PH16-71-731Q | |
| Media Intel Core i7-13700HX (67846 - 182575, n=11) | |
| Media della classe Gaming (39258 - 247074, n=102, ultimi 2 anni) | |
| Alienware m16 R1 AMD | |
| Colorful EVOL X15 AT 23 | |
| Schenker XMG Pro 15 (E23) | |
| HP Omen 16-wf000 | |
| Dell G15 5530 | |
| AIDA64 / CPU ZLib | |
| Alienware m16 R1 AMD | |
| Media della classe Gaming (574 - 2531, n=102, ultimi 2 anni) | |
| Acer Predator Helios 16 PH16-71-731Q | |
| Schenker XMG Pro 15 (E23) | |
| Uniwill GM6PX7X RTX 4070 | |
| Alienware m16 R1 Intel | |
| HP Omen 16-wf000 | |
| Colorful EVOL X15 AT 23 | |
| Dell G15 5530 | |
| Media Intel Core i7-13700HX (981 - 1451, n=11) | |
| AIDA64 / FP64 Ray-Trace | |
| Alienware m16 R1 AMD | |
| Media della classe Gaming (5509 - 45446, n=102, ultimi 2 anni) | |
| Uniwill GM6PX7X RTX 4070 | |
| Alienware m16 R1 Intel | |
| Colorful EVOL X15 AT 23 | |
| Acer Predator Helios 16 PH16-71-731Q | |
| Media Intel Core i7-13700HX (7728 - 11837, n=11) | |
| HP Omen 16-wf000 | |
| Dell G15 5530 | |
| Schenker XMG Pro 15 (E23) | |
| AIDA64 / CPU PhotoWorxx | |
| Schenker XMG Pro 15 (E23) | |
| Media della classe Gaming (12271 - 89891, n=102, ultimi 2 anni) | |
| Uniwill GM6PX7X RTX 4070 | |
| HP Omen 16-wf000 | |
| Dell G15 5530 | |
| Alienware m16 R1 Intel | |
| Acer Predator Helios 16 PH16-71-731Q | |
| Media Intel Core i7-13700HX (19678 - 42415, n=11) | |
| Alienware m16 R1 AMD | |
| Colorful EVOL X15 AT 23 | |
Maggiori informazioni sono disponibili nel nostro sito dedicato Intel Core i7-13700HX pagina dedicata.
Prestazioni del sistema
L'EVOL X15 AT si comporta meglio in PCMark 10 rispetto a CrossMark. I punteggi della memoria AIDA64 sono inferiori a causa della singola chiavetta DDR5-4800 a doppio canale dell'EVOL X15 rispetto all'implementazione a doppio canale quadruplo dei suoi concorrenti.
Detto questo, non abbiamo riscontrato alcun intoppo nell'utilizzo dell'EVOL X15 per la produttività di routine e la navigazione web.
CrossMark: Overall | Productivity | Creativity | Responsiveness
AIDA64: Memory Copy | Memory Read | Memory Write | Memory Latency
| PCMark 10 / Score | |
| Alienware m16 R1 AMD | |
| Media della classe Gaming (5828 - 12414, n=93, ultimi 2 anni) | |
| Uniwill GM6PX7X RTX 4070 | |
| HP Omen 16-wf000 | |
| Acer Predator Helios 16 PH16-71-731Q | |
| Colorful EVOL X15 AT 23 | |
| Schenker XMG Pro 15 (E23) | |
| Media Intel Core i7-13700HX, NVIDIA GeForce RTX 4060 Laptop GPU (6909 - 7743, n=5) | |
| Alienware m16 R1 Intel | |
| Dell G15 5530 | |
| PCMark 10 / Essentials | |
| Uniwill GM6PX7X RTX 4070 | |
| Alienware m16 R1 AMD | |
| Schenker XMG Pro 15 (E23) | |
| Acer Predator Helios 16 PH16-71-731Q | |
| Dell G15 5530 | |
| Alienware m16 R1 Intel | |
| Media della classe Gaming (8810 - 11935, n=97, ultimi 2 anni) | |
| Media Intel Core i7-13700HX, NVIDIA GeForce RTX 4060 Laptop GPU (9760 - 11313, n=5) | |
| Colorful EVOL X15 AT 23 | |
| HP Omen 16-wf000 | |
| PCMark 10 / Productivity | |
| Media della classe Gaming (6845 - 25323, n=95, ultimi 2 anni) | |
| Acer Predator Helios 16 PH16-71-731Q | |
| Uniwill GM6PX7X RTX 4070 | |
| Schenker XMG Pro 15 (E23) | |
| Alienware m16 R1 AMD | |
| Dell G15 5530 | |
| Media Intel Core i7-13700HX, NVIDIA GeForce RTX 4060 Laptop GPU (9131 - 11018, n=5) | |
| Alienware m16 R1 Intel | |
| Colorful EVOL X15 AT 23 | |
| HP Omen 16-wf000 | |
| PCMark 10 / Digital Content Creation | |
| Alienware m16 R1 AMD | |
| Media della classe Gaming (7602 - 19954, n=95, ultimi 2 anni) | |
| Uniwill GM6PX7X RTX 4070 | |
| HP Omen 16-wf000 | |
| Colorful EVOL X15 AT 23 | |
| Media Intel Core i7-13700HX, NVIDIA GeForce RTX 4060 Laptop GPU (9393 - 12434, n=5) | |
| Acer Predator Helios 16 PH16-71-731Q | |
| Alienware m16 R1 Intel | |
| Schenker XMG Pro 15 (E23) | |
| Dell G15 5530 | |
| CrossMark / Overall | |
| Acer Predator Helios 16 PH16-71-731Q | |
| Alienware m16 R1 Intel | |
| Alienware m16 R1 AMD | |
| Media della classe Gaming (1366 - 2409, n=94, ultimi 2 anni) | |
| Uniwill GM6PX7X RTX 4070 | |
| Schenker XMG Pro 15 (E23) | |
| Media Intel Core i7-13700HX, NVIDIA GeForce RTX 4060 Laptop GPU (1663 - 2105, n=5) | |
| Dell G15 5530 | |
| Colorful EVOL X15 AT 23 | |
| HP Omen 16-wf000 | |
| CrossMark / Productivity | |
| Acer Predator Helios 16 PH16-71-731Q | |
| Alienware m16 R1 Intel | |
| Alienware m16 R1 AMD | |
| Media della classe Gaming (1386 - 2254, n=94, ultimi 2 anni) | |
| Uniwill GM6PX7X RTX 4070 | |
| Schenker XMG Pro 15 (E23) | |
| Media Intel Core i7-13700HX, NVIDIA GeForce RTX 4060 Laptop GPU (1618 - 1989, n=5) | |
| Dell G15 5530 | |
| Colorful EVOL X15 AT 23 | |
| HP Omen 16-wf000 | |
| CrossMark / Creativity | |
| Acer Predator Helios 16 PH16-71-731Q | |
| Media della classe Gaming (1343 - 2786, n=94, ultimi 2 anni) | |
| Alienware m16 R1 Intel | |
| Schenker XMG Pro 15 (E23) | |
| Alienware m16 R1 AMD | |
| Uniwill GM6PX7X RTX 4070 | |
| Dell G15 5530 | |
| Media Intel Core i7-13700HX, NVIDIA GeForce RTX 4060 Laptop GPU (1710 - 2274, n=5) | |
| HP Omen 16-wf000 | |
| Colorful EVOL X15 AT 23 | |
| CrossMark / Responsiveness | |
| Acer Predator Helios 16 PH16-71-731Q | |
| Alienware m16 R1 Intel | |
| Uniwill GM6PX7X RTX 4070 | |
| Schenker XMG Pro 15 (E23) | |
| Alienware m16 R1 AMD | |
| Media della classe Gaming (1226 - 2334, n=94, ultimi 2 anni) | |
| Media Intel Core i7-13700HX, NVIDIA GeForce RTX 4060 Laptop GPU (1269 - 1983, n=5) | |
| Dell G15 5530 | |
| HP Omen 16-wf000 | |
| Colorful EVOL X15 AT 23 | |
| AIDA64 / Memory Copy | |
| Schenker XMG Pro 15 (E23) | |
| Media della classe Gaming (21750 - 129946, n=102, ultimi 2 anni) | |
| Uniwill GM6PX7X RTX 4070 | |
| HP Omen 16-wf000 | |
| Dell G15 5530 | |
| Alienware m16 R1 Intel | |
| Acer Predator Helios 16 PH16-71-731Q | |
| Media Intel Core i7-13700HX, NVIDIA GeForce RTX 4060 Laptop GPU (36504 - 58458, n=5) | |
| Alienware m16 R1 AMD | |
| Colorful EVOL X15 AT 23 | |
| AIDA64 / Memory Read | |
| Schenker XMG Pro 15 (E23) | |
| Media della classe Gaming (22956 - 118858, n=102, ultimi 2 anni) | |
| Uniwill GM6PX7X RTX 4070 | |
| Dell G15 5530 | |
| Alienware m16 R1 Intel | |
| HP Omen 16-wf000 | |
| Acer Predator Helios 16 PH16-71-731Q | |
| Media Intel Core i7-13700HX, NVIDIA GeForce RTX 4060 Laptop GPU (36510 - 67644, n=5) | |
| Alienware m16 R1 AMD | |
| Colorful EVOL X15 AT 23 | |
| AIDA64 / Memory Write | |
| Acer Predator Helios 16 PH16-71-731Q | |
| Media della classe Gaming (22297 - 135096, n=102, ultimi 2 anni) | |
| Schenker XMG Pro 15 (E23) | |
| HP Omen 16-wf000 | |
| Uniwill GM6PX7X RTX 4070 | |
| Media Intel Core i7-13700HX, NVIDIA GeForce RTX 4060 Laptop GPU (33598 - 85675, n=5) | |
| Dell G15 5530 | |
| Alienware m16 R1 Intel | |
| Alienware m16 R1 AMD | |
| Colorful EVOL X15 AT 23 | |
| AIDA64 / Memory Latency | |
| Media della classe Gaming (75.3 - 165.4, n=102, ultimi 2 anni) | |
| Alienware m16 R1 AMD | |
| Dell G15 5530 | |
| Alienware m16 R1 Intel | |
| Uniwill GM6PX7X RTX 4070 | |
| HP Omen 16-wf000 | |
| Media Intel Core i7-13700HX, NVIDIA GeForce RTX 4060 Laptop GPU (81.9 - 93, n=5) | |
| Acer Predator Helios 16 PH16-71-731Q | |
| Schenker XMG Pro 15 (E23) | |
| Colorful EVOL X15 AT 23 | |
* ... Meglio usare valori piccoli
| PCMark 8 Home Score Accelerated v2 | 5769 punti | |
| PCMark 8 Work Score Accelerated v2 | 5995 punti | |
| PCMark 10 Score | 7655 punti | |
Aiuto | ||
Latenza DPC
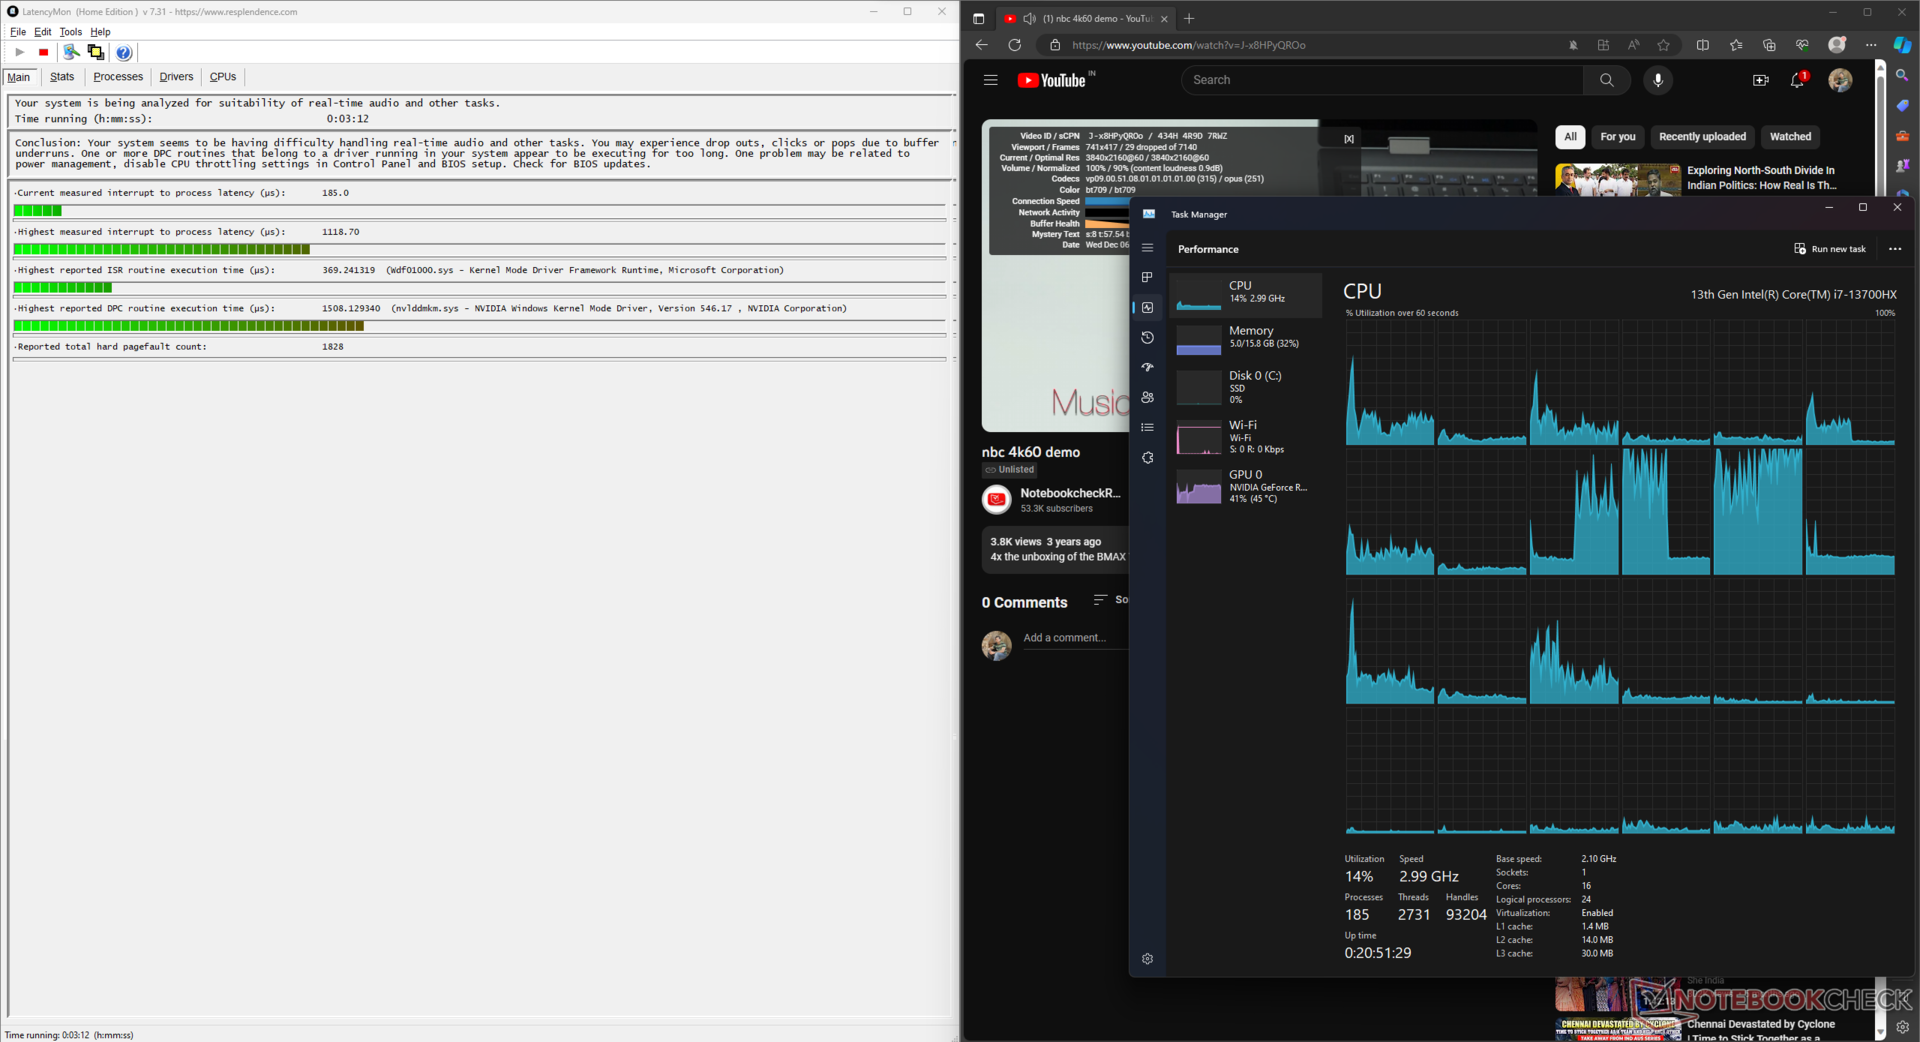
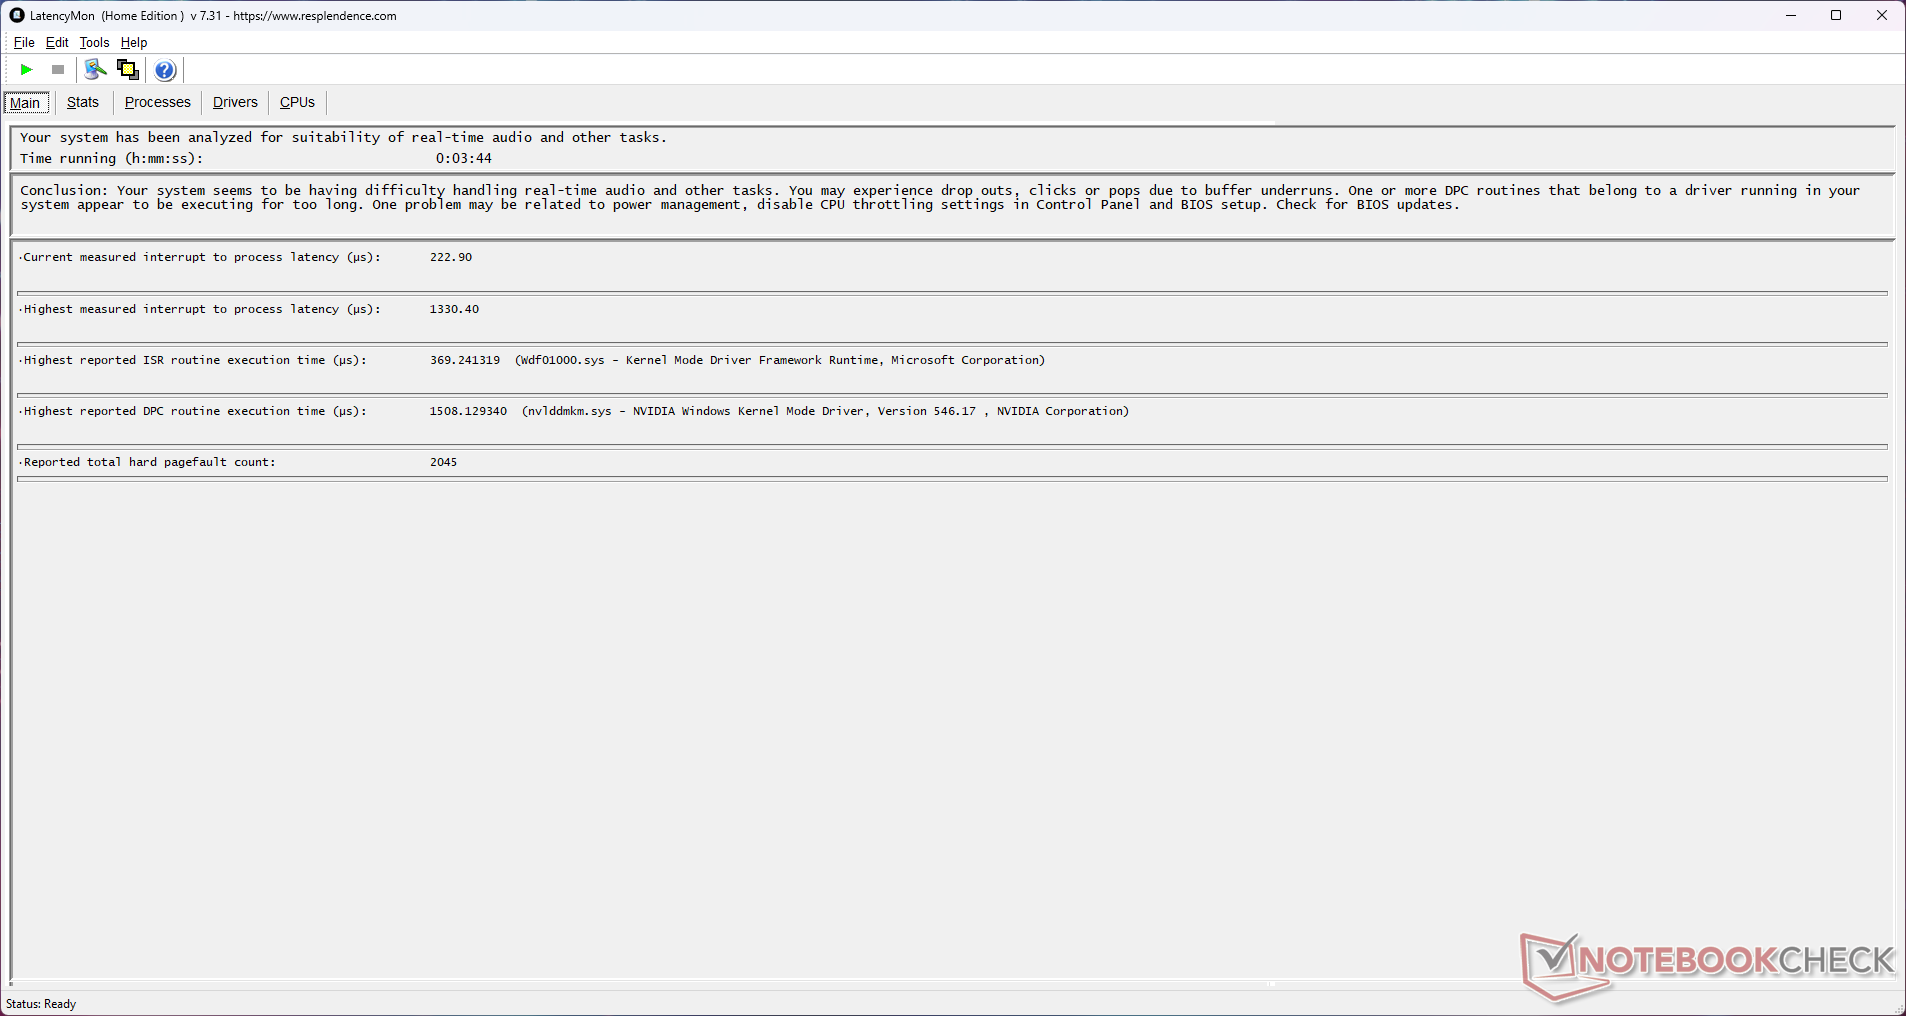
L'elevata latenza DPC è un problema noto nei computer portatili con schede Nvidia e l'EVOL X15 non fa eccezione, anche se se la cava meglio dei suoi concorrenti.
Abbiamo registrato una latenza interrupt-to-process di 1.330,4 µs utilizzando LatencyMon, dopo un esempio di riproduzione YouTube 4K60 e uno stress Prime95 di 10 secondi. L'Nvidia Windows Kernel Mode Driver Framework (nvlddmkm.sys) contribuisce a questa latenza elevata.

| DPC Latencies / LatencyMon - interrupt to process latency (max), Web, Youtube, Prime95 | |
| Dell G15 5530 | |
| Alienware m16 R1 Intel | |
| HP Omen 16-wf000 | |
| Alienware m16 R1 AMD | |
| Acer Predator Helios 16 PH16-71-731Q | |
| Colorful EVOL X15 AT 23 | |
| Uniwill GM6PX7X RTX 4070 | |
| Schenker XMG Pro 15 (E23) | |
* ... Meglio usare valori piccoli
Il nostro Classifica di Latenza DPC la pagina di LatencyMon offre ulteriori confronti tra i dispositivi testati.
Dispositivi di archiviazione
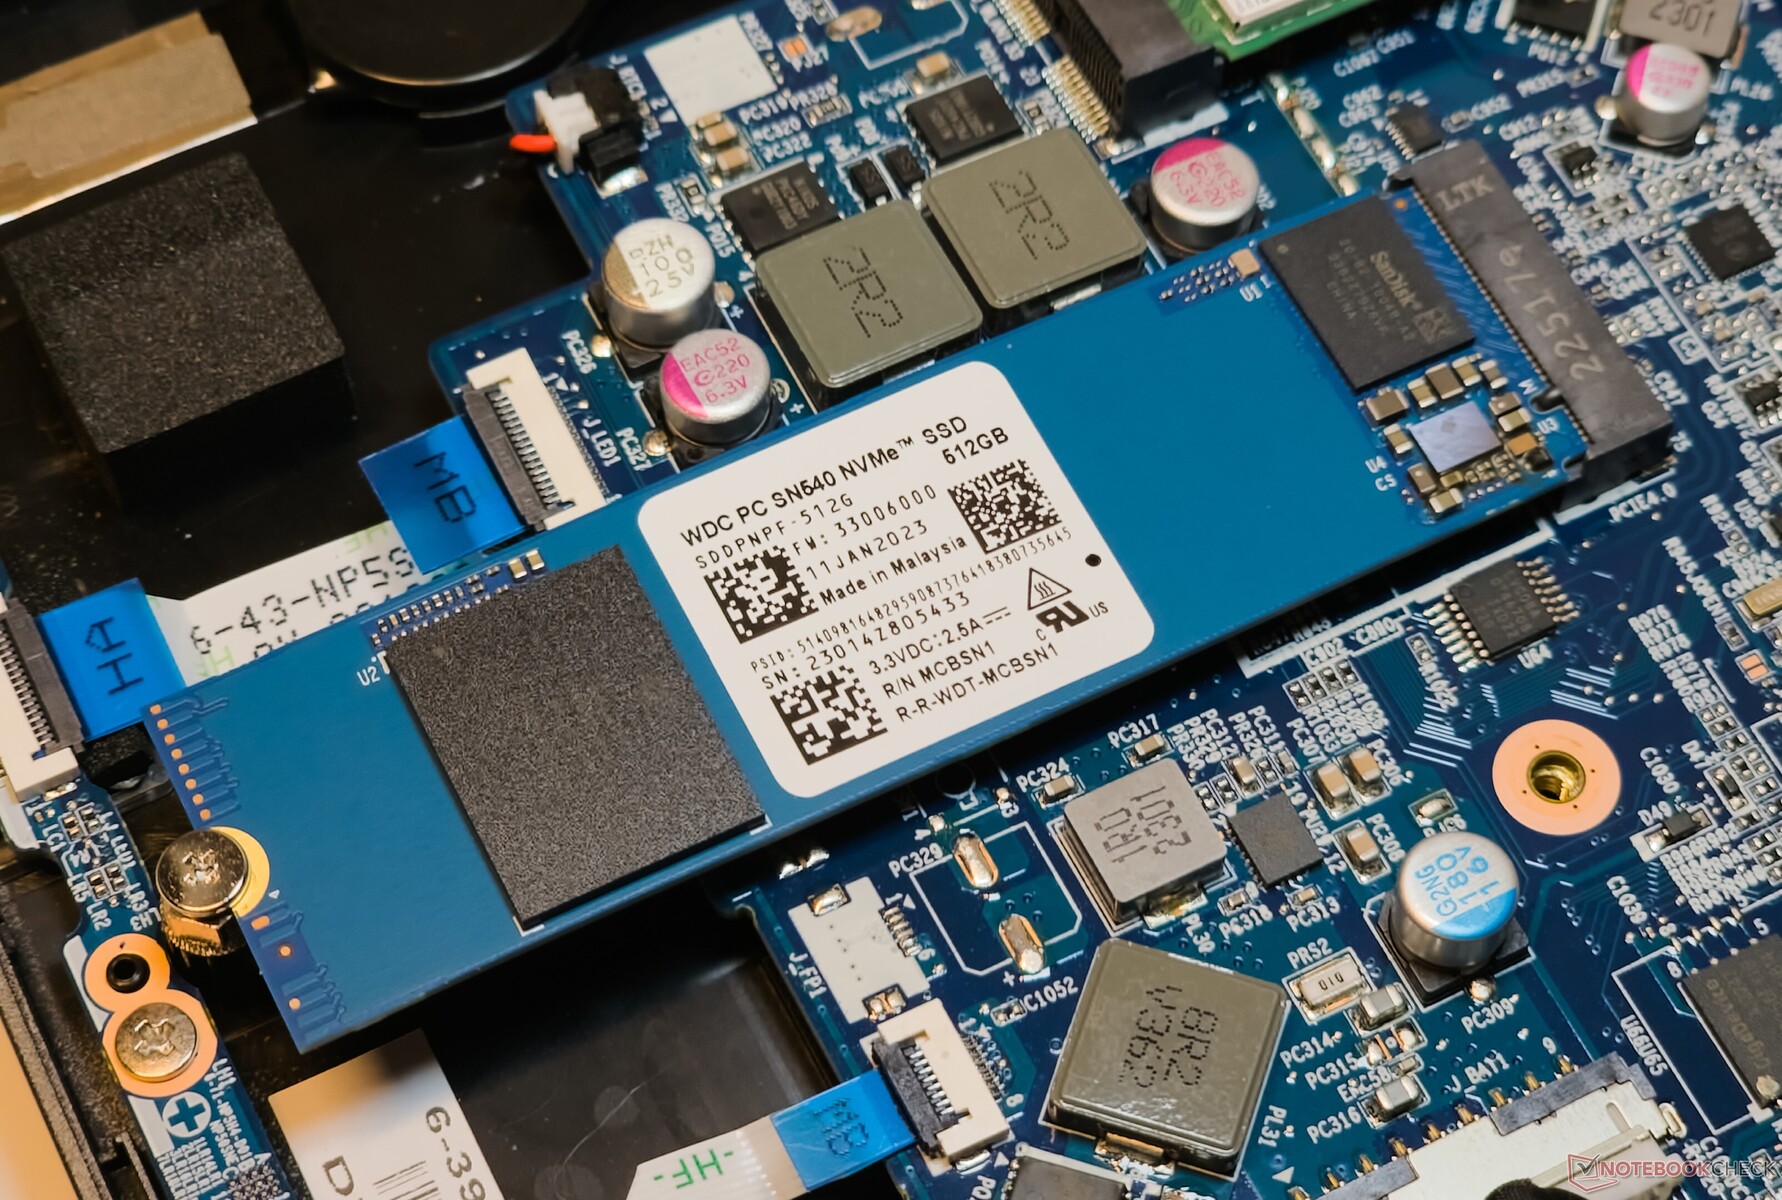
L'SSD Western Digital SN540 NVMe da 512 GB di EVOL X15 non è all'altezza delle unità Kioxia e SK Hynix utilizzate dai suoi concorrenti. Tuttavia, le letture 4k q1 t1 e le scritture 4k q1 t1 superano quelle del Kioxia XG8 nell'Alienware m16 R1 AMD.
Colorful consente di aggiungere un'altra unità PCIe Gen4 NVMe. Tuttavia, non è possibile aggiungere un'unità di archiviazione di massa SATA da 2,5 pollici.

* ... Meglio usare valori piccoli
Strozzatura del disco: DiskSpd Lettura in loop, Profondità coda 8
L'unità inizia a subire il throttling dopo il 17° ciclo durante il test DiskSpd Read Loop con una profondità di coda di 8. L'unità non è dotata di copertura o imbottitura termica.
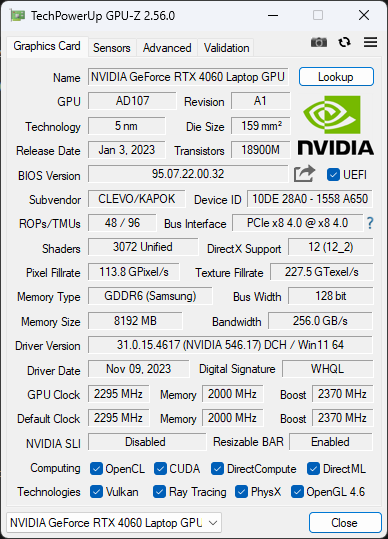
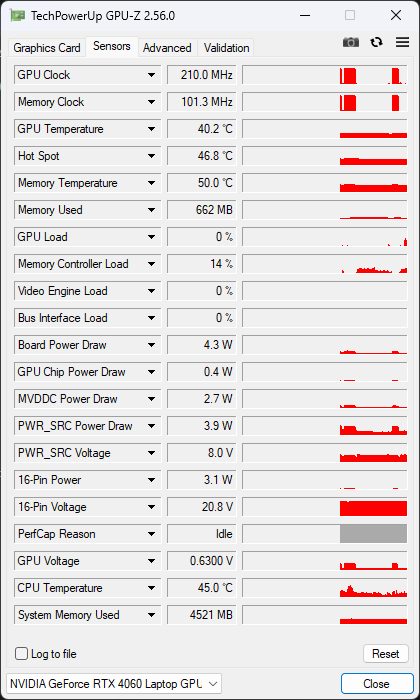
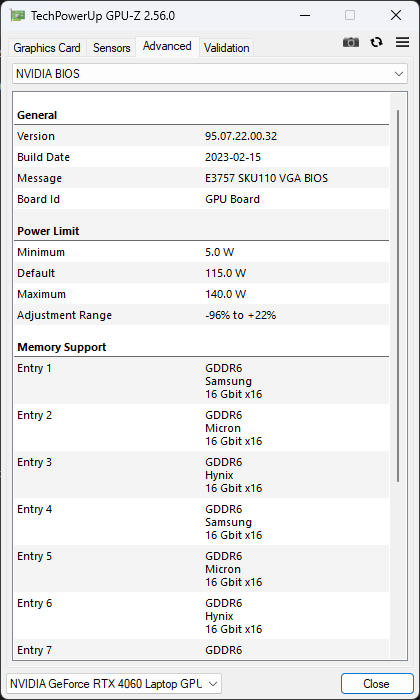
Prestazioni della GPU
La GPU Nvidia GeForce RTX 4060 Laptop nell'EVOL X15 AT funziona con un TGP di 140 W. Le sue prestazioni complessive in 3DMark sono paragonabili a quelle di altri laptop che utilizzano la stessa GPU.
Vediamo anche che la RTX 4060 è a poca distanza dalla GPU RTX 4070 Laptop da 140 W GPU RTX 4070 per computer portatili nel computer portatile Uniwill GM6PX7Xma è inferiore del 31% rispetto alla GPU RTX 4080 Laptop da 175 W RTX 4080 Laptop GPU che alimenta l' Alienware m16 R1 AMD.
i punteggi grafici di 3DMark Time Spy possono diminuire di quasi il 54% con l'alimentazione a batteria.
| 3DMark 11 Performance | 30245 punti | |
| 3DMark Ice Storm Standard Score | 278340 punti | |
| 3DMark Cloud Gate Standard Score | 63582 punti | |
| 3DMark Fire Strike Score | 24674 punti | |
| 3DMark Fire Strike Extreme Score | 12089 punti | |
| 3DMark Time Spy Score | 10590 punti | |
Aiuto | ||
| Blender / v3.3 Classroom OPTIX/RTX | |
| Schenker XMG Pro 15 (E23) | |
| Colorful EVOL X15 AT 23 | |
| Alienware m16 R1 Intel | |
| Media NVIDIA GeForce RTX 4060 Laptop GPU (19 - 28, n=53) | |
| Acer Predator Helios 16 PH16-71-731Q | |
| Dell G15 5530 | |
| Uniwill GM6PX7X RTX 4070 | |
| Media della classe Gaming (9 - 32, n=103, ultimi 2 anni) | |
| HP Omen 16-wf000 | |
| Alienware m16 R1 AMD | |
| Blender / v3.3 Classroom CUDA | |
| Schenker XMG Pro 15 (E23) | |
| Media NVIDIA GeForce RTX 4060 Laptop GPU (39 - 53, n=53) | |
| Colorful EVOL X15 AT 23 | |
| Acer Predator Helios 16 PH16-71-731Q | |
| Dell G15 5530 | |
| Alienware m16 R1 Intel | |
| Uniwill GM6PX7X RTX 4070 | |
| Media della classe Gaming (15 - 228, n=103, ultimi 2 anni) | |
| Alienware m16 R1 AMD | |
| HP Omen 16-wf000 | |
| Blender / v3.3 Classroom CPU | |
| Media NVIDIA GeForce RTX 4060 Laptop GPU (189 - 452, n=53) | |
| HP Omen 16-wf000 | |
| Dell G15 5530 | |
| Acer Predator Helios 16 PH16-71-731Q | |
| Colorful EVOL X15 AT 23 | |
| Schenker XMG Pro 15 (E23) | |
| Alienware m16 R1 Intel | |
| Uniwill GM6PX7X RTX 4070 | |
| Media della classe Gaming (122 - 565, n=99, ultimi 2 anni) | |
| Alienware m16 R1 AMD | |
* ... Meglio usare valori piccoli
Prestazioni di gioco
L'EVOL X15 gestisce piccoli vantaggi rispetto ai computer portatili della concorrenza con specifiche simili, tra cui l' Acer Predator Helios 16 e l'Alienware m16 R1 Intel nelle prestazioni di gioco complessive a 1080p Ultra.
I giochi a 60 fps in QHD sono raggiungibili in molti titoli AAA, e c'è il potenziale per ottenere frame rate ancora più elevati con l'aiuto di upscaler come Nvidia DLSS, AMD FSR o Intel XeSS.
| The Witcher 3 - 1920x1080 Ultra Graphics & Postprocessing (HBAO+) | |
| Media della classe Gaming (104.7 - 240, n=7, ultimi 2 anni) | |
| Alienware m16 R1 AMD | |
| HP Omen 16-wf000 | |
| Schenker XMG Pro 15 (E23) | |
| Uniwill GM6PX7X RTX 4070 | |
| Alienware m16 R1 Intel | |
| Dell G15 5530 | |
| Colorful EVOL X15 AT 23 | |
| Acer Predator Helios 16 PH16-71-731Q | |
| GTA V - 1920x1080 Highest AA:4xMSAA + FX AF:16x | |
| Media della classe Gaming (67.1 - 186.9, n=90, ultimi 2 anni) | |
| Uniwill GM6PX7X RTX 4070 | |
| Colorful EVOL X15 AT 23 | |
| HP Omen 16-wf000 | |
| Acer Predator Helios 16 PH16-71-731Q | |
| Dell G15 5530 | |
| Schenker XMG Pro 15 (E23) | |
| Final Fantasy XV Benchmark - 1920x1080 High Quality | |
| Alienware m16 R1 AMD | |
| HP Omen 16-wf000 | |
| Media della classe Gaming (64.2 - 215, n=91, ultimi 2 anni) | |
| Uniwill GM6PX7X RTX 4070 | |
| Alienware m16 R1 Intel | |
| Colorful EVOL X15 AT 23 | |
| Acer Predator Helios 16 PH16-71-731Q | |
| Dell G15 5530 | |
Il grafico FPS di Witcher 3
Il raffreddamento del sottosistema grafico di EVOL X15 sembra essere abbastanza efficiente, come dimostrano i frame rate stabili osservati sotto sforzo con The Witcher 3 a 1080p Ultra.
| basso | medio | alto | ultra | QHD | |
|---|---|---|---|---|---|
| GTA V (2015) | 185.6 | 182.3 | 177.3 | 114.6 | 85.6 |
| The Witcher 3 (2015) | 450 | 333 | 205 | 103.4 | 75.7 |
| Dota 2 Reborn (2015) | 192.2 | 169.7 | 164.6 | 153.1 | |
| Final Fantasy XV Benchmark (2018) | 206 | 143.9 | 101 | 74 | |
| X-Plane 11.11 (2018) | 176.1 | 155.9 | 116.4 | ||
| Far Cry 5 (2018) | 162 | 146 | 141 | 135 | 101 |
| Strange Brigade (2018) | 480 | 288 | 225 | 192 | 127.4 |
| F1 22 (2022) | 253 | 253 | 194.5 | 65.8 | 42.3 |
| F1 23 (2023) | 248 | 250 | 184.1 | 58.3 | 37 |
| Cyberpunk 2077 (2023) | 119.4 | 96.5 | 82.8 | 71.1 | 42.8 |
| Assassin's Creed Mirage (2023) | 137 | 125 | 116 | 89 | 65 |
| Call of Duty Modern Warfare 3 2023 (2023) | 128 | 114 | 86 | 65 | 56 |
| Avatar Frontiers of Pandora (2023) | 77.3 | 71.1 | 60.8 | 45.2 | 29.8 |
Faccia riferimento al nostro sito dedicato GPU per computer portatili Nvidia GeForce RTX 4060 per ulteriori informazioni e confronti delle prestazioni.
Emissioni: Basse temperature superficiali accompagnate da un'elevata rumorosità della ventola
Rumore del sistema
Colorful limita il rumore della ventola di EVOL X15 AT a meno di 30 db(A) nella modalità Quiet.
Tuttavia, sia la modalità Intrattenimento che la modalità Prestazioni vedono livelli di rumorosità vicini ai 55 db(A), anche con carichi medi di 3DMark 06.
I profili energetici forniti hanno un impatto percepibile sulle prestazioni di gioco. Per esempio, notiamo un calo medio dei frame rate del 33% in The Witcher 3 a 1080p Ultra quando si passa dalla modalità Prestazioni alla modalità Silenziosa.
Rumorosità
| Idle |
| 33.16 / 33.16 / 33.16 dB(A) |
| Sotto carico |
| 54.62 / 54.53 dB(A) |
 | ||
30 dB silenzioso 40 dB(A) udibile 50 dB(A) rumoroso |
||
min: | ||
| Modalità di prestazioni | Inattivo dB(A) | Carico medio dB(A) | Carico massimo dB(A) | Il Witcher 3 1080p Ultra dB(A) |
|---|---|---|---|---|
| Silenzioso | 24,73 | 26,61 | 26,08 | 26,82 / 67 fps |
| Risparmio energetico | 24,85 | 26,02 | 41,05 | 46,10 / 75 fps |
| Intrattenimento | 25,07 | 54,06 | 54,56 | 53,29 / 97 fps |
| Prestazioni | 33,16 | 54,62 | 54,53 | 54,62 / 100 fps |
| Colorful EVOL X15 AT 23 i7-13700HX, GeForce RTX 4060 Laptop GPU | Alienware m16 R1 Intel i7-13700HX, GeForce RTX 4060 Laptop GPU | HP Omen 16-wf000 i7-13700HX, GeForce RTX 4080 Laptop GPU | Acer Predator Helios 16 PH16-71-731Q i7-13700HX, GeForce RTX 4060 Laptop GPU | Dell G15 5530 i7-13650HX, GeForce RTX 4060 Laptop GPU | Schenker XMG Pro 15 (E23) i9-13900HX, GeForce RTX 4060 Laptop GPU | Alienware m16 R1 AMD R9 7845HX, GeForce RTX 4080 Laptop GPU | Uniwill GM6PX7X RTX 4070 i7-13700HX, GeForce RTX 4070 Laptop GPU | |
|---|---|---|---|---|---|---|---|---|
| Noise | 9% | 7% | 14% | 19% | 11% | 13% | 13% | |
| off /ambiente * (dB) | 21.32 | 25 -17% | 23 -8% | 24 -13% | 20.41 4% | 24 -13% | 22.9 -7% | 22.4 -5% |
| Idle Minimum * (dB) | 33.16 | 25 25% | 29.6 11% | 24 28% | 26.85 19% | 24 28% | 22.9 31% | 22.9 31% |
| Idle Average * (dB) | 33.16 | 26 22% | 29.8 10% | 24 28% | 26.85 19% | 24 28% | 29.7 10% | 29 13% |
| Idle Maximum * (dB) | 33.16 | 27 19% | 30.4 8% | 32.32 3% | 26.85 19% | 24 28% | 29.7 10% | 29 13% |
| Load Average * (dB) | 54.62 | 52 5% | 33.8 38% | 36.66 33% | 27.65 49% | 53.65 2% | 29.8 45% | 40.2 26% |
| Witcher 3 ultra * (dB) | 54.6 | 51 7% | 57 -4% | 49.06 10% | 47.9 12% | 53.53 2% | 54.7 -0% | 48.7 11% |
| Load Maximum * (dB) | 54.53 | 53 3% | 58.3 -7% | 49.49 9% | 47.86 12% | 53.65 2% | 54.7 -0% | 55 -1% |
* ... Meglio usare valori piccoli
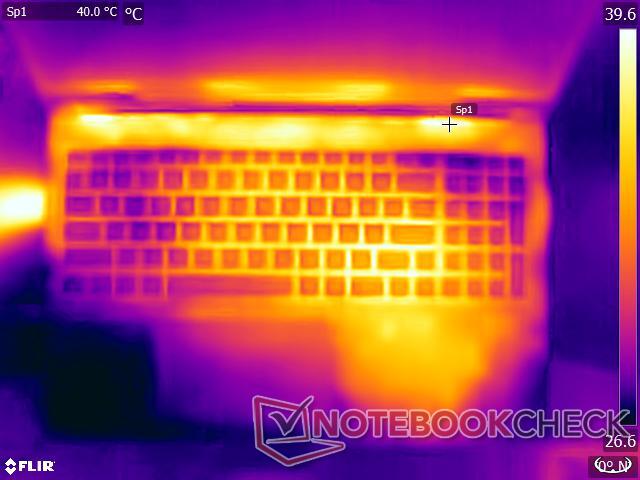
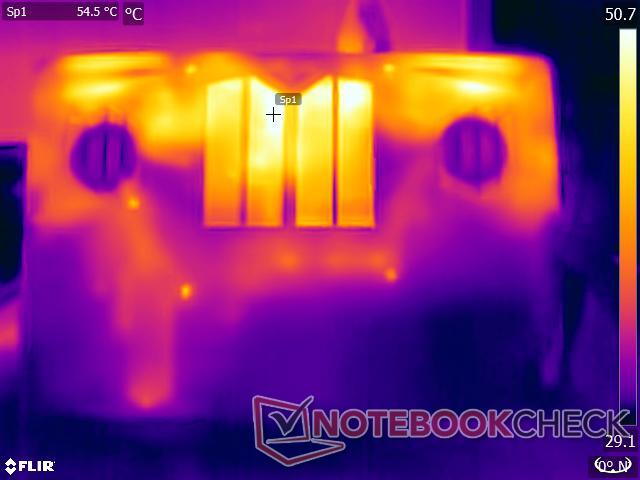
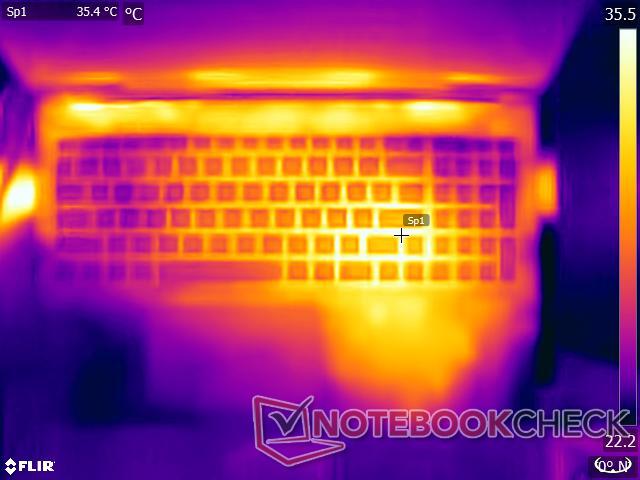
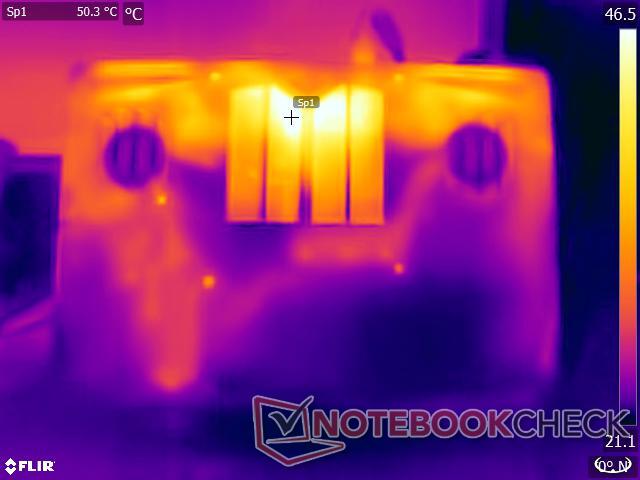
Temperatura
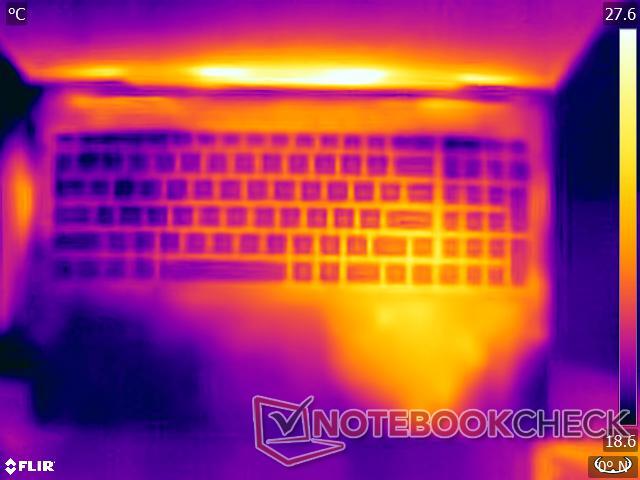
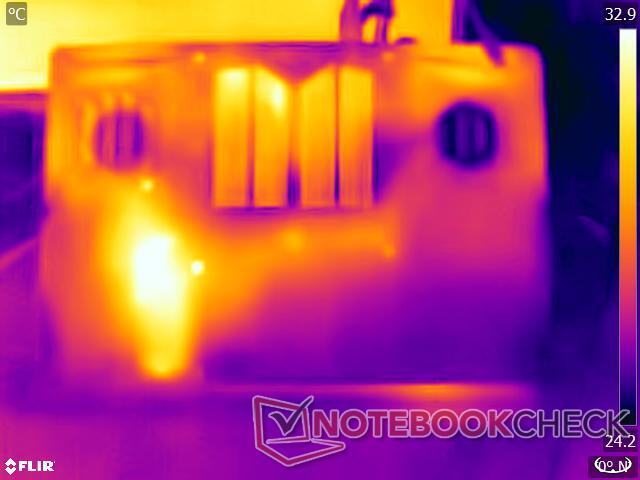
EVOL X15 è dotato di un robusto sistema di raffreddamento che copre completamente la CPU, la GPU e il chipset. Le temperature di superficie sono gestibili sotto carico pesante, grazie alla solida costruzione in plastica e all'ampio spazio del pannello posteriore dalla scheda madre. Solo un punto caldo nella parte inferiore raggiunge i 51 °C.
Nonostante il suo peso, l'EVOL X15 può essere utilizzato sulle ginocchia, a patto che non lo si spinga troppo. Le aree del touchpad e del palm rest rimangono relativamente fresche e si riscaldano leggermente solo in caso di carico estremo.
(+) La temperatura massima sul lato superiore è di 37 °C / 99 F, rispetto alla media di 40.4 °C / 105 F, che varia da 21.2 a 68.8 °C per questa classe Gaming.
(-) Il lato inferiore si riscalda fino ad un massimo di 51.2 °C / 124 F, rispetto alla media di 43.2 °C / 110 F
(+) In idle, la temperatura media del lato superiore è di 29.3 °C / 85 F, rispetto alla media deld ispositivo di 33.9 °C / 93 F.
(+) Riproducendo The Witcher 3, la temperatura media per il lato superiore e' di 31.7 °C / 89 F, rispetto alla media del dispositivo di 33.9 °C / 93 F.
(+) I poggiapolsi e il touchpad raggiungono la temperatura massima della pelle (34.8 °C / 94.6 F) e quindi non sono caldi.
(-) La temperatura media della zona del palmo della mano di dispositivi simili e'stata di 28.8 °C / 83.8 F (-6 °C / -10.8 F).
| Colorful EVOL X15 AT 23 Intel Core i7-13700HX, NVIDIA GeForce RTX 4060 Laptop GPU | Alienware m16 R1 Intel Intel Core i7-13700HX, NVIDIA GeForce RTX 4060 Laptop GPU | HP Omen 16-wf000 Intel Core i7-13700HX, NVIDIA GeForce RTX 4080 Laptop GPU | Acer Predator Helios 16 PH16-71-731Q Intel Core i7-13700HX, NVIDIA GeForce RTX 4060 Laptop GPU | Dell G15 5530 Intel Core i7-13650HX, NVIDIA GeForce RTX 4060 Laptop GPU | Schenker XMG Pro 15 (E23) Intel Core i9-13900HX, NVIDIA GeForce RTX 4060 Laptop GPU | Alienware m16 R1 AMD AMD Ryzen 9 7845HX, NVIDIA GeForce RTX 4080 Laptop GPU | Uniwill GM6PX7X RTX 4070 Intel Core i7-13700HX, NVIDIA GeForce RTX 4070 Laptop GPU | |
|---|---|---|---|---|---|---|---|---|
| Heat | -18% | 0% | -17% | -19% | -9% | -9% | -5% | |
| Maximum Upper Side * (°C) | 37 | 49 -32% | 45 -22% | 41 -11% | 54 -46% | 50 -35% | 48 -30% | 38.2 -3% |
| Maximum Bottom * (°C) | 51.2 | 48 6% | 48.8 5% | 66 -29% | 62.2 -21% | 50 2% | 39 24% | 45 12% |
| Idle Upper Side * (°C) | 31.2 | 40 -28% | 29.2 6% | 36 -15% | 33.4 -7% | 33 -6% | 37 -19% | 33.6 -8% |
| Idle Bottom * (°C) | 32.8 | 39 -19% | 28.8 12% | 37 -13% | 33.4 -2% | 32 2% | 36.2 -10% | 39.6 -21% |
* ... Meglio usare valori piccoli
Test da sforzo
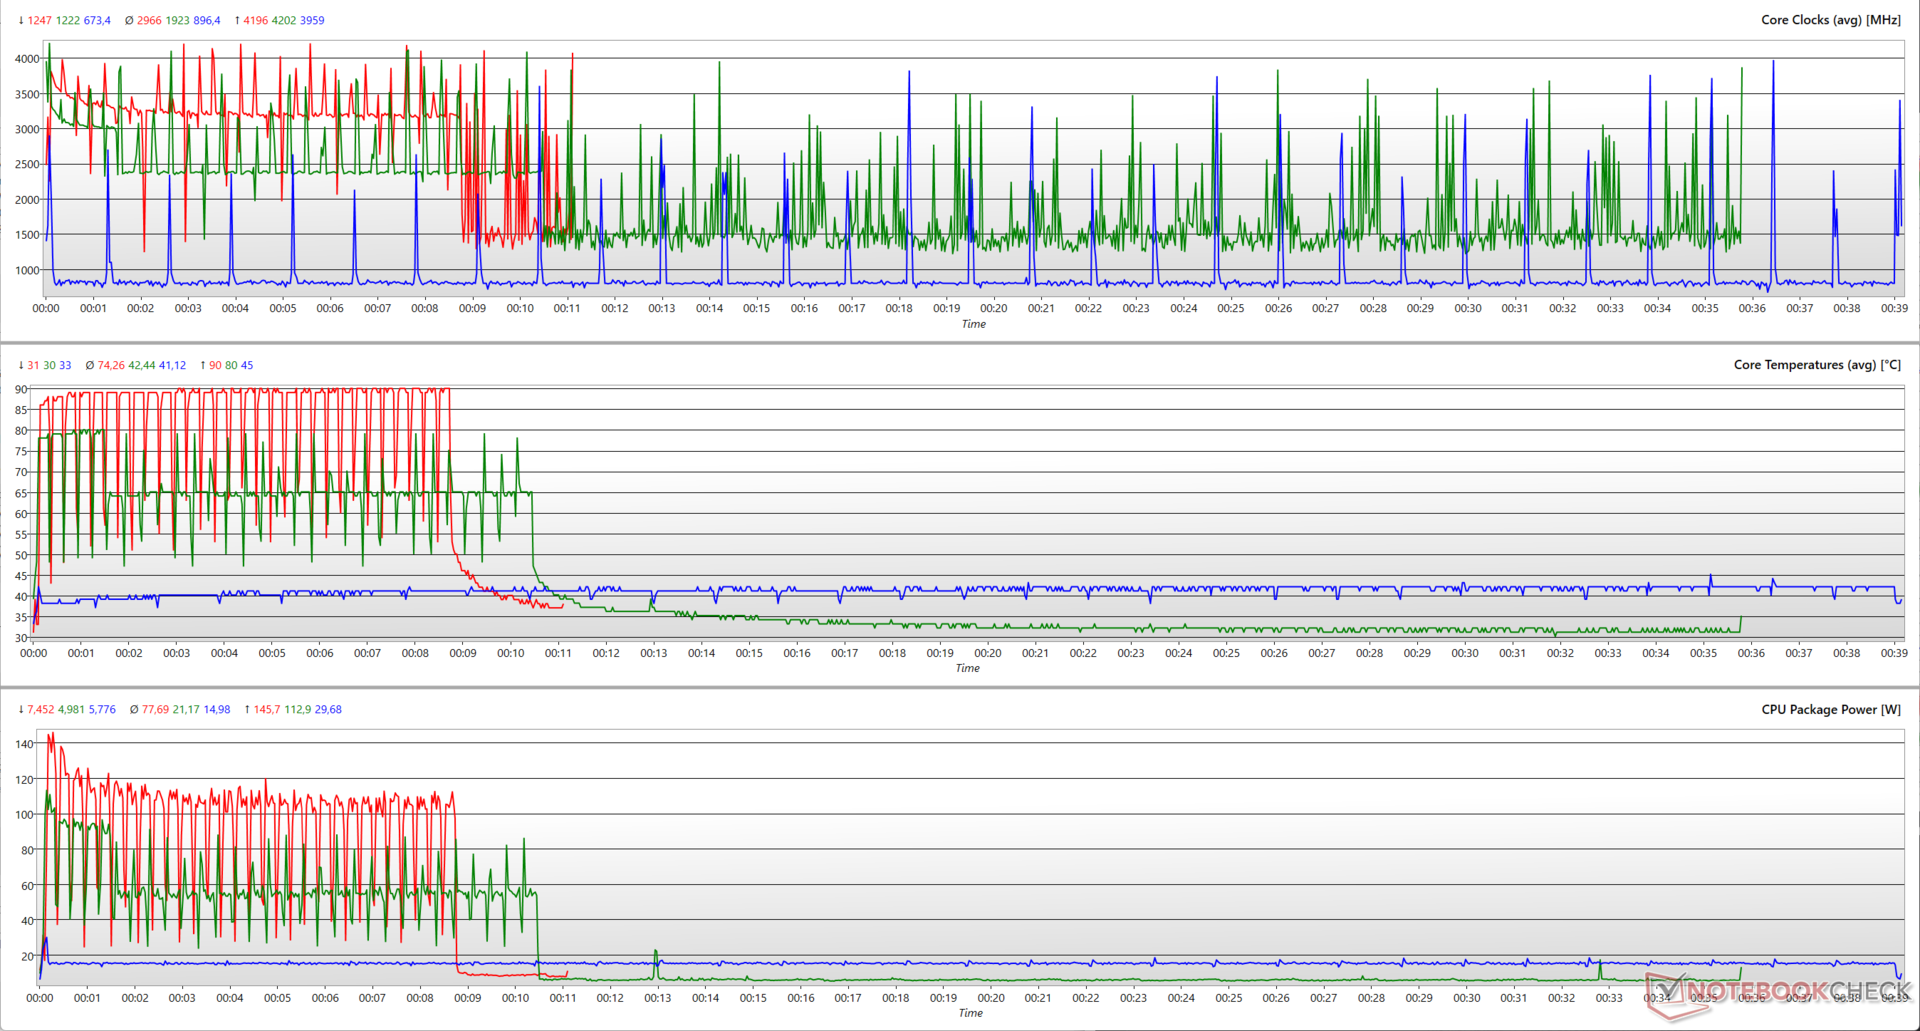
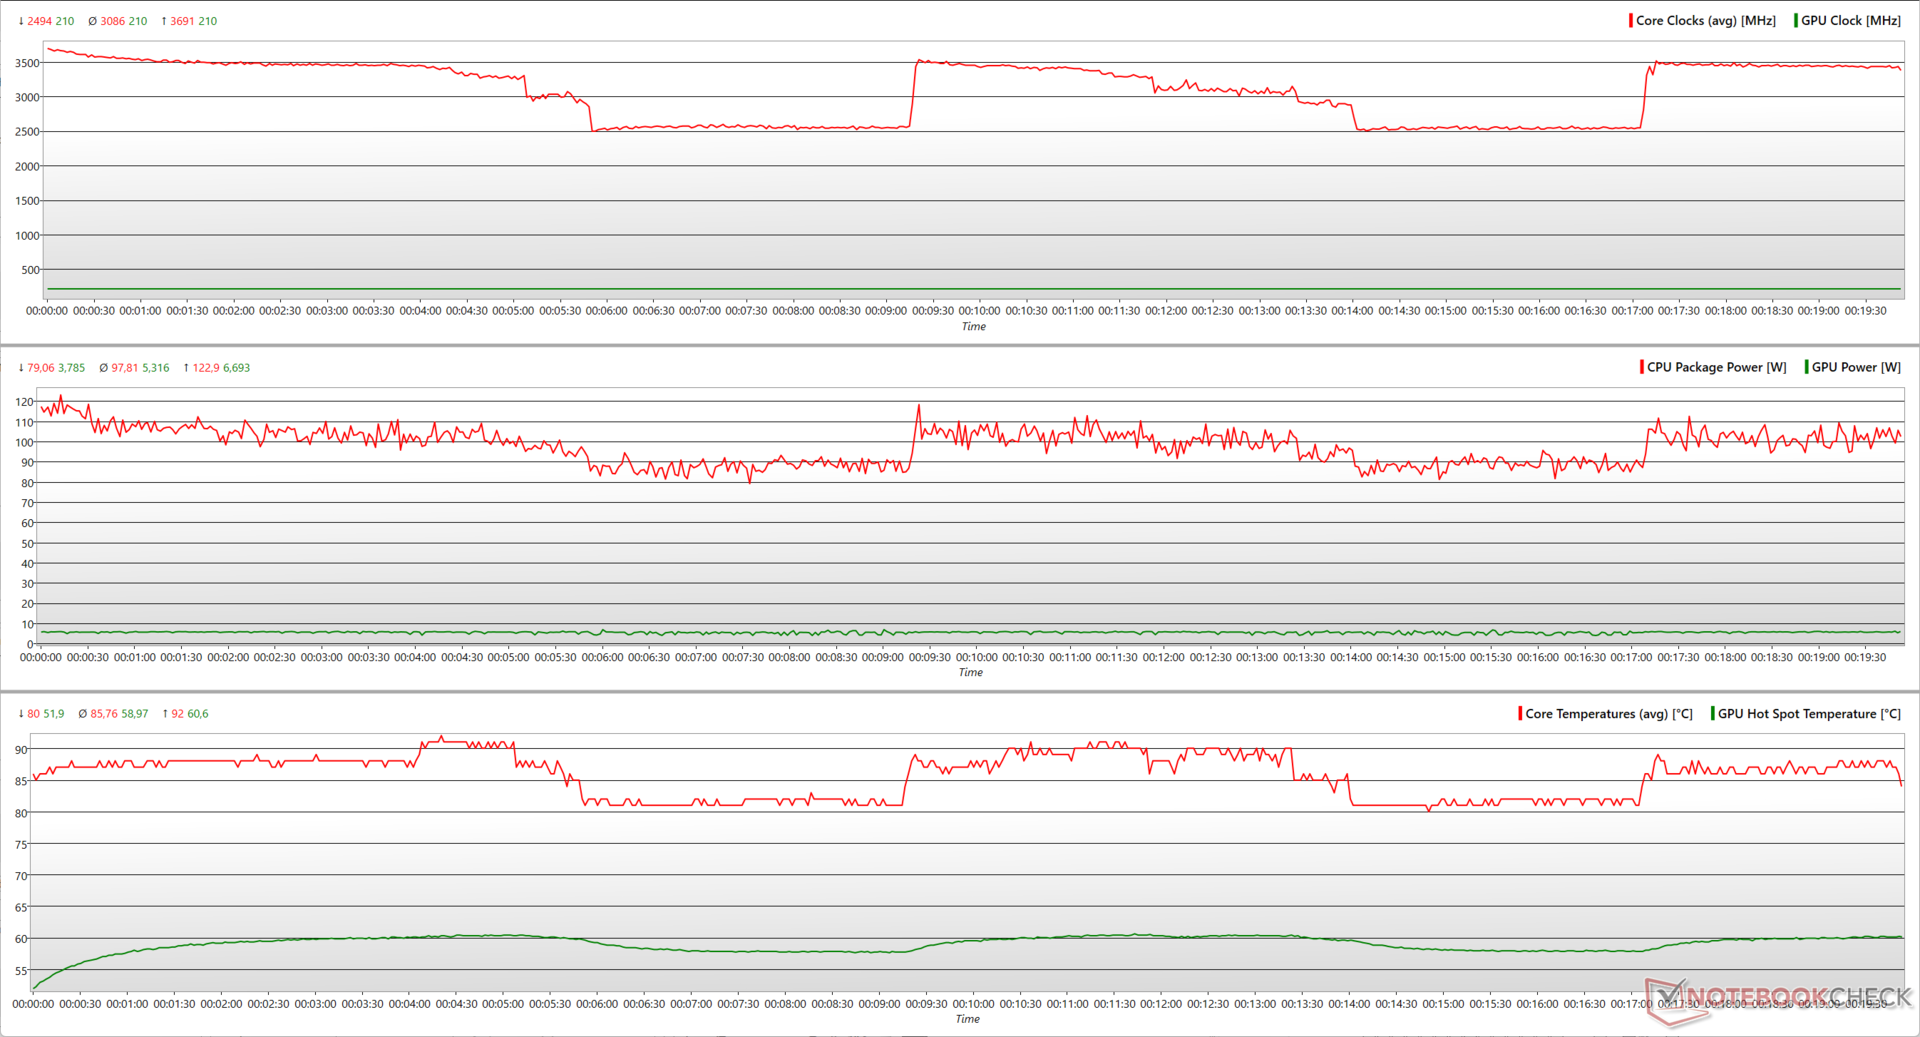
Sollecitando l'EVOL X15 con Prime95 in-place large FFT, il Core i7-13700HX raggiunge picchi fino a 3,7 GHz, utilizzando 123 W. Nonostante il raffreddamento completo, la CPU scende periodicamente a 2,5 GHz a 80 W, prima di tentare di risalire a 3,7 GHz.
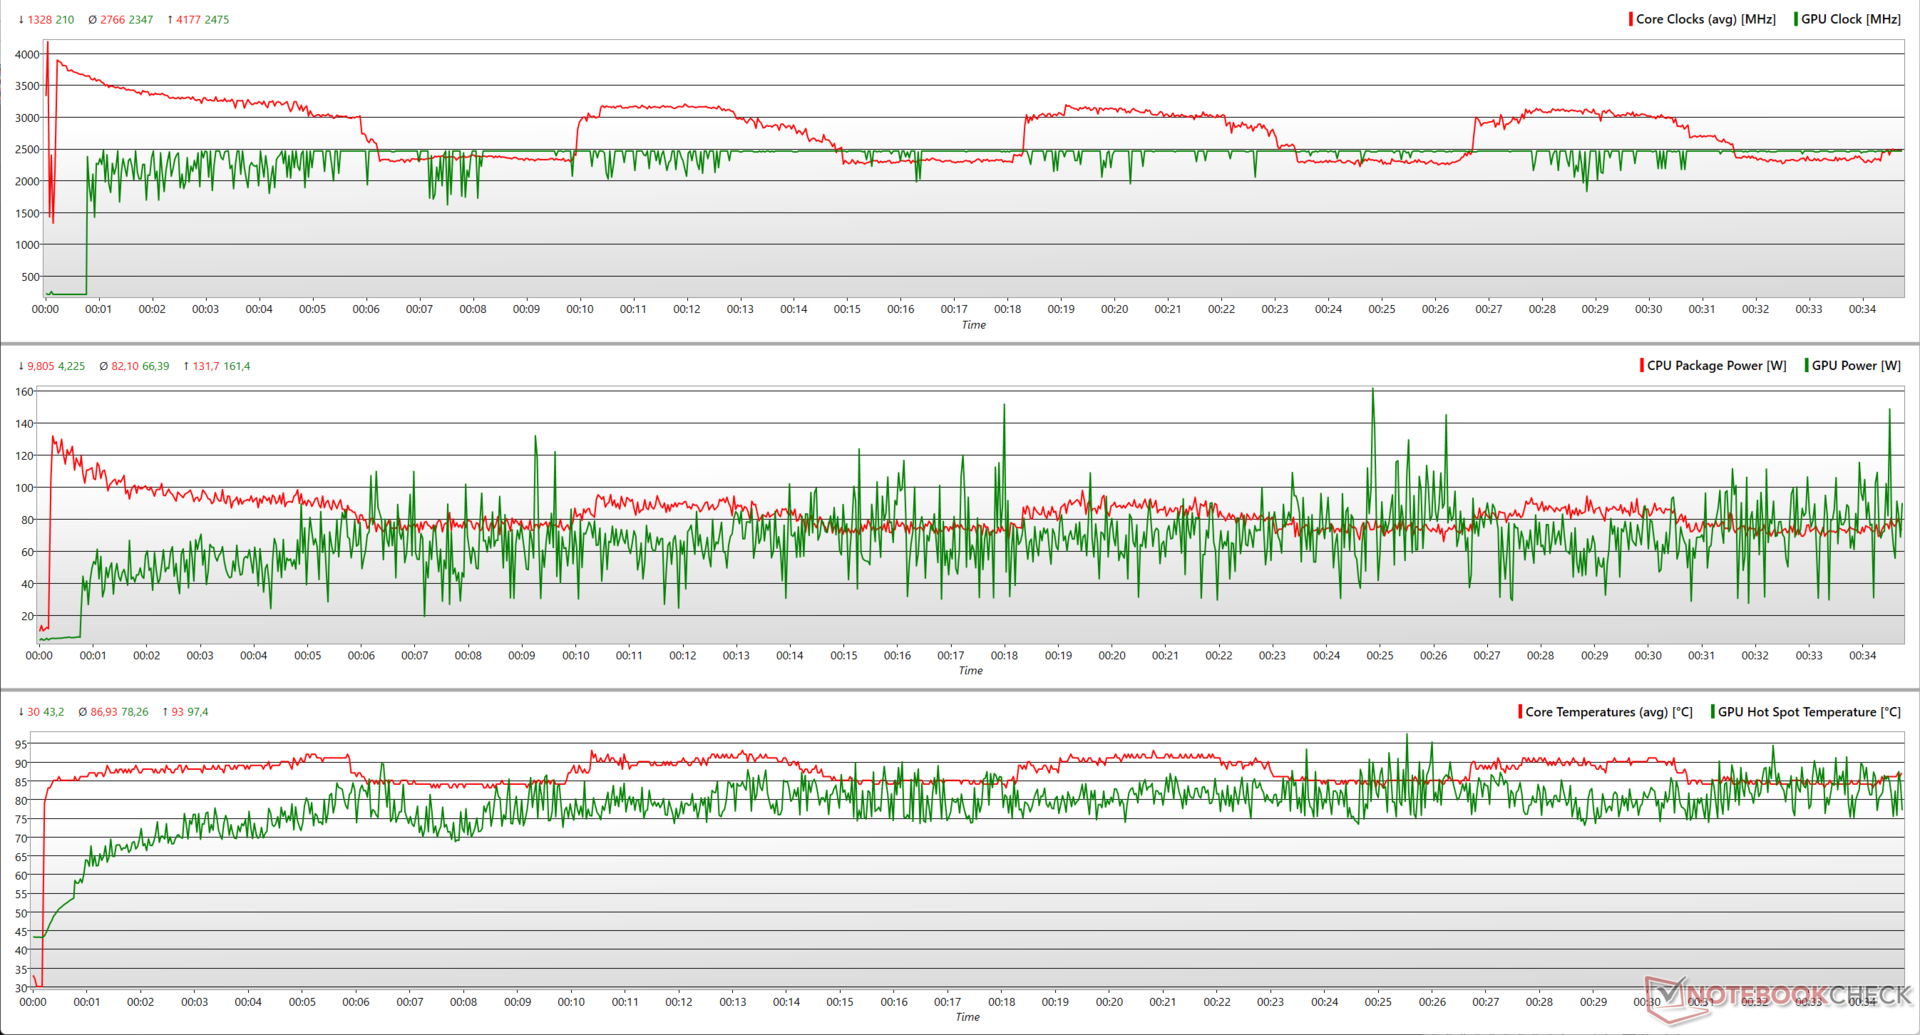
Con l'aggiunta di FurMark, il Core i7-13700HX può ora utilizzare fino a 132 W per raggiungere i 4,2 GHz, ma continua a strozzarsi a intermittenza vicino ai 2,5 GHz. L'RTX 4060 può utilizzare l'headroom di potenza e raggiungere un picco di 2.475 MHz, utilizzando 161 W.
| Stress Test | Clock CPU (GHz) | Clock GPU (MHz) | Temperatura media CPU (°C) | Temperatura media GPU (°C) |
| Sistema inattivo | 1,42 | 210 | 31 | 37,1 |
| Prime95 | 3,42 | 210 | 85 | 50,8 |
| Prime95 + FurMark | 2,99 | 2.460 | 86 | 70,8 |
| Il Witcher 3 1080p Ultra | 3,12 | 2.460 | 64 | 73,7 |
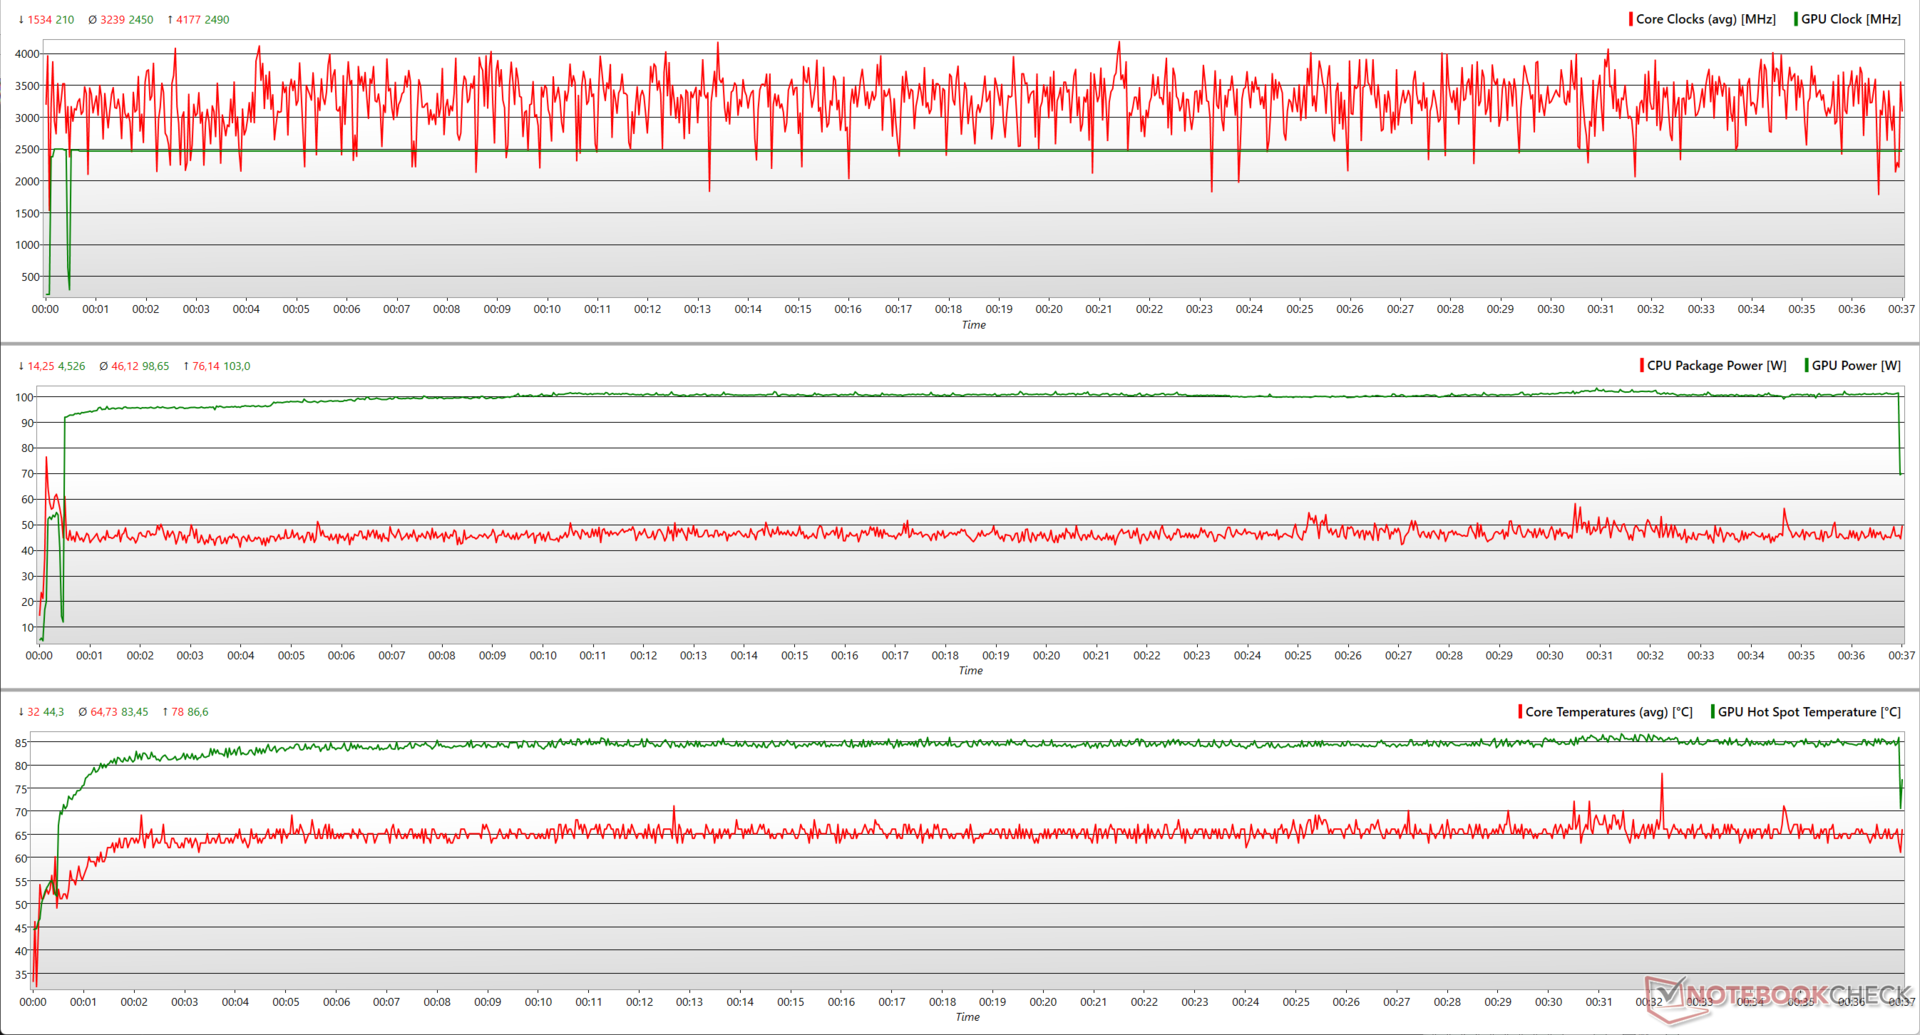
Con The Witcher 3 a 1080p Ultra, il Core i7-13700HX è in grado di raggiungere un picco di 4,2 GHz utilizzando solo 76 W, mantenendo un clock medio di 3,2 GHz a 46 W. Questo permette di avere abbastanza spazio per la RTX 4060, che raggiunge un boost quasi costante di 2.490 MHz a 103 W.
Altoparlanti
Gli altoparlanti stereo dell'EVOL X15 sono abbastanza forti per una stanza di dimensioni moderate. Colorful pubblicizza la sintonizzazione Creative SoundBlaster Studio, ma l'audio sembra insipido a causa della mancanza di risposta dei bassi e dei medi medi. Le frequenze più alte, invece, sono riprodotte abbastanza bene.
Idealmente, Colorful avrebbe potuto sfruttare l'ampio telaio per includere radiatori passivi più potenti. Tuttavia, gli utenti possono ottenere una migliore qualità audio attraverso il jack audio combo da 3,5 mm o il Bluetooth 5.2.
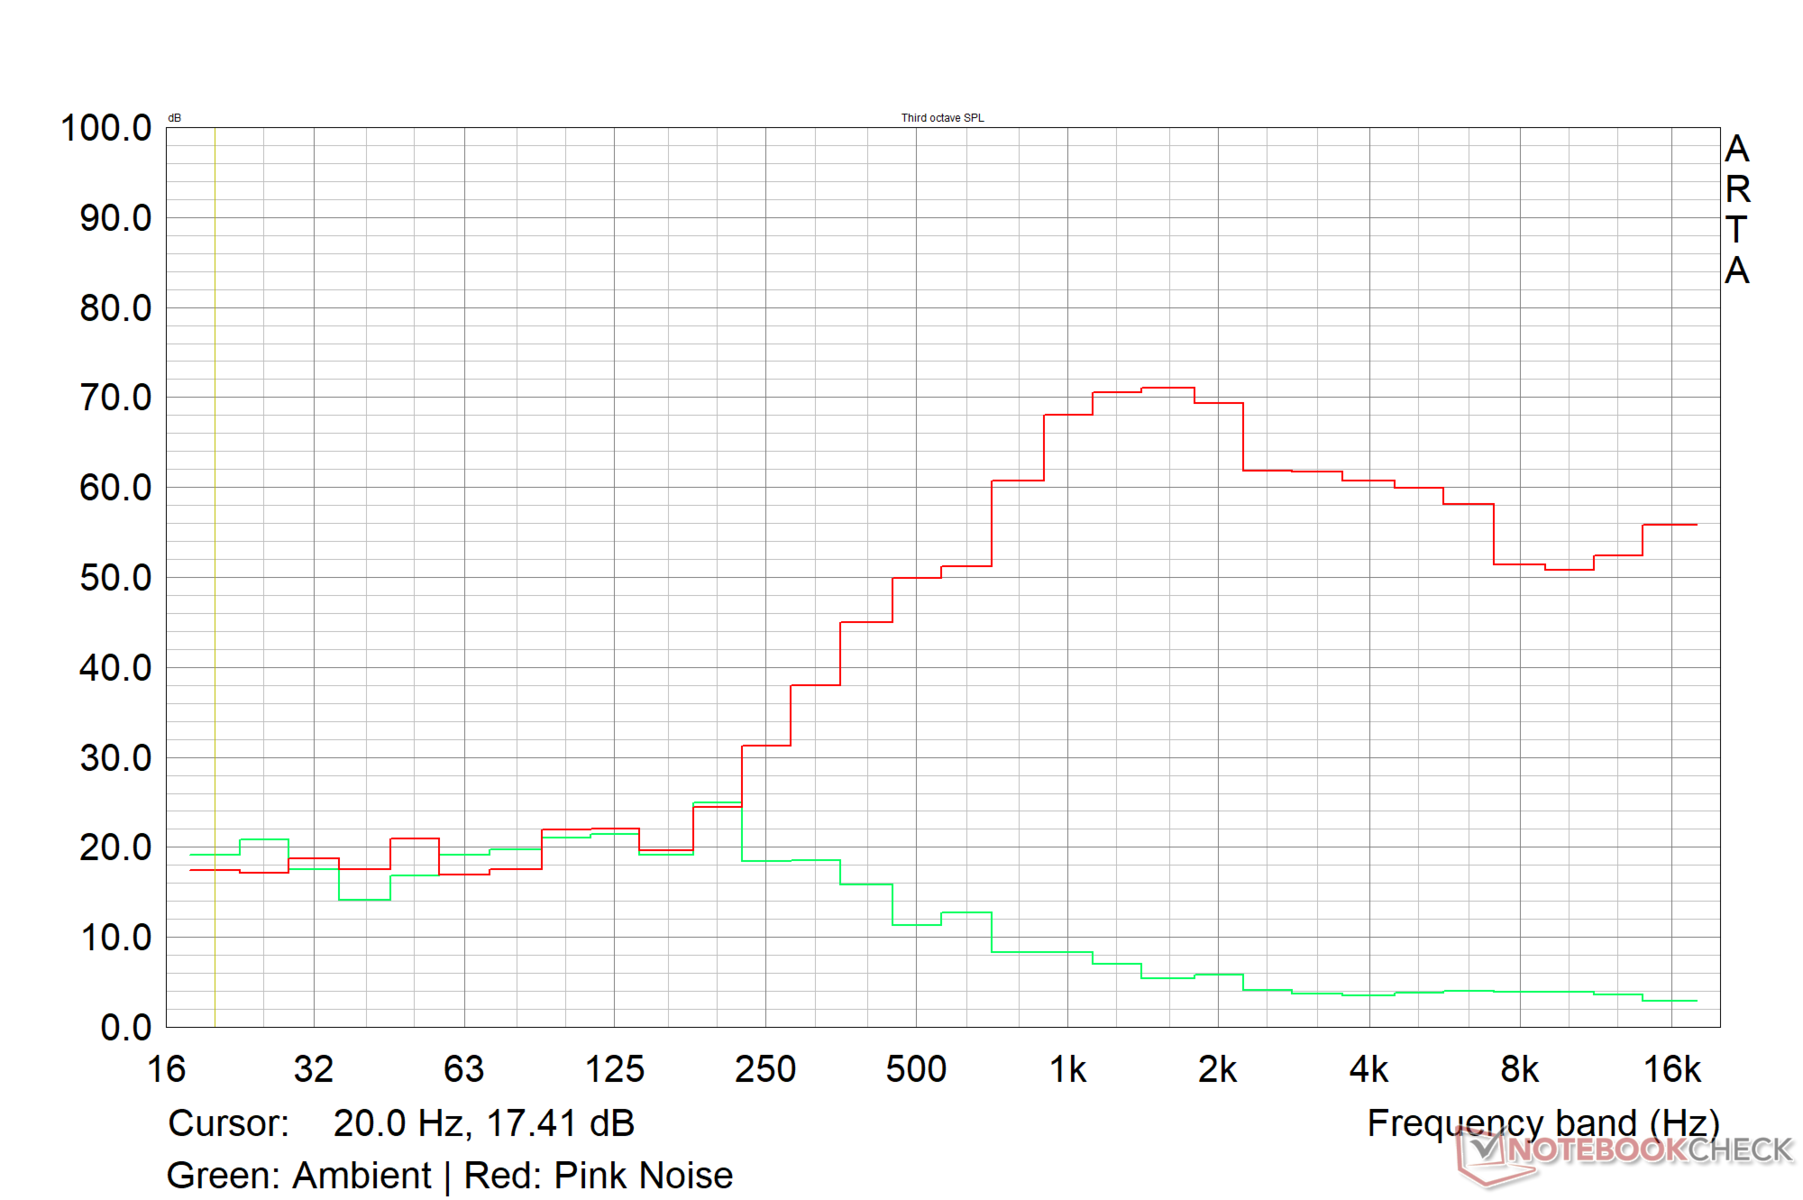
Colorful EVOL X15 AT 23 analisi audio
(±) | potenza degli altiparlanti media ma buona (77.5 dB)
Bassi 100 - 315 Hz
(-) | quasi nessun basso - in media 26.2% inferiori alla media
(±) | la linearità dei bassi è media (9.2% delta rispetto alla precedente frequenza)
Medi 400 - 2000 Hz
(±) | medi elevati - circa 11.1% superiore alla media
(±) | linearità dei medi adeguata (9.6% delta rispetto alla precedente frequenza)
Alti 2 - 16 kHz
(±) | alti elevati - circa 6.1% superiori alla media
(+) | alti lineari (5.8% delta rispetto alla precedente frequenza)
Nel complesso 100 - 16.000 Hz
(±) | la linearità complessiva del suono è media (29.7% di differenza rispetto alla media
Rispetto alla stessa classe
» 95% di tutti i dispositivi testati in questa classe è stato migliore, 2% simile, 3% peggiore
» Il migliore ha avuto un delta di 6%, medio di 18%, peggiore di 132%
Rispetto a tutti i dispositivi testati
» 88% di tutti i dispositivi testati in questa classe è stato migliore, 3% similare, 10% peggiore
» Il migliore ha avuto un delta di 4%, medio di 23%, peggiore di 134%
Apple MacBook Pro 16 2021 M1 Pro analisi audio
(+) | gli altoparlanti sono relativamente potenti (84.7 dB)
Bassi 100 - 315 Hz
(+) | bassi buoni - solo 3.8% dalla media
(+) | bassi in lineaa (5.2% delta rispetto alla precedente frequenza)
Medi 400 - 2000 Hz
(+) | medi bilanciati - solo only 1.3% rispetto alla media
(+) | medi lineari (2.1% delta rispetto alla precedente frequenza)
Alti 2 - 16 kHz
(+) | Alti bilanciati - appena 1.9% dalla media
(+) | alti lineari (2.7% delta rispetto alla precedente frequenza)
Nel complesso 100 - 16.000 Hz
(+) | suono nel complesso lineare (4.6% differenza dalla media)
Rispetto alla stessa classe
» 0% di tutti i dispositivi testati in questa classe è stato migliore, 0% simile, 100% peggiore
» Il migliore ha avuto un delta di 5%, medio di 17%, peggiore di 45%
Rispetto a tutti i dispositivi testati
» 0% di tutti i dispositivi testati in questa classe è stato migliore, 0% similare, 100% peggiore
» Il migliore ha avuto un delta di 4%, medio di 23%, peggiore di 134%
Gestione dell'energia: Economica sotto carico massimo
Consumo di energia
Il consumo energetico in idle dell'EVOL X15 è superiore rispetto alla concorrenza che utilizza il Core i7-13700HX e la RTX 4060. Detto questo, i consumi sotto carico massimo sono relativamente più bassi, con 224 W.
L'Uniwill GM6PX7X con una RTX 4070 mostra consumi superiori del 33% sotto carico massimo, ma riesce comunque ad essere complessivamente più economico del 16% rispetto all'EVOL X15.
Il mattone di alimentazione da 280 W in dotazione è in grado di alimentare adeguatamente il portatile sotto stress.
| Off / Standby | |
| Idle | |
| Sotto carico |
|
Leggenda:
min: | |
| Colorful EVOL X15 AT 23 i7-13700HX, GeForce RTX 4060 Laptop GPU, IPS, 2560x1440, 15.6" | Alienware m16 R1 Intel i7-13700HX, GeForce RTX 4060 Laptop GPU, IPS, 2560x1600, 16" | HP Omen 16-wf000 i7-13700HX, GeForce RTX 4080 Laptop GPU, IPS, 2560x1440, 16.1" | Acer Predator Helios 16 PH16-71-731Q i7-13700HX, GeForce RTX 4060 Laptop GPU, IPS-LED, 2560x1600, 16" | Dell G15 5530 i7-13650HX, GeForce RTX 4060 Laptop GPU, IPS, 1920x1080, 15.6" | Schenker XMG Pro 15 (E23) i9-13900HX, GeForce RTX 4060 Laptop GPU, IPS, 2560x1440, 15.6" | Alienware m16 R1 AMD R9 7845HX, GeForce RTX 4080 Laptop GPU, IPS, 2560x1600, 16" | Uniwill GM6PX7X RTX 4070 i7-13700HX, GeForce RTX 4070 Laptop GPU, IPS, 2560x1600, 16" | Media NVIDIA GeForce RTX 4060 Laptop GPU | Media della classe Gaming | |
|---|---|---|---|---|---|---|---|---|---|---|
| Power Consumption | 20% | 2% | 20% | 30% | -11% | -45% | 16% | 36% | 24% | |
| Idle Minimum * (Watt) | 28.3 | 10 65% | 21.8 23% | 15.9 44% | 8.4 70% | 21.6 24% | 39 -38% | 12.6 55% | 11.5 ? 59% | 13.1 ? 54% |
| Idle Average * (Watt) | 32.2 | 14 57% | 26 19% | 20.5 36% | 14.98 53% | 29 10% | 44.6 -39% | 17.7 45% | 16 ? 50% | 19 ? 41% |
| Idle Maximum * (Watt) | 36.5 | 21 42% | 36 1% | 20.9 43% | 15.56 57% | 42.7 -17% | 68.1 -87% | 31.8 13% | 20.3 ? 44% | 24.6 ? 33% |
| Load Average * (Watt) | 119 | 119 -0% | 115.5 3% | 106 11% | 96.8 19% | 190 -60% | 129.8 -9% | 101.4 15% | 92.9 ? 22% | 111.3 ? 6% |
| Witcher 3 ultra * (Watt) | 189.6 | 186.7 2% | 214 -13% | 175 8% | 186 2% | 189 -0% | 285 -50% | 185.3 2% | ||
| Load Maximum * (Watt) | 224.3 | 323 -44% | 269.7 -20% | 276 -23% | 271.42 -21% | 269 -20% | 327.3 -46% | 298 -33% | 210 ? 6% | 260 ? -16% |
* ... Meglio usare valori piccoli
Power Consumption: The Witcher 3 / Stress test
Power Consumption: External monitor
Durata della batteria
Considerando i componenti interni abbastanza potenti di EVOL X15, la batteria da 73 WHr può permettersi solo tempi di funzionamento medi. Con una luminosità di 150 nits, il portatile può durare quasi 5,5 ore nel nostro test di navigazione web Wi-Fi standard e circa 6,5 ore durante la riproduzione di video H.264 1080p.
| Colorful EVOL X15 AT 23 i7-13700HX, GeForce RTX 4060 Laptop GPU, 73 Wh | Alienware m16 R1 Intel i7-13700HX, GeForce RTX 4060 Laptop GPU, 86 Wh | HP Omen 16-wf000 i7-13700HX, GeForce RTX 4080 Laptop GPU, 83 Wh | Acer Predator Helios 16 PH16-71-731Q i7-13700HX, GeForce RTX 4060 Laptop GPU, 90 Wh | Dell G15 5530 i7-13650HX, GeForce RTX 4060 Laptop GPU, 86 Wh | Schenker XMG Pro 15 (E23) i9-13900HX, GeForce RTX 4060 Laptop GPU, 80 Wh | Alienware m16 R1 AMD R9 7845HX, GeForce RTX 4080 Laptop GPU, 86 Wh | Uniwill GM6PX7X RTX 4070 i7-13700HX, GeForce RTX 4070 Laptop GPU, 62 Wh | Media della classe Gaming | |
|---|---|---|---|---|---|---|---|---|---|
| Autonomia della batteria | -15% | -11% | 5% | -11% | 26% | -35% | -26% | 26% | |
| H.264 (h) | 6.3 | 5.6 -11% | 4.8 -24% | 6.8 8% | 8.27 ? 31% | ||||
| WiFi v1.3 (h) | 5.4 | 4.8 -11% | 5.1 -6% | 5.6 4% | 6.5 20% | 5.7 6% | 3.7 -31% | 4 -26% | 7.08 ? 31% |
| Witcher 3 ultra (h) | 1.2 | 1.5 25% | 0.8 -33% | ||||||
| Load (h) | 1.3 | 1 -23% | 1.1 -15% | 1.5 15% | 0.8 -38% | 1.9 46% | 0.8 -38% | 1.496 ? 15% | |
| Reader / Idle (h) | 6.4 | 5.5 | 4 | 7.84 ? |
Pro
Contro
Verdetto: Una buona scelta se riesce ad avere un prezzo inferiore a 1.000 dollari

Colorful mira ad offrire un portatile da gioco QHD capace a meno di 1.000 dollari e ci riesce in gran parte con EVOL X15 AT 23. Realizzato principalmente con una costruzione in plastica Clevo, si nota una certa flessione della tastiera; tuttavia, l'EVOL X15 rimane strutturalmente solido nel complesso.
L'EVOL X15 AT ha molti punti a suo favore. I potenziali acquirenti apprezzeranno la buona selezione di porte, la velocità del Wi-Fi 6E e la facilità di accesso ai componenti interni.
La combinazione di un Intel Core i7-13700HX di classe desktop e la CPU GPU Nvidia GeForce RTX 4060 Laptop permette a EVOL X15 AT di competere efficacemente con modelli di prezzo superiore, come ad esempio il modello Alienware m16 R1 e l' Acer Predator Helios 16.
Colorful EVOL X15 AT potrebbe non offrire tutte le caratteristiche e gli optional che si trovano nella concorrenza consolidata, ma riesce in gran parte a ottenere le basi giuste senza limitazioni di prestazioni evidenti"
Detto questo, ci sono anche diverse aree di critica. Aspetti come la mancanza di erogazione di energia con le porte Type-C e i tempi di risposta un po' più elevati devono essere affrontati. Colorful deve anche concentrarsi sulla messa a punto delle curve delle ventole con i profili di prestazioni predefiniti e lavorare per migliorare il consumo energetico in idle.
Nel complesso, Colorful EVOL X15 AT è un prodotto degno di considerazione, a condizione che si riesca ad accaparrarsene uno a meno di 1.000 dollari senza dover pagare un sovrapprezzo.
Detto questo, i computer portatili con GPU GPU RTX 3070 Ti Laptopo anche dalla Radeon RX 6800Mpotrebbero offrire un pacchetto complessivo migliore a prezzi simili, se non le dispiace perdere la generazione di fotogrammi DLSS 3 e i guadagni di efficienza con Ada Lovelace.
Prezzo e disponibilità
Colorful EVOL X15 AT 23 è disponibile direttamente presso i distributori locali dei prodotti Colorful. La configurazione EVOL X15 AT testata ha ufficialmente un prezzo di 969 dollari, ma attualmente viene venduta al dettaglio su Newegg ad un prezzo notevolmente elevato di 1.759 dollari.
In alternativa, una variante QHD di Acer Nitro 5 con un AMD Ryzen 7 6800H e GPU RTX 3070 Ti Laptop può essere acquistata da Amazon US per meno di 1.200 dollari.
Se le prestazioni grezze della CPU non sono una priorità, il modello Asus ROG Strix G15 con un AMD Ryzen 9 5900HX e Radeon RX 6800M è una buona scelta per meno di 1.300 dollari su Amazon US e meno di 1.200 dollari su Best Buy US.
Colorful EVOL X15 AT 23
- 12/20/2023 v7 (old)
Vaidyanathan Subramaniam
Transparency
La selezione dei dispositivi da recensire viene effettuata dalla nostra redazione. Il campione di prova è stato fornito gratuitamente all'autore dal produttore a scopo di revisione. Non vi è stata alcuna influenza di terze parti su questa recensione, né il produttore ne ha ricevuto una copia prima della pubblicazione. Non vi era alcun obbligo di pubblicare questa recensione. In quanto società mediatica indipendente, Notebookcheck non è soggetta all'autorità di produttori, rivenditori o editori.
Ecco come Notebookcheck esegue i test
Ogni anno, Notebookcheck esamina in modo indipendente centinaia di laptop e smartphone utilizzando procedure standardizzate per garantire che tutti i risultati siano comparabili. Da circa 20 anni sviluppiamo continuamente i nostri metodi di prova e nel frattempo stabiliamo gli standard di settore. Nei nostri laboratori di prova, tecnici ed editori esperti utilizzano apparecchiature di misurazione di alta qualità. Questi test comportano un processo di validazione in più fasi. Il nostro complesso sistema di valutazione si basa su centinaia di misurazioni e parametri di riferimento ben fondati, che mantengono l'obiettività.Price comparison

