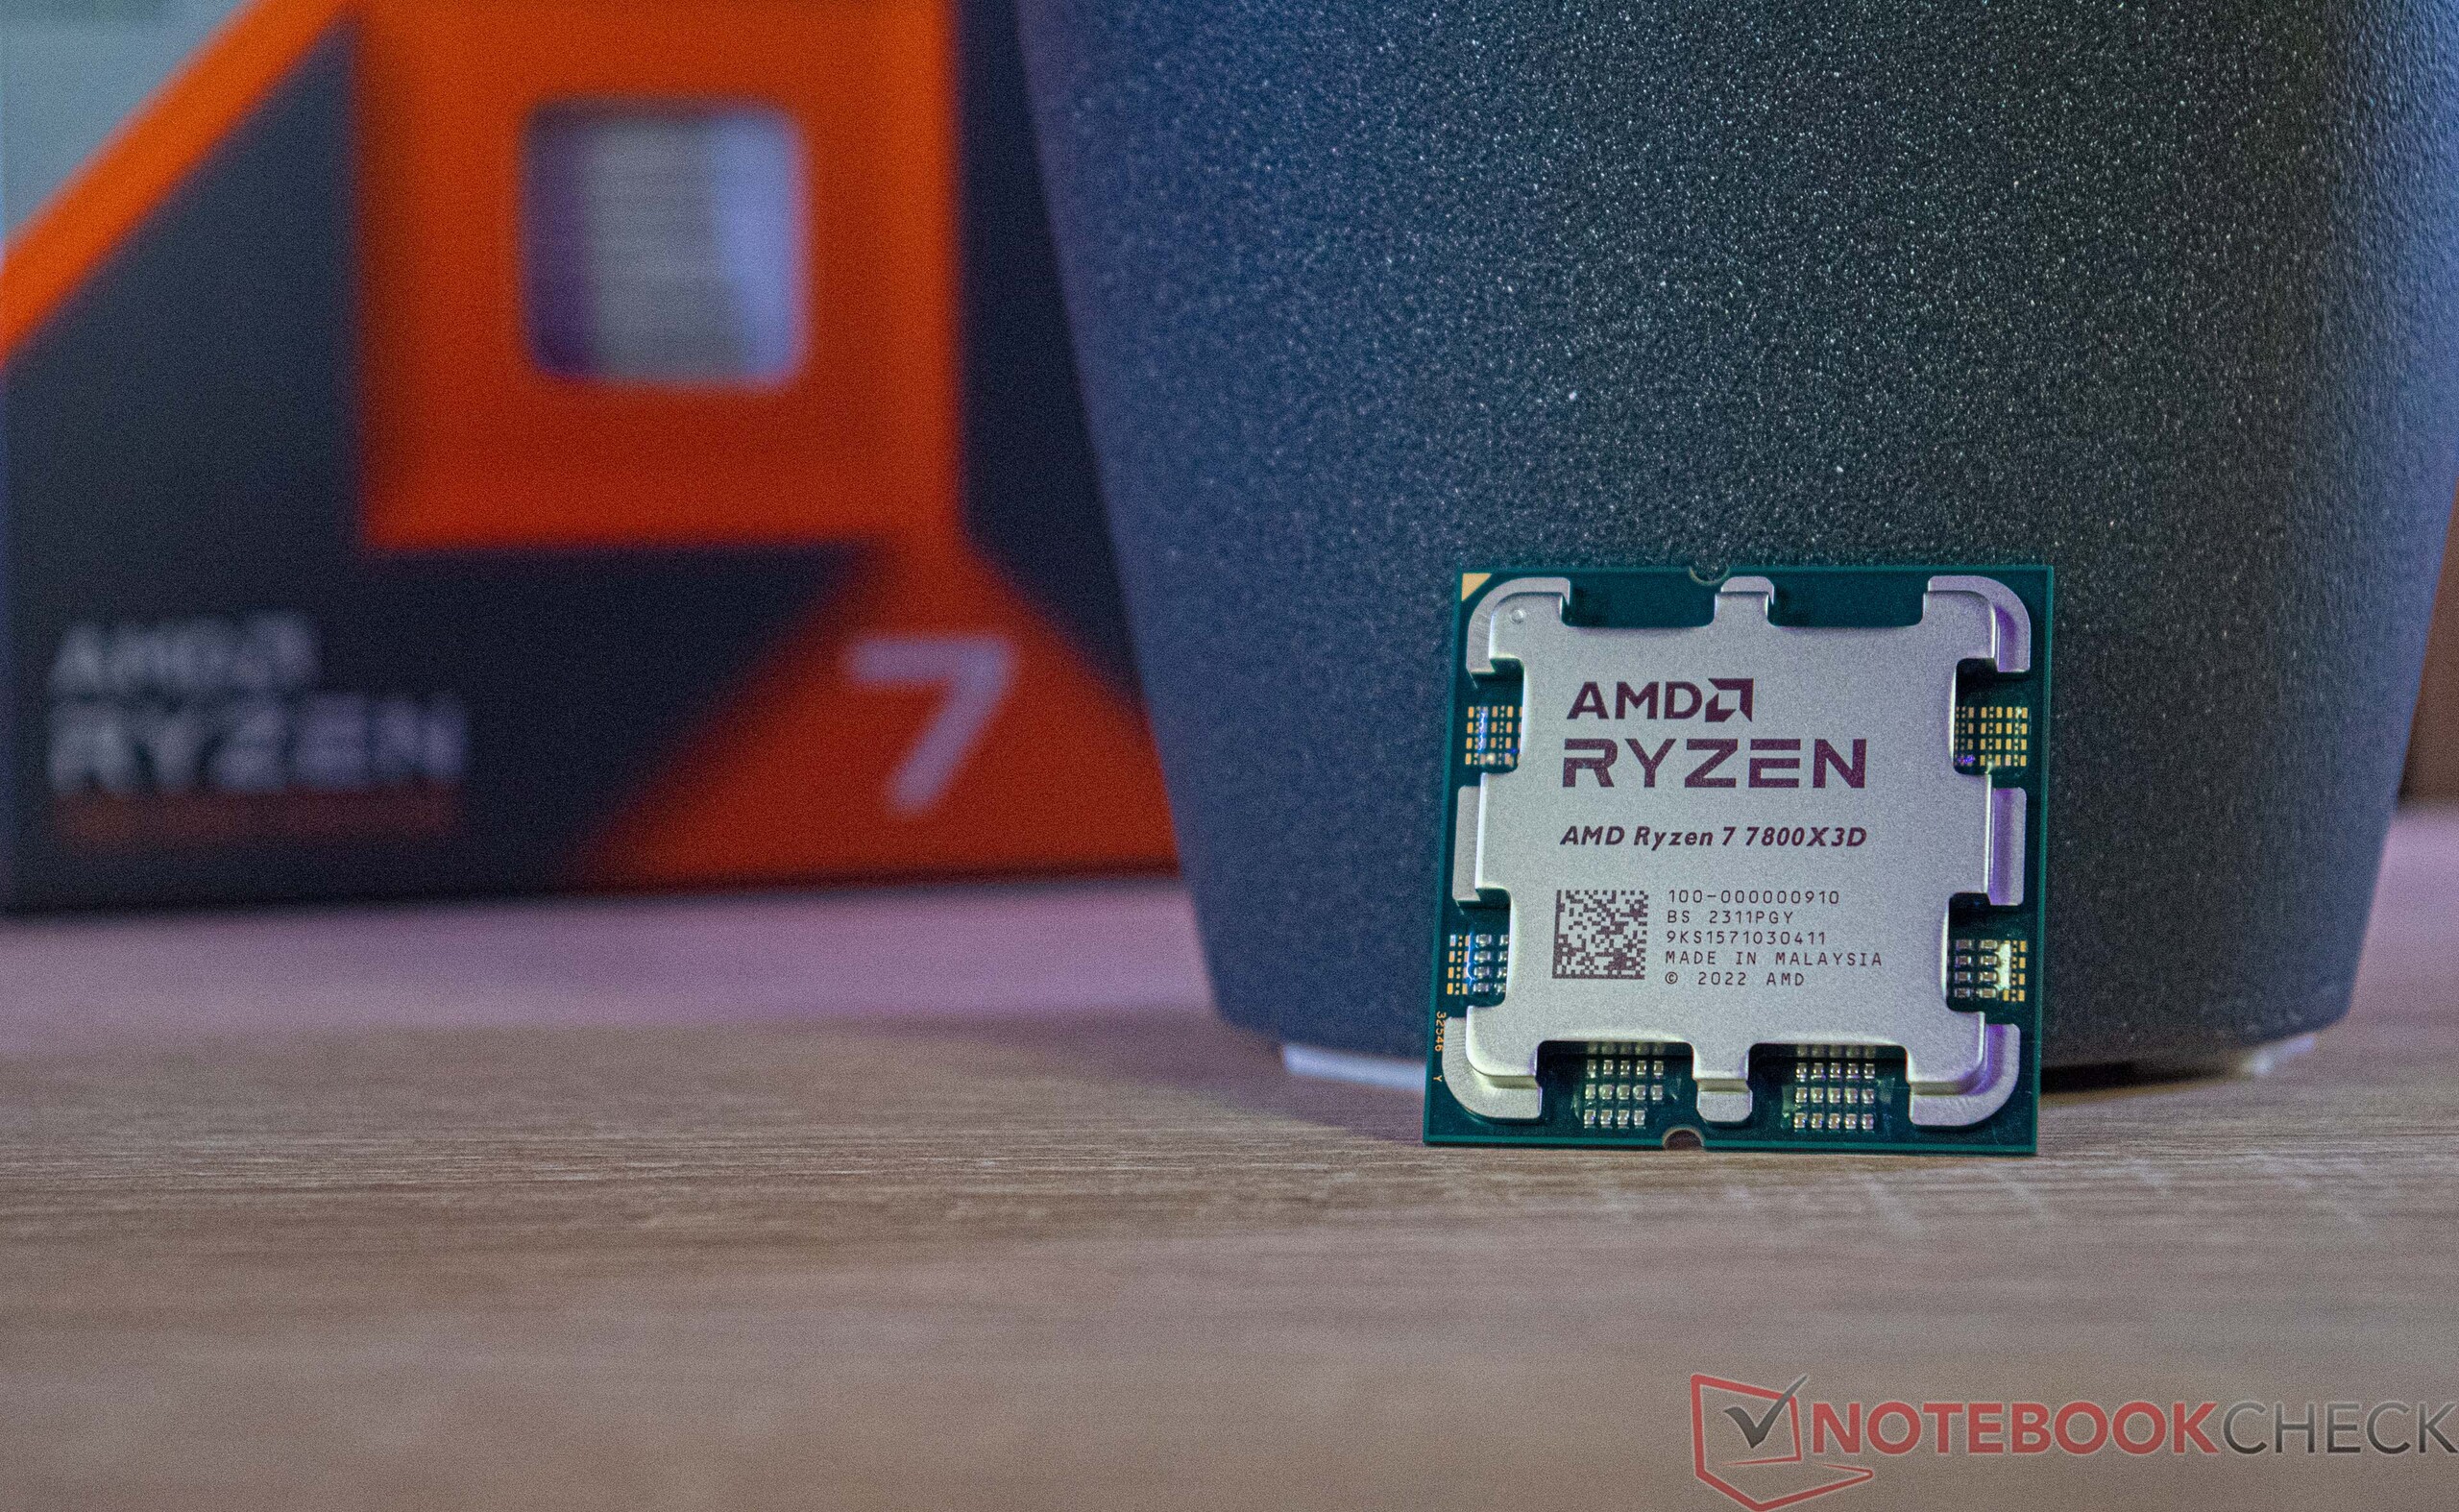
Recensione della CPU desktop AMD Ryzen 7 7800X3D: Più veloce di un Core i9-13900K grazie alla V-Cache 3D e a soli 8 core
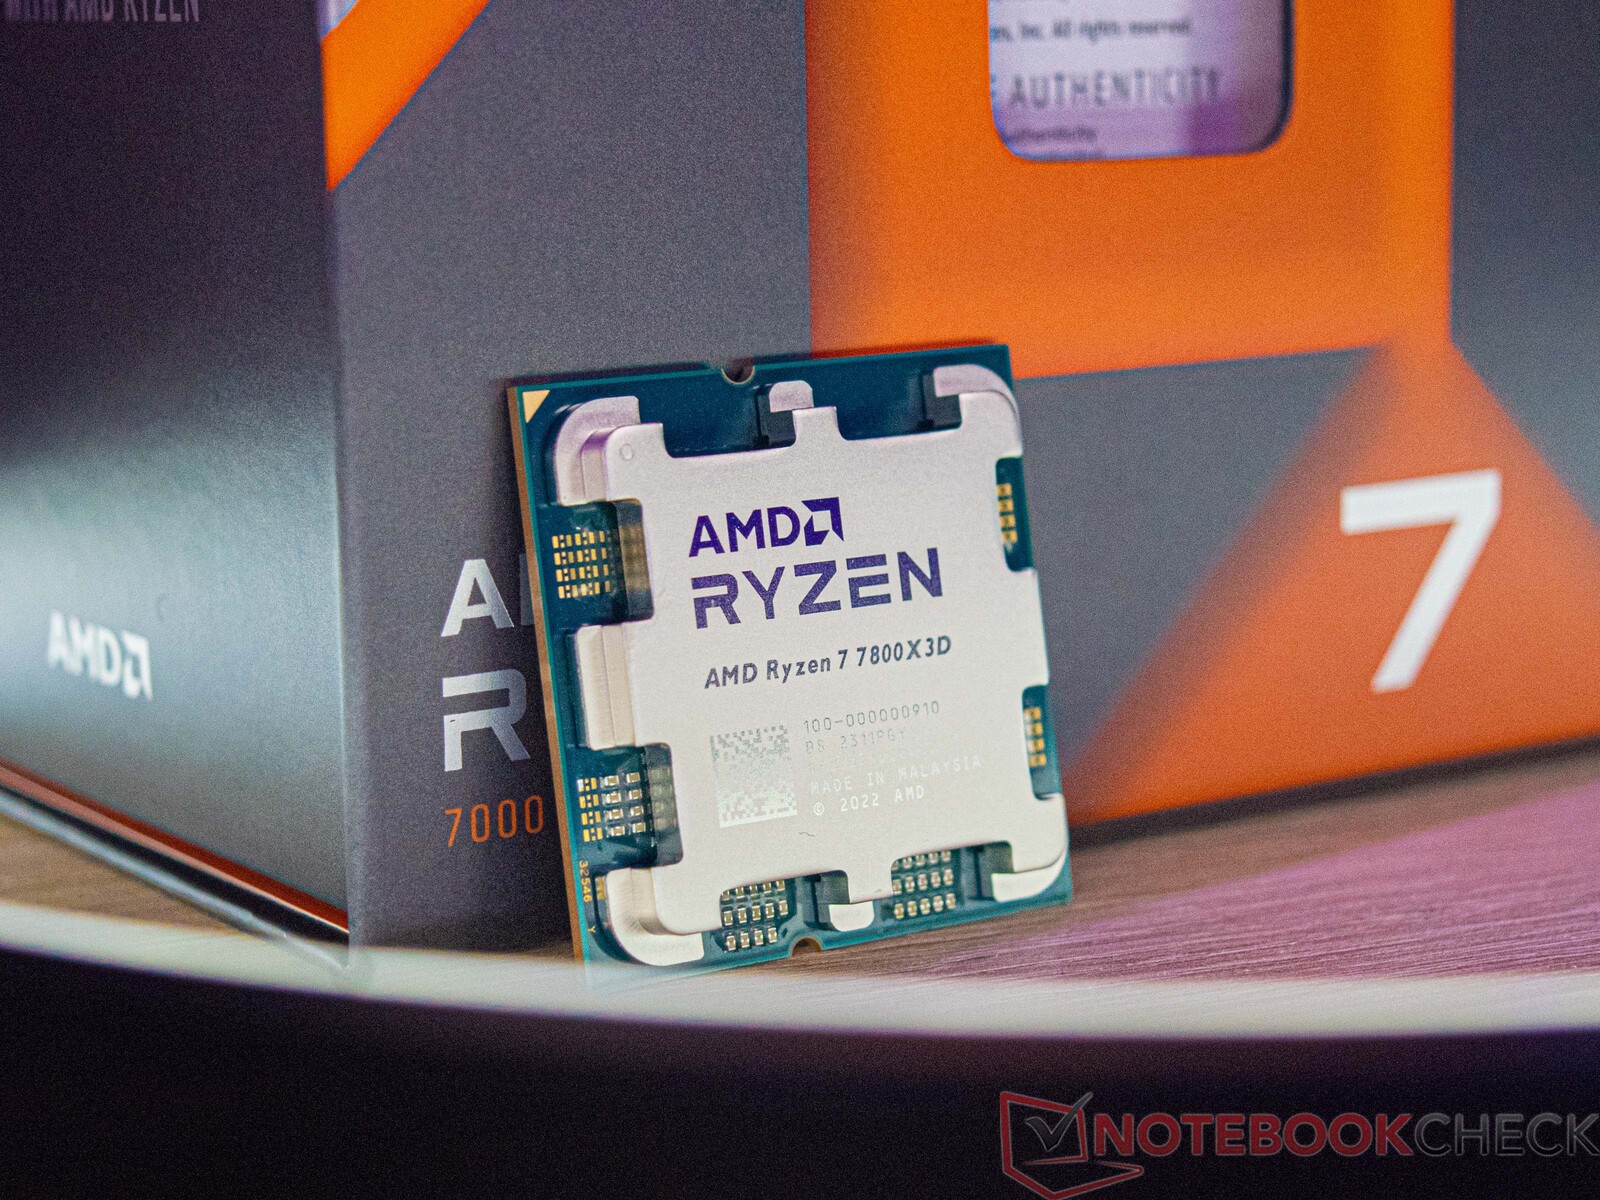
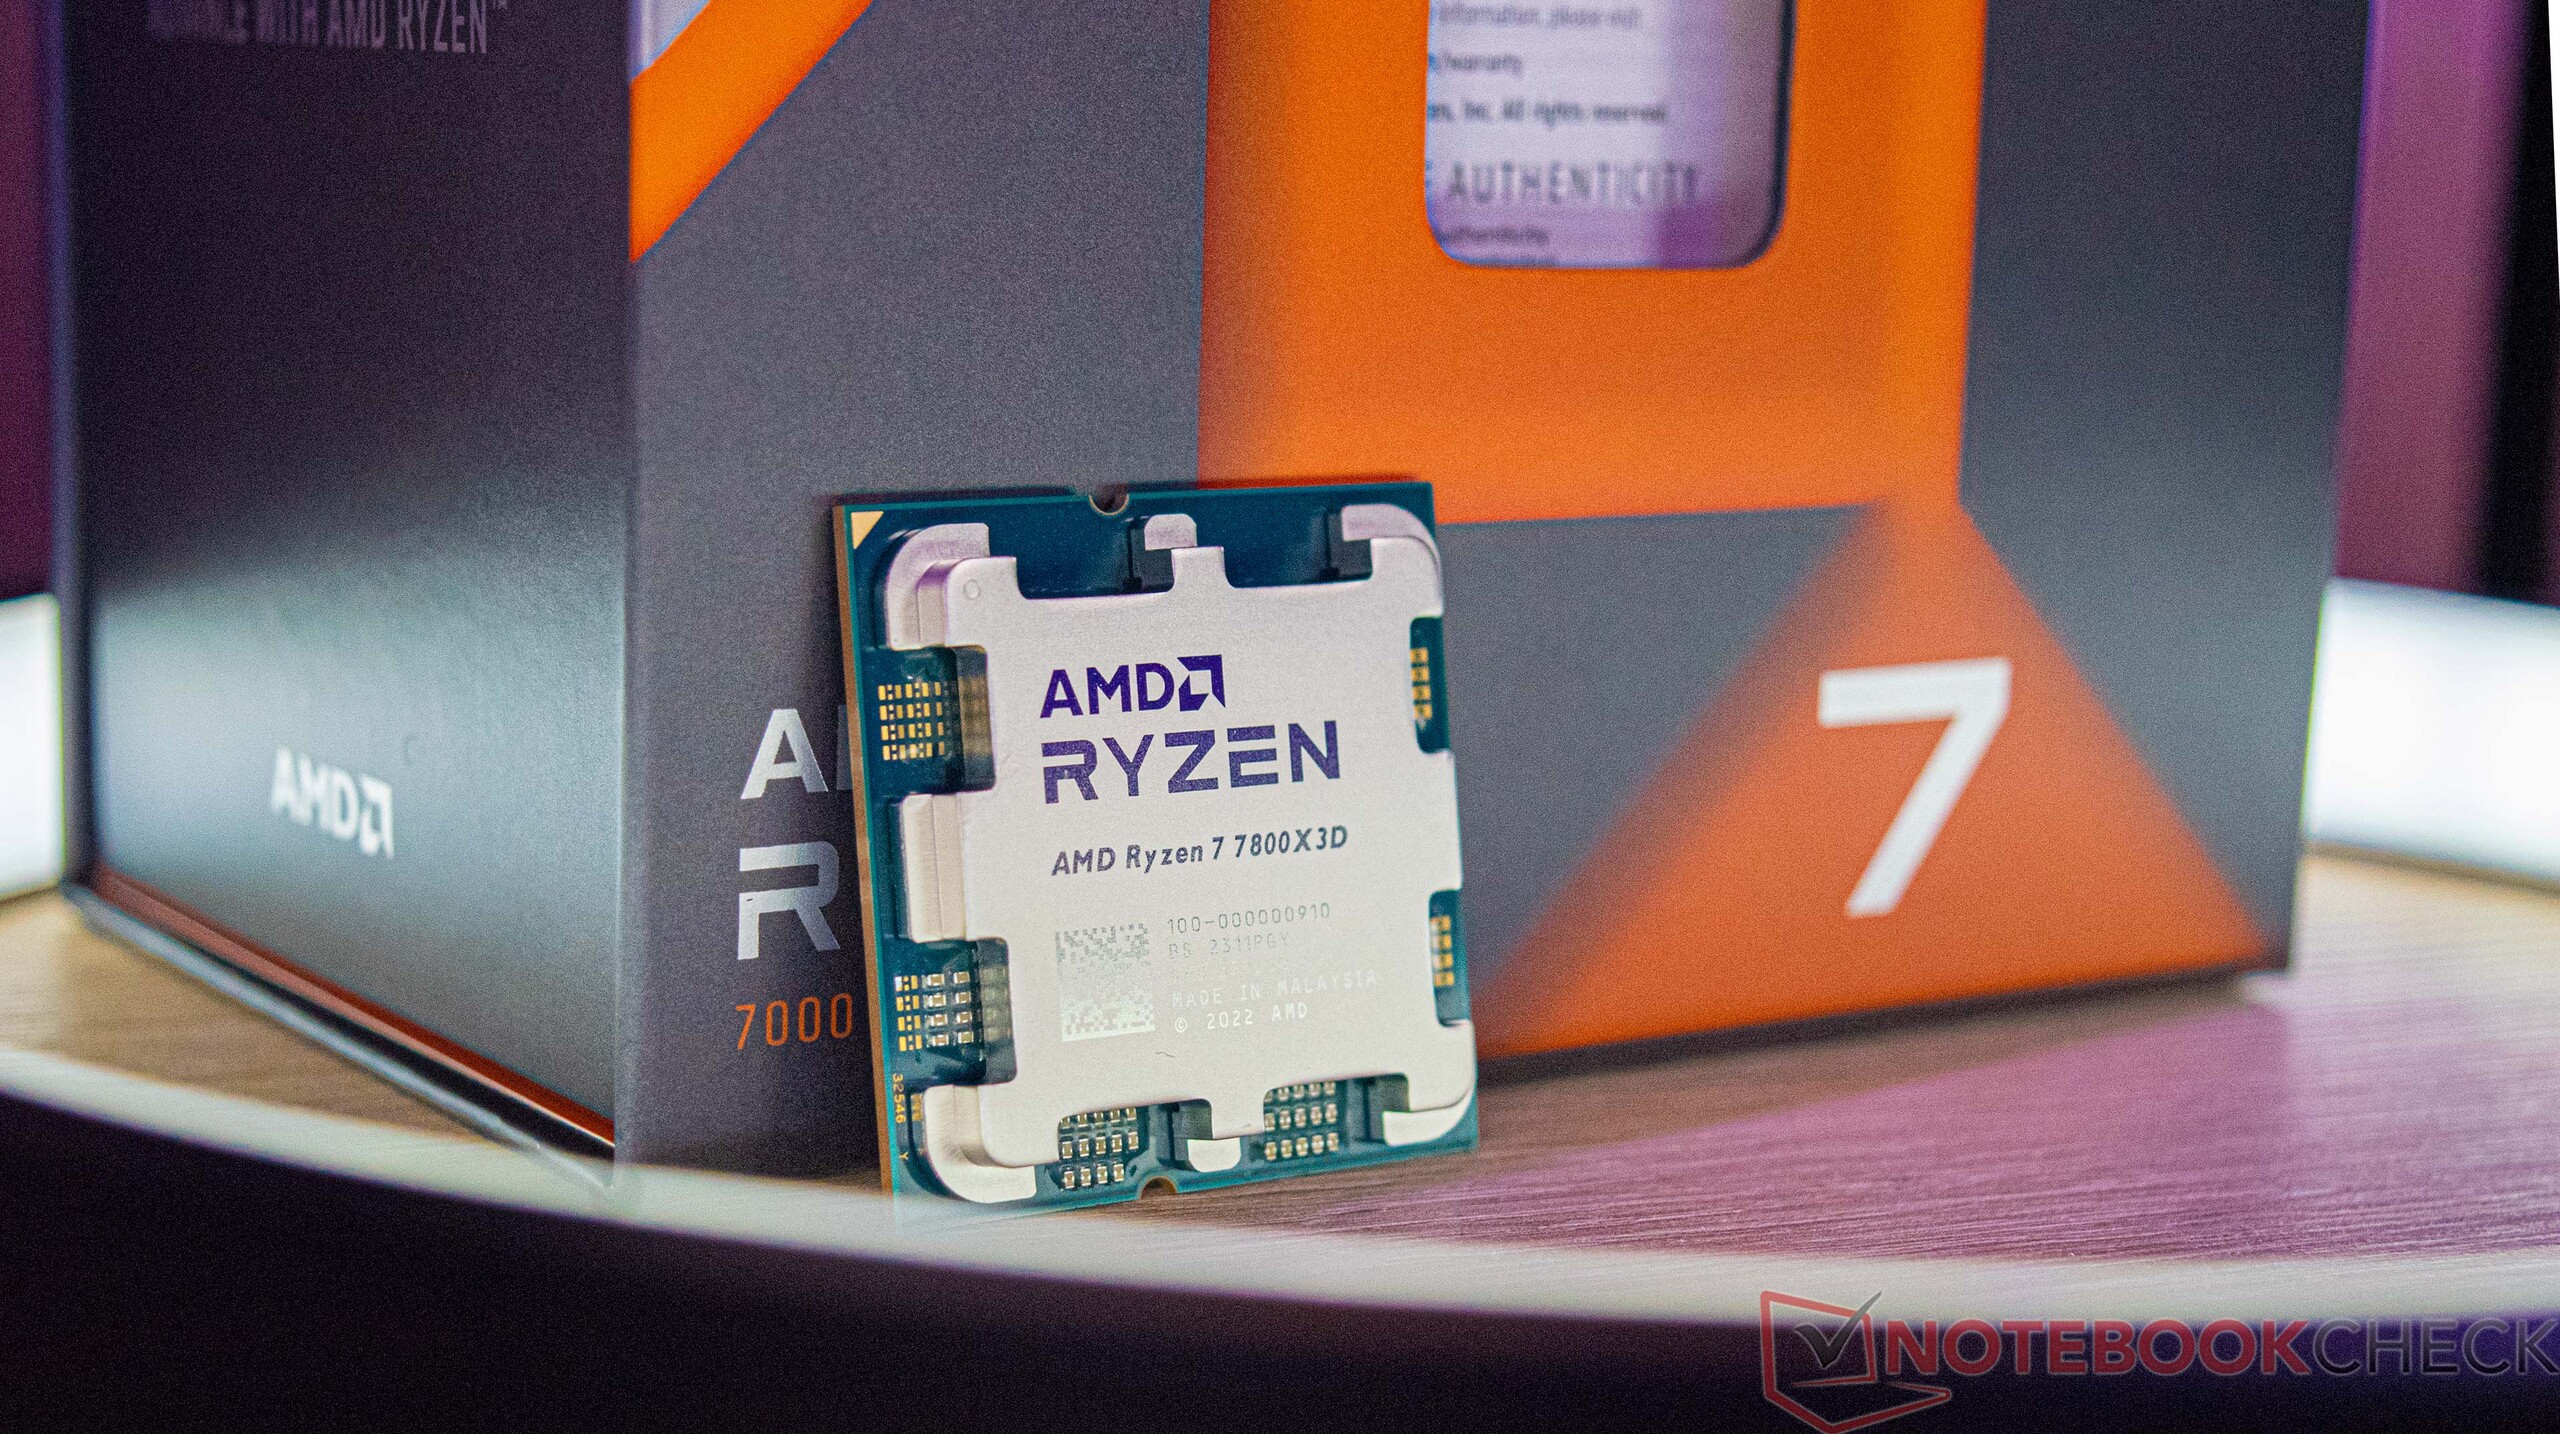
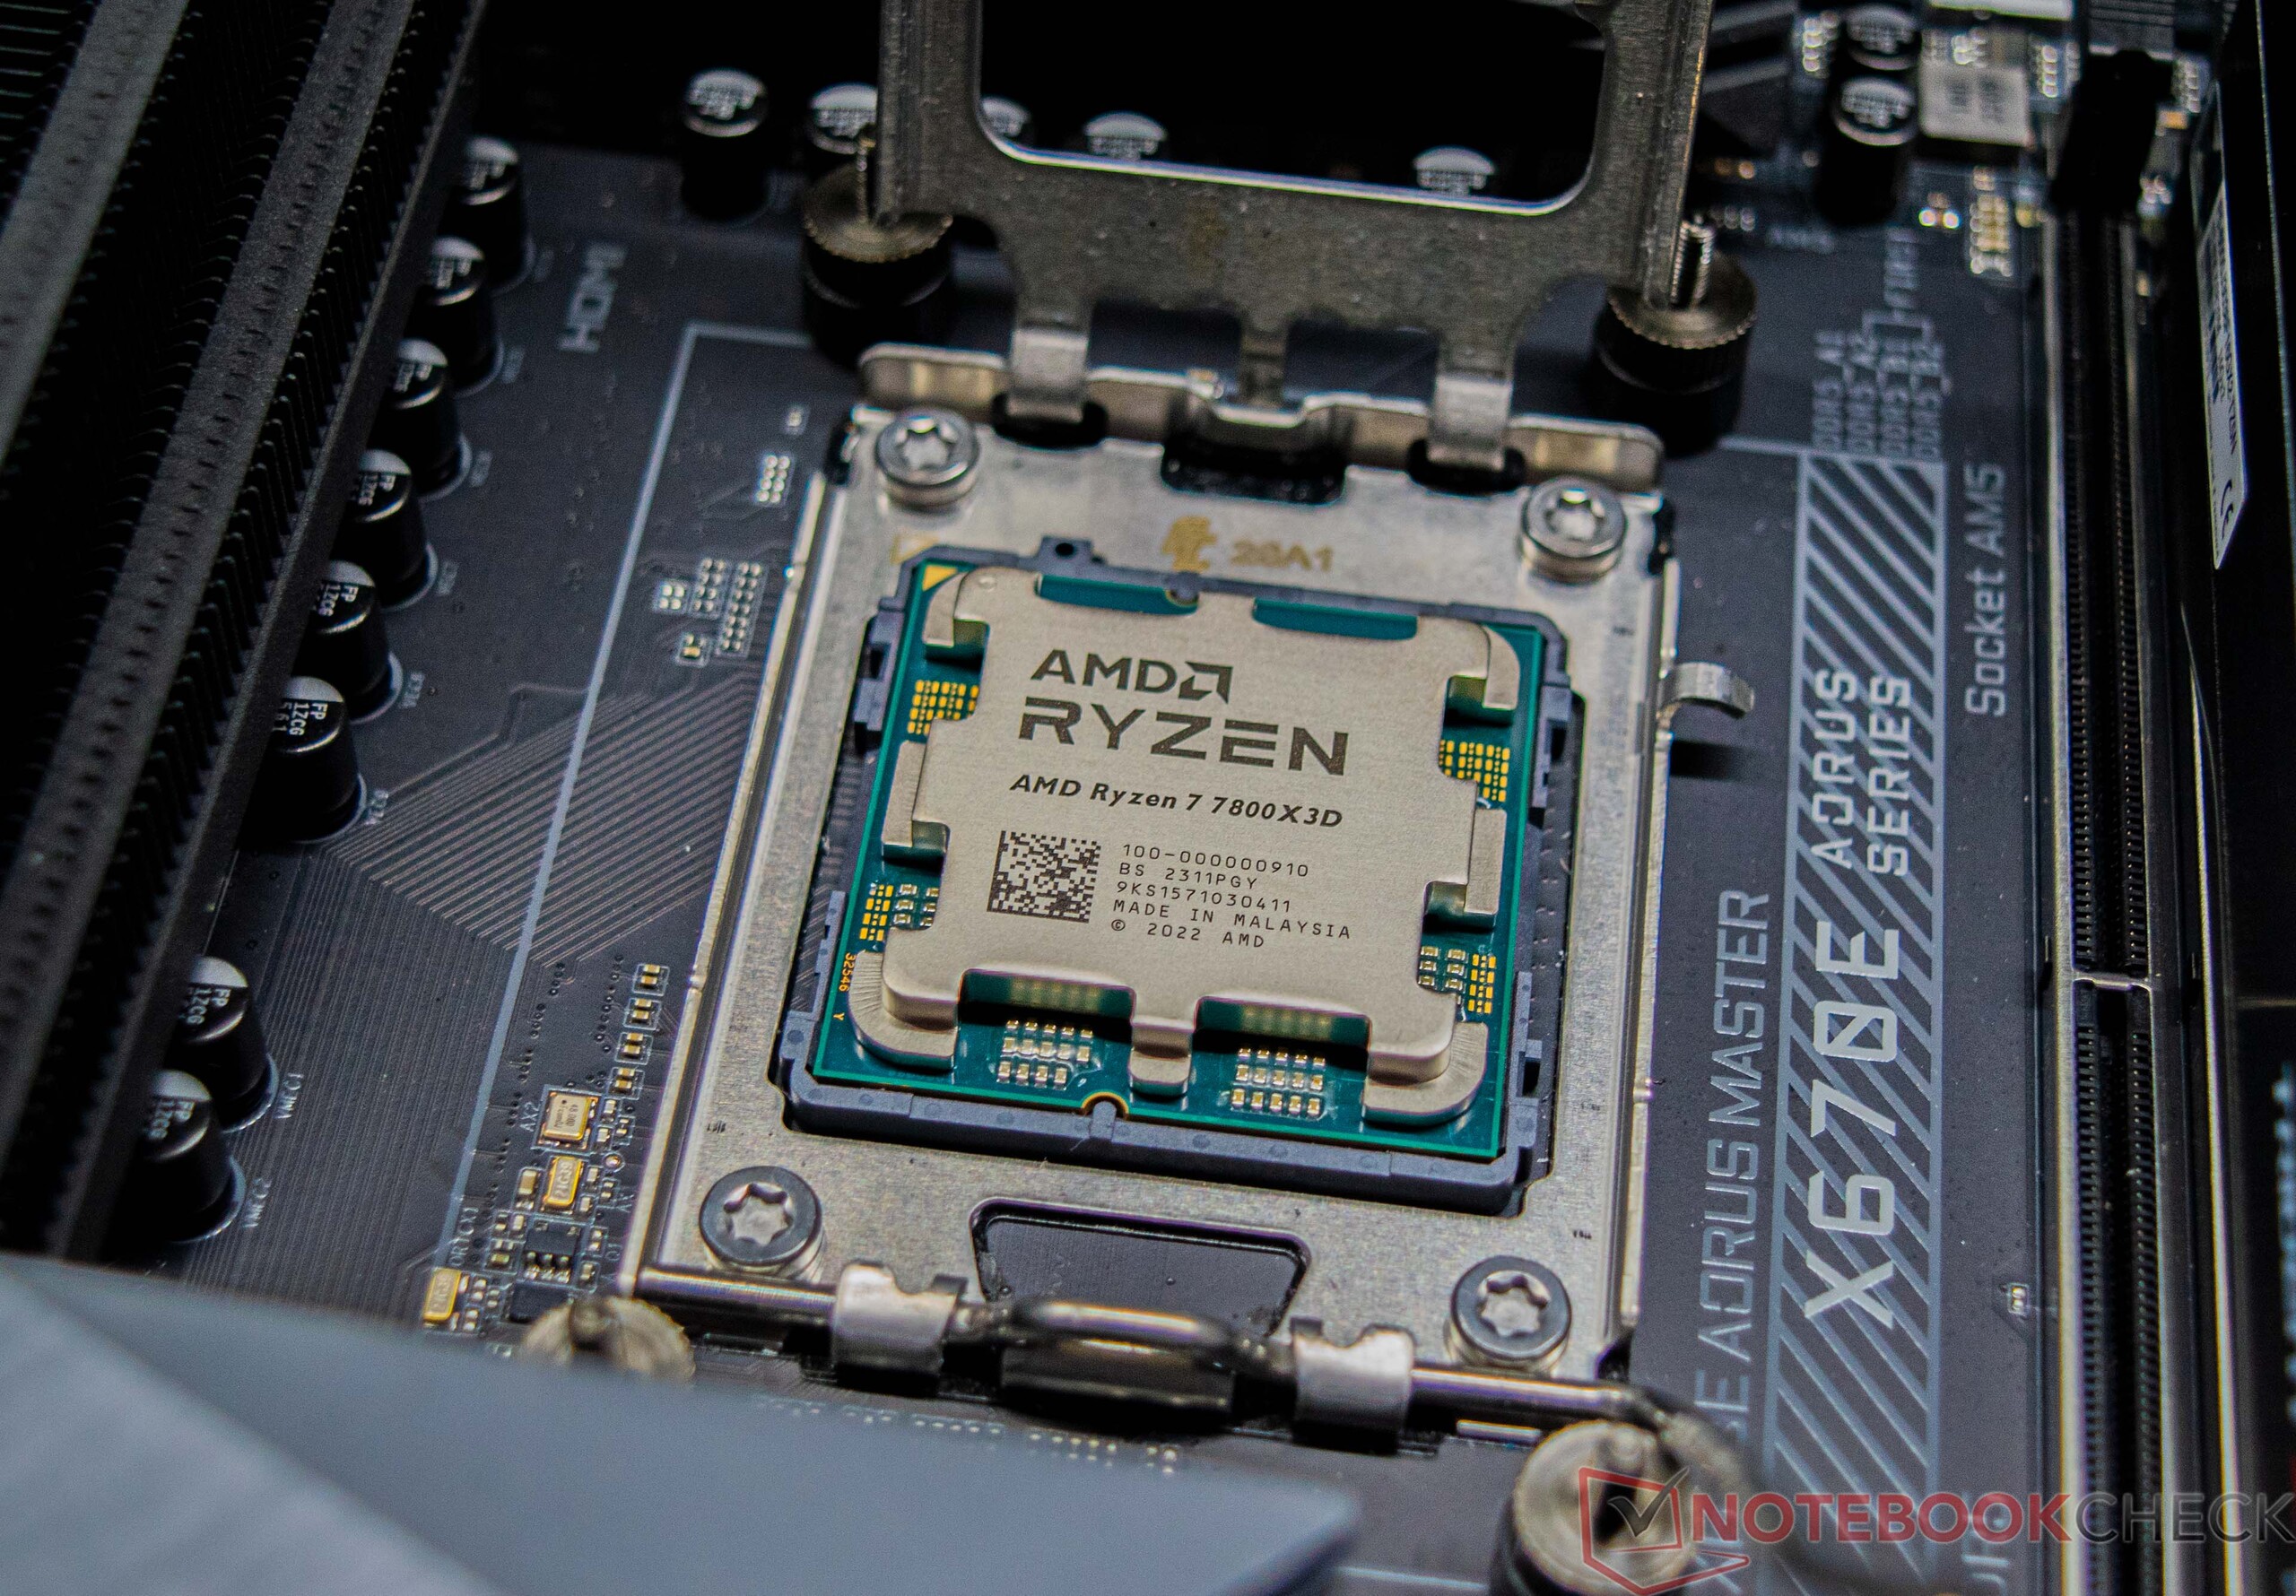
L'AMD Ryzen 7 7800X3D è ora il terzo processore di AMD basato su AM 5 con 3D V-Sync, dopo entrambi i modelli Ryzen 9 (AMD Ryzen 9 7950X3De AMD Ryzen 9 7900X3D). Insieme ai due modelli più grandi, il processore nativo a 8 core è stato presentato lo scorso gennaio al CES di Las Vegas. Tuttavia, si è dovuto aspettare un bel po' prima che il componente venisse finalmente rilasciato sul mercato il 6 aprile 2023.
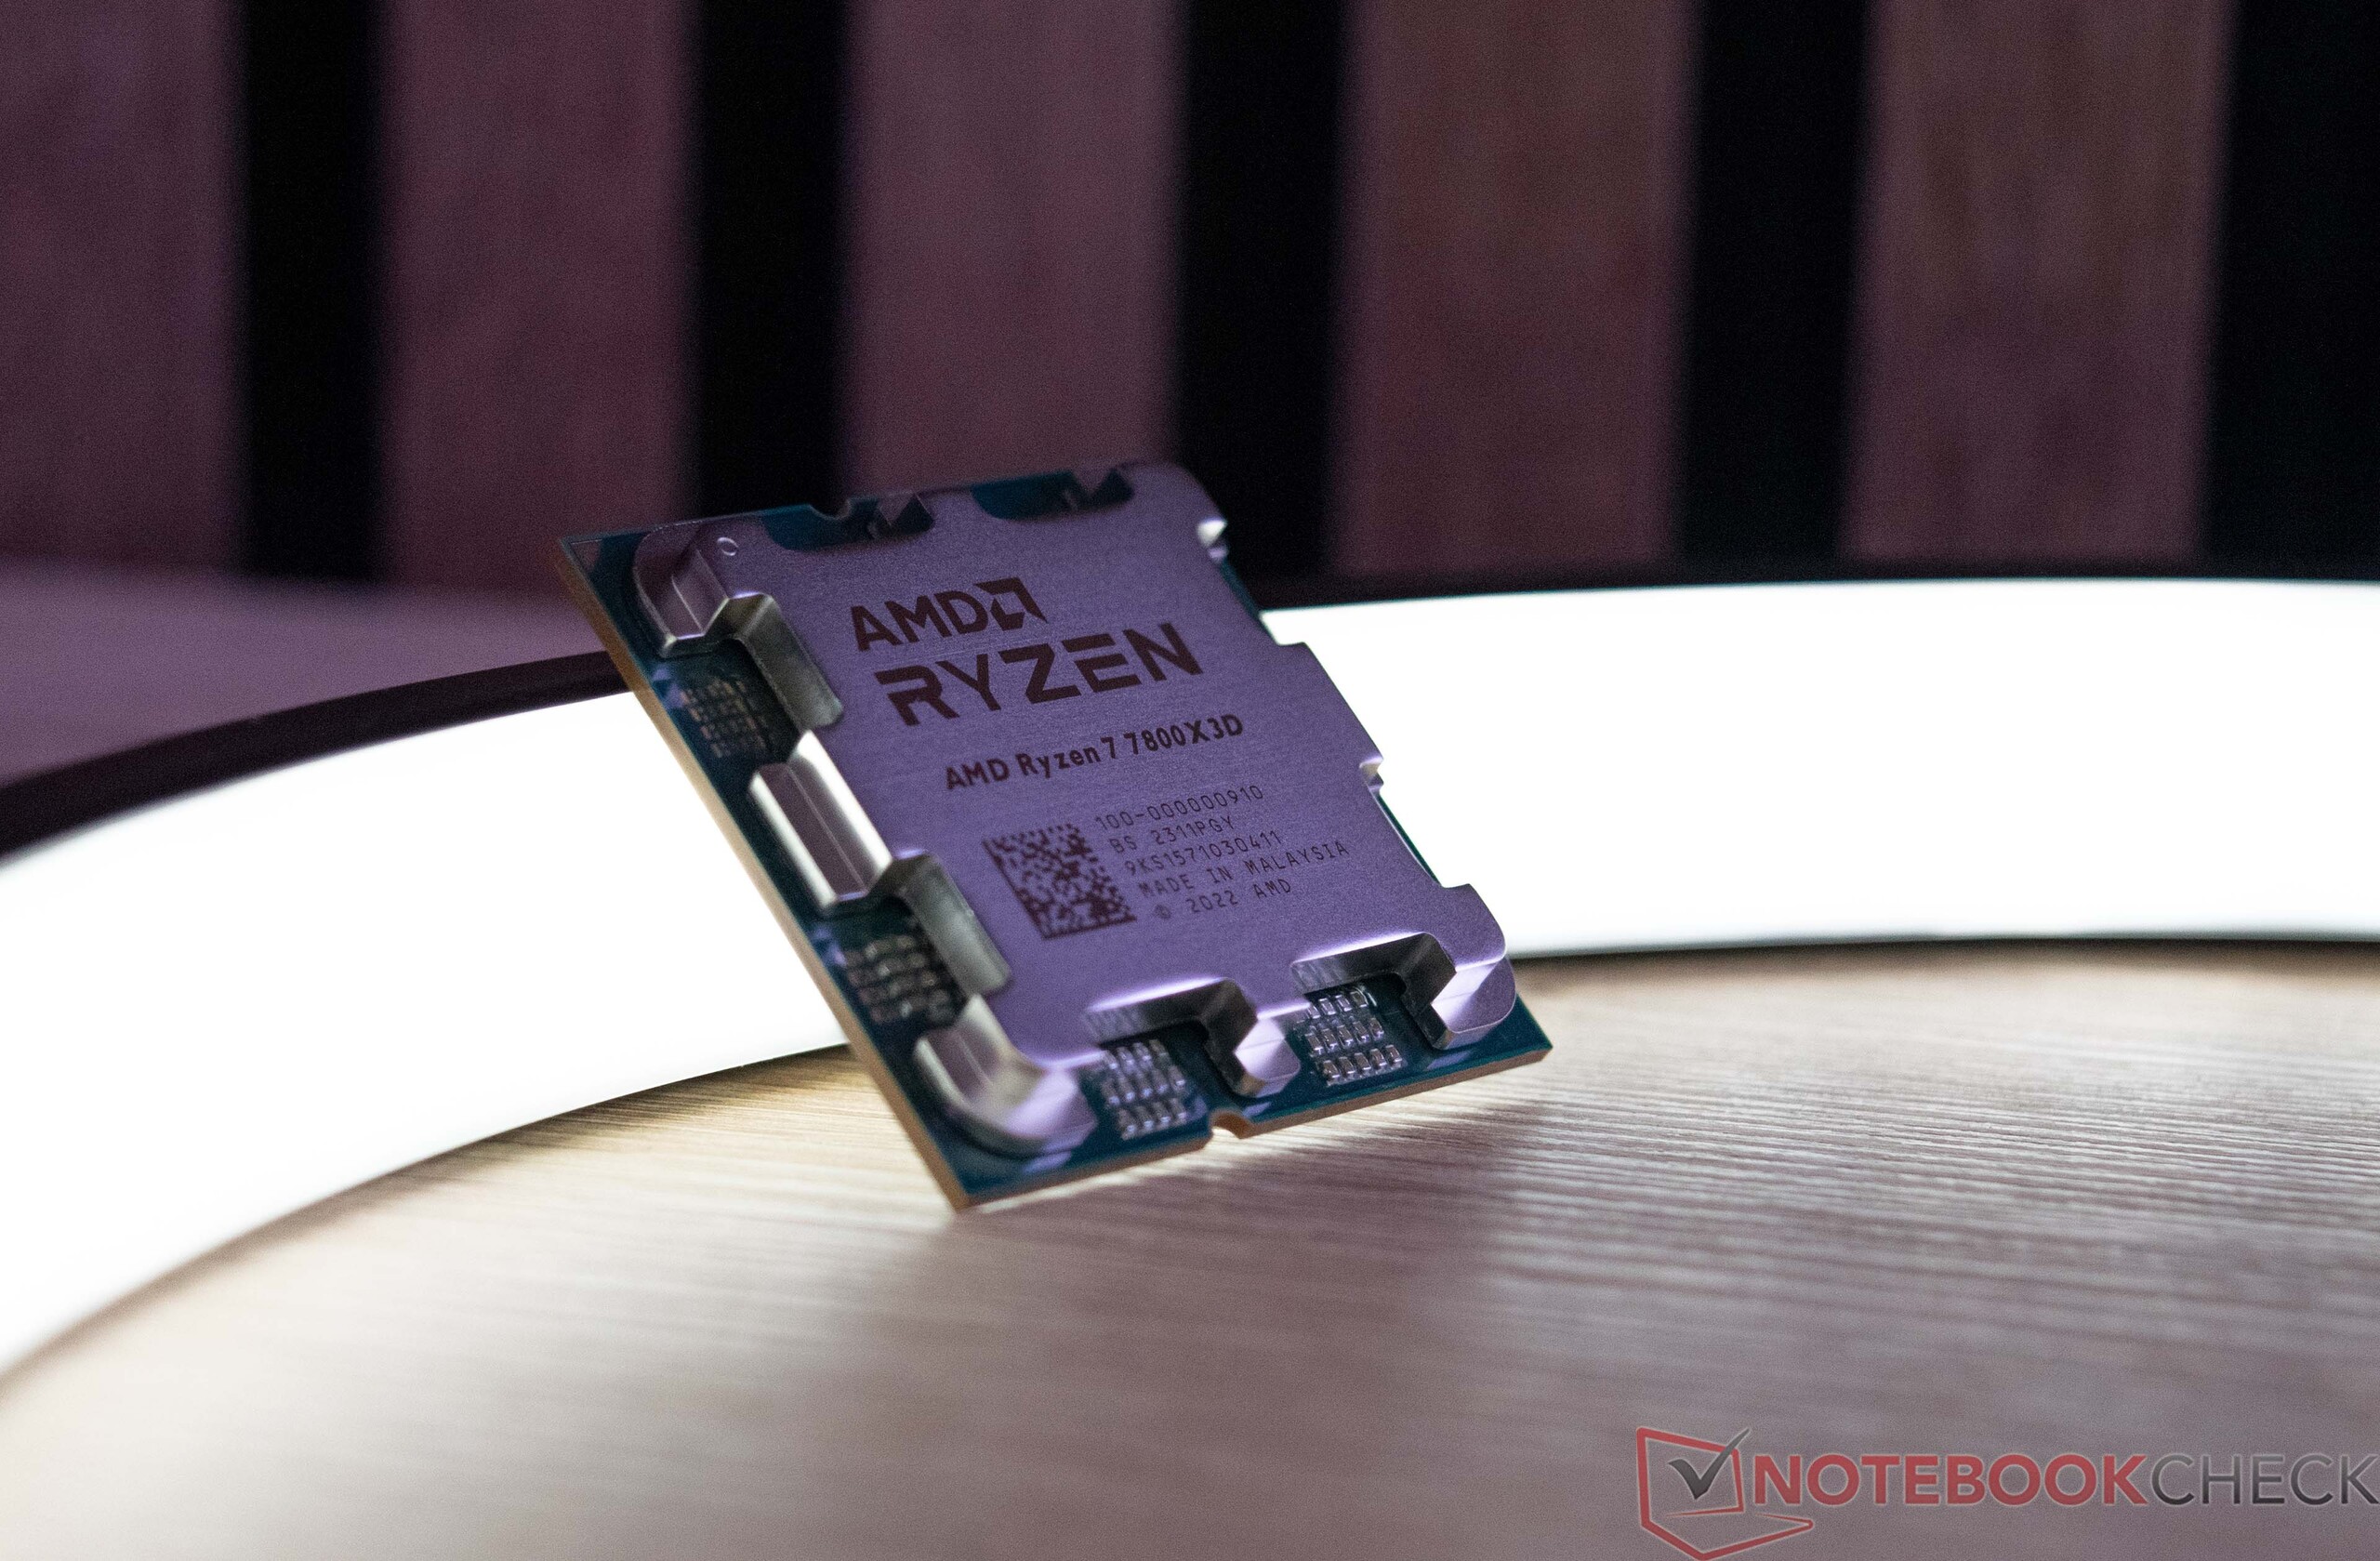
Abbiamo già testato aMD Ryzen 9 7950X3D e siamo rimasti colpiti dalle sue ottime prestazioni e dal basso consumo energetico. Vedremo come se la cava l'AMD Ryzen 7 7800X3D in confronto. In generale, la sua V-Cache 3D dovrebbe comportare un aumento delle prestazioni, il che significa che l'AMD Ryzen 7 5800X3Dbasato su AM4 dovrebbe essere ancora molto popolare. Tuttavia, la sua struttura interna è diversa rispetto a quella di entrambi i modelli Ryzen 9 che hanno questa V-Cache 3D. L'AMD Ryzen 7 7800X3D ha un solo CCD con 8 core, compresa la cache veloce, mentre i modelli Ryzen 9 hanno due CCD con rispettivamente 6 e 8 core della CPU. Tuttavia, solo uno dei due CCD è dotato di V-Cache 3D, mentre l'altro CCD è ben noto a tutti i modelli Ryzen 9 7950X.AMD Ryzen 9 7950X. Un CCD è l'effettivo die della CPU sotto il diffusore di calore, che combina un massimo di otto core.
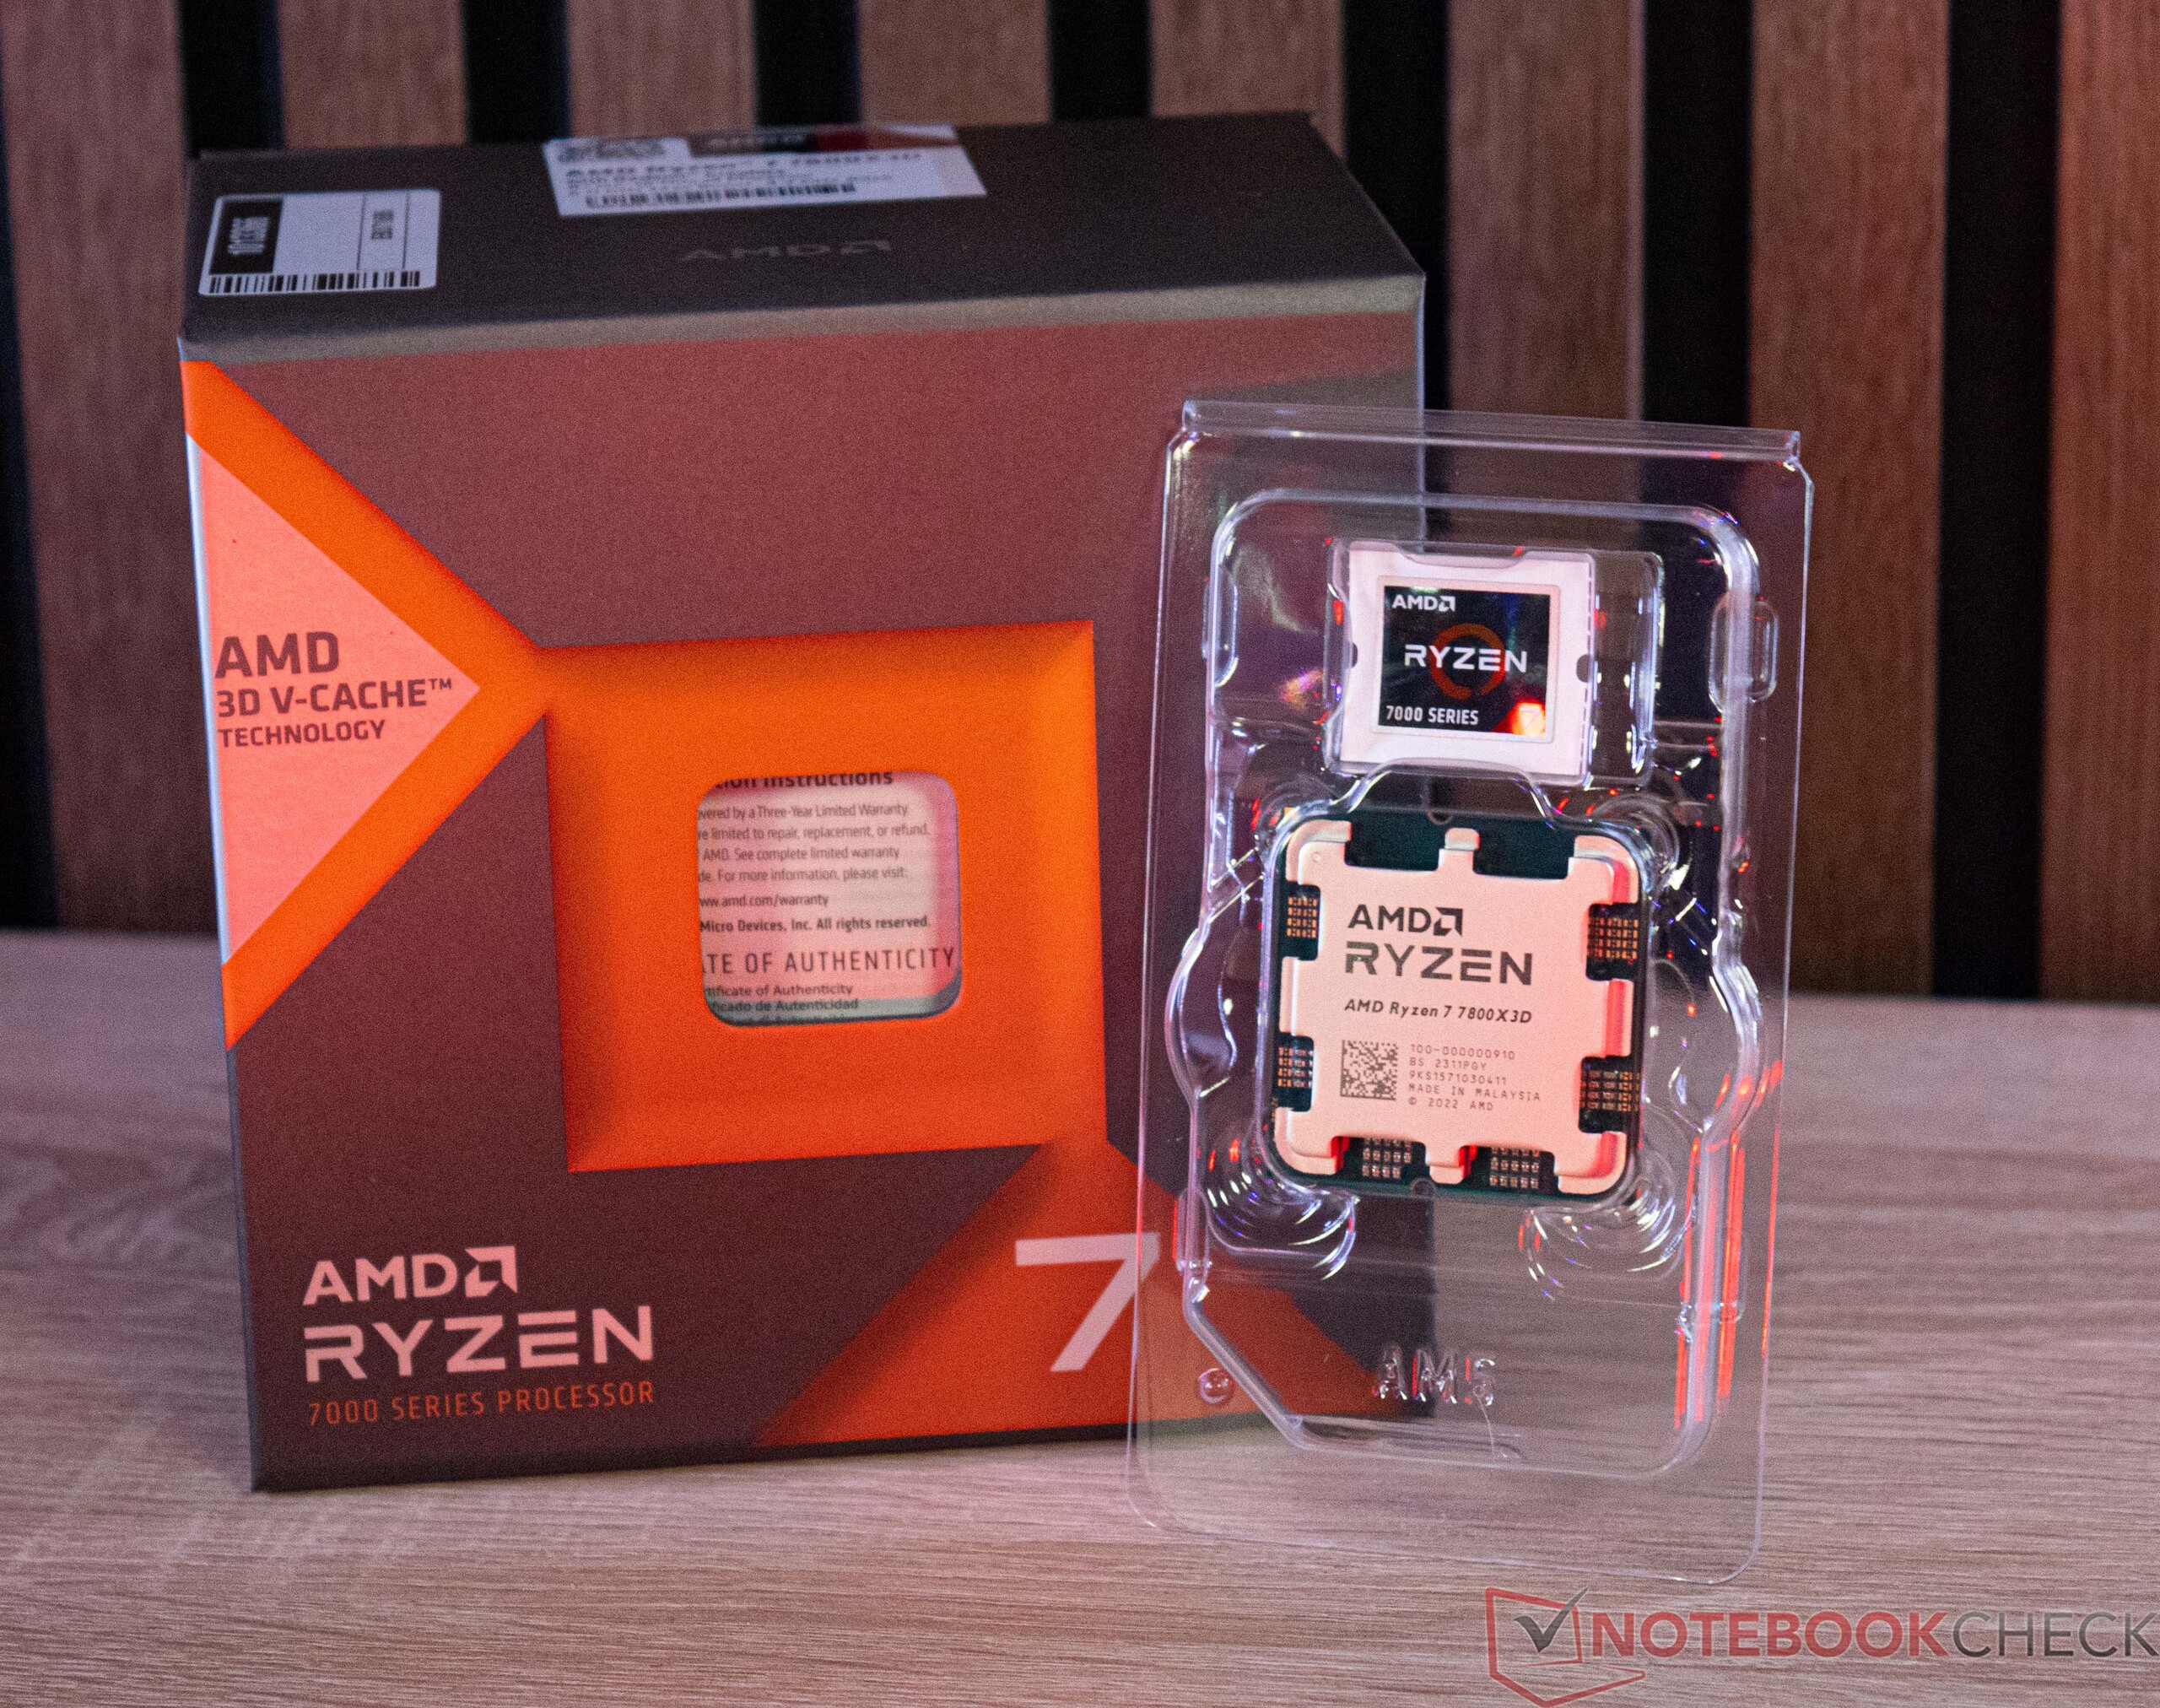
L'AMD Ryzen 7 7800X3D, come tutti i processori della serie Ryzen 7000, richiede il socket AM5 (1.718 contatti). L'aggiornamento da un Ryzen della serie 5000 o precedente comporta l'acquisto di una nuova scheda madre e l'investimento in nuova RAM. Per quanto riguarda il consumo energetico, il produttore indica un TDP di 120 watt. Il consumo massimo, tuttavia, è limitato a 162 watt dal PPT (Package Power Tracking).
La famiglia AMD-Ryzen-7000 in primo piano
| Modello | Cores/Threads | Orologio base | Turbo clock | L2-Cache | L3-Cache | TDP | PPT | Prezzo di lancio |
|---|---|---|---|---|---|---|---|---|
| Ryzen 9 7950X3D | 16/32 | 4,2 GHz | 5,7 GHz | 16x 1 MB | 128 MB | 120 watt | 162 watt | 699 USD |
| Ryzen 9 7950X | 16/32 | 4,5 GHz | 5,7 GHz | 16x 1 MB | 64 MB | 170 watt | 230 watt | 699 USD |
| Ryzen 9 7900X3D | 12/24 | 4,4 GHz | 5,6 GHz | 12x 1 MB | 128 MB | 120 watt | 162 watt | 599 USD |
| Ryzen 9 7900X | 12/24 | 4,7 GHz | 5,6 GHz | 12x 1 MB | 64 MB | 170 watt | 230 watt | 549 USD |
| Ryzen 7 7800X3D | 8/16 | 4,2 GHz | 5,0 GHz | 8x1 MB | 96 MB | 120 watt | 162 watt | 549USD |
| Ryzen 7 7700X | 8/16 | 4,5 GHz | 5,4 GHz | 8x 1 MB | 32 MB | 105 watt | 142 watt | 399 USD |
| Ryzen 5 7600X | 6/12 | 4,7 GHz | 5,3 GHz | 6x 1 MB | 32 MB | 105 watt | 142 watt | 299 USD |
Il nostro sistema di test in dettaglio
Abbiamo utilizzato questo sistema per i seguenti benchmark e test:
- Lian Li O11 Dynamic
- AMD Ryzen 7 7800X3D
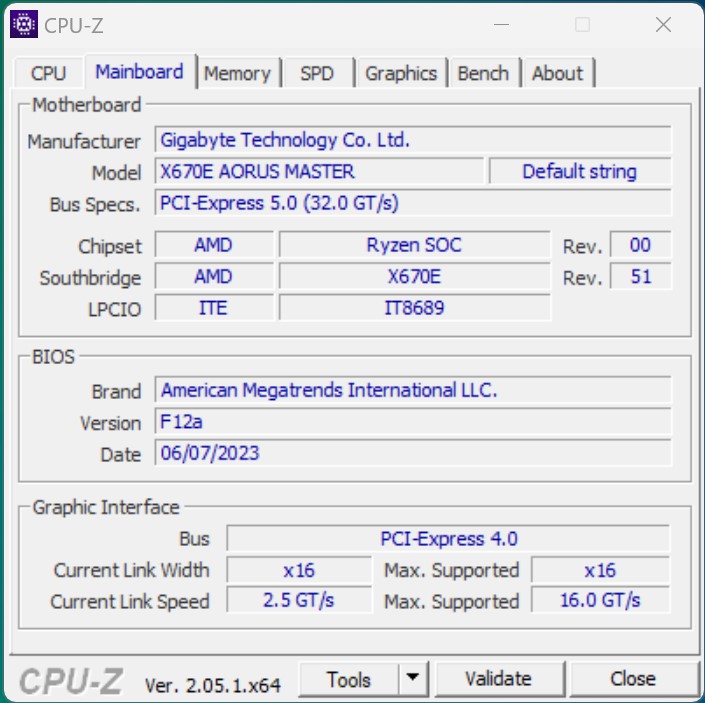
- Gigabyte X670E Aorus Master, BIOS: F12a
- Palit GeForce RTX 4090 GameRock OC
- DeepCool LT360
- Corsair HX1200i
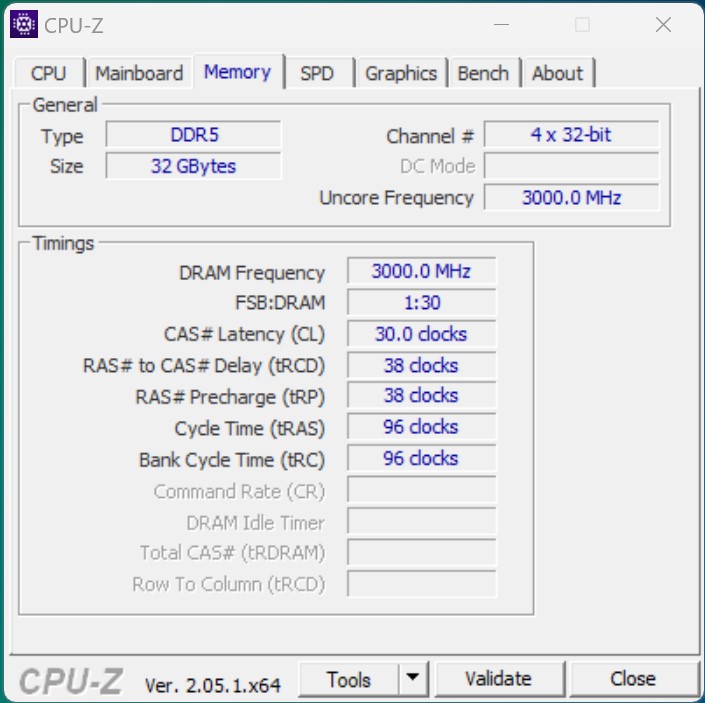
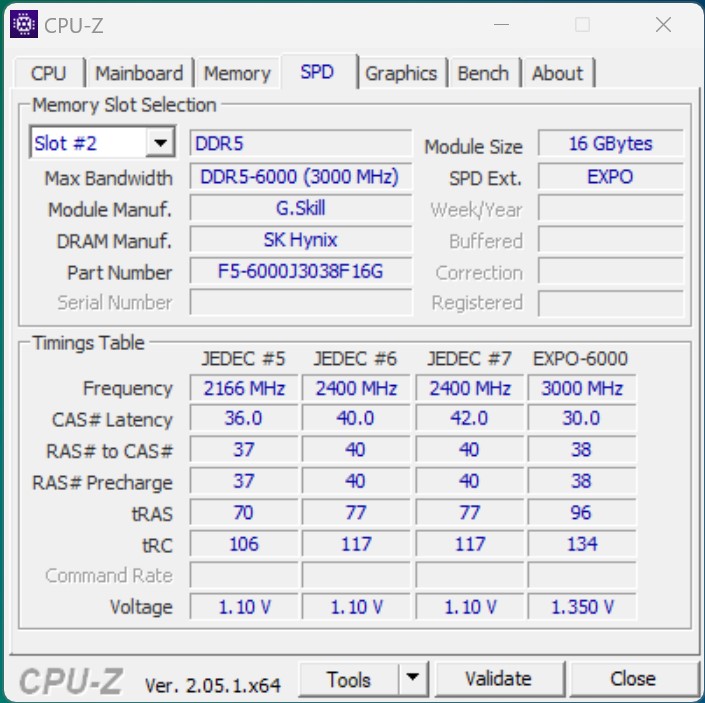
- G.Skill Trident Z5 Neo DDR5-6000 2x 16 GB, EXPO (DDR5-6000 CL30-38-38-96)
- Corsaro MP600
- Microsoft Windows 11 Professional 64 Bit (versione 22H2)

Condizioni di test
Abbiamo eseguito tutti i test sulle prestazioni utilizzando il profilo energetico "Prestazioni massime". Ci siamo discostati da questo profilo solo durante le misurazioni del consumo energetico. Per questo test è stata utilizzata una soluzione DeepCool LT360 AiO come unità di raffreddamento. Secondo il produttore, questa soluzione è elencata tra le unità di raffreddamento compatibili con i processori AMD Ryzen 7000. Di conseguenza, con questa soluzione si va sul sicuro per non violare le specifiche del produttore.
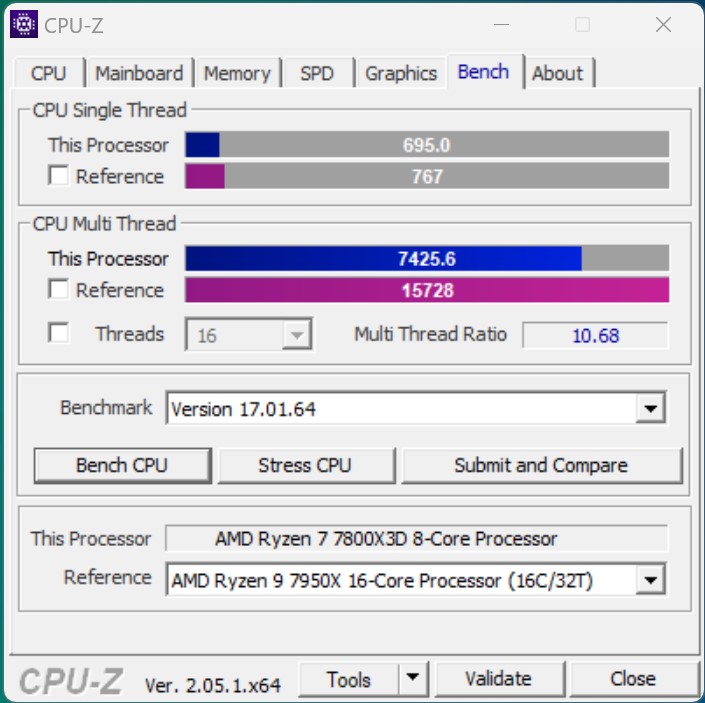
Parametri di riferimento del processore - Un Ryzen 7 7800X3D medio
Prima di dare un'occhiata ai benchmark di gioco, daremo un'occhiata alle prestazioni del processore come CPU pura. Con l'aiuto di una serie di benchmark, abbiamo notato che l'AMD Ryzen 7 7800X3D ha ottenuto prestazioni pari a quelle dell'AMD Ryzen 9 5950X.AMD Ryzen 9 5950X. Rispetto a Intel, questo è stato sufficiente per sconfiggere l'AMD Ryzen 9 5950X.AMD Ryzen 9 5950X. A questo punto, vorremmo ribadire che l'AMD Ryzen 7 7800X3D è un processore a 8 core. Ciò significa che nei benchmark multi-thread è nettamente peggiore di molti suoi concorrenti.
Rispetto all'AMD Ryzen 9 7950X3D Recensione di AMD Ryzen 9 7950X e AMD Ryzen 7 7700X: Prestazioni superlative e guadagni di efficienza che danno filo da torcere a Raptor Lake , il più piccolo Ryzen 7 7800X3D è rimasto indietro di circa il 24%. In questa fase, il Intel Core i9-13900K ha fatto meglio, ottenendo un punto percentuale in più rispetto al modello top di gamma di AMD.
Ulteriori benchmark dei processori sono disponibili qui.
| Performance rating - Percent | |
| Intel Core i9-13900K | |
| AMD Ryzen 9 7950X | |
| AMD Ryzen 9 7950X3D | |
| Intel Core i7-13700K | |
| AMD Ryzen 9 7900X | |
| AMD Ryzen 9 5950X | |
| Intel Core i5-13600K | |
| AMD Ryzen 7 7800X3D | |
| Intel Core i7-12700 | |
| Intel Core i5-12600K | |
| Intel Core i5-13400 | |
| Cinebench R15 | |
| CPU Single 64Bit | |
| Intel Core i9-13900K | |
| AMD Ryzen 9 7950X3D | |
| AMD Ryzen 9 7900X | |
| AMD Ryzen 9 7950X | |
| Intel Core i7-13700K | |
| AMD Ryzen 7 7800X3D | |
| Intel Core i5-13600K | |
| Intel Core i5-12600K | |
| AMD Ryzen 9 5950X | |
| Intel Core i7-12700 | |
| Intel Core i5-13400 | |
| CPU Multi 64Bit | |
| AMD Ryzen 9 7950X | |
| Intel Core i9-13900K | |
| AMD Ryzen 9 7950X3D | |
| AMD Ryzen 9 7900X | |
| Intel Core i7-13700K | |
| AMD Ryzen 9 5950X | |
| Intel Core i5-13600K | |
| Intel Core i7-12700 | |
| AMD Ryzen 7 7800X3D | |
| Intel Core i5-12600K | |
| Intel Core i5-13400 | |
| Cinebench R20 | |
| CPU (Single Core) | |
| Intel Core i9-13900K | |
| Intel Core i7-13700K | |
| AMD Ryzen 9 7950X3D | |
| AMD Ryzen 9 7900X | |
| AMD Ryzen 9 7950X | |
| Intel Core i5-13600K | |
| Intel Core i5-12600K | |
| Intel Core i7-12700 | |
| AMD Ryzen 7 7800X3D | |
| Intel Core i5-13400 | |
| AMD Ryzen 9 5950X | |
| CPU (Multi Core) | |
| Intel Core i9-13900K | |
| AMD Ryzen 9 7950X | |
| AMD Ryzen 9 7950X3D | |
| Intel Core i7-13700K | |
| AMD Ryzen 9 7900X | |
| AMD Ryzen 9 5950X | |
| Intel Core i5-13600K | |
| Intel Core i7-12700 | |
| AMD Ryzen 7 7800X3D | |
| Intel Core i5-12600K | |
| Intel Core i5-13400 | |
| Cinebench R23 | |
| Single Core | |
| Intel Core i9-13900K | |
| Intel Core i7-13700K | |
| AMD Ryzen 9 7950X3D | |
| AMD Ryzen 9 7900X | |
| AMD Ryzen 9 7950X | |
| Intel Core i5-13600K | |
| Intel Core i5-12600K | |
| Intel Core i7-12700 | |
| AMD Ryzen 7 7800X3D | |
| Intel Core i5-13400 | |
| AMD Ryzen 9 5950X | |
| Multi Core | |
| Intel Core i9-13900K | |
| AMD Ryzen 9 7950X | |
| AMD Ryzen 9 7950X3D | |
| Intel Core i7-13700K | |
| AMD Ryzen 9 7900X | |
| AMD Ryzen 9 5950X | |
| Intel Core i5-13600K | |
| Intel Core i7-12700 | |
| AMD Ryzen 7 7800X3D | |
| Intel Core i5-12600K | |
| Intel Core i5-13400 | |
| Cinebench R11.5 | |
| CPU Single 64Bit | |
| Intel Core i9-13900K | |
| AMD Ryzen 9 7950X3D | |
| AMD Ryzen 9 7900X | |
| AMD Ryzen 9 7950X | |
| Intel Core i7-13700K | |
| Intel Core i5-13600K | |
| AMD Ryzen 7 7800X3D | |
| Intel Core i5-12600K | |
| Intel Core i7-12700 | |
| AMD Ryzen 9 5950X | |
| Intel Core i5-13400 | |
| CPU Multi 64Bit | |
| Intel Core i9-13900K | |
| AMD Ryzen 9 7950X | |
| AMD Ryzen 9 7950X3D | |
| AMD Ryzen 9 7900X | |
| Intel Core i7-13700K | |
| AMD Ryzen 9 5950X | |
| Intel Core i5-13600K | |
| Intel Core i7-12700 | |
| AMD Ryzen 7 7800X3D | |
| Intel Core i5-12600K | |
| Intel Core i5-13400 | |
| Blender - v2.79 BMW27 CPU | |
| Intel Core i5-13400 | |
| Intel Core i5-12600K | |
| AMD Ryzen 7 7800X3D | |
| Intel Core i7-12700 | |
| Intel Core i5-13600K | |
| AMD Ryzen 9 5950X | |
| AMD Ryzen 9 7900X | |
| Intel Core i7-13700K | |
| AMD Ryzen 9 7950X3D | |
| AMD Ryzen 9 7950X | |
| Intel Core i9-13900K | |
| wPrime 2.10 | |
| 32m | |
| Intel Core i5-12600K | |
| Intel Core i5-13400 | |
| Intel Core i7-12700 | |
| AMD Ryzen 9 5950X | |
| Intel Core i5-13600K | |
| AMD Ryzen 7 7800X3D | |
| Intel Core i7-13700K | |
| AMD Ryzen 9 7950X3D | |
| Intel Core i9-13900K | |
| AMD Ryzen 9 7900X | |
| AMD Ryzen 9 7950X | |
| 1024m | |
| Intel Core i5-13400 | |
| Intel Core i7-12700 | |
| Intel Core i5-12600K | |
| Intel Core i5-13600K | |
| Intel Core i7-13700K | |
| Intel Core i9-13900K | |
| AMD Ryzen 9 5950X | |
| AMD Ryzen 7 7800X3D | |
| AMD Ryzen 9 7900X | |
| AMD Ryzen 9 7950X3D | |
| AMD Ryzen 9 7950X | |
| X264 HD Benchmark 4.0 | |
| Pass 1 | |
| Intel Core i9-13900K | |
| Intel Core i7-13700K | |
| AMD Ryzen 9 7950X3D | |
| Intel Core i5-13600K | |
| AMD Ryzen 9 7950X | |
| AMD Ryzen 9 7900X | |
| Intel Core i7-12700 | |
| AMD Ryzen 7 7800X3D | |
| AMD Ryzen 9 5950X | |
| Intel Core i5-12600K | |
| Intel Core i5-13400 | |
| Pass 2 | |
| AMD Ryzen 9 7950X | |
| Intel Core i9-13900K | |
| AMD Ryzen 9 7950X3D | |
| AMD Ryzen 9 7900X | |
| Intel Core i7-13700K | |
| AMD Ryzen 9 5950X | |
| Intel Core i5-13600K | |
| Intel Core i7-12700 | |
| AMD Ryzen 7 7800X3D | |
| Intel Core i5-12600K | |
| Intel Core i5-13400 | |
| WinRAR - Result | |
| AMD Ryzen 9 7900X | |
| AMD Ryzen 7 7800X3D | |
| AMD Ryzen 9 7950X3D | |
| AMD Ryzen 9 7950X | |
| Intel Core i9-13900K | |
| Intel Core i7-13700K | |
| AMD Ryzen 9 5950X | |
| Intel Core i5-13600K | |
| Intel Core i7-12700 | |
| Intel Core i5-13400 | |
| Intel Core i5-12600K | |
| TrueCrypt | |
| AES Mean 100MB | |
| AMD Ryzen 9 7950X | |
| Intel Core i9-13900K | |
| AMD Ryzen 9 5950X | |
| AMD Ryzen 9 7950X3D | |
| Intel Core i5-13600K | |
| Intel Core i7-13700K | |
| AMD Ryzen 7 7800X3D | |
| AMD Ryzen 9 7900X | |
| Intel Core i7-12700 | |
| Intel Core i5-12600K | |
| Intel Core i5-13400 | |
| Twofish Mean 100MB | |
| Intel Core i9-13900K | |
| AMD Ryzen 9 7950X | |
| AMD Ryzen 9 7950X3D | |
| Intel Core i7-13700K | |
| AMD Ryzen 9 5950X | |
| Intel Core i5-13600K | |
| AMD Ryzen 9 7900X | |
| Intel Core i7-12700 | |
| Intel Core i5-12600K | |
| AMD Ryzen 7 7800X3D | |
| Intel Core i5-13400 | |
| Serpent Mean 100MB | |
| Intel Core i9-13900K | |
| AMD Ryzen 9 7950X | |
| AMD Ryzen 9 7950X3D | |
| AMD Ryzen 9 5950X | |
| Intel Core i7-13700K | |
| Intel Core i5-13600K | |
| AMD Ryzen 9 7900X | |
| Intel Core i7-12700 | |
| Intel Core i5-12600K | |
| AMD Ryzen 7 7800X3D | |
| Intel Core i5-13400 | |
| Geekbench 5.5 | |
| Multi-Core | |
| AMD Ryzen 9 7950X3D | |
| Intel Core i9-13900K | |
| AMD Ryzen 9 7950X | |
| AMD Ryzen 9 7900X | |
| Intel Core i7-13700K | |
| AMD Ryzen 9 5950X | |
| Intel Core i5-13600K | |
| Intel Core i7-12700 | |
| AMD Ryzen 7 7800X3D | |
| Intel Core i5-12600K | |
| Intel Core i5-13400 | |
| Single-Core | |
| AMD Ryzen 9 7950X3D | |
| Intel Core i9-13900K | |
| AMD Ryzen 9 7900X | |
| AMD Ryzen 9 7950X | |
| Intel Core i7-13700K | |
| AMD Ryzen 7 7800X3D | |
| Intel Core i5-13600K | |
| Intel Core i7-12700 | |
| Intel Core i5-12600K | |
| Intel Core i5-13400 | |
| AMD Ryzen 9 5950X | |
| Geekbench 5.0 | |
| 5.0 Multi-Core | |
| Intel Core i9-13900K | |
| AMD Ryzen 9 7950X3D | |
| AMD Ryzen 9 7950X | |
| AMD Ryzen 9 7900X | |
| Intel Core i7-13700K | |
| Intel Core i5-13600K | |
| AMD Ryzen 9 5950X | |
| Intel Core i7-12700 | |
| AMD Ryzen 7 7800X3D | |
| Intel Core i5-12600K | |
| Intel Core i5-13400 | |
| 5.0 Single-Core | |
| Intel Core i9-13900K | |
| AMD Ryzen 9 7900X | |
| AMD Ryzen 9 7950X3D | |
| AMD Ryzen 9 7950X | |
| Intel Core i7-13700K | |
| AMD Ryzen 7 7800X3D | |
| Intel Core i5-13600K | |
| Intel Core i7-12700 | |
| Intel Core i5-12600K | |
| Intel Core i5-13400 | |
| AMD Ryzen 9 5950X | |
| Geekbench 4.4 | |
| 64 Bit Single-Core Score | |
| Intel Core i9-13900K | |
| AMD Ryzen 9 7950X3D | |
| AMD Ryzen 9 7900X | |
| AMD Ryzen 7 7800X3D | |
| AMD Ryzen 9 7950X | |
| Intel Core i7-13700K | |
| Intel Core i5-13600K | |
| Intel Core i5-12600K | |
| Intel Core i7-12700 | |
| Intel Core i5-13400 | |
| AMD Ryzen 9 5950X | |
| 64 Bit Multi-Core Score | |
| AMD Ryzen 9 7950X3D | |
| Intel Core i9-13900K | |
| AMD Ryzen 9 7950X | |
| AMD Ryzen 9 7900X | |
| Intel Core i7-13700K | |
| AMD Ryzen 9 5950X | |
| Intel Core i5-13600K | |
| AMD Ryzen 7 7800X3D | |
| Intel Core i7-12700 | |
| Intel Core i5-12600K | |
| Intel Core i5-13400 | |
| 3DMark 11 - 1280x720 Performance Physics | |
| AMD Ryzen 9 7950X3D | |
| AMD Ryzen 7 7800X3D | |
| AMD Ryzen 9 7950X | |
| Intel Core i9-13900K | |
| Intel Core i7-13700K | |
| Intel Core i5-13600K | |
| AMD Ryzen 9 7900X | |
| Intel Core i7-12700 | |
| AMD Ryzen 9 5950X | |
| Intel Core i5-12600K | |
| Intel Core i5-13400 | |
| 7-Zip 18.03 | |
| 7z b 4 | |
| AMD Ryzen 9 7950X3D | |
| AMD Ryzen 9 7950X | |
| Intel Core i9-13900K | |
| AMD Ryzen 9 5950X | |
| AMD Ryzen 9 7900X | |
| Intel Core i7-13700K | |
| Intel Core i5-13600K | |
| AMD Ryzen 7 7800X3D | |
| Intel Core i7-12700 | |
| Intel Core i5-12600K | |
| Intel Core i5-13400 | |
| 7z b 4 -mmt1 | |
| AMD Ryzen 9 7950X3D | |
| AMD Ryzen 9 7900X | |
| AMD Ryzen 7 7800X3D | |
| AMD Ryzen 9 7950X | |
| Intel Core i9-13900K | |
| Intel Core i7-13700K | |
| AMD Ryzen 9 5950X | |
| Intel Core i5-13600K | |
| Intel Core i7-12700 | |
| Intel Core i5-12600K | |
| Intel Core i5-13400 | |
| HWBOT x265 Benchmark v2.2 - 4k Preset | |
| AMD Ryzen 9 7950X | |
| Intel Core i9-13900K | |
| AMD Ryzen 9 7950X3D | |
| AMD Ryzen 9 7900X | |
| Intel Core i7-13700K | |
| AMD Ryzen 9 5950X | |
| Intel Core i5-12600K | |
| Intel Core i5-13600K | |
| Intel Core i7-12700 | |
| AMD Ryzen 7 7800X3D | |
| Intel Core i5-13400 | |
| R Benchmark 2.5 - Overall mean | |
| Intel Core i5-13400 | |
| AMD Ryzen 9 5950X | |
| Intel Core i5-12600K | |
| Intel Core i7-12700 | |
| AMD Ryzen 7 7800X3D | |
| Intel Core i5-13600K | |
| Intel Core i7-13700K | |
| AMD Ryzen 9 7950X | |
| AMD Ryzen 9 7900X | |
| AMD Ryzen 9 7950X3D | |
| Intel Core i9-13900K | |
| LibreOffice - 20 Documents To PDF | |
| Intel Core i5-12600K | |
| AMD Ryzen 9 5950X | |
| AMD Ryzen 7 7800X3D | |
| Intel Core i5-13400 | |
| AMD Ryzen 9 7950X3D | |
| Intel Core i7-12700 | |
| Intel Core i9-13900K | |
| AMD Ryzen 9 7950X | |
| Intel Core i5-13600K | |
| AMD Ryzen 9 7900X | |
| Intel Core i7-13700K | |
| WebXPRT 3 - Overall | |
| AMD Ryzen 9 7950X3D | |
| AMD Ryzen 9 7900X | |
| Intel Core i9-13900K | |
| AMD Ryzen 9 7950X | |
| AMD Ryzen 7 7800X3D | |
| Intel Core i7-13700K | |
| Intel Core i5-13600K | |
| Intel Core i7-12700 | |
| Intel Core i5-13400 | |
| Intel Core i5-12600K | |
| AMD Ryzen 9 5950X | |
| Mozilla Kraken 1.1 - Total | |
| AMD Ryzen 9 5950X | |
| Intel Core i5-13400 | |
| Intel Core i5-12600K | |
| Intel Core i7-12700 | |
| AMD Ryzen 7 7800X3D | |
| Intel Core i5-13600K | |
| Intel Core i7-13700K | |
| AMD Ryzen 9 7950X | |
| AMD Ryzen 9 7950X3D | |
| Intel Core i9-13900K | |
| AMD Ryzen 9 7900X | |
| 3DMark | |
| 1920x1080 Fire Strike Physics | |
| Intel Core i9-13900K | |
| AMD Ryzen 9 7950X | |
| Intel Core i7-13700K | |
| AMD Ryzen 9 7950X3D | |
| AMD Ryzen 9 7900X | |
| AMD Ryzen 9 5950X | |
| Intel Core i5-13600K | |
| Intel Core i7-12700 | |
| AMD Ryzen 7 7800X3D | |
| Intel Core i5-12600K | |
| Intel Core i5-13400 | |
| 2560x1440 Time Spy CPU | |
| Intel Core i9-13900K | |
| Intel Core i7-13700K | |
| AMD Ryzen 9 7950X3D | |
| Intel Core i5-13600K | |
| AMD Ryzen 9 7900X | |
| Intel Core i7-12700 | |
| AMD Ryzen 9 7950X | |
| AMD Ryzen 7 7800X3D | |
| Intel Core i5-12600K | |
| AMD Ryzen 9 5950X | |
| Intel Core i5-13400 | |
* ... Meglio usare valori piccoli
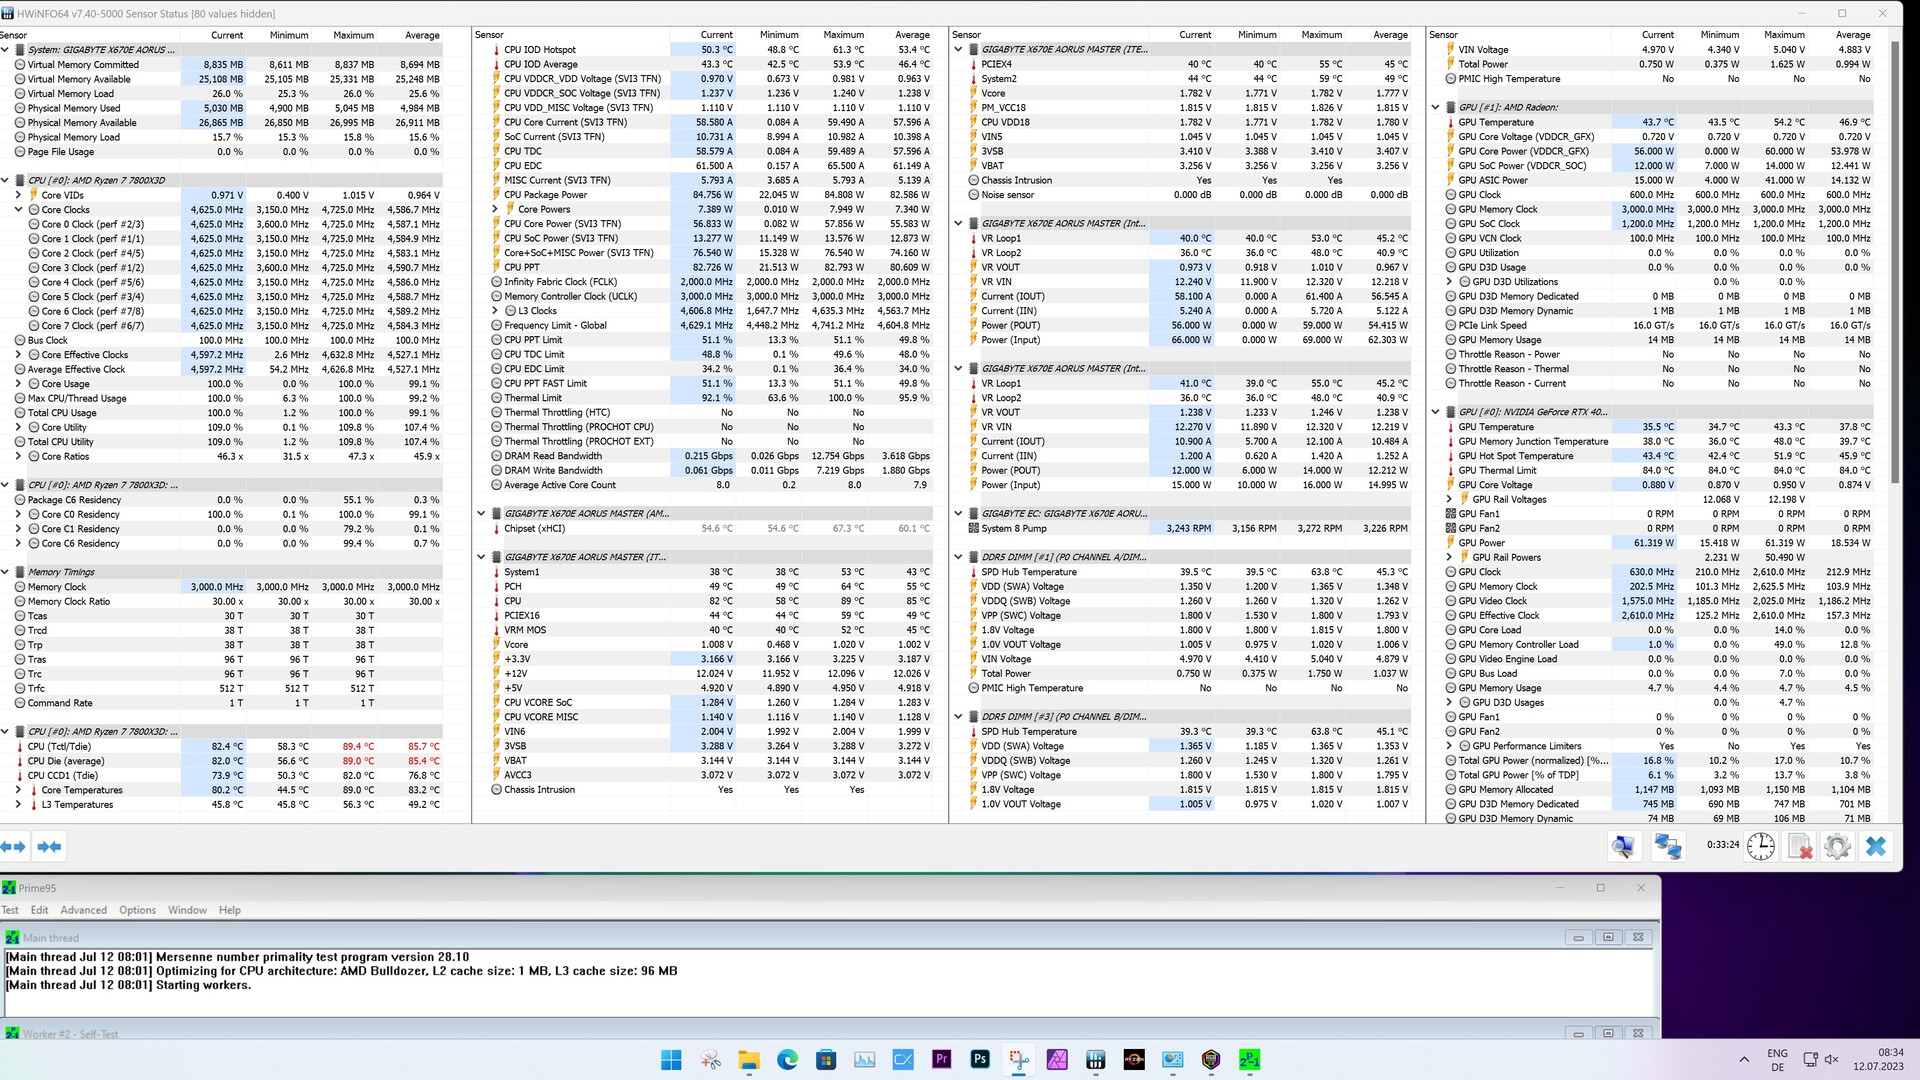
AMD Ryzen 7 7800X3D vs. Cinebench R15 Multi Loop
Con l'aiuto di Cinebench R15 Multi Loop, possiamo vedere che il sistema di raffreddamento DeepCool è sufficiente per raffreddare in modo affidabile l'AMD Ryzen 7 7800X3D. Per completezza di informazione, dobbiamo notare che tutti i test sono stati eseguiti con il case chiuso. La circolazione dell'aria nel Lian Li O11 Dynamic non era delle migliori nel nostro sistema di test, in quanto non c'erano ventole installate che avessero accesso all'aria fresca.
Benchmark sintetici e prestazioni delle applicazioni
I benchmark delle applicazioni sintetiche dell'AMD Ryzen 7 7800X3D sembrano già un po' migliori di quelli della CPU. Non si è piazzato molto lontano dall'Intel Core i5-13600K.Intel Core i5-13600Ke dell'AMD Ryzen 9 5950X.AMD Ryzen 9 5950Xè stato chiaramente in grado di essere superato.
Durante i test sulla RAM, ci saremmo aspettati risultati simili a quelli ottenuti con l'AMD Ryzen 9 7950X3D
, dato che la piattaforma di test è la stessa e anche la velocità di clock della RAM, pari a 6.000 MT/s, rimane la stessa. Tuttavia, è necessario tenere presente che l'AMD Ryzen 7 7800X3D funziona al di fuori delle specifiche del produttore quando è abilitato il profilo EXPO. La frequenza di clock abituale dell'AMD Ryzen 7 7800X3D è di 5.200 MT/s.<br>| Performance rating - Percent | |
| Intel Core i9-13900K | |
| AMD Ryzen 9 7950X | |
| AMD Ryzen 9 7950X3D | |
| Intel Core i7-13700K | |
| AMD Ryzen 9 7900X | |
| Intel Core i5-13600K | |
| AMD Ryzen 7 7800X3D | |
| Intel Core i7-12700 | |
| AMD Ryzen 9 5950X | |
| Intel Core i5-13400 | |
| PCMark 10 | |
| Productivity | |
| AMD Ryzen 9 7950X3D | |
| AMD Ryzen 9 7950X | |
| Intel Core i7-13700K | |
| AMD Ryzen 7 7800X3D | |
| AMD Ryzen 9 7900X | |
| Intel Core i5-13600K | |
| Intel Core i9-13900K | |
| Intel Core i7-12700 | |
| AMD Ryzen 9 5950X | |
| Intel Core i5-13400 | |
| Essentials | |
| Intel Core i9-13900K | |
| AMD Ryzen 9 7900X | |
| AMD Ryzen 9 7950X | |
| Intel Core i5-13600K | |
| AMD Ryzen 9 7950X3D | |
| Intel Core i7-13700K | |
| AMD Ryzen 7 7800X3D | |
| AMD Ryzen 9 5950X | |
| Intel Core i7-12700 | |
| Intel Core i5-13400 | |
| 3DMark | |
| 1920x1080 Fire Strike Physics | |
| Intel Core i9-13900K | |
| AMD Ryzen 9 7950X | |
| Intel Core i7-13700K | |
| AMD Ryzen 9 7950X3D | |
| AMD Ryzen 9 7900X | |
| AMD Ryzen 9 5950X | |
| Intel Core i5-13600K | |
| Intel Core i7-12700 | |
| AMD Ryzen 7 7800X3D | |
| Intel Core i5-13400 | |
| 2560x1440 Time Spy CPU | |
| Intel Core i9-13900K | |
| Intel Core i7-13700K | |
| AMD Ryzen 9 7950X3D | |
| Intel Core i5-13600K | |
| AMD Ryzen 9 7900X | |
| Intel Core i7-12700 | |
| AMD Ryzen 9 7950X | |
| AMD Ryzen 7 7800X3D | |
| AMD Ryzen 9 5950X | |
| Intel Core i5-13400 | |
| 3DMark 11 - 1280x720 Performance Physics | |
| AMD Ryzen 9 7950X3D | |
| AMD Ryzen 7 7800X3D | |
| AMD Ryzen 9 7950X | |
| Intel Core i9-13900K | |
| Intel Core i7-13700K | |
| Intel Core i5-13600K | |
| AMD Ryzen 9 7900X | |
| Intel Core i7-12700 | |
| AMD Ryzen 9 5950X | |
| Intel Core i5-13400 | |
| CrossMark - Overall | |
| Intel Core i9-13900K | |
| AMD Ryzen 9 7950X | |
| AMD Ryzen 9 7900X | |
| Intel Core i7-13700K | |
| Intel Core i5-13600K | |
| AMD Ryzen 7 7800X3D | |
| AMD Ryzen 9 7950X3D | |
| Intel Core i7-12700 | |
| Intel Core i5-13400 | |
| AMD Ryzen 9 5950X | |
| AIDA64 / Memory Copy | |
| Intel Core i9-13900K | |
| AMD Ryzen 9 7950X3D | |
| Intel Core i7-13700K | |
| Intel Core i7-12700 | |
| Intel Core i5-13400 | |
| Intel Core i5-13600K | |
| Intel Core i5-12600K | |
| AMD Ryzen 9 7900X | |
| AMD Ryzen 9 7950X | |
| AMD Ryzen 7 7800X3D | |
| AMD Ryzen 9 5950X | |
| Media della classe (4514 - 234662, n=2212) | |
| AIDA64 / Memory Read | |
| Intel Core i9-13900K | |
| Intel Core i7-13700K | |
| Intel Core i7-12700 | |
| AMD Ryzen 9 7950X3D | |
| Intel Core i5-13400 | |
| Intel Core i5-12600K | |
| Intel Core i5-13600K | |
| AMD Ryzen 9 7950X | |
| AMD Ryzen 9 7900X | |
| AMD Ryzen 9 5950X | |
| AMD Ryzen 7 7800X3D | |
| Media della classe (4031 - 271066, n=2174) | |
| AIDA64 / Memory Write | |
| AMD Ryzen 7 7800X3D | |
| Intel Core i7-12700 | |
| AMD Ryzen 9 7950X3D | |
| AMD Ryzen 9 7900X | |
| AMD Ryzen 9 7950X | |
| Intel Core i9-13900K | |
| Intel Core i5-13400 | |
| Intel Core i5-12600K | |
| Intel Core i5-13600K | |
| Intel Core i7-13700K | |
| Media della classe (3506 - 242868, n=2179) | |
| AMD Ryzen 9 5950X | |
| AIDA64 / Memory Latency | |
| Media della classe (6.1 - 536, n=2240) | |
| Intel Core i5-13600K | |
| Intel Core i5-13400 | |
| Intel Core i9-13900K | |
| Intel Core i7-12700 | |
| Intel Core i7-13700K | |
| AMD Ryzen 7 7800X3D | |
| AMD Ryzen 9 5950X | |
| AMD Ryzen 9 7950X3D | |
| AMD Ryzen 9 7950X | |
| AMD Ryzen 9 7900X | |
* ... Meglio usare valori piccoli
Parametri di gioco: davvero veloce per avere solo 8 core
Durante i nostri test di gioco, abbiamo notato che l'AMD Ryzen 7 7800X3D ha svolto egregiamente il suo compito principale. Il processore a 8 core è stato persino in grado di scalzare l'ammiraglia interna dal primo posto, facendola scendere al secondo. Naturalmente, il suo vantaggio è minimo e non si nota nell'uso quotidiano, ma quando si tratta di incoronare il re delle prestazioni, dobbiamo attenerci ai numeri puri. Il nostro campione di prova ha vinto il confronto con ilIntel Core i9-13900Ke ha ottenuto un vantaggio di 13 punti percentuali.
L'AMD Ryzen 9 7950X3D ha talvolta avuto problemi di distribuzione del carico tra i due CCD in alcuni dei giochi che abbiamo testato perché, come sappiamo, solo un CCD del componente a 16 core dispone della cache 3D-V. L'AMD Ryzen 7 7800X3D non ha questo problema, ed è probabilmente il motivo per cui ha ottenuto prestazioni di gioco leggermente migliori. Grazie ai benchmark della CPU, possiamo confrontare il nostro esemplare di prova con un Intel Core i7-12700 Intel Core i7-12700 Prozessor - Benchmarks und Specs in questa fase. Prima era alla pari con l'AMD Ryzen 7 7800X3D, ma ora possiamo documentare un divario di ben il 30%.
In combinazione con la Palit GeForce RTX 4090 GameRock OC, la piattaforma AM5 basata sull'AMD Ryzen 7 7800X3D offre attualmente la migliore combinazione per quanto riguarda il gioco puro. La panoramica di tutti i giochi che abbiamo testato con questa piattaforma mostra che tutti sono attualmente giocabili senza problemi a 2.160p con il massimo dei dettagli. In linea di principio, questo è possibile anche con un Intel Core i9-13900K o un AMD Ryzen 9 7590X3D. Tuttavia, per questi due si dovrà pagare di più.
| Performance rating - Percent | |
| AMD Ryzen 7 7800X3D | |
| AMD Ryzen 9 7950X3D | |
| Intel Core i9-13900K | |
| Intel Core i7-13700K | |
| Intel Core i7-13700 | |
| Intel Core i7-12700 | |
| Intel Core i5-13400 | |
| Intel Core i5-12400F | |
| F1 22 | |
| 1920x1080 Low Preset AA:T AF:16x | |
| AMD Ryzen 7 7800X3D | |
| AMD Ryzen 9 7950X3D | |
| Intel Core i9-13900K | |
| Intel Core i7-13700K | |
| Intel Core i7-13700 | |
| Intel Core i7-12700 | |
| Intel Core i5-12400F | |
| Intel Core i5-13400 | |
| 3840x2160 Ultra High Preset AA:T AF:16x | |
| AMD Ryzen 7 7800X3D | |
| Intel Core i7-13700K | |
| AMD Ryzen 9 7950X3D | |
| Intel Core i5-12400F | |
| Intel Core i7-13700 | |
| Intel Core i7-12700 | |
| Intel Core i5-13400 | |
| Intel Core i9-13900K | |
| Far Cry 5 | |
| 1280x720 Low Preset AA:T | |
| AMD Ryzen 7 7800X3D | |
| AMD Ryzen 9 7950X3D | |
| Intel Core i7-13700K | |
| Intel Core i9-13900K | |
| Intel Core i7-13700 | |
| Intel Core i7-12700 | |
| Intel Core i5-13400 | |
| Intel Core i5-12400F | |
| 3840x2160 Ultra Preset AA:T | |
| AMD Ryzen 7 7800X3D | |
| AMD Ryzen 9 7950X3D | |
| Intel Core i9-13900K | |
| Intel Core i7-13700K | |
| Intel Core i7-13700 | |
| Intel Core i7-12700 | |
| Intel Core i5-13400 | |
| Intel Core i5-12400F | |
| X-Plane 11.11 | |
| 1280x720 low (fps_test=1) | |
| Intel Core i9-13900K | |
| AMD Ryzen 9 7950X3D | |
| Intel Core i7-13700K | |
| AMD Ryzen 7 7800X3D | |
| Intel Core i7-13700 | |
| Intel Core i7-12700 | |
| Intel Core i5-13400 | |
| Intel Core i5-12400F | |
| 3840x2160 high (fps_test=3) | |
| AMD Ryzen 7 7800X3D | |
| AMD Ryzen 9 7950X3D | |
| Intel Core i9-13900K | |
| Intel Core i7-13700K | |
| Intel Core i7-13700 | |
| Intel Core i7-12700 | |
| Intel Core i5-13400 | |
| Intel Core i5-12400F | |
| Final Fantasy XV Benchmark | |
| 1280x720 Lite Quality | |
| Intel Core i7-13700 | |
| Intel Core i7-13700K | |
| AMD Ryzen 7 7800X3D | |
| Intel Core i9-13900K | |
| AMD Ryzen 9 7950X3D | |
| Intel Core i7-12700 | |
| Intel Core i5-12400F | |
| Intel Core i5-13400 | |
| 3840x2160 High Quality | |
| AMD Ryzen 7 7800X3D | |
| Intel Core i7-13700 | |
| AMD Ryzen 9 7950X3D | |
| Intel Core i7-13700K | |
| Intel Core i9-13900K | |
| Intel Core i7-12700 | |
| Intel Core i5-12400F | |
| Intel Core i5-13400 | |
| Dota 2 Reborn | |
| 1280x720 min (0/3) fastest | |
| AMD Ryzen 7 7800X3D | |
| AMD Ryzen 9 7950X3D | |
| Intel Core i9-13900K | |
| Intel Core i7-13700K | |
| Intel Core i7-13700 | |
| Intel Core i7-12700 | |
| Intel Core i5-12400F | |
| Intel Core i5-13400 | |
| 3840x2160 ultra (3/3) best looking | |
| AMD Ryzen 7 7800X3D | |
| AMD Ryzen 9 7950X3D | |
| Intel Core i9-13900K | |
| Intel Core i7-13700K | |
| Intel Core i7-13700 | |
| Intel Core i7-12700 | |
| Intel Core i5-12400F | |
| Intel Core i5-13400 | |
| The Witcher 3 | |
| 1024x768 Low Graphics & Postprocessing | |
| AMD Ryzen 9 7950X3D | |
| AMD Ryzen 7 7800X3D | |
| Intel Core i9-13900K | |
| Intel Core i7-13700K | |
| Intel Core i7-13700 | |
| Intel Core i7-12700 | |
| Intel Core i5-13400 | |
| Intel Core i5-12400F | |
| 3840x2160 High Graphics & Postprocessing (Nvidia HairWorks Off) | |
| Intel Core i5-13400 | |
| Intel Core i7-13700 | |
| Intel Core i7-12700 | |
| Intel Core i9-13900K | |
| AMD Ryzen 7 7800X3D | |
| Intel Core i7-13700K | |
| AMD Ryzen 9 7950X3D | |
| Intel Core i5-12400F | |
| F1 2021 | |
| 3840x2160 Ultra High Preset + Raytracing AA:T AF:16x | |
| AMD Ryzen 7 7800X3D | |
| AMD Ryzen 9 7950X3D | |
| Intel Core i7-13700K | |
| Intel Core i7-13700 | |
| Intel Core i9-13900K | |
| Intel Core i7-12700 | |
| Intel Core i5-12400F | |
| Intel Core i5-13400 | |
| 1280x720 Ultra Low Preset | |
| AMD Ryzen 7 7800X3D | |
| AMD Ryzen 9 7950X3D | |
| Intel Core i9-13900K | |
| Intel Core i7-13700K | |
| Intel Core i7-13700 | |
| Intel Core i7-12700 | |
| Intel Core i5-12400F | |
| Intel Core i5-13400 | |
| Shadow of the Tomb Raider | |
| 1280x720 Lowest Preset | |
| AMD Ryzen 7 7800X3D | |
| AMD Ryzen 9 7950X3D | |
| Intel Core i9-13900K | |
| Intel Core i7-13700 | |
| Intel Core i7-13700K | |
| Intel Core i7-12700 | |
| Intel Core i5-13400 | |
| Intel Core i5-12400F | |
| 3840x2160 Highest Preset AA:T | |
| Intel Core i7-13700K | |
| AMD Ryzen 7 7800X3D | |
| Intel Core i7-13700 | |
| AMD Ryzen 9 7950X3D | |
| Intel Core i9-13900K | |
| Intel Core i7-12700 | |
| Intel Core i5-13400 | |
| Intel Core i5-12400F | |
| Borderlands 3 | |
| 1280x720 Very Low Overall Quality (DX11) | |
| AMD Ryzen 7 7800X3D | |
| AMD Ryzen 9 7950X3D | |
| Intel Core i9-13900K | |
| Intel Core i7-13700 | |
| Intel Core i7-13700K | |
| Intel Core i7-12700 | |
| Intel Core i5-13400 | |
| Intel Core i5-12400F | |
| 3840x2160 Badass Overall Quality (DX11) | |
| Intel Core i7-13700K | |
| AMD Ryzen 7 7800X3D | |
| AMD Ryzen 9 7950X3D | |
| Intel Core i9-13900K | |
| Intel Core i7-13700 | |
| Intel Core i7-12700 | |
| Intel Core i5-13400 | |
| Intel Core i5-12400F | |
| Tiny Tina's Wonderlands | |
| 1280x720 Lowest Preset (DX12) | |
| AMD Ryzen 7 7800X3D | |
| AMD Ryzen 9 7950X3D | |
| Intel Core i9-13900K | |
| Intel Core i7-13700 | |
| Intel Core i7-13700K | |
| Intel Core i7-12700 | |
| Intel Core i5-13400 | |
| Intel Core i5-12400F | |
| 3840x2160 Badass Preset (DX12) | |
| AMD Ryzen 9 7950X3D | |
| Intel Core i7-13700 | |
| AMD Ryzen 7 7800X3D | |
| Intel Core i7-12700 | |
| Intel Core i5-13400 | |
| Intel Core i7-13700K | |
| Intel Core i9-13900K | |
| Intel Core i5-12400F | |
| God of War | |
| 1280x720 Low Preset | |
| AMD Ryzen 9 7950X3D | |
| AMD Ryzen 7 7800X3D | |
| Intel Core i9-13900K | |
| Intel Core i7-13700K | |
| Intel Core i7-13700 | |
| Intel Core i7-12700 | |
| Intel Core i5-13400 | |
| Intel Core i5-12400F | |
| 3840x2160 Ultra Preset | |
| AMD Ryzen 7 7800X3D | |
| AMD Ryzen 9 7950X3D | |
| Intel Core i7-13700 | |
| Intel Core i5-13400 | |
| Intel Core i7-13700K | |
| Intel Core i9-13900K | |
| Intel Core i7-12700 | |
| Intel Core i5-12400F | |
| Far Cry New Dawn | |
| 1280x720 Low Preset | |
| AMD Ryzen 7 7800X3D | |
| AMD Ryzen 9 7950X3D | |
| Intel Core i9-13900K | |
| Intel Core i7-13700 | |
| Intel Core i7-13700K | |
| Intel Core i7-12700 | |
| Intel Core i5-13400 | |
| Intel Core i5-12400F | |
| 3840x2160 Ultra Preset | |
| AMD Ryzen 7 7800X3D | |
| AMD Ryzen 9 7950X3D | |
| Intel Core i9-13900K | |
| Intel Core i7-13700 | |
| Intel Core i7-13700K | |
| Intel Core i7-12700 | |
| Intel Core i5-13400 | |
| Intel Core i5-12400F | |
| Far Cry 6 | |
| 1280x720 Low Graphics Quality | |
| AMD Ryzen 7 7800X3D | |
| AMD Ryzen 9 7950X3D | |
| Intel Core i9-13900K | |
| Intel Core i7-13700 | |
| Intel Core i7-13700K | |
| Intel Core i7-12700 | |
| Intel Core i5-13400 | |
| Intel Core i5-12400F | |
| 3840x2160 Ultra Graphics Quality + HD Textures AA:T | |
| AMD Ryzen 7 7800X3D | |
| AMD Ryzen 9 7950X3D | |
| Intel Core i7-13700K | |
| Intel Core i7-13700 | |
| Intel Core i9-13900K | |
| Intel Core i7-12700 | |
| Intel Core i5-13400 | |
| Intel Core i5-12400F | |
AMD Ryzen 7 78003D with an Nvidia GeForce RTX 4090
| basso | medio | alto | ultra | QHD | 4K DLSS | 4K | |
|---|---|---|---|---|---|---|---|
| GTA V (2015) | 188.5 | 188.5 | 188.1 | 182 | 181.1 | 188 | |
| The Witcher 3 (2015) | 858.4 | 820.4 | 658.8 | 314.3 | 281 | ||
| Dota 2 Reborn (2015) | 322.9 | 299.6 | 288.9 | 267.5 | 258.2 | ||
| Final Fantasy XV Benchmark (2018) | 236 | 234 | 233 | 231 | 158.2 | ||
| X-Plane 11.11 (2018) | 219 | 214 | 188.1 | 160.5 | |||
| Far Cry 5 (2018) | 344 | 303 | 303 | 278 | 268 | 187 | |
| Strange Brigade (2018) | 760 | 618 | 601 | 589 | 534 | 289 | |
| Shadow of the Tomb Raider (2018) | 407 | 383 | 387 | 375 | 322 | 187.7 | |
| Far Cry New Dawn (2019) | 291 | 258 | 253 | 226 | 223 | 180 | |
| Metro Exodus (2019) | 374 | 326 | 268 | 219 | 199.8 | 141.6 | |
| Control (2019) | 240 | 240 | 240 | 220 | 137.5 | 114 | |
| Borderlands 3 (2019) | 310 | 271 | 252 | 241 | 224 | 137.4 | |
| F1 2020 (2020) | 681 | 571 | 563 | 503 | 446 | 288 | |
| F1 2021 (2021) | 830 | 763 | 667 | 369 | 324 | 207 | |
| Far Cry 6 (2021) | 285 | 256 | 230 | 223 | 211 | 141.4 | |
| Guardians of the Galaxy (2021) | 268 | 266 | 267 | 267 | 263 | 194 | |
| God of War (2022) | 315 | 313 | 287 | 212 | 181.5 | 132 | |
| Cyberpunk 2077 1.6 (2022) | 272 | 268 | 251 | 241 | 166.6 | 82.3 | |
| Tiny Tina's Wonderlands (2022) | 506 | 434 | 371 | 309 | 233 | 129.8 | |
| F1 22 (2022) | 533 | 483 | 477 | 221 | 162.9 | 84.5 | |
| The Quarry (2022) | 462 | 355 | 309 | 267 | 198.1 | 82.6 | |
| A Plague Tale Requiem (2022) | 231 | 209 | 189.9 | 168.8 | 132.5 | 148.3 | 76.3 |
| Uncharted Legacy of Thieves Collection (2022) | 159.8 | 164.5 | 163 | 156.9 | 155.8 | 103.5 | |
| Spider-Man Miles Morales (2022) | 233 | 233 | 196.7 | 191.6 | 245 | 134.9 | |
| The Callisto Protocol (2022) | 279.1 | 279.7 | 280.8 | 281.1 | 274.5 | 237.1 | |
| High On Life (2023) | 446 | 404 | 345 | 312 | 225 | 107.8 | |
| The Witcher 3 v4 (2023) | 367 | 300 | 279 | 261 | 260 | 169.9 | |
| Dead Space Remake (2023) | 291 | 282 | 262 | 259 | 201 | 106.7 | |
| Hogwarts Legacy (2023) | 218 | 200 | 164.4 | 163.3 | 146.7 | 82.4 | |
| Returnal (2023) | 262 | 256 | 237 | 211 | 172 | 112 | |
| Atomic Heart (2023) | 360 | 306 | 274 | 228 | 184.1 | 112.4 | |
| Company of Heroes 3 (2023) | 465.1 | 429.6 | 376.5 | 373.3 | 314.6 | 215.4 | |
| Sons of the Forest (2023) | 184.7 | 176.4 | 171.4 | 165.4 | 159.1 | 132.1 | |
| Resident Evil 4 Remake (2023) | 383 | 344 | 336 | 237 | 199.9 | 124.2 | |
| The Last of Us (2023) | 241 | 215 | 202 | 191.1 | 146 | 122.9 | 82.6 |
| Dead Island 2 (2023) | 379 | 369 | 336 | 315 | 284 | 161.6 | |
| Star Wars Jedi Survivor (2023) | 197.7 | 197.3 | 196.1 | 193.8 | 157.6 | 82.3 | |
| Diablo 4 (2023) | 399 | 399 | 398 | 397 | 390 | 238 | 216 |
| F1 23 (2023) | 576 | 594 | 542 | 226 | 152 | 80 |
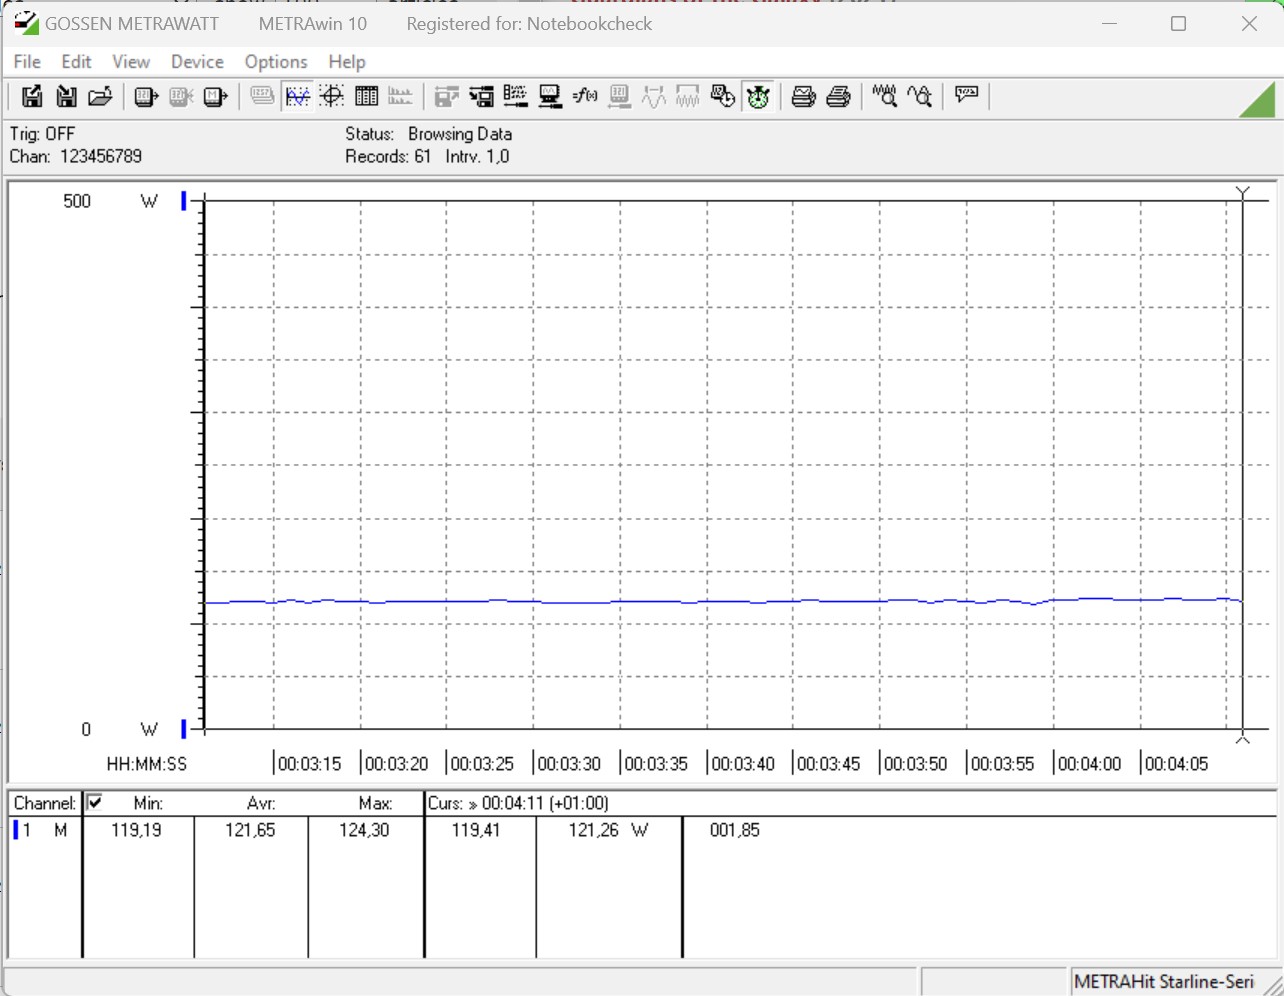
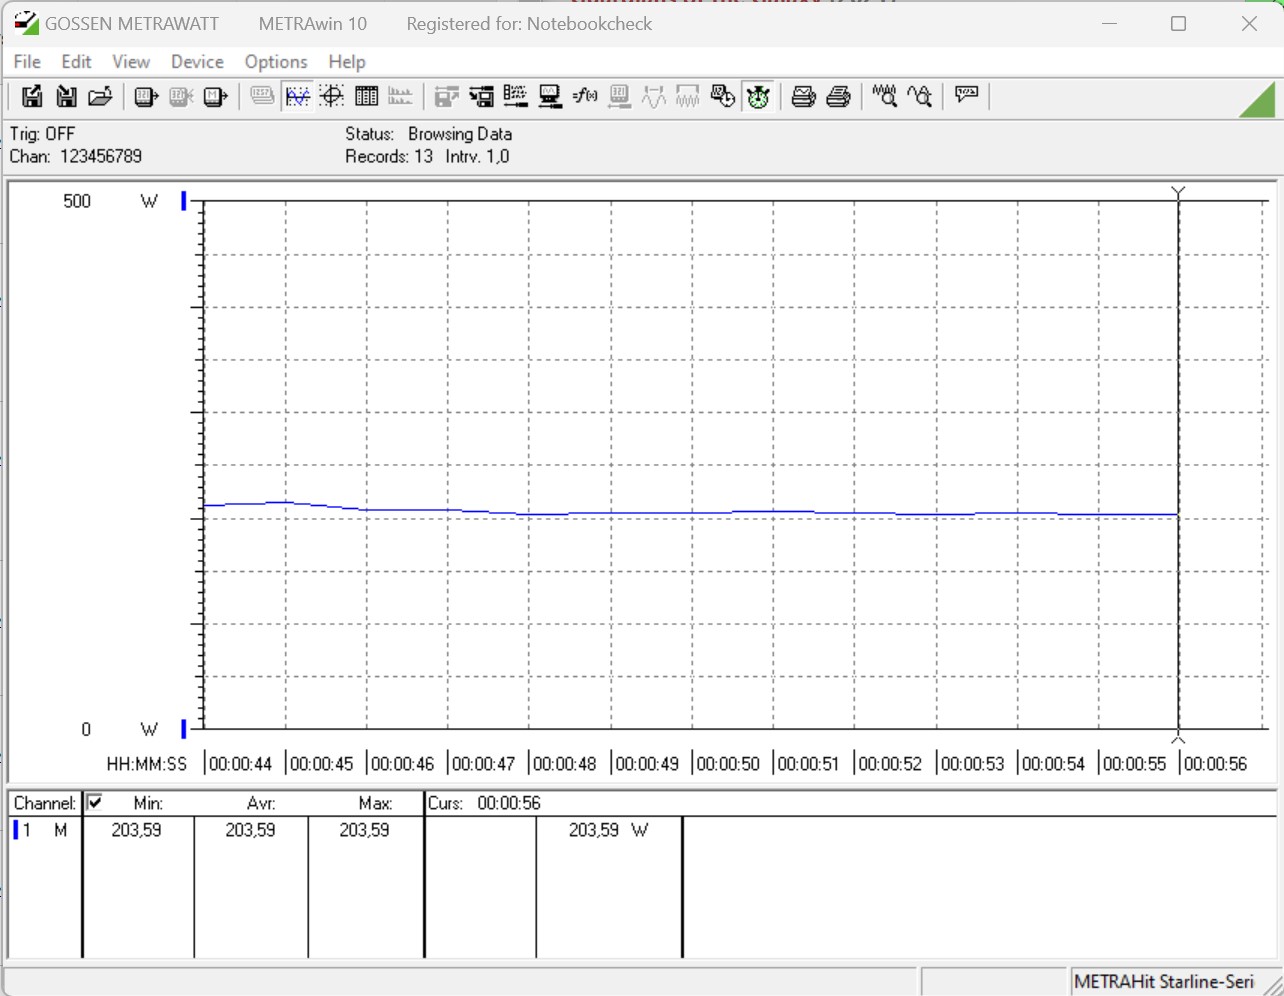
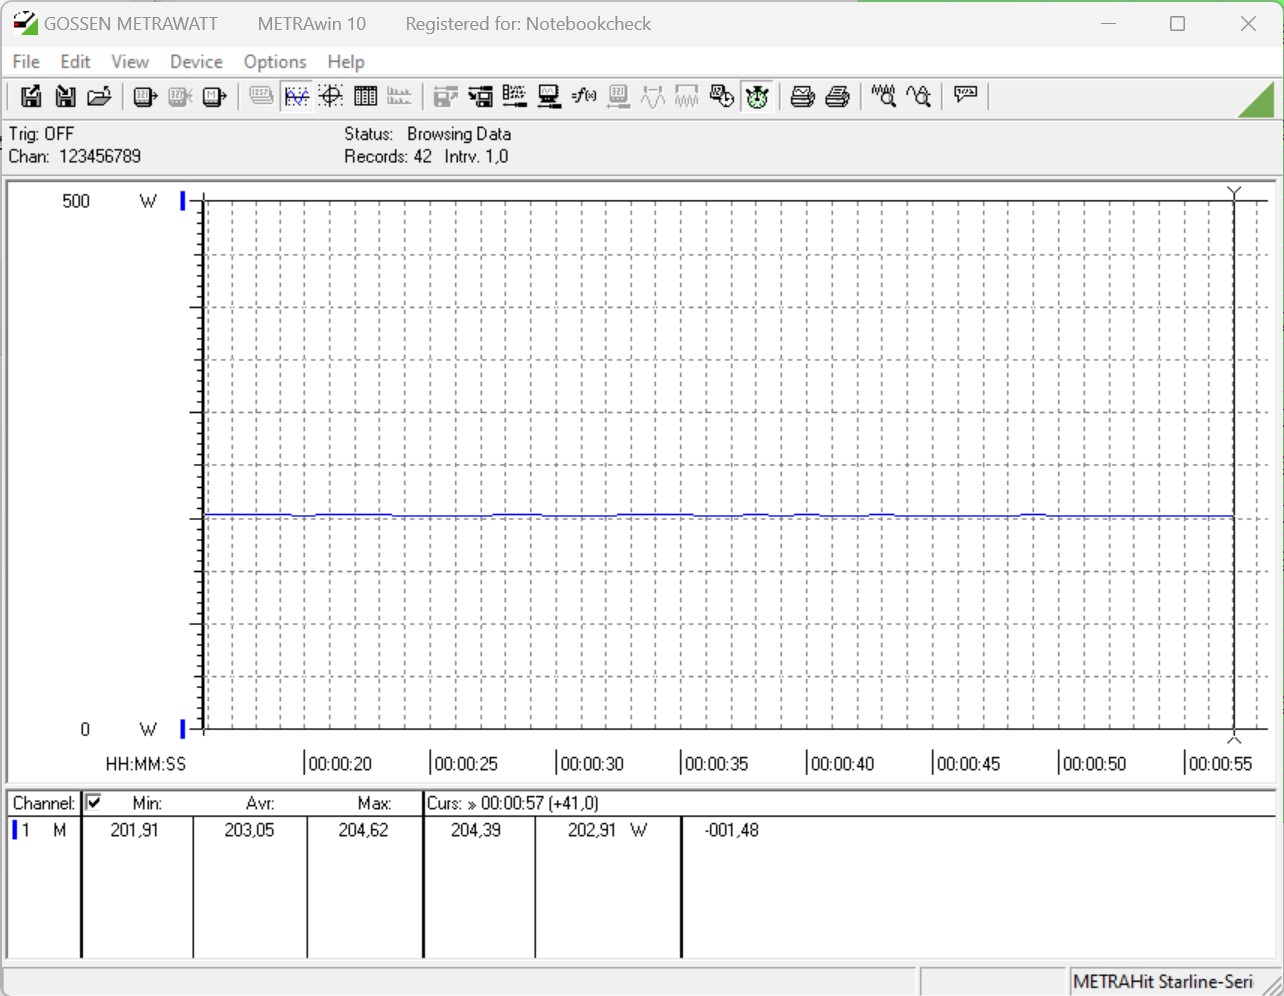
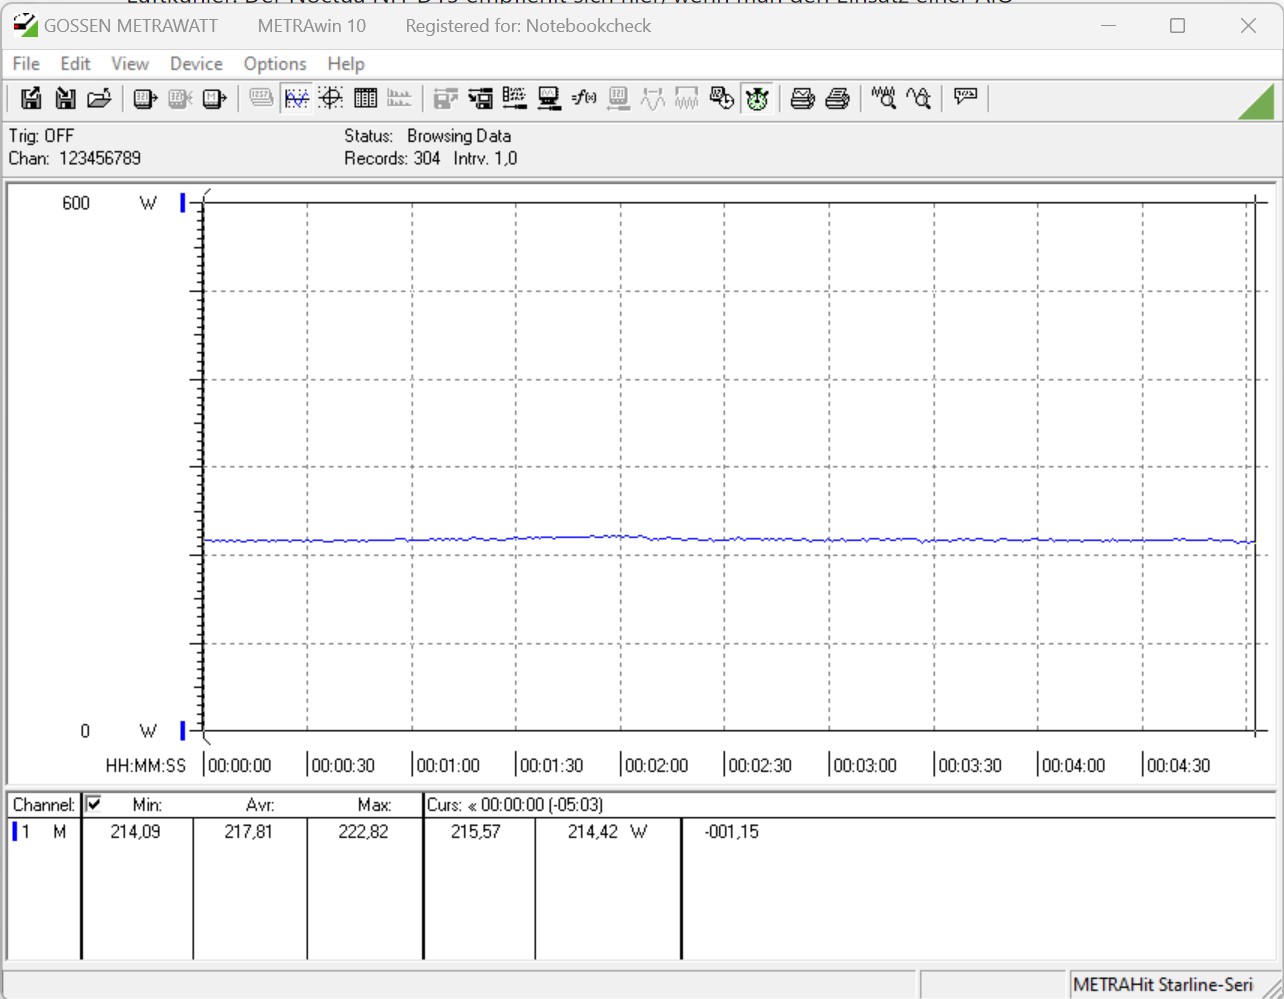
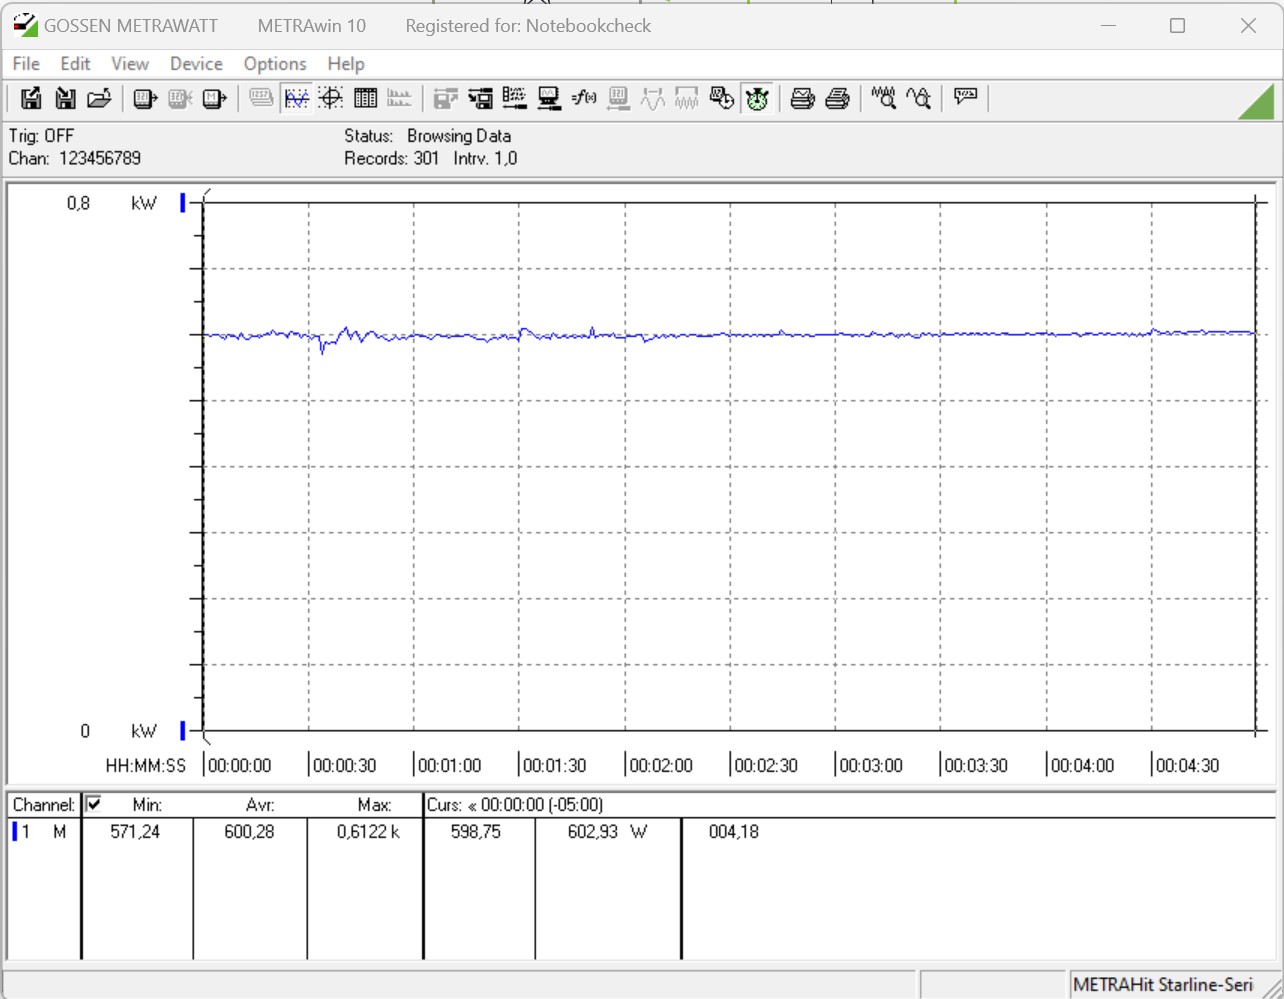
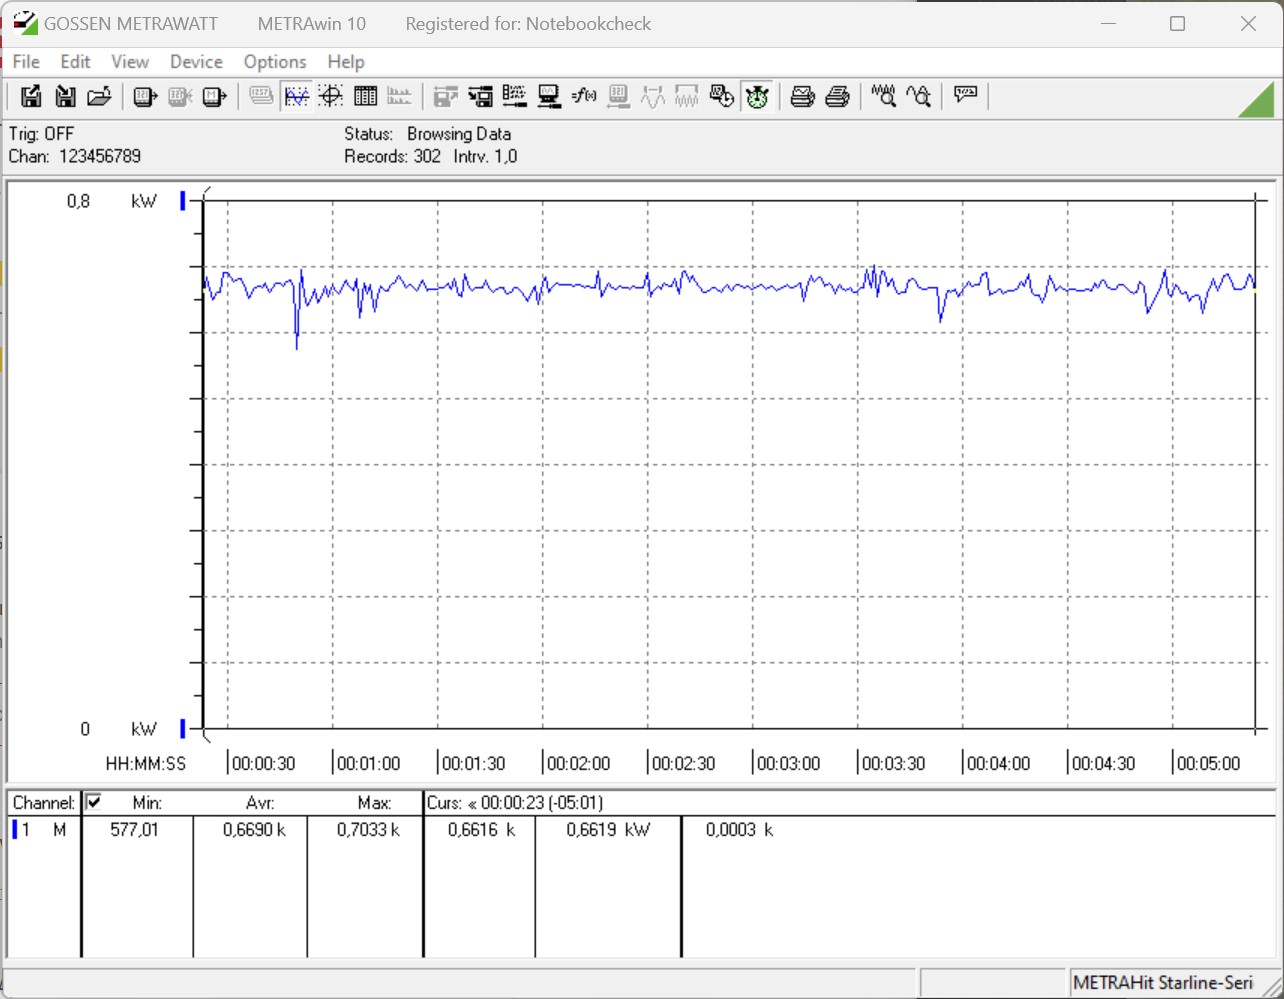
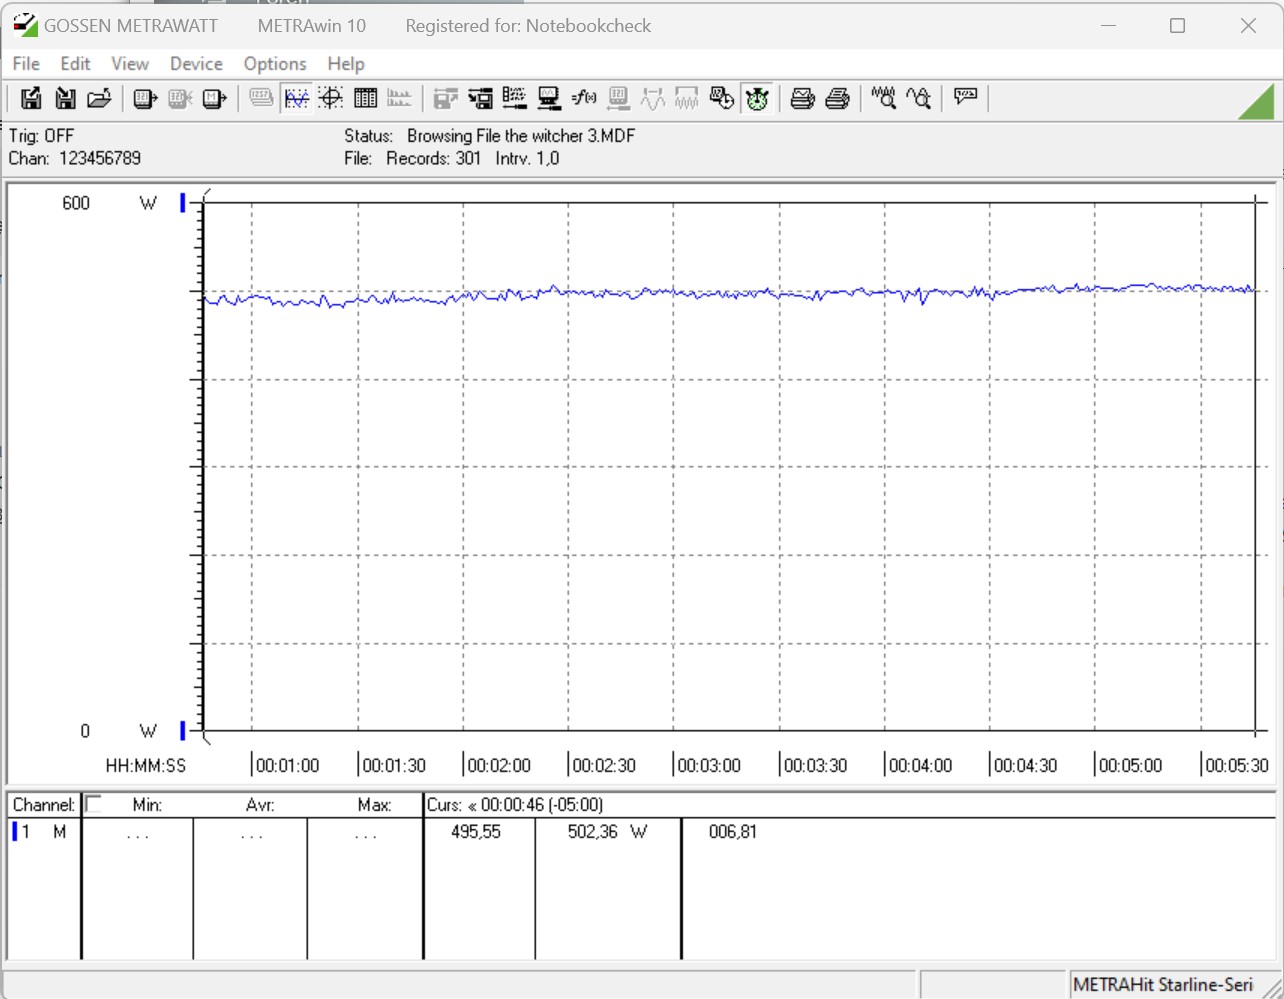
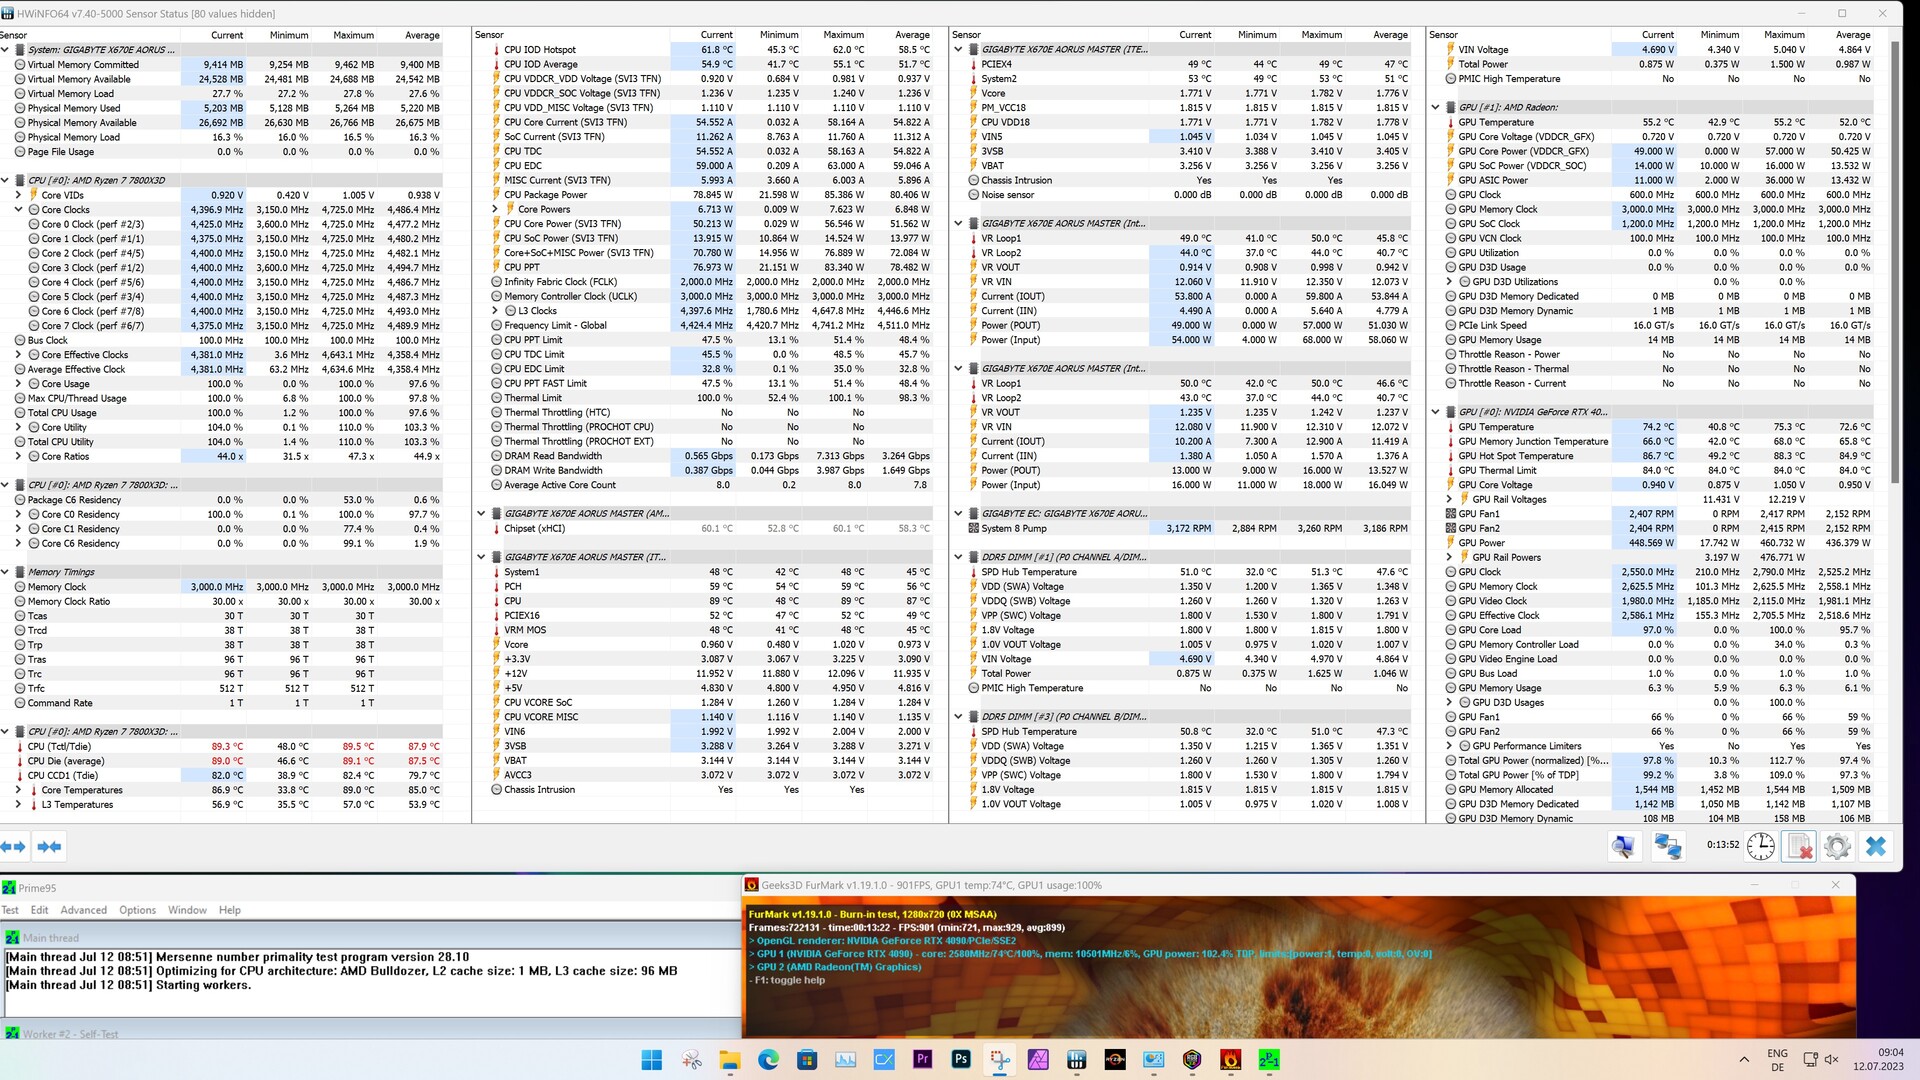
Consumo di energia - Frugale, ma è necessario un buon flusso d'aria
Tutti i processori X3D della serie 7000 sono limitati a un consumo massimo di 162 watt (PPT). Di conseguenza, lo stesso si può dire per il nostro AMD Ryzen 7 7800X3D. In modalità idle, non abbiamo notato valori record a 120 watt, ma rispetto all'AMD Ryzen 9 7950X3Di valori misurati sono quasi identici. Durante il gioco, abbiamo documentato una media di 497 watt durante la nostra scena di gioco Witcher 3 scena di gioco. Questo significa che il nostro sistema di prova è circa allo stesso livello di un sistema basato su unIntel Core i5-13400. Durante lo stress test Prime95, il sistema basato su un AMD Ryzen 7 7800X3D è stato il più parsimonioso. Il suo valore mediano è stato di soli 218 watt.
Per le nostre misurazioni sotto carico, è necessario prendere in considerazione il consumo energetico della scheda grafica. LaPalit GeForce RTX 4090 GameRock OCda sola consuma già 450 watt.
Abbiamo notato temperature piuttosto elevate, dovute al cattivo raffreddamento del case. In questo scenario peggiore, l'AMD Ryzen 7 7800X3D ha raggiunto il suo limite termico e ha dovuto essere strozzato. Per non falsare le nostre misurazioni, non abbiamo eseguito questo test con il case aperto. Abbiamo rimosso la parte laterale, il che ha fatto sì che le temperature della CPU scendessero abbastanza rapidamente a valori non critici. Un case con una buona circolazione dell'aria raffredda bene il processore a 8 core. Tuttavia, non consigliamo di rinunciare a un AiO. A questo punto, consigliamo di dare un'occhiata all'elenco dei dissipatori consigliati dal produttore https://www.amd.com/de/technologies/cpu-cooler-solution#AMD-FL%C3%9CSSIGK%C3%9CHLER-ANIMATIONEN per i processori AMD Ryzen 7000.
| Power Consumption / Cinebench R15 Multi (external Monitor) | |
| Schenker XMG SECTOR, i9 13900K, RTX 4090 | |
| Intel Core i7-13700 | |
| Intel Core i7-13700K | |
| Intel Core i7-12700 | |
| AMD Ryzen 9 7950X3D | |
| AMD Ryzen 7 7800X3D | |
| Intel Core i5-13400 | |
| Intel Core i5-12400F | |
| Power Consumption / Cinebench R15 Multi Efficiency (external Monitor) | |
| AMD Ryzen 9 7950X3D | |
| AMD Ryzen 7 7800X3D | |
| Power Consumption / Prime95 V2810 Stress (external Monitor) | |
| Intel Core i7-13700 | |
| Schenker XMG SECTOR, i9 13900K, RTX 4090 | |
| Intel Core i7-13700K | |
| Intel Core i7-12700 | |
| AMD Ryzen 9 7950X3D | |
| Intel Core i5-12400F | |
| Intel Core i5-13400 | |
| AMD Ryzen 7 7800X3D | |
| Power Consumption / The Witcher 3 ultra (external Monitor) | |
| Intel Core i7-13700 | |
| Intel Core i7-13700K | |
| AMD Ryzen 9 7950X3D | |
| Schenker XMG SECTOR, i9 13900K, RTX 4090 | |
| Intel Core i7-12700 | |
| Intel Core i5-13400 | |
| AMD Ryzen 7 7800X3D | |
| Intel Core i5-12400F | |
* ... Meglio usare valori piccoli
| Power Consumption - Cinebench R15 Multi Efficiency (external Monitor) | |
| AMD Ryzen 9 7950X3D | |
| AMD Ryzen 9 5950X | |
| AMD Ryzen 9 7950X | |
| AMD Ryzen 9 7900X | |
| AMD Ryzen 7 7800X3D | |
| Intel Core i9-13900K | |
Power consumption with external monitor
Pro
Contro
Verdetto - Ottima CPU da gioco per i giocatori più esigenti
In questa recensione abbiamo analizzato da vicino l'AMD Ryzen 7 7800X3D, il primo processore X3D completo della nuova piattaforma AM5. Con questo intendiamo dire che si tratta di un nuovo processore non costruito su un design ibrido, bensì dotato di un solo die CCD sotto forma di V-Cache 3D. Questo è un vantaggio per molti giochi e, di conseguenza, il processore a 8 core è in grado di superare leggermente l'AMD Ryzen 9 7950X3D.
Questo non significa che l'AMD Ryzen 7 7800X3D possa passare per un "jack of all-trades". Il processore a 8 core non ha ottenuto risultati sufficienti nei test sulle prestazioni della CPU e, a causa delle limitate prestazioni multi-core, il componente non è riuscito a tenere il passo con i modelli di fascia alta. Ma non è necessario. Come CPU da gioco pura, la 7800X3D può fare esattamente ciò per cui è stata sviluppata. Un aspetto positivo è il suo basso consumo energetico.
L'AMD Ryzen 7 7800X3D offre ottime prestazioni di gioco. Dal punto di vista del prezzo, il processore a 8 core avrà ancora qualche difficoltà a convincere gli acquirenti a scegliere questo modello.
In sintesi, possiamo dire che l'AMD Ryzen 7 7800X3D è, allo stato attuale, una delle CPU da gioco più veloci sul mercato. Non possiamo dire che sia il processore più veloce in assoluto - ad esempio, l'AMD Ryzen 9 7950X3D è uno dei processori più veloci sul mercato.AMD Ryzen 9 7950X3Doffre prestazioni leggermente superiori in molti giochi, a patto che l'allocazione corretta dei thread permetta di sfruttare appieno le prestazioni della CPU. A causa della struttura ibrida dei modelli Ryzen 9 con 3D V-Cache, purtroppo non è sempre garantito che il CCD con 3D V-Cache abbia la priorità. In questo caso, l'AMD Ryzen 7 7800X3D beneficia di una struttura interna più semplice. Anche se si tratta di una lamentela ai massimi livelli: tutti i giochi che abbiamo testato hanno potuto essere eseguiti, indipendentemente dalla CPU utilizzata.
Il problema principale di questo componente è, a nostro avviso, il prezzo. Attualmente viene venduto a un prezzo minimo di 441,99 dollari. UnIntel Core i7-13700Kcosta all'incirca lo stesso e offre livelli di prestazioni simili, ma offre prestazioni complessive della CPU migliori. Se consideriamo che questi processori sono a prova di futuro, nessuno può battere AMD. Che ci si creda o no, le voci suggeriscono che la piattaforma AM5 continuerà a essere supportata fino al 2025. Il socket 1.700, attualmente utilizzato per i sistemi Intel, sarà probabilmente sostituito dal suo successore l'anno prossimo e non saranno rilasciati ulteriori processori per il socket 1.700.
Prezzo e disponibilità
Attualmente è possibile acquistare l'AMD Ryzen 7 7800X3D su Amazon a 441,99 dollari.
Transparency
La selezione dei dispositivi da recensire viene effettuata dalla nostra redazione. Il campione di prova è stato acquistato gratuitamente dall'autore a proprie spese. L'istituto di credito non ha avuto alcuna influenza su questa recensione, né il produttore ne ha ricevuto una copia prima della pubblicazione. Non vi era alcun obbligo di pubblicare questa recensione. In quanto società mediatica indipendente, Notebookcheck non è soggetta all'autorità di produttori, rivenditori o editori.
Ecco come Notebookcheck esegue i test
Ogni anno, Notebookcheck esamina in modo indipendente centinaia di laptop e smartphone utilizzando procedure standardizzate per garantire che tutti i risultati siano comparabili. Da circa 20 anni sviluppiamo continuamente i nostri metodi di prova e nel frattempo stabiliamo gli standard di settore. Nei nostri laboratori di prova, tecnici ed editori esperti utilizzano apparecchiature di misurazione di alta qualità. Questi test comportano un processo di validazione in più fasi. Il nostro complesso sistema di valutazione si basa su centinaia di misurazioni e parametri di riferimento ben fondati, che mantengono l'obiettività.
