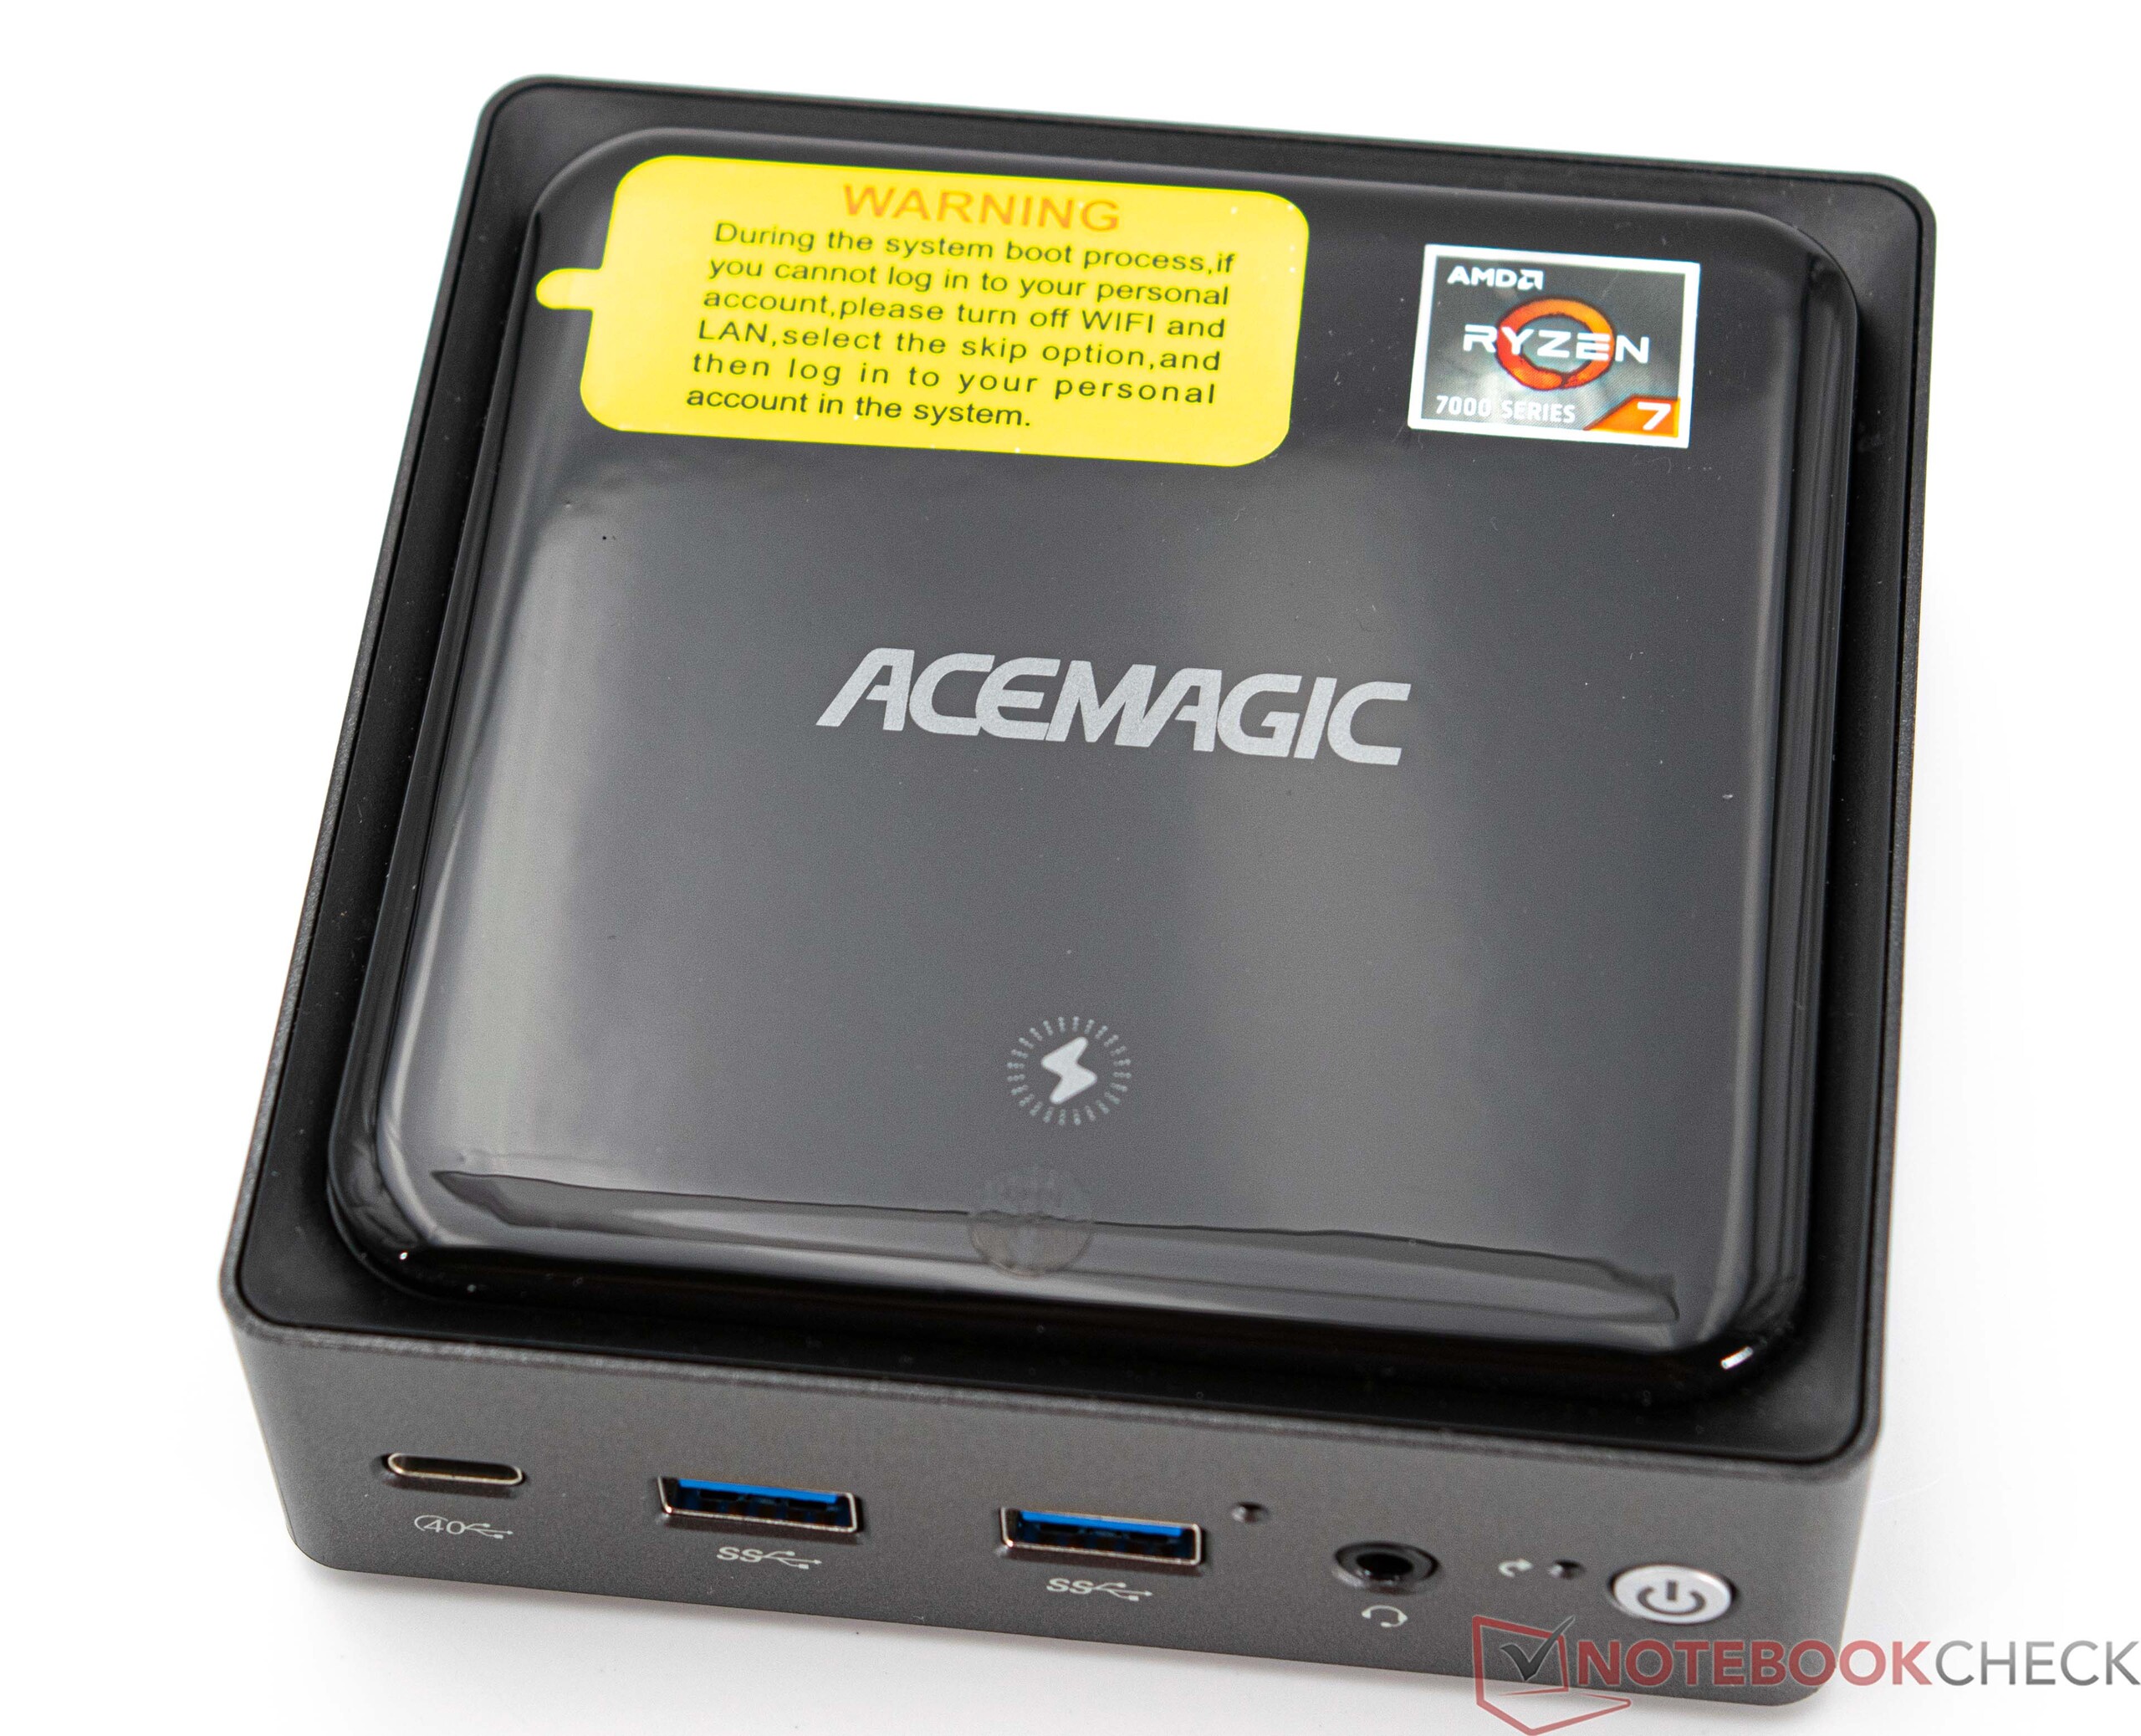
Il mini PC Acemagic AM20 con AMD Ryzen 7 7735H e 32 GB di RAM può ricaricare gli smartphone in modalità wireless
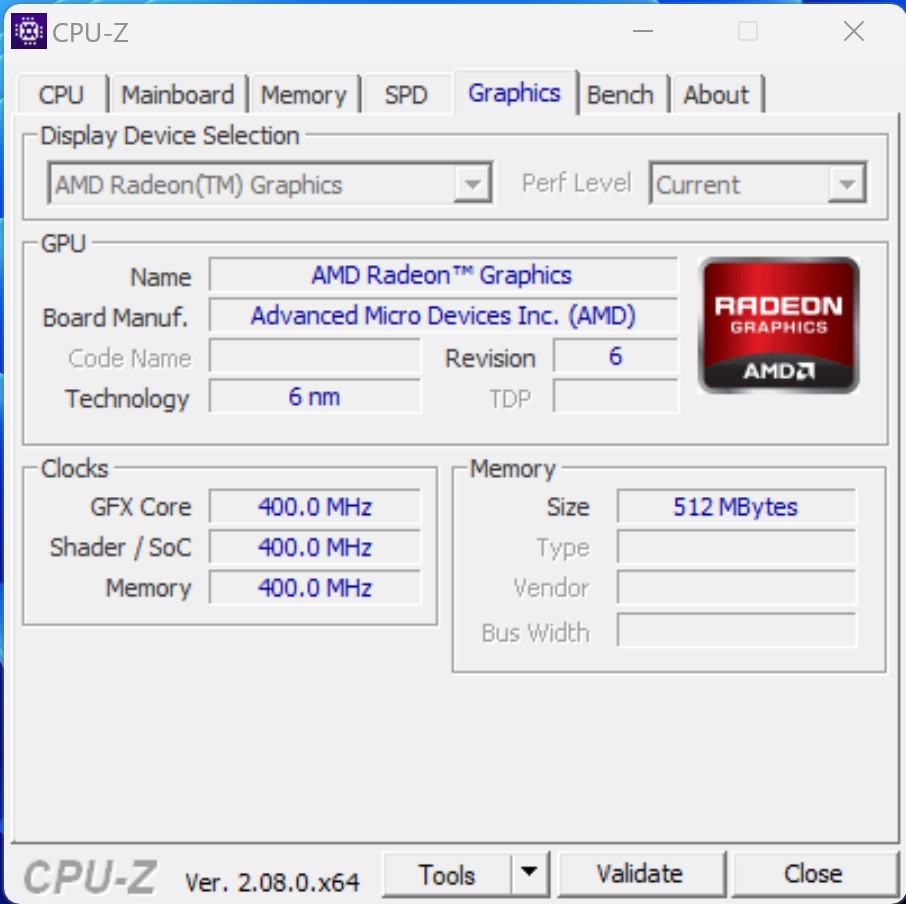
Con l'AM20, Acemagic amplia il proprio portafoglio e rilascia un'interessante novità nella categoria. Tuttavia, non si tratta di un semplice aggiornamento di un modello esistente, ma di un modello completamente nuovo. Con il modelloAMD Ryzen 7 7735Hil produttore ha optato per un SoC attuale che dispone di una potente iGPU, laAMD Radeon 680M. È risaputo che Intel è in ritardo rispetto alla concorrenza e con la suddetta iGPU è persino possibile intraprendere qualche piccola sessione di gioco. Acemagic ha dotato il dispositivo di 32 GB di RAM e di un'unità SSD da 512 GB, il che significa che il PC è ben equipaggiato per il momento. Gli acquirenti dovranno mettere da parte poco meno di 570 dollari per l'Acemagic AM20 con 16 GB di RAM. Il nostro esemplare da recensire non è attualmente presente nel negozio di Acermagic.
In questa recensione, mettiamo l'Acemagic AM20 a confronto con noti concorrenti che hanno già affrontato il nostro test. L'elenco dei dispositivi di confronto per questa recensione è riportato nella seguente panoramica.
Potenziali concorrenti a confronto
Punteggio | Data | Modello | Peso | Altezza | Prezzo |
|---|---|---|---|---|---|
| 84 % v7 (old) | 10/2023 | Acemagic AM20 R7 7735H, Radeon 680M | 339 gr | 38 mm | |
| 82.8 % v7 (old) | 07/2023 | Minisforum Venus Series UM790 Pro R9 7940HS, Radeon 780M | 666 gr | 52.3 mm | |
| 85.1 % v7 (old) | 01/2023 | Minisforum Neptune Series NAD9 i9-12900H, Iris Xe G7 96EUs | 1.2 kg | 66 mm | |
| 83.7 % v7 (old) | 05/2023 | Morefine M600, 6600U R5 6600U, Radeon 660M | 768 gr | 40.6 mm | |
| 82.8 % v7 (old) | 07/2023 | Geekom AS 6, R9 6900HX R9 6900HX, Radeon 680M | 753 gr | 58 mm | |
| 82.3 % v7 (old) | 05/2023 | Geekom Mini IT12 i7-1260P, Iris Xe G7 96EUs | 572 gr | 45.6 mm | |
| 81.7 % v7 (old) | 05/2023 | Minisforum Venus Series UM560 XT R5 5600H, Vega 7 | 652 gr | 48 mm | |
| 73.8 % v7 (old) | 08/2023 | Blackview MP200 i5-11400H, UHD Graphics Xe 16EUs | 678 gr | 75.5 mm |
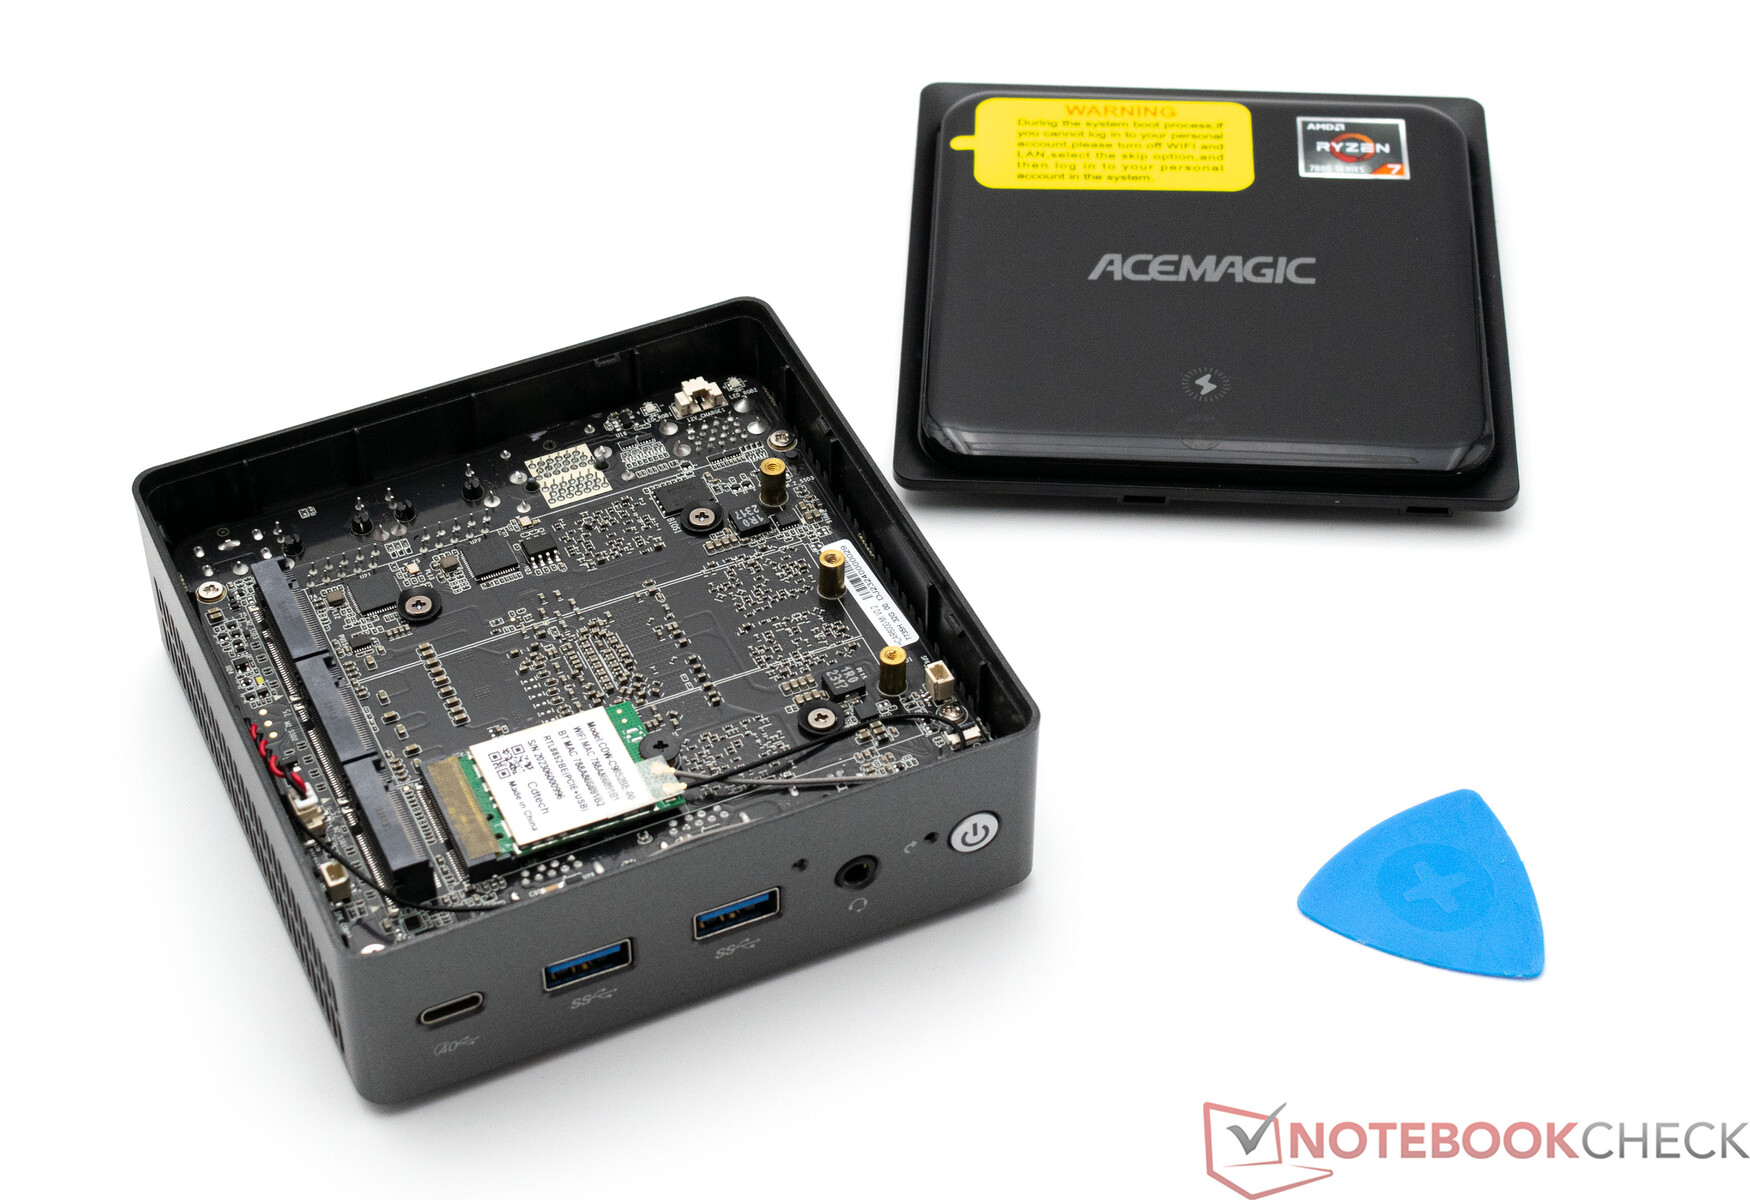
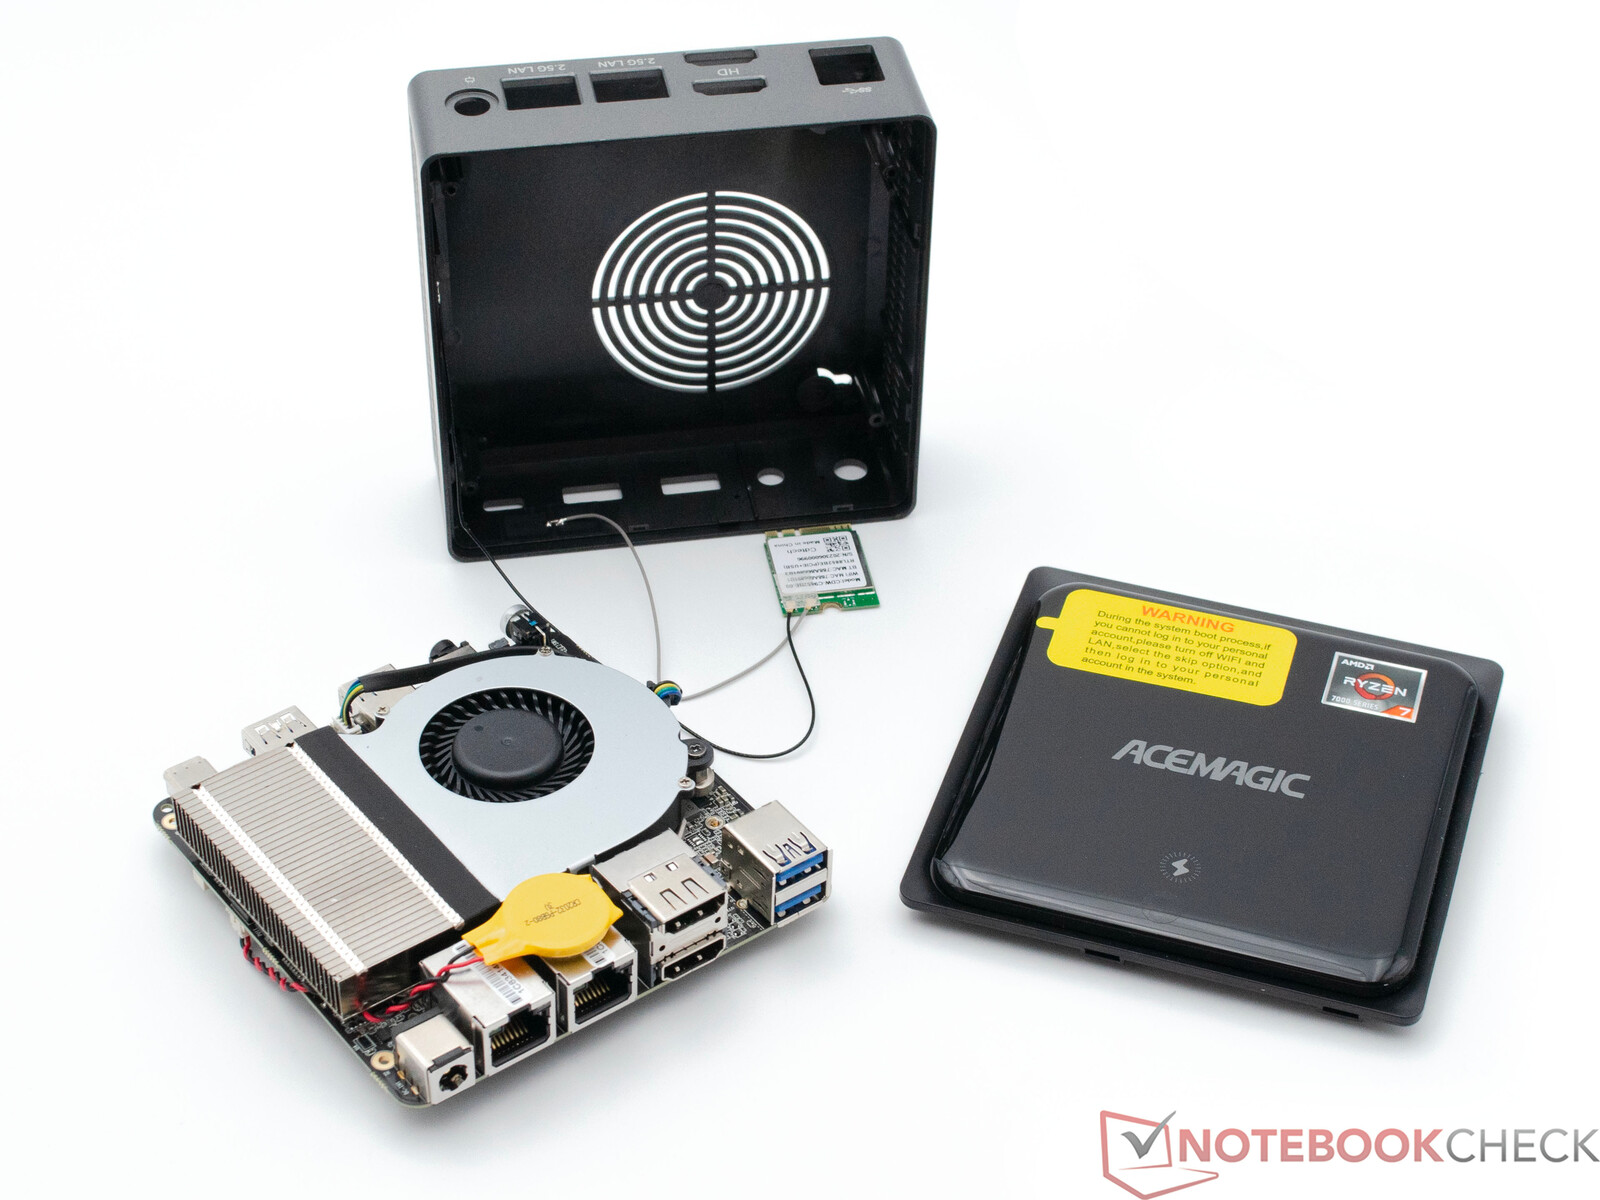
Acemagic AM20 in dettaglio
Custodia - con funzione di ricarica wireless
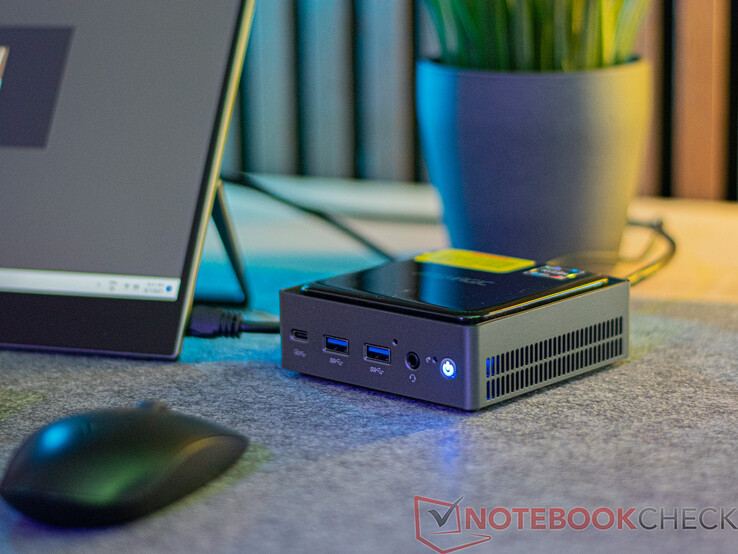
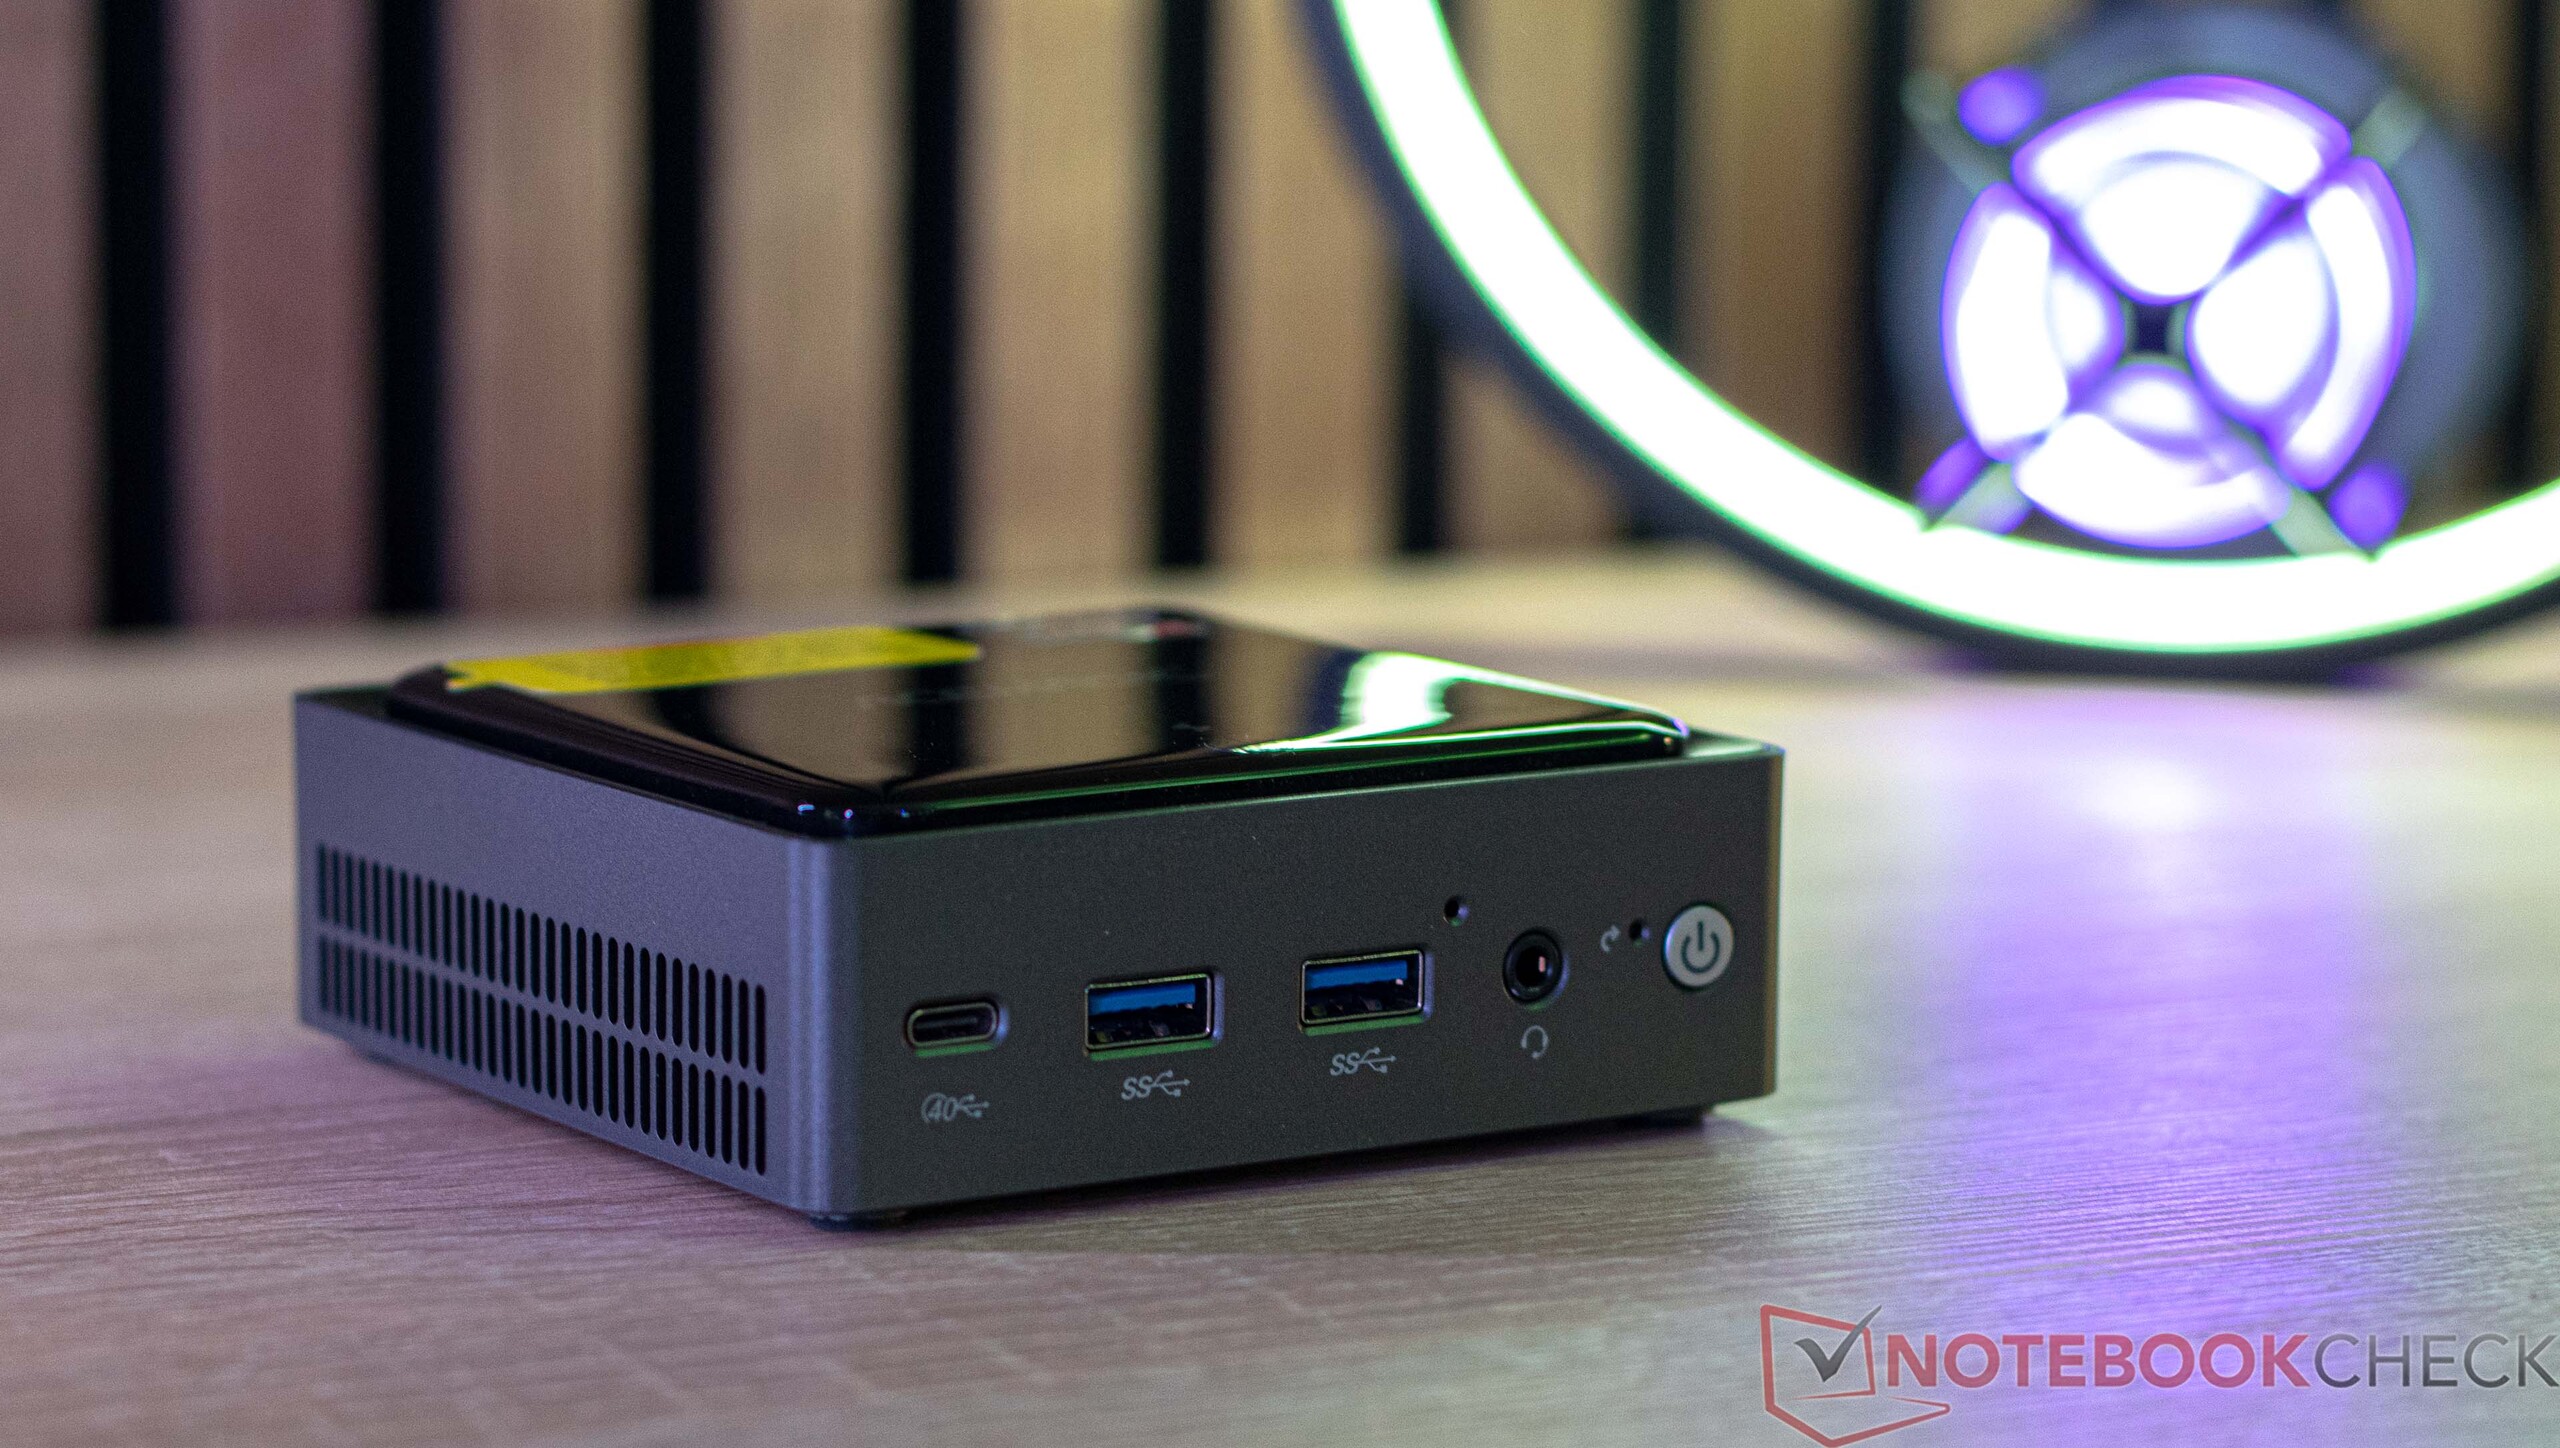
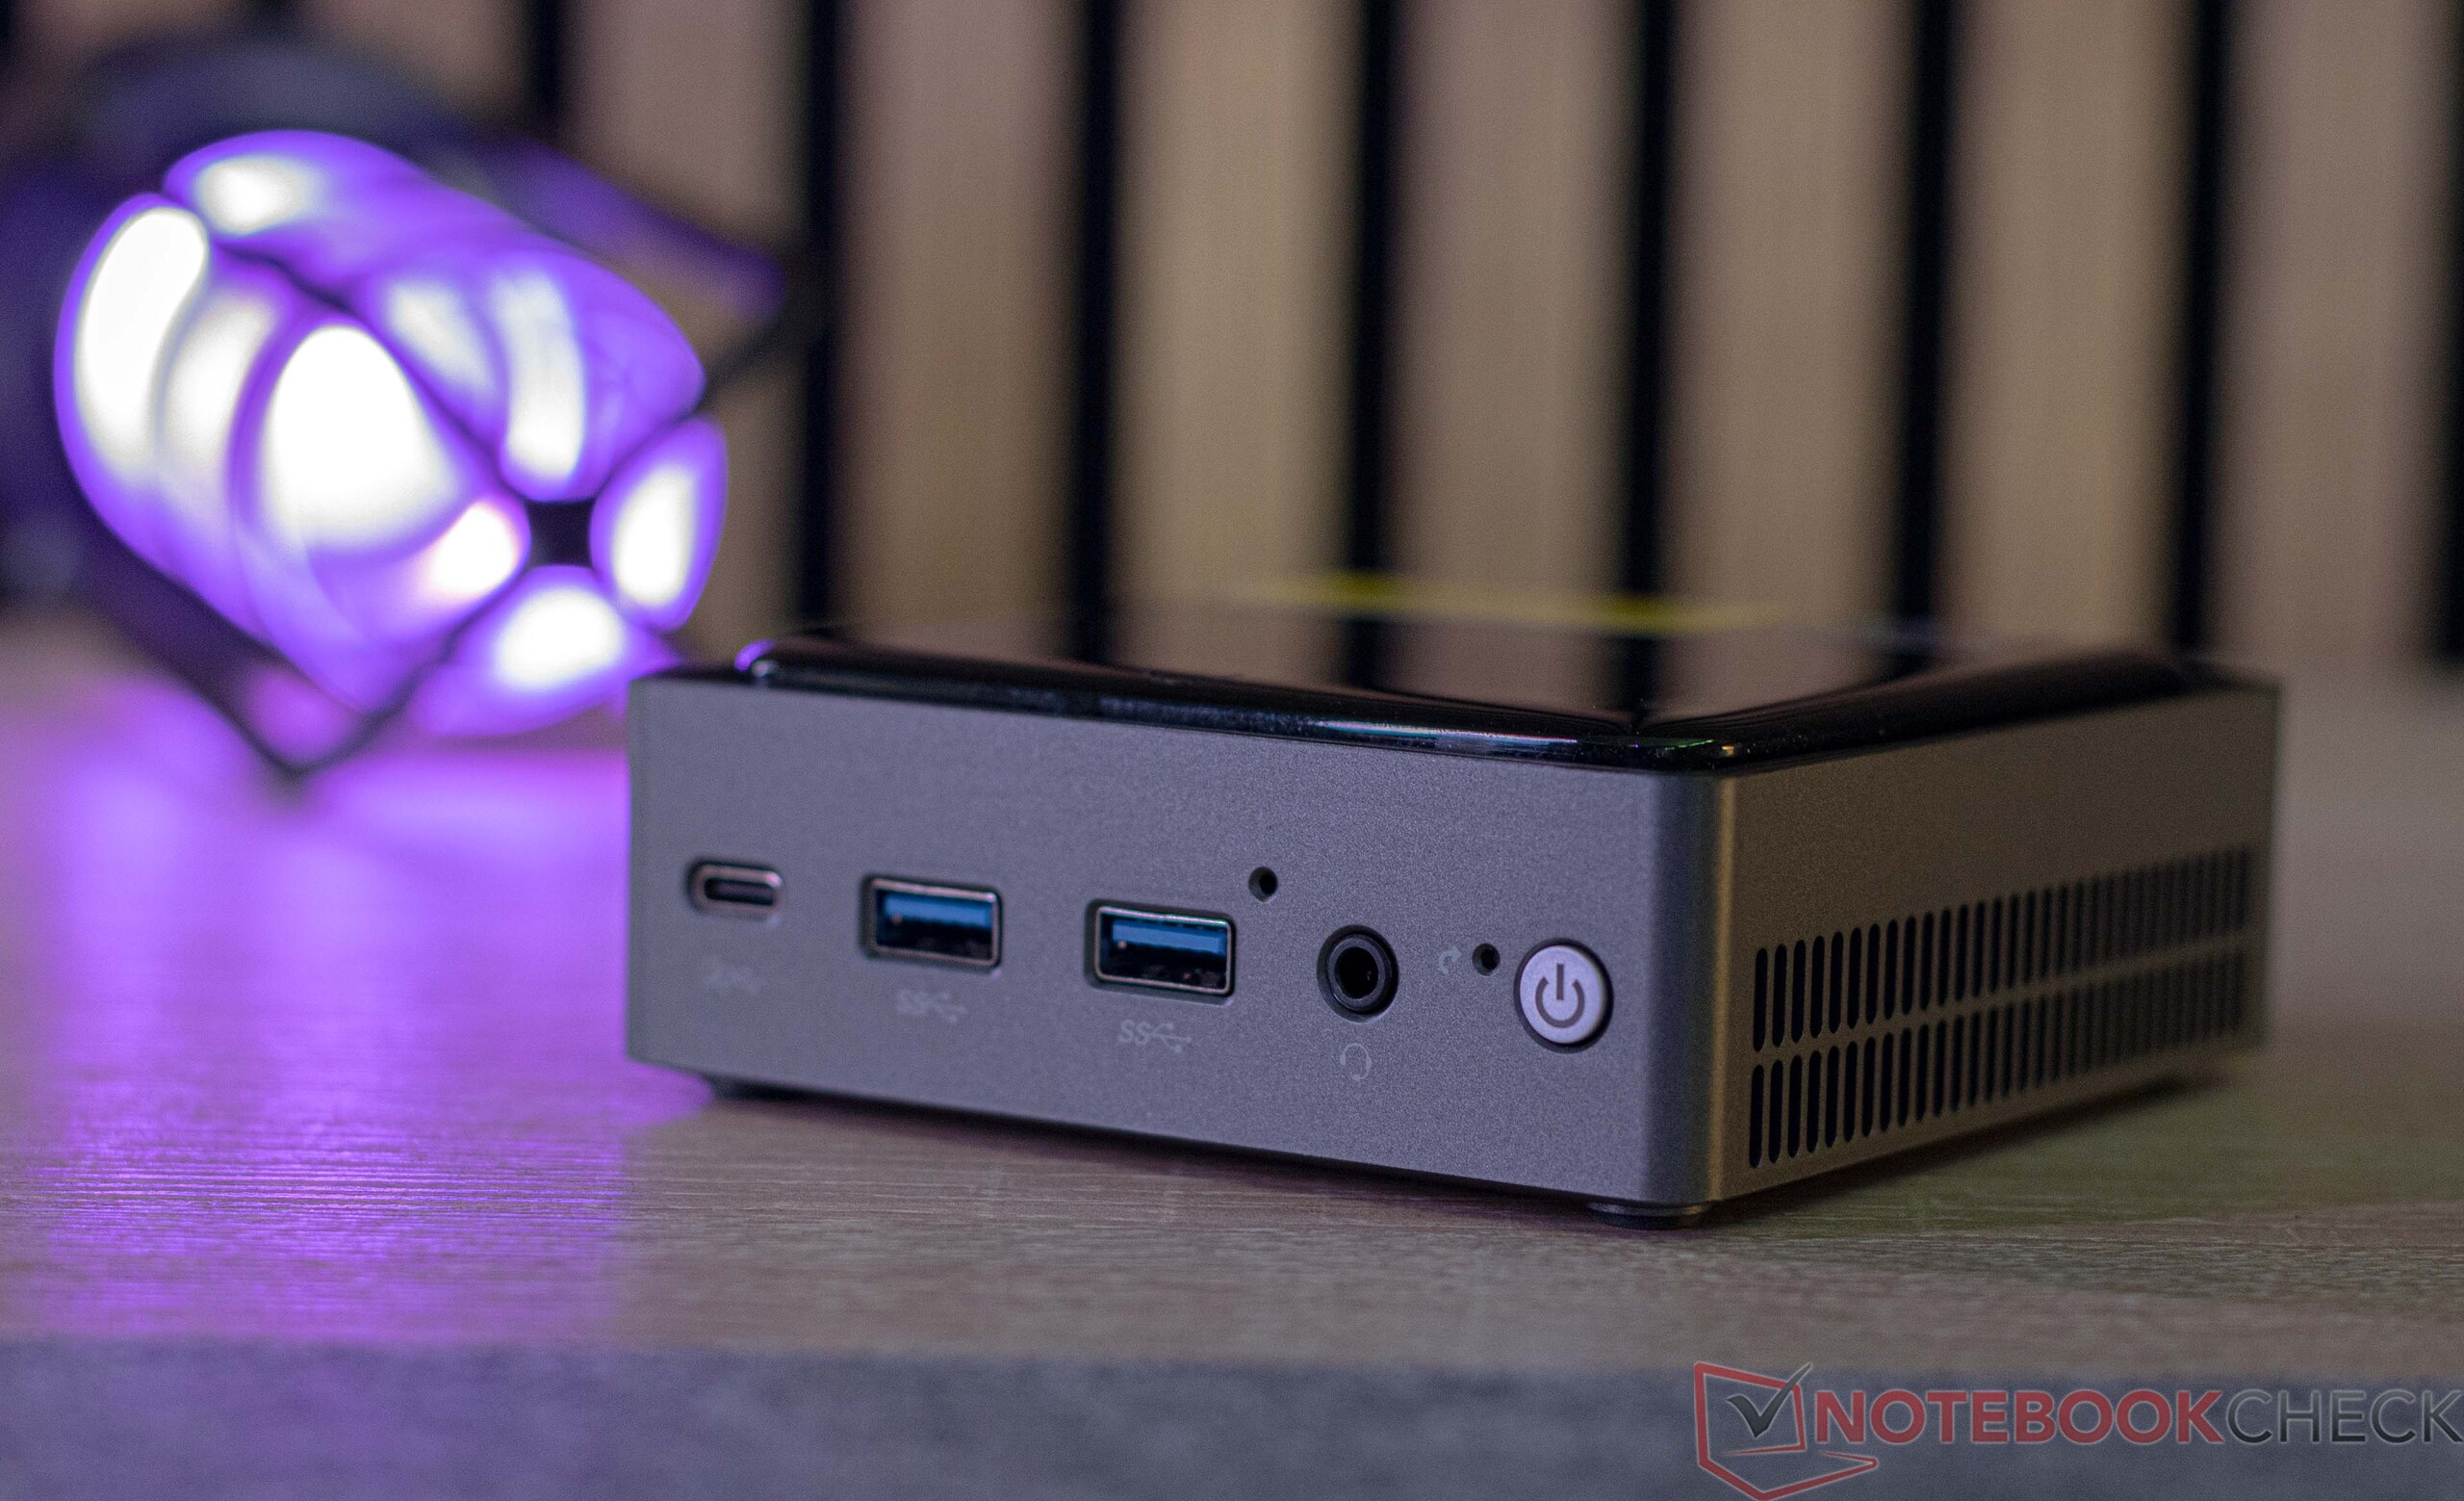
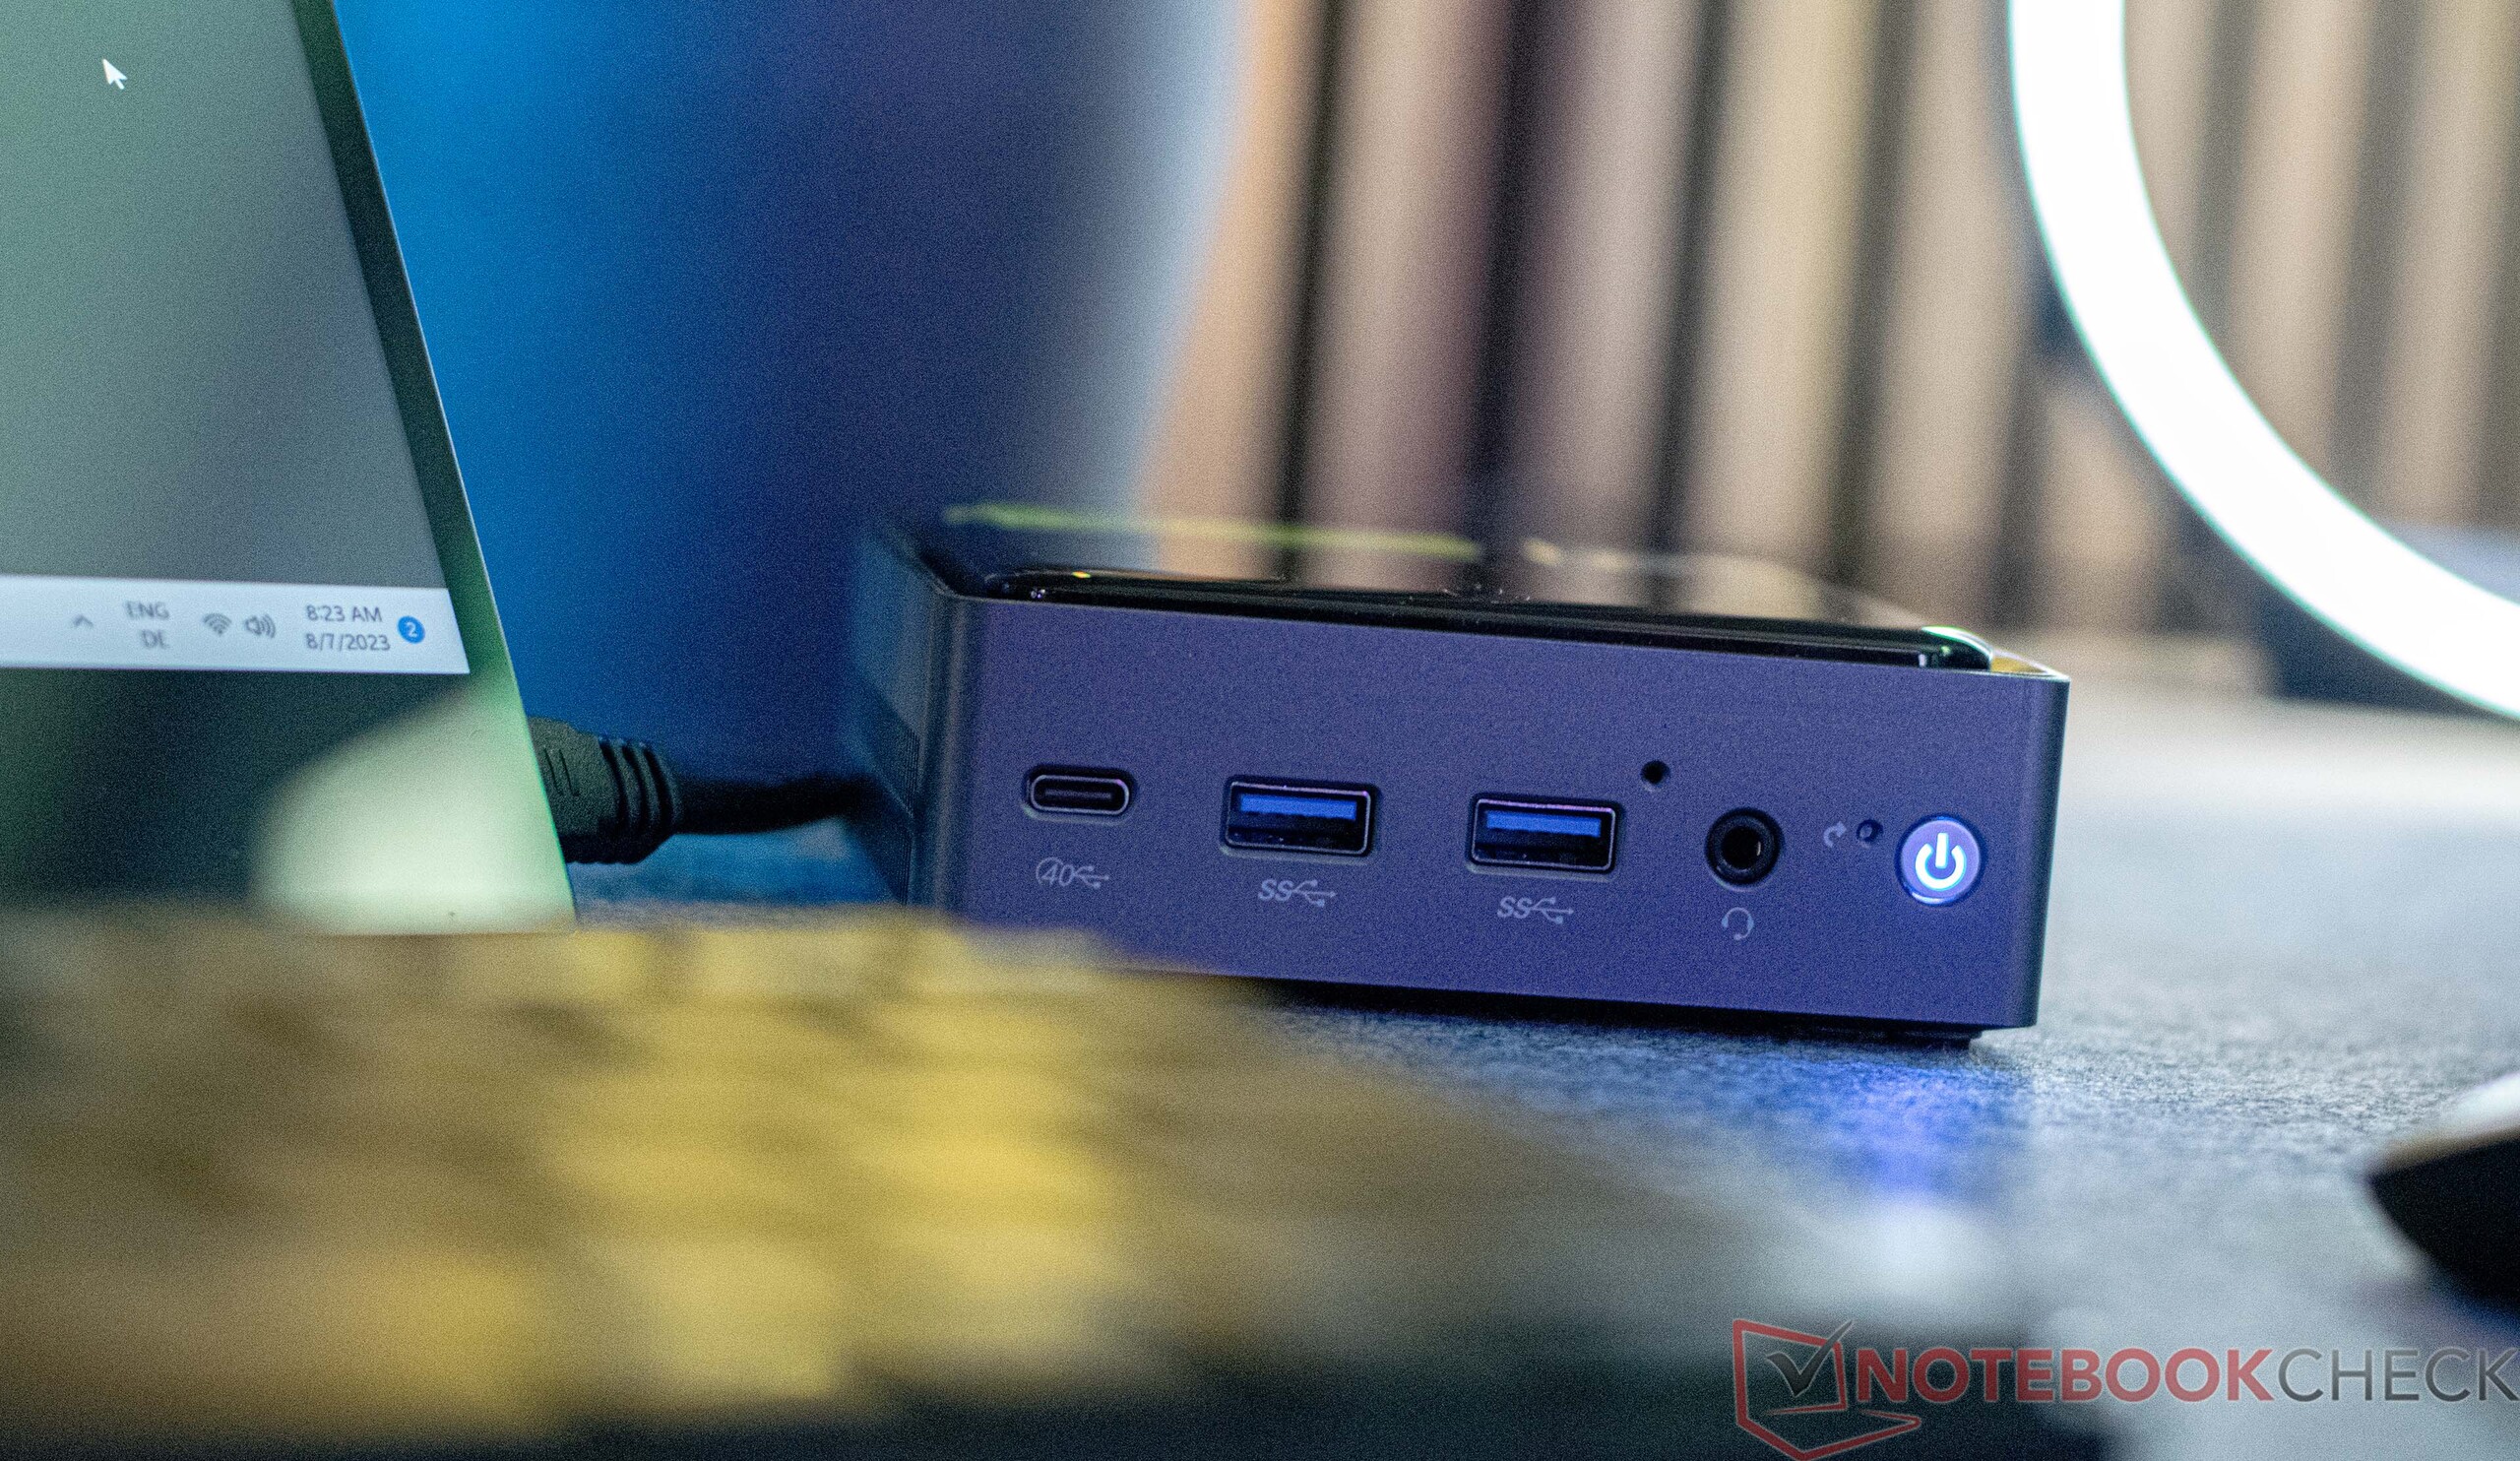
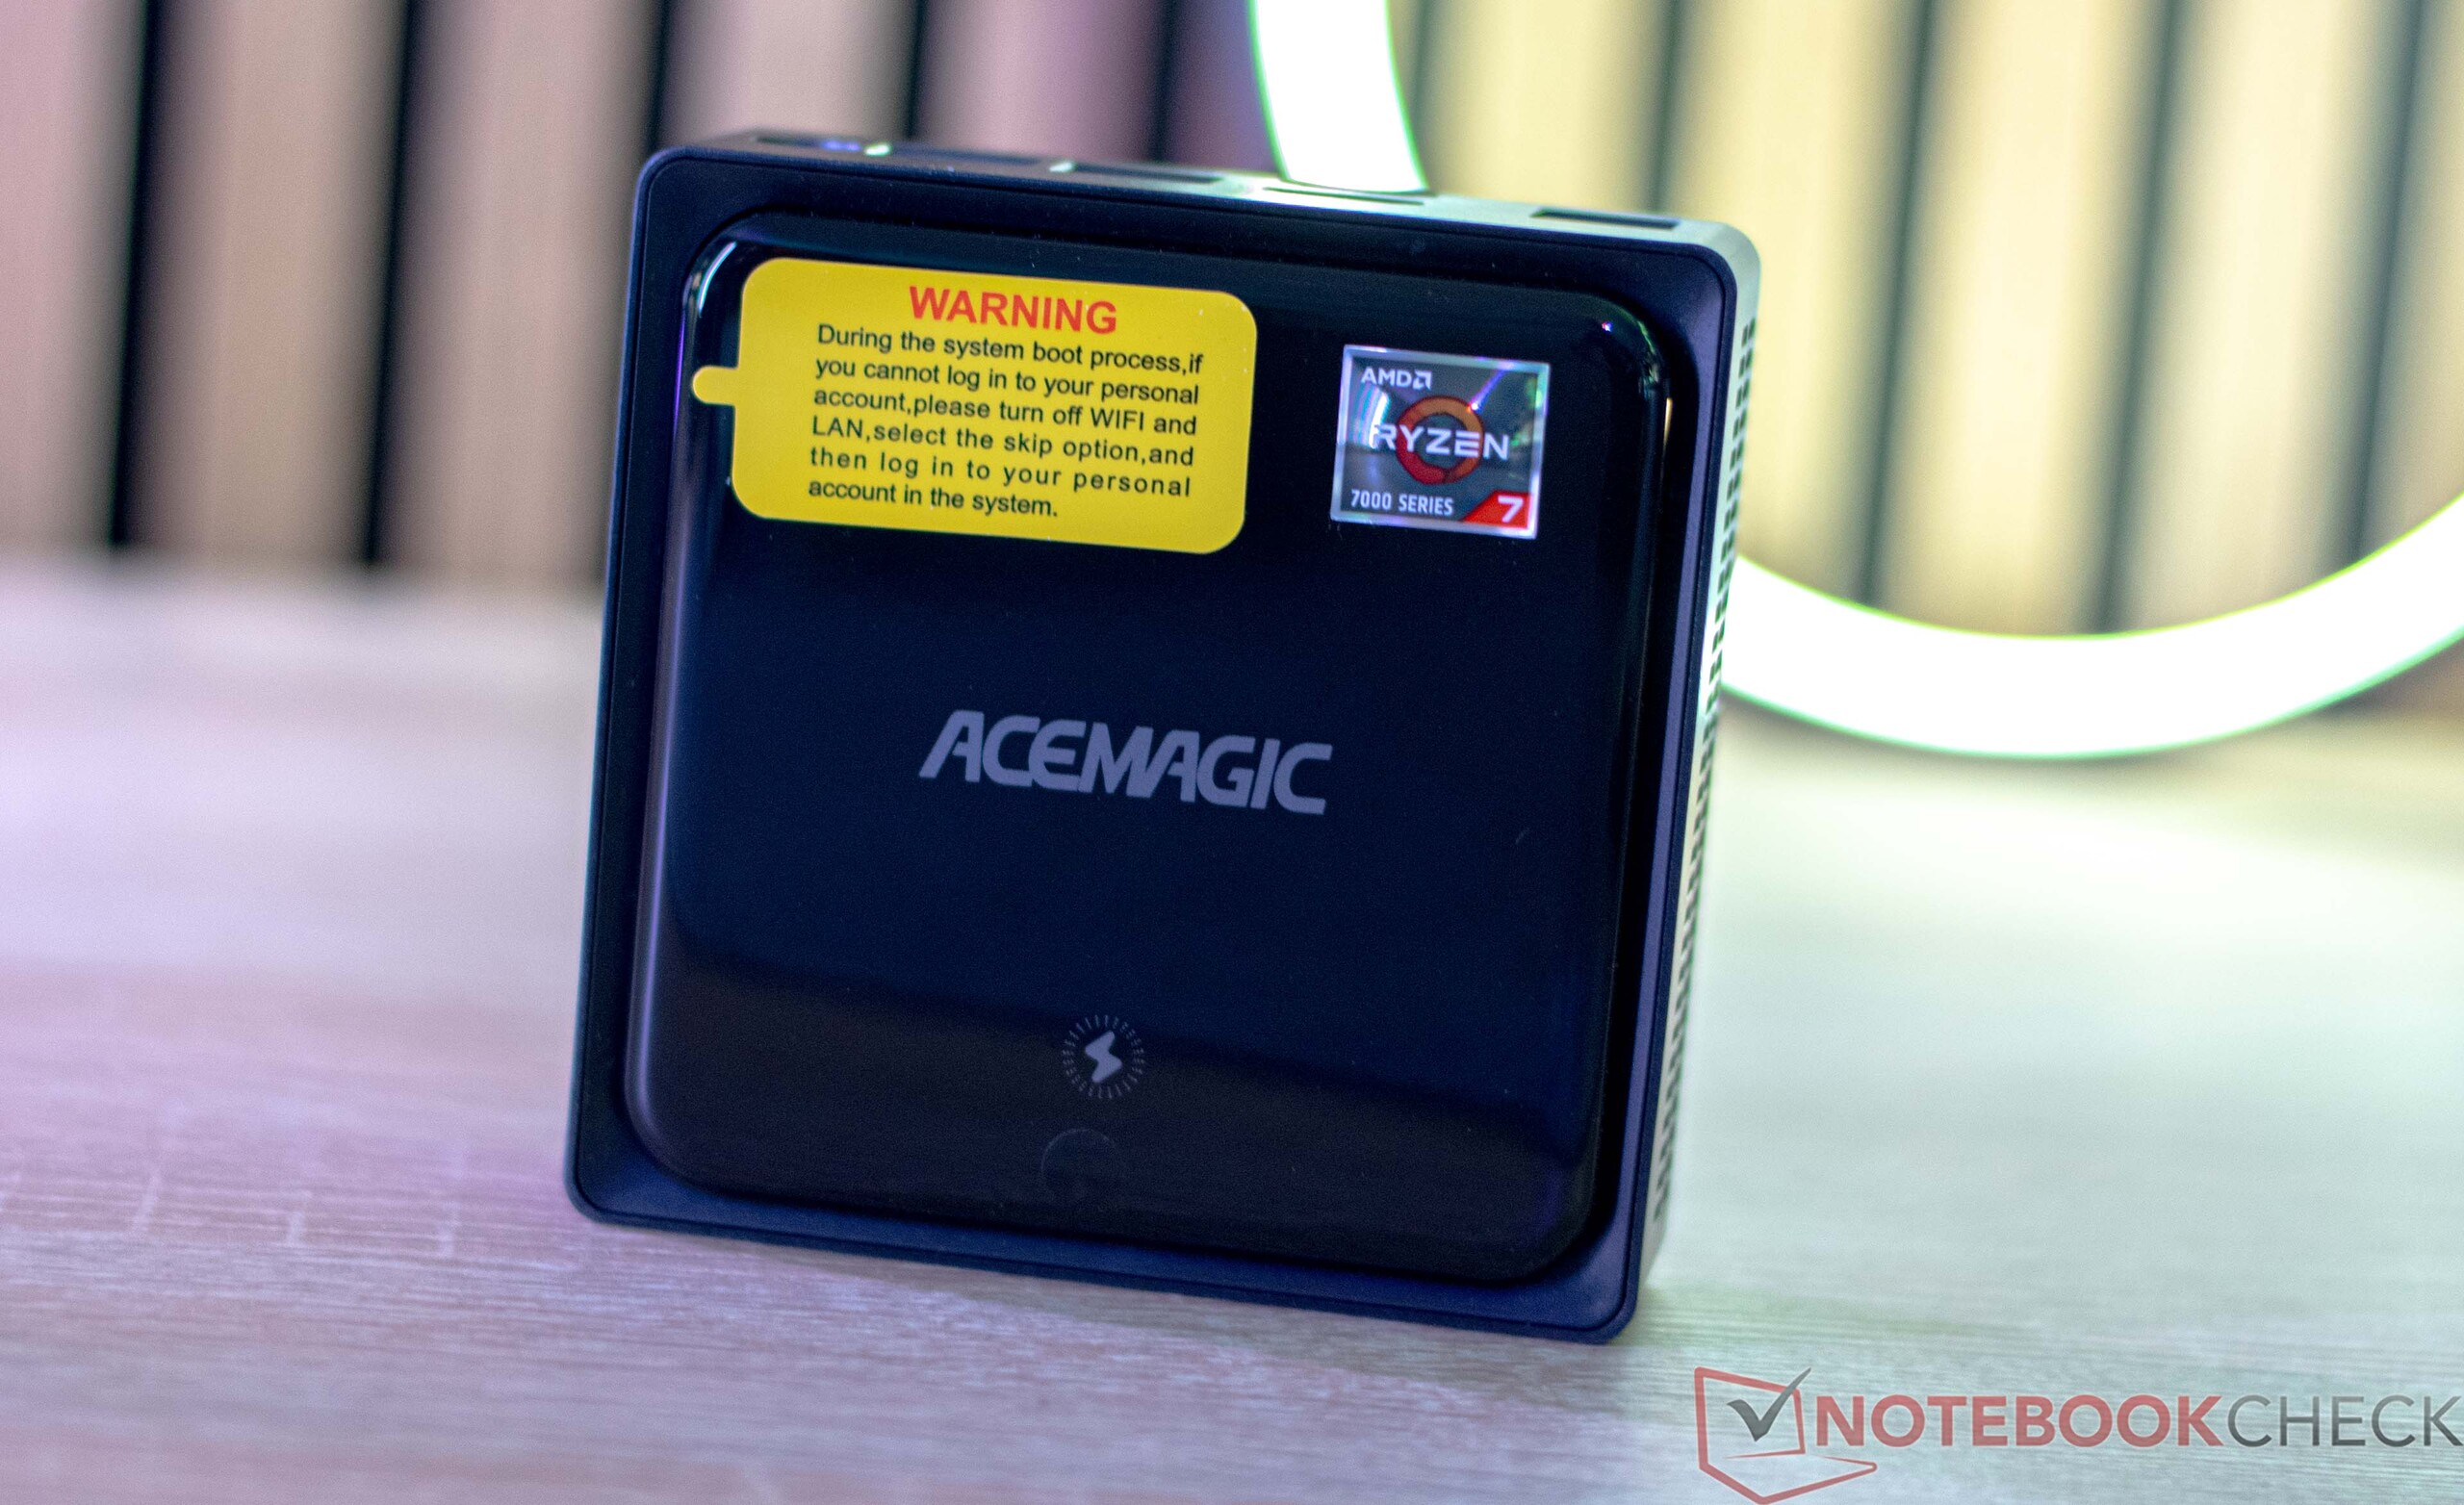
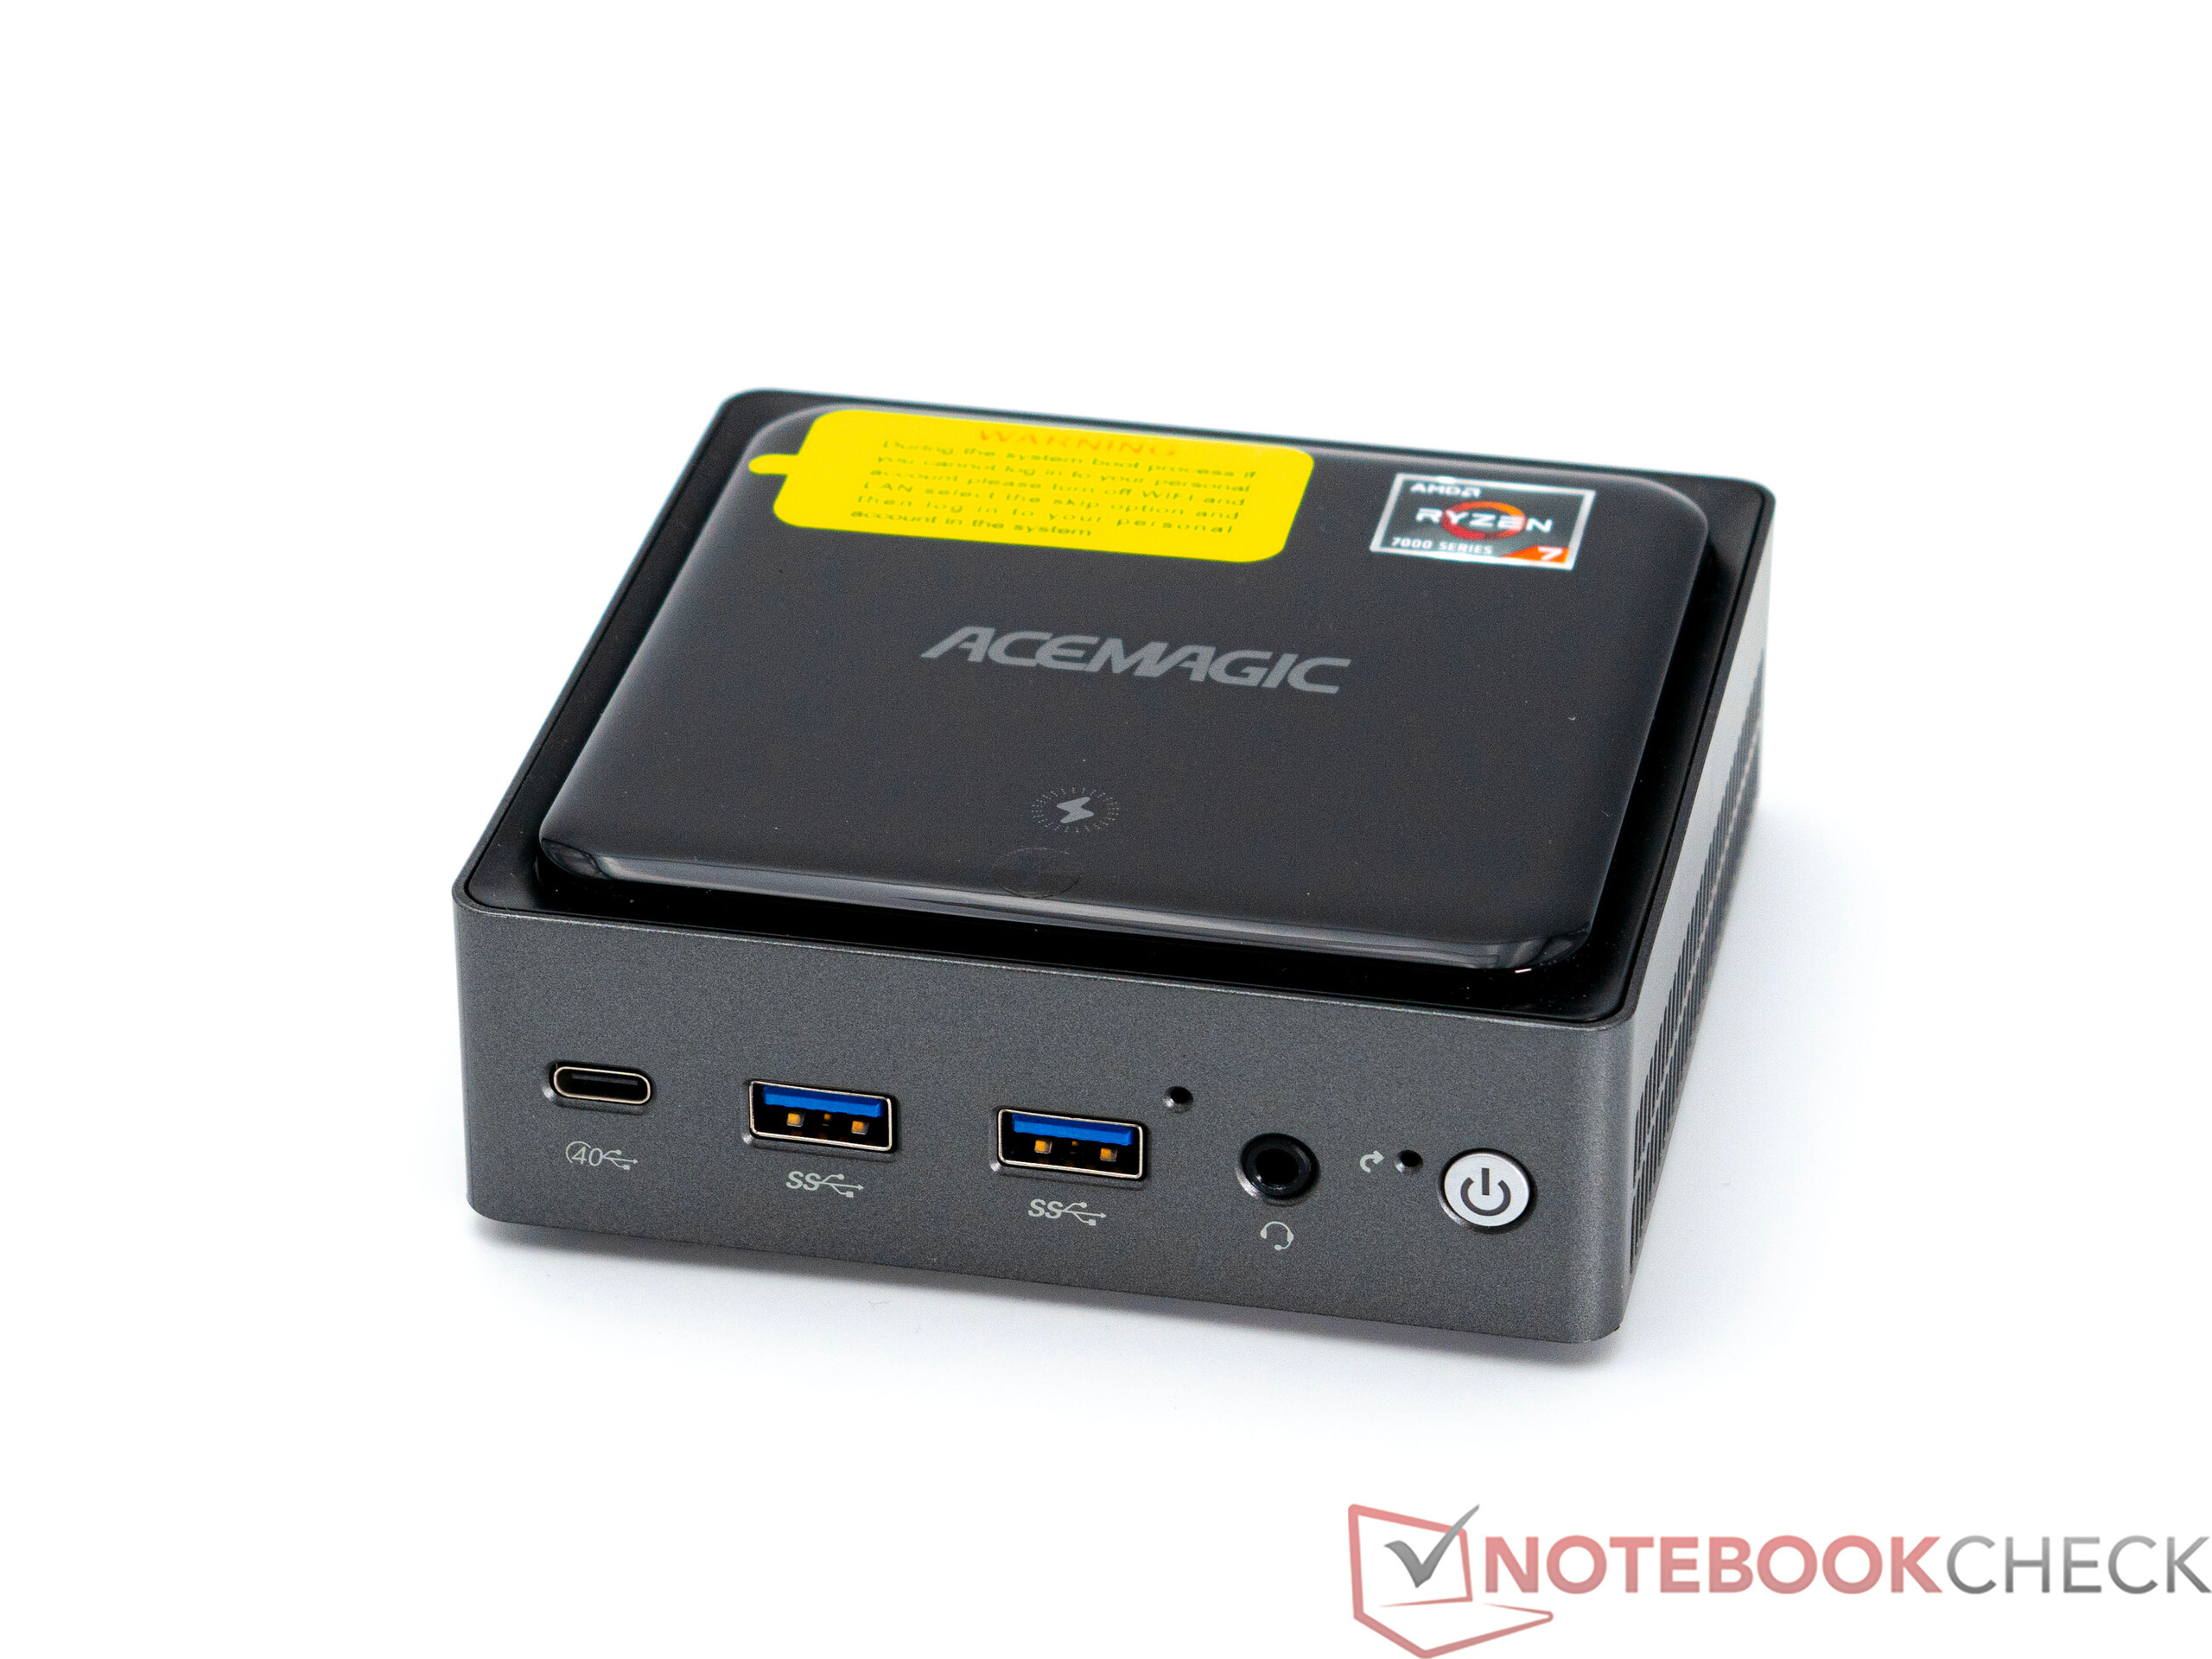
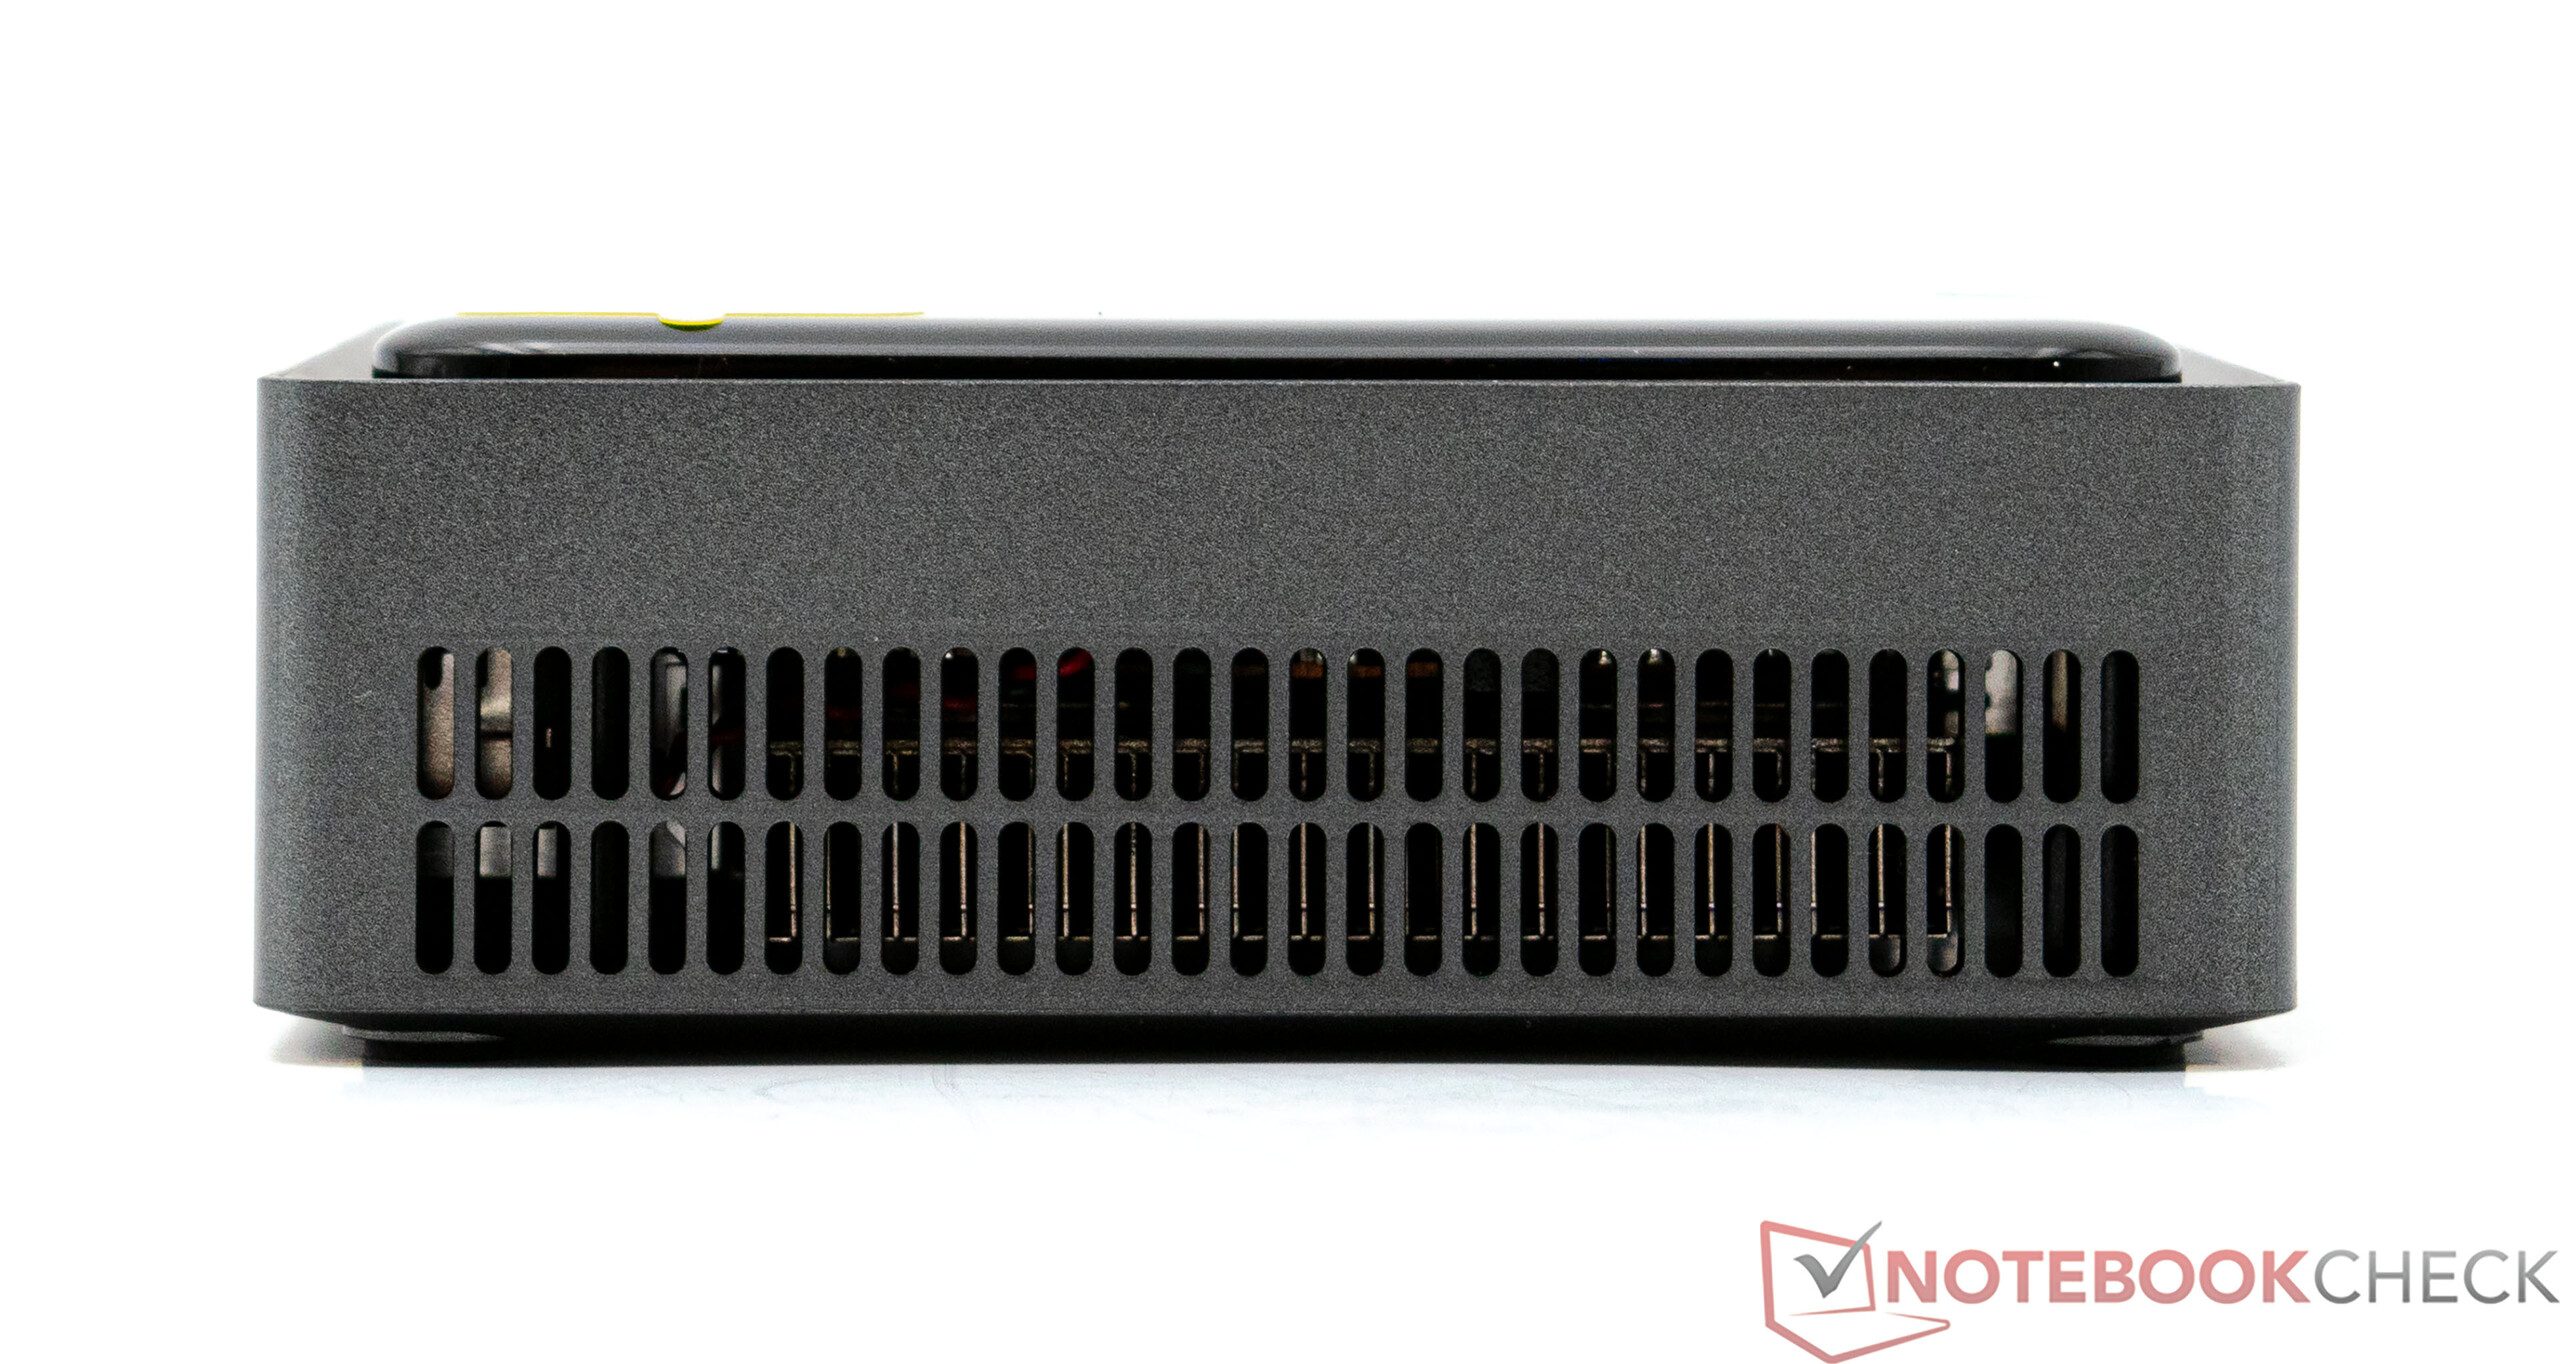
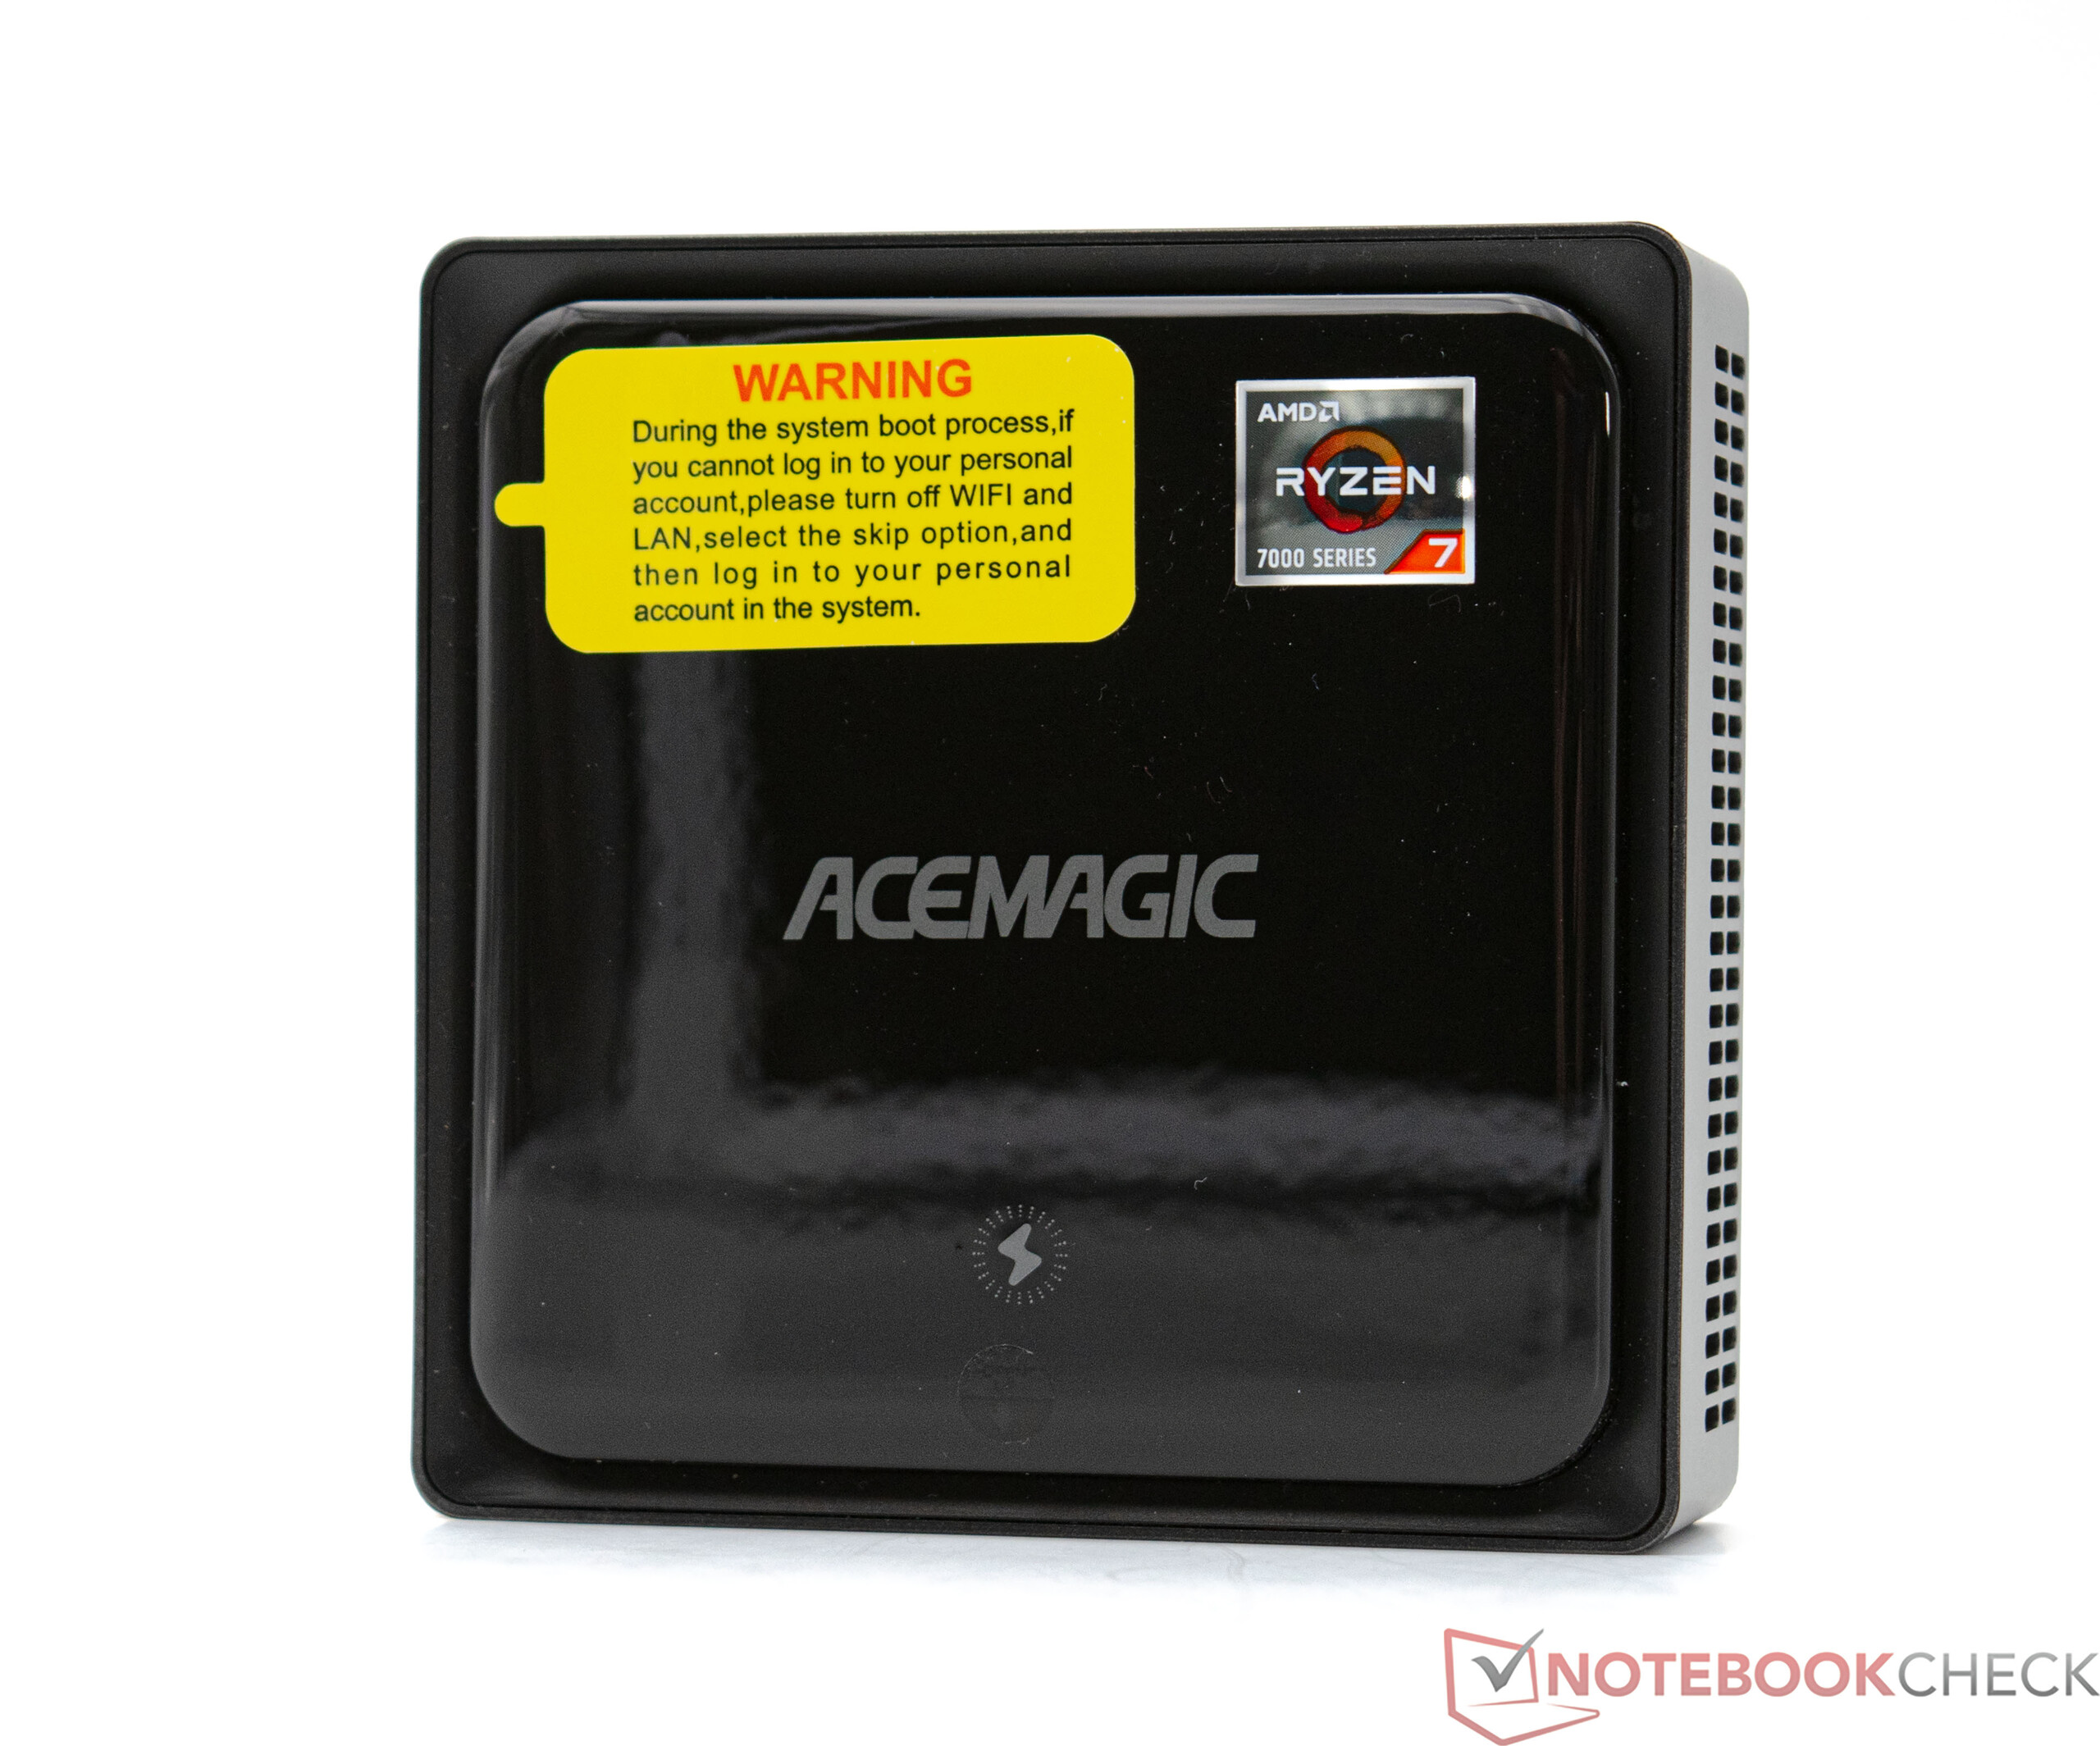
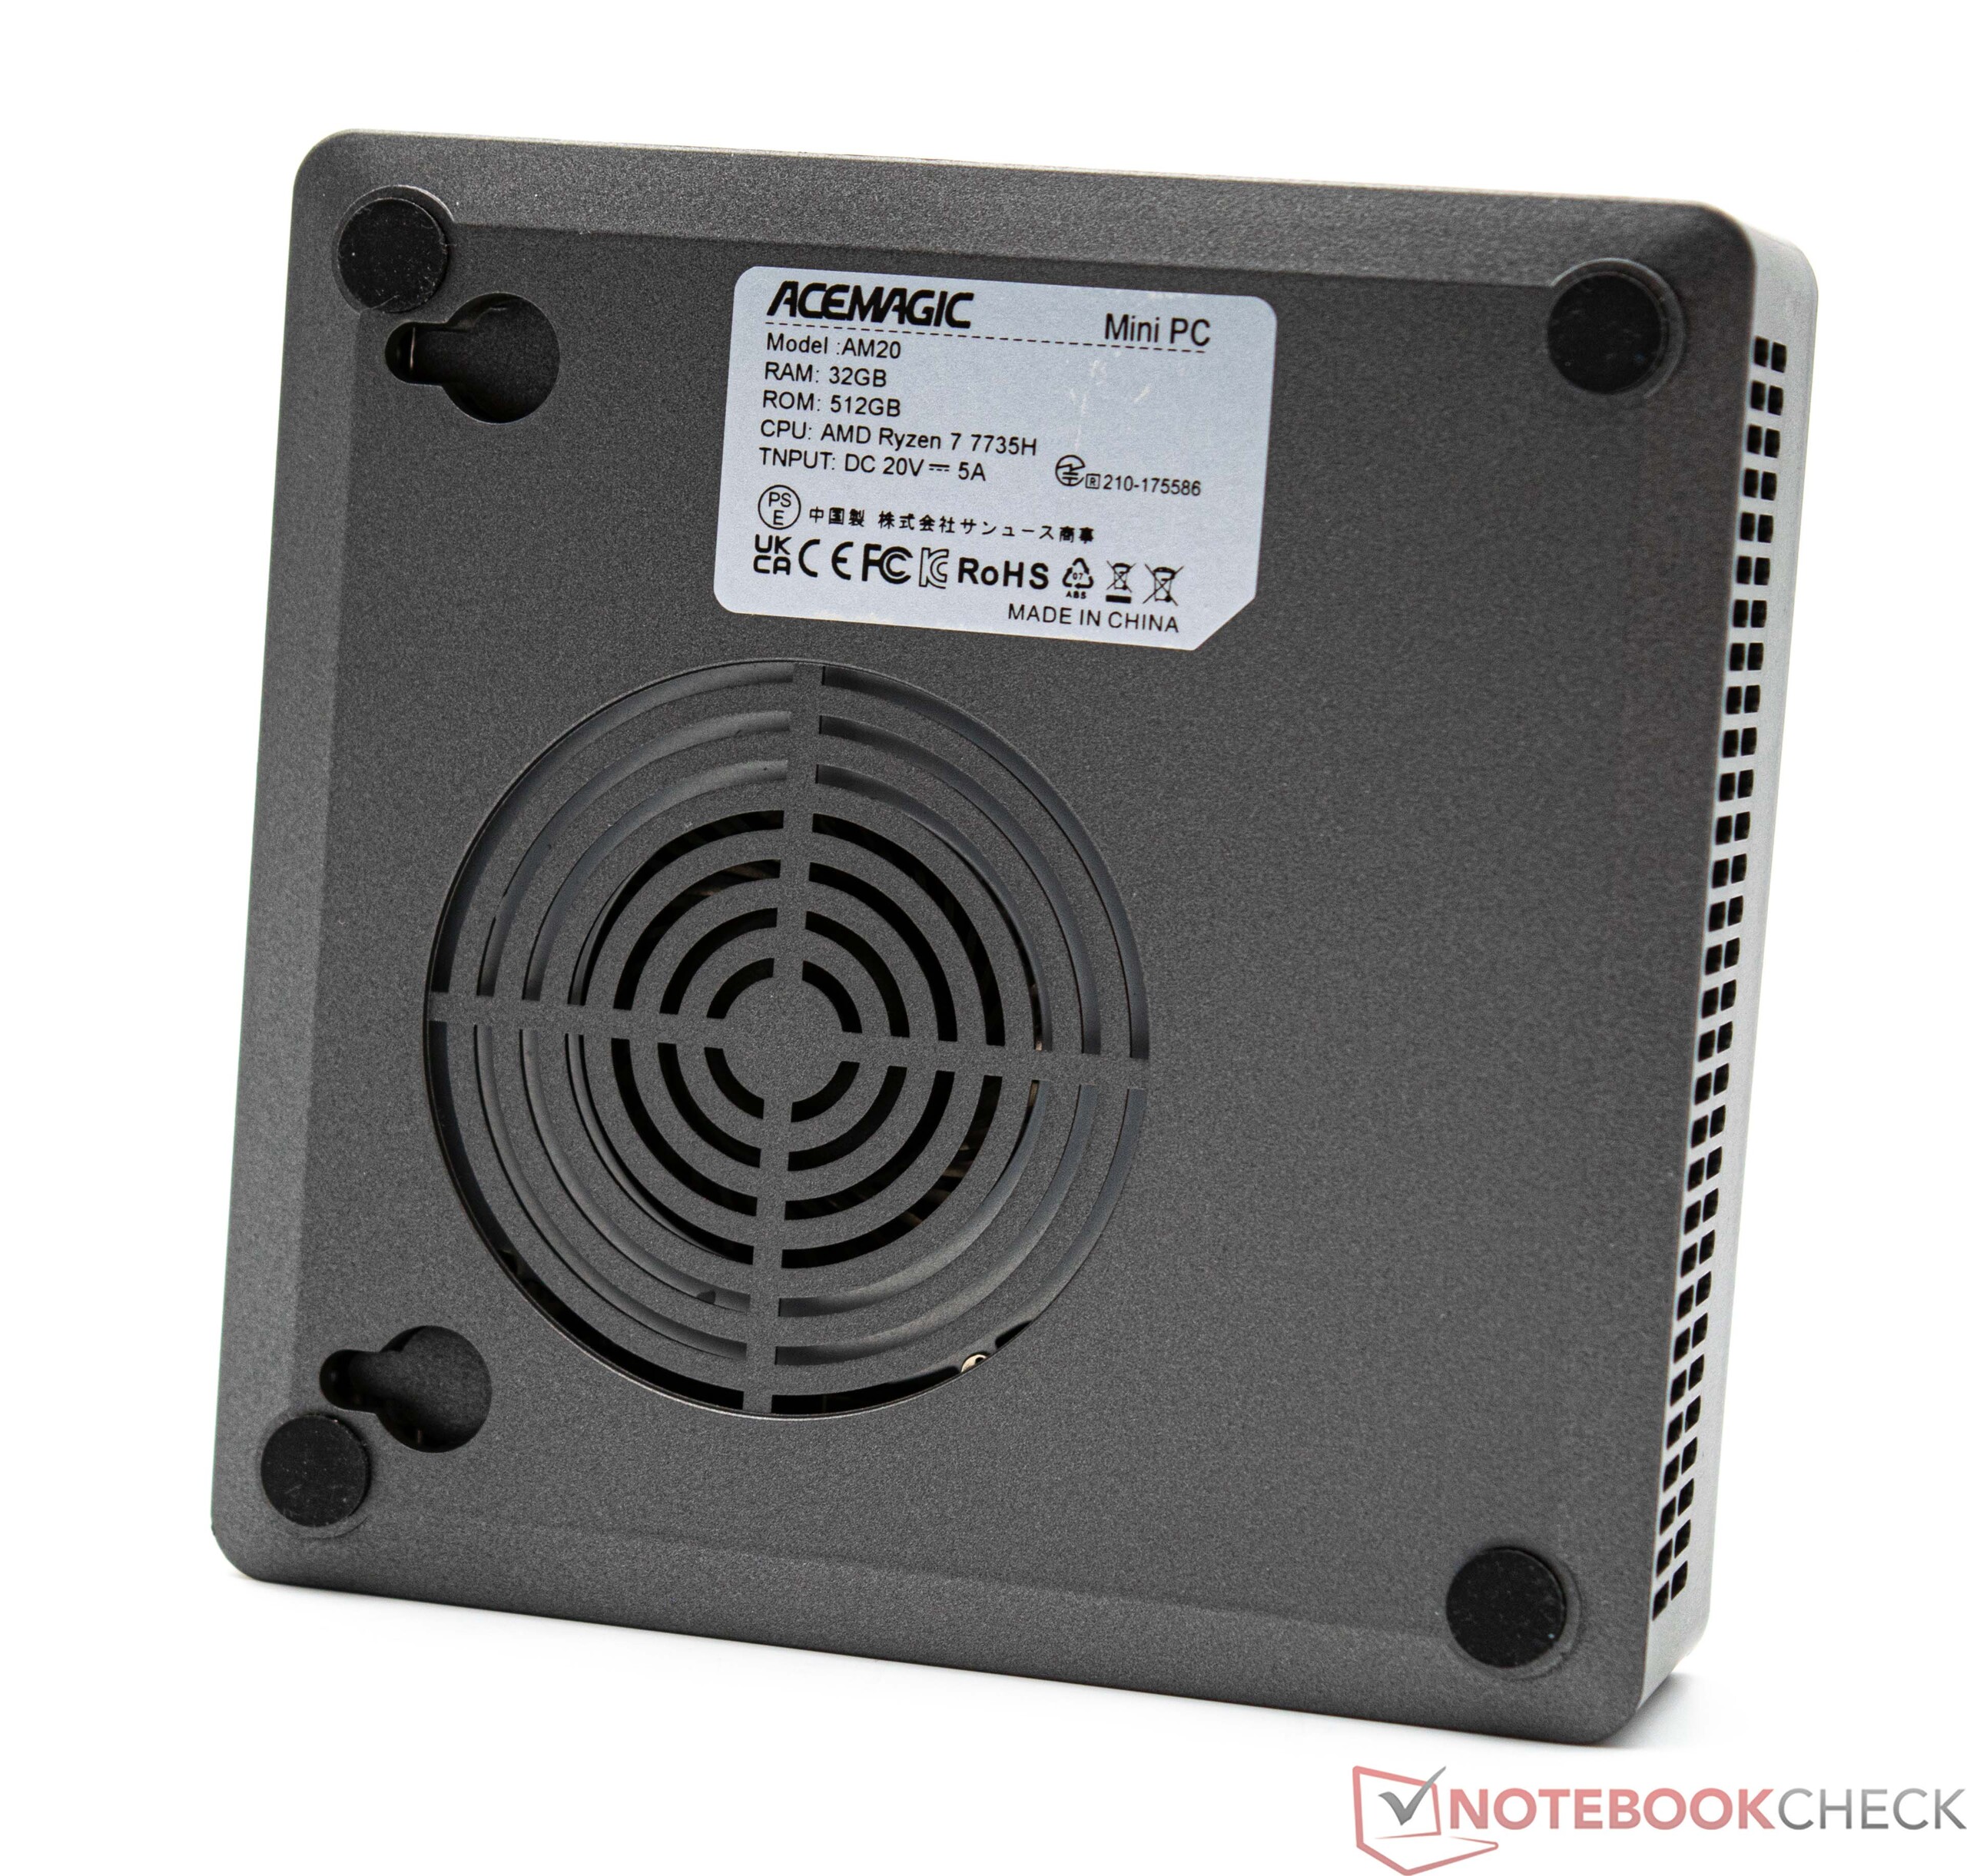
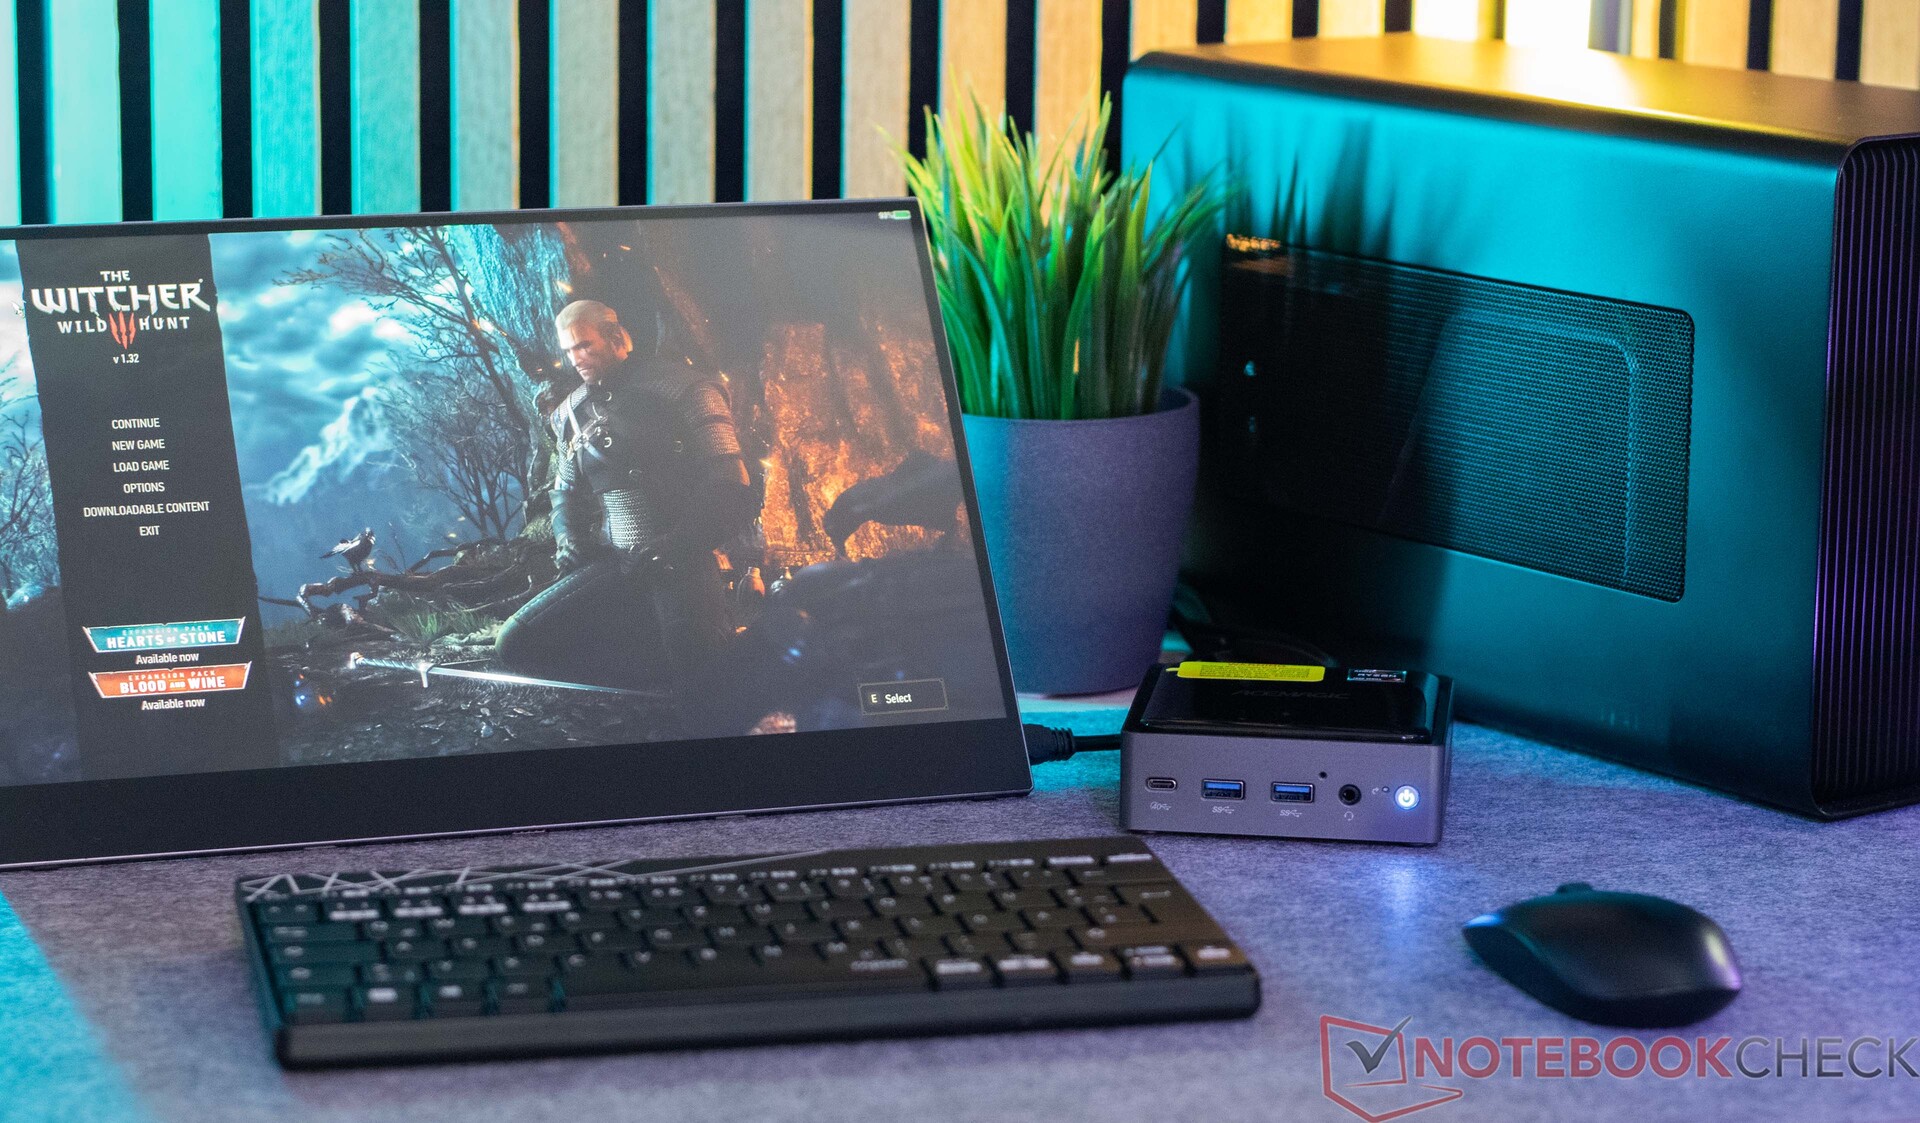
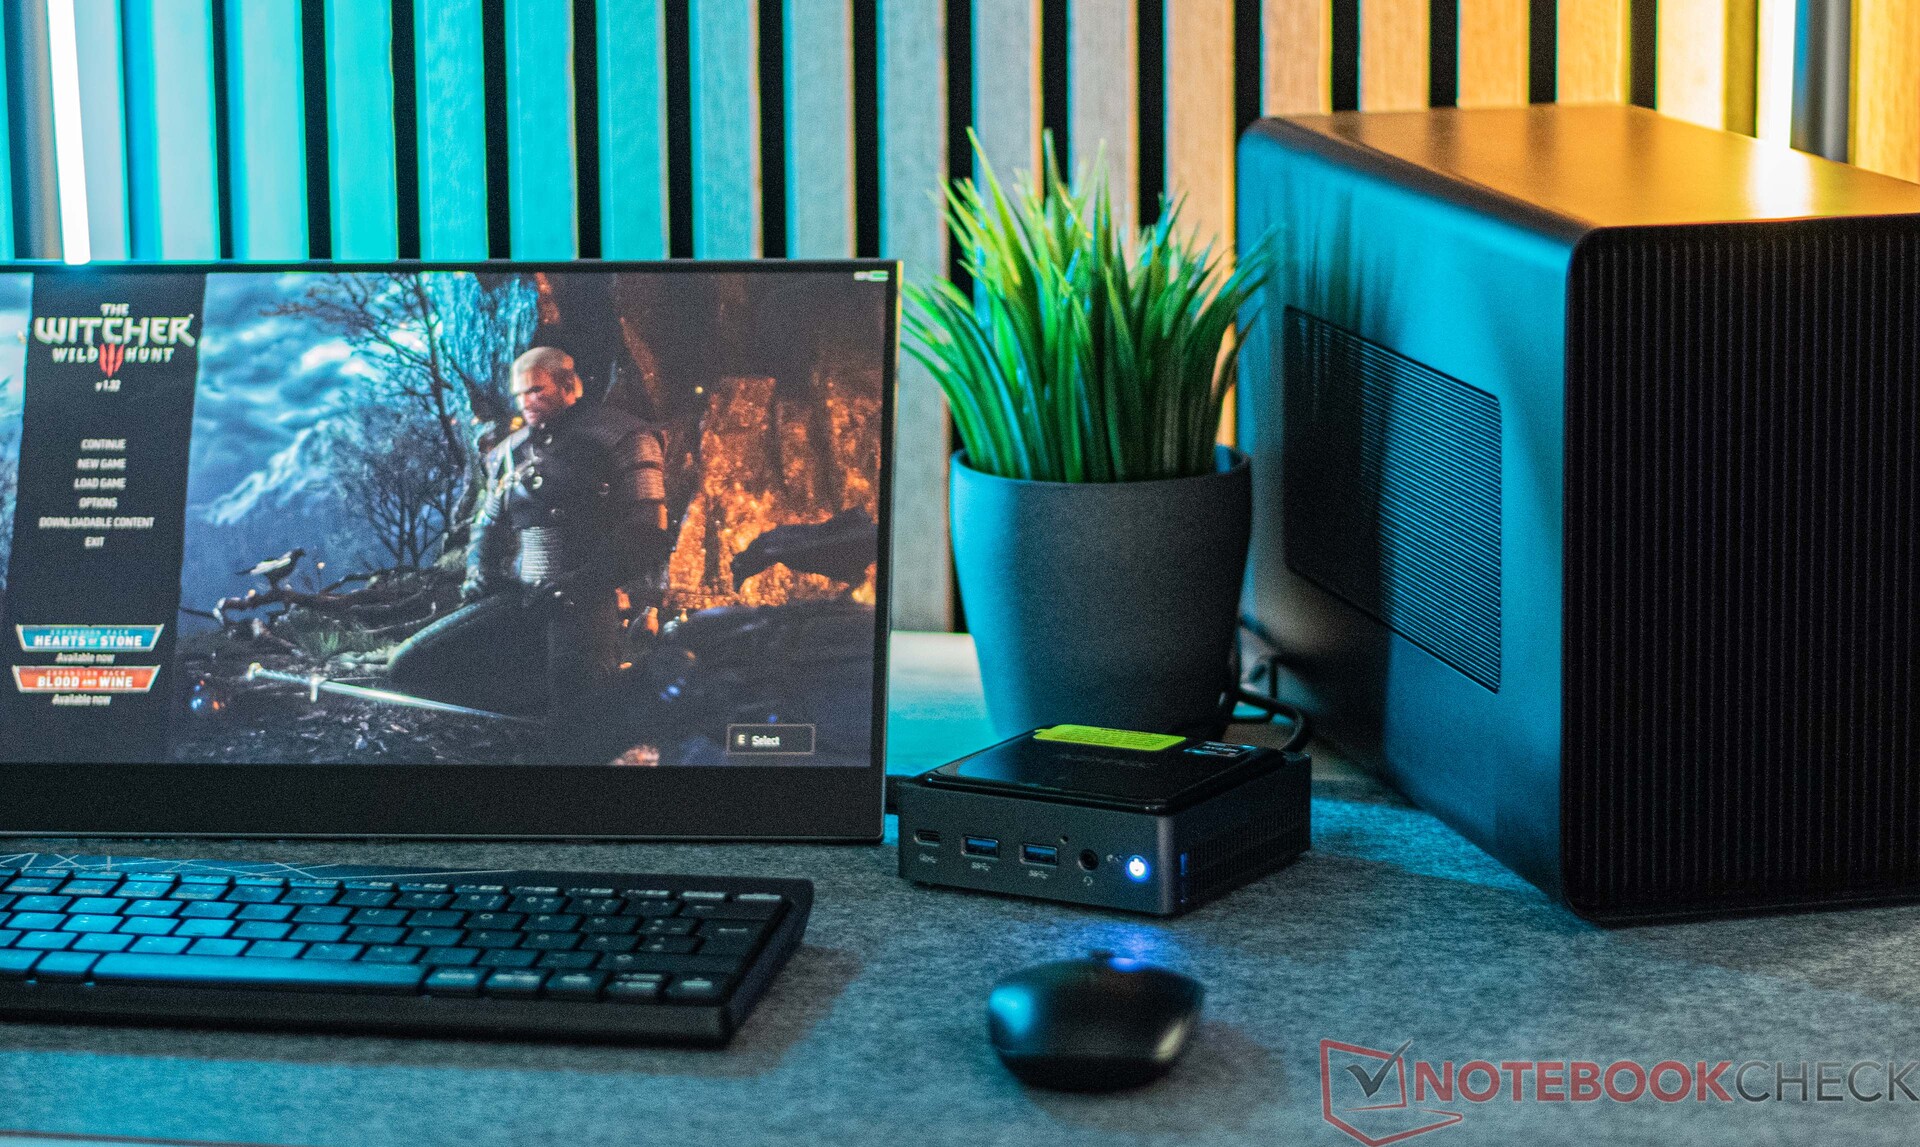
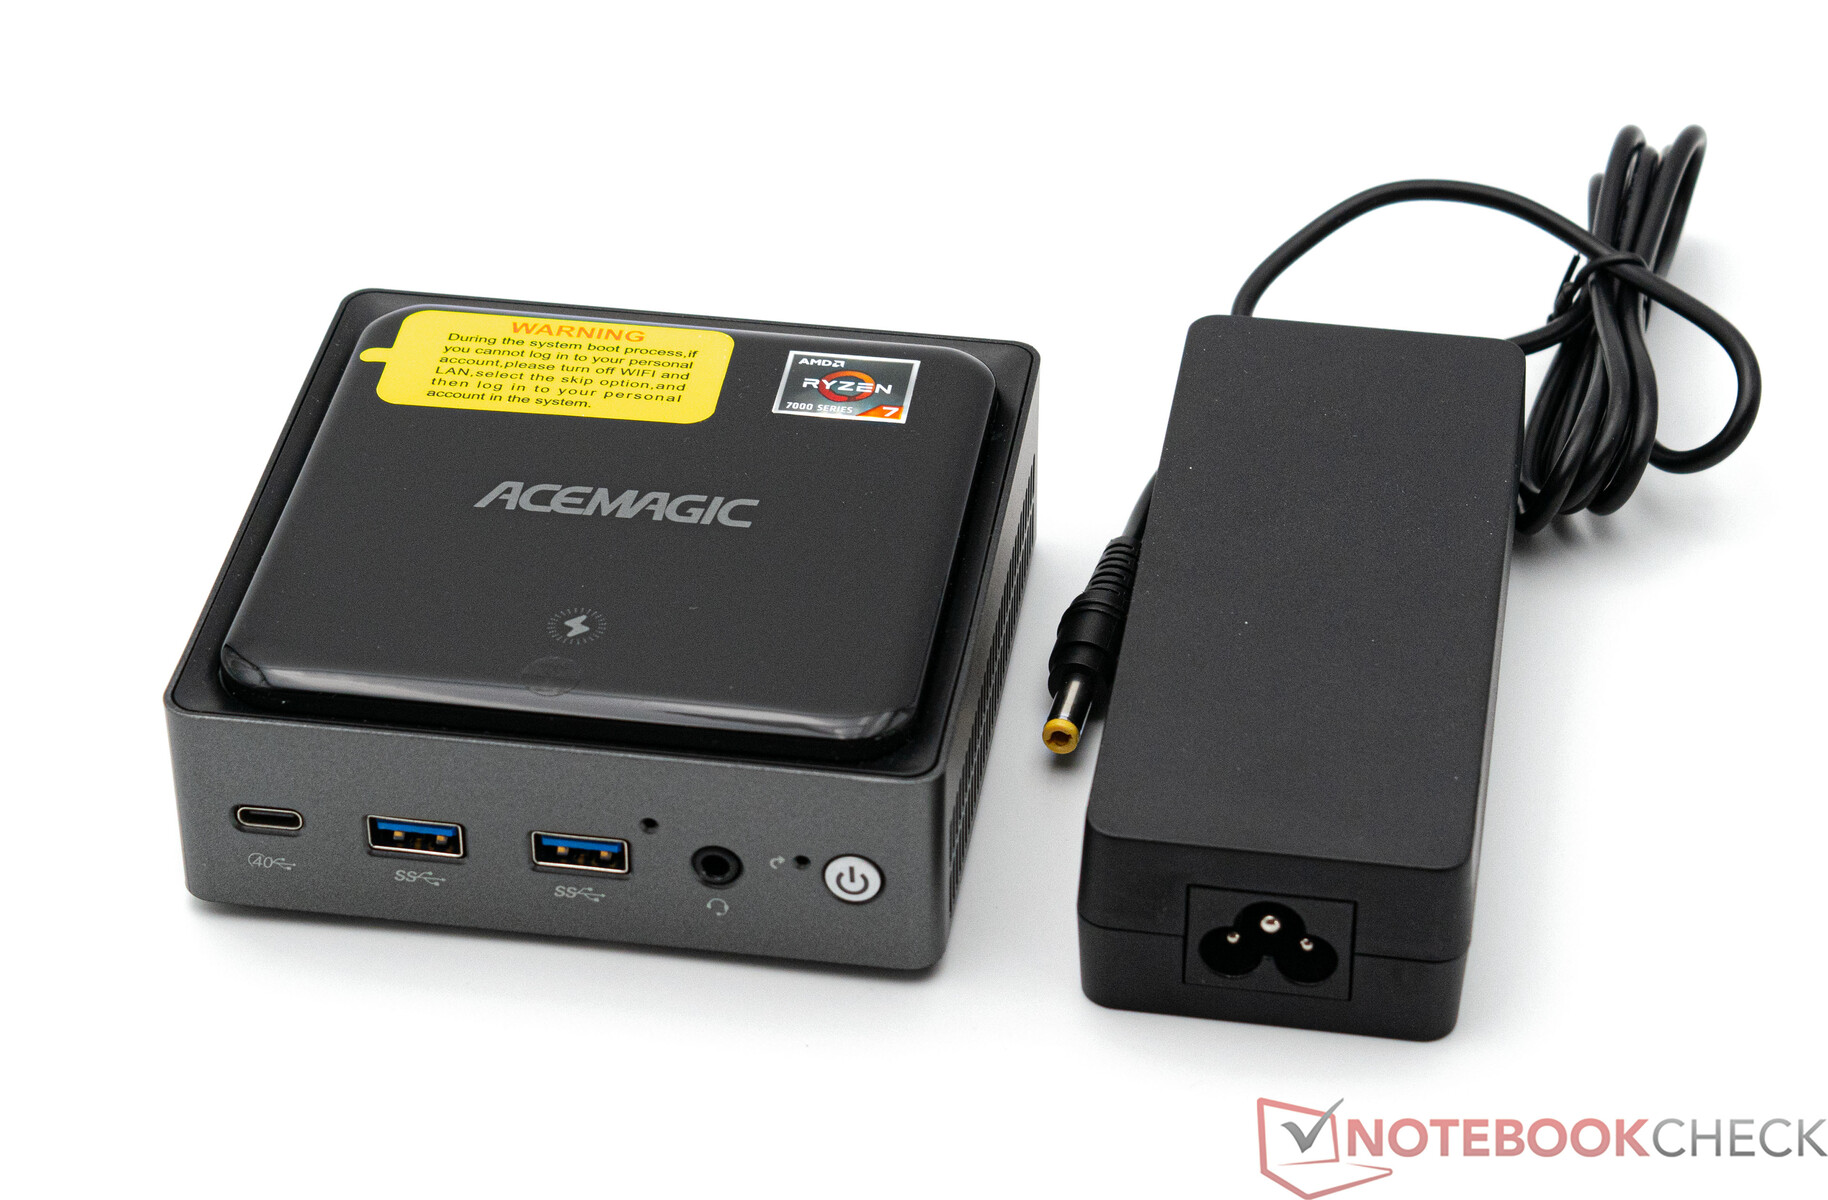
L'Acemagic AM20 non è di grande impatto visivo. L'esterno del dispositivo è grigio scuro, anche se la cover sembra nera. L'aspetto lucido lo rende purtroppo incline ad attirare le impronte digitali. All'interno dell'involucro è nascosta un'unità di ricarica per la ricarica wireless. Gli smartphone, ad esempio, possono essere ricaricati durante il funzionamento fino a 10 watt. Questo rende l'Acemagic AM20 il più piccolo mini PC con funzione di ricarica wireless. Se si considerano i requisiti di spazio, l'Acermagic AM20 appartiene ancora una volta ai dispositivi più compatti. Con 10,7 × 10,7 centimetri, il suo ingombro è molto ridotto. Anche l'altezza è di soli 3,8 centimetri.
L'Acemagic AM20 può essere fissato a un monitor tramite un supporto VESA. Tuttavia, questo tipo di implementazione dovrebbe rendere difficile l'utilizzo dell'unità di ricarica integrata nell'involucro.
Caratteristiche: una buona selezione, tra cui Thunderbolt
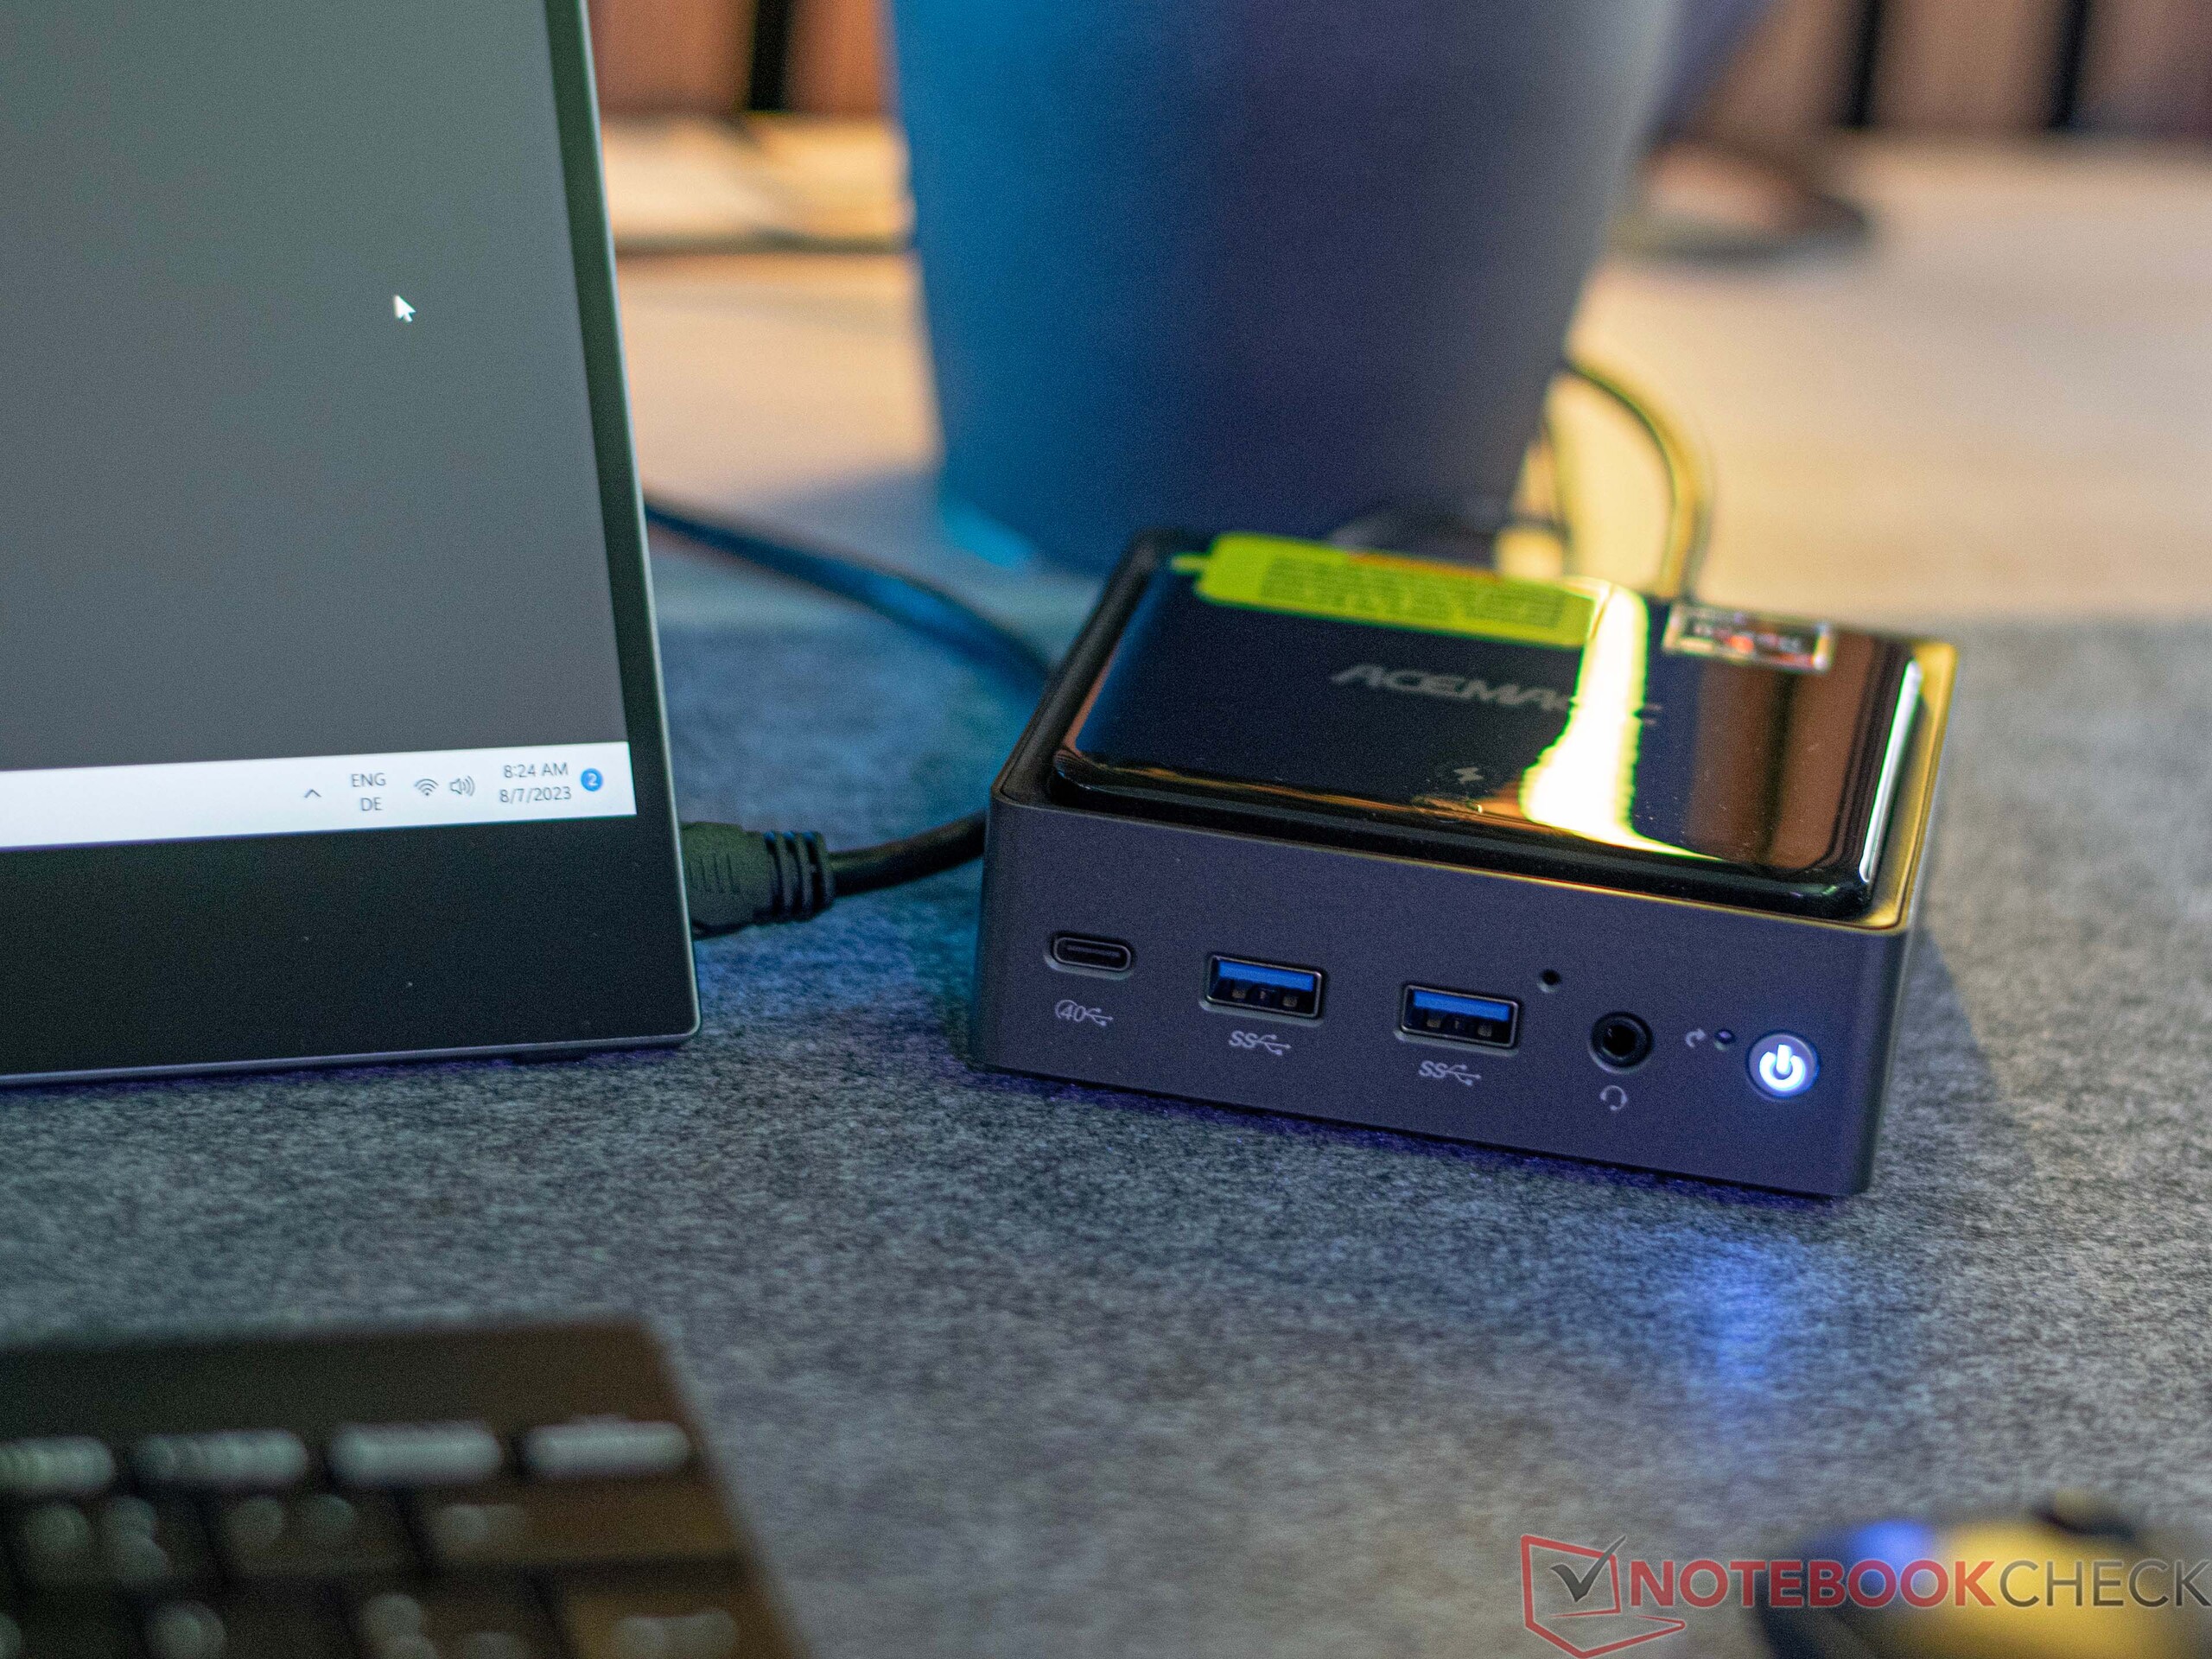
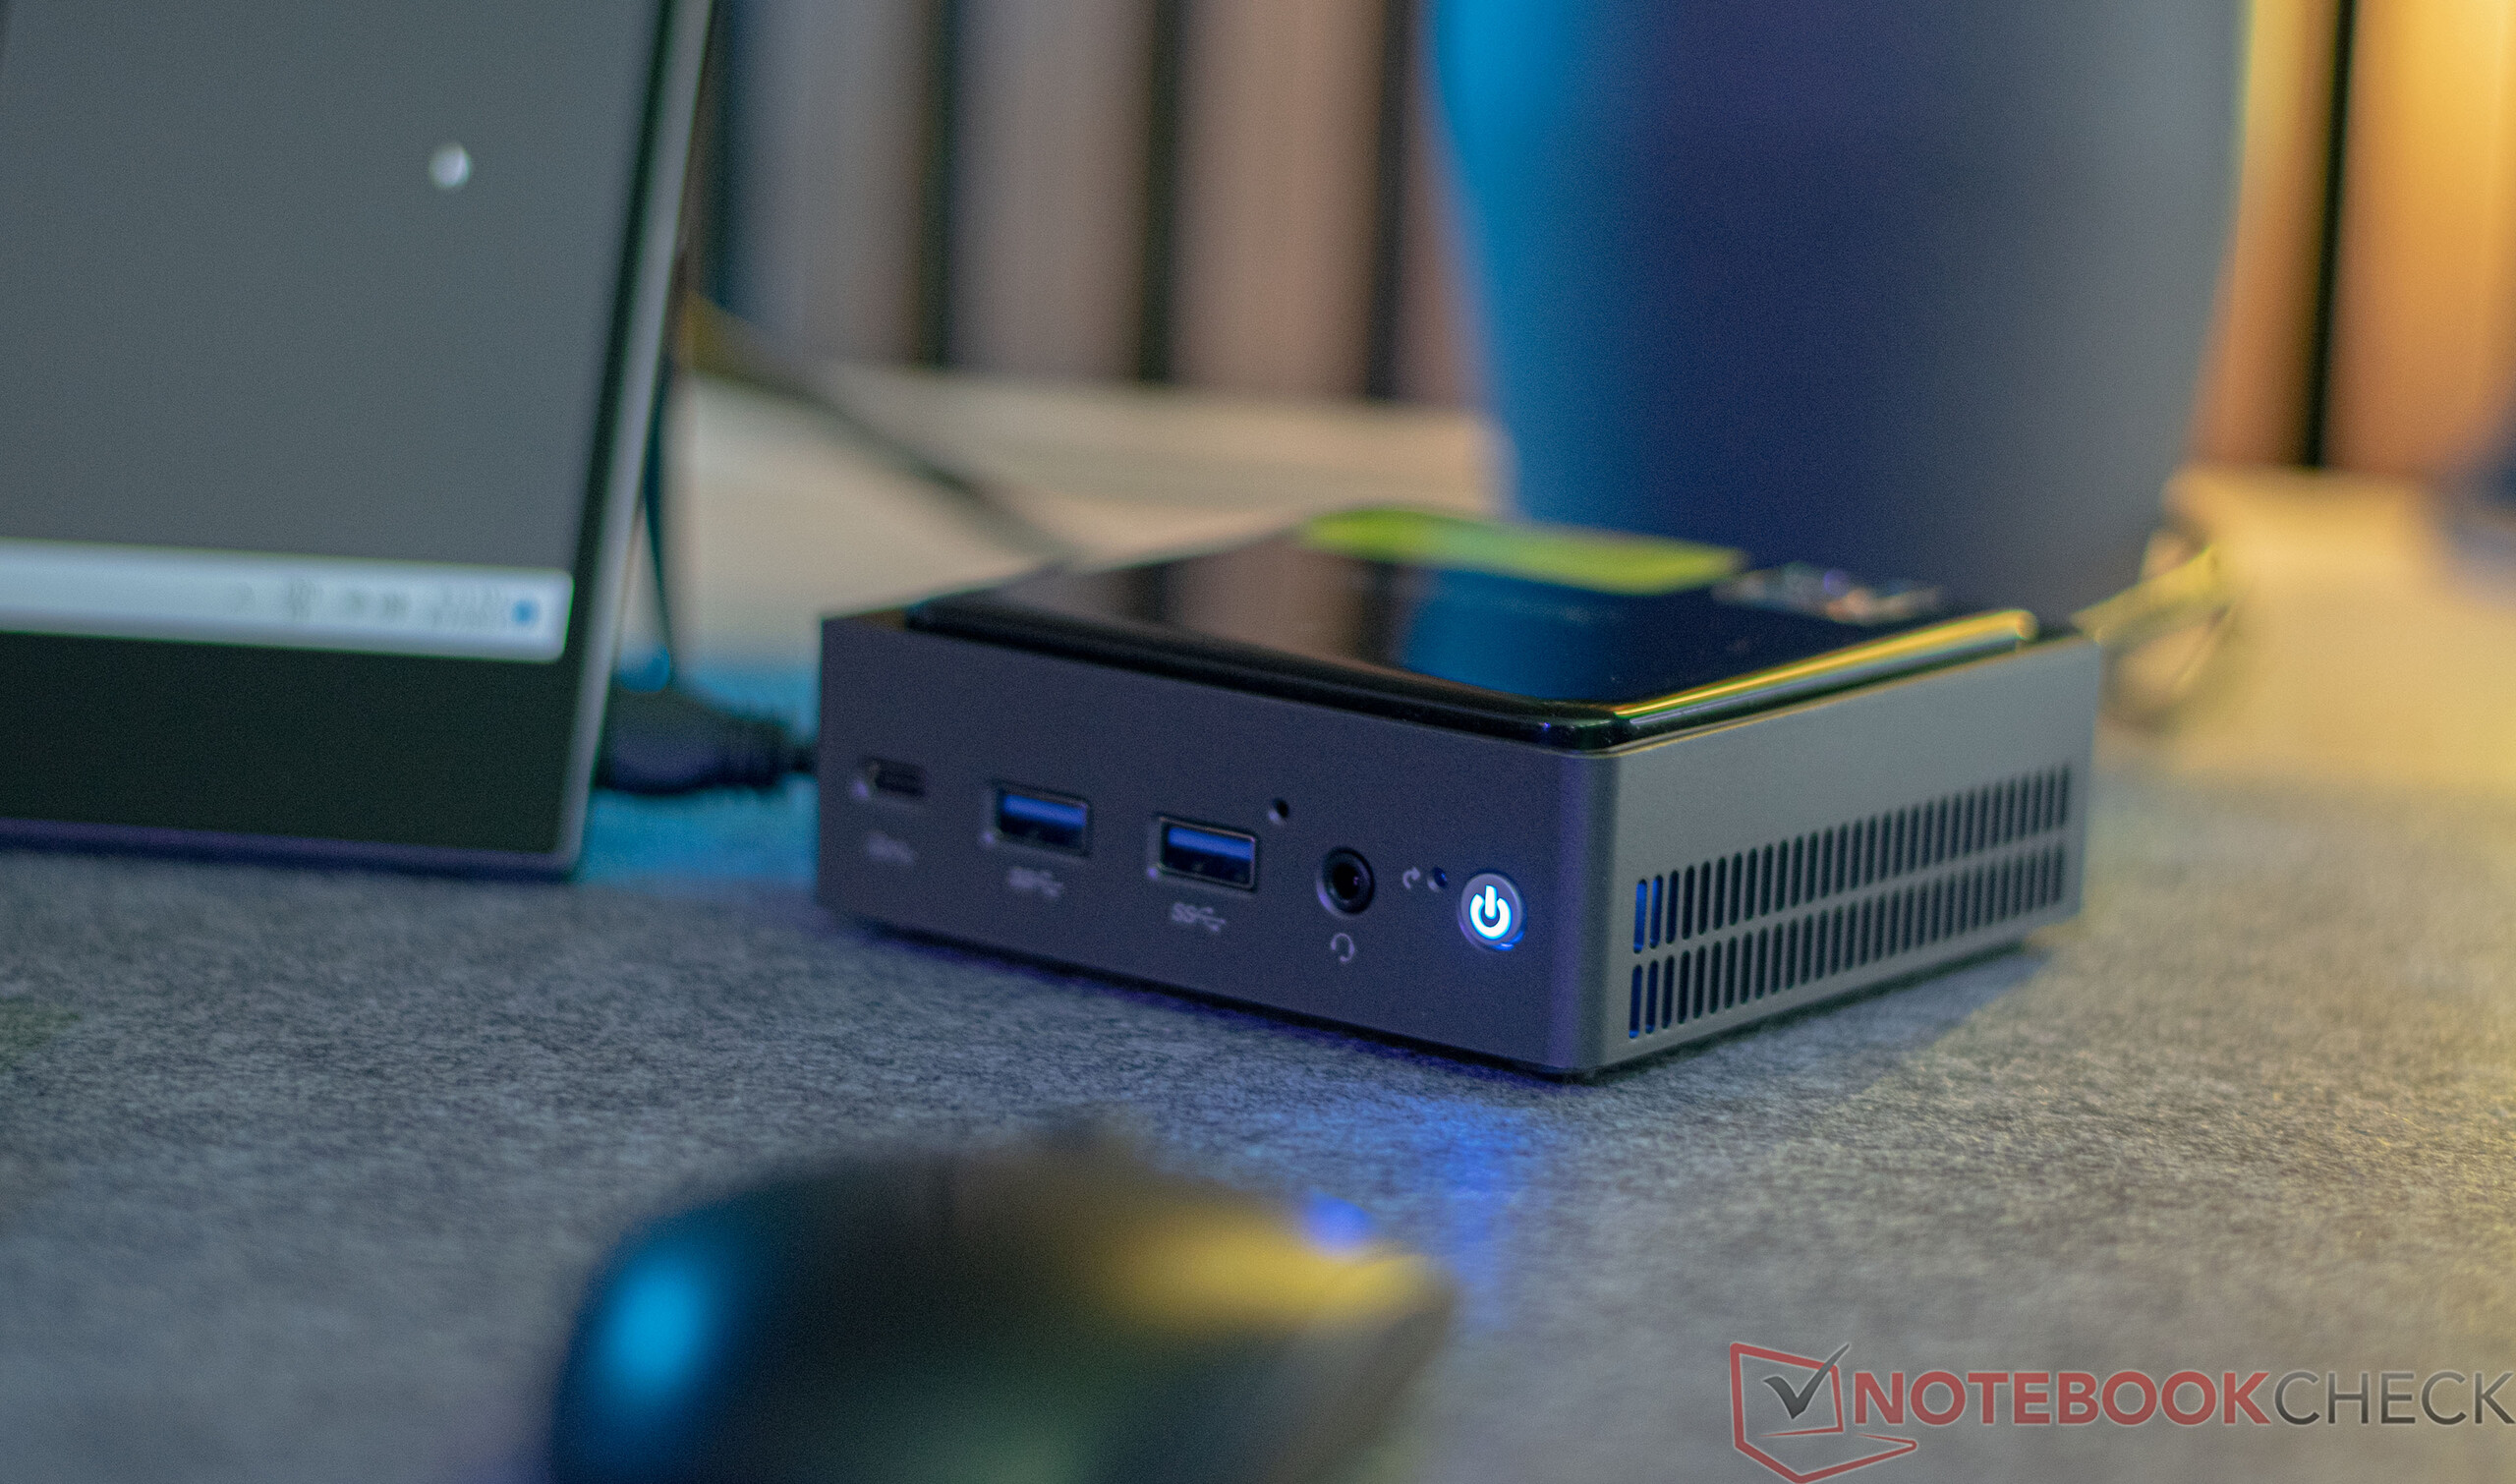
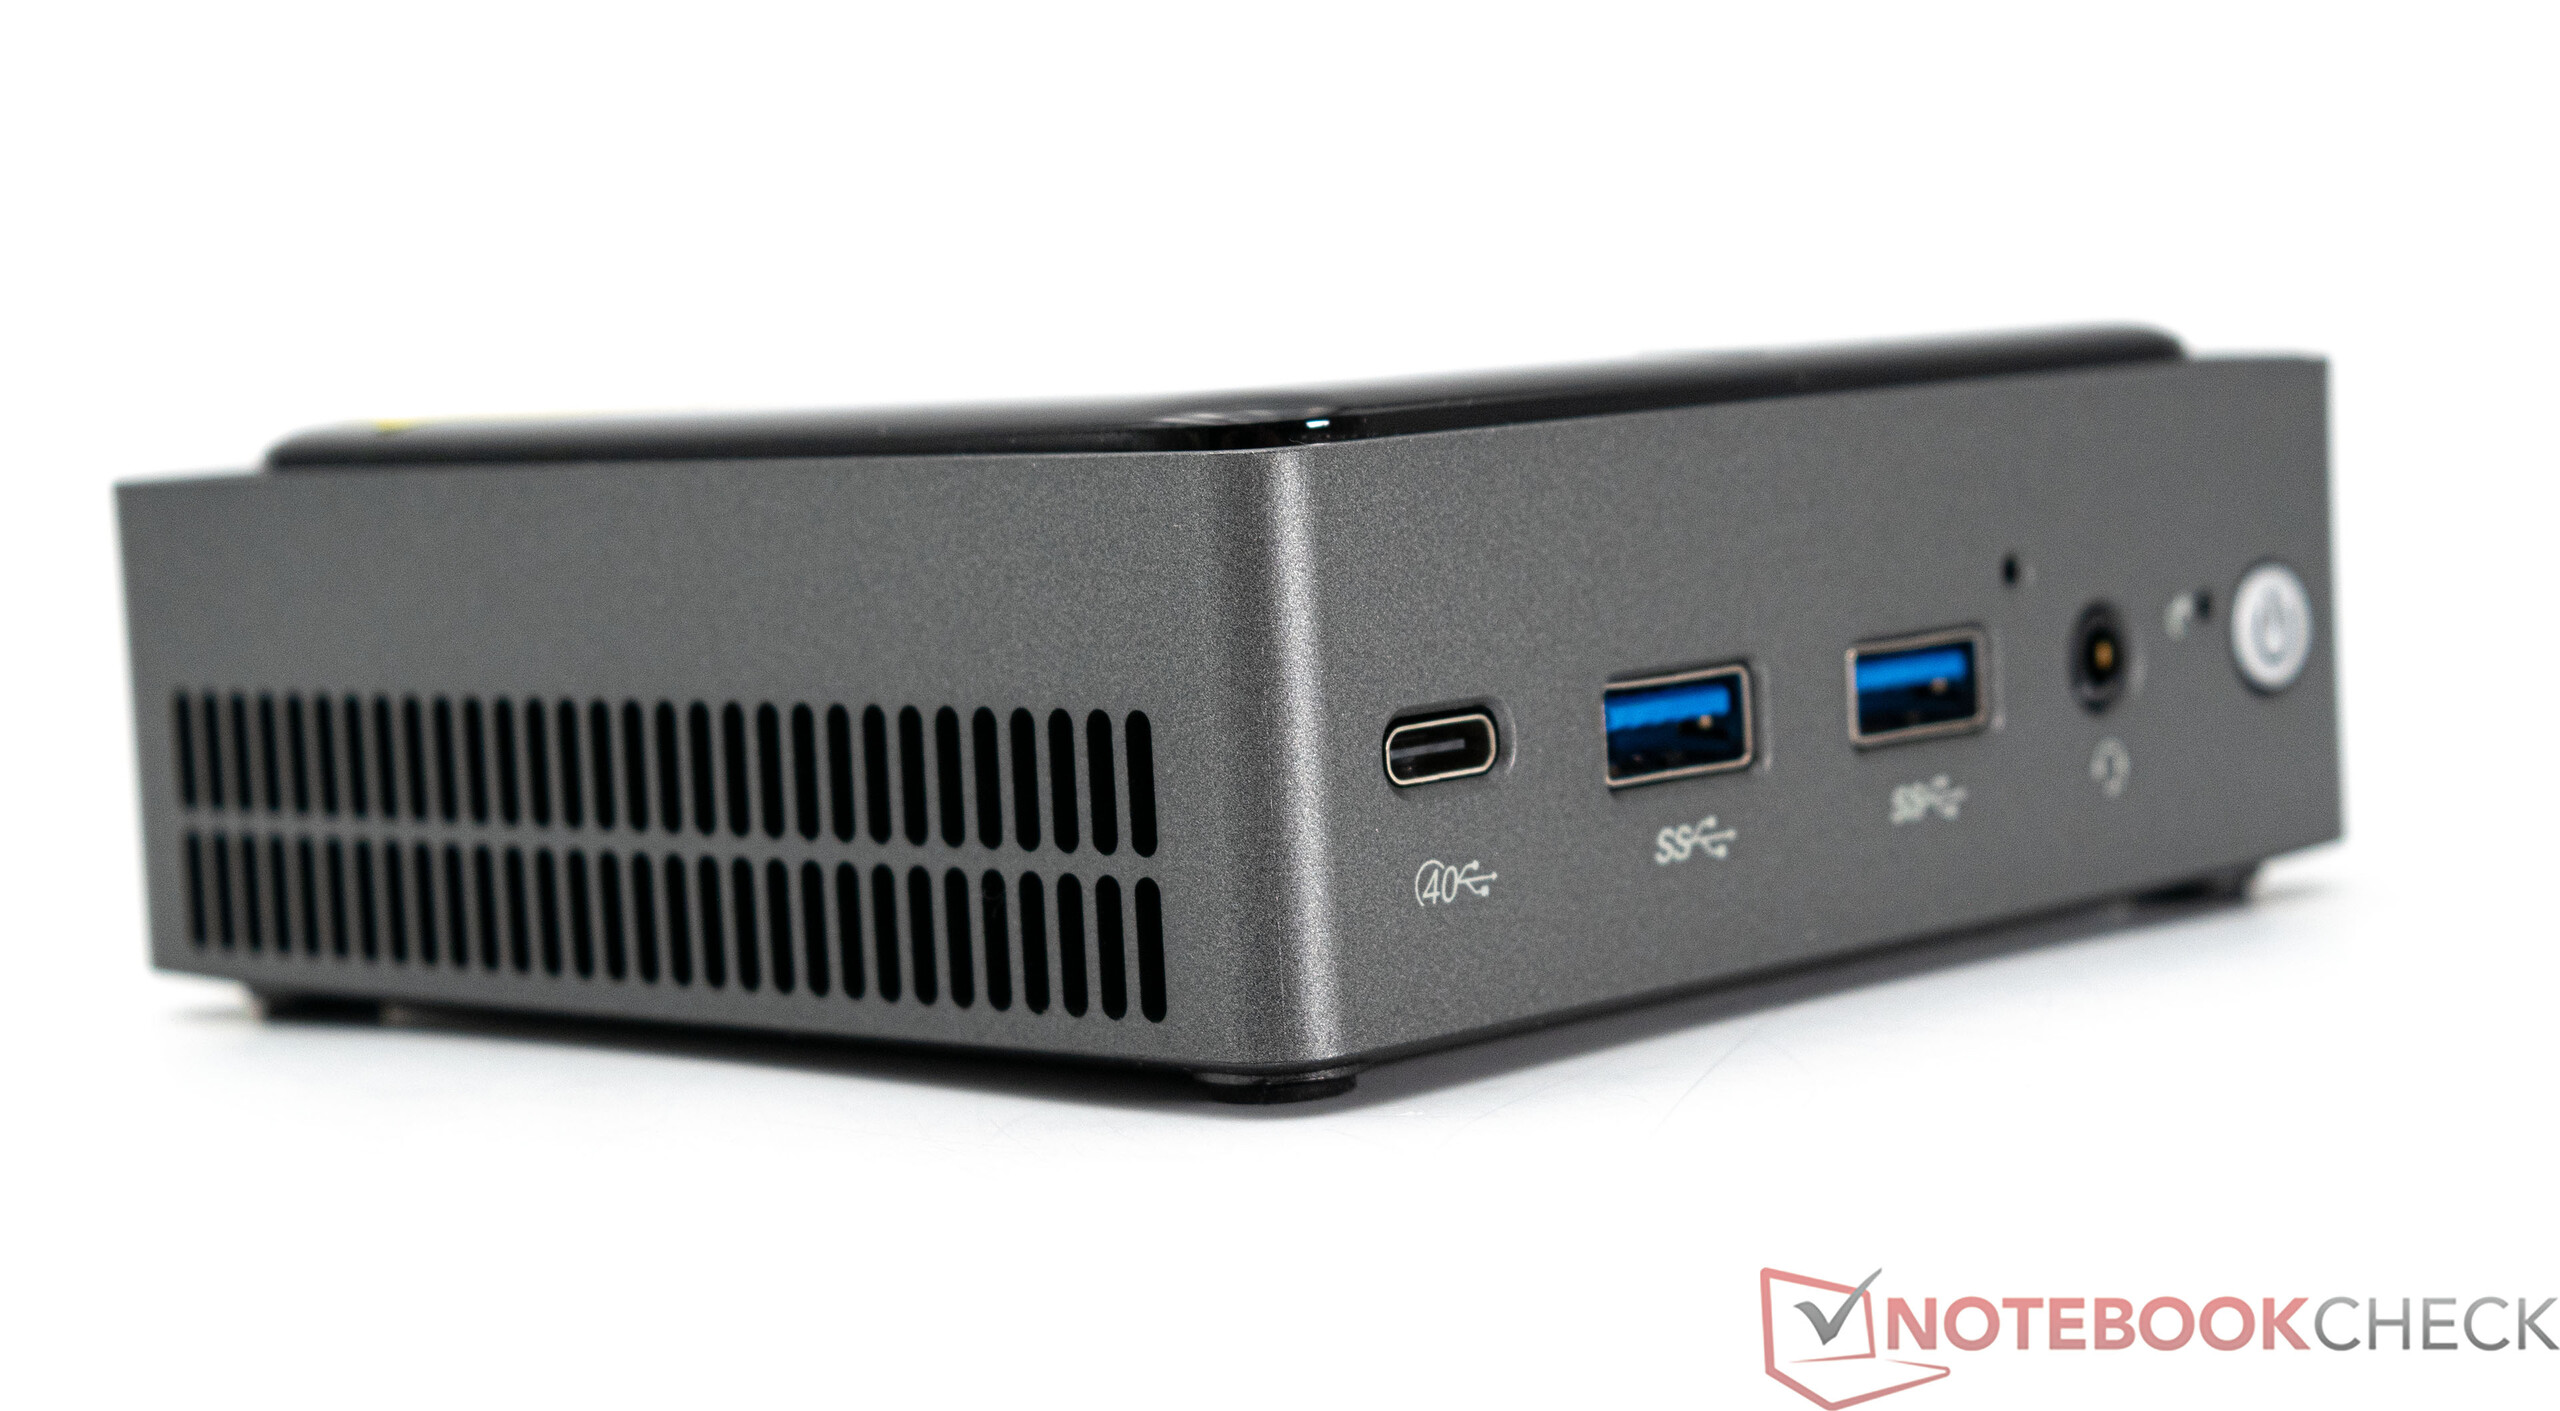
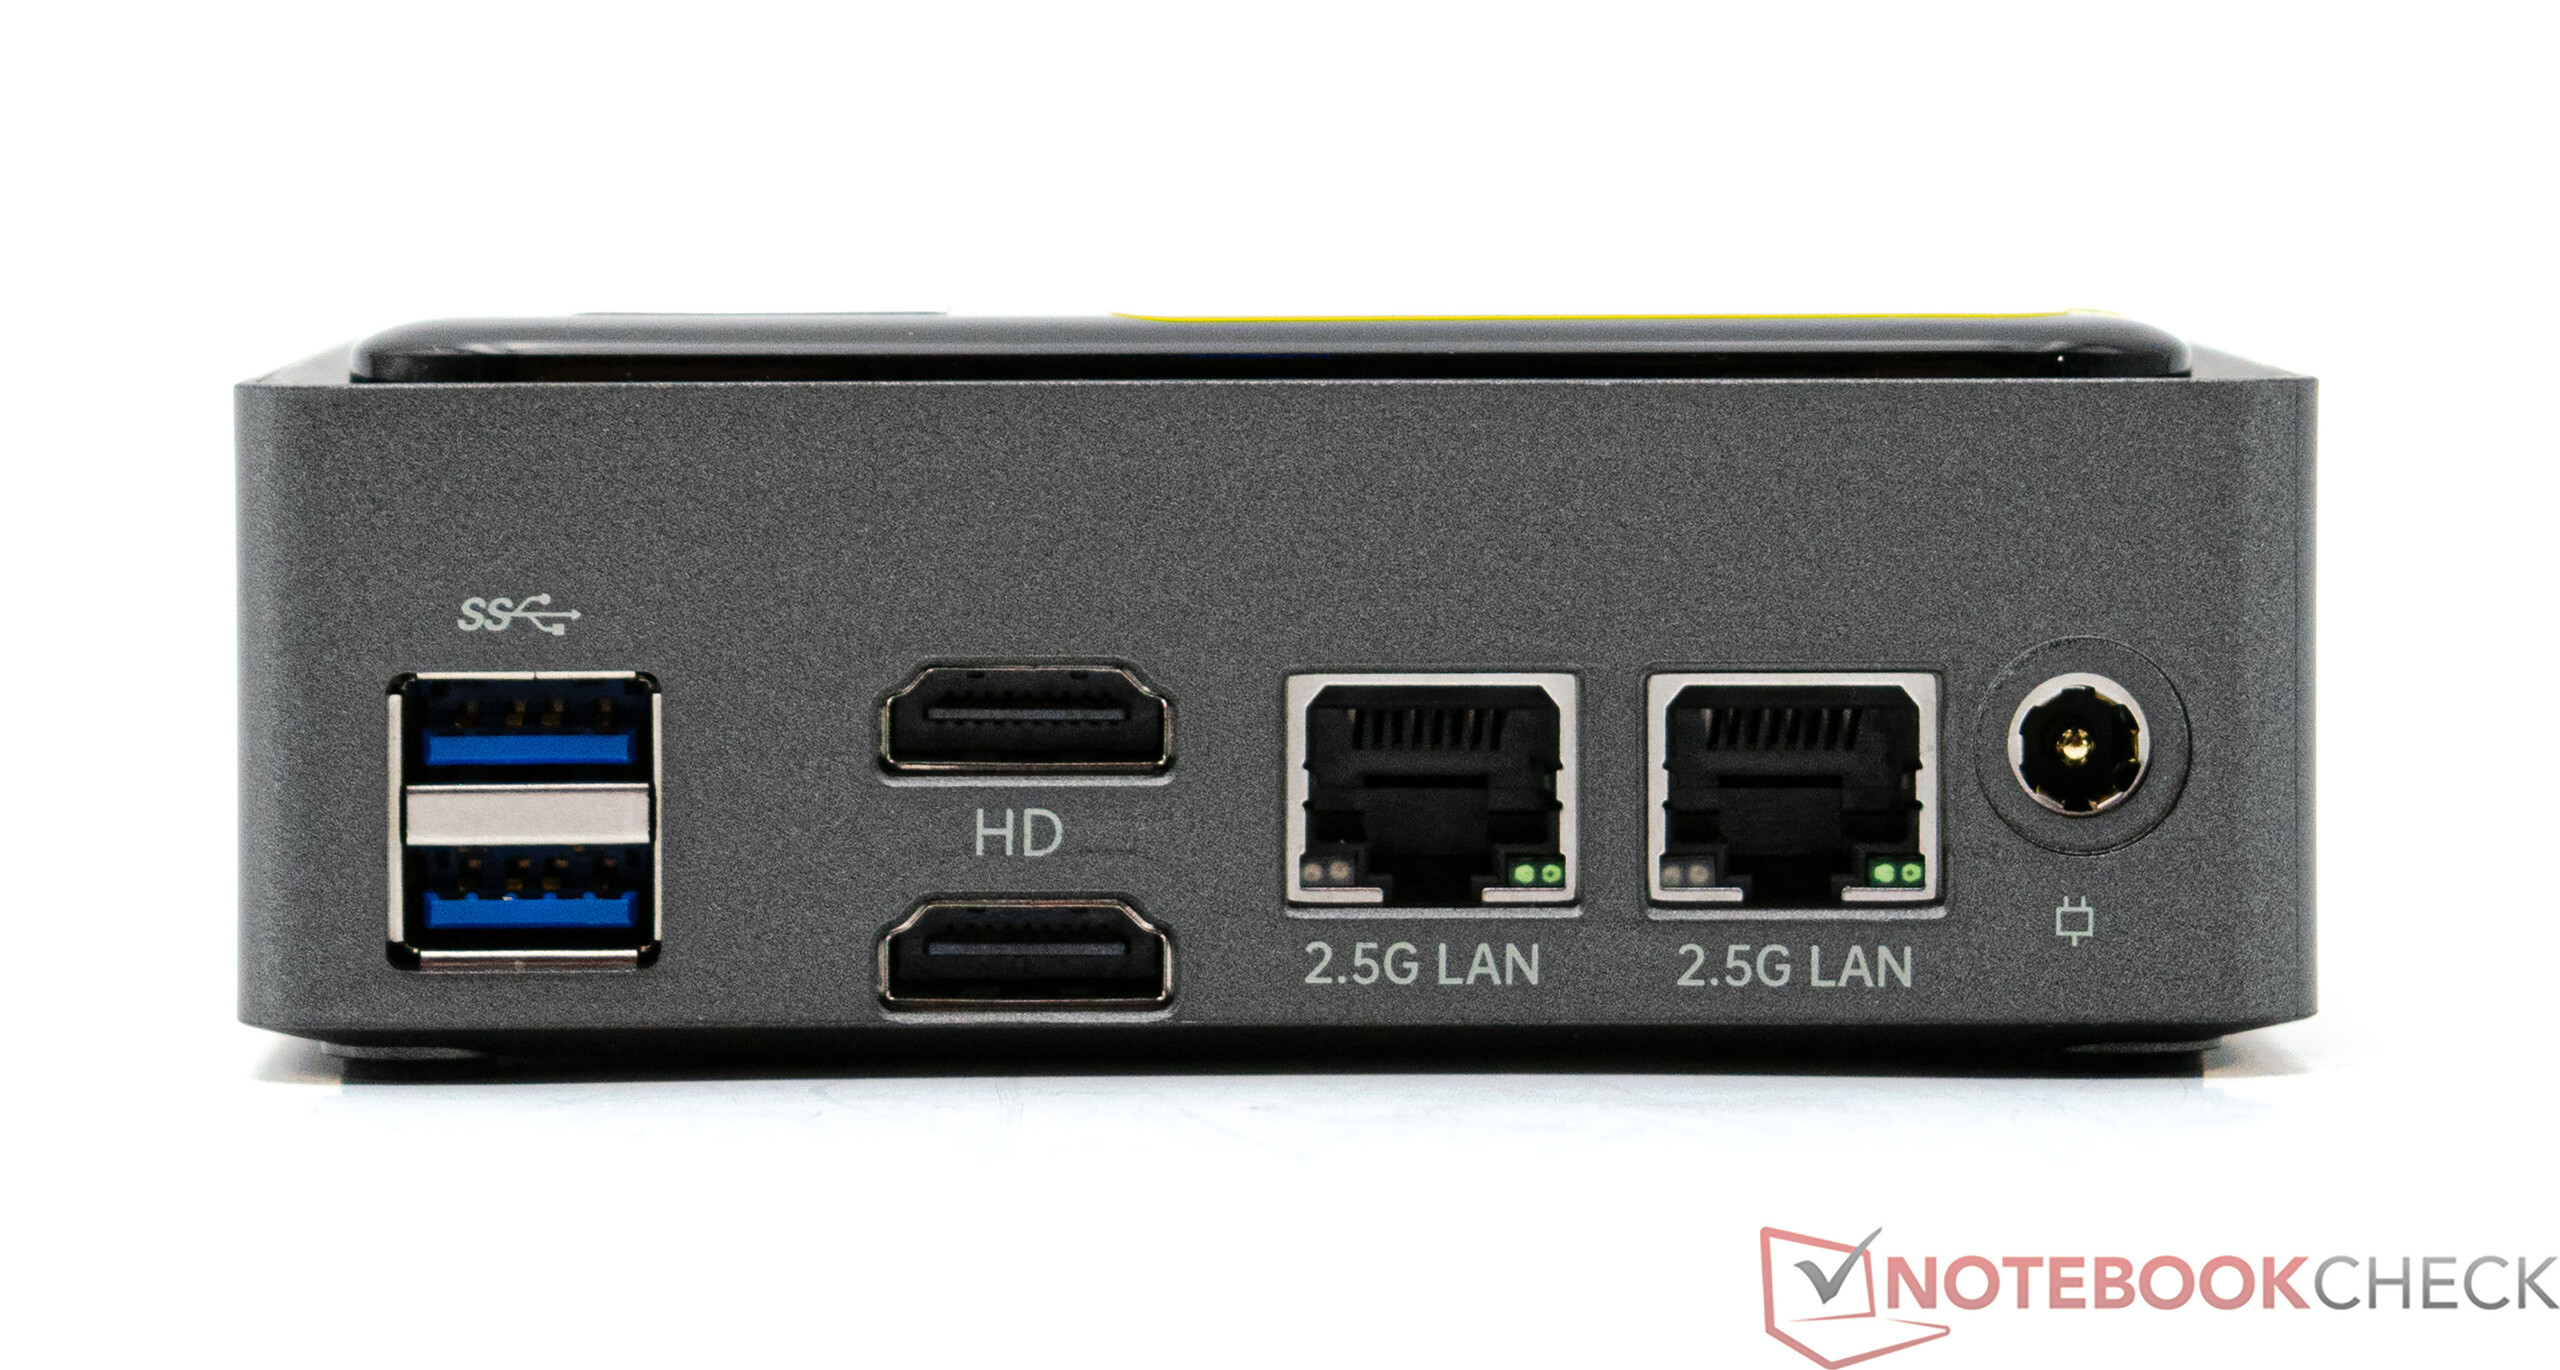
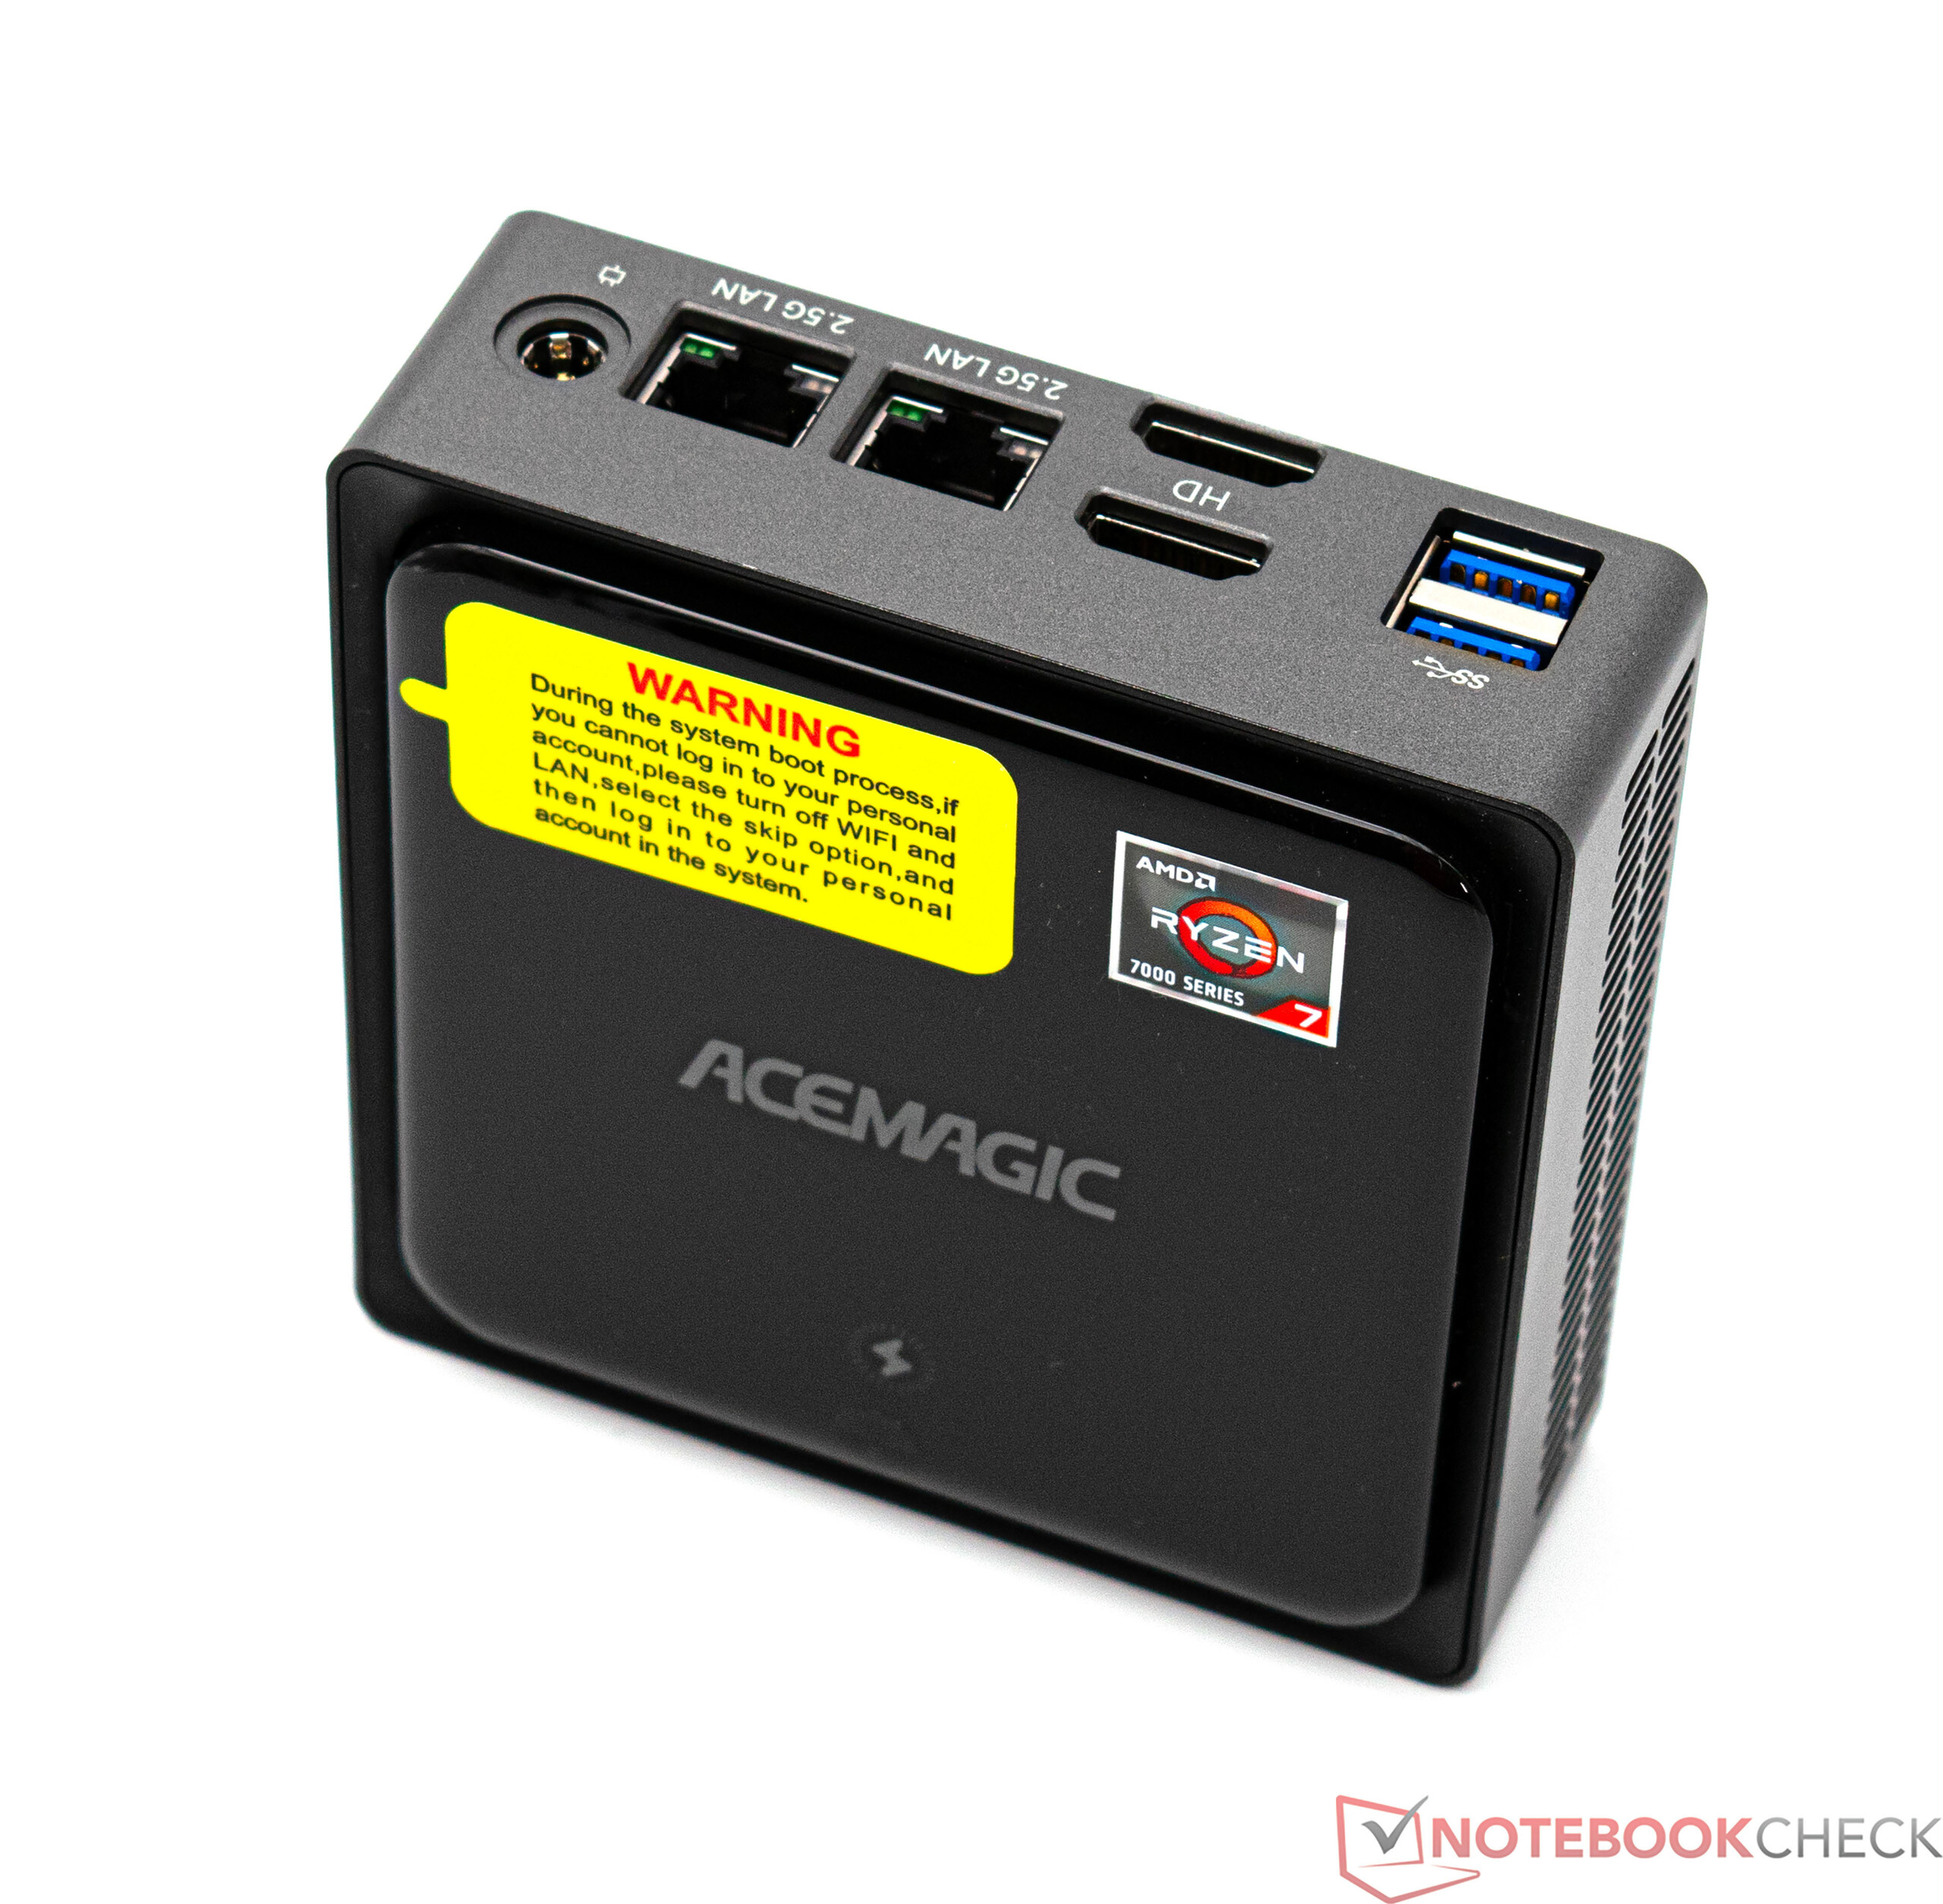
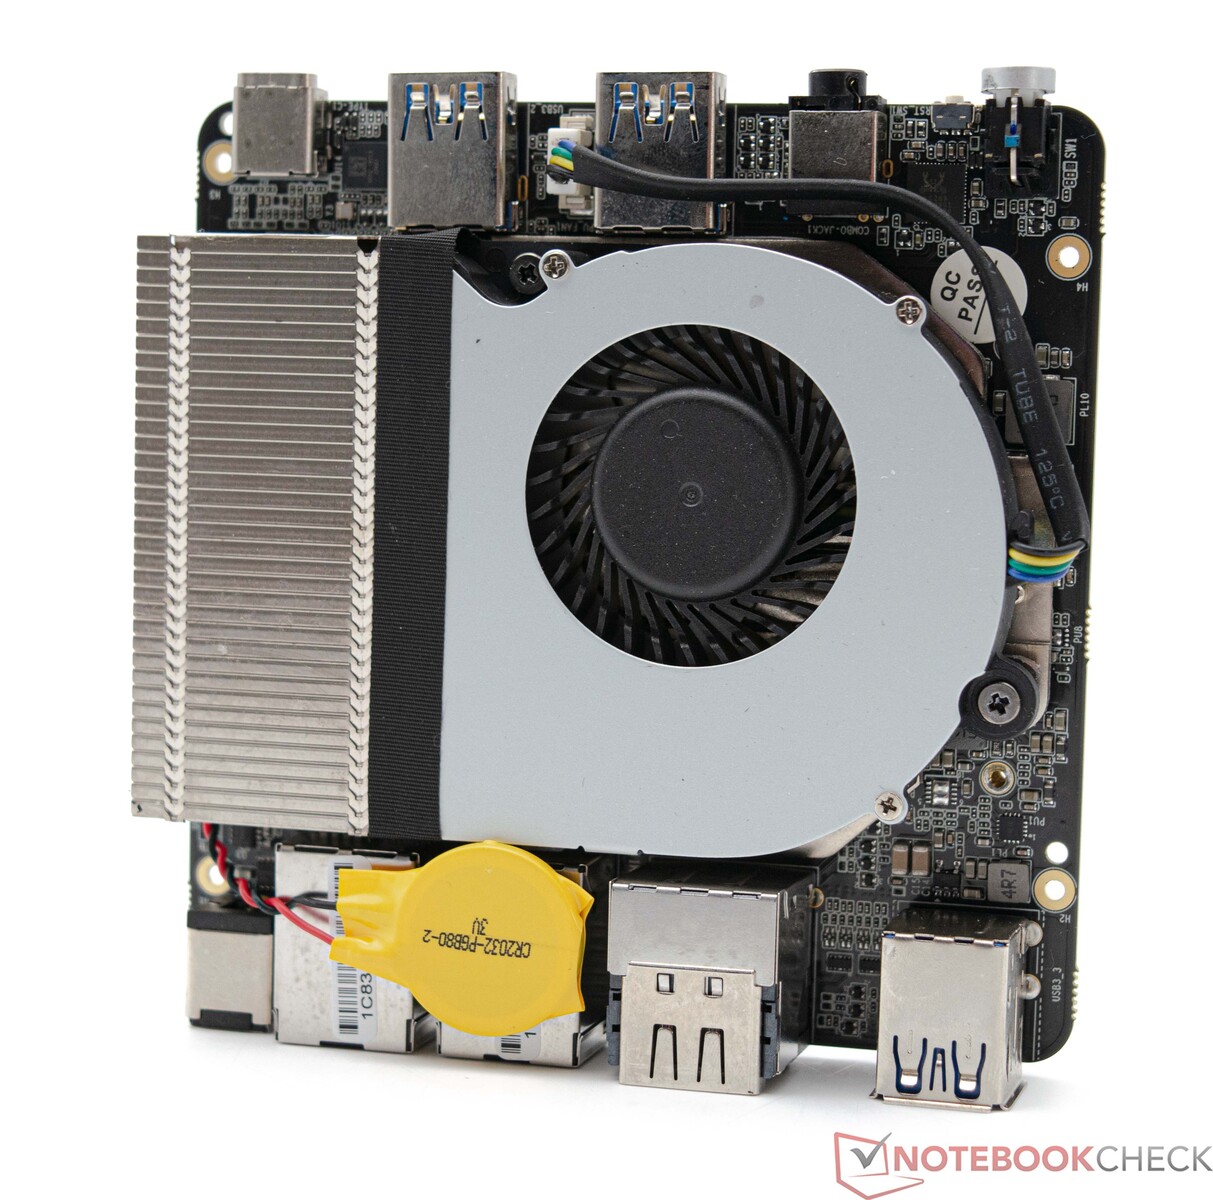
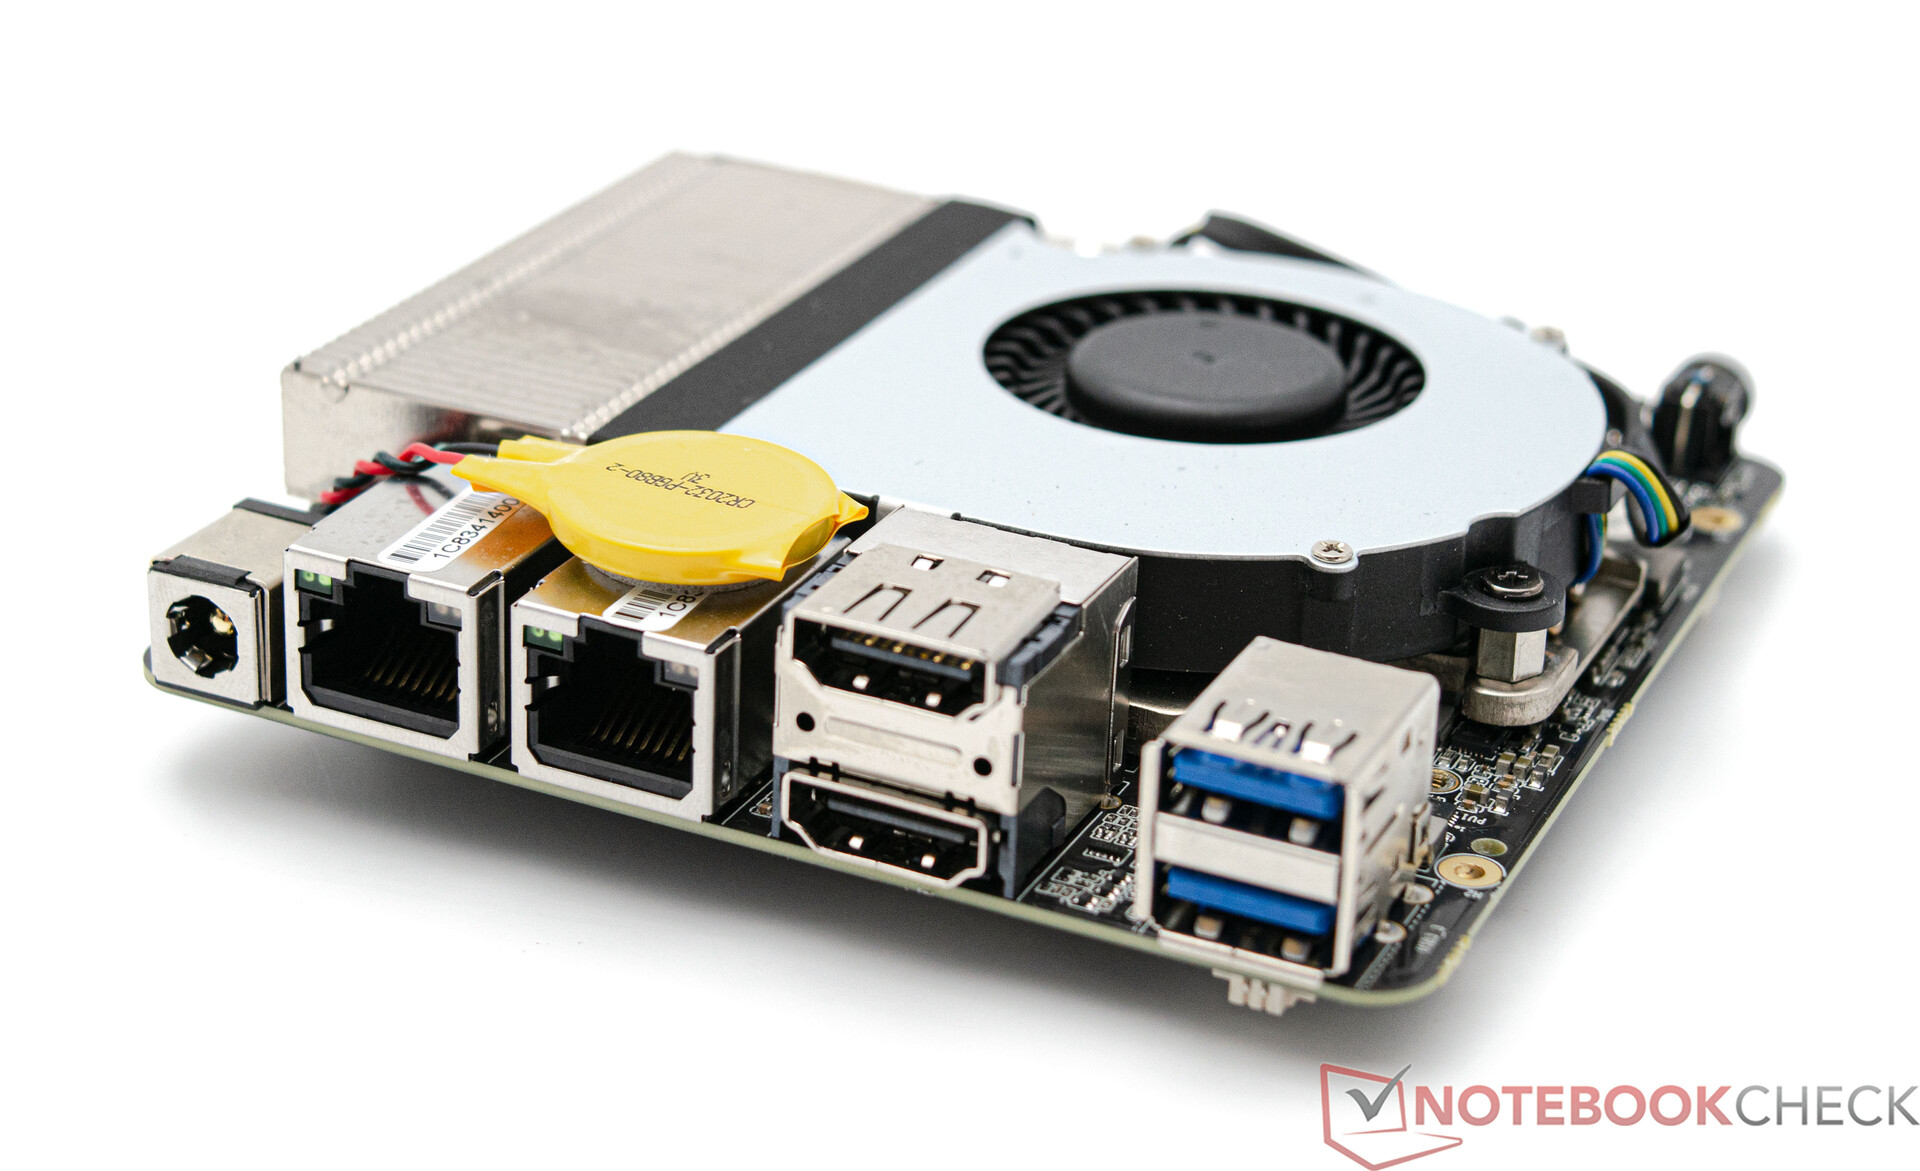
L'Acemagic AM20 offre una buona selezione di porte che si trovano sulla parte anteriore e posteriore. In totale sono presenti cinque porte USB, una delle quali supporta anche la funzionalità Thunderbolt. Gli schermi possono essere controllati tramite HDMI o USB-C, il che significa che tre schermi non sono un problema per l'Acemagic AM20
Comunicazione
Il modulo Wi-Fi installato è di Realtek e funziona idealmente nella banda di frequenza di 5 GHz. Tuttavia, è prevista la compatibilità con la banda da 2,4 GHz. Per quanto riguarda il modulo Wi-Fi installato, la nostra recensione ha rivelato risultati corrispondenti: In termini di ricezione dei dati, l'Acemagic AM20 si colloca ancora a metà del gruppo, ma quando si tratta di inviare dati, il nostro dispositivo in esame scivola all'ultimo posto. Ciononostante, questi risultati non destano alcuna preoccupazione perché le prestazioni mostrate sono sufficienti per l'uso quotidiano. Per questa recensione abbiamo utilizzato il nostro router di prova, l'Asus ROG Rapture GT-AXE11000. Entrambe le prese LAN sono degne di nota perché possono essere utilizzate come alternativa alla connessione wireless. Entrambe offrono fino a 2,5 GBit/s, che non è lo standard per i mini PC.
Manutenzione
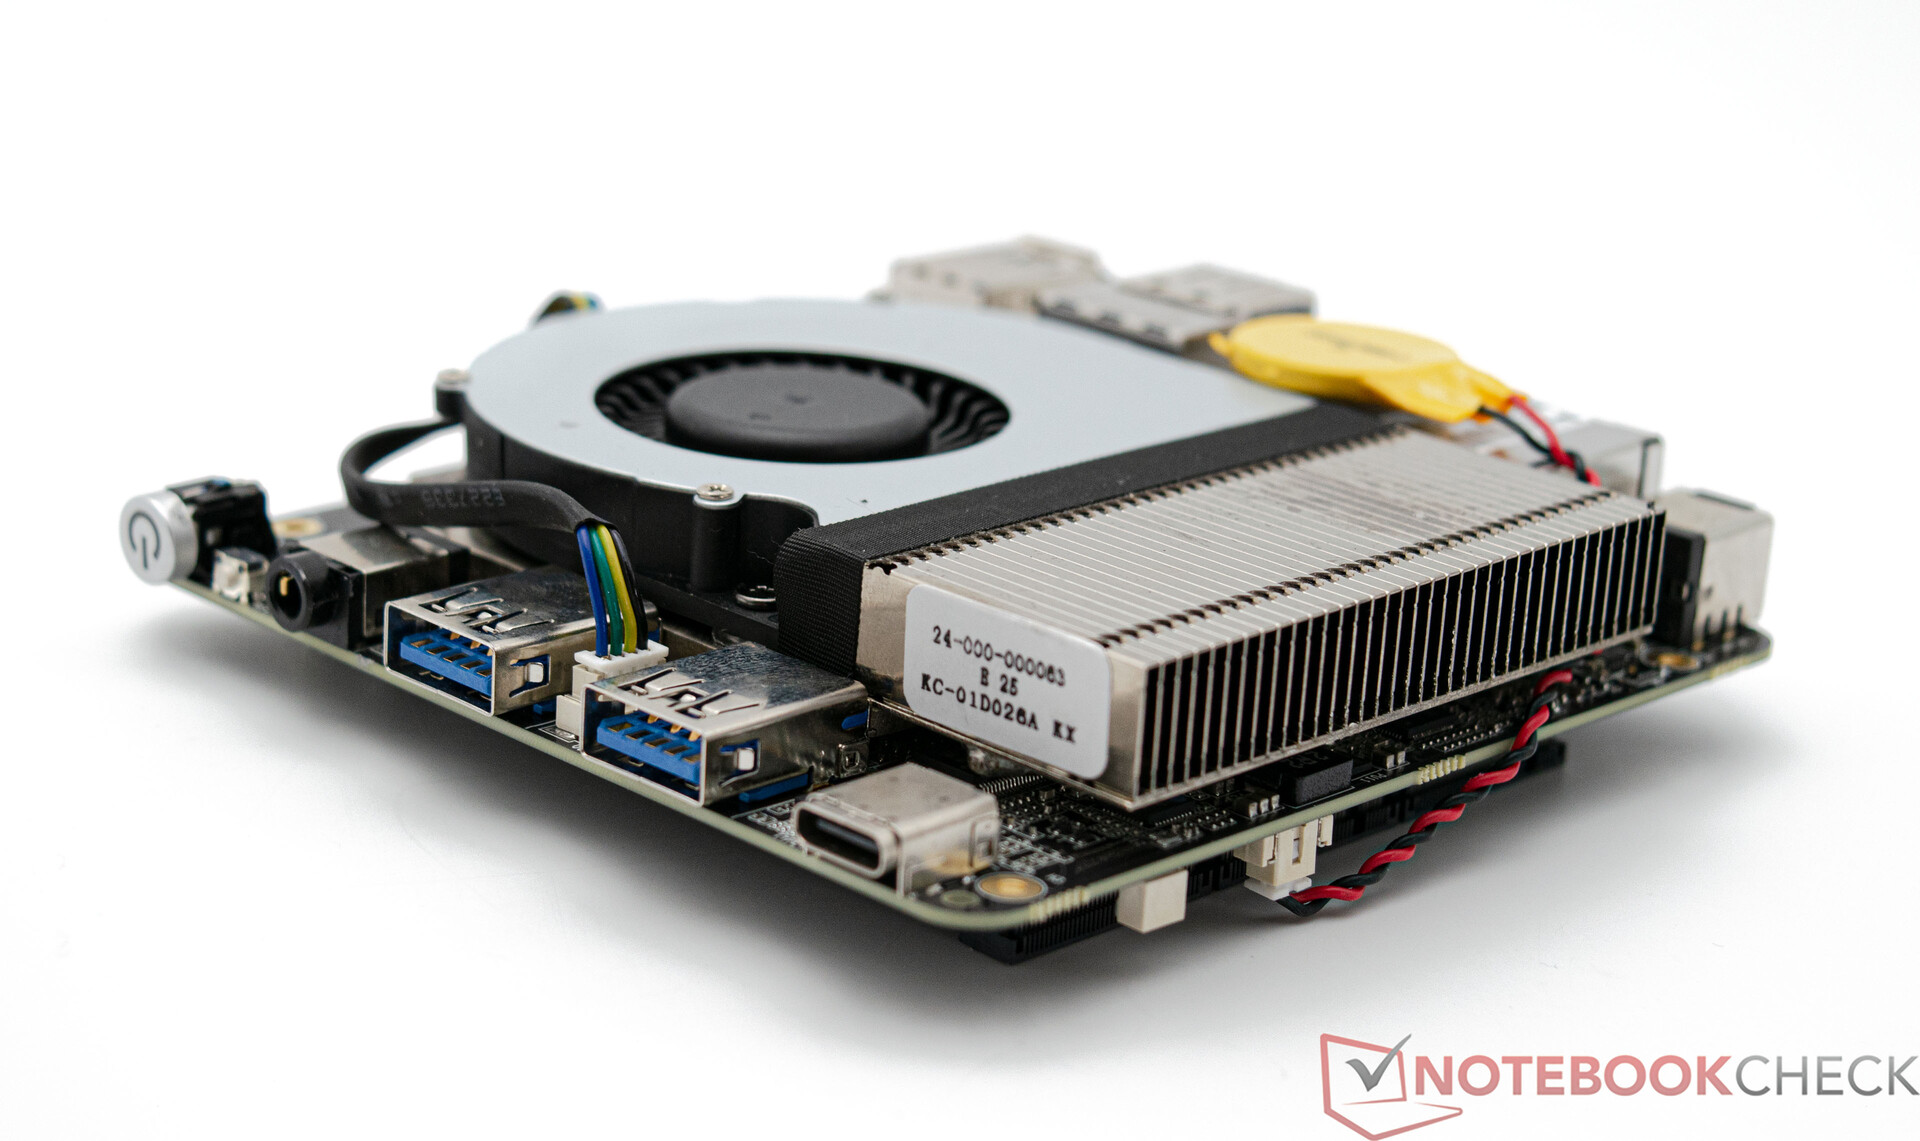
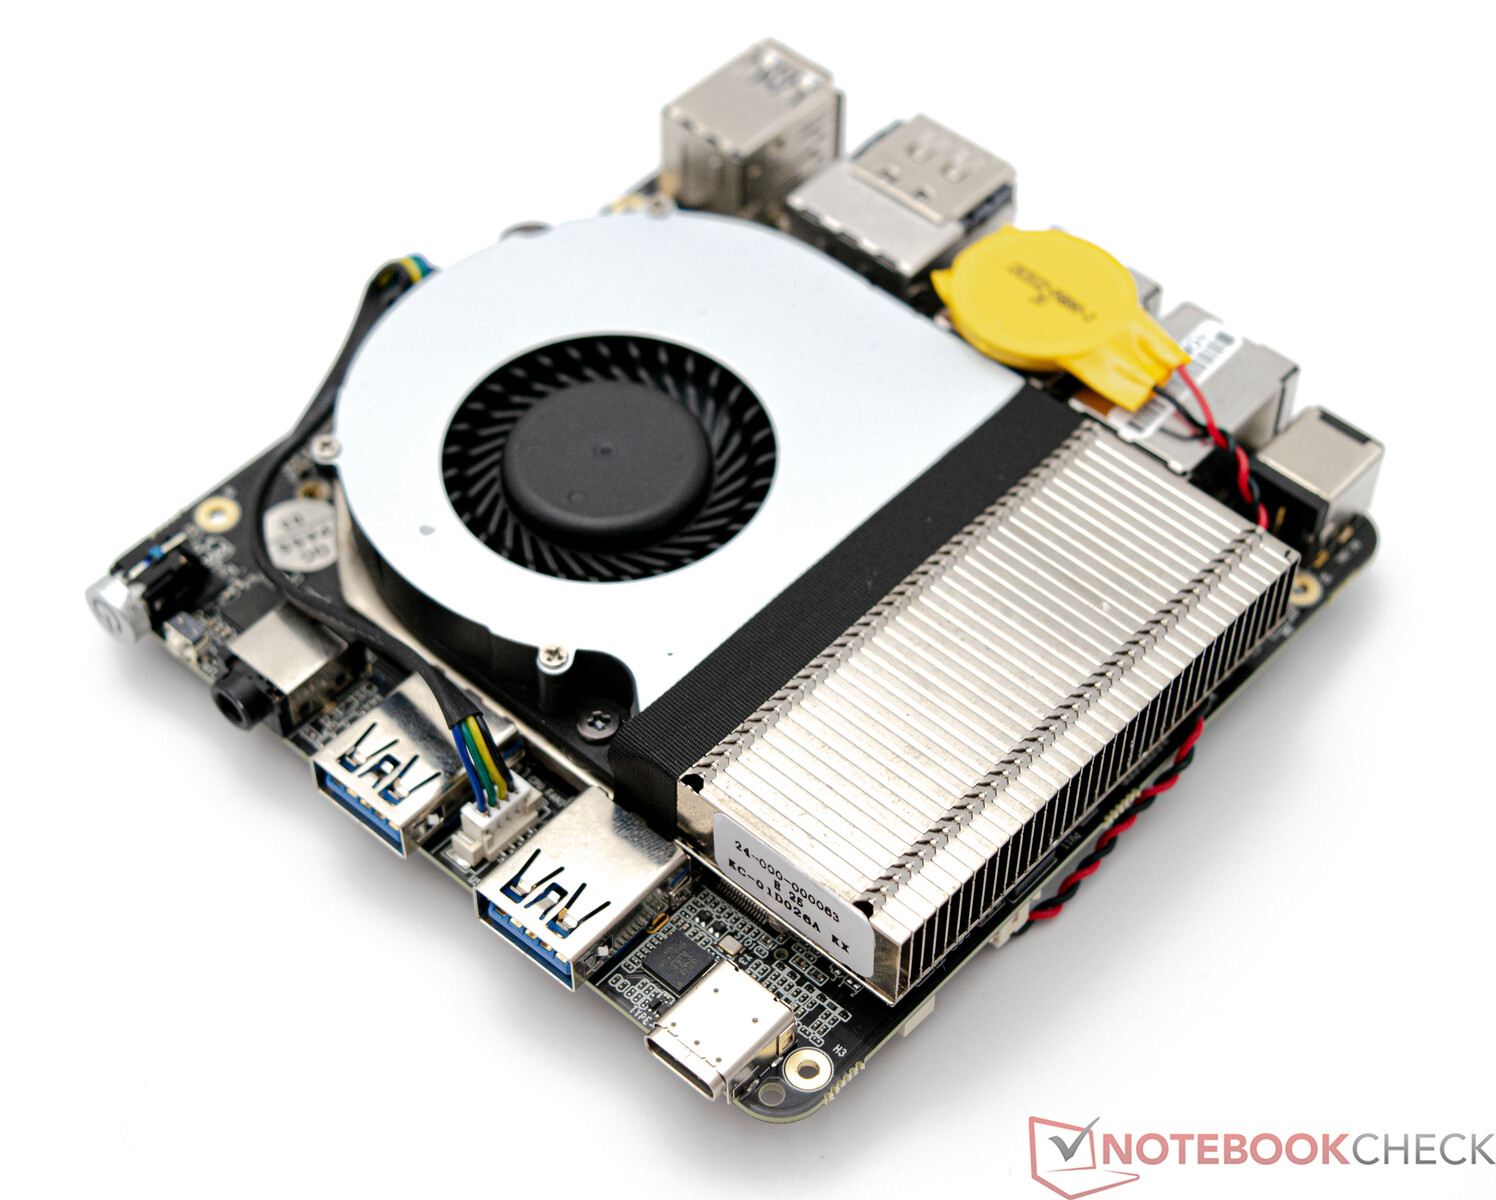
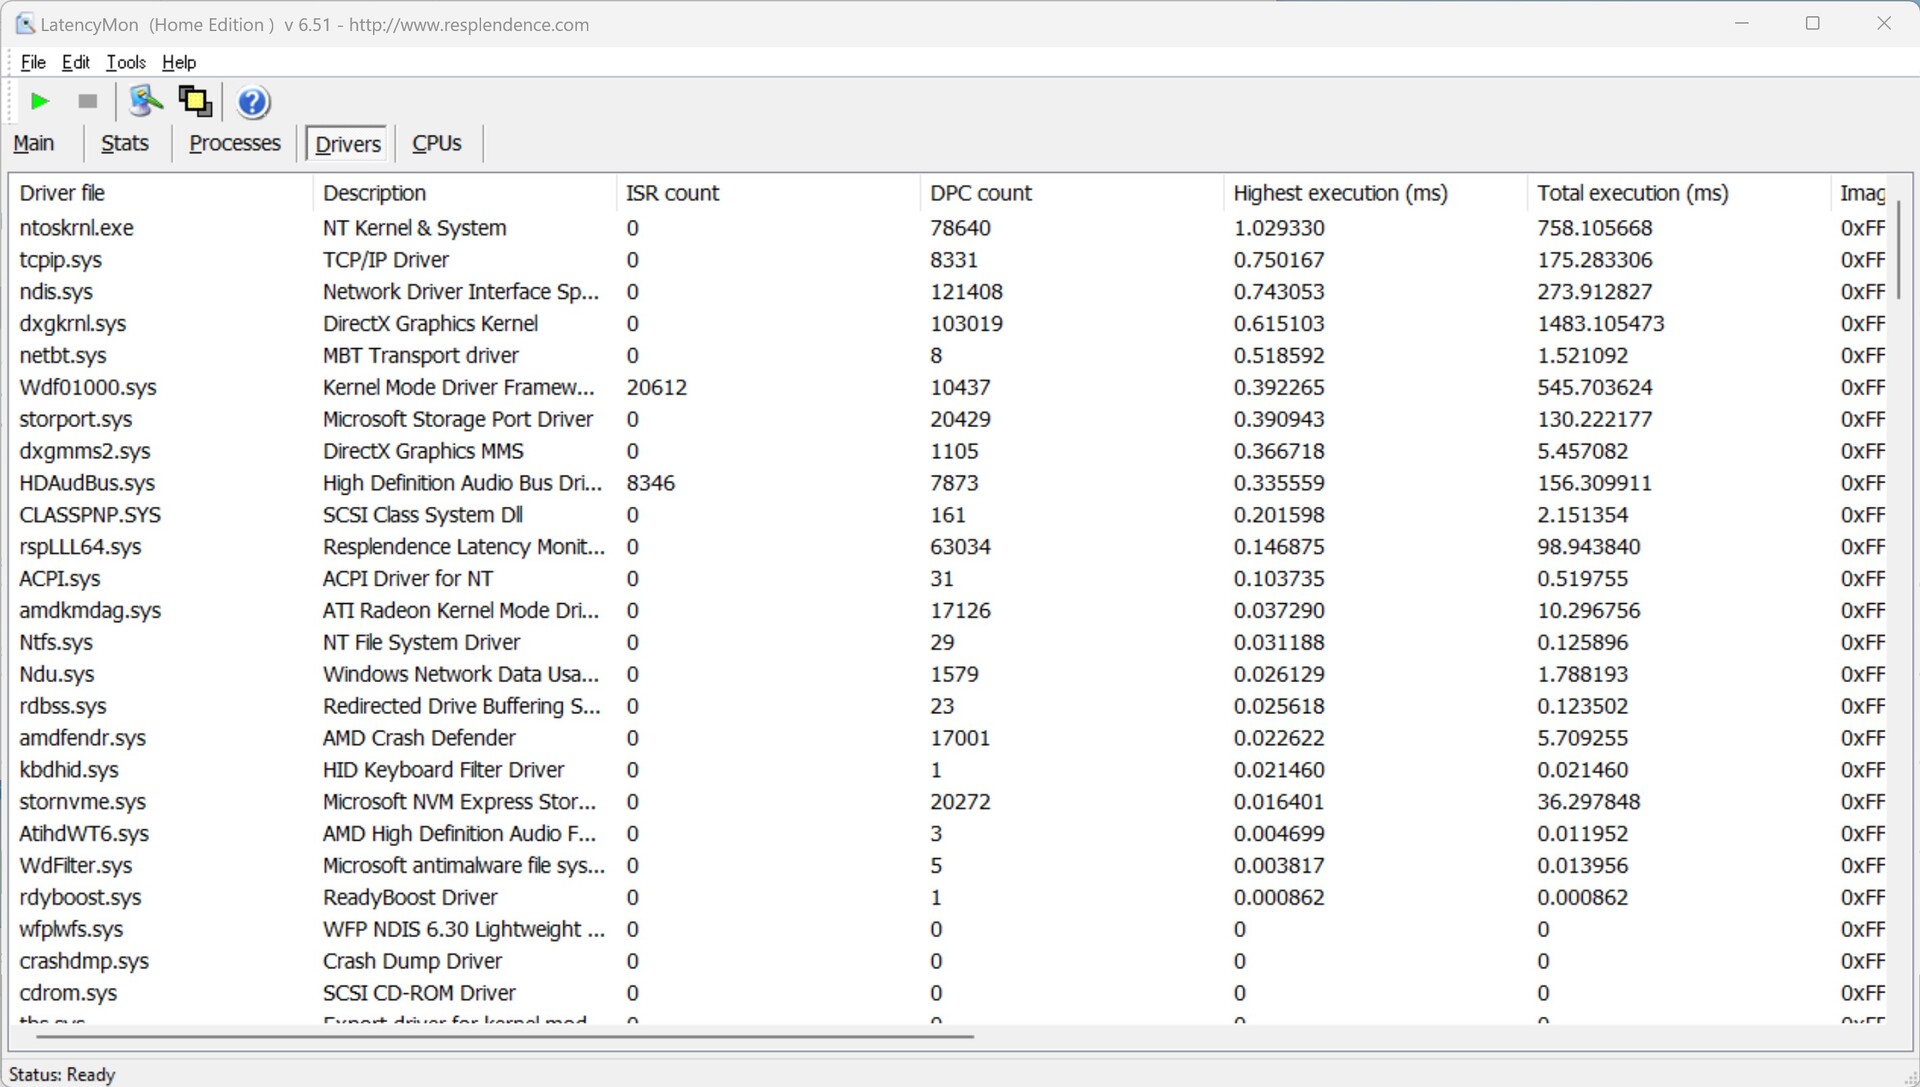
La parte superiore dell'Acemagic AM20 può essere aperta facilmente perché il produttore ha dotato il dispositivo di uno sportello fissato magneticamente. Sotto di esso si nascondono la memoria di massa e il modulo Wi-Fi, entrambi facilmente sostituibili. Si notano subito tre interfacce M.2 per le unità SSD. Anche questo non è uno standard e, considerando il fattore di forma compatto, è un aspetto importante per la decisione di acquisto. Chi desidera pulire anche la ventola dovrà smontare ulteriormente il dispositivo, cosa che si può fare essenzialmente con un tocco delicato e gli strumenti giusti.
Smontato Acemagic AM20
Prestazioni - L'AMD Ryzen 7 7735H dispone solo di core Zen 3+
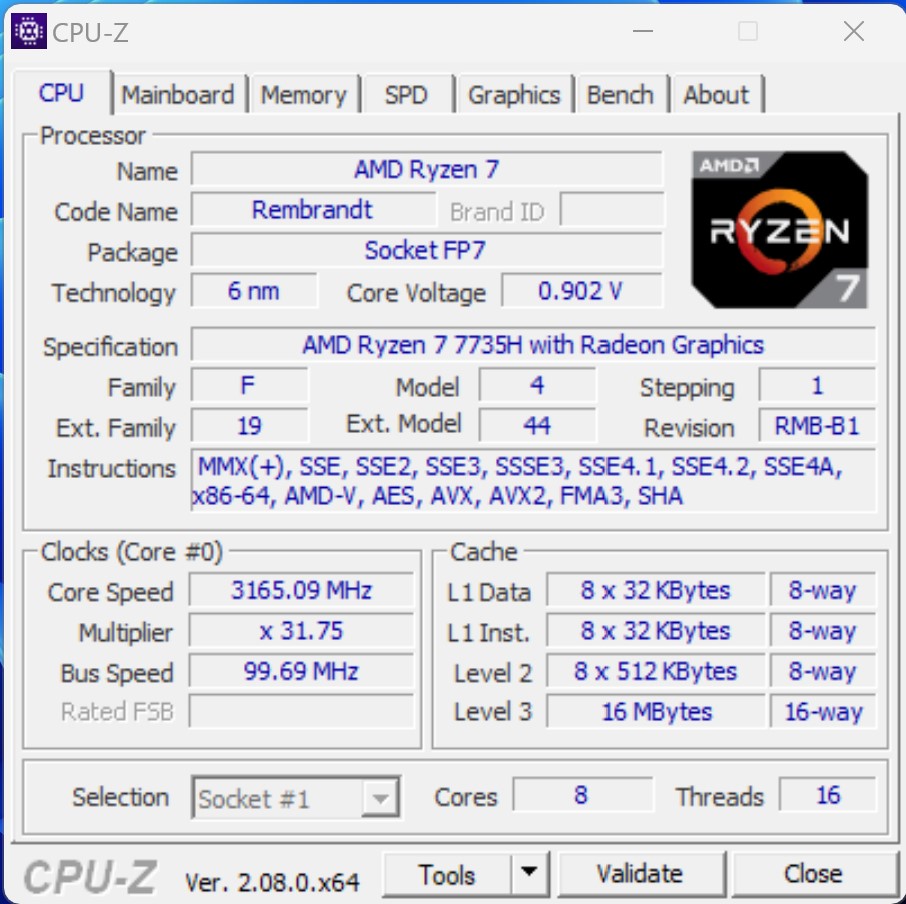
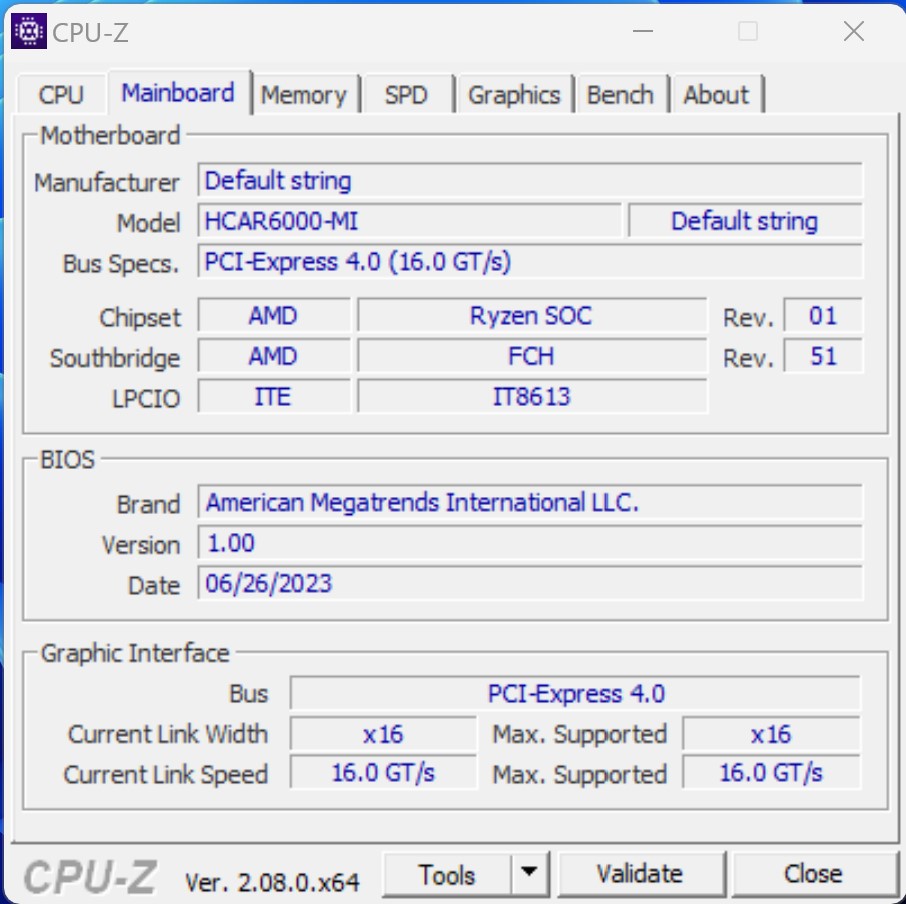
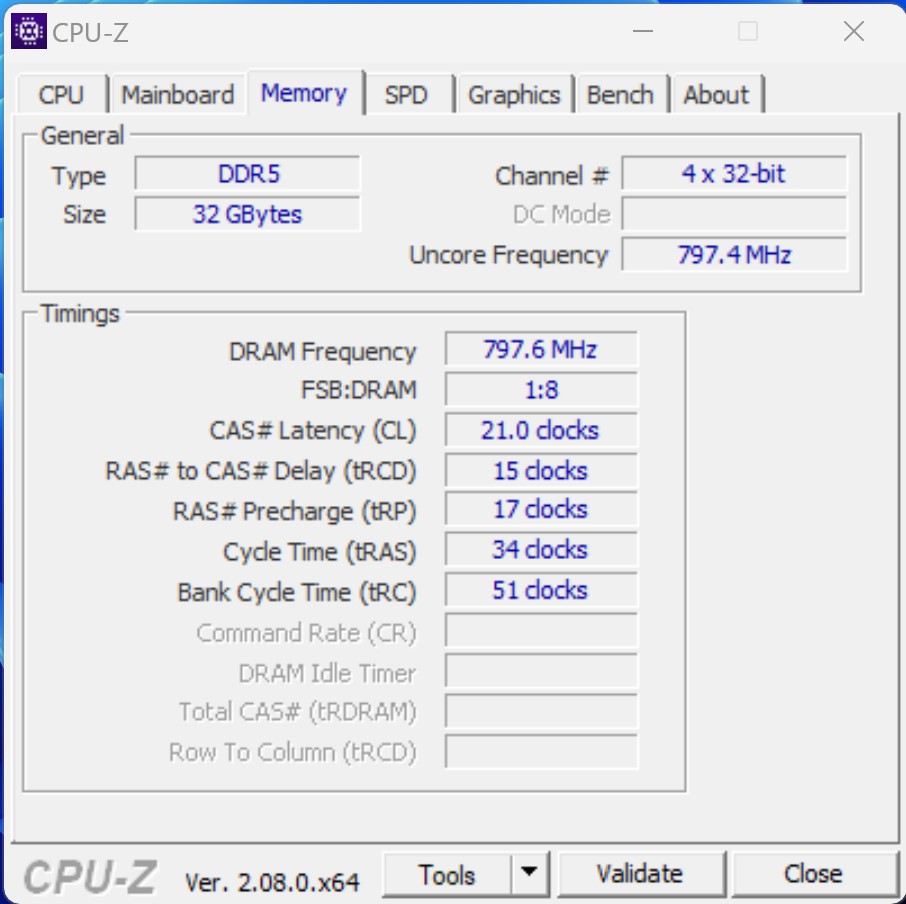
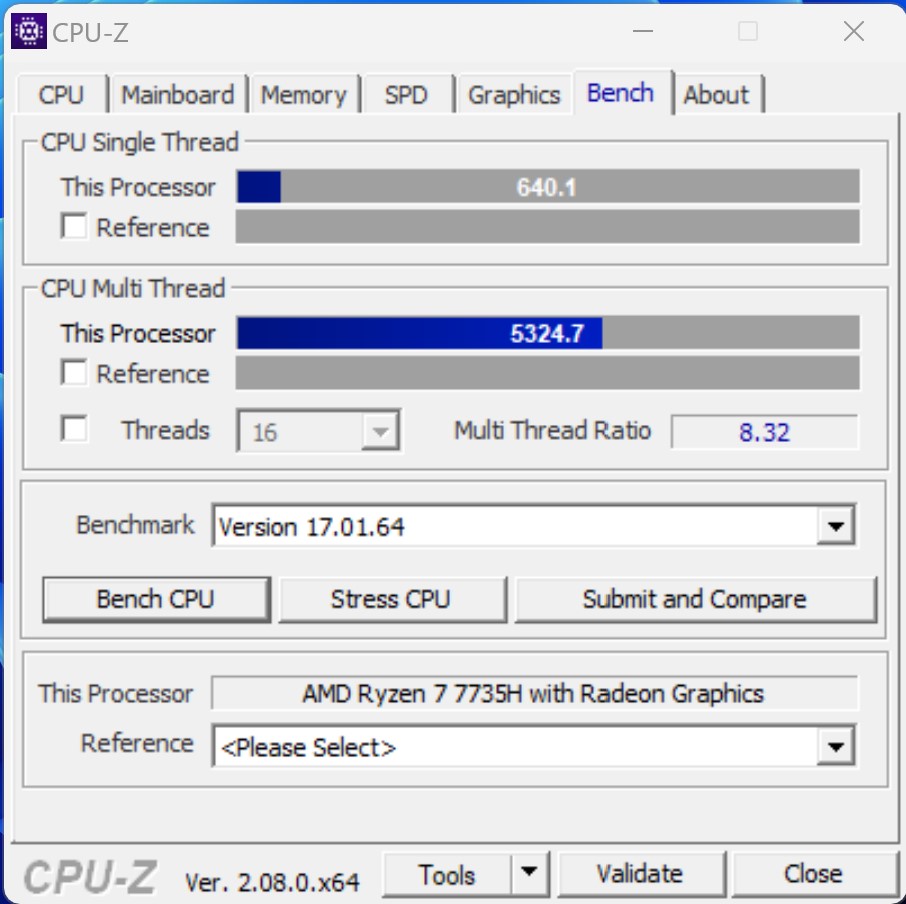
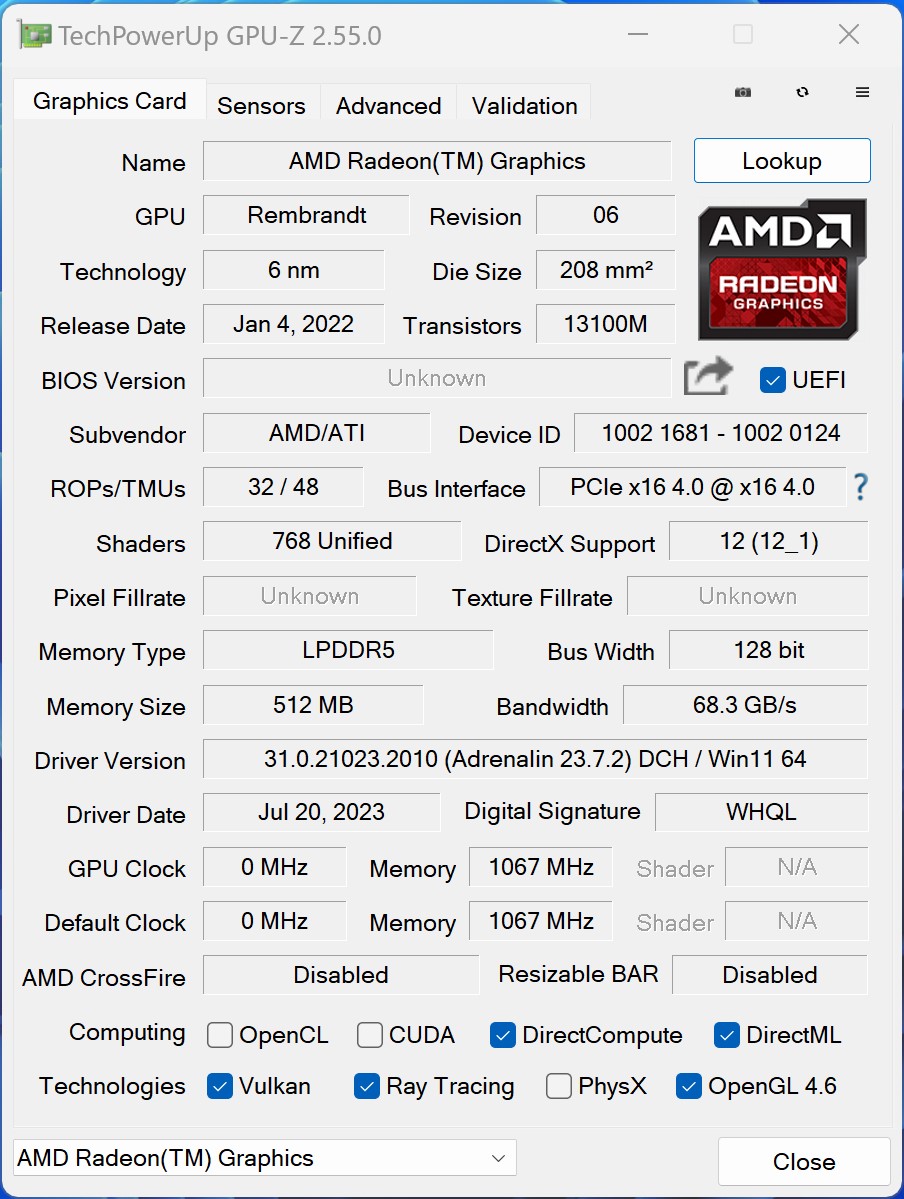
Con ilAMD Ryzen 7 7735Hl'Acemagic AM20 dispone di un SoC relativamente aggiornato con 8 core e 16 thread. In questo modo è in grado di gestire la maggior parte dei compiti. Finora non sono state rivelate altre configurazioni. Per quanto riguarda la RAM, l'Acemagic AM20 è disponibile con 16 o 32 GB. Quest'ultimo è preferibile in quanto l'aggiornamento non è possibile.
Condizioni di prova
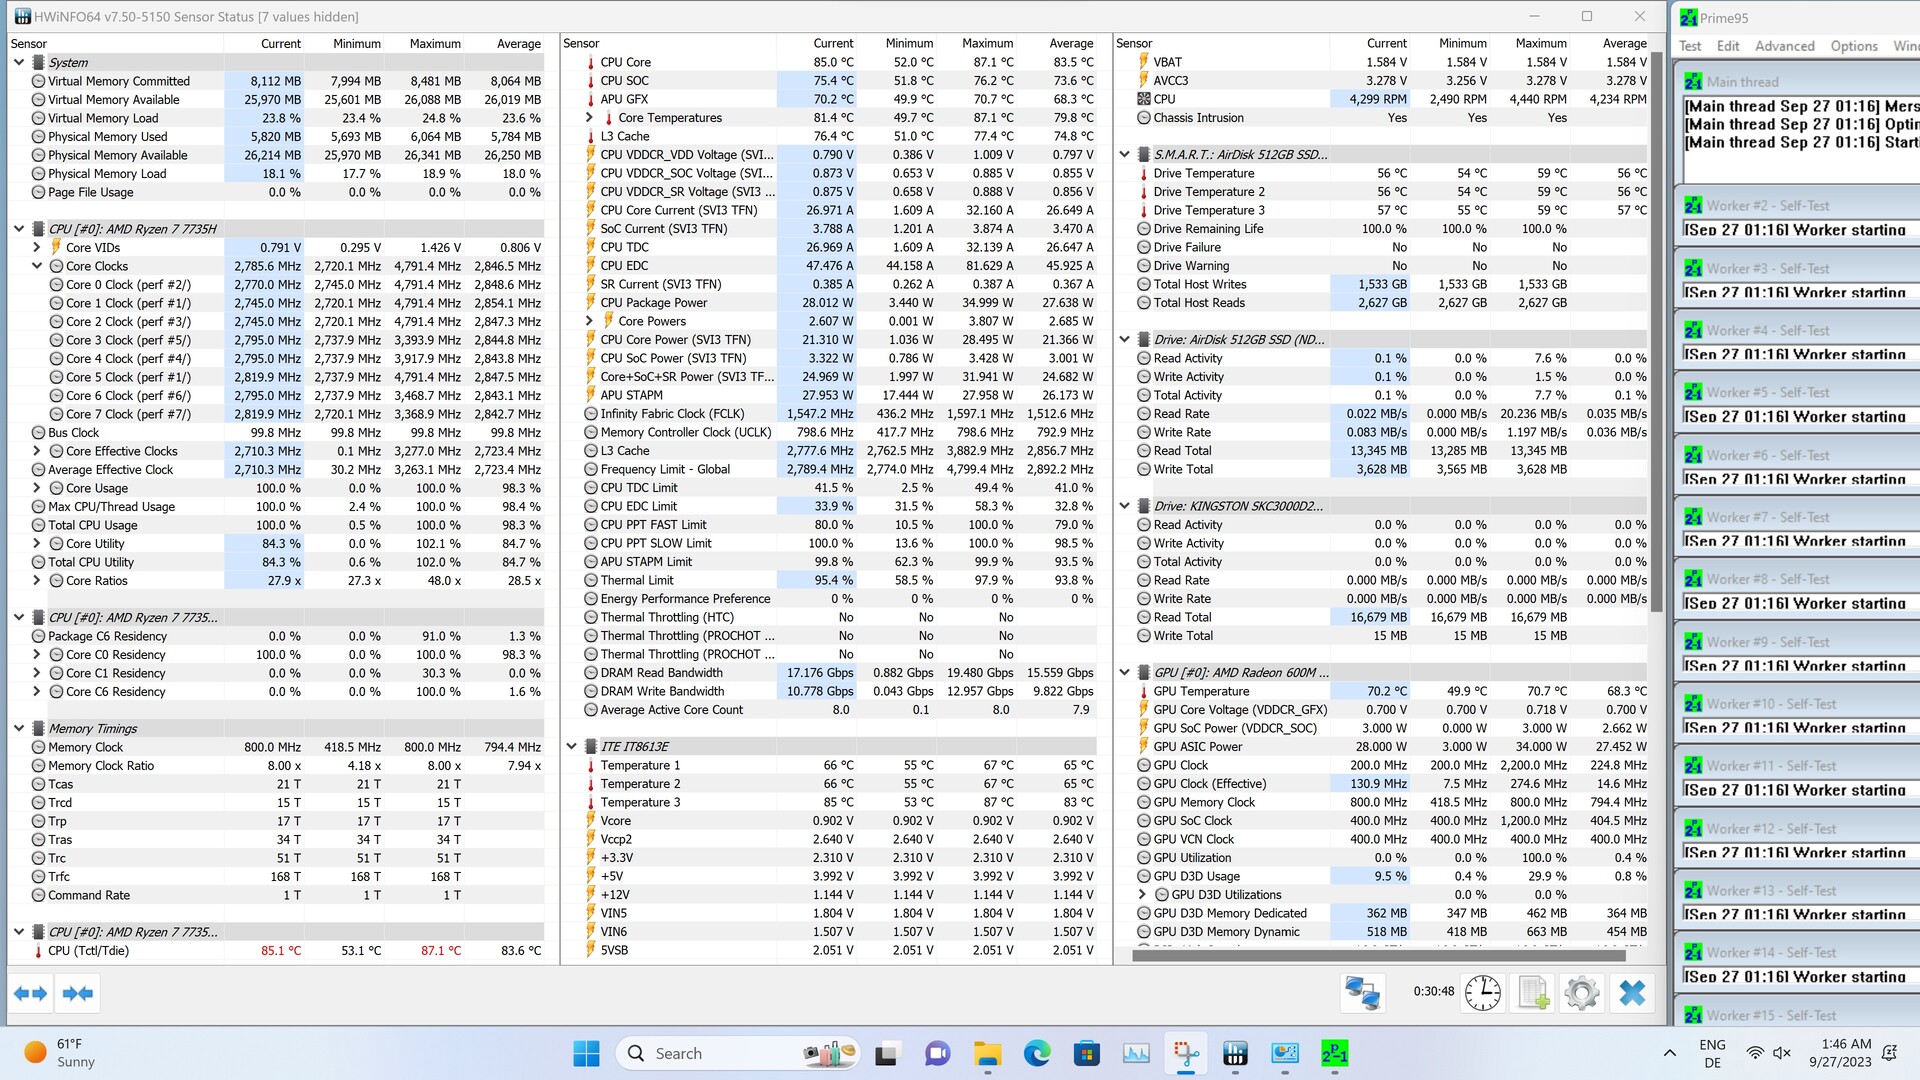
Abbiamo eseguito tutti i test sulle prestazioni utilizzando il profilo energetico "alte prestazioni". Non abbiamo modificato le prestazioni del SoC e abbiamo lasciato il dispositivo in modalità di fabbrica secondo le impostazioni del BIOS. I diversi piani di risparmio energetico sono stati utilizzati solo per le misurazioni del consumo energetico e per l'analisi del livello di rumore.
Processore
IlAMD Ryzen 7 7735Hcombina otto core Zen 3+, il che significa che il produttore ha deciso di non utilizzare l'attuale serie Phoenix di AMD. Nonostante ciò, con 8 core e 16 thread, il SoC raggiunge prestazioni multi-core decenti. Tuttavia, questo ci mostra che l'Acemagic AM20 è solo di poco superiore alMinisforum UM560 XTrispetto alAMD Ryzen 9 6900HX, il AMD Ryzen 7 7735H perde circa il sette per cento. Rispetto alGeekom Mini IT12abbiamo osservato punteggi di valutazione delle prestazioni quasi identici.
Nei benchmark AIDA64, l'Acemagic AM20 dimostra meravigliosamente che è stato installato un SoC potente. Tuttavia, il Geekom AS 6 e il Minisforum UM790 Pro sono chiaramente migliori.
Ulteriori confronti e benchmark sono disponibili nella nostra tabella di confronto delle CPU.
| WinRAR - Result | |
| Minisforum Neptune Series NAD9 | |
| Minisforum Venus Series UM560 XT | |
| Minisforum Venus Series UM790 Pro | |
| Geekom AS 6, R9 6900HX | |
| Morefine M600, 6600U | |
| Geekom Mini IT12 | |
| Acemagic AM20 | |
| Blackview MP200 | |
* ... Meglio usare valori piccoli
AIDA64: FP32 Ray-Trace | FPU Julia | CPU SHA3 | CPU Queen | FPU SinJulia | FPU Mandel | CPU AES | CPU ZLib | FP64 Ray-Trace | CPU PhotoWorxx
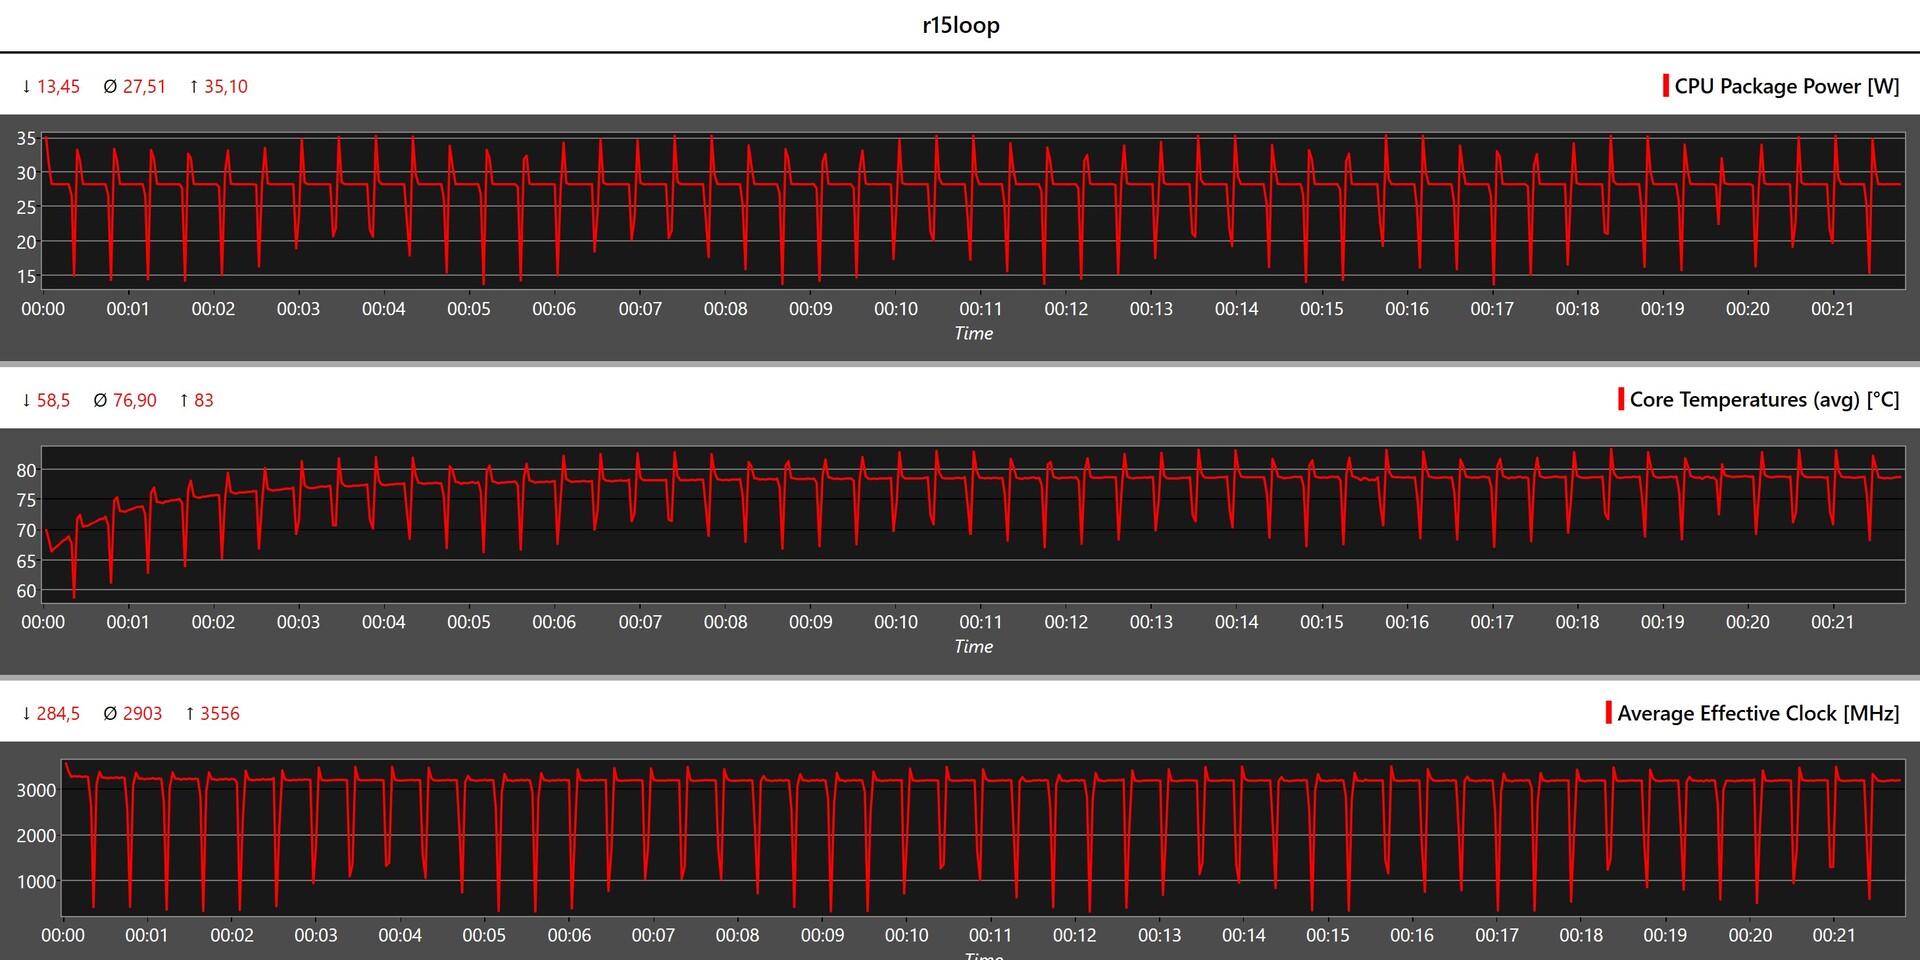
Acemagic AM20 vs. Cinebench R15 multi-loop
Con il ciclo continuo di Cinebench R15, abbiamo analizzato le prestazioni di AMD Ryzen 7 77350Hsu un periodo di tempo più lungo. L'Acemagic AM20 ha completato bene i 50 cicli senza alcuna perdita di prestazioni. Messo a confronto con il Minisforum NAD9il nostro modello in prova riesce addirittura a prevalere, ottenendo un risultato leggermente migliore.
Prestazioni del sistema
Da un punto di vista soggettivo, le prestazioni di sistema dell'Acemagic AM20 sono buone e lo dimostrano i benchmark sintetici. In PCMark 10, solo ilMinisforum UM790 Proè più veloce. In Crossmark, abbiamo osservato una storia simile, anche se si comporta meglio con i processori Intel. Questo è il motivo per cui entrambi i modelliMinisforum NAD9 e ilGeekom Mini IT12hanno entrambi il naso davanti al nostro dispositivo in prova. Nei test sulla RAM, l'Acemagic beneficia delle veloci RAM DDR5 a 6.400 MT/s. Il nostro esemplare in prova non riesce a tenere il passo con i suoi colleghi a causa dell'elevata latenza.
| AIDA64 / Memory Latency | |
| Acemagic AM20 | |
| Media della classe Mini PC (88.1 - 170, n=99, ultimi 2 anni) | |
| Minisforum Neptune Series NAD9 | |
| Morefine M600, 6600U | |
| Geekom AS 6, R9 6900HX | |
| Minisforum Venus Series UM790 Pro | |
| Geekom Mini IT12 | |
| Minisforum Venus Series UM560 XT | |
| Blackview MP200 | |
* ... Meglio usare valori piccoli
Latenze DPC
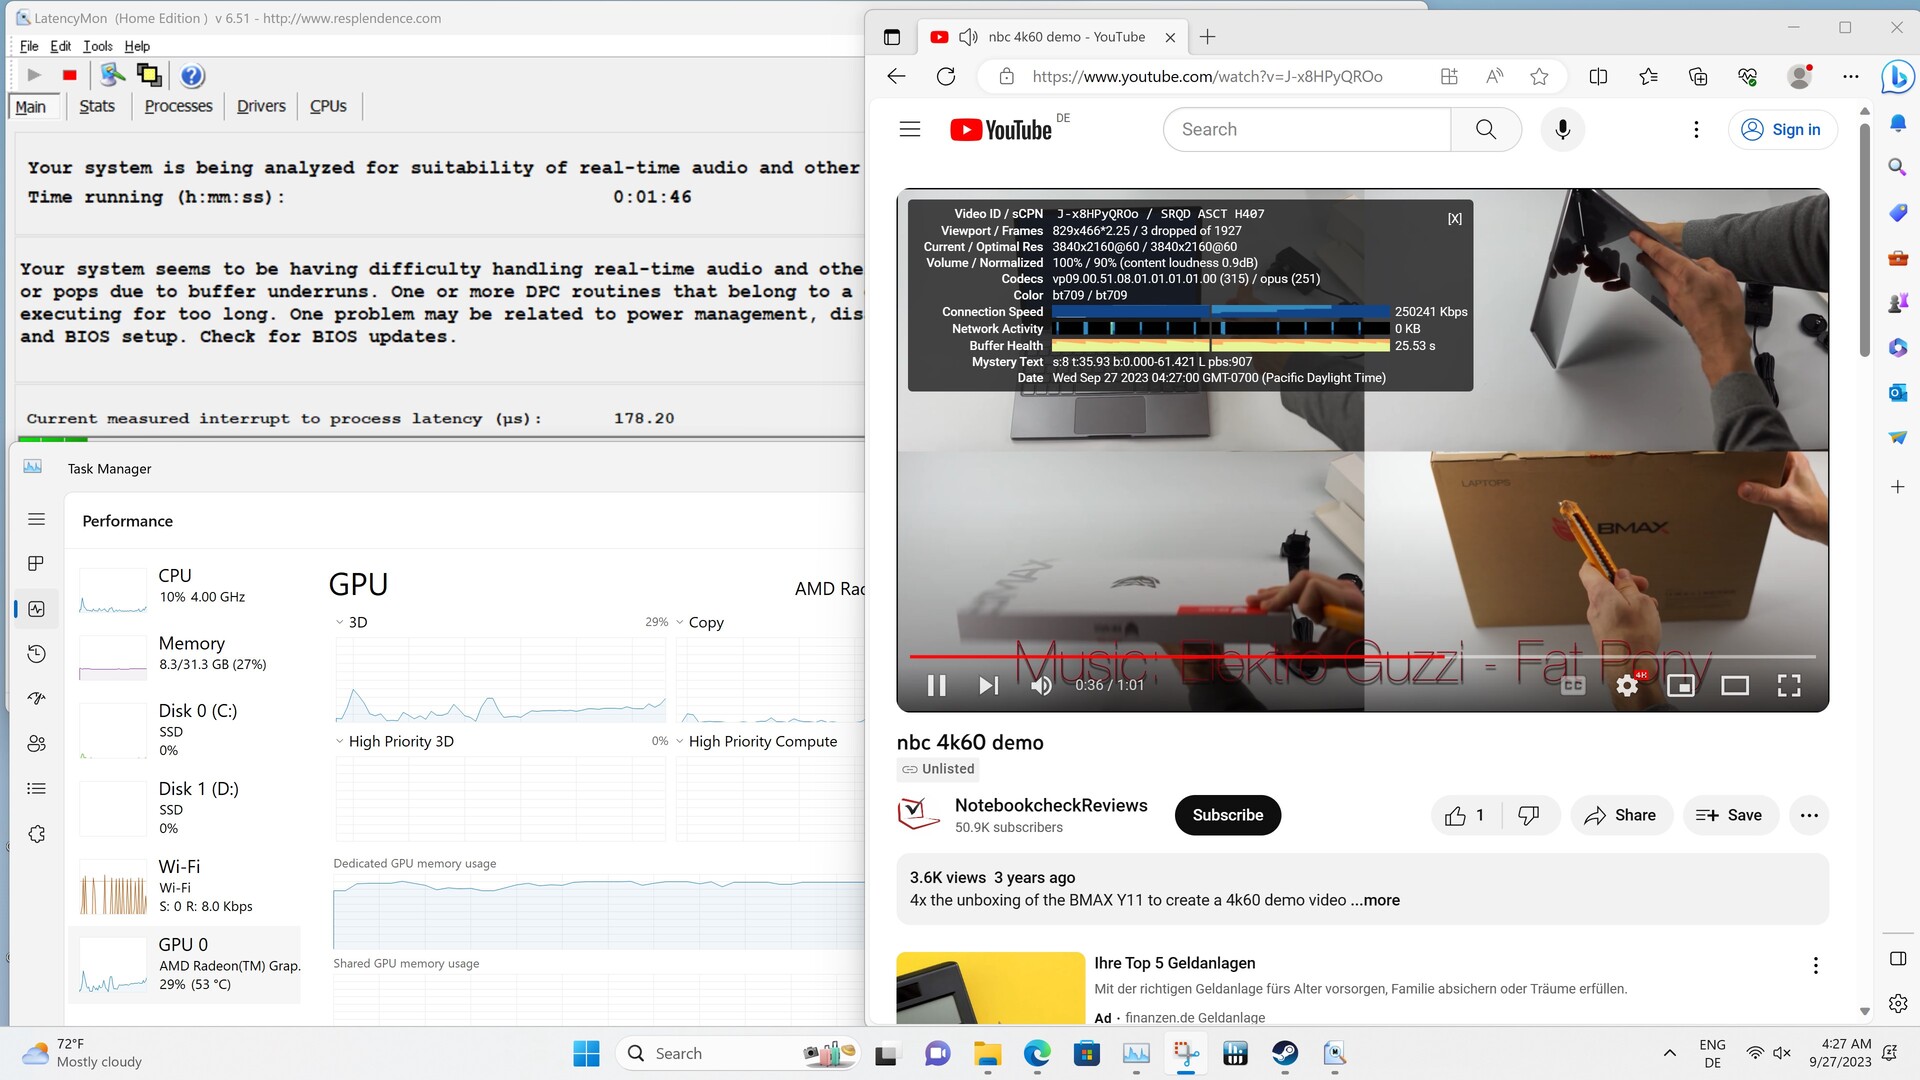
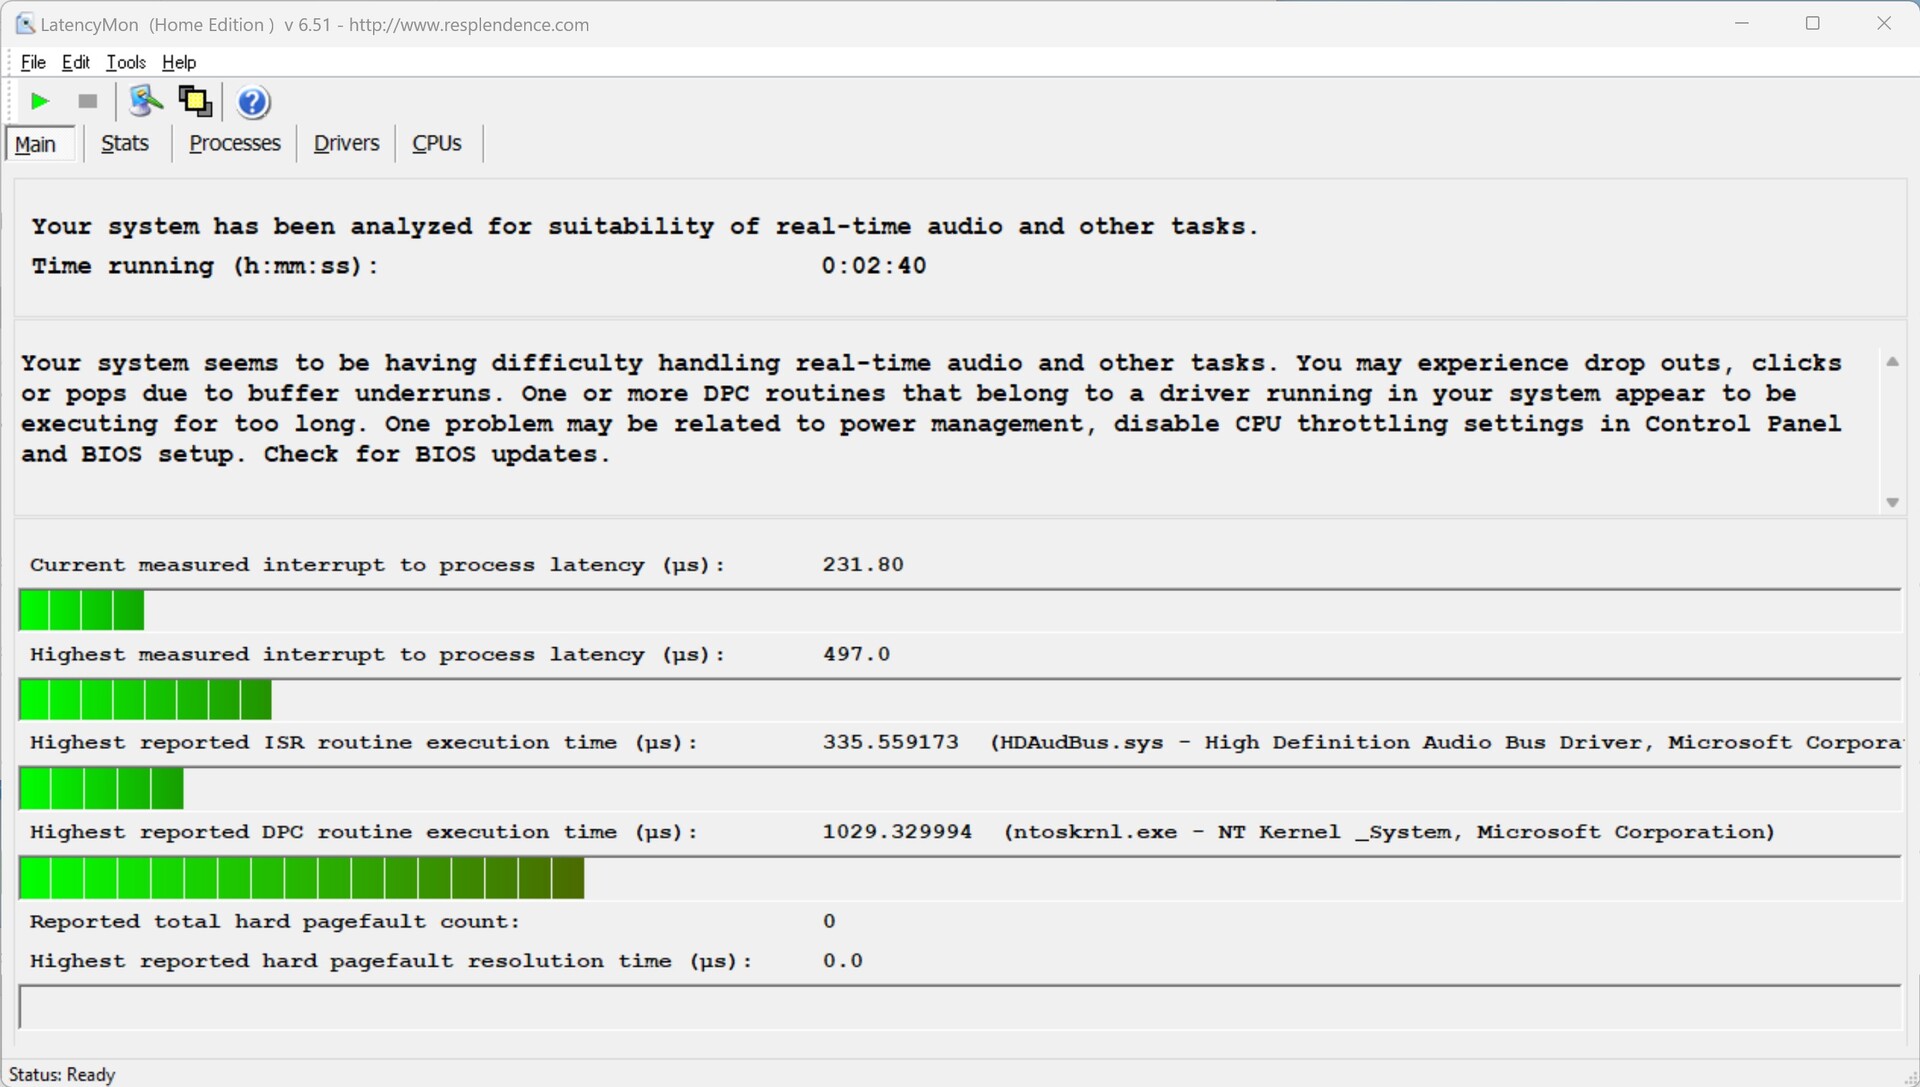
Fino a questo momento non avevamo riscontrato alcun problema di latenza quando si aprivano più schede nel browser Edge. LatencyMon ci ha mostrato solo un aumento della latenza, ma non particolarmente evidente, durante la riproduzione del nostro video di prova in 4K. I dispositivi migliori fino ad oggi non hanno ottenuto risultati migliori in quest'area, il che significa che l'Acemagic AM20 si è assicurato un piazzamento a metà classifica nel nostro confronto.
| DPC Latencies / LatencyMon - interrupt to process latency (max), Web, Youtube, Prime95 | |
| Geekom AS 6, R9 6900HX | |
| Blackview MP200 | |
| Minisforum Neptune Series NAD9 | |
| Minisforum Venus Series UM790 Pro | |
| Acemagic AM20 | |
| Morefine M600, 6600U | |
| Geekom Mini IT12 | |
| Minisforum Venus Series UM560 XT | |
* ... Meglio usare valori piccoli
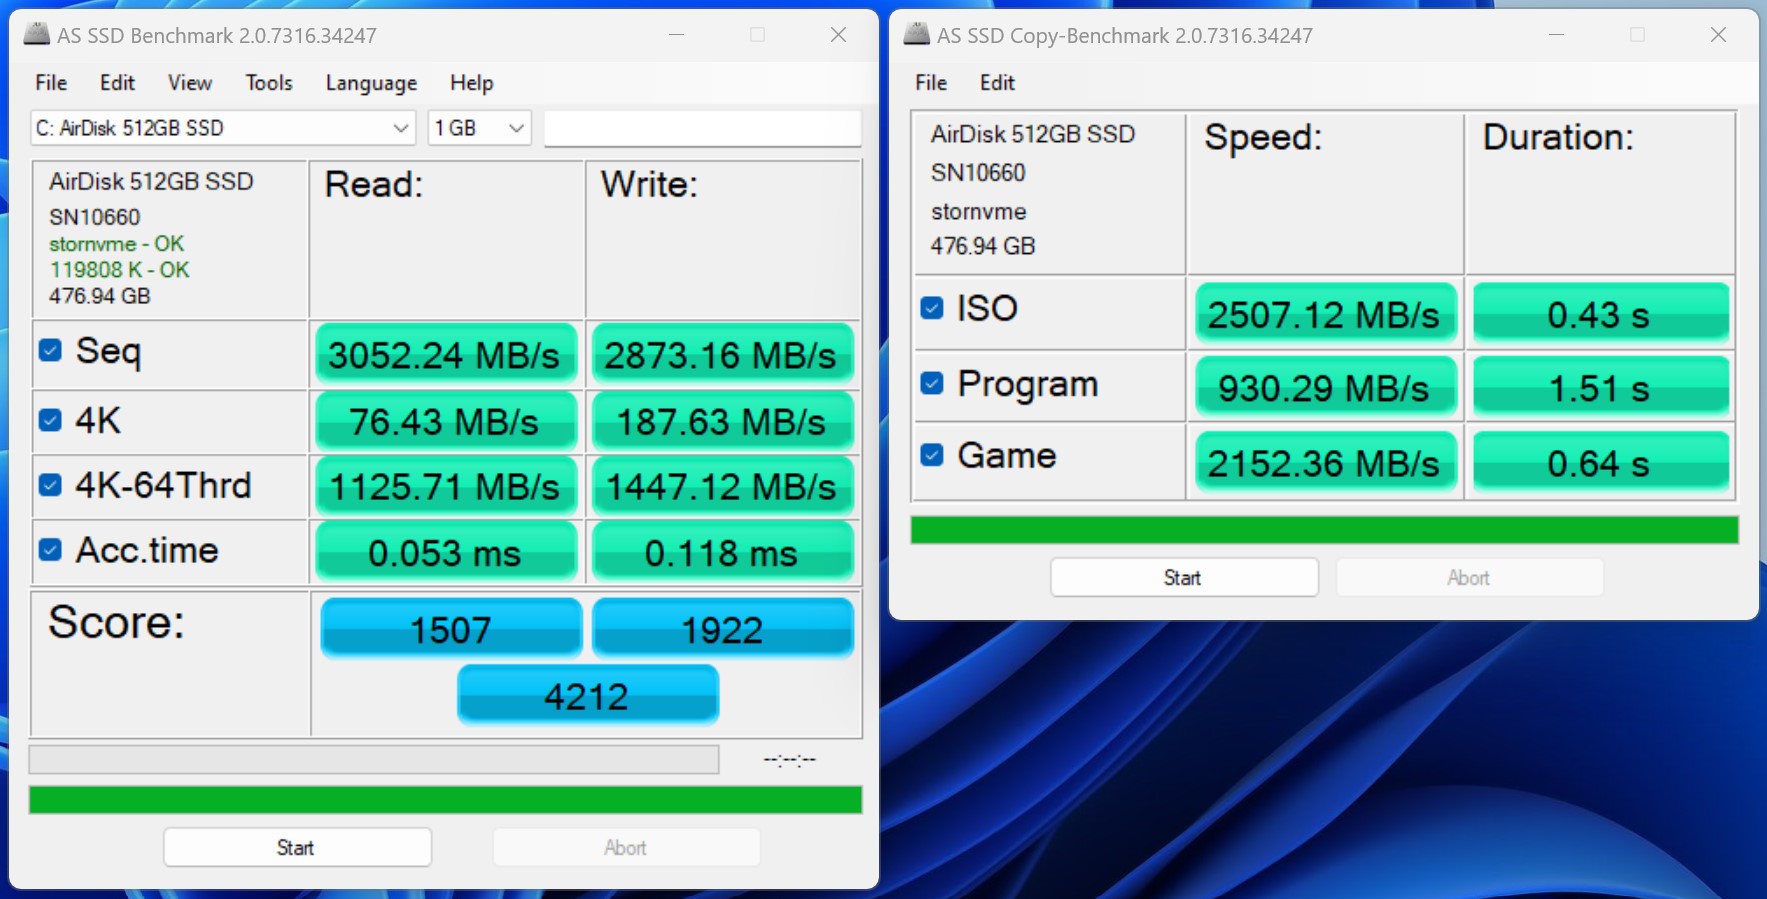
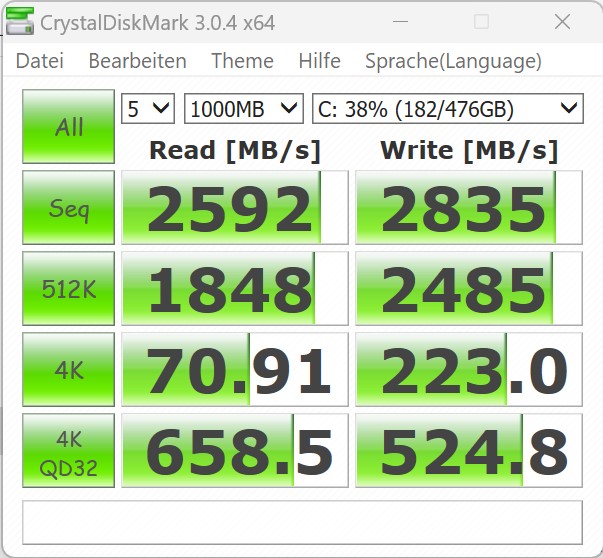
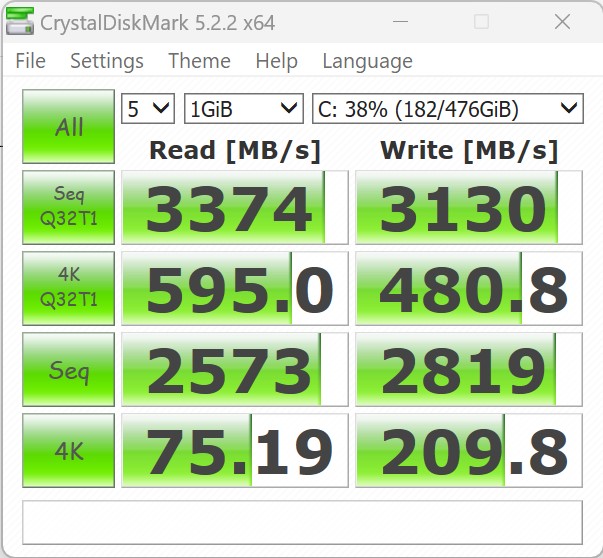
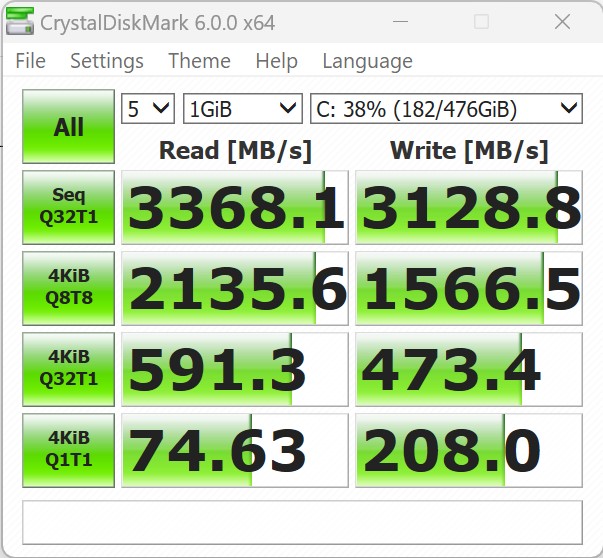
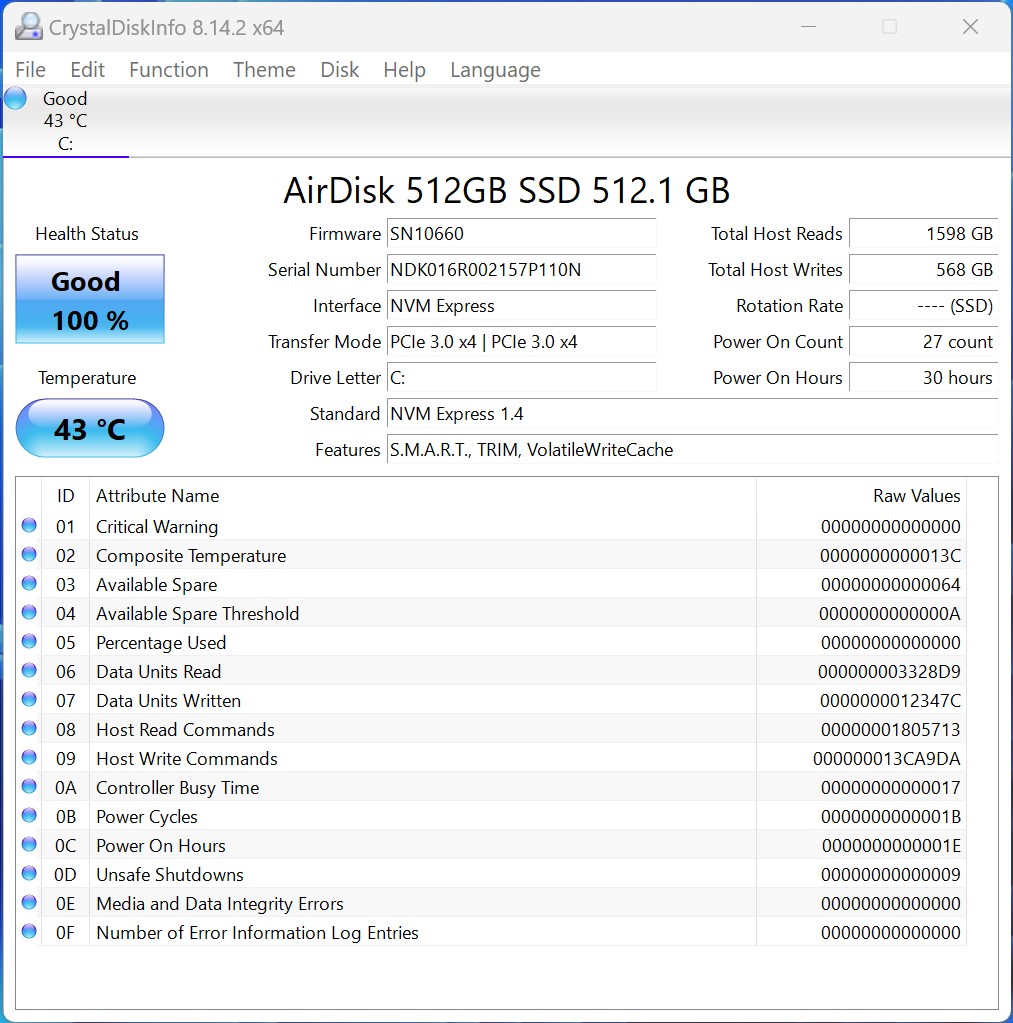
Memoria di massa
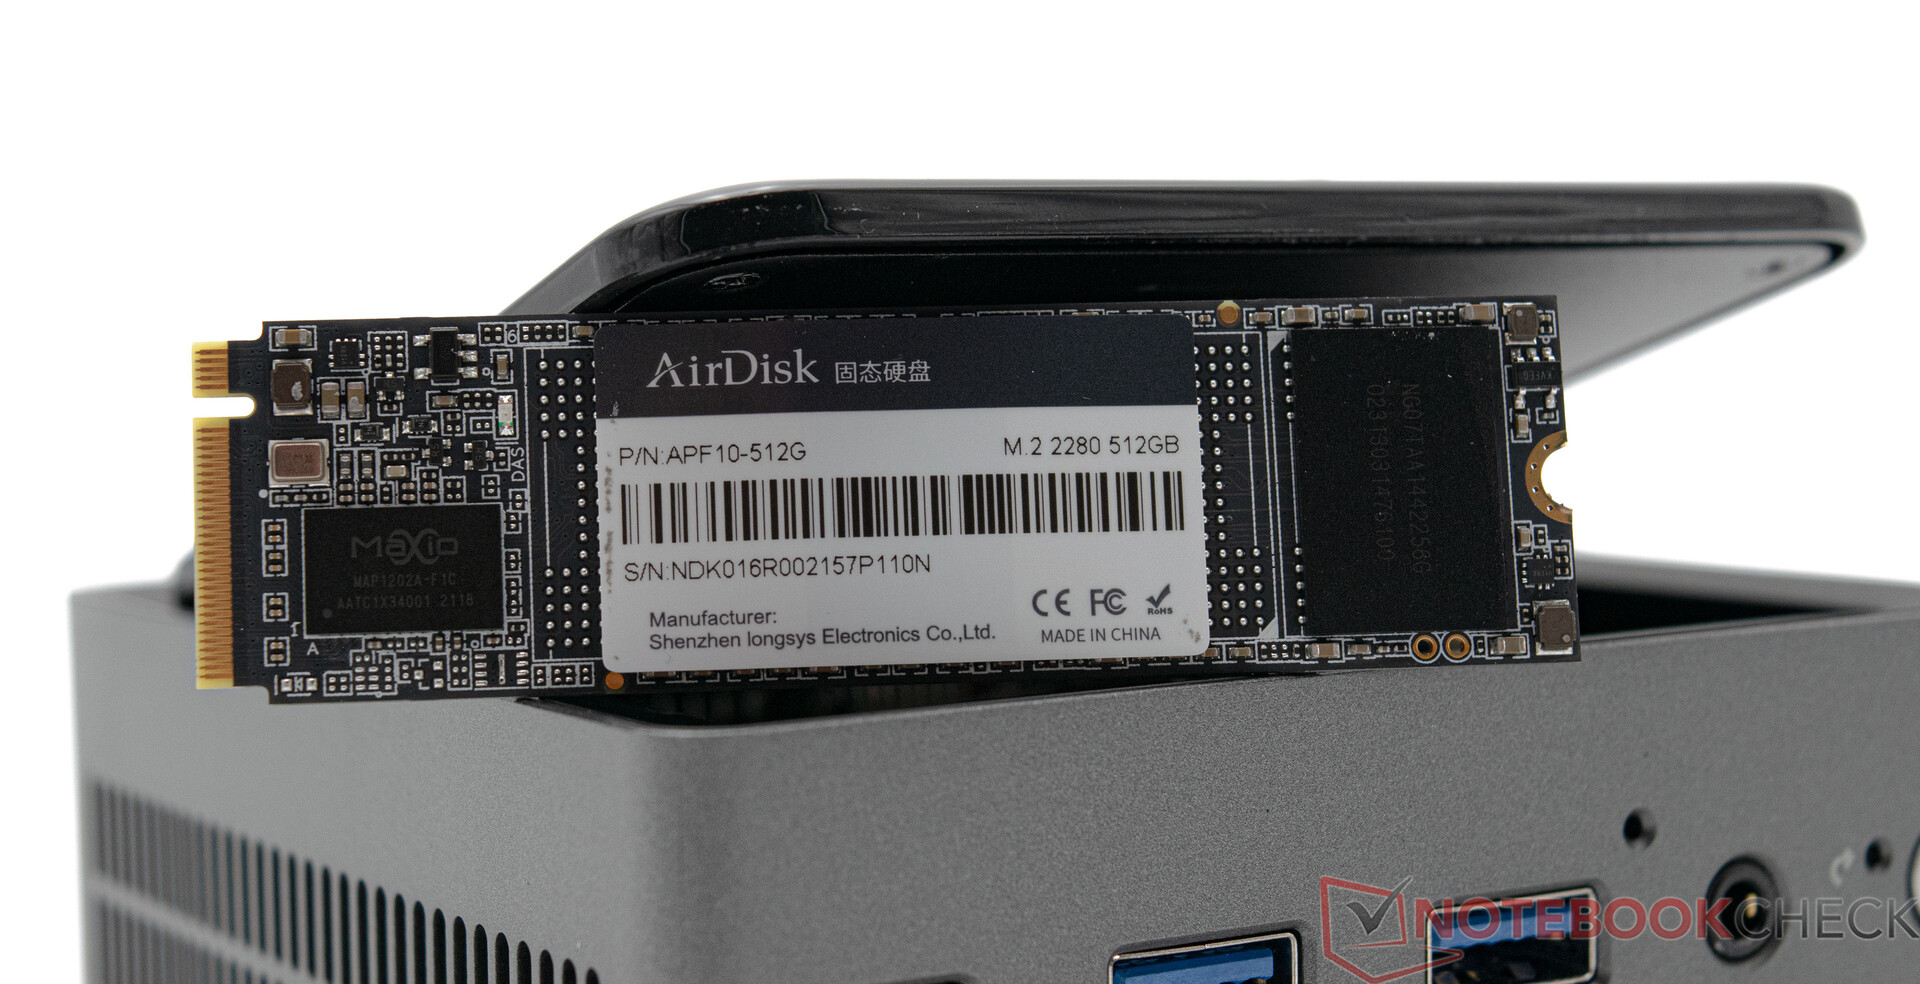
Il nostro dispositivo di recensione ospita un SSD da 512 GB del produttore AirDisk. Un'azienda finora sconosciuta che non abbiamo ancora recensito. Tuttavia, l'SSD installato utilizza l'interfaccia PCIe, il che significa che la memoria di massa offre prestazioni adeguate. Tuttavia, i punteggi dell'Acemagic AM20 non sono all'altezza di quelli delMinisforum NAD9. Tuttavia, ancora una volta, il nostro esemplare in prova è riuscito ad aggiudicarsi il secondo posto. Per quanto riguarda il raffreddamento, Acemagic ha ben controllato l'AM20, anche se la memoria di massa riesce a dissipare il calore solo passivamente attraverso l'involucro con l'aiuto di un pad termico. I test dimostrano che questo funziona e che le prestazioni del disco non calano. È possibile installare un totale di tre dispositivi di archiviazione di massa M.2. Tuttavia, i dischi da 2,5 pollici non possono essere installati nell'Acemagic AM20.
Ulteriori confronti e benchmark sono disponibili nella nostra tabella di confronto.

* ... Meglio usare valori piccoli
Continuous Performance Read: DiskSpd Read Loop, Queue Depth 8
Scheda grafica - AMD Radeon 680M
Nei benchmark sintetici, l'Acemagic AM20 beneficia dei vantaggi del AMD Ryzen 7 7735Hdella iGPU, la AMD Radeon 680Me delle sue eccellenti prestazioni di base. Si trova a una distanza quasi trascurabile rispetto alMinisforum UM790 Pro e ilGeekom AS 6- con la stessa iGPU - scende al terzo posto. Intel non ha alcuna possibilità e a questo punto non ha molto da controbattere. Con le attuali iGPU Intel Iris Xe Graphics G7, il Geekom Mini IT12è molto indietro e riesce a piazzarsi solo a metà classifica.
Per ulteriori confronti e benchmark, date un'occhiata al nostroGPU.
| Unigine Valley 1.0 | |
| 1920x1080 Extreme HD DirectX AA:x8 | |
| Acemagic AM20 | |
| Geekom AS 6, R9 6900HX | |
| Minisforum Venus Series UM790 Pro | |
| Minisforum Neptune Series NAD9 | |
| Geekom Mini IT12 | |
| Minisforum Venus Series UM560 XT | |
| Morefine M600, 6600U | |
| Blackview MP200 | |
| 1920x1080 Extreme HD Preset OpenGL AA:x8 | |
| Acemagic AM20 | |
| Geekom AS 6, R9 6900HX | |
| Minisforum Venus Series UM790 Pro | |
| Geekom Mini IT12 | |
| Minisforum Neptune Series NAD9 | |
| Minisforum Venus Series UM560 XT | |
| Morefine M600, 6600U | |
| Blackview MP200 | |
| Affinity Photo 2 - Combined (Single / Multi GPU) | |
| Minisforum Neptune Series NAD9 | |
| Geekom Mini IT12 | |
| Minisforum Venus Series UM560 XT | |
| Acemagic AM20 | |
| Minisforum Venus Series UM790 Pro | |
| Blackview MP200 | |
| Geekom AS 6, R9 6900HX | |
| 3DMark 05 Standard | 51389 punti | |
| 3DMark 06 Standard Score | 35629 punti | |
| 3DMark Vantage P Result | 34781 punti | |
| 3DMark 11 Performance | 10939 punti | |
| 3DMark Ice Storm Standard Score | 160248 punti | |
| 3DMark Cloud Gate Standard Score | 32366 punti | |
| 3DMark Fire Strike Score | 6858 punti | |
| 3DMark Fire Strike Extreme Score | 3434 punti | |
| 3DMark Time Spy Score | 2712 punti | |
Aiuto | ||
Prestazioni di gioco - AMD Radeon 680M
Per quanto riguarda la iGPU, eravamo già rimasti impressionati dalla AMD Radeon 680Mnegli altri test. In questo ambito, l'Acemagic AM20 è, senza eccezioni, allo stesso livello delGeekom AS 6. Con alcune piccole limitazioni nei dettagli grafici, è possibile giocare a molti giochi in modo fluido. Tuttavia, non può sostituire una scheda grafica.
| The Witcher 3 | |
| 1024x768 Low Graphics & Postprocessing | |
| Minisforum Venus Series UM790 Pro | |
| Acemagic AM20 | |
| Geekom AS 6, R9 6900HX | |
| Minisforum Neptune Series NAD9 | |
| Geekom Mini IT12 | |
| Morefine M600, 6600U | |
| Minisforum Venus Series UM560 XT | |
| Blackview MP200 | |
| 1920x1080 High Graphics & Postprocessing (Nvidia HairWorks Off) | |
| Minisforum Venus Series UM790 Pro | |
| Acemagic AM20 | |
| Geekom AS 6, R9 6900HX | |
| Minisforum Neptune Series NAD9 | |
| Geekom Mini IT12 | |
| Minisforum Venus Series UM560 XT | |
| Morefine M600, 6600U | |
| Blackview MP200 | |
| Borderlands 3 | |
| 1280x720 Very Low Overall Quality (DX11) | |
| Minisforum Venus Series UM790 Pro | |
| Acemagic AM20 | |
| Minisforum Venus Series UM560 XT | |
| Geekom AS 6, R9 6900HX | |
| Minisforum Neptune Series NAD9 | |
| Geekom Mini IT12 | |
| Morefine M600, 6600U | |
| Blackview MP200 | |
| 1920x1080 High Overall Quality (DX11) | |
| Minisforum Venus Series UM790 Pro | |
| Geekom AS 6, R9 6900HX | |
| Acemagic AM20 | |
| Minisforum Neptune Series NAD9 | |
| Minisforum Venus Series UM560 XT | |
| Geekom Mini IT12 | |
| Morefine M600, 6600U | |
| Blackview MP200 | |
| GTA V | |
| 1024x768 Lowest Settings possible | |
| Minisforum Venus Series UM790 Pro | |
| Acemagic AM20 | |
| Morefine M600, 6600U | |
| Minisforum Venus Series UM560 XT | |
| Minisforum Neptune Series NAD9 | |
| Geekom AS 6, R9 6900HX | |
| Geekom Mini IT12 | |
| Blackview MP200 | |
| 1920x1080 High/On (Advanced Graphics Off) AA:2xMSAA + FX AF:8x | |
| Minisforum Venus Series UM790 Pro | |
| Acemagic AM20 | |
| Geekom AS 6, R9 6900HX | |
| Morefine M600, 6600U | |
| Minisforum Venus Series UM560 XT | |
| Minisforum Neptune Series NAD9 | |
| Geekom Mini IT12 | |
| Blackview MP200 | |
| basso | medio | alto | ultra | |
|---|---|---|---|---|
| GTA V (2015) | 144.2 | 130.5 | 52.9 | 23.2 |
| The Witcher 3 (2015) | 116.4 | 51.4 | 40.2 | 26.3 |
| Dota 2 Reborn (2015) | 125.7 | 102.8 | 79.5 | 69.2 |
| Final Fantasy XV Benchmark (2018) | 64.7 | 35.5 | 25.7 | |
| X-Plane 11.11 (2018) | 56.7 | 44 | 35.4 | |
| Far Cry 5 (2018) | 67 | 41 | 38 | 36 |
| Strange Brigade (2018) | 148.9 | 60.5 | 49.5 | 42.5 |
| Shadow of the Tomb Raider (2018) | 90 | 39.2 | 35.6 | 30.5 |
| Far Cry New Dawn (2019) | 61 | 39 | 37 | 34 |
| Metro Exodus (2019) | 72.2 | 30.6 | 23.4 | 18.8 |
| Borderlands 3 (2019) | 78.8 | 38.7 | 25.6 | 20.1 |
| F1 2020 (2020) | 158 | 80.5 | 62.4 | 42.8 |
| F1 2021 (2021) | 168.1 | 85 | 26.8 | |
| Far Cry 6 (2021) | 71.8 | 40.6 | 34.5 | 29.7 |
| God of War (2022) | 37.6 | 30.5 | 24.2 | 18.1 |
| GRID Legends (2022) | 76.9 | 60.6 | 47 | 38.4 |
| Tiny Tina's Wonderlands (2022) | 56.2 | 42.2 | 28.6 | 22.5 |
| F1 22 (2022) | 80.2 | 69.9 | 50.5 | 12.3 |
| F1 23 (2023) | 71.8 | 64.5 | 44.7 | 9.36 |
prestazioni 3D tramite un dock eGPU con una Nvidia GeForce RTX 3060 Ti
Dal momento che l'Acemagic AM20 è dotato di una porta Thunderbolt, abbiamo dato un'occhiata in coppia con il nostro Razer Core X e unaNvidia GeForce RTX 3060 Ticon l'obiettivo di ottenere un incremento delle prestazioni grafiche 3D esterne. In linea di principio, l'aumento delle prestazioni 3D è notevole. Tuttavia, a titolo di confronto, abbiamo visto che ilIntel NUC 13 Pro Kit ha ottenuto prestazioni significativamente migliori. L'Acemagic AM20 si trova in una posizione più simile a quella delMorefine M600 6600U.
Da un punto di vista soggettivo, possiamo confermare che questa combinazione vi permetterà di giocare a molti più giochi in modo fluido. Tuttavia, è necessario essere consapevoli di alcune limitazioni. La scheda grafica installata può comunicare con il sistema solo attraverso quattro corsie PCIe 3.0. Questo comporta una drastica riduzione delle prestazioni. Ciò comporta una drastica riduzione della larghezza di banda. Questo è un aspetto che si è rivelato particolarmente evidente nei giochi F1 22 e F1 23. Abbiamo persino documentato risultati peggiori rispetto alla iGPU.
| Performance rating - Percent | |
| Intel NUC 13 Pro Kit NUC13ANK (Nvidia GeForce RTX 3060 Ti FE TB3) | |
| Geekom Mini IT12 (Nvidia GeForce RTX 3060 Ti FE TB3) | |
| Minisforum Venus Series UM690 (Nvidia GeForce RTX 3060 Ti FE TB3) | |
| Minisforum Venus Series UM790 Pro (Nvidia GeForce RTX 3060 Ti FE TB3) | |
| Ace Magician AM08Pro (Nvidia GeForce RTX 3060 Ti FE TB3) | |
| Morefine M600 (Nvidia GeForce RTX 3060 Ti FE TB3) | |
| Acemagic AM20 (Nvidia GeForce RTX 3060 Ti FE) | |
| 3DMark 11 - 1280x720 Performance GPU | |
| Intel NUC 13 Pro Kit NUC13ANK (Nvidia GeForce RTX 3060 Ti FE TB3) | |
| Geekom Mini IT12 (Nvidia GeForce RTX 3060 Ti FE TB3) | |
| Minisforum Venus Series UM790 Pro (Nvidia GeForce RTX 3060 Ti FE TB3) | |
| Ace Magician AM08Pro (Nvidia GeForce RTX 3060 Ti FE TB3) | |
| Minisforum Venus Series UM690 (Nvidia GeForce RTX 3060 Ti FE TB3) | |
| Acemagic AM20 (Nvidia GeForce RTX 3060 Ti FE) | |
| Morefine M600 (Nvidia GeForce RTX 3060 Ti FE TB3) | |
| 3DMark | |
| 2560x1440 Time Spy Graphics | |
| Intel NUC 13 Pro Kit NUC13ANK (Nvidia GeForce RTX 3060 Ti FE TB3) | |
| Geekom Mini IT12 (Nvidia GeForce RTX 3060 Ti FE TB3) | |
| Morefine M600 (Nvidia GeForce RTX 3060 Ti FE TB3) | |
| Minisforum Venus Series UM790 Pro (Nvidia GeForce RTX 3060 Ti FE TB3) | |
| Ace Magician AM08Pro (Nvidia GeForce RTX 3060 Ti FE TB3) | |
| Minisforum Venus Series UM690 (Nvidia GeForce RTX 3060 Ti FE TB3) | |
| Acemagic AM20 (Nvidia GeForce RTX 3060 Ti FE) | |
| 1920x1080 Fire Strike Graphics | |
| Intel NUC 13 Pro Kit NUC13ANK (Nvidia GeForce RTX 3060 Ti FE TB3) | |
| Geekom Mini IT12 (Nvidia GeForce RTX 3060 Ti FE TB3) | |
| Morefine M600 (Nvidia GeForce RTX 3060 Ti FE TB3) | |
| Ace Magician AM08Pro (Nvidia GeForce RTX 3060 Ti FE TB3) | |
| Minisforum Venus Series UM790 Pro (Nvidia GeForce RTX 3060 Ti FE TB3) | |
| Minisforum Venus Series UM690 (Nvidia GeForce RTX 3060 Ti FE TB3) | |
| Acemagic AM20 (Nvidia GeForce RTX 3060 Ti FE) | |
| 3840x2160 Fire Strike Ultra Graphics | |
| Geekom Mini IT12 (Nvidia GeForce RTX 3060 Ti FE TB3) | |
| Intel NUC 13 Pro Kit NUC13ANK (Nvidia GeForce RTX 3060 Ti FE TB3) | |
| Morefine M600 (Nvidia GeForce RTX 3060 Ti FE TB3) | |
| Minisforum Venus Series UM790 Pro (Nvidia GeForce RTX 3060 Ti FE TB3) | |
| Ace Magician AM08Pro (Nvidia GeForce RTX 3060 Ti FE TB3) | |
| Minisforum Venus Series UM690 (Nvidia GeForce RTX 3060 Ti FE TB3) | |
| Acemagic AM20 (Nvidia GeForce RTX 3060 Ti FE) | |
| Unigine Superposition | |
| 1280x720 720p Low | |
| Minisforum Venus Series UM790 Pro (Nvidia GeForce RTX 3060 Ti FE TB3) | |
| Intel NUC 13 Pro Kit NUC13ANK (Nvidia GeForce RTX 3060 Ti FE TB3) | |
| Geekom Mini IT12 (Nvidia GeForce RTX 3060 Ti FE TB3) | |
| Minisforum Venus Series UM690 (Nvidia GeForce RTX 3060 Ti FE TB3) | |
| Ace Magician AM08Pro (Nvidia GeForce RTX 3060 Ti FE TB3) | |
| Acemagic AM20 (Nvidia GeForce RTX 3060 Ti FE) | |
| Morefine M600 (Nvidia GeForce RTX 3060 Ti FE TB3) | |
| 1920x1080 1080p High | |
| Intel NUC 13 Pro Kit NUC13ANK (Nvidia GeForce RTX 3060 Ti FE TB3) | |
| Geekom Mini IT12 (Nvidia GeForce RTX 3060 Ti FE TB3) | |
| Morefine M600 (Nvidia GeForce RTX 3060 Ti FE TB3) | |
| Acemagic AM20 (Nvidia GeForce RTX 3060 Ti FE) | |
| Minisforum Venus Series UM690 (Nvidia GeForce RTX 3060 Ti FE TB3) | |
| Ace Magician AM08Pro (Nvidia GeForce RTX 3060 Ti FE TB3) | |
| Minisforum Venus Series UM790 Pro (Nvidia GeForce RTX 3060 Ti FE TB3) | |
| 1920x1080 1080p Extreme | |
| Geekom Mini IT12 (Nvidia GeForce RTX 3060 Ti FE TB3) | |
| Intel NUC 13 Pro Kit NUC13ANK (Nvidia GeForce RTX 3060 Ti FE TB3) | |
| Minisforum Venus Series UM690 (Nvidia GeForce RTX 3060 Ti FE TB3) | |
| Morefine M600 (Nvidia GeForce RTX 3060 Ti FE TB3) | |
| Acemagic AM20 (Nvidia GeForce RTX 3060 Ti FE) | |
| Ace Magician AM08Pro (Nvidia GeForce RTX 3060 Ti FE TB3) | |
| Minisforum Venus Series UM790 Pro (Nvidia GeForce RTX 3060 Ti FE TB3) | |
| 3840x2160 4k Optimized | |
| Geekom Mini IT12 (Nvidia GeForce RTX 3060 Ti FE TB3) | |
| Intel NUC 13 Pro Kit NUC13ANK (Nvidia GeForce RTX 3060 Ti FE TB3) | |
| Minisforum Venus Series UM690 (Nvidia GeForce RTX 3060 Ti FE TB3) | |
| Morefine M600 (Nvidia GeForce RTX 3060 Ti FE TB3) | |
| Acemagic AM20 (Nvidia GeForce RTX 3060 Ti FE) | |
| Ace Magician AM08Pro (Nvidia GeForce RTX 3060 Ti FE TB3) | |
| Minisforum Venus Series UM790 Pro (Nvidia GeForce RTX 3060 Ti FE TB3) | |
| 7680x4320 8k Optimized | |
| Geekom Mini IT12 (Nvidia GeForce RTX 3060 Ti FE TB3) | |
| Intel NUC 13 Pro Kit NUC13ANK (Nvidia GeForce RTX 3060 Ti FE TB3) | |
| Acemagic AM20 (Nvidia GeForce RTX 3060 Ti FE) | |
| Minisforum Venus Series UM690 (Nvidia GeForce RTX 3060 Ti FE TB3) | |
| Morefine M600 (Nvidia GeForce RTX 3060 Ti FE TB3) | |
| Ace Magician AM08Pro (Nvidia GeForce RTX 3060 Ti FE TB3) | |
| Minisforum Venus Series UM790 Pro (Nvidia GeForce RTX 3060 Ti FE TB3) | |
| Unigine Valley 1.0 | |
| 1920x1080 Extreme HD DirectX AA:x8 | |
| Intel NUC 13 Pro Kit NUC13ANK (Nvidia GeForce RTX 3060 Ti FE TB3) | |
| Geekom Mini IT12 (Nvidia GeForce RTX 3060 Ti FE TB3) | |
| Minisforum Venus Series UM690 (Nvidia GeForce RTX 3060 Ti FE TB3) | |
| Minisforum Venus Series UM790 Pro (Nvidia GeForce RTX 3060 Ti FE TB3) | |
| Ace Magician AM08Pro (Nvidia GeForce RTX 3060 Ti FE TB3) | |
| Acemagic AM20 (Nvidia GeForce RTX 3060 Ti FE) | |
| Morefine M600 (Nvidia GeForce RTX 3060 Ti FE TB3) | |
| 1920x1080 Extreme HD Preset OpenGL AA:x8 | |
| Intel NUC 13 Pro Kit NUC13ANK (Nvidia GeForce RTX 3060 Ti FE TB3) | |
| Geekom Mini IT12 (Nvidia GeForce RTX 3060 Ti FE TB3) | |
| Minisforum Venus Series UM690 (Nvidia GeForce RTX 3060 Ti FE TB3) | |
| Ace Magician AM08Pro (Nvidia GeForce RTX 3060 Ti FE TB3) | |
| Morefine M600 (Nvidia GeForce RTX 3060 Ti FE TB3) | |
| Acemagic AM20 (Nvidia GeForce RTX 3060 Ti FE) | |
| Minisforum Venus Series UM790 Pro (Nvidia GeForce RTX 3060 Ti FE TB3) | |
| Unigine Heaven 4.0 | |
| Extreme Preset OpenGL | |
| Intel NUC 13 Pro Kit NUC13ANK (Nvidia GeForce RTX 3060 Ti FE TB3) | |
| Geekom Mini IT12 (Nvidia GeForce RTX 3060 Ti FE TB3) | |
| Minisforum Venus Series UM690 (Nvidia GeForce RTX 3060 Ti FE TB3) | |
| Morefine M600 (Nvidia GeForce RTX 3060 Ti FE TB3) | |
| Ace Magician AM08Pro (Nvidia GeForce RTX 3060 Ti FE TB3) | |
| Acemagic AM20 (Nvidia GeForce RTX 3060 Ti FE) | |
| Minisforum Venus Series UM790 Pro (Nvidia GeForce RTX 3060 Ti FE TB3) | |
| Extreme Preset DX11 | |
| Intel NUC 13 Pro Kit NUC13ANK (Nvidia GeForce RTX 3060 Ti FE TB3) | |
| Geekom Mini IT12 (Nvidia GeForce RTX 3060 Ti FE TB3) | |
| Minisforum Venus Series UM690 (Nvidia GeForce RTX 3060 Ti FE TB3) | |
| Morefine M600 (Nvidia GeForce RTX 3060 Ti FE TB3) | |
| Acemagic AM20 (Nvidia GeForce RTX 3060 Ti FE) | |
| Ace Magician AM08Pro (Nvidia GeForce RTX 3060 Ti FE TB3) | |
| Minisforum Venus Series UM790 Pro (Nvidia GeForce RTX 3060 Ti FE TB3) | |
| ComputeMark v2.1 | |
| 1024x600 Normal, Score | |
| Geekom Mini IT12 (Nvidia GeForce RTX 3060 Ti FE TB3) | |
| Minisforum Venus Series UM790 Pro (Nvidia GeForce RTX 3060 Ti FE TB3) | |
| Intel NUC 13 Pro Kit NUC13ANK (Nvidia GeForce RTX 3060 Ti FE TB3) | |
| Minisforum Venus Series UM690 (Nvidia GeForce RTX 3060 Ti FE TB3) | |
| Acemagic AM20 (Nvidia GeForce RTX 3060 Ti FE) | |
| Morefine M600 (Nvidia GeForce RTX 3060 Ti FE TB3) | |
| Ace Magician AM08Pro (Nvidia GeForce RTX 3060 Ti FE TB3) | |
| 1024x600 Normal, Fluid 3DTex | |
| Intel NUC 13 Pro Kit NUC13ANK (Nvidia GeForce RTX 3060 Ti FE TB3) | |
| Geekom Mini IT12 (Nvidia GeForce RTX 3060 Ti FE TB3) | |
| Minisforum Venus Series UM790 Pro (Nvidia GeForce RTX 3060 Ti FE TB3) | |
| Acemagic AM20 (Nvidia GeForce RTX 3060 Ti FE) | |
| Minisforum Venus Series UM690 (Nvidia GeForce RTX 3060 Ti FE TB3) | |
| Morefine M600 (Nvidia GeForce RTX 3060 Ti FE TB3) | |
| Ace Magician AM08Pro (Nvidia GeForce RTX 3060 Ti FE TB3) | |
| 1024x600 Normal, Fluid 2DTexArr | |
| Geekom Mini IT12 (Nvidia GeForce RTX 3060 Ti FE TB3) | |
| Minisforum Venus Series UM690 (Nvidia GeForce RTX 3060 Ti FE TB3) | |
| Intel NUC 13 Pro Kit NUC13ANK (Nvidia GeForce RTX 3060 Ti FE TB3) | |
| Minisforum Venus Series UM790 Pro (Nvidia GeForce RTX 3060 Ti FE TB3) | |
| Acemagic AM20 (Nvidia GeForce RTX 3060 Ti FE) | |
| Morefine M600 (Nvidia GeForce RTX 3060 Ti FE TB3) | |
| Ace Magician AM08Pro (Nvidia GeForce RTX 3060 Ti FE TB3) | |
| 1024x600 Normal, Mandel Vector | |
| Geekom Mini IT12 (Nvidia GeForce RTX 3060 Ti FE TB3) | |
| Minisforum Venus Series UM790 Pro (Nvidia GeForce RTX 3060 Ti FE TB3) | |
| Intel NUC 13 Pro Kit NUC13ANK (Nvidia GeForce RTX 3060 Ti FE TB3) | |
| Acemagic AM20 (Nvidia GeForce RTX 3060 Ti FE) | |
| Minisforum Venus Series UM690 (Nvidia GeForce RTX 3060 Ti FE TB3) | |
| Ace Magician AM08Pro (Nvidia GeForce RTX 3060 Ti FE TB3) | |
| Morefine M600 (Nvidia GeForce RTX 3060 Ti FE TB3) | |
| 1024x600 Normal, Mandel Scalar | |
| Geekom Mini IT12 (Nvidia GeForce RTX 3060 Ti FE TB3) | |
| Minisforum Venus Series UM790 Pro (Nvidia GeForce RTX 3060 Ti FE TB3) | |
| Intel NUC 13 Pro Kit NUC13ANK (Nvidia GeForce RTX 3060 Ti FE TB3) | |
| Minisforum Venus Series UM690 (Nvidia GeForce RTX 3060 Ti FE TB3) | |
| Acemagic AM20 (Nvidia GeForce RTX 3060 Ti FE) | |
| Morefine M600 (Nvidia GeForce RTX 3060 Ti FE TB3) | |
| Ace Magician AM08Pro (Nvidia GeForce RTX 3060 Ti FE TB3) | |
| 1024x600 Normal, QJuliaRayTrace | |
| Geekom Mini IT12 (Nvidia GeForce RTX 3060 Ti FE TB3) | |
| Intel NUC 13 Pro Kit NUC13ANK (Nvidia GeForce RTX 3060 Ti FE TB3) | |
| Minisforum Venus Series UM790 Pro (Nvidia GeForce RTX 3060 Ti FE TB3) | |
| Minisforum Venus Series UM690 (Nvidia GeForce RTX 3060 Ti FE TB3) | |
| Acemagic AM20 (Nvidia GeForce RTX 3060 Ti FE) | |
| Morefine M600 (Nvidia GeForce RTX 3060 Ti FE TB3) | |
| Ace Magician AM08Pro (Nvidia GeForce RTX 3060 Ti FE TB3) | |
| Performance rating - Percent | |
| Intel NUC 13 Pro Kit NUC13ANK (Nvidia GeForce RTX 3060 Ti FE TB3) | |
| Geekom Mini IT12 (Nvidia GeForce RTX 3060 Ti FE TB3) | |
| Geekom AS 6 (Nvidia GeForce RTX 3060 Ti FE TB3) | |
| Minisforum Venus Series UM790 Pro (Nvidia GeForce RTX 3060 Ti FE TB3) | |
| Ace Magician AM08Pro (Nvidia GeForce RTX 3060 Ti FE TB3) | |
| Minisforum Venus Series UM690 (Nvidia GeForce RTX 3060 Ti FE TB3) | |
| Morefine M600 (Nvidia GeForce RTX 3060 Ti FE TB3) | |
| Acemagic AM20 (Nvidia GeForce RTX 3060 Ti FE) | |
| GTA V - 1920x1080 Highest AA:4xMSAA + FX AF:16x | |
| Intel NUC 13 Pro Kit NUC13ANK (Nvidia GeForce RTX 3060 Ti FE TB3) | |
| Geekom Mini IT12 (Nvidia GeForce RTX 3060 Ti FE TB3) | |
| Geekom AS 6 (Nvidia GeForce RTX 3060 Ti FE TB3) | |
| Ace Magician AM08Pro (Nvidia GeForce RTX 3060 Ti FE TB3) | |
| Minisforum Venus Series UM690 (Nvidia GeForce RTX 3060 Ti FE TB3) | |
| Minisforum Venus Series UM790 Pro (Nvidia GeForce RTX 3060 Ti FE TB3) | |
| Morefine M600 (Nvidia GeForce RTX 3060 Ti FE TB3) | |
| Acemagic AM20 (Nvidia GeForce RTX 3060 Ti FE) | |
| The Witcher 3 - 1920x1080 Ultra Graphics & Postprocessing (HBAO+) | |
| Intel NUC 13 Pro Kit NUC13ANK (Nvidia GeForce RTX 3060 Ti FE TB3) | |
| Geekom Mini IT12 (Nvidia GeForce RTX 3060 Ti FE TB3) | |
| Geekom AS 6 (Nvidia GeForce RTX 3060 Ti FE TB3) | |
| Minisforum Venus Series UM790 Pro (Nvidia GeForce RTX 3060 Ti FE TB3) | |
| Minisforum Venus Series UM690 (Nvidia GeForce RTX 3060 Ti FE TB3) | |
| Morefine M600 (Nvidia GeForce RTX 3060 Ti FE TB3) | |
| Ace Magician AM08Pro (Nvidia GeForce RTX 3060 Ti FE TB3) | |
| Acemagic AM20 (Nvidia GeForce RTX 3060 Ti FE) | |
| Dota 2 Reborn - 1920x1080 ultra (3/3) best looking | |
| Minisforum Venus Series UM790 Pro (Nvidia GeForce RTX 3060 Ti FE TB3) | |
| Intel NUC 13 Pro Kit NUC13ANK (Nvidia GeForce RTX 3060 Ti FE TB3) | |
| Geekom Mini IT12 (Nvidia GeForce RTX 3060 Ti FE TB3) | |
| Geekom AS 6 (Nvidia GeForce RTX 3060 Ti FE TB3) | |
| Ace Magician AM08Pro (Nvidia GeForce RTX 3060 Ti FE TB3) | |
| Minisforum Venus Series UM690 (Nvidia GeForce RTX 3060 Ti FE TB3) | |
| Acemagic AM20 (Nvidia GeForce RTX 3060 Ti FE) | |
| Morefine M600 (Nvidia GeForce RTX 3060 Ti FE TB3) | |
| Final Fantasy XV Benchmark - 1920x1080 High Quality | |
| Geekom AS 6 (Nvidia GeForce RTX 3060 Ti FE TB3) | |
| Intel NUC 13 Pro Kit NUC13ANK (Nvidia GeForce RTX 3060 Ti FE TB3) | |
| Geekom Mini IT12 (Nvidia GeForce RTX 3060 Ti FE TB3) | |
| Minisforum Venus Series UM790 Pro (Nvidia GeForce RTX 3060 Ti FE TB3) | |
| Ace Magician AM08Pro (Nvidia GeForce RTX 3060 Ti FE TB3) | |
| Acemagic AM20 (Nvidia GeForce RTX 3060 Ti FE) | |
| Minisforum Venus Series UM690 (Nvidia GeForce RTX 3060 Ti FE TB3) | |
| Morefine M600 (Nvidia GeForce RTX 3060 Ti FE TB3) | |
| Strange Brigade - 1920x1080 ultra AA:ultra AF:16 | |
| Geekom AS 6 (Nvidia GeForce RTX 3060 Ti FE TB3) | |
| Intel NUC 13 Pro Kit NUC13ANK (Nvidia GeForce RTX 3060 Ti FE TB3) | |
| Geekom Mini IT12 (Nvidia GeForce RTX 3060 Ti FE TB3) | |
| Minisforum Venus Series UM790 Pro (Nvidia GeForce RTX 3060 Ti FE TB3) | |
| Ace Magician AM08Pro (Nvidia GeForce RTX 3060 Ti FE TB3) | |
| Morefine M600 (Nvidia GeForce RTX 3060 Ti FE TB3) | |
| Minisforum Venus Series UM690 (Nvidia GeForce RTX 3060 Ti FE TB3) | |
| Acemagic AM20 (Nvidia GeForce RTX 3060 Ti FE) | |
| Far Cry 5 - 1920x1080 Ultra Preset AA:T | |
| Intel NUC 13 Pro Kit NUC13ANK (Nvidia GeForce RTX 3060 Ti FE TB3) | |
| Minisforum Venus Series UM790 Pro (Nvidia GeForce RTX 3060 Ti FE TB3) | |
| Geekom Mini IT12 (Nvidia GeForce RTX 3060 Ti FE TB3) | |
| Ace Magician AM08Pro (Nvidia GeForce RTX 3060 Ti FE TB3) | |
| Geekom AS 6 (Nvidia GeForce RTX 3060 Ti FE TB3) | |
| Minisforum Venus Series UM690 (Nvidia GeForce RTX 3060 Ti FE TB3) | |
| Acemagic AM20 (Nvidia GeForce RTX 3060 Ti FE) | |
| Morefine M600 (Nvidia GeForce RTX 3060 Ti FE TB3) | |
| Far Cry New Dawn - 1920x1080 Ultra Preset | |
| Intel NUC 13 Pro Kit NUC13ANK (Nvidia GeForce RTX 3060 Ti FE TB3) | |
| Minisforum Venus Series UM790 Pro (Nvidia GeForce RTX 3060 Ti FE TB3) | |
| Geekom Mini IT12 (Nvidia GeForce RTX 3060 Ti FE TB3) | |
| Ace Magician AM08Pro (Nvidia GeForce RTX 3060 Ti FE TB3) | |
| Geekom AS 6 (Nvidia GeForce RTX 3060 Ti FE TB3) | |
| Minisforum Venus Series UM690 (Nvidia GeForce RTX 3060 Ti FE TB3) | |
| Acemagic AM20 (Nvidia GeForce RTX 3060 Ti FE) | |
| Morefine M600 (Nvidia GeForce RTX 3060 Ti FE TB3) | |
| Borderlands 3 - 1920x1080 Badass Overall Quality (DX11) | |
| Geekom Mini IT12 (Nvidia GeForce RTX 3060 Ti FE TB3) | |
| Intel NUC 13 Pro Kit NUC13ANK (Nvidia GeForce RTX 3060 Ti FE TB3) | |
| Geekom AS 6 (Nvidia GeForce RTX 3060 Ti FE TB3) | |
| Minisforum Venus Series UM790 Pro (Nvidia GeForce RTX 3060 Ti FE TB3) | |
| Ace Magician AM08Pro (Nvidia GeForce RTX 3060 Ti FE TB3) | |
| Minisforum Venus Series UM690 (Nvidia GeForce RTX 3060 Ti FE TB3) | |
| Acemagic AM20 (Nvidia GeForce RTX 3060 Ti FE) | |
| Morefine M600 (Nvidia GeForce RTX 3060 Ti FE TB3) | |
| F1 22 - 1920x1080 Ultra High Preset AA:T AF:16x | |
| Geekom AS 6 (Nvidia GeForce RTX 3060 Ti FE TB3) | |
| Intel NUC 13 Pro Kit NUC13ANK (Nvidia GeForce RTX 3060 Ti FE TB3) | |
| Geekom Mini IT12 (Nvidia GeForce RTX 3060 Ti FE TB3) | |
| Minisforum Venus Series UM790 Pro (Nvidia GeForce RTX 3060 Ti FE TB3) | |
| Ace Magician AM08Pro (Nvidia GeForce RTX 3060 Ti FE TB3) | |
| Minisforum Venus Series UM690 (Nvidia GeForce RTX 3060 Ti FE TB3) | |
| Morefine M600 (Nvidia GeForce RTX 3060 Ti FE TB3) | |
| Acemagic AM20 (Nvidia GeForce RTX 3060 Ti FE) | |
| Tiny Tina's Wonderlands - 1920x1080 Badass Preset (DX12) | |
| Geekom AS 6 (Nvidia GeForce RTX 3060 Ti FE TB3) | |
| Geekom Mini IT12 (Nvidia GeForce RTX 3060 Ti FE TB3) | |
| Intel NUC 13 Pro Kit NUC13ANK (Nvidia GeForce RTX 3060 Ti FE TB3) | |
| Minisforum Venus Series UM790 Pro (Nvidia GeForce RTX 3060 Ti FE TB3) | |
| Morefine M600 (Nvidia GeForce RTX 3060 Ti FE TB3) | |
| Ace Magician AM08Pro (Nvidia GeForce RTX 3060 Ti FE TB3) | |
| Acemagic AM20 (Nvidia GeForce RTX 3060 Ti FE) | |
| Minisforum Venus Series UM690 (Nvidia GeForce RTX 3060 Ti FE TB3) | |
| basso | medio | alto | ultra | QHD | 4K DLSS | 4K | |
|---|---|---|---|---|---|---|---|
| GTA V (2015) | 161.5 | 148.2 | 88 | 59.7 | 41.8 | 32.3 | |
| The Witcher 3 (2015) | 209 | 167.7 | 107.1 | 56.2 | 49.8 | 60.8 | |
| Dota 2 Reborn (2015) | 126.9 | 114.3 | 111.9 | 106.4 | 94.7 | ||
| Final Fantasy XV Benchmark (2018) | 172.5 | 129.9 | 91.8 | 74.2 | 47.1 | ||
| X-Plane 11.11 (2018) | 102.3 | 88.2 | 71.4 | 62.8 | |||
| Far Cry 5 (2018) | 120 | 107 | 103 | 96 | 88 | 56 | |
| Strange Brigade (2018) | 167.8 | 129.7 | 128.1 | 125.2 | 115.8 | 80.4 | |
| Shadow of the Tomb Raider (2018) | 113.8 | 90.9 | 89.4 | 86.2 | 78.8 | 52 | |
| Far Cry New Dawn (2019) | 103 | 92 | 87 | 78 | 74 | 56 | |
| Metro Exodus (2019) | 112.9 | 77 | 58.6 | 44.1 | 39.3 | 30.2 | |
| Borderlands 3 (2019) | 106.2 | 94.1 | 84.1 | 74.5 | 60.8 | 37.2 | |
| F1 2020 (2020) | 170.5 | 95 | 96.7 | 81 | 72.4 | 52.3 | |
| F1 2021 (2021) | 112.7 | 85.4 | 55.6 | 42.4 | 38.9 | 33.2 | |
| Far Cry 6 (2021) | 61.8 | 53 | 43.8 | 37.4 | 37 | ||
| God of War (2022) | 99.4 | 89.1 | 73.7 | 56.7 | 50.8 | 37.9 | |
| GRID Legends (2022) | 100.1 | 82.4 | 67.7 | 57.8 | 52 | 43 | |
| Tiny Tina's Wonderlands (2022) | 153 | 124.7 | 90.8 | 74.4 | 57.7 | 34.7 | |
| F1 22 (2022) | 47.9 | 43.9 | 34.2 | 22.4 | 21.5 | 17.5 | |
| F1 23 (2023) | 52.9 | 51.9 | 43 | 27.5 | 26.1 | 26.2 | 14.1 |
Emissioni - Buone prestazioni, ma sempre economiche
Emissioni acustiche
Rispetto alla concorrenza, l'Acemagic AM20 non ottiene punti per la silenziosità operativa. Il mini PC funziona in modo silenzioso solo quando è inattivo e a basso carico. Sotto carico medio, siamo riusciti a raggiungere 44,7 dB(A). Nello stress test, abbiamo misurato 45,4 dB(A), il massimo con cui il piccolo computer è chiaramente udibile. Il Blackview MP200dimostra che un volume ancora più alto è possibile.
Rumorosità
| Idle |
| 26.1 / 26.1 / 26.4 dB(A) |
| Sotto carico |
| 44.7 / 45.4 dB(A) |
 | ||
30 dB silenzioso 40 dB(A) udibile 50 dB(A) rumoroso |
||
min: | ||
| Acemagic AM20 R7 7735H, Radeon 680M | Minisforum Venus Series UM790 Pro R9 7940HS, Radeon 780M | Minisforum Neptune Series NAD9 i9-12900H, Iris Xe G7 96EUs | Morefine M600, 6600U R5 6600U, Radeon 660M | Geekom AS 6, R9 6900HX R9 6900HX, Radeon 680M | Geekom Mini IT12 i7-1260P, Iris Xe G7 96EUs | Minisforum Venus Series UM560 XT R5 5600H, Vega 7 | Blackview MP200 i5-11400H, UHD Graphics Xe 16EUs | |
|---|---|---|---|---|---|---|---|---|
| Noise | -1% | -1% | 2% | -12% | -1% | -2% | -1% | |
| off /ambiente * (dB) | 25.2 | 29.7 -18% | 30.2 -20% | 29.4 -17% | 30 -19% | 29.8 -18% | 30 -19% | 25.1 -0% |
| Idle Minimum * (dB) | 26.1 | 31.7 -21% | 30.5 -17% | 29.4 -13% | 33.2 -27% | 29.9 -15% | 30.3 -16% | 25.3 3% |
| Idle Average * (dB) | 26.1 | 31.7 -21% | 30.5 -17% | 29.4 -13% | 33.6 -29% | 30.1 -15% | 30.5 -17% | 25.3 3% |
| Idle Maximum * (dB) | 26.4 | 31.7 -20% | 30.5 -16% | 29.5 -12% | 33.6 -27% | 30.2 -14% | 30.6 -16% | 25.3 4% |
| Load Average * (dB) | 44.7 | 32.8 27% | 30.5 32% | 29.6 34% | 36.8 18% | 32.1 28% | 32.5 27% | 46 -3% |
| Witcher 3 ultra * (dB) | 43.3 | 32.8 24% | ||||||
| Load Maximum * (dB) | 45.4 | 35.2 22% | 30.5 33% | 29.6 35% | 39.8 12% | 32.5 28% | 33.2 27% | 51.8 -14% |
* ... Meglio usare valori piccoli
Temperatura
Le temperature del case Acemagic AM20 non danno adito a critiche. Tuttavia, il coperchio del case si scalda più delle altre parti del case e questo è probabilmente dovuto alla dissipazione del calore dell'SSD. Chi equipaggia l'AM20 con tre unità di archiviazione di massa raggiungerà senza dubbio valori ancora più elevati. Nel test di stress con Prime95, ilAMD Ryzen 7 7735H ha raggiunto un massimo di 87 °C. Questo valore può essere considerato relativamente insignificante, anche se abbiamo osservato che il consumo energetico del SoC non ha superato i 35 watt. C'è un limite chiaramente definito, che si applica anche al multi-loop di Cinebench R15. Tuttavia, il limite delle prestazioni può essere mantenuto e anche dopo mezz'ora di carico continuo, il processore funziona a 28 watt.
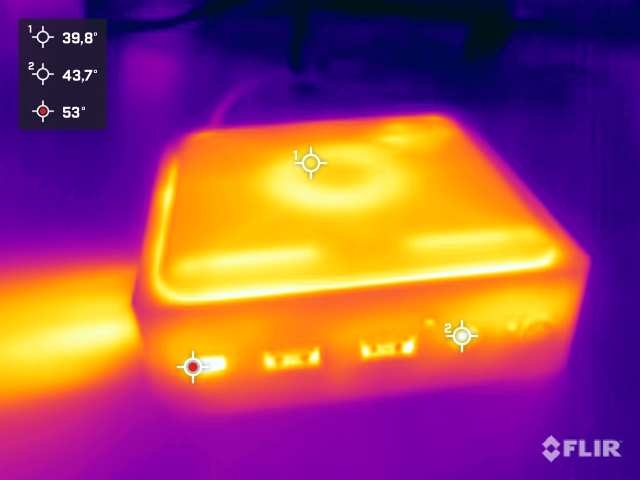
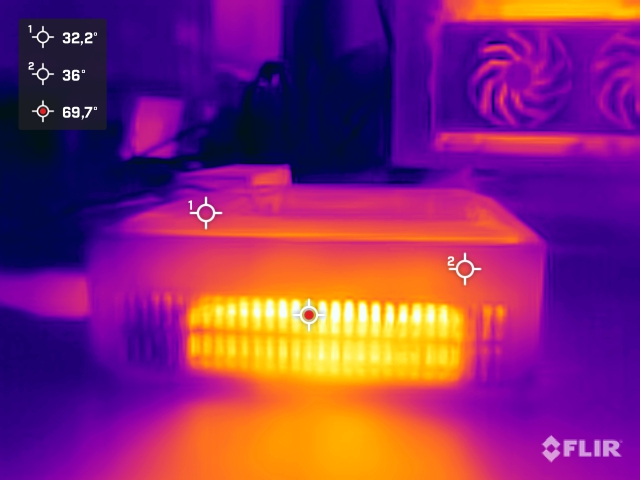
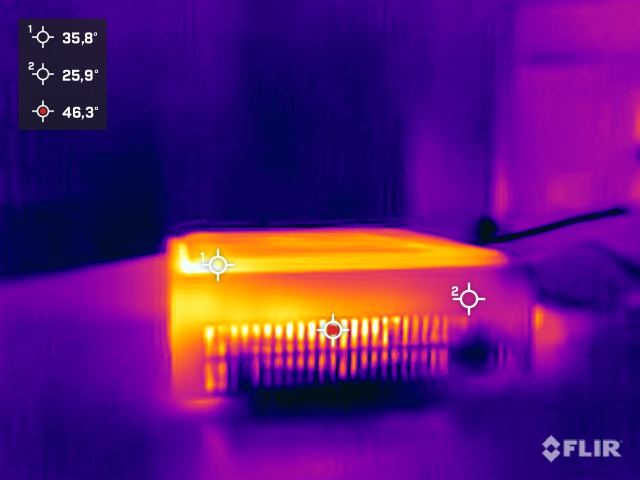
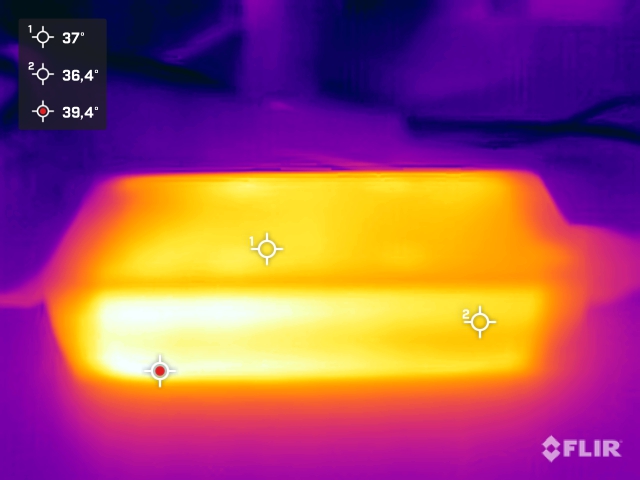
(±) La temperatura massima sul lato superiore è di 41.6 °C / 107 F, rispetto alla media di 35.4 °C / 96 F, che varia da 20.6 a 69.5 °C per questa classe Mini PC.
(+) Il lato inferiore si riscalda fino ad un massimo di 38 °C / 100 F, rispetto alla media di 36.1 °C / 97 F
(+) In idle, la temperatura media del lato superiore è di 31.7 °C / 89 F, rispetto alla media deld ispositivo di 32.1 °C / 90 F.
Consumo di energia
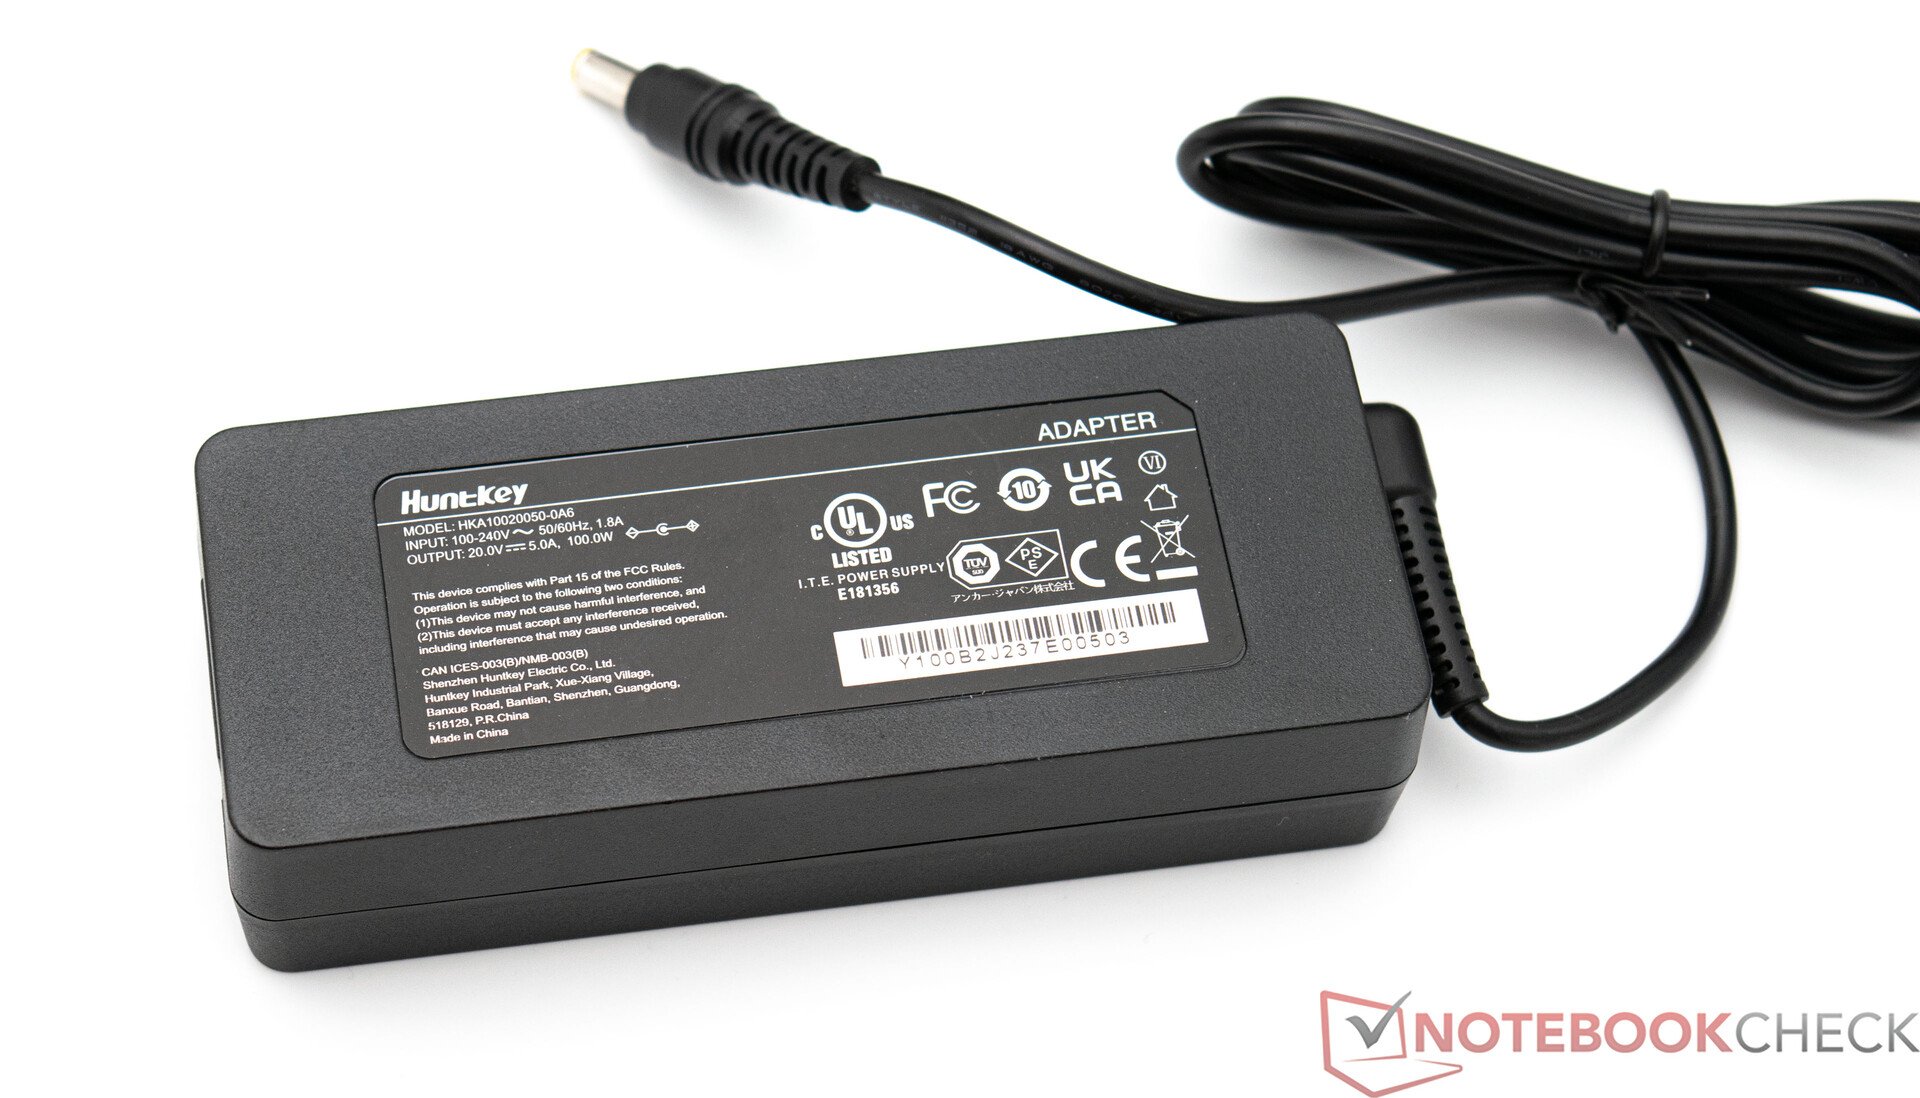
L'Acemagic AM20 è un modello estremamente economico se si considera la sua potenza. IlAMD Ryzen 7 7735H è certamente in grado di fare di più, se non fosse per le limitazioni del raffreddamento. Ciò significa che il produttore ha solo un limite di prestazioni di 35 watt, che il SoC rispetta rigorosamente. Fondamentalmente, tutto questo non è un problema perché a pieno carico, con quasi 65 watt, il nostro esemplare in prova è il dispositivo più economico rispetto agli altri, e con un certo margine. Questo fa sembrare l'alimentatore un po' sovradimensionato, dato che può fornire un massimo di 100 watt. Tuttavia, non dobbiamo dimenticare che nell'involucro è integrata una stazione di ricarica. Questa può, tra l'altro, ricaricare gli smartphone fino a 10 watt. Inoltre, è possibile installare unità di memoria di massa aggiuntive che devono essere alimentate. Per questo motivo, accogliamo con favore la decisione di includere un'unità di alimentazione da 100 watt.
| Off / Standby | |
| Idle | |
| Sotto carico |
|
Leggenda:
min: | |
| Acemagic AM20 R7 7735H, Radeon 680M | Minisforum Venus Series UM790 Pro R9 7940HS, Radeon 780M | Minisforum Neptune Series NAD9 i9-12900H, Iris Xe G7 96EUs | Morefine M600, 6600U R5 6600U, Radeon 660M | Geekom AS 6, R9 6900HX R9 6900HX, Radeon 680M | Geekom Mini IT12 i7-1260P, Iris Xe G7 96EUs | Minisforum Venus Series UM560 XT R5 5600H, Vega 7 | Blackview MP200 i5-11400H, UHD Graphics Xe 16EUs | Media AMD Radeon 680M | Media della classe Mini PC | |
|---|---|---|---|---|---|---|---|---|---|---|
| Power Consumption | -2% | -53% | -1% | -9% | 8% | 16% | -24% | 2% | -28% | |
| Idle Minimum * (Watt) | 8.7 | 4.6 47% | 12.1 -39% | 8 8% | 6.8 22% | 5 43% | 6.6 24% | 9 -3% | 6.93 ? 20% | 8.6 ? 1% |
| Idle Average * (Watt) | 9.5 | 6 37% | 13 -37% | 8.7 8% | 9.4 1% | 7 26% | 6.8 28% | 10.6 -12% | 8.98 ? 5% | 10.7 ? -13% |
| Idle Maximum * (Watt) | 10.3 | 10.6 -3% | 18.2 -77% | 8.8 15% | 13.7 -33% | 10.7 -4% | 7.2 30% | 19.9 -93% | 10.5 ? -2% | 13.5 ? -31% |
| Load Average * (Watt) | 50.8 | 72.5 -43% | 70.6 -39% | 54.6 -7% | 45.3 11% | 50.3 1% | 45.1 11% | 30.9 39% | 53.5 ? -5% | 63.5 ? -25% |
| Load Maximum * (Watt) | 64.9 | 94.6 -46% | 113 -74% | 83.2 -28% | 94.8 -46% | 82 -26% | 73.4 -13% | 97.8 -51% | 70.5 ? -9% | 110.7 ? -71% |
| Cyberpunk 2077 ultra external monitor * (Watt) | 95.7 | |||||||||
| Witcher 3 ultra * (Watt) | 44.8 |
* ... Meglio usare valori piccoli
Power consumption with an external monitor
Pro
Contro
Verdetto - Un mini PC con stazione di ricarica

Acemagic AM20 ha adottato un buon approccio per distinguersi dalla massa dei mini PC. Acemagic è attualmente uno dei pochi produttori che offre la possibilità di ricaricare in modalità wireless uno smartphone posizionandolo sopra il dispositivo. Pertanto, in combinazione con le sue dimensioni, l'AM20 ha anche un punto di vendita unico. Come limitazione, tuttavia, dovrete accontentarvi delle basse prestazioni di ricarica, pari a soli 10 watt.
La qualità costruttiva è impeccabile, anche se l'uso del metallo è stato ampiamente evitato. Dal punto di vista delle prestazioni, il SoC AMD Ryzen 7 7735H è solido. Sebbene il SoC faccia parte della serie 7000, non si tratta di un SoC con core di calcolo Zen 4, ma piuttosto di un processore basato su Zen 3. Ciononostante, l'AMD Ryzen 7 7735H offre prestazioni solide. Il grande vantaggio di questo SoC AMD si nota nell'area delle prestazioni 3D. L'AMD Radeon 680M è chiaramente superiore all'Intel, rendendo possibili anche piccole sessioni di gioco con l'Acemagic AM20.
L'Acemagic AM20 è un mini PC potente ed economico e, con i suoi 8 core e 16 thread, anche le attività multi-threading non sono un problema.
Vale la pena sottolineare la buona selezione di interfacce con due porte di rete e la porta Thunderbolt. Ciò consente di espandere il dispositivo in modo ragionevole, poiché è possibile utilizzare anche schede grafiche esterne. Per quanto riguarda la scelta del modulo WiF, ne avremmo preferito uno più moderno. I livelli di rumore del dispositivo sotto carico si rivelano uno svantaggio. A causa delle sue dimensioni ridotte, Acemagic non ha molto spazio per altri componenti, quindi è stato necessario scendere a compromessi in quest'area.
Prezzo e disponibilità
Der Acemagic AM20 può essere ordinato direttamente tramite il negozio online del produttore al prezzo di 569 dollari USA. Tuttavia, questa offerta è valida solo per gli Stati Uniti e il Regno Unito. Al momento, l'azienda non ha in programma di coprire la regione di lingua tedesca.
Acemagic AM20
- 02/27/2024 v7 (old)
Sebastian Bade
Transparency
La selezione dei dispositivi da recensire viene effettuata dalla nostra redazione. Il campione di prova è stato fornito gratuitamente all'autore dal produttore a scopo di revisione. Non vi è stata alcuna influenza di terze parti su questa recensione, né il produttore ne ha ricevuto una copia prima della pubblicazione. Non vi era alcun obbligo di pubblicare questa recensione. In quanto società mediatica indipendente, Notebookcheck non è soggetta all'autorità di produttori, rivenditori o editori.
Ecco come Notebookcheck esegue i test
Ogni anno, Notebookcheck esamina in modo indipendente centinaia di laptop e smartphone utilizzando procedure standardizzate per garantire che tutti i risultati siano comparabili. Da circa 20 anni sviluppiamo continuamente i nostri metodi di prova e nel frattempo stabiliamo gli standard di settore. Nei nostri laboratori di prova, tecnici ed editori esperti utilizzano apparecchiature di misurazione di alta qualità. Questi test comportano un processo di validazione in più fasi. Il nostro complesso sistema di valutazione si basa su centinaia di misurazioni e parametri di riferimento ben fondati, che mantengono l'obiettività.
