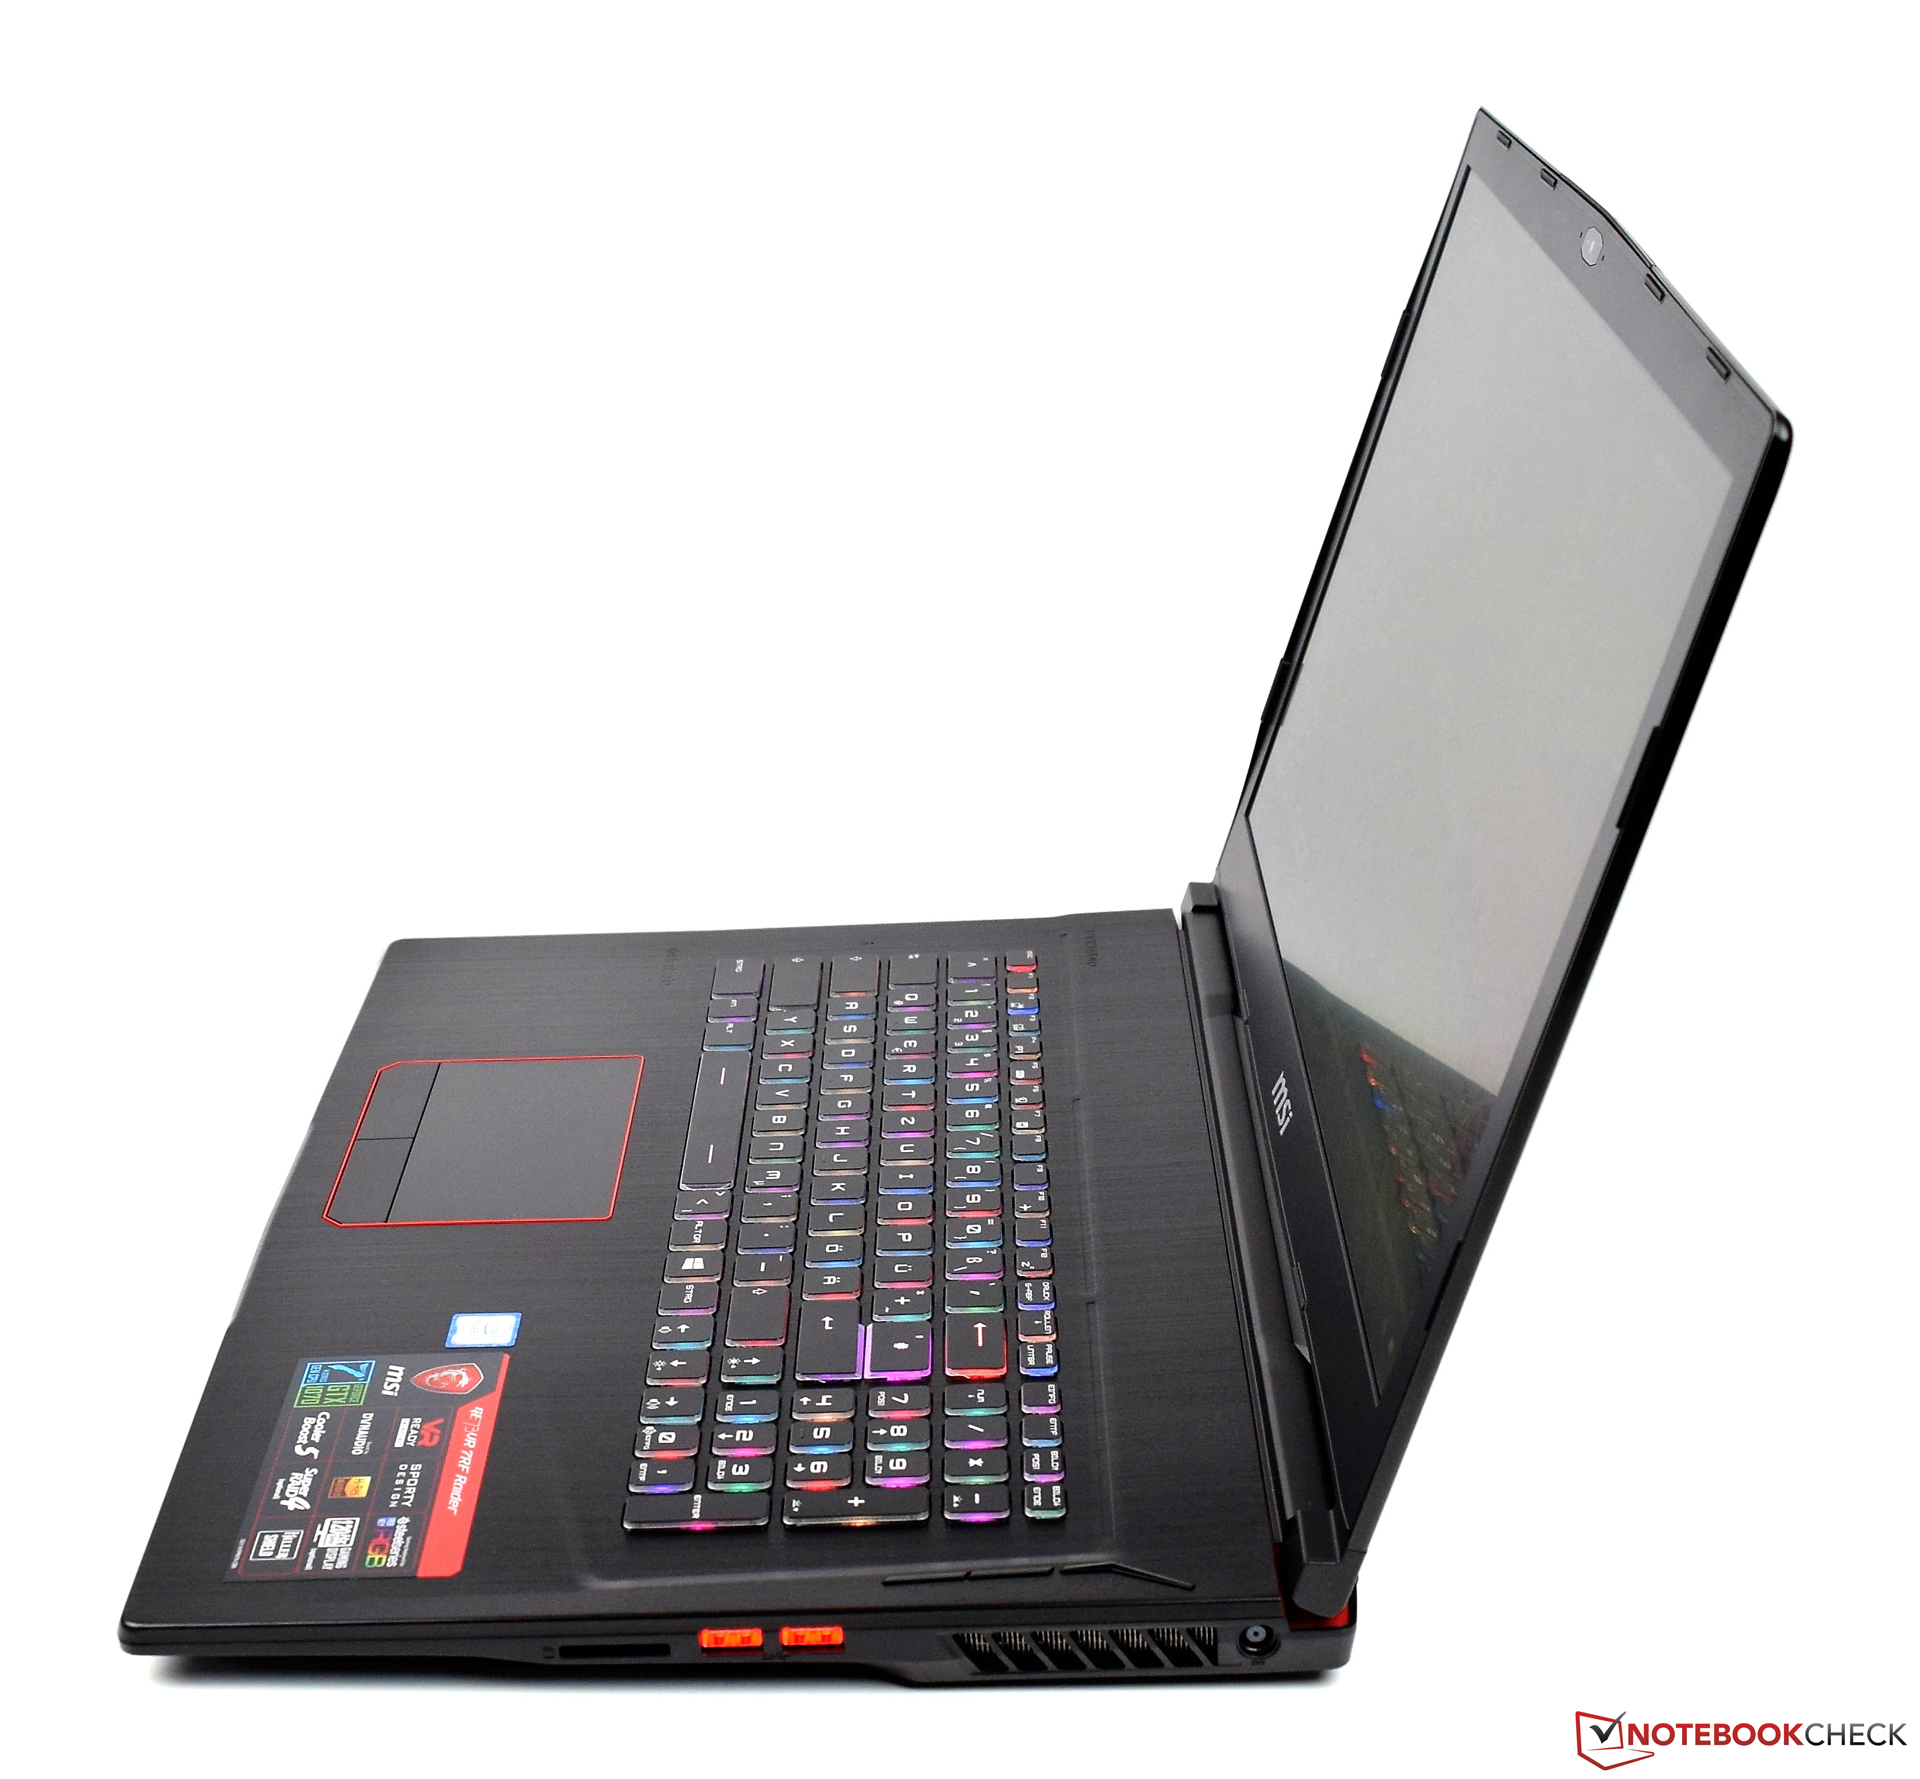
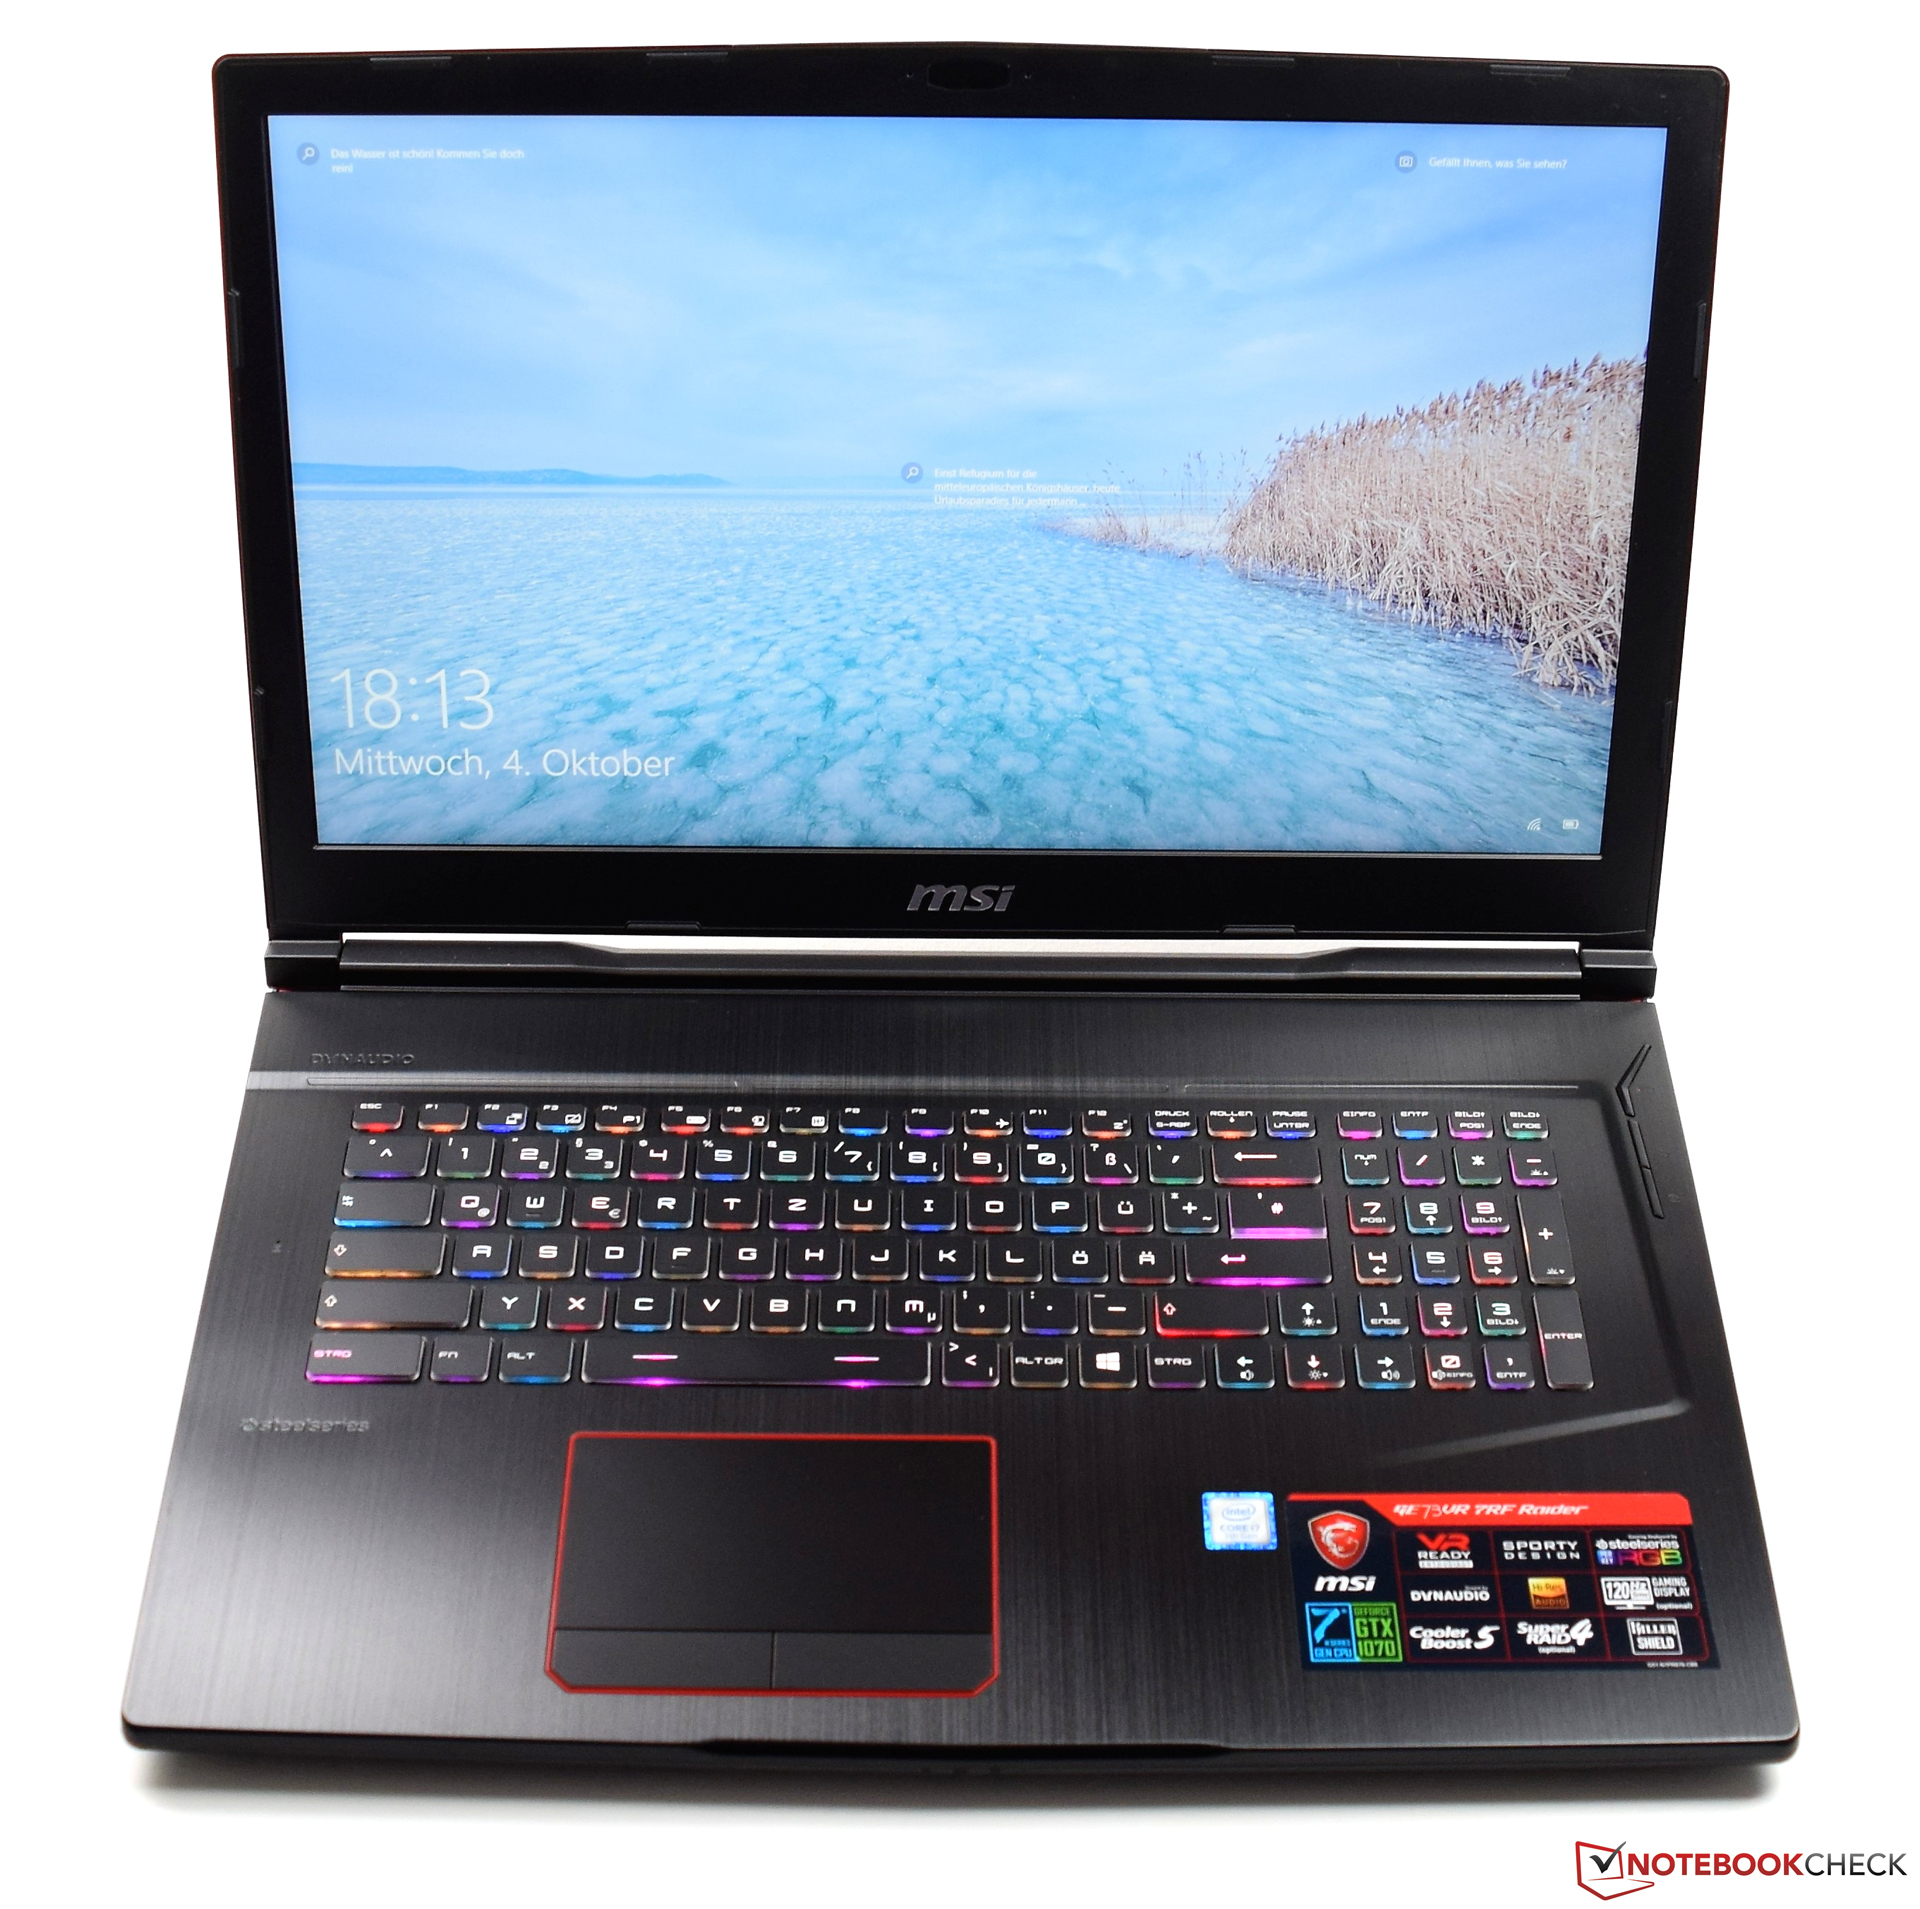
Recensione breve del Portatile MSI GE73VR 7RF Raider (i7-7700HQ, GTX 1070, Full HD)

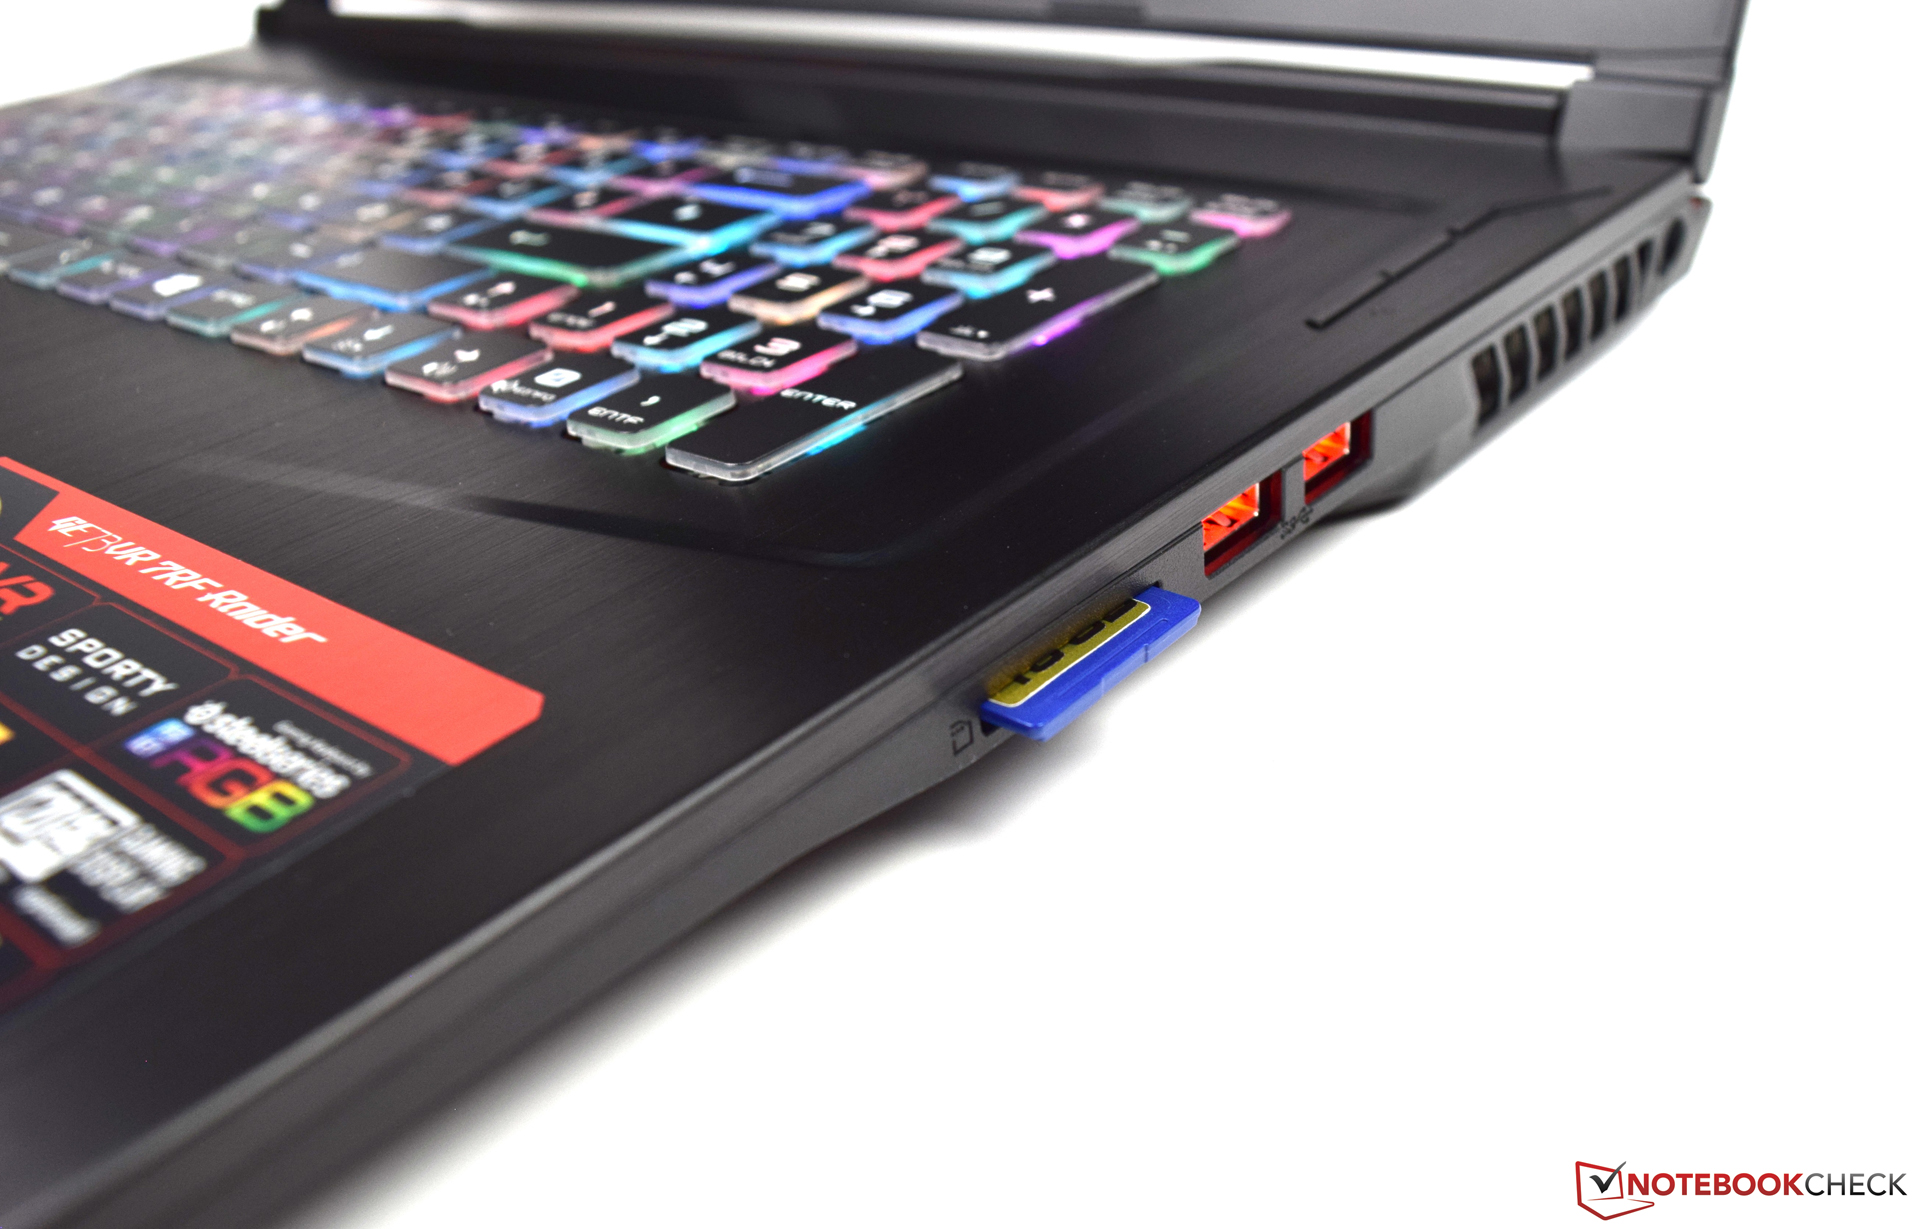
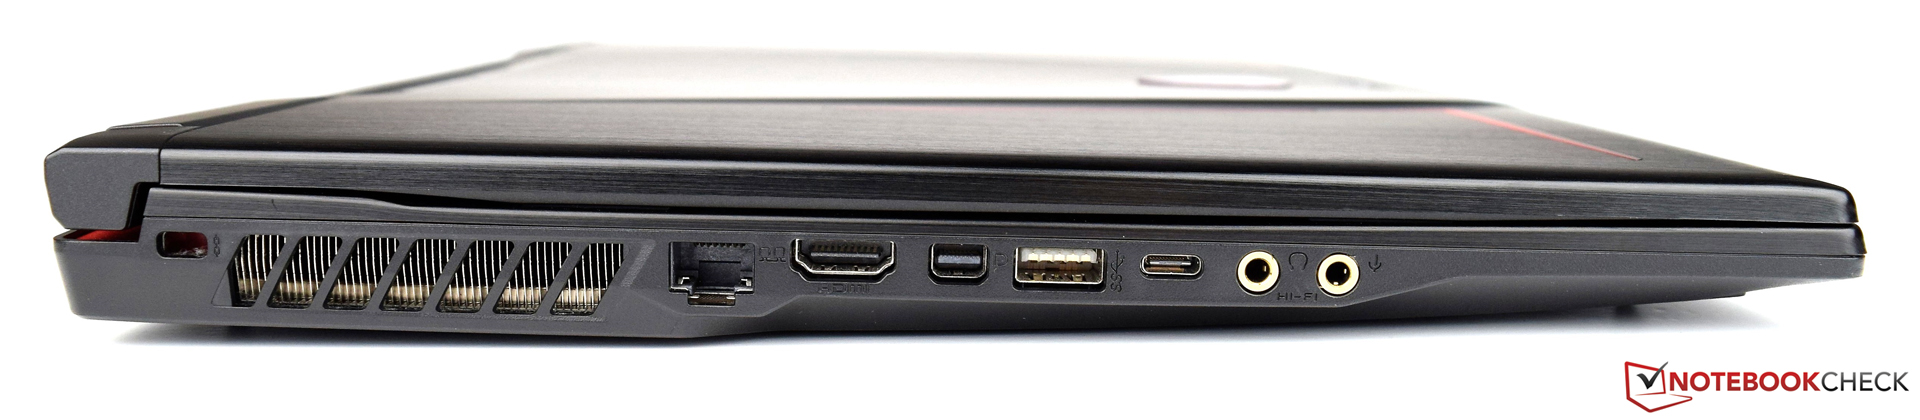
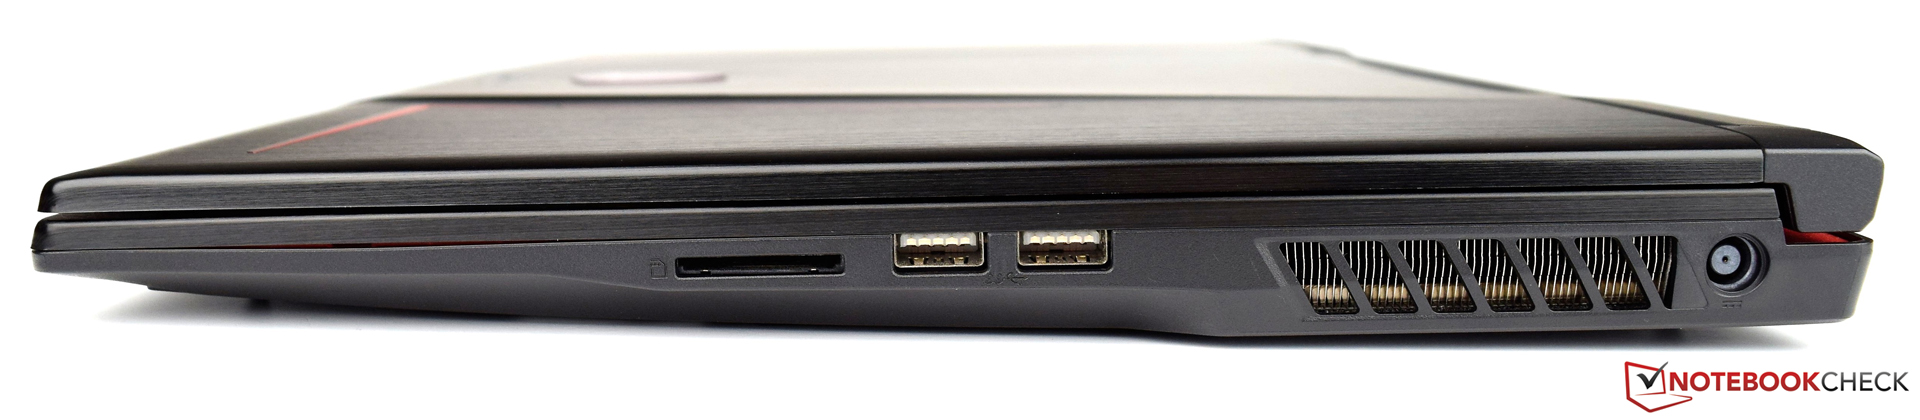
| SD Card Reader | |
| average JPG Copy Test (av. of 3 runs) | |
| MSI GE73VR 7RF Raider (Toshiba Exceria Pro SDXC 64 GB UHS-II) | |
| MSI GT72VR 7RE-433 (Toshiba Exceria Pro SDXC 64 GB UHS-II) | |
| Acer Predator 17 G9-793-70PJ (Toshiba Exceria Pro SDXC 64 GB UHS-II) | |
| Gigabyte P57X v7 (Toshiba Exceria Pro SDXC 64 GB UHS-II) | |
| Asus G752VS-BA338T (Toshiba Exceria Pro SDXC 64 GB UHS-II) | |
| HP Omen 17-an014ng (Toshiba Exceria Pro SDXC 64 GB UHS-II) | |
| maximum AS SSD Seq Read Test (1GB) | |
| MSI GT72VR 7RE-433 (Toshiba Exceria Pro SDXC 64 GB UHS-II) | |
| MSI GE73VR 7RF Raider (Toshiba Exceria Pro SDXC 64 GB UHS-II) | |
| Gigabyte P57X v7 (Toshiba Exceria Pro SDXC 64 GB UHS-II) | |
| Acer Predator 17 G9-793-70PJ (Toshiba Exceria Pro SDXC 64 GB UHS-II) | |
| Asus G752VS-BA338T (Toshiba Exceria Pro SDXC 64 GB UHS-II) | |
| HP Omen 17-an014ng (Toshiba Exceria Pro SDXC 64 GB UHS-II) | |
| |||||||||||||||||||||||||
Distribuzione della luminosità: 90 %
Al centro con la batteria: 296 cd/m²
Contrasto: 1410:1 (Nero: 0.21 cd/m²)
ΔE ColorChecker Calman: 3.09 | ∀{0.5-29.43 Ø4.71}
ΔE Greyscale Calman: 3.06 | ∀{0.09-98 Ø4.96}
100% sRGB (Argyll 1.6.3 3D)
75% AdobeRGB 1998 (Argyll 1.6.3 3D)
84.8% AdobeRGB 1998 (Argyll 3D)
99.9% sRGB (Argyll 3D)
90.5% Display P3 (Argyll 3D)
Gamma: 2.19
CCT: 7315 K
| MSI GE73VR 7RF Raider Chi Mei N173HHE-G32 (CMN1747), 1920x1080, 17.3" | HP Omen 17-an014ng AUO149D, 1920x1080, 17.3" | Asus G752VS-BA338T AU Optronics B173HAN01.1 (AUO119D), 1920x1080, 17.3" | Gigabyte P57X v7 SHP145E, 3840x2160, 17.3" | Acer Predator 17 G9-793-70PJ AU Optronics B173ZAN01.0 (AUO109B), 3840x2160, 17.3" | MSI GT72VR 7RE-433 Chi Mei N173HHE-G32 (CMN1747), 1920x1080, 17.3" | |
|---|---|---|---|---|---|---|
| Display | -19% | -23% | 5% | 4% | -21% | |
| Display P3 Coverage (%) | 90.5 | 64.6 -29% | 61.6 -32% | 87.8 -3% | 86.4 -5% | 68.3 -25% |
| sRGB Coverage (%) | 99.9 | 92.9 -7% | 90.3 -10% | 100 0% | 99.9 0% | 86.7 -13% |
| AdobeRGB 1998 Coverage (%) | 84.8 | 66.1 -22% | 62.8 -26% | 98.9 17% | 99.1 17% | 63.4 -25% |
| Response Times | -92% | -60% | -171% | -83% | 24% | |
| Response Time Grey 50% / Grey 80% * (ms) | 28.8 ? | 45.2 ? -57% | 36 ? -25% | 55.6 ? -93% | 50 ? -74% | 29 ? -1% |
| Response Time Black / White * (ms) | 13.4 ? | 30.4 ? -127% | 26 ? -94% | 46.8 ? -249% | 25.6 ? -91% | 7 ? 48% |
| PWM Frequency (Hz) | 26000 ? | 1000 ? | ||||
| Screen | -13% | -41% | -20% | -10% | -64% | |
| Brightness middle (cd/m²) | 296 | 314 6% | 307 4% | 441.3 49% | 343 16% | 299 1% |
| Brightness (cd/m²) | 279 | 309 11% | 300 8% | 408 46% | 328 18% | 277 -1% |
| Brightness Distribution (%) | 90 | 88 -2% | 88 -2% | 86 -4% | 84 -7% | 87 -3% |
| Black Level * (cd/m²) | 0.21 | 0.34 -62% | 0.32 -52% | 0.44 -110% | 0.29 -38% | 0.27 -29% |
| Contrast (:1) | 1410 | 924 -34% | 959 -32% | 1003 -29% | 1183 -16% | 1107 -21% |
| Colorchecker dE 2000 * | 3.09 | 3.19 -3% | 5.53 -79% | 5.1 -65% | 4.01 -30% | 9.65 -212% |
| Colorchecker dE 2000 max. * | 5.97 | 6.1 -2% | 11.54 -93% | 9.8 -64% | 6.03 -1% | 15.43 -158% |
| Greyscale dE 2000 * | 3.06 | 3.49 -14% | 7 -129% | 4.3 -41% | 4.7 -54% | 9.68 -216% |
| Gamma | 2.19 100% | 2.34 94% | 2.48 89% | 2.08 106% | 2.4 92% | 1.89 116% |
| CCT | 7315 89% | 7261 90% | 8103 80% | 7345 88% | 6451 101% | 11652 56% |
| Color Space (Percent of AdobeRGB 1998) (%) | 75 | 60 -20% | 58 -23% | 87 16% | 88 17% | 75 0% |
| Color Space (Percent of sRGB) (%) | 100 | 93 -7% | 90 -10% | 100 0% | 100 0% | 100 0% |
| Media totale (Programma / Settaggio) | -41% /
-25% | -41% /
-40% | -62% /
-35% | -30% /
-17% | -20% /
-44% |
* ... Meglio usare valori piccoli
Tempi di risposta del Display
| ↔ Tempi di risposta dal Nero al Bianco | ||
|---|---|---|
| 13.4 ms ... aumenta ↗ e diminuisce ↘ combinato | ↗ 11.4 ms Incremento | 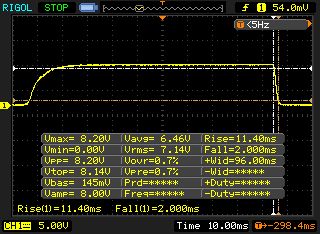 |
| ↘ 2 ms Calo | ||
| Lo schermo mostra buoni tempi di risposta durante i nostri tests, ma potrebbe essere troppo lento per i gamers competitivi. In confronto, tutti i dispositivi di test variano da 0.1 (minimo) a 240 (massimo) ms. » 34 % di tutti i dispositivi è migliore. Questo significa che i tempi di risposta rilevati sono migliori rispettto alla media di tutti i dispositivi testati (19.8 ms). | ||
| ↔ Tempo di risposta dal 50% Grigio all'80% Grigio | ||
| 28.8 ms ... aumenta ↗ e diminuisce ↘ combinato | ↗ 16.8 ms Incremento | 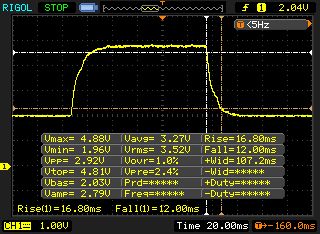 |
| ↘ 12 ms Calo | ||
| Lo schermo mostra tempi di risposta relativamente lenti nei nostri tests e potrebbe essere troppo lento per i gamers. In confronto, tutti i dispositivi di test variano da 0.165 (minimo) a 636 (massimo) ms. » 39 % di tutti i dispositivi è migliore. Questo significa che i tempi di risposta rilevati sono simili alla media di tutti i dispositivi testati (31 ms). | ||
Sfarfallio dello schermo / PWM (Pulse-Width Modulation)
| flickering dello schermo / PWM rilevato | 26000 Hz | ≤ 15 % settaggio luminosita' | 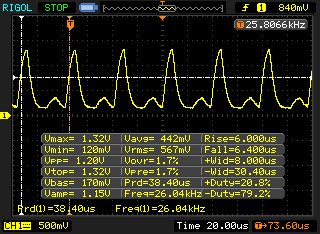 |
Il display sfarfalla a 26000 Hz (Probabilmente a causa dell'uso di PWM) Flickering rilevato ad una luminosita' di 15 % o inferiore. Non dovrebbe verificarsi flickering o PWM sopra questo valore di luminosita'. La frequenza di 26000 Hz è abbastanza alta, quindi la maggioranza degli utenti sensibili al PWM non dovrebbero notare alcun flickering. In confronto: 52 % di tutti i dispositivi testati non utilizza PWM per ridurre la luminosita' del display. Se è rilevato PWM, una media di 7757 (minimo: 5 - massimo: 343500) Hz è stata rilevata. | |||
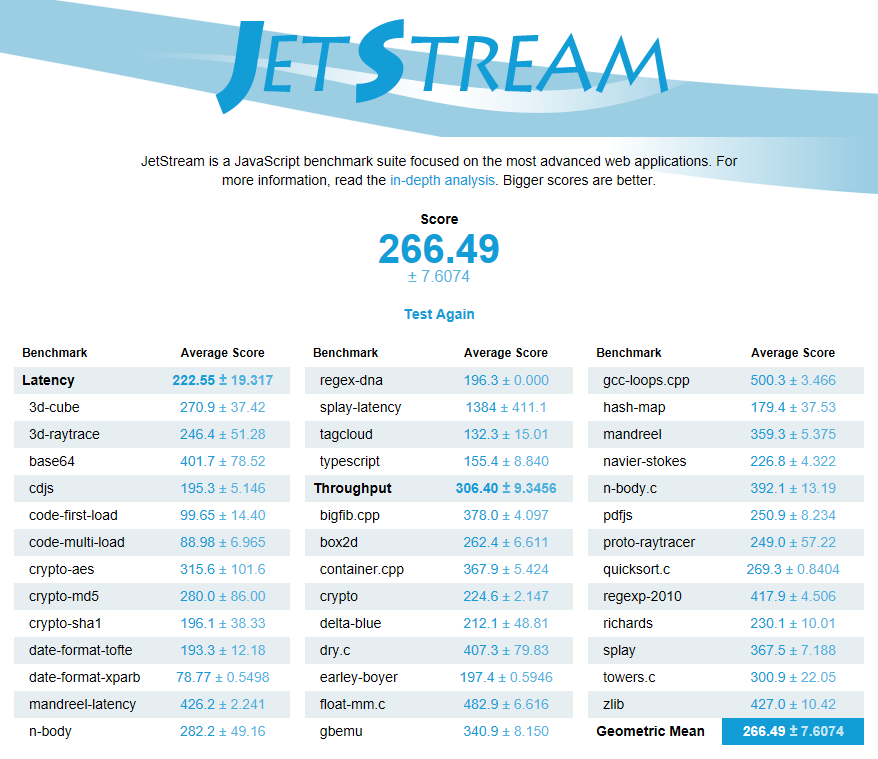
| JetStream 1.1 - 1.1 Total | |
| Asus G752VS-BA338T | |
| MSI GE73VR 7RF Raider | |
| MSI GT72VR 7RE-433 | |
| HP Omen 17-an014ng | |
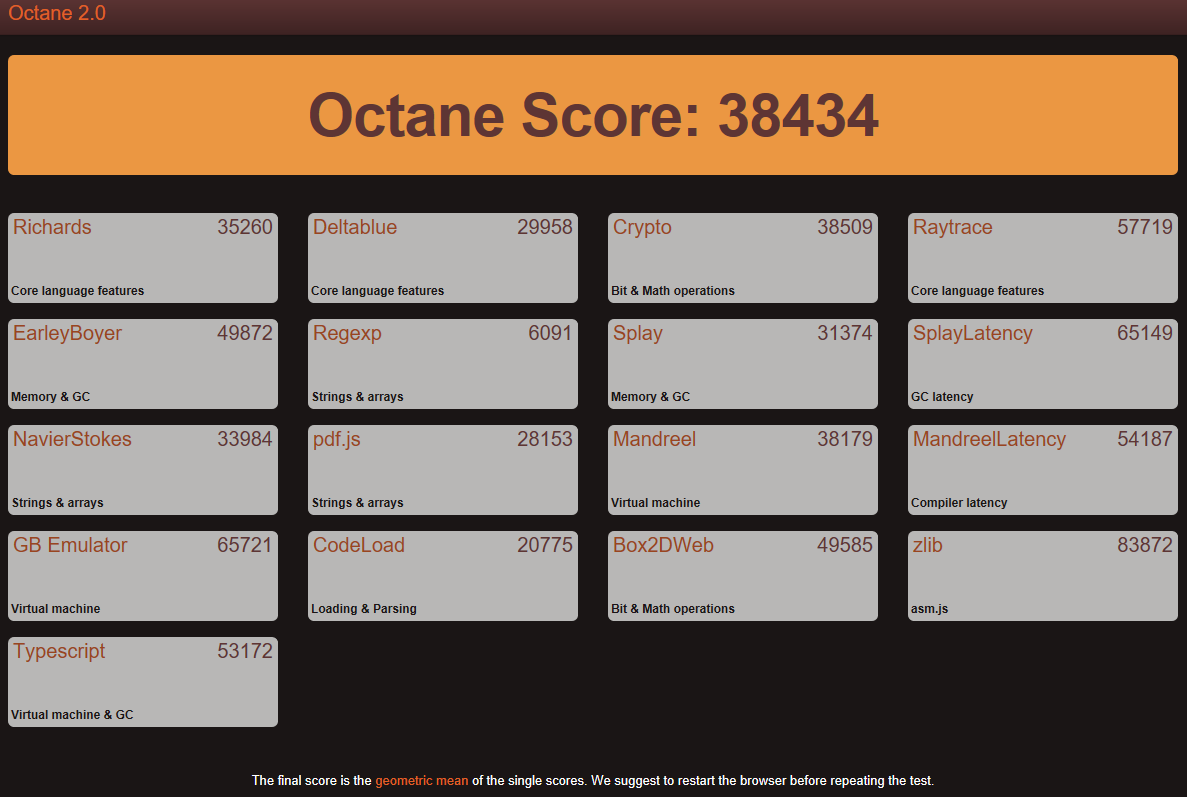
| Octane V2 - Total Score | |
| MSI GT72VR 7RE-433 | |
| MSI GE73VR 7RF Raider | |
| Asus G752VS-BA338T | |
| HP Omen 17-an014ng | |
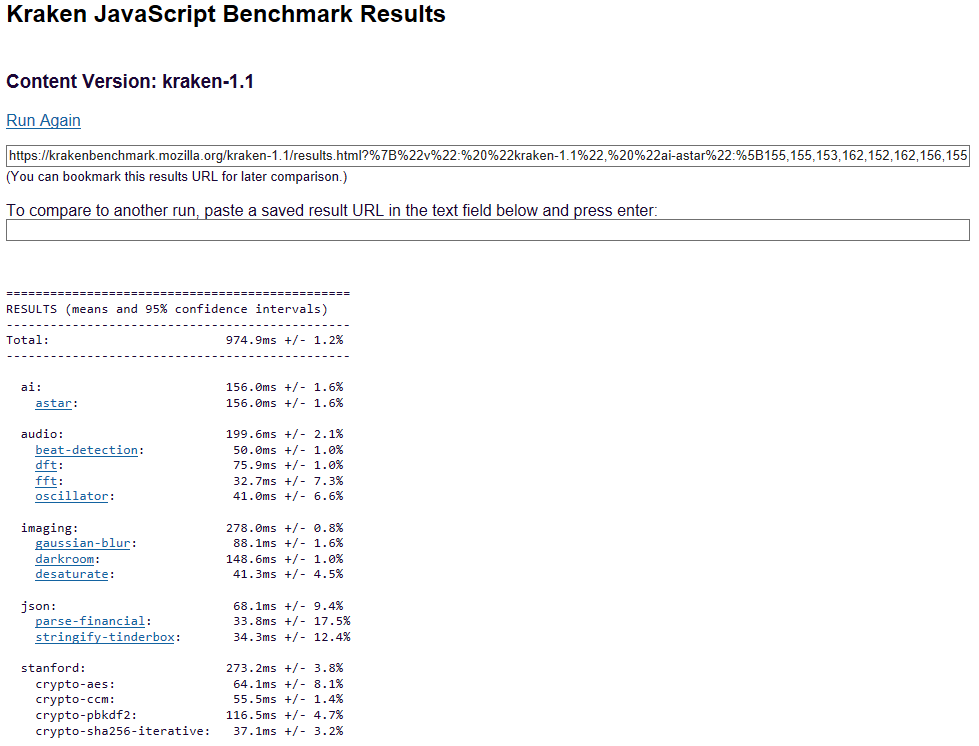
| Mozilla Kraken 1.1 - Total | |
| HP Omen 17-an014ng | |
| MSI GT72VR 7RE-433 | |
| MSI GE73VR 7RF Raider | |
| Asus G752VS-BA338T | |
* ... Meglio usare valori piccoli
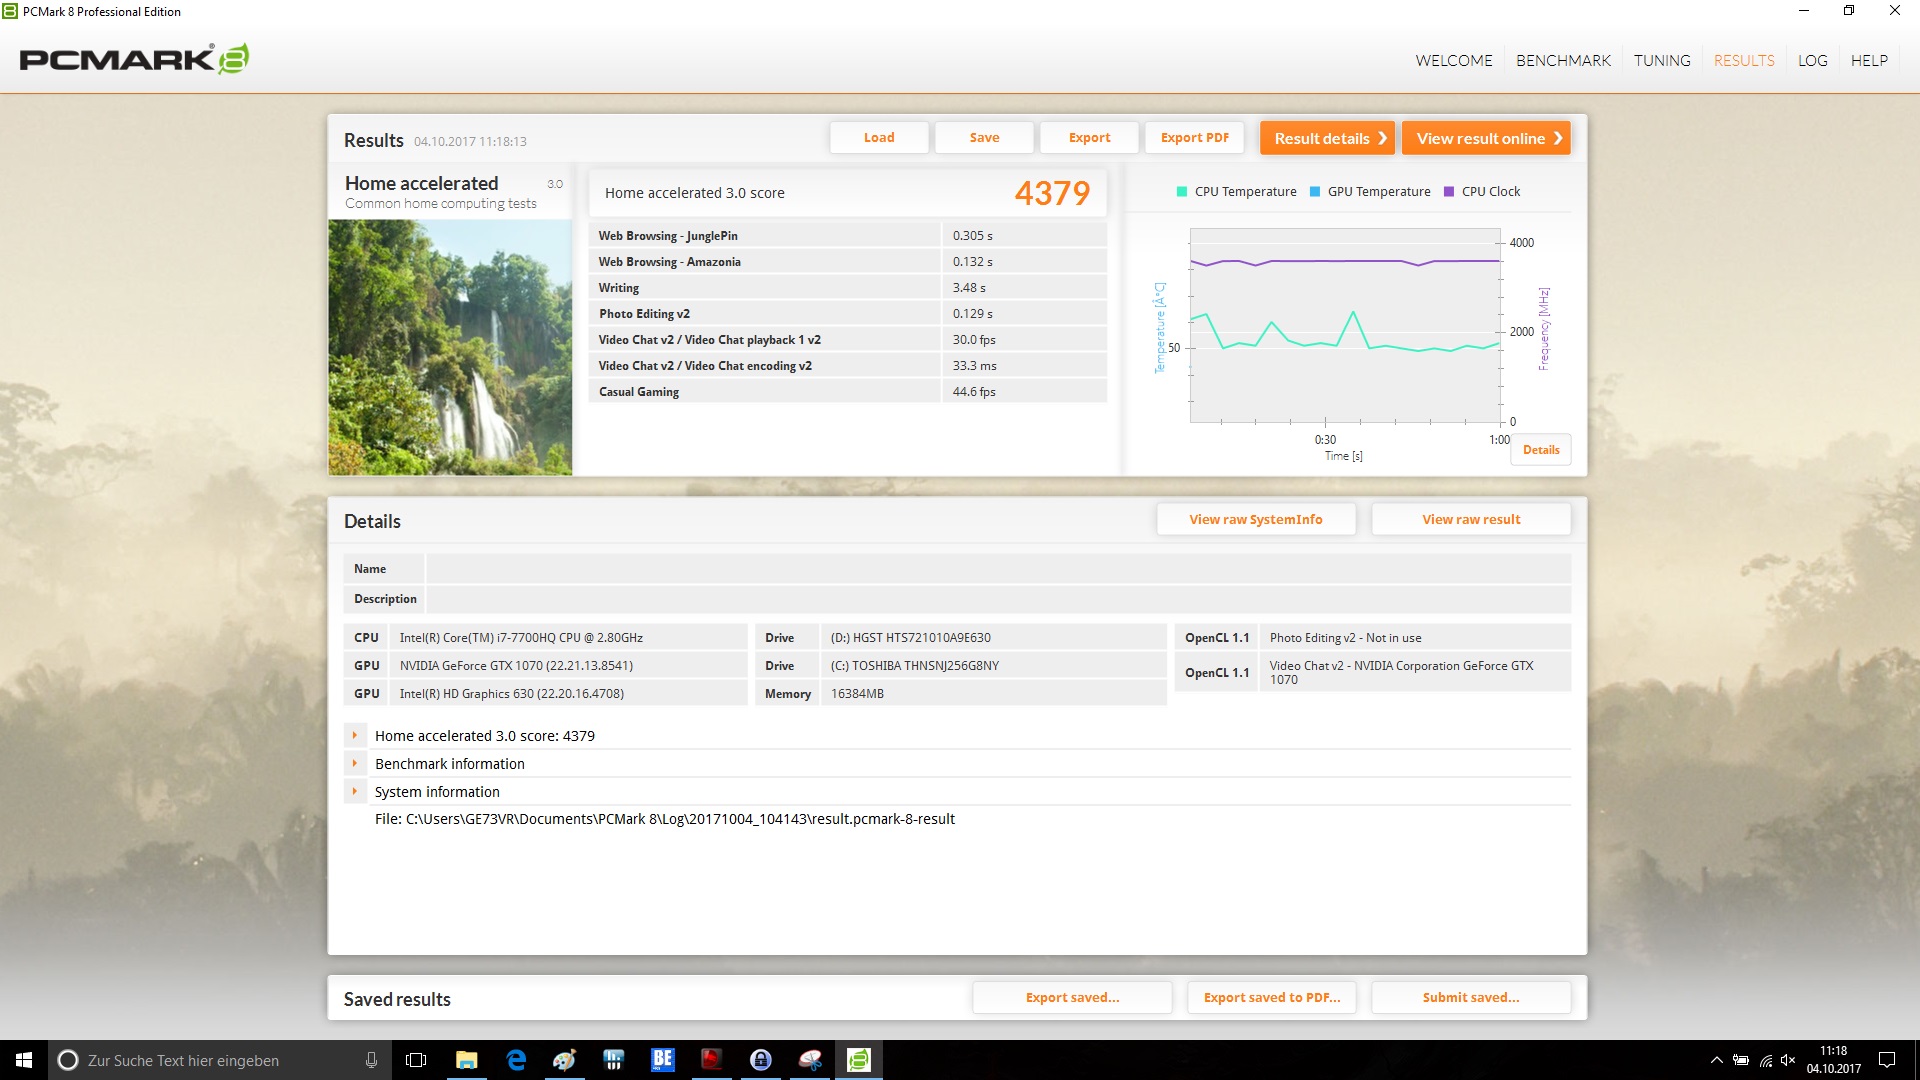
| PCMark 8 | |
| Home Score Accelerated v2 | |
| Asus G752VS-BA338T | |
| MSI GT72VR 7RE-433 | |
| HP Omen 17-an014ng | |
| Acer Predator 17 G9-793-70PJ | |
| MSI GE73VR 7RF Raider | |
| Gigabyte P57X v7 | |
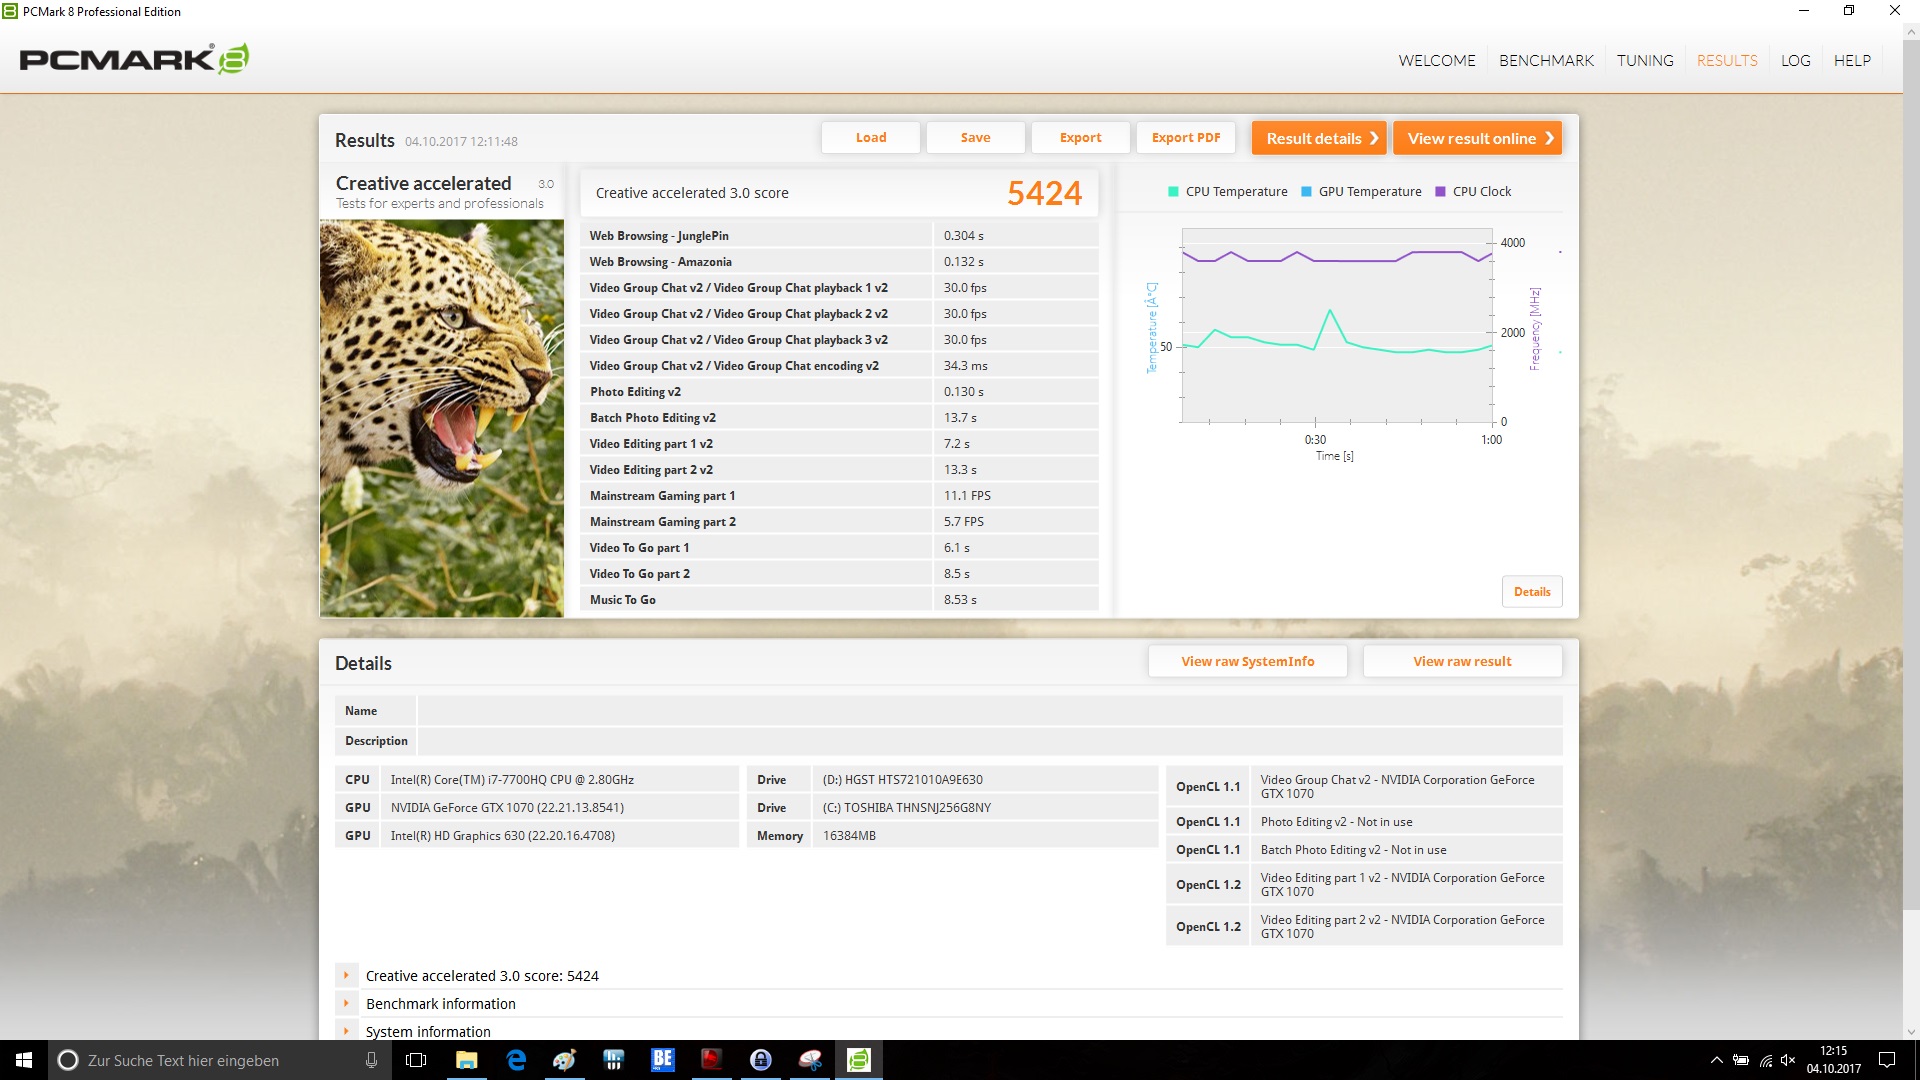
| Creative Score Accelerated v2 | |
| Asus G752VS-BA338T | |
| MSI GT72VR 7RE-433 | |
| MSI GE73VR 7RF Raider | |
| Gigabyte P57X v7 | |
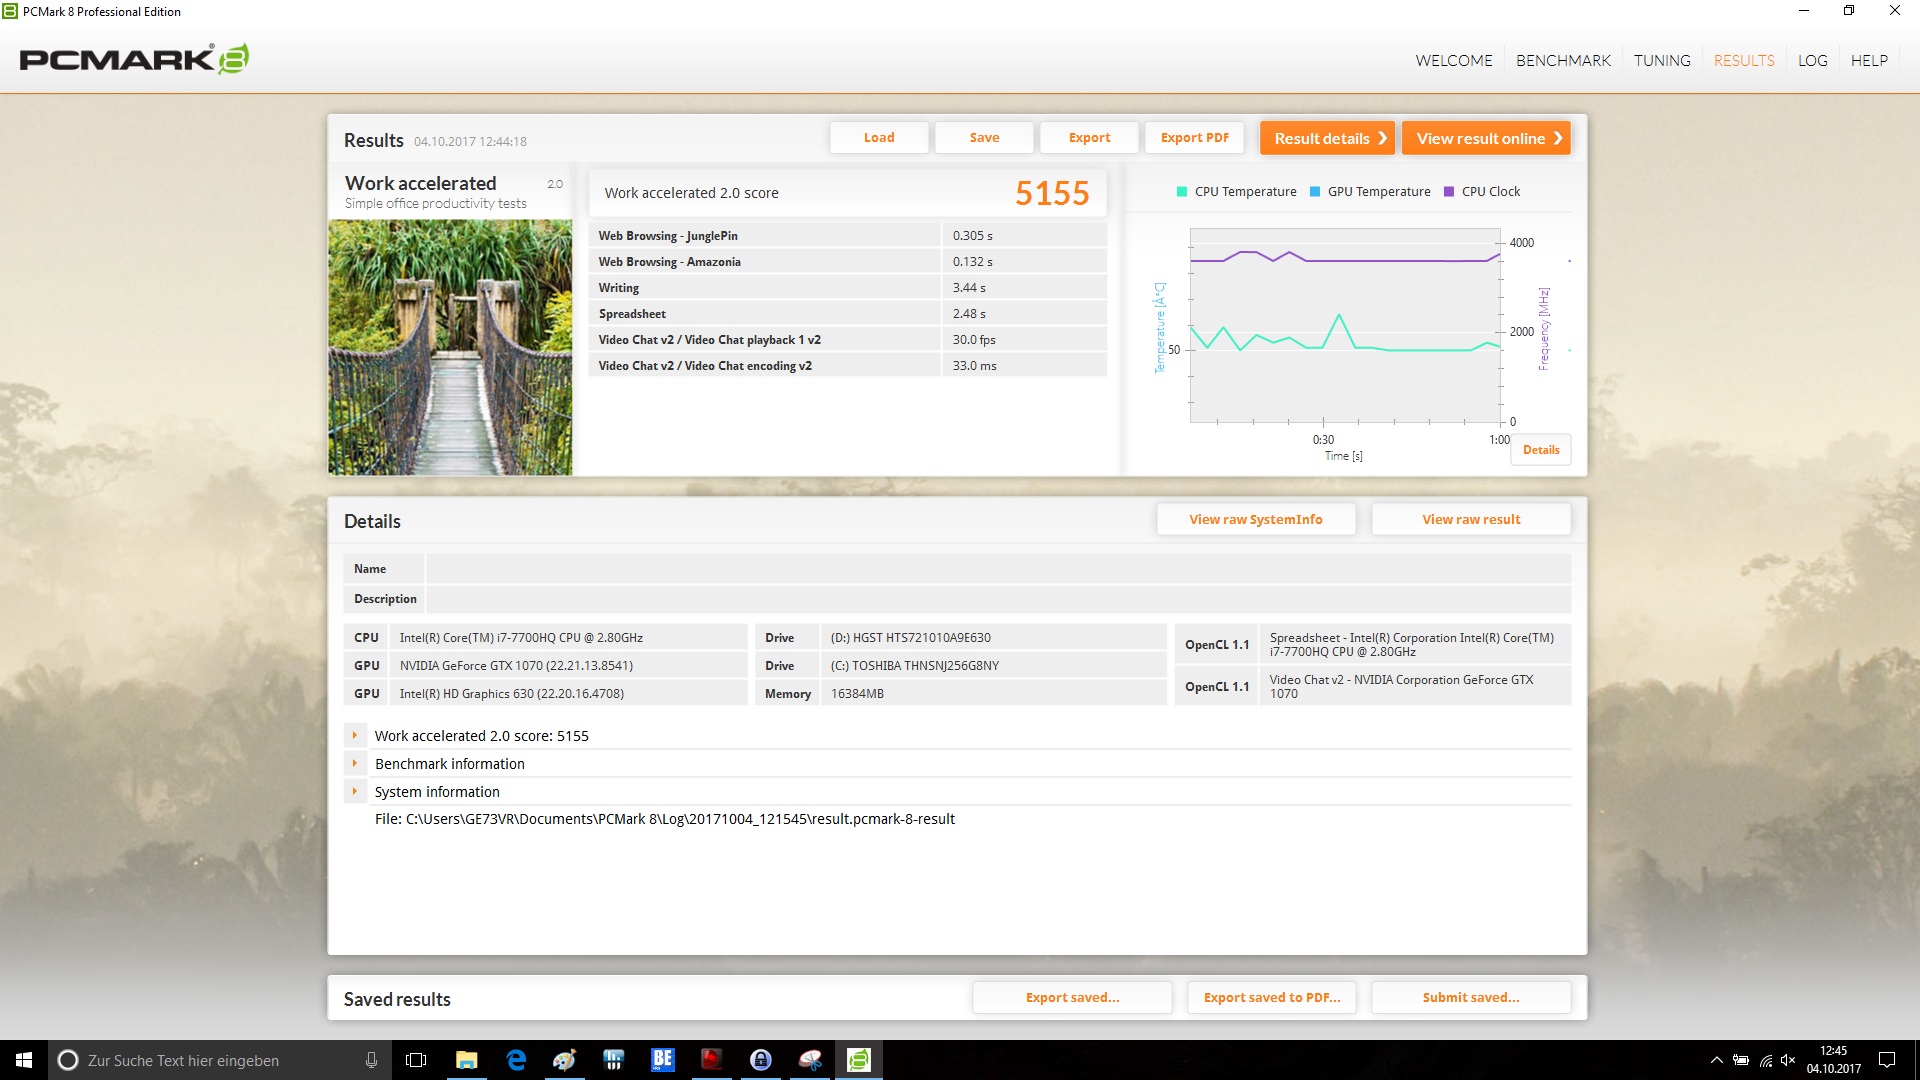
| Work Score Accelerated v2 | |
| Asus G752VS-BA338T | |
| MSI GT72VR 7RE-433 | |
| HP Omen 17-an014ng | |
| MSI GE73VR 7RF Raider | |
| Acer Predator 17 G9-793-70PJ | |
| Gigabyte P57X v7 | |
| PCMark 10 - Score | |
| HP Omen 17-an014ng | |
| MSI GE73VR 7RF Raider | |
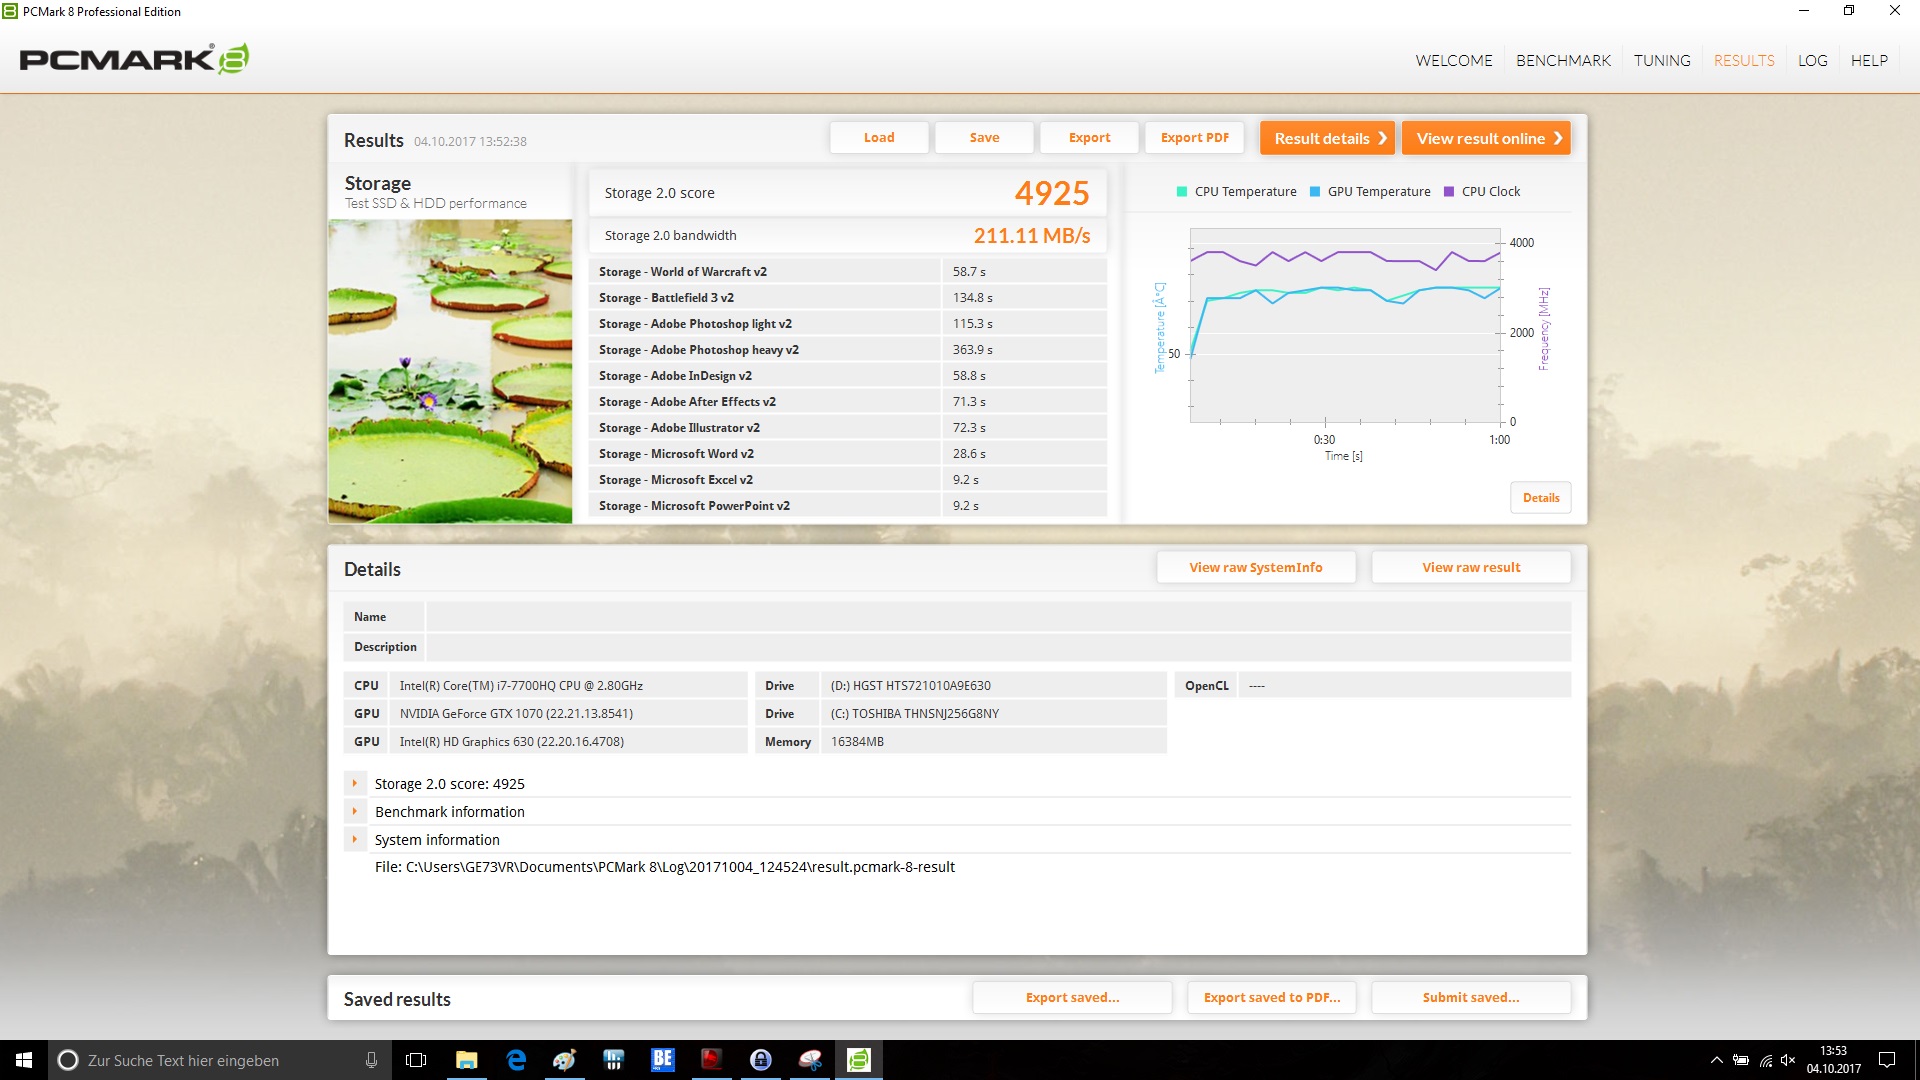
| PCMark 8 Home Score Accelerated v2 | 4379 punti | |
| PCMark 8 Creative Score Accelerated v2 | 5424 punti | |
| PCMark 8 Work Score Accelerated v2 | 5155 punti | |
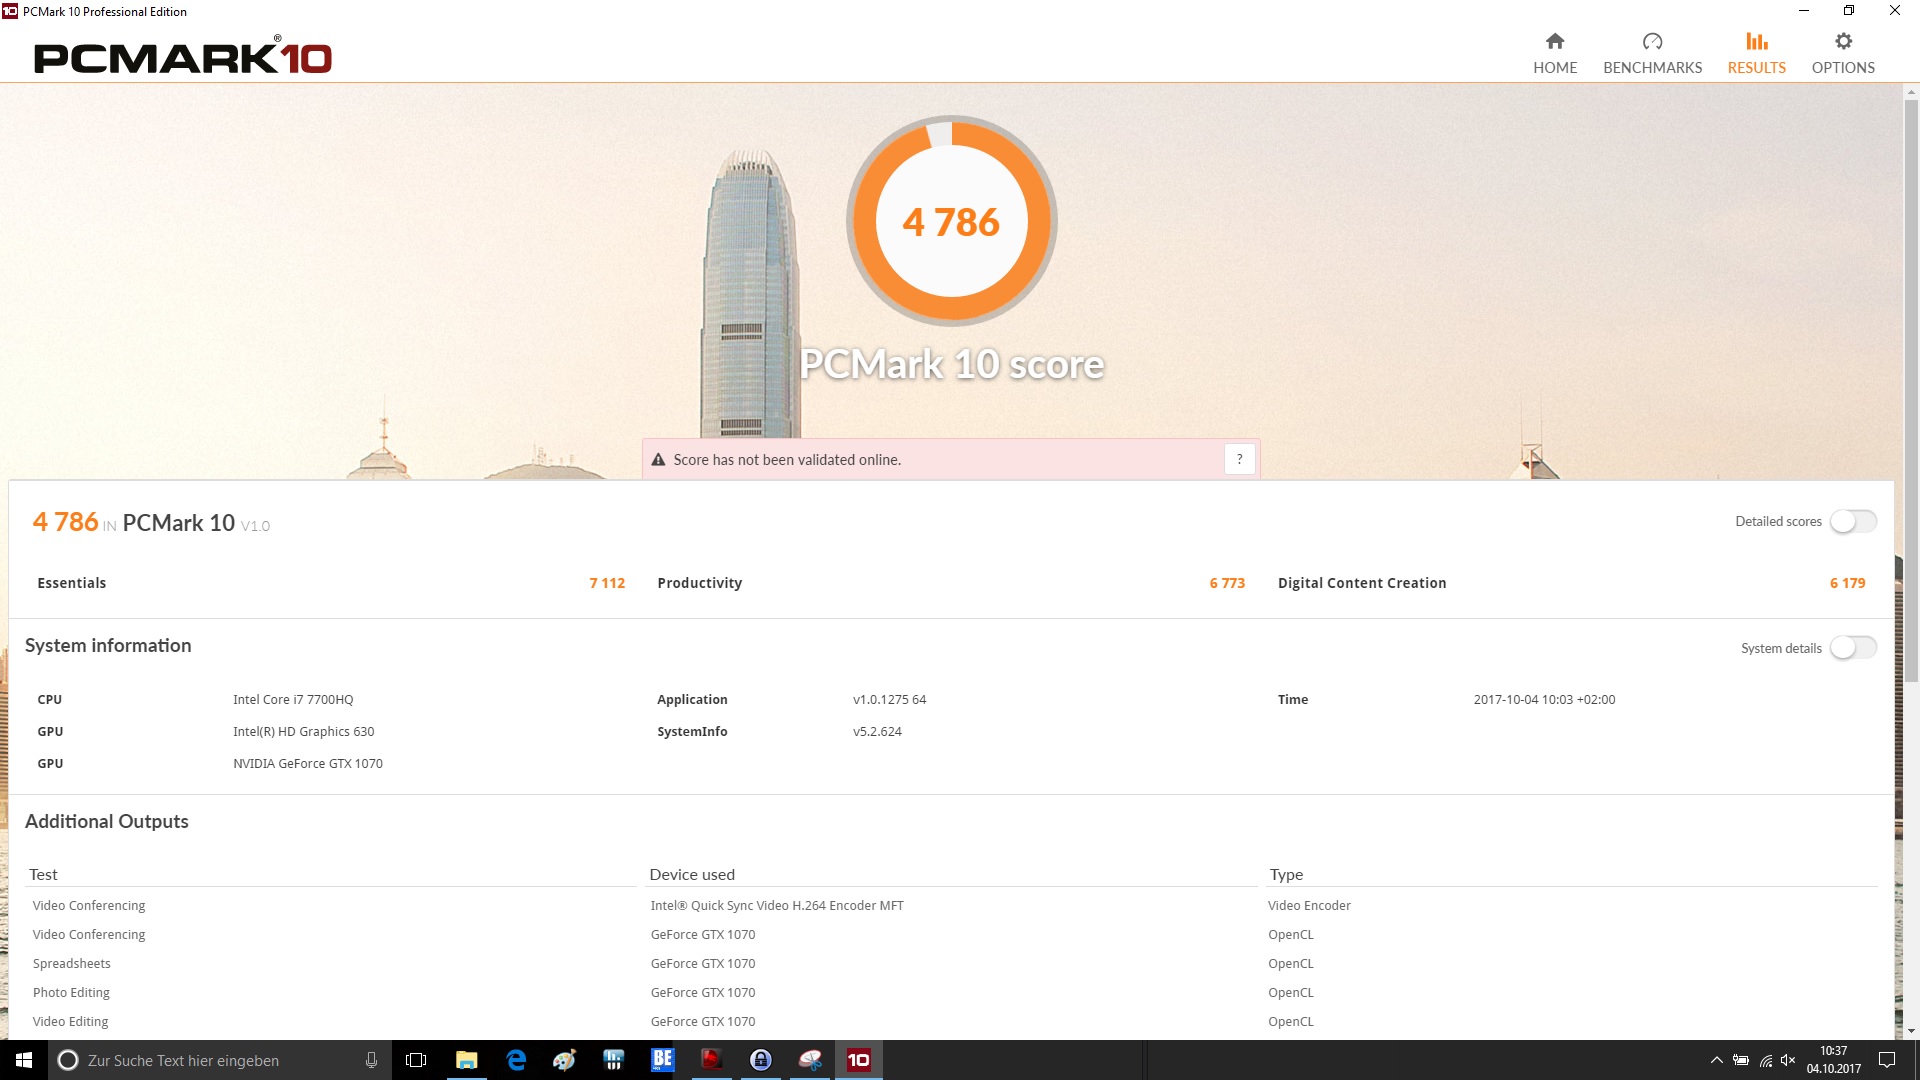
| PCMark 10 Score | 4786 punti | |
Aiuto | ||
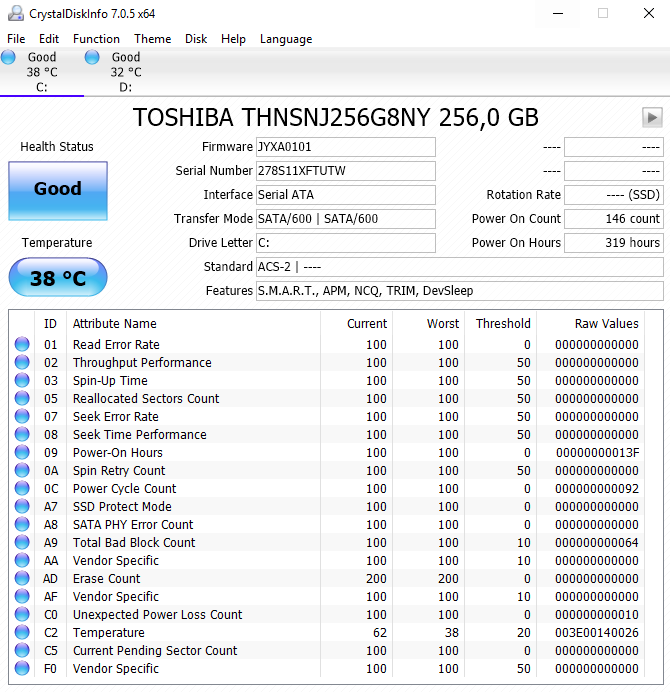
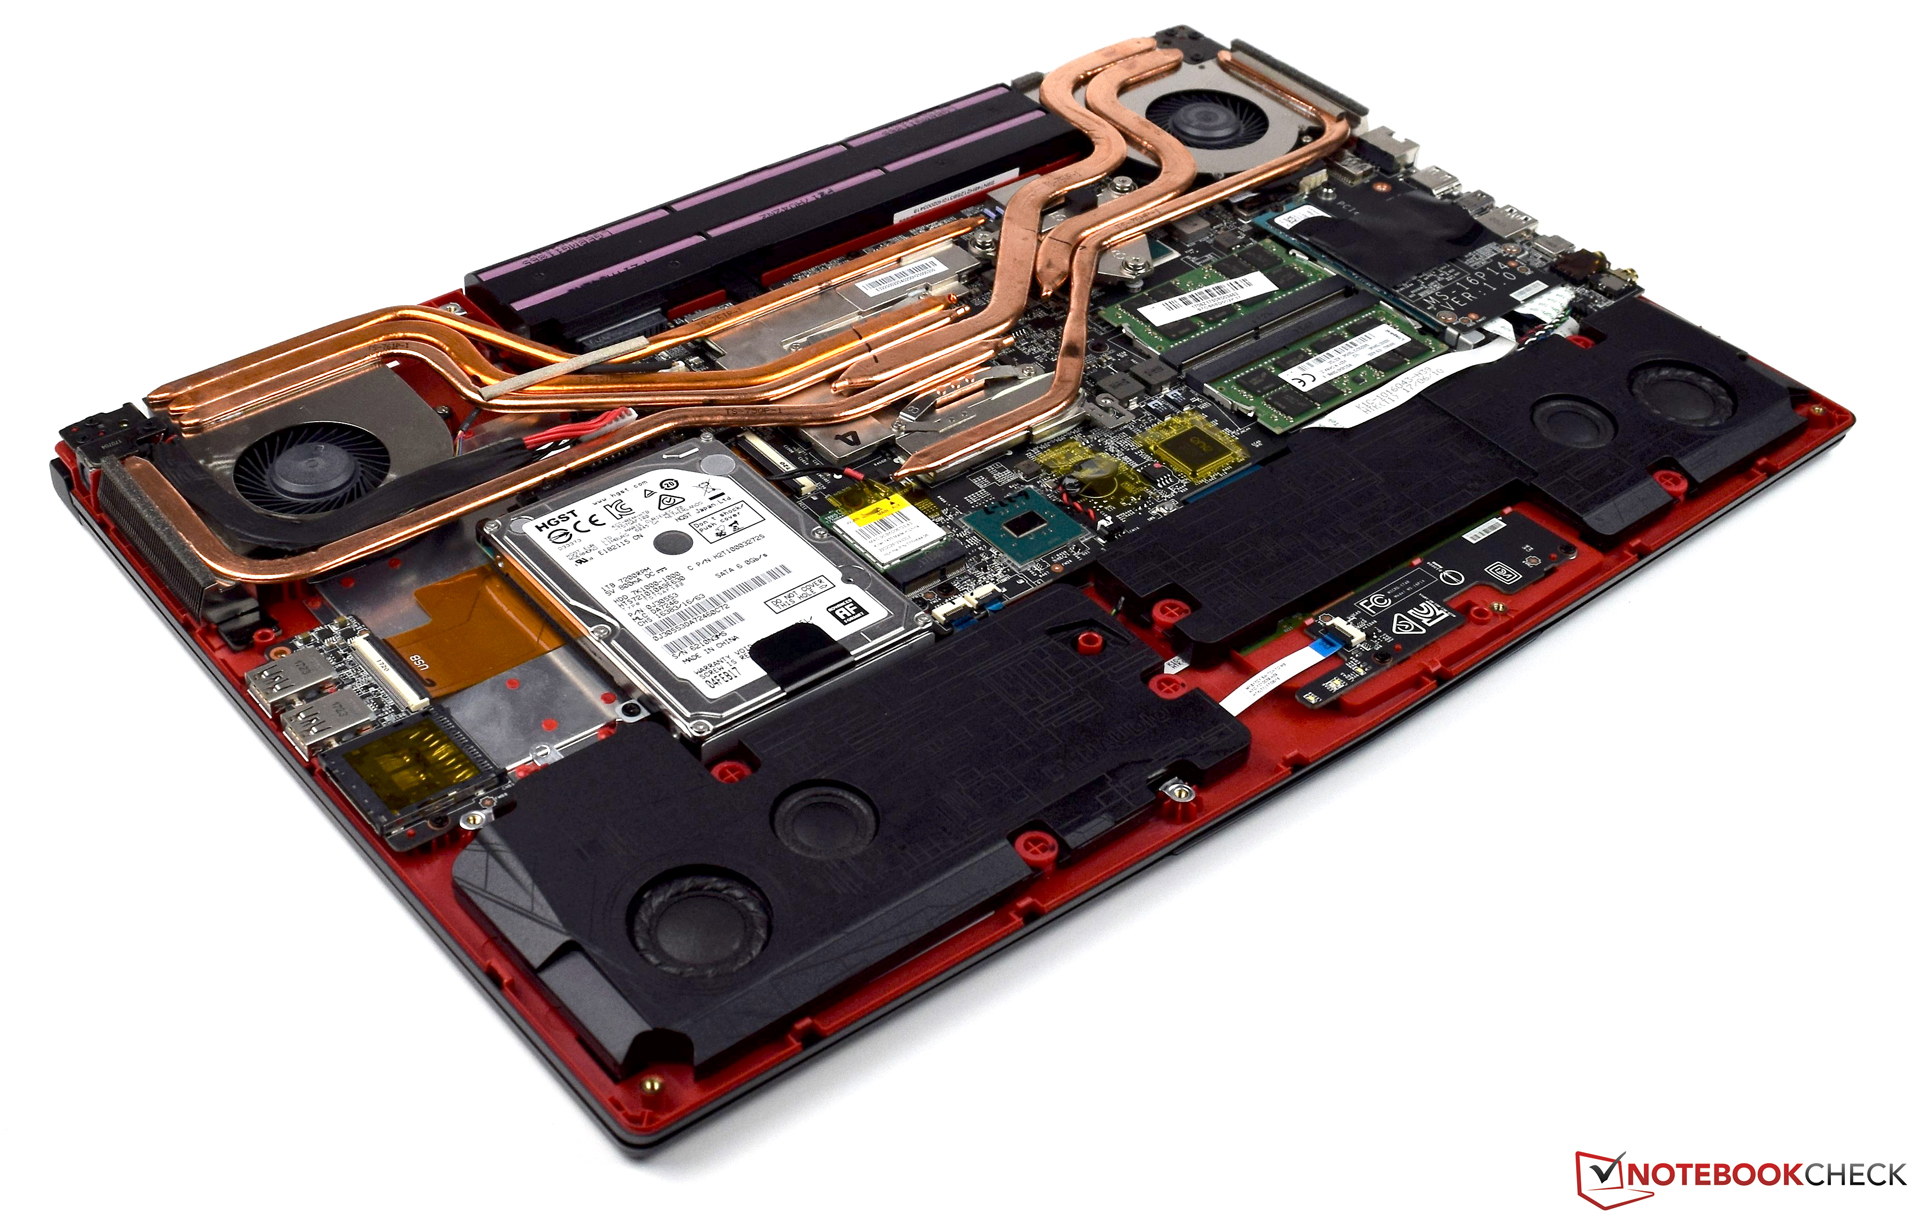
| MSI GE73VR 7RF Raider Toshiba HG6 THNSNJ256G8NY | HP Omen 17-an014ng Samsung PM961 MZVLW256HEHP | Asus G752VS-BA338T Samsung SM961 MZVKW512HMJP m.2 PCI-e | Gigabyte P57X v7 Transcend MTS800 256GB M.2 (TS256GMTS800) | Acer Predator 17 G9-793-70PJ Toshiba NVMe THNSN5512GPU7 | MSI GT72VR 7RE-433 Kingston RBU-SNS8152S3256GG5 | |
|---|---|---|---|---|---|---|
| AS SSD | -344% | 257% | 2% | 171% | 44% | |
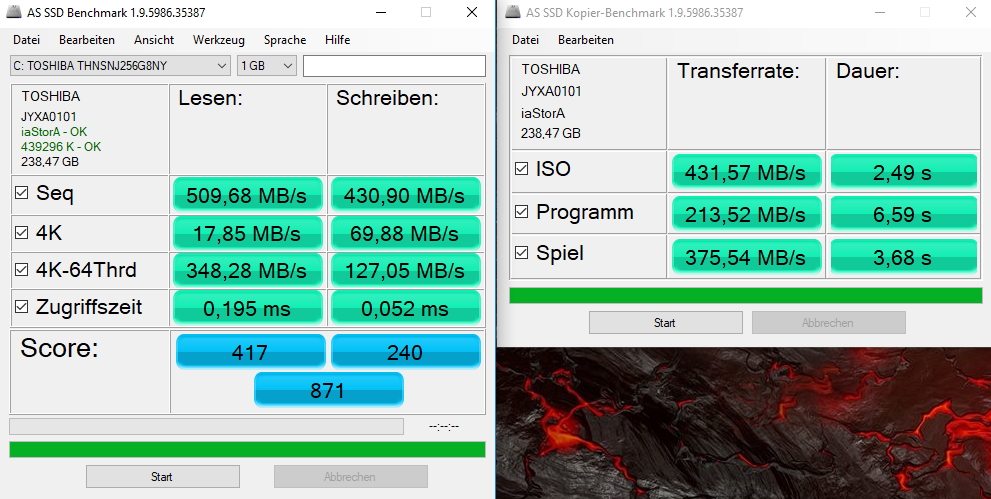
| Seq Read (MB/s) | 510 | 2374 365% | 2824 454% | 491.9 -4% | 2237 339% | 509 0% |
| Seq Write (MB/s) | 430.9 | 365.5 -15% | 1554 261% | 260.9 -39% | 1230 185% | 282.1 -35% |
| 4K Read (MB/s) | 17.85 | 47.62 167% | 49.71 178% | 23.65 32% | 37.51 110% | 40.04 124% |
| 4K Write (MB/s) | 69.9 | 1.26 -98% | 138.9 99% | 72 3% | 120.8 73% | 95.8 37% |
| 4K-64 Read (MB/s) | 348.3 | 1129 224% | 744 114% | 241.4 -31% | 851 144% | 394.5 13% |
| 4K-64 Write (MB/s) | 127.1 | 122.9 -3% | 1185 832% | 151.4 19% | 646 408% | 281.4 121% |
| Access Time Read * (ms) | 0.195 | 0.058 70% | 0.058 70% | 0.11 44% | 0.052 73% | 0.077 61% |
| Access Time Write * (ms) | 0.052 | 1.85 -3458% | 0.027 48% | 0.055 -6% | 0.033 37% | 0.035 33% |
* ... Meglio usare valori piccoli

| 3DMark | |
| 1920x1080 Fire Strike Graphics | |
| Asus G752VS-BA338T | |
| MSI GE73VR 7RF Raider | |
| MSI GT72VR 7RE-433 | |
| HP Omen 17-an014ng | |
| Gigabyte P57X v7 | |
| Acer Predator 17 G9-793-70PJ | |
| Fire Strike Extreme Graphics | |
| Asus G752VS-BA338T | |
| MSI GE73VR 7RF Raider | |
| Gigabyte P57X v7 | |
| MSI GT72VR 7RE-433 | |
| 3DMark 11 - 1280x720 Performance GPU | |
| Asus G752VS-BA338T | |
| MSI GE73VR 7RF Raider | |
| Gigabyte P57X v7 | |
| MSI GT72VR 7RE-433 | |
| Acer Predator 17 G9-793-70PJ | |
| HP Omen 17-an014ng | |
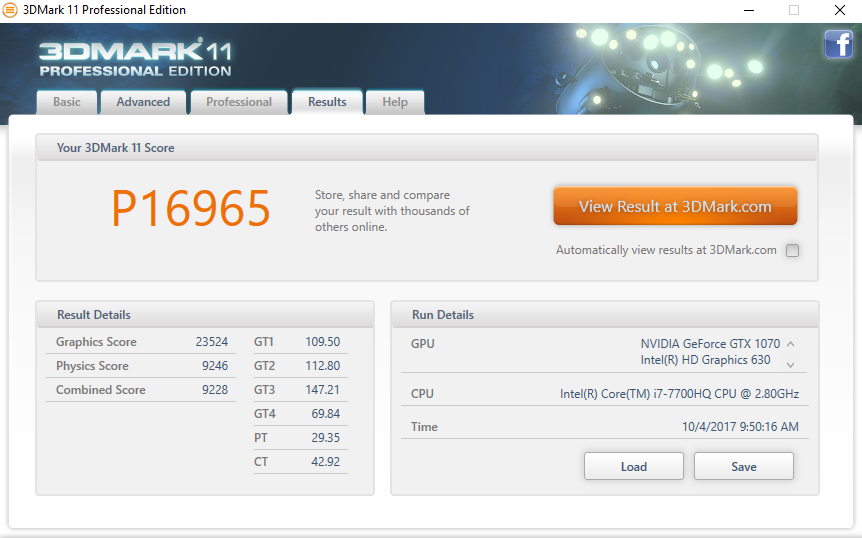
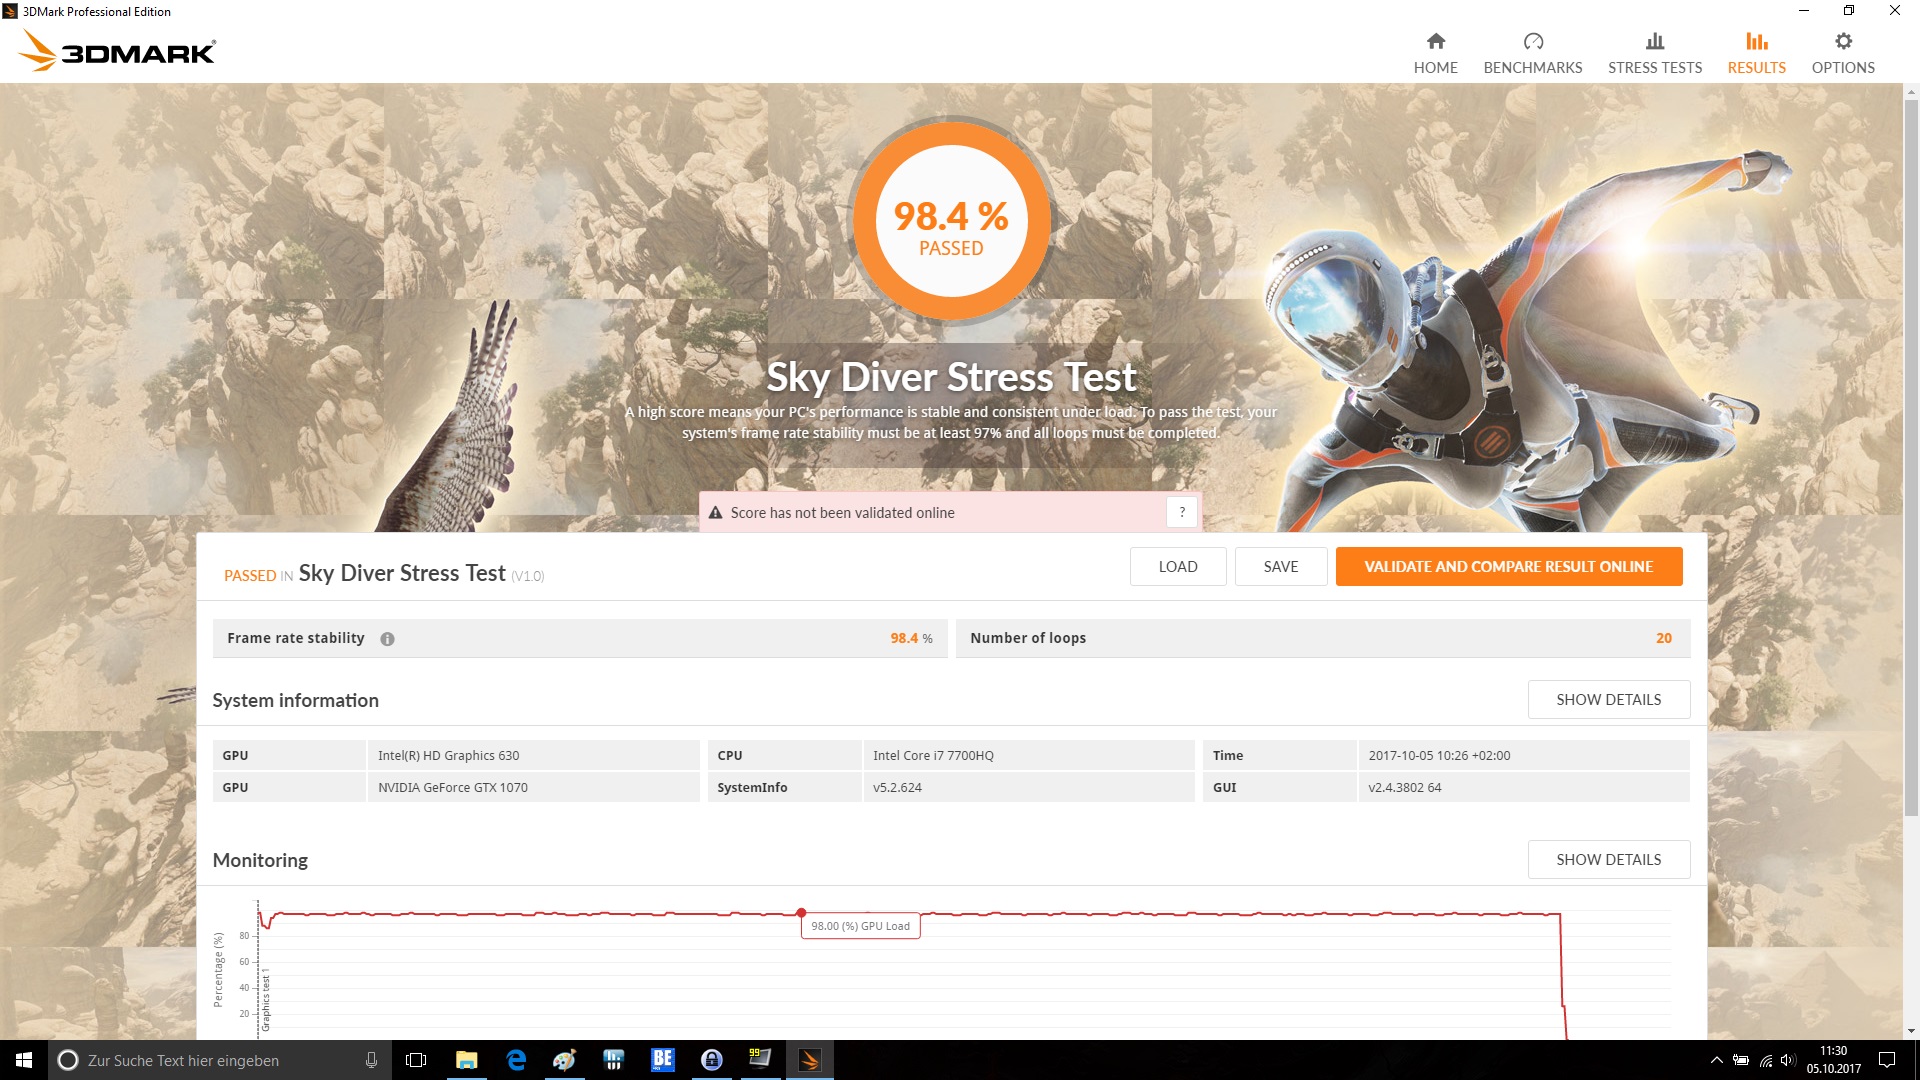
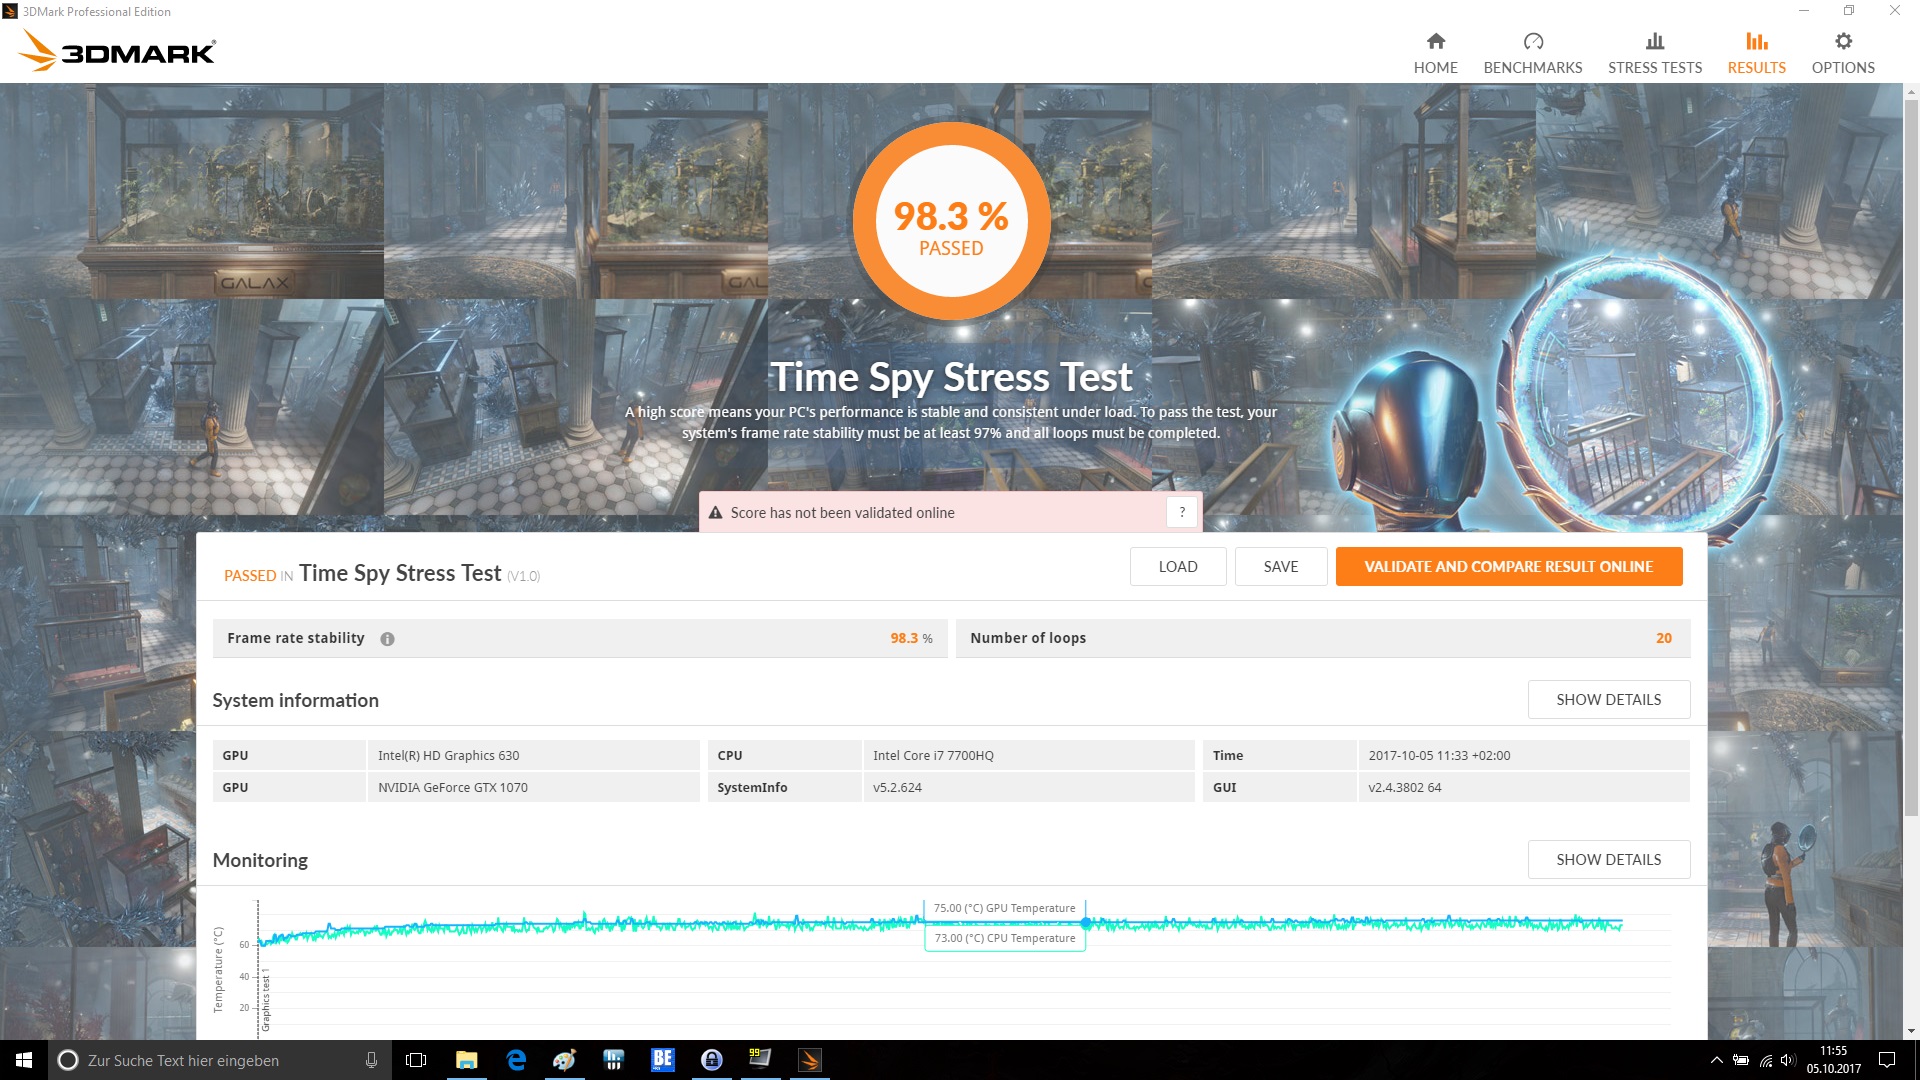
| 3DMark 11 Performance | 16965 punti | |
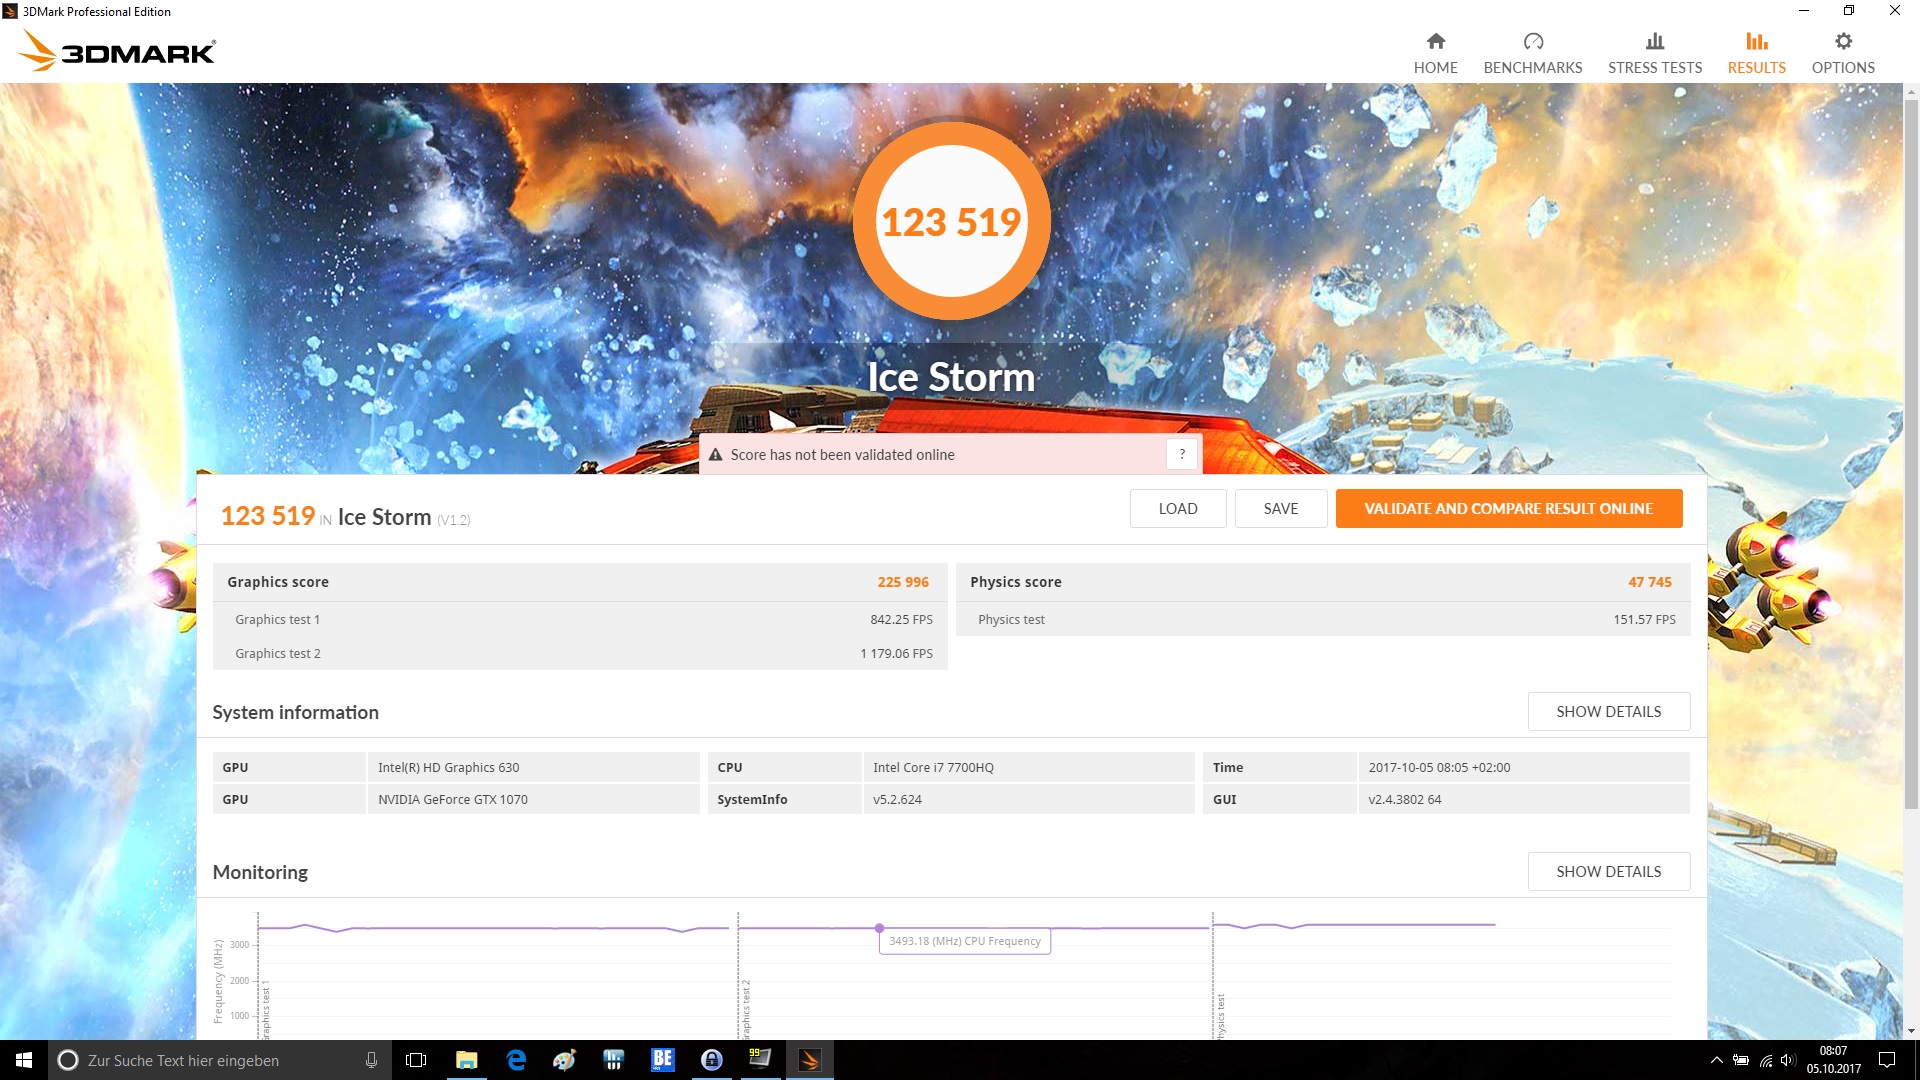
| 3DMark Ice Storm Standard Score | 123519 punti | |
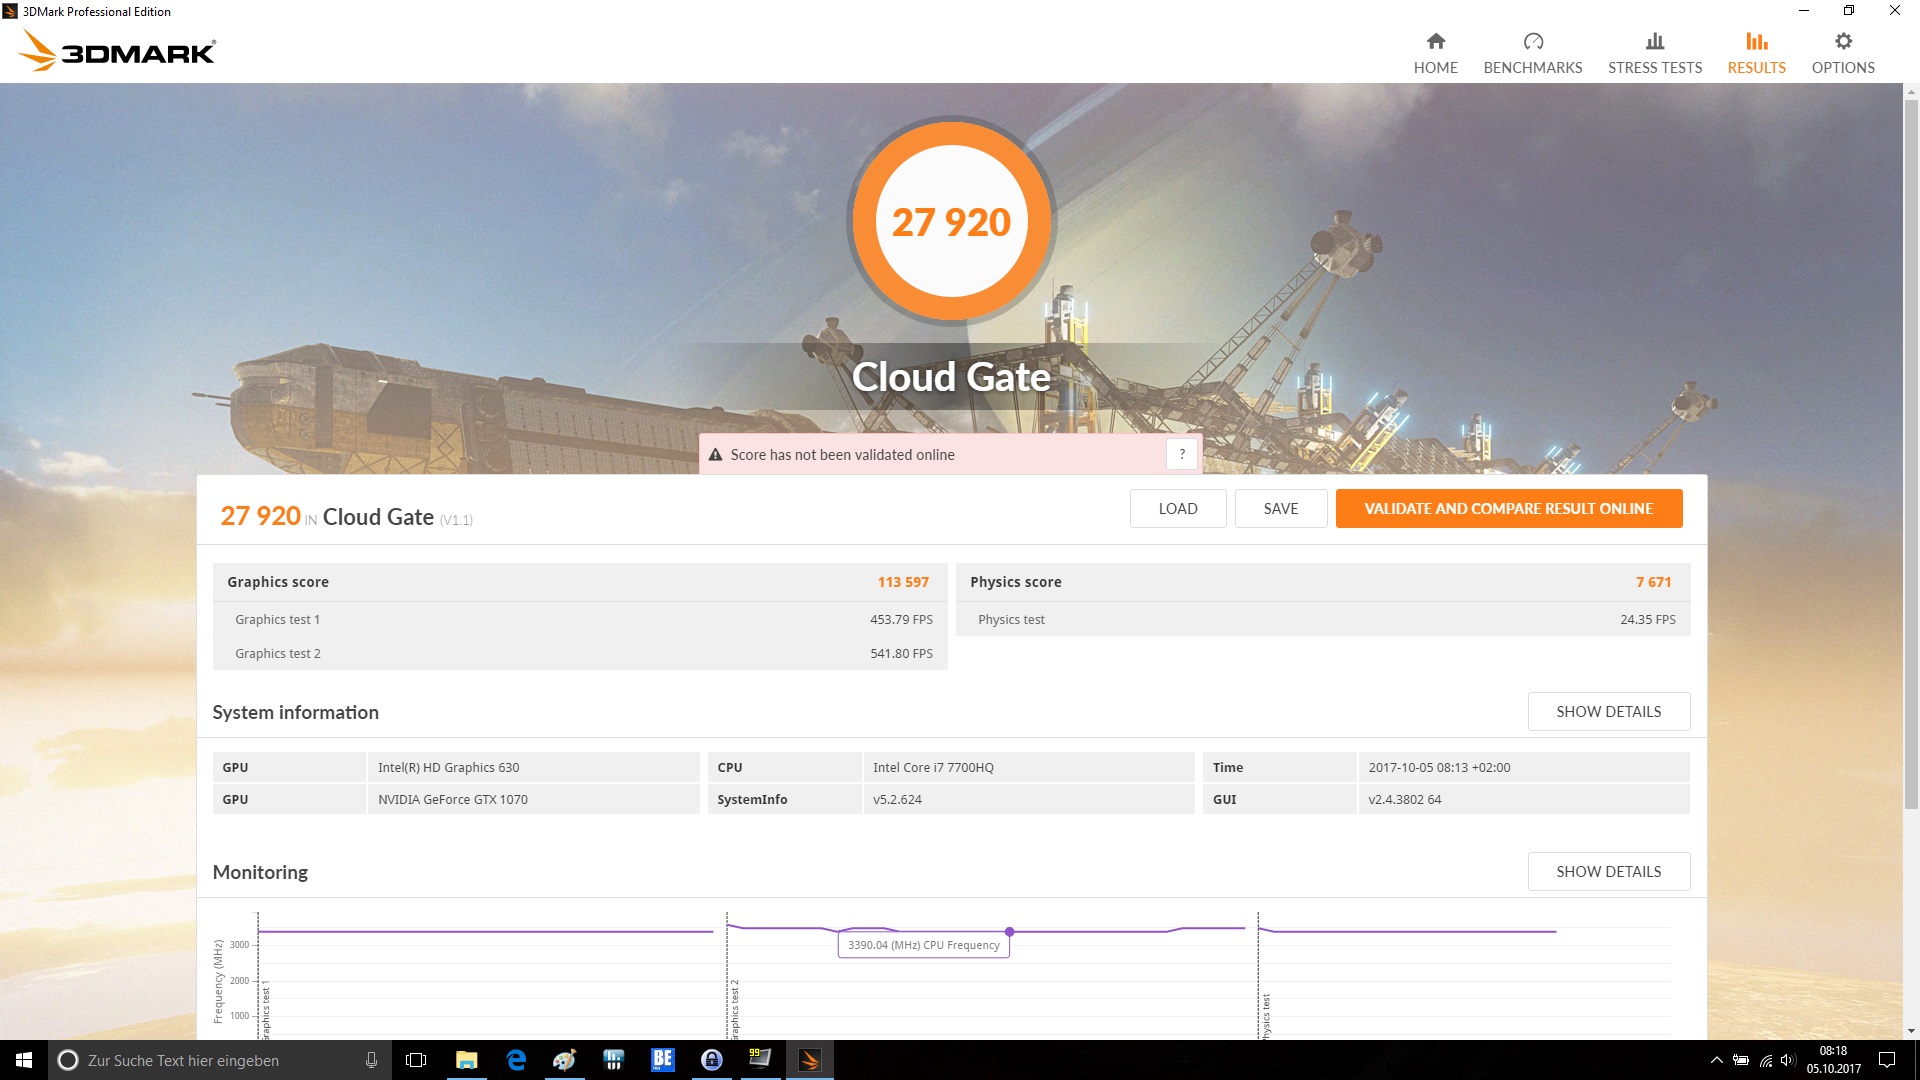
| 3DMark Cloud Gate Standard Score | 27920 punti | |
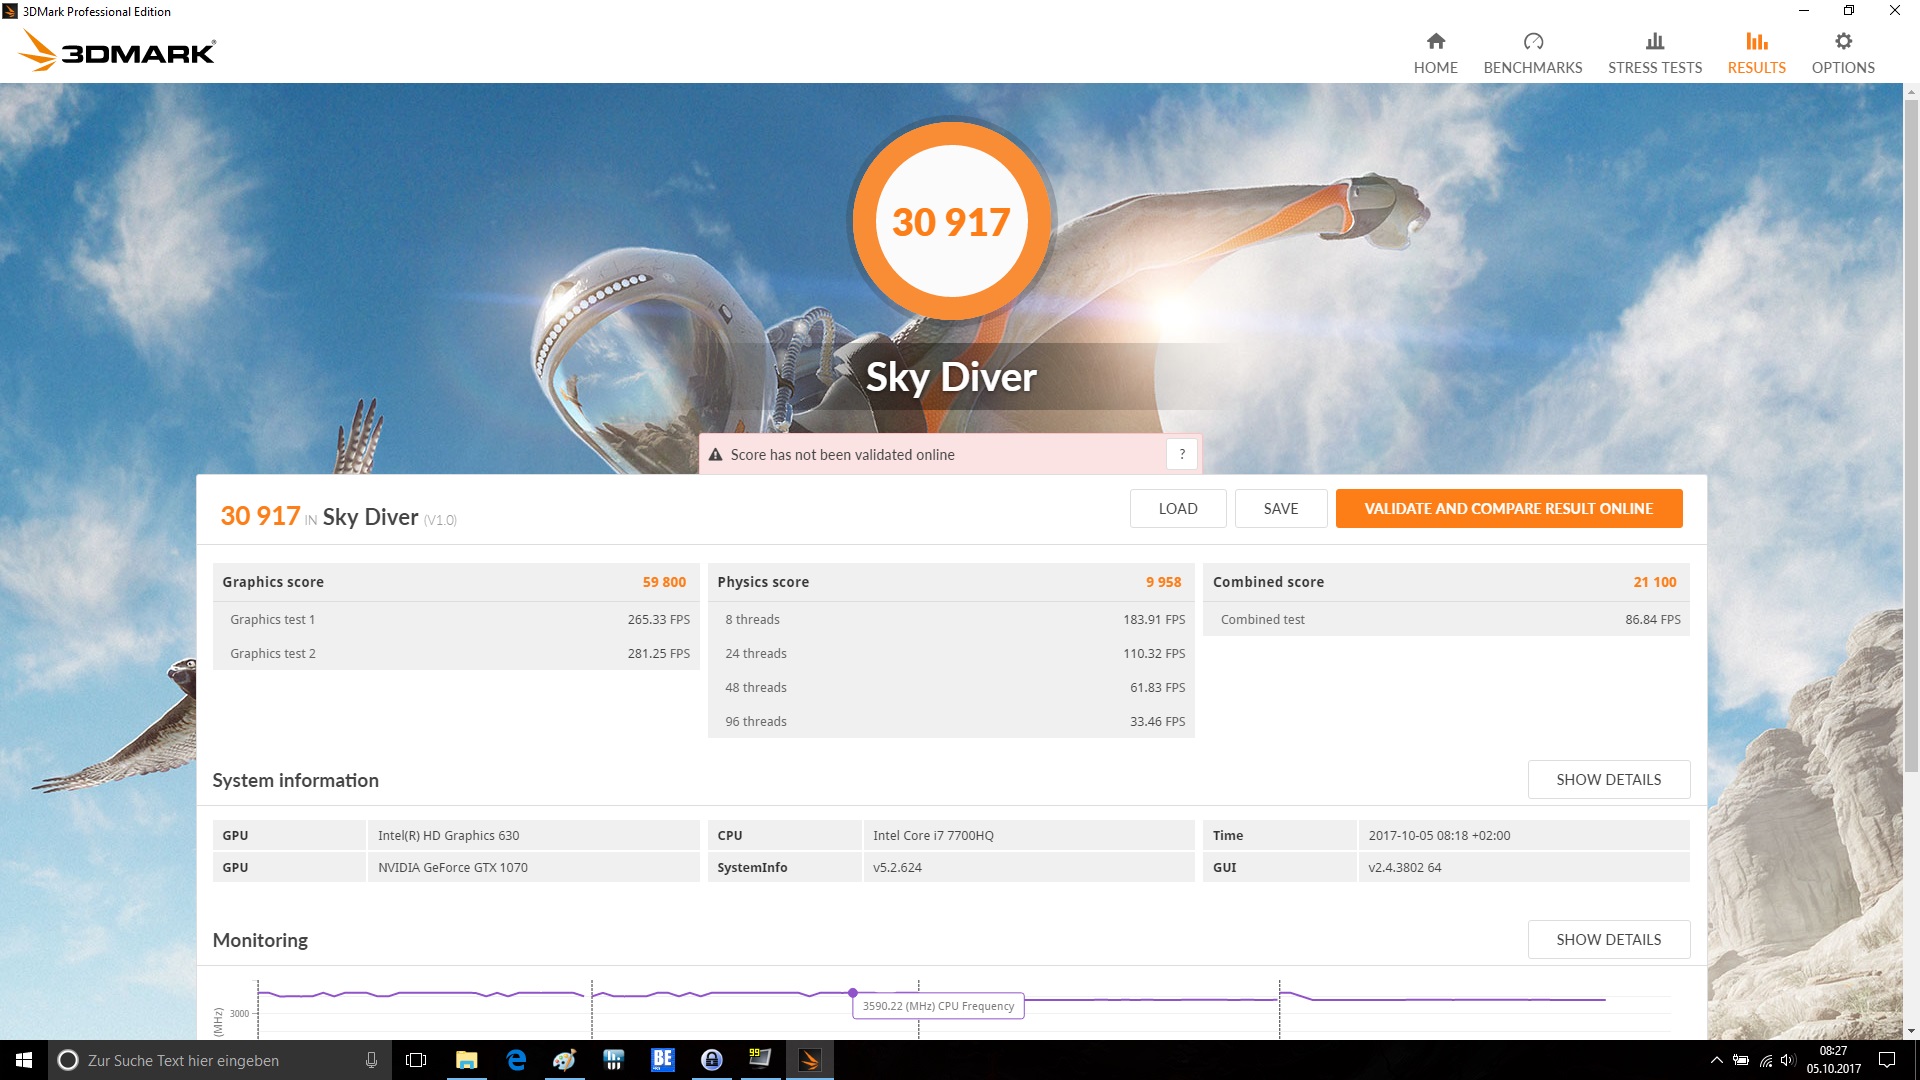
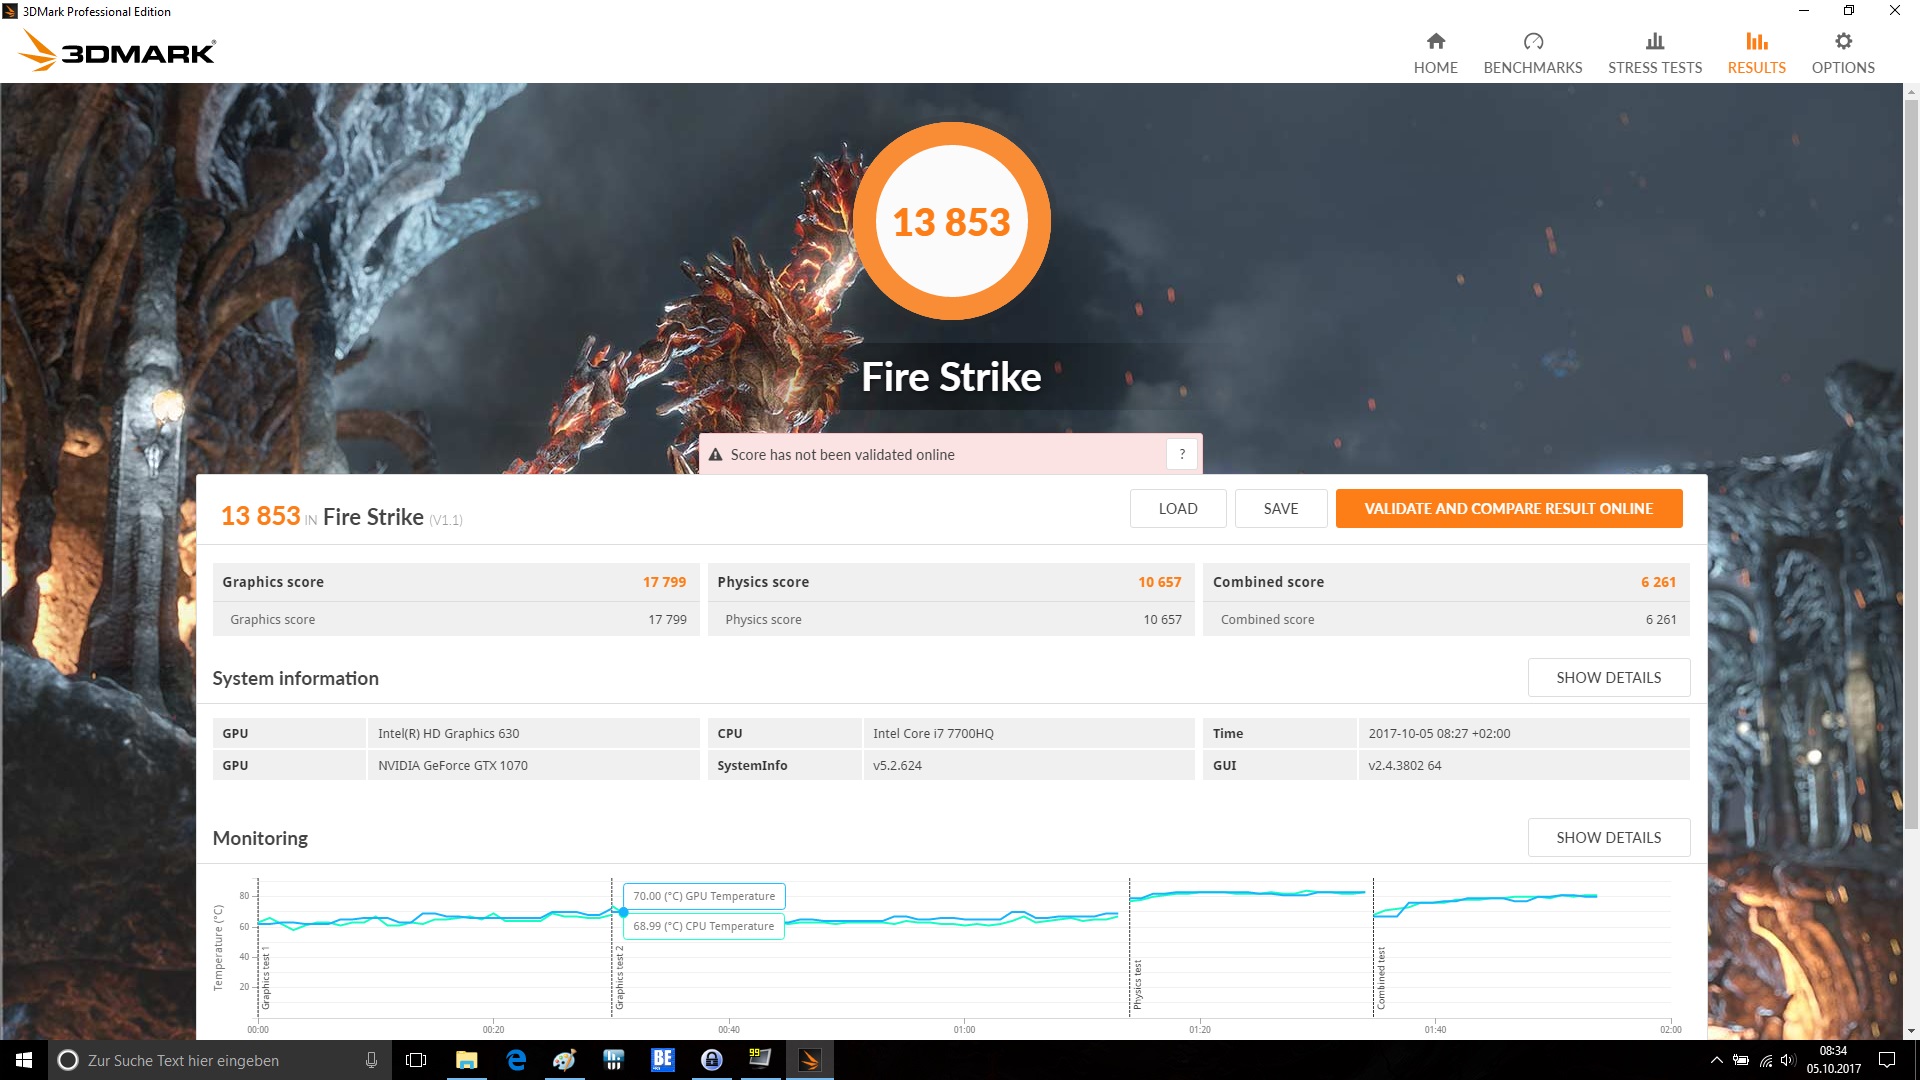
| 3DMark Fire Strike Score | 13853 punti | |
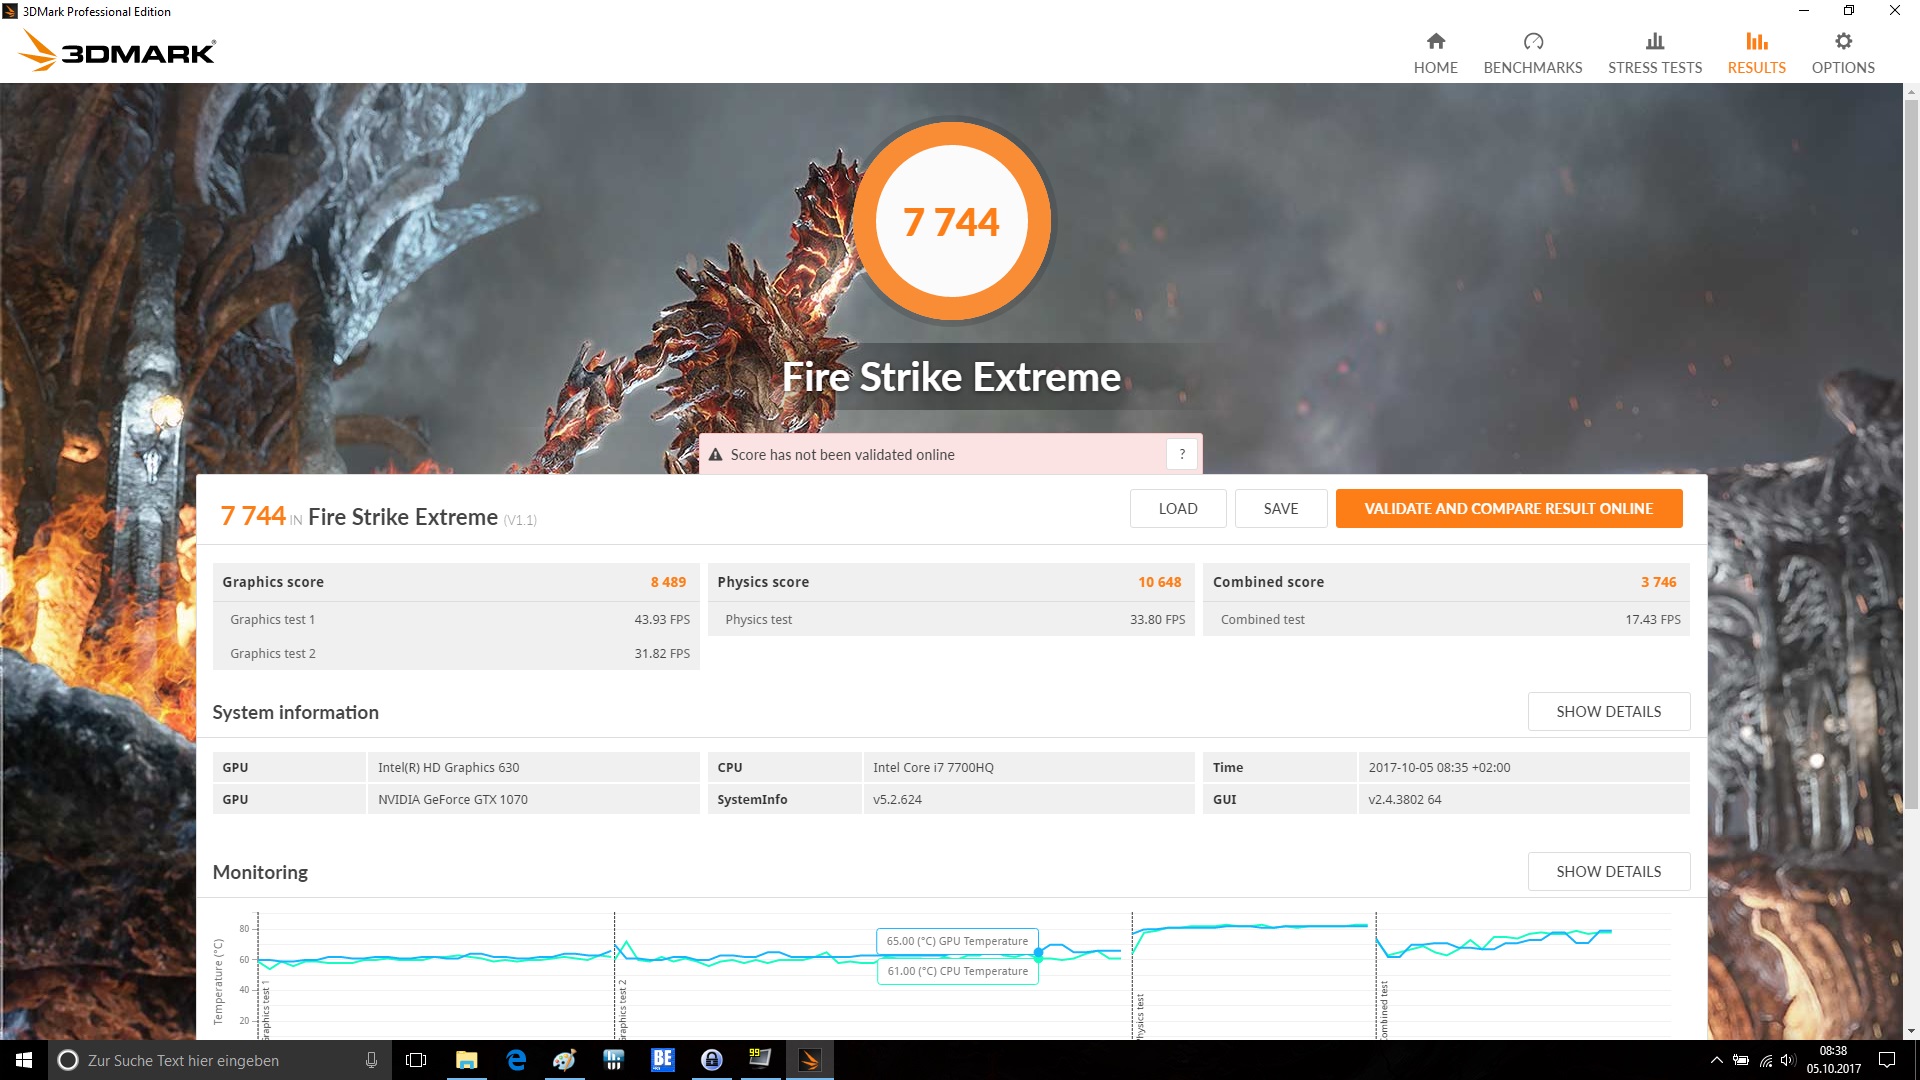
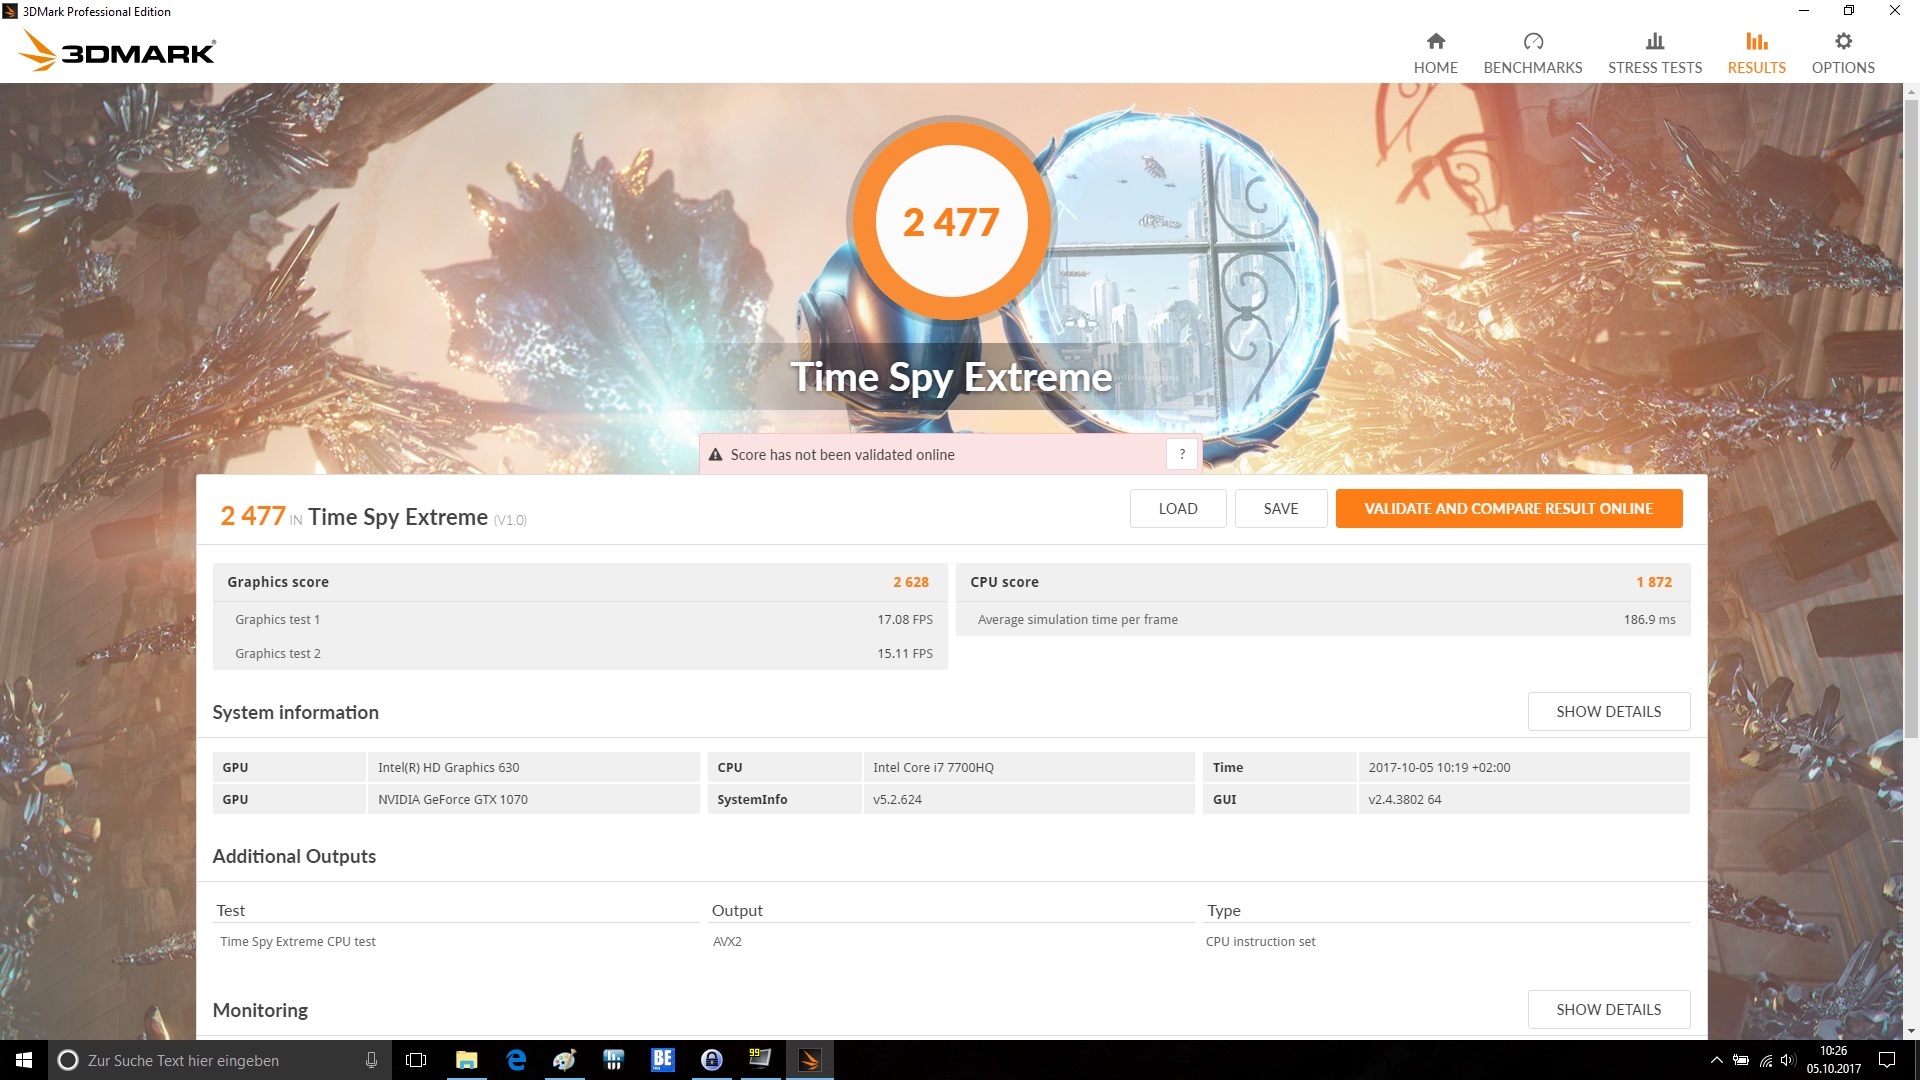
| 3DMark Fire Strike Extreme Score | 7744 punti | |
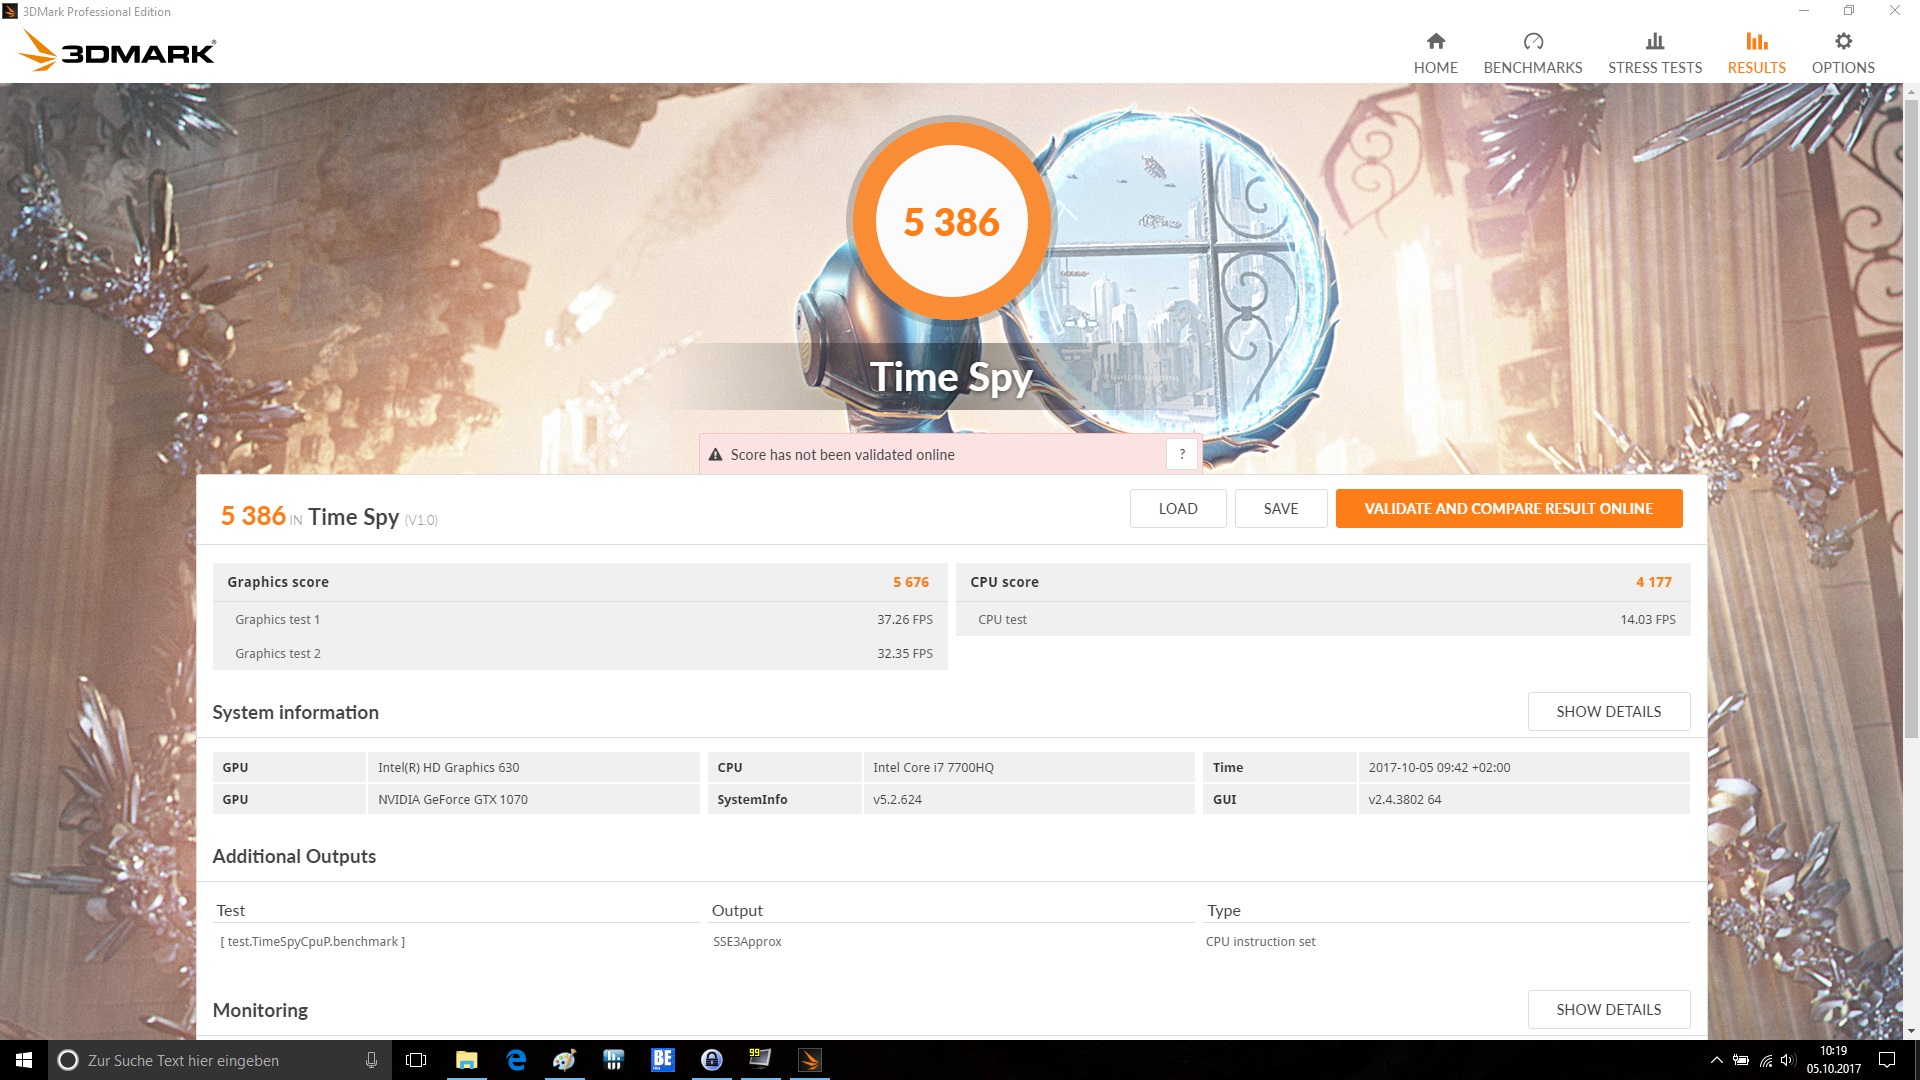
| 3DMark Time Spy Score | 5386 punti | |
Aiuto | ||
| The Witcher 3 - 1920x1080 Ultra Graphics & Postprocessing (HBAO+) | |
| Asus G752VS-BA338T | |
| Acer Predator 17 G9-793-70PJ | |
| MSI GE73VR 7RF Raider | |
| HP Omen 17-an014ng | |
| BioShock Infinite - 1920x1080 Ultra Preset, DX11 (DDOF) | |
| Asus G752VS-BA338T | |
| MSI GE73VR 7RF Raider | |
| MSI GT72VR 7RE-433 | |
| Gigabyte P57X v7 | |
| Rise of the Tomb Raider - 1920x1080 Very High Preset AA:FX AF:16x | |
| Asus G752VS-BA338T | |
| MSI GE73VR 7RF Raider | |
| HP Omen 17-an014ng | |
| Battlefield 1 - 1920x1080 Ultra Preset AA:T | |
| MSI GE73VR 7RF Raider | |
| MSI GT72VR 7RE-433 | |
| Battlefield 4 - 1920x1080 Ultra Preset AA:4x MS | |
| MSI GE73VR 7RF Raider | |
| MSI GT72VR 7RE-433 | |
| Deus Ex Mankind Divided - 1920x1080 Ultra Preset AA:2xMS AF:8x | |
| MSI GE73VR 7RF Raider | |
| MSI GT72VR 7RE-433 | |
| basso | medio | alto | ultra | 4K | |
|---|---|---|---|---|---|
| BioShock Infinite (2013) | 267.3 | 233.7 | 217.3 | 135 | |
| Battlefield 4 (2013) | 199.9 | 199.9 | 199.5 | 154.2 | 72.6 |
| The Witcher 3 (2015) | 231.9 | 175.7 | 107.8 | 58.6 | 39.9 |
| Rise of the Tomb Raider (2016) | 218.5 | 176.2 | 111.4 | 91.4 | 38.1 |
| Deus Ex Mankind Divided (2016) | 139.8 | 129.7 | 84.5 | 45.9 | 28.5 |
| Battlefield 1 (2016) | 179.2 | 161.8 | 133.4 | 123.2 | 51.8 |
Rumorosità
| Idle |
| 33 / 34 / 39 dB(A) |
| HDD |
| 34 dB(A) |
| Sotto carico |
| 47 / 54 dB(A) |
 | ||
30 dB silenzioso 40 dB(A) udibile 50 dB(A) rumoroso |
||
min: | ||
| MSI GE73VR 7RF Raider GeForce GTX 1070 Mobile, i7-7700HQ | HP Omen 17-an014ng GeForce GTX 1070 Mobile, i7-7700HQ | Asus G752VS-BA338T GeForce GTX 1070 Mobile, i7-7700HQ | Gigabyte P57X v7 GeForce GTX 1070 Mobile, i7-7700HQ | Acer Predator 17 G9-793-70PJ GeForce GTX 1070 Mobile, i7-7700HQ | MSI GT72VR 7RE-433 GeForce GTX 1070 Mobile, i7-7700HQ | |
|---|---|---|---|---|---|---|
| Noise | 1% | 8% | 7% | 4% | 6% | |
| off /ambiente * (dB) | 30 | 30 -0% | 30 -0% | 29 3% | 31 -3% | 31 -3% |
| Idle Minimum * (dB) | 33 | 30 9% | 30 9% | 30.4 8% | 32 3% | 34 -3% |
| Idle Average * (dB) | 34 | 37 -9% | 32 6% | 32.1 6% | 35 -3% | 35 -3% |
| Idle Maximum * (dB) | 39 | 39 -0% | 36 8% | 32.1 18% | 38 3% | 37 5% |
| Load Average * (dB) | 47 | 44 6% | 43 9% | 45.6 3% | 42 11% | 37 21% |
| Witcher 3 ultra * (dB) | 49 | 47 4% | 43 12% | 44 10% | ||
| Load Maximum * (dB) | 54 | 55 -2% | 49 9% | 51.5 5% | 50 7% | 44 19% |
* ... Meglio usare valori piccoli
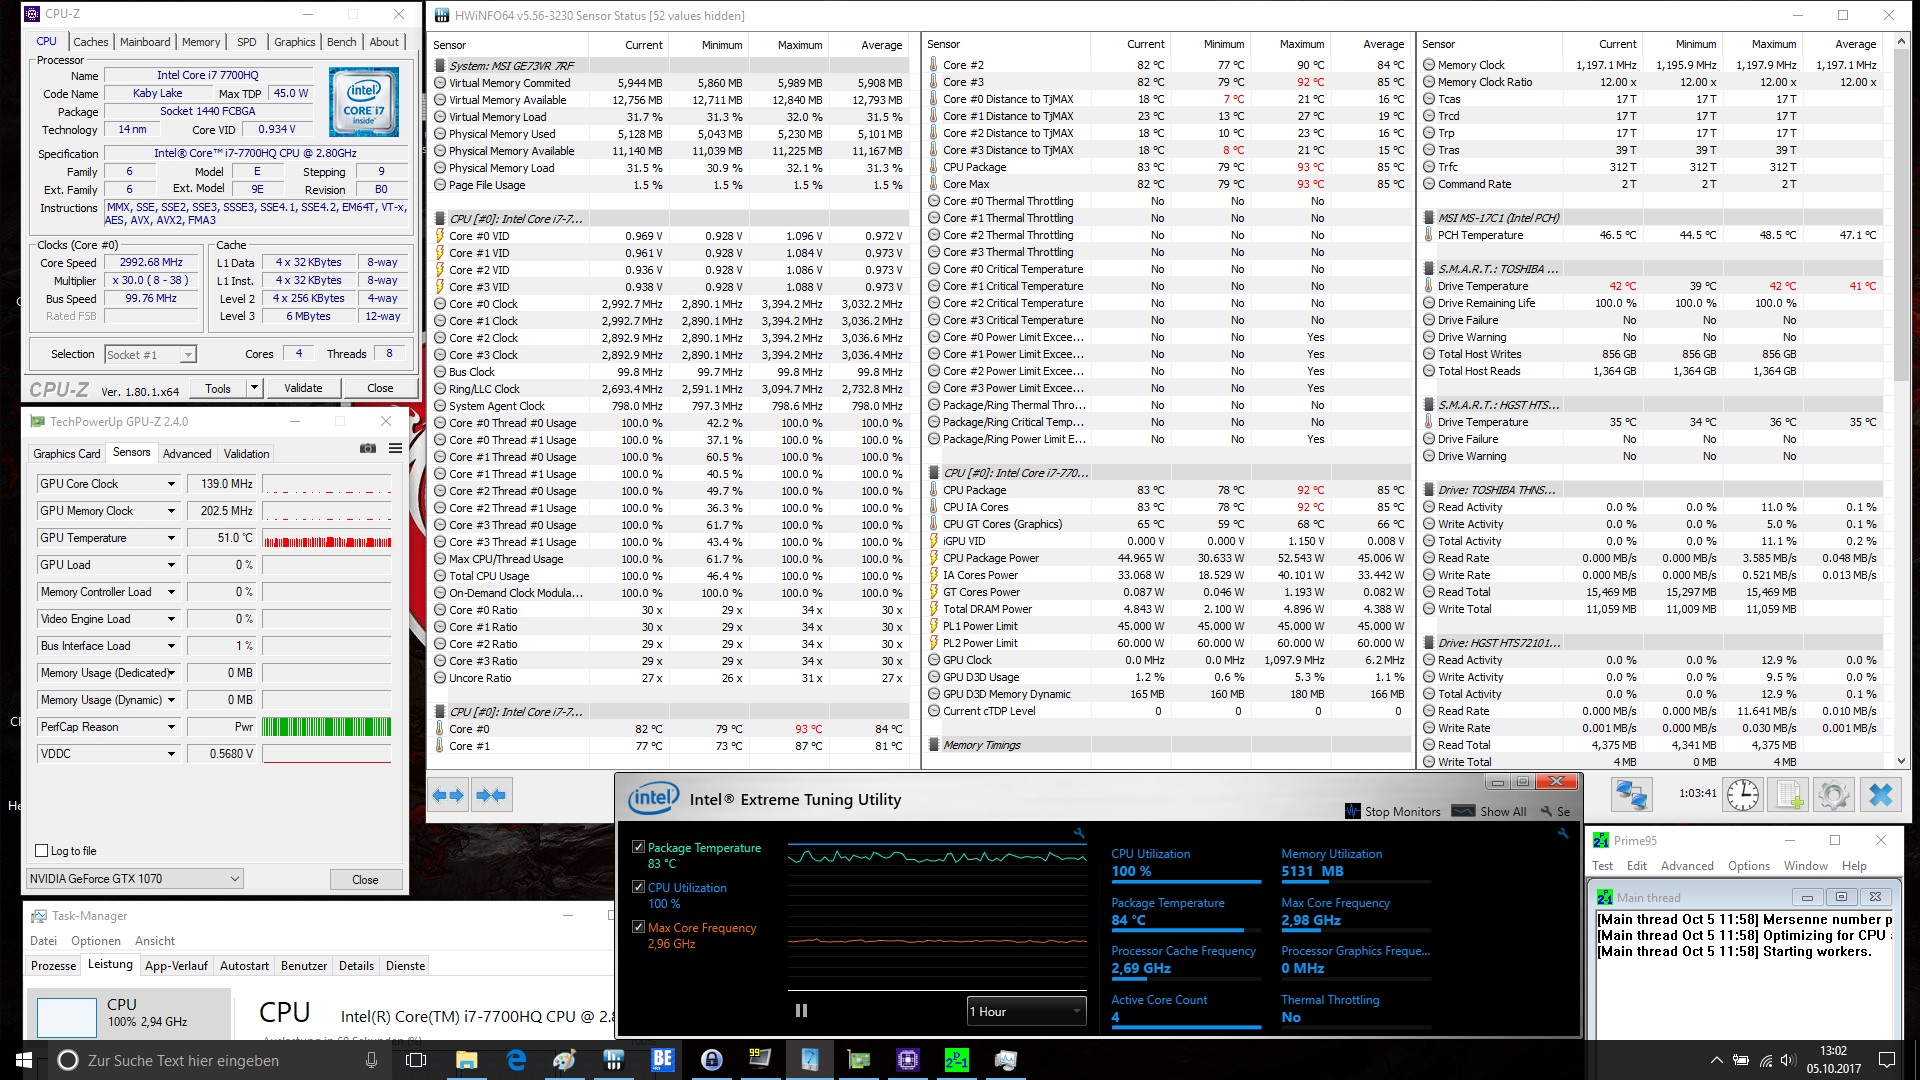
(-) La temperatura massima sul lato superiore è di 48 °C / 118 F, rispetto alla media di 40.4 °C / 105 F, che varia da 21.2 a 68.8 °C per questa classe Gaming.
(-) Il lato inferiore si riscalda fino ad un massimo di 49 °C / 120 F, rispetto alla media di 43.2 °C / 110 F
(+) In idle, la temperatura media del lato superiore è di 24.3 °C / 76 F, rispetto alla media deld ispositivo di 33.9 °C / 93 F.
(±) Riproducendo The Witcher 3, la temperatura media per il lato superiore e' di 37.9 °C / 100 F, rispetto alla media del dispositivo di 33.9 °C / 93 F.
(+) I poggiapolsi e il touchpad sono piu' freddi della temperatura della pelle con un massimo di 31 °C / 87.8 F e sono quindi freddi al tatto.
(-) La temperatura media della zona del palmo della mano di dispositivi simili e'stata di 28.8 °C / 83.8 F (-2.2 °C / -4 F).
| MSI GE73VR 7RF Raider i7-7700HQ, GeForce GTX 1070 Mobile | HP Omen 17-an014ng i7-7700HQ, GeForce GTX 1070 Mobile | Asus G752VS-BA338T i7-7700HQ, GeForce GTX 1070 Mobile | Gigabyte P57X v7 i7-7700HQ, GeForce GTX 1070 Mobile | Acer Predator 17 G9-793-70PJ i7-7700HQ, GeForce GTX 1070 Mobile | MSI GT72VR 7RE-433 i7-7700HQ, GeForce GTX 1070 Mobile | |
|---|---|---|---|---|---|---|
| Heat | -23% | 4% | -13% | 5% | 2% | |
| Maximum Upper Side * (°C) | 48 | 48 -0% | 41 15% | 51.2 -7% | 39.1 19% | 41.5 14% |
| Maximum Bottom * (°C) | 49 | 54 -10% | 39.3 20% | 56.8 -16% | 42.1 14% | 50.6 -3% |
| Idle Upper Side * (°C) | 25 | 35 -40% | 28.8 -15% | 29.2 -17% | 27.9 -12% | 26.4 -6% |
| Idle Bottom * (°C) | 26 | 37 -42% | 27.3 -5% | 29.2 -12% | 26.1 -0% | 25.4 2% |
* ... Meglio usare valori piccoli
MSI GE73VR 7RF Raider analisi audio
(+) | gli altoparlanti sono relativamente potenti (93 dB)
Bassi 100 - 315 Hz
(-) | quasi nessun basso - in media 18.5% inferiori alla media
(+) | bassi in lineaa (6.3% delta rispetto alla precedente frequenza)
Medi 400 - 2000 Hz
(±) | medi ridotti - circa 5.4% inferiori alla media
(+) | medi lineari (5.5% delta rispetto alla precedente frequenza)
Alti 2 - 16 kHz
(+) | Alti bilanciati - appena 2.5% dalla media
(+) | alti lineari (3.1% delta rispetto alla precedente frequenza)
Nel complesso 100 - 16.000 Hz
(+) | suono nel complesso lineare (14.3% differenza dalla media)
Rispetto alla stessa classe
» 26% di tutti i dispositivi testati in questa classe è stato migliore, 7% simile, 67% peggiore
» Il migliore ha avuto un delta di 6%, medio di 18%, peggiore di 132%
Rispetto a tutti i dispositivi testati
» 18% di tutti i dispositivi testati in questa classe è stato migliore, 4% similare, 78% peggiore
» Il migliore ha avuto un delta di 4%, medio di 23%, peggiore di 134%
Asus G752VS-BA338T analisi audio
(±) | potenza degli altiparlanti media ma buona (80 dB)
Bassi 100 - 315 Hz
(±) | bassi ridotti - in media 9.4% inferiori alla media
(±) | la linearità dei bassi è media (11.1% delta rispetto alla precedente frequenza)
Medi 400 - 2000 Hz
(+) | medi bilanciati - solo only 4.2% rispetto alla media
(+) | medi lineari (6% delta rispetto alla precedente frequenza)
Alti 2 - 16 kHz
(±) | alti ridotti - circa 7.7% inferiori alla media
(±) | la linearità degli alti è media (10% delta rispetto alla precedente frequenza)
Nel complesso 100 - 16.000 Hz
(±) | la linearità complessiva del suono è media (21.2% di differenza rispetto alla media
Rispetto alla stessa classe
» 76% di tutti i dispositivi testati in questa classe è stato migliore, 4% simile, 19% peggiore
» Il migliore ha avuto un delta di 6%, medio di 18%, peggiore di 132%
Rispetto a tutti i dispositivi testati
» 59% di tutti i dispositivi testati in questa classe è stato migliore, 7% similare, 34% peggiore
» Il migliore ha avuto un delta di 4%, medio di 23%, peggiore di 134%
| Off / Standby | |
| Idle | |
| Sotto carico |
|
Leggenda:
min: | |
| MSI GE73VR 7RF Raider i7-7700HQ, GeForce GTX 1070 Mobile | HP Omen 17-an014ng i7-7700HQ, GeForce GTX 1070 Mobile | Asus G752VS-BA338T i7-7700HQ, GeForce GTX 1070 Mobile | Gigabyte P57X v7 i7-7700HQ, GeForce GTX 1070 Mobile | Acer Predator 17 G9-793-70PJ i7-7700HQ, GeForce GTX 1070 Mobile | MSI GT72VR 7RE-433 i7-7700HQ, GeForce GTX 1070 Mobile | |
|---|---|---|---|---|---|---|
| Power Consumption | -31% | -25% | -34% | -43% | -28% | |
| Idle Minimum * (Watt) | 10 | 22 -120% | 21 -110% | 15.7 -57% | 23 -130% | 20 -100% |
| Idle Average * (Watt) | 18 | 28 -56% | 27 -50% | 23.4 -30% | 33 -83% | 27 -50% |
| Idle Maximum * (Watt) | 26 | 35 -35% | 32 -23% | 23.5 10% | 40 -54% | 31 -19% |
| Load Average * (Watt) | 97 | 93 4% | 86 11% | 184.6 -90% | 94 3% | 86 11% |
| Witcher 3 ultra * (Watt) | 183 | 157 14% | 165 10% | 177 3% | ||
| Load Maximum * (Watt) | 230 | 208 10% | 206 10% | 233.1 -1% | 228 1% | 184 20% |
* ... Meglio usare valori piccoli

| MSI GE73VR 7RF Raider i7-7700HQ, GeForce GTX 1070 Mobile, 51 Wh | HP Omen 17-an014ng i7-7700HQ, GeForce GTX 1070 Mobile, 86 Wh | Asus G752VS-BA338T i7-7700HQ, GeForce GTX 1070 Mobile, 90 Wh | Gigabyte P57X v7 i7-7700HQ, GeForce GTX 1070 Mobile, 75.81 Wh | Acer Predator 17 G9-793-70PJ i7-7700HQ, GeForce GTX 1070 Mobile, 88 Wh | MSI GT72VR 7RE-433 i7-7700HQ, GeForce GTX 1070 Mobile, 83 Wh | |
|---|---|---|---|---|---|---|
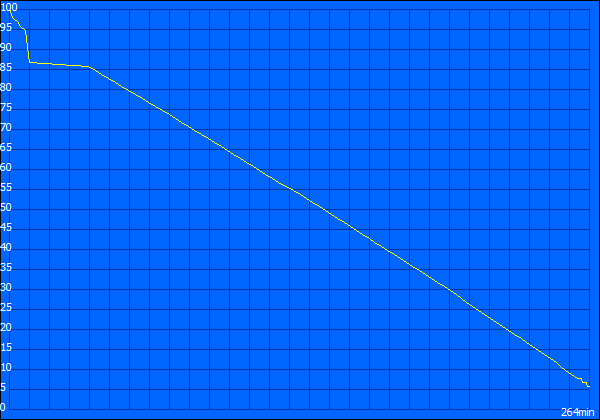
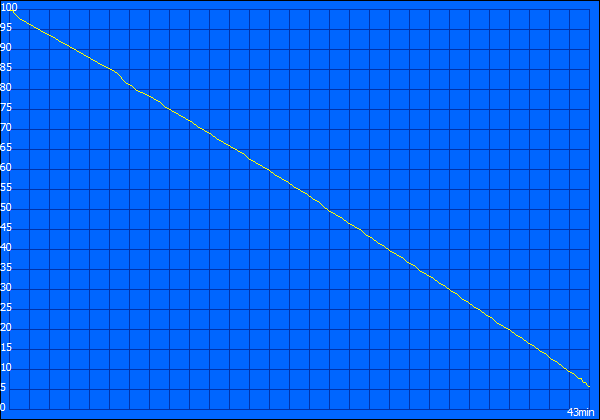
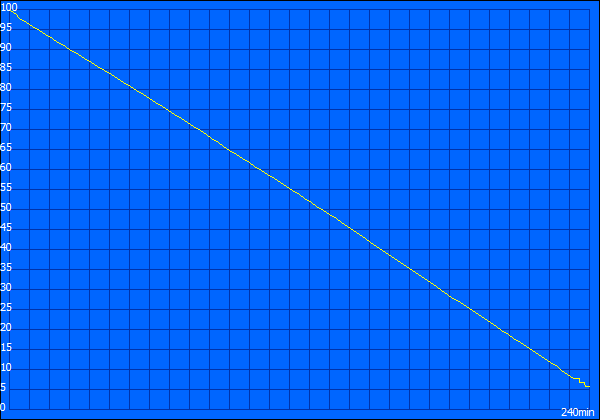
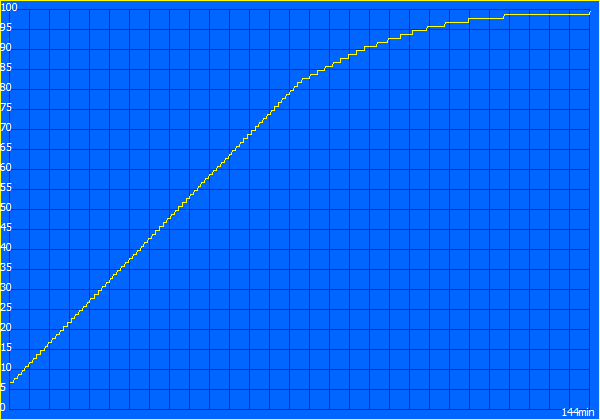
| Autonomia della batteria | 43% | 62% | 31% | 42% | 35% | |
| Reader / Idle (h) | 4.4 | 5.8 32% | 7.4 68% | 4.3 -2% | 5.4 23% | 5.3 20% |
| H.264 (h) | 3.4 | 4.3 26% | 4.3 26% | 3.8 12% | ||
| WiFi v1.3 (h) | 4 | 4.5 13% | 4.9 23% | 2.6 -35% | 3.6 -10% | 3.8 -5% |
| Load (h) | 0.7 | 1.4 100% | 1.6 129% | 1.6 129% | 1.5 114% | 1.5 114% |
Pro
Contro
Senza dubbio, l'MSI GE73VR 7RF Raider è un portatile gaming. Unendo la veloce Intel Core i7-7700HQ e la Nvidia GeForce GTX 1070 fornisce ottime basi per il gaming. Ci piace anche il display, che è ciò che fa battere il cuore dei giocatori, con una ampia copertura della gamma di colore e 120 Hz. Per il dispositivo nella nostra configurazione occorrono 1999 Euro (~$2360), un prezzo simile a quello di portatili da 17" analoghi.
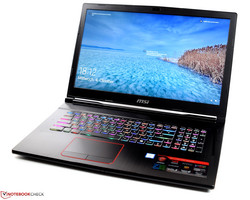
L'MSI GE73VR 7RF Raider offre una ottima base per le esigenze dei giocatori. La tastiera high-quality fa un ottimo lavoro ed attira l'attenzione con le sue luci colorate.
Oltre alle qualità positive che comprendono i consumi contenuti, in alcuni settori l'MSI GE73VR 7RF Raider merita qualche critica. In termini di archiviazione, avremmo preferito un SSD con una connessione più veloce PCIe per sfruttare in pieno le performance dell'adattatore M.2. Anche l'autonomia lascia sensazioni miste, in quanto non ci convince se la confrontiamo agli altri. Ma poiché si tratta di un portatile gaming puro, non dovrebbe essere l'aspetto più importante per l'acquisto. In definitiva possiamo dire che con il GE73VR 7RF Raider, MSI ha realizzato un portatile gaming molto buono per un segmento di mercato che scotta.
Nota: si tratta di una recensione breve, con alcune sezioni non tradotte, per la versione integrale in inglese guardate qui.
MSI GE73VR 7RF Raider
- 10/12/2017 v6 (old)
Sebastian Bade