Recensione breve del Portatile Gigabyte Aero 15X (i7-7700HQ, GTX 1070 Max-Q, FHD)

| SD Card Reader | |
| average JPG Copy Test (av. of 3 runs) | |
| Eurocom Q5 | |
| Gigabyte Aero 15X (Toshiba Exceria Pro SDXC 64 GB UHS-II) | |
| Gigabyte Aero 15 (Toshiba Exceria Pro SDXC 64 GB UHS-II) | |
| MSI GS63VR 7RF-228US (Toshiba Exceria Pro SDXC 64 GB UHS-II) | |
| maximum AS SSD Seq Read Test (1GB) | |
| Eurocom Q5 | |
| Gigabyte Aero 15 (Toshiba Exceria Pro SDXC 64 GB UHS-II) | |
| Gigabyte Aero 15X (Toshiba Exceria Pro SDXC 64 GB UHS-II) | |
| MSI GS63VR 7RF-228US (Toshiba Exceria Pro SDXC 64 GB UHS-II) | |
| Networking | |
| iperf3 transmit AX12 | |
| MSI GS63VR 7RF-228US | |
| Eurocom Q5 | |
| Asus Zephyrus GX501VS | |
| Gigabyte Aero 15X | |
| Gigabyte Aero 15 | |
| iperf3 receive AX12 | |
| Gigabyte Aero 15X | |
| Gigabyte Aero 15 | |
| Eurocom Q5 | |
| MSI GS63VR 7RF-228US | |
| Asus Zephyrus GX501VS | |
| |||||||||||||||||||||||||
Distribuzione della luminosità: 88 %
Al centro con la batteria: 338 cd/m²
Contrasto: 994:1 (Nero: 0.34 cd/m²)
ΔE ColorChecker Calman: 5.92 | ∀{0.5-29.43 Ø4.72}
ΔE Greyscale Calman: 7.45 | ∀{0.09-98 Ø4.97}
90% sRGB (Argyll 1.6.3 3D)
59% AdobeRGB 1998 (Argyll 1.6.3 3D)
65.7% AdobeRGB 1998 (Argyll 3D)
90.4% sRGB (Argyll 3D)
64.7% Display P3 (Argyll 3D)
Gamma: 2.58
CCT: 6366 K
| Gigabyte Aero 15X Chi Mei N156HCA-EA1 (CMN15D7), 1920x1080, 15.6" | MSI GS63VR 7RF-228US 3840x2160, 15.6" | Gigabyte Aero 15 N156HCA-EA1 (CMN15D7), 1920x1080, 15.6" | Asus Zephyrus GX501VS ID: AUO42ED, Name: AU Optronics B156HAN04.2, 1920x1080, 15.6" | Eurocom Q5 ID: LGD04D4, Name: LG Philips LP156UD1-SPB1, 3840x2160, 15.6" | |
|---|---|---|---|---|---|
| Display | -23% | 1% | -5% | -1% | |
| Display P3 Coverage (%) | 64.7 | 48.21 -25% | 65.2 1% | 62.1 -4% | 63 -3% |
| sRGB Coverage (%) | 90.4 | 72.6 -20% | 92.5 2% | 85.6 -5% | 92.7 3% |
| AdobeRGB 1998 Coverage (%) | 65.7 | 49.81 -24% | 66.5 1% | 62.4 -5% | 64.4 -2% |
| Response Times | 26% | -6% | 12% | 12% | |
| Response Time Grey 50% / Grey 80% * (ms) | 43.2 ? | 28 ? 35% | 42.8 ? 1% | 33.2 ? 23% | 32.4 ? 25% |
| Response Time Black / White * (ms) | 28.4 ? | 23.6 ? 17% | 32 ? -13% | 28 ? 1% | 28.8 ? -1% |
| PWM Frequency (Hz) | 26000 ? | 1351 ? | 26000 ? | ||
| Screen | -22% | 4% | 11% | -9% | |
| Brightness middle (cd/m²) | 338 | 274.2 -19% | 320 -5% | 307.1 -9% | 287.5 -15% |
| Brightness (cd/m²) | 324 | 263 -19% | 316 -2% | 309 -5% | 279 -14% |
| Brightness Distribution (%) | 88 | 92 5% | 90 2% | 86 -2% | 87 -1% |
| Black Level * (cd/m²) | 0.34 | 0.44 -29% | 0.36 -6% | 0.35 -3% | 0.65 -91% |
| Contrast (:1) | 994 | 623 -37% | 889 -11% | 877 -12% | 442 -56% |
| Colorchecker dE 2000 * | 5.92 | 8 -35% | 4.62 22% | 3.4 43% | 4.5 24% |
| Colorchecker dE 2000 max. * | 11.77 | 14.6 -24% | 9.75 17% | 8.2 30% | 8.9 24% |
| Greyscale dE 2000 * | 7.45 | 9.1 -22% | 6 19% | 1.4 81% | 4.6 38% |
| Gamma | 2.58 85% | 2.24 98% | 2.46 89% | 2.19 100% | 2.39 92% |
| CCT | 6366 102% | 5020 129% | 6761 96% | 6558 99% | 7393 88% |
| Color Space (Percent of AdobeRGB 1998) (%) | 59 | 45.7 -23% | 60 2% | 55.6 -6% | 59 0% |
| Color Space (Percent of sRGB) (%) | 90 | 72.1 -20% | 92 2% | 85 -6% | 92.3 3% |
| Media totale (Programma / Settaggio) | -6% /
-16% | -0% /
2% | 6% /
8% | 1% /
-4% |
* ... Meglio usare valori piccoli
Sfarfallio dello schermo / PWM (Pulse-Width Modulation)
| flickering dello schermo / PWM rilevato | 26000 Hz | ≤ 20 % settaggio luminosita' | 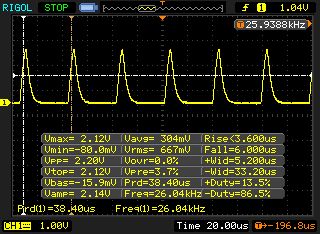 |
Il display sfarfalla a 26000 Hz (Probabilmente a causa dell'uso di PWM) Flickering rilevato ad una luminosita' di 20 % o inferiore. Non dovrebbe verificarsi flickering o PWM sopra questo valore di luminosita'. La frequenza di 26000 Hz è abbastanza alta, quindi la maggioranza degli utenti sensibili al PWM non dovrebbero notare alcun flickering. In confronto: 52 % di tutti i dispositivi testati non utilizza PWM per ridurre la luminosita' del display. Se è rilevato PWM, una media di 7781 (minimo: 5 - massimo: 343500) Hz è stata rilevata. | |||
Tempi di risposta del Display
| ↔ Tempi di risposta dal Nero al Bianco | ||
|---|---|---|
| 28.4 ms ... aumenta ↗ e diminuisce ↘ combinato | ↗ 15.6 ms Incremento | 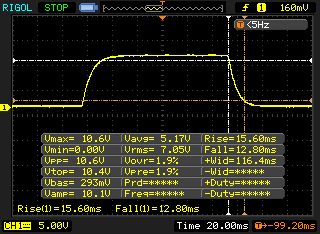 |
| ↘ 12.8 ms Calo | ||
| Lo schermo mostra tempi di risposta relativamente lenti nei nostri tests e potrebbe essere troppo lento per i gamers. In confronto, tutti i dispositivi di test variano da 0.1 (minimo) a 240 (massimo) ms. » 75 % di tutti i dispositivi è migliore. Questo significa che i tempi di risposta rilevati sono peggiori rispetto alla media di tutti i dispositivi testati (19.8 ms). | ||
| ↔ Tempo di risposta dal 50% Grigio all'80% Grigio | ||
| 43.2 ms ... aumenta ↗ e diminuisce ↘ combinato | ↗ 22.8 ms Incremento | 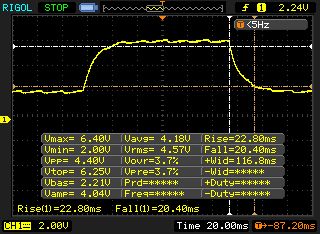 |
| ↘ 20.4 ms Calo | ||
| Lo schermo mostra tempi di risposta lenti nei nostri tests e sarà insoddisfacente per i gamers. In confronto, tutti i dispositivi di test variano da 0.165 (minimo) a 636 (massimo) ms. » 72 % di tutti i dispositivi è migliore. Questo significa che i tempi di risposta rilevati sono peggiori rispetto alla media di tutti i dispositivi testati (31 ms). | ||
| Cinebench R10 | |
| Rendering Single 32Bit | |
| Gigabyte Aero 15X | |
| HP Omen 15-ce002ng | |
| Eurocom Q5 | |
| Asus Zephyrus GX501VS | |
| MSI GS63VR 7RF-228US | |
| MSI GS63VR 7RG | |
| Rendering Multiple CPUs 32Bit | |
| Gigabyte Aero 15X | |
| Asus Zephyrus GX501VS | |
| HP Omen 15-ce002ng | |
| MSI GS63VR 7RF-228US | |
| Eurocom Q5 | |
| MSI GS63VR 7RG | |
| Geekbench 3 | |
| 32 Bit Multi-Core Score | |
| Gigabyte Aero 15X | |
| 32 Bit Single-Core Score | |
| Gigabyte Aero 15X | |
| Geekbench 4.0 | |
| 64 Bit Multi-Core Score | |
| Gigabyte Aero 15X | |
| 64 Bit Single-Core Score | |
| Gigabyte Aero 15X | |
| Geekbench 4.4 | |
| 64 Bit Multi-Core Score | |
| Gigabyte Aero 15X | |
| 64 Bit Single-Core Score | |
| Gigabyte Aero 15X | |
| JetStream 1.1 - 1.1 Total | |
| Gigabyte Aero 15X (Edge 41) | |
| Eurocom Q5 (Edge 40.15063.0.0) | |
| MSI GS63VR 7RF-228US (Edge 38.14393.0.0) | |
| Acer Aspire VN7-593G-73HP V15 Nitro BE | |
| Asus Zephyrus GX501VS (Edge 40.15063.0.0) | |
| PCMark 7 Score | 6288 punti | |
| PCMark 8 Home Score Accelerated v2 | 4394 punti | |
| PCMark 8 Creative Score Accelerated v2 | 5546 punti | |
| PCMark 8 Work Score Accelerated v2 | 5195 punti | |
| PCMark 10 Score | 4933 punti | |
Aiuto | ||

| Gigabyte Aero 15X Samsung SM961 MZVKW512HMJP m.2 PCI-e | MSI GS63VR 7RF-228US Samsung SM961 MZVKW512HMJP m.2 PCI-e | Gigabyte Aero 15 Lite-On CX2-8B512-Q11 | |
|---|---|---|---|
| CrystalDiskMark 3.0 | 19% | 13% | |
| Read Seq (MB/s) | 1381 | 2141 55% | 1769 28% |
| Write Seq (MB/s) | 1546 | 1621 5% | 1133 -27% |
| Read 512 (MB/s) | 418 | 499.7 20% | 891 113% |
| Write 512 (MB/s) | 1277 | 1531 20% | 1069 -16% |
| Read 4k (MB/s) | 51.3 | 54.2 6% | 44.7 -13% |
| Write 4k (MB/s) | 131 | 158.2 21% | 123.3 -6% |
| Read 4k QD32 (MB/s) | 544 | 632 16% | 645 19% |
| Write 4k QD32 (MB/s) | 480.2 | 527 10% | 490.5 2% |
| 3DMark 06 Standard Score | 27822 punti | |
| 3DMark 11 Performance | 14847 punti | |
| 3DMark Ice Storm Standard Score | 130556 punti | |
| 3DMark Cloud Gate Standard Score | 27624 punti | |
| 3DMark Fire Strike Score | 12166 punti | |
| 3DMark Fire Strike Extreme Score | 6378 punti | |
| 3DMark Time Spy Score | 4575 punti | |
Aiuto | ||
| BioShock Infinite - 1920x1080 Ultra Preset, DX11 (DDOF) | |
| Asus G752VS-BA338T | |
| MSI GE73VR 7RF Raider | |
| Asus Zephyrus GX501VS | |
| Eurocom Q5 | |
| Gigabyte Aero 15X | |
| MSI GS63VR 7RF-228US | |
| Acer Aspire VN7-593G-73HP V15 Nitro BE | |
| Ghost Recon Wildlands - 1920x1080 Ultra Preset AA:T AF:16x | |
| Asus G752VS-BA338T | |
| MSI GS63VR 7RG | |
| Gigabyte Aero 15X | |
| Gigabyte Aero 15 | |
| HP Omen 15-ce002ng | |
| basso | medio | alto | ultra | |
|---|---|---|---|---|
| Tomb Raider (2013) | 478.7 | 439.3 | 371.5 | 185.2 |
| BioShock Infinite (2013) | 249 | 210.1 | 194.4 | 123.9 |
| The Witcher 3 (2015) | 232.8 | 164.8 | 94.5 | 52.4 |
| For Honor (2017) | 203.9 | 128.6 | 122.7 | 96 |
| Ghost Recon Wildlands (2017) | 148.4 | 86 | 78.6 | 43.7 |
| Middle-earth: Shadow of War (2017) | 132 | 114 | 90 | 69 |
| The Evil Within 2 (2017) | 88.5 | 53.3 | 54 | 53.8 |
| ELEX (2017) | 122.5 | 107.3 | 86.7 | 66.6 |
Rumorosità
| Idle |
| 31 / 32 / 36 dB(A) |
| Sotto carico |
| 39 / 52 dB(A) |
 | ||
30 dB silenzioso 40 dB(A) udibile 50 dB(A) rumoroso |
||
min: | ||
| Gigabyte Aero 15X i7-7700HQ, GeForce GTX 1070 Max-Q | MSI GS63VR 7RF-228US i7-7700HQ, GeForce GTX 1060 Mobile | HP Omen 15-ce002ng i7-7700HQ, GeForce GTX 1060 Max-Q | Gigabyte Aero 15 i7-7700HQ, GeForce GTX 1060 Mobile | Asus Zephyrus GX501VS i7-7700HQ, GeForce GTX 1070 Max-Q | MSI GE63VR 7RF Raider i7-7700HQ, GeForce GTX 1070 Mobile | Aorus X5 v7 i7-7820HK, GeForce GTX 1070 Mobile | Gigabyte P56XT i7-7700HQ, GeForce GTX 1070 Mobile | |
|---|---|---|---|---|---|---|---|---|
| Noise | 1% | 0% | 0% | 9% | -10% | -9% | -4% | |
| off /ambiente * (dB) | 30 | 28.8 4% | 30 -0% | 31 -3% | 28.5 5% | 30 -0% | 30 -0% | 30 -0% |
| Idle Minimum * (dB) | 31 | 33.1 -7% | 30 3% | 32 -3% | 28.5 8% | 33 -6% | 35 -13% | 34 -10% |
| Idle Average * (dB) | 32 | 33.1 -3% | 33 -3% | 33 -3% | 28.5 11% | 35 -9% | 36 -13% | 35 -9% |
| Idle Maximum * (dB) | 36 | 34 6% | 37 -3% | 34 6% | 30.1 16% | 40 -11% | 40 -11% | 39 -8% |
| Load Average * (dB) | 39 | 37.2 5% | 41 -5% | 39 -0% | 35.2 10% | 48 -23% | 43 -10% | 39 -0% |
| Witcher 3 ultra * (dB) | 44 | 46.1 -5% | 42 5% | 43 2% | 41.7 5% | 50 -14% | 49 -11% | 48 -9% |
| Load Maximum * (dB) | 52 | 47.1 9% | 50 4% | 50 4% | 48.8 6% | 55 -6% | 55 -6% | 49 6% |
* ... Meglio usare valori piccoli
(-) La temperatura massima sul lato superiore è di 51 °C / 124 F, rispetto alla media di 40.4 °C / 105 F, che varia da 21.2 a 68.8 °C per questa classe Gaming.
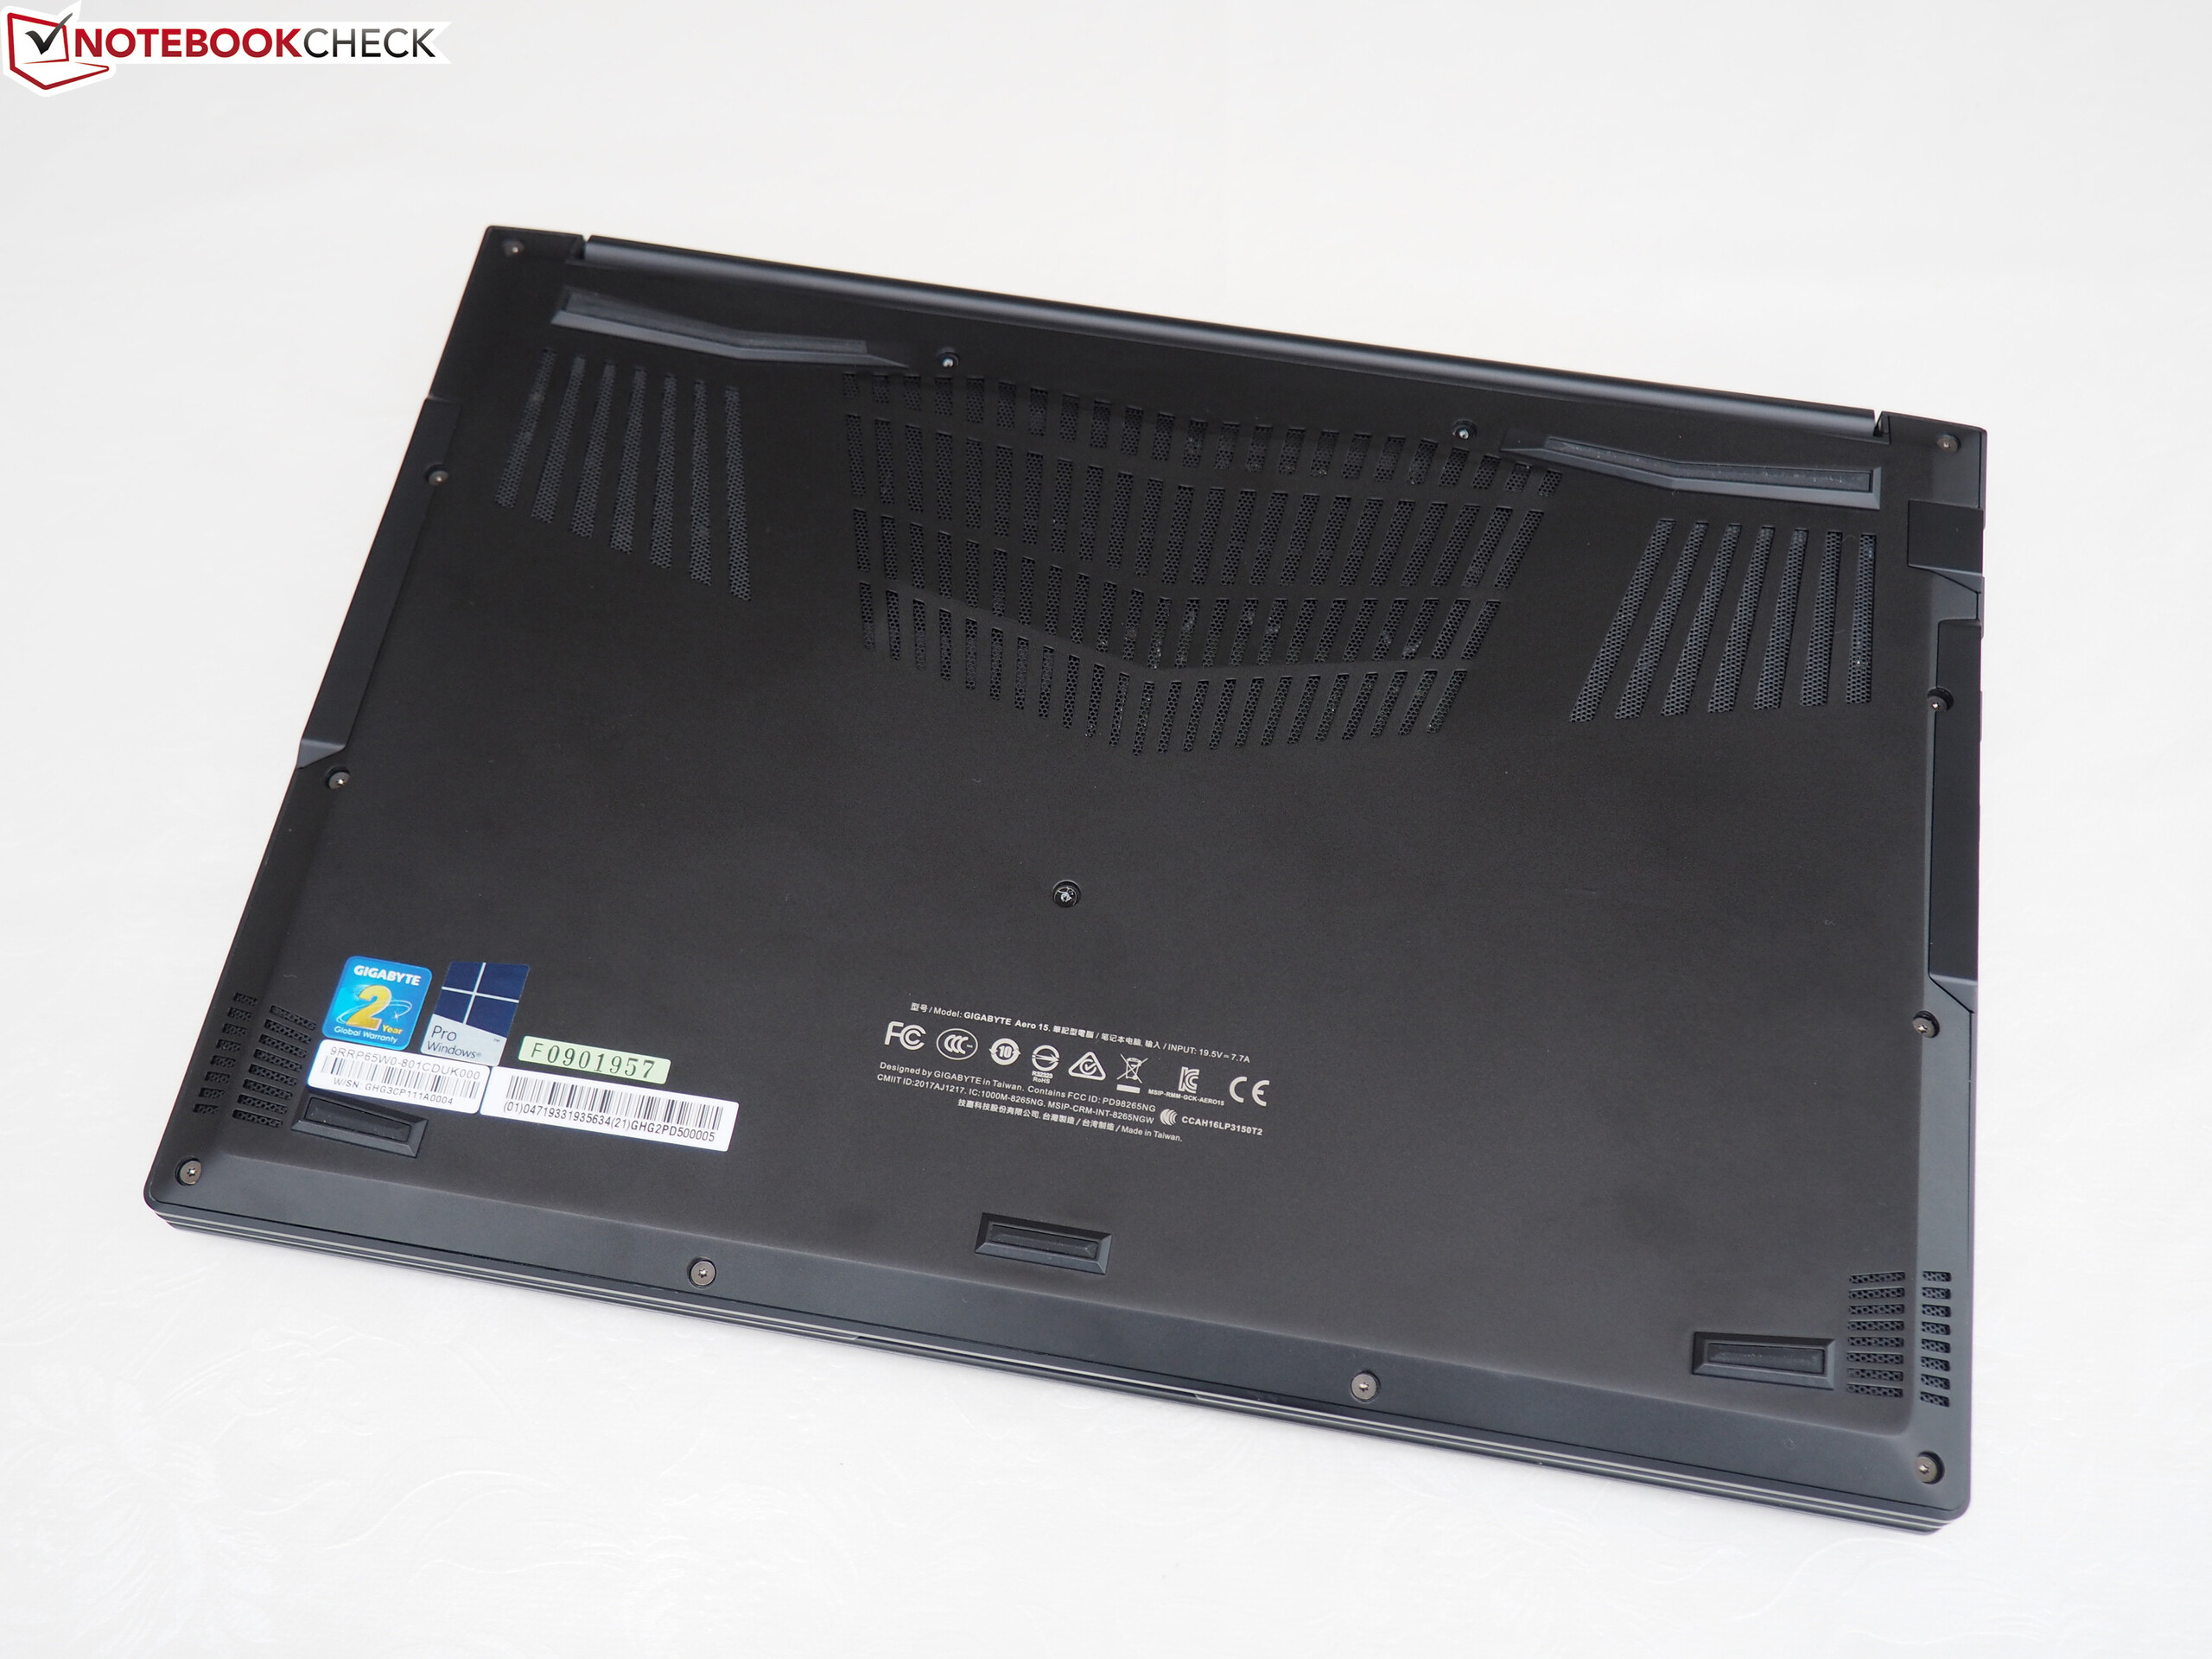
(-) Il lato inferiore si riscalda fino ad un massimo di 58 °C / 136 F, rispetto alla media di 43.2 °C / 110 F
(+) In idle, la temperatura media del lato superiore è di 24 °C / 75 F, rispetto alla media deld ispositivo di 33.9 °C / 93 F.
(-) Riproducendo The Witcher 3, la temperatura media per il lato superiore e' di 42.9 °C / 109 F, rispetto alla media del dispositivo di 33.9 °C / 93 F.
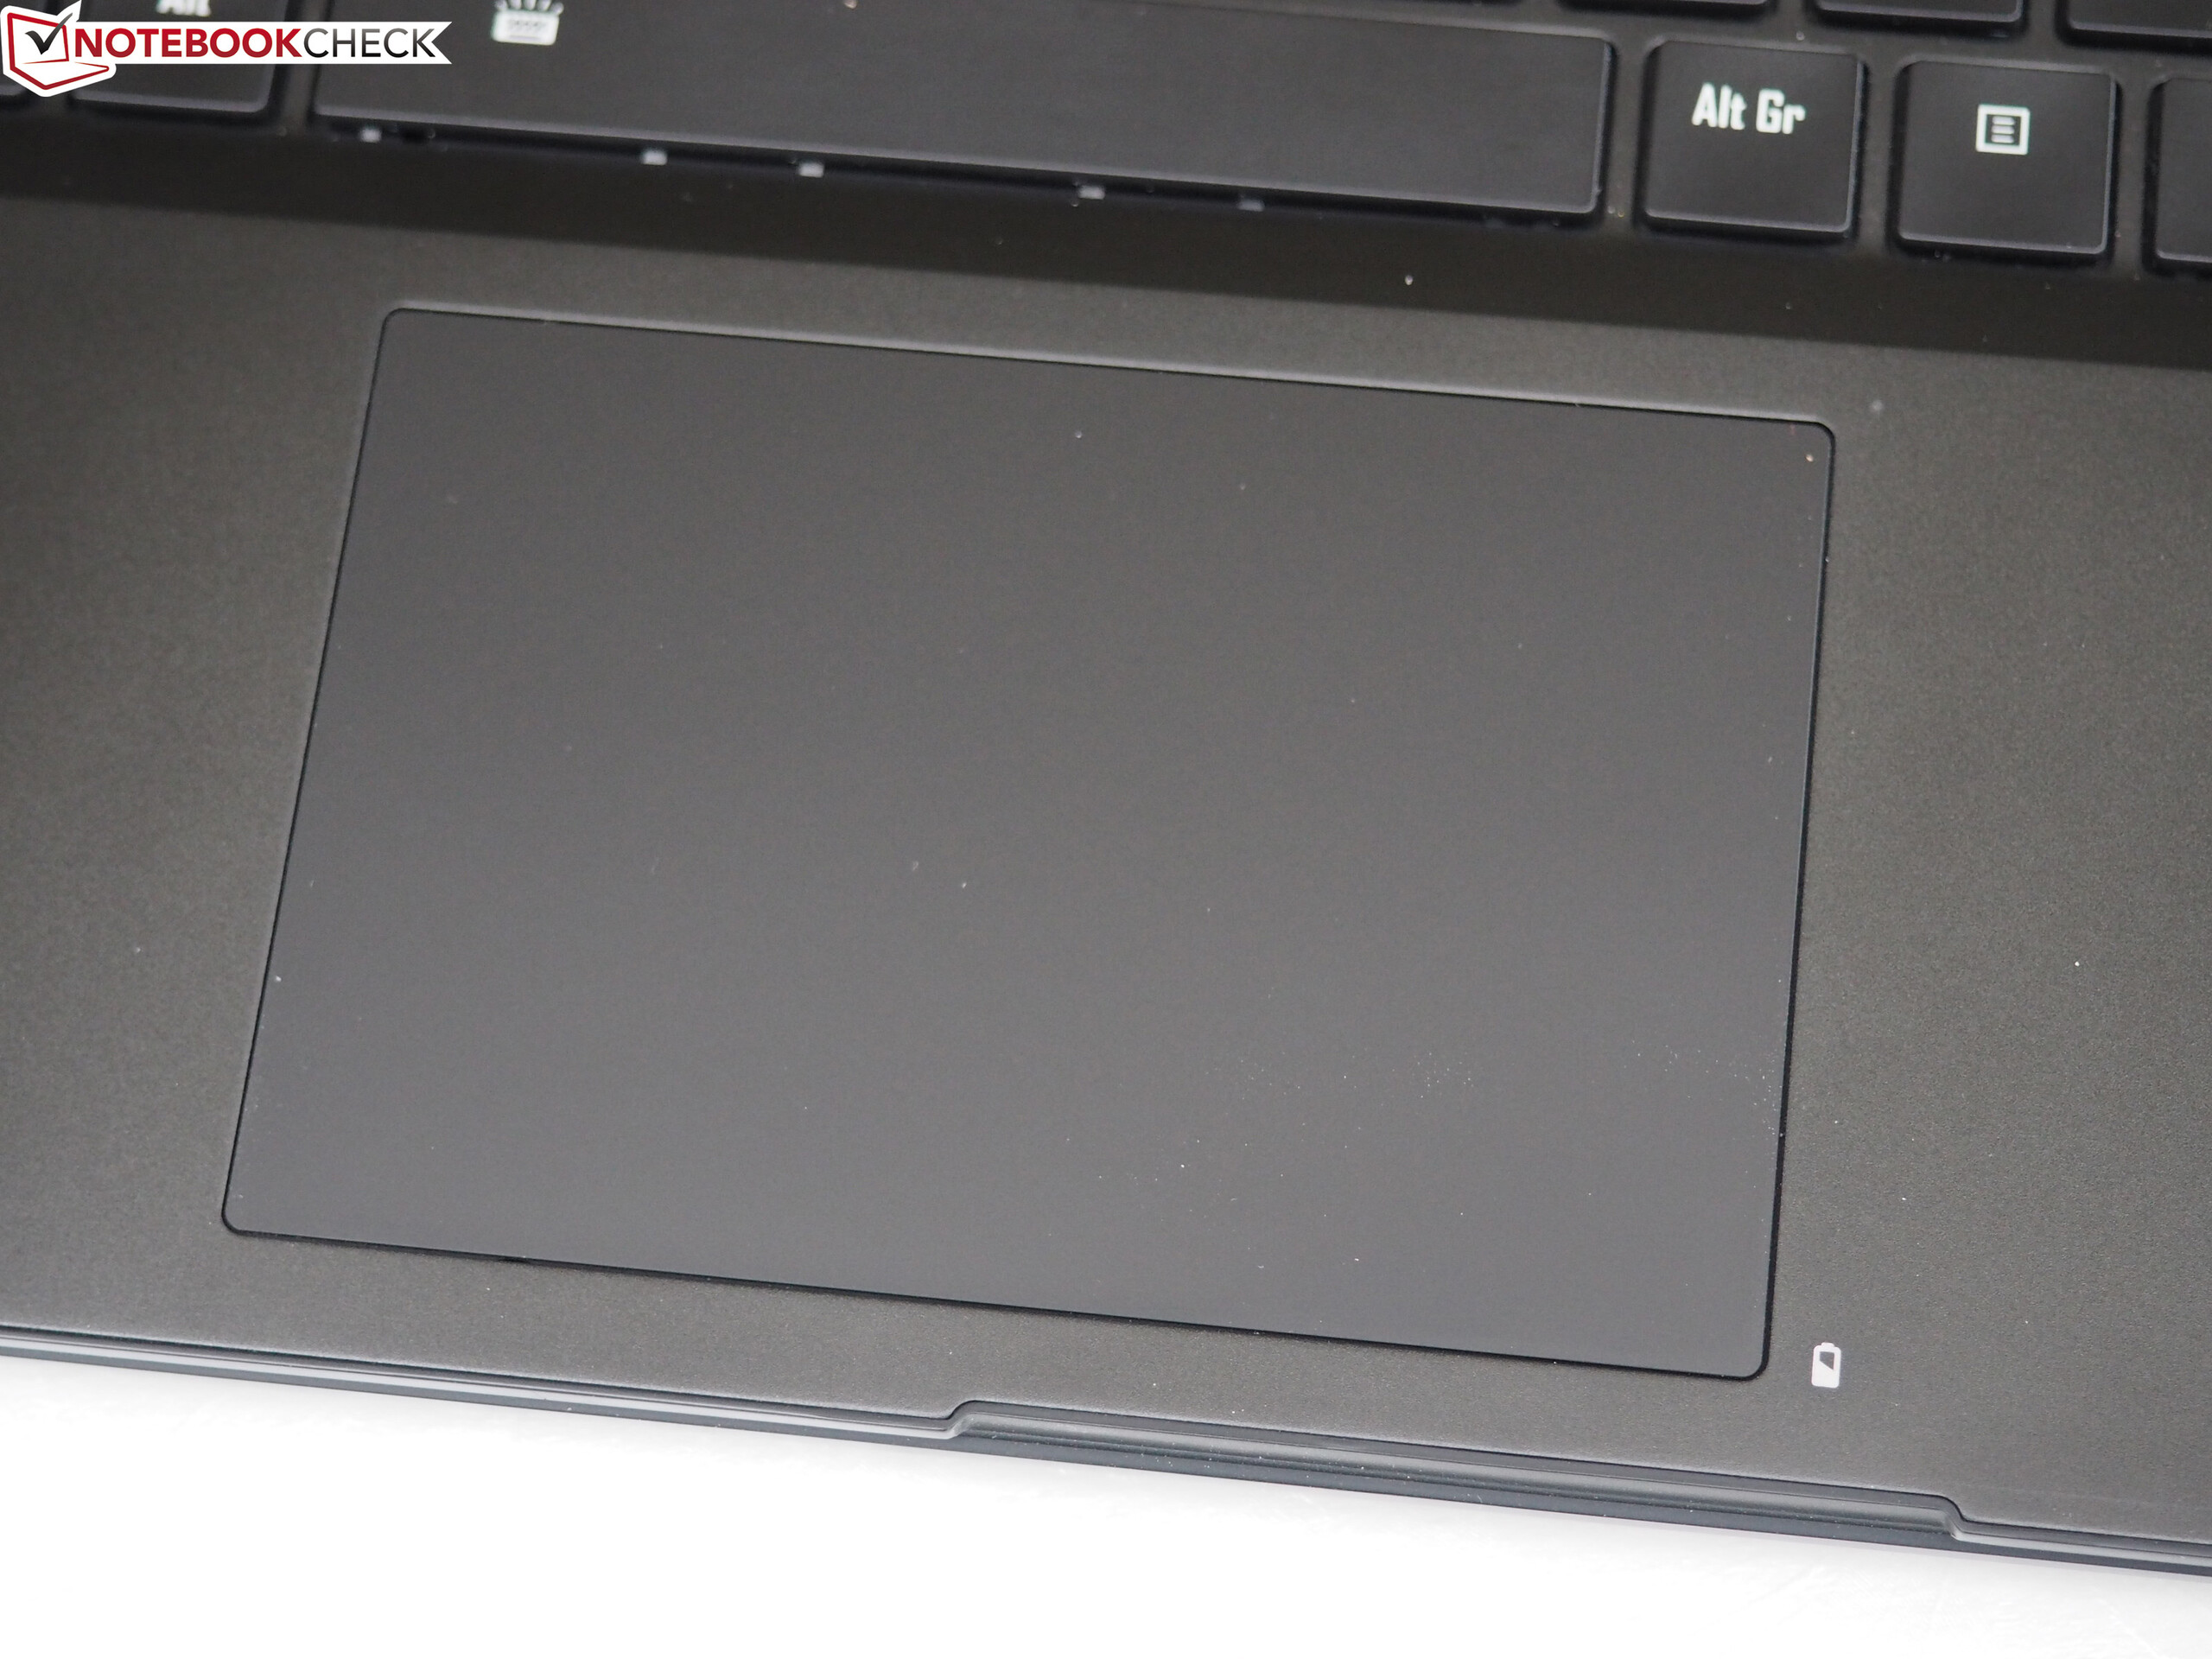
(±) I poggiapolsi e il touchpad possono diventare molto caldi al tatto con un massimo di 39 °C / 102.2 F.
(-) La temperatura media della zona del palmo della mano di dispositivi simili e'stata di 28.8 °C / 83.8 F (-10.2 °C / -18.4 F).
| Gigabyte Aero 15X i7-7700HQ, GeForce GTX 1070 Max-Q | MSI GS63VR 7RF-228US i7-7700HQ, GeForce GTX 1060 Mobile | HP Omen 15-ce002ng i7-7700HQ, GeForce GTX 1060 Max-Q | Gigabyte Aero 15 i7-7700HQ, GeForce GTX 1060 Mobile | Asus Zephyrus GX501VS i7-7700HQ, GeForce GTX 1070 Max-Q | MSI GE63VR 7RF Raider i7-7700HQ, GeForce GTX 1070 Mobile | Aorus X5 v7 i7-7820HK, GeForce GTX 1070 Mobile | Gigabyte P56XT i7-7700HQ, GeForce GTX 1070 Mobile | |
|---|---|---|---|---|---|---|---|---|
| Heat | -16% | -22% | -3% | -3% | -6% | -15% | -27% | |
| Maximum Upper Side * (°C) | 51 | 47 8% | 56 -10% | 54.4 -7% | 48 6% | 64 -25% | 65 -27% | |
| Maximum Bottom * (°C) | 58 | 54 7% | 61 -5% | 41.2 29% | 47 19% | 56 3% | 71 -22% | |
| Idle Upper Side * (°C) | 25 | 28.4 -14% | 36 -44% | 25 -0% | 31.2 -25% | 29 -16% | 29 -16% | 35 -40% |
| Idle Bottom * (°C) | 25 | 29.6 -18% | 40 -60% | 24 4% | 27.6 -10% | 33 -32% | 30 -20% | 30 -20% |
* ... Meglio usare valori piccoli
Gigabyte Aero 15X analisi audio
(±) | potenza degli altiparlanti media ma buona (76 dB)
Bassi 100 - 315 Hz
(±) | bassi ridotti - in media 12.6% inferiori alla media
(±) | la linearità dei bassi è media (14.3% delta rispetto alla precedente frequenza)
Medi 400 - 2000 Hz
(+) | medi bilanciati - solo only 4.8% rispetto alla media
(+) | medi lineari (4.1% delta rispetto alla precedente frequenza)
Alti 2 - 16 kHz
(+) | Alti bilanciati - appena 3% dalla media
(+) | alti lineari (3.1% delta rispetto alla precedente frequenza)
Nel complesso 100 - 16.000 Hz
(±) | la linearità complessiva del suono è media (16.6% di differenza rispetto alla media
Rispetto alla stessa classe
» 43% di tutti i dispositivi testati in questa classe è stato migliore, 7% simile, 50% peggiore
» Il migliore ha avuto un delta di 6%, medio di 18%, peggiore di 132%
Rispetto a tutti i dispositivi testati
» 29% di tutti i dispositivi testati in questa classe è stato migliore, 6% similare, 65% peggiore
» Il migliore ha avuto un delta di 4%, medio di 24%, peggiore di 134%
Asus Zephyrus GX501VS analisi audio
(-) | altoparlanti non molto potenti (71.4 dB)
Bassi 100 - 315 Hz
(-) | quasi nessun basso - in media 18.8% inferiori alla media
(±) | la linearità dei bassi è media (11.3% delta rispetto alla precedente frequenza)
Medi 400 - 2000 Hz
(+) | medi bilanciati - solo only 1.2% rispetto alla media
(+) | medi lineari (6.3% delta rispetto alla precedente frequenza)
Alti 2 - 16 kHz
(±) | alti elevati - circa 6.5% superiori alla media
(+) | alti lineari (6.3% delta rispetto alla precedente frequenza)
Nel complesso 100 - 16.000 Hz
(±) | la linearità complessiva del suono è media (23.4% di differenza rispetto alla media
Rispetto alla stessa classe
» 85% di tutti i dispositivi testati in questa classe è stato migliore, 5% simile, 11% peggiore
» Il migliore ha avuto un delta di 6%, medio di 18%, peggiore di 132%
Rispetto a tutti i dispositivi testati
» 70% di tutti i dispositivi testati in questa classe è stato migliore, 6% similare, 24% peggiore
» Il migliore ha avuto un delta di 4%, medio di 24%, peggiore di 134%
| Off / Standby | |
| Idle | |
| Sotto carico |
|
Leggenda:
min: | |
| Gigabyte Aero 15X i7-7700HQ, GeForce GTX 1070 Max-Q | MSI GS63VR 7RF-228US i7-7700HQ, GeForce GTX 1060 Mobile | HP Omen 15-ce002ng i7-7700HQ, GeForce GTX 1060 Max-Q | Gigabyte Aero 15 i7-7700HQ, GeForce GTX 1060 Mobile | Asus Zephyrus GX501VS i7-7700HQ, GeForce GTX 1070 Max-Q | MSI GE63VR 7RF Raider i7-7700HQ, GeForce GTX 1070 Mobile | Aorus X5 v7 i7-7820HK, GeForce GTX 1070 Mobile | Gigabyte P56XT i7-7700HQ, GeForce GTX 1070 Mobile | |
|---|---|---|---|---|---|---|---|---|
| Power Consumption | -18% | -32% | -5% | -28% | -24% | -81% | -22% | |
| Idle Minimum * (Watt) | 10 | 14.5 -45% | 18 -80% | 12 -20% | 19.1 -91% | 11 -10% | 26 -160% | 13 -30% |
| Idle Average * (Watt) | 13 | 17.3 -33% | 23 -77% | 15 -15% | 20.8 -60% | 16 -23% | 31 -138% | 17 -31% |
| Idle Maximum * (Watt) | 20 | 17.4 13% | 30 -50% | 20 -0% | 21.8 -9% | 21 -5% | 36 -80% | 22 -10% |
| Load Average * (Watt) | 79 | 93 -18% | 85 -8% | 82 -4% | 73.7 7% | 92 -16% | 93 -18% | 85 -8% |
| Witcher 3 ultra * (Watt) | 120 | 128.8 -7% | 96 20% | 111 7% | 130.2 -9% | 185 -54% | 176 -47% | 154 -28% |
| Load Maximum * (Watt) | 165 | 158 4% | 161 2% | 173.1 -5% | 224 -36% | 240 -45% | 208 -26% |
* ... Meglio usare valori piccoli
| Gigabyte Aero 15X i7-7700HQ, GeForce GTX 1070 Max-Q, 94.2 Wh | Acer Aspire VN7-593G-73HP V15 Nitro BE i7-7700HQ, GeForce GTX 1060 Mobile, 69 Wh | MSI GS63VR 7RF-228US i7-7700HQ, GeForce GTX 1060 Mobile, 65 Wh | Razer Blade (2017) i7-7700HQ, GeForce GTX 1060 Mobile, 70 Wh | HP Omen 15-ce002ng i7-7700HQ, GeForce GTX 1060 Max-Q, 70 Wh | Gigabyte Aero 15 i7-7700HQ, GeForce GTX 1060 Mobile, 94.24 Wh | Asus Zephyrus GX501VS i7-7700HQ, GeForce GTX 1070 Max-Q, 50 Wh | |
|---|---|---|---|---|---|---|---|
| Autonomia della batteria | -23% | -51% | 11% | -57% | -15% | -70% | |
| Reader / Idle (h) | 13 | 8.4 -35% | 6.4 -51% | 4.3 -67% | 10.6 -18% | 3.8 -71% | |
| H.264 (h) | 7.6 | 3.7 -51% | 7.7 1% | ||||
| WiFi v1.3 (h) | 8.2 | 6 -27% | 3.9 -52% | 9.1 11% | 3.3 -60% | 7 -15% | 2.5 -70% |
| Load (h) | 2.6 | 2.4 -8% | 1.3 -50% | 1.3 -50% | 1.9 -27% | 0.8 -69% |
Pro
Contro
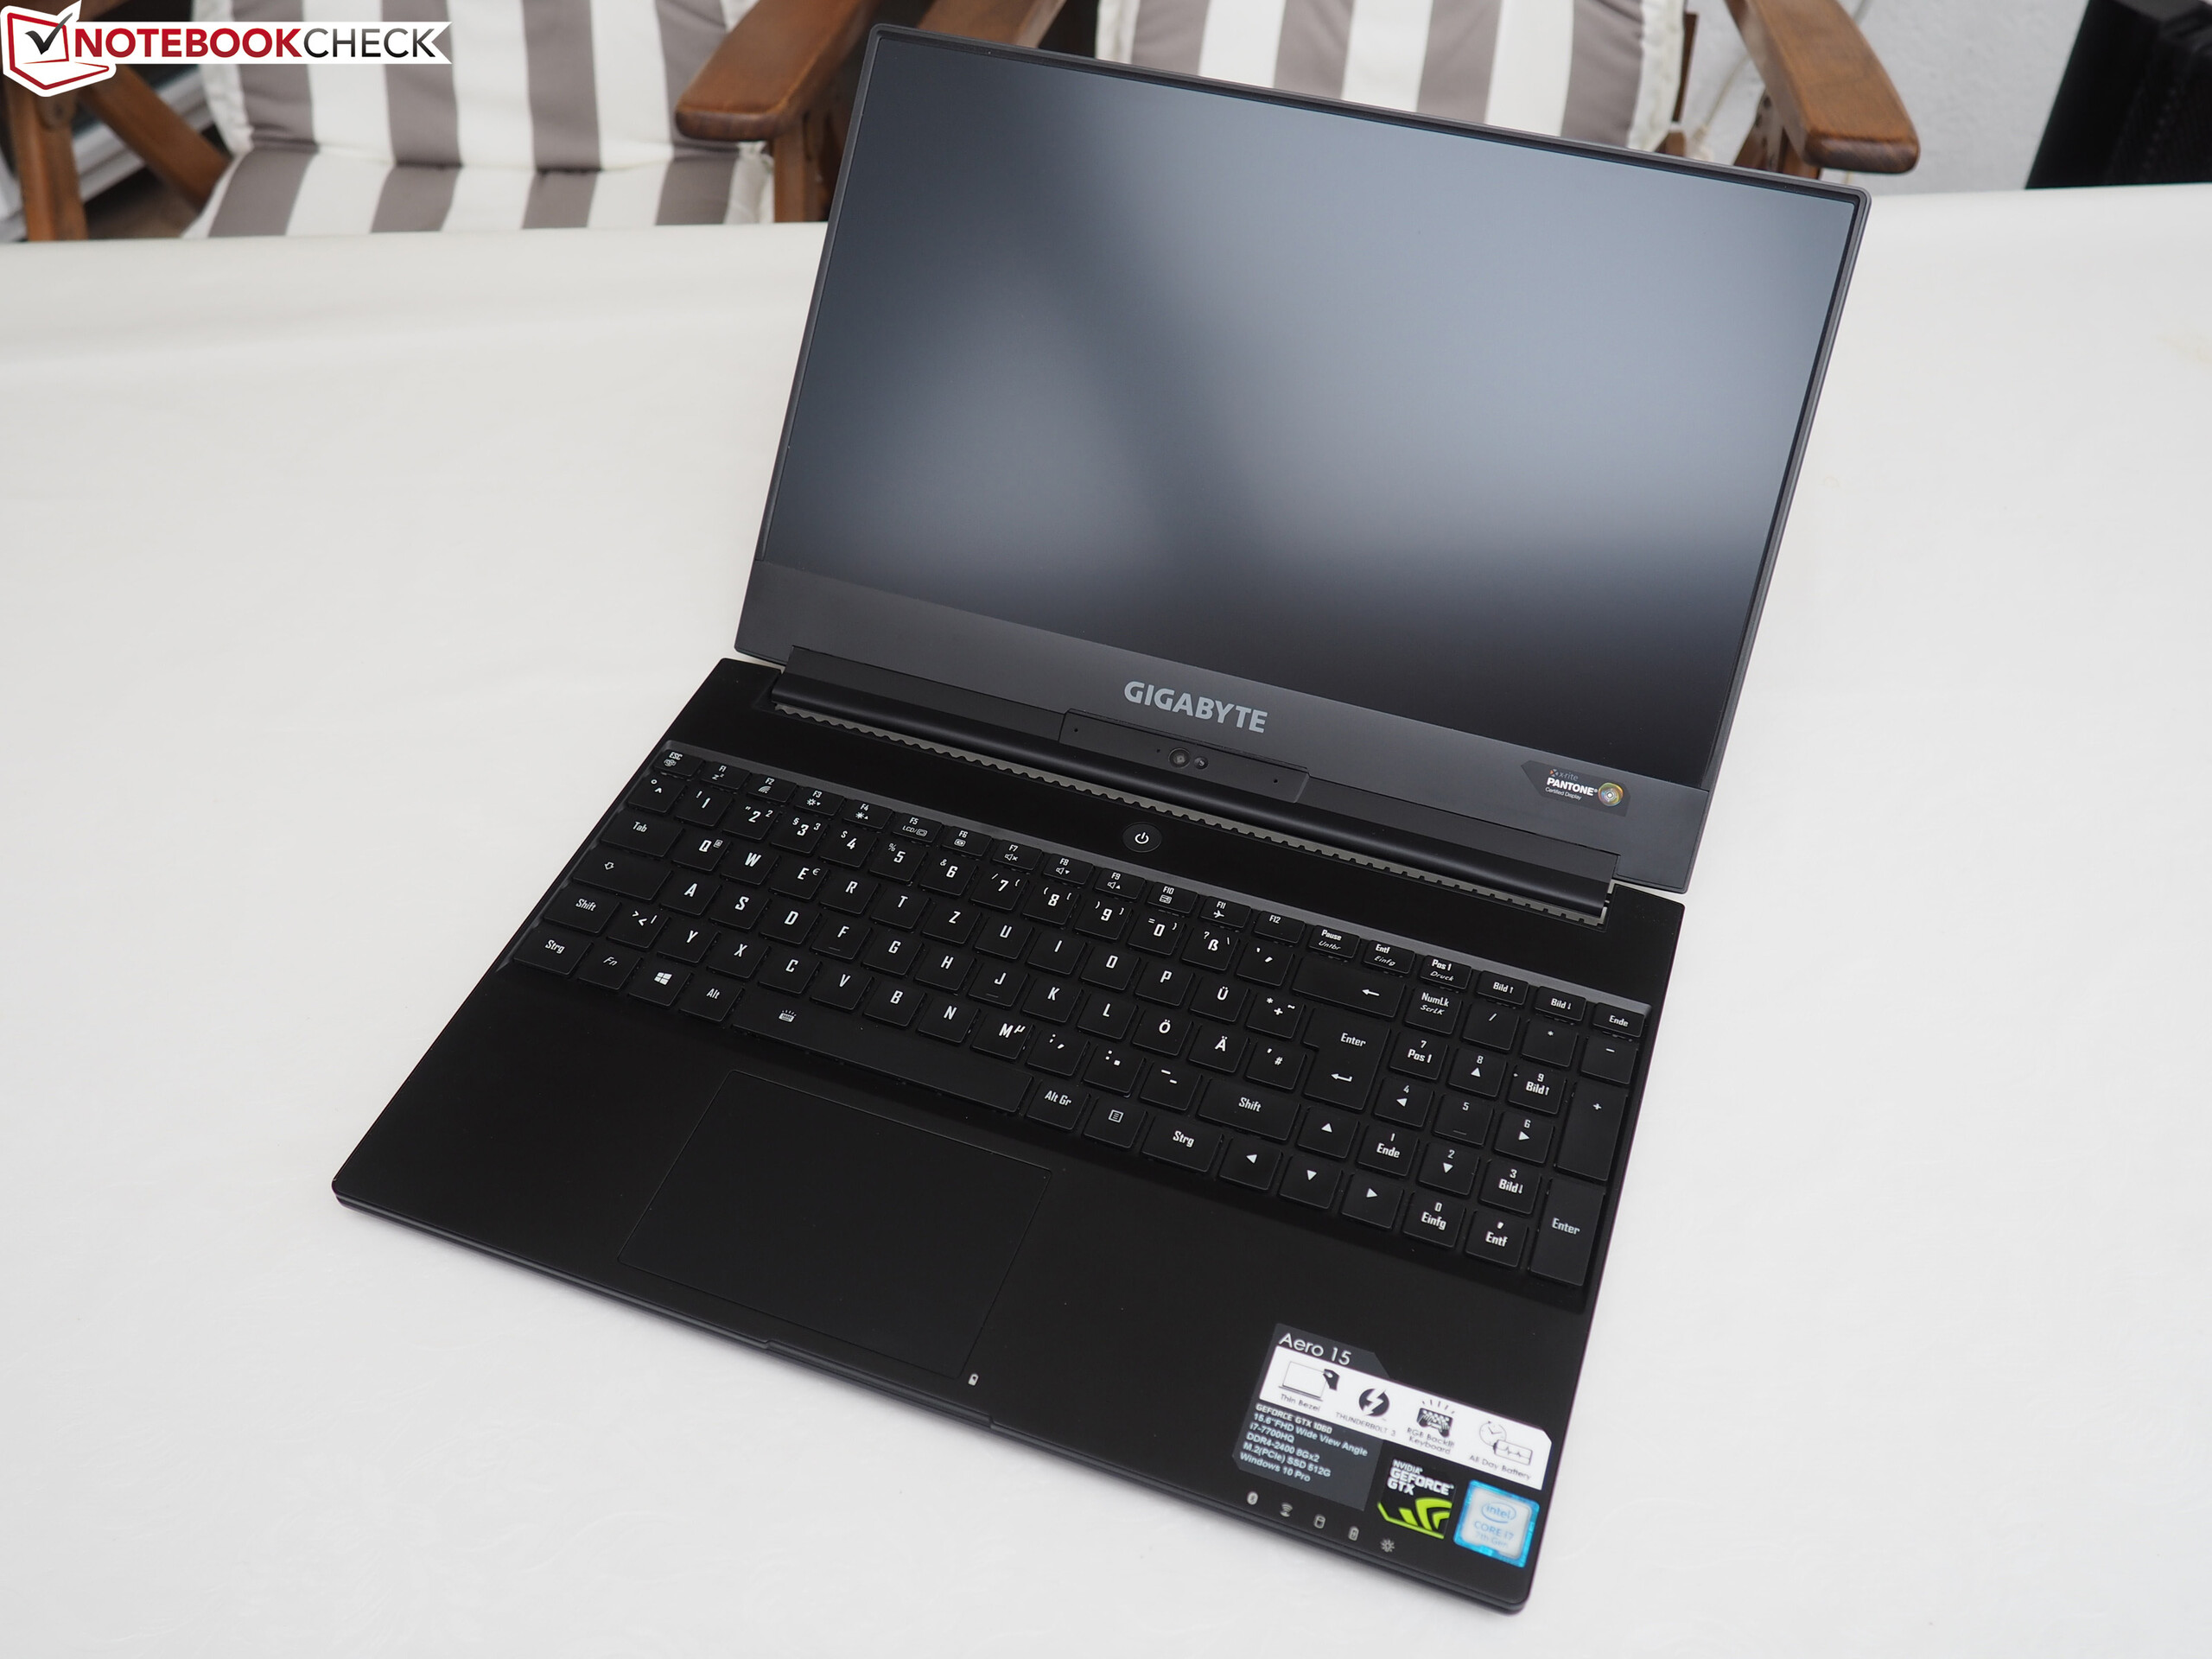
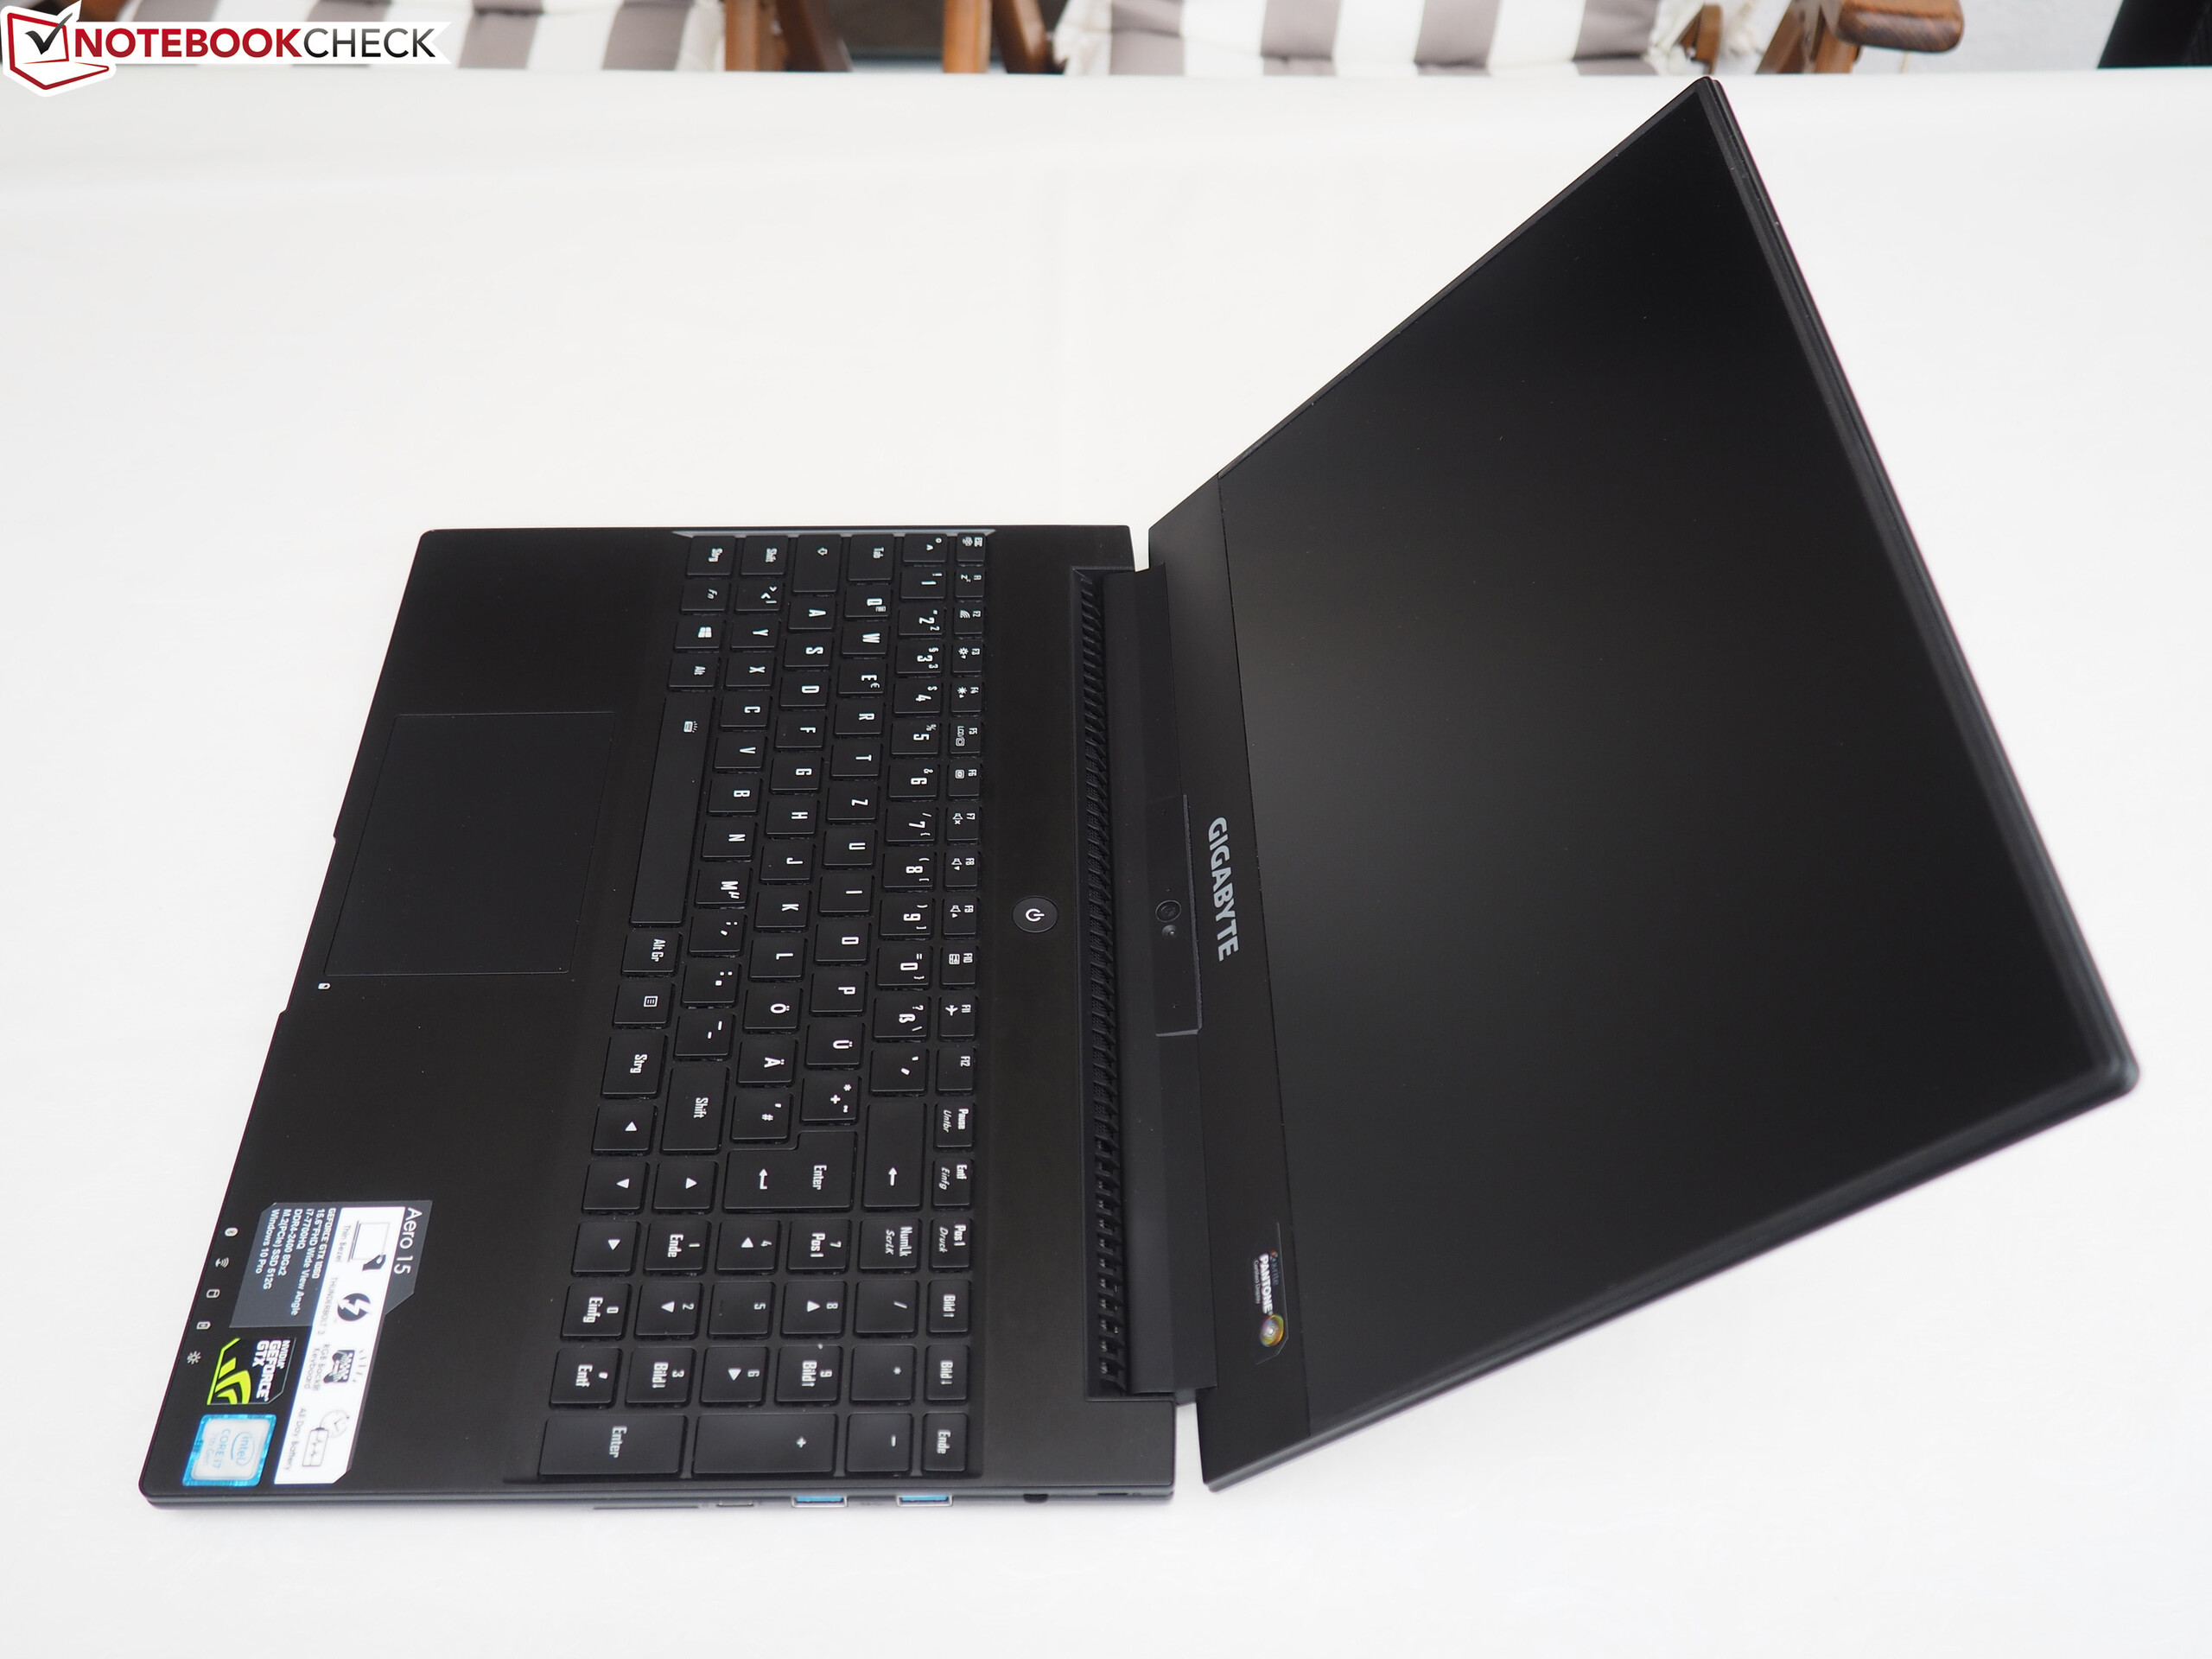
Grazie al potente hardware, il sottile e slanciato Aero 15X gestisce in modo fluido tutti i giochi attuali con dettagli elevati o medi sul suo display matto FHD.
Nonostante il potente hardware l'autonomia è sorprendentemente buona.
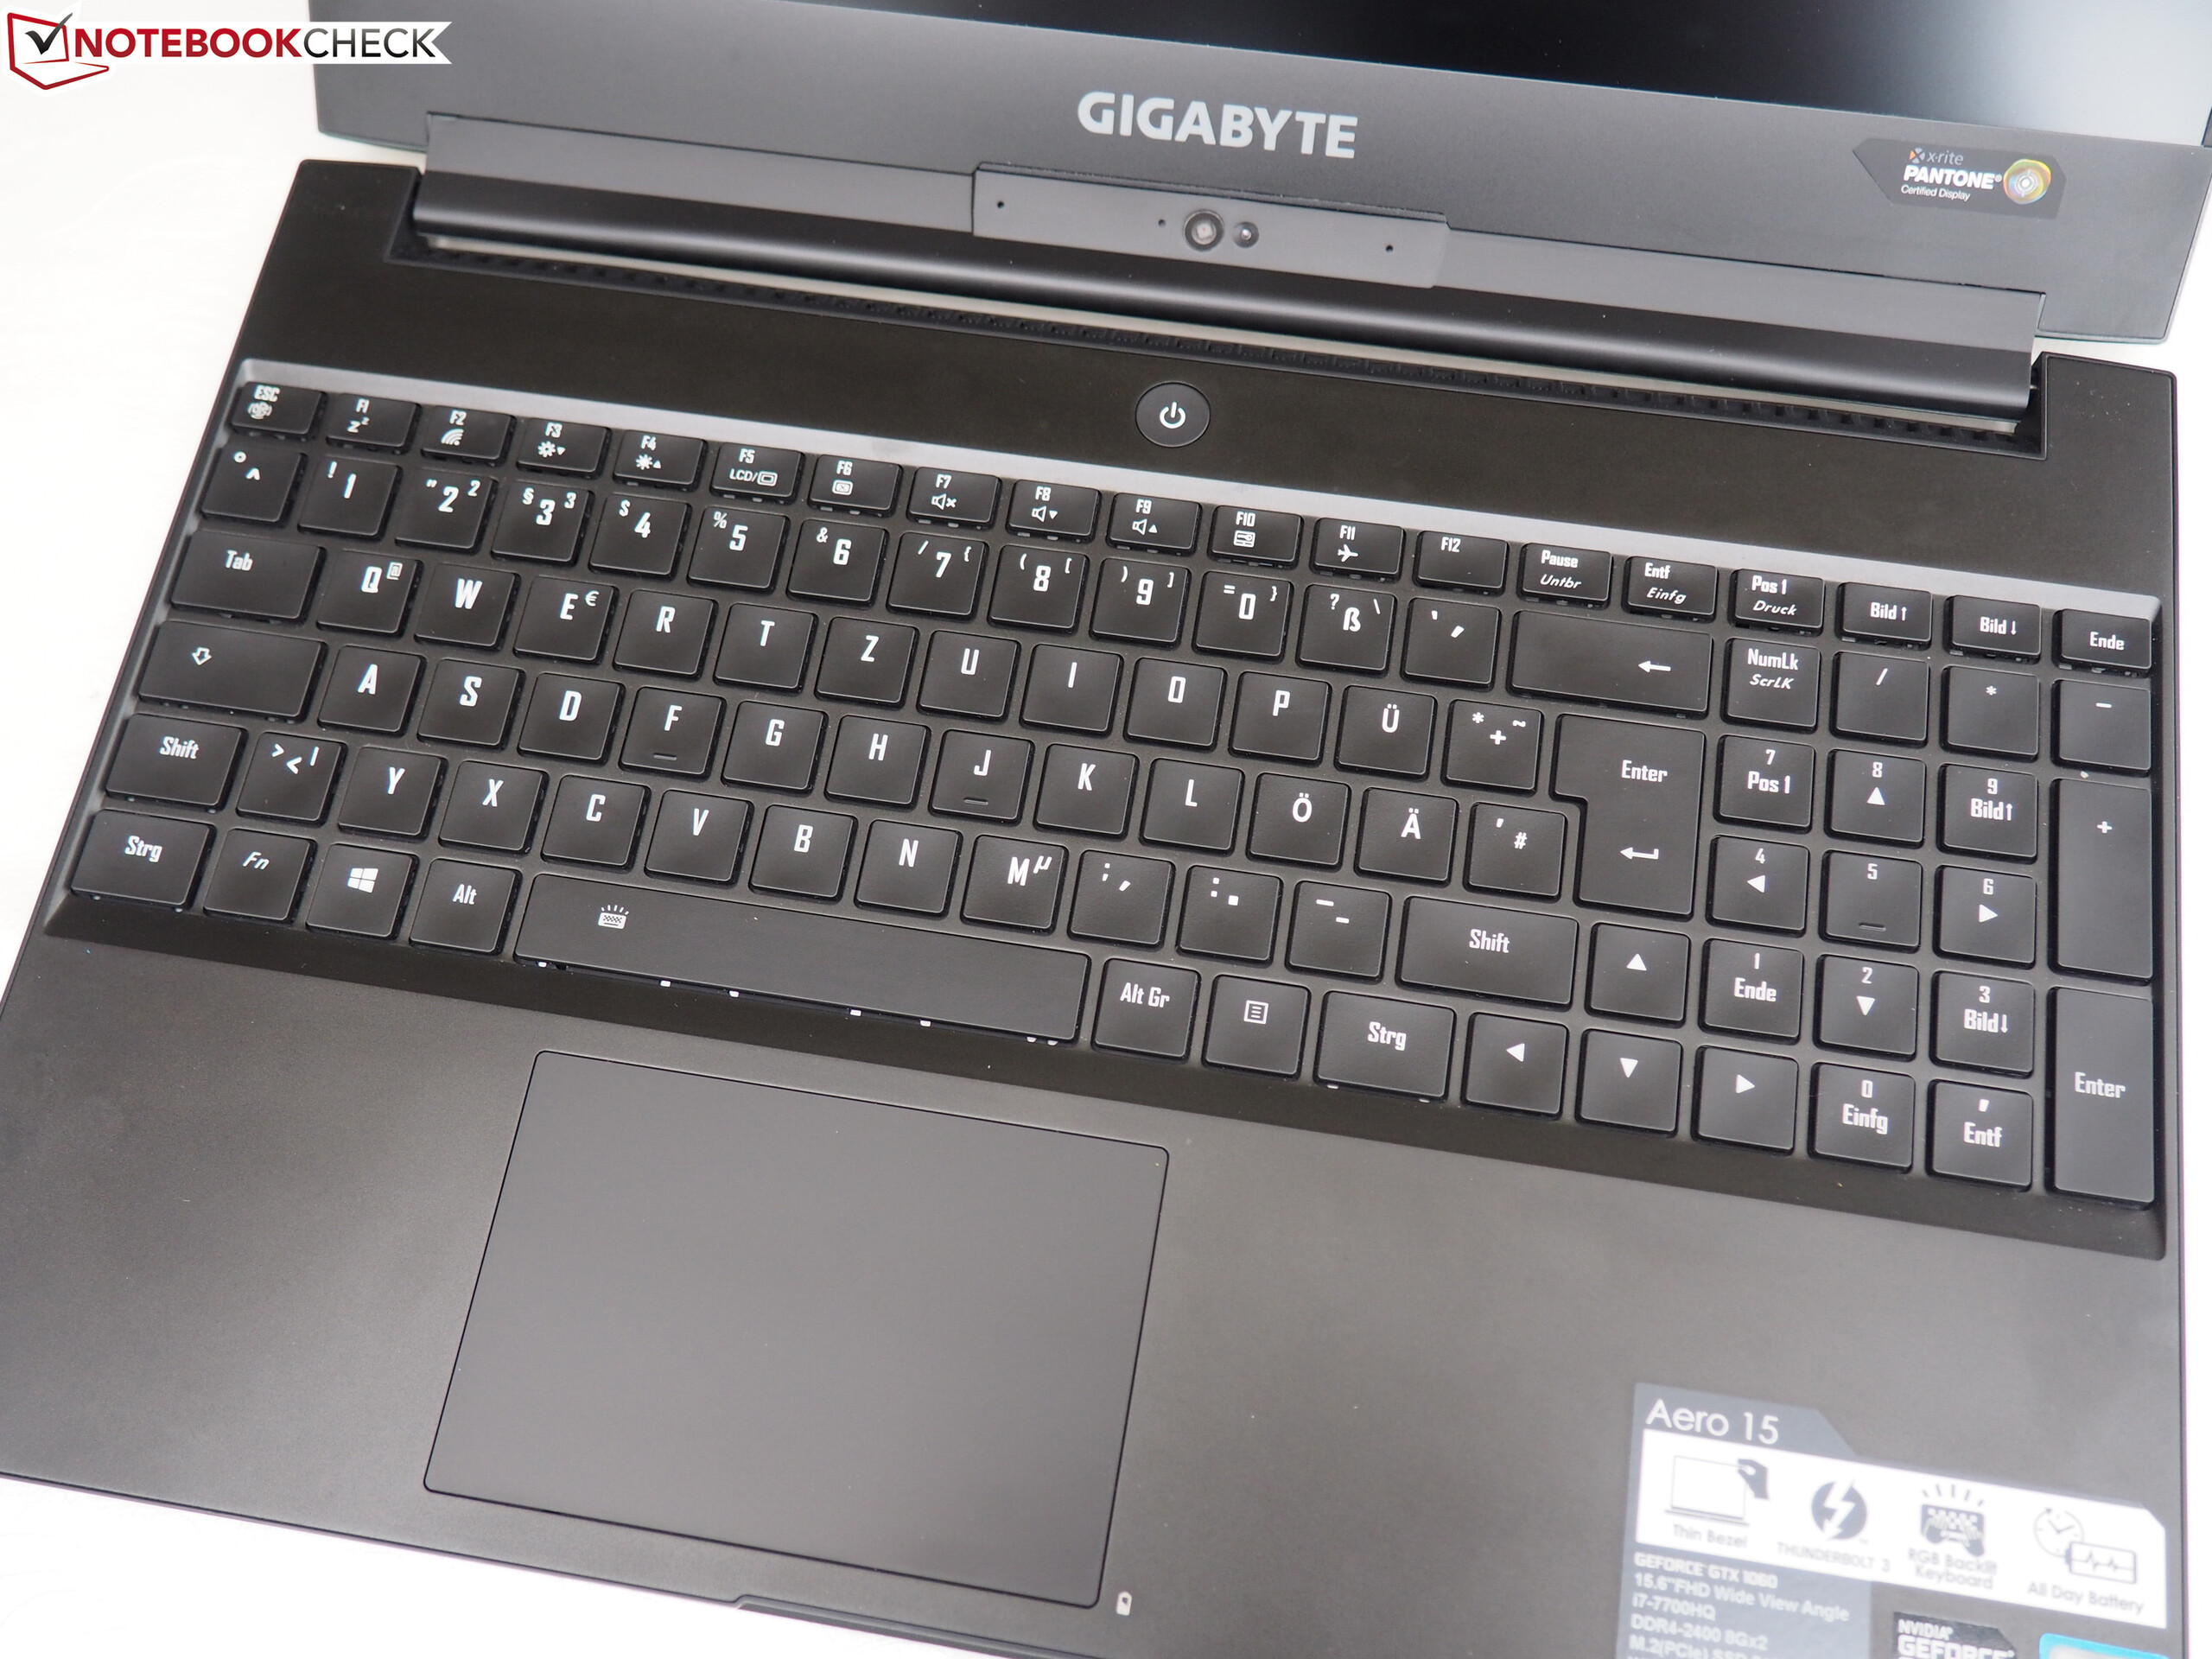
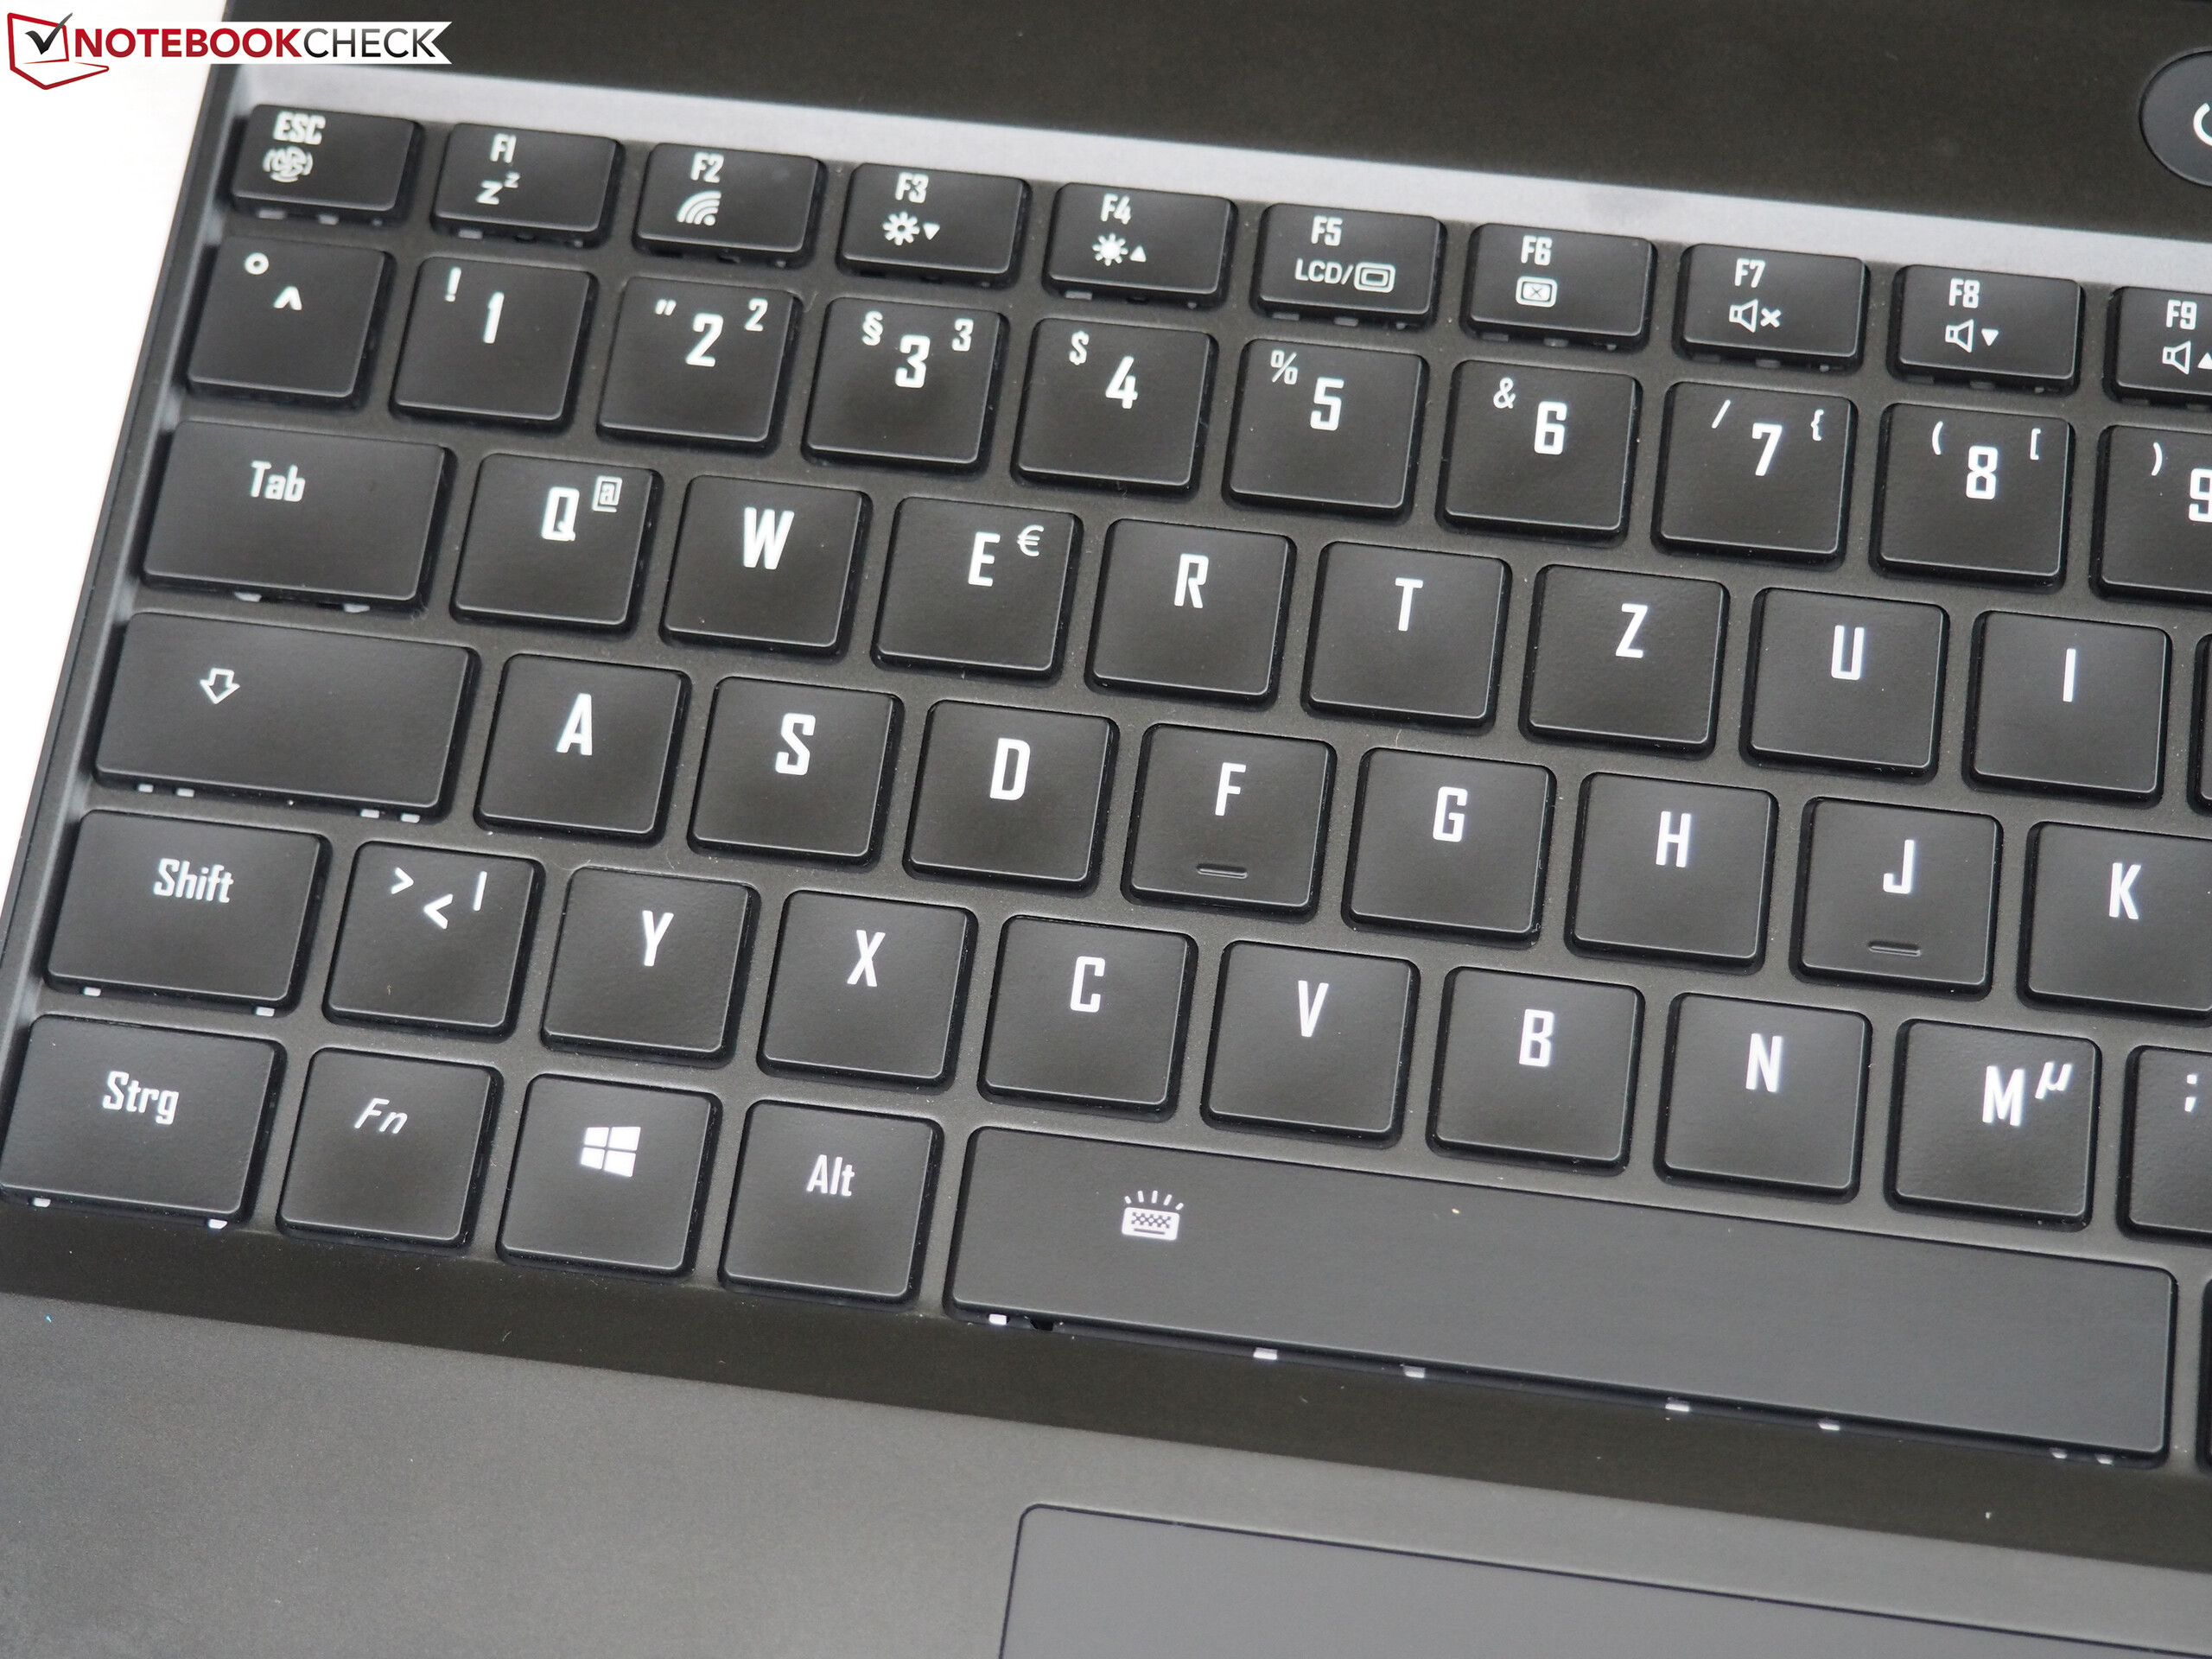
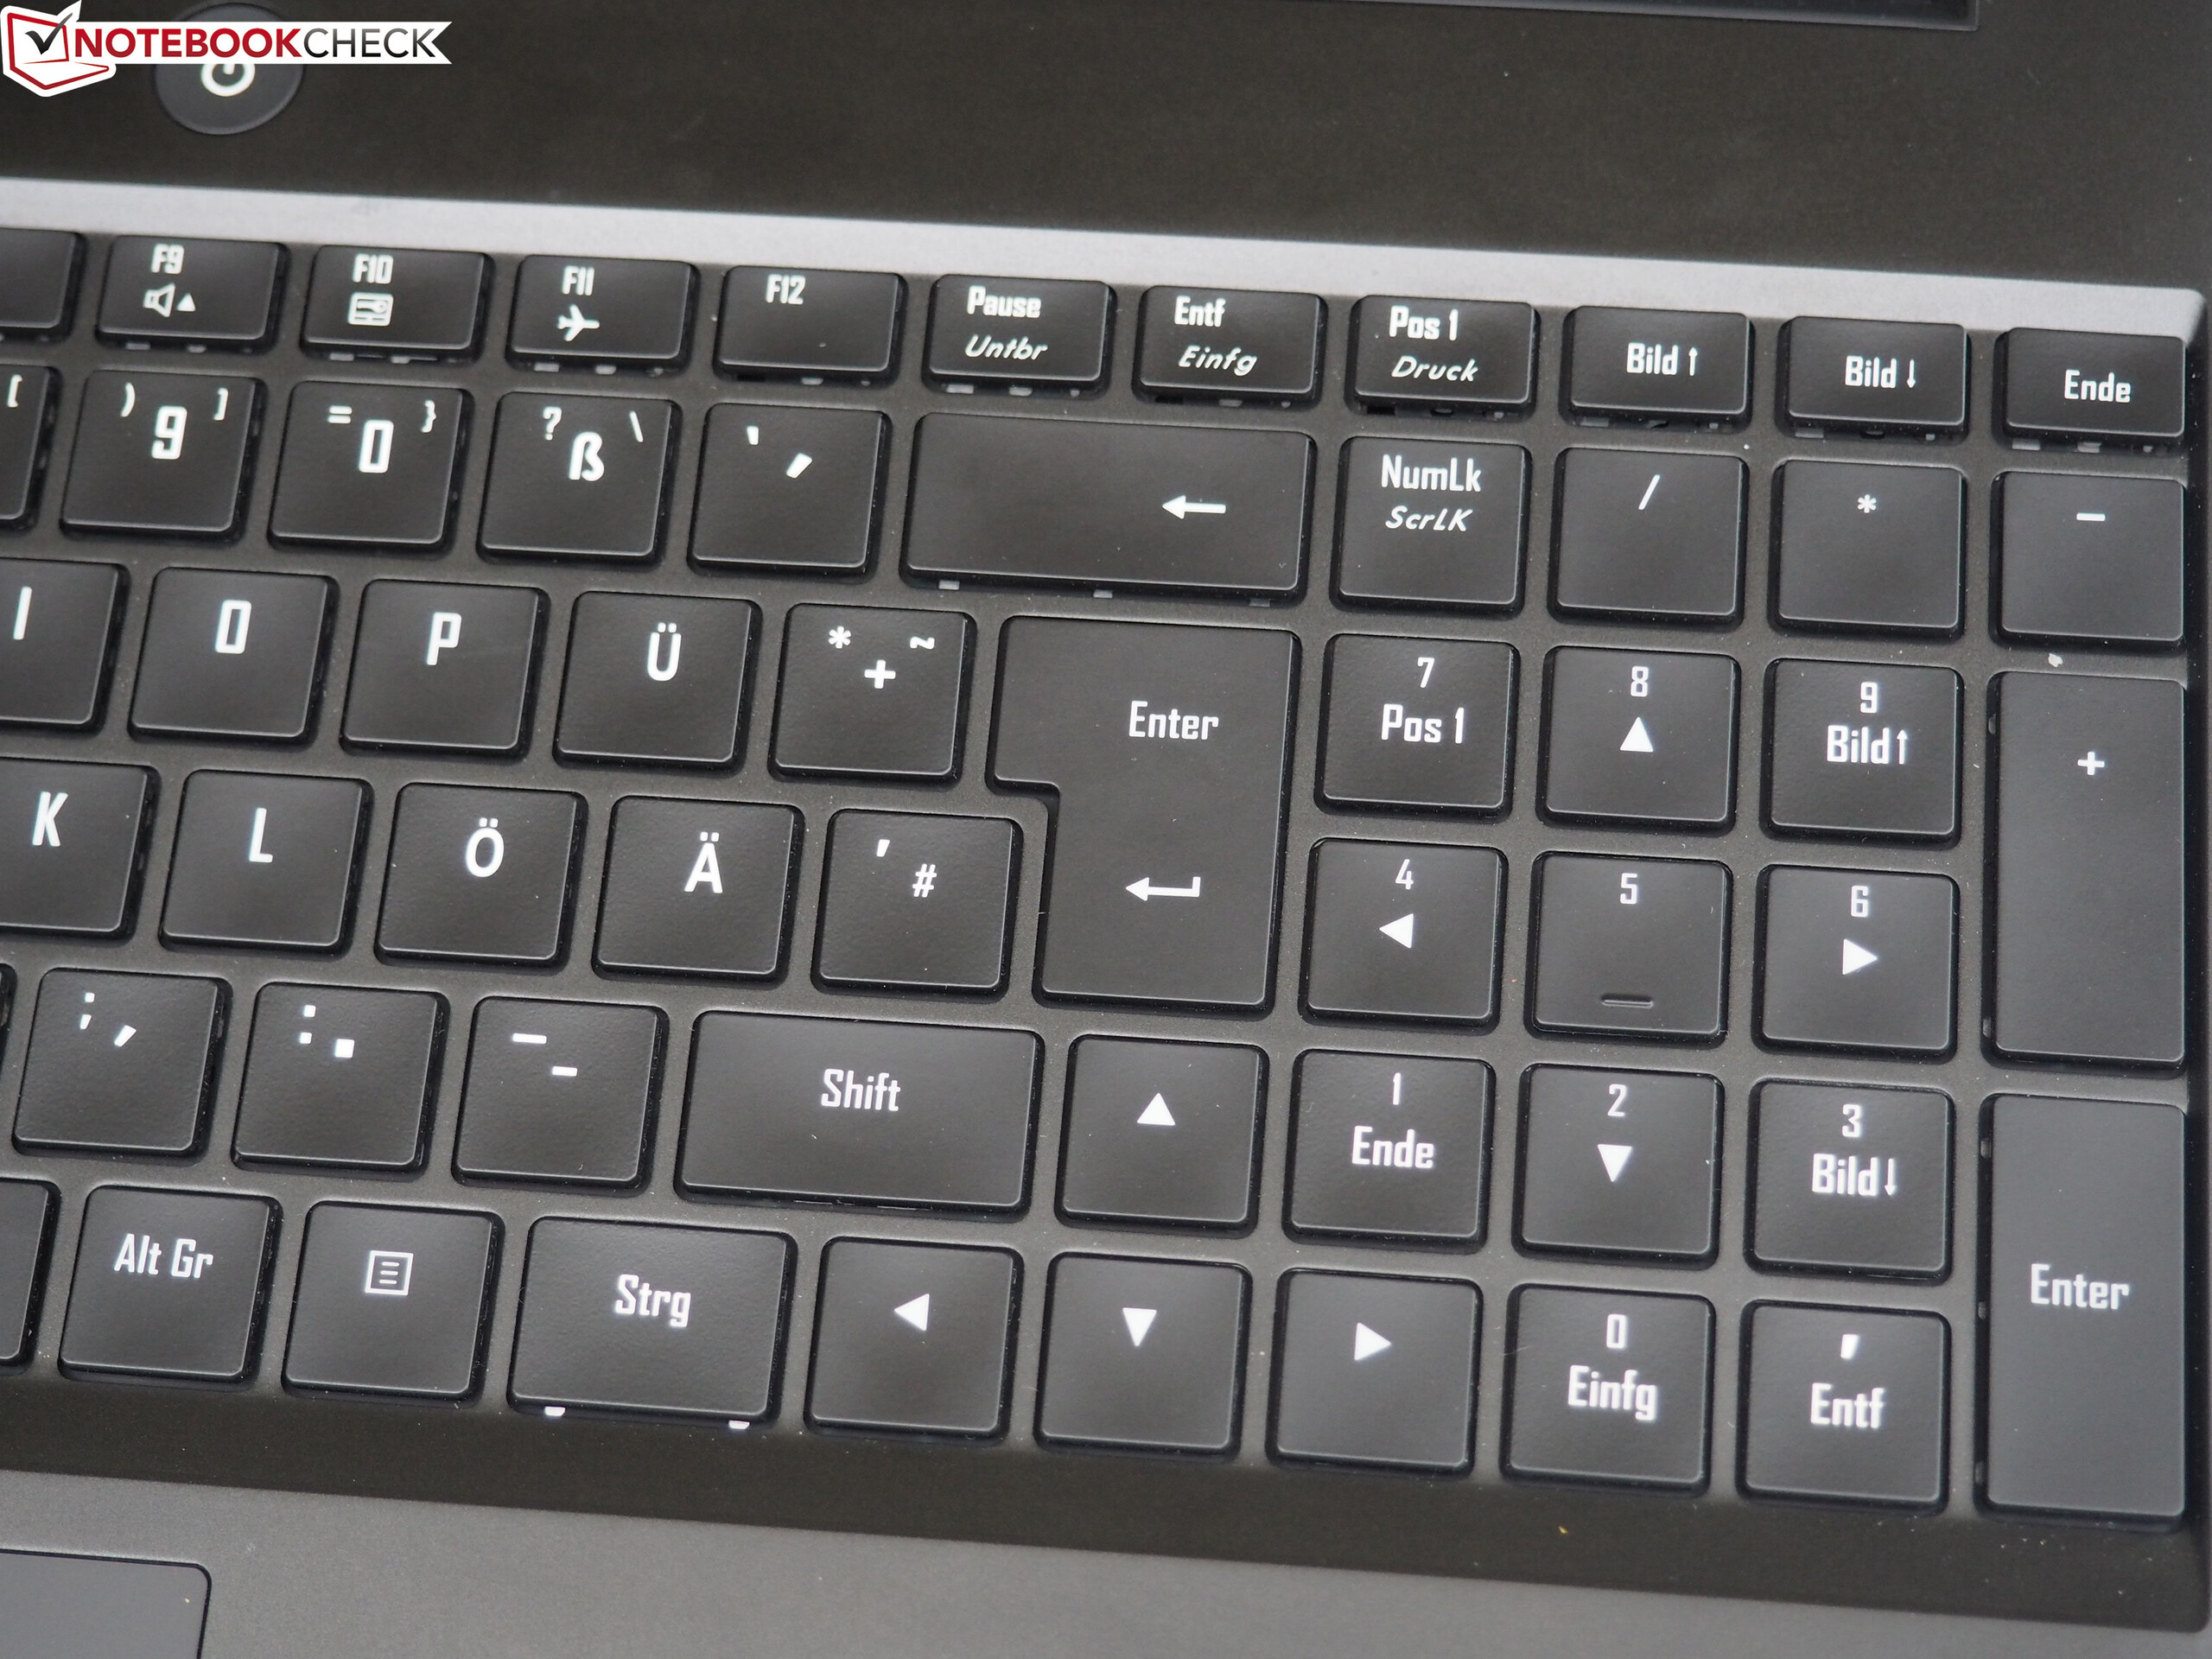
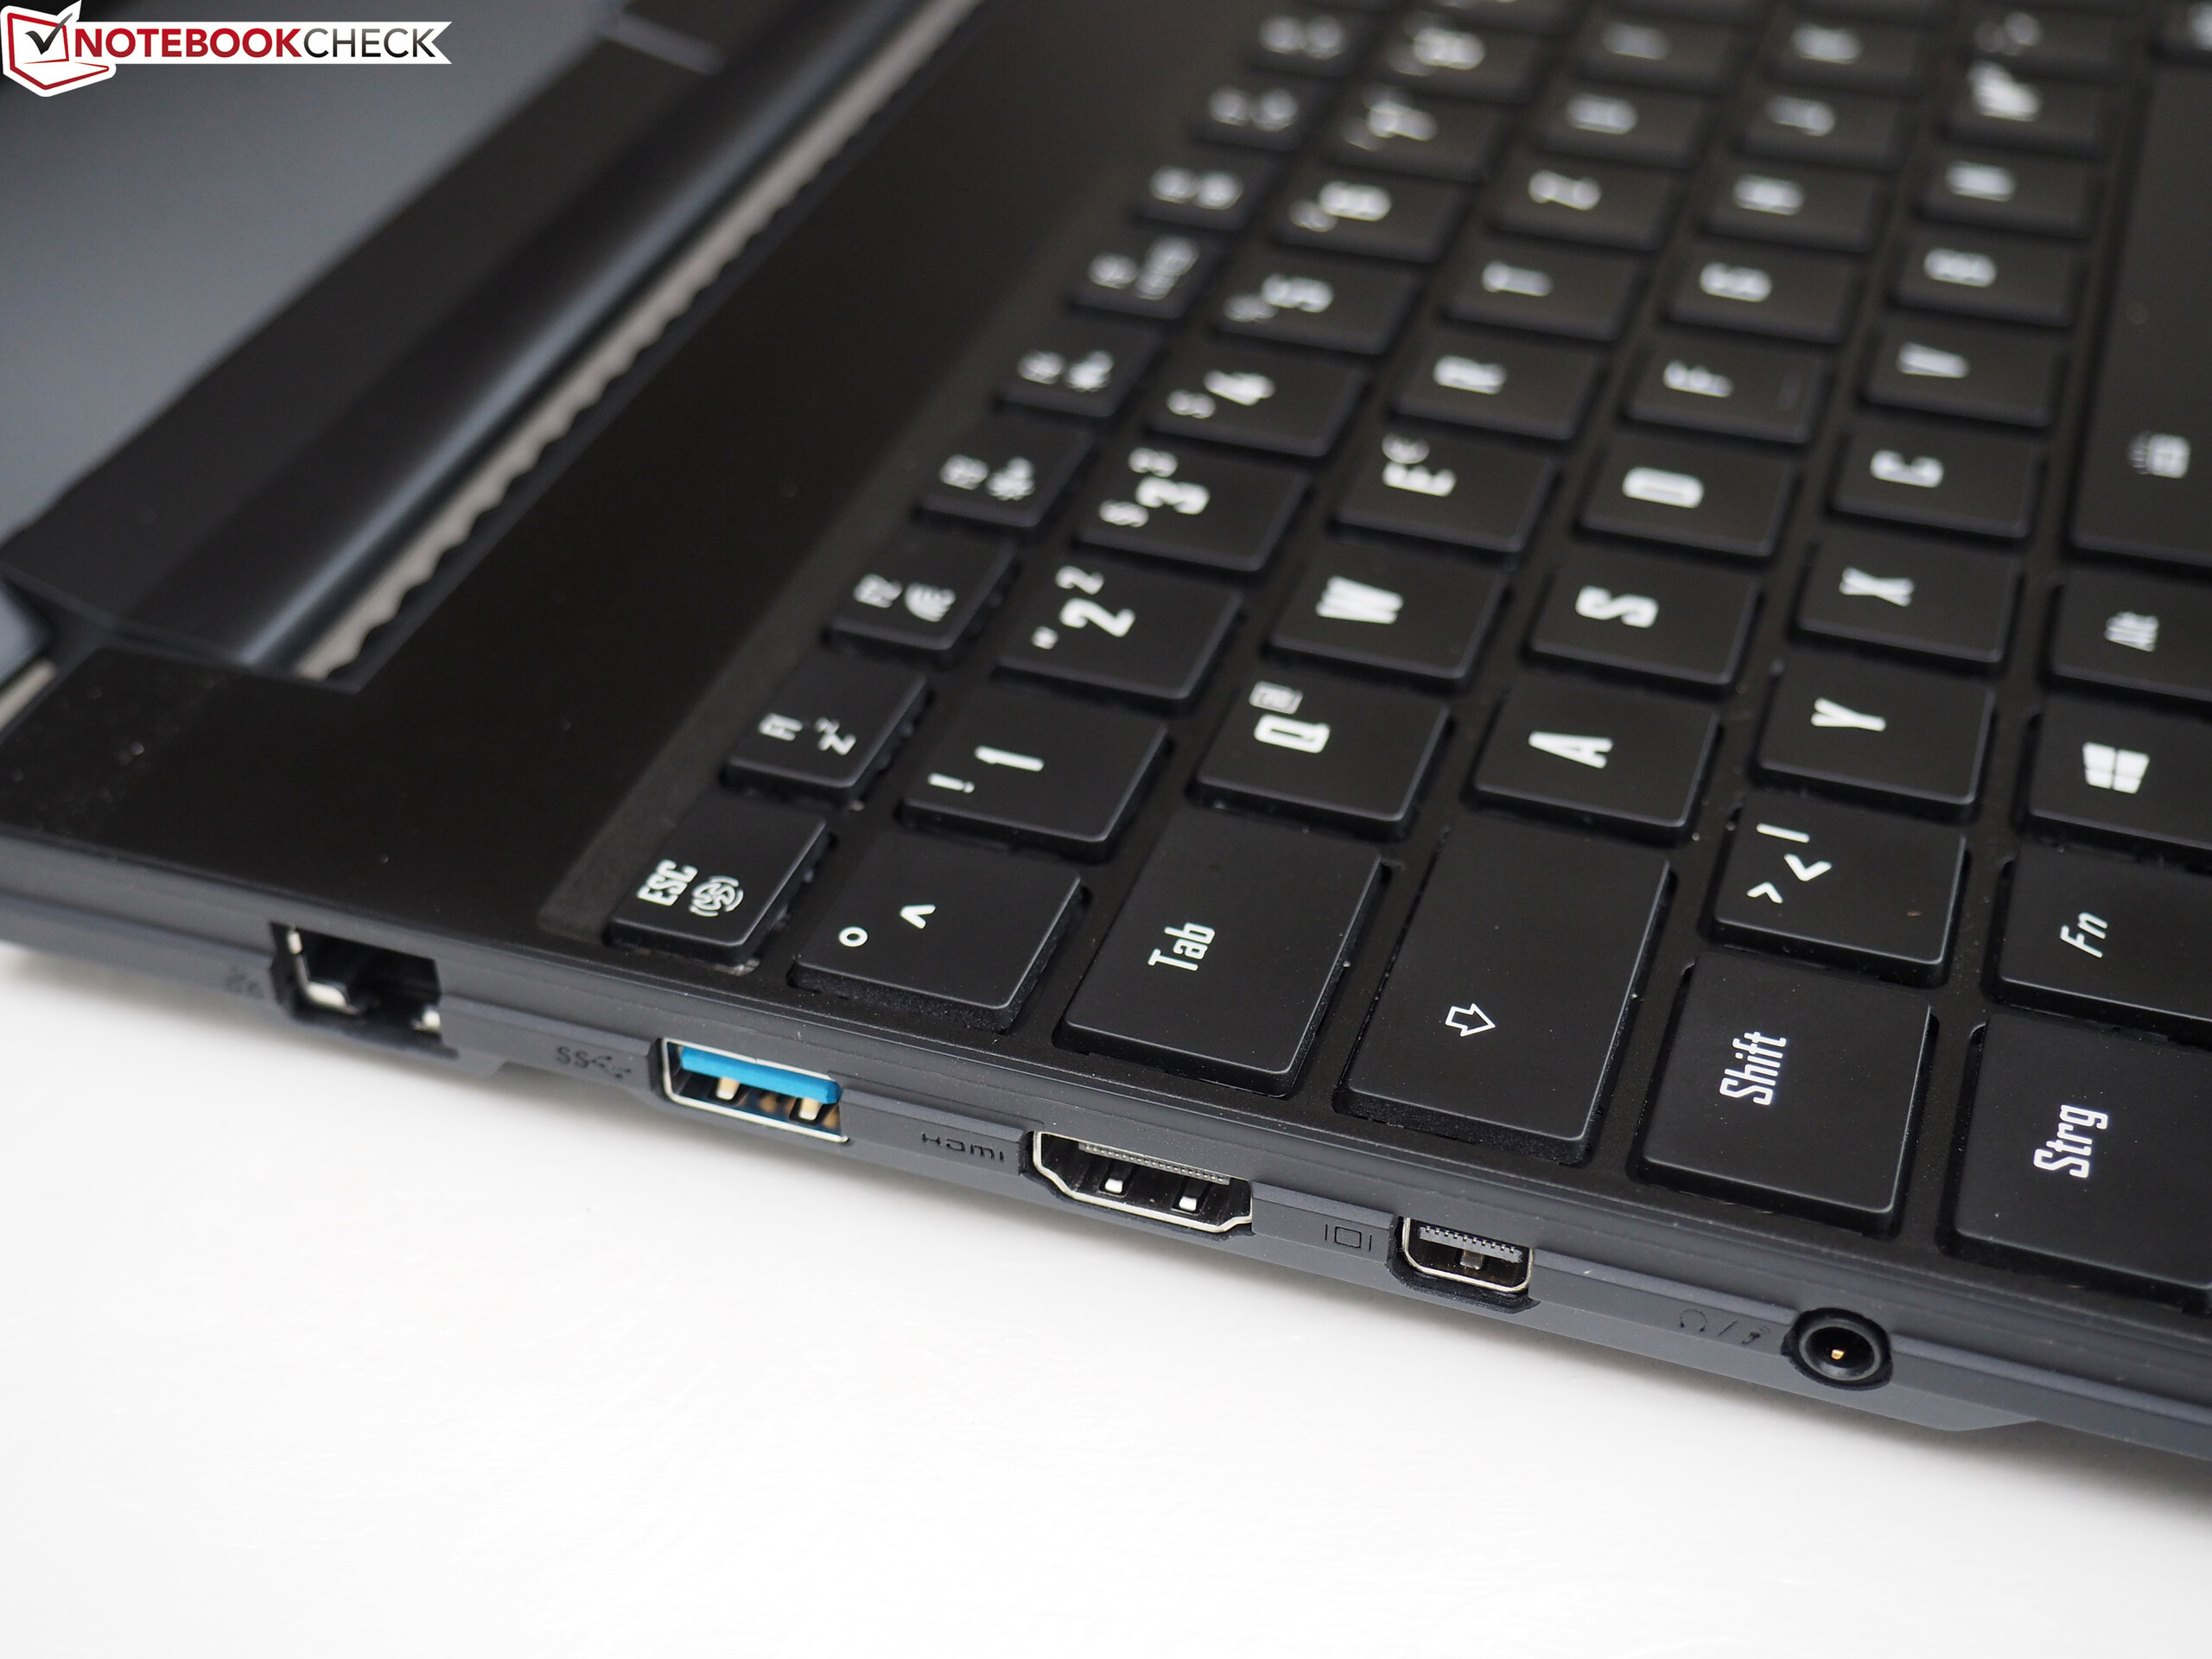
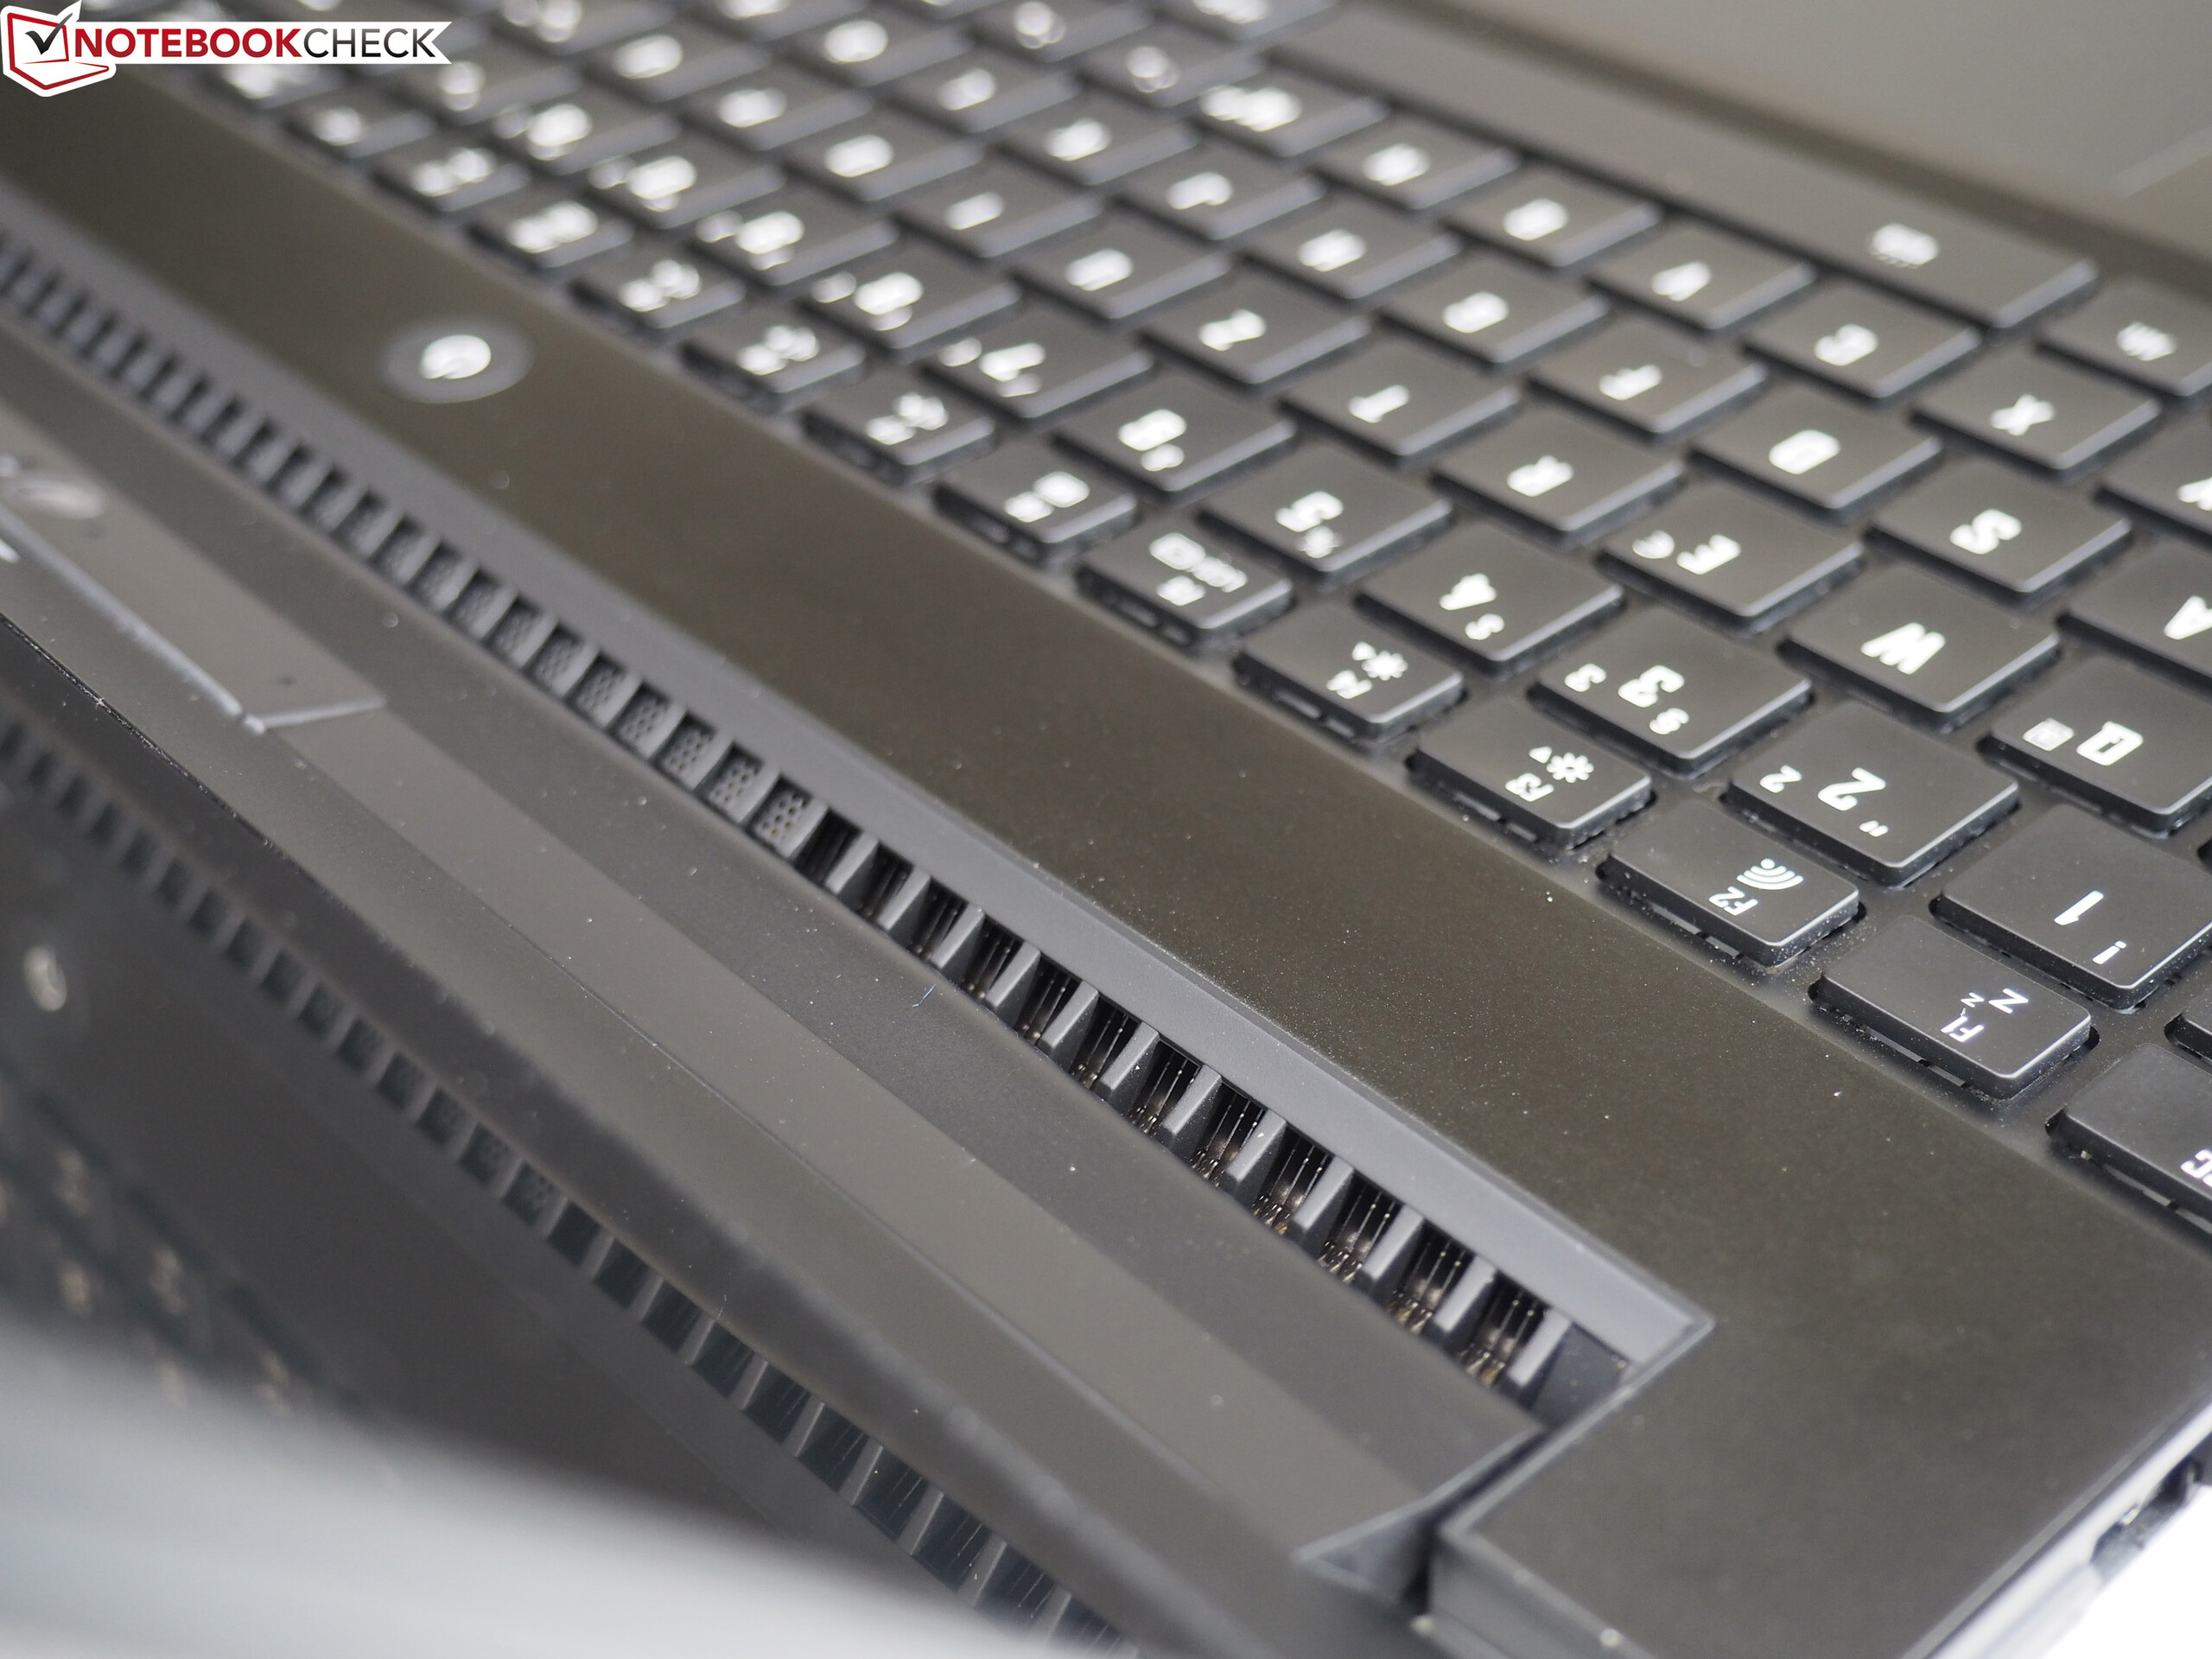
Sebbene l'Aero 15X sia di base un portatile multimedia/gaming, Gigabyte non ha fallito per lo scenario di utilizzo quotidiano. Con una decente tastiera il portatile funziona in modo silenzioso, e si rivela essere estremamente portatile grazie alla batteria molto grande che riesce a consentire un'autonomia di 8:11 ore nel test realistico Wi-Fi.
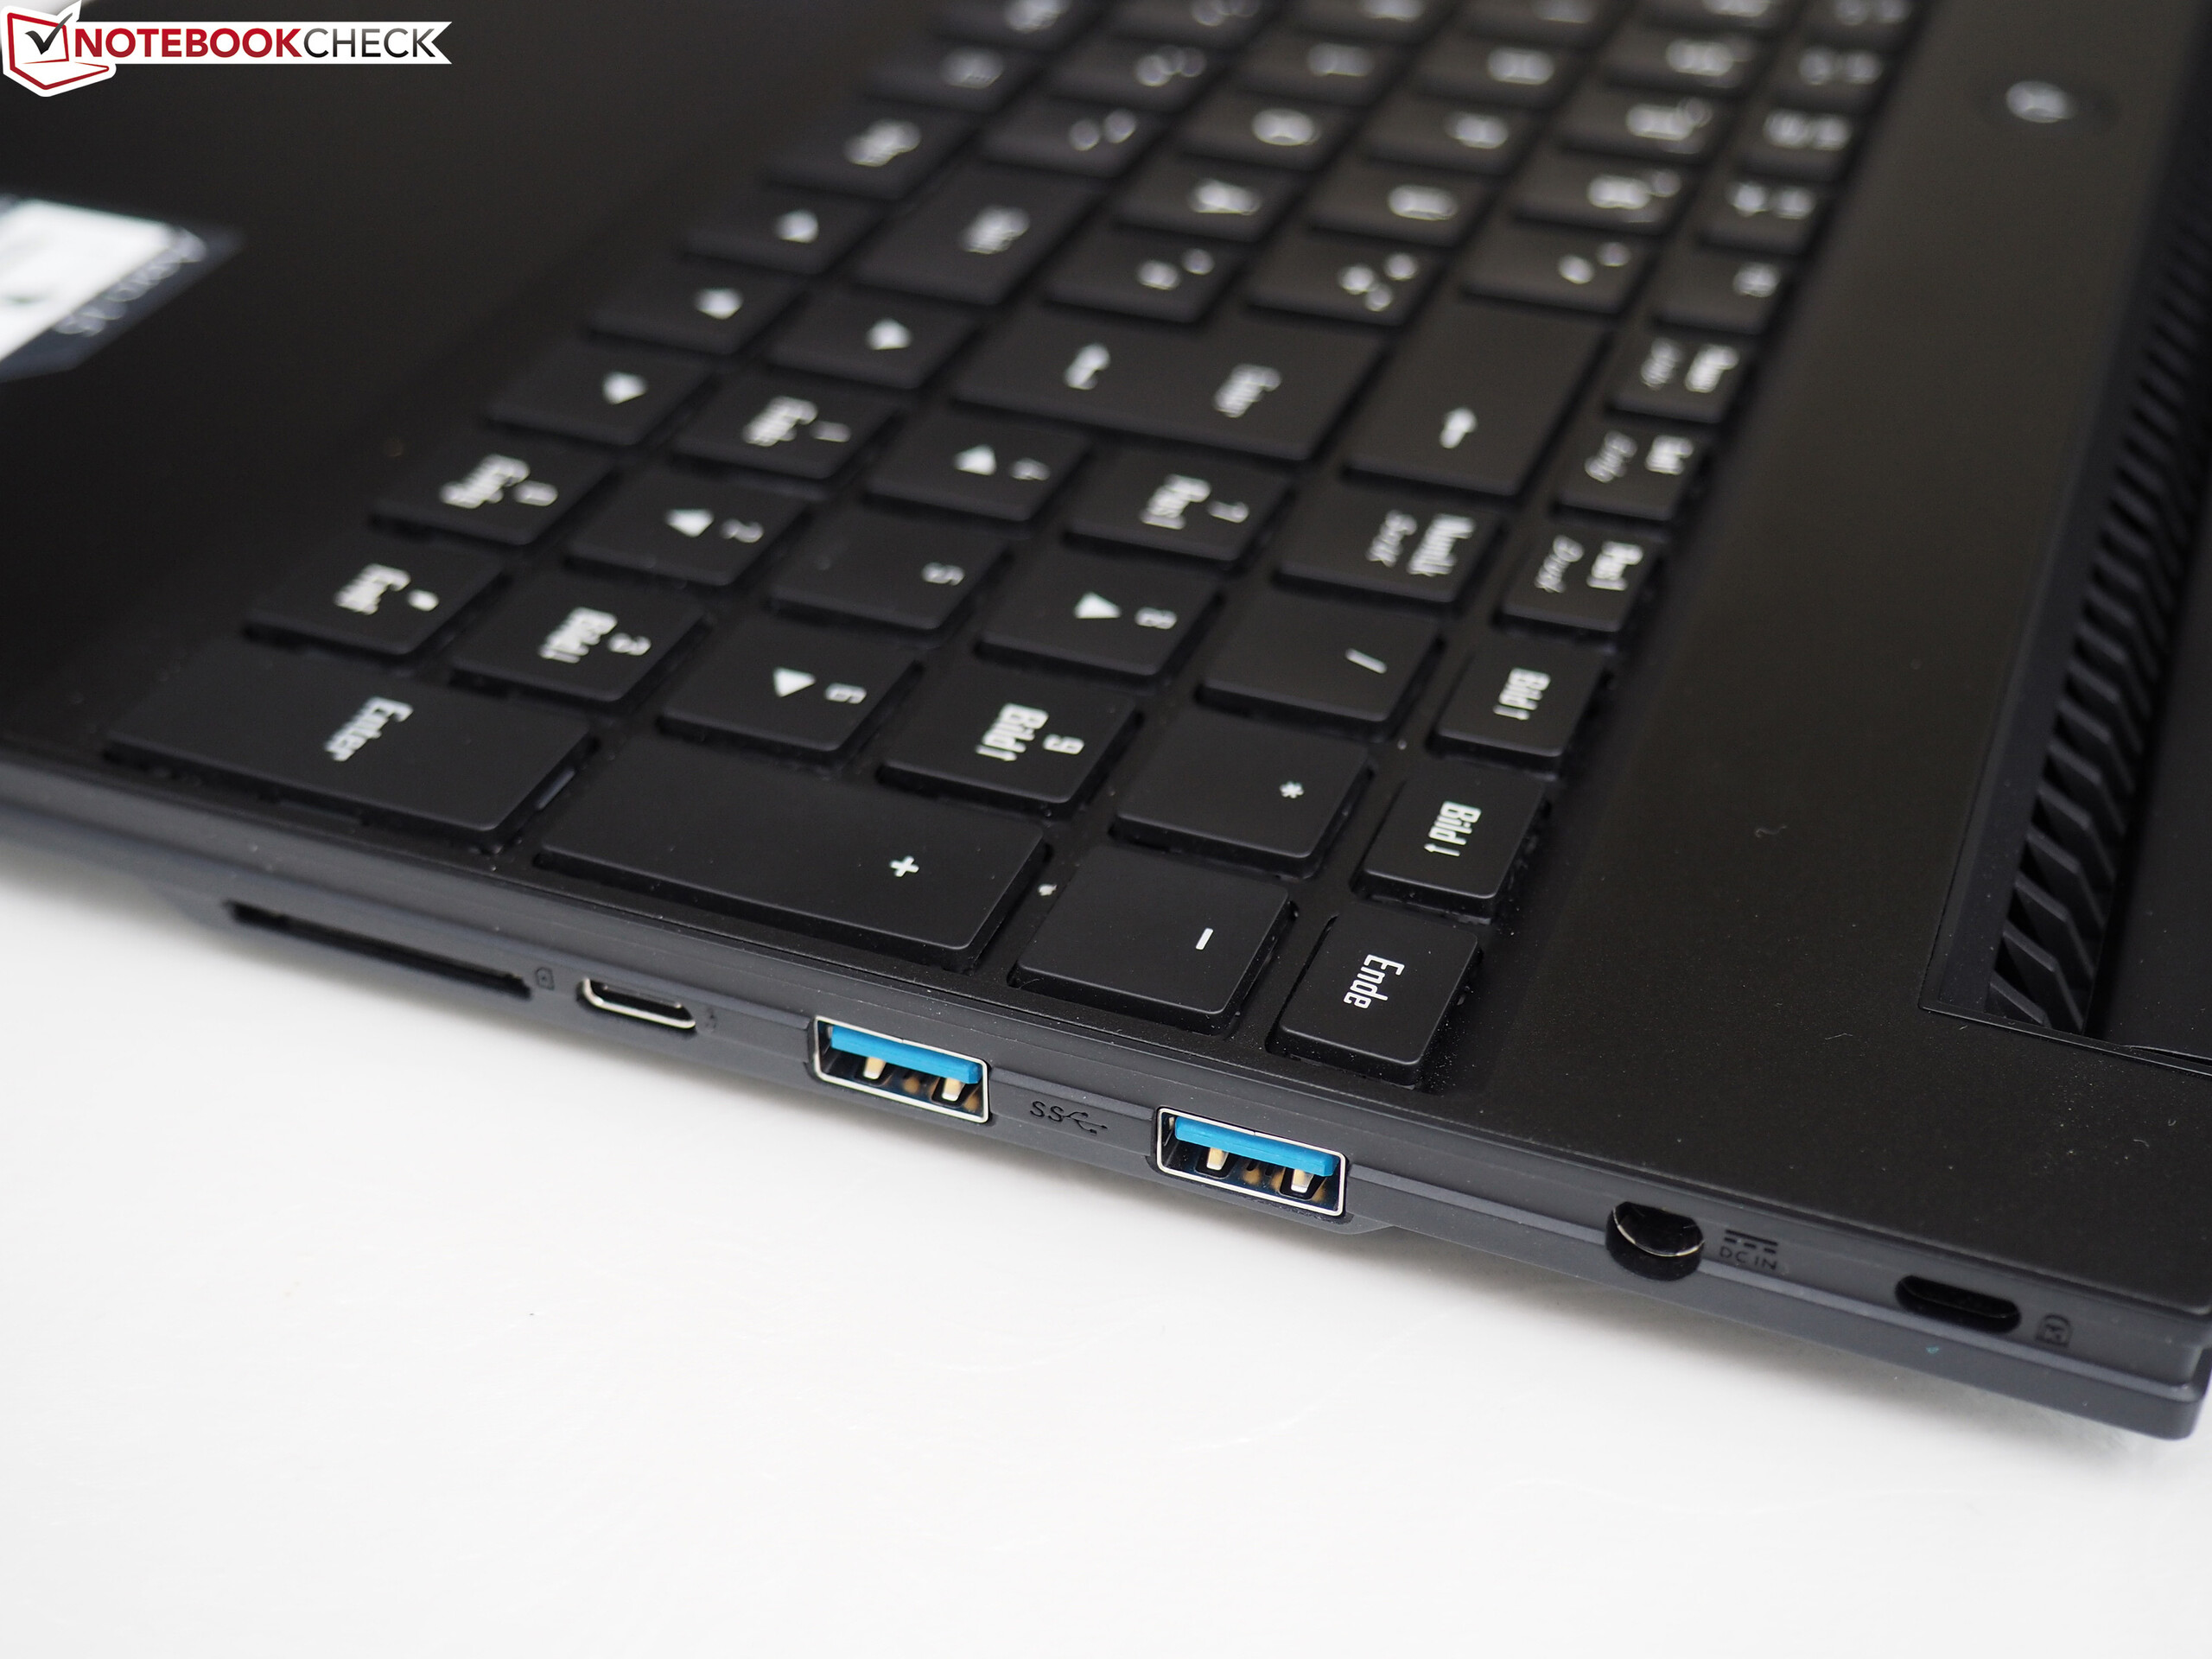
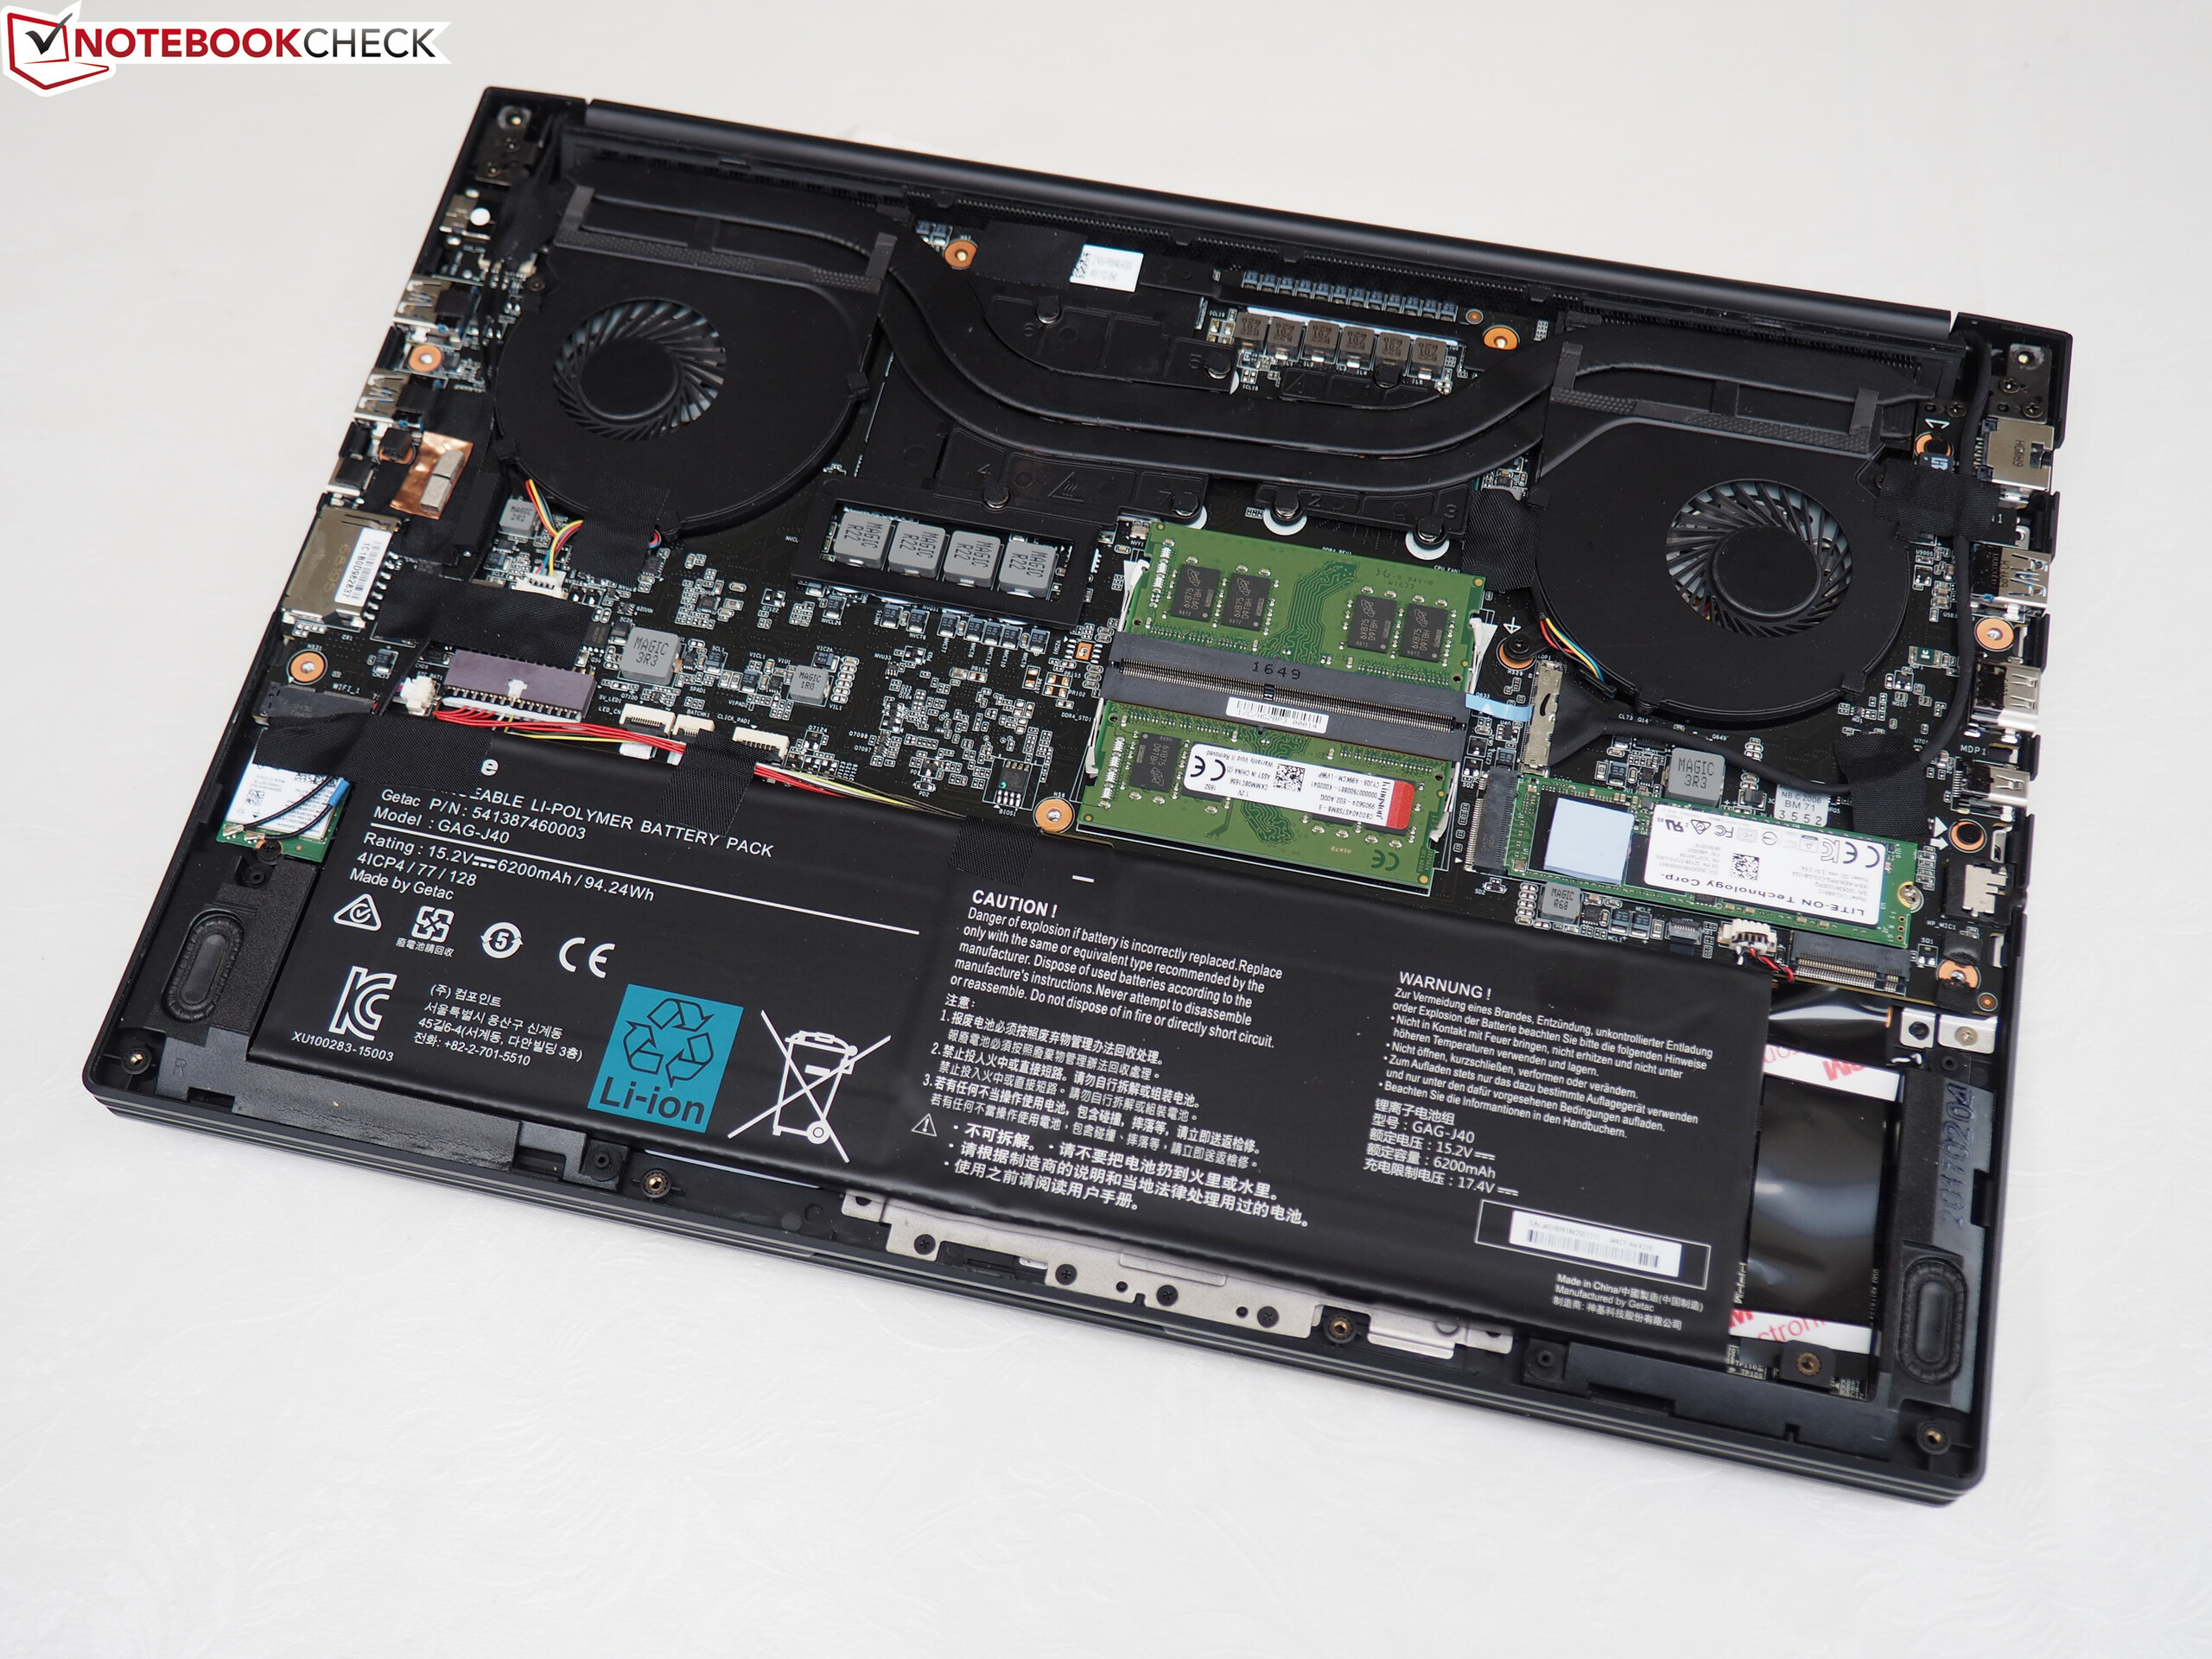
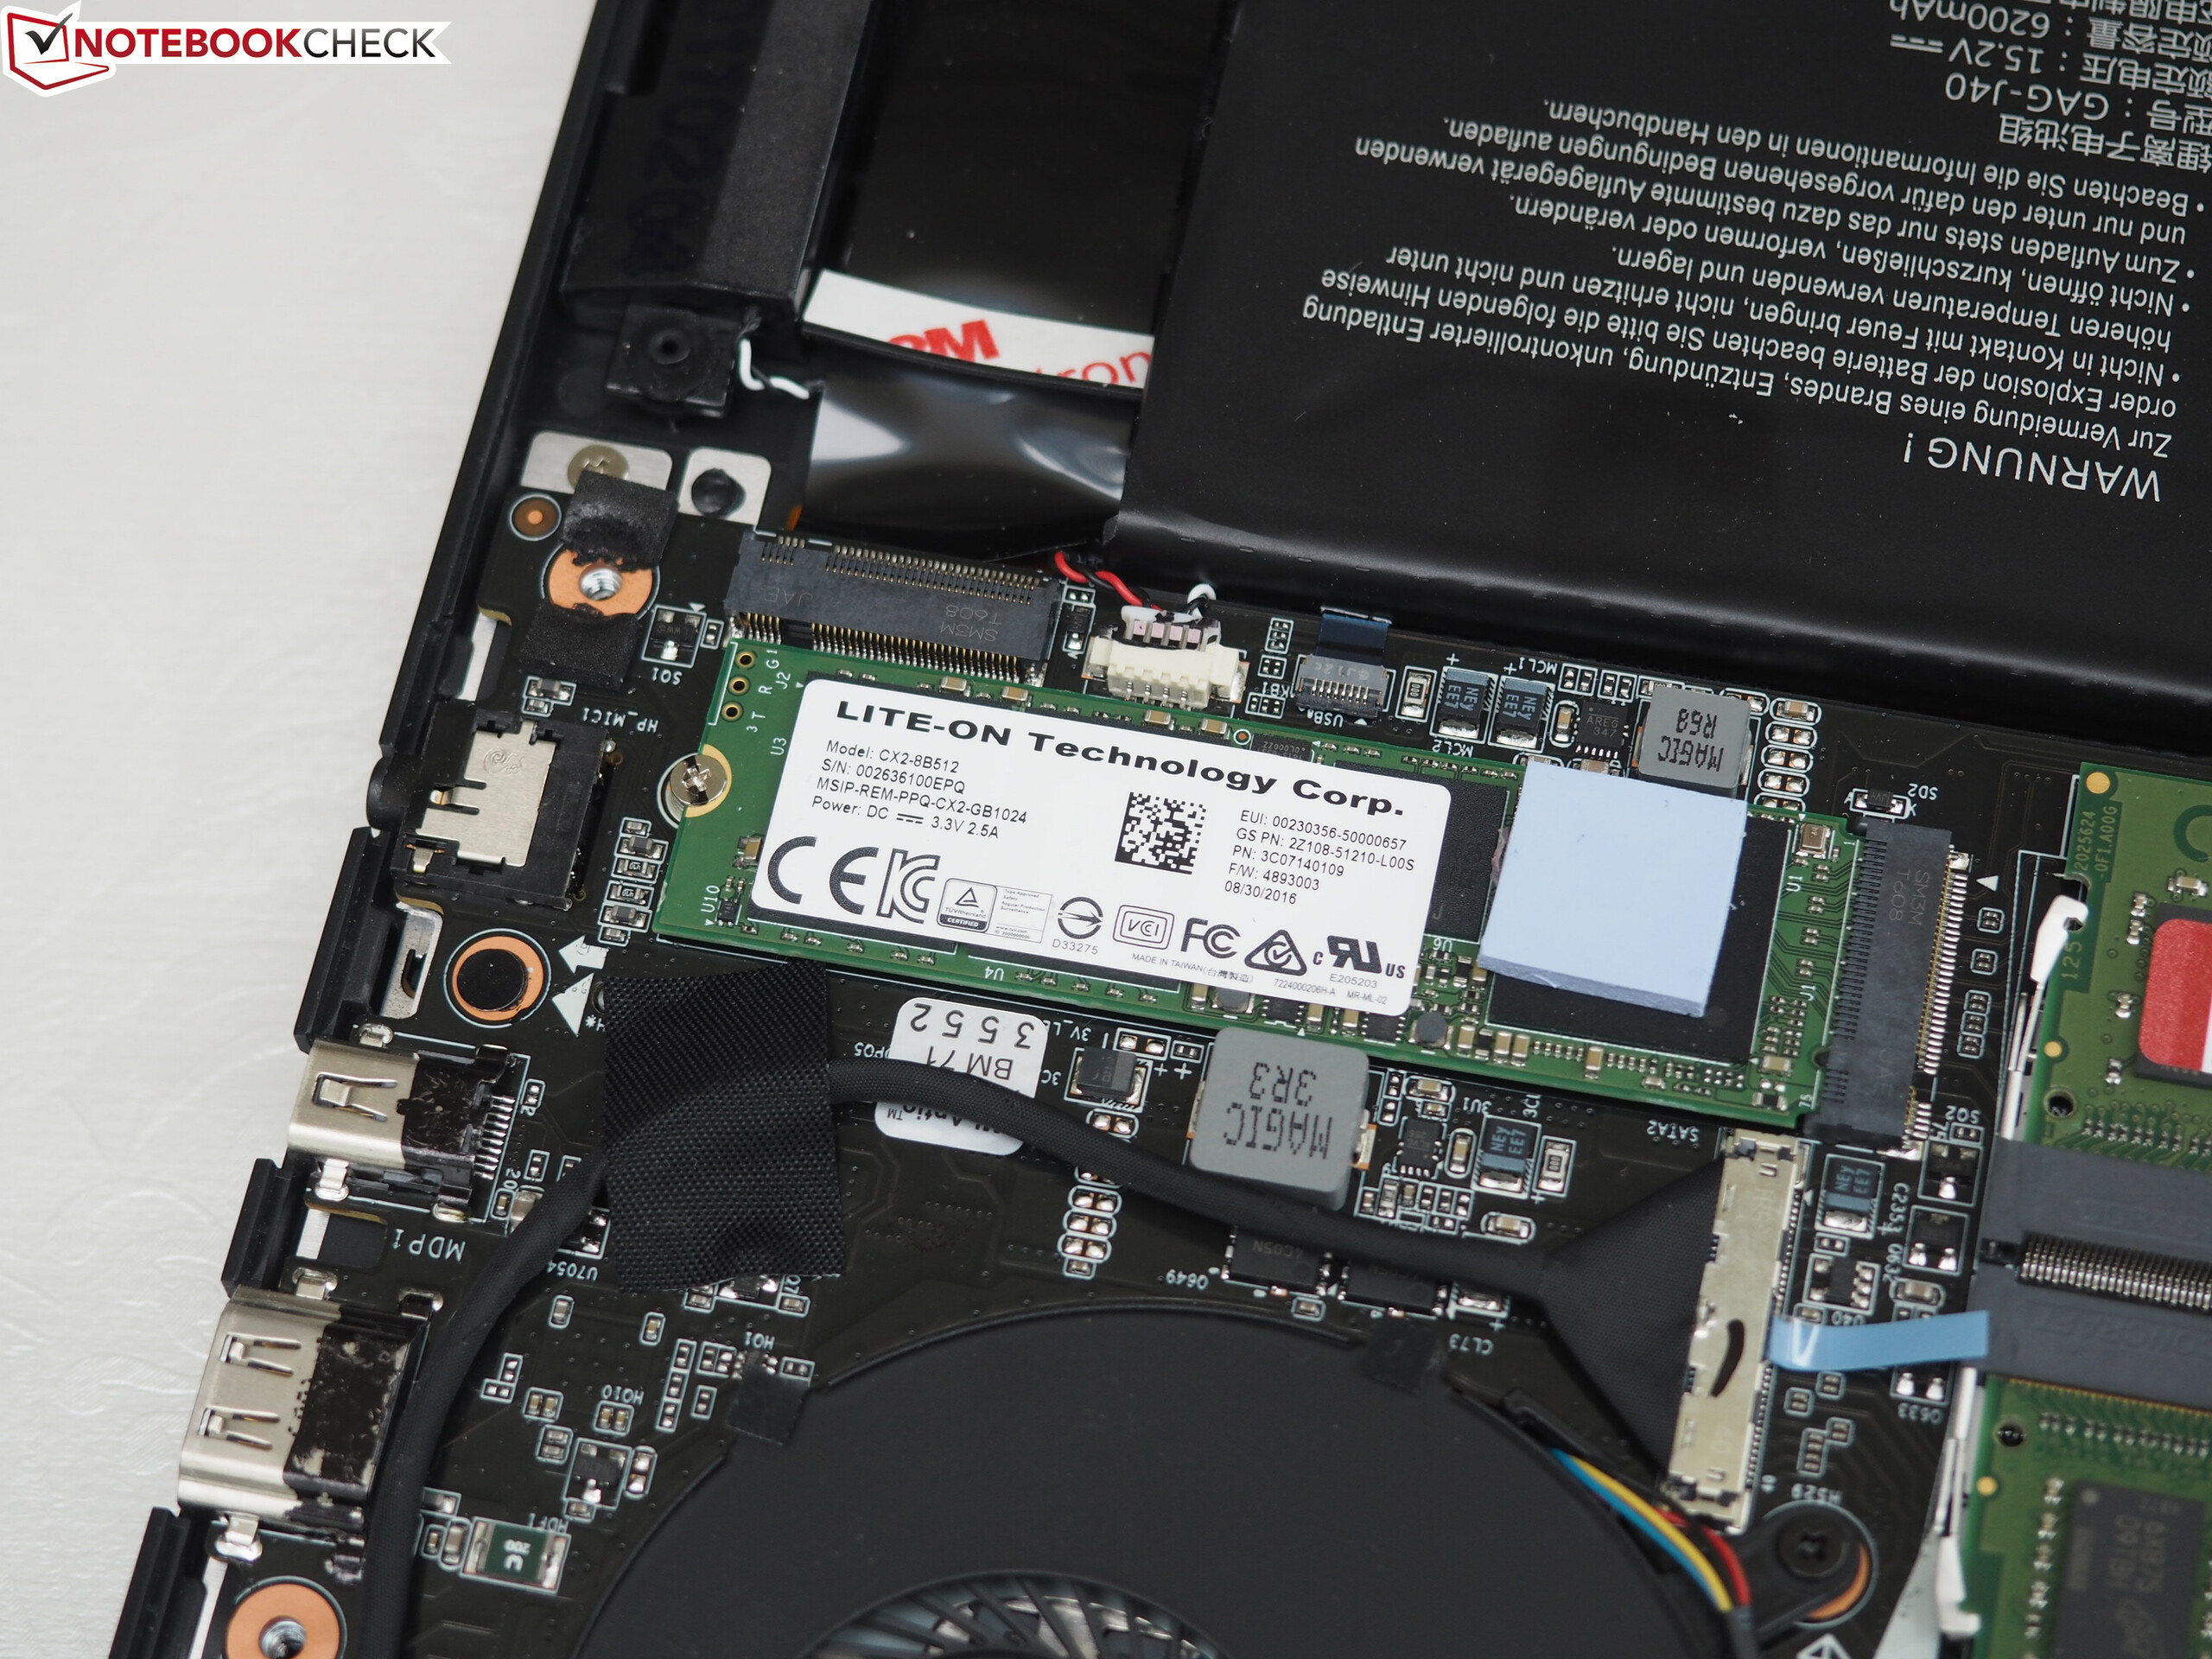
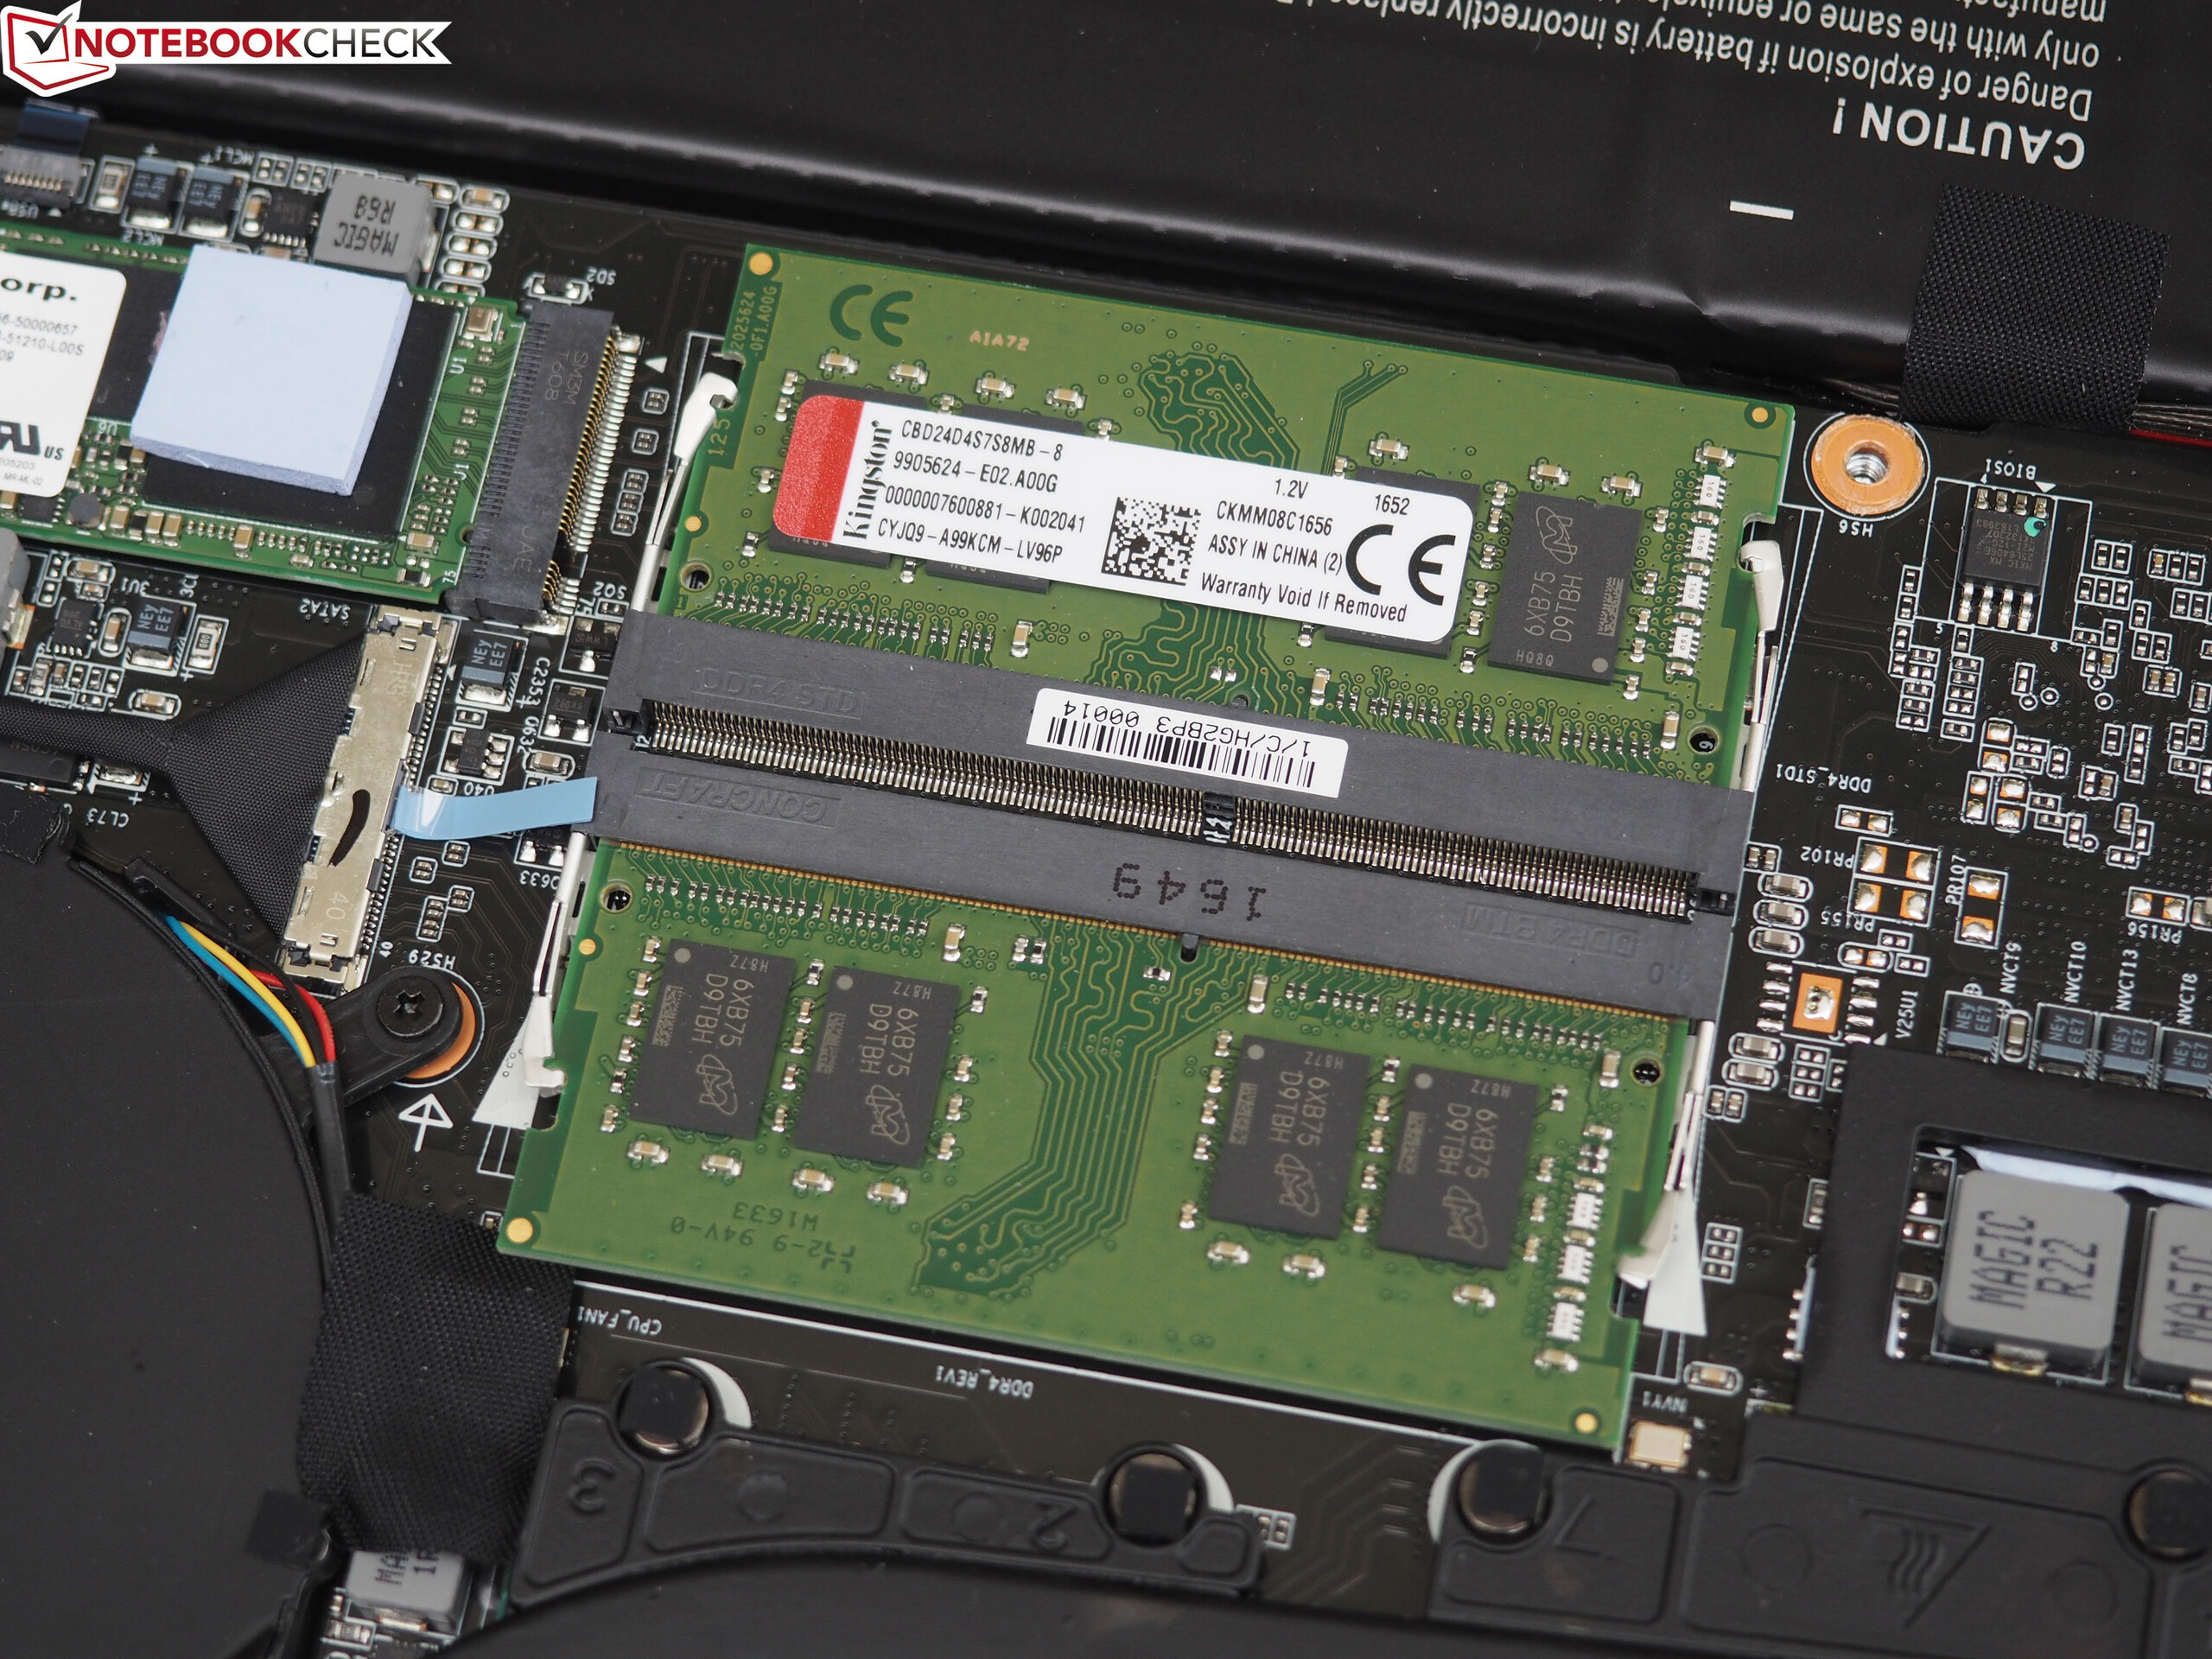
Le prestazioni di sistema sono nel complesso molto fluide grazie all'SSD NVMe sostituibile dall'utente. Potete usare spazio aggiuntivo sul secondo slot M.2, tuttavia non c'è spazio per un hard drive da 2.5". Il display matto FHD offre angoli di visuali decenti, luminosità adeguata, e un valore di contrasto molto buono. Sfortunatamente, i tempi di risposta sono lenti e potrebbero essere migliorati.
Nota: si tratta di una recensione breve, con alcune sezioni non tradotte, per la versione integrale in inglese guardate qui.
Gigabyte Aero 15X
- 11/01/2017 v6 (old)
Sascha Mölck
Price comparison
