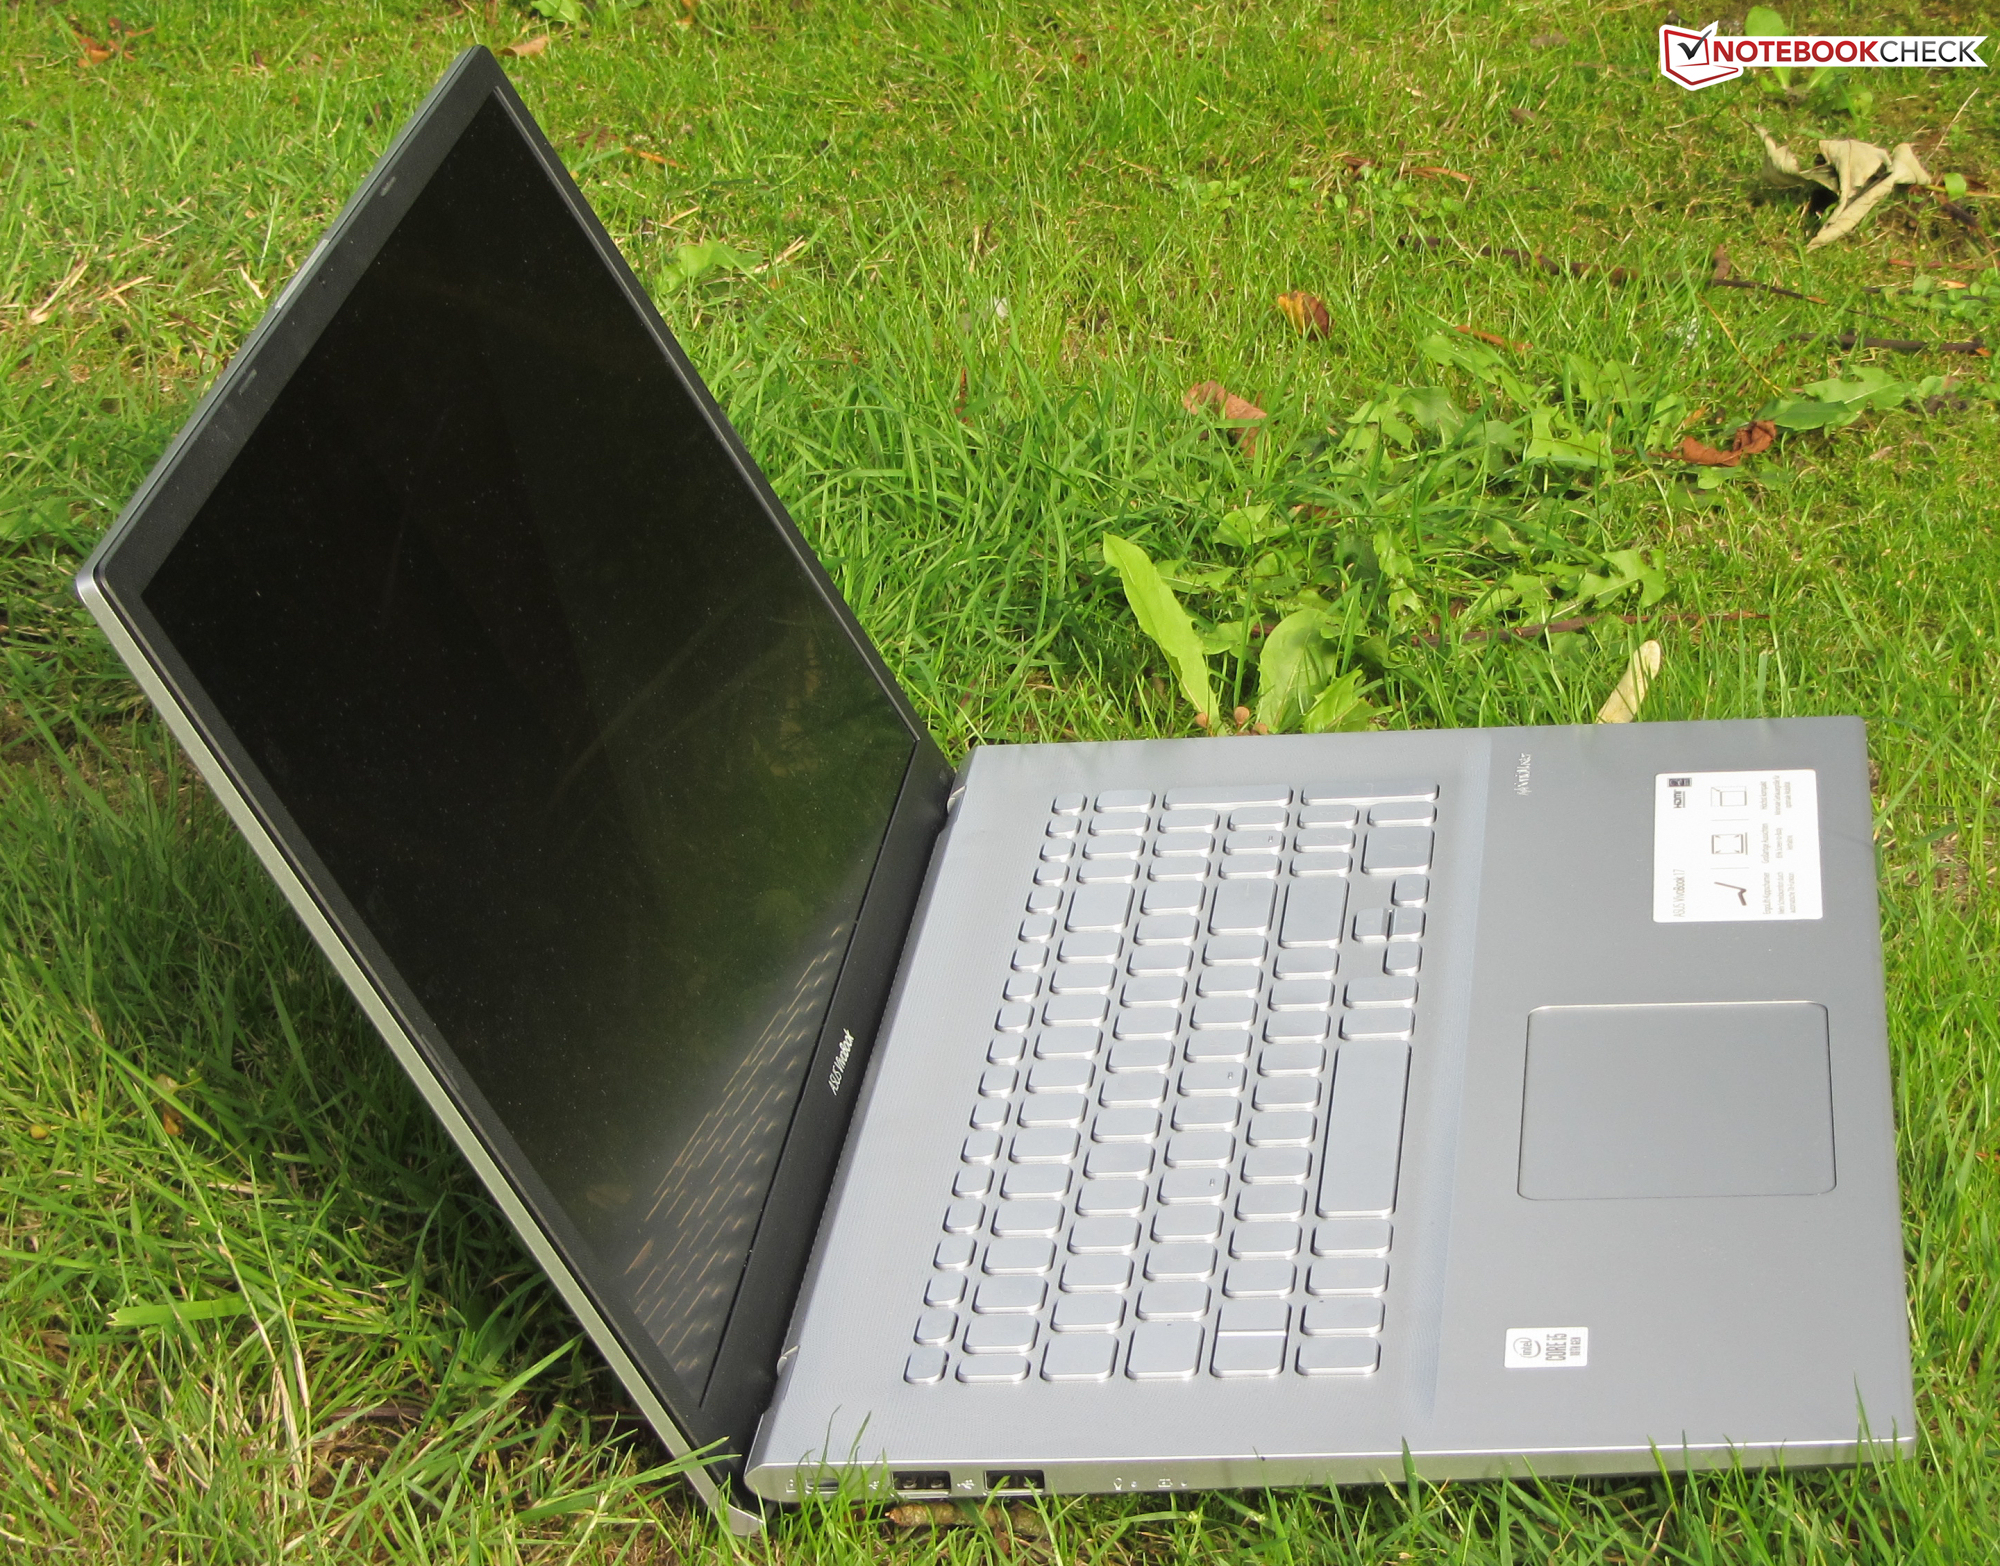
Recensione dell'Asus VivoBook 17 F712FA: Un portatile da 17,3 pollici poco luminoso per utilizzo domestico
Punteggio | Data | Modello | Peso | Altezza | Dimensione | Risoluzione | Prezzo |
|---|---|---|---|---|---|---|---|
| 77 % v7 (old) | 09/2020 | Asus VivoBook 17 F712FA-AU518T i5-10210U, UHD Graphics 620 | 2.3 kg | 21.4 mm | 17.30" | 1920x1080 | |
| 75.2 % v7 (old) | 05/2020 | HP 17-by2437ng i3-10110U, UHD Graphics 620 | 2.4 kg | 24.5 mm | 17.30" | 1600x900 | |
| 80.8 % v6 (old) | 08/2019 | Lenovo Ideapad L340-17API-81LY0004GE R5 3500U, Vega 8 | 2.8 kg | 24.3 mm | 17.30" | 1600x900 | |
| 77.1 % v7 (old) | 07/2020 | Lenovo V340-17IWL 81RG001YGE Pentium 5405U, UHD Graphics 610 | 2.8 kg | 27 mm | 17.30" | 1920x1080 |

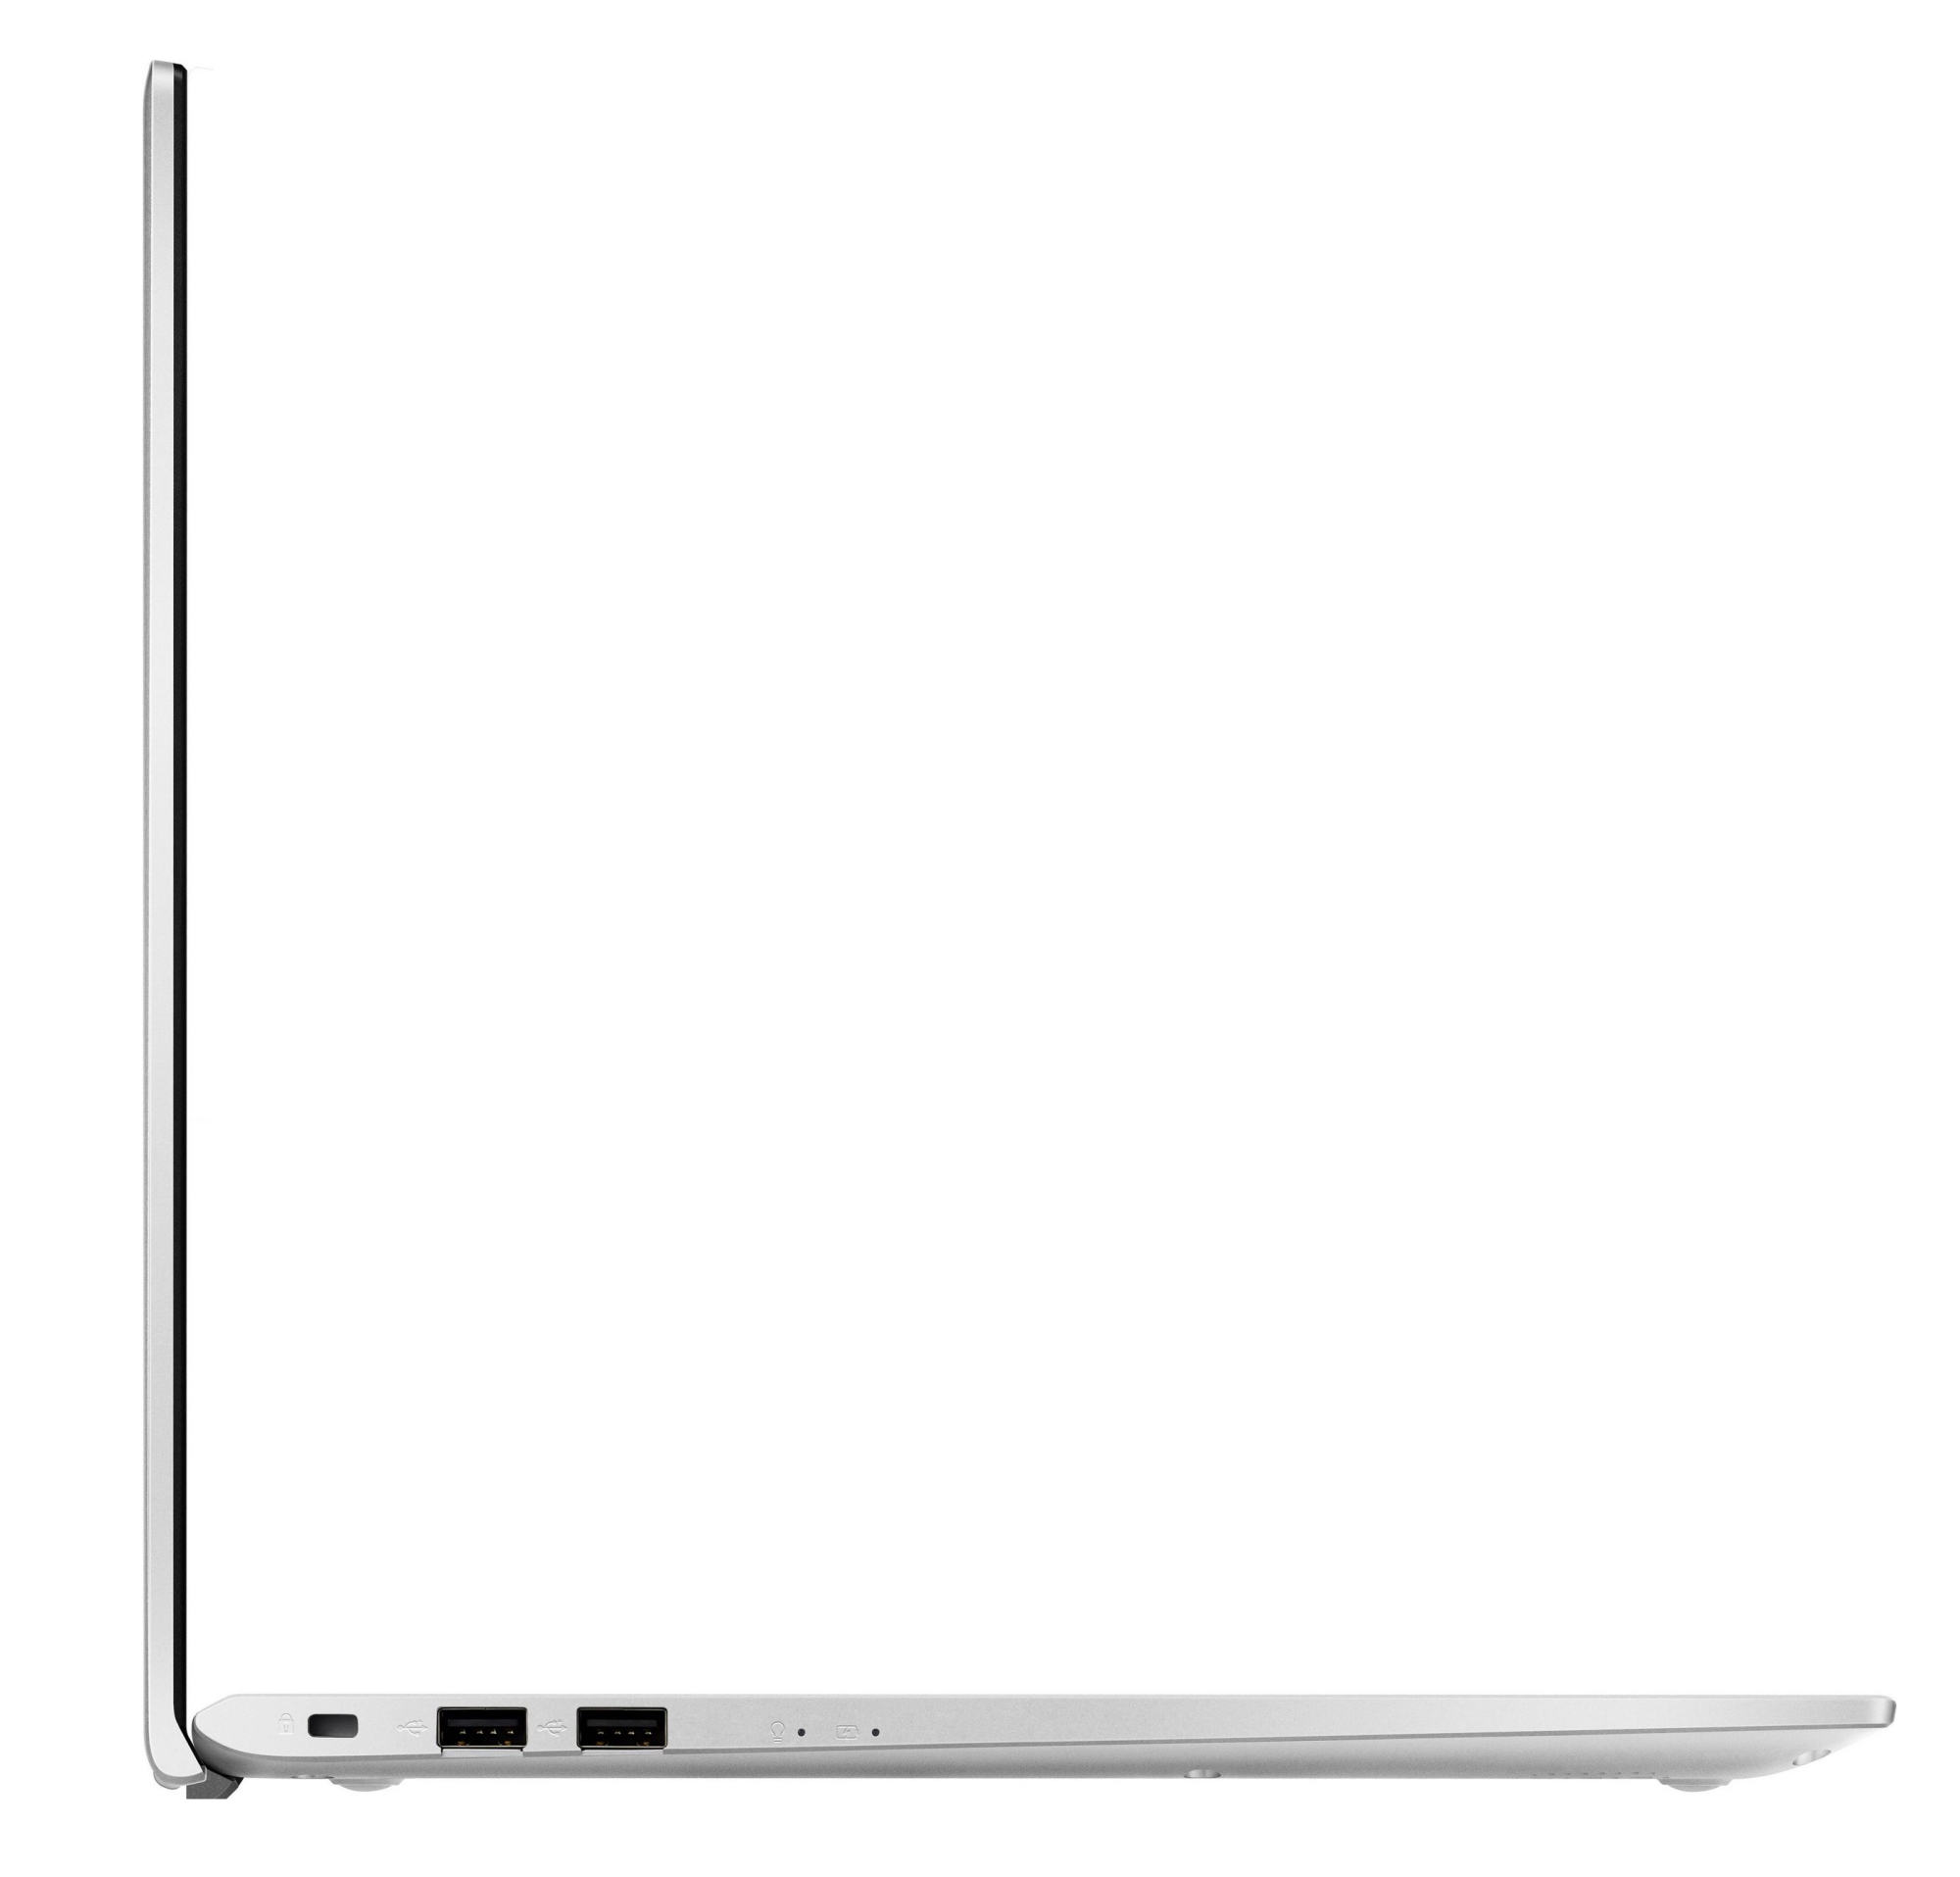
Connessioni

| SD Card Reader | |
| average JPG Copy Test (av. of 3 runs) | |
| Asus VivoBook 17 F712FA-AU518T (Toshiba Exceria Pro M501 microSDXC 64GB) | |
| Media della classe Office (19.8 - 198.5, n=22, ultimi 2 anni) | |
| Asus VivoBook 17 M712DA-AU017T (Toshiba Exceria Pro M501 microSDXC 64GB) | |
| HP 17-by2437ng (Toshiba Exceria Pro SDXC 64 GB UHS-II) | |
| maximum AS SSD Seq Read Test (1GB) | |
| Asus VivoBook 17 F712FA-AU518T (Toshiba Exceria Pro M501 microSDXC 64GB) | |
| Media della classe Office (27.4 - 249, n=21, ultimi 2 anni) | |
| Asus VivoBook 17 M712DA-AU017T (Toshiba Exceria Pro M501 microSDXC 64GB) | |
| HP 17-by2437ng (Toshiba Exceria Pro SDXC 64 GB UHS-II) | |


| |||||||||||||||||||||||||
Distribuzione della luminosità: 83 %
Al centro con la batteria: 282 cd/m²
Contrasto: 1200:1 (Nero: 0.24 cd/m²)
ΔE ColorChecker Calman: 6.14 | ∀{0.5-29.43 Ø4.73}
calibrated: 4.6
ΔE Greyscale Calman: 4.55 | ∀{0.09-98 Ø4.97}
58.1% sRGB (Argyll 1.6.3 3D)
37% AdobeRGB 1998 (Argyll 1.6.3 3D)
40.32% AdobeRGB 1998 (Argyll 3D)
58.4% sRGB (Argyll 3D)
39.03% Display P3 (Argyll 3D)
Gamma: 2.37
CCT: 7161 K
| Asus VivoBook 17 F712FA-AU518T BOE NV173FHM-N49, IPS, 1920x1080, 17.3" | HP 17-by2437ng BOE NT173WDM-N21, TN LED, 1600x900, 17.3" | Lenovo Ideapad L340-17API-81LY0004GE AU Optronics B173RTN02.1, TN LED, 1600x900, 17.3" | Lenovo V340-17IWL 81RG001YGE CMN N173HCE-E31 CMN1738, , 1920x1080, 17.3" | Asus VivoBook 17 M712DA-AU017T BOE084E, IPS, 1920x1080, 17.3" | |
|---|---|---|---|---|---|
| Display | 33% | 30% | 68% | 3% | |
| Display P3 Coverage (%) | 39.03 | 53.6 37% | 51.1 31% | 67.5 73% | 40.76 4% |
| sRGB Coverage (%) | 58.4 | 74 27% | 73.9 27% | 94.2 61% | 59.7 2% |
| AdobeRGB 1998 Coverage (%) | 40.32 | 53.9 34% | 52.7 31% | 68 69% | 42.11 4% |
| Response Times | -25% | -22% | -58% | -7% | |
| Response Time Grey 50% / Grey 80% * (ms) | 24 ? | 42 ? -75% | 42 ? -75% | 37 ? -54% | 24 ? -0% |
| Response Time Black / White * (ms) | 16 ? | 12 ? 25% | 11 ? 31% | 25.8 ? -61% | 18 ? -13% |
| PWM Frequency (Hz) | 250 ? | 25000 ? | |||
| Screen | -47% | -40% | 22% | 5% | |
| Brightness middle (cd/m²) | 288 | 222 -23% | 230 -20% | 284 -1% | 262 -9% |
| Brightness (cd/m²) | 262 | 208 -21% | 201 -23% | 268 2% | 234 -11% |
| Brightness Distribution (%) | 83 | 89 7% | 78 -6% | 77 -7% | 84 1% |
| Black Level * (cd/m²) | 0.24 | 0.649 -170% | 0.46 -92% | 0.23 4% | 0.265 -10% |
| Contrast (:1) | 1200 | 342 -72% | 500 -58% | 1235 3% | 989 -18% |
| Colorchecker dE 2000 * | 6.14 | 11.77 -92% | 10.36 -69% | 4.98 19% | 5.13 16% |
| Colorchecker dE 2000 max. * | 18.55 | 20.78 -12% | 18.63 -0% | 8.45 54% | 19.16 -3% |
| Colorchecker dE 2000 calibrated * | 4.6 | 3.5 24% | 1.87 59% | 3.96 14% | |
| Greyscale dE 2000 * | 4.55 | 14.31 -215% | 13.32 -193% | 5.3 -16% | 1.22 73% |
| Gamma | 2.37 93% | 2.24 98% | 2.54 87% | 2273 0% | 2.42 91% |
| CCT | 7161 91% | 19250 34% | 14124 46% | 7065 92% | 6584 99% |
| Color Space (Percent of AdobeRGB 1998) (%) | 37 | 48 30% | 48 30% | 61 65% | 38 3% |
| Color Space (Percent of sRGB) (%) | 58.1 | 74 27% | 74 27% | 94 62% | 59 2% |
| Media totale (Programma / Settaggio) | -13% /
-29% | -11% /
-24% | 11% /
21% | 0% /
3% |
* ... Meglio usare valori piccoli
Tempi di risposta del Display
| ↔ Tempi di risposta dal Nero al Bianco | ||
|---|---|---|
| 16 ms ... aumenta ↗ e diminuisce ↘ combinato | ↗ 8 ms Incremento | 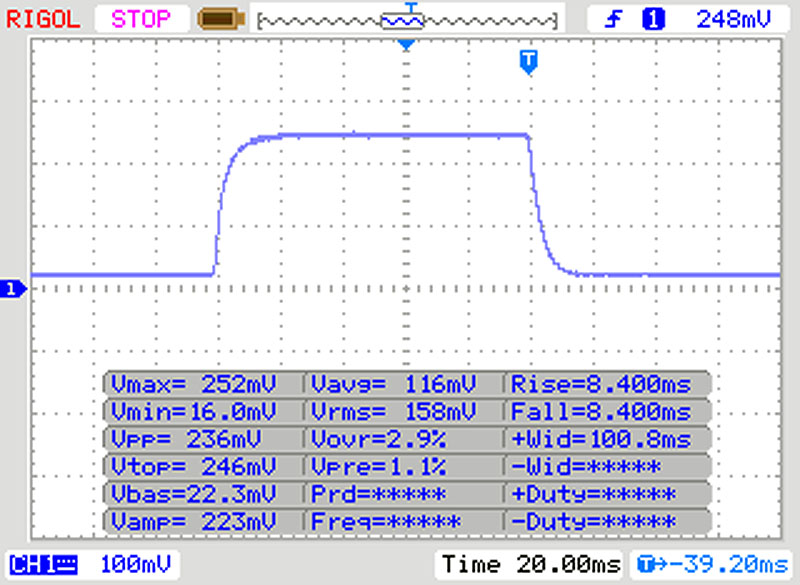 |
| ↘ 8 ms Calo | ||
| Lo schermo mostra buoni tempi di risposta durante i nostri tests, ma potrebbe essere troppo lento per i gamers competitivi. In confronto, tutti i dispositivi di test variano da 0.1 (minimo) a 240 (massimo) ms. » 37 % di tutti i dispositivi è migliore. Questo significa che i tempi di risposta rilevati sono migliori rispettto alla media di tutti i dispositivi testati (19.9 ms). | ||
| ↔ Tempo di risposta dal 50% Grigio all'80% Grigio | ||
| 24 ms ... aumenta ↗ e diminuisce ↘ combinato | ↗ 13 ms Incremento | 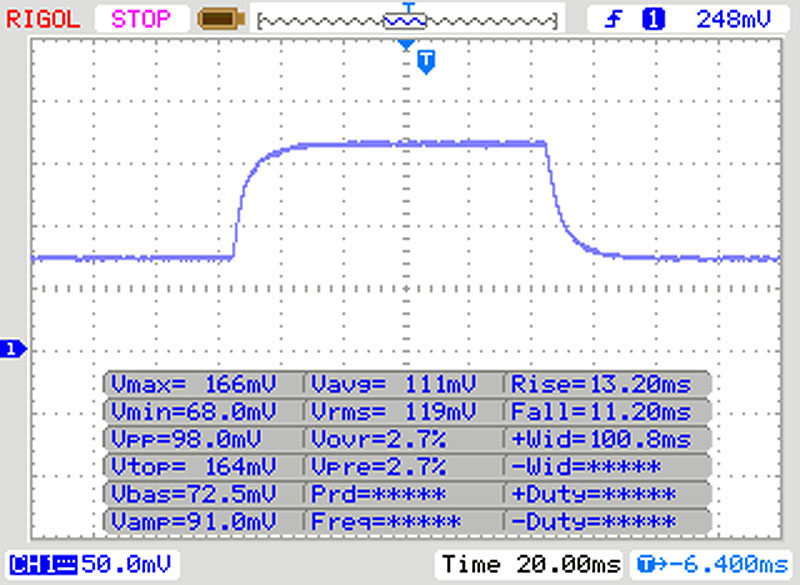 |
| ↘ 11 ms Calo | ||
| Lo schermo mostra buoni tempi di risposta durante i nostri tests, ma potrebbe essere troppo lento per i gamers competitivi. In confronto, tutti i dispositivi di test variano da 0.165 (minimo) a 636 (massimo) ms. » 34 % di tutti i dispositivi è migliore. Questo significa che i tempi di risposta rilevati sono migliori rispettto alla media di tutti i dispositivi testati (31.1 ms). | ||
Sfarfallio dello schermo / PWM (Pulse-Width Modulation)
| flickering dello schermo / PWM non rilevato | 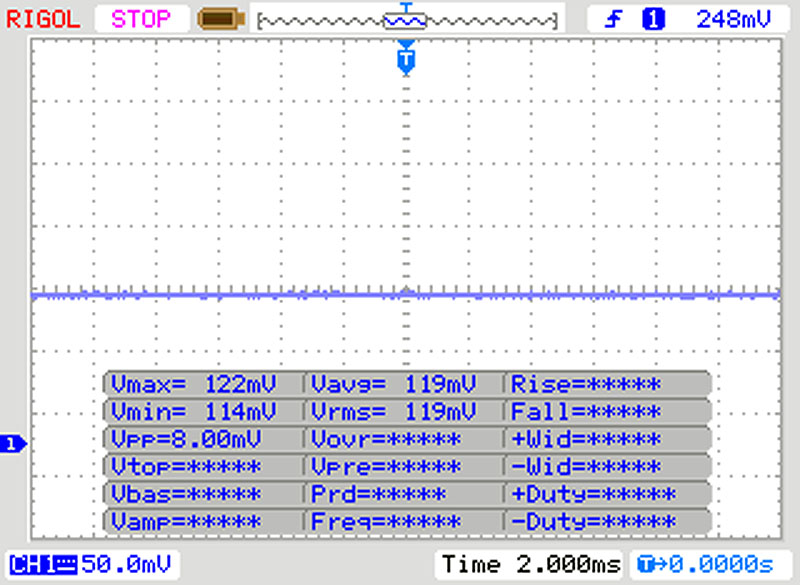 | ||
In confronto: 52 % di tutti i dispositivi testati non utilizza PWM per ridurre la luminosita' del display. Se è rilevato PWM, una media di 7784 (minimo: 5 - massimo: 343500) Hz è stata rilevata. | |||
| HWBOT x265 Benchmark v2.2 - 4k Preset | |
| Media della classe Office (2.21 - 26, n=74, ultimi 2 anni) | |
| Media Intel Core i5-10210U (2.36 - 6.28, n=24) | |
| Asus VivoBook 17 F712FA-AU518T | |
| HP 17-by2437ng | |
| Lenovo V340-17IWL 81RG001YGE | |
* ... Meglio usare valori piccoli
| PCMark 8 Home Score Accelerated v2 | 3595 punti | |
| PCMark 8 Creative Score Accelerated v2 | 3866 punti | |
| PCMark 8 Work Score Accelerated v2 | 4920 punti | |
| PCMark 10 Score | 4205 punti | |
Aiuto | ||
| DPC Latencies / LatencyMon - interrupt to process latency (max), Web, Youtube, Prime95 | |
| Asus VivoBook 17 F712FA-AU518T | |
| HP 17-by2437ng | |
| Lenovo V340-17IWL 81RG001YGE | |
* ... Meglio usare valori piccoli

| Asus VivoBook 17 F712FA-AU518T Intel SSD 660p SSDPEKNW512G8 | HP 17-by2437ng Toshiba KBG30ZMV256G | Lenovo Ideapad L340-17API-81LY0004GE Samsung SSD PM871b MZ7LN256HAJQ | Lenovo V340-17IWL 81RG001YGE Lenovo UMIS AM610 RPFTJ256PDD2MWX | Asus VivoBook 17 M712DA-AU017T Intel SSD 660p SSDPEKNW512G8 | Media Intel SSD 660p SSDPEKNW512G8 | Media della classe Office | |
|---|---|---|---|---|---|---|---|
| CrystalDiskMark 5.2 / 6 | -18% | -50% | -59% | -12% | -7% | 108% | |
| Write 4K (MB/s) | 180.3 | 126.7 -30% | 94.4 -48% | 64.1 -64% | 132 -27% | 136 ? -25% | 151.4 ? -16% |
| Read 4K (MB/s) | 62.1 | 52.5 -15% | 32.45 -48% | 10.54 -83% | 52 -16% | 55.2 ? -11% | 72.8 ? 17% |
| Write Seq (MB/s) | 972 | 669 -31% | 482.8 -50% | 296.2 -70% | 973 0% | 926 ? -5% | 2558 ? 163% |
| Read Seq (MB/s) | 1608 | 881 -45% | 524 -67% | 525 -67% | 1606 0% | 1523 ? -5% | 3237 ? 101% |
| Write 4K Q32T1 (MB/s) | 397.4 | 272.2 -32% | 232 -42% | 220.5 -45% | 210.4 -47% | 380 ? -4% | 424 ? 7% |
| Read 4K Q32T1 (MB/s) | 343 | 483.5 41% | 253.6 -26% | 274.7 -20% | 312.2 -9% | 334 ? -3% | 509 ? 48% |
| Write Seq Q32T1 (MB/s) | 973 | 796 -18% | 496.5 -49% | 294.4 -70% | 982 1% | 987 ? 1% | 3999 ? 311% |
| Read Seq Q32T1 (MB/s) | 1779 | 1503 -16% | 540 -70% | 873 -51% | 1847 4% | 1744 ? -2% | 5962 ? 235% |
| AS SSD | -29% | -50% | -41% | -2% | -2% | 109% | |
| Seq Read (MB/s) | 1679 | 1359 -19% | 489.9 -71% | 758 -55% | 1592 -5% | 1423 ? -15% | 4254 ? 153% |
| Seq Write (MB/s) | 910 | 759 -17% | 472.2 -48% | 278 -69% | 900 -1% | 828 ? -9% | 2704 ? 197% |
| 4K Read (MB/s) | 56.1 | 45.04 -20% | 29.14 -48% | 28.09 -50% | 45.24 -19% | 51.3 ? -9% | 57.1 ? 2% |
| 4K Write (MB/s) | 153.6 | 105.7 -31% | 59.8 -61% | 74.1 -52% | 104.3 -32% | 128.9 ? -16% | 162.4 ? 6% |
| 4K-64 Read (MB/s) | 324.4 | 628 94% | 262.2 -19% | 480.5 48% | 324 0% | 326 ? 0% | 919 ? 183% |
| 4K-64 Write (MB/s) | 792 | 333.8 -58% | 236.2 -70% | 273.3 -65% | 835 5% | 721 ? -9% | 1624 ? 105% |
| Access Time Read * (ms) | 0.088 | 0.09 -2% | 0.085 3% | 0.134 -52% | 0.058 34% | 0.09003 ? -2% | 0.08503 ? 3% |
| Access Time Write * (ms) | 0.046 | 0.157 -241% | 0.061 -33% | 0.065 -41% | 0.047 -2% | 0.07378 ? -60% | 0.05781 ? -26% |
| Score Read (Points) | 548 | 809 48% | 342 -38% | 584 7% | 528 -4% | 519 ? -5% | 1402 ? 156% |
| Score Write (Points) | 1037 | 515 -50% | 343 -67% | 375 -64% | 1030 -1% | 932 ? -10% | 2056 ? 98% |
| Score Total (Points) | 1849 | 1722 -7% | 869 -53% | 1242 -33% | 1810 -2% | 1708 ? -8% | 4110 ? 122% |
| Copy ISO MB/s (MB/s) | 801 | 448.4 -44% | 282.8 -65% | 290 -64% | 1109 ? 38% | 2515 ? 214% | |
| Copy Program MB/s (MB/s) | 340.9 | 248.3 -27% | 128.1 -62% | 220 -35% | 468 ? 37% | 788 ? 131% | |
| Copy Game MB/s (MB/s) | 568 | 416.4 -27% | 184.9 -67% | 280 -51% | 760 ? 34% | 1603 ? 182% | |
| Media totale (Programma / Settaggio) | -24% /
-25% | -50% /
-50% | -50% /
-48% | -7% /
-6% | -5% /
-4% | 109% /
109% |
* ... Meglio usare valori piccoli
Prestazioni di lettura continua: DiskSpd Read Loop, Queue Depth 8
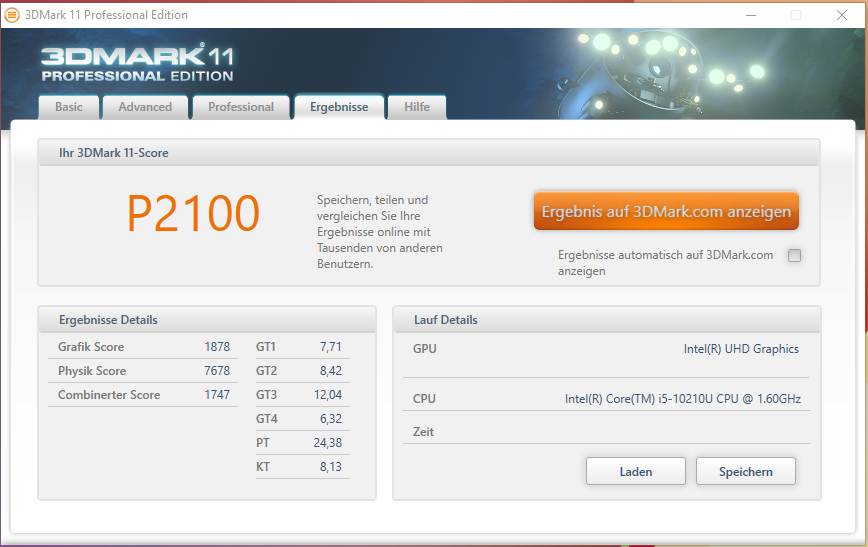
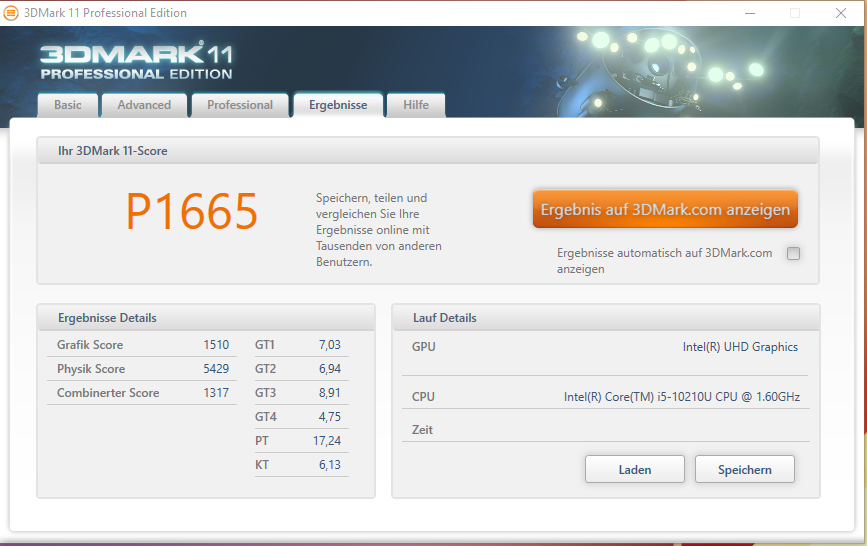
| 3DMark 11 Performance | 2100 punti | |
| 3DMark Ice Storm Standard Score | 67955 punti | |
| 3DMark Cloud Gate Standard Score | 8888 punti | |
| 3DMark Fire Strike Score | 1125 punti | |
Aiuto | ||
| basso | medio | alto | ultra | |
|---|---|---|---|---|
| BioShock Infinite (2013) | 64.1 | 35.1 | 29.6 | 9.2 |
| Dota 2 Reborn (2015) | 77 | 48.2 | 20.3 | 18 |
| X-Plane 11.11 (2018) | 18.9 | 13 |
| BioShock Infinite - 1366x768 Medium Preset | |
| Lenovo Ideapad L340-17API-81LY0004GE | |
| Asus VivoBook 17 F712FA-AU518T | |
| Media Intel UHD Graphics 620 (11.5 - 45.5, n=187) | |
| HP 17-by2437ng | |
Rumorosità
| Idle |
| 26.7 / 26.7 / 26.7 dB(A) |
| Sotto carico |
| 43.4 / 42.1 dB(A) |
 | ||
30 dB silenzioso 40 dB(A) udibile 50 dB(A) rumoroso |
||
min: | ||
(±) La temperatura massima sul lato superiore è di 41.1 °C / 106 F, rispetto alla media di 34.3 °C / 94 F, che varia da 21.2 a 62.5 °C per questa classe Office.
(±) Il lato inferiore si riscalda fino ad un massimo di 44.4 °C / 112 F, rispetto alla media di 36.8 °C / 98 F
(+) In idle, la temperatura media del lato superiore è di 25.9 °C / 79 F, rispetto alla media deld ispositivo di 29.5 °C / 85 F.
(+) I poggiapolsi e il touchpad sono piu' freddi della temperatura della pelle con un massimo di 27.7 °C / 81.9 F e sono quindi freddi al tatto.
(±) La temperatura media della zona del palmo della mano di dispositivi simili e'stata di 27.5 °C / 81.5 F (-0.2 °C / -0.4 F).
Asus VivoBook 17 F712FA-AU518T analisi audio
(-) | altoparlanti non molto potenti (66.3 dB)
Bassi 100 - 315 Hz
(±) | bassi ridotti - in media 12.6% inferiori alla media
(±) | la linearità dei bassi è media (12.7% delta rispetto alla precedente frequenza)
Medi 400 - 2000 Hz
(+) | medi bilanciati - solo only 4.5% rispetto alla media
(±) | linearità dei medi adeguata (8.3% delta rispetto alla precedente frequenza)
Alti 2 - 16 kHz
(+) | Alti bilanciati - appena 3.3% dalla media
(±) | la linearità degli alti è media (9.3% delta rispetto alla precedente frequenza)
Nel complesso 100 - 16.000 Hz
(±) | la linearità complessiva del suono è media (16.8% di differenza rispetto alla media
Rispetto alla stessa classe
» 22% di tutti i dispositivi testati in questa classe è stato migliore, 7% simile, 71% peggiore
» Il migliore ha avuto un delta di 7%, medio di 21%, peggiore di 53%
Rispetto a tutti i dispositivi testati
» 29% di tutti i dispositivi testati in questa classe è stato migliore, 8% similare, 63% peggiore
» Il migliore ha avuto un delta di 4%, medio di 24%, peggiore di 134%
| Off / Standby | |
| Idle | |
| Sotto carico |
|
Leggenda:
min: | |
Pro
Contro

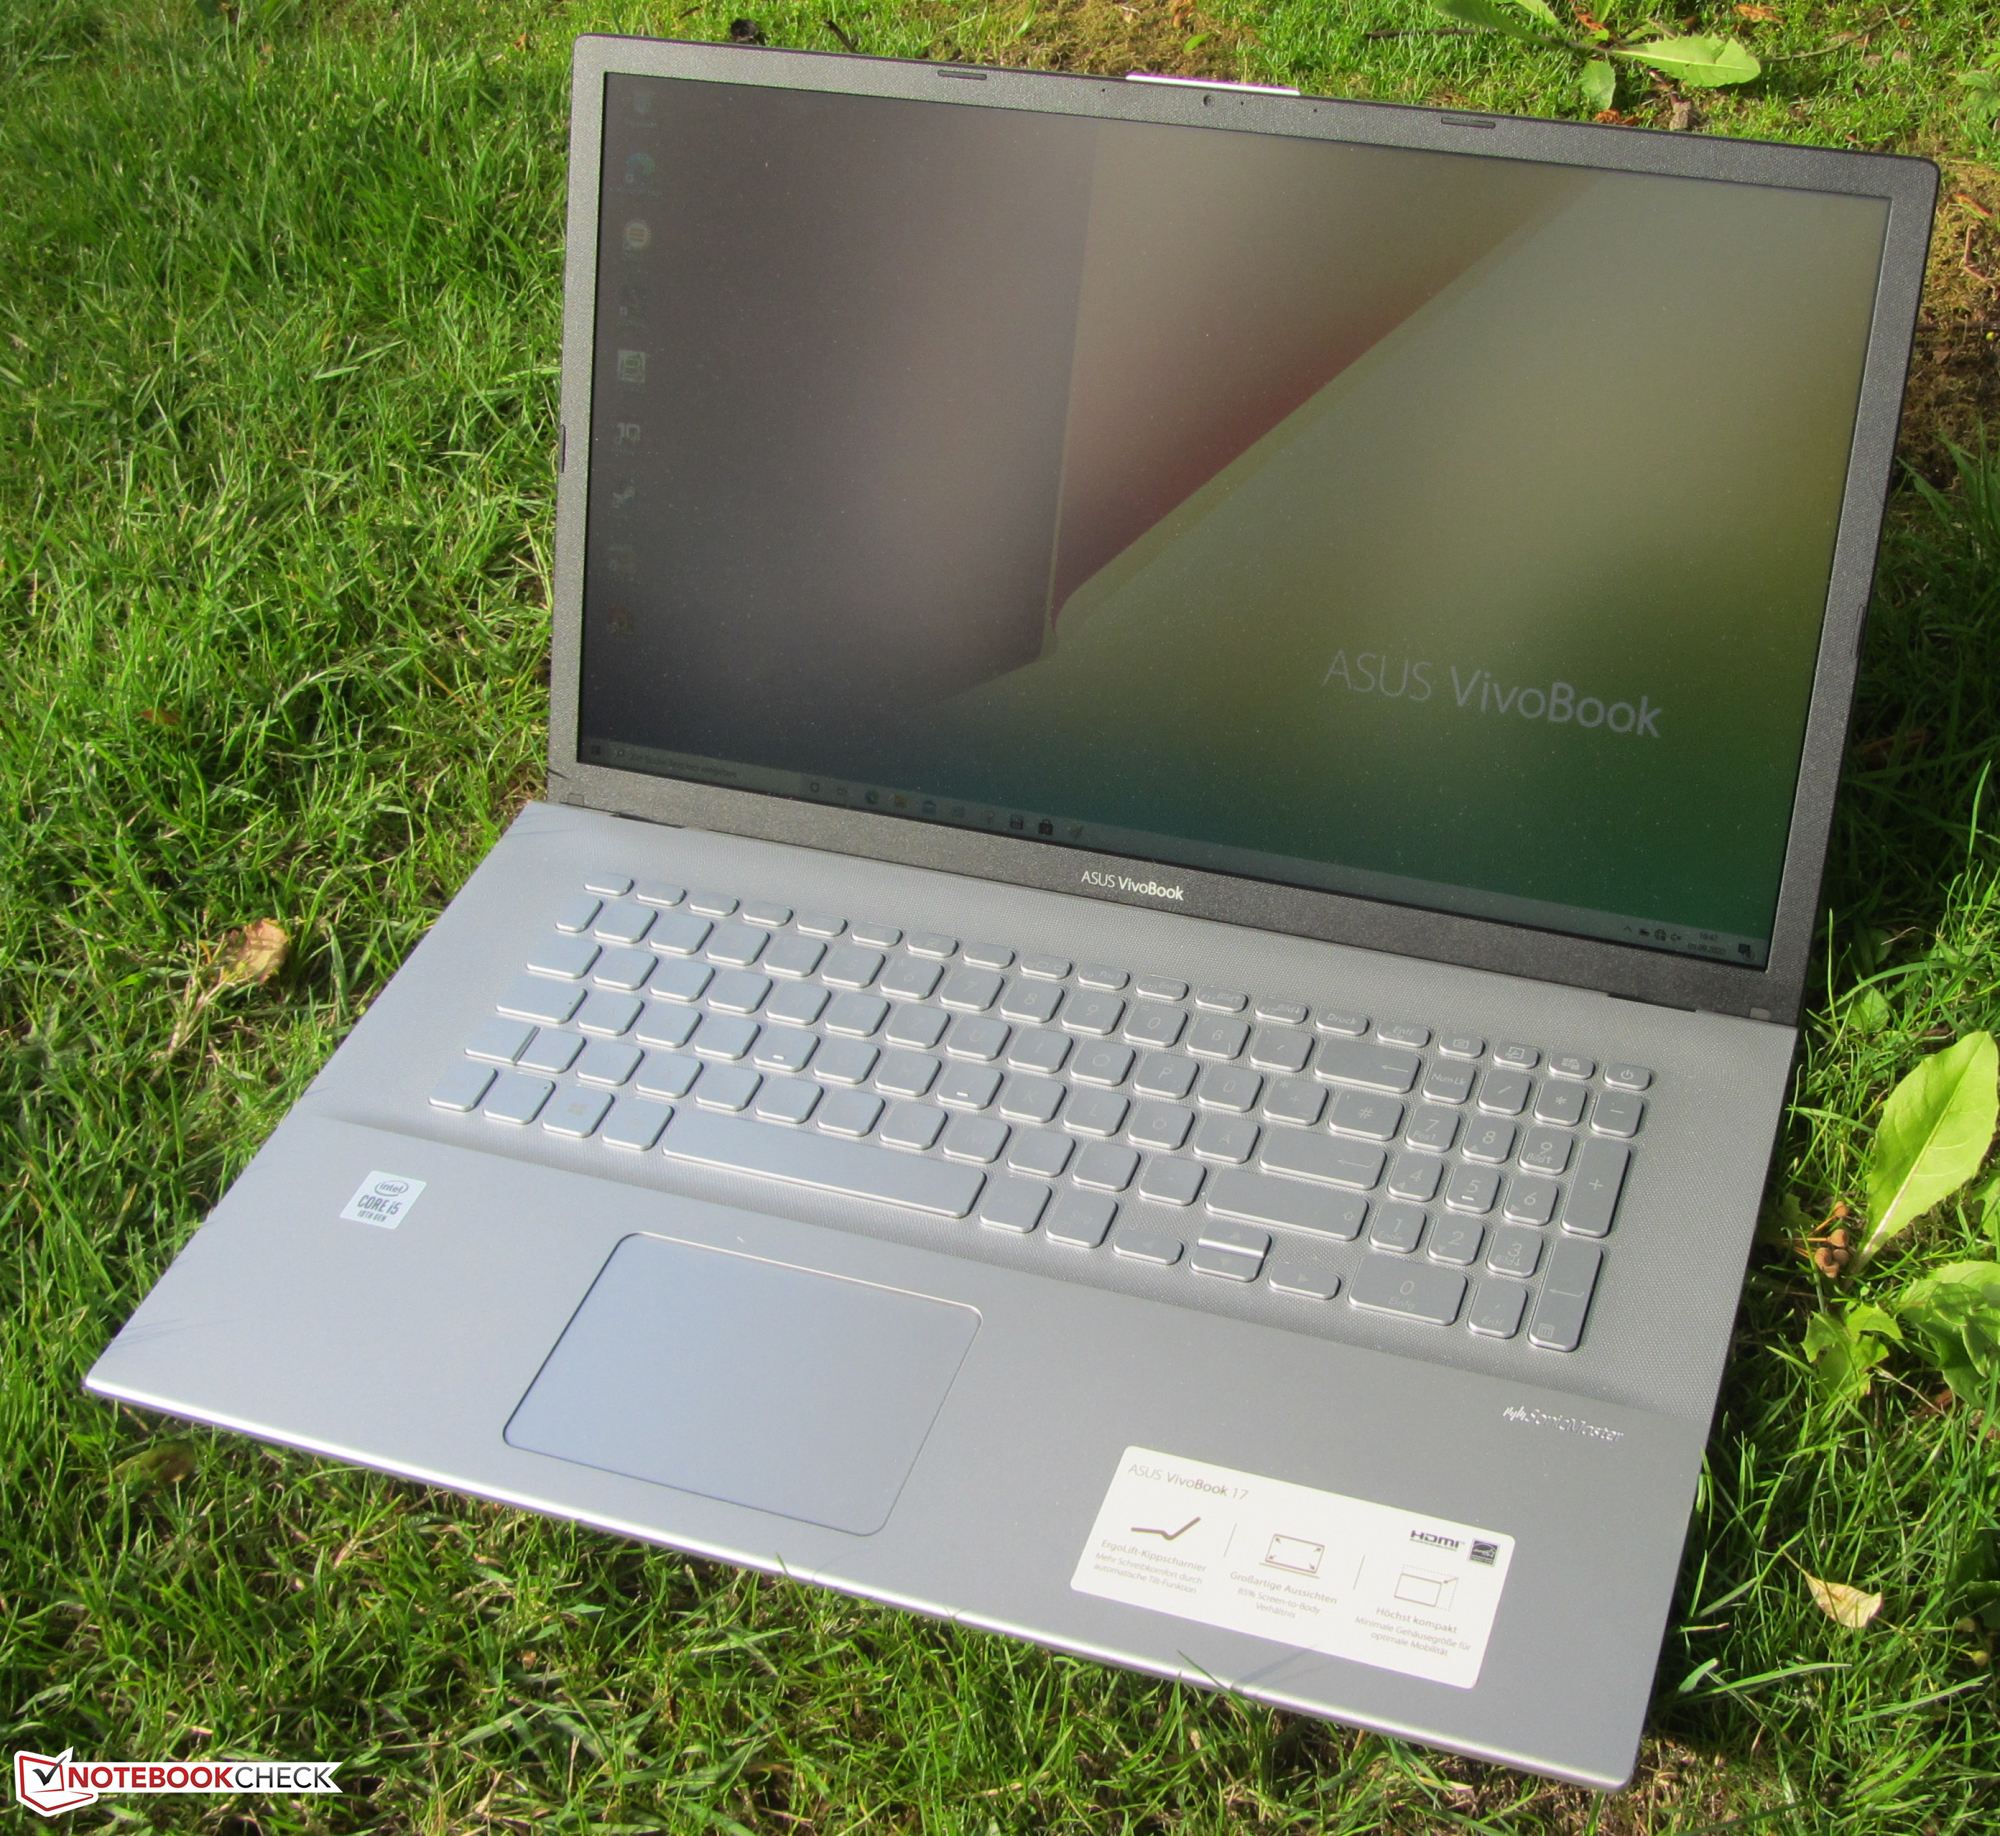
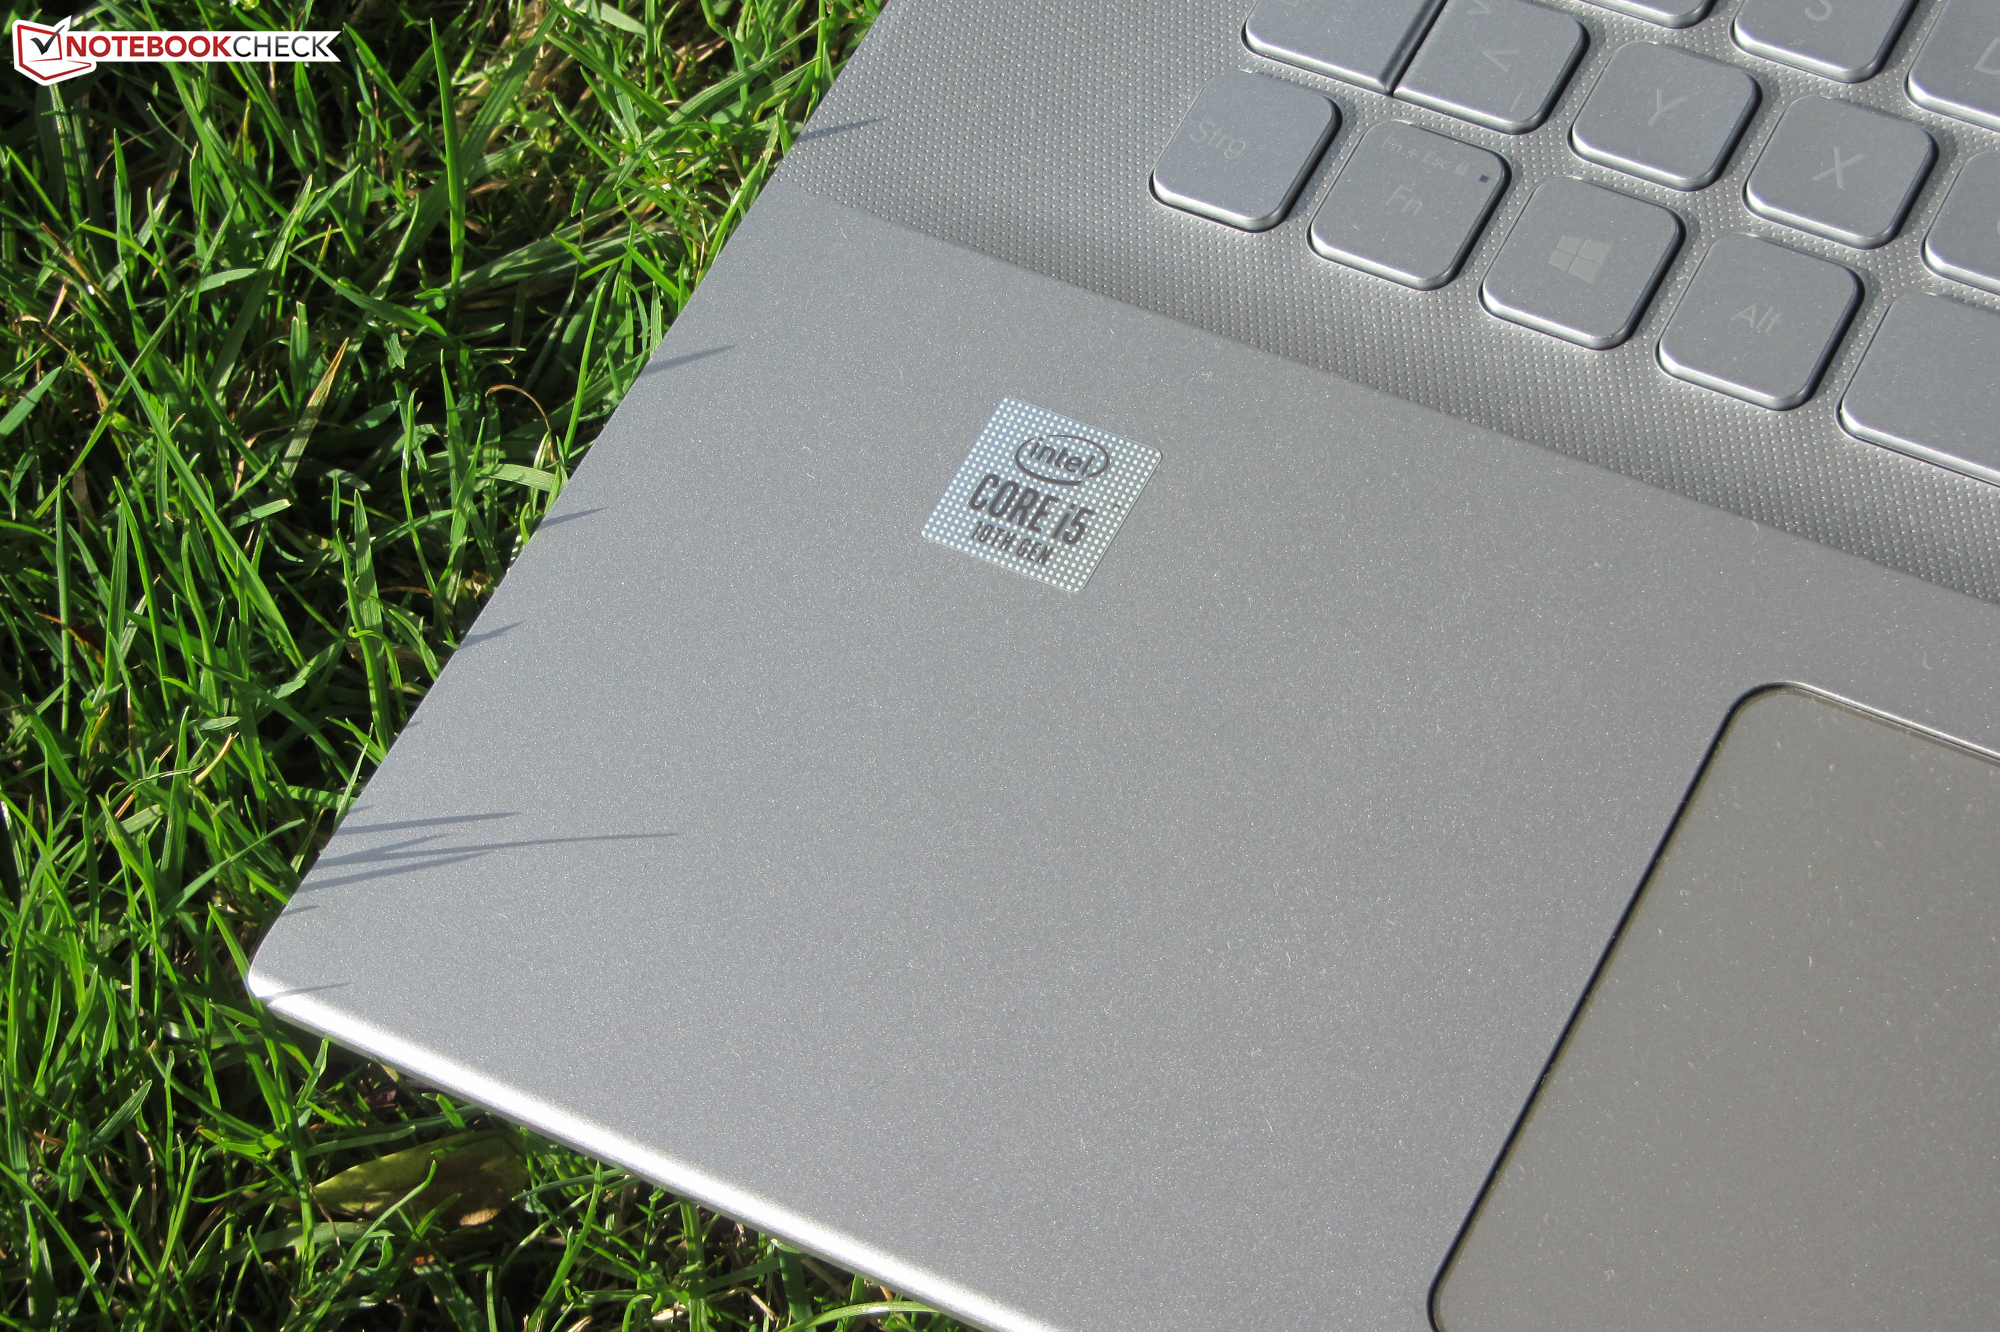
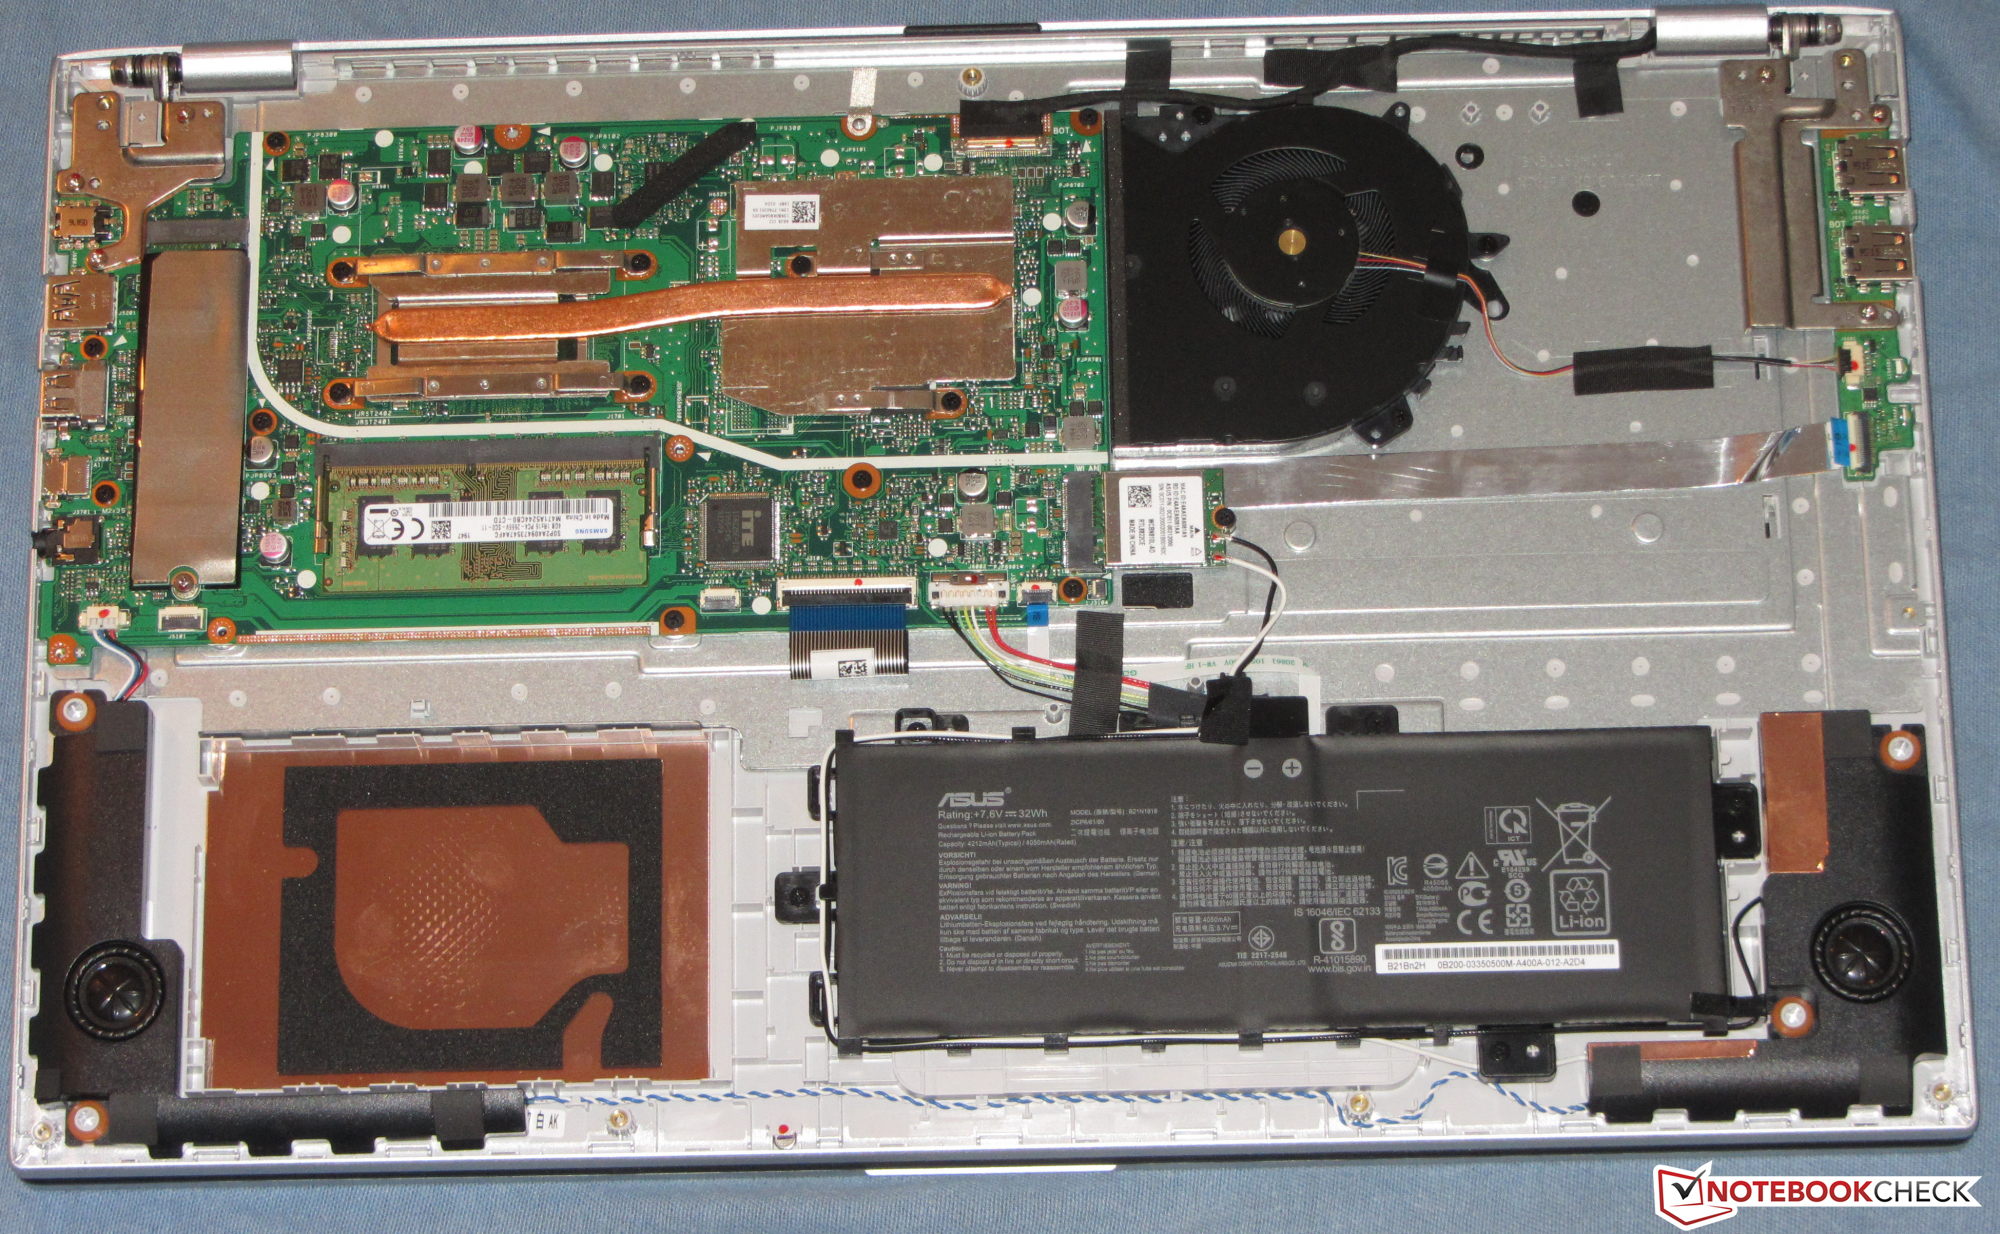
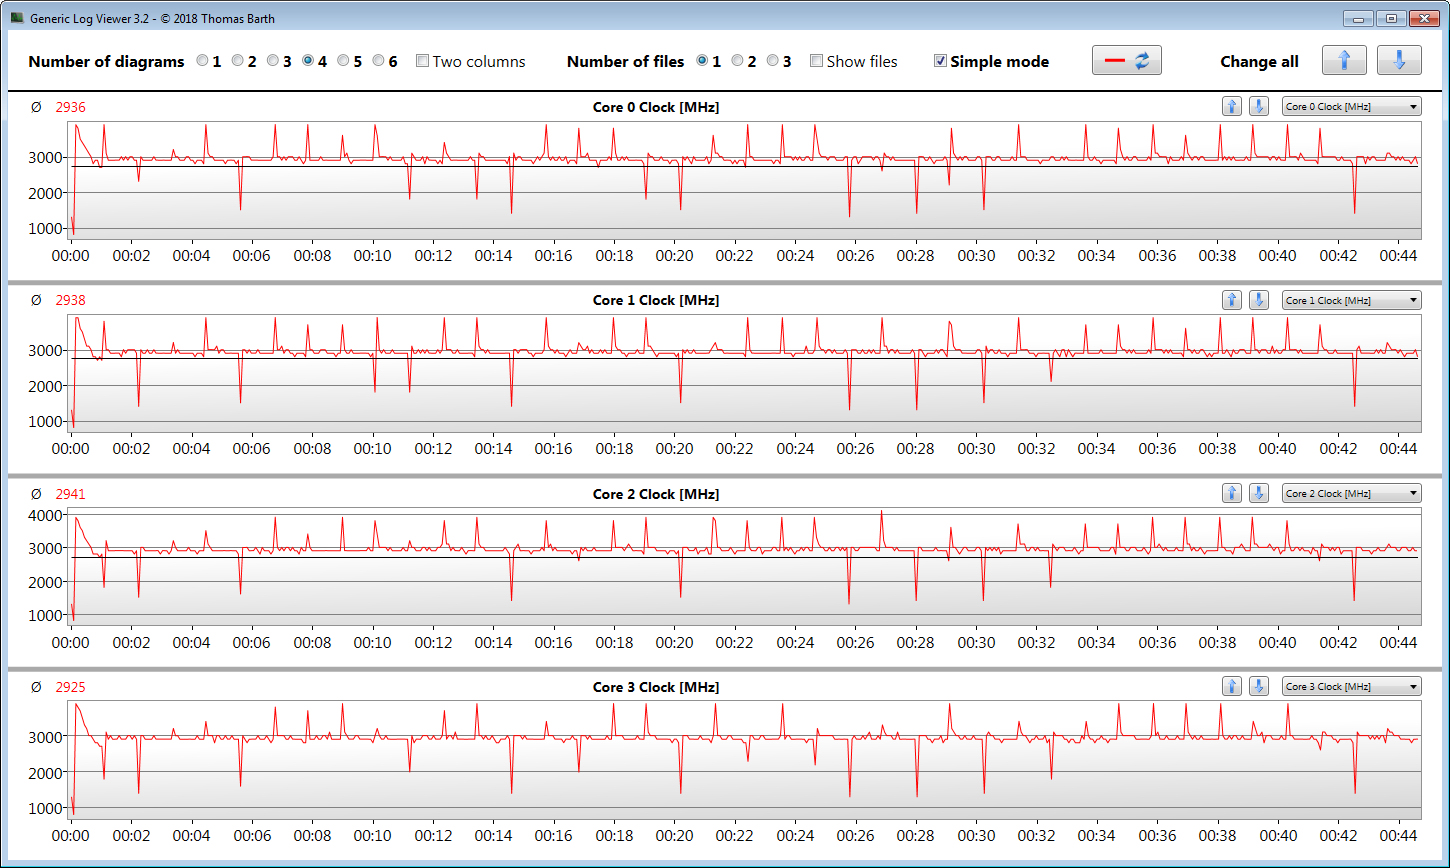
Il VivoBook 17 ha a bordo un potente processore Core-i5-10210U che offre prestazioni di calcolo più che sufficienti per le applicazioni in ufficio e su Internet. È accompagnato da 8 GB di memoria di lavoro (modalità dual-channel) e da una veloce SSD NVMe (512 GB). Con questo, il dispositivo dovrebbe essere in grado di gestire le richieste della maggior parte degli utenti.
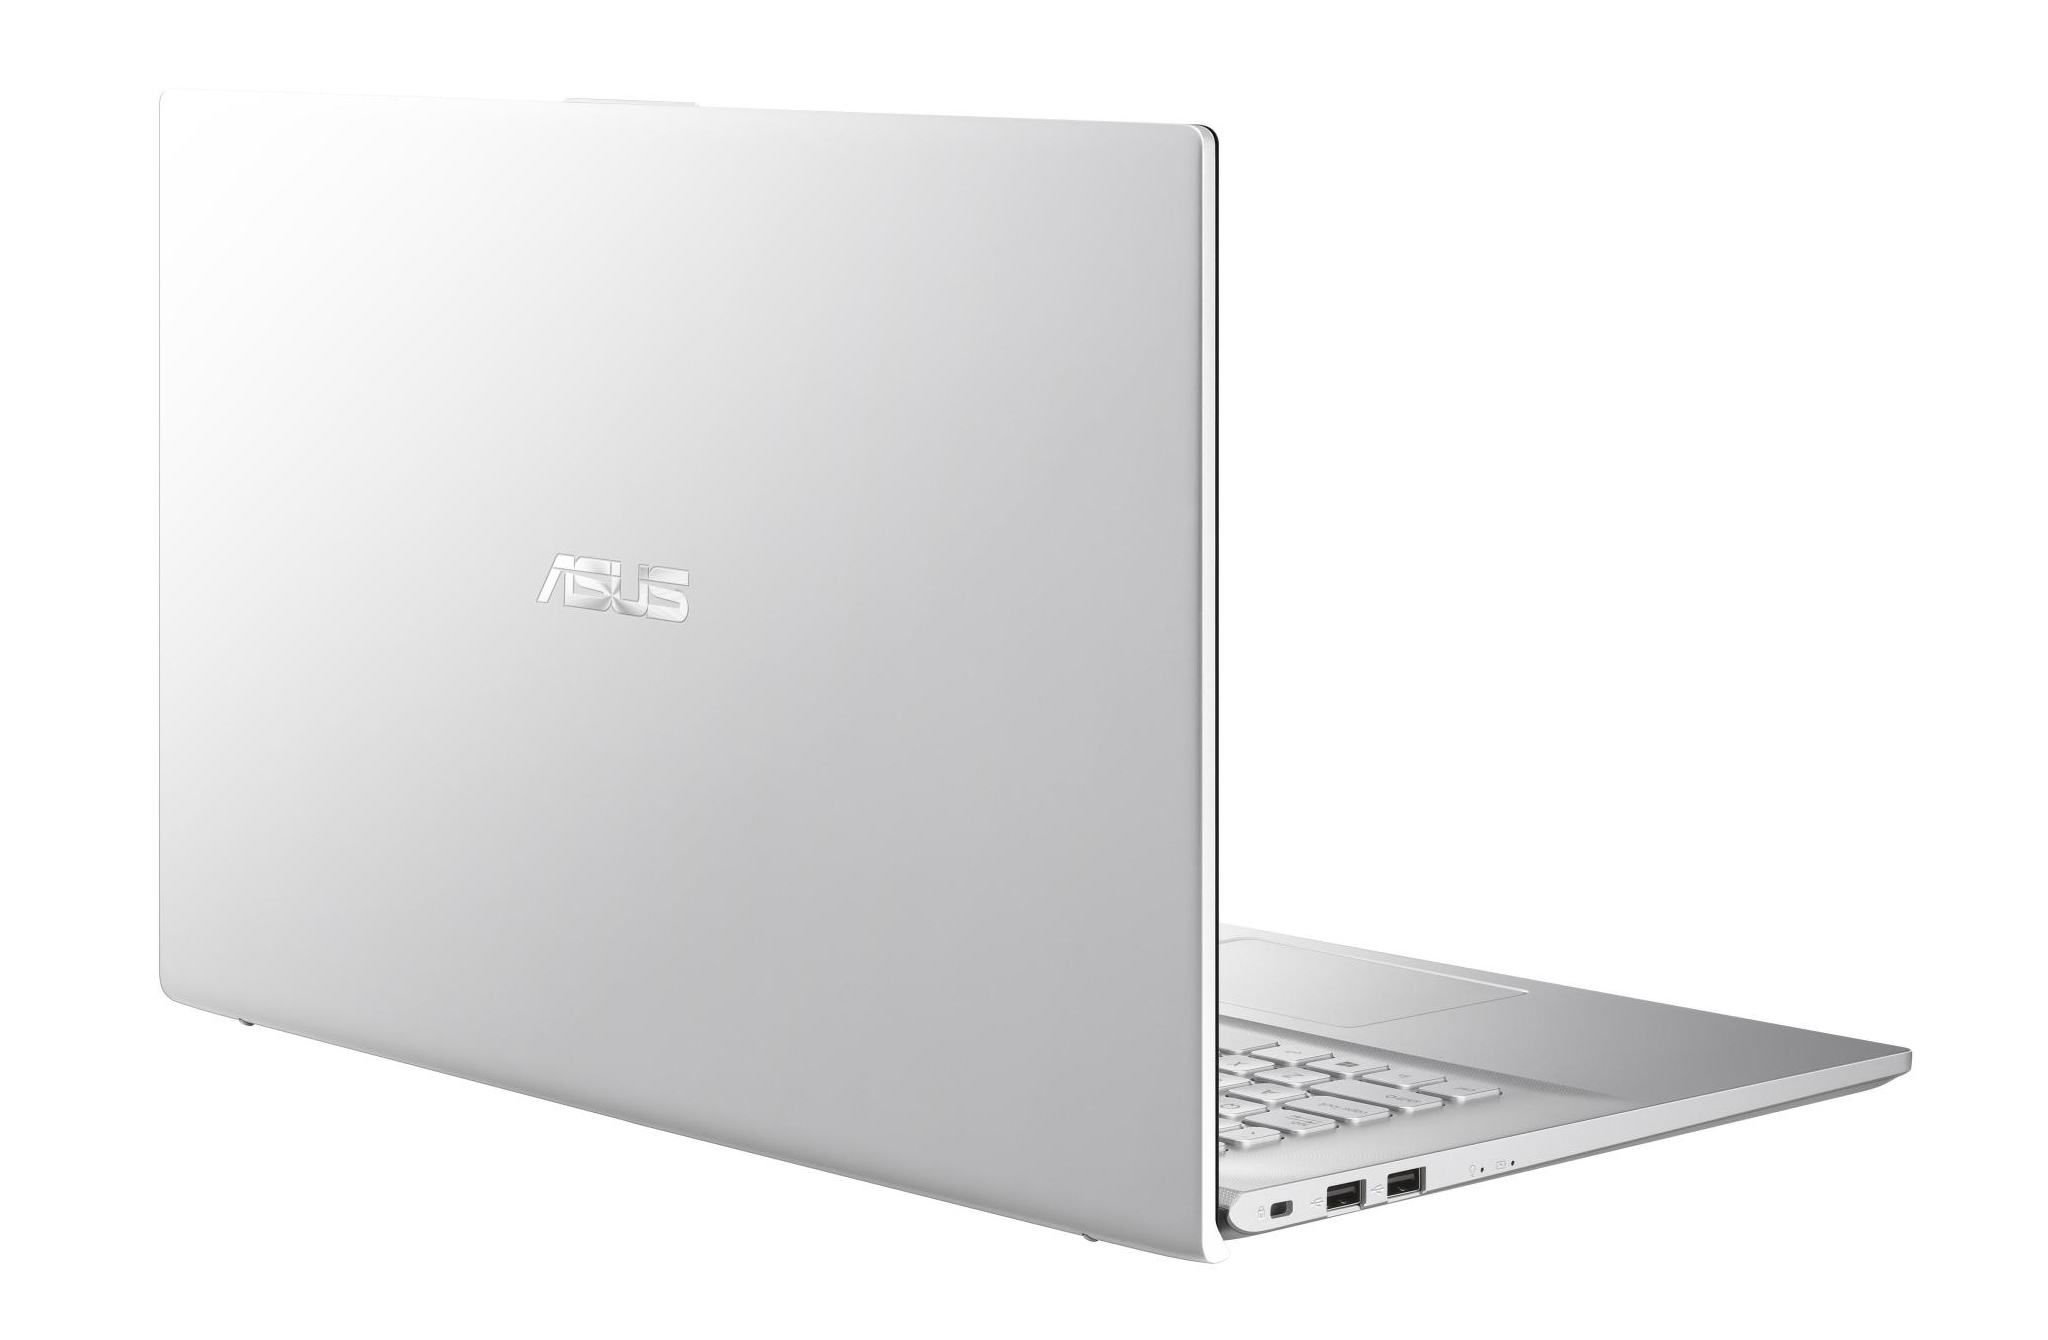
Con il VivoBook 17 F712FA, Asus offre un portatile compatto da 17,3 pollici per la casa.
Il dispositivo si riscalda moderatamente al massimo e produce poco o nessun rumore, almeno durante il funzionamento a vuoto e a basso carico. Tuttavia, dato che la ventola gira troppo sotto carico per i nostri gusti, Asus dovrebbe rielaborarne il controllo.
Rispetto ai 17,3 pollici della concorrenza, il VivoBook risulta abbastanza compatto. Tuttavia, la bassa capacità della batteria di 32 Wh indica che non è un dispositivo molto mobile. In pratica, questo porta ad una durata della batteria di appena 5,5 ore nel test WLAN, che al giorno d'oggi è inferiore allo standard.
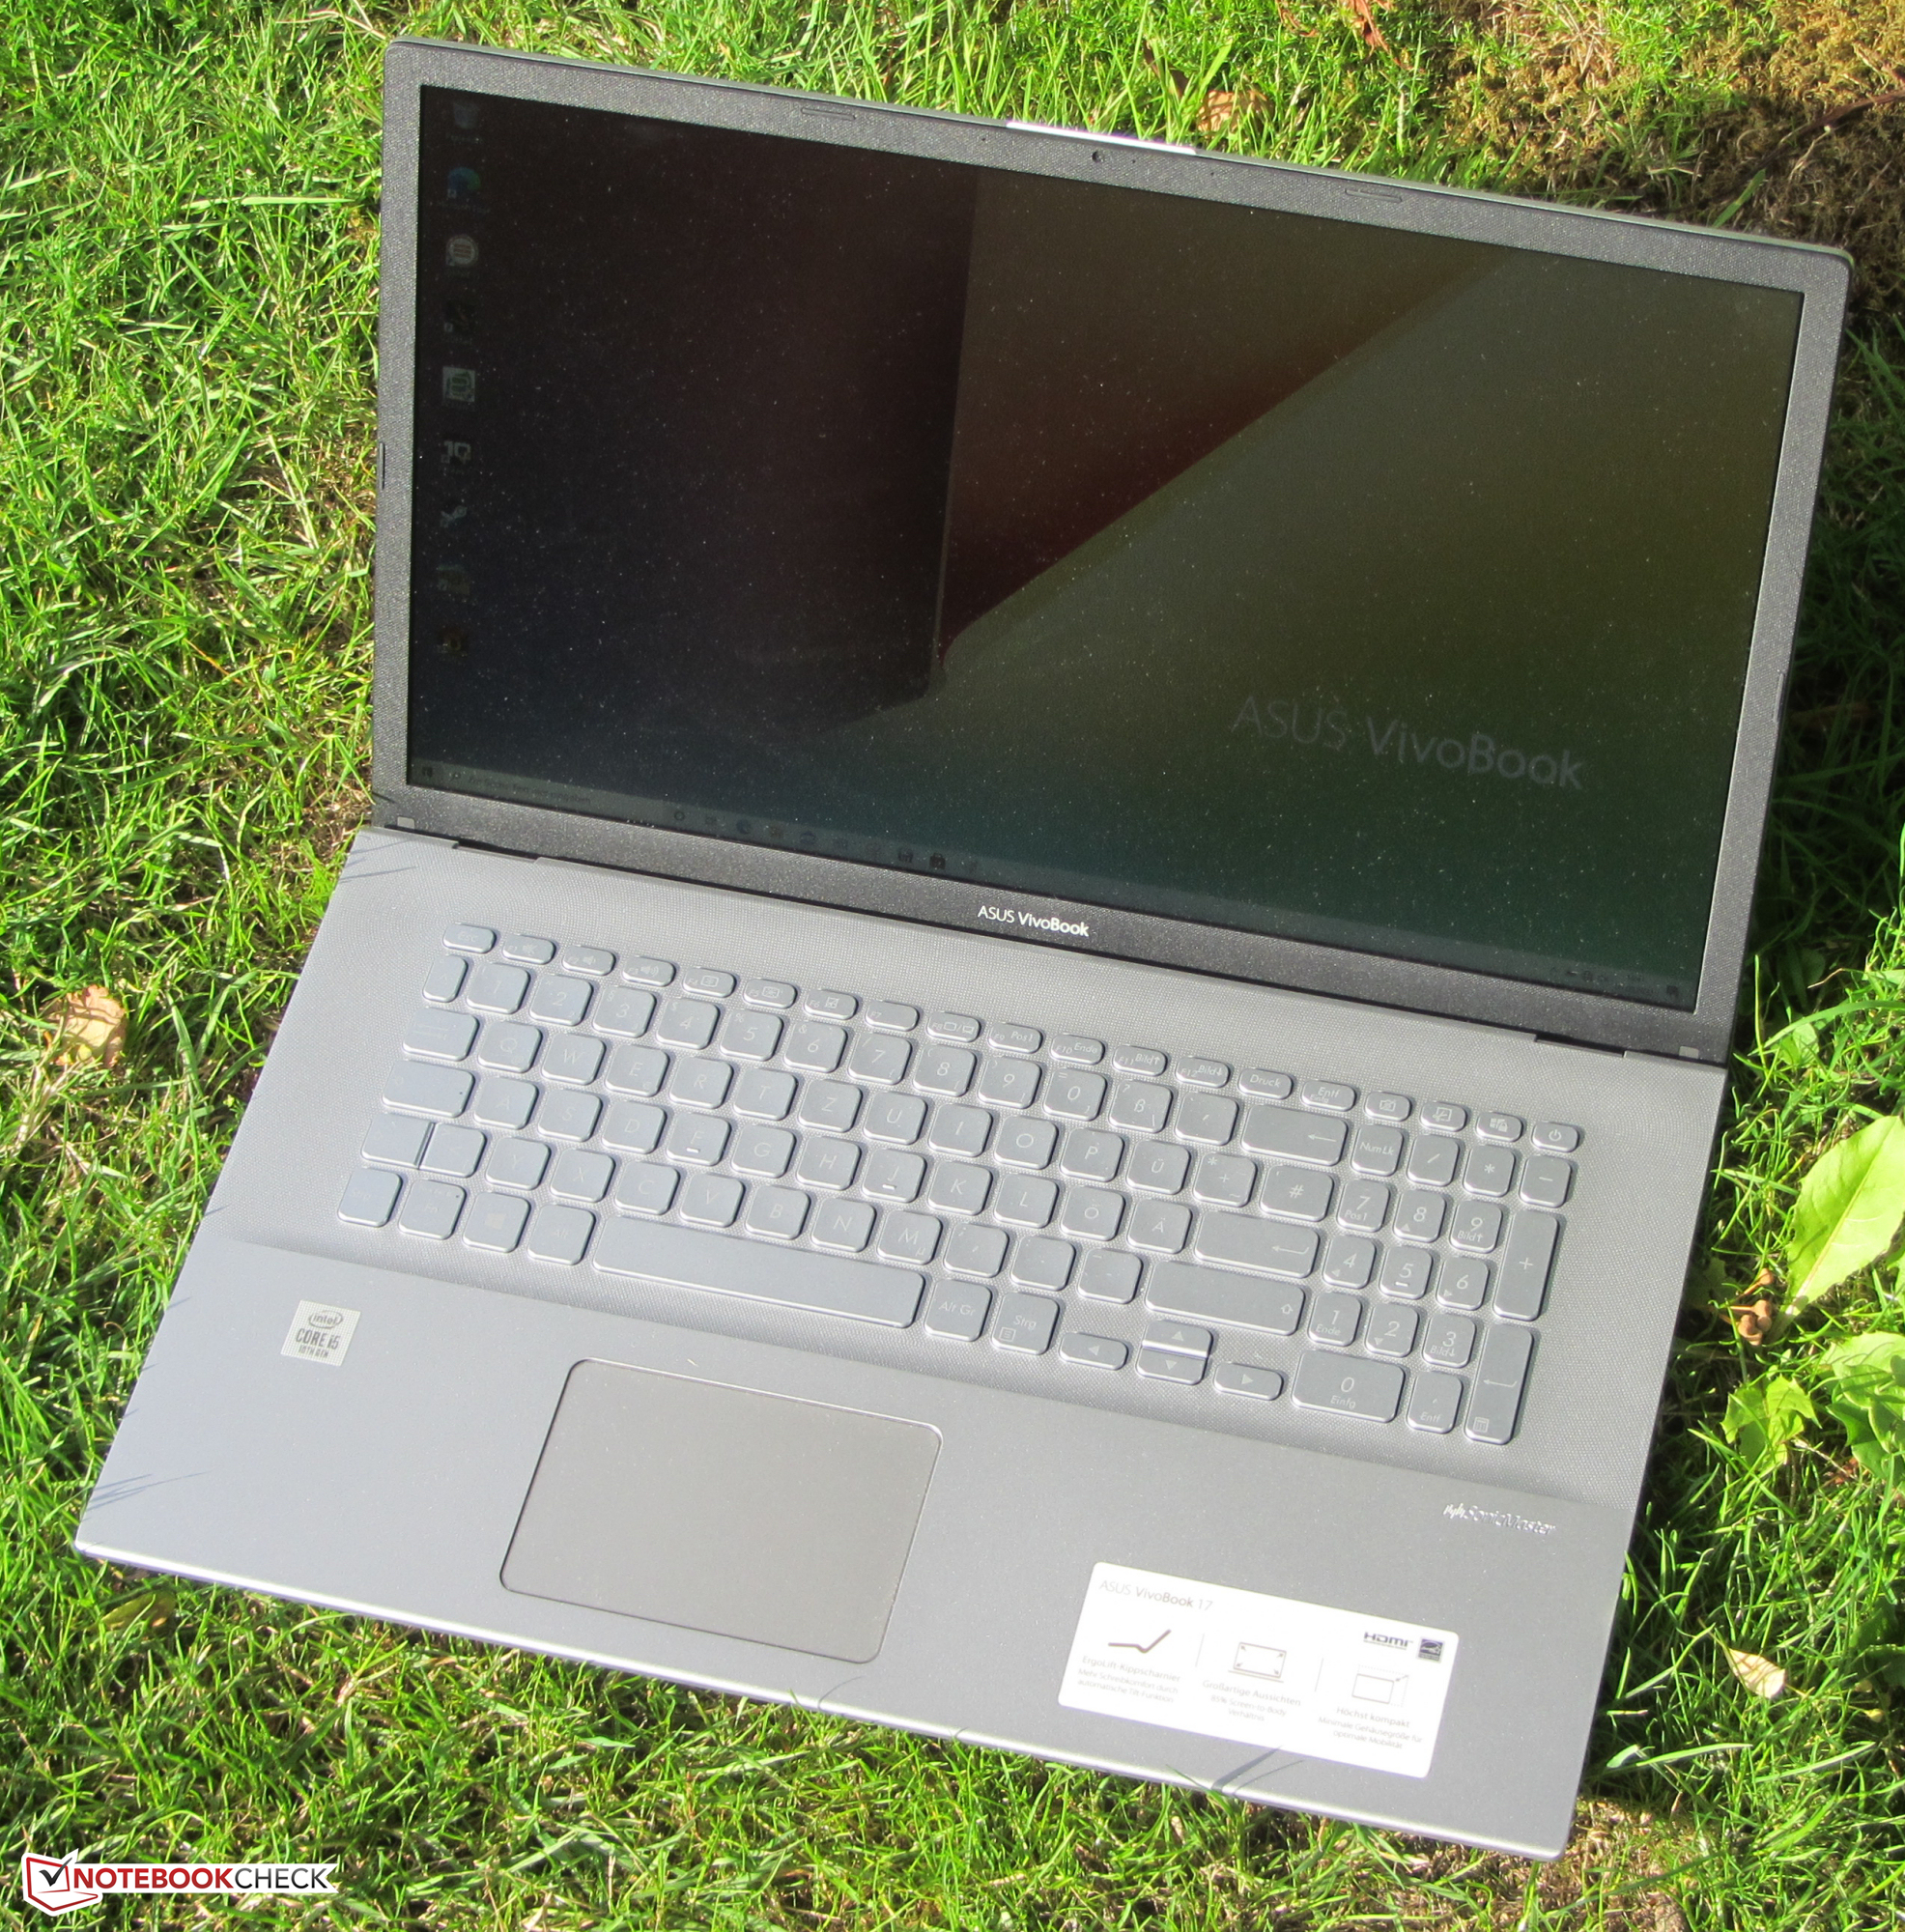
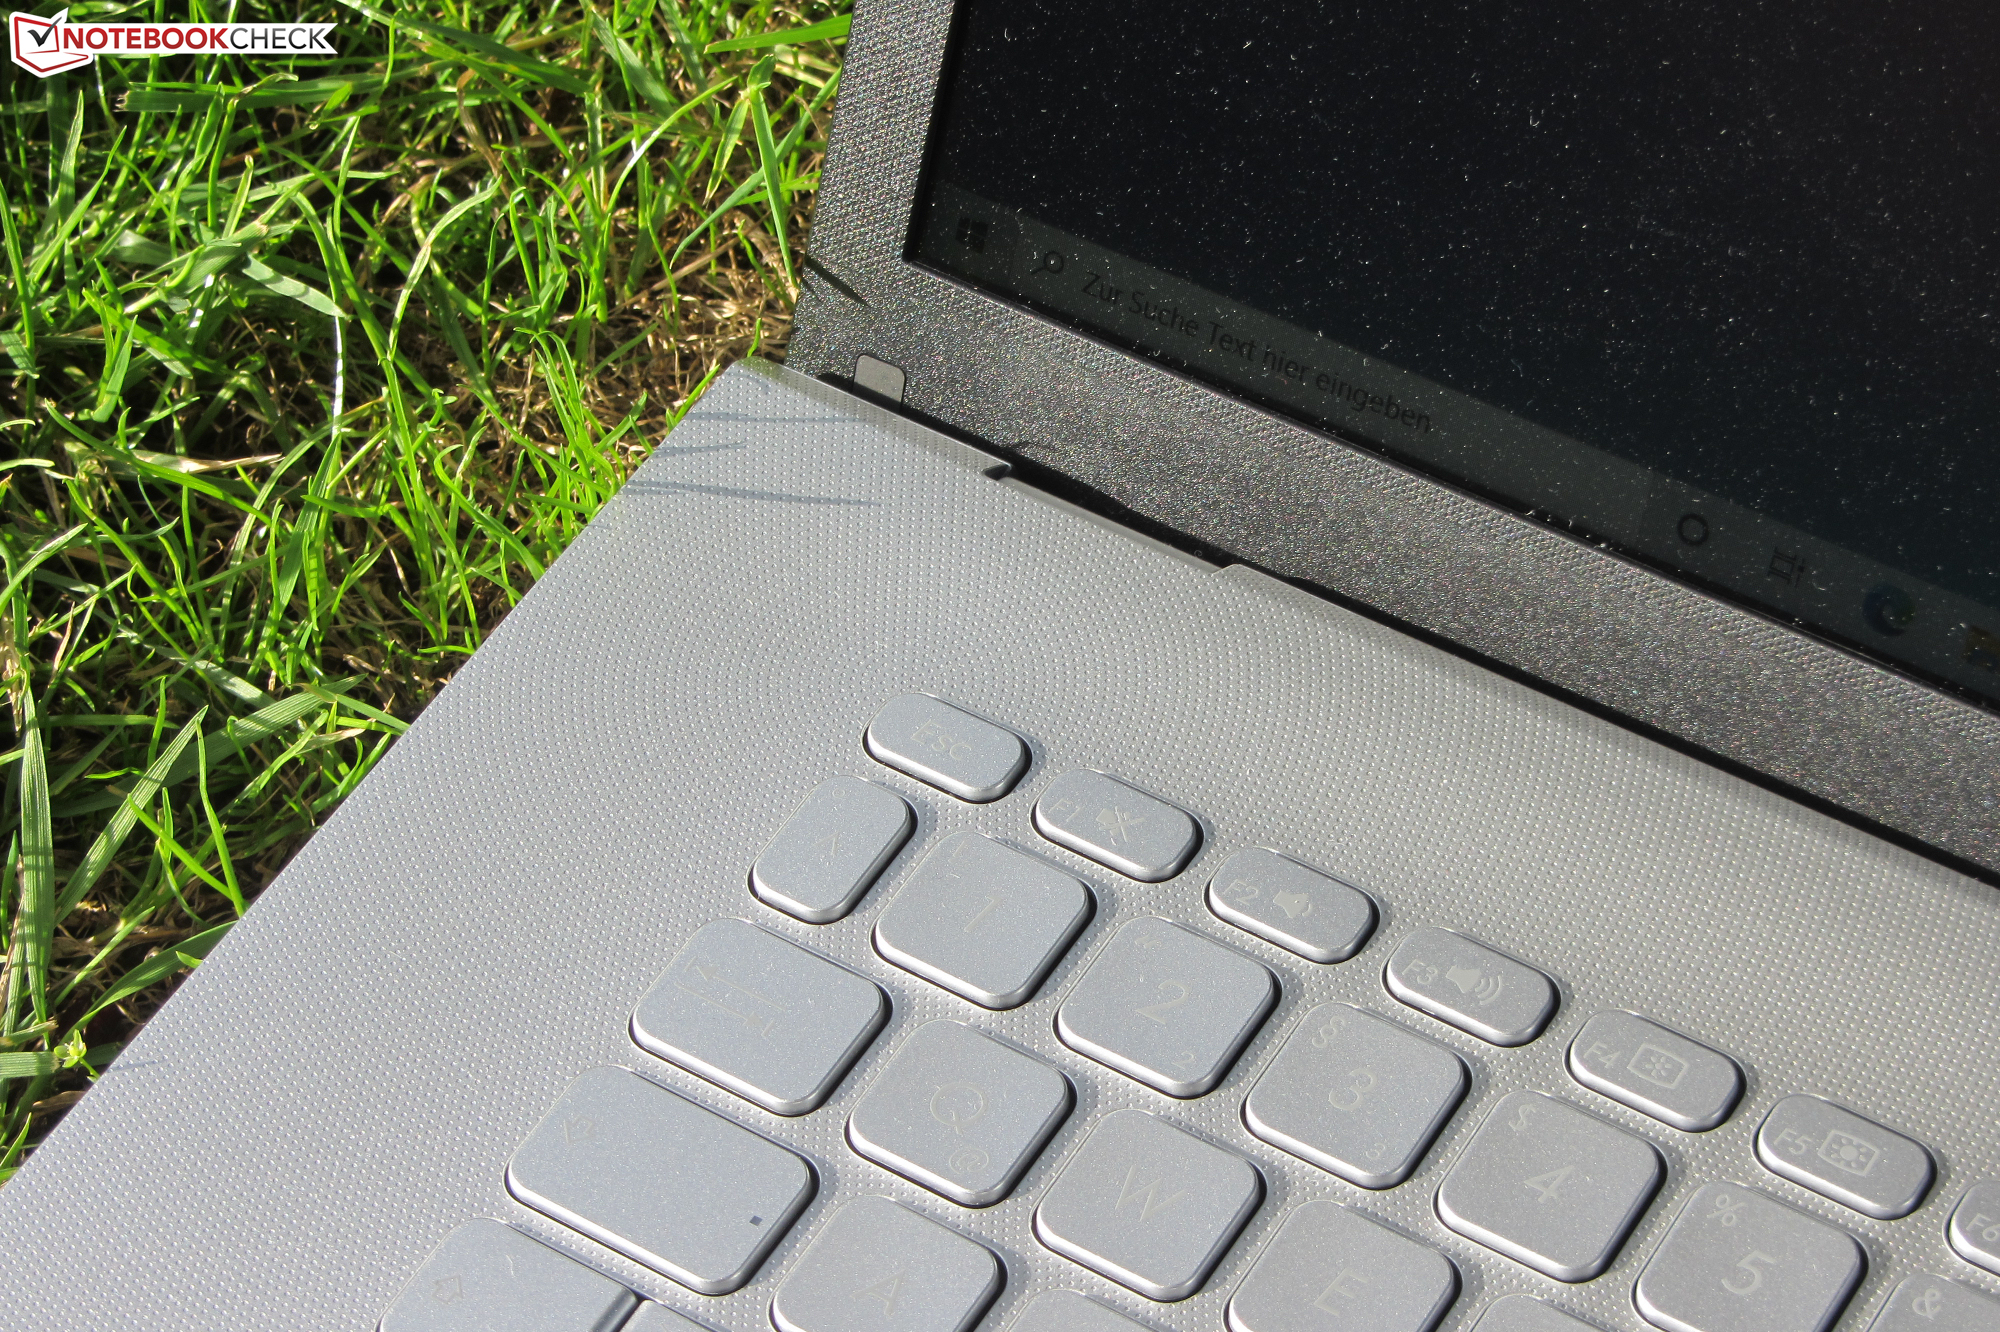
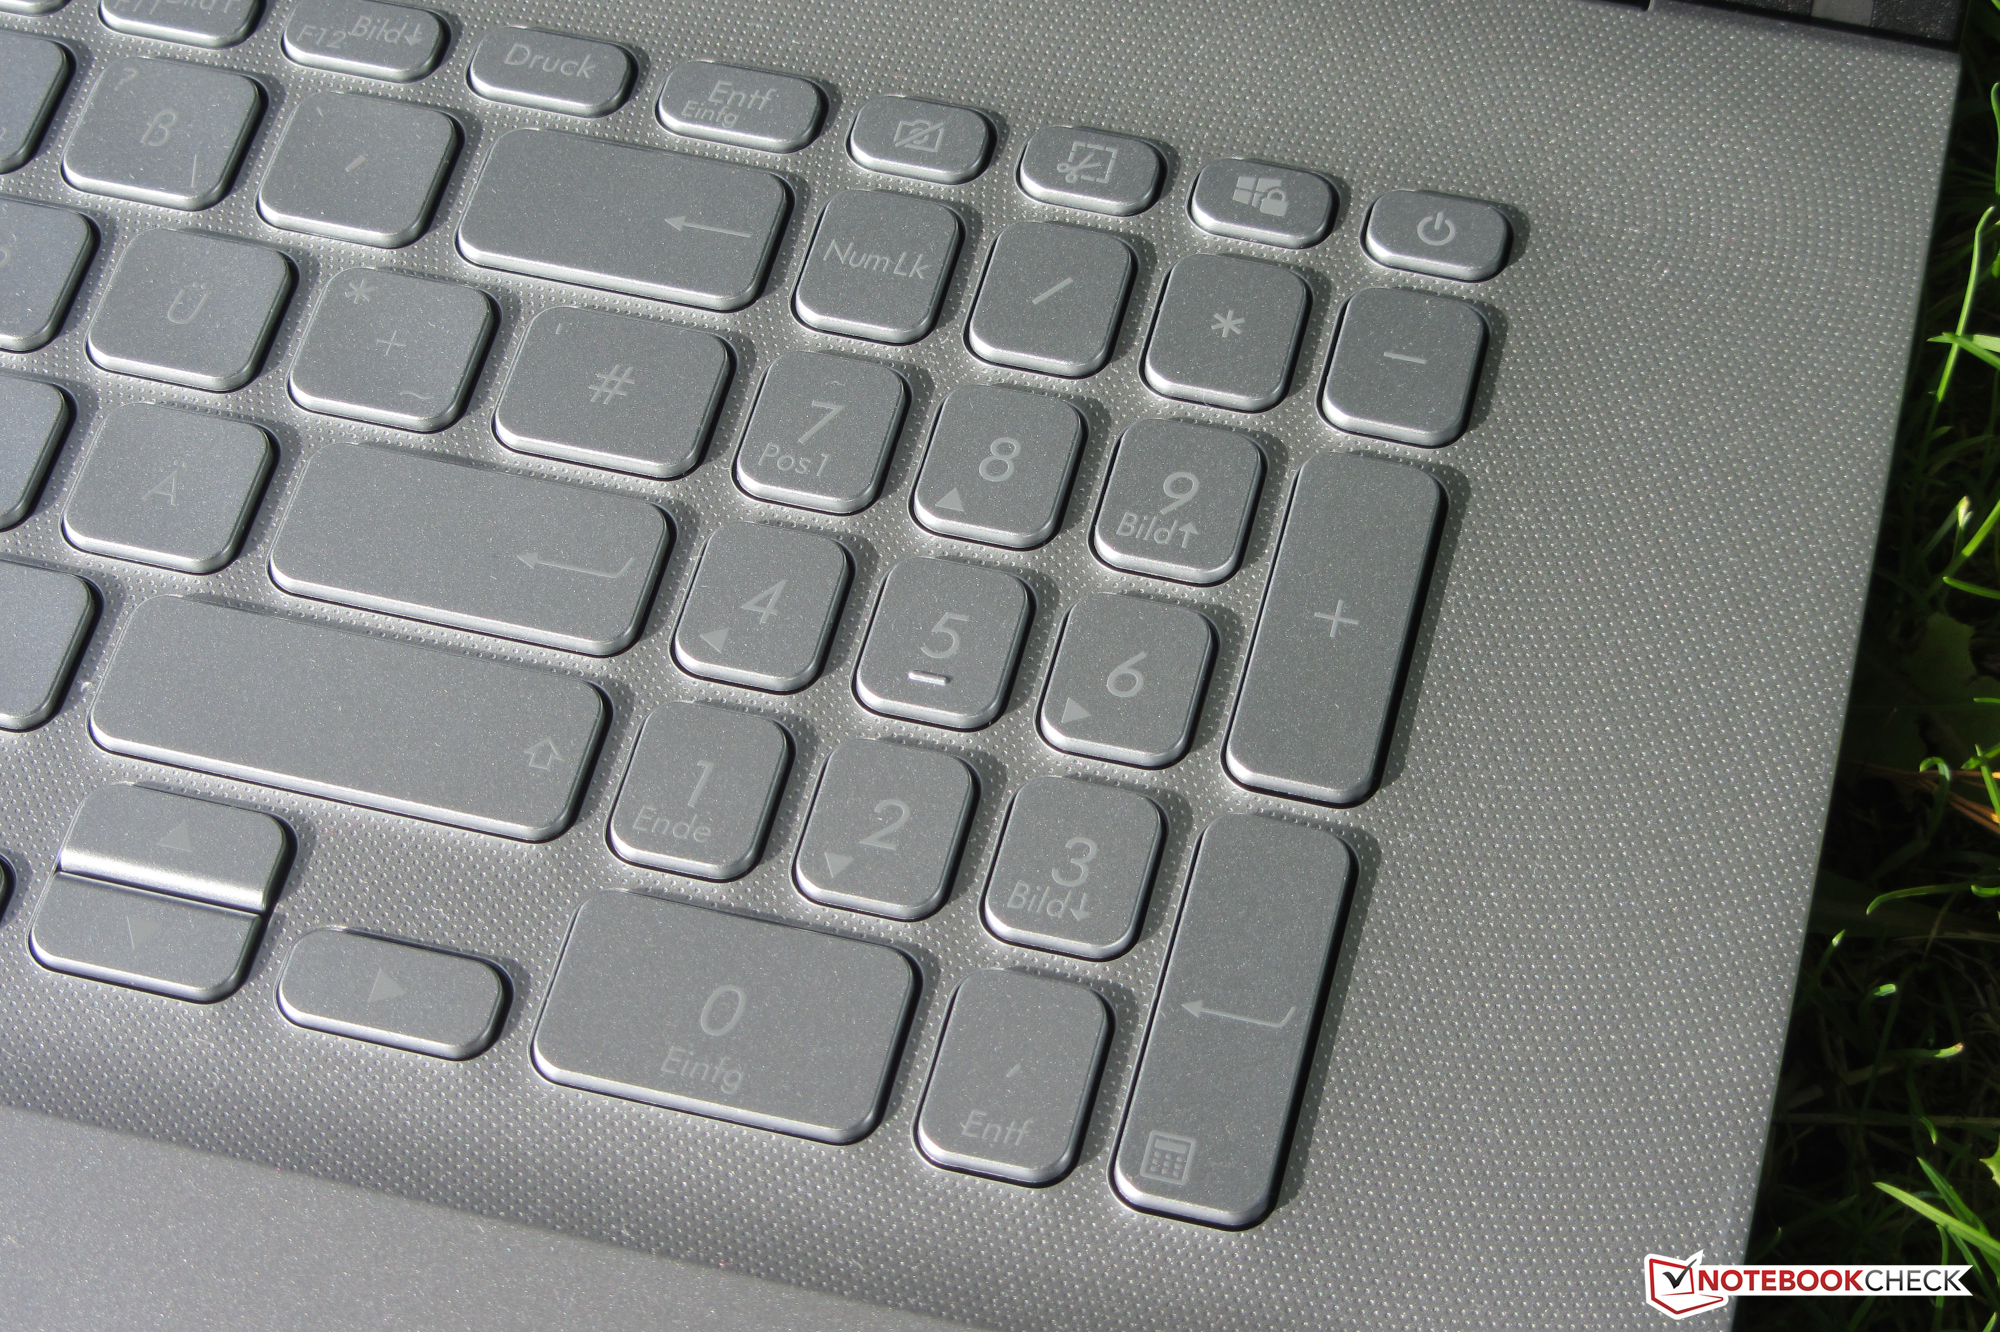
Il display Full-HD IPS si presenta con una superficie opaca, un buon contrasto, angoli di visualizzazione stabili e una buona riproduzione dei colori. La massima luminosità e la copertura dello spazio colore risultano troppo basse. La tastiera si è dimostrata adatta alle attività quotidiane. Tuttavia, ci manca l'illuminazione della tastiera.
Nota: abbiamo recentemente riferito che le CPU di alcuni modelli di VivoBook 17 funzionano molto più lentamente quando è attivo il profilo di potenza di Windows "High Performance". Tuttavia, questo non è il caso della nostra attuale unità di test.
Asus VivoBook 17 F712FA-AU518T
- 09/09/2020 v7 (old)
Sascha Mölck
Price comparison
