Recensione del Convertibile Trekstor Yourbook C11B (N3350, eMMC, FHD)
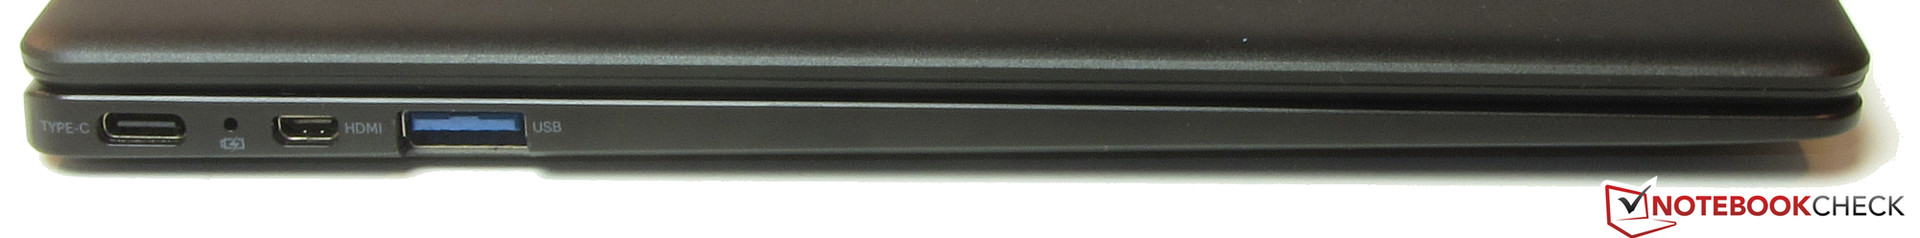
Connettività
| SD Card Reader | |
| average JPG Copy Test (av. of 3 runs) | |
| Media della classe Convertible (29.4 - 141, n=20, ultimi 2 anni) | |
| Lenovo Yoga 330-11IGM (Toshiba Exceria Pro SDXC 64 GB UHS-II) | |
| Asus VivoBook E12 E203NA-FD026T (Toshiba Exceria Pro M501 microSDXC 64GB) | |
| Trekstor Primebook C11 (Toshiba Exceria Pro M501 microSDXC 64GB) | |
| Medion Akoya E2228T-MD61250 (Toshiba Exceria Pro M501 microSDXC 64GB) | |
| Dell Chromebook 11 3181 2-in-1 (Toshiba Exceria Pro M501 UHS-II) | |
| maximum AS SSD Seq Read Test (1GB) | |
| Media della classe Convertible (67.5 - 254, n=19, ultimi 2 anni) | |
| Lenovo Yoga 330-11IGM (Toshiba Exceria Pro SDXC 64 GB UHS-II) | |
| Asus VivoBook E12 E203NA-FD026T (Toshiba Exceria Pro M501 microSDXC 64GB) | |
| Medion Akoya E2228T-MD61250 (Toshiba Exceria Pro M501 microSDXC 64GB) | |
| Trekstor Yourbook C11B (Toshiba Exceria Pro M501 microSDXC 64GB) | |
| Trekstor Primebook C11 (Toshiba Exceria Pro M501 microSDXC 64GB) | |
| Networking | |
| iperf3 transmit AX12 | |
| Asus VivoBook E12 E203NA-FD026T | |
| Asus VivoBook Flip 12 TP203NAH-BP049T | |
| Trekstor Yourbook C11B | |
| Lenovo Yoga 330-11IGM | |
| Medion Akoya E2228T-MD61250 | |
| Trekstor Primebook C11 | |
| iperf3 receive AX12 | |
| Asus VivoBook Flip 12 TP203NAH-BP049T | |
| Asus VivoBook E12 E203NA-FD026T | |
| Trekstor Primebook C11 | |
| Trekstor Yourbook C11B | |
| Lenovo Yoga 330-11IGM | |
| Medion Akoya E2228T-MD61250 | |
| |||||||||||||||||||||||||
Distribuzione della luminosità: 77 %
Al centro con la batteria: 307 cd/m²
Contrasto: 1086:1 (Nero: 0.28 cd/m²)
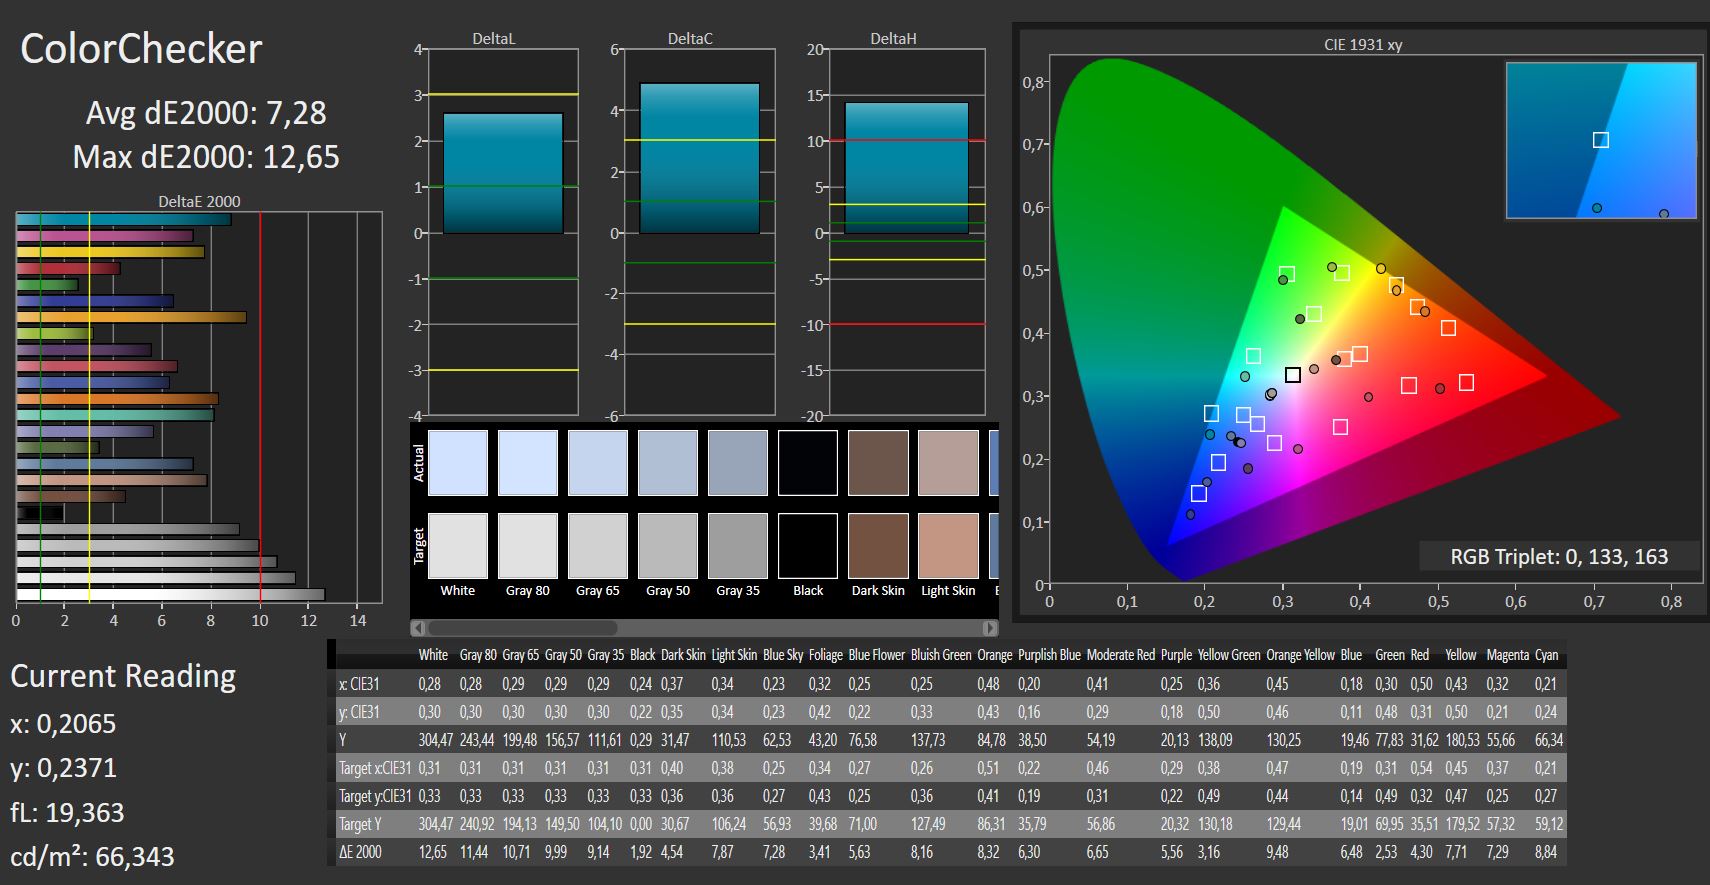
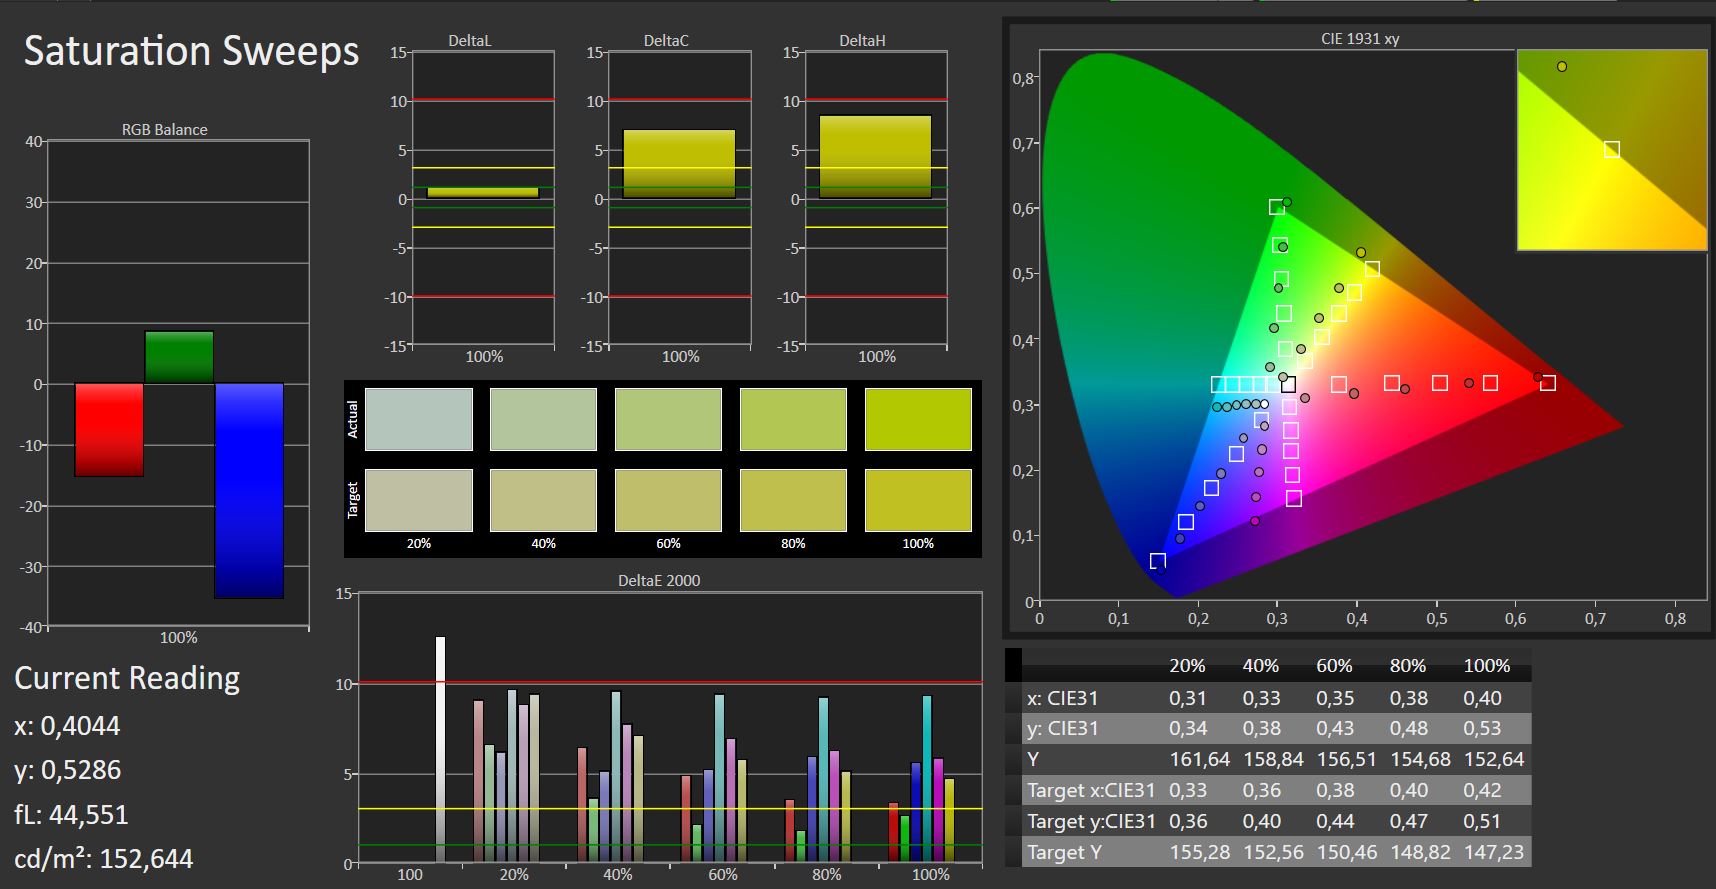
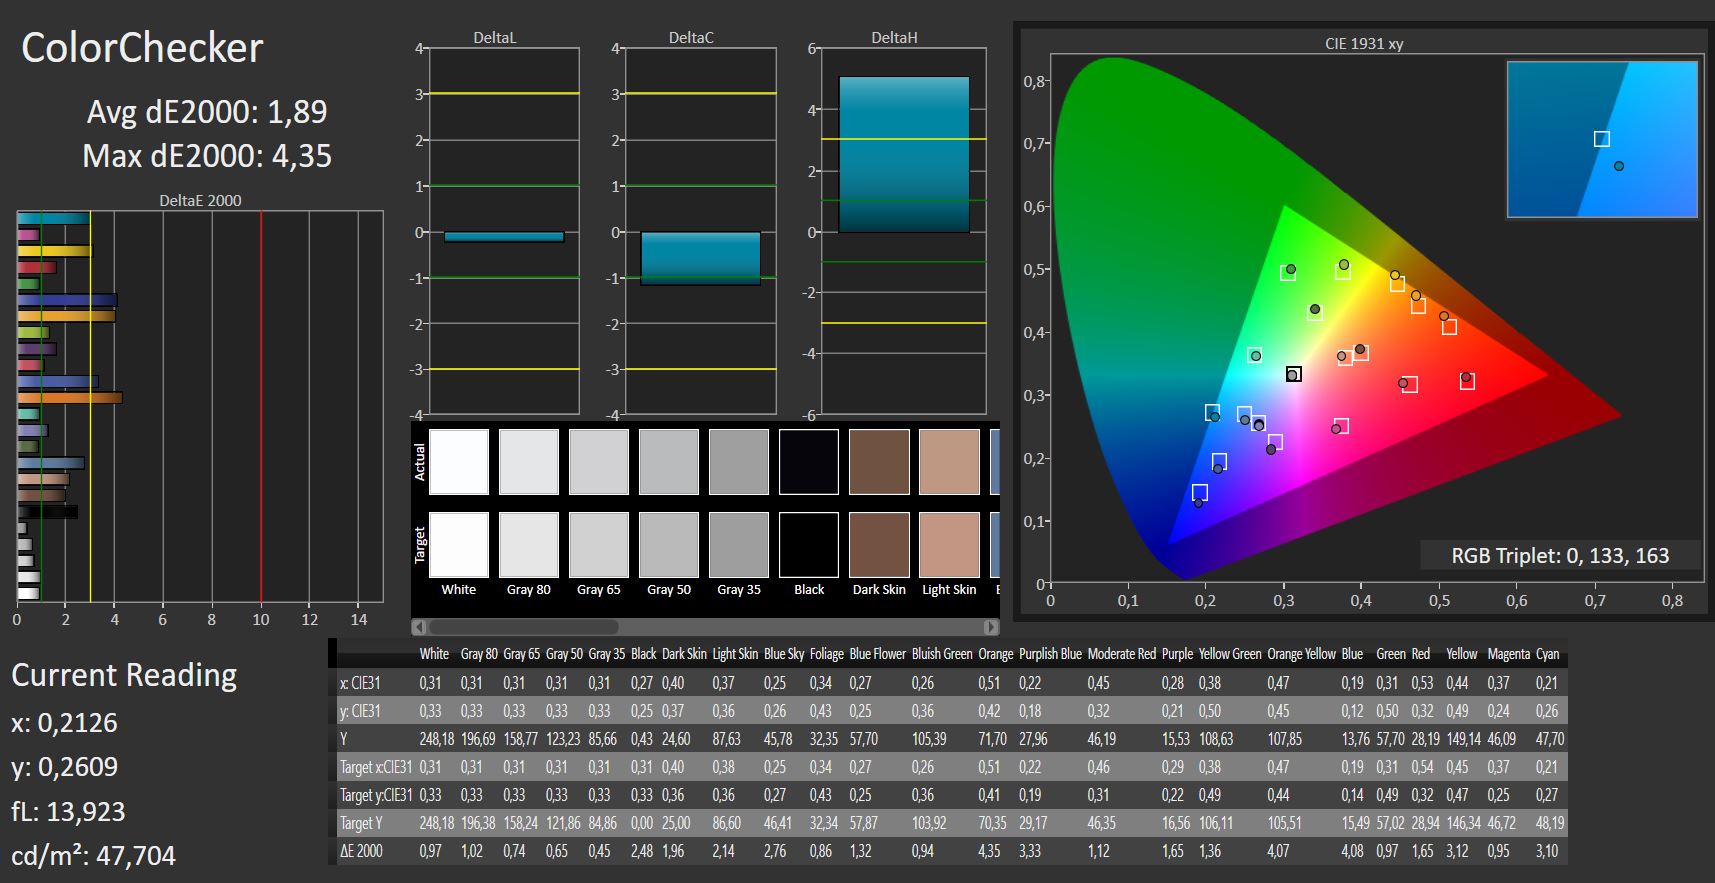
ΔE ColorChecker Calman: 7.28 | ∀{0.5-29.43 Ø4.71}
calibrated: 1.89
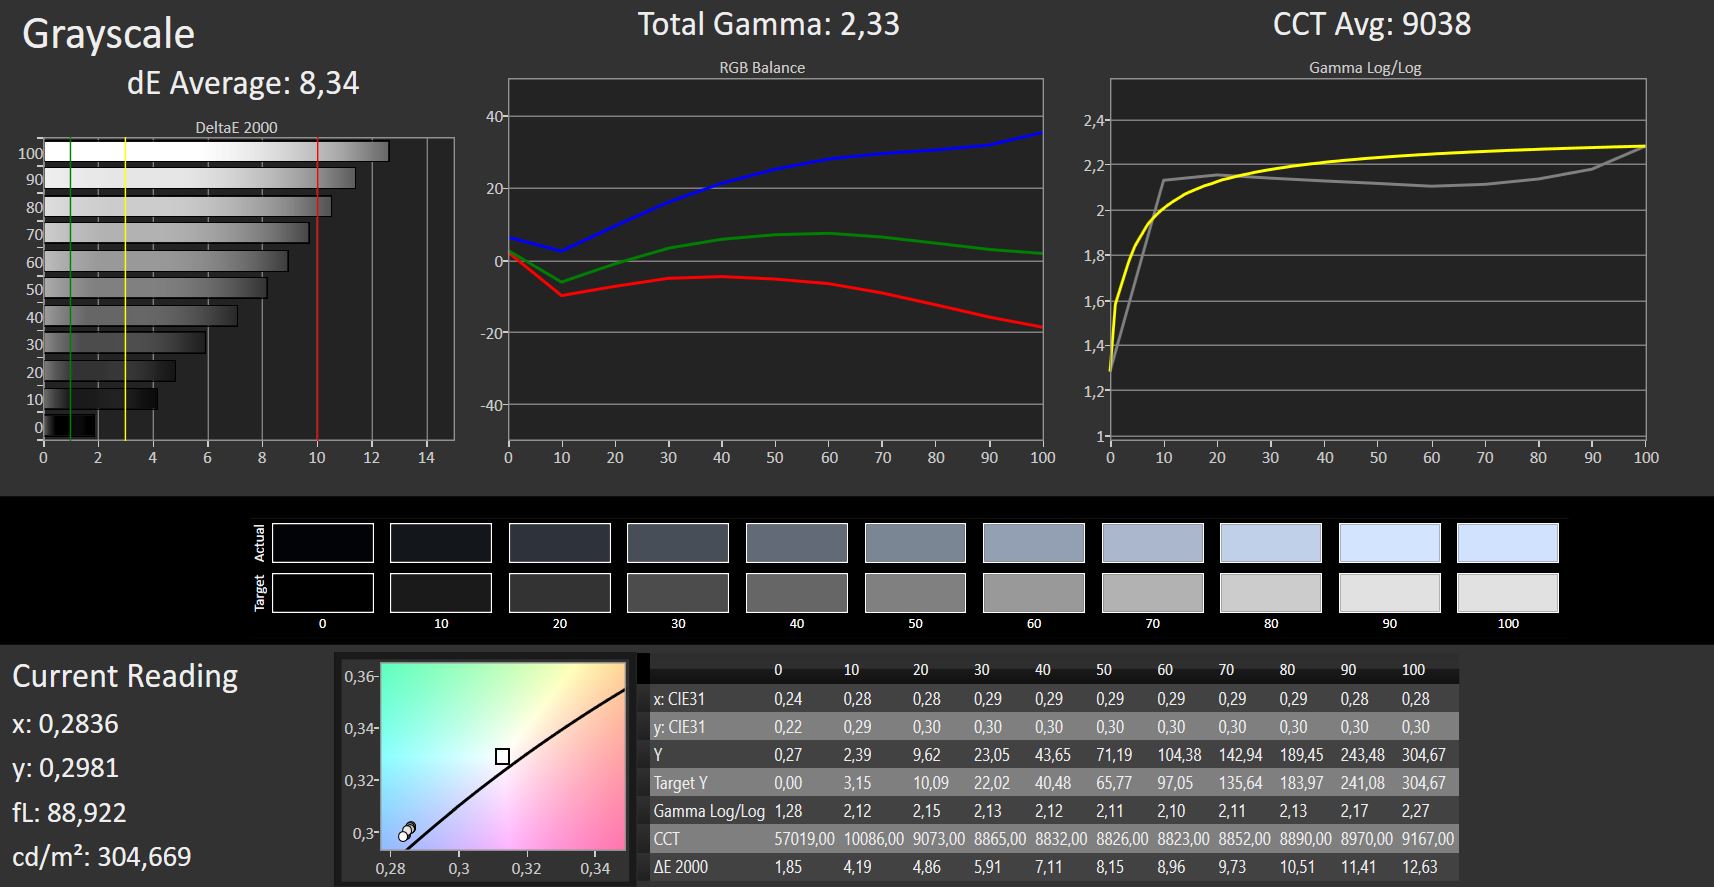
ΔE Greyscale Calman: 8.34 | ∀{0.09-98 Ø4.96}
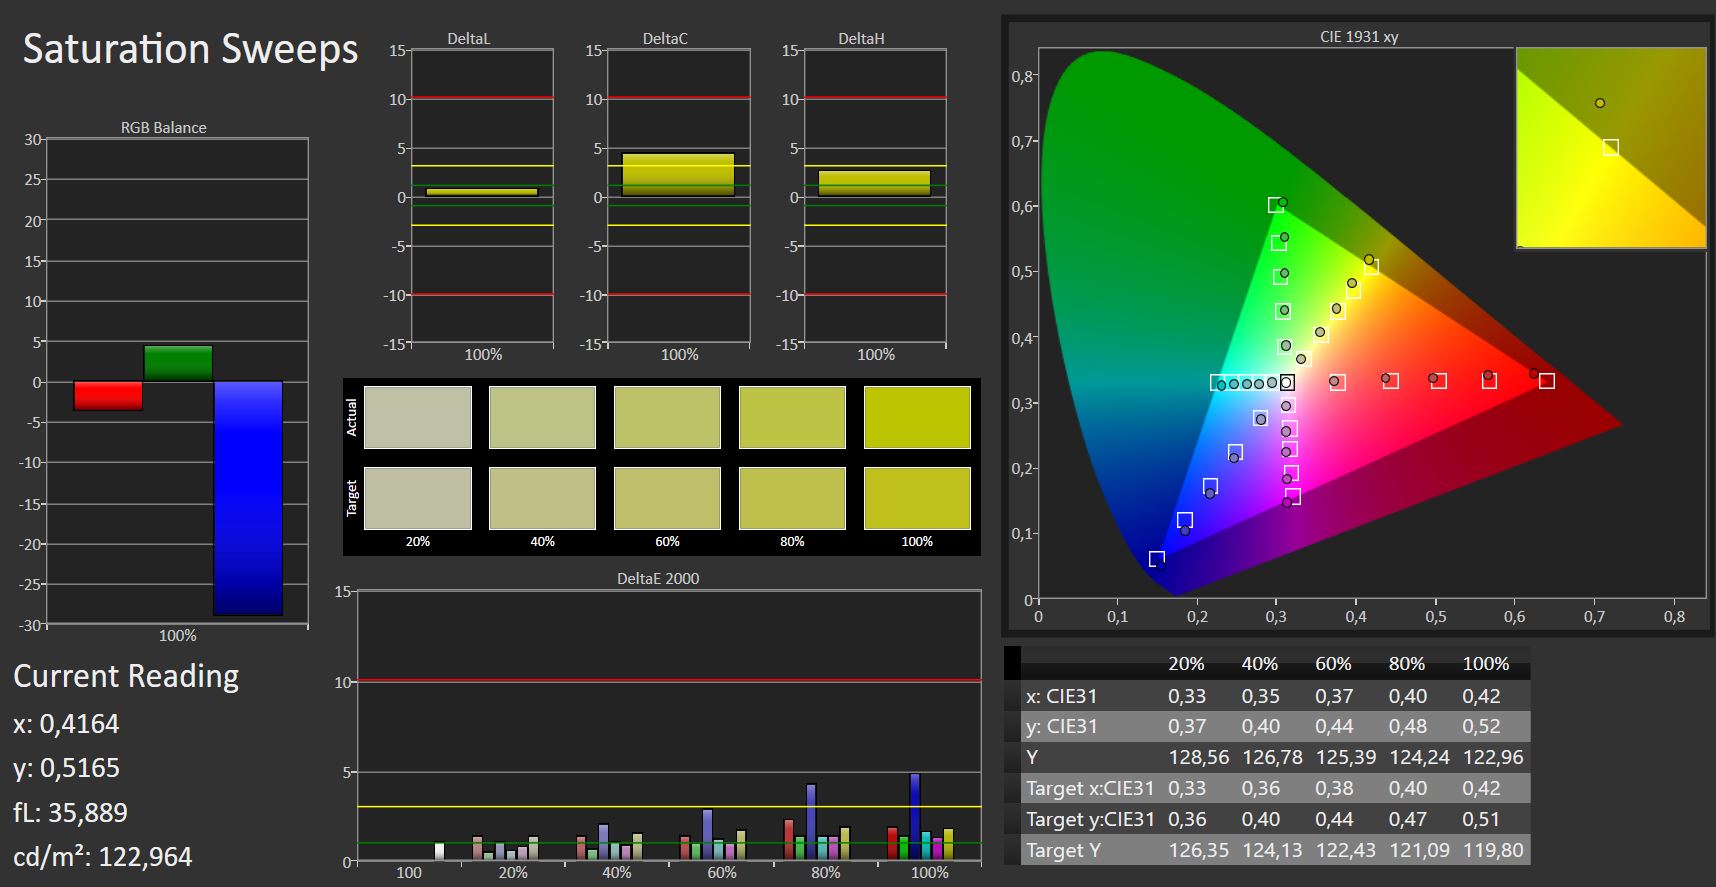
92% sRGB (Argyll 1.6.3 3D)
60% AdobeRGB 1998 (Argyll 1.6.3 3D)
65.7% AdobeRGB 1998 (Argyll 3D)
92.5% sRGB (Argyll 3D)
64.4% Display P3 (Argyll 3D)
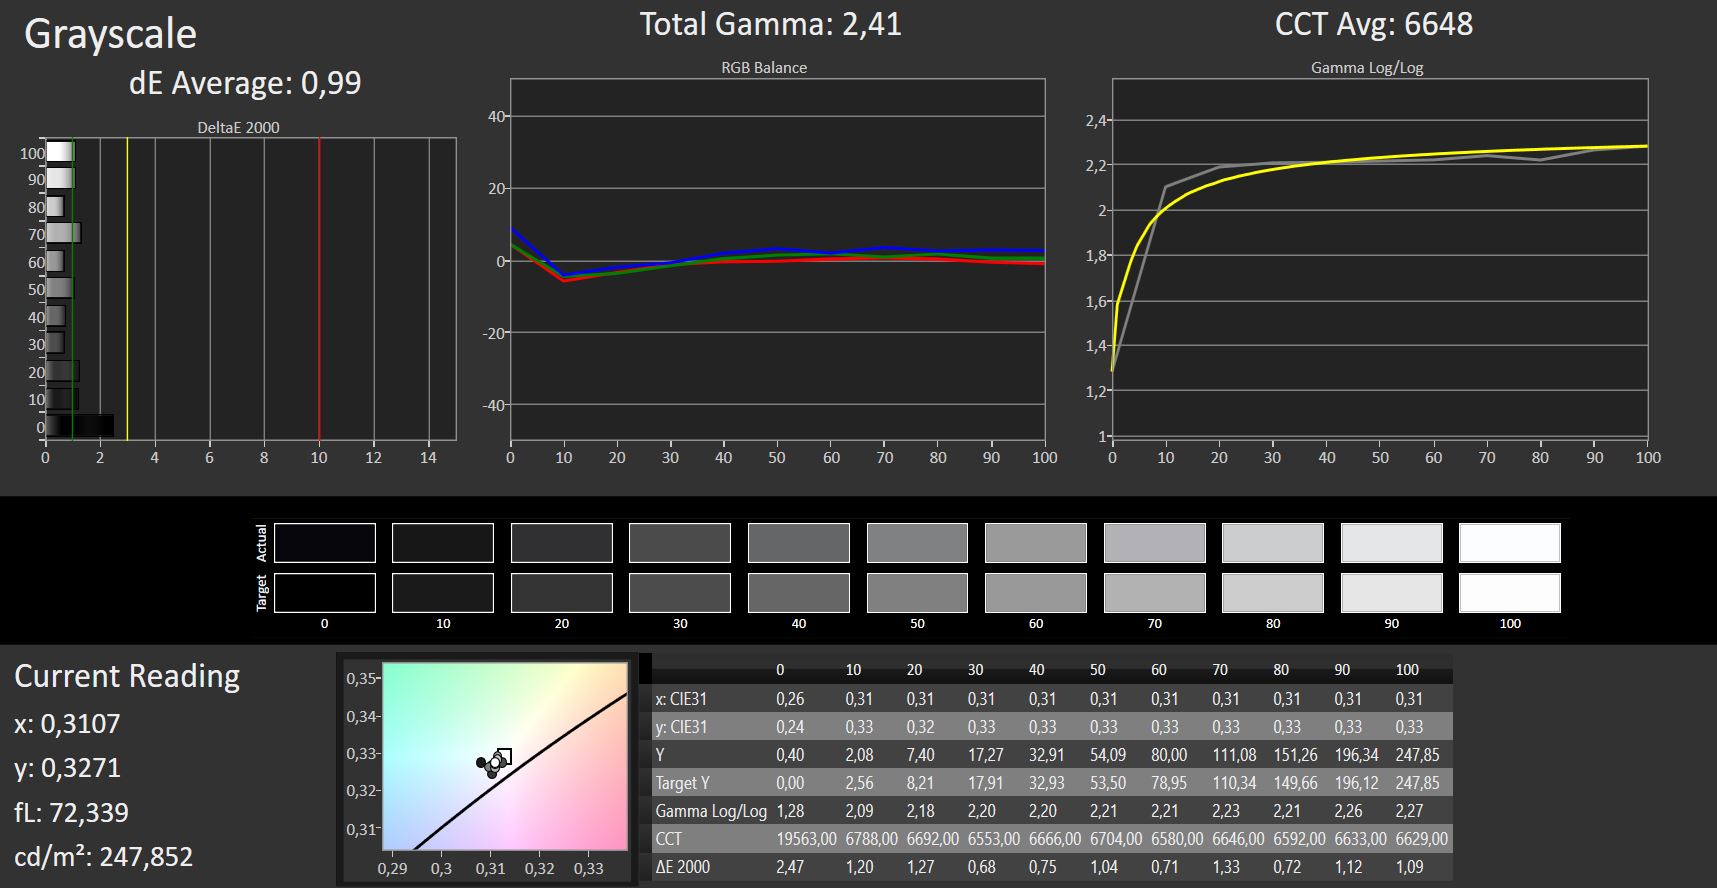
Gamma: 2.33
CCT: 9038 K
| Trekstor Yourbook C11B IPS, 1920x1080, 11.6" | Trekstor Primebook C11 IPS, 1920x1080, 11.6" | Lenovo Yoga 330-11IGM TN LED, 1366x768, 11.6" | Medion Akoya E2228T-MD61250 IPS, 1920x1080, 11.6" | Asus VivoBook E12 E203NA-FD026T TN LED, 1366x768, 11.6" | Dell Chromebook 11 3181 2-in-1 IPS, 1366x768, 11.6" | Asus VivoBook Flip 12 TP203NAH-BP049T IPS, 1366x768, 11.6" | |
|---|---|---|---|---|---|---|---|
| Display | 1% | -36% | -13% | -40% | -30% | ||
| Display P3 Coverage (%) | 64.4 | 64.9 1% | 40.42 -37% | 59.3 -8% | 37.95 -41% | 44.23 -31% | |
| sRGB Coverage (%) | 92.5 | 92.8 0% | 60.8 -34% | 77.3 -16% | 57.1 -38% | 66.3 -28% | |
| AdobeRGB 1998 Coverage (%) | 65.7 | 66.2 1% | 41.76 -36% | 56.5 -14% | 39.21 -40% | 45.73 -30% | |
| Response Times | 1% | 19% | 30% | 34% | -8% | 15% | |
| Response Time Grey 50% / Grey 80% * (ms) | 42 ? | 41 ? 2% | 50 ? -19% | 30 ? 29% | 41 ? 2% | 52.8 ? -26% | 39 ? 7% |
| Response Time Black / White * (ms) | 32 ? | 32 ? -0% | 14 ? 56% | 22 ? 31% | 11 ? 66% | 28.8 ? 10% | 25 ? 22% |
| PWM Frequency (Hz) | 200 ? | 200 ? | 200 ? | 200 ? | |||
| Screen | -7% | -44% | 18% | -27% | 9% | 15% | |
| Brightness middle (cd/m²) | 304 | 272 -11% | 224 -26% | 504 66% | 253 -17% | 213 -30% | 253 -17% |
| Brightness (cd/m²) | 267 | 249 -7% | 213 -20% | 497 86% | 234 -12% | 218 -18% | 245 -8% |
| Brightness Distribution (%) | 77 | 81 5% | 80 4% | 86 12% | 87 13% | 94 22% | 65 -16% |
| Black Level * (cd/m²) | 0.28 | 0.44 -57% | 0.52 -86% | 0.52 -86% | 0.33 -18% | 0.21 25% | 0.17 39% |
| Contrast (:1) | 1086 | 618 -43% | 431 -60% | 969 -11% | 767 -29% | 1014 -7% | 1488 37% |
| Colorchecker dE 2000 * | 7.28 | 6.36 13% | 11.64 -60% | 4.48 38% | 10.84 -49% | 3.52 52% | 3.17 56% |
| Colorchecker dE 2000 max. * | 12.65 | 11.06 13% | 20.8 -64% | 9.38 26% | 17.48 -38% | 18.36 -45% | 8.13 36% |
| Colorchecker dE 2000 calibrated * | 1.89 | ||||||
| Greyscale dE 2000 * | 8.34 | 7.15 14% | 13.4 -61% | 1.63 80% | 11.86 -42% | 2.6 69% | 2 76% |
| Gamma | 2.33 94% | 2.47 89% | 2.57 86% | 2.41 91% | 2.72 81% | 2.283 96% | 2.43 91% |
| CCT | 9038 72% | 8664 75% | 15186 43% | 6715 97% | 12882 50% | 6861 95% | 6850 95% |
| Color Space (Percent of AdobeRGB 1998) (%) | 60 | 60 0% | 38 -37% | 51 -15% | 36 -40% | 42 -30% | |
| Color Space (Percent of sRGB) (%) | 92 | 93 1% | 61 -34% | 77 -16% | 57 -38% | 66 -28% | |
| Media totale (Programma / Settaggio) | -2% /
-5% | -20% /
-34% | 12% /
13% | -11% /
-21% | 1% /
5% | 0% /
6% |
* ... Meglio usare valori piccoli
Sfarfallio dello schermo / PWM (Pulse-Width Modulation)
| flickering dello schermo / PWM rilevato | 200 Hz | ≤ 20 % settaggio luminosita' | 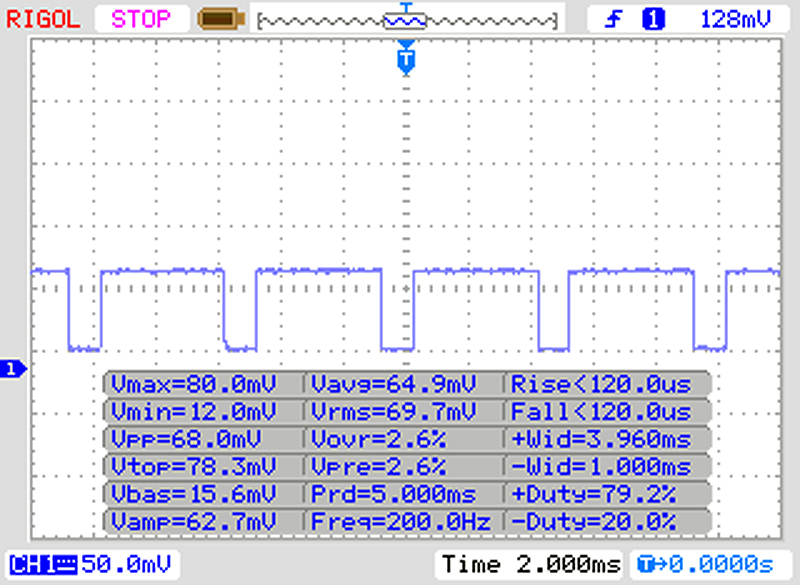 |
Il display sfarfalla a 200 Hz (Probabilmente a causa dell'uso di PWM) Flickering rilevato ad una luminosita' di 20 % o inferiore. Non dovrebbe verificarsi flickering o PWM sopra questo valore di luminosita'. La frequenza di 200 Hz è relativamente bassa, quindi gli utenti sensibili potrebbero notare il flickering ed accusare stanchezza agli occhi a questo livello di luminosità e a livelli inferiori. In confronto: 52 % di tutti i dispositivi testati non utilizza PWM per ridurre la luminosita' del display. Se è rilevato PWM, una media di 7747 (minimo: 5 - massimo: 343500) Hz è stata rilevata. | |||
Tempi di risposta del Display
| ↔ Tempi di risposta dal Nero al Bianco | ||
|---|---|---|
| 32 ms ... aumenta ↗ e diminuisce ↘ combinato | ↗ 18 ms Incremento | 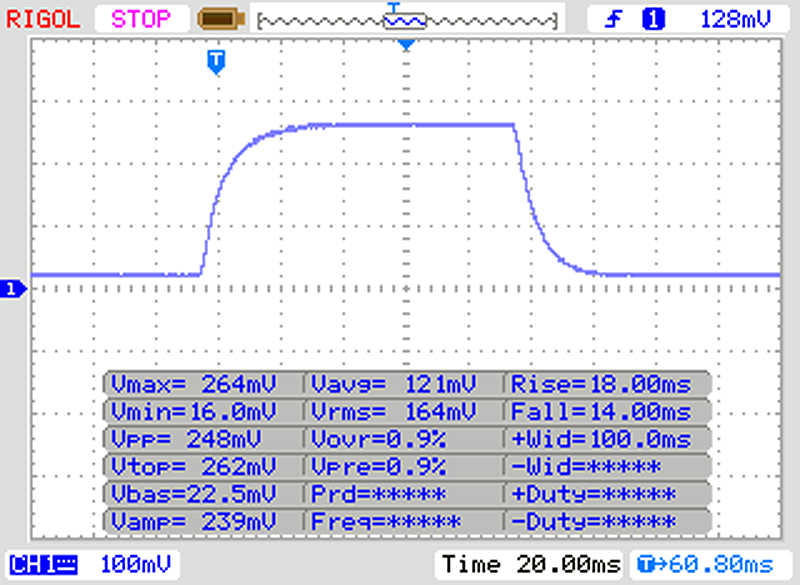 |
| ↘ 14 ms Calo | ||
| Lo schermo mostra tempi di risposta lenti nei nostri tests e sarà insoddisfacente per i gamers. In confronto, tutti i dispositivi di test variano da 0.1 (minimo) a 240 (massimo) ms. » 86 % di tutti i dispositivi è migliore. Questo significa che i tempi di risposta rilevati sono peggiori rispetto alla media di tutti i dispositivi testati (19.8 ms). | ||
| ↔ Tempo di risposta dal 50% Grigio all'80% Grigio | ||
| 42 ms ... aumenta ↗ e diminuisce ↘ combinato | ↗ 21 ms Incremento | 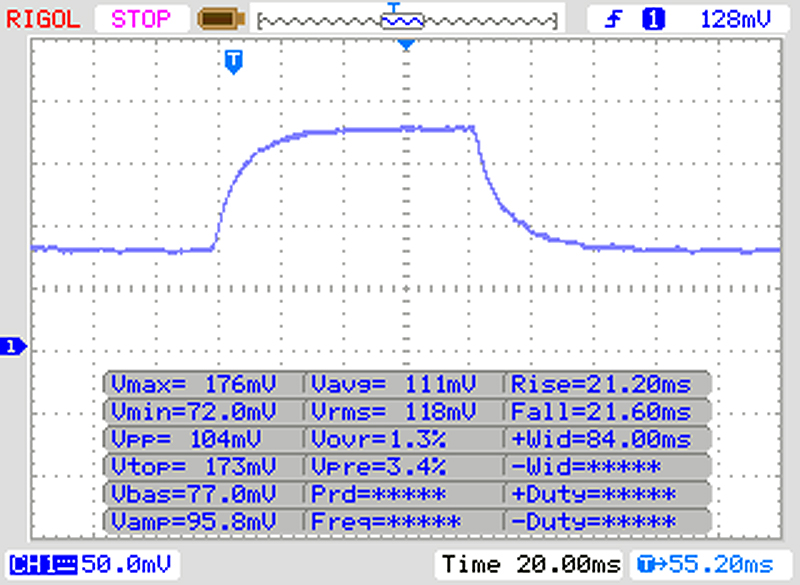 |
| ↘ 21 ms Calo | ||
| Lo schermo mostra tempi di risposta lenti nei nostri tests e sarà insoddisfacente per i gamers. In confronto, tutti i dispositivi di test variano da 0.165 (minimo) a 636 (massimo) ms. » 67 % di tutti i dispositivi è migliore. Questo significa che i tempi di risposta rilevati sono peggiori rispetto alla media di tutti i dispositivi testati (31 ms). | ||
| Cinebench R15 | |
| CPU Single 64Bit | |
| Media della classe Convertible (149.8 - 317, n=47, ultimi 2 anni) | |
| Lenovo Yoga 330-11IGM | |
| Asus VivoBook E12 E203NA-FD026T | |
| Trekstor Yourbook C11B | |
| Media Intel Celeron N3350 (43 - 48, n=9) | |
| Trekstor Primebook C11 | |
| Medion Akoya E2228T-MD61250 | |
| CPU Multi 64Bit | |
| Media della classe Convertible (478 - 4940, n=47, ultimi 2 anni) | |
| Lenovo Yoga 330-11IGM | |
| Medion Akoya E2228T-MD61250 | |
| Asus VivoBook E12 E203NA-FD026T | |
| Media Intel Celeron N3350 (81 - 92, n=9) | |
| Trekstor Yourbook C11B | |
| Trekstor Primebook C11 | |
| Cinebench R10 | |
| Rendering Single 32Bit | |
| Media della classe Convertible (7163 - 10030, n=8, ultimi 2 anni) | |
| Lenovo Yoga 330-11IGM | |
| Media Intel Celeron N3350 (1458 - 1917, n=5) | |
| Trekstor Yourbook C11B | |
| Asus VivoBook E12 E203NA-FD026T | |
| Medion Akoya E2228T-MD61250 | |
| Rendering Multiple CPUs 32Bit | |
| Media della classe Convertible (24911 - 67475, n=8, ultimi 2 anni) | |
| Lenovo Yoga 330-11IGM | |
| Medion Akoya E2228T-MD61250 | |
| Asus VivoBook E12 E203NA-FD026T | |
| Media Intel Celeron N3350 (1775 - 2787, n=5) | |
| Trekstor Yourbook C11B | |
| Geekbench 3 | |
| 32 Bit Multi-Core Score | |
| Lenovo Yoga 330-11IGM | |
| Trekstor Yourbook C11B | |
| Media Intel Celeron N3350 (2409 - 2526, n=2) | |
| Asus VivoBook E12 E203NA-FD026T | |
| Medion Akoya E2228T-MD61250 | |
| 32 Bit Single-Core Score | |
| Lenovo Yoga 330-11IGM | |
| Asus VivoBook E12 E203NA-FD026T | |
| Media Intel Celeron N3350 (1314 - 1341, n=2) | |
| Trekstor Yourbook C11B | |
| Medion Akoya E2228T-MD61250 | |
| Geekbench 4.0 | |
| 64 Bit Multi-Core Score | |
| Media della classe Convertible (23833 - 37474, n=5, ultimi 2 anni) | |
| Lenovo Yoga 330-11IGM | |
| Trekstor Yourbook C11B | |
| Media Intel Celeron N3350 (2529 - 2648, n=3) | |
| Asus VivoBook E12 E203NA-FD026T | |
| Medion Akoya E2228T-MD61250 | |
| 64 Bit Single-Core Score | |
| Media della classe Convertible (6365 - 8254, n=5, ultimi 2 anni) | |
| Lenovo Yoga 330-11IGM | |
| Asus VivoBook E12 E203NA-FD026T | |
| Media Intel Celeron N3350 (1464 - 1510, n=3) | |
| Trekstor Yourbook C11B | |
| Medion Akoya E2228T-MD61250 | |
| Geekbench 4.4 | |
| 64 Bit Multi-Core Score | |
| Media della classe Convertible (24206 - 38257, n=2, ultimi 2 anni) | |
| Lenovo Yoga 330-11IGM | |
| Trekstor Yourbook C11B | |
| Media Intel Celeron N3350 (2427 - 2731, n=4) | |
| Asus VivoBook E12 E203NA-FD026T | |
| Medion Akoya E2228T-MD61250 | |
| 64 Bit Single-Core Score | |
| Media della classe Convertible (6277 - 6637, n=2, ultimi 2 anni) | |
| Lenovo Yoga 330-11IGM | |
| Asus VivoBook E12 E203NA-FD026T | |
| Trekstor Yourbook C11B | |
| Media Intel Celeron N3350 (1374 - 1529, n=4) | |
| Medion Akoya E2228T-MD61250 | |
| Mozilla Kraken 1.1 - Total | |
| Dell Chromebook 11 3181 2-in-1 (Version 69.0.3497.100) | |
| Trekstor Yourbook C11B (Edge 42) | |
| Media Intel Celeron N3350 (3108 - 4230, n=9) | |
| Media della classe Convertible (386 - 1089, n=51, ultimi 2 anni) | |
| Octane V2 - Total Score | |
| Media della classe Convertible (50984 - 123023, n=12, ultimi 2 anni) | |
| Media Intel Celeron N3350 (8457 - 11461, n=6) | |
| Trekstor Yourbook C11B (Edge 42) | |
| Dell Chromebook 11 3181 2-in-1 (Version 69.0.3497.100) | |
| JetStream 1.1 - 1.1 Total | |
| Lenovo Yoga 330-11IGM (Edge 42) | |
| Asus VivoBook E12 E203NA-FD026T (Edge 41) | |
| Trekstor Yourbook C11B (Edge 42) | |
| Media Intel Celeron N3350 (49.9 - 79.1, n=9) | |
| Dell Chromebook 11 3181 2-in-1 (Version 69.0.3497.100) | |
| Medion Akoya E2228T-MD61250 (Edge 41) | |
* ... Meglio usare valori piccoli
| PCMark 8 Home Score Accelerated v2 | 1700 punti | |
| PCMark 8 Creative Score Accelerated v2 | 1814 punti | |
| PCMark 8 Work Score Accelerated v2 | 2370 punti | |
| PCMark 10 Score | 1208 punti | |
Aiuto | ||
| PCMark 8 - Home Score Accelerated v2 | |
| Media della classe Convertible (n=1ultimi 2 anni) | |
| Lenovo Yoga 330-11IGM | |
| Asus VivoBook Flip 12 TP203NAH-BP049T | |
| Asus VivoBook E12 E203NA-FD026T | |
| Trekstor Yourbook C11B | |
| Media Intel Celeron N3350, Intel HD Graphics 500 (1462 - 1816, n=8) | |
| Trekstor Primebook C11 | |
| Medion Akoya E2228T-MD61250 | |

| Trekstor Yourbook C11B 64 GB eMMC Flash | Trekstor Primebook C11 SanDisk DF4064 | Lenovo Yoga 330-11IGM 128 GB eMMC Flash | Medion Akoya E2228T-MD61250 64 GB eMMC Flash | Asus VivoBook E12 E203NA-FD026T 32 GB eMMC Flash | Asus VivoBook Flip 12 TP203NAH-BP049T Seagate Mobile HDD 1TB ST1000LM035 | Media 64 GB eMMC Flash | Media della classe Convertible | |
|---|---|---|---|---|---|---|---|---|
| CrystalDiskMark 3.0 | 17% | 32% | -15% | 17% | -73% | -4% | ||
| Read Seq (MB/s) | 261.1 | 265.4 2% | 293.4 12% | 119.3 -54% | 276.6 6% | 53.9 -79% | 145.5 ? -44% | |
| Write Seq (MB/s) | 117.6 | 111.2 -5% | 91.9 -22% | 41.38 -65% | 78.3 -33% | 66.4 -44% | 60.7 ? -48% | |
| Read 512 (MB/s) | 203.8 | 205.4 1% | 239.6 18% | 101.3 -50% | 238.1 17% | 22.62 -89% | 127.2 ? -38% | |
| Write 512 (MB/s) | 59 | 85.3 45% | 76.3 29% | 34.28 -42% | 43.83 -26% | 67.3 14% | 49.3 ? -16% | |
| Read 4k (MB/s) | 5.325 | 9.175 72% | 13.66 157% | 10.74 102% | 8.963 68% | 0.378 -93% | 12.2 ? 129% | |
| Write 4k (MB/s) | 9.04 | 8.721 -4% | 12.58 39% | 11.3 25% | 10.17 13% | 0.263 -97% | 9.29 ? 3% | |
| Read 4k QD32 (MB/s) | 28.67 | 32.66 14% | 36.75 28% | 14.76 -49% | 29.66 3% | 0.998 -97% | 24.8 ? -13% | |
| Write 4k QD32 (MB/s) | 12.9 | 14.19 10% | 12.47 -3% | 14.57 13% | 24.63 91% | 0.518 -96% | 12.1 ? -6% |
| 3DMark 11 Performance | 620 punti | |
| 3DMark Ice Storm Standard Score | 25262 punti | |
| 3DMark Cloud Gate Standard Score | 2280 punti | |
| 3DMark Fire Strike Score | 401 punti | |
Aiuto | ||
| 3DMark 11 - 1280x720 Performance GPU | |
| Media della classe Convertible (1505 - 40732, n=47, ultimi 2 anni) | |
| Lenovo Yoga 330-11IGM | |
| Asus VivoBook Flip 12 TP203NAH-BP049T | |
| Trekstor Yourbook C11B | |
| Trekstor Primebook C11 | |
| Asus VivoBook E12 E203NA-FD026T | |
| Media Intel HD Graphics 500 (368 - 584, n=11) | |
| Medion Akoya E2228T-MD61250 | |
| basso | medio | alto | ultra | QHD | |
|---|---|---|---|---|---|
| StarCraft 2 (2010) | 54.5 | 14.1 | |||
| Diablo III (2012) | 22 | 13.6 | |||
| Counter-Strike: GO (2012) | 16.6 | 14 | |||
| BioShock Infinite (2013) | 24.3 | 11 | 9.7 | 2.7 | |
| Middle-earth: Shadow of Mordor (2014) | 17.7 | ||||
| Dota 2 Reborn (2015) | 22.1 | 15.3 | |||
| Rainbow Six Siege (2015) | 15.5 | ||||
| Overwatch (2016) | 15.9 | ||||
| For Honor (2017) | 8.7 | ||||
| Prey (2017) | 4.9 | ||||
| Team Fortress 2 (2017) | 18.2 | 17.2 | |||
| Middle-earth: Shadow of War (2017) | 10 | ||||
| Far Cry 5 (2018) | 1 | 1 | |||
| The Crew 2 (2018) | 5.5 | ||||
| F1 2018 (2018) | 12 | ||||
| Shadow of the Tomb Raider (2018) | 3 | ||||
| Assassin´s Creed Odyssey (2018) | 2 |
(-) La temperatura massima sul lato superiore è di 49 °C / 120 F, rispetto alla media di 35.4 °C / 96 F, che varia da 19.6 a 60 °C per questa classe Convertible.
(±) Il lato inferiore si riscalda fino ad un massimo di 41.4 °C / 107 F, rispetto alla media di 36.9 °C / 98 F
(+) In idle, la temperatura media del lato superiore è di 25.9 °C / 79 F, rispetto alla media deld ispositivo di 30.3 °C / 87 F.
(-) I poggiapolsi e il touchpad possono diventare molto caldi al tatto con un massimo di 45.8 °C / 114.4 F.
(-) La temperatura media della zona del palmo della mano di dispositivi simili e'stata di 28 °C / 82.4 F (-17.8 °C / -32 F).
Trekstor Yourbook C11B analisi audio
(-) | altoparlanti non molto potenti (68.5 dB)
Bassi 100 - 315 Hz
(-) | quasi nessun basso - in media 27% inferiori alla media
(+) | bassi in lineaa (6.8% delta rispetto alla precedente frequenza)
Medi 400 - 2000 Hz
(±) | medi elevati - circa 6.8% superiore alla media
(±) | linearità dei medi adeguata (12.6% delta rispetto alla precedente frequenza)
Alti 2 - 16 kHz
(±) | alti elevati - circa 8.9% superiori alla media
(+) | alti lineari (6.9% delta rispetto alla precedente frequenza)
Nel complesso 100 - 16.000 Hz
(-) | suono nel complesso non lineare (35.9% di differenza rispetto alla media
Rispetto alla stessa classe
» 95% di tutti i dispositivi testati in questa classe è stato migliore, 1% simile, 4% peggiore
» Il migliore ha avuto un delta di 6%, medio di 20%, peggiore di 57%
Rispetto a tutti i dispositivi testati
» 94% di tutti i dispositivi testati in questa classe è stato migliore, 1% similare, 5% peggiore
» Il migliore ha avuto un delta di 4%, medio di 23%, peggiore di 134%
Apple MacBook 12 (Early 2016) 1.1 GHz analisi audio
(+) | gli altoparlanti sono relativamente potenti (83.6 dB)
Bassi 100 - 315 Hz
(±) | bassi ridotti - in media 11.3% inferiori alla media
(±) | la linearità dei bassi è media (14.2% delta rispetto alla precedente frequenza)
Medi 400 - 2000 Hz
(+) | medi bilanciati - solo only 2.4% rispetto alla media
(+) | medi lineari (5.5% delta rispetto alla precedente frequenza)
Alti 2 - 16 kHz
(+) | Alti bilanciati - appena 2% dalla media
(+) | alti lineari (4.5% delta rispetto alla precedente frequenza)
Nel complesso 100 - 16.000 Hz
(+) | suono nel complesso lineare (10.2% differenza dalla media)
Rispetto alla stessa classe
» 7% di tutti i dispositivi testati in questa classe è stato migliore, 2% simile, 90% peggiore
» Il migliore ha avuto un delta di 5%, medio di 18%, peggiore di 53%
Rispetto a tutti i dispositivi testati
» 5% di tutti i dispositivi testati in questa classe è stato migliore, 1% similare, 94% peggiore
» Il migliore ha avuto un delta di 4%, medio di 23%, peggiore di 134%
| Off / Standby | |
| Idle | |
| Sotto carico |
|
Leggenda:
min: | |
| Battery Runtime - WiFi Websurfing | |
| Dell Chromebook 11 3181 2-in-1 | |
| Media della classe Convertible (5.08 - 22, n=50, ultimi 2 anni) | |
| Lenovo Yoga 330-11IGM | |
| Trekstor Yourbook C11B | |
| Asus VivoBook E12 E203NA-FD026T | |
| Medion Akoya E2228T-MD61250 | |
| Trekstor Primebook C11 | |
| Asus VivoBook Flip 12 TP203NAH-BP049T | |
Pro
Contro
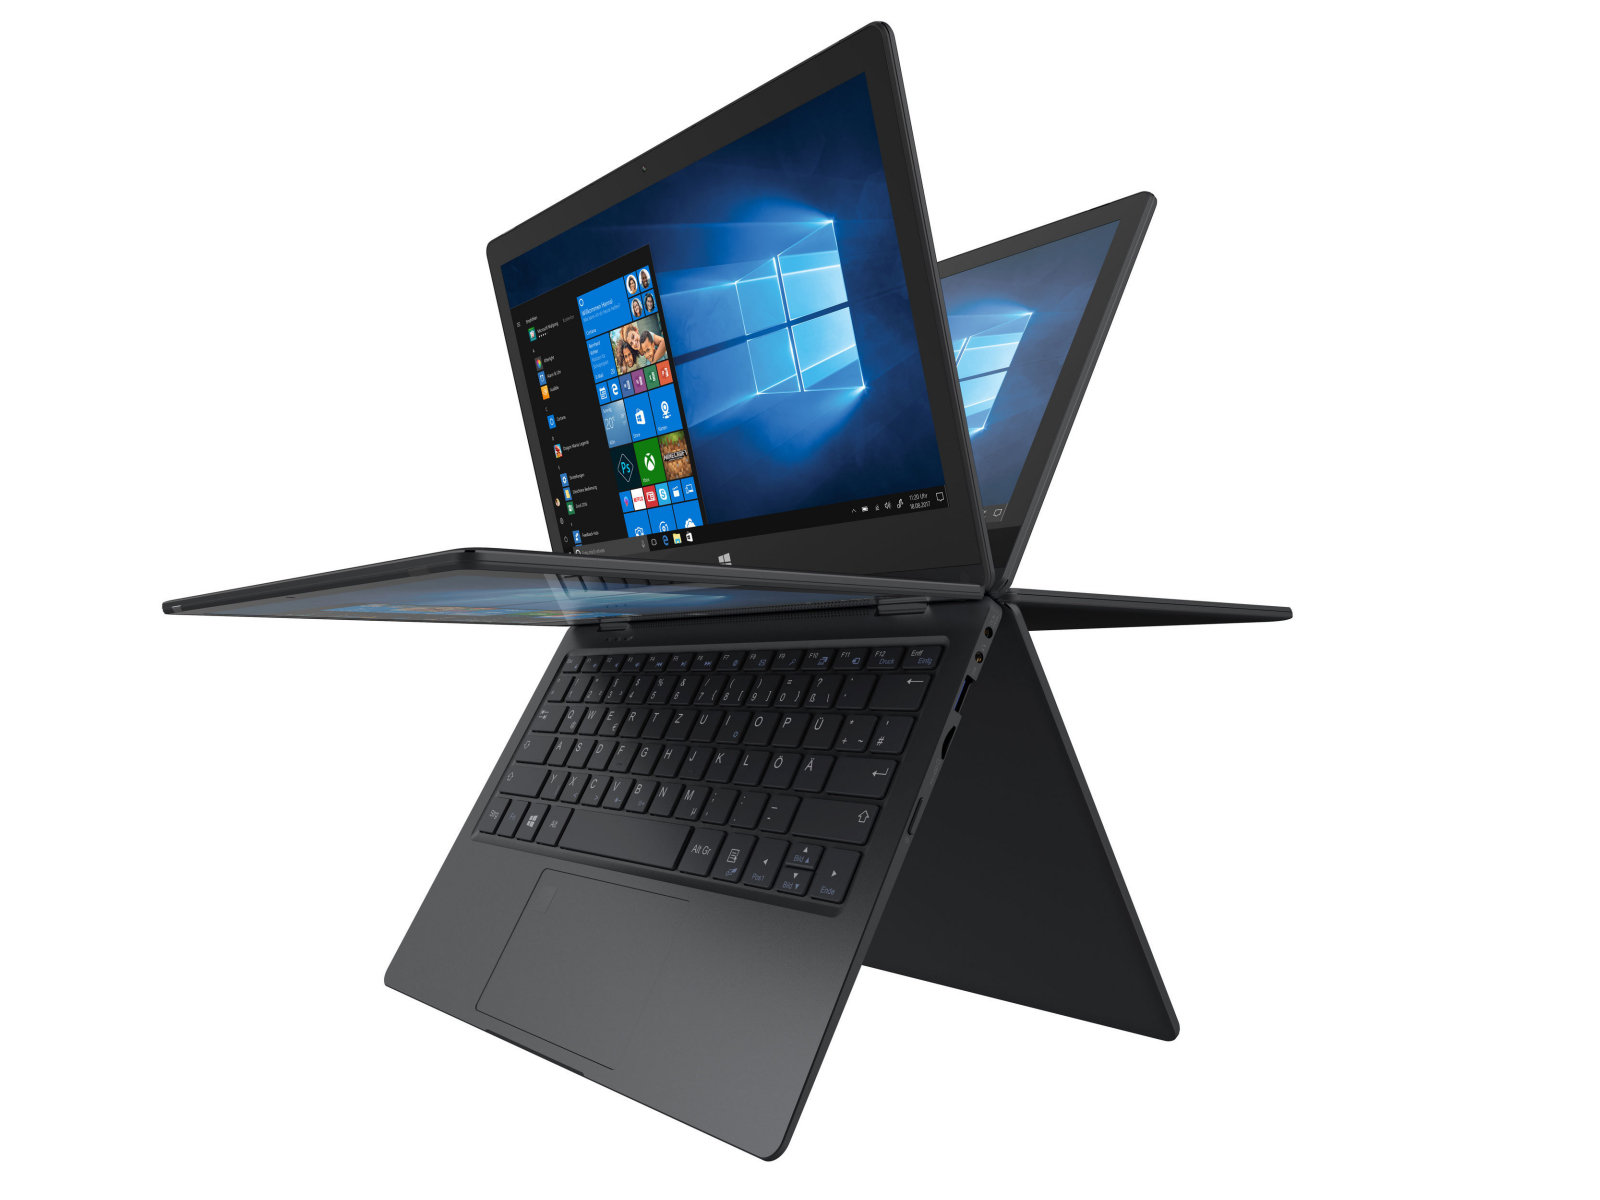
Il Trekstor Yourbook C11B è un convertibile da 11,6 pollici che è adatto per gli studenti che usano principalmente MS Office e Internet. Il Celeron N3350 non è una CPU potente, ma il sistema risulat scattante se non lo si spinge troppo forte. La GPU integrata libera anche le risorse della CPU decodificando i video, così il C11B può gestire anche servizi di streaming video come Amazon Video o Netflix.
Il Trekstor Yourbook C11B è un convertibile accessibile per la scrittura e la navigazione che è adatto per un uso leggero.
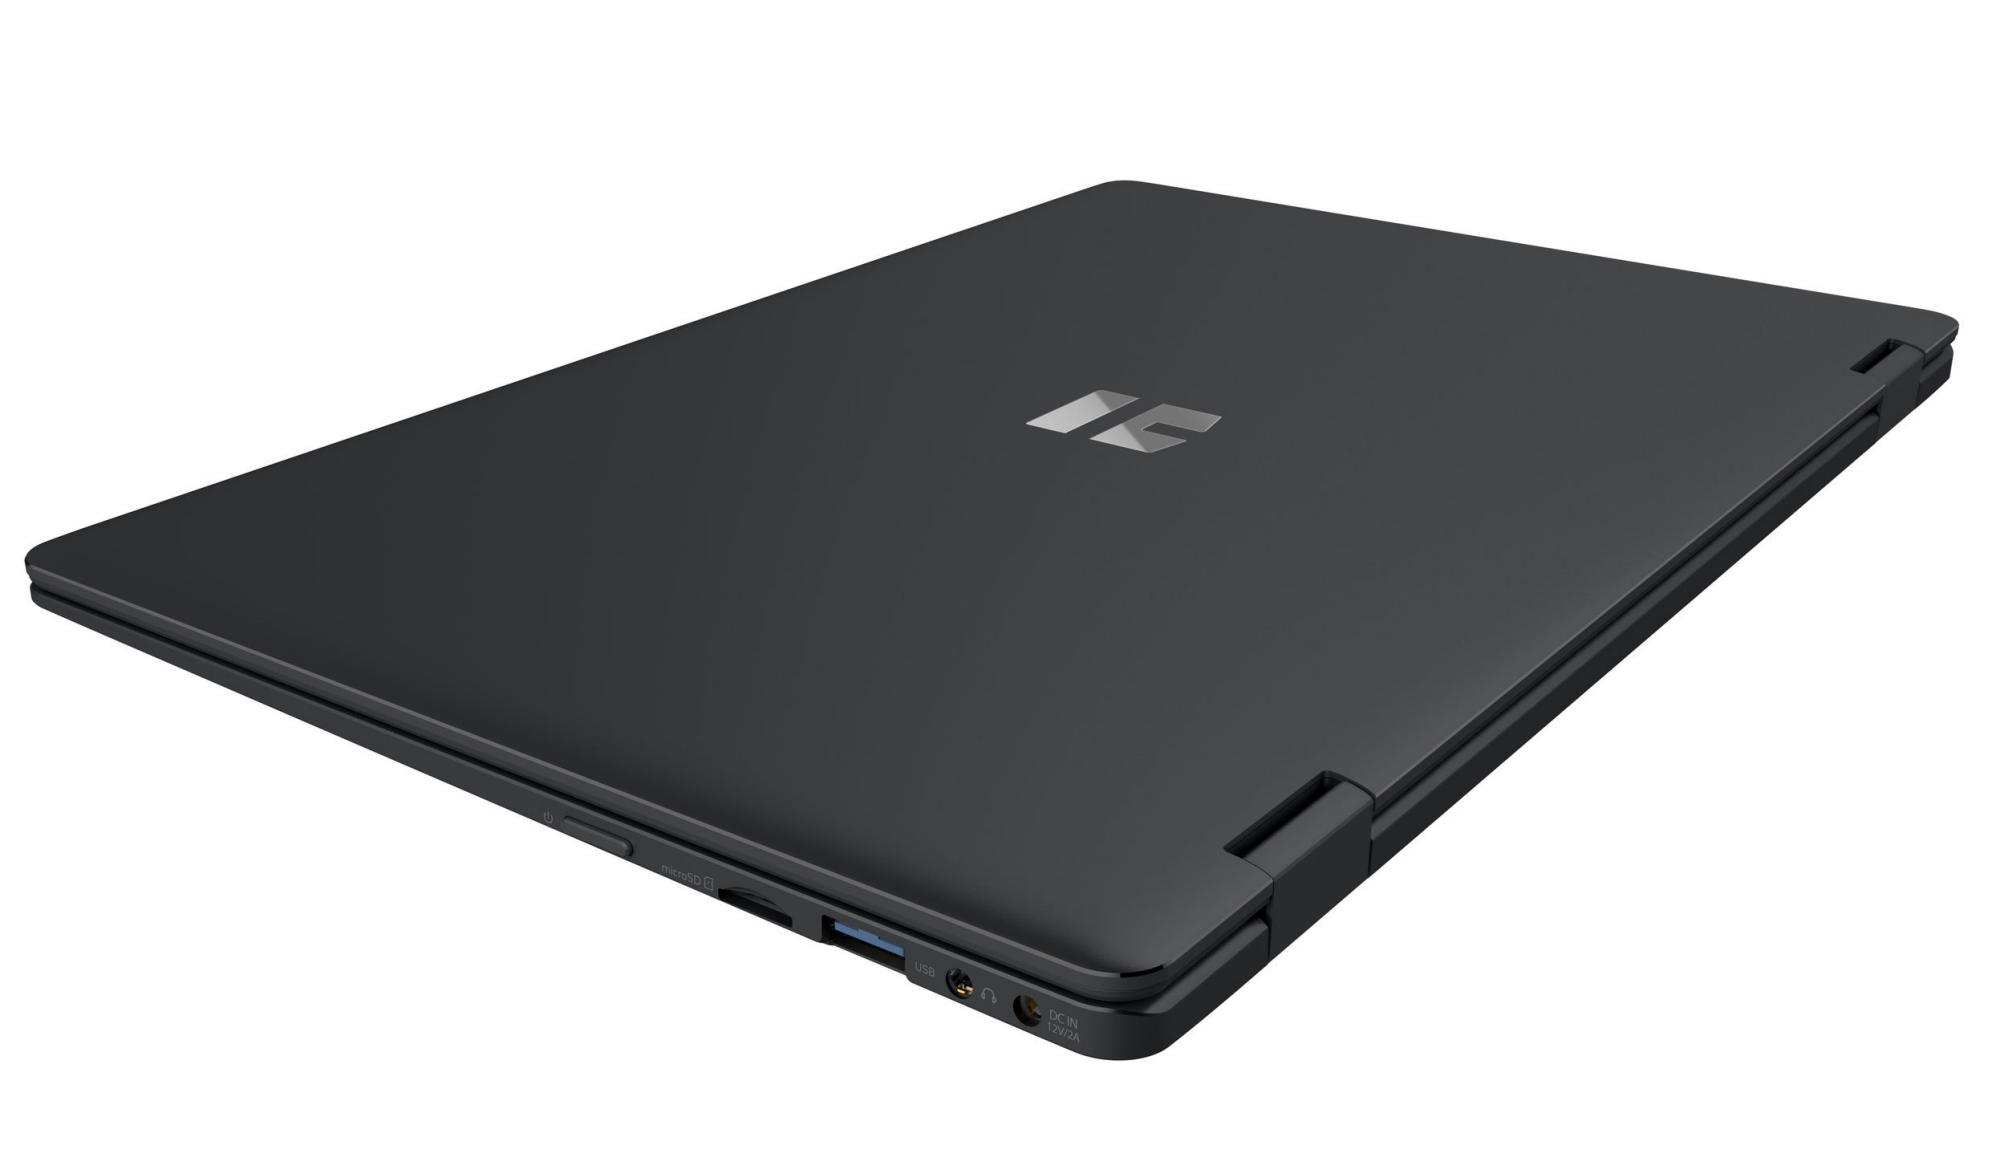
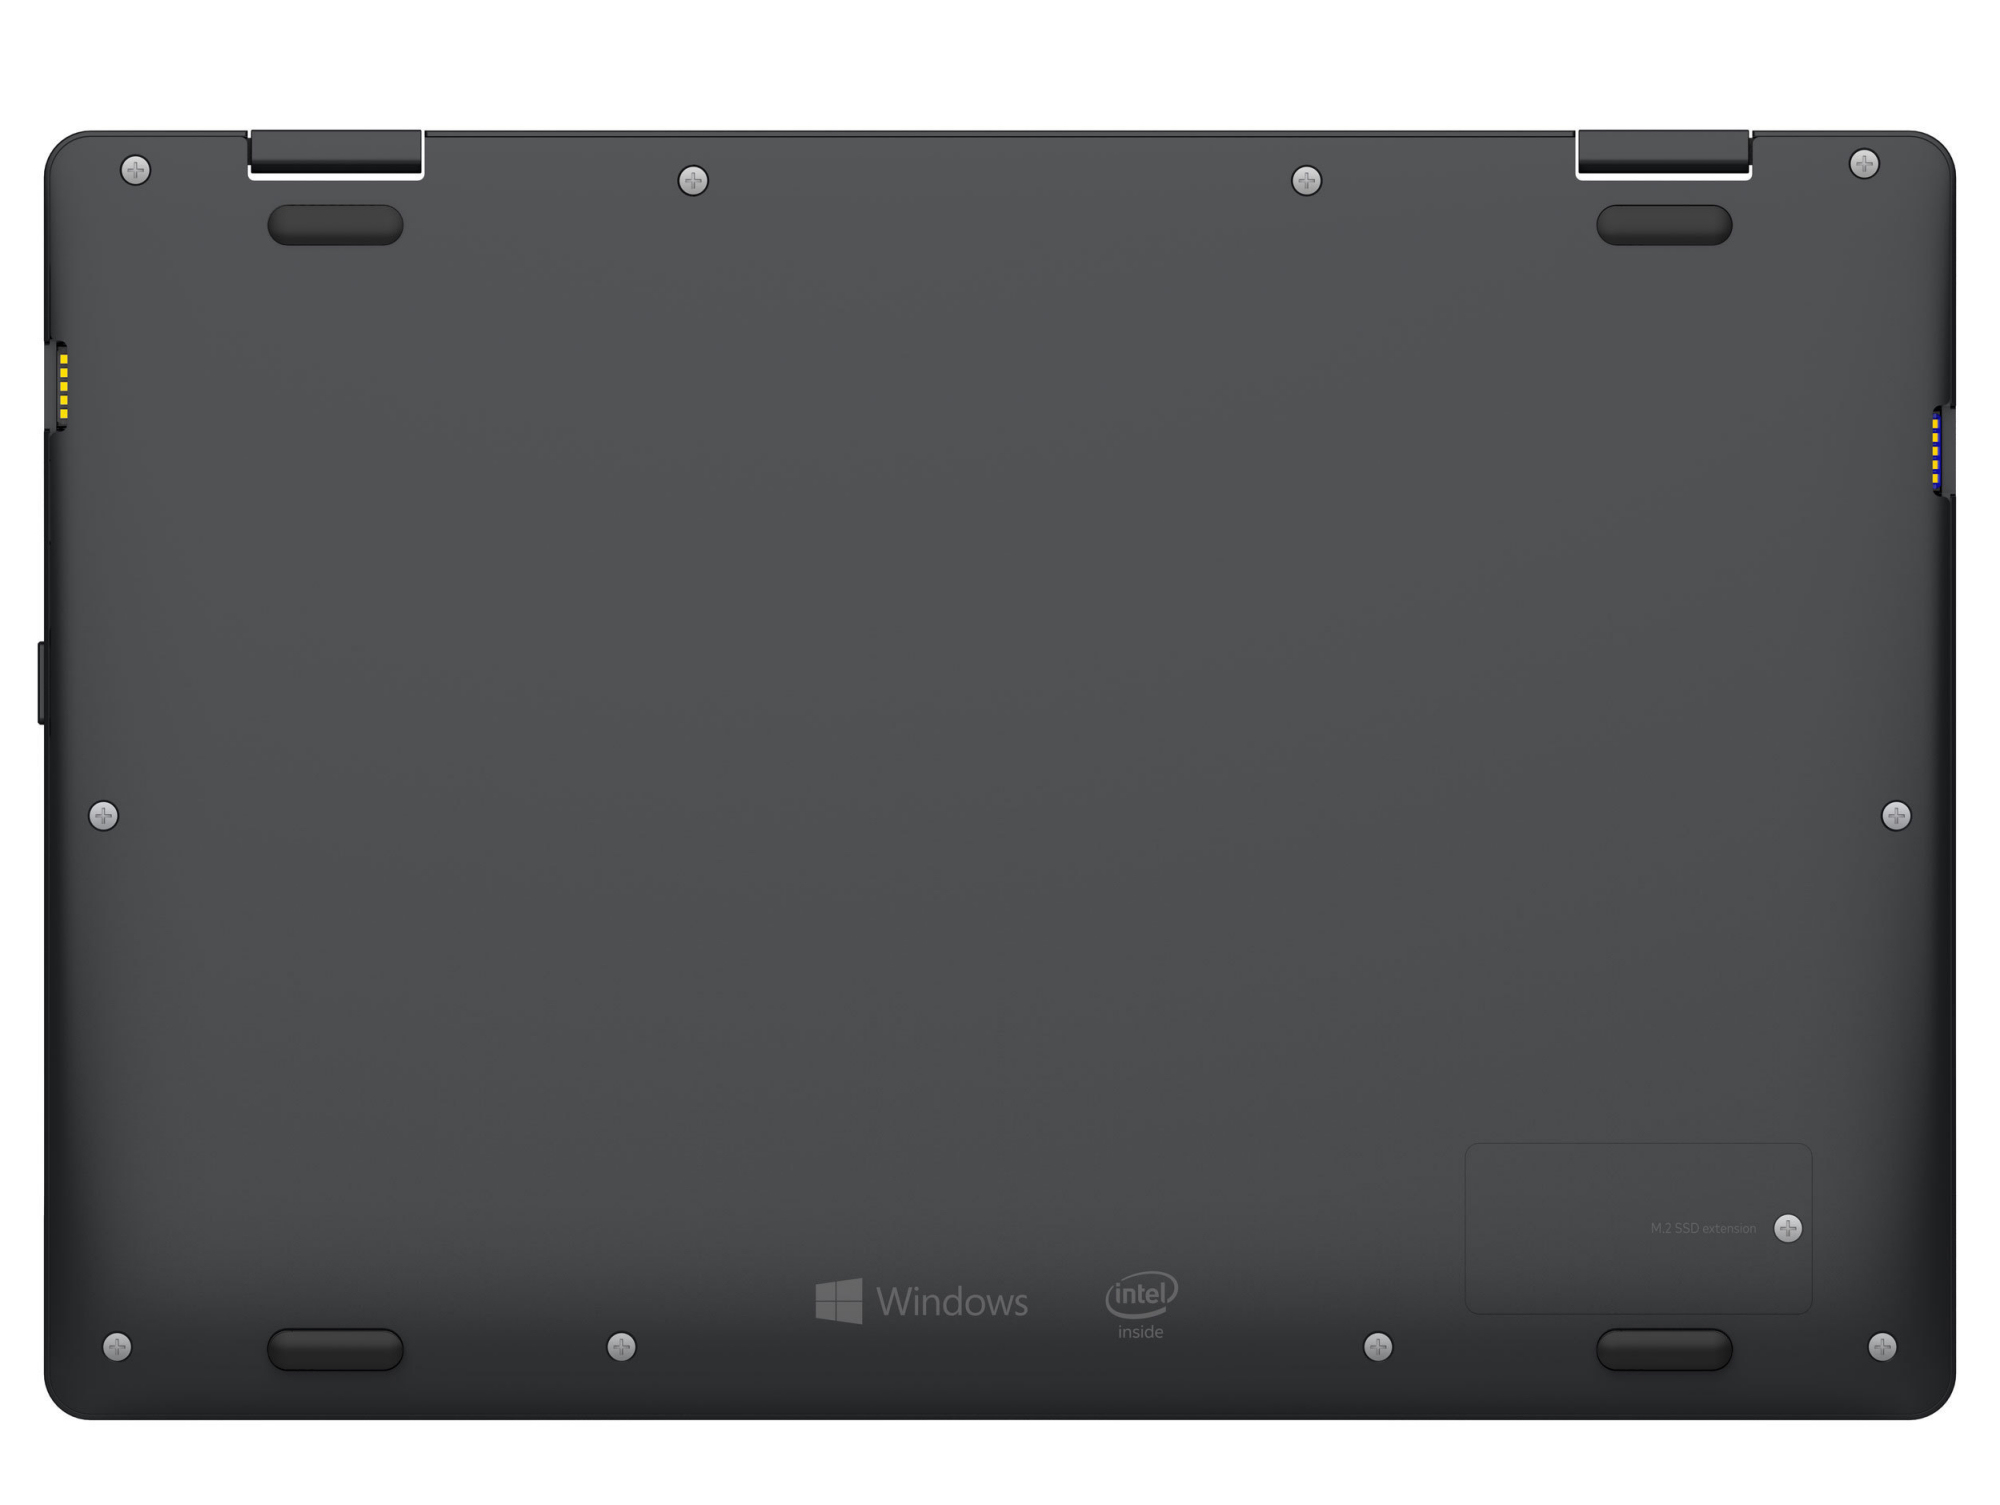
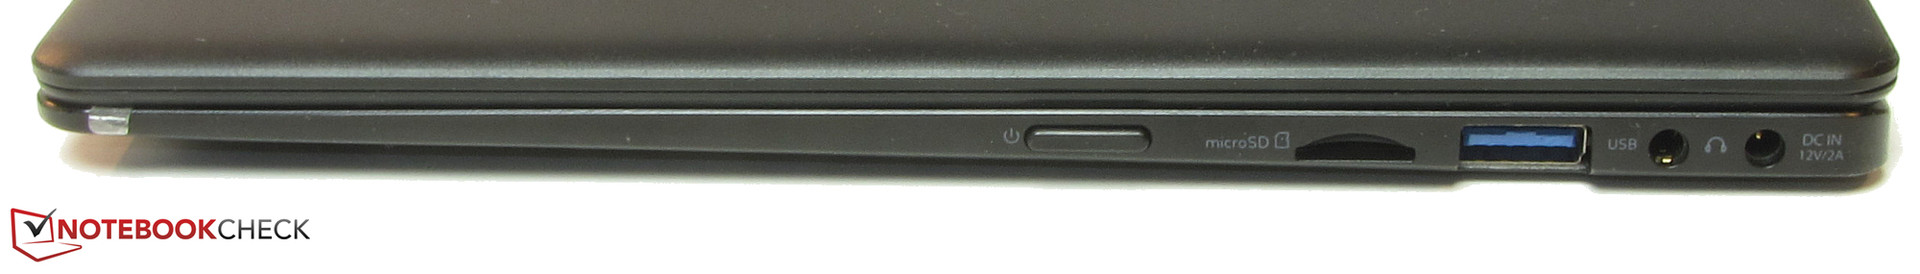
Il C11B ha appena 64 GB di storage eMMC, ma Trekstor rende facile sostituire facilmente l'unità SSD M.2-2242 se avete bisogno di più storage. È inoltre possibile aggiungere una scheda microSD per un maggiore spazio di archiviazione.
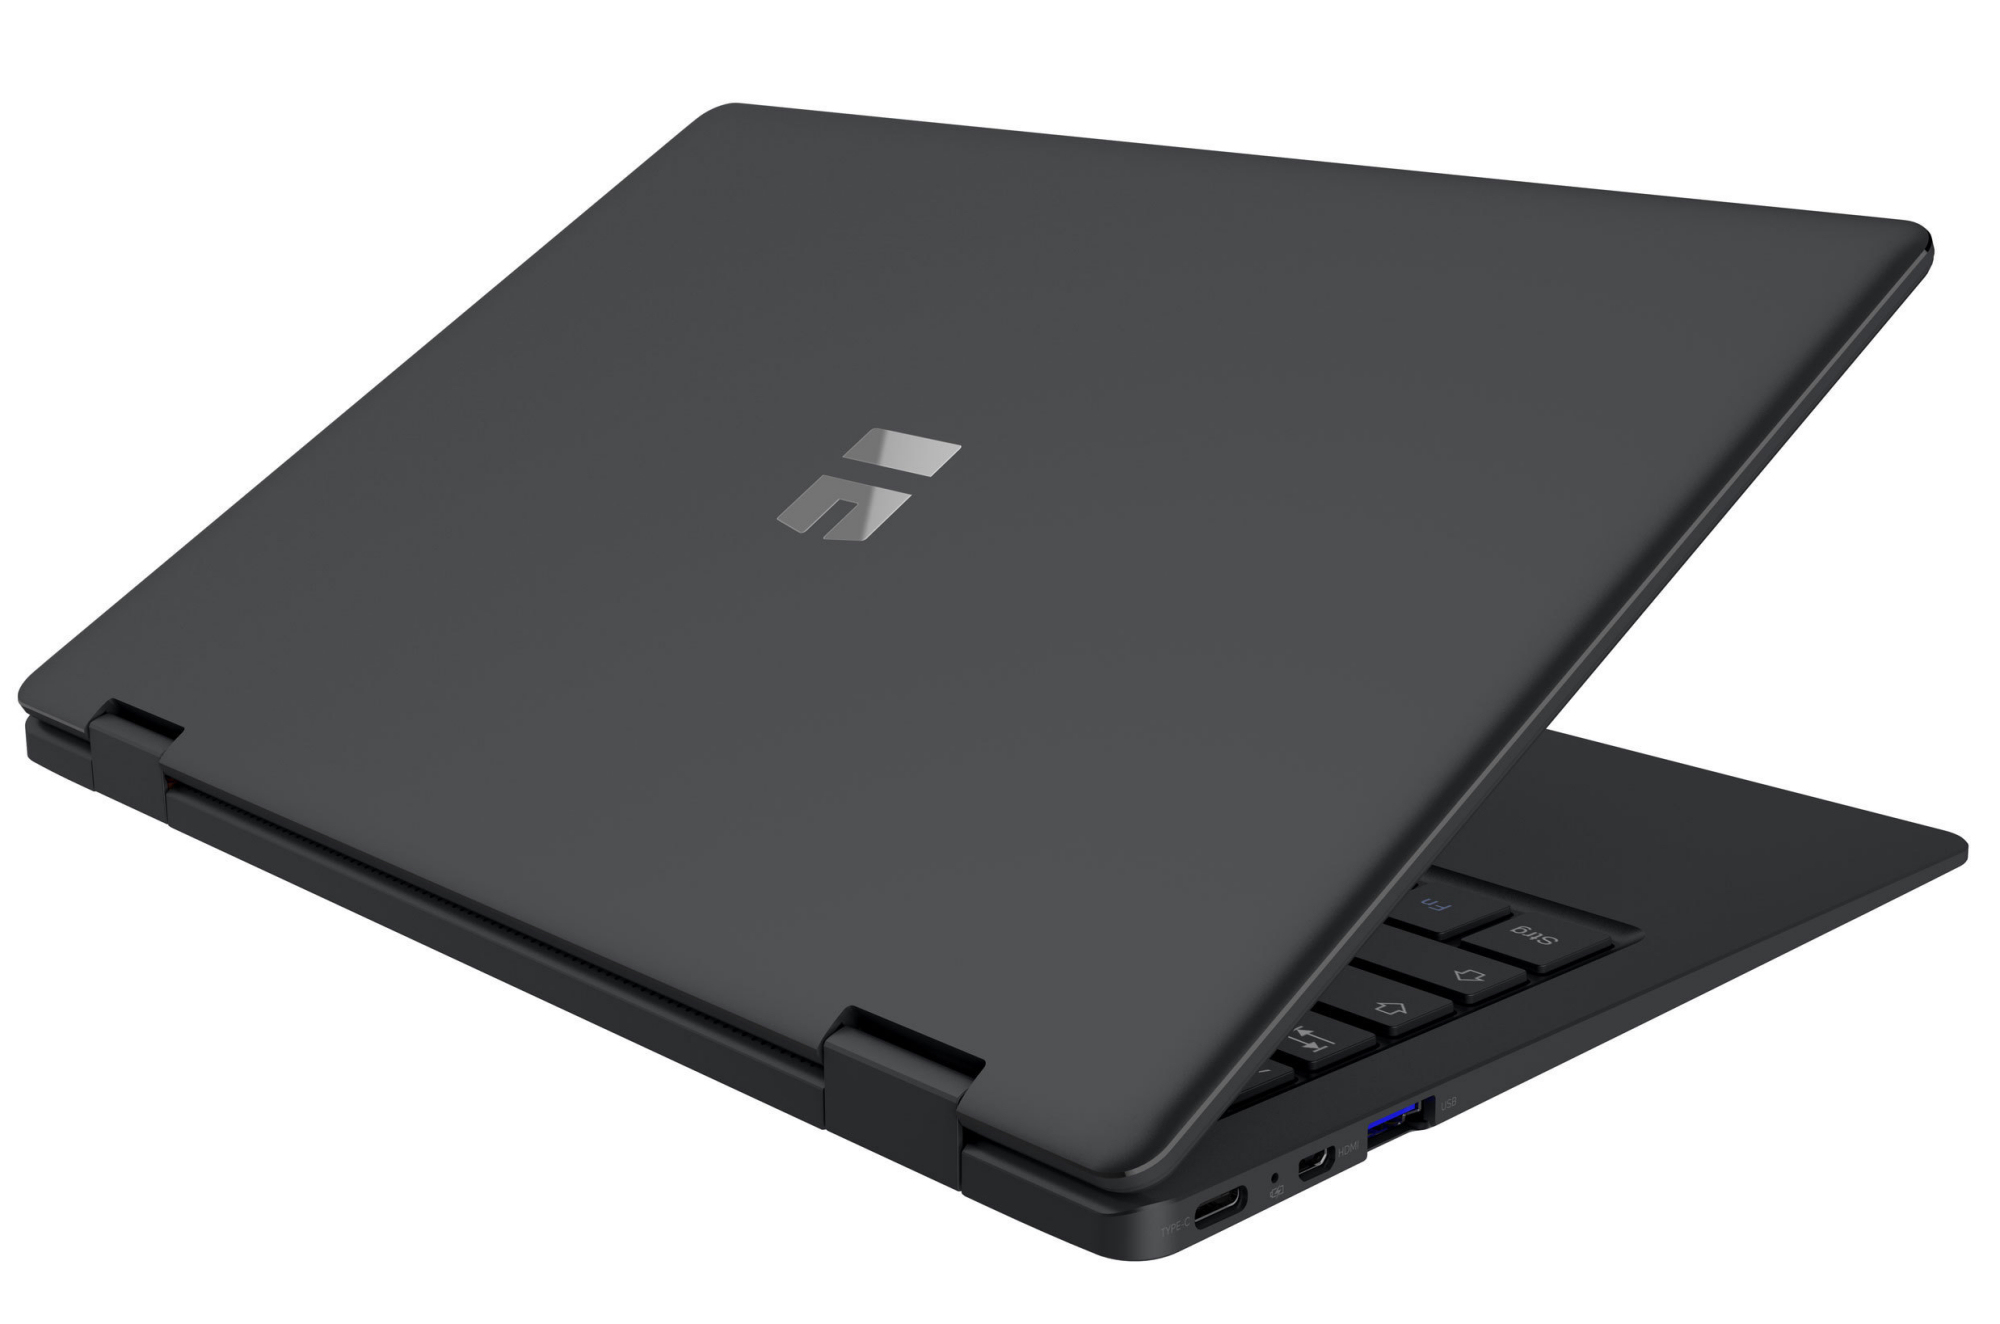
La tastiera è complessivamente buona, ma la sua mancanza di retroilluminazione delude. Il C11B ha una durata decente della batteria, mentre il suo touchscreen IPS ha un forte rapporto di contrasto e angoli di visualizzazione buoni. Avremmo preferito un display più luminoso anche per l'utilizzo del dispositivo all'esterno. Di positivo, Trekstor ha incluso una porta USB Type-C per dati, alimentazione o video.
Il C11B ha ottenuto buoni risultati anche per le licenze software incluse. Trekstor ha incluso un abbonamento di un anno a MS Office 365 Personal e Sofatutor.com, quest'ultimo di solito costa quanto il C11B per una licenza di un anno. Trekstor inoltre vende il Primebook C11 per circa 300 euro ($343/£261) se non avete bisogno del software incluso con il C11B. In breve, il Yourbook C11B è un solido e conveniente convertibile per gli studenti che viene fornito con software utile.
Trekstor Yourbook C11B
- 09/26/2019 v7 (old)
Sascha Mölck
Price comparison
