Notebookcheck Logo

Recensione dell'Asus TUF Gaming Radeon RX 7800 XT OC: Un serio sfidante della Nvidia GeForce RTX 4070 Super a meno di 600 euro?

Un midrange potente! La AMD Radeon RX 7800 XT, che è dotata di alcuni geni RDNA 3, attualmente compete con i modelli RTX 4070 di Nvidia. In termini di VRAM, AMD è in vantaggio con 16 GB. Ma se lo stesso vale anche per le prestazioni, lo analizziamo utilizzando la Asus TUF Gaming Radeon RX 7800 XT OC. Abbiamo sottoposto il modello partner della scheda a numerosi benchmark per determinare le prestazioni della GPU Desktop di fascia media.
I collegamenti esterni di Asus TUF Gaming Radeon RX 7800 XT OC

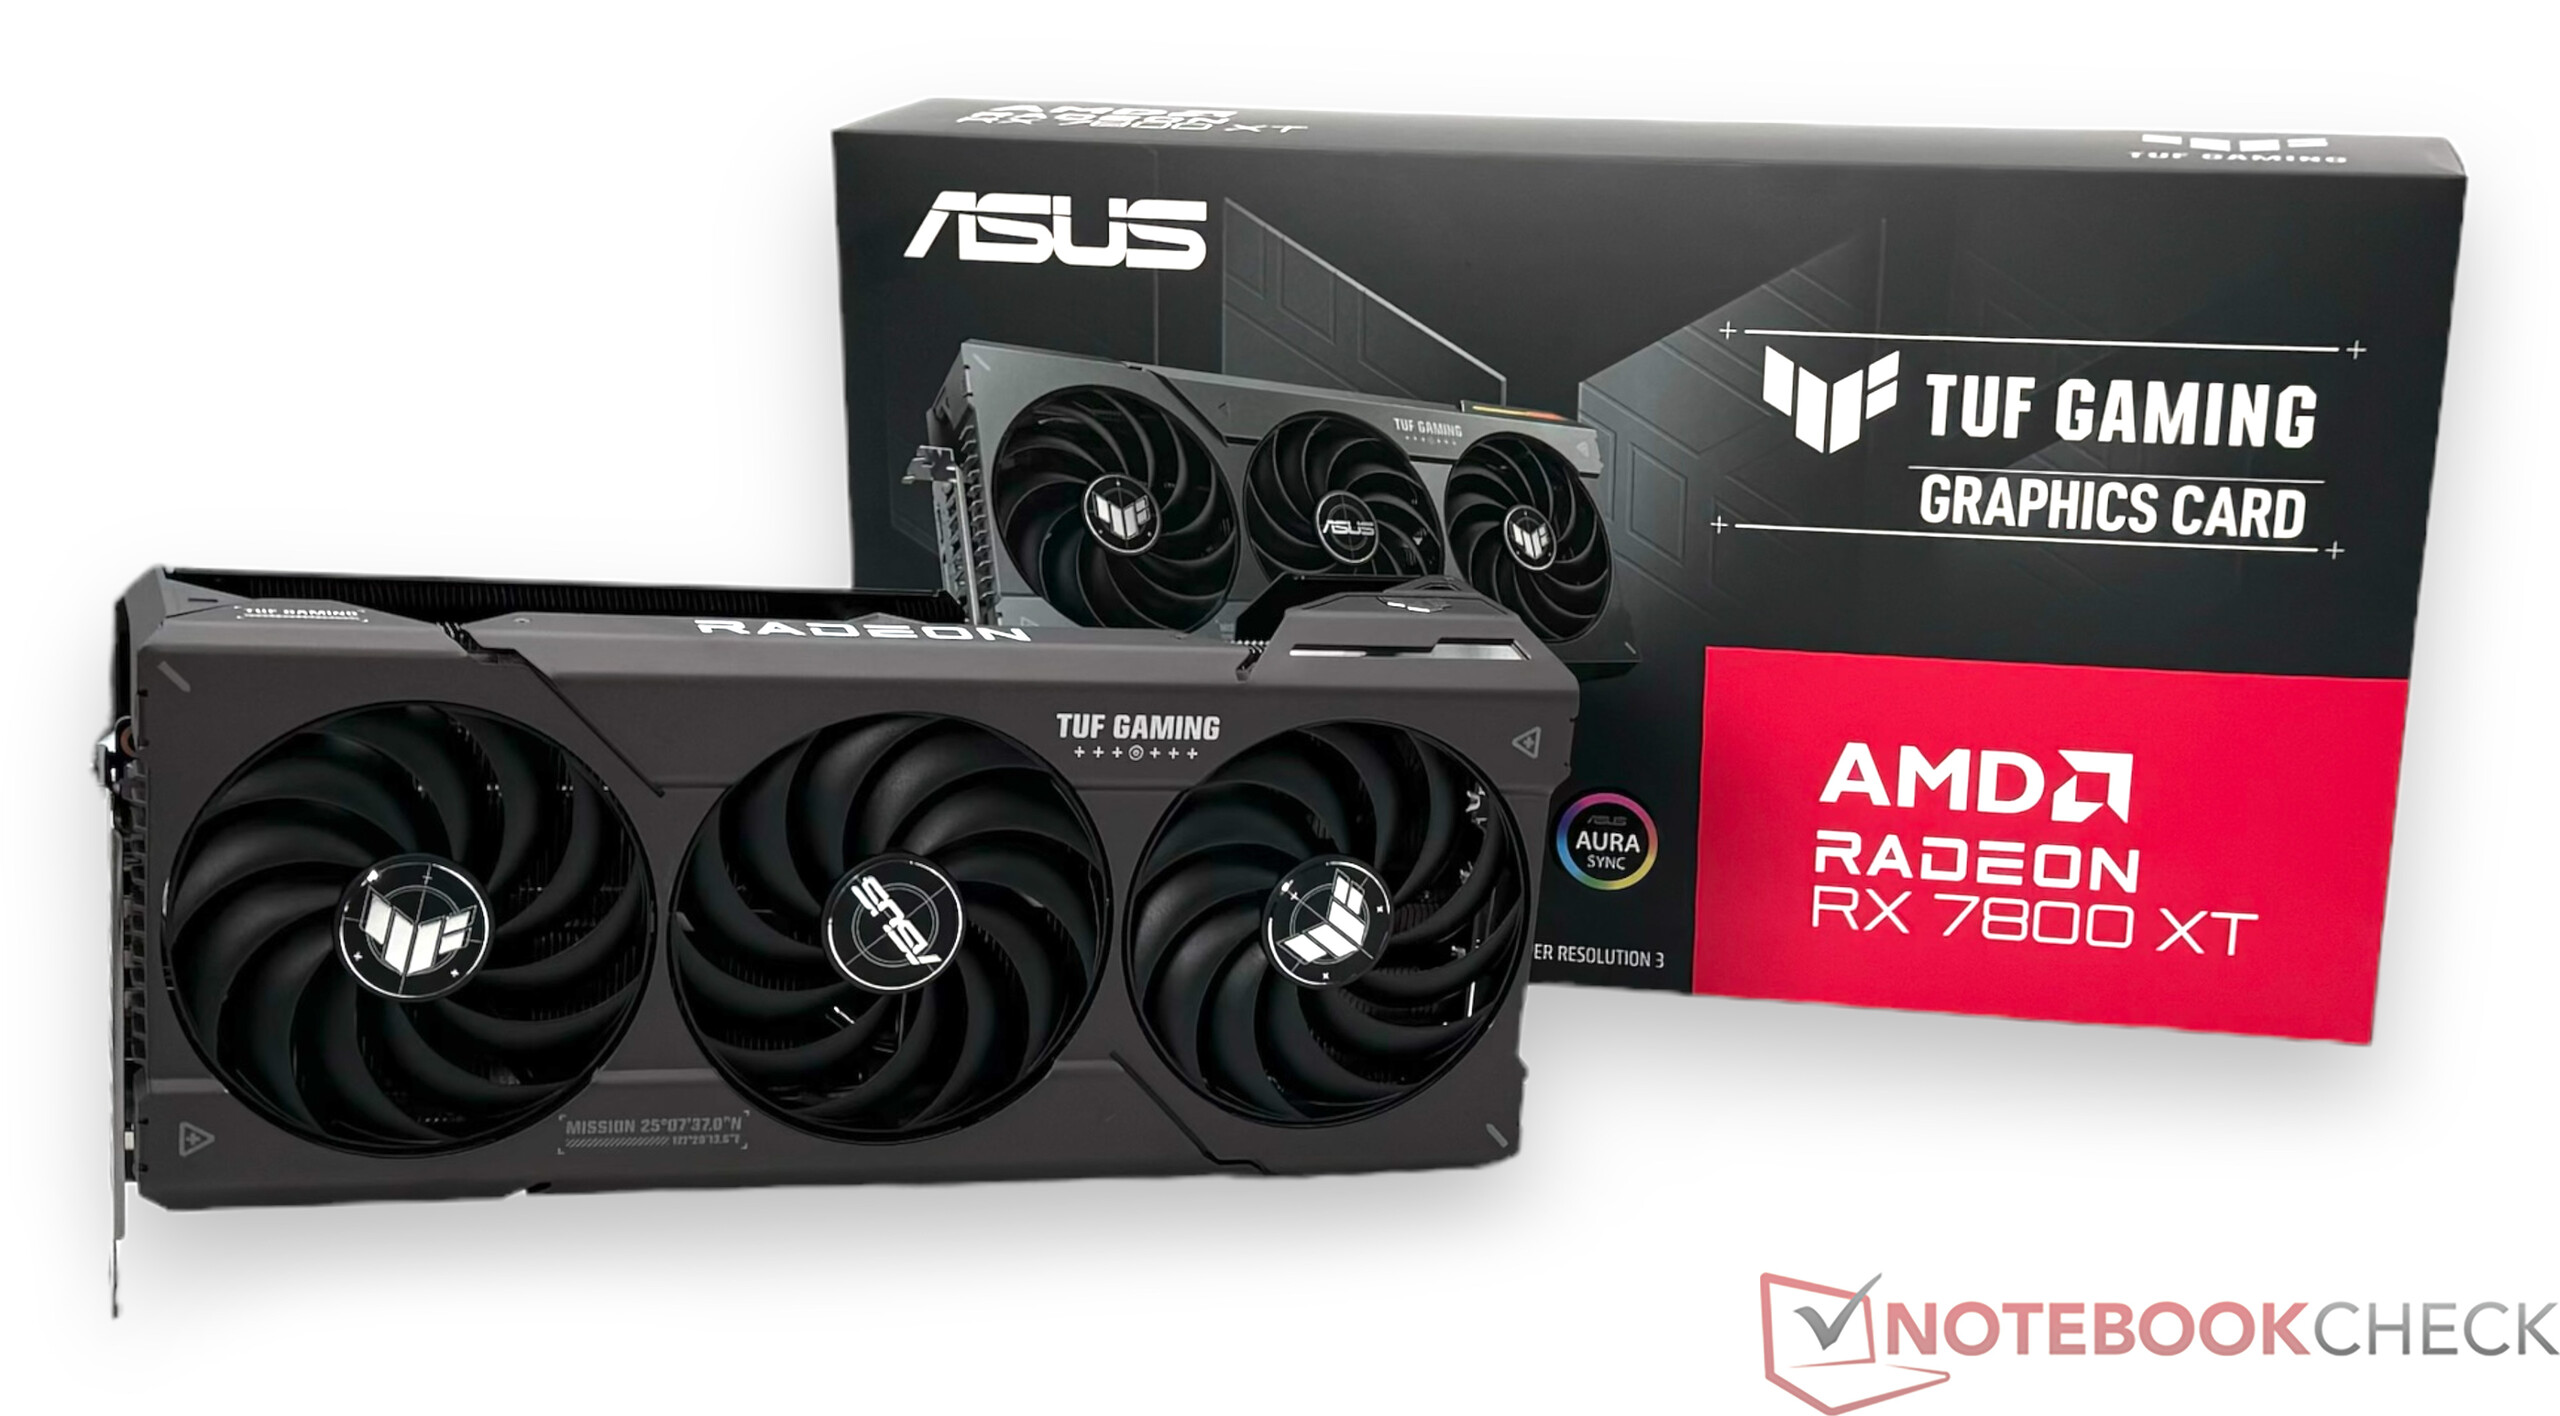
Anche se la AMD Radeon RX 7800 XT non è più una novità, grazie alla sua VRAM, la scheda grafica gode di un grande vantaggio nel segmento delle GPU Desktop di fascia media. Anche se ci sono opinioni diverse sull'argomento, possiamo sostanzialmente dire che più VRAM è sempre meglio. In questo settore, AMD è stata raramente avara e persino la AMD Radeon RX 7800 XT è dotata di 16 GB di VRAM. Dopo che abbiamo già dato un'occhiata al design di riferimento della RX 7800 XT poco dopo la sua presentazione lo scorso anno, ora la Asus TUF Gaming Radeon RX 7800 XT OC ha fatto il suo ingresso nel nostro laboratorio di prova come modello partner della scheda.

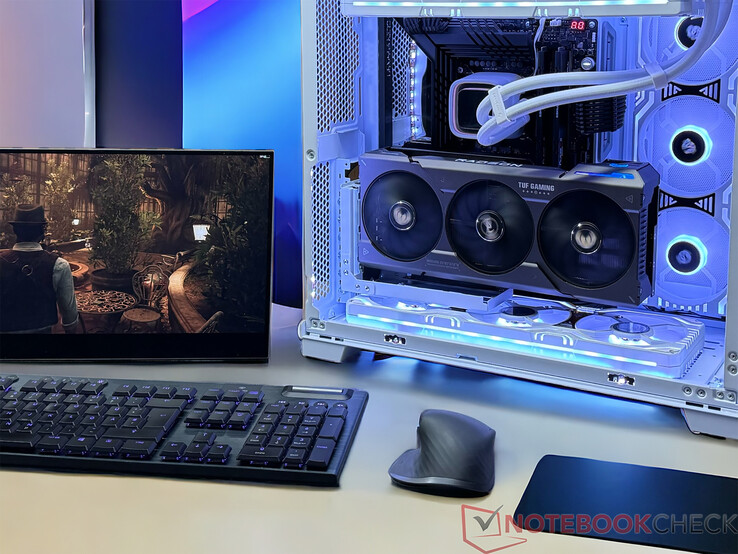
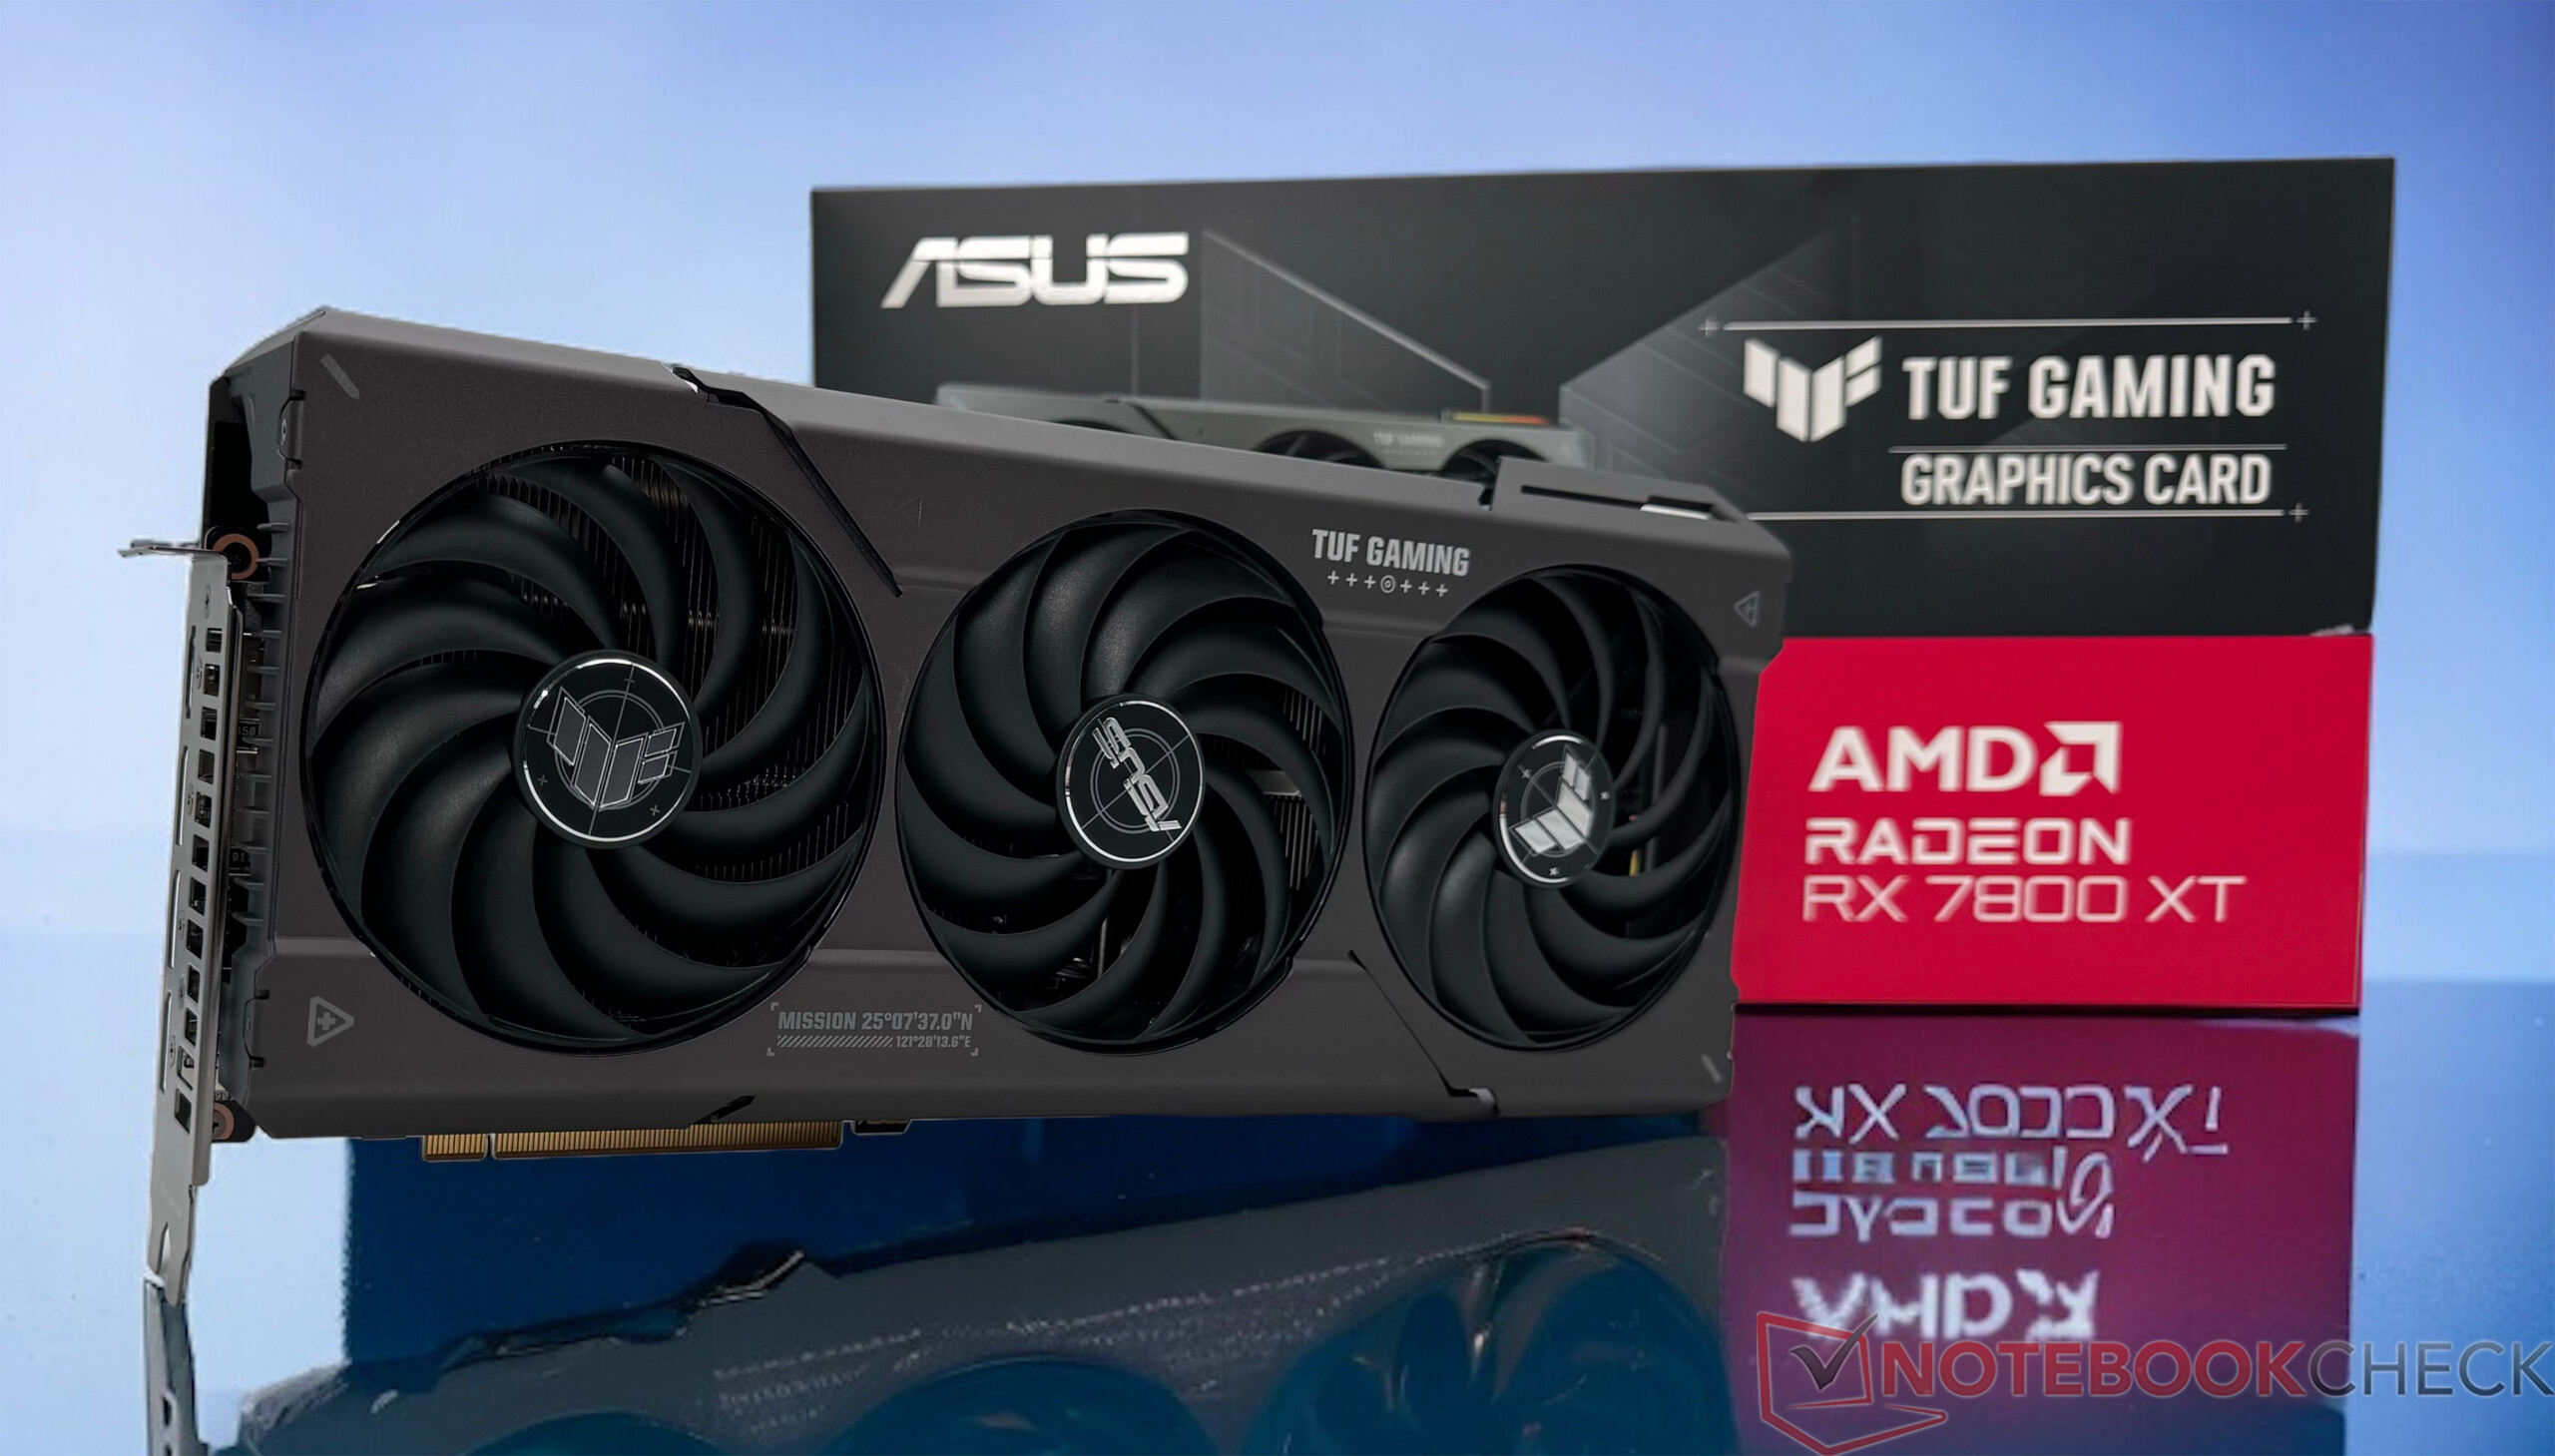
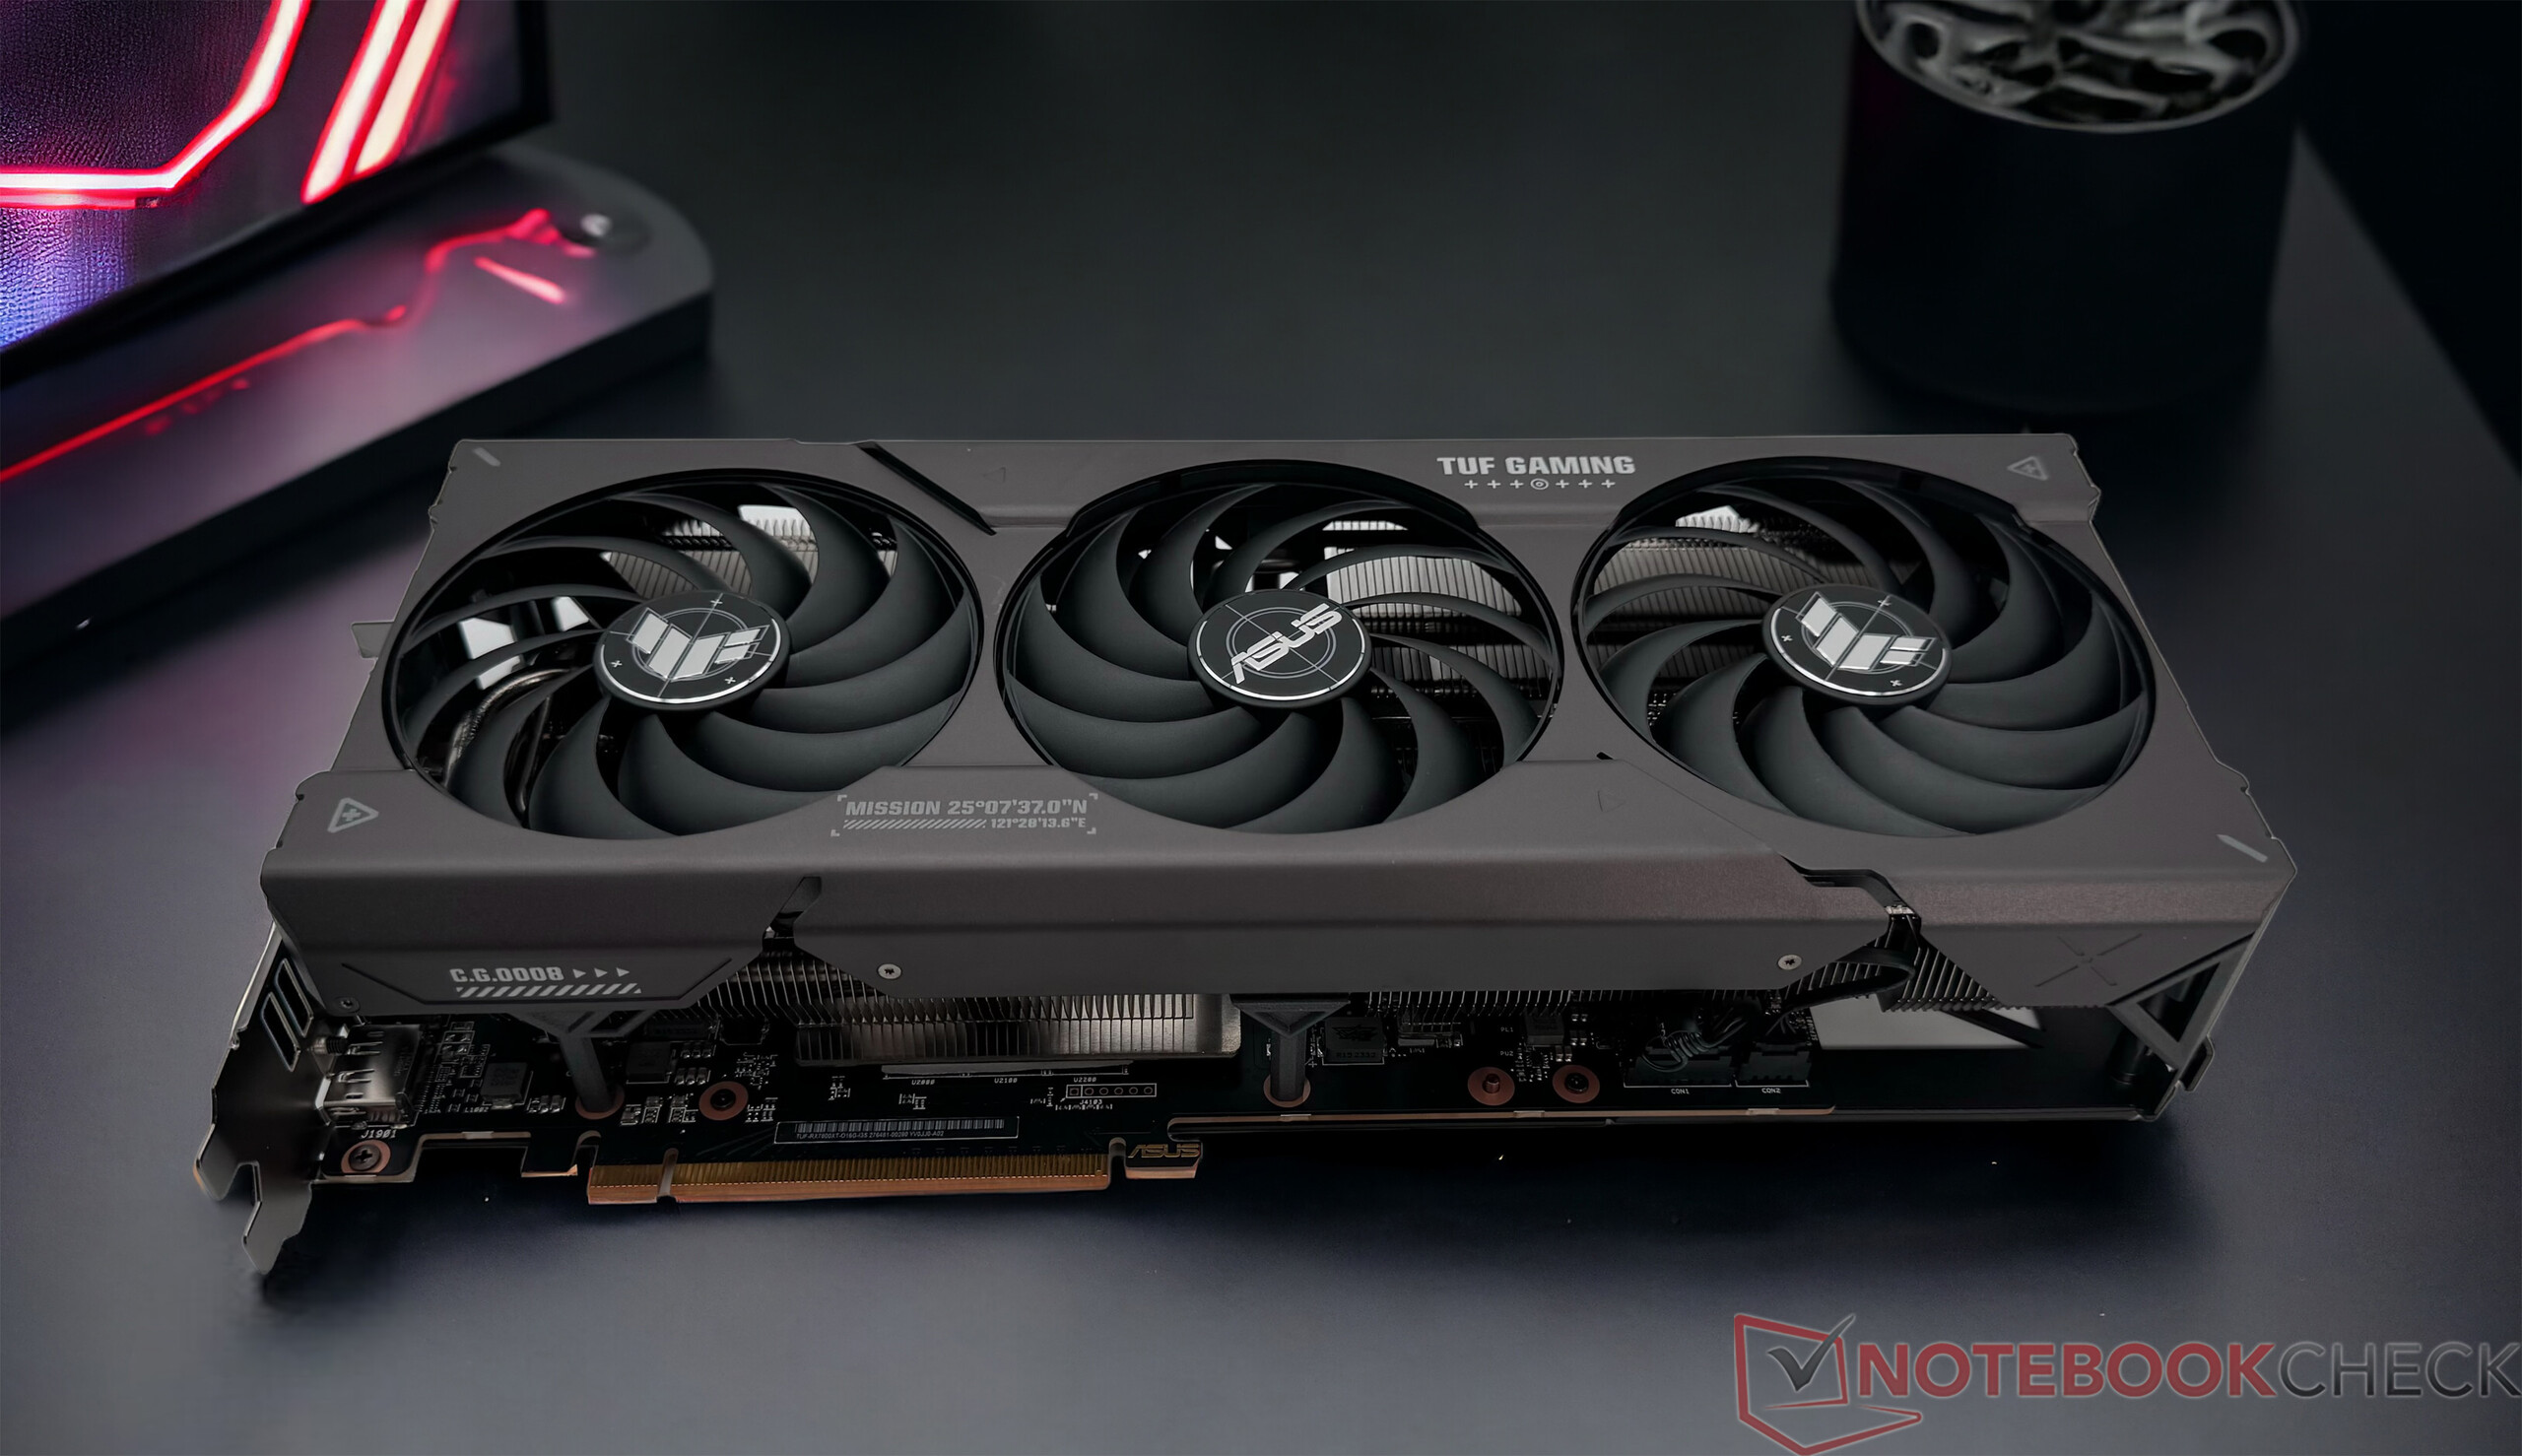
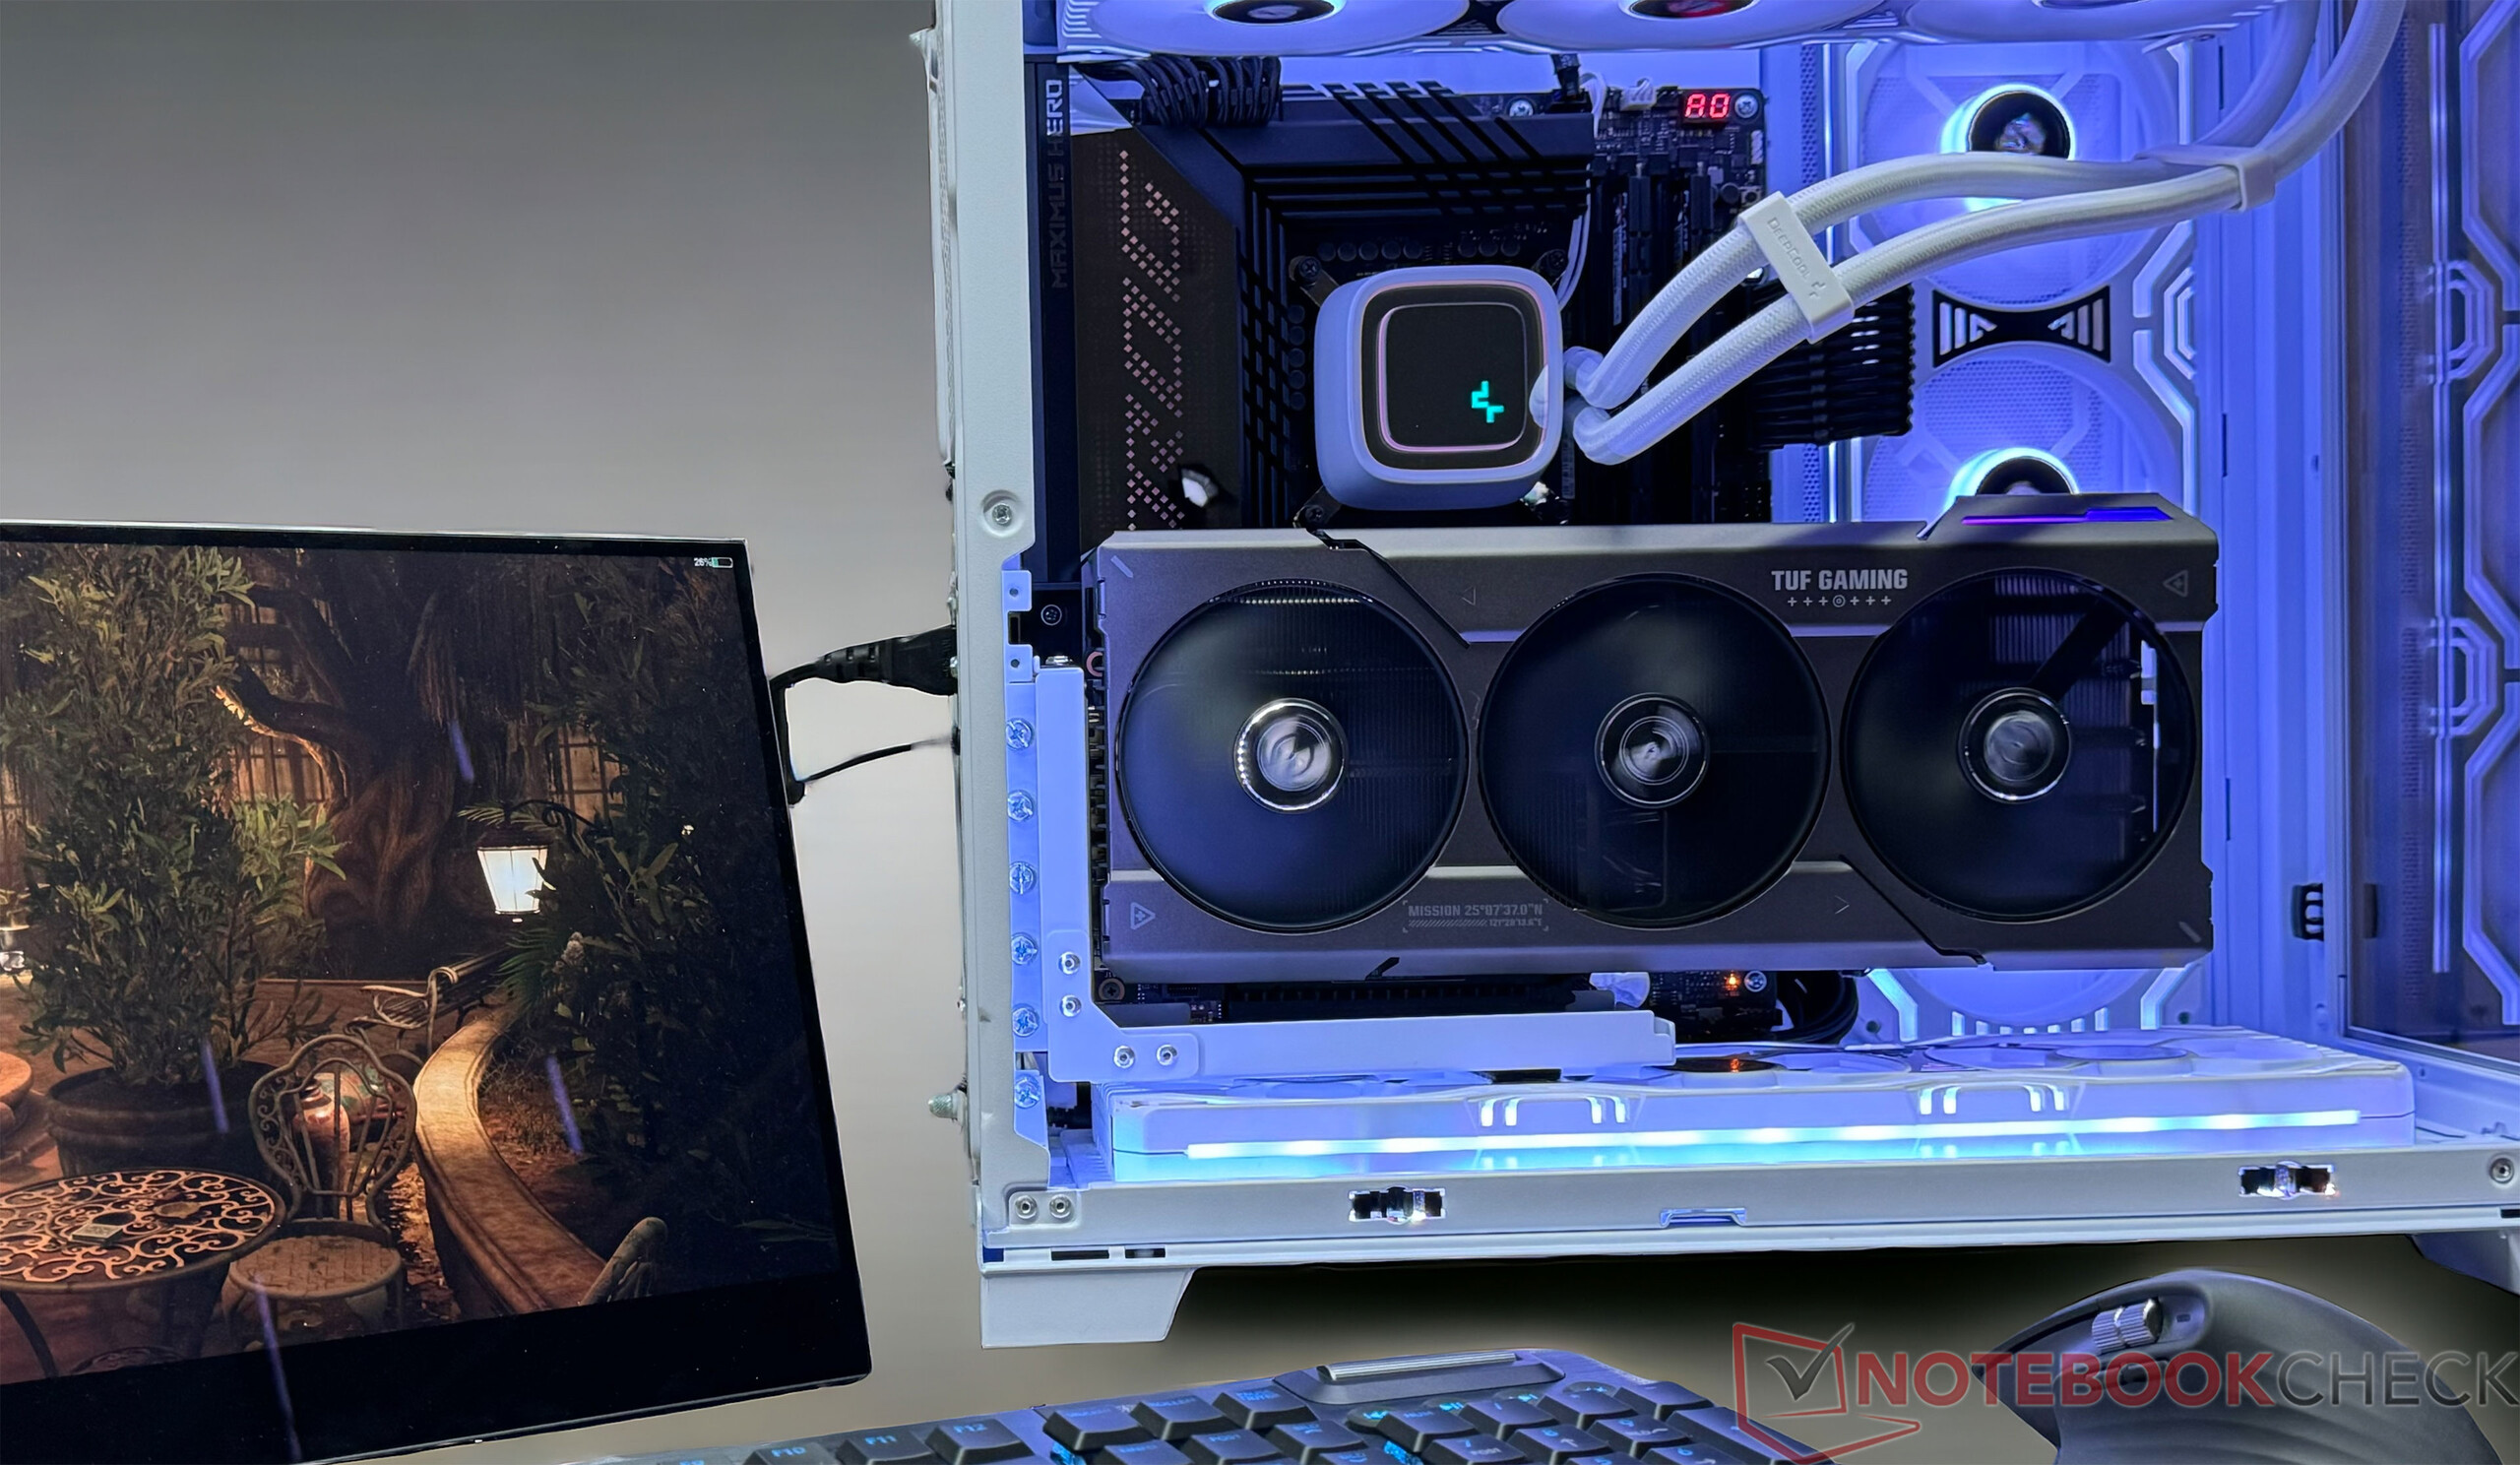
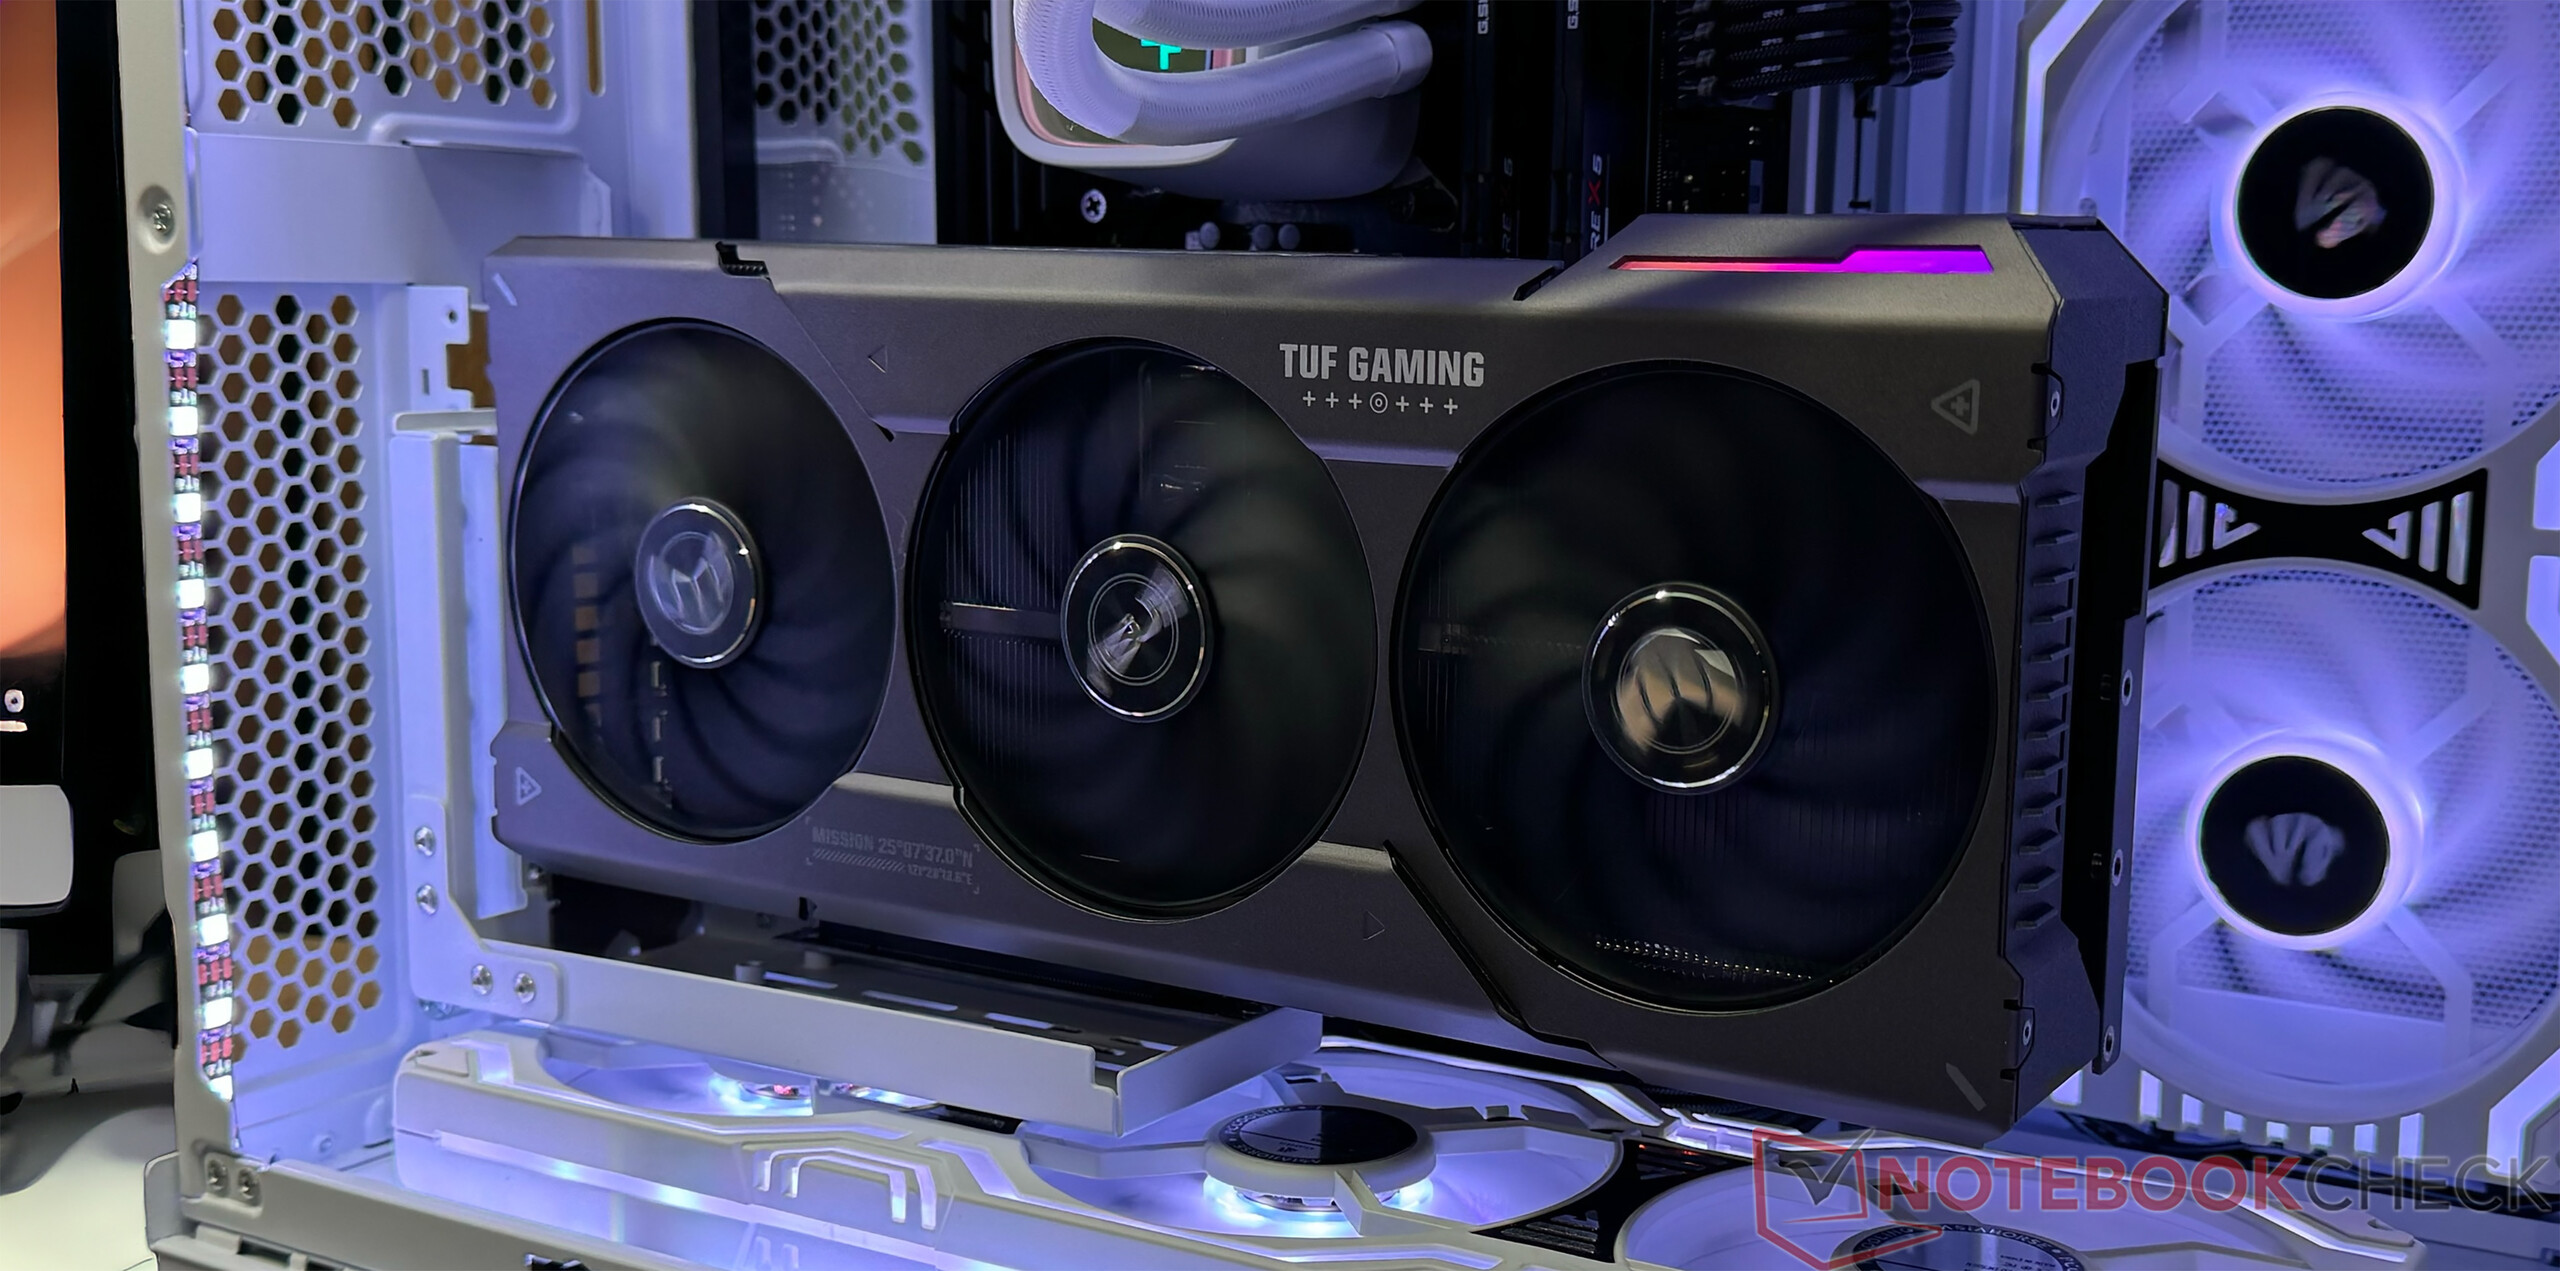
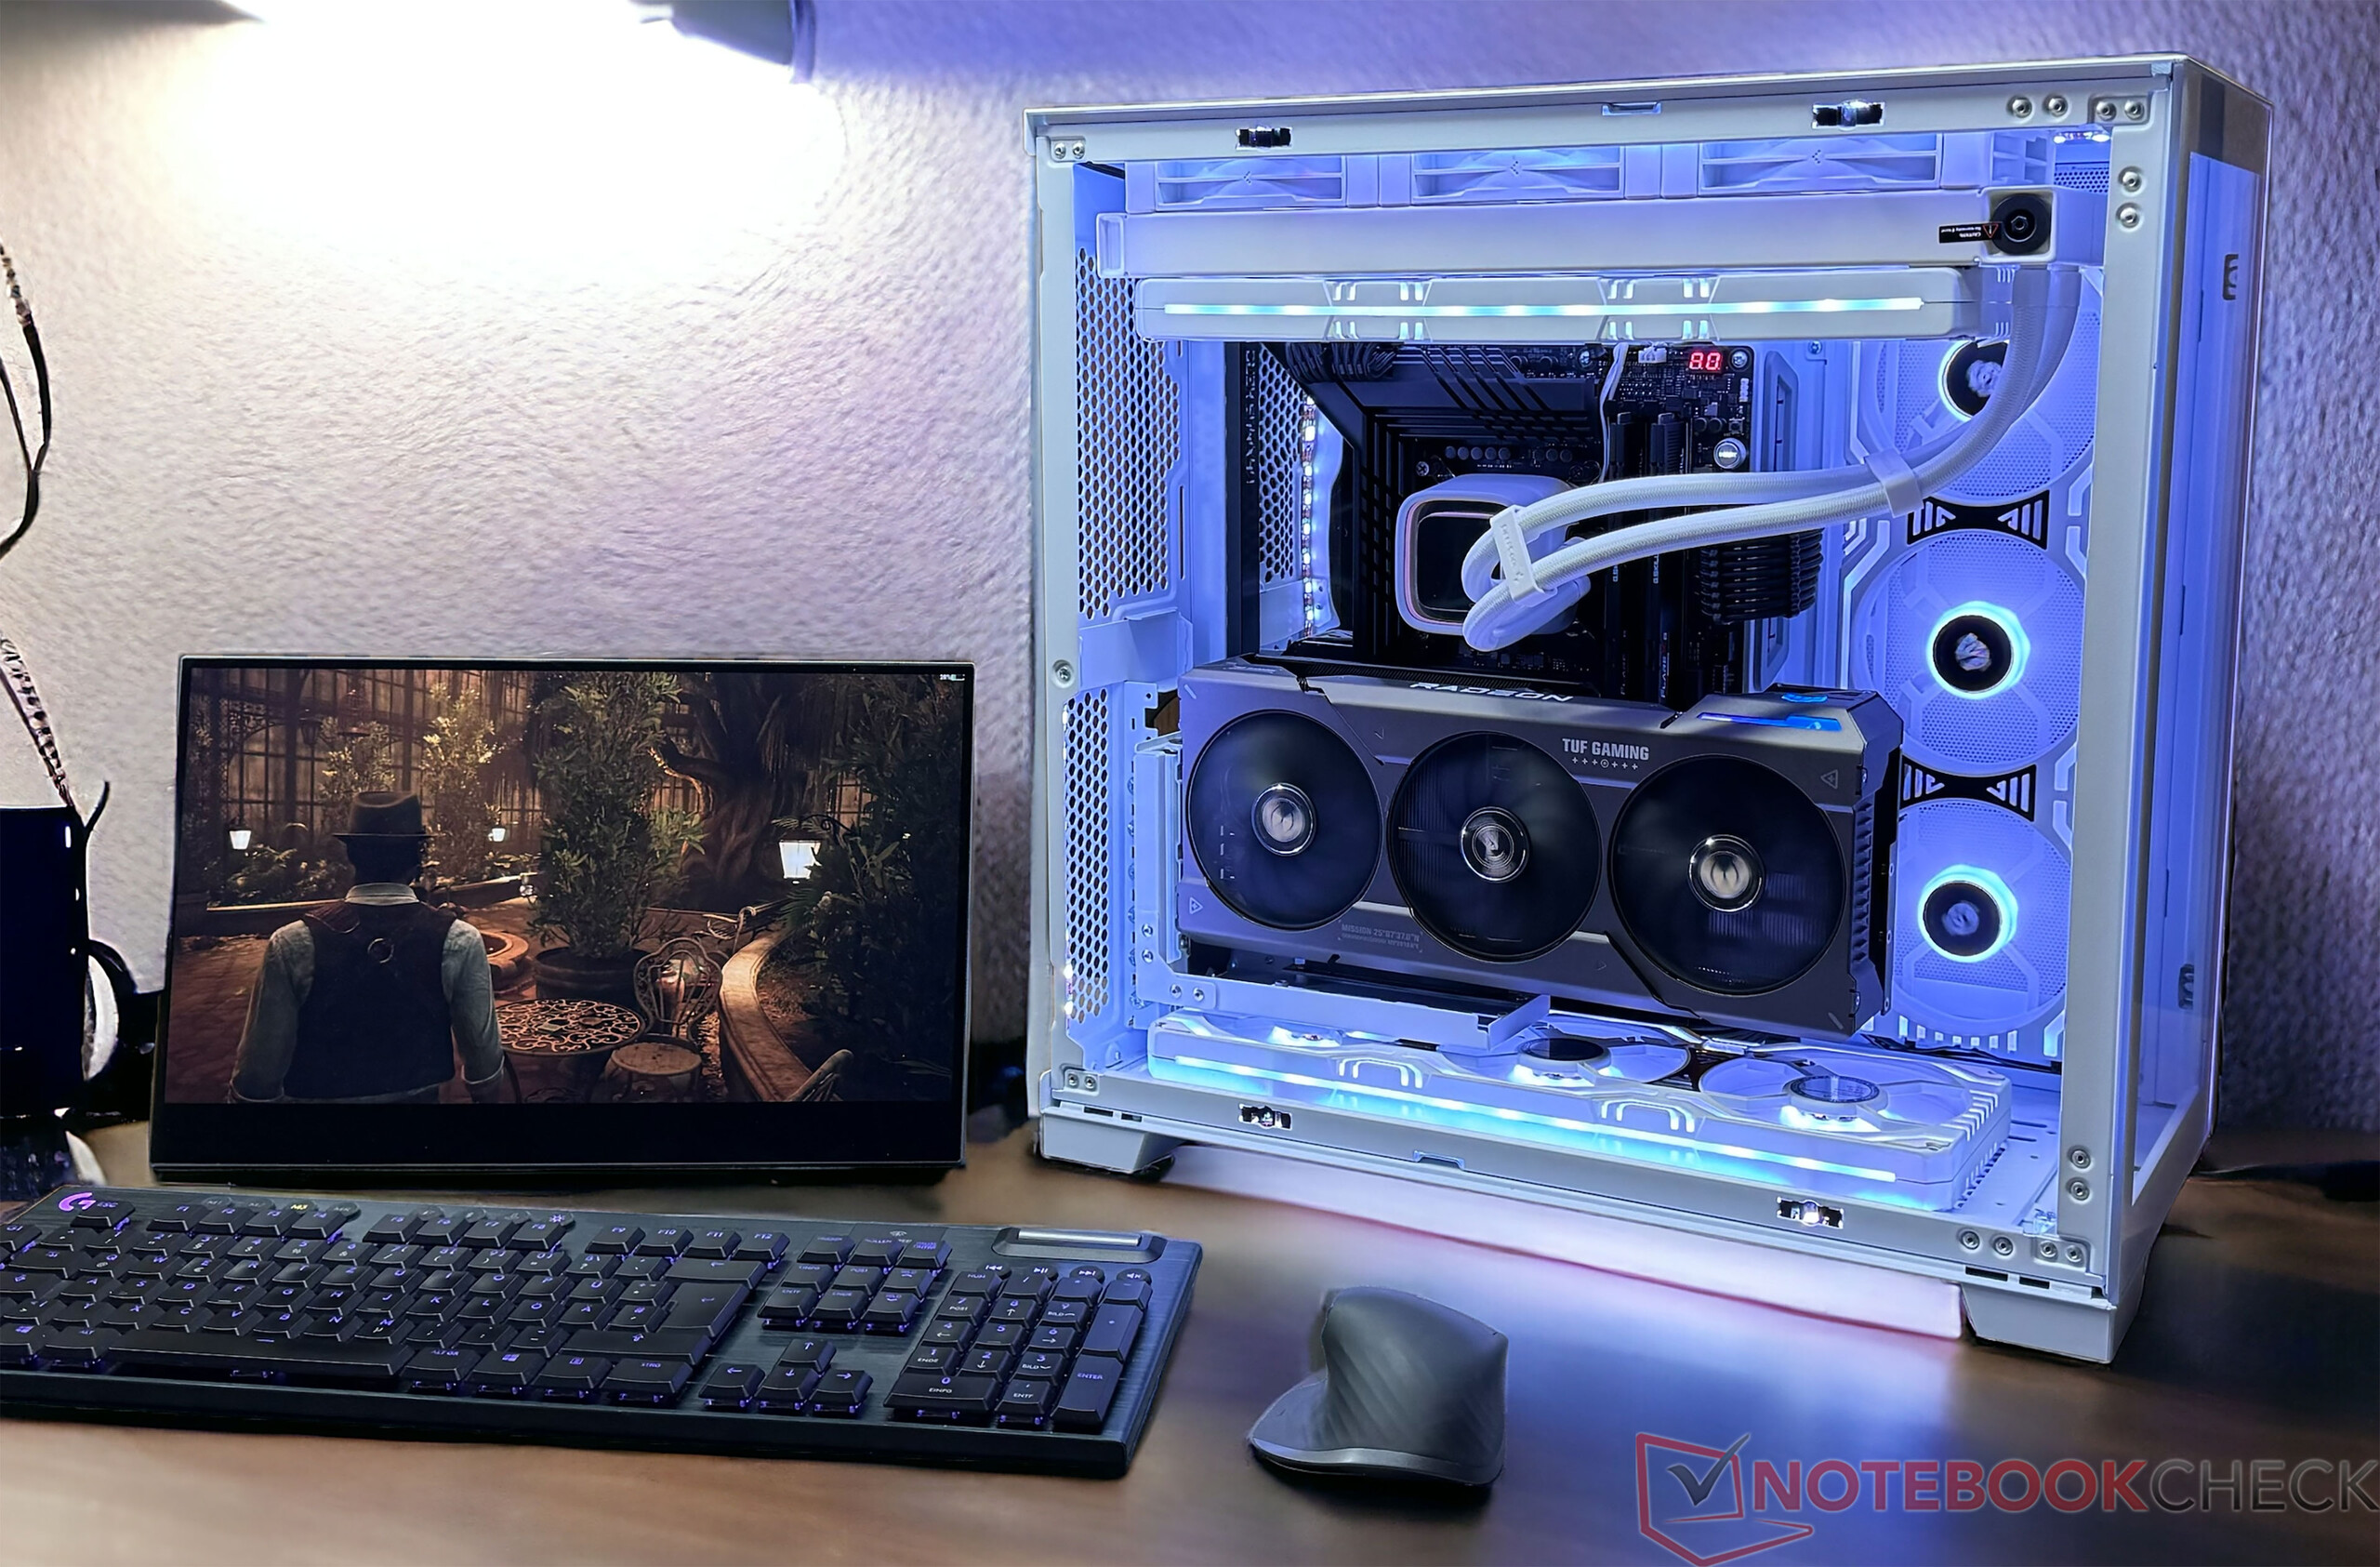
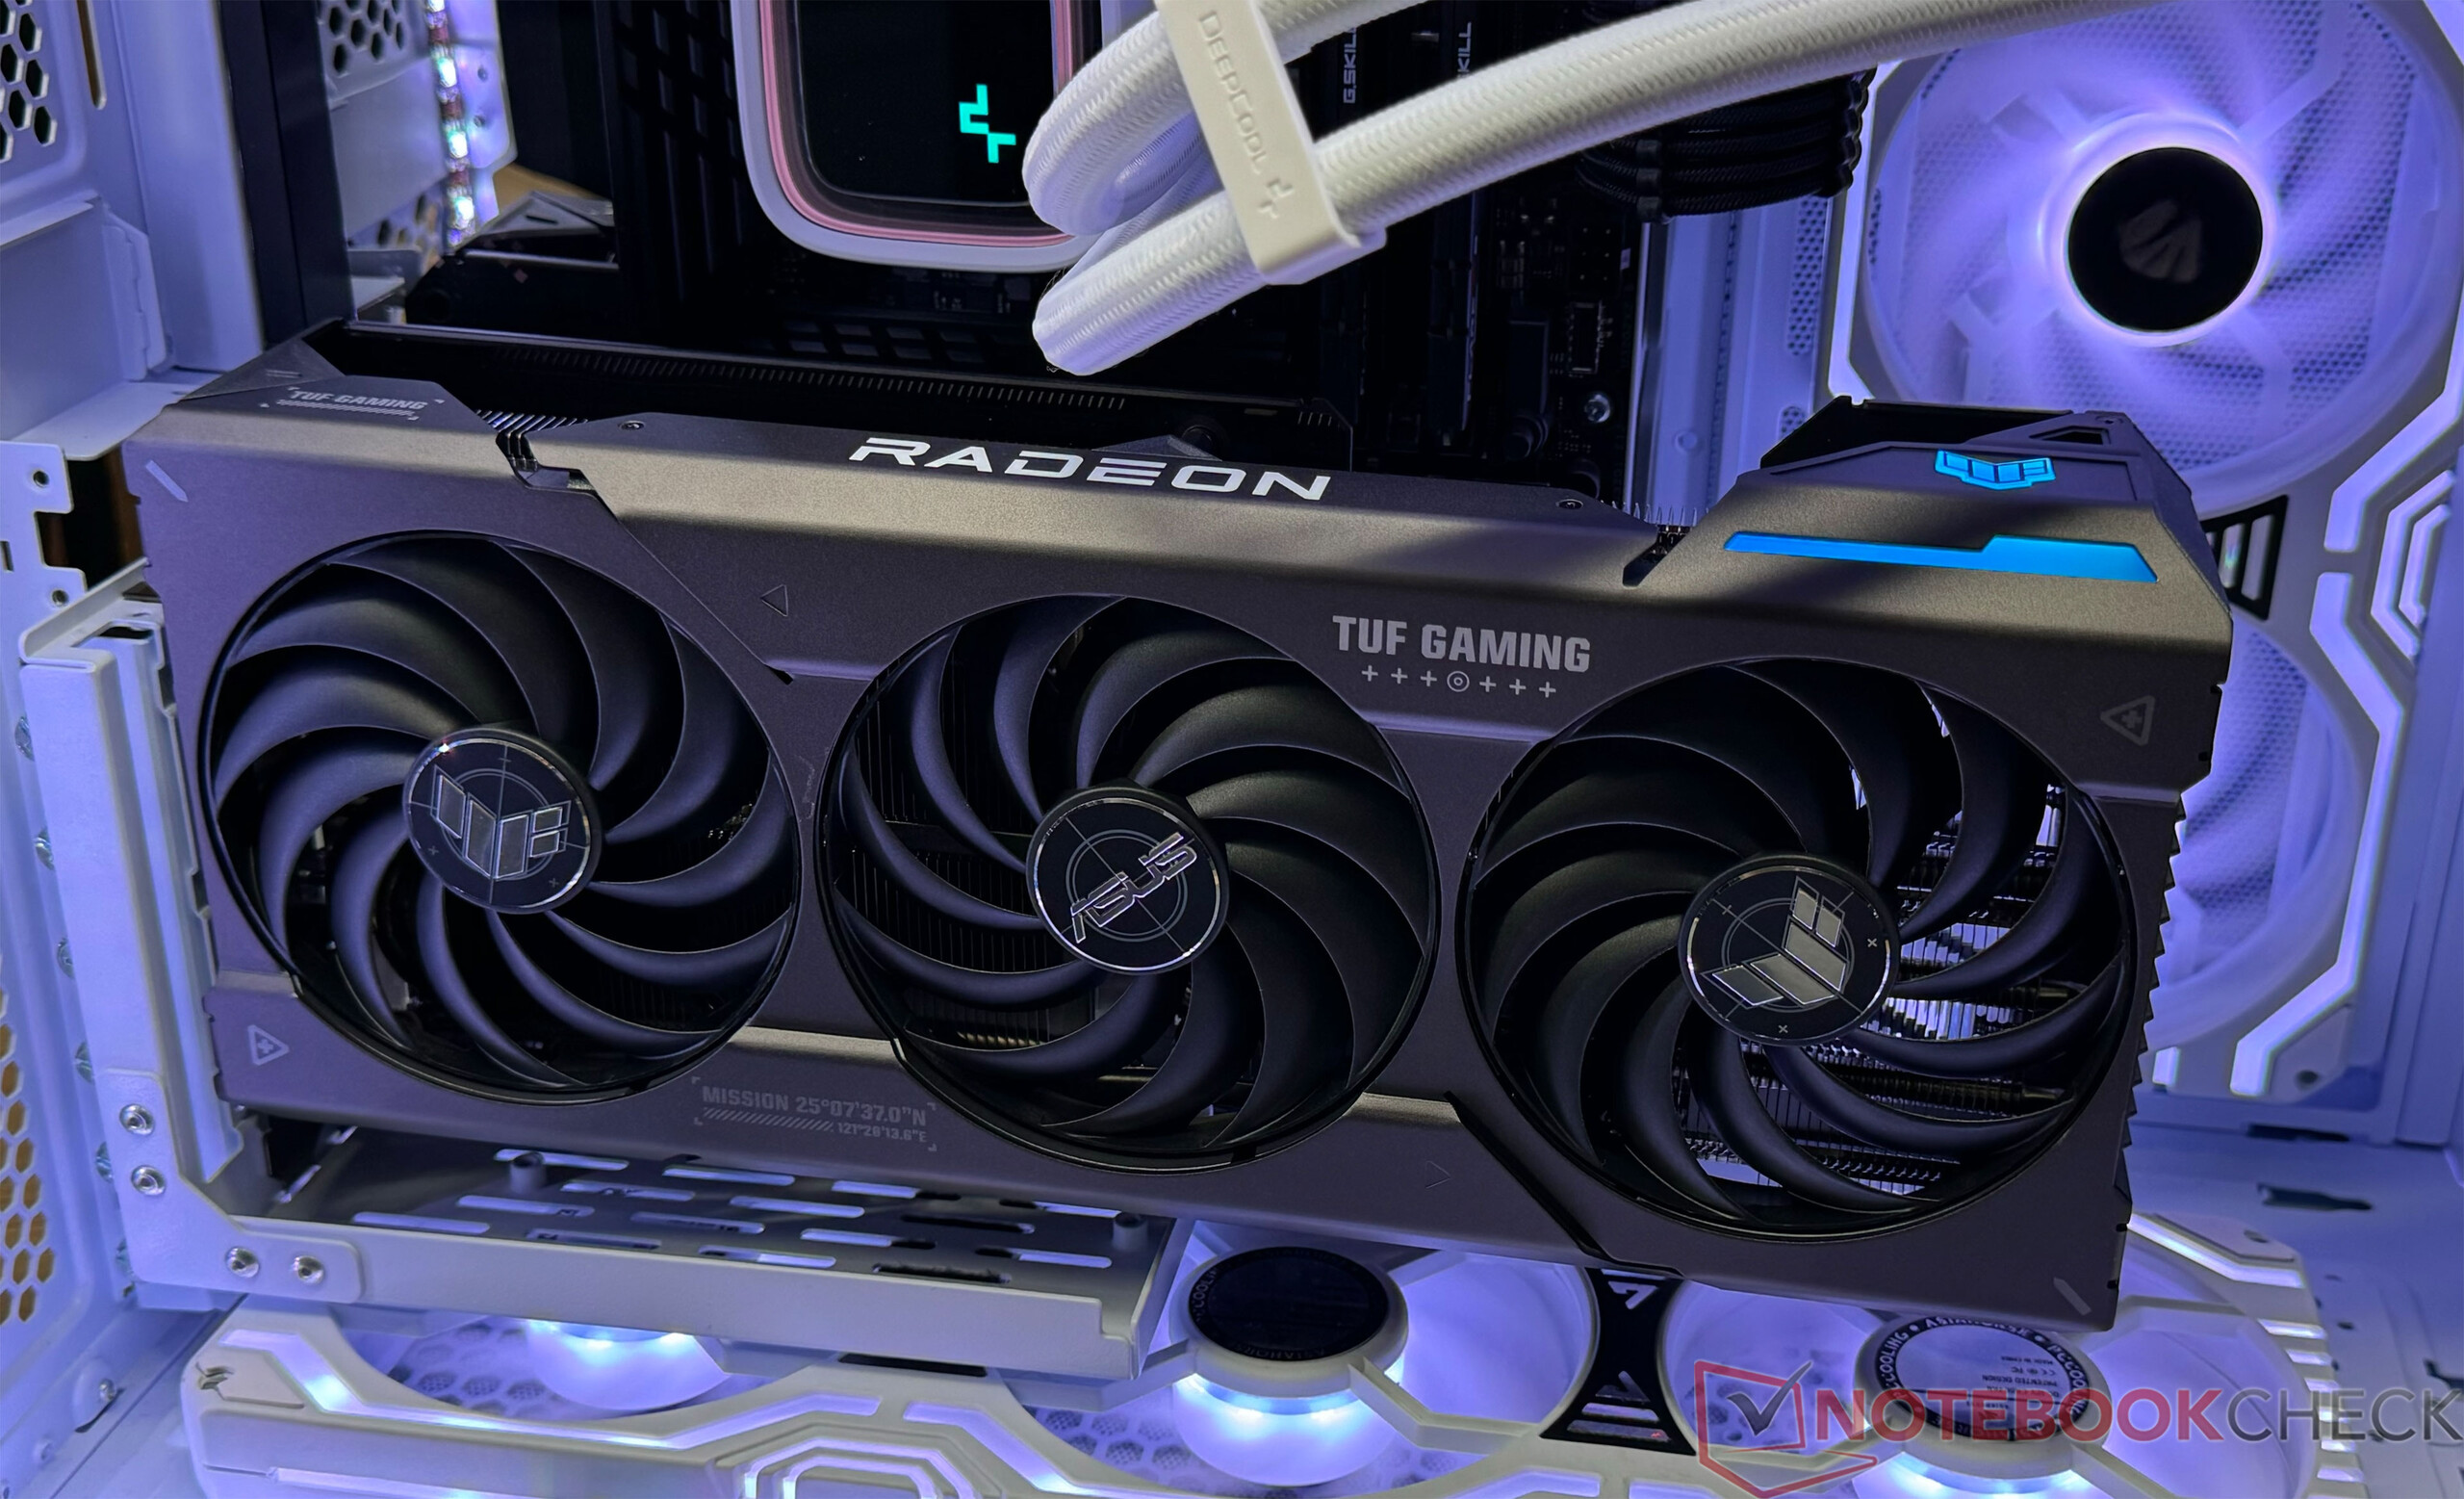
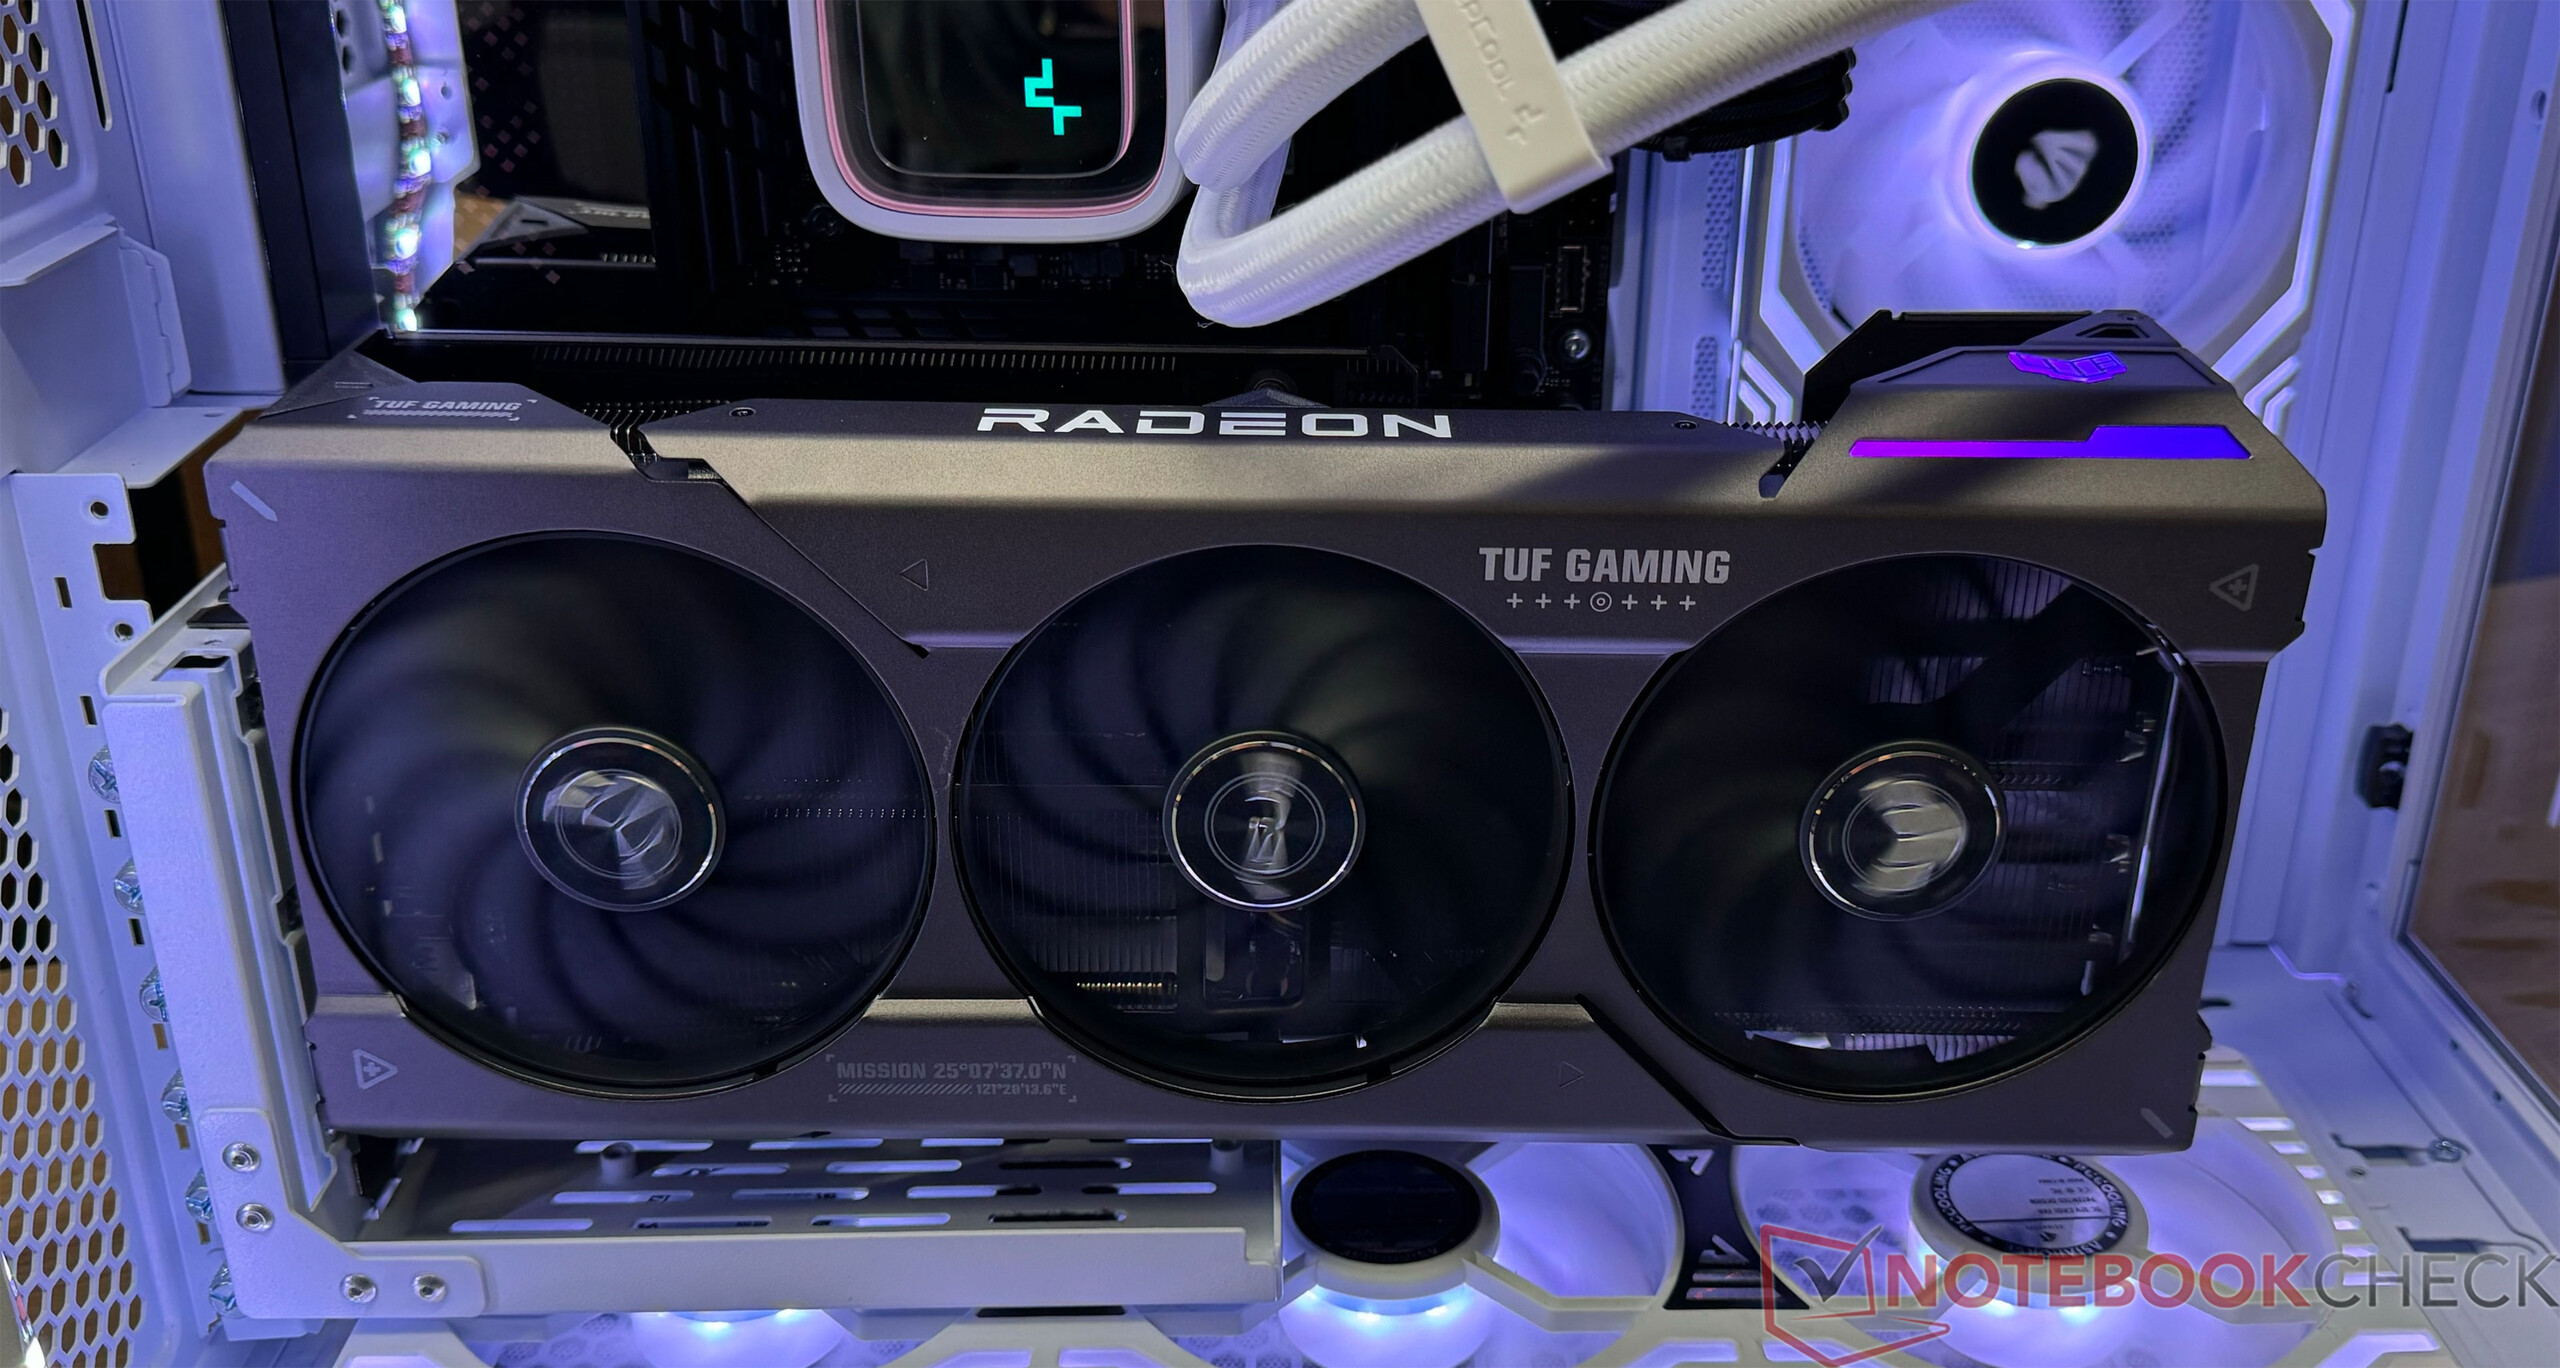
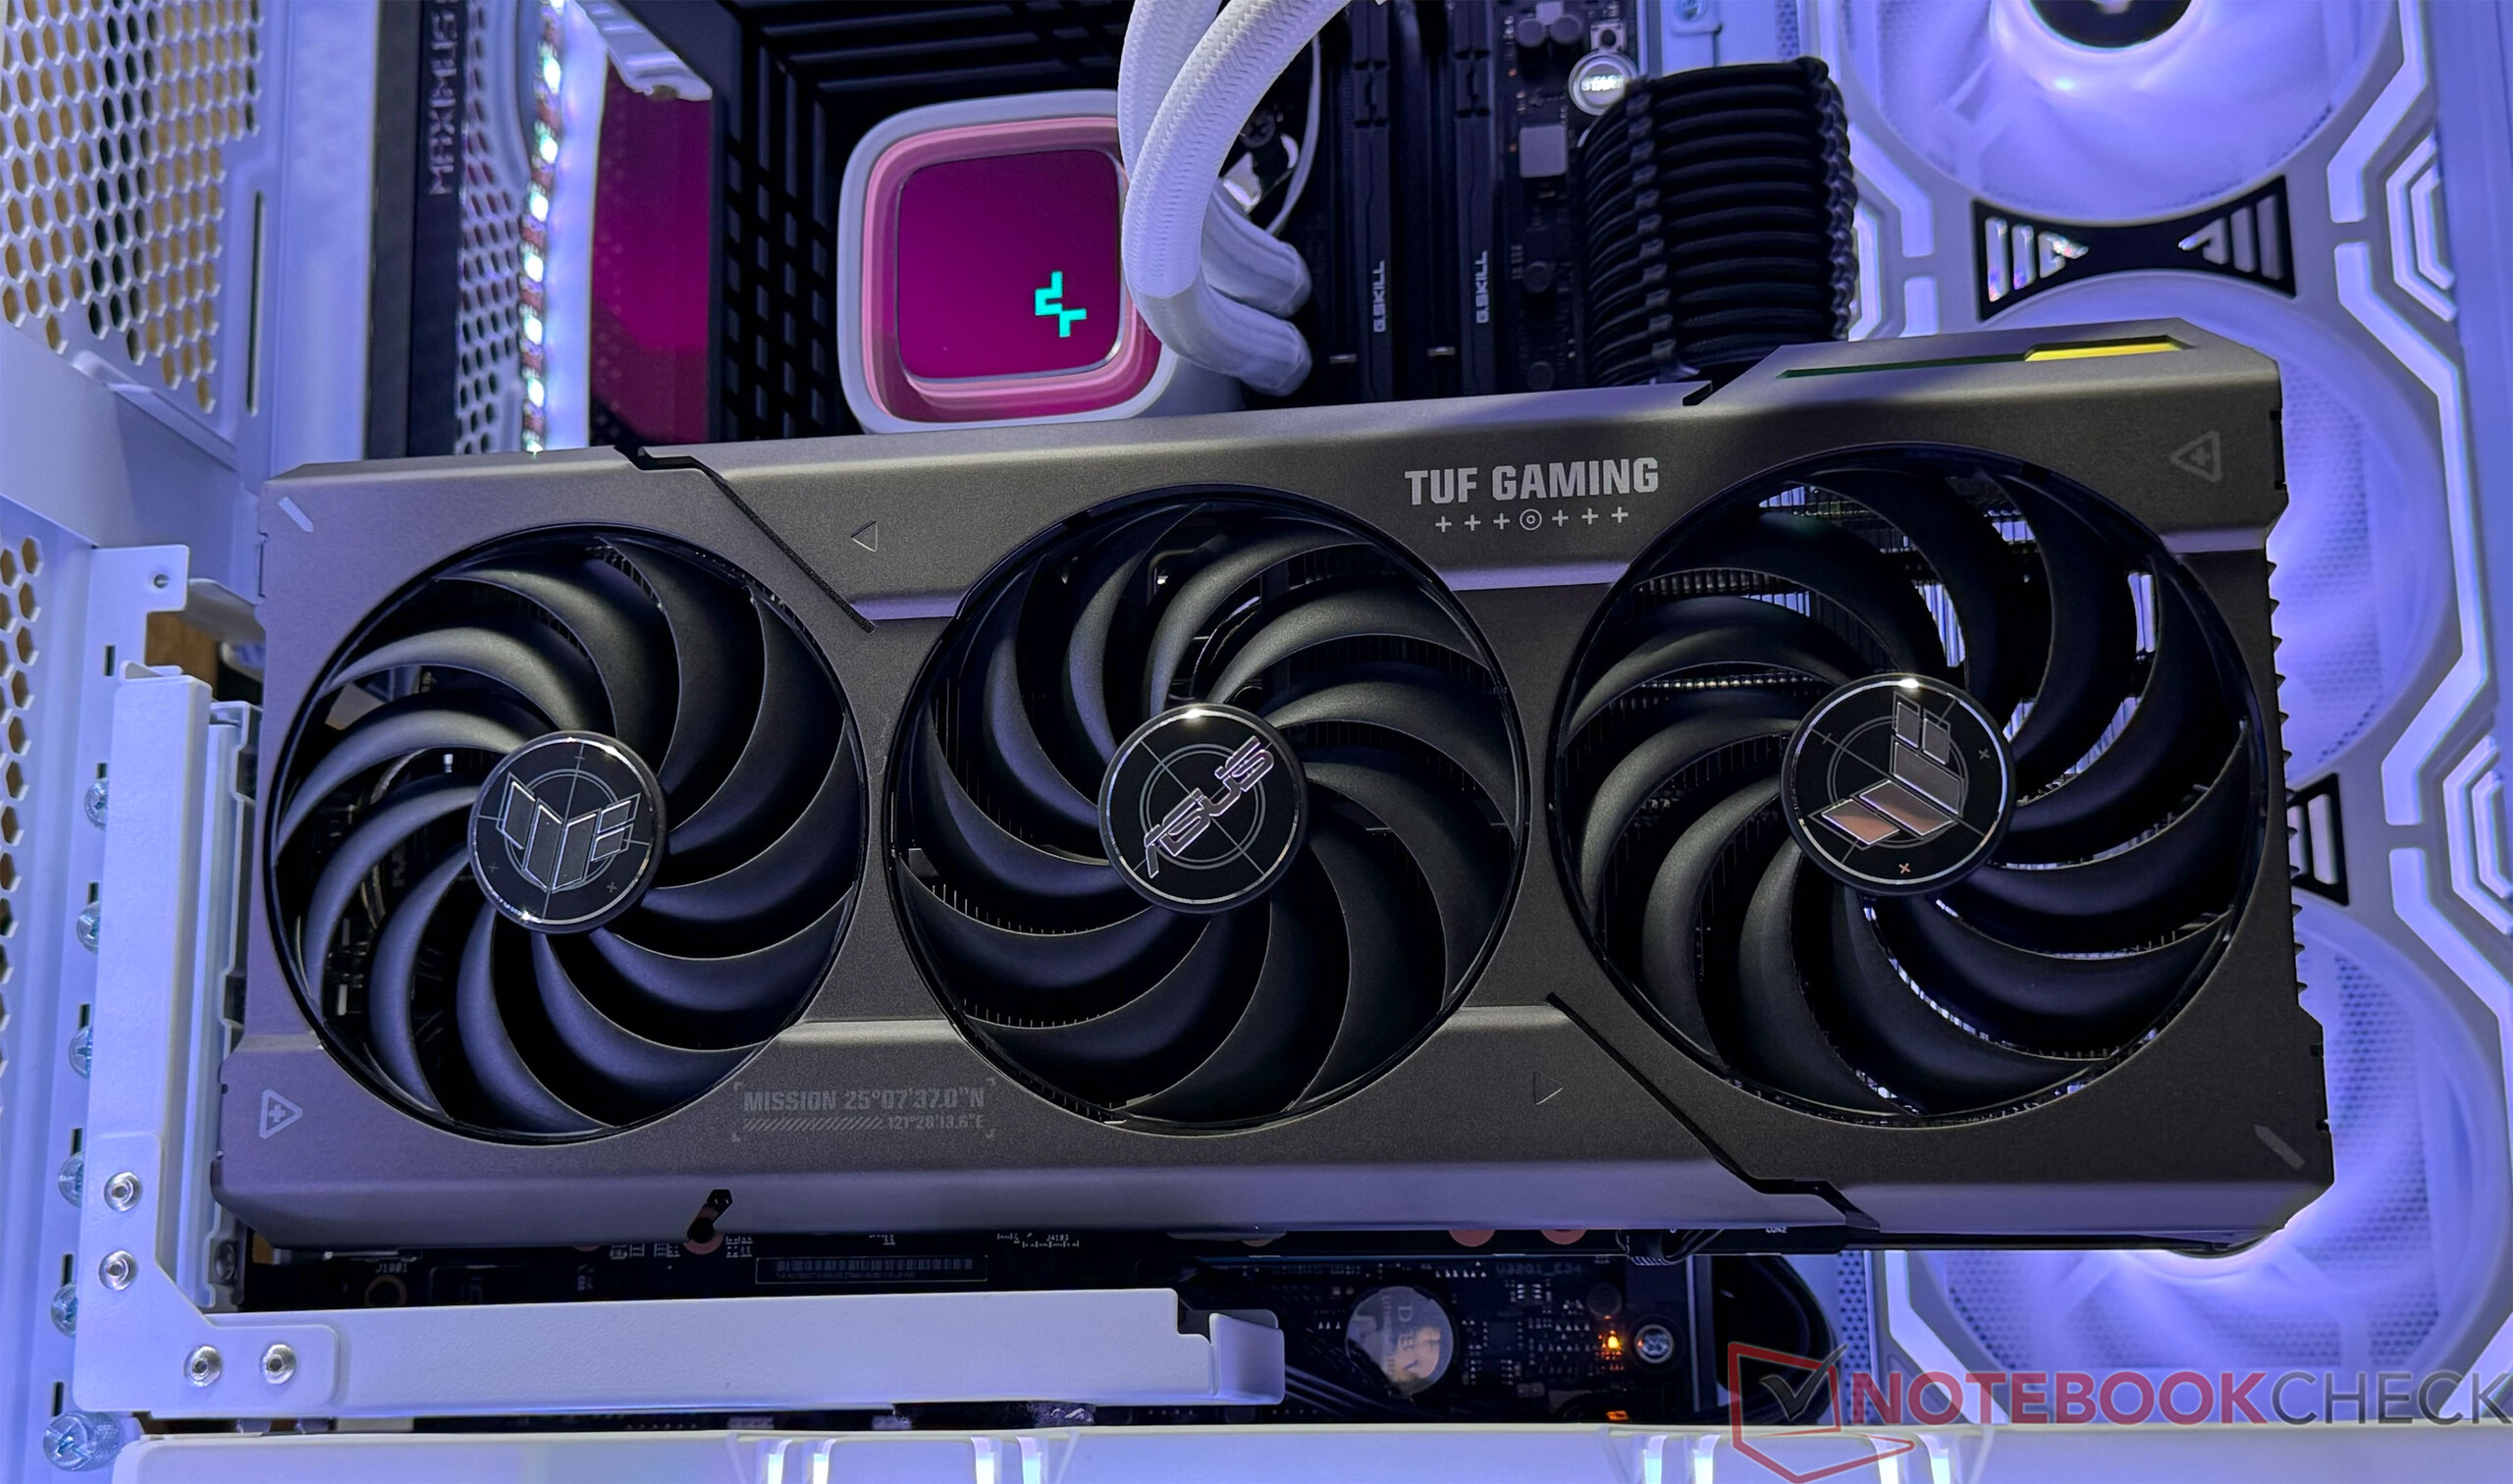
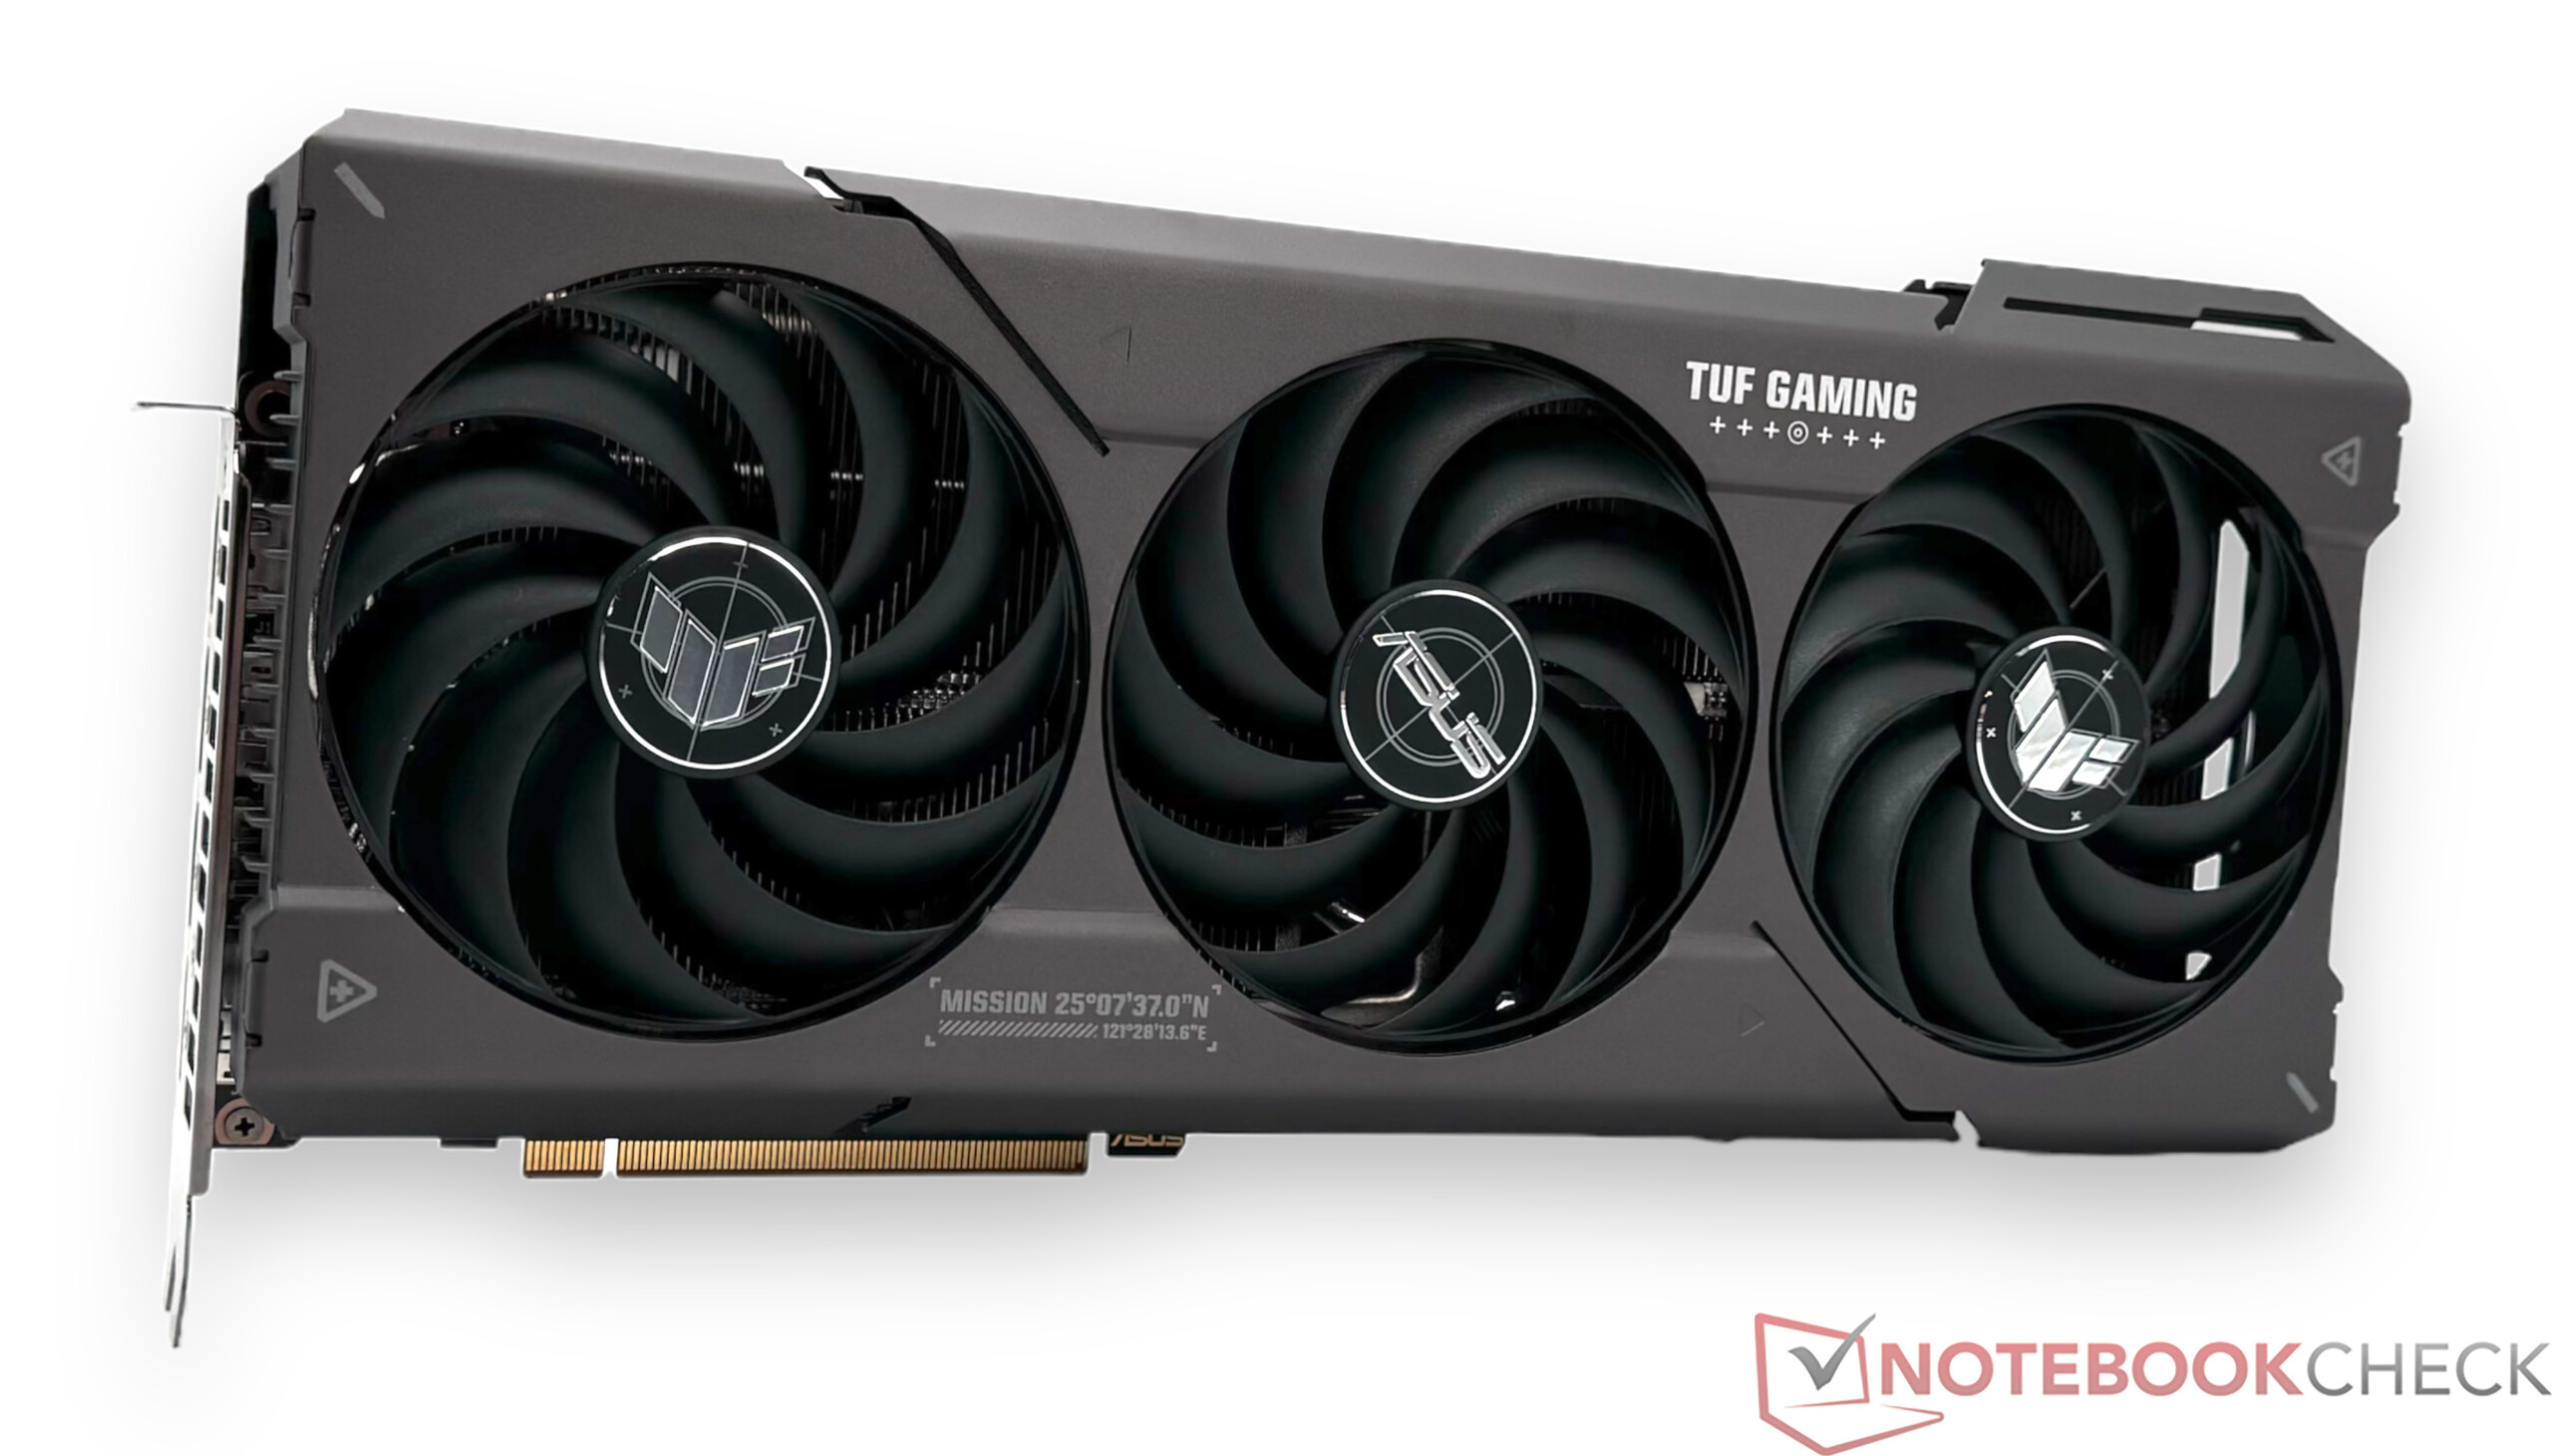
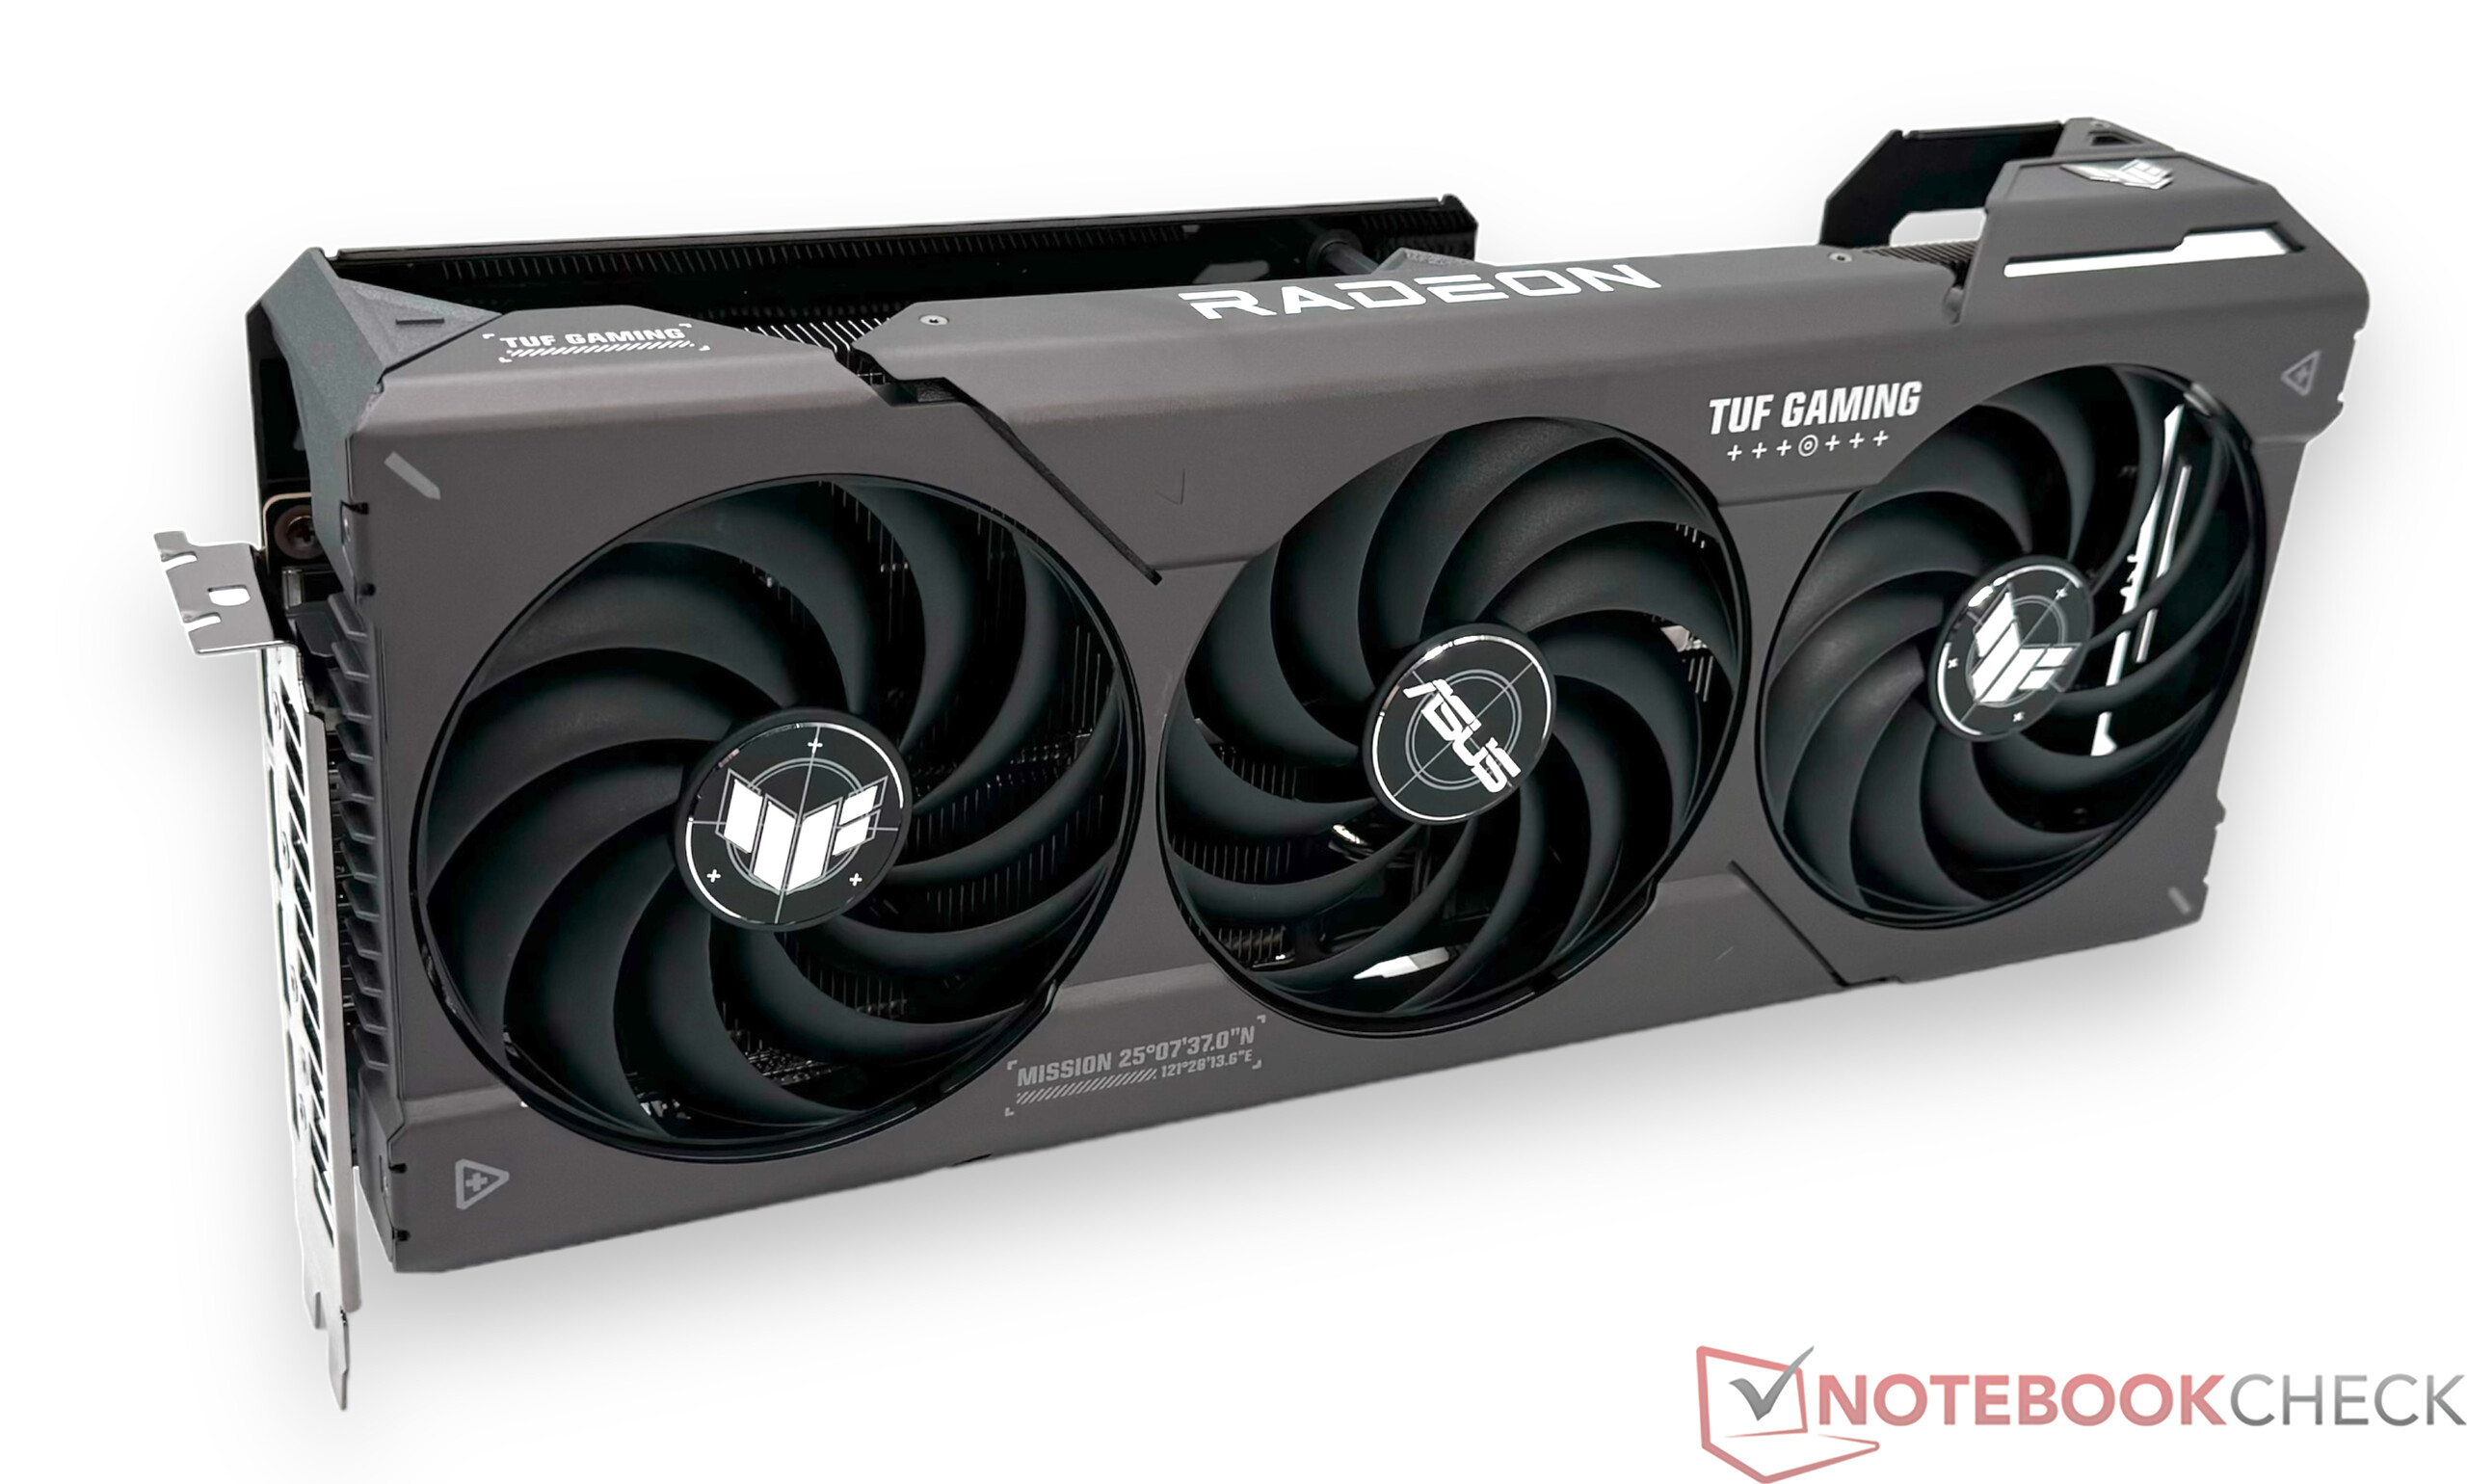
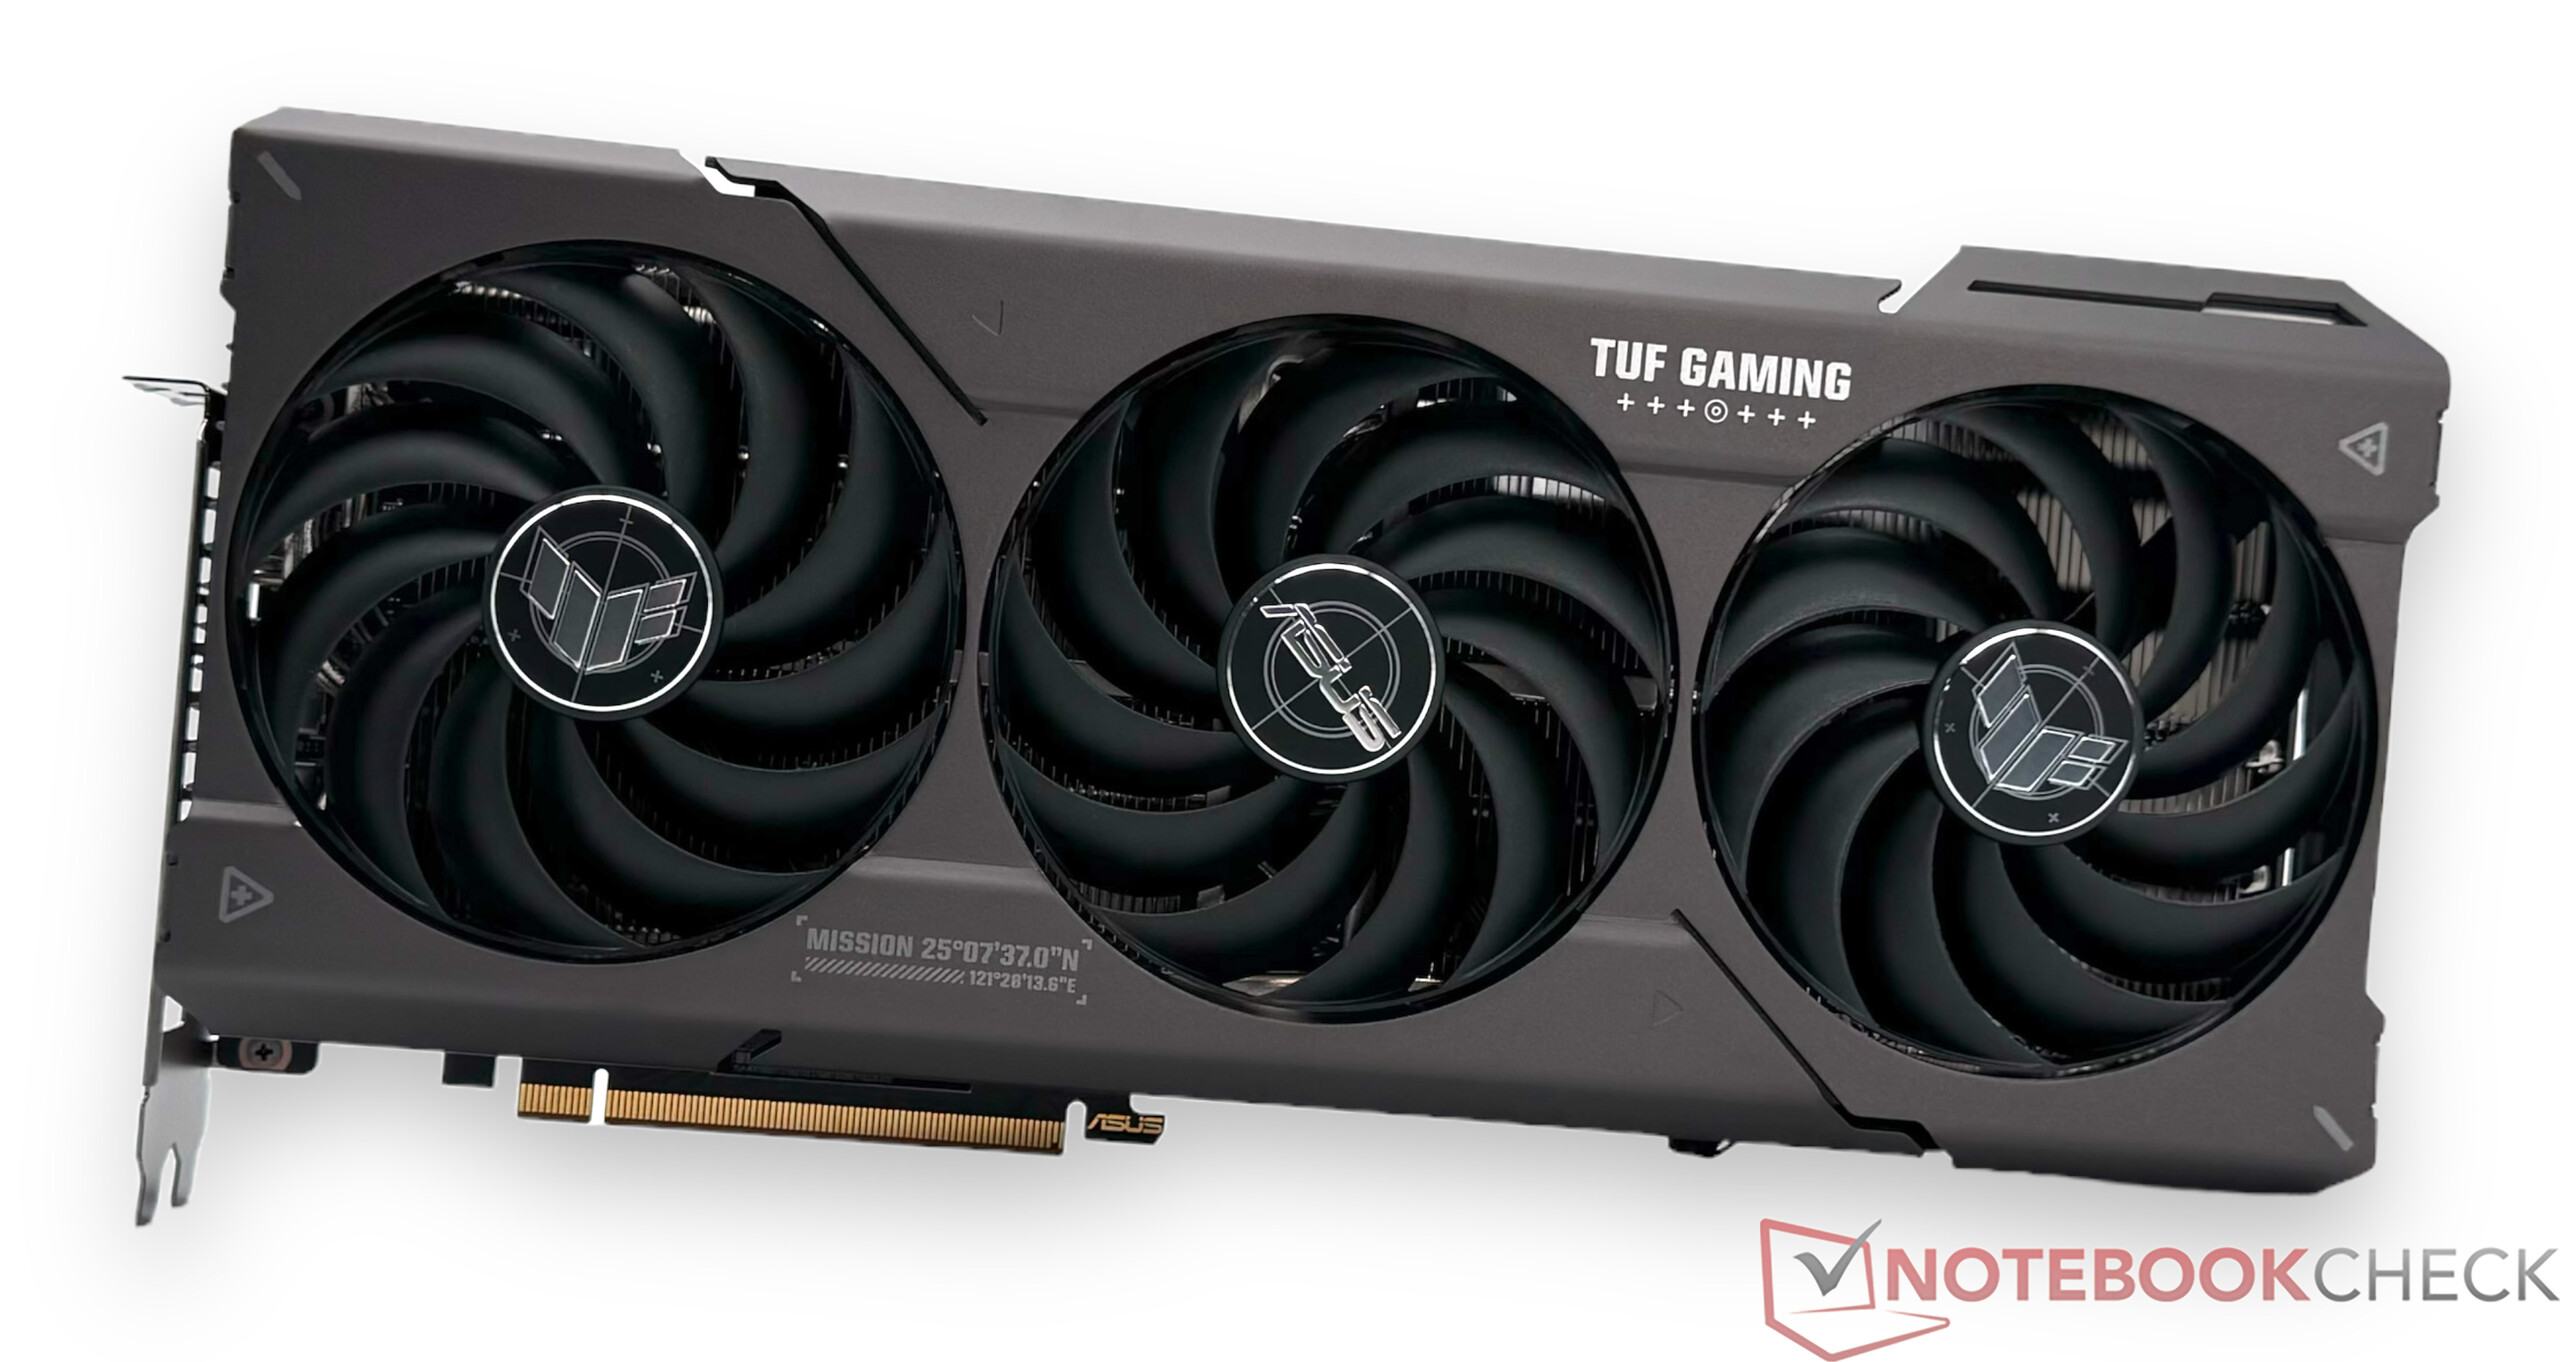
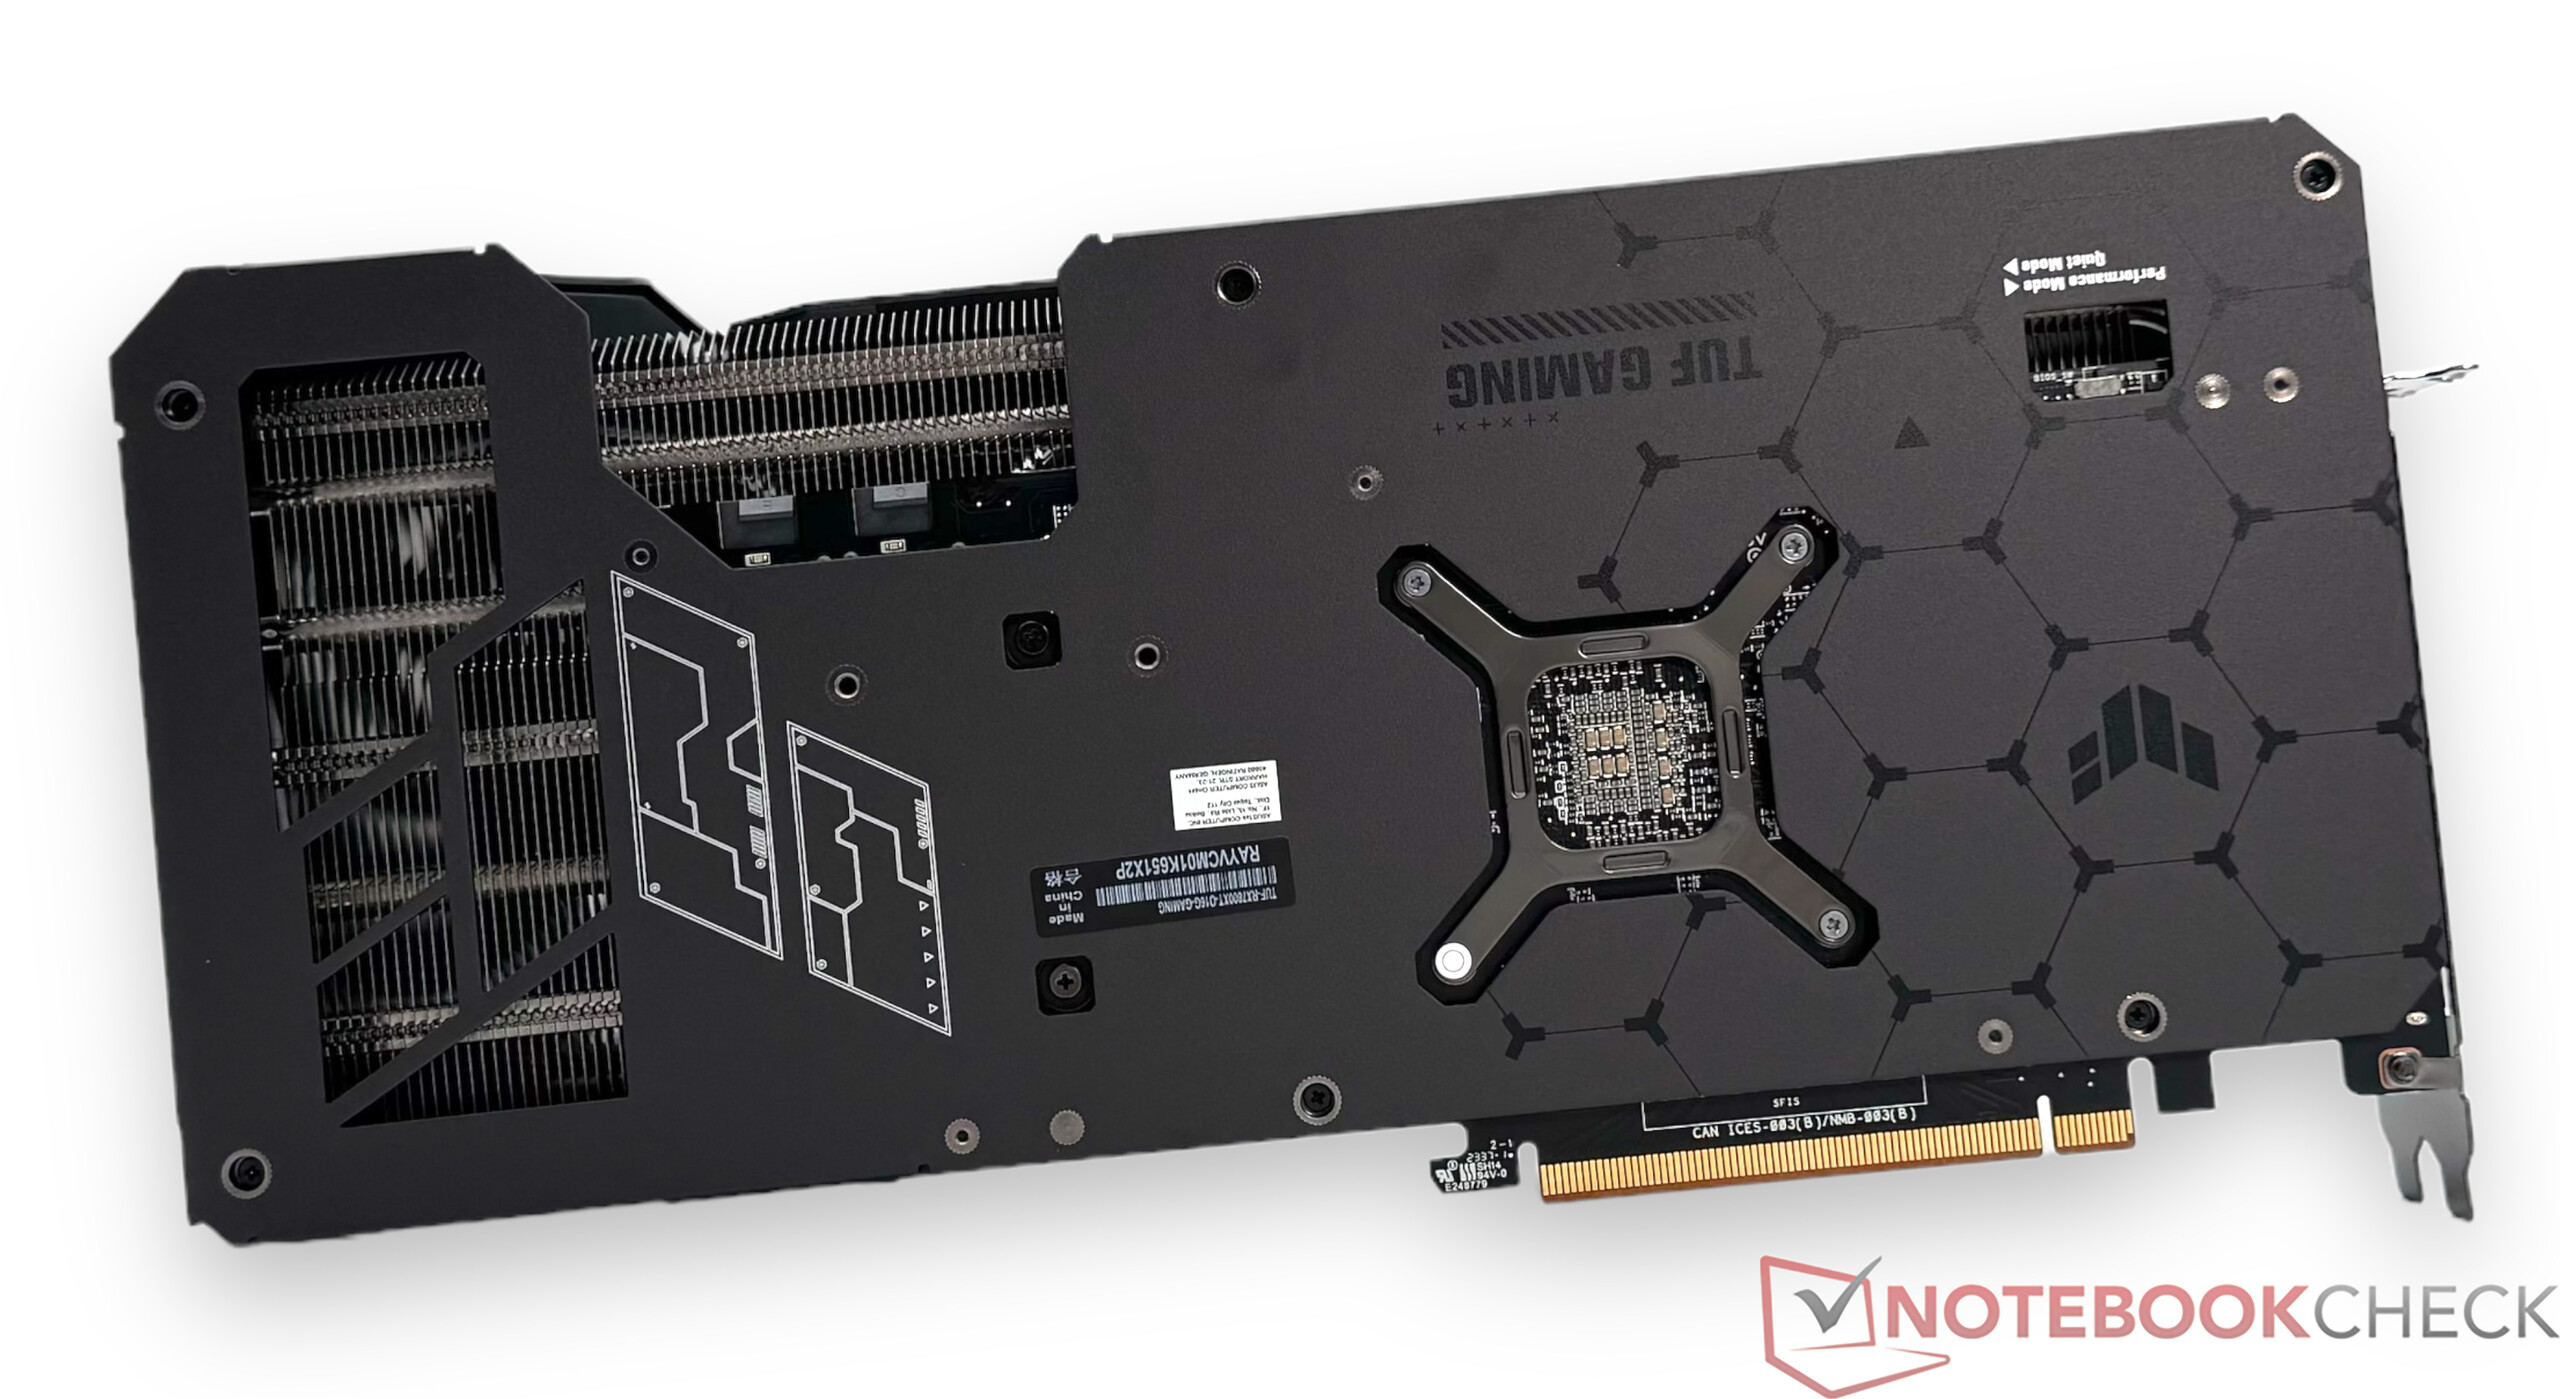
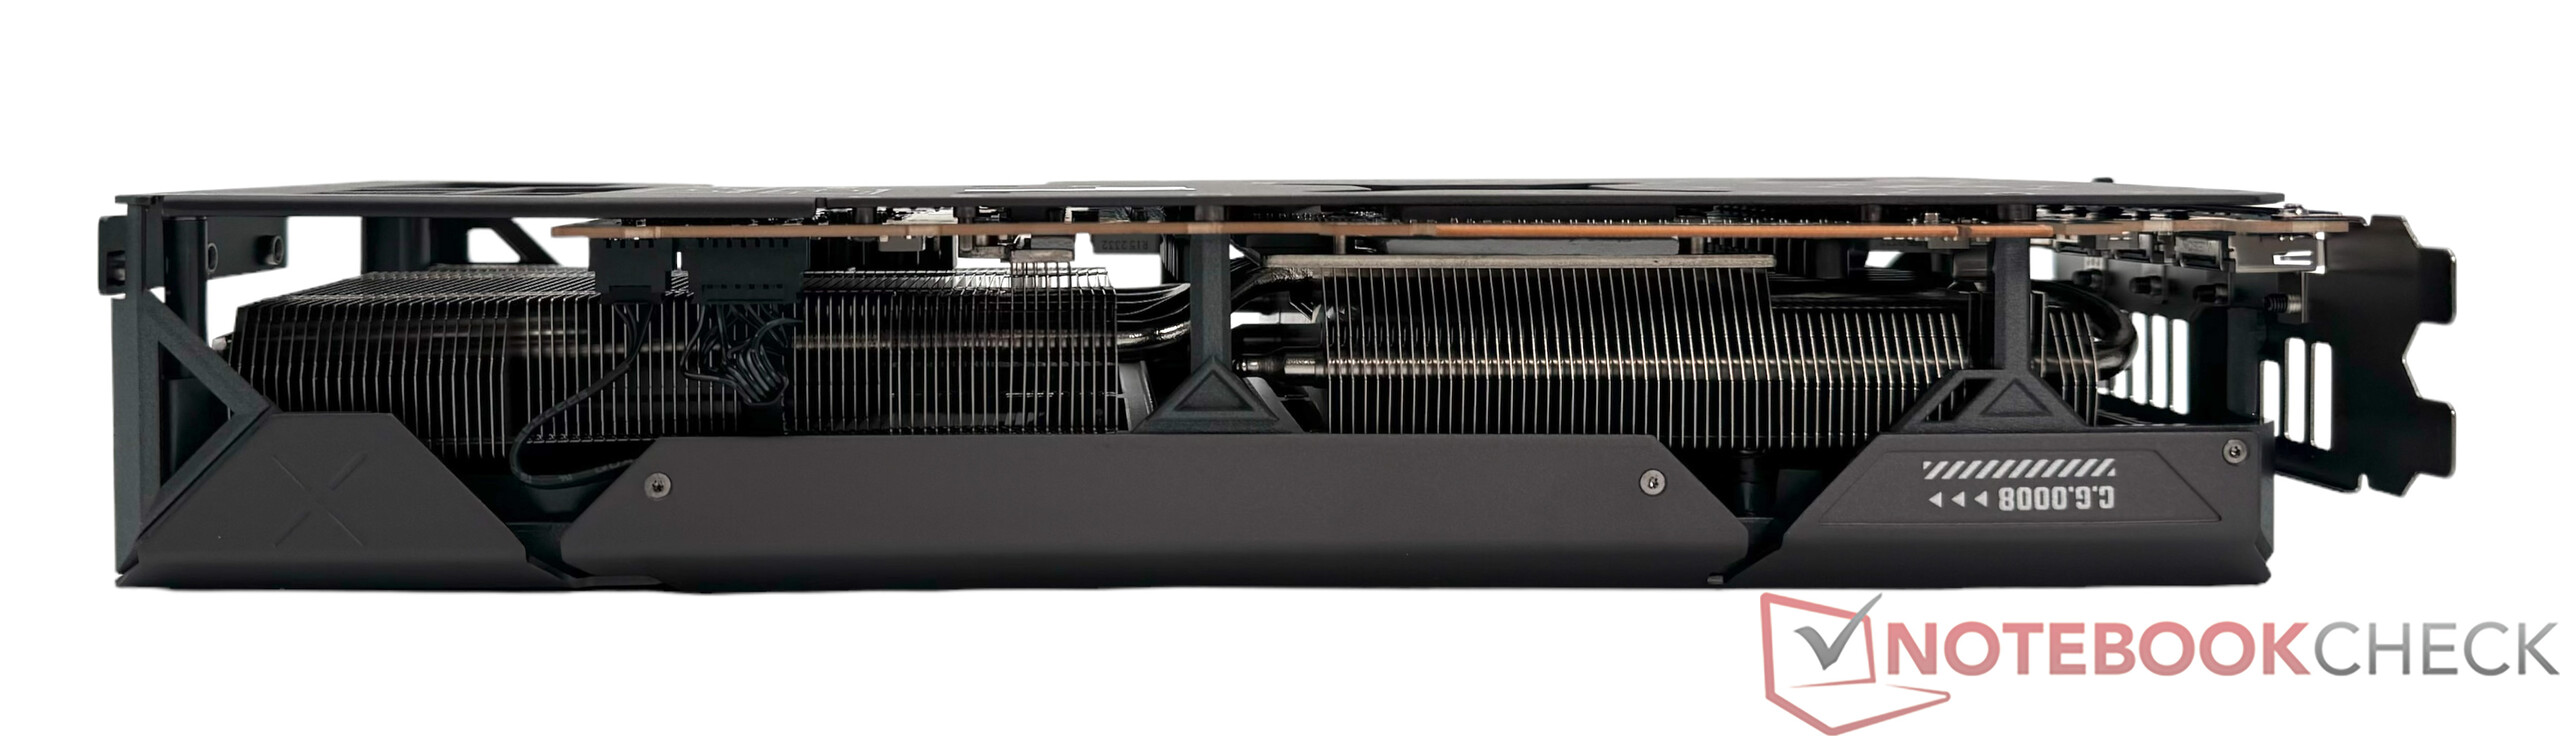
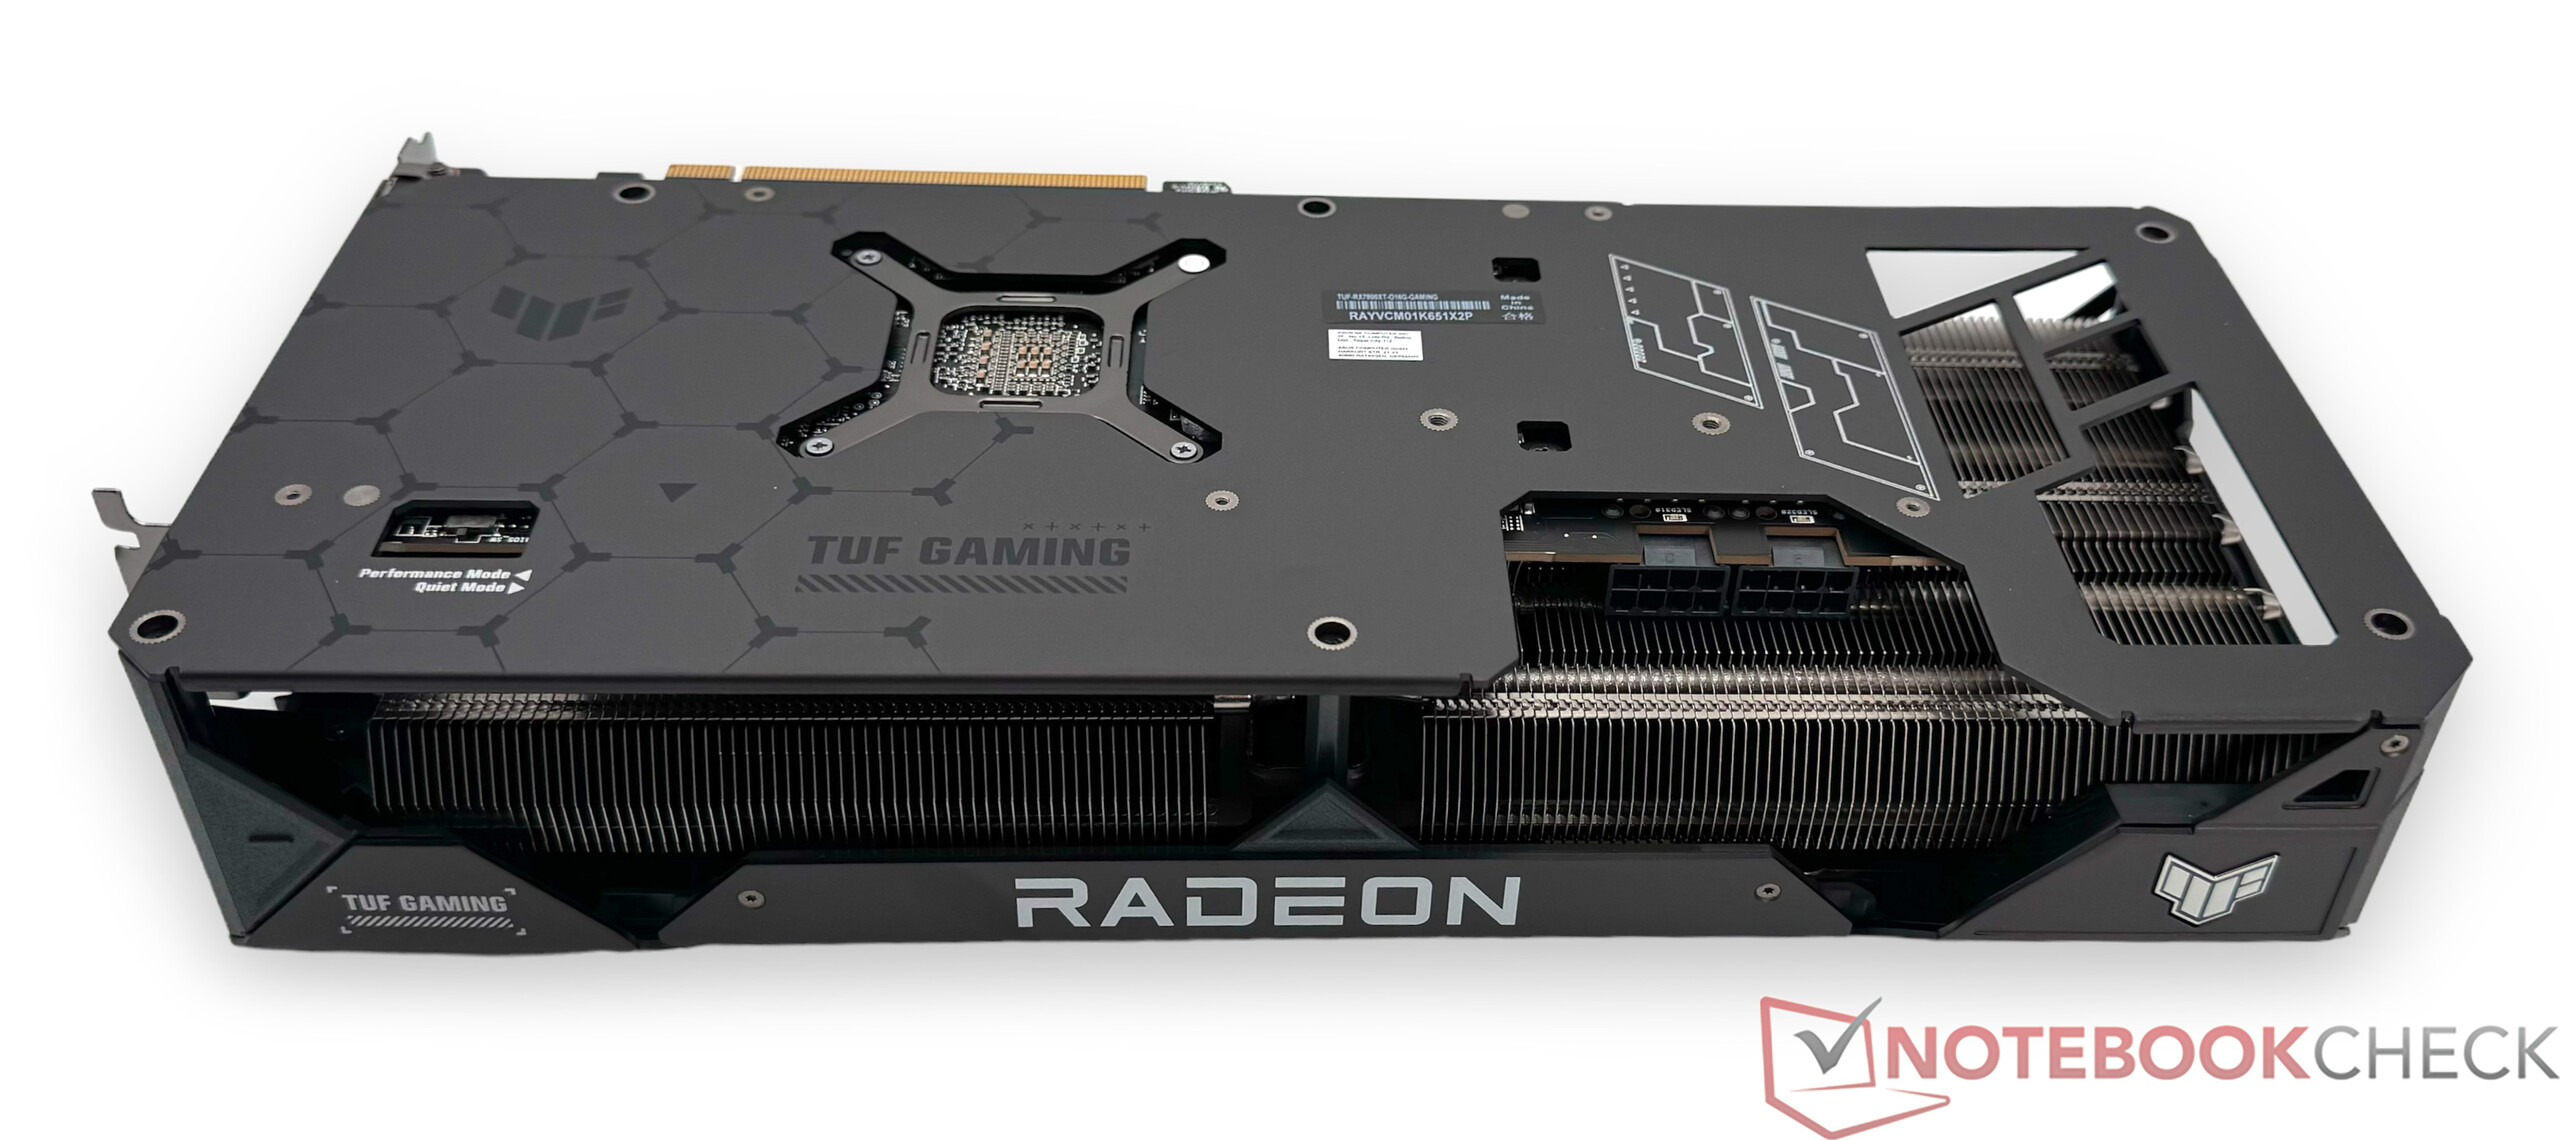
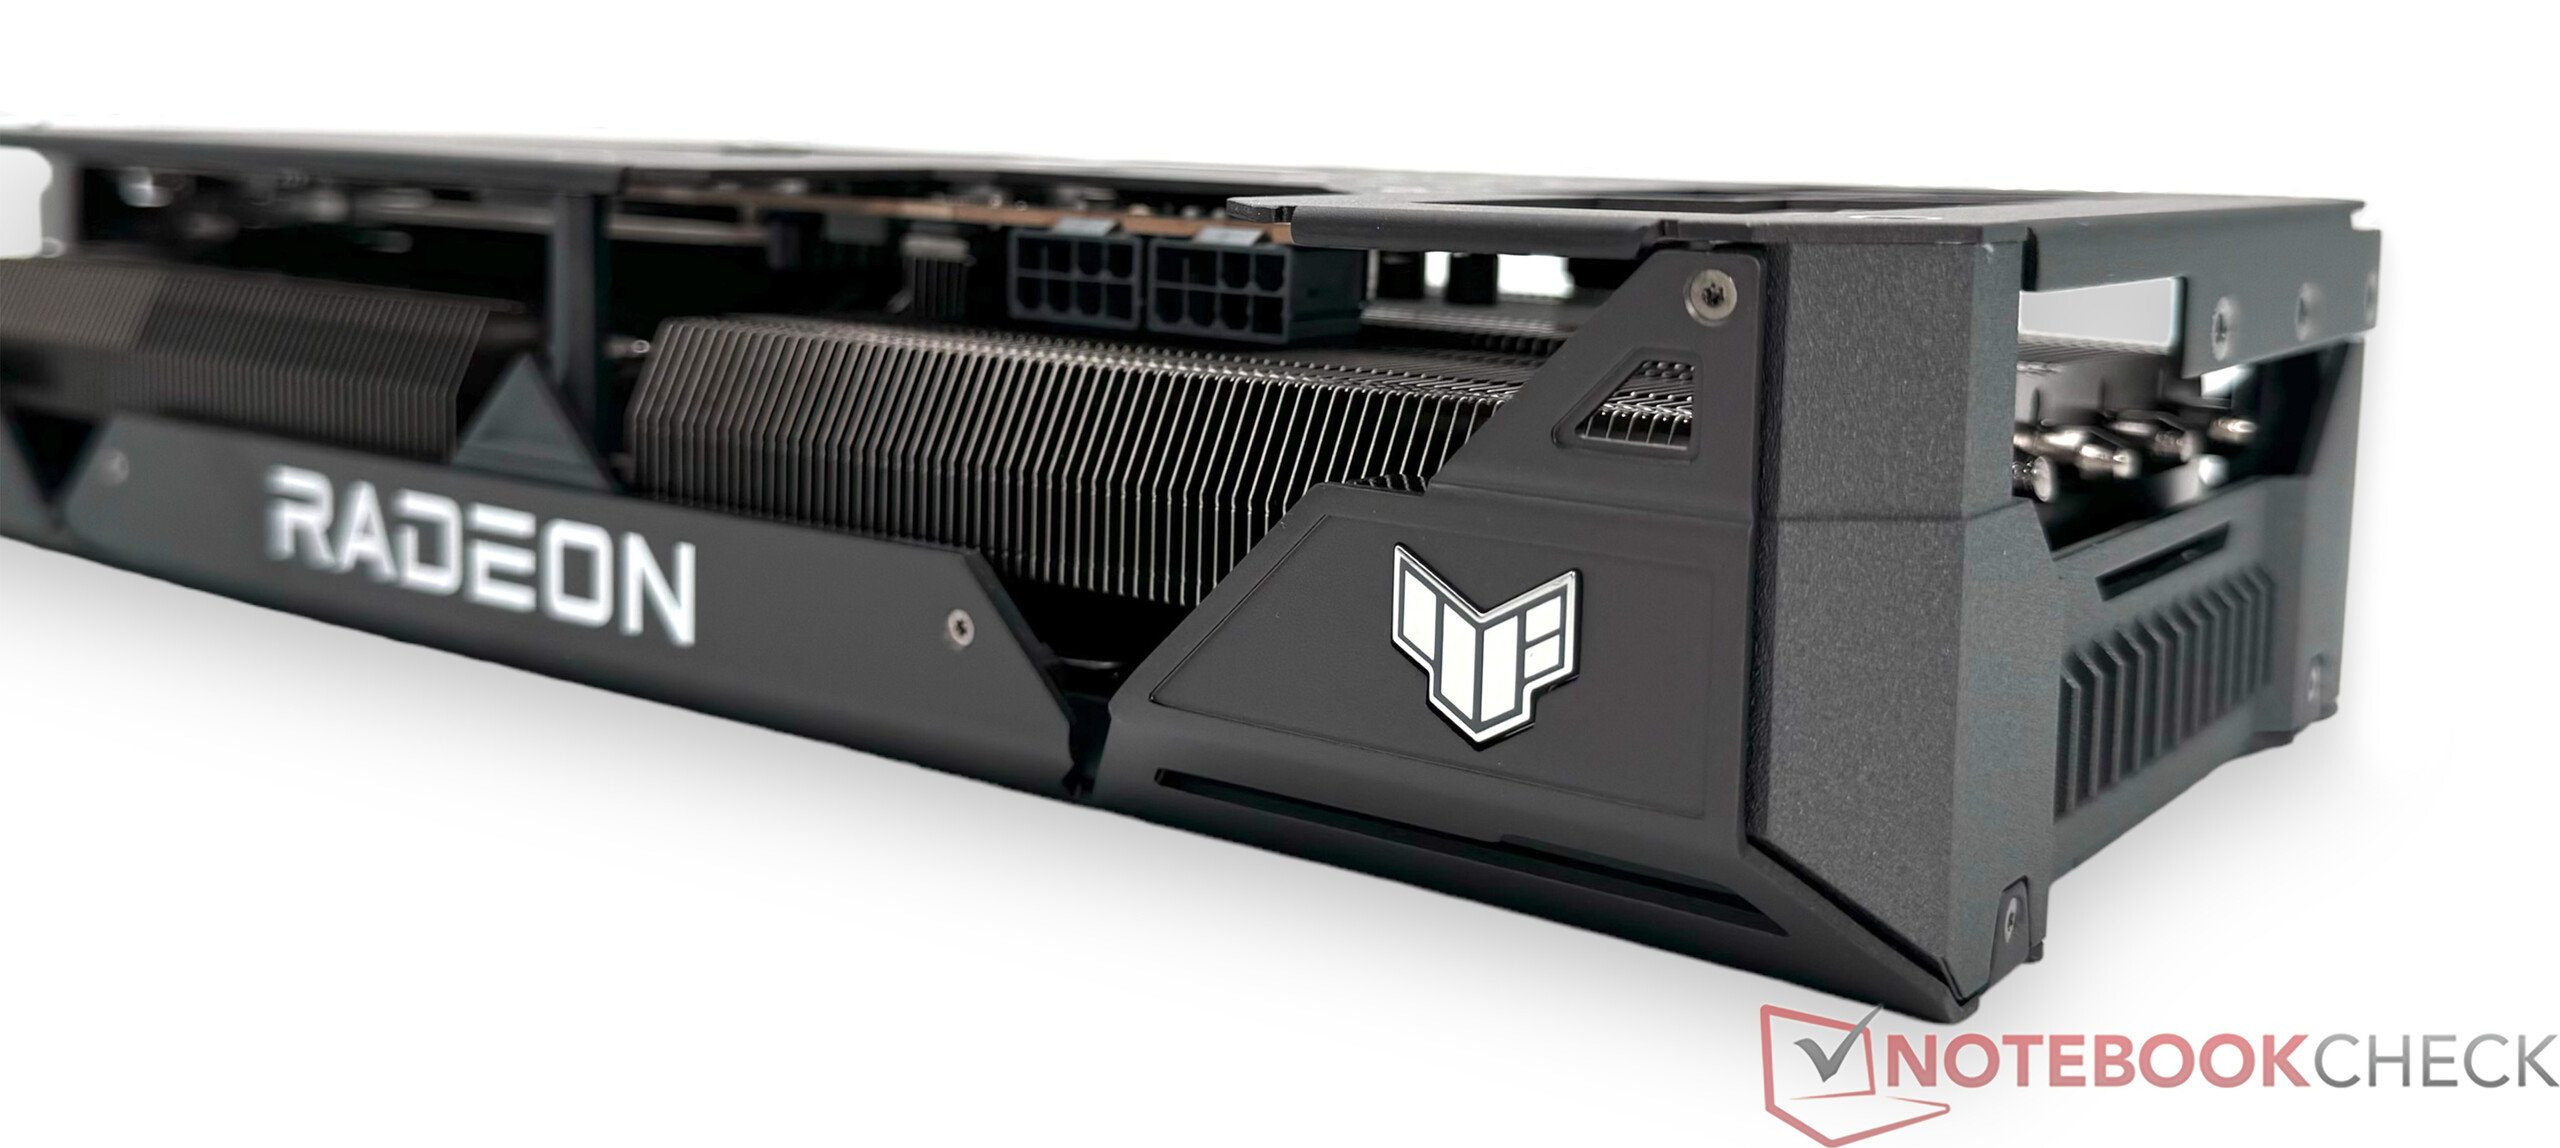
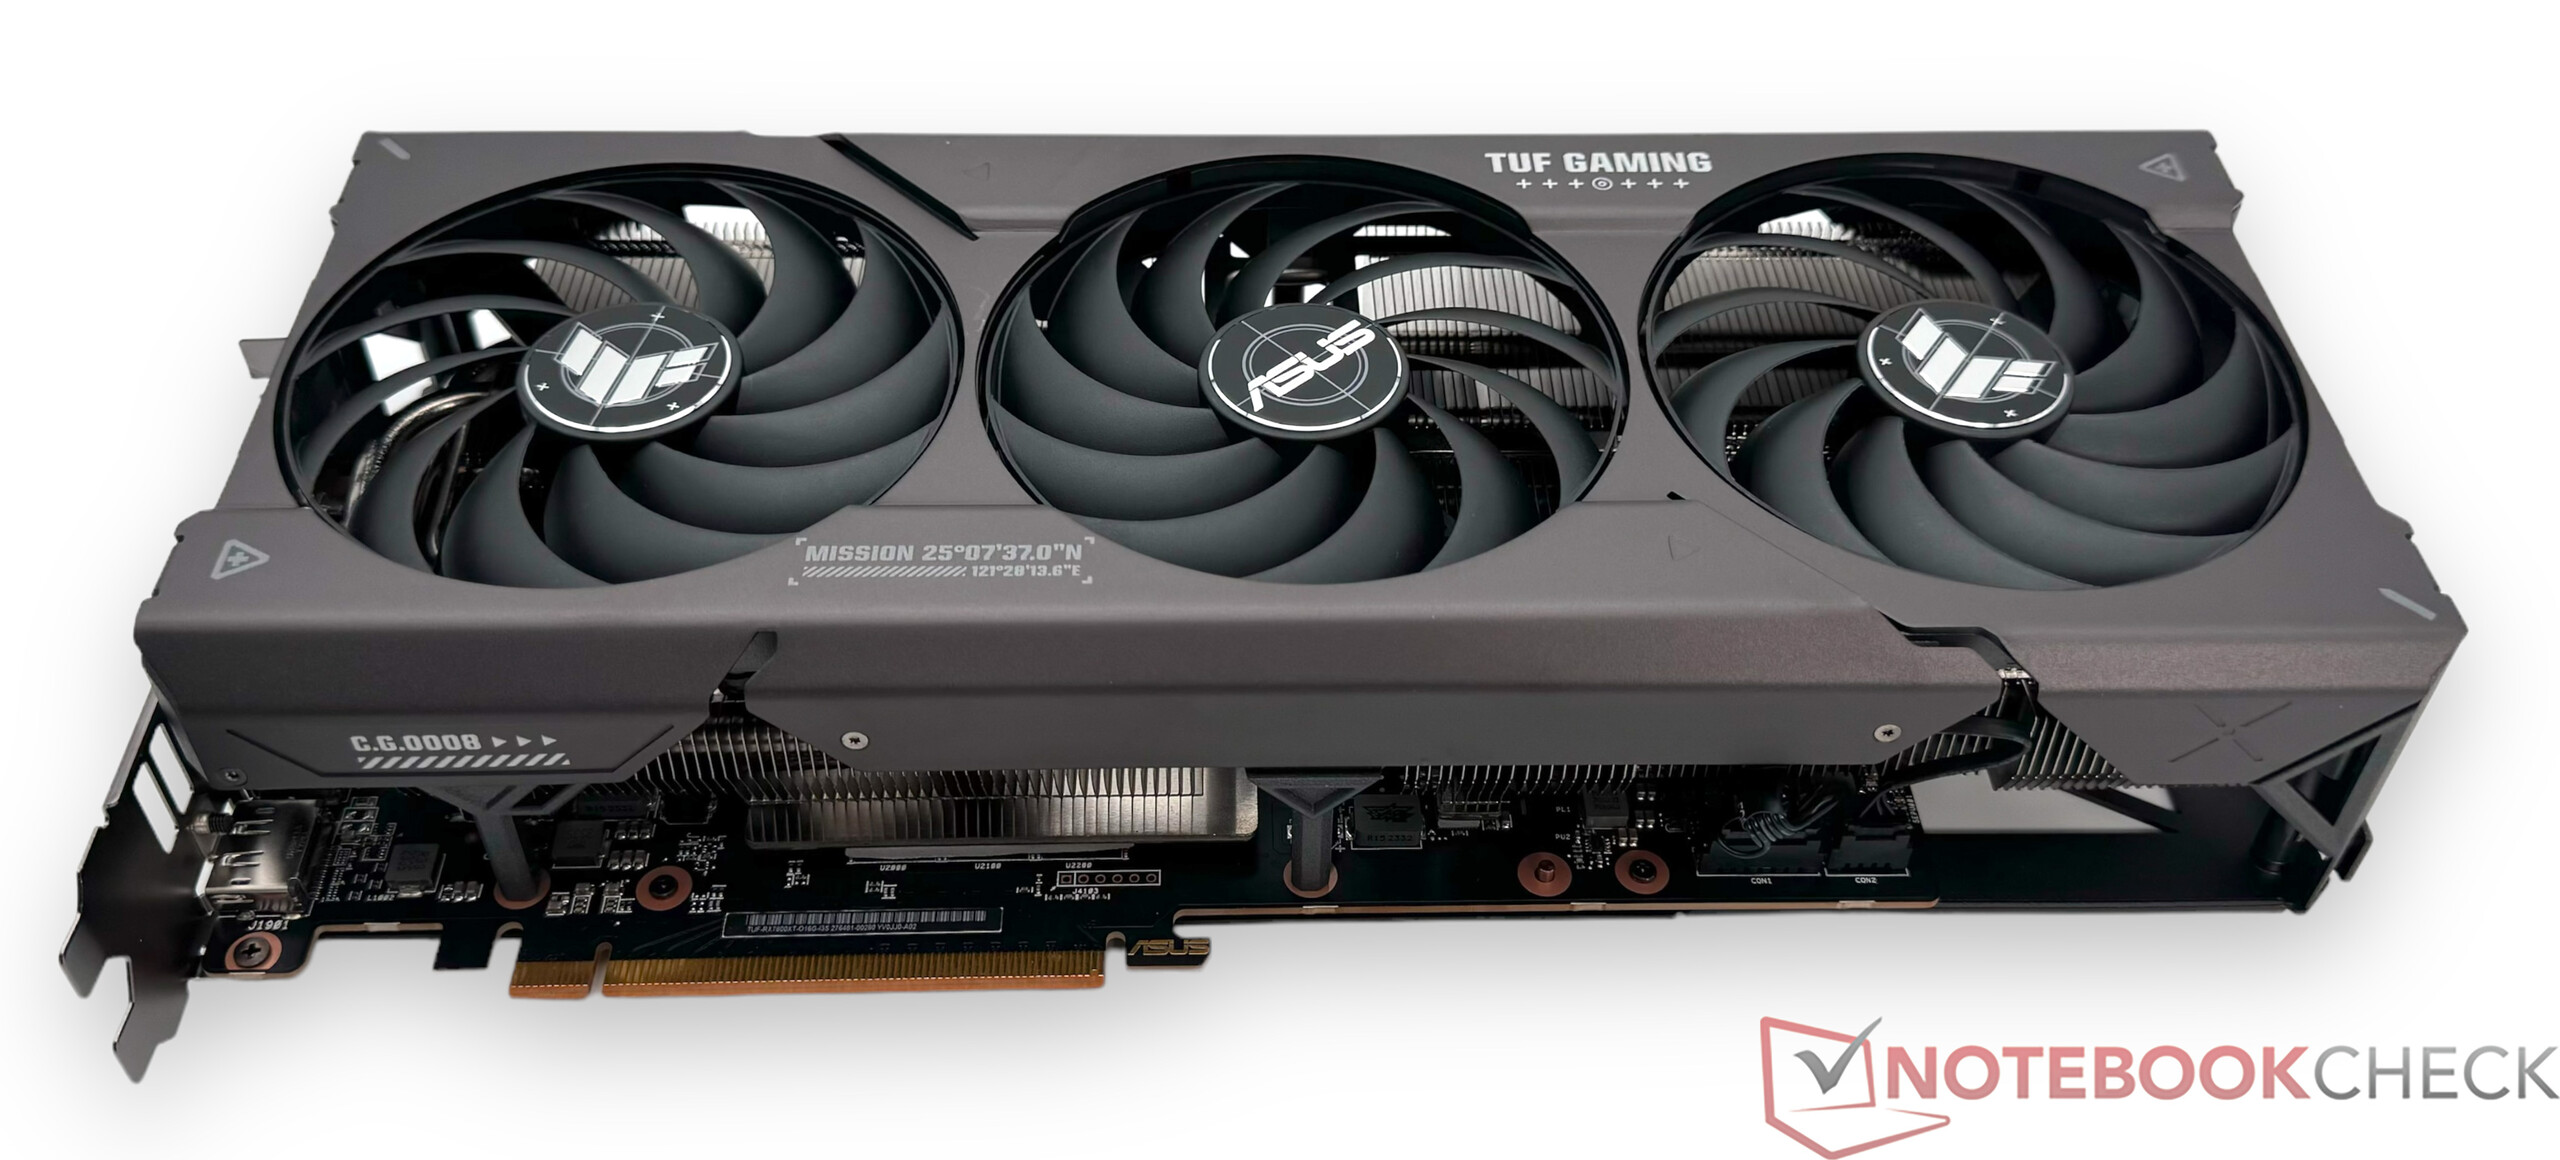
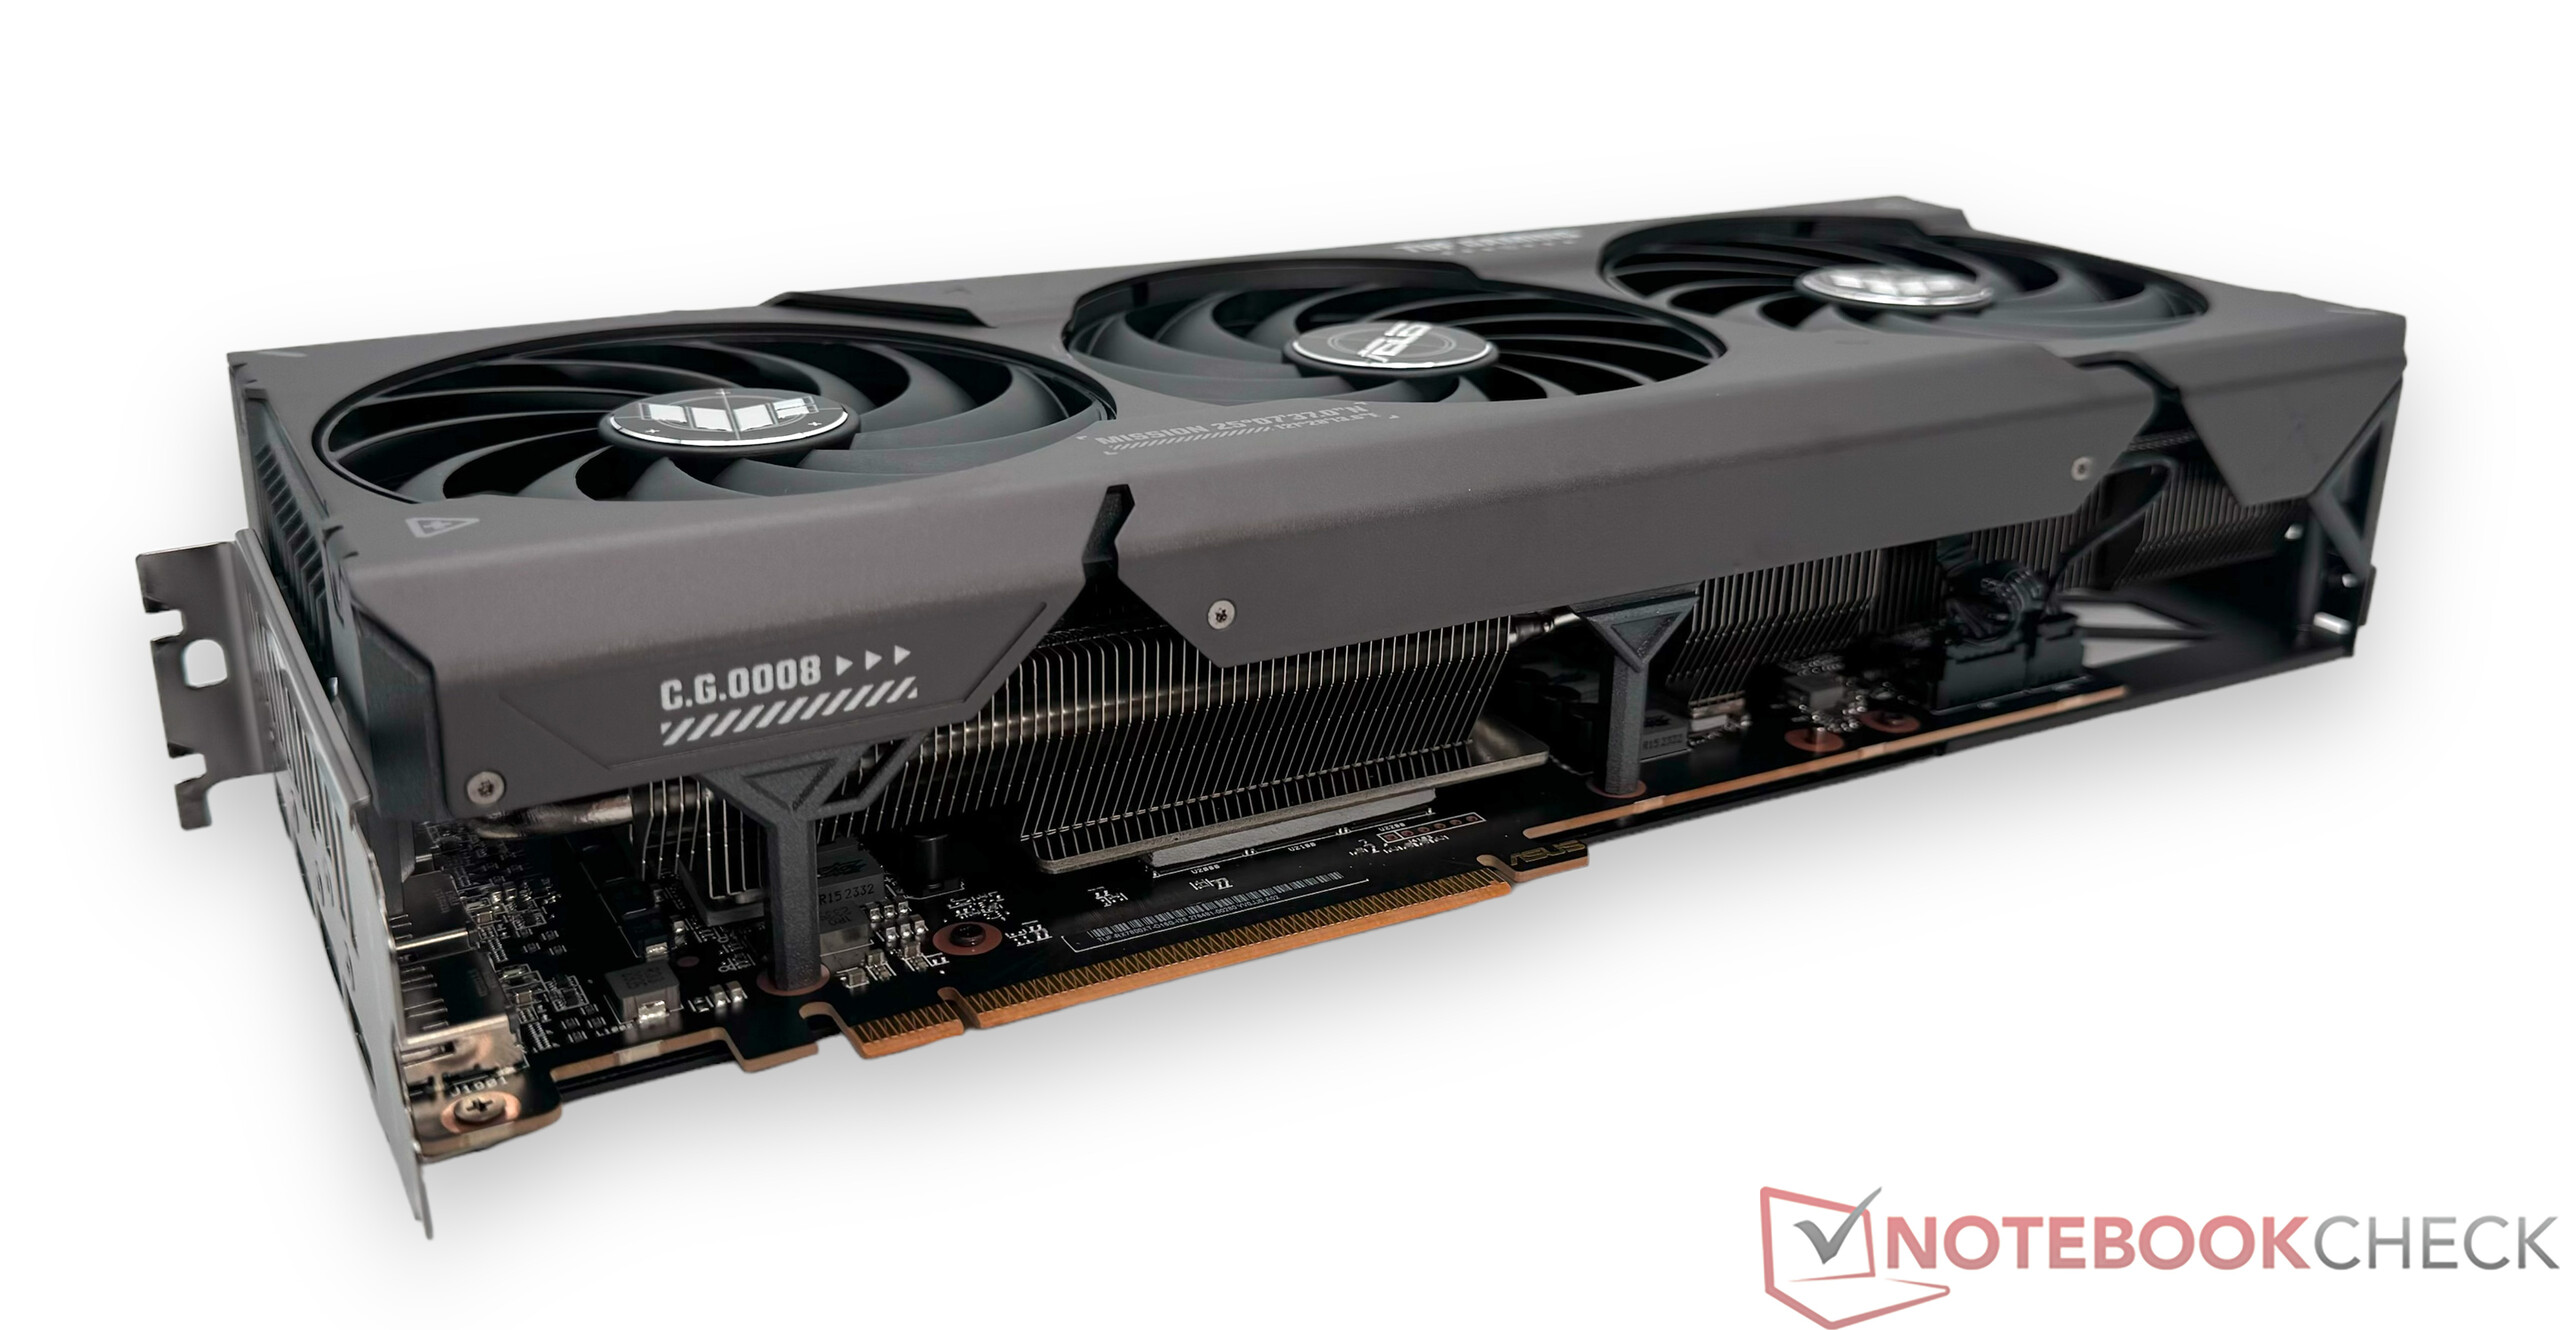
Rispetto al modello di riferimento, la nostra unità di prova di Asus è significativamente più grande, il che le consente di dissipare il calore in modo più efficace e silenzioso. Ma questo significa anche che bisogna fare attenzione alla scelta del case, poiché con 32 cm (~12,6 in), Asus TUF Gaming Radeon RX 7800 XT OC è più lunga di circa 5 cm (~2 in) rispetto al modello di riferimento di AMD. Visivamente, diventa subito evidente che si tratta di una scheda grafica Asus della serie TUF (The Ultimate Force). Il design distintivo non sembra troppo imponente, anche se Asus utilizza un'illuminazione RGB discreta. La scelta di materiali di alta qualità utilizzati sia sulla parte anteriore che su quella posteriore conferisce alla scheda grafica un'eccellente stabilità ed è molto buona. Anche il buon feedback aptico va menzionato e sottolinea l'eccellente qualità che Asus sta offrendo qui.

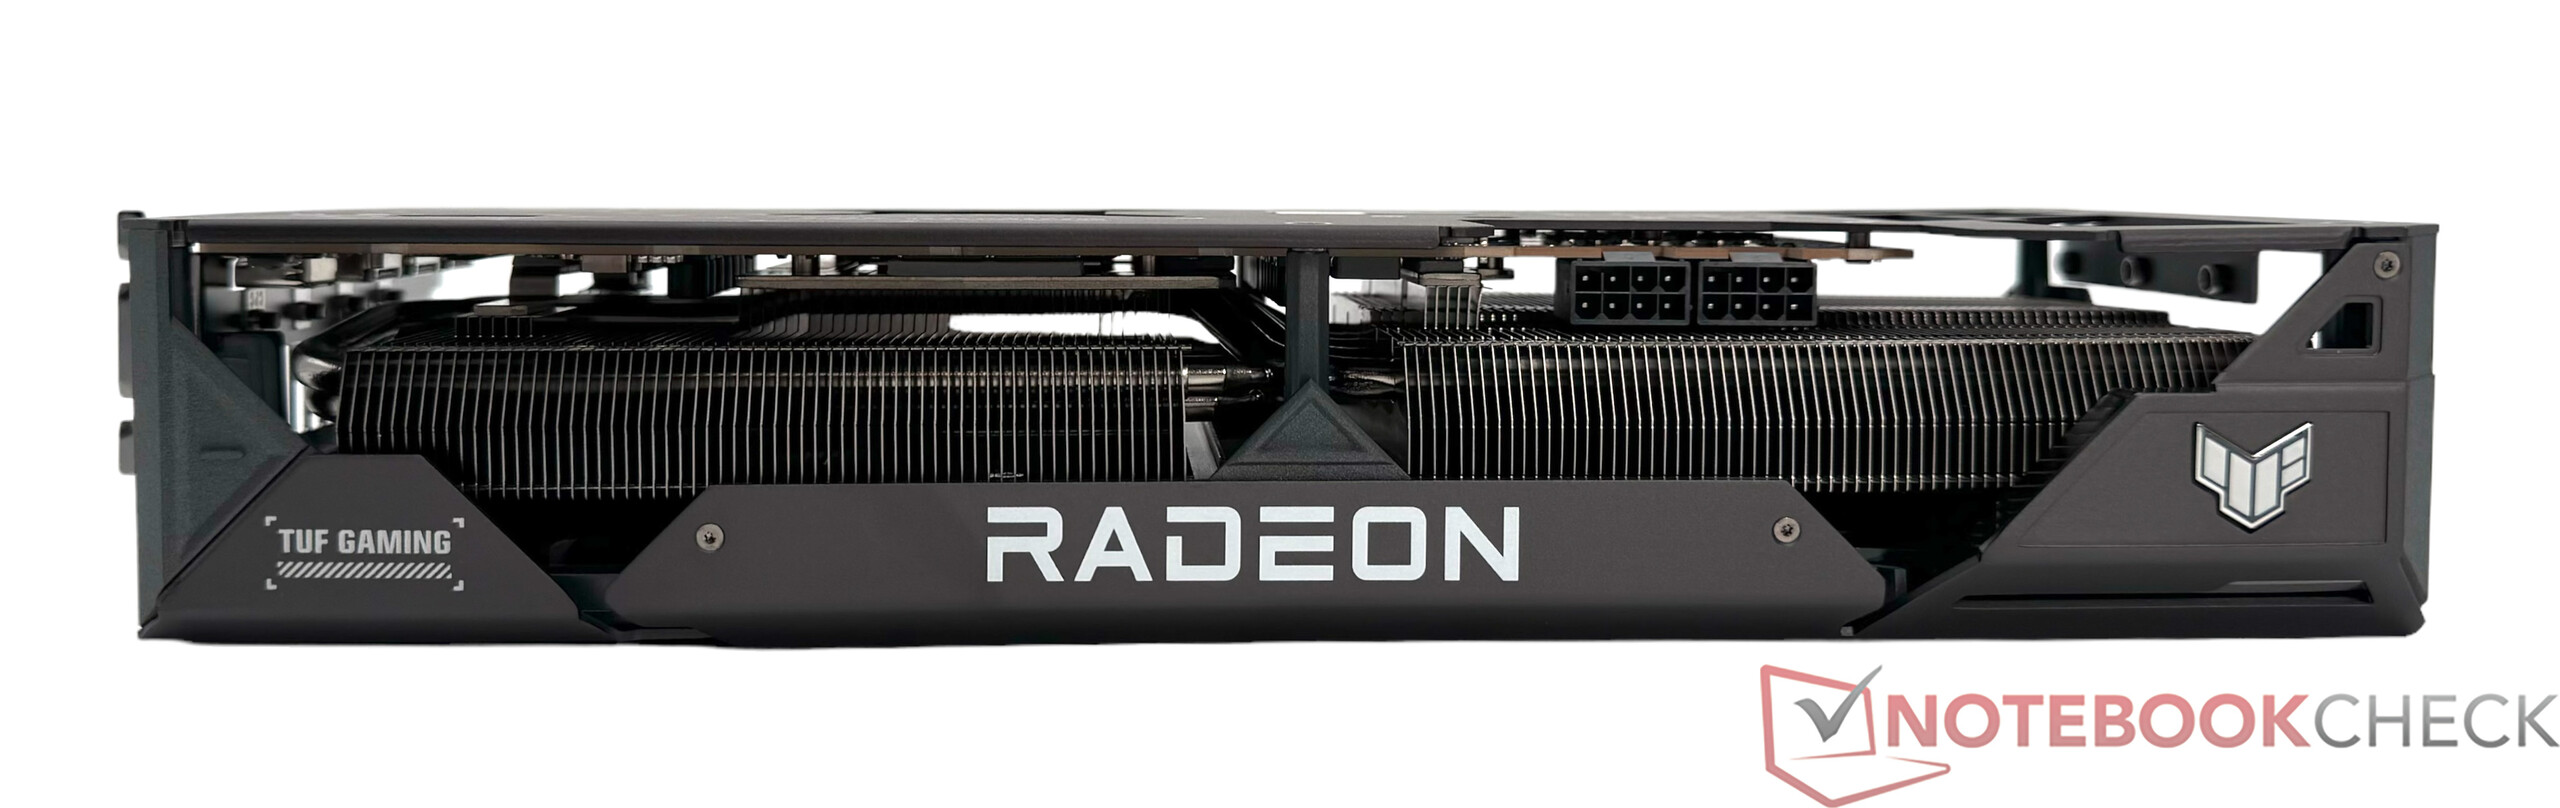
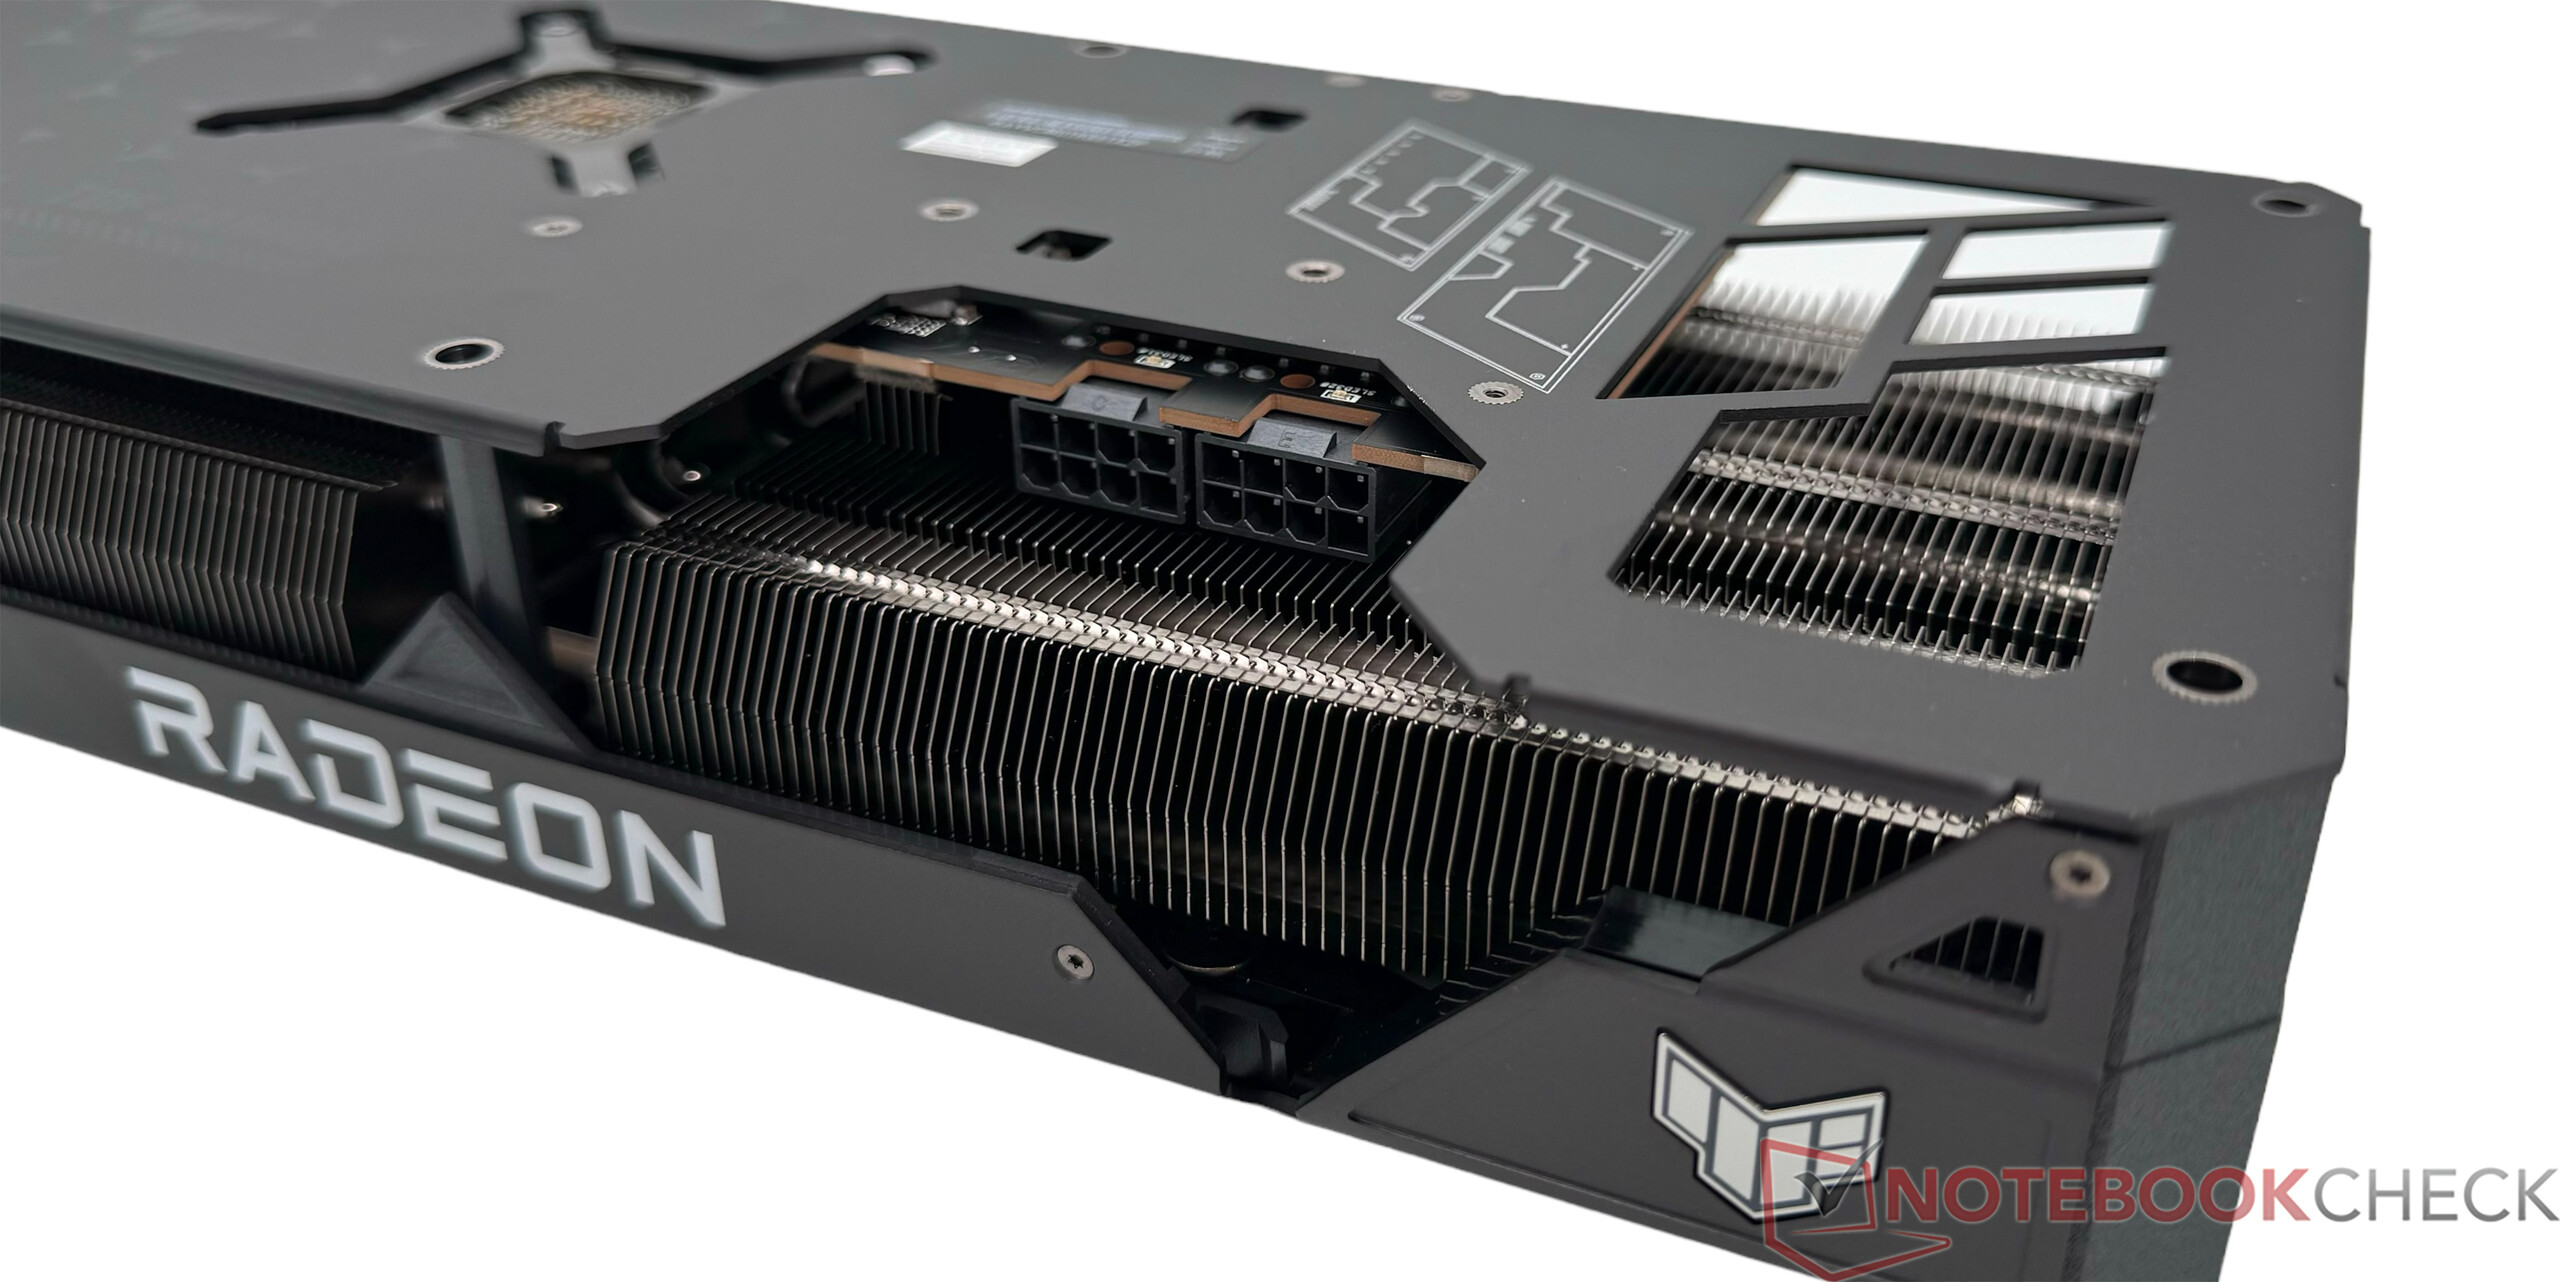
Dal punto di vista tecnico, anche qui viene utilizzato il chip grafico chiamato "Navi 32 XT" con 3.840 unità shader, utilizzato anche nei modelli di punta della serie 7900. Per essere precisi, nel design del chip sono combinati un GCD (Graphics Complex Die) di 200 mm² e quattro MCD (Memory Complex Die) di 36,6 mm² ciascuno. La VRAM è collegata tramite gli MCD, con una connessione di memoria di 256 bit. Per l'alimentazione, ci sono due connessioni di alimentazione PCIe a 6+2 pin, simili al modello di riferimento.

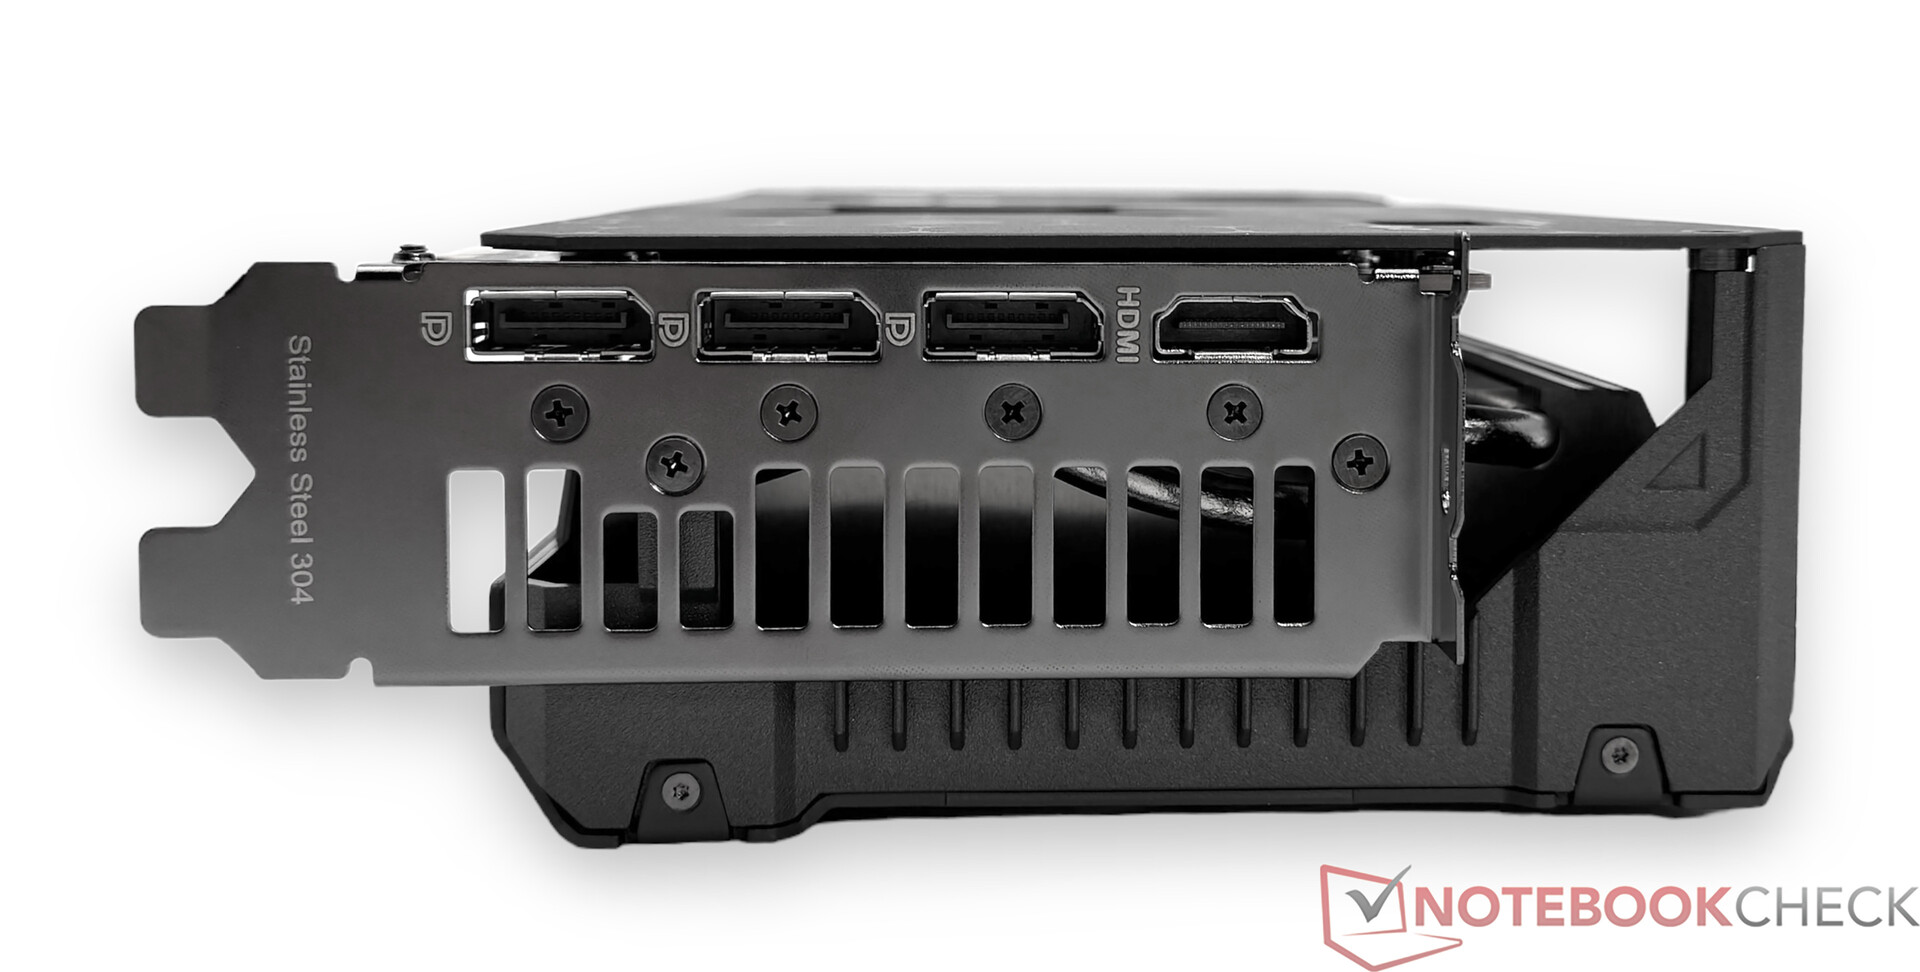
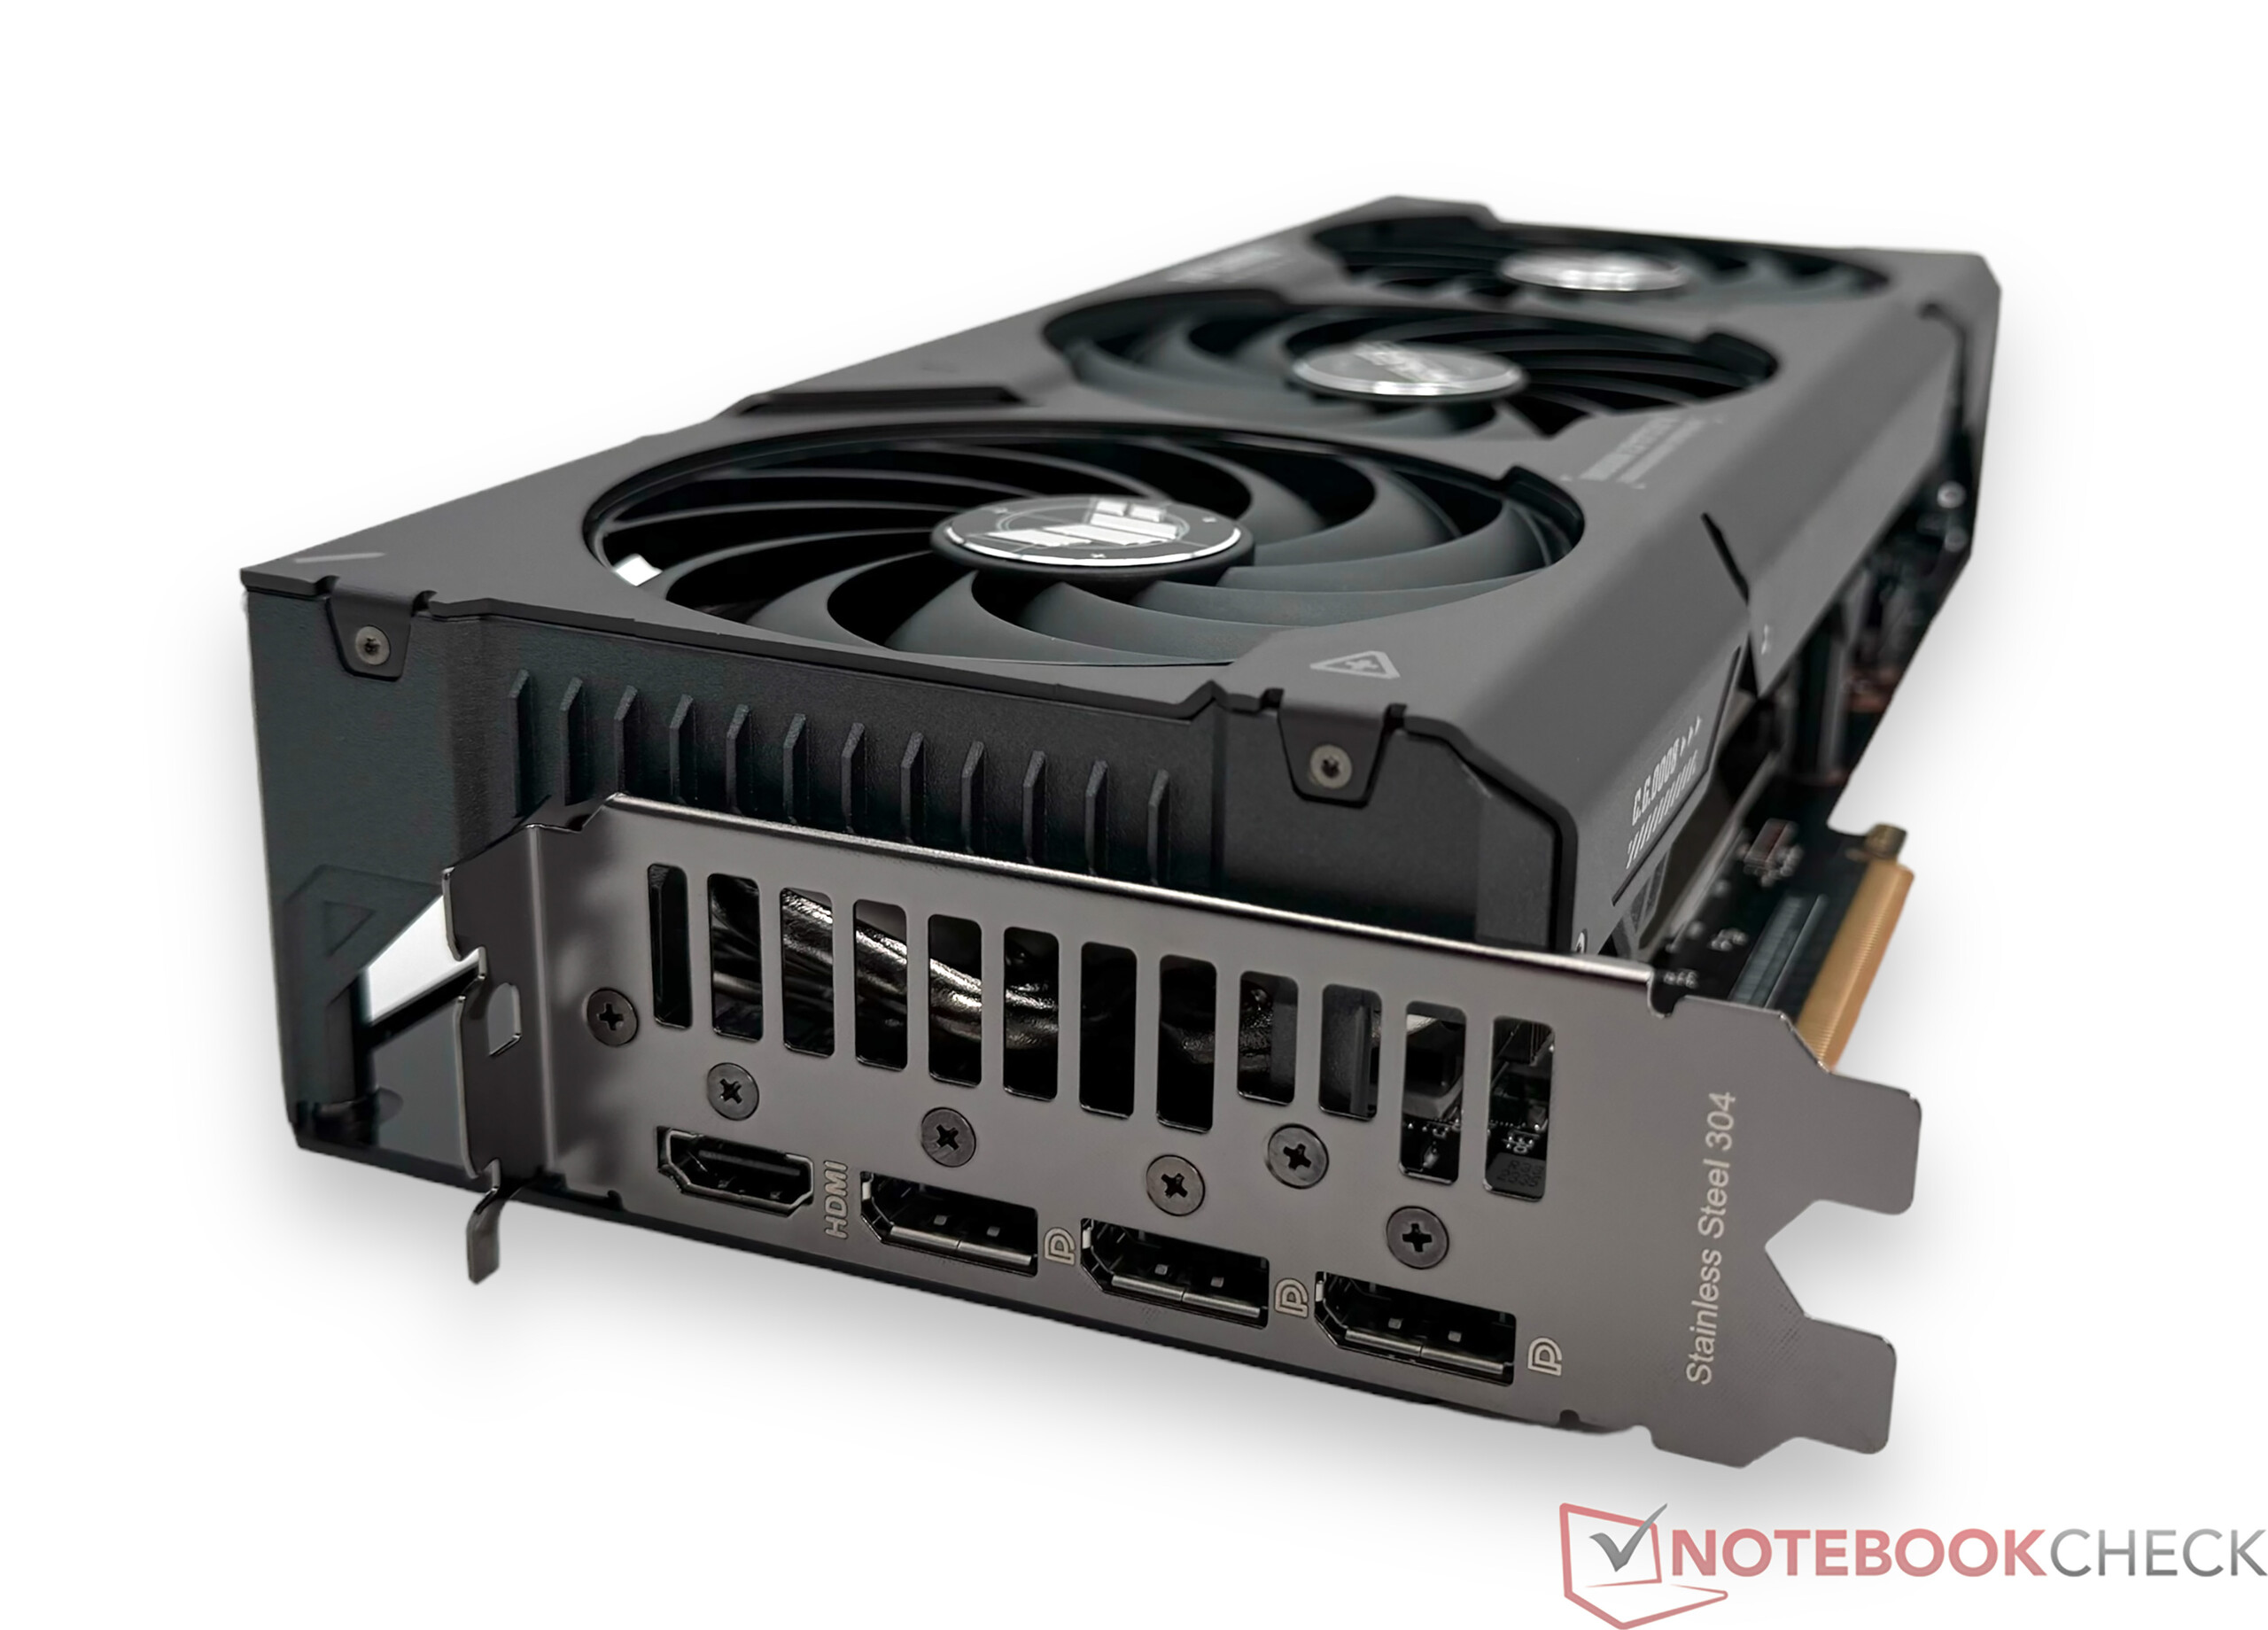
Per quanto riguarda le connessioni esterne, AMD offre attualmente la dotazione più aggiornata. Persino Nvidia non è in grado di tenere il passo, poiché DisplayPort 2.1 è attualmente disponibile solo nelle schede grafiche AMD della generazione 7000. In totale, la AMD Radeon RX 7800 XT offre 1x HDMI 2.1a e 3x DisplayPort 2.1, consentendo di collegare quattro display contemporaneamente.

Infos on our Test System

ASUS TUF Gaming Radeon RX 7800 XT
Processore
Intel Core i9-14900K 24 x 3.2 - 6 GHz, 253 W PL2 / Short Burst, 253 W PL1 / Sustained, Raptor Lake
Scheda grafica
AMD Radeon RX 7800 XT - 16 GB VRAM, Core: 2520 MHz, Memoria: 2438 MHz ( incluso 263 W Dynamic Boost), GDDR6X
Memoria
32 GB 
, DDR5-6000 (XMP)
Harddisk
Kingston KC3000 2048G SKC3000D2048G, 2048 GB 
Dimensioni
altezza x larghezza x profondità (in mm): 59.2 x 150.9 x 319.8
Sistema Operativo
Microsoft Windows 11 Pro
Altre caratteristiche
36 Mesi Garanzia
Prezzo
569 Euro
Nota: il produttore potrebbe usare componenti di fornitori diversi pannelli dei diplay, drive o banchi di memoria con specifiche simili.


Asus TUF Gaming Radeon RX 7800 XT OC in dettaglio

Asus TUF Gaming Radeon RX 7800 XT OC

Confronto delle GPU Radeon AMD

Specifiche Radeon RX 7900 XTX Radeon RX 7900 XT Radeon RX 7900 GRE RadeonRX 7800 XT Radeon RX 7700 XT Radeon RX 7600 Radeon RX 6800 XT Radeon RX 6800
GPU Navi 31 XTX Navi 31 XT Navi 31 XT Navi 32 XT Navi 32 XL Navi 33 XL Navi 21 XL Navi 21 XL
Processo di produzione 5/6 nm 5/6 nm 5/6 nm 5/6nm 5/6 nm 6 nm 7 nm 7 nm
Unità di calcolo 96 84 80 60 54 32 72 60
Unità di ombreggiatura 6.144 5.376 5.120 3.840 3.456 2.048 4.608 3.840
Unità di mappatura texture 384 336 320 240 216 128 288 240
Acceleratori di raggi 96 84 80 60 54 32 72 60
Clock di base 2.270 MHz 2.000 MHz 1.880 MHz 1.295 MHz 1.700 MHz 1.720 MHz 1.825 MHz 1.700 MHz
Game Clock 2.300 MHz 2.000 MHz 1.880 MHz 2.124 MHz 2.171 MHz 2.250 MHz 2.015 MHz 1.815 MHz
Boost Clock 2.500 MHz 2.400 MHz 2.245 MHz 2.430 MHz 2.544 MHz 2.655 MHz 2.250 MHz 2.105 MHz
Cache Infinity 96 MB 80 MB 64 MB 64 MB 48 MB 32 MB 128 MB 128 MB
Larghezza del bus di memoria 384 bit 320 bit 256 bit 256 bit 256 bit 128 bit 256 bit 256 bit
Larghezza di banda della memoria 960 GB/s 800 GB/s 576 GB/s 624,1 GB/s 432 GB/s 288 GB/s 512 GB/s 512 GB/s
Dimensioni della memoria 24 GB GDDR6 20 GB GDDR6 16 GB GDDR6 16 GB GDDR6 12 GB GDDR6 8 GB GDDR6 16 GB GDDR6 16 GB GDDR6
TBP 355 W 315 W 260 W 263 W 245 W 165 W 300 W 250 W

Le velocità di clock della Asus TUF Gaming Radeon RX 7800 XT OC

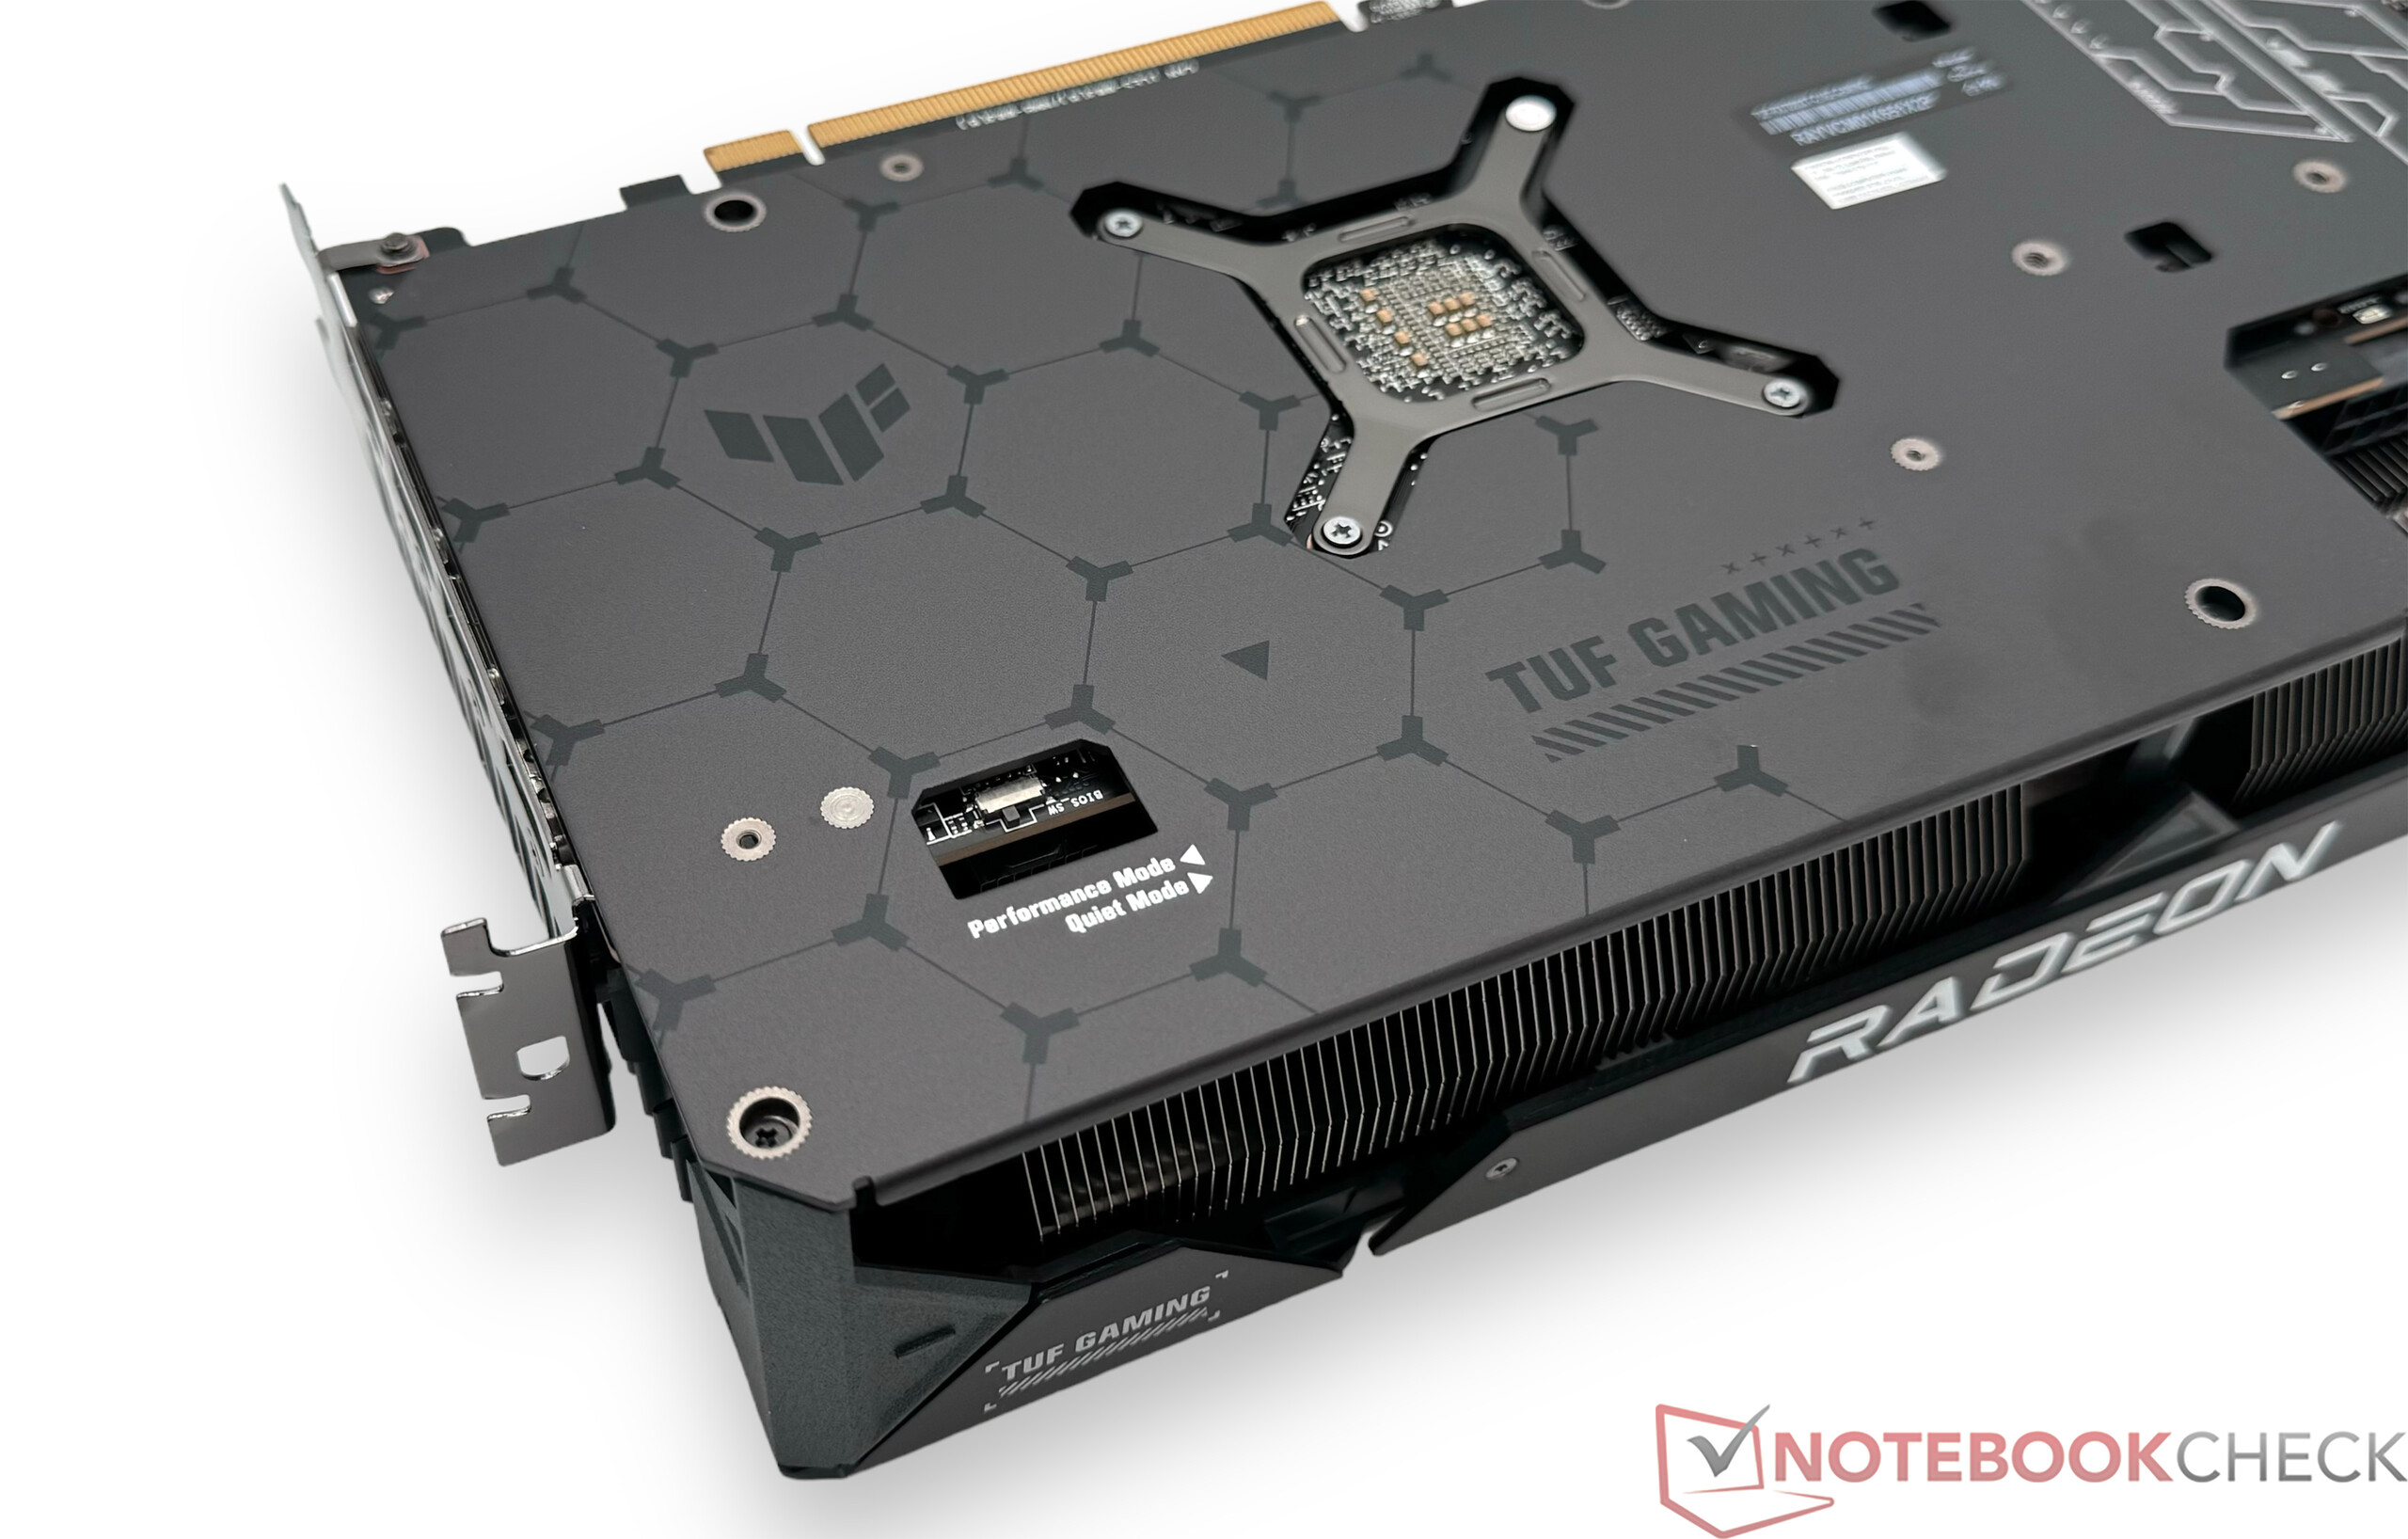
Come ci dice già il nome della nostra unità di prova, Asus TUF Gaming Radeon RX 7800 XT OC è una scheda grafica che offre velocità di clock della GPU leggermente superiori allo stato di consegna rispetto al modello di riferimento. In modalità Default, vediamo 90 MHz in più, anche se questo non dovrebbe essere molto evidente nel funzionamento quotidiano, dato che la velocità Boost delle schede grafiche attuali viene comunque superata nella maggior parte dei casi. Asus non modifica le velocità di clock della VRAM, rimanendo all'interno delle specifiche di AMD.

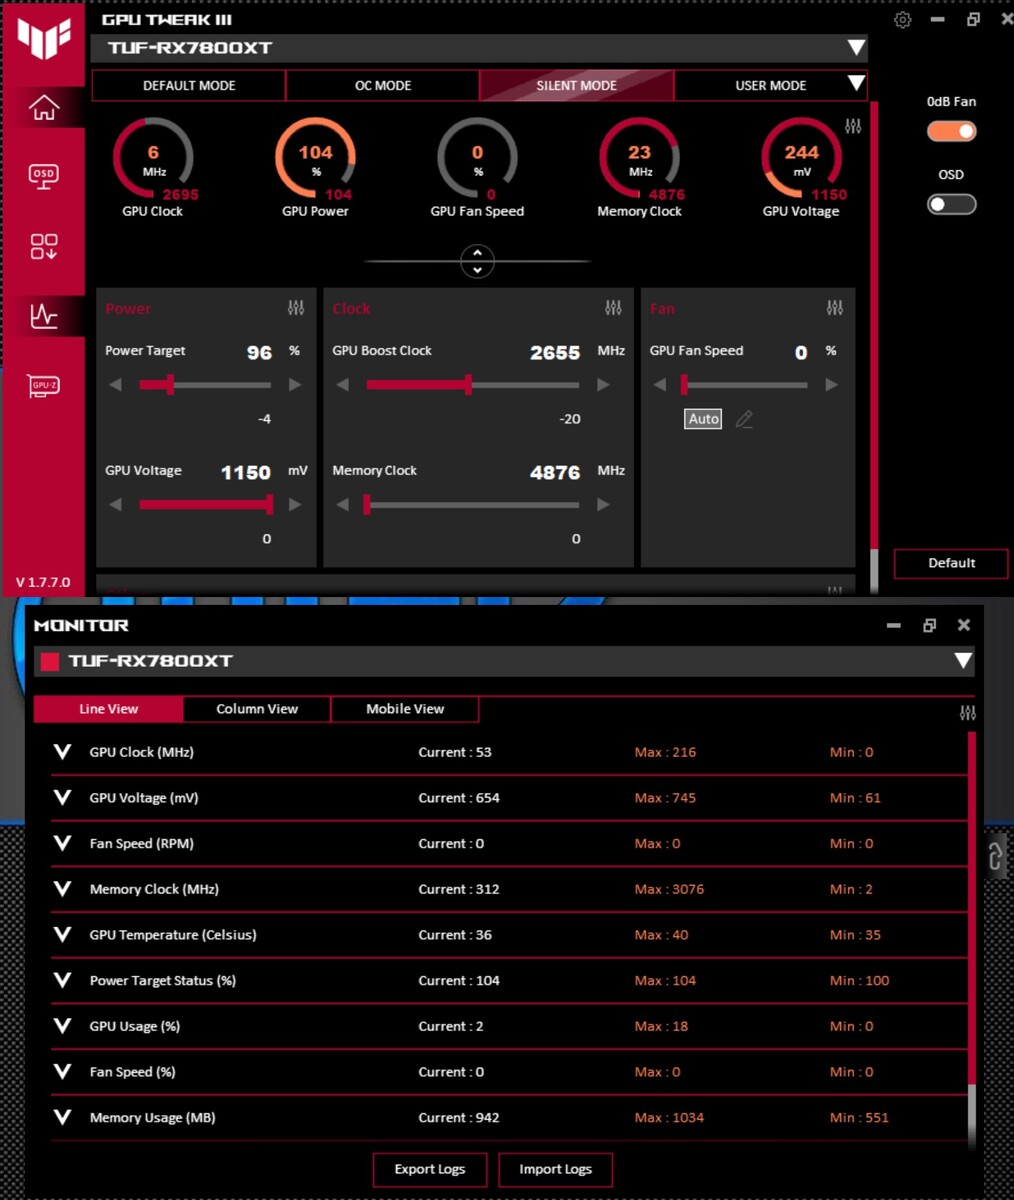
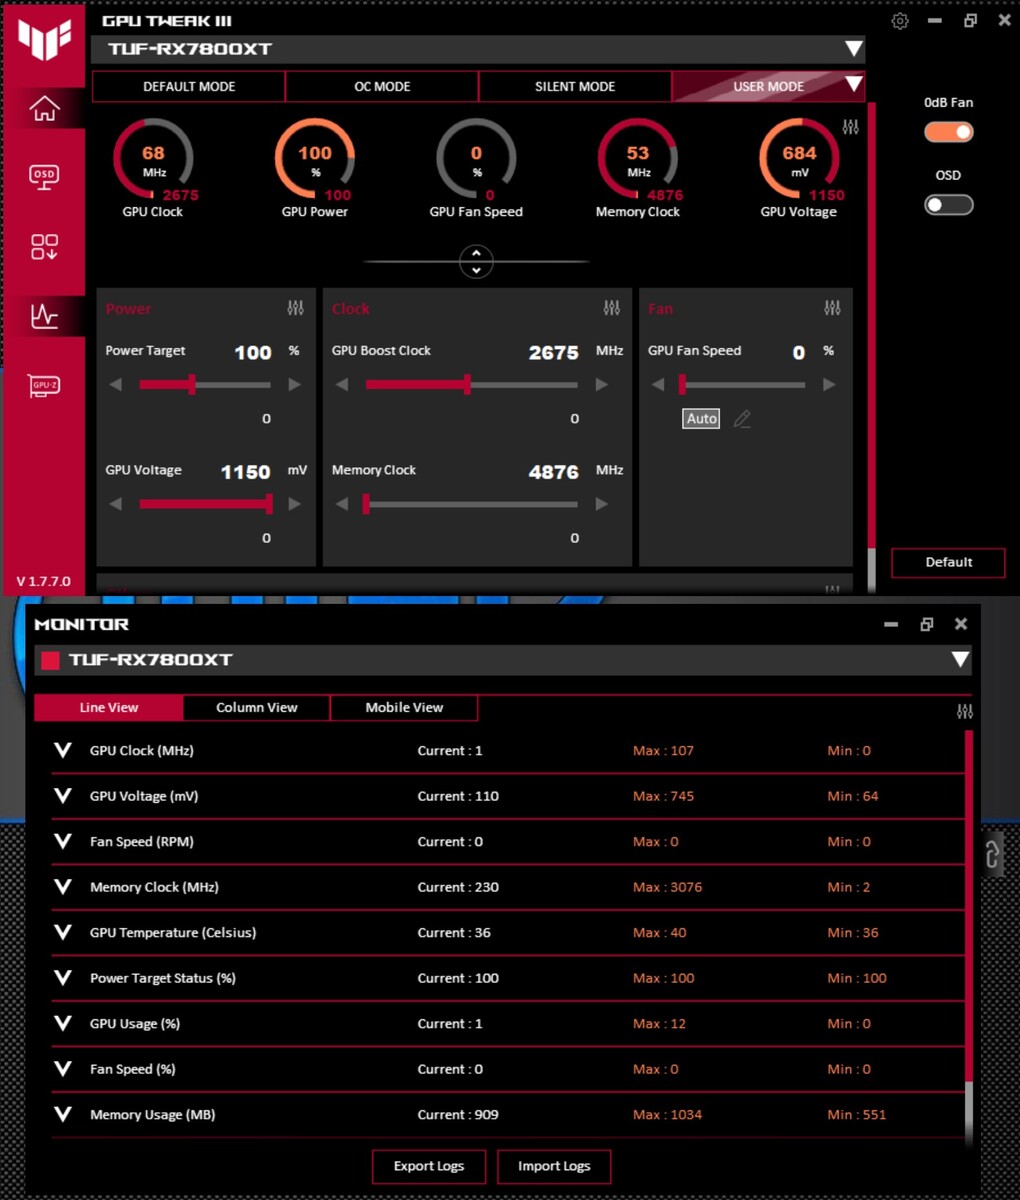
Come per la maggior parte degli altri produttori di GPU, esiste uno strumento interno per effettuare alcune regolazioni alla scheda grafica. L'opzione "Asus GPU Tweak III" consente innanzitutto di visualizzare tutti i dati tecnici. Oltre al profilo Predefinito, ci sono anche un profilo OC e un profilo Silenzioso, che aumentano o diminuiscono minimamente le velocità di clock del chip grafico. Allo stesso tempo, viene modificato anche il Power Target della scheda grafica (+/- 4%). Abbiamo utilizzato il profilo Default per tutti i nostri test. Come ulteriore espediente, è anche possibile visualizzare i dati telemetrici della scheda grafica in tempo reale su uno smartphone o un tablet, senza dover installare alcun programma aggiuntivo, il che è lodevole. L'unico requisito è che entrambi i dispositivi devono essere collegati alla stessa rete.

GPU-Z
GPU-Z
GPU-Z
GPU-Z
GPU-Z
GPU-Z

Asus GPU Tweak III

Modalità predefinita
Modalità OC
Modalità OC
Modalità silenziosa
Modalità silenziosa
Modalità utente
Modalità utente
Vista mobile
Vista mobile

Benchmark sintetici

Per il nostro primo confronto delle prestazioni, diamo un'occhiata alle prestazioni 3D della Asus TUF Gaming Radeon RX 7800 XT OC nei test sintetici. La nostra unità di prova è in grado di raggiungere un buon posto nel mezzo del nostro campo di confronto. È in grado di distanziarsi dal suo concorrente principale, la Nvidia GeForce RTX 4070. Rispetto alla AMD Radeon RX 7900 GRE, l'Asus TUF Gaming Radeon RX 7800 XT OC deve accettare un piccolo svantaggio di solo il 6%. Ma questo è un aspetto che non dovrebbe essere trascurato, poiché a questo punto la AMD Radeon RX 7900 GRE ha trovato la sua strada sugli scaffali dei negozi e non è disponibile solo in combinazione con un PC pre-costruito.

Nella competizione rosso contro verde, è solo con una Nvidia GeForce RTX 4070 Ti che ci si può aspettare un notevole aumento delle prestazioni rispetto alla AMD Radeon RX 7800 XT. Ma anche questo ha il suo prezzo, che è un po' più alto. In alternativa, può anche dare un'occhiata alla Nvidia GeForce RTX 4070 Super. Questa offre prestazioni leggermente superiori rispetto alla nostra unità di prova, ma offre meno VRAM, che può avere un effetto negativo in alcuni scenari specifici.

Performance Rating - Percent
XFX Radeon RX 7900 XTX Merc 310 Black Edition
98 pt
KFA2 GeForce RTX 4080 Super SG
93.7 pt
Asus TUF Gaming GeForce RTX 4070 Ti Super
78.9 pt
KFA2 GeForce RTX 4070 Ti EX Gamer
75.6 pt
Nvidia GeForce RTX 3090 FE
72.3 pt
AMD Radeon RX 7900 GRE
71 pt
Media NVIDIA GeForce RTX 4070 SUPER
70.7 pt
ASUS TUF Gaming Radeon RX 7800 XT
67.2 pt
KFA2 GeForce RTX 4070 EX Gamer
62.7 pt
AMD Radeon RX 6800
60.8 pt
AMD Radeon RX 6700 XT
49.3 pt
ASUS Dual GeForce RTX 4060 Ti OC
47.9 pt
Nvidia GeForce RTX 3060 Ti FE
47.6 pt
XFX Speedster QICK 308 Radeon RX 7600 Black Edition
41.7 pt
Nvidia GeForce RTX 2070 Super
40.9 pt
Sapphire Nitro+ Radeon RX 6650 XT
40.9 pt
KFA2 GeForce RTX 4060 1-Click-OC 2X
40.5 pt
Nvidia GeForce RTX 2060 Super
35.6 pt
Sapphire Pulse Radeon RX 6600
33.3 pt
3DMark
2560x1440 Time Spy Graphics
XFX Radeon RX 7900 XTX Merc 310 Black Edition
32205 Points +60%
KFA2 GeForce RTX 4080 Super SG
28378 Points +41%
Asus TUF Gaming GeForce RTX 4070 Ti Super
23695 Points +18%
KFA2 GeForce RTX 4070 Ti EX Gamer
22304 Points +11%
Media NVIDIA GeForce RTX 4070 SUPER (20867 - 21117, n=2)
20992 Points +4%
AMD Radeon RX 7900 GRE
20820 Points +3%
ASUS TUF Gaming Radeon RX 7800 XT
20147 Points
Nvidia GeForce RTX 3090 FE
19463 Points -3%
KFA2 GeForce RTX 4070 EX Gamer
17827 Points -12%
AMD Radeon RX 6800
16293 Points -19%
ASUS Dual GeForce RTX 4060 Ti OC
13427 Points -33%
AMD Radeon RX 6700 XT
12626 Points -37%
Nvidia GeForce RTX 3060 Ti FE
11855 Points -41%
XFX Speedster QICK 308 Radeon RX 7600 Black Edition
11062 Points -45%
KFA2 GeForce RTX 4060 1-Click-OC 2X
10494 Points -48%
Sapphire Nitro+ Radeon RX 6650 XT
10232 Points -49%
Nvidia GeForce RTX 2070 Super
10012 Points -50%
Nvidia GeForce RTX 2060 Super
8719 Points -57%
Sapphire Pulse Radeon RX 6600
8106 Points -60%
Fire Strike Extreme Graphics
XFX Radeon RX 7900 XTX Merc 310 Black Edition
40464 Points +58%
KFA2 GeForce RTX 4080 Super SG
33634 Points +31%
Asus TUF Gaming GeForce RTX 4070 Ti Super
27984 Points +9%
AMD Radeon RX 7900 GRE
27356 Points +6%
KFA2 GeForce RTX 4070 Ti EX Gamer
26694 Points +4%
ASUS TUF Gaming Radeon RX 7800 XT
25690 Points
Media NVIDIA GeForce RTX 4070 SUPER (24154 - 24874, n=2)
24514 Points -5%
Nvidia GeForce RTX 3090 FE
23597 Points -8%
AMD Radeon RX 6800
22166 Points -14%
KFA2 GeForce RTX 4070 EX Gamer
21216 Points -17%
AMD Radeon RX 6700 XT
17198 Points -33%
ASUS Dual GeForce RTX 4060 Ti OC
16250 Points -37%
XFX Speedster QICK 308 Radeon RX 7600 Black Edition
14966 Points -42%
Nvidia GeForce RTX 3060 Ti FE
14716 Points -43%
Sapphire Nitro+ Radeon RX 6650 XT
13658 Points -47%
KFA2 GeForce RTX 4060 1-Click-OC 2X
13086 Points -49%
Nvidia GeForce RTX 2070 Super
12017 Points -53%
Nvidia GeForce RTX 2060 Super
10726 Points -58%
Sapphire Pulse Radeon RX 6600
10717 Points -58%
3840x2160 Fire Strike Ultra Graphics
XFX Radeon RX 7900 XTX Merc 310 Black Edition
20998 Points +63%
KFA2 GeForce RTX 4080 Super SG
17236 Points +34%
AMD Radeon RX 7900 GRE
14000 Points +9%
Asus TUF Gaming GeForce RTX 4070 Ti Super
13998 Points +9%
KFA2 GeForce RTX 4070 Ti EX Gamer
13189 Points +3%
ASUS TUF Gaming Radeon RX 7800 XT
12845 Points
Media NVIDIA GeForce RTX 4070 SUPER (12086 - 12389, n=2)
12238 Points -5%
Nvidia GeForce RTX 3090 FE
12077 Points -6%
AMD Radeon RX 6800
10902 Points -15%
KFA2 GeForce RTX 4070 EX Gamer
9920 Points -23%
AMD Radeon RX 6700 XT
8420 Points -34%
Nvidia GeForce RTX 3060 Ti FE
7419 Points -42%
XFX Speedster QICK 308 Radeon RX 7600 Black Edition
7305 Points -43%
ASUS Dual GeForce RTX 4060 Ti OC
7298 Points -43%
Sapphire Nitro+ Radeon RX 6650 XT
6750 Points -47%
Nvidia GeForce RTX 2070 Super
5822 Points -55%
KFA2 GeForce RTX 4060 1-Click-OC 2X
5668 Points -56%
Sapphire Pulse Radeon RX 6600
5287 Points -59%
Nvidia GeForce RTX 2060 Super
5194 Points -60%
1920x1080 Fire Strike Graphics
XFX Radeon RX 7900 XTX Merc 310 Black Edition
62392 Points +27%
KFA2 GeForce RTX 4080 Super SG
59075 Points +20%
AMD Radeon RX 7900 GRE
54819 Points +11%
KFA2 GeForce RTX 4070 Ti EX Gamer
53736 Points +9%
Asus TUF Gaming GeForce RTX 4070 Ti Super
52738 Points +7%
ASUS TUF Gaming Radeon RX 7800 XT
49232 Points
Media NVIDIA GeForce RTX 4070 SUPER (48043 - 49709, n=2)
48876 Points -1%
Nvidia GeForce RTX 3090 FE
46890 Points -5%
AMD Radeon RX 6800
45441 Points -8%
KFA2 GeForce RTX 4070 EX Gamer
44065 Points -10%
AMD Radeon RX 6700 XT
35504 Points -28%
ASUS Dual GeForce RTX 4060 Ti OC
34547 Points -30%
XFX Speedster QICK 308 Radeon RX 7600 Black Edition
32404 Points -34%
Nvidia GeForce RTX 3060 Ti FE
30098 Points -39%
Sapphire Nitro+ Radeon RX 6650 XT
29796 Points -39%
KFA2 GeForce RTX 4060 1-Click-OC 2X
28111 Points -43%
Nvidia GeForce RTX 2070 Super
25491 Points -48%
Sapphire Pulse Radeon RX 6600
23333 Points -53%
Nvidia GeForce RTX 2060 Super
22686 Points -54%
Unigine Superposition
7680x4320 8k Optimized
XFX Radeon RX 7900 XTX Merc 310 Black Edition
8931 Points +64%
KFA2 GeForce RTX 4080 Super SG
8729 Points +60%
Asus TUF Gaming GeForce RTX 4070 Ti Super
7121 Points +31%
Nvidia GeForce RTX 3090 FE
6987 Points +28%
KFA2 GeForce RTX 4070 Ti EX Gamer
6380 Points +17%
Media NVIDIA GeForce RTX 4070 SUPER (5844 - 5892, n=2)
5868 Points +8%
AMD Radeon RX 7900 GRE
5663 Points +4%
ASUS TUF Gaming Radeon RX 7800 XT
5454 Points
KFA2 GeForce RTX 4070 EX Gamer
5290 Points -3%
AMD Radeon RX 6800
4911 Points -10%
Nvidia GeForce RTX 3060 Ti FE
4112 Points -25%
AMD Radeon RX 6700 XT
3723 Points -32%
ASUS Dual GeForce RTX 4060 Ti OC
3571 Points -35%
Nvidia GeForce RTX 2070 Super
3419 Points -37%
KFA2 GeForce RTX 4060 1-Click-OC 2X
3066 Points -44%
XFX Speedster QICK 308 Radeon RX 7600 Black Edition
2964 Points -46%
Sapphire Nitro+ Radeon RX 6650 XT
2958 Points -46%
Nvidia GeForce RTX 2060 Super
2914 Points -47%
Sapphire Pulse Radeon RX 6600
2289 Points -58%
3840x2160 4k Optimized
XFX Radeon RX 7900 XTX Merc 310 Black Edition
23972 Points +67%
KFA2 GeForce RTX 4080 Super SG
23130 Points +61%
Asus TUF Gaming GeForce RTX 4070 Ti Super
18817 Points +31%
KFA2 GeForce RTX 4070 Ti EX Gamer
16889 Points +18%
Nvidia GeForce RTX 3090 FE
16068 Points +12%
Media NVIDIA GeForce RTX 4070 SUPER (15803 - 15913, n=2)
15858 Points +11%
AMD Radeon RX 7900 GRE
15602 Points +9%
ASUS TUF Gaming Radeon RX 7800 XT
14327 Points
KFA2 GeForce RTX 4070 EX Gamer
13814 Points -4%
AMD Radeon RX 6800
12269 Points -14%
ASUS Dual GeForce RTX 4060 Ti OC
9722 Points -32%
Nvidia GeForce RTX 3060 Ti FE
9663 Points -33%
AMD Radeon RX 6700 XT
9341 Points -35%
Nvidia GeForce RTX 2070 Super
8096 Points -43%
KFA2 GeForce RTX 4060 1-Click-OC 2X
7959 Points -44%
XFX Speedster QICK 308 Radeon RX 7600 Black Edition
7817 Points -45%
Sapphire Nitro+ Radeon RX 6650 XT
7418 Points -48%
Nvidia GeForce RTX 2060 Super
6863 Points -52%
Sapphire Pulse Radeon RX 6600
5650 Points -61%
1920x1080 1080p Extreme
XFX Radeon RX 7900 XTX Merc 310 Black Edition
18081 Points +71%
KFA2 GeForce RTX 4080 Super SG
16221 Points +53%
Asus TUF Gaming GeForce RTX 4070 Ti Super
13312 Points +26%
KFA2 GeForce RTX 4070 Ti EX Gamer
12837 Points +21%
Media NVIDIA GeForce RTX 4070 SUPER (12019 - 12163, n=2)
12091 Points +14%
Nvidia GeForce RTX 3090 FE
12029 Points +14%
AMD Radeon RX 7900 GRE
11728 Points +11%
ASUS TUF Gaming Radeon RX 7800 XT
10588 Points
KFA2 GeForce RTX 4070 EX Gamer
9842 Points -7%
AMD Radeon RX 6800
8508 Points -20%
Nvidia GeForce RTX 3060 Ti FE
7308 Points -31%
ASUS Dual GeForce RTX 4060 Ti OC
7085 Points -33%
AMD Radeon RX 6700 XT
6869 Points -35%
XFX Speedster QICK 308 Radeon RX 7600 Black Edition
6419 Points -39%
Nvidia GeForce RTX 2070 Super
6161 Points -42%
KFA2 GeForce RTX 4060 1-Click-OC 2X
5974 Points -44%
Sapphire Nitro+ Radeon RX 6650 XT
5801 Points -45%
Nvidia GeForce RTX 2060 Super
5143 Points -51%
Sapphire Pulse Radeon RX 6600
4381 Points -59%
1920x1080 1080p High
KFA2 GeForce RTX 4080 Super SG
38778 Points +61%
XFX Radeon RX 7900 XTX Merc 310 Black Edition
37278 Points +54%
Asus TUF Gaming GeForce RTX 4070 Ti Super
30884 Points +28%
KFA2 GeForce RTX 4070 Ti EX Gamer
29062 Points +20%
Media NVIDIA GeForce RTX 4070 SUPER ()
27091 Points +12%
Nvidia GeForce RTX 3090 FE
26411 Points +9%
AMD Radeon RX 7900 GRE
26374 Points +9%
ASUS TUF Gaming Radeon RX 7800 XT
24138 Points
KFA2 GeForce RTX 4070 EX Gamer
23184 Points -4%
AMD Radeon RX 6800
20572 Points -15%
ASUS Dual GeForce RTX 4060 Ti OC
16909 Points -30%
AMD Radeon RX 6700 XT
16403 Points -32%
Nvidia GeForce RTX 3060 Ti FE
15957 Points -34%
XFX Speedster QICK 308 Radeon RX 7600 Black Edition
14051 Points -42%
Nvidia GeForce RTX 2070 Super
13832 Points -43%
KFA2 GeForce RTX 4060 1-Click-OC 2X
13790 Points -43%
Sapphire Nitro+ Radeon RX 6650 XT
13694 Points -43%
Nvidia GeForce RTX 2060 Super
11742 Points -51%
Sapphire Pulse Radeon RX 6600
10582 Points -56%
1280x720 720p Low
KFA2 GeForce RTX 4080 Super SG
56966 Points +24%
KFA2 GeForce RTX 4070 Ti EX Gamer
56396 Points +23%
Nvidia GeForce RTX 3090 FE
54653 Points +19%
Media NVIDIA GeForce RTX 4070 SUPER (50629 - 50724, n=2)
50677 Points +10%
Asus TUF Gaming GeForce RTX 4070 Ti Super
50322 Points +9%
KFA2 GeForce RTX 4070 EX Gamer
49545 Points +8%
Nvidia GeForce RTX 3060 Ti FE
49057 Points +7%
ASUS Dual GeForce RTX 4060 Ti OC
47695 Points +4%
ASUS TUF Gaming Radeon RX 7800 XT
46007 Points
AMD Radeon RX 7900 GRE
45946 Points 0%
XFX Radeon RX 7900 XTX Merc 310 Black Edition
45946 Points 0%
KFA2 GeForce RTX 4060 1-Click-OC 2X
45864 Points 0%
Nvidia GeForce RTX 2070 Super
45424 Points -1%
AMD Radeon RX 6700 XT
44156 Points -4%
AMD Radeon RX 6800
43556 Points -5%
XFX Speedster QICK 308 Radeon RX 7600 Black Edition
42477 Points -8%
Nvidia GeForce RTX 2060 Super
40961 Points -11%
Sapphire Nitro+ Radeon RX 6650 XT
38741 Points -16%
Sapphire Pulse Radeon RX 6600
37605 Points -18%
Unigine Heaven 4.0
Extreme Preset DX11
XFX Radeon RX 7900 XTX Merc 310 Black Edition
390.2 fps +55%
KFA2 GeForce RTX 4080 Super SG
386.2 fps +54%
KFA2 GeForce RTX 4070 Ti EX Gamer
312.1 fps +24%
Asus TUF Gaming GeForce RTX 4070 Ti Super
311.9 (47.1min - 651.4max) fps +24%
Nvidia GeForce RTX 3090 FE
309.3 fps +23%
Media NVIDIA GeForce RTX 4070 SUPER (276 - 281, n=2)
278 fps +11%
AMD Radeon RX 7900 GRE
270.8 fps +8%
KFA2 GeForce RTX 4070 EX Gamer
257.6 fps +3%
ASUS TUF Gaming Radeon RX 7800 XT
251 fps
AMD Radeon RX 6800
241.3 fps -4%
Nvidia GeForce RTX 3060 Ti FE
196.9 fps -22%
AMD Radeon RX 6700 XT
194.4 fps -23%
ASUS Dual GeForce RTX 4060 Ti OC
181.4 fps -28%
Nvidia GeForce RTX 2070 Super
172.3 fps -31%
Sapphire Nitro+ Radeon RX 6650 XT
161 fps -36%
KFA2 GeForce RTX 4060 1-Click-OC 2X
153.7 fps -39%
XFX Speedster QICK 308 Radeon RX 7600 Black Edition
148.1 fps -41%
Nvidia GeForce RTX 2060 Super
146.1 fps -42%
Sapphire Pulse Radeon RX 6600
132.2 fps -47%
Extreme Preset OpenGL
XFX Radeon RX 7900 XTX Merc 310 Black Edition
419.2 fps +62%
KFA2 GeForce RTX 4080 Super SG
381.9 fps +47%
Asus TUF Gaming GeForce RTX 4070 Ti Super
310.3 (14.5min - 698.3max) fps +20%
KFA2 GeForce RTX 4070 Ti EX Gamer
290.5 fps +12%
Nvidia GeForce RTX 3090 FE
283.2 fps +9%
Media NVIDIA GeForce RTX 4070 SUPER (276 - 280, n=2)
278 fps +7%
AMD Radeon RX 7900 GRE
277.9 fps +7%
ASUS TUF Gaming Radeon RX 7800 XT
259.3 fps
AMD Radeon RX 6800
250 fps -4%
KFA2 GeForce RTX 4070 EX Gamer
237.1 fps -9%
AMD Radeon RX 6700 XT
204.5 fps -21%
Nvidia GeForce RTX 3060 Ti FE
175.3 fps -32%
ASUS Dual GeForce RTX 4060 Ti OC
175.1 fps -32%
Sapphire Nitro+ Radeon RX 6650 XT
172.8 fps -33%
Nvidia GeForce RTX 2070 Super
156.5 fps -40%
XFX Speedster QICK 308 Radeon RX 7600 Black Edition
147.2 fps -43%
KFA2 GeForce RTX 4060 1-Click-OC 2X
147 fps -43%
Sapphire Pulse Radeon RX 6600
143.1 fps -45%
Nvidia GeForce RTX 2060 Super
133.9 fps -48%
Unigine Valley 1.0
1920x1080 Extreme HD DirectX AA:x8
XFX Radeon RX 7900 XTX Merc 310 Black Edition
293.3 fps +45%
KFA2 GeForce RTX 4080 Super SG
277.1 fps +37%
Nvidia GeForce RTX 3090 FE
246.5 fps +22%
Asus TUF Gaming GeForce RTX 4070 Ti Super
242.6 (75.4min - 480.6max) fps +20%
KFA2 GeForce RTX 4070 Ti EX Gamer
217.2 fps +7%
AMD Radeon RX 7900 GRE
217 fps +7%
Media NVIDIA GeForce RTX 4070 SUPER (214 - 215, n=2)
215 fps +6%
AMD Radeon RX 6800
207.3 fps +2%
ASUS TUF Gaming Radeon RX 7800 XT
202.8 fps
KFA2 GeForce RTX 4070 EX Gamer
190 fps -6%
Nvidia GeForce RTX 3060 Ti FE
157.4 fps -22%
AMD Radeon RX 6700 XT
155.4 fps -23%
ASUS Dual GeForce RTX 4060 Ti OC
131.2 fps -35%
Nvidia GeForce RTX 2070 Super
127.4 fps -37%
Sapphire Nitro+ Radeon RX 6650 XT
115.5 fps -43%
KFA2 GeForce RTX 4060 1-Click-OC 2X
115.3 fps -43%
Nvidia GeForce RTX 2060 Super
114.1 fps -44%
XFX Speedster QICK 308 Radeon RX 7600 Black Edition
107.5 fps -47%
Sapphire Pulse Radeon RX 6600
95.2 fps -53%
1920x1080 Extreme HD Preset OpenGL AA:x8
XFX Radeon RX 7900 XTX Merc 310 Black Edition
306.8 fps +61%
KFA2 GeForce RTX 4080 Super SG
271.3 fps +42%
Asus TUF Gaming GeForce RTX 4070 Ti Super
232.1 (62.3min - 435.4max) fps +22%
Nvidia GeForce RTX 3090 FE
225.7 fps +18%
Media NVIDIA GeForce RTX 4070 SUPER (200 - 200, n=2)
200 fps +5%
KFA2 GeForce RTX 4070 Ti EX Gamer
197.6 fps +3%
AMD Radeon RX 6800
194.7 fps +2%
AMD Radeon RX 7900 GRE
191.7 fps 0%
ASUS TUF Gaming Radeon RX 7800 XT
191 fps
KFA2 GeForce RTX 4070 EX Gamer
169 fps -12%
AMD Radeon RX 6700 XT
156.9 fps -18%
Nvidia GeForce RTX 3060 Ti FE
135.1 fps -29%
ASUS Dual GeForce RTX 4060 Ti OC
118.8 fps -38%
Sapphire Nitro+ Radeon RX 6650 XT
113 fps -41%
Nvidia GeForce RTX 2070 Super
112 fps -41%
KFA2 GeForce RTX 4060 1-Click-OC 2X
104.5 fps -45%
Nvidia GeForce RTX 2060 Super
101.5 fps -47%
XFX Speedster QICK 308 Radeon RX 7600 Black Edition
94.8 fps -50%
Sapphire Pulse Radeon RX 6600
94.2 fps -51%
3DMark 11
1280x720 Performance GPU
KFA2 GeForce RTX 4080 Super SG
87055 Points +28%
XFX Radeon RX 7900 XTX Merc 310 Black Edition
86262 Points +27%
Asus TUF Gaming GeForce RTX 4070 Ti Super
74834 Points +10%
KFA2 GeForce RTX 4070 Ti EX Gamer
74228 Points +9%
Media NVIDIA GeForce RTX 4070 SUPER (67852 - 68894, n=2)
68373 Points +1%
AMD Radeon RX 7900 GRE
68260 Points 0%
ASUS TUF Gaming Radeon RX 7800 XT
67929 Points
Nvidia GeForce RTX 3090 FE
60836 Points -10%
KFA2 GeForce RTX 4070 EX Gamer
60428 Points -11%
AMD Radeon RX 6800
57784 Points -15%
ASUS Dual GeForce RTX 4060 Ti OC
47803 Points -30%
AMD Radeon RX 6700 XT
45676 Points -33%
XFX Speedster QICK 308 Radeon RX 7600 Black Edition
43430 Points -36%
Sapphire Nitro+ Radeon RX 6650 XT
41624 Points -39%
Nvidia GeForce RTX 3060 Ti FE
41388 Points -39%
KFA2 GeForce RTX 4060 1-Click-OC 2X
38191 Points -44%
Nvidia GeForce RTX 2070 Super
35992 Points -47%
Sapphire Pulse Radeon RX 6600
32025 Points -53%
Nvidia GeForce RTX 2060 Super
29911 Points -56%
1280x720 Performance
KFA2 GeForce RTX 4080 Super SG
59568 Points +19%
XFX Radeon RX 7900 XTX Merc 310 Black Edition
56505 Points +13%
Asus TUF Gaming GeForce RTX 4070 Ti Super
54278 Points +8%
KFA2 GeForce RTX 4070 Ti EX Gamer
53915 Points +8%
Media NVIDIA GeForce RTX 4070 SUPER (51107 - 51572, n=2)
51340 Points +3%
AMD Radeon RX 7900 GRE
51189 Points +2%
KFA2 GeForce RTX 4070 EX Gamer
50253 Points 0%
ASUS TUF Gaming Radeon RX 7800 XT
50047 Points
Nvidia GeForce RTX 3090 FE
49093 Points -2%
AMD Radeon RX 6800
46167 Points -8%
ASUS Dual GeForce RTX 4060 Ti OC
43231 Points -14%
AMD Radeon RX 6700 XT
39810 Points -20%
Nvidia GeForce RTX 3060 Ti FE
39081 Points -22%
XFX Speedster QICK 308 Radeon RX 7600 Black Edition
38744 Points -23%
Sapphire Nitro+ Radeon RX 6650 XT
37387 Points -25%
KFA2 GeForce RTX 4060 1-Click-OC 2X
36813 Points -26%
Nvidia GeForce RTX 2070 Super
35274 Points -30%
Nvidia GeForce RTX 2060 Super
30486 Points -39%
Sapphire Pulse Radeon RX 6600
29811 Points -40%
LuxMark v2.0 64Bit
Room GPUs-only
NVIDIA GeForce RTX 4080 Super
10075 Samples/s +170%
NVIDIA GeForce RTX 4070 Ti SUPER
9355 Samples/s +150%
NVIDIA GeForce RTX 4070 Ti
7625 Samples/s +104%
NVIDIA GeForce RTX 4070
6950 Samples/s +86%
NVIDIA GeForce RTX 3090
5985 Samples/s +60%
NVIDIA GeForce RTX 4060 Ti 8G
4790 Samples/s +28%
AMD Radeon RX 7900 XTX
4534 Samples/s +21%
NVIDIA GeForce RTX 4060
4063 Samples/s +9%
AMD Radeon RX 7900 GRE
3784 Samples/s +1%
AMD Radeon RX 7800 XT
3737 Samples/s
AMD Radeon RX 6800
3234 Samples/s -13%
AMD Radeon RX 6700 XT
2739 Samples/s -27%
AMD Radeon RX 7600
2227 Samples/s -40%
AMD Radeon RX 6650 XT
2150 Samples/s -42%
AMD Radeon RX 6600
1932 Samples/s -48%
Sala GPUs-only
NVIDIA GeForce RTX 4080 Super
22634 Samples/s +117%
NVIDIA GeForce RTX 4070 Ti SUPER
19620 Samples/s +88%
NVIDIA GeForce RTX 4070 Ti
17719 Samples/s +70%
NVIDIA GeForce RTX 3090
15242 Samples/s +46%
NVIDIA GeForce RTX 4070
14493 Samples/s +39%
AMD Radeon RX 7900 XTX
13953 Samples/s +34%
AMD Radeon RX 7900 GRE
11265 Samples/s +8%
NVIDIA GeForce RTX 4060 Ti 8G
11264 Samples/s +8%
AMD Radeon RX 7800 XT
10441 Samples/s
NVIDIA GeForce RTX 4060
8991 Samples/s -14%
AMD Radeon RX 6800
8907 Samples/s -15%
AMD Radeon RX 6700 XT
7545 Samples/s -28%
AMD Radeon RX 7600
5583 Samples/s -47%
AMD Radeon RX 6650 XT
5307 Samples/s -49%
AMD Radeon RX 6600
4672 Samples/s -55%
ComputeMark v2.1
1024x600 Normal, QJuliaRayTrace
NVIDIA GeForce RTX 4080 Super
25693 Points +101%
NVIDIA GeForce RTX 4070 Ti SUPER
21382 Points +68%
NVIDIA GeForce RTX 4070 Ti
21107 Points +65%
AMD Radeon RX 7900 XTX
19141 Points +50%
NVIDIA GeForce RTX 3090
17583 Points +38%
NVIDIA GeForce RTX 4070
17521 Points +37%
AMD Radeon RX 7900 GRE
15546 Points +22%
NVIDIA GeForce RTX 4060 Ti 8G
13720 Points +8%
AMD Radeon RX 7800 XT
12761 Points
NVIDIA GeForce RTX 4060
9916 Points -22%
AMD Radeon RX 6800
9387 Points -26%
AMD Radeon RX 7600
8897 Points -30%
AMD Radeon RX 6700 XT
7404 Points -42%
AMD Radeon RX 6650 XT
6615 Points -48%
AMD Radeon RX 6600
5535 Points -57%
1024x600 Normal, Score
NVIDIA GeForce RTX 4080 Super
65378 Points +56%
AMD Radeon RX 7900 XTX
64304 Points +53%
NVIDIA GeForce RTX 4070 Ti SUPER
54675 Points +31%
NVIDIA GeForce RTX 4070 Ti
51287 Points +22%
NVIDIA GeForce RTX 3090
48352 Points +15%
AMD Radeon RX 7900 GRE
47257 Points +13%
NVIDIA GeForce RTX 4070
43049 Points +3%
AMD Radeon RX 7800 XT
41893 Points
AMD Radeon RX 6800
33126 Points -21%
NVIDIA GeForce RTX 4060 Ti 8G
32082 Points -23%
AMD Radeon RX 7600
25119 Points -40%
AMD Radeon RX 6700 XT
24921 Points -41%
NVIDIA GeForce RTX 4060
23841 Points -43%
AMD Radeon RX 6650 XT
20552 Points -51%
AMD Radeon RX 6600
16988 Points -59%
1024x600 Normal, Fluid 3DTex
AMD Radeon RX 7900 XTX
9123 Points +101%
NVIDIA GeForce RTX 4080 Super
6807 Points +50%
NVIDIA GeForce RTX 3090
5484 Points +21%
NVIDIA GeForce RTX 4070 Ti SUPER
4935 Points +9%
AMD Radeon RX 7900 GRE
4804 Points +6%
AMD Radeon RX 6800
4723 Points +4%
AMD Radeon RX 7800 XT
4542 Points
NVIDIA GeForce RTX 4070 Ti
3789 Points -17%
NVIDIA GeForce RTX 4070
3541 Points -22%
AMD Radeon RX 6700 XT
3359 Points -26%
NVIDIA GeForce RTX 4060 Ti 8G
2090 Points -54%
NVIDIA GeForce RTX 4060
1943 Points -57%
AMD Radeon RX 7600
1835 Points -60%
AMD Radeon RX 6650 XT
1719 Points -62%
AMD Radeon RX 6600
1436 Points -68%
1024x600 Normal, Fluid 2DTexArr
AMD Radeon RX 7900 XTX
7993 Points +79%
NVIDIA GeForce RTX 4080 Super
5651 Points +27%
NVIDIA GeForce RTX 4070 Ti SUPER
4876 Points +9%
AMD Radeon RX 7900 GRE
4779 Points +7%
NVIDIA GeForce RTX 3090
4453 Points 0%
AMD Radeon RX 7800 XT
4453 Points
NVIDIA GeForce RTX 4070 Ti
3724 Points -16%
NVIDIA GeForce RTX 4070
3494 Points -22%
AMD Radeon RX 6800
3124 Points -30%
AMD Radeon RX 6700 XT
2328 Points -48%
NVIDIA GeForce RTX 4060 Ti 8G
2044 Points -54%
NVIDIA GeForce RTX 4060
1912 Points -57%
AMD Radeon RX 7600
1878 Points -58%
AMD Radeon RX 6650 XT
1667 Points -63%
AMD Radeon RX 6600
1391 Points -69%
1024x600 Normal, Mandel Vector
AMD Radeon RX 7900 XTX
12625 Points +35%
NVIDIA GeForce RTX 4080 Super
11618 Points +24%
NVIDIA GeForce RTX 4070 Ti SUPER
10883 Points +16%
NVIDIA GeForce RTX 4070 Ti
10541 Points +12%
NVIDIA GeForce RTX 3090
9744 Points +4%
AMD Radeon RX 7900 GRE
9581 Points +2%
AMD Radeon RX 7800 XT
9379 Points
NVIDIA GeForce RTX 4070
8636 Points -8%
AMD Radeon RX 6800
7383 Points -21%
NVIDIA GeForce RTX 4060 Ti 8G
6819 Points -27%
AMD Radeon RX 7600
5764 Points -39%
AMD Radeon RX 6700 XT
5496 Points -41%
AMD Radeon RX 6650 XT
4961 Points -47%
NVIDIA GeForce RTX 4060
4916 Points -48%
AMD Radeon RX 6600
4122 Points -56%
1024x600 Normal, Mandel Scalar
NVIDIA GeForce RTX 4080 Super
15609 Points +45%
AMD Radeon RX 7900 XTX
15422 Points +43%
NVIDIA GeForce RTX 4070 Ti SUPER
12599 Points +17%
AMD Radeon RX 7900 GRE
12547 Points +17%
NVIDIA GeForce RTX 4070 Ti
12126 Points +13%
NVIDIA GeForce RTX 3090
11088 Points +3%
AMD Radeon RX 7800 XT
10759 Points
NVIDIA GeForce RTX 4070
9857 Points -8%
AMD Radeon RX 6800
8508 Points -21%
NVIDIA GeForce RTX 4060 Ti 8G
7409 Points -31%
AMD Radeon RX 7600
6746 Points -37%
AMD Radeon RX 6700 XT
6334 Points -41%
AMD Radeon RX 6650 XT
5590 Points -48%
NVIDIA GeForce RTX 4060
5153 Points -52%
AMD Radeon RX 6600
4503 Points -58%
Photoshop PugetBench
GPU Score
AMD Radeon RX 6800
169.9 Points +4%
AMD Radeon RX 6700 XT
167.4 Points +2%
AMD Radeon RX 7900 GRE
165.8 Points +1%
AMD Radeon RX 7800 XT
164 Points
AMD Radeon RX 6650 XT
160.1 Points -2%
NVIDIA GeForce RTX 3090
157.1 Points -4%
AMD Radeon RX 7900 XTX
156.1 Points -5%
AMD Radeon RX 7600
155.8 Points -5%
NVIDIA GeForce RTX 2060 Super (Desktop)
150.1 Points -8%
NVIDIA GeForce RTX 3060 Ti
146.9 Points -10%
NVIDIA GeForce RTX 2070 Super (Desktop)
146.2 Points -11%
AMD Radeon RX 6600
136 Points -17%
NVIDIA GeForce RTX 4080 Super
123 Points -25%
NVIDIA GeForce RTX 4070
122.1 Points -26%
NVIDIA GeForce RTX 4060 Ti 8G
122.1 Points -26%
NVIDIA GeForce RTX 4060
121 Points -26%
NVIDIA GeForce RTX 4070 Ti
114.9 Points -30%
Overall Score
AMD Radeon RX 7900 GRE
1606 Points +1%
NVIDIA GeForce RTX 3090
1599 Points +1%
AMD Radeon RX 7900 XTX
1594 Points 0%
AMD Radeon RX 7800 XT
1589 Points
AMD Radeon RX 6800
1576 Points -1%
AMD Radeon RX 7600
1566 Points -1%
AMD Radeon RX 6700 XT
1549 Points -3%
NVIDIA GeForce RTX 2060 Super (Desktop)
1516 Points -5%
AMD Radeon RX 6650 XT
1501 Points -6%
NVIDIA GeForce RTX 2070 Super (Desktop)
1496 Points -6%
NVIDIA GeForce RTX 4060
1433 Points -10%
NVIDIA GeForce RTX 4060 Ti 8G
1426 Points -10%
NVIDIA GeForce RTX 3060 Ti
1414 Points -11%
NVIDIA GeForce RTX 4080 Super
1395 Points -12%
NVIDIA GeForce RTX 4070
1359 Points -14%
AMD Radeon RX 6600
1281 Points -19%
NVIDIA GeForce RTX 4070 Ti
1231 Points -23%
Premiere Pro PugetBench
GPU 0.9
NVIDIA GeForce RTX 4080 Super
86.9 Points +40%
NVIDIA GeForce RTX 3090
80.5 Points +30%
NVIDIA GeForce RTX 4070 Ti
75.6 Points +22%
AMD Radeon RX 7900 XTX
74.6 Points +21%
NVIDIA GeForce RTX 4070
72.9 Points +18%
AMD Radeon RX 7900 GRE
67.5 Points +9%
AMD Radeon RX 7800 XT
61.9 Points
NVIDIA GeForce RTX 2070 Super (Desktop)
61.1 Points -1%
AMD Radeon RX 6800
60.8 Points -2%
NVIDIA GeForce RTX 3060 Ti
59.4 Points -4%
NVIDIA GeForce RTX 2060 Super (Desktop)
56 Points -10%
NVIDIA GeForce RTX 4060 Ti 8G
55.9 Points -10%
AMD Radeon RX 6700 XT
52.3 Points -16%
NVIDIA GeForce RTX 4060
46.4 Points -25%
AMD Radeon RX 7600
45.6 Points -26%
AMD Radeon RX 6650 XT
42.7 Points -31%
AMD Radeon RX 6600
35 Points -43%
Overall Score 0.9
NVIDIA GeForce RTX 3090
1044 Points +6%
NVIDIA GeForce RTX 4080 Super
1041 Points +6%
AMD Radeon RX 7900 XTX
1002 Points +2%
NVIDIA GeForce RTX 4070
997 Points +2%
AMD Radeon RX 7800 XT
981 Points
NVIDIA GeForce RTX 4070 Ti
949 Points -3%
AMD Radeon RX 7900 GRE
939 Points -4%
NVIDIA GeForce RTX 2060 Super (Desktop)
929 Points -5%
NVIDIA GeForce RTX 4060
924 Points -6%
NVIDIA GeForce RTX 3060 Ti
923 Points -6%
NVIDIA GeForce RTX 2070 Super (Desktop)
923 Points -6%
AMD Radeon RX 6800
901 Points -8%
NVIDIA GeForce RTX 4060 Ti 8G
901 Points -8%
AMD Radeon RX 7600
891 Points -9%
AMD Radeon RX 6650 XT
876 Points -11%
AMD Radeon RX 6700 XT
858 Points -13%
AMD Radeon RX 6600
745 Points -24%
Affinity Photo 2 - Combined (Single / Multi GPU)
NVIDIA GeForce RTX 4070
8704 Points +5%
NVIDIA GeForce RTX 4080 Super
8557 Points +3%
NVIDIA GeForce RTX 4070 Ti
8516 Points +3%
AMD Radeon RX 7800 XT
8283 Points
AMD Radeon RX 7900 XTX
8232 Points -1%
NVIDIA GeForce RTX 3090
8120 Points -2%
NVIDIA GeForce RTX 2070 Super (Desktop)
7722 Points -7%
AMD Radeon RX 7900 GRE
7671 Points -7%
NVIDIA GeForce RTX 2060 Super (Desktop)
7590 Points -8%
NVIDIA GeForce RTX 3060 Ti
7004 Points -15%
NVIDIA GeForce RTX 4060
6882 Points -17%
NVIDIA GeForce RTX 4060 Ti 8G
6788 Points -18%
AMD Radeon RX 7600
6273 Points -24%
AMD Radeon RX 6800
2761 Points -67%
AMD Radeon RX 6650 XT
2688 Points -68%
AMD Radeon RX 6700 XT
2676 Points -68%
AMD Radeon RX 6600
2619 Points -68%

Applicazioni professionali

Le applicazioni professionali trarranno molti vantaggi dall'uso di schede grafiche speciali. AMD e Nvidia offrono alcune GPU per workstation che sono significativamente più costose. Tuttavia, spesso è ancora possibile ottenere buoni risultati con le normali schede grafiche consumer. Rispetto a Nvidia, AMD ha prestazioni superiori alla media in questa disciplina. Nell'attuale portafoglio AMD, la Asus TUF Gaming Radeon RX 7800 XT OC si posiziona subito dopo la AMD Radeon RX 7900 GRE. Il confronto con la Nvidia RTX 6000 Ada Generation che abbiamo incluso nella nostra panoramica, mostra le prestazioni che ci si può aspettare da una scheda grafica per workstation.

AMD Radeon RX 7800 XT
i9-14900K
AMD Radeon RX 6800
R9 7950X
AMD Radeon RX 6950 XT
R9 7950X
AMD Radeon RX 7600
R9 7950X
AMD Radeon RX 7900 GRE
R9 7950X
AMD Radeon RX 7900 XT
R9 7950X
AMD Radeon RX 7900 XTX
R9 7950X
NVIDIA GeForce RTX 4060
R9 7950X
NVIDIA GeForce RTX 4060 Ti 8G
R9 7950X
NVIDIA GeForce RTX 4070
R9 7950X
NVIDIA GeForce RTX 4070 Ti
R9 7950X
NVIDIA GeForce RTX 4080
R9 7950X
NVIDIA GeForce RTX 4090
R9 7950X
Media NVIDIA RTX 6000 Ada Generation
 
Media della classe
 
SPECviewperf 12
-2%
-25%
-34%
2%
21%
35%
-60%
-54%
-41%
-31%
-20%
-13%
34%
-68%
1900x1060 3ds Max (3dsmax-05)
386
424
10%
418
8%
279
-28%
444
15%
502
30%
553
43%
251
-35%
286
-26%
382
-1%
436
13%
502
30%
571
48%
473 ?()
23%
190.5 ?(11 - 571, n=375)
-51%
1900x1060 Catia (catia-04)
396
396
0%
368
-7%
273
-31%
448
13%
481
21%
536
35%
113
-71%
128
-68%
161
-59%
192
-52%
221
-44%
257
-35%
349 ?()
-12%
103.6 ?(4.56 - 605, n=590)
-74%
1900x1060 Creo (creo-01)
153
160
5%
163
7%
115
-25%
155
1%
176
15%
187
22%
60.6
-60%
74.3
-51%
89.1
-42%
99.4
-35%
110
-28%
115
-25%
250 ?()
63%
63.2 ?(0.91 - 250, n=593)
-59%
1900x1060 Energy (energy-01)
57.7
48.4
-16%
34.3
-41%
25.5
-56%
40.3
-30%
72.4
25%
85.2
48%
15.9
-72%
22.8
-60%
31.7
-45%
48
-17%
58.8
2%
54.7
-5%
58.2 ?()
1%
14.9 ?(0.04 - 112, n=574)
-74%
1900x1060 Maya (maya-04)
283
304
7%
195
-31%
236
-17%
323
14%
347
23%
367
30%
233
-18%
252
-11%
284
0%
287
1%
309
9%
317
12%
266 ?()
-6%
107.1 ?(2.09 - 367, n=592)
-62%
1900x1060 Medical (medical-01)
227
188
-17%
95.2
-58%
128
-44%
226
0%
288
27%
347
53%
82.4
-64%
107
-53%
132
-42%
157
-31%
171
-25%
119
-48%
282 ?()
24%
52.1 ?(0.58 - 392, n=578)
-77%
1900x1060 Showcase (showcase-01)
243
229
-6%
264
9%
127
-48%
222
-9%
278
14%
322
33%
109
-55%
122
-50%
190
-22%
244
0%
333
37%
457
88%
429 ?()
77%
94.1 ?(2.63 - 459, n=581)
-61%
1900x1060 Siemens NX (snx-02)
283
296
5%
56.4
-80%
210
-26%
341
20%
373
32%
400
41%
14.2
-95%
14.5
-95%
16.4
-94%
19
-93%
21.6
-92%
27.1
-90%
677 ?()
139%
57.2 ?(0.98 - 677, n=592)
-80%
1900x1060 Solidworks (sw-03)
332
315
-5%
218
-34%
221
-33%
319
-4%
342
3%
360
8%
91.2
-73%
94.8
-71%
109
-67%
118
-64%
113
-66%
126
-62%
319 ?()
-4%
84.8 ?(0.97 - 403, n=593)
-74%
SPECviewperf 13
-10%
-23%
-36%
5%
12%
25%
-62%
-56%
-43%
-32%
-19%
-5%
23%
-64%
3ds Max (3dsmax-06)
380
424
12%
416
9%
280
-26%
439
16%
506
33%
564
48%
252
-34%
286
-25%
381
0%
433
14%
497
31%
563
48%
497 ?()
31%
Catia (catia-05)
598
616
3%
588
-2%
410
-31%
661
11%
728
22%
825
38%
163
-73%
187
-69%
241
-60%
290
-52%
340
-43%
402
-33%
579 ?()
-3%
197.3 ?(15.6 - 900, n=473)
-67%
Creo (creo-02)
454
431
-5%
374
-18%
294
-35%
470
4%
567
25%
613
35%
230
-49%
298
-34%
375
-17%
455
0%
529
17%
552
22%
590 ?()
30%
199.7 ?(1.68 - 684, n=473)
-56%
Energy (energy-02)
146
93.6
-36%
60.8
-58%
82.9
-43%
150
3%
147
1%
187
28%
34.6
-76%
45.3
-69%
54.2
-63%
72.8
-50%
92.6
-37%
126
-14%
230 ?()
58%
35.3 ?(0.21 - 310, n=459)
-76%
Maya (maya-05)
581
544
-6%
460
-21%
333
-43%
580
0%
670
15%
735
27%
343
-41%
395
-32%
510
-12%
591
2%
678
17%
715
23%
637 ?()
10%
Medical (medical-02)
348
166
-52%
226
-35%
372
7%
237
-32%
263
-24%
76.5
-78%
92
-74%
112
-68%
132
-62%
150
-57%
186
-47%
332 ?()
-5%
75.8 ?(1.96 - 479, n=467)
-78%
Showcase (showcase-02)
243
230
-5%
264
9%
127
-48%
221
-9%
279
15%
323
33%
108
-56%
121
-50%
191
-21%
244
0%
334
37%
455
87%
430 ?()
77%
117.1 ?(4.99 - 459, n=465)
-52%
Siemens NX (snx-03)
512
537
5%
101
-80%
379
-26%
617
21%
675
32%
725
42%
25.6
-95%
26.3
-95%
29.5
-94%
34.1
-93%
39
-92%
49.1
-90%
127.2 ?(1.76 - 901, n=471)
-75%
Solidworks (sw-04)
321
304
-5%
254
-21%
195
-39%
287
-11%
307
-4%
323
1%
127
-60%
135
-58%
157
-51%
168
-48%
179
-44%
186
-42%
278 ?()
-13%
119.3 ?(3.69 - 373, n=476)
-63%
SPECviewperf 2020
-12%
-33%
-38%
10%
10%
26%
-63%
-57%
-42%
-31%
-18%
3%
98%
-55%
3840x2160 Siemens NX (snx-04)
336
330
-2%
98.4
-71%
240
-29%
402
20%
476
42%
514
53%
19.5
-94%
20.1
-94%
23.9
-93%
27.5
-92%
31.9
-91%
41.3
-88%
974 ?()
190%
93.9 ?(2.25 - 974, n=267)
-72%
3840x2160 Medical (medical-03)
66.7
36.4
-45%
35
-48%
36.1
-46%
76.1
14%
53.9
-19%
62.3
-7%
13.7
-79%
17.5
-74%
22.2
-67%
26.9
-60%
32.2
-52%
45.9
-31%
79 ?()
18%
19.7 ?(0.78 - 105, n=268)
-70%
3840x2160 Maya (maya-06)
335
331
-1%
315
-6%
178
-47%
346
3%
401
20%
481
44%
196
-41%
226
-33%
305
-9%
372
11%
447
33%
498
49%
506 ?()
51%
3840x2160 Energy (energy-03)
116
113
-3%
69.3
-40%
67
-42%
133
15%
99.6
-14%
129
11%
33.2
-71%
44.8
-61%
57.6
-50%
75.7
-35%
90.4
-22%
141
22%
457 ?()
294%
3840x2160 Creo (creo-03)
150
136
-9%
92.4
-38%
106
-29%
159
6%
173
15%
187
25%
85.9
-43%
95.8
-36%
112
-25%
121
-19%
128
-15%
133
-11%
191 ?()
27%
76.6 ?(8.75 - 211, n=267)
-49%
3840x2160 CATIA (catia-06)
103
92.2
-10%
59.7
-42%
68
-34%
107
4%
113
10%
127
23%
34
-67%
39.1
-62%
51.6
-50%
61.2
-41%
75.5
-27%
95.3
-7%
139 ?()
35%
46.2 ?(2.11 - 153, n=266)
-55%
3840x2160 3ds Max (3dsmax-07)
123
102
-17%
140
14%
72.9
-41%
134
9%
143
16%
167
36%
67.4
-45%
74.5
-39%
122
-1%
147
20%
179
46%
228
85%
207 ?()
68%
77.6 ?(3.24 - 240, n=268)
-37%
Media totale (Programma / Settaggio)
-8% / -8%
-27% / -27%
-36% / -36%
6% / 5%
14% / 15%
29% / 29%
-62% / -62%
-56% / -56%
-42% / -42%
-31% / -31%
-19% / -19%
-5% / -6%
52% / 49%
-62% / -63%

Prestazioni di gioco

I test sintetici ci danno una prima impressione delle prestazioni della scheda grafica in questo senso. Nei nostri test di gioco, Asus TUF Gaming Radeon RX 7800 XT OC si comporta abbastanza bene, anche se le prestazioni sono solo leggermente superiori nel confronto diretto con il modello di riferimento. In sostanza, la nostra unità di prova si posiziona esattamente dove ci saremmo aspettati. Tuttavia, data l'ampia gamma di giochi, non siamo in grado di fornire una dichiarazione generale sulle prestazioni della AMD Radeon RX 7800 XT rispetto ai suoi concorrenti. Le prestazioni delle schede grafiche possono essere valutate solo in combinazione con il gioco specifico. Nella maggior parte dei casi, si tratta di un duello tra la Asus TUF Gaming Radeon RX 7800 XT OC e la Radeon RX 7800 XT OC KFA2 GeForce RTX 4070 EX Gamer. Entrambi i modelli offrono prestazioni simili e, a seconda del gioco, la squadra verde o quella rossa saranno in vantaggio.

Uno sguardo all'elenco di tutti i giochi testati con la Asus TUF Gaming Radeon RX 7800 XT OC dipinge un buon quadro. La scheda grafica offre attualmente prestazioni sufficienti per giocare senza problemi anche ai giochi più attuali in 1440p. Il modello di GPU padroneggia molti giochi anche a 2160p, anche se la scheda grafica copre maggiormente l'area QHD. Coloro che hanno un display UHD e vogliono giocare senza alcuna perdita di dettagli dovrebbero dare un'occhiata ai modelli 7900 di AMD.

Hogwarts Legacy
2560x1440 Ultra Preset AA:High T
KFA2 GeForce RTX 4080 Super SG
110.3 (34.8min, 53.2P0.1, 77.1P1) fps +38%
MSI Radeon RX 6950 XT Gaming X Trio
100 (43.1min, 58.7P0.1, 79.7P1) fps +25%
AMD Radeon RX 7900 GRE
91.2 (30.3min, 49.4P0.1, 72P1) fps +14%
KFA2 GeForce RTX 4070 Ti EX Gamer
86.4 (26.8min, 40.2P0.1, 59.3P1) fps +8%
KFA2 GeForce RTX 4070 EX Gamer
84.2 (30.8min, 42.2P0.1, 60.8P1) fps +6%
ASUS TUF Gaming Radeon RX 7800 XT
79.8 (26.8min, 39.8P0.1, 62P1) fps
AMD Radeon RX 7800 XT
76.4 (27.8min, 38.4P0.1, 61P1) fps -4%
Sapphire Pulse Radeon RX 7700 XT
66.9 (26.3min, 39.2P0.1, 54.8P1) fps -16%
KFA2 GeForce RTX 4060 Ti EX, 16GB GDDR6
57.6 (26.1min, 32.7P0.1, 43.9P1) fps -28%
XFX Speedster QICK 308 Radeon RX 7600 Black Edition
49.6 (22.5min, 23.6P0.1, 39.5P1) fps -38%
KFA2 GeForce RTX 4060 1-Click-OC 2X
46.3 (9.49min, 23.4P0.1, 35.2P1) fps -42%
1920x1080 Ultra Preset AA:High T
KFA2 GeForce RTX 4080 Super SG
152 (42.3min, 60.8P0.1, 99P1) fps +41%
MSI Radeon RX 6950 XT Gaming X Trio
122.3 (48.3min, 57.1P0.1, 88.1P1) fps +14%
AMD Radeon RX 7900 GRE
118.1 (33.4min, 56.2P0.1, 87.6P1) fps +10%
KFA2 GeForce RTX 4070 Ti EX Gamer
118 (35.3min, 49.6P0.1, 78P1) fps +10%
KFA2 GeForce RTX 4070 EX Gamer
112.8 (27.7min, 44.8P0.1, 66.8P1) fps +5%
AMD Radeon RX 7800 XT
108.2 (34.2min, 51.7P0.1, 83.9P1) fps +1%
ASUS TUF Gaming Radeon RX 7800 XT
107.5 (30.4min, 54.4P0.1, 82.9P1) fps
Sapphire Pulse Radeon RX 7700 XT
91.4 (30.4min, 50.9P0.1, 73.2P1) fps -15%
KFA2 GeForce RTX 4060 Ti EX, 16GB GDDR6
80 (25.1min, 40.4P0.1, 54P1) fps -26%
XFX Speedster QICK 308 Radeon RX 7600 Black Edition
71 (29.1min, 33.8P0.1, 53P1) fps -34%
KFA2 GeForce RTX 4060 1-Click-OC 2X
66.5 (29.1min, 37.8P0.1, 49.7P1) fps -38%
The Witcher 3
1920x1080 Ultra Graphics & Postprocessing (HBAO+)
Palit GeForce RTX 4090 GameRock OC
314 (65.8min, 172.6P0.1, 242P1) fps +49%
AMD Radeon RX 7900 XTX
297 (41.3min, 167.7P0.1, 245P1) fps +41%
KFA2 GeForce RTX 4080 SG
268 (91.3min, 148.4P0.1, 218P1) fps +27%
AMD Radeon RX 7900 XT
265 (104.1min, 151.5P0.1, 214P1) fps +26%
KFA2 GeForce RTX 4080 Super SG
263 (32.6min, 124.1P0.1, 207P1) fps +25%
MSI Radeon RX 6950 XT Gaming X Trio
226 (104.3min, 134P0.1, 181P1) fps +7%
KFA2 GeForce RTX 4070 Ti EX Gamer
216.8 fps +3%
ASUS TUF Gaming Radeon RX 7800 XT
211 (108.9min, 123.7P0.1, 174.6P1) fps
AMD Radeon RX 7900 GRE
210.2 fps 0%
Asus TUF Gaming GeForce RTX 4070 Ti Super
210 (190min, 190P1) fps 0%
Media NVIDIA GeForce RTX 4070 SUPER (191.9 - 210, n=2)
201 fps -5%
AMD Radeon RX 7800 XT
189.6 fps -10%
KFA2 GeForce RTX 4070 EX Gamer
171.2 fps -19%
Sapphire Pulse Radeon RX 7700 XT
168.3 (89min, 96.5P0.1, 143.7P1) fps -20%
KFA2 GeForce RTX 4060 Ti EX, 16GB GDDR6
132.3 fps -37%
XFX Speedster QICK 308 Radeon RX 7600 Black Edition
122.5 fps -42%
KFA2 GeForce RTX 4060 1-Click-OC 2X
111.6 fps -47%
1920x1080 High Graphics & Postprocessing (Nvidia HairWorks Off)
Palit GeForce RTX 4090 GameRock OC
661 (125.9min, 322P0.1, 472P1) fps +72%
KFA2 GeForce RTX 4080 SG
549 (71.3min, 221P0.1, 391P1) fps +43%
KFA2 GeForce RTX 4080 Super SG
547 (29.1min, 263P0.1, 392P1) fps +42%
AMD Radeon RX 7900 XTX
538 (75.6min, 268P0.1, 424P1) fps +40%
AMD Radeon RX 7900 XT
483 (95.4min, 251P0.1, 366P1) fps +26%
KFA2 GeForce RTX 4070 Ti EX Gamer
440.7 fps +15%
Asus TUF Gaming GeForce RTX 4070 Ti Super
430 (383min, 384.28P1) fps +12%
Media NVIDIA GeForce RTX 4070 SUPER (406 - 418, n=2)
412 fps +7%
MSI Radeon RX 6950 XT Gaming X Trio
395 (54.3min, 254P0.1, 308P1) fps +3%
AMD Radeon RX 7900 GRE
390 fps +2%
ASUS TUF Gaming Radeon RX 7800 XT
384 (46.5min, 183.4P0.1, 319P1) fps
KFA2 GeForce RTX 4070 EX Gamer
351.4 fps -8%
AMD Radeon RX 7800 XT
348.5 fps -9%
Sapphire Pulse Radeon RX 7700 XT
295 (99.3min, 207P0.1, 248P1) fps -23%
KFA2 GeForce RTX 4060 Ti EX, 16GB GDDR6
269.5 fps -30%
KFA2 GeForce RTX 4060 1-Click-OC 2X
214.9 fps -44%
XFX Speedster QICK 308 Radeon RX 7600 Black Edition
209.5 fps -45%
Metro Exodus
2560x1440 Ultra Quality AF:16x
Palit GeForce RTX 4090 GameRock OC
194.6 (92.87min) fps +78%
KFA2 GeForce RTX 4080 Super SG
161.8 (85.35min) fps +48%
AMD Radeon RX 7900 XTX
154.5 (90.83min) fps +41%
KFA2 GeForce RTX 4080 SG
153.7 (78.14min) fps +41%
AMD Radeon RX 7900 XT
135 (79.57min) fps +24%
Asus TUF Gaming GeForce RTX 4070 Ti Super
130.9 (70.75min) fps +20%
KFA2 GeForce RTX 4070 Ti EX Gamer
126.7 (70.16min) fps +16%
MSI Radeon RX 6950 XT Gaming X Trio
124.6 (75.06min) fps +14%
Media NVIDIA GeForce RTX 4070 SUPER (116.1 - 120.8, n=2)
118.5 fps +9%
AMD Radeon RX 7900 GRE
112 (65.69min) fps +3%
ASUS TUF Gaming Radeon RX 7800 XT
109.2 (65.93min) fps
KFA2 GeForce RTX 4070 EX Gamer
103.7 (58.34min) fps -5%
AMD Radeon RX 7800 XT
102.6 (62.24min) fps -6%
Sapphire Pulse Radeon RX 7700 XT
89.6 (55.65min) fps -18%
KFA2 GeForce RTX 4060 Ti EX, 16GB GDDR6
78.6 (46.09min) fps -28%
XFX Speedster QICK 308 Radeon RX 7600 Black Edition
64.9 (40.24min) fps -41%
KFA2 GeForce RTX 4060 1-Click-OC 2X
62.9 (36.84min) fps -42%
1920x1080 Ultra Quality AF:16x
Palit GeForce RTX 4090 GameRock OC
214 (96.03min) fps +57%
KFA2 GeForce RTX 4080 Super SG
186.1 (87.35min) fps +36%
AMD Radeon RX 7900 XTX
183.5 (102.51min) fps +34%
KFA2 GeForce RTX 4080 SG
177.7 (81.95min) fps +30%
AMD Radeon RX 7900 XT
164.6 (92.11min) fps +21%
Asus TUF Gaming GeForce RTX 4070 Ti Super
158.3 (76.42min) fps +16%
KFA2 GeForce RTX 4070 Ti EX Gamer
155.6 (75.36min) fps +14%
MSI Radeon RX 6950 XT Gaming X Trio
151.3 (85.77min) fps +11%
Media NVIDIA GeForce RTX 4070 SUPER (144.8 - 150.6, n=2)
147.7 fps +8%
AMD Radeon RX 7900 GRE
137.3 (75.98min) fps +1%
ASUS TUF Gaming Radeon RX 7800 XT
136.5 (75.77min) fps
KFA2 GeForce RTX 4070 EX Gamer
130.2 (69.55min) fps -5%
AMD Radeon RX 7800 XT
128.5 (73.66min) fps -6%
Sapphire Pulse Radeon RX 7700 XT
113.9 (65.05min) fps -17%
KFA2 GeForce RTX 4060 Ti EX, 16GB GDDR6
100 (54.12min) fps -27%
XFX Speedster QICK 308 Radeon RX 7600 Black Edition
83.5 (48.41min) fps -39%
KFA2 GeForce RTX 4060 1-Click-OC 2X
80.2 (41.91min) fps -41%
Far Cry 5
2560x1440 Ultra Preset AA:T
Palit GeForce RTX 4090 GameRock OC
216 (164min) fps +13%
KFA2 GeForce RTX 4080 Super SG
208 (154min) fps +9%
ASUS TUF Gaming Radeon RX 7800 XT
191 (147min) fps
Asus TUF Gaming GeForce RTX 4070 Ti Super
187 (146min) fps -2%
KFA2 GeForce RTX 4080 SG
185 (133min) fps -3%
Media NVIDIA GeForce RTX 4070 SUPER (181 - 185, n=2)
183 fps -4%
KFA2 GeForce RTX 4070 Ti EX Gamer
182 (139min) fps -5%
AMD Radeon RX 7900 XTX
174 (133min) fps -9%
AMD Radeon RX 7900 XT
173 (134min) fps -9%
AMD Radeon RX 7900 GRE
173 (131min) fps -9%
MSI Radeon RX 6950 XT Gaming X Trio
172 (131min) fps -10%
KFA2 GeForce RTX 4070 EX Gamer
171 (138min) fps -10%
AMD Radeon RX 7800 XT
161 (122min) fps -16%
Sapphire Pulse Radeon RX 7700 XT
157 (129min) fps -18%
KFA2 GeForce RTX 4060 Ti EX, 16GB GDDR6
127 (112min) fps -34%
XFX Speedster QICK 308 Radeon RX 7600 Black Edition
115 (100min) fps -40%
KFA2 GeForce RTX 4060 1-Click-OC 2X
110 (98min) fps -42%
1920x1080 Ultra Preset AA:T
Palit GeForce RTX 4090 GameRock OC
217 (159min) fps +8%
KFA2 GeForce RTX 4080 Super SG
212 (150min) fps +5%
ASUS TUF Gaming Radeon RX 7800 XT
201 (151min) fps
Media NVIDIA GeForce RTX 4070 SUPER (188 - 191, n=2)
189.5 fps -6%
KFA2 GeForce RTX 4070 EX Gamer
189 (137min) fps -6%
KFA2 GeForce RTX 4080 SG
188 (138min) fps -6%
KFA2 GeForce RTX 4070 Ti EX Gamer
188 (141min) fps -6%
Asus TUF Gaming GeForce RTX 4070 Ti Super
188 (143min) fps -6%
AMD Radeon RX 7900 XTX
175 (129min) fps -13%
MSI Radeon RX 6950 XT Gaming X Trio
174 (131min) fps -13%
AMD Radeon RX 7900 XT
173 (129min) fps -14%
AMD Radeon RX 7900 GRE
173 (124min) fps -14%
KFA2 GeForce RTX 4060 Ti EX, 16GB GDDR6
171 (127min) fps -15%
Sapphire Pulse Radeon RX 7700 XT
167 (121min) fps -17%
XFX Speedster QICK 308 Radeon RX 7600 Black Edition
163 (133min) fps -19%
KFA2 GeForce RTX 4060 1-Click-OC 2X
162 (141min) fps -19%
AMD Radeon RX 7800 XT
162 (126min) fps -19%
Far Cry 6
2560x1440 Ultra Graphics Quality + HD Textures AA:T
Palit GeForce RTX 4090 GameRock OC
195.6 (152min) fps +28%
KFA2 GeForce RTX 4080 Super SG
181 (144min) fps +19%
AMD Radeon RX 7900 XTX
176.4 (126min) fps +16%
AMD Radeon RX 7900 XT
167.9 (125min) fps +10%
Asus TUF Gaming GeForce RTX 4070 Ti Super
154 (133min) fps +1%
KFA2 GeForce RTX 4070 Ti EX Gamer
153.4 (128min) fps 0%
ASUS TUF Gaming Radeon RX 7800 XT
152.7 (140min) fps
AMD Radeon RX 7900 GRE
151.5 (132min) fps -1%
KFA2 GeForce RTX 4080 SG
150.6 (112min) fps -1%
MSI Radeon RX 6950 XT Gaming X Trio
148.8 (110min) fps -3%
AMD Radeon RX 7800 XT
147.3 (129min) fps -4%
Media NVIDIA GeForce RTX 4070 SUPER (139.4 - 145.9, n=2)
142.7 fps -7%
KFA2 GeForce RTX 4070 EX Gamer
134.1 (123min) fps -12%
Sapphire Pulse Radeon RX 7700 XT
121.9 (109min) fps -20%
KFA2 GeForce RTX 4060 Ti EX, 16GB GDDR6
98.9 (89min) fps -35%
KFA2 GeForce RTX 4060 1-Click-OC 2X
85.4 (71min) fps -44%
XFX Speedster QICK 308 Radeon RX 7600 Black Edition
82.7 (67min) fps -46%
1920x1080 Ultra Graphics Quality + HD Textures AA:T
Palit GeForce RTX 4090 GameRock OC
204 (159min) fps +4%
KFA2 GeForce RTX 4080 Super SG
197.5 (151min) fps +1%
ASUS TUF Gaming Radeon RX 7800 XT
195.7 (160min) fps
AMD Radeon RX 7900 GRE
186.4 (135min) fps -5%
AMD Radeon RX 7900 XTX
183.6 (130min) fps -6%
AMD Radeon RX 7900 XT
181.9 (129min) fps -7%
AMD Radeon RX 7800 XT
180.1 (131min) fps -8%
KFA2 GeForce RTX 4070 Ti EX Gamer
174.6 (130min) fps -11%
Asus TUF Gaming GeForce RTX 4070 Ti Super
169 (132min) fps -14%
KFA2 GeForce RTX 4070 EX Gamer
167.7 (132min) fps -14%
Sapphire Pulse Radeon RX 7700 XT
161.8 (132min) fps -17%
MSI Radeon RX 6950 XT Gaming X Trio
161.2 (116min) fps -18%
Media NVIDIA GeForce RTX 4070 SUPER (143.9 - 173.6, n=3)
159.2 fps -19%
KFA2 GeForce RTX 4080 SG
155 (118min) fps -21%
KFA2 GeForce RTX 4060 Ti EX, 16GB GDDR6
136.1 (121min) fps -30%
XFX Speedster QICK 308 Radeon RX 7600 Black Edition
123.6 (97min) fps -37%
KFA2 GeForce RTX 4060 1-Click-OC 2X
122.1 (91min) fps -38%
F1 2021
2560x1440 Ultra High Preset + Raytracing AA:T AF:16x
Palit GeForce RTX 4090 GameRock OC (874931)
291 (246min, 214P1) fps +79%
KFA2 GeForce RTX 4080 Super SG (874931)
253 (212min, 205P1) fps +55%
KFA2 GeForce RTX 4080 SG (874931)
240 (202min, 180P1) fps +47%
AMD Radeon RX 7900 XTX (874931)
220 (183min, 170P1) fps +35%
KFA2 GeForce RTX 4070 Ti EX Gamer (874931)
199.8 (168min, 166P1) fps +23%
AMD Radeon RX 7900 XT (874931)
192.8 (158min, 160P1) fps +18%
MSI Radeon RX 6950 XT Gaming X Trio (874931)
179.7 (152min, 150P1) fps +10%
KFA2 GeForce RTX 4070 EX Gamer (874931)
163.6 (138min, 138P1) fps 0%
ASUS TUF Gaming Radeon RX 7800 XT (874931)
163 (139min, 136P1) fps
AMD Radeon RX 7900 GRE (874931)
161.2 (137min, 136P1) fps -1%
AMD Radeon RX 7800 XT (874931)
155.9 (135min, 133P1) fps -4%
Sapphire Pulse Radeon RX 7700 XT (874931)
129.5 (111min, 110P1) fps -21%
KFA2 GeForce RTX 4060 Ti EX, 16GB GDDR6 (874931)
126.7 (108min, 107P1) fps -22%
XFX Speedster QICK 308 Radeon RX 7600 Black Edition (874931)
88.7 (75min, 75P1) fps -46%
1920x1080 Ultra High Preset + Raytracing AA:T AF:16x
Palit GeForce RTX 4090 GameRock OC (874931)
307 (260min, 234P1) fps +43%
KFA2 GeForce RTX 4080 Super SG (874931)
300 (249min, 213P1) fps +40%
AMD Radeon RX 7900 XTX (874931)
262 (192min, 192P1) fps +22%
KFA2 GeForce RTX 4080 SG (874931)
256 (207min, 197P1) fps +20%
KFA2 GeForce RTX 4070 Ti EX Gamer (874931)
250 (211min, 195P1) fps +17%
AMD Radeon RX 7900 XT (874931)
248 (199min, 195P1) fps +16%
MSI Radeon RX 6950 XT Gaming X Trio (874931)
237 (196min, 195P1) fps +11%
KFA2 GeForce RTX 4070 EX Gamer (874931)
225 (190min, 185P1) fps +5%
ASUS TUF Gaming Radeon RX 7800 XT (874931)
214 (180min, 172P1) fps
AMD Radeon RX 7900 GRE (874931)
209 (171min, 173P1) fps -2%
AMD Radeon RX 7800 XT (874931)
207 (172min, 169P1) fps -3%
KFA2 GeForce RTX 4060 Ti EX, 16GB GDDR6 (874931)
176.7 (149min, 148P1) fps -17%
Sapphire Pulse Radeon RX 7700 XT (874931)
172.6 (144min, 145P1) fps -19%
XFX Speedster QICK 308 Radeon RX 7600 Black Edition (874931)
124.9 (104min, 104P1) fps -42%
F1 22
2560x1440 Ultra High Preset AA:T AF:16x
Palit GeForce RTX 4090 GameRock OC (959964)
161.1 (140min, 115P1) fps +117%
KFA2 GeForce RTX 4080 Super SG (959964)
120.6 (105min, 98P1) fps +63%
KFA2 GeForce RTX 4080 SG (939134)
113.8 (99min, 92P1) fps +53%
AMD Radeon RX 7900 XTX (939134)
102.1 (74min, 75P1) fps +38%
Asus TUF Gaming GeForce RTX 4070 Ti Super (959964)
95.1 (82min, 79P1) fps +28%
KFA2 GeForce RTX 4070 Ti EX Gamer (959964)
94.1 (81min, 78P1) fps +27%
AMD Radeon RX 7900 XT (939134)
88.1 (65min, 65P1) fps +19%
Media NVIDIA GeForce RTX 4070 SUPER (83.1 - 88.8, n=2)
86 fps +16%
AMD Radeon RX 7900 GRE (959964)
76.1 (53min, 55P1) fps +3%
MSI Radeon RX 6950 XT Gaming X Trio (939134)
75.4 (56min, 56P1) fps +2%
ASUS TUF Gaming Radeon RX 7800 XT (959964)
74.2 (49min, 52P1) fps
KFA2 GeForce RTX 4070 EX Gamer (959964)
73.7 (63min, 62P1) fps -1%
AMD Radeon RX 7800 XT (959964)
69.8 (47min, 48P1) fps -6%
Sapphire Pulse Radeon RX 7700 XT (959964)
59.9 (41min, 42P1) fps -19%
KFA2 GeForce RTX 4060 Ti EX, 16GB GDDR6 (959964)
56.1 (48min, 47P1) fps -24%
KFA2 GeForce RTX 4060 1-Click-OC 2X (959964)
42.8 (36min, 36P1) fps -42%
XFX Speedster QICK 308 Radeon RX 7600 Black Edition (959964)
37.8 (25min, 26P1) fps -49%
1920x1080 Ultra High Preset AA:T AF:16x
Palit GeForce RTX 4090 GameRock OC (959964)
217 (156min, 142P1) fps +94%
KFA2 GeForce RTX 4080 Super SG (959964)
176.9 (151min, 125P1) fps +58%
KFA2 GeForce RTX 4080 SG (939134)
172.8 (145min, 123P1) fps +54%
AMD Radeon RX 7900 XTX (939134)
148.5 (112min, 104P1) fps +32%
Asus TUF Gaming GeForce RTX 4070 Ti Super (959964)
144.9 (127min, 103P1) fps +29%
KFA2 GeForce RTX 4070 Ti EX Gamer (959964)
144.5 (125min, 104P1) fps +29%
Media NVIDIA GeForce RTX 4070 SUPER (128.7 - 136.3, n=2)
132.5 fps +18%
AMD Radeon RX 7900 XT (939134)
129.8 (99min, 96P1) fps +16%
MSI Radeon RX 6950 XT Gaming X Trio (939134)
115.7 (91min, 88P1) fps +3%
KFA2 GeForce RTX 4070 EX Gamer (959964)
113.3 (99min, 92P1) fps +1%
ASUS TUF Gaming Radeon RX 7800 XT (959964)
112.1 (81min, 82P1) fps
AMD Radeon RX 7900 GRE (959964)
111.5 (82min, 83P1) fps -1%
AMD Radeon RX 7800 XT (959964)
105.5 (74min, 76P1) fps -6%
Sapphire Pulse Radeon RX 7700 XT (959964)
92.3 (65min, 66P1) fps -18%
KFA2 GeForce RTX 4060 Ti EX, 16GB GDDR6 (959964)
88.3 (75min, 74P1) fps -21%
KFA2 GeForce RTX 4060 1-Click-OC 2X (959964)
66.9 (57min, 56P1) fps -40%
XFX Speedster QICK 308 Radeon RX 7600 Black Edition (959964)
61.6 (42min, 43P1) fps -45%
Cyberpunk 2077 1.6
2560x1440 Ultra Preset
AMD Radeon RX 7900 XTX (1.61)
141.1 (43.1min) fps +39%
KFA2 GeForce RTX 4080 SG (1.61)
129.1 (39.6min) fps +27%
KFA2 GeForce RTX 4080 Super SG (1.6)
127.4 (82.1min) fps +25%
AMD Radeon RX 7900 XT (1.61)
122.4 (36min) fps +20%
MSI Radeon RX 6950 XT Gaming X Trio (1.61)
105.1 (85.6min) fps +3%
Asus TUF Gaming GeForce RTX 4070 Ti Super (1.63)
103.6 (82.9min) fps +2%
ASUS TUF Gaming Radeon RX 7800 XT (1.6)
101.7 (71min) fps
AMD Radeon RX 7900 GRE (1.6)
101.1 (69.2min) fps -1%
KFA2 GeForce RTX 4070 Ti EX Gamer
100.7 fps -1%
AMD Radeon RX 7800 XT (1.6)
96.6 (65.6min) fps -5%
Media NVIDIA GeForce RTX 4070 SUPER (91.3 - 92.8, n=2)
92.1 fps -9%
KFA2 GeForce RTX 4070 EX Gamer
80.3 fps -21%
Sapphire Pulse Radeon RX 7700 XT (1.6)
80.2 (57.3min) fps -21%
KFA2 GeForce RTX 4060 Ti EX, 16GB GDDR6 (1.6)
62.2 (40.3min) fps -39%
XFX Speedster QICK 308 Radeon RX 7600 Black Edition (1.6)
55.9 (39.5min) fps -45%
KFA2 GeForce RTX 4060 1-Click-OC 2X (1.6)
47.7 (29.9min) fps -53%
1920x1080 Ultra Preset
KFA2 GeForce RTX 4080 Super SG (1.6)
220 (127min) fps +45%
AMD Radeon RX 7900 XTX (1.61)
199.3 (42.6min) fps +31%
KFA2 GeForce RTX 4080 SG (1.61)
190.1 (74.5min) fps +25%
AMD Radeon RX 7900 XT (1.61)
178.6 (45.1min) fps +18%
MSI Radeon RX 6950 XT Gaming X Trio (1.61)
161.5 (91.4min) fps +6%
KFA2 GeForce RTX 4070 Ti EX Gamer
159.4 fps +5%
Asus TUF Gaming GeForce RTX 4070 Ti Super (1.63)
157.5 (85.2min) fps +4%
AMD Radeon RX 7900 GRE (1.6)
155.3 (94.9min) fps +2%
ASUS TUF Gaming Radeon RX 7800 XT (1.6)
151.8 (109min) fps
AMD Radeon RX 7800 XT (1.6)
148.1 (108.5min) fps -2%
Media NVIDIA GeForce RTX 4070 SUPER (141 - 146, n=2)
143.5 fps -5%
KFA2 GeForce RTX 4070 EX Gamer
131 fps -14%
Sapphire Pulse Radeon RX 7700 XT (1.6)
122.1 (51.2min) fps -20%
KFA2 GeForce RTX 4060 Ti EX, 16GB GDDR6 (1.6)
102.6 (65.6min) fps -32%
XFX Speedster QICK 308 Radeon RX 7600 Black Edition (1.6)
89.9 (65.8min) fps -41%
KFA2 GeForce RTX 4060 1-Click-OC 2X (1.6)
79.9 (51.2min) fps -47%
A Plague Tale Requiem
2560x1440 Ultra Preset
KFA2 GeForce RTX 4080 Super SG
101.6 (71.5min, 79.3P0.1, 86.1P1) fps +49%
AMD Radeon RX 7900 XTX
97.5 (74.2min, 78P0.1, 80.8P1) fps +43%
KFA2 GeForce RTX 4080 SG
95.4 (34.6min, 73P0.1, 80P1) fps +40%
AMD Radeon RX 7900 XT
84.1 (53min, 65.3P0.1, 71.6P1) fps +23%
KFA2 GeForce RTX 4070 Ti EX Gamer
77.2 (60.6min, 63.9P0.1, 66.2P1) fps +13%
MSI Radeon RX 6950 XT Gaming X Trio
72.8 (53.4min, 61.7P0.1, 63.4P1) fps +7%
AMD Radeon RX 7900 GRE
70.3 (50.2min, 55.1P0.1, 60.4P1) fps +3%
ASUS TUF Gaming Radeon RX 7800 XT
68.3 (48min, 55.8P0.1, 58.9P1) fps
AMD Radeon RX 7800 XT
64.9 (52.3min, 55.6P0.1, 56.5P1) fps -5%
KFA2 GeForce RTX 4070 EX Gamer
61 (50.3min, 52P0.1, 53.7P1) fps -11%
Sapphire Pulse Radeon RX 7700 XT
52.6 (44.8min, 45.2P0.1, 46.2P1) fps -23%
KFA2 GeForce RTX 4060 Ti EX, 16GB GDDR6
46.1 (38min, 38.4P0.1, 40.2P1) fps -33%
XFX Speedster QICK 308 Radeon RX 7600 Black Edition
38.4 (30.5min, 31.8P0.1, 33.7P1) fps -44%
KFA2 GeForce RTX 4060 1-Click-OC 2X
36 (21.5min, 28.8P0.1, 31.6P1) fps -47%
1920x1080 Ultra Preset
KFA2 GeForce RTX 4080 Super SG
132.1 (68min, 83.4P0.1, 108.7P1) fps +46%
KFA2 GeForce RTX 4080 SG
127 (59.5min, 71.8P0.1, 101.3P1) fps +40%
AMD Radeon RX 7900 XTX
121.4 (78.8min, 93.9P0.1, 100.1P1) fps +34%
AMD Radeon RX 7900 XT
106 (76.6min, 84.5P0.1, 89.8P1) fps +17%
KFA2 GeForce RTX 4070 Ti EX Gamer
105 (51.4min, 63P0.1, 84.7P1) fps +16%
AMD Radeon RX 7900 GRE
91.9 (55.1min, 70.7P0.1, 76.4P1) fps +2%
MSI Radeon RX 6950 XT Gaming X Trio
91.5 (62.8min, 70.7P0.1, 77P1) fps +1%
ASUS TUF Gaming Radeon RX 7800 XT
90.4 (48.3min, 71.3P0.1, 76.5P1) fps
AMD Radeon RX 7800 XT
86.3 (50.7min, 62.7P0.1, 72.4P1) fps -5%
KFA2 GeForce RTX 4070 EX Gamer
85.9 (54.1min, 57.2P0.1, 71.7P1) fps -5%
Sapphire Pulse Radeon RX 7700 XT
70.1 (49.3min, 57.4P0.1, 60.1P1) fps -22%
KFA2 GeForce RTX 4060 Ti EX, 16GB GDDR6
65.8 (38.1min, 43.3P0.1, 55.7P1) fps -27%
XFX Speedster QICK 308 Radeon RX 7600 Black Edition
53.4 (42.7min, 42.9P0.1, 46.1P1) fps -41%
KFA2 GeForce RTX 4060 1-Click-OC 2X
50.8 (38.8min, 40.3P0.1, 43.6P1) fps -44%
Spider-Man Miles Morales
2560x1440 Very High Preset AA:T
KFA2 GeForce RTX 4080 SG
202 (80.4min, 94.3P0.1, 151.7P1) fps +45%
KFA2 GeForce RTX 4080 Super SG
186.7 (81.9min, 97.2P0.1, 146.5P1) fps +34%
AMD Radeon RX 7900 XTX
146.3 (77.4min, 85.4P0.1, 114.1P1) fps +5%
KFA2 GeForce RTX 4070 Ti EX Gamer
143.9 (74.9min, 88.7P0.1, 118.9P1) fps +4%
ASUS TUF Gaming Radeon RX 7800 XT
139 (96.9min, 101.8P0.1, 113.5P1) fps
AMD Radeon RX 7900 XT
135 (82min, 84.7P0.1, 104.7P1) fps -3%
KFA2 GeForce RTX 4070 EX Gamer
124.2 (73.8min, 87.3P0.1, 101.6P1) fps -11%
AMD Radeon RX 7900 GRE
122.7 (80.8min, 85.2P0.1, 100.5P1) fps -12%
MSI Radeon RX 6950 XT Gaming X Trio
121.2 (76min, 80.1P0.1, 95.4P1) fps -13%
AMD Radeon RX 7800 XT
116.7 (74.3min, 84.1P0.1, 95.3P1) fps -16%
Sapphire Pulse Radeon RX 7700 XT
100.6 (69.8min, 75.1P0.1, 81P1) fps -28%
KFA2 GeForce RTX 4060 Ti EX, 16GB GDDR6
98.4 (70.7min, 76.6P0.1, 81.3P1) fps -29%
KFA2 GeForce RTX 4060 1-Click-OC 2X
80.1 (24.9min, 56.5P0.1, 69.7P1) fps -42%
XFX Speedster QICK 308 Radeon RX 7600 Black Edition
74.5 (34.3min, 38.6P0.1, 59.3P1) fps -46%
1920x1080 Very High Preset AA:T
KFA2 GeForce RTX 4080 Super SG
188.5 (74min, 99.6P0.1, 147.3P1) fps +5%
ASUS TUF Gaming Radeon RX 7800 XT
179.4 (92.1min, 102.1P0.1, 132.5P1) fps
KFA2 GeForce RTX 4070 Ti EX Gamer
169.9 (67min, 83.9P0.1, 129P1) fps -5%
AMD Radeon RX 7900 XTX
162.8 (76.5min, 84P0.1, 125.2P1) fps -9%
KFA2 GeForce RTX 4070 EX Gamer
160.3 (72.4min, 93P0.1, 123.2P1) fps -11%
KFA2 GeForce RTX 4080 SG
157.3 (69.1min, 89.3P0.1, 120.5P1) fps -12%
AMD Radeon RX 7900 XT
156.2 (81.9min, 86.6P0.1, 116P1) fps -13%
AMD Radeon RX 7800 XT
150 (64.1min, 73.9P0.1, 106P1) fps -16%
AMD Radeon RX 7900 GRE
144.4 (80min, 88.2P0.1, 116.5P1) fps -20%
MSI Radeon RX 6950 XT Gaming X Trio
143 (79.3min, 82.8P0.1, 110.5P1) fps -20%
KFA2 GeForce RTX 4060 Ti EX, 16GB GDDR6
128.2 (78.2min, 84.6P0.1, 103.1P1) fps -29%
Sapphire Pulse Radeon RX 7700 XT
121.1 (70.9min, 81.1P0.1, 94.4P1) fps -32%
KFA2 GeForce RTX 4060 1-Click-OC 2X
111.7 (78.2min, 84.8P0.1, 88.7P1) fps -38%
XFX Speedster QICK 308 Radeon RX 7600 Black Edition
107.9 (17.3min, 53.6P0.1, 84.1P1) fps -40%
Borderlands 3
2560x1440 Badass Overall Quality (DX11)
Palit GeForce RTX 4090 GameRock OC
198.4 fps +81%
KFA2 GeForce RTX 4080 Super SG
170.9 fps +56%
KFA2 GeForce RTX 4080 SG
163.2 fps +49%
AMD Radeon RX 7900 XTX
152.2 fps +39%
Asus TUF Gaming GeForce RTX 4070 Ti Super
143.6 fps +31%
AMD Radeon RX 7900 XT
135.2 fps +23%
KFA2 GeForce RTX 4070 Ti EX Gamer
134.3 fps +23%
MSI Radeon RX 6950 XT Gaming X Trio
132.3 fps +21%
Media NVIDIA GeForce RTX 4070 SUPER (125.4 - 131.2, n=2)
128.3 fps +17%
AMD Radeon RX 7900 GRE
115.5 fps +5%
KFA2 GeForce RTX 4070 EX Gamer
111.2 fps +1%
ASUS TUF Gaming Radeon RX 7800 XT
109.6 fps
AMD Radeon RX 7800 XT
105.5 fps -4%
Sapphire Pulse Radeon RX 7700 XT
89.4 fps -18%
KFA2 GeForce RTX 4060 Ti EX, 16GB GDDR6
81.7 fps -25%
XFX Speedster QICK 308 Radeon RX 7600 Black Edition
65.7 fps -40%
KFA2 GeForce RTX 4060 1-Click-OC 2X
64.8 fps -41%
1920x1080 Badass Overall Quality (DX11)
Palit GeForce RTX 4090 GameRock OC
204 fps +39%
KFA2 GeForce RTX 4080 Super SG
195.8 fps +33%
KFA2 GeForce RTX 4080 SG
187.2 fps +27%
AMD Radeon RX 7900 XTX
180.2 fps +23%
KFA2 GeForce RTX 4070 Ti EX Gamer
171.4 fps +17%
Asus TUF Gaming GeForce RTX 4070 Ti Super
169.6 fps +15%
AMD Radeon RX 7900 XT
169.4 fps +15%
MSI Radeon RX 6950 XT Gaming X Trio
169.1 fps +15%
Media NVIDIA GeForce RTX 4070 SUPER (163.4 - 166.6, n=2)
165 fps +12%
KFA2 GeForce RTX 4070 EX Gamer
156.3 fps +6%
AMD Radeon RX 7900 GRE
153.4 fps +4%
ASUS TUF Gaming Radeon RX 7800 XT
147 fps
AMD Radeon RX 7800 XT
141.8 fps -4%
Sapphire Pulse Radeon RX 7700 XT
126.4 fps -14%
KFA2 GeForce RTX 4060 Ti EX, 16GB GDDR6
117.3 fps -20%
XFX Speedster QICK 308 Radeon RX 7600 Black Edition
96.2 fps -35%
KFA2 GeForce RTX 4060 1-Click-OC 2X
93.9 fps -36%
God of War
2560x1440 Ultra Preset
Palit GeForce RTX 4090 GameRock OC
183.3 (95.7min, 120.9P0.1, 155.6P1) fps +76%
AMD Radeon RX 7900 XTX
153.8 (118min, 124.2P0.1, 129.7P1) fps +47%
KFA2 GeForce RTX 4080 Super SG
138.9 (100.7min, 113.9P0.1, 121.2P1) fps +33%
AMD Radeon RX 7900 XT
136.7 (105.2min, 115.2P0.1, 118.2P1) fps +31%
KFA2 GeForce RTX 4080 SG
136.3 (52.3min, 80.9P0.1, 116.8P1) fps +31%
MSI Radeon RX 6950 XT Gaming X Trio
112.9 (86.8min, 94P0.1, 97.4P1) fps +8%
ASUS TUF Gaming Radeon RX 7800 XT
104.4 (82.1min, 82.7P0.1, 86P1) fps
AMD Radeon RX 7900 GRE
104.2 (36min, 85.5P0.1, 89.6P1) fps 0%
AMD Radeon RX 7800 XT
101.7 (86.8min, 87.3P0.1, 89.5P1) fps -3%
KFA2 GeForce RTX 4070 EX Gamer
92.6 (50.7min, 60.4P0.1, 80.2P1) fps -11%
Sapphire Pulse Radeon RX 7700 XT
85.3 (69.3min, 71.3P0.1, 72.7P1) fps -18%
KFA2 GeForce RTX 4060 Ti EX, 16GB GDDR6
67.9 (48.1min, 57.4P0.1, 59.7P1) fps -35%
KFA2 GeForce RTX 4060 1-Click-OC 2X
57.2 (48.1min, 48.5P0.1, 49.6P1) fps -45%
XFX Speedster QICK 308 Radeon RX 7600 Black Edition
56.5 (33.9min, 48.1P0.1, 49.1P1) fps -46%
1920x1080 Ultra Preset
Palit GeForce RTX 4090 GameRock OC
215 (91.5min, 124.3P0.1, 160.9P1) fps +73%
AMD Radeon RX 7900 XTX
185.3 (65.2min, 124P0.1, 138.6P1) fps +49%
KFA2 GeForce RTX 4080 Super SG
165.7 (88min, 93.3P0.1, 133.1P1) fps +33%
AMD Radeon RX 7900 XT
165 (56.4min, 131P0.1, 136.9P1) fps +32%
KFA2 GeForce RTX 4080 SG
164.9 (17.5min, 86.4P0.1, 134.3P1) fps +32%
MSI Radeon RX 6950 XT Gaming X Trio
135.7 (103.2min, 110.3P0.1, 113.8P1) fps +9%
AMD Radeon RX 7900 GRE
128.3 (39.3min, 101.2P0.1, 106.9P1) fps +3%
ASUS TUF Gaming Radeon RX 7800 XT
124.6 (91.3min, 93.8P0.1, 100.3P1) fps
AMD Radeon RX 7800 XT
122.8 (43.6min, 95.6P0.1, 99.1P1) fps -1%
KFA2 GeForce RTX 4070 EX Gamer
105.6 (41.1min, 72.4P0.1, 86.1P1) fps -15%
Sapphire Pulse Radeon RX 7700 XT
102 (40.3min, 83.1P0.1, 85.5P1) fps -18%
KFA2 GeForce RTX 4060 Ti EX, 16GB GDDR6
80.6 (42.8min, 60.8P0.1, 70.5P1) fps -35%
XFX Speedster QICK 308 Radeon RX 7600 Black Edition
73.2 (30.2min, 63.3P0.1, 64.7P1) fps -41%
KFA2 GeForce RTX 4060 1-Click-OC 2X
70 (52.7min, 56P0.1, 60.1P1) fps -44%
GTA V
2560x1440 Highest Settings possible AA:4xMSAA + FX AF:16x
Palit GeForce RTX 4090 GameRock OC
171.9 (4.45min, 142.9P1) fps +21%
KFA2 GeForce RTX 4080 Super SG
168.8 (6.31min, 125P1) fps +19%
MSI Radeon RX 6950 XT Gaming X Trio
164.9 (11.3min, 111.1P1) fps +16%
AMD Radeon RX 7900 XTX
160.4 (10.4min, 100P1) fps +13%
KFA2 GeForce RTX 4080 SG
159.2 (3.49min, 111.1P1) fps +12%
AMD Radeon RX 7900 XT
159.2 (9.41min, 100P1) fps +12%
Asus TUF Gaming GeForce RTX 4070 Ti Super
155.3 (30.3min, 111.1P1) fps +10%
Media NVIDIA GeForce RTX 4070 SUPER (147.2 - 148.2, n=2)
147.7 fps +4%
KFA2 GeForce RTX 4070 Ti EX Gamer
146.7 (4.54min, 100P1) fps +4%
AMD Radeon RX 7900 GRE
142.7 (17.1min, 100P1) fps +1%
ASUS TUF Gaming Radeon RX 7800 XT
141.6 (5.28min, 90.9P1) fps
AMD Radeon RX 7800 XT
138.7 (8.98min, 90.9P1) fps -2%
KFA2 GeForce RTX 4070 EX Gamer
136.2 (8.88min, 90.9P1) fps -4%
Sapphire Pulse Radeon RX 7700 XT
105.4 (16.6min, 71.4P1) fps -26%
KFA2 GeForce RTX 4060 Ti EX, 16GB GDDR6
101.3 (6.75min, 66.7P1) fps -28%
KFA2 GeForce RTX 4060 1-Click-OC 2X
90.3 (6.72min, 58.8P1) fps -36%
XFX Speedster QICK 308 Radeon RX 7600 Black Edition
77.4 (14.6min, 52.6P1) fps -45%
1920x1080 Highest Settings possible AA:4xMSAA + FX AF:16x
MSI Radeon RX 6950 XT Gaming X Trio
177.2 (2.02min, 111.1P1) fps +7%
AMD Radeon RX 7900 GRE
172.2 (2.81min, 111.1P1) fps +4%
AMD Radeon RX 7800 XT
171.4 (3.02min, 111.1P1) fps +4%
KFA2 GeForce RTX 4080 Super SG
171.3 (5.55min, 142.9P1) fps +3%
Palit GeForce RTX 4090 GameRock OC
170.9 (3.95min, 142.9P1) fps +3%
ASUS TUF Gaming Radeon RX 7800 XT
165.6 (8.05min, 125P1) fps
KFA2 GeForce RTX 4080 SG
164.3 (6.85min, 111.1P1) fps -1%
KFA2 GeForce RTX 4070 EX Gamer
160.9 (3.73min, 111.1P1) fps -3%
Asus TUF Gaming GeForce RTX 4070 Ti Super
160.1 (8.82min, 125P1) fps -3%
AMD Radeon RX 7900 XT
159.9 (3.47min, 100P1) fps -3%
AMD Radeon RX 7900 XTX
159.4 (5.55min, 100P1) fps -4%
Media NVIDIA GeForce RTX 4070 SUPER (158.8 - 160, n=2)
159.4 fps -4%
KFA2 GeForce RTX 4070 Ti EX Gamer
158.4 (6.48min, 111.1P1) fps -4%
Sapphire Pulse Radeon RX 7700 XT
146 (13.6min, 100P1) fps -12%
KFA2 GeForce RTX 4060 Ti EX, 16GB GDDR6
139.2 (9.64min, 90.9P1) fps -16%
KFA2 GeForce RTX 4060 1-Click-OC 2X
127.8 (9.25min, 83.3P1) fps -23%
XFX Speedster QICK 308 Radeon RX 7600 Black Edition
112.9 (10.4min, 76.9P1) fps -32%
The Quarry
2560x1440 Ultra Preset
Palit GeForce RTX 4090 GameRock OC
198.7 (47.1min, 93.1P0.1, 161P1) fps +124%
KFA2 GeForce RTX 4080 Super SG
149.4 (16.3min, 70.7P0.1, 125.3P1) fps +69%
KFA2 GeForce RTX 4080 SG
149 (34.3min, 46P0.1, 119.7P1) fps +68%
AMD Radeon RX 7900 XTX
136.9 (51.4min, 70.5P0.1, 114.2P1) fps +55%
AMD Radeon RX 7900 XT
118.7 (47.8min, 58.3P0.1, 100P1) fps +34%
KFA2 GeForce RTX 4070 Ti EX Gamer
114.1 (25.5min, 44.5P0.1, 96.6P1) fps +29%
MSI Radeon RX 6950 XT Gaming X Trio
102.7 (45.2min, 49.7P0.1, 87.1P1) fps +16%
AMD Radeon RX 7900 GRE
97.6 (48.1min, 51.8P0.1, 83.4P1) fps +10%
KFA2 GeForce RTX 4070 EX Gamer
90.9 (17.1min, 36.9P0.1, 75.4P1) fps +3%
ASUS TUF Gaming Radeon RX 7800 XT
88.6 (35.1min, 40.8P0.1, 75.4P1) fps
AMD Radeon RX 7800 XT
84.6 (36.4min, 41.9P0.1, 71.5P1) fps -5%
Sapphire Pulse Radeon RX 7700 XT
73.6 (33.7min, 36.4P0.1, 62.4P1) fps -17%
KFA2 GeForce RTX 4060 Ti EX, 16GB GDDR6
68.1 (24.1min, 31.6P0.1, 57.8P1) fps -23%
KFA2 GeForce RTX 4060 1-Click-OC 2X
54.7 (16.6min, 25P0.1, 45.3P1) fps -38%
XFX Speedster QICK 308 Radeon RX 7600 Black Edition
49.4 (19.8min, 20.2P0.1, 43P1) fps -44%
1920x1080 Ultra Preset
Palit GeForce RTX 4090 GameRock OC
261 (45.3min, 92.8P0.1, 189.7P1) fps +113%
KFA2 GeForce RTX 4080 Super SG
208 (40.2min, 97.3P0.1, 161.7P1) fps +70%
KFA2 GeForce RTX 4080 SG
207 (12.7min, 79.6P0.1, 161.9P1) fps +69%
AMD Radeon RX 7900 XTX
196.5 fps +60%
AMD Radeon RX 7900 XT
169.3 (56.2min, 94.1P0.1, 138P1) fps +38%
KFA2 GeForce RTX 4070 Ti EX Gamer
166.2 (37.3min, 79.5P0.1, 133.6P1) fps +36%
MSI Radeon RX 6950 XT Gaming X Trio
150.4 (53.9min, 79.5P0.1, 121.1P1) fps +23%
AMD Radeon RX 7900 GRE
143.4 (56.5min, 84.9P0.1, 116.2P1) fps +17%
KFA2 GeForce RTX 4070 EX Gamer
132.8 (27.4min, 43.6P0.1, 108.7P1) fps +8%
ASUS TUF Gaming Radeon RX 7800 XT
122.5 (59.6min, 71P0.1, 101P1) fps
AMD Radeon RX 7800 XT
121.5 (50.8min, 71.9P0.1, 98.5P1) fps -1%
Sapphire Pulse Radeon RX 7700 XT
106.3 (48.5min, 56.8P0.1, 88P1) fps -13%
KFA2 GeForce RTX 4060 Ti EX, 16GB GDDR6
98.6 (16.6min, 41.7P0.1, 82.1P1) fps -20%
KFA2 GeForce RTX 4060 1-Click-OC 2X
80.5 (28.6min, 40P0.1, 67.2P1) fps -34%
XFX Speedster QICK 308 Radeon RX 7600 Black Edition
74.6 (32.2min, 34.7P0.1, 62.5P1) fps -39%
Tiny Tina's Wonderlands
2560x1440 Badass Preset (DX12)
Palit GeForce RTX 4090 GameRock OC
234 fps +110%
KFA2 GeForce RTX 4080 Super SG
172.6 fps +55%
KFA2 GeForce RTX 4080 SG
165.8 fps +49%
AMD Radeon RX 7900 XTX
160.7 fps +44%
MSI Radeon RX 6950 XT Gaming X Trio
146.2 fps +31%
AMD Radeon RX 7900 XT
136 fps +22%
KFA2 GeForce RTX 4070 Ti EX Gamer
129.8 fps +17%
AMD Radeon RX 7900 GRE
114.8 fps +3%
ASUS TUF Gaming Radeon RX 7800 XT
111.4 fps
AMD Radeon RX 7800 XT
108.6 fps -3%
KFA2 GeForce RTX 4070 EX Gamer
106.9 fps -4%
Sapphire Pulse Radeon RX 7700 XT
89.2 fps -20%
KFA2 GeForce RTX 4060 Ti EX, 16GB GDDR6
80.2 fps -28%
XFX Speedster QICK 308 Radeon RX 7600 Black Edition
65.8 fps -41%
KFA2 GeForce RTX 4060 1-Click-OC 2X
62.6 fps -44%
1920x1080 Badass Preset (DX12)
Palit GeForce RTX 4090 GameRock OC
305 fps +94%
KFA2 GeForce RTX 4080 Super SG
242 fps +54%
KFA2 GeForce RTX 4080 SG
226 fps +44%
AMD Radeon RX 7900 XTX
226 fps +44%
MSI Radeon RX 6950 XT Gaming X Trio
202 fps +28%
AMD Radeon RX 7900 XT
194.2 fps +24%
KFA2 GeForce RTX 4070 Ti EX Gamer
187.1 fps +19%
AMD Radeon RX 7900 GRE
168.5 fps +7%
AMD Radeon RX 7800 XT
157.6 fps 0%
ASUS TUF Gaming Radeon RX 7800 XT
157.2 fps
KFA2 GeForce RTX 4070 EX Gamer
153.9 fps -2%
Sapphire Pulse Radeon RX 7700 XT
133.2 fps -15%
KFA2 GeForce RTX 4060 Ti EX, 16GB GDDR6
117.8 fps -25%
XFX Speedster QICK 308 Radeon RX 7600 Black Edition
100 fps -36%
KFA2 GeForce RTX 4060 1-Click-OC 2X
92.4 fps -41%
GRID Legends
2560x1440 Ultra Preset
AMD Radeon RX 7900 XTX (643827)
259 (75.5min) fps +35%
AMD Radeon RX 7900 XT (643827)
241 (68.5min) fps +26%
MSI Radeon RX 6950 XT Gaming X Trio (643827)
236 (77.2min) fps +23%
KFA2 GeForce RTX 4080 SG (643827)
233 (70.3min) fps +21%
Palit GeForce RTX 4090 GameRock OC (800660)
225 (98.2min) fps +17%
KFA2 GeForce RTX 4080 Super SG (800660)
207 (56.9min) fps +8%
KFA2 GeForce RTX 4070 Ti EX Gamer (712825)
198 (81.4min) fps +3%
ASUS TUF Gaming Radeon RX 7800 XT (800660)
191.8 (55.5min) fps
AMD Radeon RX 7900 GRE (800660)
185 (85.1min) fps -4%
AMD Radeon RX 7800 XT (800660)
173.5 (71.7min) fps -10%
KFA2 GeForce RTX 4070 EX Gamer (712825)
166.8 (68min) fps -13%
Sapphire Pulse Radeon RX 7700 XT (800660)
153.8 (51.7min) fps -20%
KFA2 GeForce RTX 4060 Ti EX, 16GB GDDR6 (800660)
135.2 (59.4min) fps -30%
XFX Speedster QICK 308 Radeon RX 7600 Black Edition (800660)
126.3 (78.3min) fps -34%
KFA2 GeForce RTX 4060 1-Click-OC 2X (800660)
112.7 (65.9min) fps -41%
1920x1080 Ultra Preset
AMD Radeon RX 7900 XTX (643827)
289 (43.8min) fps +38%
MSI Radeon RX 6950 XT Gaming X Trio (643827)
277 (74min) fps +32%
AMD Radeon RX 7900 XT (643827)
273 (73.9min) fps +30%
KFA2 GeForce RTX 4080 SG (643827)
237 (70.3min) fps +13%
Palit GeForce RTX 4090 GameRock OC (800660)
230 (92.5min) fps +10%
KFA2 GeForce RTX 4080 Super SG (800660)
222 (70.9min) fps +6%
KFA2 GeForce RTX 4070 Ti EX Gamer (712825)
220 (87.2min) fps +5%
ASUS TUF Gaming Radeon RX 7800 XT (800660)
210 (53.6min) fps
KFA2 GeForce RTX 4070 EX Gamer (712825)
207 (42.8min) fps -1%
AMD Radeon RX 7900 GRE (800660)
199.5 (88min) fps -5%
AMD Radeon RX 7800 XT (800660)
187.5 (74.4min) fps -11%
Sapphire Pulse Radeon RX 7700 XT (800660)
173.1 (79.9min) fps -18%
KFA2 GeForce RTX 4060 Ti EX, 16GB GDDR6 (800660)
161.5 (69min) fps -23%
XFX Speedster QICK 308 Radeon RX 7600 Black Edition (800660)
152.6 (77.4min) fps -27%
KFA2 GeForce RTX 4060 1-Click-OC 2X (800660)
143.7 (75.2min) fps -32%
Final Fantasy XV Benchmark
2560x1440 High Quality
Palit GeForce RTX 4090 GameRock OC (1.3)
229 fps +80%
KFA2 GeForce RTX 4080 Super SG (1.3)
203 fps +59%
KFA2 GeForce RTX 4080 SG (1.3)
195.7 fps +54%
AMD Radeon RX 7900 XTX (1.3)
172.8 fps +36%
Asus TUF Gaming GeForce RTX 4070 Ti Super (1.3)
168.8 fps +32%
KFA2 GeForce RTX 4070 Ti EX Gamer (1.3)
160.1 fps +26%
MSI Radeon RX 6950 XT Gaming X Trio (1.3)
152.4 fps +20%
AMD Radeon RX 7900 XT (1.3)
149.9 fps +18%
Media NVIDIA GeForce RTX 4070 SUPER (148 - 150.5, n=2)
149.3 fps +17%
KFA2 GeForce RTX 4070 EX Gamer (1.3)
135.2 fps +6%
AMD Radeon RX 7900 GRE (1.3)
133 fps +4%
ASUS TUF Gaming Radeon RX 7800 XT (1.3)
127.4 fps
AMD Radeon RX 7800 XT (1.3)
124.6 fps -2%
Sapphire Pulse Radeon RX 7700 XT (1.3)
103.1 fps -19%
KFA2 GeForce RTX 4060 Ti EX, 16GB GDDR6 (1.3)
90.5 fps -29%
KFA2 GeForce RTX 4060 1-Click-OC 2X (1.3)
79.3 fps -38%
XFX Speedster QICK 308 Radeon RX 7600 Black Edition (1.3)
74.2 fps -42%
1920x1080 High Quality
Palit GeForce RTX 4090 GameRock OC (1.3)
234 fps +40%
KFA2 GeForce RTX 4080 Super SG (1.3)
232 fps +38%
KFA2 GeForce RTX 4080 SG (1.3)
225 fps +34%
AMD Radeon RX 7900 XTX (1.3)
216 fps +29%
Asus TUF Gaming GeForce RTX 4070 Ti Super (1.3)
209 fps +25%
KFA2 GeForce RTX 4070 Ti EX Gamer (1.3)
204 fps +22%
AMD Radeon RX 7900 XT (1.3)
197.2 fps +18%
MSI Radeon RX 6950 XT Gaming X Trio (1.3)
196.8 fps +17%
Media NVIDIA GeForce RTX 4070 SUPER (194 - 197.1, n=2)
195.6 fps +17%
KFA2 GeForce RTX 4070 EX Gamer (1.3)
182.6 fps +9%
AMD Radeon RX 7900 GRE (1.3)
174.5 fps +4%
ASUS TUF Gaming Radeon RX 7800 XT (1.3)
167.6 fps
AMD Radeon RX 7800 XT (1.3)
162.6 fps -3%
Sapphire Pulse Radeon RX 7700 XT (1.3)
139.5 fps -17%
KFA2 GeForce RTX 4060 Ti EX, 16GB GDDR6 (1.3)
124.6 fps -26%
KFA2 GeForce RTX 4060 1-Click-OC 2X (1.3)
109.3 fps -35%
XFX Speedster QICK 308 Radeon RX 7600 Black Edition (1.3)
103.6 fps -38%
The Last of Us
2560x1440 Ultra Preset
KFA2 GeForce RTX 4080 Super SG
120.9 (84.5min, 93.7P0.1, 101.5P1) fps +34%
ASUS TUF Gaming Radeon RX 7800 XT
90.3 (35.9min, 65.5P0.1, 72.6P1) fps
AMD Radeon RX 7900 GRE
88.9 (47.9min, 70.5P0.1, 73P1) fps -2%
KFA2 GeForce RTX 4070 Ti EX Gamer
87.9 (51min, 58.7P0.1, 71.8P1) fps -3%
AMD Radeon RX 7800 XT
86.1 (46.8min, 68P0.1, 70.9P1) fps -5%
MSI Radeon RX 6950 XT Gaming X Trio
76.8 (61.2min, 62.6P0.1, 64.4P1) fps -15%
KFA2 GeForce RTX 4070 EX Gamer
72.5 (53.2min, 56.3P0.1, 59.7P1) fps -20%
Sapphire Pulse Radeon RX 7700 XT
68 (39.1min, 54.5P0.1, 56.3P1) fps -25%
KFA2 GeForce RTX 4060 Ti EX, 16GB GDDR6
56.3 (43.4min, 44.5P0.1, 45.7P1) fps -38%
KFA2 GeForce RTX 4060 1-Click-OC 2X
39.9 (1.82min, 11.8P0.1, 28.9P1) fps -56%
XFX Speedster QICK 308 Radeon RX 7600 Black Edition
36.5 (2.78min, 6.02P0.1, 23.1P1) fps -60%
1920x1080 Ultra Preset
KFA2 GeForce RTX 4080 Super SG
172.5 (29.6min, 111.7P0.1, 140P1) fps +33%
ASUS TUF Gaming Radeon RX 7800 XT
129.3 (31.6min, 82.4P0.1, 99.4P1) fps
KFA2 GeForce RTX 4070 Ti EX Gamer
127.6 (55.7min, 60.6P0.1, 77P1) fps -1%
AMD Radeon RX 7900 GRE
126.5 (32.9min, 77.5P0.1, 100.3P1) fps -2%
AMD Radeon RX 7800 XT
124.5 (42.8min, 82.9P0.1, 99.5P1) fps -4%
MSI Radeon RX 6950 XT Gaming X Trio
111.2 (4.76min, 83.7P0.1, 86.4P1) fps -14%
KFA2 GeForce RTX 4070 EX Gamer
108.8 (47.4min, 61.6P0.1, 78.1P1) fps -16%
Sapphire Pulse Radeon RX 7700 XT
105 (32.5min, 83.6P0.1, 85.8P1) fps -19%
KFA2 GeForce RTX 4060 Ti EX, 16GB GDDR6
87.4 (59.8min, 68.5P0.1, 72.5P1) fps -32%
KFA2 GeForce RTX 4060 1-Click-OC 2X
68.2 (44.2min, 45.8P0.1, 56.3P1) fps -47%
XFX Speedster QICK 308 Radeon RX 7600 Black Edition
64.3 (7.55min, 27.2P0.1, 52.9P1) fps -50%
F1 23
2560x1440 Ultra High Preset AA:T AF:16x
Palit GeForce RTX 4090 GameRock OC (1030131)
155.5 (121min, 121P1) fps +162%
KFA2 GeForce RTX 4080 Super SG (1070925)
111.4 (85min, 86P1) fps +88%
Asus TUF Gaming GeForce RTX 4070 Ti Super (1057599)
90 (70min, 69P1) fps +52%
Media NVIDIA GeForce RTX 4070 SUPER (78 - 81.2, n=2)
79.6 fps +34%
KFA2 GeForce RTX 4070 EX Gamer
66 (52min) fps +11%
AMD Radeon RX 7900 GRE (1016022)
64.1 (41min, 40P1) fps +8%
MSI Radeon RX 6950 XT Gaming X Trio (1016022)
62 (40min, 40P1) fps +4%
ASUS TUF Gaming Radeon RX 7800 XT (1093534)
59.4 (37min, 36P1) fps
AMD Radeon RX 7800 XT (1022189)
55.8 (34min, 34P1) fps -6%
KFA2 GeForce RTX 4060 Ti EX, 16GB GDDR6 (1022189)
51 (39min, 39P1) fps -14%
Sapphire Pulse Radeon RX 7700 XT (1026791)
48.7 (31min, 31P1) fps -18%
KFA2 GeForce RTX 4060 1-Click-OC 2X (1008687)
38 (27min, 29P1) fps -36%
XFX Speedster QICK 308 Radeon RX 7600 Black Edition (1016022)
31.8 (19min, 19P1) fps -46%
1920x1080 Ultra High Preset AA:T AF:16x
Palit GeForce RTX 4090 GameRock OC (1030131)
213 (164min, 144P1) fps +129%
KFA2 GeForce RTX 4080 Super SG (1070925)
170.3 (134min, 133P1) fps +83%
Asus TUF Gaming GeForce RTX 4070 Ti Super (1057599)
138.2 (109min, 108P1) fps +49%
Media NVIDIA GeForce RTX 4070 SUPER (122.4 - 125.9, n=2)
124.2 fps +34%
KFA2 GeForce RTX 4070 EX Gamer
105 (84min) fps +13%
AMD Radeon RX 7900 GRE (1016022)
97.6 (67min, 65P1) fps +5%
MSI Radeon RX 6950 XT Gaming X Trio (1016022)
97.1 (64min, 65P1) fps +4%
ASUS TUF Gaming Radeon RX 7800 XT (1093534)
93 (62min, 60P1) fps
AMD Radeon RX 7800 XT (1022189)
87.4 (56min, 56P1) fps -6%
KFA2 GeForce RTX 4060 Ti EX, 16GB GDDR6 (1022189)
81.9 (63min, 63P1) fps -12%
Sapphire Pulse Radeon RX 7700 XT (1026791)
76.5 (49min, 50P1) fps -18%
KFA2 GeForce RTX 4060 1-Click-OC 2X (1008687)
60.2 (47min, 47P1) fps -35%
XFX Speedster QICK 308 Radeon RX 7600 Black Edition (1016022)
48.8 (31min, 31P1) fps -48%
Avatar Frontiers of Pandora
2560x1440 Ultra Preset AA:T
KFA2 GeForce RTX 4080 Super SG
93 (74min) fps +69%
Asus TUF Gaming GeForce RTX 4070 Ti Super
76.6 (59min) fps +39%
Media NVIDIA GeForce RTX 4070 SUPER (61.5 - 67.6, n=2)
64.6 fps +17%
MSI Radeon RX 6950 XT Gaming X Trio
62 (48min) fps +13%
ASUS TUF Gaming Radeon RX 7800 XT
55 (44min) fps
Sapphire Pulse Radeon RX 7700 XT
46 (36min) fps -16%
XFX Speedster QICK 308 Radeon RX 7600 Black Edition
28 (18min) fps -49%
1920x1080 Ultra Preset AA:T
KFA2 GeForce RTX 4080 Super SG
136 (99min) fps +70%
Asus TUF Gaming GeForce RTX 4070 Ti Super
113.2 (83min) fps +42%
Media NVIDIA GeForce RTX 4070 SUPER (96.2 - 101.2, n=2)
98.7 fps +23%
MSI Radeon RX 6950 XT Gaming X Trio
91 (73min) fps +14%
ASUS TUF Gaming Radeon RX 7800 XT
80 (60min) fps
Sapphire Pulse Radeon RX 7700 XT
68 (49min) fps -15%
XFX Speedster QICK 308 Radeon RX 7600 Black Edition
42 (28min) fps -47%
Alan Wake 2
2560x1440 High Preset
KFA2 GeForce RTX 4080 Super SG
107.5 (62.3min, 74.4P0.1, 90.5P1) fps +36%
Asus TUF Gaming GeForce RTX 4070 Ti Super
82.5 (51.1min, 57.2P0.1, 67.4P1) fps +4%
ASUS TUF Gaming Radeon RX 7800 XT
79.1 (39.6min, 51.3P0.1, 66.4P1) fps
Media NVIDIA GeForce RTX 4070 SUPER (73.8 - 79.7, n=2)
76.8 fps -3%
MSI Radeon RX 6950 XT Gaming X Trio
71.8 (23.3min, 23.9P0.1, 50.8P1) fps -9%
Sapphire Pulse Radeon RX 7700 XT
62.7 (37.5min, 38.4P0.1, 47.6P1) fps -21%
XFX Speedster QICK 308 Radeon RX 7600 Black Edition
40.3 (27.8min, 28.6P0.1, 31.6P1) fps -49%
1920x1080 High Preset
KFA2 GeForce RTX 4080 Super SG
151.3 (88.5min, 98P0.1, 116.5P1) fps +22%
ASUS TUF Gaming Radeon RX 7800 XT
123.6 (49min, 66.2P0.1, 93P1) fps
Asus TUF Gaming GeForce RTX 4070 Ti Super
114.4 (63.9min, 66.6P0.1, 80.1P1) fps -7%
Media NVIDIA GeForce RTX 4070 SUPER (105.1 - 114.1, n=2)
109.6 fps -11%
MSI Radeon RX 6950 XT Gaming X Trio
107.5 (44.5min, 52.1P0.1, 73P1) fps -13%
Sapphire Pulse Radeon RX 7700 XT
93.2 (43min, 55.1P0.1, 66.5P1) fps -25%
XFX Speedster QICK 308 Radeon RX 7600 Black Edition
62.8 (34.8min, 39.9P0.1, 46.9P1) fps -49%

Prestazioni del Raytracing

Le prestazioni di raytracing della Asus TUF Gaming Radeon RX 7800 XT OC sono miste e dipendono ancora una volta dal gioco specifico. Anche con l'architettura RDNA 3, AMD non riesce a mettere in difficoltà Nvidia. Tuttavia, non deve rinunciare completamente a questa funzione. Ma per ottenere frame rate adeguati, è necessario ridurre la risoluzione. Rispetto a una vecchia AMD Radeon RX 6800aMD è stata in grado di aumentare le prestazioni di raytracing della RX 7800 XT in modo considerevole, e ci si può aspettare un aumento delle prestazioni di circa il 30%. Rispetto alla serie 4000 di Nvidia, la AMD Radeon RX 7800 XT è in grado di tenere il passo solo con una Nvidia GeForce RTX 4060 Ti.

Hogwarts Legacy - 1920x1080 Ultra Preset + Full Ray Tracing AA:High T
Palit GeForce RTX 4090 GameRock OC
86 (15.3min, 32.6P0.1, 59.3P1) fps +52%
XFX Radeon RX 7900 XTX Merc 310 Black Edition
84.9 (27.5min, 40.2P0.1, 61.8P1) fps +50%
Palit GeForce RTX 4090 GameRock OC
84.4 (30.9min, 38.4P0.1, 61.8P1) fps +49%
Nvidia GeForce RTX 3090 FE
76.6 (27.4min, 40P0.1, 50.8P1) fps +35%
KFA2 GeForce RTX 4070 EX Gamer
73.1 (24.1min, 27.4P0.1, 42P1) fps +29%
MSI Radeon RX 6950 XT Gaming X Trio
64.2 (23.9min, 31.1P0.1, 48.3P1) fps +13%
AMD Radeon RX 7900 GRE
60.4 (24.6min, 28.4P0.1, 43.1P1) fps +7%
Nvidia Titan RTX
60.1 (23.2min, 23.5P0.1, 43.5P1) fps +6%
ASUS TUF Gaming Radeon RX 7800 XT
56.6 (23min, 30P0.1, 39.8P1) fps
ASUS Dual GeForce RTX 4060 Ti OC
54.4 (17.4min, 25.5P0.1, 37.1P1) fps -4%
Sapphire Pulse Radeon RX 7700 XT
48.6 (21.2min, 26.2P0.1, 37.1P1) fps -14%
AMD Radeon RX 6800
47.5 (23min, 26.8P0.1, 36.2P1) fps -16%
Nvidia GeForce RTX 2070 Super
42.3 (16.3min, 20.4P0.1, 30.2P1) fps -25%
Acer Predator BiFrost Arc A770 OC, 16GB GDDR6
41.3 (13.4min, 19.8P0.1, 31.8P1) fps -27%
Sapphire Pulse Radeon RX 6750 XT
39.8 (18.8min, 23.3P0.1, 31.2P1) fps -30%
Nvidia GeForce RTX 2060 Super
36.9 (20.6min, 21.7P0.1, 28.5P1) fps -35%
XFX Speedster QICK 308 Radeon RX 7600 Black Edition
30.5 (3.79min, 3.97P0.1, 8.09P1) fps -46%
Spider-Man Miles Morales - 1920x0180 Very High Preset + Ray-Tracing AA:T
Palit GeForce RTX 4090 GameRock OC
138.7 (76.9min, 83.4P0.1, 107.3P1) fps +56%
Palit GeForce RTX 4090 GameRock OC
122.2 (60.2min, 67.7P0.1, 89P1) fps +38%
XFX Radeon RX 7900 XTX Merc 310 Black Edition
119.2 (78.3min, 82.3P0.1, 97.9P1) fps +34%
KFA2 GeForce RTX 4070 Ti SG
102 (65.6min, 73.3P0.1, 87.1P1) fps +15%
Nvidia GeForce RTX 3090 FE
97.2 (77.7min, 78.7P0.1, 81.2P1) fps +10%
ASUS TUF Gaming Radeon RX 7800 XT
88.7 (70.6min, 72.1P0.1, 74.6P1) fps
AMD Radeon RX 7900 XT
88.5 (67.1min, 70.7P0.1, 74.7P1) fps 0%
KFA2 GeForce RTX 4070 EX Gamer
88.2 (67.7min, 70.6P0.1, 73.5P1) fps -1%
AMD Radeon RX 7800 XT
84.8 (66.4min, 67.2P0.1, 69.6P1) fps -4%
MSI Radeon RX 6950 XT Gaming X Trio
80.9 (60.3min, 63.4P0.1, 67.7P1) fps -9%
AMD Radeon RX 7900 GRE
78.6 (59.1min, 62.8P0.1, 64.9P1) fps -11%
ASUS Dual GeForce RTX 4060 Ti OC
70.3 (33min, 46.9P0.1, 57.7P1) fps -21%
Sapphire Pulse Radeon RX 7700 XT
66.9 (52.6min, 53.1P0.1, 55.3P1) fps -25%
Nvidia Titan RTX
66.7 (52.9min, 54P0.1, 55.9P1) fps -25%
AMD Radeon RX 6800
65 (48.7min, 50.9P0.1, 52.4P1) fps -27%
Acer Predator BiFrost Arc A770 OC, 16GB GDDR6
64.6 (33.1min, 54.4P0.1, 55.7P1) fps -27%
Sapphire Pulse Radeon RX 6750 XT
56 (43.8min, 44.2P0.1, 45.6P1) fps -37%
Nvidia GeForce RTX 2070 Super
50.9 (23.9min, 24.2P0.1, 32.7P1) fps -43%
XFX Speedster QICK 308 Radeon RX 7600 Black Edition
43 (28.5min, 29.6P0.1, 30.3P1) fps -52%
Nvidia GeForce RTX 2060 Super
39.5 (22.7min, 23P0.1, 28.8P1) fps -55%
Metro Exodus - 1920x1080 Ultra Quality DXR AF:16x
Palit GeForce RTX 4090 GameRock OC
159.9 (95.45min) fps +51%
Palit GeForce RTX 4090 GameRock OC
157.3 (96.47min) fps +49%
XFX Radeon RX 7900 XTX Merc 310 Black Edition
152 (95.06min) fps +44%
Asus TUF Gaming GeForce RTX 4070 Ti Super
133.4 (69.17min) fps +26%
KFA2 GeForce RTX 4070 Ti SG
133.3 (68.29min) fps +26%
AMD Radeon RX 7900 XT
124.3 (78.88min) fps +18%
MSI Radeon RX 6950 XT Gaming X Trio
110.2 (69.77min) fps +4%
KFA2 GeForce RTX 4070 EX Gamer
109.4 (61.5min) fps +4%
ASUS TUF Gaming Radeon RX 7800 XT
105.6 (65.73min) fps
AMD Radeon RX 7900 GRE
103.8 (63.84min) fps -2%
AMD Radeon RX 7800 XT
98.4 (61.39min) fps -7%
Nvidia Titan RTX
91.8 (51.42min) fps -13%
Sapphire Pulse Radeon RX 7700 XT
88.1 (56.03min) fps -17%
ASUS Dual GeForce RTX 4060 Ti OC
84.8 (45.59min) fps -20%
Acer Predator BiFrost Arc A770 OC, 16GB GDDR6
70.9 (42.22min) fps -33%
Sapphire Pulse Radeon RX 6750 XT
70.5 (43.91min) fps -33%
XFX Speedster QICK 308 Radeon RX 7600 Black Edition
62.9 (40.28min) fps -40%
Nvidia GeForce RTX 2070 Super
62.1 (35.93min) fps -41%
Nvidia GeForce RTX 2060 Super
53.3 (31.47min) fps -50%
Far Cry 6 - 1920x1080 Ultra Graphics Quality + HD Textures + DXR AA:T
XFX Radeon RX 7900 XTX Merc 310 Black Edition
156.5 (83min) fps +14%
Palit GeForce RTX 4090 GameRock OC
156.1 (130min) fps +14%
Asus TUF Gaming GeForce RTX 4070 Ti Super
144 (125min) fps +5%
AMD Radeon RX 7900 XT
143.6 (46min) fps +5%
Nvidia GeForce RTX 3090 FE
138.2 (126min) fps +1%
AMD Radeon RX 7900 GRE
136.7 (44min) fps 0%
ASUS TUF Gaming Radeon RX 7800 XT
136.7 (61min) fps
Palit GeForce RTX 4090 GameRock OC
133.4 (108min) fps -2%
KFA2 GeForce RTX 4070 Ti SG
133.4 (109min) fps -2%
MSI Radeon RX 6950 XT Gaming X Trio
132.8 (51min) fps -3%
KFA2 GeForce RTX 4070 EX Gamer
132 (110min) fps -3%
AMD Radeon RX 7800 XT
129.4 (36min) fps -5%
AMD Radeon RX 6800
112.6 (63min) fps -18%
Nvidia Titan RTX
109.3 (98min) fps -20%
Sapphire Pulse Radeon RX 7700 XT
104.1 (18min) fps -24%
Sapphire Pulse Radeon RX 6750 XT
101.4 (33min) fps -26%
Acer Predator BiFrost Arc A770 OC, 16GB GDDR6
79.5 (71min) fps -42%
XFX Speedster QICK 308 Radeon RX 7600 Black Edition
63.6 (31min) fps -53%
Nvidia GeForce RTX 2070 Super
49.6 (32min) fps -64%
Nvidia GeForce RTX 2060 Super
47.7 (30min) fps -65%
The Callisto Protocol - 1920x1080 Ultra Preset (without FSR Upscaling) + Full Ray-Tracing
XFX Radeon RX 7900 XTX Merc 310 Black Edition
114.4 fps +3%
ASUS TUF Gaming Radeon RX 7800 XT
111 fps
Nvidia GeForce RTX 3090 FE
109 fps -2%
AMD Radeon RX 7800 XT
99.3 fps -11%
AMD Radeon RX 7900 GRE
99 fps -11%
Asus TUF Gaming GeForce RTX 4070 Ti Super
96.75 fps -13%
Sapphire Pulse Radeon RX 7700 XT
92.4 fps -17%
Palit GeForce RTX 4090 GameRock OC
92 fps -17%
ASUS Dual GeForce RTX 4060 Ti OC
90.7 fps -18%
AMD Radeon RX 7900 XT
89 fps -20%
MSI Radeon RX 6950 XT Gaming X Trio
84 fps -24%
KFA2 GeForce RTX 4070 Ti SG
82.1 fps -26%
KFA2 GeForce RTX 4070 EX Gamer
78.6 fps -29%
AMD Radeon RX 6800
66 fps -41%
XFX Speedster QICK 308 Radeon RX 7600 Black Edition
65.8 fps -41%
Nvidia Titan RTX
58.7 fps -47%
Acer Predator BiFrost Arc A770 OC, 16GB GDDR6
58.6 fps -47%
Nvidia GeForce RTX 2070 Super
45.6 fps -59%
Nvidia GeForce RTX 2060 Super
37.5 fps -66%
Sapphire Pulse Radeon RX 6750 XT
28.8 fps -74%
Guardians of the Galaxy - 1920x1080 Ultra Preset + Ultra Ray-Tracing
Palit GeForce RTX 4090 GameRock OC
215 (128min) fps +117%
XFX Radeon RX 7900 XTX Merc 310 Black Edition
157 fps +59%
Nvidia GeForce RTX 3090 FE
155 fps +57%
KFA2 GeForce RTX 4070 EX Gamer
131 fps +32%
AMD Radeon RX 7900 XT
122 fps +23%
AMD Radeon RX 7900 GRE
105 fps +6%
MSI Radeon RX 6950 XT Gaming X Trio
101 fps +2%
ASUS Dual GeForce RTX 4060 Ti OC
100 fps +1%
ASUS TUF Gaming Radeon RX 7800 XT
99 fps
AMD Radeon RX 7800 XT
97 fps -2%
Nvidia Titan RTX
94 fps -5%
Sapphire Pulse Radeon RX 7700 XT
77 fps -22%
Nvidia GeForce RTX 2070 Super
68 fps -31%
Sapphire Pulse Radeon RX 6750 XT
62 fps -37%
Acer Predator BiFrost Arc A770 OC, 16GB GDDR6
59 fps -40%
Nvidia GeForce RTX 2060 Super
54 fps -45%
XFX Speedster QICK 308 Radeon RX 7600 Black Edition
51 fps -48%
Returnal
1920x1080 Epic Preset + Epic Ray-Tracing
Palit GeForce RTX 4090 GameRock OC
180 (77min) fps +89%
Palit GeForce RTX 4090 GameRock OC
167 fps +76%
XFX Radeon RX 7900 XTX Merc 310 Black Edition
136 (76min) fps +43%
Nvidia GeForce RTX 3090 FE
110 (64min) fps +16%
KFA2 GeForce RTX 4070 EX Gamer
102 fps +7%
AMD Radeon RX 7900 GRE
99 fps +4%
ASUS TUF Gaming Radeon RX 7800 XT
95 (65min) fps
AMD Radeon RX 7800 XT
93 fps -2%
Nvidia Titan RTX
86 fps -9%
ASUS Dual GeForce RTX 4060 Ti OC
84 fps -12%
Sapphire Pulse Radeon RX 7700 XT
78 (44min) fps -18%
AMD Radeon RX 6800
71 fps -25%
Nvidia GeForce RTX 2070 Super
61 fps -36%
Sapphire Pulse Radeon RX 6750 XT
60 fps -37%
Nvidia GeForce RTX 2060 Super
53 fps -44%
XFX Speedster QICK 308 Radeon RX 7600 Black Edition
50 fps -47%
Acer Predator BiFrost Arc A770 OC, 16GB GDDR6
50 (31min) fps -47%
3840x2160 Epic Preset + Epic Ray-Tracing
Palit GeForce RTX 4090 GameRock OC
88 (52min) fps +132%
Palit GeForce RTX 4090 GameRock OC
85 fps +124%
XFX Radeon RX 7900 XTX Merc 310 Black Edition
60 (34min) fps +58%
Nvidia GeForce RTX 3090 FE
47 (33min) fps +24%
AMD Radeon RX 7900 GRE
41 fps +8%
KFA2 GeForce RTX 4070 EX Gamer
40 fps +5%
ASUS TUF Gaming Radeon RX 7800 XT
38 (18min) fps
AMD Radeon RX 7800 XT
37 fps -3%
Nvidia Titan RTX
36 fps -5%
ASUS Dual GeForce RTX 4060 Ti OC
32 fps -16%
Sapphire Pulse Radeon RX 7700 XT
31 (10min) fps -18%
AMD Radeon RX 6800
29 fps -24%
Acer Predator BiFrost Arc A770 OC, 16GB GDDR6
24 (11min) fps -37%
Nvidia GeForce RTX 2070 Super
23 fps -39%
Sapphire Pulse Radeon RX 6750 XT
22 fps -42%
Nvidia GeForce RTX 2060 Super
19 fps -50%
XFX Speedster QICK 308 Radeon RX 7600 Black Edition
15 fps -61%
F1 23 - 1920x1080 Ultra High Preset AA:T AF:16x
Palit GeForce RTX 4090 GameRock OC (1038401)
216 (177min, 154P1) fps +132%
Palit GeForce RTX 4090 GameRock OC (1022189)
210 (168min, 150P1) fps +126%
XFX Radeon RX 7900 XTX Merc 310 Black Edition (1070925)
138.6 (96min, 94P1) fps +49%
Asus TUF Gaming GeForce RTX 4070 Ti Super (1057599)
138.2 (109min, 108P1) fps +49%
Nvidia GeForce RTX 3090 FE (1082038)
123.3 (98min, 97P1) fps +33%
KFA2 GeForce RTX 4070 EX Gamer
105 (84min) fps +13%
AMD Radeon RX 7900 GRE (1016022)
97.6 (67min, 65P1) fps +5%
MSI Radeon RX 6950 XT Gaming X Trio (1016022)
97.1 (64min, 65P1) fps +4%
ASUS TUF Gaming Radeon RX 7800 XT (1093534)
93 (62min, 60P1) fps
AMD Radeon RX 7800 XT (1022189)
87.4 (56min, 56P1) fps -6%
ASUS Dual GeForce RTX 4060 Ti OC (1012607)
82.1 (64min, 64P1) fps -12%
Nvidia Titan RTX (1021115)
81.6 (65min, 64P1) fps -12%
Sapphire Pulse Radeon RX 7700 XT (1026791)
76.5 (49min, 50P1) fps -18%
AMD Radeon RX 6800 (1016022)
69.5 (44min, 45P1) fps -25%
Acer Predator BiFrost Arc A770 OC, 16GB GDDR6 (1026791)
67.2 (52min, 52P1) fps -28%
Sapphire Pulse Radeon RX 6750 XT (1016022)
57.3 (37min, 37P1) fps -38%
Nvidia GeForce RTX 2070 Super (1021115)
54.4 (42min, 42P1) fps -42%
XFX Speedster QICK 308 Radeon RX 7600 Black Edition (1016022)
48.8 (31min, 31P1) fps -48%
Nvidia GeForce RTX 2060 Super (1021115)
46 (35min, 35P1) fps -51%
Star Wars Jedi Survivor - 1920x1080 Epic Preset + Ray Tracing
Palit GeForce RTX 4090 GameRock OC
146.8 (51.4min, 70.2P0.1, 108.8P1) fps +70%
Palit GeForce RTX 4090 GameRock OC
133.1 (28.3min, 54.3P0.1, 89.1P1) fps +54%
XFX Radeon RX 7900 XTX Merc 310 Black Edition
118.3 (52min, 62.3P0.1, 91.6P1) fps +37%
Nvidia GeForce RTX 3090 FE
95.7 (46.9min, 58.1P0.1, 72.6P1) fps +11%
MSI Radeon RX 6950 XT Gaming X Trio
90.2 (25.5min, 33.6P0.1, 67.2P1) fps +4%
ASUS TUF Gaming Radeon RX 7800 XT
86.6 (36.7min, 55.8P0.1, 67.9P1) fps
AMD Radeon RX 7900 GRE
84 (19.9min, 36.1P0.1, 63.4P1) fps -3%
KFA2 GeForce RTX 4070 EX Gamer
83.9 (16.9min, 23.7P0.1, 54.8P1) fps -3%
AMD Radeon RX 7800 XT
82.4 (36.2min, 44P0.1, 63.7P1) fps -5%
Sapphire Pulse Radeon RX 7700 XT
71 (36.4min, 44.4P0.1, 54.8P1) fps -18%
Nvidia Titan RTX
70.2 (20.7min, 34.7P0.1, 50.9P1) fps -19%
AMD Radeon RX 6800
66.5 (18.8min, 32.8P0.1, 49.4P1) fps -23%
ASUS Dual GeForce RTX 4060 Ti OC
59.8 (14.9min, 17.9P0.1, 40.8P1) fps -31%
Sapphire Pulse Radeon RX 6750 XT
58.3 (19.6min, 31.9P0.1, 46.6P1) fps -33%
Nvidia GeForce RTX 2070 Super
51.2 (17min, 27.3P0.1, 40.4P1) fps -41%
Acer Predator BiFrost Arc A770 OC, 16GB GDDR6
48.8 (33.4min, 37.1P0.1, 40.6P1) fps -44%
XFX Speedster QICK 308 Radeon RX 7600 Black Edition
47.1 (17min, 23.5P0.1, 35.8P1) fps -46%
Nvidia GeForce RTX 2060 Super
41.6 (17.2min, 23.5P0.1, 33P1) fps -52%
Ghostwire Tokyo - 1920x1080 Highest Settings + Maximum Ray Tracing
Palit GeForce RTX 4090 GameRock OC
183.2 (43min, 94.2P0.1, 137.8P1) fps +88%
XFX Radeon RX 7900 XTX Merc 310 Black Edition
148.8 (46.5min, 88P0.1, 101.5P1) fps +53%
Asus TUF Gaming GeForce RTX 4070 Ti Super
142.2 (32.5min, 52.5P0.1, 88.4P1) fps +46%
KFA2 GeForce RTX 4070 Ti SG
130.7 (40.2min, 67.1P0.1, 87.4P1) fps +34%
Nvidia GeForce RTX 3090 FE
121.6 (37.7min, 66P0.1, 75.1P1) fps +25%
AMD Radeon RX 7900 XT
116.5 (30.3min, 71.6P0.1, 78.1P1) fps +20%
KFA2 GeForce RTX 4070 EX Gamer
113.3 (41.1min, 59P0.1, 70.4P1) fps +17%
AMD Radeon RX 7900 GRE
100.8 (20.2min, 48.3P0.1, 63.1P1) fps +4%
MSI Radeon RX 6950 XT Gaming X Trio
99 (35.8min, 58.6P0.1, 66P1) fps +2%
ASUS TUF Gaming Radeon RX 7800 XT
97.2 (26.2min, 50.6P0.1, 59P1) fps
AMD Radeon RX 7800 XT
95.3 (30.1min, 39.9P0.1, 57.5P1) fps -2%
ASUS Dual GeForce RTX 4060 Ti OC
88.9 (36.1min, 48.4P0.1, 52.3P1) fps -9%
Sapphire Pulse Radeon RX 7700 XT
82.5 (20.2min, 38.6P0.1, 48.8P1) fps -15%
Nvidia Titan RTX
79 (25.6min, 41.8P0.1, 47.6P1) fps -19%
Acer Predator BiFrost Arc A770 OC, 16GB GDDR6
63.5 (24.4min, 34.3P0.1, 36.2P1) fps -35%
Sapphire Pulse Radeon RX 6750 XT
61.8 (30.9min, 32.8P0.1, 34.4P1) fps -36%
Nvidia GeForce RTX 2070 Super
53.8 (28.3min, 28.7P0.1, 31P1) fps -45%
XFX Speedster QICK 308 Radeon RX 7600 Black Edition
52.8 (26.9min, 27.7P0.1, 28.6P1) fps -46%
Nvidia GeForce RTX 2060 Super
43.7 (23.2min, 23.6P0.1, 24.3P1) fps -55%
Cyberpunk 2077 1.6
1920x1080 Ray Tracing Ultra Preset (DLSS off)
Palit GeForce RTX 4090 GameRock OC (1.6)
135.7 (93.9min) fps +178%
Palit GeForce RTX 4090 GameRock OC (1.6)
118.6 (69.3min) fps +143%
KFA2 GeForce RTX 4070 Ti SG (1.5)
81.5 (62.2min) fps +67%
Asus TUF Gaming GeForce RTX 4070 Ti Super (1.63)
79.9 (63.5min) fps +64%
XFX Radeon RX 7900 XTX Merc 310 Black Edition (1.6)
72.7 (55.4min) fps +49%
Nvidia GeForce RTX 3090 FE (1.6)
70.4 (52.3min) fps +44%
KFA2 GeForce RTX 4070 EX Gamer
63.1 fps +29%
AMD Radeon RX 7900 XT (1.61)
57.1 (41.7min) fps +17%
AMD Radeon RX 7900 GRE (1.6)
50.6 (38.5min) fps +4%
ASUS TUF Gaming Radeon RX 7800 XT (1.6)
48.8 (36.5min) fps
ASUS Dual GeForce RTX 4060 Ti OC (1.6)
48 (36.7min) fps -2%
MSI Radeon RX 6950 XT Gaming X Trio (1.61)
47.7 (32.5min) fps -2%
AMD Radeon RX 7800 XT (1.6)
46 (33.3min) fps -6%
Sapphire Pulse Radeon RX 7700 XT (1.6)
39.8 (30min) fps -18%
Sapphire Pulse Radeon RX 7700 XT (1.6)
39.8 (30min) fps -18%
Sapphire Pulse Radeon RX 7700 XT (1.6)
39.8 (30min) fps -18%
AMD Radeon RX 6800 (1.61)
33.7 (23.1min) fps -31%
Nvidia GeForce RTX 2070 Super (1.6)
33.4 fps -32%
Acer Predator BiFrost Arc A770 OC, 16GB GDDR6 (1.6)
29.4 (22.1min) fps -40%
Sapphire Pulse Radeon RX 6750 XT
28.6 fps -41%
Nvidia GeForce RTX 2060 Super (1.6)
25.4 (19.1min) fps -48%
XFX Speedster QICK 308 Radeon RX 7600 Black Edition (1.6)
22.4 (13.9min) fps -54%
3840x2160 Ray Tracing Ultra Preset (DLSS off)
Palit GeForce RTX 4090 GameRock OC (1.6)
44.7 (32.5min) fps +208%
Palit GeForce RTX 4090 GameRock OC (1.6)
42.5 (31.9min) fps +193%
Asus TUF Gaming GeForce RTX 4070 Ti Super (1.63)
24.2 (19.3min) fps +67%
XFX Radeon RX 7900 XTX Merc 310 Black Edition (1.6)
23.3 (17.3min) fps +61%
Nvidia GeForce RTX 3090 FE (1.6)
21.8 (15.1min) fps +50%
KFA2 GeForce RTX 4070 Ti SG (1.5)
21.6 (9.54min) fps +49%
KFA2 GeForce RTX 4070 EX Gamer
17.9 fps +23%
AMD Radeon RX 7900 XT (1.61)
17.6 (12min) fps +21%
AMD Radeon RX 7900 GRE (1.6)
15 (10.3min) fps +3%
ASUS TUF Gaming Radeon RX 7800 XT (1.6)
14.5 (10.7min) fps
MSI Radeon RX 6950 XT Gaming X Trio (1.61)
13.7 (9.28min) fps -6%
AMD Radeon RX 7800 XT (1.6)
13.7 (10.2min) fps -6%
Sapphire Pulse Radeon RX 7700 XT (1.6)
11.5 (7.84min) fps -21%
Sapphire Pulse Radeon RX 7700 XT (1.6)
11.5 (7.84min) fps -21%
Acer Predator BiFrost Arc A770 OC, 16GB GDDR6 (1.6)
10.1 (8.06min) fps -30%
AMD Radeon RX 6800 (1.61)
9.47 (6.59min) fps -35%
Sapphire Pulse Radeon RX 6750 XT
7.7 fps -47%
Nvidia GeForce RTX 2070 Super (1.6)
2.58 (1.427min) fps -82%
ASUS Dual GeForce RTX 4060 Ti OC (1.6)
2.2 (1.622min) fps -85%
XFX Speedster QICK 308 Radeon RX 7600 Black Edition (1.6)
2.05 (0.904min) fps -86%
Ratchet & Clank Rift Apart
1920x1080 Very High Preset + Very High Raytracing AA:T
Palit GeForce RTX 4090 GameRock OC
138.2 (56.2min, 72.1P0.1, 90.9P1) fps +121%
Palit GeForce RTX 4090 GameRock OC
124.3 (63.5min, 66.3P0.1, 76.3P1) fps +99%
XFX Radeon RX 7900 XTX Merc 310 Black Edition
88.4 (59.3min, 60P0.1, 61.7P1) fps +41%
Nvidia GeForce RTX 3090 FE
86.7 (38.9min, 47.8P0.1, 51.9P1) fps +38%
AMD Radeon RX 7800 XT
63.1 (38.7min, 40.4P0.1, 41.4P1) fps +1%
ASUS TUF Gaming Radeon RX 7800 XT
62.6 (36.6min, 40.2P0.1, 41.3P1) fps
ASUS Dual GeForce RTX 4060 Ti OC
61.7 (32.9min, 35.3P0.1, 38.6P1) fps -1%
Nvidia Titan RTX
61.2 (17min, 32.2P0.1, 35.7P1) fps -2%
AMD Radeon RX 6800
50.5 (30.3min, 31.3P0.1, 32P1) fps -19%
Sapphire Pulse Radeon RX 7700 XT
47.8 (18min, 27.7P0.1, 28.4P1) fps -24%
Acer Predator BiFrost Arc A770 OC, 16GB GDDR6
44.5 (24min, 24.8P0.1, 26.9P1) fps -29%
Sapphire Pulse Radeon RX 6750 XT
38 (18min, 21.8P0.1, 22.5P1) fps -39%
Nvidia GeForce RTX 2070 Super
35.4 (19.7min, 19.7P0.1, 21.1P1) fps -43%
Nvidia GeForce RTX 2060 Super
31.7 (14.1min, 16.3P0.1, 18.5P1) fps -49%
XFX Speedster QICK 308 Radeon RX 7600 Black Edition
12 (5.57min, 5.86P0.1, 6.47P1) fps -81%
3840x2160 Very High Preset + Very High Raytracing + DLSS Quality + FG
Palit GeForce RTX 4090 GameRock OC
145.2 (64.8min, 82.2P0.1, 98.9P1) fps
Palit GeForce RTX 4090 GameRock OC
136.3 (55.4min, 61.1P0.1, 72.9P1) fps
ASUS Dual GeForce RTX 4060 Ti OC
15.6 (5.66min, 6.01P0.1, 6.38P1) fps
Alan Wake 2 - 1920x1080 High Preset + High Ray Tracing
Palit GeForce RTX 4090 GameRock OC
94.3 (58.2min, 64.3P0.1, 75.4P1) fps +177%
Asus TUF Gaming GeForce RTX 4070 Ti Super
69.8 (45.3min, 48.6P0.1, 57.5P1) fps +105%
XFX Radeon RX 7900 XTX Merc 310 Black Edition
53.2 (21.9min, 34.4P0.1, 40.3P1) fps +56%
Nvidia GeForce RTX 3090 FE
52 (37.9min, 38.6P0.1, 42.4P1) fps +53%
ASUS TUF Gaming Radeon RX 7800 XT
34 (14.7min, 14.8P0.1, 25.1P1) fps
MSI Radeon RX 6950 XT Gaming X Trio
29.6 (18.3min, 18.6P0.1, 21.9P1) fps -13%
Nvidia Titan RTX
27.9 (19.9min, 20.2P0.1, 21.5P1) fps -18%
Sapphire Pulse Radeon RX 7700 XT
26.7 (18.3min, 18.4P0.1, 20.9P1) fps -21%
AMD Radeon RX 6800
21.1 (15min, 15P0.1, 15.4P1) fps -38%
Sapphire Pulse Radeon RX 6750 XT
17.4 (11.5min, 11.6P0.1, 13P1) fps -49%
Nvidia GeForce RTX 2070 Super
5.28 (2.55min, 2.57P0.1, 2.79P1) fps -84%
Nvidia GeForce RTX 2060 Super
4.9 (2.34min, 2.34P0.1, 2.38P1) fps -86%
XFX Speedster QICK 308 Radeon RX 7600 Black Edition
4.4 (2.21min, 2.21P0.1, 2.24P1) fps -87%
Cyberpunk 2077 2.1 Phantom Liberty
1920x1080 Ray Tracing Ultra Preset (DLSS off)
Palit GeForce RTX 4090 GameRock OC (2.0)
126.3 (100.3min) fps +169%
Asus TUF Gaming GeForce RTX 4070 Ti Super (2.1)
81.8 (63.1min) fps +74%
XFX Radeon RX 7900 XTX Merc 310 Black Edition (2.11)
70.3 (61.5min) fps +50%
Nvidia GeForce RTX 3090 FE (2.11)
69.7 (60.9min) fps +48%
MSI Radeon RX 6950 XT Gaming X Trio (2.02)
47.4 (35min) fps +1%
ASUS TUF Gaming Radeon RX 7800 XT (2.11)
47 (40.8min) fps
Sapphire Pulse Radeon RX 7700 XT (2.02)
37 (29.3min) fps -21%
AMD Radeon RX 6800 (2.02)
34 (23.8min) fps -28%
Acer Predator BiFrost Arc A770 OC, 16GB GDDR6 (2.0)
31.3 (25.7min) fps -33%
Sapphire Pulse Radeon RX 6750 XT (2.02)
28.1 (19.7min) fps -40%
XFX Speedster QICK 308 Radeon RX 7600 Black Edition (2.02)
23.9 (17.8min) fps -49%
3840x2160 Ray Tracing Ultra Preset (DLSS off, no Path Tracing)
Asus TUF Gaming GeForce RTX 4070 Ti Super (2.1)
25 (16.2min) fps +77%
XFX Radeon RX 7900 XTX Merc 310 Black Edition (2.11)
22.4 (19.5min) fps +59%
Nvidia GeForce RTX 3090 FE (2.11)
21.8 (19min) fps +55%
Nvidia GeForce RTX 3090 FE (2.11)
21.1 (18.4min) fps +50%
ASUS TUF Gaming Radeon RX 7800 XT (2.11)
14.1 (12.3min) fps
AMD Radeon RX 6800 (2.02)
9.8 (7.13min) fps -30%
Sapphire Pulse Radeon RX 6750 XT (2.02)
7.8 (5.86min) fps -45%
XFX Speedster QICK 308 Radeon RX 7600 Black Edition (2.02)
3.2 (0.817min) fps -77%

Overview of the Games Tested with the Asus TUF Gaming Radeon RX 7800 XT OC

all | 2015 | 2017 | 2018 | 2019 | 2020 | 2021 | 2022 | 2023 | 2024
basso medio alto ultraQHD4K FSR4K
Prince of Persia The Lost Crown (2024) 359 359 359 359 344
Palworld (2024) 228 197.1 140.2 138.9 118.5 63.4
Enshrouded (2024) 133 123.2 105.3 89.6 69.2 61 41
Helldivers 2 (2024) 213 193.2 172.3 164.9 123.7 68.5
Skull & Bones (2024) 209 197 157 103 91 55 55
Last Epoch (2024) 295 292 291 232 142.7 64.9
Alone in the Dark (2024) 310 298 280 166.1 102.5 98.6 46.5
Horizon Forbidden West (2024) 180.3 164.7 111 109.8 85.3 72.5 54.7
Dragon's Dogma 2 (2024) 113.7 109.2 90.6 58 55
Ghost of Tsushima (2024) 185.1 158.1 147.6 113.9 92 83.2 58
Senua's Saga Hellblade 2 (2024) 114.3 96.3 70 51.7 47.2 28.4
F1 24 (2024) 484 422 317 88.3 57.3 49.8 28.7
show all (73 hidden)

Emissioni - Silenzioso, ma non molto efficiente

Emissioni di rumore

Rotazioni opposte delle ventole (fonte: Asus)

Asus ha dotato TUF Gaming Radeon RX 7800 XT OC di una modalità di arresto delle ventole. Le tre ventole assiali da 100 mm (~3,9 pollici) iniziano a funzionare solo a temperature della GPU superiori a 55 °C (131 °F), il che garantisce un funzionamento silenzioso con le attività 2D e sotto carico ridotto. Sotto un carico medio 3D, le tre ventole funzionano a bassa velocità e misuriamo solo un basso livello di rumore di 31,1 dB(A). Durante lo stress test, il sistema di raffreddamento deve lavorare di più, il che è accompagnato da un livello di rumore massimo di 37,7 dB(A). Come particolarità, dobbiamo anche menzionare che le due ventole esterne ruotano in senso antiorario nella direzione opposta rispetto alla ventola centrale. Questo dovrebbe evitare alcune turbolenze e garantire una migliore circolazione dell'aria.

Per documentare il livello di rumore della scheda grafica, abbiamo inserito Asus TUF Gaming Radeon RX 7800 XT OC nel nostro sistema con un case aperto per misurare i livelli di rumore. Quando è inserita nel nostro sistema di test GPU, non siamo in grado di sentire esplicitamente il rumore della scheda grafica sotto carico.

No Loudness Data found for specs ID 346127
dB(A) 0102030405060708090Deep BassMiddle BassHigh BassLower RangeMidsHigher MidsLower HighsMid HighsUpper HighsSuper Highs2038.433.435.635.938.339.938.42536.937.139.339.533.835.236.93135.733.932.835.632.133.935.7403030.427.326.124.527.3305031.633.831.731.630.13031.66327.628.425.129.9252627.68026.924.916.715.916.223.426.910025.825.619.218.518.61925.812525.325.315.115.51516.625.316028.823.710.110.711.613.328.820029.920.31314.212.913.329.925023.722.211.310.811.511.123.731525.121.59.79.810.610.525.140023.3199.39.69.71023.350022.218.610.59.19.29.522.263017.715.19.69.29.29.717.780016.814.210.210.210.19.216.8100014.412.210.210.310.31014.4125018.516.210.91110.810.818.5160021.417.111.111.21110.621.4200021.816.712.212.112.211.121.8250023.816.312.912.812.611.723.8315024.416.514.114.21412.424.4400025.618.91515.114.812.925.6500029.221.315.21515.113.229.2630029.423.215.11515.113.429.4800030.522.314.514.614.613.530.51000029.120.414.714.714.913.729.11250024.718.414.614.614.713.524.71600023.620.516.416.316.413.523.6SPL37.731.125.325.325.224.137.7N2.61.40.60.60.60.52.6median 24.4median 19median 12.9median 12.8median 12.6median 12.4median 24.4Delta2.62.72.12.22.11.52.6hearing rangehide median Fan NoiseASUS TUF Gaming Radeon RX 7800 XT

Temperature e consumo di energia

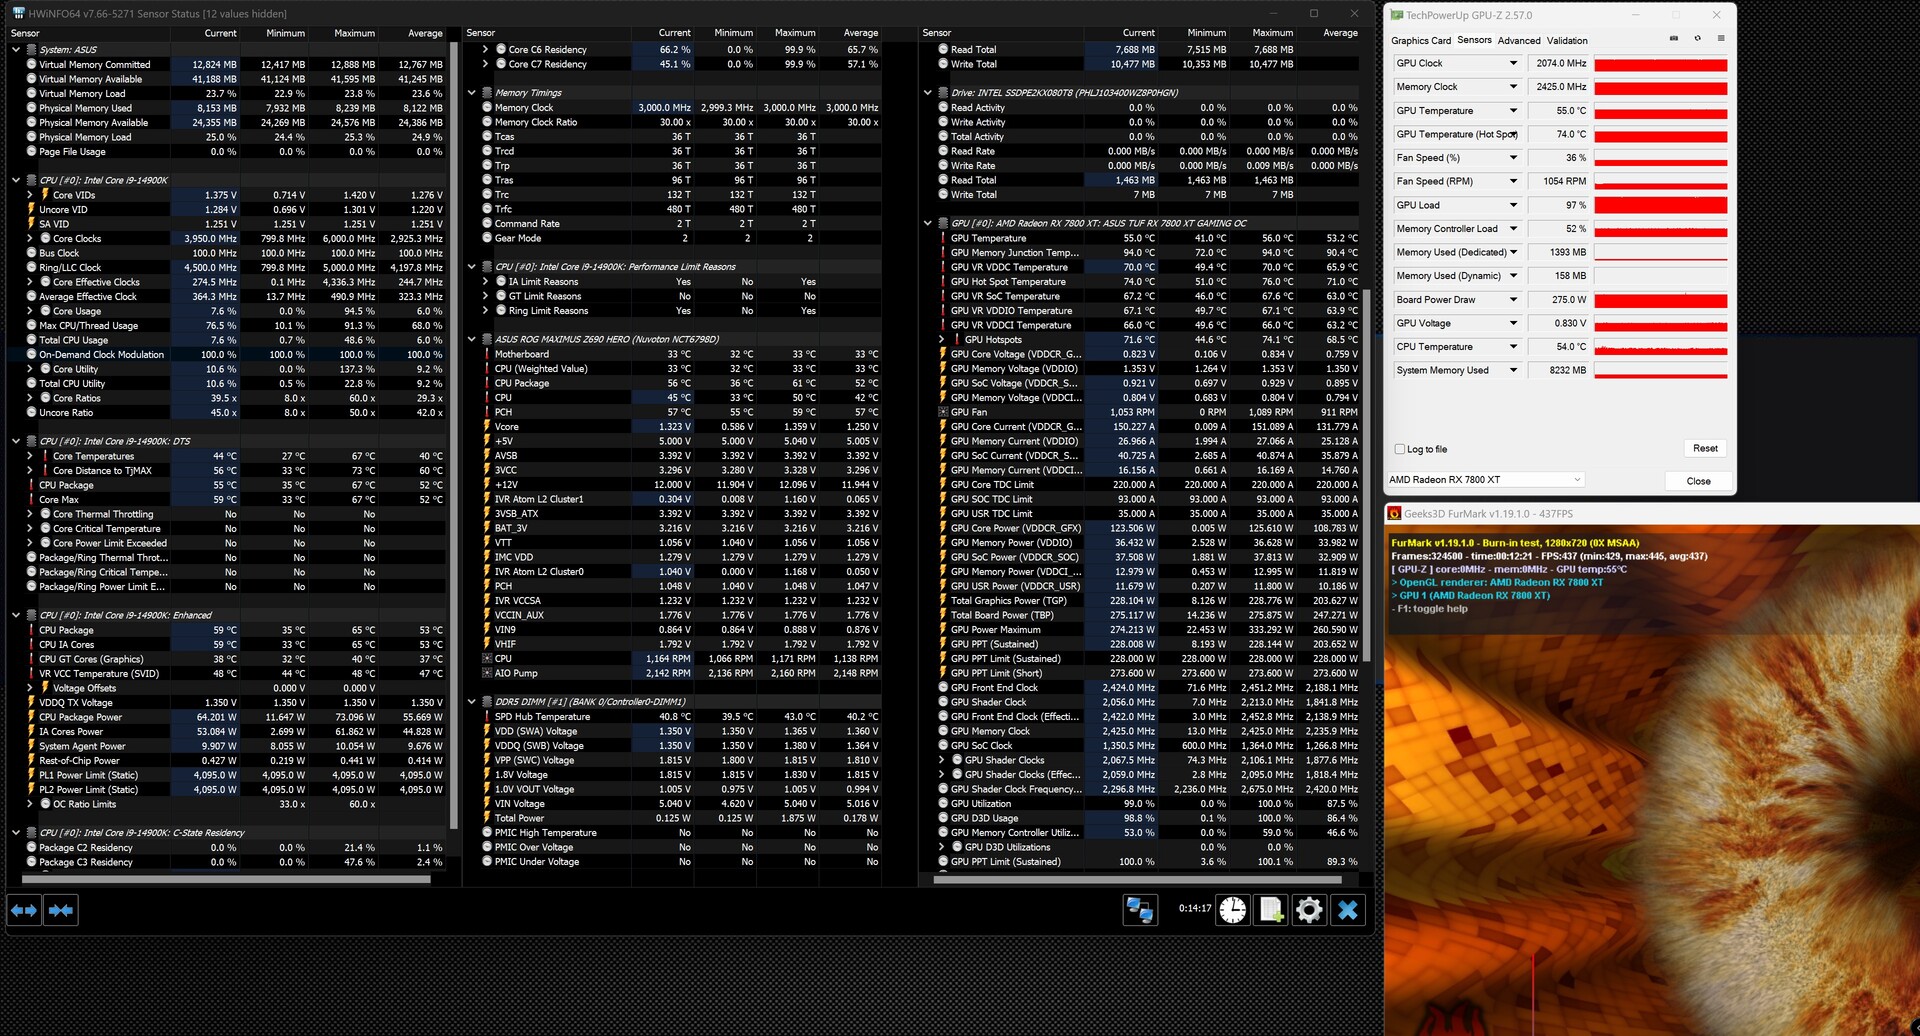
Asus TUF Gaming Radeon RX 7800 XT OC è dotata di un ampio corpo di raffreddamento che impedisce l'insorgere di problemi di temperatura in qualsiasi momento. Abbiamo potuto confermarlo nel nostro test e, con una temperatura del punto caldo della GPU di soli 76 °C (169 °F), la scheda grafica rimane sorprendentemente fresca. Tuttavia, a 94 °C (201 °F) per la VRAM, misuriamo un valore più alto, anche se questo non influisce comunque sulle capacità prestazionali.

Il consumo energetico è una delle aree in cui Asus TUF Gaming Radeon RX 7800 XT OC non riesce a brillare con un buon risultato. Nvidia ha fissato l'asticella dell'efficienza molto in alto con i suoi modelli Ada Lovelace. AMD specifica un consumo energetico di 263 watt per la Radeon RX 7800 XT. Nel nostro campione di prova, vediamo che questo valore viene leggermente superato, attestandosi a circa 275 watt (TBP). Con questo, la nostra unità di test si posiziona al livello di una AMD Radeon RX 7900 GRE. Nel confronto con Nvidia, il consumo energetico del nostro modello è addirittura superiore a quello di una Nvidia GeForce RTX 4070 Ti.

Utilizzando il PMD (Power Measurement Device) di Elmor, diamo un'ulteriore occhiata ai brevi picchi di carico della Asus TUF Gaming Radeon RX 7800 XT OC. Durante il gioco, la scheda grafica raggiunge brevemente i 474 watt. Secondo il produttore, si raccomanda un'alimentazione di almeno 750 watt, e possiamo confermarlo grazie al consumo energetico.

Test da sforzo FurMark (PT, 100%)
Consumo di energia del nostro sistema di prova durante il funzionamento inattivo
Consumo di energia del nostro sistema di test durante lo stress test
Consumo di energia del nostro sistema di prova durante il gioco
Picchi di carico della RX 7800 XT Super durante lo stress test
Picchi di carico della RX 7800 XT Super durante il gioco
 
Power Consumption / FurMark 1.19 GPU Stress Test (external Monitor)
MSI Radeon RX 6950 XT Gaming X Trio
MSI Radeon RX 6950 XT Gaming X Trio, Intel Core i9-14900K
595 (584min, 585P1 - 676max) Watt * -42%
Palit GeForce RTX 4090 GameRock OC
Palit GeForce RTX 4090 GameRock OC, Intel Core i9-14900K
588 (572min, 577P1 - 632max) Watt * -40%
Nvidia GeForce RTX 3090 FE
Nvidia GeForce RTX 3090 FE, Intel Core i9-14900K
492 (484min, 485P1 - 517max) Watt * -17%
KFA2 GeForce RTX 4080 Super SG
KFA2 GeForce RTX 4080 Super SG, Intel Core i9-14900K
441 (426min, 433P1 - 452max) Watt * -5%
Asus TUF Gaming GeForce RTX 4070 Ti Super
Asus TUF Gaming GeForce RTX 4070 Ti Super, Intel Core i9-13900K (Idle: 138 W)
426 (419min, 420P1 - 452max) Watt * -2%
Asus TUF Gaming GeForce RTX 4070 Ti Super
Asus TUF Gaming GeForce RTX 4070 Ti Super, Intel Core i9-13900K (Idle: 138 W)
395 (389min, 389P1 - 425max) Watt * +6%
Nvidia Titan RTX
Nvidia Titan RTX, Intel Core i9-14900K
419 (412min, 414P1 - 440max) Watt * -0%
ASUS TUF Gaming Radeon RX 7800 XT
ASUS TUF Gaming Radeon RX 7800 XT, Intel Core i9-14900K
419 (413min, 413P1 - 431max) Watt *
AMD Radeon RX 7900 GRE
AMD Radeon RX 7900 GRE, AMD Ryzen 9 7950X
418 (412min, 414P1 - 431max) Watt * -0%
Gigabyte GeForce RTX 4070 Super Gaming OC 12G
Intel Core i9-13900K (Idle: 122.6 W)
413 (403min, 404P1 - 440max) Watt * +1%
Gigabyte GeForce RTX 4070 Super Gaming OC 12G
Intel Core i9-13900K (Idle: 122.6 W)
335 (330min, 330P1 - 359max) Watt * +20%
Acer Predator BiFrost Arc A750 OC
Acer Predator BiFrost Arc A750 OC, Intel Core i9-14900K
388 (374min, 377P1 - 427max) Watt * +7%
Acer Predator BiFrost Arc A770 OC
Acer Predator BiFrost Arc A770 OC, Intel Core i9-14900K
386 (357min, 362P1 - 436max) Watt * +8%
Sapphire Pulse Radeon RX 6750 XT
Sapphire Pulse Radeon RX 6750 XT, Intel Core i9-14900K
383 (372min, 372P1 - 420max) Watt * +9%
AMD Radeon RX 6800
AMD Radeon RX 6800, Intel Core i9-14900K
379 (350min, 351P1 - 423max) Watt * +10%
KFA2 GeForce RTX 2070 SUPER Work The Frames Edition
KFA2 GeForce RTX 2070 SUPER Work The Frames Edition, Intel Core i9-14900K
343 (338min, 339P1 - 374max) Watt * +18%
Nvidia GeForce RTX 3060 Ti FE
Nvidia GeForce RTX 3060 Ti FE, Intel Core i9-14900K
338 (321min, 327P1 - 378max) Watt * +19%
AMD Radeon RX 5700 XT
AMD Radeon RX 5700 XT, Intel Core i9-14900K
338 (332min, 333P1 - 365max) Watt * +19%
ASRock Arc A580 Challenger OC
ASRock Arc A580 Challenger OC, Intel Core i9-14900K
337 (330min, 332P1 - 351max) Watt * +20%
XFX Speedster QICK 308 Radeon RX 7600 Black Edition
XFX Speedster QICK 308 Radeon RX 7600 Black Edition, Intel Core i9-14900K
312 (302min, 303P1 - 340max) Watt * +26%
Power Consumption / The Witcher 3 ultra (external Monitor)
MSI Radeon RX 6950 XT Gaming X Trio
MSI Radeon RX 6950 XT Gaming X Trio, Intel Core i9-14900K
613 (607min, 610P1 - 627max) Watt * -41%
Palit GeForce RTX 4090 GameRock OC
Palit GeForce RTX 4090 GameRock OC, Intel Core i9-14900K
600 (586min, 590P1 - 664max) Watt * -38%
Nvidia GeForce RTX 3090 FE
Nvidia GeForce RTX 3090 FE, Intel Core i9-14900K
544 (535min, 537P1 - 641max) Watt * -25%
KFA2 GeForce RTX 4080 Super SG
KFA2 GeForce RTX 4080 Super SG, Intel Core i9-14900K
489 (481min, 482P1 - 502max) Watt * -12%
Nvidia Titan RTX
Nvidia Titan RTX, Intel Core i9-14900K
448 (438min, 440P1 - 513max) Watt * -3%
AMD Radeon RX 7900 GRE
AMD Radeon RX 7900 GRE, AMD Ryzen 9 7950X
440 (433min, 435P1 - 447max) Watt * -1%
ASUS TUF Gaming Radeon RX 7800 XT
ASUS TUF Gaming Radeon RX 7800 XT, Intel Core i9-14900K
436 (432min, 433P1 - 466max) Watt *
Asus TUF Gaming GeForce RTX 4070 Ti Super
Asus TUF Gaming GeForce RTX 4070 Ti Super, Intel Core i9-13900K (Idle: 138 W)
398 (386min, 387P1 - 431max) Watt * +9%
Asus TUF Gaming GeForce RTX 4070 Ti Super
Asus TUF Gaming GeForce RTX 4070 Ti Super, Intel Core i9-13900K (Idle: 138 W)
393 (382min, 383P1 - 420max) Watt * +10%
Sapphire Pulse Radeon RX 6750 XT
Sapphire Pulse Radeon RX 6750 XT, Intel Core i9-14900K
398 (393min, 393P1 - 441max) Watt * +9%
Gigabyte GeForce RTX 4070 Super Gaming OC 12G
Intel Core i9-13900K (Idle: 122.6 W)
388 (373min, 375P1 - 438max) Watt * +11%
Gigabyte GeForce RTX 4070 Super Gaming OC 12G
Intel Core i9-13900K (Idle: 122.6 W)
388 (377min, 377P1 - 418max) Watt * +11%
AMD Radeon RX 6800
AMD Radeon RX 6800, Intel Core i9-14900K
388 (373min, 376P1 - 415max) Watt * +11%
Nvidia GeForce RTX 3060 Ti FE
Nvidia GeForce RTX 3060 Ti FE, Intel Core i9-14900K
371 (361min, 363P1 - 406max) Watt * +15%
KFA2 GeForce RTX 2070 SUPER Work The Frames Edition
KFA2 GeForce RTX 2070 SUPER Work The Frames Edition, Intel Core i9-14900K
353 (337min, 341P1 - 512max) Watt * +19%
AMD Radeon RX 5700 XT
AMD Radeon RX 5700 XT, Intel Core i9-14900K
326 (316min, 318P1 - 340max) Watt * +25%
XFX Speedster QICK 308 Radeon RX 7600 Black Edition
XFX Speedster QICK 308 Radeon RX 7600 Black Edition, Intel Core i9-14900K
323 (318min, 318P1 - 333max) Watt * +26%
Acer Predator BiFrost Arc A750 OC
Acer Predator BiFrost Arc A750 OC, Intel Core i9-14900K
323 (319min, 319P1 - 339max) Watt * +26%
ASRock Arc A580 Challenger OC
ASRock Arc A580 Challenger OC, Intel Core i9-14900K
312 (302min, 305P1 - 321max) Watt * +28%
Acer Predator BiFrost Arc A770 OC
Acer Predator BiFrost Arc A770 OC, Intel Core i9-14900K
298 (287min, 288P1 - 334max) Watt * +32%
Power Consumption / Witcher 3 ultra Efficiency (external Monitor)
Gigabyte GeForce RTX 4070 Super Gaming OC 12G
Intel Core i9-13900K
0.541 fps per Watt +12%
KFA2 GeForce RTX 4080 Super SG
KFA2 GeForce RTX 4080 Super SG, Intel Core i9-14900K
0.538 fps per Watt +11%
Asus TUF Gaming GeForce RTX 4070 Ti Super
Asus TUF Gaming GeForce RTX 4070 Ti Super, Intel Core i9-13900K
0.528 fps per Watt +9%
Palit GeForce RTX 4090 GameRock OC
Palit GeForce RTX 4090 GameRock OC, Intel Core i9-14900K
0.518 fps per Watt +7%
ASUS TUF Gaming Radeon RX 7800 XT
ASUS TUF Gaming Radeon RX 7800 XT, Intel Core i9-14900K
0.4839 fps per Watt
AMD Radeon RX 7900 GRE
AMD Radeon RX 7900 GRE, AMD Ryzen 9 7950X
0.4777 fps per Watt -1%
ASRock Arc A580 Challenger OC
ASRock Arc A580 Challenger OC, Intel Core i9-14900K
0.2183 fps per Watt -55%

* ... Meglio usare valori piccoli

Power Consumption With External Monitor

0255075100125150175200225250275300325350375400425450Tooltip
ASUS TUF Gaming Radeon RX 7800 XT Radeon RX 7800 XT, i9-14900K, Kingston KC3000 2048G SKC3000D2048G; 1280x720 FurMark 1.19 GPU Stress Test (external Monitor): Ø419 (413-431)
AMD Radeon RX 6800 Radeon RX 6800, i9-14900K, Kingston KC3000 2048G SKC3000D2048G; 1280x720 FurMark 1.19 GPU Stress Test (external Monitor): Ø379 (350-423)
Acer Predator BiFrost Arc A770 OC Arc A770, i9-14900K, Kingston KC3000 2048G SKC3000D2048G; 1280x720 FurMark 1.19 GPU Stress Test (external Monitor): Ø386 (357-436)
ASUS TUF Gaming Radeon RX 7800 XT Radeon RX 7800 XT, i9-14900K, Kingston KC3000 2048G SKC3000D2048G; 1920x1080 The Witcher 3 ultra (external Monitor): Ø436 (432-466)
AMD Radeon RX 6800 Radeon RX 6800, i9-14900K, Kingston KC3000 2048G SKC3000D2048G; 1920x1080 The Witcher 3 ultra (external Monitor): Ø388 (373-415)
Acer Predator BiFrost Arc A770 OC Arc A770, i9-14900K, Kingston KC3000 2048G SKC3000D2048G; 1920x1080 The Witcher 3 ultra (external Monitor): Ø298 (287-334)
ASUS TUF Gaming Radeon RX 7800 XT Radeon RX 7800 XT, i9-14900K, Kingston KC3000 2048G SKC3000D2048G; Idle 1min (external Monitor): Ø74.7 (72-78.6)
AMD Radeon RX 6800 Radeon RX 6800, i9-14900K, Kingston KC3000 2048G SKC3000D2048G; Idle 1min (external Monitor): Ø77.6 (75.1-99)
Acer Predator BiFrost Arc A770 OC Arc A770, i9-14900K, Kingston KC3000 2048G SKC3000D2048G; Idle 1min (external Monitor): Ø121.8 (107.6-164.9)

Pro

+ prestazioni sufficienti per i giochi a 1440p
+ modalità di arresto della ventola
+ DisplayPort 2.1
+ 16 GB DI VRAM
+ scelta di materiali di alta qualità
+ illuminazione RGB discreta
+ potente concetto di raffreddamento

Contro

- basse prestazioni di raytracing
- efficienza energetica
- relativamente costoso

Verdetto - Un modello premium di fascia media

Test della Asus TUF Gaming Radeon RX 7800 XT OC. Unità di prova fornita da Asus Germania.

Come potente modello di fascia media, Asus TUF Gaming Radeon RX 7800 XT OC fa un buon lavoro. I suoi 16 GB di VRAM costituiscono un buon argomento di acquisto per competere con una Nvidia GeForce RTX 4070. Le prestazioni 3D di base di Asus TUF Gaming Radeon RX 7800 XT OC sono per lo più sufficienti per competere con Nvidia GeForce RTX 4070, anche se le cose vanno leggermente peggio rispetto ai modelli Super più recenti.

Nel complesso, Asus TUF Gaming Radeon RX 7800 XT OC è una delle schede grafiche più veloci in grado di gestire i giochi attuali. La nostra unità di prova offre frame rate giocabili in risoluzione QHD con dettagli massimi. La scheda grafica dovrebbe coprire esattamente quest'area di prestazioni e ci riesce facilmente. Il modello di Asus che abbiamo testato qui offre prestazioni leggermente superiori rispetto al modello di riferimento, anche se non è molto evidente. L'unità di raffreddamento utilizzata da Asus è buona e la scheda grafica non raggiunge mai temperature critiche sotto carico. Tuttavia, le dimensioni della scheda grafica potrebbero rappresentare un problema per quanto riguarda la compatibilità con alcuni case.

Asus TUF Gaming Radeon RX 7800 XT OC è una scheda grafica che mostra una lavorazione di alta qualità e offre un design del sistema di raffreddamento di prim'ordine.

Il prezzo di Asus TUF Gaming Radeon RX 7800 XT OC è attualmente di 570 Euro (~$620). Bisogna aspettarsi circa lo stesso prezzo per una nuova Nvidia GeForce RTX 4070, anche se questo modello è già stato sostituito dalla Nvidia GeForce RTX 4070 Super. Entrambi sono già disponibili a 599 Euro (~$651) e offrono prestazioni superiori con un consumo energetico inferiore. Ma è il prezzo di acquisto il vero problema: Con 570 Euro (~$620), Asus TUF Gaming Radeon RX 7800 XT OC è uno dei modelli RX 7800 XT più costosi, mentre è già possibile trovare modelli di altri partner di schede che offrono prestazioni identiche a 479 Euro (~$521).

Prezzo e disponibilità

L'Asus TUF Gaming Radeon RX 7800 XT OC è in listino sul sito web statunitense di Asus al prezzo di 530 dollarianche se attualmente non è disponibile. Microcenter sembra attualmente averla in stock a 520 dollari.

Transparency

The present review sample was given to the author by the manufacturer free of charge for the purposes of review. There was no third-party influence on this review, nor did the manufacturer receive a copy of this review before publication. There was no obligation to publish this review.

Please share our article, every link counts!
> Recensioni e prove di notebook, tablets e smartphones > Recensioni e prove > Recensioni e prove > Recensione dell'Asus TUF Gaming Radeon RX 7800 XT OC: Un serio sfidante della Nvidia GeForce RTX 4070 Super a meno di 600 euro?
Sebastian Bade, 2024-05-19 (Update: 2024-05-24)