Recensione del Medion Erazer Beast X40 (2024): un gaming Laptop di fascia alta con RTX 4090 e tastiera meccanica

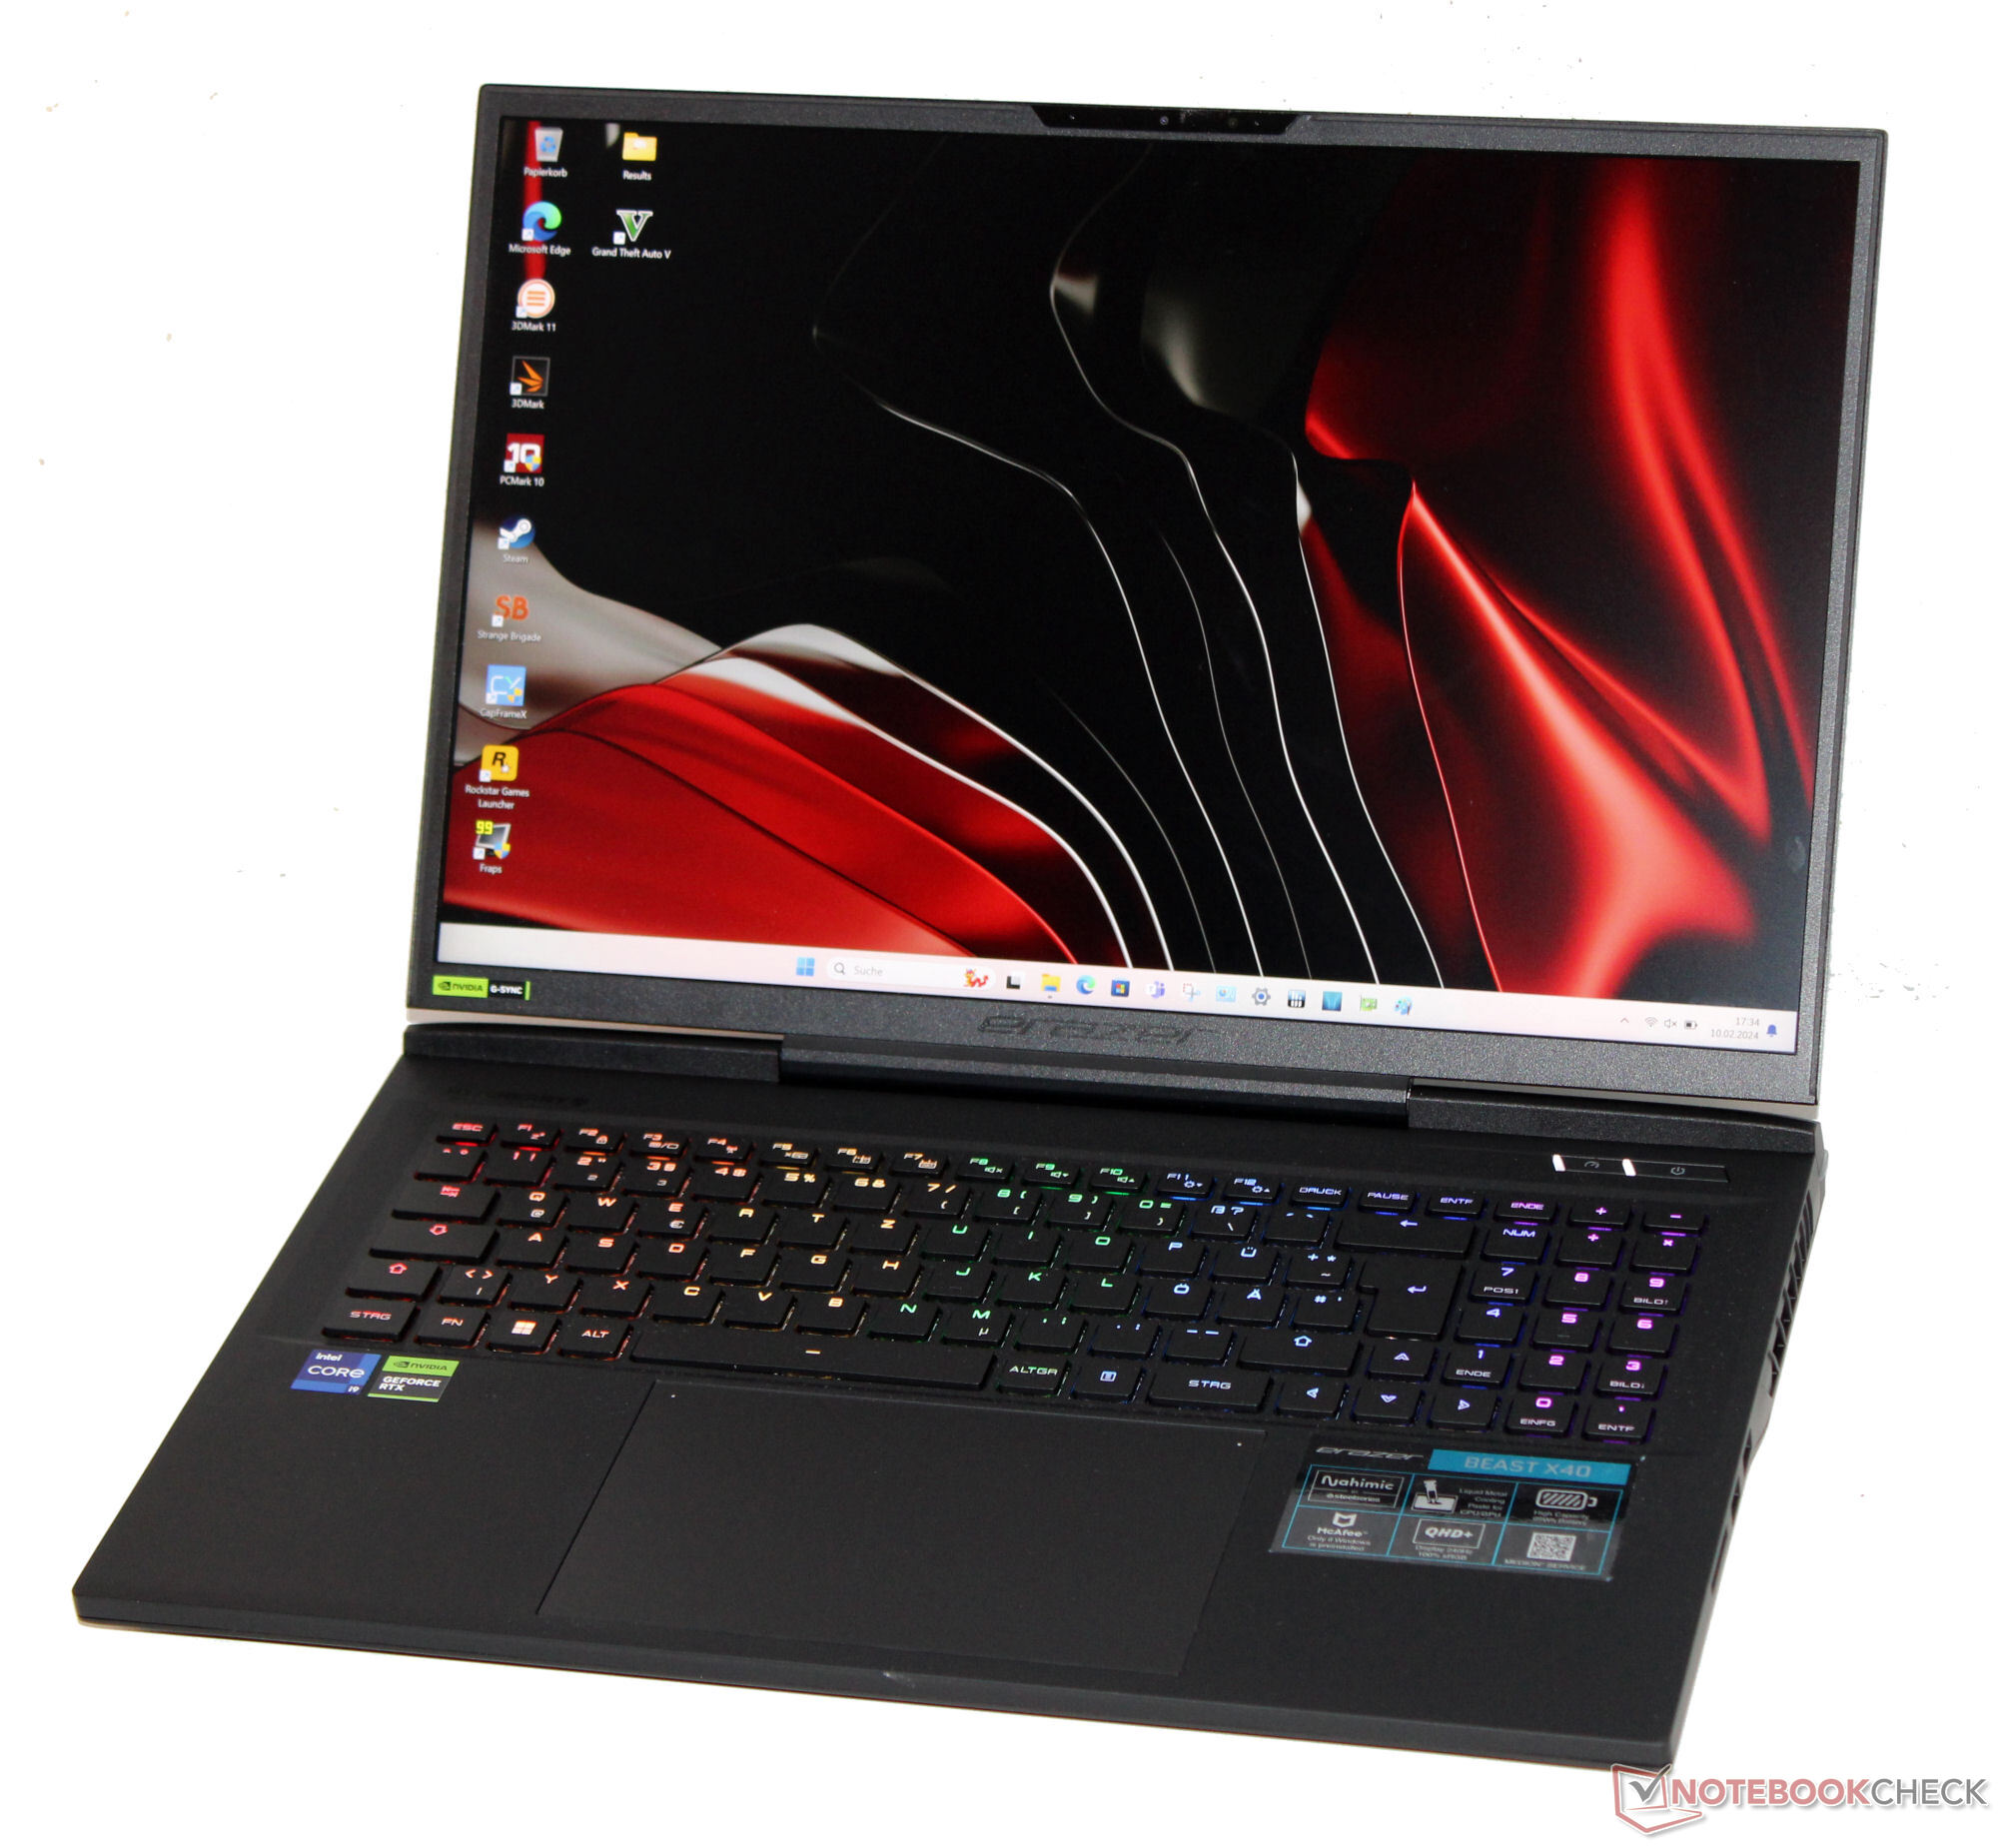
Medion Beast X40 è uno dei laptop più potenti attualmente disponibili. Intel Raptor Lake, Nvidia Ada Lovelace, 2 TB di spazio di archiviazione e 32 GB di RAM si sommano per equipaggiare il laptop per lo streaming, il rendering e il gioco, pur costando una bomba, circa 4.000 euro.
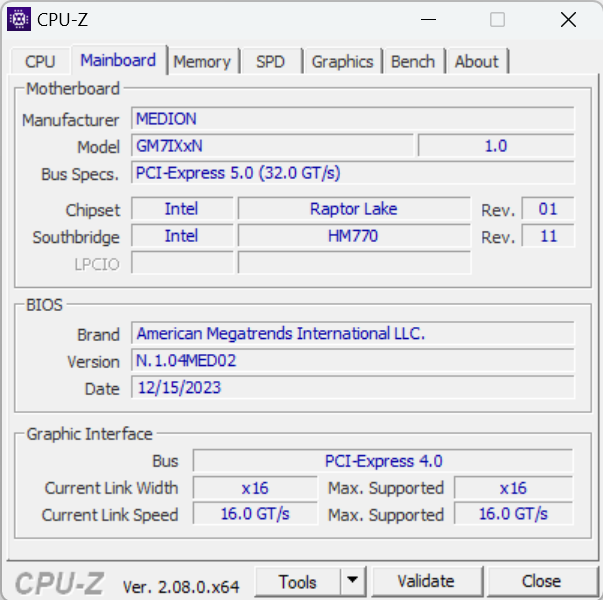
Come nel caso del suo predecessoreun telaio barebone Tongfang (GM7IX9N) funge da base per la costruzione di Beast X40. La concorrenza comprende computer portatili da gioco come l' Asus ROG Strix Scar 17 G733PYVe il modello Schenker Key 17 Pro (Early 23)e il MSI Titan 18 HX A14VIG.
Potenziali concorrenti a confrontos
Punteggio | Data | Modello | Peso | Altezza | Dimensione | Risoluzione | Prezzo |
|---|---|---|---|---|---|---|---|
| 89.2 % v7 (old) | 02/2024 | Medion Erazer Beast X40 2024 i9-14900HX, GeForce RTX 4090 Laptop GPU | 2.9 kg | 36 mm | 17.00" | 2560x1600 | |
| 87.2 % v7 (old) | 08/2023 | Asus ROG Strix Scar 17 G733PYV-LL053X R9 7945HX3D, GeForce RTX 4090 Laptop GPU | 2.9 kg | 28.3 mm | 17.30" | 2560x1440 | |
| 85.5 % v7 (old) | 06/2023 | Schenker Key 17 Pro (Early 23) i9-13900HX, GeForce RTX 4090 Laptop GPU | 3.4 kg | 24.9 mm | 17.30" | 3840x2160 | |
| 88.3 % v7 (old) | 02/2024 | Asus ROG Strix Scar 18 G834JYR (2024) i9-14900HX, GeForce RTX 4090 Laptop GPU | 3.1 kg | 30.8 mm | 18.00" | 2560x1600 | |
| 88.8 % v7 (old) | 01/2024 | MSI Titan 18 HX A14VIG i9-14900HX, GeForce RTX 4090 Laptop GPU | 3.6 kg | 32.1 mm | 18.00" | 3840x2400 |
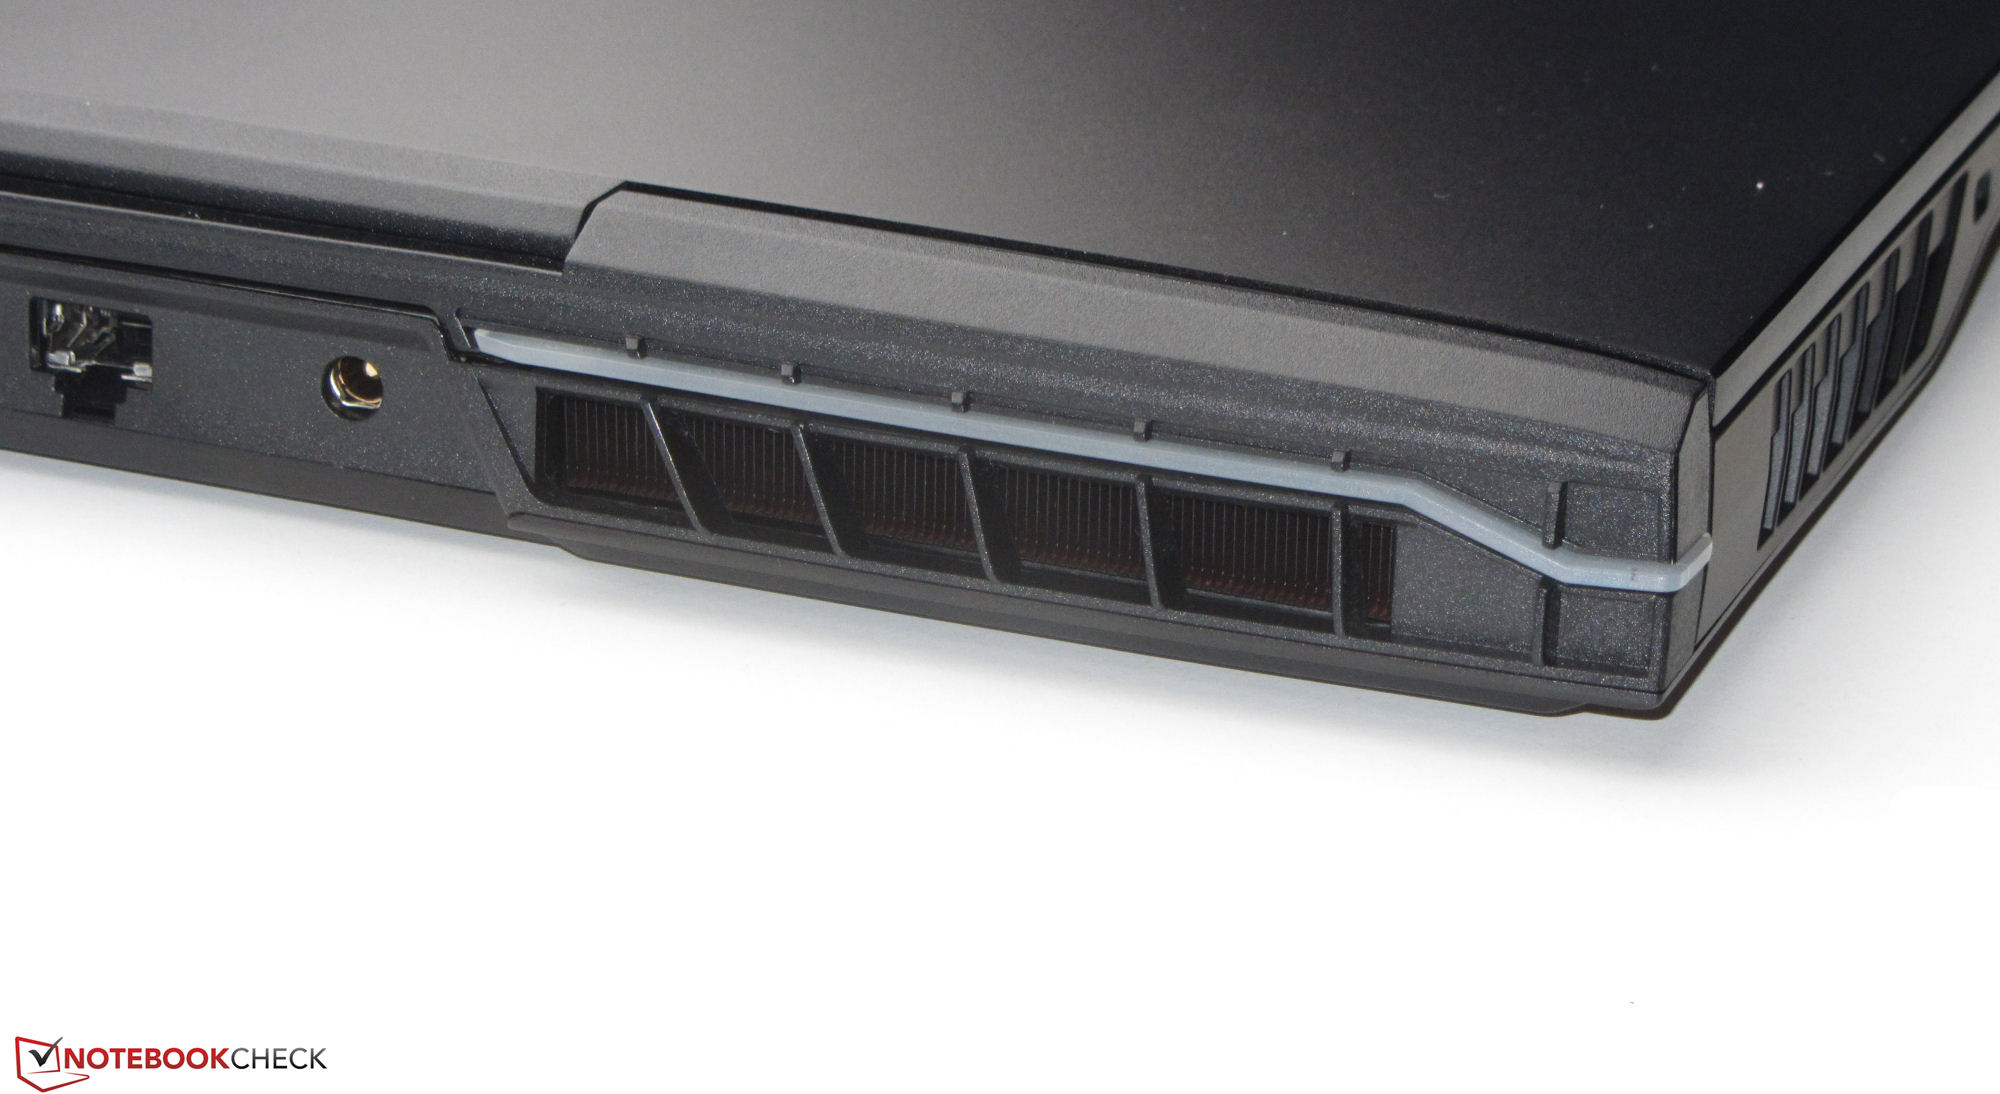
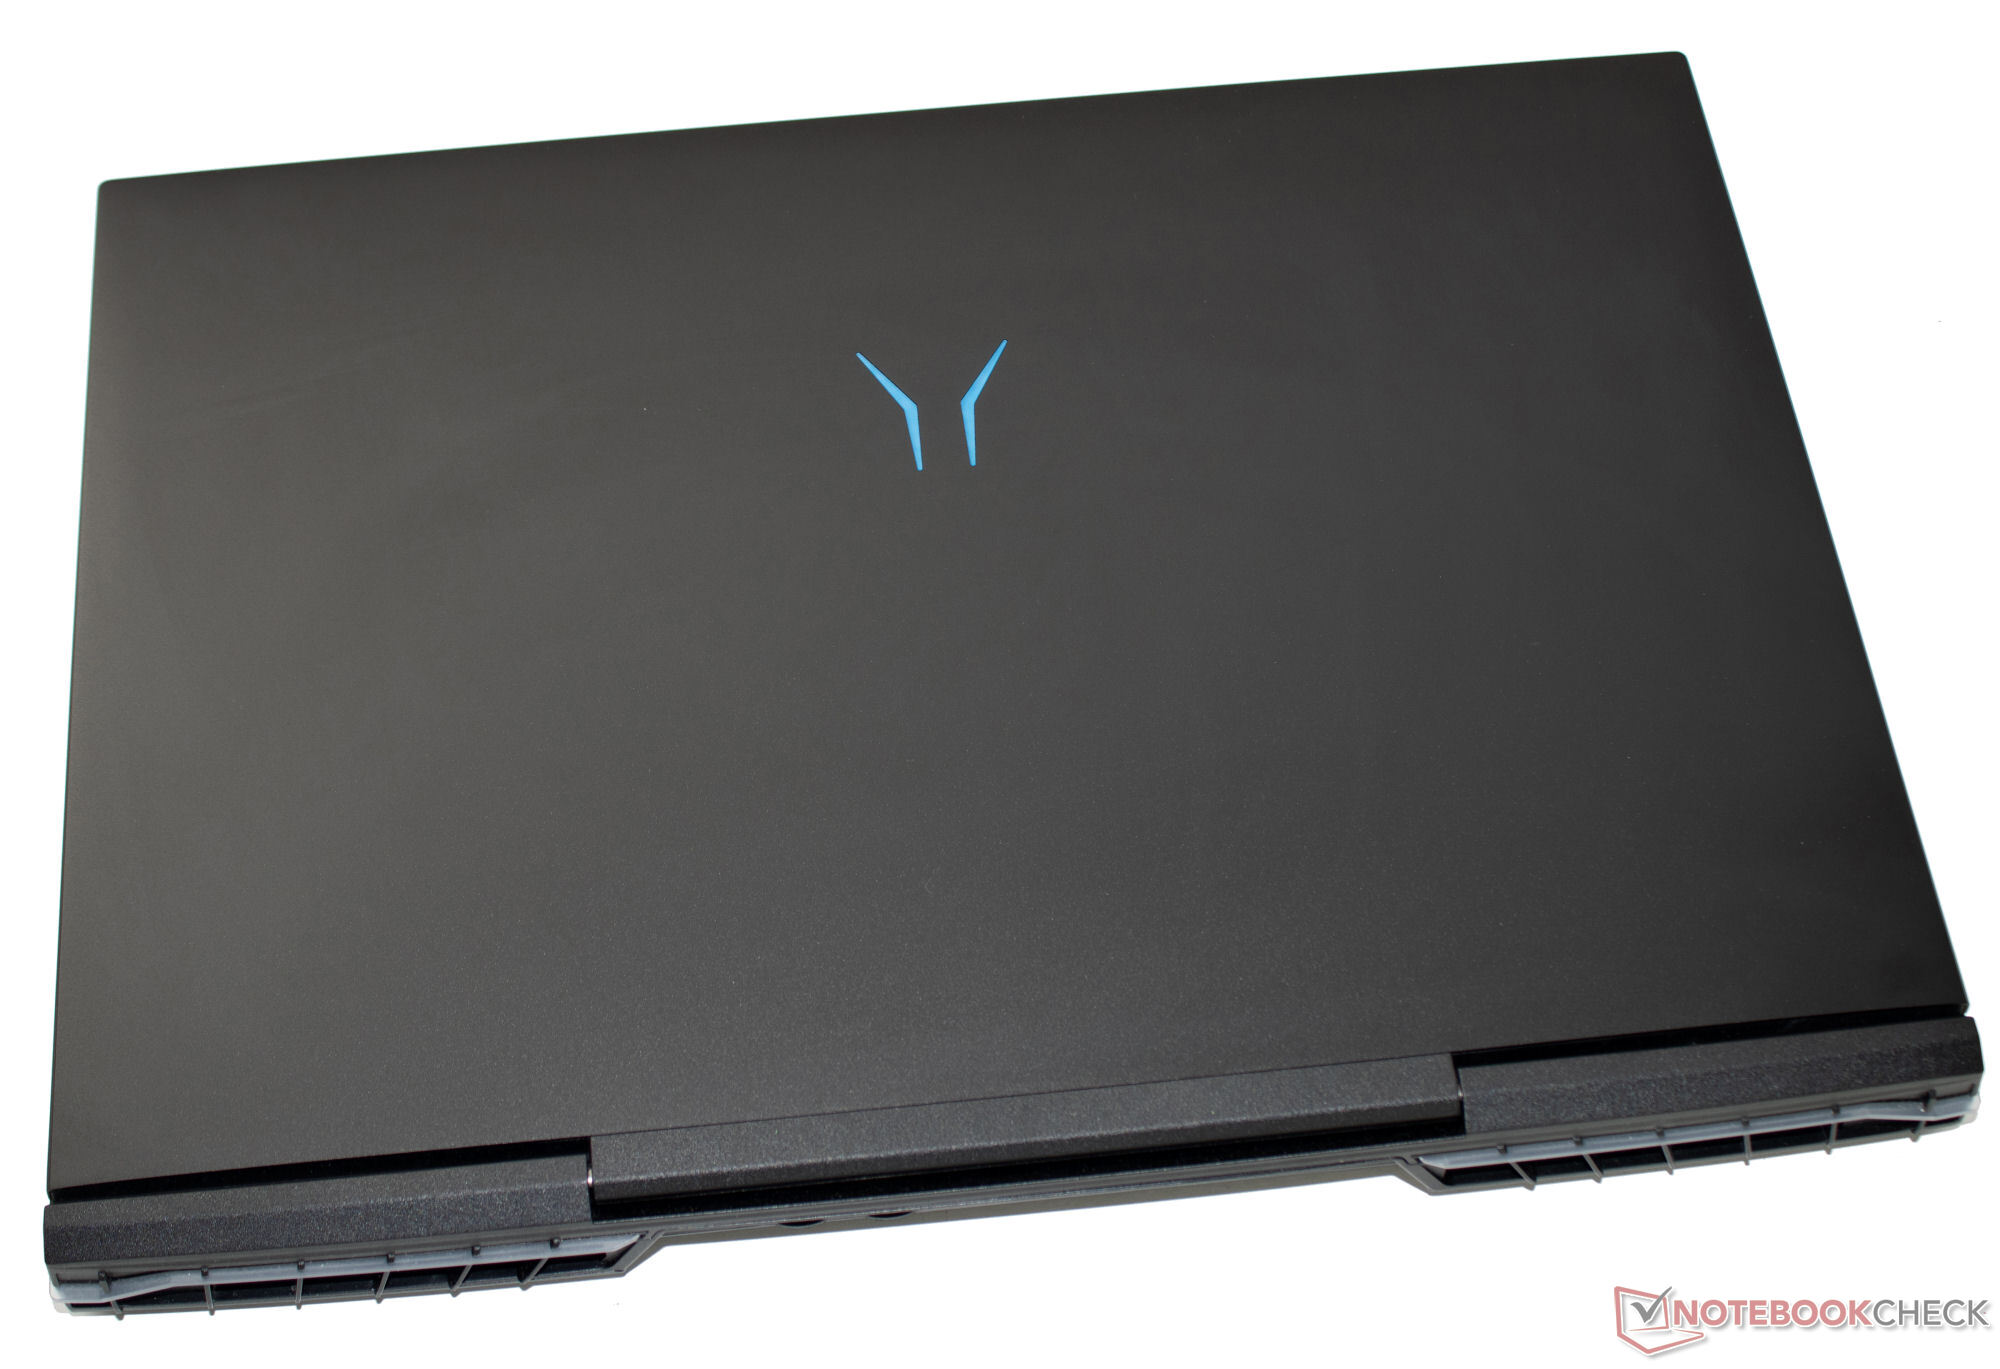
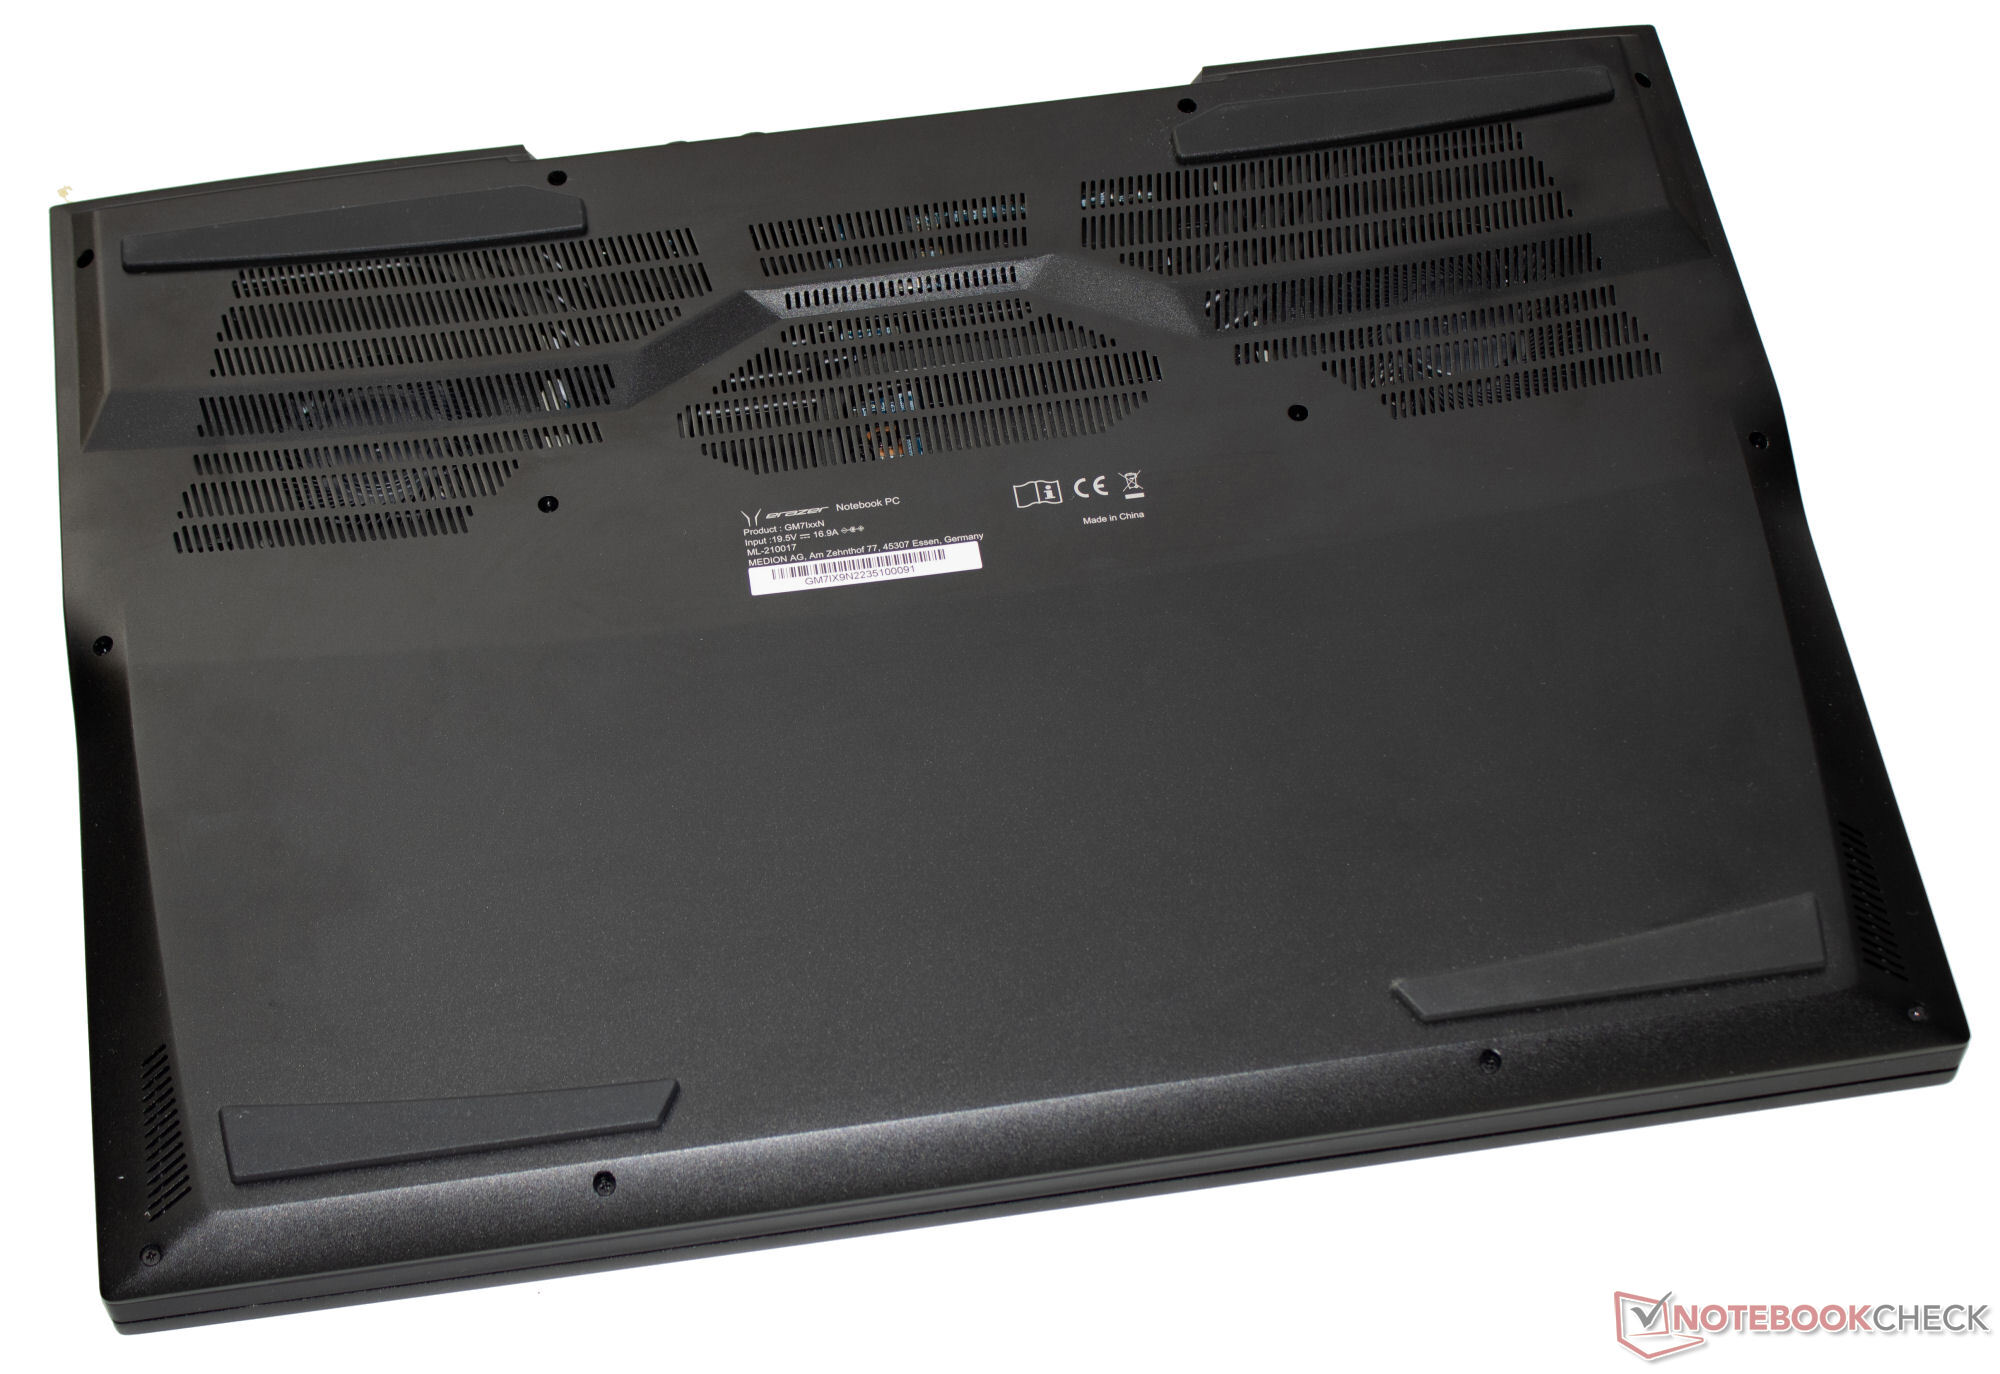
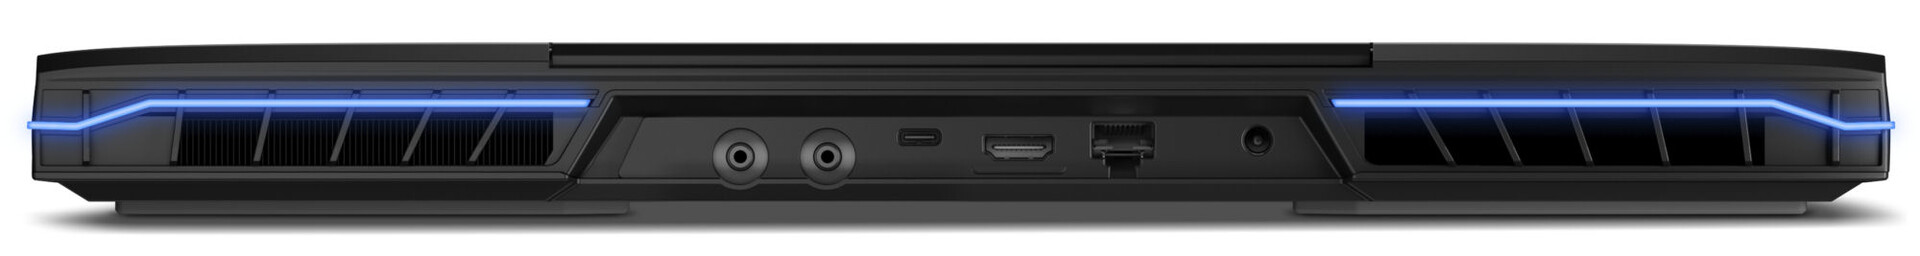
Telaio e caratteristiche: La Bestia X40 offre Thunderbolt 4
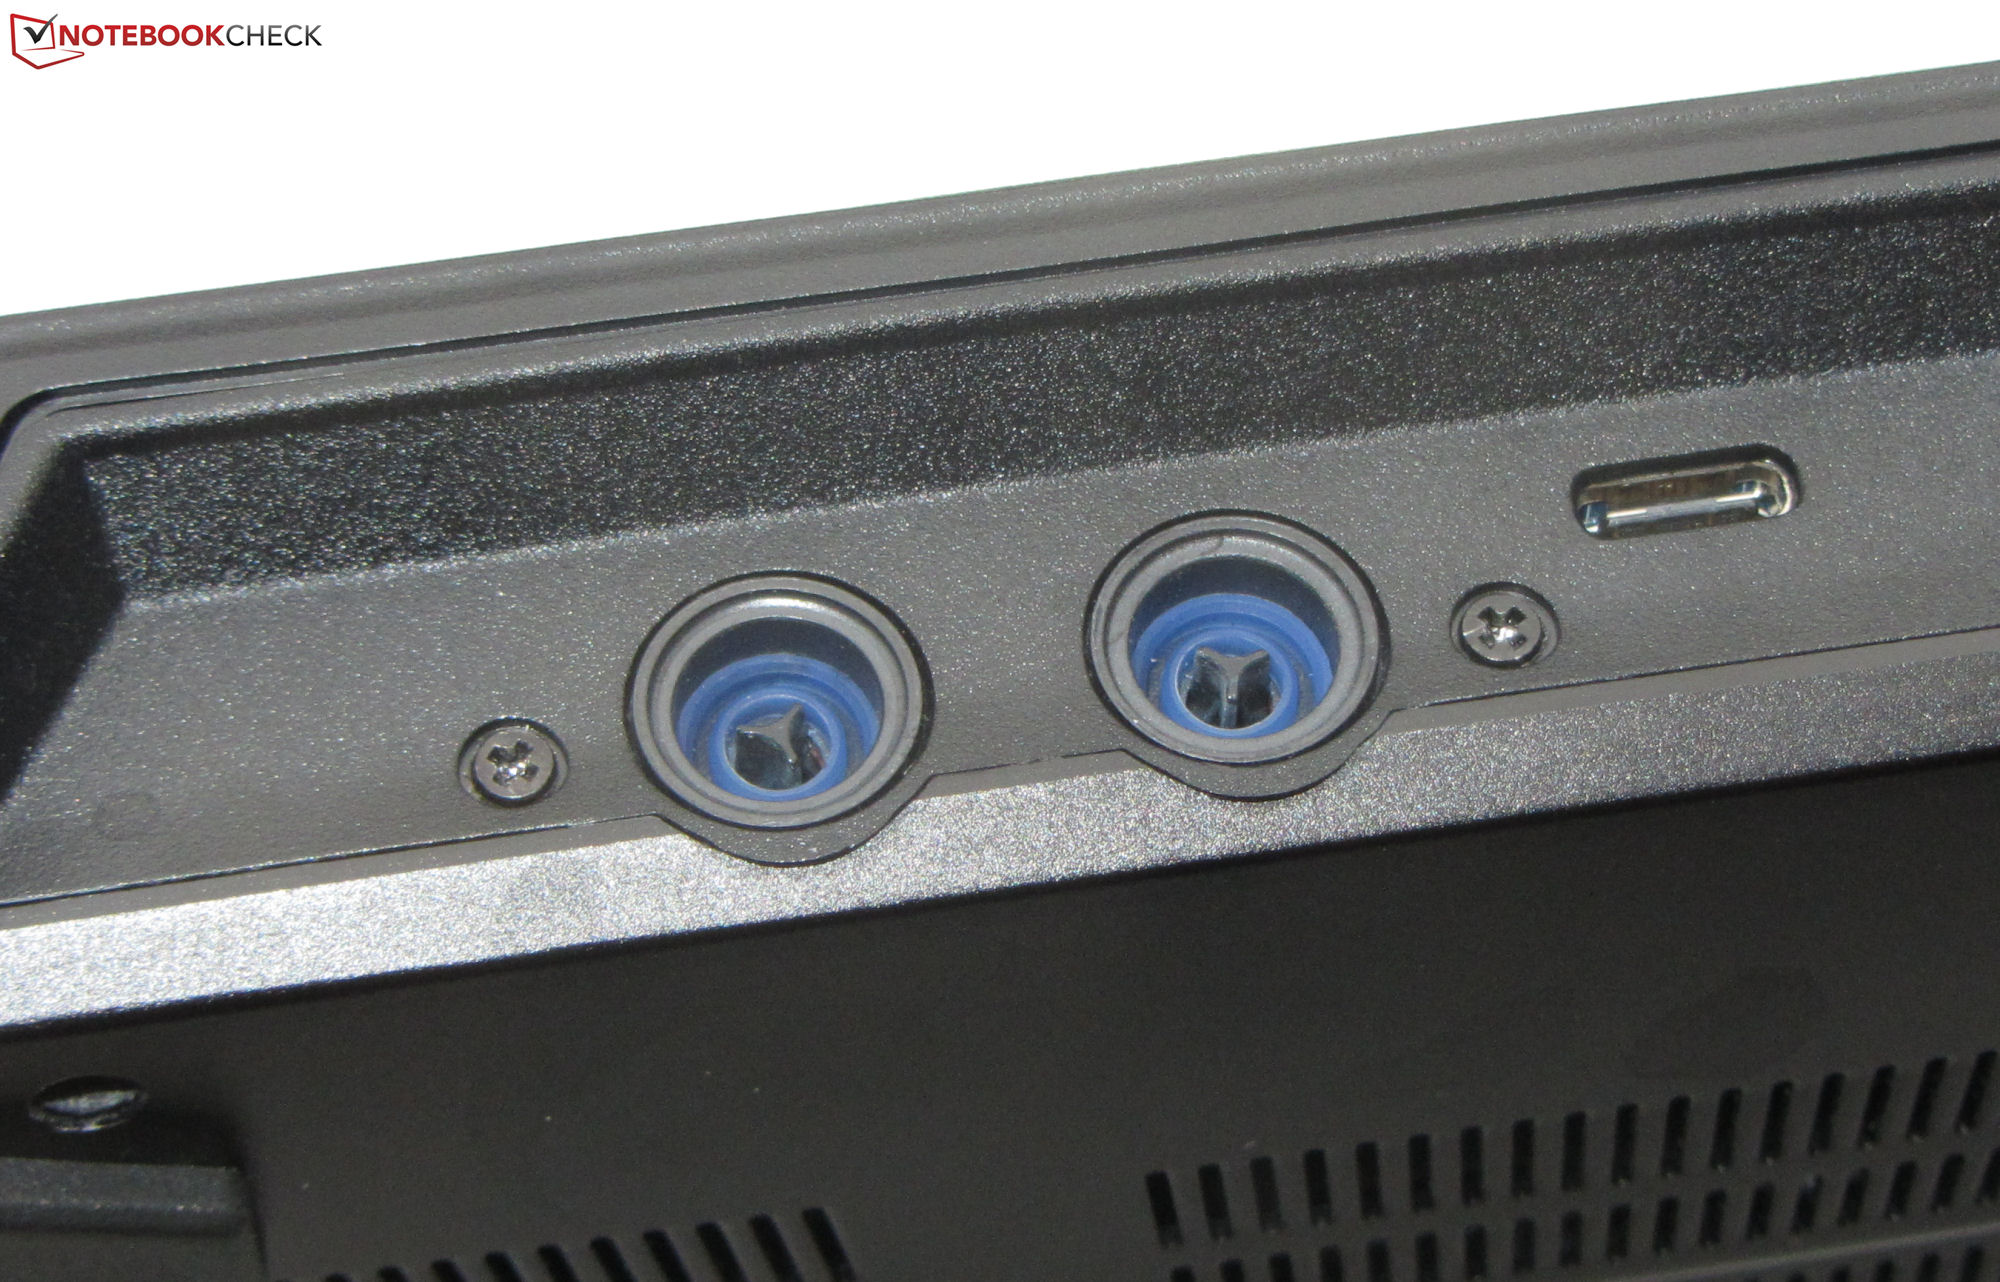
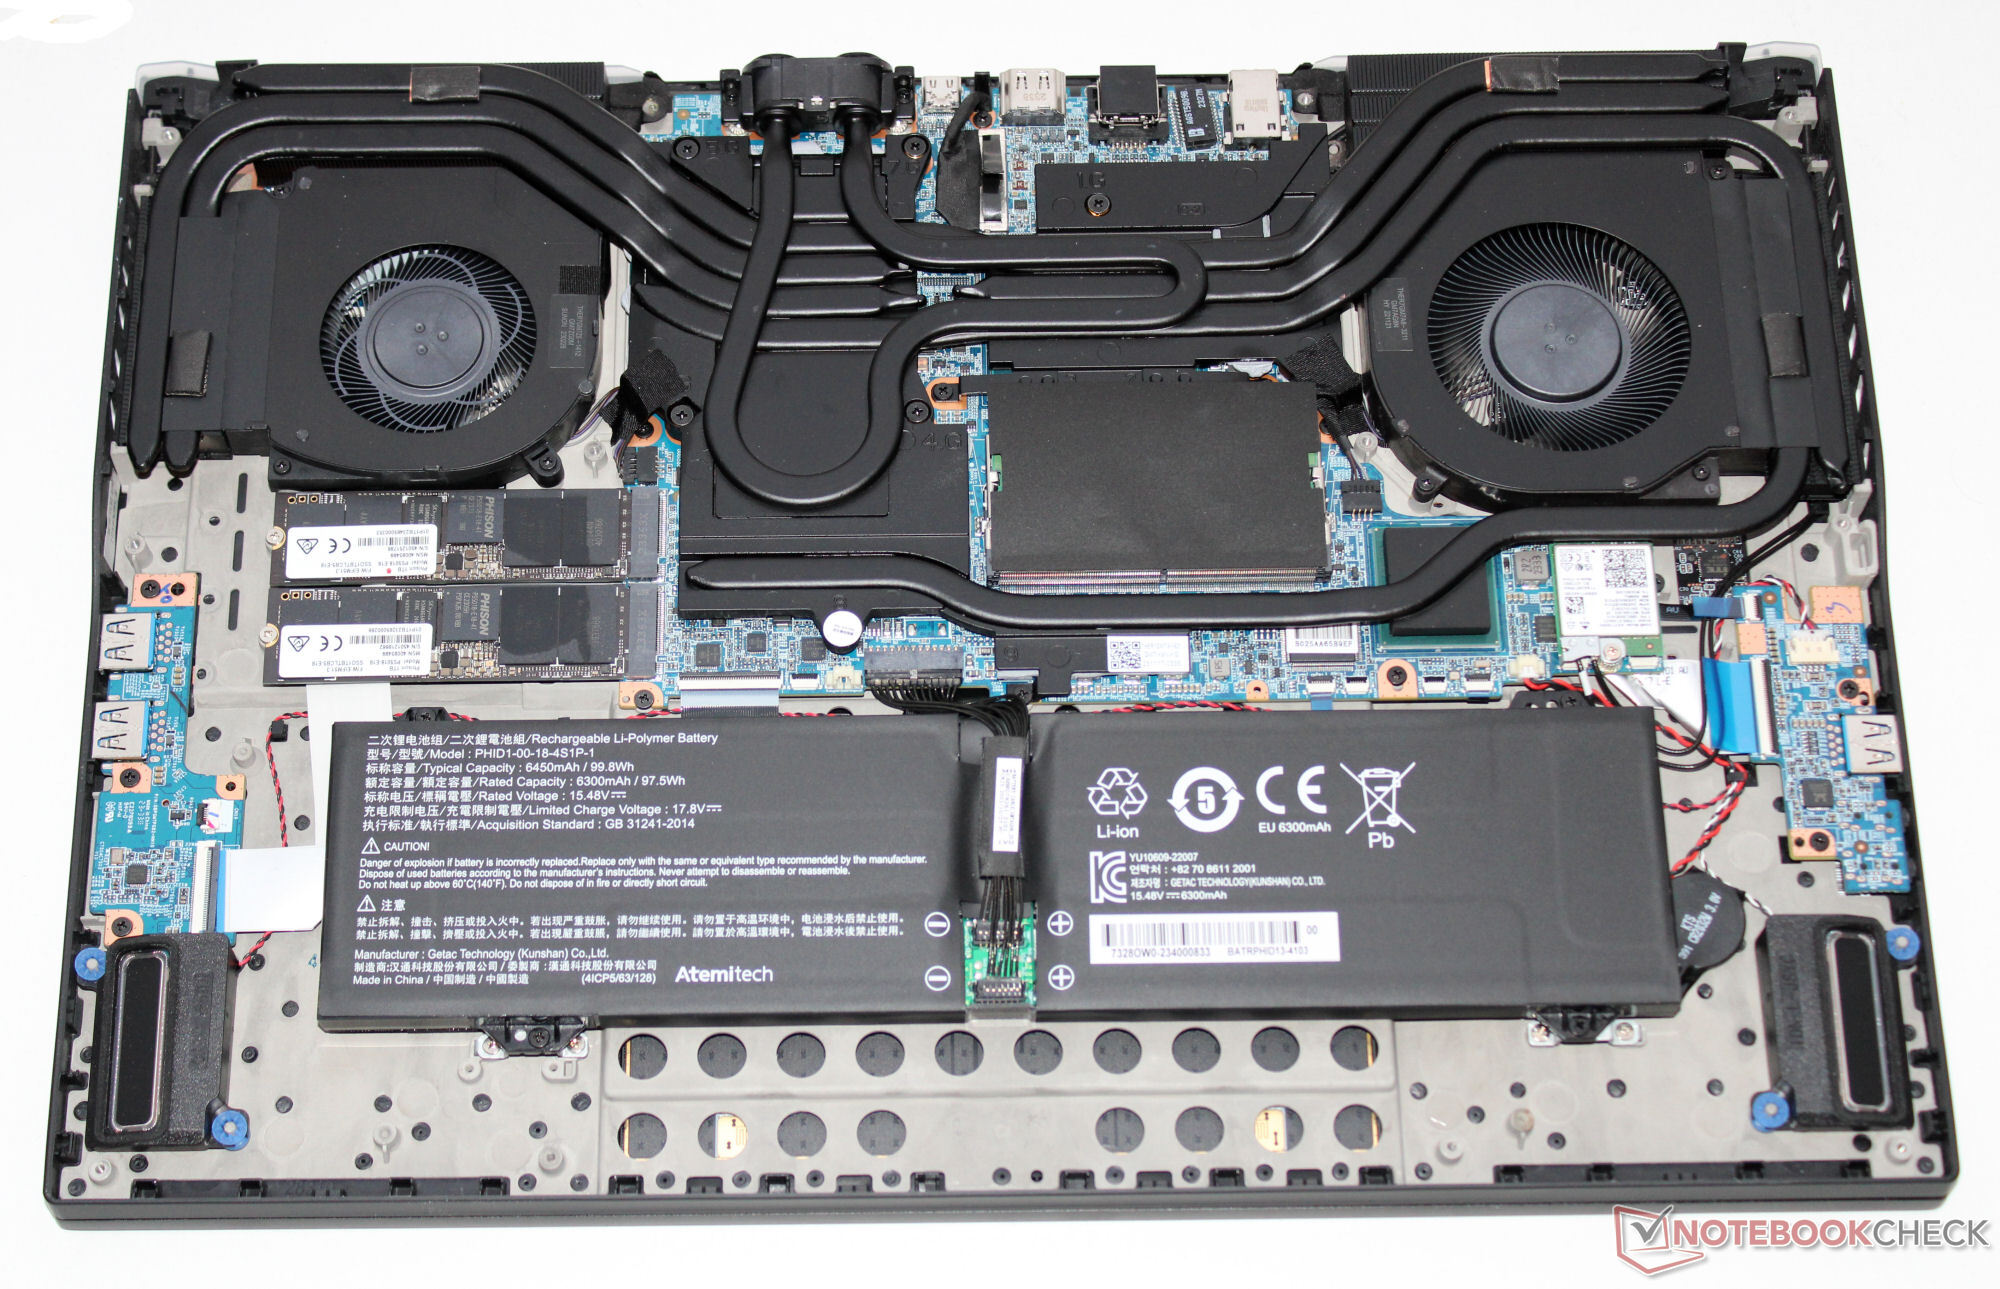
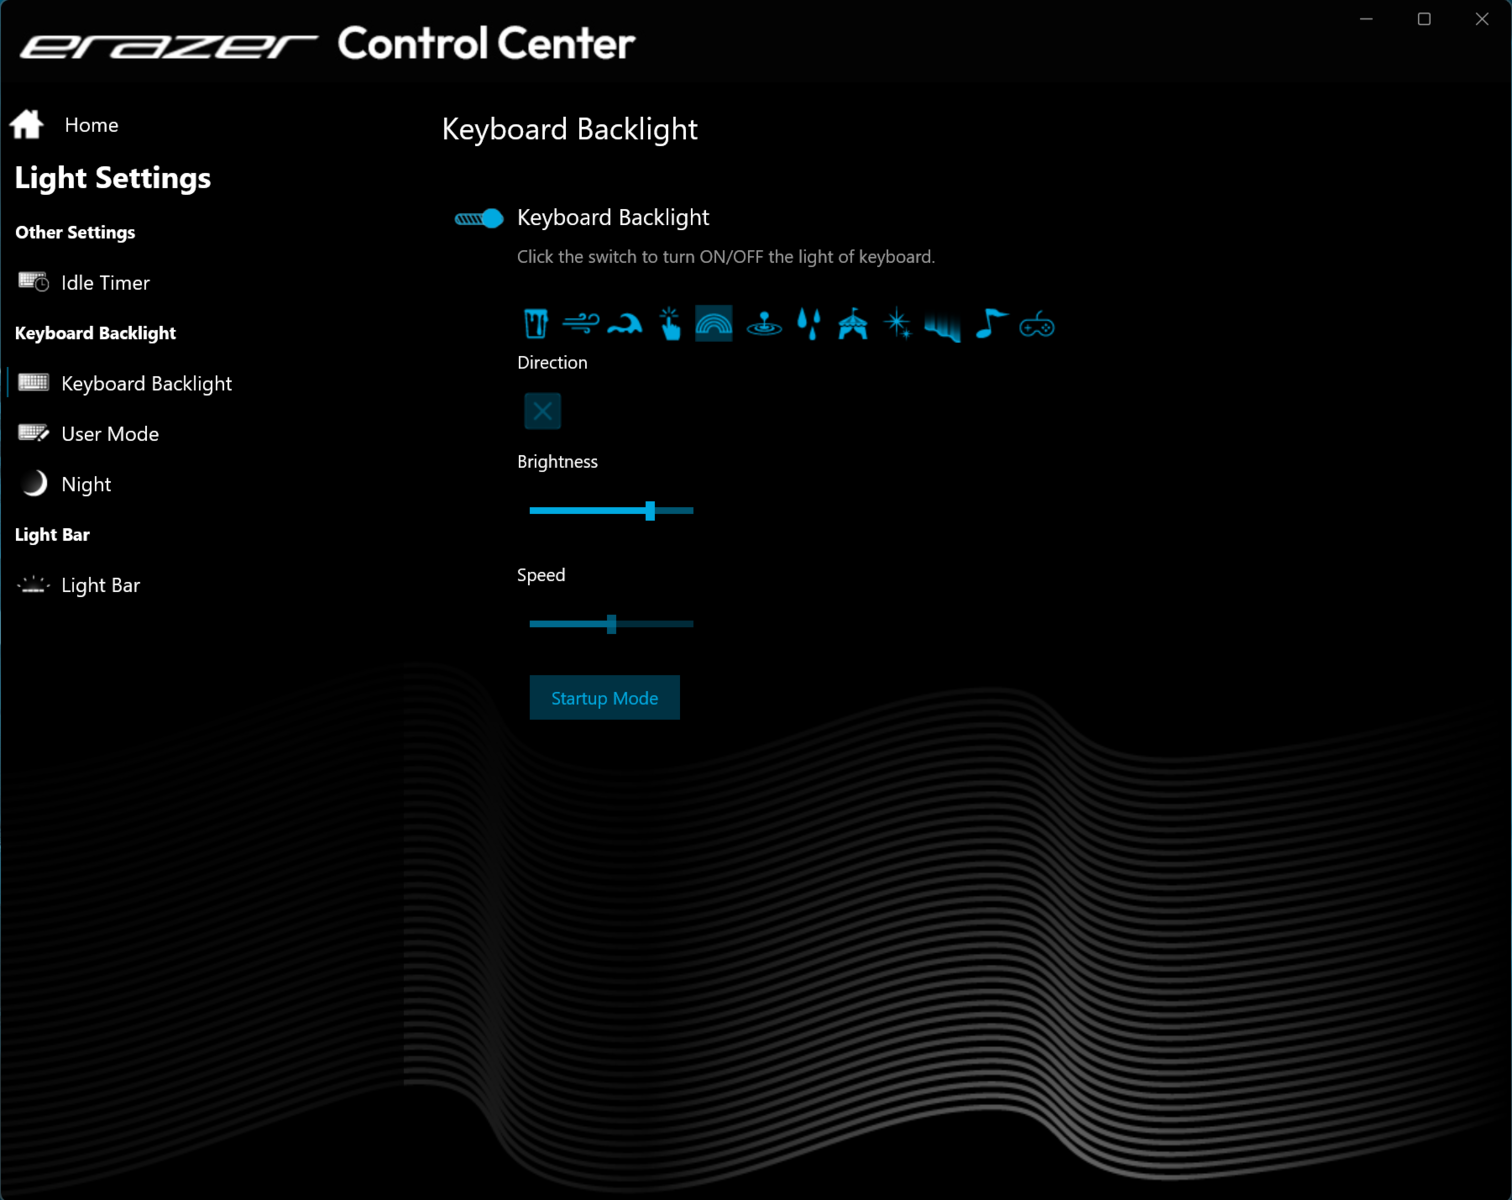
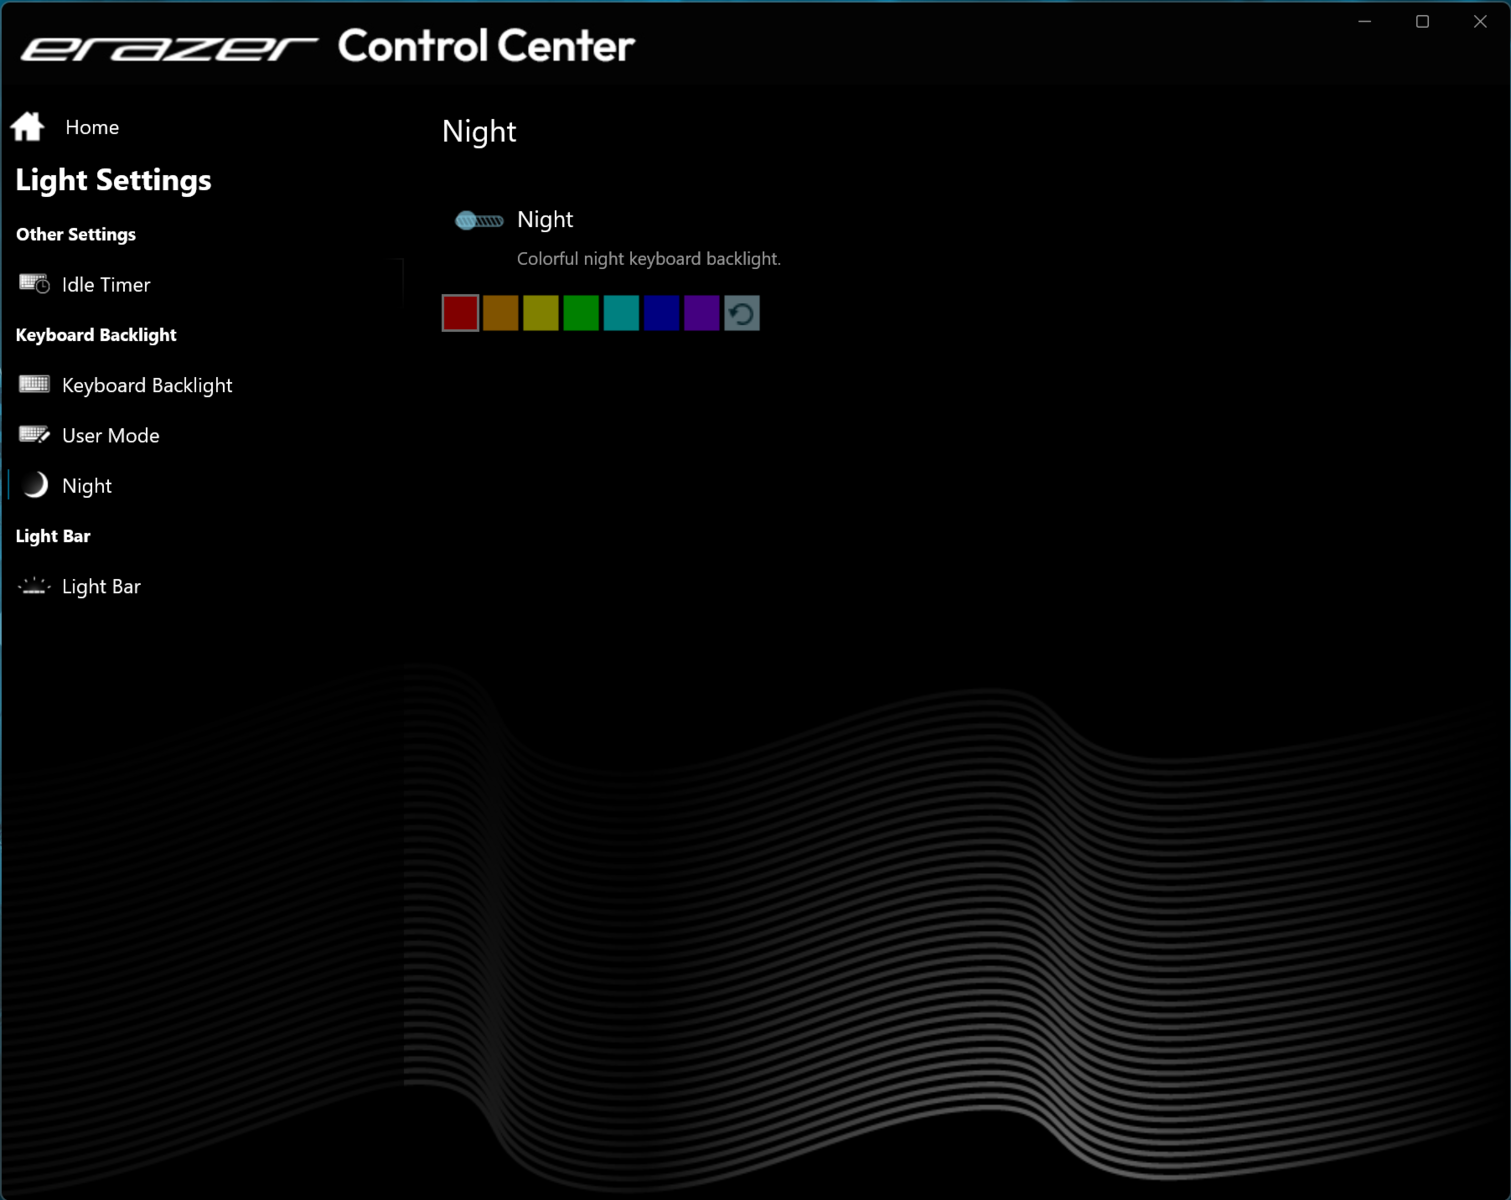
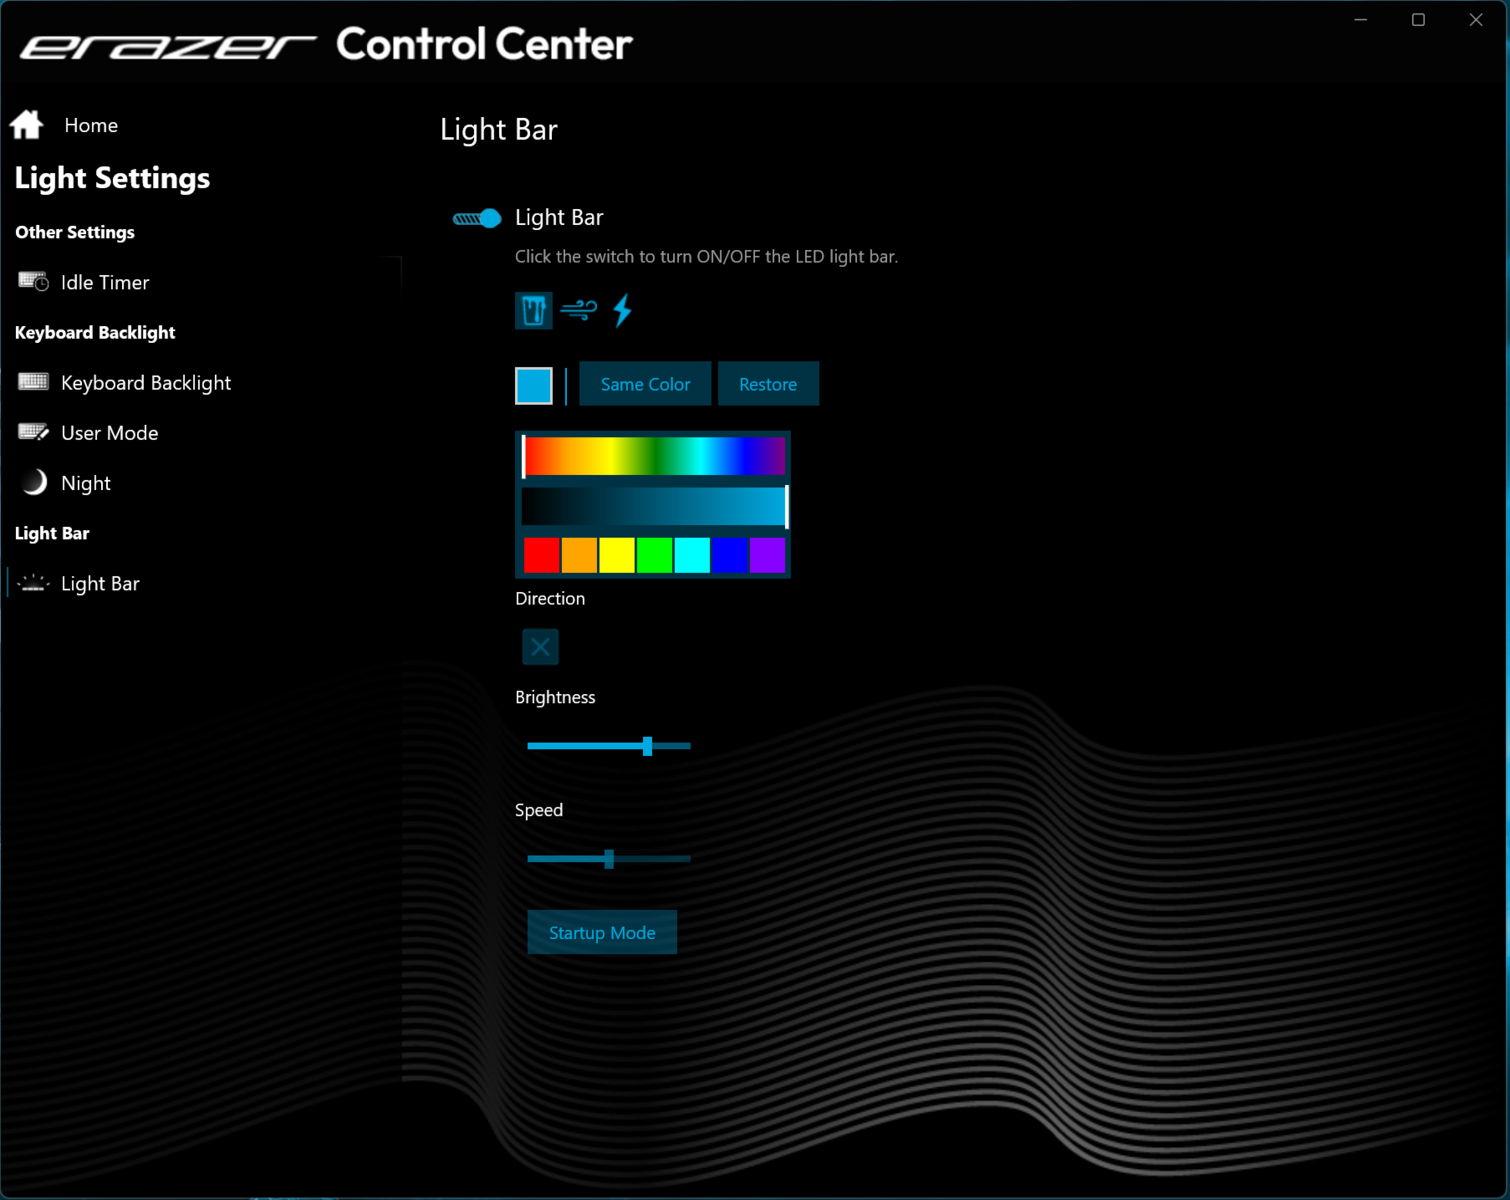
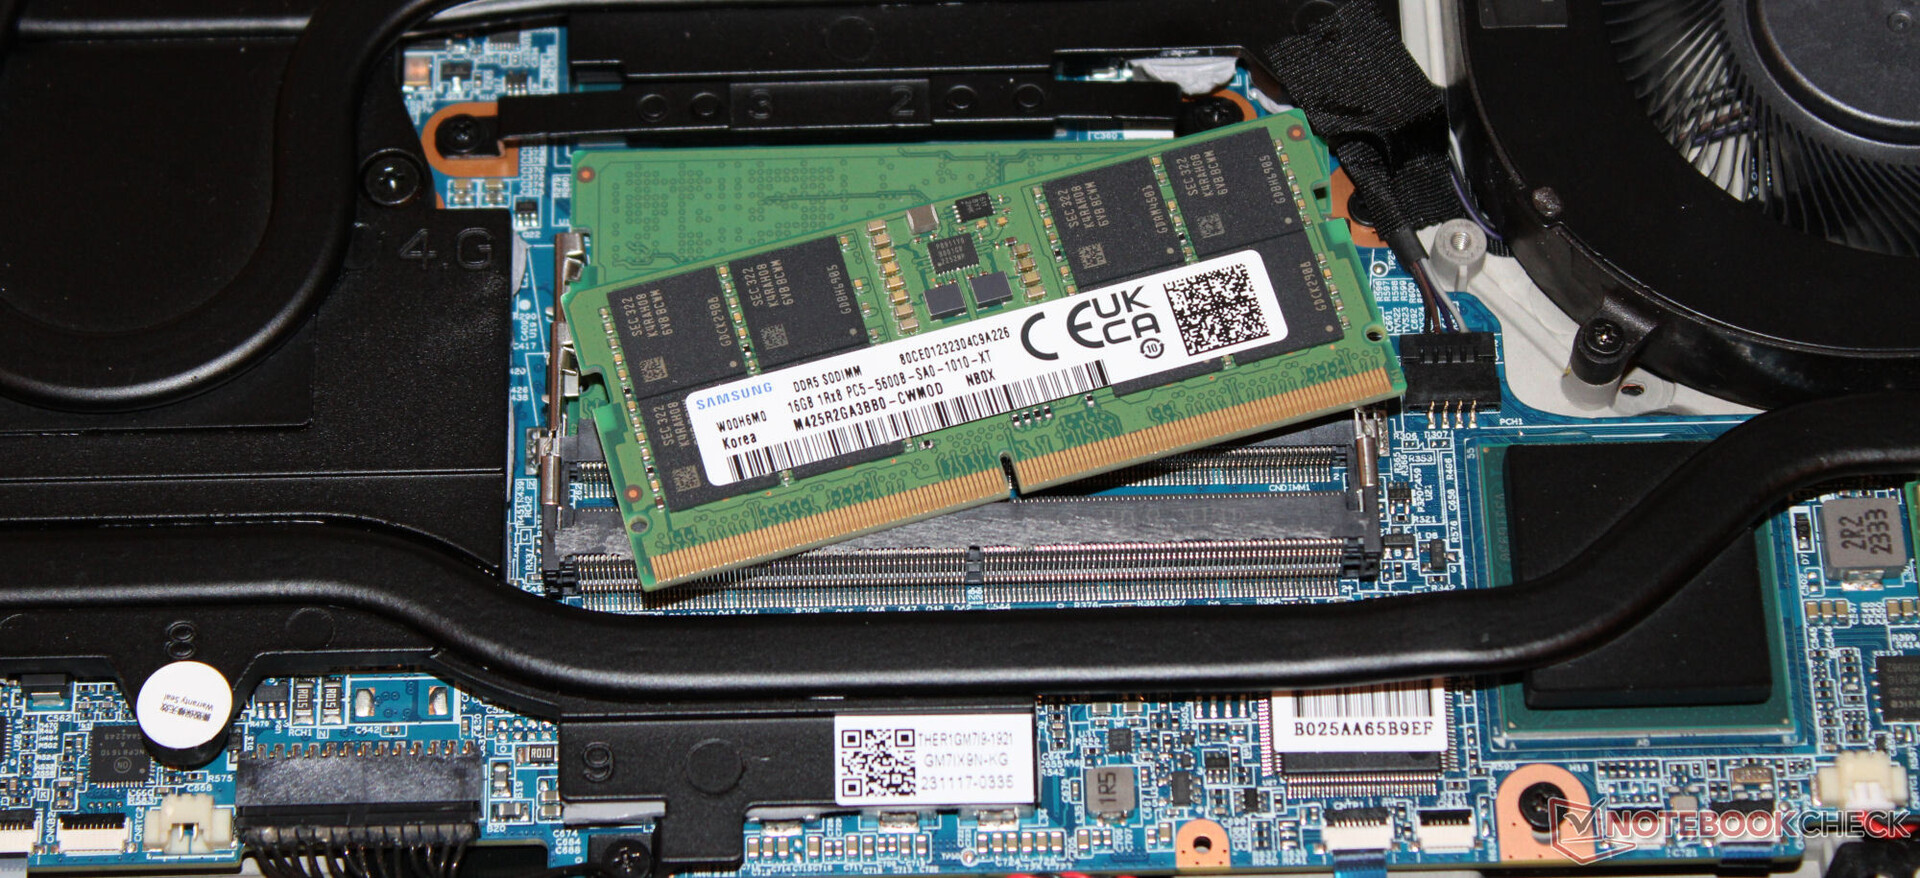
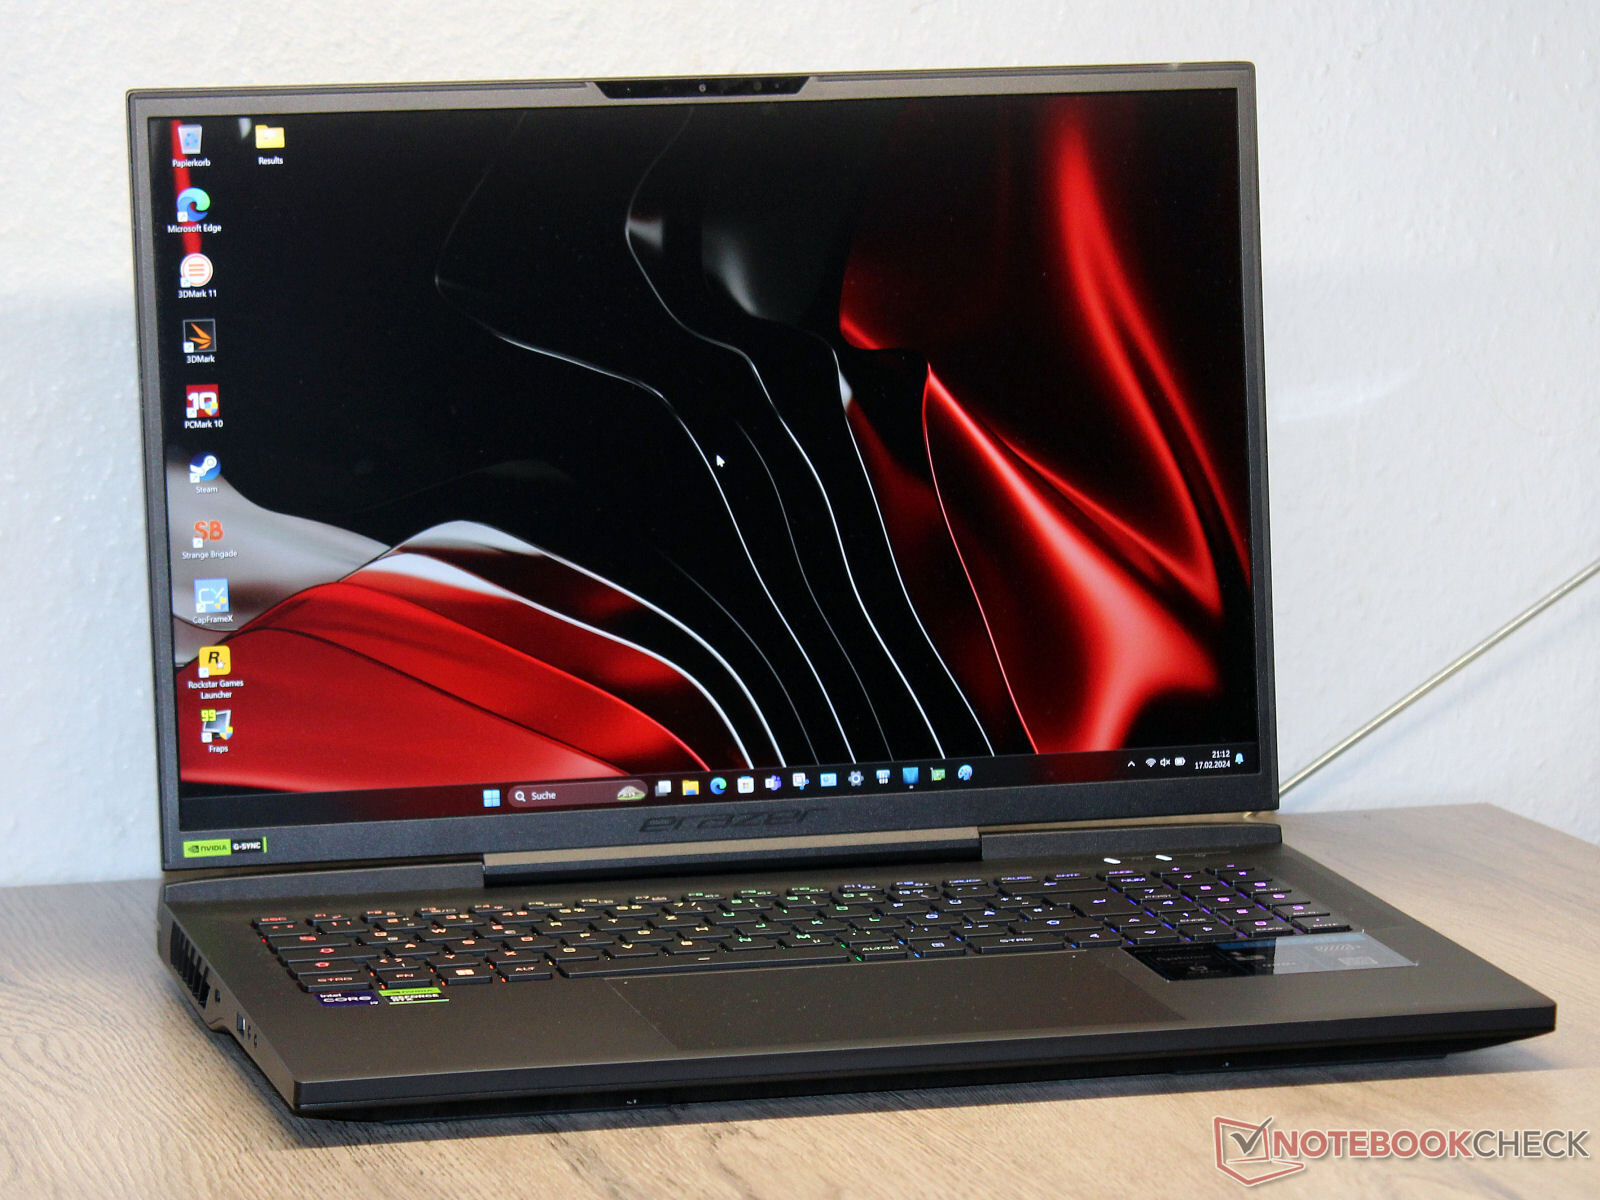
La tecnologia di Beast X40 è racchiusa in un alloggiamento in metallo nero opaco, robusto e dal design elegante, con superfici lisce. L'unità di base è ricoperta da un rivestimento in gomma antiscivolo. Due strisce LED RGB sopra le uscite d'aria posteriori, il logo del coperchio illuminato e l'illuminazione dei tasti RGB aggiungono un tocco di colore. La batteria (avvitata, non incollata) e gli altri componenti interni sono accessibili dopo aver rimosso il pannello inferiore.
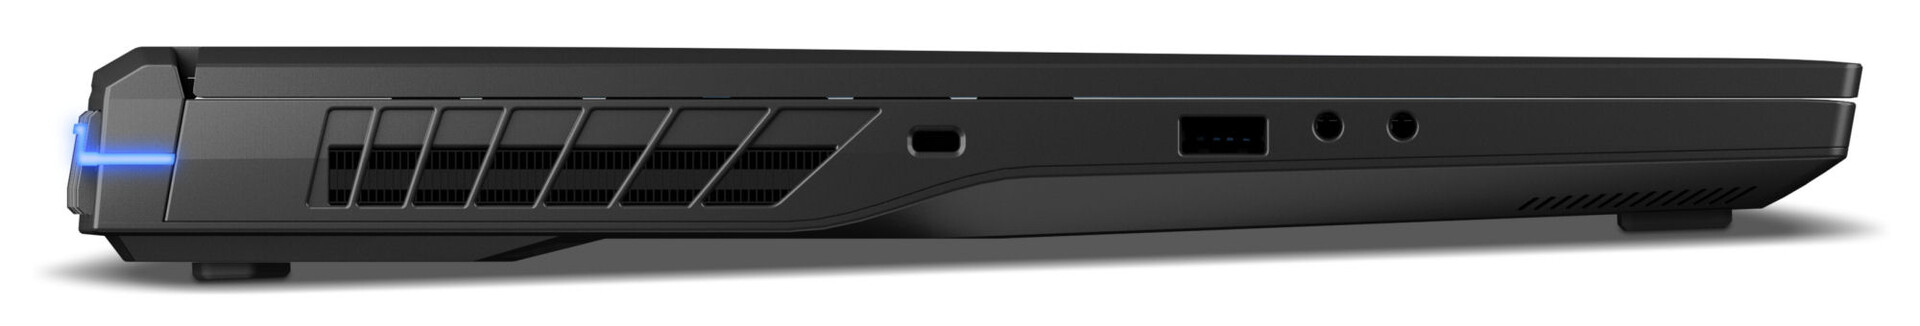
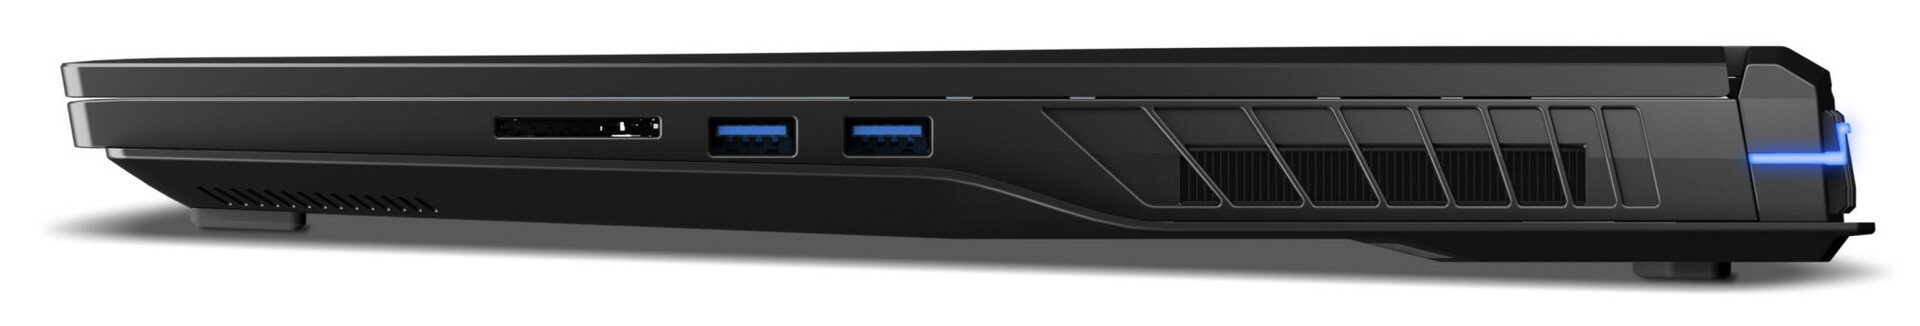
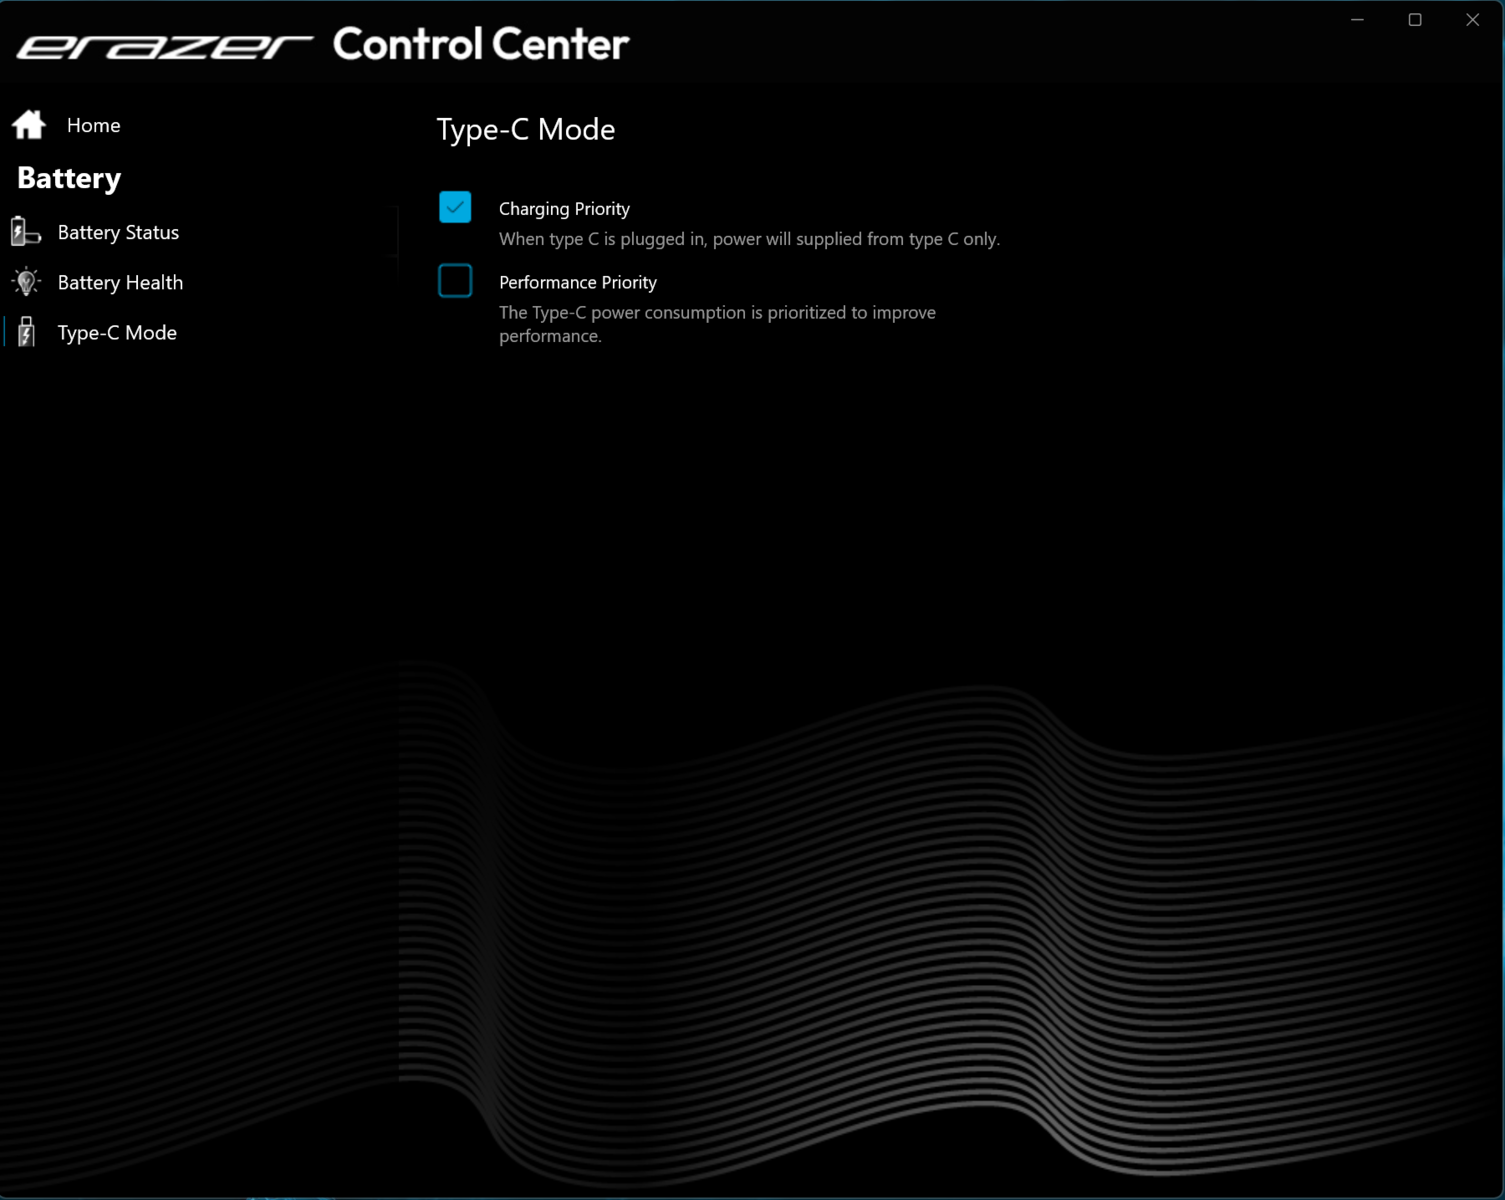
Erazer dispone di tre porte USB-A (2x USB 3.2 Gen 1 e 1x USB 3.2 Gen 2) e di una porta USB Tipo-C sotto forma di Thunderbolt 4. Abbiamo potuto confermare che quest'ultima è in grado di emettere una potenza di uscita pari a quella di un'automobile. Abbiamo potuto confermare che quest'ultima può emettere un segnale DisplayPort e supporta Power Delivery. In totale, il portatile dispone di due uscite video (HDMI 2.1 e DisplayPort).
Abbiamo testato il lettore di schede di memoria SD con la nostra scheda di riferimento AV Pro SD microSD 128 GB V60 e abbiamo scoperto che offre velocità di lettura superiori alla media. La webcam a 1080p è di serie.
Erazer Beast X40 utilizza un chip Intel Wi-Fi 6E AX211, mentre le connessioni cablate sono gestite da un controller Realtek RTL8125 da 2,5 GbE. Il portatile offre solide prestazioni Wi-Fi nel nostro test utilizzando il router di riferimento Asus ROG Rapture GT-AXE11000, senza altri dispositivi Wi-Fi nelle immediate vicinanze e a breve distanza tra il portatile e il PC server.
| SD Card Reader | |
| average JPG Copy Test (av. of 3 runs) | |
| Media della classe Gaming (20.9 - 210, n=54, ultimi 2 anni) | |
| MSI Titan 18 HX A14VIG (Toshiba Exceria Pro SDXC 64 GB UHS-II) | |
| Medion Erazer Beast X40 (AV PRO microSD 128 GB V60) | |
| Medion Erazer Beast X40 2024 (AV PRO microSD 128 GB V60) | |
| maximum AS SSD Seq Read Test (1GB) | |
| Media della classe Gaming (25.5 - 261, n=51, ultimi 2 anni) | |
| MSI Titan 18 HX A14VIG (Toshiba Exceria Pro SDXC 64 GB UHS-II) | |
| Medion Erazer Beast X40 2024 (AV PRO microSD 128 GB V60) | |
| Medion Erazer Beast X40 (AV PRO microSD 128 GB V60) | |


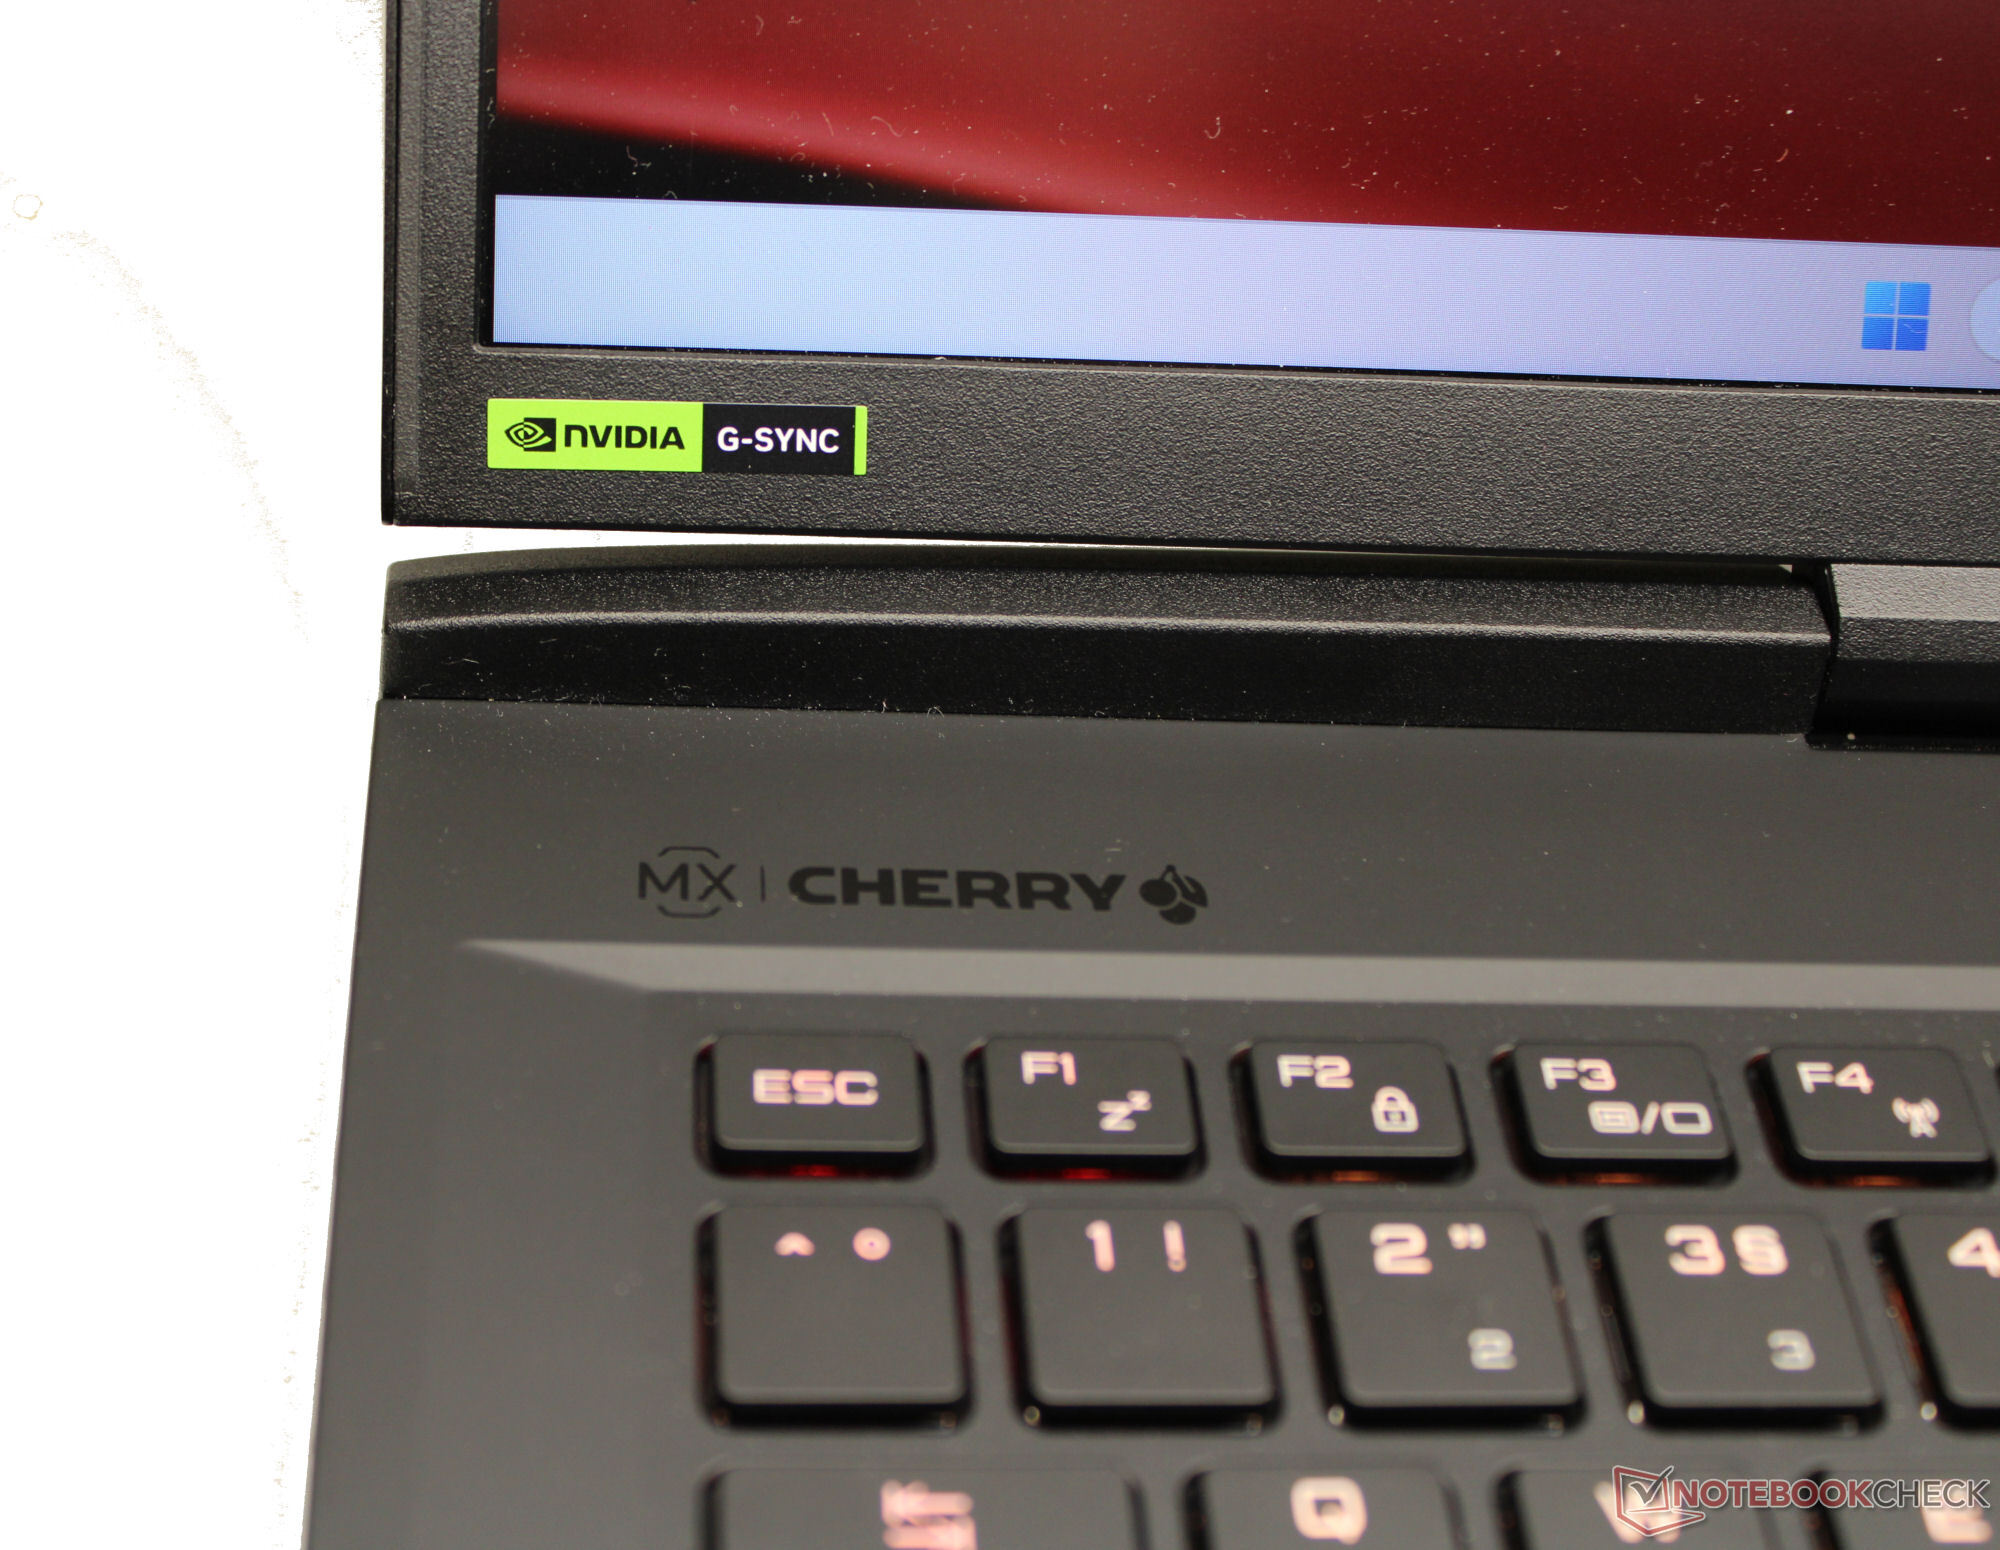
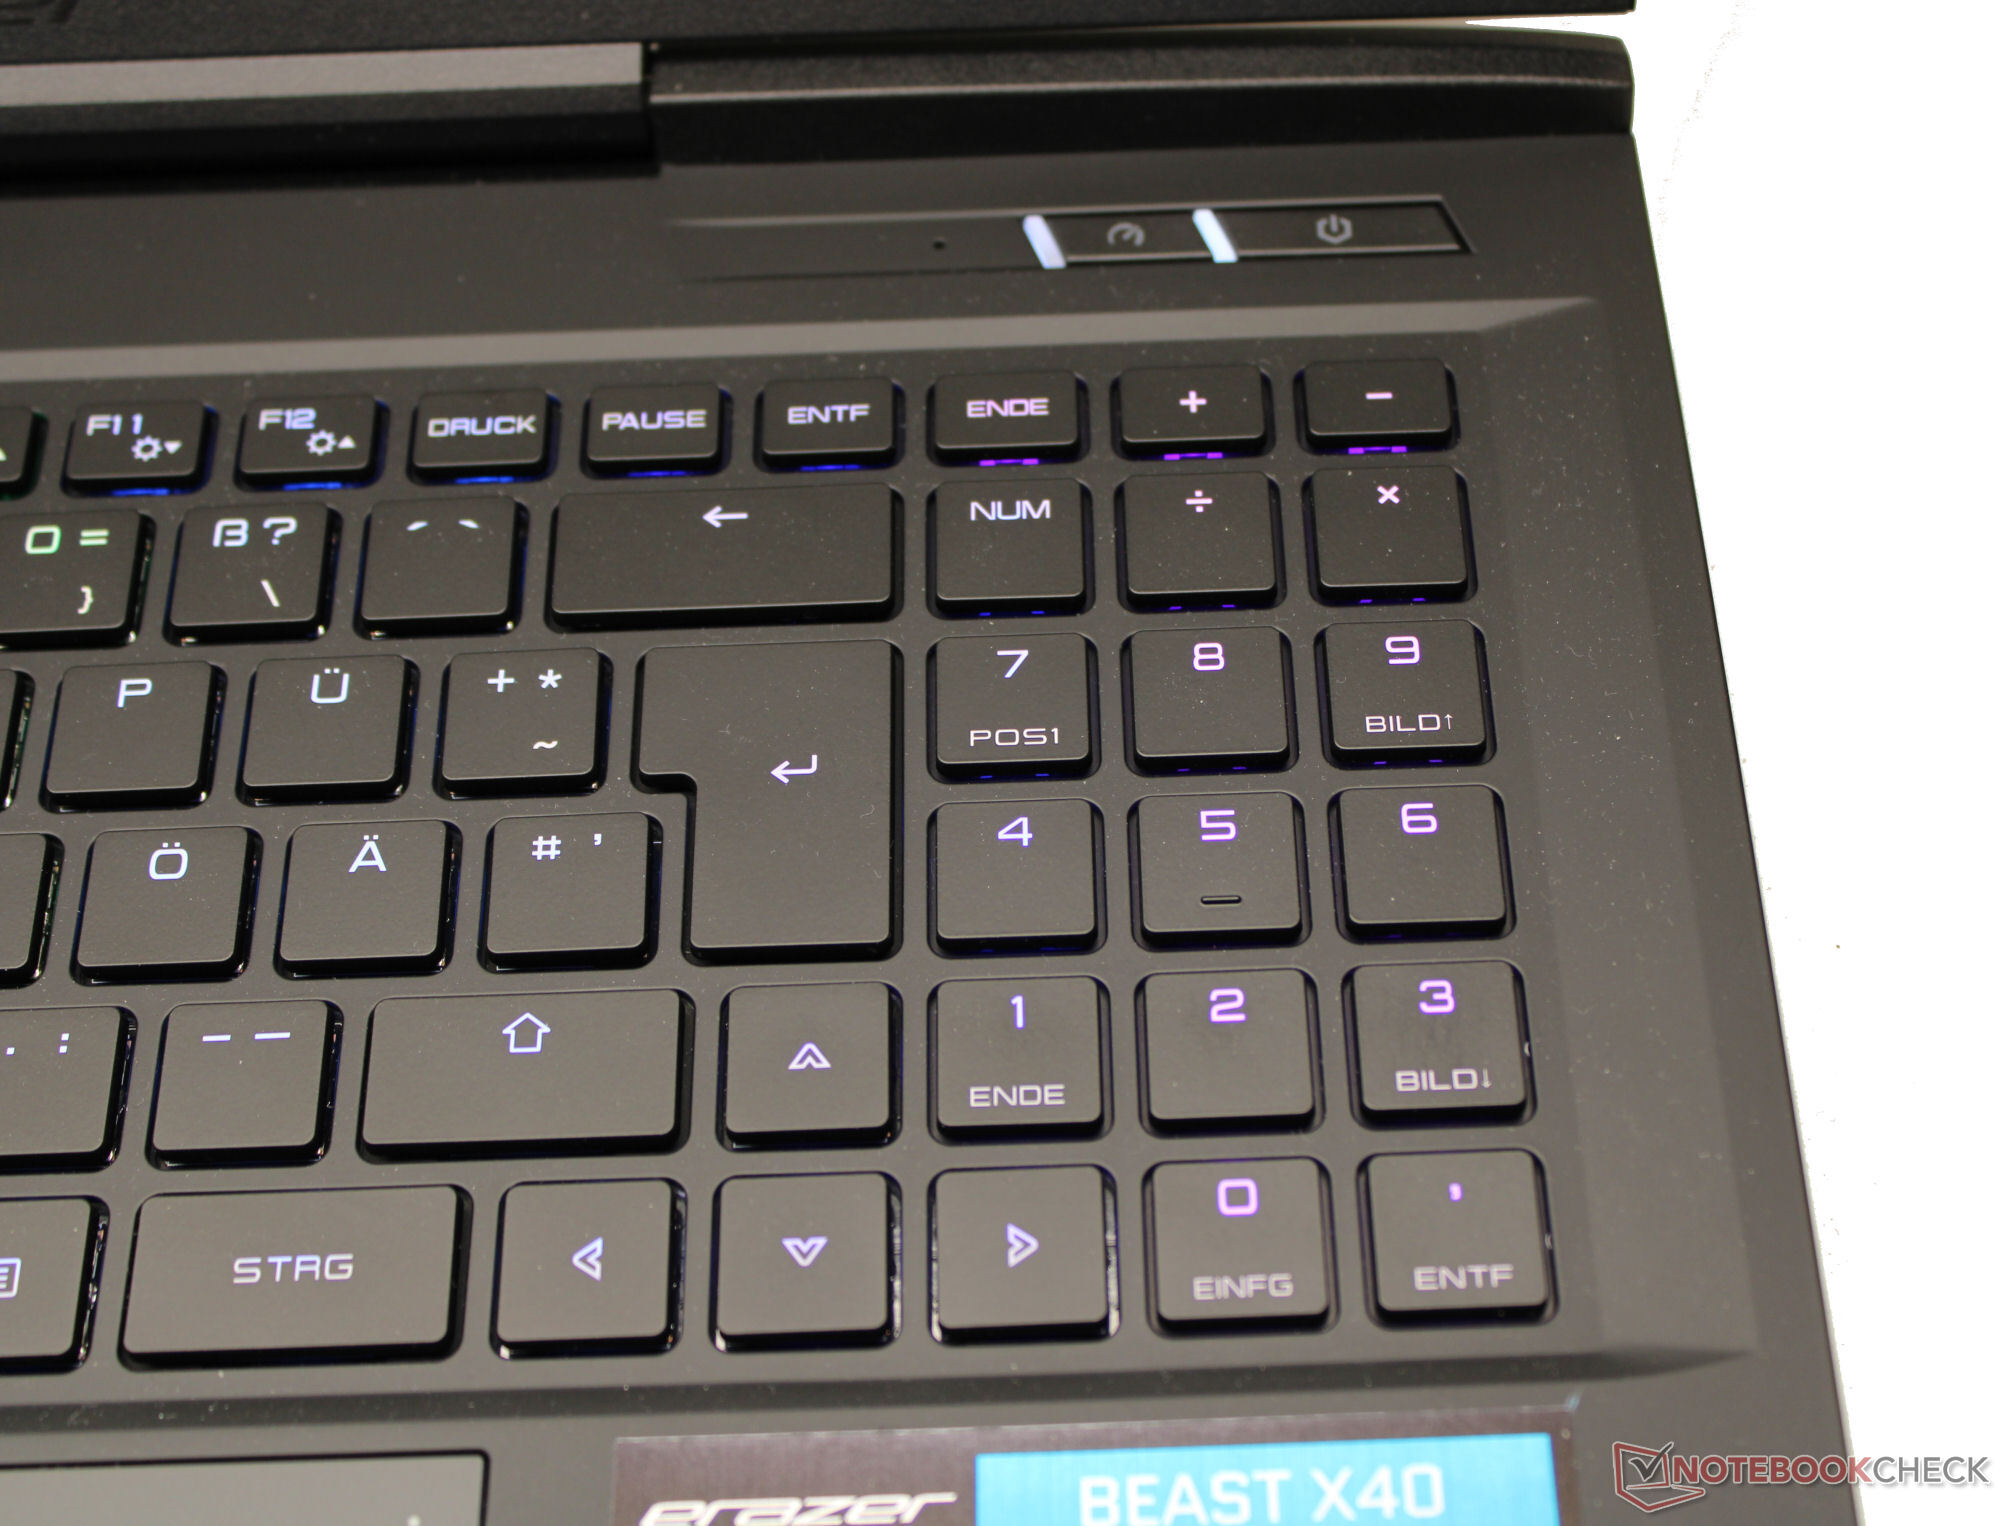
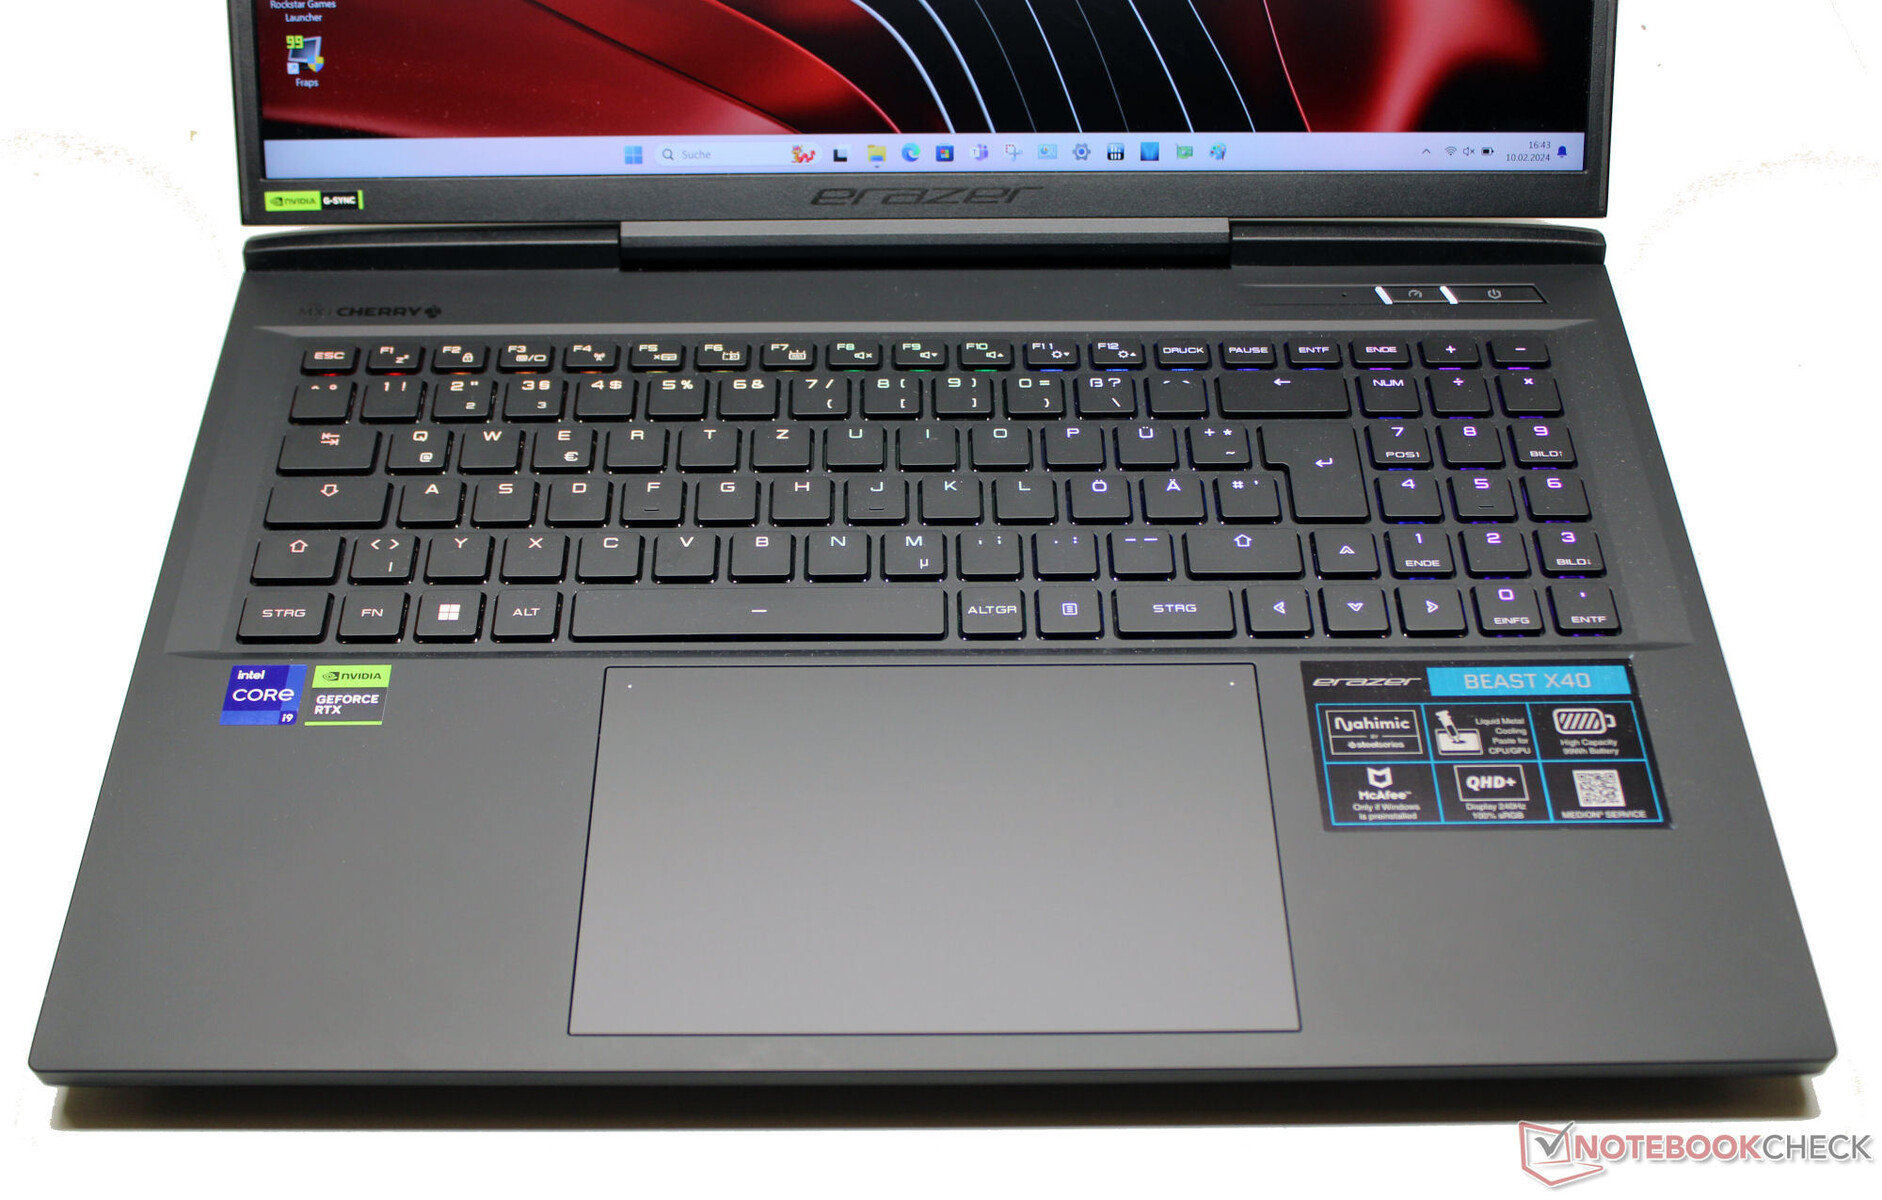
Dispositivi di input: Tastiera meccanica con interruttori Cherry MX
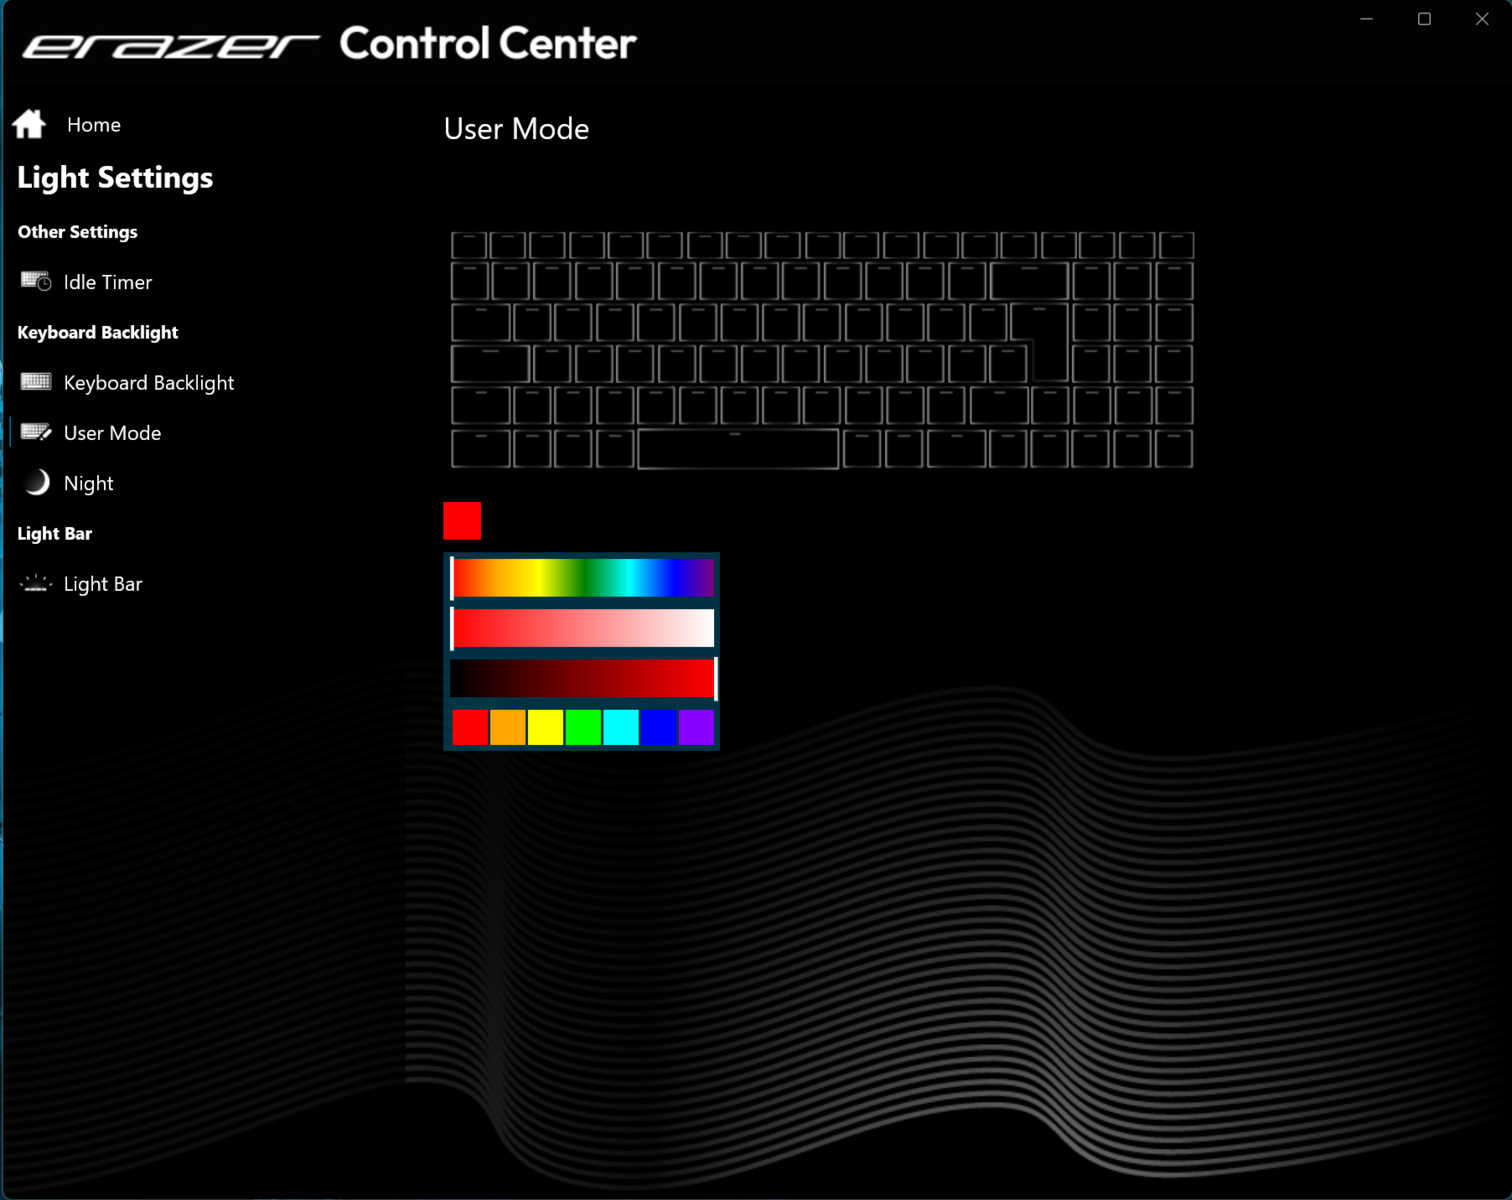
La tastiera meccanica Beast X40 guadagna punti grazie alla sensazione di digitazione ricca e alla precisione degli input. I suoi interruttori Cherry MX offrono una corsa media e un punto di pressione chiaramente udibile e percepibile. Il tastierino numerico e l'illuminazione RGB individuale dei tasti completano l'armonia generale della tastiera.
Il touchpad multi-touch (15,5 x 10 cm) ha una corsa breve e un punto di pressione chiaro. Può essere disattivato completamente o solo su un lato (a destra).
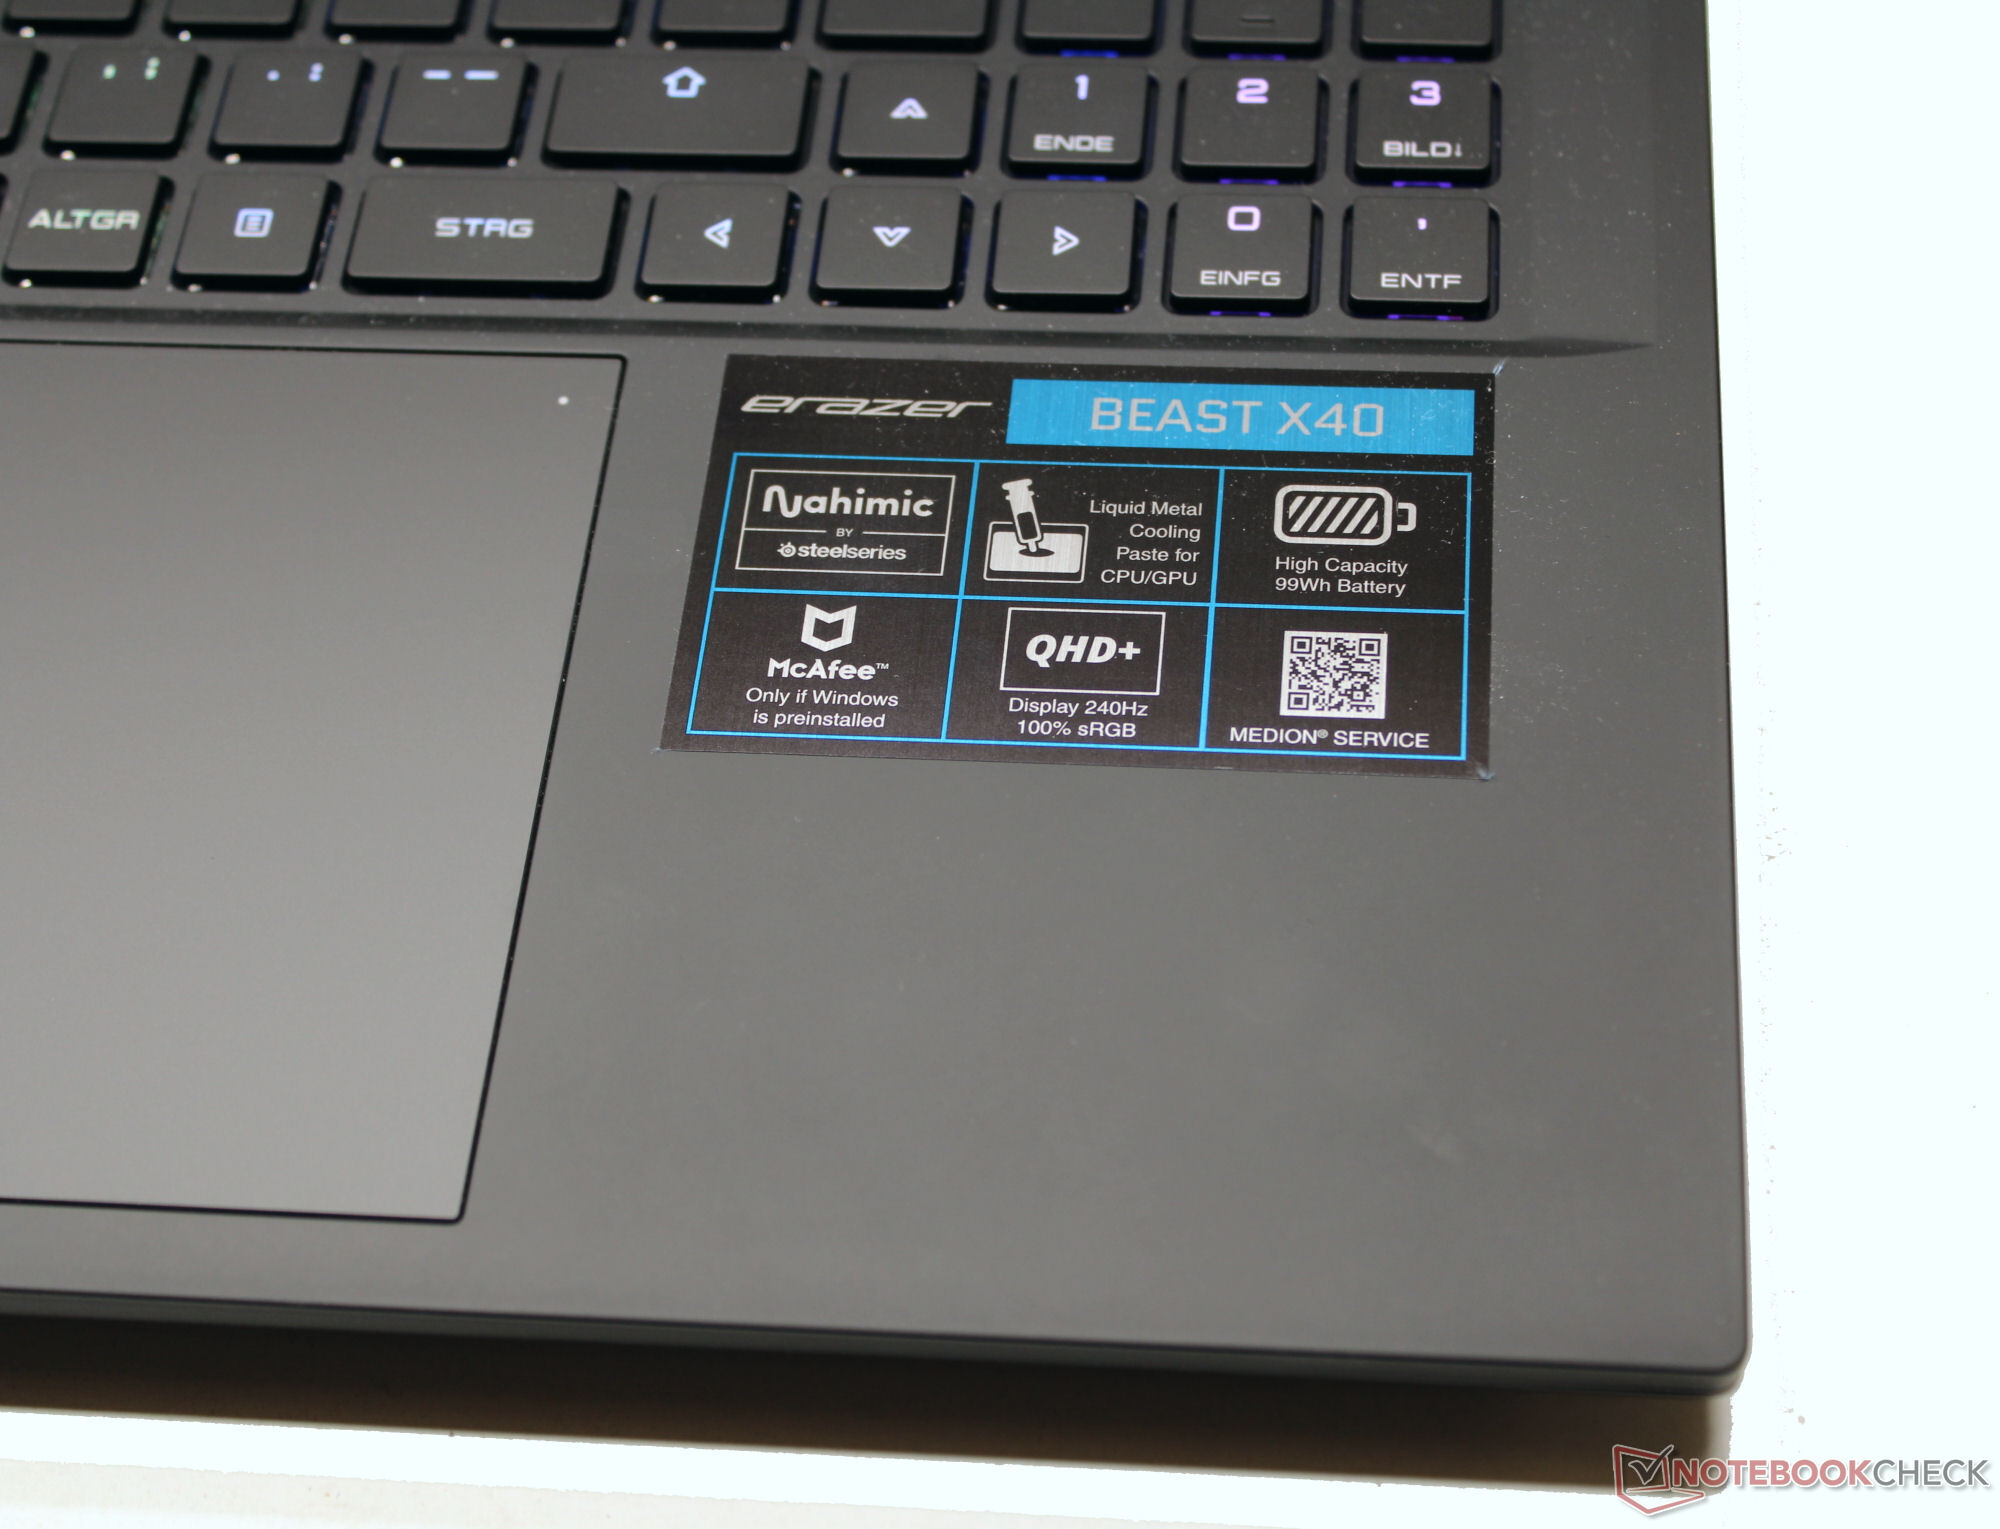
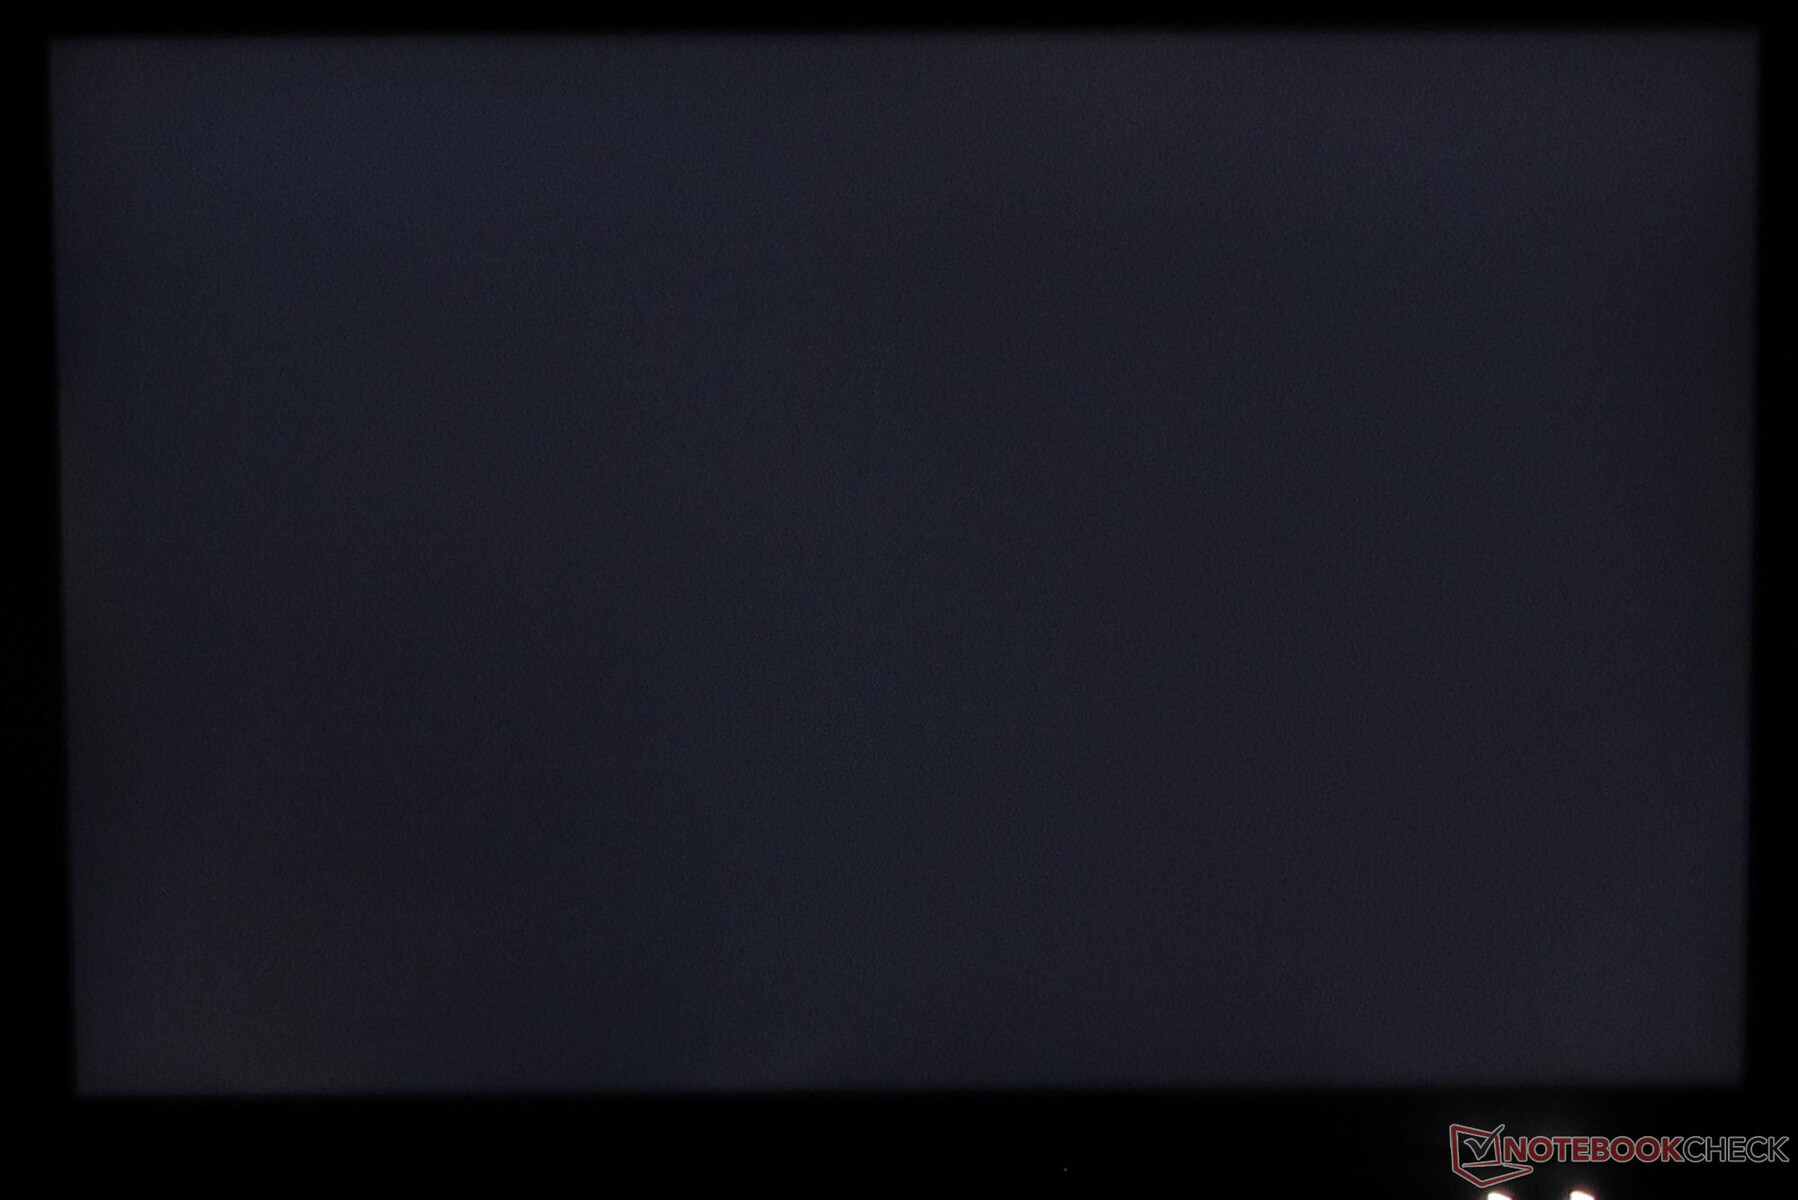
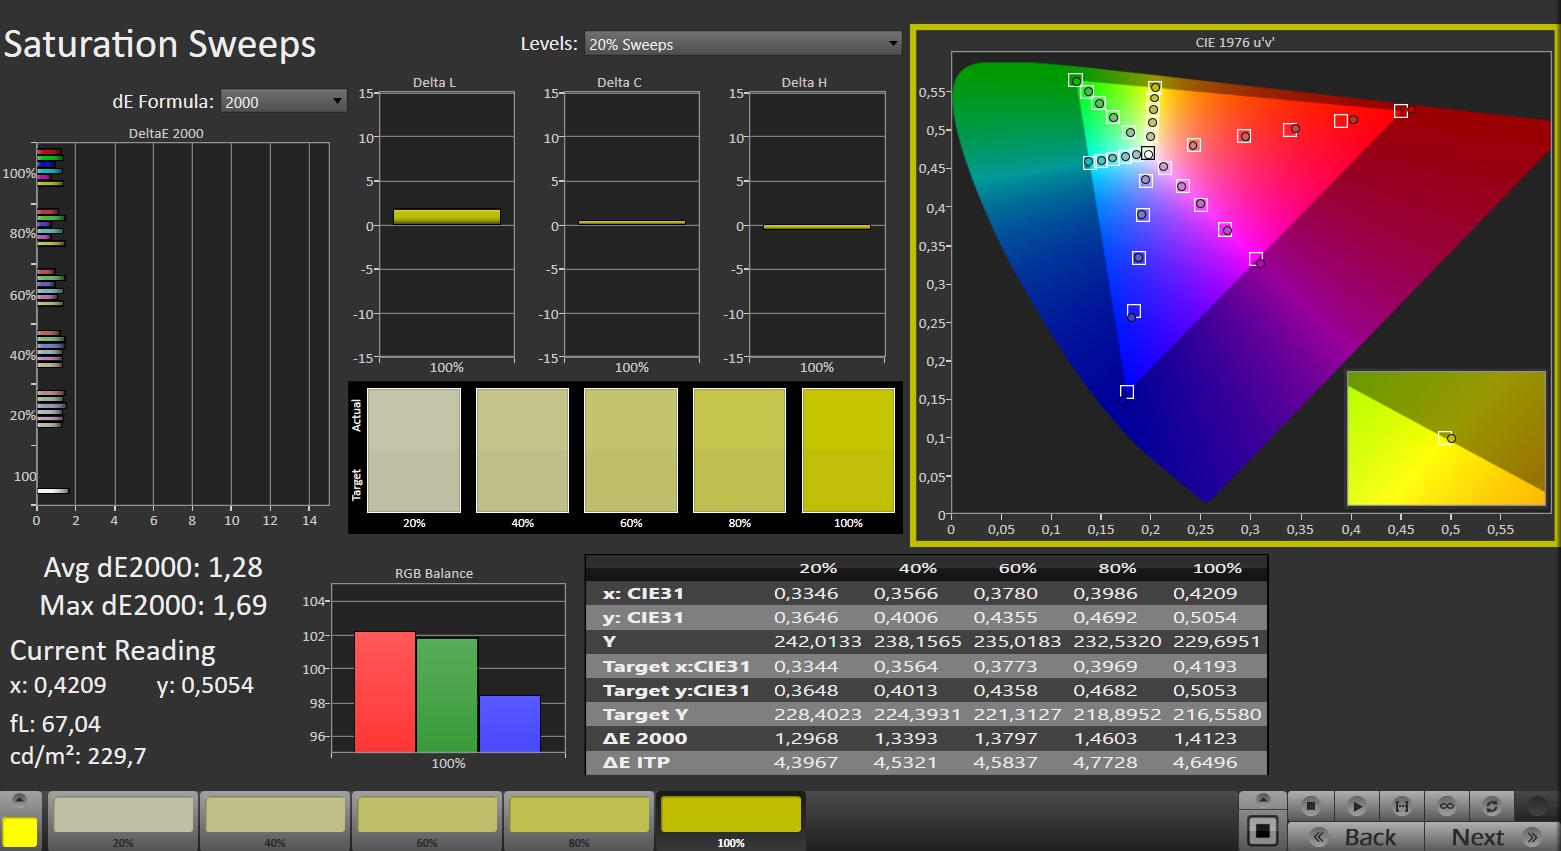
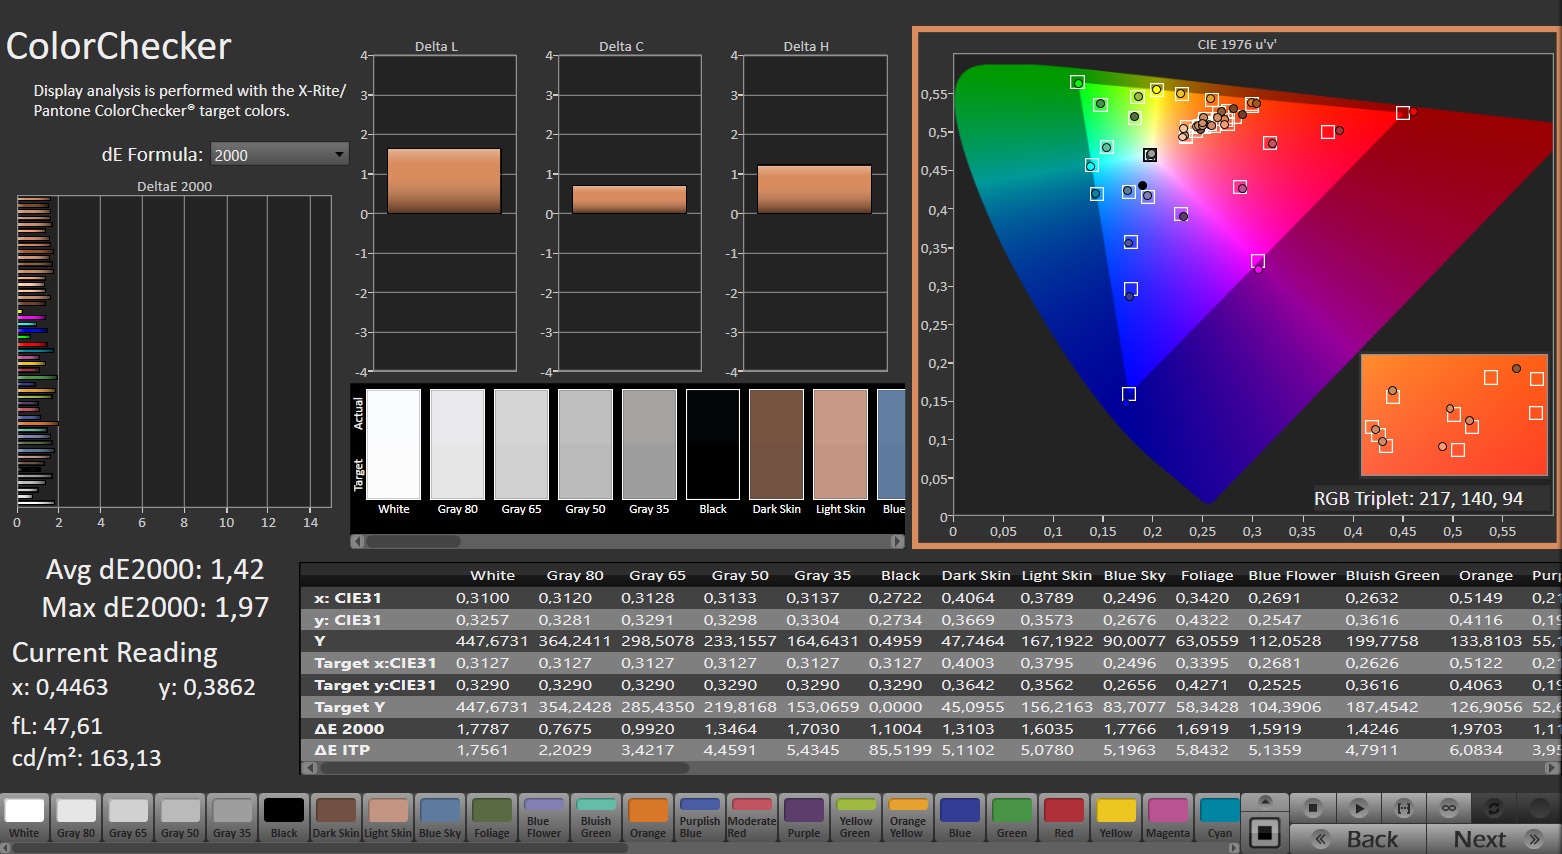
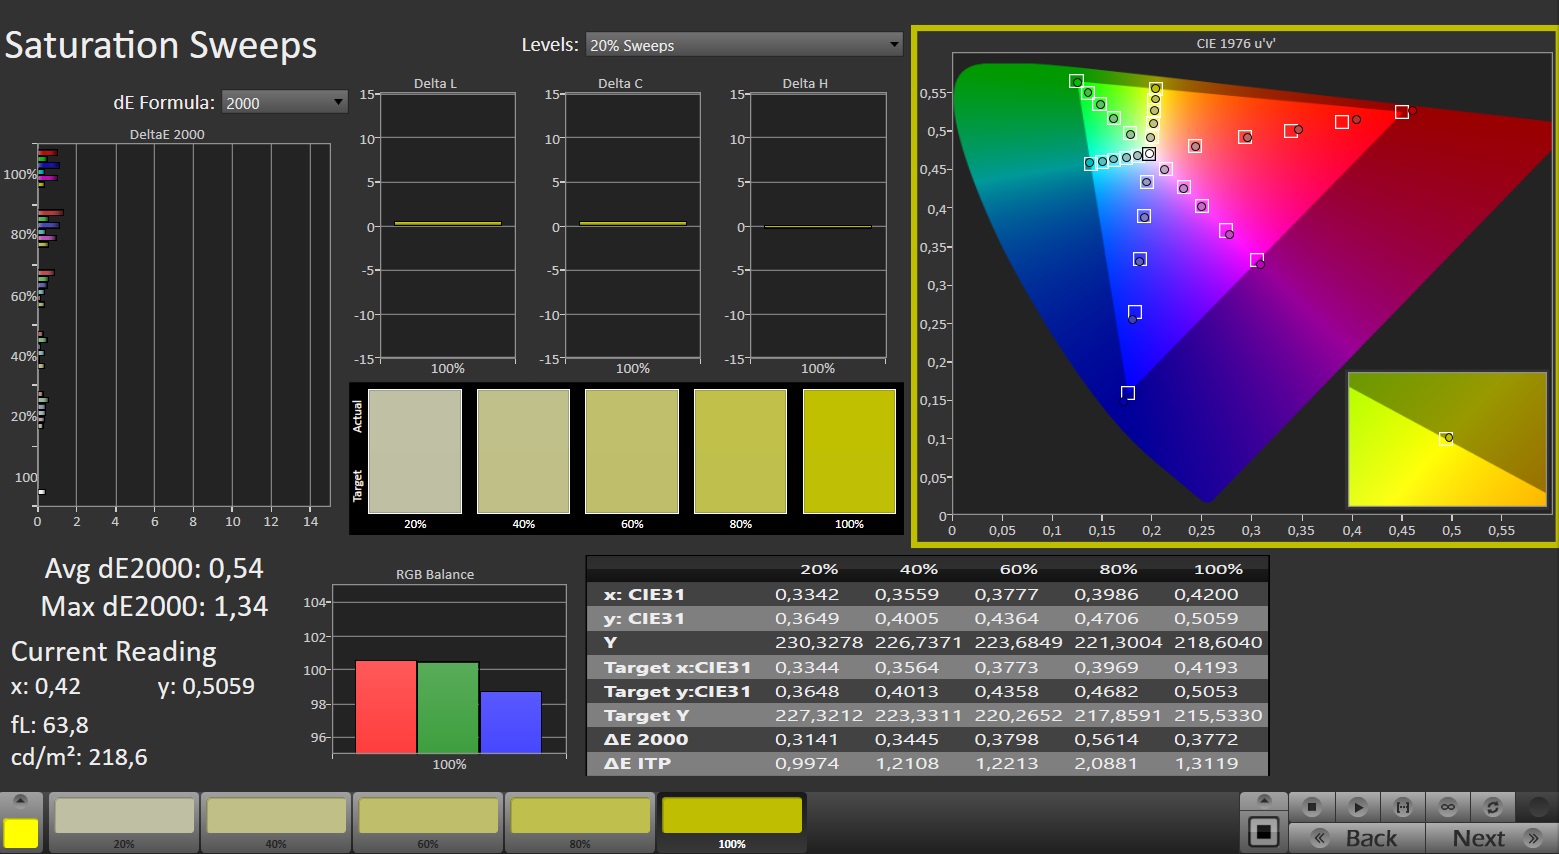
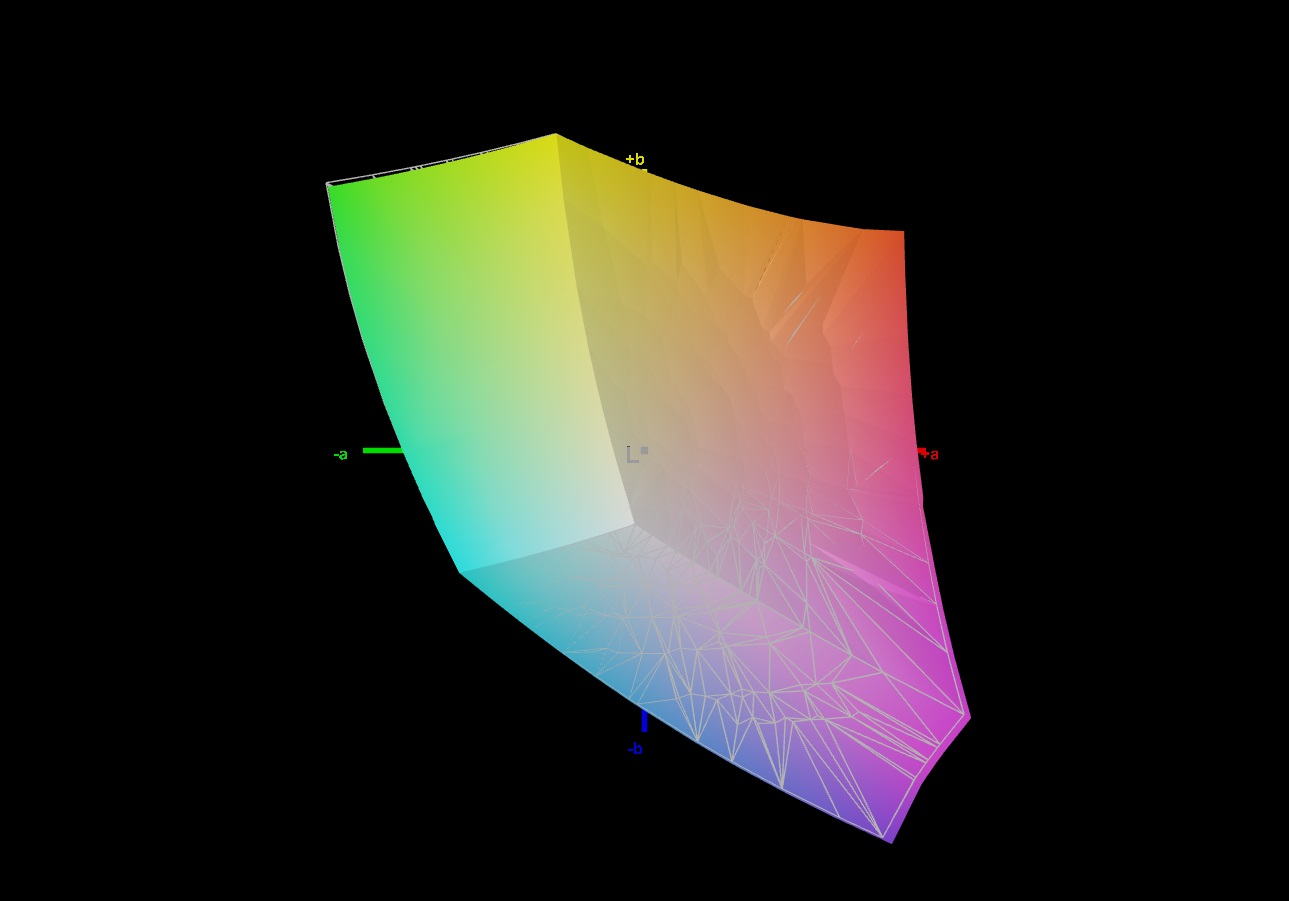
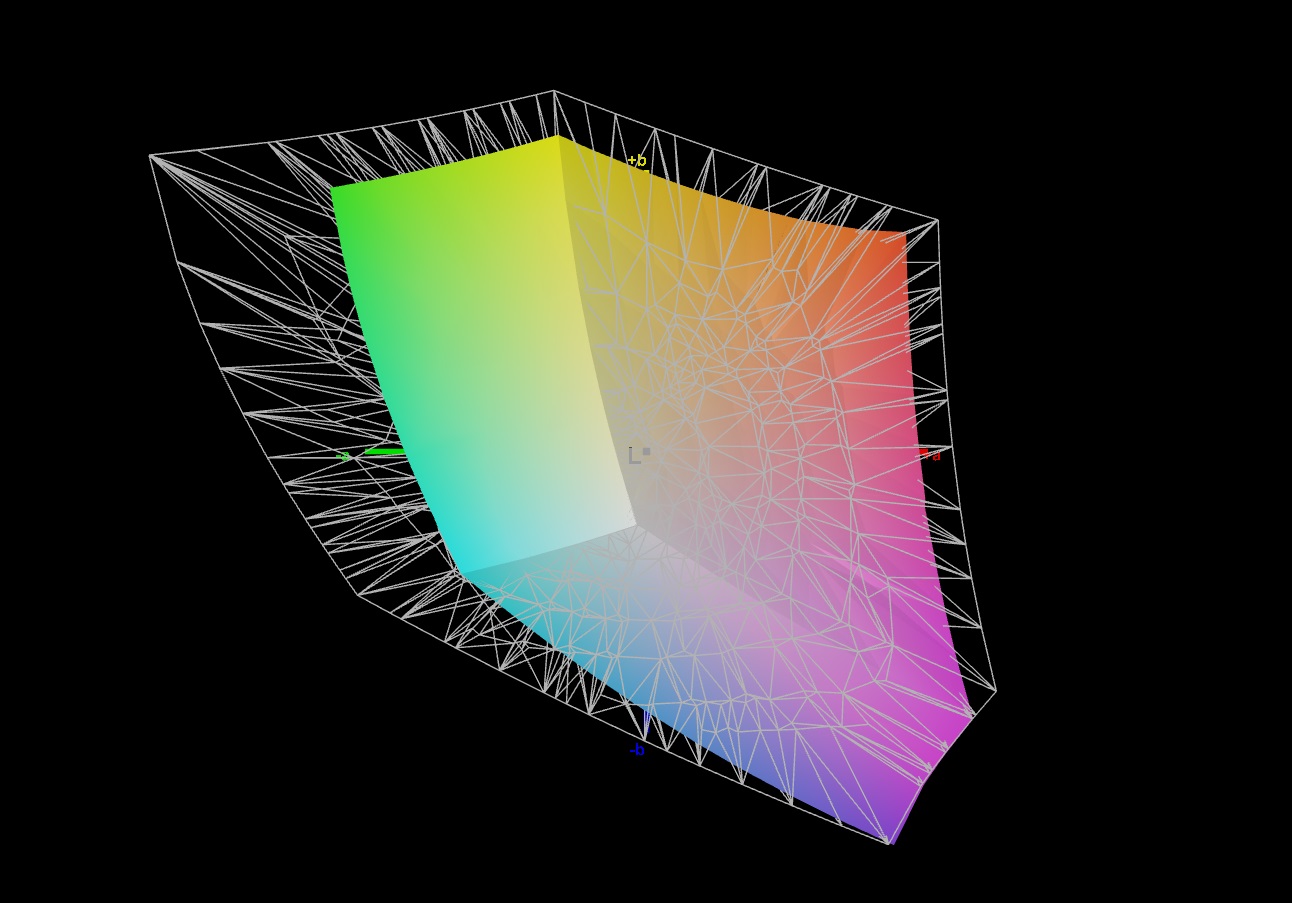
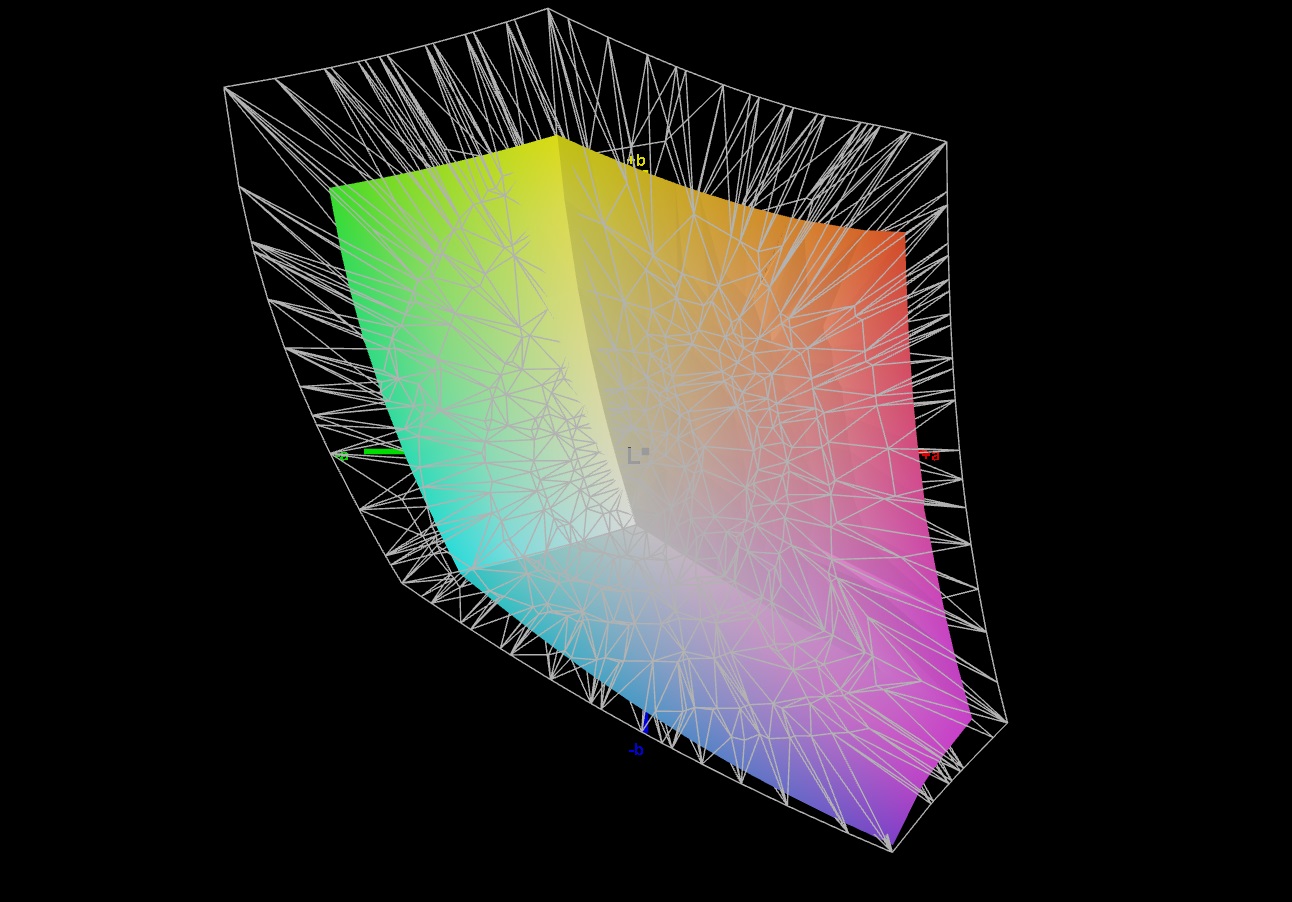
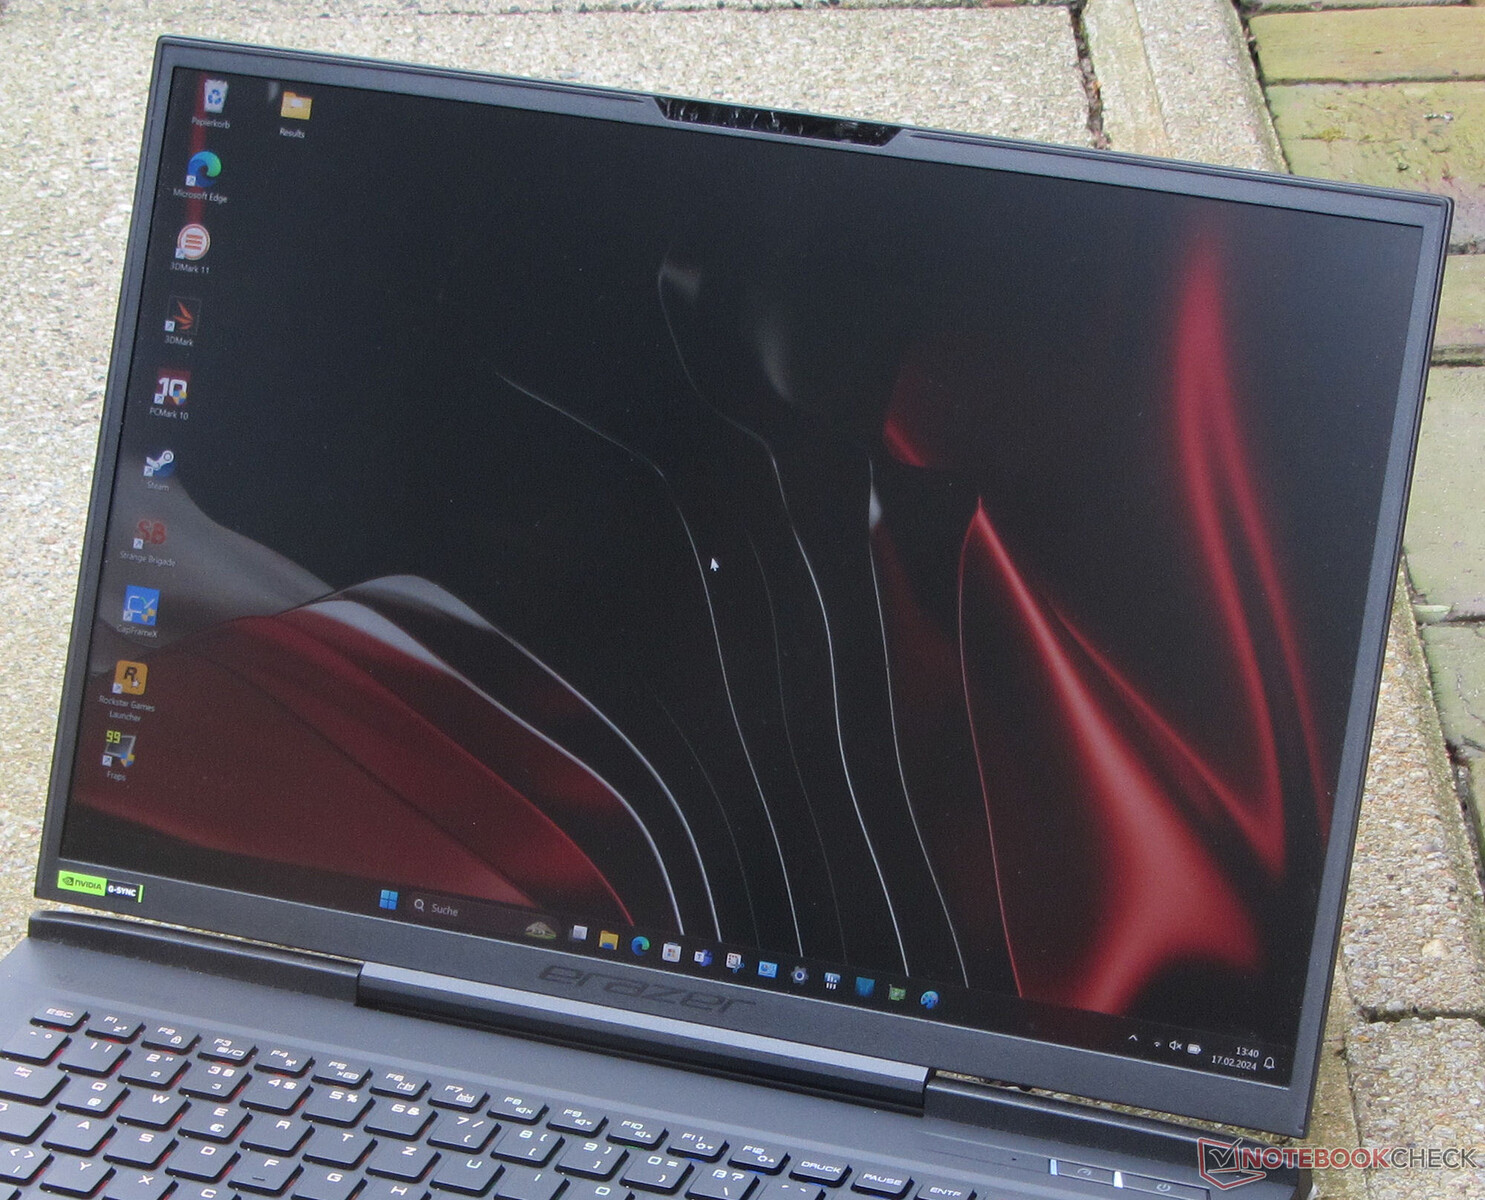
Display: QHD+ con una copertura sRGB decente
Beast X40 2024 utilizza lo stesso display opaco QHD+ 240 Hz (2.560 x 1.600 pixel) sviluppato da BOE, simile a quello di Beast X40 2024 2023 Beast X40. Il pannello ha buoni livelli di luminosità, tempi di risposta brevi, frame rate elevati e non presenta sfarfallio PWM.
Attualmente Medion non offre altre opzioni di display tra cui scegliere.
| |||||||||||||||||||||||||
Distribuzione della luminosità: 87 %
Al centro con la batteria: 422 cd/m²
Contrasto: 1005:1 (Nero: 0.42 cd/m²)
ΔE ColorChecker Calman: 1.42 | ∀{0.5-29.43 Ø4.71}
calibrated: 0.7
ΔE Greyscale Calman: 1.2 | ∀{0.09-98 Ø4.96}
69% AdobeRGB 1998 (Argyll 3D)
99.5% sRGB (Argyll 3D)
68.1% Display P3 (Argyll 3D)
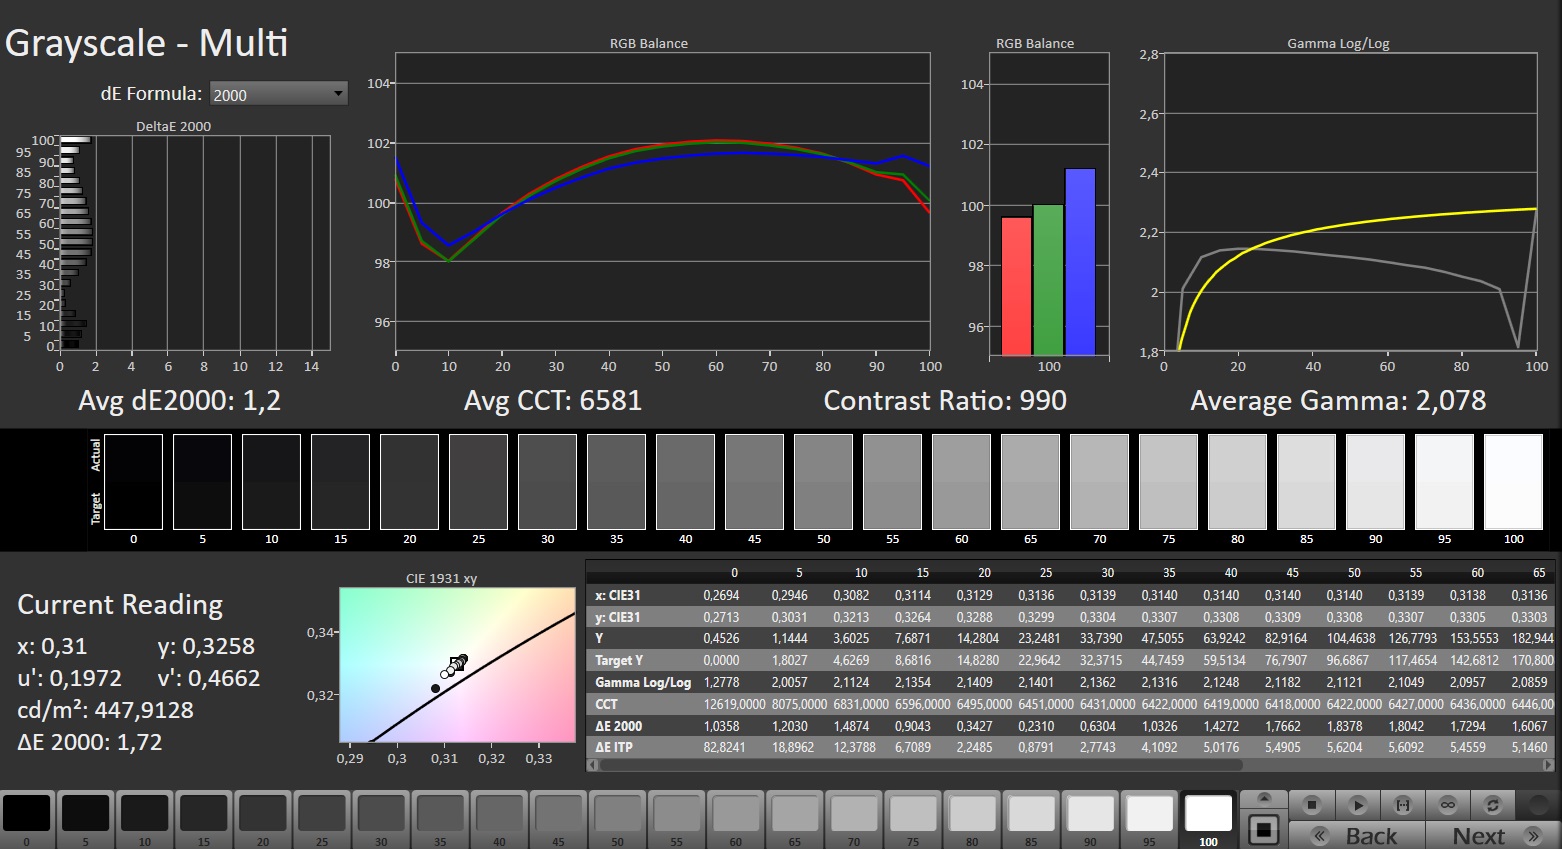
Gamma: 2.078
CCT: 6581 K
| Medion Erazer Beast X40 2024 BOE NE170QDM-NZ1, IPS, 2560x1600, 17" | Schenker Key 17 Pro (Early 23) BOE CQ NE173QUM-NY1, IPS, 3840x2160, 17.3" | Asus ROG Strix Scar 17 G733PY-XS96 NE173QHM-NZ2, IPS, 2560x1440, 17.3" | Asus ROG Strix Scar 18 G834JYR (2024) BOE NE180QDM-NM1, Mini LED, 2560x1600, 18" | MSI Titan 18 HX A14VIG AU Optronics B180ZAN01.0, Mini-LED, 3840x2400, 18" | Medion Erazer Beast X40 BOE NE170QDM-NZ1, IPS, 2560x1600, 17" | |
|---|---|---|---|---|---|---|
| Display | 21% | 23% | 26% | 23% | 1% | |
| Display P3 Coverage (%) | 68.1 | 96.4 42% | 98 44% | 99.9 47% | 98.1 44% | 68.6 1% |
| sRGB Coverage (%) | 99.5 | 99.9 0% | 100 1% | 100 1% | 99.8 0% | 99.8 0% |
| AdobeRGB 1998 Coverage (%) | 69 | 84.3 22% | 85.6 24% | 90 30% | 86.2 25% | 69.4 1% |
| Response Times | -15% | -9% | -29% | -530% | -3% | |
| Response Time Grey 50% / Grey 80% * (ms) | 11.7 ? | 14.8 ? -26% | 6.2 ? 47% | 12 ? -3% | 8.6 ? 26% | 11.3 ? 3% |
| Response Time Black / White * (ms) | 6.9 ? | 7.2 ? -4% | 11.4 ? -65% | 10.7 ? -55% | 81.8 ? -1086% | 7.5 ? -9% |
| PWM Frequency (Hz) | 5733 ? | 2592 ? | ||||
| Screen | -0% | -6% | 166% | -119% | -29% | |
| Brightness middle (cd/m²) | 422 | 487 15% | 322.5 -24% | 937 122% | 467.5 11% | 384 -9% |
| Brightness (cd/m²) | 388 | 485 25% | 317 -18% | 934 141% | 459 18% | 377 -3% |
| Brightness Distribution (%) | 87 | 87 0% | 86 -1% | 89 2% | 90 3% | 90 3% |
| Black Level * (cd/m²) | 0.42 | 0.51 -21% | 0.29 31% | 0.066 84% | 0.45 -7% | |
| Contrast (:1) | 1005 | 955 -5% | 1112 11% | 14197 1313% | 853 -15% | |
| Colorchecker dE 2000 * | 1.42 | 1.51 -6% | 1.15 19% | 1.52 -7% | 3.77 -165% | 2.05 -44% |
| Colorchecker dE 2000 max. * | 1.97 | 2.19 -11% | 3.03 -54% | 2.82 -43% | 6.12 -211% | 3.64 -85% |
| Colorchecker dE 2000 calibrated * | 0.7 | 0.56 20% | 1.21 -73% | 2.94 -320% | 0.74 -6% | |
| Greyscale dE 2000 * | 1.2 | 1.2 -0% | 1.7 -42% | 1.7 -42% | 3.2 -167% | 2.3 -92% |
| Gamma | 2.078 106% | 2.273 97% | 2.27 97% | 2.042 108% | 2.43 91% | 2.017 109% |
| CCT | 6581 99% | 6451 101% | 6299 103% | 6578 99% | 6478 100% | 6546 99% |
| Media totale (Programma / Settaggio) | 2% /
2% | 3% /
-1% | 54% /
108% | -209% /
-152% | -10% /
-19% |
* ... Meglio usare valori piccoli
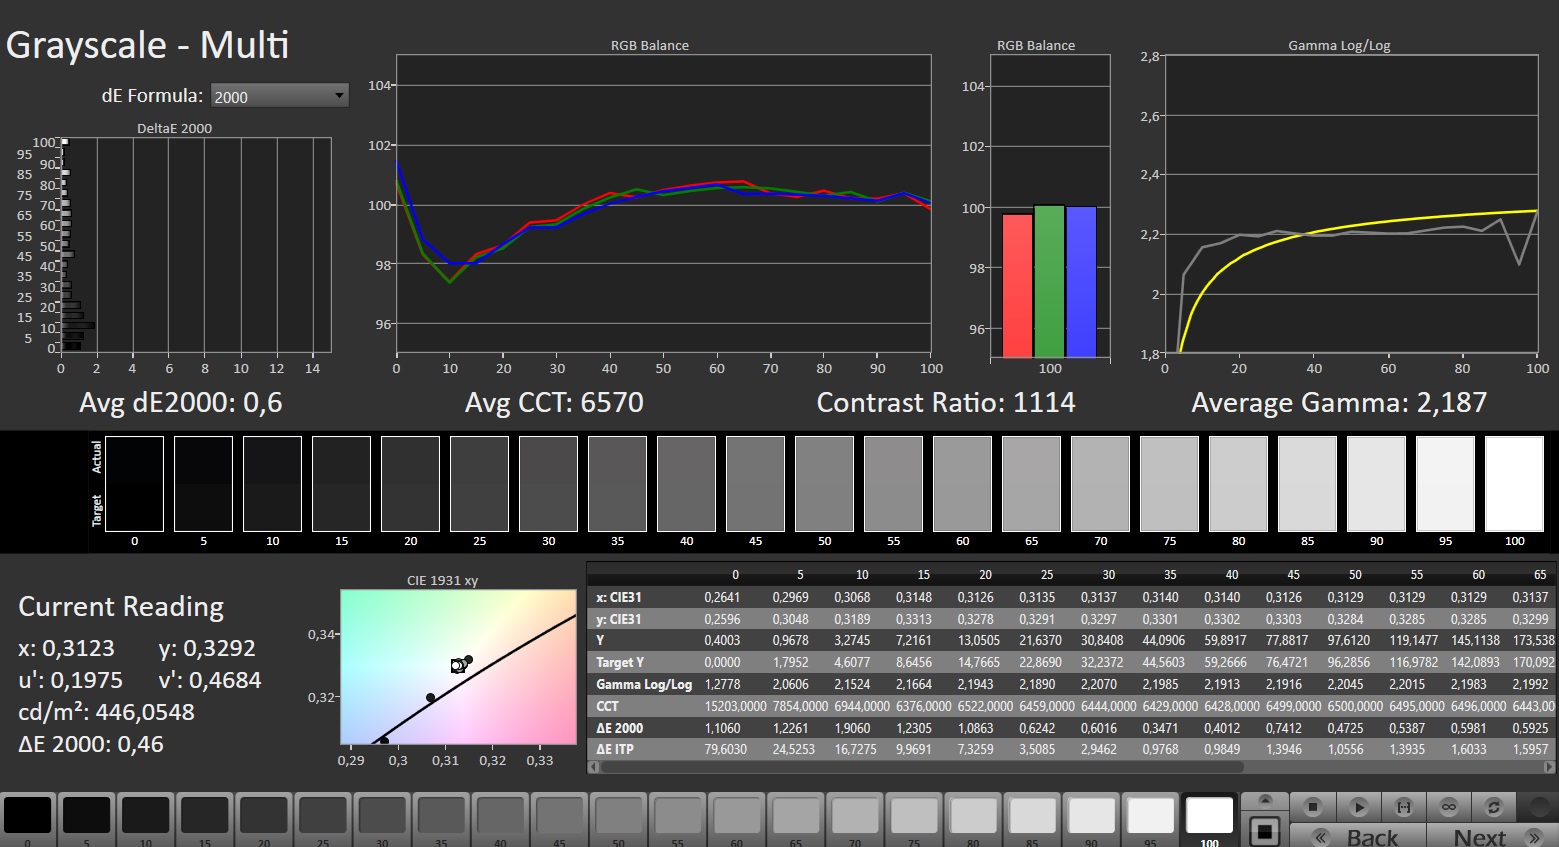
Il display mostra una buona rappresentazione cromatica ex funziona: Con una deviazione di circa 1,4, l'obiettivo (DeltaE < 3) è soddisfatto. La calibrazione riduce la deviazione a 0,7 e garantisce scale di grigi più equilibrate.
Il pannello è in grado di riprodurre completamente lo spazio colore sRGB, ma non gli spazi colore AdobeRGB e DCI P3. I display della concorrenza offrono di più.

Tempi di risposta del Display
| ↔ Tempi di risposta dal Nero al Bianco | ||
|---|---|---|
| 6.9 ms ... aumenta ↗ e diminuisce ↘ combinato | ↗ 2.8 ms Incremento | 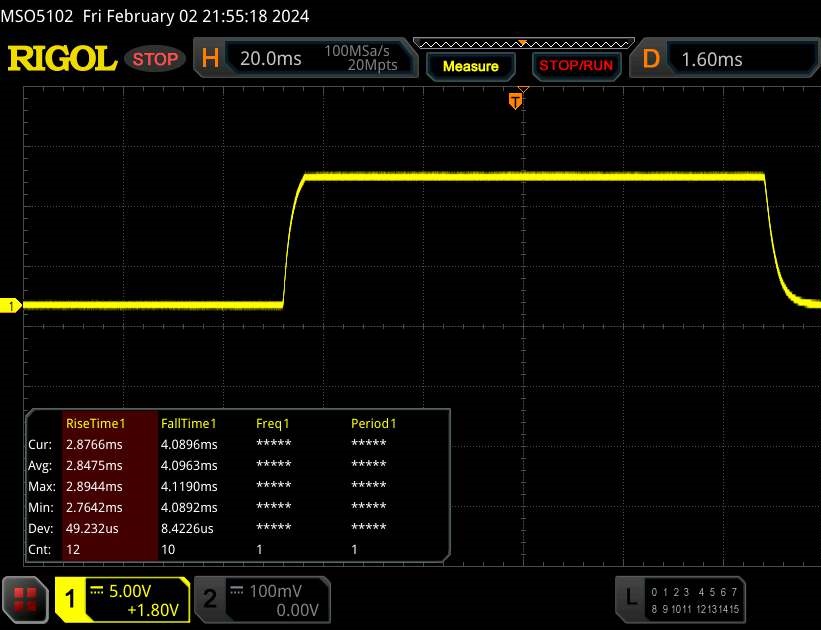 |
| ↘ 4.1 ms Calo | ||
| Lo schermo ha mostrato valori di risposta molto veloci nei nostri tests ed è molto adatto per i gaming veloce. In confronto, tutti i dispositivi di test variano da 0.1 (minimo) a 240 (massimo) ms. » 21 % di tutti i dispositivi è migliore. Questo significa che i tempi di risposta rilevati sono migliori rispettto alla media di tutti i dispositivi testati (19.8 ms). | ||
| ↔ Tempo di risposta dal 50% Grigio all'80% Grigio | ||
| 11.7 ms ... aumenta ↗ e diminuisce ↘ combinato | ↗ 5.7 ms Incremento | 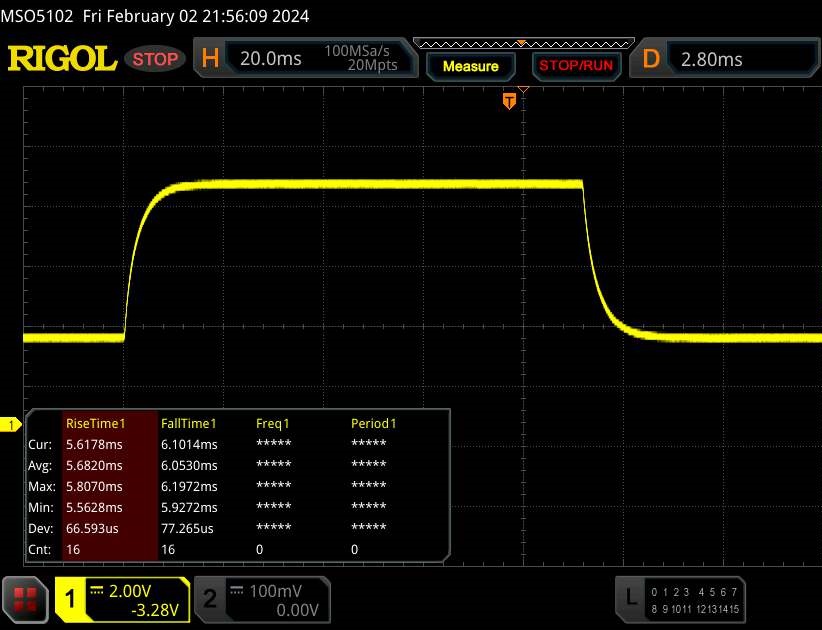 |
| ↘ 6 ms Calo | ||
| Lo schermo mostra buoni tempi di risposta durante i nostri tests, ma potrebbe essere troppo lento per i gamers competitivi. In confronto, tutti i dispositivi di test variano da 0.165 (minimo) a 636 (massimo) ms. » 25 % di tutti i dispositivi è migliore. Questo significa che i tempi di risposta rilevati sono migliori rispettto alla media di tutti i dispositivi testati (31 ms). | ||
Sfarfallio dello schermo / PWM (Pulse-Width Modulation)
| flickering dello schermo / PWM non rilevato | 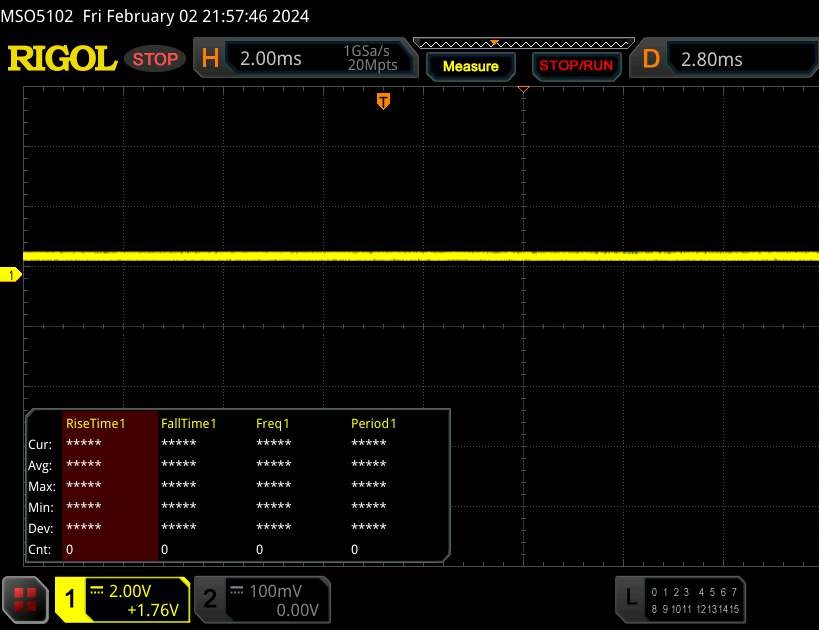 | ||
In confronto: 52 % di tutti i dispositivi testati non utilizza PWM per ridurre la luminosita' del display. Se è rilevato PWM, una media di 7747 (minimo: 5 - massimo: 343500) Hz è stata rilevata. | |||
Il pannello IPS con angolo di visione stabile può essere letto da qualsiasi posizione. È possibile leggere il display all'aperto, se il sole non è troppo luminoso.
Prestazioni: Medion Beast X40 è dotato di hardware di fascia alta
Il notebook di fascia alta di Medion si distingue in tutte le aree applicative che richiedono prestazioni elevate (ad esempio, gaming, rendering). La potenza di calcolo necessaria è fornita da Raptor Lake e Ada Lovelace. Questo modello X40 è disponibile a circa 4.000 euro. Versioni più economiche sono disponibili a partire da 2.500 euro. Come accessorio opzionale, Medion offre un sistema di raffreddamento ad acqua (circa 200 euro), che può determinare un piccolo aumento delle prestazioni e una riduzione delle emissioni.
Condizioni del test
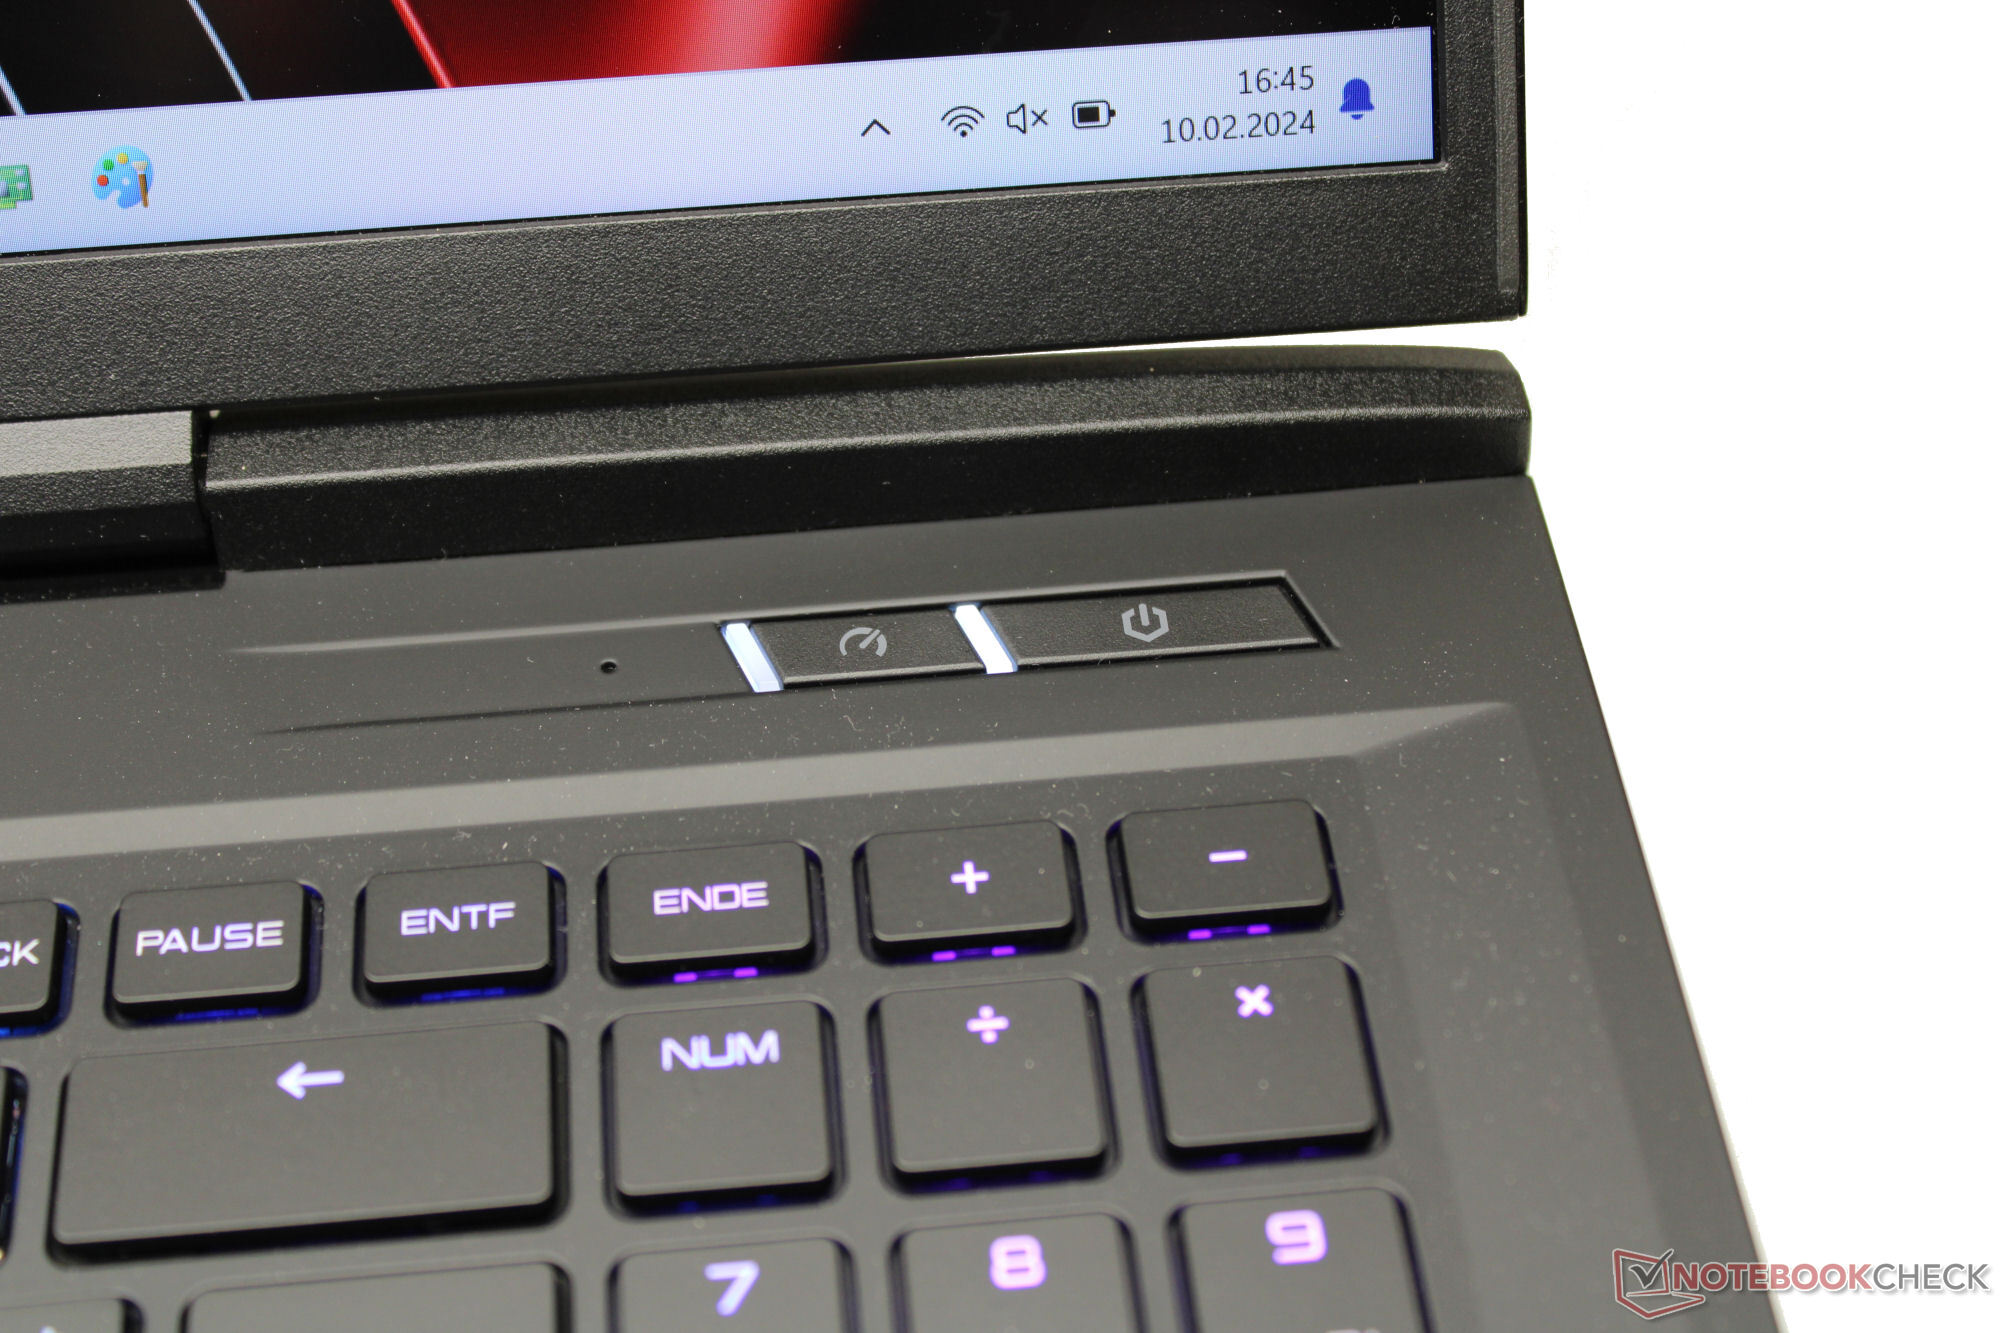
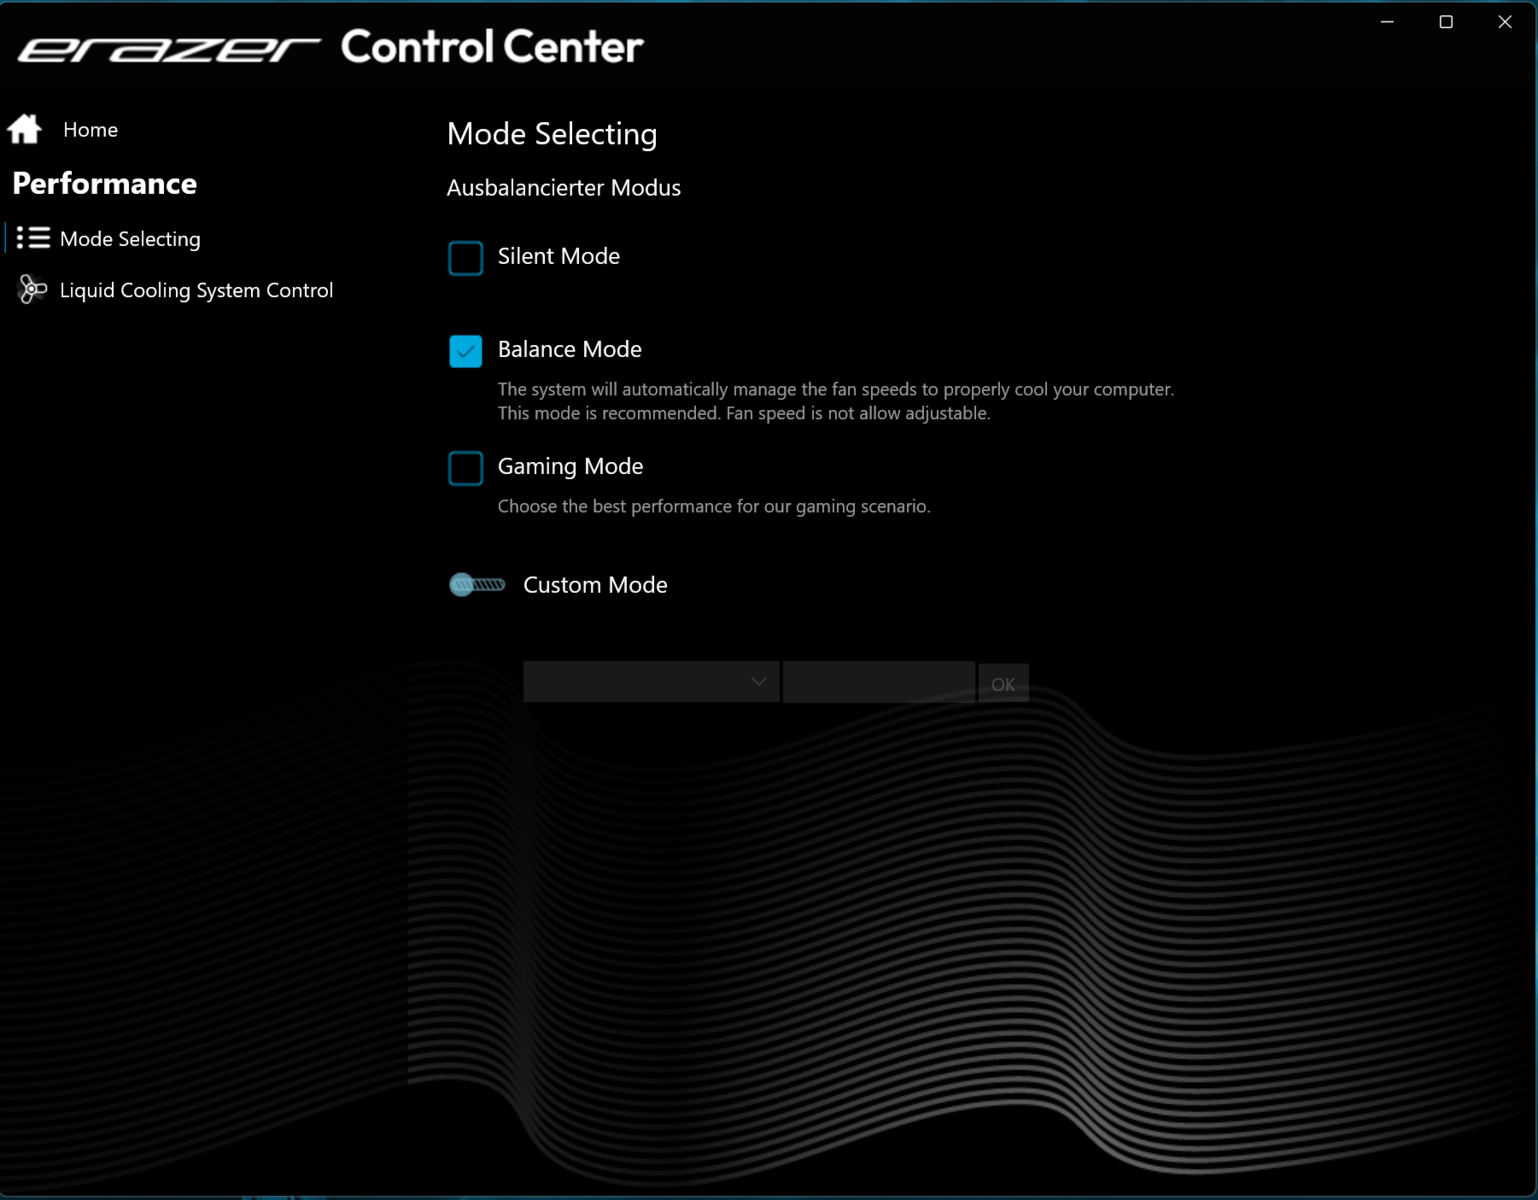
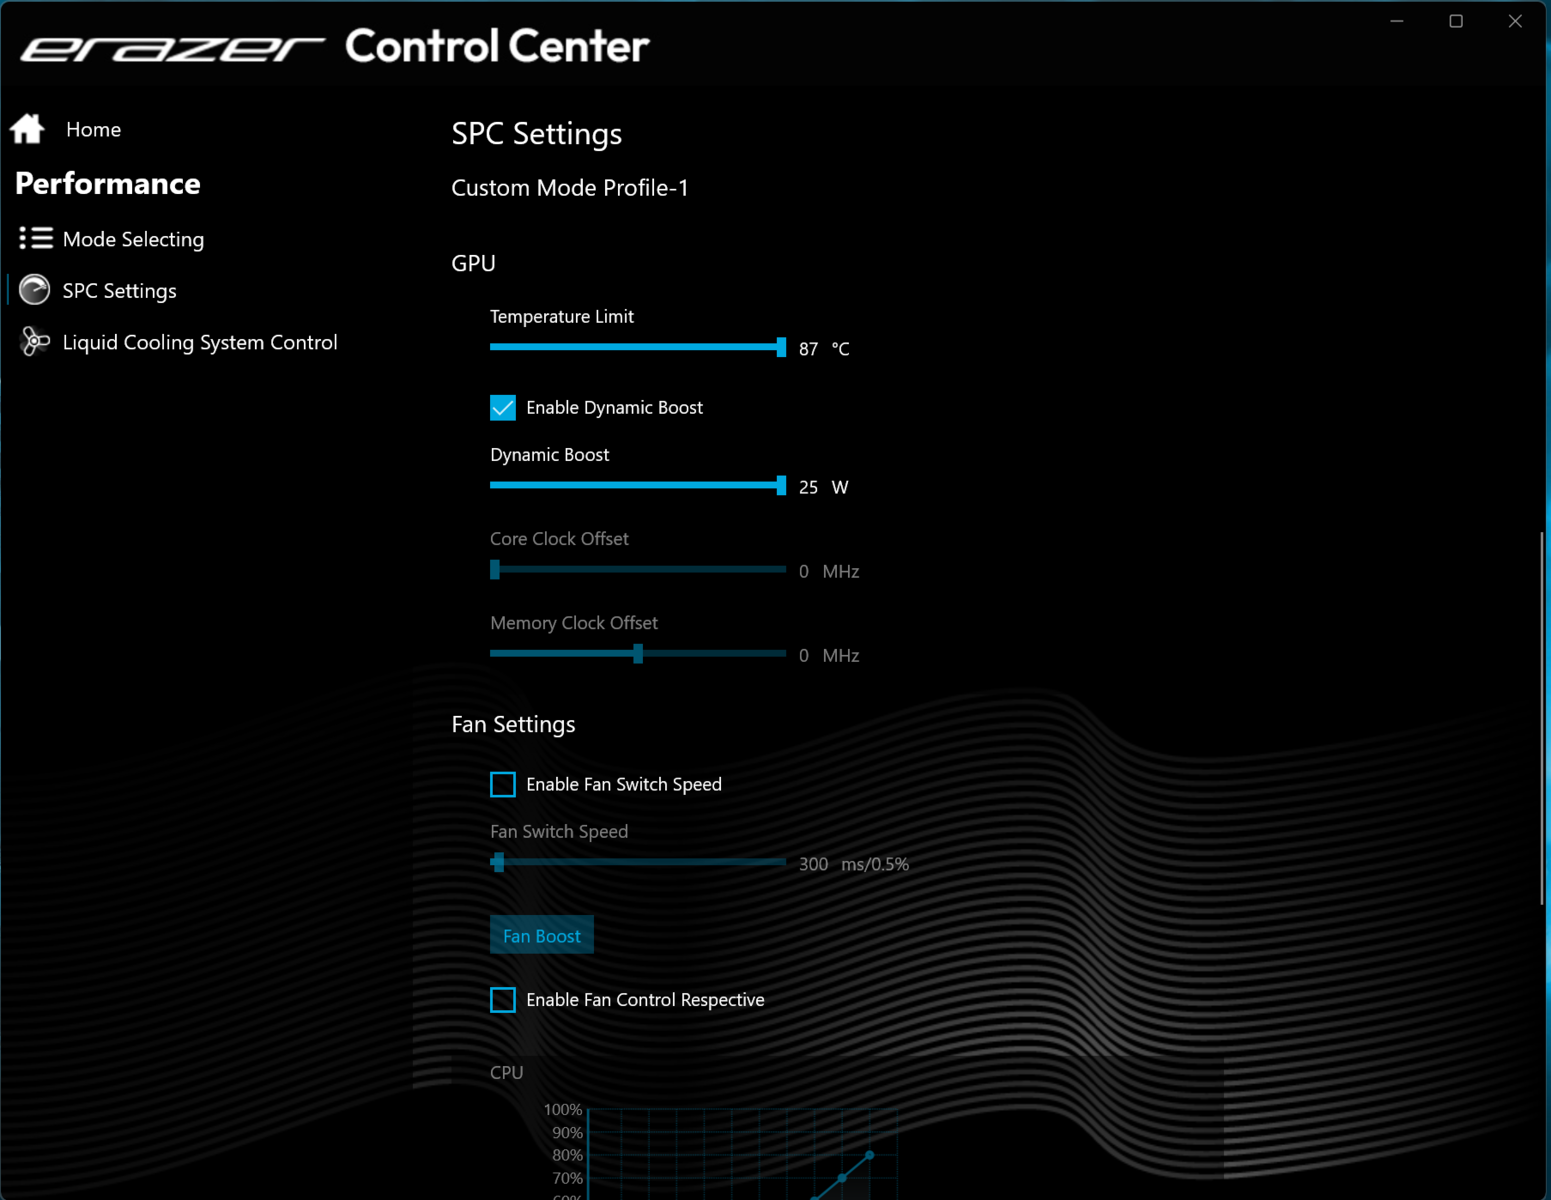
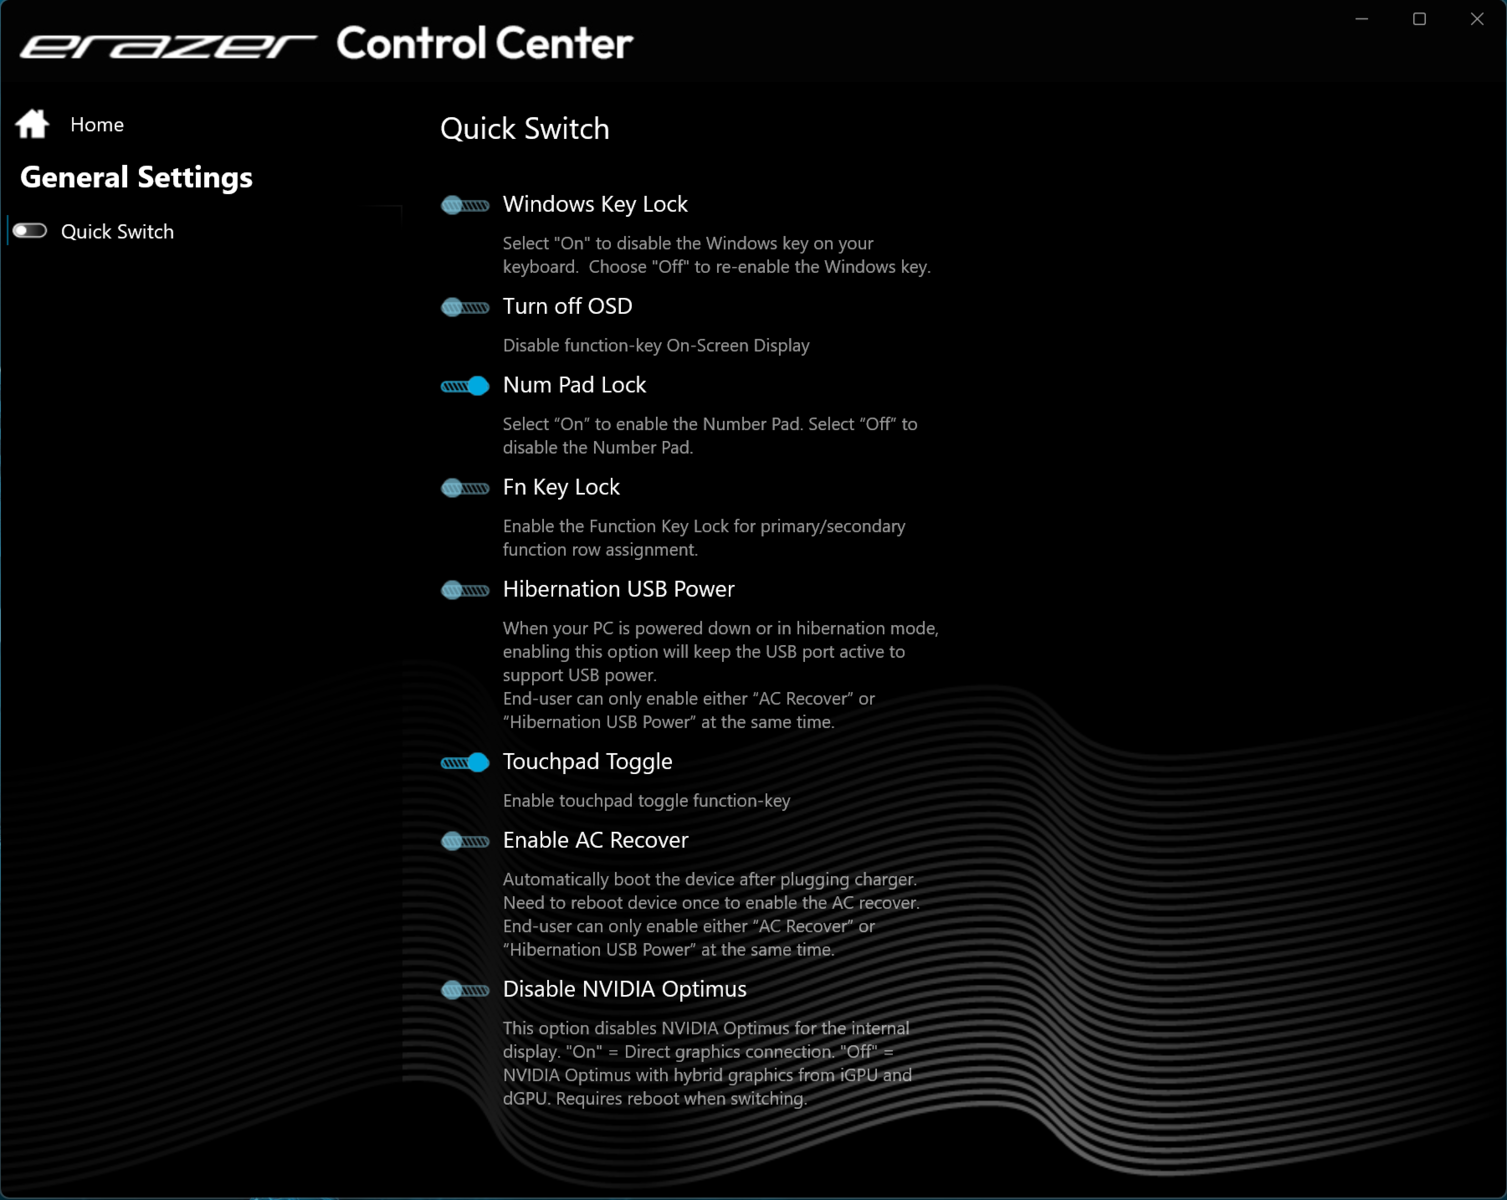
Un tasto dedicato accanto al pulsante di accensione consente di passare rapidamente tra le tre modalità di prestazioni specifiche del produttore (vedere la tabella sottostante). Sono state utilizzate le modalità "Balance Mode" (benchmark) e "Silent Mode" (test della batteria).
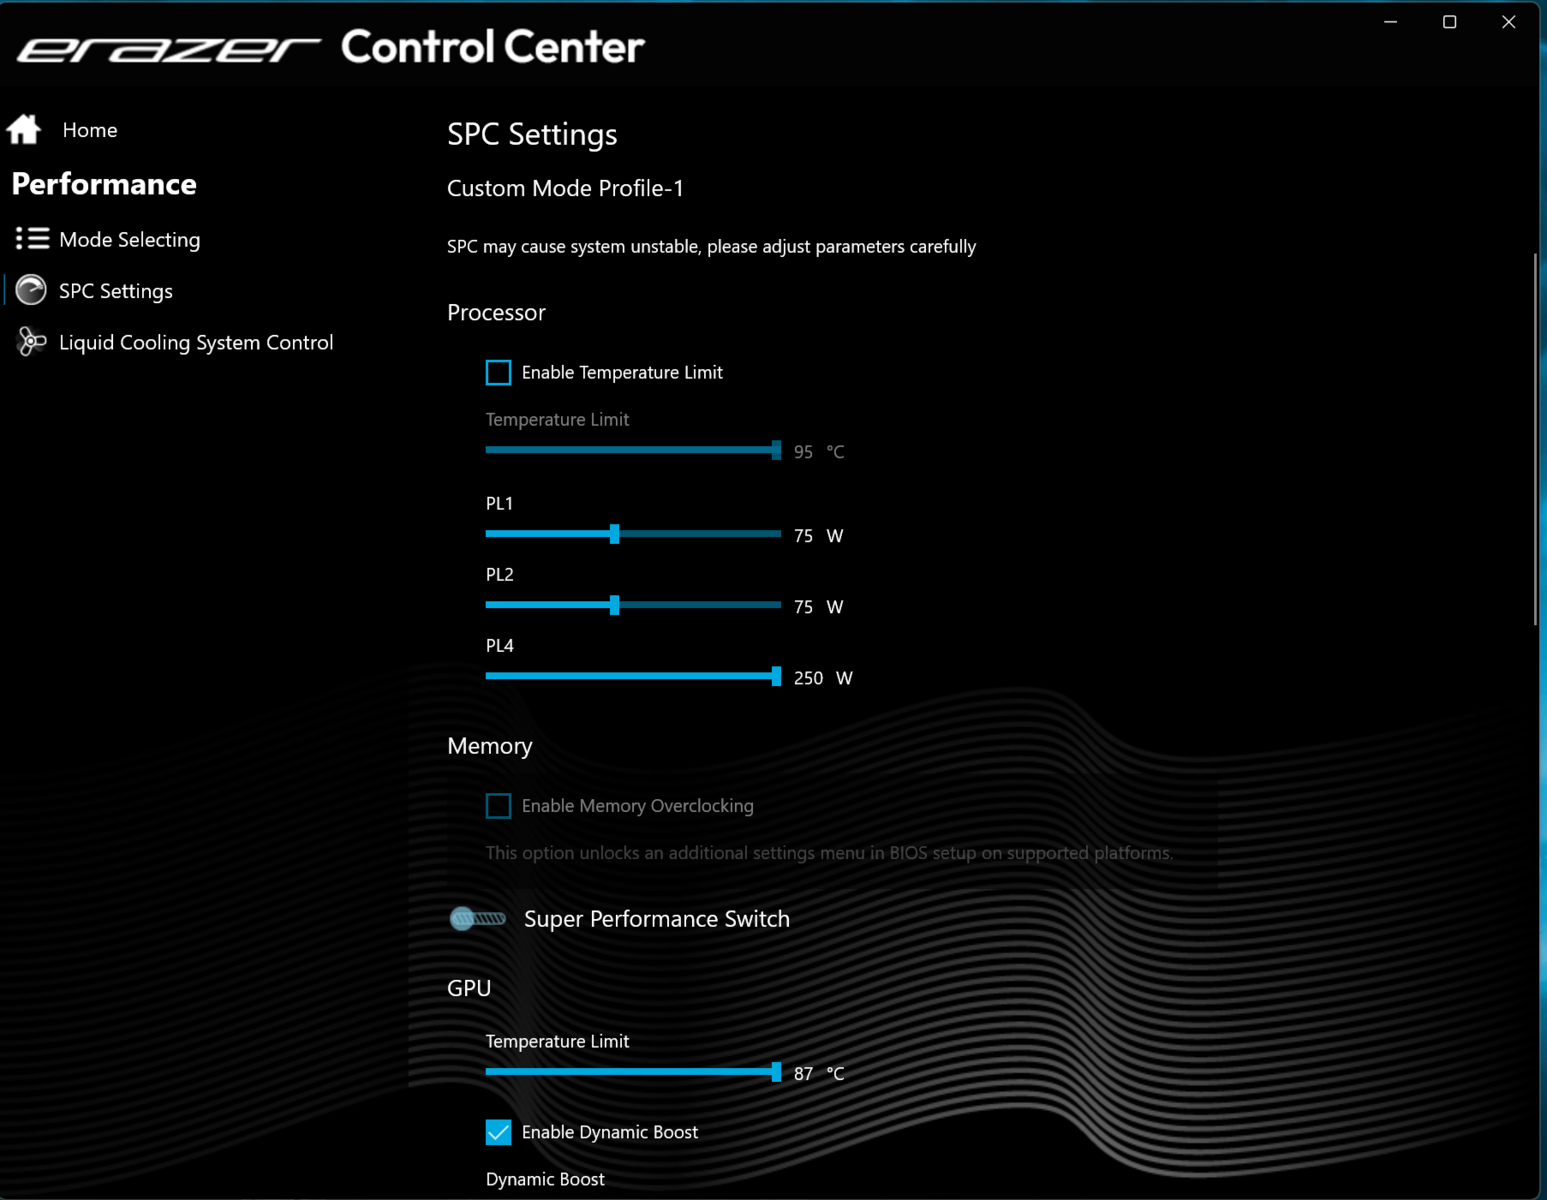
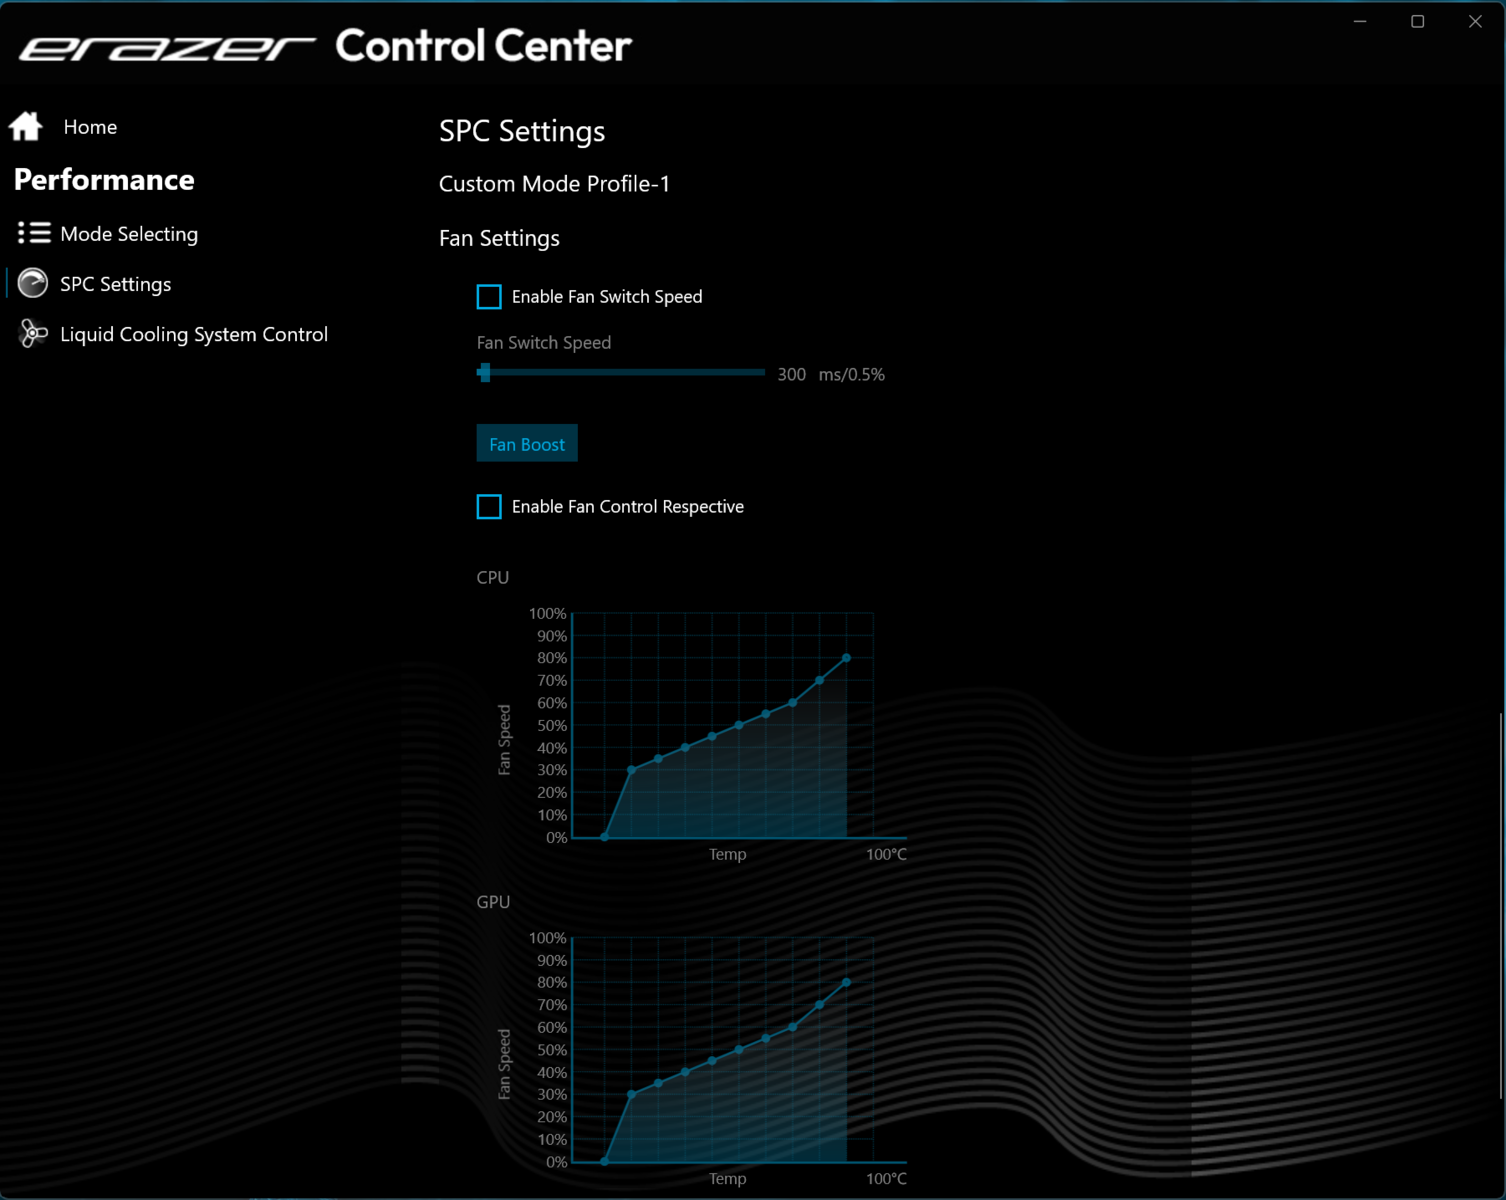
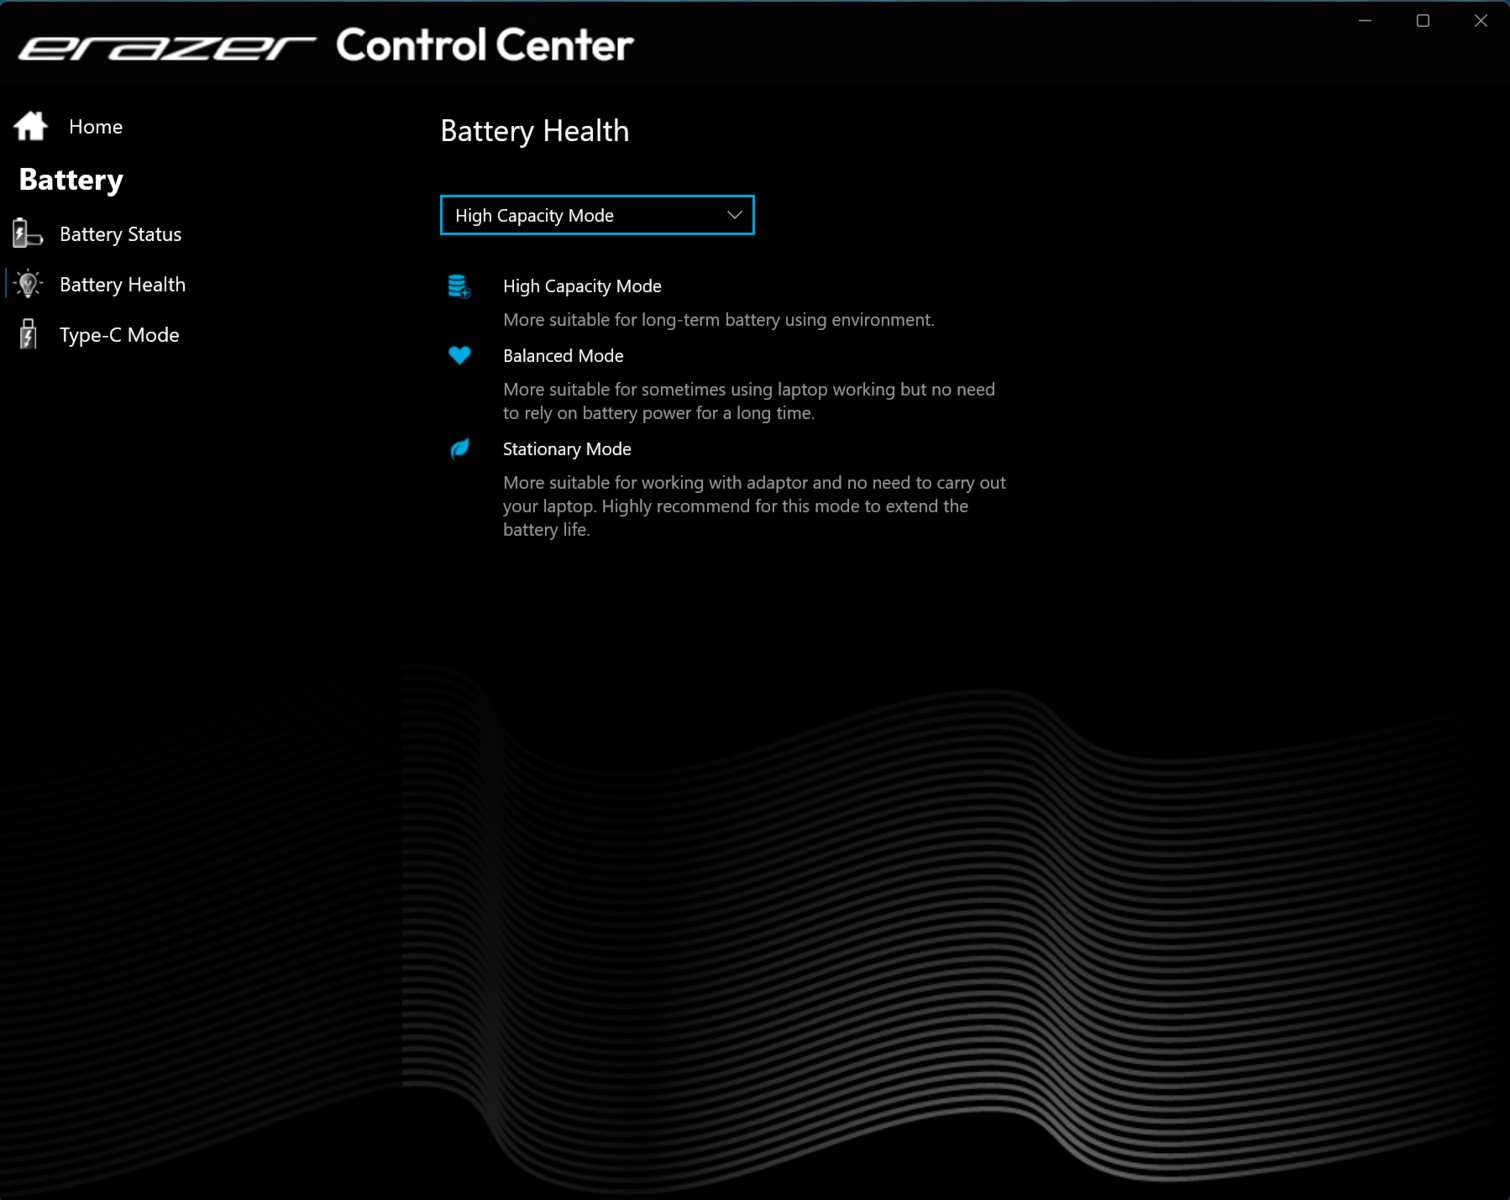
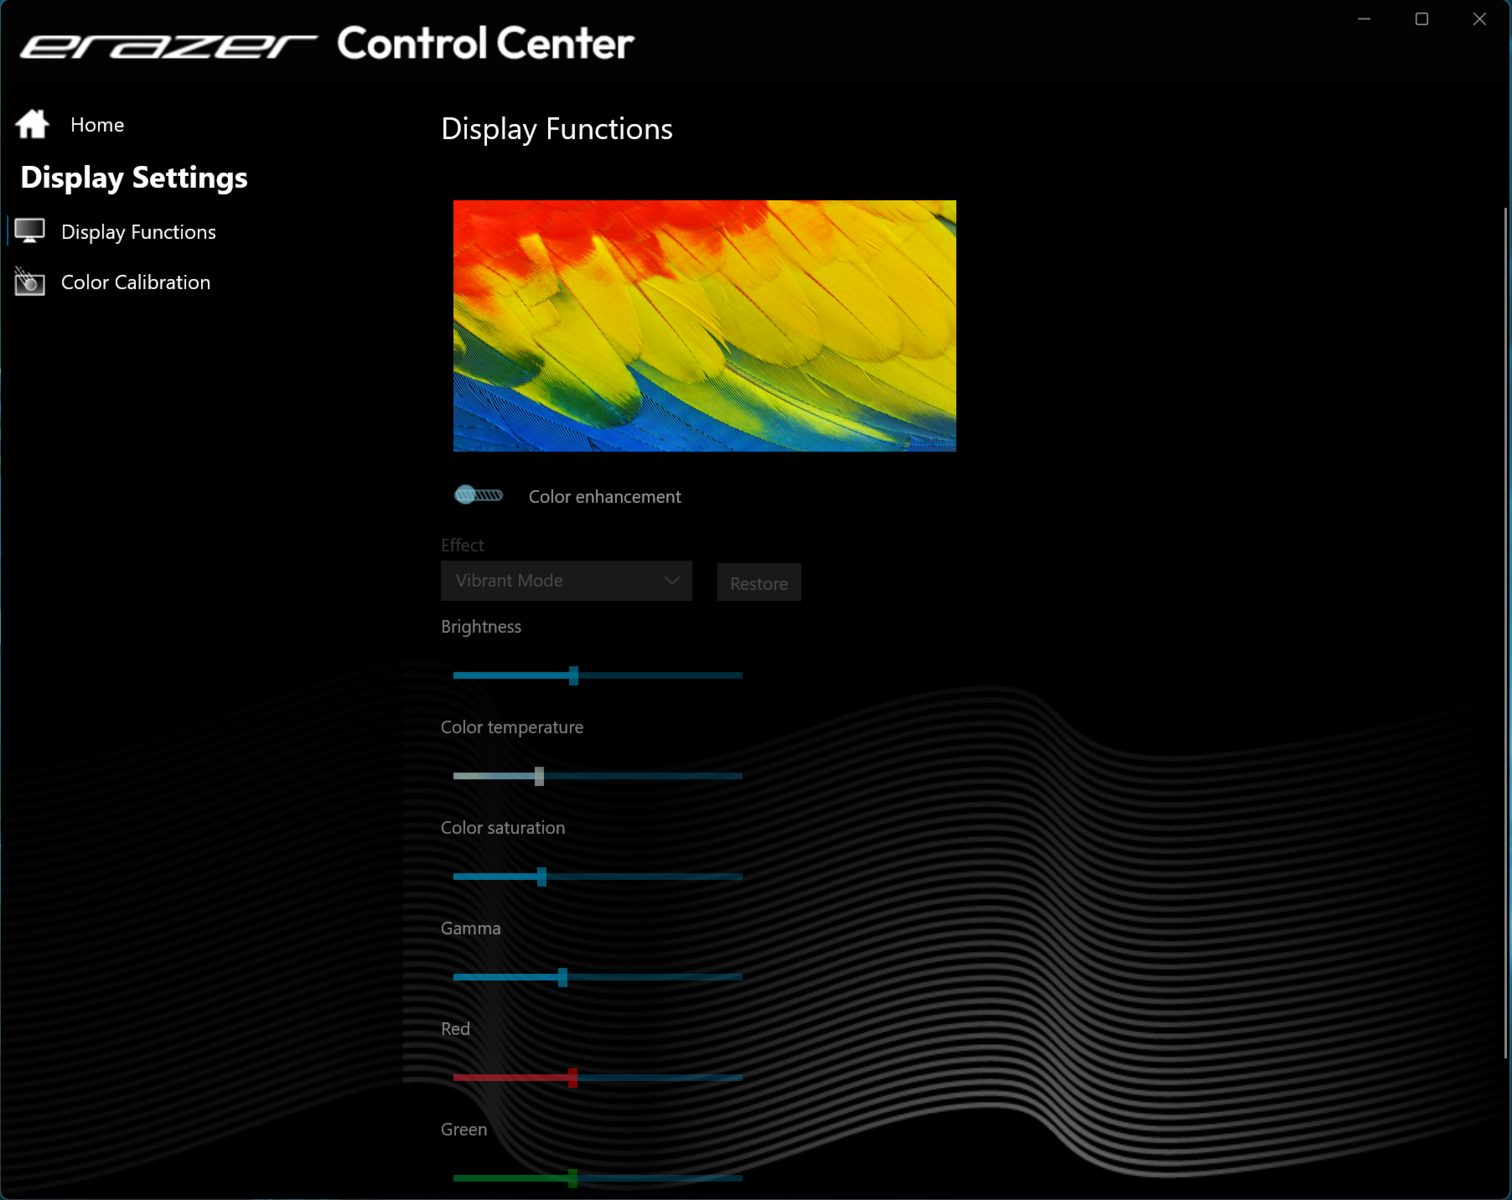
È possibile creare profili individuali utilizzando il software Control Center preinstallato, dove è possibile regolare i limiti di potenza della CPU, il TGP della GPU e/o i limiti di temperatura superiore.
| Modalità Gioco | Modalità Equilibrio | Modalità Silenziosa | |
|---|---|---|---|
| Limite di potenza 1 (HWInfo) | 160 Watt | 160 Watt | 160 Watt |
| Limite di potenza 2 (HWInfo) | 160 Watt | 160 Watt | 160 Watt |
| Rumore (Witcher 3) | 52 dB(A) | 50 dB(A) | 34 dB(A) |
| Prestazioni (Witcher 3) | ~214 fps | ~204 fps | 30 fps (bloccato) |
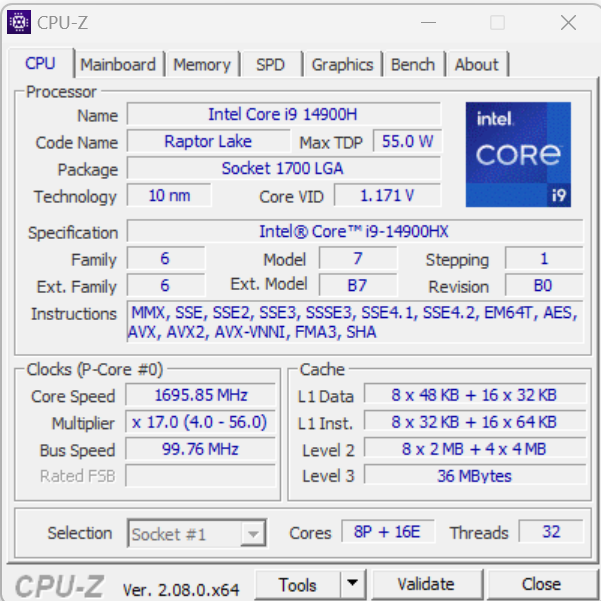
Processore
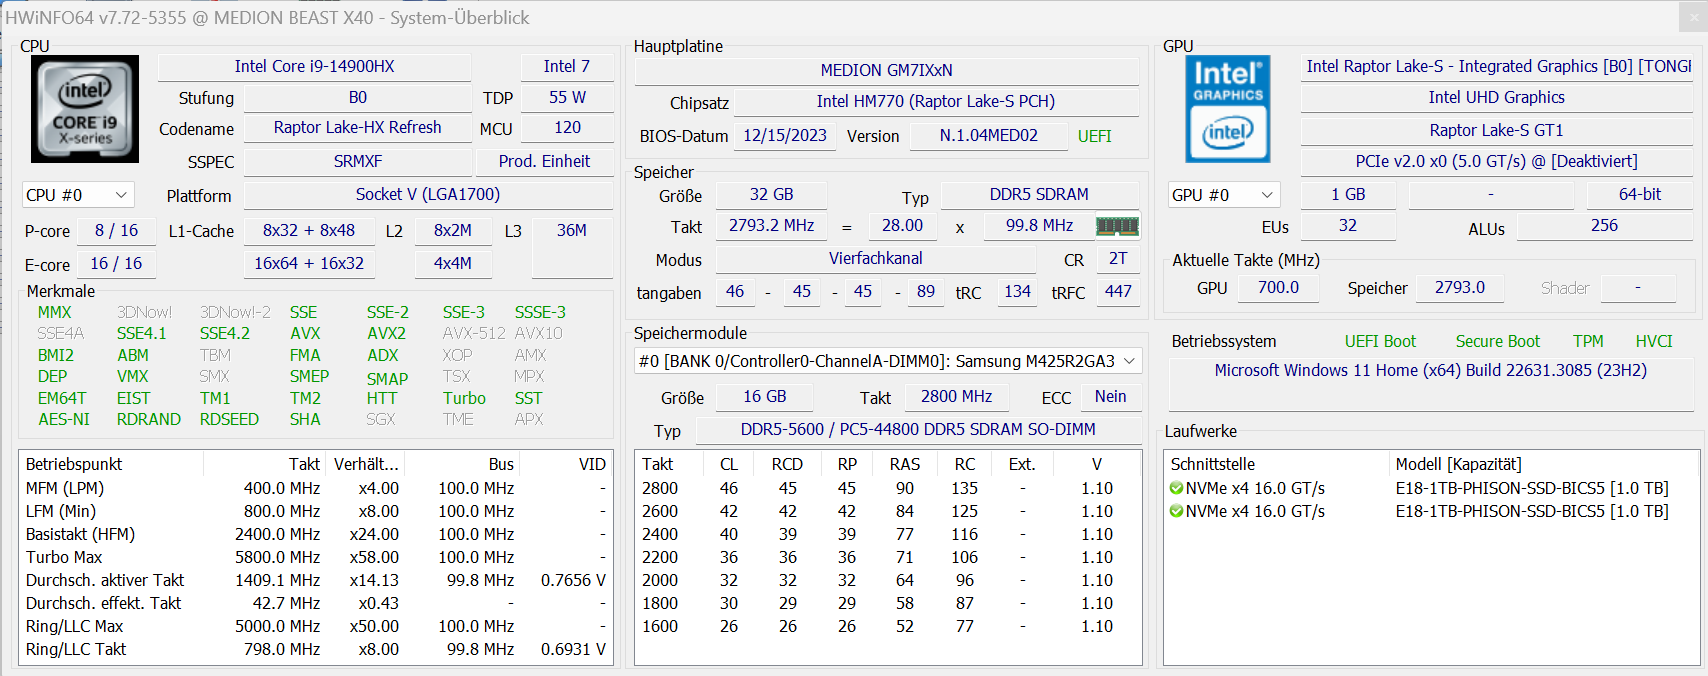
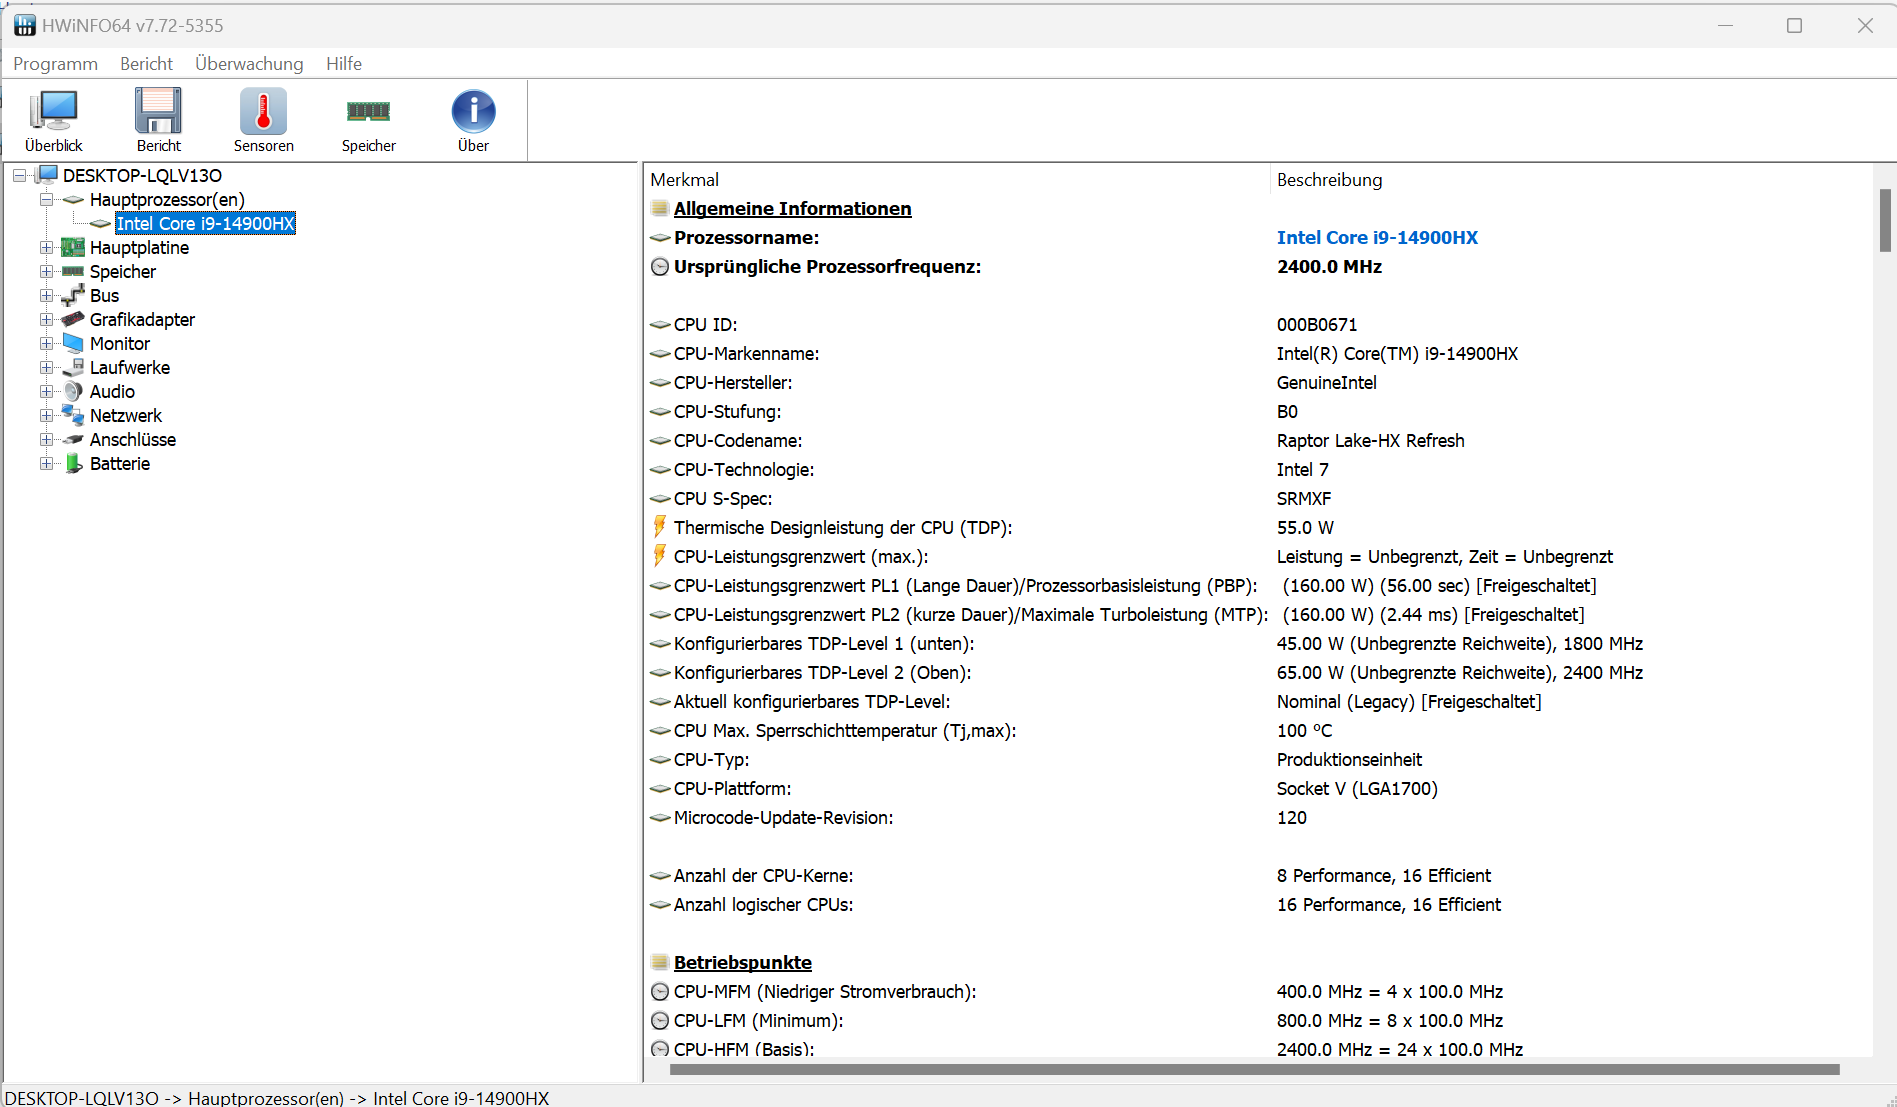
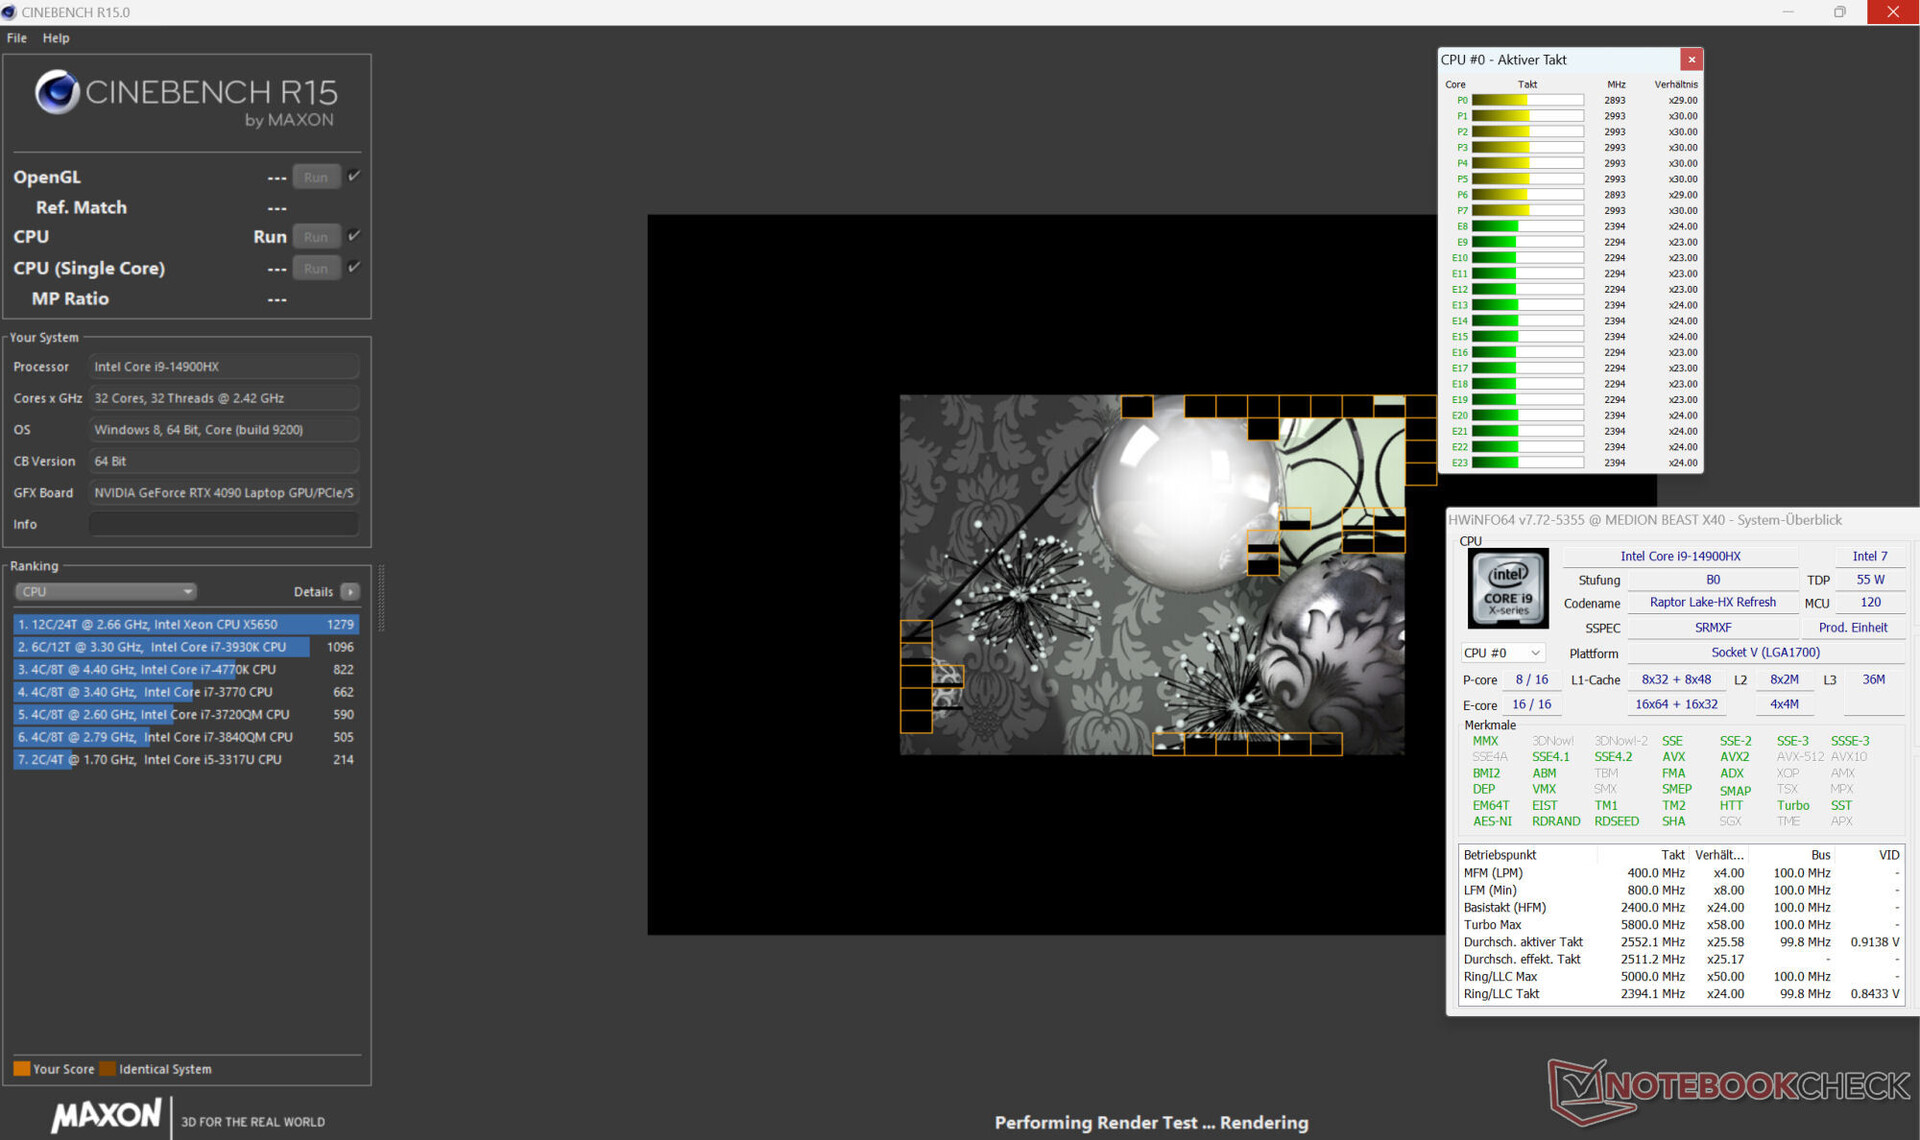
I 24 core della CPU (8P + 16E e 32 thread) del Raptor Lake-HX Core i9-14900HX raggiungono velocità di clock massime di 5,8 GHz (core P) e 4,1 GHz (core E). Grazie a velocità di clock leggermente più elevate, la CPU offre prestazioni leggermente superiori rispetto alla CPU del modello 2023 Beast X40 predecessore con un Core i9-13900HX.
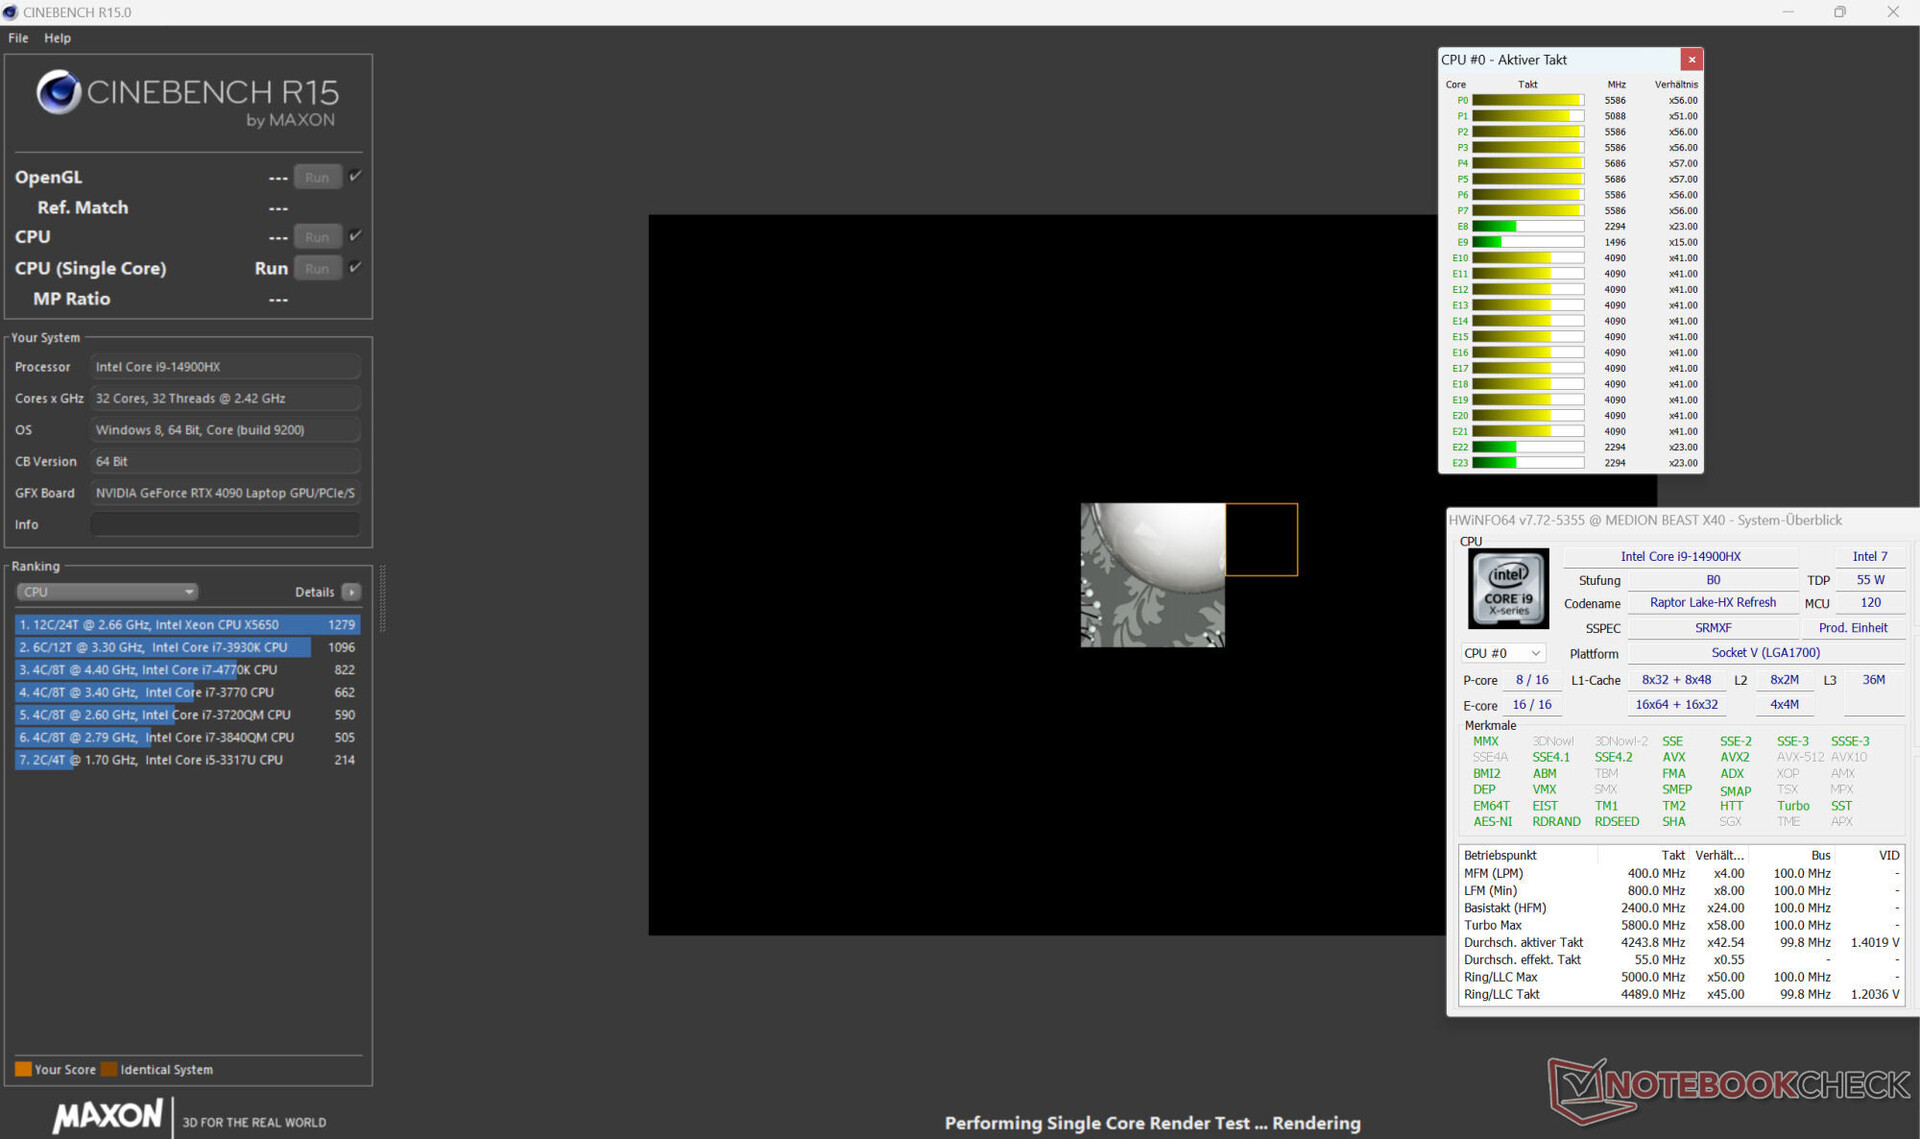
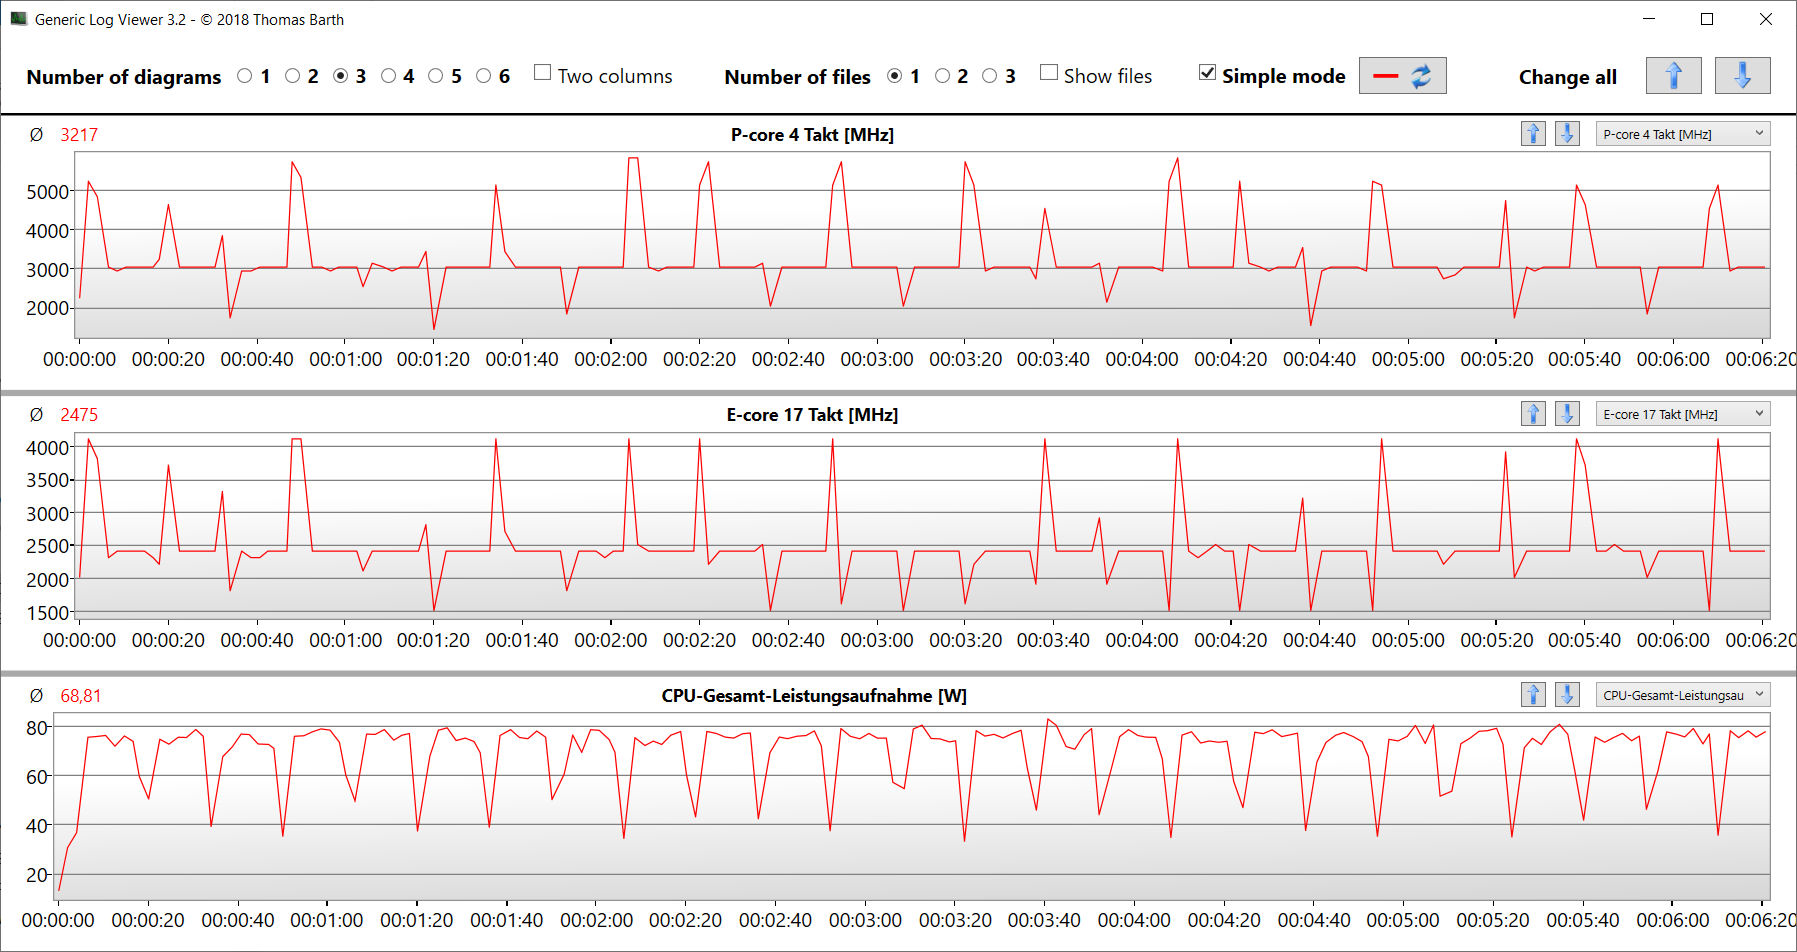
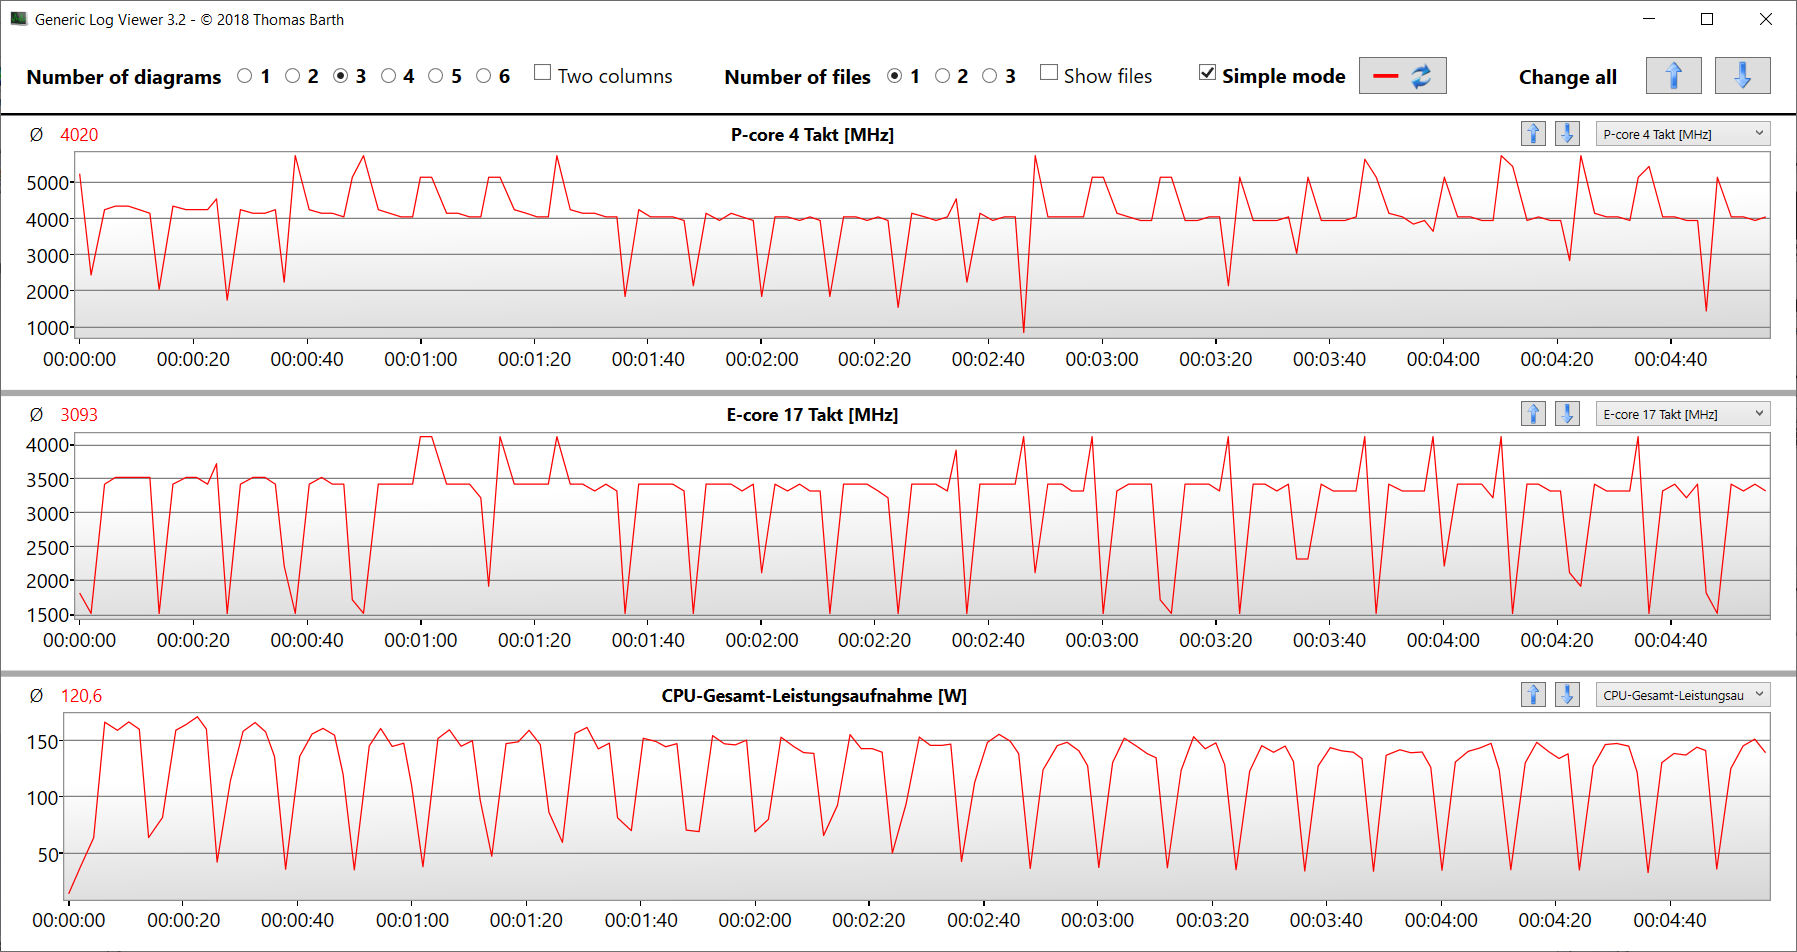
Il carico multi-thread continuo (ciclo CB15) viene riconosciuto con una frequenza di clock costante - il livello dipende dalla modalità di alimentazione. la modalità "Balance" fornisce valori di benchmark inferiori alla media della CPU, mentre la modalità "Gaming" li innalza al di sopra di essa. Le prestazioni single-thread sono diverse: si trovano a un livello elevato, quasi identico in tutti e tre i profili.
Maggiori informazioni sul Core i9-14900HX sono disponibili nel nostro articolo di analisi Analisi dell'aggiornamento Intel Raptor Lake-HX - Core i9-14900HX con maggiori prestazioni single-core .
Cinebench R15 Multi Dauertest
| CPU Performance rating - Percent | |
| Asus ROG Strix Scar 17 G733PYV-LL053X | |
| Medion Erazer Beast X40 2024 | |
| MSI Titan 18 HX A14VIG | |
| Asus ROG Strix Scar 18 G834JYR (2024) | |
| Media Intel Core i9-14900HX | |
| Medion Erazer Beast X40 -2! | |
| Schenker Key 17 Pro (Early 23) -2! | |
| Medion Erazer Beast X40 2024 | |
| Media della classe Gaming | |
| Cinebench R20 | |
| CPU (Multi Core) | |
| Asus ROG Strix Scar 17 G733PYV-LL053X | |
| MSI Titan 18 HX A14VIG | |
| Medion Erazer Beast X40 2024 (Gaming Mode) | |
| Medion Erazer Beast X40 | |
| Media Intel Core i9-14900HX (6579 - 13832, n=37) | |
| Asus ROG Strix Scar 18 G834JYR (2024) | |
| Schenker Key 17 Pro (Early 23) | |
| Media della classe Gaming (4029 - 16433, n=106, ultimi 2 anni) | |
| Medion Erazer Beast X40 2024 | |
| CPU (Single Core) | |
| Medion Erazer Beast X40 2024 | |
| Asus ROG Strix Scar 18 G834JYR (2024) | |
| Medion Erazer Beast X40 2024 (Gaming Mode) | |
| Media Intel Core i9-14900HX (657 - 859, n=37) | |
| MSI Titan 18 HX A14VIG | |
| Schenker Key 17 Pro (Early 23) | |
| Medion Erazer Beast X40 | |
| Media della classe Gaming (442 - 913, n=106, ultimi 2 anni) | |
| Asus ROG Strix Scar 17 G733PYV-LL053X | |
| Cinebench R15 | |
| CPU Multi 64Bit | |
| Asus ROG Strix Scar 17 G733PYV-LL053X | |
| Medion Erazer Beast X40 | |
| MSI Titan 18 HX A14VIG | |
| Medion Erazer Beast X40 2024 (Gaming Mode) | |
| Media Intel Core i9-14900HX (3263 - 5589, n=38) | |
| Schenker Key 17 Pro (Early 23) | |
| Asus ROG Strix Scar 18 G834JYR (2024) | |
| Media della classe Gaming (1578 - 6330, n=105, ultimi 2 anni) | |
| Medion Erazer Beast X40 2024 | |
| CPU Single 64Bit | |
| Medion Erazer Beast X40 2024 (Gaming Mode) | |
| Medion Erazer Beast X40 2024 | |
| Asus ROG Strix Scar 17 G733PYV-LL053X | |
| Media Intel Core i9-14900HX (247 - 323, n=37) | |
| Asus ROG Strix Scar 18 G834JYR (2024) | |
| MSI Titan 18 HX A14VIG | |
| Medion Erazer Beast X40 | |
| Media della classe Gaming (188.8 - 350, n=106, ultimi 2 anni) | |
| Schenker Key 17 Pro (Early 23) | |
| Blender - v2.79 BMW27 CPU | |
| Media della classe Gaming (79 - 330, n=104, ultimi 2 anni) | |
| Medion Erazer Beast X40 2024 | |
| Media Intel Core i9-14900HX (91 - 206, n=37) | |
| Schenker Key 17 Pro (Early 23) | |
| Asus ROG Strix Scar 18 G834JYR (2024) | |
| Medion Erazer Beast X40 2024 (Gaming Mode) | |
| Medion Erazer Beast X40 | |
| MSI Titan 18 HX A14VIG | |
| Asus ROG Strix Scar 17 G733PYV-LL053X | |
| Geekbench 6.7 | |
| Multi-Core | |
| Medion Erazer Beast X40 2024 (6.2.1, Gaming Mode) | |
| Asus ROG Strix Scar 18 G834JYR (2024) (6.2.1) | |
| Media Intel Core i9-14900HX (13158 - 19665, n=37) | |
| Asus ROG Strix Scar 17 G733PYV-LL053X | |
| MSI Titan 18 HX A14VIG (6.2.1) | |
| Media della classe Gaming (6625 - 22850, n=106, ultimi 2 anni) | |
| Medion Erazer Beast X40 2024 (6.2.1) | |
| Single-Core | |
| Medion Erazer Beast X40 2024 (6.2.1, Gaming Mode) | |
| Medion Erazer Beast X40 2024 (6.2.1) | |
| Asus ROG Strix Scar 18 G834JYR (2024) (6.2.1) | |
| Media Intel Core i9-14900HX (2419 - 3129, n=37) | |
| Asus ROG Strix Scar 17 G733PYV-LL053X | |
| Media della classe Gaming (1490 - 3259, n=106, ultimi 2 anni) | |
| MSI Titan 18 HX A14VIG (6.2.1) | |
| HWBOT x265 Benchmark v2.2 - 4k Preset | |
| Asus ROG Strix Scar 17 G733PYV-LL053X | |
| Medion Erazer Beast X40 2024 (Gaming Mode) | |
| MSI Titan 18 HX A14VIG | |
| Medion Erazer Beast X40 | |
| Media Intel Core i9-14900HX (16.8 - 38.9, n=37) | |
| Asus ROG Strix Scar 18 G834JYR (2024) | |
| Media della classe Gaming (11.5 - 44.4, n=105, ultimi 2 anni) | |
| Schenker Key 17 Pro (Early 23) | |
| Medion Erazer Beast X40 2024 | |
| LibreOffice - 20 Documents To PDF | |
| Media della classe Gaming (33.2 - 88.8, n=105, ultimi 2 anni) | |
| MSI Titan 18 HX A14VIG (6.3.4.2) | |
| Asus ROG Strix Scar 18 G834JYR (2024) (6.3.4.2) | |
| Medion Erazer Beast X40 | |
| Medion Erazer Beast X40 2024 (6.3.4.2) | |
| Media Intel Core i9-14900HX (19 - 85.1, n=37) | |
| Schenker Key 17 Pro (Early 23) | |
| Medion Erazer Beast X40 2024 (6.3.4.2, Gaming Mode) | |
| Asus ROG Strix Scar 17 G733PYV-LL053X | |
| R Benchmark 2.5 - Overall mean | |
| Media della classe Gaming (0.3439 - 0.759, n=106, ultimi 2 anni) | |
| Asus ROG Strix Scar 17 G733PYV-LL053X | |
| Medion Erazer Beast X40 | |
| Schenker Key 17 Pro (Early 23) | |
| Asus ROG Strix Scar 18 G834JYR (2024) | |
| MSI Titan 18 HX A14VIG | |
| Media Intel Core i9-14900HX (0.3604 - 0.4859, n=37) | |
| Medion Erazer Beast X40 2024 | |
| Medion Erazer Beast X40 2024 (Gaming Mode) | |
* ... Meglio usare valori piccoli
AIDA64: FP32 Ray-Trace | FPU Julia | CPU SHA3 | CPU Queen | FPU SinJulia | FPU Mandel | CPU AES | CPU ZLib | FP64 Ray-Trace | CPU PhotoWorxx
| Performance rating | |
| Asus ROG Strix Scar 17 G733PYV-LL053X | |
| Medion Erazer Beast X40 2024 | |
| MSI Titan 18 HX A14VIG | |
| Medion Erazer Beast X40 | |
| Asus ROG Strix Scar 18 G834JYR (2024) | |
| Schenker Key 17 Pro (Early 23) | |
| Media della classe Gaming | |
| Media Intel Core i9-14900HX | |
| Medion Erazer Beast X40 2024 | |
| AIDA64 / FP32 Ray-Trace | |
| Asus ROG Strix Scar 17 G733PYV-LL053X (v6.88.6413 Beta) | |
| Media della classe Gaming (10227 - 85542, n=105, ultimi 2 anni) | |
| MSI Titan 18 HX A14VIG (v6.92.6600) | |
| Medion Erazer Beast X40 2024 (v6.92.6600, Gaming Mode) | |
| Medion Erazer Beast X40 (v6.75.6100) | |
| Asus ROG Strix Scar 18 G834JYR (2024) (v6.92.6600) | |
| Media Intel Core i9-14900HX (13098 - 33474, n=36) | |
| Schenker Key 17 Pro (Early 23) (v6.75.6100) | |
| Medion Erazer Beast X40 2024 (v6.92.6600) | |
| AIDA64 / FPU Julia | |
| Asus ROG Strix Scar 17 G733PYV-LL053X (v6.88.6413 Beta) | |
| MSI Titan 18 HX A14VIG (v6.92.6600) | |
| Medion Erazer Beast X40 2024 (v6.92.6600, Gaming Mode) | |
| Media della classe Gaming (51376 - 238426, n=105, ultimi 2 anni) | |
| Medion Erazer Beast X40 (v6.75.6100) | |
| Asus ROG Strix Scar 18 G834JYR (2024) (v6.92.6600) | |
| Media Intel Core i9-14900HX (67573 - 166040, n=36) | |
| Schenker Key 17 Pro (Early 23) (v6.75.6100) | |
| Medion Erazer Beast X40 2024 (v6.92.6600) | |
| AIDA64 / CPU SHA3 | |
| Asus ROG Strix Scar 17 G733PYV-LL053X (v6.88.6413 Beta) | |
| MSI Titan 18 HX A14VIG (v6.92.6600) | |
| Medion Erazer Beast X40 2024 (v6.92.6600, Gaming Mode) | |
| Medion Erazer Beast X40 (v6.75.6100) | |
| Media della classe Gaming (2180 - 10115, n=105, ultimi 2 anni) | |
| Asus ROG Strix Scar 18 G834JYR (2024) (v6.92.6600) | |
| Media Intel Core i9-14900HX (3589 - 7979, n=36) | |
| Schenker Key 17 Pro (Early 23) (v6.75.6100) | |
| Medion Erazer Beast X40 2024 (v6.92.6600) | |
| AIDA64 / CPU Queen | |
| Asus ROG Strix Scar 17 G733PYV-LL053X (v6.88.6413 Beta) | |
| MSI Titan 18 HX A14VIG (v6.92.6600) | |
| Medion Erazer Beast X40 2024 (v6.92.6600, Gaming Mode) | |
| Asus ROG Strix Scar 18 G834JYR (2024) (v6.92.6600) | |
| Media Intel Core i9-14900HX (118405 - 148966, n=36) | |
| Schenker Key 17 Pro (Early 23) (v6.75.6100) | |
| Medion Erazer Beast X40 (v6.75.6100) | |
| Medion Erazer Beast X40 2024 (v6.92.6600) | |
| Media della classe Gaming (49785 - 173351, n=90, ultimi 2 anni) | |
| AIDA64 / FPU SinJulia | |
| Asus ROG Strix Scar 17 G733PYV-LL053X (v6.88.6413 Beta) | |
| MSI Titan 18 HX A14VIG (v6.92.6600) | |
| Medion Erazer Beast X40 2024 (v6.92.6600, Gaming Mode) | |
| Asus ROG Strix Scar 18 G834JYR (2024) (v6.92.6600) | |
| Medion Erazer Beast X40 (v6.75.6100) | |
| Media Intel Core i9-14900HX (10475 - 18517, n=36) | |
| Schenker Key 17 Pro (Early 23) (v6.75.6100) | |
| Media della classe Gaming (4424 - 33636, n=105, ultimi 2 anni) | |
| Medion Erazer Beast X40 2024 (v6.92.6600) | |
| AIDA64 / FPU Mandel | |
| Asus ROG Strix Scar 17 G733PYV-LL053X (v6.88.6413 Beta) | |
| Media della classe Gaming (25115 - 128721, n=105, ultimi 2 anni) | |
| MSI Titan 18 HX A14VIG (v6.92.6600) | |
| Medion Erazer Beast X40 2024 (v6.92.6600, Gaming Mode) | |
| Medion Erazer Beast X40 (v6.75.6100) | |
| Asus ROG Strix Scar 18 G834JYR (2024) (v6.92.6600) | |
| Media Intel Core i9-14900HX (32543 - 83662, n=36) | |
| Schenker Key 17 Pro (Early 23) (v6.75.6100) | |
| Medion Erazer Beast X40 2024 | |
| AIDA64 / CPU AES | |
| Asus ROG Strix Scar 17 G733PYV-LL053X (v6.88.6413 Beta) | |
| Schenker Key 17 Pro (Early 23) (v6.75.6100) | |
| Media Intel Core i9-14900HX (86964 - 241777, n=36) | |
| MSI Titan 18 HX A14VIG (v6.92.6600) | |
| Medion Erazer Beast X40 2024 (v6.92.6600, Gaming Mode) | |
| Medion Erazer Beast X40 (v6.75.6100) | |
| Asus ROG Strix Scar 18 G834JYR (2024) (v6.92.6600) | |
| Media della classe Gaming (39258 - 247074, n=105, ultimi 2 anni) | |
| Medion Erazer Beast X40 2024 (v6.92.6600) | |
| AIDA64 / CPU ZLib | |
| MSI Titan 18 HX A14VIG (v6.92.6600) | |
| Medion Erazer Beast X40 2024 (v6.92.6600, Gaming Mode) | |
| Asus ROG Strix Scar 17 G733PYV-LL053X (v6.88.6413 Beta) | |
| Medion Erazer Beast X40 (v6.75.6100) | |
| Media Intel Core i9-14900HX (1054 - 2292, n=36) | |
| Asus ROG Strix Scar 18 G834JYR (2024) | |
| Schenker Key 17 Pro (Early 23) (v6.75.6100) | |
| Media della classe Gaming (574 - 2531, n=105, ultimi 2 anni) | |
| Medion Erazer Beast X40 2024 (v6.92.6600) | |
| AIDA64 / FP64 Ray-Trace | |
| Asus ROG Strix Scar 17 G733PYV-LL053X (v6.88.6413 Beta) | |
| Media della classe Gaming (5509 - 45446, n=105, ultimi 2 anni) | |
| MSI Titan 18 HX A14VIG (v6.92.6600) | |
| Medion Erazer Beast X40 2024 (v6.92.6600, Gaming Mode) | |
| Medion Erazer Beast X40 (v6.75.6100) | |
| Asus ROG Strix Scar 18 G834JYR (2024) (v6.92.6600) | |
| Media Intel Core i9-14900HX (6809 - 18349, n=36) | |
| Schenker Key 17 Pro (Early 23) (v6.75.6100) | |
| Medion Erazer Beast X40 2024 (v6.92.6600) | |
| AIDA64 / CPU PhotoWorxx | |
| Schenker Key 17 Pro (Early 23) (v6.75.6100) | |
| Asus ROG Strix Scar 18 G834JYR (2024) (v6.92.6600) | |
| Medion Erazer Beast X40 2024 (v6.92.6600) | |
| Medion Erazer Beast X40 2024 (v6.92.6600, Gaming Mode) | |
| Media Intel Core i9-14900HX (23903 - 54702, n=36) | |
| Media della classe Gaming (12271 - 89891, n=105, ultimi 2 anni) | |
| Medion Erazer Beast X40 (v6.75.6100) | |
| Asus ROG Strix Scar 17 G733PYV-LL053X (v6.88.6413 Beta) | |
| MSI Titan 18 HX A14VIG (v6.92.6600) | |
Prestazioni del sistema
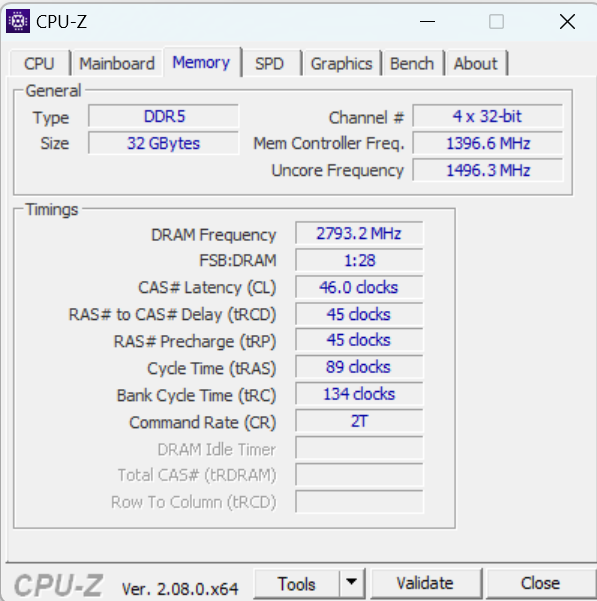
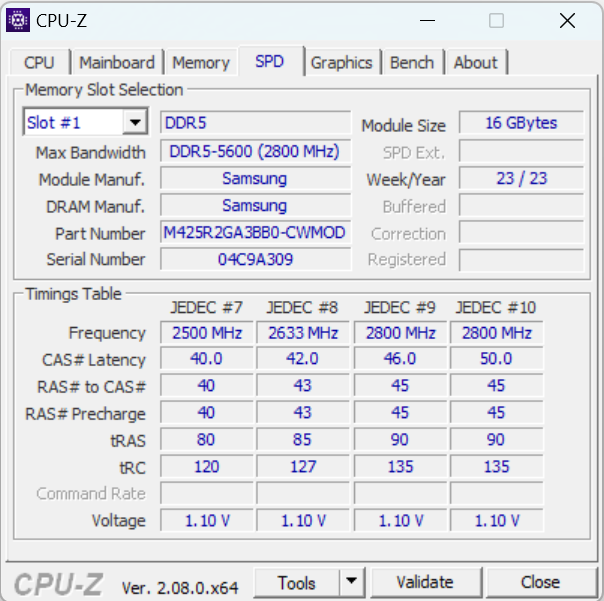
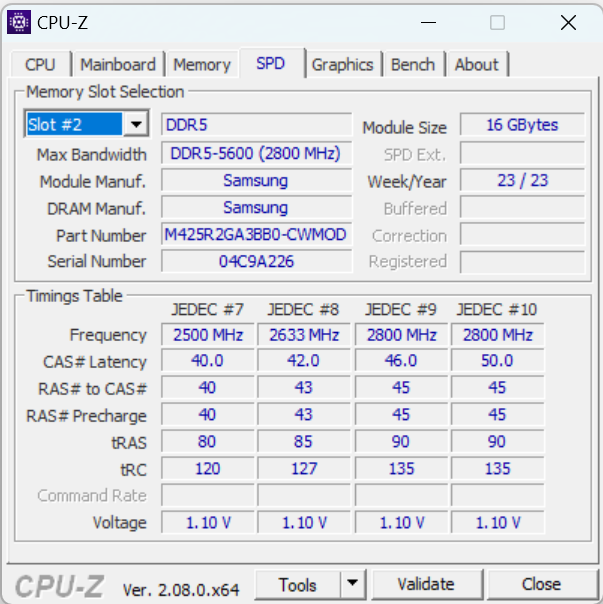
Un'occhiata superficiale alla scheda tecnica è sufficiente per confermare che il sistema offre una potenza sufficiente per eseguire senza problemi applicazioni impegnative come il gioco, il rendering e lo streaming. Le velocità di trasferimento della RAM sono a un livello normale per una RAM DDR5-5600.
CrossMark: Overall | Productivity | Creativity | Responsiveness
WebXPRT 3: Overall
WebXPRT 4: Overall
Mozilla Kraken 1.1: Total
| PCMark 10 / Score | |
| Asus ROG Strix Scar 17 G733PYV-LL053X | |
| MSI Titan 18 HX A14VIG | |
| Medion Erazer Beast X40 2024 | |
| Schenker Key 17 Pro (Early 23) | |
| Asus ROG Strix Scar 18 G834JYR (2024) | |
| Media Intel Core i9-14900HX, NVIDIA GeForce RTX 4090 Laptop GPU (8230 - 9234, n=13) | |
| Media della classe Gaming (5828 - 12414, n=93, ultimi 2 anni) | |
| Medion Erazer Beast X40 | |
| PCMark 10 / Essentials | |
| MSI Titan 18 HX A14VIG | |
| Asus ROG Strix Scar 17 G733PYV-LL053X | |
| Asus ROG Strix Scar 18 G834JYR (2024) | |
| Schenker Key 17 Pro (Early 23) | |
| Medion Erazer Beast X40 | |
| Media Intel Core i9-14900HX, NVIDIA GeForce RTX 4090 Laptop GPU (10778 - 11628, n=13) | |
| Medion Erazer Beast X40 2024 | |
| Media della classe Gaming (8810 - 11935, n=97, ultimi 2 anni) | |
| PCMark 10 / Productivity | |
| Medion Erazer Beast X40 2024 | |
| Medion Erazer Beast X40 | |
| Schenker Key 17 Pro (Early 23) | |
| Media della classe Gaming (6845 - 25323, n=95, ultimi 2 anni) | |
| Asus ROG Strix Scar 17 G733PYV-LL053X | |
| Media Intel Core i9-14900HX, NVIDIA GeForce RTX 4090 Laptop GPU (9458 - 11759, n=13) | |
| Asus ROG Strix Scar 18 G834JYR (2024) | |
| MSI Titan 18 HX A14VIG | |
| PCMark 10 / Digital Content Creation | |
| MSI Titan 18 HX A14VIG | |
| Asus ROG Strix Scar 17 G733PYV-LL053X | |
| Asus ROG Strix Scar 18 G834JYR (2024) | |
| Medion Erazer Beast X40 2024 | |
| Media Intel Core i9-14900HX, NVIDIA GeForce RTX 4090 Laptop GPU (13219 - 16462, n=13) | |
| Schenker Key 17 Pro (Early 23) | |
| Media della classe Gaming (7602 - 19954, n=95, ultimi 2 anni) | |
| Medion Erazer Beast X40 | |
| CrossMark / Overall | |
| Schenker Key 17 Pro (Early 23) | |
| Asus ROG Strix Scar 18 G834JYR (2024) | |
| Medion Erazer Beast X40 2024 | |
| Medion Erazer Beast X40 | |
| Media Intel Core i9-14900HX, NVIDIA GeForce RTX 4090 Laptop GPU (1877 - 2344, n=10) | |
| Asus ROG Strix Scar 17 G733PYV-LL053X | |
| Media della classe Gaming (1366 - 2409, n=94, ultimi 2 anni) | |
| MSI Titan 18 HX A14VIG | |
| CrossMark / Productivity | |
| Schenker Key 17 Pro (Early 23) | |
| Medion Erazer Beast X40 2024 | |
| Asus ROG Strix Scar 18 G834JYR (2024) | |
| Medion Erazer Beast X40 | |
| Media Intel Core i9-14900HX, NVIDIA GeForce RTX 4090 Laptop GPU (1738 - 2162, n=10) | |
| Asus ROG Strix Scar 17 G733PYV-LL053X | |
| Media della classe Gaming (1386 - 2254, n=94, ultimi 2 anni) | |
| MSI Titan 18 HX A14VIG | |
| CrossMark / Creativity | |
| Asus ROG Strix Scar 18 G834JYR (2024) | |
| Schenker Key 17 Pro (Early 23) | |
| Asus ROG Strix Scar 17 G733PYV-LL053X | |
| Medion Erazer Beast X40 | |
| Media Intel Core i9-14900HX, NVIDIA GeForce RTX 4090 Laptop GPU (2195 - 2660, n=10) | |
| Medion Erazer Beast X40 2024 | |
| Media della classe Gaming (1343 - 2786, n=94, ultimi 2 anni) | |
| MSI Titan 18 HX A14VIG | |
| CrossMark / Responsiveness | |
| Schenker Key 17 Pro (Early 23) | |
| Asus ROG Strix Scar 18 G834JYR (2024) | |
| Medion Erazer Beast X40 2024 | |
| Media Intel Core i9-14900HX, NVIDIA GeForce RTX 4090 Laptop GPU (1478 - 2327, n=10) | |
| Medion Erazer Beast X40 | |
| Media della classe Gaming (1226 - 2334, n=94, ultimi 2 anni) | |
| Asus ROG Strix Scar 17 G733PYV-LL053X | |
| MSI Titan 18 HX A14VIG | |
| WebXPRT 3 / Overall | |
| Asus ROG Strix Scar 17 G733PYV-LL053X | |
| MSI Titan 18 HX A14VIG | |
| Medion Erazer Beast X40 2024 | |
| Media Intel Core i9-14900HX, NVIDIA GeForce RTX 4090 Laptop GPU (279 - 339, n=10) | |
| Medion Erazer Beast X40 | |
| Asus ROG Strix Scar 18 G834JYR (2024) | |
| Media della classe Gaming (220 - 532, n=98, ultimi 2 anni) | |
| Schenker Key 17 Pro (Early 23) | |
| WebXPRT 4 / Overall | |
| Asus ROG Strix Scar 17 G733PYV-LL053X | |
| Asus ROG Strix Scar 18 G834JYR (2024) | |
| Medion Erazer Beast X40 2024 | |
| Schenker Key 17 Pro (Early 23) | |
| Media Intel Core i9-14900HX, NVIDIA GeForce RTX 4090 Laptop GPU (246 - 309, n=8) | |
| MSI Titan 18 HX A14VIG | |
| Media della classe Gaming (165 - 354, n=98, ultimi 2 anni) | |
| Mozilla Kraken 1.1 / Total | |
| Schenker Key 17 Pro (Early 23) | |
| Medion Erazer Beast X40 | |
| Media della classe Gaming (391 - 590, n=100, ultimi 2 anni) | |
| Media Intel Core i9-14900HX, NVIDIA GeForce RTX 4090 Laptop GPU (428 - 535, n=11) | |
| MSI Titan 18 HX A14VIG | |
| Asus ROG Strix Scar 18 G834JYR (2024) | |
| Medion Erazer Beast X40 2024 | |
| Asus ROG Strix Scar 17 G733PYV-LL053X | |
* ... Meglio usare valori piccoli
| PCMark 10 Score | 8963 punti | |
Aiuto | ||
| AIDA64 / Memory Copy | |
| Asus ROG Strix Scar 18 G834JYR (2024) | |
| Schenker Key 17 Pro (Early 23) | |
| Medion Erazer Beast X40 2024 | |
| Media Intel Core i9-14900HX (38028 - 83392, n=36) | |
| Media della classe Gaming (21750 - 129946, n=105, ultimi 2 anni) | |
| Medion Erazer Beast X40 | |
| MSI Titan 18 HX A14VIG | |
| Asus ROG Strix Scar 17 G733PYV-LL053X | |
| AIDA64 / Memory Read | |
| Asus ROG Strix Scar 18 G834JYR (2024) | |
| Medion Erazer Beast X40 2024 | |
| Schenker Key 17 Pro (Early 23) | |
| Media Intel Core i9-14900HX (43306 - 87568, n=36) | |
| Medion Erazer Beast X40 | |
| Media della classe Gaming (22956 - 118858, n=105, ultimi 2 anni) | |
| Asus ROG Strix Scar 17 G733PYV-LL053X | |
| MSI Titan 18 HX A14VIG | |
| AIDA64 / Memory Write | |
| Asus ROG Strix Scar 18 G834JYR (2024) | |
| Medion Erazer Beast X40 2024 | |
| Schenker Key 17 Pro (Early 23) | |
| Media della classe Gaming (22297 - 135096, n=105, ultimi 2 anni) | |
| Media Intel Core i9-14900HX (37146 - 80589, n=36) | |
| Medion Erazer Beast X40 | |
| Asus ROG Strix Scar 17 G733PYV-LL053X | |
| MSI Titan 18 HX A14VIG | |
| AIDA64 / Memory Latency | |
| Media della classe Gaming (75.3 - 259, n=105, ultimi 2 anni) | |
| MSI Titan 18 HX A14VIG | |
| Schenker Key 17 Pro (Early 23) | |
| Medion Erazer Beast X40 | |
| Asus ROG Strix Scar 17 G733PYV-LL053X | |
| Media Intel Core i9-14900HX (76.1 - 105, n=36) | |
| Asus ROG Strix Scar 18 G834JYR (2024) | |
| Medion Erazer Beast X40 2024 | |
* ... Meglio usare valori piccoli
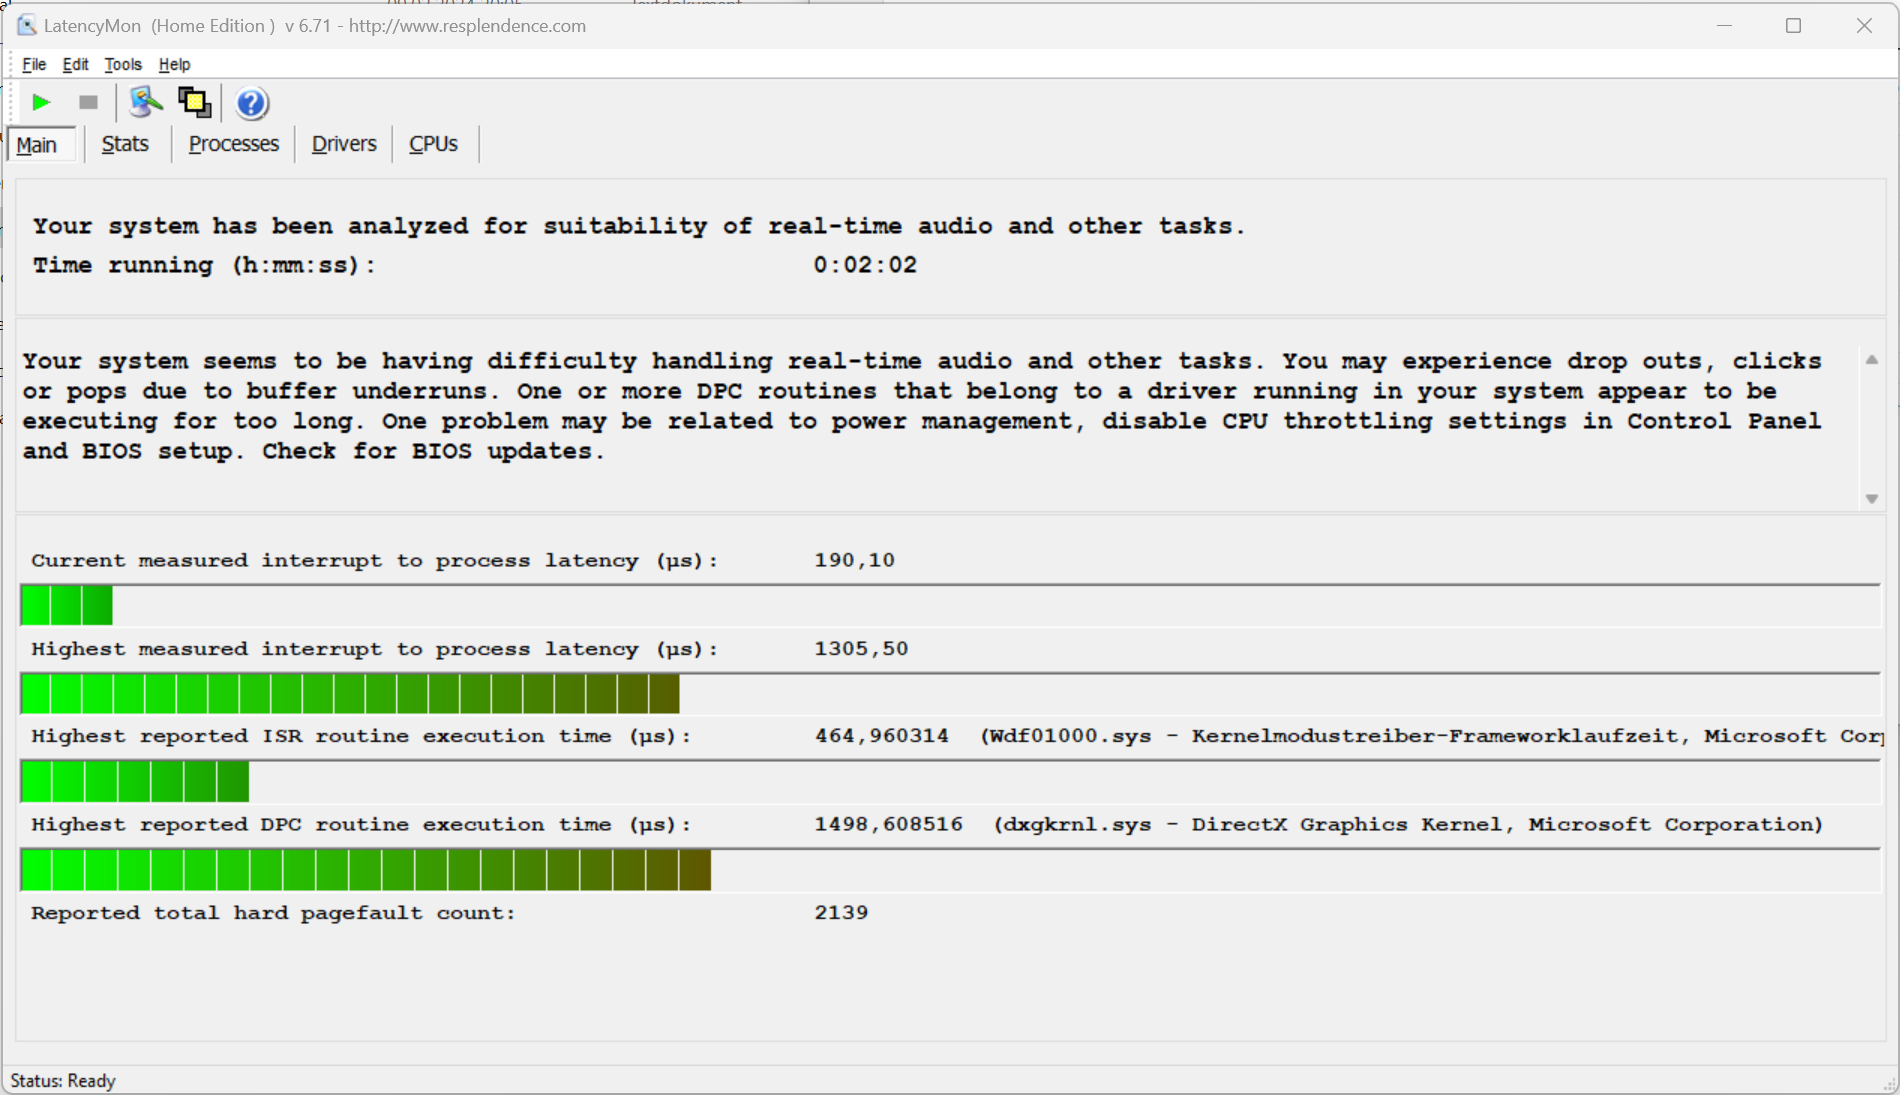
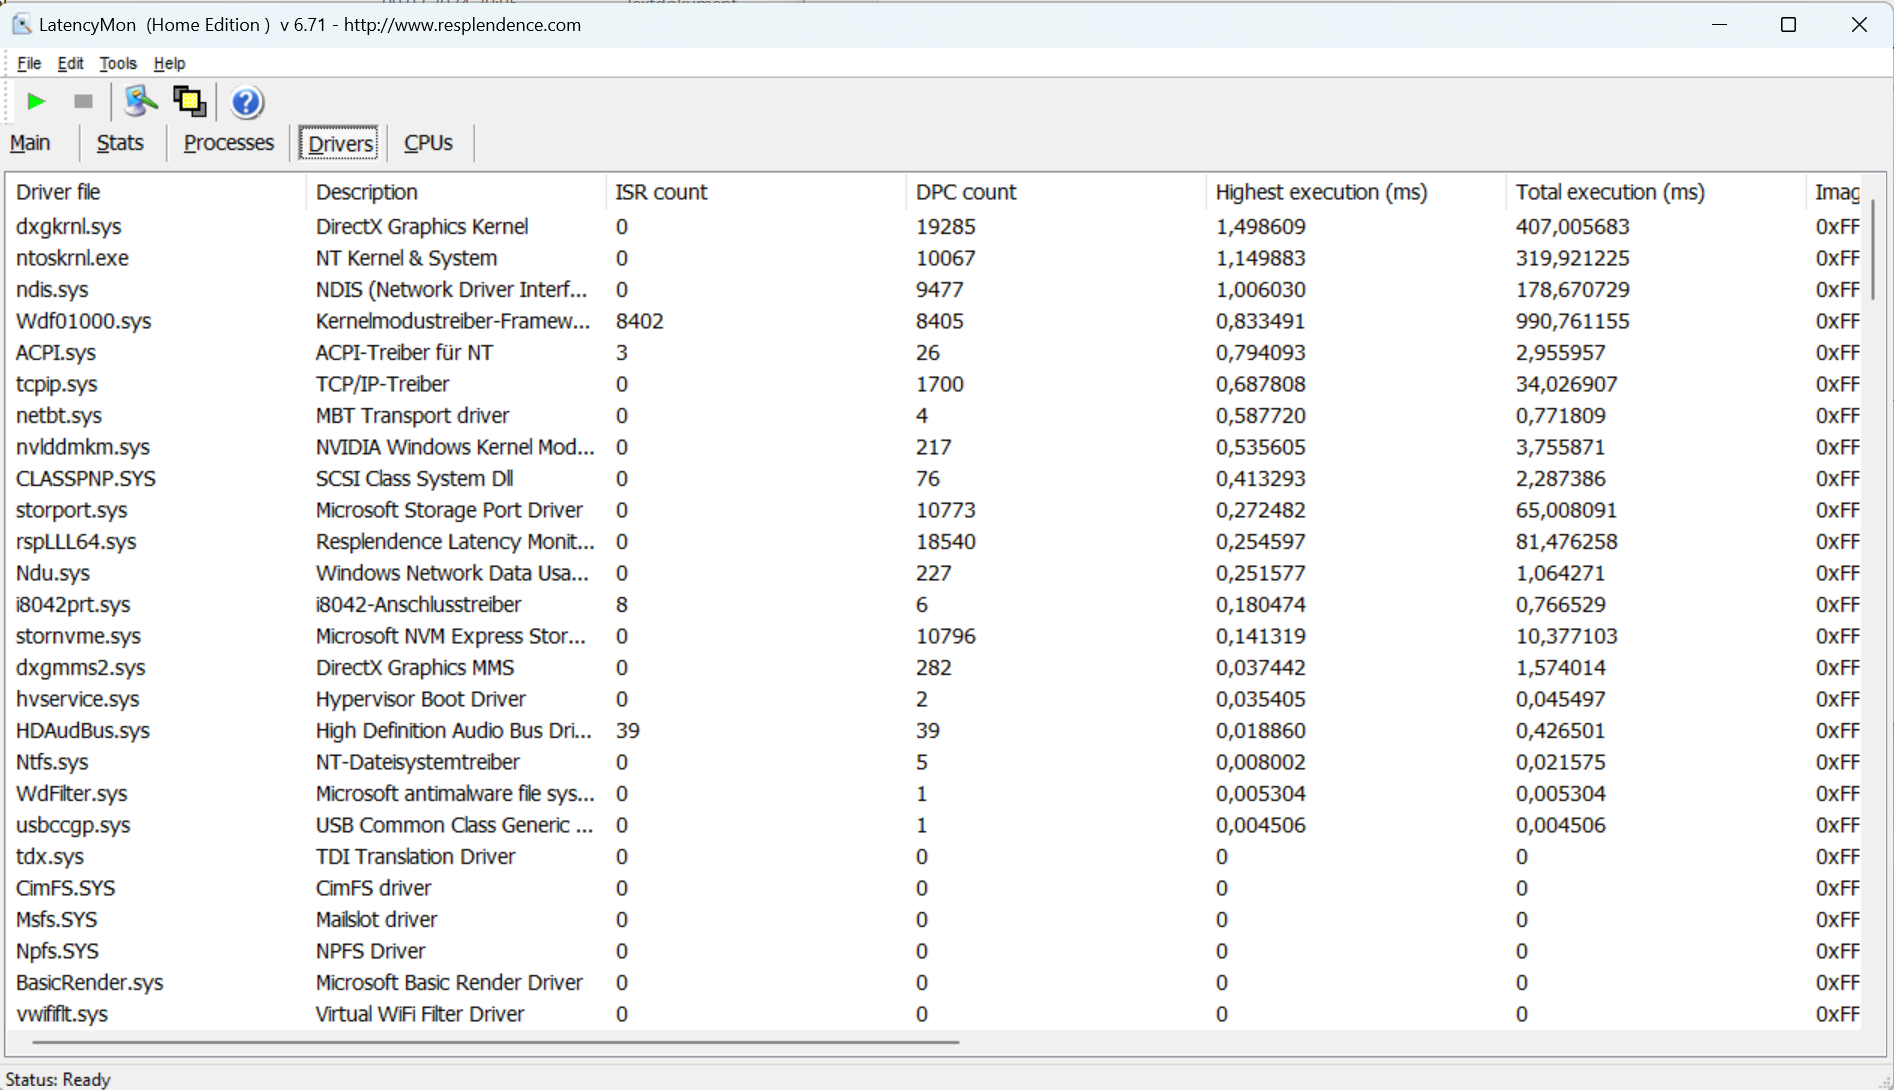
Latenza DPC
Latency Monitor rivela anomalie durante il test di latenza (navigazione web, riproduzione video 4k e Prime95 ad alto carico). Il sistema non sembra essere adatto all'editing video e audio in tempo reale. I futuri aggiornamenti del software e dei driver potrebbero portare a potenziali miglioramenti o addirittura a peggioramenti.
| DPC Latencies / LatencyMon - interrupt to process latency (max), Web, Youtube, Prime95 | |
| Schenker Key 17 Pro (Early 23) | |
| MSI Titan 18 HX A14VIG | |
| Medion Erazer Beast X40 | |
| Medion Erazer Beast X40 2024 | |
| Asus ROG Strix Scar 18 G834JYR (2024) | |
| Asus ROG Strix Scar 17 G733PYV-LL053X | |
* ... Meglio usare valori piccoli
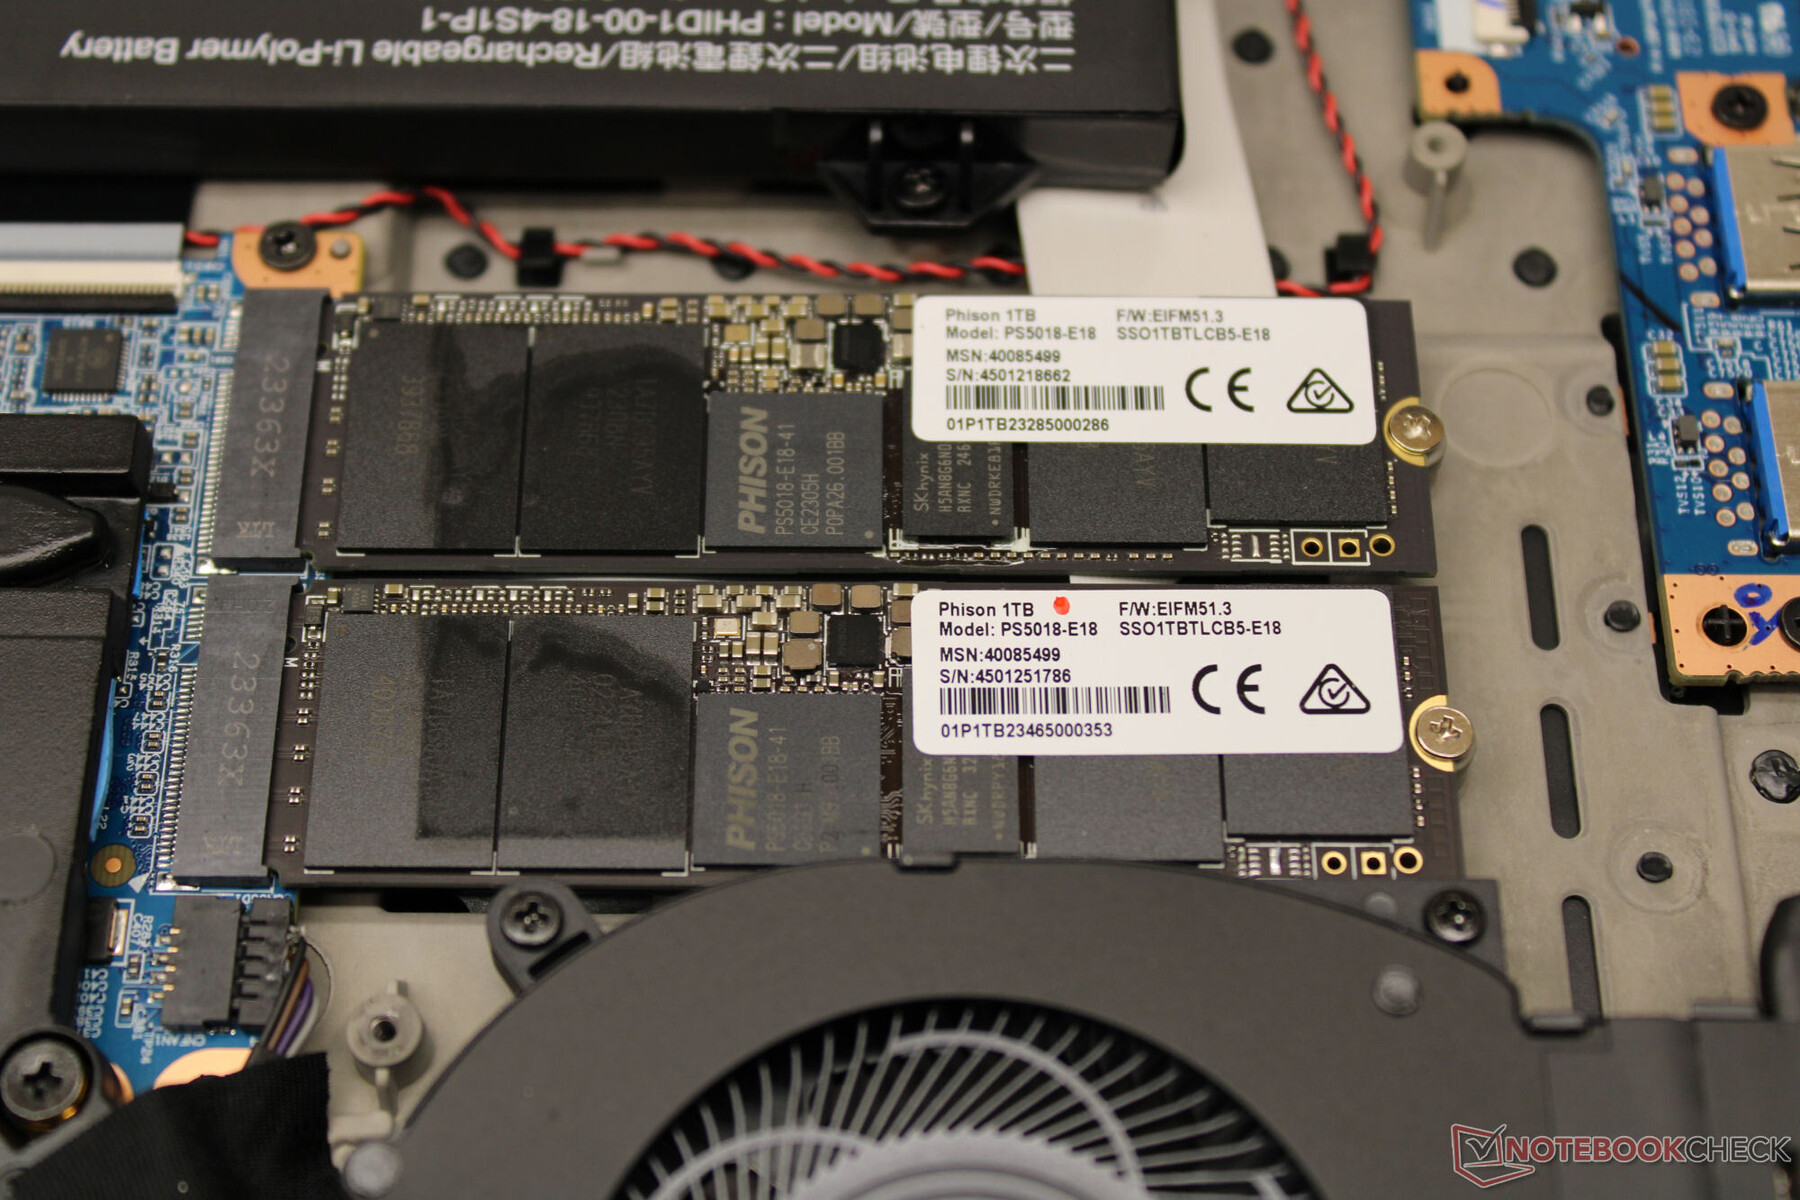
Memoria di massa
L'X40 ha due SSD PCIe Gen 4 M.2 2280 da 1 TB ciascuno a bordo, ma non sono configurati in un array RAID. Un SSD funge da unità di sistema e l'altro da archiviazione dati. Si ottengono ottime velocità di trasferimento dati. Non ci sono cali di prestazioni dovuti al throttling termico.
L'X40 supporta generalmente RAID-0/1, ma l'opzione corrispondente deve essere prima attivata nel BIOS, dopodiché è necessario reinstallare Windows. Questa procedura non è consigliata ai non esperti.

* ... Meglio usare valori piccoli
Disk throttling: DiskSpd Read Loop, Queue Depth 8
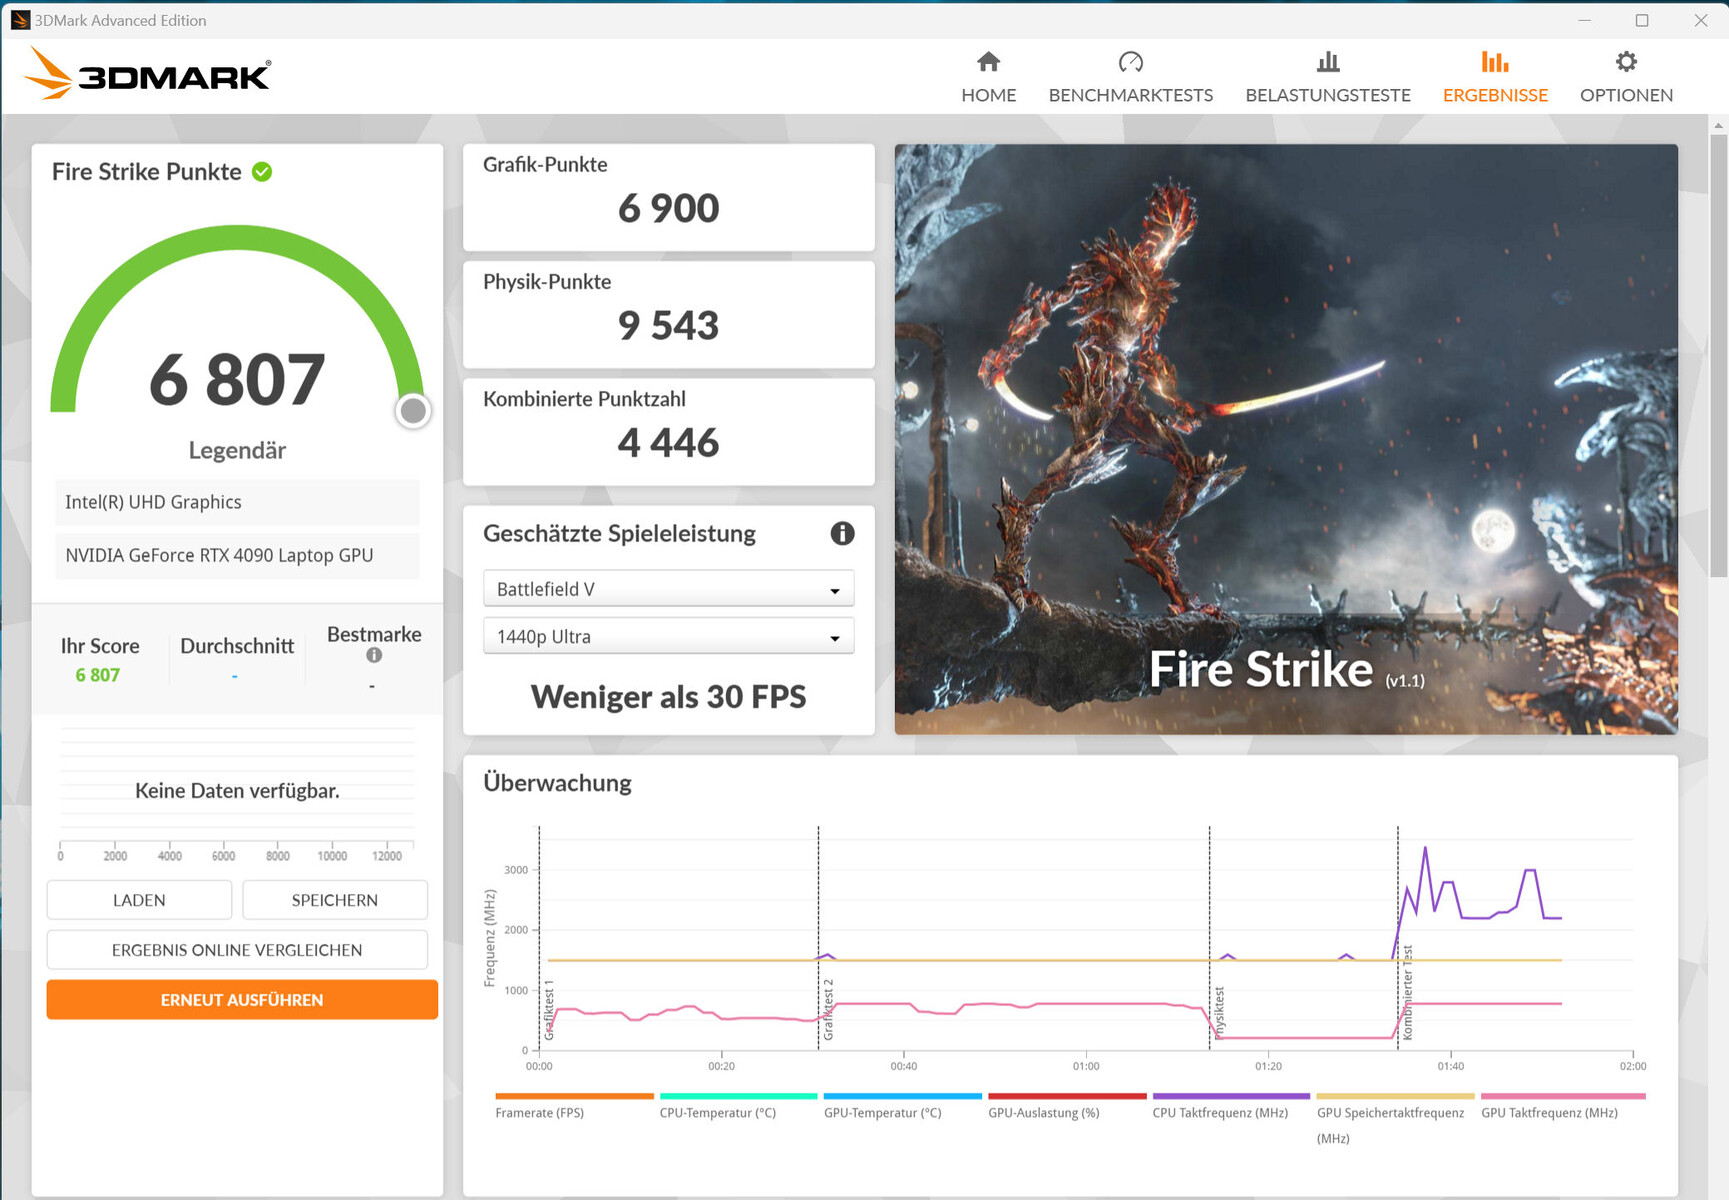
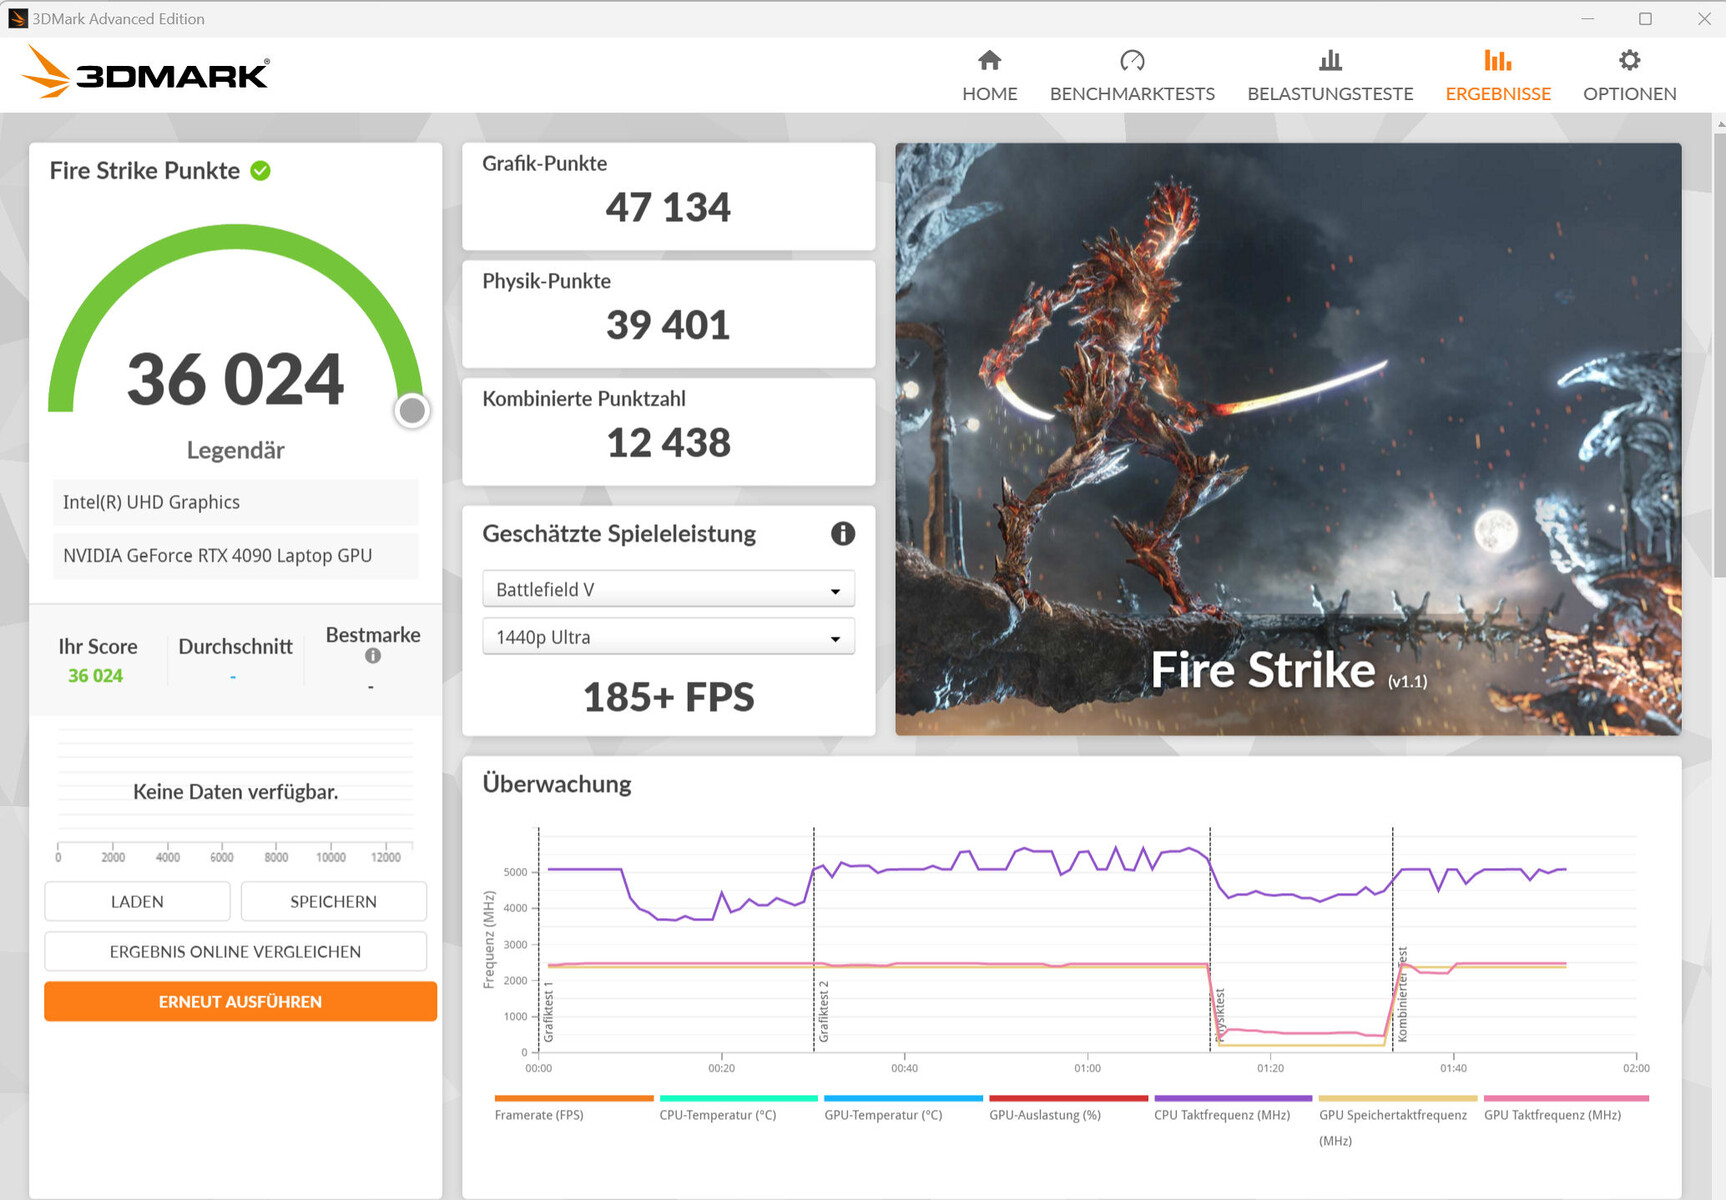
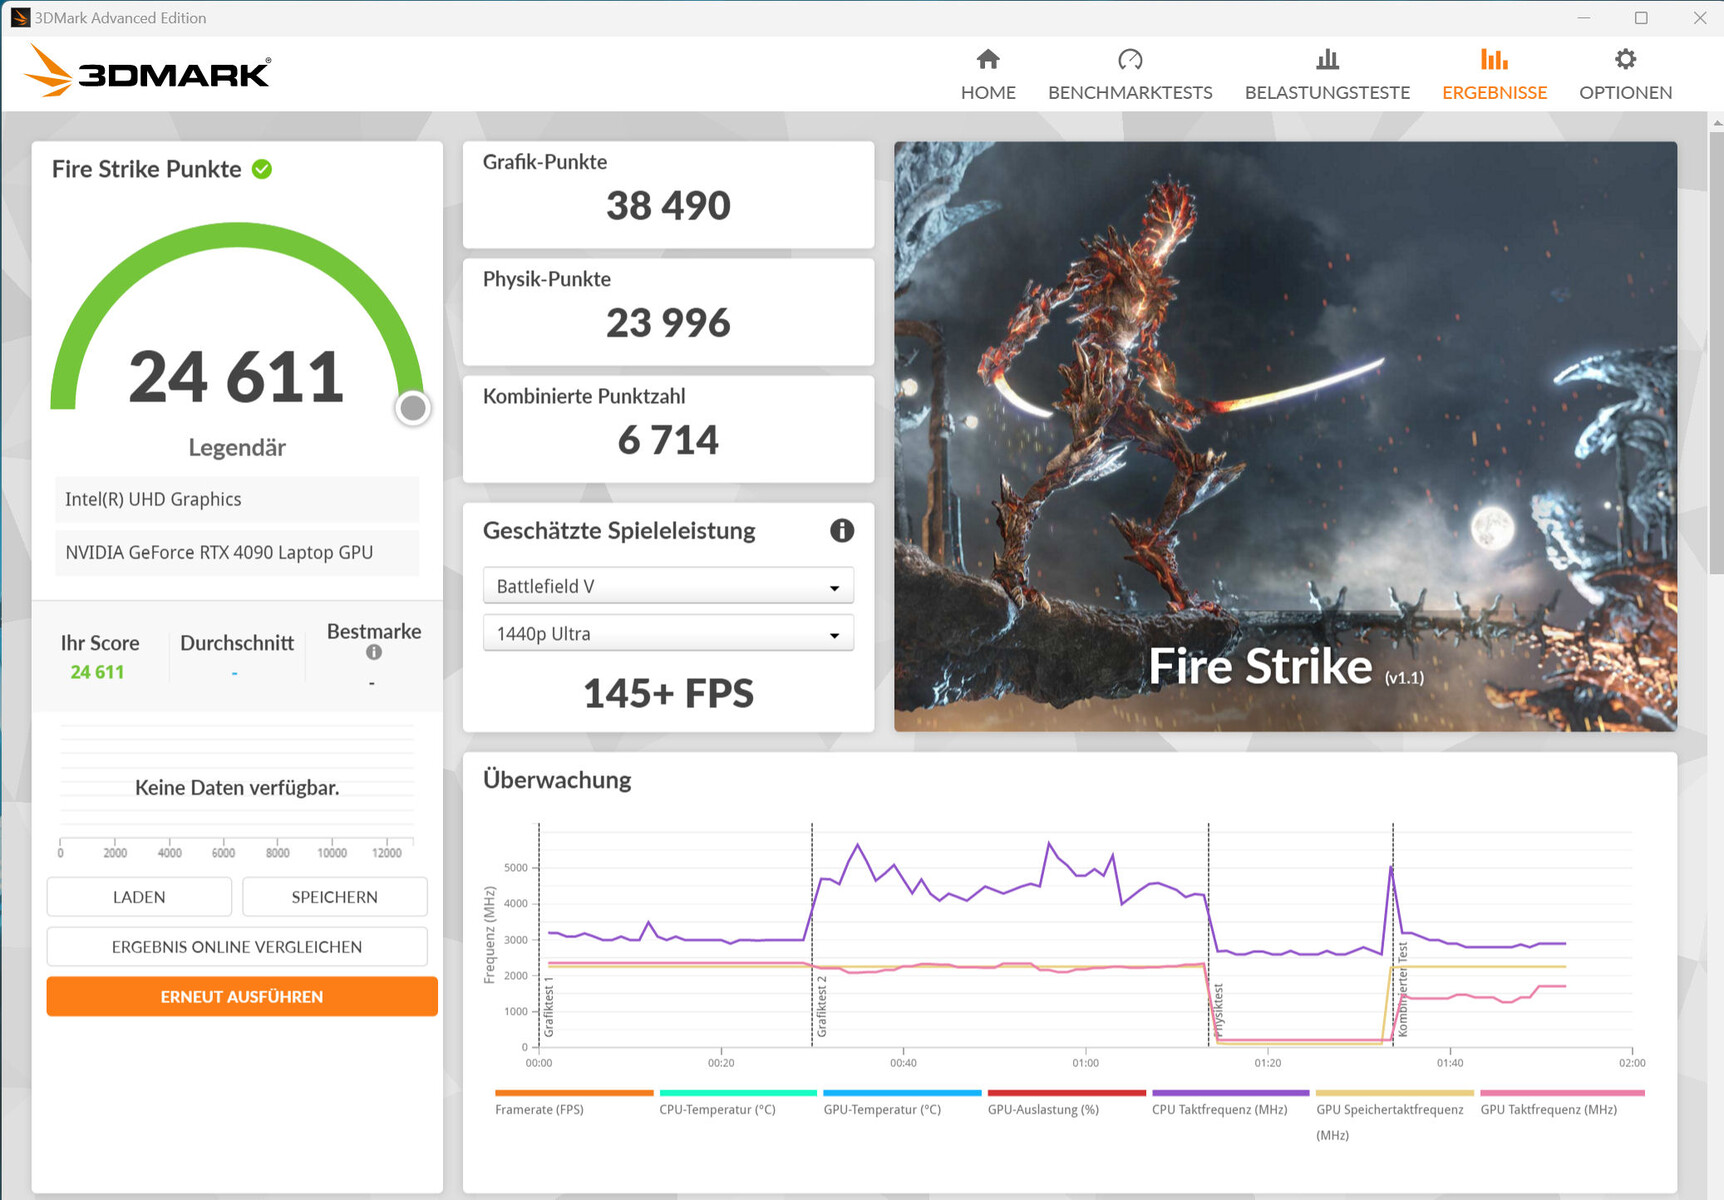
Scheda grafica
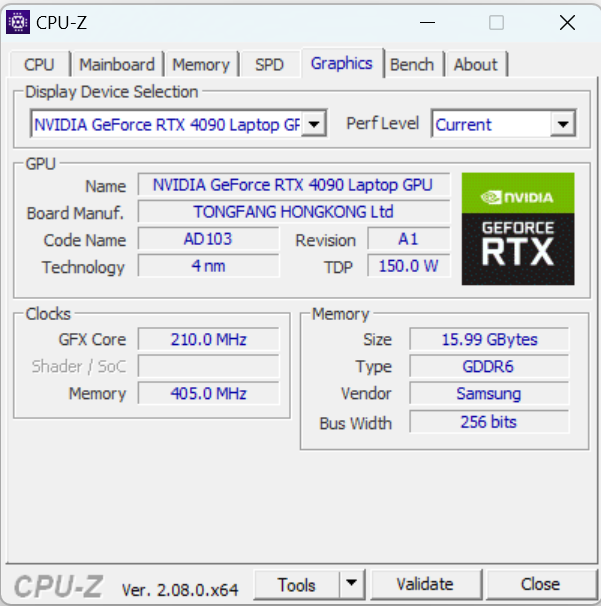
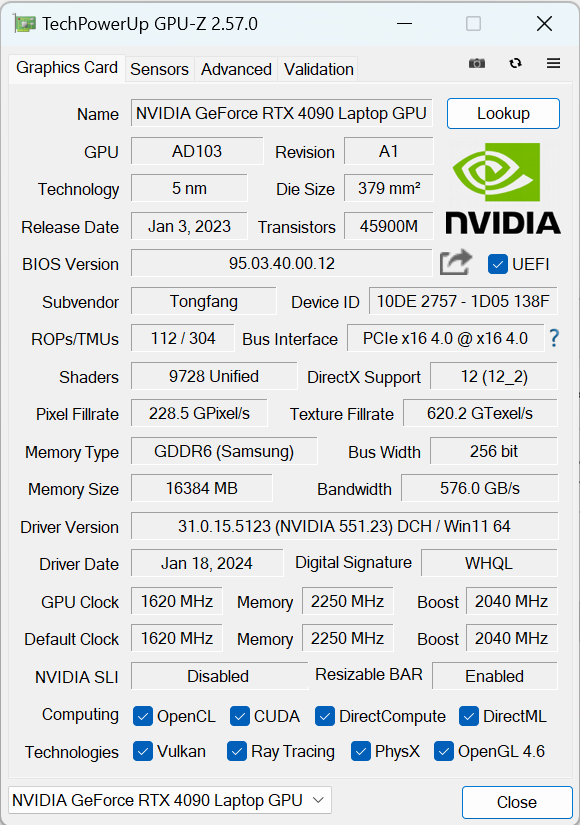
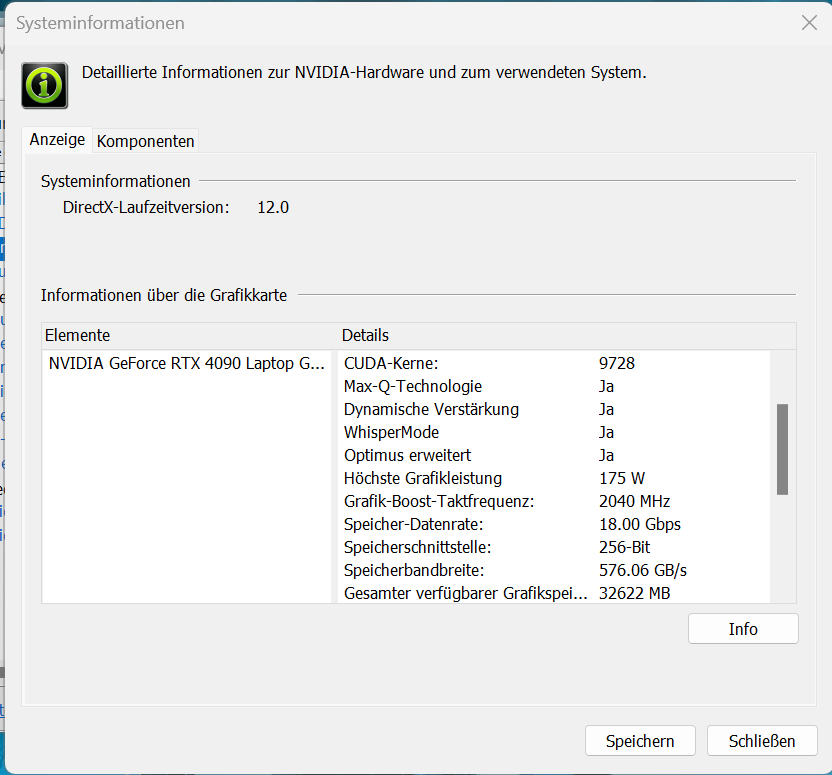
Medion Erazer Beast X40 si affida alla GeForce RTX 4090 - attualmente la GPU mobile più potente di Nvidia. Dispone di 9.728 shader, un bus di memoria ampio 256 bit e una memoria GDDR6 da 16 GB. Alla RTX 4090 è concesso un TGP massimo di 175 W (150 watt + 25 watt Dynamic Boost) - non c'è modo di andare oltre questo limite.
I risultati dei benchmark sono allo stesso livello (Modalità Balance) o superiori (Modalità Gaming) alla media della precedente RTX 4090. La situazione è diversa nel gioco, tuttavia.
In entrambi i casi si ottengono frame rate superiori alla media della GPU. Optimus avanzato è supportato, quindi il passaggio da dGPU a Optimus non richiede un riavvio.
| 3DMark Performance rating - Percent | |
| Medion Erazer Beast X40 2024 | |
| MSI Titan 18 HX A14VIG | |
| Asus ROG Strix Scar 17 G733PYV-LL053X | |
| Medion Erazer Beast X40 | |
| Schenker Key 17 Pro (Early 23) | |
| Media NVIDIA GeForce RTX 4090 Laptop GPU | |
| Medion Erazer Beast X40 2024 | |
| Asus ROG Strix Scar 18 G834JYR (2024) | |
| Media della classe Gaming | |
| 3DMark 11 - 1280x720 Performance GPU | |
| Medion Erazer Beast X40 2024 (Gaming Mode) | |
| Schenker Key 17 Pro (Early 23) | |
| Medion Erazer Beast X40 | |
| Media NVIDIA GeForce RTX 4090 Laptop GPU (54073 - 73027, n=42) | |
| Medion Erazer Beast X40 2024 | |
| Asus ROG Strix Scar 17 G733PYV-LL053X | |
| MSI Titan 18 HX A14VIG | |
| Asus ROG Strix Scar 18 G834JYR (2024) | |
| Media della classe Gaming (21841 - 80022, n=104, ultimi 2 anni) | |
| 3DMark | |
| 1920x1080 Fire Strike Graphics | |
| MSI Titan 18 HX A14VIG | |
| Asus ROG Strix Scar 17 G733PYV-LL053X | |
| Medion Erazer Beast X40 2024 (Gaming Mode) | |
| Media NVIDIA GeForce RTX 4090 Laptop GPU (40259 - 53059, n=41) | |
| Medion Erazer Beast X40 | |
| Medion Erazer Beast X40 2024 | |
| Asus ROG Strix Scar 18 G834JYR (2024) | |
| Schenker Key 17 Pro (Early 23) | |
| Media della classe Gaming (12242 - 62849, n=115, ultimi 2 anni) | |
| 2560x1440 Time Spy Graphics | |
| Medion Erazer Beast X40 2024 (Gaming Mode) | |
| MSI Titan 18 HX A14VIG | |
| Schenker Key 17 Pro (Early 23) | |
| Asus ROG Strix Scar 17 G733PYV-LL053X | |
| Medion Erazer Beast X40 | |
| Media NVIDIA GeForce RTX 4090 Laptop GPU (16950 - 23292, n=43) | |
| Medion Erazer Beast X40 2024 | |
| Asus ROG Strix Scar 18 G834JYR (2024) | |
| Media della classe Gaming (5012 - 26212, n=115, ultimi 2 anni) | |
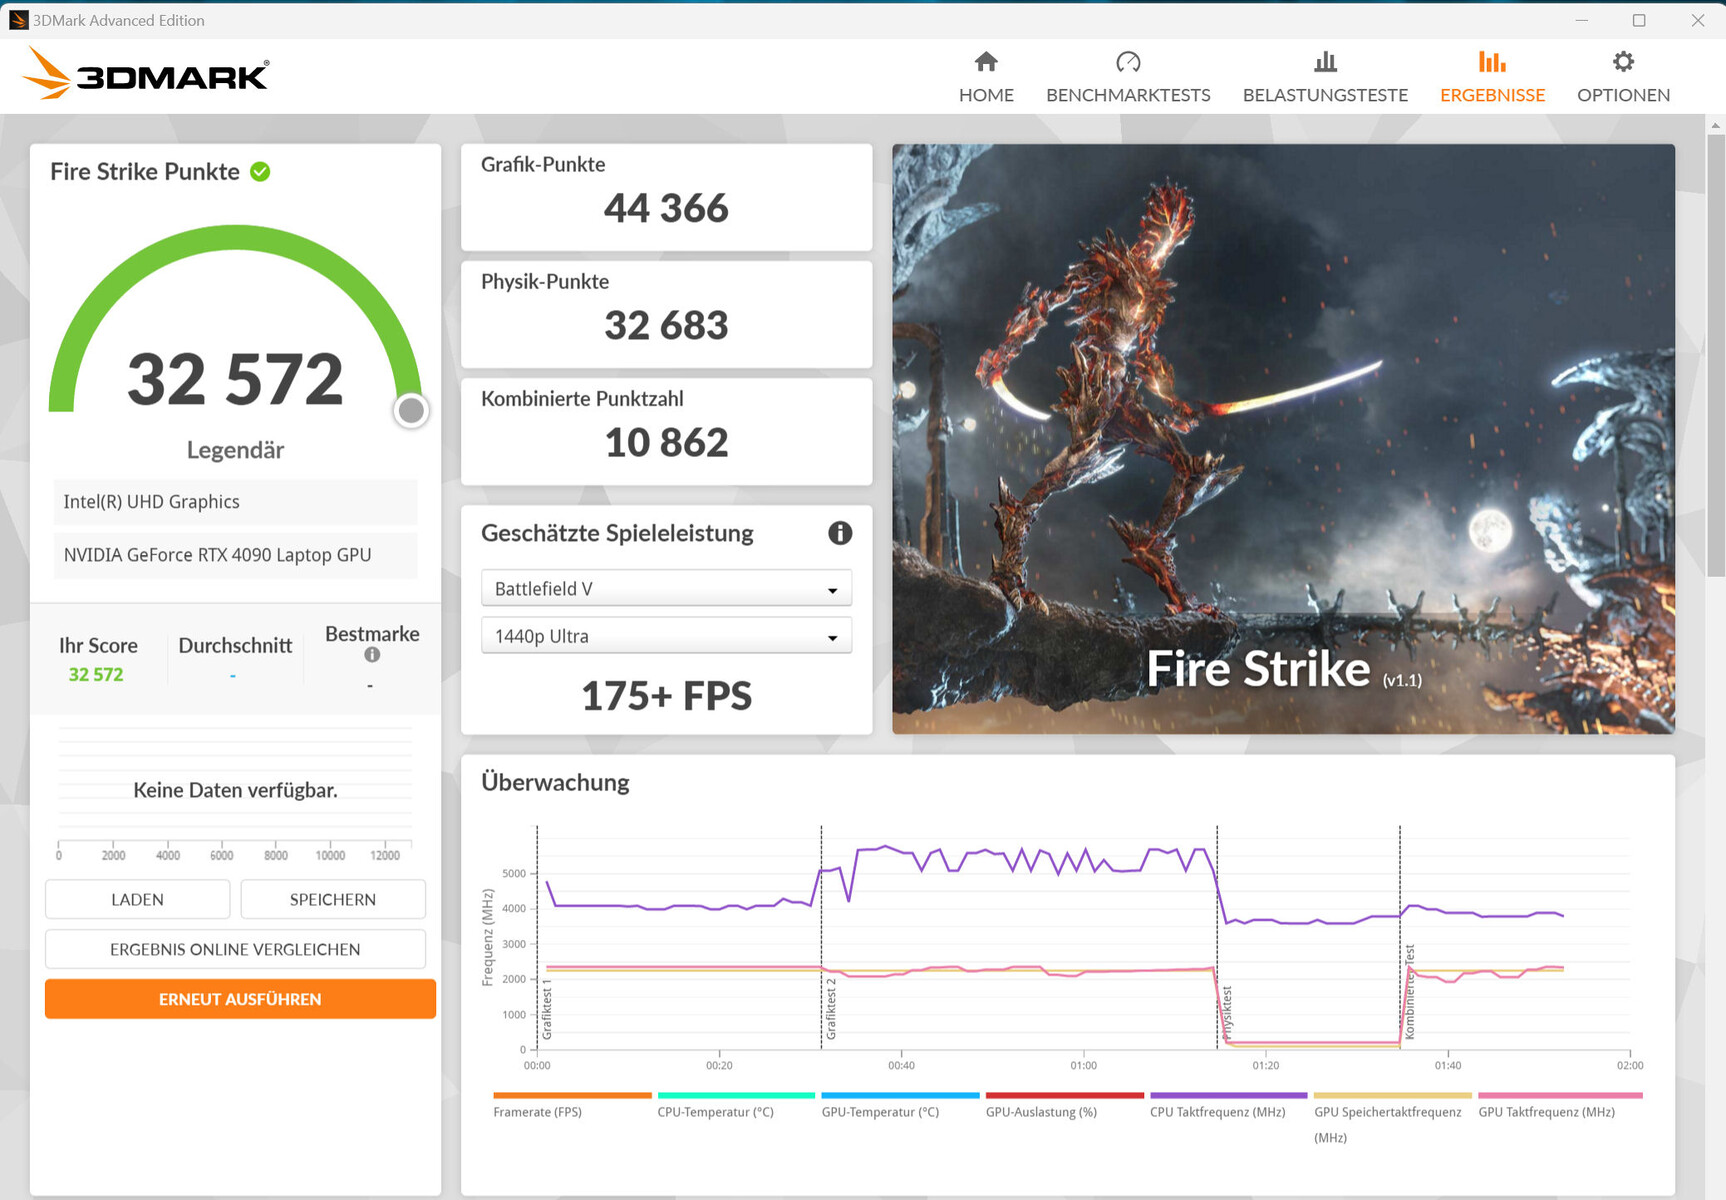
| 3DMark 11 Performance | 41974 punti | |
| 3DMark Fire Strike Score | 32572 punti | |
| 3DMark Time Spy Score | 19655 punti | |
Aiuto | ||
| Geekbench 5.5 | |
| OpenCL Score | |
| Medion Erazer Beast X40 2024 (Gaming Mode) | |
| Asus ROG Strix Scar 18 G834JYR (2024) | |
| Schenker Key 17 Pro (Early 23) | |
| Asus ROG Strix Scar 17 G733PYV-LL053X | |
| Medion Erazer Beast X40 2024 | |
| Media NVIDIA GeForce RTX 4090 Laptop GPU (6841 - 237138, n=39) | |
| MSI Titan 18 HX A14VIG | |
| Medion Erazer Beast X40 | |
| Media della classe Gaming (80702 - 277970, n=101, ultimi 2 anni) | |
| Vulkan Score 5.5 | |
| Medion Erazer Beast X40 2024 (Gaming Mode) | |
| Medion Erazer Beast X40 2024 | |
| MSI Titan 18 HX A14VIG | |
| Asus ROG Strix Scar 18 G834JYR (2024) | |
| Asus ROG Strix Scar 17 G733PYV-LL053X | |
| Media della classe Gaming (18857 - 246759, n=76, ultimi 2 anni) | |
| Media NVIDIA GeForce RTX 4090 Laptop GPU (49663 - 163089, n=28) | |
| Geekbench 6.7 | |
| GPU Vulkan | |
| Medion Erazer Beast X40 2024 (6.2.1, Gaming Mode) | |
| Medion Erazer Beast X40 2024 (6.2.1) | |
| Asus ROG Strix Scar 18 G834JYR (2024) (6.2.1) | |
| Asus ROG Strix Scar 17 G733PYV-LL053X | |
| MSI Titan 18 HX A14VIG (6.2.1) | |
| Media NVIDIA GeForce RTX 4090 Laptop GPU (128748 - 196201, n=16) | |
| Media della classe Gaming (7562 - 244348, n=59, ultimi 2 anni) | |
| GPU OpenCL | |
| Medion Erazer Beast X40 2024 (6.2.1) | |
| Medion Erazer Beast X40 2024 (6.2.1, Gaming Mode) | |
| Asus ROG Strix Scar 17 G733PYV-LL053X | |
| Asus ROG Strix Scar 18 G834JYR (2024) (6.2.1) | |
| Media NVIDIA GeForce RTX 4090 Laptop GPU (159127 - 209521, n=20) | |
| MSI Titan 18 HX A14VIG (6.2.1) | |
| Media della classe Gaming (67235 - 253130, n=103, ultimi 2 anni) | |
| V-Ray Benchmark Next 4.10 | |
| GPU | |
| Medion Erazer Beast X40 2024 (v4.10.07, Gaming Mode) | |
| Asus ROG Strix Scar 17 G733PYV-LL053X (v4.10.07 ) | |
| Schenker Key 17 Pro (Early 23) (v4.10.07 ) | |
| Medion Erazer Beast X40 (v4.10.07 ) | |
| Media NVIDIA GeForce RTX 4090 Laptop GPU (873 - 1334, n=30) | |
| Asus ROG Strix Scar 18 G834JYR (2024) (v4.10.07 ) | |
| Medion Erazer Beast X40 2024 (v4.10.07 ) | |
| Media della classe Gaming (427 - 1627, n=99, ultimi 2 anni) | |
| CPU | |
| Asus ROG Strix Scar 17 G733PYV-LL053X (v4.10.07 ) | |
| Medion Erazer Beast X40 2024 (v4.10.07, Gaming Mode) | |
| Medion Erazer Beast X40 (v4.10.07 ) | |
| Media NVIDIA GeForce RTX 4090 Laptop GPU (18206 - 37629, n=30) | |
| Asus ROG Strix Scar 18 G834JYR (2024) (v4.10.07 ) | |
| Schenker Key 17 Pro (Early 23) (v4.10.07 ) | |
| Media della classe Gaming (10048 - 45327, n=97, ultimi 2 anni) | |
| Medion Erazer Beast X40 2024 (v4.10.07 ) | |
* ... Meglio usare valori piccoli
| The Witcher 3 - 1920x1080 Ultra Graphics & Postprocessing (HBAO+) | |
| Medion Erazer Beast X40 2024 (Gaming Mode) | |
| MSI Titan 18 HX A14VIG | |
| Asus ROG Strix Scar 17 G733PYV-LL053X | |
| Schenker Key 17 Pro (Early 23) | |
| Medion Erazer Beast X40 2024 | |
| Media NVIDIA GeForce RTX 4090 Laptop GPU (139.2 - 216, n=35) | |
| Medion Erazer Beast X40 | |
| Media della classe Gaming (104.7 - 240, n=6, ultimi 2 anni) | |
| Asus ROG Strix Scar 18 G834JYR (2024) | |
| GTA V - 1920x1080 Highest AA:4xMSAA + FX AF:16x | |
| Asus ROG Strix Scar 17 G733PYV-LL053X | |
| Medion Erazer Beast X40 2024 (Gaming Mode) | |
| Medion Erazer Beast X40 | |
| Schenker Key 17 Pro (Early 23) | |
| Medion Erazer Beast X40 2024 | |
| MSI Titan 18 HX A14VIG | |
| Media NVIDIA GeForce RTX 4090 Laptop GPU (91.1 - 167.7, n=40) | |
| Asus ROG Strix Scar 18 G834JYR (2024) | |
| Media della classe Gaming (48.3 - 186.9, n=93, ultimi 2 anni) | |
| Final Fantasy XV Benchmark - 1920x1080 High Quality | |
| Medion Erazer Beast X40 2024 (1.3, Gaming Mode) | |
| MSI Titan 18 HX A14VIG (1.3) | |
| Schenker Key 17 Pro (Early 23) (1.3) | |
| Medion Erazer Beast X40 2024 (1.3) | |
| Asus ROG Strix Scar 17 G733PYV-LL053X (1.3) | |
| Medion Erazer Beast X40 (1.3) | |
| Media NVIDIA GeForce RTX 4090 Laptop GPU (122.2 - 201, n=40) | |
| Asus ROG Strix Scar 18 G834JYR (2024) (1.3) | |
| Media della classe Gaming (41 - 215, n=95, ultimi 2 anni) | |
| Strange Brigade - 1920x1080 ultra AA:ultra AF:16 | |
| Asus ROG Strix Scar 17 G733PYV-LL053X (1.47.22.14 D3D12) | |
| MSI Titan 18 HX A14VIG (1.47.22.14 D3D12) | |
| Schenker Key 17 Pro (Early 23) (1.47.22.14 D3D12) | |
| Medion Erazer Beast X40 2024 (1.47.22.14 D3D12, Gaming Mode) | |
| Medion Erazer Beast X40 2024 (1.47.22.14 D3D12) | |
| Medion Erazer Beast X40 (1.47.22.14 D3D12) | |
| Media NVIDIA GeForce RTX 4090 Laptop GPU (233 - 421, n=39) | |
| Asus ROG Strix Scar 18 G834JYR (2024) (1.47.22.14 D3D12) | |
| Media della classe Gaming (76.3 - 456, n=86, ultimi 2 anni) | |
| Dota 2 Reborn - 1920x1080 ultra (3/3) best looking | |
| Asus ROG Strix Scar 17 G733PYV-LL053X | |
| Medion Erazer Beast X40 2024 | |
| Medion Erazer Beast X40 2024 (Gaming Mode) | |
| Schenker Key 17 Pro (Early 23) | |
| Media NVIDIA GeForce RTX 4090 Laptop GPU (115.7 - 220, n=42) | |
| MSI Titan 18 HX A14VIG | |
| Medion Erazer Beast X40 | |
| Asus ROG Strix Scar 18 G834JYR (2024) | |
| Media della classe Gaming (84.8 - 248, n=107, ultimi 2 anni) | |
| X-Plane 11.11 - 1920x1080 high (fps_test=3) | |
| Asus ROG Strix Scar 17 G733PYV-LL053X | |
| Medion Erazer Beast X40 2024 | |
| Medion Erazer Beast X40 2024 (Gaming Mode) | |
| Asus ROG Strix Scar 18 G834JYR (2024) | |
| Schenker Key 17 Pro (Early 23) | |
| Media NVIDIA GeForce RTX 4090 Laptop GPU (77.8 - 166.2, n=46) | |
| Medion Erazer Beast X40 | |
| MSI Titan 18 HX A14VIG | |
| Media della classe Gaming (55.5 - 143.5, n=109, ultimi 2 anni) | |
| Helldivers 2 | |
| 1920x1080 Ultra Preset | |
| Medion Erazer Beast X40 2024 | |
| Media NVIDIA GeForce RTX 4090 Laptop GPU (130.2 - 141.2, n=2) | |
| Asus ROG Zephyrus M16 | |
| Media della classe Gaming (18.4 - 153.8, n=5, ultimi 2 anni) | |
| 2560x1440 Ultra Preset | |
| Medion Erazer Beast X40 2024 | |
| Media della classe Gaming (81.3 - 140.1, n=5, ultimi 2 anni) | |
| Media NVIDIA GeForce RTX 4090 Laptop GPU (105.5 - 122.6, n=2) | |
| Asus ROG Zephyrus M16 | |
| Enshrouded | |
| 1920x1080 Max. Quality AA:FX | |
| Medion Erazer Beast X40 2024 | |
| Media NVIDIA GeForce RTX 4090 Laptop GPU (79 - 101.5, n=3) | |
| Asus ROG Strix Scar 18 G834JYR (2024) | |
| Asus ROG Zephyrus M16 | |
| Media della classe Gaming (n=1ultimi 2 anni) | |
| 2560x1440 Max. Quality AA:FX | |
| Medion Erazer Beast X40 2024 | |
| Asus ROG Strix Scar 18 G834JYR (2024) | |
| Media NVIDIA GeForce RTX 4090 Laptop GPU (61.8 - 76, n=3) | |
| Asus ROG Zephyrus M16 | |
| Ready or Not | |
| 1920x1080 Epic Preset | |
| Asus ROG Zephyrus M16 | |
| Media NVIDIA GeForce RTX 4090 Laptop GPU (155.1 - 203, n=2) | |
| Medion Erazer Beast X40 2024 | |
| 2560x1440 Epic Preset | |
| Medion Erazer Beast X40 2024 | |
| Media NVIDIA GeForce RTX 4090 Laptop GPU (141.1 - 144.3, n=2) | |
| Asus ROG Zephyrus M16 | |
| Immortals of Aveum | |
| 1920x1080 Ultra AF:16x | |
| Medion Erazer Beast X40 2024 | |
| Media NVIDIA GeForce RTX 4090 Laptop GPU (90.6 - 106.3, n=2) | |
| 2560x1440 Ultra AF:16x | |
| Medion Erazer Beast X40 2024 | |
| Media NVIDIA GeForce RTX 4090 Laptop GPU (62.9 - 76.5, n=2) | |
The Witcher 3 FPS chart
| basso | medio | alto | ultra | QHD | |
|---|---|---|---|---|---|
| GTA V (2015) | 187.3 | 186.7 | 183 | 141.5 | 139.8 |
| The Witcher 3 (2015) | 555 | 518 | 394 | 204 | 157.6 |
| Dota 2 Reborn (2015) | 241 | 214 | 205 | 189.9 | |
| Final Fantasy XV Benchmark (2018) | 225 | 210 | 181.1 | 147.7 | |
| X-Plane 11.11 (2018) | 207 | 182.2 | 143.9 | ||
| Strange Brigade (2018) | 484 | 401 | 387 | 371 | 289 |
| Immortals of Aveum (2023) | 119.3 | 109.6 | 106.3 | 76.5 | |
| Cyberpunk 2077 (2023) | 133.2 | 131 | 120.9 | 118.9 | 87.5 |
| Ready or Not (2023) | 289 | 166.6 | 158 | 155.1 | 144.3 |
| Enshrouded (2024) | 150.5 | 134.5 | 116.2 | 101.5 | 76 |
| Helldivers 2 (2024) | 146.8 | 143.8 | 143.3 | 141.2 | 122.6 |
Emissioni ed energia: La Bestia X40 può lavorare in modo silenzioso
Emissioni di rumore
La sollecitazione a pieno carico rivela che con Beast X40 sono possibili livelli di pressione sonora fino a 52 dB(A). Il portatile è solo leggermente più silenzioso in modalità Gaming.
La "Modalità silenziosa" assicura un livello di rumore molto basso, ma fornisce comunque una potenza più che sufficiente per le attività quotidiane, come l'ufficio e internet. In questa modalità è possibile anche giocare. Tuttavia, la frequenza dei fotogrammi è bloccata a 30 fps dal sistema nel nostro test Witcher 3.
In alcune circostanze, si può sentire un fruscio elettronico dall'interno del portatile durante il test The Witcher 3, ad esempio, o durante l'esecuzione del benchmark Specviewperf.
Rumorosità
| Idle |
| 28 / 29 / 32 dB(A) |
| Sotto carico |
| 48 / 52 dB(A) |
 | ||
30 dB silenzioso 40 dB(A) udibile 50 dB(A) rumoroso |
||
min: | ||
| Medion Erazer Beast X40 2024 i9-14900HX, GeForce RTX 4090 Laptop GPU | Asus ROG Strix Scar 17 G733PYV-LL053X R9 7945HX3D, GeForce RTX 4090 Laptop GPU | Schenker Key 17 Pro (Early 23) i9-13900HX, GeForce RTX 4090 Laptop GPU | Asus ROG Strix Scar 18 G834JYR (2024) i9-14900HX, GeForce RTX 4090 Laptop GPU | MSI Titan 18 HX A14VIG i9-14900HX, GeForce RTX 4090 Laptop GPU | Medion Erazer Beast X40 i9-13900HX, GeForce RTX 4090 Laptop GPU | |
|---|---|---|---|---|---|---|
| Noise | 0% | -17% | 1% | 6% | -1% | |
| off /ambiente * (dB) | 25 | 23 8% | 26 -4% | 24 4% | 22.8 9% | 24 4% |
| Idle Minimum * (dB) | 28 | 23 18% | 26 7% | 27 4% | 23.8 15% | 25 11% |
| Idle Average * (dB) | 29 | 27.7 4% | 33 -14% | 28 3% | 23.8 18% | 29 -0% |
| Idle Maximum * (dB) | 32 | 34.7 -8% | 46 -44% | 32 -0% | 28 12% | 35 -9% |
| Load Average * (dB) | 48 | 53.4 -11% | 56 -17% | 50 -4% | 38 21% | 51 -6% |
| Witcher 3 ultra * (dB) | 50 | 53.4 -7% | 62 -24% | 50 -0% | 57.3 -15% | 51 -2% |
| Load Maximum * (dB) | 52 | 53.4 -3% | 64 -23% | 52 -0% | 62.8 -21% | 53 -2% |
* ... Meglio usare valori piccoli
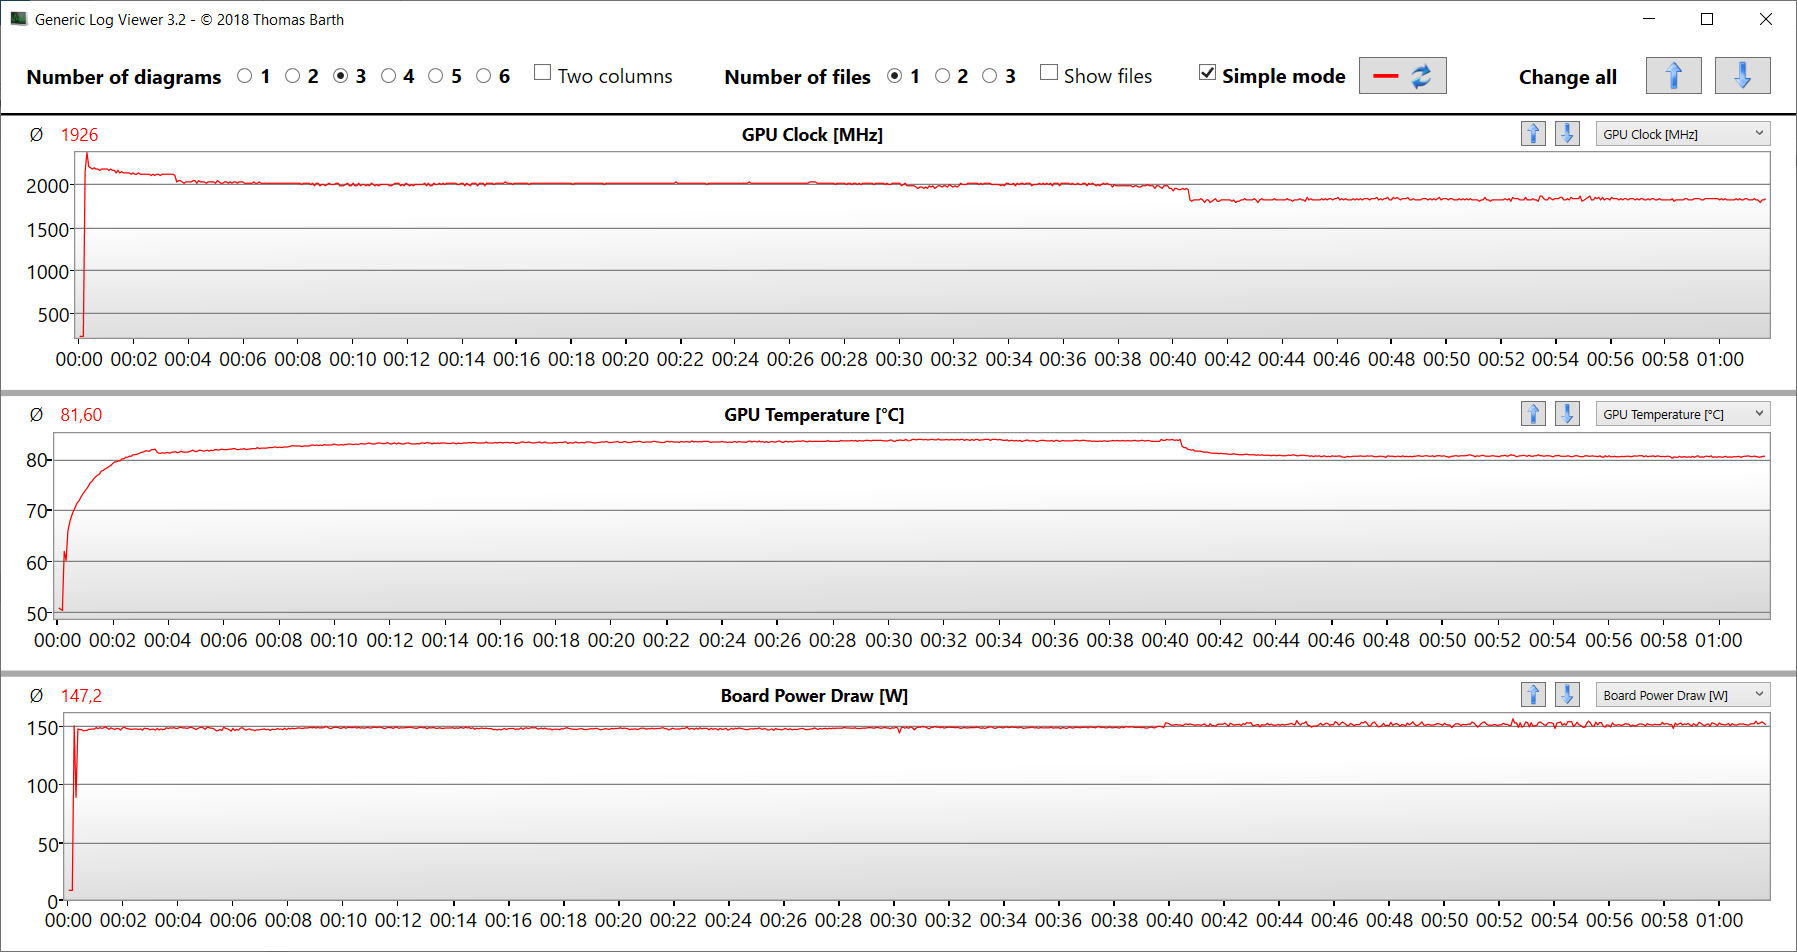
Temperatura
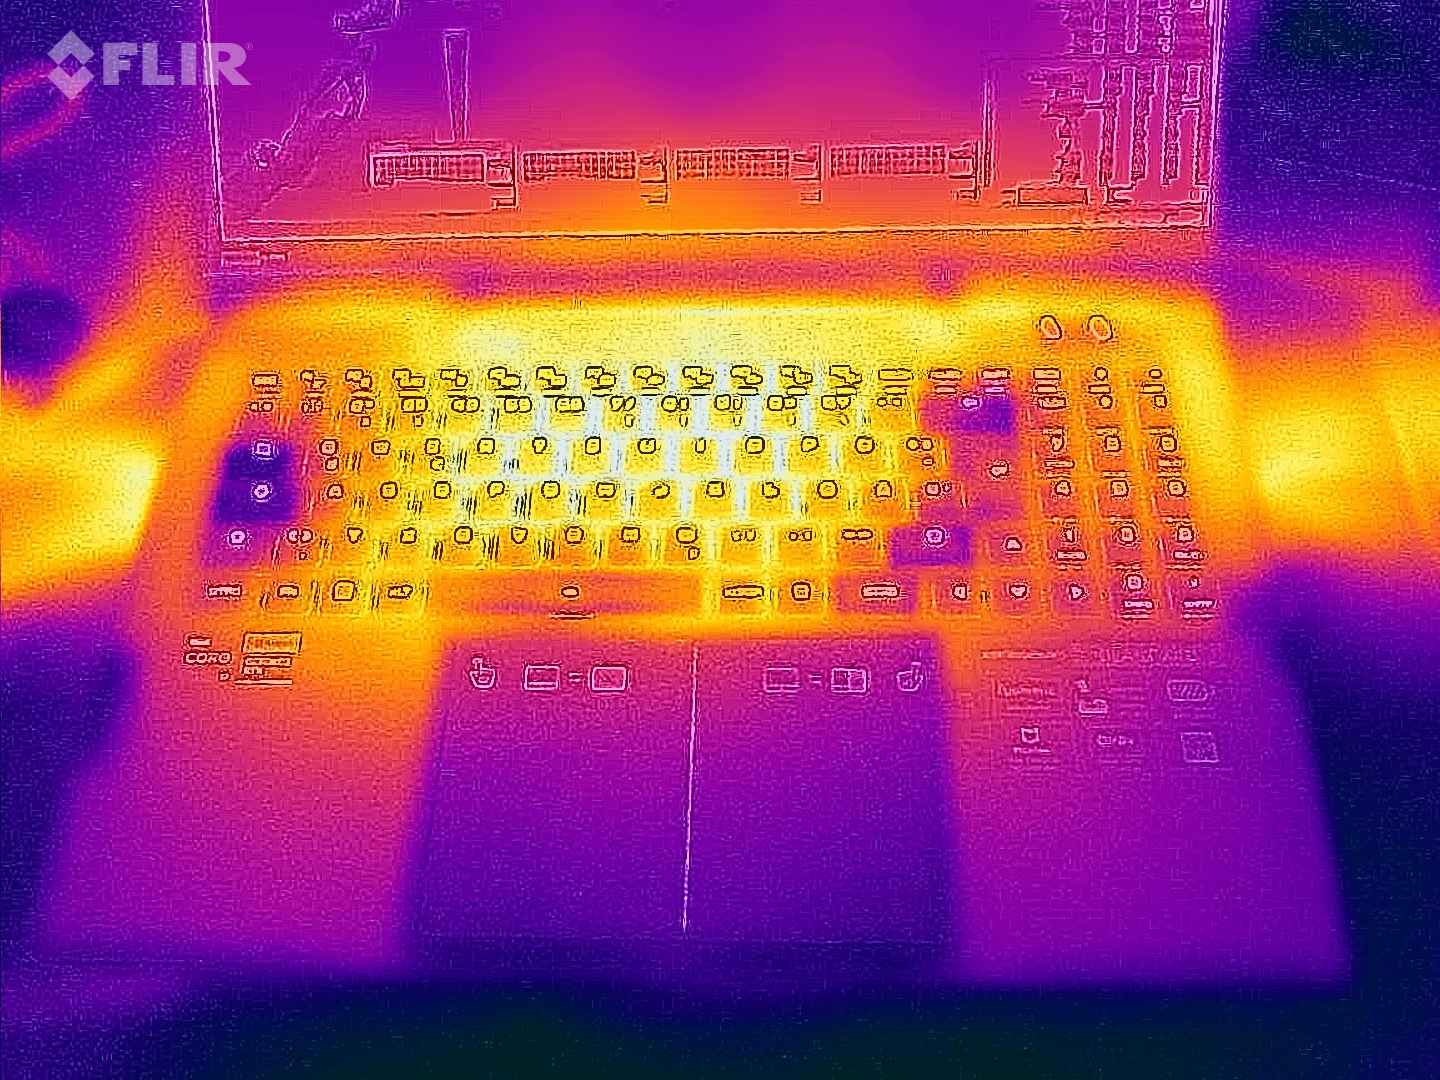
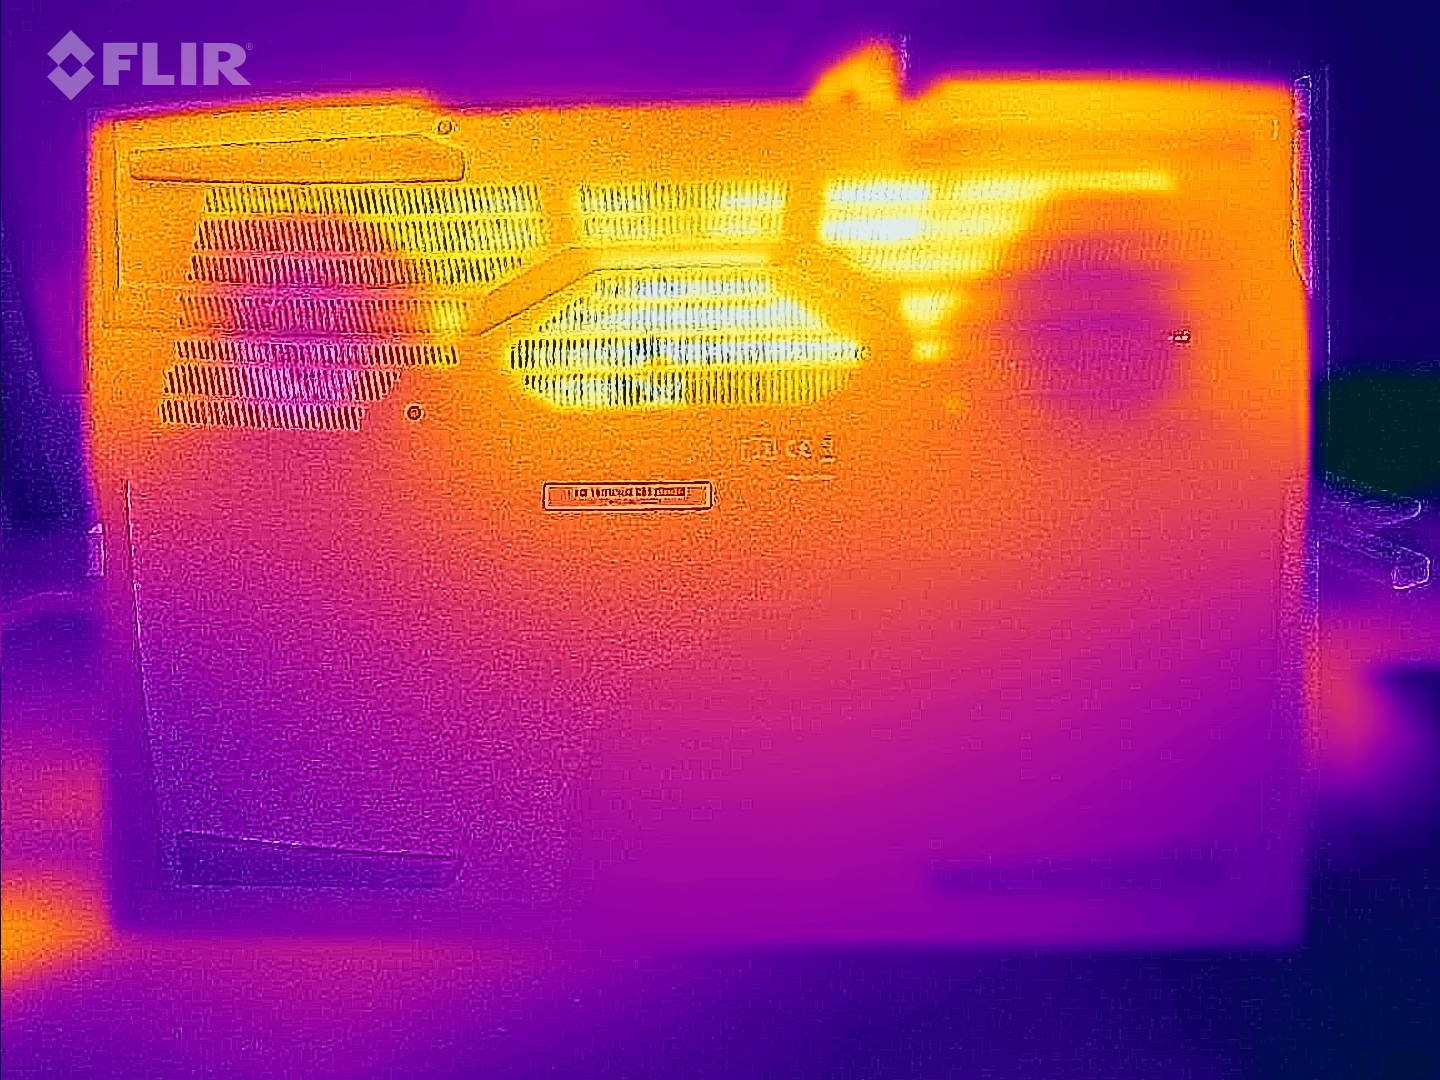
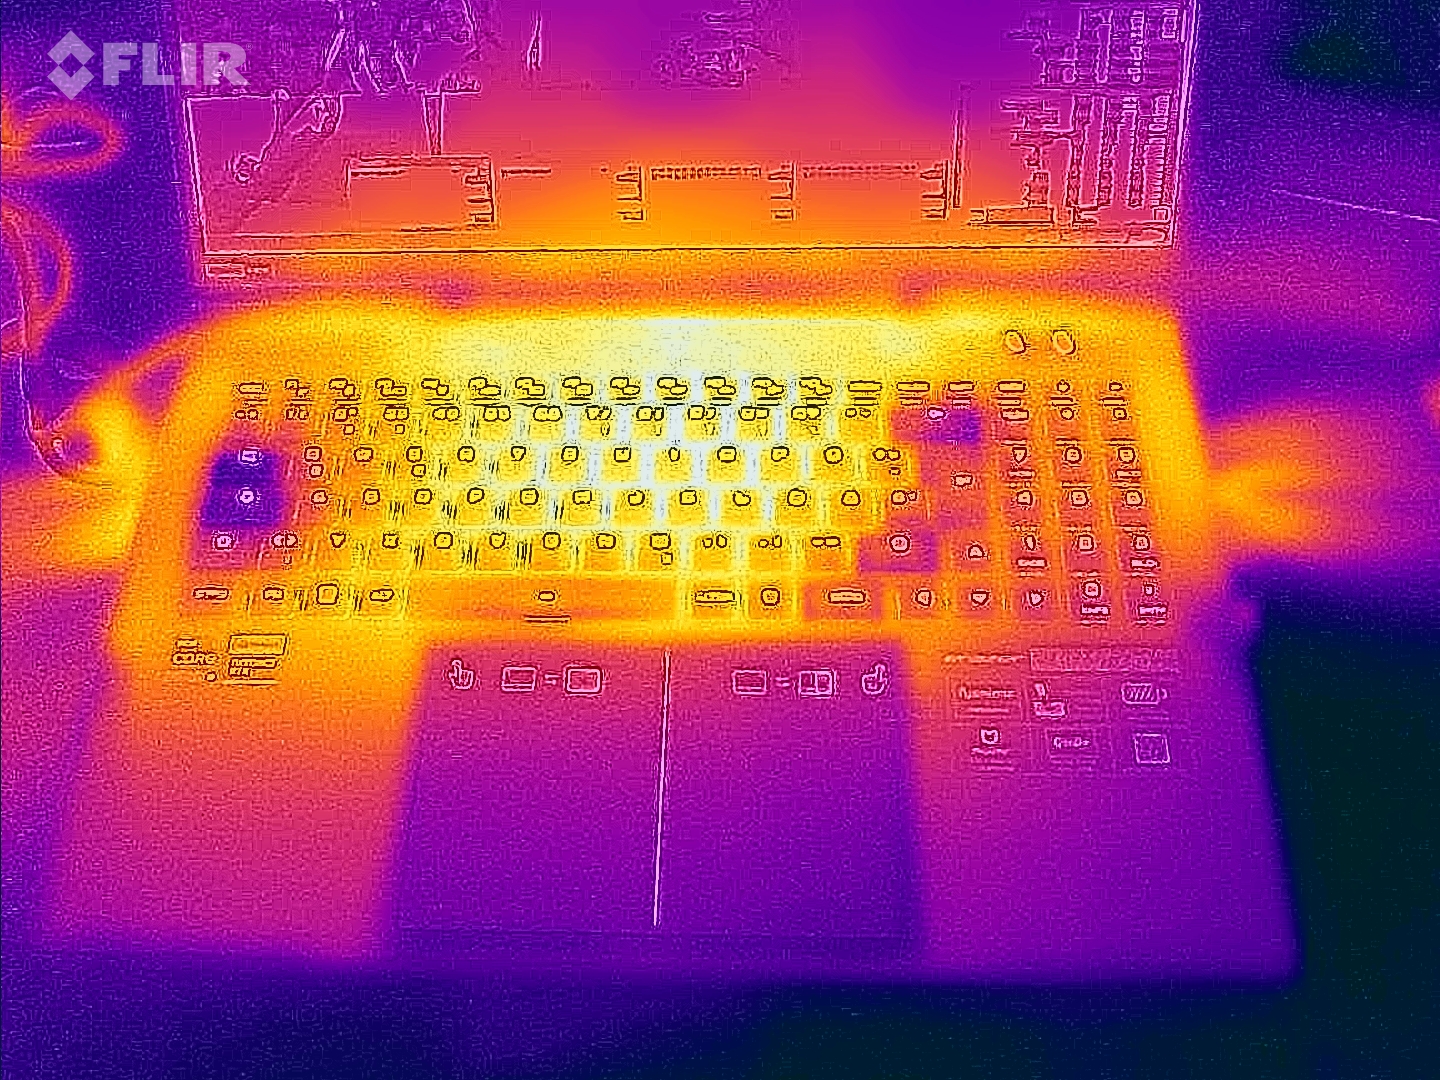
Il test di stress e il test Witcher 3 provocano un notevole riscaldamento del notebook, ma non eccessivo. In alcuni punti si raggiungono valori superiori a 50 gradi Celsius. Nell'uso quotidiano (Office, Internet), i valori rimangono nella fascia verde.
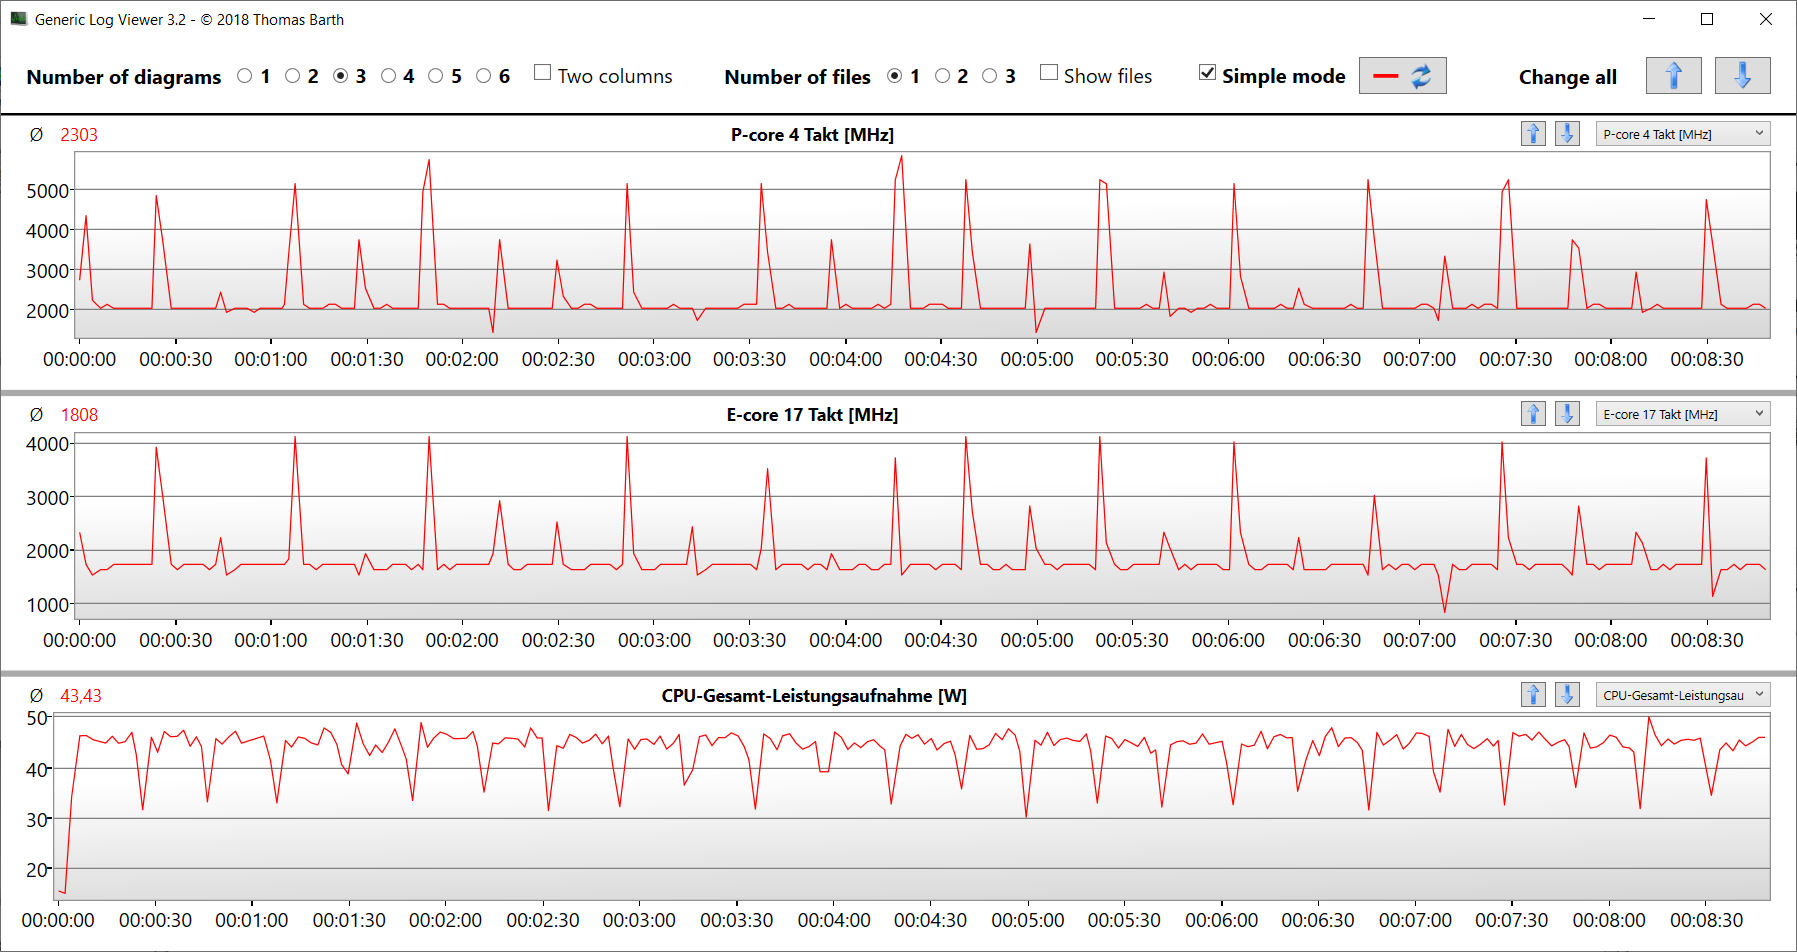
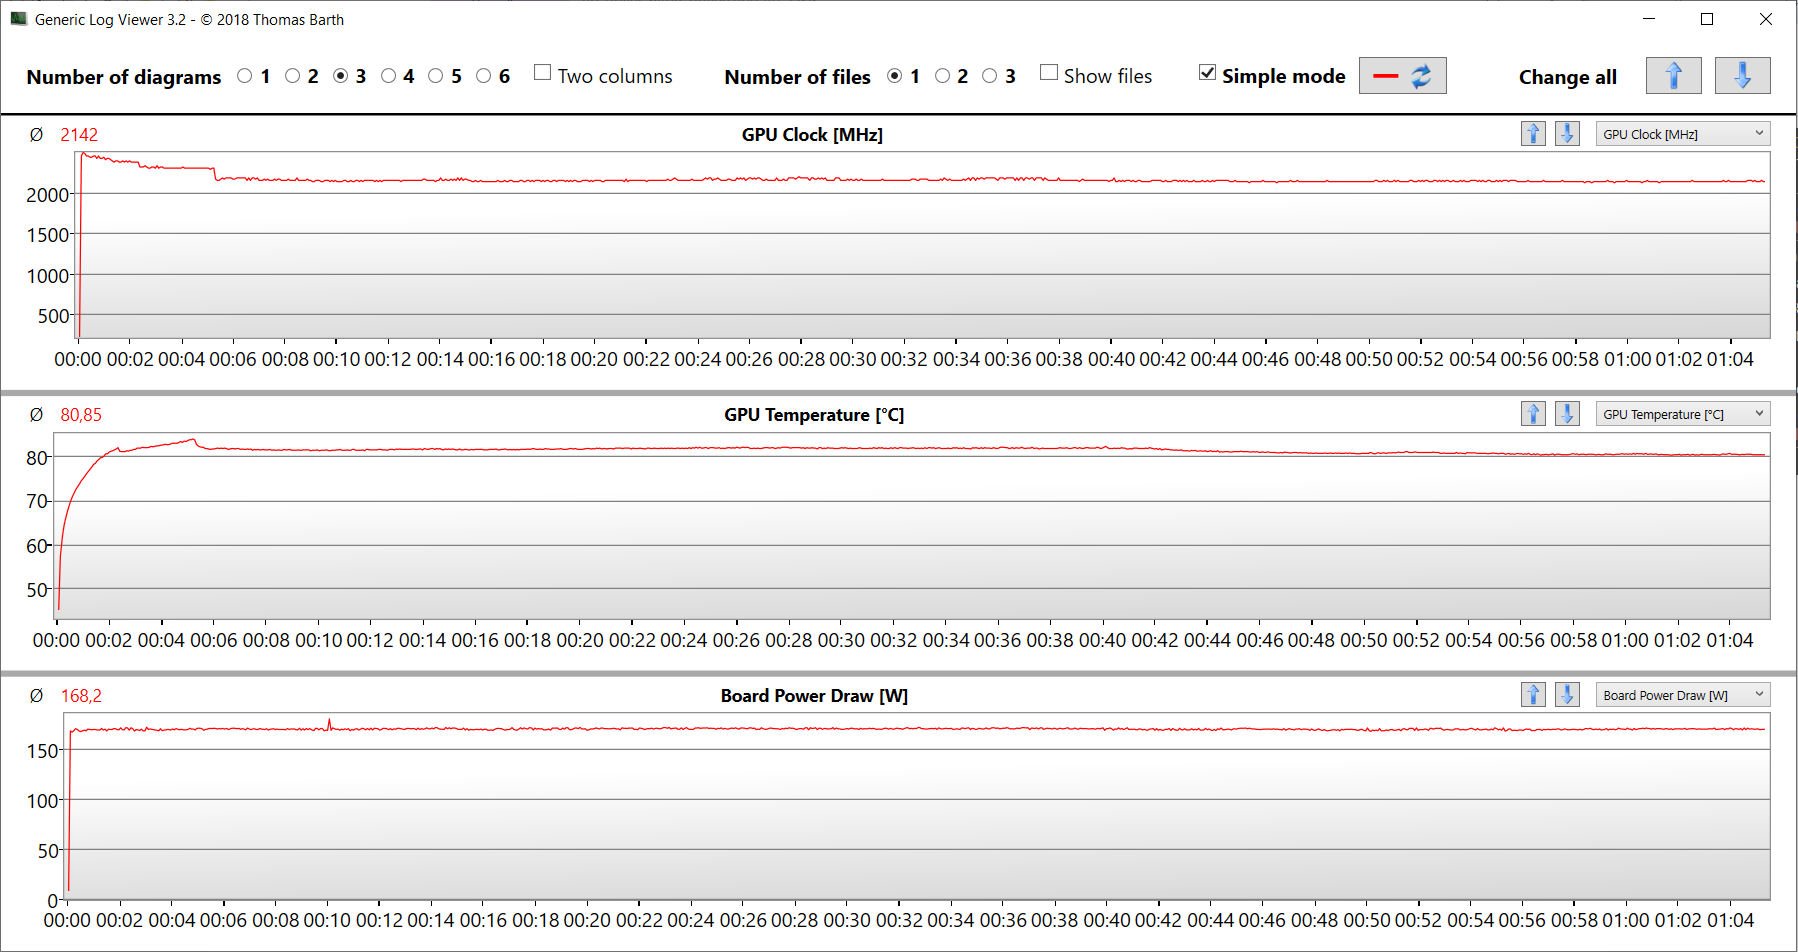
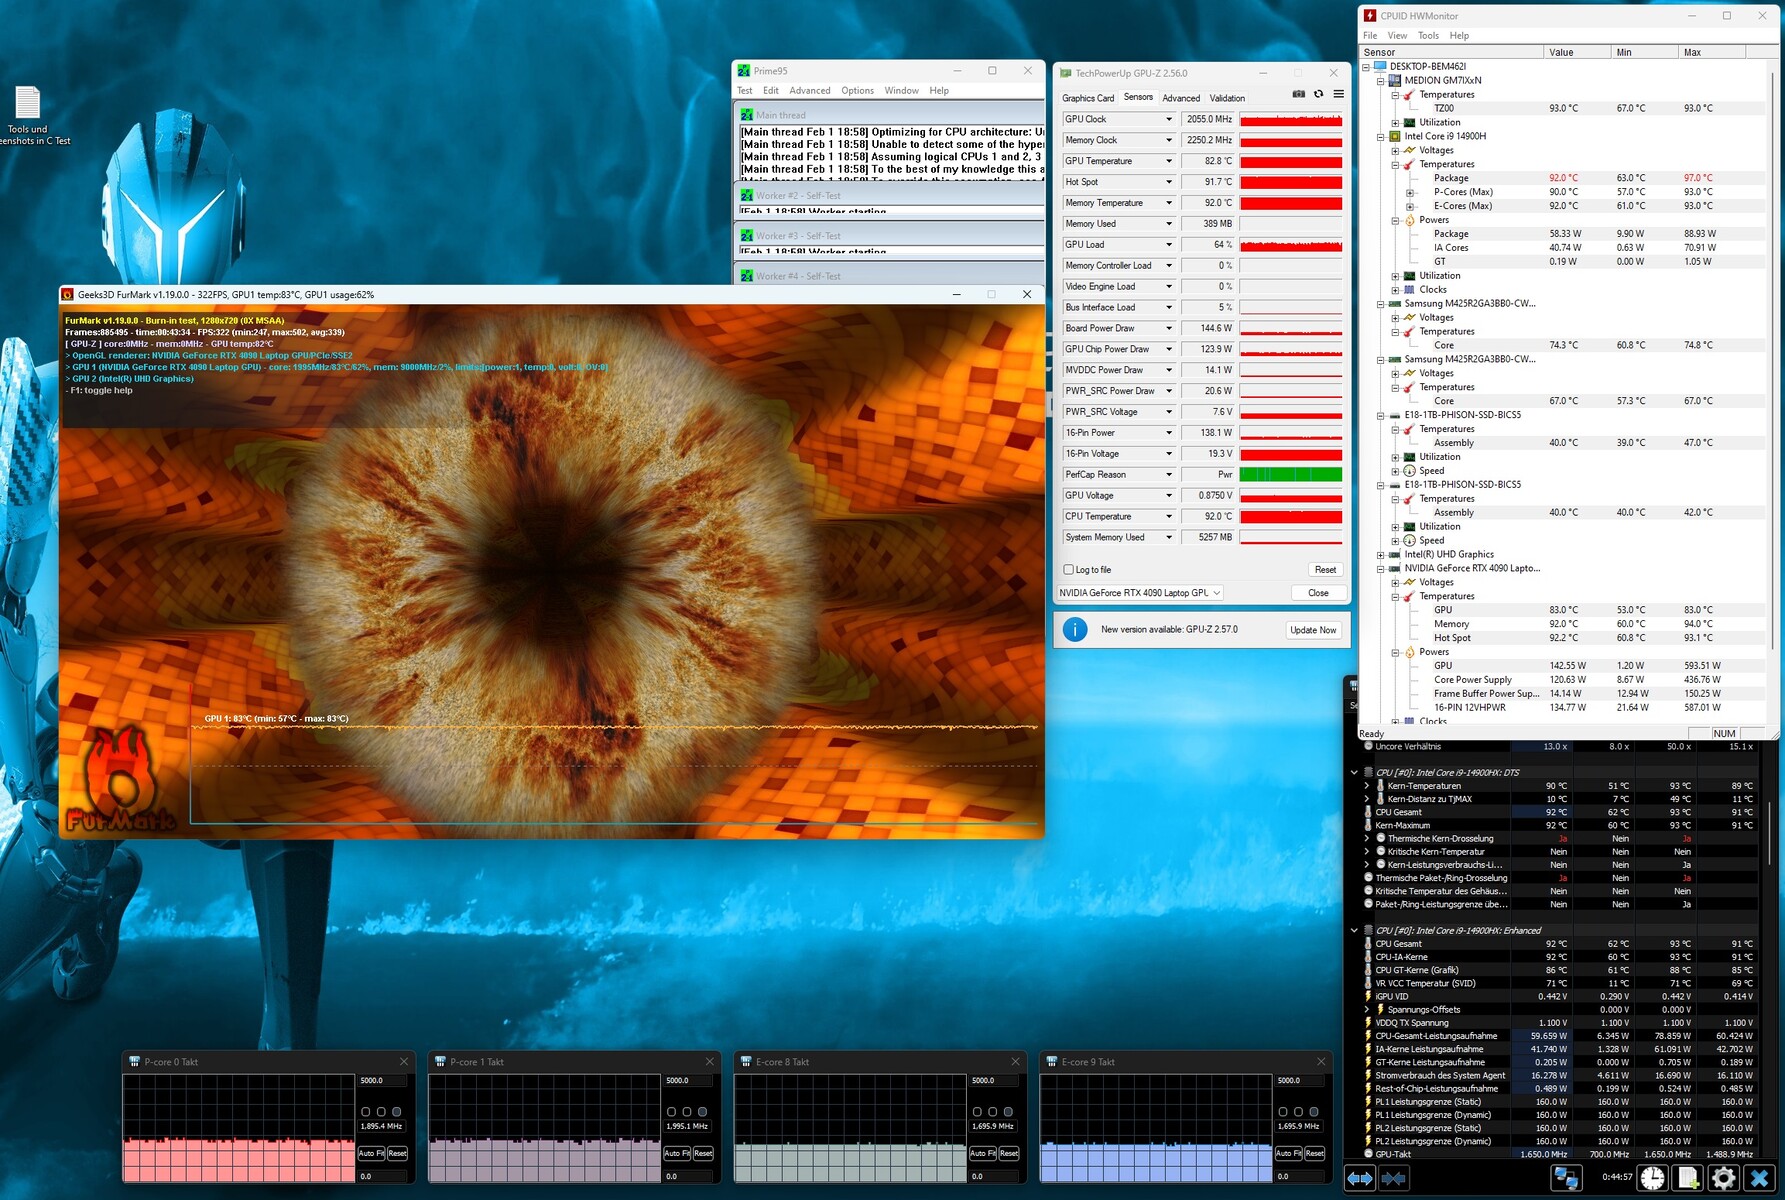
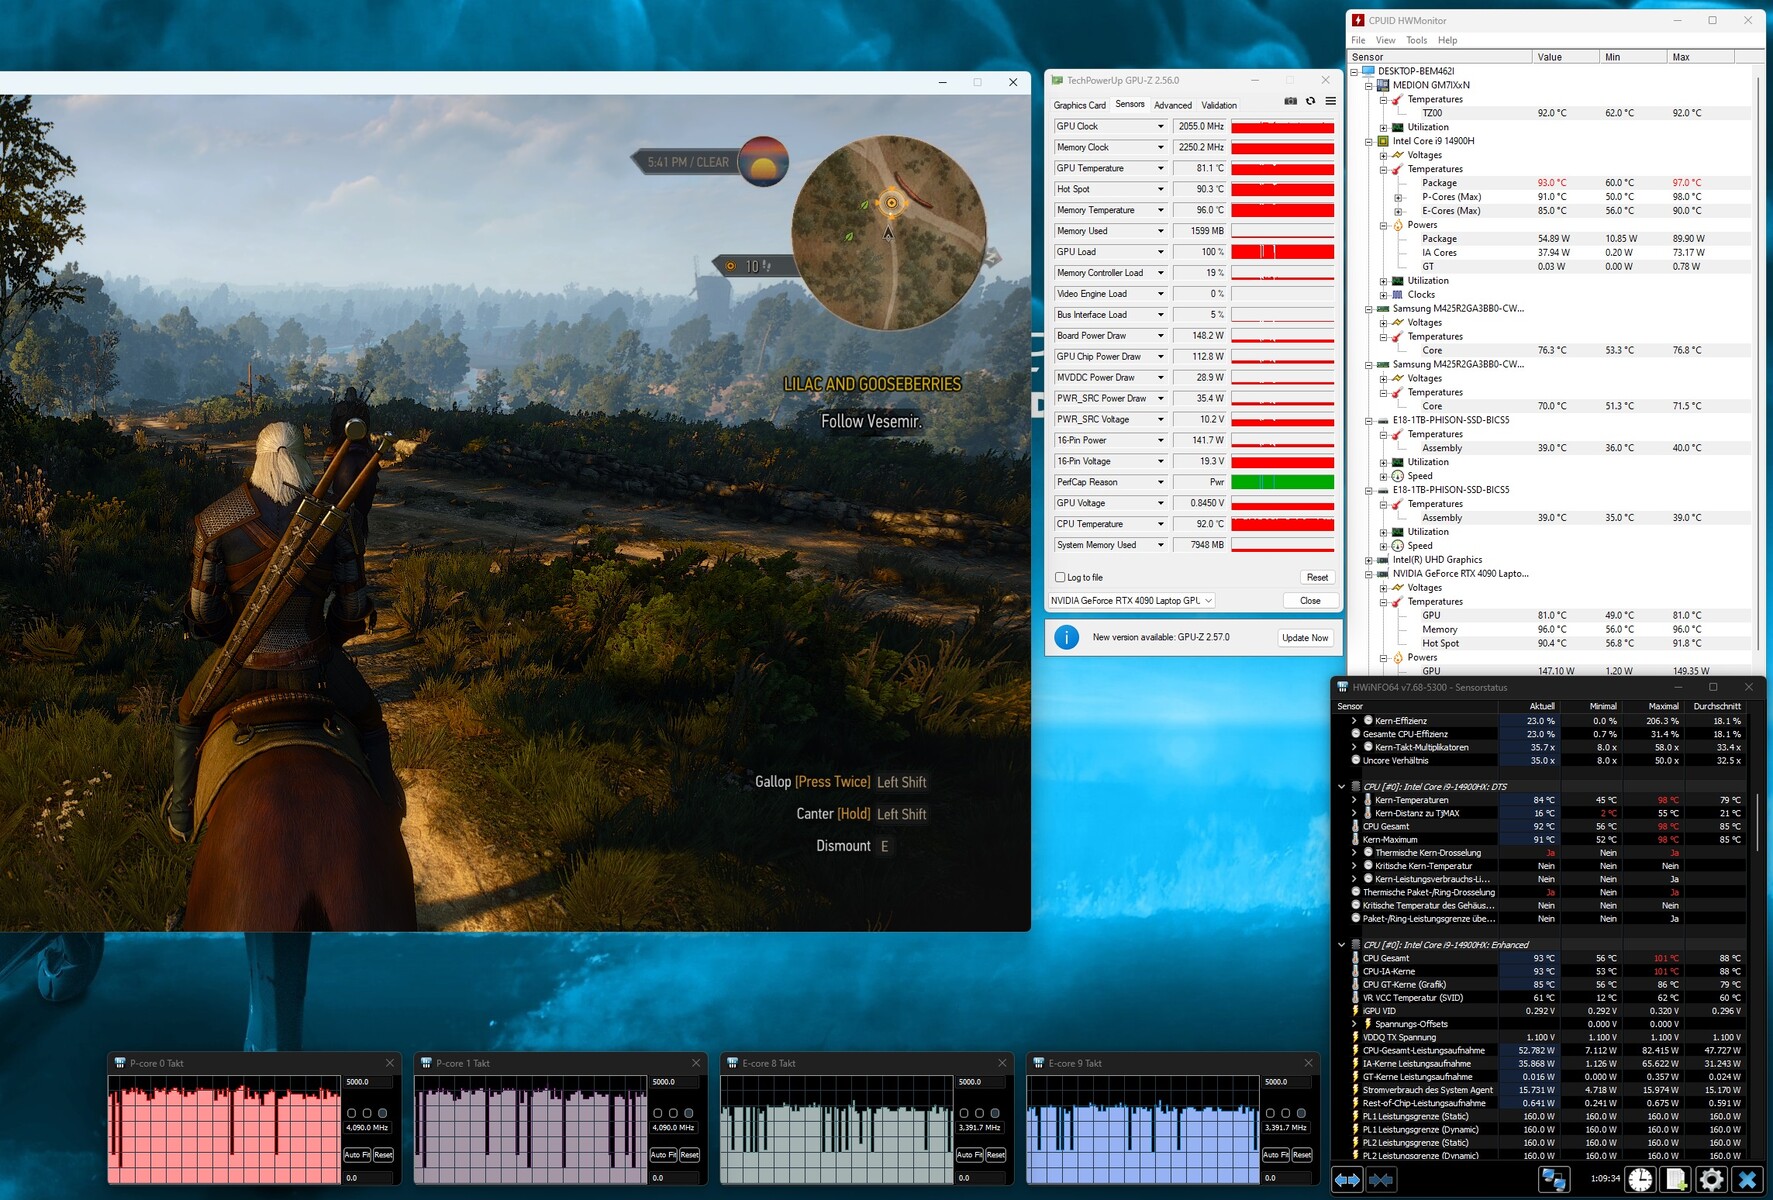
Il test di stress (Prime95 e Furmark in funzionamento continuo) è uno scenario estremo per testare la stabilità del sistema sotto pieno carico. La velocità di clock della CPU scende a 1,9-2 GHz (core P) o 1,7 GHz (core E) nei primi minuti e rimane a questo livello. La GPU funziona a velocità comprese tra 2 e 2,1 GHz.
(-) La temperatura massima sul lato superiore è di 47 °C / 117 F, rispetto alla media di 40.4 °C / 105 F, che varia da 21.2 a 68.8 °C per questa classe Gaming.
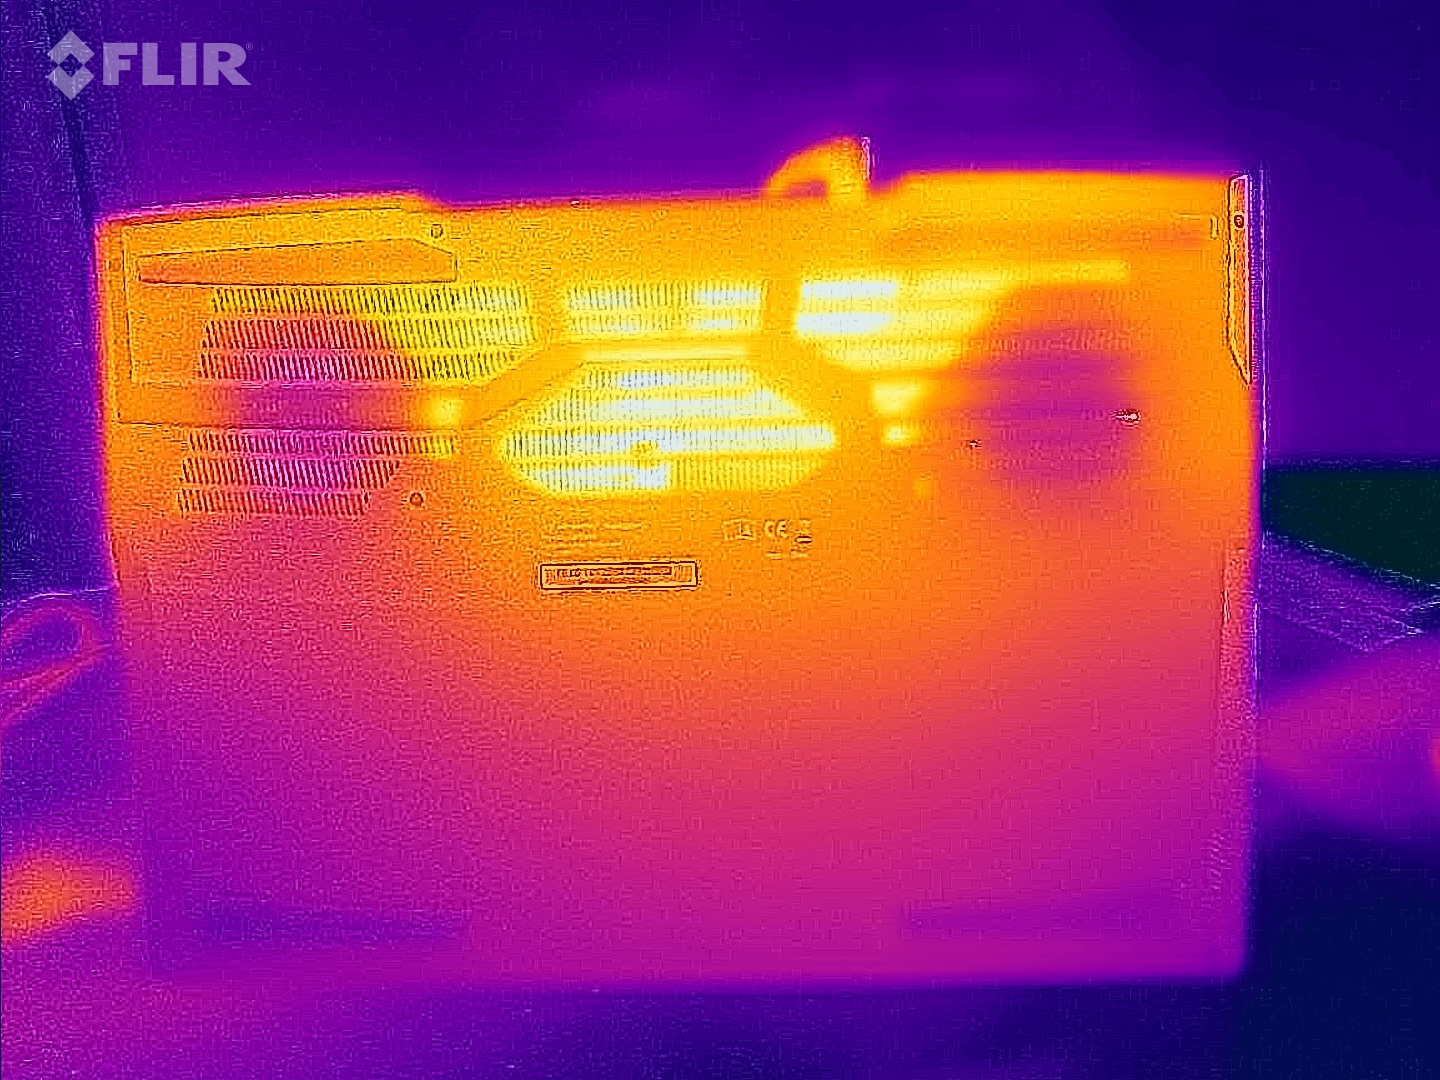
(-) Il lato inferiore si riscalda fino ad un massimo di 54 °C / 129 F, rispetto alla media di 43.2 °C / 110 F
(+) In idle, la temperatura media del lato superiore è di 28.1 °C / 83 F, rispetto alla media deld ispositivo di 33.9 °C / 93 F.
(-) Riproducendo The Witcher 3, la temperatura media per il lato superiore e' di 39.1 °C / 102 F, rispetto alla media del dispositivo di 33.9 °C / 93 F.
(+) I poggiapolsi e il touchpad raggiungono la temperatura massima della pelle (34 °C / 93.2 F) e quindi non sono caldi.
(-) La temperatura media della zona del palmo della mano di dispositivi simili e'stata di 28.8 °C / 83.8 F (-5.2 °C / -9.4 F).
| Medion Erazer Beast X40 2024 Intel Core i9-14900HX, NVIDIA GeForce RTX 4090 Laptop GPU | Asus ROG Strix Scar 17 G733PYV-LL053X AMD Ryzen 9 7945HX3D, NVIDIA GeForce RTX 4090 Laptop GPU | Schenker Key 17 Pro (Early 23) Intel Core i9-13900HX, NVIDIA GeForce RTX 4090 Laptop GPU | Asus ROG Strix Scar 18 G834JYR (2024) Intel Core i9-14900HX, NVIDIA GeForce RTX 4090 Laptop GPU | MSI Titan 18 HX A14VIG Intel Core i9-14900HX, NVIDIA GeForce RTX 4090 Laptop GPU | Medion Erazer Beast X40 Intel Core i9-13900HX, NVIDIA GeForce RTX 4090 Laptop GPU | |
|---|---|---|---|---|---|---|
| Heat | 14% | -11% | 4% | 5% | 1% | |
| Maximum Upper Side * (°C) | 47 | 40.1 15% | 57 -21% | 49 -4% | 37.8 20% | 48 -2% |
| Maximum Bottom * (°C) | 54 | 46.7 14% | 60 -11% | 47 13% | 37.6 30% | 52 4% |
| Idle Upper Side * (°C) | 30 | 26.5 12% | 32 -7% | 29 3% | 34.8 -16% | 30 -0% |
| Idle Bottom * (°C) | 32 | 27.7 13% | 34 -6% | 31 3% | 36 -13% | 31 3% |
* ... Meglio usare valori piccoli
Altoparlante
Gli altoparlanti stereo producono un suono complessivamente molto decente.
Medion Erazer Beast X40 2024 analisi audio
(+) | gli altoparlanti sono relativamente potenti (88 dB)
Bassi 100 - 315 Hz
(±) | bassi ridotti - in media 14.7% inferiori alla media
(±) | la linearità dei bassi è media (7.2% delta rispetto alla precedente frequenza)
Medi 400 - 2000 Hz
(+) | medi bilanciati - solo only 3.7% rispetto alla media
(+) | medi lineari (5.8% delta rispetto alla precedente frequenza)
Alti 2 - 16 kHz
(+) | Alti bilanciati - appena 2.8% dalla media
(+) | alti lineari (6.4% delta rispetto alla precedente frequenza)
Nel complesso 100 - 16.000 Hz
(+) | suono nel complesso lineare (12.1% differenza dalla media)
Rispetto alla stessa classe
» 12% di tutti i dispositivi testati in questa classe è stato migliore, 4% simile, 84% peggiore
» Il migliore ha avuto un delta di 6%, medio di 18%, peggiore di 132%
Rispetto a tutti i dispositivi testati
» 10% di tutti i dispositivi testati in questa classe è stato migliore, 2% similare, 88% peggiore
» Il migliore ha avuto un delta di 4%, medio di 23%, peggiore di 134%
Consumo di energia
Beast X40 non riserva sorprese in termini di consumo energetico. I valori sono a un livello normale per l'hardware installato.
Il test Witcher 3 e lo stress test vengono eseguiti con un consumo energetico leggermente inferiore. L'alimentatore da 330 W si dimostra adeguato durante lo stress.
| Off / Standby | |
| Idle | |
| Sotto carico |
|
Leggenda:
min: | |
Power consumption: The Witcher 3 / Stress test
Power consumption: External monitor
Durata della batteria
Beast X40 raggiunge un tempo di esecuzione di 6:14 ore nel test pratico WLAN (illustrazione del carico quando si accede ai siti web utilizzando uno script), che è un valore decente.
Questo pone l'X40 allo stesso livello del suo predecessore.
Pro
Contro
Verdetto: una centrale elettrica di fascia alta
Medion Erazer Beast X40 proviene dall'estremo superiore della scala delle prestazioni: la GeForce RTX 4090 e Core i9-14900HX offrono la potenza necessaria per il gioco, lo streaming, il rendering e l'editing video. È possibile trovare un compromesso tra prestazioni e rumore. Con un sistema di raffreddamento ad acqua opzionale (circa 200 euro), è possibile ottenere un piccolo aumento delle prestazioni e una riduzione complessiva delle emissioni.
Medion offre un notebook da gioco estremamente potente con Erazer Beast X40.
Il lato positivo è la presenza di un display da 17 pollici di alta qualità (2.560 x 1.600 pixel, 240 Hz, G-Sync, sRGB) in formato 16:10, di una tastiera meccanica tattile e di una porta Thunderbolt 4. Quest'ultima apre le porte di espansione (esterne). Quest'ultima apre opzioni di espansione (GPU esterna, soluzione docking), supporta Power Delivery e può emettere un segnale DisplayPort. Ha anche una discreta durata della batteria.
Le differenze tra il modello attuale e quello dello scorso anno x40 dell'anno scorso non sono sostanziali. Grazie a velocità di clock leggermente superiori, il Core i9-14900HX offre prestazioni leggermente superiori con lo stesso numero di core e thread rispetto al Core i9-13900HX del modello dell'anno precedente. Quest'ultimo sarebbe un'alternativa (più economica): Medion lo vende attualmente a poco meno di 3.500 euro.
Un'altra alternativa potrebbe essere il Asus ROG Strix Scar 17 X3D. Offre un livello di prestazioni comparabile e uno schermo con copertura DCI-P3. Tuttavia, il laptop Asus non offre Thunderbolt 4. È anche inferiore in termini di durata della batteria.
Prezzo e disponibilità
Medion Erazer Beast X40 (2024) è disponibile presso il negozio Medion e Cyberport.de a un prezzo inferiore a 4.000 euro.
Medion Erazer Beast X40 2024
- 02/21/2024 v7 (old)
Sascha Mölck
Transparency
La selezione dei dispositivi da recensire viene effettuata dalla nostra redazione. Il campione di prova è stato fornito all'autore come prestito dal produttore o dal rivenditore ai fini di questa recensione. L'istituto di credito non ha avuto alcuna influenza su questa recensione, né il produttore ne ha ricevuto una copia prima della pubblicazione. Non vi era alcun obbligo di pubblicare questa recensione. In quanto società mediatica indipendente, Notebookcheck non è soggetta all'autorità di produttori, rivenditori o editori.
Ecco come Notebookcheck esegue i test
Ogni anno, Notebookcheck esamina in modo indipendente centinaia di laptop e smartphone utilizzando procedure standardizzate per garantire che tutti i risultati siano comparabili. Da circa 20 anni sviluppiamo continuamente i nostri metodi di prova e nel frattempo stabiliamo gli standard di settore. Nei nostri laboratori di prova, tecnici ed editori esperti utilizzano apparecchiature di misurazione di alta qualità. Questi test comportano un processo di validazione in più fasi. Il nostro complesso sistema di valutazione si basa su centinaia di misurazioni e parametri di riferimento ben fondati, che mantengono l'obiettività.Price comparison
