Verdetto - Mantenere la semplicità per l'ufficio
Essendo un portatile business relativamente economico, non ci aspettiamo molto da Dynabook Tecra A65-M, al di là dei solidi fondamenti come la qualità costruttiva, l'assistenza e la facilità d'uso. Il modello eccelle in tutti e tre i campi, anche se la tastiera e il clickpad morbidi possono richiedere un po' di tempo per abituarsi rispetto a una configurazione desktop adeguata. Le sue rispettabili prestazioni del processore grezzo meritano una menzione, soprattutto se si considera che alternative più sottili o più costose possono essere dotate di CPU più lente.
Gli aspetti più deludenti del Tecra A65-M sono probabilmente la riproduzione dei colori limitata e le deboli prestazioni della GPU e dell'AI. I colori limitati sono comprensibili per preservare i prezzi di partenza accessibili, ma dovrebbe esserci almeno una seconda opzione di pannello con colori sRGB completi per coloro che lo richiedono. Per quanto riguarda la CPU, il fatto di rimanere con Zen 4 permette al modello di preservare la maggior parte delle prestazioni grezze possibili senza ricorrere alla più costosa serie Zen 5, ma la sua GPU integrata invecchiata e l'accelerazione AI limitata rendono il sistema meno che ideale per l'esecuzione di attività più avanzate che coinvolgono Co-Pilot+ o software di editing grafico.
Pro
Contro
Prezzo e disponibilità
Il Dynabook Tecra A65-M non è ancora disponibile per l'acquisto. Tuttavia, il Tecra A60-M alimentato da Intel è ora in vendita con lo stesso design dello chassis e le stesse caratteristiche fisiche del Tecra A65-M per circa 1020 dollari su Amazon.
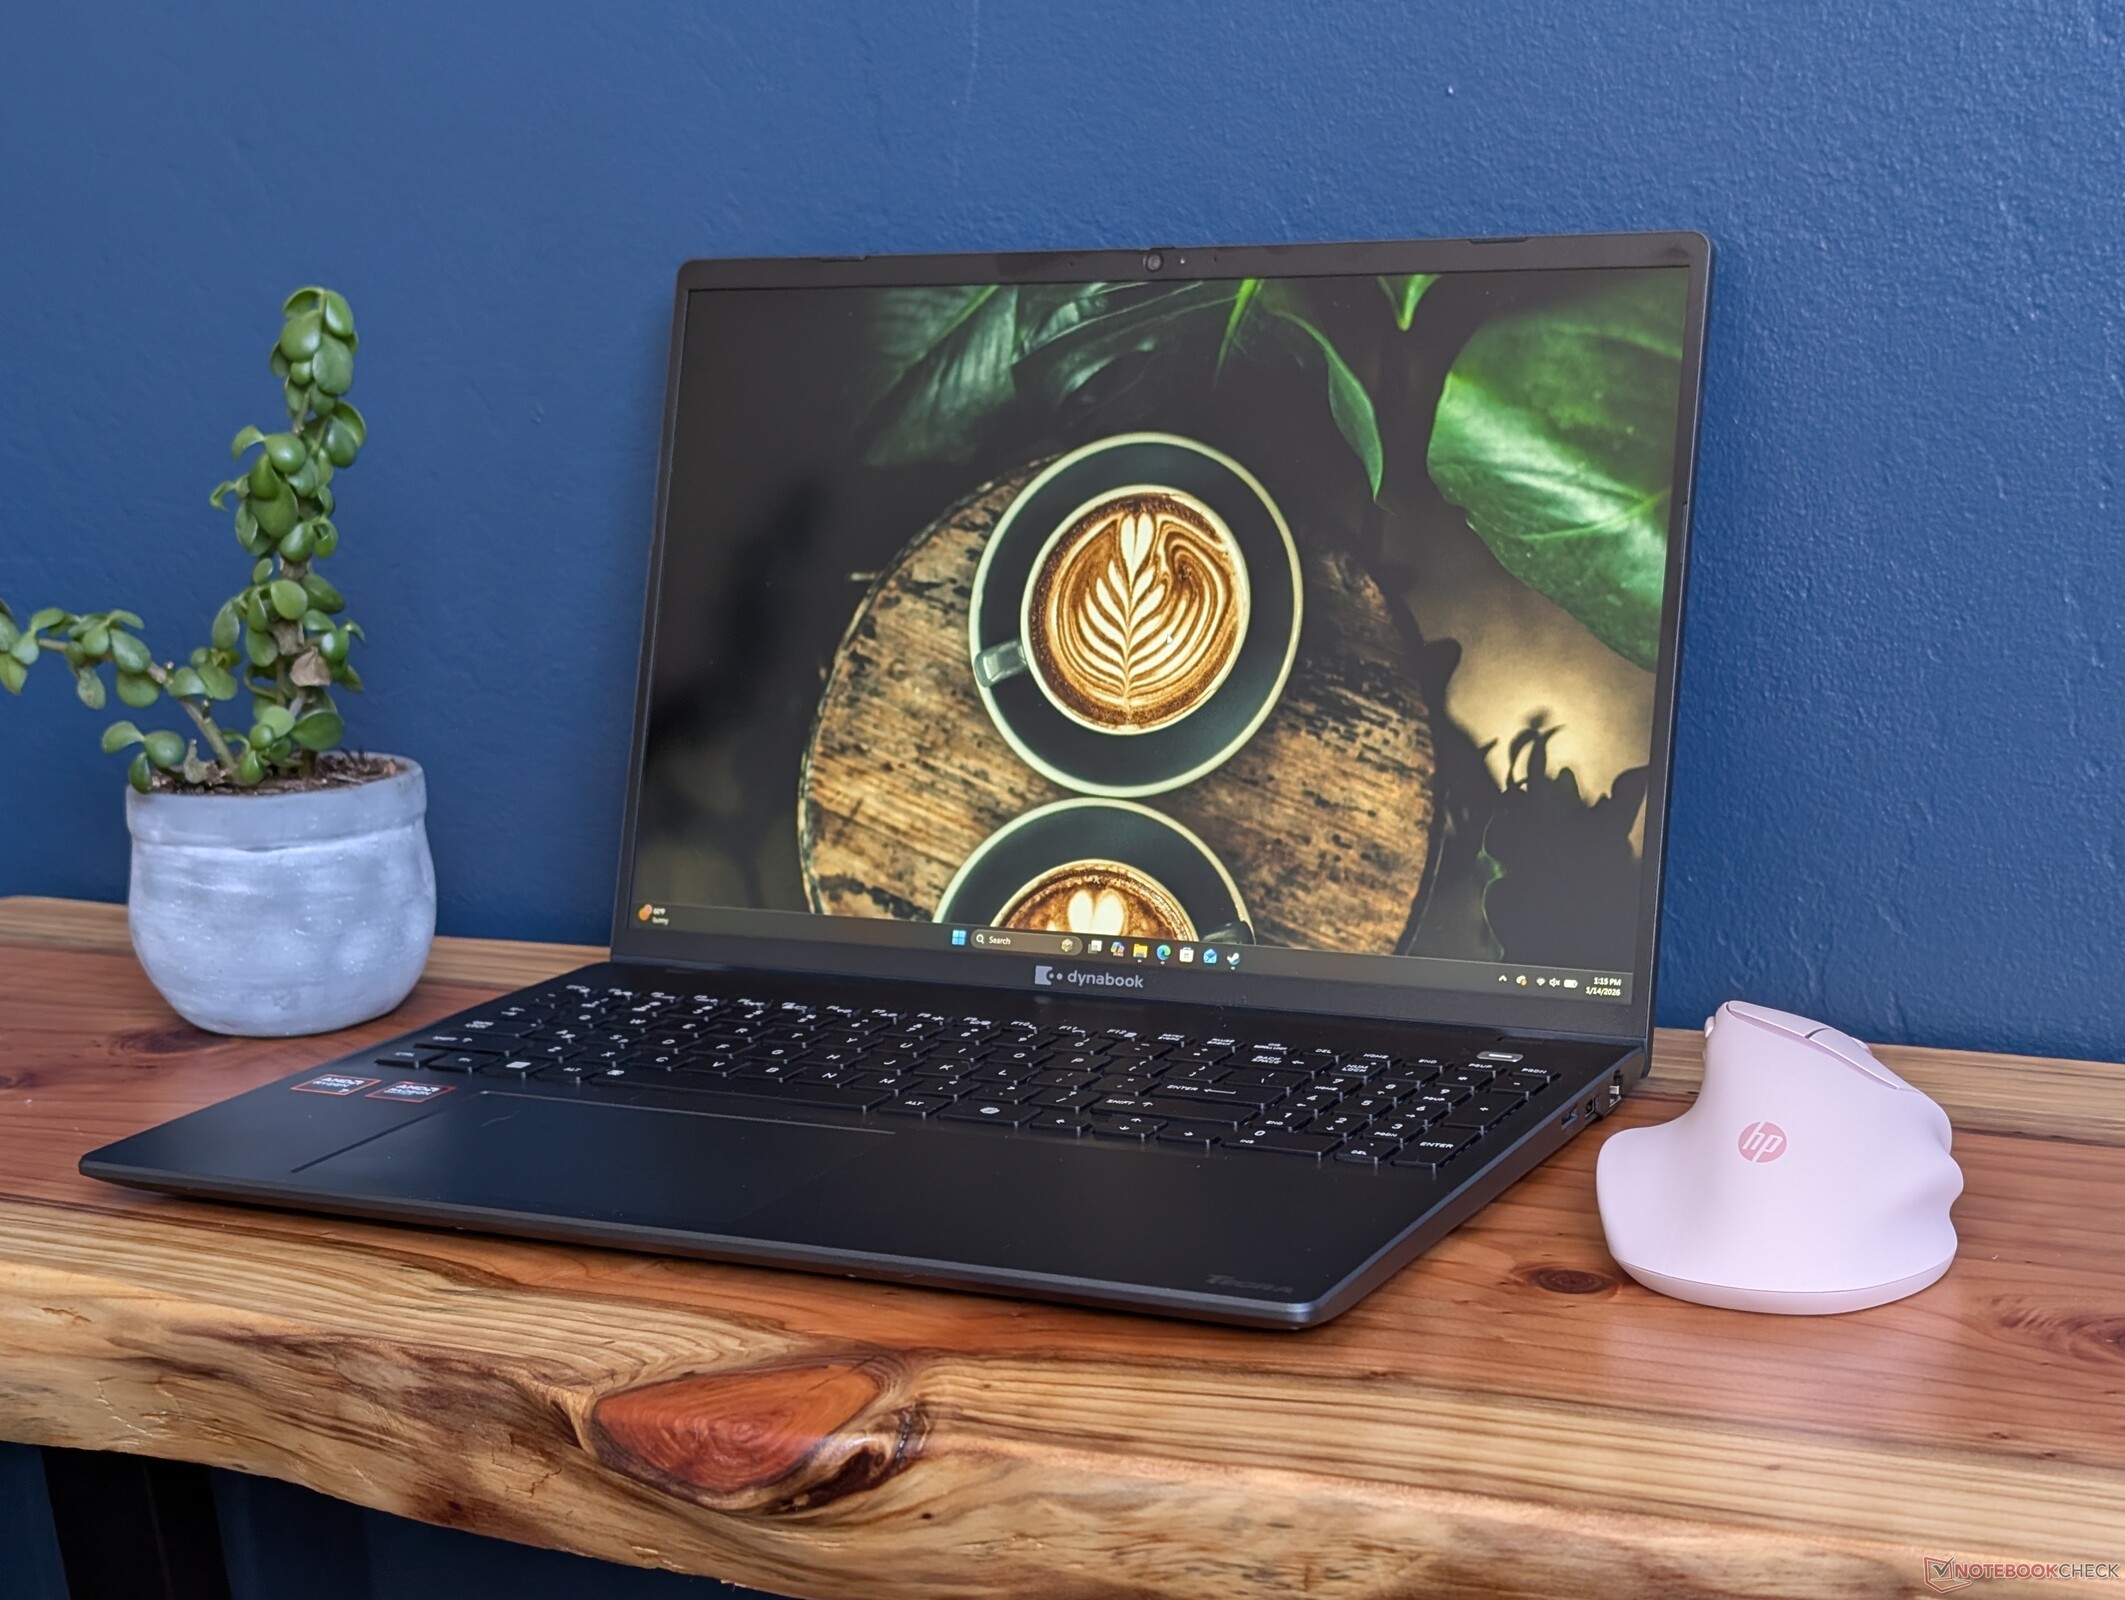
Annunciato all'inizio del mese scorso accanto al Dynabook Tecra A45-M da 14 pollici, il Tecra A65-M da 16 pollici è un computer portatile orientato al valore, progettato per i professionisti o gli utenti orientati all'ufficio. I modelli funzionano con CPU AMD Ryzen serie 200 con SKU Pro opzionali per completare le serie A40-M e A60-M alimentate da Intel.
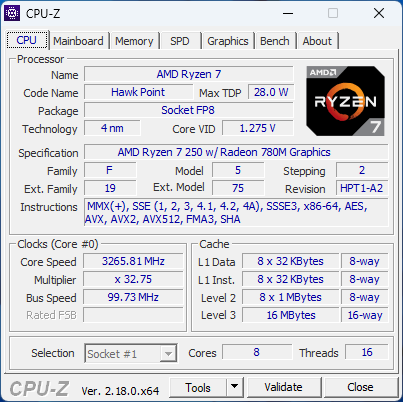
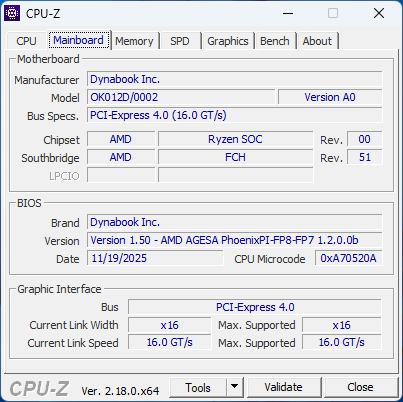
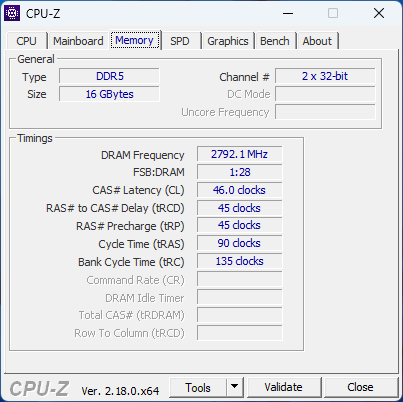
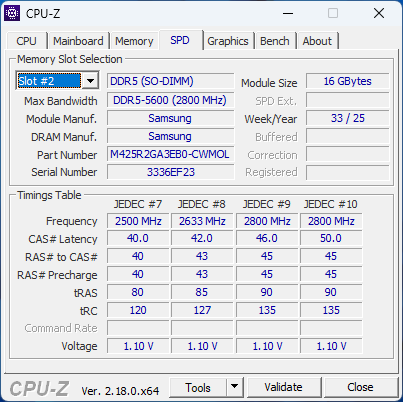
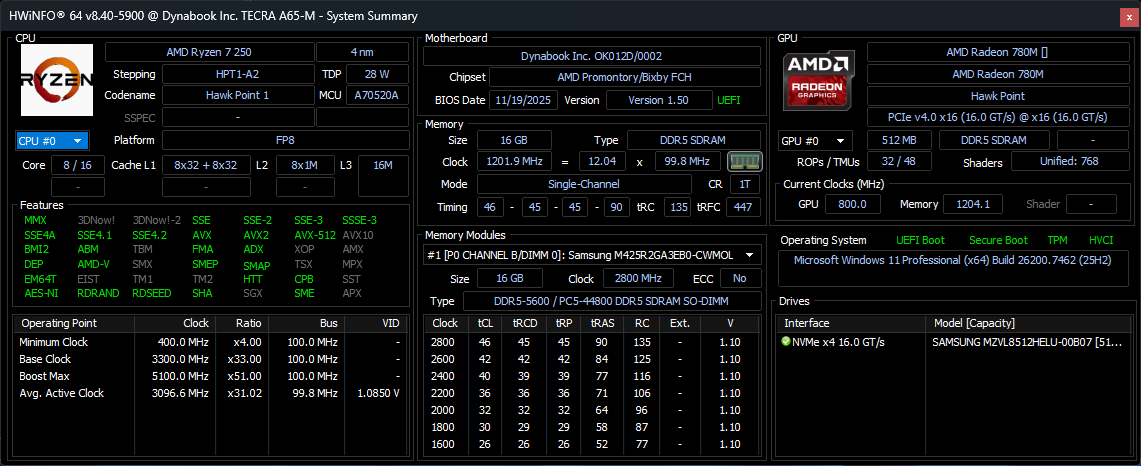
La nostra unità di prova è una configurazione di fascia media con la CPU Zen 4 Ryzen 7 250, 32 GB di RAM rimovibile e un display IPS 1920 x 1200p FHD 60 Hz per circa 1300 dollari. Le SKU di fascia inferiore vengono fornite con Ryzen 5 230, ma tutte le opzioni sono limitate allo stesso pannello IPS opaco da 1200p.
L'economica serie Tecra si affianca alla serie di fascia alta Serie Portege nella linea di computer portatili professionali Dynabook. I concorrenti diretti includono altri computer portatili business orientati al budget, come quelli della serie Lenovo ThinkPad serie E o la serie HP EliteBook 6.
Altre recensioni di Dynabook:
Specifiche
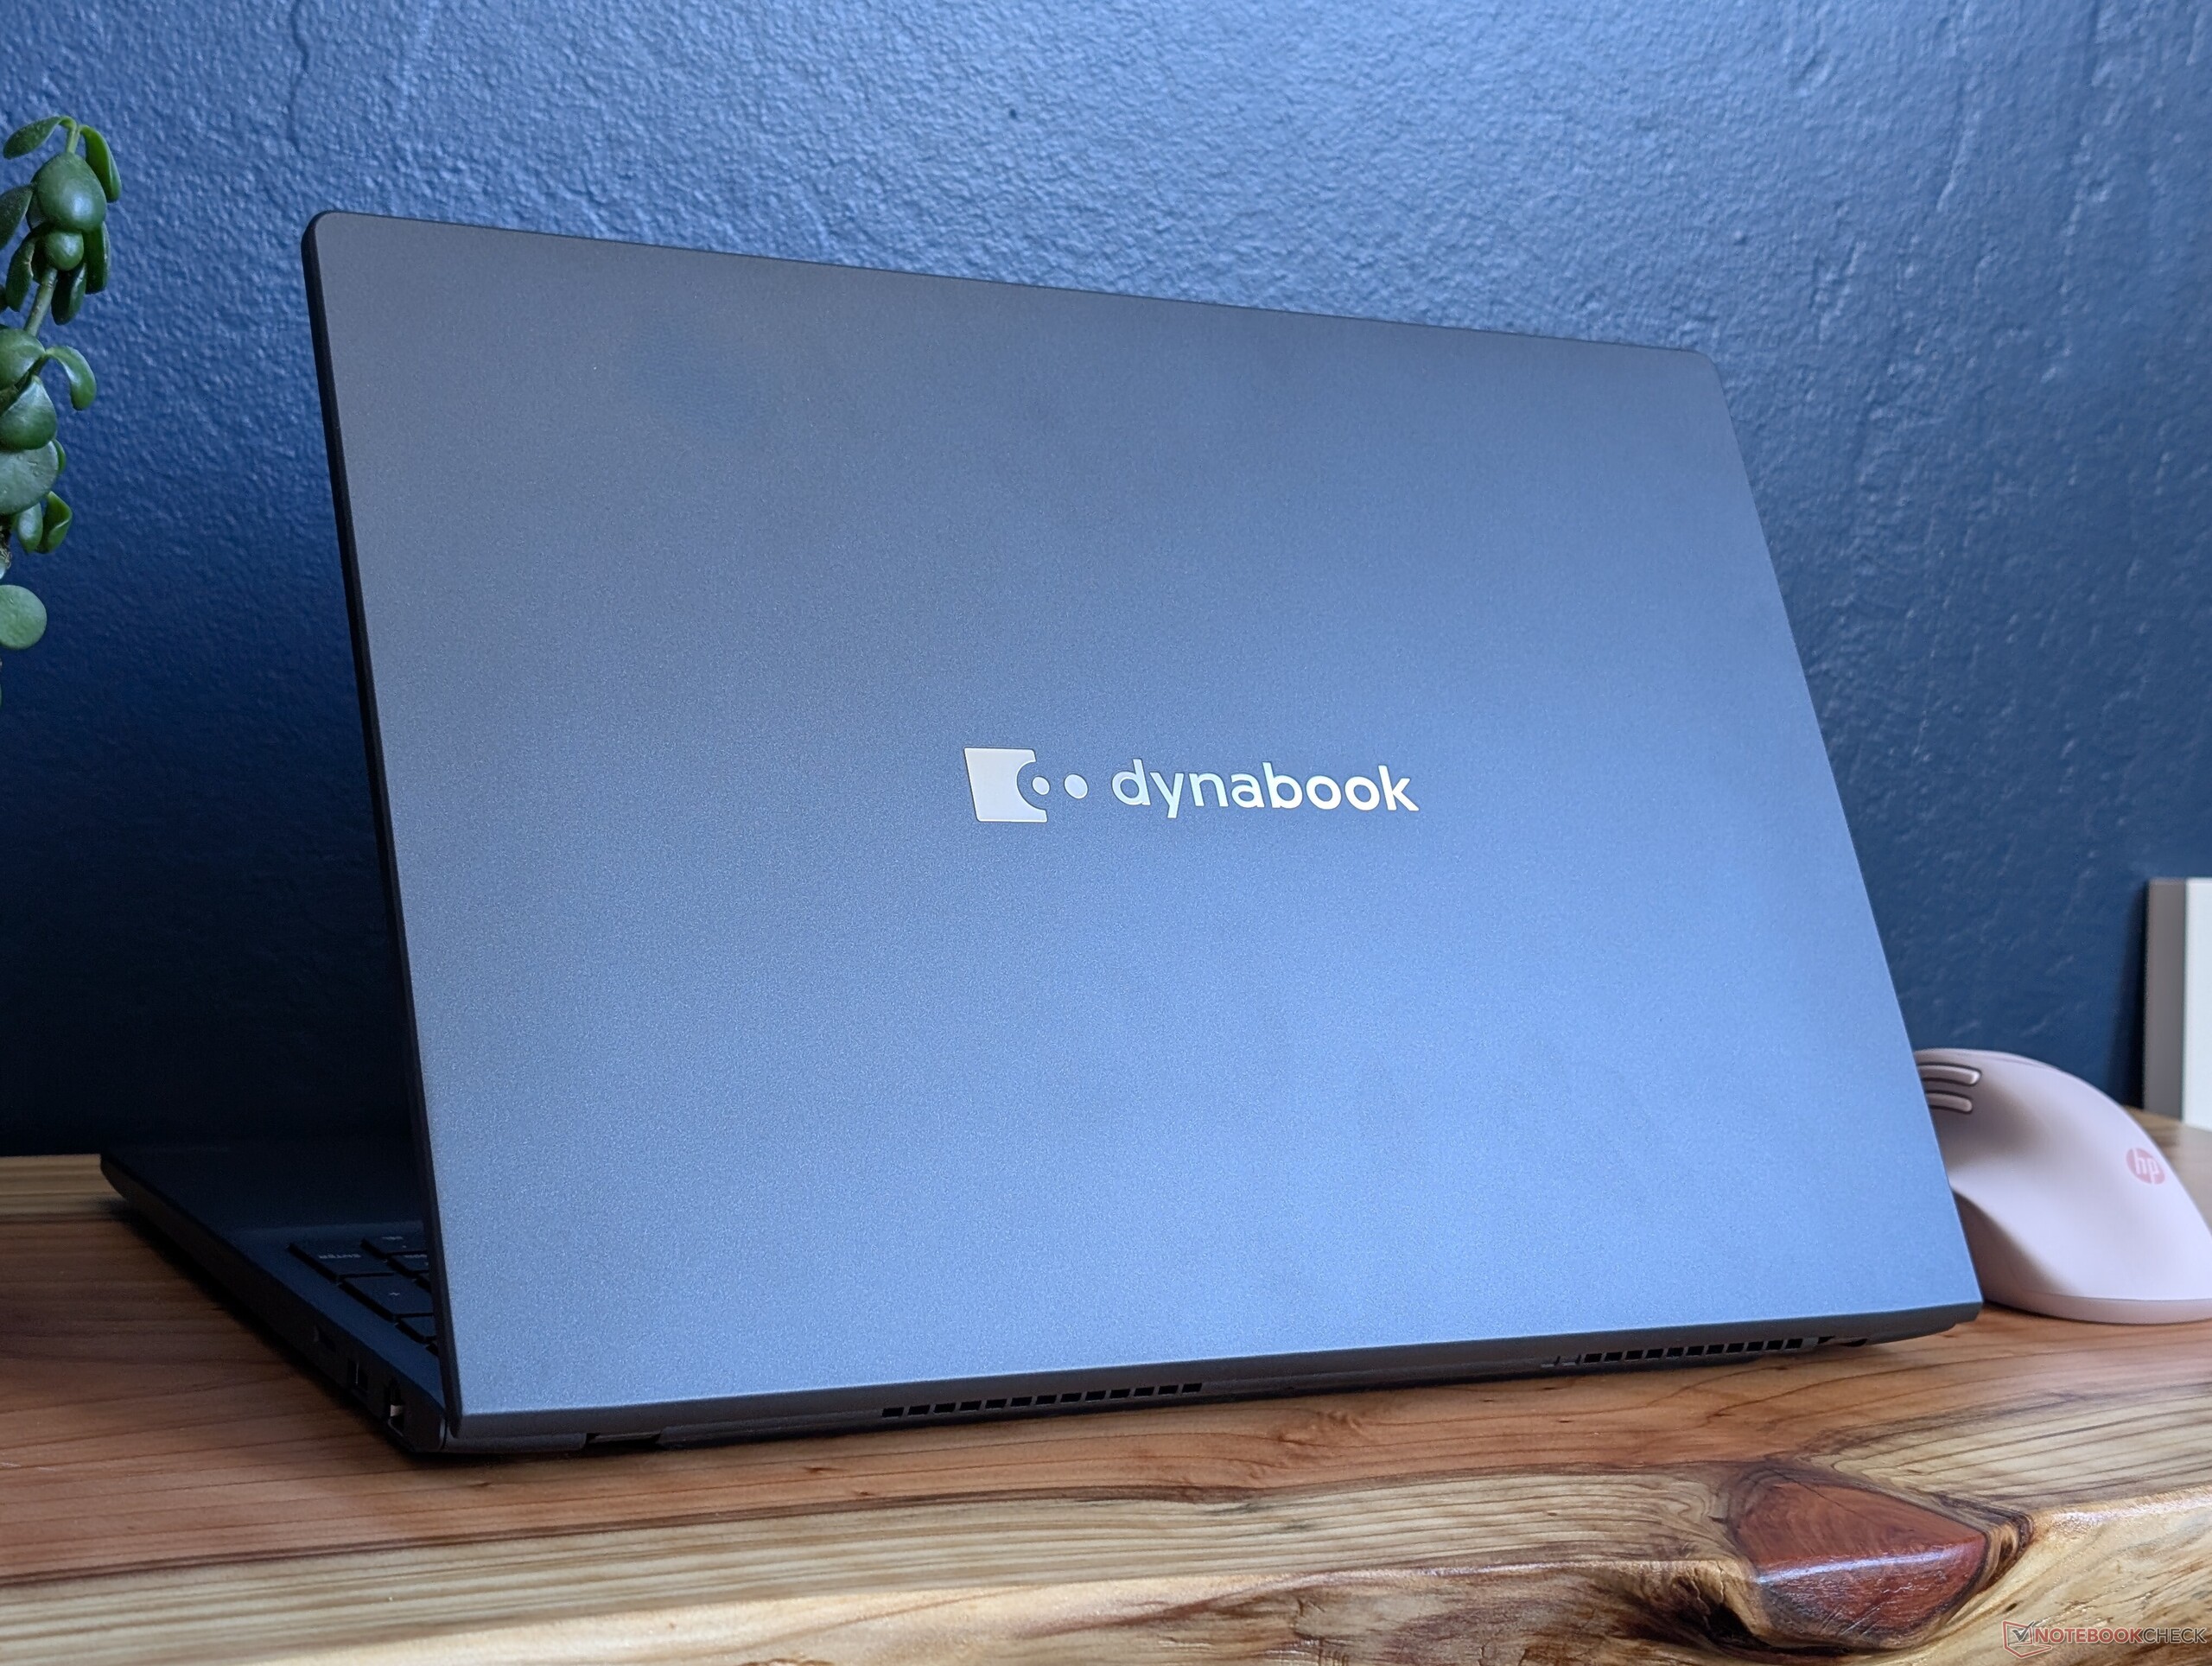
Caso
Il telaio è in gran parte in policarbonato opaco anziché in lega metallica e quindi si flette più facilmente. È comunque certificato secondo gli standard MIL-STD-810H per essere adatto agli ambienti professionali.
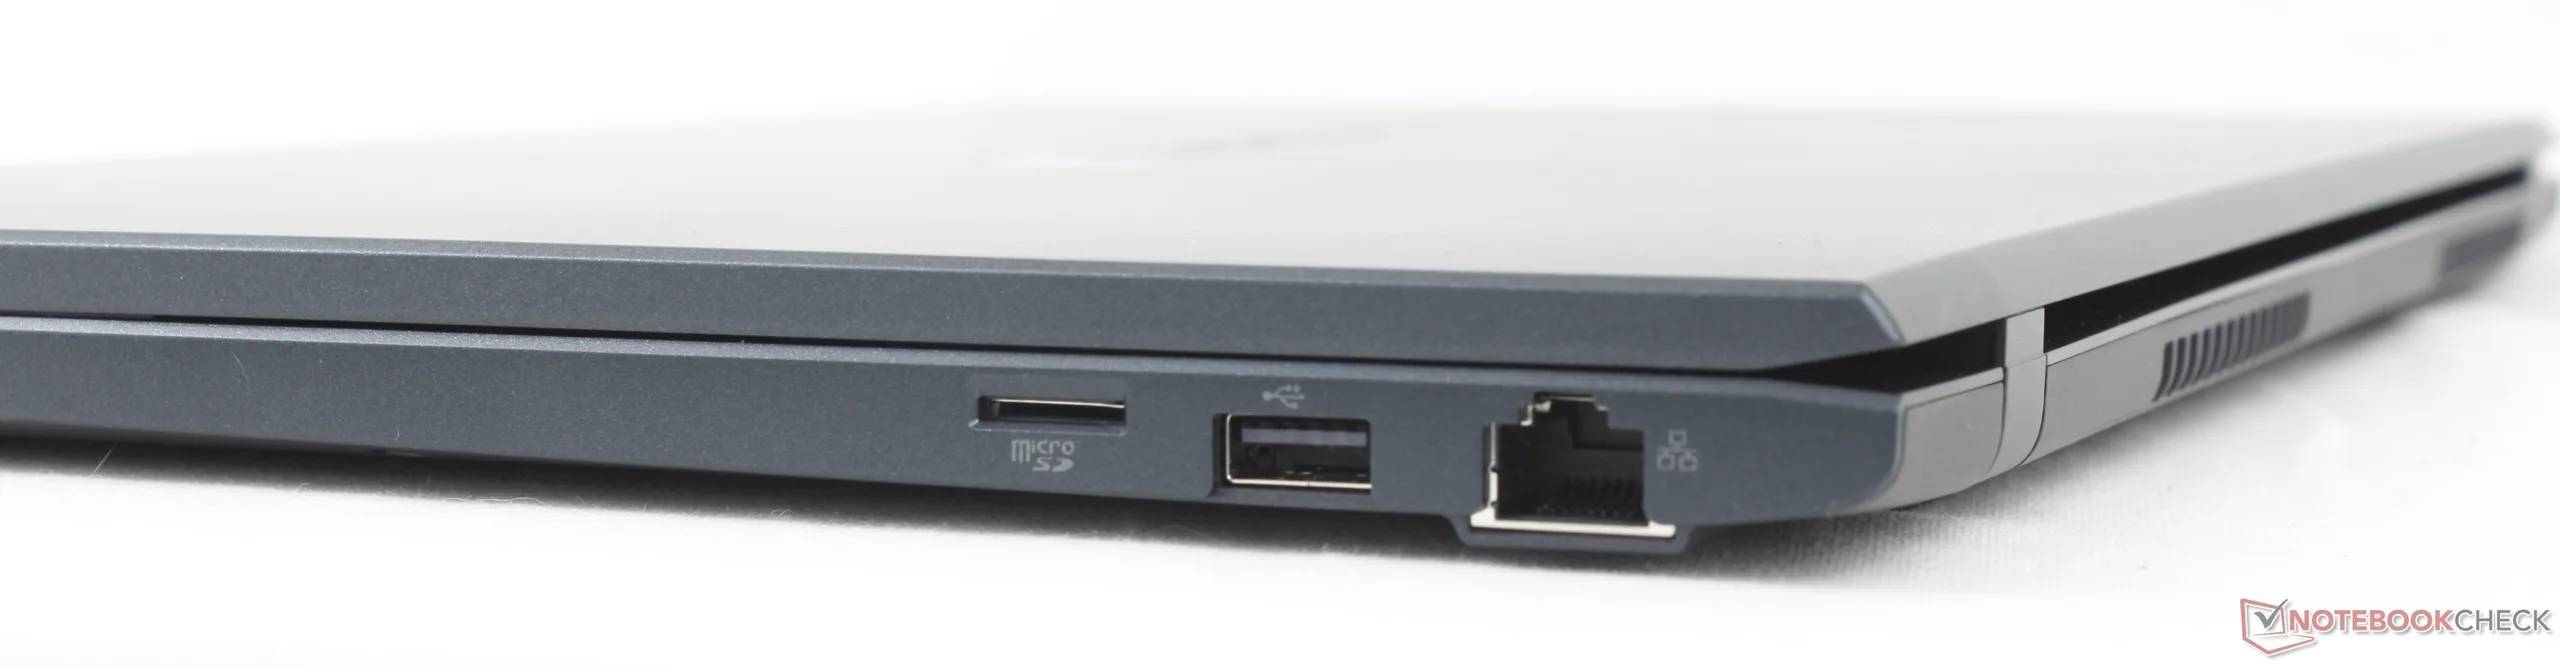
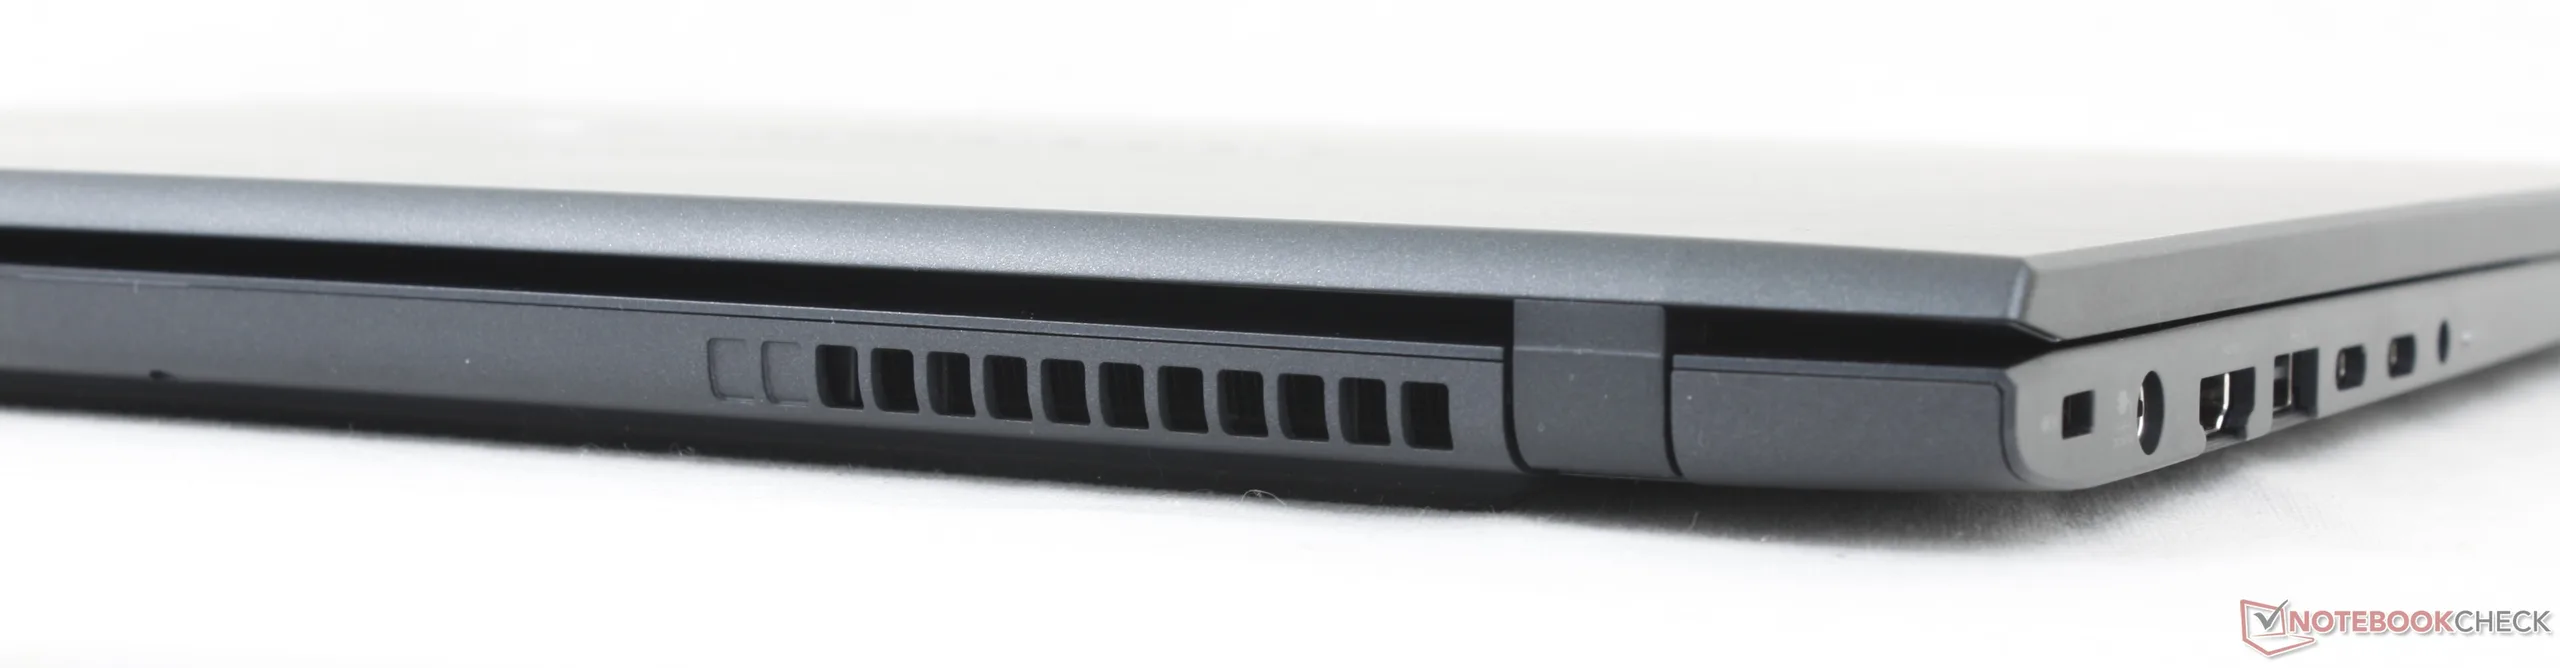
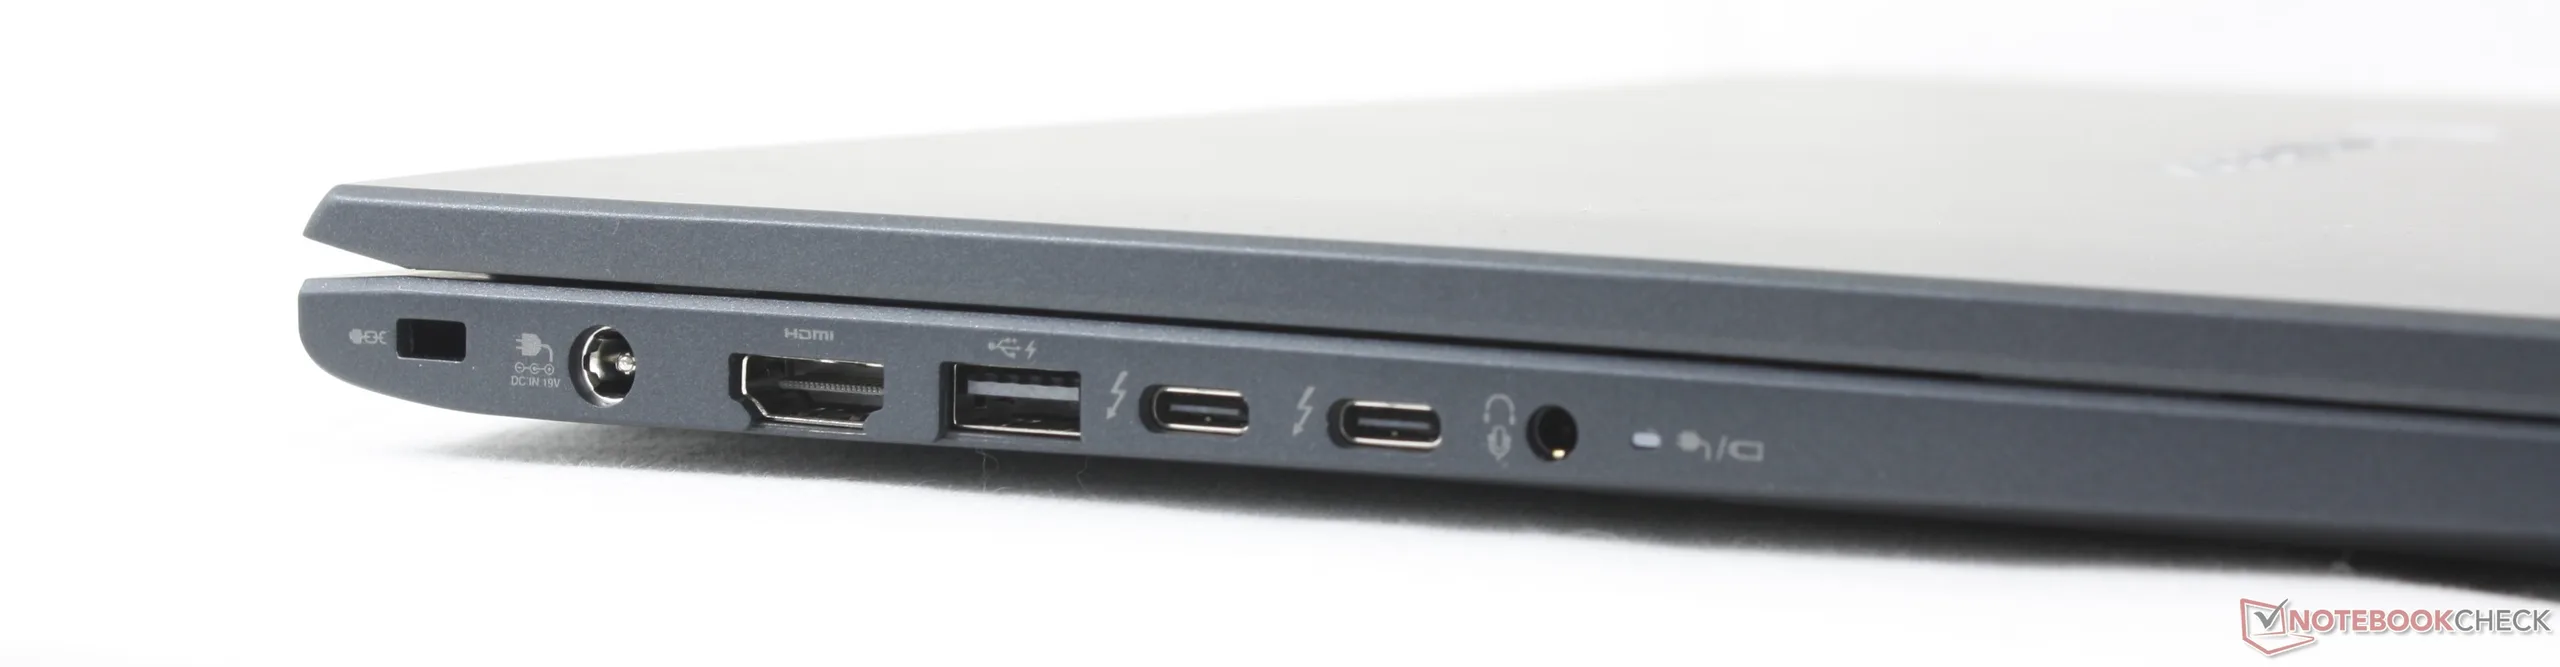
Connettività
C'è un numero rispettabile di porte integrate, tra cui RJ-45 e più porte USB-A, a differenza di quanto accade sul modello EliteBook 8 G1a 16. Tuttavia, le porte lungo il bordo sinistro possono sembrare piuttosto strette.
Lettore di schede SD
| SD Card Reader | |
| average JPG Copy Test (av. of 3 runs) | |
| Asus ExpertBook B5 B5605CCA (Angelbird AV Pro V60) | |
| Dynabook Tecra A60 A65-M (Angelbird AV Pro V60) | |
| maximum AS SSD Seq Read Test (1GB) | |
| Dynabook Tecra A60 A65-M (Angelbird AV Pro V60) | |
| Asus ExpertBook B5 B5605CCA (Angelbird AV Pro V60) | |
Comunicazione
| Networking | |
| iperf3 transmit AXE11000 | |
| Lenovo ThinkPad T16 Gen 4 21QQS06M00 | |
| Asus ExpertBook B5 B5605CCA | |
| HP EliteBook 8 G1a 16 AI | |
| Dynabook Tecra A60 A65-M | |
| Dell 16 Premium DA16250 | |
| iperf3 receive AXE11000 | |
| Lenovo ThinkPad T16 Gen 4 21QQS06M00 | |
| Asus ExpertBook B5 B5605CCA | |
| HP EliteBook 8 G1a 16 AI | |
| Dynabook Tecra A60 A65-M | |
| Dell 16 Premium DA16250 | |
| iperf3 transmit AXE11000 6GHz | |
| LG Gram Pro 16 16Z90TR-E.AD8BG | |
| Dynabook Tecra A60 A65-M | |
| HP EliteBook 8 G1a 16 AI | |
| Dell 16 Premium DA16250 | |
| iperf3 receive AXE11000 6GHz | |
| LG Gram Pro 16 16Z90TR-E.AD8BG | |
| HP EliteBook 8 G1a 16 AI | |
| Dell 16 Premium DA16250 | |
| Dynabook Tecra A60 A65-M | |
Webcam


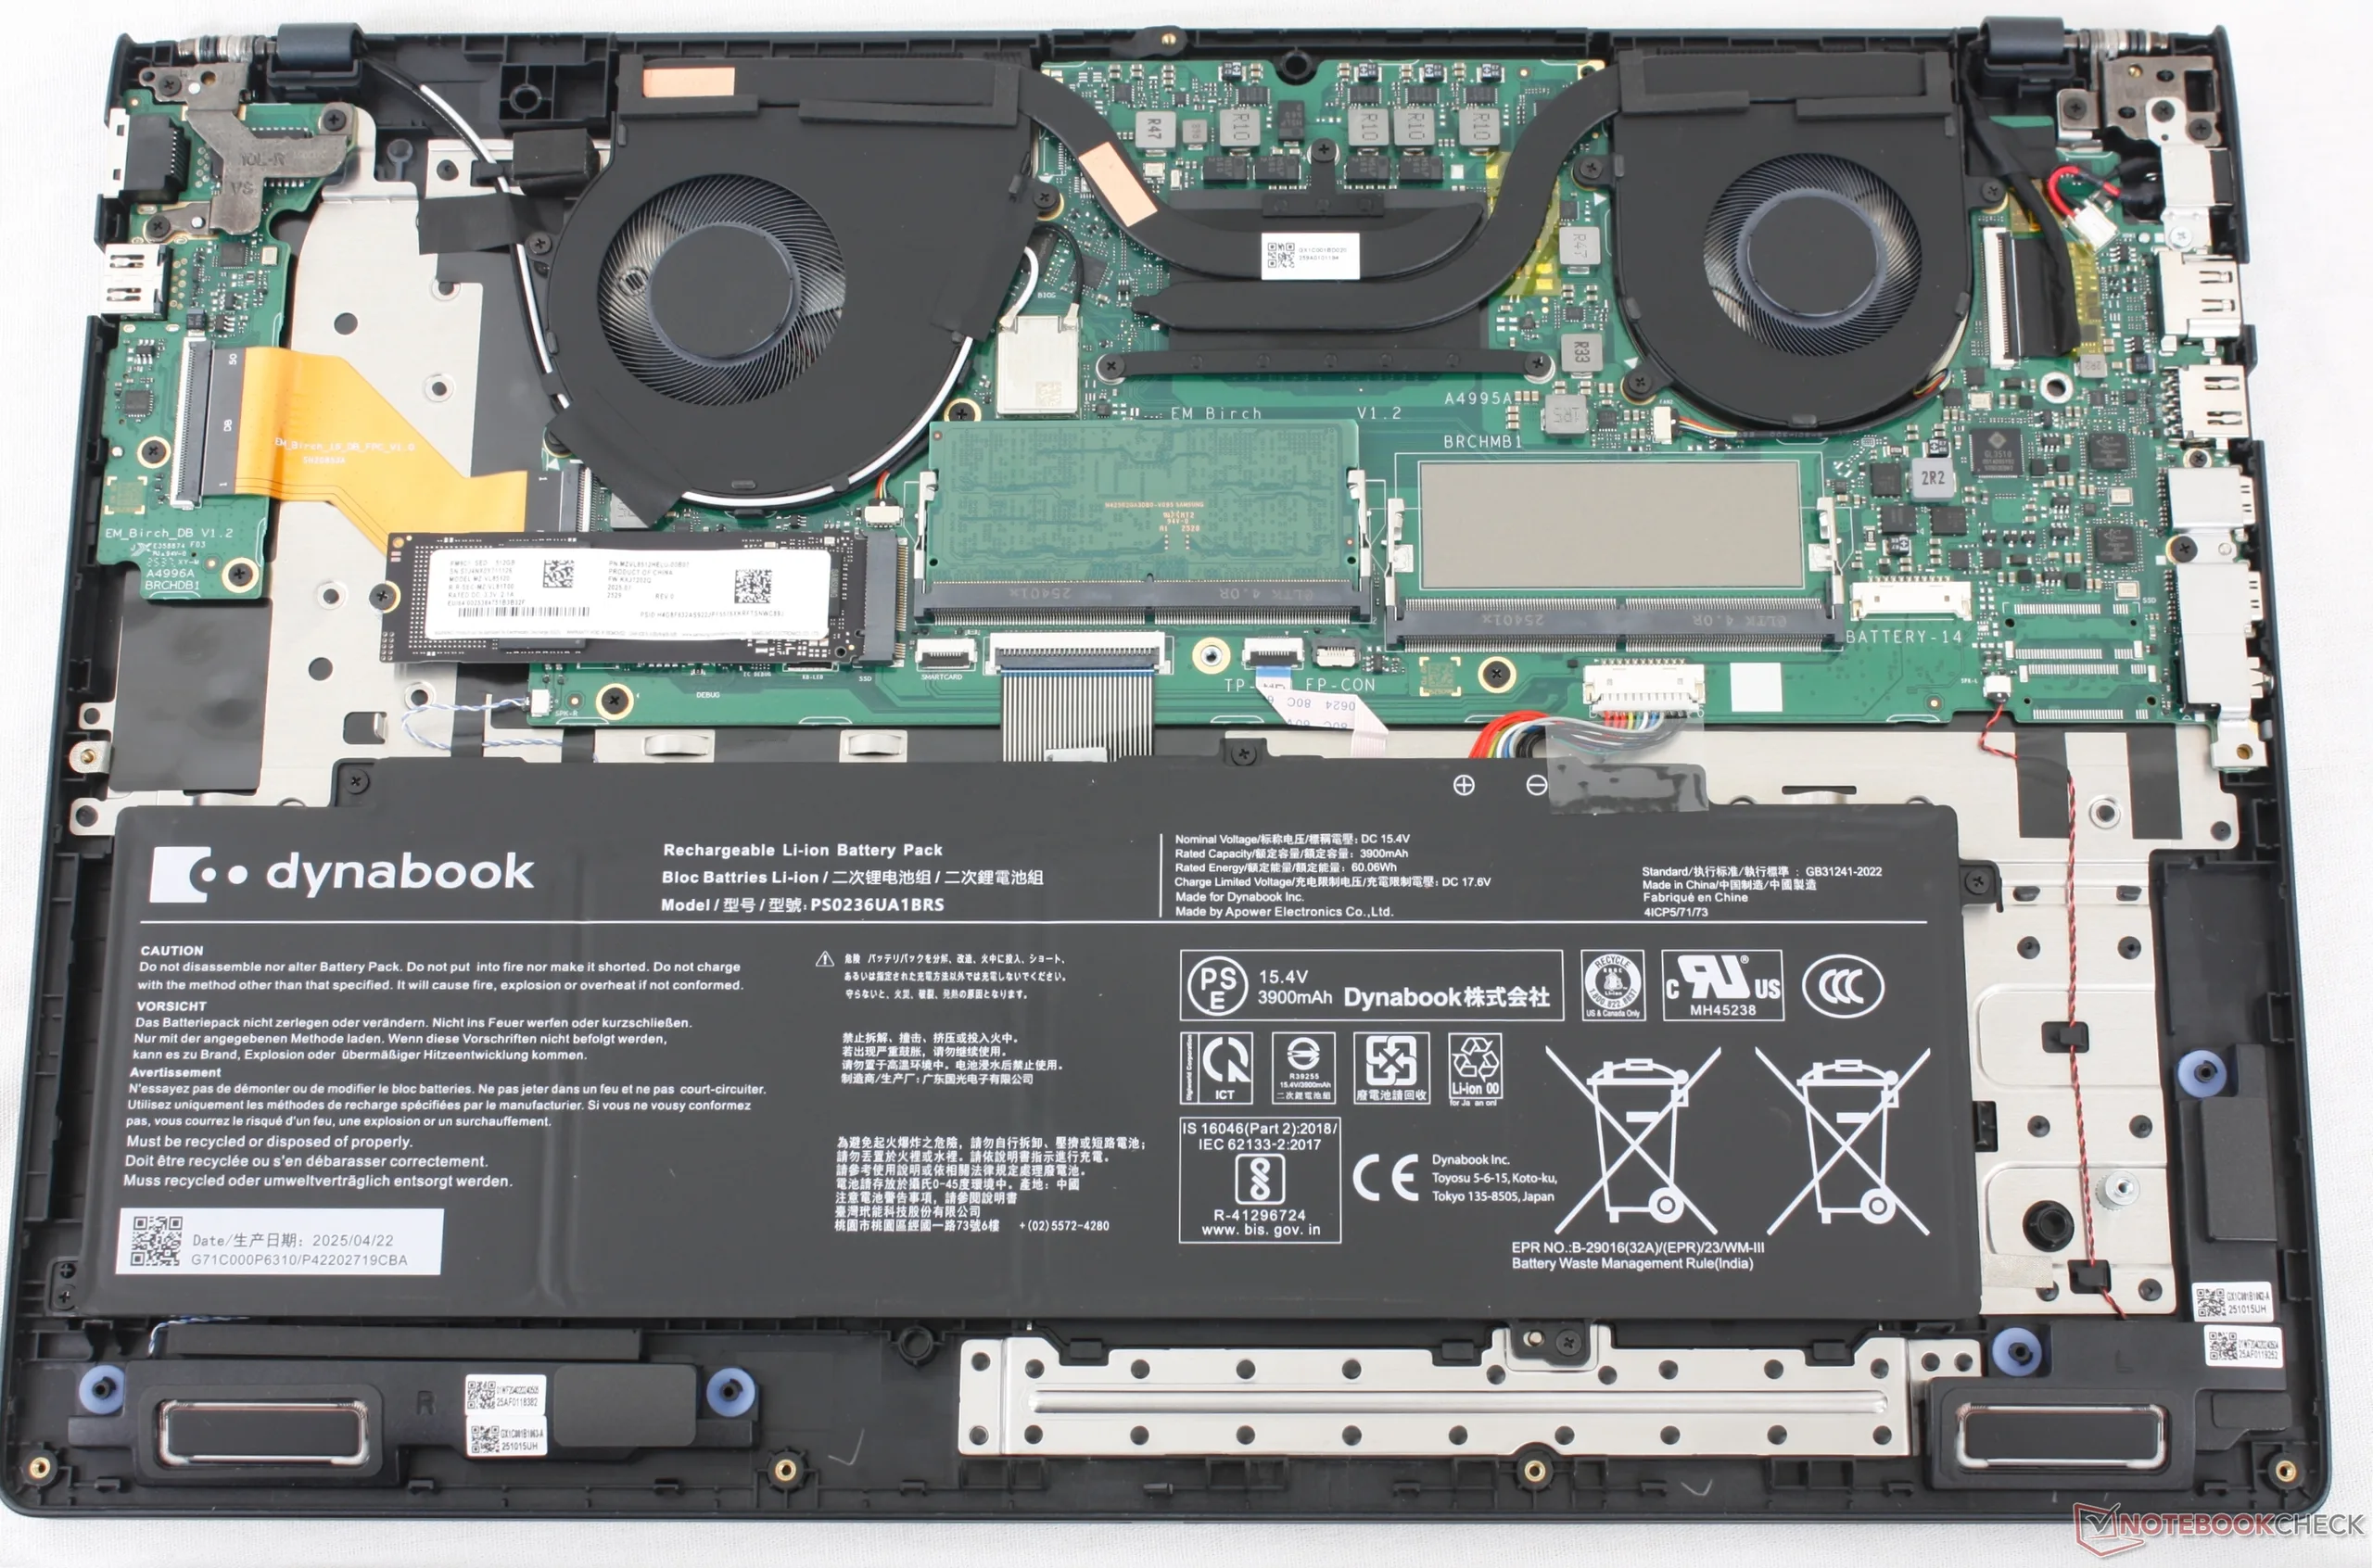
Manutenzione
Sostenibilità
Sebbene Dynabook dichiari un "grande impegno" per ridurre l'impatto ambientale, non riusciamo a trovare dati sui materiali riciclati utilizzati durante la produzione. La confezione utilizza ancora un involucro di plastica per l'adattatore CA e per il portatile stesso.
Accessori e garanzia
Nella confezione non ci sono altri extra oltre all'adattatore CA e alla documentazione. La garanzia limitata di tre anni del produttore è standard.
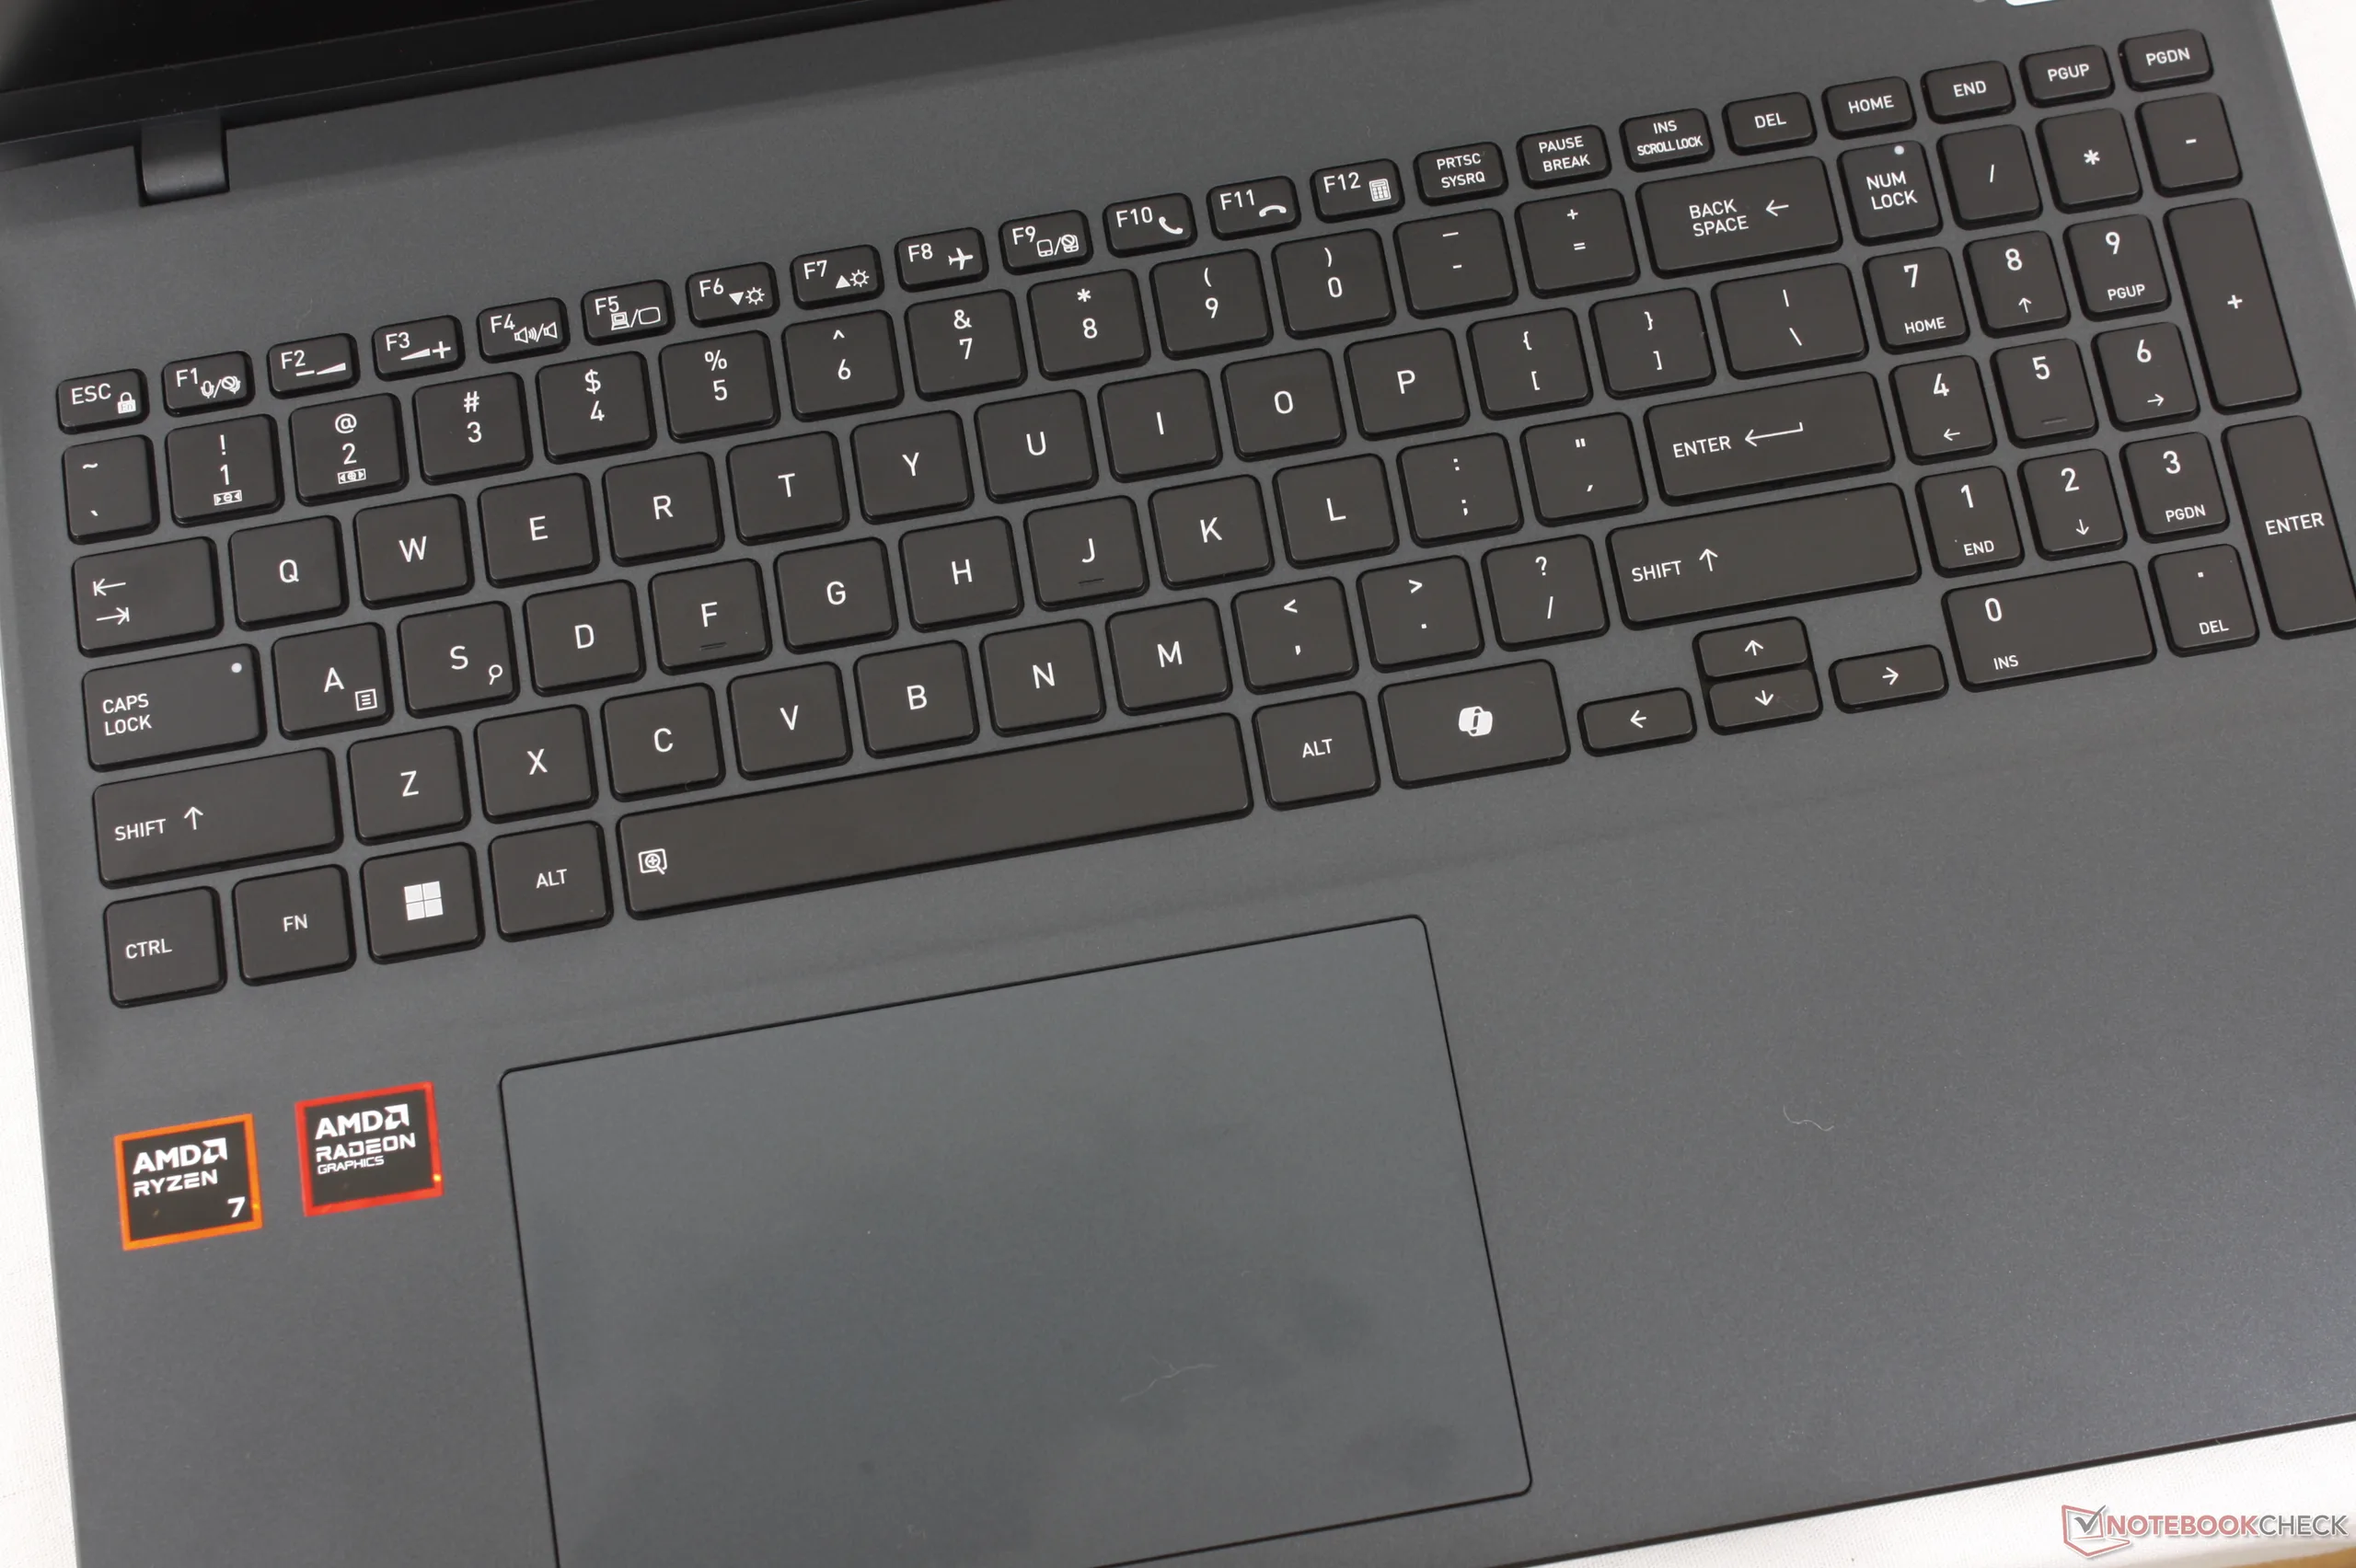
Dispositivi di ingresso
La corsa dei tasti e il feedback sono sensibilmente più corti e più morbidi, rispettivamente, rispetto ai tasti di un Lenovo ThinkPad o di un HP EliteBook. A sua volta, il rumore è più silenzioso rispetto alla maggior parte degli altri computer portatili.
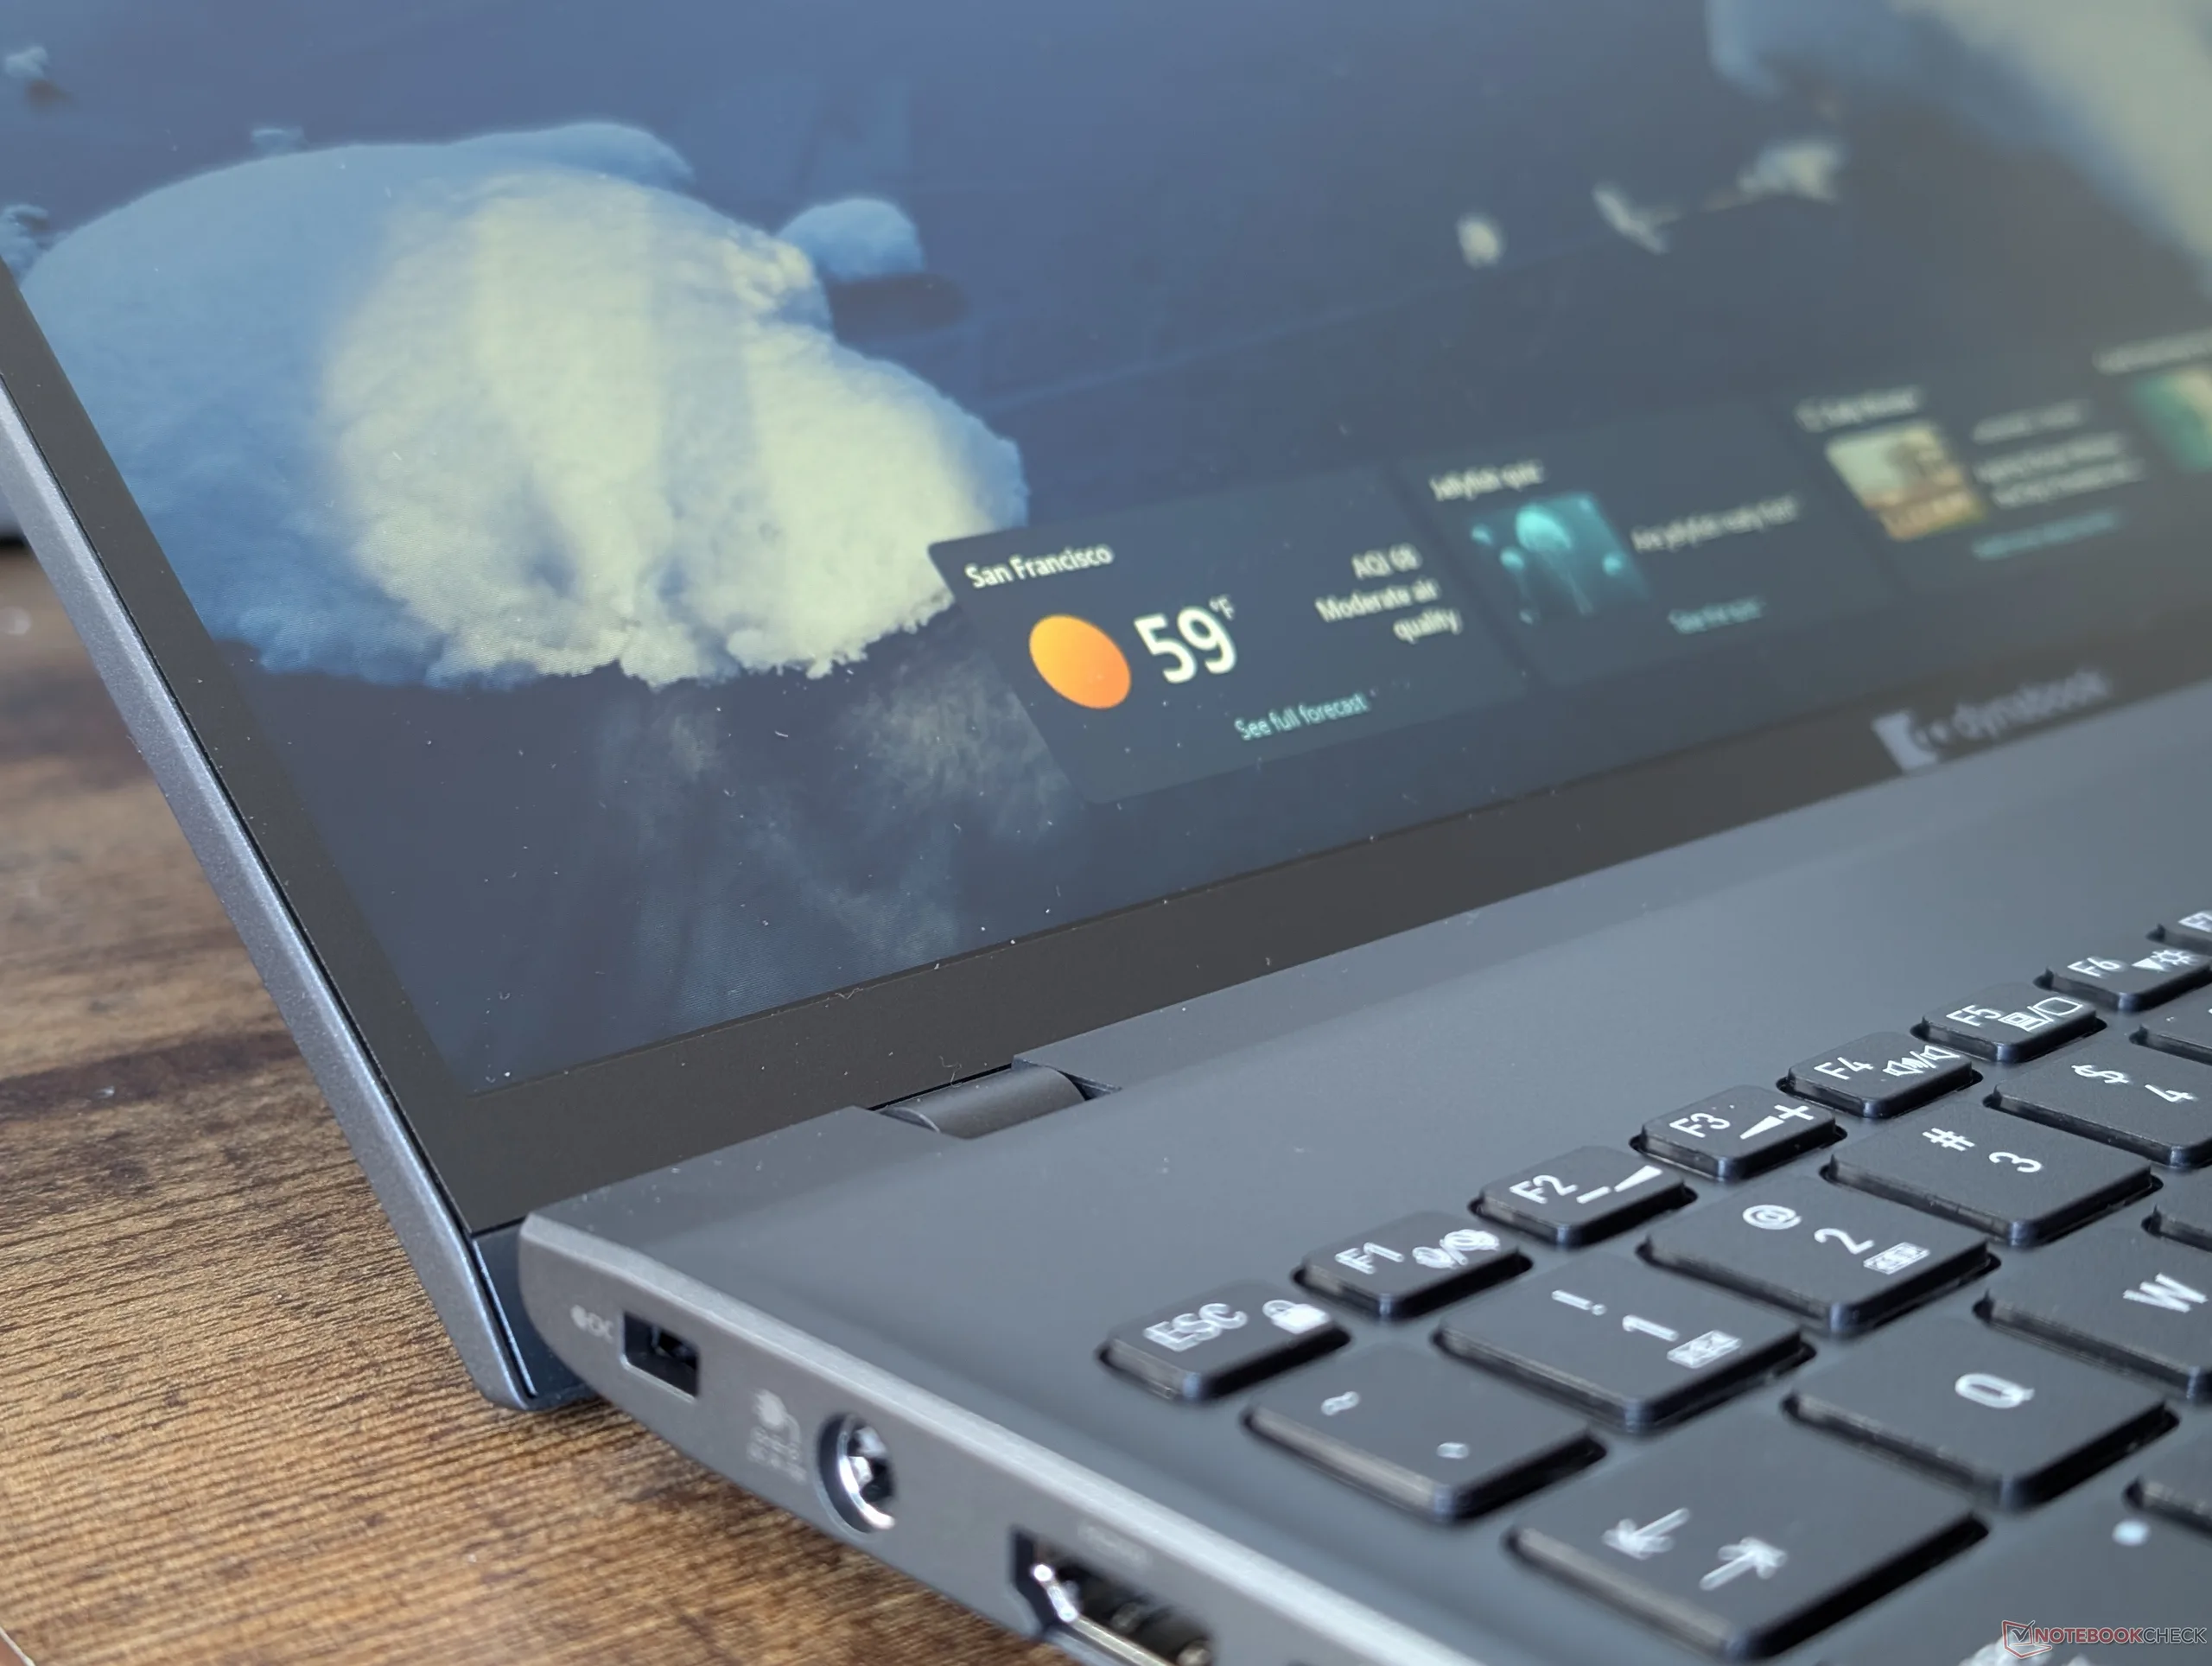
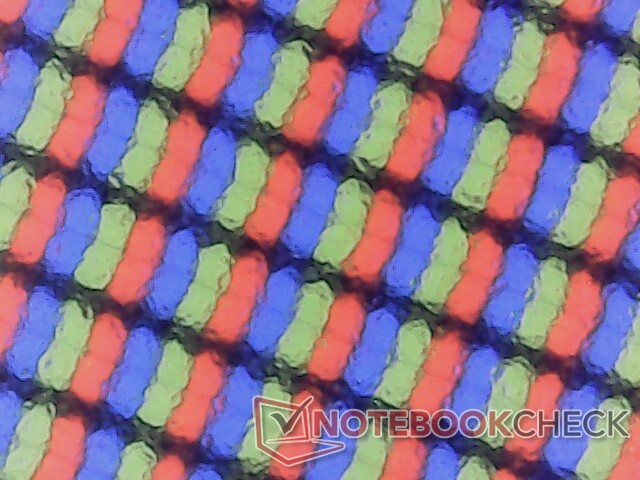
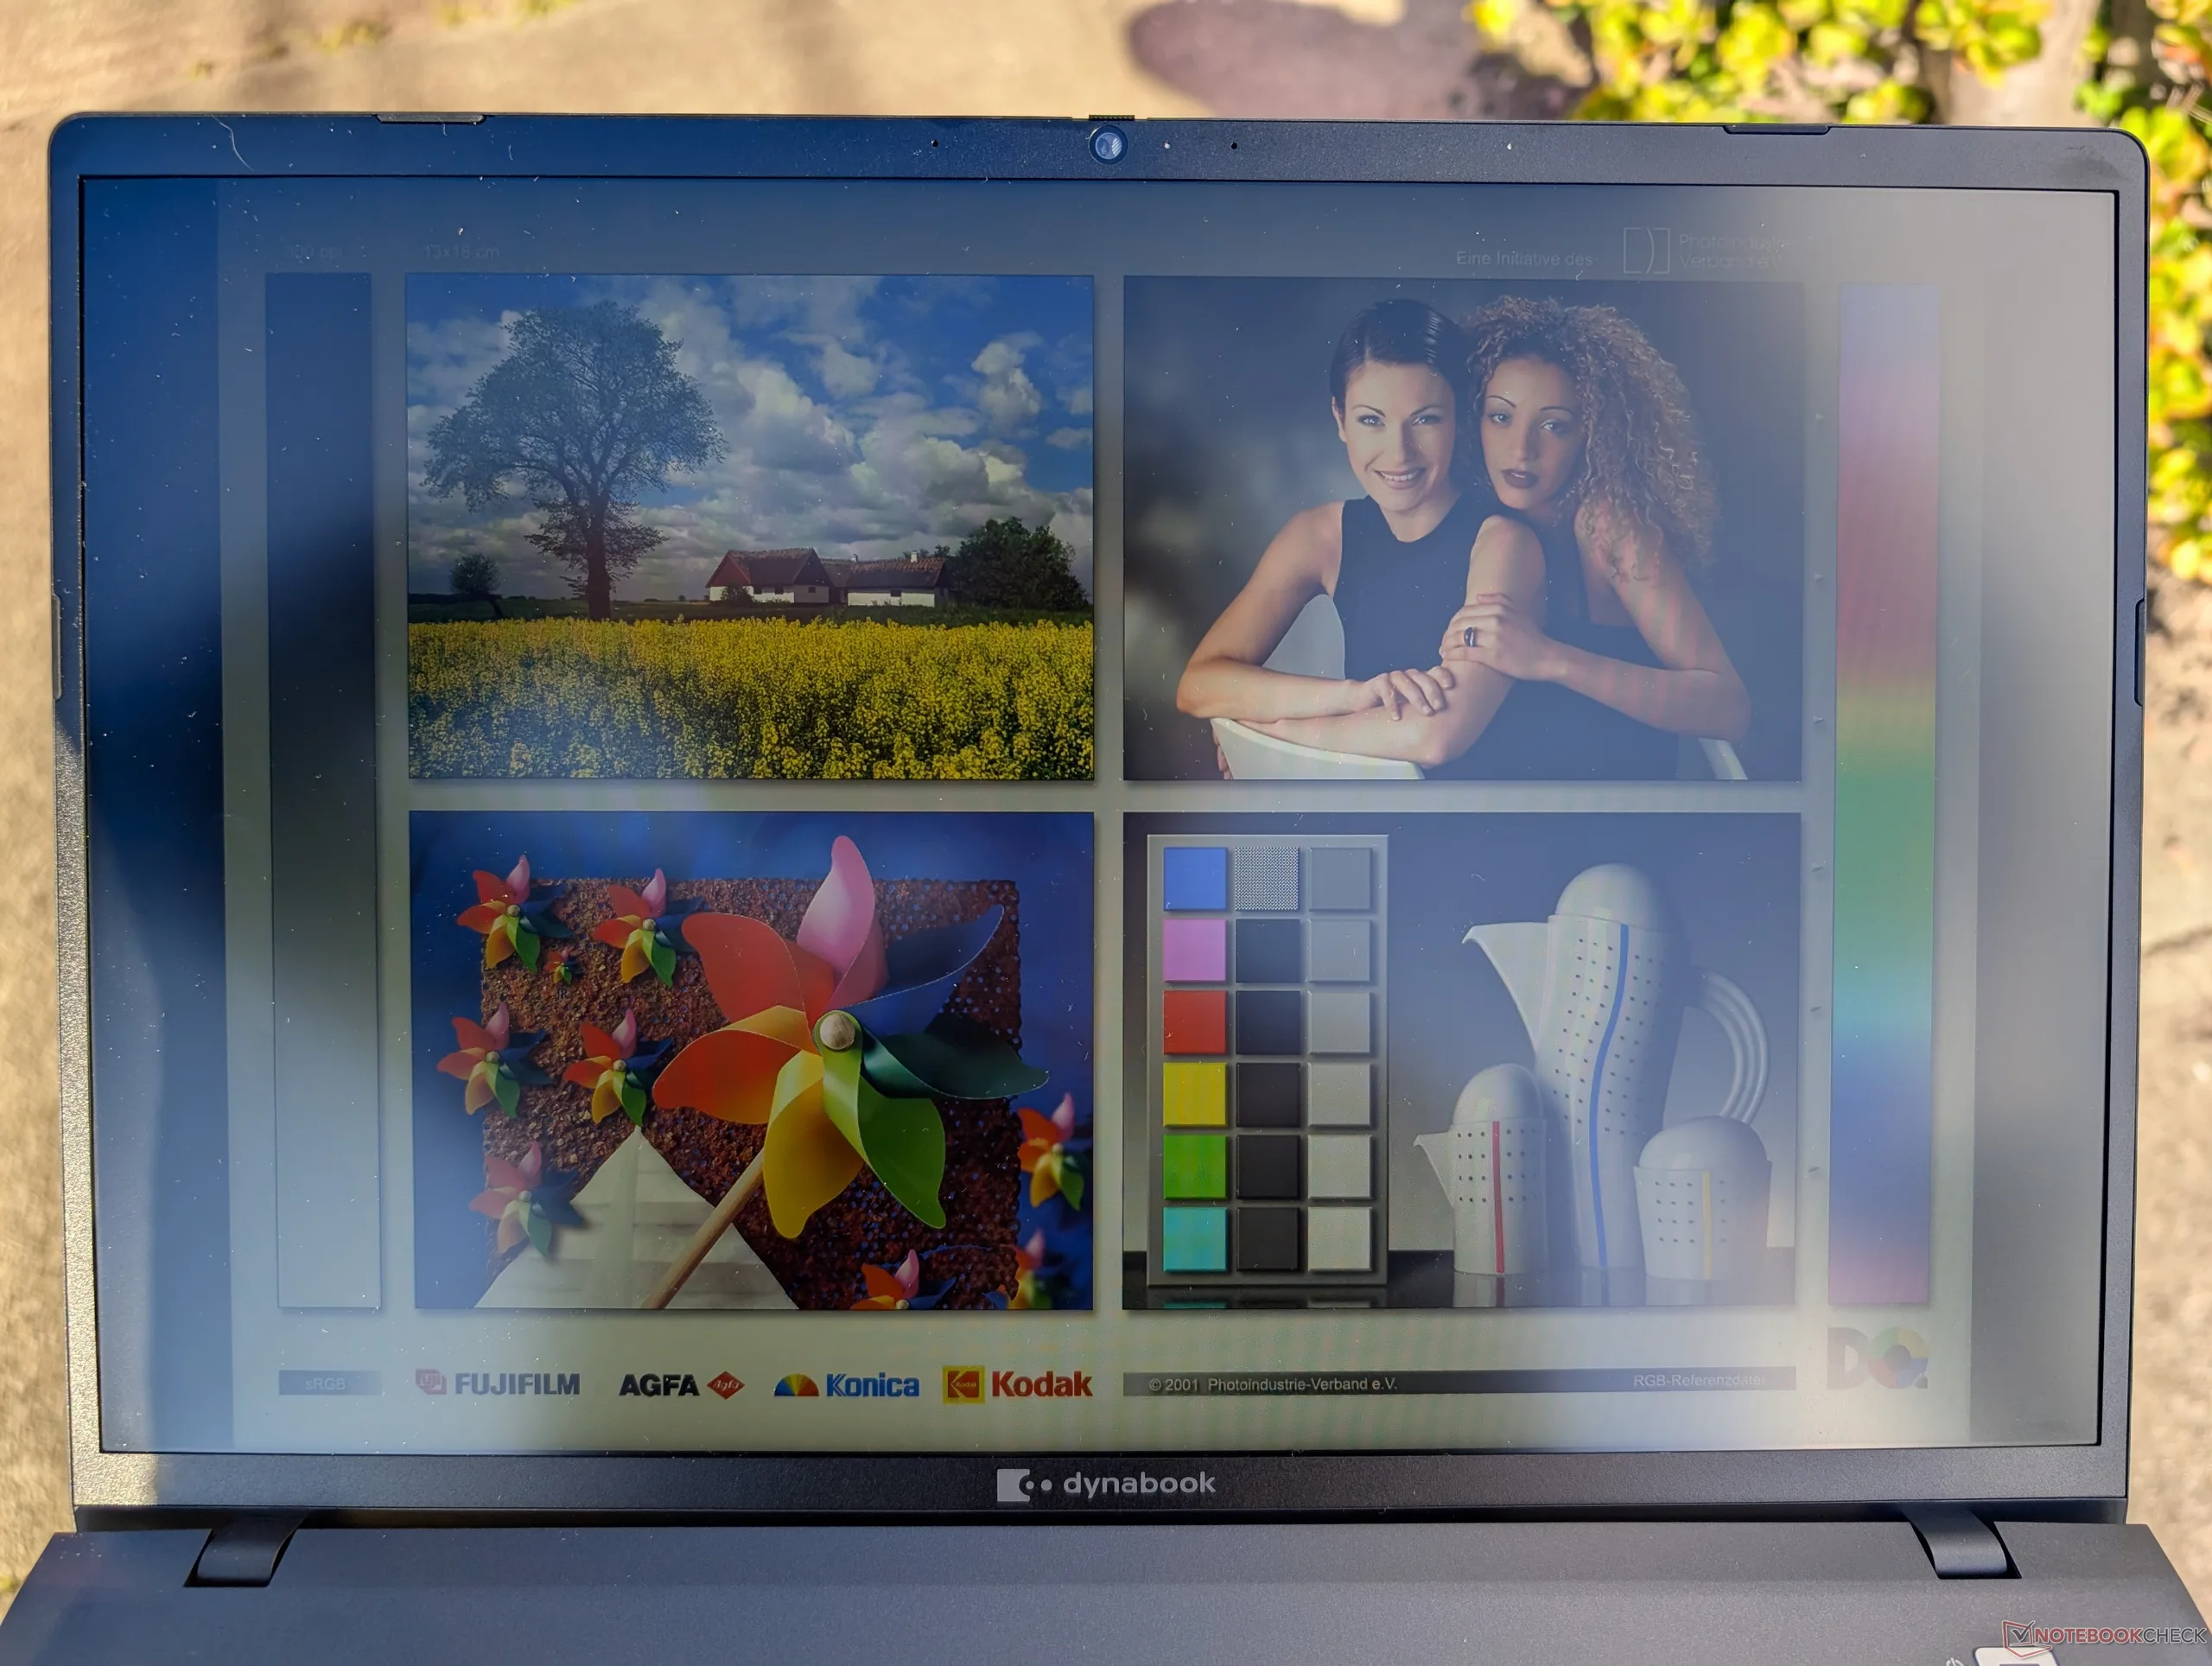
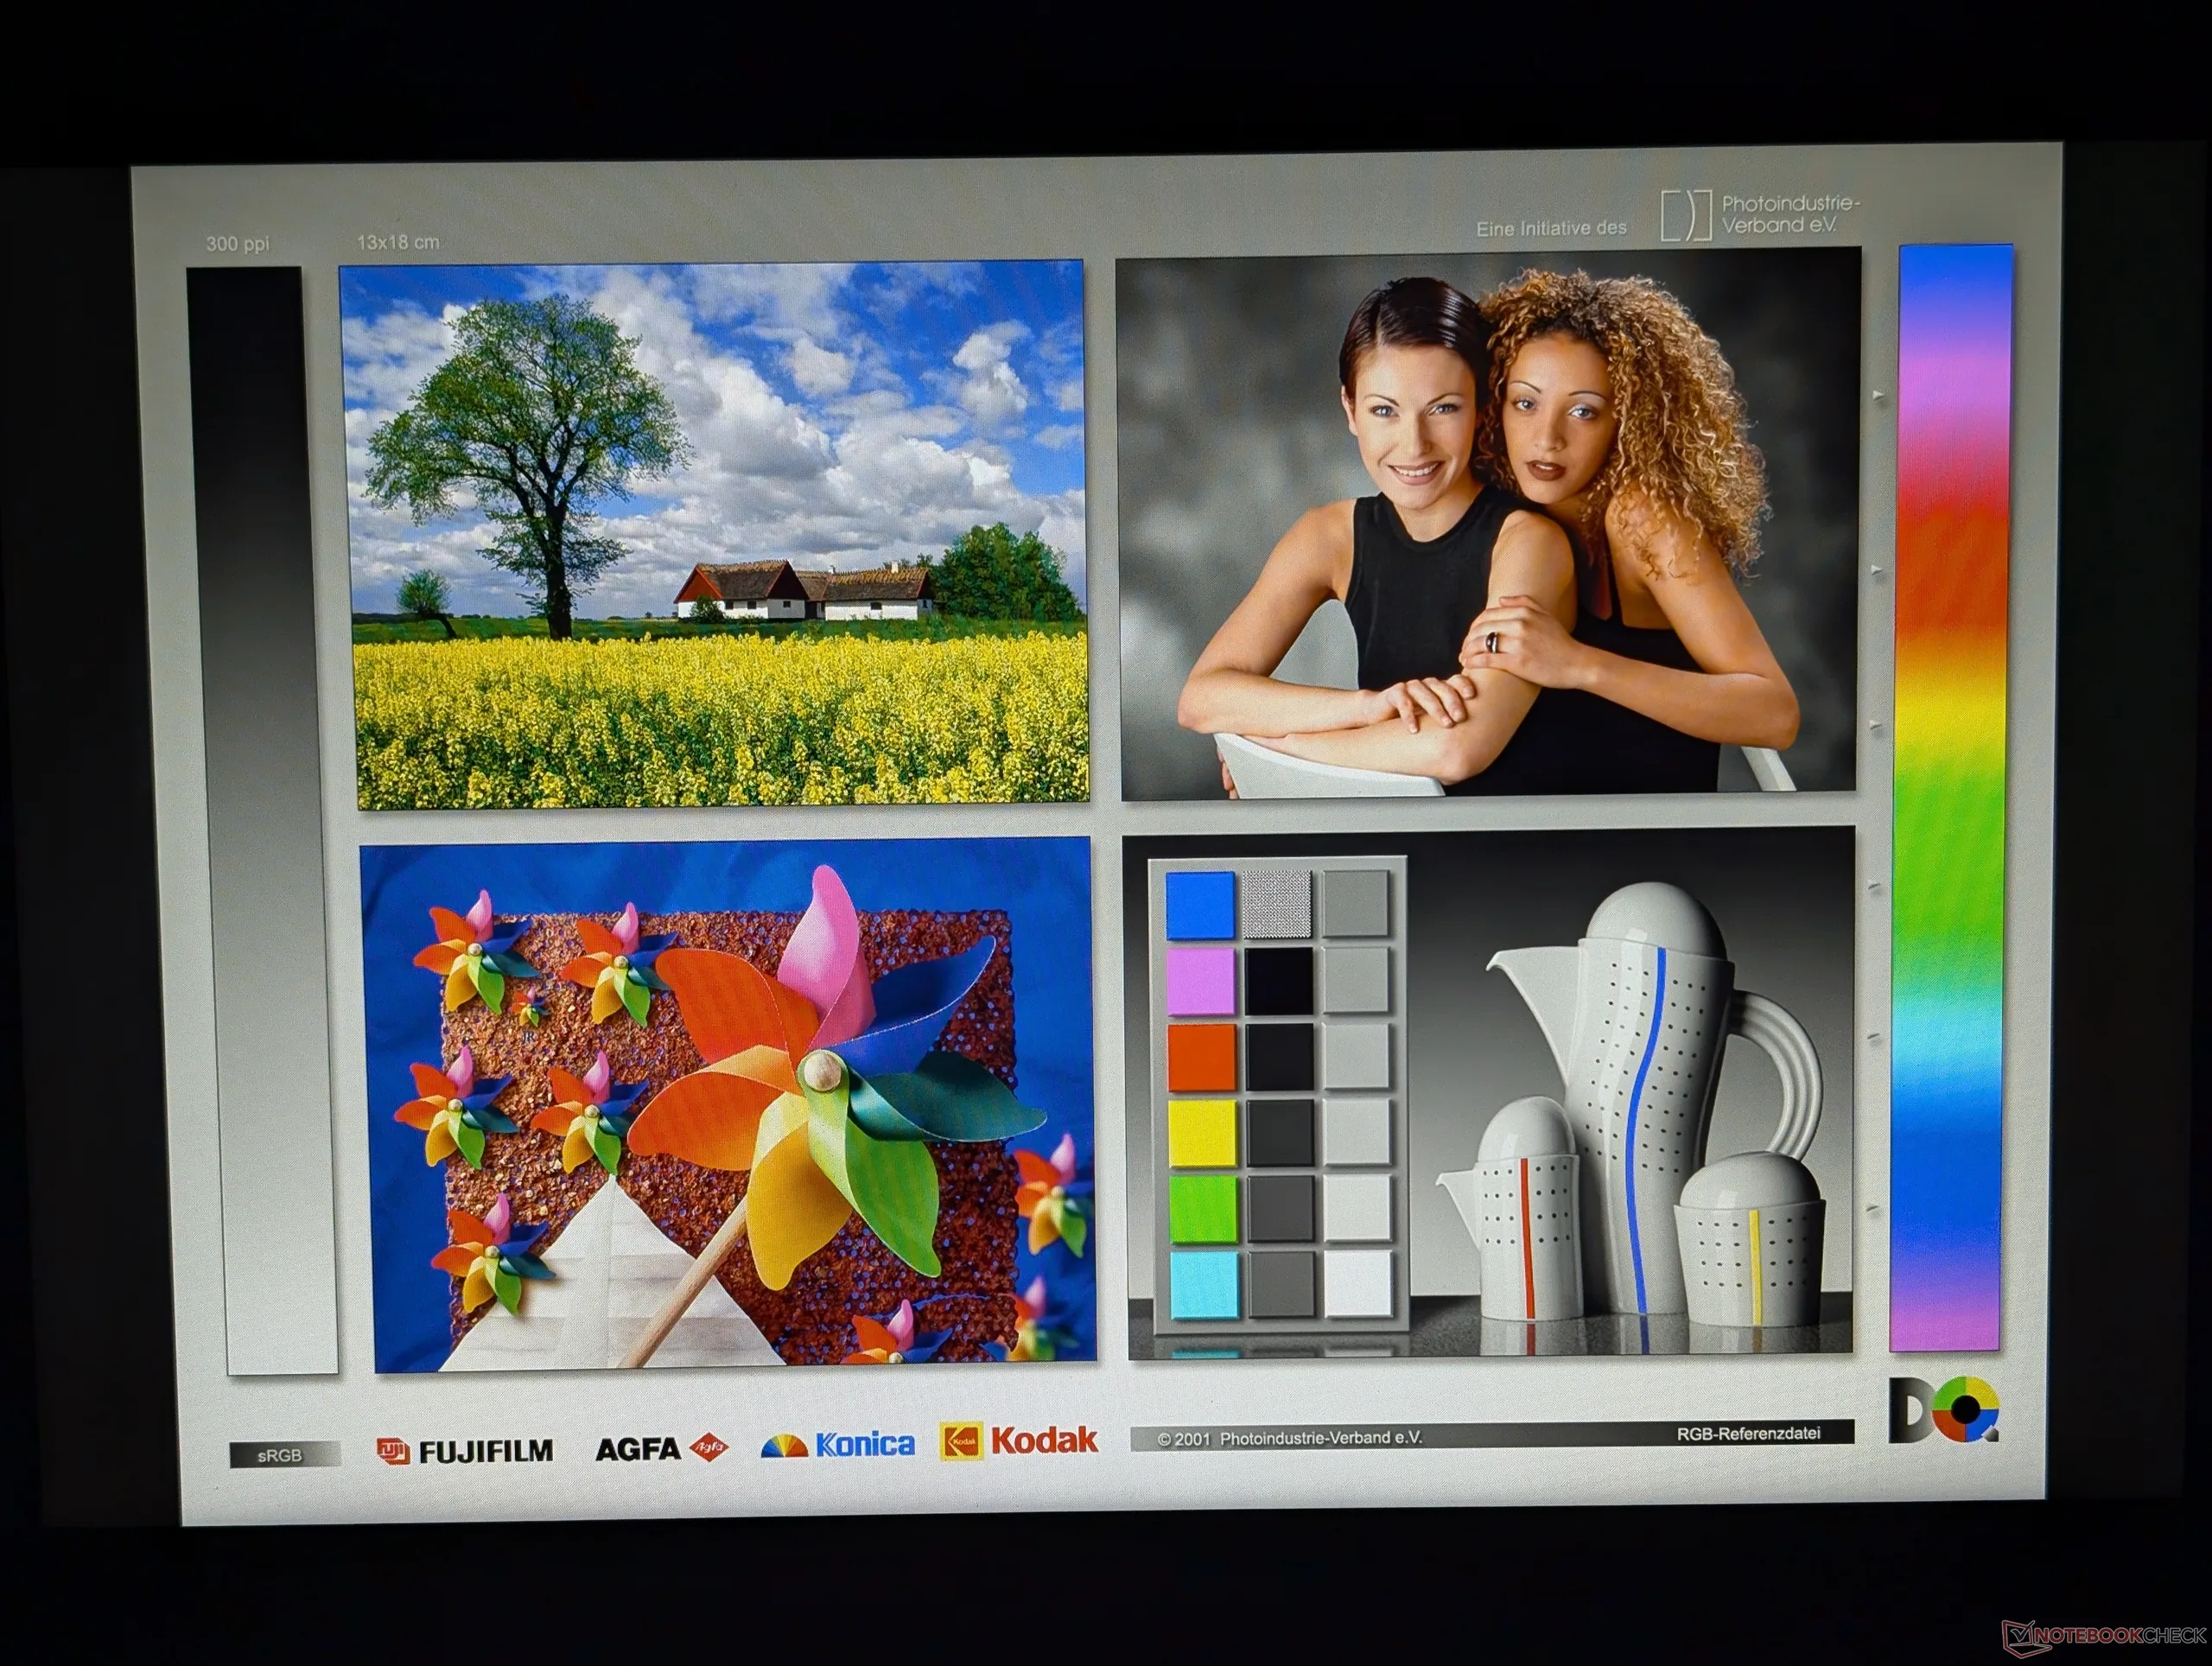
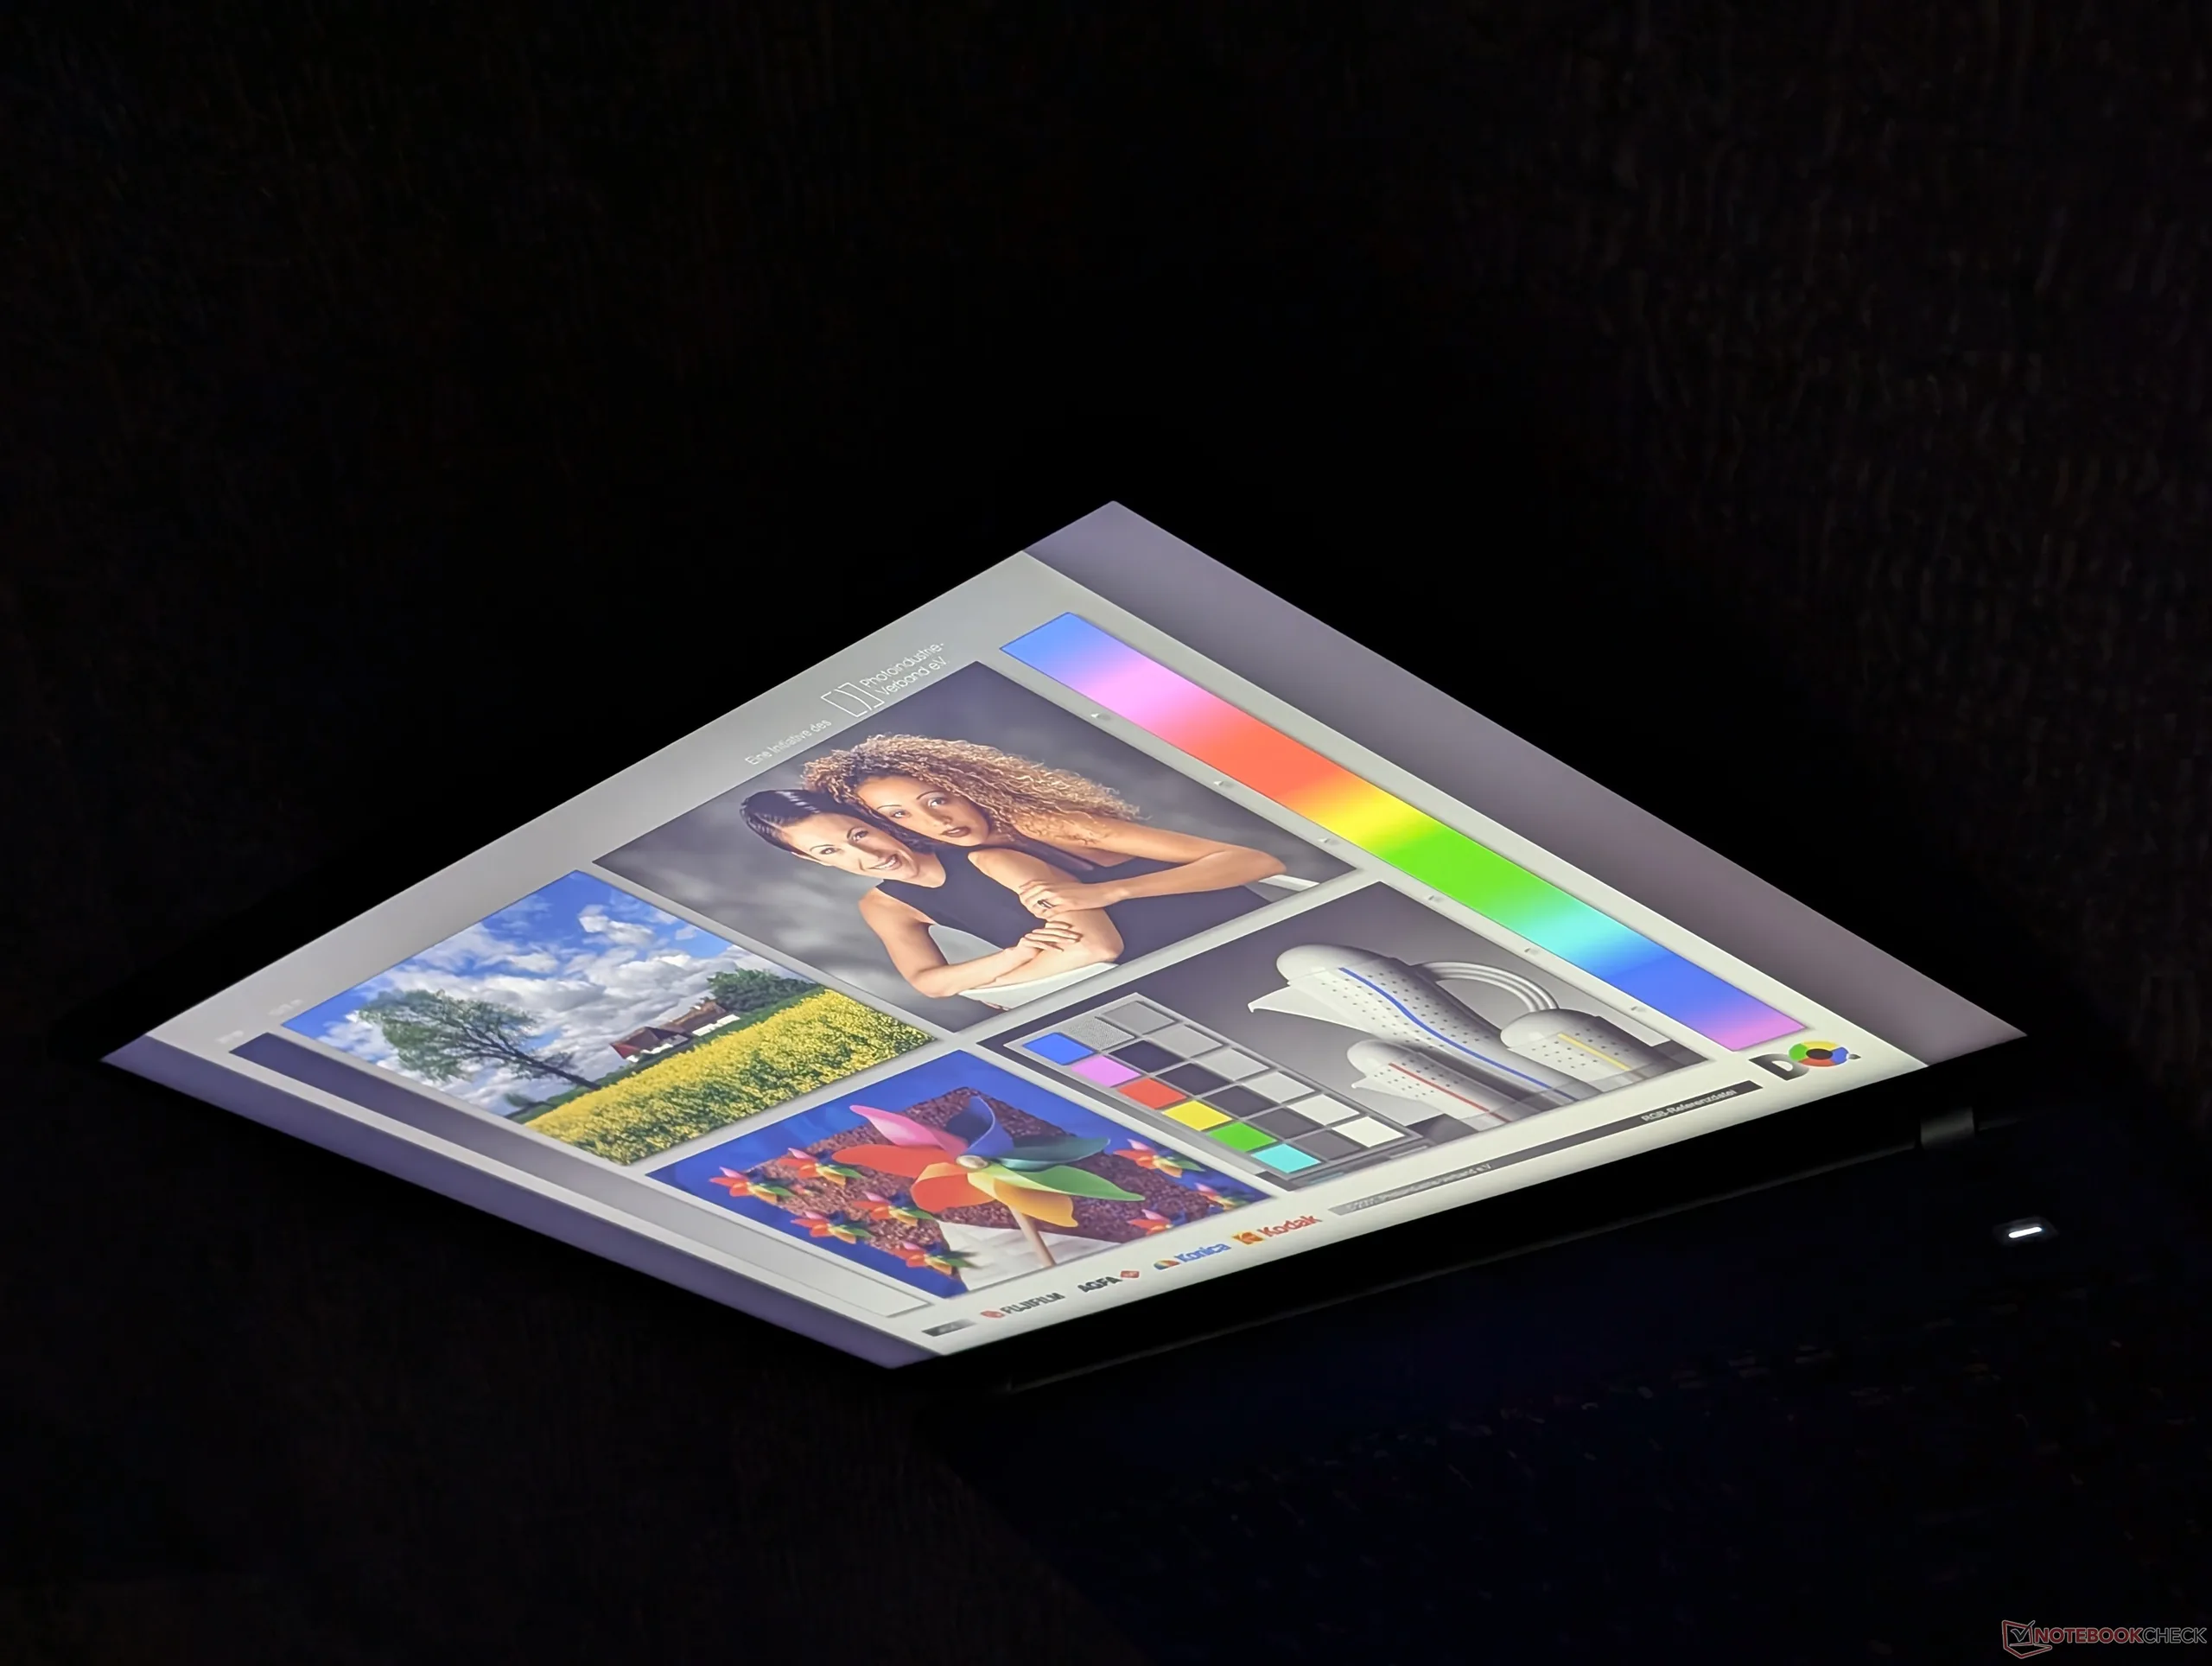
Display
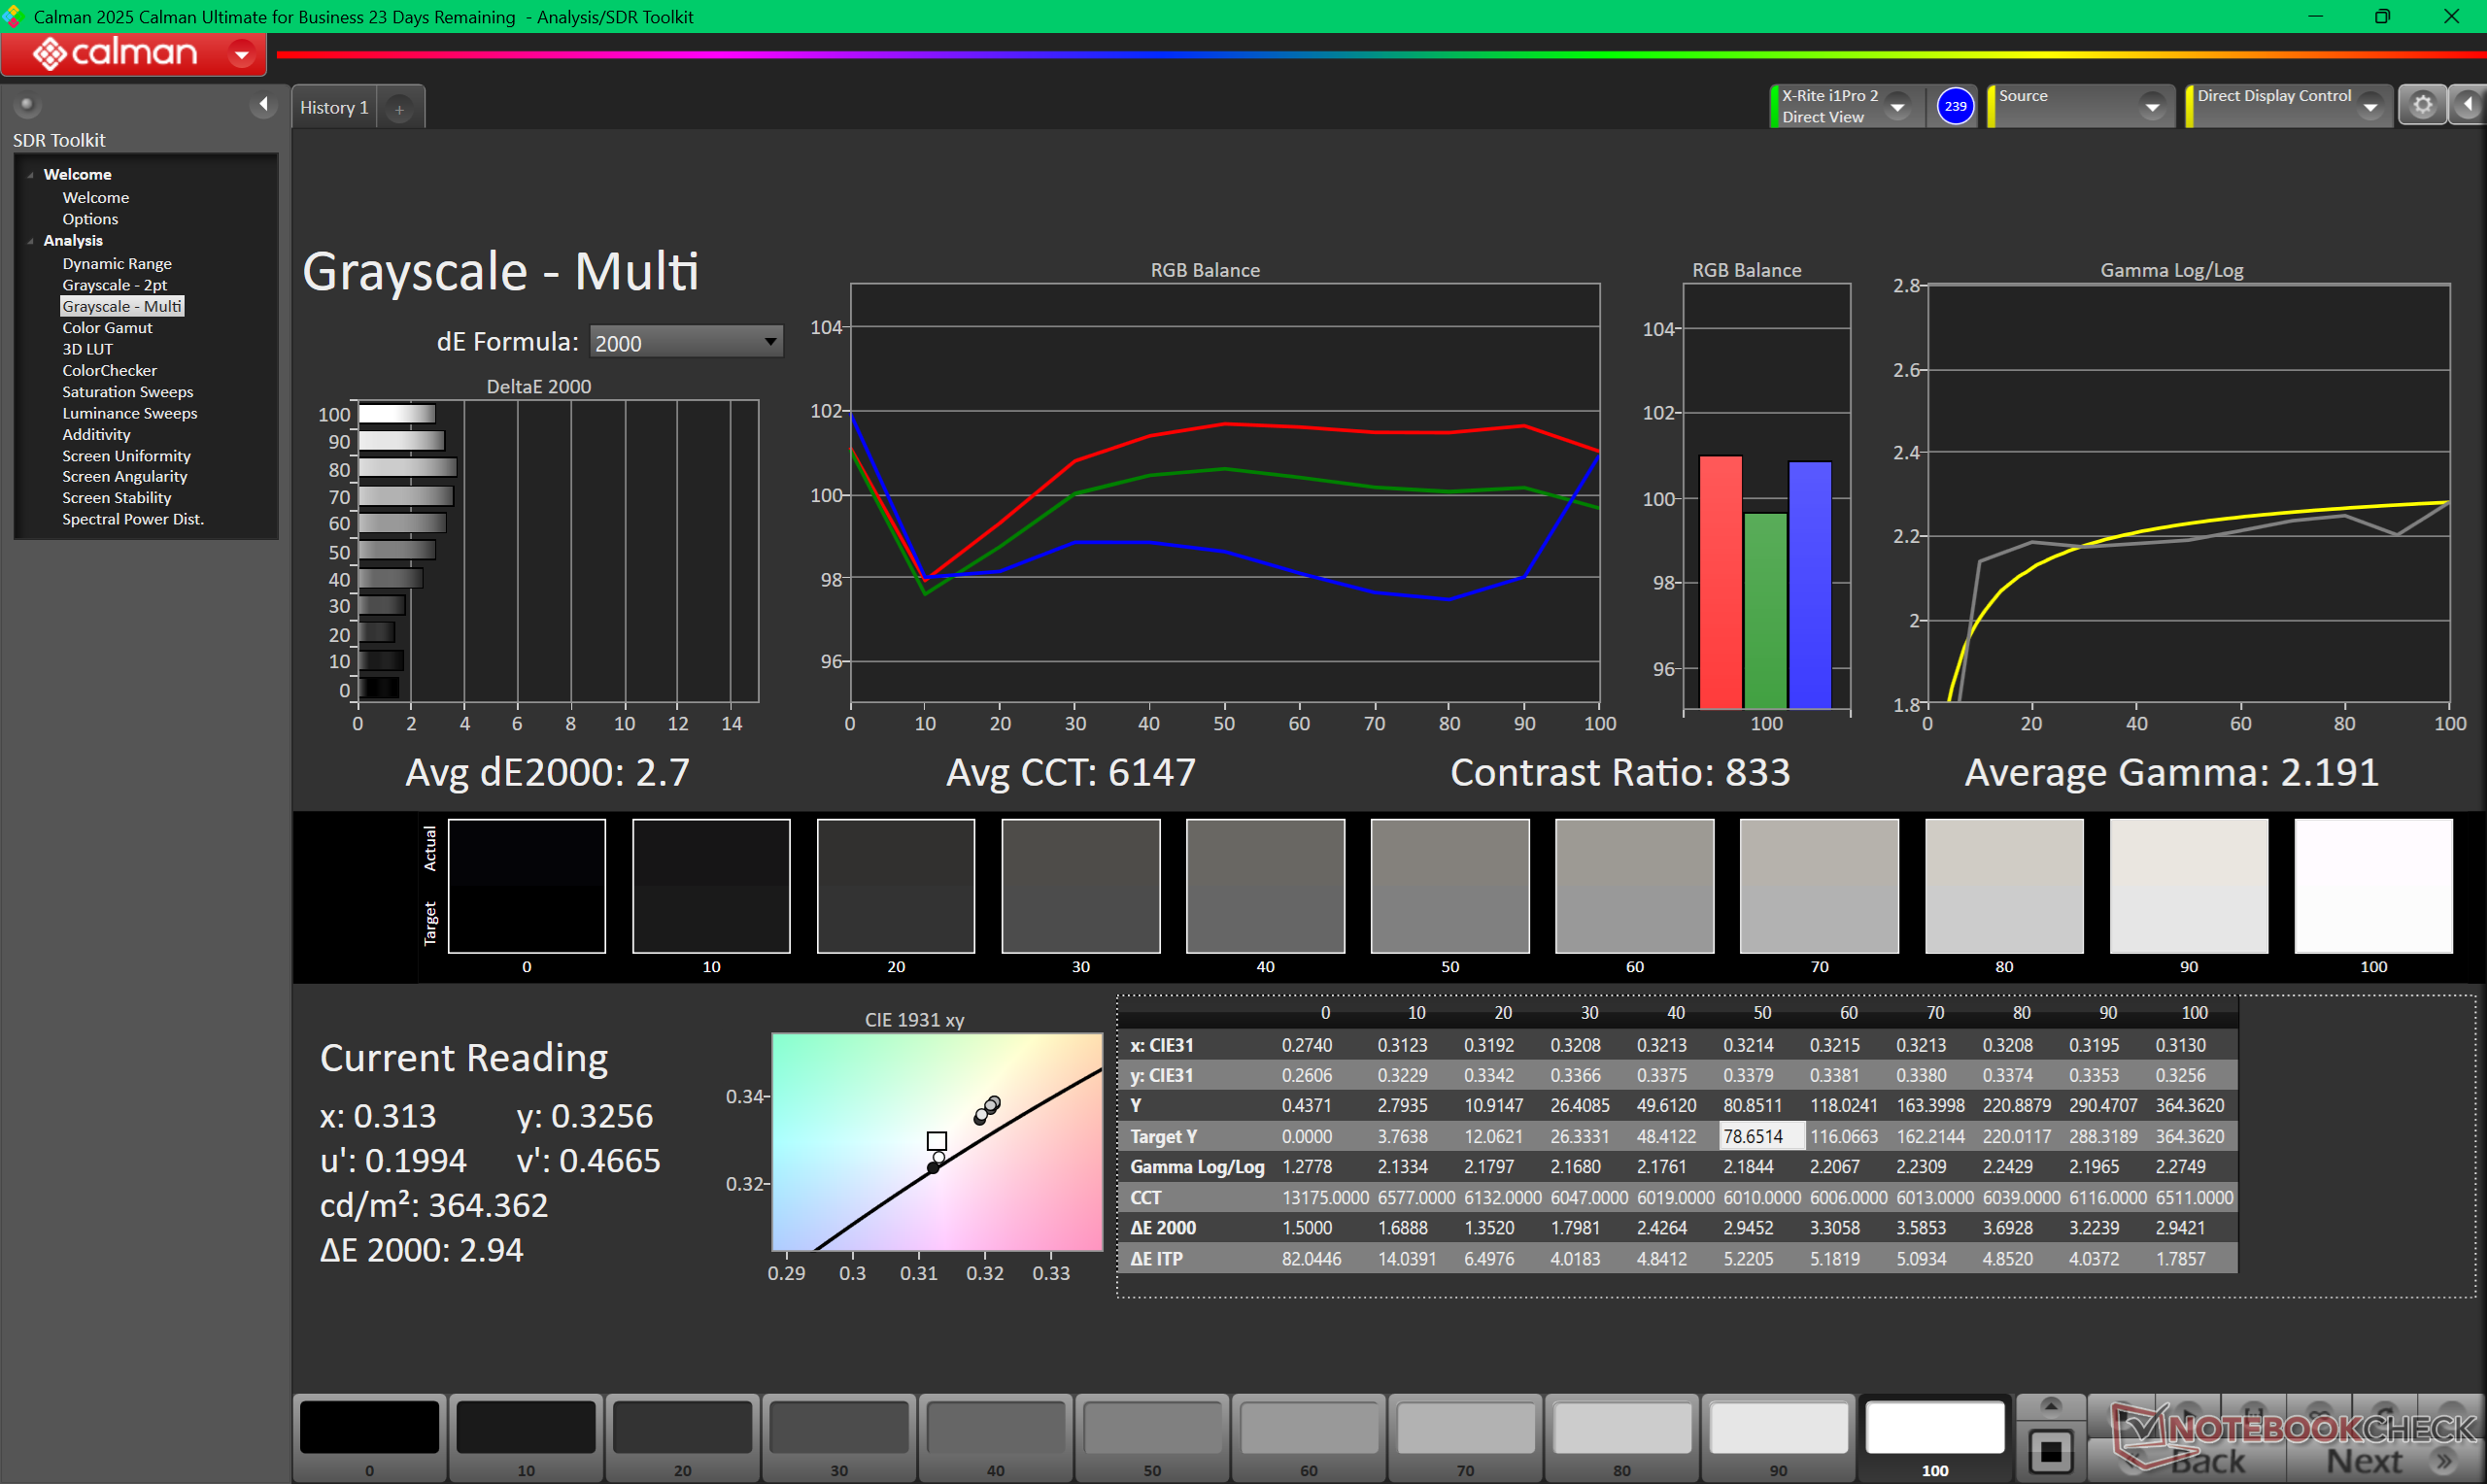
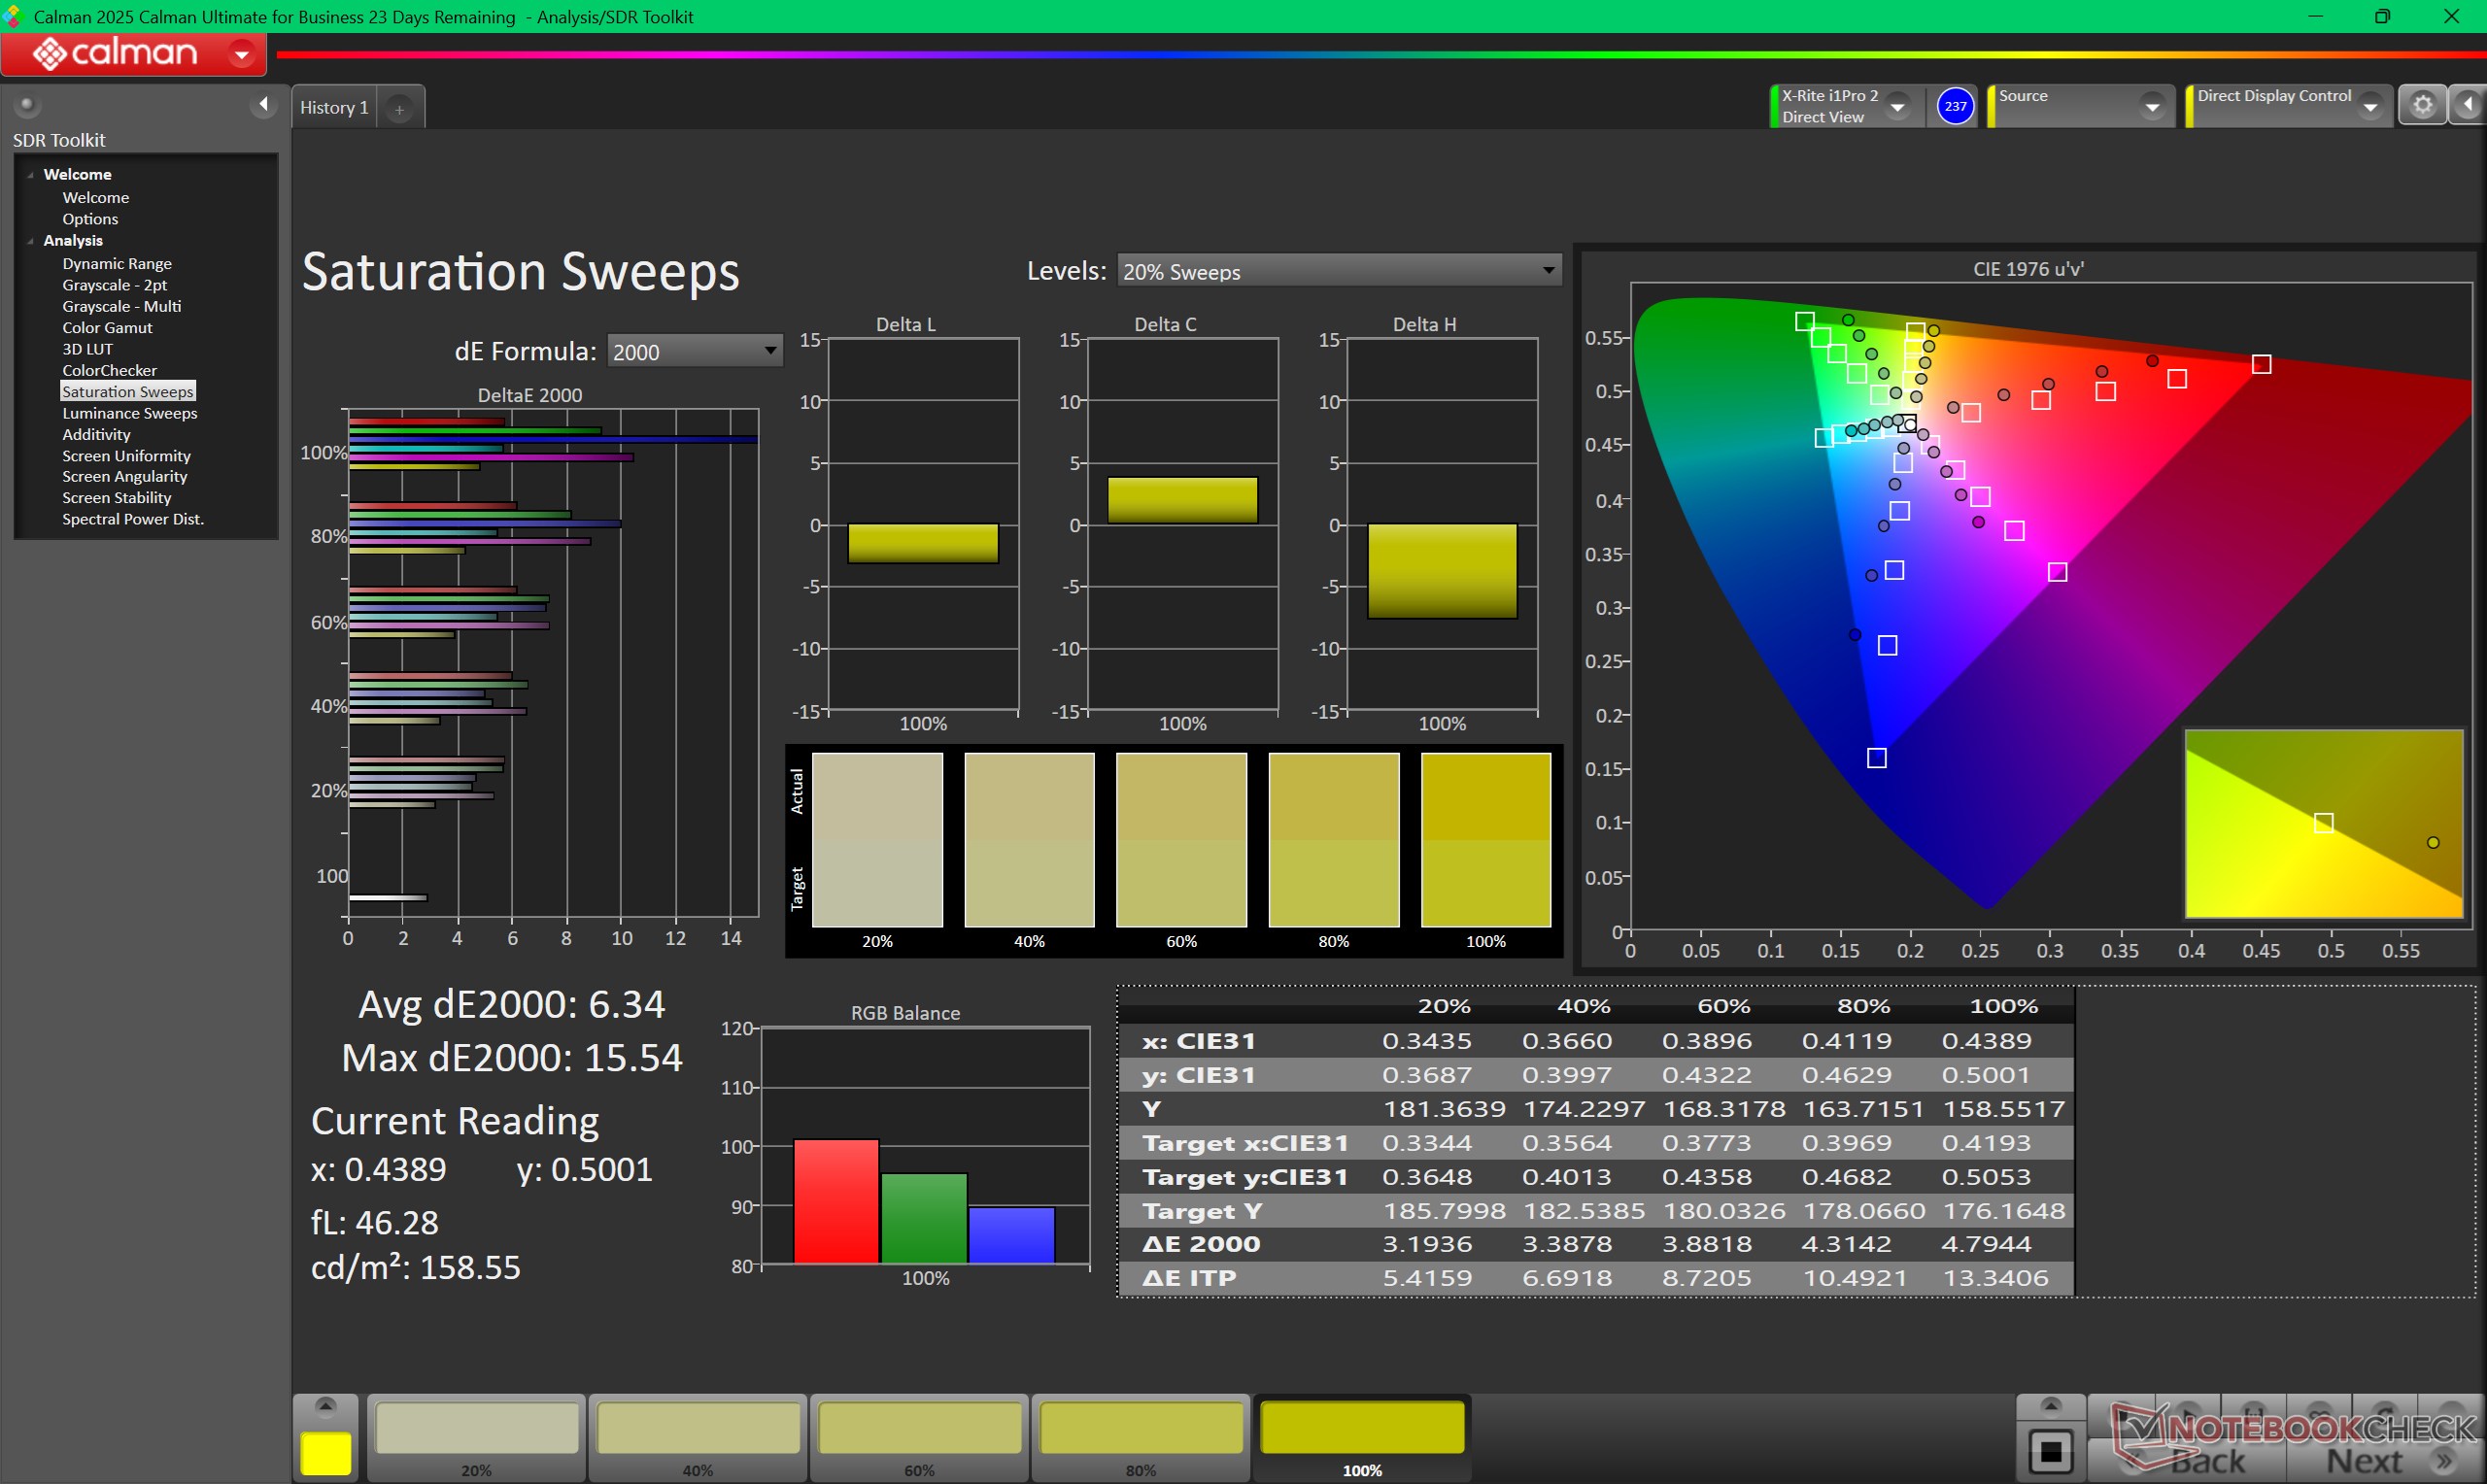
C'è solo un'opzione di visualizzazione con la scelta tra touch o non-touch. Sfortunatamente, questo pannello IPS è una versione di fascia bassa con spazio colore ristretto, frequenza di aggiornamento di 60 Hz e tempi di risposta del contrasto e del bianco e nero solo nella media. Sebbene sia perfettamente adatto alla maggior parte degli scenari d'ufficio, per le applicazioni più sensibili ai colori vorrà un display con una copertura sRGB almeno completa.


| |||||||||||||||||||||||||
Distribuzione della luminosità: 88 %
Al centro con la batteria: 362.3 cd/m²
Contrasto: 725:1 (Nero: 0.5 cd/m²)
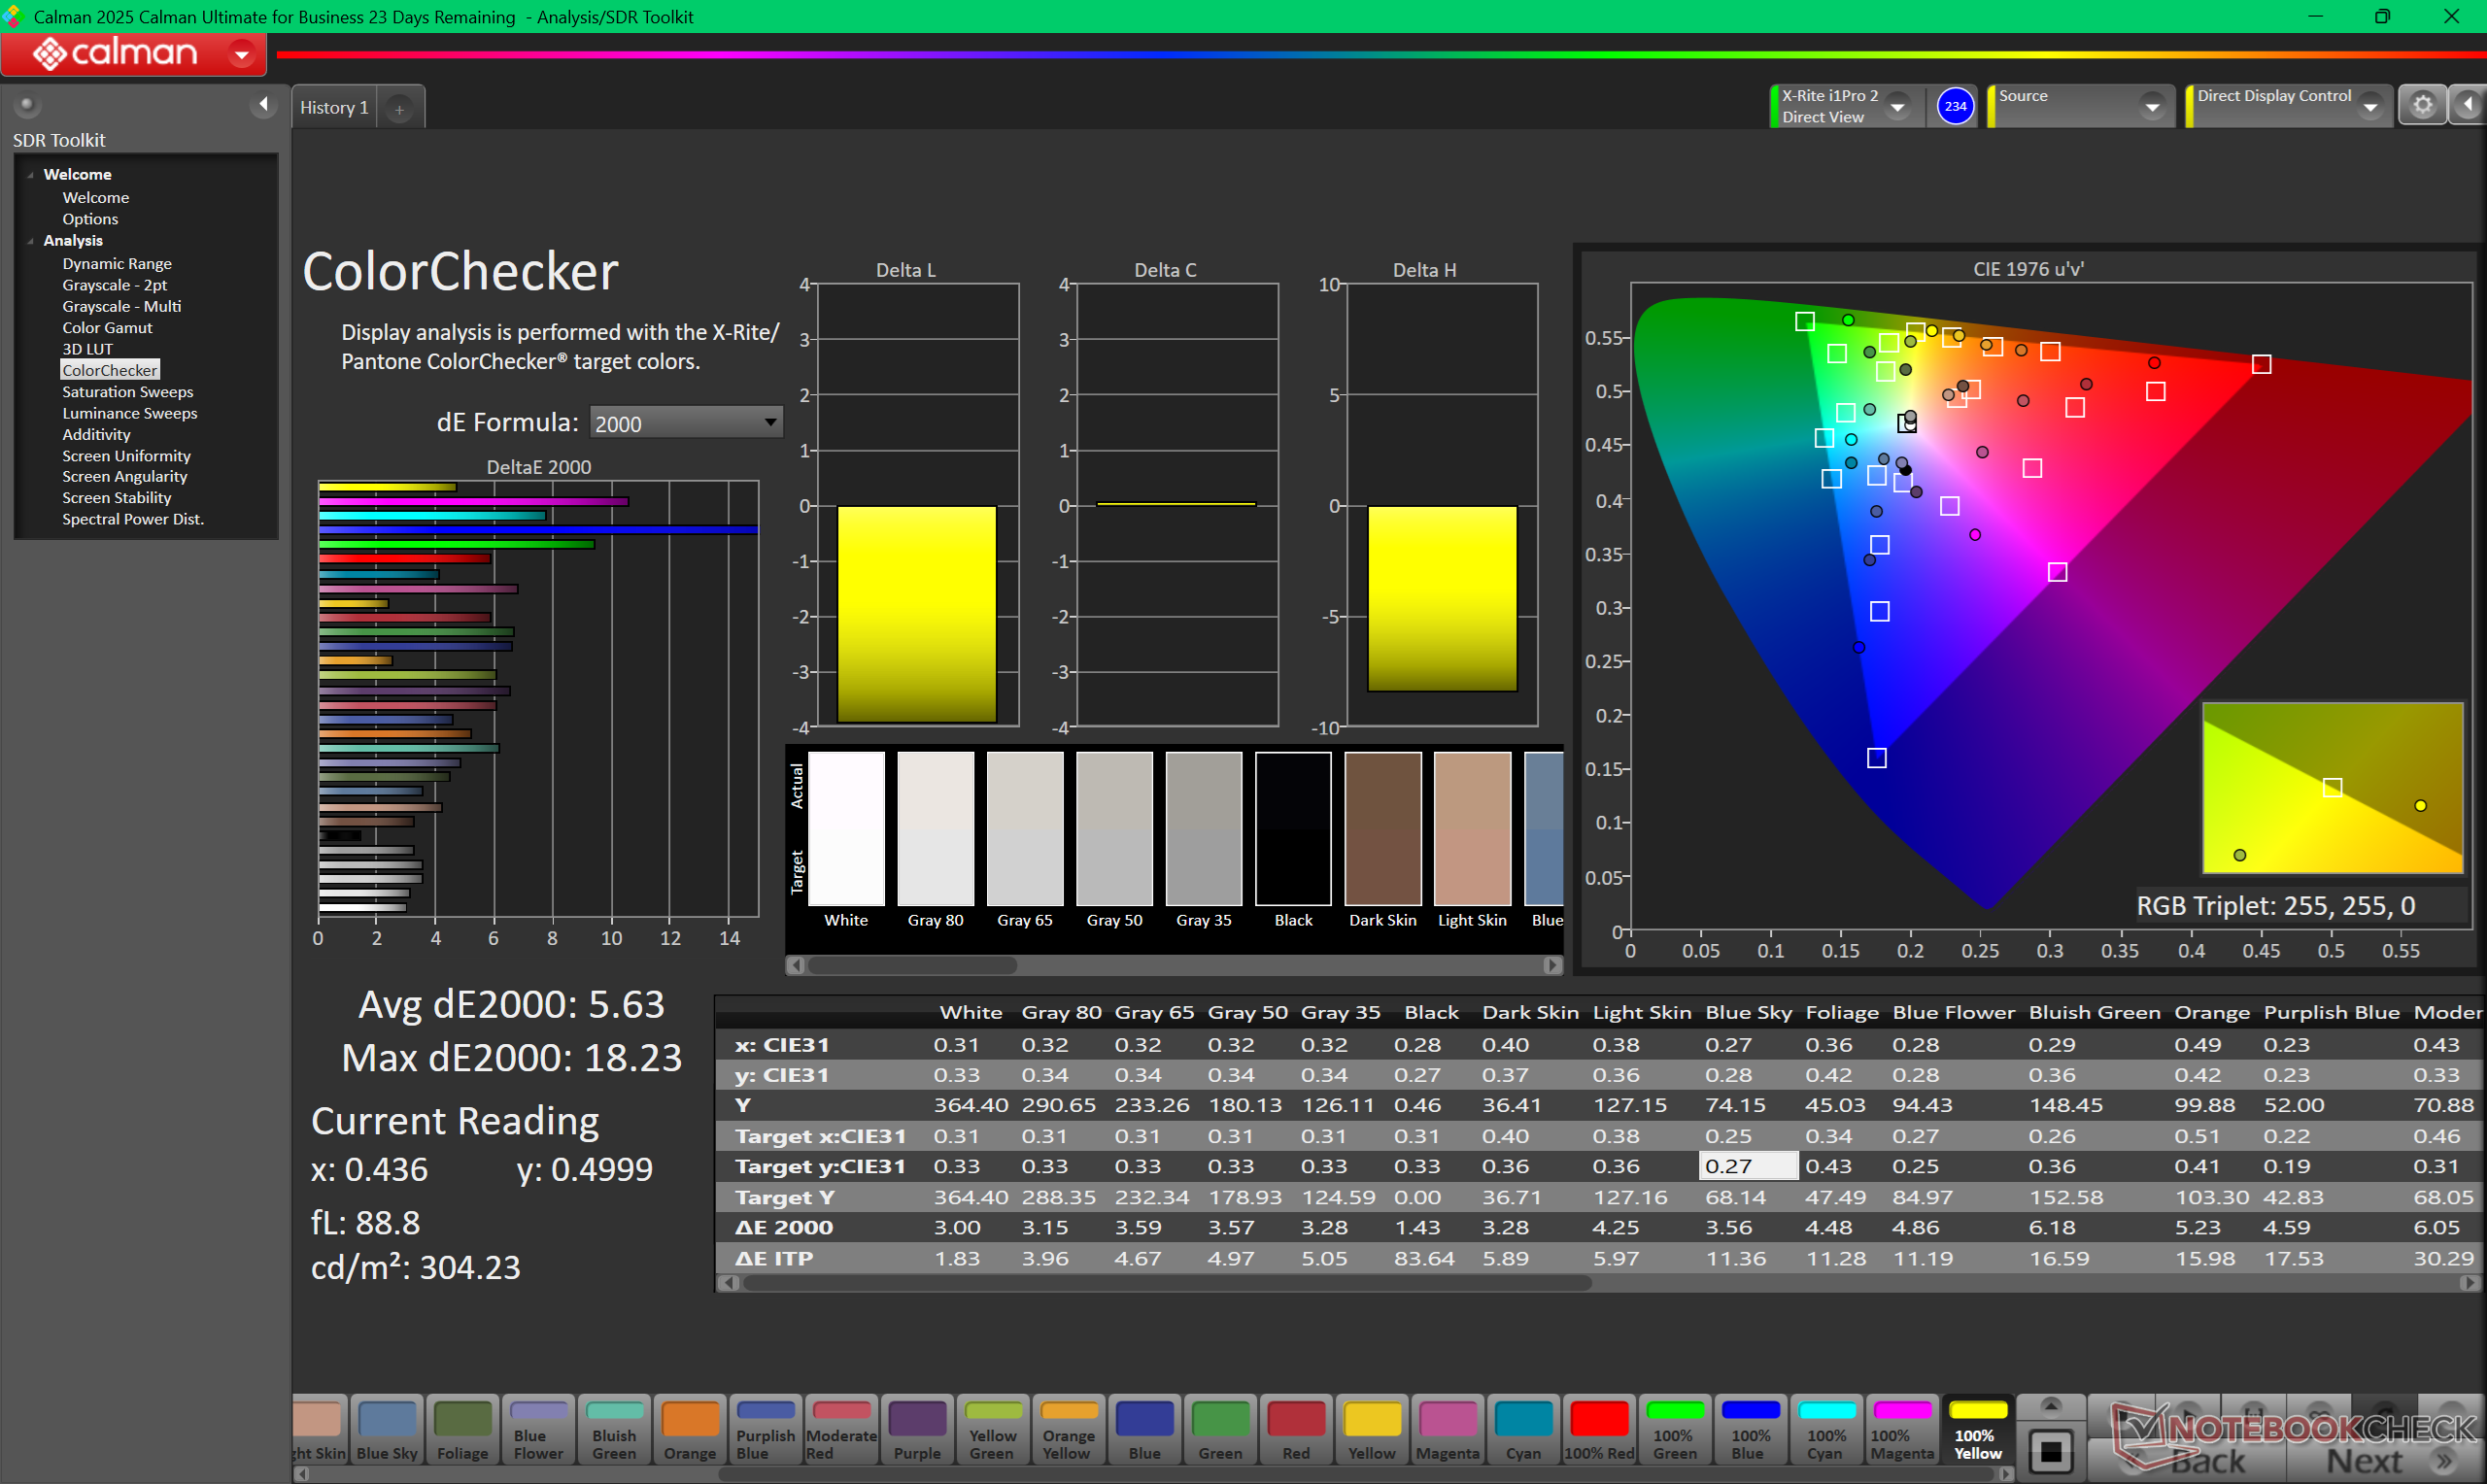
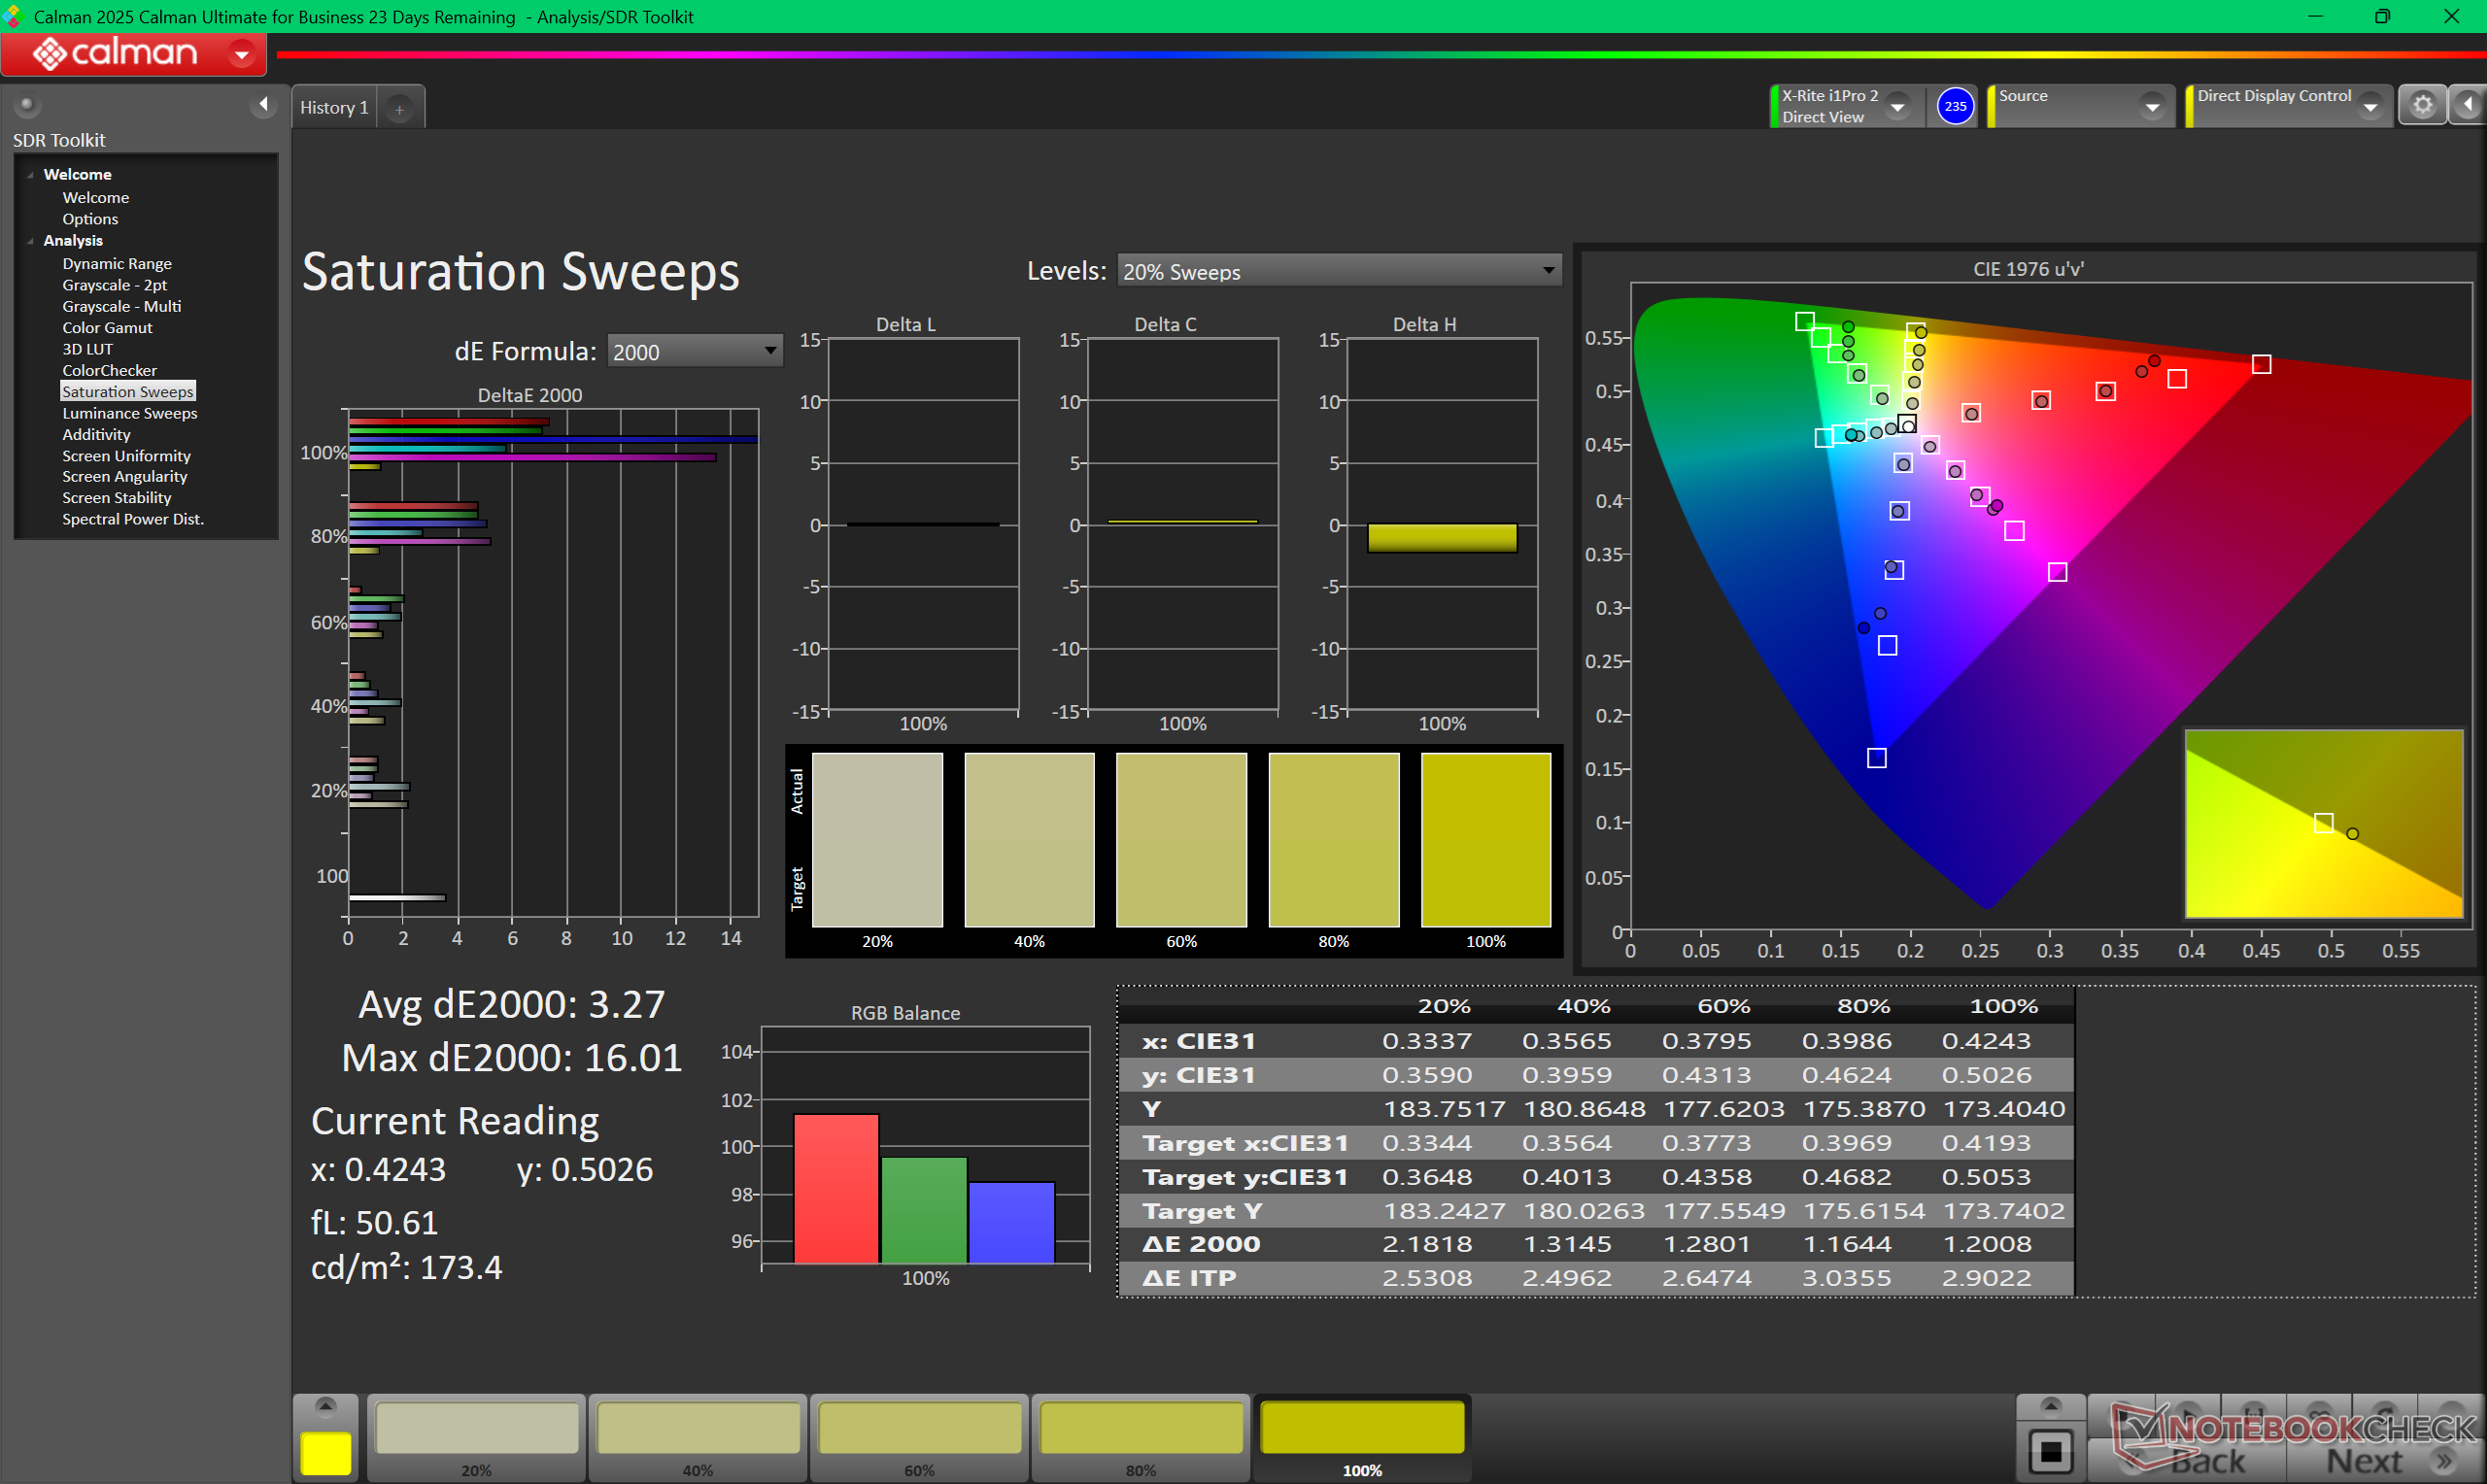
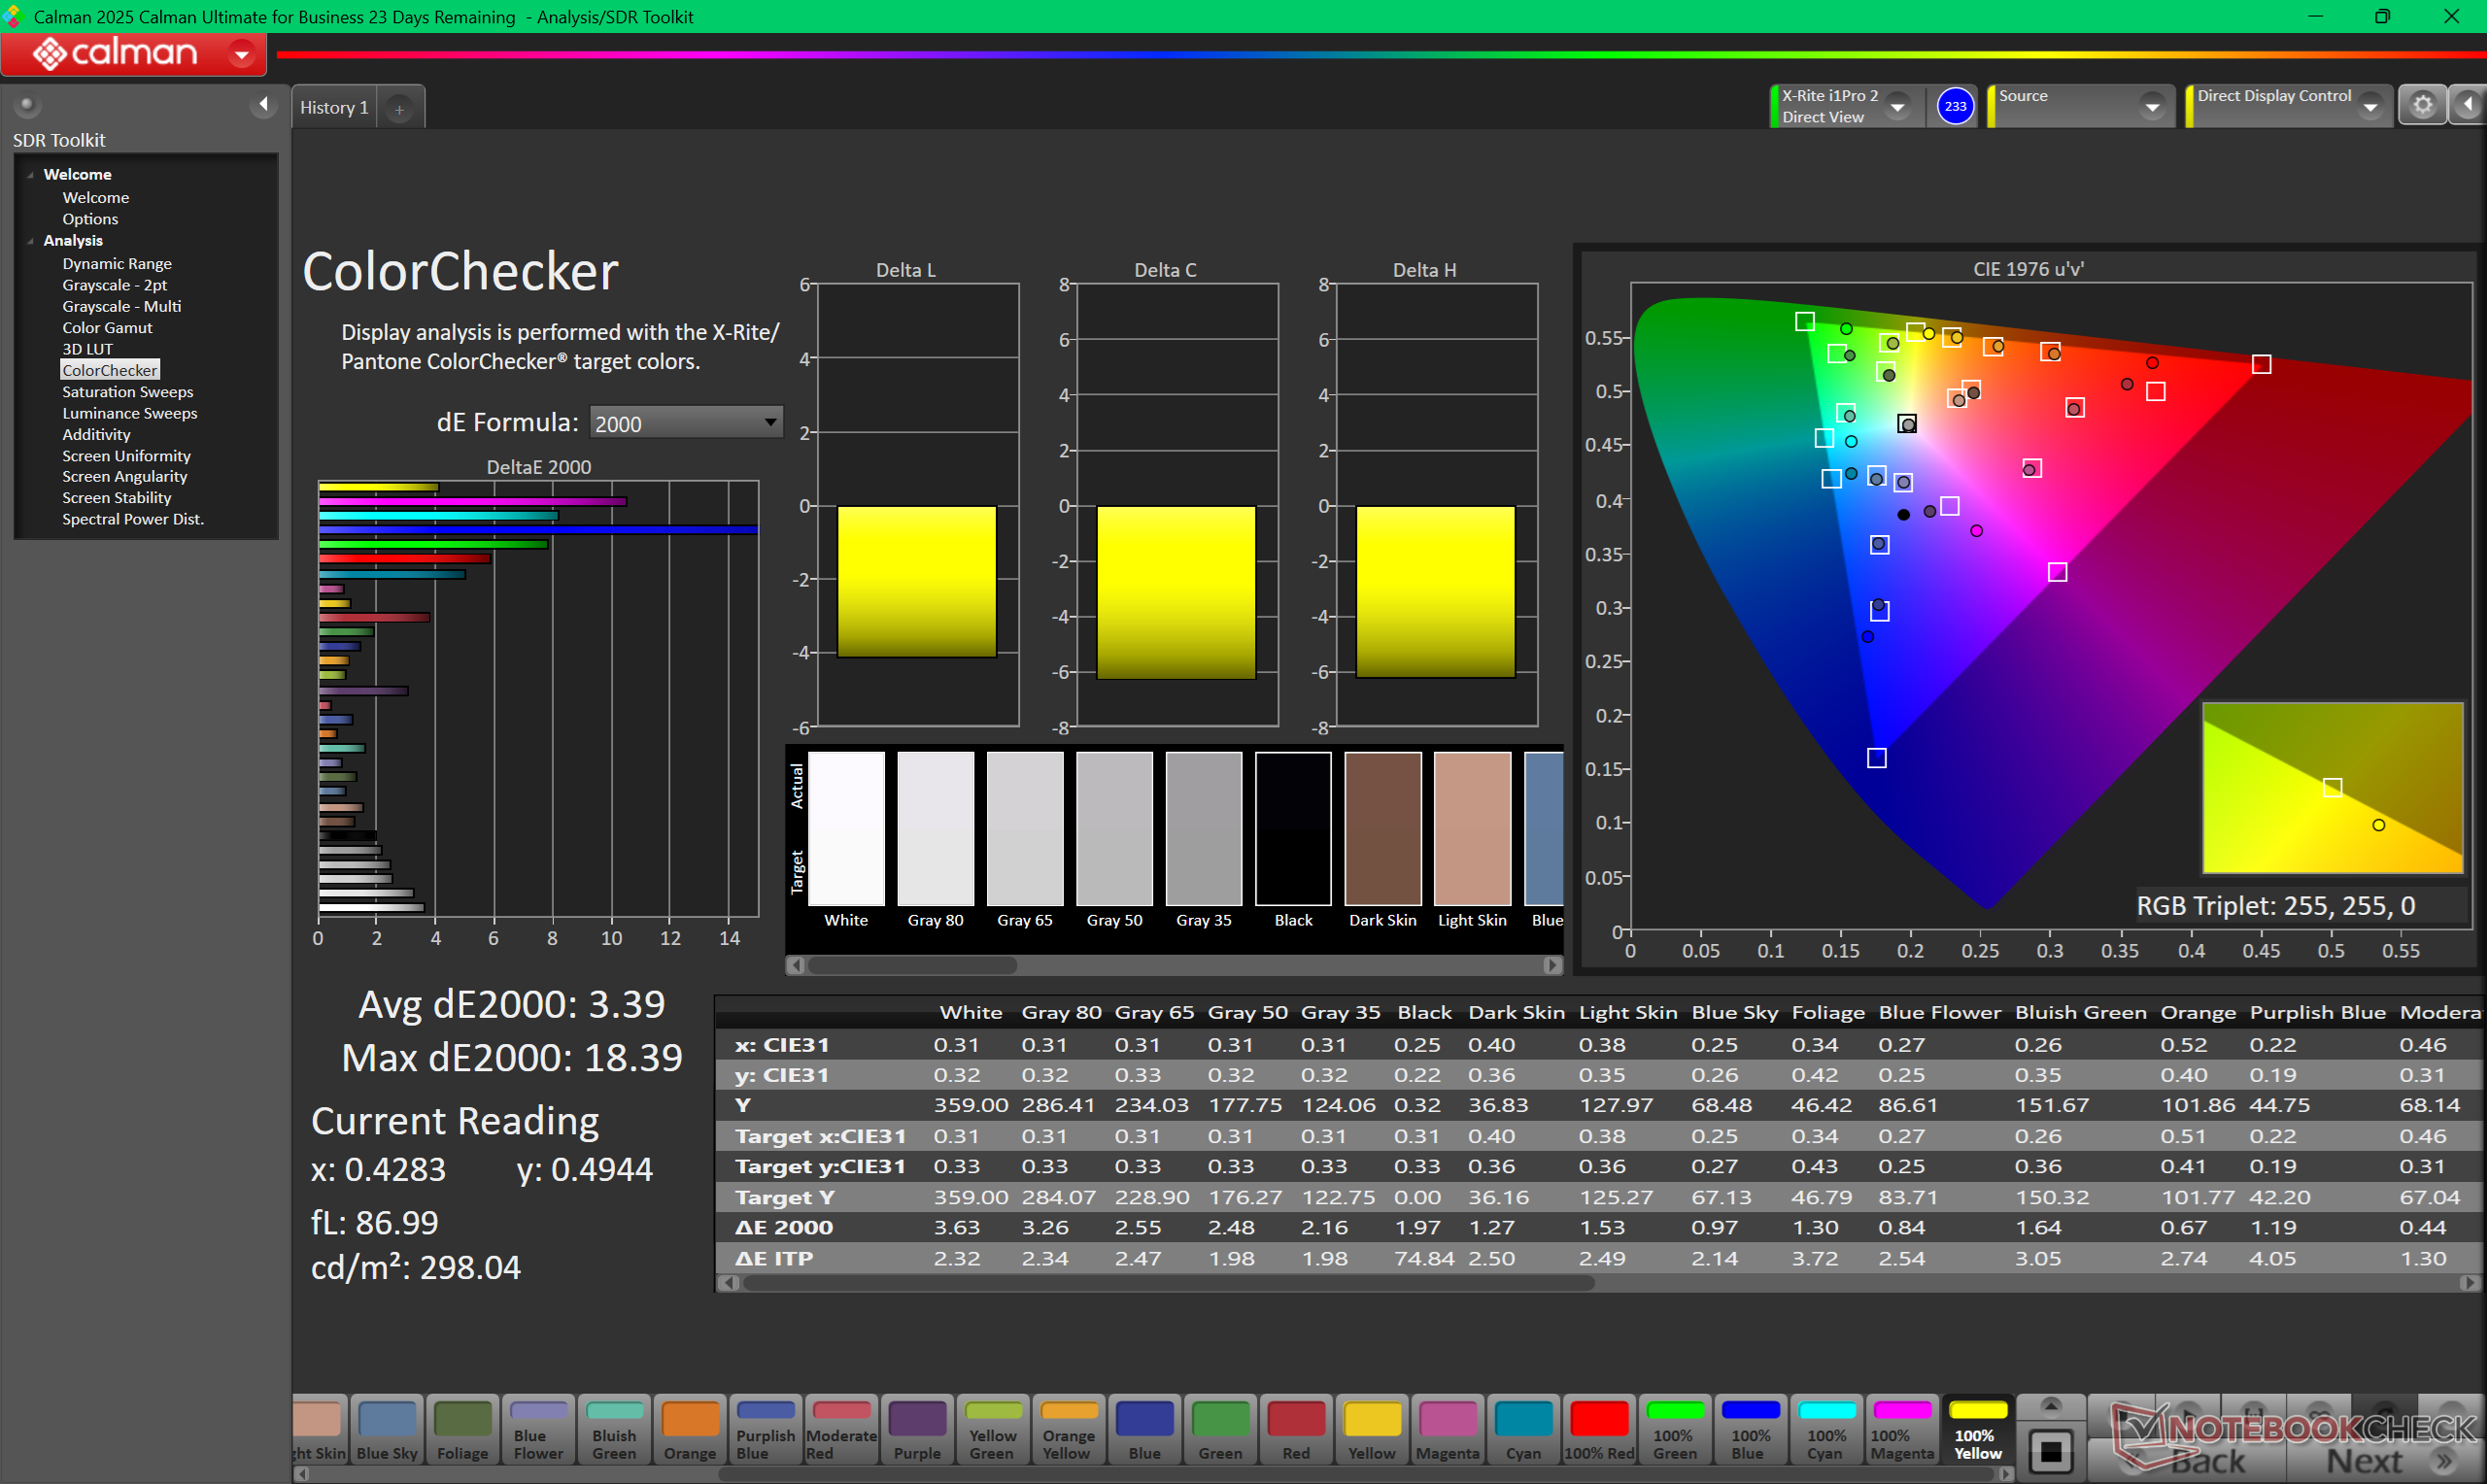
ΔE ColorChecker Calman: 5.63 | ∀{0.5-29.43 Ø4.71}
calibrated: 3.39
ΔE Greyscale Calman: 2.7 | ∀{0.09-98 Ø4.96}
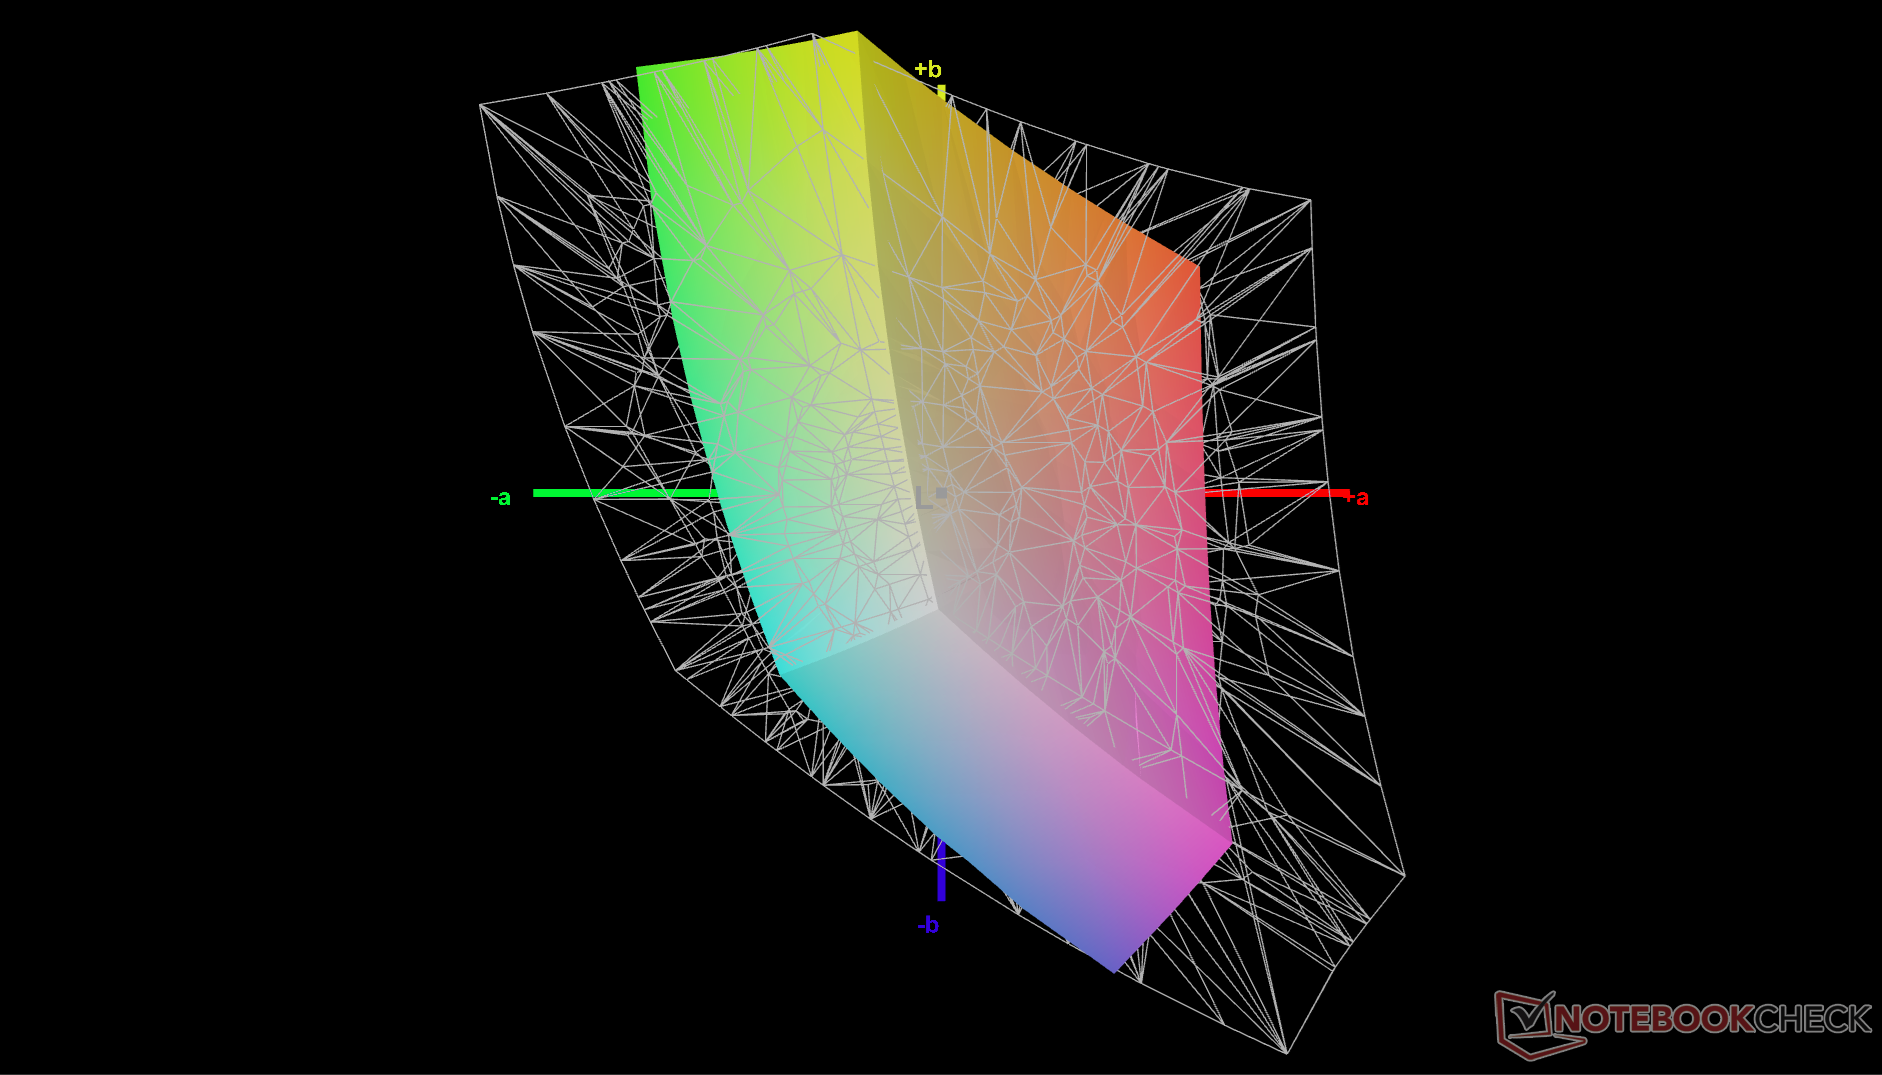
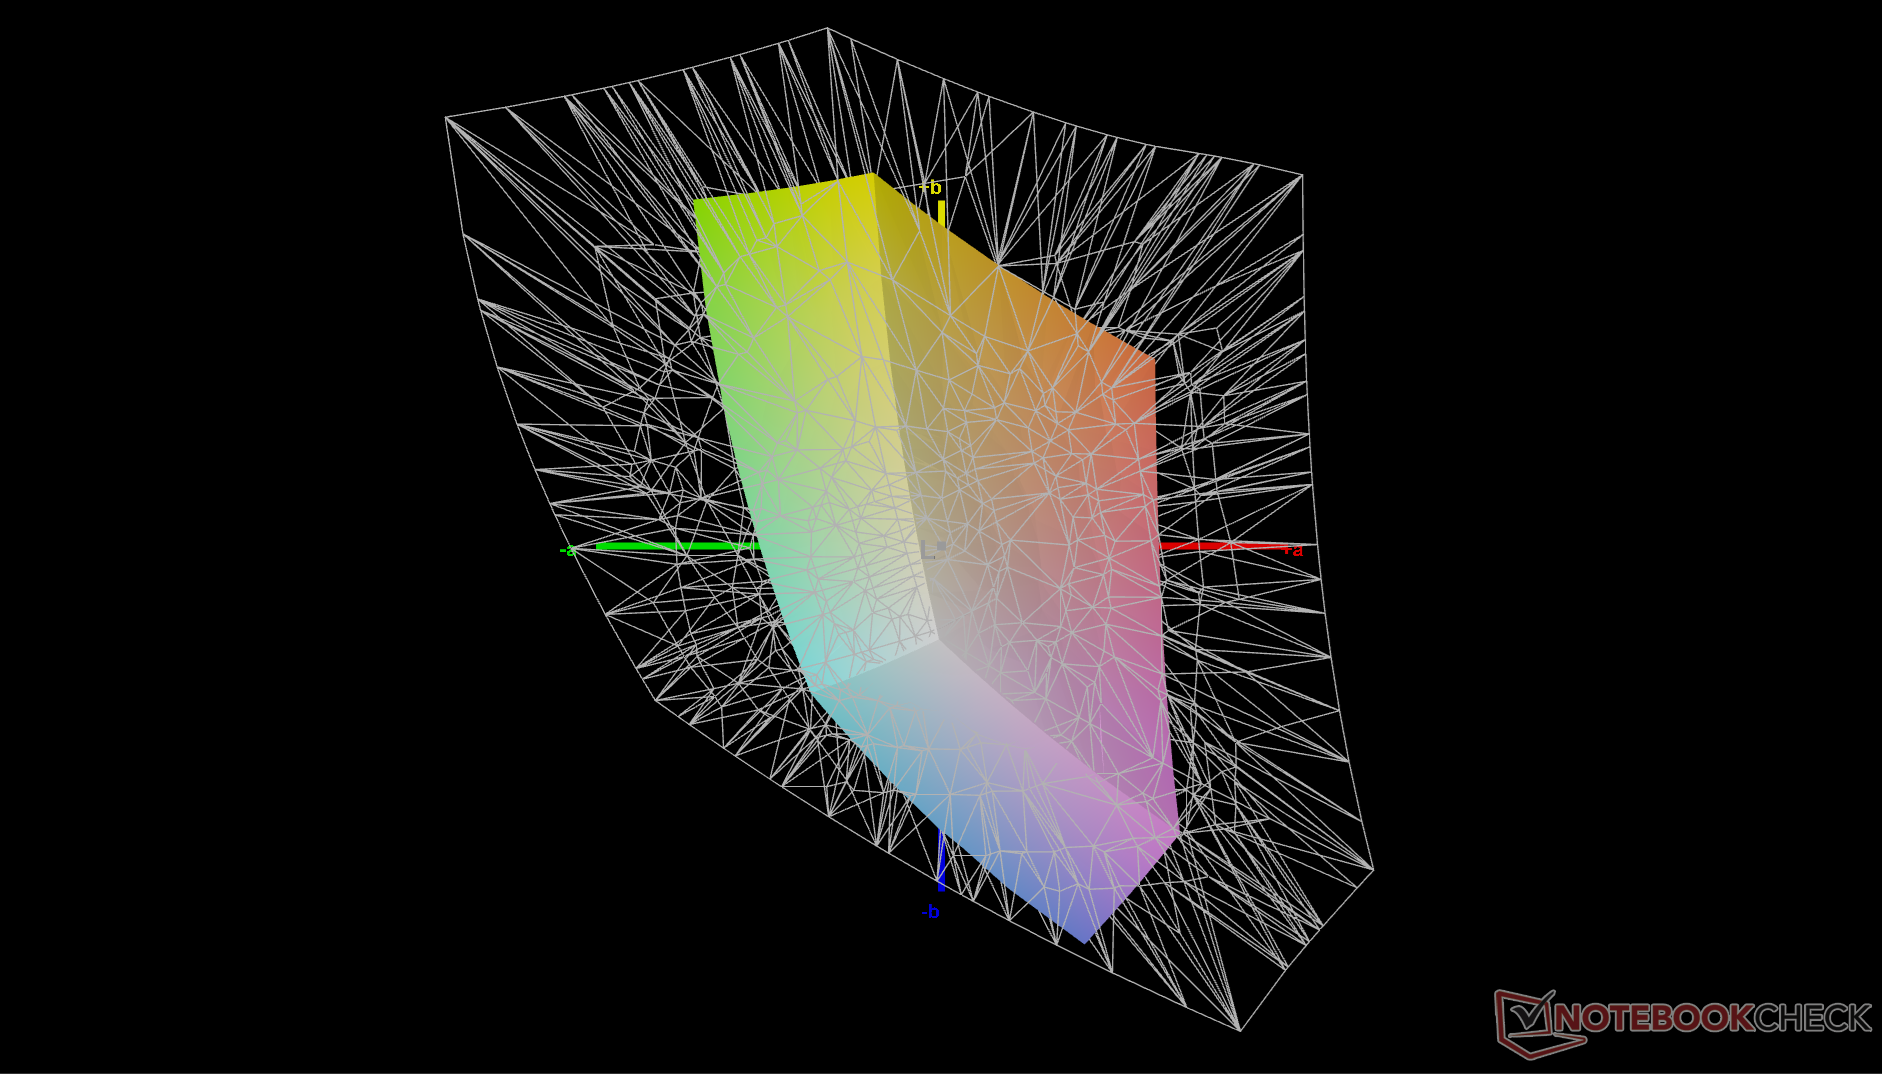
41% AdobeRGB 1998 (Argyll 3D)
58% sRGB (Argyll 3D)
39.9% Display P3 (Argyll 3D)
Gamma: 2.19
CCT: 6147 K
| Dynabook Tecra A60 A65-M BOE NV160WUM-N43, IPS, 1920x1200, 16", 60 Hz | LG Gram Pro 16Z90TS-G.AU89G LG DISPLAY LP160WQ2-SPF1, IPS, 2560x1600, 16", 144 Hz | Lenovo ThinkPad T16 Gen 4 21QQS06M00 N160JCA-GT1, IPS, 1920x1200, 16", 60 Hz | HP EliteBook 8 G1a 16 AI IPS, 1920x1200, 16", 60 Hz | Dell 16 Premium DA16250 Samsung 163DU02, OLED, 3840x2400, 16.3", 120 Hz | Asus ExpertBook B5 B5605CCA NE160QDM-NX4, IPS, 2560x1600, 16", 144 Hz | |
|---|---|---|---|---|---|---|
| Display | 110% | 66% | 71% | 112% | 70% | |
| Display P3 Coverage (%) | 39.9 | 97.96 146% | 65.9 65% | 68.5 72% | 99.7 150% | 68.5 72% |
| sRGB Coverage (%) | 58 | 100 72% | 97.2 68% | 98.6 70% | 100 72% | 98.3 69% |
| AdobeRGB 1998 Coverage (%) | 41 | 86.65 111% | 68 66% | 70.4 72% | 88.1 115% | 69.4 69% |
| Response Times | -38% | 16% | -44% | 97% | 8% | |
| Response Time Grey 50% / Grey 80% * (ms) | 33.7 ? | 47 ? -39% | 35.3 ? -5% | 50.2 ? -49% | 0.61 ? 98% | 35.6 ? -6% |
| Response Time Black / White * (ms) | 22.1 ? | 30 ? -36% | 14.2 ? 36% | 30.7 ? -39% | 0.88 ? 96% | 17.5 ? 21% |
| PWM Frequency (Hz) | 490.8 ? | |||||
| PWM Amplitude * (%) | 35 | |||||
| Screen | 73% | 36% | 42% | 46% | 41% | |
| Brightness middle (cd/m²) | 362.3 | 442 22% | 489 35% | 439.2 21% | 385.7 6% | 413 14% |
| Brightness (cd/m²) | 342 | 406 19% | 469 37% | 405 18% | 387 13% | 408 19% |
| Brightness Distribution (%) | 88 | 86 -2% | 90 2% | 88 0% | 98 11% | 94 7% |
| Black Level * (cd/m²) | 0.5 | 0.17 66% | 0.26 48% | 0.31 38% | 0.2 60% | |
| Contrast (:1) | 725 | 2600 259% | 1881 159% | 1417 95% | 2065 185% | |
| Colorchecker dE 2000 * | 5.63 | 0.84 85% | 4.3 24% | 2.2 61% | 1.36 76% | 3.6 36% |
| Colorchecker dE 2000 max. * | 18.23 | 1.62 91% | 7 62% | 4.31 76% | 2.85 84% | 7.1 61% |
| Colorchecker dE 2000 calibrated * | 3.39 | 0.88 74% | 0.9 73% | 0.49 86% | 0.65 81% | 1.5 56% |
| Greyscale dE 2000 * | 2.7 | 1.53 43% | 5.8 -115% | 3.2 -19% | 1.3 52% | 4.6 -70% |
| Gamma | 2.19 100% | 2.173 101% | 2.61 84% | 2.3 96% | 2.2 100% | 2.25 98% |
| CCT | 6147 106% | 6496 100% | 6195 105% | 6438 101% | 6282 103% | 7461 87% |
| Media totale (Programma / Settaggio) | 48% /
65% | 39% /
40% | 23% /
36% | 85% /
71% | 40% /
42% |
* ... Meglio usare valori piccoli
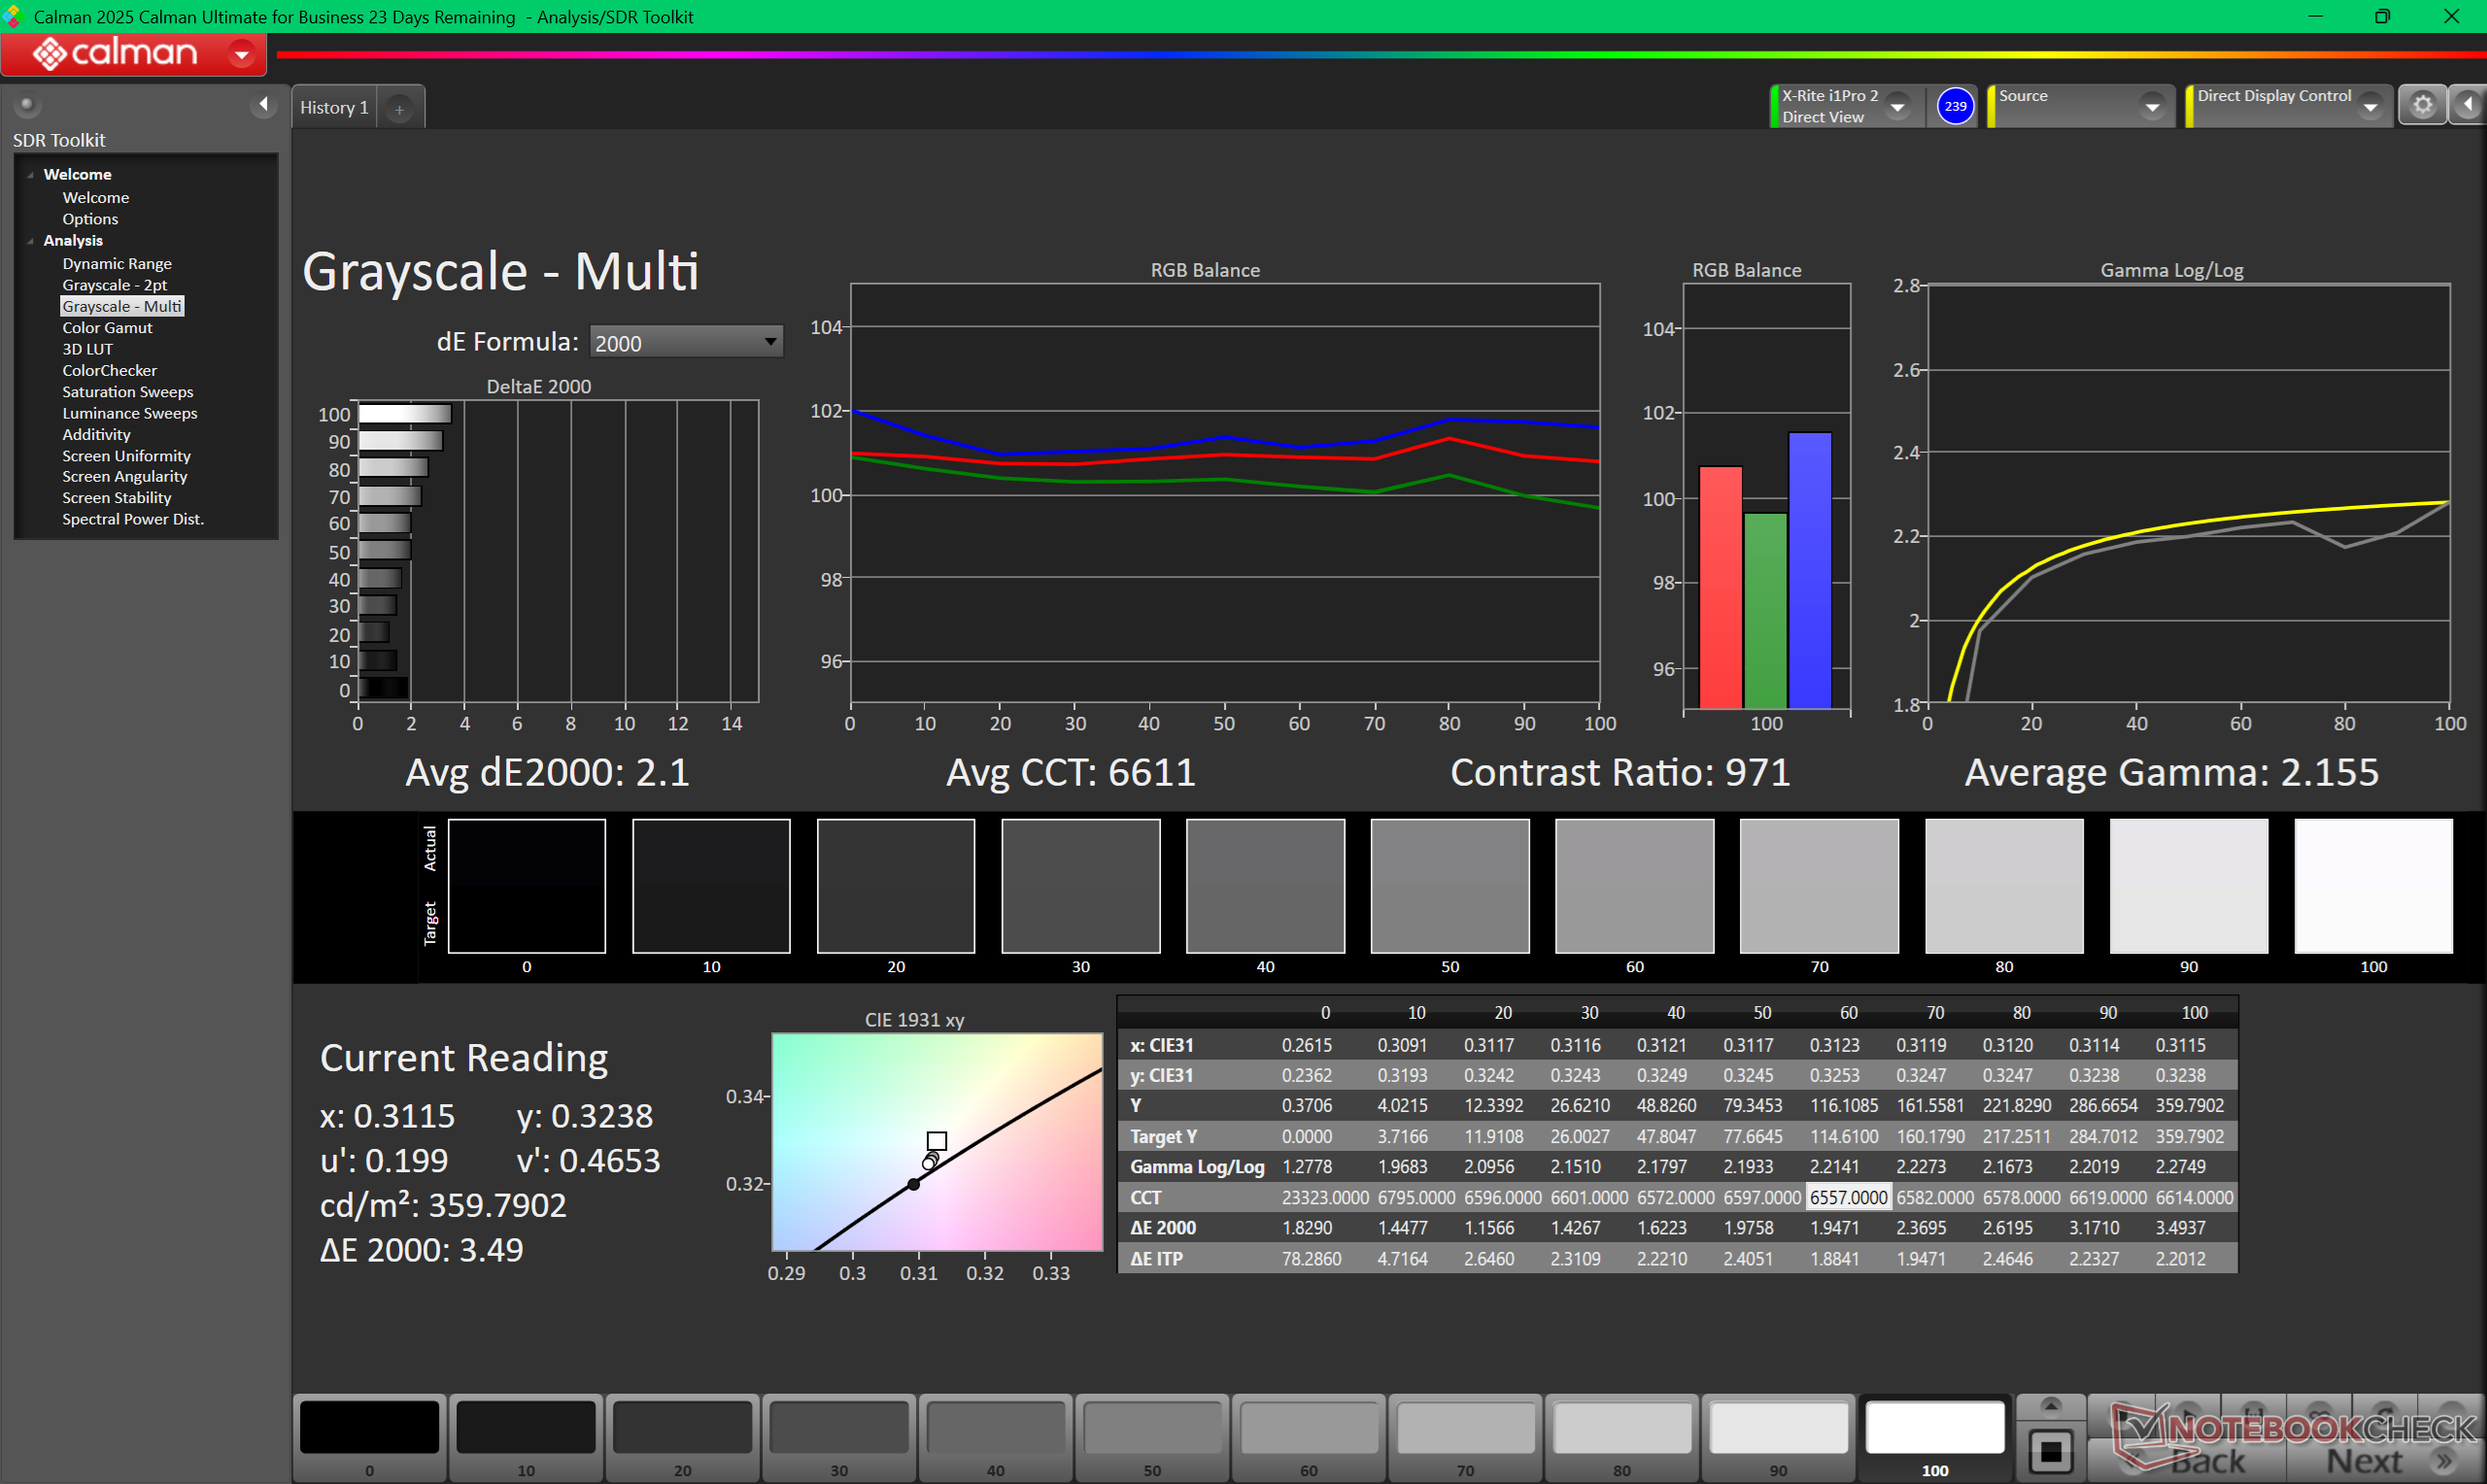
La temperatura del colore è leggermente troppo calda a ~6100K fuori dalla scatola. La calibrazione con un colorimetro X-Rite risolve questo problema e migliora i valori DeltaE medi, come mostrano gli screenshot di CalMan qui sotto. I proprietari possono scaricare e applicare il nostro profilo ICM calibrato gratuito qui sopra.
Tempi di risposta del Display
| ↔ Tempi di risposta dal Nero al Bianco | ||
|---|---|---|
| 22.1 ms ... aumenta ↗ e diminuisce ↘ combinato | ↗ 10.9 ms Incremento | 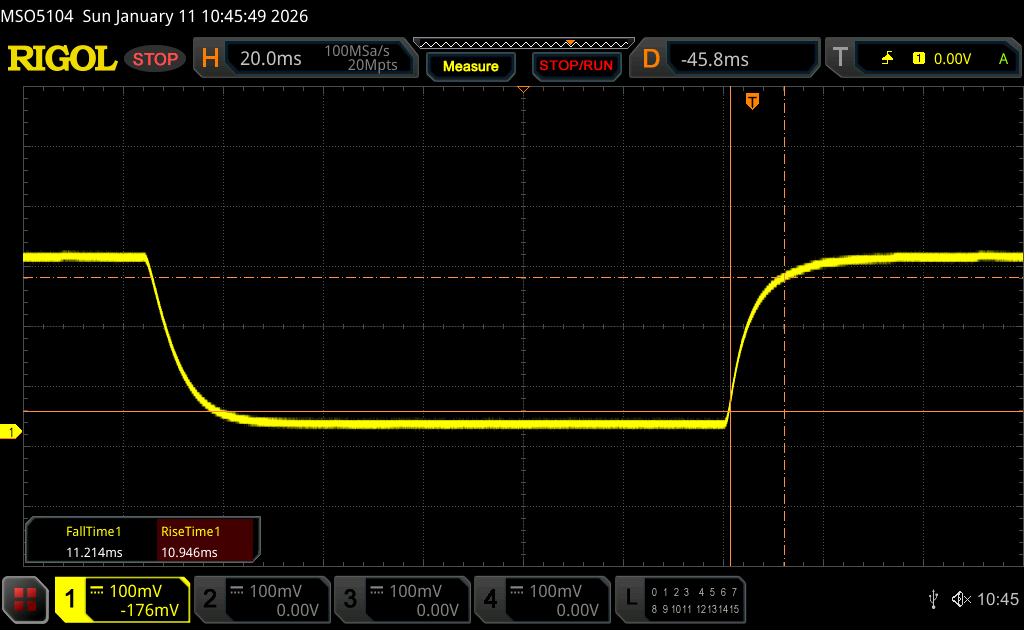 |
| ↘ 11.2 ms Calo | ||
| Lo schermo mostra buoni tempi di risposta durante i nostri tests, ma potrebbe essere troppo lento per i gamers competitivi. In confronto, tutti i dispositivi di test variano da 0.1 (minimo) a 240 (massimo) ms. » 51 % di tutti i dispositivi è migliore. Questo significa che i tempi di risposta rilevati sono peggiori rispetto alla media di tutti i dispositivi testati (19.8 ms). | ||
| ↔ Tempo di risposta dal 50% Grigio all'80% Grigio | ||
| 33.7 ms ... aumenta ↗ e diminuisce ↘ combinato | ↗ 15.7 ms Incremento | 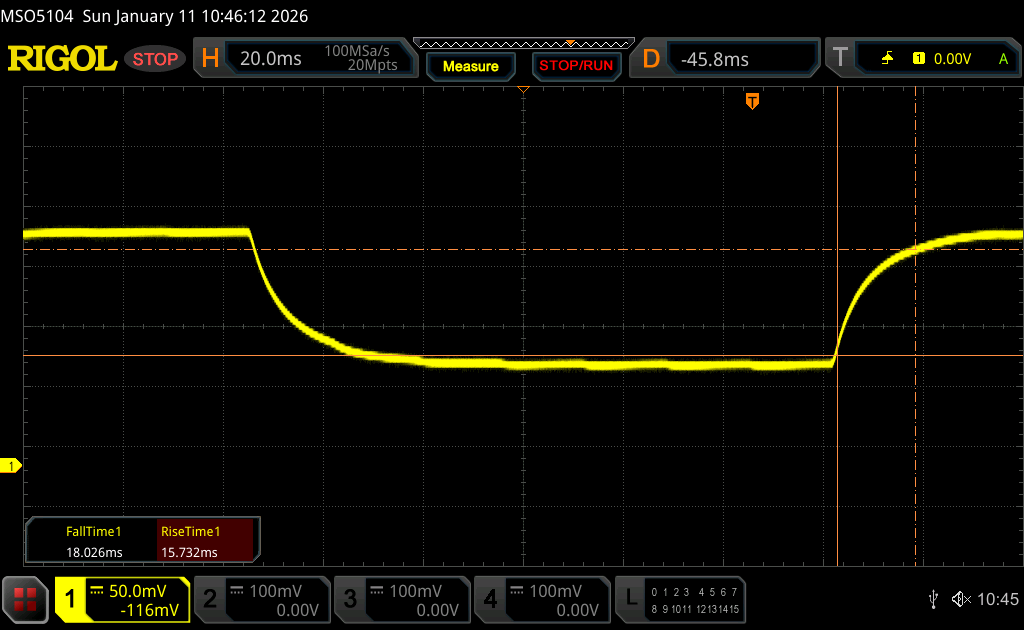 |
| ↘ 18 ms Calo | ||
| Lo schermo mostra tempi di risposta lenti nei nostri tests e sarà insoddisfacente per i gamers. In confronto, tutti i dispositivi di test variano da 0.165 (minimo) a 636 (massimo) ms. » 47 % di tutti i dispositivi è migliore. Questo significa che i tempi di risposta rilevati sono simili alla media di tutti i dispositivi testati (31 ms). | ||
Sfarfallio dello schermo / PWM (Pulse-Width Modulation)
| flickering dello schermo / PWM non rilevato | 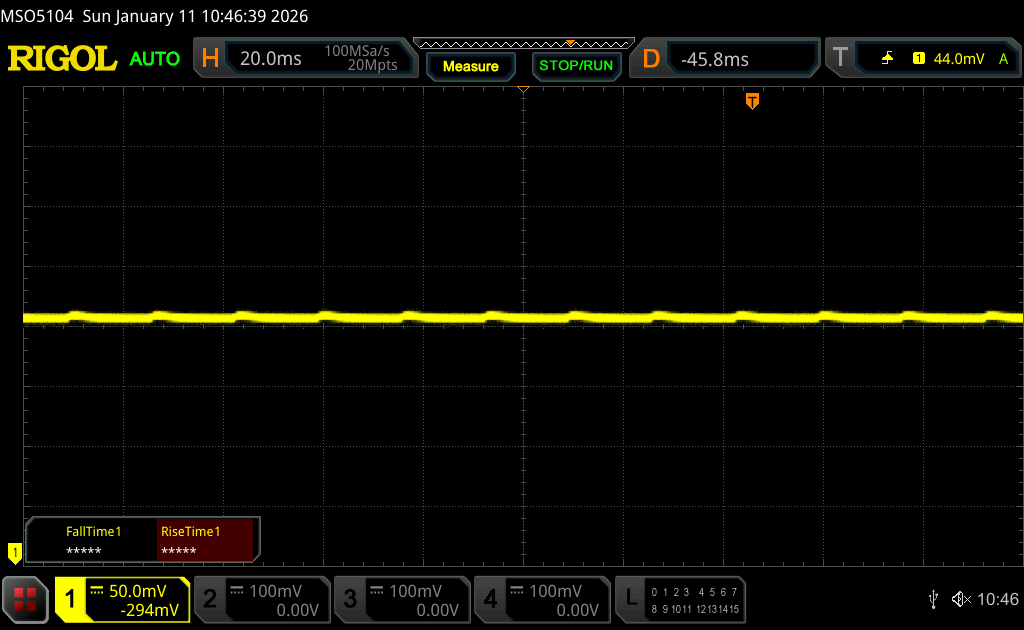 | ||
In confronto: 52 % di tutti i dispositivi testati non utilizza PWM per ridurre la luminosita' del display. Se è rilevato PWM, una media di 7747 (minimo: 5 - massimo: 343500) Hz è stata rilevata. | |||

Prestazioni
Condizioni del test
Abbiamo impostato Windows in modalità Prestazioni prima di eseguire i benchmark qui sotto.
Processore
Le prestazioni della CPU sono quelle che ci aspettiamo rispetto ad altri computer portatili con lo stesso Ryzen 7 250 opzione. Le prestazioni multi-thread grezze sono più veloci di circa il 30-35 percento rispetto al ben apprezzato Core Ultra 7 258Vma le prestazioni dell'iGPU e dell'NPU sono molto inferiori.
Cinebench R15 Multi Loop
Cinebench R23: Multi Core | Single Core
Cinebench R20: CPU (Multi Core) | CPU (Single Core)
Cinebench R15: CPU Multi 64Bit | CPU Single 64Bit
Blender: v2.79 BMW27 CPU
7-Zip 18.03: 7z b 4 | 7z b 4 -mmt1
Geekbench 6.7: Multi-Core | Single-Core
Geekbench 5.5: Multi-Core | Single-Core
HWBOT x265 Benchmark v2.2: 4k Preset
LibreOffice : 20 Documents To PDF
R Benchmark 2.5: Overall mean
| CPU Performance rating | |
| Dell 16 Premium DA16250 | |
| LG Gram Pro 16 16Z90TR-E.AD8BG | |
| Asus ExpertBook B5 B5605CCA | |
| HP EliteBook 8 G1a 16 AI | |
| Media AMD Ryzen 7 250 | |
| Lenovo ThinkPad T16 Gen 4 21QQS06M00 | |
| Dynabook Tecra A60 A65-M | |
| Lenovo ThinkBook Plus Gen6 Rollable | |
| Lenovo IdeaPad 5 2-in-1 16IAL10 | |
| HP Pavilion 16-ag0057ng | |
| Cinebench R23 / Multi Core | |
| Dell 16 Premium DA16250 | |
| LG Gram Pro 16 16Z90TR-E.AD8BG | |
| Asus ExpertBook B5 B5605CCA | |
| HP EliteBook 8 G1a 16 AI | |
| Dynabook Tecra A60 A65-M | |
| Media AMD Ryzen 7 250 (12275 - 16154, n=5) | |
| Lenovo ThinkPad T16 Gen 4 21QQS06M00 | |
| Lenovo IdeaPad 5 2-in-1 16IAL10 | |
| Lenovo ThinkBook Plus Gen6 Rollable | |
| HP Pavilion 16-ag0057ng | |
| Cinebench R23 / Single Core | |
| LG Gram Pro 16 16Z90TR-E.AD8BG | |
| Asus ExpertBook B5 B5605CCA | |
| HP EliteBook 8 G1a 16 AI | |
| Lenovo ThinkPad T16 Gen 4 21QQS06M00 | |
| Lenovo IdeaPad 5 2-in-1 16IAL10 | |
| Dell 16 Premium DA16250 | |
| Lenovo ThinkBook Plus Gen6 Rollable | |
| HP Pavilion 16-ag0057ng | |
| Dynabook Tecra A60 A65-M | |
| Media AMD Ryzen 7 250 (1649 - 1757, n=5) | |
| Cinebench R20 / CPU (Multi Core) | |
| Dell 16 Premium DA16250 | |
| LG Gram Pro 16 16Z90TR-E.AD8BG | |
| Asus ExpertBook B5 B5605CCA | |
| HP EliteBook 8 G1a 16 AI | |
| Media AMD Ryzen 7 250 (4901 - 6320, n=5) | |
| Dynabook Tecra A60 A65-M | |
| Lenovo ThinkPad T16 Gen 4 21QQS06M00 | |
| Lenovo IdeaPad 5 2-in-1 16IAL10 | |
| Lenovo ThinkBook Plus Gen6 Rollable | |
| HP Pavilion 16-ag0057ng | |
| Cinebench R20 / CPU (Single Core) | |
| LG Gram Pro 16 16Z90TR-E.AD8BG | |
| HP EliteBook 8 G1a 16 AI | |
| Lenovo ThinkPad T16 Gen 4 21QQS06M00 | |
| Asus ExpertBook B5 B5605CCA | |
| Dell 16 Premium DA16250 | |
| Lenovo IdeaPad 5 2-in-1 16IAL10 | |
| Lenovo ThinkBook Plus Gen6 Rollable | |
| Media AMD Ryzen 7 250 (655 - 694, n=5) | |
| HP Pavilion 16-ag0057ng | |
| Dynabook Tecra A60 A65-M | |
| Cinebench R15 / CPU Multi 64Bit | |
| Dell 16 Premium DA16250 | |
| Asus ExpertBook B5 B5605CCA | |
| LG Gram Pro 16 16Z90TR-E.AD8BG | |
| Lenovo ThinkPad T16 Gen 4 21QQS06M00 | |
| HP EliteBook 8 G1a 16 AI | |
| Media AMD Ryzen 7 250 (2002 - 2544, n=5) | |
| Dynabook Tecra A60 A65-M | |
| Lenovo IdeaPad 5 2-in-1 16IAL10 | |
| Lenovo ThinkBook Plus Gen6 Rollable | |
| HP Pavilion 16-ag0057ng | |
| Cinebench R15 / CPU Single 64Bit | |
| LG Gram Pro 16 16Z90TR-E.AD8BG | |
| HP EliteBook 8 G1a 16 AI | |
| Asus ExpertBook B5 B5605CCA | |
| Dell 16 Premium DA16250 | |
| Lenovo ThinkBook Plus Gen6 Rollable | |
| HP Pavilion 16-ag0057ng | |
| Media AMD Ryzen 7 250 (263 - 279, n=5) | |
| Dynabook Tecra A60 A65-M | |
| Lenovo IdeaPad 5 2-in-1 16IAL10 | |
| Lenovo ThinkPad T16 Gen 4 21QQS06M00 | |
| Blender / v2.79 BMW27 CPU | |
| HP Pavilion 16-ag0057ng | |
| Lenovo ThinkBook Plus Gen6 Rollable | |
| Lenovo IdeaPad 5 2-in-1 16IAL10 | |
| Lenovo ThinkPad T16 Gen 4 21QQS06M00 | |
| Dynabook Tecra A60 A65-M | |
| Media AMD Ryzen 7 250 (204 - 249, n=5) | |
| Asus ExpertBook B5 B5605CCA | |
| HP EliteBook 8 G1a 16 AI | |
| LG Gram Pro 16 16Z90TR-E.AD8BG | |
| Dell 16 Premium DA16250 | |
| 7-Zip 18.03 / 7z b 4 | |
| Dell 16 Premium DA16250 | |
| LG Gram Pro 16 16Z90TR-E.AD8BG | |
| Media AMD Ryzen 7 250 (57169 - 63475, n=5) | |
| HP EliteBook 8 G1a 16 AI | |
| Dynabook Tecra A60 A65-M | |
| Lenovo ThinkPad T16 Gen 4 21QQS06M00 | |
| Asus ExpertBook B5 B5605CCA | |
| Lenovo IdeaPad 5 2-in-1 16IAL10 | |
| HP Pavilion 16-ag0057ng | |
| Lenovo ThinkBook Plus Gen6 Rollable | |
| 7-Zip 18.03 / 7z b 4 -mmt1 | |
| Media AMD Ryzen 7 250 (6163 - 6491, n=5) | |
| Dynabook Tecra A60 A65-M | |
| HP Pavilion 16-ag0057ng | |
| HP EliteBook 8 G1a 16 AI | |
| LG Gram Pro 16 16Z90TR-E.AD8BG | |
| Dell 16 Premium DA16250 | |
| Asus ExpertBook B5 B5605CCA | |
| Lenovo ThinkBook Plus Gen6 Rollable | |
| Lenovo IdeaPad 5 2-in-1 16IAL10 | |
| Lenovo ThinkPad T16 Gen 4 21QQS06M00 | |
| Geekbench 6.7 / Multi-Core | |
| Dell 16 Premium DA16250 | |
| LG Gram Pro 16 16Z90TR-E.AD8BG | |
| Lenovo ThinkPad T16 Gen 4 21QQS06M00 | |
| HP EliteBook 8 G1a 16 AI | |
| Asus ExpertBook B5 B5605CCA | |
| Lenovo ThinkBook Plus Gen6 Rollable | |
| Lenovo IdeaPad 5 2-in-1 16IAL10 | |
| Media AMD Ryzen 7 250 (9641 - 11206, n=5) | |
| Dynabook Tecra A60 A65-M | |
| HP Pavilion 16-ag0057ng | |
| Geekbench 6.7 / Single-Core | |
| Lenovo ThinkPad T16 Gen 4 21QQS06M00 | |
| HP EliteBook 8 G1a 16 AI | |
| Dell 16 Premium DA16250 | |
| Asus ExpertBook B5 B5605CCA | |
| LG Gram Pro 16 16Z90TR-E.AD8BG | |
| Lenovo ThinkBook Plus Gen6 Rollable | |
| Media AMD Ryzen 7 250 (2418 - 2623, n=5) | |
| HP Pavilion 16-ag0057ng | |
| Lenovo IdeaPad 5 2-in-1 16IAL10 | |
| Dynabook Tecra A60 A65-M | |
| Geekbench 5.5 / Multi-Core | |
| Dell 16 Premium DA16250 | |
| LG Gram Pro 16 16Z90TR-E.AD8BG | |
| Lenovo ThinkPad T16 Gen 4 21QQS06M00 | |
| HP EliteBook 8 G1a 16 AI | |
| Asus ExpertBook B5 B5605CCA | |
| Lenovo IdeaPad 5 2-in-1 16IAL10 | |
| Lenovo ThinkBook Plus Gen6 Rollable | |
| Media AMD Ryzen 7 250 (9215 - 10350, n=5) | |
| Dynabook Tecra A60 A65-M | |
| HP Pavilion 16-ag0057ng | |
| Geekbench 5.5 / Single-Core | |
| HP EliteBook 8 G1a 16 AI | |
| Lenovo ThinkPad T16 Gen 4 21QQS06M00 | |
| Lenovo ThinkBook Plus Gen6 Rollable | |
| LG Gram Pro 16 16Z90TR-E.AD8BG | |
| Asus ExpertBook B5 B5605CCA | |
| Dell 16 Premium DA16250 | |
| Media AMD Ryzen 7 250 (1779 - 1934, n=5) | |
| HP Pavilion 16-ag0057ng | |
| Dynabook Tecra A60 A65-M | |
| Lenovo IdeaPad 5 2-in-1 16IAL10 | |
| HWBOT x265 Benchmark v2.2 / 4k Preset | |
| Dell 16 Premium DA16250 | |
| LG Gram Pro 16 16Z90TR-E.AD8BG | |
| HP EliteBook 8 G1a 16 AI | |
| Asus ExpertBook B5 B5605CCA | |
| Lenovo ThinkPad T16 Gen 4 21QQS06M00 | |
| Media AMD Ryzen 7 250 (15 - 18.1, n=5) | |
| Dynabook Tecra A60 A65-M | |
| Lenovo ThinkBook Plus Gen6 Rollable | |
| Lenovo IdeaPad 5 2-in-1 16IAL10 | |
| HP Pavilion 16-ag0057ng | |
| LibreOffice / 20 Documents To PDF | |
| Lenovo ThinkPad T16 Gen 4 21QQS06M00 | |
| HP EliteBook 8 G1a 16 AI | |
| HP Pavilion 16-ag0057ng | |
| LG Gram Pro 16 16Z90TR-E.AD8BG | |
| Media AMD Ryzen 7 250 (52.1 - 68.6, n=5) | |
| Dynabook Tecra A60 A65-M | |
| Asus ExpertBook B5 B5605CCA | |
| Lenovo IdeaPad 5 2-in-1 16IAL10 | |
| Lenovo ThinkBook Plus Gen6 Rollable | |
| Dell 16 Premium DA16250 | |
| R Benchmark 2.5 / Overall mean | |
| HP EliteBook 8 G1a 16 AI | |
| Lenovo ThinkPad T16 Gen 4 21QQS06M00 | |
| HP Pavilion 16-ag0057ng | |
| Dynabook Tecra A60 A65-M | |
| LG Gram Pro 16 16Z90TR-E.AD8BG | |
| Media AMD Ryzen 7 250 (0.4471 - 0.502, n=5) | |
| Lenovo IdeaPad 5 2-in-1 16IAL10 | |
| Dell 16 Premium DA16250 | |
| Asus ExpertBook B5 B5605CCA | |
| Lenovo ThinkBook Plus Gen6 Rollable | |
* ... Meglio usare valori piccoli
AIDA64: FP32 Ray-Trace | FPU Julia | CPU SHA3 | CPU Queen | FPU SinJulia | FPU Mandel | CPU AES | CPU ZLib | FP64 Ray-Trace | CPU PhotoWorxx
| Performance rating | |
| HP EliteBook 8 G1a 16 AI | |
| Dynabook Tecra A60 A65-M | |
| Media AMD Ryzen 7 250 | |
| LG Gram Pro 16 16Z90TR-E.AD8BG | |
| Lenovo ThinkPad T16 Gen 4 21QQS06M00 | |
| Asus ExpertBook B5 B5605CCA | |
| AIDA64 / FP32 Ray-Trace | |
| HP EliteBook 8 G1a 16 AI | |
| Dynabook Tecra A60 A65-M | |
| Media AMD Ryzen 7 250 (19614 - 24783, n=5) | |
| Lenovo ThinkPad T16 Gen 4 21QQS06M00 | |
| LG Gram Pro 16 16Z90TR-E.AD8BG | |
| LG Gram Pro 16 16Z90TR-E.AD8BG | |
| Asus ExpertBook B5 B5605CCA | |
| AIDA64 / FPU Julia | |
| HP EliteBook 8 G1a 16 AI | |
| LG Gram Pro 16 16Z90TR-E.AD8BG | |
| LG Gram Pro 16 16Z90TR-E.AD8BG | |
| Dynabook Tecra A60 A65-M | |
| Media AMD Ryzen 7 250 (79019 - 98709, n=5) | |
| Asus ExpertBook B5 B5605CCA | |
| Lenovo ThinkPad T16 Gen 4 21QQS06M00 | |
| AIDA64 / CPU SHA3 | |
| LG Gram Pro 16 16Z90TR-E.AD8BG | |
| LG Gram Pro 16 16Z90TR-E.AD8BG | |
| Dynabook Tecra A60 A65-M | |
| Media AMD Ryzen 7 250 (3817 - 4563, n=5) | |
| HP EliteBook 8 G1a 16 AI | |
| Asus ExpertBook B5 B5605CCA | |
| Lenovo ThinkPad T16 Gen 4 21QQS06M00 | |
| AIDA64 / CPU Queen | |
| Media AMD Ryzen 7 250 (97511 - 114915, n=4) | |
| Dynabook Tecra A60 A65-M | |
| Lenovo ThinkPad T16 Gen 4 21QQS06M00 | |
| HP EliteBook 8 G1a 16 AI | |
| LG Gram Pro 16 16Z90TR-E.AD8BG | |
| LG Gram Pro 16 16Z90TR-E.AD8BG | |
| Asus ExpertBook B5 B5605CCA | |
| AIDA64 / FPU SinJulia | |
| Media AMD Ryzen 7 250 (12847 - 14798, n=5) | |
| Dynabook Tecra A60 A65-M | |
| HP EliteBook 8 G1a 16 AI | |
| Lenovo ThinkPad T16 Gen 4 21QQS06M00 | |
| LG Gram Pro 16 16Z90TR-E.AD8BG | |
| LG Gram Pro 16 16Z90TR-E.AD8BG | |
| Asus ExpertBook B5 B5605CCA | |
| AIDA64 / FPU Mandel | |
| HP EliteBook 8 G1a 16 AI | |
| Dynabook Tecra A60 A65-M | |
| LG Gram Pro 16 16Z90TR-E.AD8BG | |
| LG Gram Pro 16 16Z90TR-E.AD8BG | |
| Media AMD Ryzen 7 250 (42572 - 53836, n=5) | |
| Asus ExpertBook B5 B5605CCA | |
| Lenovo ThinkPad T16 Gen 4 21QQS06M00 | |
| AIDA64 / CPU AES | |
| HP EliteBook 8 G1a 16 AI | |
| Dynabook Tecra A60 A65-M | |
| Lenovo ThinkPad T16 Gen 4 21QQS06M00 | |
| Media AMD Ryzen 7 250 (68090 - 85430, n=5) | |
| LG Gram Pro 16 16Z90TR-E.AD8BG | |
| LG Gram Pro 16 16Z90TR-E.AD8BG | |
| Asus ExpertBook B5 B5605CCA | |
| AIDA64 / CPU ZLib | |
| LG Gram Pro 16 16Z90TR-E.AD8BG | |
| LG Gram Pro 16 16Z90TR-E.AD8BG | |
| Asus ExpertBook B5 B5605CCA | |
| HP EliteBook 8 G1a 16 AI | |
| Dynabook Tecra A60 A65-M | |
| Media AMD Ryzen 7 250 (850 - 1074, n=5) | |
| Lenovo ThinkPad T16 Gen 4 21QQS06M00 | |
| AIDA64 / FP64 Ray-Trace | |
| HP EliteBook 8 G1a 16 AI | |
| Dynabook Tecra A60 A65-M | |
| Media AMD Ryzen 7 250 (10504 - 13039, n=5) | |
| Lenovo ThinkPad T16 Gen 4 21QQS06M00 | |
| LG Gram Pro 16 16Z90TR-E.AD8BG | |
| LG Gram Pro 16 16Z90TR-E.AD8BG | |
| Asus ExpertBook B5 B5605CCA | |
| AIDA64 / CPU PhotoWorxx | |
| LG Gram Pro 16 16Z90TR-E.AD8BG | |
| LG Gram Pro 16 16Z90TR-E.AD8BG | |
| HP EliteBook 8 G1a 16 AI | |
| Lenovo ThinkPad T16 Gen 4 21QQS06M00 | |
| Media AMD Ryzen 7 250 (22645 - 40403, n=5) | |
| Asus ExpertBook B5 B5605CCA | |
| Dynabook Tecra A60 A65-M | |
Prestazioni del sistema
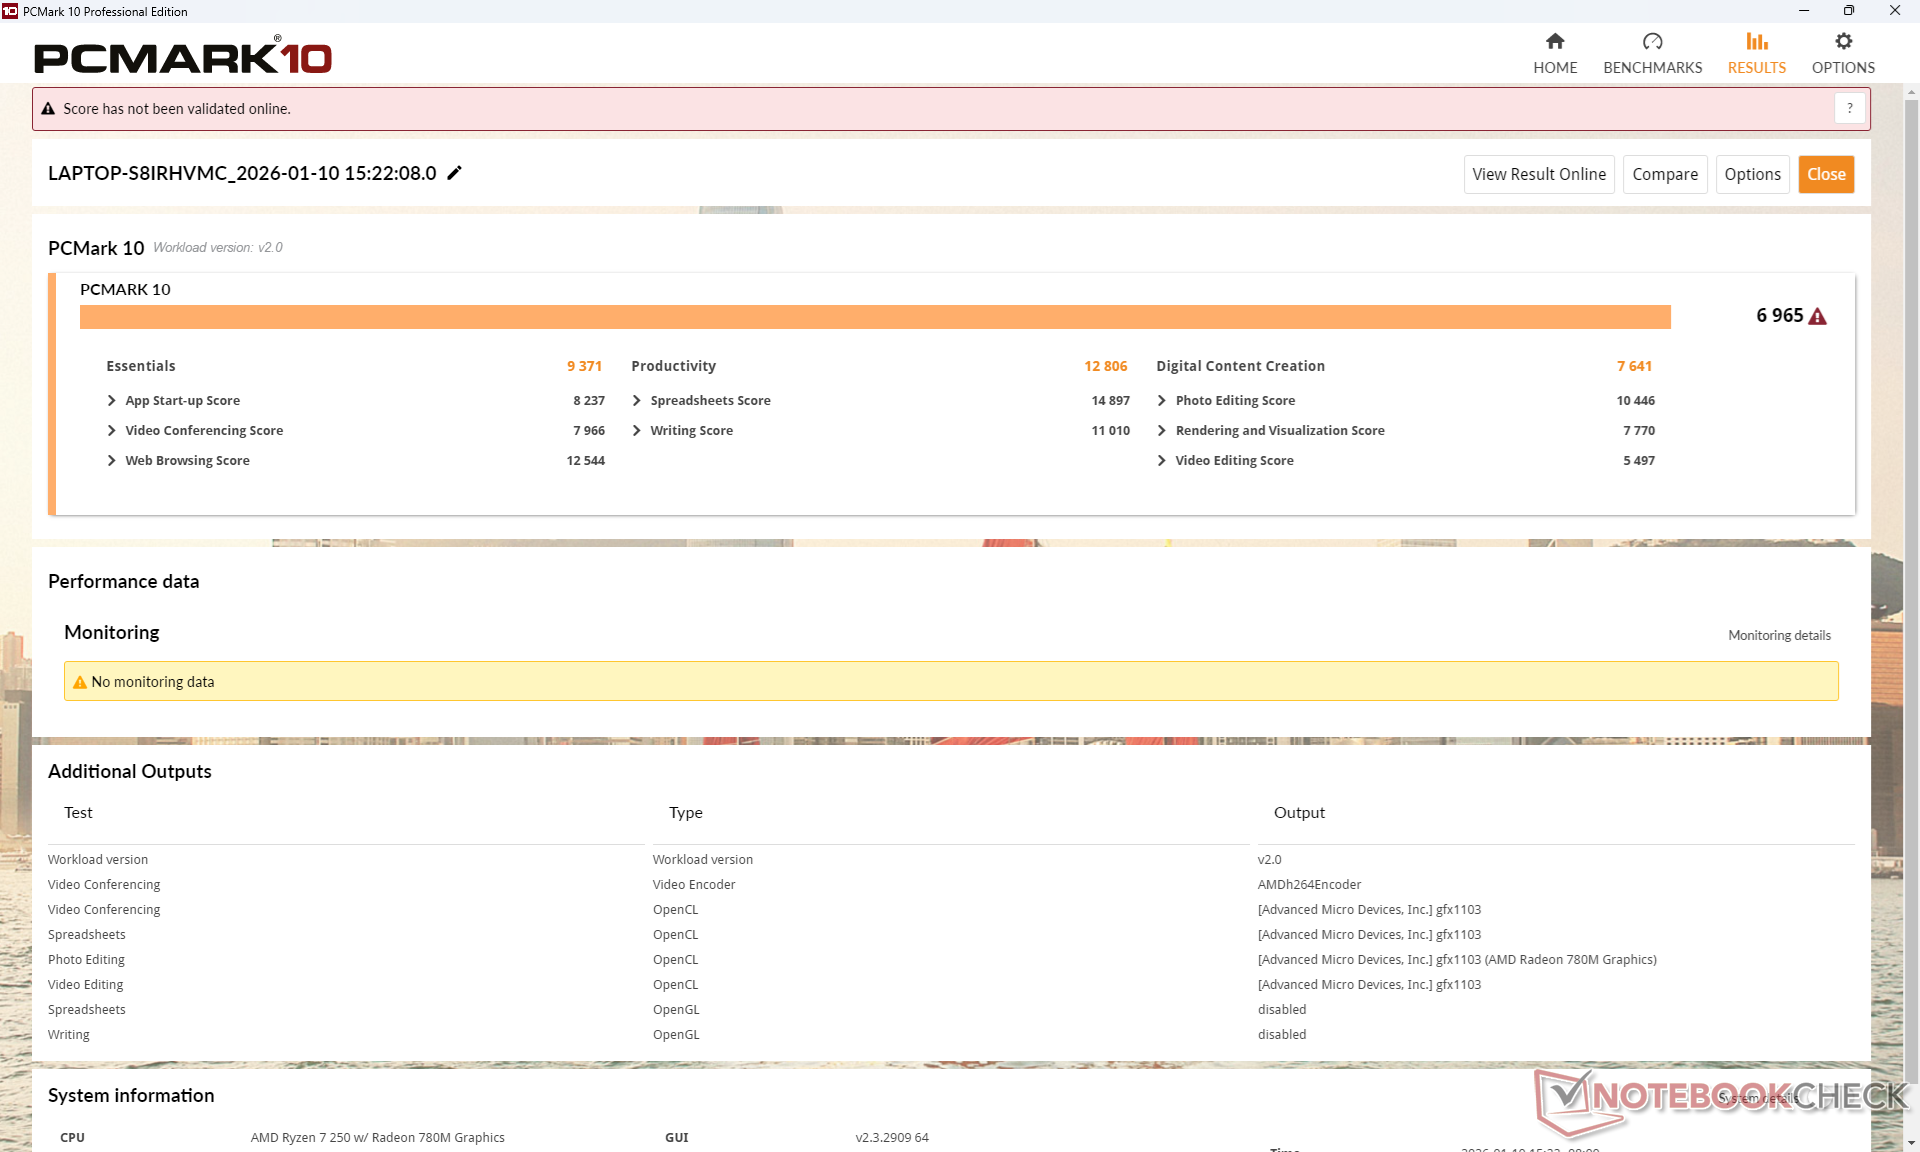
PCMark 10: Score | Essentials | Productivity | Digital Content Creation
CrossMark: Overall | Productivity | Creativity | Responsiveness
WebXPRT 3: Overall
WebXPRT 4: Overall
Mozilla Kraken 1.1: Total
Geekbench AI: Single Precision GPU 1.7 | Half Precision GPU 1.7 | Quantized GPU 1.7
| Performance rating | |
| Dell 16 Premium DA16250 -4! | |
| Asus ExpertBook B5 B5605CCA -3! | |
| Lenovo ThinkPad T16 Gen 4 21QQS06M00 -3! | |
| HP EliteBook 8 G1a 16 AI | |
| Media AMD Ryzen 7 250, AMD Radeon 780M | |
| Dynabook Tecra A60 A65-M | |
| PCMark 10 / Score | |
| HP EliteBook 8 G1a 16 AI | |
| Lenovo ThinkPad T16 Gen 4 21QQS06M00 | |
| Asus ExpertBook B5 B5605CCA | |
| Dynabook Tecra A60 A65-M | |
| Media AMD Ryzen 7 250, AMD Radeon 780M (6437 - 6965, n=3) | |
| PCMark 10 / Essentials | |
| HP EliteBook 8 G1a 16 AI | |
| Lenovo ThinkPad T16 Gen 4 21QQS06M00 | |
| Asus ExpertBook B5 B5605CCA | |
| Media AMD Ryzen 7 250, AMD Radeon 780M (9371 - 10121, n=3) | |
| Dynabook Tecra A60 A65-M | |
| PCMark 10 / Productivity | |
| Dynabook Tecra A60 A65-M | |
| HP EliteBook 8 G1a 16 AI | |
| Media AMD Ryzen 7 250, AMD Radeon 780M (8865 - 12806, n=3) | |
| Lenovo ThinkPad T16 Gen 4 21QQS06M00 | |
| Asus ExpertBook B5 B5605CCA | |
| PCMark 10 / Digital Content Creation | |
| Asus ExpertBook B5 B5605CCA | |
| HP EliteBook 8 G1a 16 AI | |
| Lenovo ThinkPad T16 Gen 4 21QQS06M00 | |
| Media AMD Ryzen 7 250, AMD Radeon 780M (7641 - 8333, n=3) | |
| Dynabook Tecra A60 A65-M | |
| CrossMark / Overall | |
| Dell 16 Premium DA16250 | |
| Asus ExpertBook B5 B5605CCA | |
| HP EliteBook 8 G1a 16 AI | |
| Media AMD Ryzen 7 250, AMD Radeon 780M (1412 - 1581, n=3) | |
| Lenovo ThinkPad T16 Gen 4 21QQS06M00 | |
| Dynabook Tecra A60 A65-M | |
| CrossMark / Productivity | |
| Dell 16 Premium DA16250 | |
| Asus ExpertBook B5 B5605CCA | |
| HP EliteBook 8 G1a 16 AI | |
| Media AMD Ryzen 7 250, AMD Radeon 780M (1439 - 1550, n=3) | |
| Dynabook Tecra A60 A65-M | |
| Lenovo ThinkPad T16 Gen 4 21QQS06M00 | |
| CrossMark / Creativity | |
| Dell 16 Premium DA16250 | |
| HP EliteBook 8 G1a 16 AI | |
| Asus ExpertBook B5 B5605CCA | |
| Lenovo ThinkPad T16 Gen 4 21QQS06M00 | |
| Media AMD Ryzen 7 250, AMD Radeon 780M (1456 - 1784, n=3) | |
| Dynabook Tecra A60 A65-M | |
| CrossMark / Responsiveness | |
| Dell 16 Premium DA16250 | |
| HP EliteBook 8 G1a 16 AI | |
| Asus ExpertBook B5 B5605CCA | |
| Media AMD Ryzen 7 250, AMD Radeon 780M (1220 - 1281, n=3) | |
| Dynabook Tecra A60 A65-M | |
| Lenovo ThinkPad T16 Gen 4 21QQS06M00 | |
| WebXPRT 3 / Overall | |
| Dell 16 Premium DA16250 | |
| Asus ExpertBook B5 B5605CCA | |
| Lenovo ThinkPad T16 Gen 4 21QQS06M00 | |
| Media AMD Ryzen 7 250, AMD Radeon 780M (271 - 281, n=3) | |
| Dynabook Tecra A60 A65-M | |
| HP EliteBook 8 G1a 16 AI | |
| WebXPRT 4 / Overall | |
| Dell 16 Premium DA16250 | |
| Asus ExpertBook B5 B5605CCA | |
| Media AMD Ryzen 7 250, AMD Radeon 780M (224 - 238, n=3) | |
| Dynabook Tecra A60 A65-M | |
| HP EliteBook 8 G1a 16 AI | |
| Lenovo ThinkPad T16 Gen 4 21QQS06M00 | |
| Mozilla Kraken 1.1 / Total | |
| HP EliteBook 8 G1a 16 AI | |
| Media AMD Ryzen 7 250, AMD Radeon 780M (540 - 591, n=3) | |
| Dynabook Tecra A60 A65-M | |
| Lenovo ThinkPad T16 Gen 4 21QQS06M00 | |
| Dell 16 Premium DA16250 | |
| Asus ExpertBook B5 B5605CCA | |
| Geekbench AI / Single Precision GPU 1.7 | |
| Dell 16 Premium DA16250 | |
| HP EliteBook 8 G1a 16 AI | |
| Dynabook Tecra A60 A65-M | |
| Media AMD Ryzen 7 250, AMD Radeon 780M (n=1) | |
| Geekbench AI / Half Precision GPU 1.7 | |
| Dell 16 Premium DA16250 | |
| HP EliteBook 8 G1a 16 AI | |
| Dynabook Tecra A60 A65-M | |
| Media AMD Ryzen 7 250, AMD Radeon 780M (n=1) | |
| Geekbench AI / Quantized GPU 1.7 | |
| Dell 16 Premium DA16250 | |
| HP EliteBook 8 G1a 16 AI | |
| Dynabook Tecra A60 A65-M | |
| Media AMD Ryzen 7 250, AMD Radeon 780M (n=1) | |
* ... Meglio usare valori piccoli
| PCMark 10 Score | 6965 punti | |
Aiuto | ||
| AIDA64 / Memory Copy | |
| LG Gram Pro 16 16Z90TR-E.AD8BG | |
| LG Gram Pro 16 16Z90TR-E.AD8BG | |
| Lenovo ThinkPad T16 Gen 4 21QQS06M00 | |
| HP EliteBook 8 G1a 16 AI | |
| Asus ExpertBook B5 B5605CCA | |
| Media AMD Ryzen 7 250 (35172 - 68811, n=5) | |
| Dynabook Tecra A60 A65-M | |
| AIDA64 / Memory Read | |
| LG Gram Pro 16 16Z90TR-E.AD8BG | |
| LG Gram Pro 16 16Z90TR-E.AD8BG | |
| HP EliteBook 8 G1a 16 AI | |
| Lenovo ThinkPad T16 Gen 4 21QQS06M00 | |
| Asus ExpertBook B5 B5605CCA | |
| Media AMD Ryzen 7 250 (29534 - 60683, n=5) | |
| Dynabook Tecra A60 A65-M | |
| AIDA64 / Memory Write | |
| HP EliteBook 8 G1a 16 AI | |
| Lenovo ThinkPad T16 Gen 4 21QQS06M00 | |
| LG Gram Pro 16 16Z90TR-E.AD8BG | |
| LG Gram Pro 16 16Z90TR-E.AD8BG | |
| Media AMD Ryzen 7 250 (40057 - 86628, n=5) | |
| Dynabook Tecra A60 A65-M | |
| Asus ExpertBook B5 B5605CCA | |
| AIDA64 / Memory Latency | |
| LG Gram Pro 16 16Z90TR-E.AD8BG | |
| LG Gram Pro 16 16Z90TR-E.AD8BG | |
| Asus ExpertBook B5 B5605CCA | |
| Lenovo ThinkPad T16 Gen 4 21QQS06M00 | |
| HP EliteBook 8 G1a 16 AI | |
| Dynabook Tecra A60 A65-M | |
| Media AMD Ryzen 7 250 (94.1 - 103, n=5) | |
* ... Meglio usare valori piccoli
Latenza DPC
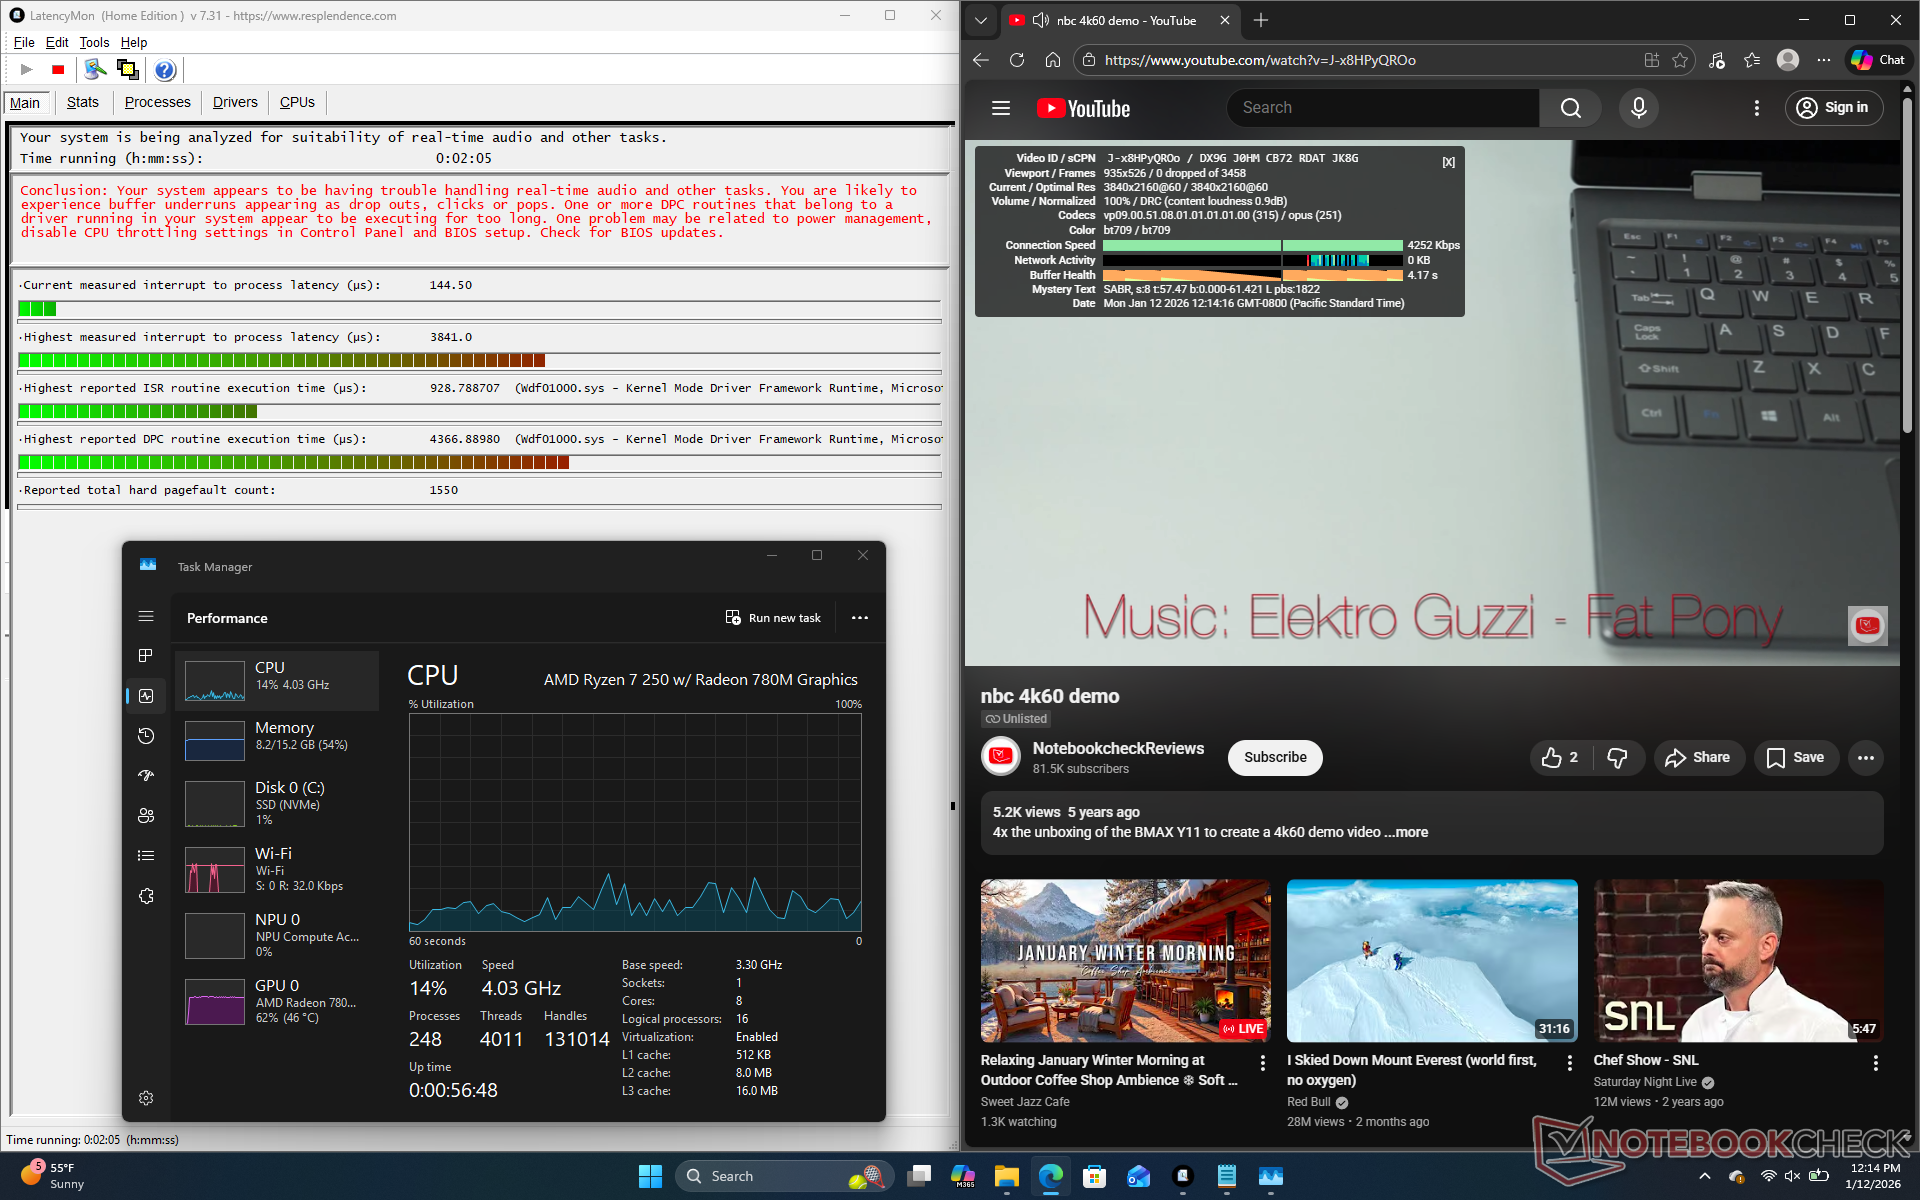
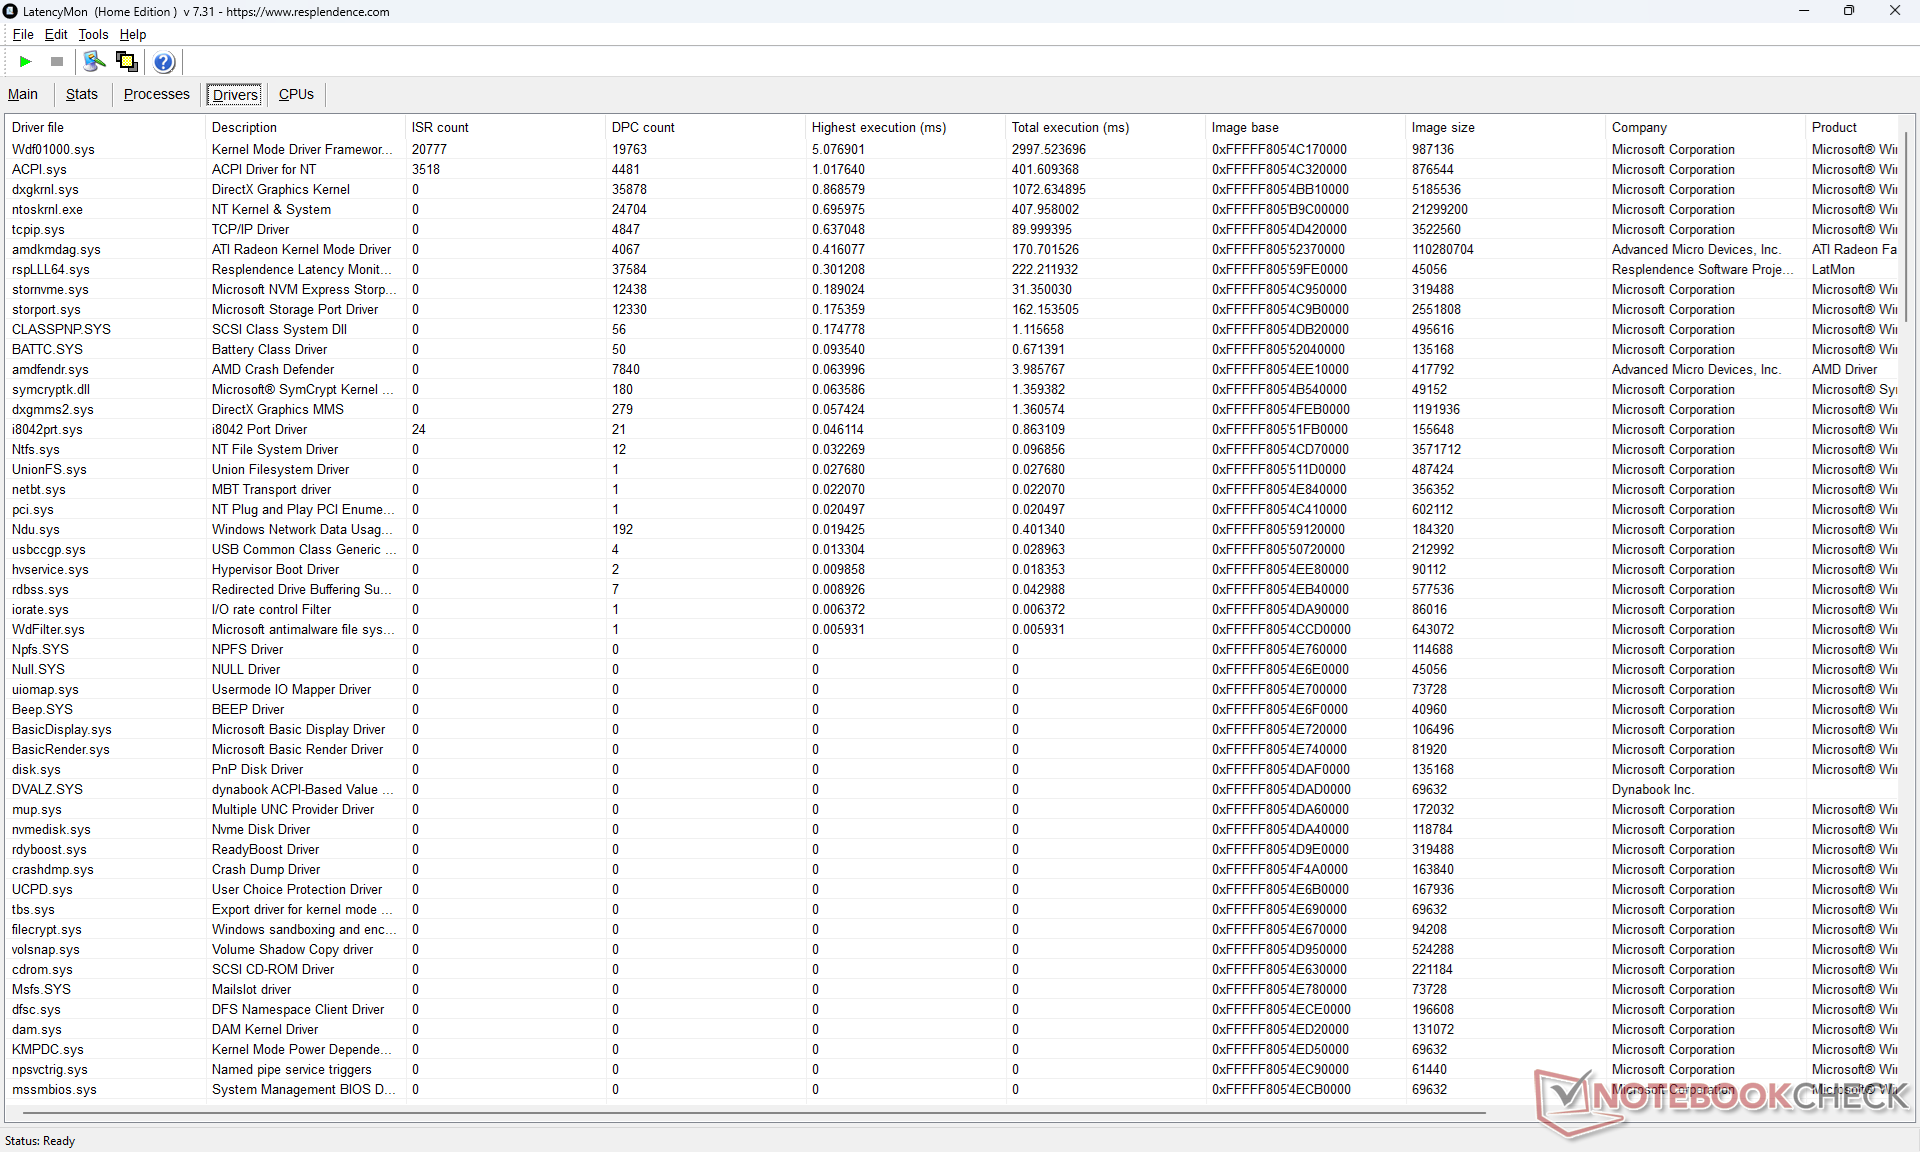
| DPC Latencies / LatencyMon - interrupt to process latency (max), Web, Youtube, Prime95 | |
| HP EliteBook 8 G1a 16 AI | |
| Dynabook Tecra A60 A65-M | |
| Asus ExpertBook B5 B5605CCA | |
| Lenovo ThinkPad T16 Gen 4 21QQS06M00 | |
| Dell 16 Premium DA16250 | |
* ... Meglio usare valori piccoli
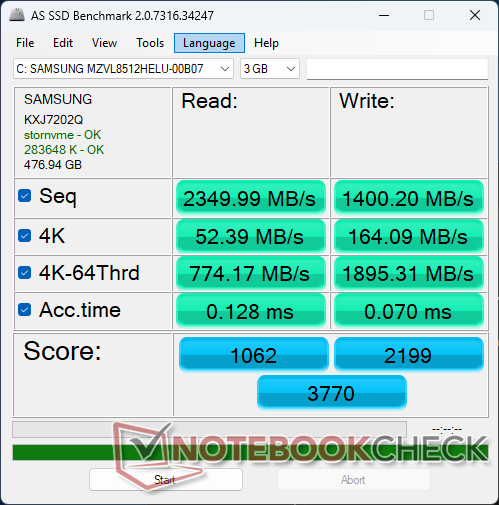
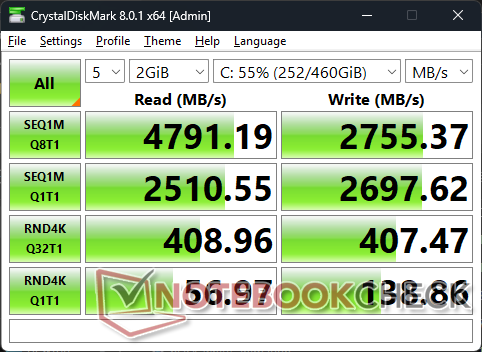
Dispositivi di archiviazione
Il modello supporta solo un SSD M.2 2280 interno, nonostante il fattore di forma da 16 pollici relativamente spazioso.

| Drive Performance rating - Percent | |
| Lenovo ThinkPad T16 Gen 4 21QQS06M00 | |
| Dell 16 Premium DA16250 | |
| HP EliteBook 8 G1a 16 AI | |
| LG Gram Pro 16 16Z90TR-E.AD8BG -11! | |
| Asus ExpertBook B5 B5605CCA | |
| Dynabook Tecra A60 A65-M | |
* ... Meglio usare valori piccoli
Strozzatura del disco: DiskSpd Lettura in loop, Profondità coda 8
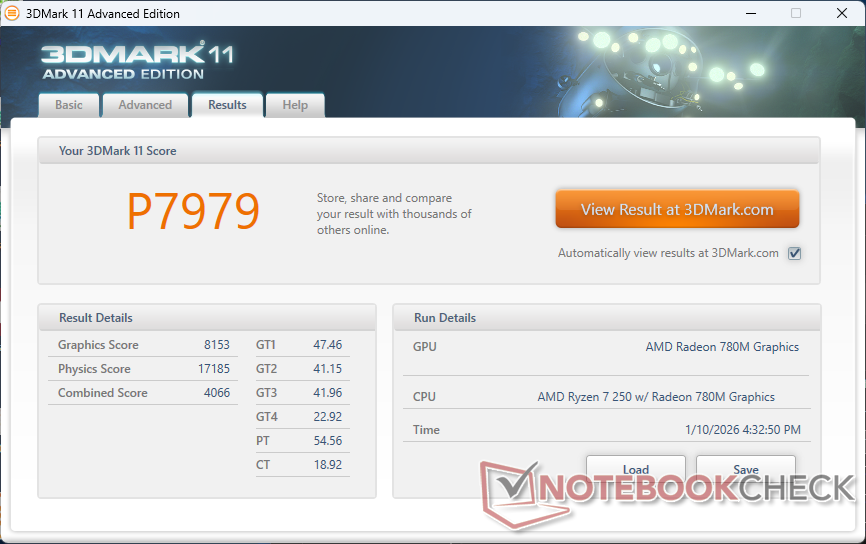
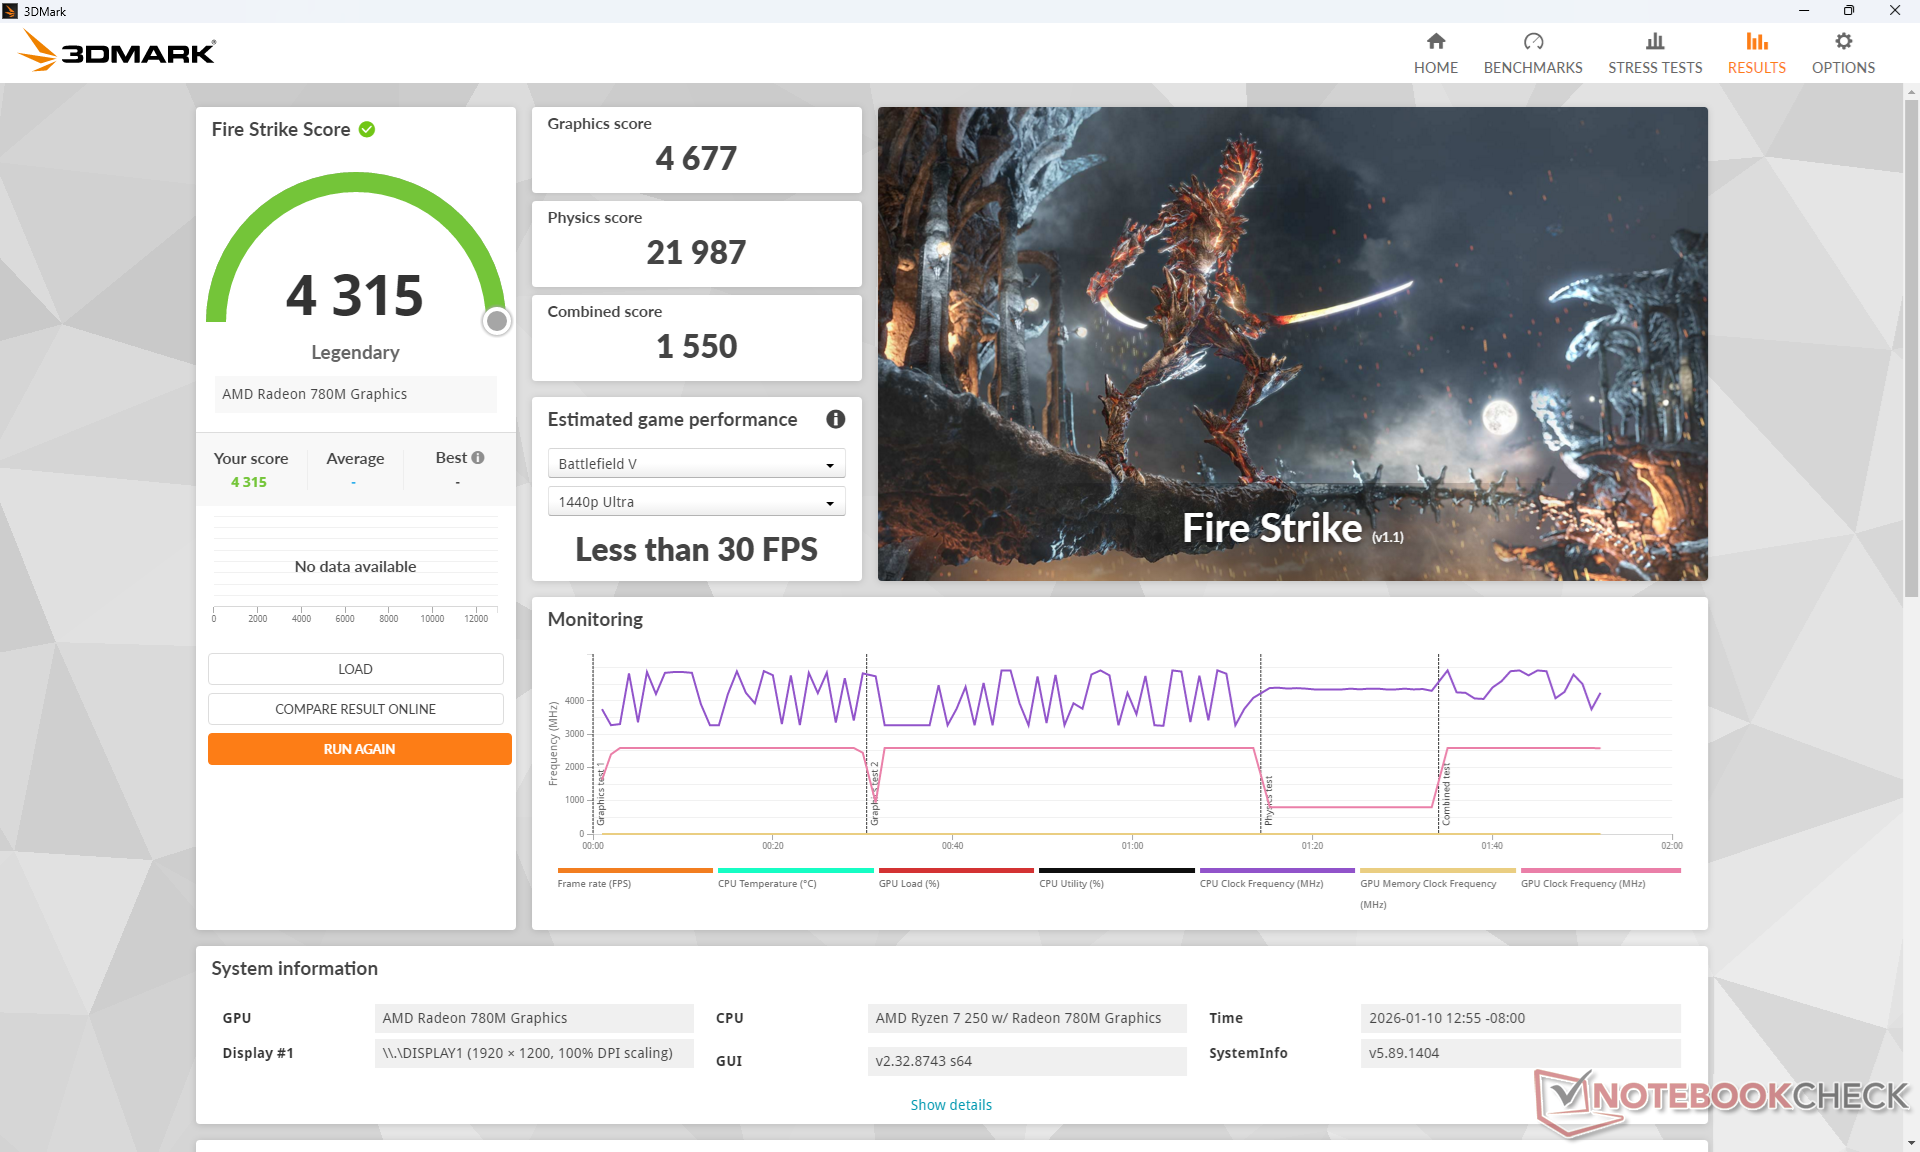
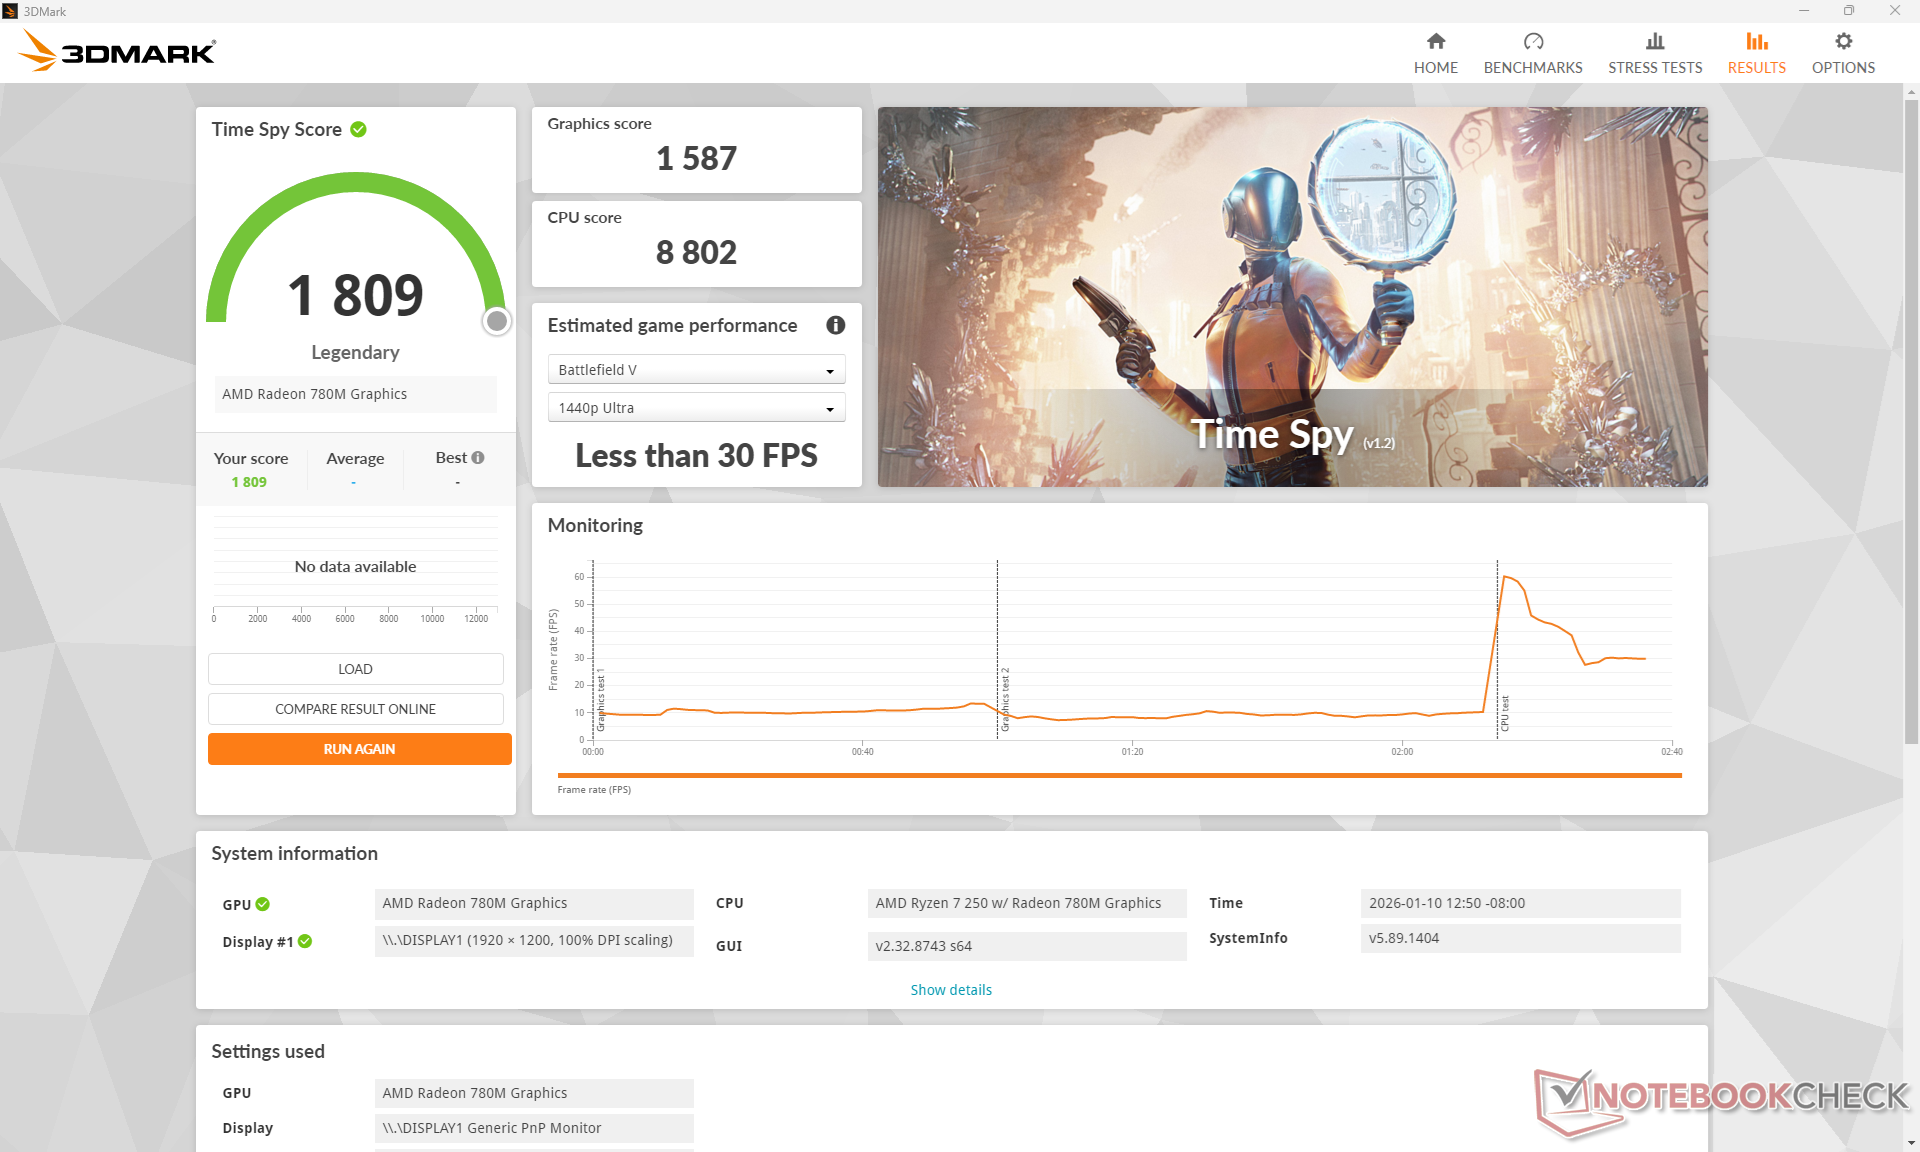
Prestazioni della GPU
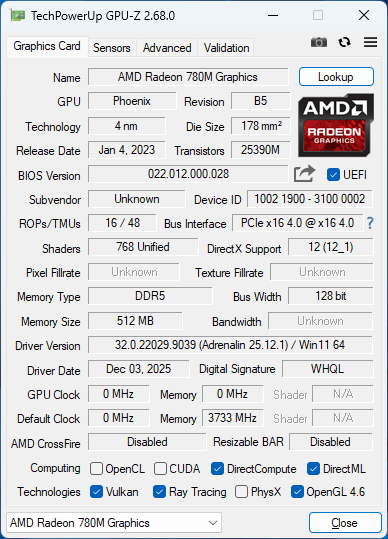
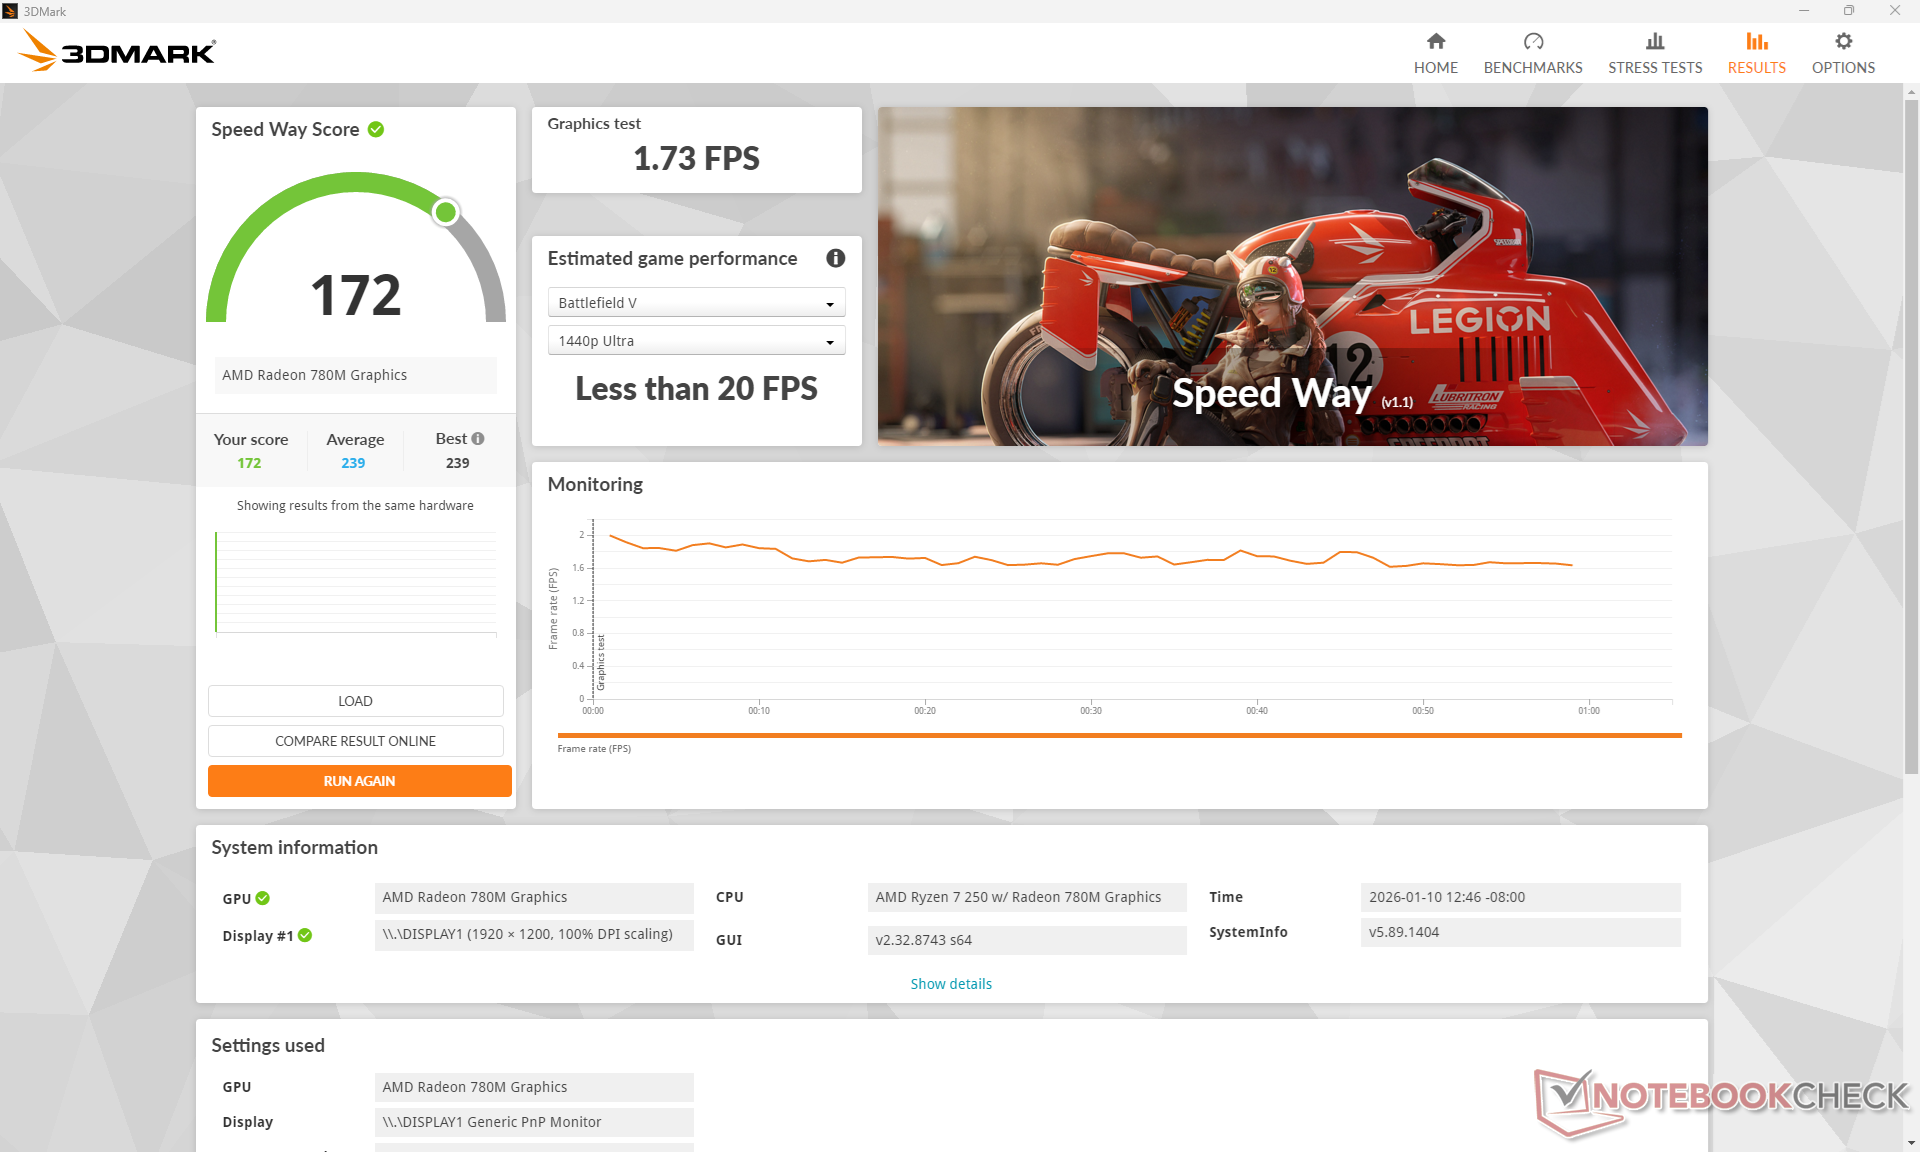
Le prestazioni grafiche sono circa il 40 percento più lente rispetto alla media dei laptop del nostro database con la stessa scheda Radeon 780M integrata Radeon 780M integrata. La discrepanza può essere in gran parte attribuita alla configurazione della RAM a canale singolo della nostra unità di test configurata. Raccomandiamo assolutamente di utilizzare la modalità dual-channel con due stick di RAM individuali, quando possibile, per massimizzare le prestazioni dell'iGPU.
F1 24 si bloccava costantemente quando era impostato su grafica Alta o migliore sulla nostra unità e quindi i suoi risultati sono lasciati vuoti qui sotto.
| Profilo di potenza | Punteggio grafico | Punteggio Fisica | Punteggio combinato |
| Modalità Prestazioni | 4677 | 21987 | 1550 |
| Modalità equilibrata | 4701 (-0%) | 22083 (-0%) | 1566 (-0%) |
| Alimentazione a batteria | 4284 (-8%) | 19313 (-12%) | 1480 (-5%) |
| 3DMark Performance rating - Percent | |
| Dell 16 Premium DA16250 | |
| LG Gram Pro 16 16Z90TR-E.AD8BG -3! | |
| Dell 16 Plus 2-in-1 -1! | |
| Samsung Galaxy Book5 Pro 360 -1! | |
| Media AMD Radeon 780M | |
| HP EliteBook 8 G1a 16 AI | |
| Lenovo ThinkPad T16 Gen 4 21QQS06M00 -1! | |
| Asus ExpertBook B5 B5605CCA | |
| Dynabook Tecra A60 A65-M | |
| 3DMark 11 Performance | 7979 punti | |
| 3DMark Cloud Gate Standard Score | 22748 punti | |
| 3DMark Fire Strike Score | 4315 punti | |
| 3DMark Time Spy Score | 1809 punti | |
Aiuto | ||
| Blender | |
| v3.3 Classroom OPTIX/RTX | |
| Dell 16 Premium DA16250 | |
| v3.3 Classroom CUDA | |
| Dell 16 Premium DA16250 | |
| v3.3 Classroom CPU | |
| Dynabook Tecra A60 A65-M | |
| Lenovo ThinkPad T16 Gen 4 21QQS06M00 | |
| Media AMD Radeon 780M (300 - 664, n=76) | |
| Asus ExpertBook B5 B5605CCA | |
| HP EliteBook 8 G1a 16 AI | |
| Dell 16 Premium DA16250 | |
| v4.3 Barbershop CPU | |
| Dynabook Tecra A60 A65-M | |
| Media AMD Radeon 780M (1449 - 2132, n=22) | |
| HP EliteBook 8 G1a 16 AI | |
| Dell 16 Premium DA16250 | |
* ... Meglio usare valori piccoli
| Performance rating - Percent | |
| LG Gram Pro 16 16Z90TR-E.AD8BG -1! | |
| HP EliteBook 8 G1a 16 AI | |
| Lenovo ThinkPad T16 Gen 4 21QQS06M00 | |
| Asus ExpertBook B5 B5605CCA | |
| Dynabook Tecra A60 A65-M | |
| Lenovo IdeaPad Slim 5 16IRU9 | |
| Cyberpunk 2077 - 1920x1080 Ultra Preset (FSR off) | |
| LG Gram Pro 16 16Z90TR-E.AD8BG | |
| HP EliteBook 8 G1a 16 AI | |
| Lenovo ThinkPad T16 Gen 4 21QQS06M00 | |
| Asus ExpertBook B5 B5605CCA | |
| Dynabook Tecra A60 A65-M | |
| Lenovo IdeaPad Slim 5 16IRU9 | |
| Baldur's Gate 3 - 1920x1080 Ultra Preset AA:T | |
| LG Gram Pro 16 16Z90TR-E.AD8BG | |
| Asus ExpertBook B5 B5605CCA | |
| HP EliteBook 8 G1a 16 AI | |
| Lenovo ThinkPad T16 Gen 4 21QQS06M00 | |
| Dynabook Tecra A60 A65-M | |
| Lenovo IdeaPad Slim 5 16IRU9 | |
| GTA V - 1920x1080 Highest AA:4xMSAA + FX AF:16x | |
| Lenovo ThinkPad T16 Gen 4 21QQS06M00 | |
| HP EliteBook 8 G1a 16 AI | |
| Dynabook Tecra A60 A65-M | |
| Lenovo IdeaPad Slim 5 16IRU9 | |
| Asus ExpertBook B5 B5605CCA | |
| Final Fantasy XV Benchmark - 1920x1080 High Quality | |
| LG Gram Pro 16 16Z90TR-E.AD8BG | |
| Lenovo ThinkPad T16 Gen 4 21QQS06M00 | |
| HP EliteBook 8 G1a 16 AI | |
| Asus ExpertBook B5 B5605CCA | |
| Lenovo IdeaPad Slim 5 16IRU9 | |
| Dynabook Tecra A60 A65-M | |
| Strange Brigade - 1920x1080 ultra AA:ultra AF:16 | |
| LG Gram Pro 16 16Z90TR-E.AD8BG | |
| Lenovo ThinkPad T16 Gen 4 21QQS06M00 | |
| HP EliteBook 8 G1a 16 AI | |
| Asus ExpertBook B5 B5605CCA | |
| Dynabook Tecra A60 A65-M | |
| Lenovo IdeaPad Slim 5 16IRU9 | |
| Dota 2 Reborn - 1920x1080 ultra (3/3) best looking | |
| LG Gram Pro 16 16Z90TR-E.AD8BG | |
| HP EliteBook 8 G1a 16 AI | |
| Lenovo ThinkPad T16 Gen 4 21QQS06M00 | |
| Lenovo IdeaPad Slim 5 16IRU9 | |
| Dynabook Tecra A60 A65-M | |
| Asus ExpertBook B5 B5605CCA | |
| X-Plane 11.11 - 1920x1080 high (fps_test=3) | |
| LG Gram Pro 16 16Z90TR-E.AD8BG | |
| Lenovo ThinkPad T16 Gen 4 21QQS06M00 | |
| HP EliteBook 8 G1a 16 AI | |
| Lenovo IdeaPad Slim 5 16IRU9 | |
| Asus ExpertBook B5 B5605CCA | |
| Dynabook Tecra A60 A65-M | |
| Dota 2 Reborn | |
| 1280x720 min (0/3) fastest | |
| Dell 16 Premium DA16250 | |
| HP EliteBook 8 G1a 16 AI | |
| LG Gram Pro 16 16Z90TR-E.AD8BG | |
| Lenovo ThinkPad T16 Gen 4 21QQS06M00 | |
| Media AMD Radeon 780M (34.7 - 164.8, n=80) | |
| Dynabook Tecra A60 A65-M | |
| Asus ExpertBook B5 B5605CCA | |
| 1366x768 med (1/3) | |
| Dell 16 Premium DA16250 | |
| LG Gram Pro 16 16Z90TR-E.AD8BG | |
| HP EliteBook 8 G1a 16 AI | |
| Lenovo ThinkPad T16 Gen 4 21QQS06M00 | |
| Media AMD Radeon 780M (33.6 - 130.2, n=80) | |
| Dynabook Tecra A60 A65-M | |
| Asus ExpertBook B5 B5605CCA | |
| 1920x1080 high (2/3) | |
| Dell 16 Premium DA16250 | |
| LG Gram Pro 16 16Z90TR-E.AD8BG | |
| Media AMD Radeon 780M (31.6 - 100.9, n=80) | |
| Lenovo ThinkPad T16 Gen 4 21QQS06M00 | |
| HP EliteBook 8 G1a 16 AI | |
| Dynabook Tecra A60 A65-M | |
| Asus ExpertBook B5 B5605CCA | |
| 1920x1080 ultra (3/3) best looking | |
| Dell 16 Premium DA16250 | |
| LG Gram Pro 16 16Z90TR-E.AD8BG | |
| HP EliteBook 8 G1a 16 AI | |
| Media AMD Radeon 780M (30.8 - 91.2, n=80) | |
| Lenovo ThinkPad T16 Gen 4 21QQS06M00 | |
| Dynabook Tecra A60 A65-M | |
| Asus ExpertBook B5 B5605CCA | |
| Final Fantasy XV Benchmark | |
| 1280x720 Lite Quality | |
| Dell 16 Premium DA16250 | |
| LG Gram Pro 16 16Z90TR-E.AD8BG | |
| Media AMD Radeon 780M (41.1 - 84.9, n=75) | |
| Lenovo ThinkPad T16 Gen 4 21QQS06M00 | |
| HP EliteBook 8 G1a 16 AI | |
| Asus ExpertBook B5 B5605CCA | |
| Dynabook Tecra A60 A65-M | |
| 1920x1080 Standard Quality | |
| Dell 16 Premium DA16250 | |
| LG Gram Pro 16 16Z90TR-E.AD8BG | |
| Media AMD Radeon 780M (20.5 - 42.3, n=77) | |
| HP EliteBook 8 G1a 16 AI | |
| Lenovo ThinkPad T16 Gen 4 21QQS06M00 | |
| Asus ExpertBook B5 B5605CCA | |
| Dynabook Tecra A60 A65-M | |
| 1920x1080 High Quality | |
| Dell 16 Premium DA16250 | |
| LG Gram Pro 16 16Z90TR-E.AD8BG | |
| Media AMD Radeon 780M (14.6 - 30.8, n=78) | |
| Lenovo ThinkPad T16 Gen 4 21QQS06M00 | |
| HP EliteBook 8 G1a 16 AI | |
| Asus ExpertBook B5 B5605CCA | |
| Dynabook Tecra A60 A65-M | |
| X-Plane 11.11 | |
| 1280x720 low (fps_test=1) | |
| Dell 16 Premium DA16250 | |
| LG Gram Pro 16 16Z90TR-E.AD8BG | |
| HP EliteBook 8 G1a 16 AI | |
| Lenovo ThinkPad T16 Gen 4 21QQS06M00 | |
| Media AMD Radeon 780M (39 - 69.6, n=81) | |
| Asus ExpertBook B5 B5605CCA | |
| Dynabook Tecra A60 A65-M | |
| 1920x1080 med (fps_test=2) | |
| Dell 16 Premium DA16250 | |
| LG Gram Pro 16 16Z90TR-E.AD8BG | |
| Lenovo ThinkPad T16 Gen 4 21QQS06M00 | |
| HP EliteBook 8 G1a 16 AI | |
| Media AMD Radeon 780M (26.2 - 49.1, n=81) | |
| Asus ExpertBook B5 B5605CCA | |
| Dynabook Tecra A60 A65-M | |
| 1920x1080 high (fps_test=3) | |
| Dell 16 Premium DA16250 | |
| LG Gram Pro 16 16Z90TR-E.AD8BG | |
| Lenovo ThinkPad T16 Gen 4 21QQS06M00 | |
| HP EliteBook 8 G1a 16 AI | |
| Media AMD Radeon 780M (24.5 - 41.5, n=80) | |
| Asus ExpertBook B5 B5605CCA | |
| Dynabook Tecra A60 A65-M | |
| Strange Brigade | |
| 1280x720 lowest AF:1 | |
| Dell 16 Premium DA16250 | |
| LG Gram Pro 16 16Z90TR-E.AD8BG | |
| Media AMD Radeon 780M (74.1 - 185.2, n=60) | |
| HP EliteBook 8 G1a 16 AI | |
| Lenovo ThinkPad T16 Gen 4 21QQS06M00 | |
| Asus ExpertBook B5 B5605CCA | |
| Dynabook Tecra A60 A65-M | |
| 1920x1080 medium AA:medium AF:4 | |
| Dell 16 Premium DA16250 | |
| LG Gram Pro 16 16Z90TR-E.AD8BG | |
| Media AMD Radeon 780M (31.7 - 73.7, n=61) | |
| Lenovo ThinkPad T16 Gen 4 21QQS06M00 | |
| HP EliteBook 8 G1a 16 AI | |
| Asus ExpertBook B5 B5605CCA | |
| Dynabook Tecra A60 A65-M | |
| 1920x1080 high AA:high AF:8 | |
| Dell 16 Premium DA16250 | |
| LG Gram Pro 16 16Z90TR-E.AD8BG | |
| Media AMD Radeon 780M (27.3 - 62.6, n=61) | |
| Lenovo ThinkPad T16 Gen 4 21QQS06M00 | |
| HP EliteBook 8 G1a 16 AI | |
| Asus ExpertBook B5 B5605CCA | |
| Dynabook Tecra A60 A65-M | |
| 1920x1080 ultra AA:ultra AF:16 | |
| Dell 16 Premium DA16250 | |
| LG Gram Pro 16 16Z90TR-E.AD8BG | |
| Media AMD Radeon 780M (23.5 - 53.4, n=62) | |
| Lenovo ThinkPad T16 Gen 4 21QQS06M00 | |
| HP EliteBook 8 G1a 16 AI | |
| Asus ExpertBook B5 B5605CCA | |
| Dynabook Tecra A60 A65-M | |
Grafico Cyberpunk 2077 ultra FPS
| basso | medio | alto | ultra | |
|---|---|---|---|---|
| GTA V (2015) | 106.4 | 32.9 | 13.3 | |
| Dota 2 Reborn (2015) | 127.8 | 98.2 | 63.1 | 56.4 |
| Final Fantasy XV Benchmark (2018) | 42.6 | 21.6 | 16 | |
| X-Plane 11.11 (2018) | 43.3 | 30.1 | 26.2 | |
| Strange Brigade (2018) | 86 | 34.8 | 29.7 | 25.9 |
| Baldur's Gate 3 (2023) | 23.7 | 19.5 | 16 | 15.7 |
| Cyberpunk 2077 (2023) | 24.7 | 20.3 | 15.6 | 13.7 |
| F1 24 (2024) | 44.8 | 38.3 |
Emissioni
Rumore del sistema
Il rumore della ventola è in gran parte impercettibile in scenari poco impegnativi, come l'elaborazione di testi o lo streaming video. Se si eseguono carichi più impegnativi, il rumore della ventola tende ad aggirarsi intorno ai 35 dB(A) fino a poco più di 41 dB(A), che è un intervallo tipico per la maggior parte degli Ultrabook alimentati da CPU della serie U.
Rumorosità
| Idle |
| 22.8 / 22.9 / 23.5 dB(A) |
| Sotto carico |
| 35 / 41.3 dB(A) |
 | ||
30 dB silenzioso 40 dB(A) udibile 50 dB(A) rumoroso |
||
min: | ||
| Dynabook Tecra A60 A65-M R7 250, Radeon 780M | LG Gram Pro 16Z90TS-G.AU89G Core Ultra 7 256V, Arc 140V | Lenovo ThinkPad T16 Gen 4 21QQS06M00 Ryzen AI 7 PRO 350, Radeon 860M | HP EliteBook 8 G1a 16 AI Ryzen AI 7 PRO 350, Radeon 860M | Dell 16 Premium DA16250 Ultra 7 255H, GeForce RTX 5070 Laptop | Asus ExpertBook B5 B5605CCA Ultra 5 225H, Arc 130T | |
|---|---|---|---|---|---|---|
| Noise | -10% | -4% | -11% | -9% | 6% | |
| off /ambiente * (dB) | 22.6 | 25.2 -12% | 26.3 -16% | 22.7 -0% | 23.2 -3% | 23.2 -3% |
| Idle Minimum * (dB) | 22.8 | 25.2 -11% | 26.3 -15% | 22.8 -0% | 23.2 -2% | 23.2 -2% |
| Idle Average * (dB) | 22.9 | 25.2 -10% | 26.3 -15% | 22.8 -0% | 23.2 -1% | 23.2 -1% |
| Idle Maximum * (dB) | 23.5 | 27.7 -18% | 26.3 -12% | 24.7 -5% | 26.6 -13% | 23.2 1% |
| Load Average * (dB) | 35 | 34.2 2% | 46 -31% | 39.4 -13% | 26.3 25% | |
| Cyberpunk 2077 ultra * (dB) | 41.1 | 42.6 -4% | 34.2 17% | 48.7 -18% | 47.3 -15% | 35.4 14% |
| Load Maximum * (dB) | 41.3 | 42.7 -3% | 36.2 12% | 49.5 -20% | 48.9 -18% | 38.8 6% |
* ... Meglio usare valori piccoli
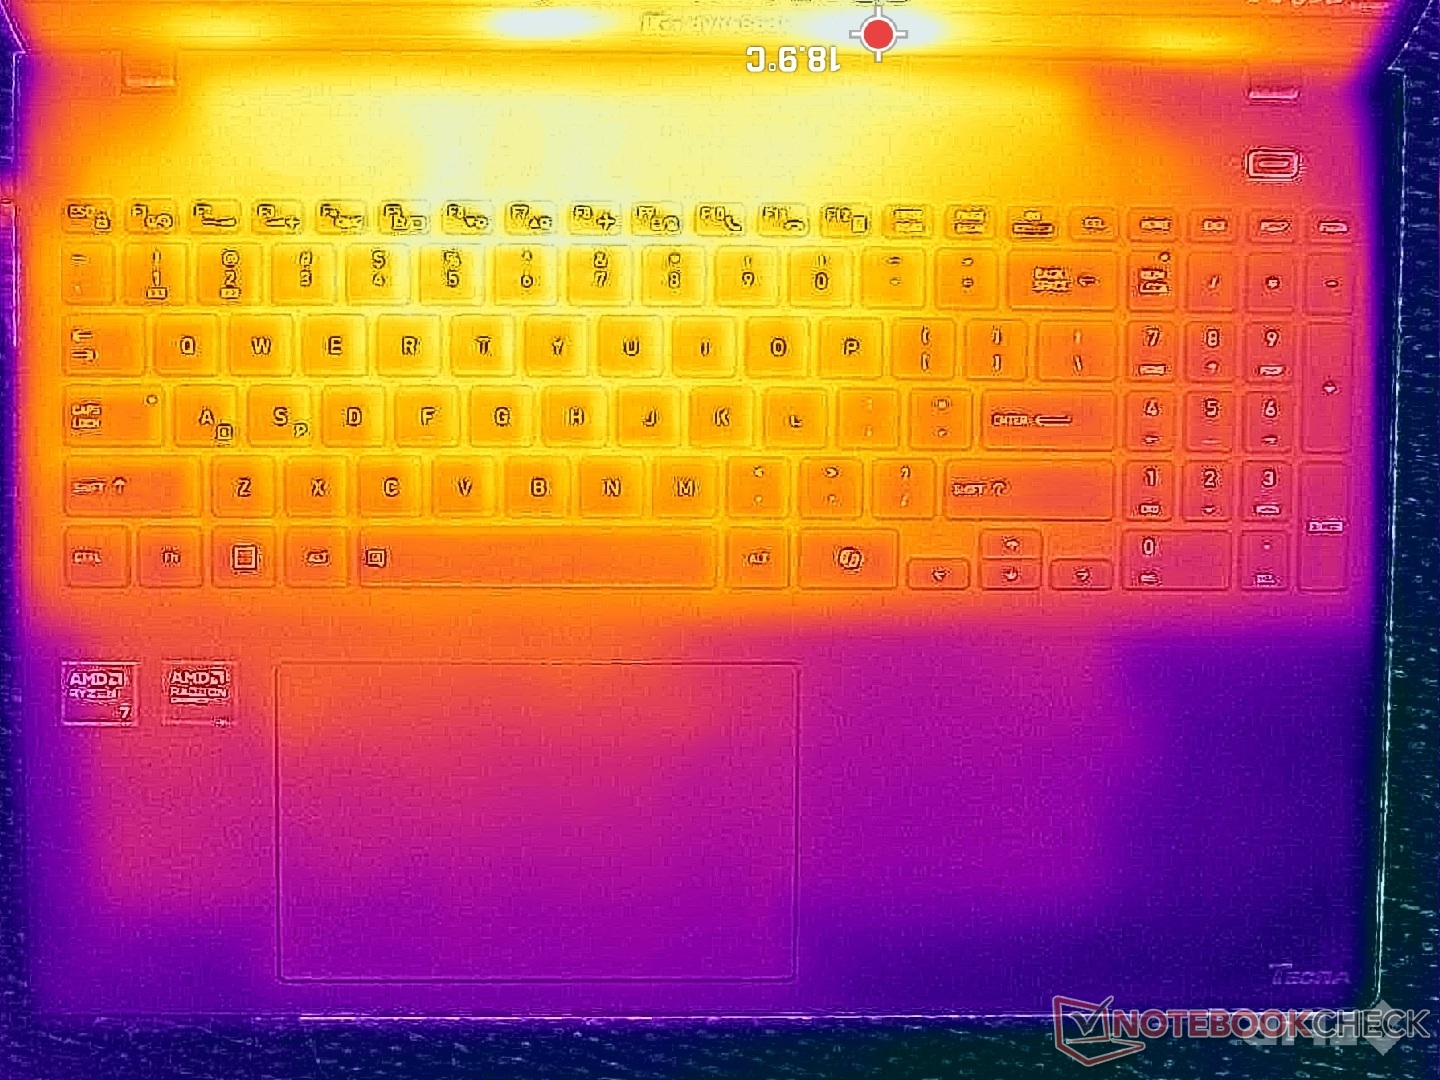
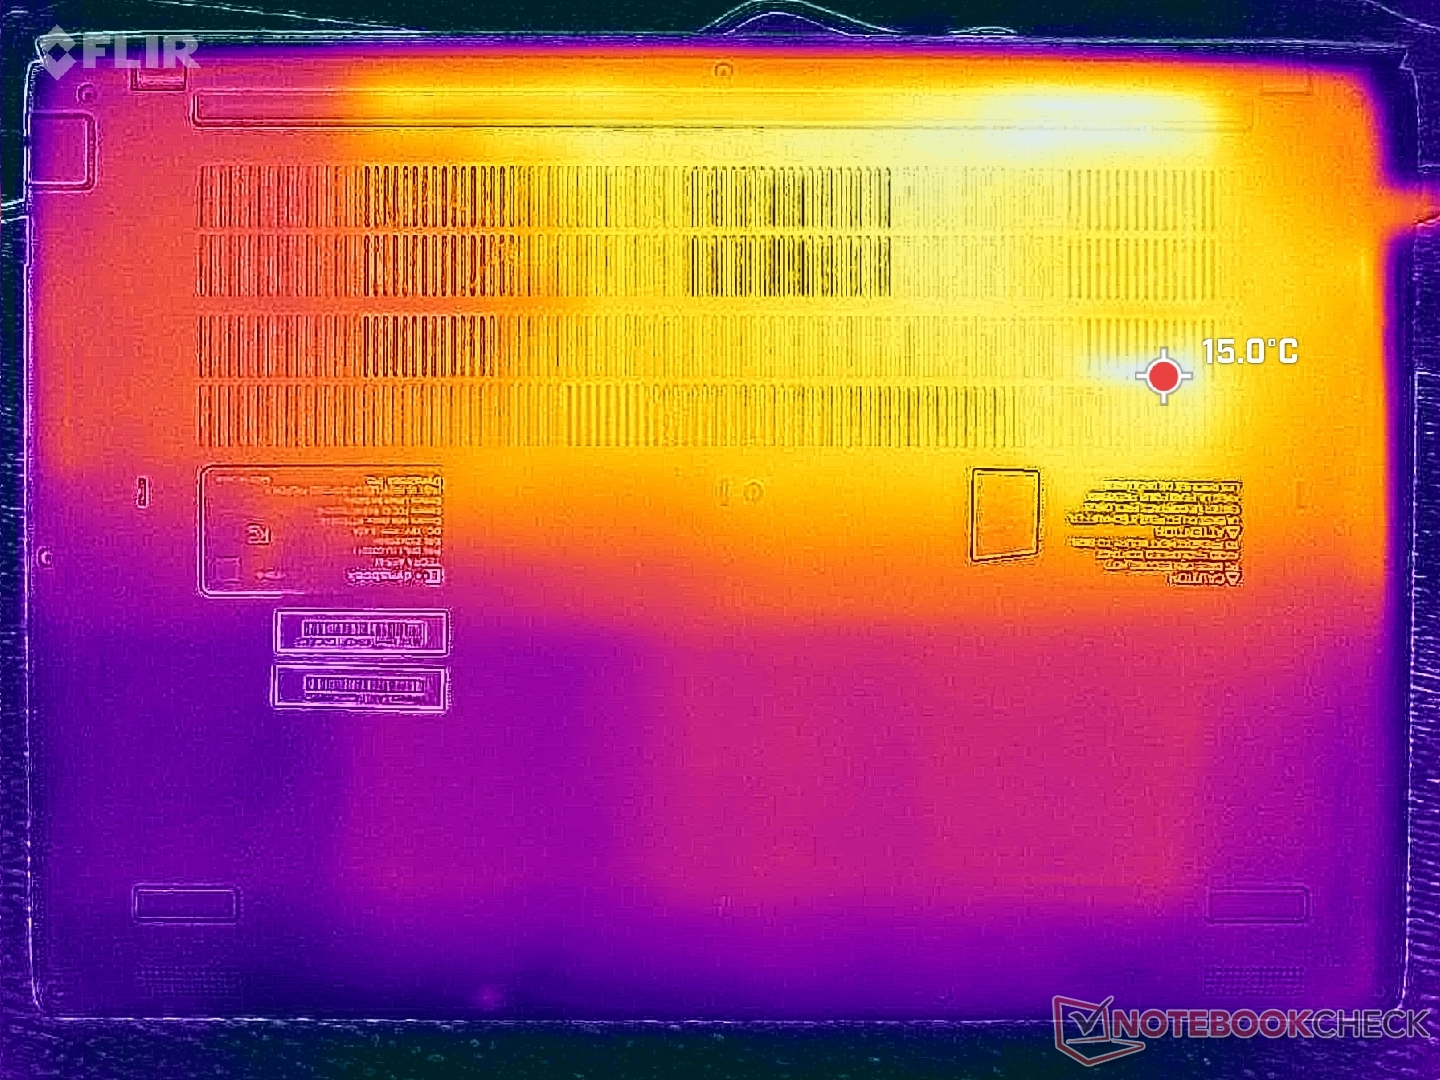
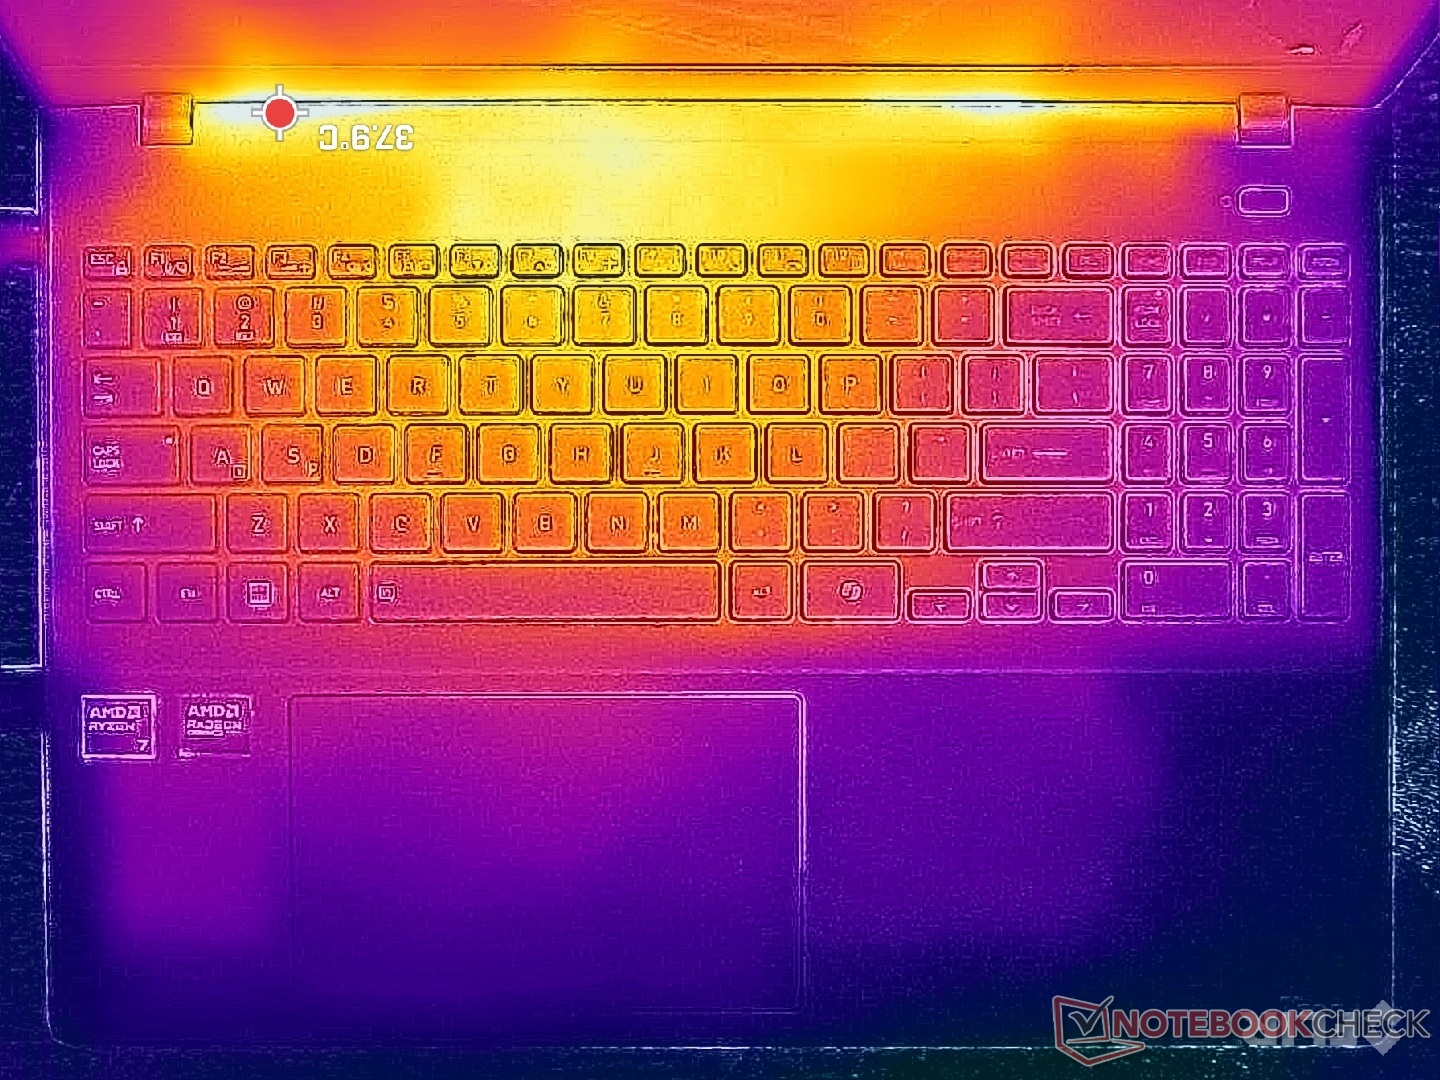
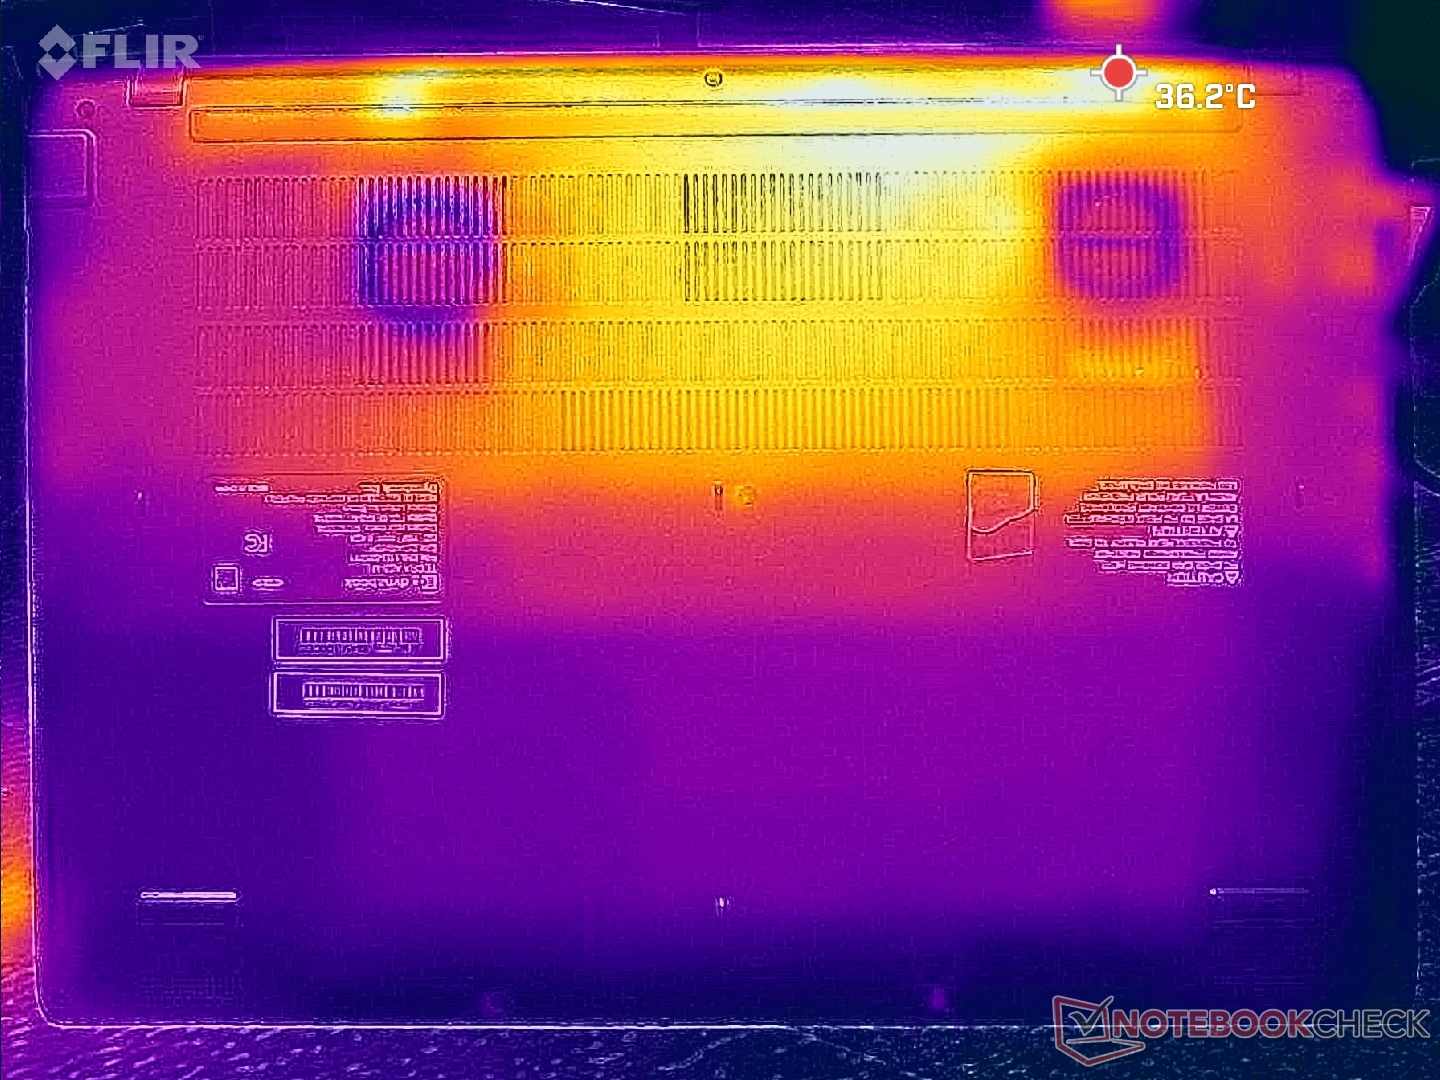
Temperatura
Le temperature di superficie superano a malapena i 40 C quando si eseguono carichi estremi per periodi prolungati, dato che il fattore di forma da 16 pollici è piuttosto grande per quella che è essenzialmente una CPU Ryzen serie U.
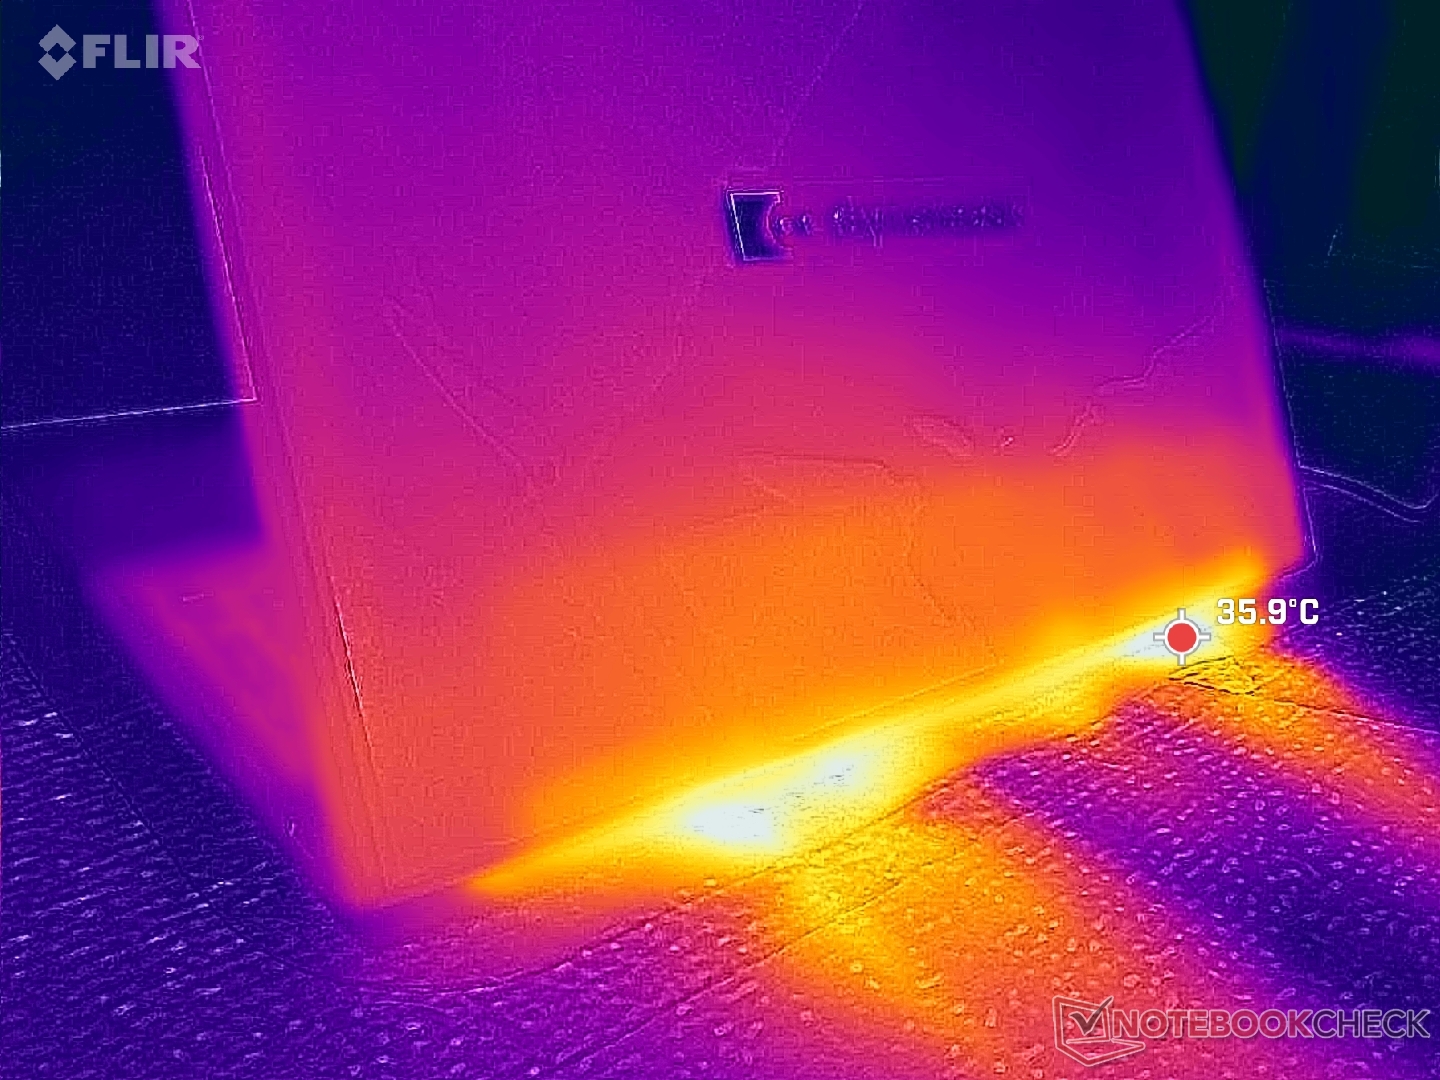
(+) La temperatura massima sul lato superiore è di 35.8 °C / 96 F, rispetto alla media di 34.3 °C / 94 F, che varia da 21.2 a 62.5 °C per questa classe Office.
(+) Il lato inferiore si riscalda fino ad un massimo di 36 °C / 97 F, rispetto alla media di 36.8 °C / 98 F
(+) In idle, la temperatura media del lato superiore è di 22.5 °C / 73 F, rispetto alla media deld ispositivo di 29.5 °C / 85 F.
(+) I poggiapolsi e il touchpad sono piu' freddi della temperatura della pelle con un massimo di 21.6 °C / 70.9 F e sono quindi freddi al tatto.
(+) La temperatura media della zona del palmo della mano di dispositivi simili e'stata di 27.5 °C / 81.5 F (+5.9 °C / 10.6 F).
| Dynabook Tecra A60 A65-M R7 250, Radeon 780M | LG Gram Pro 16Z90TS-G.AU89G Core Ultra 7 256V, Arc 140V | Lenovo ThinkPad T16 Gen 4 21QQS06M00 Ryzen AI 7 PRO 350, Radeon 860M | HP EliteBook 8 G1a 16 AI Ryzen AI 7 PRO 350, Radeon 860M | Dell 16 Premium DA16250 Ultra 7 255H, GeForce RTX 5070 Laptop | Asus ExpertBook B5 B5605CCA Ultra 5 225H, Arc 130T | |
|---|---|---|---|---|---|---|
| Heat | -13% | -17% | -4% | -10% | -13% | |
| Maximum Upper Side * (°C) | 35.8 | 40.5 -13% | 44.4 -24% | 38 -6% | 36.8 -3% | 40.7 -14% |
| Maximum Bottom * (°C) | 36 | 45 -25% | 53.8 -49% | 33.4 7% | 34.8 3% | 47.8 -33% |
| Idle Upper Side * (°C) | 25.6 | 27.1 -6% | 24.9 3% | 28 -9% | 31.2 -22% | 26 -2% |
| Idle Bottom * (°C) | 26.6 | 28.8 -8% | 25.6 4% | 28.2 -6% | 30.8 -16% | 27 -2% |
* ... Meglio usare valori piccoli
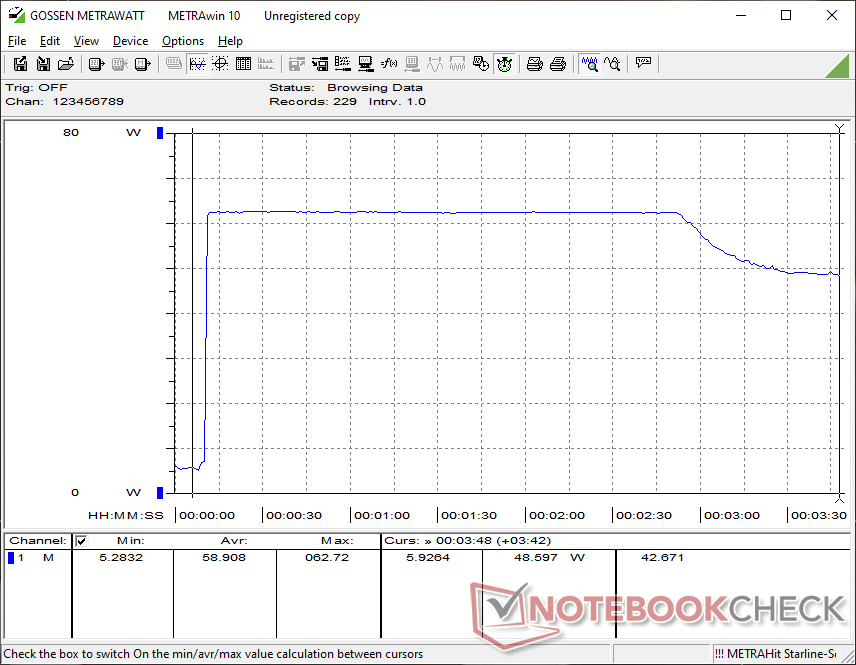
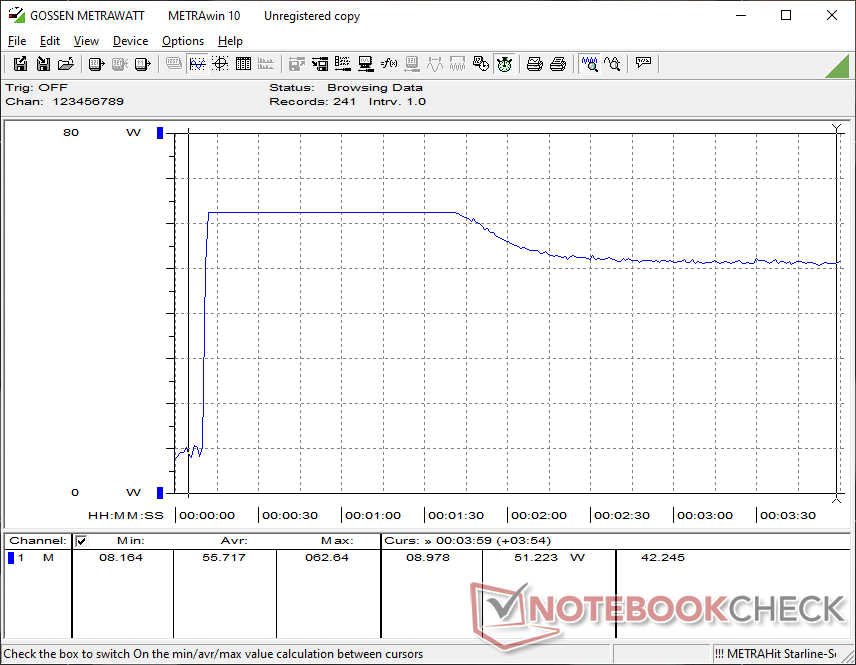
Test da sforzo
La CPU ha raggiunto i 4,2 GHz, 41 W e 87 C per i primi due minuti, prima di scendere e stabilizzarsi a 3 GHz, 28 W e 67 C. Il processore è rimasto relativamente fresco, sotto i 70 C, rispetto ai 75 C del modello con processore Intel Asus ExpertBook B5.
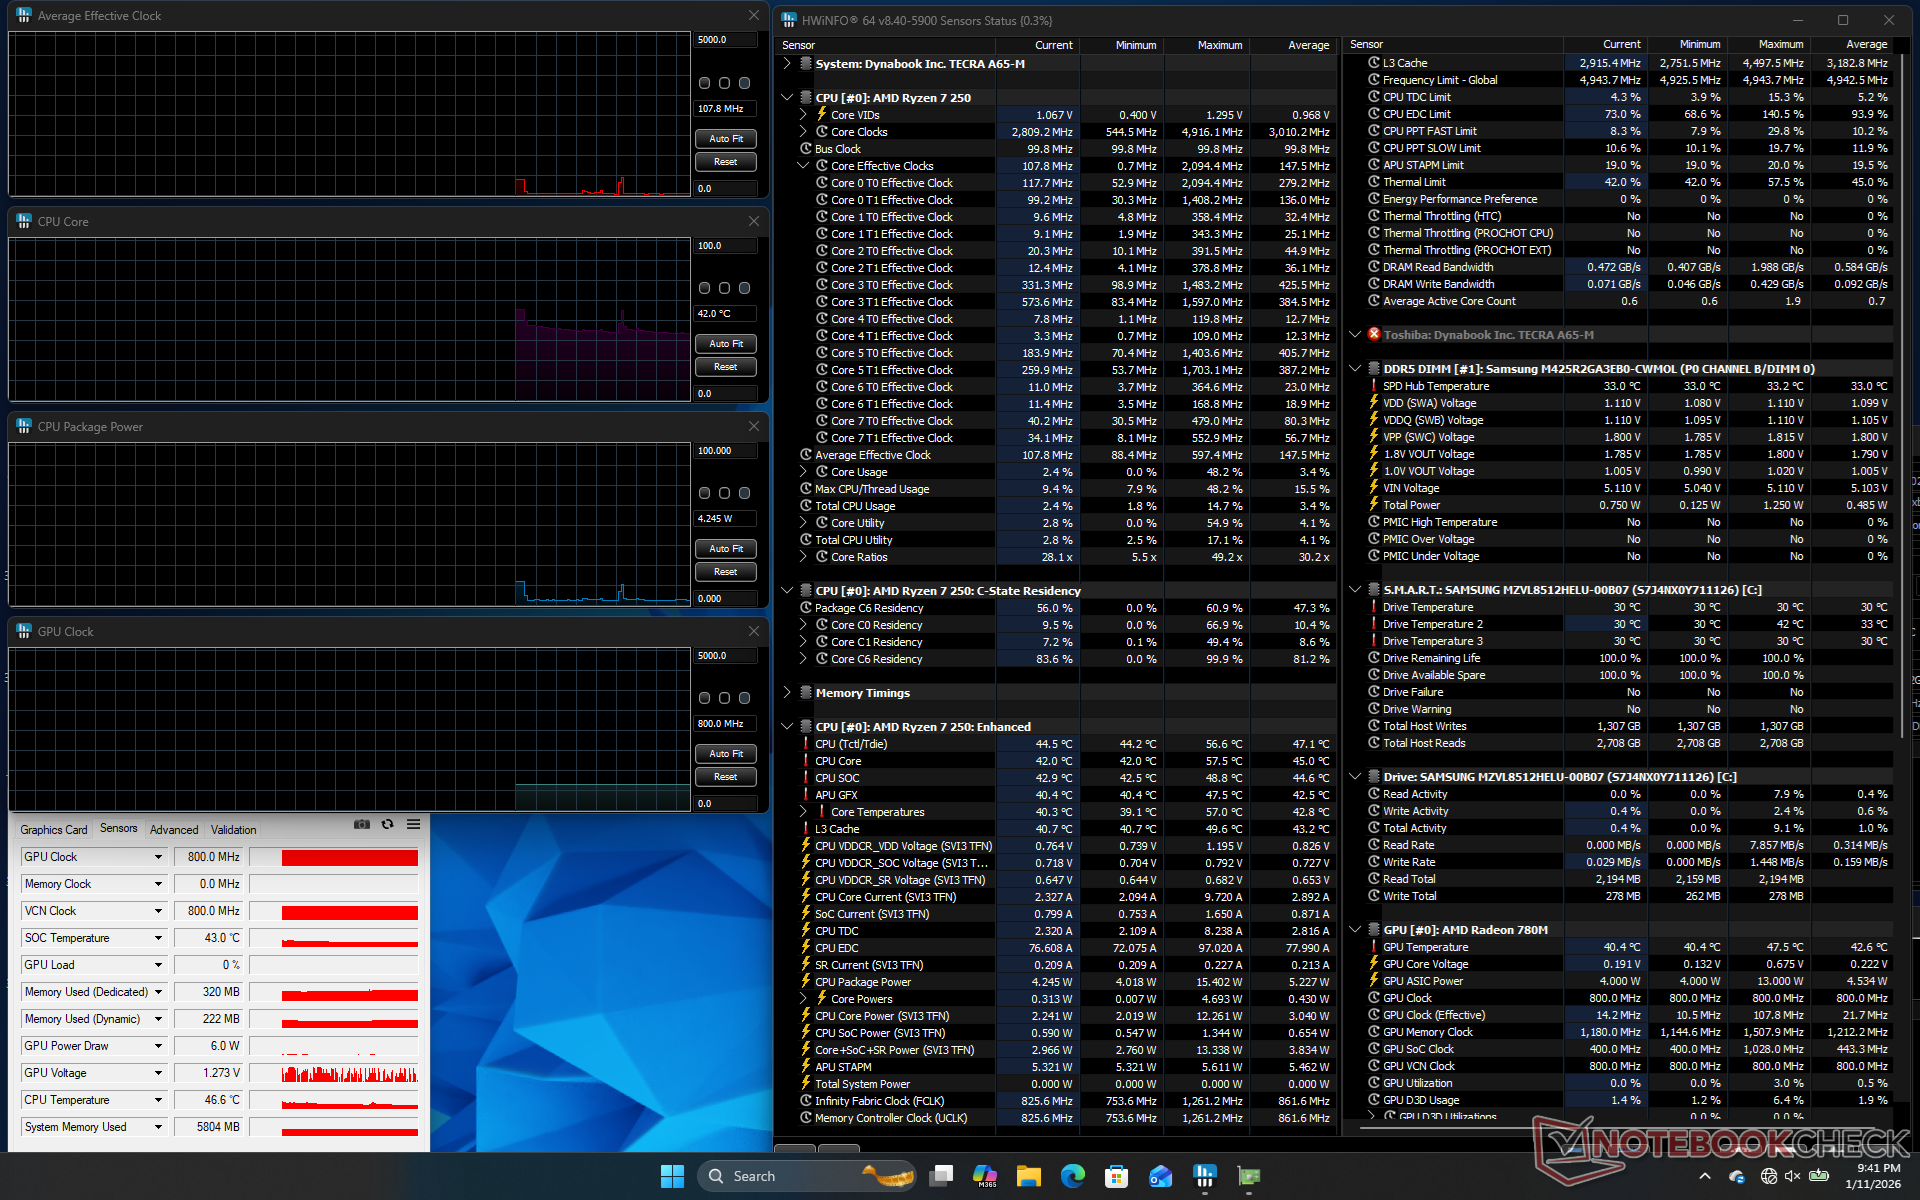
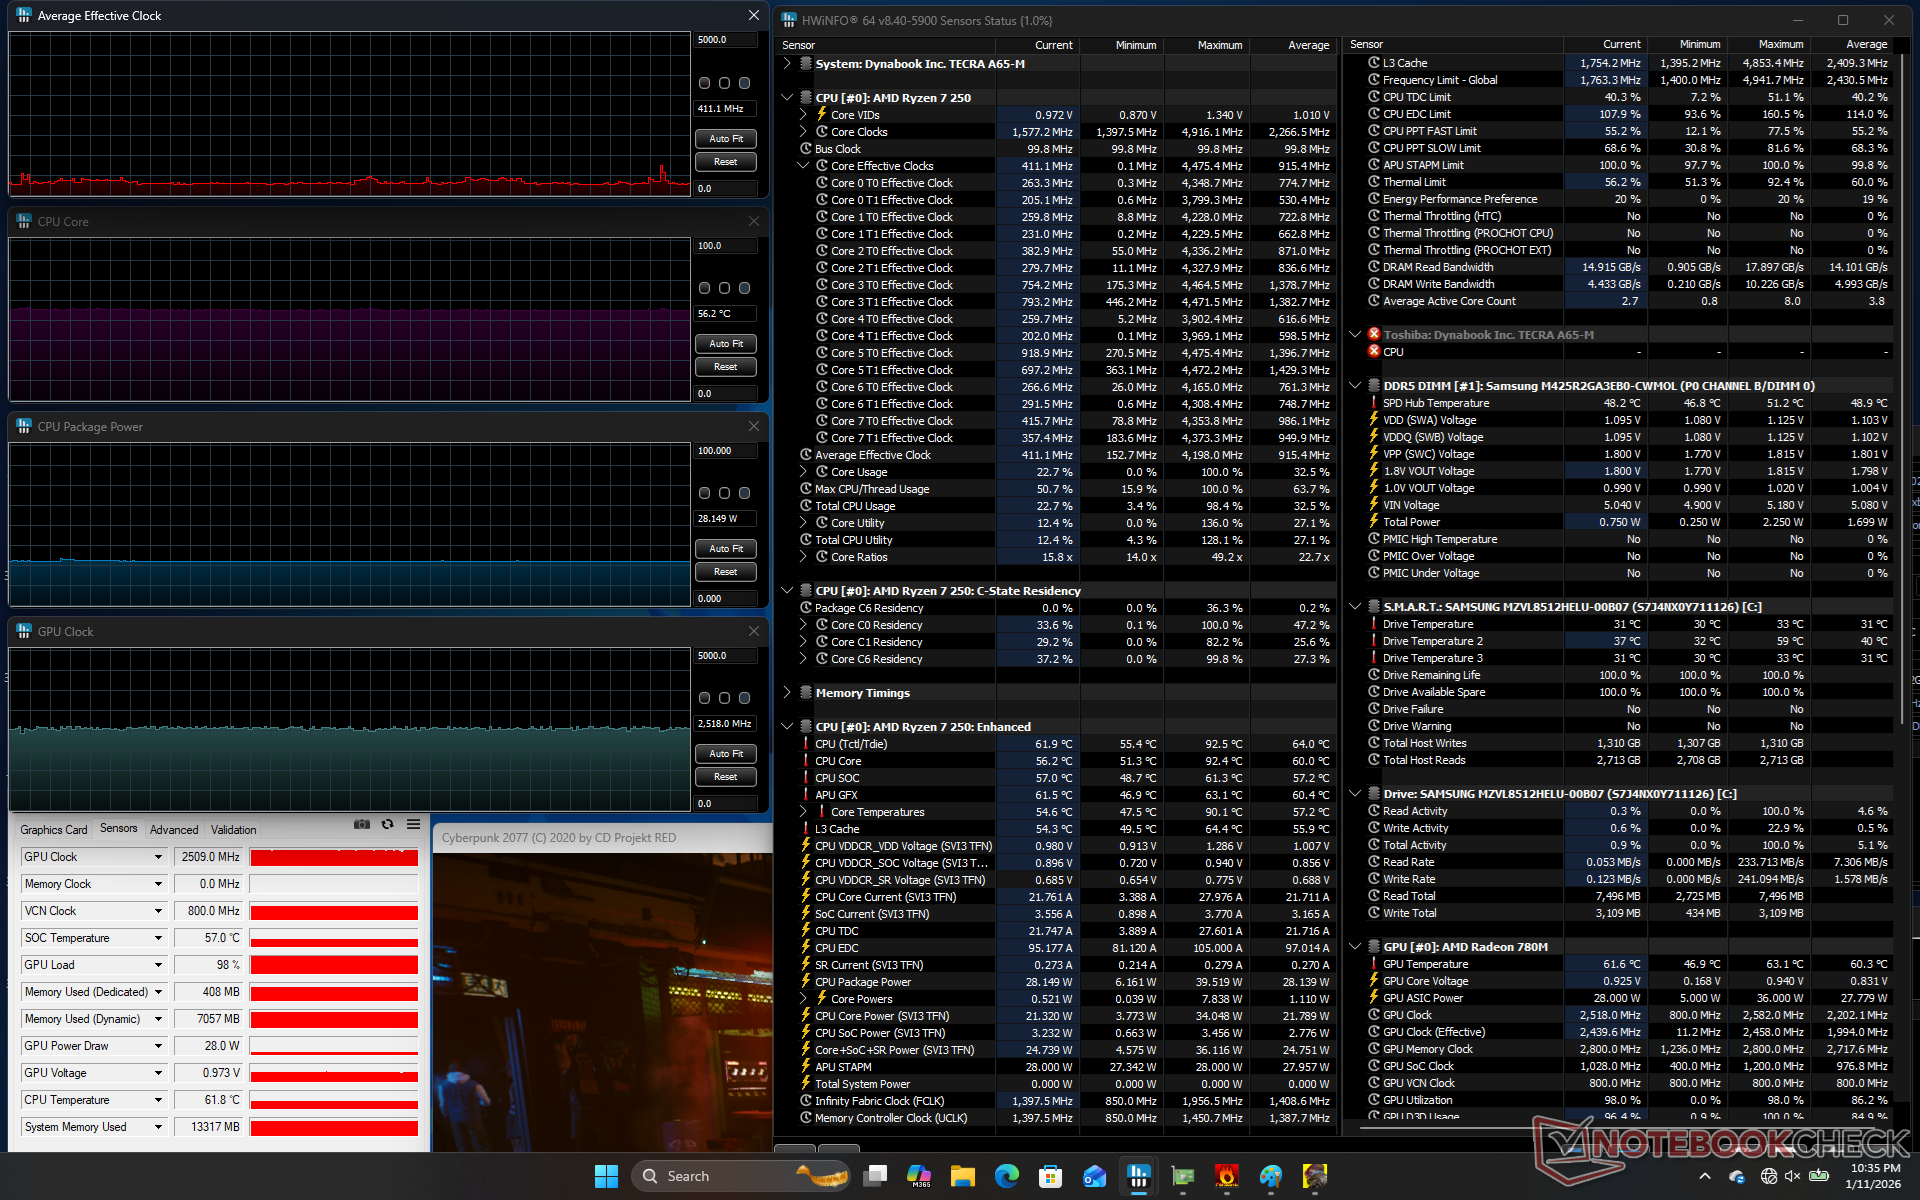
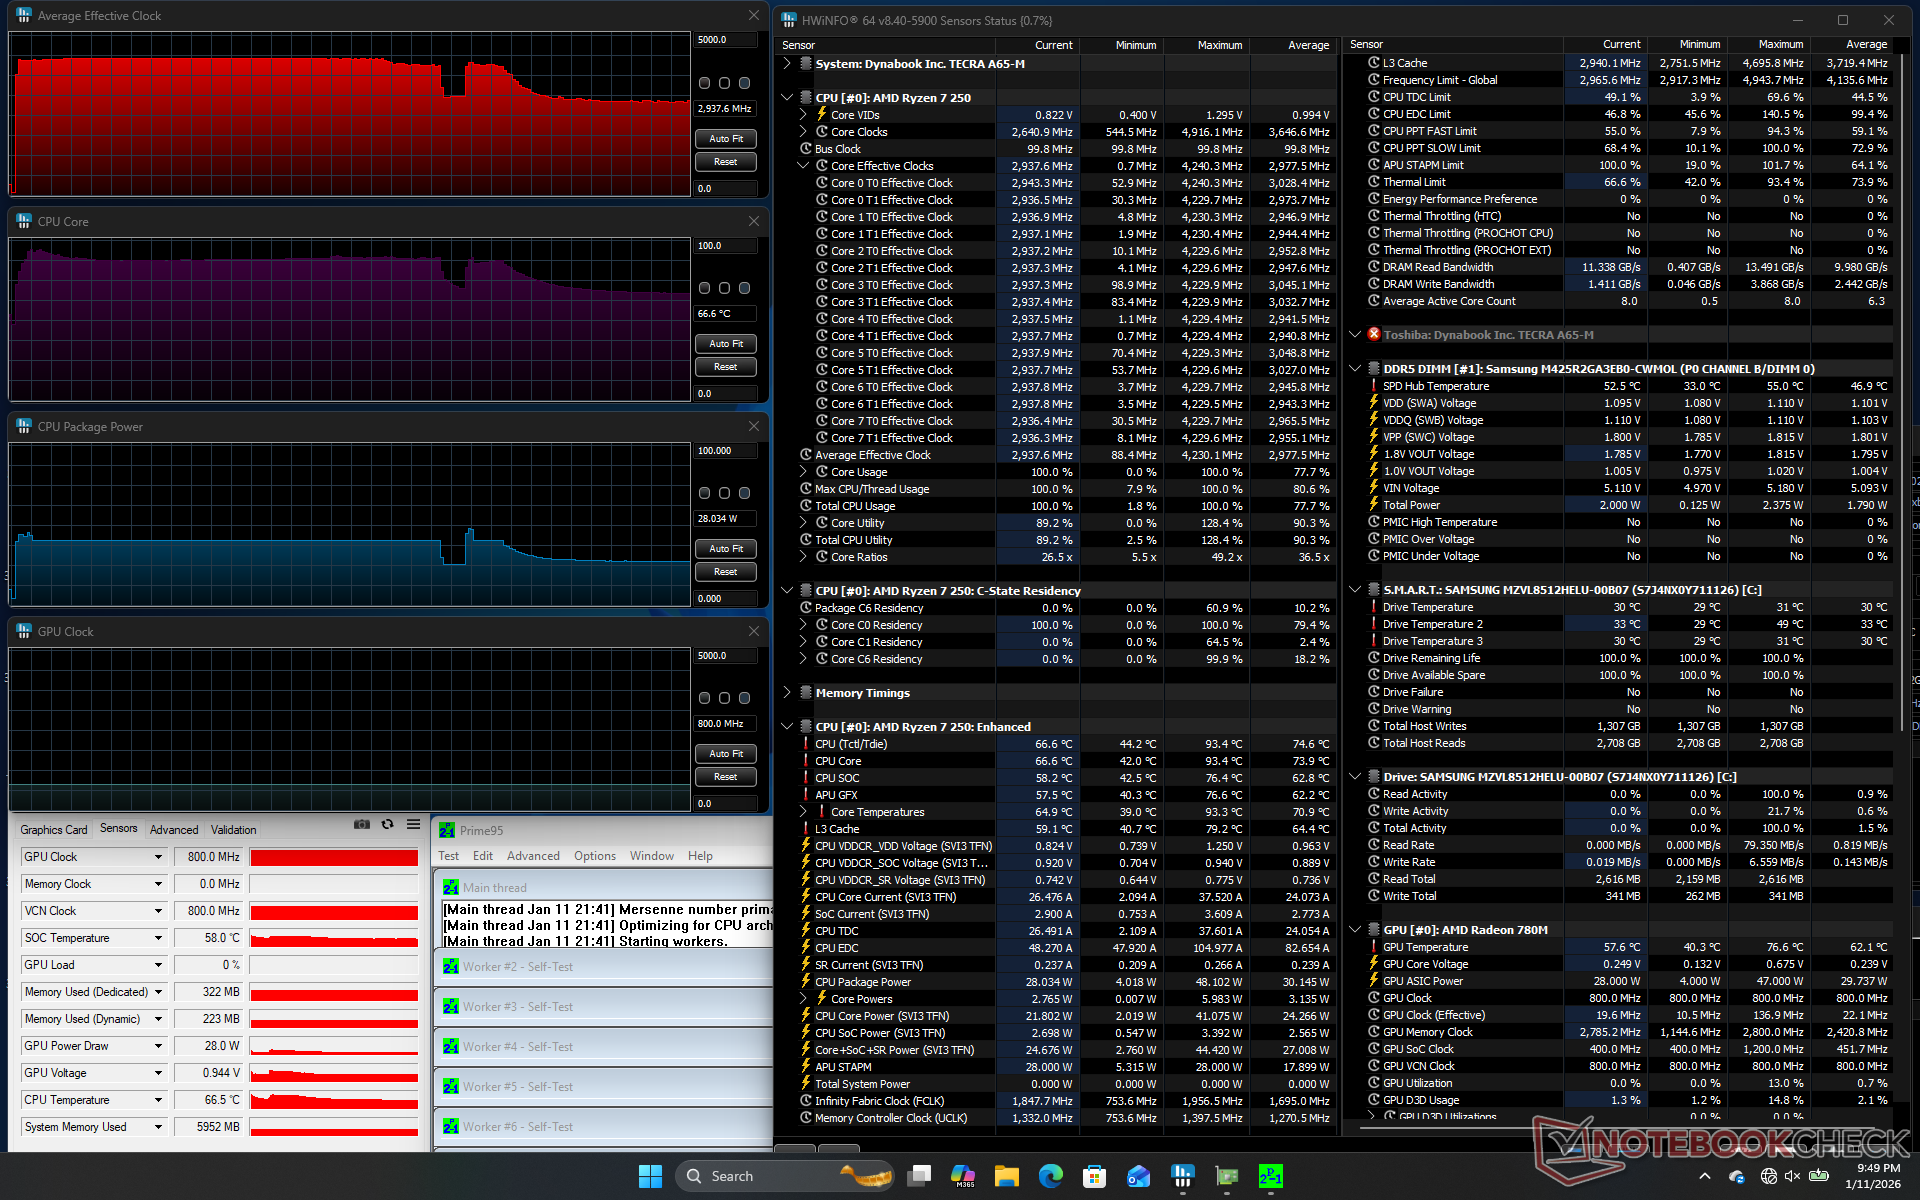
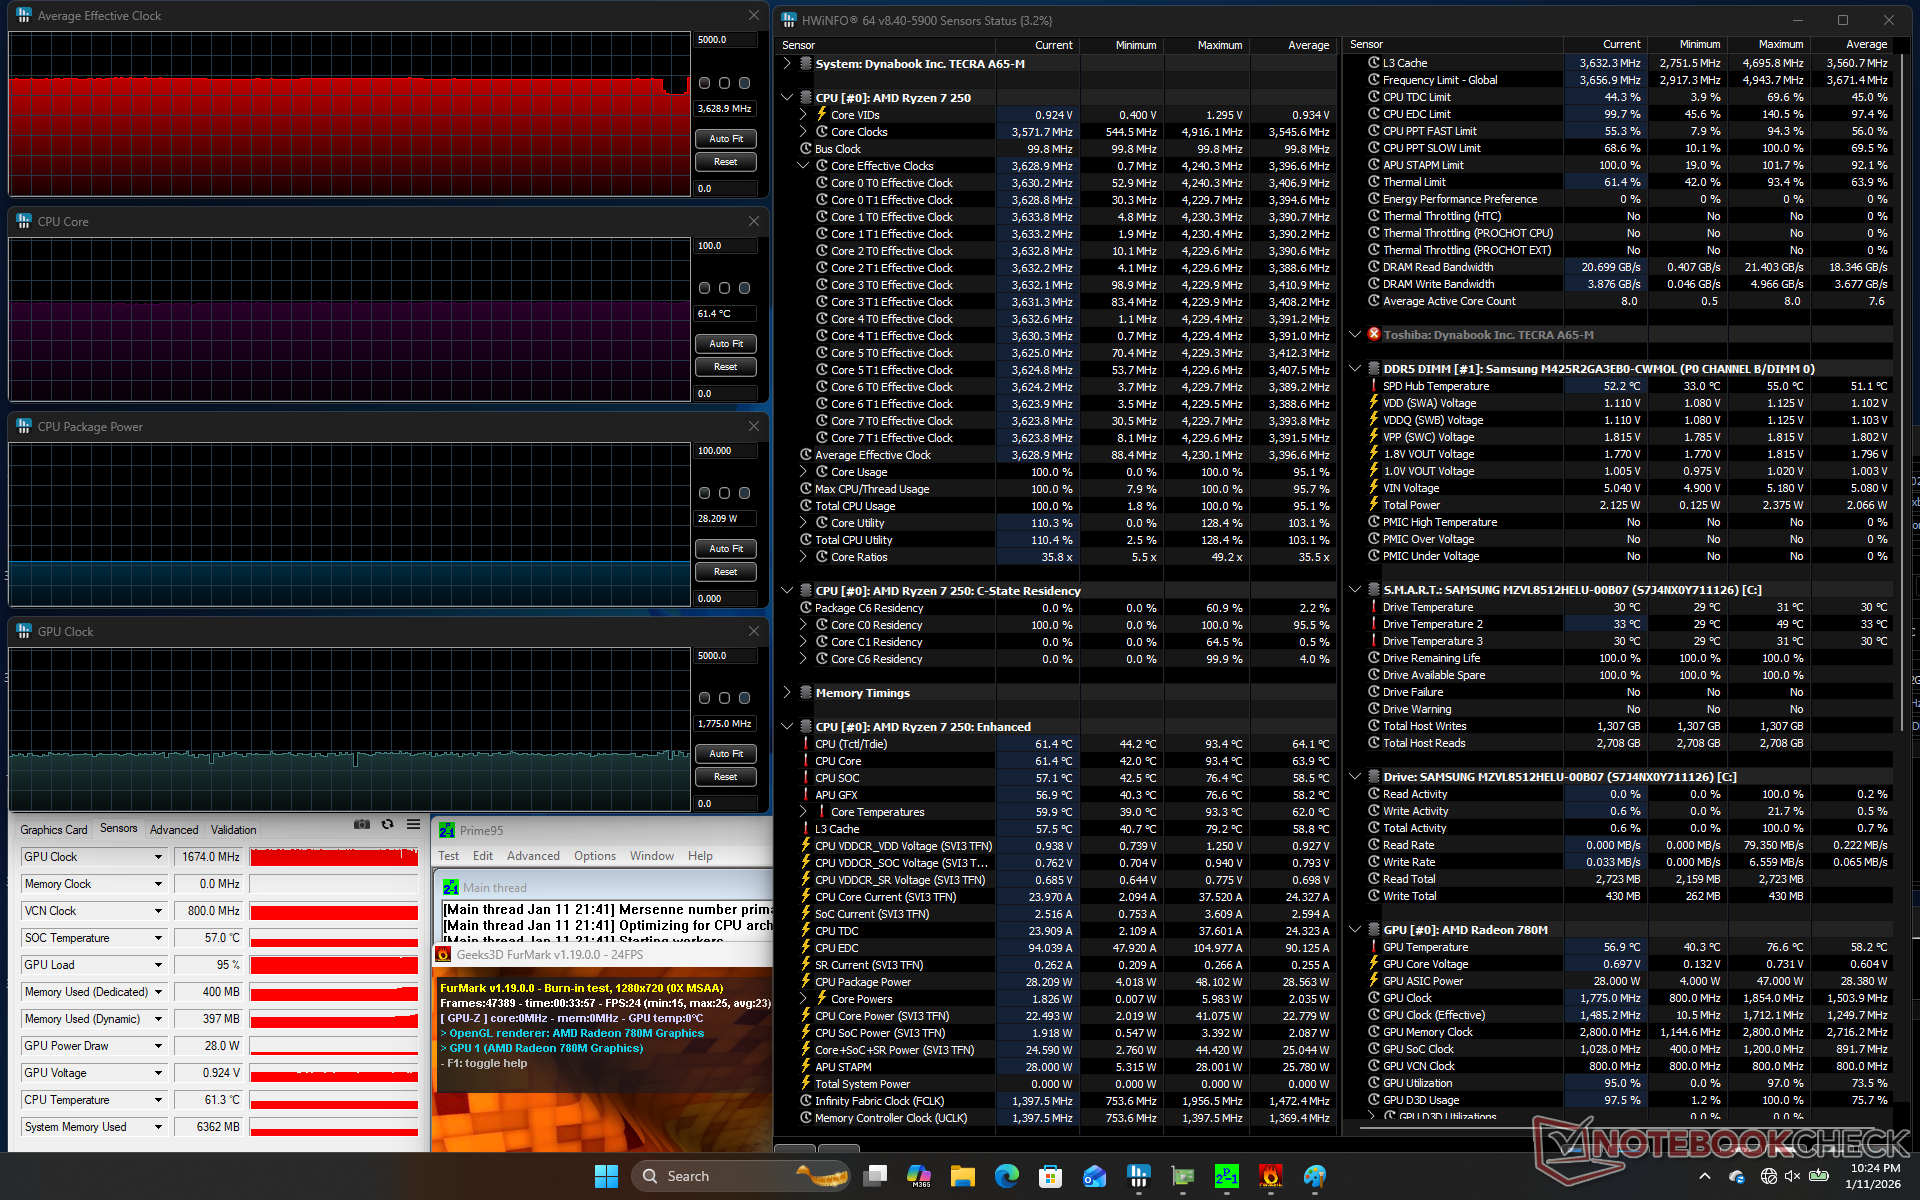
| Clock della CPU (GHz) | Clock della GPU (MHz) | Temperatura media della CPU (°C) | |
| Sistema inattivo | -- | -- | 42 |
| Stress Prime95 | 2,9 | -- | 67 |
| Prime95 + FurMark Stress | 3,6 | 1775 | 61 |
| Cyberpunk 2077 Stress | 0,4 | 2518 | 56 |
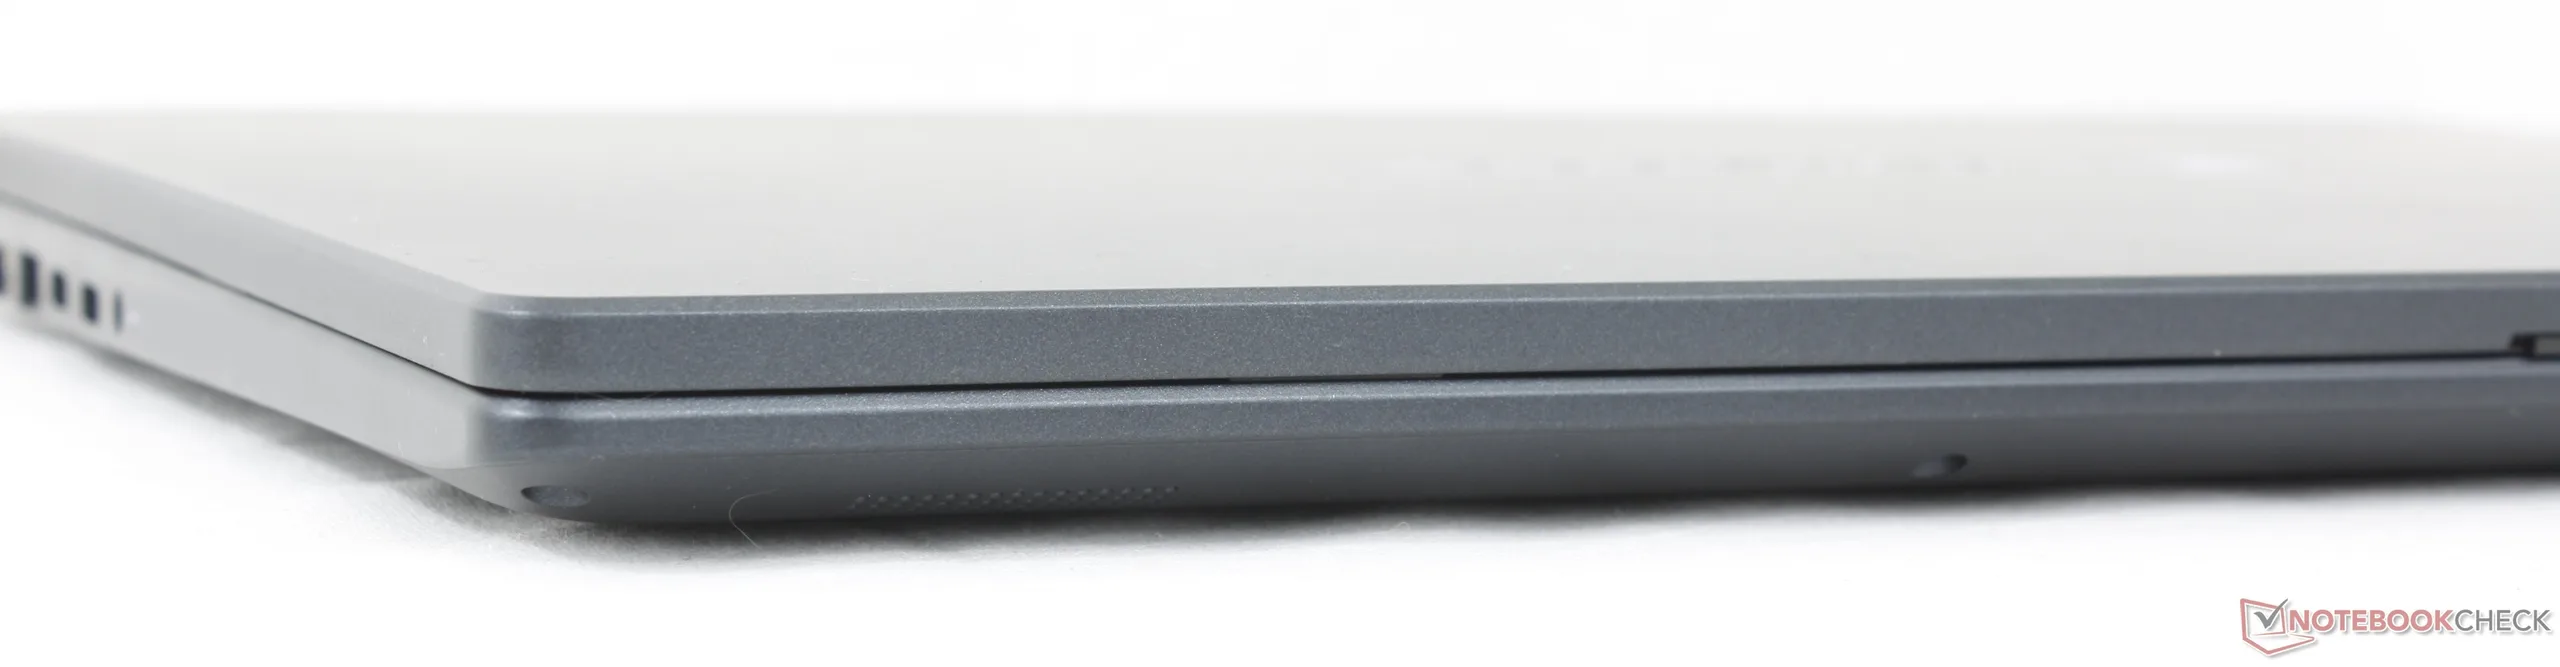
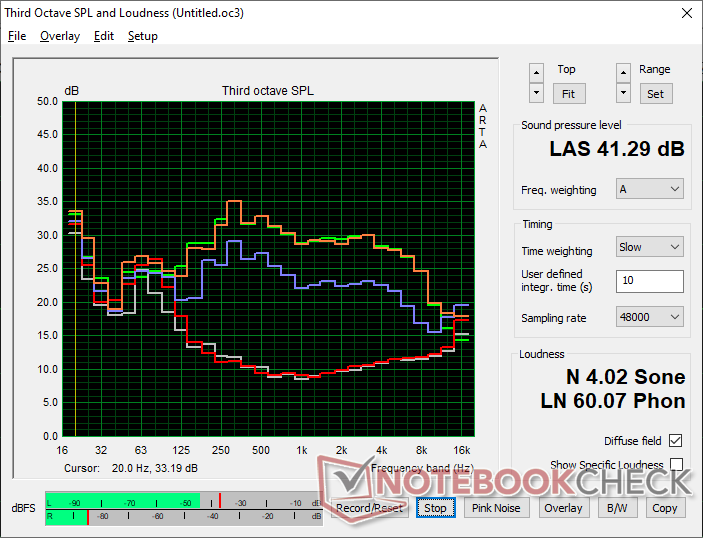
Altoparlanti
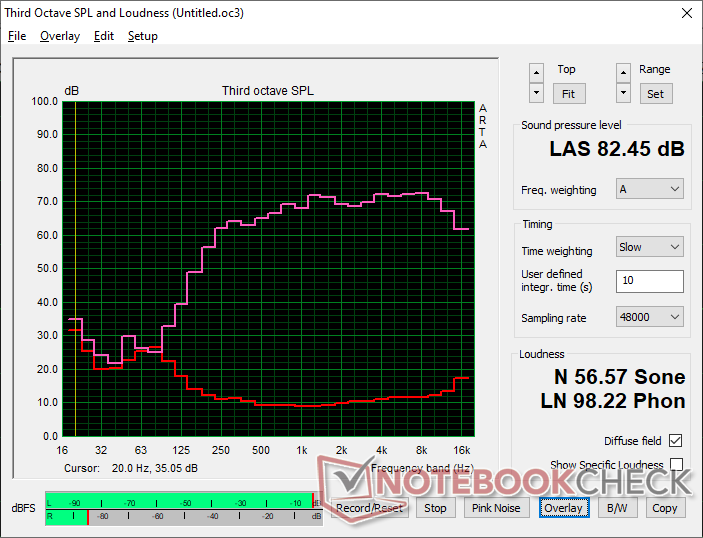
Dynabook Tecra A60 A65-M analisi audio
(+) | gli altoparlanti sono relativamente potenti (82.5 dB)
Bassi 100 - 315 Hz
(-) | quasi nessun basso - in media 17.3% inferiori alla media
(±) | la linearità dei bassi è media (11.4% delta rispetto alla precedente frequenza)
Medi 400 - 2000 Hz
(+) | medi bilanciati - solo only 2.4% rispetto alla media
(+) | medi lineari (3.3% delta rispetto alla precedente frequenza)
Alti 2 - 16 kHz
(+) | Alti bilanciati - appena 3.2% dalla media
(+) | alti lineari (1.7% delta rispetto alla precedente frequenza)
Nel complesso 100 - 16.000 Hz
(+) | suono nel complesso lineare (12.5% differenza dalla media)
Rispetto alla stessa classe
» 5% di tutti i dispositivi testati in questa classe è stato migliore, 2% simile, 93% peggiore
» Il migliore ha avuto un delta di 7%, medio di 21%, peggiore di 53%
Rispetto a tutti i dispositivi testati
» 11% di tutti i dispositivi testati in questa classe è stato migliore, 2% similare, 87% peggiore
» Il migliore ha avuto un delta di 4%, medio di 23%, peggiore di 134%
Apple MacBook Pro 16 2021 M1 Pro analisi audio
(+) | gli altoparlanti sono relativamente potenti (84.7 dB)
Bassi 100 - 315 Hz
(+) | bassi buoni - solo 3.8% dalla media
(+) | bassi in lineaa (5.2% delta rispetto alla precedente frequenza)
Medi 400 - 2000 Hz
(+) | medi bilanciati - solo only 1.3% rispetto alla media
(+) | medi lineari (2.1% delta rispetto alla precedente frequenza)
Alti 2 - 16 kHz
(+) | Alti bilanciati - appena 1.9% dalla media
(+) | alti lineari (2.7% delta rispetto alla precedente frequenza)
Nel complesso 100 - 16.000 Hz
(+) | suono nel complesso lineare (4.6% differenza dalla media)
Rispetto alla stessa classe
» 0% di tutti i dispositivi testati in questa classe è stato migliore, 0% simile, 100% peggiore
» Il migliore ha avuto un delta di 5%, medio di 17%, peggiore di 45%
Rispetto a tutti i dispositivi testati
» 0% di tutti i dispositivi testati in questa classe è stato migliore, 0% similare, 100% peggiore
» Il migliore ha avuto un delta di 4%, medio di 23%, peggiore di 134%
Gestione dell'energia
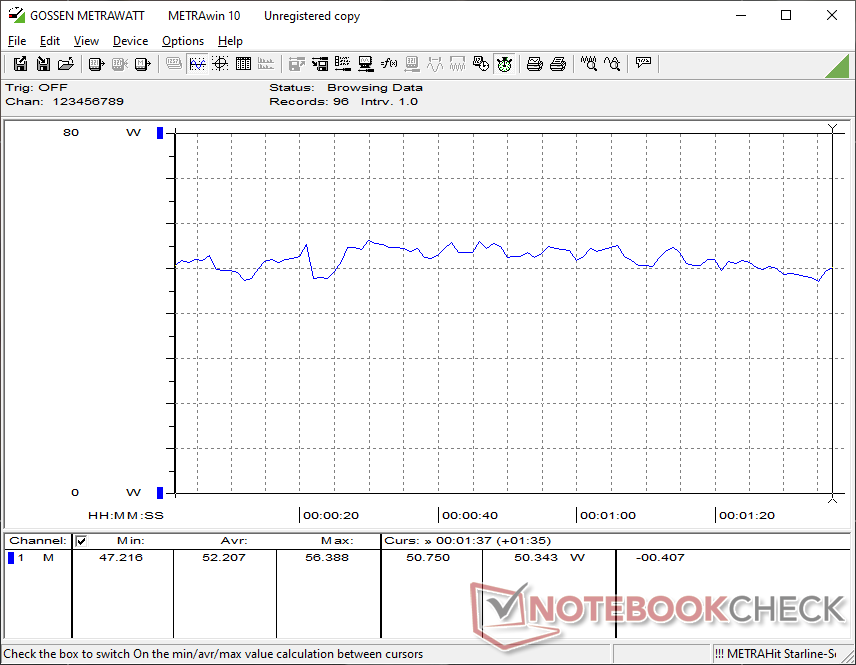
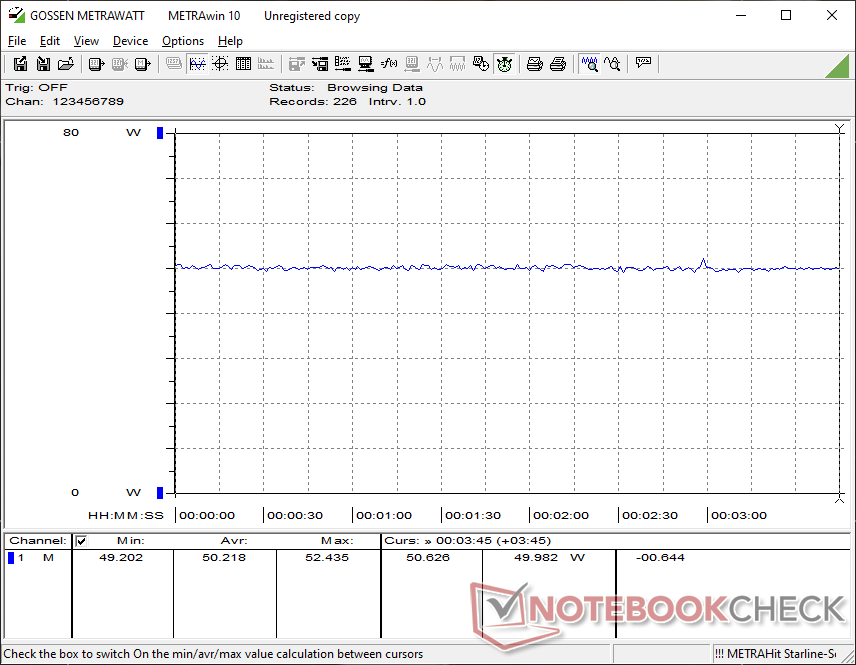
Consumo di energia
Il consumo energetico della CPU Zen 4 uscente è ancora competitivo rispetto a Lunar Lake-V, soprattutto quando si eseguono compiti pesanti per la CPU. Tuttavia, le prestazioni per watt sono inferiori quando si eseguono compiti più intensivi della GPU, poiché la serie Arc 130V/140V è molto più efficiente.
| Off / Standby | |
| Idle | |
| Sotto carico |
|
Leggenda:
min: | |
| Dynabook Tecra A60 A65-M R7 250, Radeon 780M, Samsung PM9C1 MZVL8512HELU, IPS, 1920x1200, 16" | LG Gram Pro 16Z90TS-G.AU89G Core Ultra 7 256V, Arc 140V, Samsung PM9A1a MZVL21T0HDLU, IPS, 2560x1600, 16" | Lenovo ThinkPad T16 Gen 4 21QQS06M00 Ryzen AI 7 PRO 350, Radeon 860M, SK hynix PC801 HFS001TEJ9X162N, IPS, 1920x1200, 16" | HP EliteBook 8 G1a 16 AI Ryzen AI 7 PRO 350, Radeon 860M, Micron 3500 MTFDKBA512TGD, IPS, 1920x1200, 16" | Dell 16 Premium DA16250 Ultra 7 255H, GeForce RTX 5070 Laptop, Kioxia BG6 KBG6AZNV1T02, OLED, 3840x2400, 16.3" | Asus ExpertBook B5 B5605CCA Ultra 5 225H, Arc 130T, Micron 2500 MTFDKBA512QGN, IPS, 2560x1600, 16" | |
|---|---|---|---|---|---|---|
| Power Consumption | -3% | -3% | -8% | -115% | -10% | |
| Idle Minimum * (Watt) | 3.9 | 4.15 -6% | 3.1 21% | 2.9 26% | 6.5 -67% | 4.7 -21% |
| Idle Average * (Watt) | 7.8 | 5.4 31% | 8.4 -8% | 6.5 17% | 8.1 -4% | 9.7 -24% |
| Idle Maximum * (Watt) | 8.4 | 12.4 -48% | 9.1 -8% | 6.7 20% | 33 -293% | 10.1 -20% |
| Load Average * (Watt) | 52.2 | 53.3 -2% | 65.6 -26% | 88.9 -70% | 44.2 15% | |
| Cyberpunk 2077 ultra external monitor * (Watt) | 46.9 | 48.1 -3% | 42.6 9% | 62.8 -34% | 108.9 -132% | 50.9 -9% |
| Cyberpunk 2077 ultra * (Watt) | 50.2 | 48.2 4% | 48.6 3% | 65.8 -31% | 108.7 -117% | 50.3 -0% |
| Load Maximum * (Watt) | 62.6 | 60.049 4% | 83.9 -34% | 80.6 -29% | 138.3 -121% | 69.6 -11% |
* ... Meglio usare valori piccoli
Consumo di energia Cyberpunk / Stress Test
Consumo di energia del monitor esterno
Durata della batteria
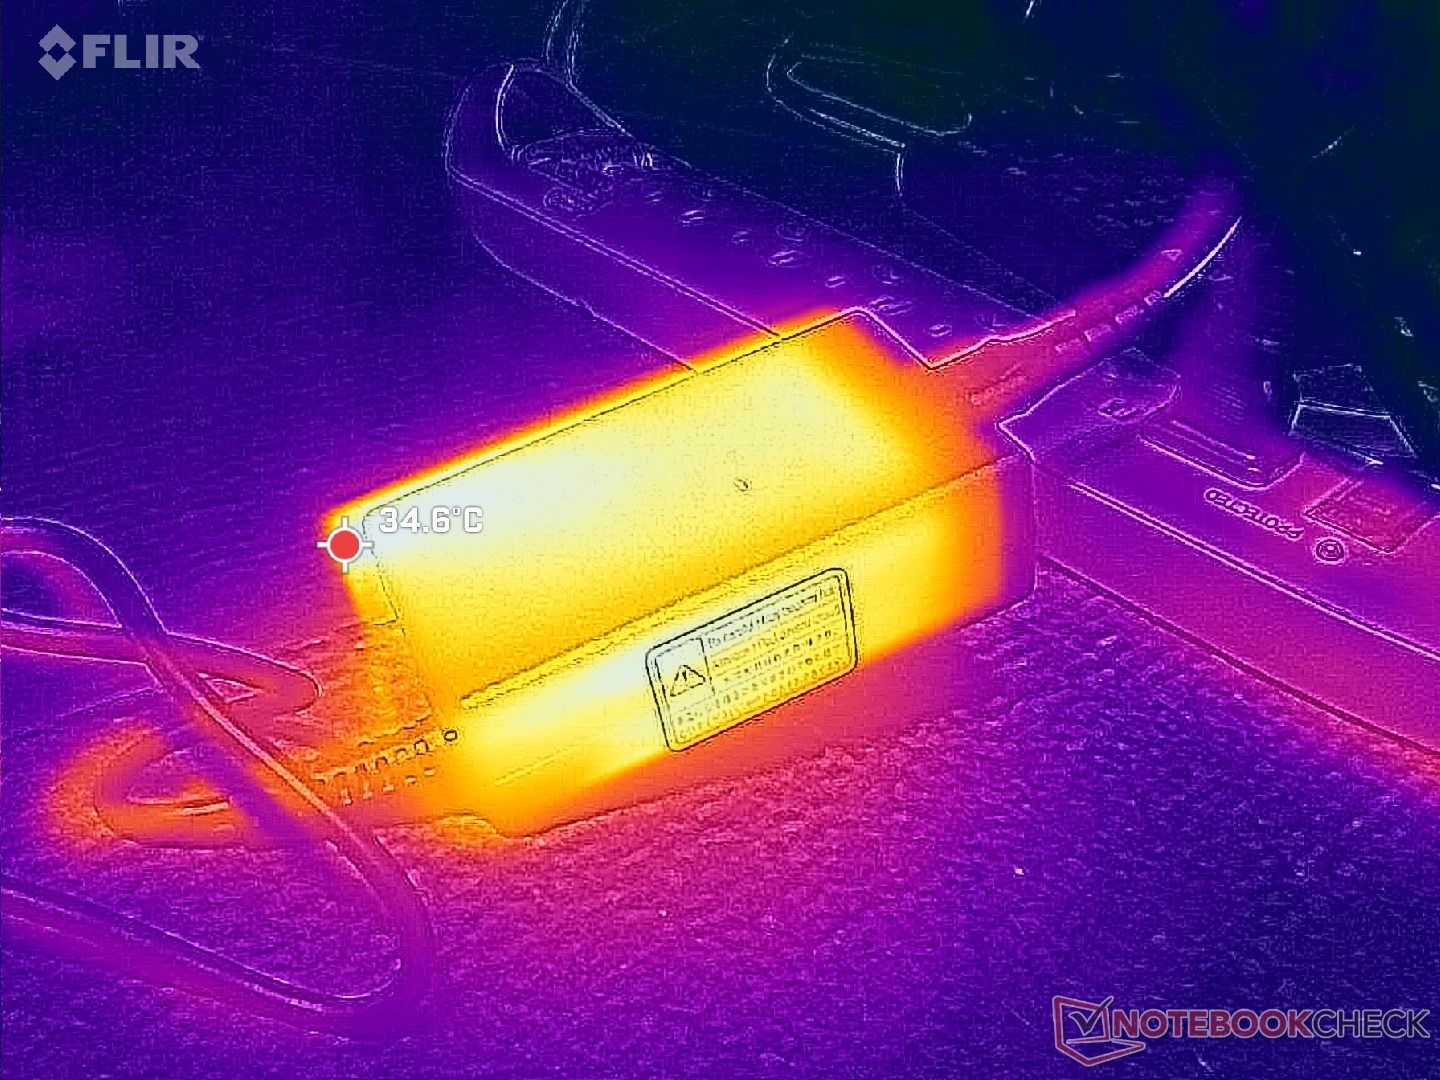
L'autonomia è discreta, con circa 11 ore di navigazione WLAN nel mondo reale, nonostante la capacità relativamente piccola della batteria da 60 Wh. Il sistema può essere ricaricato sia con l'adattatore AC proprietario a barile che con la maggior parte degli adattatori AC universali USB-C.
| Dynabook Tecra A60 A65-M R7 250, Radeon 780M, 60 Wh | LG Gram Pro 16Z90TS-G.AU89G Core Ultra 7 256V, Arc 140V, 77 Wh | Lenovo ThinkPad T16 Gen 4 21QQS06M00 Ryzen AI 7 PRO 350, Radeon 860M, 86 Wh | HP EliteBook 8 G1a 16 AI Ryzen AI 7 PRO 350, Radeon 860M, 77 Wh | Dell 16 Premium DA16250 Ultra 7 255H, GeForce RTX 5070 Laptop, 99.5 Wh | Asus ExpertBook B5 B5605CCA Ultra 5 225H, Arc 130T, 50 Wh | |
|---|---|---|---|---|---|---|
| Autonomia della batteria | ||||||
| WiFi v1.3 (h) | 11.1 | 19.6 77% | 17.1 54% | 13.3 20% | 11 -1% | 8.9 -20% |
Valutazione Notebookcheck
Un portatile economico orientato all'ufficio con prestazioni decenti del processore ma colori deboli del display.
Dynabook Tecra A60 A65-M
- 01/22/2026 v8
Allen Ngo
 Total Sustainability Score:
 Potenziali concorrenti a confronto
Immagine | Modello | Prezzo | Peso | Altezza | Schermo |
|---|---|---|---|---|---|
1. 83.7%  | Dynabook Tecra A60 A65-M AMD Ryzen 7 250 ⎘ AMD Radeon 780M ⎘ 16 GB Memoria, 512 GB SSD | Amazon: 1. $123.00 16.0" WUXGA 1920(RGB)*1200 f... 2. $129.00 Replacement Screen 16.0" for... 3. $1,779.00 dynabook Tecra A40-M 14" WUX... Prezzo di listino: 1300 USD | 1.7 kg | 19.9 mm | 16.00" 1920x1200 142 PPI IPS |
2. 83.9%  | LG Gram Pro 16Z90TS-G.AU89G Intel Core Ultra 7 256V ⎘ Intel Arc Graphics 140V ⎘ 16 GB Memoria, 1024 GB SSD | Amazon: Prezzo di listino: 2050€ | 1.2 kg | 13 mm | 16.00" 2560x1600 189 PPI IPS |
3. 87.4%  | Lenovo ThinkPad T16 Gen 4 21QQS06M00 AMD Ryzen AI 7 PRO 350 ⎘ AMD Radeon 860M ⎘ 32 GB Memoria, 1024 GB SSD | Amazon: Prezzo di listino: 1349€ | 2 kg | 18.1 mm | 16.00" 1920x1200 142 PPI IPS |
4. 87%  | HP EliteBook 8 G1a 16 AI AMD Ryzen AI 7 PRO 350 ⎘ AMD Radeon 860M ⎘ 32 GB Memoria, 512 GB SSD | Amazon: Prezzo di listino: 4400 USD | 1.9 kg | 15.5 mm | 16.00" 1920x1200 142 PPI IPS |
5. 87.9%  | Dell 16 Premium DA16250 Intel Core Ultra 7 255H ⎘ NVIDIA GeForce RTX 5070 Laptop ⎘ 32 GB Memoria, 1024 GB SSD | Amazon: Prezzo di listino: 3300 USD | 2.3 kg | 18.7 mm | 16.30" 3840x2400 278 PPI OLED |
6. 84.4%  | Asus ExpertBook B5 B5605CCA Intel Core Ultra 5 225H ⎘ Intel Arc Graphics 130T ⎘ 16 GB Memoria, 512 GB SSD | Amazon: Prezzo di listino: 1300€ | 1.7 kg | 18 mm | 16.00" 2560x1600 189 PPI IPS |
Transparency
La selezione dei dispositivi da recensire viene effettuata dalla nostra redazione. Il campione di prova è stato fornito all'autore come prestito dal produttore o dal rivenditore ai fini di questa recensione. L'istituto di credito non ha avuto alcuna influenza su questa recensione, né il produttore ne ha ricevuto una copia prima della pubblicazione. Non vi era alcun obbligo di pubblicare questa recensione. In quanto società mediatica indipendente, Notebookcheck non è soggetta all'autorità di produttori, rivenditori o editori.
Ecco come Notebookcheck esegue i test
Ogni anno, Notebookcheck esamina in modo indipendente centinaia di laptop e smartphone utilizzando procedure standardizzate per garantire che tutti i risultati siano comparabili. Da circa 20 anni sviluppiamo continuamente i nostri metodi di prova e nel frattempo stabiliamo gli standard di settore. Nei nostri laboratori di prova, tecnici ed editori esperti utilizzano apparecchiature di misurazione di alta qualità. Questi test comportano un processo di validazione in più fasi. Il nostro complesso sistema di valutazione si basa su centinaia di misurazioni e parametri di riferimento ben fondati, che mantengono l'obiettività.
