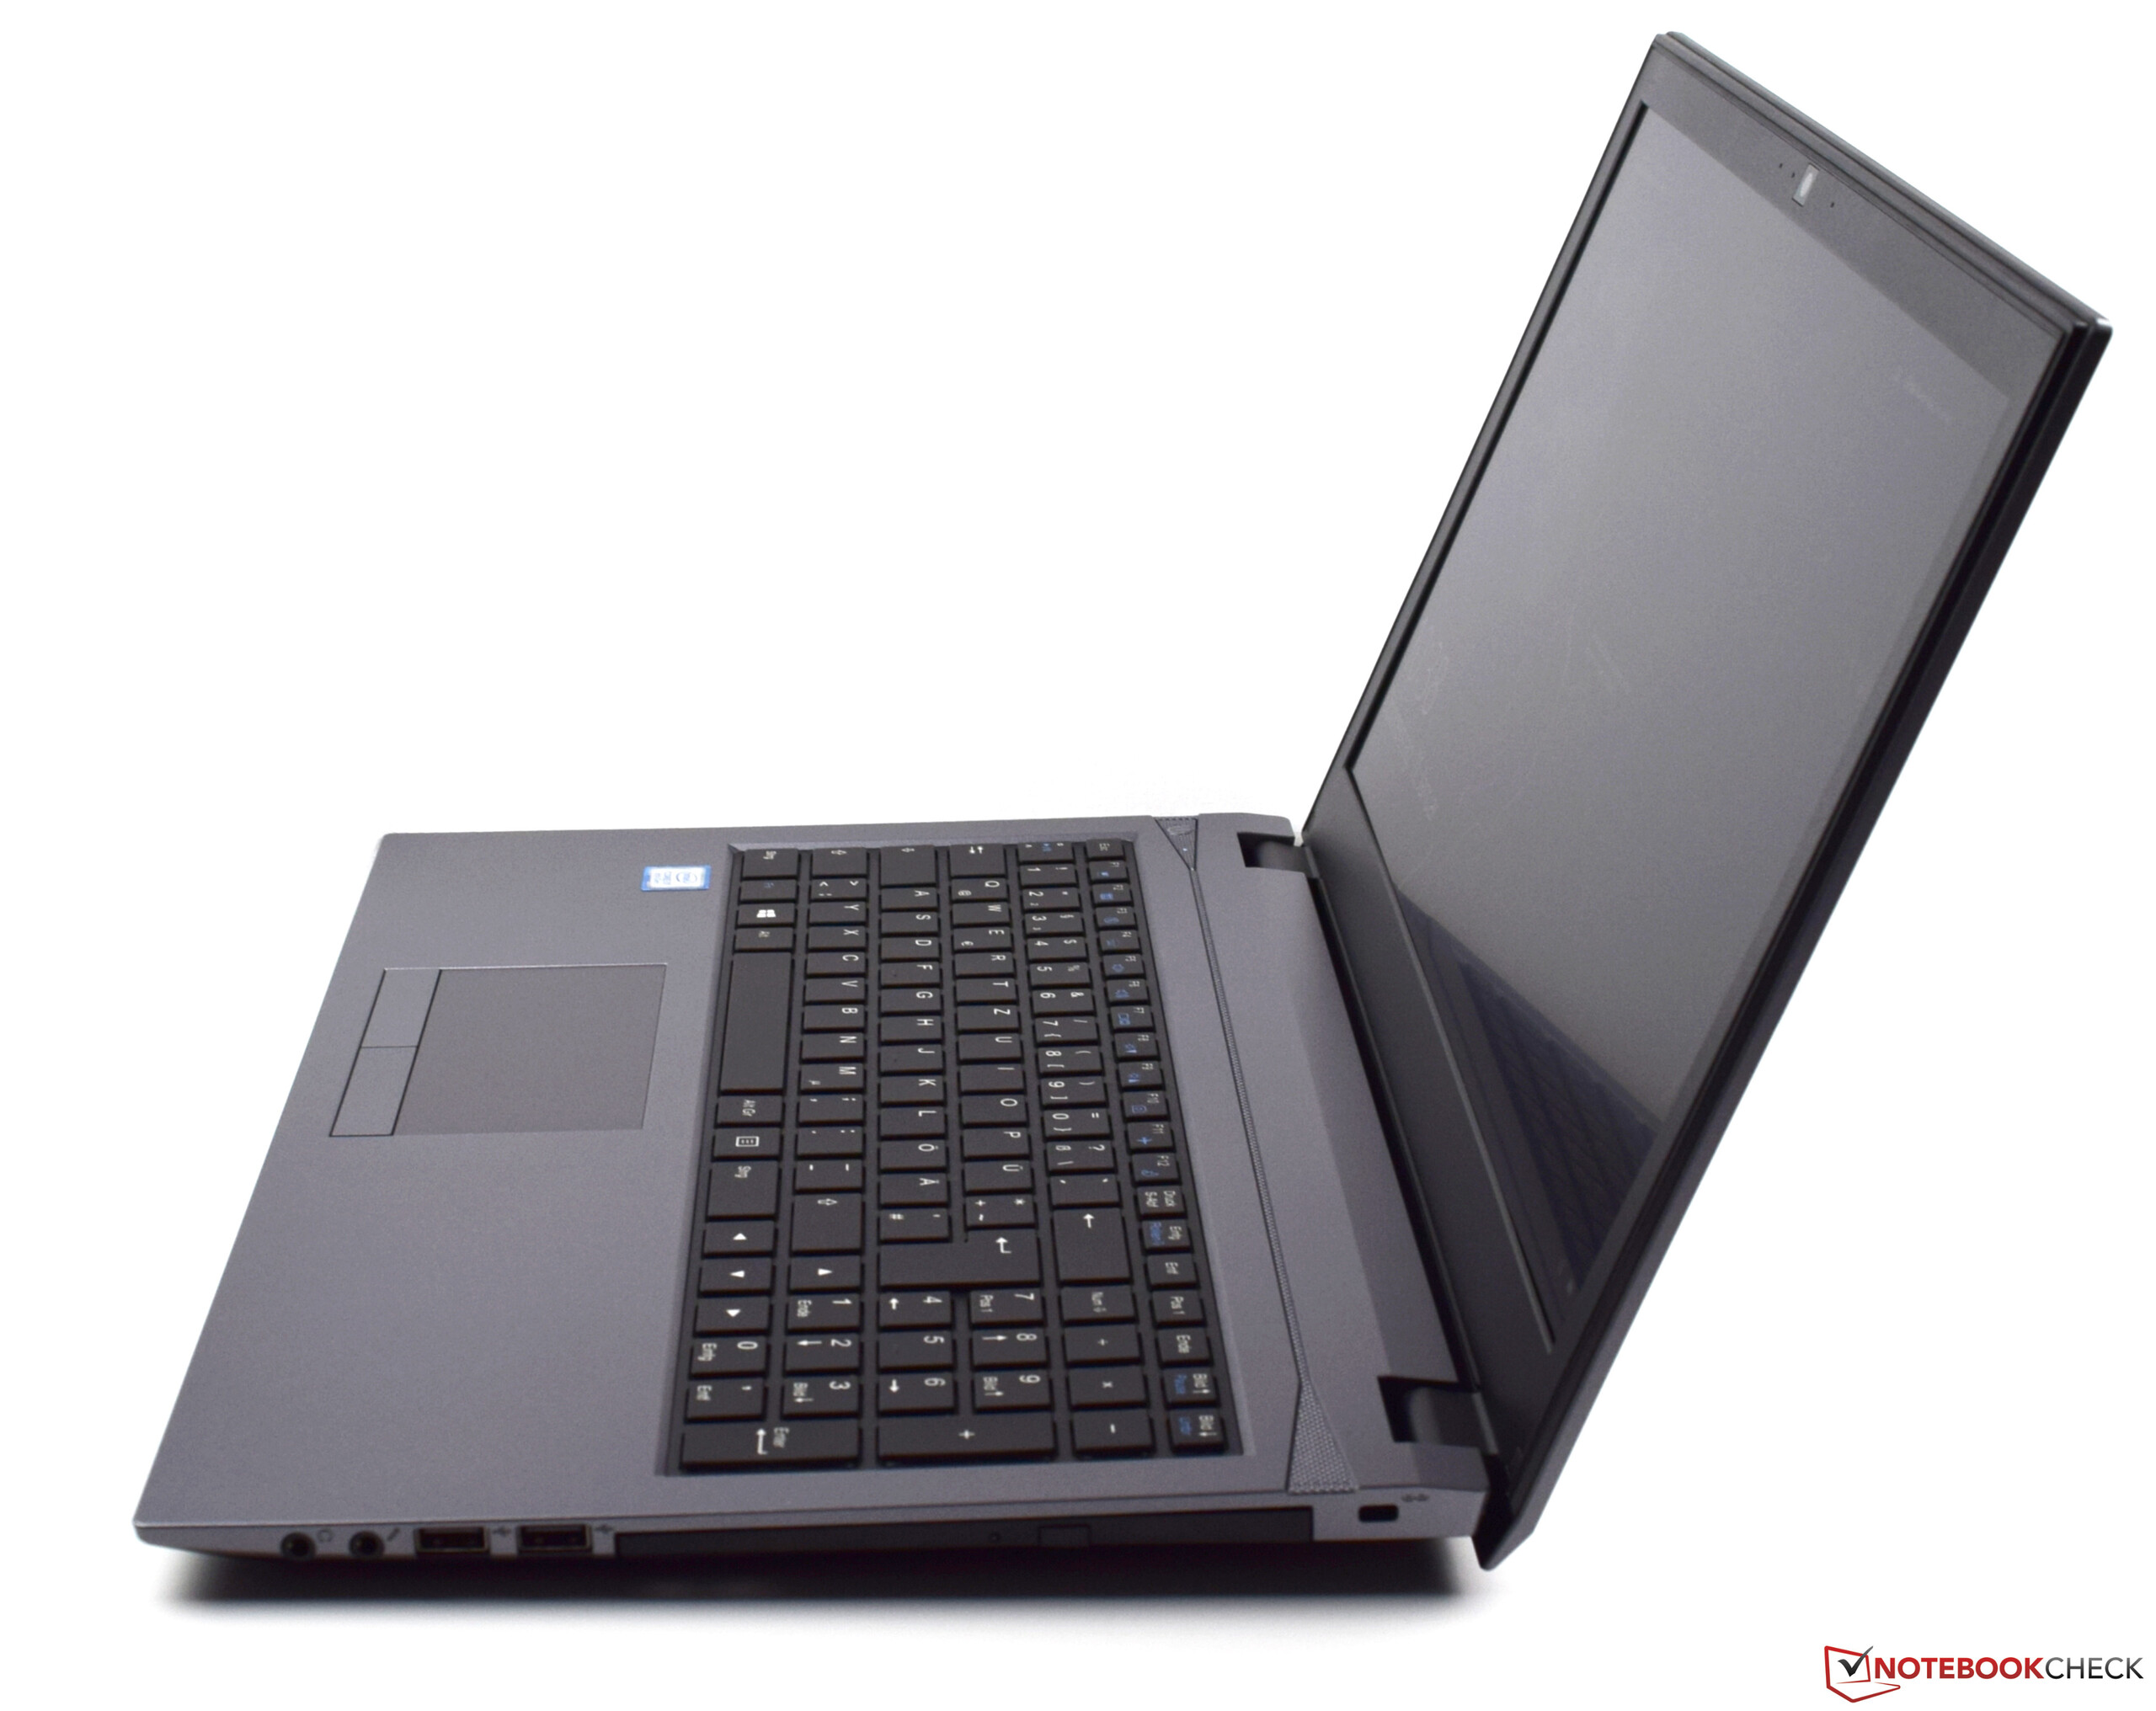
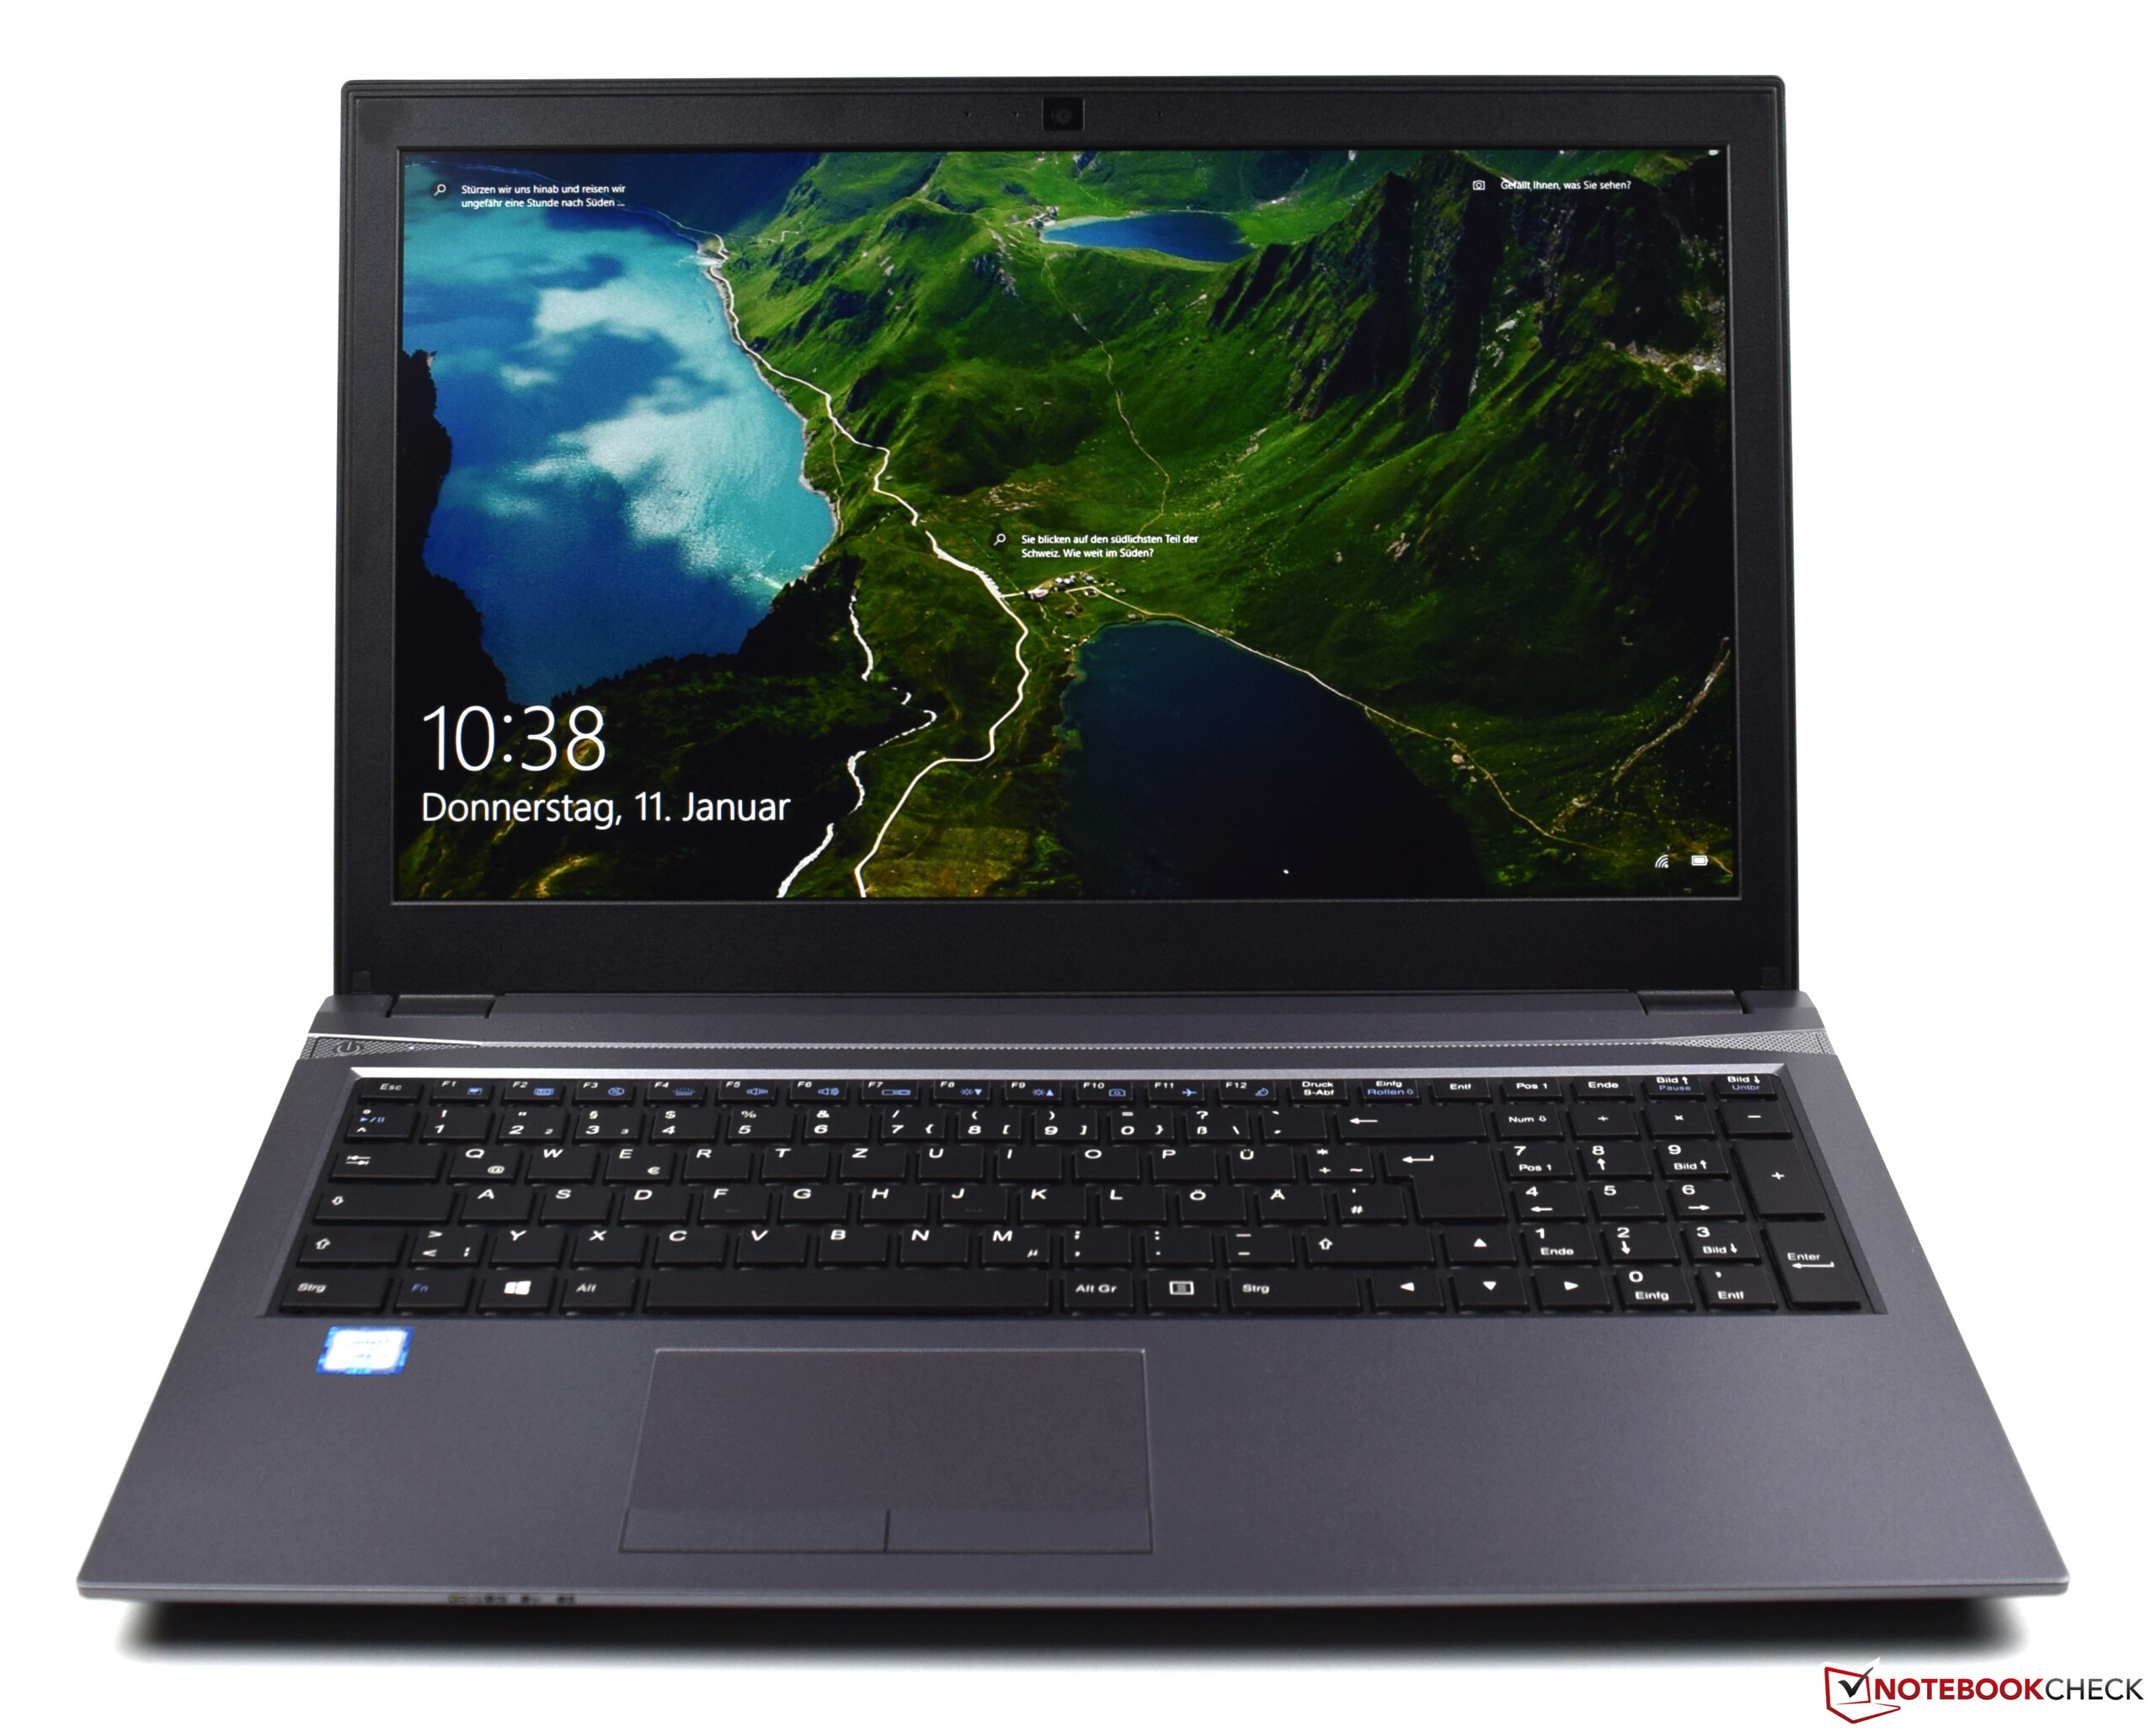
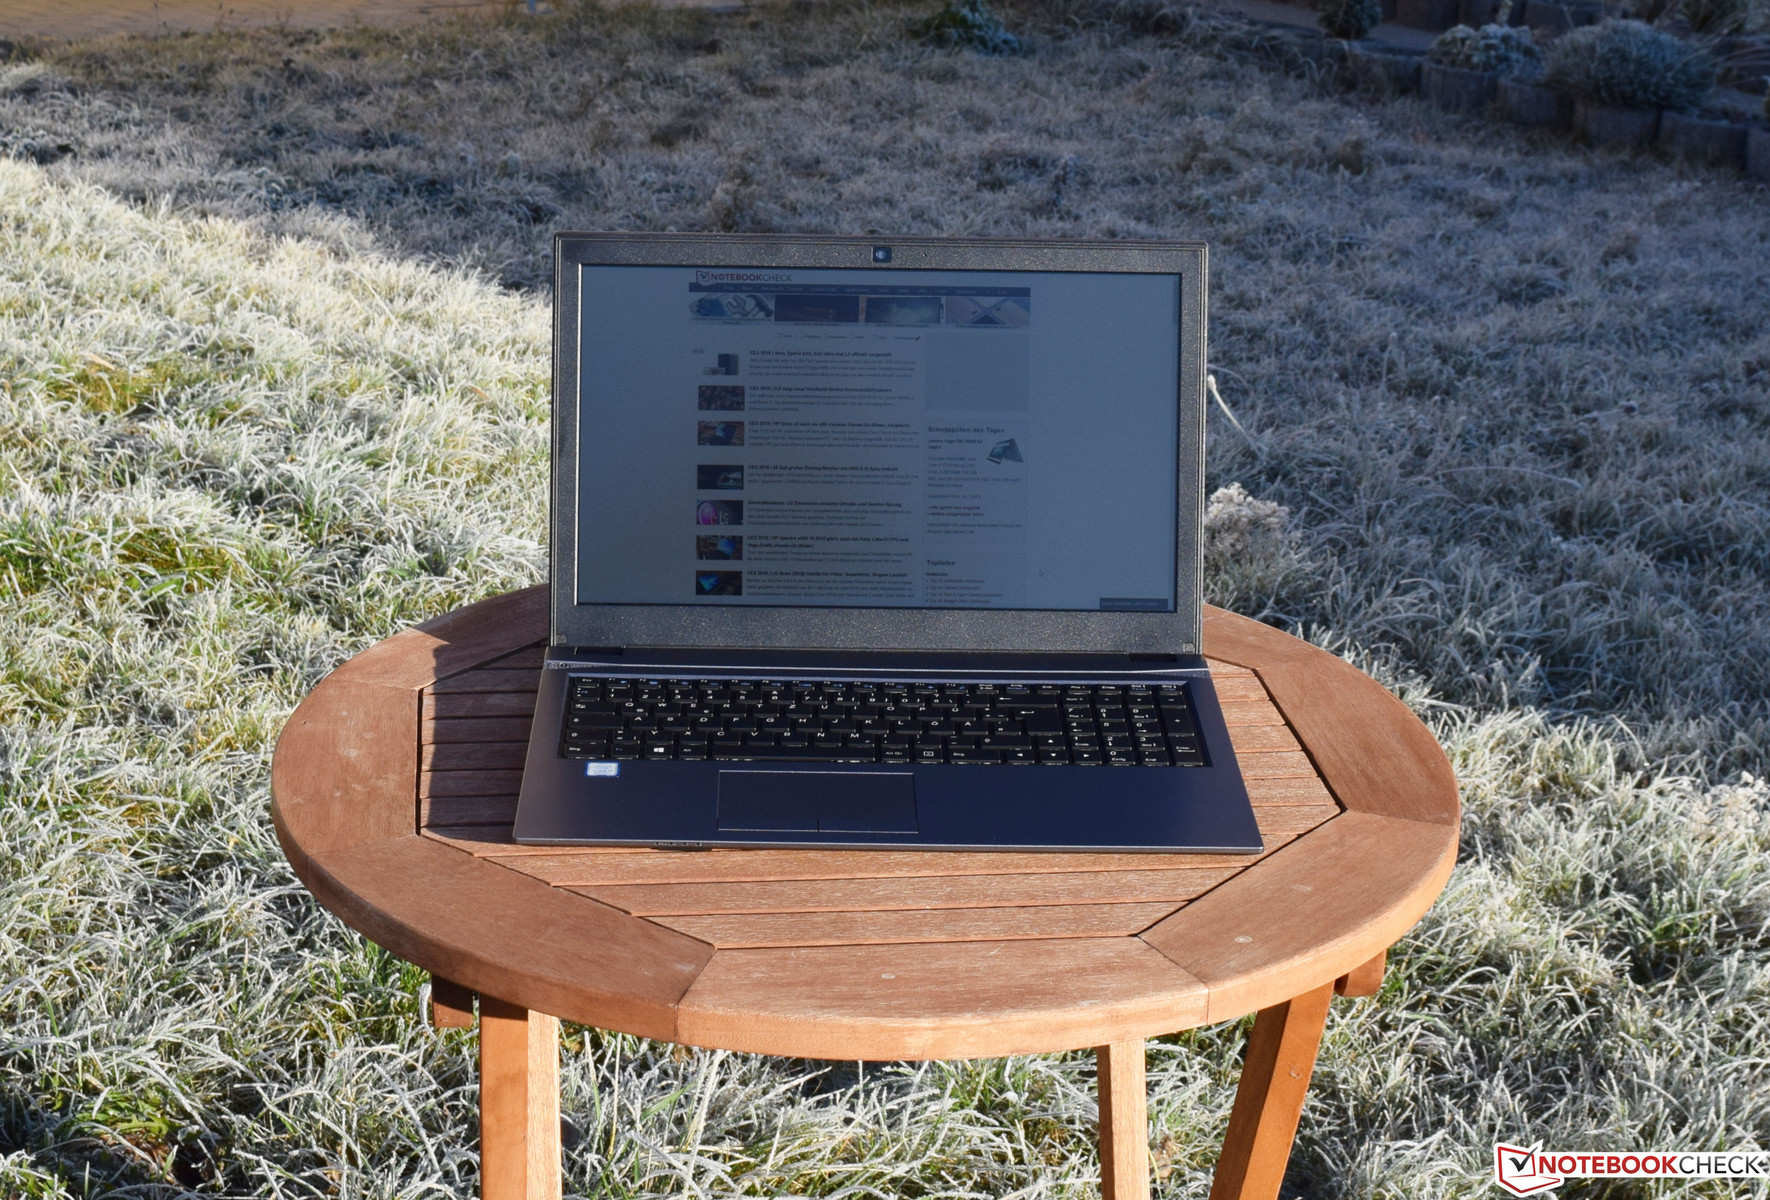
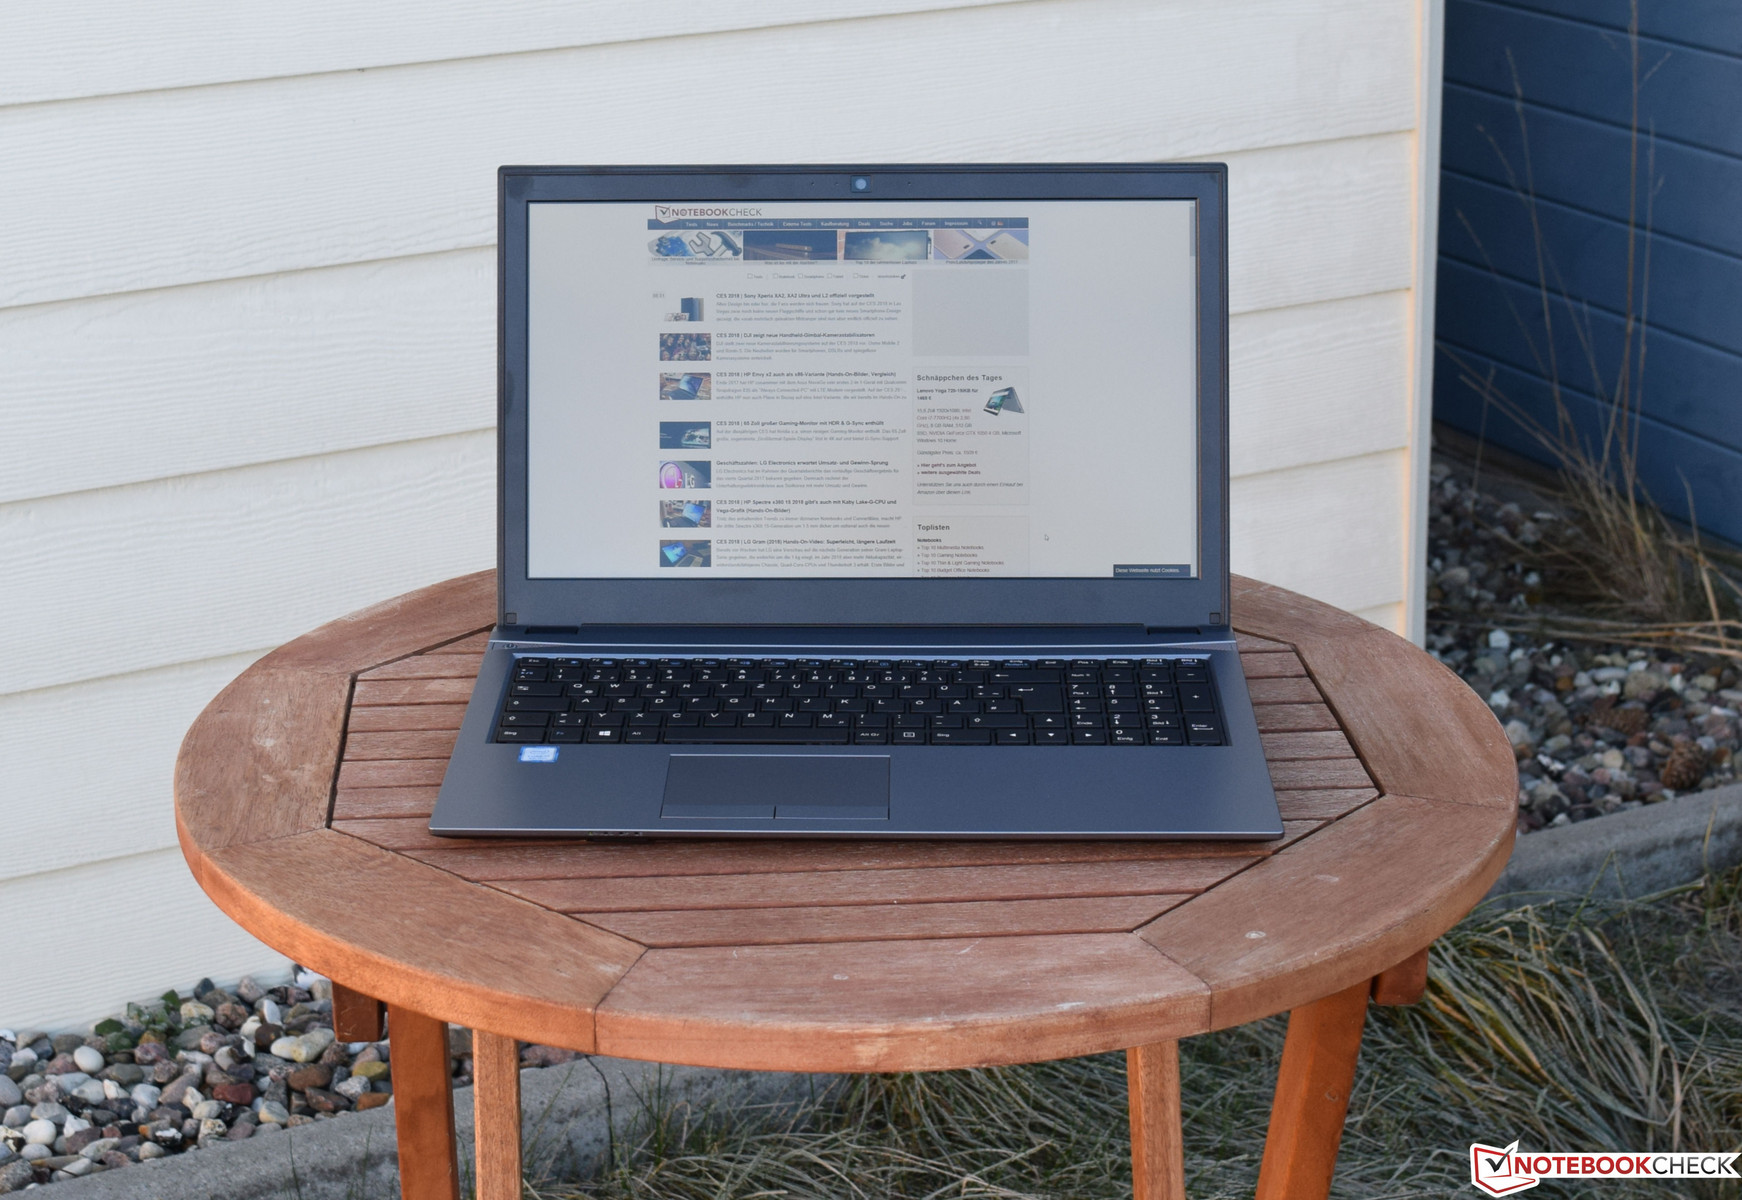
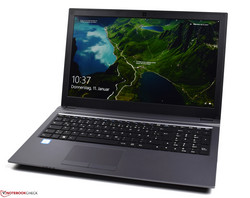
Recensione breve del Portatile Schenker Slim 15 L17 (Clevo N751WU, i7-8550U, FHD)

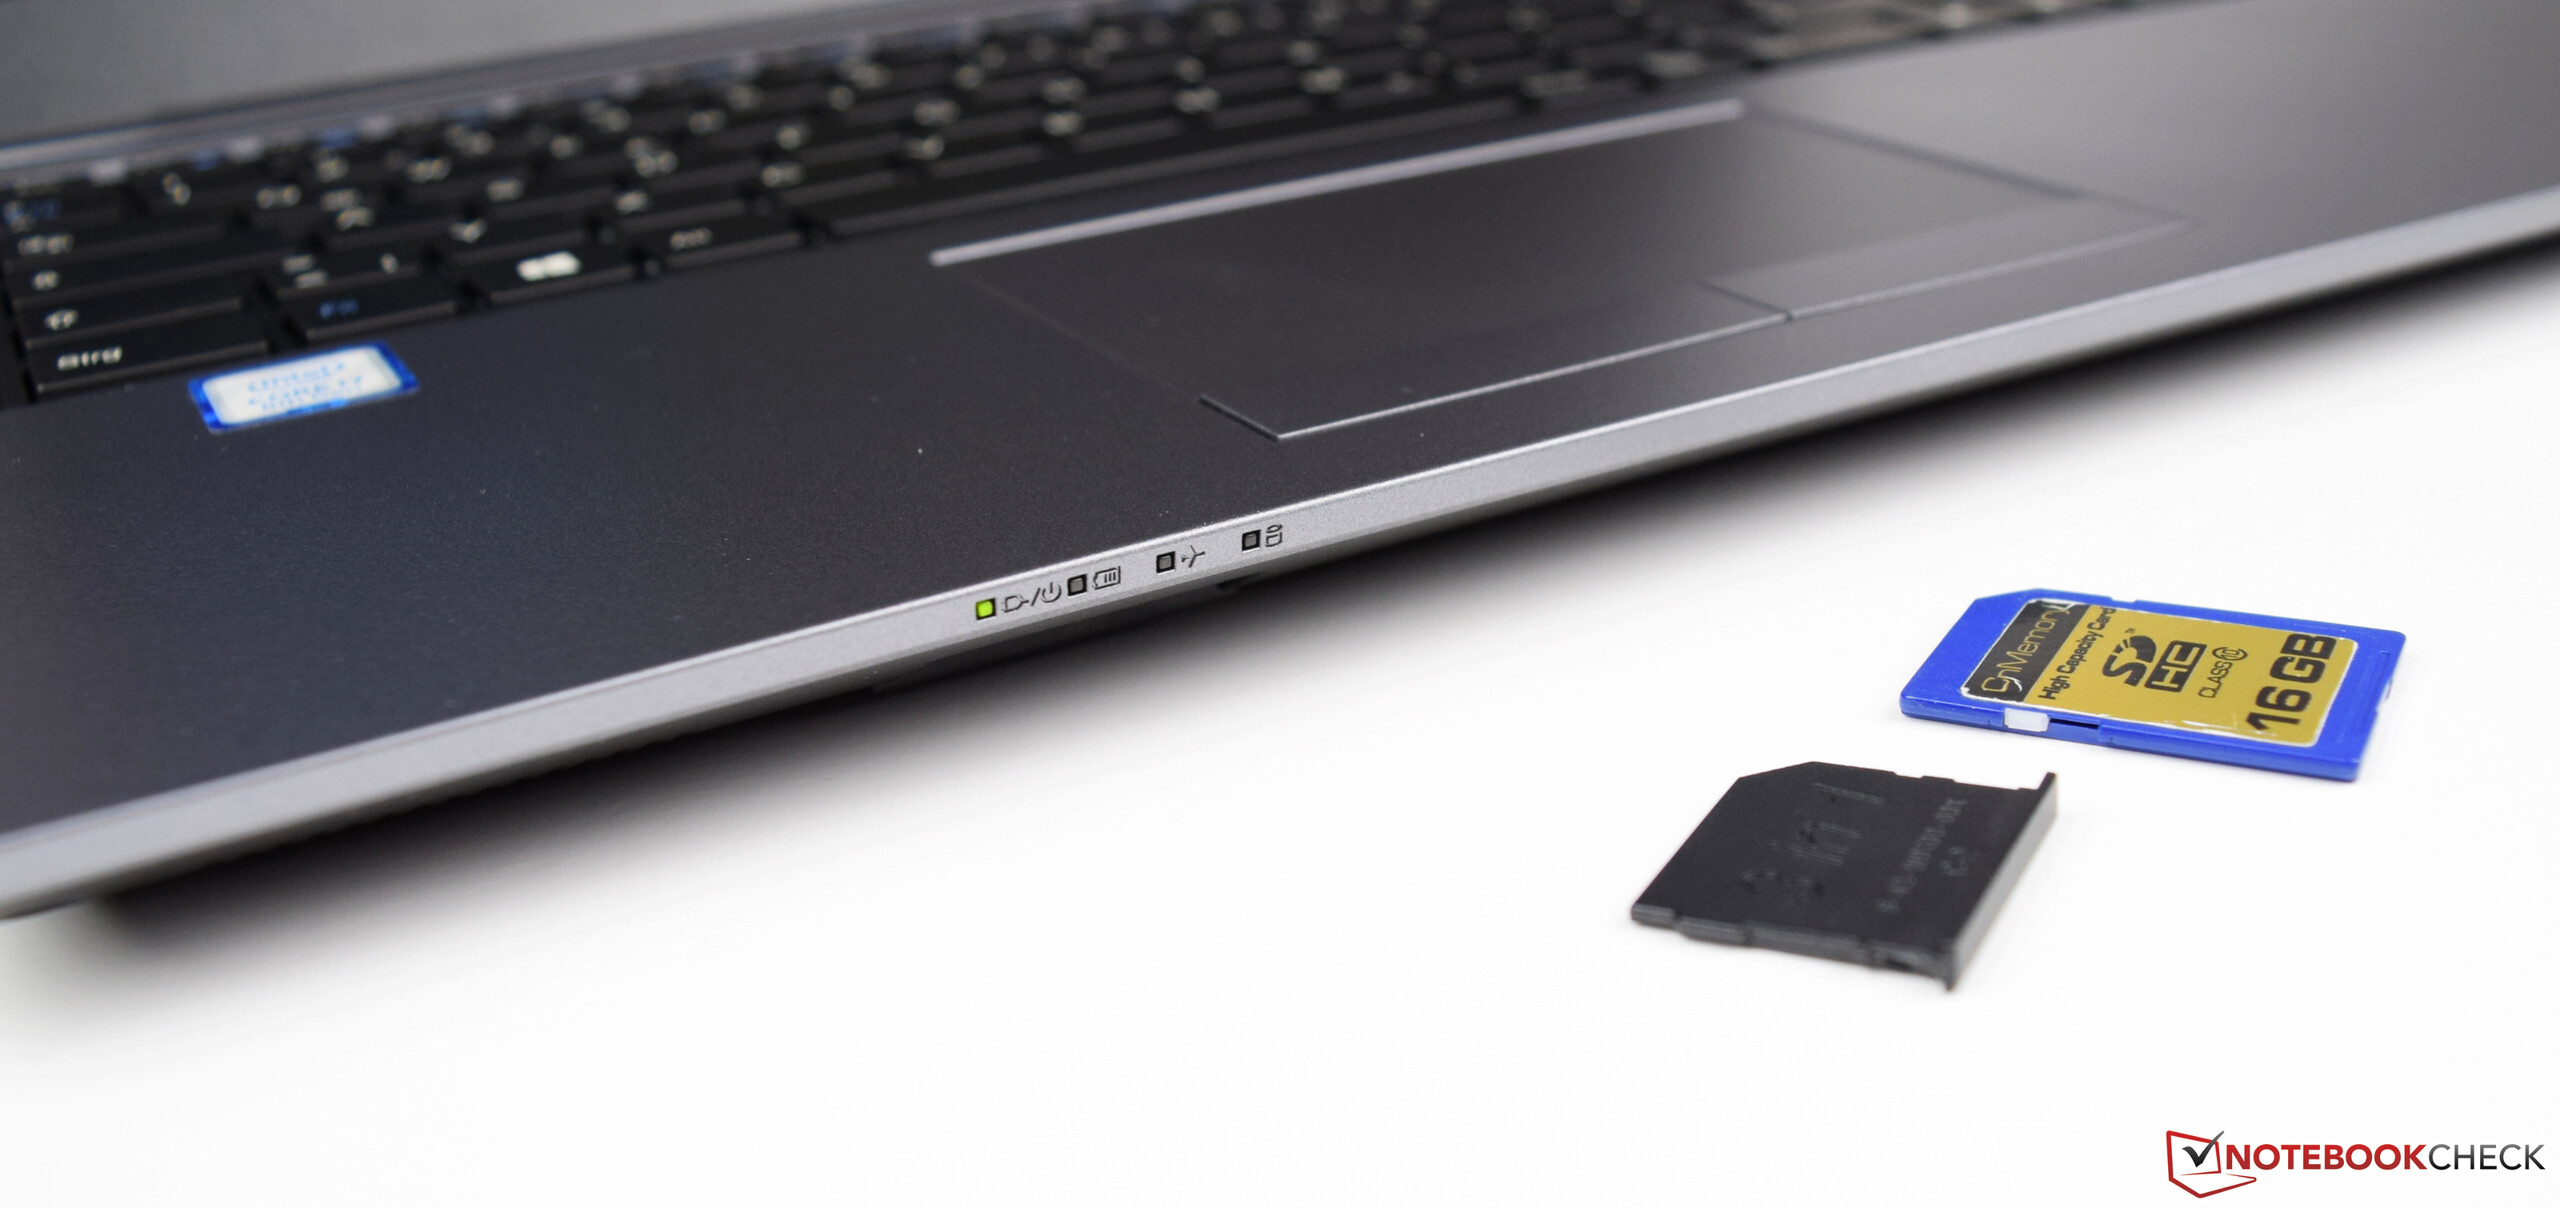
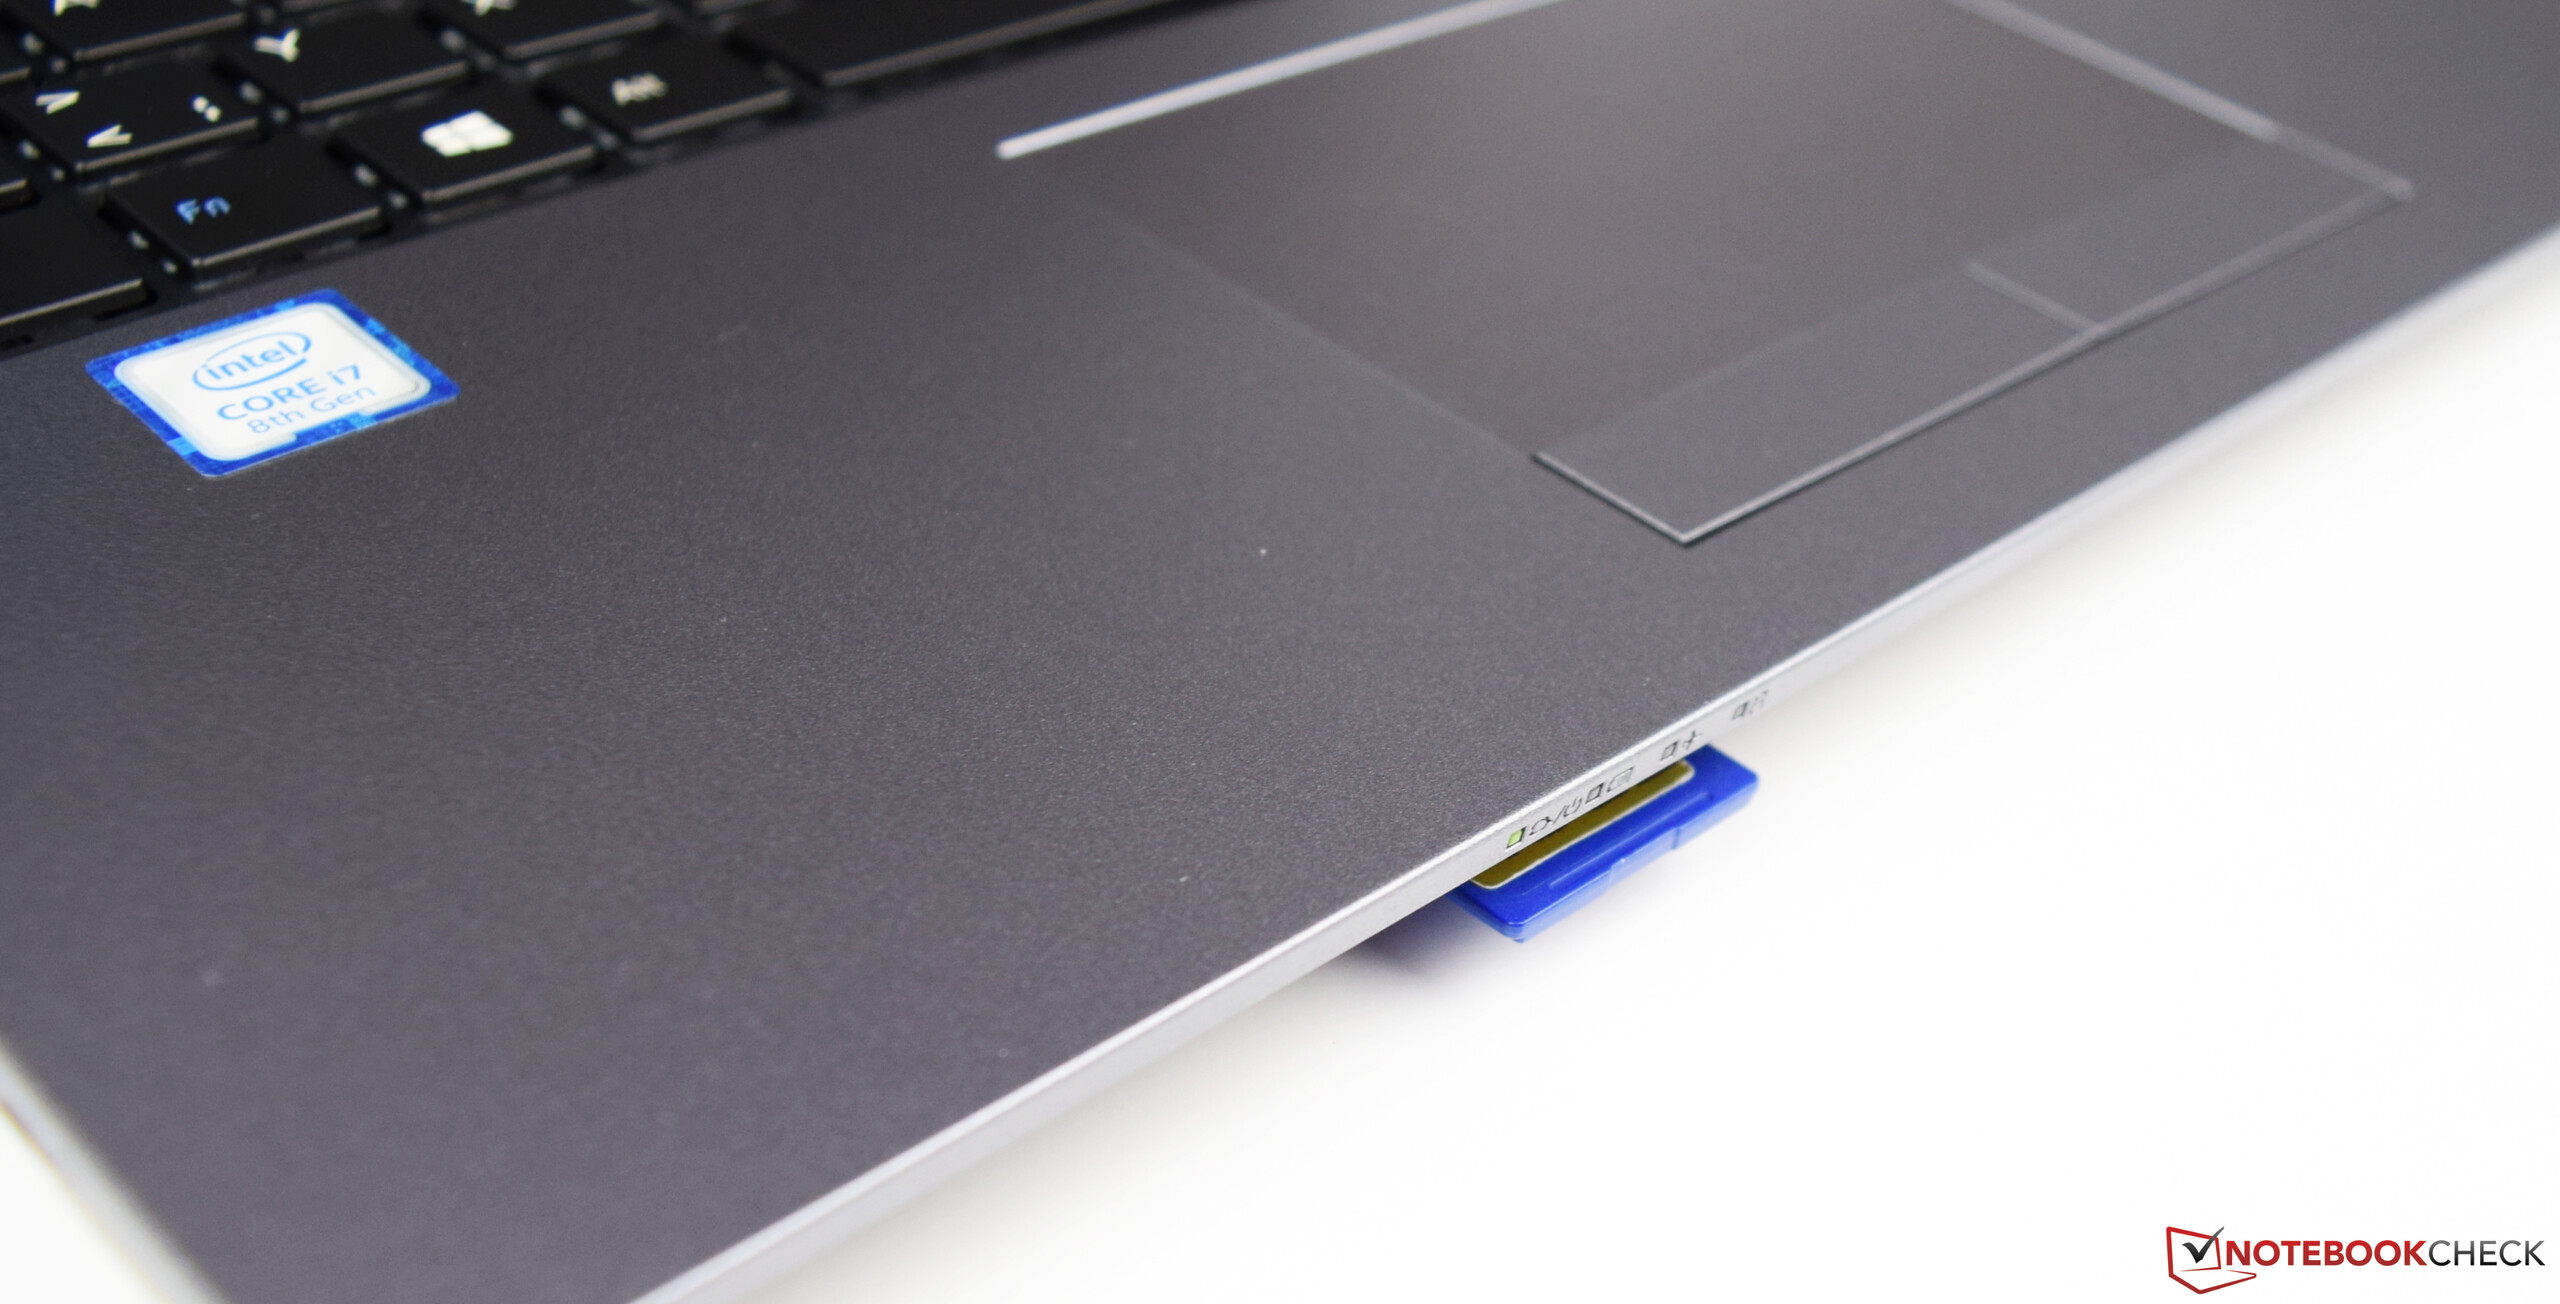
| SD Card Reader | |
| average JPG Copy Test (av. of 3 runs) | |
| Schenker Slim 15 L17 (Toshiba Exceria Pro SDXC 64 GB UHS-II) | |
| Fujitsu LifeBook U757 (Toshiba Exceria Pro SDXC 64 GB UHS-II) | |
| Lenovo Thinkpad L570 20J9S01600 (Toshiba Exceria Pro SDXC 64 GB UHS-II) | |
| HP EliteBook 755 G4 (Toshiba Exceria Pro SDXC 64 GB UHS-II) | |
| Dell Inspiron 15 7570 (Toshiba Exceria Pro SDXC 64 GB UHS-II) | |
| maximum AS SSD Seq Read Test (1GB) | |
| Schenker Slim 15 L17 (Toshiba Exceria Pro SDXC 64 GB UHS-II) | |
| Fujitsu LifeBook U757 (Toshiba Exceria Pro SDXC 64 GB UHS-II) | |
| HP EliteBook 755 G4 (Toshiba Exceria Pro SDXC 64 GB UHS-II) | |
| Dell Inspiron 15 7570 (Toshiba Exceria Pro SDXC 64 GB UHS-II) | |
| |||||||||||||||||||||||||
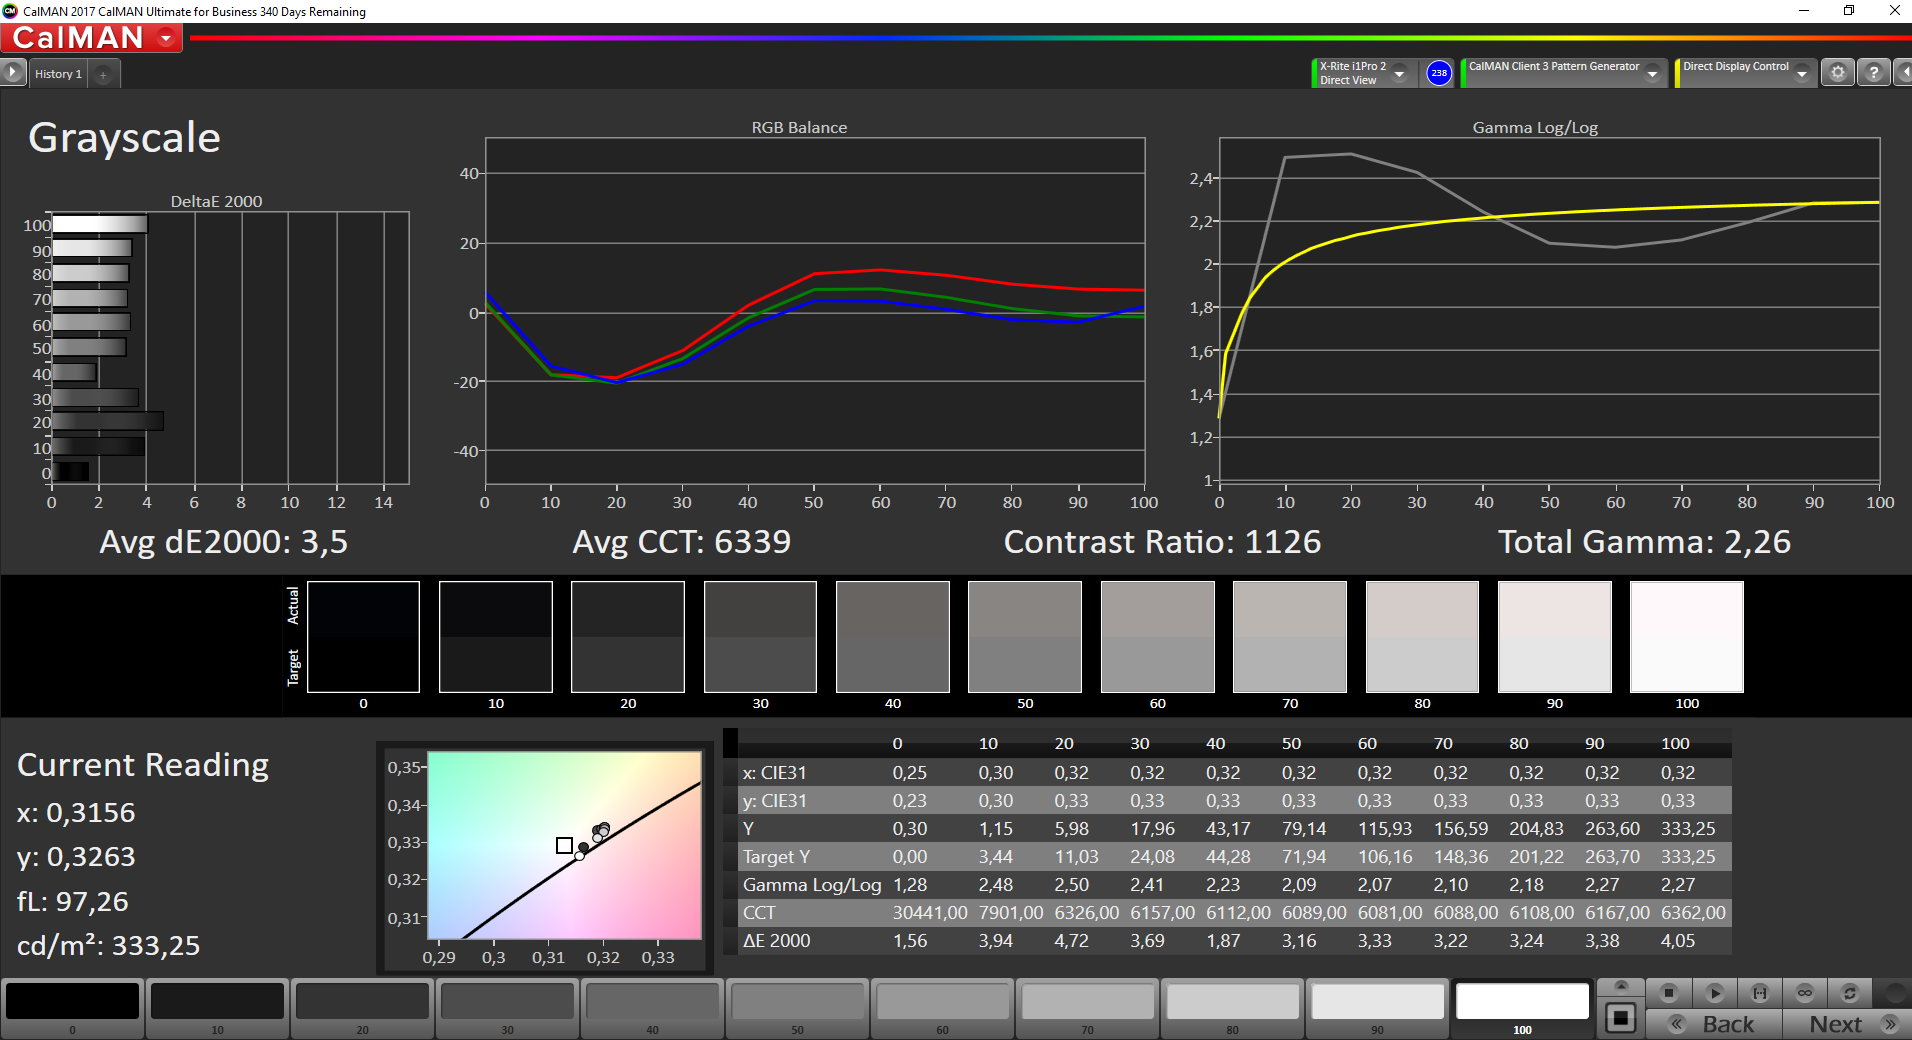
Distribuzione della luminosità: 93 %
Al centro con la batteria: 335 cd/m²
Contrasto: 1110:1 (Nero: 0.3 cd/m²)
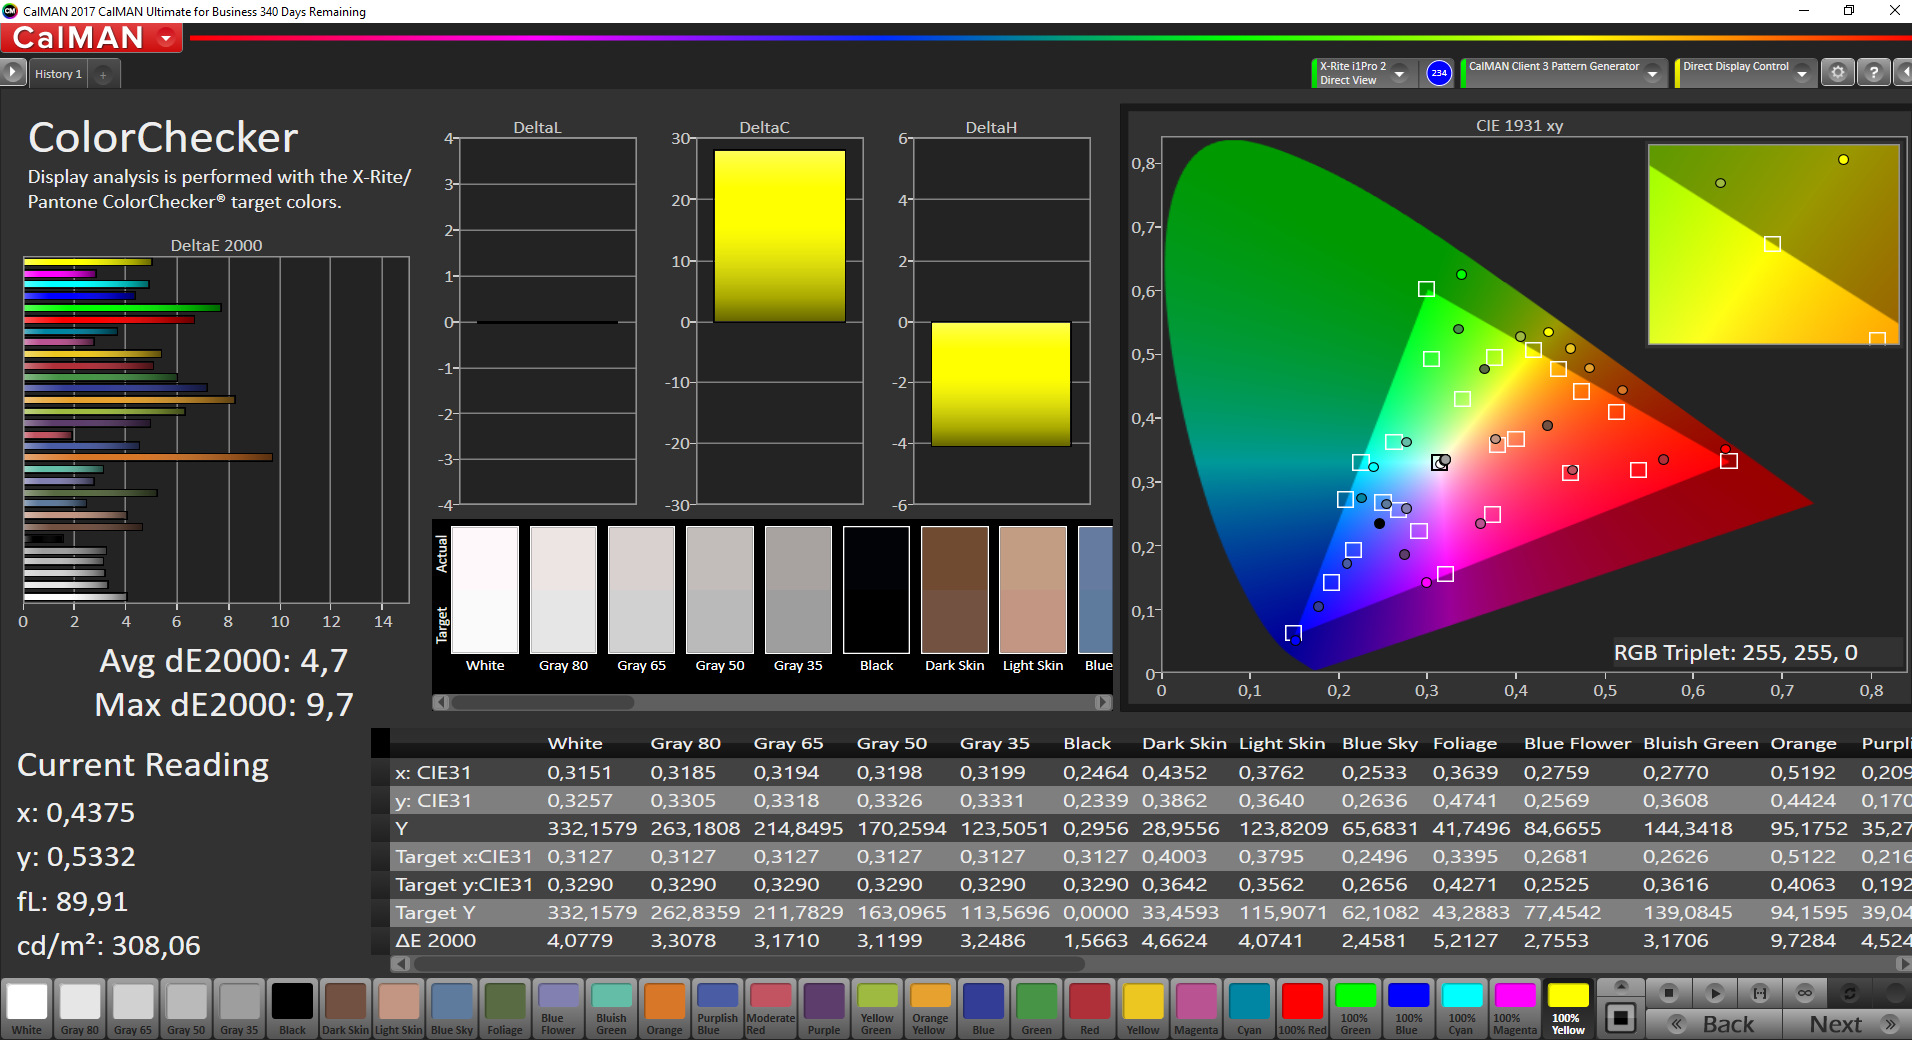
ΔE ColorChecker Calman: 4.7 | ∀{0.5-29.43 Ø4.71}
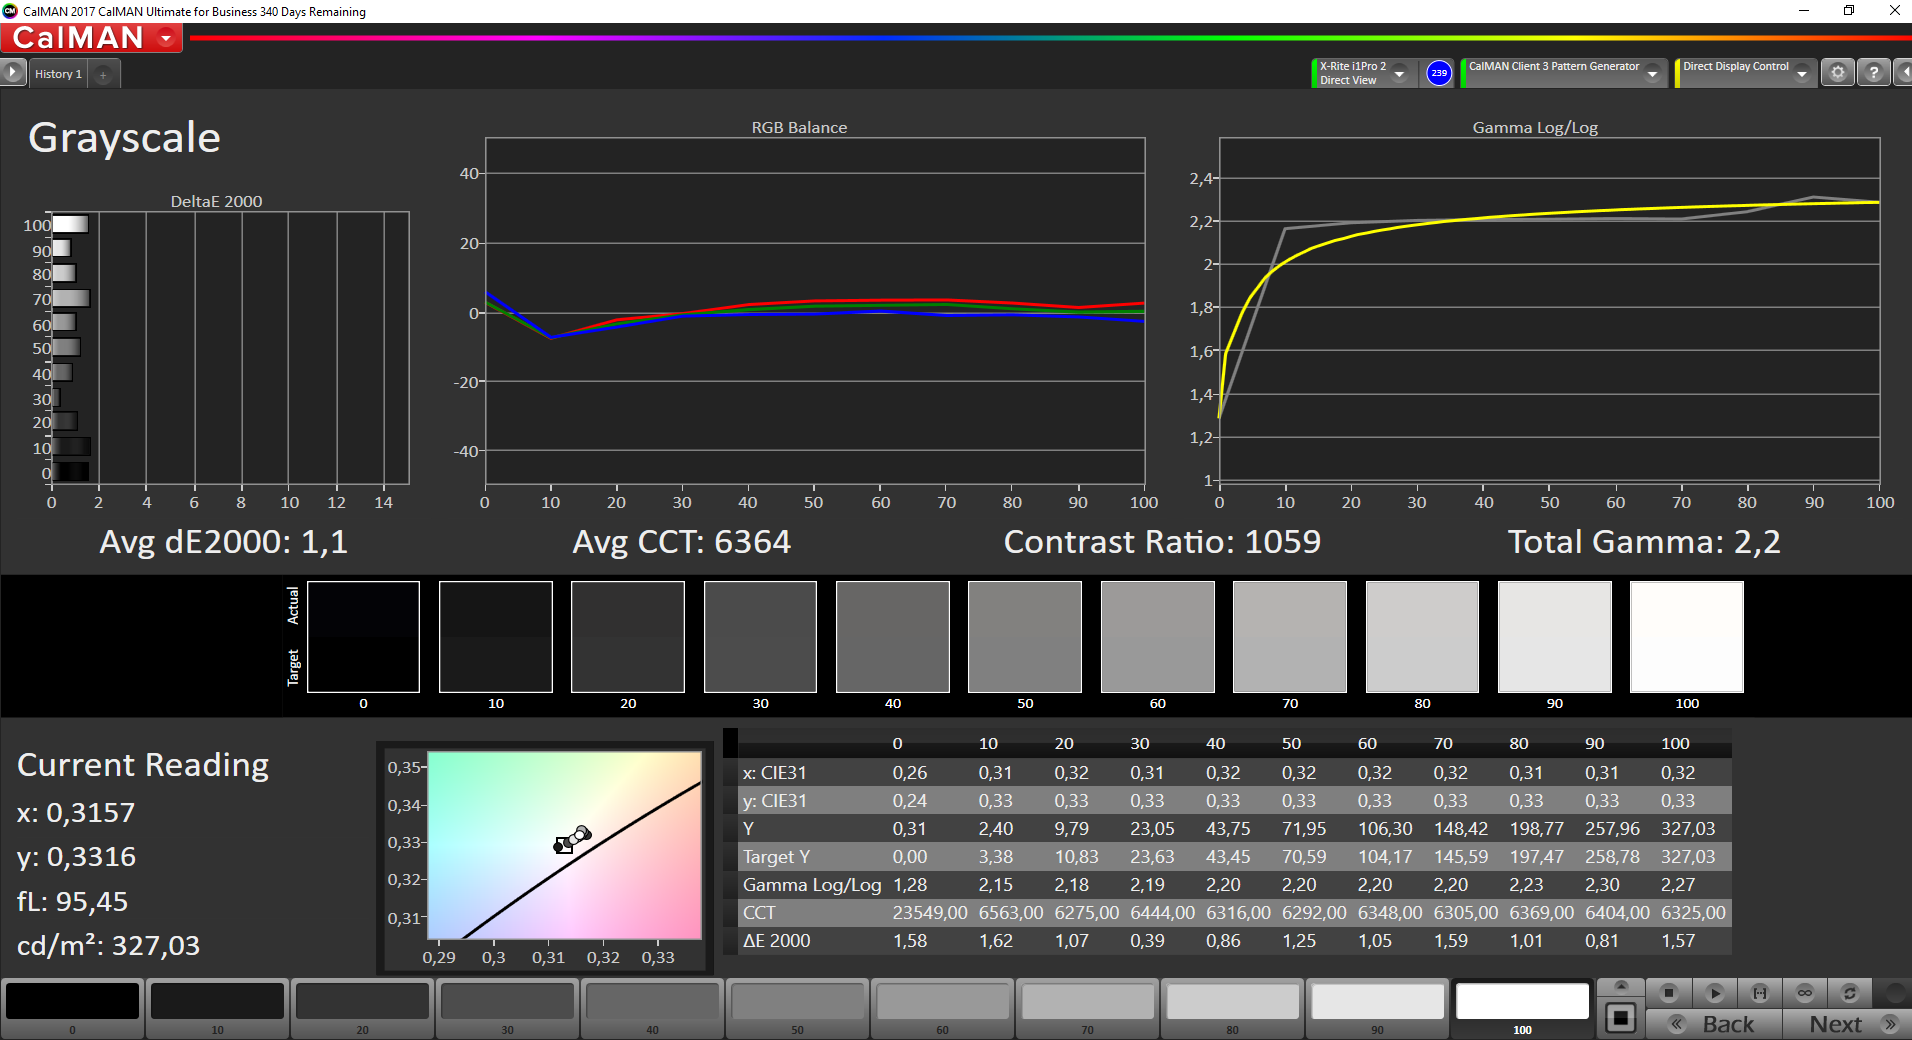
ΔE Greyscale Calman: 3.5 | ∀{0.09-98 Ø4.96}
82.7% sRGB (Argyll 1.6.3 3D)
54.2% AdobeRGB 1998 (Argyll 1.6.3 3D)
60.5% AdobeRGB 1998 (Argyll 3D)
82.8% sRGB (Argyll 3D)
63.9% Display P3 (Argyll 3D)
Gamma: 2.26
CCT: 6339 K
| Schenker Slim 15 L17 LG LP156WF6, IPS, 1920x1080, 15.6" | Dell Inspiron 15 7570 BOE06B4, IPS, 1920x1080, 15.6" | HP EliteBook 755 G4 Chi Mei, CMN15C3, TN LED, 1920x1080, 15.6" | Lenovo Thinkpad L570 20J9S01600 Lenovo LP156WF6-SPK4, IPS, 1920x1080, 15.6" | Fujitsu LifeBook U757 LP156WF6-SPP1, IPS LED, 1920x1080, 15.6" | |
|---|---|---|---|---|---|
| Display | -32% | -5% | -36% | 2% | |
| Display P3 Coverage (%) | 63.9 | 40.43 -37% | 56.3 -12% | 37.68 -41% | 65.8 3% |
| sRGB Coverage (%) | 82.8 | 60 -28% | 84.2 2% | 56.4 -32% | 84.8 2% |
| AdobeRGB 1998 Coverage (%) | 60.5 | 41.77 -31% | 57.7 -5% | 38.97 -36% | 62 2% |
| Response Times | -13% | 13% | 27% | 10% | |
| Response Time Grey 50% / Grey 80% * (ms) | 40 ? | 45 ? -13% | 45 ? -13% | 43 ? -8% | 36 ? 10% |
| Response Time Black / White * (ms) | 29.2 ? | 33 ? -13% | 18 ? 38% | 11 ? 62% | 26.4 ? 10% |
| PWM Frequency (Hz) | 20660 ? | 996 ? | 1000 ? | ||
| Screen | 0% | -83% | -22% | -3% | |
| Brightness middle (cd/m²) | 333 | 255 -23% | 333 0% | 276 -17% | 313 -6% |
| Brightness (cd/m²) | 336 | 240 -29% | 306 -9% | 252 -25% | 294 -12% |
| Brightness Distribution (%) | 93 | 91 -2% | 82 -12% | 85 -9% | 84 -10% |
| Black Level * (cd/m²) | 0.3 | 0.16 47% | 0.89 -197% | 0.45 -50% | 0.27 10% |
| Contrast (:1) | 1110 | 1594 44% | 374 -66% | 613 -45% | 1159 4% |
| Colorchecker dE 2000 * | 4.7 | 4.74 -1% | 11.69 -149% | 5.01 -7% | 4.5 4% |
| Colorchecker dE 2000 max. * | 9.7 | 7.68 21% | 20.57 -112% | 9.71 -0% | 10.5 -8% |
| Greyscale dE 2000 * | 3.5 | 3.44 2% | 13.7 -291% | 3.69 -5% | 4 -14% |
| Gamma | 2.26 97% | 2.43 91% | 2.29 96% | 2.39 92% | 2.24 98% |
| CCT | 6339 103% | 7064 92% | 15194 43% | 7023 93% | 6387 102% |
| Color Space (Percent of AdobeRGB 1998) (%) | 54.2 | 38 -30% | 54 0% | 36 -34% | 55.3 2% |
| Color Space (Percent of sRGB) (%) | 82.7 | 60 -27% | 84 2% | 56.3 -32% | 84.74 2% |
| Media totale (Programma / Settaggio) | -15% /
-8% | -25% /
-55% | -10% /
-19% | 3% /
-0% |
* ... Meglio usare valori piccoli
Tempi di risposta del Display
| ↔ Tempi di risposta dal Nero al Bianco | ||
|---|---|---|
| 29.2 ms ... aumenta ↗ e diminuisce ↘ combinato | ↗ 16.8 ms Incremento | 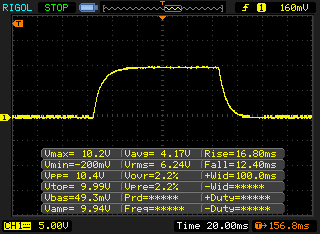 |
| ↘ 12.4 ms Calo | ||
| Lo schermo mostra tempi di risposta relativamente lenti nei nostri tests e potrebbe essere troppo lento per i gamers. In confronto, tutti i dispositivi di test variano da 0.1 (minimo) a 240 (massimo) ms. » 78 % di tutti i dispositivi è migliore. Questo significa che i tempi di risposta rilevati sono peggiori rispetto alla media di tutti i dispositivi testati (19.8 ms). | ||
| ↔ Tempo di risposta dal 50% Grigio all'80% Grigio | ||
| 40 ms ... aumenta ↗ e diminuisce ↘ combinato | ↗ 20.4 ms Incremento | 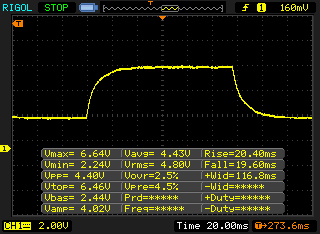 |
| ↘ 19.6 ms Calo | ||
| Lo schermo mostra tempi di risposta lenti nei nostri tests e sarà insoddisfacente per i gamers. In confronto, tutti i dispositivi di test variano da 0.165 (minimo) a 636 (massimo) ms. » 61 % di tutti i dispositivi è migliore. Questo significa che i tempi di risposta rilevati sono peggiori rispetto alla media di tutti i dispositivi testati (31 ms). | ||
Sfarfallio dello schermo / PWM (Pulse-Width Modulation)
| flickering dello schermo / PWM rilevato | 20660 Hz | ≤ 99 % settaggio luminosita' | 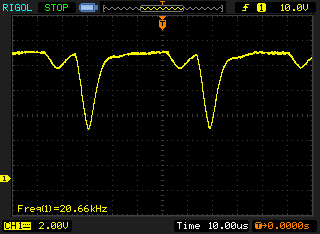 |
Il display sfarfalla a 20660 Hz (Probabilmente a causa dell'uso di PWM) Flickering rilevato ad una luminosita' di 99 % o inferiore. Non dovrebbe verificarsi flickering o PWM sopra questo valore di luminosita'. La frequenza di 20660 Hz è abbastanza alta, quindi la maggioranza degli utenti sensibili al PWM non dovrebbero notare alcun flickering. In confronto: 52 % di tutti i dispositivi testati non utilizza PWM per ridurre la luminosita' del display. Se è rilevato PWM, una media di 7747 (minimo: 5 - massimo: 343500) Hz è stata rilevata. | |||


| Cinebench R11.5 | |
| CPU Single 64Bit | |
| Dell Inspiron 15 7570 | |
| Schenker Slim 15 L17 | |
| Lenovo Thinkpad L570 20J9S01600 | |
| HP EliteBook 755 G4 | |
| CPU Multi 64Bit | |
| Dell Inspiron 15 7570 | |
| Schenker Slim 15 L17 | |
| Lenovo Thinkpad L570 20J9S01600 | |
| HP EliteBook 755 G4 | |
| JetStream 1.1 - 1.1 Total | |
| Schenker Slim 15 L17 | |
| Lenovo Thinkpad L570 20J9S01600 | |
| Fujitsu LifeBook U757 | |
| HP EliteBook 755 G4 | |
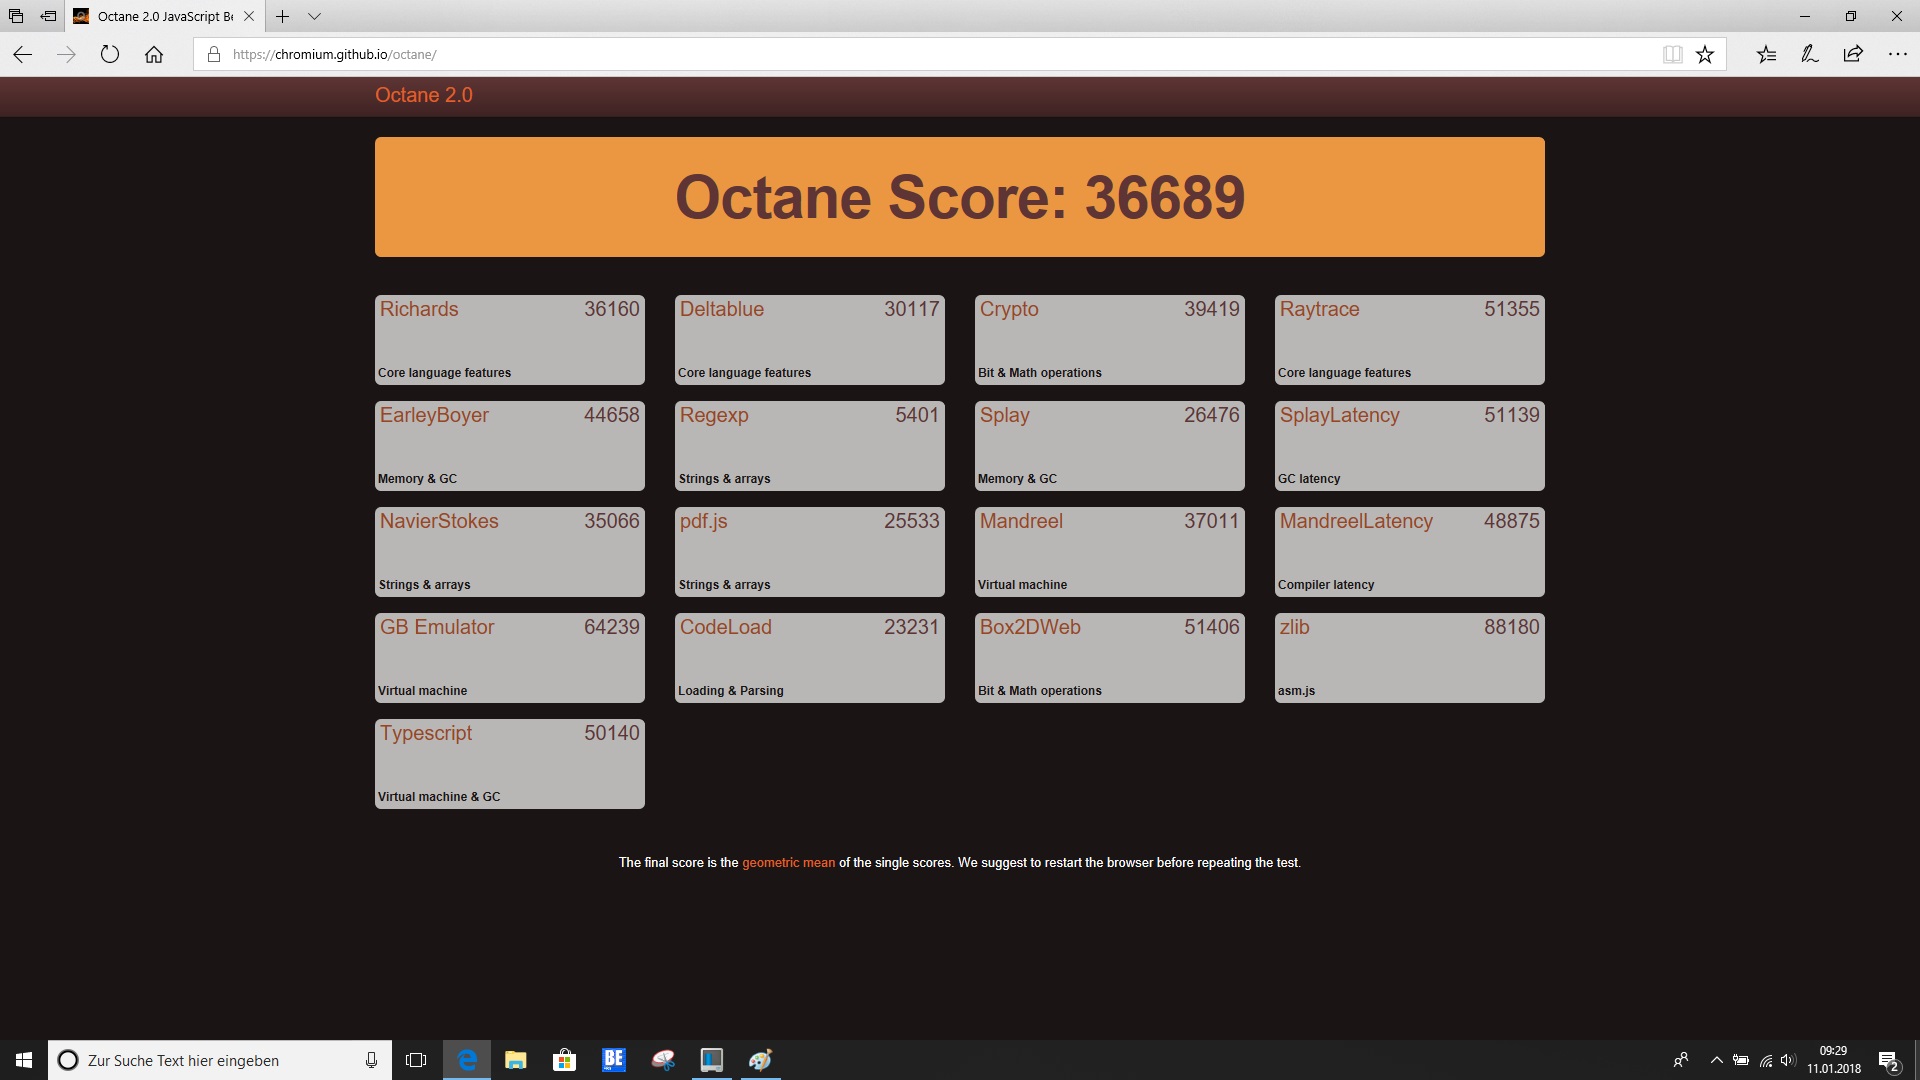
| Octane V2 - Total Score | |
| Schenker Slim 15 L17 | |
| Lenovo Thinkpad L570 20J9S01600 | |
| HP EliteBook 755 G4 | |
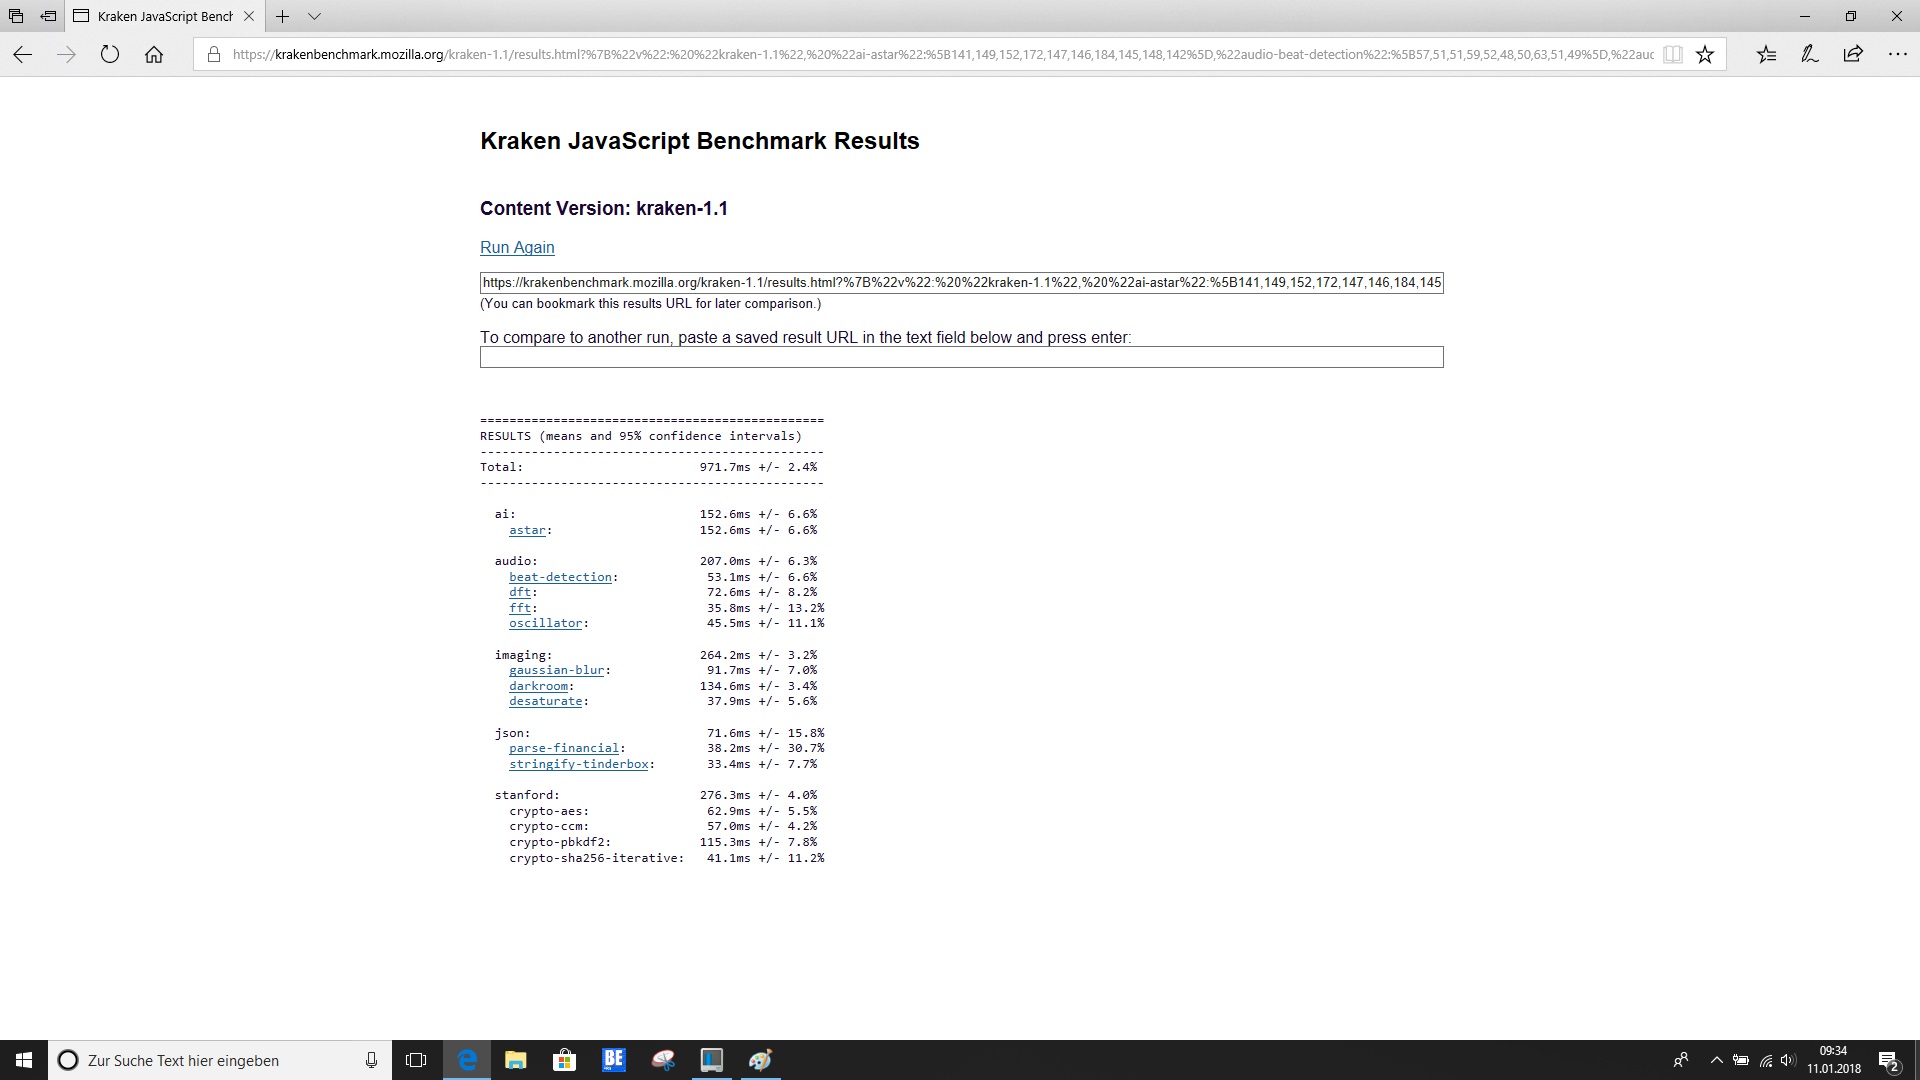
| Mozilla Kraken 1.1 - Total | |
| HP EliteBook 755 G4 | |
| Lenovo Thinkpad L570 20J9S01600 | |
| Schenker Slim 15 L17 | |
* ... Meglio usare valori piccoli
| PCMark 8 - Home Score Accelerated v2 | |
| Dell Inspiron 15 7570 | |
| Lenovo Thinkpad L570 20J9S01600 | |
| Schenker Slim 15 L17 | |
| Fujitsu LifeBook U757 | |
| HP EliteBook 755 G4 | |
| PCMark 10 | |
| Score | |
| Dell Inspiron 15 7570 | |
| Schenker Slim 15 L17 | |
| HP EliteBook 755 G4 | |
| Productivity | |
| Schenker Slim 15 L17 | |
| Dell Inspiron 15 7570 | |
| HP EliteBook 755 G4 | |
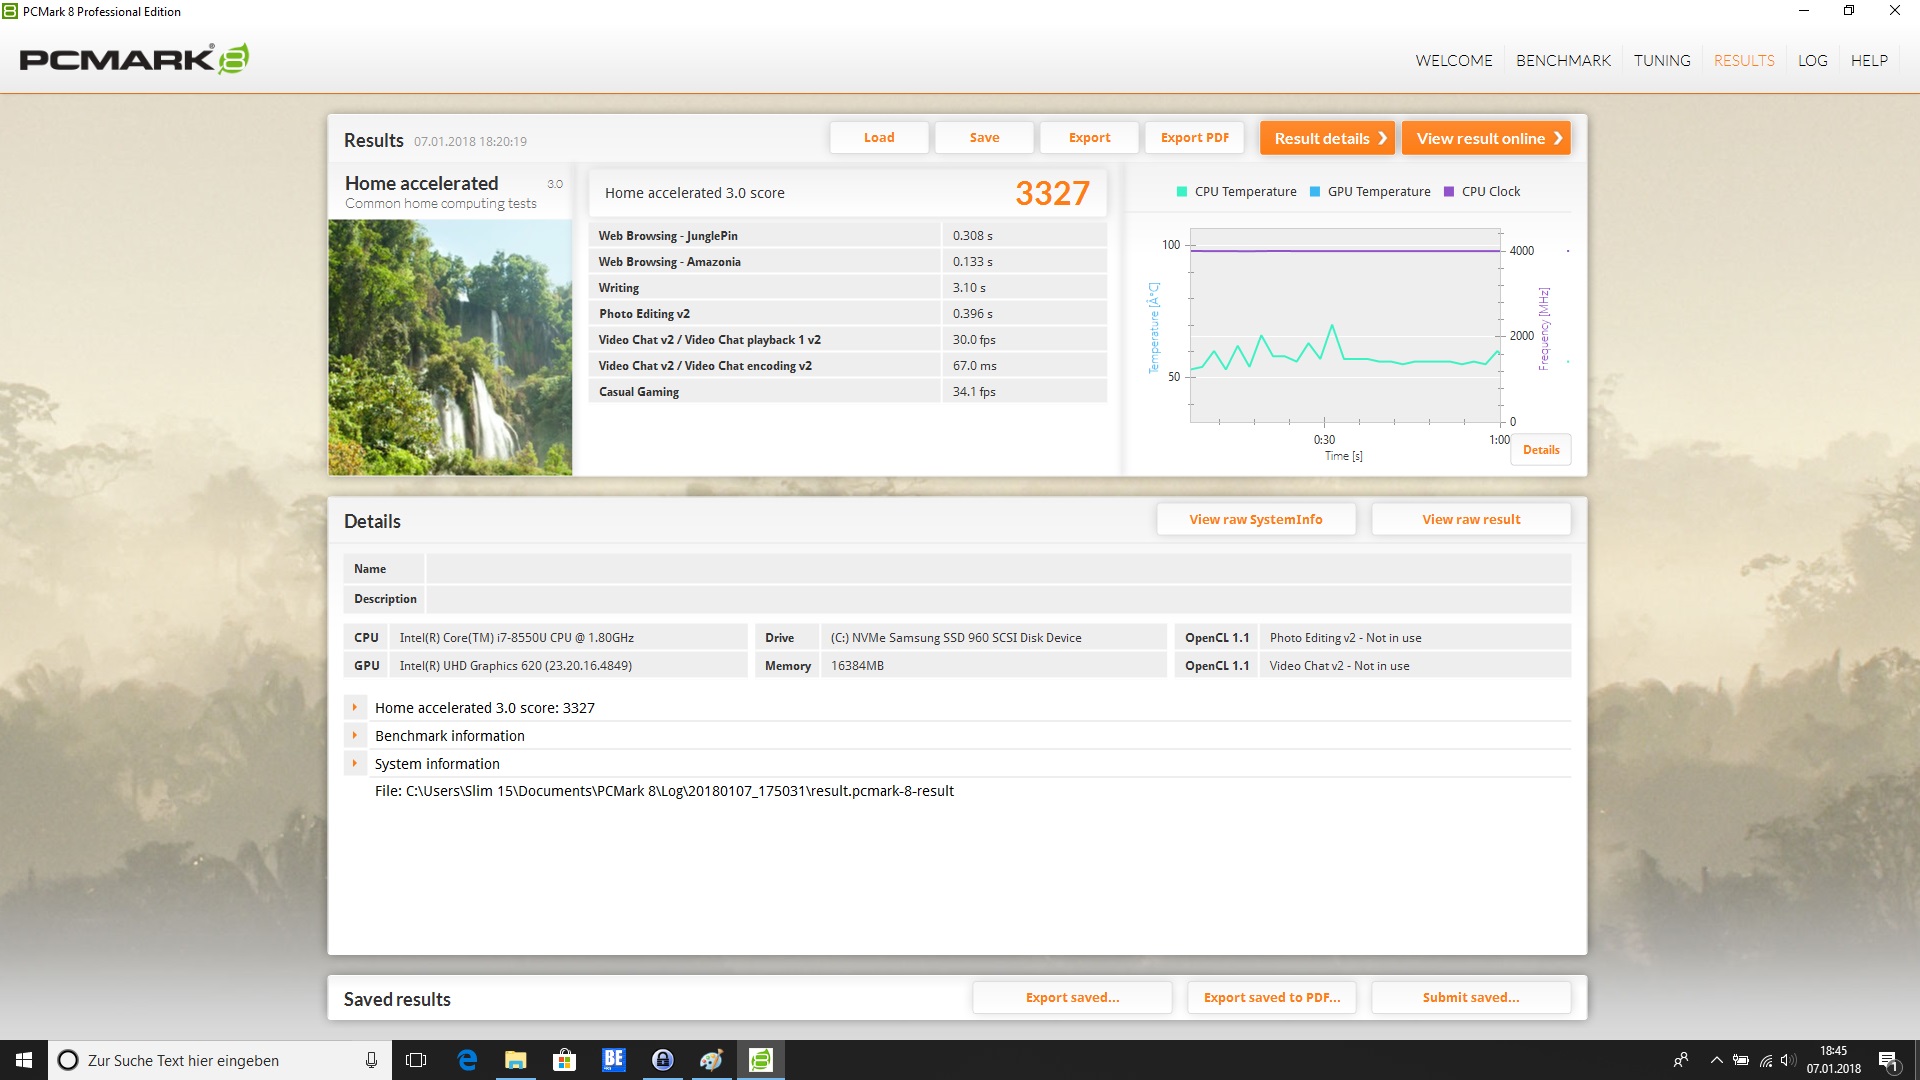
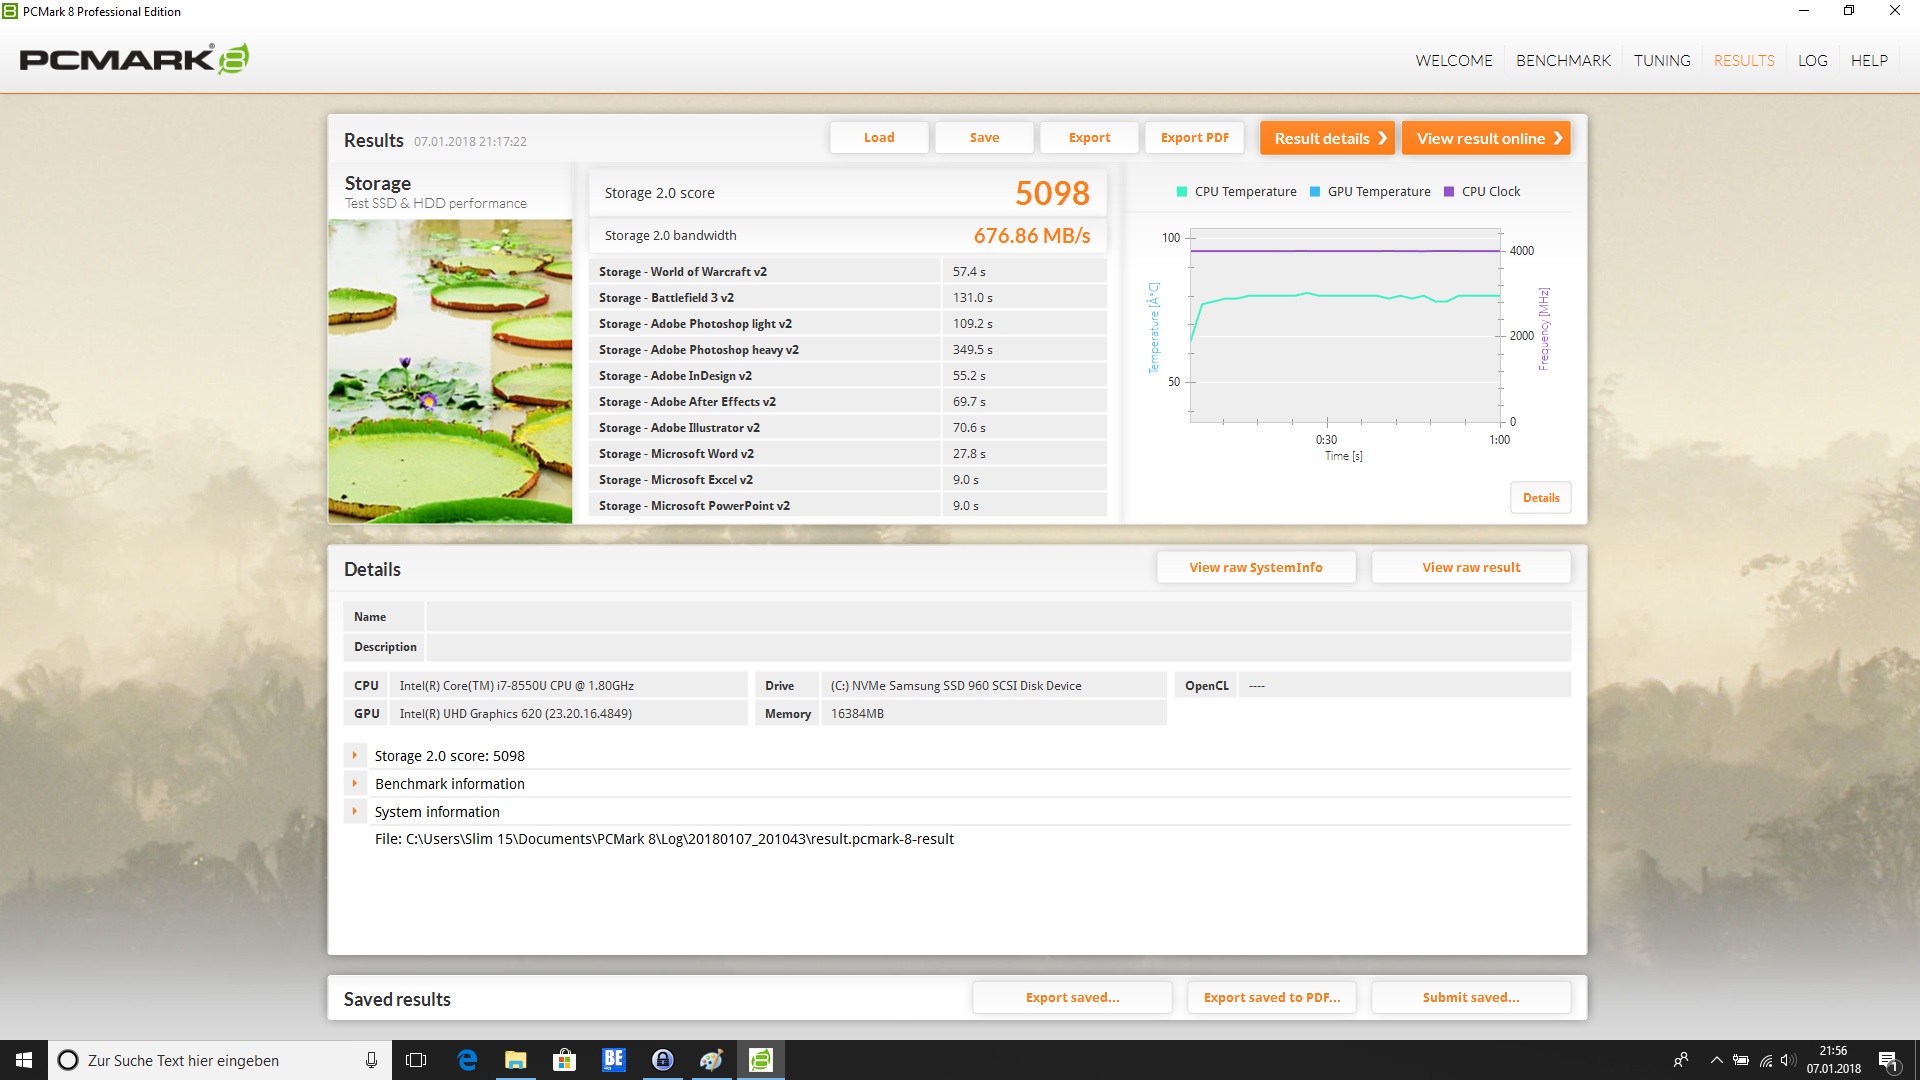
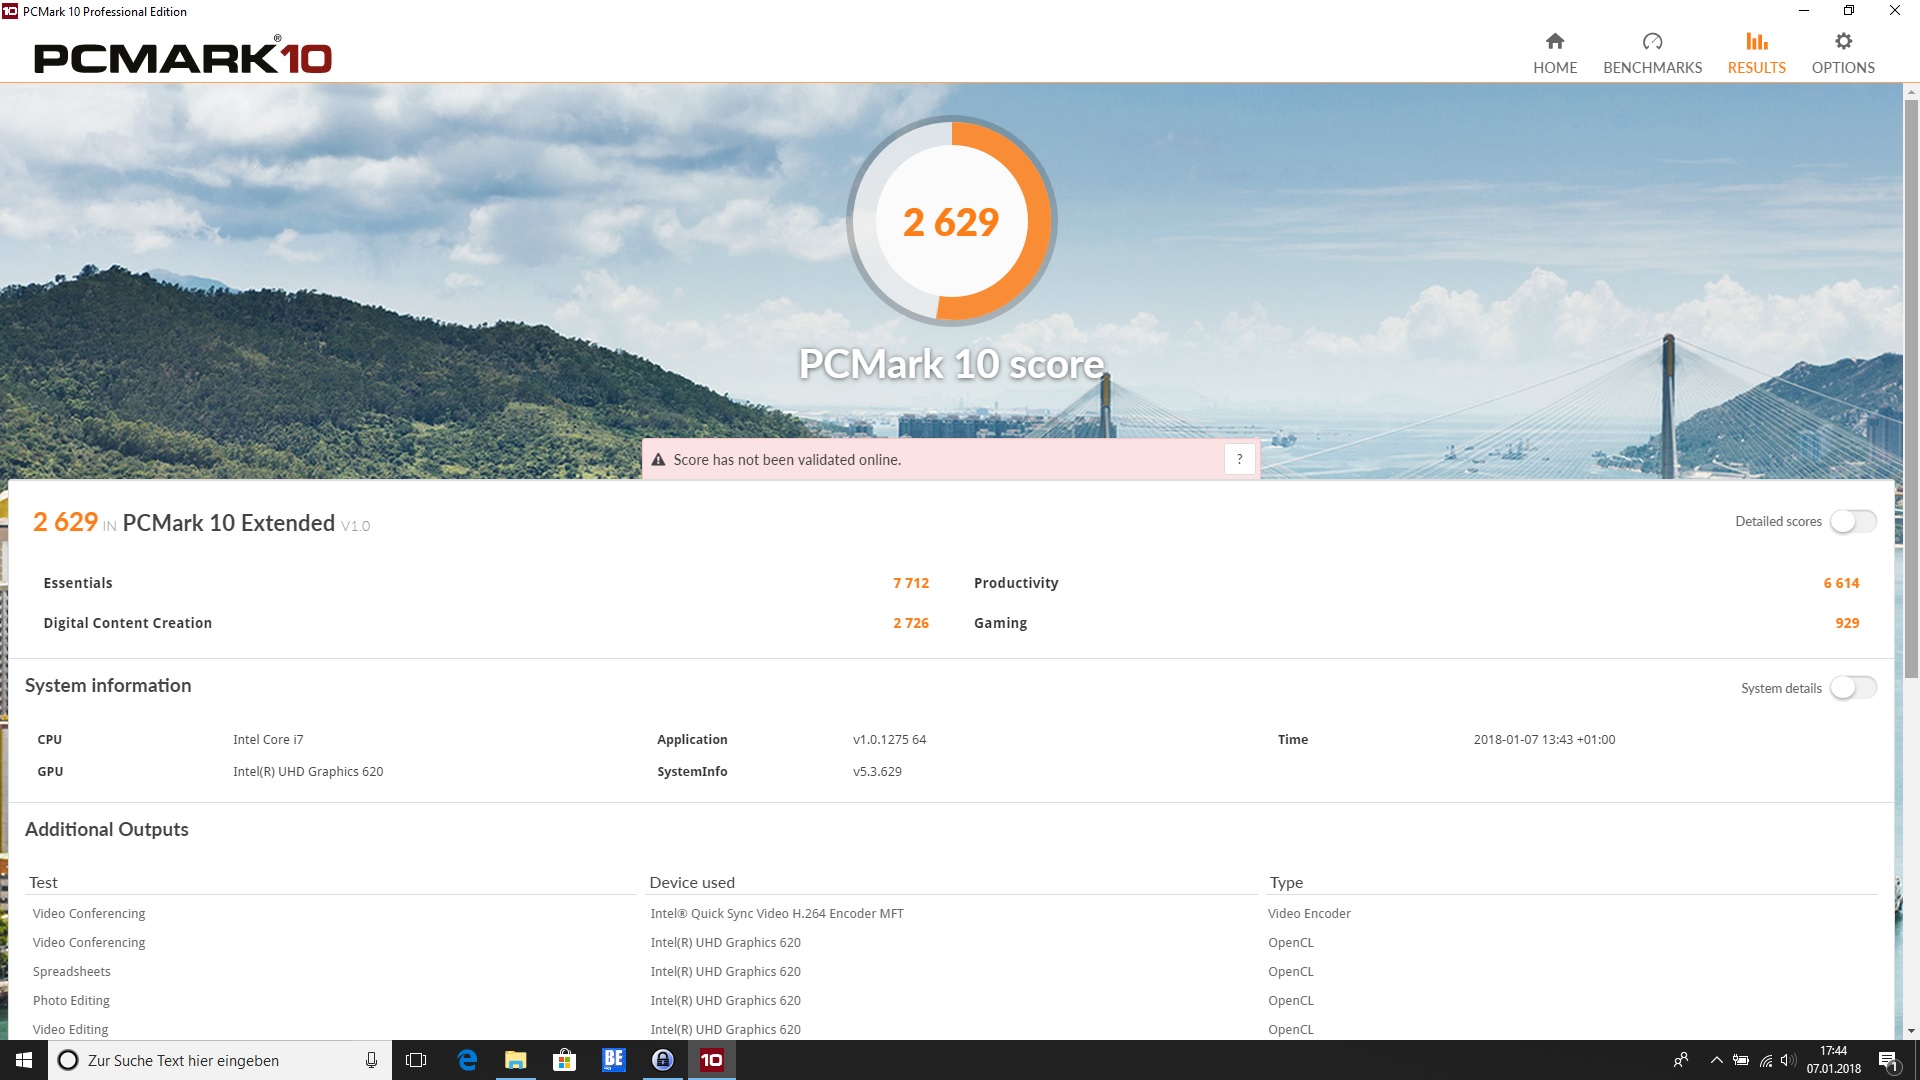
| PCMark 8 Home Score Accelerated v2 | 3327 punti | |
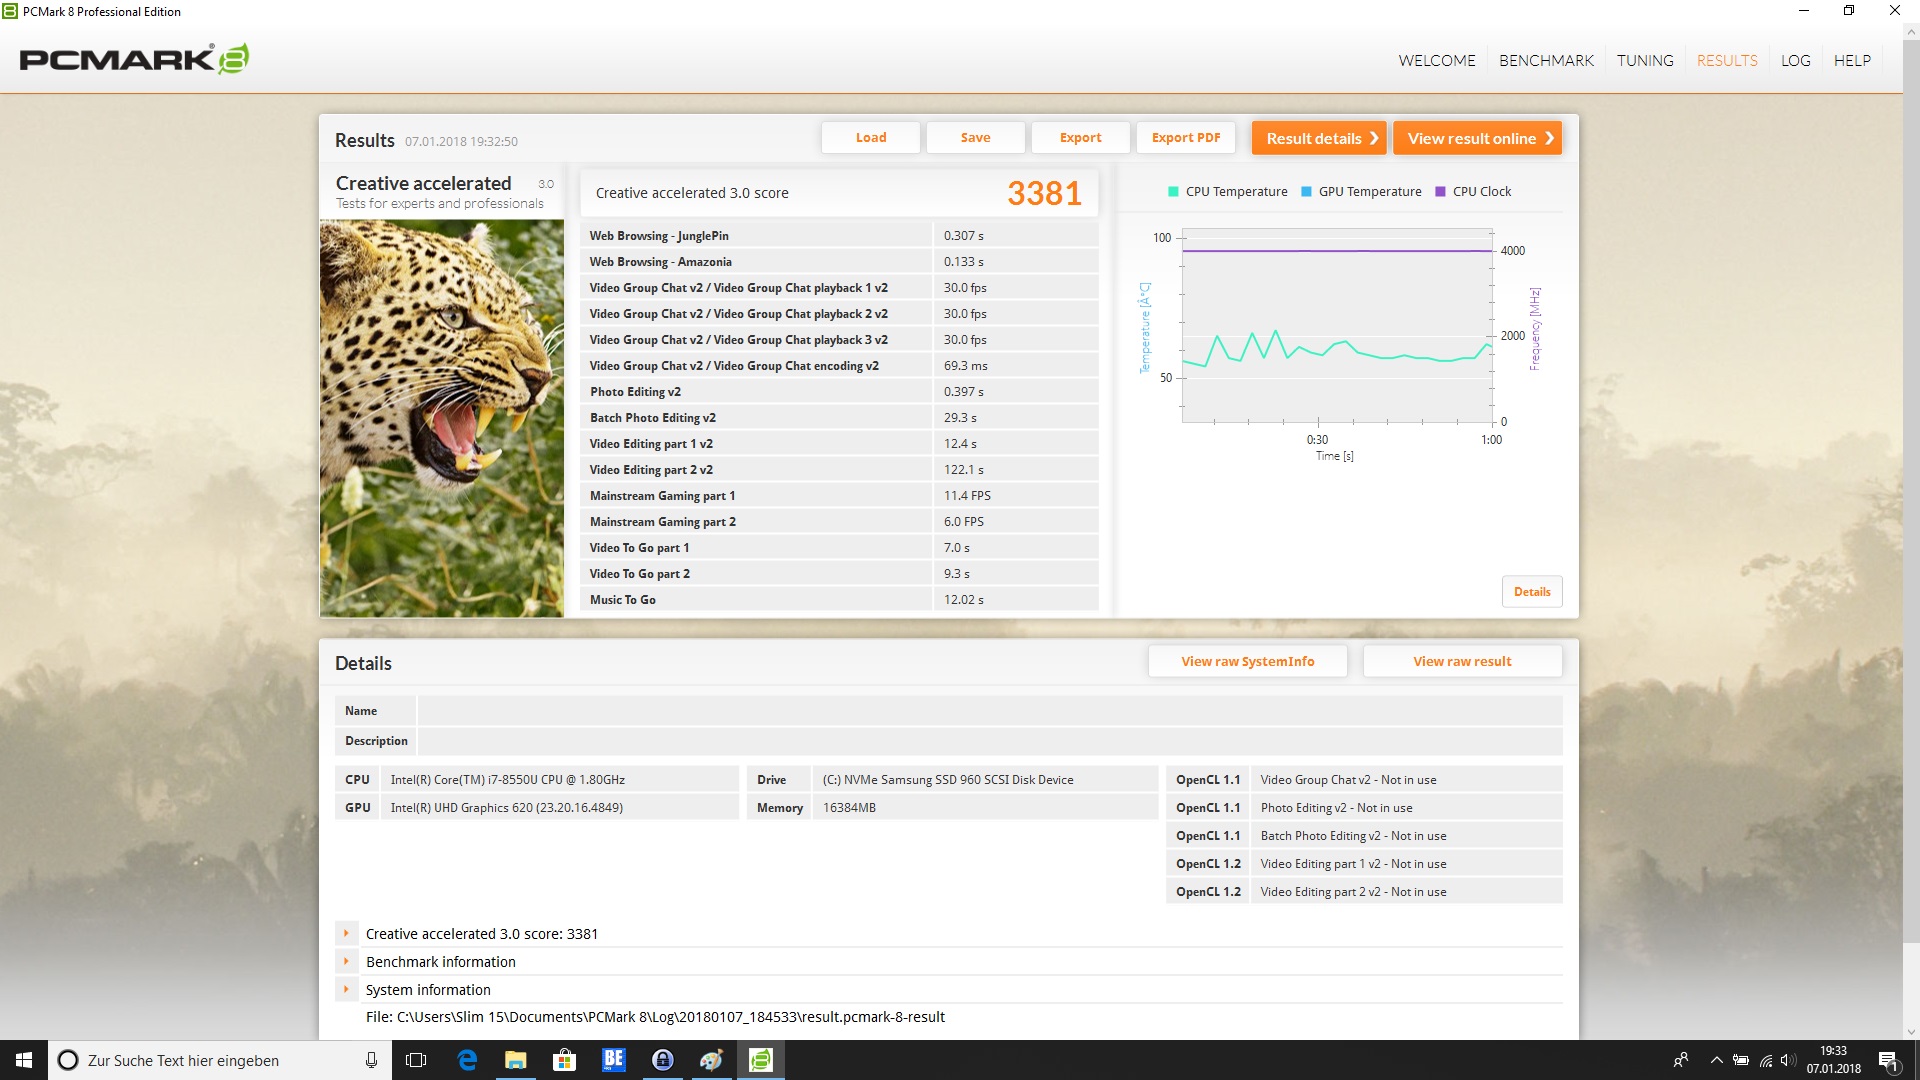
| PCMark 8 Creative Score Accelerated v2 | 3381 punti | |
| PCMark 10 Score | 2629 punti | |
Aiuto | ||
| Schenker Slim 15 L17 Samsung SSD 960 Pro 512 GB m.2 | Dell Inspiron 15 7570 Samsung PM961 NVMe MZVLW512HMJP | HP EliteBook 755 G4 Samsung PM961 MZVLW256HEHP | Lenovo Thinkpad L570 20J9S01600 Samsung PM961 NVMe MZVLW512HMJP | Fujitsu LifeBook U757 Samsung CM871a MZNTY256HDHP | |
|---|---|---|---|---|---|
| CrystalDiskMark 3.0 | -9% | -58% | -14% | -54% | |
| Read Seq (MB/s) | 1958 | 2013 3% | 800 -59% | 1412 -28% | 509 -74% |
| Write Seq (MB/s) | 1776 | 1015 -43% | 774 -56% | 1110 -37% | 488.4 -73% |
| Read 512 (MB/s) | 819 | 1076 31% | 583 -29% | 833 2% | 414.3 -49% |
| Write 512 (MB/s) | 1157 | 1038 -10% | 580 -50% | 920 -20% | 321.7 -72% |
| Read 4k (MB/s) | 54 | 52.1 -4% | 31.42 -42% | 56.8 5% | 36.43 -33% |
| Write 4k (MB/s) | 157.7 | 135 -14% | 49.86 -68% | 138.9 -12% | 88.4 -44% |
| Read 4k QD32 (MB/s) | 605 | 404.2 -33% | 141.2 -77% | 539 -11% | 402.8 -33% |
| Write 4k QD32 (MB/s) | 511 | 510 0% | 99.1 -81% | 444.8 -13% | 256.7 -50% |

| 3DMark | |
| 1920x1080 Ice Storm Extreme Graphics | |
| Schenker Slim 15 L17 | |
| Lenovo Thinkpad L570 20J9S01600 | |
| HP EliteBook 755 G4 | |
| 1920x1080 Fire Strike Graphics | |
| Dell Inspiron 15 7570 | |
| Schenker Slim 15 L17 | |
| HP EliteBook 755 G4 | |
| Lenovo Thinkpad L570 20J9S01600 | |
| 3DMark 11 - 1280x720 Performance GPU | |
| Dell Inspiron 15 7570 | |
| HP EliteBook 755 G4 | |
| Schenker Slim 15 L17 | |
| Lenovo Thinkpad L570 20J9S01600 | |
| Fujitsu LifeBook U757 | |
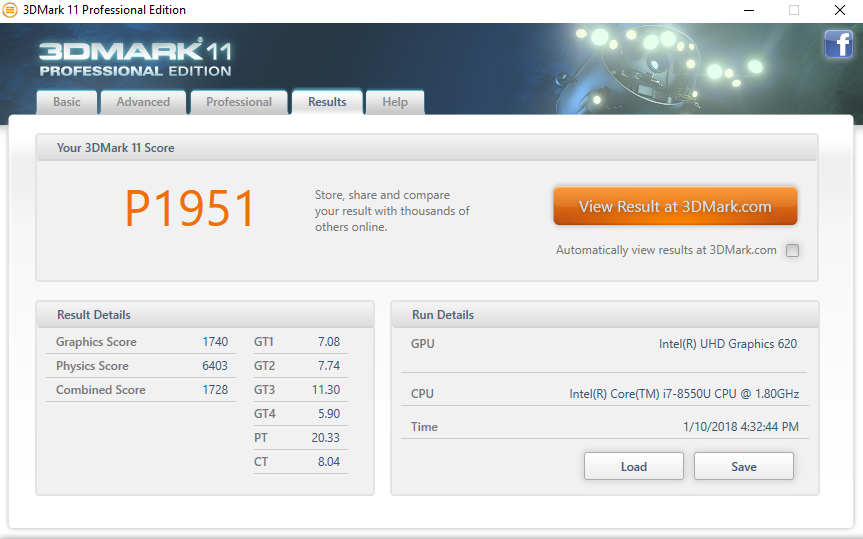
| 3DMark 11 Performance | 1951 punti | |
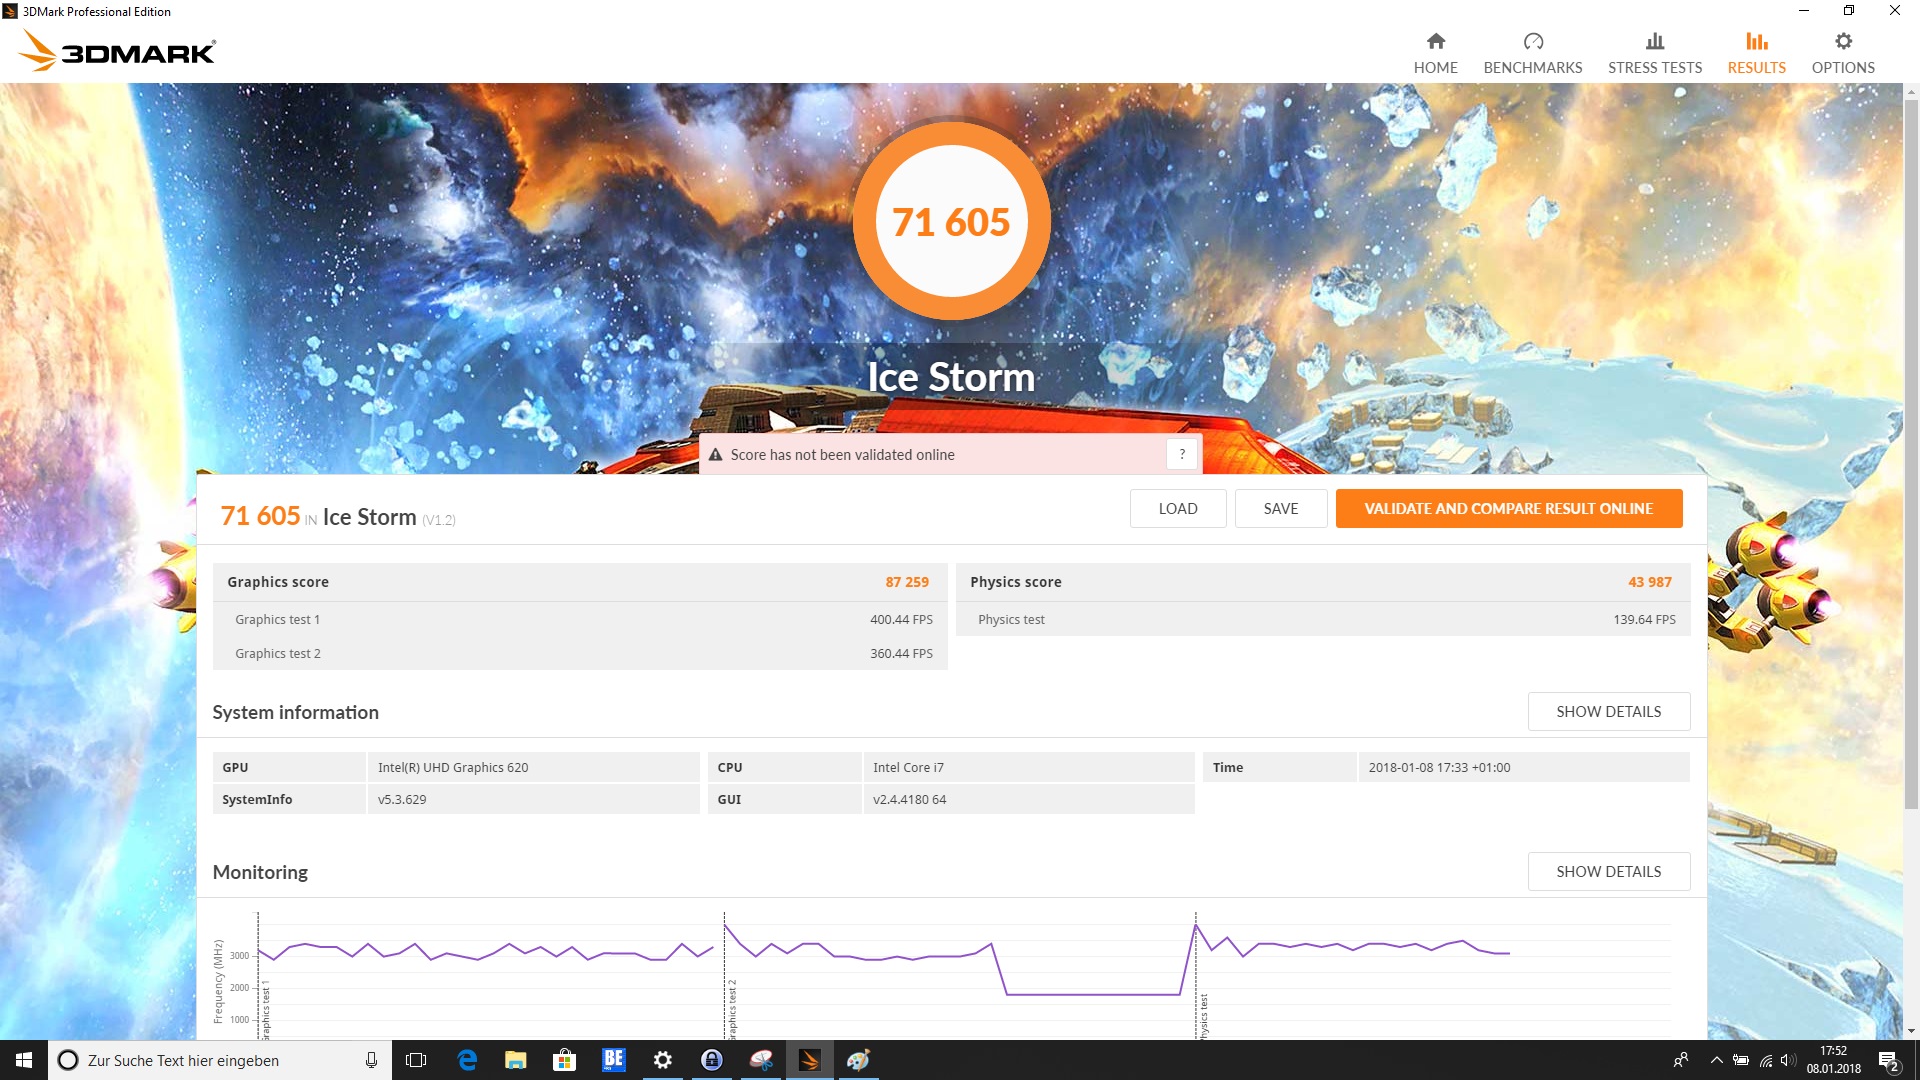
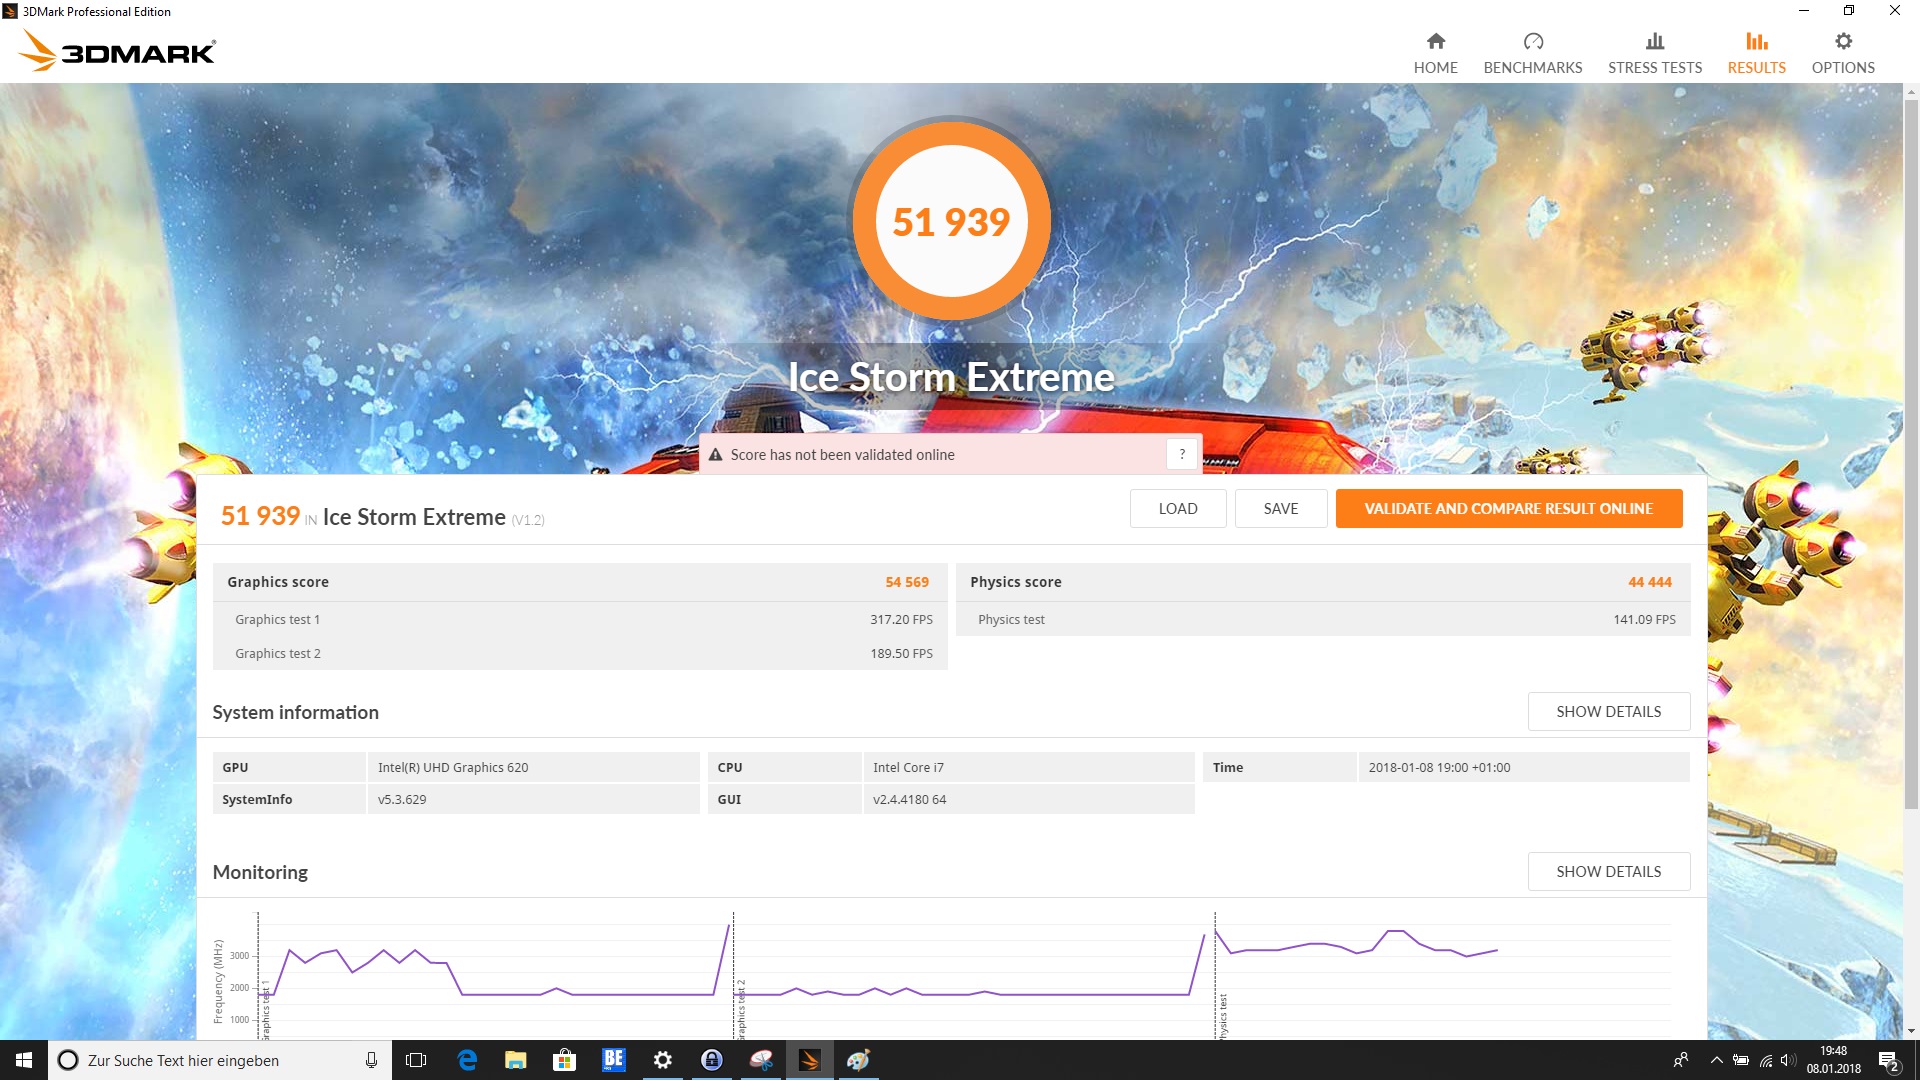
| 3DMark Ice Storm Standard Score | 71605 punti | |
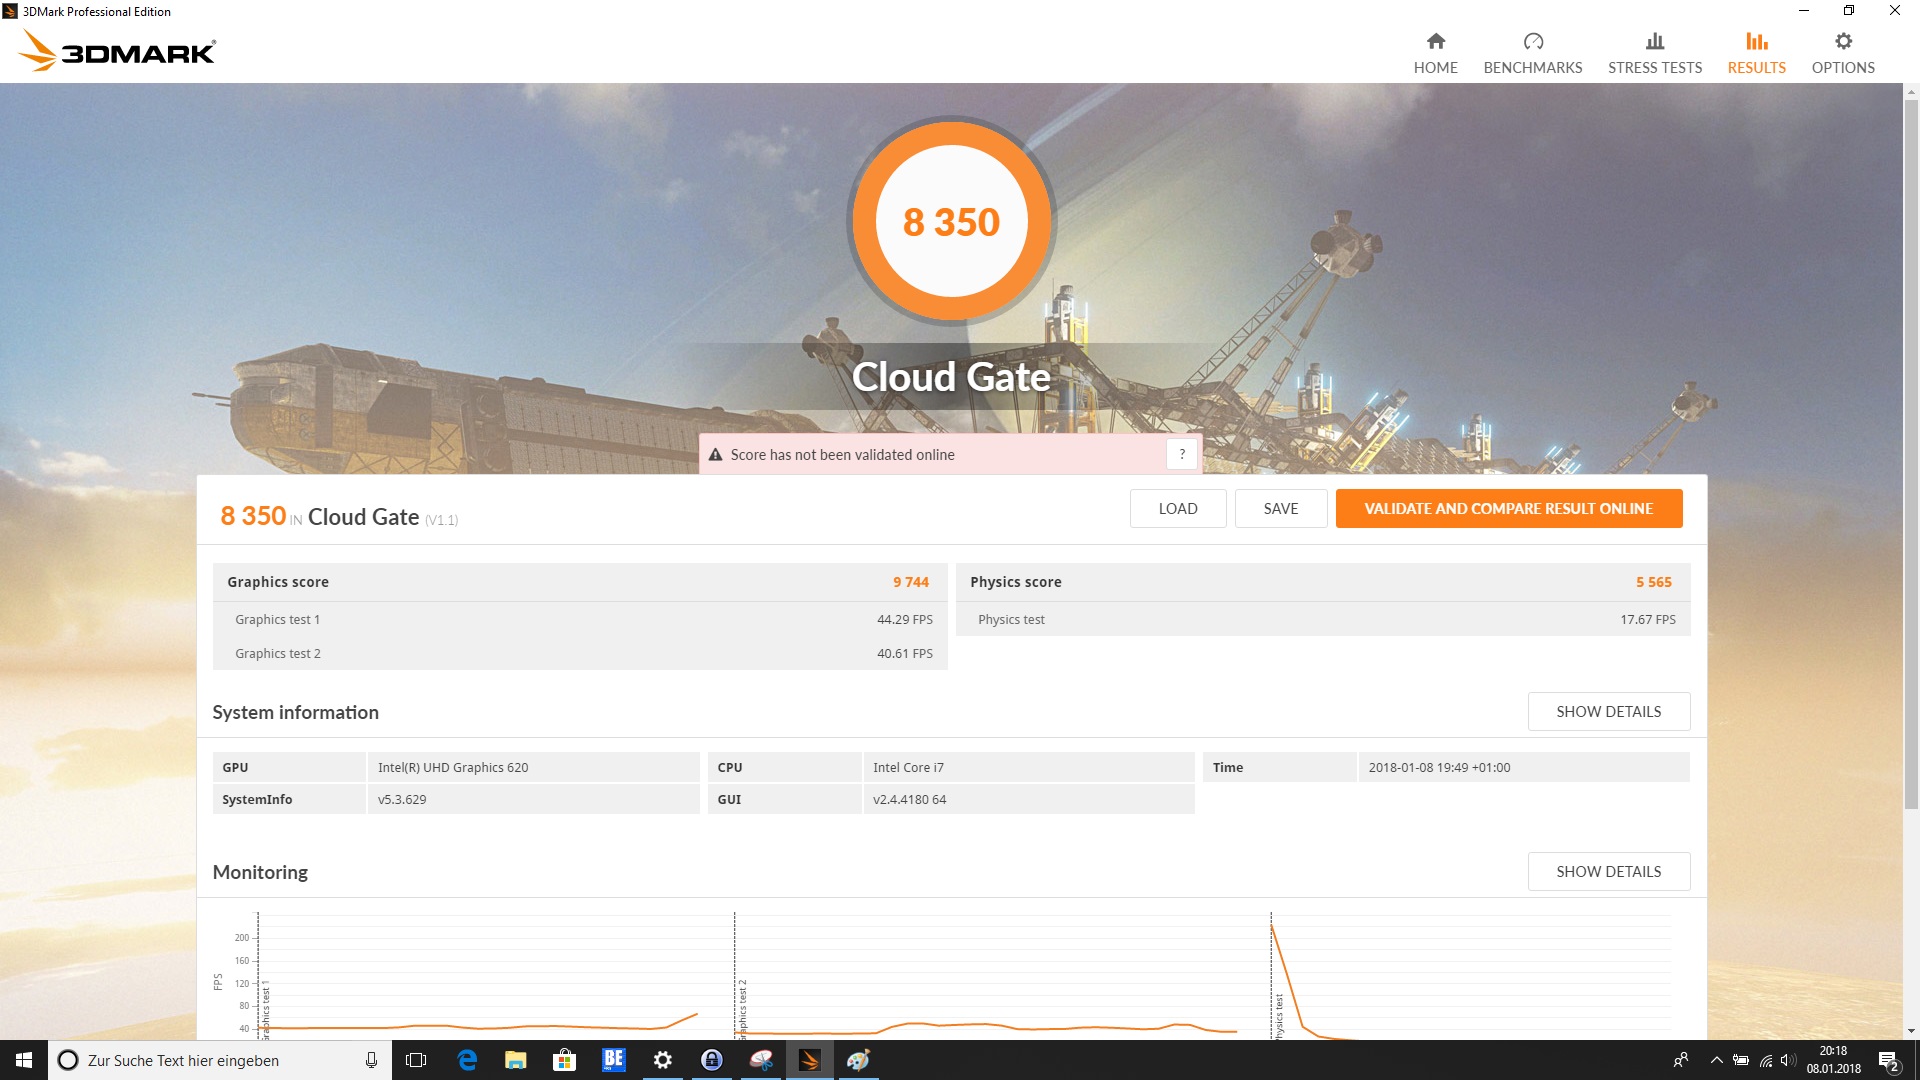
| 3DMark Cloud Gate Standard Score | 8350 punti | |
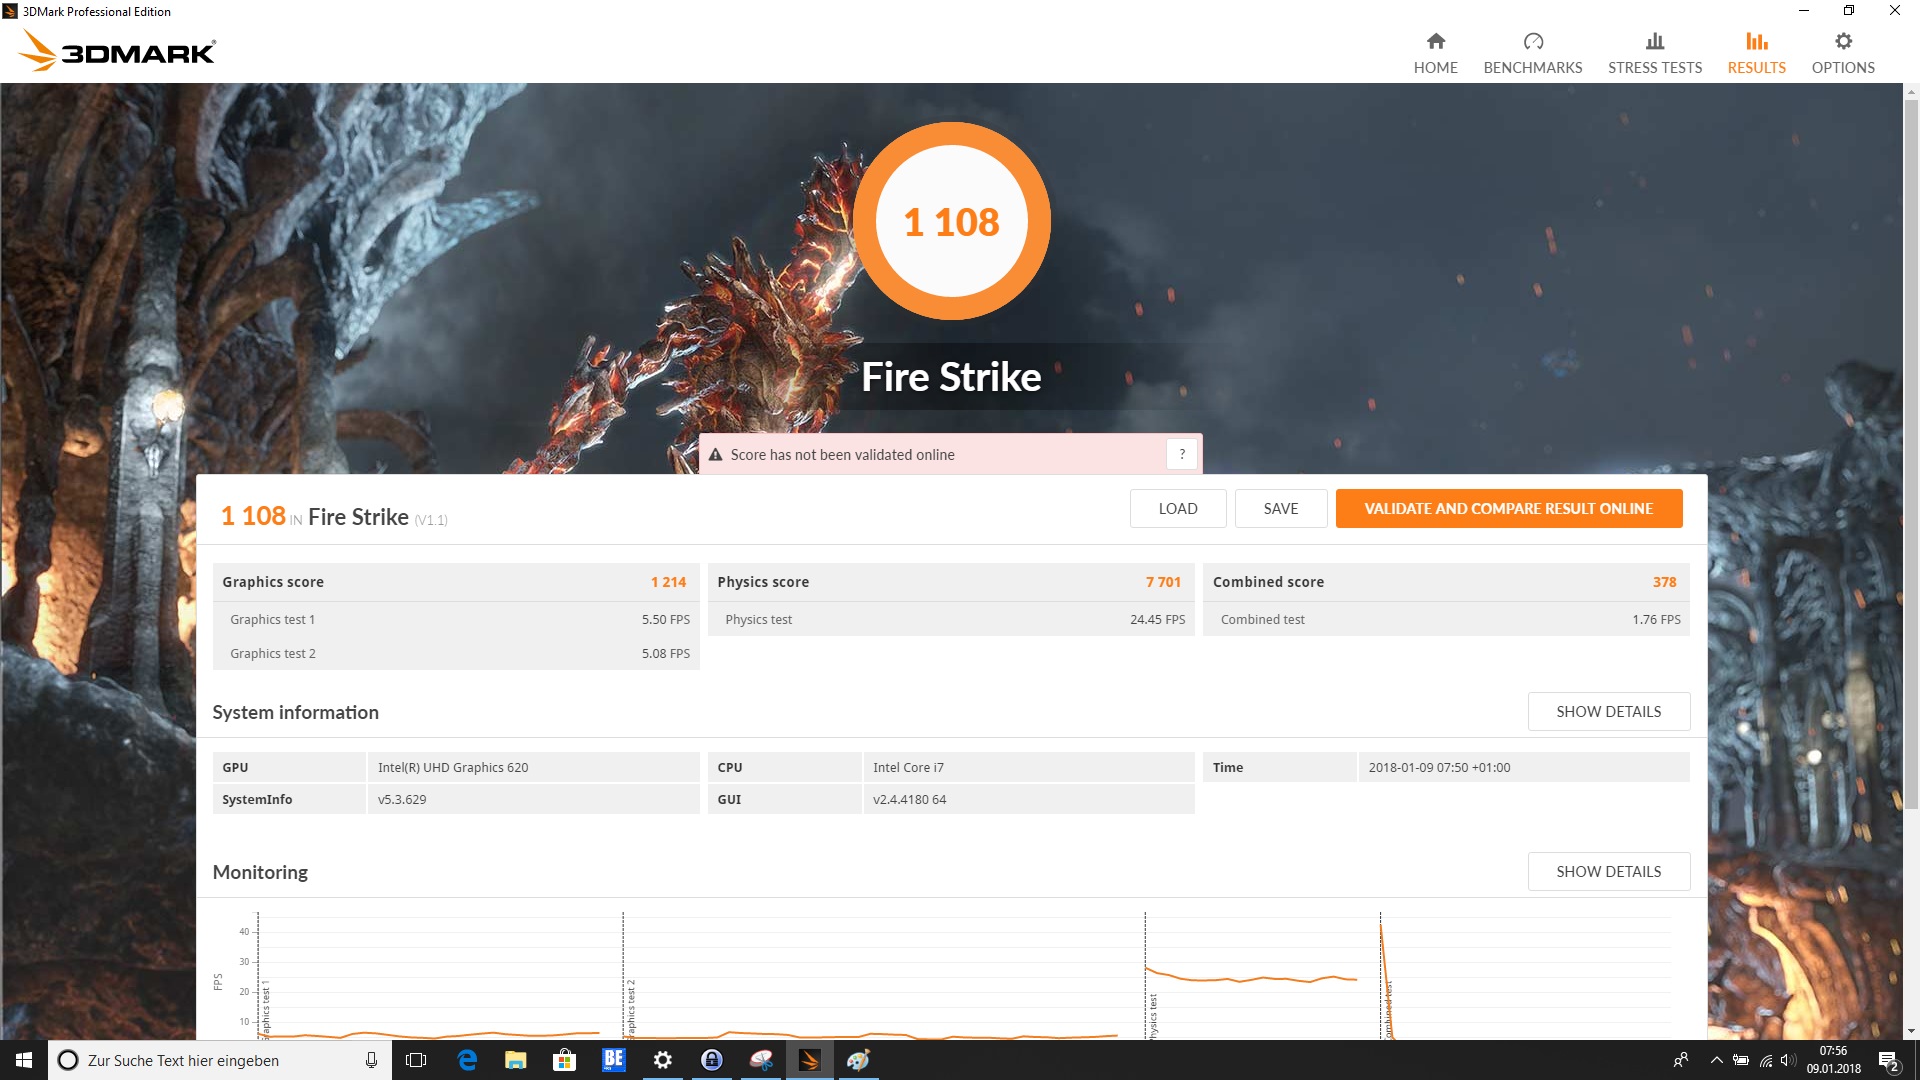
| 3DMark Fire Strike Score | 1108 punti | |
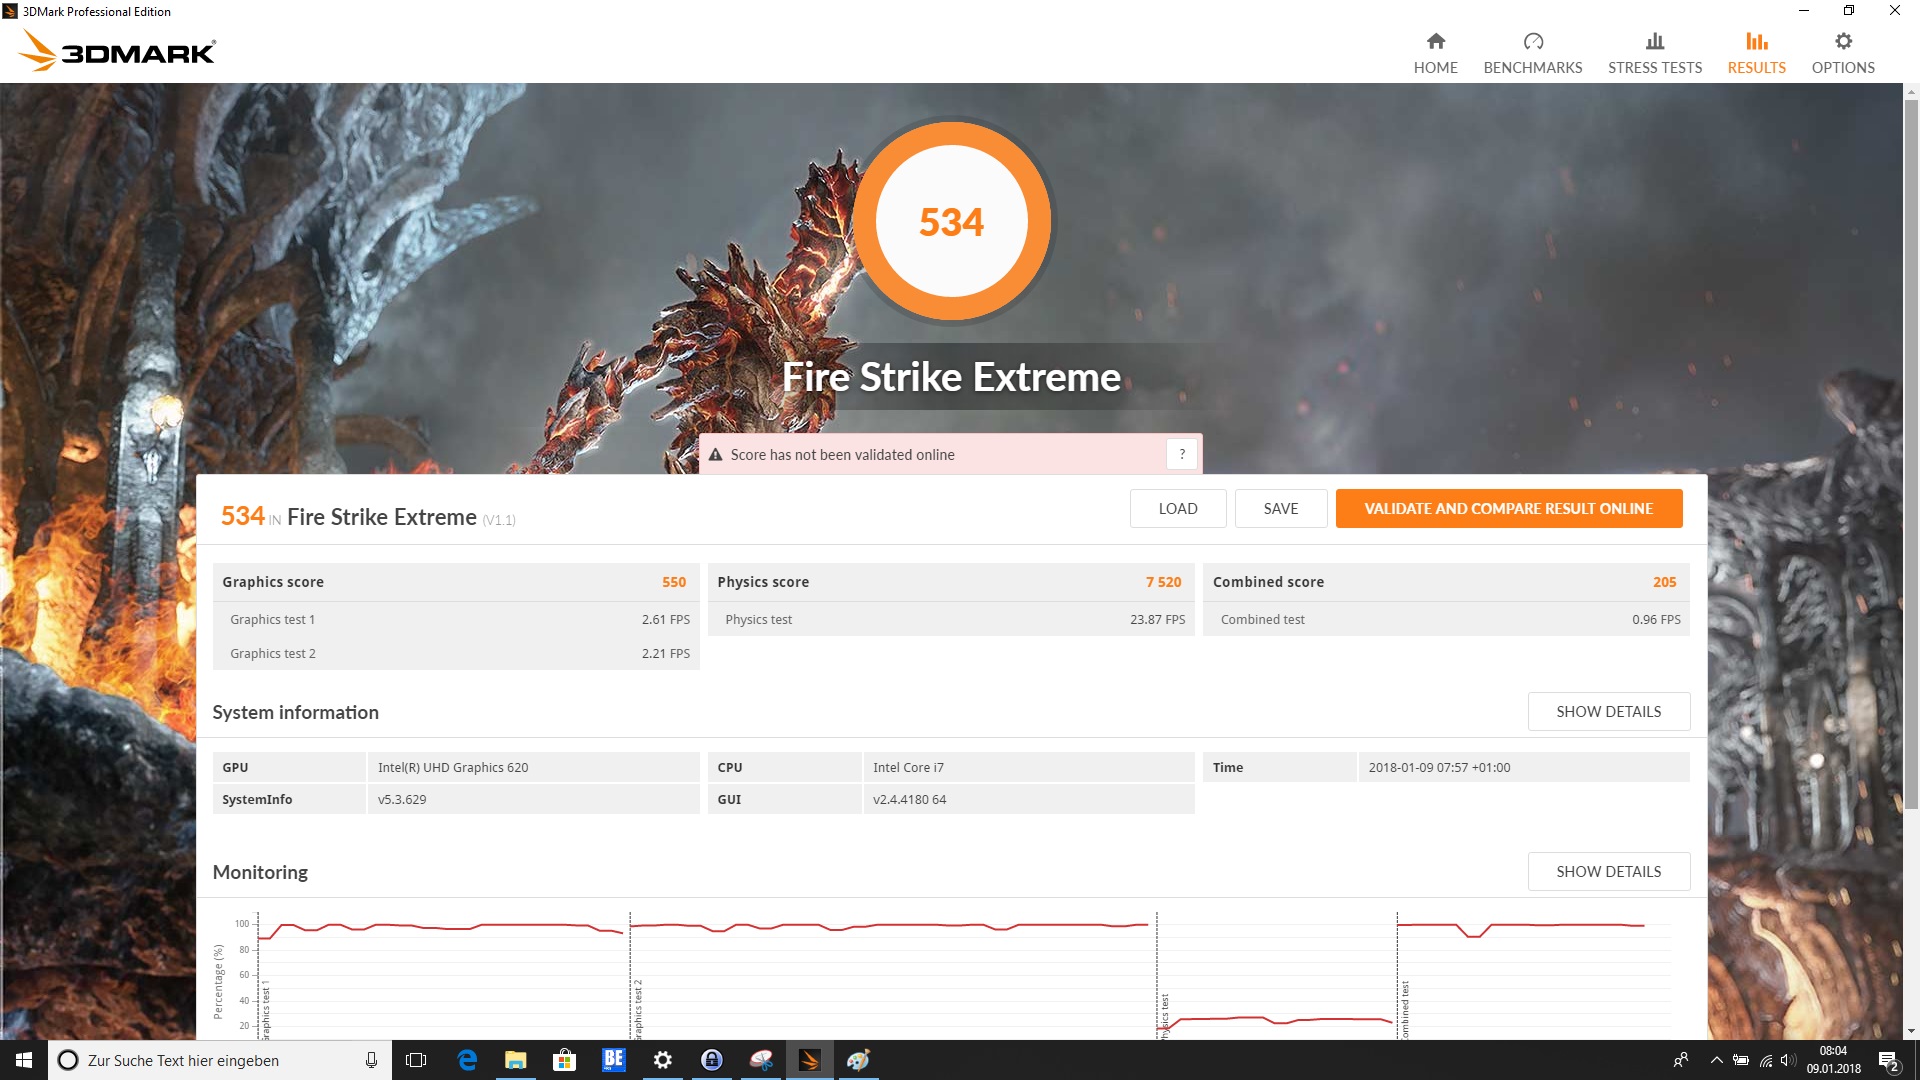
| 3DMark Fire Strike Extreme Score | 534 punti | |
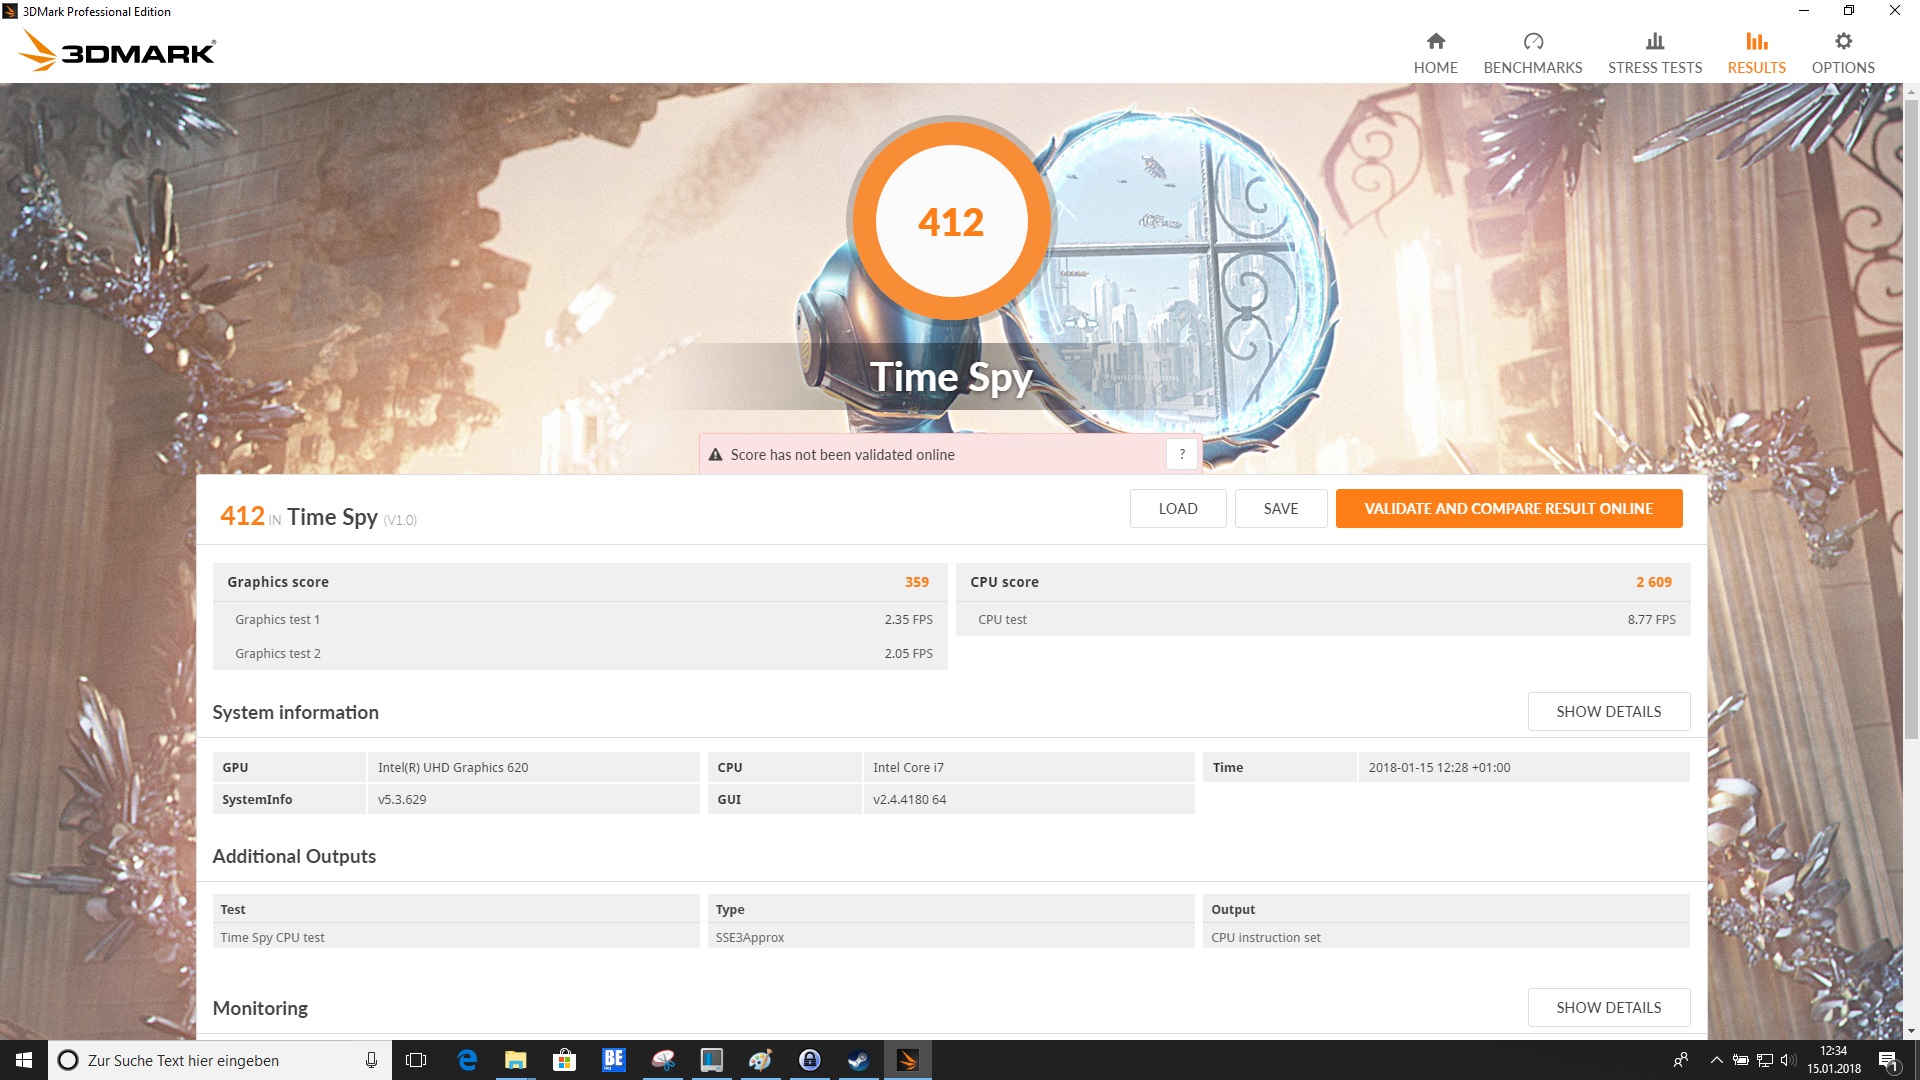
| 3DMark Time Spy Score | 412 punti | |
Aiuto | ||
| basso | medio | alto | ultra | |
|---|---|---|---|---|
| BioShock Infinite (2013) | 58.1 | 31.4 | 26.7 | 9.9 |
| Schenker Slim 15 L17 UHD Graphics 620, i5-8550U, Samsung SSD 960 Pro 512 GB m.2 | Dell Inspiron 15 7570 GeForce 940MX, i5-8550U, Samsung PM961 NVMe MZVLW512HMJP | HP EliteBook 755 G4 Radeon R7 (Bristol Ridge), PRO A12-9800B, Samsung PM961 MZVLW256HEHP | Lenovo Thinkpad L570 20J9S01600 HD Graphics 620, i5-7200U, Samsung PM961 NVMe MZVLW512HMJP | Fujitsu LifeBook U757 HD Graphics 620, i5-7200U, Samsung CM871a MZNTY256HDHP | |
|---|---|---|---|---|---|
| Noise | -7% | 4% | 2% | 6% | |
| off /ambiente * (dB) | 29.1 | 30.3 -4% | 29.9 -3% | 30.3 -4% | 28.2 3% |
| Idle Minimum * (dB) | 29.1 | 30.3 -4% | 29.9 -3% | 30.3 -4% | 28.2 3% |
| Idle Average * (dB) | 29.1 | 30.3 -4% | 29.9 -3% | 30.3 -4% | 28.2 3% |
| Idle Maximum * (dB) | 30.5 | 30.3 1% | 29.9 2% | 30.3 1% | 28.2 8% |
| Load Average * (dB) | 31.2 | 42.6 -37% | 30.9 1% | 33.2 -6% | 33.3 -7% |
| Load Maximum * (dB) | 45.9 | 42.5 7% | 32.8 29% | 33.1 28% | 34 26% |
* ... Meglio usare valori piccoli
Rumorosità
| Idle |
| 29.1 / 29.1 / 30.5 dB(A) |
| Sotto carico |
| 31.2 / 45.9 dB(A) |
 | ||
30 dB silenzioso 40 dB(A) udibile 50 dB(A) rumoroso |
||
min: | ||
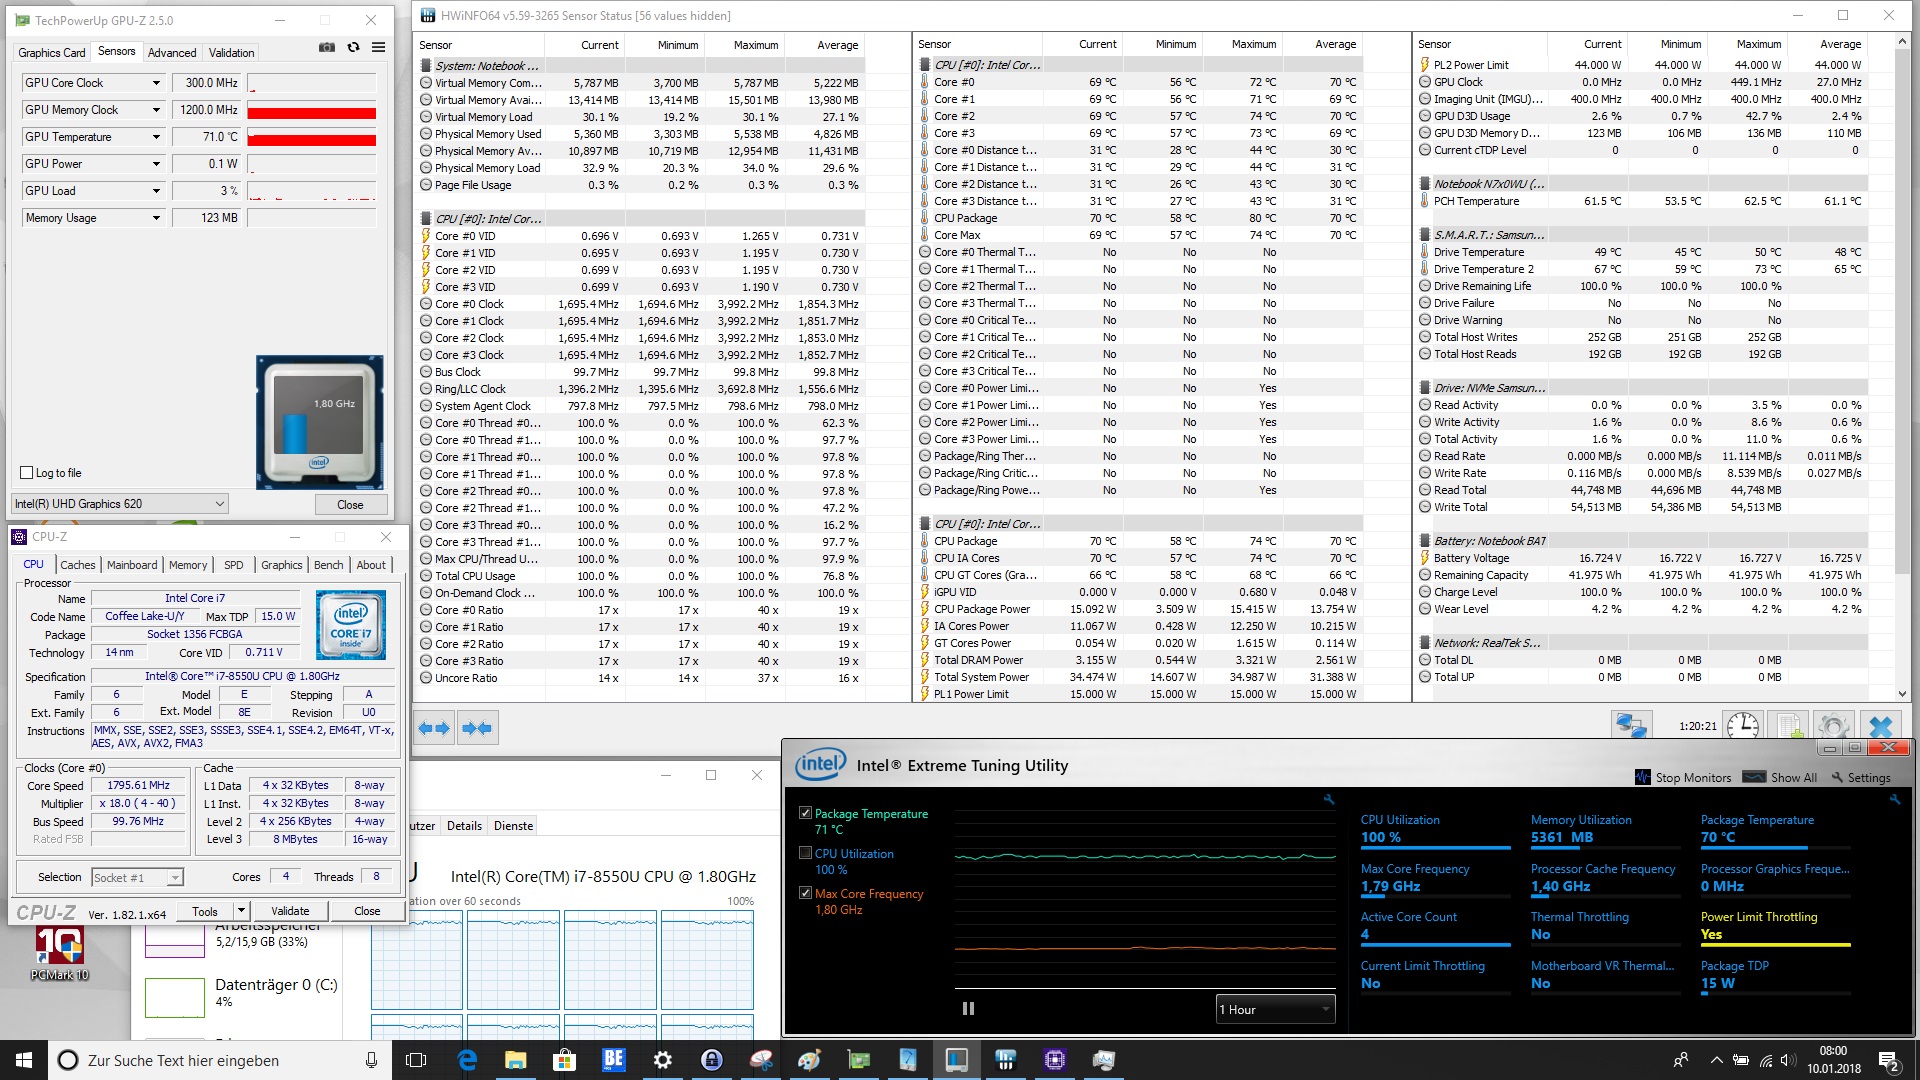
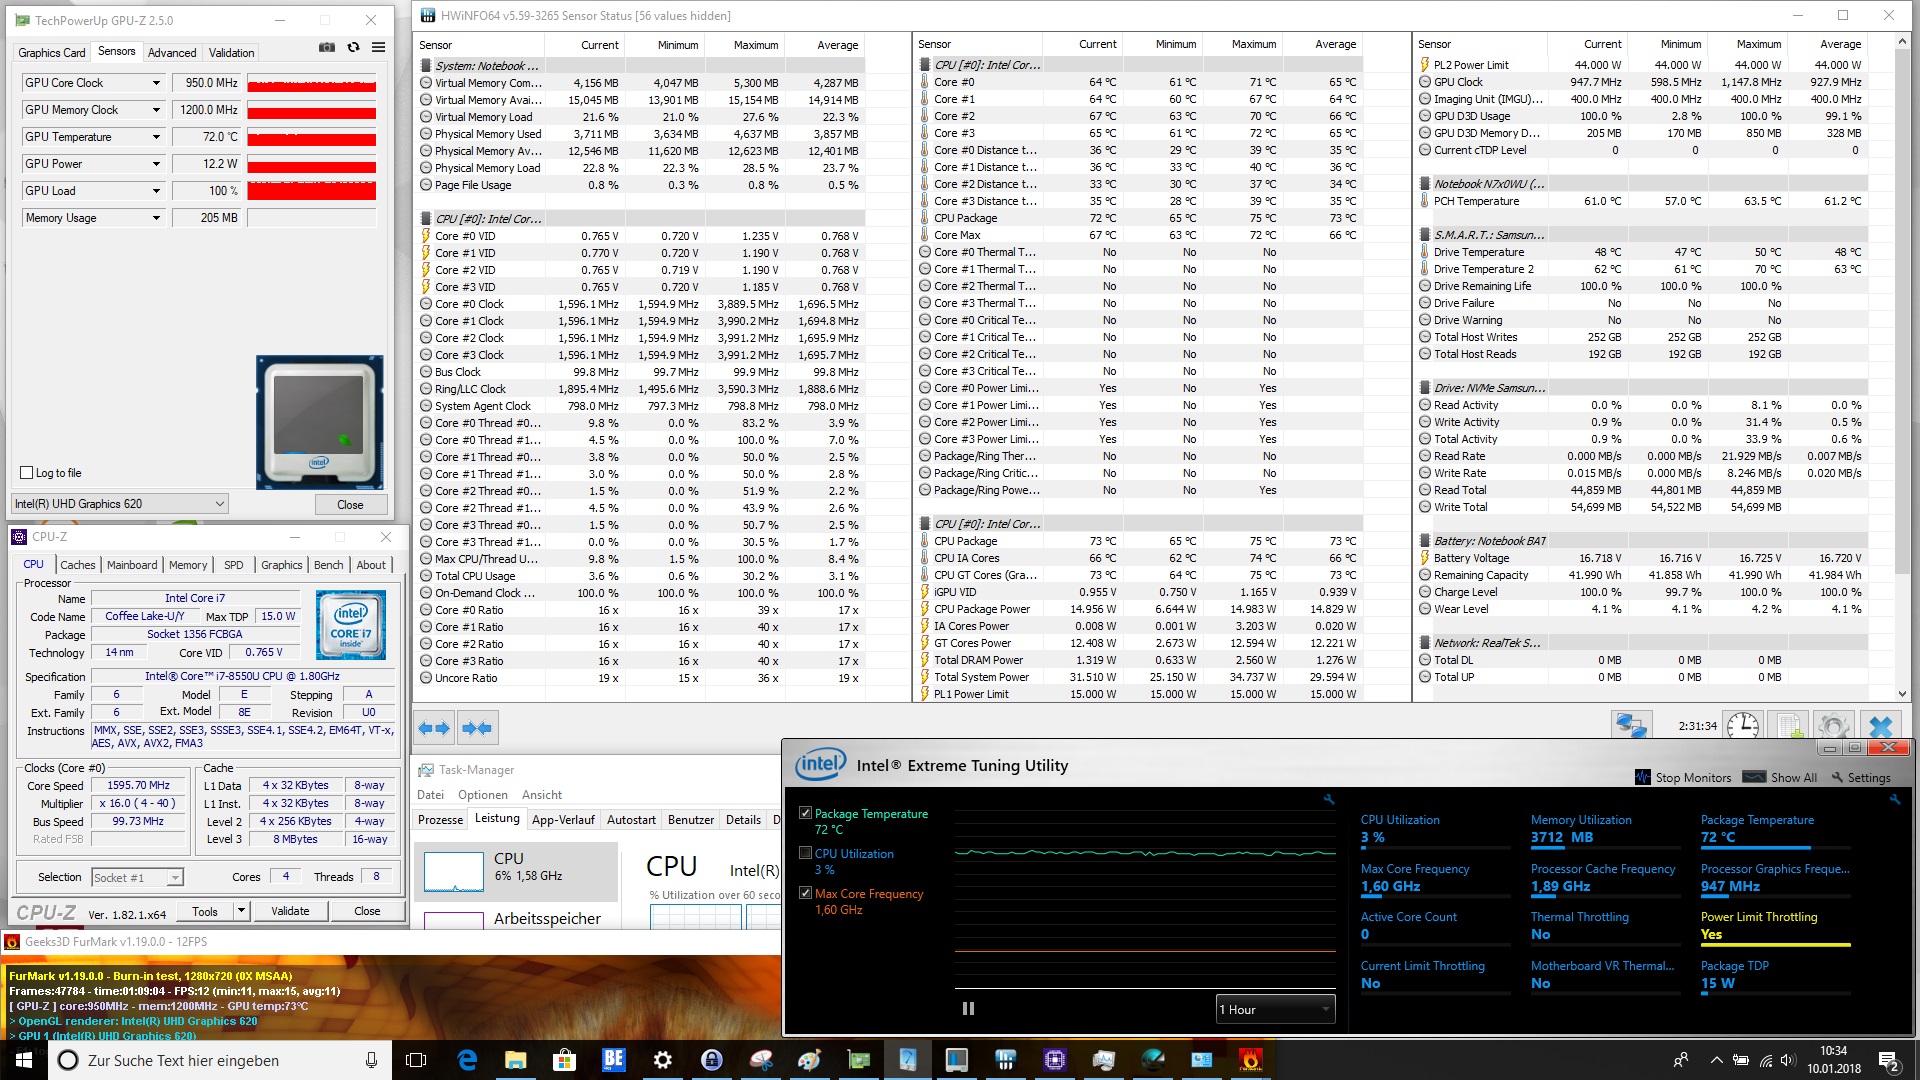
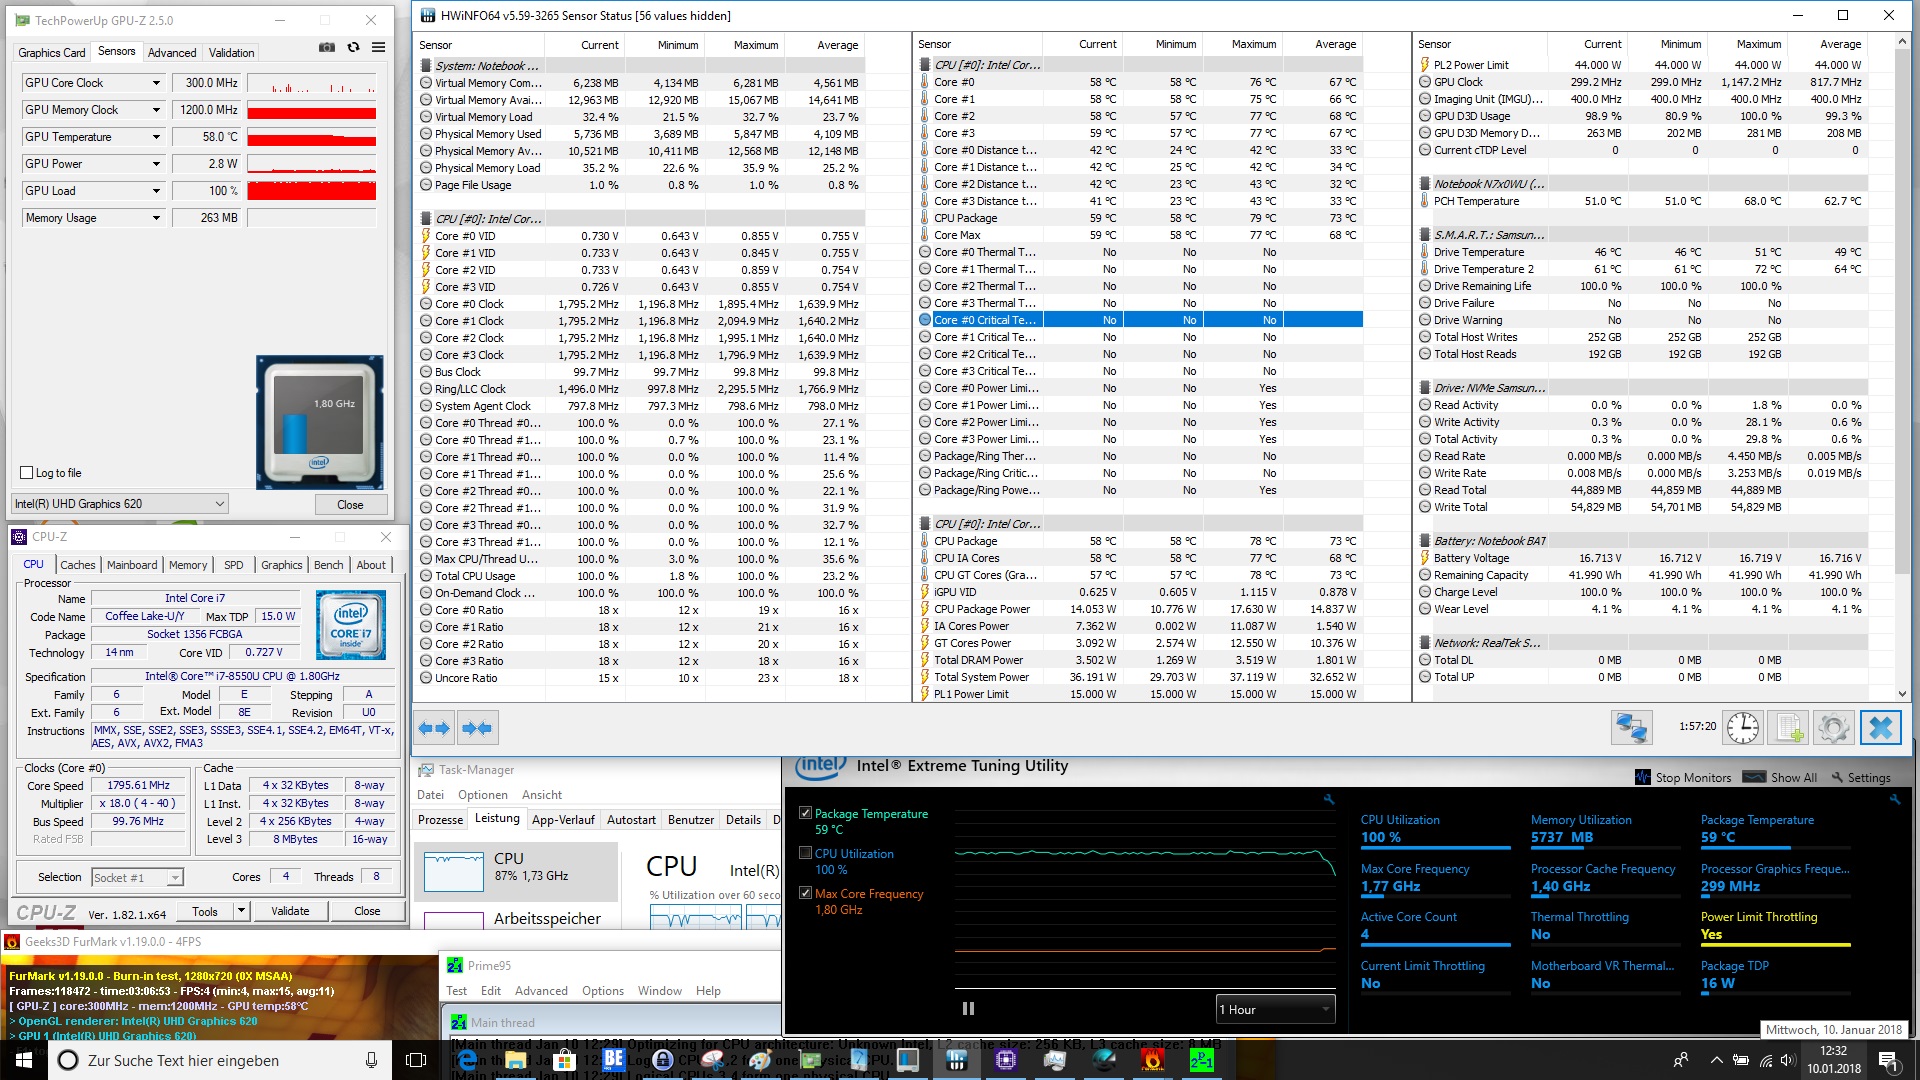
(+) La temperatura massima sul lato superiore è di 38.5 °C / 101 F, rispetto alla media di 34.3 °C / 94 F, che varia da 21.2 a 62.5 °C per questa classe Office.
(±) Il lato inferiore si riscalda fino ad un massimo di 41.8 °C / 107 F, rispetto alla media di 36.8 °C / 98 F
(+) In idle, la temperatura media del lato superiore è di 25.1 °C / 77 F, rispetto alla media deld ispositivo di 29.5 °C / 85 F.
(+) I poggiapolsi e il touchpad sono piu' freddi della temperatura della pelle con un massimo di 29.2 °C / 84.6 F e sono quindi freddi al tatto.
(±) La temperatura media della zona del palmo della mano di dispositivi simili e'stata di 27.5 °C / 81.5 F (-1.7 °C / -3.1 F).
| Schenker Slim 15 L17 UHD Graphics 620, i5-8550U, Samsung SSD 960 Pro 512 GB m.2 | Dell Inspiron 15 7570 GeForce 940MX, i5-8550U, Samsung PM961 NVMe MZVLW512HMJP | HP EliteBook 755 G4 Radeon R7 (Bristol Ridge), PRO A12-9800B, Samsung PM961 MZVLW256HEHP | Lenovo Thinkpad L570 20J9S01600 HD Graphics 620, i5-7200U, Samsung PM961 NVMe MZVLW512HMJP | Fujitsu LifeBook U757 HD Graphics 620, i5-7200U, Samsung CM871a MZNTY256HDHP | |
|---|---|---|---|---|---|
| Heat | -4% | 0% | 13% | -2% | |
| Maximum Upper Side * (°C) | 38.5 | 42.8 -11% | 35.7 7% | 36.1 6% | 42 -9% |
| Maximum Bottom * (°C) | 41.8 | 43 -3% | 31.8 24% | 33.1 21% | 38.8 7% |
| Idle Upper Side * (°C) | 26.4 | 27.8 -5% | 30.9 -17% | 23.7 10% | 29.2 -11% |
| Idle Bottom * (°C) | 27.9 | 26.6 5% | 31.8 -14% | 24.1 14% | 26.3 6% |
* ... Meglio usare valori piccoli
Schenker Slim 15 L17 analisi audio
(±) | potenza degli altiparlanti media ma buona (80.5 dB)
Bassi 100 - 315 Hz
(-) | quasi nessun basso - in media 25.2% inferiori alla media
(±) | la linearità dei bassi è media (10.4% delta rispetto alla precedente frequenza)
Medi 400 - 2000 Hz
(±) | medi elevati - circa 8.5% superiore alla media
(±) | linearità dei medi adeguata (7.6% delta rispetto alla precedente frequenza)
Alti 2 - 16 kHz
(±) | alti elevati - circa 8.3% superiori alla media
(±) | la linearità degli alti è media (11.7% delta rispetto alla precedente frequenza)
Nel complesso 100 - 16.000 Hz
(-) | suono nel complesso non lineare (32.4% di differenza rispetto alla media
Rispetto alla stessa classe
» 95% di tutti i dispositivi testati in questa classe è stato migliore, 1% simile, 4% peggiore
» Il migliore ha avuto un delta di 7%, medio di 21%, peggiore di 53%
Rispetto a tutti i dispositivi testati
» 92% di tutti i dispositivi testati in questa classe è stato migliore, 1% similare, 7% peggiore
» Il migliore ha avuto un delta di 4%, medio di 23%, peggiore di 134%
Lenovo Thinkpad L570 20J9S01600 analisi audio
(-) | altoparlanti non molto potenti (70 dB)
Bassi 100 - 315 Hz
(±) | bassi ridotti - in media 13.2% inferiori alla media
(+) | bassi in lineaa (4.8% delta rispetto alla precedente frequenza)
Medi 400 - 2000 Hz
(+) | medi bilanciati - solo only 4.1% rispetto alla media
(+) | medi lineari (4.1% delta rispetto alla precedente frequenza)
Alti 2 - 16 kHz
(+) | Alti bilanciati - appena 1.4% dalla media
(+) | alti lineari (2.5% delta rispetto alla precedente frequenza)
Nel complesso 100 - 16.000 Hz
(±) | la linearità complessiva del suono è media (15.2% di differenza rispetto alla media
Rispetto alla stessa classe
» 15% di tutti i dispositivi testati in questa classe è stato migliore, 4% simile, 81% peggiore
» Il migliore ha avuto un delta di 7%, medio di 21%, peggiore di 53%
Rispetto a tutti i dispositivi testati
» 22% di tutti i dispositivi testati in questa classe è stato migliore, 4% similare, 74% peggiore
» Il migliore ha avuto un delta di 4%, medio di 23%, peggiore di 134%
| Off / Standby | |
| Idle | |
| Sotto carico |
|
Leggenda:
min: | |

| Schenker Slim 15 L17 i5-8550U, UHD Graphics 620, 44 Wh | Dell Inspiron 15 7570 i5-8550U, GeForce 940MX, 42 Wh | HP EliteBook 755 G4 PRO A12-9800B, Radeon R7 (Bristol Ridge), 51 Wh | Lenovo ThinkPad T570-20H90002GE i5-7200U, HD Graphics 620, 56 Wh | Acer TravelMate P658-G2-MG-7327 i7-7500U, GeForce 940MX, 55 Wh | |
|---|---|---|---|---|---|
| Battery Runtime | |||||
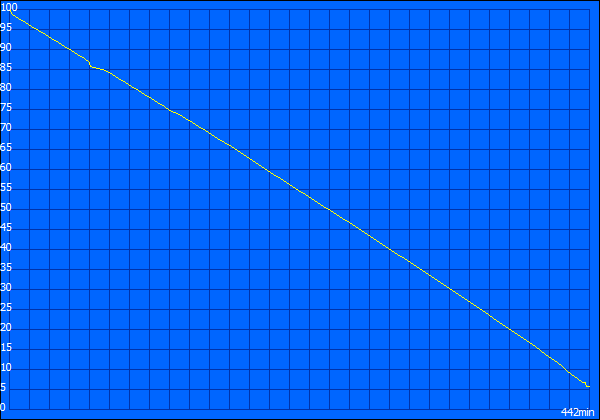
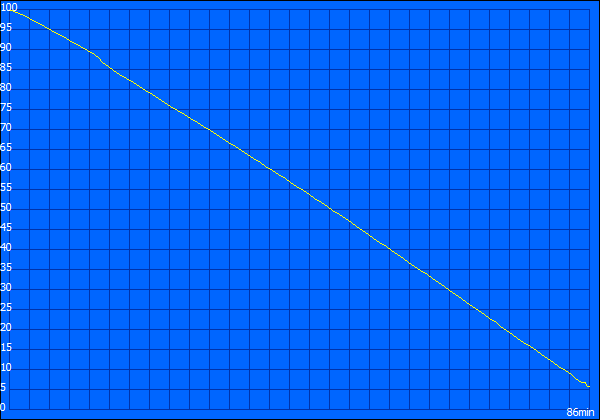
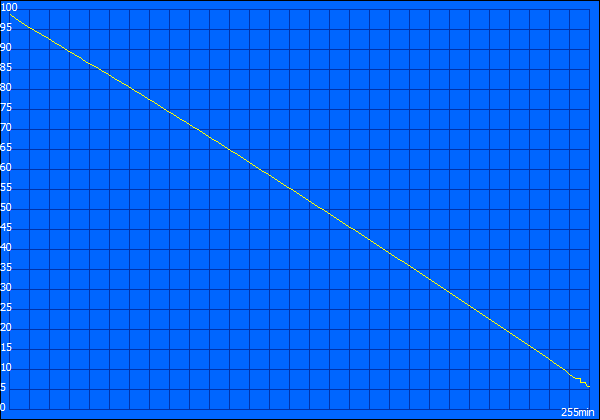
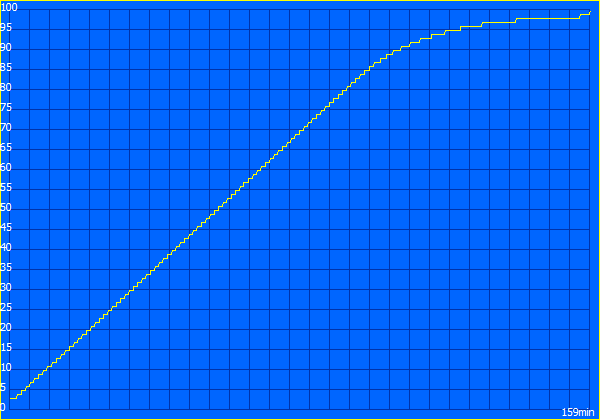
| WiFi Websurfing (h) | 4.6 | 1.8 -61% | 4.3 -7% | 7.6 65% | 8.4 83% |
Pro
Contro
Lo Schenker Slim 15 è un portatile da ufficio semplice e molto configurabile con un design sobrio. Sfortunatamente, non ha features di sicurezza aggiuntive che occorrono su un portatile business oggigiorno. La mobilità è compromessa dalla scarsa autonomia della batteria - lo Slim 15 non resisterà una giornata intera con la sua batteria.
Lo Schenker Slim 15 è un portatile potente ma silenzioso. Se l'autonomia è in fondo alla liste delle vostre esigenze, potrebbe essere il portatile giusto per voi.
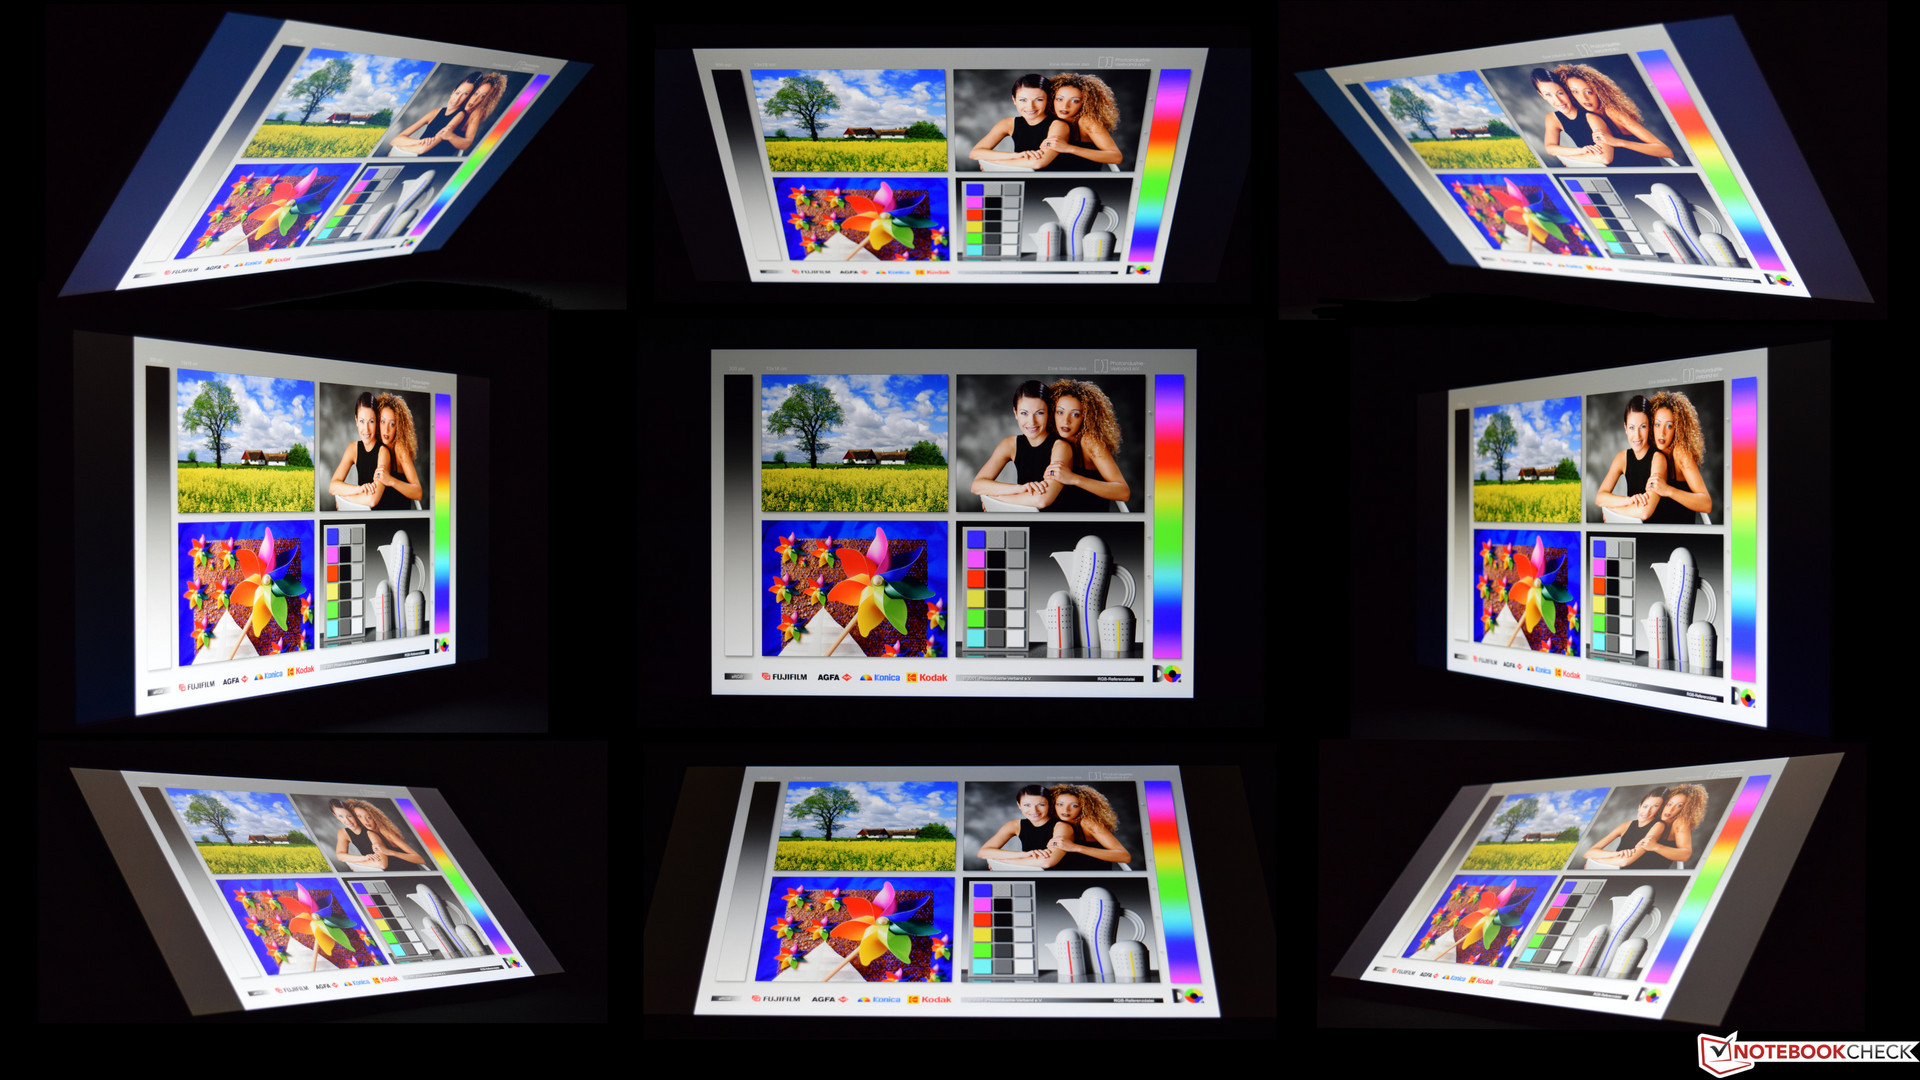
Nel complesso, abbiamo apprezzato le ottime prestazioni della CPU dello Slim 15 e l'SSD incredibilmente veloce grazie al quale l'utilizzo del portatile è stata un'esperienza molto piacevole. Il display con la sua superficie matta, la sua elevata luminosità massima, e i superbi angoli di visuale sono tutti punti di forza di questo dispositivo. I dispositivi di input sono decenti nonostante l'input con il touchpad ha qualche problema alle estremità.
Nota: si tratta di una recensione breve, con alcune sezioni non tradotte, per la versione integrale in inglese guardate qui.
Schenker Slim 15 L17
- 05/15/2020 v7 (old)
Sebastian Bade
Price comparison
