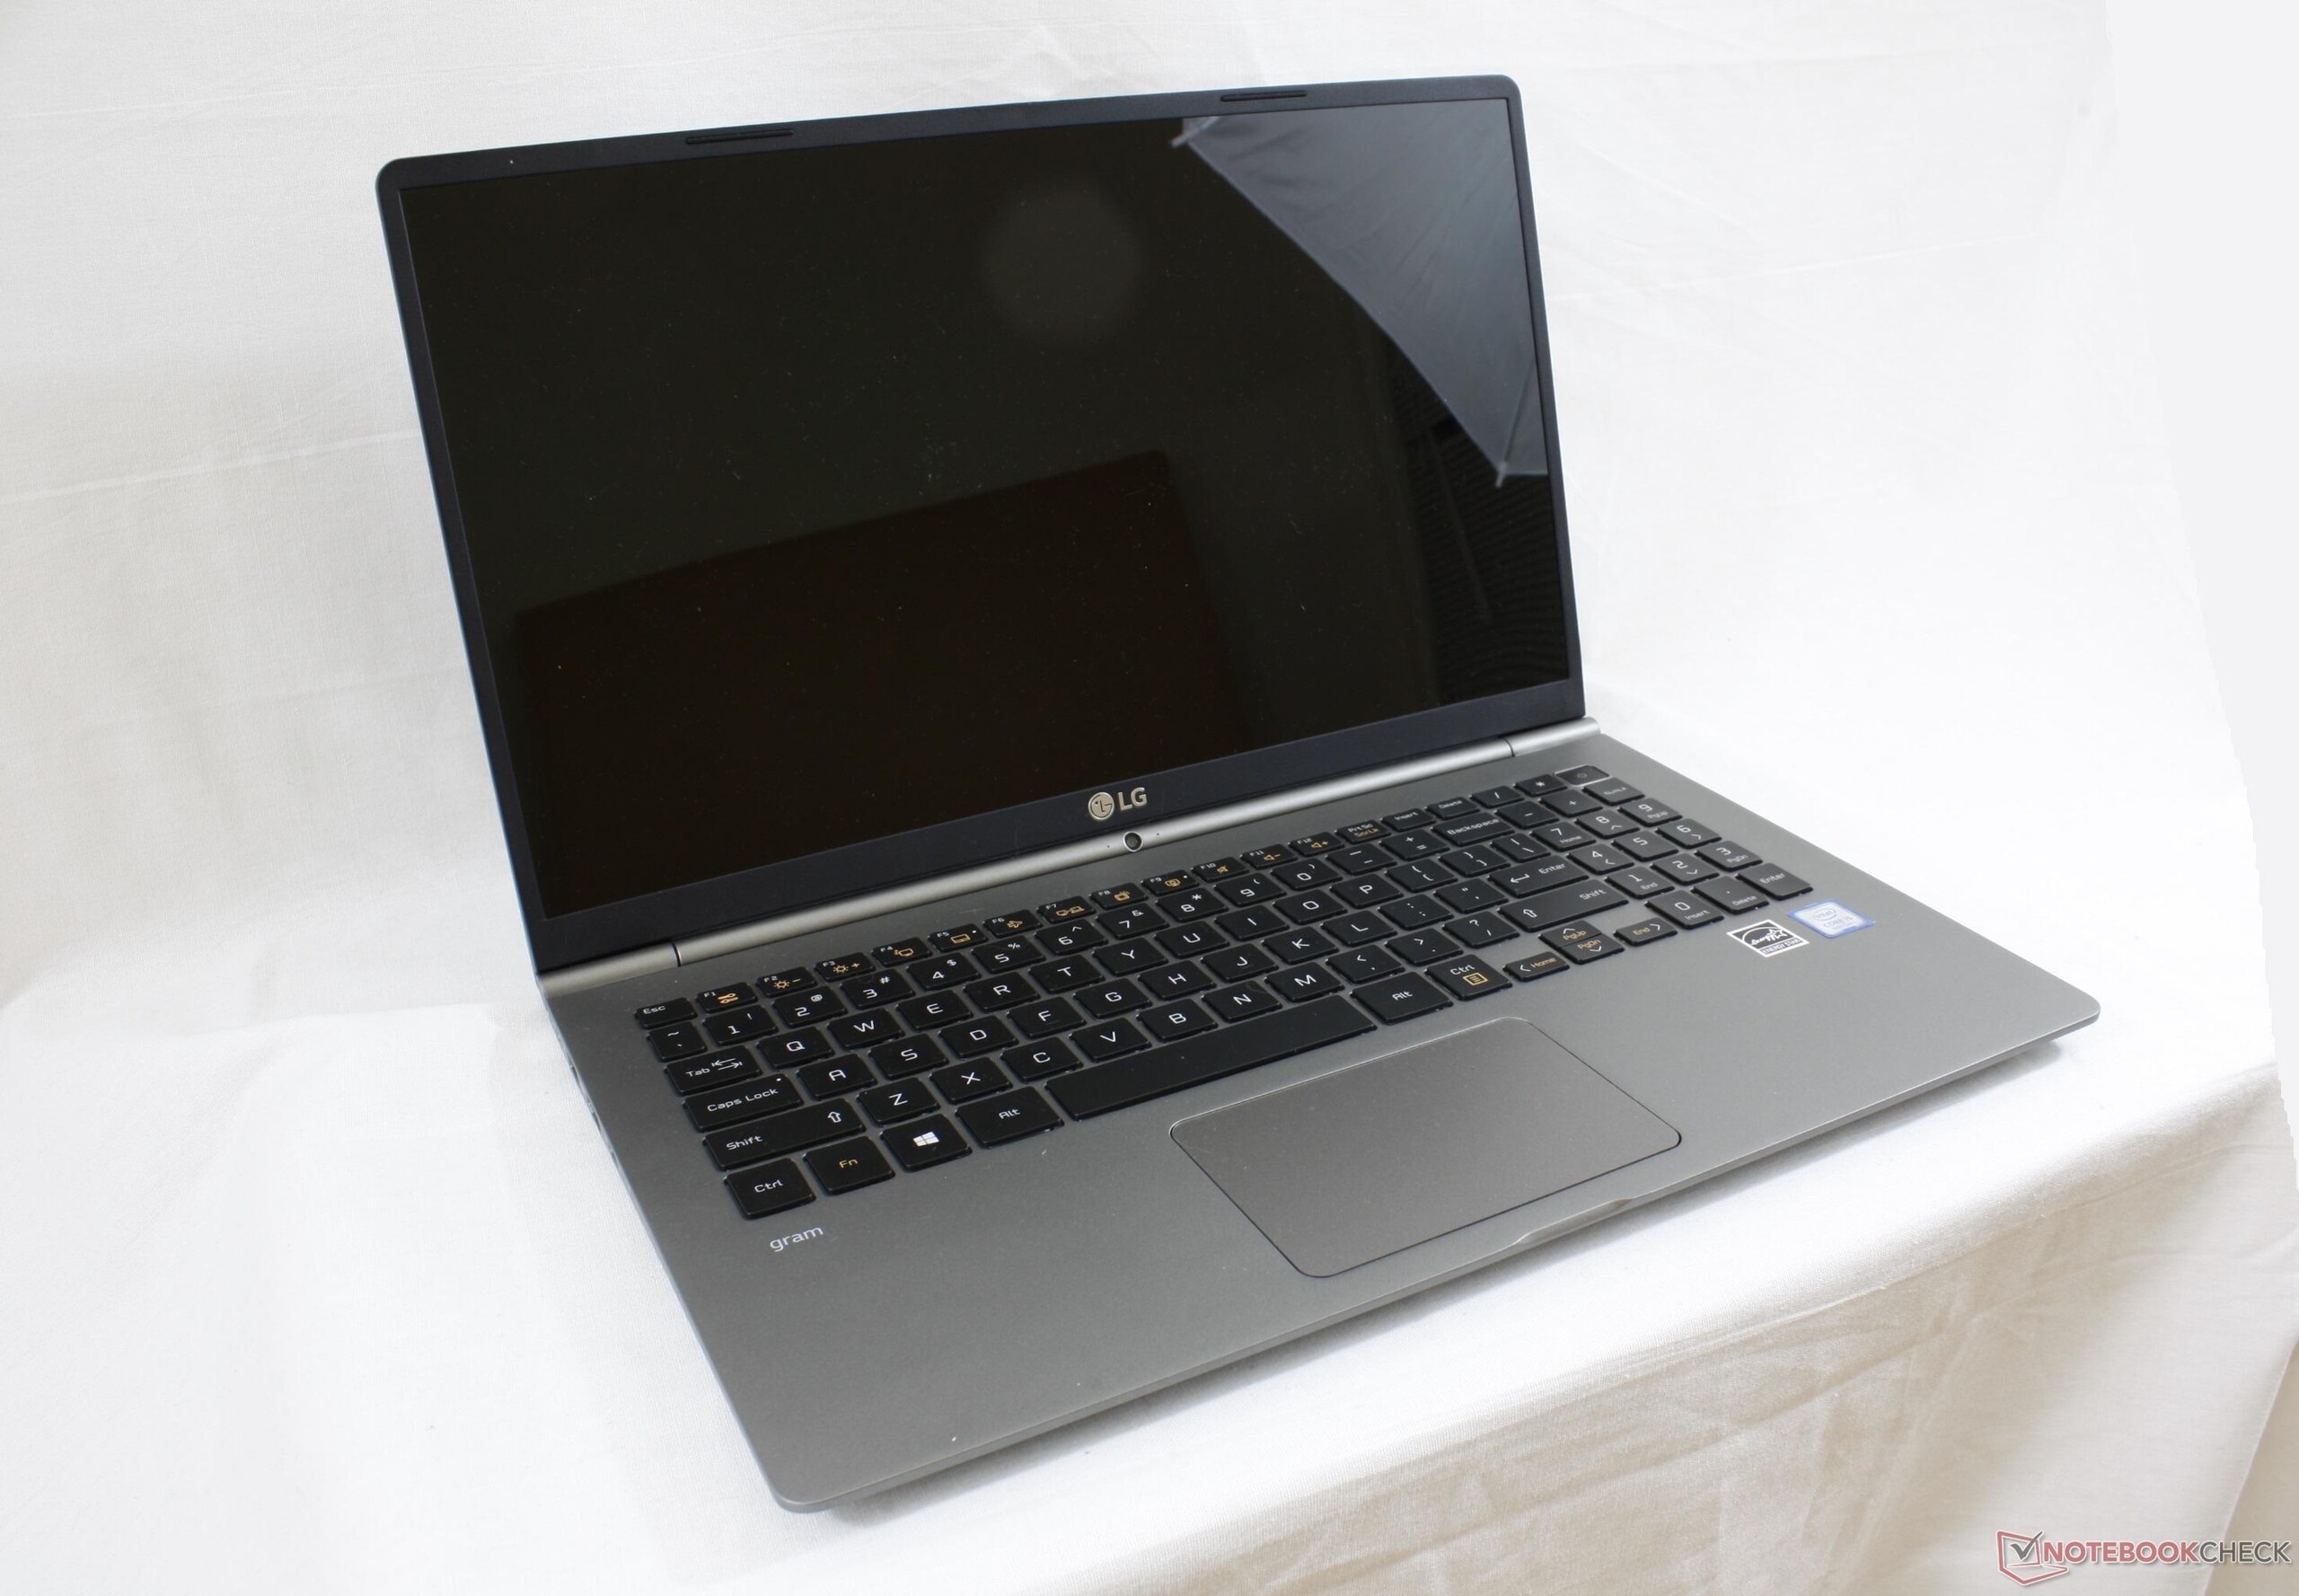
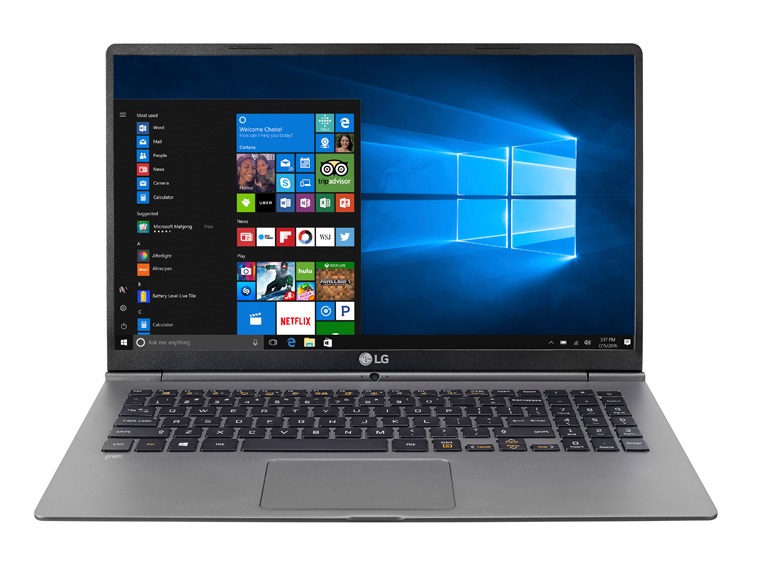
Recensione breve del Portatile LG Gram 15 (i5-8250U, FHD)


| SD Card Reader | |
| average JPG Copy Test (av. of 3 runs) | |
| Dell XPS 15 9560 (i7-7700HQ, UHD) | |
| LG Gram 15Z975 | |
| Samsung Notebook 9 NP900X5N-X01US | |
| maximum AS SSD Seq Read Test (1GB) | |
| Dell XPS 15 9560 (i7-7700HQ, UHD) | |
| Samsung Notebook 9 NP900X5N-X01US | |
| LG Gram 15Z975 | |
| Networking | |
| iperf3 transmit AX12 | |
| Dell XPS 15 9560 (i7-7700HQ, UHD) | |
| LG Gram 15Z975 | |
| Samsung Notebook 9 NP900X5N-X01US | |
| iperf3 receive AX12 | |
| Samsung Notebook 9 NP900X5N-X01US | |
| Dell XPS 15 9560 (i7-7700HQ, UHD) | |
| LG Gram 15Z975 | |
| |||||||||||||||||||||||||
Distribuzione della luminosità: 89 %
Al centro con la batteria: 273 cd/m²
Contrasto: 1241:1 (Nero: 0.22 cd/m²)
ΔE ColorChecker Calman: 4.77 | ∀{0.5-29.43 Ø4.71}
ΔE Greyscale Calman: 8.6 | ∀{0.09-98 Ø4.96}
76.9% sRGB (Argyll 1.6.3 3D)
50.2% AdobeRGB 1998 (Argyll 1.6.3 3D)
56.3% AdobeRGB 1998 (Argyll 3D)
77.1% sRGB (Argyll 3D)
54.9% Display P3 (Argyll 3D)
Gamma: 1.7
CCT: 6678 K
| LG Gram 15Z975 ID: LGD052A, Name: LG Philips LP156WFA-SPC1, IPS, 15.6", 1920x1080 | Acer Swift 3 SF315-51G-57E5 BOE NV156FHM-N48, IPS, 15.6", 1920x1080 | Dell XPS 15 9560 (i7-7700HQ, UHD) IGZO IPS, 15.6", 3840x2160 | Samsung Notebook 9 NP900X5N-X01US ID: BOE06E8, Name: BOE HF NV150FHB-N31, IPS, 15", 1920x1080 | HP Envy 15-as133cl Chi Mei CMN15D8, IPS, 15.6", 1920x1080 | Dell Inspiron 15 7570 BOE06B4, IPS, 15.6", 1920x1080 | |
|---|---|---|---|---|---|---|
| Display | -26% | 57% | 22% | -20% | -25% | |
| Display P3 Coverage (%) | 54.9 | 39.86 -27% | 89.7 63% | 65.2 19% | 42.95 -22% | 40.43 -26% |
| sRGB Coverage (%) | 77.1 | 58.7 -24% | 100 30% | 97.7 27% | 64.3 -17% | 60 -22% |
| AdobeRGB 1998 Coverage (%) | 56.3 | 41.18 -27% | 100 78% | 67.2 19% | 44.41 -21% | 41.77 -26% |
| Response Times | -22% | -58% | -22% | -22% | -29% | |
| Response Time Grey 50% / Grey 80% * (ms) | 35.2 ? | 42 ? -19% | 57.2 ? -63% | 40.8 ? -16% | 44.4 ? -26% | 45 ? -28% |
| Response Time Black / White * (ms) | 25.6 ? | 32 ? -25% | 39.2 ? -53% | 32.4 ? -27% | 30 ? -17% | 33 ? -29% |
| PWM Frequency (Hz) | 21000 ? | 962 | 208.3 ? | 1000 ? | 996 ? | |
| Screen | -2% | 13% | 30% | -11% | 8% | |
| Brightness middle (cd/m²) | 273 | 248 -9% | 370.1 36% | 565.6 107% | 262.3 -4% | 255 -7% |
| Brightness (cd/m²) | 276 | 237 -14% | 356 29% | 524 90% | 240 -13% | 240 -13% |
| Brightness Distribution (%) | 89 | 79 -11% | 87 -2% | 88 -1% | 83 -7% | 91 2% |
| Black Level * (cd/m²) | 0.22 | 0.21 5% | 0.37 -68% | 0.49 -123% | 0.24 -9% | 0.16 27% |
| Contrast (:1) | 1241 | 1181 -5% | 1000 -19% | 1154 -7% | 1093 -12% | 1594 28% |
| Colorchecker dE 2000 * | 4.77 | 4.98 -4% | 5.3 -11% | 2 58% | 5 -5% | 4.74 1% |
| Colorchecker dE 2000 max. * | 10.76 | 8.41 22% | 9.9 8% | 5 54% | 20.6 -91% | 7.68 29% |
| Greyscale dE 2000 * | 8.6 | 4.26 50% | 4.6 47% | 2.5 71% | 3.2 63% | 3.44 60% |
| Gamma | 1.7 129% | 2.37 93% | 2.31 95% | 2.21 100% | 2.45 90% | 2.43 91% |
| CCT | 6678 97% | 7149 91% | 6284 103% | 6896 94% | 6817 95% | 7064 92% |
| Color Space (Percent of AdobeRGB 1998) (%) | 50.2 | 38 -24% | 88.3 76% | 61.2 22% | 40.5 -19% | 38 -24% |
| Color Space (Percent of sRGB) (%) | 76.9 | 58 -25% | 100 30% | 97.5 27% | 63.5 -17% | 60 -22% |
| Media totale (Programma / Settaggio) | -17% /
-9% | 4% /
12% | 10% /
21% | -18% /
-14% | -15% /
-3% |
* ... Meglio usare valori piccoli
Tempi di risposta del Display
| ↔ Tempi di risposta dal Nero al Bianco | ||
|---|---|---|
| 25.6 ms ... aumenta ↗ e diminuisce ↘ combinato | ↗ 14.8 ms Incremento | 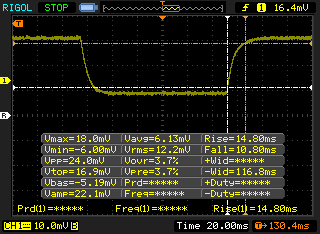 |
| ↘ 10.8 ms Calo | ||
| Lo schermo mostra tempi di risposta relativamente lenti nei nostri tests e potrebbe essere troppo lento per i gamers. In confronto, tutti i dispositivi di test variano da 0.1 (minimo) a 240 (massimo) ms. » 61 % di tutti i dispositivi è migliore. Questo significa che i tempi di risposta rilevati sono peggiori rispetto alla media di tutti i dispositivi testati (19.8 ms). | ||
| ↔ Tempo di risposta dal 50% Grigio all'80% Grigio | ||
| 35.2 ms ... aumenta ↗ e diminuisce ↘ combinato | ↗ 19.6 ms Incremento | 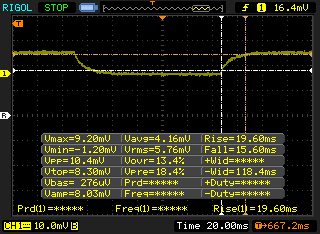 |
| ↘ 15.6 ms Calo | ||
| Lo schermo mostra tempi di risposta lenti nei nostri tests e sarà insoddisfacente per i gamers. In confronto, tutti i dispositivi di test variano da 0.165 (minimo) a 636 (massimo) ms. » 49 % di tutti i dispositivi è migliore. Questo significa che i tempi di risposta rilevati sono peggiori rispetto alla media di tutti i dispositivi testati (31 ms). | ||
Sfarfallio dello schermo / PWM (Pulse-Width Modulation)
| flickering dello schermo / PWM non rilevato | 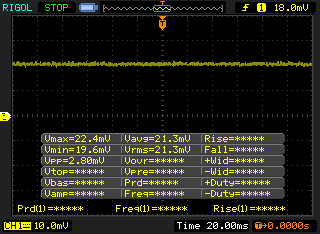 | ||
In confronto: 52 % di tutti i dispositivi testati non utilizza PWM per ridurre la luminosita' del display. Se è rilevato PWM, una media di 7754 (minimo: 5 - massimo: 343500) Hz è stata rilevata. | |||
| wPrime 2.10 - 1024m | |
| Lenovo ThinkPad 25 | |
| Dell Latitude 5280 | |
| Microsoft Surface Laptop i7 | |
| Razer Blade Stealth QHD i7-8550U | |
| Dell Inspiron 15 7000 7577 | |
| LG Gram 15Z975 | |
| HP Envy x360 15m-bq121dx | |
* ... Meglio usare valori piccoli
| PCMark 8 Home Score Accelerated v2 | 3557 punti | |
| PCMark 8 Creative Score Accelerated v2 | 4651 punti | |
| PCMark 8 Work Score Accelerated v2 | 4736 punti | |
| PCMark 10 Score | 3391 punti | |
Aiuto | ||
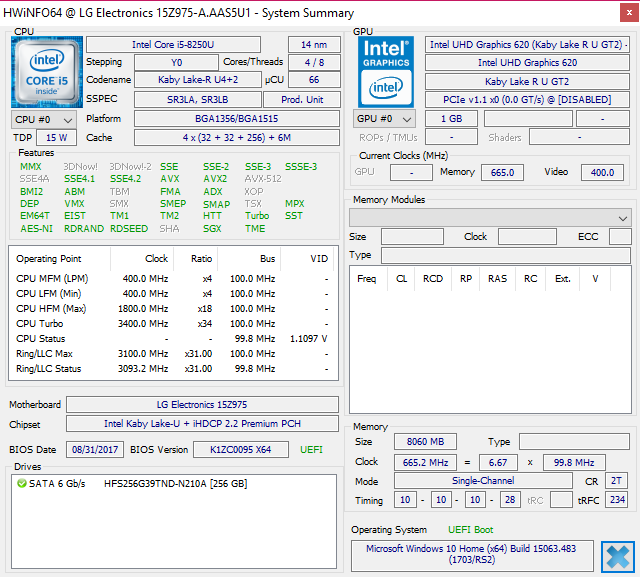
| LG Gram 15Z975 SK Hynix HFS256G39TND-N210A | Acer Swift 3 SF315-51G-57E5 Hynix HFS128G39TND | Dell XPS 15 9560 (i7-7700HQ, UHD) Lite-On CX2-8B512-Q11 | Samsung Notebook 9 NP900X5N-X01US Samsung PM961 MZVLW256HEHP | Dell Inspiron 15 7570 Samsung PM961 NVMe MZVLW512HMJP | |
|---|---|---|---|---|---|
| AS SSD | -20% | 203% | 269% | -127% | |
| Copy Game MB/s (MB/s) | 179.8 | 112.3 -38% | 540 200% | 648 260% | |
| Copy Program MB/s (MB/s) | 141.2 | 97.9 -31% | 411.5 191% | 497.9 253% | |
| Copy ISO MB/s (MB/s) | 197.5 | 130.3 -34% | 1272 544% | 1685 753% | |
| Score Total (Points) | 1003 | 854 -15% | 2810 180% | 3906 289% | 1455 45% |
| Score Write (Points) | 339 | 204 -40% | 1022 201% | 928 174% | 68 -80% |
| Score Read (Points) | 442 | 437 -1% | 1206 173% | 2011 355% | 960 117% |
| Access Time Write * (ms) | 0.232 | 0.273 -18% | 0.034 85% | 0.03 87% | 4.391 -1793% |
| Access Time Read * (ms) | 0.08 | 0.101 -26% | 0.034 57% | 0.043 46% | 0.04 50% |
| 4K-64 Write (MB/s) | 246.7 | 114.1 -54% | 789 220% | 674 173% | 40.26 -84% |
| 4K-64 Read (MB/s) | 366.5 | 355.3 -3% | 962 162% | 1709 366% | 736 101% |
| 4K Write (MB/s) | 67.6 | 77.5 15% | 112.2 66% | 124.1 84% | 1 -99% |
| 4K Read (MB/s) | 26.24 | 29.84 14% | 41.34 58% | 48.71 86% | 44.3 69% |
| Seq Write (MB/s) | 248.5 | 124 -50% | 1207 386% | 1299 423% | 271.5 9% |
| Seq Read (MB/s) | 488.1 | 515 6% | 2026 315% | 2533 419% | 1800 269% |
* ... Meglio usare valori piccoli

| 3DMark | |
| 1280x720 Cloud Gate Standard Graphics | |
| HP Envy x360 15m-bq121dx | |
| Microsoft Surface Laptop i7 | |
| Razer Blade Stealth QHD i7-8550U | |
| HP ProBook 470 G5 | |
| Asus Transformer 4 Pro (i7-7500U, HD620) | |
| LG Gram 15Z975 | |
| Acer TravelMate P257-M-56AX | |
| HP 250 G5 SP X0N33EA | |
| Teclast Tbook 16 Power | |
| 1920x1080 Fire Strike Graphics | |
| HP Envy x360 15m-bq121dx | |
| HP ProBook 470 G5 | |
| Microsoft Surface Laptop i7 | |
| LG Gram 15Z975 | |
| Asus Transformer 4 Pro (i7-7500U, HD620) | |
| 1920x1080 Ice Storm Extreme Graphics | |
| HP ProBook 470 G5 | |
| LG Gram 15Z975 | |
| 3DMark 11 Performance | 1668 punti | |
| 3DMark Ice Storm Standard Score | 52051 punti | |
| 3DMark Cloud Gate Standard Score | 7121 punti | |
| 3DMark Fire Strike Score | 864 punti | |
Aiuto | ||
| basso | medio | alto | ultra | |
|---|---|---|---|---|
| BioShock Infinite (2013) | 49 | 28 | 23 | 7.5 |
| Rise of the Tomb Raider (2016) | 17 | 10 |
Rumorosità
| Idle |
| 29.2 / 29.2 / 29.2 dB(A) |
| Sotto carico |
| 32.5 / 37.2 dB(A) |
 | ||
30 dB silenzioso 40 dB(A) udibile 50 dB(A) rumoroso |
||
min: | ||
| LG Gram 15Z975 UHD Graphics 620, i5-8250U, SK Hynix HFS256G39TND-N210A | Acer Swift 3 SF315-51G-57E5 GeForce MX150, i5-8250U, Hynix HFS128G39TND | Dell XPS 15 9560 (i7-7700HQ, UHD) GeForce GTX 1050 Mobile, i7-7700HQ, Lite-On CX2-8B512-Q11 | Samsung Notebook 9 NP900X5N-X01US GeForce 940MX, i7-7500U, Samsung PM961 MZVLW256HEHP | HP Envy 15-as133cl HD Graphics 620, i7-7500U, HGST Travelstar 5K1000 HTS541010A7E630 | Acer Swift 3 SF315-41-R4W1 Vega 8, R5 2500U, Intel SSD 600p SSDPEKKW256G7 | |
|---|---|---|---|---|---|---|
| Noise | -4% | -13% | -2% | -7% | -6% | |
| off /ambiente * (dB) | 29.2 | 30.5 -4% | 28.4 3% | 28.3 3% | 30 -3% | 31.8 -9% |
| Idle Minimum * (dB) | 29.2 | 30.5 -4% | 29 1% | 28.3 3% | 32.5 -11% | 31.8 -9% |
| Idle Average * (dB) | 29.2 | 30.5 -4% | 29 1% | 28.3 3% | 32.5 -11% | 32.1 -10% |
| Idle Maximum * (dB) | 29.2 | 30.9 -6% | 32.2 -10% | 28.3 3% | 32.5 -11% | 32.1 -10% |
| Load Average * (dB) | 32.5 | 35.7 -10% | 47.1 -45% | 38.3 -18% | 38.7 -19% | 33 -2% |
| Load Maximum * (dB) | 37.2 | 35.6 4% | 47.1 -27% | 38.3 -3% | 32.5 13% | 34.8 6% |
| Witcher 3 ultra * (dB) | 52 |
* ... Meglio usare valori piccoli
(±) La temperatura massima sul lato superiore è di 41.4 °C / 107 F, rispetto alla media di 36.8 °C / 98 F, che varia da 21 a 71 °C per questa classe Multimedia.
(+) Il lato inferiore si riscalda fino ad un massimo di 39.4 °C / 103 F, rispetto alla media di 39.1 °C / 102 F
(+) In idle, la temperatura media del lato superiore è di 23 °C / 73 F, rispetto alla media deld ispositivo di 31.3 °C / 88 F.
(+) I poggiapolsi e il touchpad sono piu' freddi della temperatura della pelle con un massimo di 24.2 °C / 75.6 F e sono quindi freddi al tatto.
(+) La temperatura media della zona del palmo della mano di dispositivi simili e'stata di 28.7 °C / 83.7 F (+4.5 °C / 8.1 F).
LG Gram 15Z975 analisi audio
(-) | altoparlanti non molto potenti (71.9 dB)
Bassi 100 - 315 Hz
(-) | quasi nessun basso - in media 28.2% inferiori alla media
(+) | bassi in lineaa (2.6% delta rispetto alla precedente frequenza)
Medi 400 - 2000 Hz
(±) | medi ridotti - circa 7.6% inferiori alla media
(-) | medi non in linea (18.4% delta rispetto alla precedente frequenza)
Alti 2 - 16 kHz
(±) | alti elevati - circa 9.8% superiori alla media
(±) | la linearità degli alti è media (9.4% delta rispetto alla precedente frequenza)
Nel complesso 100 - 16.000 Hz
(-) | suono nel complesso non lineare (42.9% di differenza rispetto alla media
Rispetto alla stessa classe
» 100% di tutti i dispositivi testati in questa classe è stato migliore, 0% simile, 0% peggiore
» Il migliore ha avuto un delta di 5%, medio di 17%, peggiore di 45%
Rispetto a tutti i dispositivi testati
» 96% di tutti i dispositivi testati in questa classe è stato migliore, 0% similare, 4% peggiore
» Il migliore ha avuto un delta di 4%, medio di 23%, peggiore di 134%
Apple MacBook 12 (Early 2016) 1.1 GHz analisi audio
(+) | gli altoparlanti sono relativamente potenti (83.6 dB)
Bassi 100 - 315 Hz
(±) | bassi ridotti - in media 11.3% inferiori alla media
(±) | la linearità dei bassi è media (14.2% delta rispetto alla precedente frequenza)
Medi 400 - 2000 Hz
(+) | medi bilanciati - solo only 2.4% rispetto alla media
(+) | medi lineari (5.5% delta rispetto alla precedente frequenza)
Alti 2 - 16 kHz
(+) | Alti bilanciati - appena 2% dalla media
(+) | alti lineari (4.5% delta rispetto alla precedente frequenza)
Nel complesso 100 - 16.000 Hz
(+) | suono nel complesso lineare (10.2% differenza dalla media)
Rispetto alla stessa classe
» 7% di tutti i dispositivi testati in questa classe è stato migliore, 2% simile, 90% peggiore
» Il migliore ha avuto un delta di 5%, medio di 18%, peggiore di 53%
Rispetto a tutti i dispositivi testati
» 5% di tutti i dispositivi testati in questa classe è stato migliore, 1% similare, 94% peggiore
» Il migliore ha avuto un delta di 4%, medio di 23%, peggiore di 134%
| Off / Standby | |
| Idle | |
| Sotto carico |
|
Leggenda:
min: | |
| LG Gram 15Z975 i5-8250U, UHD Graphics 620, SK Hynix HFS256G39TND-N210A, IPS, 1920x1080, 15.6" | Acer Swift 3 SF315-51G-57E5 i5-8250U, GeForce MX150, Hynix HFS128G39TND, IPS, 1920x1080, 15.6" | Samsung Notebook 9 NP900X5N-X01US i7-7500U, GeForce 940MX, Samsung PM961 MZVLW256HEHP, IPS, 1920x1080, 15" | HP Envy 15-as133cl i7-7500U, HD Graphics 620, HGST Travelstar 5K1000 HTS541010A7E630, IPS, 1920x1080, 15.6" | HP Envy x360 15m-bq121dx R5 2500U, Vega 8, HGST Travelstar 7K1000 HTS721010A9E630, IPS, 1920x1080, 15.6" | Apple MacBook Pro 15 2017 (2.9 GHz, 560) i7-7820HQ, Radeon Pro 560, , , 2880x1800, 15.4" | |
|---|---|---|---|---|---|---|
| Power Consumption | -12% | -32% | 16% | -21% | -73% | |
| Idle Minimum * (Watt) | 4.4 | 3.8 14% | 5 -14% | 4.6 -5% | 5.9 -34% | 3.7 16% |
| Idle Average * (Watt) | 9.1 | 6.5 29% | 11.6 -27% | 7.7 15% | 8.7 4% | 16.2 -78% |
| Idle Maximum * (Watt) | 9.6 | 9.1 5% | 12.2 -27% | 7.8 19% | 10.5 -9% | 18 -88% |
| Load Average * (Watt) | 34.8 | 53.4 -53% | 47.8 -37% | 30.5 12% | 45.7 -31% | 58.4 -68% |
| Load Maximum * (Watt) | 36 | 55.6 -54% | 55.7 -55% | 22.7 37% | 49.4 -37% | 89.6 -149% |
| Witcher 3 ultra * (Watt) | 51.9 | 45.8 |
* ... Meglio usare valori piccoli
| LG Gram 15Z975 i5-8250U, UHD Graphics 620, 60 Wh | Acer Swift 3 SF315-51G-57E5 i5-8250U, GeForce MX150, 49.7 Wh | Dell XPS 15 9560 (i7-7700HQ, UHD) i7-7700HQ, GeForce GTX 1050 Mobile, 97 Wh | Samsung Notebook 9 NP900X5N-X01US i7-7500U, GeForce 940MX, 66 Wh | Dell Inspiron 15 7570 i5-8550U, GeForce 940MX, 42 Wh | HP Envy 15-as133cl i7-7500U, HD Graphics 620, 52 Wh | |
|---|---|---|---|---|---|---|
| Autonomia della batteria | 16% | -16% | 25% | -63% | -33% | |
| Reader / Idle (h) | 18 | 13.9 -23% | 27.4 52% | 4.7 -74% | 9.6 -47% | |
| WiFi v1.3 (h) | 7.3 | 8.5 16% | 7.2 -1% | 10.1 38% | 1.8 -75% | 6.8 -7% |
| Load (h) | 2.2 | 1.7 -23% | 1.9 -14% | 1.3 -41% | 1.2 -45% |
Pro
Contro
Così come il "portatile più sottile del mondo" deve sacrificare alcuni aspetti del design per raggiungere la fascia di mercato target, "L'ultrabook più leggero al mondo" ha delle sue pecche. L'LG Gram 15 potrebbe essere incredibilmente leggero, ma dovrete rinunciare ad una serie di di features che sarebbero presenti su qualsiasi altro Ultrabook di "peso normale".
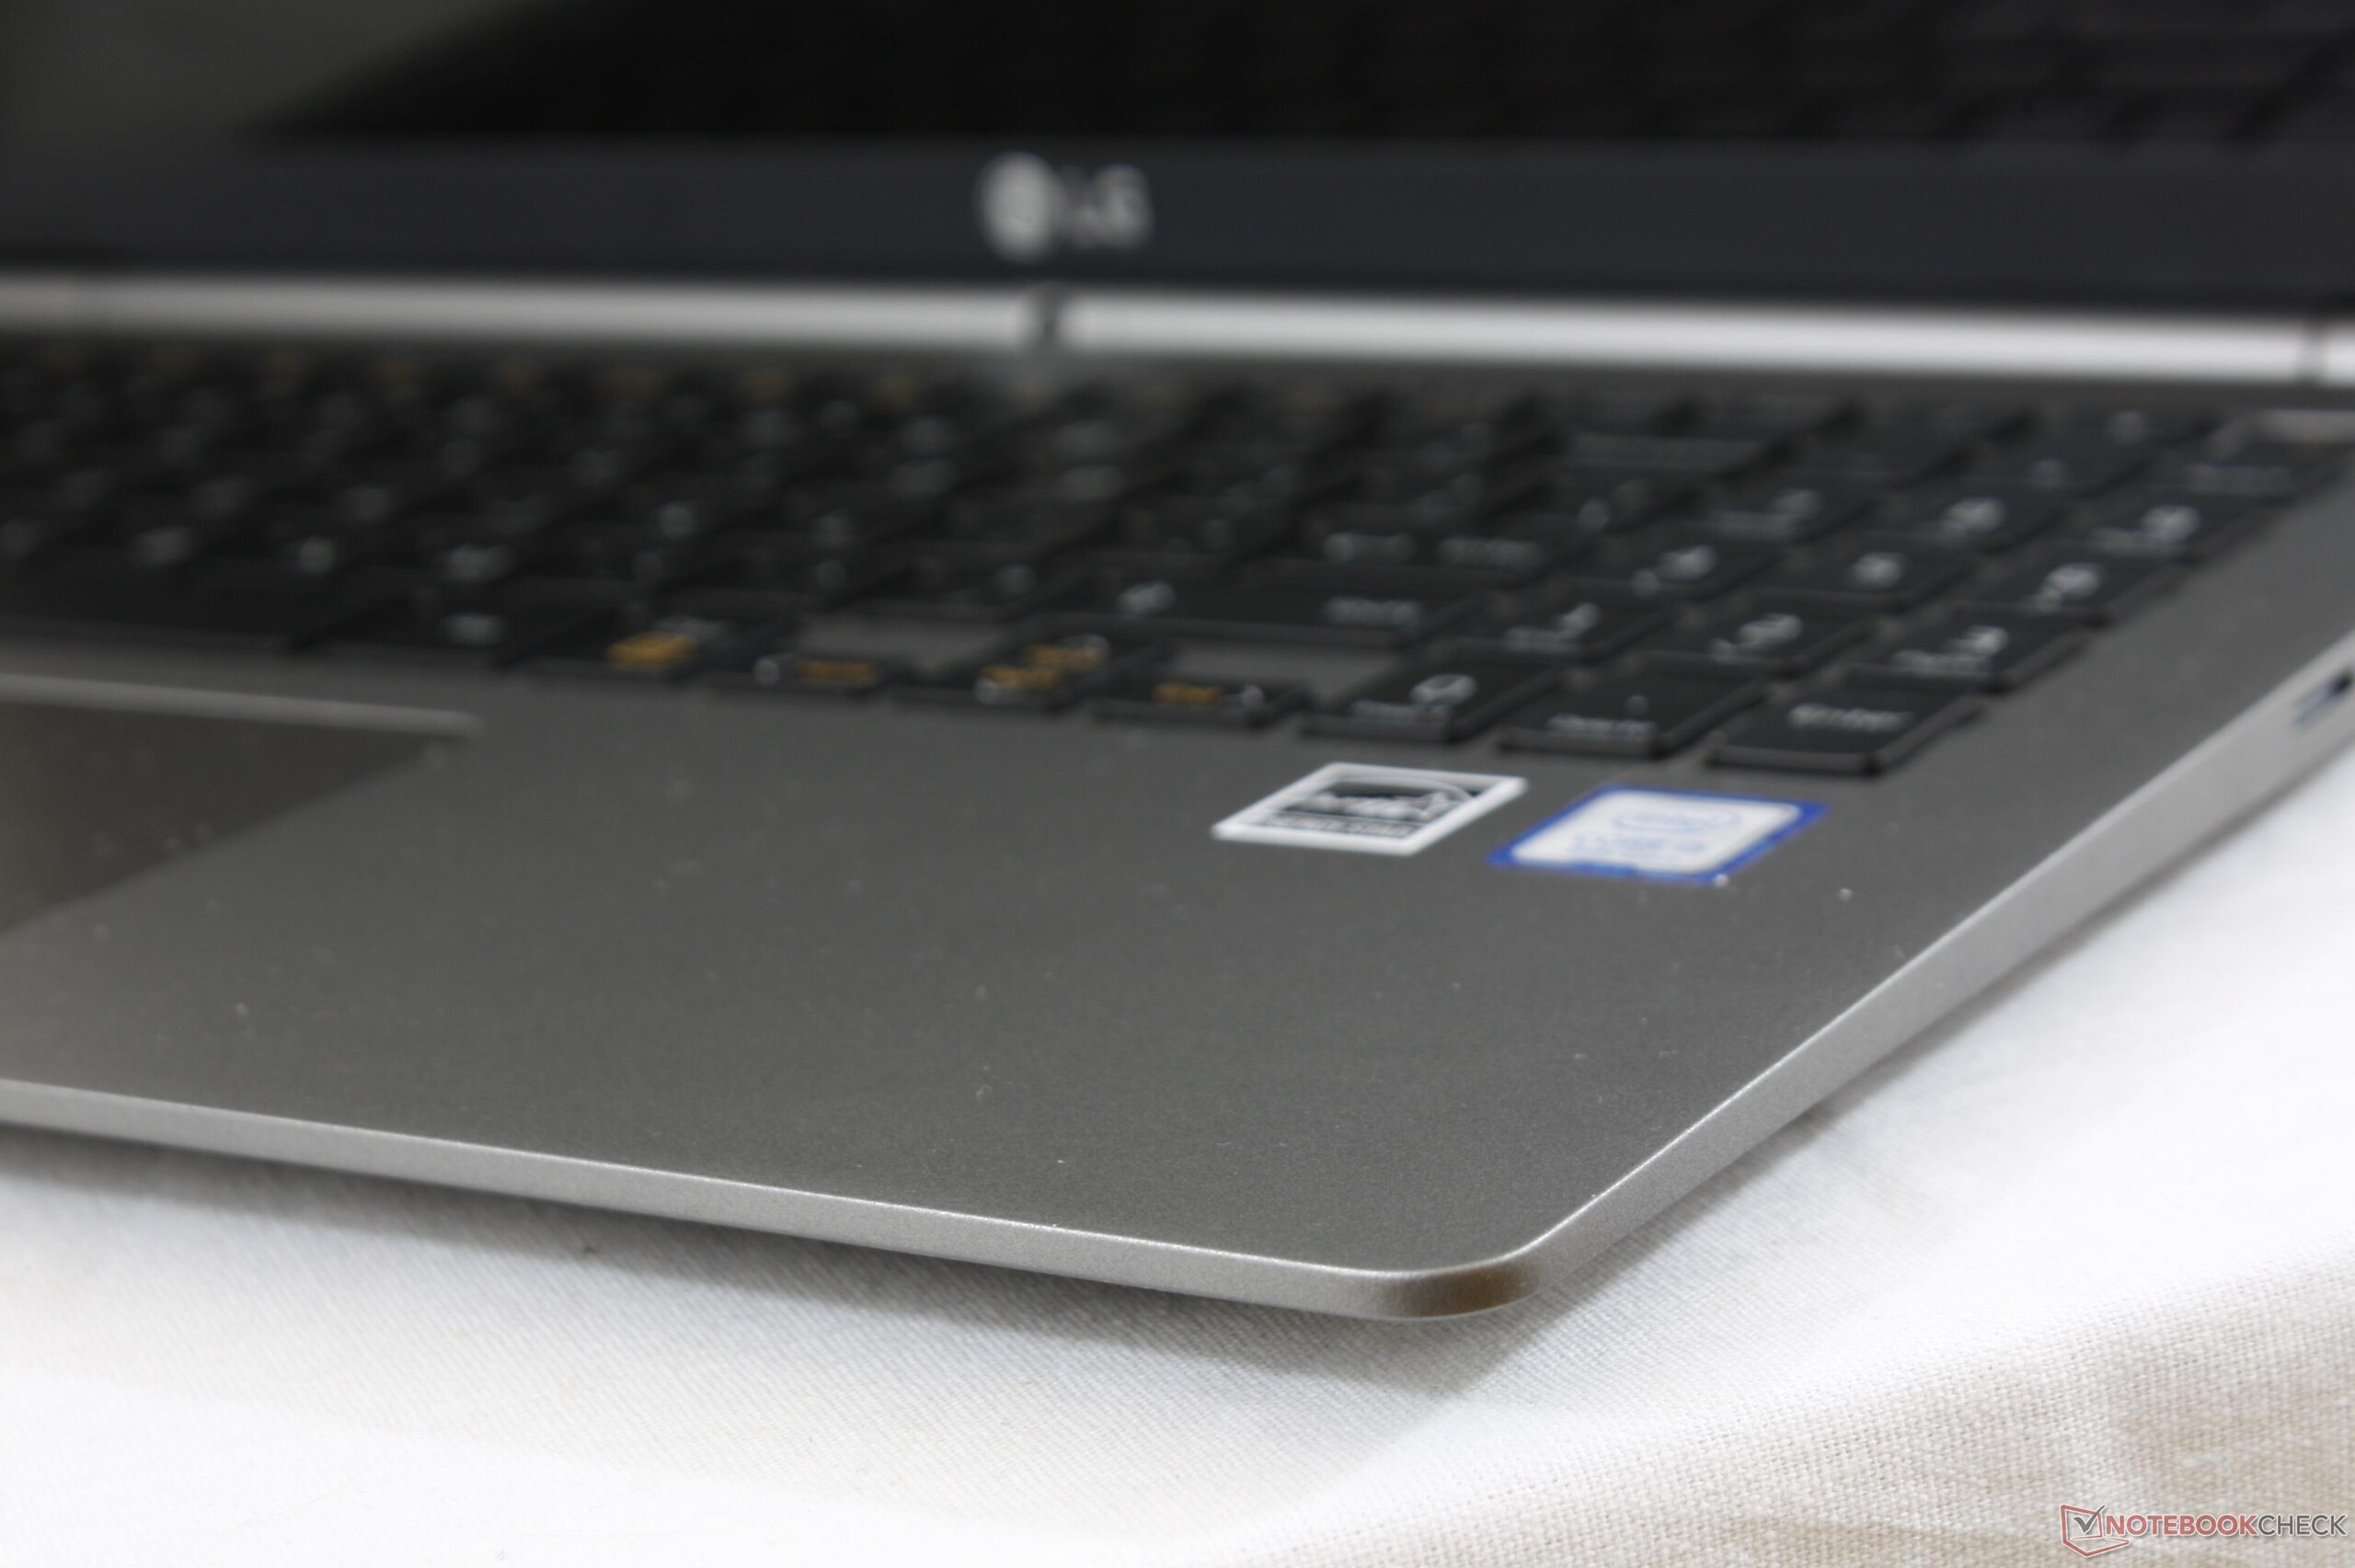
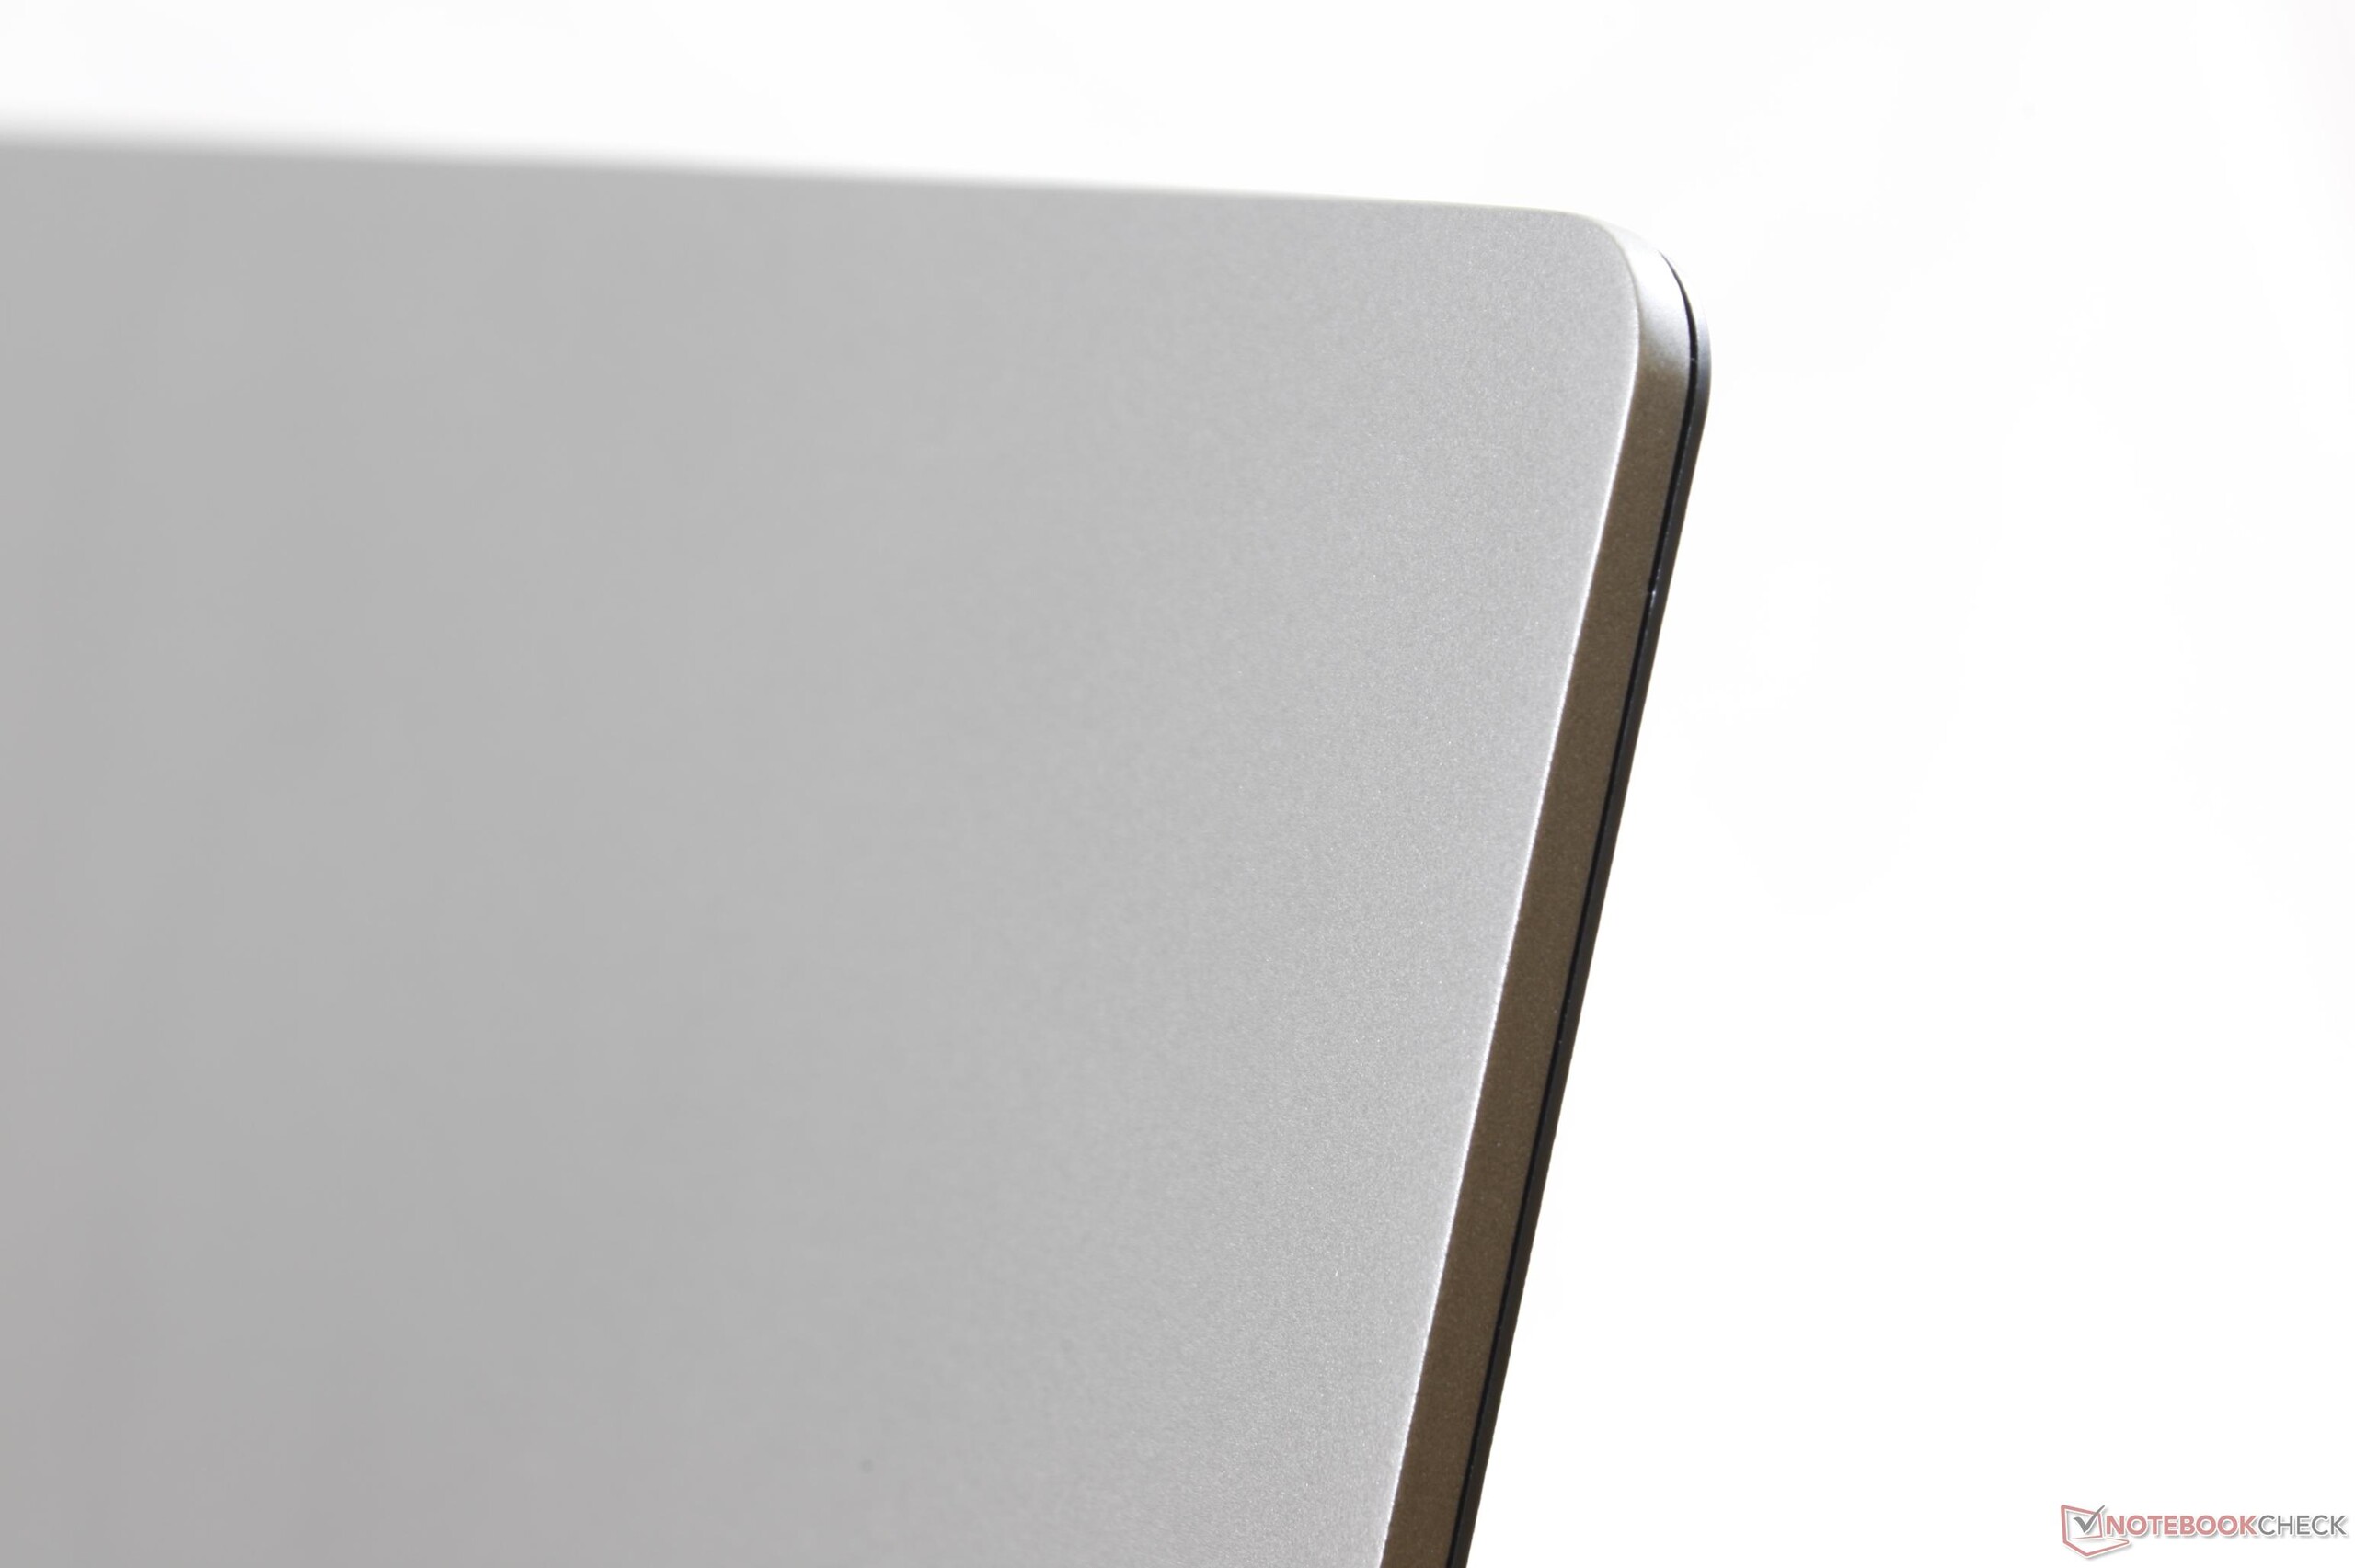
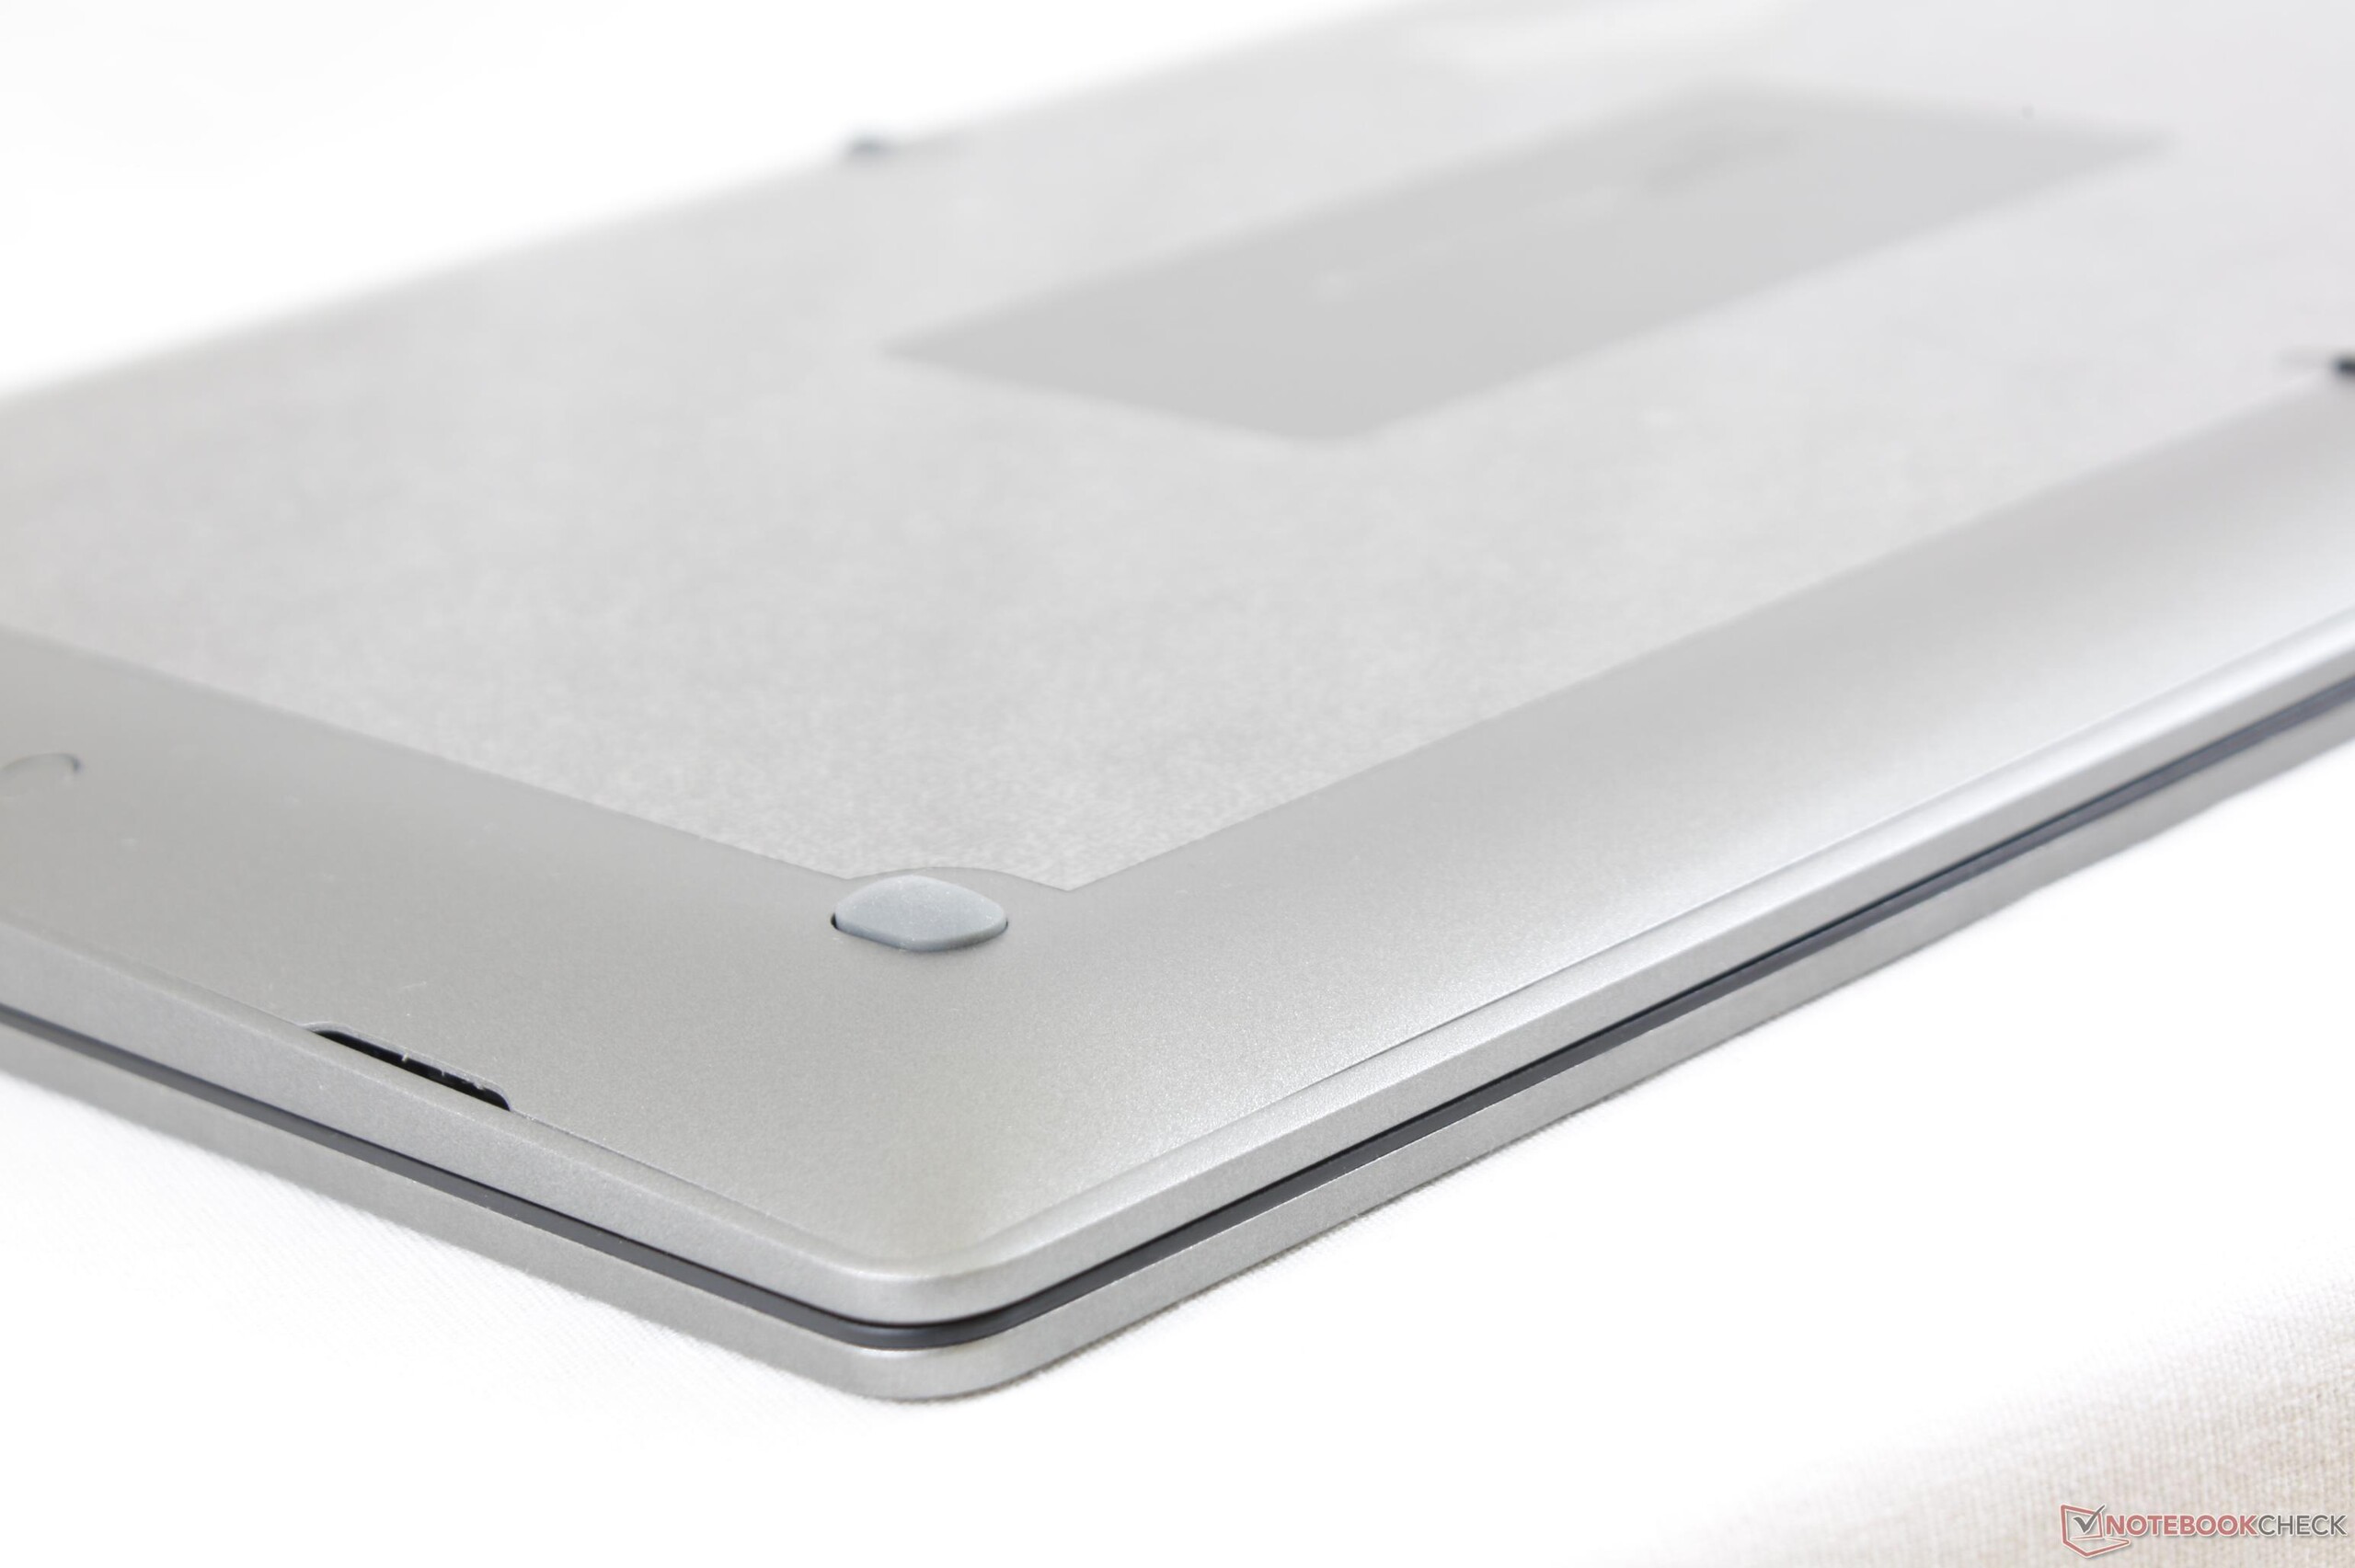
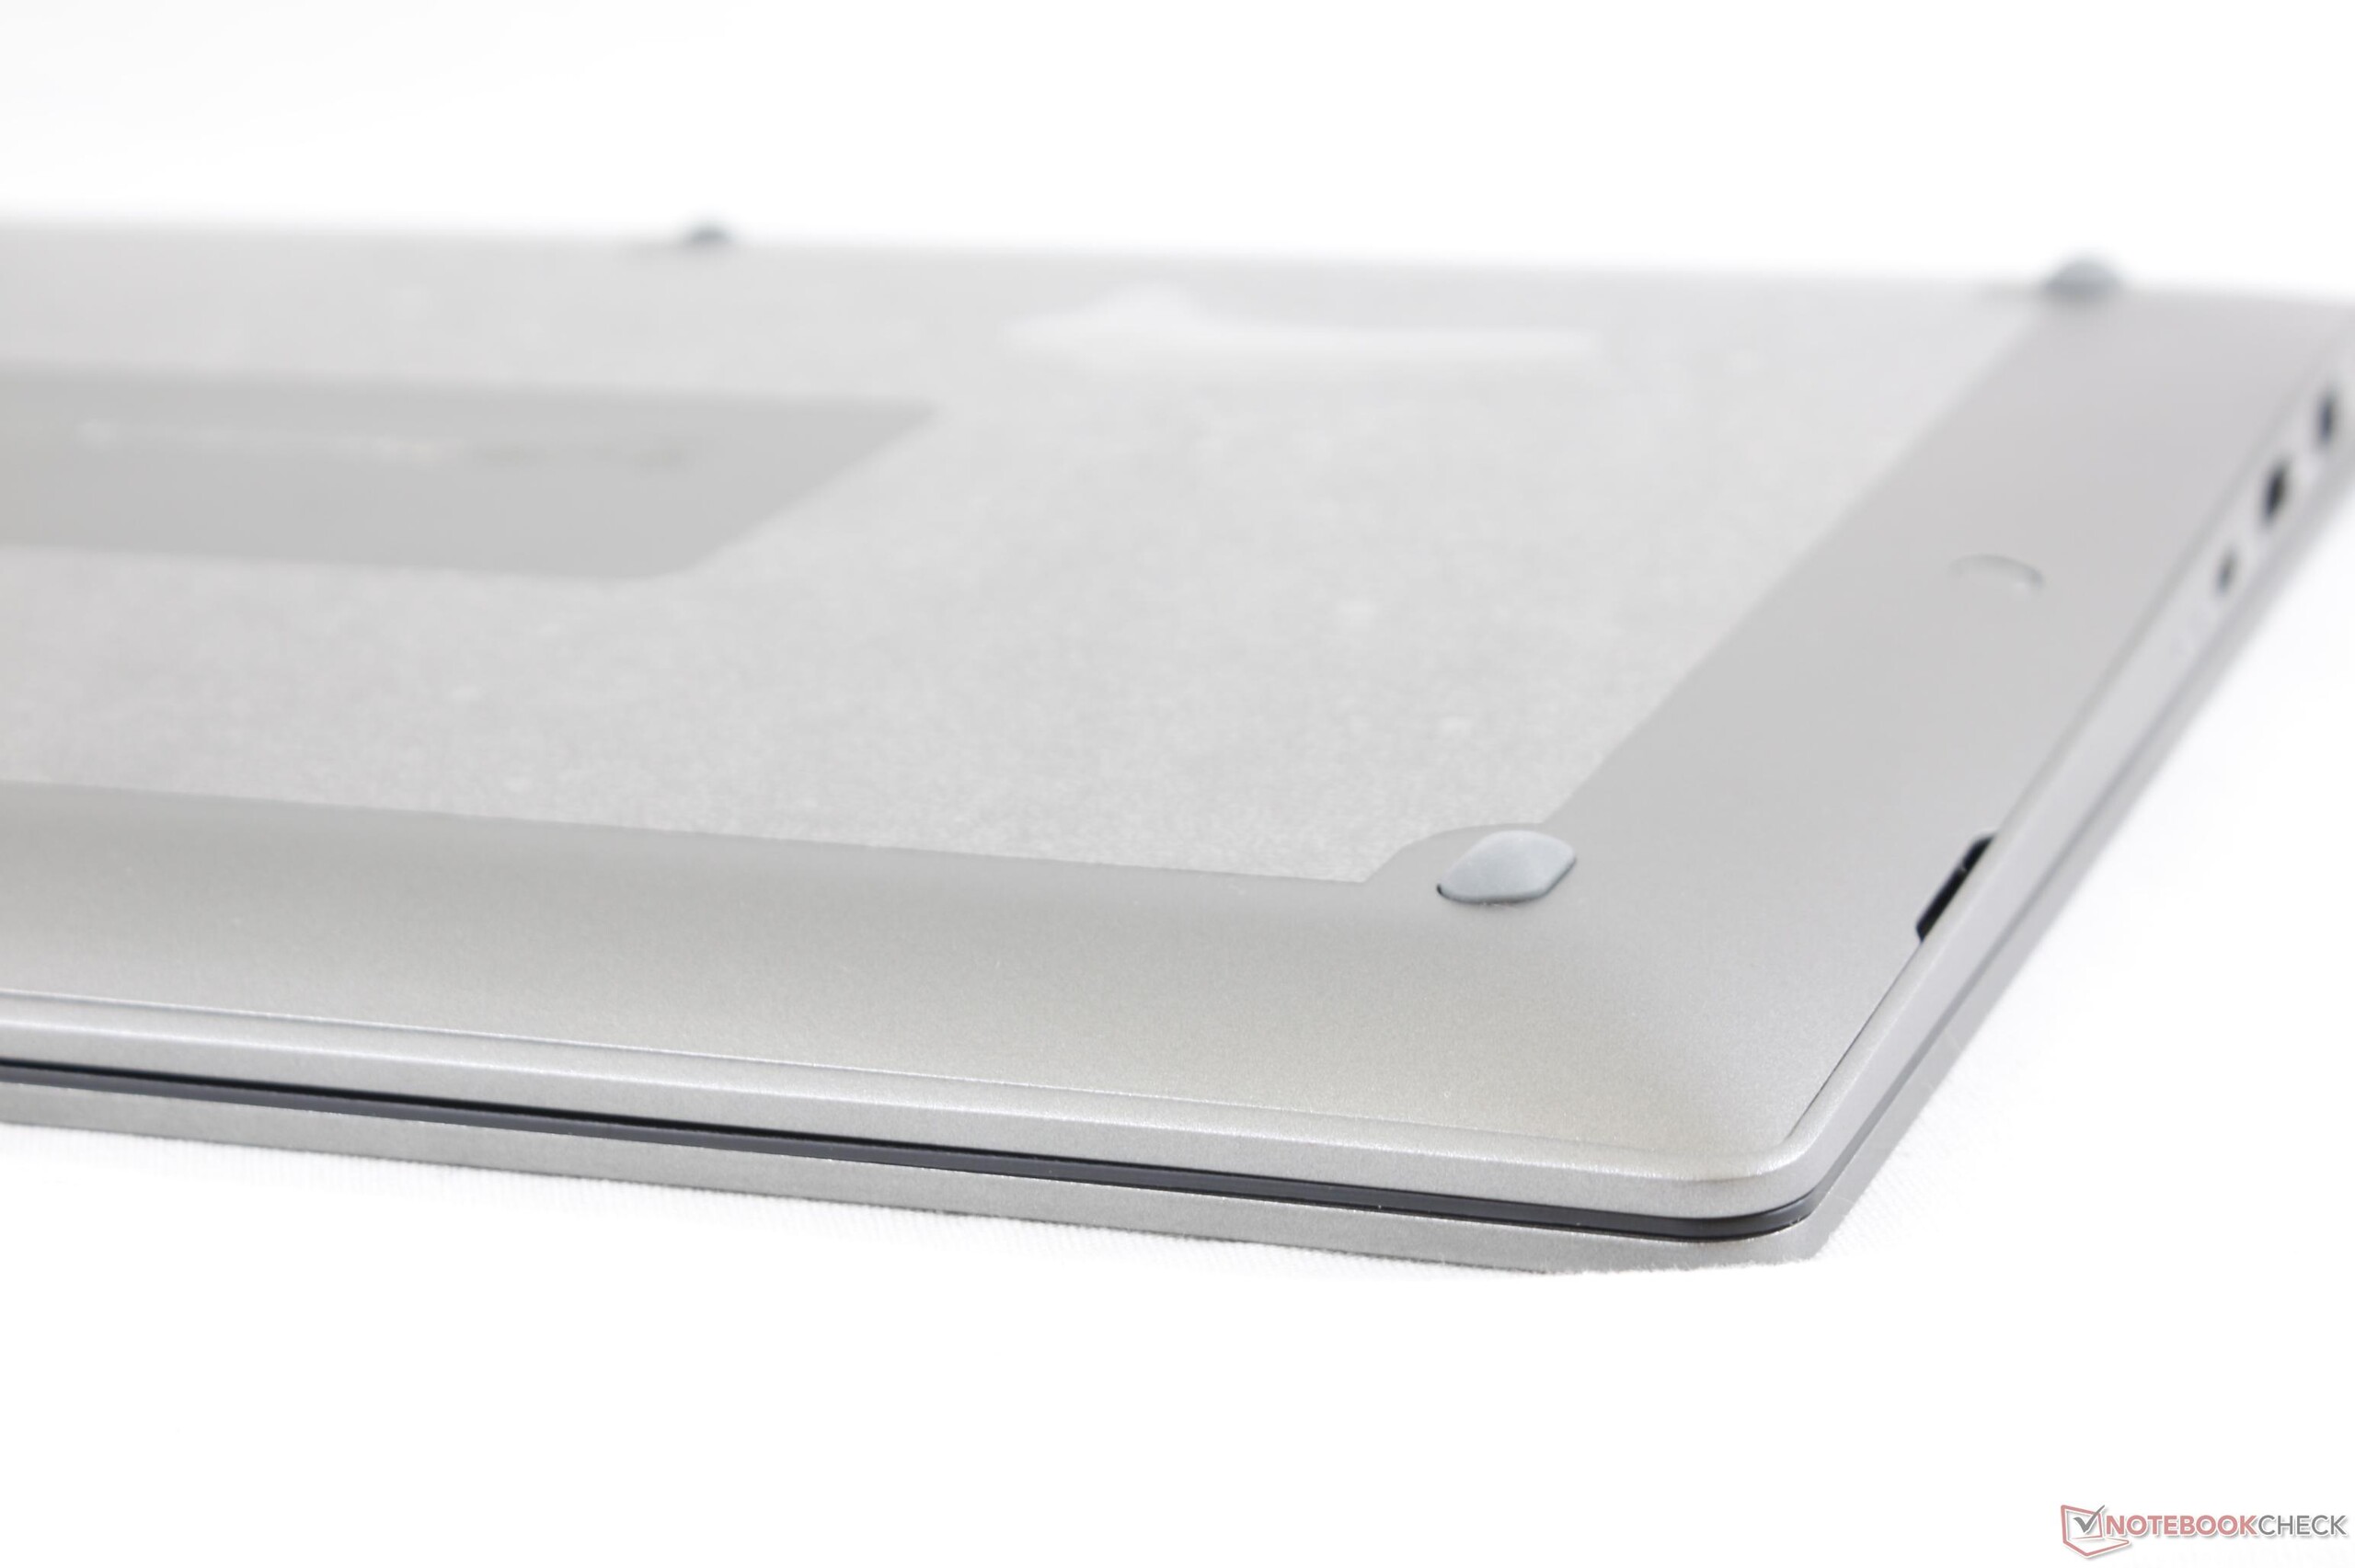
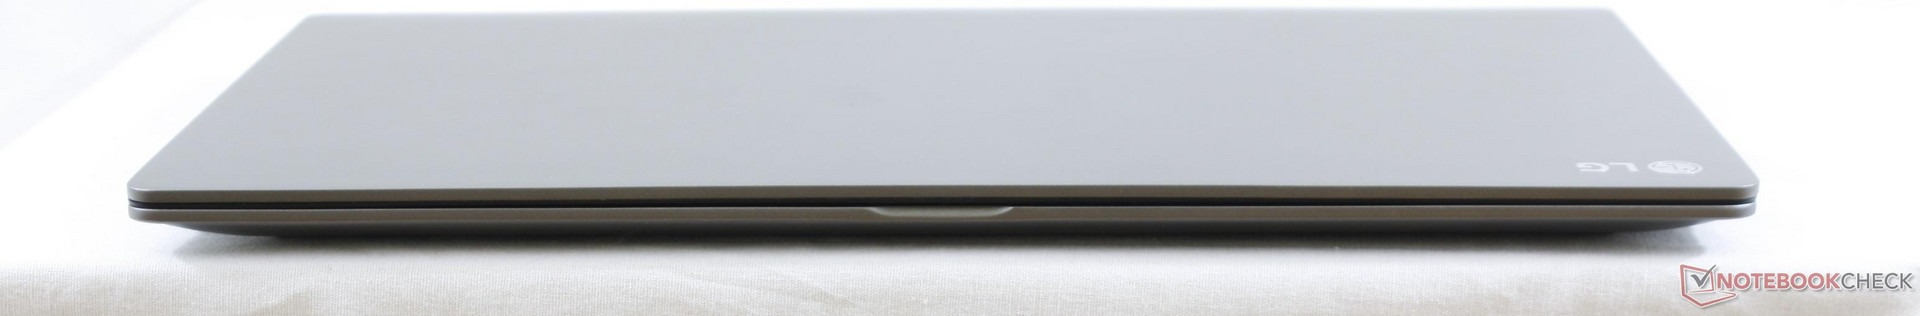
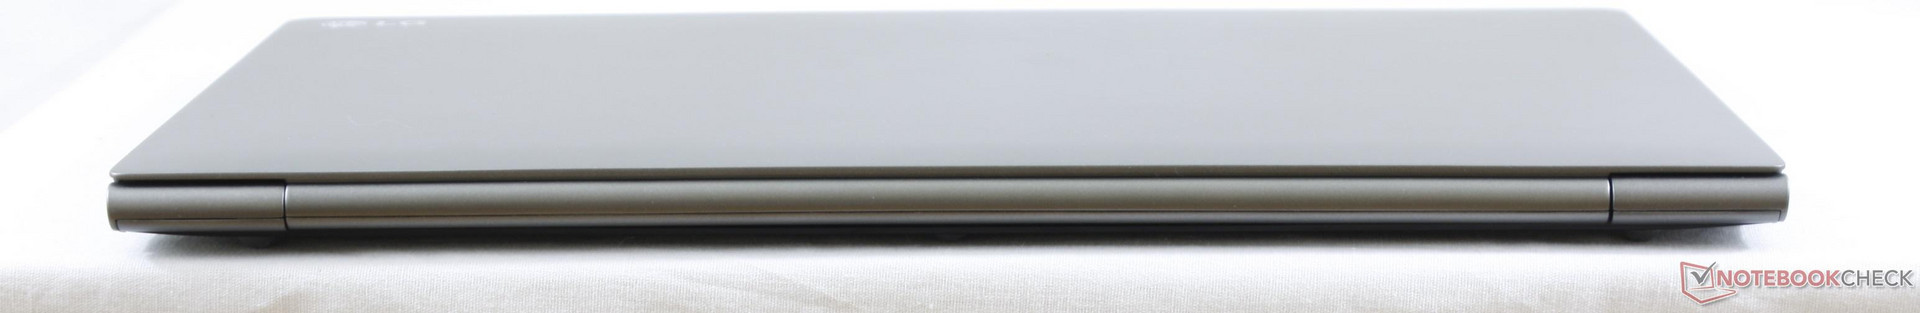
La principale pecca è lo chassis. Il display con base sottile non ha rinforzi edge-to-edge e quindi è molto flessibile rispetto alla maggioranza degli Ultrabooks. La lega di magnesio della base sembra sottile rispetto alla struttura dell'XPS 15. Questi punti deboli riducono il peso complessivo incidendo sulla rigidità.
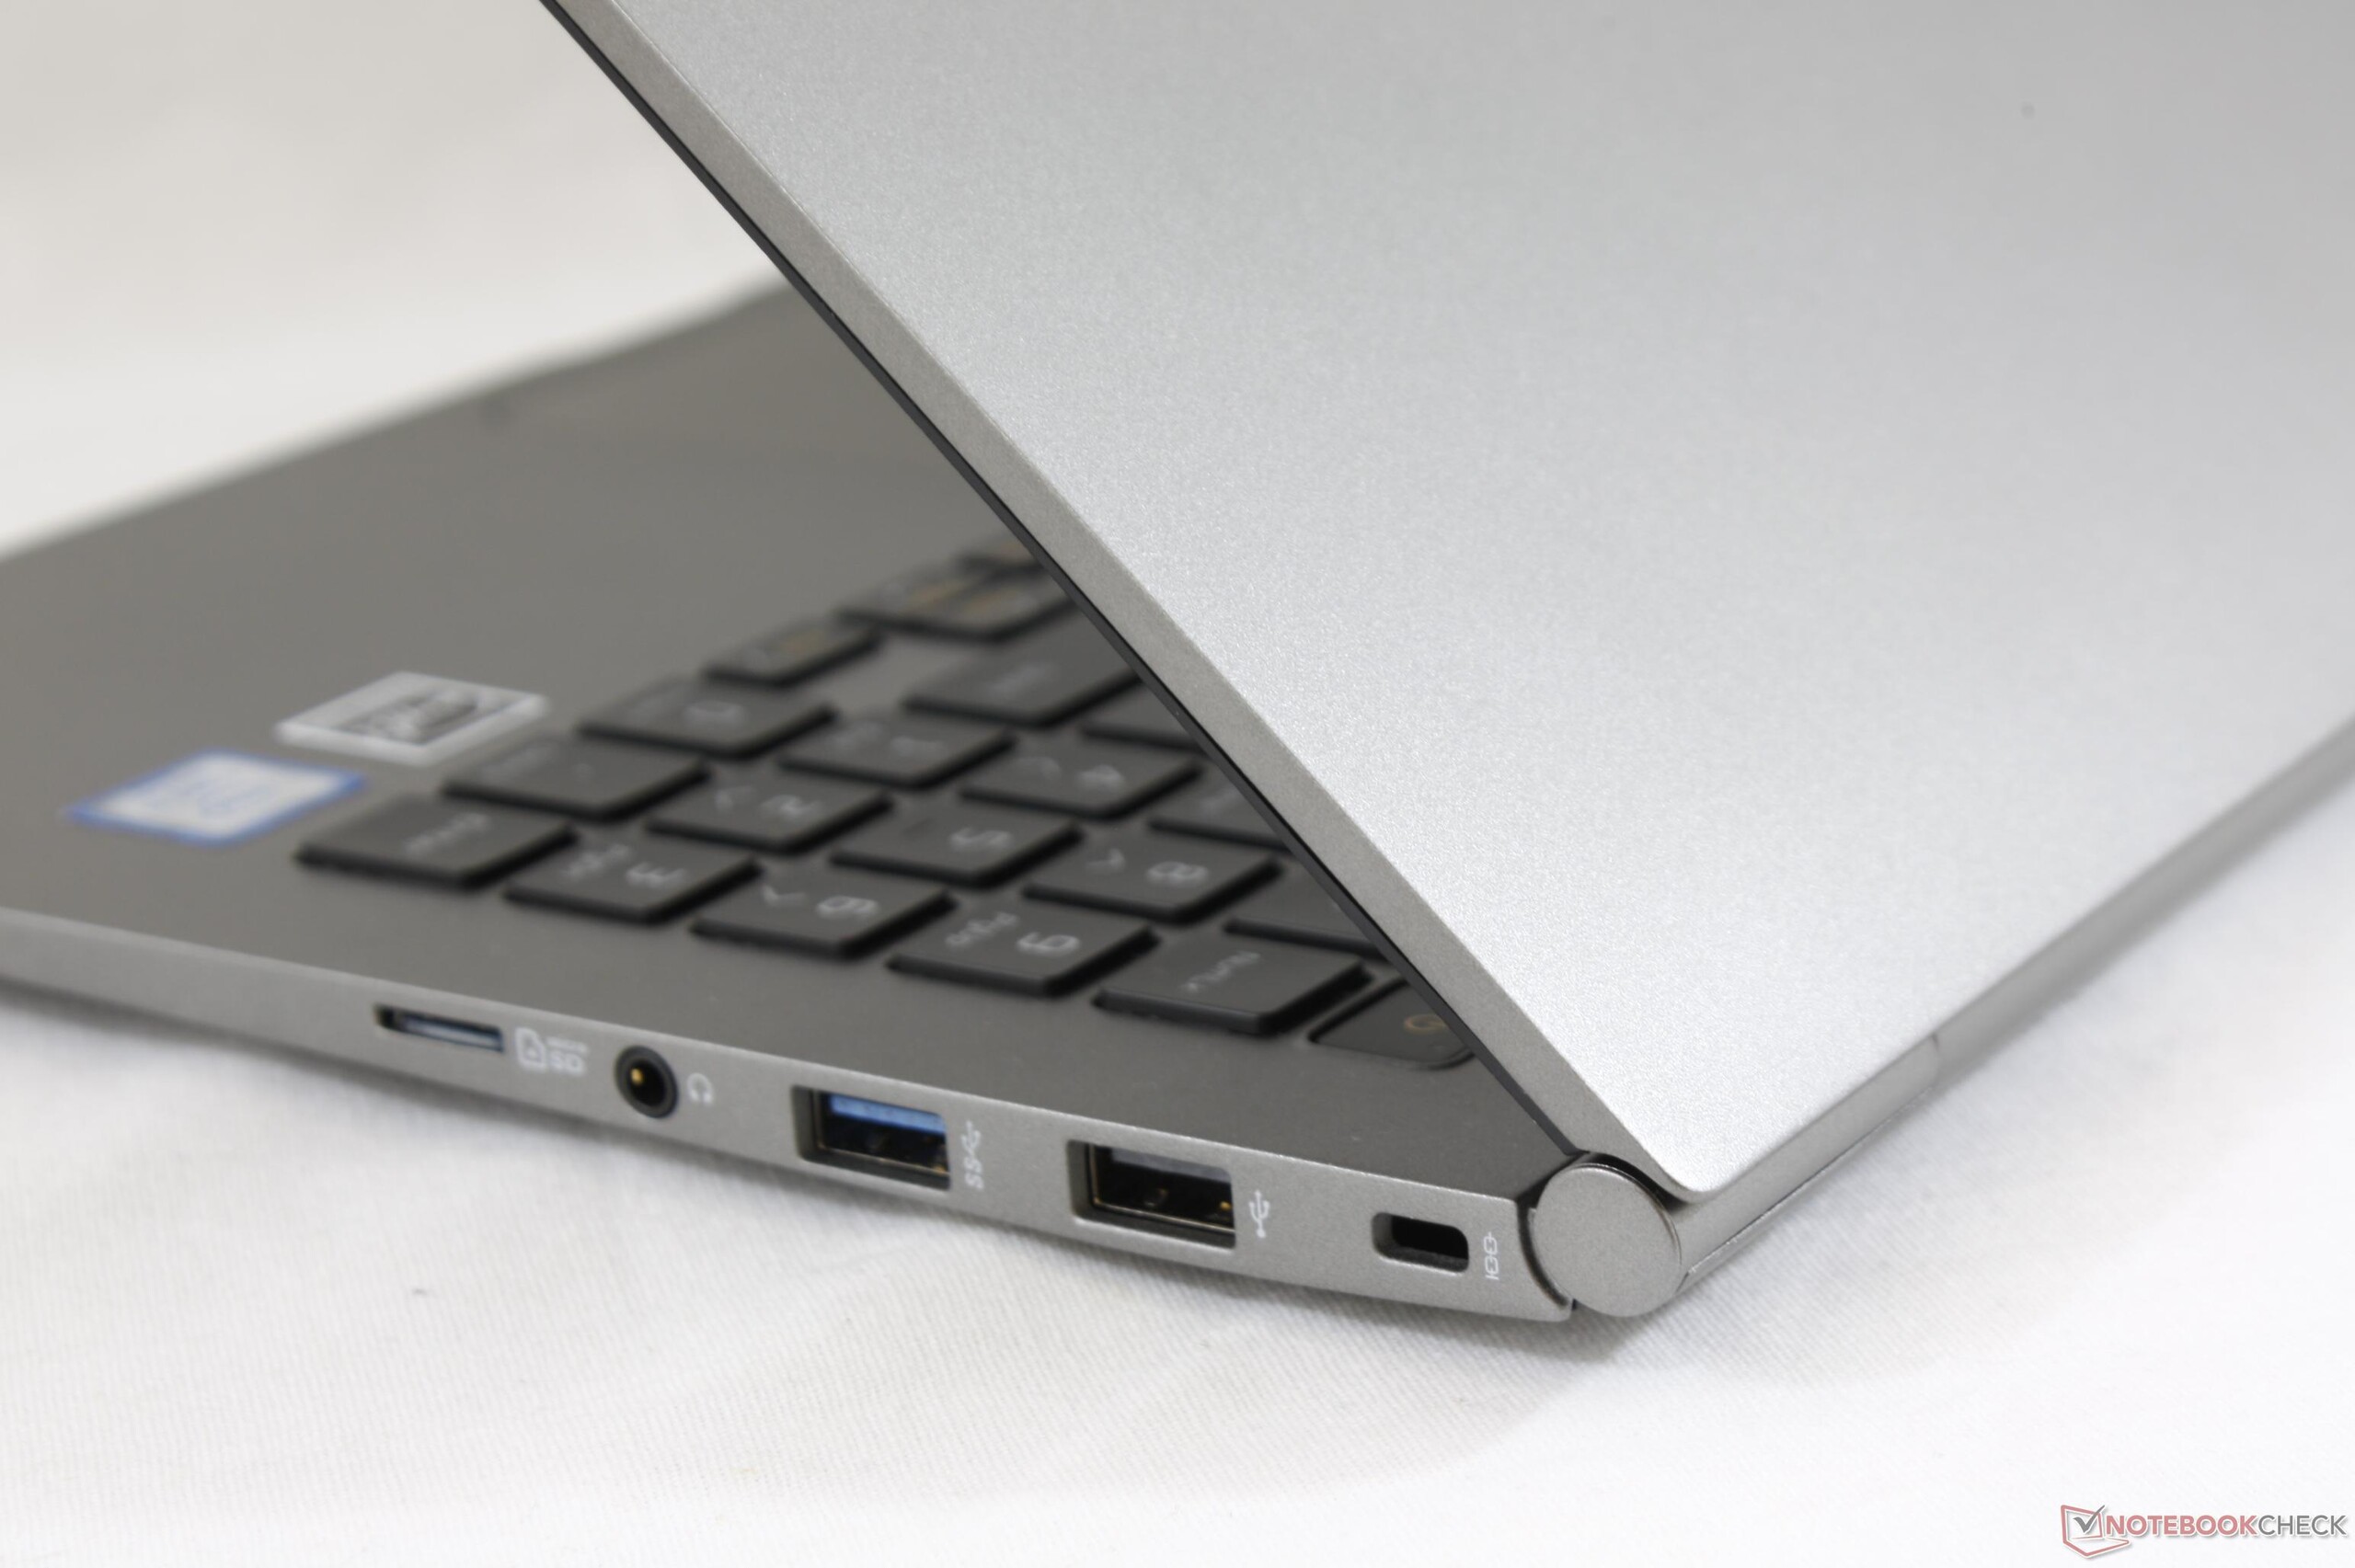
Dal punto di vista delle prestazioni, non ci sono opzioni per GPU dedicate ed il processore non riesce a mantenere a lungo il Turbo Boost. Ci sono altri problemi che sembrano relativi alla leggerezza del peso del sistema come la retroilluminazione bassa, le cerniere lente, i tasti e il trackpad soffici, la pessima posizione della videocamera, oltre all'assenza della Thunderbolt 3. Nel complesso l'utilizzo dell'LG Gram dà un'esperienza di qualità inferiore rispetto alle alternative più pesanti e solide come XPS 15, Spectre x360 15, o Yoga 720. Il Gram Z15980 dovrebbe risolvere molti di questi problemi, ma ci vorrebbe una revisione del modello nuovo per effettuare le modifiche.
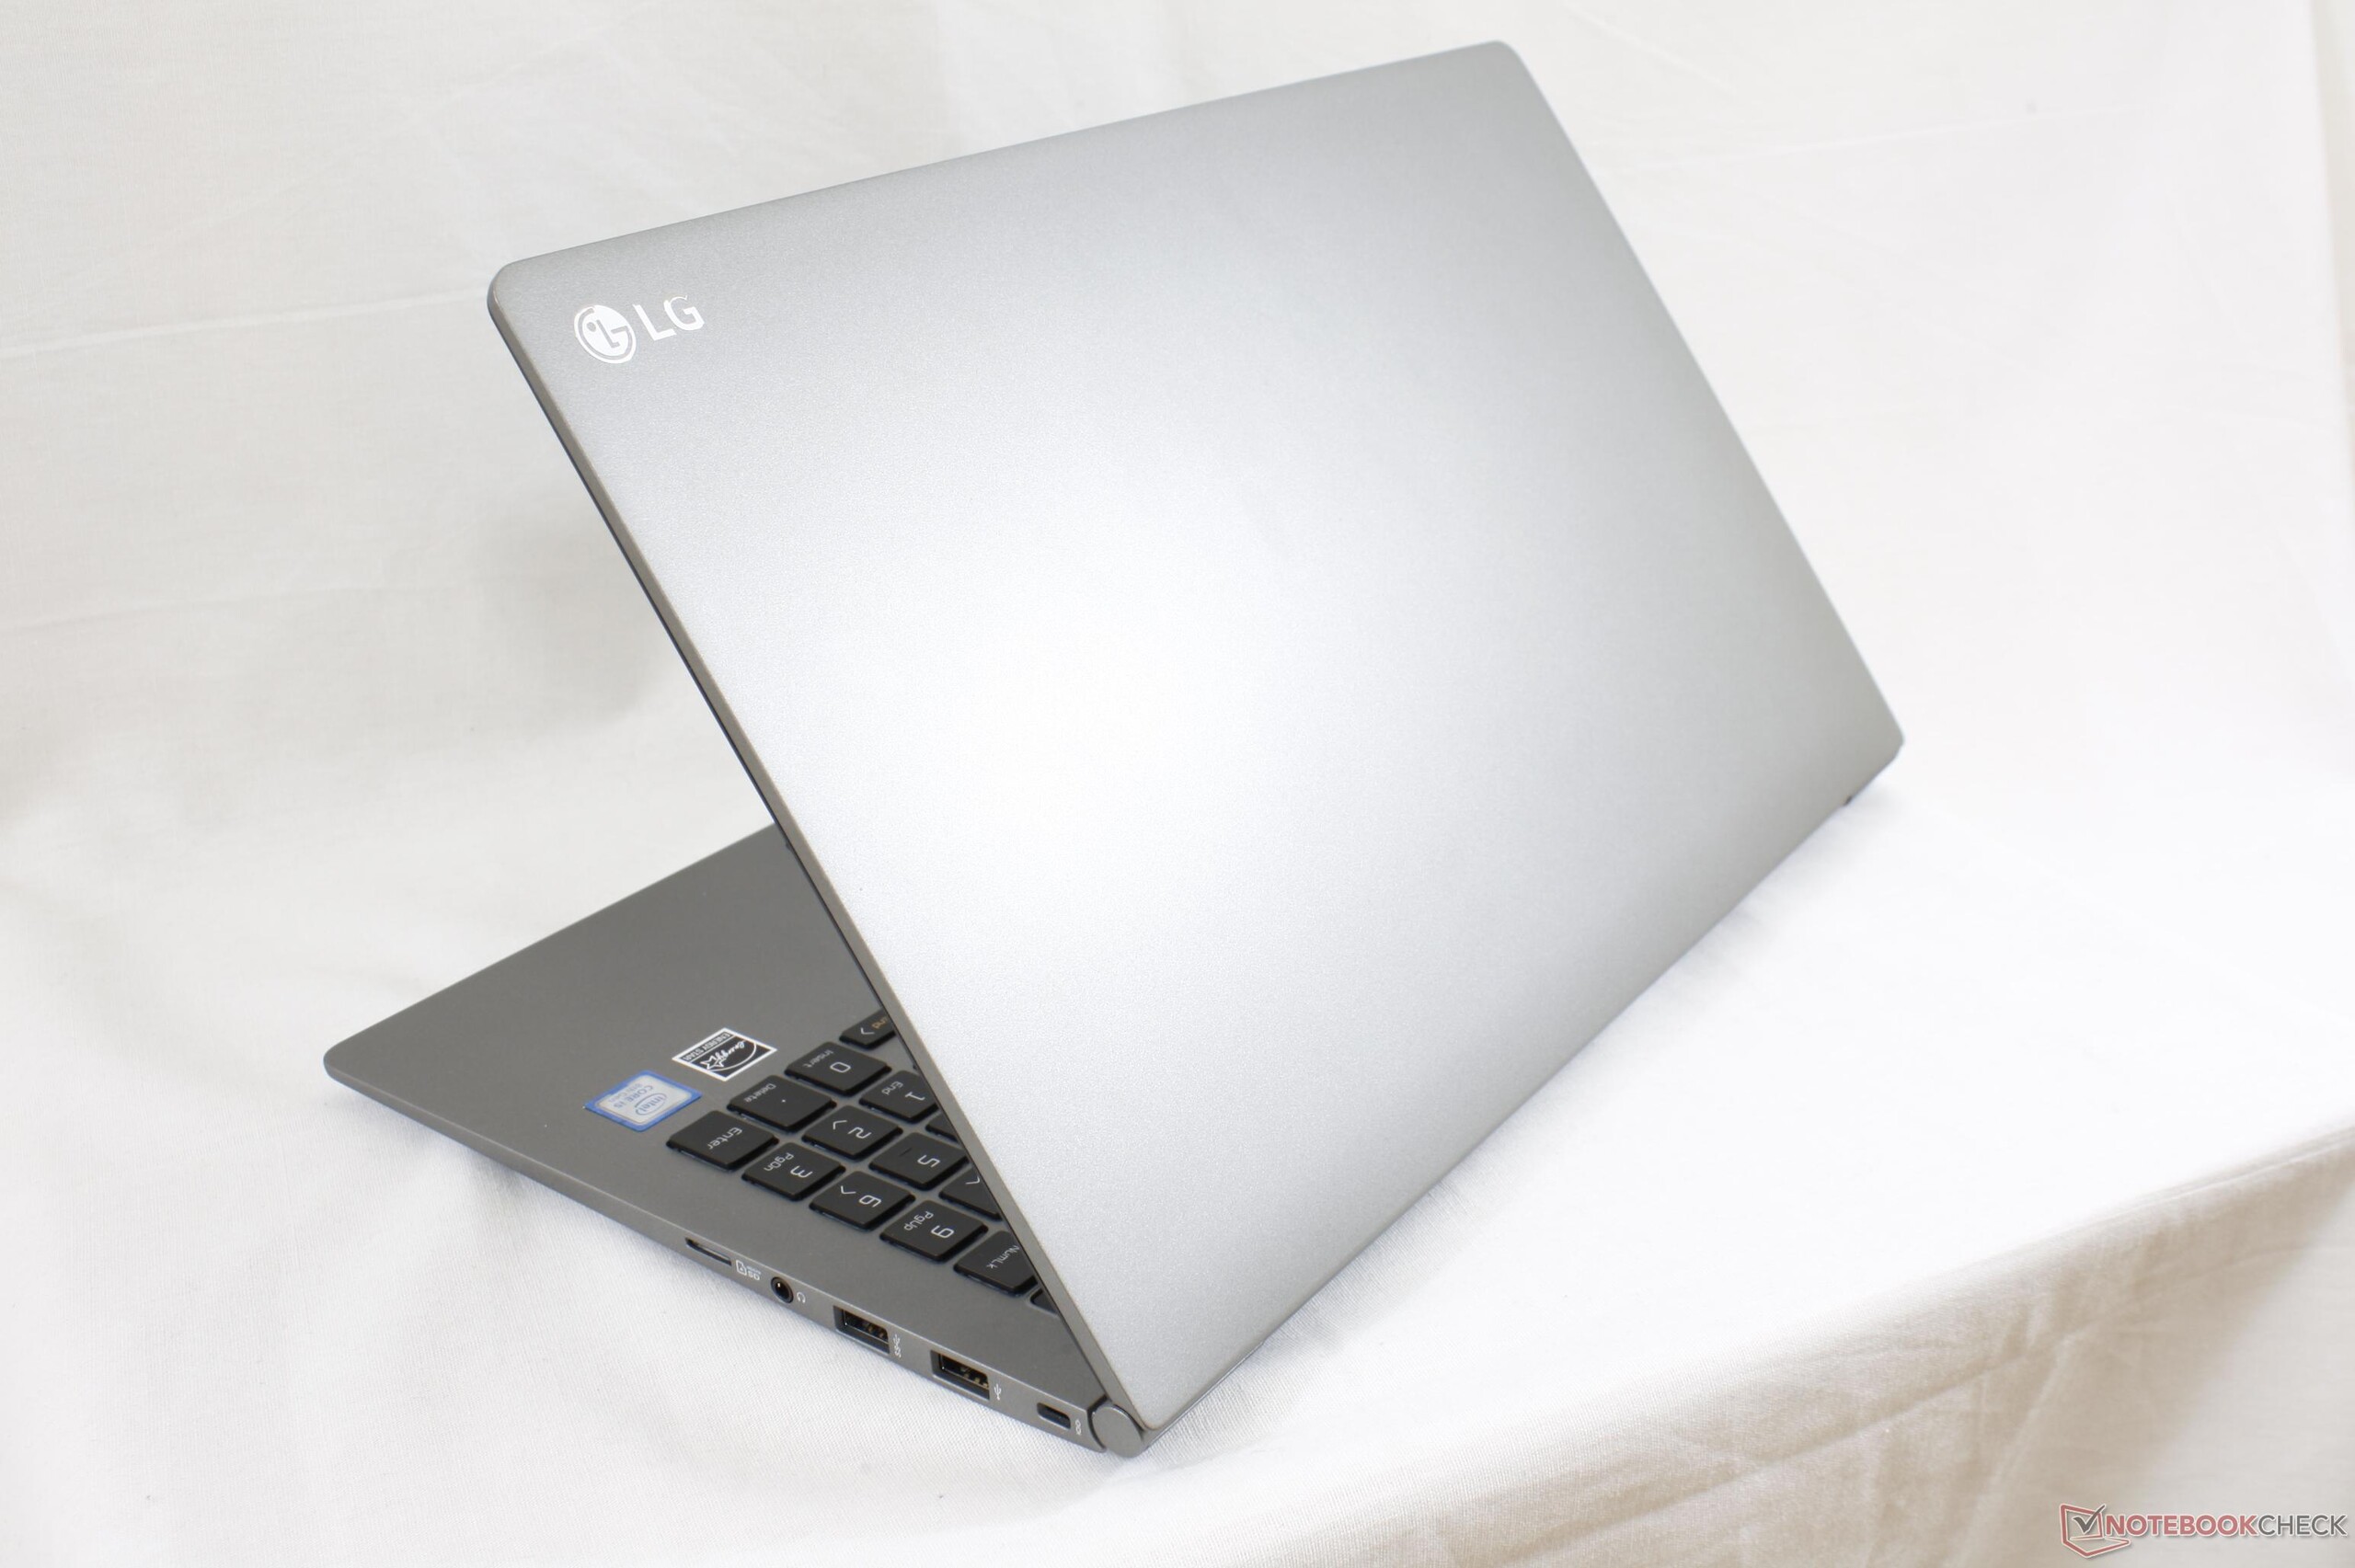
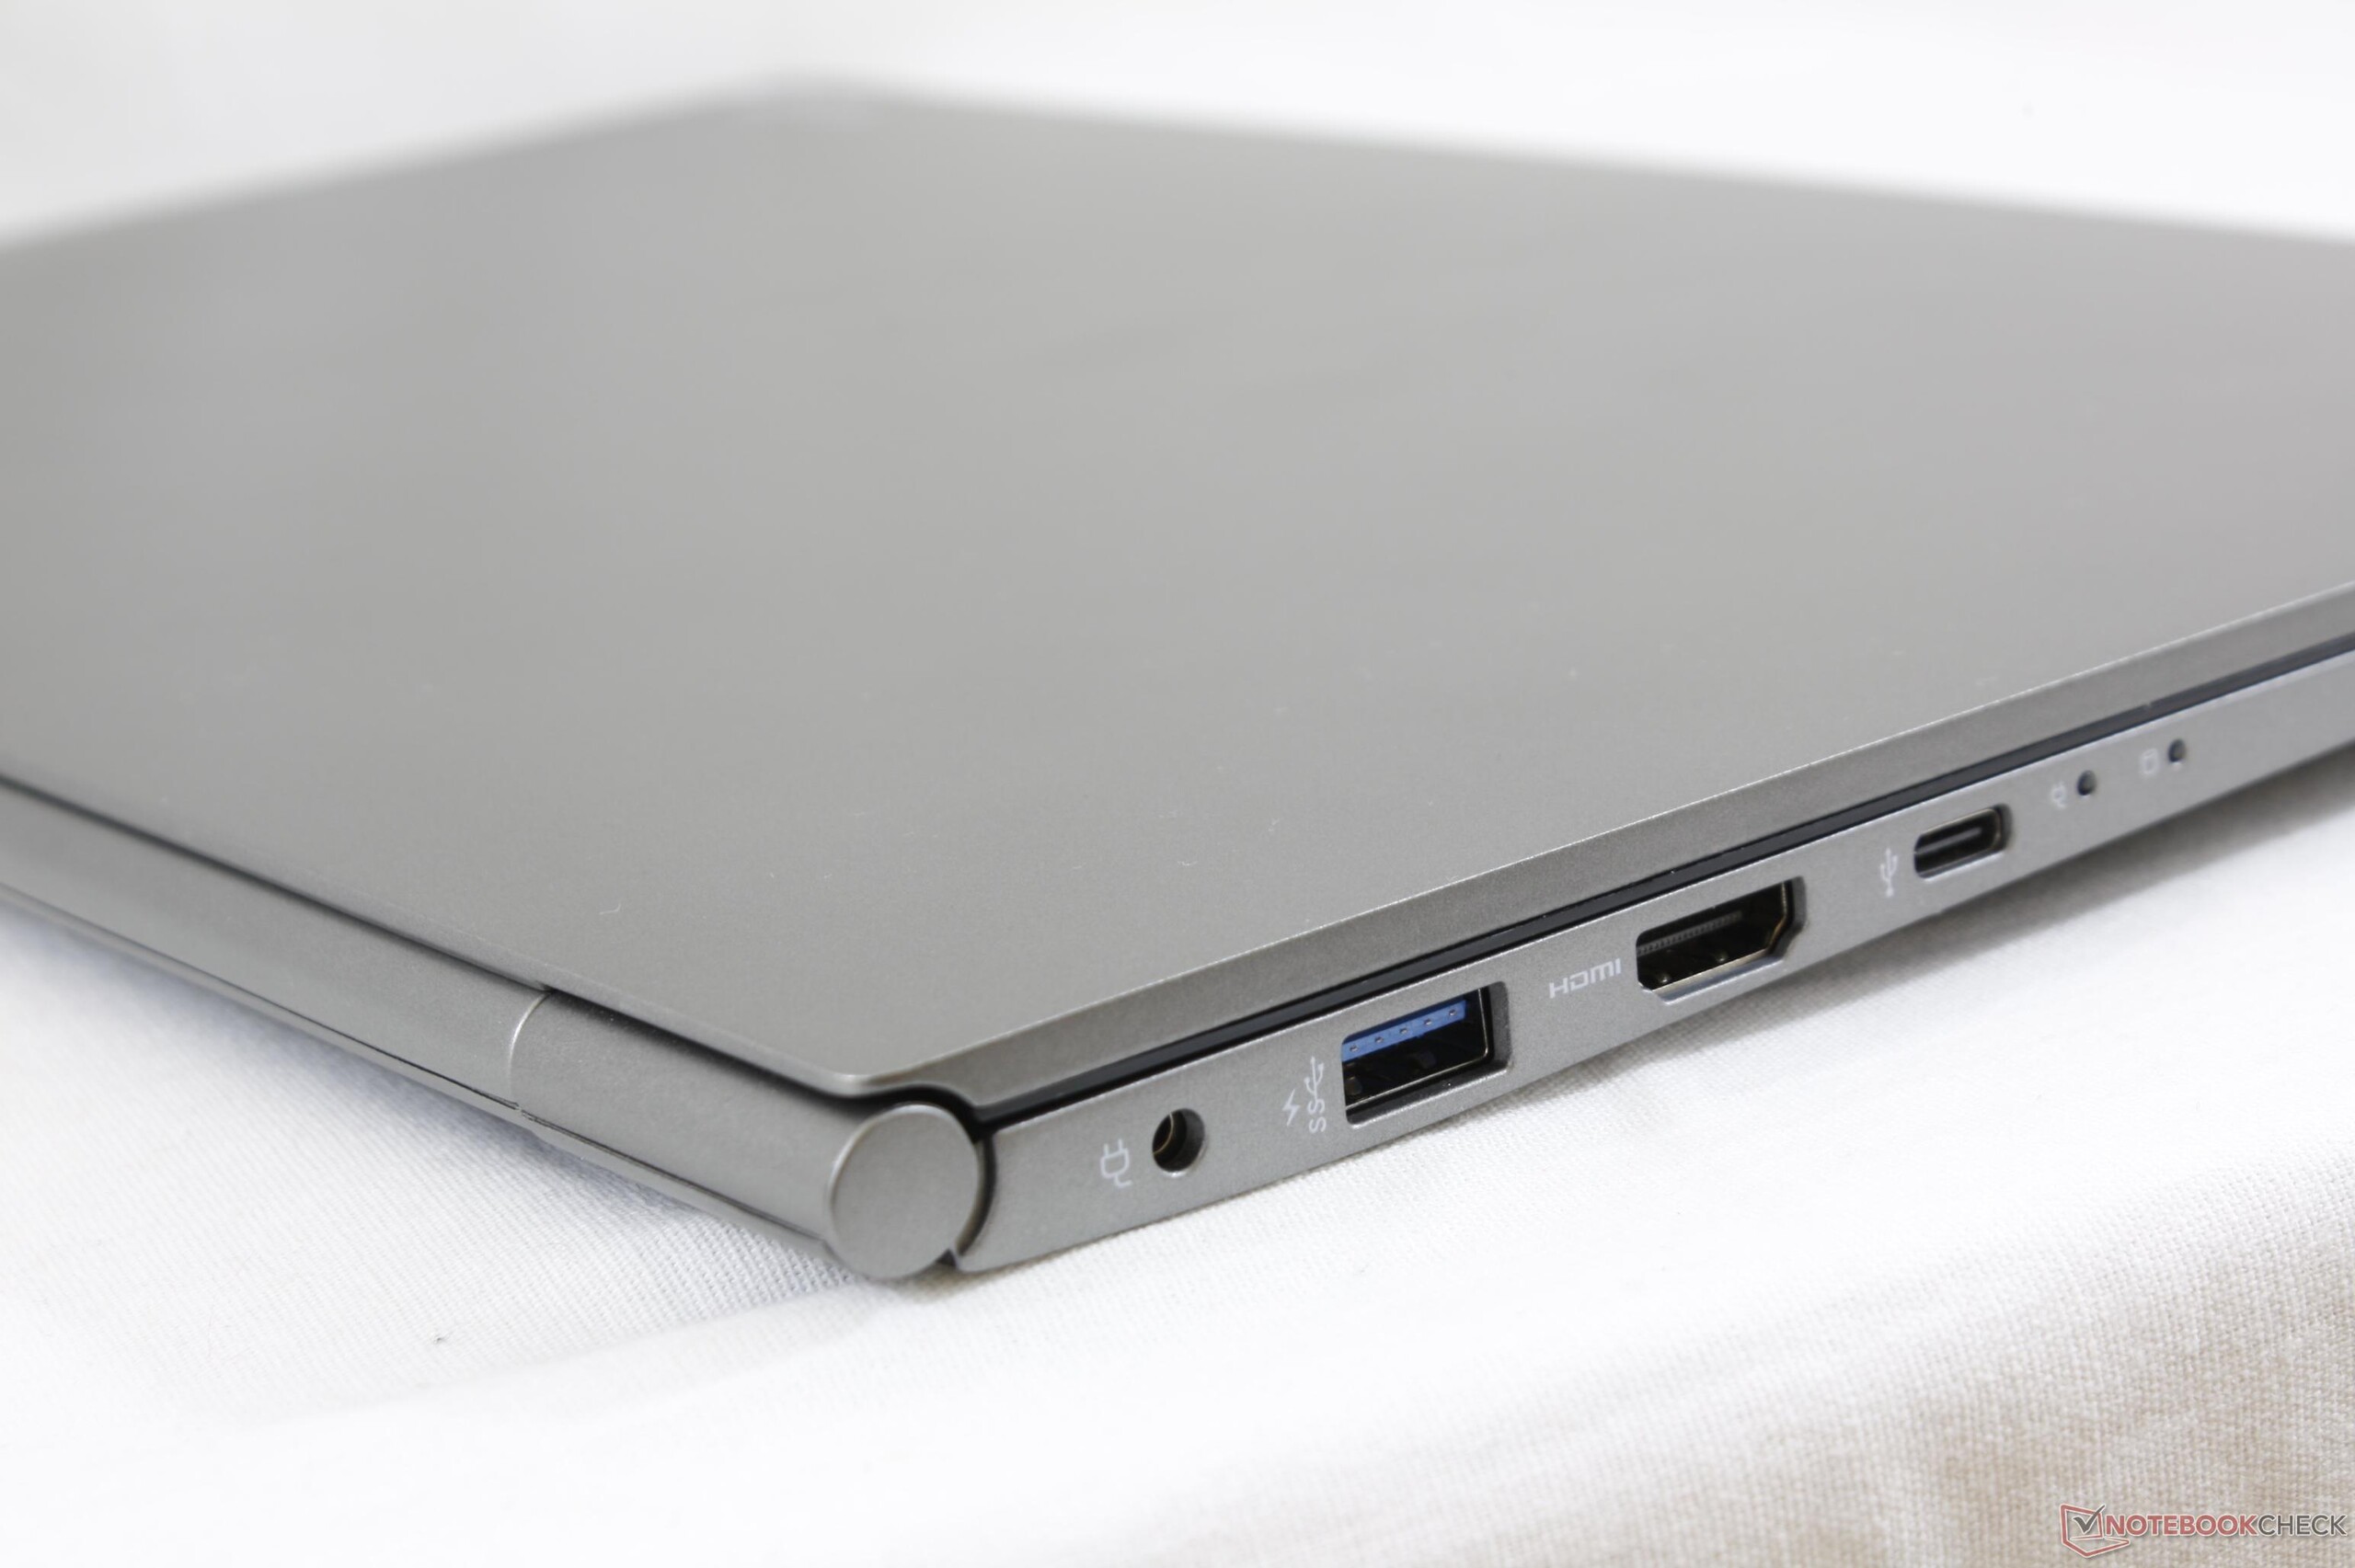
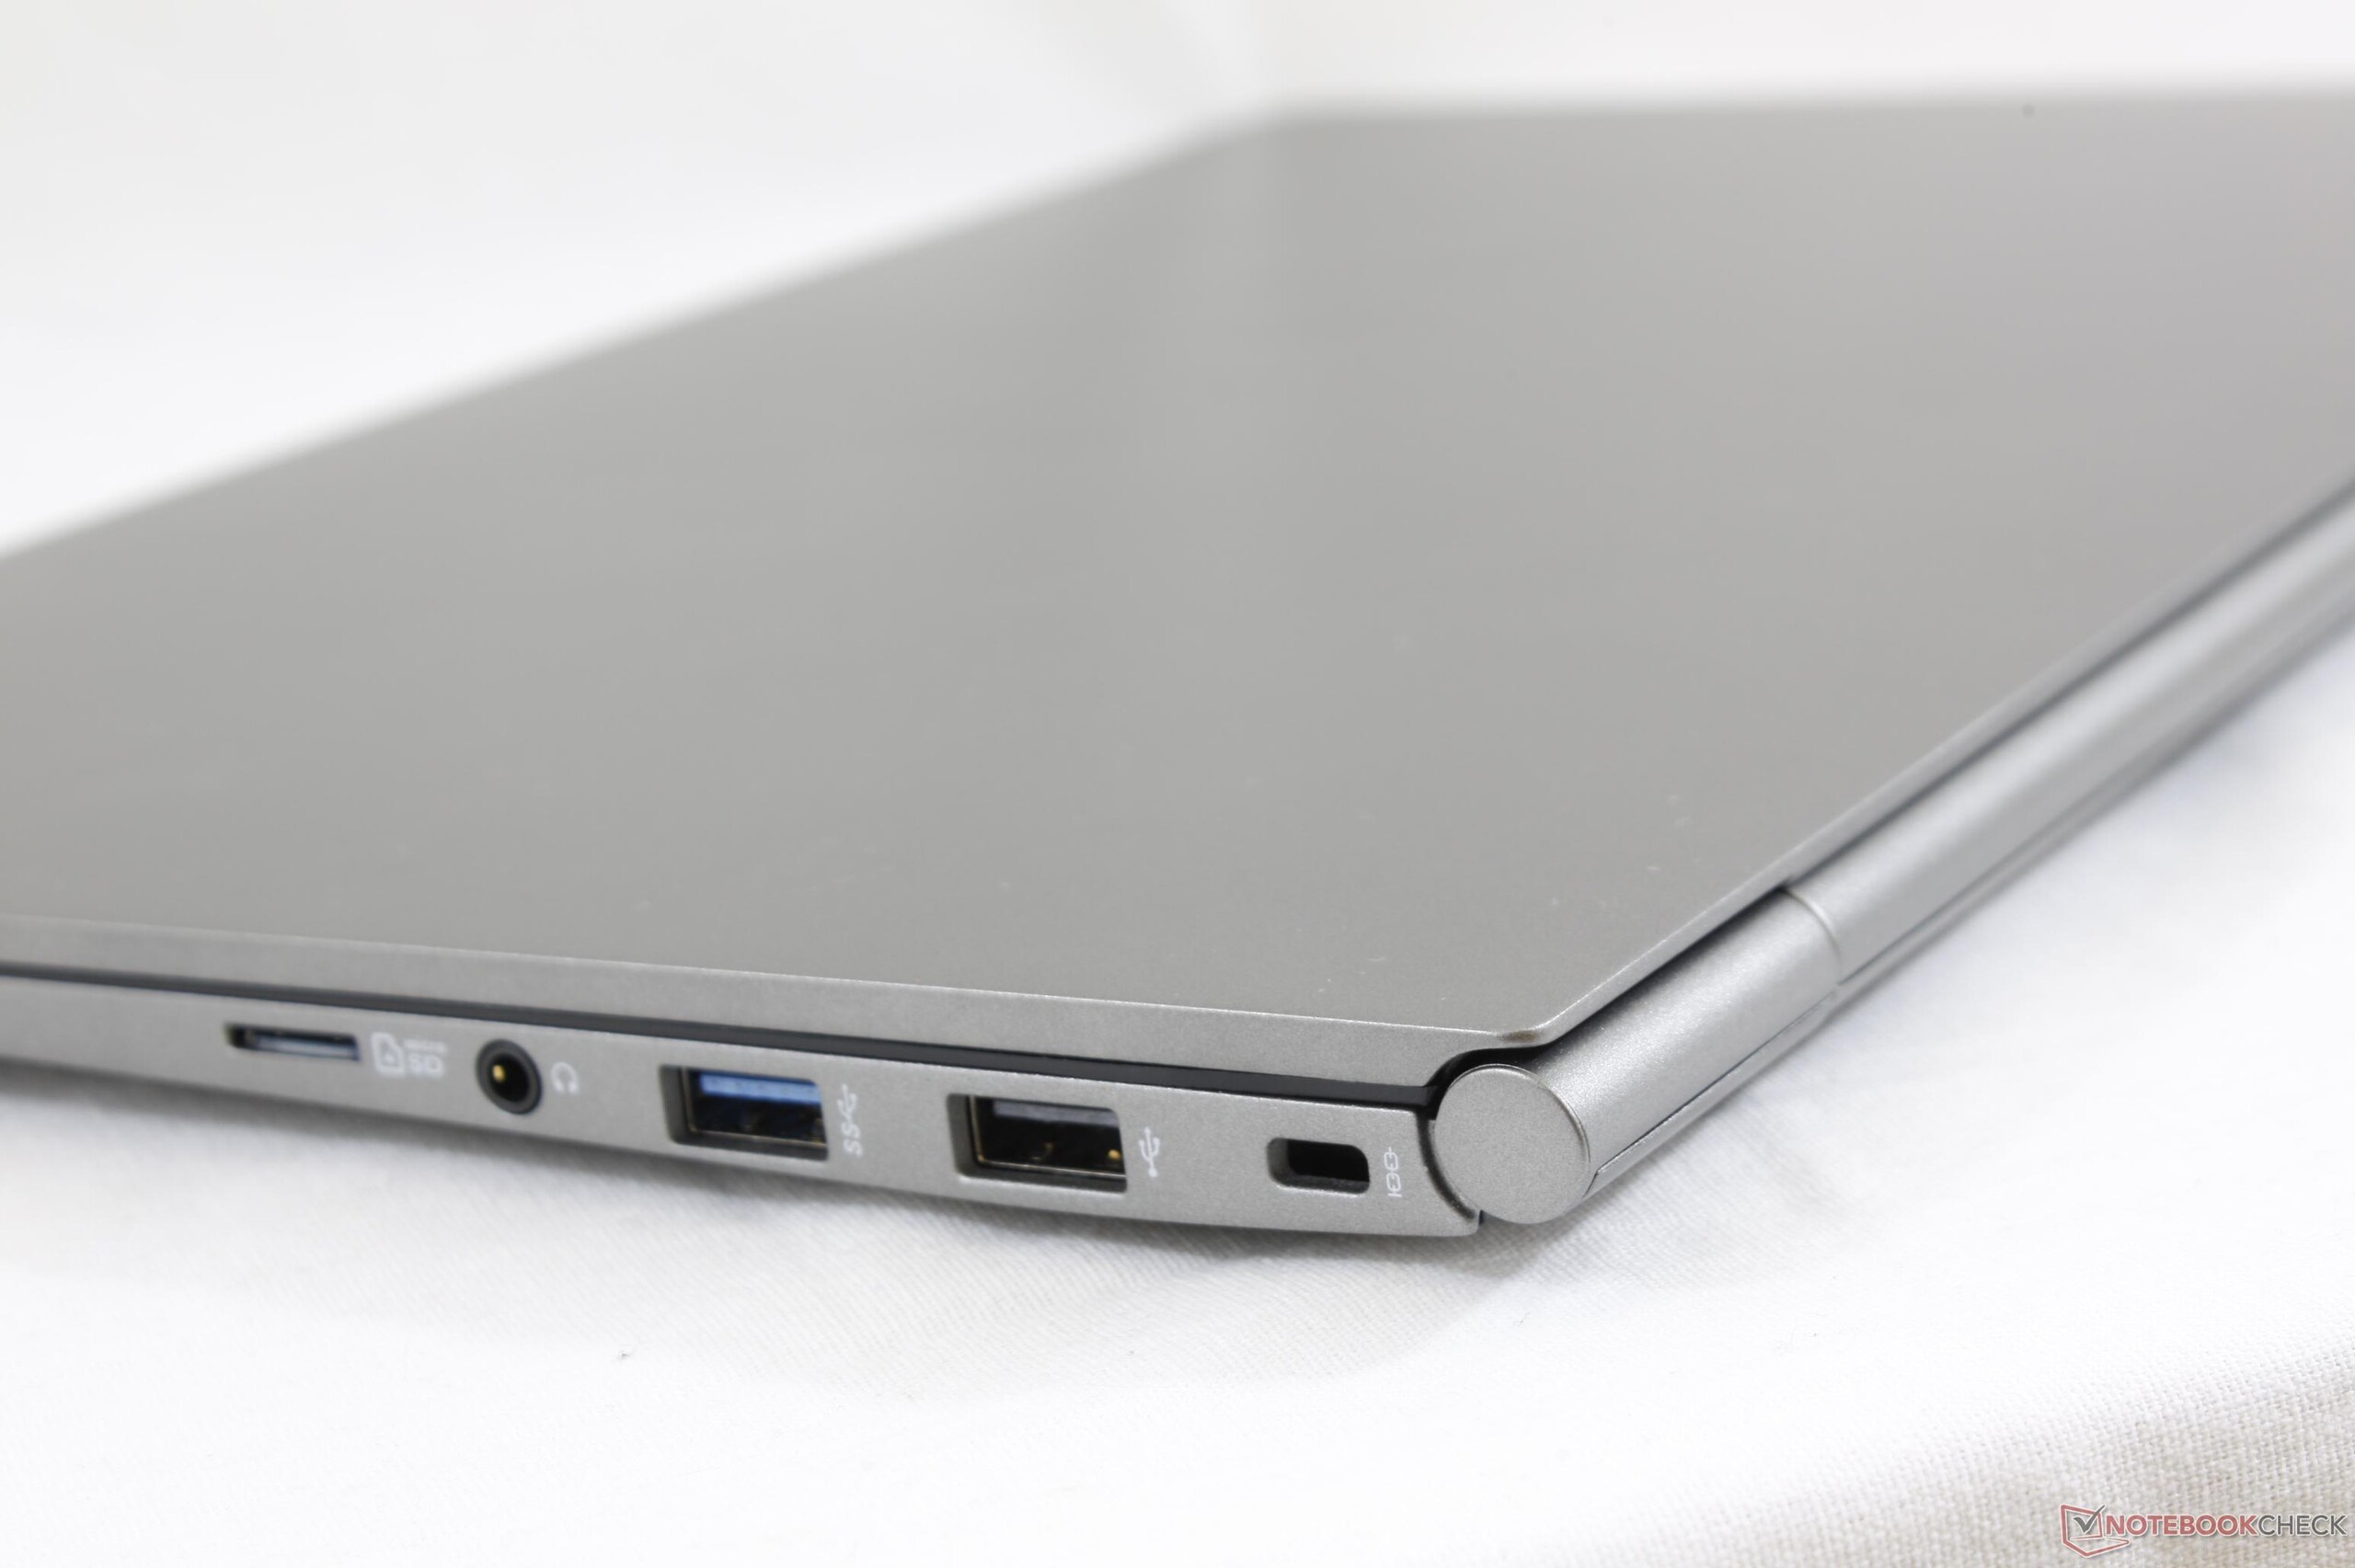
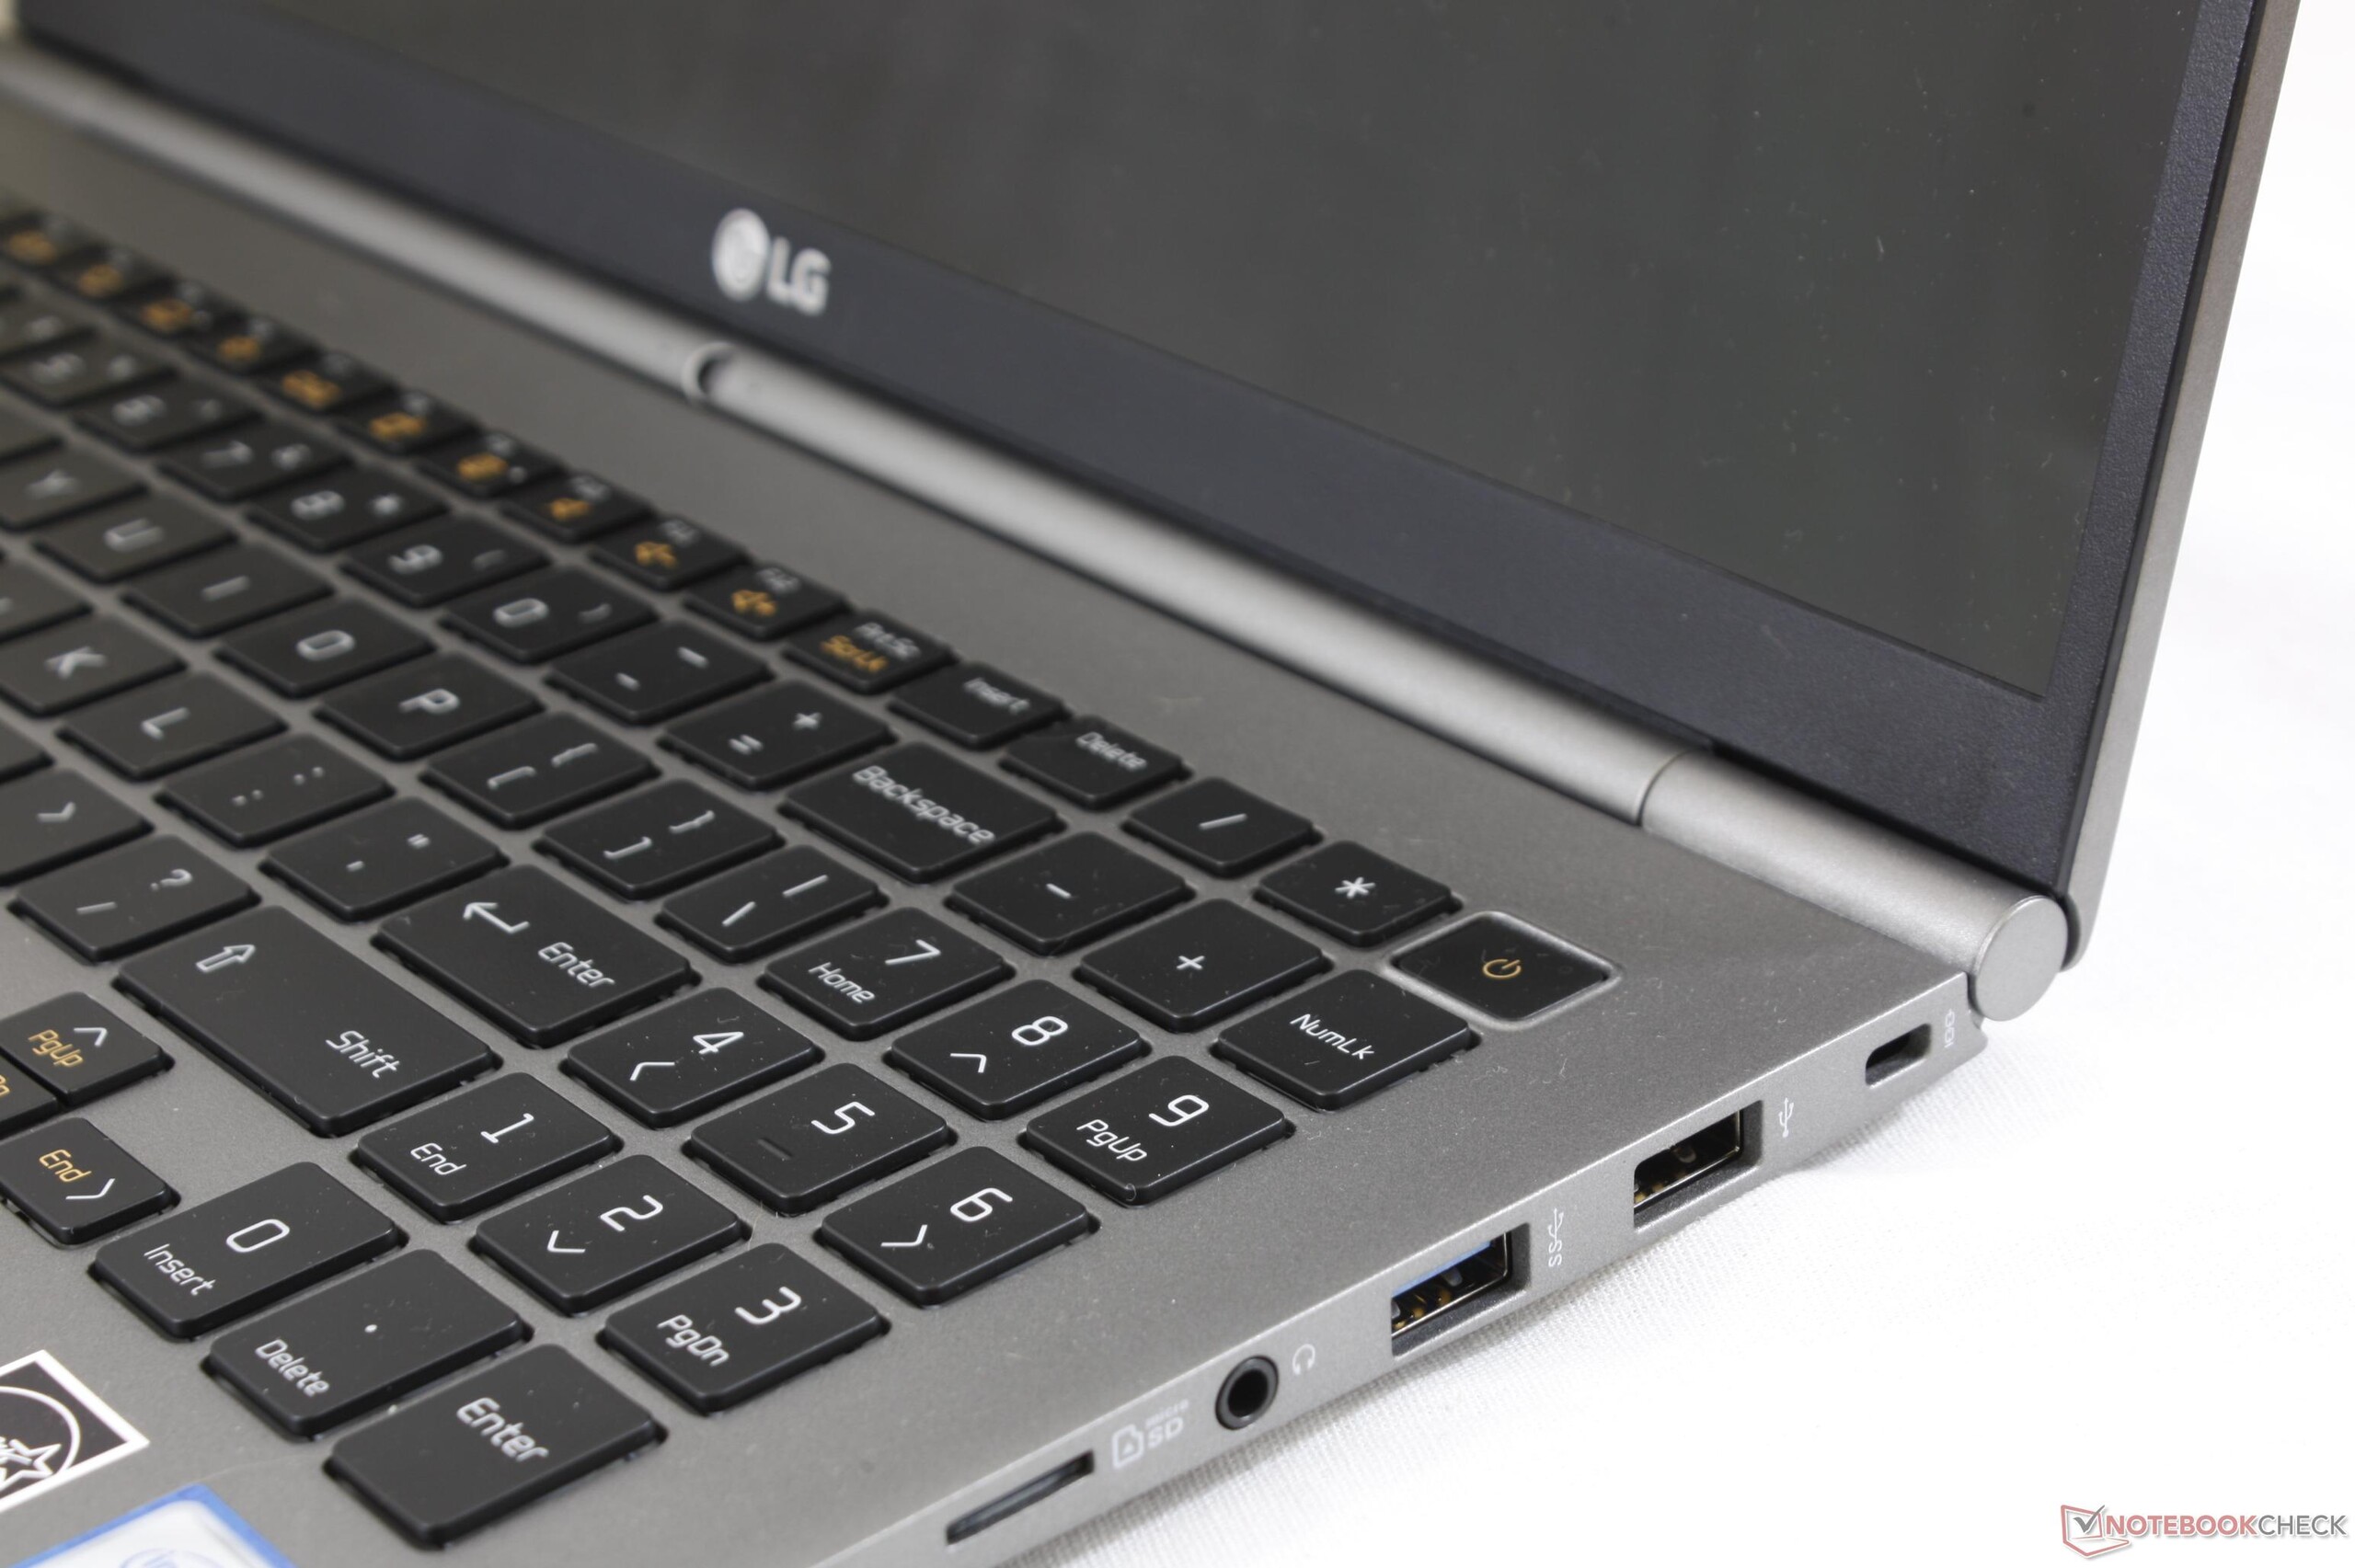
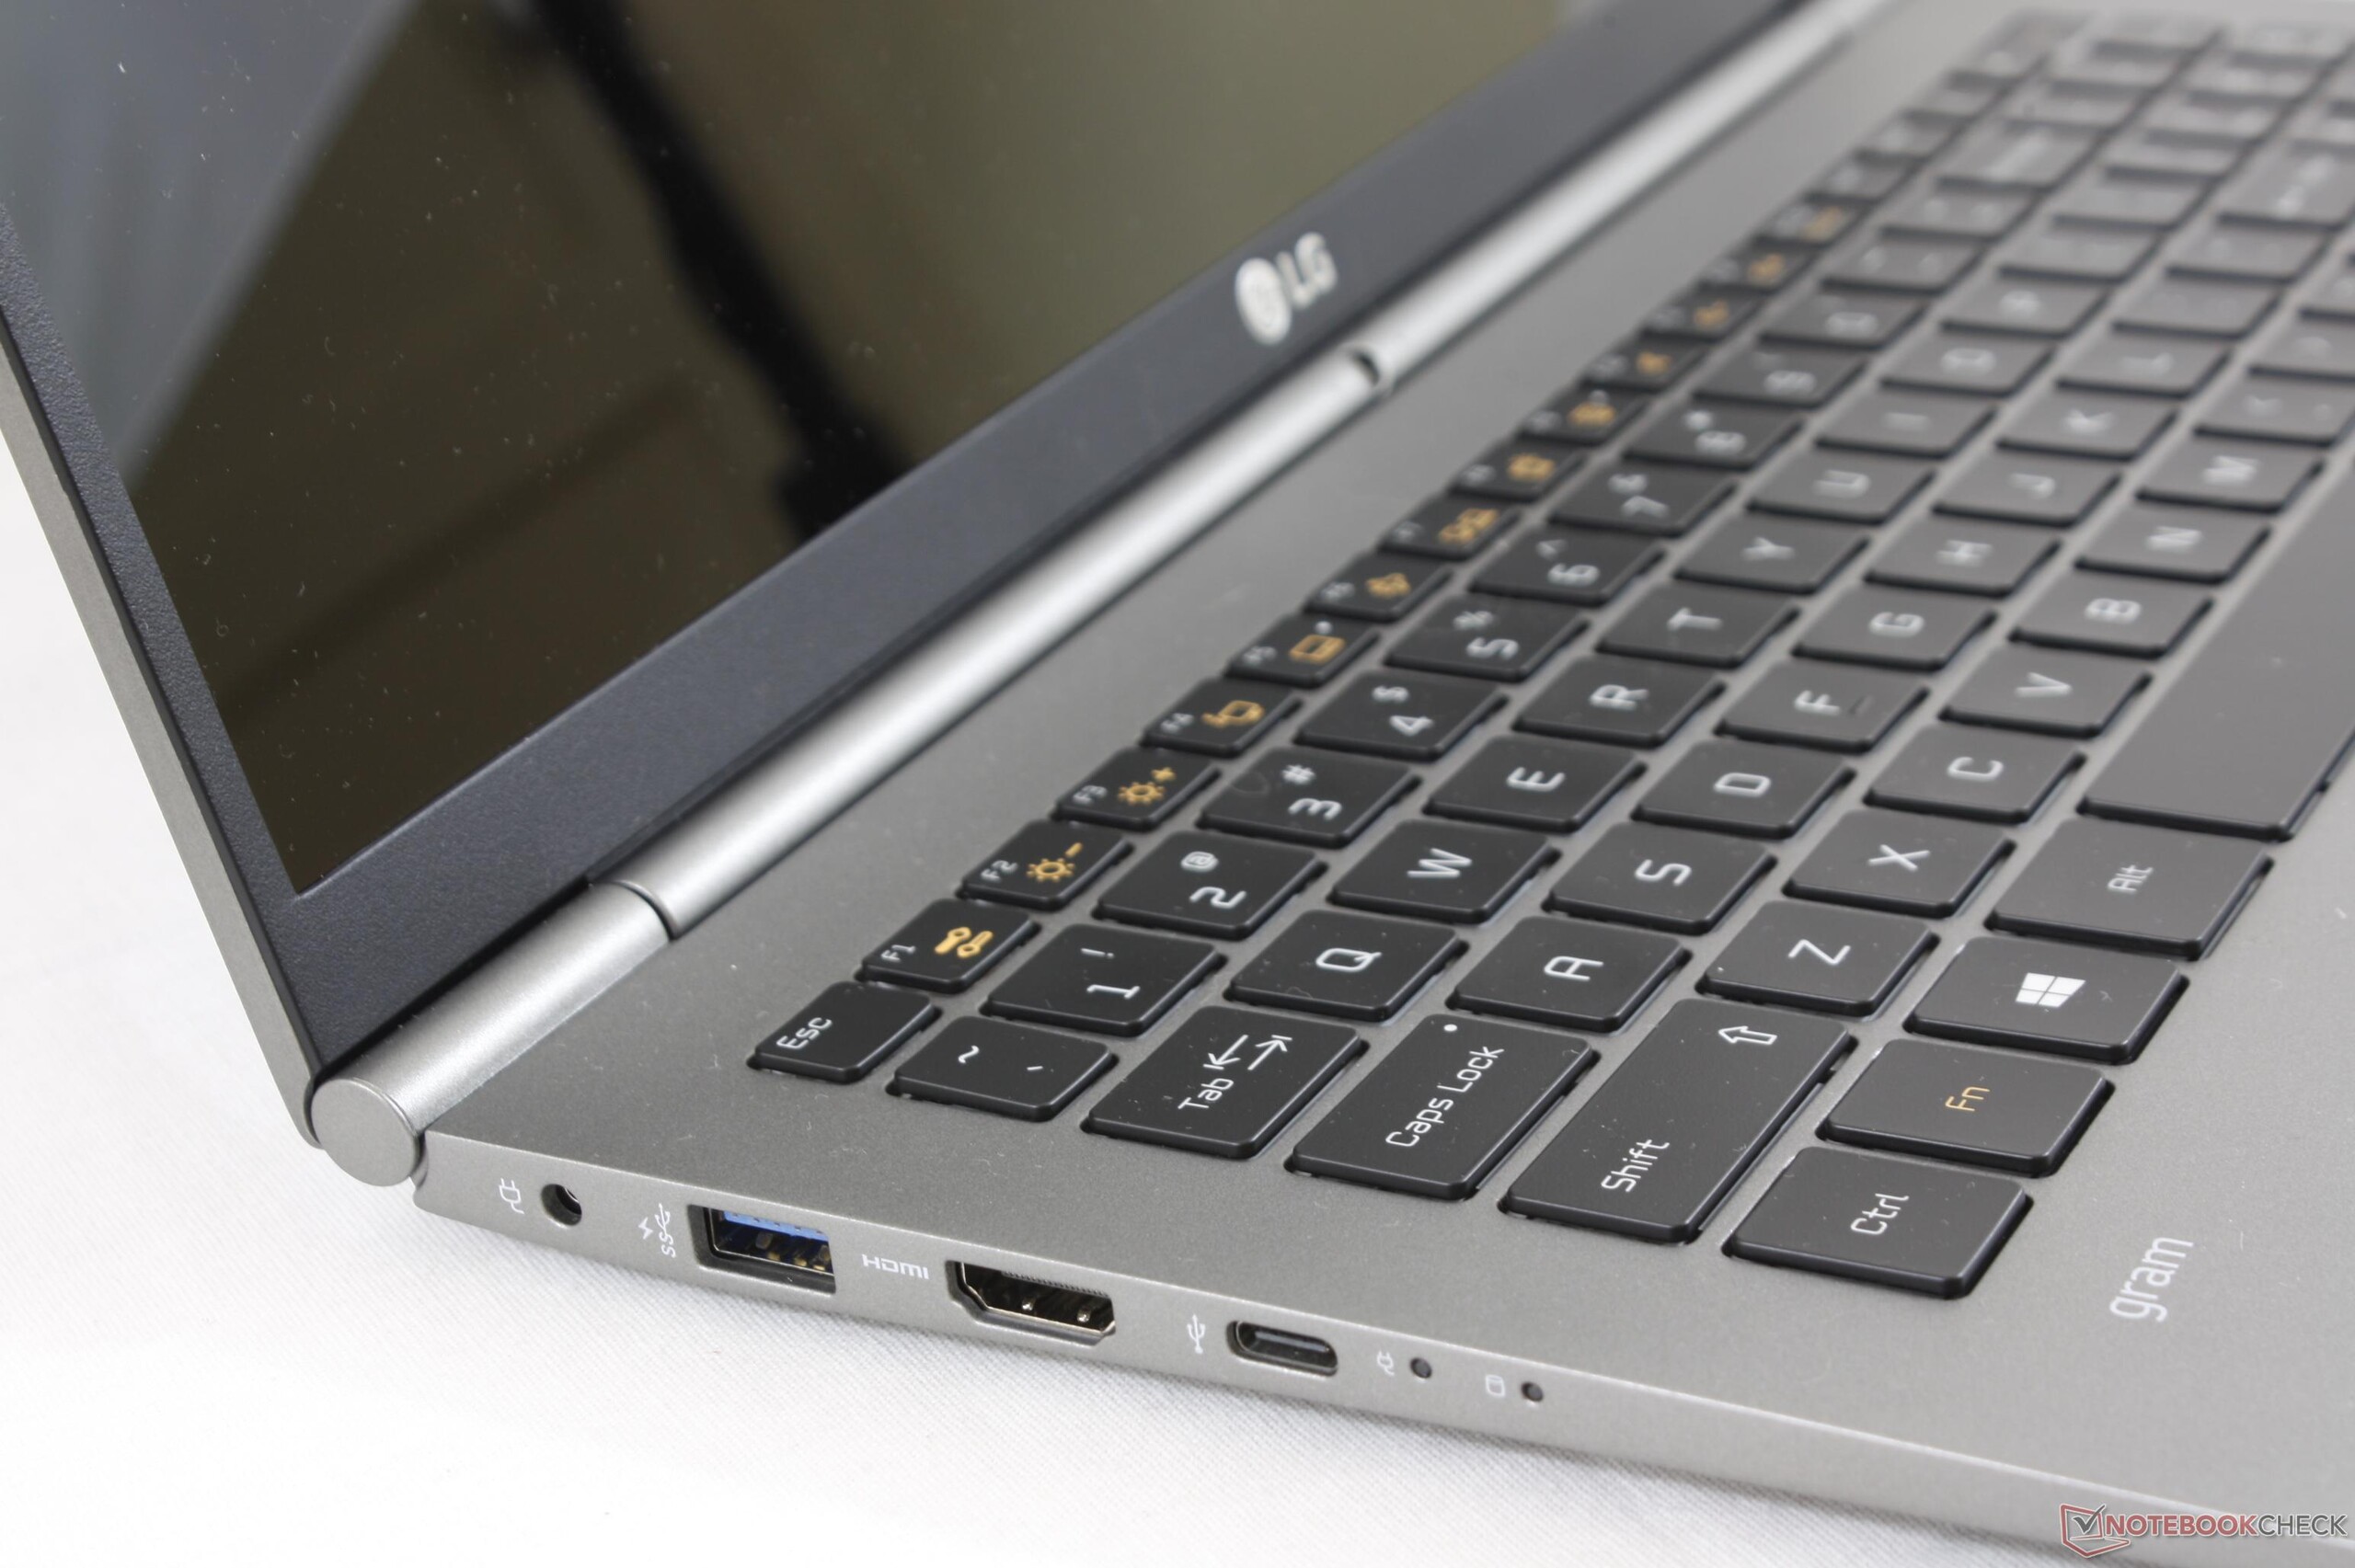
Ci sono un paio di punti di forza nonostante le pecche. La rumorosità della ventola in genere è bassa, e la RAM è espandibile, ci sono un buon numero di porte, e il prezzo di partenza è qualche centinaio di dollari sotto le ammiraglie Ultrabooks dei noti competitors. Se avete bisogno di un Ultrabook da 15" leggero, allora raccomandiamo di guardare anche il Samsung Notebook 9 oltre al Gram 15Z975 in quanto il Samsung è altrettanto leggero ma ha una tastiera migliore e un display molto più luminoso.
Il Gram 15 con la sua leggerezza incoraggia chi viaggia molto e lavora in giro, ma display scuro, tastiera spugnosa, webcam posizionata male, e chassis fragile rendono difficile raccomandare l'LG.
Nota: si tratta di una recensione breve, con alcune sezioni non tradotte, per la versione integrale in inglese guardate qui.
LG Gram 15Z975
- 01/22/2018 v6 (old)
Allen Ngo
Price comparison
