Recensione breve del Portatile Lenovo ThinkPad E480 (i5-8250U, UHD 620, SSD)

| SD Card Reader | |
| average JPG Copy Test (av. of 3 runs) | |
| HP ProBook 440 G5-3KX87ES (Toshiba Exceria Pro SDXC 64 GB UHS-II) | |
| Schenker Slim 14 L17 (Toshiba Exceria Pro SDXC 64 GB UHS-II) | |
| Lenovo ThinkPad E480-20KQS00000 (Toshiba Exceria Pro M501) | |
| Lenovo ThinkPad E480-20KNCTO1WW (Toshiba Exceria Pro M501) | |
| Media della classe Office (19.8 - 198.5, n=22, ultimi 2 anni) | |
| Asus VivoBook S14 S406UA-BV023T (Toshiba Exceria Pro M501 microSDXC 64GB) | |
| Acer TravelMate P449-G2-M-56CD (Toshiba Exceria Pro SDXC 64 GB UHS-II) | |
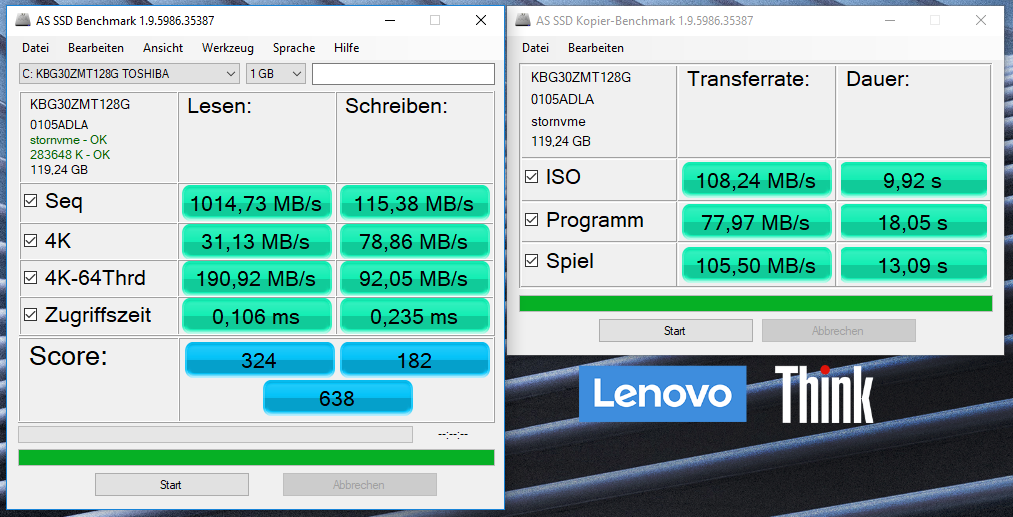
| maximum AS SSD Seq Read Test (1GB) | |
| HP ProBook 440 G5-3KX87ES (Toshiba Exceria Pro SDXC 64 GB UHS-II) | |
| Lenovo ThinkPad E480-20KNCTO1WW (Toshiba Exceria Pro M501) | |
| Schenker Slim 14 L17 (Toshiba Exceria Pro SDXC 64 GB UHS-II) | |
| Lenovo ThinkPad E480-20KQS00000 (Toshiba Exceria Pro M501) | |
| Media della classe Office (27.4 - 249, n=21, ultimi 2 anni) | |
| Asus VivoBook S14 S406UA-BV023T (Toshiba Exceria Pro M501 microSDXC 64GB) | |
| Acer TravelMate P449-G2-M-56CD (Toshiba Exceria Pro SDXC 64 GB UHS-II) | |
| |||||||||||||||||||||||||
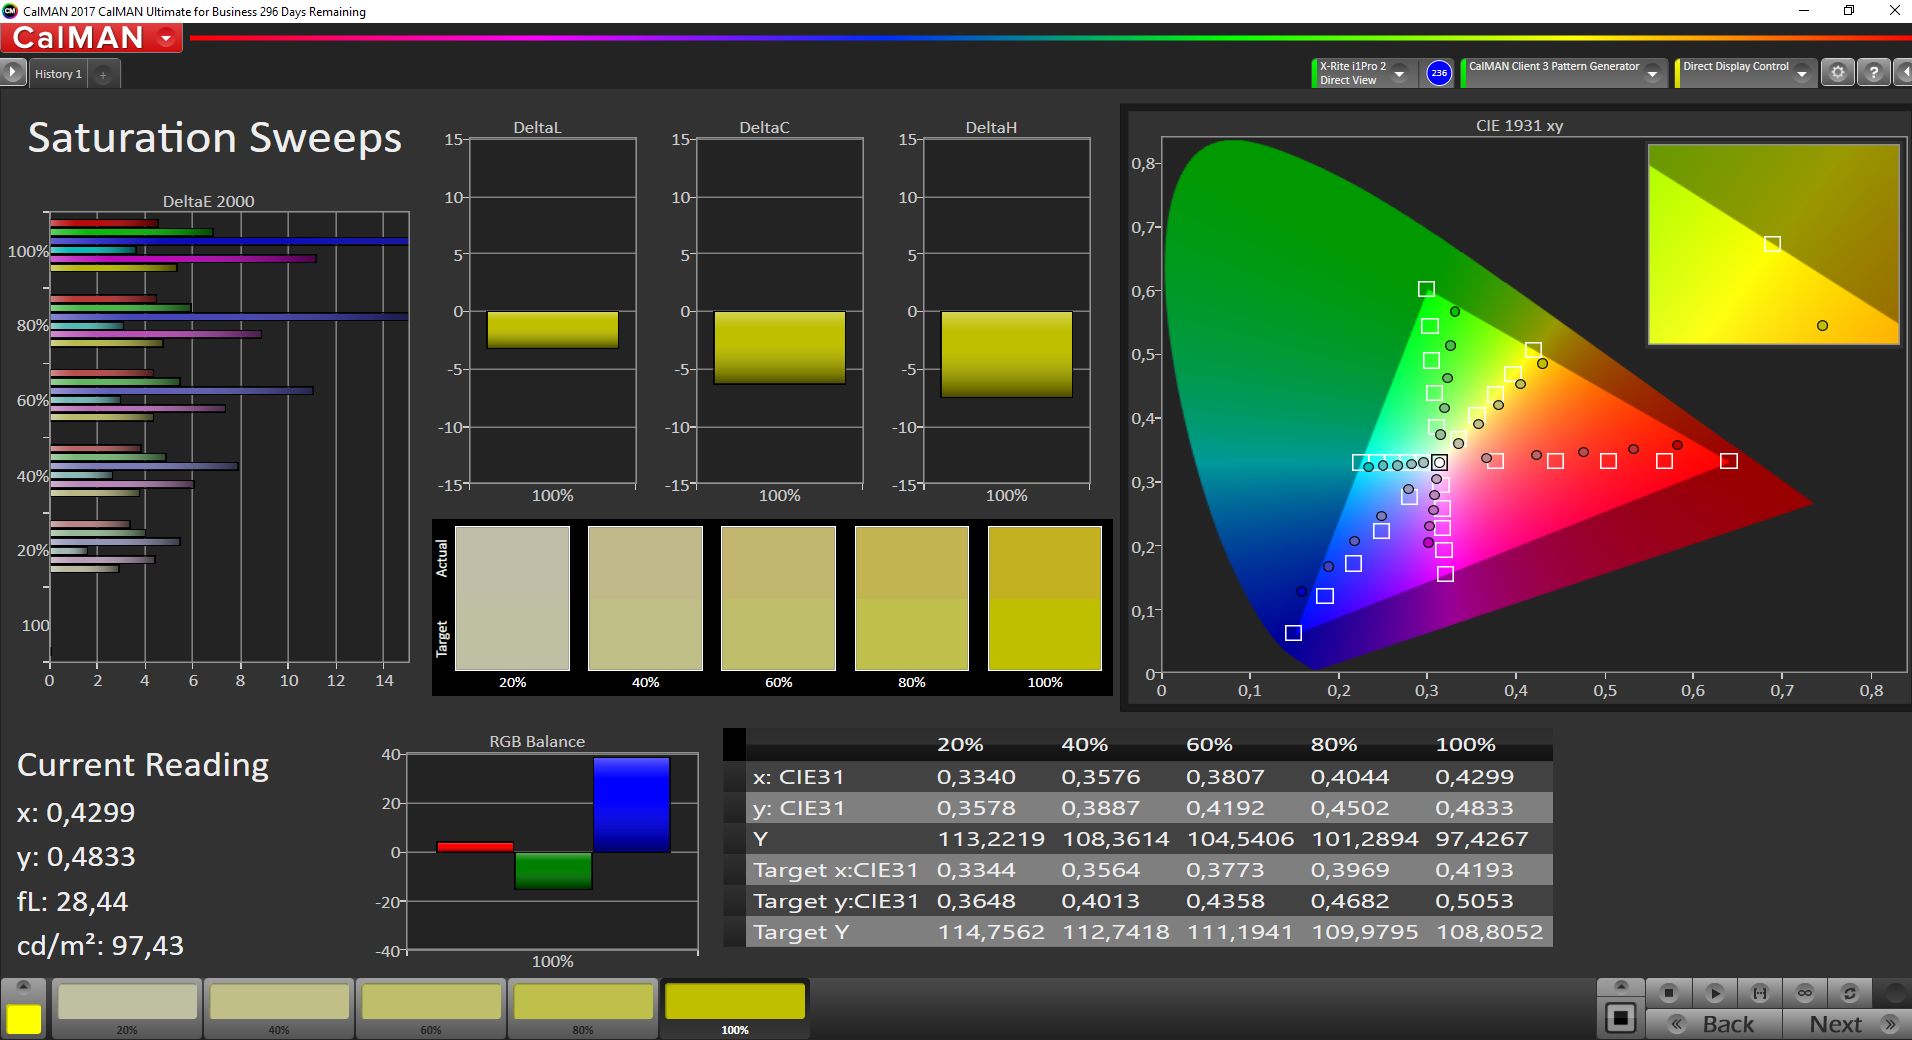
Distribuzione della luminosità: 83 %
Al centro con la batteria: 262 cd/m²
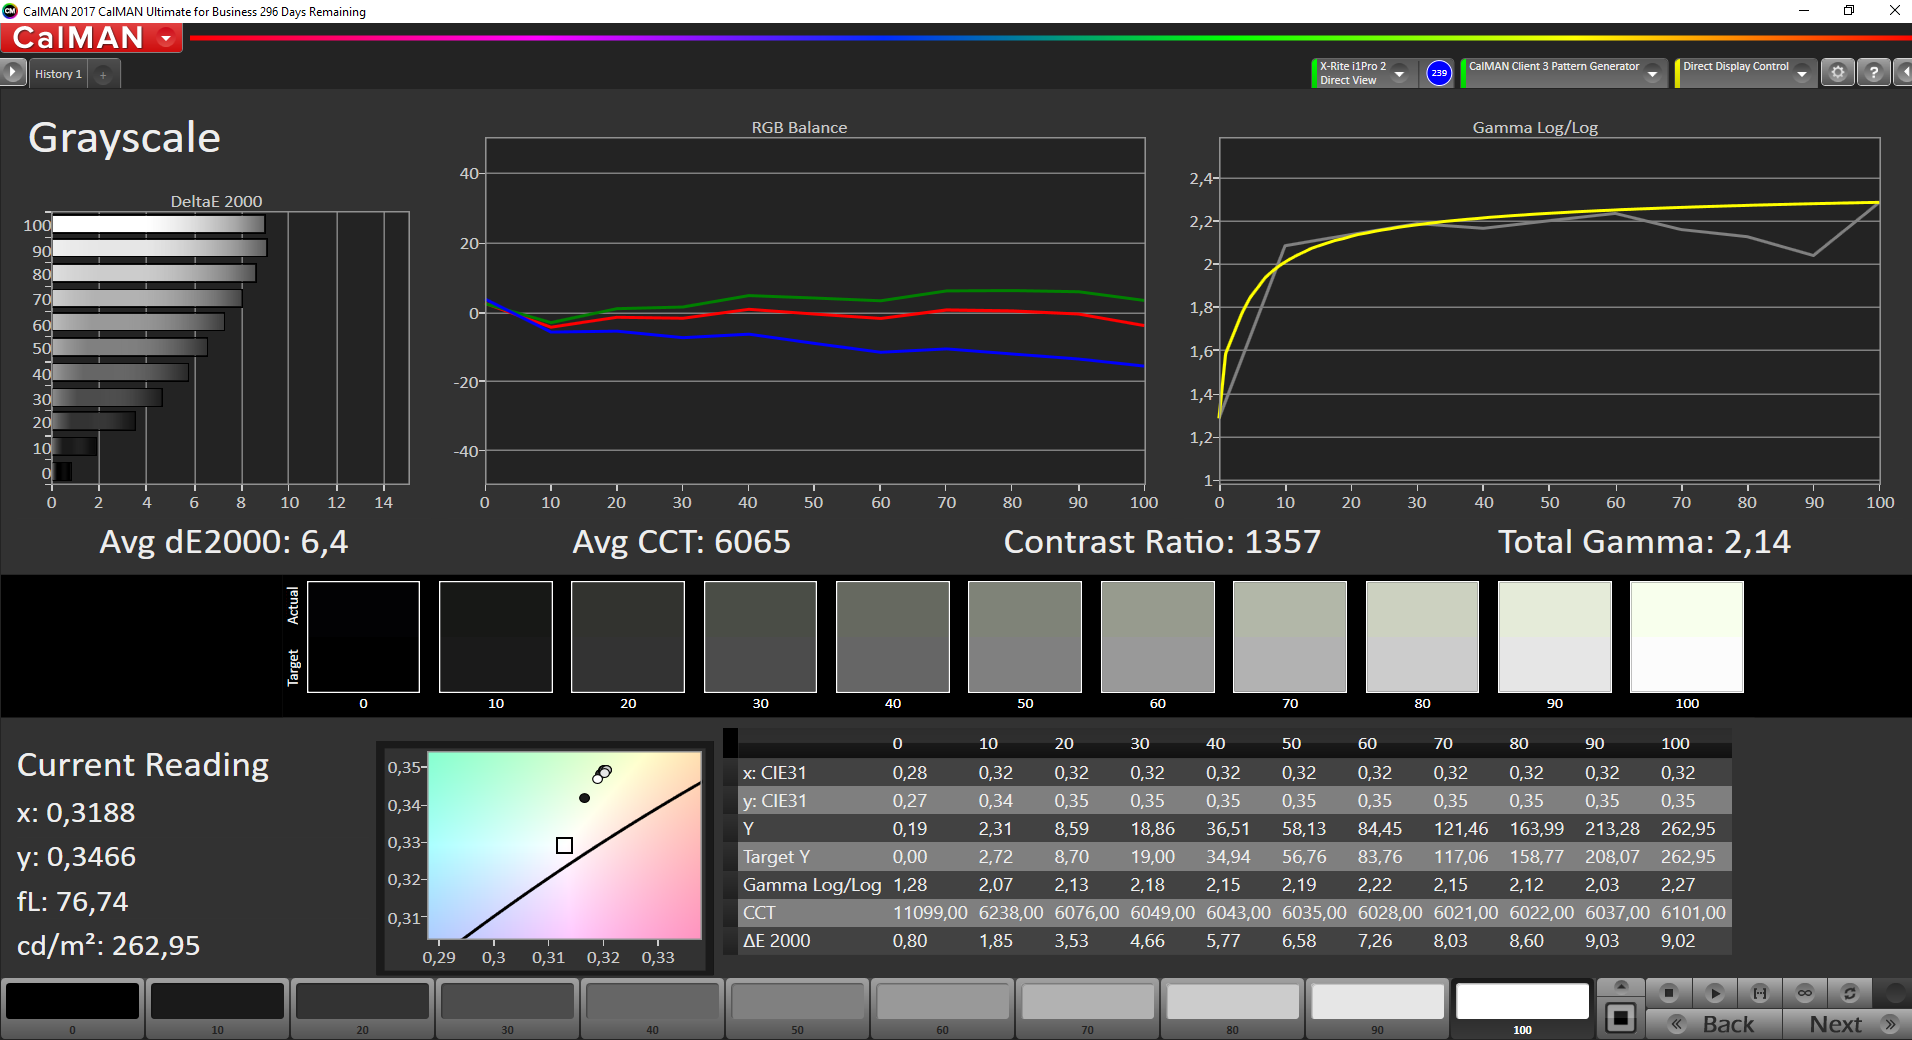
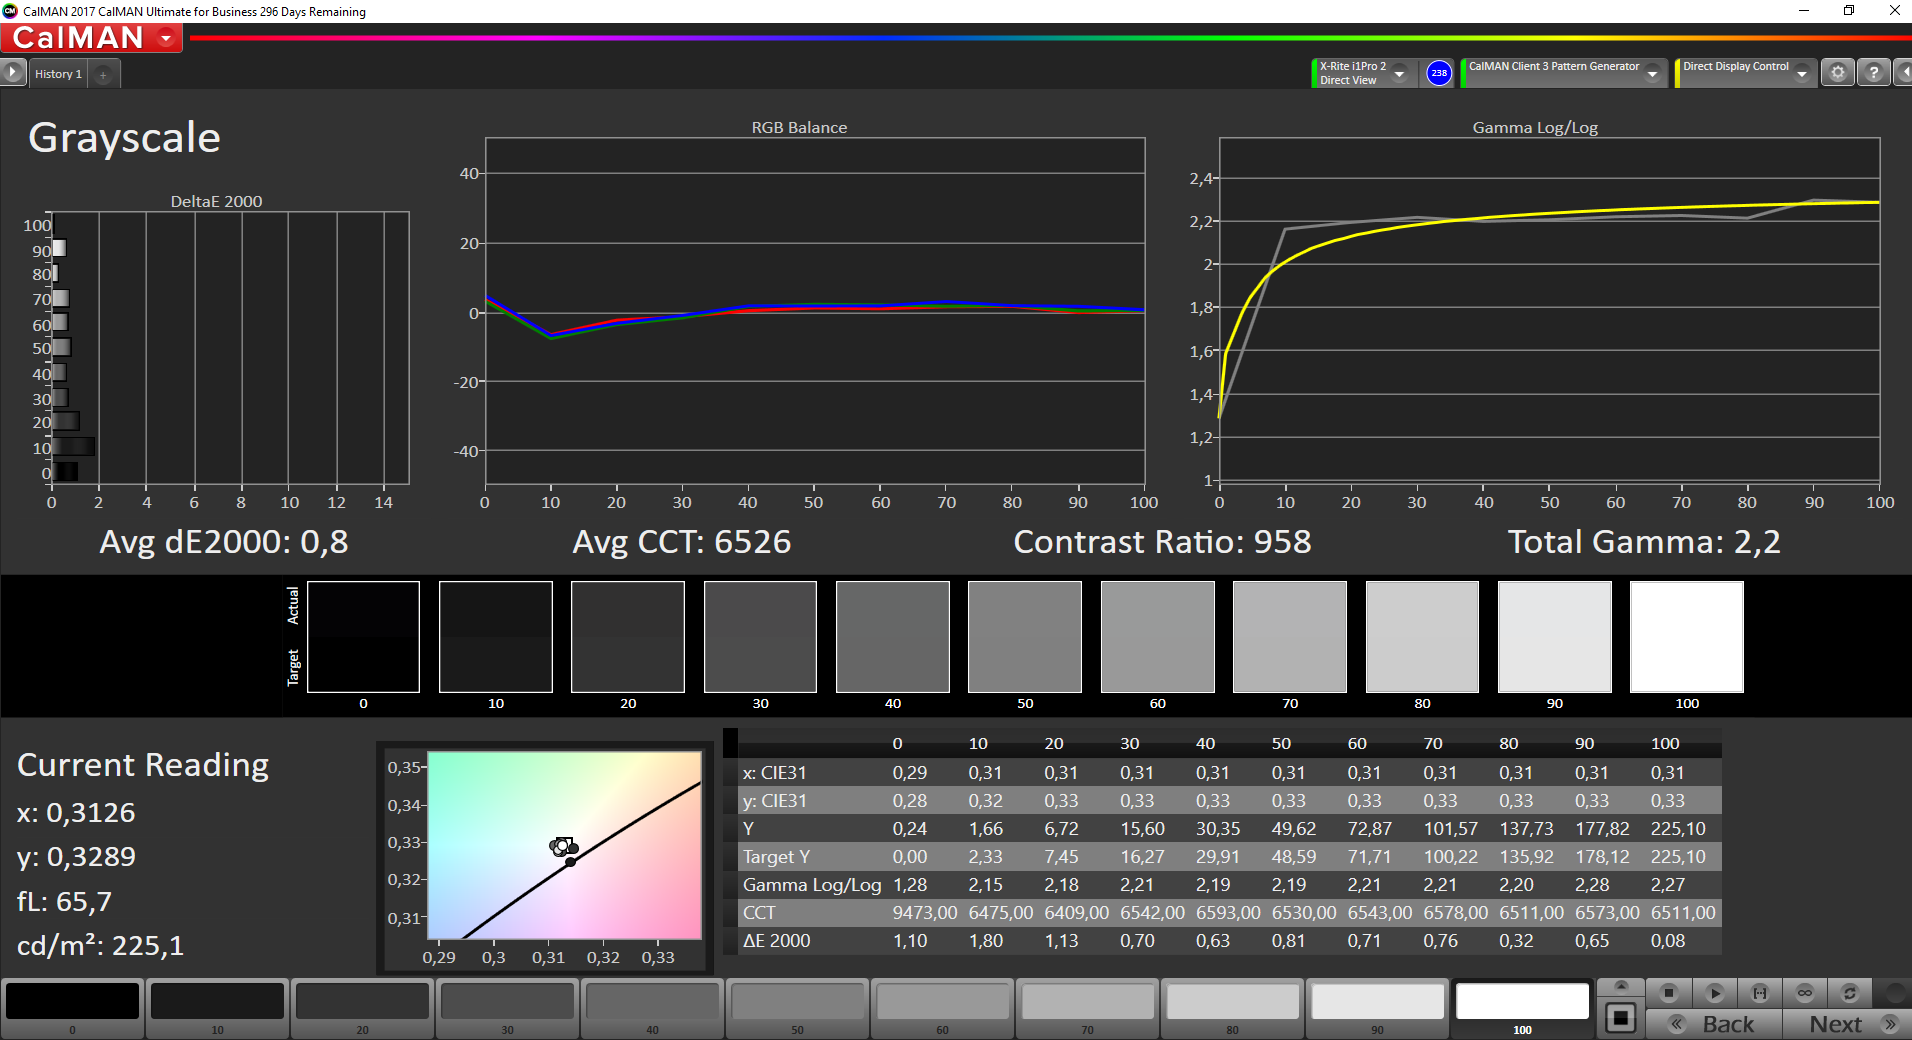
Contrasto: 1379:1 (Nero: 0.19 cd/m²)
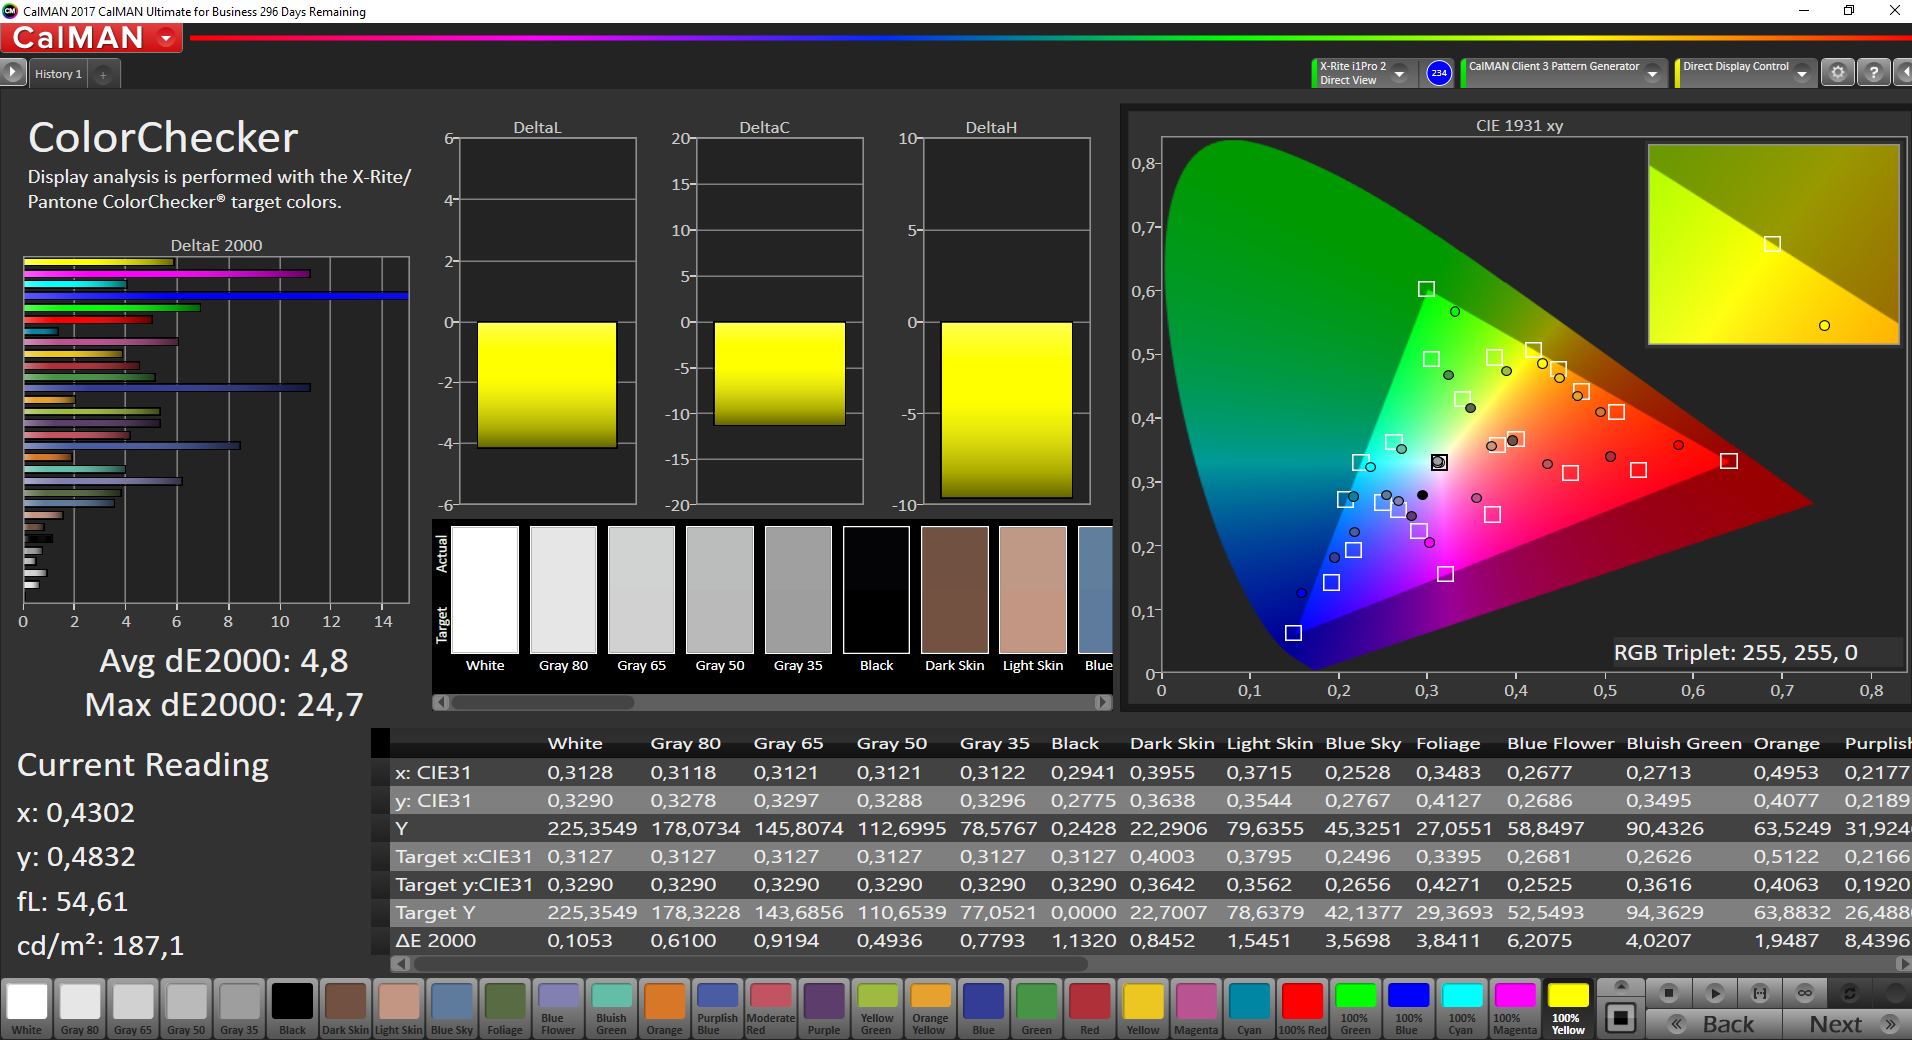
ΔE ColorChecker Calman: 7 | ∀{0.5-29.43 Ø4.71}
ΔE Greyscale Calman: 6.4 | ∀{0.09-98 Ø4.96}
61.9% sRGB (Argyll 1.6.3 3D)
39.5% AdobeRGB 1998 (Argyll 1.6.3 3D)
42.96% AdobeRGB 1998 (Argyll 3D)
62.2% sRGB (Argyll 3D)
41.56% Display P3 (Argyll 3D)
Gamma: 2.14
CCT: 6065 K
| Lenovo ThinkPad E480-20KNCTO1WW Innolux N140HCA-EAC, 1920x1080, 14" | Lenovo ThinkPad E480-20KQS00000 Innolux N140HCA-EAC, 1920x1080, 14" | HP ProBook 440 G5-3KX87ES LGD04B2, 1920x1080, 14" | Lenovo ThinkPad E470 NT140WHM-N41, 1366x768, 14" | Acer TravelMate P449-G2-M-56CD N140HCA-EAB, 1920x1080, 14" | Schenker Slim 14 L17 LG Philips LGD046D, 1920x1080, 14" | Asus VivoBook S14 S406UA-BV023T BOE CQ NT140WHM-N44, 1366x768, 14" | |
|---|---|---|---|---|---|---|---|
| Display | 1% | -5% | -6% | -1% | 47% | -7% | |
| Display P3 Coverage (%) | 41.56 | 41.88 1% | 39.56 -5% | 39.13 -6% | 41.04 -1% | 66.1 59% | 38.82 -7% |
| sRGB Coverage (%) | 62.2 | 62.8 1% | 59.3 -5% | 58.3 -6% | 61.2 -2% | 85.2 37% | 58.2 -6% |
| AdobeRGB 1998 Coverage (%) | 42.96 | 43.29 1% | 40.88 -5% | 40.43 -6% | 42.47 -1% | 62.3 45% | 40.11 -7% |
| Response Times | 1% | 10% | 29% | 12% | 13% | 32% | |
| Response Time Grey 50% / Grey 80% * (ms) | 44.8 ? | 44 ? 2% | 40 ? 11% | 44 ? 2% | 39 ? 13% | 37.6 ? 16% | 42 ? 6% |
| Response Time Black / White * (ms) | 31.2 ? | 31.2 ? -0% | 28.8 ? 8% | 14 ? 55% | 28 ? 10% | 28 ? 10% | 13 ? 58% |
| PWM Frequency (Hz) | 25000 ? | 24880 ? | 200 ? | 25000 ? | 20490 ? | 200 ? | |
| Screen | 10% | -3% | -36% | -6% | 17% | -28% | |
| Brightness middle (cd/m²) | 262 | 251 -4% | 236 -10% | 209 -20% | 271 3% | 326 24% | 215 -18% |
| Brightness (cd/m²) | 245 | 231 -6% | 221 -10% | 208 -15% | 256 4% | 320 31% | 208 -15% |
| Brightness Distribution (%) | 83 | 80 -4% | 88 6% | 81 -2% | 85 2% | 81 -2% | 81 -2% |
| Black Level * (cd/m²) | 0.19 | 0.19 -0% | 0.26 -37% | 0.58 -205% | 0.43 -126% | 0.31 -63% | 0.4 -111% |
| Contrast (:1) | 1379 | 1321 -4% | 908 -34% | 360 -74% | 630 -54% | 1052 -24% | 538 -61% |
| Colorchecker dE 2000 * | 7 | 5.1 27% | 5.7 19% | 8.12 -16% | 5.03 28% | 4.6 34% | 9.37 -34% |
| Colorchecker dE 2000 max. * | 23.6 | 10.6 55% | 22 7% | 15.18 36% | 11.9 50% | 10.3 56% | 15.84 33% |
| Greyscale dE 2000 * | 6.4 | 4.5 30% | 3.8 41% | 9.86 -54% | 4.02 37% | 4.4 31% | 10.52 -64% |
| Gamma | 2.14 103% | 2.18 101% | 2.1 105% | 2.37 93% | 2.31 95% | 2.24 98% | 2.45 90% |
| CCT | 6065 107% | 6146 106% | 7318 89% | 10218 64% | 6659 98% | 5978 109% | 11214 58% |
| Color Space (Percent of AdobeRGB 1998) (%) | 39.5 | 39.8 1% | 37.7 -5% | 37 -6% | 39 -1% | 55.8 41% | 37 -6% |
| Color Space (Percent of sRGB) (%) | 61.9 | 62.5 1% | 59.2 -4% | 58 -6% | 61 -1% | 85.1 37% | 58 -6% |
| Media totale (Programma / Settaggio) | 4% /
7% | 1% /
-2% | -4% /
-22% | 2% /
-3% | 26% /
22% | -1% /
-16% |
* ... Meglio usare valori piccoli


Tempi di risposta del Display
| ↔ Tempi di risposta dal Nero al Bianco | ||
|---|---|---|
| 31.2 ms ... aumenta ↗ e diminuisce ↘ combinato | ↗ 17.2 ms Incremento | 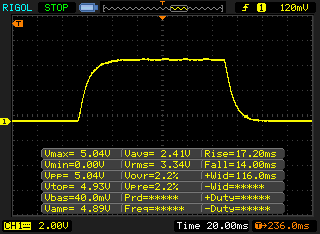 |
| ↘ 14 ms Calo | ||
| Lo schermo mostra tempi di risposta lenti nei nostri tests e sarà insoddisfacente per i gamers. In confronto, tutti i dispositivi di test variano da 0.1 (minimo) a 240 (massimo) ms. » 84 % di tutti i dispositivi è migliore. Questo significa che i tempi di risposta rilevati sono peggiori rispetto alla media di tutti i dispositivi testati (19.8 ms). | ||
| ↔ Tempo di risposta dal 50% Grigio all'80% Grigio | ||
| 44.8 ms ... aumenta ↗ e diminuisce ↘ combinato | ↗ 23.6 ms Incremento | 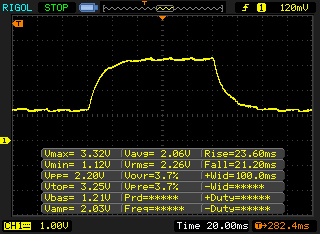 |
| ↘ 21.2 ms Calo | ||
| Lo schermo mostra tempi di risposta lenti nei nostri tests e sarà insoddisfacente per i gamers. In confronto, tutti i dispositivi di test variano da 0.165 (minimo) a 636 (massimo) ms. » 76 % di tutti i dispositivi è migliore. Questo significa che i tempi di risposta rilevati sono peggiori rispetto alla media di tutti i dispositivi testati (30.9 ms). | ||
Sfarfallio dello schermo / PWM (Pulse-Width Modulation)
| flickering dello schermo / PWM rilevato | 25000 Hz | ≤ 30 % settaggio luminosita' | 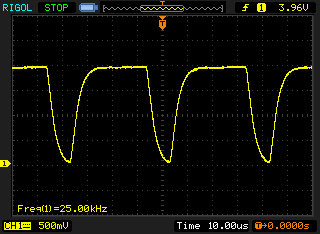 |
Il display sfarfalla a 25000 Hz (Probabilmente a causa dell'uso di PWM) Flickering rilevato ad una luminosita' di 30 % o inferiore. Non dovrebbe verificarsi flickering o PWM sopra questo valore di luminosita'. La frequenza di 25000 Hz è abbastanza alta, quindi la maggioranza degli utenti sensibili al PWM non dovrebbero notare alcun flickering. In confronto: 52 % di tutti i dispositivi testati non utilizza PWM per ridurre la luminosita' del display. Se è rilevato PWM, una media di 7744 (minimo: 5 - massimo: 343500) Hz è stata rilevata. | |||
* ... Meglio usare valori piccoli
| Lenovo ThinkPad E480-20KNCTO1WW UHD Graphics 620, i5-8250U, Toshiba KBG30ZMT128G | Lenovo ThinkPad E480-20KQS00000 Radeon RX 550 (Laptop), i5-8250U, Lenovo LENSE20256GMSP34MEAT2TA | HP ProBook 440 G5-3KX87ES UHD Graphics 620, i5-8250U, Intel SSD 600p SSDPEKKW256G7 | Lenovo ThinkPad E470 HD Graphics 620, i5-7200U, SanDisk X400 SED 256GB, SATA (SD8TB8U-256G) | Acer TravelMate P449-G2-M-56CD HD Graphics 620, i5-7200U, Intel SSD 600p SSDPEKKW512G7 | Schenker Slim 14 L17 UHD Graphics 620, i5-8250U, Samsung SSD 960 Pro 512 GB m.2 | Asus VivoBook S14 S406UA-BV023T UHD Graphics 620, i5-8250U, SanDisk SD8SN8U256G1002 | Media Intel Core i5-8250U, Intel UHD Graphics 620 | Media della classe Office | |
|---|---|---|---|---|---|---|---|---|---|
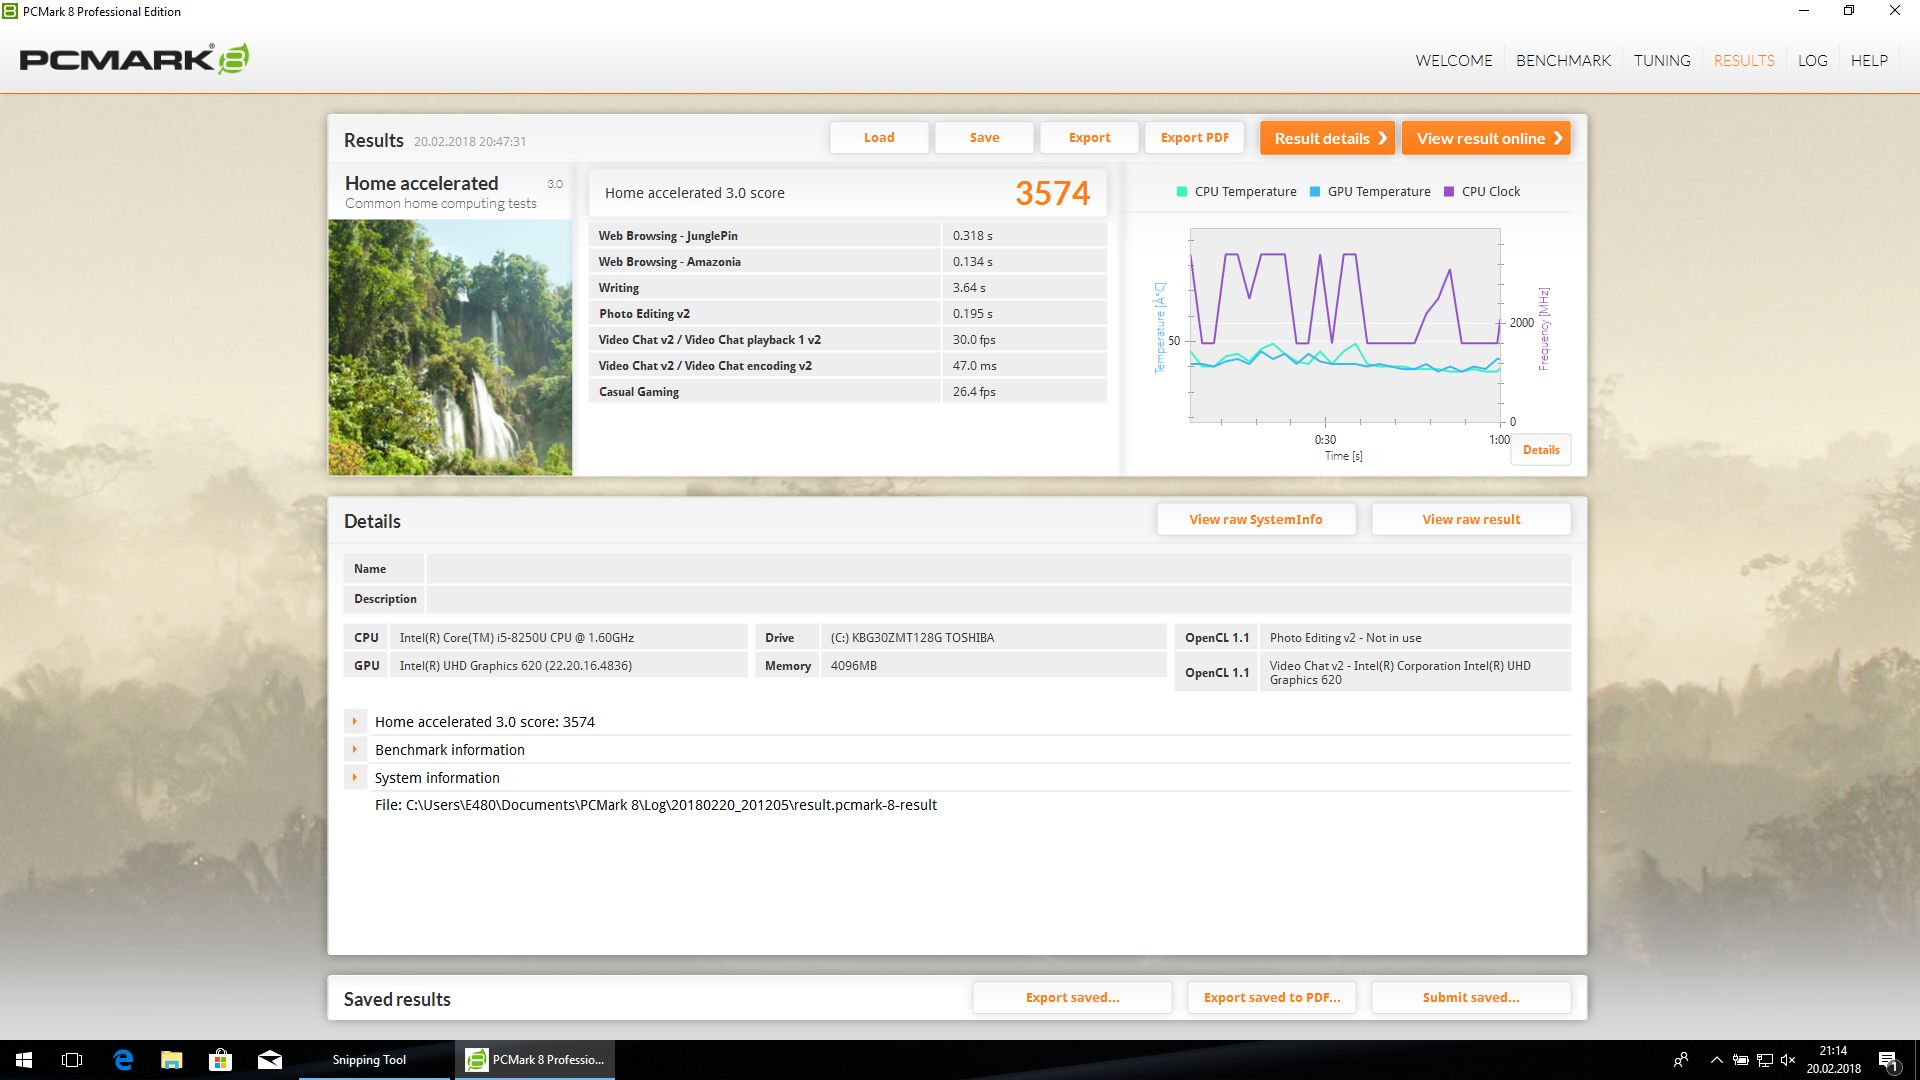
| PCMark 8 | 12% | 4% | 2% | -4% | 12% | 8% | -2% | 30% | |
| Home Score Accelerated v2 (Points) | 3574 | 4187 17% | 3774 6% | 3674 3% | 3519 -2% | 4006 12% | 3937 10% | 3584 ? 0% | 5222 ? 46% |
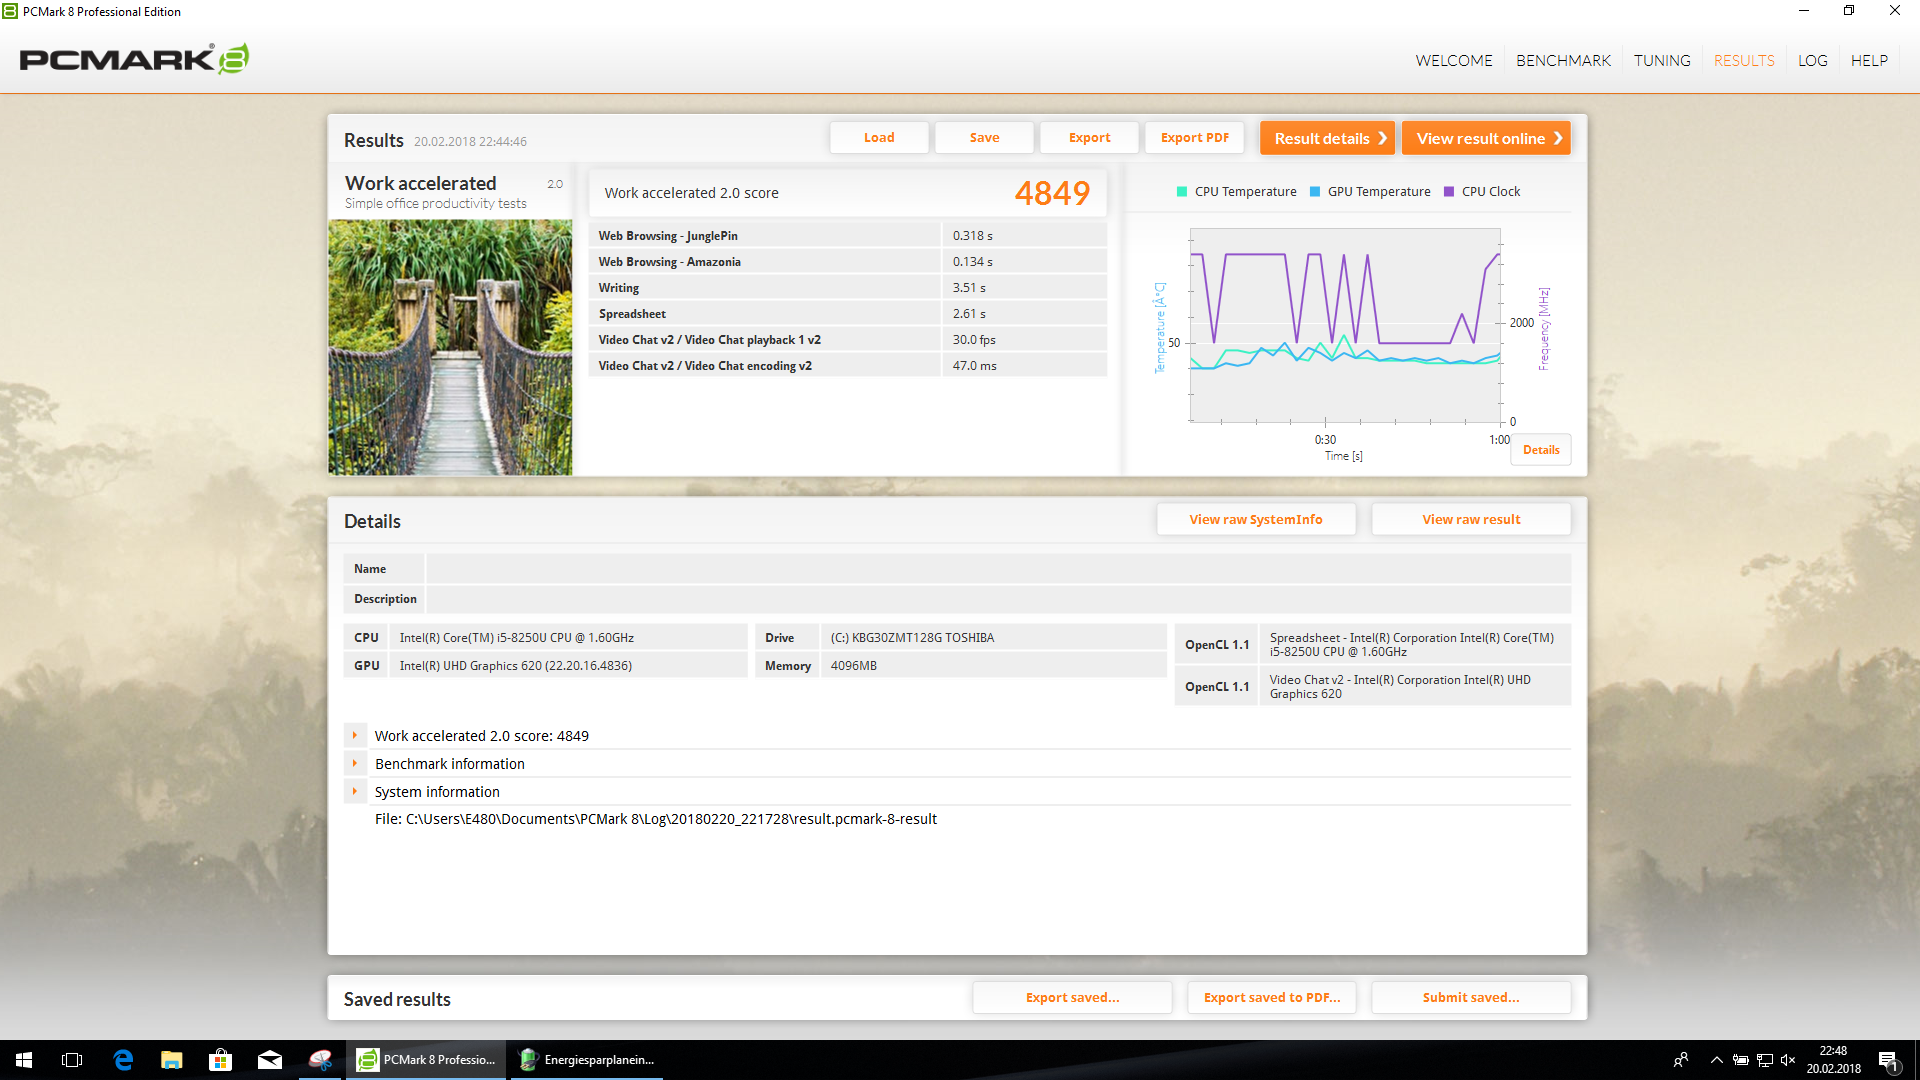
| Work Score Accelerated v2 (Points) | 4849 | 5189 7% | 4922 2% | 4834 0% | 4605 -5% | 5106 5% | 4646 ? -4% | 5491 ? 13% | |
| PCMark 10 | 42% | 33% | 16% | 18% | 33% | 26% | 117% | ||
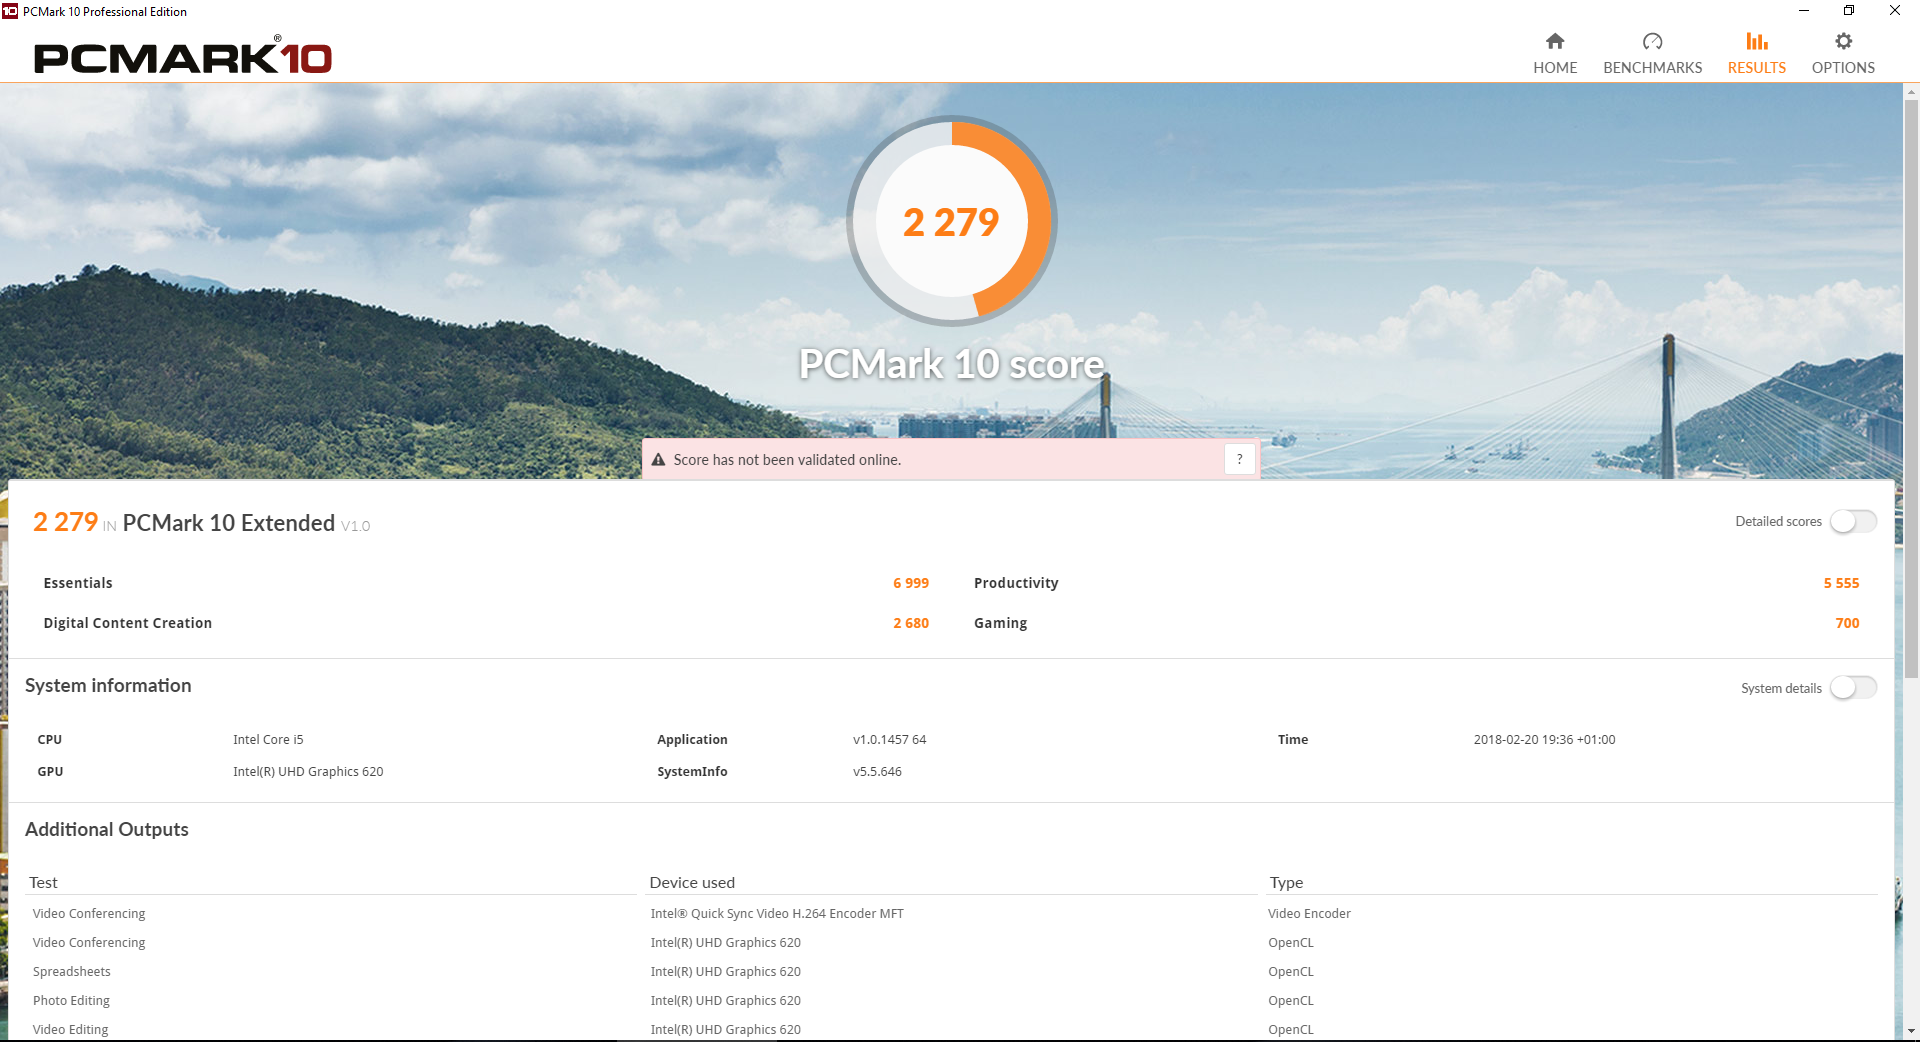
| Score (Points) | 2279 | 3954 73% | 3577 57% | 3144 38% | 3068 35% | 3612 58% | 3296 ? 45% | 6626 ? 191% | |
| Essentials (Points) | 6999 | 7722 10% | 7655 9% | 6547 -6% | 7077 1% | 7468 7% | 7398 ? 6% | 10034 ? 43% | |
| Media totale (Programma / Settaggio) | 27% /
27% | 19% /
19% | 9% /
9% | 7% /
7% | 12% /
12% | 21% /
20% | 12% /
12% | 74% /
73% |
| PCMark 8 Home Score Accelerated v2 | 3574 punti | |
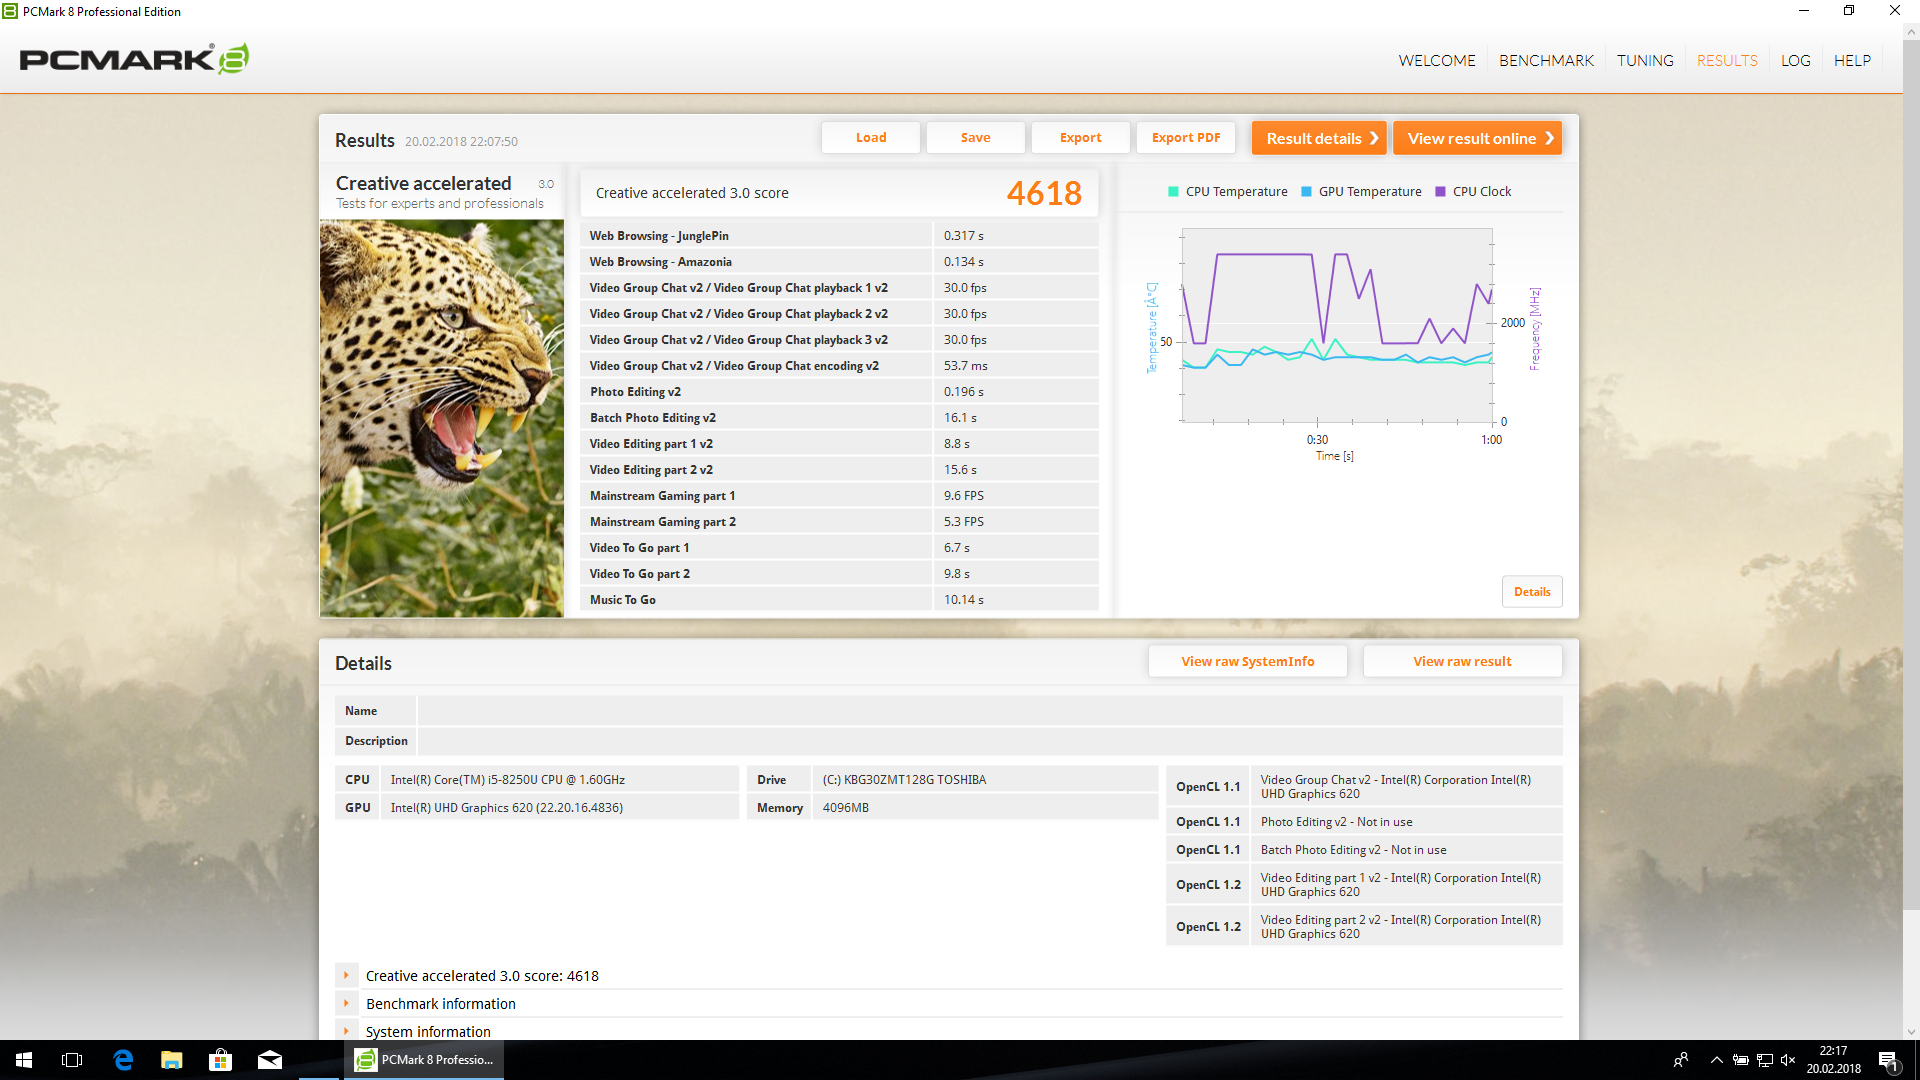
| PCMark 8 Creative Score Accelerated v2 | 4618 punti | |
| PCMark 8 Work Score Accelerated v2 | 4849 punti | |
| PCMark 10 Score | 2279 punti | |
Aiuto | ||
| Lenovo ThinkPad E480-20KNCTO1WW UHD Graphics 620, i5-8250U, Toshiba KBG30ZMT128G | Lenovo ThinkPad E480-20KQS00000 Radeon RX 550 (Laptop), i5-8250U, Lenovo LENSE20256GMSP34MEAT2TA | HP ProBook 440 G5-3KX87ES UHD Graphics 620, i5-8250U, Intel SSD 600p SSDPEKKW256G7 | Lenovo ThinkPad E470 HD Graphics 620, i5-7200U, SanDisk X400 SED 256GB, SATA (SD8TB8U-256G) | Acer TravelMate P449-G2-M-56CD HD Graphics 620, i5-7200U, Intel SSD 600p SSDPEKKW512G7 | Schenker Slim 14 L17 UHD Graphics 620, i5-8250U, Samsung SSD 960 Pro 512 GB m.2 | |
|---|---|---|---|---|---|---|
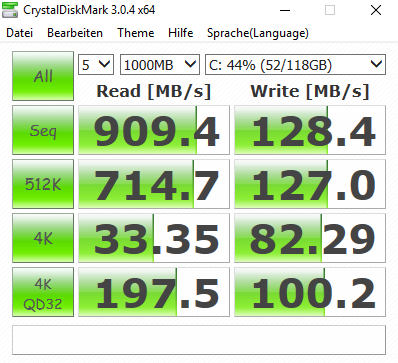
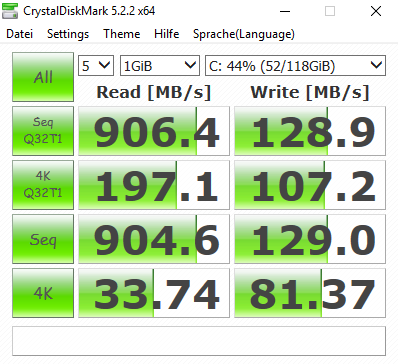
| CrystalDiskMark 3.0 | 24% | 155% | 56% | 152% | 440% | |
| Read Seq (MB/s) | 909 | 1295 42% | 1181 30% | 454.2 -50% | 1086 19% | 2860 215% |
| Write Seq (MB/s) | 128.4 | 160.6 25% | 602 369% | 438.1 241% | 581 352% | 1995 1454% |
| Read 512 (MB/s) | 715 | 872 22% | 923 29% | 304.6 -57% | 869 22% | 815 14% |
| Write 512 (MB/s) | 127 | 122 -4% | 600 372% | 343.7 171% | 584 360% | 1480 1065% |
| Read 4k (MB/s) | 33.35 | 25.72 -23% | 35.48 6% | 34.15 2% | 35.89 8% | 57.7 73% |
| Write 4k (MB/s) | 82.3 | 95.2 16% | 139.8 70% | 75.1 -9% | 122.4 49% | 196.7 139% |
| Read 4k QD32 (MB/s) | 197.5 | 389.9 97% | 287.8 46% | 284.2 44% | 462.9 134% | 565 186% |
| Write 4k QD32 (MB/s) | 100.2 | 118.3 18% | 417.1 316% | 208.8 108% | 370.9 270% | 475.1 374% |


| 3DMark 11 Performance | 1591 punti | |
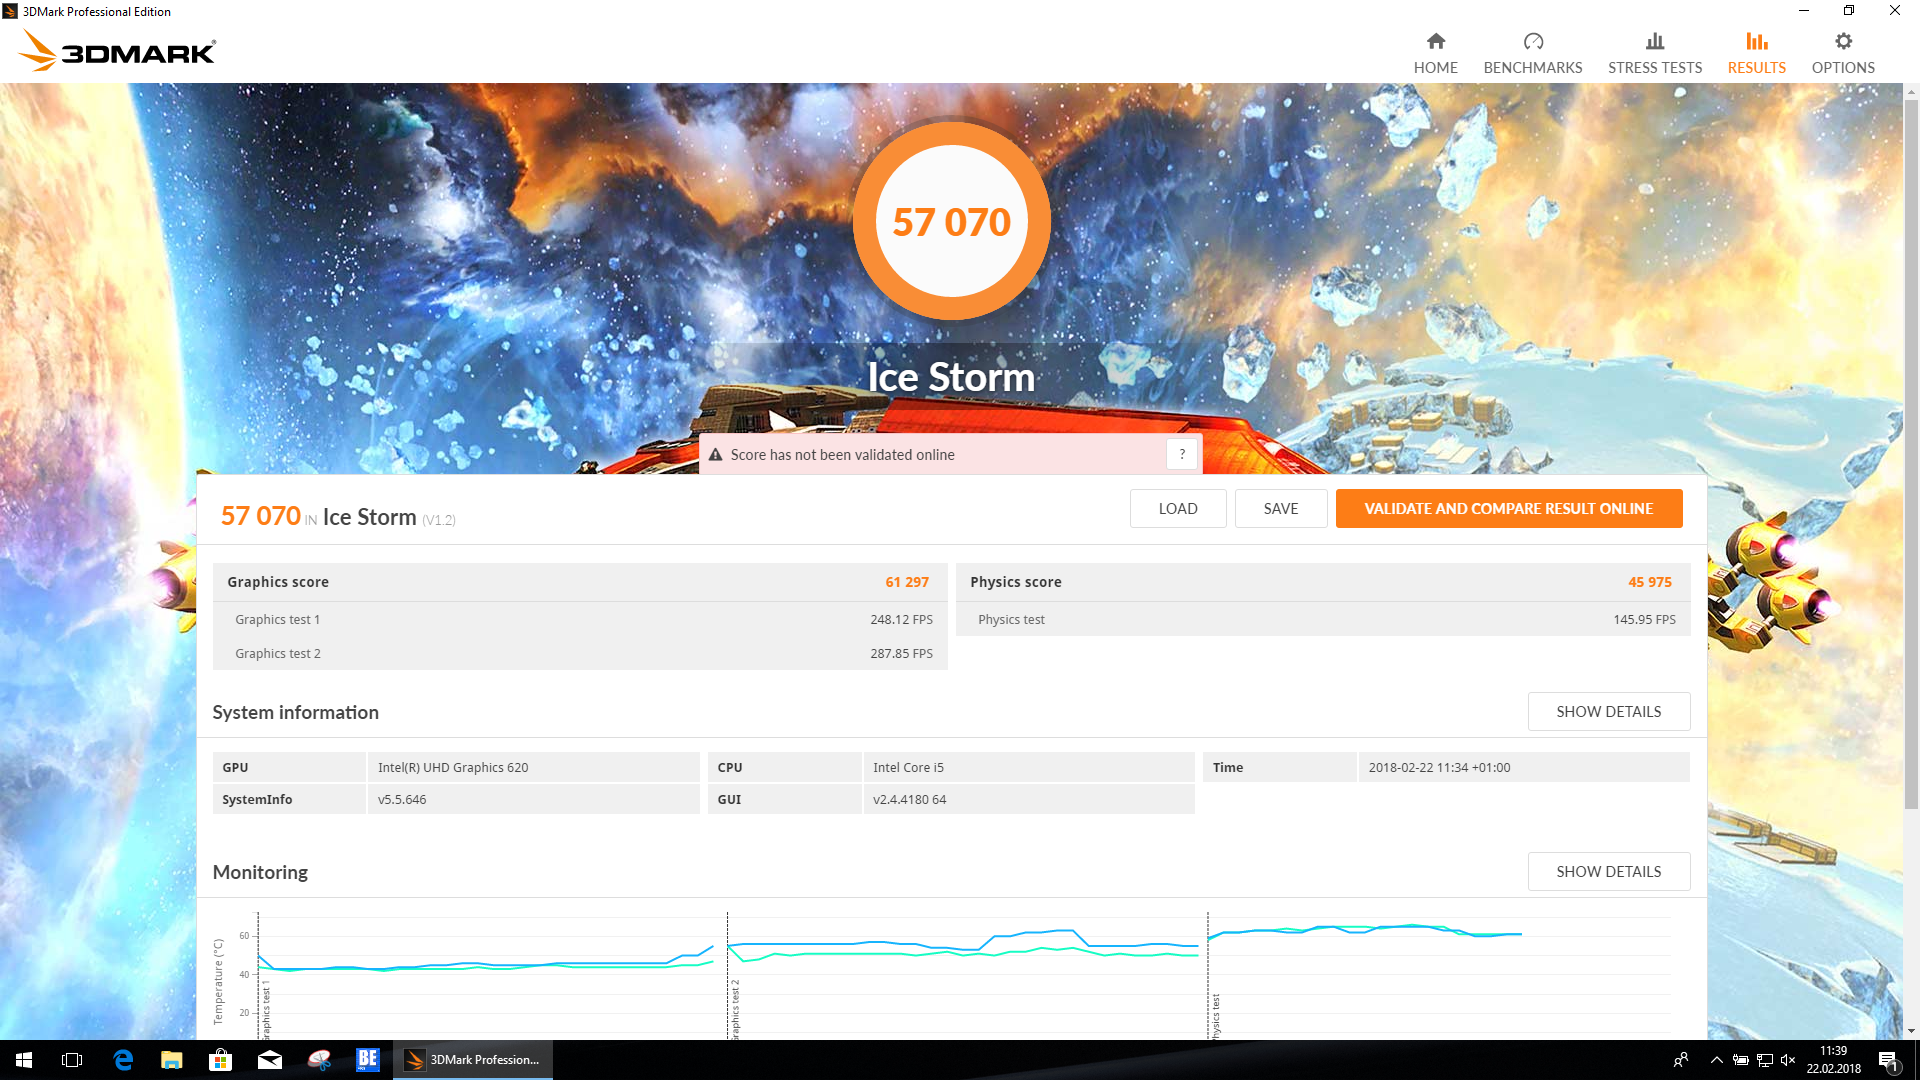
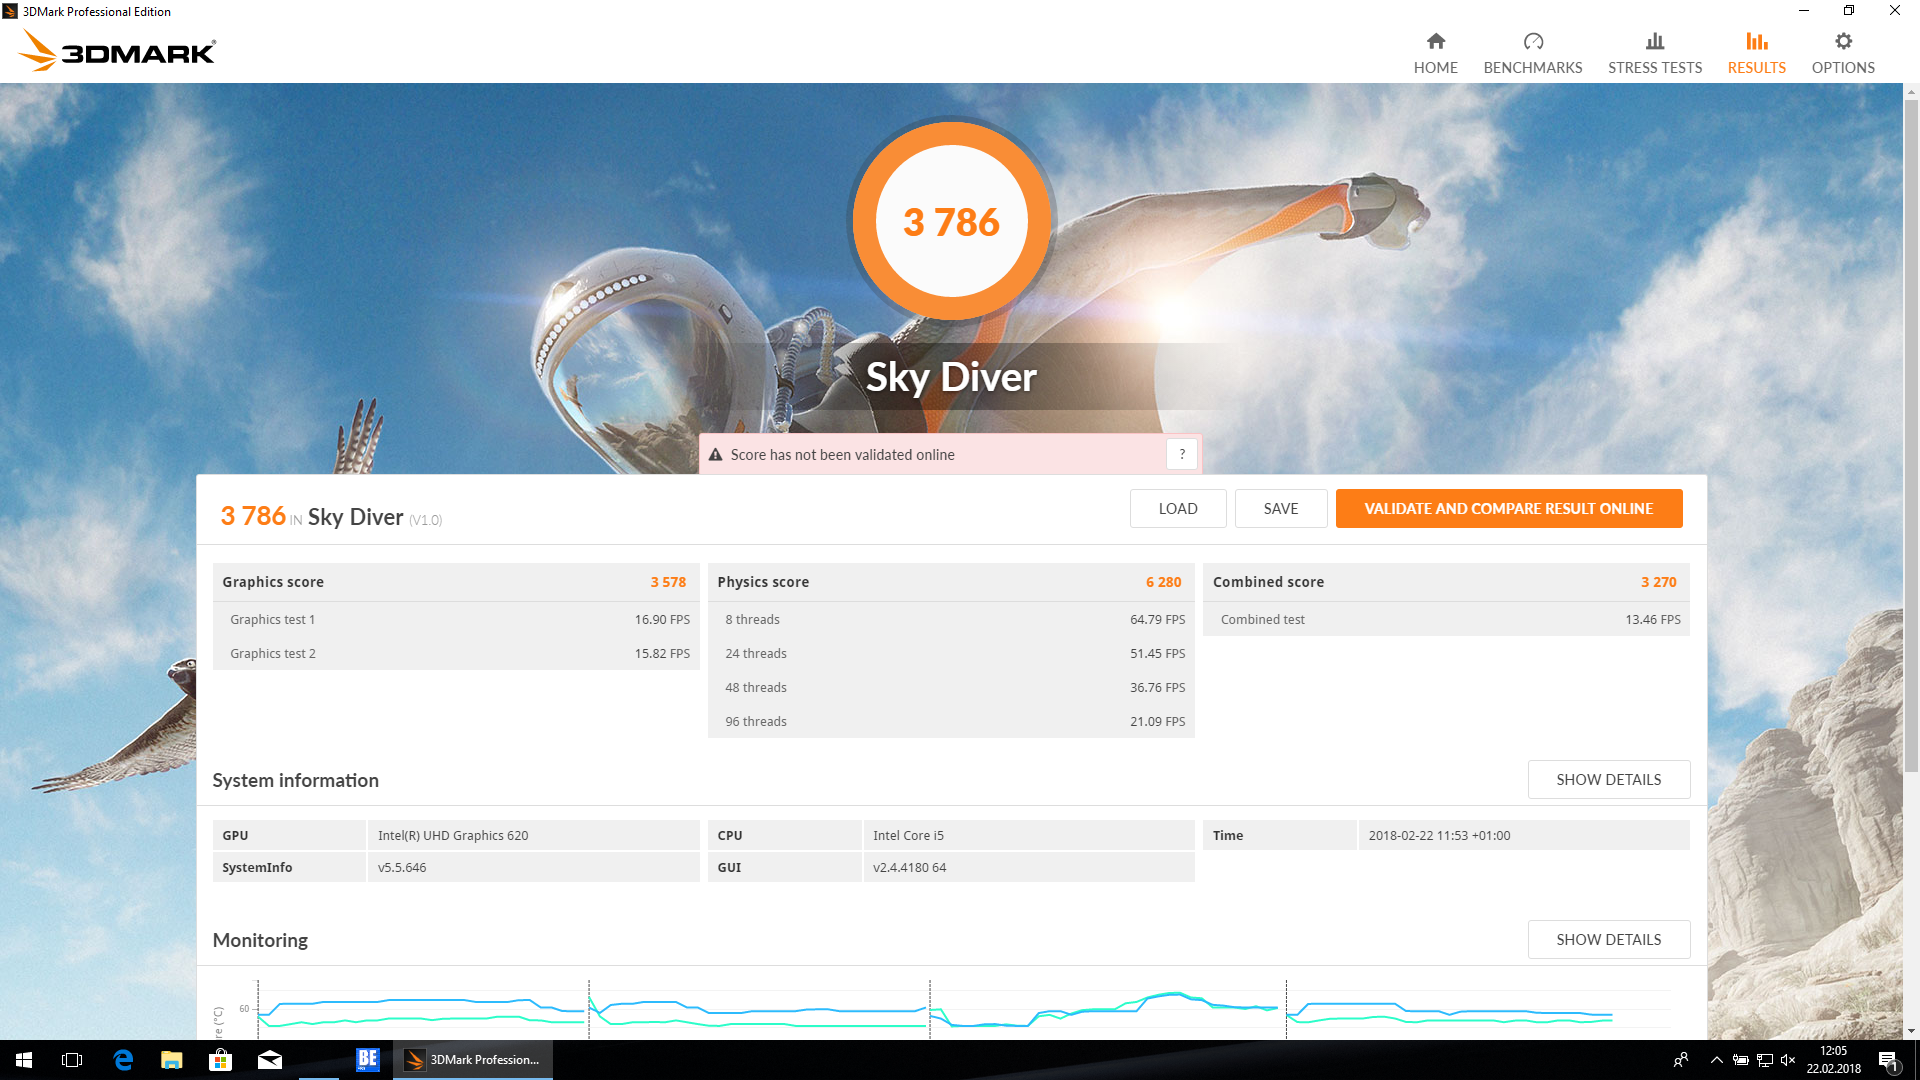
| 3DMark Ice Storm Standard Score | 57070 punti | |
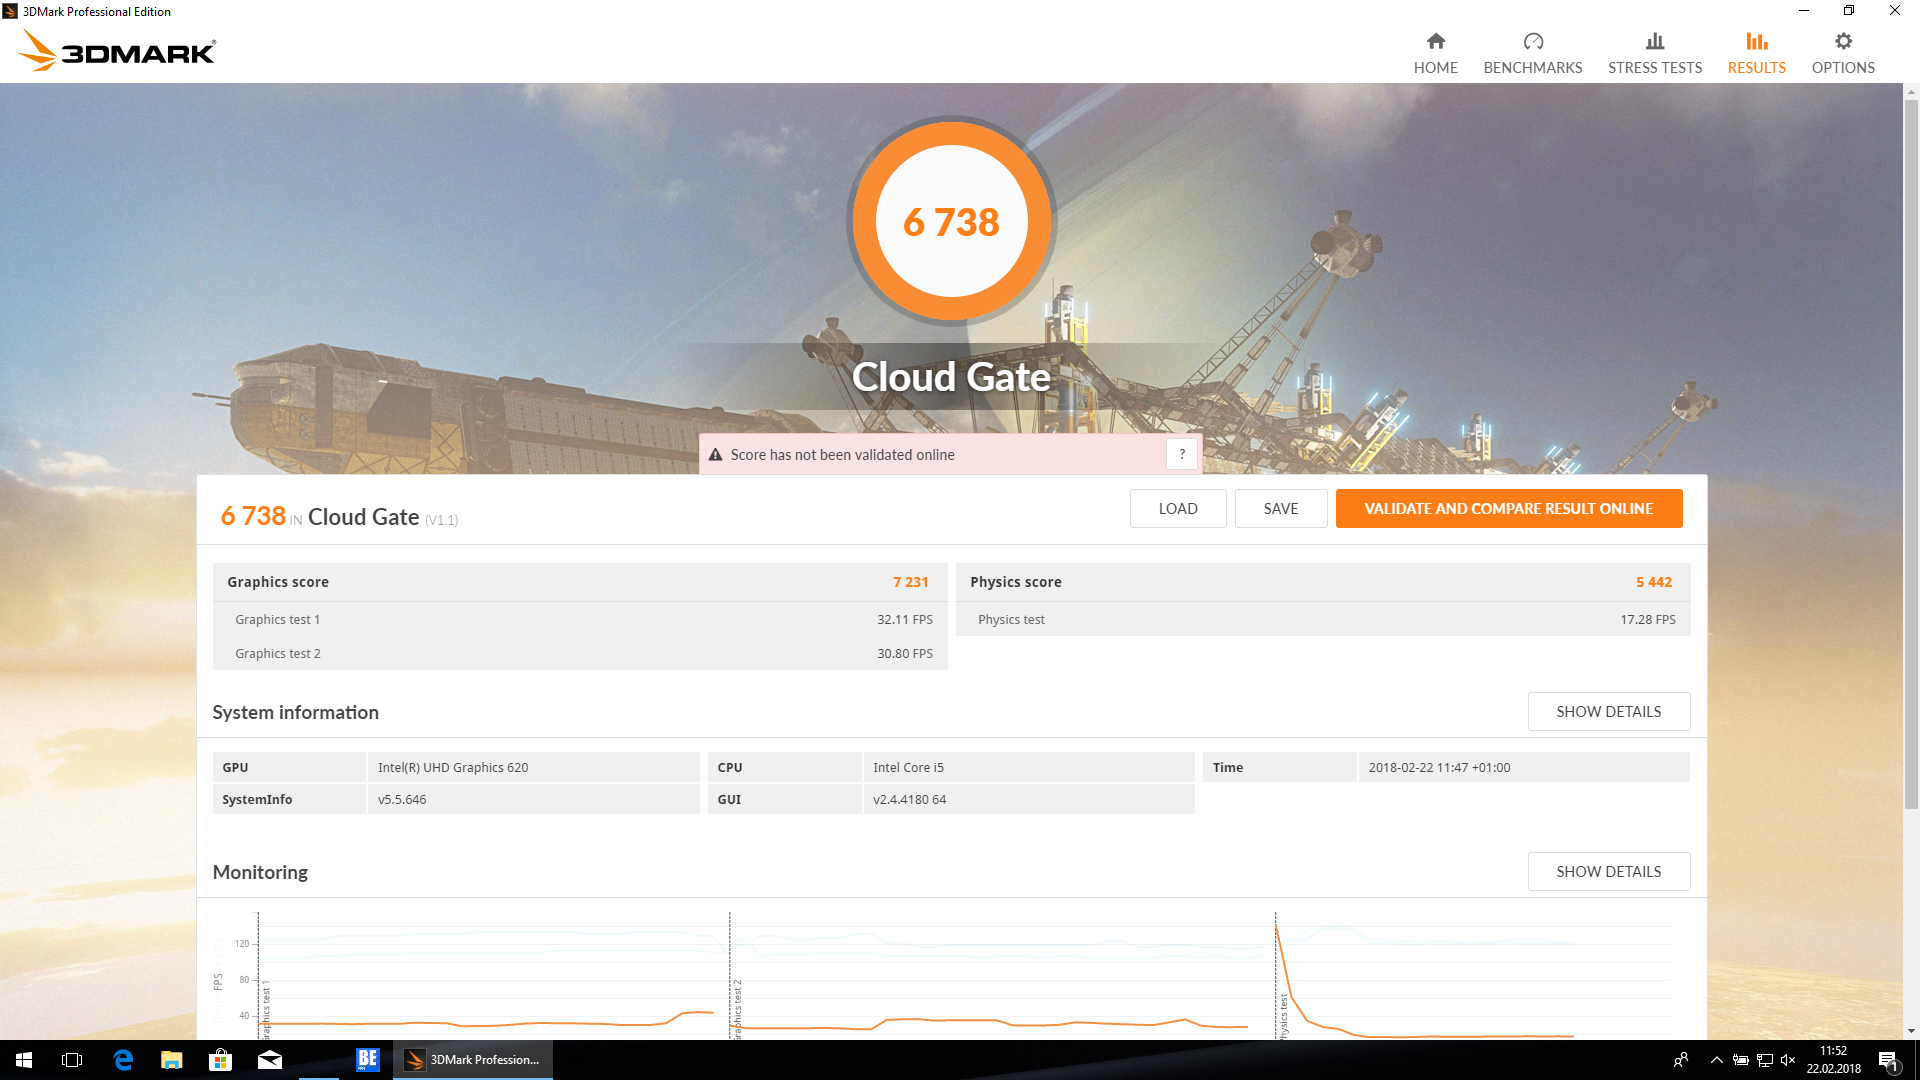
| 3DMark Cloud Gate Standard Score | 6738 punti | |
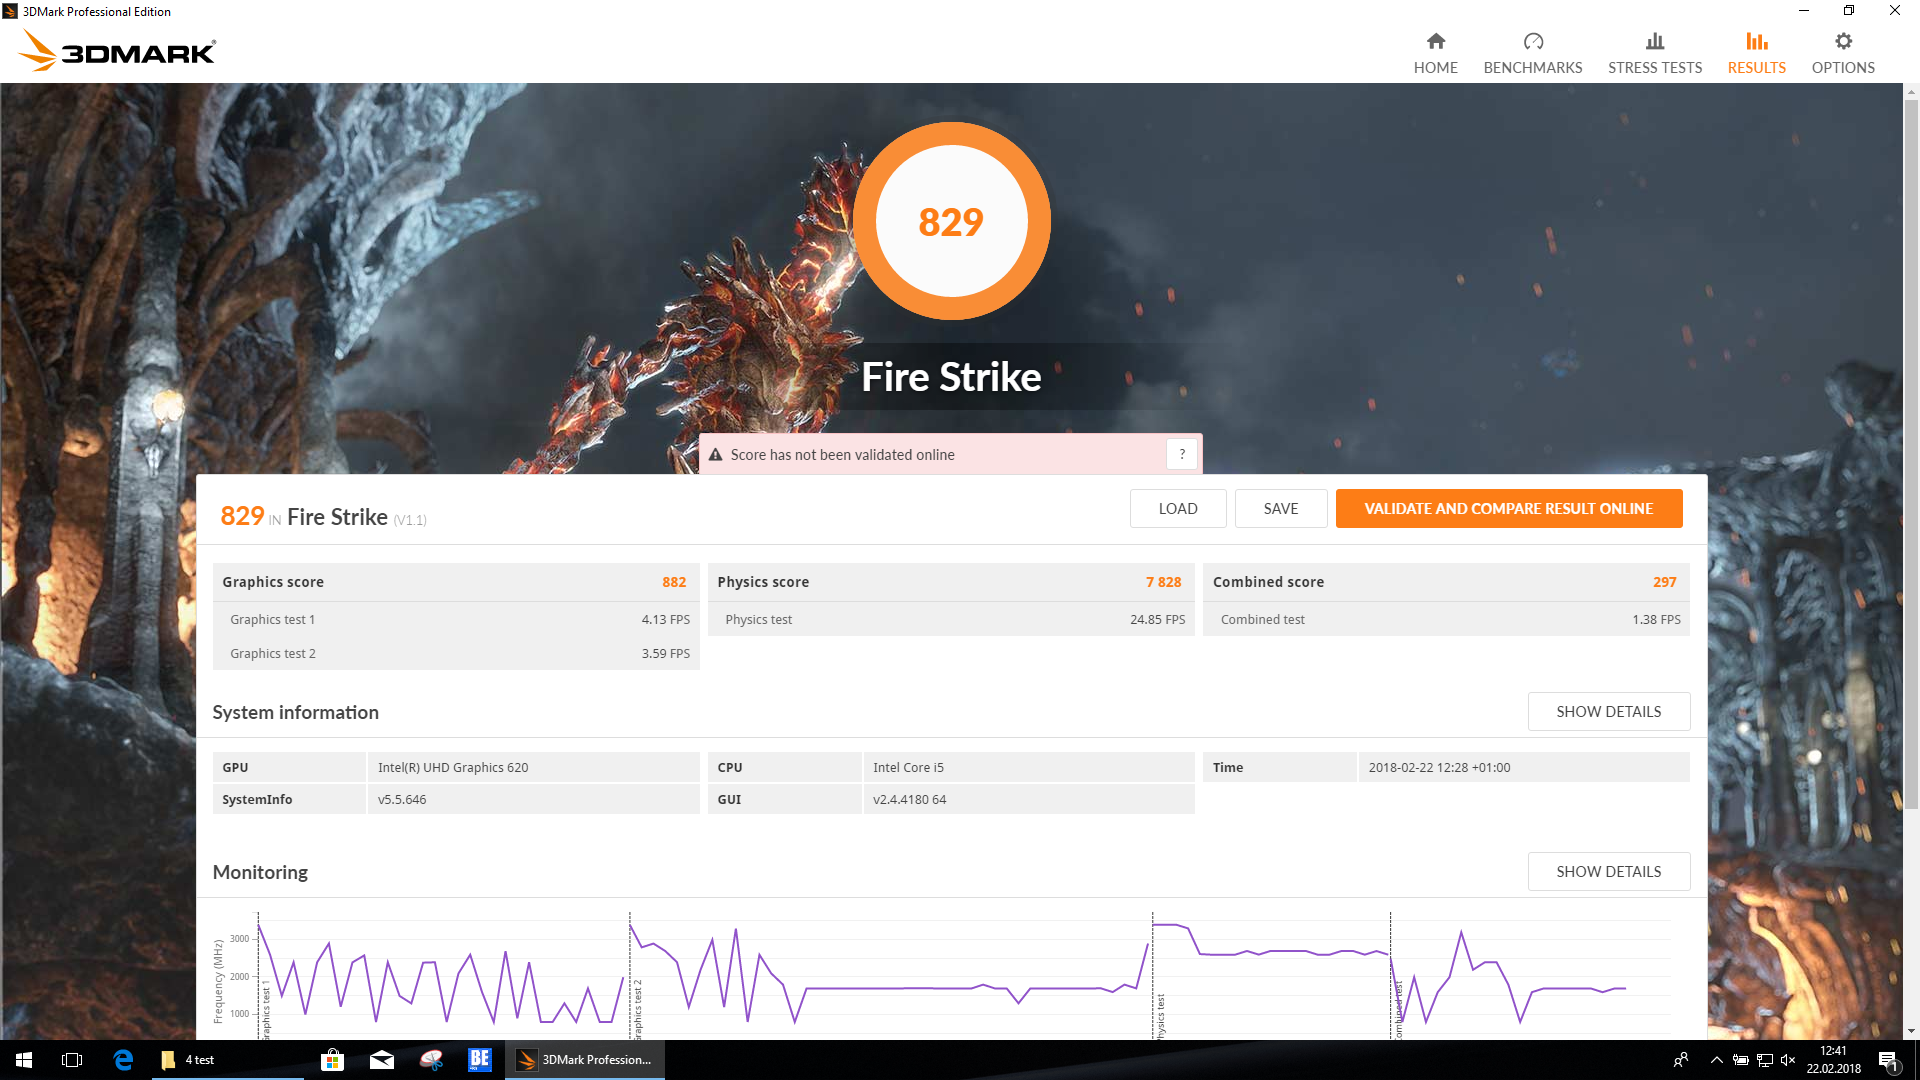
| 3DMark Fire Strike Score | 829 punti | |
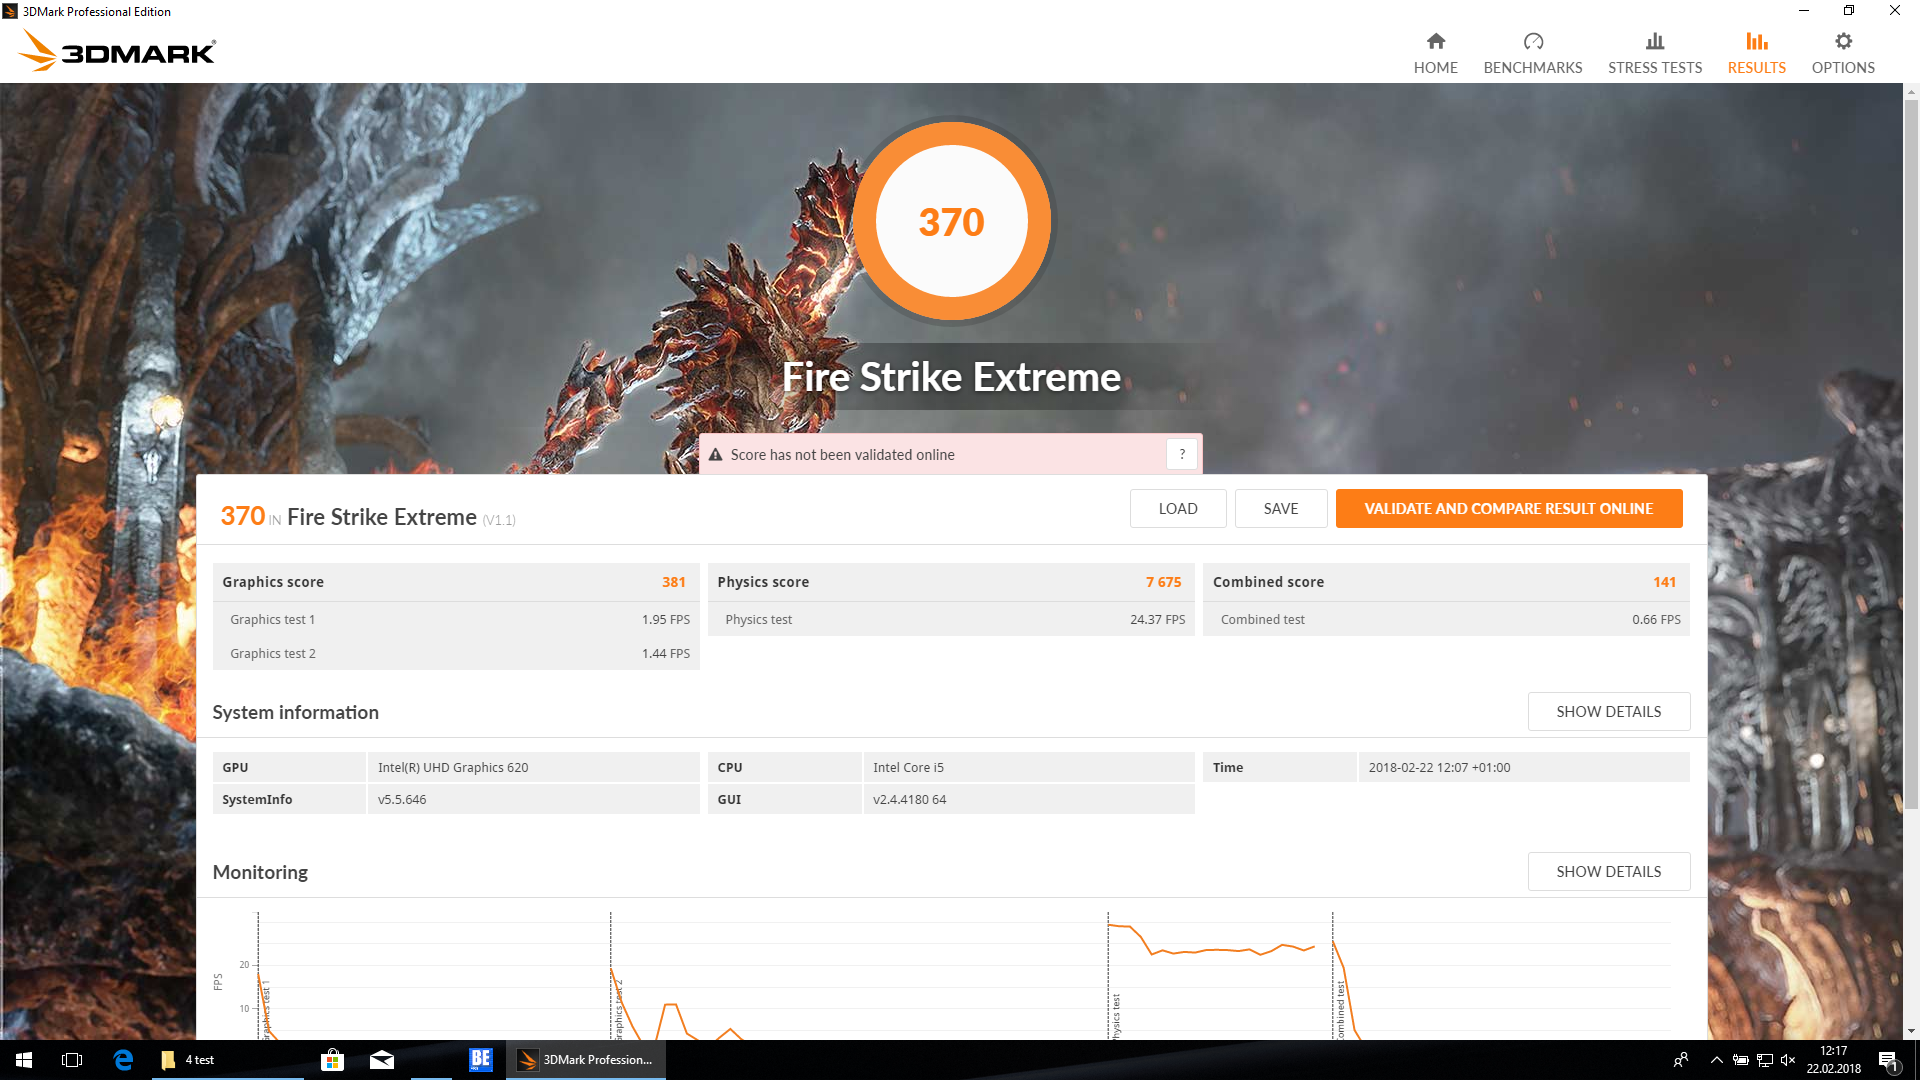
| 3DMark Fire Strike Extreme Score | 370 punti | |
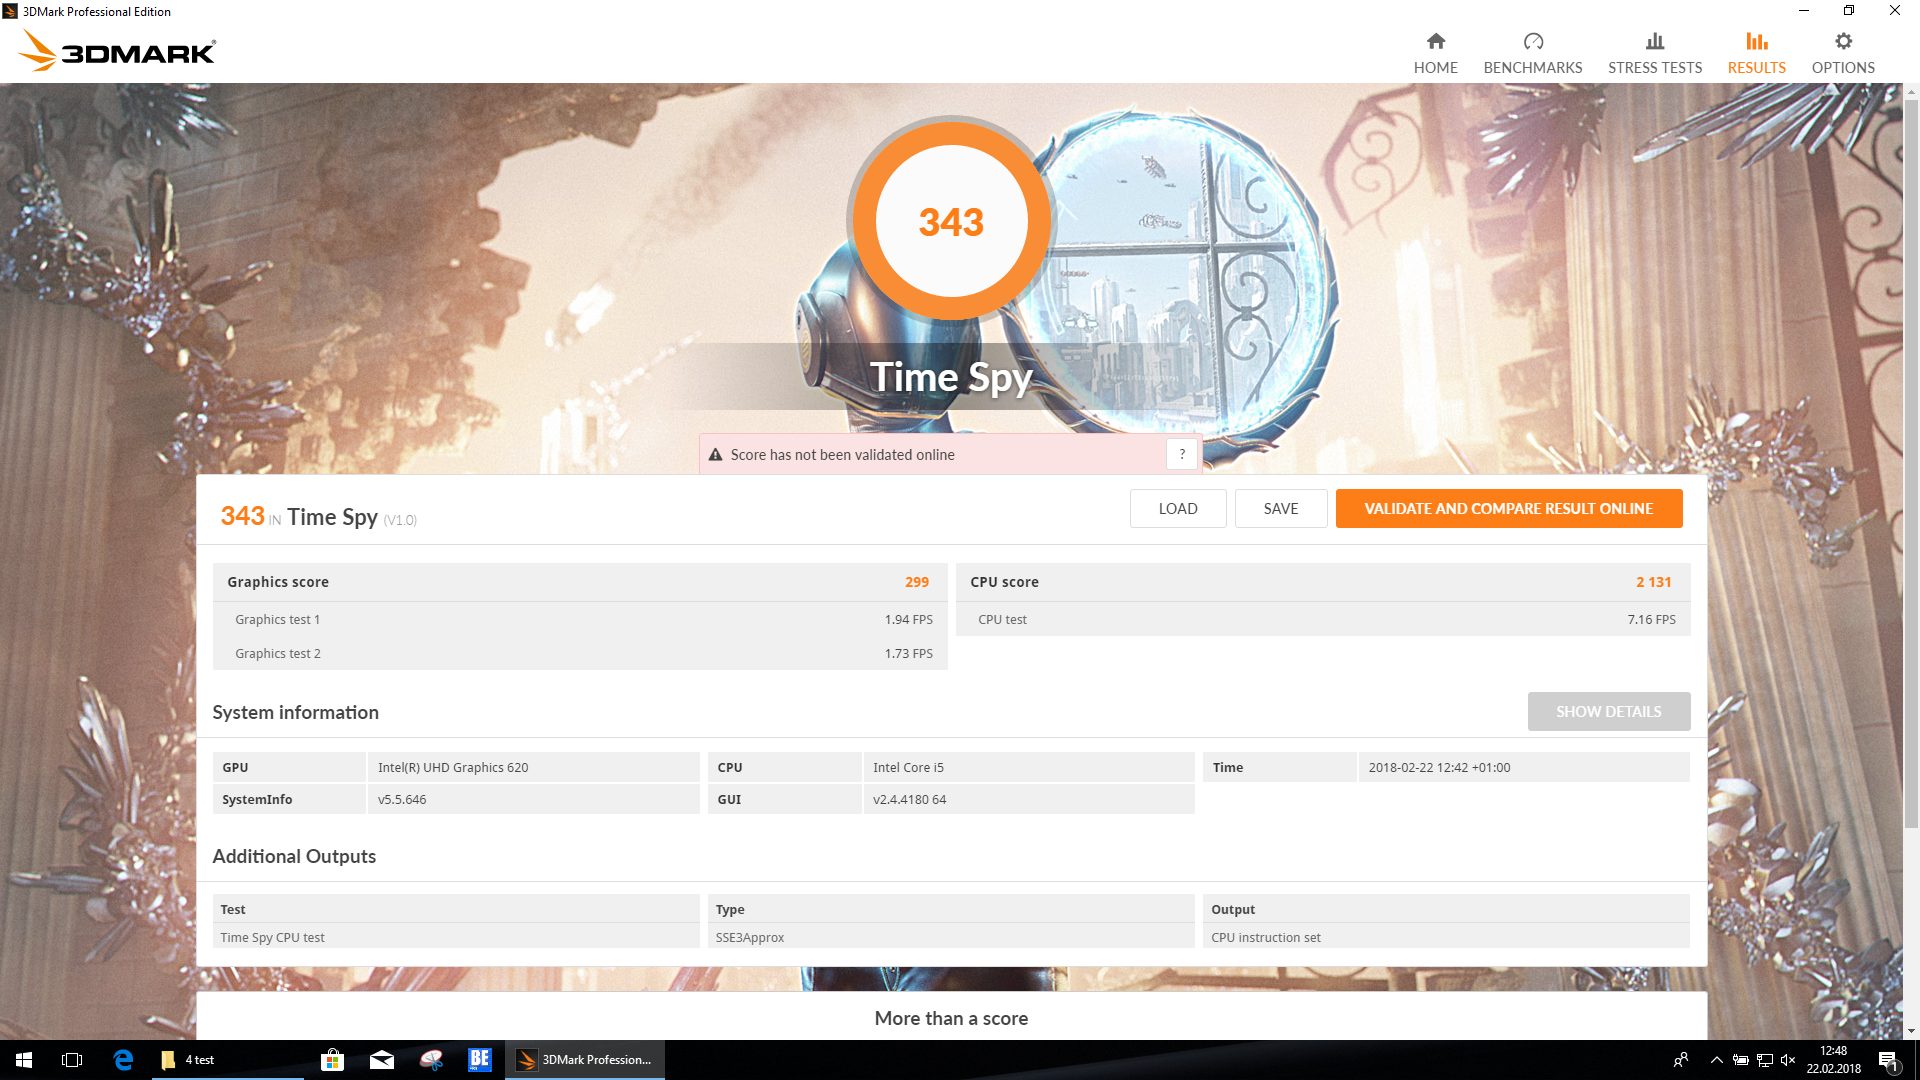
| 3DMark Time Spy Score | 343 punti | |
Aiuto | ||
| basso | medio | alto | ultra | |
|---|---|---|---|---|
| BioShock Infinite (2013) | 37.8 | 24.4 | 19.9 | 6.8 |
| The Witcher 3 (2015) | 14.8 | 9.4 | 5.2 | |
| Rise of the Tomb Raider (2016) | 16.9 | 10.4 | 5.9 |
Rumorosità
| Idle |
| 29.1 / 29.1 / 30.3 dB(A) |
| Sotto carico |
| 31.8 / 33.8 dB(A) |
 | ||
30 dB silenzioso 40 dB(A) udibile 50 dB(A) rumoroso |
||
min: | ||
| Lenovo ThinkPad E480-20KNCTO1WW | Lenovo ThinkPad E480-20KQS00000 | HP ProBook 440 G5-3KX87ES | Lenovo ThinkPad E470 | Acer TravelMate P449-G2-M-56CD | Schenker Slim 14 L17 | Asus VivoBook S14 S406UA-BV023T | |
|---|---|---|---|---|---|---|---|
| Noise | -11% | -3% | -3% | -6% | 2% | -10% | |
| off /ambiente * (dB) | 29.1 | 29.8 -2% | 29.1 -0% | 30.5 -5% | 29.9 -3% | 28.7 1% | 30.2 -4% |
| Idle Minimum * (dB) | 29.1 | 29.8 -2% | 29.1 -0% | 30.5 -5% | 30.2 -4% | 28.7 1% | 30.2 -4% |
| Idle Average * (dB) | 29.1 | 31.5 -8% | 29.1 -0% | 30.5 -5% | 30.2 -4% | 29.5 -1% | 30.2 -4% |
| Idle Maximum * (dB) | 30.3 | 33.3 -10% | 30.7 -1% | 30.5 -1% | 30.2 -0% | 29.5 3% | 31.3 -3% |
| Load Average * (dB) | 31.8 | 39.1 -23% | 34.5 -8% | 32.9 -3% | 36.7 -15% | 30.5 4% | 40.1 -26% |
| Load Maximum * (dB) | 33.8 | 40.4 -20% | 36 -7% | 32.9 3% | 36.4 -8% | 33.4 1% | 40.4 -20% |
| Witcher 3 ultra * (dB) | 39.1 |
* ... Meglio usare valori piccoli
(+) La temperatura massima sul lato superiore è di 36.7 °C / 98 F, rispetto alla media di 34.3 °C / 94 F, che varia da 21.2 a 62.5 °C per questa classe Office.
(±) Il lato inferiore si riscalda fino ad un massimo di 42.8 °C / 109 F, rispetto alla media di 36.8 °C / 98 F
(+) In idle, la temperatura media del lato superiore è di 22.7 °C / 73 F, rispetto alla media deld ispositivo di 29.5 °C / 85 F.
(+) I poggiapolsi e il touchpad sono piu' freddi della temperatura della pelle con un massimo di 25.8 °C / 78.4 F e sono quindi freddi al tatto.
(±) La temperatura media della zona del palmo della mano di dispositivi simili e'stata di 27.6 °C / 81.7 F (+1.8 °C / 3.3 F).
| Lenovo ThinkPad E480-20KNCTO1WW | Lenovo ThinkPad E480-20KQS00000 | HP ProBook 440 G5-3KX87ES | Lenovo ThinkPad E470 | Acer TravelMate P449-G2-M-56CD | Schenker Slim 14 L17 | Asus VivoBook S14 S406UA-BV023T | |
|---|---|---|---|---|---|---|---|
| Heat | -37% | -7% | 0% | -5% | -12% | -13% | |
| Maximum Upper Side * (°C) | 36.7 | 51.9 -41% | 39 -6% | 35.6 3% | 36.8 -0% | 41.9 -14% | 42.2 -15% |
| Maximum Bottom * (°C) | 42.8 | 71.6 -67% | 45.5 -6% | 37.2 13% | 31.3 27% | 43.7 -2% | 39.4 8% |
| Idle Upper Side * (°C) | 23.4 | 24.8 -6% | 24.8 -6% | 24.4 -4% | 26.7 -14% | 24.8 -6% | 28.1 -20% |
| Idle Bottom * (°C) | 22.8 | 30 -32% | 25 -10% | 25.6 -12% | 30 -32% | 28.4 -25% | 28.1 -23% |
* ... Meglio usare valori piccoli
| Off / Standby | |
| Idle | |
| Sotto carico |
|
Leggenda:
min: | |
| Lenovo ThinkPad E480-20KNCTO1WW i5-8250U, UHD Graphics 620, IPS LED, 1920x1080, 14" | Lenovo ThinkPad E480-20KQS00000 i5-8250U, Radeon RX 550 (Laptop), IPS LED, 1920x1080, 14" | HP ProBook 440 G5-3KX87ES i5-8250U, UHD Graphics 620, IPS LED, 1920x1080, 14" | Lenovo ThinkPad E470 i5-7200U, HD Graphics 620, TN LED, 1366x768, 14" | Acer TravelMate P449-G2-M-56CD i5-7200U, HD Graphics 620, IPS, 1920x1080, 14" | Schenker Slim 14 L17 i5-8250U, UHD Graphics 620, IPS, 1920x1080, 14" | Asus VivoBook S14 S406UA-BV023T i5-8250U, UHD Graphics 620, TN LED, 1366x768, 14" | |
|---|---|---|---|---|---|---|---|
| Power Consumption | -38% | -33% | -25% | -20% | -42% | -8% | |
| Idle Minimum * (Watt) | 3.5 | 4.1 -17% | 4.4 -26% | 5.2 -49% | 4.5 -29% | 6 -71% | 3.7 -6% |
| Idle Average * (Watt) | 5.3 | 6.3 -19% | 7.1 -34% | 7.6 -43% | 7.1 -34% | 8.46 -60% | 5.6 -6% |
| Idle Maximum * (Watt) | 6.1 | 7.1 -16% | 10.2 -67% | 9.9 -62% | 10.2 -67% | 9.48 -55% | 7.6 -25% |
| Load Average * (Watt) | 30 | 54.8 -83% | 36.5 -22% | 31 -3% | 29.8 1% | 37.4 -25% | 37.4 -25% |
| Load Maximum * (Watt) | 42.3 | 66.4 -57% | 48.7 -15% | 29.7 30% | 31 27% | 41.1 3% | 33 22% |
| Witcher 3 ultra * (Watt) | 43.8 |
* ... Meglio usare valori piccoli

| Lenovo ThinkPad E480-20KNCTO1WW i5-8250U, UHD Graphics 620, 45 Wh | Lenovo ThinkPad E480-20KQS00000 i5-8250U, Radeon RX 550 (Laptop), 48 Wh | HP ProBook 440 G5-3KX87ES i5-8250U, UHD Graphics 620, 48 Wh | Lenovo ThinkPad E470 i5-7200U, HD Graphics 620, 45 Wh | Acer TravelMate P449-G2-M-56CD i5-7200U, HD Graphics 620, 48 Wh | Schenker Slim 14 L17 i5-8250U, UHD Graphics 620, 44 Wh | Asus VivoBook S14 S406UA-BV023T i5-8250U, UHD Graphics 620, 39 Wh | Media della classe Office | |
|---|---|---|---|---|---|---|---|---|
| Autonomia della batteria | -5% | -5% | 7% | -8% | -39% | -5% | 49% | |
| Reader / Idle (h) | 18.4 | 19.4 5% | 13.7 -26% | 18.5 1% | 16.3 -11% | 22.2 ? 21% | ||
| H.264 (h) | 7.2 | 8.9 24% | 3.7 -49% | 9.1 26% | 8.4 17% | 15.4 ? 114% | ||
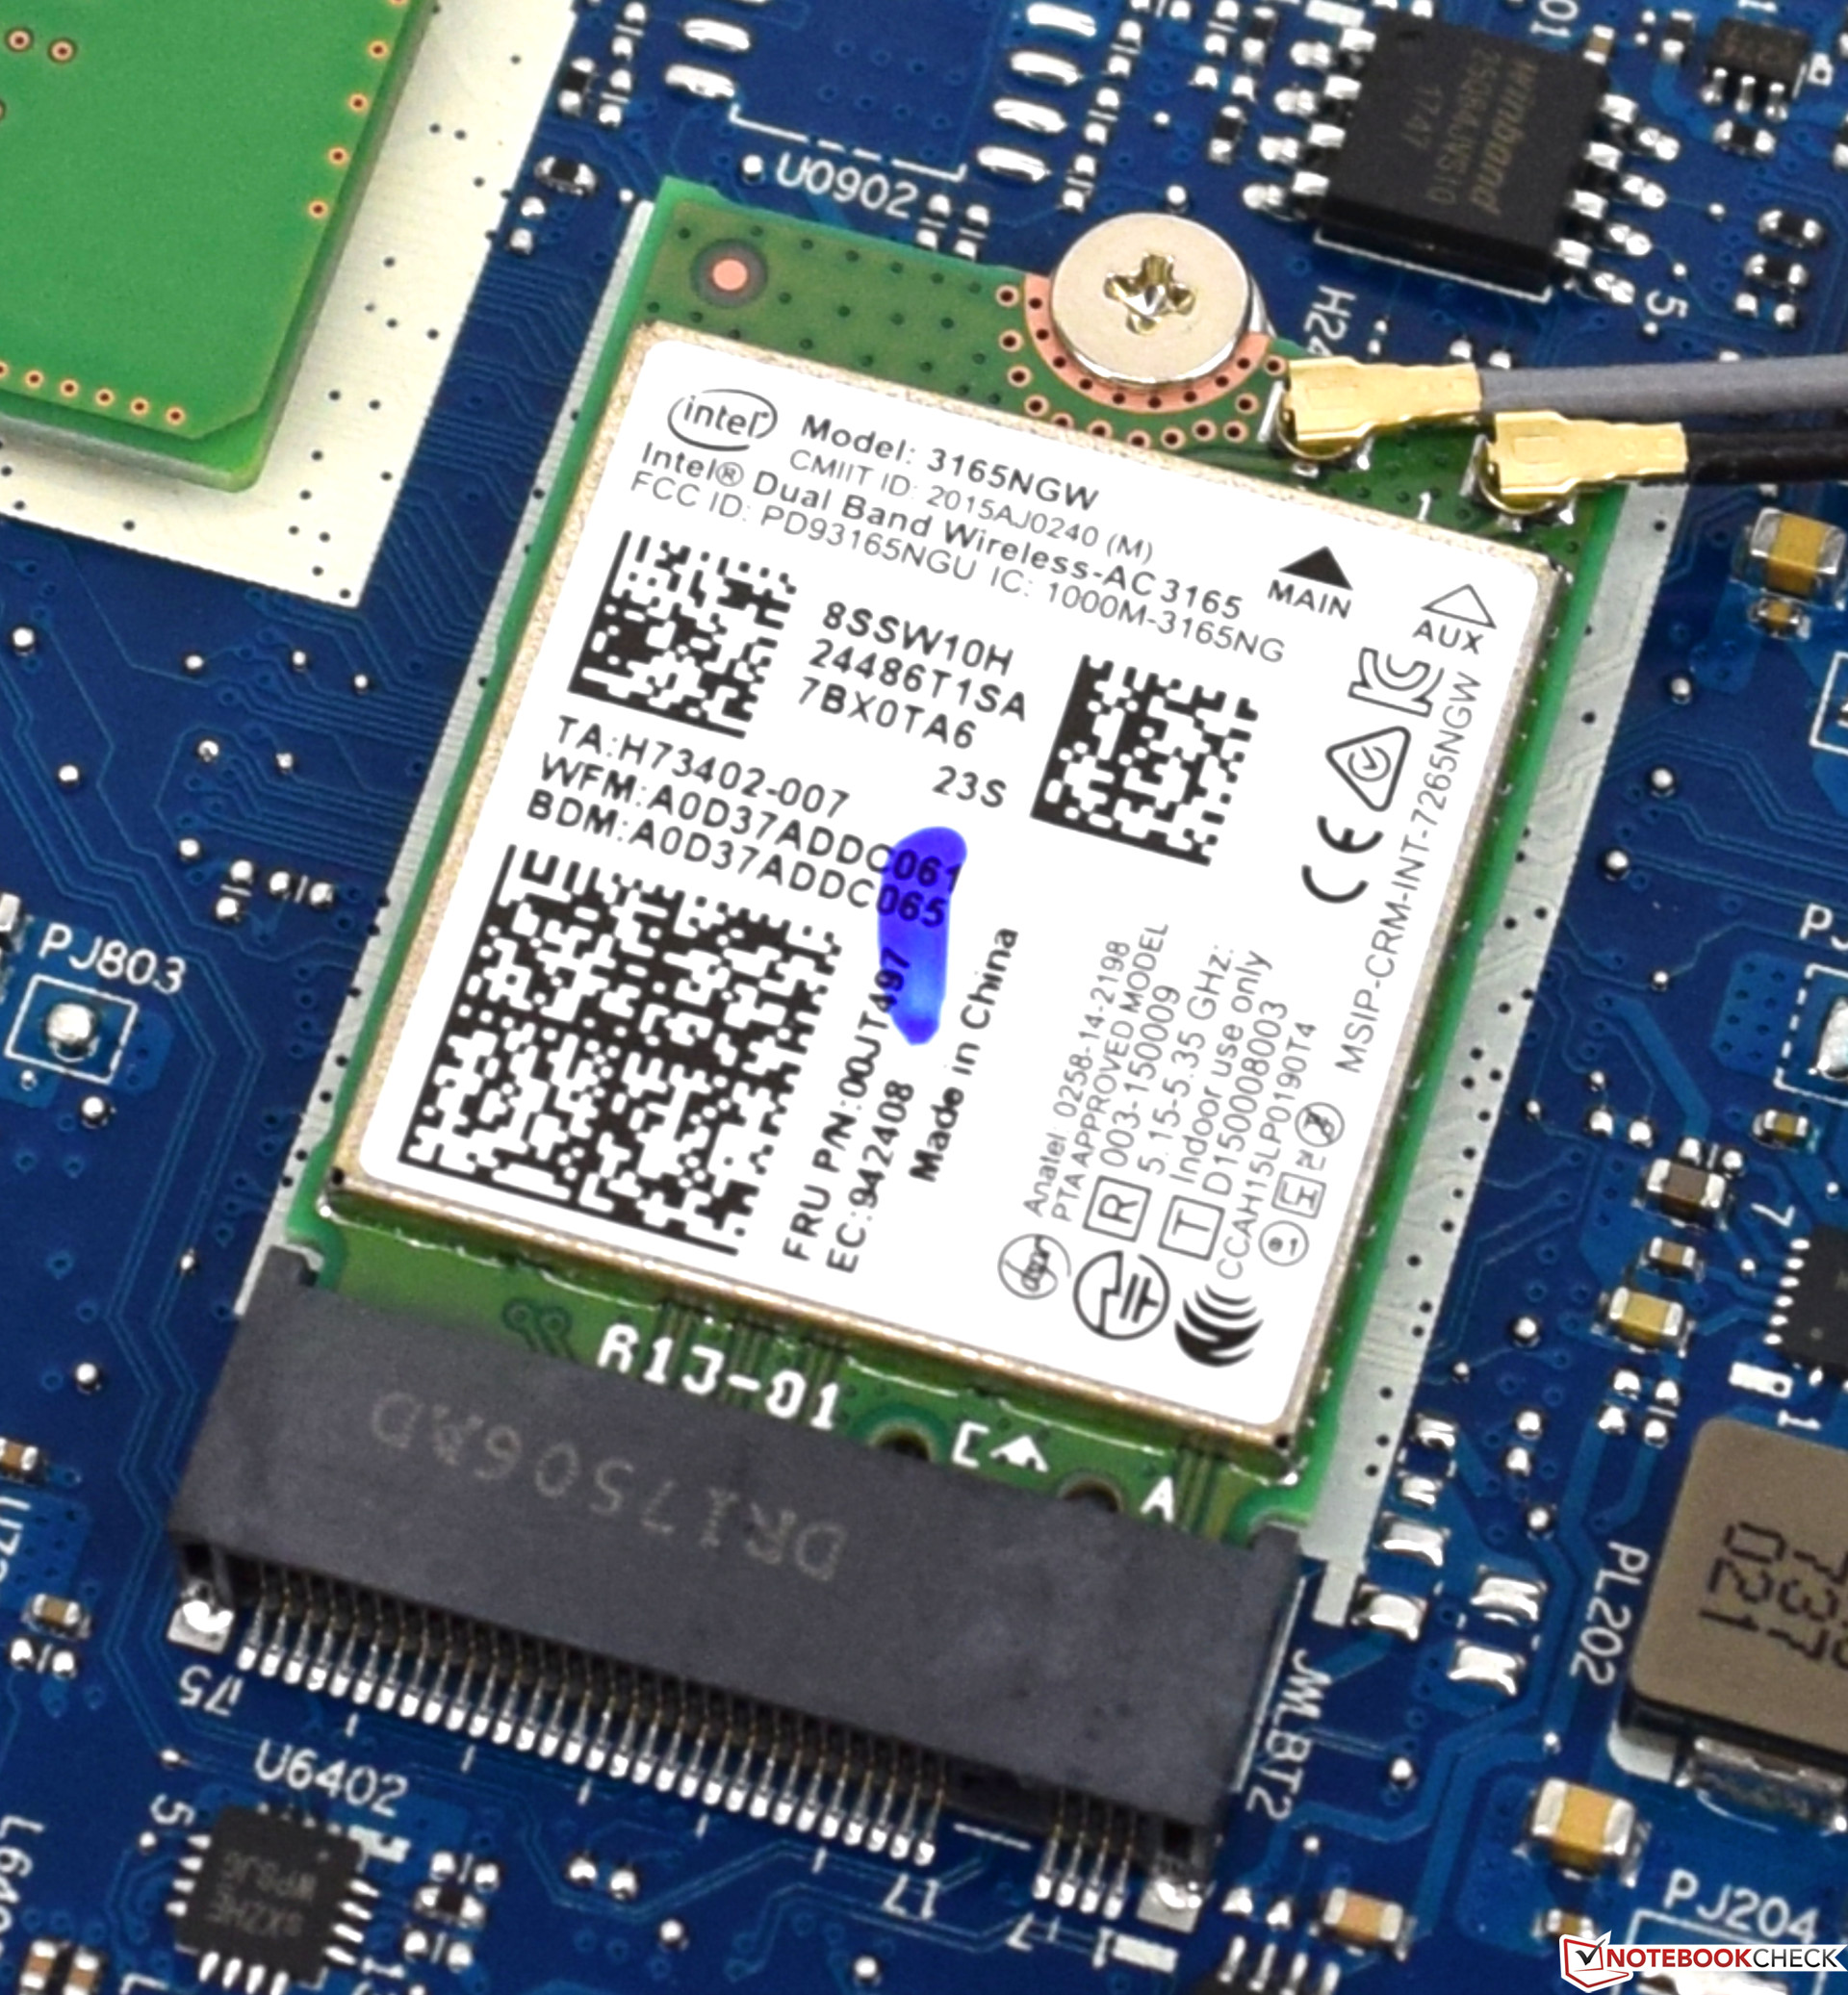
| WiFi v1.3 (h) | 8.3 | 5.7 -31% | 6.9 -17% | 8 -4% | 5.7 -31% | 5.1 -39% | 7.9 -5% | 13.2 ? 59% |
| Load (h) | 1.8 | 1.5 -17% | 3.1 72% | 1.9 6% | 1.7 -6% | 1.808 ? 0% |
Pro
Contro
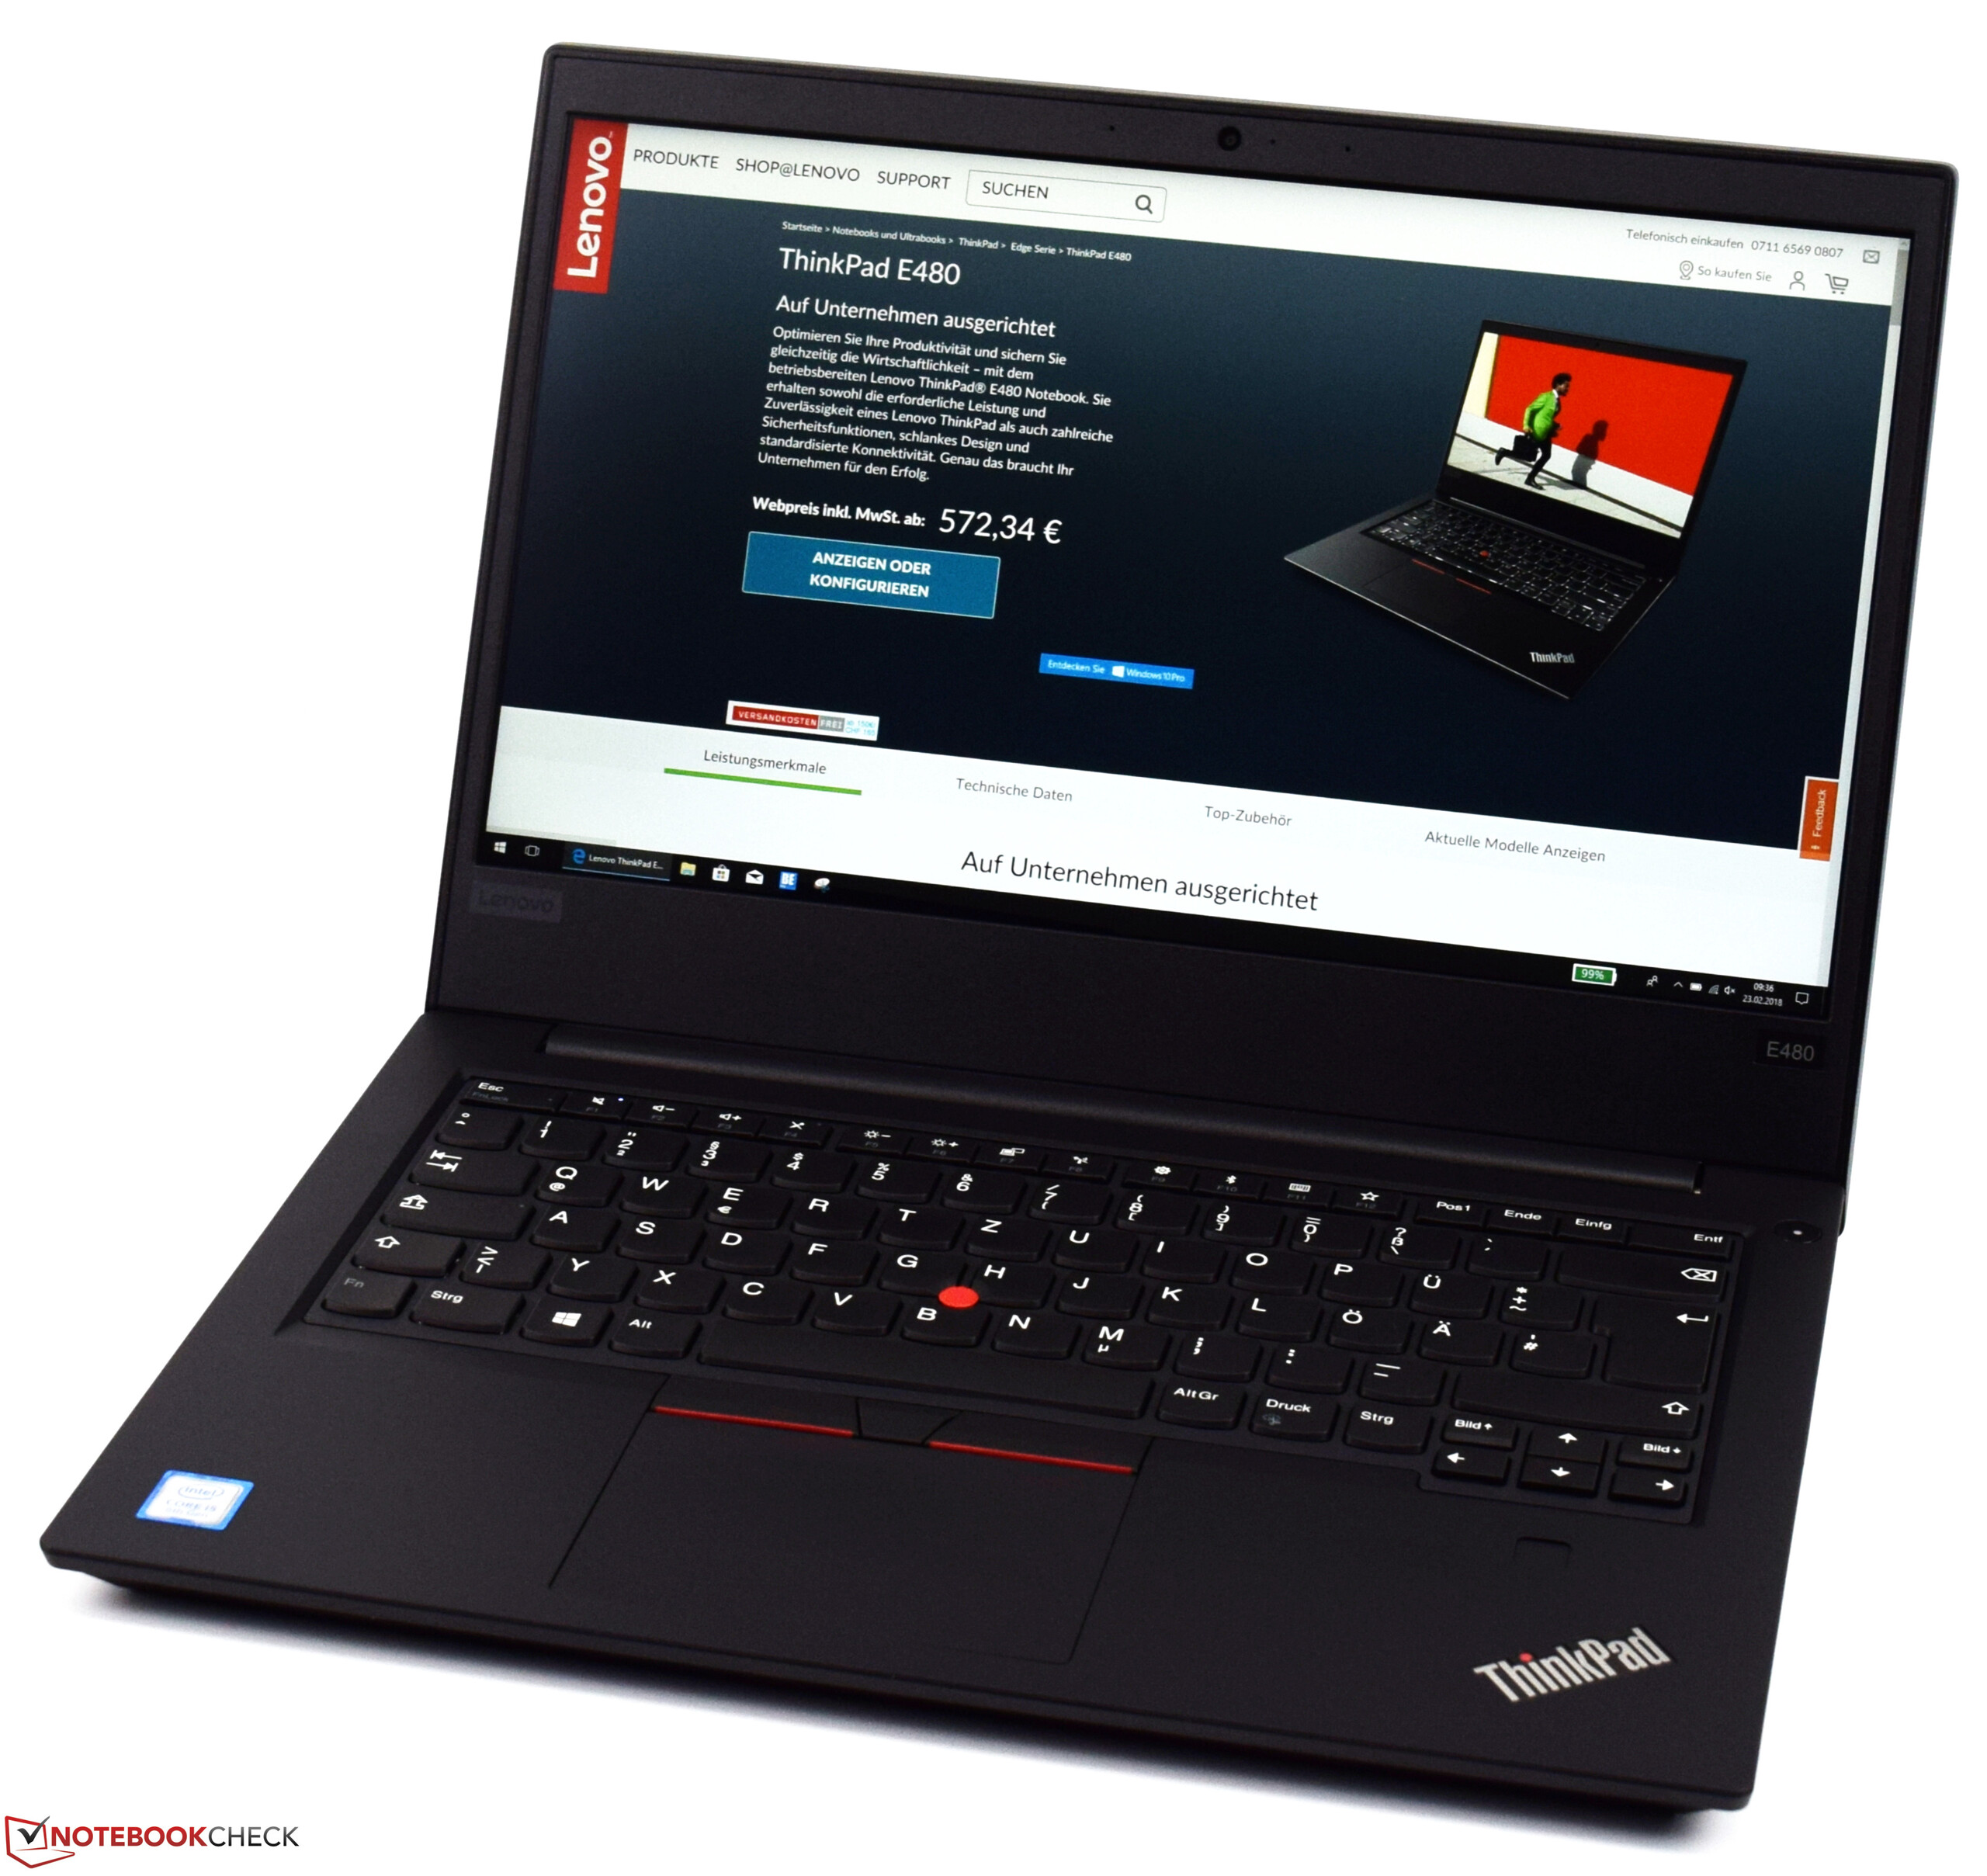
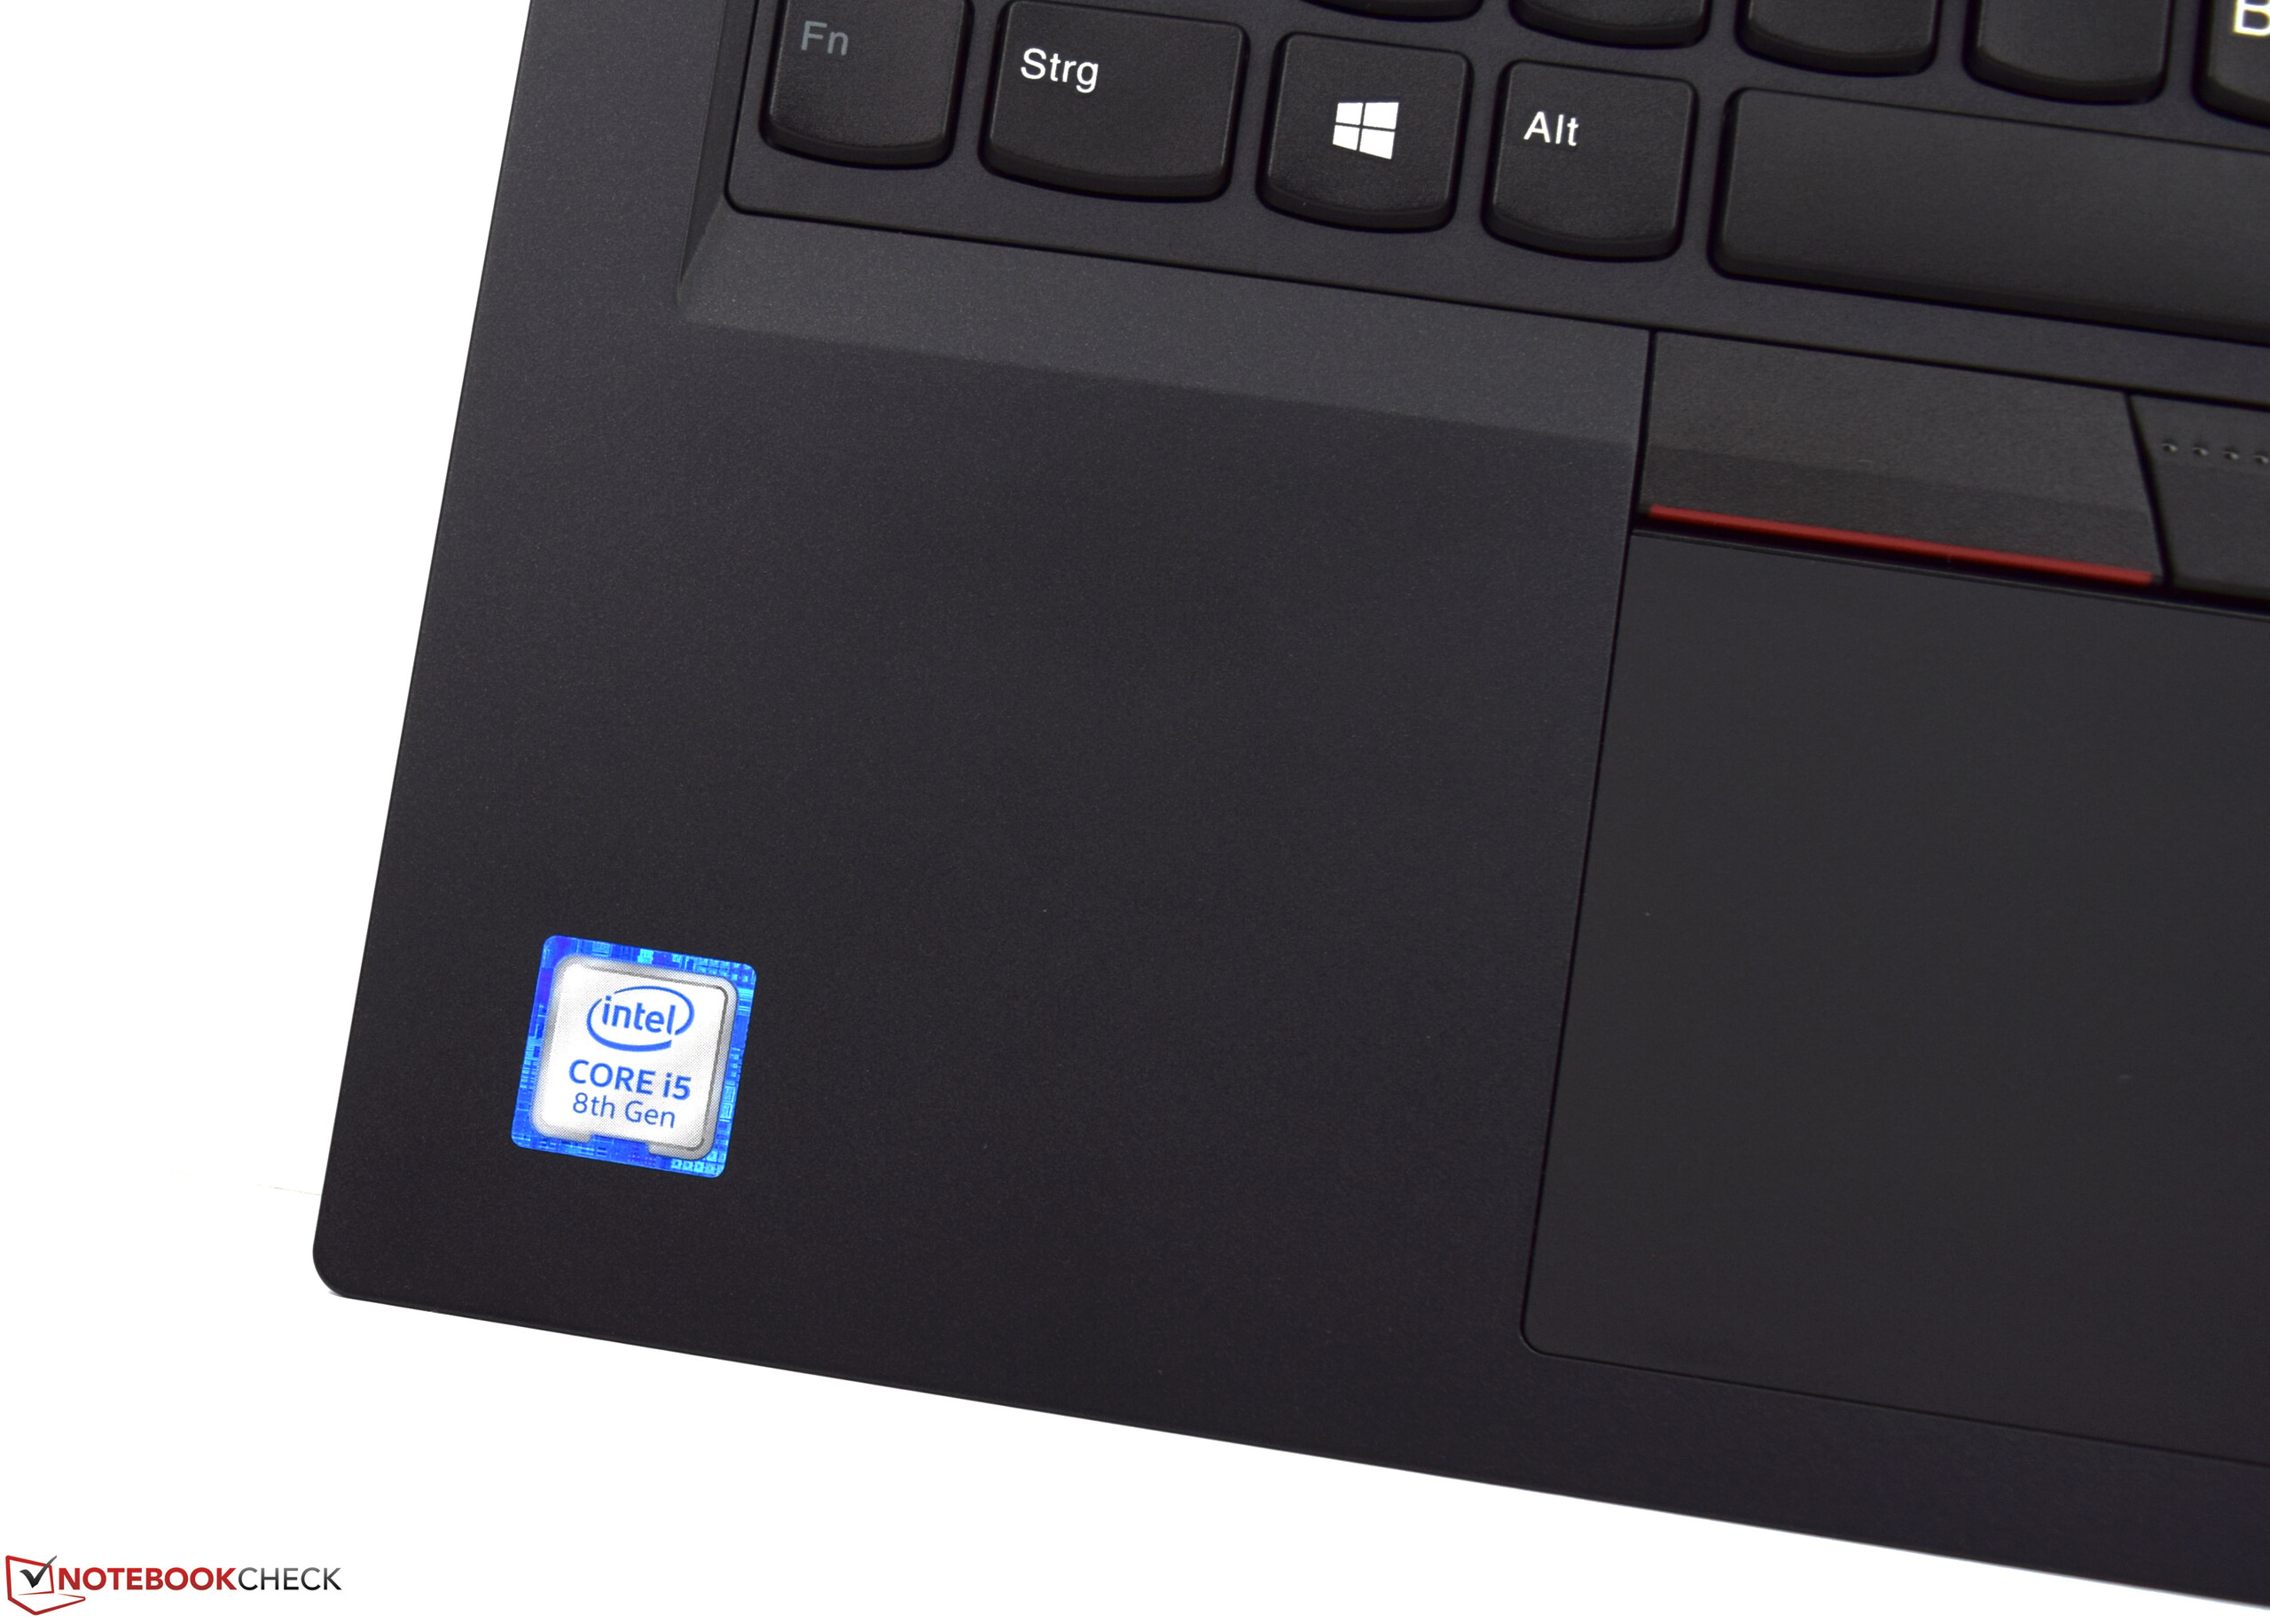
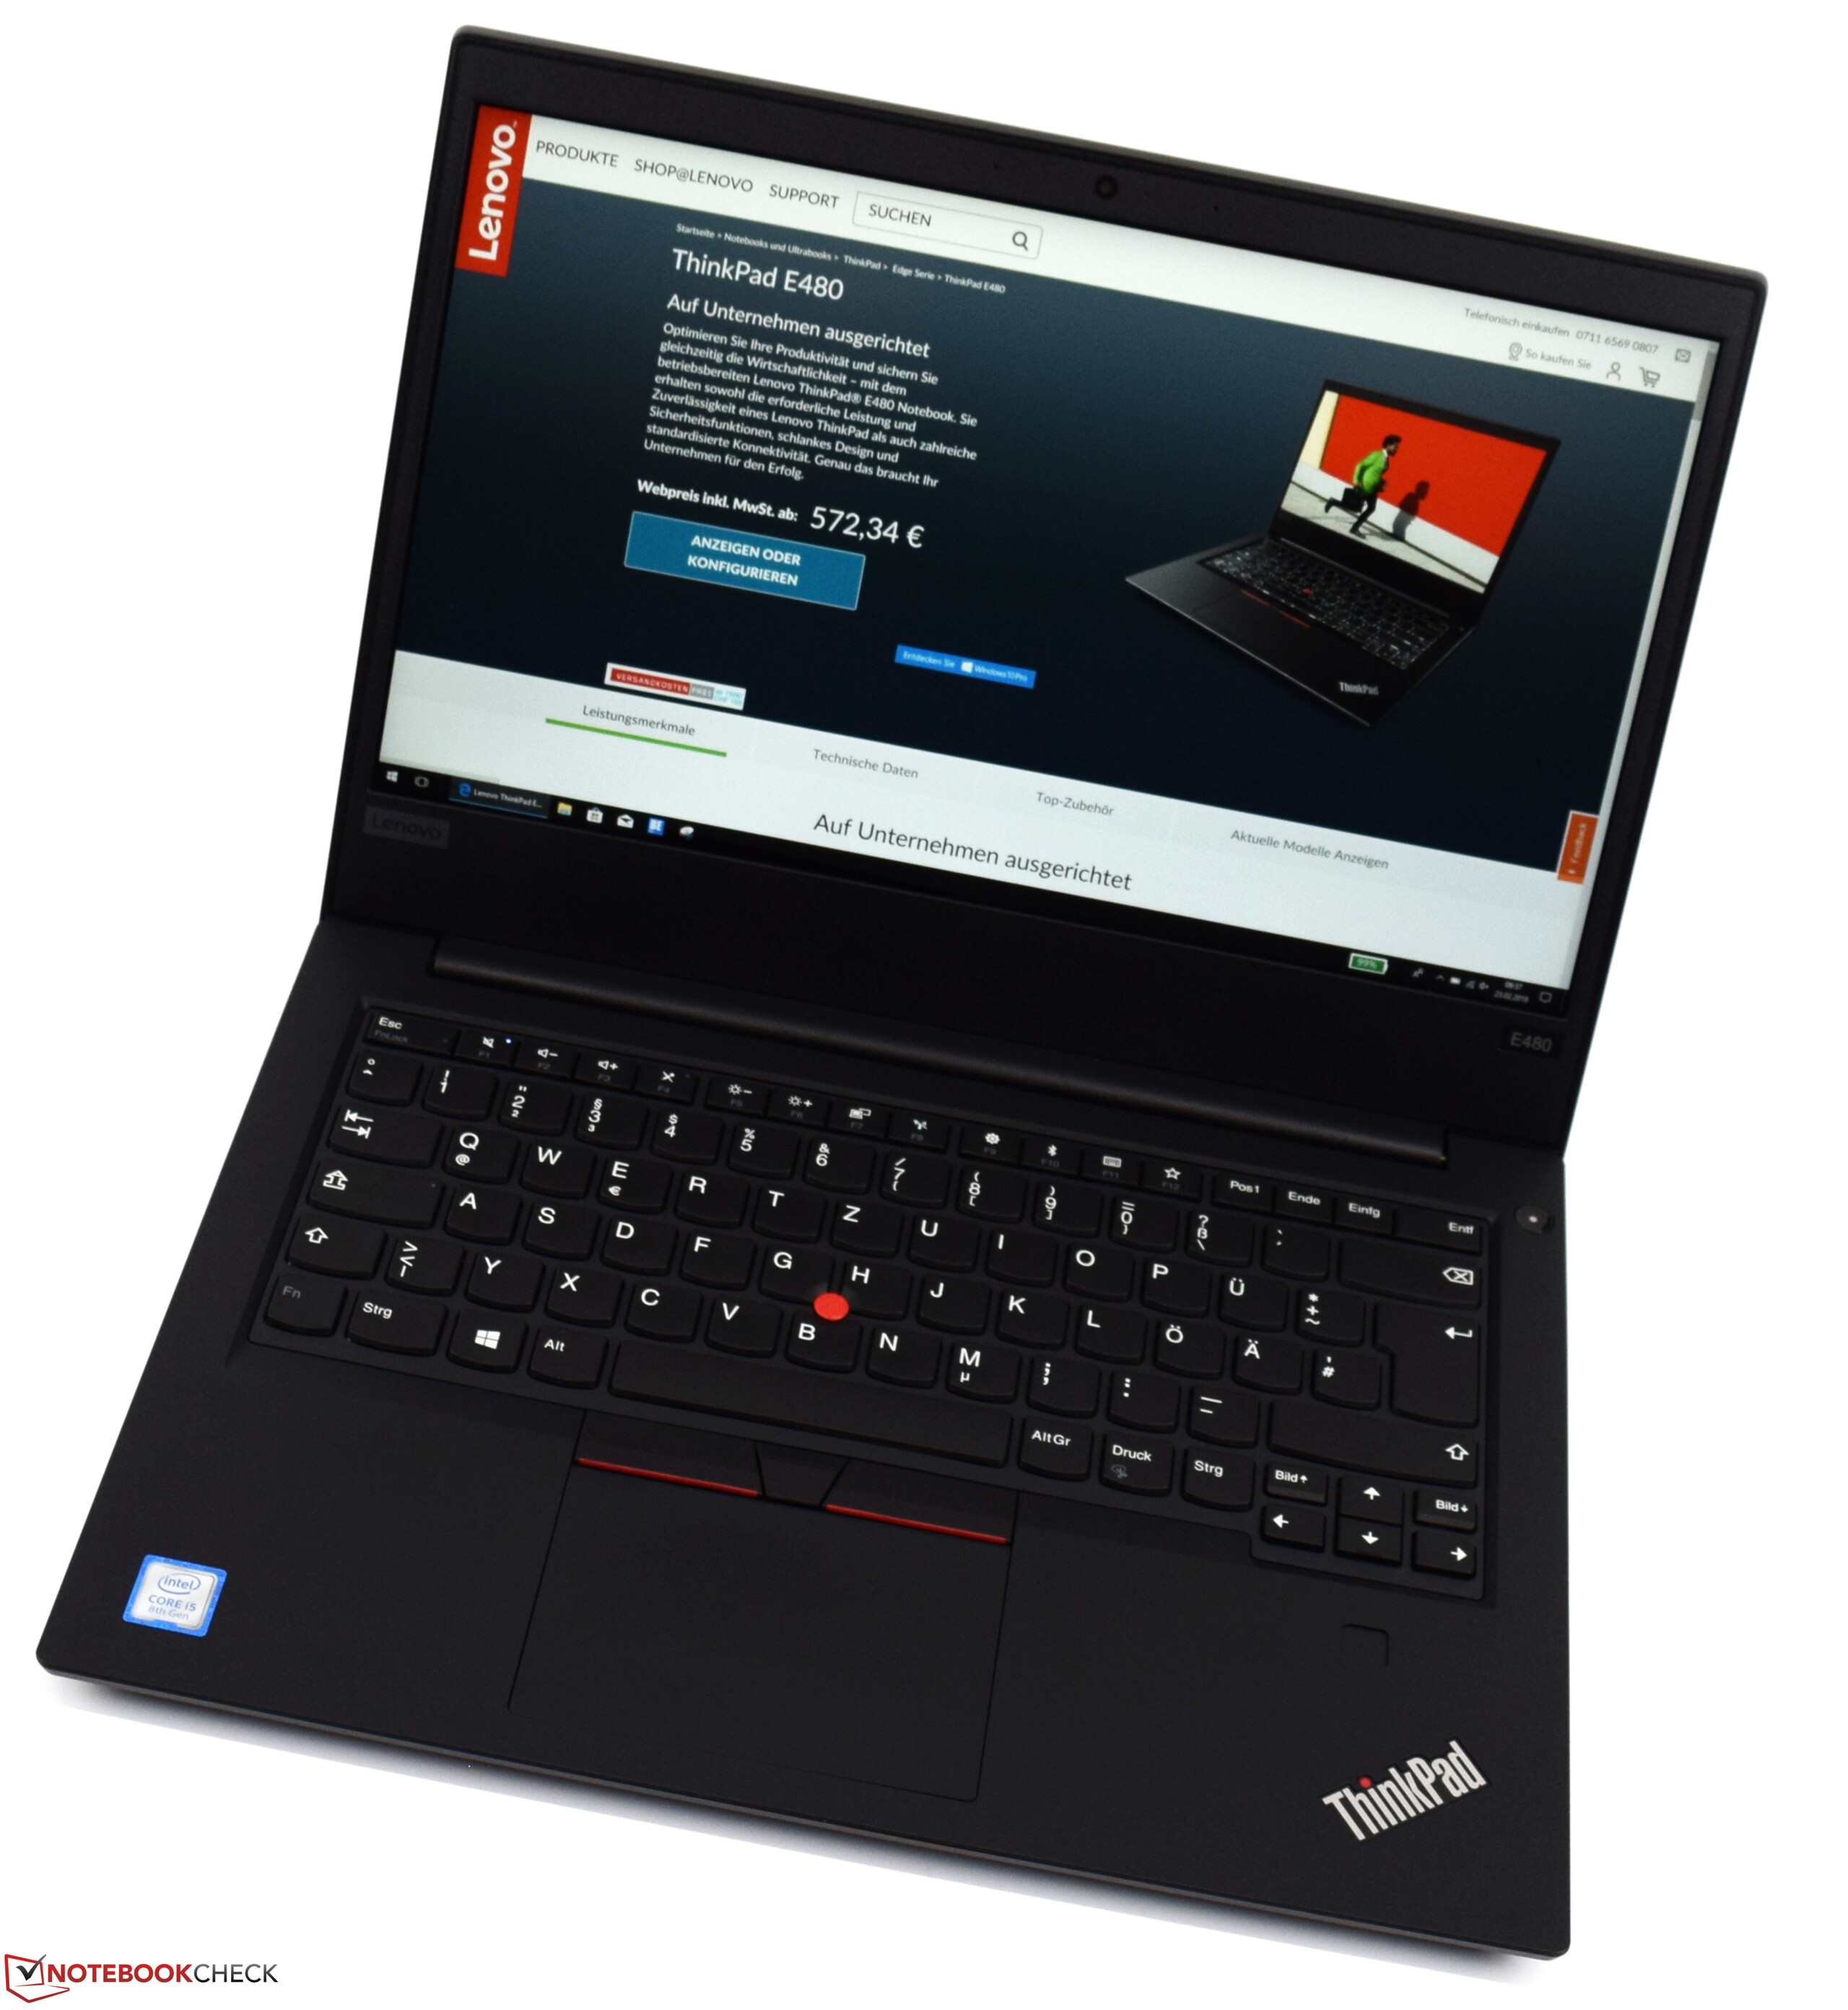
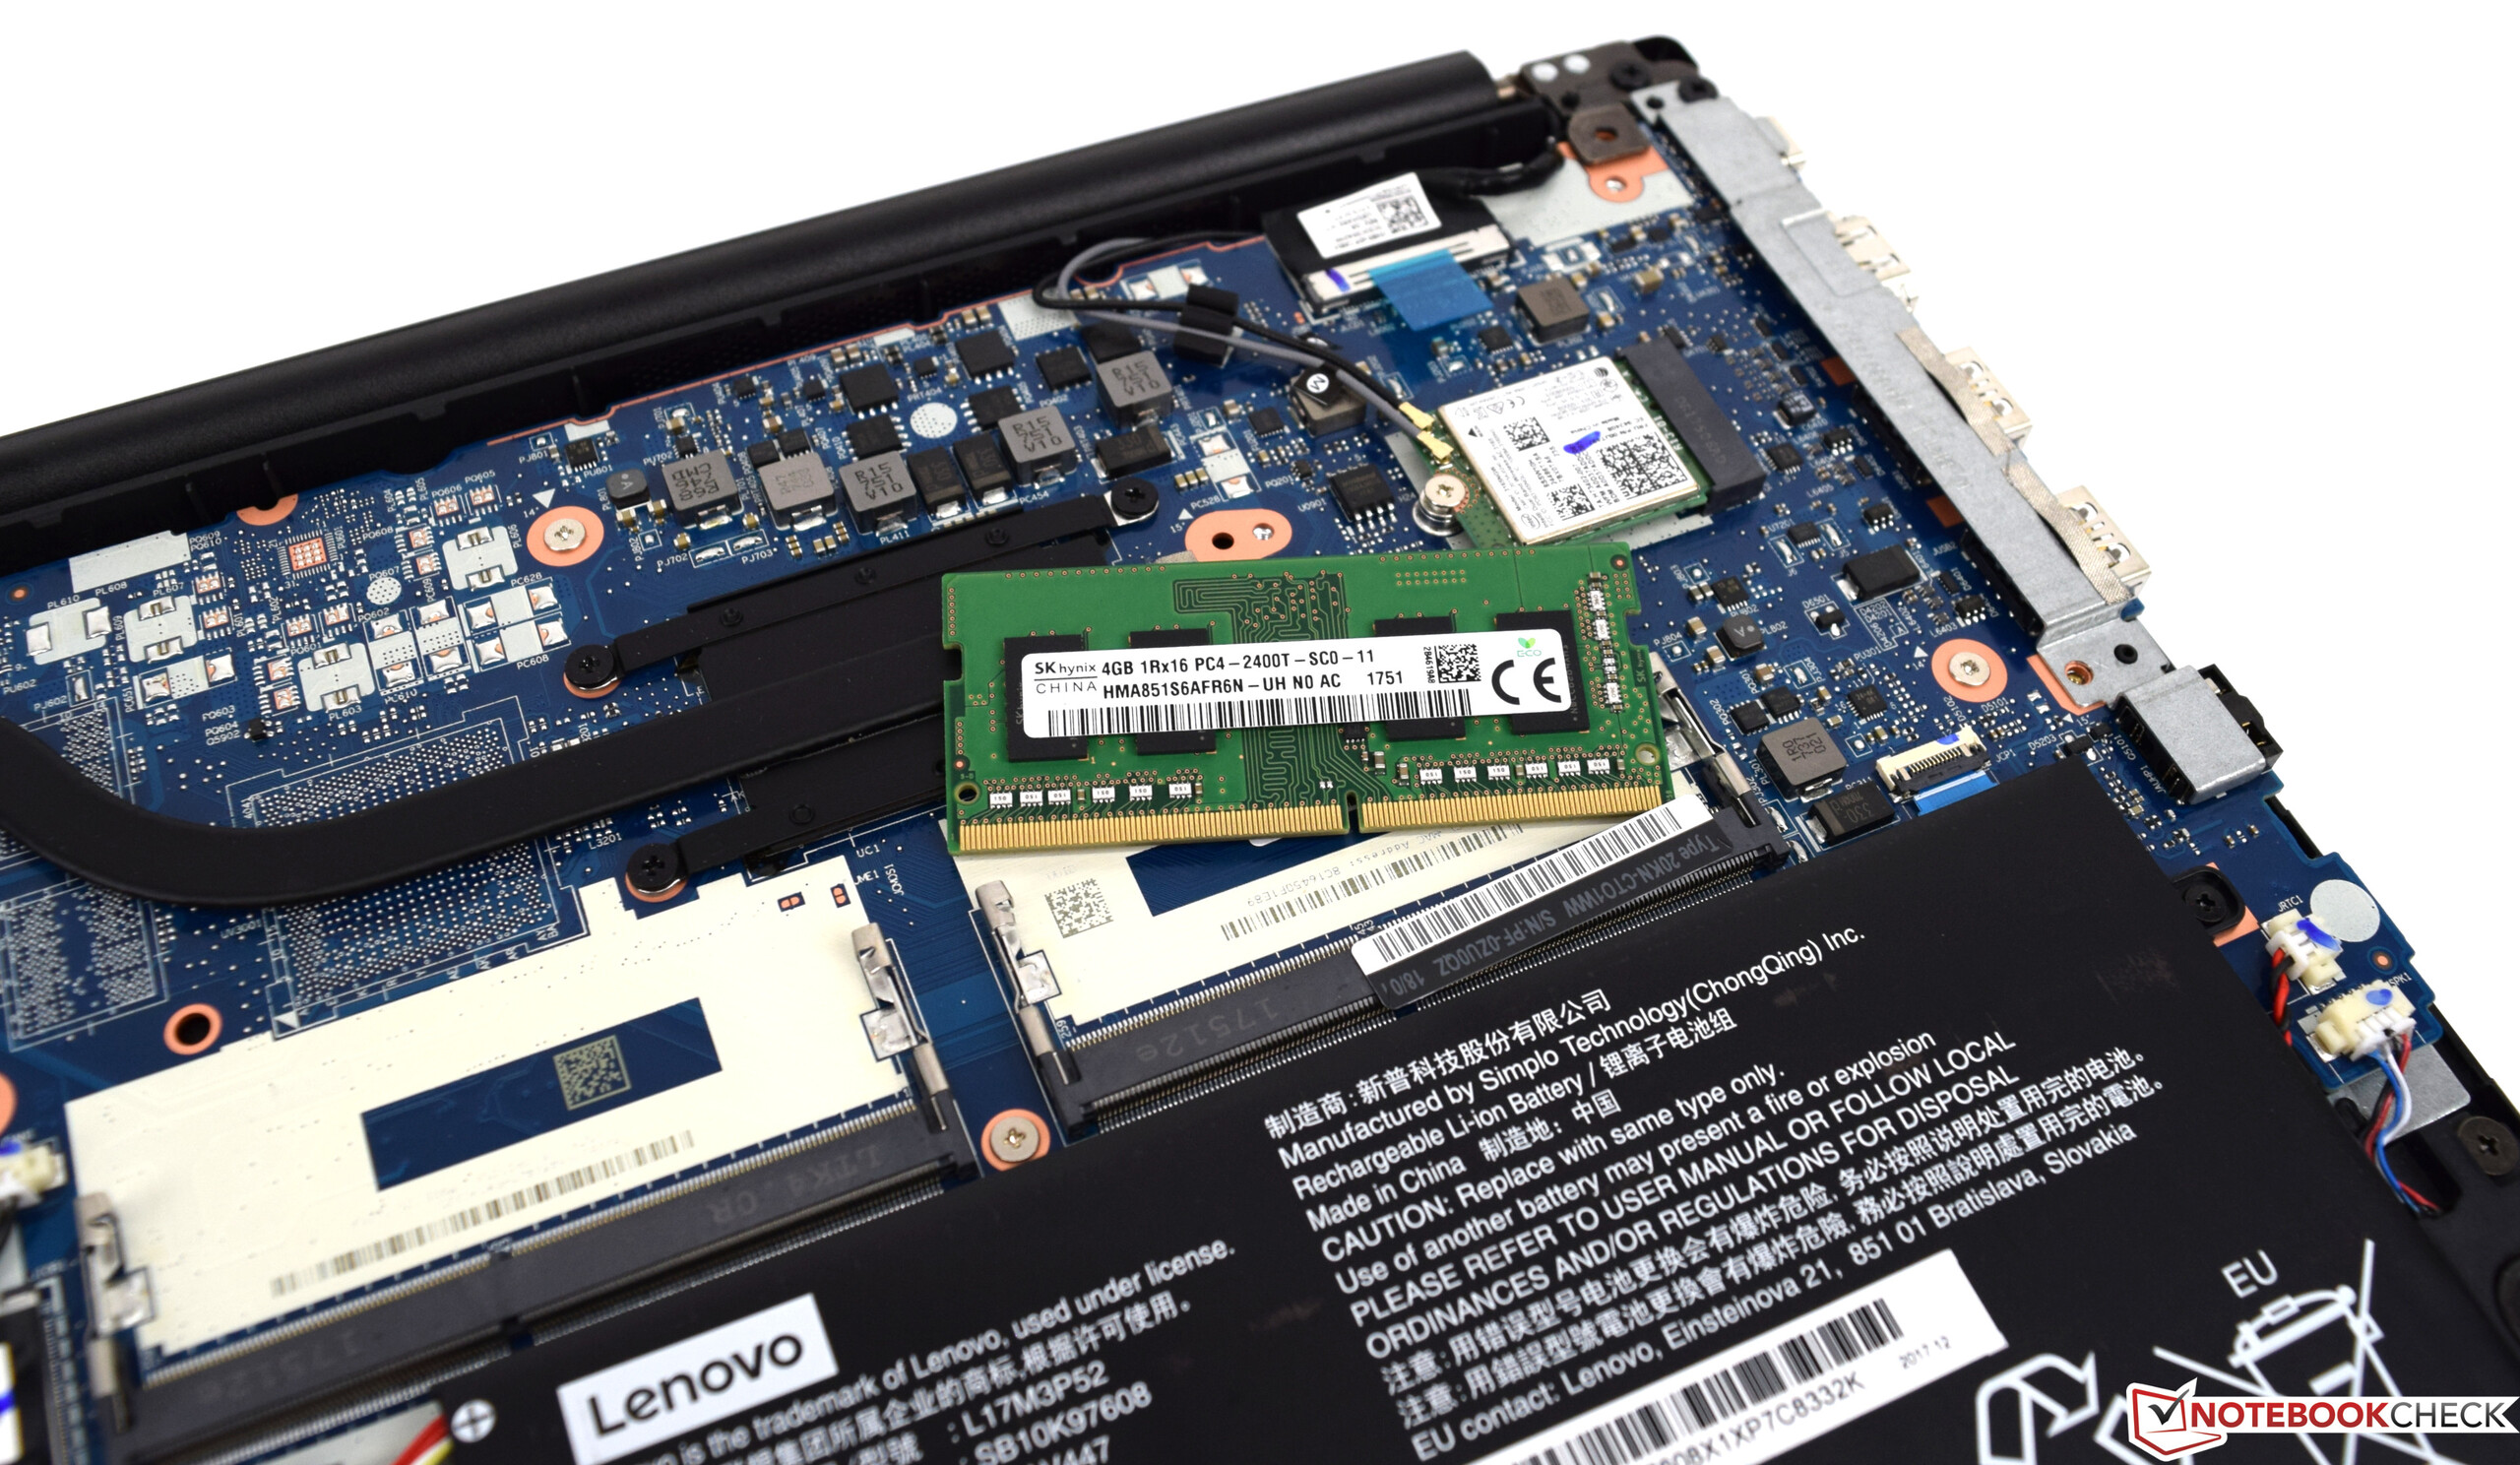
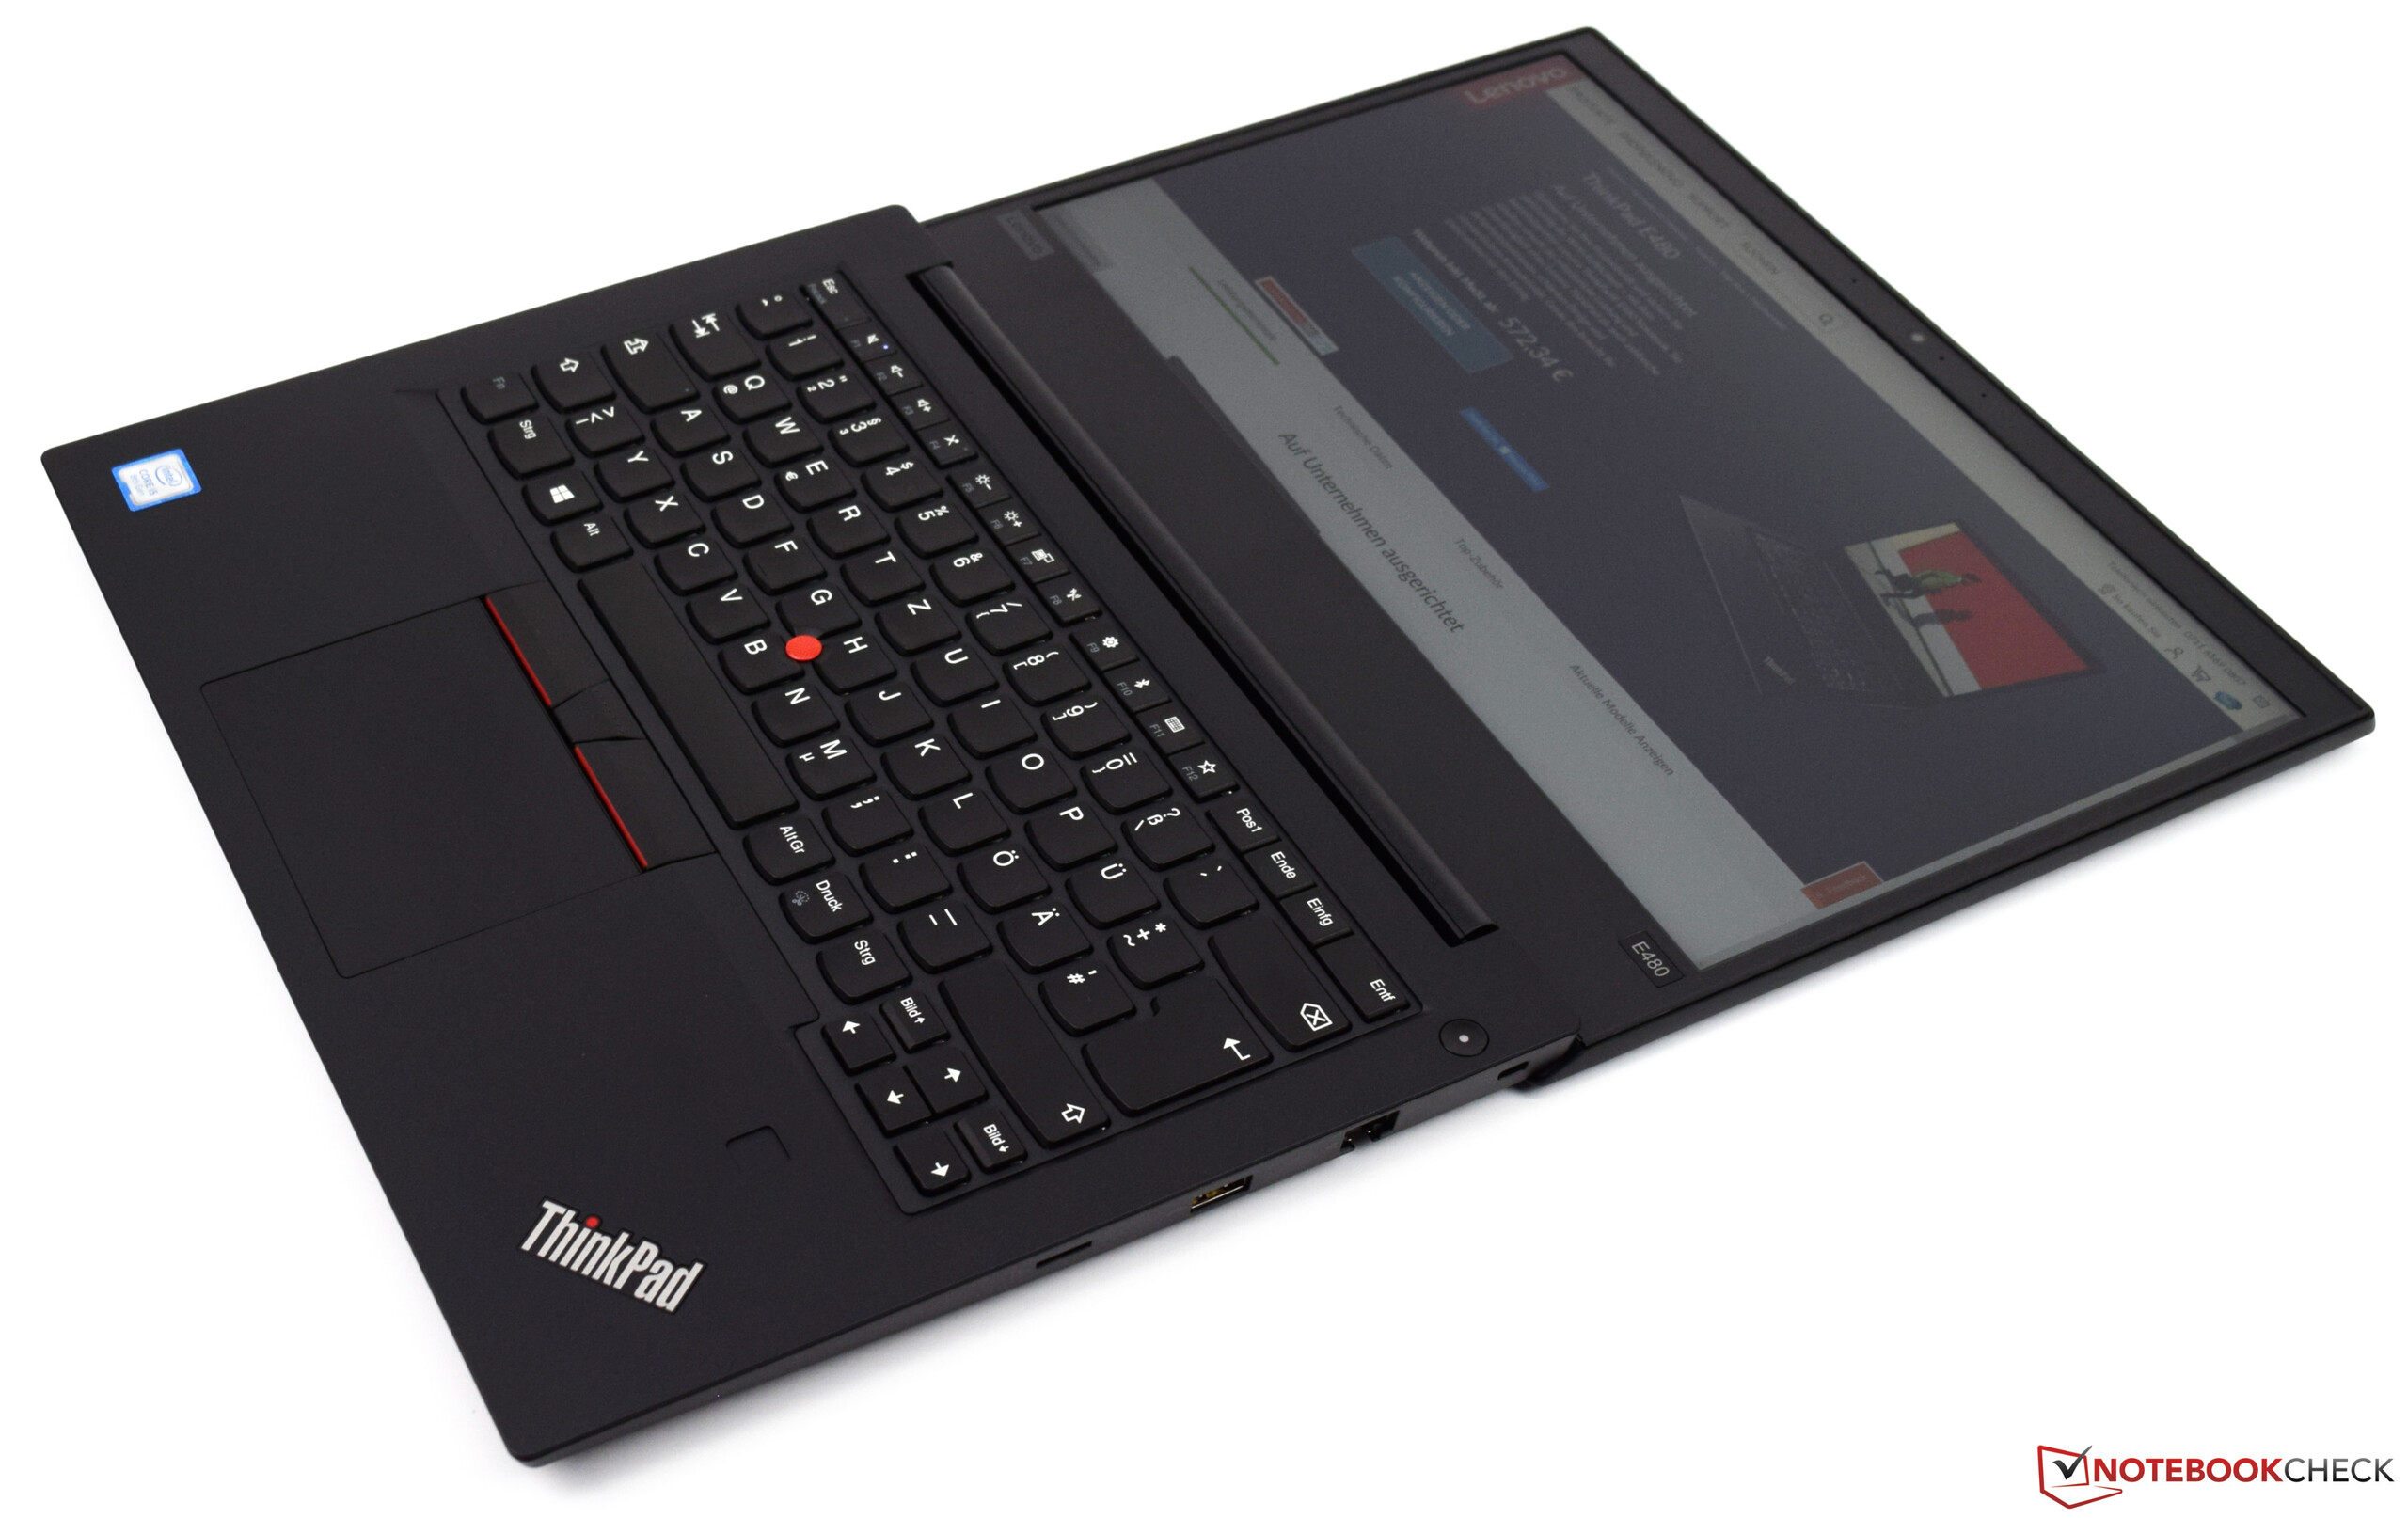
Il Lenovo ThinkPad E480 è un economico portatile da ufficio con hardware potente. Il suo processore Intel Core i5-8250U è una CPU potente ma energeticamente efficiente, che ha un consumo migliore rispetto alla media e l'autonomia ne beneficia. Monta appena 4 GB di RAM ed uno spazio di 128 GB, il ThinkPad E480 non offre molto altro, ma è abbastanza per le attività quotidiane da ufficio.
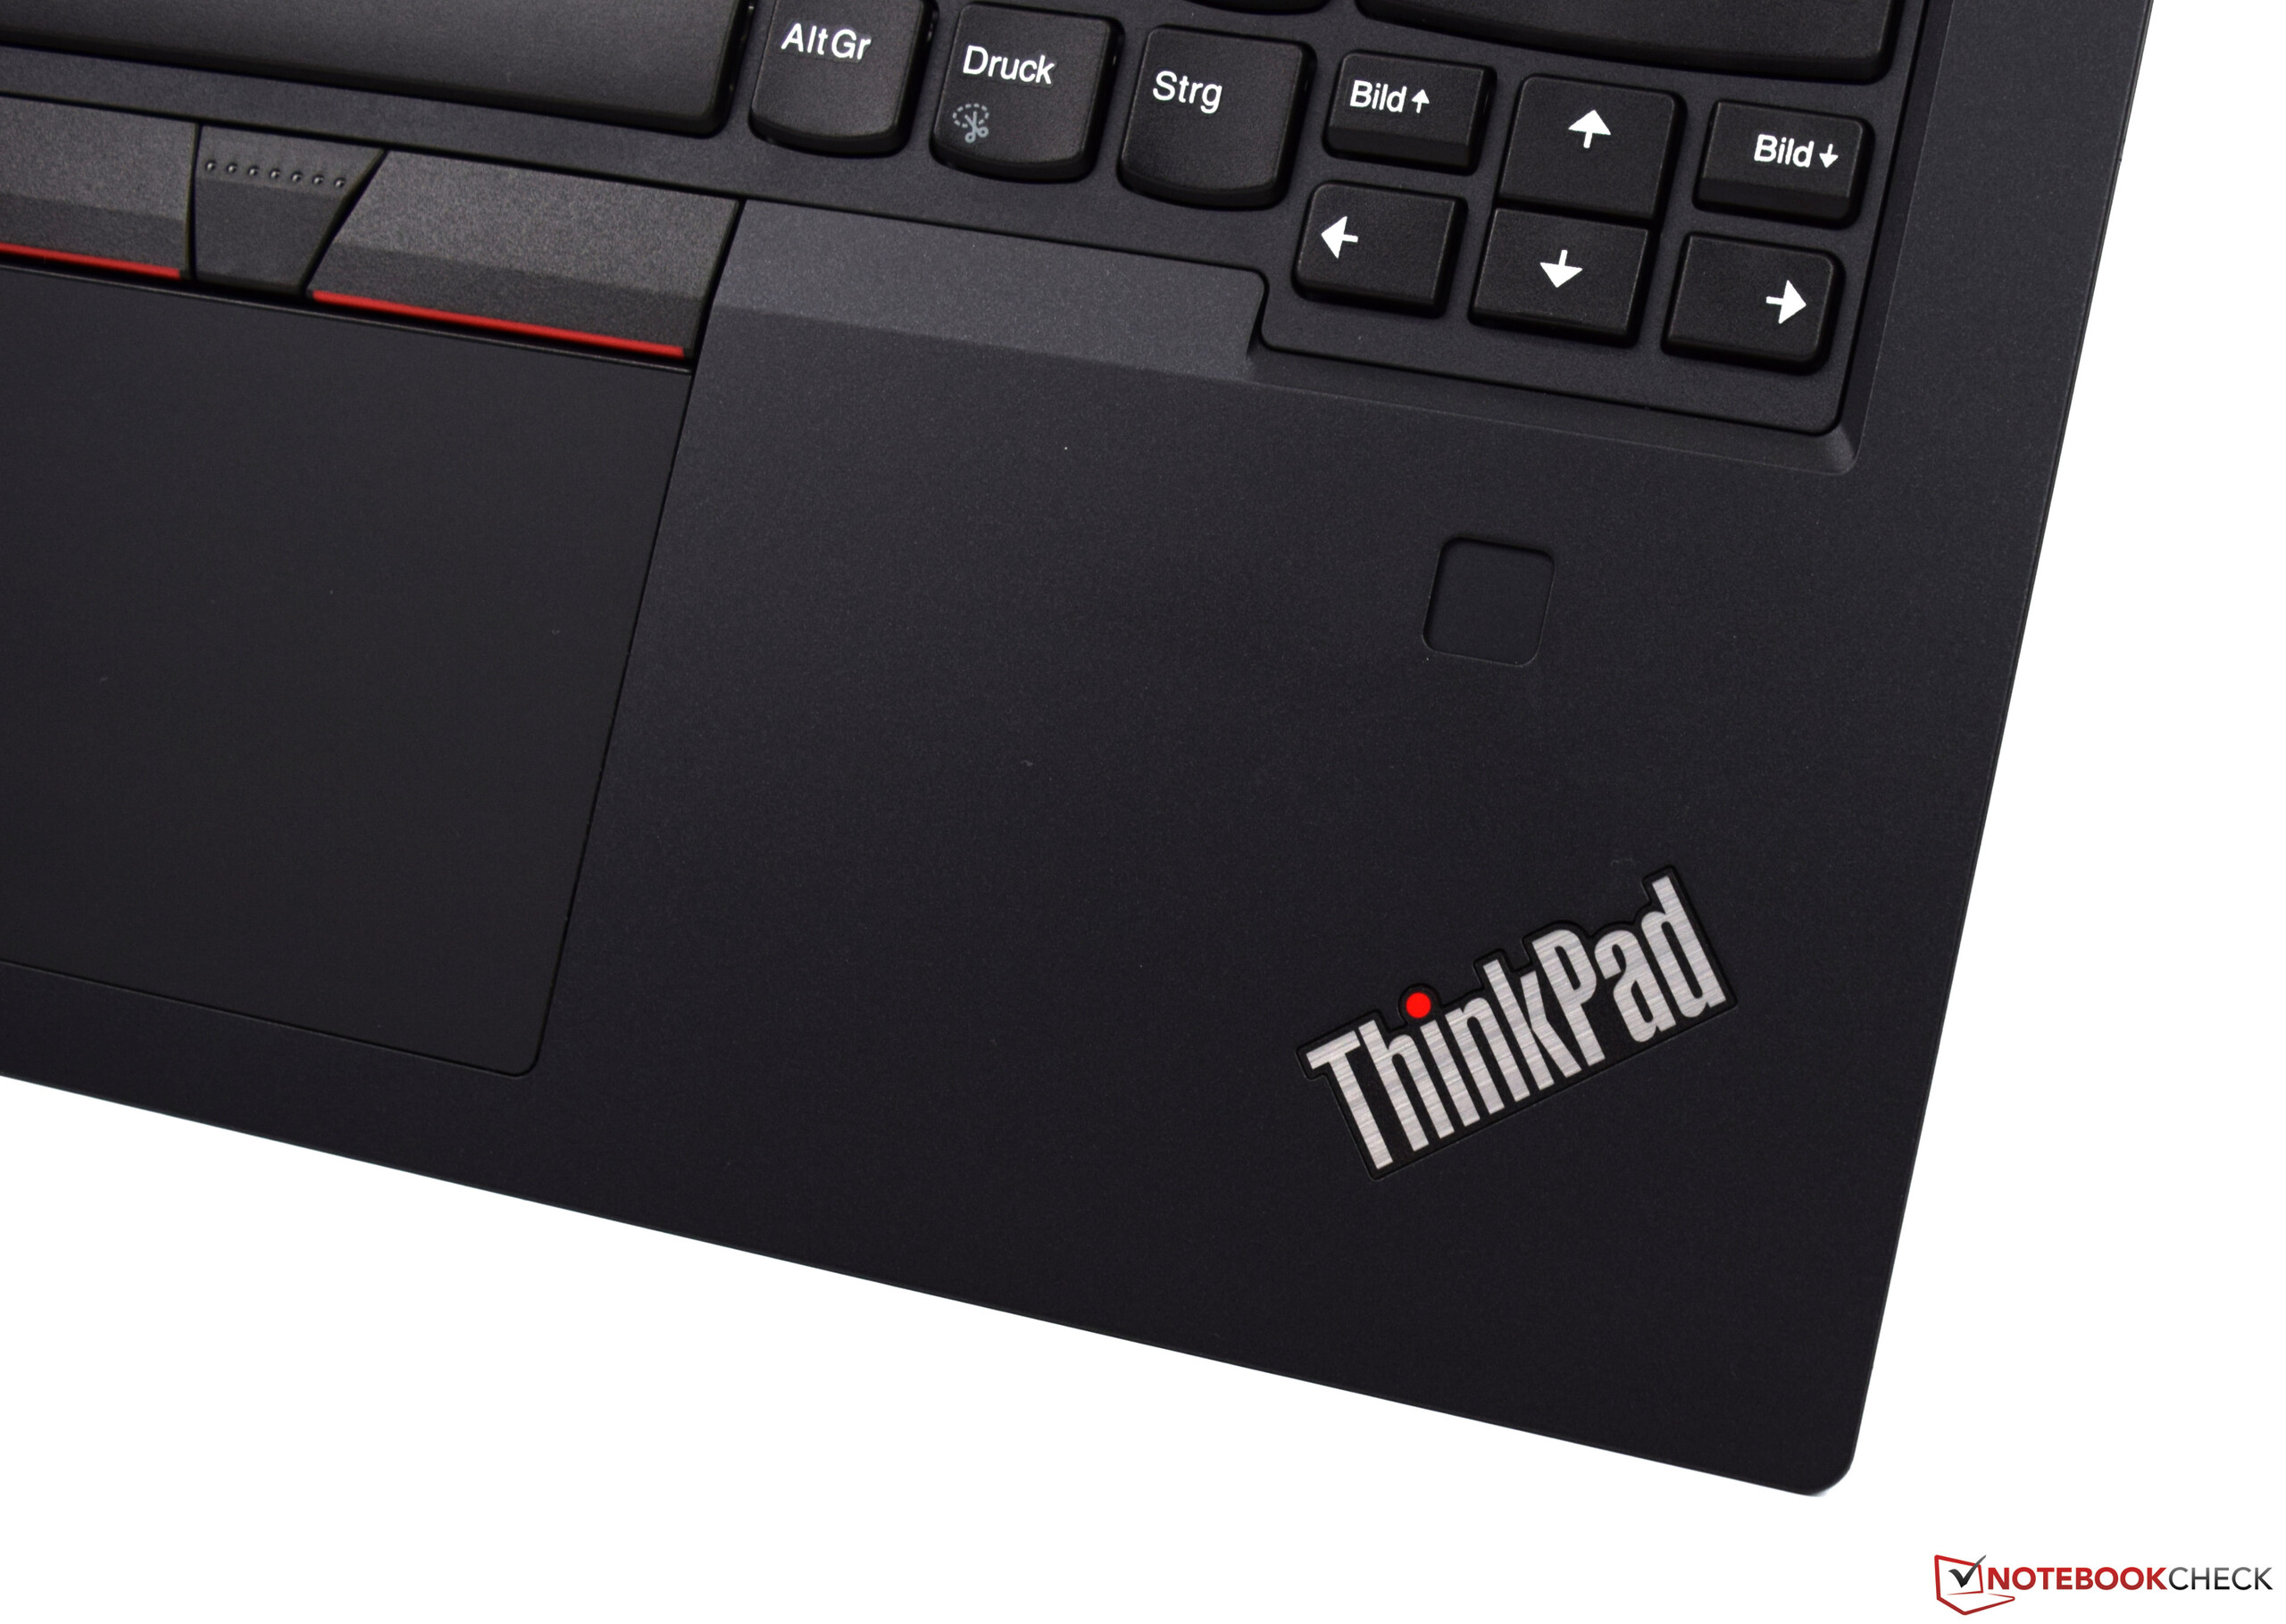
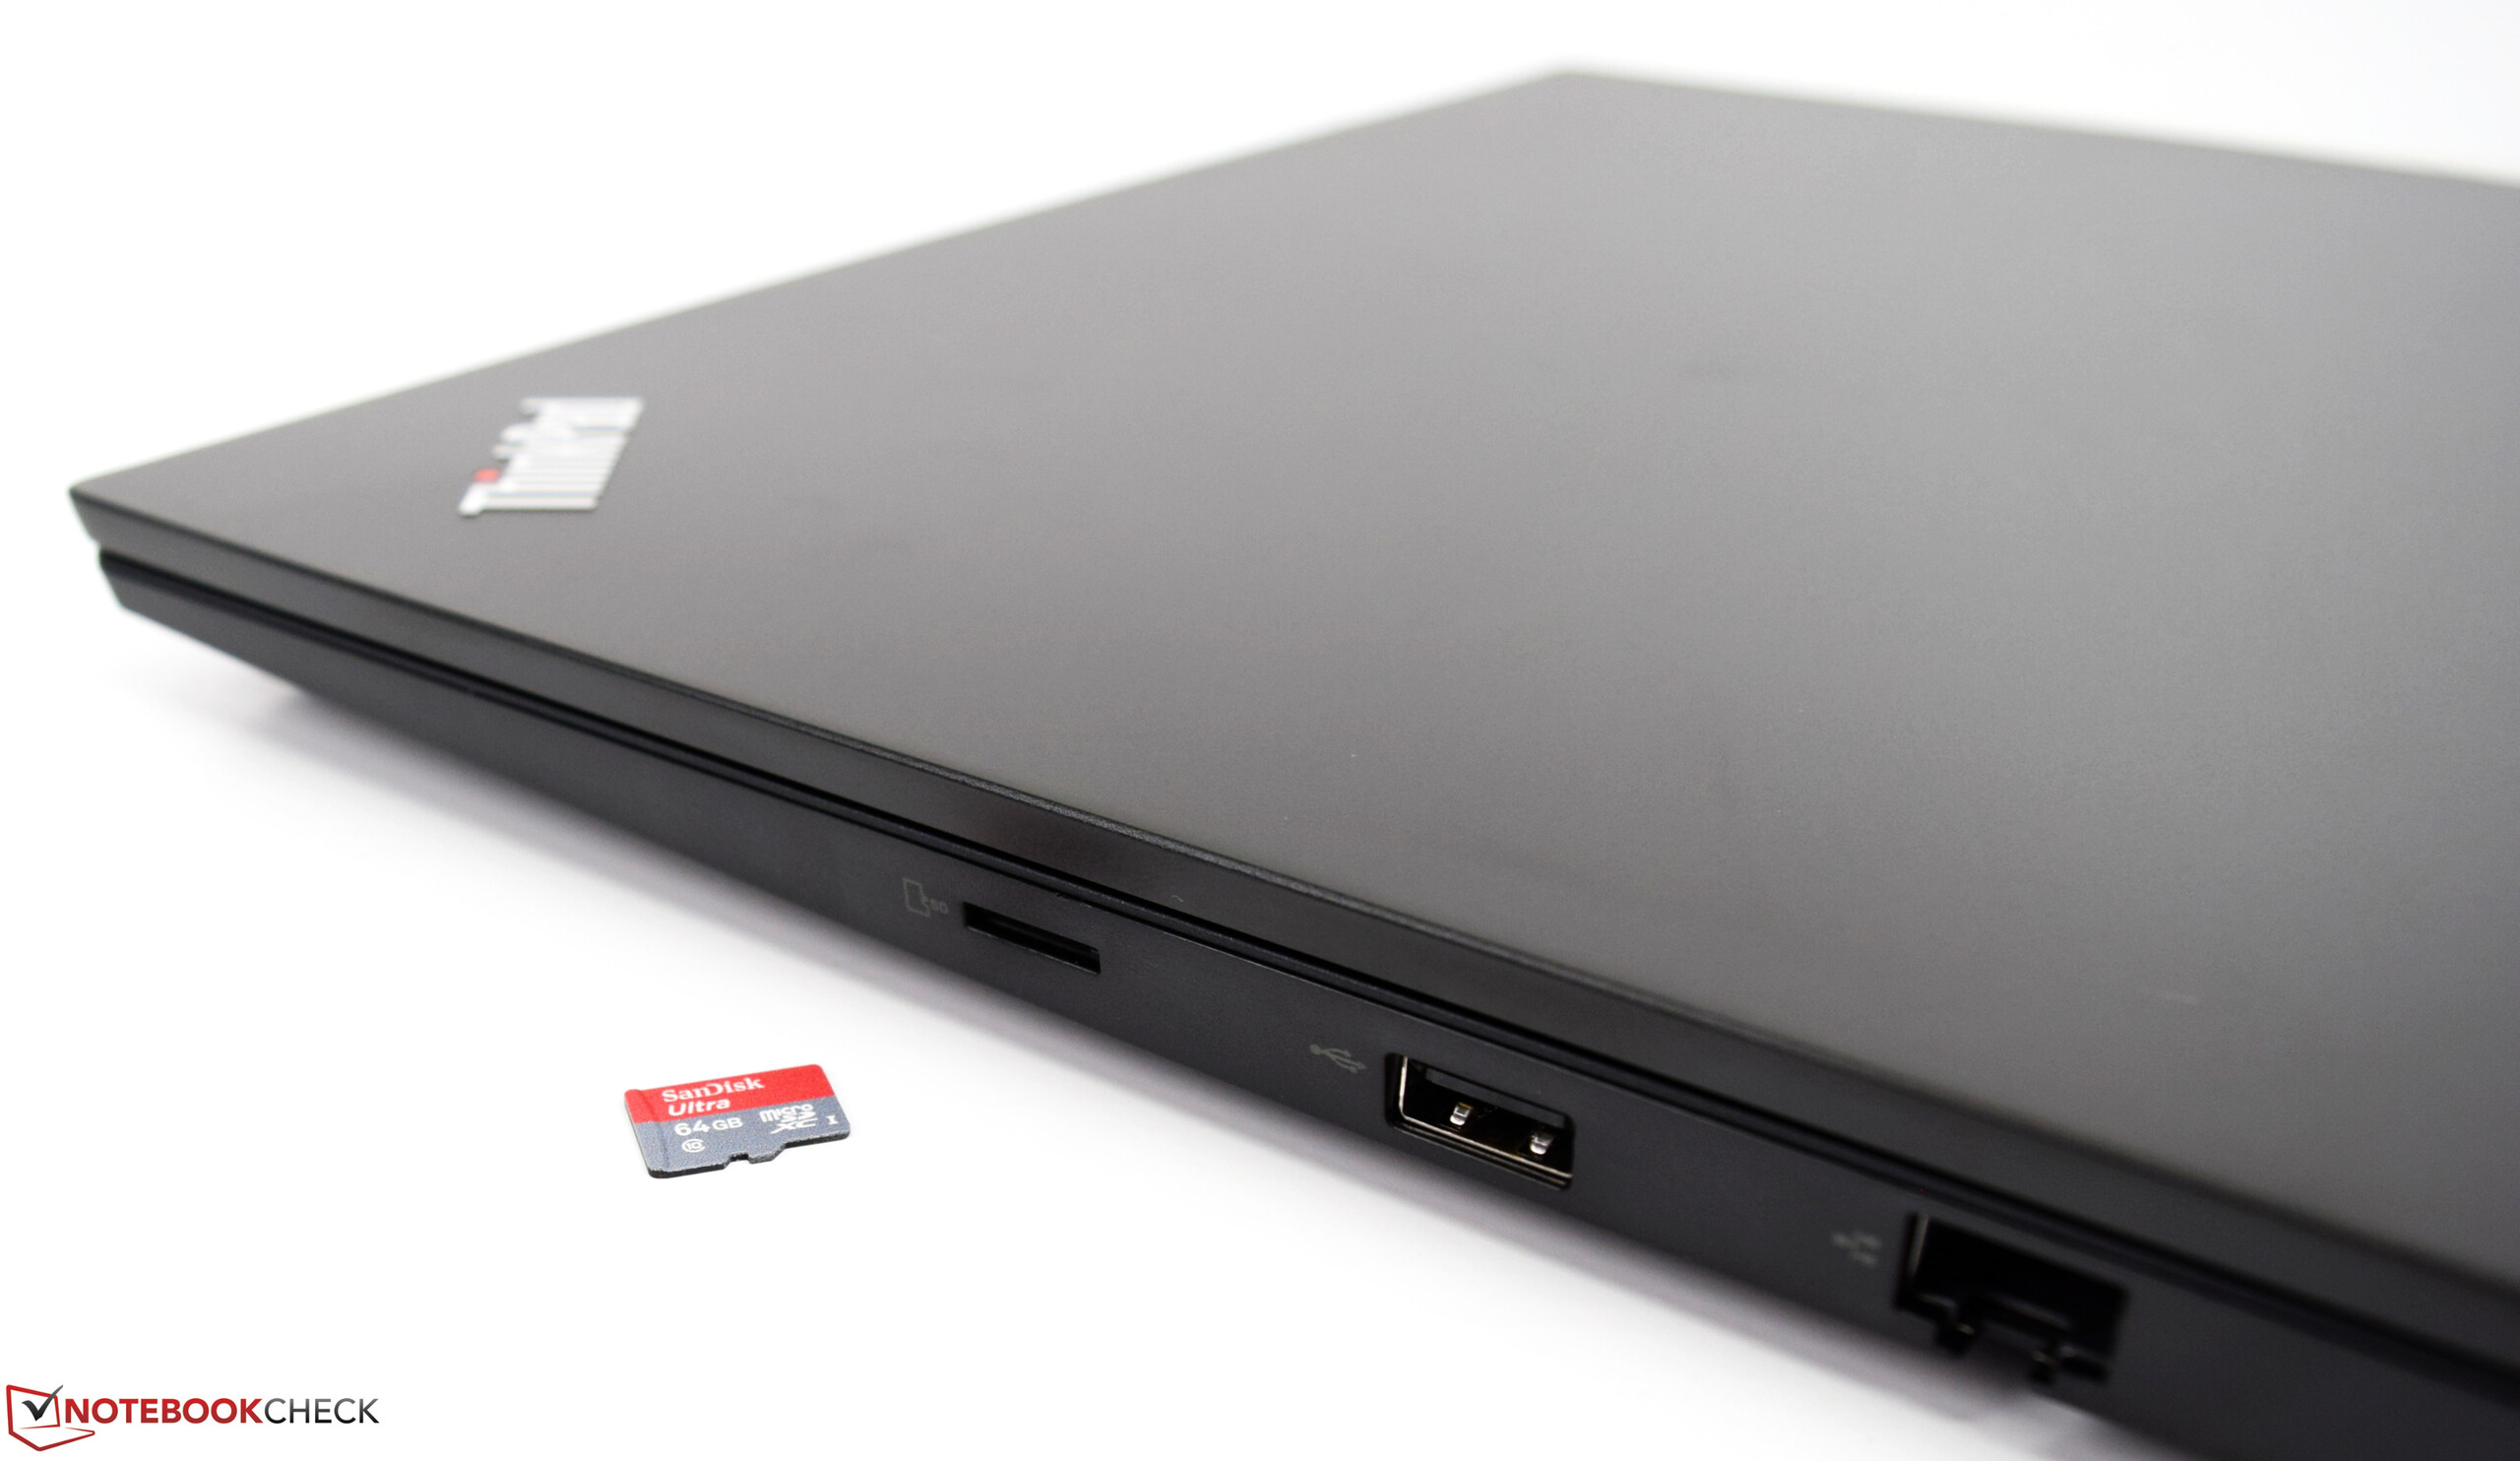
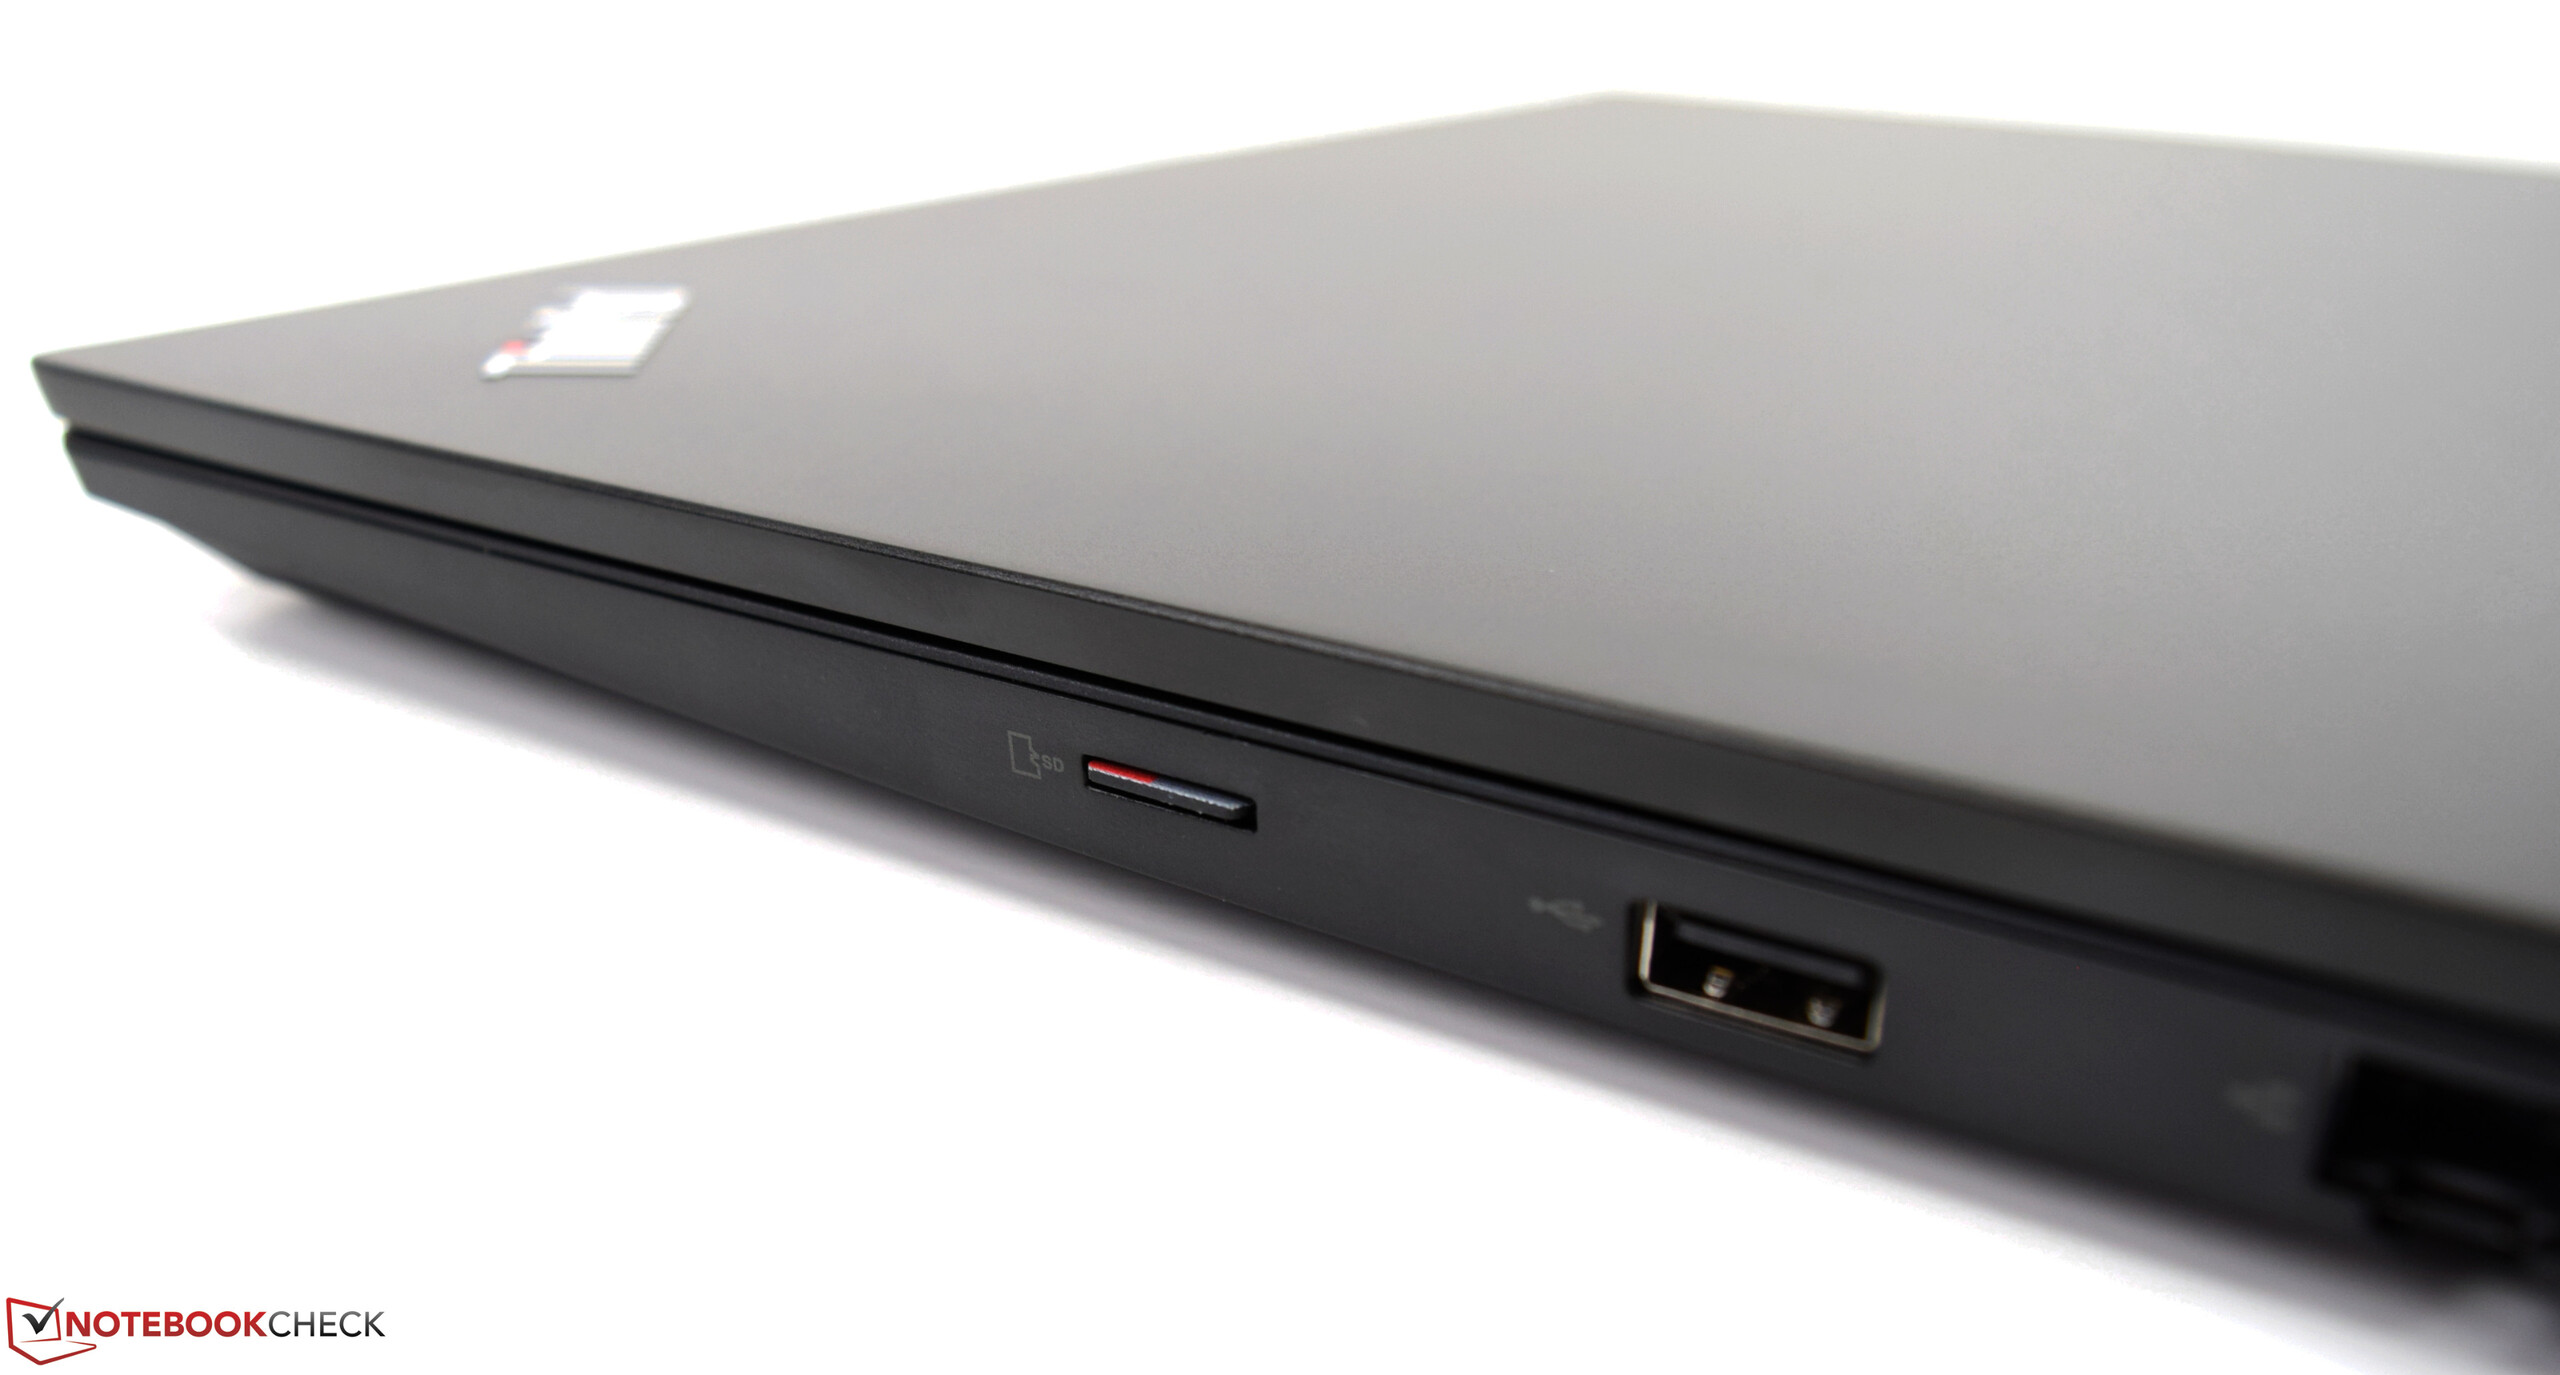
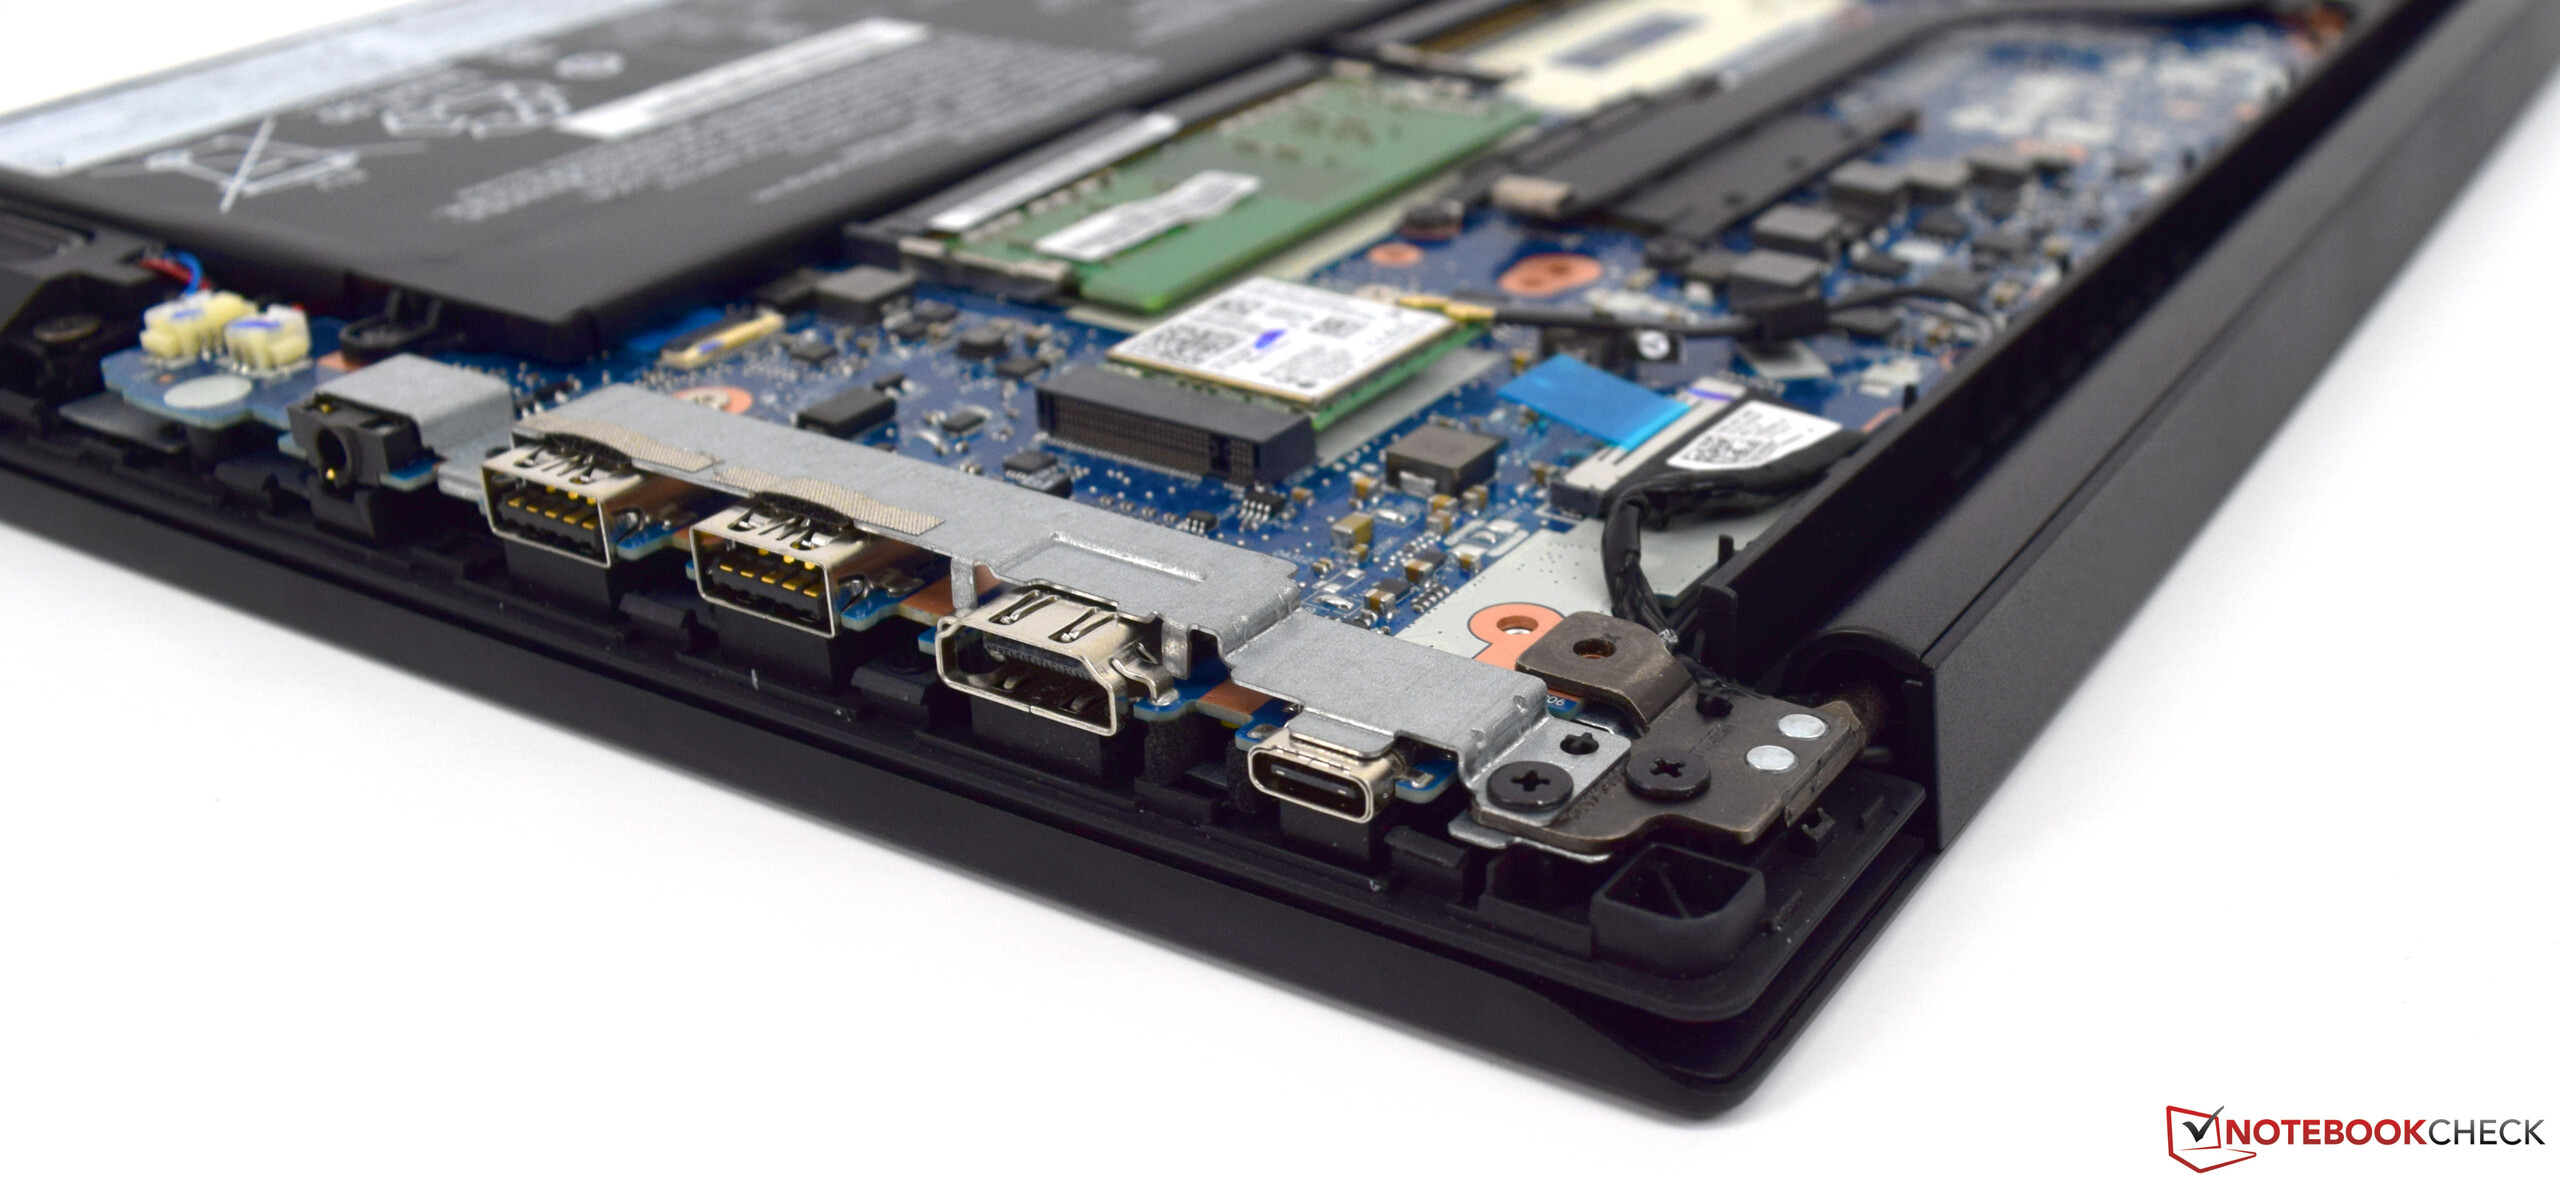
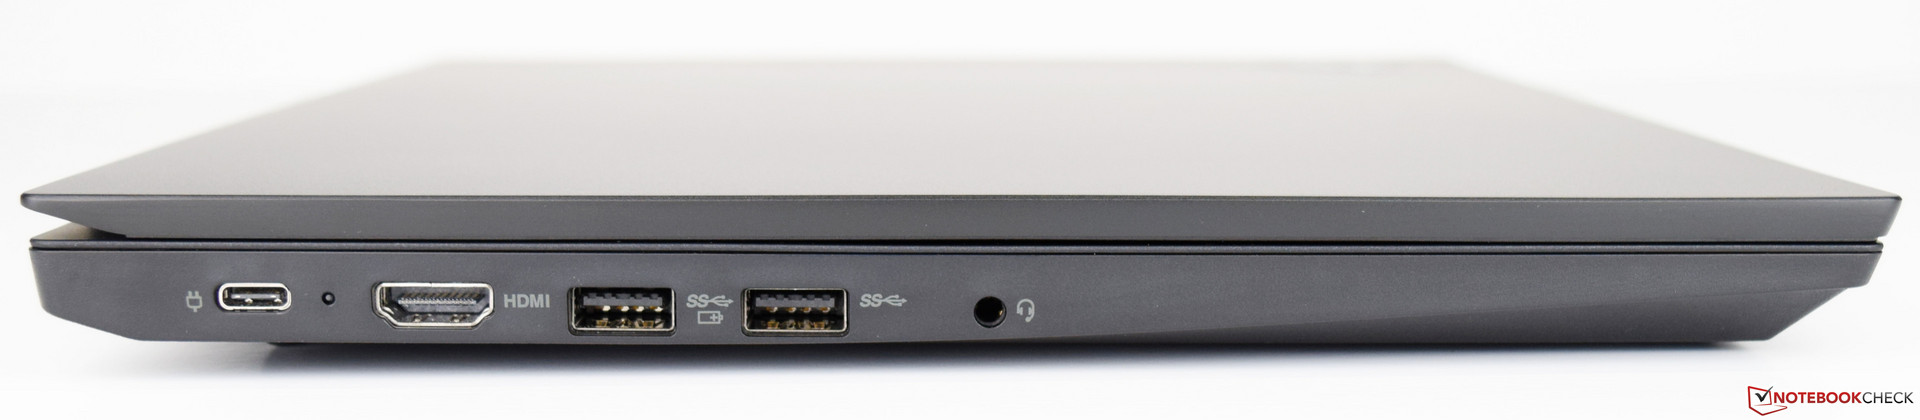
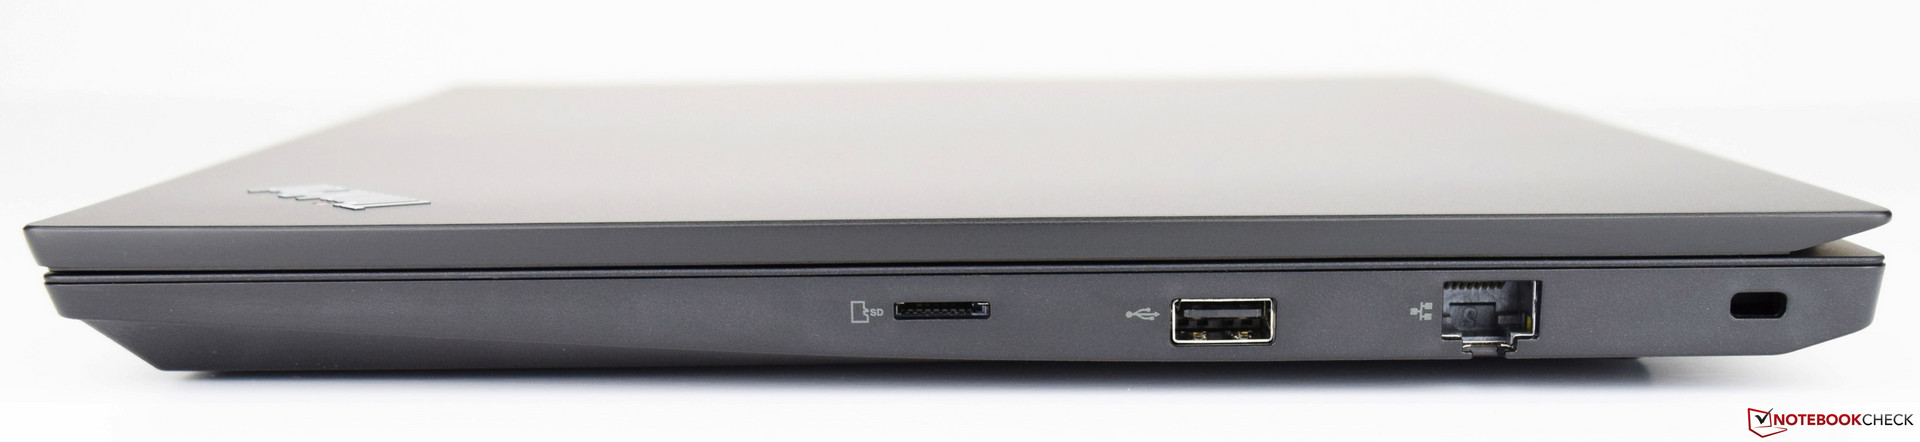
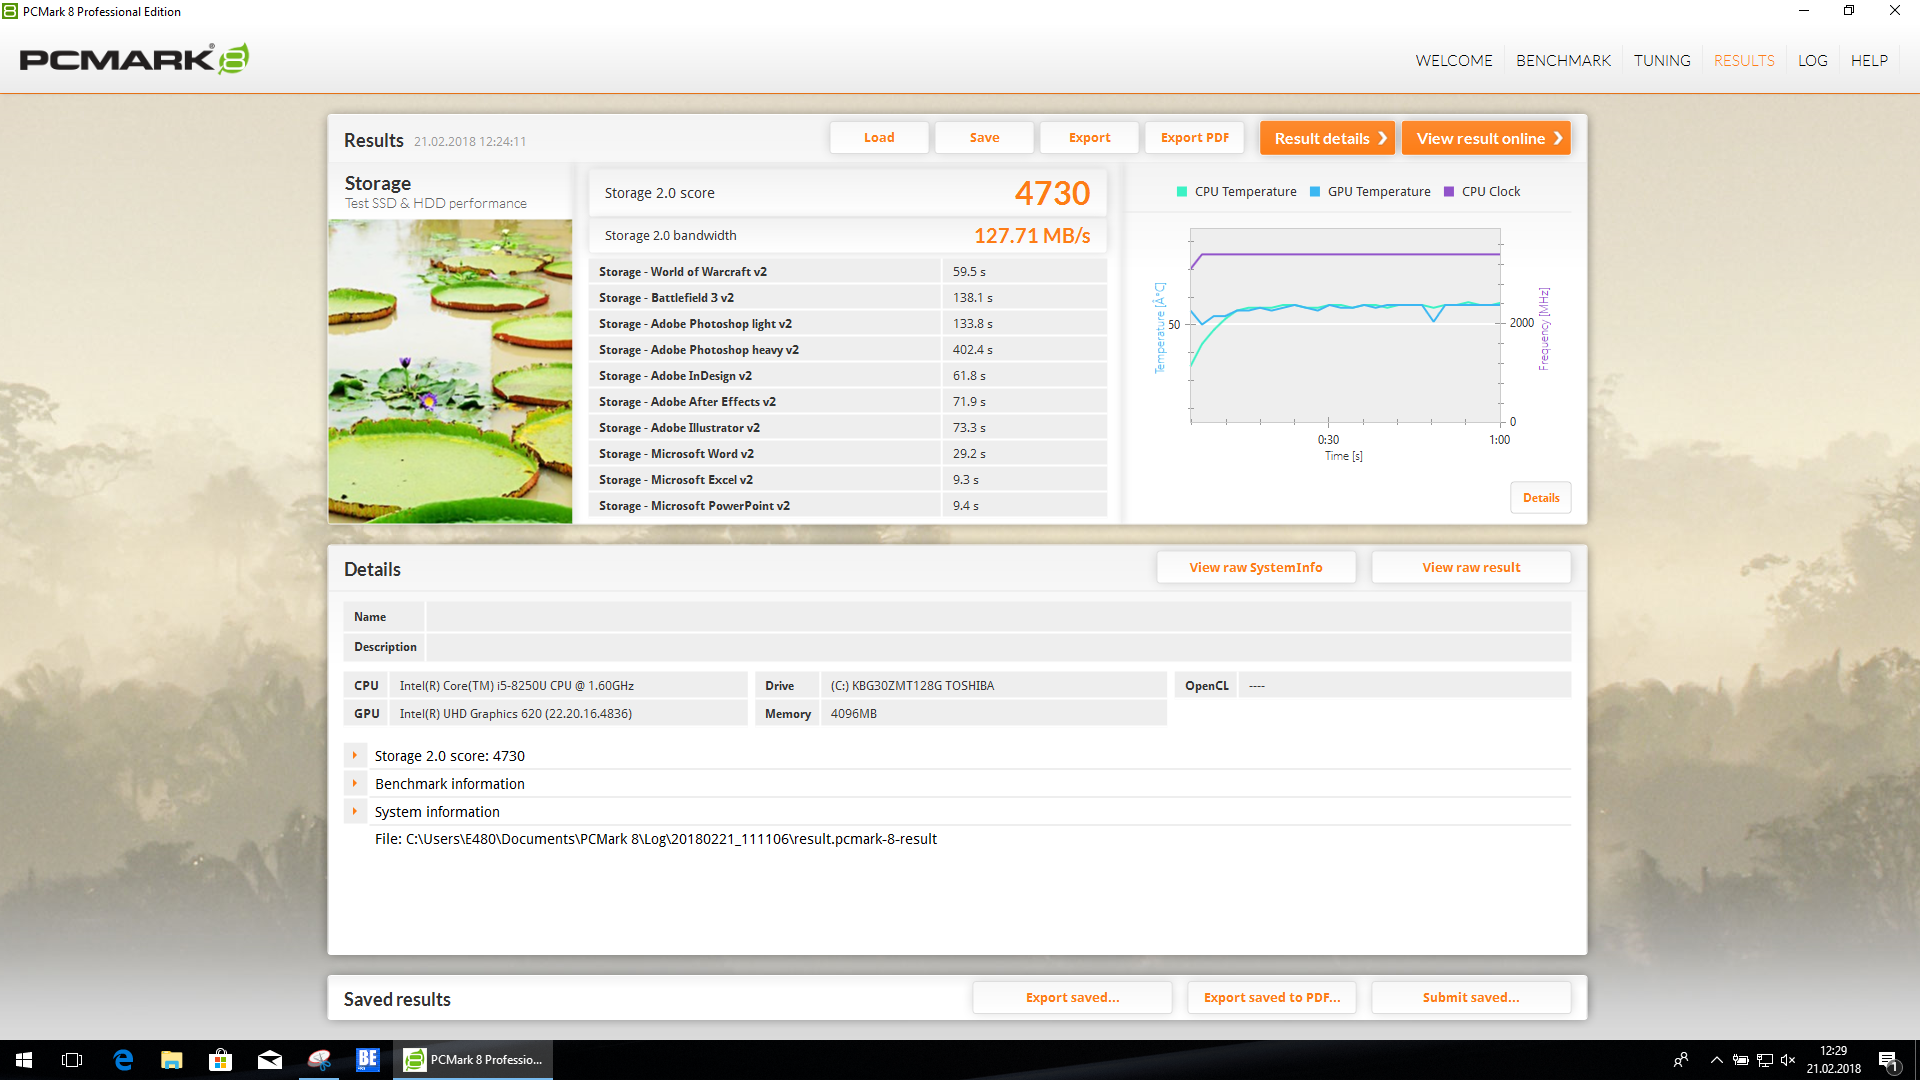
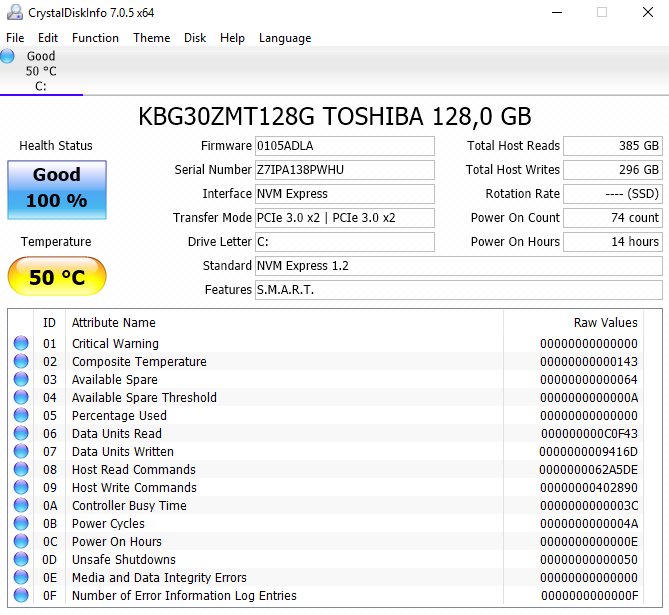
Non potete sbagliarvi con l'E480 considerato il prezzo di appena $700. Diversamente dall'E480 con AMD Radeon RX 550 che abbiamo visto da poco, questo modello merita la nostra raccomandazione. Siamo rimasti particolarmente impressionati dal pannello IPS con elevato contrasto - un pannello del genere è davvero insolito nella fascia di prezzo dell'E480. La nostra principale preoccupazione sono state le scarse prestazioni dell'SSD, e abbiamo notato l'assenza di un lettore SD (che è stato sostituito da un lettore MicroSD). Nel complesso, avrete un solido dispositivo con un prezzo onesto.
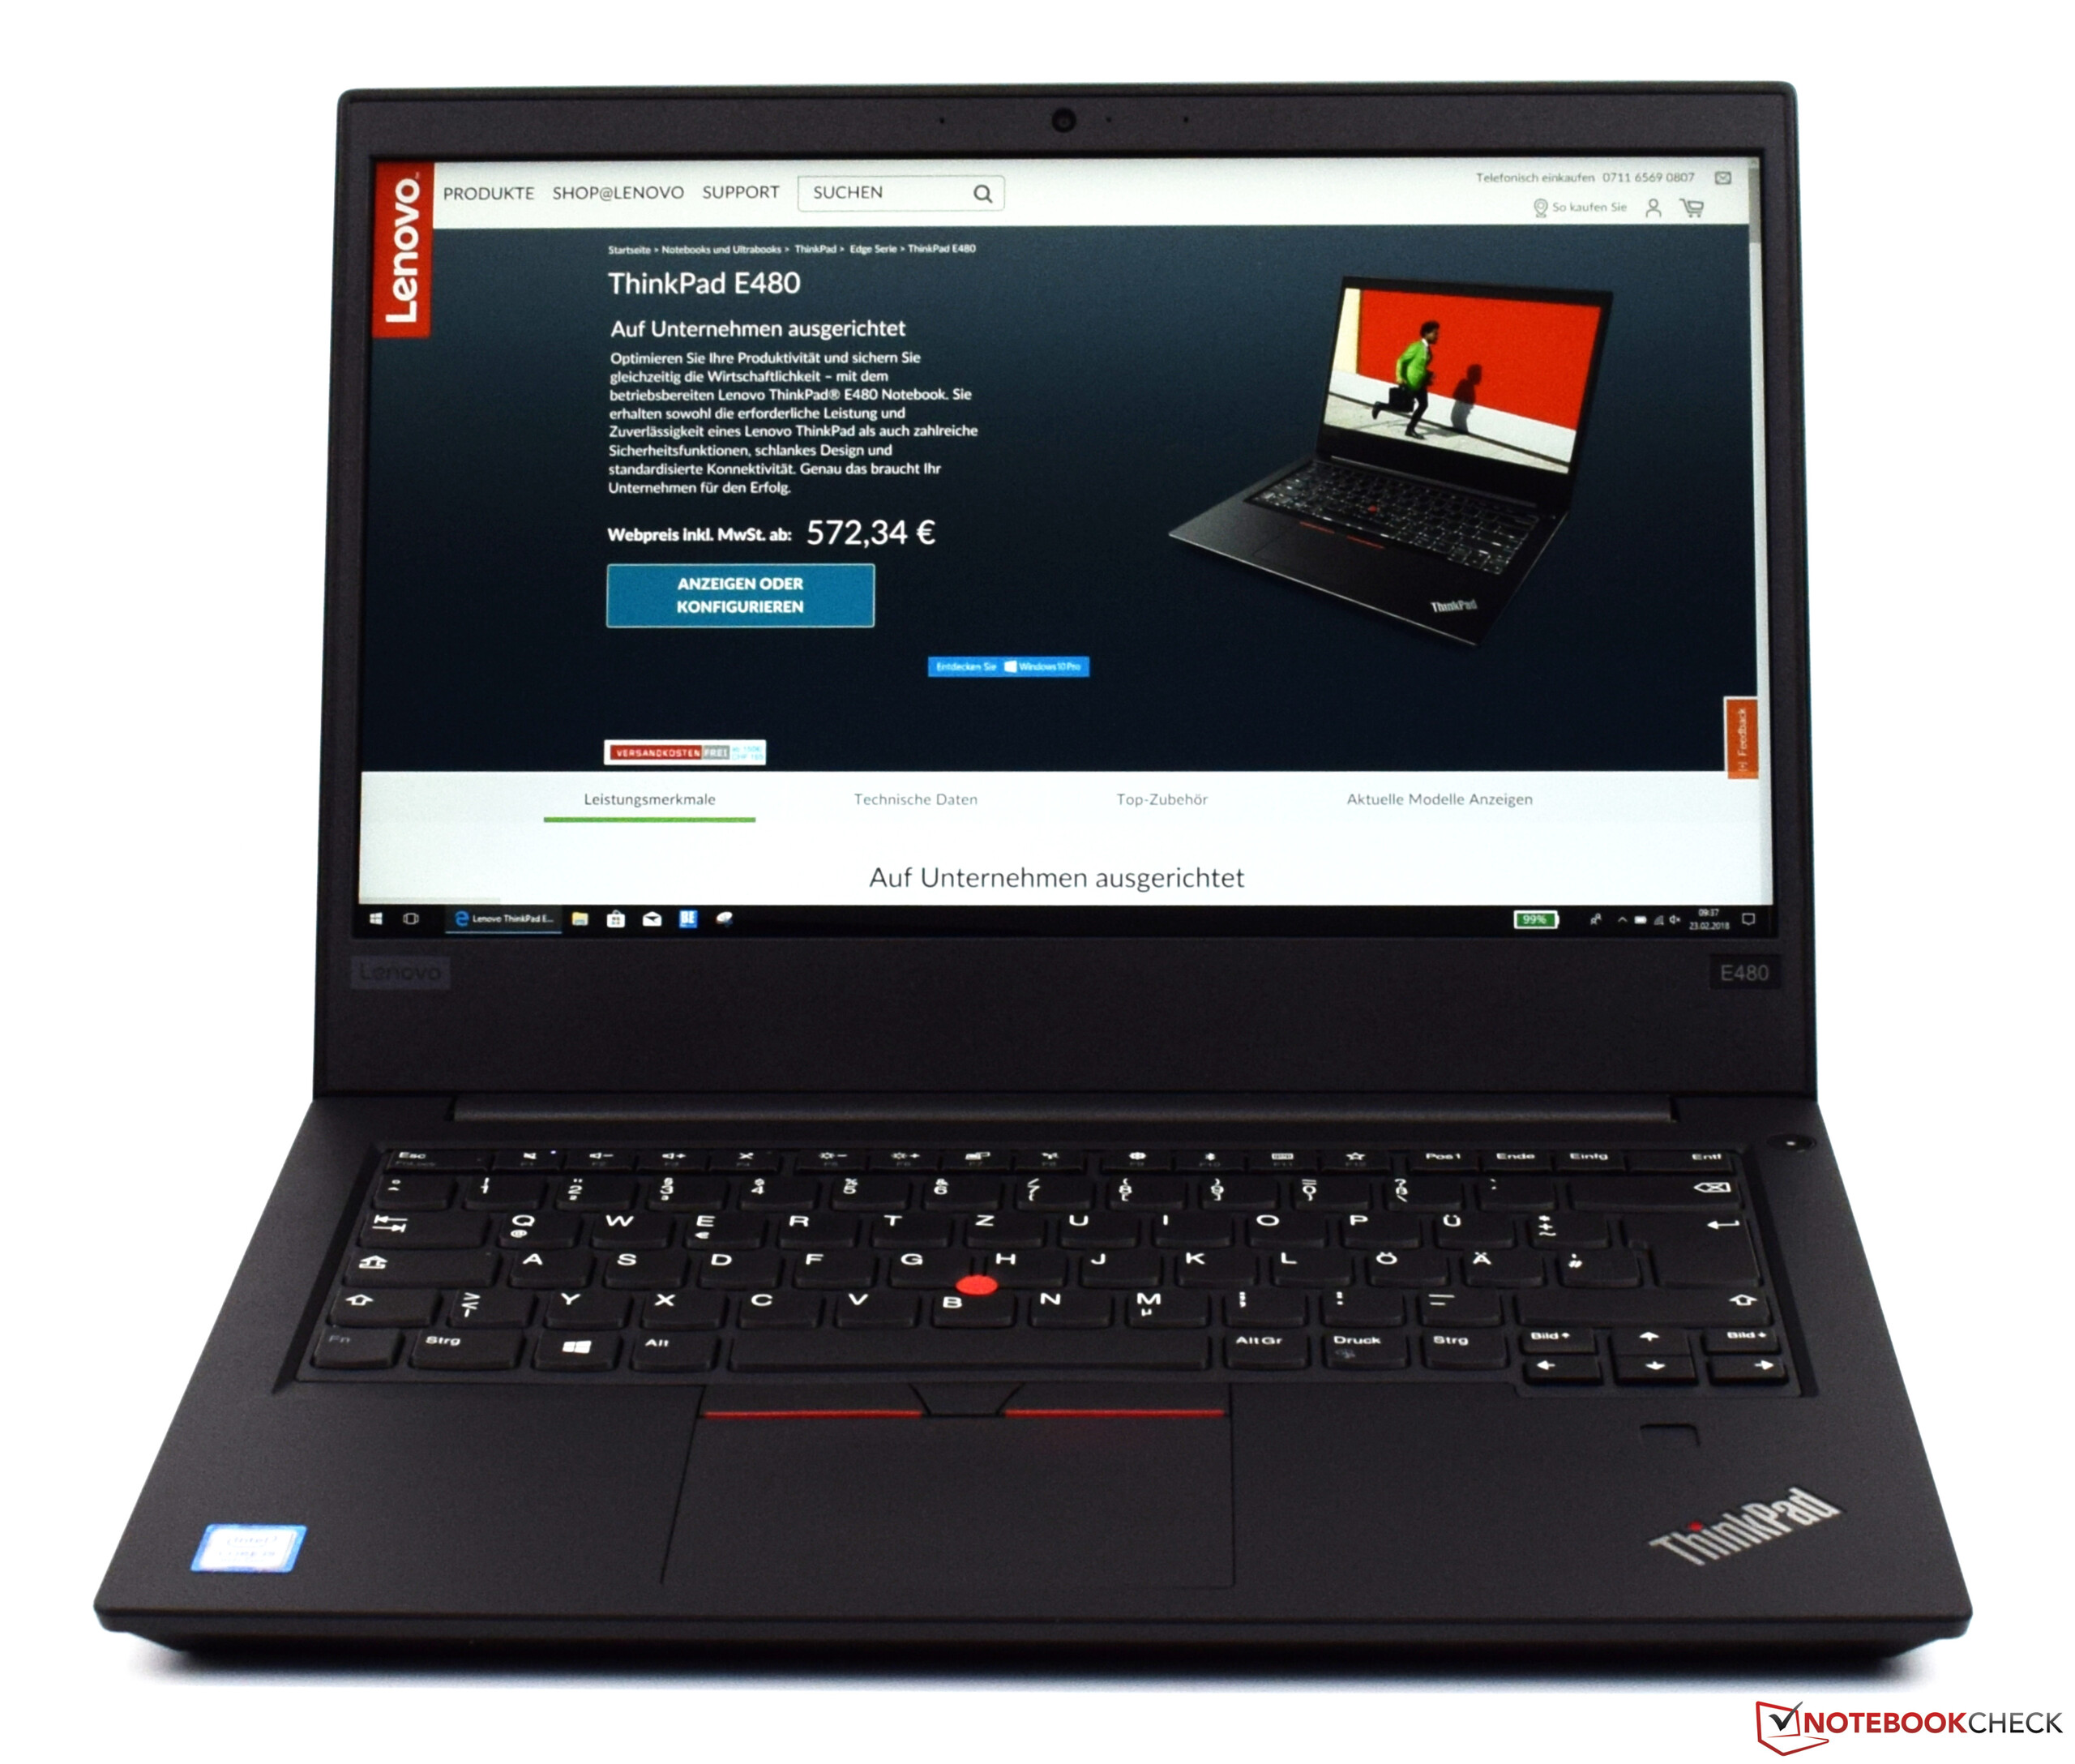
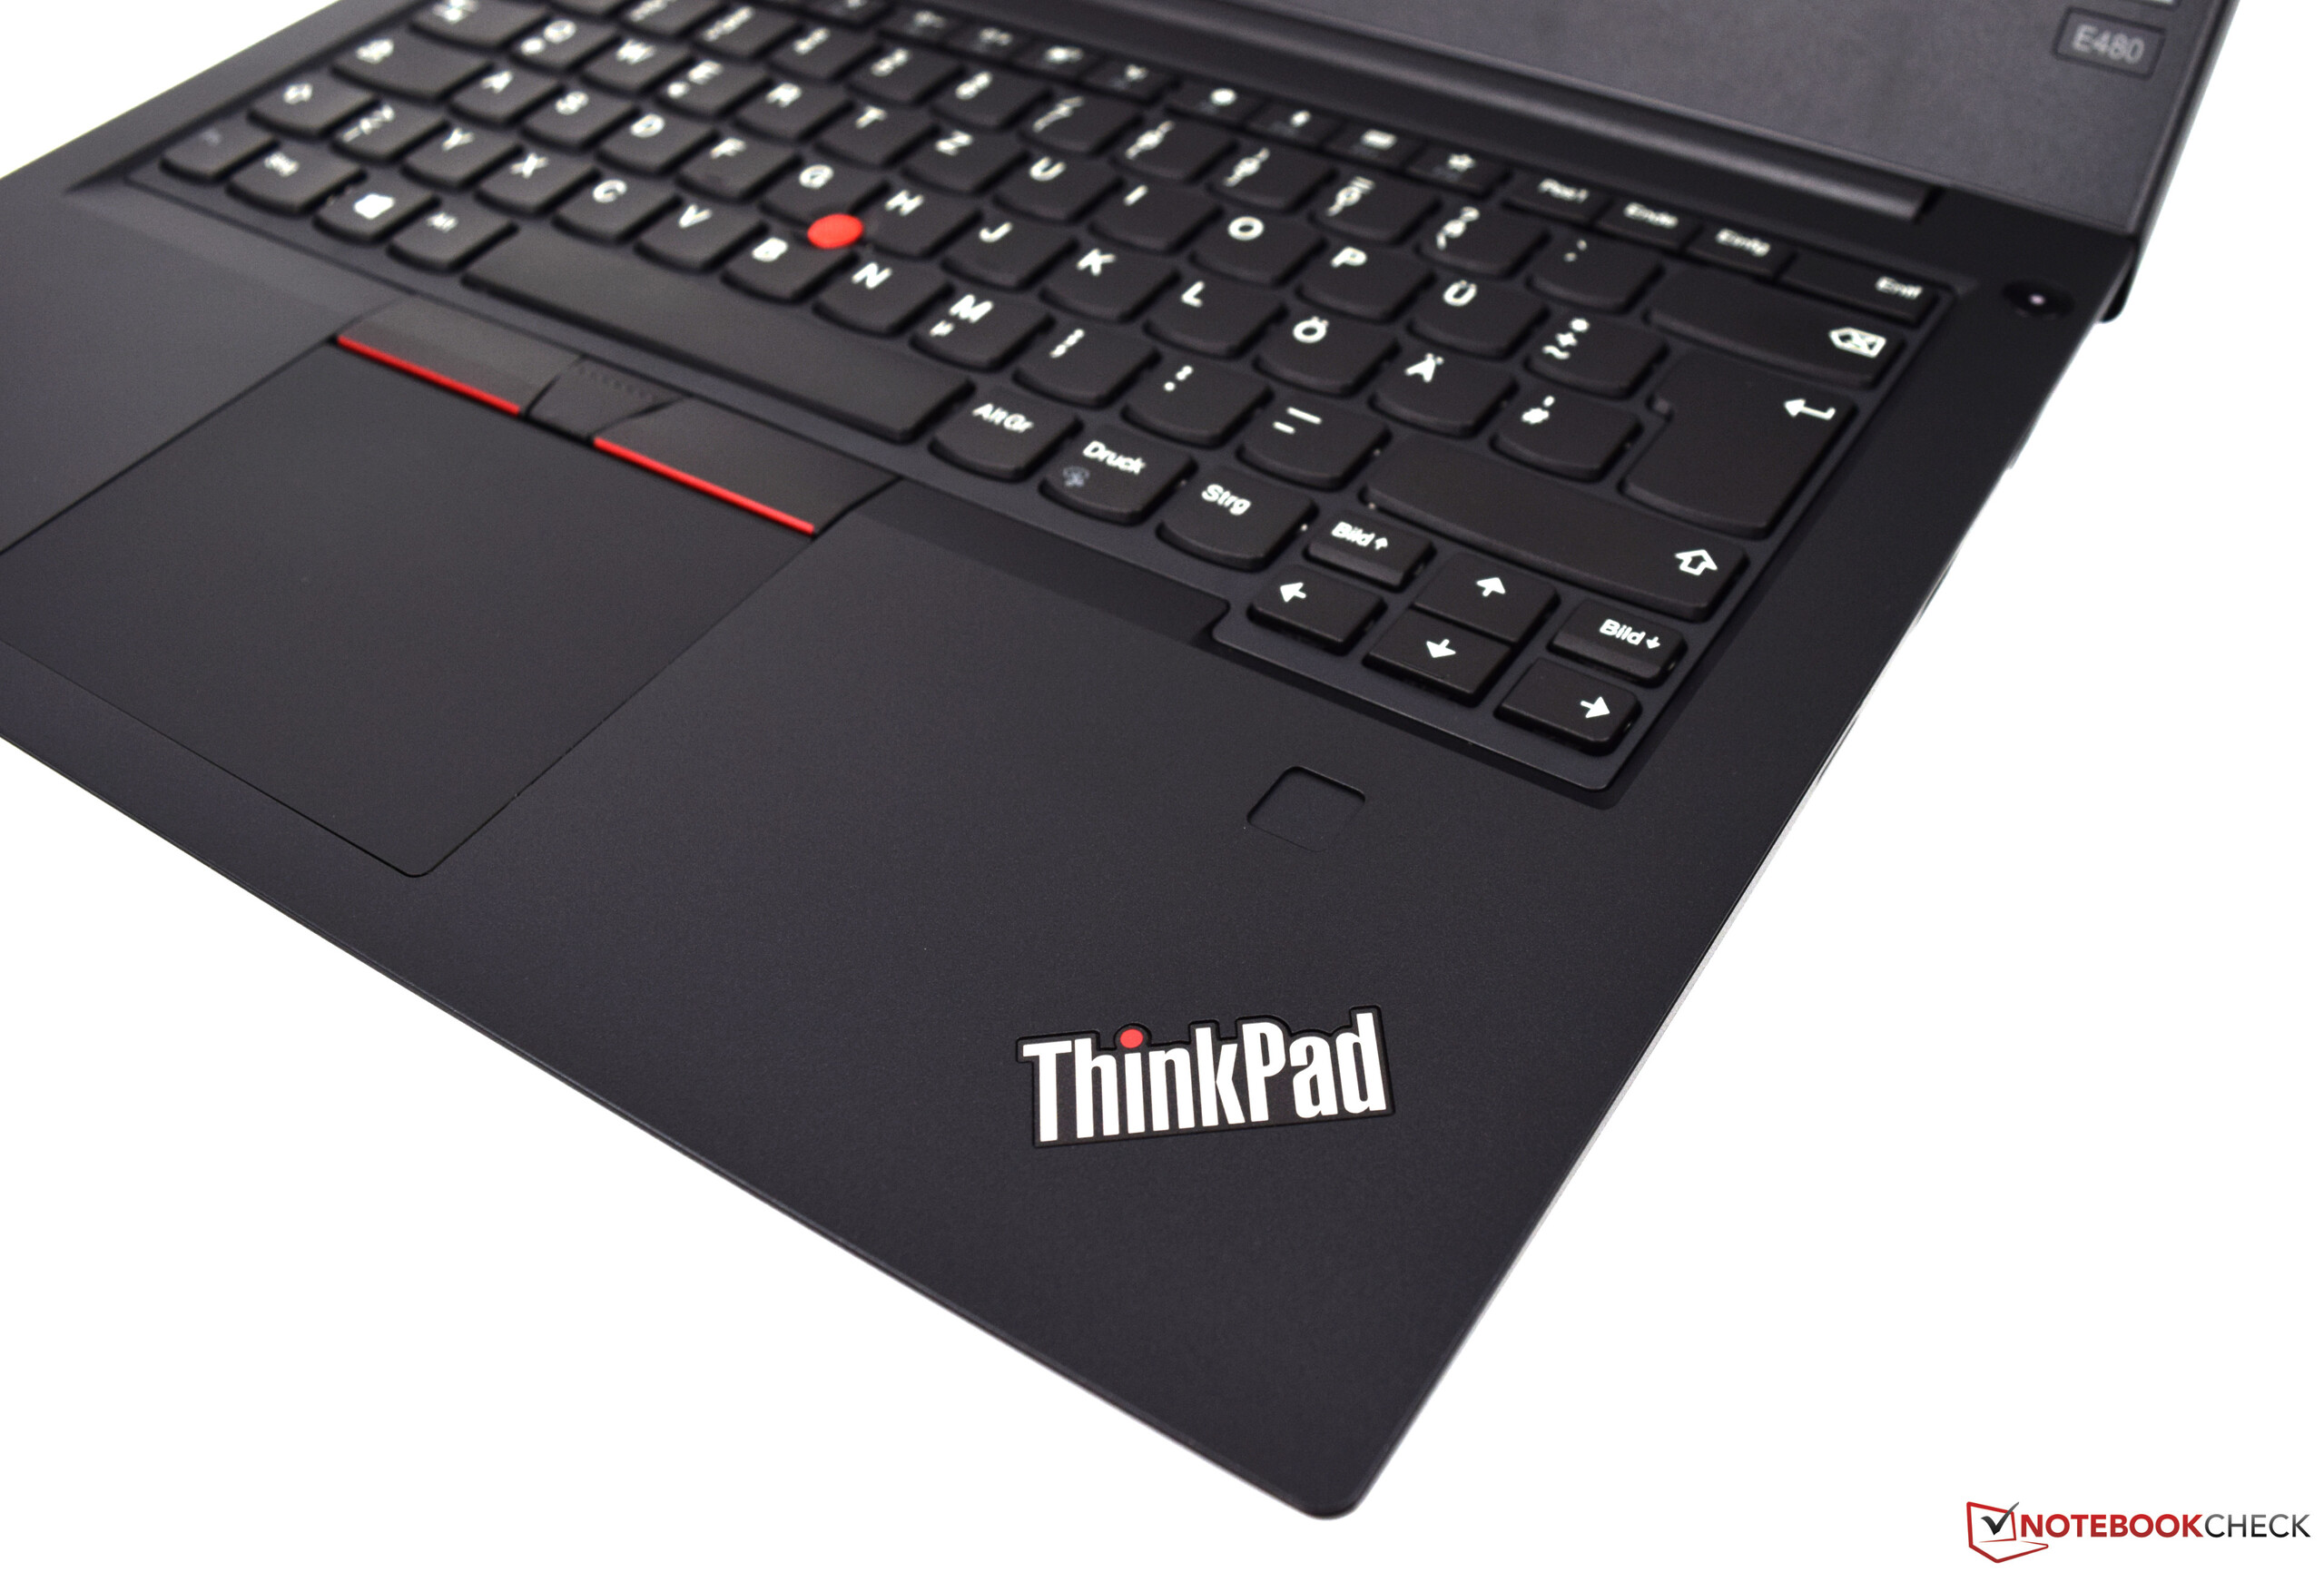
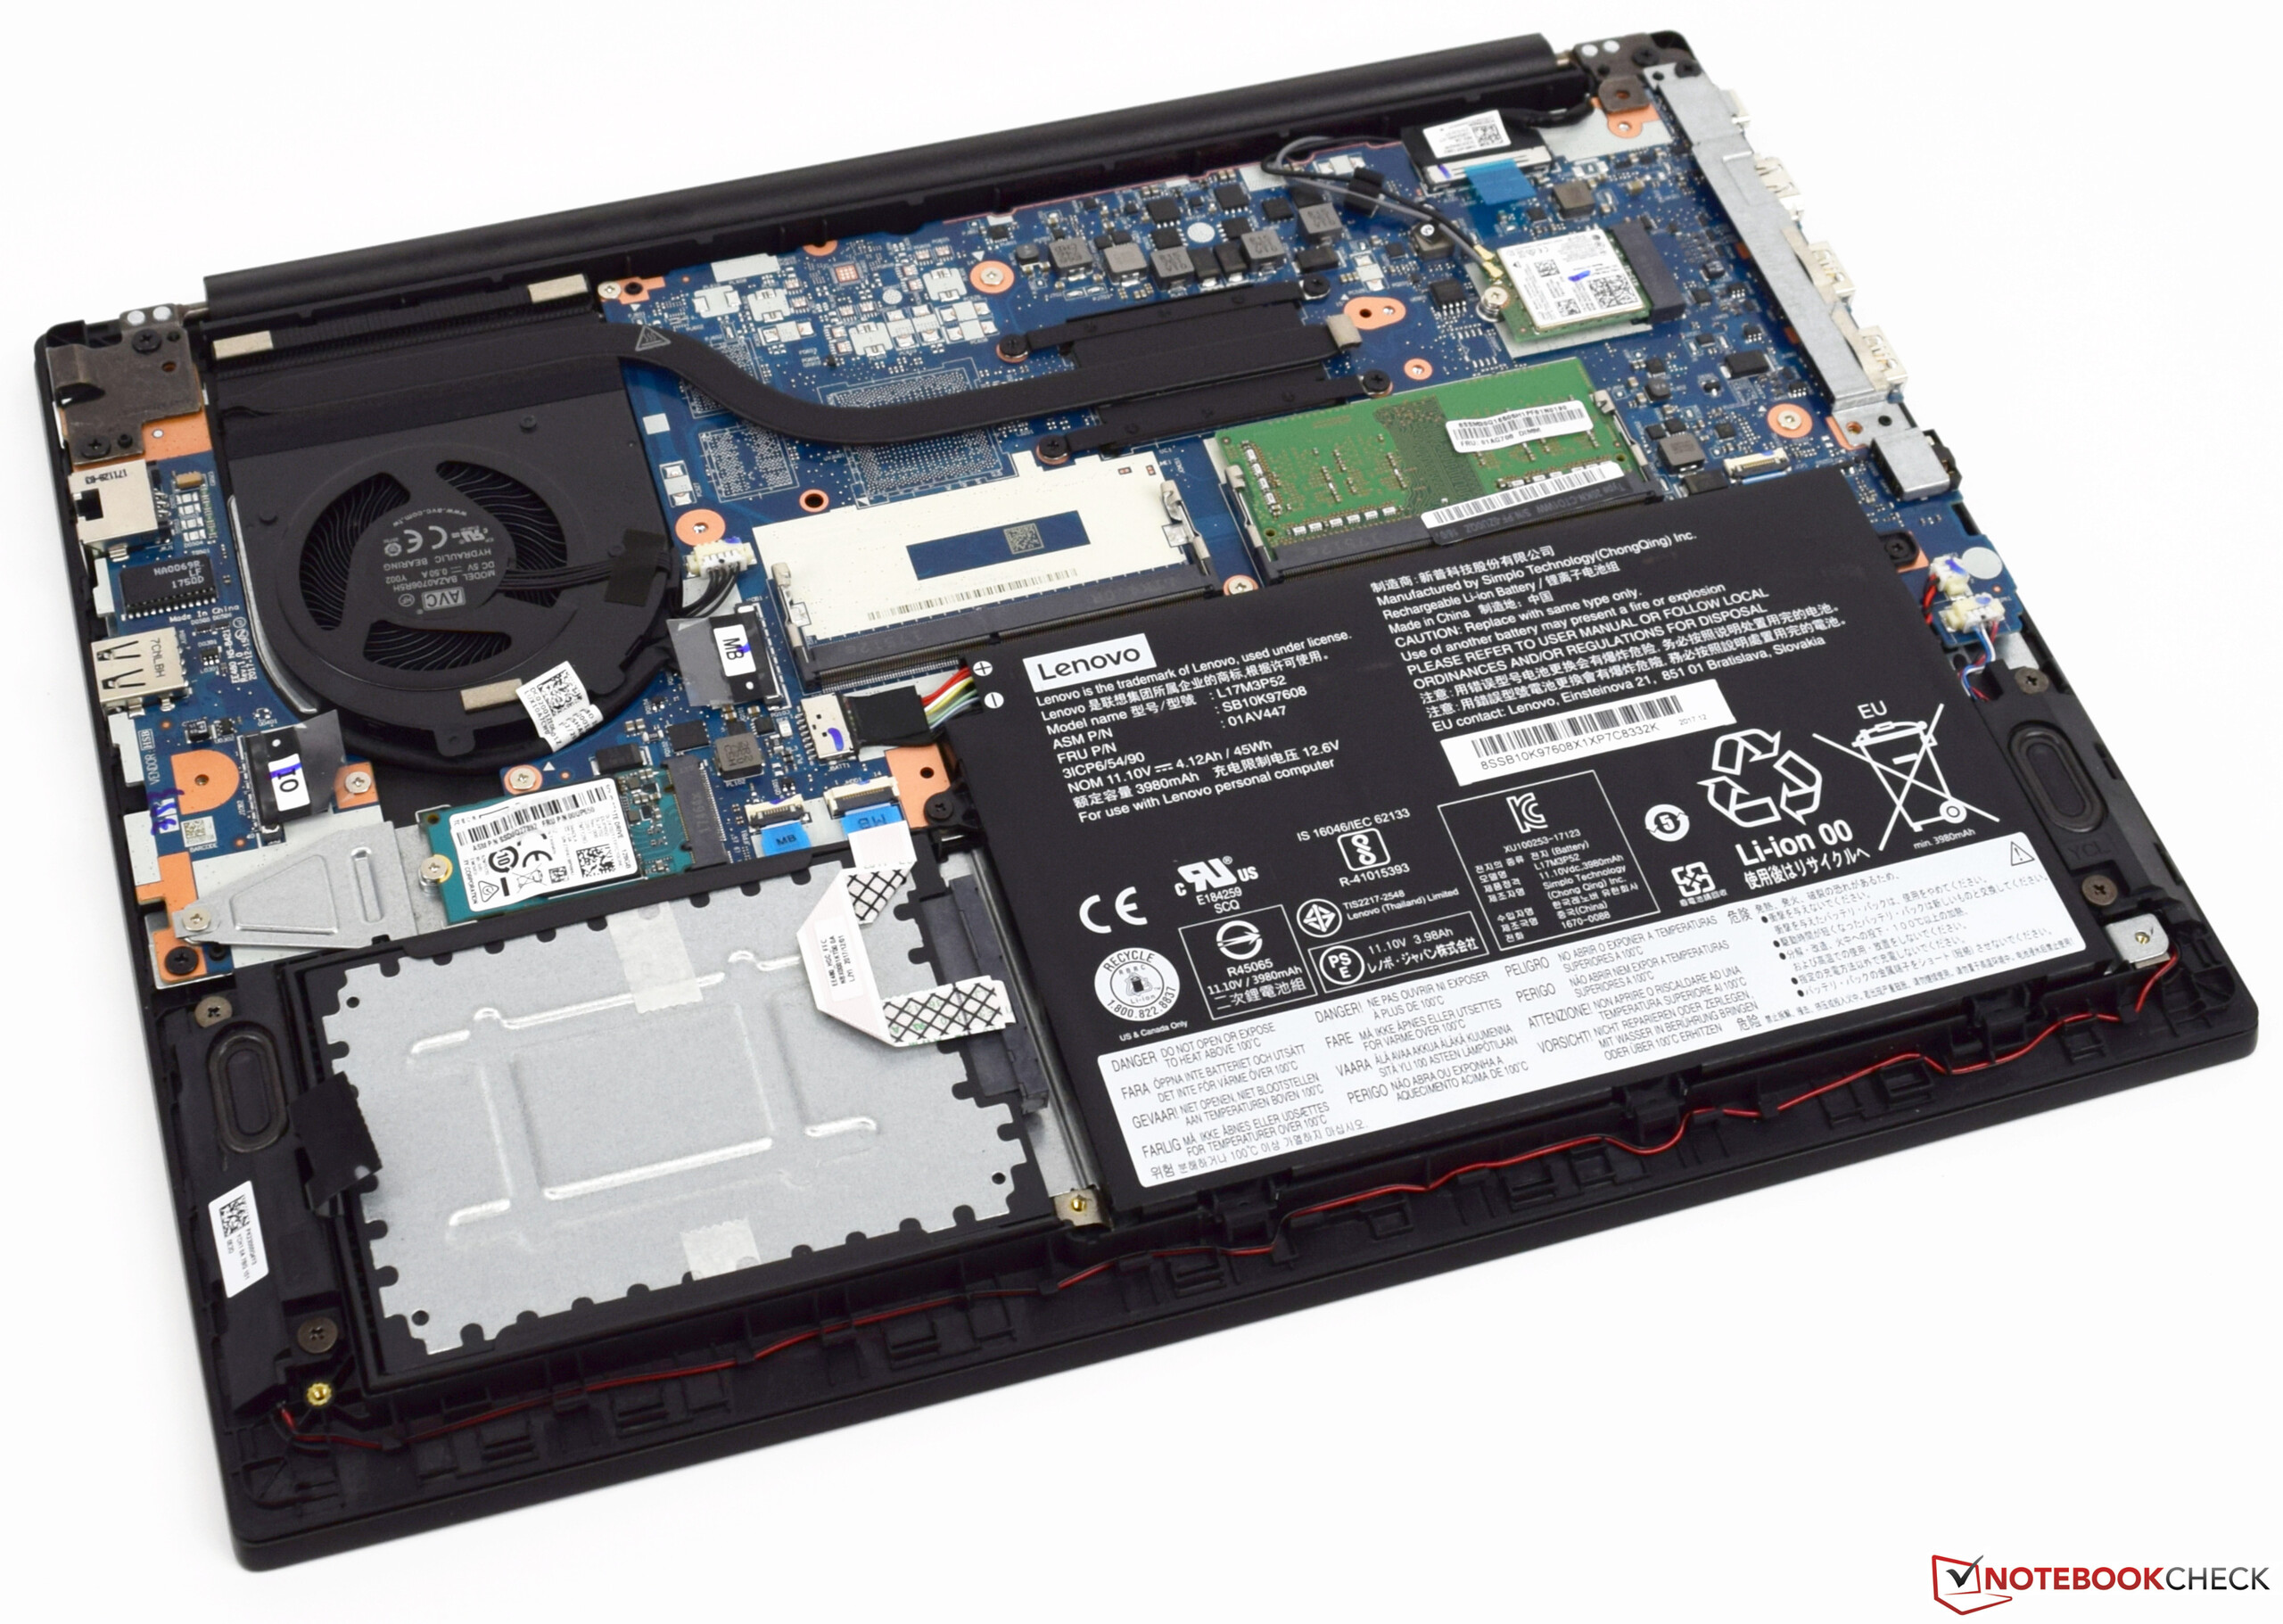
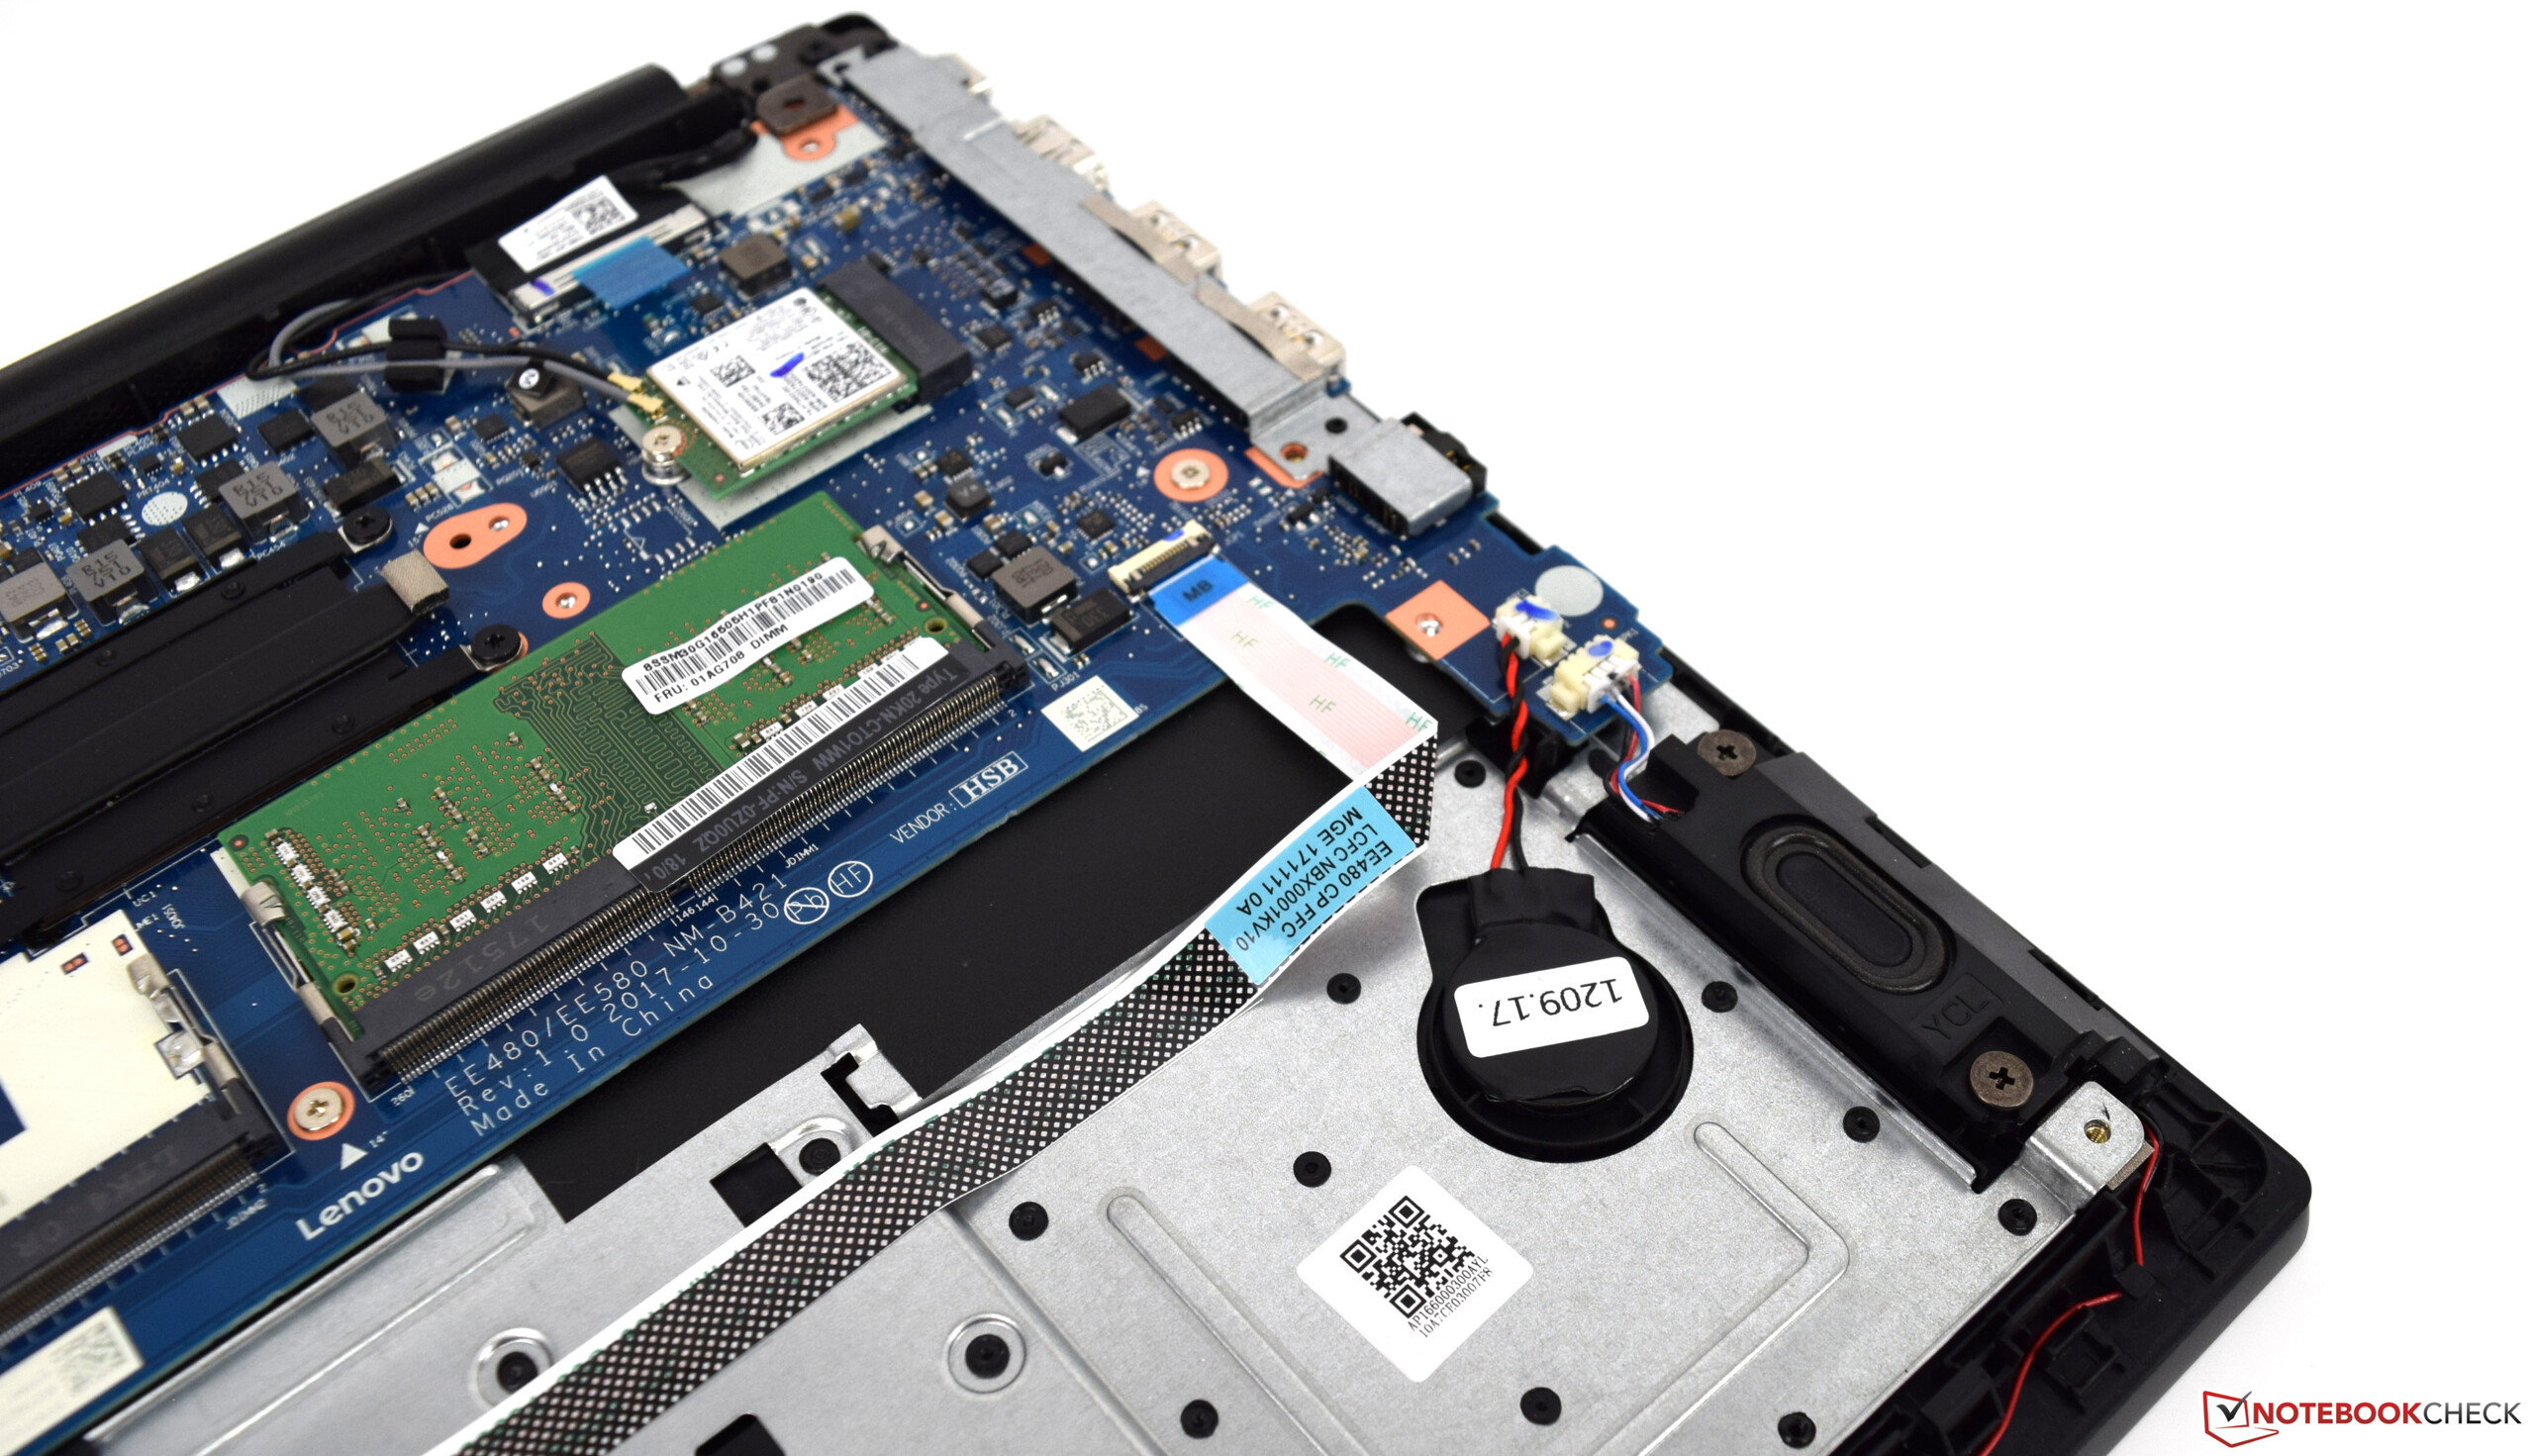
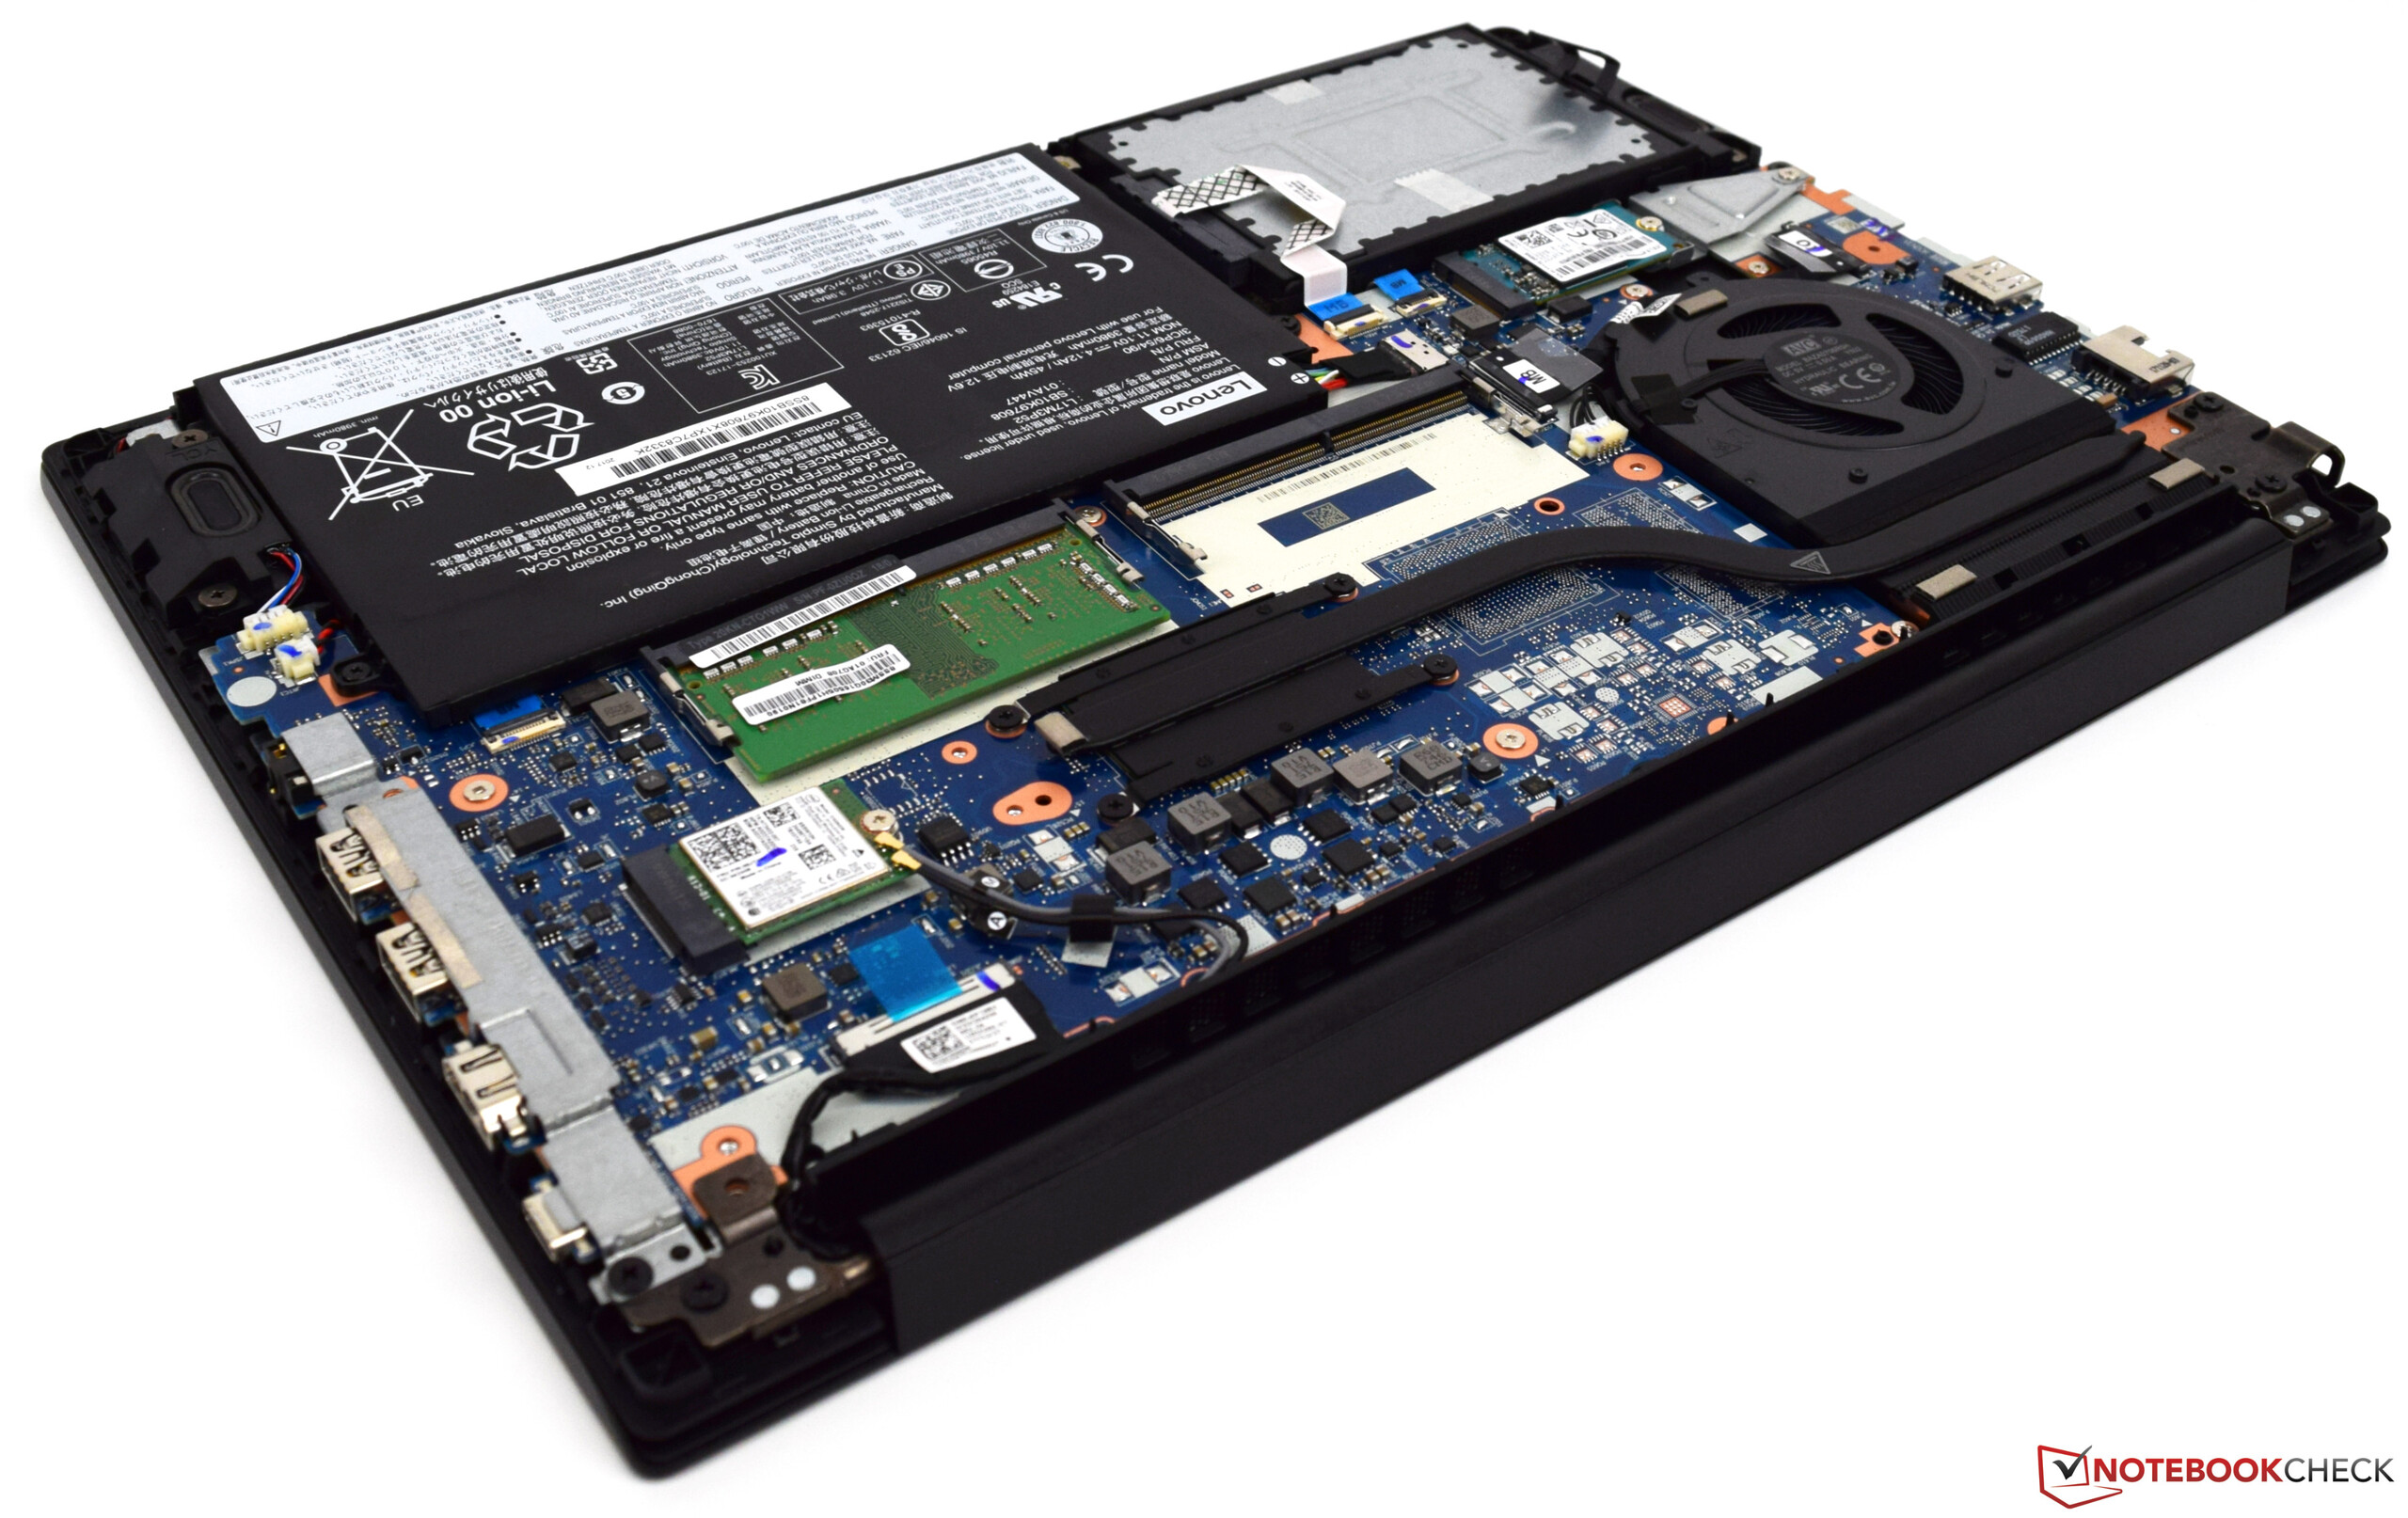
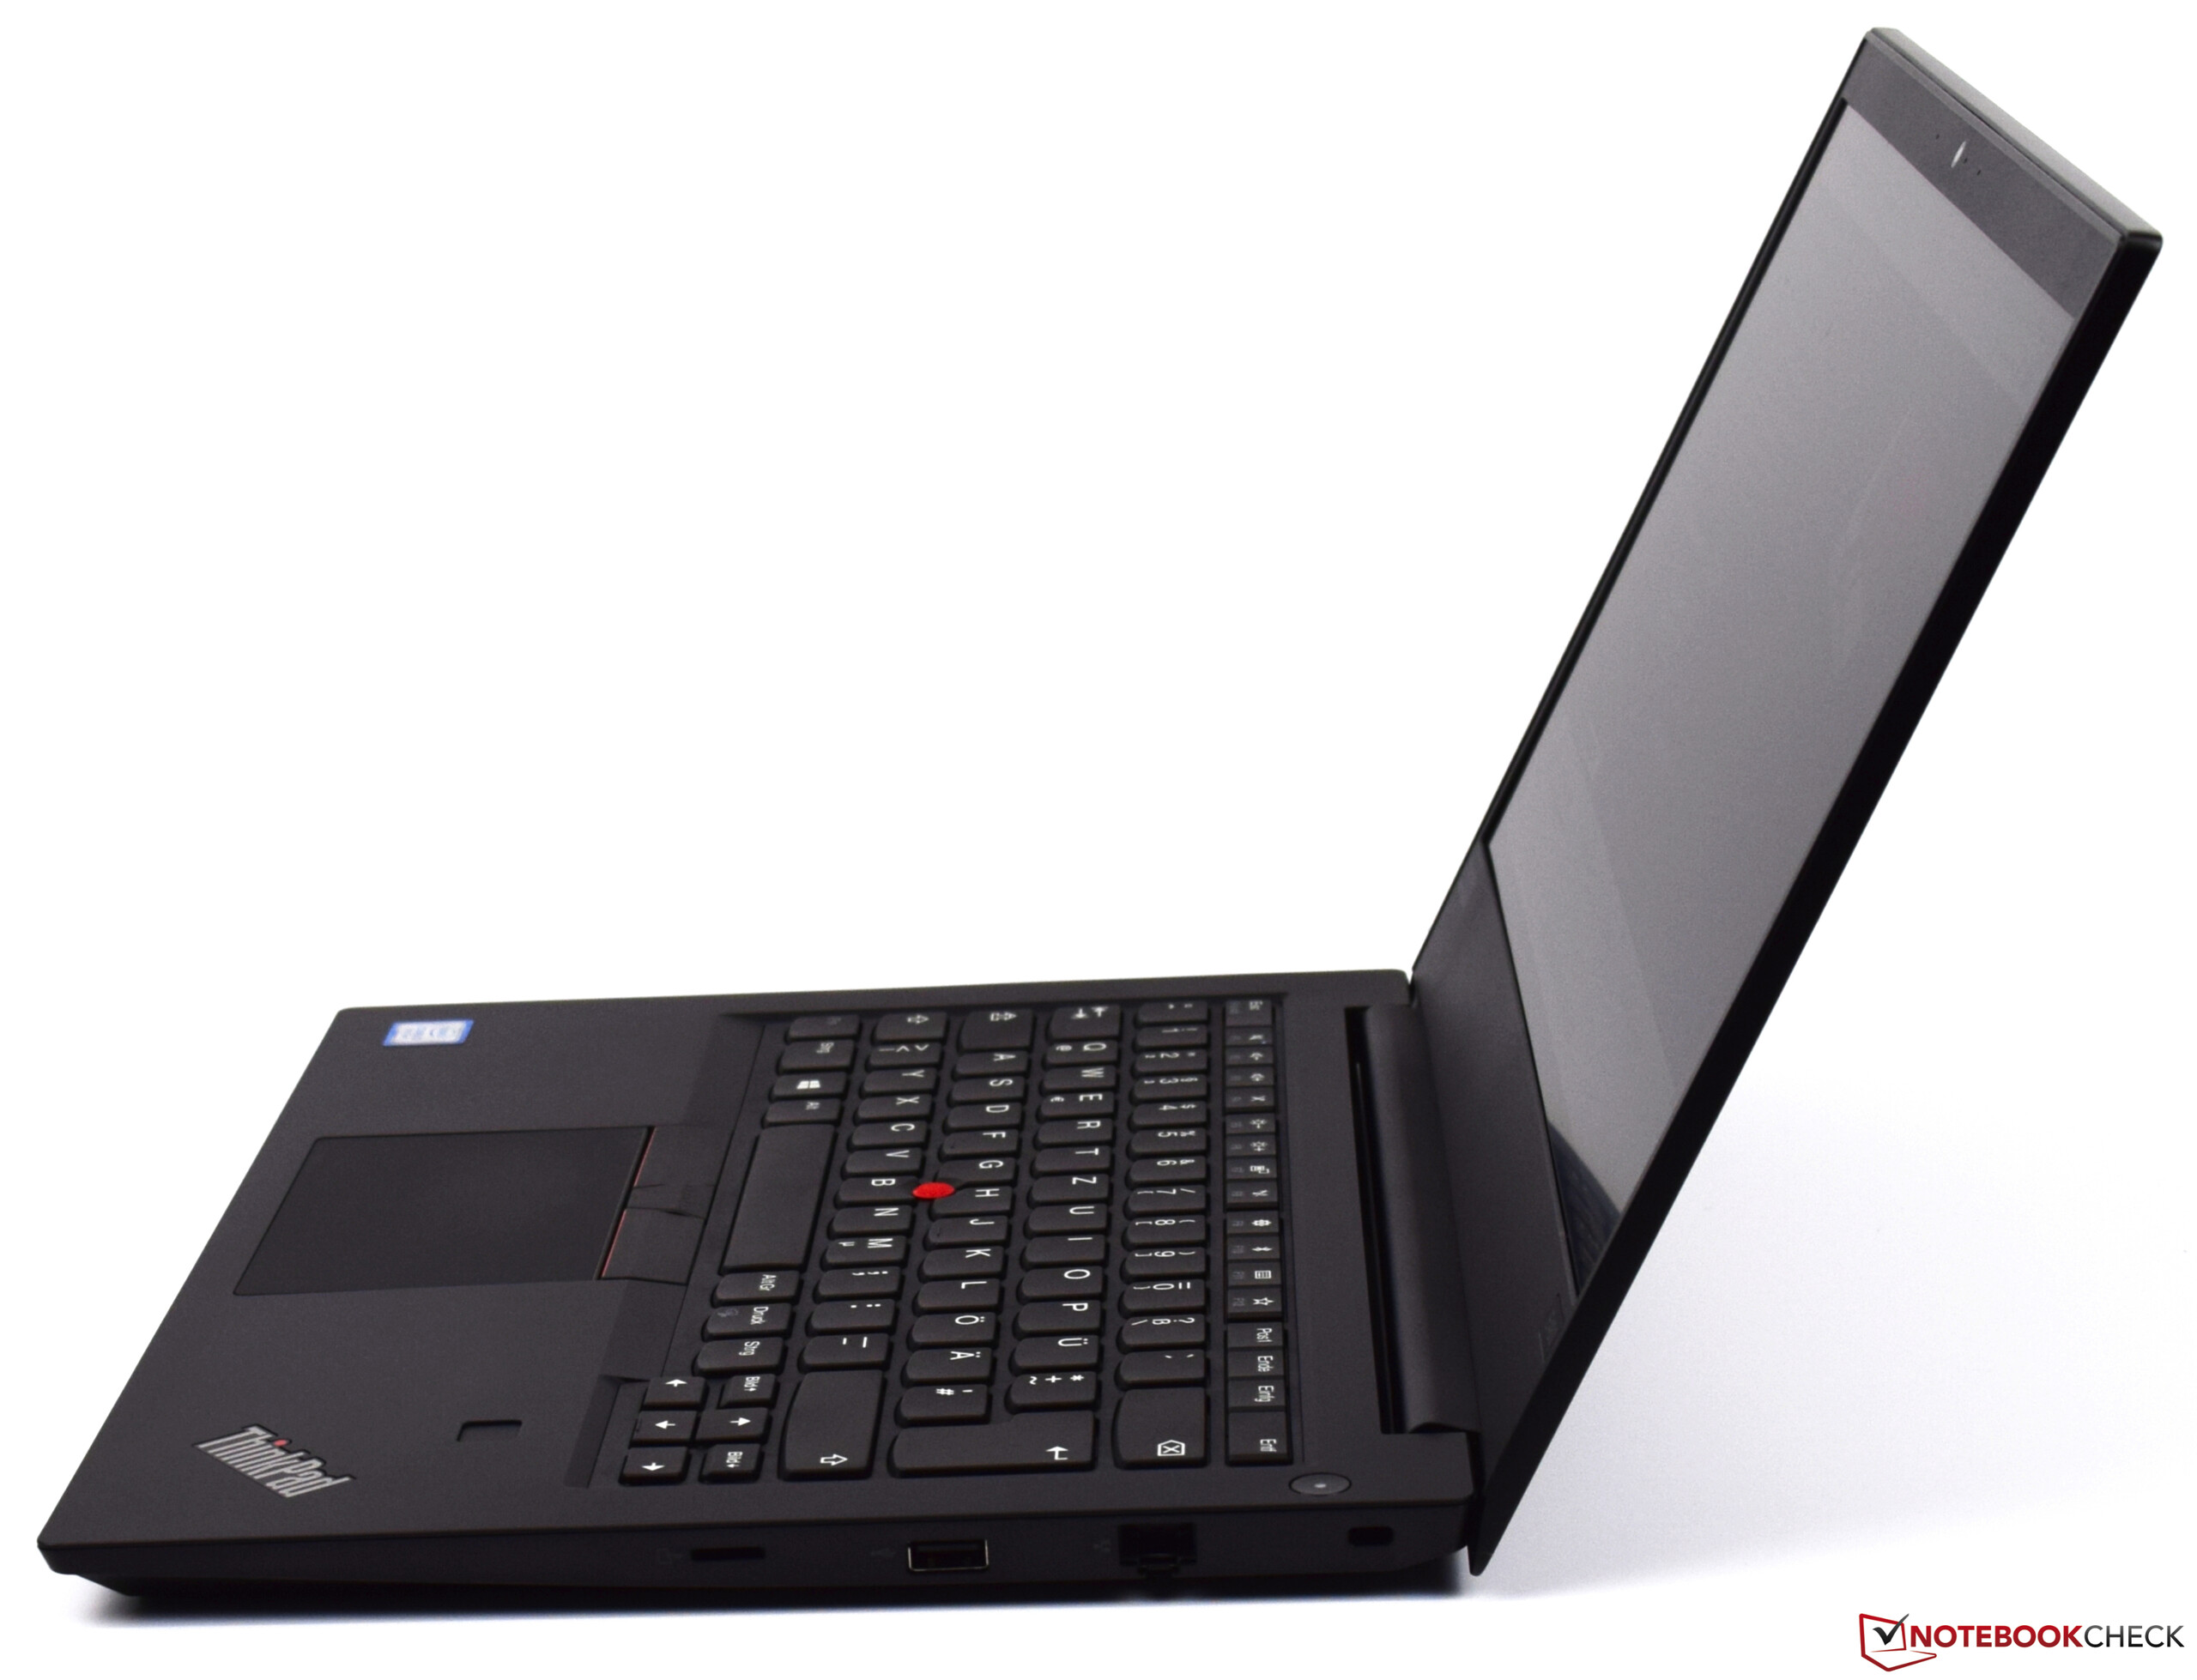
IL Lenovo ThinkPad E480 è ben costruito e usa dispositivi di input conosciuti che abbiamo già molte volte lodato in passato.
Nota: si tratta di una recensione breve, con alcune sezioni non tradotte, per la versione integrale in inglese guardate qui.
Lenovo ThinkPad E480-20KNCTO1WW
- 03/13/2018 v6 (old)
Sebastian Bade
Price comparison
