NVIDIA GeForce RTX 3080 Ti Laptop GPU
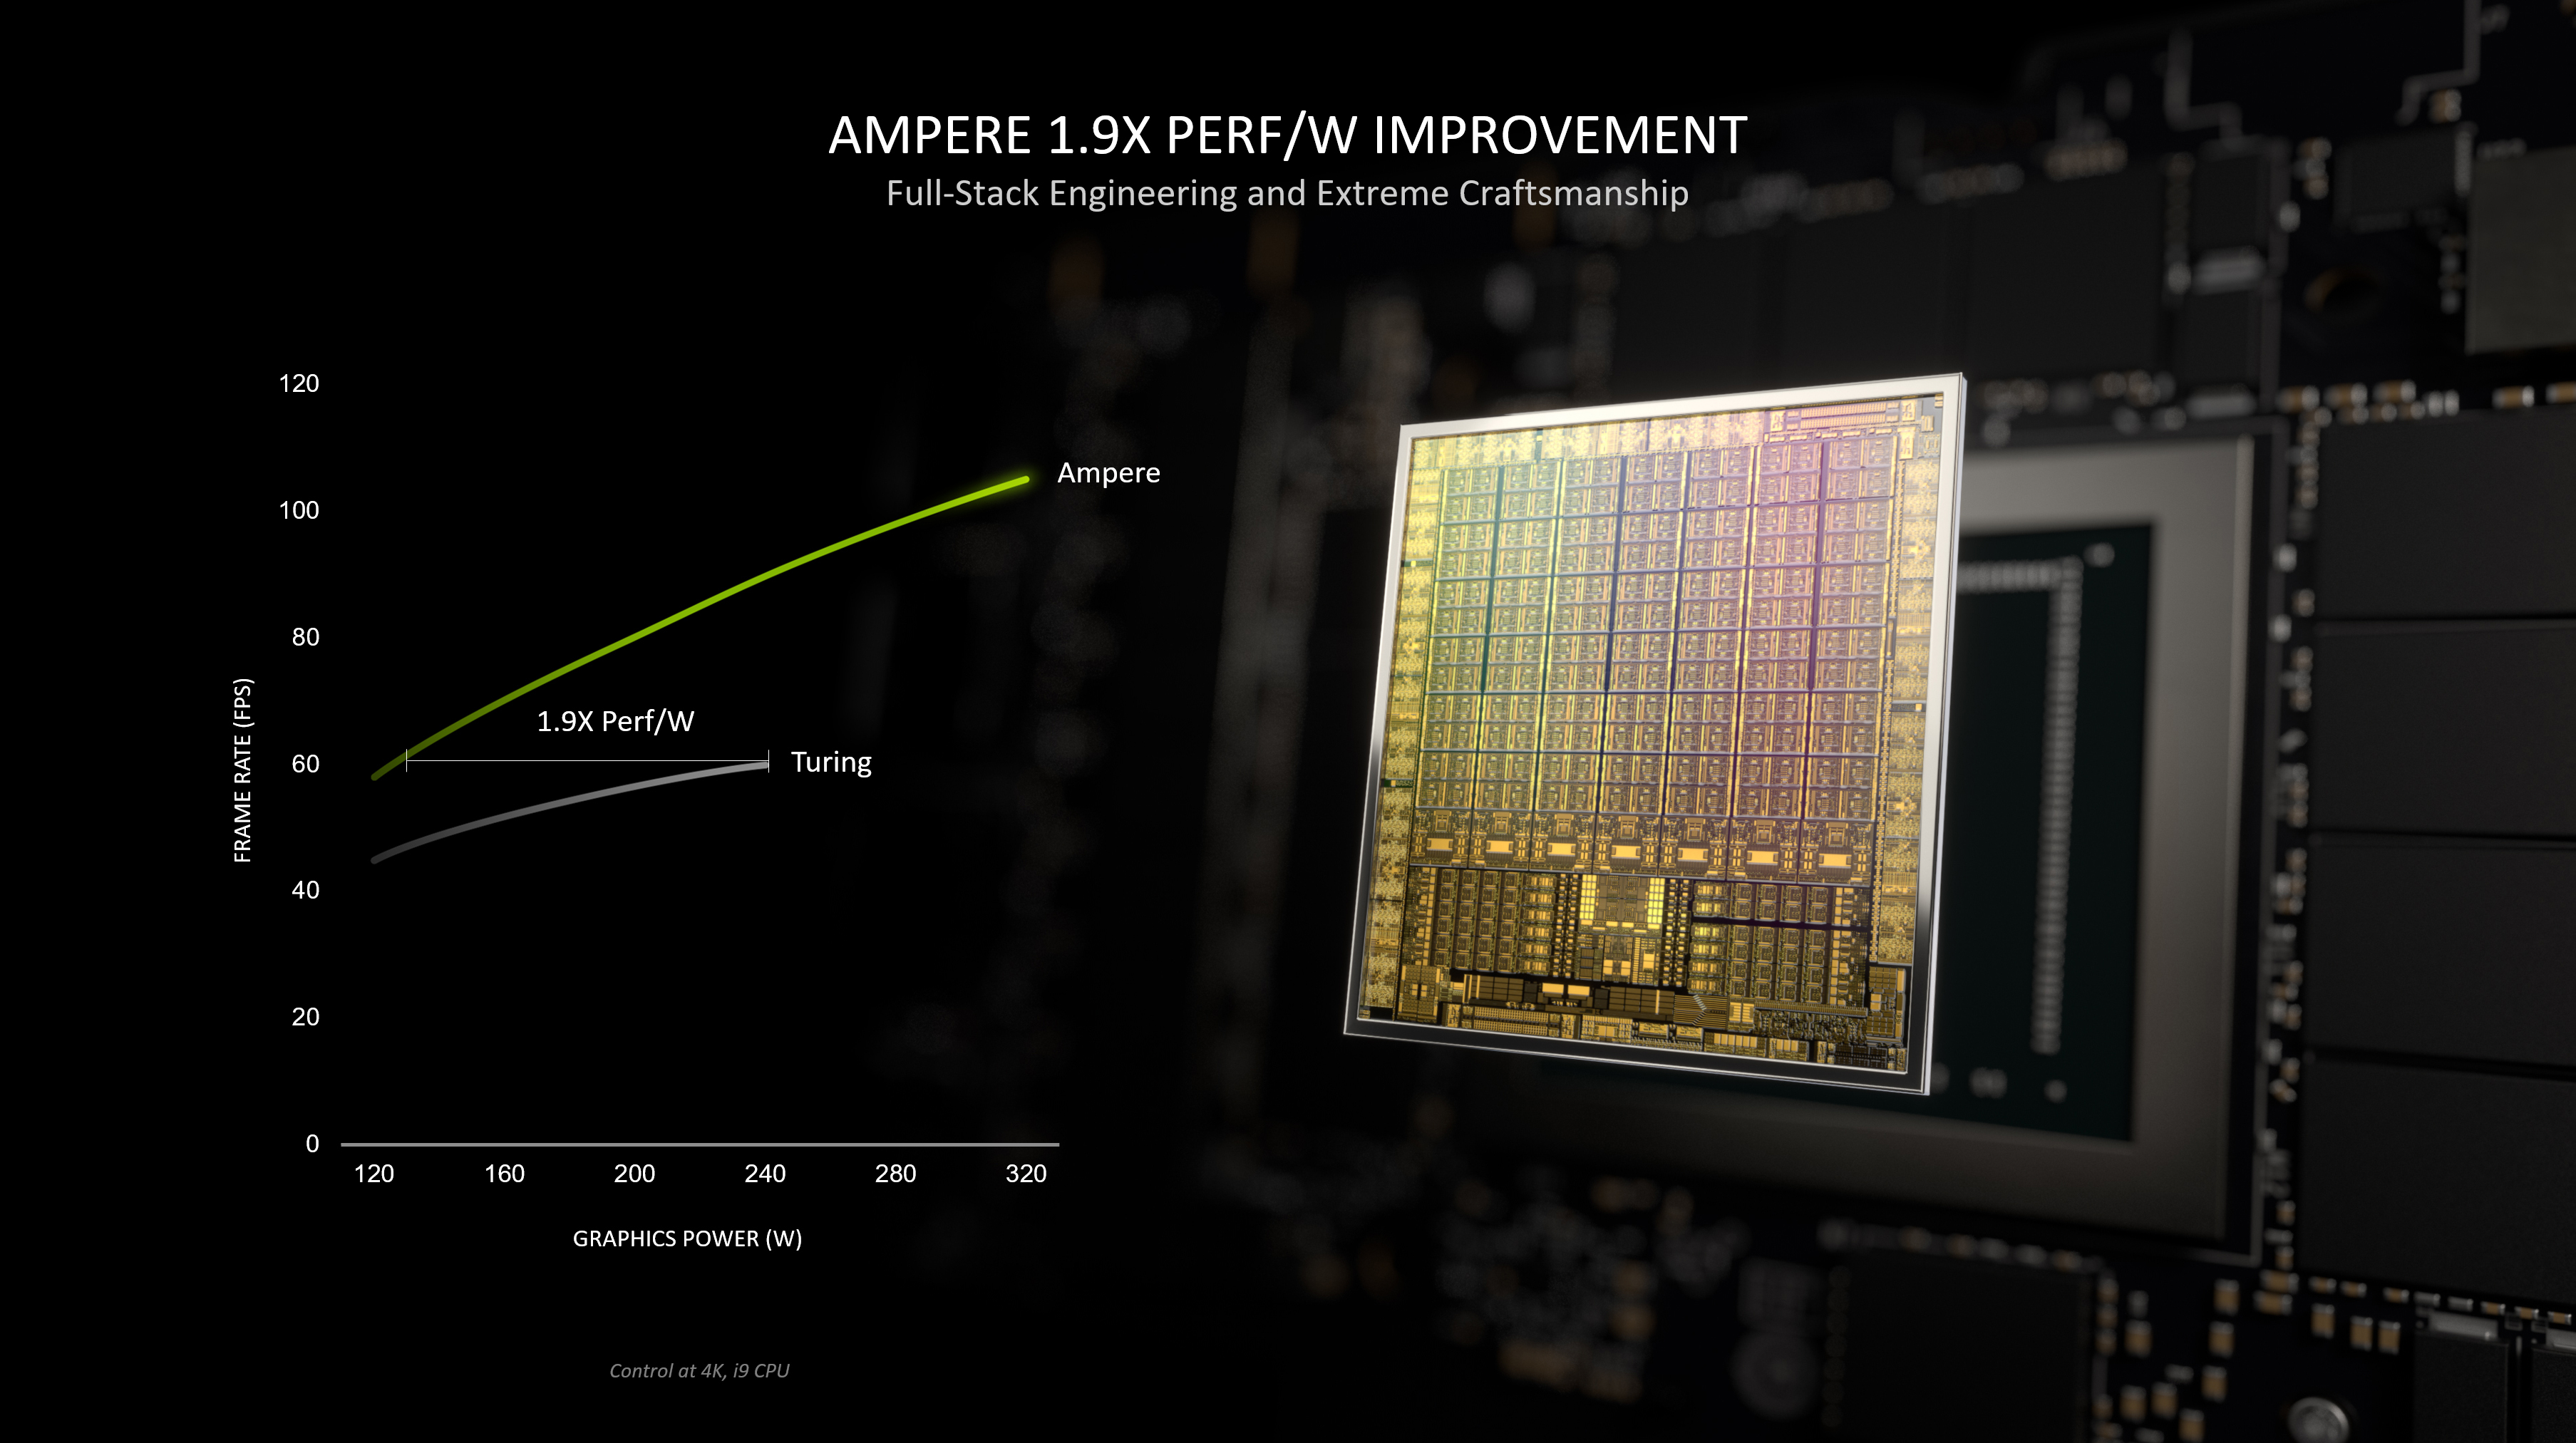
La GPU Nvidia GeForce RTX 3080 Ti Laptop o 3080 Ti Mobile (per computer portatili, GN20-E8) è la più veloce scheda grafica per notebook all'inizio del 2022. È basata sul chip GA103S Ampere e offre 7.424 shader e 16 GB di memoria grafica GDDR6 con un bus di memoria a 256 Bit. Supporta PCIe 4.0 e sarà disponibile in diverse varianti (80 - 175 Watt TGP attualmente noti). Il Boost clock massimo può variare da 1125 (80 W) a 1590 MHz (da 150W in su).
Non c'è più la variante Max-Q (precedentemente utilizzata per le varianti a bassa potenza) ma ogni OEM può scegliere di implementare le tecnologie Max-Q (Dynamic Boost, Whispermode).
Le prestazioni dipendono dall'impostazione TGP e dal raffreddamento del portatile. Grazie al maggior numero di core, la RTX 3080 Ti dovrebbe essere chiaramente più veloce della vecchia RTX 3080 Mobile e quindi ben adatta al gioco 4K.
Il chip GA103S offre 7.680 ALU FP32 di cui la metà può eseguire anche istruzioni INT32 (cioè 3.840 ALU INT32). Con Turing tutti gli shader potrebbero comunque eseguire istruzioni FP32 o INT32. Il GA103 integra 60 core di Raytracing e 240 core Tensor (ad esempio, per DLSS). La cache L2 è di 4 MB. I chip Ampere includono anche un encoder video migliorato di quinta generazione (NVENC per H.264 e H.265) e un decoder di settima generazione (per vari formati che ora includono AV1). Rispetto al GA103, il GA103S integra solo un bus di memoria a 256 bit.
Il chip GA103 è prodotto da Samsung in 8nm (8N), che non è del tutto in grado di tenere il passo con il nodo a 7nm di TSMC (utilizzato ad esempio da AMD e anche per il chip professionale GA100 Ampere).
GeForce RTX 3000 Serie Nome in codice GN20-E8 Architettura Ampere Pipelines 7424 - unified TMUs 232 ROPs 96 Raytracing Cores 58 Tensor / AI Cores 232 Velocità del core 975 - 1590 (Boost) MHz Velocità della memoria 14000 effective = 2000 MHz Larghezza del bus di memoria 256 Bit Tipo di memoria GDDR6 Max. quantità di memoria 16 GB Memoria condivisa no Memory Bandwidth 512 GB/s API DirectX 12_2, Shader 6.7, OpenGL 4.6 Consumo di corrente 150 Watt (80 - 150 Watt TGP) tecnologia 8 nm PCIe 4.0 Displays HDMI 2.1, DisplayPort 1.4a Caratteristiche NVIDIA DLSS, NVIDIA Reflex, Resizable BAR, NVIDIA Broadcast, NVIDIA Ansel, NVIDIA ShadowPlay®, NVIDIA G-SYNC®, Advanced Optimus, Nvidia Max-Q, Dynamic Boost, Nvidia Omniverse, VR-ready Dimensione del portatile grande Data dell'annuncio 04.01.2022
Benchmark Performance Rating - 3DMark 11 + Fire Strike + Time Spy
14.1 pt (42%)
...
NVIDIA GeForce RTX 3080 Ti Laptop GPU
max:
3DMark - 3DMark Time Spy Score
min: 4973 media: 11802 media: 12267 (35%) massimo: 13808 Points
GPU TDP ? TDP 90 W TDP 105 W TDP 110 W TDP 115 W TDP 130 W TDP 140 W TDP 150 W TDP 155 W TDP 165 W TDP 175 W TDP 180 W 86% 81% 81% 81% 88% 92% 96% 99% 93% 94% 100% 99%
...
NVIDIA GeForce RTX 2080 Super Mobile
NVIDIA GeForce RTX 3080 Ti Laptop GPU
...
max:
3DMark - 3DMark Time Spy Graphics
min: 4921 media: 11850 media: 12269 (32%) massimo: 13835 Points
GPU TDP ? TDP 90 W TDP 105 W TDP 110 W TDP 115 W TDP 130 W TDP 140 W TDP 150 W TDP 155 W TDP 165 W TDP 175 W TDP 180 W 88% 78% 79% 80% 86% 94% 95% 99% 96% 95% 100% 96%
...
NVIDIA GeForce RTX 2080 Super Mobile
NVIDIA GeForce RTX 3080 Ti Laptop GPU
...
max:
3DMark - 3DMark Ice Storm Unlimited Graphics
min: 496658 media: 623062 media: 648870 (74%) massimo: 692473 Points
GPU TDP 105 W TDP 165 W TDP 175 W 100% 91% 94%
...
NVIDIA GeForce RTX 3080 Ti Laptop GPU
max:
3DMark - 3DMark Ice Storm Extreme Graphics
min: 51510 media: 379638 media: 458784 (59%) massimo: 549474 Points
GPU TDP 105 W TDP 140 W TDP 175 W 10% 100% 89%
...
NVIDIA GeForce RTX 3080 Ti Laptop GPU
max:
3DMark - 3DMark Cloud Gate Score
min: 42346 media: 58530 media: 60593 (65%) massimo: 66067 Points
GPU TDP ? TDP 90 W TDP 105 W TDP 110 W TDP 115 W TDP 130 W TDP 140 W TDP 150 W TDP 155 W TDP 165 W TDP 175 W 100% 92% 77% 79% 94% 90% 95% 100% 88% 77% 94%
...
NVIDIA GeForce RTX 2080 Super Mobile
NVIDIA GeForce RTX 3080 Ti Laptop GPU
...
max:
3DMark - 3DMark Cloud Gate Graphics
min: 73574 media: 145836 media: 152074 (40%) massimo: 192520 Points
GPU TDP ? TDP 90 W TDP 105 W TDP 110 W TDP 115 W TDP 130 W TDP 140 W TDP 150 W TDP 155 W TDP 165 W TDP 175 W 97% 77% 54% 80% 79% 92% 97% 100% 82% 64% 83%
...
NVIDIA GeForce RTX 2080 Super Mobile
NVIDIA GeForce RTX 3080 Ti Laptop GPU
...
max:
3DMark - 3DMark Fire Strike Standard Score
min: 6853 media: 25206 media: 26549 (47%) massimo: 31051 Points
GPU TDP ? TDP 90 W TDP 105 W TDP 110 W TDP 115 W TDP 130 W TDP 140 W TDP 150 W TDP 155 W TDP 165 W TDP 175 W TDP 180 W 77% 79% 77% 76% 82% 83% 80% 86% 80% 83% 92% 100%
...
NVIDIA GeForce RTX 3080 Ti Laptop GPU
max:
3DMark - 3DMark Fire Strike Standard Graphics
min: 6928 media: 29496 media: 31033 (35%) massimo: 34439 Points
GPU TDP ? TDP 90 W TDP 105 W TDP 110 W TDP 115 W TDP 130 W TDP 140 W TDP 150 W TDP 155 W TDP 165 W TDP 175 W TDP 180 W 83% 81% 80% 82% 85% 94% 92% 93% 94% 92% 98% 100%
...
NVIDIA GeForce RTX 3080 Ti Laptop GPU
max:
3DMark - 3DMark Ice Storm Graphics
min: 78806 media: 371291 media: 400891 (48%) massimo: 604575 Points
GPU TDP 105 W TDP 110 W TDP 140 W TDP 175 W 13% 37% 96% 100%
...
NVIDIA GeForce RTX 3080 Ti Laptop GPU
...
max:
3DMark - 3DMark Wild Life Unlimited
min: 63284 media: 76976 media: 78187.5 (39%) massimo: 88244 Points
GPU TDP 105 W TDP 140 W TDP 175 W 73% 84% 100%
...
NVIDIA GeForce RTX 2070 Super Max-Q
NVIDIA GeForce RTX 2070 Super Mobile
Apple M1 Max 32-Core GPU
NVIDIA GeForce RTX 3080 Ti Laptop GPU
...
Apple M1 Max 32-Core GPU
max:
3DMark - 3DMark Wild Life Extreme Unlimited
min: 20846 media: 26251 media: 27501 (32%) massimo: 28879 Points
GPU TDP 105 W TDP 140 W TDP 165 W TDP 175 W TDP 180 W 74% 86% 82% 100% 98%
...
Apple M1 Max 32-Core GPU
NVIDIA GeForce RTX 3080 Ti Laptop GPU
max:
3DMark - 3DMark Night Raid
min: 57186 media: 60442 media: 57544 (54%) massimo: 66597 Points
GPU TDP 140 W TDP 175 W 92% 100%
...
NVIDIA GeForce RTX 3080 Ti Laptop GPU
max:
3DMark - 3DMark Night Raid Graphics Score
min: 109337 media: 125472 media: 124667 (48%) massimo: 142413 Points
GPU TDP 140 W TDP 175 W 99% 100%
...
NVIDIA GeForce RTX 3080 Ti Laptop GPU
max:
3DMark 11 - 3DM11 Performance Score
min: 12229 media: 31971 media: 33697 (47%) massimo: 37061 Points
GPU TDP ? TDP 90 W TDP 105 W TDP 110 W TDP 115 W TDP 130 W TDP 140 W TDP 150 W TDP 155 W TDP 165 W TDP 175 W TDP 180 W 80% 39% 85% 77% 87% 82% 91% 95% 88% 87% 96% 100%
...
NVIDIA GeForce RTX 2080 Super Mobile
NVIDIA GeForce RTX 3080 Ti Laptop GPU
...
max:
3DMark 11 - 3DM11 Performance GPU
min: 13920 media: 39402 media: 42275 (36%) massimo: 45841 Points
GPU TDP ? TDP 90 W TDP 105 W TDP 110 W TDP 115 W TDP 130 W TDP 140 W TDP 150 W TDP 155 W TDP 165 W TDP 175 W TDP 180 W 85% 32% 81% 79% 85% 95% 90% 98% 95% 96% 100% 99%
...
NVIDIA GeForce RTX 2080 Super Mobile
NVIDIA GeForce RTX 3080 Ti Laptop GPU
...
max:
3DMark Vantage + 3DMark Vantage - 3DM Vant. Perf. total
94760 Points (27%)
...
NVIDIA GeForce RTX 3080 Ti Laptop GPU
max:
3DM Vant. Perf. GPU no PhysX + 3DMark Vantage - 3DM Vant. Perf. GPU no PhysX
102426 Points (58%)
...
NVIDIA GeForce RTX 3080 Ti Laptop GPU
max:
3DMark 06 3DMark 06 - Standard 1280x1024 +
min: 55891 media: 57054 media: 56967 (74%) massimo: 58305 Points
GPU TDP 105 W TDP 175 W 97% 100%
...
NVIDIA GeForce RTX 3080 Ti Laptop GPU
max:
Blender - Blender 3.3 Classroom CUDA *
min: 32 media: 35 media: 34 (5%) massimo: 41 Seconds
GPU TDP ? TDP 130 W TDP 140 W TDP 155 W TDP 175 W TDP 180 W 101% 101% 100% 101% 101% 101%
...
NVIDIA GeForce RTX 3080 Ti Laptop GPU
...
Blender - Blender 3.3 Classroom OPTIX *
min: 20 media: 23.1 media: 23 (9%) massimo: 28 Seconds
GPU TDP ? TDP 130 W TDP 140 W TDP 155 W TDP 175 W TDP 180 W 102% 102% 100% 102% 102% 102%
...
NVIDIA GeForce RTX 3080 Ti Laptop GPU
...
SPECviewperf 12 + SPECviewperf 12 - specvp12 sw-03
75.1 fps (19%)
...
NVIDIA Quadro P2000 Max-Q
AMD Radeon 660M
NVIDIA GeForce RTX 3080 Ti Laptop GPU
AMD Radeon Pro WX Vega M GL
NVIDIA Quadro P620
AMD Radeon 680M
...
max:
specvp12 snx-02 + SPECviewperf 12 - specvp12 snx-02
12 fps (2%)
...
AMD Radeon RX Vega 10
NVIDIA GeForce RTX 3080 Ti Laptop GPU
AMD Radeon Pro 455
AMD Radeon Pro 555
AMD Radeon Pro WX 3100
...
max:
specvp12 showcase-01 + SPECviewperf 12 - specvp12 showcase-01
126.5 fps (28%)
...
NVIDIA GeForce RTX 3080 Ti Laptop GPU
max:
specvp12 mediacal-01 + SPECviewperf 12 - specvp12 mediacal-01
59.1 fps (15%)
...
NVIDIA Quadro P4000 Max-Q
NVIDIA GeForce RTX 3080 Ti Laptop GPU
...
max:
specvp12 maya-04 + SPECviewperf 12 - specvp12 maya-04
137.5 fps (37%)
...
NVIDIA GeForce RTX 3080 Ti Laptop GPU
...
max:
specvp12 energy-01 + SPECviewperf 12 - specvp12 energy-01
11.3 fps (10%)
...
NVIDIA GeForce RTX 3080 Ti Laptop GPU
NVIDIA Quadro P4000 Max-Q
...
AMD Radeon 660M
max:
specvp12 creo-01 + SPECviewperf 12 - specvp12 creo-01
69.1 fps (28%)
...
NVIDIA Quadro P620
NVIDIA GeForce RTX 3080 Ti Laptop GPU
NVIDIA Quadro P4000 Max-Q
...
max:
specvp12 catia-04 + SPECviewperf 12 - specvp12 catia-04
113.5 fps (19%)
...
NVIDIA Quadro P4000 Max-Q
NVIDIA GeForce RTX 3080 Ti Laptop GPU
...
max:
specvp12 3dsmax-05 + SPECviewperf 12 - specvp12 3dsmax-05
211.7 fps (37%)
...
NVIDIA GeForce RTX 3080 Ti Laptop GPU
max:
SPECviewperf 13 specvp13 sw-04 + SPECviewperf 13 - specvp13 sw-04
min: 62.9 media: 108.8 media: 110.7 (30%) massimo: 133.4 fps
GPU TDP ? TDP 105 W TDP 165 W TDP 175 W 92% 88% 93% 100%
Intel Iris Plus Graphics G7 (Ice Lake 64 EU)
...
NVIDIA GeForce RTX 3080 Ti Laptop GPU
...
max:
specvp13 snx-03 + SPECviewperf 13 - specvp13 snx-03
min: 18.3 media: 22.3 media: 22.1 (2%) massimo: 25.3 fps
GPU TDP ? TDP 105 W TDP 165 W TDP 175 W 99% 95% 93% 100%
...
NVIDIA GeForce RTX 2070 Super Max-Q
NVIDIA GeForce RTX 2070 Super Mobile
NVIDIA GeForce RTX 3080 Ti Laptop GPU
NVIDIA Quadro P520
...
max:
specvp13 showcase-02 + SPECviewperf 13 - specvp13 showcase-02
min: 110 media: 146.6 media: 153 (33%) massimo: 175 fps
GPU TDP ? TDP 105 W TDP 165 W TDP 175 W 89% 79% 92% 100%
Intel UHD Graphics 24EUs (Alder Lake-N)
...
NVIDIA GeForce RTX 3080 Ti Laptop GPU
max:
specvp13 medical-02 + SPECviewperf 13 - specvp13 medical-02
min: 65.3 media: 74.5 media: 75.6 (16%) massimo: 79.1 fps
GPU TDP ? TDP 105 W TDP 165 W TDP 175 W 96% 94% 98% 100%
...
NVIDIA GeForce RTX 3080 Ti Laptop GPU
...
max:
specvp13 maya-05 + SPECviewperf 13 - specvp13 maya-05
min: 211.5 media: 320.8 media: 305.4 (35%) massimo: 429.5 fps
GPU TDP ? TDP 105 W TDP 165 W TDP 175 W 100% 83% 93% 100%
Intel UHD Graphics 24EUs (Alder Lake-N)
...
NVIDIA GeForce RTX 3080 Ti Laptop GPU
max:
specvp13 energy-02 + SPECviewperf 13 - specvp13 energy-02
min: 19.3 media: 24.5 media: 26.3 (8%) massimo: 27.3 fps
GPU TDP ? TDP 105 W TDP 165 W TDP 175 W 86% 80% 96% 100%
...
NVIDIA GeForce RTX 2070 Super Mobile
NVIDIA GeForce RTX 2080 Super Mobile
NVIDIA GeForce RTX 3080 Ti Laptop GPU
...
Intel UHD Graphics 24EUs (Alder Lake-N)
specvp13 creo-02 + SPECviewperf 13 - specvp13 creo-02
min: 177.4 media: 249.4 media: 247.2 (36%) massimo: 310.5 fps
GPU TDP ? TDP 105 W TDP 165 W TDP 175 W 94% 81% 90% 100%
Intel Iris Plus Graphics G7 (Ice Lake 64 EU)
...
NVIDIA GeForce RTX 3080 Ti Laptop GPU
max:
specvp13 catia-05 + SPECviewperf 13 - specvp13 catia-05
min: 130.4 media: 170 media: 175.7 (20%) massimo: 190.3 fps
GPU TDP ? TDP 105 W TDP 165 W TDP 175 W 93% 90% 95% 100%
Intel UHD Graphics 24EUs (Alder Lake-N)
...
NVIDIA GeForce RTX 3080 Ti Laptop GPU
...
max:
specvp13 3dsmax-06 + SPECviewperf 13 - specvp13 3dsmax-06
min: 161 media: 222.8 media: 220.2 (38%) massimo: 260.4 fps
GPU TDP ? TDP 105 W TDP 165 W TDP 175 W 93% 88% 87% 100%
Intel UHD Graphics 24EUs (Alder Lake-N)
...
NVIDIA GeForce RTX 3080 Ti Laptop GPU
max:
SPECviewperf 2020 specvp2020 solidworks-05 1080p + SPECviewperf 2020 - specvp2020 solidworks-05 1080p
min: 174.7 media: 198.6 media: 210.4 (41%) massimo: 210.7 fps
GPU TDP ? TDP 105 W 91% 100%
...
NVIDIA GeForce RTX 2070 Super Max-Q
NVIDIA GeForce RTX 3080 Ti Laptop GPU
specvp2020 snx-04 1080p + SPECviewperf 2020 - specvp2020 snx-04 1080p
min: 18.1 media: 21.8 media: 21.8 (4%) massimo: 25 fps
GPU TDP ? TDP 105 W TDP 165 W 100% 97% 95%
...
NVIDIA GeForce RTX 3050 4GB Laptop GPU
NVIDIA GeForce RTX 2070 Super Max-Q
NVIDIA GeForce RTX 3080 Ti Laptop GPU
AMD Radeon RX Vega 7
NVIDIA Quadro P520
...
max:
NVIDIA RTX A6000
specvp2020 medical-03 1080p + SPECviewperf 2020 - specvp2020 medical-03 1080p
min: 33 media: 37.4 media: 37.5 (27%) massimo: 40.2 fps
GPU TDP ? TDP 105 W TDP 165 W 96% 94% 100%
...
NVIDIA GeForce RTX 3080 Ti Laptop GPU
...
max:
NVIDIA RTX A6000
specvp2020 maya-06 1080p + SPECviewperf 2020 - specvp2020 maya-06 1080p
min: 247.9 media: 351.3 media: 331.3 (48%) massimo: 455.9 fps
GPU TDP ? TDP 105 W TDP 165 W 100% 84% 92%
...
NVIDIA GeForce RTX 3080 Ti Laptop GPU
max:
NVIDIA RTX A6000
specvp2020 energy-03 1080p + SPECviewperf 2020 - specvp2020 energy-03 1080p
min: 19.6 media: 23.7 media: 23.9 (19%) massimo: 27 fps
GPU TDP ? TDP 105 W TDP 165 W 90% 82% 100%
...
NVIDIA GeForce RTX 2070 Super Max-Q
NVIDIA GeForce RTX 3080 Ti Laptop GPU
...
max:
NVIDIA RTX A6000
specvp2020 creo-03 1080p + SPECviewperf 2020 - specvp2020 creo-03 1080p
min: 55.3 media: 92.3 media: 95.9 (47%) massimo: 114.7 fps
GPU TDP ? TDP 105 W TDP 165 W 100% 95% 91%
...
NVIDIA GeForce RTX 2070 Super Max-Q
NVIDIA GeForce RTX 3080 Ti Laptop GPU
...
max:
NVIDIA RTX A6000
specvp2020 catia-06 1080p + SPECviewperf 2020 - specvp2020 catia-06 1080p
min: 51.8 media: 67.4 media: 66 (43%) massimo: 78.7 fps
GPU TDP ? TDP 105 W TDP 165 W 100% 95% 98%
...
NVIDIA GeForce RTX 3080 Ti Laptop GPU
max:
NVIDIA RTX A6000
specvp2020 3dsmax-07 1080p + SPECviewperf 2020 - specvp2020 3dsmax-07 1080p
min: 99.2 media: 128.4 media: 125.1 (57%) massimo: 153 fps
GPU TDP ? TDP 105 W TDP 165 W 100% 93% 99%
...
NVIDIA GeForce RTX 2070 Super Max-Q
NVIDIA GeForce RTX 3080 Ti Laptop GPU
...
max:
NVIDIA RTX A6000
specvp2020 solidworks-05 4k + SPECviewperf 2020 - specvp2020 solidworks-05 4k
min: 87.9 media: 137.6 media: 103.8 (31%) massimo: 255 fps
GPU TDP ? TDP 105 W TDP 175 W 38% 41% 100%
Intel UHD Graphics Xe 32EUs (Tiger Lake-H)
...
NVIDIA GeForce RTX 3080 Ti Laptop GPU
max:
specvp2020 snx-04 4k + SPECviewperf 2020 - specvp2020 snx-04 4k
min: 15.5 media: 18.9 media: 18.7 (2%) massimo: 21.1 fps
GPU TDP ? TDP 105 W TDP 165 W TDP 175 W 90% 86% 86% 100%
...
NVIDIA GeForce RTX 3080 Ti Laptop GPU
AMD Radeon RX Vega 7
AMD Radeon 660M
AMD Radeon 680M
...
max:
specvp2020 medical-03 4k + SPECviewperf 2020 - specvp2020 medical-03 4k
min: 13.2 media: 17.9 media: 16.1 (15%) massimo: 34.3 fps
GPU TDP ? TDP 105 W TDP 165 W TDP 175 W 44% 42% 47% 100%
Intel UHD Graphics Xe 32EUs (Tiger Lake-H)
...
NVIDIA GeForce RTX 3080 Ti Laptop GPU
...
max:
specvp2020 maya-06 4k + SPECviewperf 2020 - specvp2020 maya-06 4k
min: 137.4 media: 208.2 media: 161.1 (26%) massimo: 345 fps
GPU TDP ? TDP 105 W TDP 165 W TDP 175 W 58% 44% 47% 100%
Intel UHD Graphics Xe 32EUs (Tiger Lake-H)
...
NVIDIA GeForce RTX 3080 Ti Laptop GPU
max:
specvp2020 energy-03 4k + SPECviewperf 2020 - specvp2020 energy-03 4k
min: 27.7 media: 65.1 media: 63.2 (14%) massimo: 118.7 fps
GPU TDP ? TDP 105 W TDP 165 W TDP 175 W 52% 54% 100% 23%
...
NVIDIA GeForce RTX 3080 Ti Laptop GPU
max:
specvp2020 creo-03 4k + SPECviewperf 2020 - specvp2020 creo-03 4k
min: 49 media: 77.4 media: 78.6 (37%) massimo: 93.3 fps
GPU TDP ? TDP 105 W TDP 165 W TDP 175 W 86% 78% 82% 100%
Intel UHD Graphics Xe 32EUs (Tiger Lake-H)
...
NVIDIA GeForce RTX 3080 Ti Laptop GPU
max:
specvp2020 catia-06 4k + SPECviewperf 2020 - specvp2020 catia-06 4k
min: 30.3 media: 43.7 media: 40.3 (26%) massimo: 69.6 fps
GPU TDP ? TDP 105 W TDP 165 W TDP 175 W 57% 54% 58% 100%
Intel UHD Graphics Xe 32EUs (Tiger Lake-H)
...
NVIDIA GeForce RTX 3080 Ti Laptop GPU
max:
specvp2020 3dsmax-07 4k + SPECviewperf 2020 - specvp2020 3dsmax-07 4k
min: 69.5 media: 95.7 media: 87.9 (37%) massimo: 144 fps
GPU TDP ? TDP 105 W TDP 165 W TDP 175 W 61% 59% 61% 100%
Intel UHD Graphics Xe 32EUs (Tiger Lake-H)
...
NVIDIA GeForce RTX 3080 Ti Laptop GPU
...
max:
Cinebench R10 Cinebench R10 Shading (32bit) + Cinebench R10 - Cinebench R10 Shading (32bit)
min: 13665 media: 18105 media: 17110 (12%) massimo: 23540 punti
Intel Graphics Media Accelerator (GMA) 500
...
NVIDIA GeForce RTX 3080 Ti Laptop GPU
...
Cinebench R11.5 Cinebench R11.5 OpenGL 64 Bit + Cinebench R11.5 - Cinebench R11.5 OpenGL 64 Bit
min: 101.16 media: 152.9 media: 178.5 (62%) massimo: 178.98 fps
...
NVIDIA GeForce RTX 3080 Ti Laptop GPU
...
max:
Cinebench R15 + Cinebench R15 - Cinebench R15 OpenGL 64 Bit
min: 68.6 media: 200.8 media: 206 (12%) massimo: 271 fps
GPU TDP ? TDP 90 W TDP 105 W TDP 110 W TDP 115 W TDP 130 W TDP 140 W TDP 150 W TDP 155 W TDP 165 W TDP 175 W TDP 180 W 71% 90% 88% 85% 68% 75% 83% 100% 93% 77% 88% 99%
...
NVIDIA GeForce RTX 3080 Ti Laptop GPU
...
Cinebench R15 OpenGL Ref. Match 64 Bit + Cinebench R15 - Cinebench R15 OpenGL Ref. Match 64 Bit
99.6 % (100%)
GPU TDP ? TDP 90 W TDP 105 W TDP 110 W TDP 115 W TDP 130 W TDP 140 W TDP 150 W TDP 155 W TDP 165 W TDP 175 W TDP 180 W 100% 100% 100% 100% 100% 100% 100% 100% 100% 100% 100% 100%
...
NVIDIA GeForce RTX 3080 Ti Laptop GPU
...
GFXBench - GFXBench 5.0 Aztec Ruins High Tier Offscreen
261.5 fps (48%)
...
Apple M1 Max 24-Core GPU
NVIDIA GeForce RTX 3080 Ti Laptop GPU
Apple M1 Max 32-Core GPU
GFXBench - GFXBench 5.0 Aztec Ruins Normal Tier Offscreen
646 fps (48%)
...
Apple M1 Pro 16-Core GPU
Apple M1 Max 24-Core GPU
NVIDIA GeForce RTX 3080 Ti Laptop GPU
Apple M1 Max 32-Core GPU
GFXBench (DX / GLBenchmark) 2.7 + GFXBench (DX / GLBenchmark) 2.7 - GFXBench T-Rex HD Offscreen C24Z16
2363 fps (19%)
...
Apple M1 Pro 16-Core GPU
Apple M1 Max 24-Core GPU
Apple M1 Max 32-Core GPU
NVIDIA GeForce RTX 3080 Ti Laptop GPU
...
Basemark GPU 1.2 - Basemark GPU 1.2 Vulkan Official Medium Offscreen 1080
174.3 fps (1%)
...
NVIDIA GeForce RTX 3050 4GB Laptop GPU
NVIDIA GeForce RTX 3080 Ti Laptop GPU
AMD Radeon Pro 560X
AMD Radeon 680M
...
max:
Geekbench 6.2 - Geekbench 6.2 GPU OpenCL
138312 punti (40%)
Intel UHD Graphics Xe 750 32EUs (Rocket Lake)
...
NVIDIA GeForce RTX 3080 Ti Laptop GPU
max:
Geekbench 6.2 - Geekbench 6.2 GPU Vulkan
16624 punti (5%)
...
AMD Radeon 610M
Intel UHD Graphics Xe 32EUs (Tiger Lake-H)
Intel UHD Graphics Xe G4 48EUs
AMD Radeon RX Vega 7
NVIDIA GeForce RTX 3080 Ti Laptop GPU
AMD Radeon 660M
...
max:
LuxMark v2.0 64Bit - LuxMark v2.0 Room GPU
4296 Samples/s (19%)
...
NVIDIA GeForce RTX 2080 Super Mobile
NVIDIA GeForce RTX 3080 Ti Laptop GPU
...
max:
4x NVIDIA RTX A6000
LuxMark v2.0 64Bit - LuxMark v2.0 Sala GPU
10333 Samples/s (18%)
...
NVIDIA GeForce RTX 2080 Super Mobile
NVIDIA GeForce RTX 3080 Ti Laptop GPU
...
max:
4x NVIDIA RTX A6000
ComputeMark v2.1 - ComputeMark v2.1 Result
30717 punti (33%)
...
NVIDIA GeForce RTX 3080 Ti Laptop GPU
...
max:
Power Consumption - Furmark Stress Test Power Consumption - external Monitor *
min: 139.2 media: 203.1 media: 210.5 (30%) massimo: 288 Watt
GPU TDP ? TDP 90 W TDP 105 W TDP 110 W TDP 115 W TDP 130 W TDP 140 W TDP 150 W TDP 155 W TDP 165 W TDP 175 W TDP 180 W 109% 121% 117% 120% 119% 111% 110% 111% 106% 108% 101% 100%
...
NVIDIA GeForce RTX 2070 Super Mobile
NVIDIA GeForce RTX 3080 Ti Laptop GPU
max:
4x NVIDIA RTX A6000
0 20 40 60 80 100 120 140 160 180 200 220 240 260 280 300 Tooltip MSI Creator Z16P B12UHST: Ø139.2 (136.2-148.8)
Razer Blade 15 Advanced Model Early 2022: Ø139.8 (138-142)
MSI Stealth GS77 12UHS-083US: Ø145.9 (138-158)
Razer Blade 15 2022: Ø150 (143-175)
Acer Predator Triton 500 SE PT516-52s-70KX: Ø150.1 (146.4-155.1)
Asus ROG Zephyrus Duo 16 GX650RX: Ø166.2 (157.9-172.1)
Gigabyte Aero 16 YE5: Ø170.4 (167-184)
Aorus 15 YE5-54DEB34SH: Ø157.1 (70.07-161.31)
MSI Raider GE66 12UHS: Ø188.5 (187-191)
Alienware x15 R2 P111F: Ø192.9 (180.2-210)
SCHENKER Uniwill Technology GM7AG8P: Ø194.9 (188-202)
SCHENKER XMG Pro 17 E22: Ø196.6 (193.8-221)
Medion Erazer Beast X30: Ø199.1 (193-209)
SCHENKER XMG Neo 17 M22: Ø210 (204-215)
SCHENKER XMG Neo 15 E22 (Early 2022, RTX 3080 Ti): Ø211 (207.74-215.92)
Razer Blade 17 RTX 3080 Ti: Ø214 (198-246)
Asus ROG Strix Scar 17 SE G733CX-LL014W: Ø215 (206-220)
SCHENKER XMG Pro 15 (i7-12700H, RTX 3080 Ti): Ø216 (210.9-232.89)
Razer Blade 17 Early 2022: Ø221 (213-227)
Eurocom Nightsky TXi317: Ø221 (210-230)
SCHENKER XMG Neo 15 (i7-12700H, RTX 3080 Ti): Ø232 (218.14-240.49)
MSI GE76 Raider: Ø238 (233-251)
Lenovo Legion 7 16IAX7-82TD004SGE: Ø238 (225-252)
MSI Titan GT77 12UHS: Ø239 (230-252)
MSI Raider GE77 HX 12UHS: Ø240 (232-248)
MSI Titan GT77 12UHS: Ø239 (230-248)
Alienware x17 R2 P48E: Ø245 (239-264)
Uniwell Technology GM7AG8N Liquid Cooling Box: Ø288 (278-302)
Power Consumption - The Witcher 3 Power Consumption - external Monitor *
min: 144 media: 212.6 media: 220 (31%) massimo: 287 Watt
GPU TDP ? TDP 105 W TDP 110 W TDP 115 W TDP 130 W TDP 140 W TDP 150 W TDP 155 W TDP 165 W TDP 175 W TDP 180 W 107% 116% 118% 119% 109% 108% 109% 103% 106% 101% 100%
...
NVIDIA GeForce RTX 3080 Ti Laptop GPU
...
max:
4x NVIDIA RTX A6000
0 15 30 45 60 75 90 105 120 135 150 165 180 195 210 225 240 255 270 285 Tooltip Razer Blade 15 Advanced Model Early 2022: Ø144.2 (140-150)
Acer Predator Triton 500 SE PT516-52s-70KX: Ø148 (144.2-154.9)
MSI Stealth GS77 12UHS-083US: Ø161.7 (160-167)
Razer Blade 15 2022: Ø166.9 (159-170)
Gigabyte Aero 16 YE5: Ø170.4 (166-176)
Asus ROG Zephyrus Duo 16 GX650RX: Ø174.7 (170-184)
MSI Raider GE66 12UHS: Ø195.4 (192-204)
Aorus 15 YE5-54DEB34SH: Ø196 (189.22-200.53)
Alienware x15 R2 P111F: Ø199.6 (194.8-208)
SCHENKER Uniwill Technology GM7AG8P: Ø206 (202-210)
SCHENKER XMG Pro 17 E22: Ø212 (204-225)
Medion Erazer Beast X30: Ø213 (195-235)
Asus ROG Strix Scar 17 SE G733CX-LL014W: Ø214 (211-217)
Razer Blade 17 Early 2022: Ø220 (215-227)
SCHENKER XMG Neo 17 M22: Ø222 (204-233)
MSI Titan GT77 12UHS: Ø227 (220-233)
SCHENKER XMG Pro 15 (i7-12700H, RTX 3080 Ti): Ø228 (218.11-235.19)
SCHENKER XMG Neo 15 E22 (Early 2022, RTX 3080 Ti): Ø229 (224.93-233.96)
Eurocom Nightsky TXi317: Ø232 (218-245)
MSI Raider GE77 HX 12UHS: Ø236 (228-245)
Razer Blade 17 RTX 3080 Ti: Ø237 (234-241)
SCHENKER XMG Neo 15 (i7-12700H, RTX 3080 Ti): Ø242 (237.2-253.5)
Lenovo Legion 7 16IAX7-82TD004SGE: Ø240 (226-252)
MSI GE76 Raider: Ø243 (237-254)
MSI Titan GT77 12UHS: Ø247 (242-254)
Alienware x17 R2 P48E: Ø250 (248-254)
Uniwell Technology GM7AG8N Liquid Cooling Box: Ø287 (281-296)
Power Consumption - Witcher 3 Power Consumption *
min: 133.5 media: 216 media: 224 (49%) massimo: 291 Watt
GPU TDP ? TDP 90 W TDP 105 W TDP 110 W TDP 115 W TDP 130 W TDP 140 W TDP 150 W TDP 155 W TDP 165 W TDP 175 W TDP 180 W 121% 159% 141% 146% 147% 128% 123% 125% 110% 117% 105% 100%
...
NVIDIA GeForce RTX 2070 Super Mobile
AMD Radeon RX 580 (Laptop)
NVIDIA GeForce RTX 3080 Ti Laptop GPU
NVIDIA GeForce RTX 2080 Super Mobile
0 15 30 45 60 75 90 105 120 135 150 165 180 195 210 225 240 255 270 285 Tooltip MSI Creator Z16P B12UHST: Ø133.5 (121-170.3)
Razer Blade 15 Advanced Model Early 2022: Ø149.6 (143-155)
Acer Predator Triton 500 SE PT516-52s-70KX: Ø159 (145.6-177.5)
MSI Stealth GS77 12UHS-083US: Ø164.9 (161-169)
Razer Blade 15 2022: Ø172 (170-180)
Gigabyte Aero 16 YE5: Ø175.7 (168-184)
Asus ROG Zephyrus Duo 16 GX650RX: Ø186.5 (182.4-193.3)
Aorus 15 YE5-54DEB34SH: Ø195.8 (184.78-212.87)
MSI Raider GE66 12UHS: Ø202 (195-210)
Alienware x15 R2 P111F: Ø207 (201-213)
SCHENKER Uniwill Technology GM7AG8P: Ø210 (205-258)
SCHENKER XMG Pro 17 E22: Ø221 (213-246)
SCHENKER XMG Neo 17 M22: Ø221 (201-226)
Medion Erazer Beast X30: Ø223 (203-245)
Asus ROG Strix Scar 17 SE G733CX-LL014W: Ø225 (221-232)
SCHENKER XMG Neo 15 E22 (Early 2022, RTX 3080 Ti): Ø228 (209.46-284.11)
Razer Blade 17 Early 2022: Ø229 (225-233)
SCHENKER XMG Neo 15 (i7-12700H, RTX 3080 Ti): Ø234 (215.98-248.92)
SCHENKER XMG Pro 15 (i7-12700H, RTX 3080 Ti): Ø208 (80.84-241.62)
MSI Titan GT77 12UHS: Ø236 (231-245)
Razer Blade 17 RTX 3080 Ti: Ø243 (231-250)
Eurocom Nightsky TXi317: Ø243 (238-246)
MSI Raider GE77 HX 12UHS: Ø247 (241-272)
MSI GE76 Raider: Ø252 (248-257)
Lenovo Legion 7 16IAX7-82TD004SGE: Ø253 (247-264)
Alienware x17 R2 P48E: Ø254 (227-291)
MSI Titan GT77 12UHS: Ø256 (250-265)
Uniwell Technology GM7AG8N Liquid Cooling Box: Ø291 (285-298)
Power Consumption - Witcher 3 ultra Power Efficiency
min: 0.4371 media: 0.5 media: 0.5 (52%) massimo: 0.661 fps per Watt
GPU TDP ? TDP 90 W TDP 105 W TDP 110 W TDP 115 W TDP 130 W TDP 140 W TDP 150 W TDP 155 W TDP 165 W TDP 175 W TDP 180 W 87% 79% 92% 95% 100% 95% 87% 85% 76% 85% 80% 70%
...
NVIDIA GeForce RTX 3080 Ti Laptop GPU
...
Apple M2 10-Core GPU
Power Consumption - Witcher 3 ultra Power Efficiency - external Monitor
min: 0.4432 media: 0.6 media: 0.5 (45%) massimo: 0.69 fps per Watt
GPU TDP ? TDP 105 W TDP 110 W TDP 115 W TDP 130 W TDP 140 W TDP 150 W TDP 155 W TDP 165 W TDP 175 W TDP 180 W 82% 88% 91% 100% 89% 84% 82% 74% 82% 76% 69%
...
NVIDIA GeForce RTX 3080 Ti Laptop GPU
...
Emissions Witcher 3 Fan Noise + Emissions - Witcher 3 Fan Noise
min: 43 media: 50.9 media: 51.5 (82%) massimo: 57 dB(A)
GPU TDP ? TDP 90 W TDP 105 W TDP 110 W TDP 115 W TDP 130 W TDP 140 W TDP 150 W TDP 155 W TDP 165 W TDP 175 W TDP 180 W 92% 76% 85% 78% 94% 83% 82% 79% 100% 88% 94% 86%
...
NVIDIA GeForce RTX 2070 Super Max-Q
NVIDIA GeForce RTX 3080 Ti Laptop GPU
...
Clock Speed - GPU Clock Witcher 3 ultra
min: 1215 media: 1416 media: 1425 (56%) massimo: 1710 MHz
GPU TDP 105 W TDP 110 W TDP 115 W TDP 150 W TDP 165 W TDP 175 W 77% 76% 89% 87% 93% 100%
...
NVIDIA GeForce RTX 2070 Super Max-Q
NVIDIA GeForce GTX 1050 Ti Max-Q
NVIDIA GeForce RTX 3080 Ti Laptop GPU
AMD Radeon RX 5300M
NVIDIA GeForce RTX 2070 Super Mobile
AMD Radeon RX Vega 7
...
- Valori di benchmark per questa scheda grafica
- Valori medi di benchmark per questa scheda grafica
* Numeri più piccoli rappresentano prestazioni supeiori
Benchmarks per i giochi I seguenti benchmarks deirivano dai benchmarks dei portatili recensiti. Le prestazioni dipendono dalla scheda grafica utilizzata, dal clock rate, dal processore, dai settaggi di sistema, dai drivers, e dai sistemi operativi. Quindi i risultati non sono rappresentativi per i portatili con questa GPU. Per informazioni dettagliate sui risultati del benchmark, cliccate sul numero di fps.
NVIDIA GeForce RTX 3080 Ti Laptop GPU
...
max:
NVIDIA GeForce RTX 3080 Ti Laptop GPU
max:
NVIDIA GeForce RTX 3080 Ti Laptop GPU
max:
» Giocabile con tutti i portatili testati con dettagli alto.
...
NVIDIA GeForce RTX 3080 Ti Laptop GPU
...
max:
NVIDIA GeForce RTX 3080 Ti Laptop GPU
...
max:
NVIDIA GeForce RTX 3080 Ti Laptop GPU
max:
NVIDIA GeForce RTX 3080 Ti Laptop GPU
max:
» Giocabile con tutti i portatili testati con dettagli ultra.
...
NVIDIA GeForce RTX 3080 Ti Laptop GPU
...
max:
NVIDIA GeForce RTX 3080 Ti Laptop GPU
max:
NVIDIA GeForce RTX 3080 Ti Laptop GPU
max:
NVIDIA GeForce RTX 3080 Ti Laptop GPU
max:
» Giocabile con tutti i portatili testati con dettagli ultra.
...
NVIDIA GeForce RTX 3050 4GB Laptop GPU
NVIDIA GeForce RTX 3080 Ti Laptop GPU
max:
NVIDIA GeForce RTX 3080 Ti Laptop GPU
max:
NVIDIA GeForce RTX 3080 Ti Laptop GPU
max:
» Giocabile con tutti i portatili testati con dettagli ultra.
...
NVIDIA GeForce RTX 3050 4GB Laptop GPU
NVIDIA GeForce RTX 3080 Ti Laptop GPU
...
max:
NVIDIA GeForce RTX 3080 Ti Laptop GPU
max:
NVIDIA GeForce RTX 3080 Ti Laptop GPU
max:
» Giocabile con tutti i portatili testati con dettagli ultra.
...
NVIDIA GeForce RTX 3050 4GB Laptop GPU
NVIDIA GeForce RTX 3080 Ti Laptop GPU
max:
NVIDIA GeForce RTX 3080 Ti Laptop GPU
max:
NVIDIA GeForce RTX 3080 Ti Laptop GPU
max:
» Giocabile con tutti i portatili testati con dettagli ultra.
...
NVIDIA GeForce RTX 3080 Ti Laptop GPU
max:
NVIDIA GeForce RTX 3080 Ti Laptop GPU
max:
NVIDIA GeForce RTX 3080 Ti Laptop GPU
max:
» Giocabile con tutti i portatili testati con dettagli ultra.
...
NVIDIA GeForce RTX 3080 Ti Laptop GPU
max:
NVIDIA GeForce RTX 3080 Ti Laptop GPU
max:
NVIDIA GeForce RTX 3080 Ti Laptop GPU
max:
» Giocabile con tutti i portatili testati con dettagli ultra.
NVIDIA GeForce RTX 3080 Ti Laptop GPU
max:
Intel Iris Plus Graphics G7 (Ice Lake 64 EU)
...
NVIDIA GeForce RTX 3080 Ti Laptop GPU
max:
0 100 200 300 400 500 600 700 Tooltip
...
NVIDIA GeForce RTX 3080 Ti Laptop GPU
max:
161.8 [X] Asus ROG Strix Scar 17 G733ZX Intel Core i9-12900H 1.8GHz
GeForce RTX 3080 Ti Laptop GPU
min:
26.5 fps, P0.1:
59.4 fps, P1:
92.6 fps, max:
341 fps
178.8 [X] MSI Raider GE76 12UHS @175 W TGP Intel Core i9-12900HK 1.8GHz
GeForce RTX 3080 Ti Laptop GPU
min:
21.3 fps, P0.1:
75.9 fps, P1:
117.1 fps, max:
280 fps
~ 170 fps
+ Confronta
- Nascondi il confronto
+ 📈 Graph
- 📈 Hide Graph
0 100 200 Tooltip : Ø164.7 (106.44-193.4)
: Ø184.3 (138.46-294.8)
...
NVIDIA GeForce RTX 3080 Ti Laptop GPU
...
max:
102.9 [X] Asus ROG Strix Scar 17 G733ZX Intel Core i9-12900H 1.8GHz
GeForce RTX 3080 Ti Laptop GPU
min:
27.8 fps, P0.1:
55.1 fps, P1:
62.1 fps, max:
285 fps
103.8 [X] MSI Raider GE76 12UHS @175 W TGP Intel Core i9-12900HK 1.8GHz
GeForce RTX 3080 Ti Laptop GPU
min:
0.4427 fps, P0.1:
29.5 fps, P1:
68.8 fps, max:
276 fps
~ 103 fps
+ Confronta
- Nascondi il confronto
+ 📈 Graph
- 📈 Hide Graph
0 100 200 Tooltip : Ø109 (75.661-247.4)
: Ø108.1 (-0.01747-139)
NVIDIA GeForce RTX 3080 Ti Laptop GPU
max:
46.8 [X] MSI Raider GE76 12UHS @175 W TGP Intel Core i9-12900HK 1.8GHz
GeForce RTX 3080 Ti Laptop GPU
min:
6.08 fps, P0.1:
6.6 fps, P1:
12.9 fps, max:
227 fps
48.4 [X] Asus ROG Strix Scar 17 G733ZX Intel Core i9-12900H 1.8GHz
GeForce RTX 3080 Ti Laptop GPU
min:
13.2 fps, P0.1:
20.8 fps, P1:
26.9 fps, max:
297 fps
~ 48 fps
+ Confronta
- Nascondi il confronto
+ 📈 Graph
- 📈 Hide Graph
0 100 Tooltip : Ø49.9 (26.352-101.1)
: Ø51.6 (38.077-105.9)
NVIDIA GeForce RTX 3080 Ti Laptop GPU
max:
NVIDIA GeForce RTX 3080 Ti Laptop GPU
max:
» Giocabile con tutti i portatili testati con dettagli ultra.
...
NVIDIA GeForce RTX 3080 Ti Laptop GPU
max:
Intel UHD Graphics Xe 32EUs (Tiger Lake-H)
...
NVIDIA GeForce RTX 3080 Ti Laptop GPU
...
max:
0 100 Tooltip : Ø158.8 (127.013-175.69)
...
NVIDIA GeForce RTX 3080 Ti Laptop GPU
max:
NVIDIA GeForce RTX 3080 Ti Laptop GPU
max:
NVIDIA GeForce RTX 3080 Ti Laptop GPU
max:
» Giocabile con tutti i portatili testati con dettagli ultra.
Additional Benchmarks
Epic Preset + Epic RTX Global Illumination 1920x1080
143.2 [X] Asus ROG Strix Scar 17 G733ZX Intel Core i9-12900H 1.8GHz
GeForce RTX 3080 Ti Laptop GPU
min:
32.6 fps, P0.1:
62 fps, P1:
103.4 fps, max:
231 fps
...
NVIDIA GeForce RTX 3080 Ti Laptop GPU
max:
...
NVIDIA GeForce RTX 3080 Ti Laptop GPU
max:
...
NVIDIA GeForce RTX 3080 Ti Laptop GPU
max:
NVIDIA GeForce RTX 3080 Ti Laptop GPU
max:
NVIDIA GeForce RTX 3080 Ti Laptop GPU
max:
NVIDIA GeForce RTX 3080 Ti Laptop GPU
max:
» Giocabile con tutti i portatili testati con dettagli ultra.
...
NVIDIA GeForce RTX 3080 Ti Laptop GPU
max:
...
NVIDIA GeForce RTX 3080 Ti Laptop GPU
max:
...
NVIDIA GeForce RTX 3050 4GB Laptop GPU
NVIDIA GeForce RTX 3080 Ti Laptop GPU
max:
NVIDIA GeForce RTX 3080 Ti Laptop GPU
max:
NVIDIA GeForce RTX 3080 Ti Laptop GPU
max:
NVIDIA GeForce RTX 3080 Ti Laptop GPU
max:
» Giocabile con tutti i portatili testati con dettagli ultra.
...
NVIDIA GeForce RTX 3050 4GB Laptop GPU
NVIDIA GeForce RTX 3080 Ti Laptop GPU
max:
...
NVIDIA GeForce RTX 3080 Ti Laptop GPU
max:
...
NVIDIA GeForce RTX 3080 Ti Laptop GPU
max:
NVIDIA GeForce RTX 3080 Ti Laptop GPU
max:
NVIDIA GeForce RTX 3080 Ti Laptop GPU
max:
NVIDIA GeForce RTX 3080 Ti Laptop GPU
max:
» Giocabile con tutti i portatili testati con dettagli ultra.
...
NVIDIA GeForce RTX 3080 Ti Laptop GPU
max:
...
NVIDIA GeForce RTX 3080 Ti Laptop GPU
max:
...
NVIDIA GeForce RTX 3080 Ti Laptop GPU
max:
...
NVIDIA GeForce RTX 3080 Ti Laptop GPU
max:
...
NVIDIA GeForce RTX 3080 Ti Laptop GPU
max:
» Giocabile con tutti i portatili testati con dettagli alto.
Additional Benchmarks
High Preset + High Ray Tracing 1920x1080
37.2 [X] Asus ROG Strix Scar 17 G733ZX Intel Core i9-12900H 1.8GHz
GeForce RTX 3080 Ti Laptop GPU
min:
18.8 fps, P0.1:
23.1 fps, P1:
28.7 fps, max:
73.5 fps
0 100 200 300 400 500 600 700 Tooltip
...
NVIDIA GeForce RTX 3080 Ti Laptop GPU
max:
...
NVIDIA GeForce RTX 3080 Ti Laptop GPU
...
max:
...
NVIDIA GeForce RTX 3050 4GB Laptop GPU
NVIDIA GeForce RTX 3080 Ti Laptop GPU
max:
NVIDIA GeForce RTX 3080 Ti Laptop GPU
max:
0 100 200 300 400 500 600 700 800 900 1000 1100 1200 1300 1400 1500 Tooltip
NVIDIA GeForce RTX 3080 Ti Laptop GPU
max:
NVIDIA GeForce RTX 3080 Ti Laptop GPU
max:
» Giocabile con tutti i portatili testati con dettagli ultra.
...
NVIDIA GeForce RTX 3080 Ti Laptop GPU
max:
Intel UHD Graphics G1 (Ice Lake 32 EU)
...
NVIDIA GeForce RTX 3080 Ti Laptop GPU
max:
...
NVIDIA GeForce RTX 3080 Ti Laptop GPU
max:
...
NVIDIA GeForce RTX 3080 Ti Laptop GPU
max:
...
NVIDIA GeForce RTX 3080 Ti Laptop GPU
max:
» Giocabile con tutti i portatili testati con dettagli ultra.
...
NVIDIA GeForce RTX 3080 Ti Laptop GPU
max:
...
NVIDIA GeForce RTX 3080 Ti Laptop GPU
max:
...
NVIDIA GeForce RTX 3080 Ti Laptop GPU
...
max:
...
NVIDIA GeForce RTX 3080 Ti Laptop GPU
max:
...
NVIDIA GeForce RTX 3080 Ti Laptop GPU
max:
NVIDIA GeForce RTX 3080 Ti Laptop GPU
max:
» Giocabile con tutti i portatili testati con dettagli ultra.
...
NVIDIA GeForce RTX 3080 Ti Laptop GPU
max:
...
NVIDIA GeForce RTX 3080 Ti Laptop GPU
max:
166.3 [X] MSI Raider GE76 12UHS @175 W TGP Intel Core i9-12900HK 1.8GHz
GeForce RTX 3080 Ti Laptop GPU
min:
67.3 fps, P0.1:
79.7 fps, P1:
126.4 fps, max:
219 fps
182.8 [X] Asus ROG Strix Scar 17 G733ZX Intel Core i9-12900H 1.8GHz
GeForce RTX 3080 Ti Laptop GPU
min:
49.6 fps, P0.1:
86.9 fps, P1:
138.9 fps, max:
243 fps
~ 175 fps
+ Confronta
- Nascondi il confronto
+ 📈 Graph
- 📈 Hide Graph
0 100 200 300 Tooltip : Ø173.7 (155.3-363.8)
: Ø186.6 (166.044-214.6)
...
NVIDIA GeForce RTX 3080 Ti Laptop GPU
...
max:
...
NVIDIA GeForce RTX 3080 Ti Laptop GPU
max:
...
NVIDIA GeForce RTX 3080 Ti Laptop GPU
max:
» Giocabile con tutti i portatili testati con dettagli ultra.
0 100 200 300 400 500 600 700 800 900 1000 Tooltip
...
NVIDIA GeForce RTX 3050 4GB Laptop GPU
NVIDIA GeForce RTX 3080 Ti Laptop GPU
max:
AMD Radeon RX 6800
...
NVIDIA GeForce RTX 3080 Ti Laptop GPU
max:
...
NVIDIA GeForce RTX 3080 Ti Laptop GPU
max:
0 100 Tooltip : Ø122.1 (82.832-182.989)
NVIDIA GeForce RTX 3080 Ti Laptop GPU
max:
NVIDIA GeForce RTX 3080 Ti Laptop GPU
max:
» Giocabile con tutti i portatili testati con dettagli ultra.
141.1 [X] MSI Raider GE76 12UHS @175 W TGP 2.01
Intel Core i9-12900HK 1.8GHz
GeForce RTX 3080 Ti Laptop GPU
min:
50.8 fps, max:
208 fps
148.3 [X] MSI Raider GE76 12UHS @175 W TGP 2.02
Intel Core i9-12900HK 1.8GHz
GeForce RTX 3080 Ti Laptop GPU
min:
11.6 fps, max:
214 fps
~ 145 fps
+ Confronta
- Nascondi il confronto
Intel UHD Graphics Xe 16EUs (Tiger Lake-H)
...
NVIDIA GeForce RTX 3080 Ti Laptop GPU
...
max:
124.5 [X] MSI Raider GE76 12UHS @175 W TGP 2.01
Intel Core i9-12900HK 1.8GHz
GeForce RTX 3080 Ti Laptop GPU
min:
49.4 fps, max:
177.5 fps
126 [X] Asus ROG Strix Scar 17 G733ZX Intel Core i9-12900H 1.8GHz
GeForce RTX 3080 Ti Laptop GPU
min:
34 fps
~ 125 fps
+ Confronta
- Nascondi il confronto
...
NVIDIA GeForce RTX 3080 Ti Laptop GPU
...
max:
107 [X] Asus ROG Strix Scar 17 G733ZX Intel Core i9-12900H 1.8GHz
GeForce RTX 3080 Ti Laptop GPU
min:
26 fps
112.9 [X] MSI Raider GE76 12UHS @175 W TGP 2.01
Intel Core i9-12900HK 1.8GHz
GeForce RTX 3080 Ti Laptop GPU
min:
52.7 fps, max:
157.8 fps
~ 110 fps
+ Confronta
- Nascondi il confronto
...
NVIDIA GeForce RTX 3080 Ti Laptop GPU
...
max:
82.7 [X] MSI Raider GE76 12UHS @175 W TGP 2.02
Intel Core i9-12900HK 1.8GHz
GeForce RTX 3080 Ti Laptop GPU
min:
12.5 fps, max:
176 fps
96.6 [X] Asus ROG Strix Scar 17 G733ZX Intel Core i9-12900H 1.8GHz
GeForce RTX 3080 Ti Laptop GPU
min:
44 fps
97.1 [X] MSI Raider GE76 12UHS @175 W TGP 2.11
Intel Core i9-12900HK 1.8GHz
GeForce RTX 3080 Ti Laptop GPU
min:
78 fps, max:
125.4 fps
104.5 [X] MSI Raider GE76 12UHS @175 W TGP 2.01
Intel Core i9-12900HK 1.8GHz
GeForce RTX 3080 Ti Laptop GPU
min:
57.3 fps, max:
150.1 fps
~ 95 fps
+ Confronta
- Nascondi il confronto
...
NVIDIA GeForce RTX 3080 Ti Laptop GPU
max:
...
NVIDIA GeForce RTX 3080 Ti Laptop GPU
...
max:
26.9 [X] MSI Raider GE76 12UHS @175 W TGP 2.11
Intel Core i9-12900HK 1.8GHz
GeForce RTX 3080 Ti Laptop GPU
min:
23.1 fps, max:
33.9 fps
27.1 [X] MSI Raider GE76 12UHS @175 W TGP 2.02
Intel Core i9-12900HK 1.8GHz
GeForce RTX 3080 Ti Laptop GPU
min:
20.5 fps, max:
56.2 fps
30.6 [X] Asus ROG Strix Scar 17 G733ZX Intel Core i9-12900H 1.8GHz
GeForce RTX 3080 Ti Laptop GPU
min:
25 fps
~ 28 fps
+ Confronta
- Nascondi il confronto
...
NVIDIA GeForce RTX 3080 Ti Laptop GPU
...
max:
» Giocabile con tutti i portatili testati con dettagli ultra.
Additional Benchmarks
Low Preset (FSR off) 1280x720
151.4 [X] MSI Raider GE76 12UHS @175 W TGP Intel Core i9-12900HK 1.8GHz
GeForce RTX 3080 Ti Laptop GPU
min:
59.3 fps, max:
209 fps
171.1 [X] MSI Raider GE76 12UHS @175 W TGP Intel Core i9-12900HK 1.8GHz
GeForce RTX 3080 Ti Laptop GPU
min:
8.53 fps, max:
227 fps
Ray Tracing Ultra Preset (DLSS off) 1920x1080
44.4 [X] Asus ROG Strix Scar 17 G733ZX Intel Core i9-12900H 1.8GHz
GeForce RTX 3080 Ti Laptop GPU
min:
31 fps
Steam Deck 1280x720
157.5 [X] MSI Raider GE76 12UHS @175 W TGP Intel Core i9-12900HK 1.8GHz
GeForce RTX 3080 Ti Laptop GPU
min:
60.7 fps, max:
206 fps
Ultra Preset (FSR on) 1920x1080
106.1 [X] MSI Raider GE76 12UHS @175 W TGP Intel Core i9-12900HK 1.8GHz
GeForce RTX 3080 Ti Laptop GPU
min:
19.3 fps, max:
192.6 fps
Ray Tracing Ultra Preset (DLSS off, no Path Tracing) 3840x2160
13.7 [X] MSI Raider GE76 12UHS @175 W TGP Intel Core i9-12900HK 1.8GHz
GeForce RTX 3080 Ti Laptop GPU
min:
12 fps, max:
17.2 fps
0 100 200 300 400 500 600 700 800 900 1000 1100 1200 1300 1400 1500 1600 1700 1800 1900 2000 2100 2200 2300 2400 2500 2600 2700 2800 2900 3000 3100 3200 3300 3400 3500 3600 Tooltip
...
NVIDIA GeForce RTX 3080 Ti Laptop GPU
max:
...
NVIDIA GeForce RTX 3080 Ti Laptop GPU
...
max:
...
NVIDIA GeForce RTX 3080 Ti Laptop GPU
max:
...
NVIDIA GeForce RTX 3080 Ti Laptop GPU
...
max:
0 100 200 300 400 500 600 700 800 Tooltip
...
NVIDIA GeForce RTX 3080 Ti Laptop GPU
max:
0 100 200 300 400 500 600 700 800 900 Tooltip
NVIDIA GeForce RTX 3080 Ti Laptop GPU
max:
» Giocabile con tutti i portatili testati con dettagli ultra.
...
NVIDIA GeForce RTX 3050 4GB Laptop GPU
NVIDIA GeForce RTX 3080 Ti Laptop GPU
...
max:
...
NVIDIA GeForce RTX 3050 4GB Laptop GPU
NVIDIA GeForce RTX 3080 Ti Laptop GPU
...
max:
...
NVIDIA GeForce RTX 3050 4GB Laptop GPU
NVIDIA GeForce RTX 3080 Ti Laptop GPU
...
max:
NVIDIA GeForce RTX 3080 Ti Laptop GPU
...
max:
NVIDIA GeForce RTX 3080 Ti Laptop GPU
max:
» Giocabile con tutti i portatili testati con dettagli ultra.
0 100 200 300 400 500 600 700 800 900 1000 1100 1200 1300 1400 1500 1600 1700 1800 1900 2000 2100 2200 2300 2400 2500 2600 2700 2800 2900 3000 3100 3200 3300 3400 3500 3600 3700 3800 3900 4000 4100 4200 4300 4400 4500 4600 4700 4800 4900 5000 5100 5200 5300 5400 5500 5600 5700 5800 5900 6000 6100 6200 6300 6400 6500 6600 6700 6800 6900 7000 7100 7200 7300 7400 7500 7600 7700 Tooltip
...
NVIDIA GeForce RTX 3080 Ti Laptop GPU
max:
...
NVIDIA GeForce RTX 3080 Ti Laptop GPU
max:
...
NVIDIA GeForce RTX 3080 Ti Laptop GPU
max:
...
NVIDIA GeForce RTX 3080 Ti Laptop GPU
max:
...
NVIDIA GeForce RTX 3080 Ti Laptop GPU
max:
» Giocabile con tutti i portatili testati con dettagli ultra.
...
NVIDIA GeForce RTX 3080 Ti Laptop GPU
max:
...
NVIDIA GeForce RTX 3080 Ti Laptop GPU
max:
...
NVIDIA GeForce RTX 3080 Ti Laptop GPU
max:
NVIDIA GeForce RTX 3080 Ti Laptop GPU
max:
...
NVIDIA GeForce RTX 3080 Ti Laptop GPU
max:
» Giocabile con tutti i portatili testati con dettagli ultra.
...
NVIDIA GeForce RTX 3080 Ti Laptop GPU
max:
...
NVIDIA GeForce RTX 3080 Ti Laptop GPU
max:
NVIDIA GeForce RTX 3080 Ti Laptop GPU
max:
NVIDIA GeForce RTX 3080 Ti Laptop GPU
max:
» Giocabile con tutti i portatili testati con dettagli ultra.
...
NVIDIA GeForce RTX 3080 Ti Laptop GPU
max:
...
NVIDIA GeForce RTX 3080 Ti Laptop GPU
max:
0 100 Tooltip : Ø139.9 (129.139-153.532)
...
NVIDIA GeForce RTX 3080 Ti Laptop GPU
max:
...
NVIDIA GeForce RTX 3080 Ti Laptop GPU
max:
NVIDIA GeForce RTX 3080 Ti Laptop GPU
max:
» Giocabile con tutti i portatili testati con dettagli ultra.
...
NVIDIA GeForce RTX 3080 Ti Laptop GPU
max:
...
NVIDIA GeForce RTX 3080 Ti Laptop GPU
max:
103.2 [X] MSI Raider GE76 12UHS @175 W TGP Intel Core i9-12900HK 1.8GHz
GeForce RTX 3080 Ti Laptop GPU
min:
34.4 fps, P0.1:
49 fps, P1:
75 fps, max:
238 fps
108.1 [X] Asus ROG Strix Scar 17 G733ZX Intel Core i9-12900H 1.8GHz
GeForce RTX 3080 Ti Laptop GPU
min:
19.1 fps, P0.1:
22.4 fps, P1:
62.1 fps, max:
261 fps
~ 106 fps
+ Confronta
- Nascondi il confronto
+ 📈 Graph
- 📈 Hide Graph
0 100 Tooltip : Ø106.3 (94.437-120.35)
: Ø112.5 (104.329-140.8)
...
NVIDIA GeForce RTX 3080 Ti Laptop GPU
max:
...
NVIDIA GeForce RTX 3080 Ti Laptop GPU
max:
...
NVIDIA GeForce RTX 3080 Ti Laptop GPU
max:
NVIDIA GeForce RTX 3080 Ti Laptop GPU
max:
» Giocabile con tutti i portatili testati con dettagli ultra.
...
NVIDIA GeForce RTX 3080 Ti Laptop GPU
max:
AMD Radeon RX 560X (Laptop)
...
NVIDIA GeForce RTX 3080 Ti Laptop GPU
max:
...
NVIDIA GeForce RTX 3080 Ti Laptop GPU
max:
...
NVIDIA GeForce RTX 3080 Ti Laptop GPU
max:
NVIDIA GeForce RTX 3080 Ti Laptop GPU
max:
» Giocabile con tutti i portatili testati con dettagli ultra.
Additional Benchmarks
Very High Preset + Very High Raytracing TAA 1920x1080
59.4 [X] Asus ROG Strix Scar 17 G733ZX Intel Core i9-12900H 1.8GHz
GeForce RTX 3080 Ti Laptop GPU
min:
2.1 fps, P0.1:
18.7 fps, P1:
33.4 fps, max:
103 fps
Intel UHD Graphics Xe 16EUs (Tiger Lake-H)
...
NVIDIA GeForce RTX 3080 Ti Laptop GPU
max:
251 [X] Asus ROG Strix Scar 17 G733ZX Intel Core i9-12900H 1.8GHz
GeForce RTX 3080 Ti Laptop GPU
min:
186 fps
287 [X] MSI Raider GE76 12UHS @175 W TGP 1006145
Intel Core i9-12900HK 1.8GHz
GeForce RTX 3080 Ti Laptop GPU
min:
206 fps, P1:
189 fps, max:
318 fps
~ 269 fps
+ Confronta
- Nascondi il confronto
...
NVIDIA GeForce RTX 3080 Ti Laptop GPU
max:
193 [X] Asus ROG Strix Scar 17 G733ZX Intel Core i9-12900H 1.8GHz
GeForce RTX 3080 Ti Laptop GPU
min:
166 fps
232 [X] MSI Raider GE76 12UHS @175 W TGP 1006145
Intel Core i9-12900HK 1.8GHz
GeForce RTX 3080 Ti Laptop GPU
min:
199 fps, P1:
175 fps, max:
264 fps
~ 213 fps
+ Confronta
- Nascondi il confronto
Intel UHD Graphics Xe 16EUs (Tiger Lake-H)
...
NVIDIA GeForce RTX 3080 Ti Laptop GPU
max:
75 [X] Asus ROG Strix Scar 17 G733ZX Intel Core i9-12900H 1.8GHz
GeForce RTX 3080 Ti Laptop GPU
min:
61 fps
78.9 [X] MSI Raider GE76 12UHS @175 W TGP 1006145
Intel Core i9-12900HK 1.8GHz
GeForce RTX 3080 Ti Laptop GPU
min:
62 fps, P1:
59 fps, max:
92 fps
~ 77 fps
+ Confronta
- Nascondi il confronto
...
NVIDIA GeForce RTX 3080 Ti Laptop GPU
max:
48 [X] Asus ROG Strix Scar 17 G733ZX Intel Core i9-12900H 1.8GHz
GeForce RTX 3080 Ti Laptop GPU
min:
39 fps
50.3 [X] MSI Raider GE76 12UHS @175 W TGP 1006145
Intel Core i9-12900HK 1.8GHz
GeForce RTX 3080 Ti Laptop GPU
min:
39 fps, P1:
37 fps, max:
59 fps
~ 49 fps
+ Confronta
- Nascondi il confronto
...
NVIDIA GeForce RTX 3080 Ti Laptop GPU
max:
24 [X] Asus ROG Strix Scar 17 G733ZX Intel Core i9-12900H 1.8GHz
GeForce RTX 3080 Ti Laptop GPU
min:
18 fps
24.2 [X] MSI Raider GE76 12UHS @175 W TGP 1006145
Intel Core i9-12900HK 1.8GHz
GeForce RTX 3080 Ti Laptop GPU
min:
18 fps, P1:
16 fps, max:
28 fps
~ 24 fps
+ Confronta
- Nascondi il confronto
...
NVIDIA GeForce RTX 3080 Ti Laptop GPU
...
max:
» Giocabile con tutti i portatili testati con dettagli ultra.
Additional Benchmarks
Ultra Low Preset TAA 1280x720
262 [X] MSI Raider GE76 12UHS @175 W TGP Intel Core i9-12900HK 1.8GHz
GeForce RTX 3080 Ti Laptop GPU
min:
197 fps, P1:
178 fps, max:
327 fps
...
NVIDIA GeForce RTX 3080 Ti Laptop GPU
max:
...
NVIDIA GeForce RTX 3080 Ti Laptop GPU
max:
...
NVIDIA GeForce RTX 3080 Ti Laptop GPU
max:
202 [X] MSI Raider GE76 12UHS @175 W TGP Intel Core i9-12900HK 1.8GHz
GeForce RTX 3080 Ti Laptop GPU
min:
68.5 fps, P0.1:
115 fps, P1:
142.4 fps, max:
349 fps
202 [X] Asus ROG Strix Scar 17 G733ZX Intel Core i9-12900H 1.8GHz
GeForce RTX 3080 Ti Laptop GPU
min:
16.8 fps, P0.1:
63.3 fps, P1:
131.5 fps, max:
374 fps
~ 202 fps
+ Confronta
- Nascondi il confronto
+ 📈 Graph
- 📈 Hide Graph
0 100 200 Tooltip : Ø207 (162.779-240.8)
: Ø204 (166.986-245.08)
...
NVIDIA GeForce RTX 3080 Ti Laptop GPU
max:
NVIDIA GeForce RTX 3080 Ti Laptop GPU
max:
NVIDIA GeForce RTX 3080 Ti Laptop GPU
max:
» Giocabile con tutti i portatili testati con dettagli ultra.
...
NVIDIA GeForce RTX 3080 Ti Laptop GPU
max:
AMD Radeon RX 560X (Laptop)
...
NVIDIA GeForce RTX 3080 Ti Laptop GPU
...
max:
...
NVIDIA GeForce RTX 3080 Ti Laptop GPU
max:
...
NVIDIA GeForce RTX 3080 Ti Laptop GPU
...
max:
...
NVIDIA GeForce RTX 3080 Ti Laptop GPU
max:
» Giocabile con tutti i portatili testati con dettagli ultra.
...
NVIDIA GeForce RTX 3080 Ti Laptop GPU
max:
...
NVIDIA GeForce RTX 3080 Ti Laptop GPU
max:
...
NVIDIA GeForce RTX 3080 Ti Laptop GPU
max:
AMD Radeon RX 560X (Laptop)
...
NVIDIA GeForce RTX 3080 Ti Laptop GPU
max:
NVIDIA GeForce RTX 3080 Ti Laptop GPU
...
max:
NVIDIA GeForce RTX 3080 Ti Laptop GPU
max:
NVIDIA GeForce RTX 3080 Ti Laptop GPU
max:
» Giocabile con tutti i portatili testati con dettagli ultra.
...
NVIDIA GeForce RTX 3080 Ti Laptop GPU
max:
...
NVIDIA GeForce RTX 3080 Ti Laptop GPU
max:
...
NVIDIA GeForce RTX 3080 Ti Laptop GPU
max:
...
NVIDIA GeForce RTX 3080 Ti Laptop GPU
max:
...
NVIDIA GeForce RTX 3080 Ti Laptop GPU
max:
NVIDIA GeForce RTX 3080 Ti Laptop GPU
max:
» Giocabile con tutti i portatili testati con dettagli ultra.
AMD Radeon RX Vega 8 (Ryzen 2000/3000)
...
NVIDIA GeForce RTX 3080 Ti Laptop GPU
max:
...
NVIDIA GeForce RTX 3080 Ti Laptop GPU
max:
159 [X] MSI Raider GE76 12UHS @175 W TGP Intel Core i9-12900HK 1.8GHz
GeForce RTX 3080 Ti Laptop GPU
P0.1:
37 fpsP1:
81 fps
173 [X] MSI Titan GT77 12UHS Intel Core i9-12900HX 1.7GHz
GeForce RTX 3080 Ti Laptop GPU
min:
50 fps
~ 166 fps
+ Confronta
- Nascondi il confronto
...
NVIDIA GeForce RTX 3080 Ti Laptop GPU
max:
121 [X] MSI Raider GE76 12UHS @175 W TGP Intel Core i9-12900HK 1.8GHz
GeForce RTX 3080 Ti Laptop GPU
P0.1:
52 fpsP1:
72 fps
131 [X] MSI Titan GT77 12UHS Intel Core i9-12900HX 1.7GHz
GeForce RTX 3080 Ti Laptop GPU
min:
39 fps
~ 126 fps
+ Confronta
- Nascondi il confronto
...
NVIDIA GeForce RTX 3080 Ti Laptop GPU
max:
71.1 [X] MSI Raider GE76 12UHS @175 W TGP Intel Core i9-12900HK 1.8GHz
GeForce RTX 3080 Ti Laptop GPU
P0.1:
39 fpsP1:
51 fps
78.5 [X] MSI Titan GT77 12UHS Intel Core i9-12900HX 1.7GHz
GeForce RTX 3080 Ti Laptop GPU
min:
18 fps
~ 75 fps
+ Confronta
- Nascondi il confronto
...
NVIDIA GeForce RTX 3080 Ti Laptop GPU
max:
» Giocabile con tutti i portatili testati con dettagli ultra.
...
NVIDIA GeForce RTX 3080 Ti Laptop GPU
max:
0 100 200 300 400 500 600 700 800 900 1000 1100 Tooltip
...
NVIDIA GeForce RTX 3080 Ti Laptop GPU
max:
...
NVIDIA GeForce RTX 3080 Ti Laptop GPU
max:
0 100 200 300 400 500 600 700 800 900 1000 1100 1200 1300 1400 1500 1600 1700 1800 1900 2000 2100 2200 2300 2400 2500 2600 2700 2800 2900 3000 3100 3200 3300 3400 3500 3600 3700 3800 3900 4000 4100 4200 4300 4400 4500 4600 4700 4800 4900 5000 5100 5200 5300 5400 5500 5600 5700 5800 5900 6000 6100 6200 6300 6400 6500 6600 6700 6800 6900 7000 7100 7200 7300 7400 7500 7600 7700 7800 7900 8000 8100 8200 8300 8400 8500 8600 8700 8800 8900 9000 9100 9200 9300 9400 9500 9600 9700 9800 9900 Tooltip
...
NVIDIA GeForce RTX 3080 Ti Laptop GPU
max:
...
NVIDIA GeForce RTX 3080 Ti Laptop GPU
max:
NVIDIA GeForce RTX 3080 Ti Laptop GPU
max:
» Giocabile con tutti i portatili testati con dettagli ultra.
Intel UHD Graphics Xe 16EUs (Tiger Lake-H)
...
NVIDIA GeForce RTX 3080 Ti Laptop GPU
max:
...
NVIDIA GeForce RTX 3080 Ti Laptop GPU
...
max:
0 100 200 300 400 500 600 Tooltip
...
NVIDIA GeForce RTX 3080 Ti Laptop GPU
max:
0 100 200 300 400 500 600 700 800 900 1000 1100 1200 1300 1400 1500 1600 1700 1800 1900 2000 2100 2200 2300 2400 2500 2600 2700 2800 2900 3000 3100 3200 3300 3400 3500 3600 3700 3800 3900 4000 4100 4200 4300 4400 4500 4600 4700 4800 4900 5000 Tooltip
...
NVIDIA GeForce RTX 3080 Ti Laptop GPU
max:
...
NVIDIA GeForce RTX 3080 Ti Laptop GPU
max:
NVIDIA GeForce RTX 3080 Ti Laptop GPU
max:
» Giocabile con tutti i portatili testati con dettagli ultra.
...
NVIDIA GeForce RTX 3080 Ti Laptop GPU
max:
...
NVIDIA GeForce RTX 3080 Ti Laptop GPU
max:
97 [X] MSI Raider GE76 12UHS @175 W TGP Intel Core i9-12900HK 1.8GHz
GeForce RTX 3080 Ti Laptop GPU
min:
45 fps, max:
182 fps
100 [X] MSI Titan GT77 12UHS Intel Core i9-12900HX 1.7GHz
GeForce RTX 3080 Ti Laptop GPU
min:
53 fps
~ 99 fps
+ Confronta
- Nascondi il confronto
...
NVIDIA GeForce RTX 3080 Ti Laptop GPU
max:
74 [X] MSI Raider GE76 12UHS @175 W TGP Intel Core i9-12900HK 1.8GHz
GeForce RTX 3080 Ti Laptop GPU
min:
25 fps, max:
190 fps
76 [X] MSI Titan GT77 12UHS Intel Core i9-12900HX 1.7GHz
GeForce RTX 3080 Ti Laptop GPU
min:
42 fps
~ 75 fps
+ Confronta
- Nascondi il confronto
...
NVIDIA GeForce RTX 3080 Ti Laptop GPU
max:
44 [X] MSI Raider GE76 12UHS @175 W TGP Intel Core i9-12900HK 1.8GHz
GeForce RTX 3080 Ti Laptop GPU
min:
28 fps, max:
73 fps
46 [X] MSI Titan GT77 12UHS Intel Core i9-12900HX 1.7GHz
GeForce RTX 3080 Ti Laptop GPU
min:
27 fps
~ 45 fps
+ Confronta
- Nascondi il confronto
...
NVIDIA GeForce RTX 3080 Ti Laptop GPU
max:
» Giocabile con tutti i portatili testati con dettagli ultra.
Additional Benchmarks
Epic Preset + Epic Ray-Tracing 1920x1080
80 [X] MSI Titan GT77 12UHS Intel Core i9-12900HX 1.7GHz
GeForce RTX 3080 Ti Laptop GPU
min:
52 fps
Epic Preset + Epic Ray-Tracing 3840x2160
33 [X] MSI Titan GT77 12UHS Intel Core i9-12900HX 1.7GHz
GeForce RTX 3080 Ti Laptop GPU
min:
15 fps
...
NVIDIA GeForce RTX 3080 Ti Laptop GPU
max:
...
NVIDIA GeForce RTX 3080 Ti Laptop GPU
max:
73.6 [X] MSI Raider GE76 12UHS @175 W TGP Intel Core i9-12900HK 1.8GHz
GeForce RTX 3080 Ti Laptop GPU
min:
9.94 fps, P0.1:
27.4 fps, P1:
42 fps, max:
110.2 fps
79.2 [X] MSI Titan GT77 12UHS Intel Core i9-12900HX 1.7GHz
GeForce RTX 3080 Ti Laptop GPU
min:
12.5 fps, P0.1:
32.9 fps, P1:
46.7 fps, max:
120.8 fps
~ 76 fps
+ Confronta
- Nascondi il confronto
+ 📈 Graph
- 📈 Hide Graph
0 100 Tooltip : Ø74.7 (55.803-88.075)
: Ø81.2 (63.082-101.16)
...
NVIDIA GeForce RTX 3080 Ti Laptop GPU
max:
...
NVIDIA GeForce RTX 3080 Ti Laptop GPU
max:
...
NVIDIA GeForce RTX 3080 Ti Laptop GPU
max:
» Giocabile con tutti i portatili testati con dettagli ultra.
Additional Benchmarks
Ultra Preset + Full Ray Tracing High TAA 1920x1080
49.2 [X] MSI Titan GT77 12UHS Intel Core i9-12900HX 1.7GHz
GeForce RTX 3080 Ti Laptop GPU
min:
11.2 fps, P0.1:
17.6 fps, P1:
27.5 fps, max:
93.7 fps
Ultra Preset + Full Ray Tracing High TAA 3840x2160
21.3 [X] MSI Titan GT77 12UHS Intel Core i9-12900HX 1.7GHz
GeForce RTX 3080 Ti Laptop GPU
min:
12.8 fps, P0.1:
13.3 fps, P1:
14.7 fps, max:
46.7 fps
Intel UHD Graphics Xe 16EUs (Tiger Lake-H)
...
NVIDIA GeForce RTX 3080 Ti Laptop GPU
max:
...
NVIDIA GeForce RTX 3080 Ti Laptop GPU
max:
AMD Radeon RX 560X (Laptop)
...
NVIDIA GeForce RTX 3080 Ti Laptop GPU
max:
...
NVIDIA GeForce RTX 3080 Ti Laptop GPU
max:
...
NVIDIA GeForce RTX 3080 Ti Laptop GPU
max:
...
NVIDIA GeForce RTX 3080 Ti Laptop GPU
max:
» Giocabile con tutti i portatili testati con dettagli ultra.
...
NVIDIA GeForce RTX 3080 Ti Laptop GPU
max:
...
NVIDIA GeForce RTX 3080 Ti Laptop GPU
max:
...
NVIDIA GeForce RTX 3080 Ti Laptop GPU
max:
0 100 200 Tooltip : Ø144.2 (114.58-251.7)
4.04: Ø161.4 (137.186-217.8)
...
NVIDIA GeForce RTX 3080 Ti Laptop GPU
max:
...
NVIDIA GeForce RTX 3080 Ti Laptop GPU
max:
» Giocabile con tutti i portatili testati con dettagli ultra.
Additional Benchmarks
Low Preset / Off 1280x720
234 [X] MSI Titan GT77 12UHS Intel Core i9-12900HX 1.7GHz
GeForce RTX 3080 Ti Laptop GPU
min:
12.2 fps, P0.1:
52.2 fps, P1:
163.4 fps, max:
346 fps
RT Ultra Preset / On FXAA 1920x1080
39.5 [X] MSI Titan GT77 12UHS Intel Core i9-12900HX 1.7GHz
GeForce RTX 3080 Ti Laptop GPU
min:
5.02 fps, P0.1:
5.86 fps, P1:
15.7 fps, max:
87.5 fps
Intel UHD Graphics Xe 16EUs (Tiger Lake-H)
...
NVIDIA GeForce RTX 3080 Ti Laptop GPU
max:
...
NVIDIA GeForce RTX 3080 Ti Laptop GPU
max:
...
NVIDIA GeForce RTX 3080 Ti Laptop GPU
max:
...
NVIDIA GeForce RTX 3080 Ti Laptop GPU
max:
...
NVIDIA GeForce RTX 3080 Ti Laptop GPU
max:
...
NVIDIA GeForce RTX 3080 Ti Laptop GPU
max:
» Giocabile con tutti i portatili testati con dettagli ultra.
...
NVIDIA GeForce RTX 3080 Ti Laptop GPU
max:
...
NVIDIA GeForce RTX 3080 Ti Laptop GPU
...
max:
...
NVIDIA GeForce RTX 3080 Ti Laptop GPU
...
max:
...
NVIDIA GeForce RTX 3080 Ti Laptop GPU
...
max:
...
NVIDIA GeForce RTX 3080 Ti Laptop GPU
...
max:
» Giocabile con tutti i portatili testati con dettagli ultra.
...
NVIDIA GeForce RTX 3080 Ti Laptop GPU
max:
...
NVIDIA GeForce RTX 3080 Ti Laptop GPU
max:
...
NVIDIA GeForce RTX 3080 Ti Laptop GPU
max:
91.3 [X] MSI Raider GE76 12UHS @175 W TGP Intel Core i9-12900HK 1.8GHz
GeForce RTX 3080 Ti Laptop GPU
min:
26.8 fps, P0.1:
56 fps, P1:
66.7 fps, max:
128 fps
94.7 [X] MSI Titan GT77 12UHS Intel Core i9-12900HX 1.7GHz
GeForce RTX 3080 Ti Laptop GPU
min:
28 fps, P0.1:
37 fps, P1:
69.5 fps, max:
133 fps
~ 93 fps
+ Confronta
- Nascondi il confronto
+ 📈 Graph
- 📈 Hide Graph
0 100 200 300 400 Tooltip : Ø95.5 (78.831-162.5)
: Ø108.4 (85.128-404)
...
NVIDIA GeForce RTX 3080 Ti Laptop GPU
max:
» Giocabile con tutti i portatili testati con dettagli ultra.
...
NVIDIA GeForce RTX 3080 Ti Laptop GPU
max:
...
NVIDIA GeForce RTX 3080 Ti Laptop GPU
max:
...
NVIDIA GeForce RTX 3080 Ti Laptop GPU
max:
...
NVIDIA GeForce RTX 3080 Ti Laptop GPU
...
max:
...
NVIDIA GeForce RTX 3080 Ti Laptop GPU
...
max:
» Giocabile con tutti i portatili testati con dettagli ultra.
Additional Benchmarks
Very High Preset + Ray-Tracing TAA 1920x0180
63.4 [X] MSI Raider GE76 12UHS @175 W TGP Intel Core i9-12900HK 1.8GHz
GeForce RTX 3080 Ti Laptop GPU
min:
18.3 fps, P0.1:
23.8 fps, P1:
55 fps, max:
91.4 fps
...
NVIDIA GeForce RTX 3080 Ti Laptop GPU
...
max:
AMD Radeon RX Vega 8 (Ryzen 2000/3000)
...
NVIDIA GeForce RTX 3080 Ti Laptop GPU
...
max:
...
NVIDIA GeForce RTX 3080 Ti Laptop GPU
max:
...
NVIDIA GeForce RTX 3080 Ti Laptop GPU
max:
...
NVIDIA GeForce RTX 3080 Ti Laptop GPU
max:
» Giocabile con tutti i portatili testati con dettagli ultra.
AMD Radeon RX Vega 8 (Ryzen 2000/3000)
...
NVIDIA GeForce RTX 3080 Ti Laptop GPU
max:
...
NVIDIA GeForce RTX 3080 Ti Laptop GPU
max:
...
NVIDIA GeForce RTX 3080 Ti Laptop GPU
max:
...
NVIDIA GeForce RTX 3080 Ti Laptop GPU
max:
NVIDIA GeForce RTX 3080 Ti Laptop GPU
max:
» Giocabile con tutti i portatili testati con dettagli ultra.
Intel UHD Graphics Xe 16EUs (Tiger Lake-H)
...
NVIDIA GeForce RTX 3080 Ti Laptop GPU
max:
...
NVIDIA GeForce RTX 3080 Ti Laptop GPU
max:
...
NVIDIA GeForce RTX 3080 Ti Laptop GPU
max:
...
NVIDIA GeForce RTX 3080 Ti Laptop GPU
...
max:
...
NVIDIA GeForce RTX 3080 Ti Laptop GPU
...
max:
...
NVIDIA GeForce RTX 3080 Ti Laptop GPU
...
max:
» Giocabile con tutti i portatili testati con dettagli ultra.
Additional Benchmarks
Ultra DLSS Quality 3840x2160
33.8 [X] MSI Raider GE76 12UHS @175 W TGP Intel Core i9-12900HK 1.8GHz
GeForce RTX 3080 Ti Laptop GPU
min:
21.9 fps, P0.1:
22.1 fps, P1:
23.8 fps, max:
63.3 fps
Intel UHD Graphics Xe G4 48EUs
AMD Radeon RX Vega 7
NVIDIA GeForce RTX 3080 Ti Laptop GPU
AMD Radeon 680M
max:
AMD Radeon 680M
NVIDIA GeForce RTX 3080 Ti Laptop GPU
max:
...
AMD Radeon 680M
AMD Radeon RX 560X (Laptop)
NVIDIA GeForce RTX 3080 Ti Laptop GPU
...
max:
NVIDIA GeForce RTX 3080 Ti Laptop GPU
...
max:
NVIDIA GeForce RTX 3080 Ti Laptop GPU
max:
» Giocabile con tutti i portatili testati con dettagli ultra.
Intel UHD Graphics Xe G4 48EUs
...
NVIDIA GeForce RTX 3080 Ti Laptop GPU
max:
...
NVIDIA GeForce RTX 3080 Ti Laptop GPU
max:
...
NVIDIA GeForce RTX 3080 Ti Laptop GPU
max:
» Giocabile con tutti i portatili testati con dettagli ultra.
Intel UHD Graphics Xe 16EUs (Tiger Lake-H)
...
NVIDIA GeForce RTX 3080 Ti Laptop GPU
...
max:
Intel UHD Graphics Xe 16EUs (Tiger Lake-H)
...
NVIDIA GeForce RTX 3080 Ti Laptop GPU
...
max:
Intel UHD Graphics Xe 16EUs (Tiger Lake-H)
...
NVIDIA GeForce RTX 3080 Ti Laptop GPU
max:
...
NVIDIA GeForce RTX 3080 Ti Laptop GPU
...
max:
...
NVIDIA GeForce RTX 3080 Ti Laptop GPU
...
max:
...
NVIDIA GeForce RTX 3080 Ti Laptop GPU
max:
» Giocabile con tutti i portatili testati con dettagli ultra.
Additional Benchmarks
Ultra Low Preset 16xAF TAA 1280x720
283 [X] MSI Titan GT77 12UHS 905427
Intel Core i9-12900HX 1.7GHz
GeForce RTX 3080 Ti Laptop GPU
min:
233 fps, P1:
46 fps, max:
313 fps
...
NVIDIA GeForce RTX 3080 Ti Laptop GPU
max:
...
NVIDIA GeForce RTX 3080 Ti Laptop GPU
max:
Intel UHD Graphics Xe G4 48EUs
...
NVIDIA GeForce RTX 3080 Ti Laptop GPU
max:
» Giocabile con tutti i portatili testati con dettagli ultra.
0 100 200 300 Tooltip Erazer Beast X30: Ø145.4 (91.6-284.8)
ROG Zephyrus Duo 16 GX650RX: Ø155.1 (109.71-388)
...
NVIDIA GeForce RTX 3050 4GB Laptop GPU
NVIDIA GeForce RTX 3080 Ti Laptop GPU
max:
0 100 200 Tooltip Erazer Beast X30: Ø135.1 (87.091-216.3)
ROG Zephyrus Duo 16 GX650RX: Ø149.7 (118.98-185.1)
...
NVIDIA GeForce RTX 3080 Ti Laptop GPU
max:
0 100 200 300 Tooltip Erazer Beast X30: Ø137.9 (96.55-354)
ROG Zephyrus Duo 16 GX650RX: Ø148.1 (122.95-227.5)
...
NVIDIA GeForce RTX 3050 4GB Laptop GPU
NVIDIA GeForce RTX 3080 Ti Laptop GPU
max:
0 100 200 Tooltip Erazer Beast X30: Ø133.7 (91.76-284.4)
ROG Zephyrus Duo 16 GX650RX: Ø148.3 (110.194-235.7)
...
NVIDIA GeForce RTX 3080 Ti Laptop GPU
max:
0 100 Tooltip Erazer Beast X30: Ø108.5 (66.303-156)
ROG Zephyrus Duo 16 GX650RX: Ø112.8 (102.628-137.4)
...
NVIDIA GeForce RTX 3080 Ti Laptop GPU
max:
0 100 200 300 400 500 600 700 800 900 Tooltip ROG Zephyrus Duo 16 GX650RX: Ø84.2 (53.124-953)
...
NVIDIA GeForce RTX 3080 Ti Laptop GPU
max:
» Giocabile con tutti i portatili testati con dettagli ultra.
Additional Benchmarks
Lowest Settings 1280x720
Highest Settings + Maximum Ray Tracing 1920x1080
68.3 [X] Medion Erazer Beast X30 Intel Core i9-12900HK 1.8GHz
GeForce RTX 3080 Ti Laptop GPU
min:
19.2 fps, P0.1:
29.1 fps, P1:
43.2 fps, max:
110.8 fps
...
NVIDIA GeForce RTX 3080 Ti Laptop GPU
max:
...
NVIDIA GeForce RTX 3080 Ti Laptop GPU
max:
...
NVIDIA GeForce RTX 3080 Ti Laptop GPU
...
max:
Intel UHD Graphics 24EUs (Alder Lake-N)
...
NVIDIA GeForce RTX 3080 Ti Laptop GPU
...
max:
...
NVIDIA GeForce RTX 3080 Ti Laptop GPU
...
max:
...
NVIDIA GeForce RTX 3080 Ti Laptop GPU
...
max:
» Giocabile con tutti i portatili testati con dettagli ultra.
Additional Benchmarks
Lowest Preset (DX12) 1280x720
...
NVIDIA GeForce RTX 3080 Ti Laptop GPU
max:
AMD Radeon RX Vega 8 (Ryzen 2000/3000)
...
NVIDIA GeForce RTX 3080 Ti Laptop GPU
...
max:
...
NVIDIA GeForce RTX 3080 Ti Laptop GPU
...
max:
AMD Radeon RX Vega 8 (Ryzen 2000/3000)
...
NVIDIA GeForce RTX 3080 Ti Laptop GPU
max:
36 39.7 49.7 53.4 53.7 55.3 [X] MSI Raider GE76 12UHS @175 W TGP 1.5
Intel Core i9-12900HK 1.8GHz
GeForce RTX 3080 Ti Laptop GPU
min:
19 fps, max:
184 fps
56 56.8 59.7 62 [X] MSI Raider GE76 12UHS @175 W TGP 1.65
Intel Core i9-12900HK 1.8GHz
GeForce RTX 3080 Ti Laptop GPU
min:
20 fps, max:
181 fps
63.3 64.8 [X] MSI Raider GE76 12UHS @175 W TGP 1.63
Intel Core i9-12900HK 1.8GHz
GeForce RTX 3080 Ti Laptop GPU
min:
18.4 fps, max:
179.8 fps
69.6 [X] SCHENKER XMG Neo 15 with XMG Oasis Intel Core i7-12700H 1.7GHz
GeForce RTX 3080 Ti Laptop GPU
~ 55 fps
+ Confronta
- Nascondi il confronto
...
NVIDIA GeForce RTX 3080 Ti Laptop GPU
...
max:
19.6 25.2 27.6 27.8 [X] MSI Raider GE76 12UHS @175 W TGP 1.5
Intel Core i9-12900HK 1.8GHz
GeForce RTX 3080 Ti Laptop GPU
min:
18 fps, max:
152 fps
29.8 [X] MSI Raider GE76 12UHS @175 W TGP 1.65
Intel Core i9-12900HK 1.8GHz
GeForce RTX 3080 Ti Laptop GPU
min:
19 fps, max:
140 fps
32.4 [X] MSI Raider GE76 12UHS @175 W TGP 1.63
Intel Core i9-12900HK 1.8GHz
GeForce RTX 3080 Ti Laptop GPU
min:
20.9 fps, max:
134.5 fps
~ 27 fps
+ Confronta
- Nascondi il confronto
...
NVIDIA GeForce RTX 3080 Ti Laptop GPU
...
max:
» Giocabile con tutti i portatili testati con dettagli ultra.
Additional Benchmarks
Low Preset 1280x720
159 [X] SCHENKER XMG Neo 15 with XMG Oasis Intel Core i7-12700H 1.7GHz
GeForce RTX 3080 Ti Laptop GPU
Ray Tracing Ultra Preset (DLSS off) 1920x1080
42.2 [X] SCHENKER XMG Neo 15 with XMG Oasis Intel Core i7-12700H 1.7GHz
GeForce RTX 3080 Ti Laptop GPU
Ray Tracing Ultra Preset (DLSS off) 3840x2160
0 100 Tooltip Aero 16 YE5: Ø96.5 (80.25-140.4)
...
NVIDIA GeForce RTX 3080 Ti Laptop GPU
0 100 Tooltip Aero 16 YE5: Ø91.9 (80.778-114.7)
...
NVIDIA GeForce RTX 3080 Ti Laptop GPU
...
0 Tooltip Aero 16 YE5: Ø79.9 (67.269-98.4)
...
NVIDIA GeForce RTX 3050 4GB Laptop GPU
NVIDIA GeForce RTX 3080 Ti Laptop GPU
...
0 Tooltip Aero 16 YE5: Ø72.7 (64.037-83.4)
...
NVIDIA GeForce RTX 3050 4GB Laptop GPU
NVIDIA GeForce RTX 3080 Ti Laptop GPU
...
0 Tooltip Aero 16 YE5: Ø51.1 (41.34-65.49)
NVIDIA GeForce RTX 3080 Ti Laptop GPU
0 100 Tooltip Aero 16 YE5: Ø35.5 (25.192-194)
NVIDIA GeForce RTX 3080 Ti Laptop GPU
max:
» Giocabile con la maggior parte dei portatili testati con dettagli ultra.
Additional Benchmarks
Low / Off 1280x720
105 [X] Gigabyte Aero 16 YE5 Intel Core i9-12900HK 1.8GHz
GeForce RTX 3080 Ti Laptop GPU
min:
42.8 fps, P0.1:
56.1 fps, P1:
64.4 fps, max:
171 fps
...
NVIDIA GeForce RTX 3080 Ti Laptop GPU
max:
...
NVIDIA GeForce RTX 3050 4GB Laptop GPU
NVIDIA GeForce RTX 3080 Ti Laptop GPU
...
max:
Intel UHD Graphics 24EUs (Alder Lake-N)
...
NVIDIA GeForce RTX 3050 4GB Laptop GPU
NVIDIA GeForce RTX 3080 Ti Laptop GPU
...
max:
...
NVIDIA GeForce RTX 3050 4GB Laptop GPU
NVIDIA GeForce RTX 3080 Ti Laptop GPU
...
max:
...
NVIDIA GeForce RTX 3080 Ti Laptop GPU
...
max:
NVIDIA GeForce RTX 3080 Ti Laptop GPU
max:
» Giocabile con tutti i portatili testati con dettagli ultra.
Additional Benchmarks
Low Preset 1280x720
Intel UHD Graphics Xe G4 48EUs
...
NVIDIA GeForce RTX 3080 Ti Laptop GPU
...
max:
...
NVIDIA GeForce RTX 3080 Ti Laptop GPU
max:
...
NVIDIA GeForce RTX 3080 Ti Laptop GPU
max:
» Giocabile con tutti i portatili testati con dettagli ultra.
0 100 Tooltip Aero 16 YE5: Ø99.5 (91.076-119.5)
ROG Zephyrus Duo 16 GX650RX: Ø111 (101.884-142.9)
...
NVIDIA GeForce RTX 3080 Ti Laptop GPU
max:
0 100 Tooltip Aero 16 YE5: Ø81.8 (77.013-103.5)
ROG Zephyrus Duo 16 GX650RX: Ø91.6 (86.09-116.9)
...
NVIDIA GeForce RTX 3080 Ti Laptop GPU
max:
0 Tooltip Aero 16 YE5: Ø71.4 (66.308-78.5)
ROG Zephyrus Duo 16 GX650RX: Ø79.8 (75.204-90.1)
...
NVIDIA GeForce RTX 3080 Ti Laptop GPU
max:
0 100 Tooltip Aero 16 YE5: Ø51.9 (46.204-60.9)
ROG Zephyrus Duo 16 GX650RX: Ø62.3 (54.092-113.1)
...
NVIDIA GeForce RTX 3080 Ti Laptop GPU
max:
0 Tooltip Aero 16 YE5: Ø30.1 (25.264-41.5)
ROG Zephyrus Duo 16 GX650RX: Ø32.3 (29.121-40.29)
NVIDIA GeForce RTX 3080 Ti Laptop GPU
max:
» Giocabile con tutti i portatili testati con dettagli alto.
Additional Benchmarks
Low Quality 1280x720
147 [X] Gigabyte Aero 16 YE5 Intel Core i9-12900HK 1.8GHz
GeForce RTX 3080 Ti Laptop GPU
min:
61.3 fps, P0.1:
79.4 fps, P1:
120 fps, max:
186 fps
169 [X] SCHENKER XMG Neo 15 with XMG Oasis Intel Core i7-12700H 1.7GHz
GeForce RTX 3080 Ti Laptop GPU
High Quality Raytracing 1920x1080
33.4 [X] Gigabyte Aero 16 YE5 Intel Core i9-12900HK 1.8GHz
GeForce RTX 3080 Ti Laptop GPU
min:
23.3 fps, P0.1:
24.3 fps, P1:
27.8 fps, max:
62.2 fps
42.3 [X] SCHENKER XMG Neo 15 with XMG Oasis Intel Core i7-12700H 1.7GHz
GeForce RTX 3080 Ti Laptop GPU
...
NVIDIA GeForce RTX 3080 Ti Laptop GPU
max:
...
NVIDIA GeForce RTX 3080 Ti Laptop GPU
max:
...
NVIDIA GeForce RTX 3080 Ti Laptop GPU
max:
...
NVIDIA GeForce RTX 3080 Ti Laptop GPU
max:
...
NVIDIA GeForce RTX 3080 Ti Laptop GPU
max:
...
NVIDIA GeForce RTX 3080 Ti Laptop GPU
max:
» Giocabile con tutti i portatili testati con dettagli ultra.
Additional Benchmarks
Ultra Low Preset (with Fixed Resolution Quality) 1280x720
0 100 Tooltip XMG Neo 17 M22: Ø132.3 (99.869-149.6)
Intel UHD Graphics G1 (Ice Lake 32 EU)
...
NVIDIA GeForce RTX 3080 Ti Laptop GPU
max:
0 100 Tooltip XMG Neo 17 M22: Ø130.4 (113.98-144.8)
GE76 Raider: Ø148.4 (135.8-164.4)
...
NVIDIA GeForce RTX 3080 Ti Laptop GPU
max:
0 100 200 Tooltip XMG Neo 17 M22: Ø114.8 (108.017-139.4)
GE76 Raider: Ø127.2 (113.357-238)
...
NVIDIA GeForce RTX 3080 Ti Laptop GPU
max:
0 100 200 300 400 500 600 700 800 900 1000 1100 1200 1300 1400 1500 1600 1700 1800 1900 2000 2100 2200 2300 2400 2500 2600 2700 2800 2900 3000 3100 3200 3300 3400 3500 3600 3700 3800 3900 4000 4100 4200 4300 4400 4500 4600 4700 4800 4900 5000 5100 5200 5300 5400 5500 5600 5700 5800 5900 6000 6100 6200 6300 6400 6500 6600 6700 6800 6900 7000 7100 7200 7300 7400 7500 7600 7700 7800 7900 8000 8100 8200 8300 8400 8500 8600 8700 8800 8900 9000 9100 9200 9300 9400 9500 9600 9700 9800 9900 Tooltip XMG Neo 17 M22: Ø90.4 (70.609-265.7)
GE76 Raider: Ø461 (73.097-11240)
...
NVIDIA GeForce RTX 3080 Ti Laptop GPU
max:
0 100 Tooltip XMG Neo 17 M22: Ø66.6 (61.102-79.1)
GE76 Raider: Ø73.3 (62.352-149.3)
...
NVIDIA GeForce RTX 3080 Ti Laptop GPU
max:
0 Tooltip GE76 Raider: Ø50 (43.131-77.4)
XMG Neo 17 M22: Ø48.4 (44.38-60.6)
...
NVIDIA GeForce RTX 3080 Ti Laptop GPU
max:
» Giocabile con tutti i portatili testati con dettagli ultra.
AMD Radeon RX Vega 7
AMD Radeon 660M
AMD Radeon 680M
NVIDIA GeForce RTX 3080 Ti Laptop GPU
0 100 Tooltip GE76 Raider: Ø172.7 (157.652-196.7)
...
NVIDIA GeForce RTX 3080 Ti Laptop GPU
0 100 200 Tooltip GE76 Raider: Ø153.3 (137.195-247.8)
...
NVIDIA GeForce RTX 3080 Ti Laptop GPU
0 100 Tooltip GE76 Raider: Ø145 (132.101-183.5)
...
NVIDIA GeForce RTX 3080 Ti Laptop GPU
0 100 Tooltip GE76 Raider: Ø106.4 (94.567-130.3)
...
NVIDIA GeForce RTX 3080 Ti Laptop GPU
0 100 200 300 400 Tooltip GE76 Raider: Ø87.8 (53.272-471)
...
NVIDIA GeForce RTX 3080 Ti Laptop GPU
» Giocabile con tutti i portatili testati con dettagli ultra.
0 100 200 300 400 500 Tooltip GE76 Raider: Ø216 (-0.0309-535)
...
NVIDIA GeForce RTX 3080 Ti Laptop GPU
max:
0 100 200 Tooltip GE76 Raider: Ø188.5 (-0.0361-281)
...
NVIDIA GeForce RTX 3080 Ti Laptop GPU
max:
0 100 200 300 400 Tooltip GE76 Raider: Ø165.1 (-0.0524-410)
...
NVIDIA GeForce RTX 3080 Ti Laptop GPU
max:
0 100 Tooltip GE76 Raider: Ø144.3 (-0.0383-177)
...
NVIDIA GeForce RTX 3080 Ti Laptop GPU
max:
0 100 Tooltip GE76 Raider: Ø95.7 (-0.035-156.9)
...
NVIDIA GeForce RTX 3080 Ti Laptop GPU
max:
» Giocabile con tutti i portatili testati con dettagli ultra.
0 100 Tooltip GE76 Raider: Ø143.4 (132.472-167.4)
Intel UHD Graphics Xe 32EUs (Tiger Lake-H)
...
NVIDIA GeForce RTX 3080 Ti Laptop GPU
max:
0 100 Tooltip GE76 Raider: Ø125 (105.32-184)
...
NVIDIA GeForce RTX 3050 4GB Laptop GPU
NVIDIA GeForce RTX 3080 Ti Laptop GPU
max:
0 100 Tooltip GE76 Raider: Ø112.2 (87.11-151.4)
...
NVIDIA GeForce RTX 3080 Ti Laptop GPU
0 100 Tooltip GE76 Raider: Ø89.9 (63.95-102.49)
NVIDIA GeForce RTX 3080 Ti Laptop GPU
0 Tooltip GE76 Raider: Ø60.1 (52.639-67.78)
NVIDIA GeForce RTX 3080 Ti Laptop GPU
» Giocabile con tutti i portatili testati con dettagli ultra.
Additional Benchmarks
Ultra Preset + Ray Tracing 1920x1080
87.3 [X] MSI GE76 Raider Intel Core i9-12900HK 1.8GHz
GeForce RTX 3080 Ti Laptop GPU
min:
8.49 fps, P0.1:
20.3 fps, P1:
62.7 fps, max:
127 fps
...
AMD Radeon 680M
NVIDIA GeForce RTX 3050 4GB Laptop GPU
NVIDIA GeForce RTX 3080 Ti Laptop GPU
max:
Intel UHD Graphics Xe 16EUs (Tiger Lake-H)
...
NVIDIA GeForce RTX 3080 Ti Laptop GPU
max:
...
NVIDIA GeForce RTX 3050 4GB Laptop GPU
NVIDIA GeForce RTX 3080 Ti Laptop GPU
...
max:
...
NVIDIA GeForce RTX 3080 Ti Laptop GPU
max:
...
NVIDIA GeForce RTX 3080 Ti Laptop GPU
max:
...
NVIDIA GeForce RTX 3080 Ti Laptop GPU
max:
» Giocabile con tutti i portatili testati con dettagli ultra.
Additional Benchmarks
Low Preset 1920x1080
...
NVIDIA GeForce RTX 3050 4GB Laptop GPU
NVIDIA GeForce RTX 3080 Ti Laptop GPU
max:
...
NVIDIA GeForce RTX 3080 Ti Laptop GPU
max:
...
NVIDIA GeForce RTX 3080 Ti Laptop GPU
max:
...
NVIDIA GeForce RTX 3080 Ti Laptop GPU
max:
...
NVIDIA GeForce RTX 3080 Ti Laptop GPU
max:
...
NVIDIA GeForce RTX 3080 Ti Laptop GPU
max:
» Giocabile con tutti i portatili testati con dettagli ultra.
Additional Benchmarks
Low Preset 1920x1080
...
NVIDIA GeForce RTX 3050 4GB Laptop GPU
NVIDIA GeForce RTX 3080 Ti Laptop GPU
max:
...
NVIDIA GeForce RTX 3080 Ti Laptop GPU
max:
...
NVIDIA GeForce RTX 3080 Ti Laptop GPU
max:
AMD Radeon RX 560X (Laptop)
...
NVIDIA GeForce RTX 3080 Ti Laptop GPU
max:
...
NVIDIA GeForce RTX 3080 Ti Laptop GPU
max:
...
NVIDIA GeForce RTX 3080 Ti Laptop GPU
max:
» Giocabile con tutti i portatili testati con dettagli ultra.
Additional Benchmarks
Low Preset 1920x1080
Ultra Preset + Ultra Ray-Tracing 1920x1080
0 100 200 300 Tooltip GE76 Raider: Ø296 (235.95-382.64)
...
NVIDIA GeForce RTX 3080 Ti Laptop GPU
0 100 200 300 400 500 600 700 800 900 1000 1100 1200 1300 1400 1500 1600 1700 1800 1900 2000 2100 2200 2300 2400 2500 2600 2700 2800 2900 3000 3100 Tooltip GE76 Raider: Ø392 (203.99-3147)
...
NVIDIA GeForce RTX 3080 Ti Laptop GPU
0 100 200 300 Tooltip GE76 Raider: Ø245 (167.583-318.063)
Intel UHD Graphics Xe G4 48EUs
...
NVIDIA GeForce RTX 3080 Ti Laptop GPU
0 100 200 Tooltip GE76 Raider: Ø176 (150.95-225.5)
...
NVIDIA GeForce RTX 3080 Ti Laptop GPU
0 100 Tooltip GE76 Raider: Ø92.4 (76.51-114.7)
...
NVIDIA GeForce RTX 3080 Ti Laptop GPU
max:
» Giocabile con tutti i portatili testati con dettagli ultra.
0 100 Tooltip ROG Zephyrus Duo 16 GX650RX: Ø116.2 (101-149)
XMG Neo 17 M22: Ø118.6 (98-146)
...
NVIDIA GeForce RTX 3080 Ti Laptop GPU
...
max:
0 100 Tooltip ROG Zephyrus Duo 16 GX650RX: Ø100.3 (83-123)
XMG Neo 17 M22: Ø104 (84-129)
...
NVIDIA GeForce RTX 3080 Ti Laptop GPU
max:
0 100 Tooltip ROG Zephyrus Duo 16 GX650RX: Ø90.9 (75-112)
XMG Neo 17 M22: Ø95 (74-122)
Intel UHD Graphics Xe 32EUs (Tiger Lake-H)
...
NVIDIA GeForce RTX 3080 Ti Laptop GPU
...
max:
0 100 Tooltip ROG Zephyrus Duo 16 GX650RX: Ø71.3 (59-90)
ROG Zephyrus Duo 16 GX650RX: Ø86.2 (65-106)
XMG Neo 17 M22: Ø99.4 (75-128)
...
NVIDIA GeForce RTX 3080 Ti Laptop GPU
...
max:
0 Tooltip ROG Zephyrus Duo 16 GX650RX: Ø75.2 (64-83)
XMG Neo 17 M22: Ø86.6 (73-98)
...
NVIDIA GeForce RTX 3080 Ti Laptop GPU
...
max:
0 Tooltip ROG Zephyrus Duo 16 GX650RX: Ø46.2 (42-56)
XMG Neo 17 M22: Ø54.2 (47-59)
...
NVIDIA GeForce RTX 3080 Ti Laptop GPU
max:
» Giocabile con tutti i portatili testati con dettagli ultra.
Additional Benchmarks
Low Graphics Quality 1920x1080
Ultra Graphics Quality + HD Textures + DXR TAA 1920x1080
0 100 200 Tooltip ROG Zephyrus Duo 16 GX650RX: Ø145.9 (127.657-206.72)
...
AMD Radeon 660M
AMD Radeon 680M
AMD Radeon RX 560X (Laptop)
NVIDIA GeForce RTX 3050 4GB Laptop GPU
NVIDIA GeForce RTX 3080 Ti Laptop GPU
0 100 200 Tooltip ROG Zephyrus Duo 16 GX650RX: Ø125.2 (106.1-199.9)
GE76 Raider: Ø161 (141.008-217.7)
...
NVIDIA GeForce RTX 3080 Ti Laptop GPU
0 100 200 300 Tooltip ROG Zephyrus Duo 16 GX650RX: Ø125.8 (105.542-227.3)
GE76 Raider: Ø164 (136.47-341)
...
NVIDIA GeForce RTX 3080 Ti Laptop GPU
max:
AMD Radeon RX 6800
0 100 200 Tooltip ROG Zephyrus Duo 16 GX650RX: Ø119.4 (105.171-183.5)
GE76 Raider: Ø157.2 (139.265-273)
...
NVIDIA GeForce RTX 3080 Ti Laptop GPU
max:
AMD Radeon RX 6800
0 100 Tooltip ROG Zephyrus Duo 16 GX650RX: Ø73.6 (65.927-89.3)
GE76 Raider: Ø91.6 (82.036-107.3)
NVIDIA GeForce RTX 3080 Ti Laptop GPU
...
max:
» Giocabile con tutti i portatili testati con dettagli alto.
Additional Benchmarks
Low Preset 1920x1080
0 100 Tooltip XMG Neo 17 M22: Ø128.6 (84.245-175.23)
...
NVIDIA GeForce RTX 3050 4GB Laptop GPU
NVIDIA GeForce RTX 3080 Ti Laptop GPU
max:
0 100 200 Tooltip XMG Neo 17 M22: Ø109 (75.166-160.361)
GE76 Raider: Ø132 (91.17-208.077)
...
NVIDIA GeForce RTX 3080 Ti Laptop GPU
max:
0 100 Tooltip XMG Neo 17 M22: Ø100.6 (68.91-158.1)
GE76 Raider: Ø123.7 (78.144-197.077)
...
NVIDIA GeForce RTX 3080 Ti Laptop GPU
max:
0 100 200 300 400 500 600 700 800 Tooltip XMG Neo 17 M22: Ø100 (69.37-183.1)
GE76 Raider: Ø137.6 (83.32-882)
...
NVIDIA GeForce RTX 3080 Ti Laptop GPU
max:
0 100 200 300 400 500 600 700 800 900 1000 1100 1200 1300 1400 1500 1600 1700 1800 1900 2000 2100 2200 2300 2400 2500 2600 2700 2800 2900 3000 3100 3200 3300 3400 3500 3600 Tooltip XMG Neo 17 M22: Ø94.7 (60.158-216.6)
GE76 Raider: Ø193.8 (77.871-3613)
...
NVIDIA GeForce RTX 3080 Ti Laptop GPU
max:
0 Tooltip XMG Neo 17 M22: Ø53.3 (40.14-86.2)
GE76 Raider: Ø52.1 (45.03-62.422)
...
NVIDIA GeForce RTX 3080 Ti Laptop GPU
max:
» Giocabile con tutti i portatili testati con dettagli ultra.
0 100 200 300 400 500 600 700 800 900 1000 1100 1200 1300 1400 1500 1600 1700 1800 1900 2000 2100 2200 2300 2400 2500 2600 2700 2800 2900 3000 3100 3200 3300 3400 Tooltip GE76 Raider: Ø253 (122.348-3467)
...
NVIDIA GeForce RTX 3080 Ti Laptop GPU
0 100 200 Tooltip GE76 Raider: Ø142.2 (113.088-205.9)
...
NVIDIA GeForce RTX 3080 Ti Laptop GPU
0 100 200 300 400 500 Tooltip GE76 Raider: Ø138.1 (84.421-510)
...
NVIDIA GeForce RTX 3080 Ti Laptop GPU
0 100 Tooltip GE76 Raider: Ø86.3 (65.935-140.4)
...
NVIDIA GeForce RTX 3080 Ti Laptop GPU
0 100 Tooltip GE76 Raider: Ø51.6 (40.382-120.1)
NVIDIA GeForce RTX 3080 Ti Laptop GPU
max:
» Giocabile con tutti i portatili testati con dettagli ultra.
295 311 [X] Medion Erazer Beast X30 874931
Intel Core i9-12900HK 1.8GHz
GeForce RTX 3080 Ti Laptop GPU
min:
247 fps, P1:
219 fps, max:
339 fps
330 337 348 [X] MSI Titan GT77 12UHS 874931
Intel Core i9-12900HX 1.7GHz
GeForce RTX 3080 Ti Laptop GPU
min:
300 fps, P1:
221 fps, max:
363 fps
354 354 361 [X] Alienware x15 R2 P111F 874931
Intel Core i9-12900H 1.8GHz
GeForce RTX 3080 Ti Laptop GPU
min:
301 fps, P1:
250 fps, max:
393 fps
364 383 [X] Gigabyte Aero 16 YE5 852849
Intel Core i9-12900HK 1.8GHz
GeForce RTX 3080 Ti Laptop GPU
min:
309 fps, P1:
270 fps, max:
419 fps
384 394 [X] MSI Raider GE66 12UHS 874931
Intel Core i9-12900HK @5GHz
GeForce RTX 3080 Ti Laptop GPU
min:
325 fps, P1:
268 fps, max:
419 fps
404 [X] MSI Titan GT77 12UHS 874931
Intel Core i9-12900HX 1.7GHz
GeForce RTX 3080 Ti Laptop GPU
min:
333 fps, P1:
271 fps, max:
434 fps
452 [X] MSI Titan GT77 12UHS 874931, dGPU, Extreme Leistung
Intel Core i9-12900HX 1.7GHz
GeForce RTX 3080 Ti Laptop GPU
min:
349 fps, P1:
293 fps, max:
492 fps
473 [X] MSI Raider GE77 HX 12UHS 874931, dGPU, Extreme Leistung
Intel Core i9-12900HX 1.7GHz
GeForce RTX 3080 Ti Laptop GPU
min:
370 fps, P1:
304 fps, max:
507 fps
~ 370 fps
+ Confronta
- Nascondi il confronto
...
NVIDIA GeForce RTX 3080 Ti Laptop GPU
max:
207 236 [X] Gigabyte Aero 16 YE5 852849
Intel Core i9-12900HK 1.8GHz
GeForce RTX 3080 Ti Laptop GPU
min:
209 fps, P1:
157 fps, max:
278 fps
236 237 [X] MSI Titan GT77 12UHS 874931
Intel Core i9-12900HX 1.7GHz
GeForce RTX 3080 Ti Laptop GPU
min:
198 fps, P1:
150 fps, max:
252 fps
240 [X] Medion Erazer Beast X30 874931
Intel Core i9-12900HK 1.8GHz
GeForce RTX 3080 Ti Laptop GPU
min:
187 fps, P1:
160 fps, max:
277 fps
243 255 275 287 314 319 [X] Alienware x15 R2 P111F 874931
Intel Core i9-12900H 1.8GHz
GeForce RTX 3080 Ti Laptop GPU
min:
256 fps, P1:
217 fps, max:
363 fps
328 342 [X] MSI GE76 Raider Intel Core i9-12900HK 1.8GHz
GeForce RTX 3080 Ti Laptop GPU
min:
273 fps
351 [X] MSI Raider GE66 12UHS 874931
Intel Core i9-12900HK @5GHz
GeForce RTX 3080 Ti Laptop GPU
min:
302 fps, P1:
238 fps, max:
382 fps
383 [X] MSI Titan GT77 12UHS 874931
Intel Core i9-12900HX 1.7GHz
GeForce RTX 3080 Ti Laptop GPU
min:
310 fps, P1:
250 fps, max:
418 fps
385 [X] MSI Titan GT77 12UHS 874931, dGPU, Extreme Leistung
Intel Core i9-12900HX 1.7GHz
GeForce RTX 3080 Ti Laptop GPU
min:
320 fps, P1:
255 fps, max:
419 fps
401 [X] MSI Raider GE77 HX 12UHS 874931, dGPU, Extreme Leistung
Intel Core i9-12900HX 1.7GHz
GeForce RTX 3080 Ti Laptop GPU
min:
327 fps, P1:
269 fps, max:
438 fps
~ 296 fps
+ Confronta
- Nascondi il confronto
...
NVIDIA GeForce RTX 3080 Ti Laptop GPU
max:
182.1 196 [X] Gigabyte Aero 16 YE5 852849
Intel Core i9-12900HK 1.8GHz
GeForce RTX 3080 Ti Laptop GPU
min:
173 fps, P1:
129 fps, max:
219 fps
205 [X] MSI Titan GT77 12UHS 874931
Intel Core i9-12900HX 1.7GHz
GeForce RTX 3080 Ti Laptop GPU
min:
173 fps, P1:
130 fps, max:
239 fps
207 211 215 [X] Medion Erazer Beast X30 874931
Intel Core i9-12900HK 1.8GHz
GeForce RTX 3080 Ti Laptop GPU
min:
166 fps, P1:
121 fps, max:
241 fps
219 225 246 248 [X] Alienware x15 R2 P111F 874931
Intel Core i9-12900H 1.8GHz
GeForce RTX 3080 Ti Laptop GPU
min:
180 fps, P1:
128 fps, max:
304 fps
269 271 289 [X] MSI GE76 Raider Intel Core i9-12900HK 1.8GHz
GeForce RTX 3080 Ti Laptop GPU
min:
228 fps
292 [X] MSI Raider GE66 12UHS 874931
Intel Core i9-12900HK @5GHz
GeForce RTX 3080 Ti Laptop GPU
min:
248 fps, P1:
218 fps, max:
327 fps
302 [X] MSI Titan GT77 12UHS 874931
Intel Core i9-12900HX 1.7GHz
GeForce RTX 3080 Ti Laptop GPU
min:
224 fps, P1:
161 fps, max:
339 fps
314 [X] MSI Titan GT77 12UHS 874931, dGPU, Extreme Leistung
Intel Core i9-12900HX 1.7GHz
GeForce RTX 3080 Ti Laptop GPU
min:
240 fps, P1:
197 fps, max:
356 fps
316 [X] MSI Raider GE77 HX 12UHS 874931, dGPU, Extreme Leistung
Intel Core i9-12900HX 1.7GHz
GeForce RTX 3080 Ti Laptop GPU
min:
248 fps, P1:
171 fps, max:
360 fps
~ 247 fps
+ Confronta
- Nascondi il confronto
...
NVIDIA GeForce RTX 3080 Ti Laptop GPU
...
max:
30.2 [X] Medion Erazer Beast X30 874931
Intel Core i9-12900HK @4.1GHz
GeForce RTX 3080 Ti Laptop GPU
min:
29 fps, P1:
26 fps, max:
34 fps
60 [X] Asus ROG Zephyrus Duo 16 GX650RX 874931, Leise
AMD Ryzen 9 6900HX 3.3GHz
GeForce RTX 3080 Ti Laptop GPU
min:
59 fps, P1:
57 fps, max:
60 fps
68 [X] Gigabyte Aero 16 YE5 852849, Silence Mode
Intel Core i9-12900HK @2.1GHz
GeForce RTX 3080 Ti Laptop GPU
min:
48 fps, P1:
42 fps, max:
82 fps
97.5 103 103 [X] Gigabyte Aero 16 YE5 852849
Intel Core i9-12900HK 1.8GHz
GeForce RTX 3080 Ti Laptop GPU
min:
76 fps, P1:
83 fps, max:
116 fps
107 [X] Gigabyte Aero 16 YE5 852849, Turbo Mode
Intel Core i9-12900HK 1.8GHz
GeForce RTX 3080 Ti Laptop GPU
min:
91 fps, P1:
84 fps, max:
118 fps
118.4 [X] Razer Blade 17 Early 2022 874931, Lautlos
Intel Core i9-12900H 1.8GHz
GeForce RTX 3080 Ti Laptop GPU
min:
101 fps, P1:
89 fps, max:
125 fps
121.9 124.1 [X] Medion Erazer Beast X30 874931, Dyn. Boost 25W
Intel Core i9-12900HK 1.8GHz
GeForce RTX 3080 Ti Laptop GPU
min:
99 fps, P1:
91 fps, max:
143 fps
126.3 [X] Medion Erazer Beast X30 874931
Intel Core i9-12900HK 1.8GHz
GeForce RTX 3080 Ti Laptop GPU
min:
112 fps, P1:
91 fps, max:
148 fps
129 [X] Medion Erazer Beast X30 874931, Turbo Mode
Intel Core i9-12900HK 1.8GHz
GeForce RTX 3080 Ti Laptop GPU
min:
116 fps, P1:
90 fps, max:
146 fps
130.2 130.4 [X] MSI Titan GT77 12UHS 874931
Intel Core i9-12900HX 1.7GHz
GeForce RTX 3080 Ti Laptop GPU
min:
115 fps, P1:
91 fps, max:
143 fps
132.8 132.8 133.2 [X] MSI Raider GE77 HX 12UHS 874931, Extreme Leistung
Intel Core i9-12900HX 1.7GHz
GeForce RTX 3080 Ti Laptop GPU
min:
114 fps, P1:
91 fps, max:
144 fps
133.8 138.3 [X] Razer Blade 17 Early 2022 874931, Max.
Intel Core i9-12900H 1.8GHz
GeForce RTX 3080 Ti Laptop GPU
min:
120 fps, P1:
100 fps, max:
153 fps
142.1 [X] Asus ROG Zephyrus Duo 16 GX650RX 874931, Turbo
AMD Ryzen 9 6900HX 3.3GHz
GeForce RTX 3080 Ti Laptop GPU
min:
121 fps, P1:
103 fps, max:
154 fps
142.3 [X] Medion Erazer Beast X30 874931, dGPU only
Intel Core i9-12900HK 1.8GHz
GeForce RTX 3080 Ti Laptop GPU
min:
117 fps, P1:
110 fps, max:
164 fps
142.7 [X] MSI Raider GE66 12UHS 874931
Intel Core i9-12900HK @5GHz
GeForce RTX 3080 Ti Laptop GPU
min:
121 fps, P1:
119 fps, max:
161 fps
146.9 [X] Alienware x15 R2 P111F 874931
Intel Core i9-12900H 1.8GHz
GeForce RTX 3080 Ti Laptop GPU
min:
125 fps, P1:
109 fps, max:
165 fps
148.5 152.5 [X] Razer Blade 17 Early 2022 874931, dGPU, 175W
Intel Core i9-12900H 1.8GHz
GeForce RTX 3080 Ti Laptop GPU
min:
128 fps, P1:
121 fps, max:
169 fps
155.9 [X] Asus ROG Zephyrus Duo 16 GX650RX 874931, sep. GPU, 25W
AMD Ryzen 9 6900HX 3.3GHz
GeForce RTX 3080 Ti Laptop GPU
min:
129 fps, P1:
120 fps, max:
173 fps
156.6 [X] MSI Titan GT77 12UHS 874931, dGPU, Extreme Leistung
Intel Core i9-12900HX 1.7GHz
GeForce RTX 3080 Ti Laptop GPU
min:
131 fps, P1:
129 fps, max:
178 fps
157 [X] MSI GE76 Raider Intel Core i9-12900HK 1.8GHz
GeForce RTX 3080 Ti Laptop GPU
min:
132 fps
158.2 [X] MSI Titan GT77 12UHS 874931
Intel Core i9-12900HX 1.7GHz
GeForce RTX 3080 Ti Laptop GPU
min:
133 fps, P1:
130 fps, max:
180 fps
160.6 [X] MSI Raider GE77 HX 12UHS 874931, dGPU, Extreme Leistung
Intel Core i9-12900HX 1.7GHz
GeForce RTX 3080 Ti Laptop GPU
min:
137 fps, P1:
132 fps, max:
181 fps
~ 126 fps
+ Confronta
- Nascondi il confronto
...
NVIDIA GeForce RTX 3080 Ti Laptop GPU
max:
30 [X] Medion Erazer Beast X30 874931, Office Mode
Intel Core i9-12900HK @4.1GHz
GeForce RTX 3080 Ti Laptop GPU
min:
29 fps, P1:
26 fps, max:
31 fps
60 [X] Asus ROG Zephyrus Duo 16 GX650RX 874931, Leise
AMD Ryzen 9 6900HX 3.3GHz
GeForce RTX 3080 Ti Laptop GPU
min:
59 fps, P1:
54 fps, max:
60 fps
71 74.9 84 [X] Gigabyte Aero 16 YE5 852849
Intel Core i9-12900HK 1.8GHz
GeForce RTX 3080 Ti Laptop GPU
min:
72 fps, P1:
69 fps, max:
93 fps
91.7 94.8 [X] Razer Blade 17 Early 2022 874931, Lautlos
Intel Core i9-12900H 1.8GHz
GeForce RTX 3080 Ti Laptop GPU
min:
81 fps, P1:
69 fps, max:
102 fps
100.2 [X] Medion Erazer Beast X30 874931
Intel Core i9-12900HK 1.8GHz
GeForce RTX 3080 Ti Laptop GPU
min:
85 fps, P1:
71 fps, max:
112 fps
100.4 [X] Medion Erazer Beast X30 874931, Dyn. Boost 25W
Intel Core i9-12900HK 1.8GHz
GeForce RTX 3080 Ti Laptop GPU
min:
86 fps, P1:
70 fps, max:
111 fps
101.6 [X] Medion Erazer Beast X30 874931, Turbo Mode
Intel Core i9-12900HK 1.8GHz
GeForce RTX 3080 Ti Laptop GPU
min:
87 fps, P1:
71 fps, max:
114 fps
102.5 103.4 [X] MSI Titan GT77 12UHS 874931
Intel Core i9-12900HX 1.7GHz
GeForce RTX 3080 Ti Laptop GPU
min:
90 fps, P1:
72 fps, max:
112 fps
104.3 104.3 106.2 107.7 [X] Medion Erazer Beast X30 874931, dGPU only
Intel Core i9-12900HK 1.8GHz
GeForce RTX 3080 Ti Laptop GPU
min:
93 fps, P1:
89 fps, max:
120 fps
114.2 117 [X] MSI GE76 Raider Intel Core i9-12900HK 1.8GHz
GeForce RTX 3080 Ti Laptop GPU
min:
100 fps
120.1 [X] MSI Titan GT77 12UHS 874931, dGPU, Extreme Leistung
Intel Core i9-12900HX 1.7GHz
GeForce RTX 3080 Ti Laptop GPU
min:
101 fps, P1:
99 fps, max:
134 fps
~ 94 fps
+ Confronta
- Nascondi il confronto
...
NVIDIA GeForce RTX 3080 Ti Laptop GPU
max:
41.1 [X] Gigabyte Aero 16 YE5 852849, Silence Mode
Intel Core i9-12900HK @2.1GHz
GeForce RTX 3080 Ti Laptop GPU
min:
35 fps, P1:
31 fps, max:
47 fps
47.3 [X] Gigabyte Aero 16 YE5 852849
Intel Core i9-12900HK 1.8GHz
GeForce RTX 3080 Ti Laptop GPU
min:
39 fps, P1:
38 fps, max:
53 fps
50.3 [X] Gigabyte Aero 16 YE5 852849, Turbo Mode
Intel Core i9-12900HK 1.8GHz
GeForce RTX 3080 Ti Laptop GPU
min:
43 fps, P1:
42 fps, max:
56 fps
56.4 [X] Razer Blade 17 Early 2022 874931, Lautlos
Intel Core i9-12900H 1.8GHz
GeForce RTX 3080 Ti Laptop GPU
min:
49 fps, P1:
44 fps, max:
63 fps
56.5 [X] Asus ROG Zephyrus Duo 16 GX650RX 874931, Leise
AMD Ryzen 9 6900HX 3.3GHz
GeForce RTX 3080 Ti Laptop GPU
min:
50 fps, P1:
47 fps, max:
60 fps
60 62.5 62.8 [X] MSI Titan GT77 12UHS 874931
Intel Core i9-12900HX 1.7GHz
GeForce RTX 3080 Ti Laptop GPU
min:
55 fps, P1:
45 fps, max:
68 fps
62.9 [X] Razer Blade 17 Early 2022 874931, Max.
Intel Core i9-12900H 1.8GHz
GeForce RTX 3080 Ti Laptop GPU
min:
55 fps, P1:
50 fps, max:
69 fps
64 64.4 [X] Asus ROG Zephyrus Duo 16 GX650RX 874931, Turbo
AMD Ryzen 9 6900HX 3.3GHz
GeForce RTX 3080 Ti Laptop GPU
min:
56 fps, P1:
53 fps, max:
73 fps
64.9 [X] MSI Raider GE77 HX 12UHS 874931, Extreme Leistung
Intel Core i9-12900HX 1.7GHz
GeForce RTX 3080 Ti Laptop GPU
min:
57 fps, P1:
48 fps, max:
71 fps
65.3 66 [X] Razer Blade 17 Early 2022 874931, dGPU, 175W
Intel Core i9-12900H 1.8GHz
GeForce RTX 3080 Ti Laptop GPU
min:
57 fps, P1:
56 fps, max:
75 fps
66.4 [X] Asus ROG Zephyrus Duo 16 GX650RX 874931, sep. GPU, 25W
AMD Ryzen 9 6900HX 3.3GHz
GeForce RTX 3080 Ti Laptop GPU
min:
58 fps, P1:
57 fps, max:
76 fps
67.5 [X] MSI Raider GE77 HX 12UHS 874931, dGPU, Extreme Leistung
Intel Core i9-12900HX 1.7GHz
GeForce RTX 3080 Ti Laptop GPU
min:
58 fps, P1:
39 fps, max:
78 fps
68 70.2 [X] MSI Titan GT77 12UHS 874931, dGPU, Extreme Leistung
Intel Core i9-12900HX 1.7GHz
GeForce RTX 3080 Ti Laptop GPU
min:
60 fps, P1:
57 fps, max:
79 fps
~ 61 fps
+ Confronta
- Nascondi il confronto
...
NVIDIA GeForce RTX 3080 Ti Laptop GPU
max:
» Giocabile con la maggior parte dei portatili testati con dettagli ultra.
Additional Benchmarks
Ultra Low Preset 1920x1080
0 100 200 Tooltip GE76 Raider: Ø199.7 (168.035-230.7)
...
NVIDIA GeForce RTX 3080 Ti Laptop GPU
0 100 200 300 400 500 600 Tooltip GE76 Raider: Ø199.2 (165.141-652)
Intel UHD Graphics Xe 32EUs (Tiger Lake-H)
...
NVIDIA GeForce RTX 3080 Ti Laptop GPU
0 100 Tooltip GE76 Raider: Ø137.2 (124.16-190.9)
...
NVIDIA GeForce RTX 3080 Ti Laptop GPU
max:
0 100 200 Tooltip GE76 Raider: Ø104.9 (92.036-220)
...
NVIDIA GeForce RTX 3080 Ti Laptop GPU
max:
0 100 200 300 400 Tooltip GE76 Raider: Ø67.9 (55.28-446)
...
NVIDIA GeForce RTX 3050 4GB Laptop GPU
NVIDIA GeForce RTX 3080 Ti Laptop GPU
max:
» Giocabile con tutti i portatili testati con dettagli ultra.
0 100 200 300 400 500 600 Tooltip GE76 Raider: Ø169.8 (90.47-636)
...
NVIDIA GeForce RTX 3080 Ti Laptop GPU
0 100 200 Tooltip GE76 Raider: Ø153.8 (92.028-249.1)
...
NVIDIA GeForce RTX 3080 Ti Laptop GPU
0 100 Tooltip GE76 Raider: Ø118.8 (83.391-161.18)
...
NVIDIA GeForce RTX 3050 4GB Laptop GPU
NVIDIA GeForce RTX 3080 Ti Laptop GPU
max:
» Giocabile con tutti i portatili testati con dettagli ultra.
0 100 200 Tooltip GE76 Raider: Ø250 (196.65-290.504)
Intel UHD Graphics Xe 32EUs (Tiger Lake-H)
...
NVIDIA GeForce RTX 3080 Ti Laptop GPU
max:
AMD Radeon RX 6700 XT
0 100 200 Tooltip GE76 Raider: Ø236 (183.389-295.3)
...
NVIDIA GeForce RTX 3080 Ti Laptop GPU
max:
AMD Radeon RX 6700 XT
0 100 200 Tooltip GE76 Raider: Ø202 (156.397-247.14)
...
NVIDIA GeForce RTX 3080 Ti Laptop GPU
0 100 200 300 400 500 Tooltip GE76 Raider: Ø152.4 (115.64-518)
...
NVIDIA GeForce RTX 3080 Ti Laptop GPU
max:
0 Tooltip GE76 Raider: Ø73.3 (64.525-89.076)
...
NVIDIA GeForce RTX 3080 Ti Laptop GPU
max:
» Giocabile con tutti i portatili testati con dettagli ultra.
Additional Benchmarks
Ray Tracing Preset 1920x1080
129 [X] MSI GE76 Raider Intel Core i9-12900HK 1.8GHz
GeForce RTX 3080 Ti Laptop GPU
min:
60.2 fps, P0.1:
92.7 fps, P1:
103 fps, max:
170 fps
0 100 200 Tooltip GE76 Raider: Ø163.7 (119.63-260.87)
...
NVIDIA GeForce RTX 3080 Ti Laptop GPU
max:
AMD Radeon RX 6700 XT
0 100 200 300 Tooltip GE76 Raider: Ø170.7 (125.51-389)
...
NVIDIA GeForce RTX 3080 Ti Laptop GPU
max:
NVIDIA Titan RTX
0 100 200 Tooltip GE76 Raider: Ø155.9 (123.294-217.66)
...
NVIDIA GeForce RTX 3080 Ti Laptop GPU
max:
NVIDIA Titan RTX
0 100 Tooltip GE76 Raider: Ø113.4 (90.14-142.7)
...
NVIDIA GeForce RTX 3080 Ti Laptop GPU
max:
0 100 Tooltip GE76 Raider: Ø65.5 (49.671-187)
...
NVIDIA GeForce RTX 3080 Ti Laptop GPU
max:
» Giocabile con tutti i portatili testati con dettagli ultra.
...
NVIDIA GeForce RTX 3080 Ti Laptop GPU
max:
AMD Radeon RX 6700 XT
...
NVIDIA GeForce RTX 3080 Ti Laptop GPU
max:
...
NVIDIA GeForce RTX 3080 Ti Laptop GPU
max:
...
NVIDIA GeForce RTX 3080 Ti Laptop GPU
max:
...
NVIDIA GeForce RTX 3080 Ti Laptop GPU
max:
...
NVIDIA GeForce RTX 3080 Ti Laptop GPU
max:
» Giocabile con tutti i portatili testati con dettagli ultra.
Additional Benchmarks
Minimum Settings 1920x1080
0 100 200 Tooltip GE76 Raider: Ø125.9 (101.205-284)
...
NVIDIA GeForce RTX 3080 Ti Laptop GPU
max:
0 100 200 Tooltip GE76 Raider: Ø106 (53.882-247)
...
NVIDIA GeForce RTX 3080 Ti Laptop GPU
max:
0 100 200 300 Tooltip GE76 Raider: Ø93.5 (66.189-314)
...
NVIDIA GeForce RTX 3080 Ti Laptop GPU
max:
0 100 Tooltip GE76 Raider: Ø59.3 (31.102-179)
...
NVIDIA GeForce RTX 3080 Ti Laptop GPU
max:
0 Tooltip GE76 Raider: Ø29.1 (22.301-55.3)
NVIDIA GeForce RTX 3050 4GB Laptop GPU
...
NVIDIA GeForce RTX 3080 Ti Laptop GPU
max:
» Giocabile con tutti i portatili testati con dettagli ultra.
Additional Benchmarks
Ray Tracing Ultra Preset (DLSS off) 1920x1080
45.8 [X] MSI GE76 Raider Intel Core i9-12900HK 1.8GHz
GeForce RTX 3080 Ti Laptop GPU
min:
3.21 fps, P0.1:
3.67 fps, P1:
40 fps, max:
97.4 fps
0 100 200 Tooltip GE76 Raider: Ø165.8 (121.215-207.3)
...
NVIDIA GeForce RTX 2070 Super Mobile
NVIDIA GeForce RTX 3080 Ti Laptop GPU
0 100 200 Tooltip GE76 Raider: Ø168.6 (132.5-263)
Intel UHD Graphics Xe 32EUs (Tiger Lake-H)
...
NVIDIA GeForce RTX 2070 Super Max-Q
NVIDIA GeForce RTX 2070 Super Mobile
NVIDIA GeForce RTX 3080 Ti Laptop GPU
0 100 Tooltip GE76 Raider: Ø143.8 (122.53-167.3)
...
NVIDIA GeForce RTX 2070 Super Mobile
NVIDIA GeForce RTX 3080 Ti Laptop GPU
0 100 Tooltip GE76 Raider: Ø112.7 (97.719-159.7)
...
NVIDIA GeForce RTX 2070 Super Mobile
NVIDIA GeForce RTX 3080 Ti Laptop GPU
0 Tooltip GE76 Raider: Ø56.8 (49.686-68.2)
...
NVIDIA GeForce RTX 2070 Super Mobile
NVIDIA GeForce RTX 3080 Ti Laptop GPU
max:
» Giocabile con tutti i portatili testati con dettagli ultra.
...
NVIDIA GeForce RTX 2070 Super Max-Q
NVIDIA GeForce RTX 2070 Super Mobile
NVIDIA GeForce RTX 3080 Ti Laptop GPU
max:
...
NVIDIA GeForce RTX 3080 Ti Laptop GPU
max:
...
NVIDIA GeForce RTX 3080 Ti Laptop GPU
max:
...
NVIDIA GeForce RTX 2070 Super Mobile
NVIDIA GeForce RTX 3080 Ti Laptop GPU
max:
...
NVIDIA GeForce RTX 3080 Ti Laptop GPU
max:
...
NVIDIA GeForce RTX 3080 Ti Laptop GPU
max:
» Giocabile con tutti i portatili testati con dettagli ultra.
Intel UHD Graphics Xe 16EUs (Tiger Lake-H)
...
NVIDIA GeForce RTX 2070 Super Max-Q
NVIDIA GeForce RTX 2070 Super Mobile
NVIDIA GeForce RTX 3080 Ti Laptop GPU
max:
...
NVIDIA GeForce RTX 3080 Ti Laptop GPU
max:
...
NVIDIA GeForce RTX 3080 Ti Laptop GPU
max:
...
NVIDIA GeForce RTX 3080 Ti Laptop GPU
...
max:
...
NVIDIA GeForce RTX 3080 Ti Laptop GPU
max:
...
NVIDIA GeForce RTX 3080 Ti Laptop GPU
max:
» Giocabile con tutti i portatili testati con dettagli ultra.
0 100 200 Tooltip x15 R2 P111F: Ø135.2 (28-210)
Titan GT77 12UHS: Ø143.6 (39-216)
...
NVIDIA GeForce RTX 2070 Super Mobile
NVIDIA GeForce RTX 3080 Ti Laptop GPU
max:
AMD Radeon RX 6700 XT
0 100 200 Tooltip x15 R2 P111F: Ø123.7 (23-184)
Titan GT77 12UHS: Ø135.9 (37-218)
Intel UHD Graphics Xe 16EUs (Tiger Lake-H)
...
NVIDIA GeForce RTX 3080 Ti Laptop GPU
max:
0 100 Tooltip x15 R2 P111F: Ø108.8 (34-148)
Titan GT77 12UHS: Ø122.7 (38-178)
...
NVIDIA GeForce RTX 3080 Ti Laptop GPU
max:
0 100 Tooltip x15 R2 P111F: Ø78.7 (23-131)
Titan GT77 12UHS: Ø84.2 (46-153)
...
NVIDIA GeForce RTX 3080 Ti Laptop GPU
...
max:
...
NVIDIA GeForce RTX 3080 Ti Laptop GPU
...
max:
...
NVIDIA GeForce RTX 3080 Ti Laptop GPU
max:
» Giocabile con tutti i portatili testati con dettagli ultra.
Additional Benchmarks
Ultra Preset + Ultra Ray Tracing (DX12) 1920x1080
55.8 [X] MSI Titan GT77 12UHS 905427
Intel Core i9-12900HX 1.7GHz
GeForce RTX 3080 Ti Laptop GPU
min:
29.04 fps, P1:
45.55 fps, max:
123.08 fps
0 100 200 300 400 Tooltip GE76 Raider: Ø409 (335.691-452.24)
...
NVIDIA GeForce RTX 2070 Super Mobile
NVIDIA GeForce RTX 3080 Ti Laptop GPU
max:
0 100 200 300 400 Tooltip GE76 Raider: Ø380 (319.67-430)
...
NVIDIA GeForce RTX 2080 Super Mobile
NVIDIA GeForce RTX 3080 Ti Laptop GPU
max:
0 100 200 300 400 Tooltip GE76 Raider: Ø360 (300.8-462)
...
NVIDIA GeForce RTX 2080 Super Mobile
NVIDIA GeForce RTX 3080 Ti Laptop GPU
max:
0 100 200 300 400 500 600 700 Tooltip GE76 Raider: Ø282 (222.5-720)
...
NVIDIA GeForce RTX 2080 Super Mobile
NVIDIA GeForce RTX 3080 Ti Laptop GPU
max:
0 100 200 300 400 500 600 700 800 Tooltip GE76 Raider: Ø173.4 (124.773-892)
...
NVIDIA GeForce RTX 2080 Super Mobile
NVIDIA GeForce RTX 3080 Ti Laptop GPU
max:
» Giocabile con tutti i portatili testati con dettagli ultra.
0 100 Tooltip GE76 Raider: Ø159.7 (145.46-177.79)
Intel UHD Graphics G1 (Ice Lake 32 EU)
...
NVIDIA GeForce RTX 2070 Super Mobile
NVIDIA GeForce RTX 3080 Ti Laptop GPU
max:
0 100 200 300 400 500 600 700 800 900 1000 1100 1200 1300 1400 1500 1600 1700 1800 1900 2000 2100 2200 2300 2400 2500 2600 2700 2800 2900 3000 3100 3200 3300 3400 3500 3600 3700 3800 3900 4000 4100 4200 4300 4400 4500 4600 4700 4800 4900 5000 5100 5200 5300 5400 5500 5600 5700 5800 5900 6000 6100 6200 6300 6400 6500 6600 6700 6800 6900 7000 7100 7200 7300 7400 Tooltip GE76 Raider: Ø408 (137.18-7479)
...
NVIDIA GeForce RTX 2070 Super Mobile
NVIDIA GeForce RTX 2080 Super Mobile
NVIDIA GeForce RTX 3080 Ti Laptop GPU
max:
0 100 Tooltip GE76 Raider: Ø109.6 (102.44-134.2)
...
NVIDIA GeForce RTX 2080 Super Mobile
NVIDIA GeForce RTX 3080 Ti Laptop GPU
max:
0 100 200 300 Tooltip GE76 Raider: Ø73.1 (56.379-305)
NVIDIA GeForce GTX 1050 Ti Mobile
...
NVIDIA GeForce RTX 2080 Super Mobile
NVIDIA GeForce RTX 3080 Ti Laptop GPU
max:
» Giocabile con tutti i portatili testati con dettagli alto.
...
NVIDIA GeForce RTX 2070 Super Max-Q
NVIDIA GeForce RTX 2070 Super Mobile
NVIDIA GeForce RTX 3080 Ti Laptop GPU
max:
...
NVIDIA GeForce RTX 2070 Super Max-Q
NVIDIA GeForce RTX 2070 Super Mobile
NVIDIA GeForce RTX 3080 Ti Laptop GPU
NVIDIA GeForce RTX 2080 Super Mobile
max:
...
NVIDIA GeForce RTX 2070 Super Mobile
NVIDIA GeForce RTX 2080 Super Mobile
NVIDIA GeForce RTX 3080 Ti Laptop GPU
max:
...
NVIDIA GeForce RTX 2070 Super Mobile
NVIDIA GeForce RTX 2080 Super Mobile
NVIDIA GeForce RTX 3080 Ti Laptop GPU
max:
NVIDIA GeForce RTX 2070 Super Mobile
NVIDIA GeForce RTX 2080 Super Mobile
NVIDIA GeForce RTX 3080 Ti Laptop GPU
max:
» Giocabile con tutti i portatili testati con dettagli ultra.
0 100 200 Tooltip GE76 Raider: Ø203 (166.145-230.32)
...
NVIDIA GeForce RTX 3080 Ti Laptop GPU
max:
0 100 Tooltip GE76 Raider: Ø109.9 (96.56-150.5)
...
NVIDIA GeForce RTX 3080 Ti Laptop GPU
max:
0 Tooltip GE76 Raider: Ø72.9 (66.12-80.32)
...
NVIDIA GeForce RTX 3080 Ti Laptop GPU
max:
0 100 Tooltip GE76 Raider: Ø65.1 (49.48-115.3)
...
NVIDIA GeForce RTX 3080 Ti Laptop GPU
max:
0 Tooltip GE76 Raider: Ø44.1 (32.033-85.2)
...
NVIDIA GeForce RTX 3080 Ti Laptop GPU
max:
» Giocabile con tutti i portatili testati con dettagli ultra.
Intel UHD Graphics Xe 16EUs (Tiger Lake-H)
...
NVIDIA GeForce RTX 3050 4GB Laptop GPU
NVIDIA GeForce RTX 3080 Ti Laptop GPU
AMD Radeon RX Vega 8 (Ryzen 2000/3000)
...
NVIDIA GeForce RTX 2070 Super Mobile
NVIDIA GeForce RTX 3080 Ti Laptop GPU
...
NVIDIA GeForce RTX 2070 Super Mobile
NVIDIA GeForce RTX 2080 Super Mobile
NVIDIA GeForce RTX 3080 Ti Laptop GPU
...
NVIDIA GeForce RTX 2070 Super Mobile
NVIDIA GeForce RTX 2080 Super Mobile
NVIDIA GeForce RTX 3080 Ti Laptop GPU
NVIDIA GeForce GTX 1050 Ti Mobile
...
NVIDIA GeForce RTX 2080 Super Mobile
NVIDIA GeForce RTX 3080 Ti Laptop GPU
NVIDIA GeForce GTX 1050 Ti Mobile
...
NVIDIA GeForce RTX 2080 Super Mobile
NVIDIA GeForce RTX 3080 Ti Laptop GPU
» Giocabile con tutti i portatili testati con dettagli ultra.
...
NVIDIA GeForce RTX 2070 Super Max-Q
NVIDIA GeForce RTX 2070 Super Mobile
NVIDIA GeForce RTX 3080 Ti Laptop GPU
max:
Intel UHD Graphics Xe 16EUs (Tiger Lake-H)
...
NVIDIA GeForce RTX 2070 Super Mobile
NVIDIA GeForce RTX 2070 Super Max-Q
NVIDIA GeForce RTX 3080 Ti Laptop GPU
max:
...
NVIDIA GeForce RTX 2070 Super Mobile
NVIDIA GeForce RTX 2070 Super Max-Q
NVIDIA GeForce RTX 2080 Super Mobile
NVIDIA GeForce RTX 3080 Ti Laptop GPU
max:
...
NVIDIA GeForce RTX 2070 Super Max-Q
NVIDIA GeForce RTX 2080 Super Mobile
NVIDIA GeForce RTX 3080 Ti Laptop GPU
max:
...
NVIDIA GeForce RTX 2080 Super Mobile
NVIDIA GeForce RTX 3080 Ti Laptop GPU
max:
...
NVIDIA GeForce RTX 2080 Super Mobile
NVIDIA GeForce RTX 3080 Ti Laptop GPU
max:
NVIDIA GeForce RTX 3080 Ti Laptop GPU
max:
» Giocabile con tutti i portatili testati con dettagli ultra.
Additional Benchmarks
Ultimate Quality FidelityFX Quality 3840x2160
95 [X] MSI Raider GE76 12UHS @175 W TGP Intel Core i9-12900HK 1.8GHz
GeForce RTX 3080 Ti Laptop GPU
P1:
72 fps
0 100 Tooltip GE76 Raider: Ø153.9 (140.702-168.8)
...
NVIDIA GeForce RTX 2070 Super Mobile
NVIDIA GeForce RTX 3080 Ti Laptop GPU
max:
0 100 Tooltip GE76 Raider: Ø153.7 (144.004-176.4)
...
NVIDIA GeForce RTX 2080 Super Mobile
NVIDIA GeForce RTX 3080 Ti Laptop GPU
max:
0 100 200 300 400 500 600 Tooltip GE76 Raider: Ø171.3 (138.24-653)
...
NVIDIA GeForce RTX 2080 Super Mobile
NVIDIA GeForce RTX 3080 Ti Laptop GPU
max:
0 100 Tooltip GE76 Raider: Ø132.1 (119.331-158.5)
...
NVIDIA GeForce RTX 2080 Super Mobile
NVIDIA GeForce RTX 3080 Ti Laptop GPU
max:
0 100 200 300 Tooltip GE76 Raider: Ø93 (73.489-313)
...
NVIDIA GeForce RTX 2070 Super Mobile
NVIDIA GeForce RTX 2080 Super Mobile
NVIDIA GeForce RTX 3080 Ti Laptop GPU
max:
» Giocabile con tutti i portatili testati con dettagli ultra.
...
NVIDIA GeForce RTX 2070 Super Max-Q
NVIDIA GeForce RTX 3080 Ti Laptop GPU
max:
...
NVIDIA GeForce RTX 2080 Super Mobile
NVIDIA GeForce RTX 3080 Ti Laptop GPU
max:
...
NVIDIA GeForce RTX 2080 Super Mobile
NVIDIA GeForce RTX 3080 Ti Laptop GPU
max:
...
NVIDIA GeForce RTX 2080 Super Mobile
NVIDIA GeForce RTX 3080 Ti Laptop GPU
max:
...
NVIDIA GeForce RTX 2080 Super Mobile
NVIDIA GeForce RTX 3080 Ti Laptop GPU
max:
...
NVIDIA GeForce RTX 2080 Super Mobile
NVIDIA GeForce RTX 3080 Ti Laptop GPU
max:
» Giocabile con tutti i portatili testati con dettagli ultra.
...
NVIDIA GeForce RTX 3080 Ti Laptop GPU
...
NVIDIA GeForce RTX 2070 Super Max-Q
NVIDIA GeForce RTX 3080 Ti Laptop GPU
max:
...
NVIDIA GeForce RTX 2080 Super Mobile
NVIDIA GeForce RTX 3080 Ti Laptop GPU
max:
...
NVIDIA GeForce RTX 2080 Super Mobile
NVIDIA GeForce RTX 3080 Ti Laptop GPU
max:
...
NVIDIA GeForce RTX 2080 Super Mobile
NVIDIA GeForce RTX 3080 Ti Laptop GPU
max:
...
NVIDIA GeForce RTX 2080 Super Mobile
NVIDIA GeForce RTX 3080 Ti Laptop GPU
max:
...
NVIDIA GeForce RTX 2070 Super Mobile
NVIDIA GeForce RTX 2080 Super Mobile
NVIDIA GeForce RTX 3080 Ti Laptop GPU
max:
» Giocabile con tutti i portatili testati con dettagli ultra.
...
AMD Radeon 680M
NVIDIA GeForce RTX 3080 Ti Laptop GPU
max:
0 100 200 300 400 Tooltip GE76 Raider: Ø366 (240.31-434.8)
Intel UHD Graphics Xe 16EUs (Tiger Lake-H)
...
NVIDIA GeForce RTX 2080 Super Mobile
NVIDIA GeForce RTX 3080 Ti Laptop GPU
max:
0 100 200 300 Tooltip GE76 Raider: Ø309 (245.19-350.51)
Intel Iris Plus Graphics G7 (Ice Lake 64 EU)
...
NVIDIA GeForce RTX 2080 Super Mobile
NVIDIA GeForce RTX 3080 Ti Laptop GPU
max:
0 100 200 300 Tooltip GE76 Raider: Ø308 (262.317-338.7)
AMD Radeon RX Vega 8 (Ryzen 2000/3000)
...
NVIDIA GeForce RTX 2080 Super Mobile
NVIDIA GeForce RTX 3080 Ti Laptop GPU
max:
0 100 200 Tooltip GE76 Raider: Ø239 (194.037-276)
...
NVIDIA GeForce RTX 2080 Super Mobile
NVIDIA GeForce RTX 3080 Ti Laptop GPU
max:
0 100 Tooltip GE76 Raider: Ø130.1 (115.15-149.6)
...
NVIDIA GeForce RTX 2080 Super Mobile
NVIDIA GeForce RTX 3080 Ti Laptop GPU
max:
» Giocabile con tutti i portatili testati con dettagli ultra.
AMD Radeon R4 (Stoney Ridge)
...
NVIDIA GeForce RTX 3080 Ti Laptop GPU
0 100 200 Tooltip GE76 Raider: Ø210 (191.547-270.6)
...
NVIDIA GeForce RTX 2070 Super Mobile
NVIDIA GeForce RTX 2080 Super Mobile
NVIDIA GeForce RTX 3080 Ti Laptop GPU
0 100 200 Tooltip GE76 Raider: Ø183.1 (169.68-216.43)
...
NVIDIA GeForce RTX 2070 Super Mobile
NVIDIA GeForce RTX 2080 Super Mobile
NVIDIA GeForce RTX 3080 Ti Laptop GPU
0 100 Tooltip GE76 Raider: Ø122.7 (112.023-170)
...
NVIDIA GeForce RTX 2070 Super Mobile
NVIDIA GeForce RTX 2080 Super Mobile
NVIDIA GeForce RTX 3080 Ti Laptop GPU
max:
0 100 Tooltip GE76 Raider: Ø64.5 (51.368-134.9)
NVIDIA GeForce GTX 1050 Max-Q
...
NVIDIA GeForce RTX 2070 Super Mobile
NVIDIA GeForce RTX 3080 Ti Laptop GPU
NVIDIA GeForce RTX 2080 Super Mobile
max:
» Giocabile con tutti i portatili testati con dettagli alto.
...
NVIDIA GeForce RTX 3080 Ti Laptop GPU
...
max:
...
NVIDIA GeForce RTX 3080 Ti Laptop GPU
NVIDIA GeForce RTX 2070 Super Max-Q
NVIDIA GeForce RTX 2070 Super Mobile
...
max:
Intel UHD Graphics Xe 16EUs (Tiger Lake-H)
...
NVIDIA GeForce RTX 2070 Super Mobile
NVIDIA GeForce RTX 3080 Ti Laptop GPU
NVIDIA GeForce RTX 2080 Super Mobile
max:
Intel Iris Plus Graphics G4 (Ice Lake 48 EU)
...
NVIDIA GeForce RTX 2080 Super Mobile
NVIDIA GeForce RTX 3080 Ti Laptop GPU
max:
...
NVIDIA GeForce RTX 2080 Super Mobile
NVIDIA GeForce RTX 3080 Ti Laptop GPU
max:
NVIDIA GeForce GTX 1050 Ti Mobile
...
NVIDIA GeForce RTX 2080 Super Mobile
NVIDIA GeForce RTX 3080 Ti Laptop GPU
max:
» Giocabile con tutti i portatili testati con dettagli ultra.
Additional Benchmarks
Very Low Overall Quality (DX11) 1920x1080
...
NVIDIA GeForce RTX 2070 Super Mobile
NVIDIA GeForce RTX 2080 Super Mobile
NVIDIA GeForce RTX 3080 Ti Laptop GPU
max:
NVIDIA GeForce GTX 1050 Ti Mobile
...
NVIDIA GeForce RTX 2070 Super Mobile
NVIDIA GeForce RTX 2080 Super Mobile
NVIDIA GeForce RTX 3080 Ti Laptop GPU
max:
NVIDIA GeForce RTX 3080 Ti Laptop GPU
max:
Additional Benchmarks
High Quality Preset & High Ray Tracing Preset (DX12) 3840x2160
23.3 [X] MSI Raider GE76 12UHS @175 W TGP Intel Core i9-12900HK 1.8GHz
GeForce RTX 3080 Ti Laptop GPU
min:
12.9 fps, P0.1:
13.5 fps, P1:
20.3 fps, max:
85.8 fps
0 100 Tooltip XMG Neo 17 M22: Ø124.8 (90-185)
...
NVIDIA GeForce RTX 3050 4GB Laptop GPU
NVIDIA GeForce RTX 3080 Ti Laptop GPU
max:
0 100 Tooltip XMG Neo 17 M22: Ø112 (88-164)
...
NVIDIA GeForce RTX 2070 Super Max-Q
NVIDIA GeForce RTX 2070 Super Mobile
NVIDIA GeForce RTX 3080 Ti Laptop GPU
NVIDIA GeForce RTX 2080 Super Mobile
max:
0 100 Tooltip XMG Neo 17 M22: Ø108.2 (83-158)
...
NVIDIA GeForce RTX 2070 Super Max-Q
NVIDIA GeForce RTX 2070 Super Mobile
NVIDIA GeForce RTX 3080 Ti Laptop GPU
NVIDIA GeForce RTX 2080 Super Mobile
max:
0 100 Tooltip XMG Neo 17 M22: Ø96.3 (68-152)
Intel UHD Graphics Xe 16EUs (Tiger Lake-H)
...
NVIDIA GeForce RTX 2070 Super Max-Q
NVIDIA GeForce RTX 2070 Super Mobile
NVIDIA GeForce RTX 3080 Ti Laptop GPU
NVIDIA GeForce RTX 2080 Super Mobile
max:
0 100 Tooltip XMG Neo 17 M22: Ø93.2 (66-145)
...
NVIDIA GeForce RTX 2070 Super Mobile
NVIDIA GeForce RTX 2080 Super Mobile
NVIDIA GeForce RTX 3080 Ti Laptop GPU
max:
0 Tooltip XMG Neo 17 M22: Ø72.8 (62-90)
...
NVIDIA GeForce RTX 2070 Super Mobile
NVIDIA GeForce RTX 2080 Super Mobile
NVIDIA GeForce RTX 3080 Ti Laptop GPU
max:
» Giocabile con tutti i portatili testati con dettagli ultra.
...
NVIDIA GeForce RTX 3080 Ti Laptop GPU
max:
...
NVIDIA GeForce RTX 2080 Super Mobile
NVIDIA GeForce RTX 3080 Ti Laptop GPU
...
max:
...
NVIDIA GeForce RTX 2080 Super Mobile
NVIDIA GeForce RTX 3080 Ti Laptop GPU
...
max:
AMD Radeon RX Vega 8 (Ryzen 2000/3000)
...
NVIDIA GeForce RTX 2080 Super Mobile
NVIDIA GeForce RTX 3080 Ti Laptop GPU
...
max:
...
NVIDIA GeForce RTX 2080 Super Mobile
NVIDIA GeForce RTX 3080 Ti Laptop GPU
...
max:
AMD Radeon Pro W6800
NVIDIA GeForce GTX 1050 Ti Max-Q
...
NVIDIA GeForce RTX 3080 Ti Laptop GPU
max:
» Giocabile con tutti i portatili testati con dettagli ultra.
Additional Benchmarks
Ultra Quality DXR 16xAF 1920x1080
...
Apple M1 Max 32-Core GPU
Apple M1 Max 24-Core GPU
NVIDIA GeForce RTX 3080 Ti Laptop GPU
max:
...
NVIDIA GeForce RTX 2080 Super Mobile
NVIDIA GeForce RTX 3080 Ti Laptop GPU
max:
...
NVIDIA GeForce RTX 2080 Super Mobile
NVIDIA GeForce RTX 3080 Ti Laptop GPU
...
max:
...
NVIDIA GeForce RTX 2080 Super Mobile
NVIDIA GeForce RTX 3080 Ti Laptop GPU
max:
...
NVIDIA GeForce RTX 2080 Super Mobile
NVIDIA GeForce RTX 3080 Ti Laptop GPU
...
max:
AMD Radeon RX Vega 8 (Ryzen 2000/3000)
...
NVIDIA GeForce RTX 2080 Super Mobile
NVIDIA GeForce RTX 3080 Ti Laptop GPU
...
max:
» Giocabile con tutti i portatili testati con dettagli ultra.
205 [X] SCHENKER XMG Neo 17 M22 1.47.22.14 D3D12
AMD Ryzen 9 6900HX 3.3GHz
GeForce RTX 3080 Ti Laptop GPU
min:
39.1 fps, P1:
177.9 fps, max:
288 fps
359 361 361 382 [X] Razer Blade 17 Early 2022 1.47.22.14 D3D12
Intel Core i9-12900H 1.8GHz
GeForce RTX 3080 Ti Laptop GPU
min:
159.2 fps, P1:
271 fps, max:
566 fps
415 [X] Medion Erazer Beast X30 1.47.22.14 D3D12
Intel Core i9-12900HK 1.8GHz
GeForce RTX 3080 Ti Laptop GPU
min:
206 fps, P1:
306 fps, max:
626 fps
415.8 416 [X] Eurocom Nightsky TXi317 1.47.22.14 D3D12
Intel Core i7-12700H 1.7GHz
GeForce RTX 3080 Ti Laptop GPU
min:
148.7 fps, P1:
314 fps, max:
715 fps
424 [X] Gigabyte Aero 16 YE5 1.47.22.14 D3D12
Intel Core i9-12900HK 1.8GHz
GeForce RTX 3080 Ti Laptop GPU
min:
218 fps, P1:
290 fps, max:
693 fps
426 [X] SCHENKER XMG Neo 15 with XMG Oasis 1.47.22.14 D3D12
Intel Core i7-12700H 1.7GHz
GeForce RTX 3080 Ti Laptop GPU
min:
123.2 fps, P1:
312 fps, max:
626 fps
428 [X] SCHENKER XMG Neo 15 with XMG Oasis 1.47.22.14 D3D12
Intel Core i7-12700H 1.7GHz
GeForce RTX 3080 Ti Laptop GPU
min:
102.2 fps, P1:
314 fps, max:
633 fps
431 442 [X] Razer Blade 15 2022 1.47.22.14 D3D12
Intel Core i7-12800H 1.8GHz
GeForce RTX 3080 Ti Laptop GPU
min:
112 fps, P1:
326 fps, max:
657 fps
442 447 448 458 [X] Alienware x15 R2 P111F 1.47.22.14 D3D12
Intel Core i9-12900H 1.8GHz
GeForce RTX 3080 Ti Laptop GPU
min:
227 fps, P1:
343 fps, max:
640 fps
472 474 [X] Alienware x17 R2 P48E 1.47.22.14 D3D12
Intel Core i9-12900HK 1.8GHz
GeForce RTX 3080 Ti Laptop GPU
min:
62.3 fps, P1:
339 fps, max:
736 fps
474 490 [X] MSI Raider GE66 12UHS 1.47.22.14 D3D12
Intel Core i9-12900HK @5GHz
GeForce RTX 3080 Ti Laptop GPU
min:
132.6 fps, P1:
360 fps, max:
734 fps
505 [X] MSI Raider GE77 HX 12UHS 1.47.22.14 D3D12
Intel Core i9-12900HX 1.7GHz
GeForce RTX 3080 Ti Laptop GPU
min:
212 fps, P1:
386 fps, max:
736 fps
519 [X] MSI Titan GT77 12UHS 1.47.22.14 D3D12
Intel Core i9-12900HX 1.7GHz
GeForce RTX 3080 Ti Laptop GPU
min:
251 fps, P1:
392 fps, max:
790 fps
535 [X] MSI Titan GT77 12UHS 1.47.22.14 D3D12
Intel Core i9-12900HX 1.7GHz
GeForce RTX 3080 Ti Laptop GPU
min:
279 fps, P1:
404 fps, max:
797 fps
550 [X] MSI Titan GT77 12UHS 1.47.22.14 D3D12, dGPU, Extreme Leistung
Intel Core i9-12900HX 1.7GHz
GeForce RTX 3080 Ti Laptop GPU
min:
119.4 fps, P1:
415 fps, max:
816 fps
563 [X] MSI Raider GE77 HX 12UHS 1.47.22.14 D3D12, dGPU, Extreme Leistung
Intel Core i9-12900HX 1.7GHz
GeForce RTX 3080 Ti Laptop GPU
min:
102.7 fps, P1:
433 fps, max:
826 fps
~ 440 fps
+ Confronta
- Nascondi il confronto
...
NVIDIA GeForce RTX 3080 Ti Laptop GPU
NVIDIA GeForce RTX 2080 Super Mobile
max:
194 200 [X] Gigabyte Aero 16 YE5 1.47.22.14 D3D12
Intel Core i9-12900HK 1.8GHz
GeForce RTX 3080 Ti Laptop GPU
min:
95.5 fps, P1:
161 fps, max:
312 fps
212 229 234 239 246 [X] Alienware x15 R2 P111F 1.47.22.14 D3D12
Intel Core i9-12900H 1.8GHz
GeForce RTX 3080 Ti Laptop GPU
min:
165 fps, P1:
191.7 fps, max:
364 fps
252 [X] Razer Blade 15 2022 1.47.22.14 D3D12
Intel Core i7-12800H 1.8GHz
GeForce RTX 3080 Ti Laptop GPU
min:
136 fps, P1:
194 fps, max:
392 fps
268 [X] Medion Erazer Beast X30 1.47.22.14 D3D12
Intel Core i9-12900HK 1.8GHz
GeForce RTX 3080 Ti Laptop GPU
min:
135.1 fps, P1:
197.4 fps, max:
423 fps
272 [X] Razer Blade 17 Early 2022 1.47.22.14 D3D12
Intel Core i9-12900H 1.8GHz
GeForce RTX 3080 Ti Laptop GPU
min:
33.5 fps, P1:
199 fps, max:
419 fps
273 [X] Eurocom Nightsky TXi317 1.47.22.14 D3D12
Intel Core i7-12700H 1.7GHz
GeForce RTX 3080 Ti Laptop GPU
min:
78.5 fps, P1:
203 fps, max:
447 fps
274 277 [X] SCHENKER XMG Neo 15 with XMG Oasis 1.47.22.14 D3D12
Intel Core i7-12700H 1.7GHz
GeForce RTX 3080 Ti Laptop GPU
min:
77.3 fps, P1:
208 fps, max:
453 fps
277 [X] SCHENKER XMG Neo 17 M22 1.47.22.14 D3D12
AMD Ryzen 9 6900HX 3.3GHz
GeForce RTX 3080 Ti Laptop GPU
min:
59.8 fps, P1:
216 fps, max:
414 fps
279 [X] SCHENKER XMG Neo 15 with XMG Oasis 1.47.22.14 D3D12
Intel Core i7-12700H 1.7GHz
GeForce RTX 3080 Ti Laptop GPU
min:
83.8 fps, P1:
209 fps, max:
469 fps
284 [X] MSI Raider GE66 12UHS 1.47.22.14 D3D12
Intel Core i9-12900HK @5GHz
GeForce RTX 3080 Ti Laptop GPU
min:
62.1 fps, P1:
242 fps, max:
437 fps
285 286 [X] MSI Titan GT77 12UHS 1.47.22.14 D3D12
Intel Core i9-12900HX 1.7GHz
GeForce RTX 3080 Ti Laptop GPU
min:
128.1 fps, P1:
225 fps, max:
451 fps
290 291 [X] MSI Raider GE77 HX 12UHS 1.47.22.14 D3D12
Intel Core i9-12900HX 1.7GHz
GeForce RTX 3080 Ti Laptop GPU
min:
123.7 fps, P1:
225 fps, max:
450 fps
296 [X] Razer Blade 17 RTX 3080 Ti 1.47.22.14 D3D12
Intel Core i7-12800H 1.8GHz
GeForce RTX 3080 Ti Laptop GPU
min:
19.6 fps, P1:
232 fps, max:
470 fps
300 [X] Alienware x17 R2 P48E 1.47.22.14 D3D12
Intel Core i9-12900HK 1.8GHz
GeForce RTX 3080 Ti Laptop GPU
min:
92.3 fps, P1:
235 fps, max:
454 fps
311 312 [X] MSI GE76 Raider 1.47.22.14 D3D12
Intel Core i9-12900HK 1.8GHz
GeForce RTX 3080 Ti Laptop GPU
min:
118 fps, P1:
257 fps, max:
463 fps
312 [X] MSI Titan GT77 12UHS 1.47.22.14 D3D12, dGPU, Extreme Leistung
Intel Core i9-12900HX 1.7GHz
GeForce RTX 3080 Ti Laptop GPU
min:
68.3 fps, P1:
263 fps, max:
478 fps
313 [X] MSI Titan GT77 12UHS 1.47.22.14 D3D12
Intel Core i9-12900HX 1.7GHz
GeForce RTX 3080 Ti Laptop GPU
min:
38.9 fps, P1:
264 fps, max:
500 fps
314 [X] MSI Raider GE77 HX 12UHS 1.47.22.14 D3D12, dGPU, Extreme Leistung
Intel Core i9-12900HX 1.7GHz
GeForce RTX 3080 Ti Laptop GPU
min:
81.4 fps, P1:
260 fps, max:
451 fps
~ 271 fps
+ Confronta
- Nascondi il confronto
...
NVIDIA GeForce RTX 2080 Super Mobile
NVIDIA GeForce RTX 3080 Ti Laptop GPU
max:
156 159 [X] MSI Creator Z16P B12UHST 1.47.22.14 D3D12
Intel Core i9-12900H 1.8GHz
GeForce RTX 3080 Ti Laptop GPU
min:
79.2 fps, P1:
100.7 fps, max:
381 fps
167.6 168 [X] Gigabyte Aero 16 YE5 1.47.22.14 D3D12
Intel Core i9-12900HK 1.8GHz
GeForce RTX 3080 Ti Laptop GPU
min:
43.1 fps, P1:
131 fps, max:
332 fps
189.4 196 198.8 200 [X] Alienware x15 R2 P111F 1.47.22.14 D3D12
Intel Core i9-12900H 1.8GHz
GeForce RTX 3080 Ti Laptop GPU
min:
18.2 fps, P1:
144.7 fps, max:
339 fps
205 [X] Razer Blade 15 2022 1.47.22.14 D3D12
Intel Core i7-12800H 1.8GHz
GeForce RTX 3080 Ti Laptop GPU
min:
74.7 fps, P1:
147 fps, max:
345 fps
222 [X] Medion Erazer Beast X30 1.47.22.14 D3D12
Intel Core i9-12900HK 1.8GHz
GeForce RTX 3080 Ti Laptop GPU
min:
111.2 fps, P1:
154.4 fps, max:
394 fps
224 [X] MSI Raider GE66 12UHS 1.47.22.14 D3D12
Intel Core i9-12900HK @5GHz
GeForce RTX 3080 Ti Laptop GPU
min:
61.2 fps, P1:
162.6 fps, max:
449 fps
225 226 [X] SCHENKER XMG Neo 15 with XMG Oasis 1.47.22.14 D3D12
Intel Core i7-12700H 1.7GHz
GeForce RTX 3080 Ti Laptop GPU
min:
42.3 fps, P1:
155.2 fps, max:
439 fps
226 [X] Eurocom Nightsky TXi317 1.47.22.14 D3D12
Intel Core i7-12700H 1.7GHz
GeForce RTX 3080 Ti Laptop GPU
min:
27.9 fps, P1:
171.2 fps, max:
402 fps
229 [X] Razer Blade 17 Early 2022 1.47.22.14 D3D12
Intel Core i9-12900H 1.8GHz
GeForce RTX 3080 Ti Laptop GPU
min:
89.9 fps, P1:
156.8 fps, max:
380 fps
229 [X] SCHENKER XMG Neo 17 M22 1.47.22.14 D3D12
AMD Ryzen 9 6900HX 3.3GHz
GeForce RTX 3080 Ti Laptop GPU
min:
37.5 fps, P1:
169 fps, max:
369 fps
231 232 233 [X] MSI Titan GT77 12UHS 1.47.22.14 D3D12
Intel Core i9-12900HX 1.7GHz
GeForce RTX 3080 Ti Laptop GPU
min:
118.6 fps, P1:
156.3 fps, max:
479 fps
234 [X] MSI Raider GE77 HX 12UHS 1.47.22.14 D3D12
Intel Core i9-12900HX 1.7GHz
GeForce RTX 3080 Ti Laptop GPU
min:
103 fps, P1:
156.1 fps, max:
465 fps
236 238 [X] SCHENKER XMG Pro 17 E22 1.47.22.14 D3D12
Intel Core i9-12900H 1.8GHz
GeForce RTX 3080 Ti Laptop GPU
min:
42.8 fps, P1:
162.5 fps, max:
415 fps
242 [X] Razer Blade 17 RTX 3080 Ti 1.47.22.14 D3D12
Intel Core i7-12800H 1.8GHz
GeForce RTX 3080 Ti Laptop GPU
min:
82.8 fps, P1:
169 fps, max:
419 fps
243 [X] Alienware x17 R2 P48E 1.47.22.14 D3D12
Intel Core i9-12900HK 1.8GHz
GeForce RTX 3080 Ti Laptop GPU
min:
91.8 fps, P1:
171.1 fps, max:
410 fps
247 [X] MSI Titan GT77 12UHS 1.47.22.14 D3D12, dGPU, Extreme Leistung
Intel Core i9-12900HX 1.7GHz
GeForce RTX 3080 Ti Laptop GPU
min:
91.7 fps, P1:
176.6 fps, max:
462 fps
248 [X] MSI Titan GT77 12UHS 1.47.22.14 D3D12
Intel Core i9-12900HX 1.7GHz
GeForce RTX 3080 Ti Laptop GPU
min:
46.9 fps, P1:
177.7 fps, max:
472 fps
251 [X] MSI GE76 Raider 1.47.22.14 D3D12
Intel Core i9-12900HK 1.8GHz
GeForce RTX 3080 Ti Laptop GPU
min:
139 fps, P1:
181 fps, max:
451 fps
252 [X] MSI Raider GE77 HX 12UHS 1.47.22.14 D3D12, dGPU, Extreme Leistung
Intel Core i9-12900HX 1.7GHz
GeForce RTX 3080 Ti Laptop GPU
min:
137.5 fps, P1:
169.8 fps, max:
531 fps
255 ~ 219 fps
+ Confronta
- Nascondi il confronto
...
NVIDIA GeForce RTX 2080 Super Mobile
NVIDIA GeForce RTX 3080 Ti Laptop GPU
...
max:
42.3 [X] Medion Erazer Beast X30 1.47.22.14 D3D12, Office Mode
Intel Core i9-12900HK @4.1GHz
GeForce RTX 3080 Ti Laptop GPU
min:
30.4 fps, P1:
31 fps, max:
89 fps
60 [X] Asus ROG Zephyrus Duo 16 GX650RX 1.47.22.14 D3D12, Leise
AMD Ryzen 9 6900HX 3.3GHz
GeForce RTX 3080 Ti Laptop GPU
min:
44 fps, P1:
59.5 fps, max:
108 fps
130 [X] Gigabyte Aero 16 YE5 1.47.22.14 D3D12, Silence Mode
Intel Core i9-12900HK @2.1GHz
GeForce RTX 3080 Ti Laptop GPU
min:
64.4 fps, P1:
92.8 fps, max:
218 fps
137.6 149.8 151 [X] Gigabyte Aero 16 YE5 1.47.22.14 D3D12
Intel Core i9-12900HK 1.8GHz
GeForce RTX 3080 Ti Laptop GPU
min:
35.4 fps, P1:
116 fps, max:
355 fps
156.7 [X] MSI Creator Z16P B12UHST 1.47.22.14 D3D12
Intel Core i9-12900H 1.8GHz
GeForce RTX 3080 Ti Laptop GPU
min:
48.2 fps, P1:
115.5 fps, max:
328 fps
159 [X] Gigabyte Aero 16 YE5 1.47.22.14 D3D12, Turbo Mode
Intel Core i9-12900HK 1.8GHz
GeForce RTX 3080 Ti Laptop GPU
min:
33.5 fps, P1:
116 fps, max:
329 fps
171.2 177 180.5 [X] Alienware x15 R2 P111F 1.47.22.14 D3D12
Intel Core i9-12900H 1.8GHz
GeForce RTX 3080 Ti Laptop GPU
min:
26.6 fps, P1:
131.7 fps, max:
315 fps
182.4 184 [X] Razer Blade 15 2022 1.47.22.14 D3D12
Intel Core i7-12800H 1.8GHz
GeForce RTX 3080 Ti Laptop GPU
min:
33.3 fps, P1:
131 fps, max:
306 fps
184.5 [X] Razer Blade 17 Early 2022 1.47.22.14 D3D12, Lautlos
Intel Core i9-12900H 1.8GHz
GeForce RTX 3080 Ti Laptop GPU
min:
68.5 fps, P1:
133.3 fps, max:
298 fps
194.9 [X] Asus ROG Zephyrus Duo 16 GX650RX 1.47.22.14 D3D12, Turbo
AMD Ryzen 9 6900HX 3.3GHz
GeForce RTX 3080 Ti Laptop GPU
min:
119.9 fps, P1:
137.3 fps, max:
362 fps
196.3 [X] Medion Erazer Beast X30 1.47.22.14 D3D12
Intel Core i9-12900HK 1.8GHz
GeForce RTX 3080 Ti Laptop GPU
min:
44.4 fps, P1:
139.6 fps, max:
333 fps
196.5 [X] Medion Erazer Beast X30 1.47.22.14 D3D12, Turbo Mode
Intel Core i9-12900HK 1.8GHz
GeForce RTX 3080 Ti Laptop GPU
min:
63.8 fps, P1:
151.4 fps, max:
327 fps
199.1 [X] Medion Erazer Beast X30 1.47.22.14 D3D12, Dyn. Boost 25W
Intel Core i9-12900HK 1.8GHz
GeForce RTX 3080 Ti Laptop GPU
min:
82.6 fps, P1:
152.3 fps, max:
345 fps
199.8 [X] MSI Raider GE66 12UHS 1.47.22.14 D3D12
Intel Core i9-12900HK @5GHz
GeForce RTX 3080 Ti Laptop GPU
min:
41.6 fps, P1:
145.9 fps, max:
394 fps
199.8 [X] Eurocom Nightsky TXi317 1.47.22.14 D3D12
Intel Core i7-12700H 1.7GHz
GeForce RTX 3080 Ti Laptop GPU
min:
25.2 fps, P1:
146.2 fps, max:
328 fps
200 201 201 [X] SCHENKER XMG Neo 15 with XMG Oasis 1.47.22.14 D3D12
Intel Core i7-12700H 1.7GHz
GeForce RTX 3080 Ti Laptop GPU
min:
32.1 fps, P1:
147.3 fps, max:
375 fps
201 [X] SCHENKER XMG Neo 17 M22 1.47.22.14 D3D12
AMD Ryzen 9 6900HX 3.3GHz
GeForce RTX 3080 Ti Laptop GPU
min:
41.3 fps, P1:
148.1 fps, max:
319 fps
203 204 [X] Razer Blade 17 Early 2022 1.47.22.14 D3D12
Intel Core i9-12900H 1.8GHz
GeForce RTX 3080 Ti Laptop GPU
min:
124.8 fps, P1:
152.6 fps, max:
338 fps
205 [X] Medion Erazer Beast X30 1.47.22.14 D3D12, dGPU only
Intel Core i9-12900HK 1.8GHz
GeForce RTX 3080 Ti Laptop GPU
min:
79.4 fps, P1:
153.5 fps, max:
395 fps
206 [X] MSI Titan GT77 12UHS 1.47.22.14 D3D12
Intel Core i9-12900HX 1.7GHz
GeForce RTX 3080 Ti Laptop GPU
min:
120.7 fps, P1:
153.5 fps, max:
438 fps
207 [X] SCHENKER XMG Pro 17 E22 1.47.22.14 D3D12
Intel Core i9-12900H 1.8GHz
GeForce RTX 3080 Ti Laptop GPU
min:
84.6 fps, P1:
149.5 fps, max:
381 fps
209 [X] MSI Raider GE77 HX 12UHS 1.47.22.14 D3D12
Intel Core i9-12900HX 1.7GHz
GeForce RTX 3080 Ti Laptop GPU
min:
104.8 fps, P1:
154.1 fps, max:
378 fps
211 213 [X] Alienware x17 R2 P48E 1.47.22.14 D3D12
Intel Core i9-12900HK 1.8GHz
GeForce RTX 3080 Ti Laptop GPU
min:
71.8 fps, P1:
156.1 fps, max:
334 fps
213 [X] MSI Raider GE77 HX 12UHS 1.47.22.14 D3D12, Extreme Leistung
Intel Core i9-12900HX 1.7GHz
GeForce RTX 3080 Ti Laptop GPU
min:
95.8 fps, P1:
155 fps, max:
465 fps
214 [X] Razer Blade 17 Early 2022 1.47.22.14 D3D12, dGPU, 175W
Intel Core i9-12900H 1.8GHz
GeForce RTX 3080 Ti Laptop GPU
min:
133.5 fps, P1:
158.7 fps, max:
339 fps
215 [X] Razer Blade 17 RTX 3080 Ti 1.47.22.14 D3D12
Intel Core i7-12800H 1.8GHz
GeForce RTX 3080 Ti Laptop GPU
min:
48.3 fps, P1:
148 fps, max:
358 fps
218 [X] MSI Titan GT77 12UHS 1.47.22.14 D3D12, dGPU, Extreme Leistung
Intel Core i9-12900HX 1.7GHz
GeForce RTX 3080 Ti Laptop GPU
min:
83.4 fps, P1:
157.6 fps, max:
428 fps
219 [X] MSI Titan GT77 12UHS 1.47.22.14 D3D12
Intel Core i9-12900HX 1.7GHz
GeForce RTX 3080 Ti Laptop GPU
min:
67.8 fps, P1:
154.6 fps, max:
369 fps
220 [X] MSI Raider GE77 HX 12UHS 1.47.22.14 D3D12, dGPU, Extreme Leistung
Intel Core i9-12900HX 1.7GHz
GeForce RTX 3080 Ti Laptop GPU
min:
64.8 fps, P1:
156.2 fps, max:
415 fps
221 [X] MSI GE76 Raider 1.47.22.14 D3D12
Intel Core i9-12900HK 1.8GHz
GeForce RTX 3080 Ti Laptop GPU
min:
94.6 fps, P1:
162 fps, max:
381 fps
221 [X] Asus ROG Zephyrus Duo 16 GX650RX 1.47.22.14 D3D12, sep. GPU, 25W
AMD Ryzen 9 6900HX 3.3GHz
GeForce RTX 3080 Ti Laptop GPU
min:
76.3 fps, P1:
154.1 fps, max:
350 fps
224 ~ 187 fps
+ Confronta
- Nascondi il confronto
...
NVIDIA GeForce RTX 2080 Super Mobile
NVIDIA GeForce RTX 3080 Ti Laptop GPU
...
max:
34.8 [X] Medion Erazer Beast X30 1.47.22.14 D3D12, Office Mode
Intel Core i9-12900HK @4.1GHz
GeForce RTX 3080 Ti Laptop GPU
min:
29.2 fps, P1:
29.6 fps, max:
93 fps
96.5 [X] MSI Creator Z16P B12UHST 1.47.22.14 D3D12
Intel Core i9-12900H 1.8GHz
GeForce RTX 3080 Ti Laptop GPU
min:
61.7 fps, P1:
71.6 fps, max:
170.4 fps
107 113 [X] Gigabyte Aero 16 YE5 1.47.22.14 D3D12
Intel Core i9-12900HK 1.8GHz
GeForce RTX 3080 Ti Laptop GPU
min:
40.6 fps, P1:
86.9 fps, max:
367 fps
126 127.8 132 [X] Razer Blade 15 2022 1.47.22.14 D3D12
Intel Core i7-12800H 1.8GHz
GeForce RTX 3080 Ti Laptop GPU
min:
78.6 fps, P1:
106 fps, max:
232 fps
136.3 [X] Razer Blade 17 Early 2022 1.47.22.14 D3D12, Lautlos
Intel Core i9-12900H 1.8GHz
GeForce RTX 3080 Ti Laptop GPU
min:
48.3 fps, P1:
103.6 fps, max:
242 fps
140.2 146 146.1 [X] Medion Erazer Beast X30 1.47.22.14 D3D12, Turbo Mode
Intel Core i9-12900HK 1.8GHz
GeForce RTX 3080 Ti Laptop GPU
min:
41.5 fps, P1:
114.2 fps, max:
296 fps
146.9 [X] MSI Raider GE66 12UHS 1.47.22.14 D3D12
Intel Core i9-12900HK @5GHz
GeForce RTX 3080 Ti Laptop GPU
min:
65.8 fps, P1:
112.6 fps, max:
283 fps
148.9 [X] Medion Erazer Beast X30 1.47.22.14 D3D12
Intel Core i9-12900HK 1.8GHz
GeForce RTX 3080 Ti Laptop GPU
min:
38.3 fps, P1:
116.3 fps, max:
319 fps
149.1 [X] SCHENKER XMG Pro 17 E22 1.47.22.14 D3D12
Intel Core i9-12900H 1.8GHz
GeForce RTX 3080 Ti Laptop GPU
min:
41.3 fps, P1:
114 fps, max:
254 fps
149.9 [X] Medion Erazer Beast X30 1.47.22.14 D3D12, Dyn. Boost 25W
Intel Core i9-12900HK 1.8GHz
GeForce RTX 3080 Ti Laptop GPU
min:
31.6 fps, P1:
116.9 fps, max:
280 fps
151 151 [X] SCHENKER XMG Neo 15 with XMG Oasis Intel Core i7-12700H 1.7GHz
GeForce RTX 3080 Ti Laptop GPU
151.4 [X] Asus ROG Zephyrus Duo 16 GX650RX 1.47.22.14 D3D12, Turbo
AMD Ryzen 9 6900HX 3.3GHz
GeForce RTX 3080 Ti Laptop GPU
min:
48.4 fps, P1:
116.9 fps, max:
291 fps
152.2 [X] Medion Erazer Beast X30 1.47.22.14 D3D12, dGPU only
Intel Core i9-12900HK 1.8GHz
GeForce RTX 3080 Ti Laptop GPU
min:
84.1 fps, P1:
116 fps, max:
296 fps
152.7 [X] Razer Blade 17 Early 2022 1.47.22.14 D3D12
Intel Core i9-12900H 1.8GHz
GeForce RTX 3080 Ti Laptop GPU
min:
51.3 fps, P1:
116.5 fps, max:
280 fps
153.8 154.4 [X] SCHENKER XMG Neo 17 M22 1.47.22.14 D3D12
AMD Ryzen 9 6900HX 3.3GHz
GeForce RTX 3080 Ti Laptop GPU
min:
51.3 fps, P1:
116.4 fps, max:
312 fps
156.2 [X] MSI Titan GT77 12UHS 1.47.22.14 D3D12
Intel Core i9-12900HX 1.7GHz
GeForce RTX 3080 Ti Laptop GPU
min:
67.7 fps, P1:
117.8 fps, max:
285 fps
157.7 158 [X] Razer Blade 17 RTX 3080 Ti 1.47.22.14 D3D12
Intel Core i7-12800H 1.8GHz
GeForce RTX 3080 Ti Laptop GPU
min:
14.4 fps, P1:
120 fps, max:
280 fps
159.9 [X] MSI Raider GE77 HX 12UHS 1.47.22.14 D3D12
Intel Core i9-12900HX 1.7GHz
GeForce RTX 3080 Ti Laptop GPU
min:
51.2 fps, P1:
117.8 fps, max:
376 fps
164.3 [X] MSI Titan GT77 12UHS 1.47.22.14 D3D12, dGPU, Extreme Leistung
Intel Core i9-12900HX 1.7GHz
GeForce RTX 3080 Ti Laptop GPU
min:
30.2 fps, P1:
123 fps, max:
351 fps
166.8 ~ 140 fps
+ Confronta
- Nascondi il confronto
...
NVIDIA GeForce RTX 2080 Super Mobile
NVIDIA GeForce RTX 3080 Ti Laptop GPU
...
max:
61.7 [X] Gigabyte Aero 16 YE5 1.47.22.14 D3D12, Silence Mode
Intel Core i9-12900HK @2.1GHz
GeForce RTX 3080 Ti Laptop GPU
min:
44.4 fps, P1:
52.1 fps, max:
124 fps
68.4 [X] Gigabyte Aero 16 YE5 1.47.22.14 D3D12
Intel Core i9-12900HK 1.8GHz
GeForce RTX 3080 Ti Laptop GPU
min:
41.3 fps, P1:
58.5 fps, max:
144 fps
70.6 [X] Gigabyte Aero 16 YE5 1.47.22.14 D3D12, Turbo Mode
Intel Core i9-12900HK 1.8GHz
GeForce RTX 3080 Ti Laptop GPU
min:
38.3 fps, P1:
59 fps, max:
270 fps
80.5 [X] Razer Blade 17 Early 2022 1.47.22.14 D3D12, Lautlos
Intel Core i9-12900H 1.8GHz
GeForce RTX 3080 Ti Laptop GPU
min:
61 fps, P1:
66.3 fps, max:
136.8 fps
84.5 86.9 [X] MSI Raider GE66 12UHS 1.47.22.14 D3D12
Intel Core i9-12900HK @5GHz
GeForce RTX 3080 Ti Laptop GPU
min:
51.2 fps, P1:
72.5 fps, max:
288 fps
91.1 [X] Razer Blade 17 Early 2022 1.47.22.14 D3D12
Intel Core i9-12900H 1.8GHz
GeForce RTX 3080 Ti Laptop GPU
min:
30.9 fps, P1:
72.7 fps, max:
212 fps
92.9 [X] Asus ROG Zephyrus Duo 16 GX650RX 1.47.22.14 D3D12, Turbo
AMD Ryzen 9 6900HX 3.3GHz
GeForce RTX 3080 Ti Laptop GPU
min:
64.3 fps, P1:
67.3 fps, max:
139.9 fps
93.7 [X] MSI Titan GT77 12UHS 1.47.22.14 D3D12
Intel Core i9-12900HX 1.7GHz
GeForce RTX 3080 Ti Laptop GPU
min:
41.1 fps, P1:
78.2 fps, max:
271 fps
95 96.1 [X] Razer Blade 17 Early 2022 1.47.22.14 D3D12, dGPU, 175W
Intel Core i9-12900H 1.8GHz
GeForce RTX 3080 Ti Laptop GPU
min:
36.3 fps, P1:
77.4 fps, max:
262 fps
96.6 [X] MSI Raider GE77 HX 12UHS 1.47.22.14 D3D12
Intel Core i9-12900HX 1.7GHz
GeForce RTX 3080 Ti Laptop GPU
min:
73.2 fps, P1:
79.3 fps, max:
145.1 fps
97.4 [X] MSI Raider GE77 HX 12UHS 1.47.22.14 D3D12, Extreme Leistung
Intel Core i9-12900HX 1.7GHz
GeForce RTX 3080 Ti Laptop GPU
min:
73.4 fps, P1:
79.3 fps, max:
139.3 fps
98.6 [X] MSI Raider GE77 HX 12UHS 1.47.22.14 D3D12, dGPU, Extreme Leistung
Intel Core i9-12900HX 1.7GHz
GeForce RTX 3080 Ti Laptop GPU
min:
42 fps, P1:
82.3 fps, max:
288 fps
100.7 [X] MSI Titan GT77 12UHS 1.47.22.14 D3D12, dGPU, Extreme Leistung
Intel Core i9-12900HX 1.7GHz
GeForce RTX 3080 Ti Laptop GPU
min:
54.9 fps, P1:
83.1 fps, max:
264 fps
~ 88 fps
+ Confronta
- Nascondi il confronto
...
NVIDIA GeForce RTX 2080 Super Mobile
NVIDIA GeForce RTX 3080 Ti Laptop GPU
...
max:
» Giocabile con tutti i portatili testati con dettagli ultra.
0 100 200 Tooltip XMG Neo 17 M22: Ø142.4 (102-193)
ROG Zephyrus Duo 16 GX650RX: Ø146 (103-195)
Blade 17 Early 2022: Ø147.5 (100-185)
Erazer Beast X30: Ø170.2 (124-211)
x15 R2 P111F: Ø171.7 (112-220)
Aero 16 YE5: Ø188.9 (140-235)
Titan GT77 12UHS: Ø191.6 (121-252)
Titan GT77 12UHS: Ø198.9 (148-261)
Raider GE77 HX 12UHS: Ø214 (153-282)
...
NVIDIA GeForce RTX 2070 Super Max-Q
NVIDIA GeForce RTX 3080 Ti Laptop GPU
max:
0 100 200 Tooltip ROG Zephyrus Duo 16 GX650RX: Ø124.4 (92-163)
XMG Neo 17 M22: Ø125.3 (96-169)
Blade 17 Early 2022: Ø126.9 (78-163)
Aero 16 YE5: Ø140.5 (117-159)
Erazer Beast X30: Ø143.4 (113-176)
x15 R2 P111F: Ø152.2 (121-200)
Titan GT77 12UHS: Ø168.7 (132-226)
Titan GT77 12UHS: Ø172.5 (136-229)
Raider GE77 HX 12UHS: Ø175.9 (137-231)
...
NVIDIA GeForce RTX 3080 Ti Laptop GPU
max:
0 100 200 Tooltip XMG Neo 17 M22: Ø118.5 (88-163)
ROG Zephyrus Duo 16 GX650RX: Ø119.6 (73-162)
Blade 17 Early 2022: Ø122 (86-160)
Aero 16 YE5: Ø129.5 (105-147)
Creator Z16P B12UHST: Ø133.9 (96-160)
Erazer Beast X30: Ø139 (107-168)
x15 R2 P111F: Ø142.5 (112-187)
XMG Pro 17 E22: Ø152.6 (119-197)
Titan GT77 12UHS: Ø161.3 (130-211)
Titan GT77 12UHS: Ø163.9 (130-215)
Raider GE77 HX 12UHS: Ø167.4 (135-213)
...
NVIDIA GeForce RTX 3080 Ti Laptop GPU
max:
0 100 200 Tooltip ROG Zephyrus Duo 16 GX650RX: Ø111.3 (82-147)
XMG Neo 17 M22: Ø112.9 (81-151)
Blade 17 Early 2022: Ø115.8 (89-152)
Blade 17 Early 2022 dGPU, 175W: Ø117.9 (88-156)
Aero 16 YE5: Ø121.6 (97-143)
Creator Z16P B12UHST: Ø123.1 (97-147)
Erazer Beast X30: Ø129.7 (93-163)
x15 R2 P111F: Ø134.9 (106-177)
XMG Pro 17 E22: Ø135.7 (100-178)
Titan GT77 12UHS: Ø151 (113-199)
Titan GT77 12UHS: Ø152.9 (116-201)
Raider GE77 HX 12UHS: Ø156.5 (122-203)
Titan GT77 12UHS dGPU, Extreme Leistung: Ø162.3 (127-210)
...
NVIDIA GeForce RTX 3080 Ti Laptop GPU
...
max:
0 100 Tooltip Aero 16 YE5: Ø86.5 (77-105)
Creator Z16P B12UHST: Ø98.2 (88-117)
ROG Zephyrus Duo 16 GX650RX: Ø104 (75-123)
Erazer Beast X30: Ø110.2 (84-129)
Blade 17 Early 2022: Ø110.2 (70-140)
XMG Neo 17 M22: Ø109.7 (82-141)
XMG Pro 17 E22: Ø120.1 (104-142)
Raider GE77 HX 12UHS: Ø131.4 (118-154)
Titan GT77 12UHS: Ø134.1 (113-155)
...
NVIDIA GeForce RTX 3080 Ti Laptop GPU
...
max:
0 Tooltip Aero 16 YE5: Ø45.1 (37-54)
ROG Zephyrus Duo 16 GX650RX: Ø60.4 (54-75)
Blade 17 Early 2022 dGPU, 175W: Ø69.5 (60-80)
Blade 17 Early 2022: Ø70.2 (63-85)
XMG Neo 17 M22: Ø69.8 (62-80)
Raider GE77 HX 12UHS: Ø72.6 (65-86)
Titan GT77 12UHS dGPU, Extreme Leistung: Ø75.3 (68-84)
Titan GT77 12UHS: Ø76.2 (69-89)
...
NVIDIA GeForce RTX 3080 Ti Laptop GPU
...
max:
» Giocabile con tutti i portatili testati con dettagli ultra.
Additional Benchmarks
Low Preset TAA 1920x1080
154 [X] SCHENKER XMG Neo 15 with XMG Oasis Intel Core i7-12700H 1.7GHz
GeForce RTX 3080 Ti Laptop GPU
38.9 [X] Medion Erazer Beast X30 Office Mode
Intel Core i9-12900HK @4.1GHz
GeForce RTX 3080 Ti Laptop GPU
60.9 [X] Asus ROG Zephyrus Duo 16 GX650RX Leise
AMD Ryzen 9 6900HX 3.3GHz
GeForce RTX 3080 Ti Laptop GPU
78.2 [X] Gigabyte Aero 16 YE5 Silence Mode
Intel Core i9-12900HK @2.1GHz
GeForce RTX 3080 Ti Laptop GPU
105.8 [X] Razer Blade 17 Early 2022 Lautlos
Intel Core i9-12900H 1.8GHz
GeForce RTX 3080 Ti Laptop GPU
112.9 113.7 [X] Asus ROG Zephyrus Duo 16 GX650RX Turbo
AMD Ryzen 9 6900HX 3.3GHz
GeForce RTX 3080 Ti Laptop GPU
113.7 119.1 [X] Asus ROG Zephyrus Duo 16 GX650RX sep. GPU, 25W
AMD Ryzen 9 6900HX 3.3GHz
GeForce RTX 3080 Ti Laptop GPU
124.3 124.3 127.9 134.1 140.2 140.3 141 141.3 [X] SCHENKER XMG Neo 15 with XMG Oasis Intel Core i7-12700H 1.7GHz
GeForce RTX 3080 Ti Laptop GPU
142 142.5 143.5 [X] Medion Erazer Beast X30 Dyn. Boost 25W
Intel Core i9-12900HK 1.8GHz
GeForce RTX 3080 Ti Laptop GPU
143.8 [X] Medion Erazer Beast X30 PL 140W
Intel Core i9-12900HK 1.8GHz
GeForce RTX 3080 Ti Laptop GPU
144.6 [X] Medion Erazer Beast X30 Turbo Mode
Intel Core i9-12900HK 1.8GHz
GeForce RTX 3080 Ti Laptop GPU
146 146.9 148.8 [X] Razer Blade 17 Early 2022 Max.
Intel Core i9-12900H 1.8GHz
GeForce RTX 3080 Ti Laptop GPU
149.2 154 154 [X] Gigabyte Aero 16 YE5 Turbo Mode
Intel Core i9-12900HK 1.8GHz
GeForce RTX 3080 Ti Laptop GPU
155 155.2 [X] Medion Erazer Beast X30 dGPU only
Intel Core i9-12900HK 1.8GHz
GeForce RTX 3080 Ti Laptop GPU
155.2 [X] Razer Blade 17 Early 2022 dGPU, 175W
Intel Core i9-12900H 1.8GHz
GeForce RTX 3080 Ti Laptop GPU
158 158 160 161 165.3 170 170.5 170.8 171.8 [X] MSI Raider GE77 HX 12UHS Extreme Leistung
Intel Core i9-12900HX 1.7GHz
GeForce RTX 3080 Ti Laptop GPU
172.8 181.4 [X] MSI Titan GT77 12UHS dGPU, Extreme Leistung
Intel Core i9-12900HX 1.7GHz
GeForce RTX 3080 Ti Laptop GPU
184 187.7 [X] MSI Raider GE77 HX 12UHS dGPU, Extreme Leistung
Intel Core i9-12900HX 1.7GHz
GeForce RTX 3080 Ti Laptop GPU
~ 142 fps
+ Confronta
- Nascondi il confronto
...
NVIDIA GeForce RTX 2080 Super Mobile
NVIDIA GeForce RTX 3080 Ti Laptop GPU
...
max:
35.2 [X] Medion Erazer Beast X30 Office Mode
Intel Core i9-12900HK @4.1GHz
GeForce RTX 3080 Ti Laptop GPU
60 [X] Asus ROG Zephyrus Duo 16 GX650RX Leise
AMD Ryzen 9 6900HX 3.3GHz
GeForce RTX 3080 Ti Laptop GPU
69.6 [X] Gigabyte Aero 16 YE5 Silence Mode
Intel Core i9-12900HK @2.1GHz
GeForce RTX 3080 Ti Laptop GPU
95.1 95.1 [X] Razer Blade 17 Early 2022 Lautlos
Intel Core i9-12900H 1.8GHz
GeForce RTX 3080 Ti Laptop GPU
100.2 [X] Asus ROG Zephyrus Duo 16 GX650RX Turbo
AMD Ryzen 9 6900HX 3.3GHz
GeForce RTX 3080 Ti Laptop GPU
102 104.3 [X] Asus ROG Zephyrus Duo 16 GX650RX sep. GPU, 25W
AMD Ryzen 9 6900HX 3.3GHz
GeForce RTX 3080 Ti Laptop GPU
106.6 109.5 115.5 121.3 122.4 122.5 123.2 [X] SCHENKER XMG Neo 15 with XMG Oasis Intel Core i7-12700H 1.7GHz
GeForce RTX 3080 Ti Laptop GPU
124 124.8 [X] Medion Erazer Beast X30 PL 140W
Intel Core i9-12900HK 1.8GHz
GeForce RTX 3080 Ti Laptop GPU
125.2 125.5 [X] Medion Erazer Beast X30 Turbo Mode
Intel Core i9-12900HK 1.8GHz
GeForce RTX 3080 Ti Laptop GPU
126 128.3 [X] Medion Erazer Beast X30 Dyn. Boost 25W
Intel Core i9-12900HK 1.8GHz
GeForce RTX 3080 Ti Laptop GPU
130.8 131.3 [X] Razer Blade 17 Early 2022 Max.
Intel Core i9-12900H 1.8GHz
GeForce RTX 3080 Ti Laptop GPU
133 133.8 134 135 [X] Gigabyte Aero 16 YE5 Turbo Mode
Intel Core i9-12900HK 1.8GHz
GeForce RTX 3080 Ti Laptop GPU
137.7 139 140 140.4 [X] Medion Erazer Beast X30 dGPU only
Intel Core i9-12900HK 1.8GHz
GeForce RTX 3080 Ti Laptop GPU
141.6 [X] Razer Blade 17 Early 2022 dGPU, 175W
Intel Core i9-12900H 1.8GHz
GeForce RTX 3080 Ti Laptop GPU
142 143.5 143.9 149.6 150.5 150.8 151.8 [X] MSI Raider GE77 HX 12UHS Extreme Leistung
Intel Core i9-12900HX 1.7GHz
GeForce RTX 3080 Ti Laptop GPU
152.3 159.4 [X] MSI Titan GT77 12UHS dGPU, Extreme Leistung
Intel Core i9-12900HX 1.7GHz
GeForce RTX 3080 Ti Laptop GPU
160.4 164.7 [X] MSI Raider GE77 HX 12UHS dGPU, Extreme Leistung
Intel Core i9-12900HX 1.7GHz
GeForce RTX 3080 Ti Laptop GPU
~ 126 fps
+ Confronta
- Nascondi il confronto
...
NVIDIA GeForce RTX 2070 Super Max-Q
NVIDIA GeForce RTX 2080 Super Mobile
NVIDIA GeForce RTX 3080 Ti Laptop GPU
...
max:
32.6 [X] Medion Erazer Beast X30 Office Mode
Intel Core i9-12900HK @4.1GHz
GeForce RTX 3080 Ti Laptop GPU
60.2 [X] Gigabyte Aero 16 YE5 Silence Mode
Intel Core i9-12900HK @2.1GHz
GeForce RTX 3080 Ti Laptop GPU
60.4 [X] Asus ROG Zephyrus Duo 16 GX650RX Leise
AMD Ryzen 9 6900HX 3.3GHz
GeForce RTX 3080 Ti Laptop GPU
78.2 79.7 [X] Asus ROG Zephyrus Duo 16 GX650RX Turbo
AMD Ryzen 9 6900HX 3.3GHz
GeForce RTX 3080 Ti Laptop GPU
80.2 [X] Razer Blade 17 Early 2022 Lautlos
Intel Core i9-12900H 1.8GHz
GeForce RTX 3080 Ti Laptop GPU
80.3 82.8 [X] Asus ROG Zephyrus Duo 16 GX650RX sep. GPU, 25W
AMD Ryzen 9 6900HX 3.3GHz
GeForce RTX 3080 Ti Laptop GPU
93.4 94.9 95.6 96.4 99.3 99.4 99.5 [X] Medion Erazer Beast X30 PL 140W
Intel Core i9-12900HK 1.8GHz
GeForce RTX 3080 Ti Laptop GPU
100 [X] SCHENKER XMG Neo 15 with XMG Oasis Intel Core i7-12700H 1.7GHz
GeForce RTX 3080 Ti Laptop GPU
100.1 100.2 [X] Medion Erazer Beast X30 Turbo Mode
Intel Core i9-12900HK 1.8GHz
GeForce RTX 3080 Ti Laptop GPU
101 102 103 103.1 [X] Medion Erazer Beast X30 Dyn. Boost 25W
Intel Core i9-12900HK 1.8GHz
GeForce RTX 3080 Ti Laptop GPU
103.1 104.5 [X] Razer Blade 17 Early 2022 Max.
Intel Core i9-12900H 1.8GHz
GeForce RTX 3080 Ti Laptop GPU
105.5 106.2 107 108 108 [X] Gigabyte Aero 16 YE5 Turbo Mode
Intel Core i9-12900HK 1.8GHz
GeForce RTX 3080 Ti Laptop GPU
109 109.8 [X] Medion Erazer Beast X30 dGPU only
Intel Core i9-12900HK 1.8GHz
GeForce RTX 3080 Ti Laptop GPU
110 111 111.6 [X] Razer Blade 17 Early 2022 dGPU, 175W
Intel Core i9-12900H 1.8GHz
GeForce RTX 3080 Ti Laptop GPU
112.9 115.5 116.2 117.5 118.3 119.4 [X] MSI Raider GE77 HX 12UHS Extreme Leistung
Intel Core i9-12900HX 1.7GHz
GeForce RTX 3080 Ti Laptop GPU
120.2 121.1 123.3 [X] MSI Titan GT77 12UHS dGPU, Extreme Leistung
Intel Core i9-12900HX 1.7GHz
GeForce RTX 3080 Ti Laptop GPU
123.8 127 [X] MSI Raider GE77 HX 12UHS dGPU, Extreme Leistung
Intel Core i9-12900HX 1.7GHz
GeForce RTX 3080 Ti Laptop GPU
~ 101 fps
+ Confronta
- Nascondi il confronto
...
NVIDIA GeForce RTX 2070 Super Max-Q
NVIDIA GeForce RTX 2080 Super Mobile
NVIDIA GeForce RTX 3080 Ti Laptop GPU
...
max:
32.9 [X] Medion Erazer Beast X30 Office Mode
Intel Core i9-12900HK @4.1GHz
GeForce RTX 3080 Ti Laptop GPU
47.2 [X] Gigabyte Aero 16 YE5 Silence Mode
Intel Core i9-12900HK @2.1GHz
GeForce RTX 3080 Ti Laptop GPU
58.5 [X] Asus ROG Zephyrus Duo 16 GX650RX Leise
AMD Ryzen 9 6900HX 3.3GHz
GeForce RTX 3080 Ti Laptop GPU
66.1 66.7 [X] Asus ROG Zephyrus Duo 16 GX650RX Turbo
AMD Ryzen 9 6900HX 3.3GHz
GeForce RTX 3080 Ti Laptop GPU
69 [X] Razer Blade 17 Early 2022 Lautlos
Intel Core i9-12900H 1.8GHz
GeForce RTX 3080 Ti Laptop GPU
78.6 80.9 [X] Gigabyte Aero 16 YE5 Turbo Mode
Intel Core i9-12900HK 1.8GHz
GeForce RTX 3080 Ti Laptop GPU
82.1 85.4 86.4 88.7 [X] Razer Blade 17 Early 2022 Max.
Intel Core i9-12900H 1.8GHz
GeForce RTX 3080 Ti Laptop GPU
89.7 [X] Medion Erazer Beast X30 Turbo Mode
Intel Core i9-12900HK 1.8GHz
GeForce RTX 3080 Ti Laptop GPU
97.1 [X] Razer Blade 17 Early 2022 dGPU, 175W
Intel Core i9-12900H 1.8GHz
GeForce RTX 3080 Ti Laptop GPU
100.9 101.9 [X] MSI Raider GE77 HX 12UHS Extreme Leistung
Intel Core i9-12900HX 1.7GHz
GeForce RTX 3080 Ti Laptop GPU
102.1 103 106.6 [X] MSI Titan GT77 12UHS dGPU, Extreme Leistung
Intel Core i9-12900HX 1.7GHz
GeForce RTX 3080 Ti Laptop GPU
109.5 [X] MSI Raider GE77 HX 12UHS dGPU, Extreme Leistung
Intel Core i9-12900HX 1.7GHz
GeForce RTX 3080 Ti Laptop GPU
~ 83 fps
+ Confronta
- Nascondi il confronto
...
NVIDIA GeForce RTX 2070 Super Max-Q
NVIDIA GeForce RTX 3080 Ti Laptop GPU
NVIDIA GeForce RTX 2080 Super Mobile
...
max:
» Giocabile con la maggior parte dei portatili testati con dettagli alto.
...
NVIDIA GeForce RTX 3080 Ti Laptop GPU
NVIDIA GeForce RTX 2080 Super Mobile
...
max:
...
NVIDIA GeForce RTX 2080 Super Mobile
NVIDIA GeForce RTX 3080 Ti Laptop GPU
...
max:
30.7 [X] Medion Erazer Beast X30 1.3, Office Mode
Intel Core i9-12900HK @4.1GHz
GeForce RTX 3080 Ti Laptop GPU
85.8 89.4 89.4 [X] Razer Blade 17 Early 2022 1.3, Lautlos
Intel Core i9-12900H 1.8GHz
GeForce RTX 3080 Ti Laptop GPU
90.4 90.9 [X] Gigabyte Aero 16 YE5 1.3, Turbo Mode
Intel Core i9-12900HK 1.8GHz
GeForce RTX 3080 Ti Laptop GPU
93.7 101 103.9 106 107.7 [X] Medion Erazer Beast X30 1.3, Dyn. Boost 25W
Intel Core i9-12900HK 1.8GHz
GeForce RTX 3080 Ti Laptop GPU
108 110.2 [X] Medion Erazer Beast X30 1.3, dGPU only
Intel Core i9-12900HK 1.8GHz
GeForce RTX 3080 Ti Laptop GPU
110.4 112.2 112.9 [X] Medion Erazer Beast X30 1.3, Turbo Mode
Intel Core i9-12900HK 1.8GHz
GeForce RTX 3080 Ti Laptop GPU
115 115.1 116.4 117 118.5 [X] Asus ROG Zephyrus Duo 16 GX650RX 1.3, Turbo
AMD Ryzen 9 6900HX 3.3GHz
GeForce RTX 3080 Ti Laptop GPU
118.5 119.2 119.6 119.6 [X] SCHENKER XMG Neo 15 with XMG Oasis 1.3
Intel Core i7-12700H 1.7GHz
GeForce RTX 3080 Ti Laptop GPU
119.6 [X] Razer Blade 17 Early 2022 1.3, Max.
Intel Core i9-12900H 1.8GHz
GeForce RTX 3080 Ti Laptop GPU
120.2 120.5 121 121.2 122.7 122.8 125.1 [X] Asus ROG Zephyrus Duo 16 GX650RX 1.3, sep. GPU, 25W
AMD Ryzen 9 6900HX 3.3GHz
GeForce RTX 3080 Ti Laptop GPU
127.7 [X] Razer Blade 17 Early 2022 1.3, dGPU, 175W
Intel Core i9-12900H 1.8GHz
GeForce RTX 3080 Ti Laptop GPU
127.8 131 131 132 136.9 [X] MSI Raider GE77 HX 12UHS 1.3, Extreme Leistung
Intel Core i9-12900HX 1.7GHz
GeForce RTX 3080 Ti Laptop GPU
137.6 138.7 [X] MSI Titan GT77 12UHS 1.3, dGPU, Extreme Leistung
Intel Core i9-12900HX 1.7GHz
GeForce RTX 3080 Ti Laptop GPU
140.6 [X] MSI Raider GE77 HX 12UHS 1.3, dGPU, Extreme Leistung
Intel Core i9-12900HX 1.7GHz
GeForce RTX 3080 Ti Laptop GPU
~ 114 fps
+ Confronta
- Nascondi il confronto
...
NVIDIA GeForce RTX 2080 Super Mobile
NVIDIA GeForce RTX 3080 Ti Laptop GPU
...
max:
30.8 [X] Medion Erazer Beast X30 1.3, Office Mode
Intel Core i9-12900HK @4.1GHz
GeForce RTX 3080 Ti Laptop GPU
50.9 [X] Gigabyte Aero 16 YE5 1.3, Silence Mode
Intel Core i9-12900HK @2.1GHz
GeForce RTX 3080 Ti Laptop GPU
60.1 [X] Asus ROG Zephyrus Duo 16 GX650RX 1.3, Leise
AMD Ryzen 9 6900HX 3.3GHz
GeForce RTX 3080 Ti Laptop GPU
64.8 69.6 77 [X] Razer Blade 17 Early 2022 1.3, Lautlos
Intel Core i9-12900H 1.8GHz
GeForce RTX 3080 Ti Laptop GPU
79.5 80.9 82.9 84.6 85.2 [X] Medion Erazer Beast X30 1.3, Dyn. Boost 25W
Intel Core i9-12900HK 1.8GHz
GeForce RTX 3080 Ti Laptop GPU
86.8 [X] Medion Erazer Beast X30 1.3, Turbo Mode
Intel Core i9-12900HK 1.8GHz
GeForce RTX 3080 Ti Laptop GPU
87.4 87.8 88.2 [X] Medion Erazer Beast X30 1.3, dGPU only
Intel Core i9-12900HK 1.8GHz
GeForce RTX 3080 Ti Laptop GPU
88.8 89.5 89.6 90.8 91.1 91.8 [X] Asus ROG Zephyrus Duo 16 GX650RX 1.3, Turbo
AMD Ryzen 9 6900HX 3.3GHz
GeForce RTX 3080 Ti Laptop GPU
92.2 [X] SCHENKER XMG Neo 15 with XMG Oasis 1.3
Intel Core i7-12700H 1.7GHz
GeForce RTX 3080 Ti Laptop GPU
92.2 92.8 92.8 93.1 [X] Razer Blade 17 Early 2022 1.3, Max.
Intel Core i9-12900H 1.8GHz
GeForce RTX 3080 Ti Laptop GPU
93.3 96.4 97 98.6 100.3 103.4 [X] MSI Raider GE77 HX 12UHS 1.3, Extreme Leistung
Intel Core i9-12900HX 1.7GHz
GeForce RTX 3080 Ti Laptop GPU
105.6 [X] MSI Titan GT77 12UHS 1.3, dGPU, Extreme Leistung
Intel Core i9-12900HX 1.7GHz
GeForce RTX 3080 Ti Laptop GPU
105.8 [X] MSI Raider GE77 HX 12UHS 1.3, dGPU, Extreme Leistung
Intel Core i9-12900HX 1.7GHz
GeForce RTX 3080 Ti Laptop GPU
~ 86 fps
+ Confronta
- Nascondi il confronto
...
NVIDIA GeForce RTX 2080 Super Mobile
NVIDIA GeForce RTX 3080 Ti Laptop GPU
...
max:
35.1 [X] Gigabyte Aero 16 YE5 1.3, Silence Mode
Intel Core i9-12900HK @2.1GHz
GeForce RTX 3080 Ti Laptop GPU
40.1 41.8 [X] Gigabyte Aero 16 YE5 1.3, Turbo Mode
Intel Core i9-12900HK 1.8GHz
GeForce RTX 3080 Ti Laptop GPU
43.8 [X] Razer Blade 17 Early 2022 1.3, Lautlos
Intel Core i9-12900H 1.8GHz
GeForce RTX 3080 Ti Laptop GPU
47.2 [X] Asus ROG Zephyrus Duo 16 GX650RX 1.3, Leise
AMD Ryzen 9 6900HX 3.3GHz
GeForce RTX 3080 Ti Laptop GPU
51.4 52.1 55.2 55.4 [X] Asus ROG Zephyrus Duo 16 GX650RX 1.3, Turbo
AMD Ryzen 9 6900HX 3.3GHz
GeForce RTX 3080 Ti Laptop GPU
55.5 [X] Razer Blade 17 Early 2022 1.3, Max.
Intel Core i9-12900H 1.8GHz
GeForce RTX 3080 Ti Laptop GPU
57.5 [X] Razer Blade 17 Early 2022 1.3, dGPU, 175W
Intel Core i9-12900H 1.8GHz
GeForce RTX 3080 Ti Laptop GPU
57.9 57.9 58.3 58.4 [X] Asus ROG Zephyrus Duo 16 GX650RX 1.3, sep. GPU, 25W
AMD Ryzen 9 6900HX 3.3GHz
GeForce RTX 3080 Ti Laptop GPU
60.2 [X] MSI Titan GT77 12UHS 1.3, dGPU, Extreme Leistung
Intel Core i9-12900HX 1.7GHz
GeForce RTX 3080 Ti Laptop GPU
60.3 [X] MSI Raider GE77 HX 12UHS 1.3, Extreme Leistung
Intel Core i9-12900HX 1.7GHz
GeForce RTX 3080 Ti Laptop GPU
61.2 [X] MSI Raider GE77 HX 12UHS 1.3, dGPU, Extreme Leistung
Intel Core i9-12900HX 1.7GHz
GeForce RTX 3080 Ti Laptop GPU
~ 53 fps
+ Confronta
- Nascondi il confronto
...
NVIDIA GeForce RTX 2080 Super Mobile
NVIDIA GeForce RTX 3080 Ti Laptop GPU
max:
» Giocabile con la maggior parte dei portatili testati con dettagli alto.
59.9 60.9 [X] Medion Erazer Beast X30 Office Mode
Intel Core i9-12900HK @4.1GHz
GeForce RTX 3080 Ti Laptop GPU
min:
55.1 fps, max:
-1 fps
69.2 [X] Asus ROG Zephyrus Duo 16 GX650RX Leise
AMD Ryzen 9 6900HX 3.3GHz
GeForce RTX 3080 Ti Laptop GPU
min:
61.1 fps, max:
-1 fps
101 [X] Gigabyte Aero 16 YE5 Silence Mode
Intel Core i9-12900HK @2.1GHz
GeForce RTX 3080 Ti Laptop GPU
min:
85.6 fps, max:
-1 fps
133.8 139.9 [X] Asus ROG Zephyrus Duo 16 GX650RX sep. GPU, 25W
AMD Ryzen 9 6900HX 3.3GHz
GeForce RTX 3080 Ti Laptop GPU
min:
120.6 fps, max:
-1 fps
142.3 [X] Asus ROG Zephyrus Duo 16 GX650RX Turbo
AMD Ryzen 9 6900HX 3.3GHz
GeForce RTX 3080 Ti Laptop GPU
min:
126.3 fps, max:
-1 fps
144.8 [X] Razer Blade 17 Early 2022 Lautlos
Intel Core i9-12900H 1.8GHz
GeForce RTX 3080 Ti Laptop GPU
min:
126.4 fps, max:
-1 fps
146.5 161.1 167.6 171.3 171.7 172.8 174.7 175 175.7 [X] Razer Blade 17 Early 2022 dGPU, 175W
Intel Core i9-12900H 1.8GHz
GeForce RTX 3080 Ti Laptop GPU
min:
152 fps, max:
-1 fps
176.1 [X] Medion Erazer Beast X30 dGPU only
Intel Core i9-12900HK 1.8GHz
GeForce RTX 3080 Ti Laptop GPU
min:
148.6 fps, max:
-1 fps
176.1 176.1 176.7 [X] SCHENKER XMG Neo 15 with XMG Oasis Intel Core i7-12700H 1.7GHz
GeForce RTX 3080 Ti Laptop GPU
min:
156.5 fps, max:
-1 fps
177.8 179 [X] Razer Blade 17 Early 2022 Max.
Intel Core i9-12900H 1.8GHz
GeForce RTX 3080 Ti Laptop GPU
min:
159.6 fps, max:
-1 fps
179.7 [X] Medion Erazer Beast X30 Dyn. Boost 25W
Intel Core i9-12900HK 1.8GHz
GeForce RTX 3080 Ti Laptop GPU
min:
158.3 fps, max:
-1 fps
180.5 [X] Medion Erazer Beast X30 Turbo Mode
Intel Core i9-12900HK 1.8GHz
GeForce RTX 3080 Ti Laptop GPU
min:
160.7 fps, max:
-1 fps
181 182 183 183.7 [X] Medion Erazer Beast X30 PL 140W
Intel Core i9-12900HK 1.8GHz
GeForce RTX 3080 Ti Laptop GPU
min:
162.7 fps, max:
-1 fps
186 [X] MSI GE76 Raider Intel Core i9-12900HK 1.8GHz
GeForce RTX 3080 Ti Laptop GPU
min:
166.4 fps, max:
-1 fps
186 186.1 187.4 189 [X] Gigabyte Aero 16 YE5 Turbo Mode
Intel Core i9-12900HK 1.8GHz
GeForce RTX 3080 Ti Laptop GPU
min:
168.2 fps, max:
-1 fps
191 194.1 [X] MSI Titan GT77 12UHS dGPU, Extreme Leistung
Intel Core i9-12900HX 1.7GHz
GeForce RTX 3080 Ti Laptop GPU
min:
165.9 fps, max:
-1 fps
199.6 [X] MSI Raider GE77 HX 12UHS dGPU, Extreme Leistung
Intel Core i9-12900HX 1.7GHz
GeForce RTX 3080 Ti Laptop GPU
min:
170.4 fps, max:
-1 fps
199.9 202 [X] MSI Raider GE77 HX 12UHS Extreme Leistung
Intel Core i9-12900HX 1.7GHz
GeForce RTX 3080 Ti Laptop GPU
min:
179.1 fps, max:
-1 fps
203 204.5 206 211 ~ 169 fps
+ Confronta
- Nascondi il confronto
...
NVIDIA GeForce RTX 2070 Super Mobile
NVIDIA Quadro P620
NVIDIA GeForce RTX 3080 Ti Laptop GPU
NVIDIA GeForce RTX 2080 Super Mobile
max:
34.6 [X] Medion Erazer Beast X30 Office Mode
Intel Core i9-12900HK @4.1GHz
GeForce RTX 3080 Ti Laptop GPU
min:
32.9 fps, max:
-1 fps
59.9 94.3 [X] Gigabyte Aero 16 YE5 Silence Mode
Intel Core i9-12900HK @2.1GHz
GeForce RTX 3080 Ti Laptop GPU
min:
82.3 fps, max:
-1 fps
122.2 127.8 [X] Razer Blade 17 Early 2022 Lautlos
Intel Core i9-12900H 1.8GHz
GeForce RTX 3080 Ti Laptop GPU
min:
111.4 fps, max:
-1 fps
129.1 [X] Asus ROG Zephyrus Duo 16 GX650RX Turbo
AMD Ryzen 9 6900HX 3.3GHz
GeForce RTX 3080 Ti Laptop GPU
min:
114.9 fps, max:
-1 fps
129.3 [X] Asus ROG Zephyrus Duo 16 GX650RX sep. GPU, 25W
AMD Ryzen 9 6900HX 3.3GHz
GeForce RTX 3080 Ti Laptop GPU
min:
111.7 fps, max:
-1 fps
133.9 137.9 [X] Asus ROG Zephyrus Duo 16 GX650RX Leise
AMD Ryzen 9 6900HX 3.3GHz
GeForce RTX 3080 Ti Laptop GPU
min:
122.1 fps, max:
-1 fps
148.4 149.2 154.1 157.8 157.9 158.9 159.9 162 162.2 163.3 [X] Medion Erazer Beast X30 dGPU only
Intel Core i9-12900HK 1.8GHz
GeForce RTX 3080 Ti Laptop GPU
min:
140.8 fps, max:
-1 fps
164.2 [X] SCHENKER XMG Neo 15 with XMG Oasis Intel Core i7-12700H 1.7GHz
GeForce RTX 3080 Ti Laptop GPU
min:
145.7 fps, max:
-1 fps
165 165.5 [X] Razer Blade 17 Early 2022 dGPU, 175W
Intel Core i9-12900H 1.8GHz
GeForce RTX 3080 Ti Laptop GPU
min:
141.1 fps, max:
-1 fps
165.8 [X] Medion Erazer Beast X30 Dyn. Boost 25W
Intel Core i9-12900HK 1.8GHz
GeForce RTX 3080 Ti Laptop GPU
min:
145.2 fps, max:
-1 fps
167.1 [X] Razer Blade 17 Early 2022 Max.
Intel Core i9-12900H 1.8GHz
GeForce RTX 3080 Ti Laptop GPU
min:
148.1 fps, max:
-1 fps
168 [X] Medion Erazer Beast X30 Turbo Mode
Intel Core i9-12900HK 1.8GHz
GeForce RTX 3080 Ti Laptop GPU
min:
147.1 fps, max:
-1 fps
168.5 [X] Medion Erazer Beast X30 PL 140W
Intel Core i9-12900HK 1.8GHz
GeForce RTX 3080 Ti Laptop GPU
min:
148.5 fps, max:
-1 fps
169 169 170.8 171 172 [X] MSI GE76 Raider Intel Core i9-12900HK 1.8GHz
GeForce RTX 3080 Ti Laptop GPU
min:
151.6 fps, max:
-1 fps
172 172.3 176 176 [X] Gigabyte Aero 16 YE5 Turbo Mode
Intel Core i9-12900HK 1.8GHz
GeForce RTX 3080 Ti Laptop GPU
min:
154.3 fps, max:
-1 fps
178 [X] MSI Titan GT77 12UHS dGPU, Extreme Leistung
Intel Core i9-12900HX 1.7GHz
GeForce RTX 3080 Ti Laptop GPU
min:
151.7 fps, max:
-1 fps
180.7 183.2 [X] MSI Raider GE77 HX 12UHS dGPU, Extreme Leistung
Intel Core i9-12900HX 1.7GHz
GeForce RTX 3080 Ti Laptop GPU
min:
156.9 fps, max:
-1 fps
184 184.5 185 [X] MSI Raider GE77 HX 12UHS Extreme Leistung
Intel Core i9-12900HX 1.7GHz
GeForce RTX 3080 Ti Laptop GPU
min:
161.8 fps, max:
-1 fps
185.1 191 ~ 156 fps
+ Confronta
- Nascondi il confronto
...
NVIDIA GeForce RTX 2070 Super Max-Q
NVIDIA GeForce RTX 3080 Ti Laptop GPU
NVIDIA GeForce RTX 2080 Super Mobile
...
max:
29.9 [X] Medion Erazer Beast X30 Office Mode
Intel Core i9-12900HK @4.1GHz
GeForce RTX 3080 Ti Laptop GPU
min:
29.3 fps, max:
-1 fps
59.7 [X] Asus ROG Zephyrus Duo 16 GX650RX Leise
AMD Ryzen 9 6900HX 3.3GHz
GeForce RTX 3080 Ti Laptop GPU
min:
57.6 fps, max:
-1 fps
59.9 90 [X] Gigabyte Aero 16 YE5 Silence Mode
Intel Core i9-12900HK @2.1GHz
GeForce RTX 3080 Ti Laptop GPU
min:
78.2 fps, max:
-1 fps
114.8 120.4 [X] Razer Blade 17 Early 2022 Lautlos
Intel Core i9-12900H 1.8GHz
GeForce RTX 3080 Ti Laptop GPU
min:
103.8 fps, max:
-1 fps
121.7 [X] Asus ROG Zephyrus Duo 16 GX650RX Turbo
AMD Ryzen 9 6900HX 3.3GHz
GeForce RTX 3080 Ti Laptop GPU
min:
107.8 fps, max:
-1 fps
123.3 [X] Asus ROG Zephyrus Duo 16 GX650RX sep. GPU, 25W
AMD Ryzen 9 6900HX 3.3GHz
GeForce RTX 3080 Ti Laptop GPU
min:
105.1 fps, max:
-1 fps
129.3 138.9 140 146.4 148.6 150.9 151.4 151.6 152.3 153 155 [X] SCHENKER XMG Neo 15 with XMG Oasis Intel Core i7-12700H 1.7GHz
GeForce RTX 3080 Ti Laptop GPU
min:
135.1 fps, max:
-1 fps
155.9 156.1 [X] Razer Blade 17 Early 2022 Max.
Intel Core i9-12900H 1.8GHz
GeForce RTX 3080 Ti Laptop GPU
min:
137.2 fps, max:
-1 fps
157.1 [X] Medion Erazer Beast X30 Dyn. Boost 25W
Intel Core i9-12900HK 1.8GHz
GeForce RTX 3080 Ti Laptop GPU
min:
135.8 fps, max:
-1 fps
157.2 [X] Medion Erazer Beast X30 dGPU only
Intel Core i9-12900HK 1.8GHz
GeForce RTX 3080 Ti Laptop GPU
min:
135.3 fps, max:
-1 fps
157.9 [X] Razer Blade 17 Early 2022 dGPU, 175W
Intel Core i9-12900H 1.8GHz
GeForce RTX 3080 Ti Laptop GPU
min:
134.9 fps, max:
-1 fps
158.7 [X] Medion Erazer Beast X30 Turbo Mode
Intel Core i9-12900HK 1.8GHz
GeForce RTX 3080 Ti Laptop GPU
min:
139.6 fps, max:
-1 fps
160.2 [X] Medion Erazer Beast X30 PL 140W
Intel Core i9-12900HK 1.8GHz
GeForce RTX 3080 Ti Laptop GPU
min:
139.8 fps, max:
-1 fps
161 163.9 164 [X] MSI GE76 Raider Intel Core i9-12900HK 1.8GHz
GeForce RTX 3080 Ti Laptop GPU
min:
144.3 fps, max:
-1 fps
164 164.5 165 166 166.6 166.9 168 168 [X] Gigabyte Aero 16 YE5 Turbo Mode
Intel Core i9-12900HK 1.8GHz
GeForce RTX 3080 Ti Laptop GPU
min:
146.6 fps, max:
-1 fps
169.7 170 [X] MSI Titan GT77 12UHS dGPU, Extreme Leistung
Intel Core i9-12900HX 1.7GHz
GeForce RTX 3080 Ti Laptop GPU
min:
145.3 fps, max:
-1 fps
174.8 176.2 [X] MSI Raider GE77 HX 12UHS dGPU, Extreme Leistung
Intel Core i9-12900HX 1.7GHz
GeForce RTX 3080 Ti Laptop GPU
min:
149.8 fps, max:
-1 fps
176.3 [X] MSI Raider GE77 HX 12UHS Extreme Leistung
Intel Core i9-12900HX 1.7GHz
GeForce RTX 3080 Ti Laptop GPU
min:
153.8 fps, max:
-1 fps
177.8 179.8 180.8 ~ 148 fps
+ Confronta
- Nascondi il confronto
...
NVIDIA GeForce RTX 2070 Super Max-Q
NVIDIA GeForce RTX 3080 Ti Laptop GPU
NVIDIA GeForce RTX 2080 Super Mobile
...
max:
29.9 [X] Medion Erazer Beast X30 Office Mode
Intel Core i9-12900HK @4.1GHz
GeForce RTX 3080 Ti Laptop GPU
min:
29.3 fps, max:
-1 fps
59.6 [X] Asus ROG Zephyrus Duo 16 GX650RX Leise
AMD Ryzen 9 6900HX 3.3GHz
GeForce RTX 3080 Ti Laptop GPU
min:
57.5 fps, max:
-1 fps
59.9 82.5 [X] Gigabyte Aero 16 YE5 Silence Mode
Intel Core i9-12900HK @2.1GHz
GeForce RTX 3080 Ti Laptop GPU
min:
70.7 fps, max:
-1 fps
111.3 113.9 [X] Razer Blade 17 Early 2022 Lautlos
Intel Core i9-12900H 1.8GHz
GeForce RTX 3080 Ti Laptop GPU
min:
98 fps, max:
-1 fps
115 [X] Asus ROG Zephyrus Duo 16 GX650RX Turbo
AMD Ryzen 9 6900HX 3.3GHz
GeForce RTX 3080 Ti Laptop GPU
min:
97.7 fps, max:
-1 fps
118.5 [X] Asus ROG Zephyrus Duo 16 GX650RX sep. GPU, 25W
AMD Ryzen 9 6900HX 3.3GHz
GeForce RTX 3080 Ti Laptop GPU
min:
101.8 fps, max:
-1 fps
121.4 131.7 131.9 138.9 140.8 144 145.1 145.3 145.7 147 147.9 [X] SCHENKER XMG Neo 15 with XMG Oasis Intel Core i7-12700H 1.7GHz
GeForce RTX 3080 Ti Laptop GPU
min:
129.5 fps, max:
-1 fps
149.9 150 [X] Medion Erazer Beast X30 Dyn. Boost 25W
Intel Core i9-12900HK 1.8GHz
GeForce RTX 3080 Ti Laptop GPU
min:
131.4 fps, max:
-1 fps
150.6 [X] Medion Erazer Beast X30 dGPU only
Intel Core i9-12900HK 1.8GHz
GeForce RTX 3080 Ti Laptop GPU
min:
127.8 fps, max:
-1 fps
150.8 [X] Razer Blade 17 Early 2022 dGPU, 175W
Intel Core i9-12900H 1.8GHz
GeForce RTX 3080 Ti Laptop GPU
min:
128.2 fps, max:
-1 fps
151.1 [X] Medion Erazer Beast X30 Turbo Mode
Intel Core i9-12900HK 1.8GHz
GeForce RTX 3080 Ti Laptop GPU
min:
132.8 fps, max:
-1 fps
151.4 [X] Medion Erazer Beast X30 PL 140W
Intel Core i9-12900HK 1.8GHz
GeForce RTX 3080 Ti Laptop GPU
min:
131.9 fps, max:
-1 fps
152.5 [X] Razer Blade 17 Early 2022 Max.
Intel Core i9-12900H 1.8GHz
GeForce RTX 3080 Ti Laptop GPU
min:
132.7 fps, max:
-1 fps
154 155.8 156 [X] MSI GE76 Raider Intel Core i9-12900HK 1.8GHz
GeForce RTX 3080 Ti Laptop GPU
min:
137 fps, max:
-1 fps
156 156.8 157 157.2 158.9 159 160 160 [X] Gigabyte Aero 16 YE5 Turbo Mode
Intel Core i9-12900HK 1.8GHz
GeForce RTX 3080 Ti Laptop GPU
min:
139.3 fps, max:
-1 fps
162.7 162.8 [X] MSI Titan GT77 12UHS dGPU, Extreme Leistung
Intel Core i9-12900HX 1.7GHz
GeForce RTX 3080 Ti Laptop GPU
min:
137.8 fps, max:
-1 fps
165.7 166.1 [X] MSI Raider GE77 HX 12UHS dGPU, Extreme Leistung
Intel Core i9-12900HX 1.7GHz
GeForce RTX 3080 Ti Laptop GPU
min:
140.7 fps, max:
-1 fps
167.1 [X] MSI Raider GE77 HX 12UHS Extreme Leistung
Intel Core i9-12900HX 1.7GHz
GeForce RTX 3080 Ti Laptop GPU
min:
145.6 fps, max:
-1 fps
168 169.8 170.5 ~ 141 fps
+ Confronta
- Nascondi il confronto
...
NVIDIA GeForce RTX 2070 Super Max-Q
NVIDIA GeForce RTX 3080 Ti Laptop GPU
NVIDIA GeForce RTX 2080 Super Mobile
...
max:
70.8 [X] Gigabyte Aero 16 YE5 Silence Mode
Intel Core i9-12900HK @2.1GHz
GeForce RTX 3080 Ti Laptop GPU
min:
59.4 fps, max:
-1 fps
89.2 92.3 [X] Asus ROG Zephyrus Duo 16 GX650RX Turbo
AMD Ryzen 9 6900HX 3.3GHz
GeForce RTX 3080 Ti Laptop GPU
min:
81.3 fps, max:
-1 fps
103.4 [X] Razer Blade 17 Early 2022 Lautlos
Intel Core i9-12900H 1.8GHz
GeForce RTX 3080 Ti Laptop GPU
min:
88.5 fps, max:
-1 fps
105.5 [X] Asus ROG Zephyrus Duo 16 GX650RX Leise
AMD Ryzen 9 6900HX 3.3GHz
GeForce RTX 3080 Ti Laptop GPU
min:
92.7 fps, max:
-1 fps
112 117.3 119 [X] Gigabyte Aero 16 YE5 Turbo Mode
Intel Core i9-12900HK 1.8GHz
GeForce RTX 3080 Ti Laptop GPU
min:
100.8 fps, max:
-1 fps
122.7 130.4 [X] Razer Blade 17 Early 2022 Max.
Intel Core i9-12900H 1.8GHz
GeForce RTX 3080 Ti Laptop GPU
min:
113.9 fps, max:
-1 fps
139.9 140.1 142.3 142.3 [X] Razer Blade 17 Early 2022 dGPU, 175W
Intel Core i9-12900H 1.8GHz
GeForce RTX 3080 Ti Laptop GPU
min:
116.9 fps, max:
-1 fps
144.7 145.9 [X] MSI Raider GE77 HX 12UHS Extreme Leistung
Intel Core i9-12900HX 1.7GHz
GeForce RTX 3080 Ti Laptop GPU
min:
123.4 fps, max:
-1 fps
146.3 [X] Medion Erazer Beast X30 Turbo Mode
Intel Core i9-12900HK 1.8GHz
GeForce RTX 3080 Ti Laptop GPU
min:
123.4 fps, max:
-1 fps
151.6 [X] MSI Titan GT77 12UHS dGPU, Extreme Leistung
Intel Core i9-12900HX 1.7GHz
GeForce RTX 3080 Ti Laptop GPU
min:
123.4 fps, max:
-1 fps
155.6 [X] MSI Raider GE77 HX 12UHS dGPU, Extreme Leistung
Intel Core i9-12900HX 1.7GHz
GeForce RTX 3080 Ti Laptop GPU
min:
126.9 fps, max:
-1 fps
~ 125 fps
+ Confronta
- Nascondi il confronto
...
NVIDIA GeForce RTX 3080 Ti Laptop GPU
NVIDIA GeForce RTX 2080 Super Mobile
...
NVIDIA GeForce RTX 2080 Super Mobile
max:
» Giocabile con la maggior parte dei portatili testati con dettagli ultra.
316 328 [X] Razer Blade 17 Early 2022 Intel Core i9-12900H 1.8GHz
GeForce RTX 3080 Ti Laptop GPU
min:
12.1 fps, P0.1:
49.6 fps, P1:
212 fps, max:
506 fps
345 366 379 [X] Medion Erazer Beast X30 Intel Core i9-12900HK 1.8GHz
GeForce RTX 3080 Ti Laptop GPU
min:
11.5 fps, P0.1:
60.6 fps, P1:
258 fps, max:
602 fps
385 386 [X] SCHENKER XMG Neo 17 M22 AMD Ryzen 9 6900HX 3.3GHz
GeForce RTX 3080 Ti Laptop GPU
min:
65.3 fps, P0.1:
192.6 fps, P1:
276 fps, max:
599 fps
388.4 391 [X] Alienware x15 R2 P111F Intel Core i9-12900H 1.8GHz
GeForce RTX 3080 Ti Laptop GPU
min:
344 fps, P1:
345.14 fps, max:
471 fps
391.9 398 407 408 [X] Gigabyte Aero 16 YE5 Intel Core i9-12900HK 1.8GHz
GeForce RTX 3080 Ti Laptop GPU
min:
14.8 fps, P0.1:
71.2 fps, P1:
237 fps, max:
659 fps
409.2 [X] SCHENKER XMG Neo 15 with XMG Oasis Intel Core i7-12700H 1.7GHz
GeForce RTX 3080 Ti Laptop GPU
411 447.2 457.4 459 464.9 472.4 480 [X] MSI Titan GT77 12UHS Intel Core i9-12900HX 1.7GHz
GeForce RTX 3080 Ti Laptop GPU
min:
17.3 fps, P0.1:
82.3 fps, P1:
291 fps, max:
824 fps
498 [X] MSI Raider GE77 HX 12UHS Intel Core i9-12900HX 1.7GHz
GeForce RTX 3080 Ti Laptop GPU
min:
16.6 fps, P0.1:
87.4 fps, P1:
311 fps, max:
843 fps
500.9 543 [X] MSI Titan GT77 12UHS Intel Core i9-12900HX 1.7GHz
GeForce RTX 3080 Ti Laptop GPU
min:
483 fps, P1:
483 fps, max:
603 fps
~ 418 fps
+ Confronta
- Nascondi il confronto
+ 📈 Graph
- 📈 Hide Graph
0 100 200 300 400 500 600 700 800 900 1000 Tooltip Blade 17 Early 2022: Ø339 (283.192-552)
ROG Zephyrus Duo 16 GX650RX: Ø349 (302.472-387.783)
Erazer Beast X30: Ø386 (296.576-449.5)
XMG Neo 17 M22: Ø397 (348.312-817)
x15 R2 P111F: Ø391 (344-471)
Aero 16 YE5: Ø441 (348.05-1048)
Titan GT77 12UHS: Ø485 (394-553.55)
Raider GE77 HX 12UHS: Ø509 (412.529-665.6)
Titan GT77 12UHS: Ø543 (483-603)
...
NVIDIA GeForce RTX 3080 Ti Laptop GPU
NVIDIA GeForce RTX 2080 Super Mobile
max:
200 278 [X] Gigabyte Aero 16 YE5 Intel Core i9-12900HK 1.8GHz
GeForce RTX 3080 Ti Laptop GPU
min:
27 fps, P0.1:
80.6 fps, P1:
167 fps, max:
518 fps
279 289 [X] Razer Blade 17 Early 2022 Intel Core i9-12900H 1.8GHz
GeForce RTX 3080 Ti Laptop GPU
min:
26.9 fps, P0.1:
80.1 fps, P1:
187.9 fps, max:
484 fps
291 298 298.8 306 313.9 317 [X] Medion Erazer Beast X30 Intel Core i9-12900HK 1.8GHz
GeForce RTX 3080 Ti Laptop GPU
min:
33 fps, P0.1:
69.9 fps, P1:
212 fps, max:
519 fps
319 320.9 325.6 335 [X] SCHENKER XMG Neo 17 M22 AMD Ryzen 9 6900HX 3.3GHz
GeForce RTX 3080 Ti Laptop GPU
min:
19.8 fps, P0.1:
152.7 fps, P1:
234 fps, max:
502 fps
340.9 341 343 [X] SCHENKER XMG Neo 15 with XMG Oasis Intel Core i7-12700H 1.7GHz
GeForce RTX 3080 Ti Laptop GPU
344 345 [X] Alienware x15 R2 P111F Intel Core i9-12900H 1.8GHz
GeForce RTX 3080 Ti Laptop GPU
min:
307 fps, P1:
312.13 fps, max:
390 fps
366.2 368.4 379 [X] MSI Titan GT77 12UHS Intel Core i9-12900HX 1.7GHz
GeForce RTX 3080 Ti Laptop GPU
min:
44.3 fps, P0.1:
96.7 fps, P1:
223 fps, max:
653 fps
384 [X] MSI GE76 Raider Intel Core i9-12900HK 1.8GHz
GeForce RTX 3080 Ti Laptop GPU
min:
317 fps
388.5 392 [X] MSI Raider GE77 HX 12UHS Intel Core i9-12900HX 1.7GHz
GeForce RTX 3080 Ti Laptop GPU
min:
38.3 fps, P0.1:
108.2 fps, P1:
238 fps, max:
670 fps
411 [X] MSI Titan GT77 12UHS Intel Core i9-12900HX 1.7GHz
GeForce RTX 3080 Ti Laptop GPU
min:
335 fps, P1:
342.98 fps, max:
465 fps
~ 330 fps
+ Confronta
- Nascondi il confronto
+ 📈 Graph
- 📈 Hide Graph
0 100 200 300 400 500 600 700 800 900 1000 Tooltip Aero 16 YE5: Ø281 (251.859-316.7)
Blade 17 Early 2022: Ø291 (257.444-334.24)
ROG Zephyrus Duo 16 GX650RX: Ø299 (275.459-352.13)
Erazer Beast X30: Ø318 (290.18-375.11)
XMG Neo 17 M22: Ø339 (305.553-394.05)
x15 R2 P111F: Ø345 (307-390)
Titan GT77 12UHS: Ø408 (322.116-1082)
Raider GE77 HX 12UHS: Ø396 (359.303-452.83)
Titan GT77 12UHS: Ø411 (335-465)
...
NVIDIA GeForce RTX 2080 Super Mobile
NVIDIA GeForce RTX 3080 Ti Laptop GPU
max:
144 [X] Gigabyte Aero 16 YE5 Intel Core i9-12900HK 1.8GHz
GeForce RTX 3080 Ti Laptop GPU
min:
33.3 fps, P0.1:
39.8 fps, P1:
65 fps, max:
353 fps
145 155.5 186.6 197.9 206.8 210 211 212.4 212.5 213.7 214 [X] Medion Erazer Beast X30 Intel Core i9-12900HK 1.8GHz
GeForce RTX 3080 Ti Laptop GPU
min:
26.7 fps, P0.1:
54.6 fps, P1:
124 fps, max:
407 fps
218 [X] Razer Blade 17 Early 2022 Intel Core i9-12900H 1.8GHz
GeForce RTX 3080 Ti Laptop GPU
min:
15.9 fps, P0.1:
46 fps, P1:
122.8 fps, max:
353 fps
222 223 227.3 [X] SCHENKER XMG Neo 15 with XMG Oasis Intel Core i7-12700H 1.7GHz
GeForce RTX 3080 Ti Laptop GPU
229 [X] Alienware x15 R2 P111F Intel Core i9-12900H 1.8GHz
GeForce RTX 3080 Ti Laptop GPU
min:
193 fps, P1:
195.32 fps, max:
258 fps
236 [X] SCHENKER XMG Neo 17 M22 AMD Ryzen 9 6900HX 3.3GHz
GeForce RTX 3080 Ti Laptop GPU
min:
30.3 fps, P0.1:
70.5 fps, P1:
139.4 fps, max:
400 fps
236.3 240 [X] MSI Titan GT77 12UHS Intel Core i9-12900HX 1.7GHz
GeForce RTX 3080 Ti Laptop GPU
min:
37.3 fps, P0.1:
67.9 fps, P1:
160.4 fps, max:
504 fps
242.8 247 [X] MSI GE76 Raider Intel Core i9-12900HK 1.8GHz
GeForce RTX 3080 Ti Laptop GPU
min:
213 fps
249 [X] MSI Raider GE77 HX 12UHS Intel Core i9-12900HX 1.7GHz
GeForce RTX 3080 Ti Laptop GPU
min:
39.7 fps, P0.1:
69.3 fps, P1:
165.5 fps, max:
471 fps
250.4 251 257.5 260 [X] MSI Titan GT77 12UHS Intel Core i9-12900HX 1.7GHz
GeForce RTX 3080 Ti Laptop GPU
min:
213 fps, P1:
216.3 fps, max:
290 fps
267.7 ~ 220 fps
+ Confronta
- Nascondi il confronto
+ 📈 Graph
- 📈 Hide Graph
0 100 200 Tooltip Aero 16 YE5: Ø150.6 (71.63-203.7)
ROG Zephyrus Duo 16 GX650RX: Ø204 (174.85-262.7)
Erazer Beast X30: Ø223 (193.122-294)
Blade 17 Early 2022: Ø221 (177.128-255.36)
x15 R2 P111F: Ø229 (193-258)
XMG Neo 17 M22: Ø239 (210.188-294)
Titan GT77 12UHS: Ø244 (208.199-289.8)
Raider GE77 HX 12UHS: Ø255 (214.404-288.3)
Titan GT77 12UHS: Ø260 (213-290)
...
NVIDIA GeForce RTX 2080 Super Mobile
NVIDIA GeForce RTX 3080 Ti Laptop GPU
max:
30 [X] Medion Erazer Beast X30 Office Mode
Intel Core i9-12900HK @4.1GHz
GeForce RTX 3080 Ti Laptop GPU
min:
18.1 fps, P0.1:
19.1 fps, P1:
25 fps, max:
101.2 fps
60 [X] Asus ROG Zephyrus Duo 16 GX650RX Leise
AMD Ryzen 9 6900HX 3.3GHz
GeForce RTX 3080 Ti Laptop GPU
min:
33.6 fps, P0.1:
39 fps, P1:
47.5 fps, max:
130.2 fps
68 79.4 [X] Gigabyte Aero 16 YE5 SIlence Mode
Intel Core i9-12900HK @2.1GHz
GeForce RTX 3080 Ti Laptop GPU
min:
13.7 fps, P0.1:
18.1 fps, P1:
35.9 fps, max:
135 fps
89.3 92.2 [X] Gigabyte Aero 16 YE5 Intel Core i9-12900HK 1.8GHz
GeForce RTX 3080 Ti Laptop GPU
min:
19.1 fps, P0.1:
45.8 fps, P1:
67.7 fps, max:
266 fps
98.2 [X] Gigabyte Aero 16 YE5 Turbo Mode
Intel Core i9-12900HK 1.8GHz
GeForce RTX 3080 Ti Laptop GPU
min:
36.5 fps, P0.1:
43 fps, P1:
74.9 fps, max:
258 fps
102.1 107.2 109.1 109.4 110 111.1 112 113 [X] Razer Blade 17 Early 2022 Lautlos
Intel Core i9-12900H 1.8GHz
GeForce RTX 3080 Ti Laptop GPU
114.4 116 [X] Alienware x15 R2 P111F Intel Core i9-12900H 1.8GHz
GeForce RTX 3080 Ti Laptop GPU
min:
100 fps, P1:
101.71 fps, max:
132 fps
116.4 [X] Medion Erazer Beast X30 Dyn. Boost 25W
Intel Core i9-12900HK 1.8GHz
GeForce RTX 3080 Ti Laptop GPU
min:
27.7 fps, P0.1:
32.8 fps, P1:
72.5 fps, max:
267 fps
117.1 [X] Medion Erazer Beast X30 Turbo Mode
Intel Core i9-12900HK 1.8GHz
GeForce RTX 3080 Ti Laptop GPU
min:
11.1 fps, P0.1:
31.8 fps, P1:
72.9 fps, max:
274 fps
117.2 117.4 [X] Medion Erazer Beast X30 Intel Core i9-12900HK 1.8GHz
GeForce RTX 3080 Ti Laptop GPU
min:
26.9 fps, P0.1:
30.4 fps, P1:
81.6 fps, max:
242 fps
118.2 [X] Medion Erazer Beast X30 dGPU only
Intel Core i9-12900HK 1.8GHz
GeForce RTX 3080 Ti Laptop GPU
min:
81 fps, P0.1:
86.9 fps, P1:
101.1 fps, max:
228 fps
118.8 119 119.6 [X] Razer Blade 17 Early 2022 Intel Core i9-12900H 1.8GHz
GeForce RTX 3080 Ti Laptop GPU
min:
28.2 fps, P0.1:
31 fps, P1:
74.4 fps, max:
239 fps
120 120.7 [X] Asus ROG Zephyrus Duo 16 GX650RX Turbo
AMD Ryzen 9 6900HX 3.3GHz
GeForce RTX 3080 Ti Laptop GPU
min:
22.4 fps, P0.1:
49.9 fps, P1:
82.6 fps, max:
256 fps
121 121 123.4 [X] Razer Blade 17 Early 2022 Max.
Intel Core i9-12900H 1.8GHz
GeForce RTX 3080 Ti Laptop GPU
min:
32.6 fps, P0.1:
35.4 fps, P1:
91.7 fps, max:
268 fps
123.7 [X] Razer Blade 17 Early 2022 dGPU, 175W
Intel Core i9-12900H 1.8GHz
GeForce RTX 3080 Ti Laptop GPU
min:
17.1 fps, P0.1:
41.8 fps, P1:
92.8 fps, max:
331 fps
123.7 [X] MSI Titan GT77 12UHS Intel Core i9-12900HX 1.7GHz
GeForce RTX 3080 Ti Laptop GPU
min:
34.1 fps, P0.1:
44.3 fps, P1:
88.8 fps, max:
294 fps
124.4 [X] Asus ROG Zephyrus Duo 16 GX650RX sep. GPU, 25W
AMD Ryzen 9 6900HX 3.3GHz
GeForce RTX 3080 Ti Laptop GPU
min:
20.1 fps, P0.1:
40.2 fps, P1:
88.9 fps, max:
264 fps
124.6 124.6 [X] SCHENKER XMG Neo 15 with XMG Oasis Intel Core i7-12700H 1.7GHz
GeForce RTX 3080 Ti Laptop GPU
126 [X] MSI GE76 Raider Intel Core i9-12900HK 1.8GHz
GeForce RTX 3080 Ti Laptop GPU
min:
108 fps
126.7 [X] MSI Raider GE77 HX 12UHS Intel Core i9-12900HX 1.7GHz
GeForce RTX 3080 Ti Laptop GPU
min:
29.1 fps, P0.1:
45.6 fps, P1:
97.9 fps, max:
340 fps
127.2 127.8 128 129.3 [X] MSI Titan GT77 12UHS Intel Core i9-12900HX 1.7GHz
GeForce RTX 3080 Ti Laptop GPU
min:
110 fps, P1:
111.14 fps, max:
146 fps
130.4 [X] MSI Raider GE77 HX 12UHS dGPU, Extreme Leistung
Intel Core i9-12900HX 1.7GHz
GeForce RTX 3080 Ti Laptop GPU
min:
34.8 fps, P0.1:
53.7 fps, P1:
100.2 fps, max:
379 fps
130.6 [X] MSI Titan GT77 12UHS dGPU, Extreme Leistung
Intel Core i9-12900HX 1.7GHz
GeForce RTX 3080 Ti Laptop GPU
min:
64.4 fps, P0.1:
74.8 fps, P1:
100.6 fps, max:
343 fps
~ 112 fps
+ Confronta
- Nascondi il confronto
+ 📈 Graph
- 📈 Hide Graph
0 100 Tooltip Erazer Beast X30 Office Mode: Ø30 (29-33)
ROG Zephyrus Duo 16 GX650RX Leise: Ø60 (59-61)
Creator Z16P B12UHST: Ø59.6 (52-96)
Aero 16 YE5 SIlence Mode: Ø82.9 (51-92)
Blade 15 Advanced Model Early 2022: Ø87.2 (70-92)
Aero 16 YE5: Ø91.2 (87-96)
Aero 16 YE5 Turbo Mode: Ø93.9 (86-100)
Predator Triton 500 SE PT516-52s-70KX: Ø104.8 (88-110)
Blade 15 2022: Ø102.3 (87-111)
Stealth GS77 12UHS-083US: Ø102.5 (93-111)
Nightsky TXi317: Ø107.4 (100-116)
Raider GE66 12UHS: Ø110.3 (101-123)
ROG Zephyrus Duo 16 GX650RX: Ø111.3 (107-116)
XMG Pro 17 E22: Ø106.6 (98-115)
Blade 17 Early 2022 Lautlos: Ø108.2 (95-113)
Legion 7 16IAX7-82TD004SGE: Ø114.4 (108-123)
x15 R2 P111F: Ø115.1 (104-121)
Erazer Beast X30 Dyn. Boost 25W: Ø121.4 (101.161-161.5)
Erazer Beast X30 Turbo Mode: Ø114.3 (108-121)
Uniwill Technology GM7AG8P: Ø112.2 (106-119)
Erazer Beast X30: Ø112.9 (95-119)
Erazer Beast X30 dGPU only: Ø118.7 (118.282-119.076)
ROG Strix Scar 17 SE G733CX-LL014W: Ø118.8 (111-126)
XMG Pro 15 (i7-12700H, RTX 3080 Ti): Ø117.1 (110-125)
Blade 17 Early 2022: Ø118.8 (94-125)
15 YE5-54DEB34SH: Ø116.7 (107-125)
ROG Zephyrus Duo 16 GX650RX Turbo: Ø117.9 (98-124)
XMG Neo 15 E22 (Early 2022, RTX 3080 Ti): Ø112.9 (102-128)
XMG Neo 17 M22: Ø119.7 (105-125)
Blade 17 Early 2022 Max.: Ø119.5 (110-125)
Blade 17 Early 2022 dGPU, 175W: Ø122.3 (111-130)
Titan GT77 12UHS: Ø119.8 (112-126)
ROG Zephyrus Duo 16 GX650RX sep. GPU, 25W: Ø124.6 (120-128)
Blade 17 RTX 3080 Ti: Ø121 (110-130)
XMG Neo 15 with XMG Oasis: Ø118.4 (110-126)
GE76 Raider: Ø122.2 (107-127)
Raider GE77 HX 12UHS: Ø123.8 (113-129)
GM7AG8N Liquid Cooling Box: Ø119 (109-129)
XMG Neo 15 (i7-12700H, RTX 3080 Ti): Ø109.2 (98-119)
x17 R2 P48E: Ø121.3 (111-128)
Titan GT77 12UHS: Ø132 (125-136)
Raider GE77 HX 12UHS dGPU, Extreme Leistung: Ø126.7 (115-133)
Titan GT77 12UHS dGPU, Extreme Leistung: Ø125.8 (115-131)
...
NVIDIA GeForce RTX 2080 Super Mobile
NVIDIA GeForce RTX 3080 Ti Laptop GPU
...
max:
...
NVIDIA GeForce RTX 3080 Ti Laptop GPU
max:
62.1 [X] MSI Raider GE77 HX 12UHS Intel Core i9-12900HX 1.7GHz
GeForce RTX 3080 Ti Laptop GPU
min:
22 fps, P0.1:
25.2 fps, P1:
46.6 fps, max:
257 fps
64 [X] Gigabyte Aero 16 YE5 Intel Core i9-12900HK 1.8GHz
GeForce RTX 3080 Ti Laptop GPU
min:
20.4 fps, P0.1:
29.2 fps, P1:
51.9 fps, max:
371 fps
77.5 80.5 89.6 [X] Razer Blade 17 Early 2022 Intel Core i9-12900H 1.8GHz
GeForce RTX 3080 Ti Laptop GPU
min:
22.2 fps, P0.1:
27.3 fps, P1:
70 fps, max:
317 fps
90.5 [X] SCHENKER XMG Neo 17 M22 AMD Ryzen 9 6900HX 3.3GHz
GeForce RTX 3080 Ti Laptop GPU
min:
49.5 fps, P0.1:
57.8 fps, P1:
75.3 fps, max:
310 fps
91.9 [X] MSI Titan GT77 12UHS Intel Core i9-12900HX 1.7GHz
GeForce RTX 3080 Ti Laptop GPU
min:
24.2 fps, P0.1:
29.7 fps, P1:
72.1 fps, max:
355 fps
94.3 [X] MSI Raider GE77 HX 12UHS Intel Core i9-12900HX 1.7GHz
GeForce RTX 3080 Ti Laptop GPU
min:
27.7 fps, P0.1:
31.8 fps, P1:
75.4 fps, max:
373 fps
~ 81 fps
+ Confronta
- Nascondi il confronto
+ 📈 Graph
- 📈 Hide Graph
0 100 200 300 400 Tooltip Raider GE77 HX 12UHS: Ø83 (56.94-437)
Raider GE77 HX 12UHS: Ø108.4 (86.134-372)
Aero 16 YE5: Ø69.1 (59.11-99.7)
ROG Zephyrus Duo 16 GX650RX: Ø83.3 (75.04-97.9)
Blade 17 Early 2022: Ø90.9 (81.545-98.85)
XMG Neo 17 M22: Ø93.4 (83.08-122.9)
Titan GT77 12UHS: Ø94.3 (84.226-117)
...
NVIDIA GeForce RTX 2080 Super Mobile
NVIDIA GeForce RTX 3080 Ti Laptop GPU
...
max:
» Giocabile con la maggior parte dei portatili testati con dettagli ultra.
Additional Benchmarks
Ultra Graphics & Postprocessing (HBAO+) 3840x2160
44.8 [X] Gigabyte Aero 16 YE5 Intel Core i9-12900HK 1.8GHz
GeForce RTX 3080 Ti Laptop GPU
min:
14.7 fps, P0.1:
26.1 fps, P1:
36.7 fps, max:
248 fps
60.3 [X] MSI Titan GT77 12UHS 874931
Intel Core i9-12900HX 1.7GHz
GeForce RTX 3080 Ti Laptop GPU
min:
19.2 fps, P0.1:
24.1 fps, P1:
45.7 fps, max:
243 fps
62.7 [X] MSI Titan GT77 12UHS 874931, dGPU, Extreme Leistung
Intel Core i9-12900HX 1.7GHz
GeForce RTX 3080 Ti Laptop GPU
min:
23.1 fps, P0.1:
32.8 fps, P1:
50.7 fps, max:
270 fps
Medium Graphics & Postprocessing 1920x1080
262 [X] SCHENKER XMG Neo 15 with XMG Oasis Intel Core i7-12700H 1.7GHz
GeForce RTX 3080 Ti Laptop GPU
310 [X] MSI Titan GT77 12UHS 905427
Intel Core i9-12900HX 1.7GHz
GeForce RTX 3080 Ti Laptop GPU
min:
273 fps, P1:
274.14 fps, max:
350 fps
178.7 179.4 180.4 181.2 184.4 184.8 185 185.7 185.8 [X] SCHENKER XMG Neo 15 with XMG Oasis Intel Core i7-12700H 1.7GHz
GeForce RTX 3080 Ti Laptop GPU
min:
1.883 fps, P1:
125 fps, max:
405 fps
185.9 186 186 [X] Razer Blade 15 2022 Intel Core i7-12800H 1.8GHz
GeForce RTX 3080 Ti Laptop GPU
min:
1.675 fps, P1:
143 fps, max:
360 fps
186 186 186 186.2 186.8 187 [X] Gigabyte Aero 16 YE5 Intel Core i9-12900HK 1.8GHz
GeForce RTX 3080 Ti Laptop GPU
min:
1.732 fps, P1:
167 fps, max:
329 fps
187 187 [X] Alienware x17 R2 P48E Intel Core i9-12900HK 1.8GHz
GeForce RTX 3080 Ti Laptop GPU
min:
2.05 fps, P1:
200 fps, max:
343 fps
187.1 [X] MSI Titan GT77 12UHS Intel Core i9-12900HX 1.7GHz
GeForce RTX 3080 Ti Laptop GPU
min:
1.532 fps, P1:
200 fps, max:
380 fps
187.1 187.2 [X] MSI Titan GT77 12UHS dGPU, Extreme Leistung
Intel Core i9-12900HX 1.7GHz
GeForce RTX 3080 Ti Laptop GPU
min:
1.555 fps, P1:
200 fps, max:
382 fps
187.3 [X] MSI Titan GT77 12UHS Intel Core i9-12900HX 1.7GHz
GeForce RTX 3080 Ti Laptop GPU
min:
3.64 fps, P1:
200 fps, max:
373 fps
~ 185 fps
+ Confronta
- Nascondi il confronto
...
NVIDIA GeForce RTX 2070 Super Max-Q
NVIDIA GeForce RTX 2070 Super Mobile
NVIDIA GeForce RTX 3080 Ti Laptop GPU
NVIDIA GeForce RTX 2080 Super Mobile
max:
170.7 175.2 175.4 175.8 176.1 180.8 [X] Aorus 15 YE5-54DEB34SH Intel Core i5-12500H 1.8GHz
GeForce RTX 3080 Ti Laptop GPU
min:
2.73 fps, P1:
142.9 fps, max:
354 fps
181 [X] Razer Blade 15 2022 Intel Core i7-12800H 1.8GHz
GeForce RTX 3080 Ti Laptop GPU
min:
3.05 fps, P1:
125 fps, max:
368 fps
181 181.3 181.6 182 182.4 182.4 [X] SCHENKER XMG Neo 15 with XMG Oasis Intel Core i7-12700H 1.7GHz
GeForce RTX 3080 Ti Laptop GPU
min:
2.59 fps, P1:
125 fps, max:
370 fps
182.7 182.8 183 184 [X] MSI GE76 Raider Intel Core i9-12900HK 1.8GHz
GeForce RTX 3080 Ti Laptop GPU
min:
2.19 fps, P1:
143 fps, max:
337 fps
185 [X] Gigabyte Aero 16 YE5 Intel Core i9-12900HK 1.8GHz
GeForce RTX 3080 Ti Laptop GPU
min:
2.04 fps, P1:
143 fps, max:
330 fps
185 185.1 [X] Alienware x17 R2 P48E Intel Core i9-12900HK 1.8GHz
GeForce RTX 3080 Ti Laptop GPU
min:
2.11 fps, P1:
142.9 fps, max:
364 fps
186.5 186.6 [X] MSI Titan GT77 12UHS Intel Core i9-12900HX 1.7GHz
GeForce RTX 3080 Ti Laptop GPU
min:
2.3 fps, P1:
166.7 fps, max:
280 fps
186.6 [X] MSI Titan GT77 12UHS dGPU, Extreme Leistung
Intel Core i9-12900HX 1.7GHz
GeForce RTX 3080 Ti Laptop GPU
min:
1.473 fps, P1:
166.7 fps, max:
360 fps
186.8 [X] MSI Titan GT77 12UHS Intel Core i9-12900HX 1.7GHz
GeForce RTX 3080 Ti Laptop GPU
min:
1.467 fps, P1:
166.7 fps, max:
428 fps
186.8 187 ~ 182 fps
+ Confronta
- Nascondi il confronto
...
NVIDIA GeForce RTX 2070 Super Mobile
NVIDIA GeForce RTX 2080 Super Mobile
NVIDIA GeForce RTX 3080 Ti Laptop GPU
max:
153.4 158.9 163.8 166 169.5 170.2 [X] SCHENKER XMG Neo 15 with XMG Oasis Intel Core i7-12700H 1.7GHz
GeForce RTX 3080 Ti Laptop GPU
min:
3.96 fps, P1:
125 fps, max:
312 fps
172.2 172.6 175 175.7 176 [X] MSI GE76 Raider Intel Core i9-12900HK 1.8GHz
GeForce RTX 3080 Ti Laptop GPU
min:
4.26 fps, P1:
125 fps, max:
266 fps
176 176 176.1 176.5 177 [X] Razer Blade 15 2022 Intel Core i7-12800H 1.8GHz
GeForce RTX 3080 Ti Laptop GPU
min:
3.71 fps, P1:
125 fps, max:
328 fps
177.3 177.5 177.7 179 179 [X] Gigabyte Aero 16 YE5 Intel Core i9-12900HK 1.8GHz
GeForce RTX 3080 Ti Laptop GPU
min:
3.17 fps, P1:
143 fps, max:
342 fps
180.7 180.8 [X] Alienware x17 R2 P48E Intel Core i9-12900HK 1.8GHz
GeForce RTX 3080 Ti Laptop GPU
min:
3.24 fps, P1:
142.9 fps, max:
362 fps
182.3 [X] MSI Titan GT77 12UHS Intel Core i9-12900HX 1.7GHz
GeForce RTX 3080 Ti Laptop GPU
min:
2.97 fps, P1:
142.9 fps, max:
335 fps
182.7 [X] MSI Titan GT77 12UHS Intel Core i9-12900HX 1.7GHz
GeForce RTX 3080 Ti Laptop GPU
min:
8.3 fps, P1:
142.9 fps, max:
398 fps
183.4 183.9 [X] MSI Titan GT77 12UHS dGPU, Extreme Leistung
Intel Core i9-12900HX 1.7GHz
GeForce RTX 3080 Ti Laptop GPU
min:
6.31 fps, P1:
142.9 fps, max:
371 fps
184.3 ~ 175 fps
+ Confronta
- Nascondi il confronto
...
NVIDIA GeForce RTX 2080 Super Mobile
NVIDIA GeForce RTX 3080 Ti Laptop GPU
...
max:
30 [X] Medion Erazer Beast X30 Office Mode
Intel Core i9-12900HK @4.1GHz
GeForce RTX 3080 Ti Laptop GPU
min:
11.7 fps, P1:
29.4 fps, max:
35.1 fps
47.4 [X] Gigabyte Aero 16 YE5 Silence Mode
Intel Core i9-12900HK @2.1GHz
GeForce RTX 3080 Ti Laptop GPU
min:
9.59 fps, P1:
27.8 fps, max:
80 fps
60 [X] Asus ROG Zephyrus Duo 16 GX650RX Leise
AMD Ryzen 9 6900HX 3.3GHz
GeForce RTX 3080 Ti Laptop GPU
min:
11.5 fps, P1:
58.8 fps, max:
87.4 fps
84.8 [X] Razer Blade 17 Early 2022 Lautlos
Intel Core i9-12900H 1.8GHz
GeForce RTX 3080 Ti Laptop GPU
min:
19.5 fps, P1:
55.6 fps, max:
153.2 fps
91.1 92.4 101.5 101.8 102.7 [X] Asus ROG Zephyrus Duo 16 GX650RX Turbo
AMD Ryzen 9 6900HX 3.3GHz
GeForce RTX 3080 Ti Laptop GPU
min:
18.1 fps, P1:
76.9 fps, max:
186.1 fps
106 106.6 [X] Asus ROG Zephyrus Duo 16 GX650RX sep. GPU, 25W
AMD Ryzen 9 6900HX 3.3GHz
GeForce RTX 3080 Ti Laptop GPU
min:
3.82 fps, P1:
71.4 fps, max:
192.1 fps
107 [X] Medion Erazer Beast X30 Dyn. Boost 25W
Intel Core i9-12900HK 1.8GHz
GeForce RTX 3080 Ti Laptop GPU
min:
20 fps, P1:
66.7 fps, max:
181.5 fps
107.4 109.3 [X] Medion Erazer Beast X30 dGPU only
Intel Core i9-12900HK 1.8GHz
GeForce RTX 3080 Ti Laptop GPU
min:
9 fps, P1:
66.7 fps, max:
192.4 fps
109.4 110.9 111.4 113 [X] Gigabyte Aero 16 YE5 Intel Core i9-12900HK 1.8GHz
GeForce RTX 3080 Ti Laptop GPU
min:
20.6 fps, P1:
76.9 fps, max:
212 fps
113 113 113 116.6 [X] Medion Erazer Beast X30 Turbo Mode
Intel Core i9-12900HK 1.8GHz
GeForce RTX 3080 Ti Laptop GPU
min:
21.5 fps, P1:
76.9 fps, max:
202 fps
116.6 118 [X] Razer Blade 15 2022 Intel Core i7-12800H 1.8GHz
GeForce RTX 3080 Ti Laptop GPU
min:
4.44 fps, P1:
76.9 fps, max:
213 fps
118 [X] Gigabyte Aero 16 YE5 Turbo Mode
Intel Core i9-12900HK 1.8GHz
GeForce RTX 3080 Ti Laptop GPU
min:
21 fps, P1:
76.9 fps, max:
225 fps
118 [X] Aorus 15 YE5-54DEB34SH Intel Core i5-12500H 1.8GHz
GeForce RTX 3080 Ti Laptop GPU
min:
3.98 fps, P1:
83.3 fps, max:
210 fps
119.2 119.5 [X] SCHENKER XMG Neo 15 with XMG Oasis Intel Core i7-12700H 1.7GHz
GeForce RTX 3080 Ti Laptop GPU
min:
7.19 fps, P1:
83.3 fps, max:
213 fps
120.3 [X] Razer Blade 17 Early 2022 dGPU, 175W
Intel Core i9-12900H 1.8GHz
GeForce RTX 3080 Ti Laptop GPU
min:
6.71 fps, P1:
83.3 fps, max:
201 fps
123.1 123.3 123.7 [X] Razer Blade 17 Early 2022 Max.
Intel Core i9-12900H 1.8GHz
GeForce RTX 3080 Ti Laptop GPU
min:
46.8 fps, P1:
90.9 fps, max:
198.4 fps
125 [X] MSI GE76 Raider Intel Core i9-12900HK 1.8GHz
GeForce RTX 3080 Ti Laptop GPU
min:
10.6 fps, P1:
83.3 fps, max:
257 fps
125 126.3 [X] Alienware x17 R2 P48E Intel Core i9-12900HK 1.8GHz
GeForce RTX 3080 Ti Laptop GPU
min:
5.94 fps, P1:
90.9 fps, max:
208 fps
126.7 131.8 [X] MSI Titan GT77 12UHS Intel Core i9-12900HX 1.7GHz
GeForce RTX 3080 Ti Laptop GPU
min:
6.21 fps, P1:
90.9 fps, max:
199.2 fps
132.3 [X] MSI Titan GT77 12UHS dGPU, Extreme Leistung
Intel Core i9-12900HX 1.7GHz
GeForce RTX 3080 Ti Laptop GPU
min:
7.96 fps, P1:
90.9 fps, max:
207 fps
134.4 [X] MSI Titan GT77 12UHS Intel Core i9-12900HX 1.7GHz
GeForce RTX 3080 Ti Laptop GPU
min:
23 fps, P1:
100 fps, max:
251 fps
136 138.1 [X] MSI Raider GE77 HX 12UHS dGPU, Extreme Leistung
Intel Core i9-12900HX 1.7GHz
GeForce RTX 3080 Ti Laptop GPU
min:
6.29 fps, P1:
100 fps, max:
215 fps
139.2 [X] MSI Raider GE77 HX 12UHS Extreme Leistung
Intel Core i9-12900HX 1.7GHz
GeForce RTX 3080 Ti Laptop GPU
min:
6.75 fps, P1:
100 fps, max:
212 fps
~ 111 fps
+ Confronta
- Nascondi il confronto
...
NVIDIA GeForce RTX 2080 Super Mobile
NVIDIA GeForce RTX 3080 Ti Laptop GPU
...
max:
30 [X] Medion Erazer Beast X30 Office Mode
Intel Core i9-12900HK @4.1GHz
GeForce RTX 3080 Ti Laptop GPU
min:
9.19 fps, P1:
29.4 fps, max:
46.1 fps
74.9 82.4 82.7 [X] Gigabyte Aero 16 YE5 Intel Core i9-12900HK 1.8GHz
GeForce RTX 3080 Ti Laptop GPU
min:
20.6 fps, P1:
55.6 fps, max:
155 fps
84.1 [X] Razer Blade 17 Early 2022 Lautlos
Intel Core i9-12900H 1.8GHz
GeForce RTX 3080 Ti Laptop GPU
min:
20.8 fps, P1:
58.8 fps, max:
140.7 fps
91 92.2 93.5 94.2 95.3 [X] Asus ROG Zephyrus Duo 16 GX650RX Turbo
AMD Ryzen 9 6900HX 3.3GHz
GeForce RTX 3080 Ti Laptop GPU
min:
22.9 fps, P1:
66.7 fps, max:
174.7 fps
97.8 [X] Razer Blade 15 2022 Intel Core i7-12800H 1.8GHz
GeForce RTX 3080 Ti Laptop GPU
min:
4.26 fps, P1:
62.5 fps, max:
166 fps
98 [X] Medion Erazer Beast X30 Dyn. Boost 25W
Intel Core i9-12900HK 1.8GHz
GeForce RTX 3080 Ti Laptop GPU
min:
25.2 fps, P1:
58.8 fps, max:
267 fps
98.1 100.1 [X] Asus ROG Zephyrus Duo 16 GX650RX sep. GPU, 25W
AMD Ryzen 9 6900HX 3.3GHz
GeForce RTX 3080 Ti Laptop GPU
min:
8.12 fps, P1:
71.4 fps, max:
190.1 fps
101.1 102.1 [X] Medion Erazer Beast X30 dGPU only
Intel Core i9-12900HK 1.8GHz
GeForce RTX 3080 Ti Laptop GPU
min:
4.4 fps, P1:
66.7 fps, max:
191.1 fps
102.7 103.5 [X] Medion Erazer Beast X30 Turbo Mode
Intel Core i9-12900HK 1.8GHz
GeForce RTX 3080 Ti Laptop GPU
min:
35.9 fps, P1:
71.4 fps, max:
178.4 fps
105 105.7 106.6 [X] SCHENKER XMG Neo 15 with XMG Oasis Intel Core i7-12700H 1.7GHz
GeForce RTX 3080 Ti Laptop GPU
min:
7.28 fps, P1:
76.9 fps, max:
192.8 fps
110.8 111 112.6 114.1 117.8 [X] MSI Titan GT77 12UHS Intel Core i9-12900HX 1.7GHz
GeForce RTX 3080 Ti Laptop GPU
min:
16.1 fps, P1:
83.3 fps, max:
214 fps
121.1 121.2 [X] MSI Titan GT77 12UHS dGPU, Extreme Leistung
Intel Core i9-12900HX 1.7GHz
GeForce RTX 3080 Ti Laptop GPU
min:
10.3 fps, P1:
83.3 fps, max:
245 fps
~ 98 fps
+ Confronta
- Nascondi il confronto
...
NVIDIA GeForce RTX 2080 Super Mobile
NVIDIA GeForce RTX 3080 Ti Laptop GPU
...
max:
78.2 [X] Gigabyte Aero 16 YE5 Intel Core i9-12900HK 1.8GHz
GeForce RTX 3080 Ti Laptop GPU
min:
29 fps, P1:
58.8 fps, max:
237 fps
101.5 104.6 [X] Razer Blade 17 Early 2022 Lautlos
Intel Core i9-12900H 1.8GHz
GeForce RTX 3080 Ti Laptop GPU
min:
36.3 fps, P1:
71.4 fps, max:
210 fps
112.3 [X] Asus ROG Zephyrus Duo 16 GX650RX Turbo
AMD Ryzen 9 6900HX 3.3GHz
GeForce RTX 3080 Ti Laptop GPU
min:
31.3 fps, P1:
90.9 fps, max:
162.6 fps
118 119 [X] Razer Blade 17 Early 2022 Max.
Intel Core i9-12900H 1.8GHz
GeForce RTX 3080 Ti Laptop GPU
min:
5.47 fps, P1:
83.3 fps, max:
242 fps
121 121.7 [X] MSI Titan GT77 12UHS Intel Core i9-12900HX 1.7GHz
GeForce RTX 3080 Ti Laptop GPU
min:
5.85 fps, P1:
83.3 fps, max:
294 fps
122 125.5 [X] MSI Raider GE77 HX 12UHS Extreme Leistung
Intel Core i9-12900HX 1.7GHz
GeForce RTX 3080 Ti Laptop GPU
min:
6.51 fps, P1:
83.3 fps, max:
290 fps
126.7 [X] Razer Blade 17 Early 2022 dGPU, 175W
Intel Core i9-12900H 1.8GHz
GeForce RTX 3080 Ti Laptop GPU
min:
11 fps, P1:
90.9 fps, max:
277 fps
134.4 [X] MSI Titan GT77 12UHS dGPU, Extreme Leistung
Intel Core i9-12900HX 1.7GHz
GeForce RTX 3080 Ti Laptop GPU
min:
5.96 fps, P1:
100 fps, max:
273 fps
~ 115 fps
+ Confronta
- Nascondi il confronto
...
NVIDIA GeForce RTX 2080 Super Mobile
NVIDIA GeForce RTX 3080 Ti Laptop GPU
...
max:
» Giocabile con la maggior parte dei portatili testati con dettagli ultra.
Additional Benchmarks
Highest Settings possible 16xAF 4xMSAA + FXAA 3840x2160
44.7 [X] Gigabyte Aero 16 YE5 852849, Turbo Mode
Intel Core i9-12900HK 1.8GHz
GeForce RTX 3080 Ti Laptop GPU
min:
12.4 fps, P1:
34.5 fps, max:
127 fps
37.7 [X] Gigabyte Aero 16 YE5 852849, Silence Mode
Intel Core i9-12900HK @2.1GHz
GeForce RTX 3080 Ti Laptop GPU
min:
8.69 fps, P1:
22.7 fps, max:
74.3 fps
63.2 [X] Asus ROG Zephyrus Duo 16 GX650RX 874931, Turbo
AMD Ryzen 9 6900HX 3.3GHz
GeForce RTX 3080 Ti Laptop GPU
min:
14.7 fps, P1:
47.6 fps, max:
96.4 fps
63.5 [X] Razer Blade 17 Early 2022 874931, Max.
Intel Core i9-12900H 1.8GHz
GeForce RTX 3080 Ti Laptop GPU
min:
14.1 fps, P1:
45.5 fps, max:
108.3 fps
55.9 [X] Razer Blade 17 Early 2022 874931, Lautlos
Intel Core i9-12900H 1.8GHz
GeForce RTX 3080 Ti Laptop GPU
min:
13.2 fps, P1:
38.5 fps, max:
110 fps
62.8 [X] Razer Blade 17 Early 2022 874931, dGPU, 175W
Intel Core i9-12900H 1.8GHz
GeForce RTX 3080 Ti Laptop GPU
min:
4.58 fps, P1:
45.5 fps, max:
103.3 fps
63.1 [X] no model min:
13.6 fps, P1:
45.5 fps, max:
118 fps
67.2 [X] MSI Raider GE77 HX 12UHS 874931, Extreme Leistung
Intel Core i9-12900HX 1.7GHz
GeForce RTX 3080 Ti Laptop GPU
min:
14.6 fps, P1:
47.6 fps, max:
185.6 fps
66.8 [X] MSI Raider GE77 HX 12UHS 874931, dGPU, Extreme Leistung
Intel Core i9-12900HX 1.7GHz
GeForce RTX 3080 Ti Laptop GPU
min:
4.76 fps, P1:
47.6 fps, max:
274 fps
64.5 [X] MSI Titan GT77 12UHS 874931
Intel Core i9-12900HX 1.7GHz
GeForce RTX 3080 Ti Laptop GPU
min:
15.7 fps, P1:
45.5 fps, max:
241 fps
66.3 [X] MSI Titan GT77 12UHS 874931, dGPU, Extreme Leistung
Intel Core i9-12900HX 1.7GHz
GeForce RTX 3080 Ti Laptop GPU
min:
8.8 fps, P1:
47.6 fps, max:
273 fps
Normal/Off 4xAF 1920x1080
184 [X] MSI GE76 Raider Intel Core i9-12900HK 1.8GHz
GeForce RTX 3080 Ti Laptop GPU
min:
1.687 fps, P1:
125 fps, max:
272 fps
179 [X] Razer Blade 15 2022 1.47.22.14 D3D12
Intel Core i7-12800H 1.8GHz
GeForce RTX 3080 Ti Laptop GPU
min:
3.26 fps, P1:
125 fps, max:
370 fps
179.5 [X] SCHENKER XMG Neo 15 with XMG Oasis Intel Core i7-12700H 1.7GHz
GeForce RTX 3080 Ti Laptop GPU
min:
3.25 fps, P1:
125 fps, max:
364 fps
186 [X] MSI Titan GT77 12UHS 874931, dGPU, Extreme Leistung
Intel Core i9-12900HX 1.7GHz
GeForce RTX 3080 Ti Laptop GPU
min:
1.473 fps, P1:
166.7 fps, max:
343 fps
Lowest Settings possible 1920x1080
185 [X] Razer Blade 15 2022 1.47.22.14 D3D12
Intel Core i7-12800H 1.8GHz
GeForce RTX 3080 Ti Laptop GPU
min:
1.671 fps, P1:
143 fps, max:
359 fps
187.4 [X] MSI Titan GT77 12UHS 874931, dGPU, Extreme Leistung
Intel Core i9-12900HX 1.7GHz
GeForce RTX 3080 Ti Laptop GPU
min:
2.78 fps, P1:
200 fps, max:
408 fps
basso medio alto ultra QHD 4K Dragon's Dogma 2 69.8 65.5 42.4 Horizon Forbidden West 77.3 58.5 37.8 Alone in the Dark 143.8 90.9 34.2 Last Epoch 167.3 112.4 55.3 Skull & Bones 75 63 41 Helldivers 2 112.4 82.7 47.9 Enshrouded 60.8 51 30.4 Palworld 115.6 86.6 47.1 Prince of Persia The Lost Crown 246 Ready or Not 232 208 170 103 48 The Finals 212 190.1 156.4 100.7 47.5 Avatar Frontiers of Pandora 85 73 56 38 20 Call of Duty Modern Warfare 3 2023 148 117 110 81 54 EA Sports WRC 107.8 101 91.6 72.9 42.9 Alan Wake 2 85.7 79.6 76.3 50.8 27 Lords of the Fallen 89.5 64.2 45 31.5 16.5 Total War Pharaoh 256 157 123 98.4 53.5 Assassin's Creed Mirage 115 109 87 71 47 EA Sports FC 24 231 194.3 175 151.7 97.8 Counter-Strike 2 220 194.4 164 120.2 66.7 Cyberpunk 2077 2.0 Phantom Liberty 145 125 110 95 62.8 28 Lies of P 178.9 158.4 143.7 99.9 53.3 The Crew Motorfest 60 60 60 59 41 Starfield 70.3 58 51.8 42.2 27.3 Armored Core 6 115.9 114.5 109.6 88.6 55.5 Immortals of Aveum 62.7 51.7 35.6 20.3 Atlas Fallen 173.6 162.1 138.1 99 55.9 Baldur's Gate 3 128.6 111.1 106 76.4 41.7 Ratchet & Clank Rift Apart 115.2 93.7 80.3 65 41.6 F1 23 278 269 213 77 49 24 Diablo 4 276 257 238 202 138.4 72.3 Star Wars Jedi Survivor 84.1 79.4 75.8 49.5 24.8 The Last of Us 107.8 95.4 88.4 81.2 56.8 29.4 Resident Evil 4 Remake 171.8 129.4 119.3 89.7 70.3 40.6 Company of Heroes 3 220 175 166 126 75 Sons of the Forest 91.7 87.8 85.7 84.6 74 53.8 Atomic Heart 221 169.2 99.8 84.1 67.1 42.6 Returnal 127 114 99 75 45 Hogwarts Legacy 108.6 89.4 76 60.6 34.4 Dead Space Remake 109.3 108.3 95 89.4 60 32 The Witcher 3 v4.00 226 195.6 168.1 148 110 High On Life 252 204 154.1 129.7 82 34.6 The Callisto Protocol 119 95.3 94.1 73.2 44.2 Need for Speed Unbound 133 125.2 106.8 93 Spider-Man Miles Morales 128.9 117.3 112.1 89.2 50.3 Call of Duty Modern Warfare 2 2022 146 115 107 81 49 Uncharted Legacy of Thieves Collection 88.9 86.1 82.8 65 40.4 A Plague Tale Requiem 111.8 74.7 63.8 54.8 40.5 24.4 FIFA 23 79.5 80.8 81.6 75.7 80.3 The Quarry 151 126 101 F1 22 218 215 192 83 57 32 Vampire Bloodhunt 276 252 219 Ghostwire Tokyo 142 139 135 134 108 59.9 Tiny Tina's Wonderlands 202 171 129 105 76 42 Cyberpunk 2077 1.6 136 124 103 94 55 27 Elex 2 93.5 89.5 72 64 57 28.2 GRID Legends 183 145 128 102 88 54.4 Elden Ring 59.8 59 57.9 Dying Light 2 118 93 81 58 29 Rainbow Six Extraction 213 184 180 152 104 51 God of War 144 136 113 80 66 46 Halo Infinite 260.3 168 147 139 100 59 Farming Simulator 22 205 183 158 143 93.3 Battlefield 2042 141 121 108 88.2 58.7 Forza Horizon 5 185 138 117 78 66 50 Riders Republic 205 149 124 114 84 48 Guardians of the Galaxy 138 142 142 140 120 68 Back 4 Blood 294 263 238 171 88.9 Far Cry 6 131 124 112 99 87 53 Alan Wake Remastered 142.4 140 137 132 80 New World 126.4 118 110 105 90 51 Deathloop 143 133 112 80.2 44.4 F1 2021 370 296 247 126 94 61 Days Gone 197 177 133 98.5 57.1 Mass Effect Legendary Edition 152 149 115 Resident Evil Village 248 232 197 135 70.9 Outriders 160 155 153 111 57.4 Hitman 3 297.5 221 204 195 135 76.1 Cyberpunk 2077 1.0 121 101 85.3 53.9 26.1 Yakuza Like a Dragon 162 160 143 107 54.8 Assassin´s Creed Valhalla 166 123 101 88 71 48 Dirt 5 217.5 169 139 111 89 60.9 Watch Dogs Legion 137 126 114 83 67 42 Star Wars Squadrons 407 378 354 261 144 Mafia Definitive Edition 158 151 108 58.6 Serious Sam 4 121 109 103 94.4 65.6 Crysis Remastered 199 103 71.4 60.9 38.1 Flight Simulator 2020 131.5 114.4 78.7 63.1 52.6 32 Horizon Zero Dawn 165 149 137 123 102 59 Death Stranding 152 151 150 130 78 F1 2020 325 287 263 194 153.6 88.1 Valorant 347 Gears Tactics 366.3 283 200 145 100 58.9 Doom Eternal 491.8 341 300 292 223 128 Hunt Showdown 243.2 202 174 110 54.3 Borderlands 3 123.6 106.4 99.8 90.7 78.2 46.1 Control 72.9 34.5 Far Cry New Dawn 125 112 108 96 93 73 Metro Exodus 172.4 134.4 108.6 88.1 73.2 47.6 Shadow of the Tomb Raider 175.2 152.9 152.6 156.5 123.9 72.4 Strange Brigade 440 271 219 187 140 88 Far Cry 5 175 149 142 133 114 68 X-Plane 11.11 142 126 101 83 Final Fantasy XV Benchmark 192 152 114 86 53 Dota 2 Reborn 169 156 148 141 125 The Witcher 3 418 330 220 112 86 81 GTA V 185 182 175 111 98 115 < 30 fps < 60 fps < 120 fps ≥ 120 fps 8 44 23 69 1 46 48 6 53 37 19 64 17 14 60 24 5
Per conoscere altri giochi che potrebbero essere utilizzabili e per una lista completa di tutti i giochi e delle schede grafiche visitate la nostra Gaming List
v1.26
log 30. 19:15:17
#0 no ids found in url (should be separated by "_") +0s ... 0s
#1 not redirecting to Ajax server +0s ... 0s
#2 did not recreate cache, as it is less than 5 days old! Created at Sun, 28 Apr 2024 05:41:30 +0200 +0.001s ... 0.001s
#3 no comparison url found in template nbc.compare_page_1 needed +0.051s ... 0.052s
#4 no comparison url found in template nbc.compare_page_1 needed +0s ... 0.053s
#5 no comparison url found in template nbc.compare_page_1 needed +0s ... 0.053s
#6 no comparison url found in template nbc.compare_page_1 needed +0s ... 0.053s
#7 no comparison url found in template nbc.compare_page_1 needed +0s ... 0.054s
#8 no comparison url found in template nbc.compare_page_1 needed +0s ... 0.054s
#9 no comparison url found in template nbc.compare_page_1 needed +0s ... 0.054s
#10 no comparison url found in template nbc.compare_page_1 needed +0s ... 0.055s
#11 no comparison url found in template nbc.compare_page_1 needed +0s ... 0.055s
#12 no comparison url found in template nbc.compare_page_1 needed +0s ... 0.055s
#13 no comparison url found in template nbc.compare_page_1 needed +0s ... 0.056s
#14 no comparison url found in template nbc.compare_page_1 needed +0s ... 0.056s
#15 no comparison url found in template nbc.compare_page_1 needed +0s ... 0.056s
#16 no comparison url found in template nbc.compare_page_1 needed +0s ... 0.056s
#17 no comparison url found in template nbc.compare_page_1 needed +0s ... 0.056s
#18 no comparison url found in template nbc.compare_page_1 needed +0s ... 0.057s
#19 no comparison url found in template nbc.compare_page_1 needed +0s ... 0.057s
#20 no comparison url found in template nbc.compare_page_1 needed +0s ... 0.057s
#21 no comparison url found in template nbc.compare_page_1 needed +0s ... 0.058s
#22 no comparison url found in template nbc.compare_page_1 needed +0s ... 0.058s
#23 composed specs +0s ... 0.058s
#24 did output specs +0s ... 0.058s
#25 start showIntegratedCPUs +0s ... 0.058s
#26 getting avg benchmarks for device 11117 +0.03s ... 0.088s
#27 got single benchmarks 11117 +0.128s ... 0.216s
#28 got avg benchmarks for devices +0s ... 0.216s
#29 min, max, avg, median took s +1.549s ... 1.765s
#30 before gaming benchmark output +0.001s ... 1.766s
#31 Got 1992 rows for game benchmarks. +0.822s ... 2.588s
#32 composed SQL query for gamebenchmarks +0s ... 2.588s
#33 got data and put it in $dataArray +0.09s ... 2.679s
#34 benchmarks composed for output. +5.822s ... 8.501s
#35 no comparison url found in template nbc.compare_page_1 needed +0.014s ... 8.514s
#36 return log +0s ... 8.514s
Recensioni Notebook con NVIDIA GeForce RTX 3080 Ti Laptop GPU la scheda grafica
Recensione dell'Aorus 15 YE5: Il portatile gaming di fascia alta per i risparmiatori Aorus ha utilizzato una CPU e una GPU di ultima generazione per commercializzare l'ex-flagship RTX 3080 Ti a un prezzo di soli 1.500 dollari. A sua volta, il ca...
Intel Core i5-12500H | NVIDIA GeForce RTX 3080 Ti Laptop GPU | 15.60" | 2.3 kg
Recensione dell'Asus ROG Strix Scar 17 SE - Laptop per il gaming dotato di RTX 3080 Ti Con il nuovo ROG Strix Scar 17 SE del 2022, Asus offre un portatile da gioco di fascia alta con il miglior hardware attualmente disponibile sul mercato. Oltre a...
Intel Core i9-12950HX | NVIDIA GeForce RTX 3080 Ti Laptop GPU | 17.30" | 2.9 kg
Recensione del portatile Eurocom Nightsky TXi317: 125 W GeForce RTX 3080 Ti, una macchina veloce Il Nightsky TXi317 incorpora alcune delle opzioni di CPU e GPU più veloci attualmente disponibili su qualsiasi portatile, ma sono avvolte in un telaio dal desig...
Intel Core i7-12700H | NVIDIA GeForce RTX 3080 Ti Laptop GPU | 17.30" | 2.9 kg
Recensione del portatile Uniwell Technology GM7AG8N: il sistema di raffreddamento a liquido è più silenzioso del previsto Il dissipatore esterno è in grado di svolgere la maggior parte del lavoro pesante anche quando è impostato sul livello più silenzioso. È sicuramente più scomodo...
Intel Core i9-12900H | NVIDIA GeForce RTX 3080 Ti Laptop GPU | 17.00" | 2.7 kg
Recensione del portatile Alienware x15 R2: L'UFO simile a un ultrabook vola con Core i9-12900H e RTX 3080 Ti da 140 W Dell ha rinnovato la linea Alienware x15 con il nuovo x15 R2. L'x15 R2 di quest'anno offre aggiornamenti interni a Intel Alder Lake-H e alle GPU Nvidia RTX 30 S...
Intel Core i9-12900H | NVIDIA GeForce RTX 3080 Ti Laptop GPU | 15.60" | 2.4 kg
Lenovo Legion 7 16IAX7-82TD004SGE : Intel Core i9-12900HX, 16.00", 2.6 kgrecensione » Recensione del portatile Lenovo Legion 7 16IAX7: Veloce 16 pollici con display da 165 Hz
MSI Titan GT77 12UHS : Intel Core i9-12900HX, 17.30", 3.4 kgrecensione » Recensione dell'MSI Titan GT77 12UHS 4K: Elite tra i portatili UHD DTR
SCHENKER XMG Neo 17 M22 : AMD Ryzen 9 6900HX, 17.00", 2.8 kgrecensione » Recensione dello Schenker XMG Neo 17 M22: gaming Laptop ad alte prestazioni con tasti meccanici Cherry MX
MSI Titan GT77 12UHS : Intel Core i9-12900HX, 17.30", 3.3 kgrecensione » Recensione del portatile MSI Titan GT77 12UHS: Il figlio di Alder Lake-HX con prestazioni senza ostacoli di classe desktop
SCHENKER XMG Pro 15 (i7-12700H, RTX 3080 Ti) : Intel Core i7-12700H, 15.60", 2.4 kgrecensione » Recensione del portatile Schenker XMG Pro 15 (RTX 3080 Ti): Il Mike Tyson dei portatili tuttofare
SCHENKER XMG Pro 17 E22 : Intel Core i9-12900H, 17.30", 2.8 kgrecensione » Recensione dello Schenker XMG Pro 17 E22: Il portatile gaming con RTX 3080 Ti è all'altezza della situazione
MSI Raider GE77 HX 12UHS : Intel Core i9-12900HX, 17.30", 3.1 kgrecensione » Recensione MSI Raider GE77 HX 12UHS: notebook per il gaming 4K con prestazioni al top
SCHENKER XMG Neo 15 (i7-12700H, RTX 3080 Ti) : Intel Core i7-12700H, 15.60", 2.3 kgrecensione » Recensione dello Schenker XMG Neo 15 con XMG Oasis: RTX 3080 Ti senza limiti termici
Razer Blade 17 Early 2022 : Intel Core i9-12900H, 17.30", 2.8 kgrecensione » Recensione del Razer Blade 17 (inizio 2022): Elegante portatile gaming 4k con schermo luminoso
MSI Creator Z16P B12UHST : Intel Core i9-12900H, 16.00", 2.4 kgrecensione » Recensione del portatile MSI Creator Z16P: Lavoro creativo con un i9 e la RTX 3080 Ti
Acer Predator Triton 500 SE PT516-52s-70KX : Intel Core i7-12700H, 16.00", 2.3 kgrecensione » Recensione dell'Acer Predator Triton 500 SE: gaming Laptop sottile con RTX 3080 Ti e Alder Lake
MSI Raider GE66 12UHS : Intel Core i9-12900HK, 15.60", 2.4 kgrecensione » Recensione del notebook MSI Raider GE66 12UHS: Promosso a pieni voti
Asus ROG Zephyrus Duo 16 GX650RX : AMD Ryzen 9 6900HX, 16.00", 2.6 kgrecensione » Recensione dell'Asus ROG Zephyrus Duo 16: Un portatile gaming insolito con una buona durata della batteria
Alienware x17 R2 P48E : Intel Core i9-12900HK, 17.30", 3.1 kgrecensione » Recensione del portatile Alienware x17 R2: Prestazioni di picco 175 W GeForce RTX 3080 Ti
Medion Erazer Beast X30 : Intel Core i9-12900HK, 17.30", 2.2 kgrecensione » Recensione del Medion Erazer Beast X30: gaming Notebook QHD sottile e potente
Razer Blade 15 Advanced Model Early 2022 : Intel Core i7-12800H, 15.60", 2.1 kgrecensione » Recensione del Razer Blade 15 Advanced Model Early 2022 - laptop gaming compatto con display veloce
MSI Stealth GS77 12UHS-083US : Intel Core i7-12700H, 17.30", 2.9 kgrecensione » Recensione del portatile MSI Stealth GS77: Una buona alternativa al Razer Blade 17?
Razer Blade 17 RTX 3080 Ti : Intel Core i7-12800H, 17.30", 2.7 kgrecensione » Recensione del portatile Razer Blade 17 2022 Core i7 RTX 3080 Ti: Prestazioni sovralimentate
Gigabyte Aero 16 YE5 : Intel Core i9-12900HK, 16.00", 2.3 kgrecensione » Recensione del Gigabyte Aero 16 YE5: Notebook multimediale compatto 4K
Razer Blade 15 2022 : Intel Core i7-12800H, 15.60", 2.1 kgrecensione » Recensione del portatile Razer Blade 15: debutto dell'Intel Core i7-12800H
SCHENKER XMG Neo 15 E22 (Early 2022, RTX 3080 Ti) : Intel Core i7-12700H, 15.60", 2.2 kgrecensione » Recensione preliminare di XMG Neo 15 E22 con RTX 3080 Ti (Tongfang GM5AG8W): Il raffreddamento ad acqua è una soluzione provvisoria ma fattibile per i portatili da gioco?
SCHENKER Uniwill Technology GM7AG8P : Intel Core i9-12900H, 17.30", 2.3 kgrecensione » Debutto di Intel Core i9-12900H: Recensione del portatile Uniwill Technology GM7AG8P
MSI GE76 Raider : Intel Core i9-12900HK, 17.30", 3 kgrecensione » Recensione del portatile MSI GE76 Raider: Con Alder Lake e RTX 3080 Ti nel paradiso del gaming
MSI Raider GE66 12UHS : Intel Core i9-12900HK, 15.60", 2.4 kgRecensioni esterne » MSI Raider GE66 12UHS
Alienware x15 R2 P111F : Intel Core i9-12900H, 15.60", 2.4 kgRecensioni esterne » Alienware x15 R2 P111F
HP ZBook Studio 16 G9, i9-12900H RTX 3080 Ti : Intel Core i9-12900H, 16.00", 1.7 kgRecensioni esterne » HP ZBook Studio 16 G9, i9-12900H RTX 3080 Ti
Razer Blade 15 2022 : Intel Core i7-12800H, 15.60", 2.1 kgRecensioni esterne » Razer Blade 15 2022
MSI Titan GT77 12UHS-066RU : Intel Core i9-12900HX, 17.30", 3.4 kgRecensioni esterne » MSI Titan GT77 12UHS-066RU
Asus ROG Strix SCAR 15 G533ZX-LN060W : Intel Core i9-12900H, 15.60", 2.4 kgRecensioni esterne » Asus ROG Strix SCAR 15 G533ZX-LN060W
HP Omen 17-ck1098ng : Intel Core i9-12900HX, 17.30", 2.8 kgRecensioni esterne » HP Omen 17-ck1098ng
Asus ROG Strix Scar 17 SE G733CX-LL014W : Intel Core i9-12950HX, 17.30", 2.9 kgRecensioni esterne » Asus ROG Strix Scar 17 SE G733CX-LL014W
MSI Raider GE67 HX 12UHS-026 : Intel Core i9-12900HX, 15.60", 2.4 kgRecensioni esterne » MSI Raider GE67 HX 12UHS-026
MSI Raider GE67 HX 12UHS-039AU : Intel Core i7-12800HX, 15.60", 2.4 kgRecensioni esterne » MSI Raider GE67 HX 12UHS-039AU
MSI Raider GE77 HX 12UHS : Intel Core i9-12900HX, 17.30", 3.1 kgRecensioni esterne » MSI Raider GE77 HX 12UHS
Hyperbook SL705, i7-12700H RTX 3080 Ti : Intel Core i7-12700H, 17.30", 2.8 kgRecensioni esterne » Hyperbook SL705, i7-12700H RTX 3080 Ti
SCHENKER XMG Neo 17 M22 : AMD Ryzen 9 6900HX, 17.00", 2.8 kgRecensioni esterne » Schenker XMG Neo 17 M22
Razer Blade 14 Ryzen 9 RTX 3080 Ti : AMD Ryzen 9 6900HX, 14.00", 1.8 kgRecensioni esterne » Razer Blade 14 Ryzen 9 RTX 3080 Ti
MSI Titan GT77 12UHS : Intel Core i9-12900HX, 17.30", 3.3 kgRecensioni esterne » MSI Titan GT77 12UHS
Alienware x15 R2-8PYH6 : Intel Core i7-12700H, 15.60", 2.5 kgRecensioni esterne » Alienware x15 R2-8PYH6
Hyperbook SL505, i7-12700H RTX 3080 Ti : Intel Core i7-12700H, 15.60", 2.4 kgRecensioni esterne » Hyperbook SL505, i7-12700H RTX 3080 Ti
Origin PC EVO17-S 2022, i9 3080 Ti : Intel Core i9-12900H, 17.30", 2.7 kgRecensioni esterne » Origin PC EVO17-S 2022, i9 3080 Ti
MSI Creator Z17 A12UHST-052 : Intel Core i9-12900H, 17.30", 2.5 kgRecensioni esterne » MSI Creator Z17 A12UHST-052
Asus ROG Strix Scar 17 SE G733CX-LL016W : Intel Core i9-12950HX, 17.30", 3.1 kgRecensioni esterne » Asus ROG Strix Scar 17 SE G733CX-LL016W
Alienware m15 R7-VPV1K : Intel Core i7-12700H, 15.60", 2.7 kgRecensioni esterne » Alienware m15 R7-VPV1K
Lenovo Legion 7 16IAX7-82TD004SGE : Intel Core i9-12900HX, 16.00", 2.6 kgRecensioni esterne » Lenovo Legion 7 16IAX7-82TD004SGE
MSI Titan GT77 12UHS-010 : Intel Core i9-12900HX, 17.30", 3.3 kgRecensioni esterne » MSI Titan GT77 12UHS-010
Asus ROG Zephyrus Duo 16 GX650RX : AMD Ryzen 9 6900HX, 16.00", 2.6 kgRecensioni esterne » Asus ROG Zephyrus Duo 16 GX650RX
Medion Erazer Beast X30 : Intel Core i9-12900HK, 17.30", 2.2 kgRecensioni esterne » Medion Erazer Beast X30
Razer Blade 15 Advanced Model Early 2022 : Intel Core i7-12800H, 15.60", 2.1 kgRecensioni esterne » Razer Blade 15 Advanced Model Early 2022
Alienware x17 R2-KTJKT : Intel Core i7-12700H, 17.30", 3.1 kgRecensioni esterne » Alienware x17 R2-KTJKT
Acer Predator Triton 500SE PT516-52s-98LC : Intel Core i9-12900H, 16.00", 2.4 kgRecensioni esterne » Acer Predator Triton 500SE PT516-52s-98LC
Razer Blade 17 Early 2022 : Intel Core i9-12900H, 17.30", 2.8 kgRecensioni esterne » Razer Blade 17 Early 2022
Asus ROG Zephyrus M16 GU603ZX-K8001W : Intel Core i9-12900H, 16.00", 1.9 kgRecensioni esterne » Asus ROG Zephyrus M16 GU603ZX-K8001W
MSI Stealth GS66 12UHS-091 : Intel Core i9-12900H, 15.60", 2.1 kgRecensioni esterne » MSI Stealth GS66 12UHS-091
MSI Creator Z16P B12UHST-046 : Intel Core i9-12900H, 16.00", 2.3 kgRecensioni esterne » MSI Creator Z16P B12UHST-046
Asus ROG Strix G17 G733ZX-LL009W : Intel Core i9-12900H, 17.30", 2.9 kgRecensioni esterne » Asus ROG Strix G17 G733ZX-LL009W
Razer Blade 17 RTX 3080 Ti : Intel Core i7-12800H, 17.30", 2.7 kgRecensioni esterne » Razer Blade 17 RTX 3080 Ti
Alienware x17 R2 P48E : Intel Core i9-12900HK, 17.30", 3.1 kgRecensioni esterne » Alienware x17 R2 P48E
Asus ROG Strix Scar 15 G533ZX-XS96 : Intel Core i9-12900H, 15.60", 2.4 kgRecensioni esterne » Asus ROG Strix Scar 15 G533ZX-XS96
Razer Blade 17 RZ09-0423PGD3-R3G1 : Intel Core i7-12800H, 17.30", 2.8 kgRecensioni esterne » Razer Blade 17 RZ09-0423PGD3-R3G1
Razer Blade 15 Advanced RZ09-0421PGF3-R3G1 : Intel Core i9-12900HK, 15.60", 2 kgRecensioni esterne » Razer Blade 15 Advanced RZ09-0421PGF3-R3G1
Gigabyte Aero 16 YE5 : Intel Core i9-12900HK, 16.00", 2.3 kgRecensioni esterne » Gigabyte Aero 16 YE5
MSI Raider GE76 12UHS-293 : Intel Core i7-12700H, 17.30", 2.9 kgRecensioni esterne » MSI Raider GE76 12UHS-293
MSI Raider GE76 12UHS-214 : Intel Core i9-12900HK, 17.30", 2.9 kgRecensioni esterne » MSI Raider GE76 12UHS-214
MSI Stealth GS77 12UHS-063 : Intel Core i9-12900H, 17.30", 2.8 kgRecensioni esterne » MSI Stealth GS77 12UHS-063
Razer Blade 17 RZ09-0423PGD3 : Intel Core i7-12800H, 17.30", 2.8 kgRecensioni esterne » Razer Blade 17 RZ09-0423PGD3
MSI Stealth GS77 12UHS-083US : Intel Core i7-12700H, 17.30", 2.9 kg165 W vs. 105 W GeForce RTX 3080 Ti: conta di più alle risoluzioni più alte
Razer Blade 17 RTX 3080 Ti : Intel Core i7-12800H, 17.30", 2.7 kgIl Razer Blade 17 ha improvvisamente una batteria più grande quest'anno. Qual è il segreto?
Razer Blade 15 2022 : Intel Core i7-12800H, 15.60", 2.1 kgRazer Blade 15 2022 contro Blade 15 2018: Quattro anni di miglioramenti accumulati
SCHENKER Uniwill Technology GM7AG8P : Intel Core i9-12900H, 17.30", 2.3 kg27 PC AMD Ryzen 9 5900HX contro il Core i9-12900H: Intel ha la meglio, ma c'è un problema
Please share our article, every link counts!
Classe 1 GeForce RTX 2080 Super Mobile
Classe 2 M1 Max 32-Core GPU *
GeForce RTX 2070 Super Mobile
M1 Max 24-Core GPU *
Radeon RX 5700M *
M1 Pro 16-Core GPU *
Radeon PRO W6600M *
GeForce RTX 2070 Super Max-Q
M1 Pro 14-Core GPU *
Quadro P4200
Quadro P5000 Max-Q *
GeForce RTX 3050 4GB Laptop GPU
Quadro P4000 Max-Q
Radeon RX 580X (Laptop) *
Radeon RX 580 (Laptop)
Radeon Pro 5300M
Radeon RX 5300M
Quadro P3000 Max-Q *
Radeon Pro WX 7100 *
Radeon RX 570X (Laptop) *
Radeon RX 570 (Laptop) *
Radeon RX 470 (Laptop) *
Classe 3 GeForce GTX 1050 Ti Mobile
Radeon 680M
Quadro P2000 Max-Q
Radeon R9 M395X
GeForce GTX 1050 Ti Max-Q *
WX Vega M GL
Radeon R9 M485X
GeForce GTX 1050 Max-Q *
Radeon 660M
Radeon RX 560X (Laptop)
Radeon RX 560 (Laptop)
Radeon Pro 560X
Radeon Pro 560
Radeon Pro 460
Radeon Pro WX 4130 *
Quadro P620 *
Radeon RX 550X (Laptop)
Radeon Pro 555X
Radeon Pro 555
Radeon Pro 455
Quadro P600
Radeon RX 540X *
Radeon Pro WX 2100 *
Radeon Pro WX 3100 *
Radeon Pro 450
Radeon 630
Radeon 540X *
Quadro P520
Quadro P500 *
Iris Plus Graphics G7 (Ice Lake 64 EU) *
Vega 10 *
Iris Pro Graphics 580
Vega 9
FirePro W5130M
UHD Graphics Xe G4 48EUs *
UHD Graphics 32EUs
UHD Graphics Xe 32EUs (Tiger Lake-H) *
UHD Graphics 750
Vega 7
Radeon R7 M465
Vega 8
Iris Plus Graphics G4 (Ice Lake 48 EU)
Quadro M600M
FirePro W4190M
Radeon R7 M445
UHD Graphics 24EUs (Alder Lake-N) *
Radeon R7 M340
Radeon 610M *
UHD Graphics G1 (Ice Lake 32 EU)
UHD Graphics Xe 16EUs (Tiger Lake-H) *
Radeon R5 (Bristol Ridge)
Adreno 690 *
Adreno 685 *
Adreno 680 *
Classe 4 UHD Graphics 730
Radeon R5 M315 *
Radeon R5 M420 *
UHD Graphics 617
UHD Graphics 615
Radeon R4 (Stoney Ridge)
Radeon R2 (Stoney Ridge)
HD Graphics (Broadwell)
Classe 5 Posizione approssimativa dell'adattatore grafico
Klaus Hinum, 2022-04- 3 (Update: 2022-04- 3)
 Deutsch
 English
 Español
 Français
 Italiano
 Nederlands
 Polski
 Português
 Русский
 Türkçe
 Svenska
 Chinese
 Magyar