 Deutsch
 English
 Español
 Français
 Italiano
 Nederlands
 Polski
 Português
 Русский
 Türkçe
 Svenska
 Chinese
 Magyar
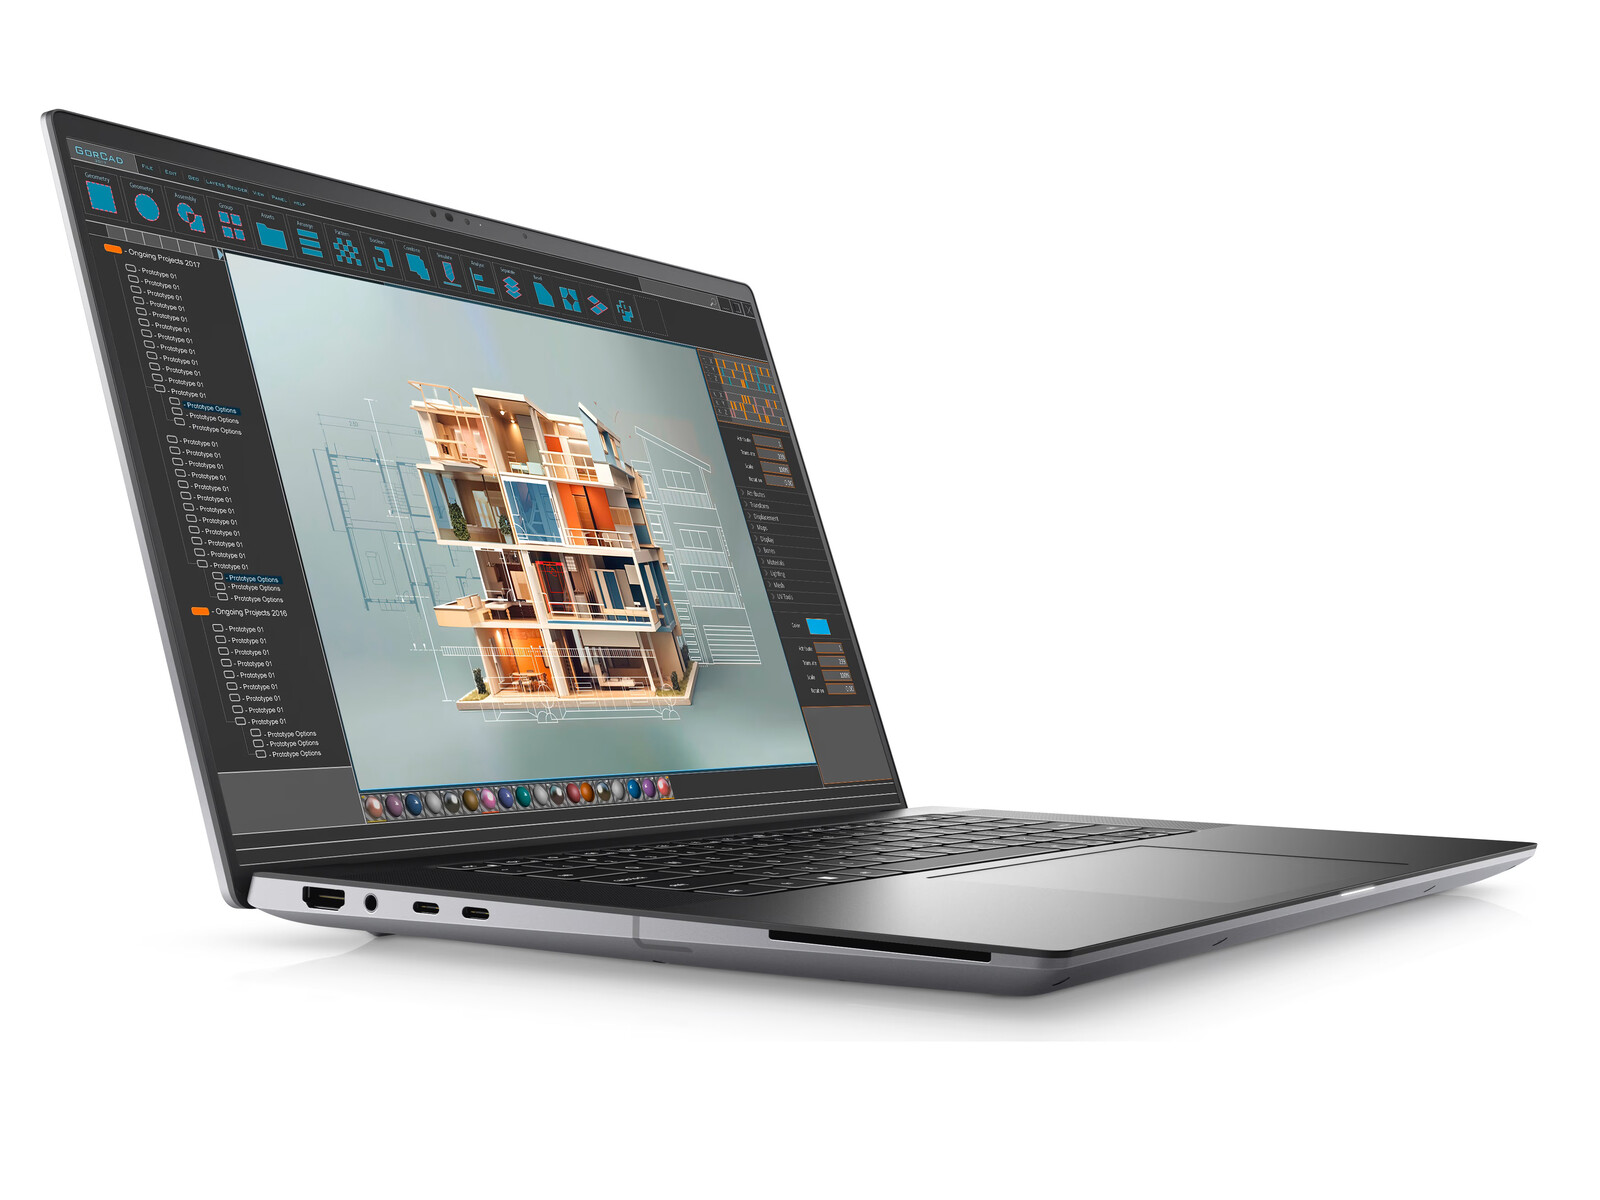
Recensione della workstation Dell Precision 5690: Pronta per la rivoluzione AI

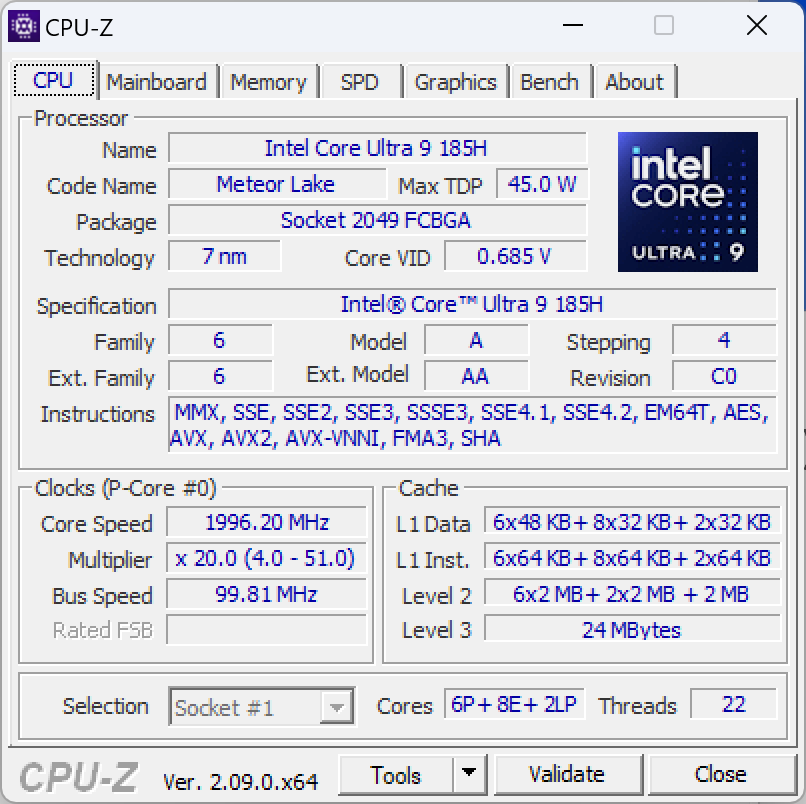
Il modello Precision 5690 succede al modello Precision 5680 dello scorso anno, sostituendo le vecchie CPU Raptor Lake-H con le più recenti Meteor Lake-H, complete di NPU integrate. Per il resto, i due modelli sono identici, con le stesse opzioni di display e GPU. Consigliamo di consultare la nostra recensione di Precision 5680 per saperne di più sulle caratteristiche fisiche della serie ispirata all'XPS 16.
La nostra unità in recensione è la configurazione di fascia più alta con CPU Core Ultra 9 185H vPro, GPU Nvidia 5000 Ada e schermo touchscreen OLED da 16 pollici a 2400p per circa 5900 dollari USA. Le SKU minori partono dal Core Ultra 5 135H vPro, solo grafica Arc integrata e display IPS da 1200p per soli 2300 dollari.
Tra le alternative a Precision 5690 ci sono altre workstation da 16 pollici, come il modello Lenovo ThinkPad P16 G2, HP ZBook Fury 16 G10o il MSI CreatorPro Z16P.
Altre recensioni di Dell:
Potenziali concorrenti a confrontos
Punteggio | Data | Modello | Peso | Altezza | Dimensione | Risoluzione | Miglior Prezzo |
|---|---|---|---|---|---|---|---|
| 88.3 % | 05/2024 | Dell Precision 5690 Ultra 9 185H, NVIDIA RTX 5000 Ada Generation Laptop GPU | 2.3 kg | 22.17 mm | 16.00" | 3840x2400 | |
| 89 % | 08/2023 | Dell Precision 5000 5680 i9-13900H, NVIDIA RTX 5000 Ada Generation Laptop GPU | 2.3 kg | 22.17 mm | 16.00" | 3840x2400 | |
| 90.2 % | 03/2024 | Lenovo ThinkPad P16 G2 21FA000FGE i7-13700HX, NVIDIA RTX 2000 Ada Generation Laptop GPU | 3 kg | 30.23 mm | 16.00" | 2560x1600 | |
| 91.7 % | 10/2023 | Lenovo ThinkPad P1 G6-21FV000DGE i9-13900H, NVIDIA RTX 2000 Ada Generation Laptop GPU | 1.9 kg | 17.5 mm | 16.00" | 2560x1600 | |
| 92.3 % | 09/2023 | HP ZBook Fury 16 G10 i9-13950HX, NVIDIA RTX 5000 Ada Generation Laptop GPU | 2.6 kg | 28.5 mm | 16.00" | 3840x2400 | |
| 84.3 % | 11/2022 | MSI CreatorPro Z16P B12UKST i7-12700H, RTX A3000 Laptop GPU | 2.4 kg | 19 mm | 16.00" | 2560x1600 |
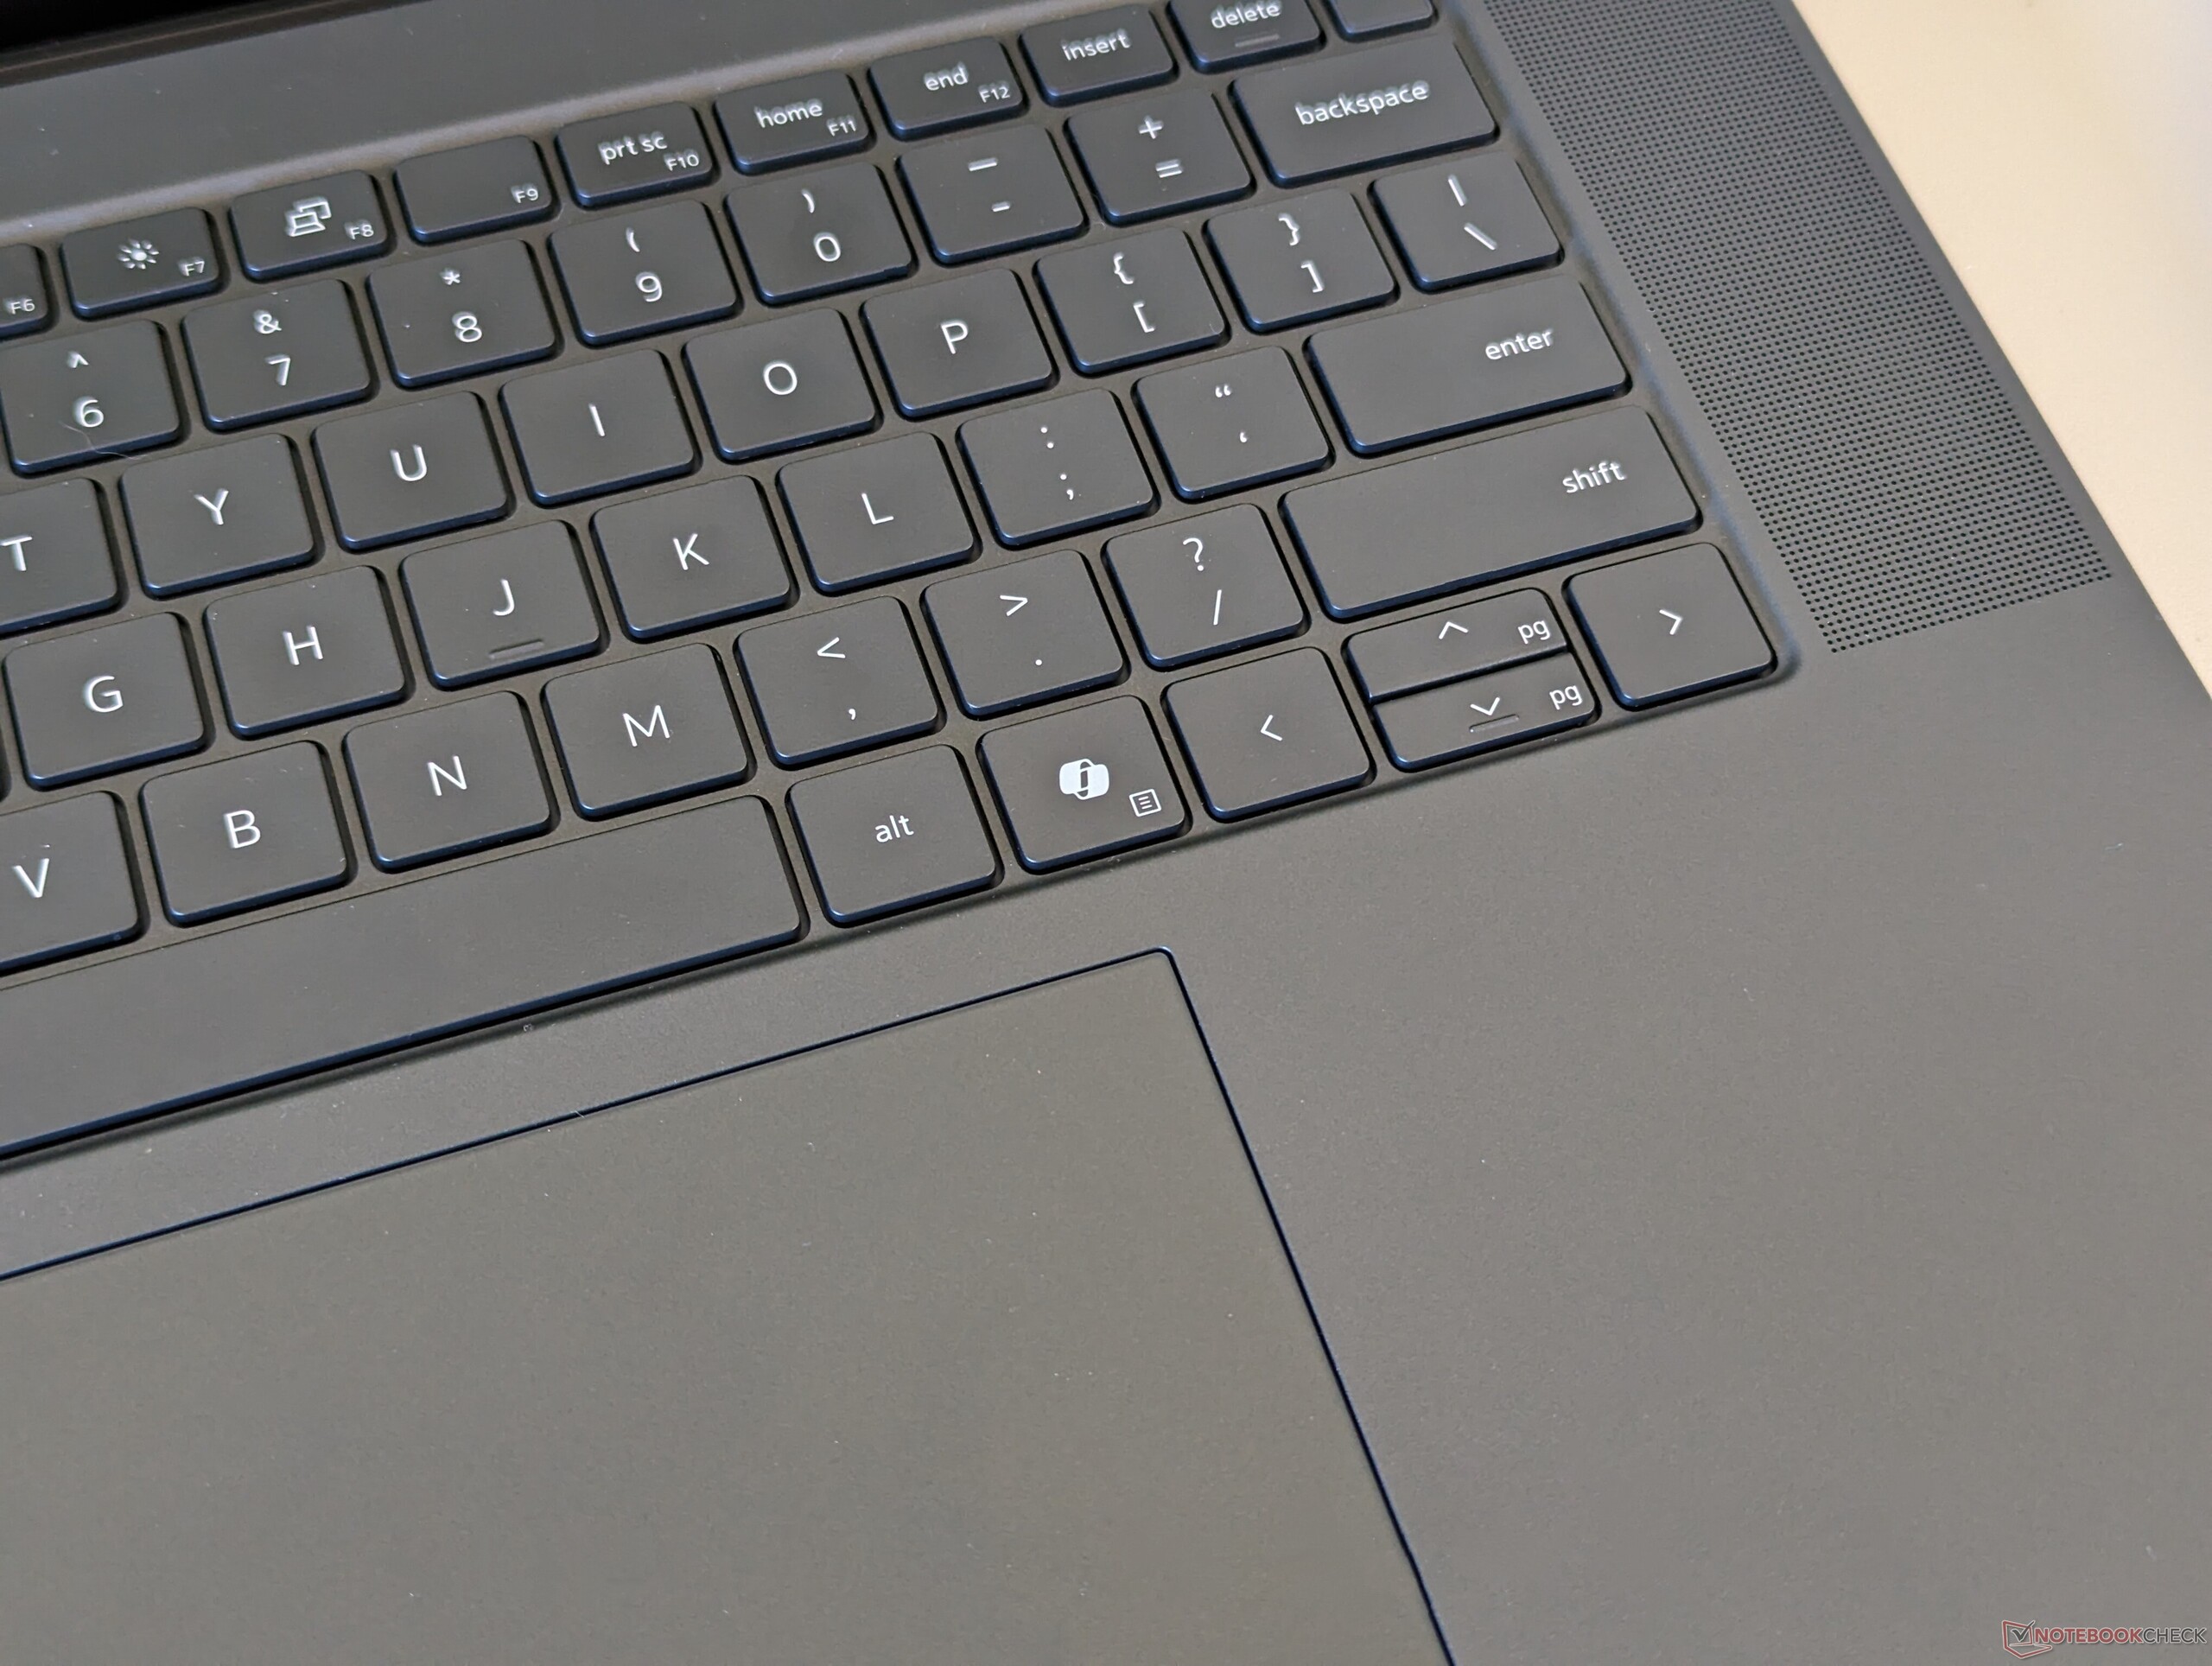
Custodia - Ispirata all'XPS 16
La tastiera integra ora un tasto dedicato Microsoft Co-Pilot al posto del tasto Ctrl destro, per separare visivamente Precision 5690 dal 5680.
Connettività
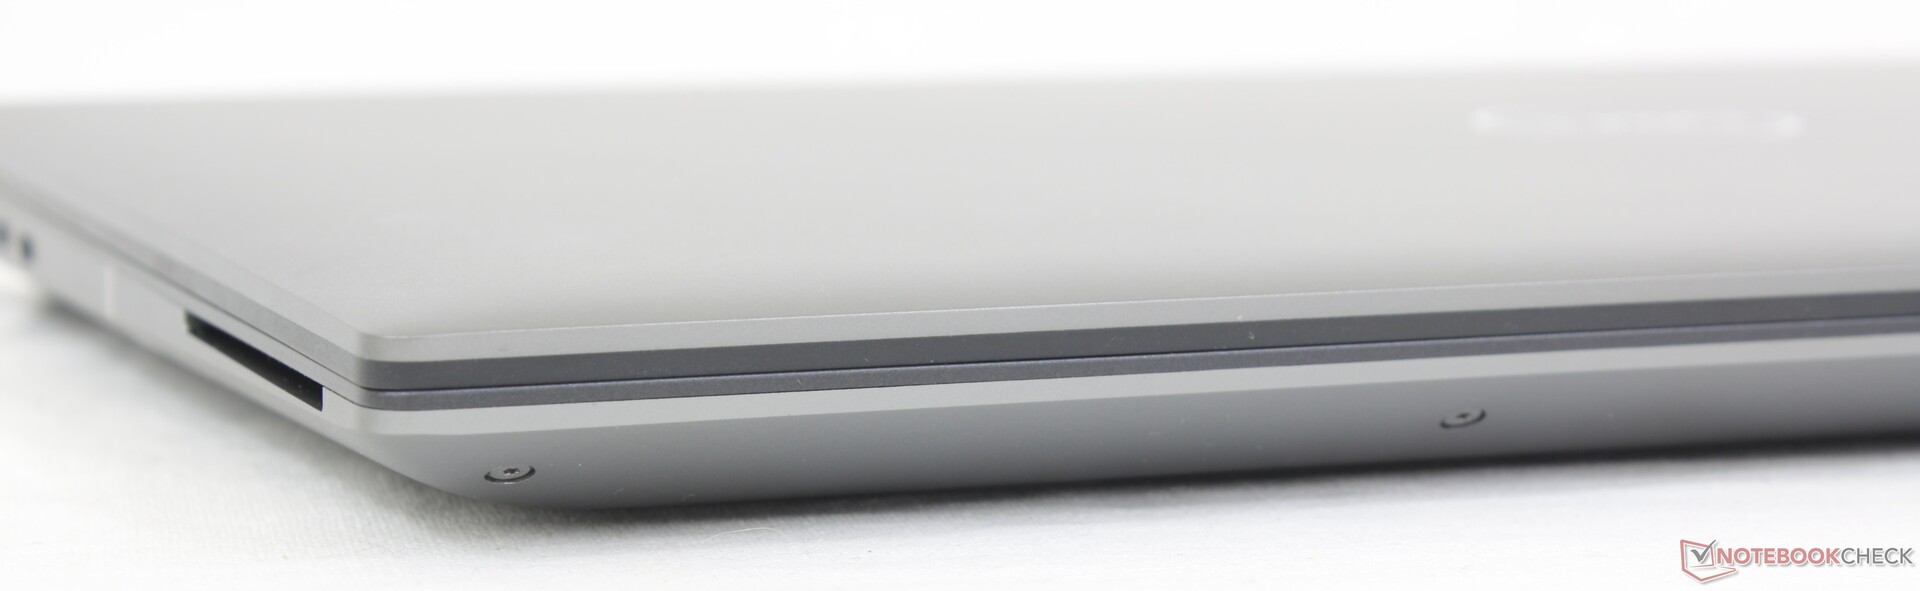
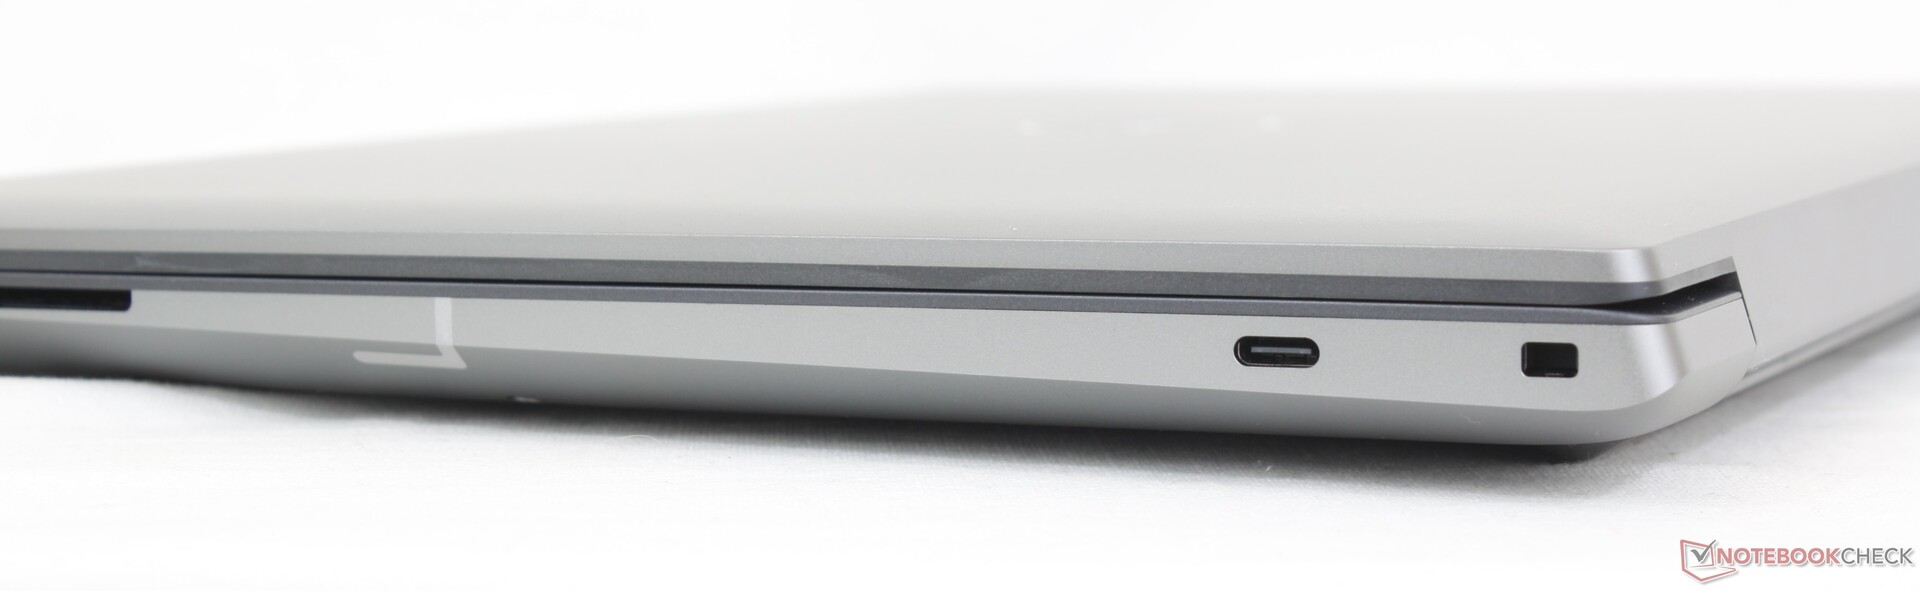
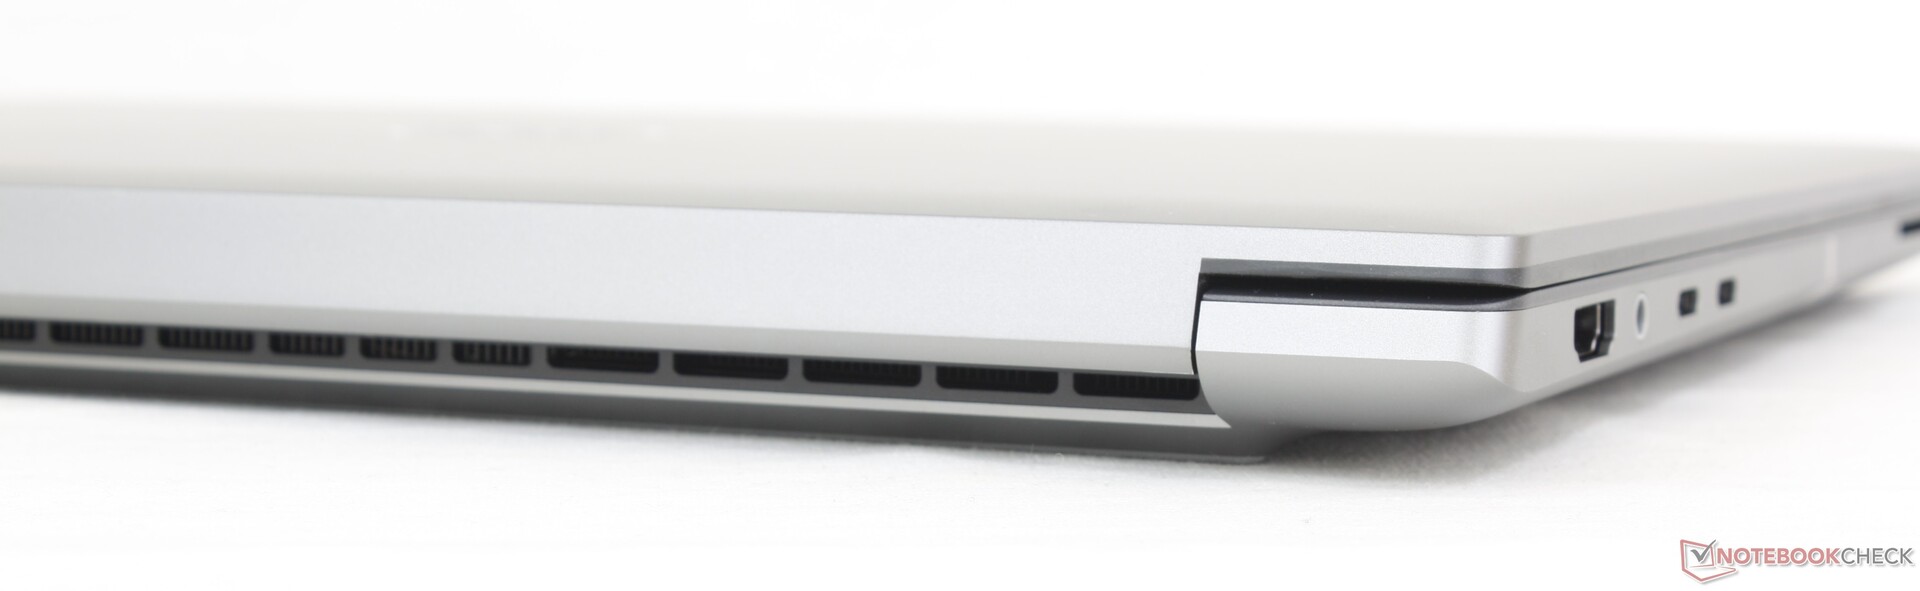
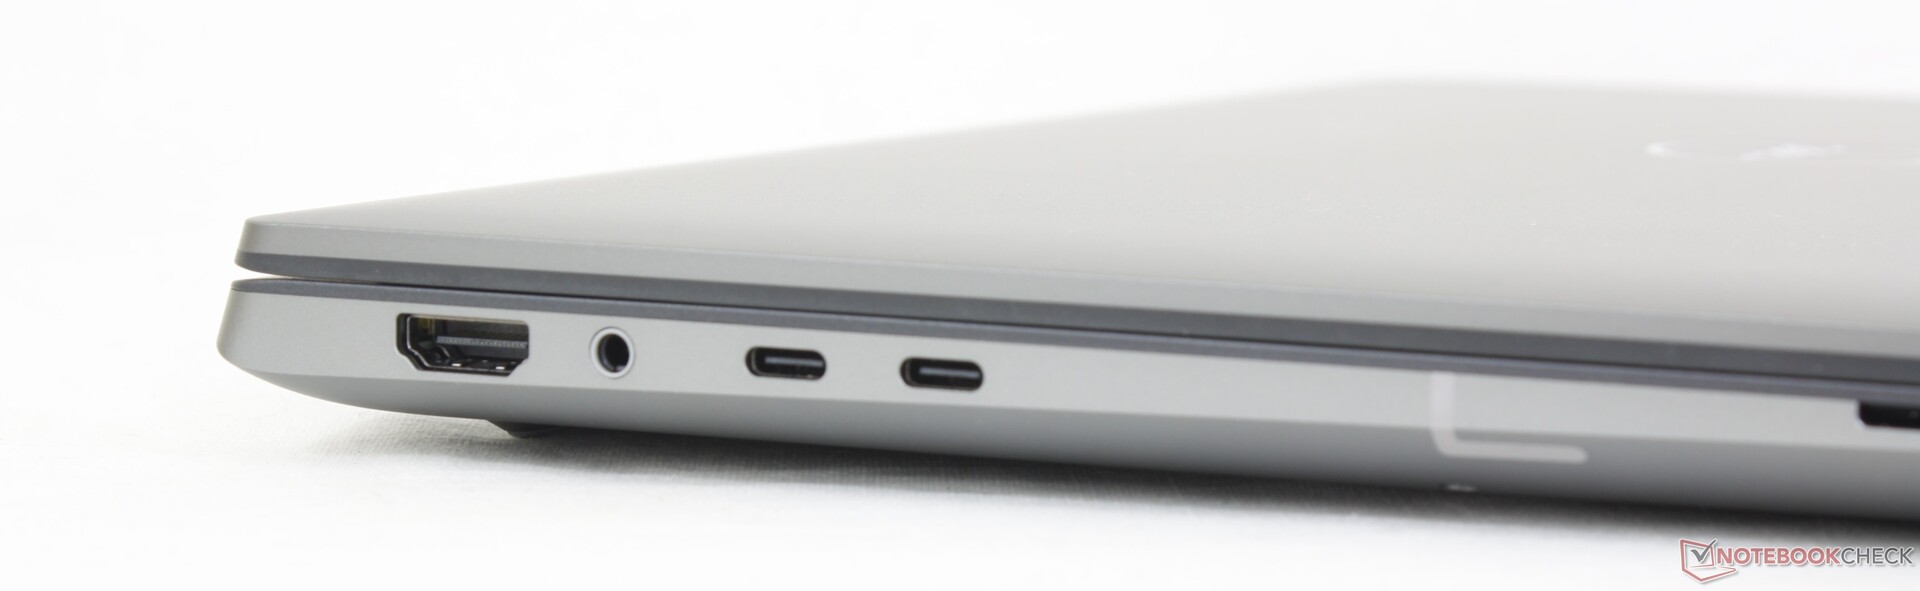
Comunicazione
La rete WLAN è stata aggiornata dall'Intel AX211 all'Intel BE200 per supportare la connettività Wi-Fi 7. Tuttavia, la stragrande maggioranza degli utenti è ancora limitata alle reti Wi-Fi 6E o più vecchie, per cui la maggior parte non noterà alcun vantaggio in termini di prestazioni per il momento.
Webcam


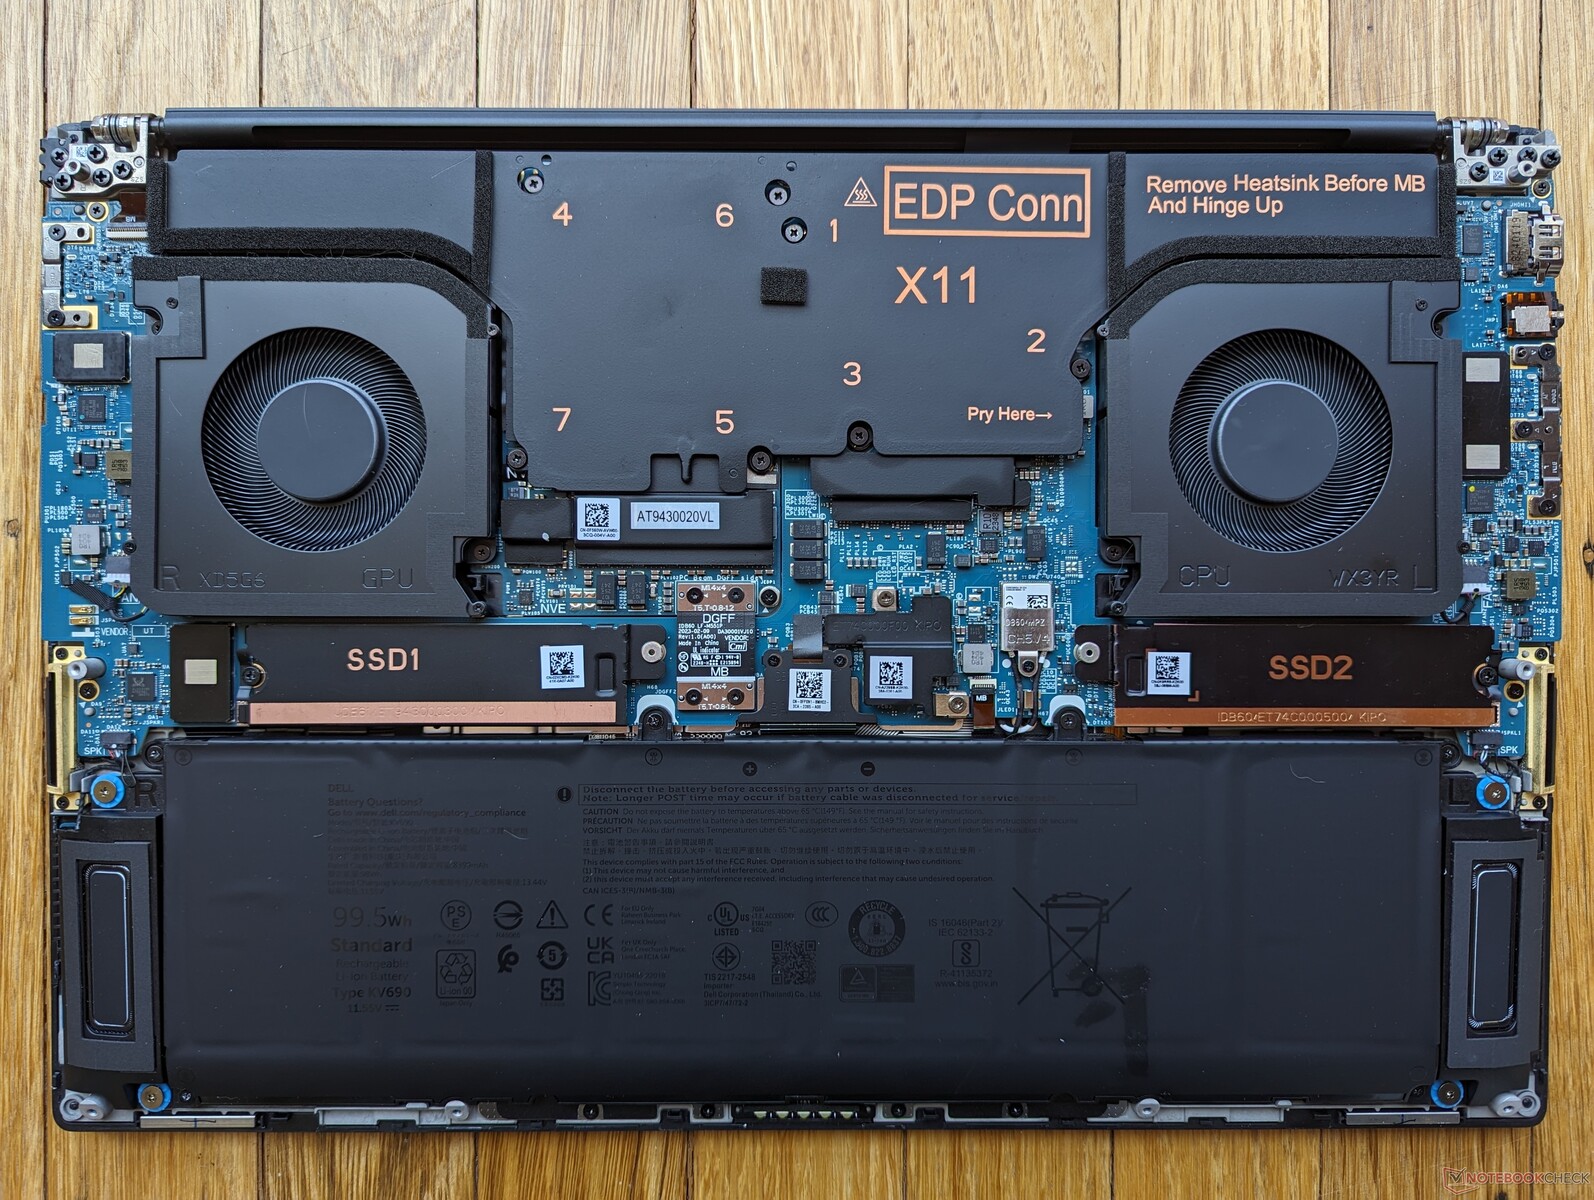
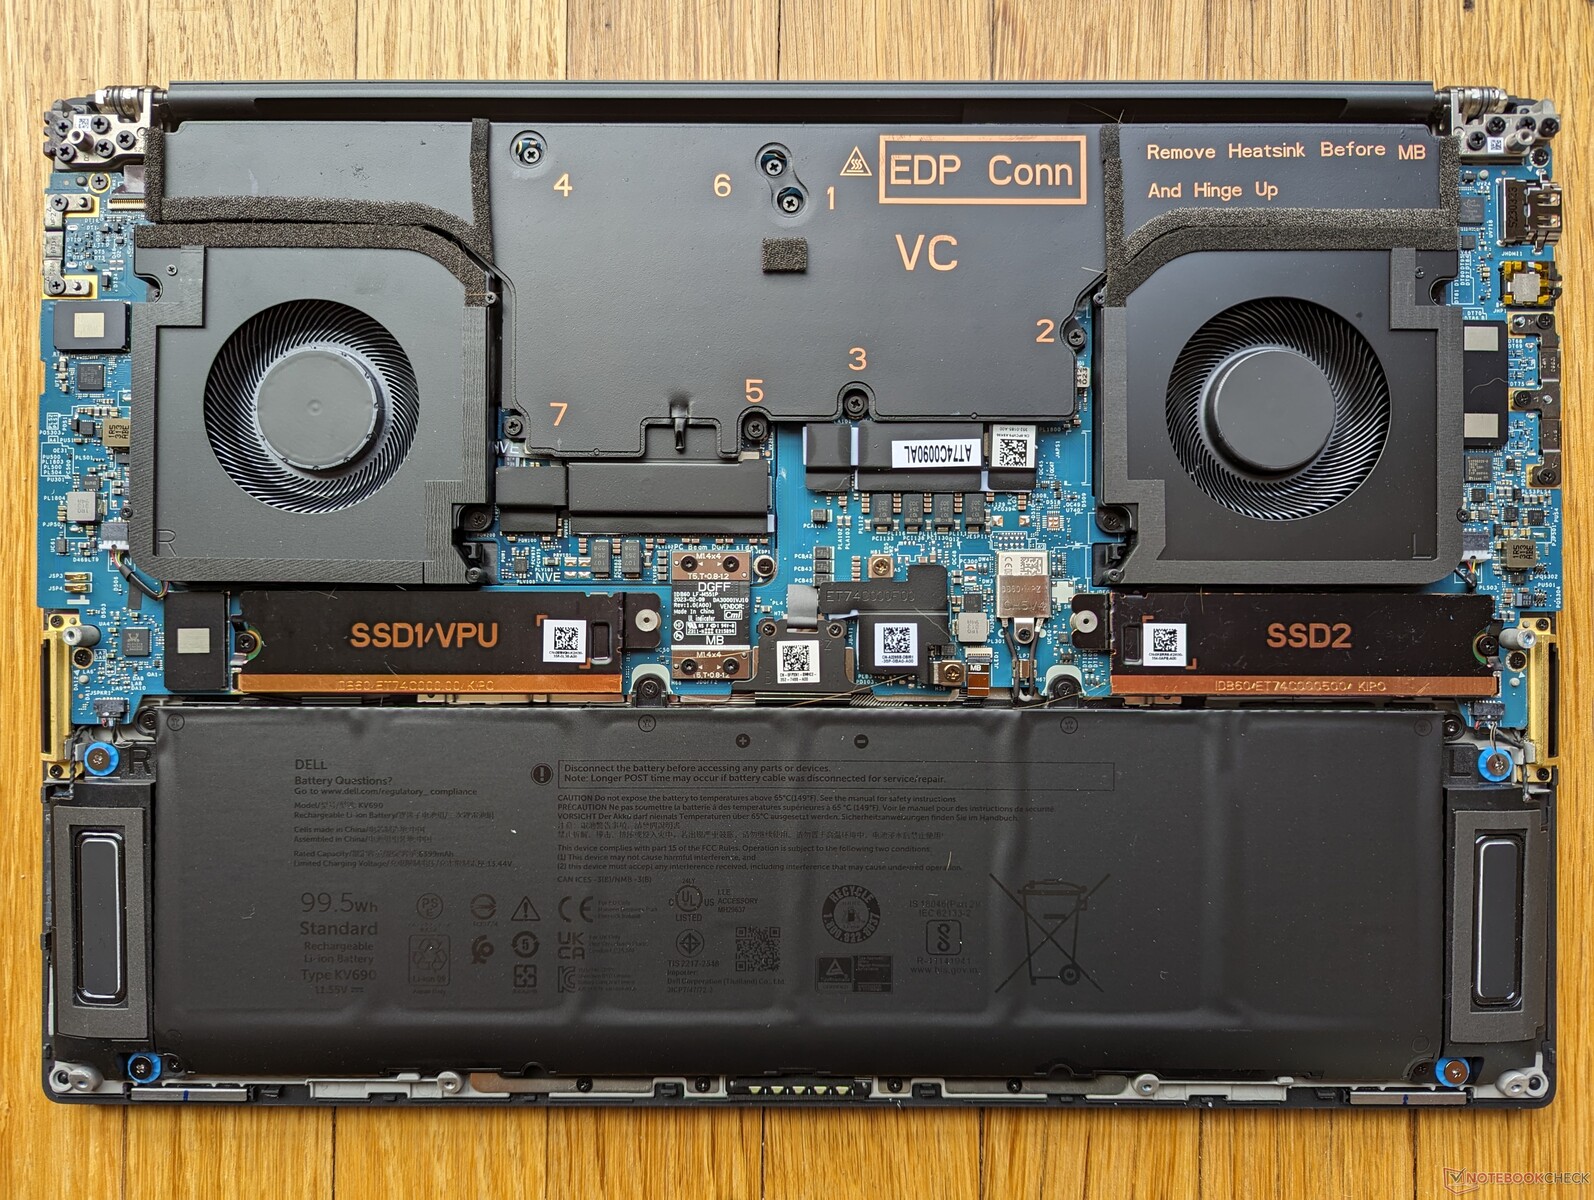
Manutenzione
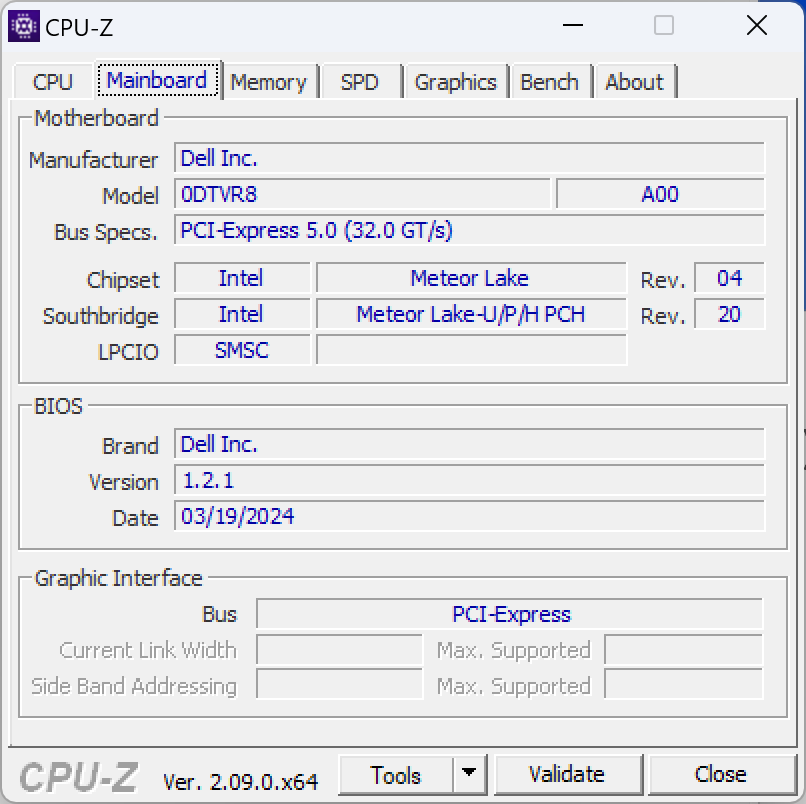
Non ci sono differenze interne degne di nota tra Precision 5690 e il vecchio 5680.
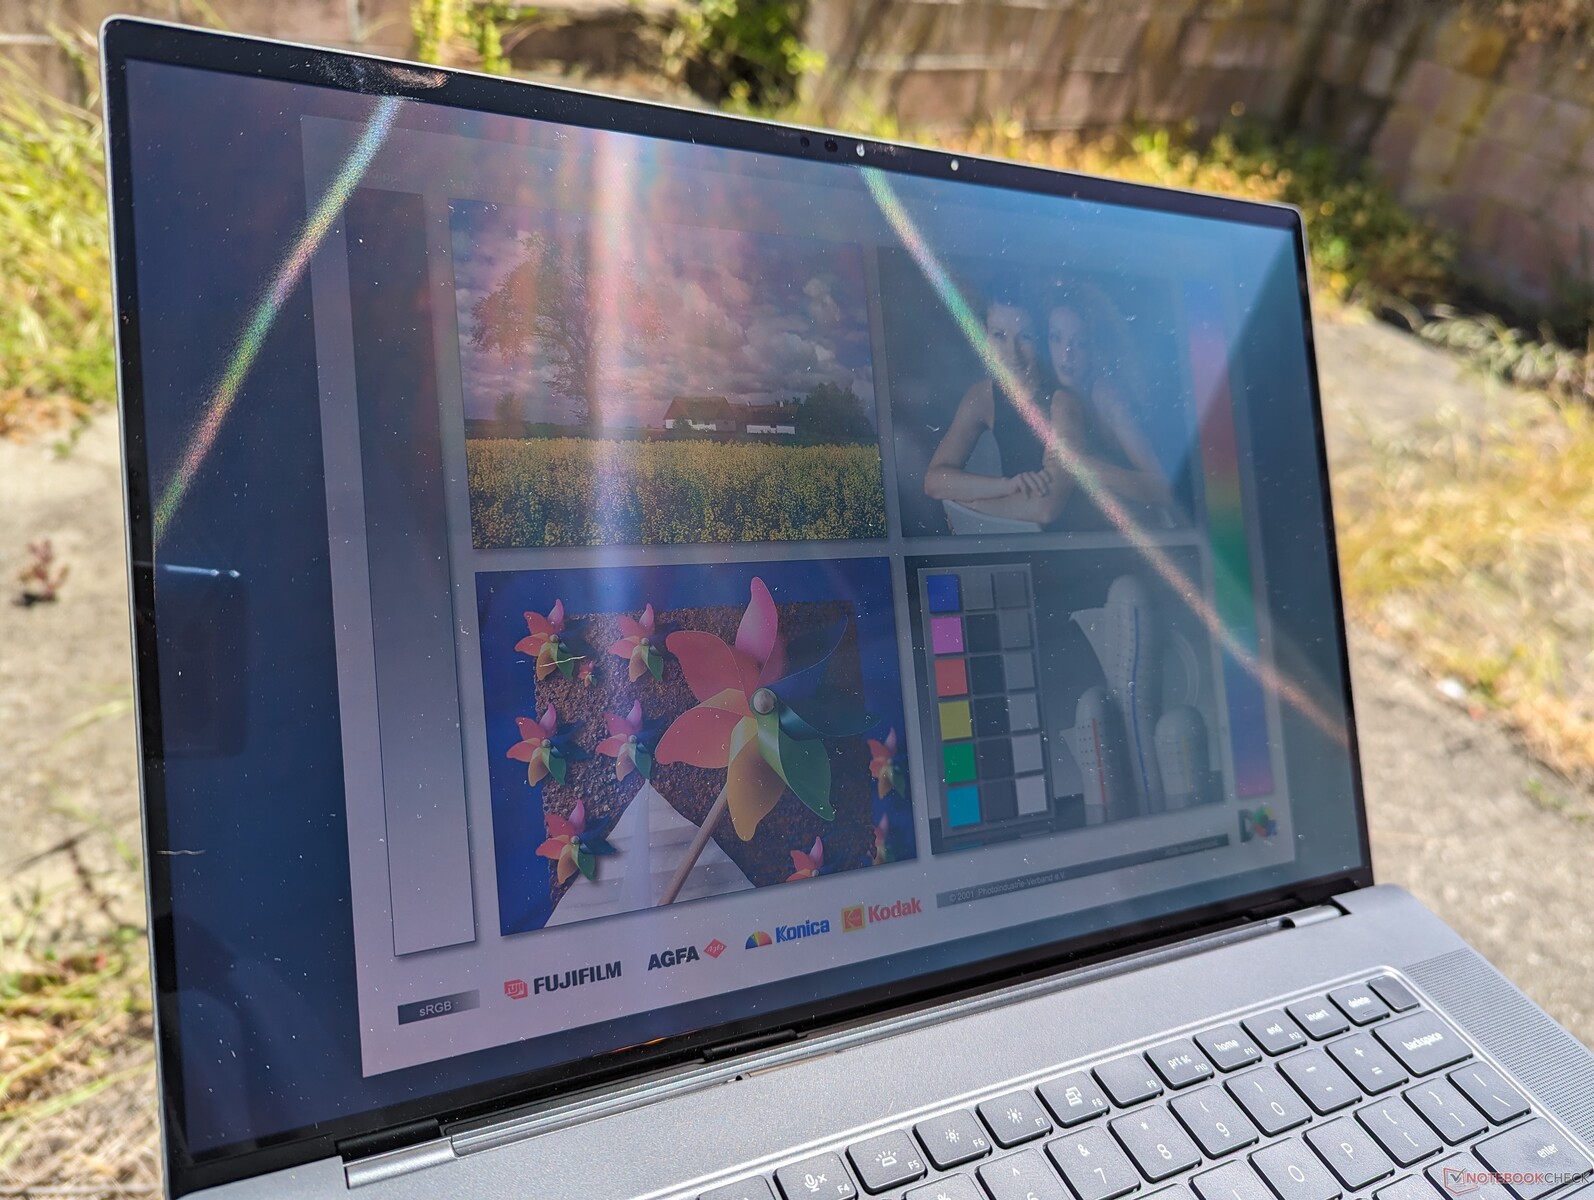
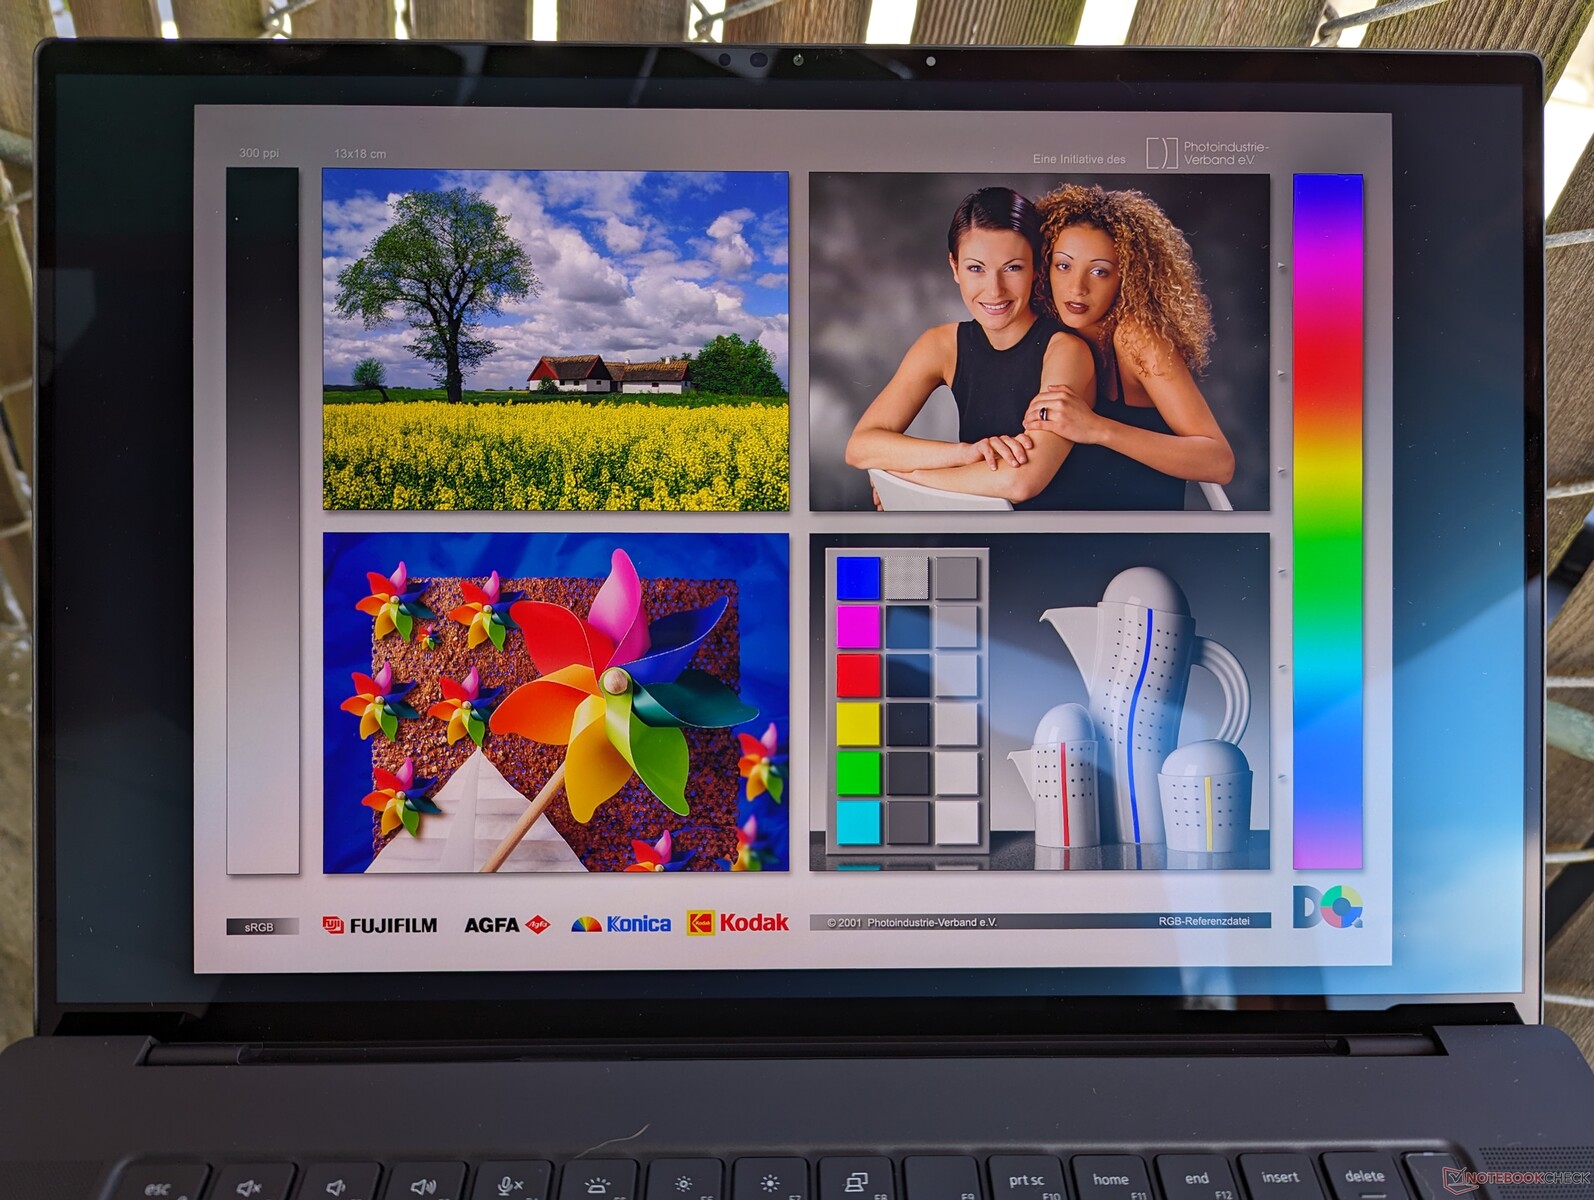
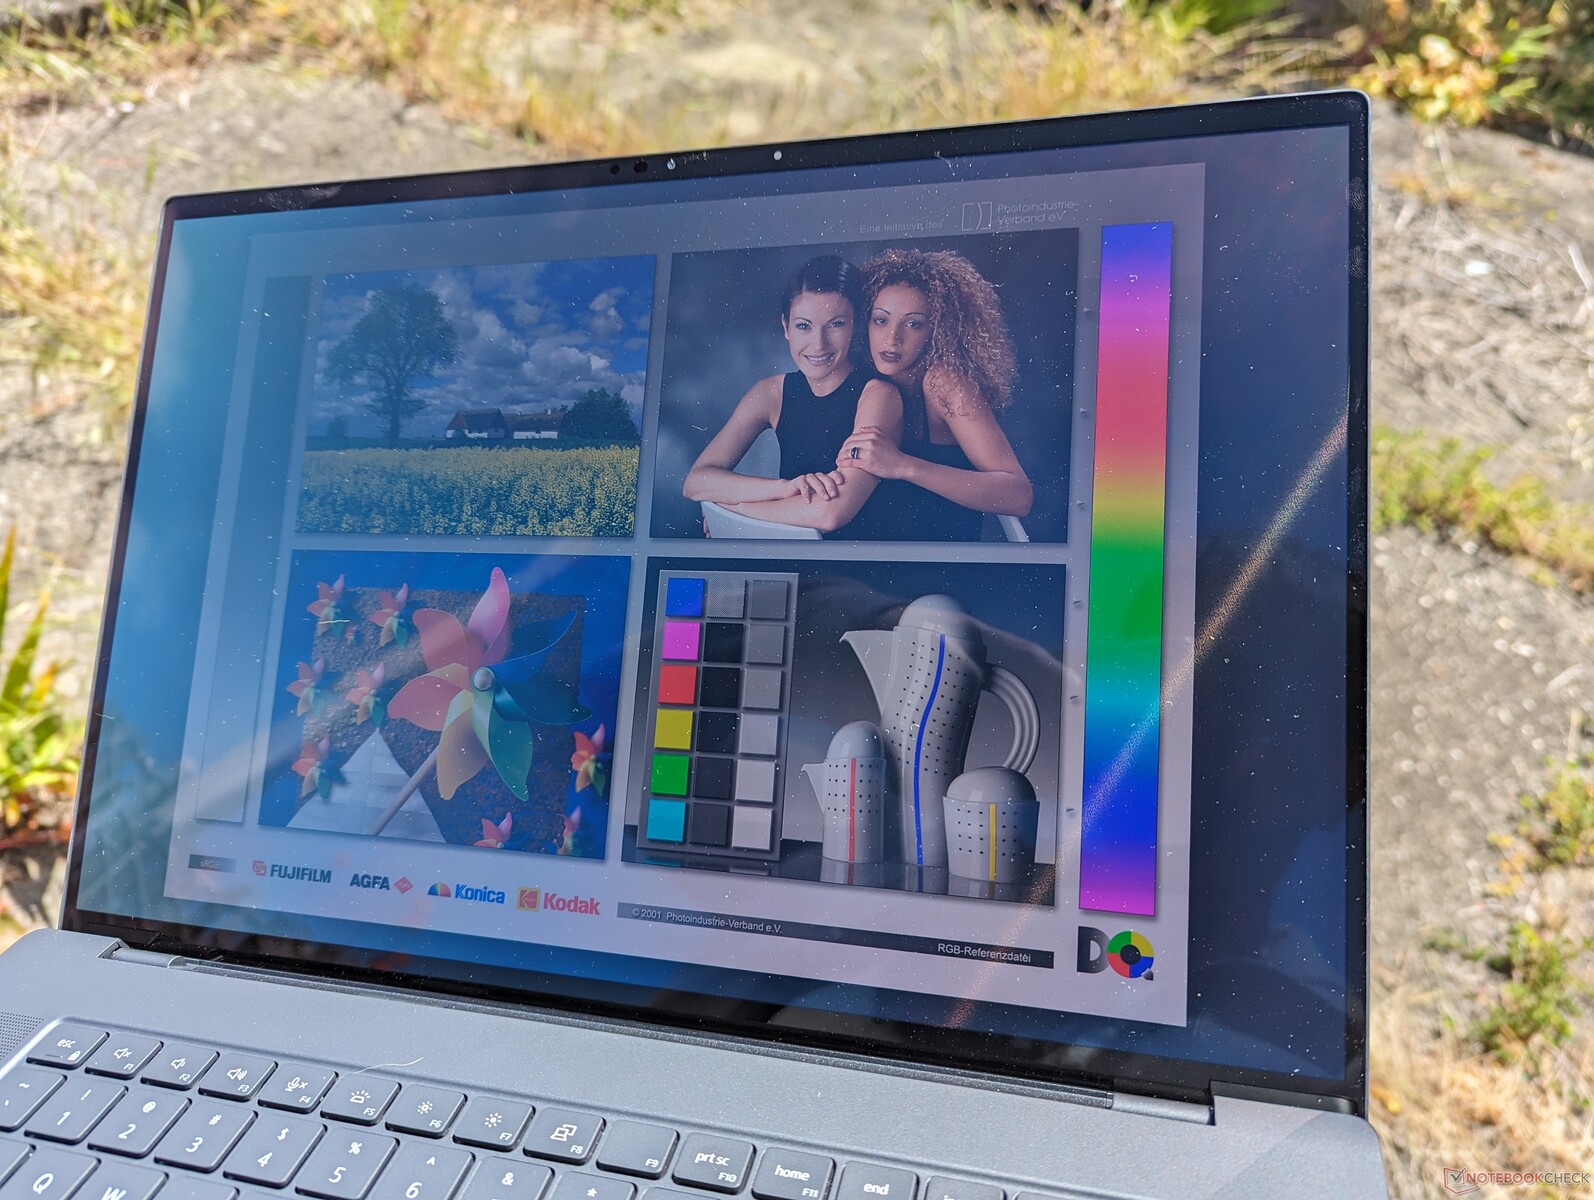
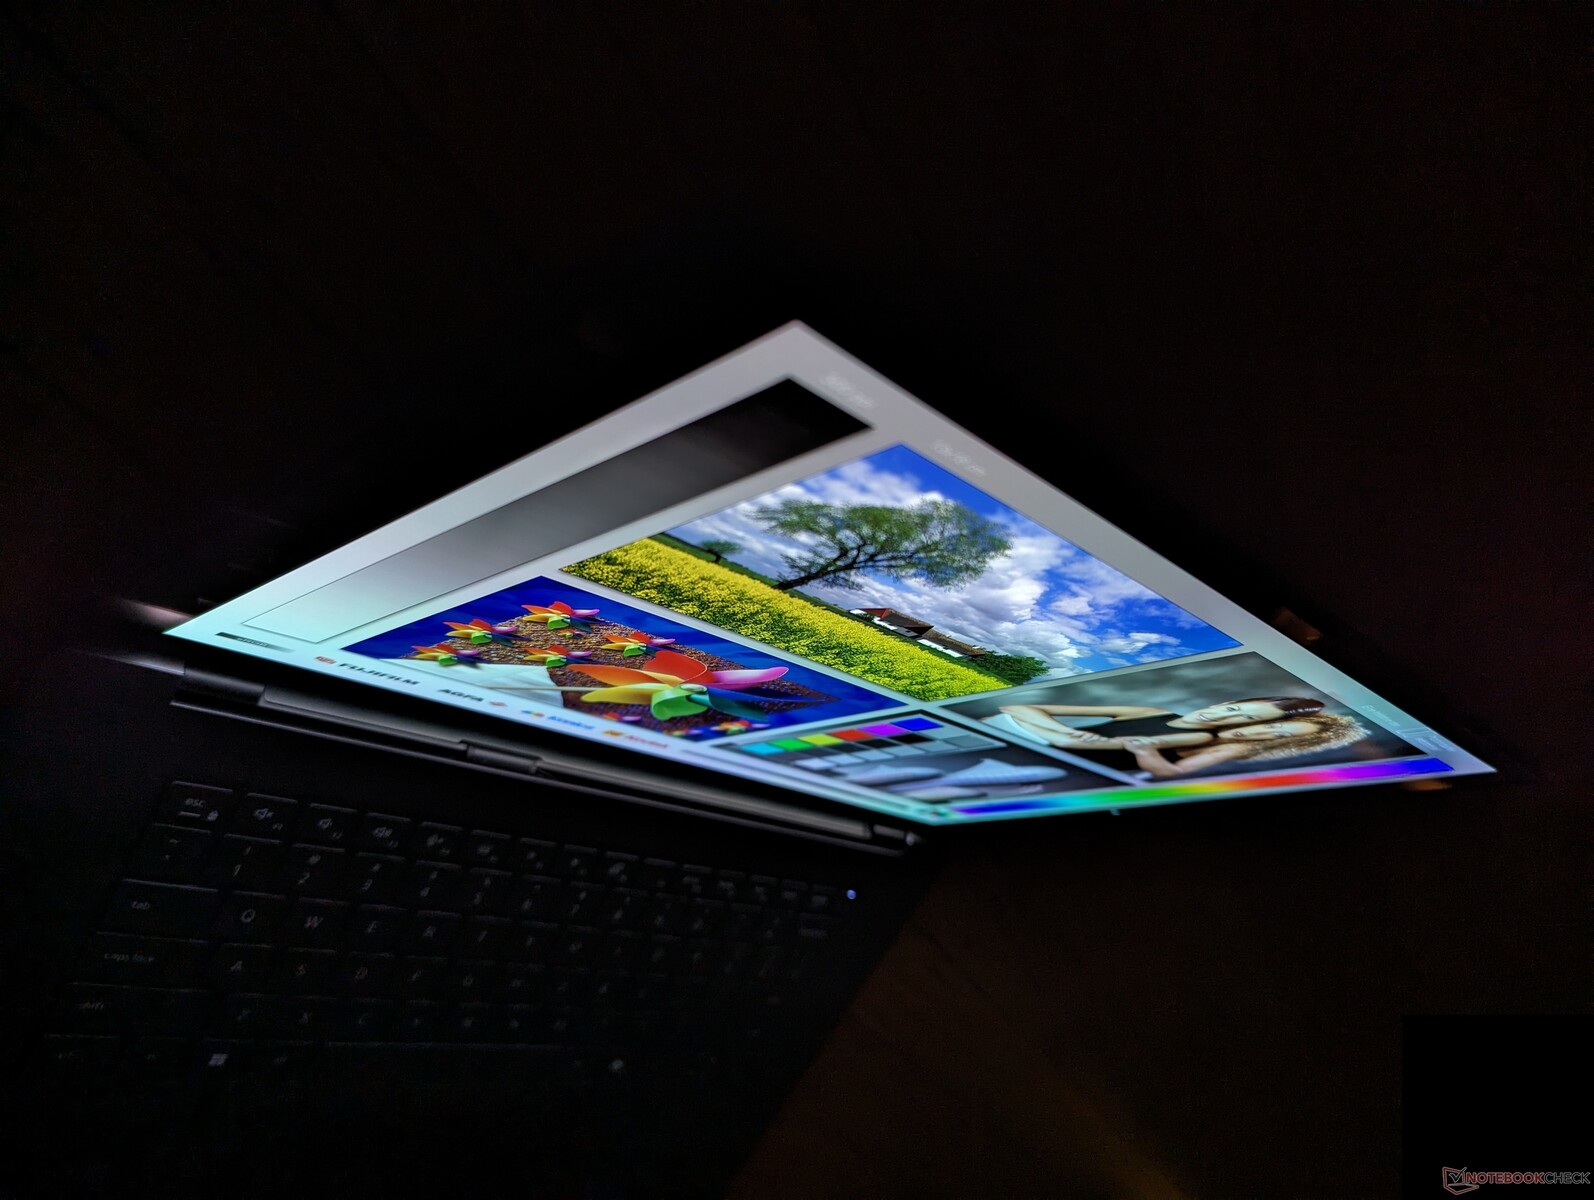
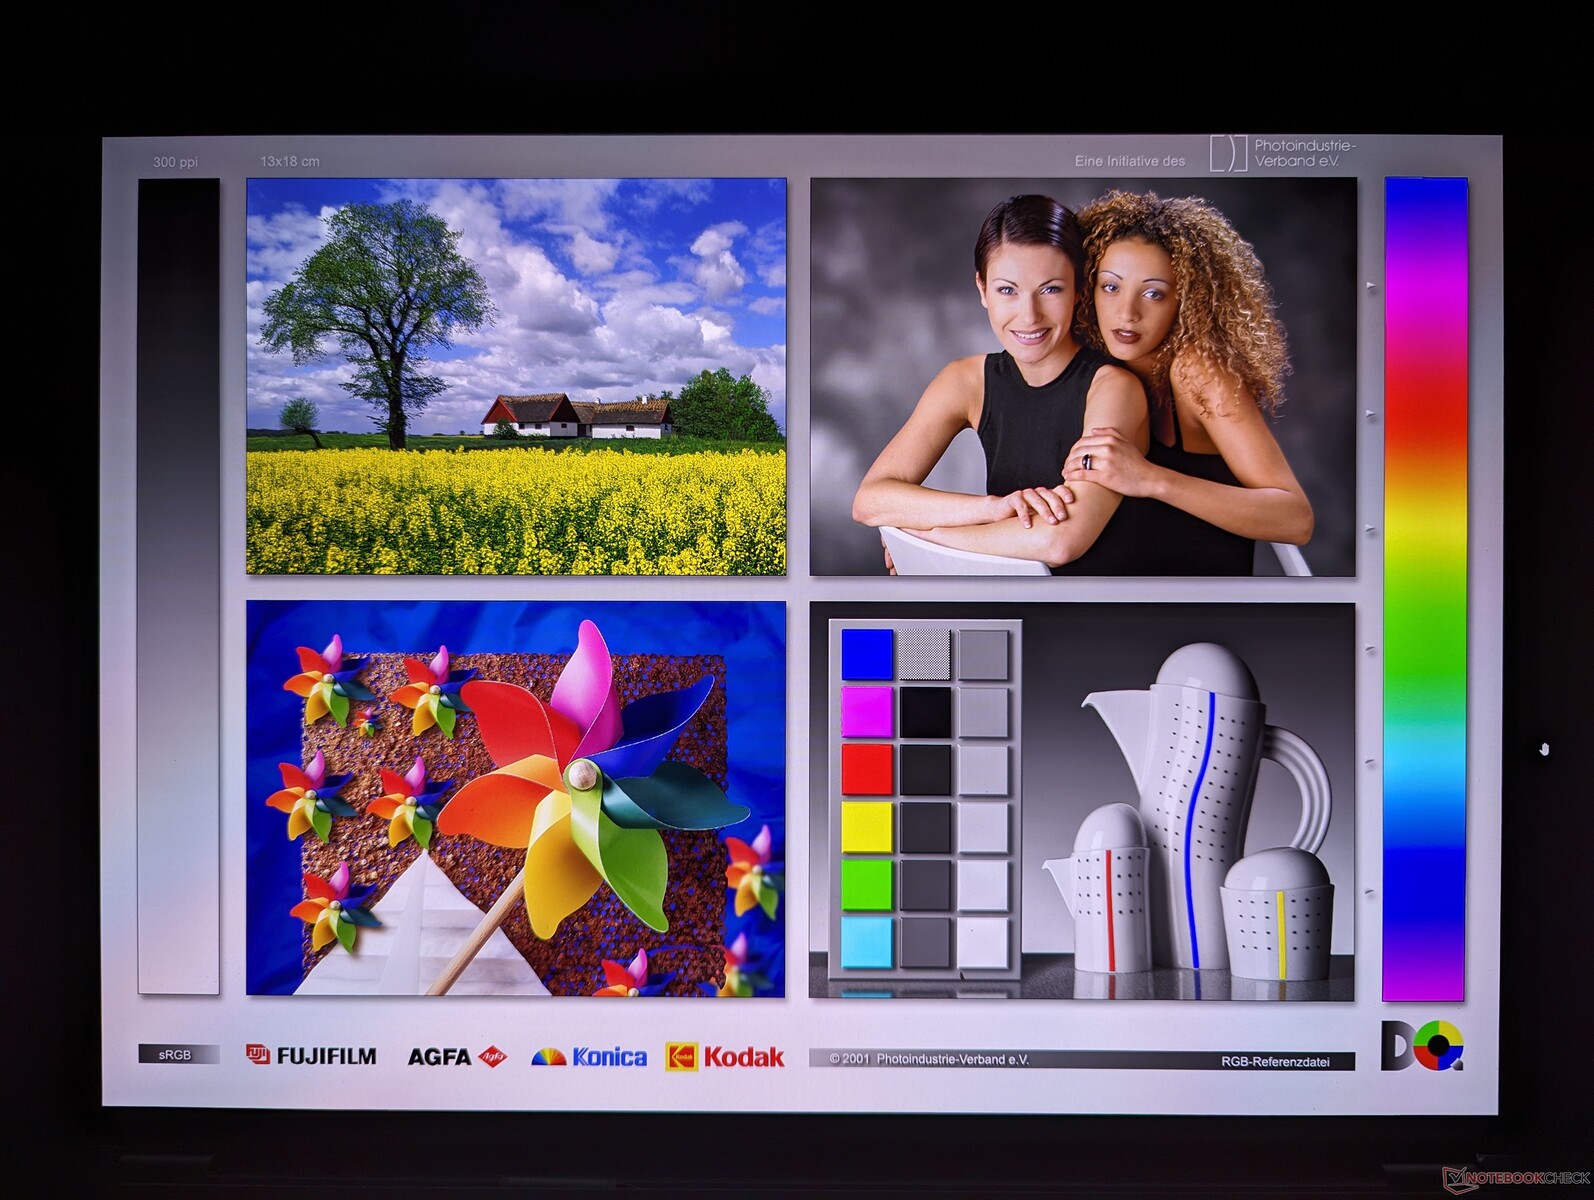
Display - HDR OLED a 60 Hz
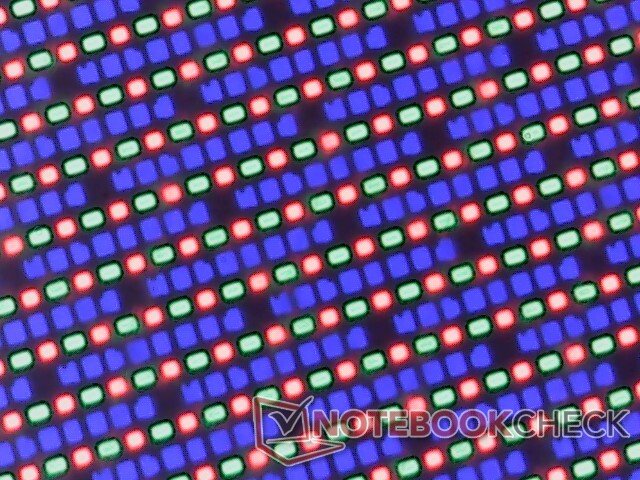
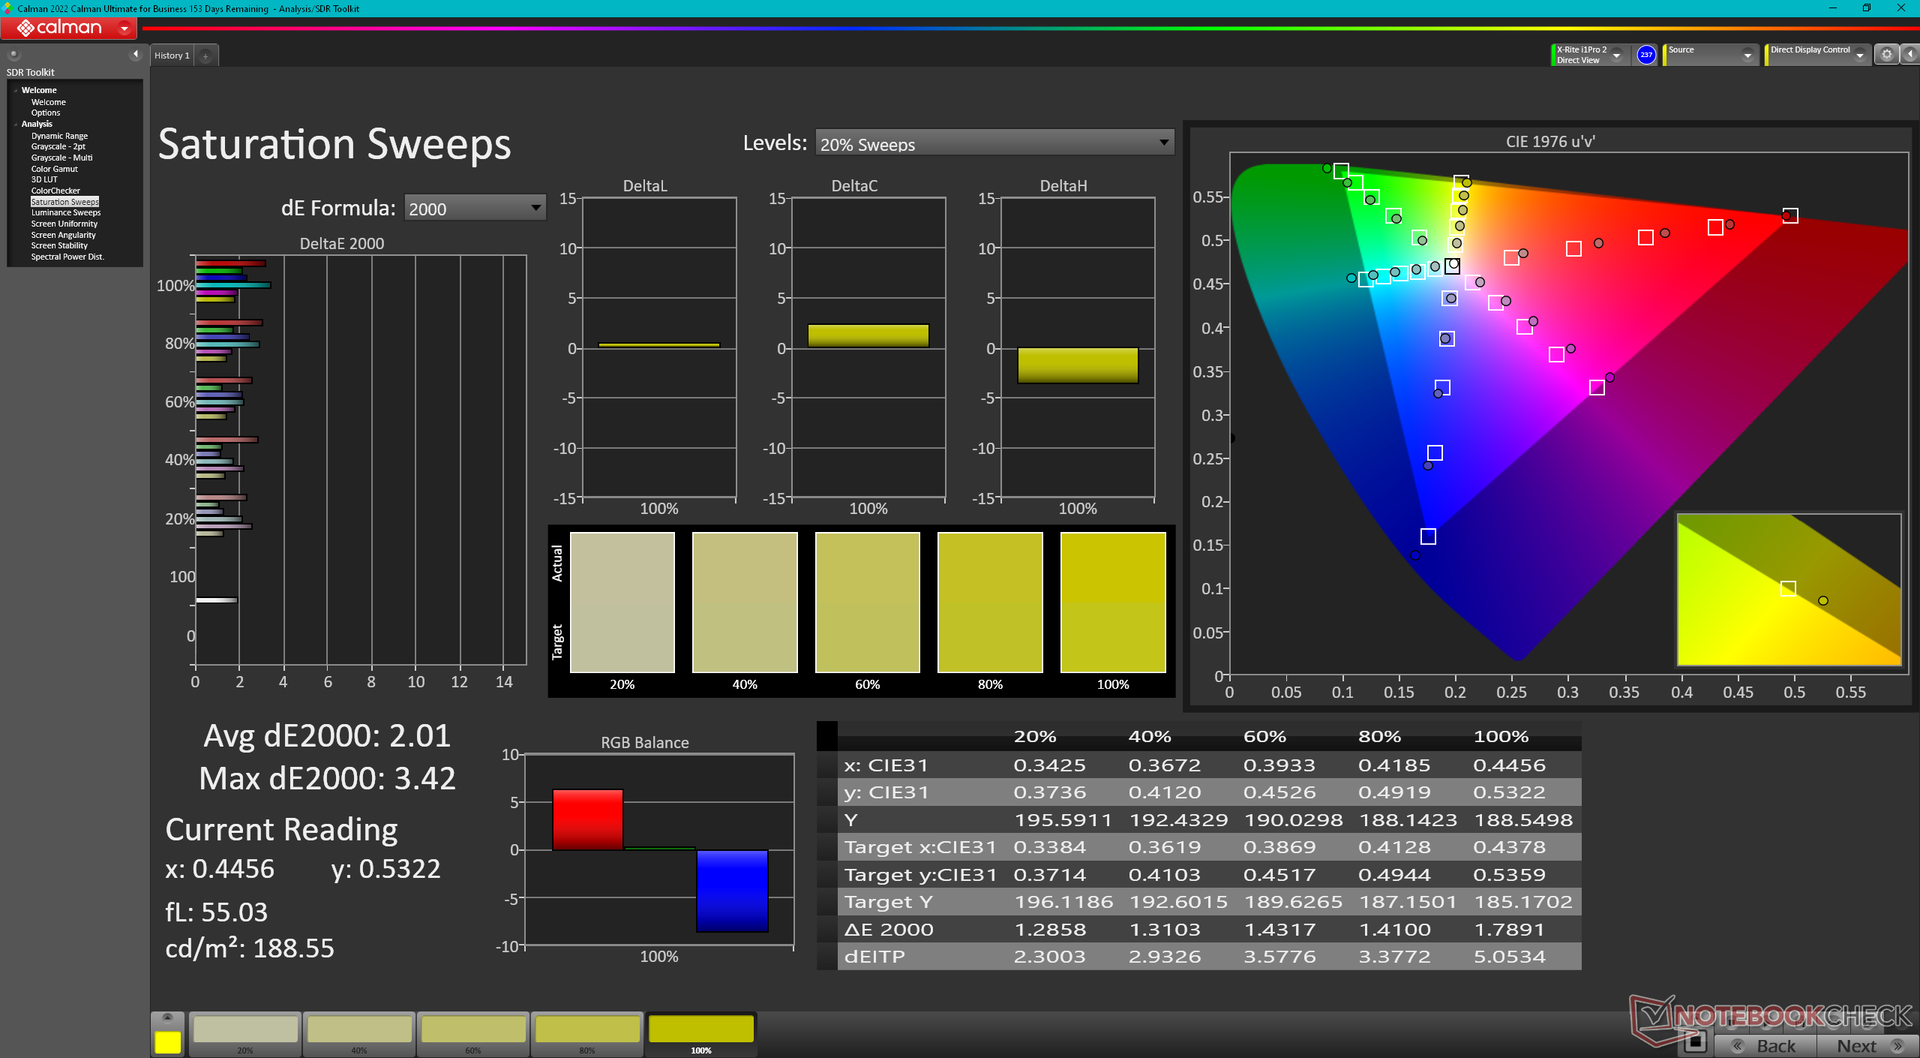
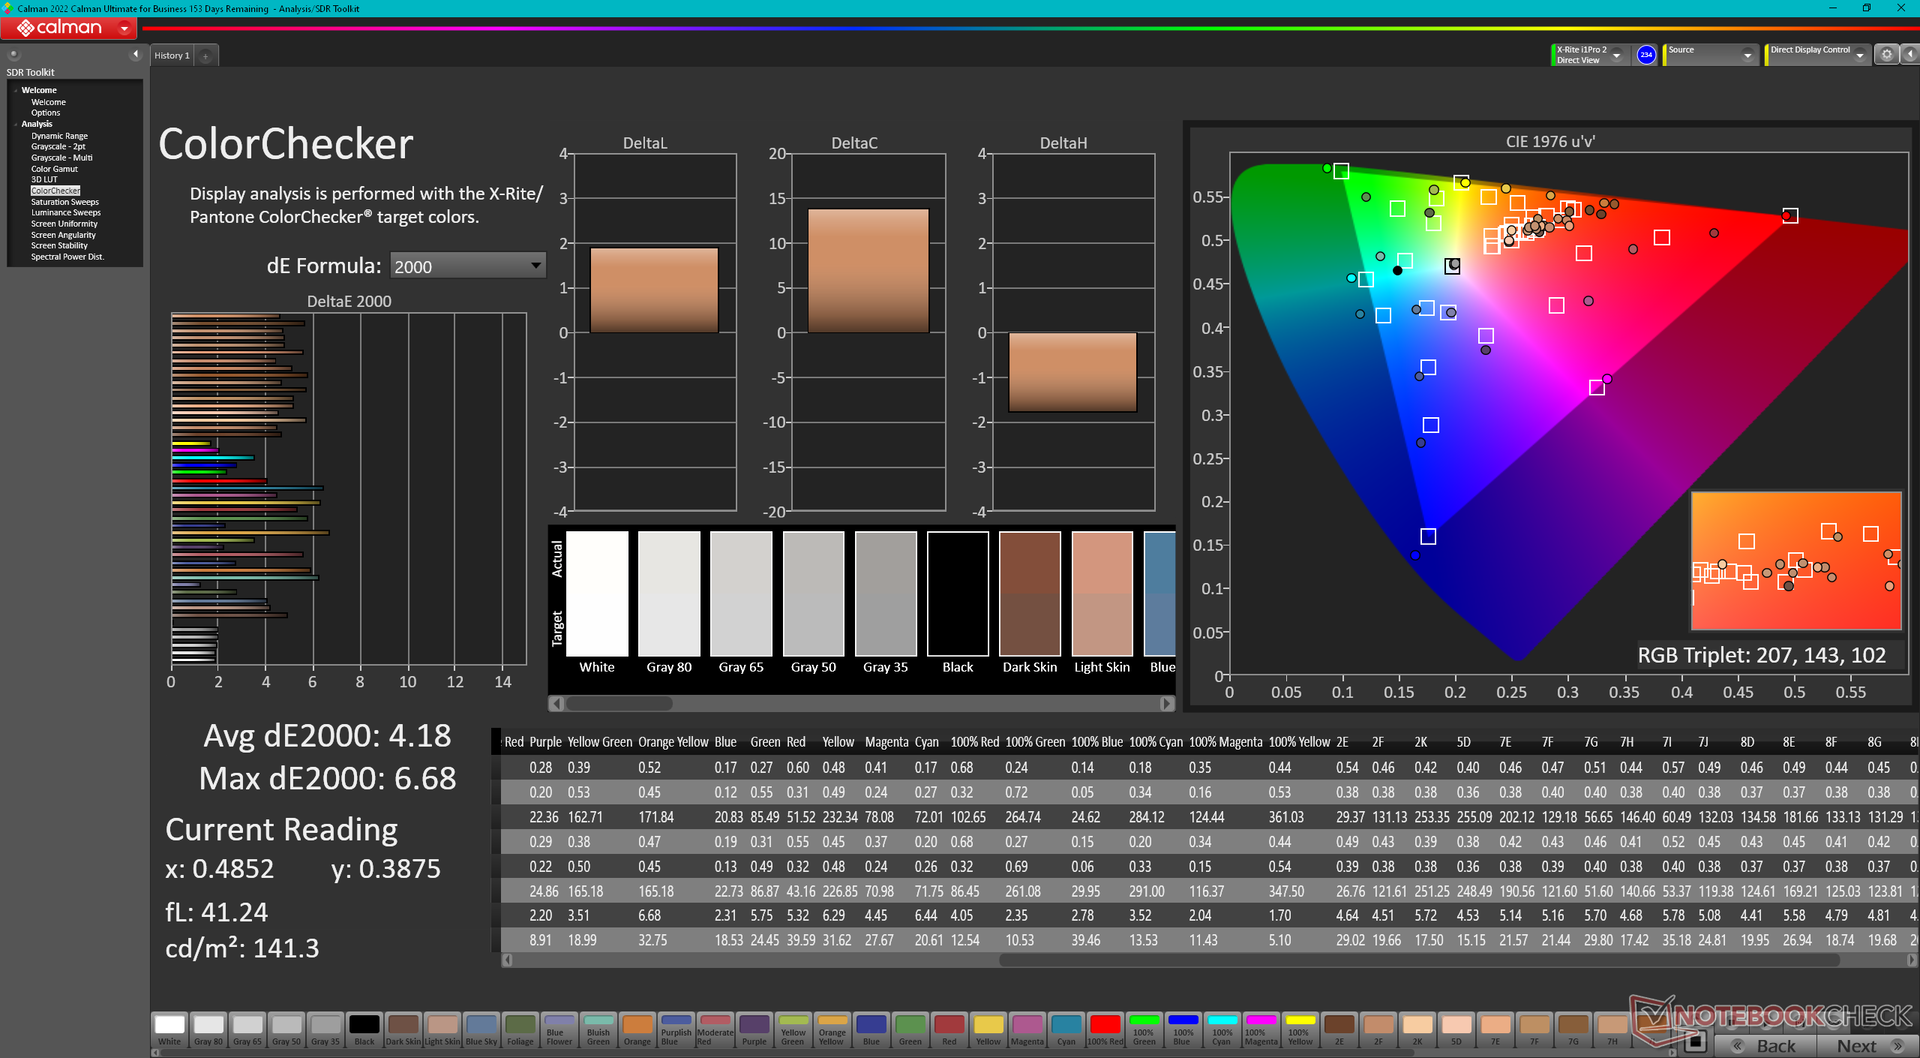
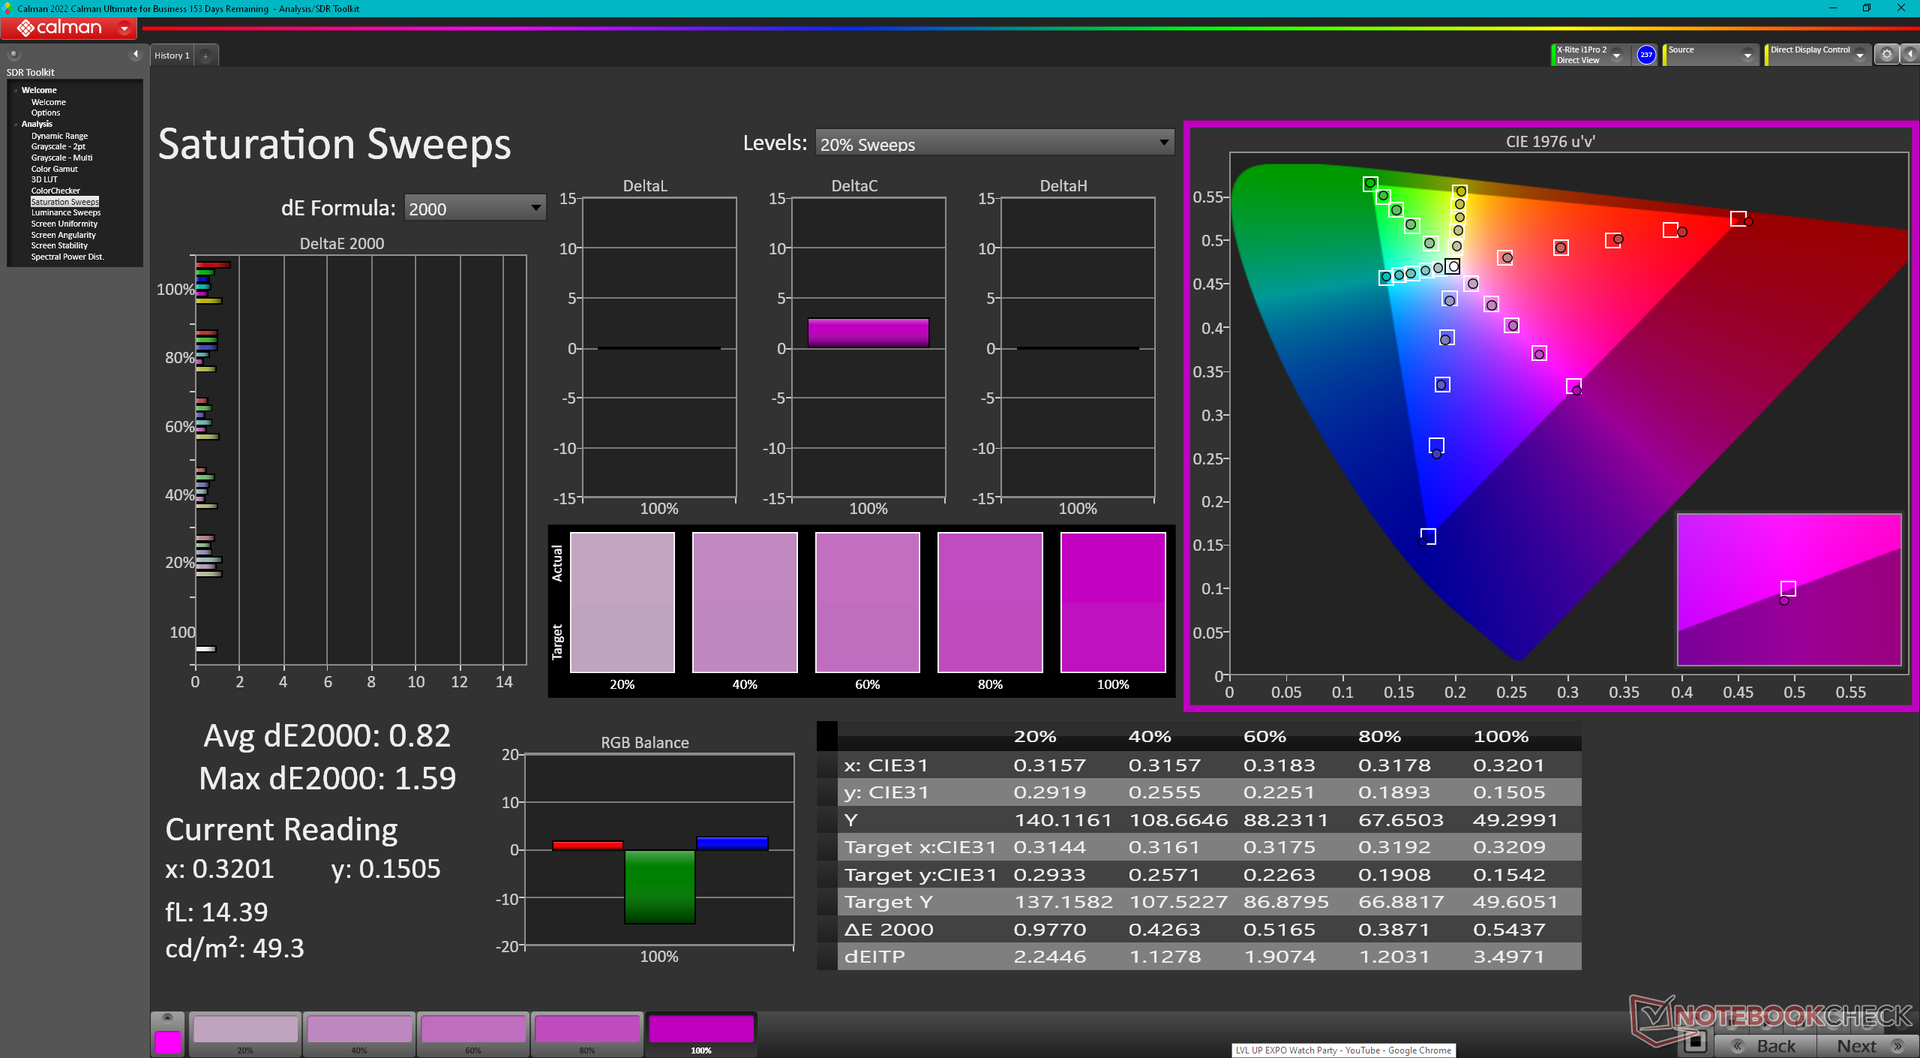
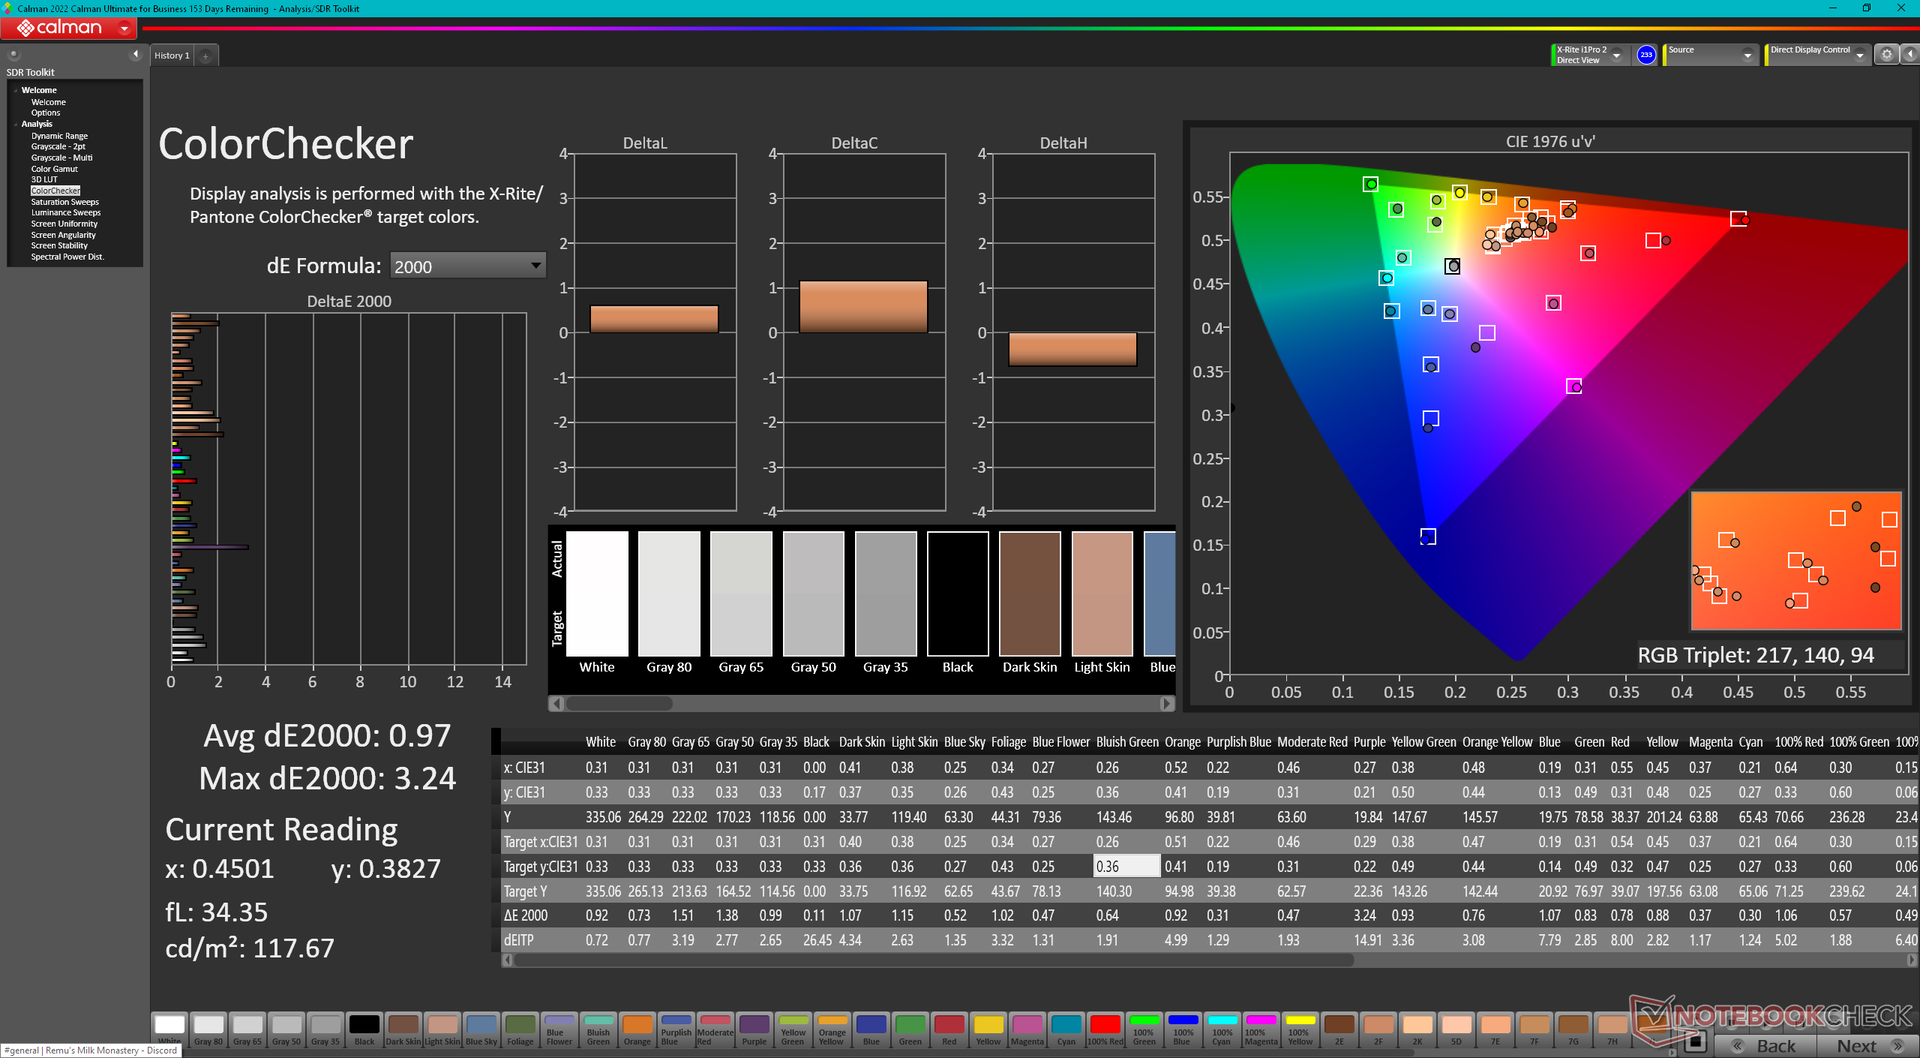
Il modello 2024 utilizza lo stesso pannello OLED 4K Samsung 160YV03 e il numero di parte D3KJF dell'anno precedente, senza alcuna modifica dell'esperienza visiva. Da un lato, questo è eccellente, in quanto il pannello OLED è pre-calibrato con colori DCI-P3 completi e supporto touch. D'altra parte, sarebbe stato bello vedere frequenze di aggiornamento più elevate con opzioni adattive, dato che la frequenza di aggiornamento standard di 60 Hz sta iniziando a invecchiare.
La luminosità massima in modalità SDR e HDR può raggiungere rispettivamente 350 e 600 nit.
| |||||||||||||||||||||||||
Distribuzione della luminosità: 97 %
Al centro con la batteria: 348.1 cd/m²
Contrasto: ∞:1 (Nero: 0 cd/m²)
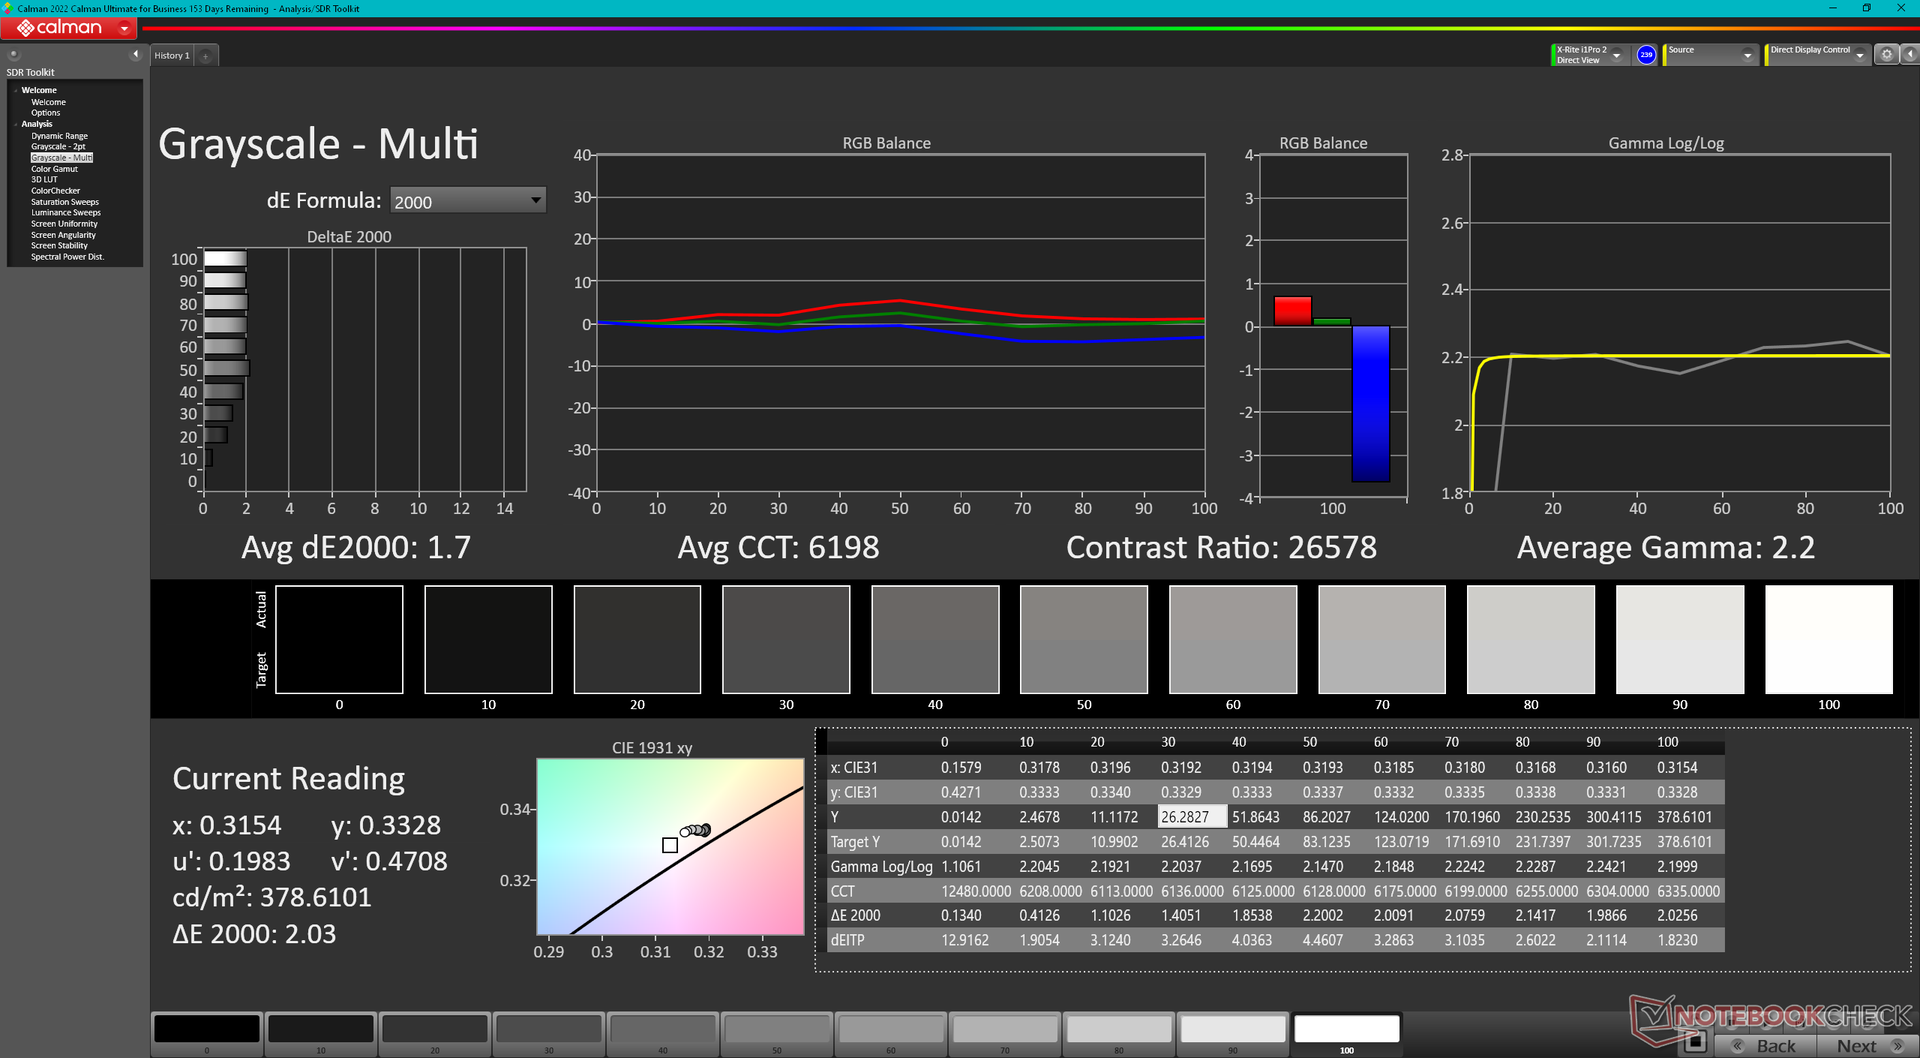
ΔE Color 4.18 | 0.5-29.43 Ø5, calibrated: 0.97
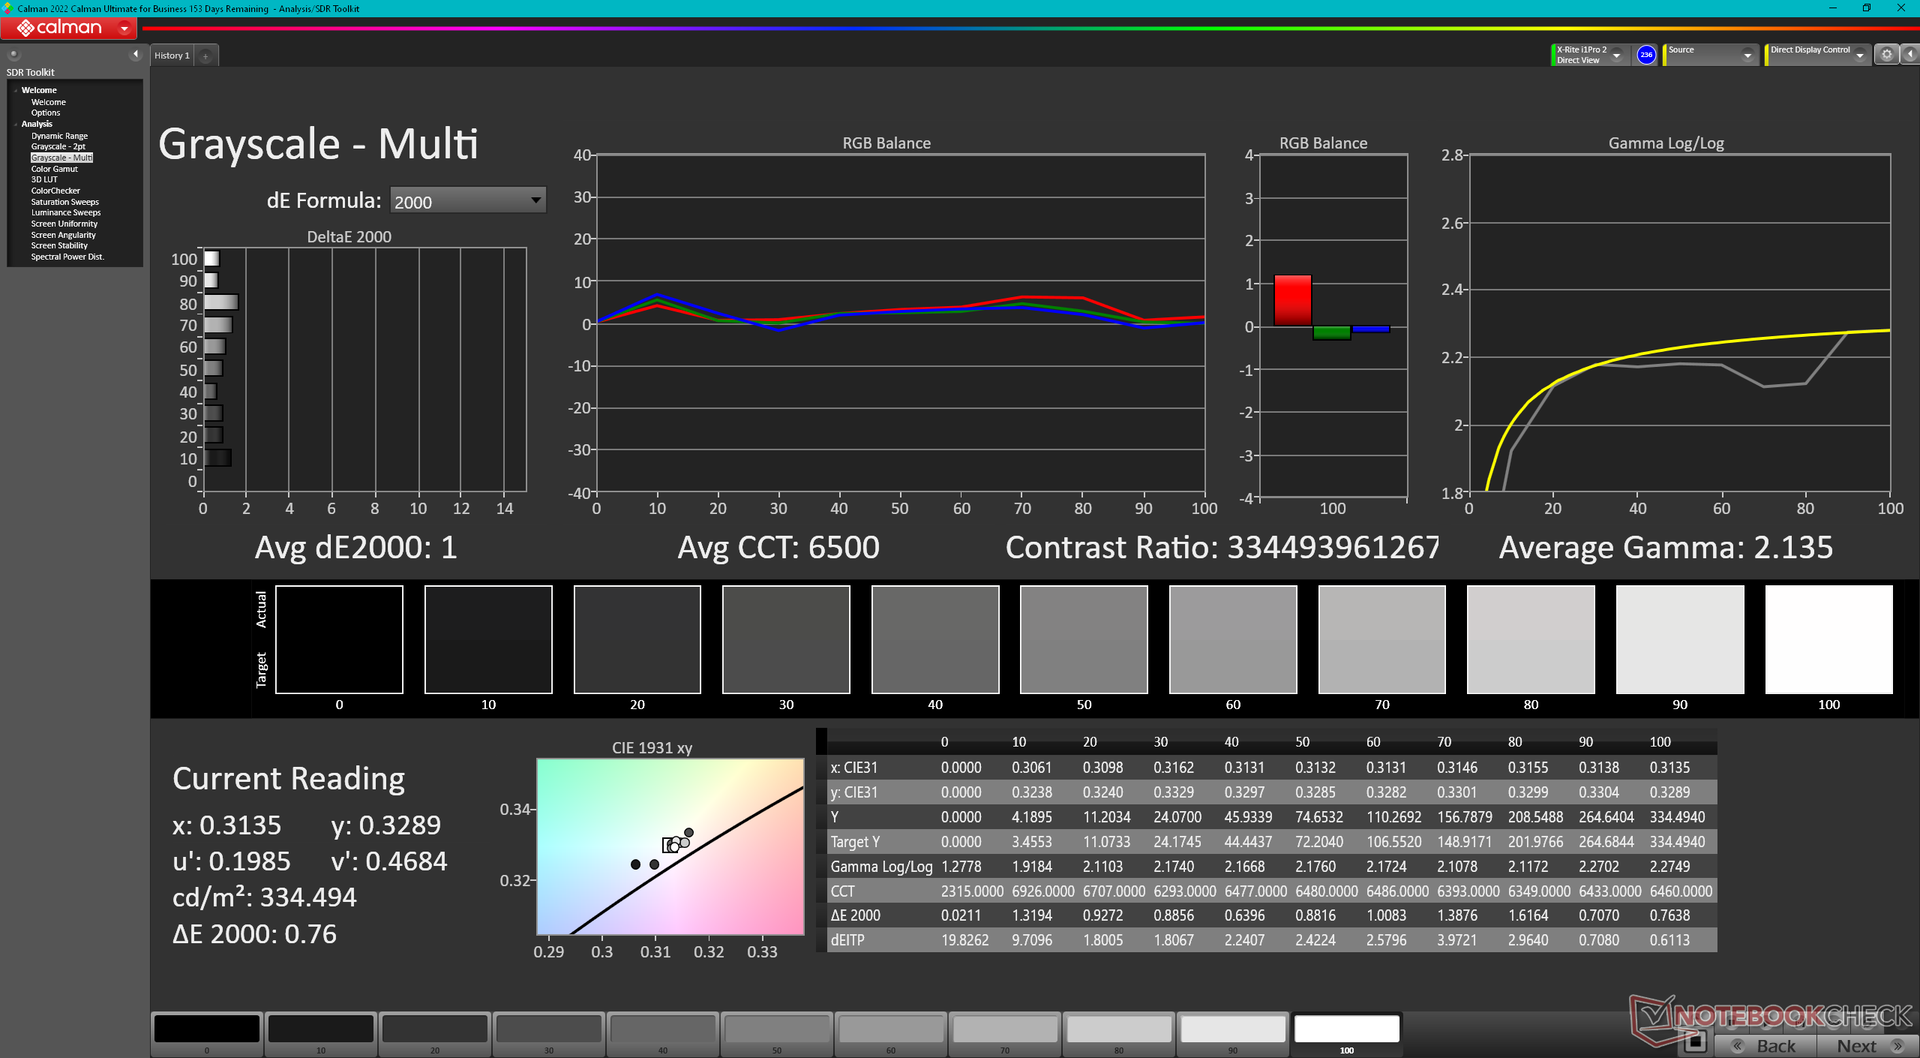
ΔE Greyscale 1.7 | 0.57-98 Ø5.3
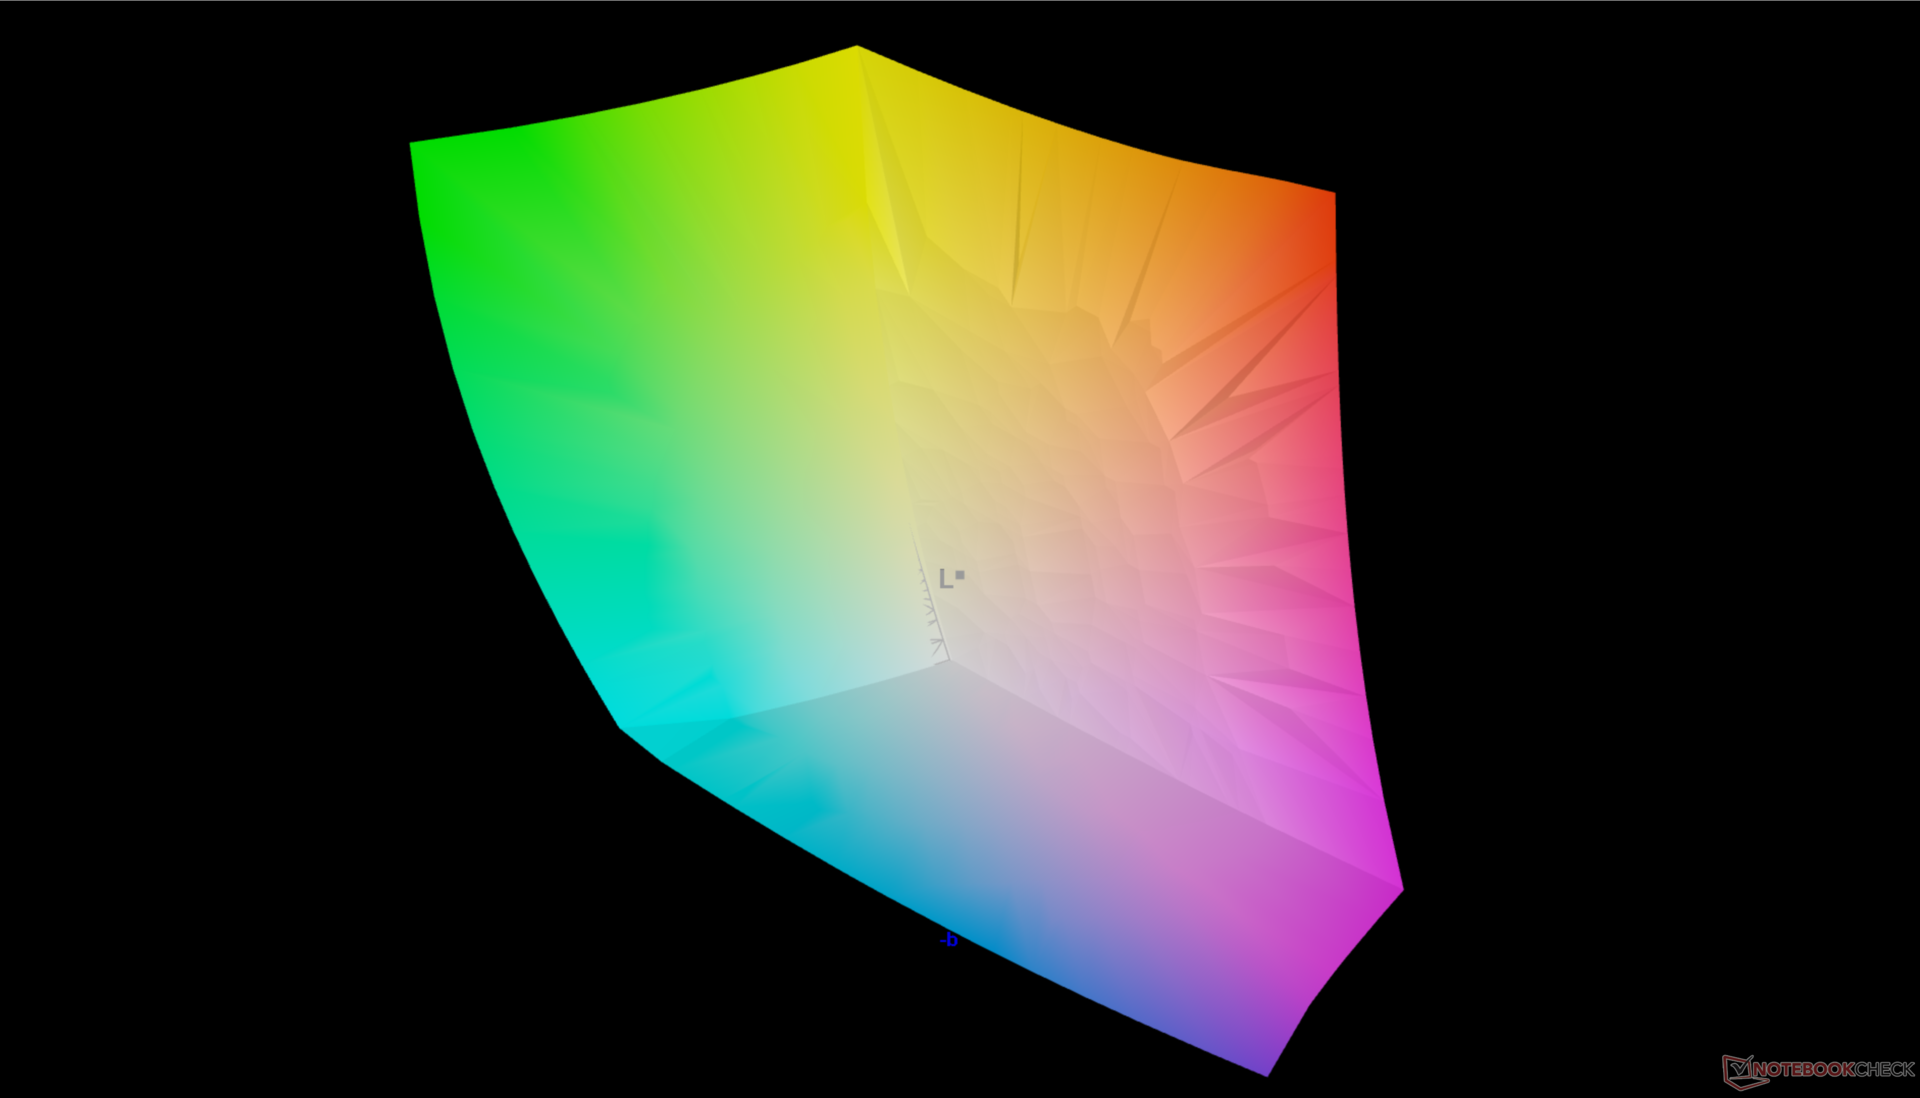
96.6% AdobeRGB 1998 (Argyll 2.2.0 3D)
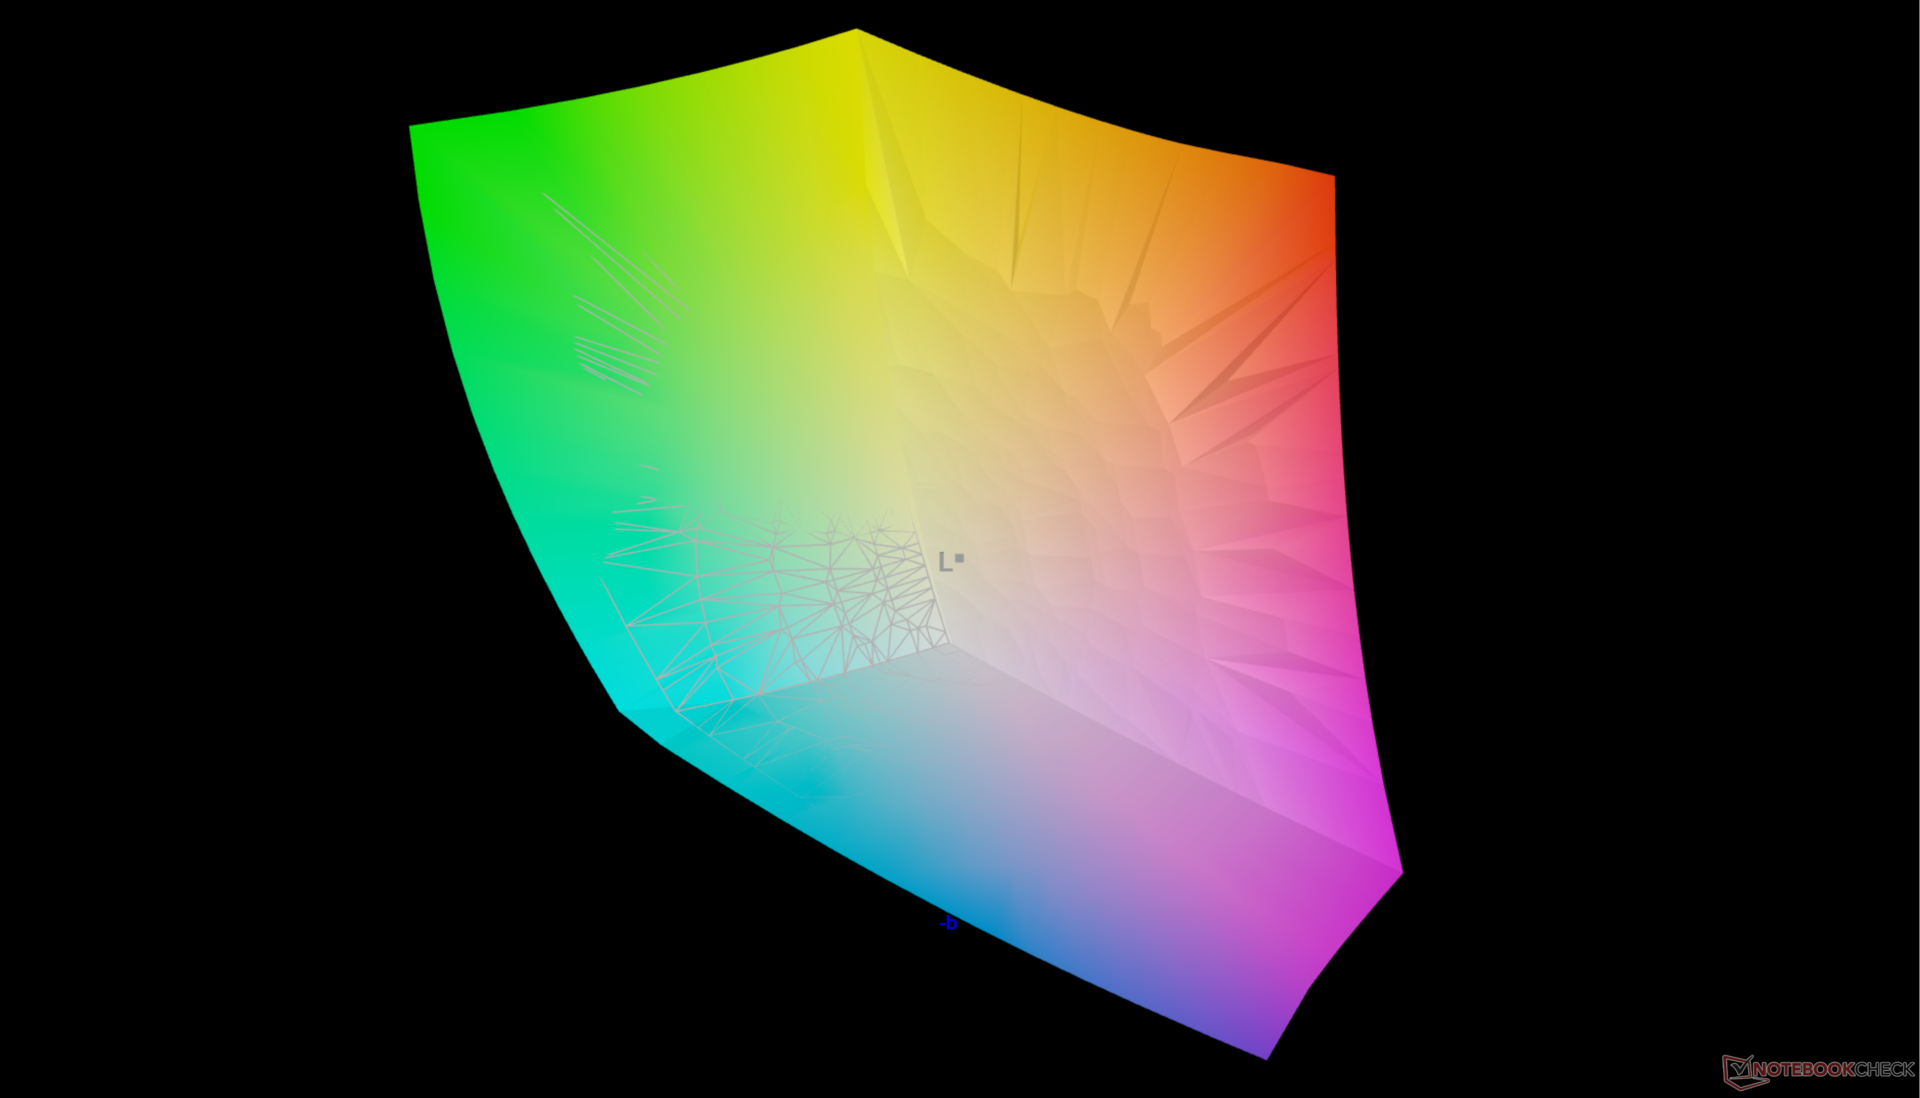
100% sRGB (Argyll 2.2.0 3D)
99.8% Display P3 (Argyll 2.2.0 3D)
Gamma: 2.2
| Dell Precision 5690 Samsung 160YV03, OLED, 3840x2400, 16.00 | Dell Precision 5000 5680 Samsung 160YV03, OLED, 3840x2400, 16.00 | Lenovo ThinkPad P16 G2 21FA000FGE MNG007DA1-9, IPS LED, 2560x1600, 16.00 | Lenovo ThinkPad P1 G6-21FV000DGE NE160QDM-NY1, IPS, 2560x1600, 16.00 | HP ZBook Fury 16 G10 AUO87A8, IPS, 3840x2400, 16.00 | MSI CreatorPro Z16P B12UKST B160QAN02.N, IPS, 2560x1600, 16.00 | |
|---|---|---|---|---|---|---|
| Display | 0% | -18% | -20% | -4% | -4% | |
| Display P3 Coverage | 99.8 | 99.9 0% | 71 -29% | 68.1 -32% | 98 -2% | 97.6 -2% |
| sRGB Coverage | 100 | 100 0% | 99.2 -1% | 97.5 -2% | 99.9 0% | 99.9 0% |
| AdobeRGB 1998 Coverage | 96.6 | 97.5 1% | 73.2 -24% | 70.2 -27% | 86.2 -11% | 87.4 -10% |
| Response Times | -1% | -574% | -586% | -533% | -494% | |
| Response Time Grey 50% / Grey 80% * | 1.7 ? | 1.68 ? 1% | 12.8 ? -653% | 13.7 ? -706% | 11.9 ? -600% | 12.8 ? -653% |
| Response Time Black / White * | 1.7 ? | 1.77 ? -4% | 10.1 ? -494% | 9.6 ? -465% | 9.6 ? -465% | 7.4 ? -335% |
| PWM Frequency | 60 ? | 60 ? 0% | ||||
| Screen | -11% | -15% | 33% | 36% | 22% | |
| Brightness middle | 348.1 | 345.7 -1% | 510 47% | 521 50% | 514.6 48% | 407 17% |
| Brightness | 351 | 349 -1% | 517 47% | 484 38% | 495 41% | 388 11% |
| Brightness Distribution | 97 | 98 1% | 89 -8% | 89 -8% | 90 -7% | 88 -9% |
| Black Level * | 0.37 | 0.36 | 0.46 | 0.36 | ||
| Colorchecker dE 2000 * | 4.18 | 3.59 14% | 2.6 38% | 1.2 71% | 2.4 43% | 1.3 69% |
| Colorchecker dE 2000 max. * | 6.68 | 7.02 -5% | 5.2 22% | 2.5 63% | 4.86 27% | 2.5 63% |
| Colorchecker dE 2000 calibrated * | 0.97 | 0.99 -2% | 2.3 -137% | 1 -3% | 0.4 59% | 0.7 28% |
| Greyscale dE 2000 * | 1.7 | 3.1 -82% | 3.6 -112% | 1.4 18% | 1 41% | 2.1 -24% |
| Gamma | 2.2 100% | 2.13 103% | 2.26 97% | 2.25 98% | 2.3 96% | 2.26 97% |
| CCT | 6198 105% | 6448 101% | 5969 109% | 6682 97% | 6553 99% | 6437 101% |
| Contrast | 1378 | 1447 | 1119 | 1131 | ||
| Media totale (Programma / Settaggio) | -4% /
-6% | -202% /
-109% | -191% /
-84% | -167% /
-69% | -159% /
-70% |
* ... Meglio usare valori piccoli
Il display è ben calibrato rispetto allo standard P3, con valori DeltaE medi della scala di grigi e del colore di appena 1,7 e 4,18, rispettivamente.
Tempi di risposta del Display
| ↔ Tempi di risposta dal Nero al Bianco | ||
|---|---|---|
| 1.7 ms ... aumenta ↗ e diminuisce ↘ combinato | ↗ 0.74 ms Incremento | 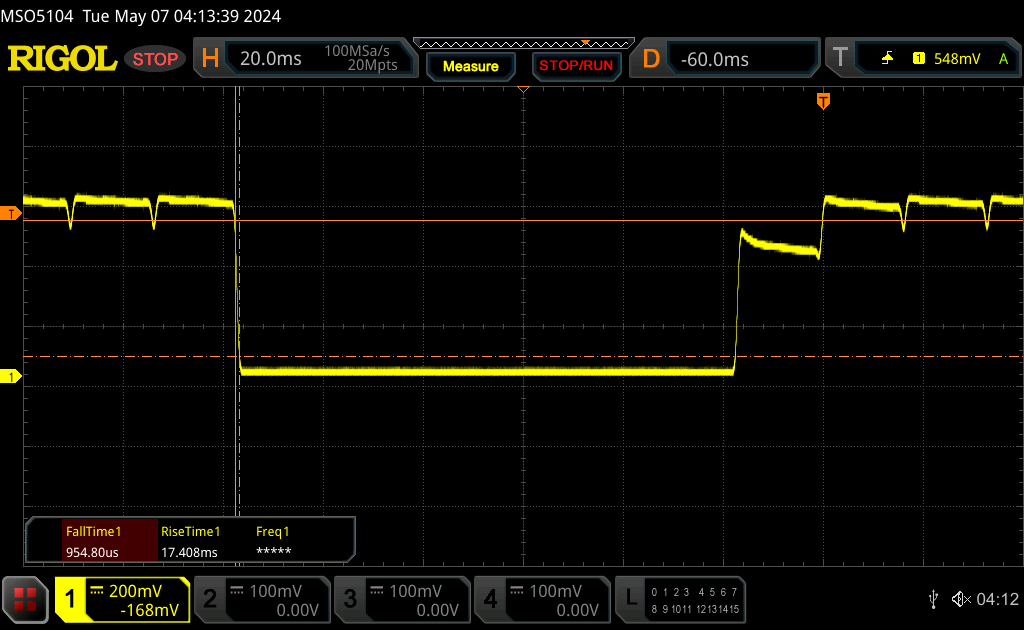 |
| ↘ 0.96 ms Calo | ||
| Lo schermo ha mostrato valori di risposta molto veloci nei nostri tests ed è molto adatto per i gaming veloce. In confronto, tutti i dispositivi di test variano da 0.1 (minimo) a 240 (massimo) ms. » 5 % di tutti i dispositivi è migliore. Questo significa che i tempi di risposta rilevati sono migliori rispettto alla media di tutti i dispositivi testati (21.4 ms). | ||
| ↔ Tempo di risposta dal 50% Grigio all'80% Grigio | ||
| 1.7 ms ... aumenta ↗ e diminuisce ↘ combinato | ↗ 0.88 ms Incremento | 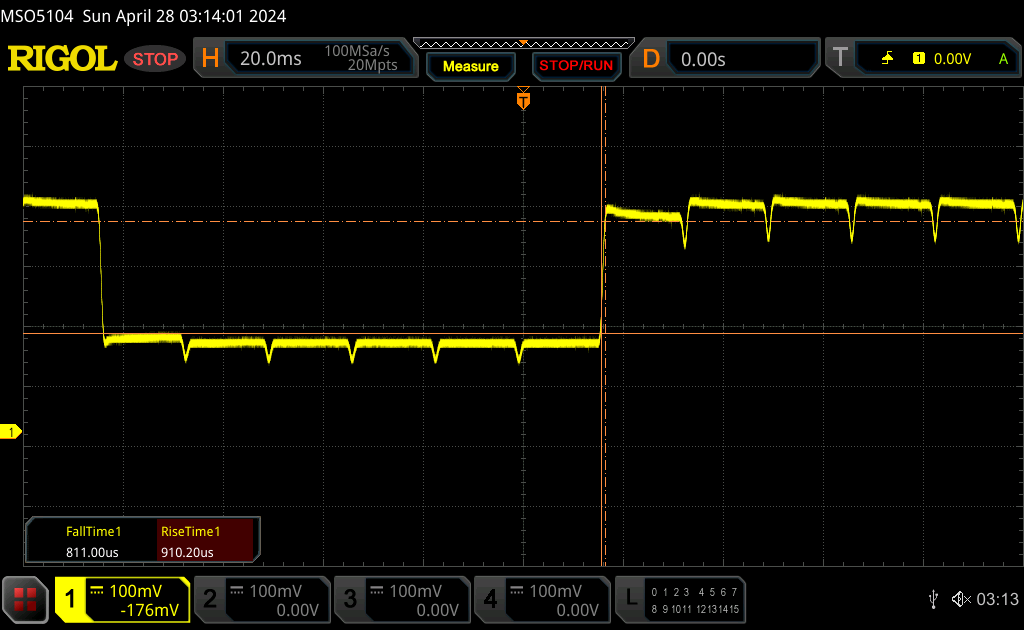 |
| ↘ 0.82 ms Calo | ||
| Lo schermo ha mostrato valori di risposta molto veloci nei nostri tests ed è molto adatto per i gaming veloce. In confronto, tutti i dispositivi di test variano da 0.2 (minimo) a 636 (massimo) ms. » 4 % di tutti i dispositivi è migliore. Questo significa che i tempi di risposta rilevati sono migliori rispettto alla media di tutti i dispositivi testati (33.7 ms). | ||
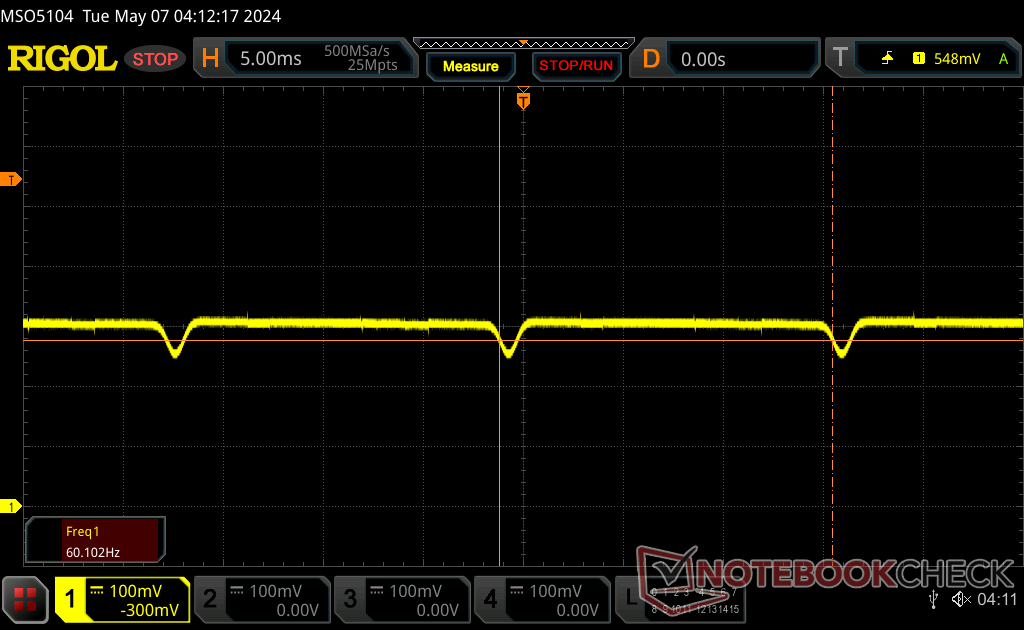
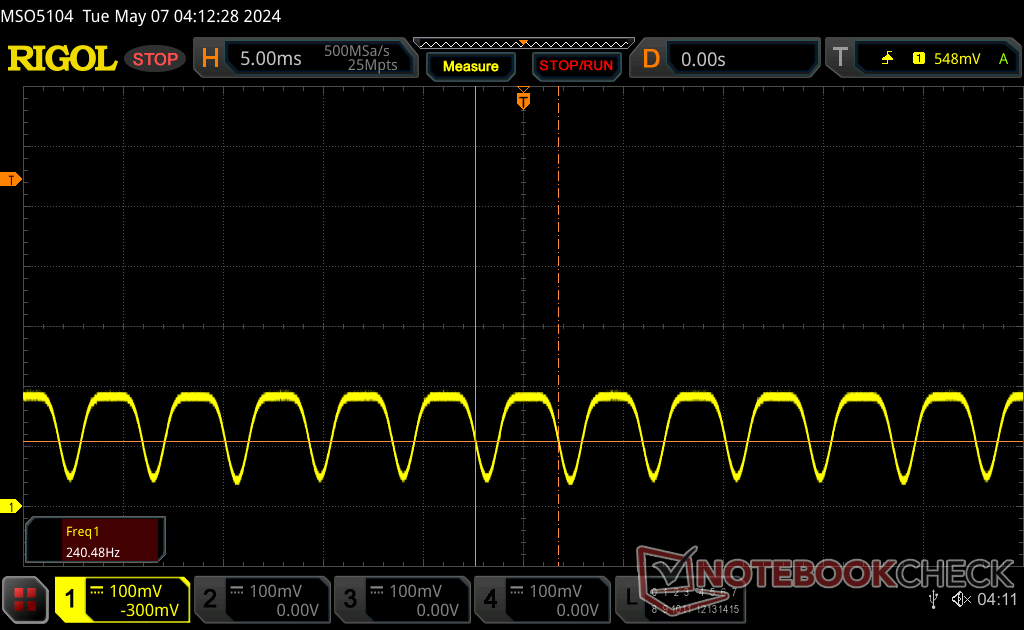
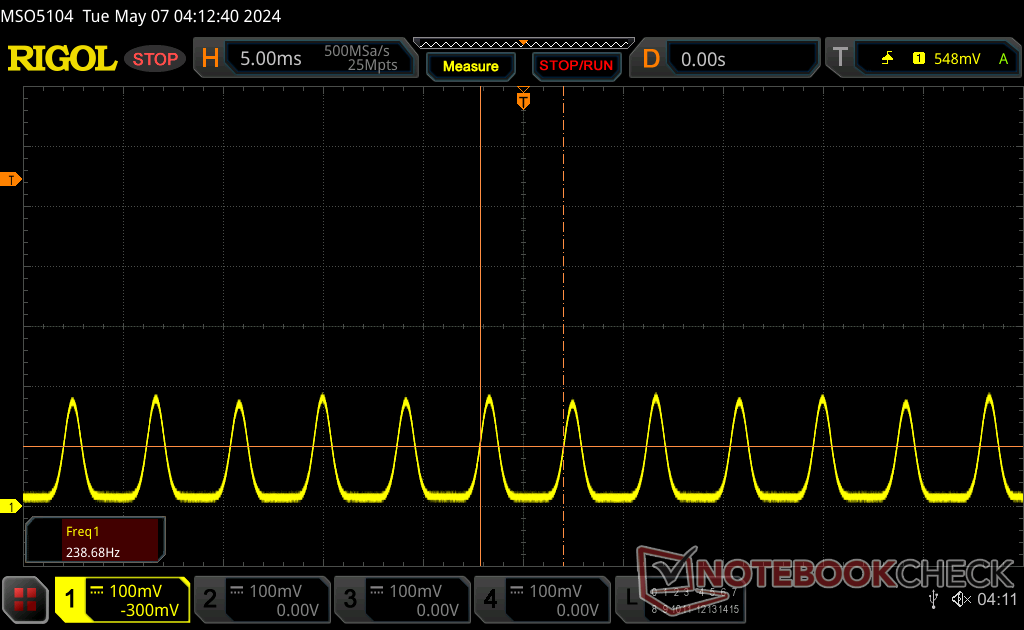
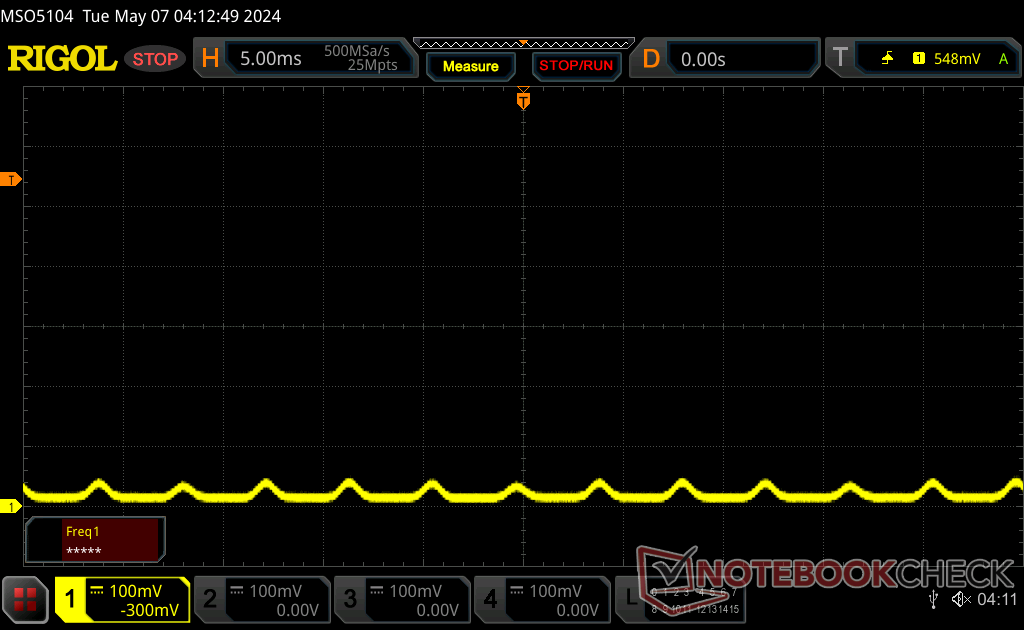
Sfarfallio dello schermo / PWM (Pulse-Width Modulation)
| flickering dello schermo / PWM rilevato | 60 Hz | ≤ 100 % settaggio luminosita' | 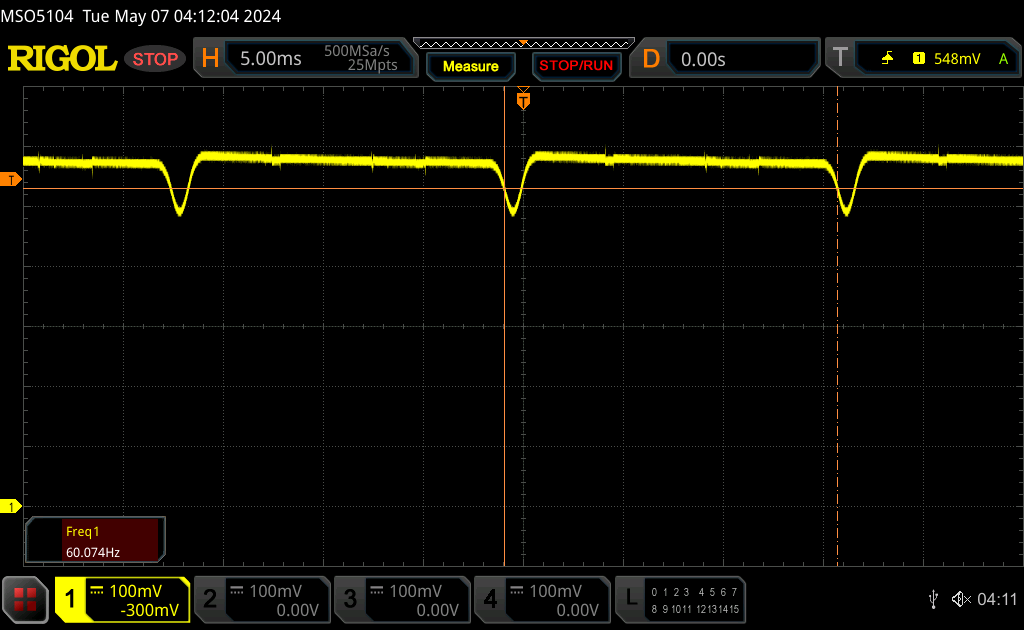 |
Il display sfarfalla a 60 Hz (Probabilmente a causa dell'uso di PWM) Flickering rilevato ad una luminosita' di 100 % o inferiore. Non dovrebbe verificarsi flickering o PWM sopra questo valore di luminosita'. La frequenza di 60 Hz è molto bassa, quindi il flickering potrebbe causare stanchezza agli occhi e mal di testa con un utilizzo prolungato. In confronto: 53 % di tutti i dispositivi testati non utilizza PWM per ridurre la luminosita' del display. Se è rilevato PWM, una media di 17803 (minimo: 5 - massimo: 3846000) Hz è stata rilevata. | |||

Prestazioni
Condizioni del test
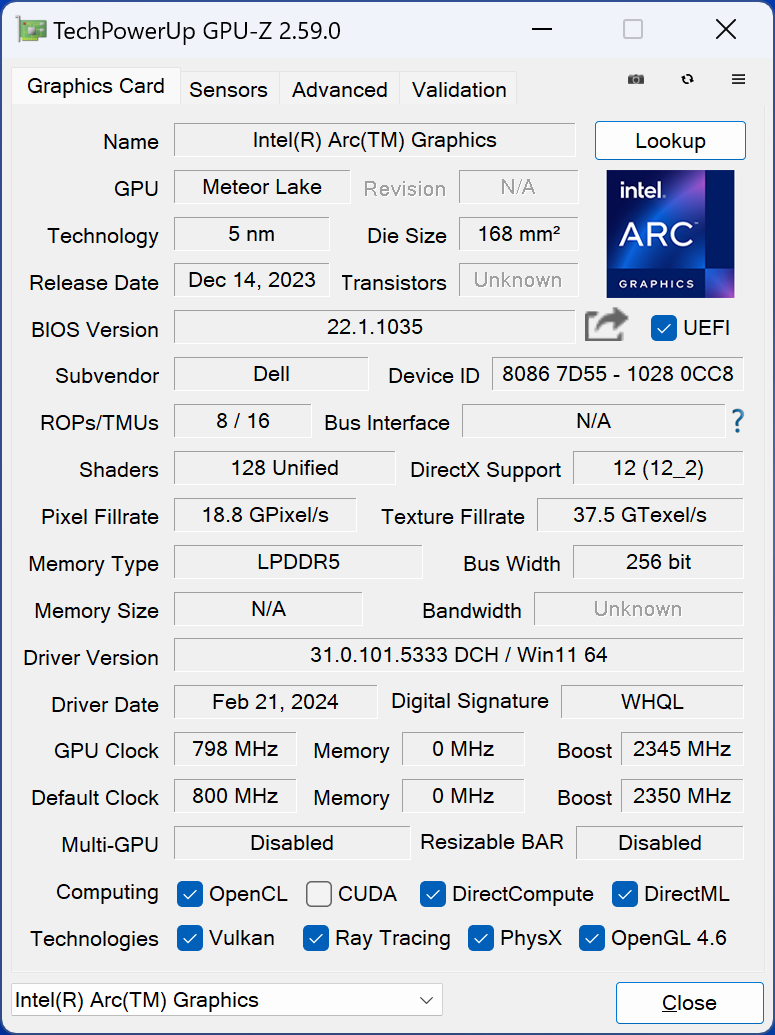
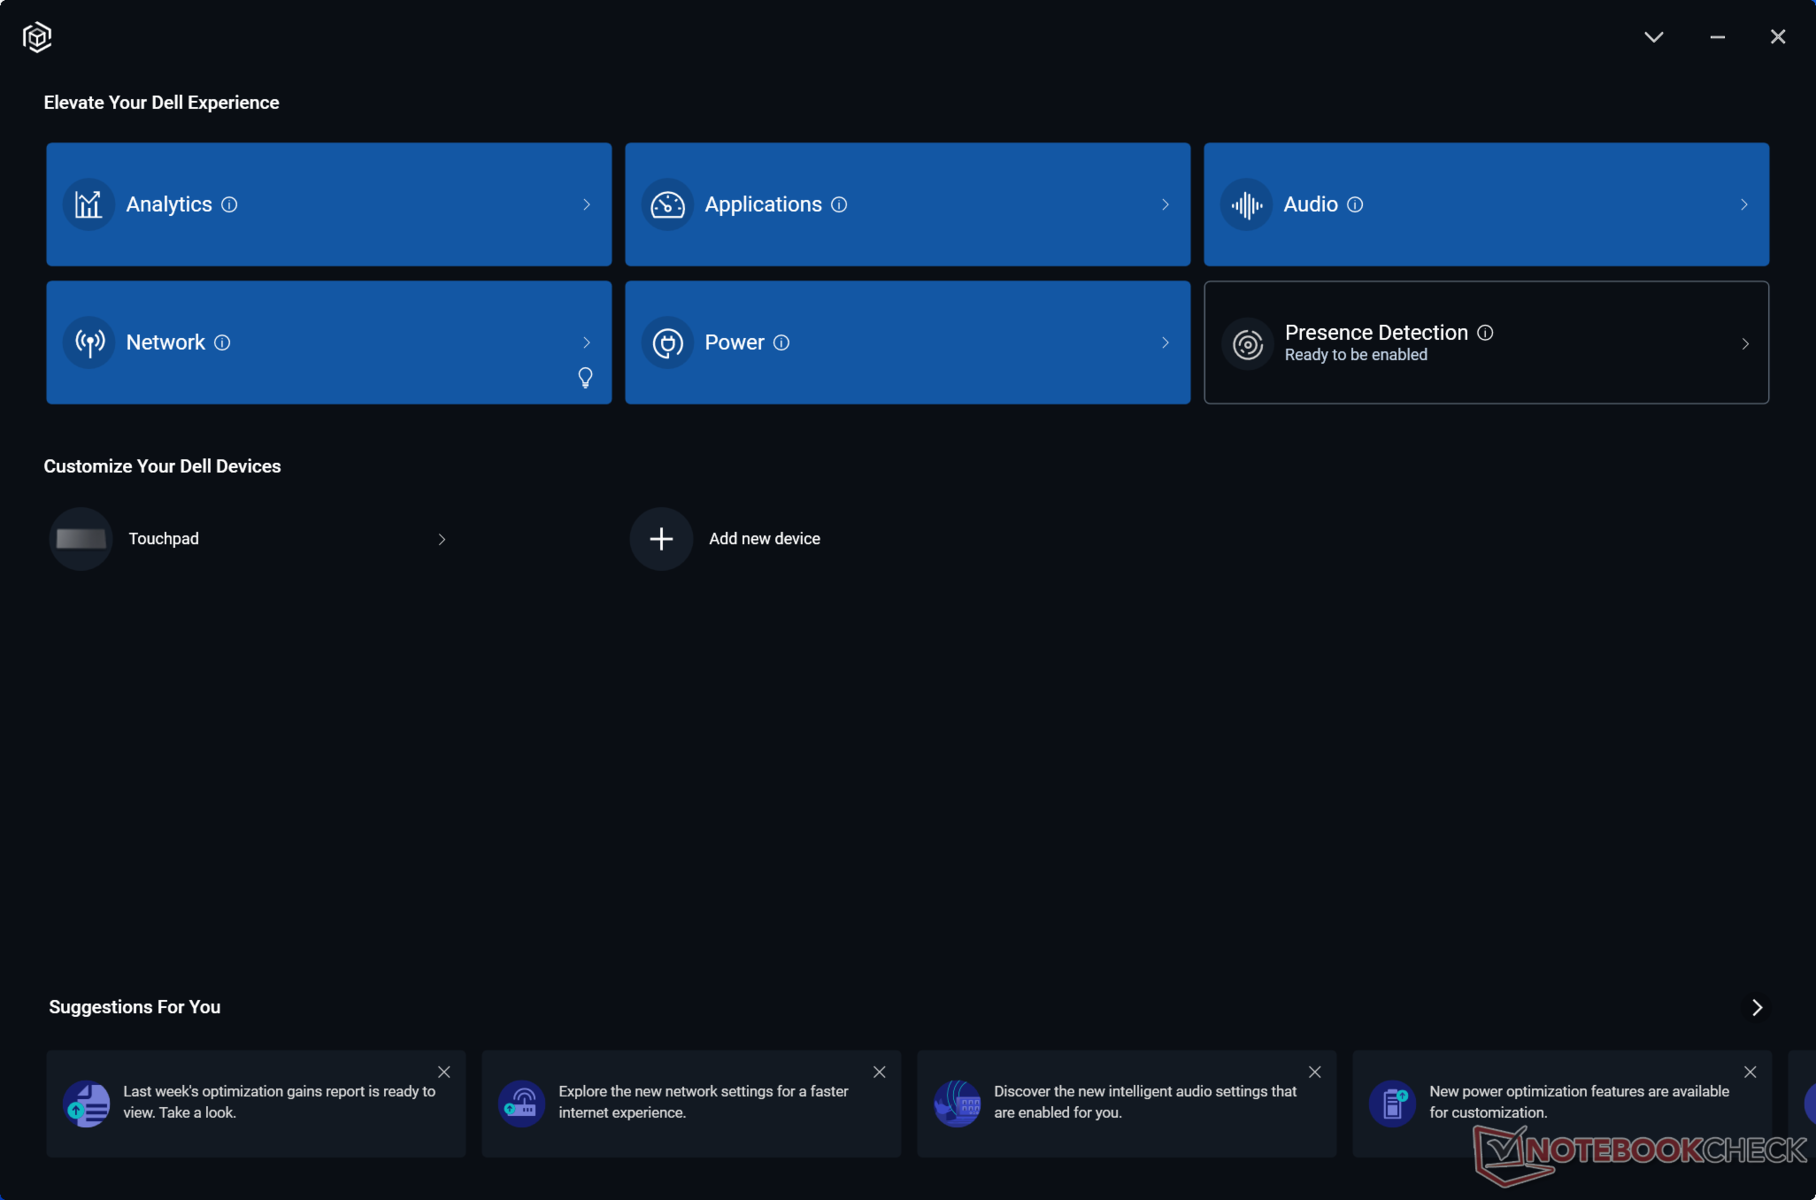
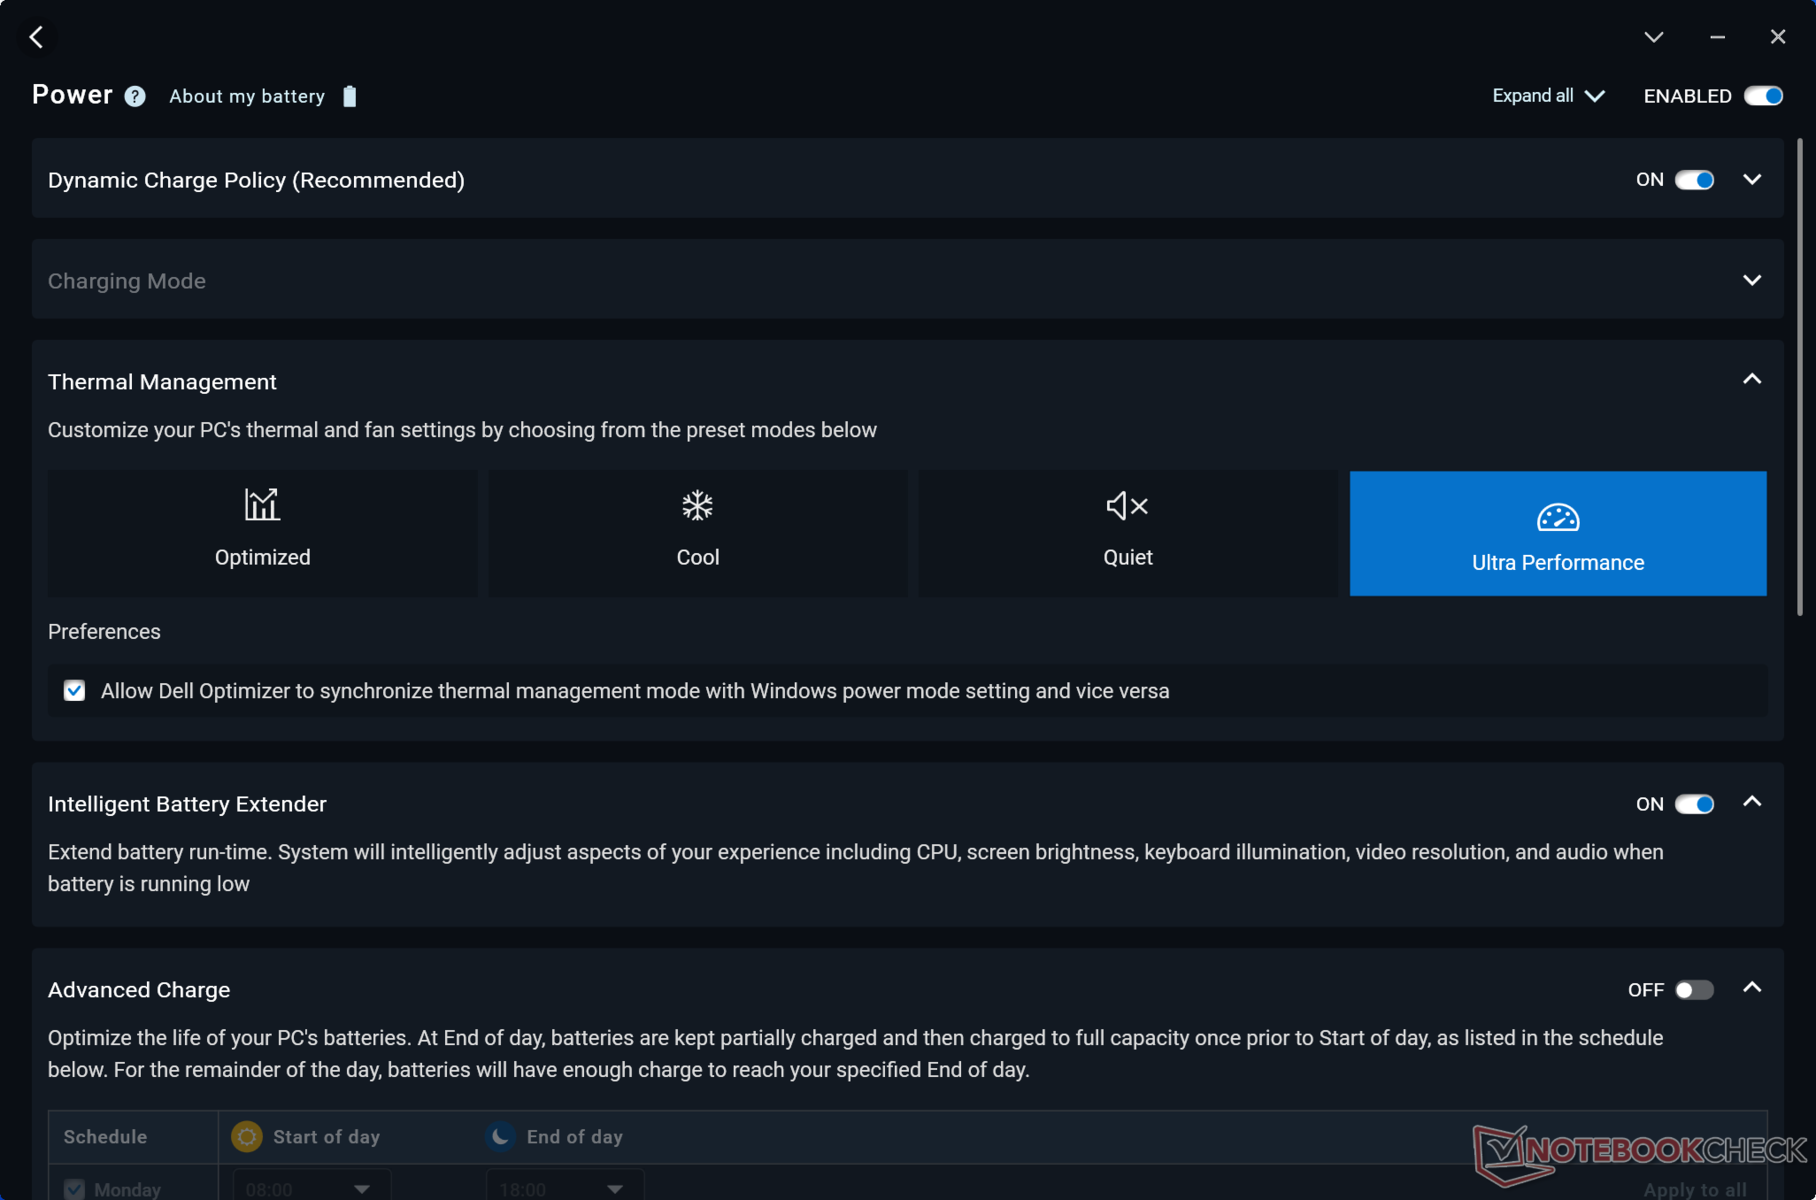
Abbiamo impostato Dell Optimizer sulla modalità Ultra Performance prima di eseguire i benchmark qui sotto. Abbiamo anche disattivato l'ECC VRAM tramite il Pannello di controllo Nvidia. L'attivazione della VRAM ECC riduce la memoria accessibile di circa 1 GB.

Processore
Il Core Ultra 9 185H ha prestazioni quasi identiche a quelle del Core i9-13900H sia nei carichi di lavoro a thread singolo che in quelli multi-thread. Beneficia maggiormente del Turbo Boost per l'esplosione iniziale di velocità, ma questo vantaggio è solo temporaneo prima di assestarsi su livelli di prestazioni simili a quelli del vecchio Core i9 Precision 5680, come mostra il grafico di confronto qui sotto.
Passando al Core Ultra 7 165H e Ultra 5 135H dovrebbe avere un impatto sulle prestazioni del processore rispettivamente del 5-10 percento e del 40-50 percento, il che significa che il delta delle prestazioni è significativamente più ampio tra il Core Ultra 5 e l'Ultra 7 rispetto al Core Ultra 7 e all'Ultra 9. Il modello Precision 5690 non include alcuna CPU Raptor Lake-HX di 14esima generazione, che avrebbe incrementato le prestazioni in modo ancora più rapido rispetto al Core Ultra 9 185H. In compenso, però, le CPU Core Ultra includono NPU integrate per accelerare le attività AI locali, quando saranno più facilmente disponibili nel prossimo futuro.
Cinebench R15 Multi Loop
Cinebench R23: Multi Core | Single Core
Cinebench R20: CPU (Multi Core) | CPU (Single Core)
Cinebench R15: CPU Multi 64Bit | CPU Single 64Bit
Blender: v2.79 BMW27 CPU
7-Zip 18.03: 7z b 4 | 7z b 4 -mmt1
Geekbench 6.2: Multi-Core | Single-Core
Geekbench 5.5: Multi-Core | Single-Core
HWBOT x265 Benchmark v2.2: 4k Preset
LibreOffice : 20 Documents To PDF
R Benchmark 2.5: Overall mean
| Geekbench 6.2 / Multi-Core | |
| HP ZBook Fury 16 G10 | |
| Dell Precision 5000 5680 | |
| Dell Precision 5690 | |
| Media Intel Core Ultra 9 185H (13351 - 14160, n=5) | |
| Dell XPS 16 9640 | |
| Lenovo ThinkPad P1 G6-21FV000DGE | |
| Lenovo ThinkPad P16s G2 21K9000CGE | |
| Samsung Galaxy Book4 Pro 360 | |
| Lenovo ThinkPad P16v G1 AMD | |
| Geekbench 6.2 / Single-Core | |
| HP ZBook Fury 16 G10 | |
| Lenovo ThinkPad P1 G6-21FV000DGE | |
| Dell Precision 5000 5680 | |
| Lenovo ThinkPad P16v G1 AMD | |
| Dell Precision 5690 | |
| Media Intel Core Ultra 9 185H (2384 - 2570, n=5) | |
| Lenovo ThinkPad P16s G2 21K9000CGE | |
| Dell XPS 16 9640 | |
| Samsung Galaxy Book4 Pro 360 | |
Cinebench R23: Multi Core | Single Core
Cinebench R20: CPU (Multi Core) | CPU (Single Core)
Cinebench R15: CPU Multi 64Bit | CPU Single 64Bit
Blender: v2.79 BMW27 CPU
7-Zip 18.03: 7z b 4 | 7z b 4 -mmt1
Geekbench 6.2: Multi-Core | Single-Core
Geekbench 5.5: Multi-Core | Single-Core
HWBOT x265 Benchmark v2.2: 4k Preset
LibreOffice : 20 Documents To PDF
R Benchmark 2.5: Overall mean
* ... Meglio usare valori piccoli
AIDA64: FP32 Ray-Trace | FPU Julia | CPU SHA3 | CPU Queen | FPU SinJulia | FPU Mandel | CPU AES | CPU ZLib | FP64 Ray-Trace | CPU PhotoWorxx
| Performance Rating | |
| HP ZBook Fury 16 G10 | |
| Dell Precision 5690 | |
| Lenovo ThinkPad P16 G2 21FA000FGE | |
| Media Intel Core Ultra 9 185H | |
| Dell Precision 5000 5680 | |
| MSI CreatorPro Z16P B12UKST | |
| Lenovo ThinkPad P1 G6-21FV000DGE | |
| AIDA64 / FP32 Ray-Trace | |
| HP ZBook Fury 16 G10 | |
| Dell Precision 5690 | |
| Lenovo ThinkPad P16 G2 21FA000FGE | |
| Lenovo ThinkPad P1 G6-21FV000DGE | |
| Dell Precision 5000 5680 | |
| Media Intel Core Ultra 9 185H (9220 - 18502, n=5) | |
| MSI CreatorPro Z16P B12UKST | |
| AIDA64 / FPU Julia | |
| HP ZBook Fury 16 G10 | |
| Dell Precision 5690 | |
| Lenovo ThinkPad P16 G2 21FA000FGE | |
| Lenovo ThinkPad P1 G6-21FV000DGE | |
| Media Intel Core Ultra 9 185H (48865 - 95213, n=5) | |
| Dell Precision 5000 5680 | |
| MSI CreatorPro Z16P B12UKST | |
| AIDA64 / CPU SHA3 | |
| HP ZBook Fury 16 G10 | |
| Dell Precision 5690 | |
| Lenovo ThinkPad P16 G2 21FA000FGE | |
| Media Intel Core Ultra 9 185H (2394 - 4382, n=5) | |
| Lenovo ThinkPad P1 G6-21FV000DGE | |
| MSI CreatorPro Z16P B12UKST | |
| Dell Precision 5000 5680 | |
| AIDA64 / CPU Queen | |
| HP ZBook Fury 16 G10 | |
| Dell Precision 5000 5680 | |
| Lenovo ThinkPad P1 G6-21FV000DGE | |
| Lenovo ThinkPad P16 G2 21FA000FGE | |
| MSI CreatorPro Z16P B12UKST | |
| Dell Precision 5690 | |
| Media Intel Core Ultra 9 185H (66785 - 94589, n=5) | |
| AIDA64 / FPU SinJulia | |
| HP ZBook Fury 16 G10 | |
| Lenovo ThinkPad P16 G2 21FA000FGE | |
| Dell Precision 5690 | |
| Lenovo ThinkPad P1 G6-21FV000DGE | |
| Media Intel Core Ultra 9 185H (7255 - 11392, n=5) | |
| Dell Precision 5000 5680 | |
| MSI CreatorPro Z16P B12UKST | |
| AIDA64 / FPU Mandel | |
| HP ZBook Fury 16 G10 | |
| Dell Precision 5690 | |
| Lenovo ThinkPad P16 G2 21FA000FGE | |
| Lenovo ThinkPad P1 G6-21FV000DGE | |
| Media Intel Core Ultra 9 185H (24004 - 47315, n=5) | |
| Dell Precision 5000 5680 | |
| MSI CreatorPro Z16P B12UKST | |
| AIDA64 / CPU AES | |
| MSI CreatorPro Z16P B12UKST | |
| HP ZBook Fury 16 G10 | |
| Media Intel Core Ultra 9 185H (53116 - 154066, n=5) | |
| Dell Precision 5690 | |
| Lenovo ThinkPad P16 G2 21FA000FGE | |
| Lenovo ThinkPad P1 G6-21FV000DGE | |
| Dell Precision 5000 5680 | |
| AIDA64 / CPU ZLib | |
| HP ZBook Fury 16 G10 | |
| Dell Precision 5690 | |
| Lenovo ThinkPad P16 G2 21FA000FGE | |
| Media Intel Core Ultra 9 185H (678 - 1341, n=5) | |
| Lenovo ThinkPad P1 G6-21FV000DGE | |
| MSI CreatorPro Z16P B12UKST | |
| Dell Precision 5000 5680 | |
| AIDA64 / FP64 Ray-Trace | |
| HP ZBook Fury 16 G10 | |
| Lenovo ThinkPad P16 G2 21FA000FGE | |
| Dell Precision 5690 | |
| Lenovo ThinkPad P1 G6-21FV000DGE | |
| Dell Precision 5000 5680 | |
| Media Intel Core Ultra 9 185H (4428 - 9768, n=5) | |
| MSI CreatorPro Z16P B12UKST | |
| AIDA64 / CPU PhotoWorxx | |
| Dell Precision 5690 | |
| Media Intel Core Ultra 9 185H (45560 - 53918, n=5) | |
| Dell Precision 5000 5680 | |
| MSI CreatorPro Z16P B12UKST | |
| HP ZBook Fury 16 G10 | |
| Lenovo ThinkPad P16 G2 21FA000FGE | |
| Lenovo ThinkPad P1 G6-21FV000DGE | |
Test da sforzo
Quando si avvia lo stress Prime95, la CPU sale a 3,7 GHz e 120 W, fino a raggiungere una temperatura del nucleo di 100 C pochi secondi dopo. Poi scendeva a 3 GHz e 73 W e rimaneva relativamente stabile per tutto il tempo. Sia la temperatura del core che l'assorbimento di potenza del pacchetto sarebbero leggermente superiori a quelli registrati su Precision 5680.
L'assorbimento di potenza della scheda GPU quando è in funzione Witcher 3 sarebbe stabile a 72 W, anche se la GPU è indicata come 90 W su Nvidia Control Center. I risultati sono simili a quelli registrati sul modello dello scorso anno.
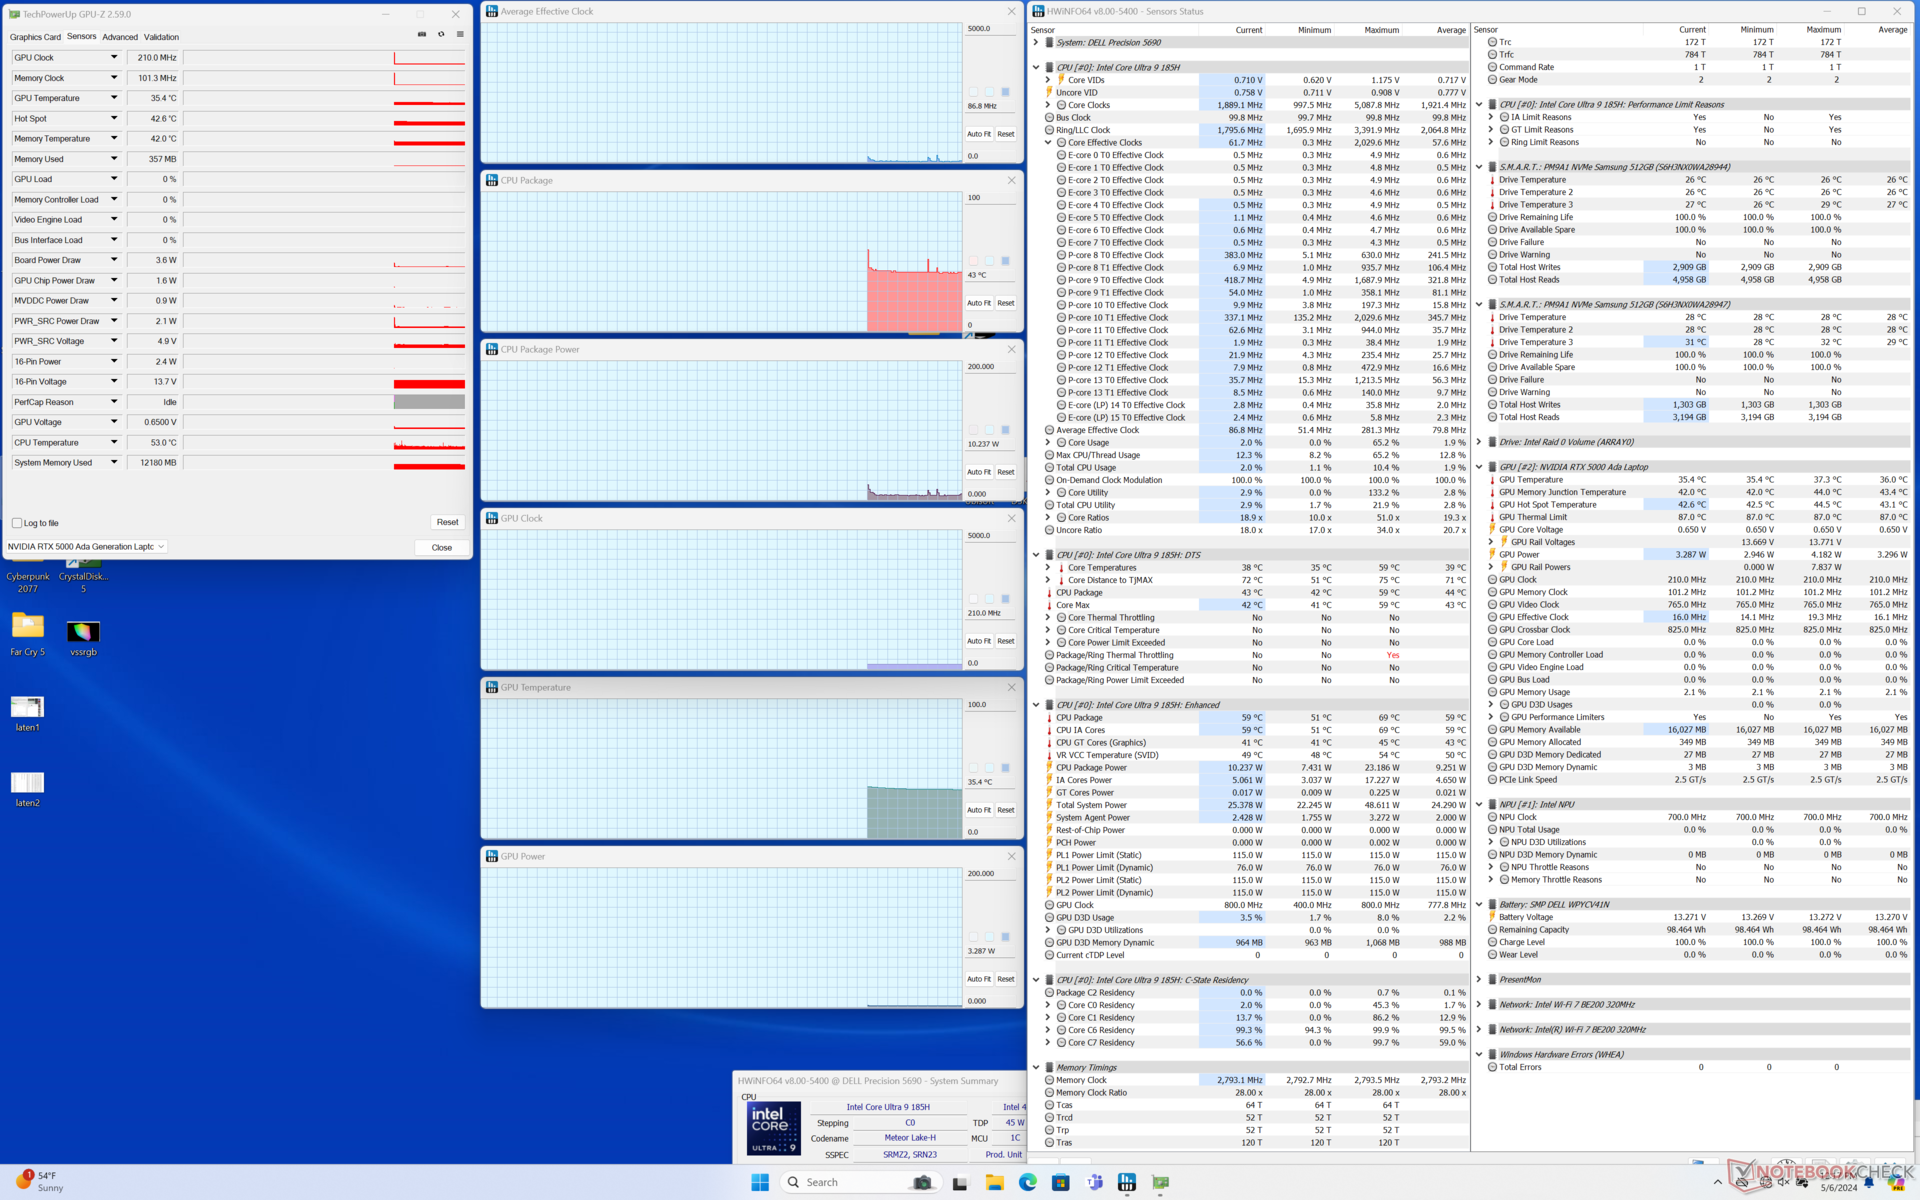
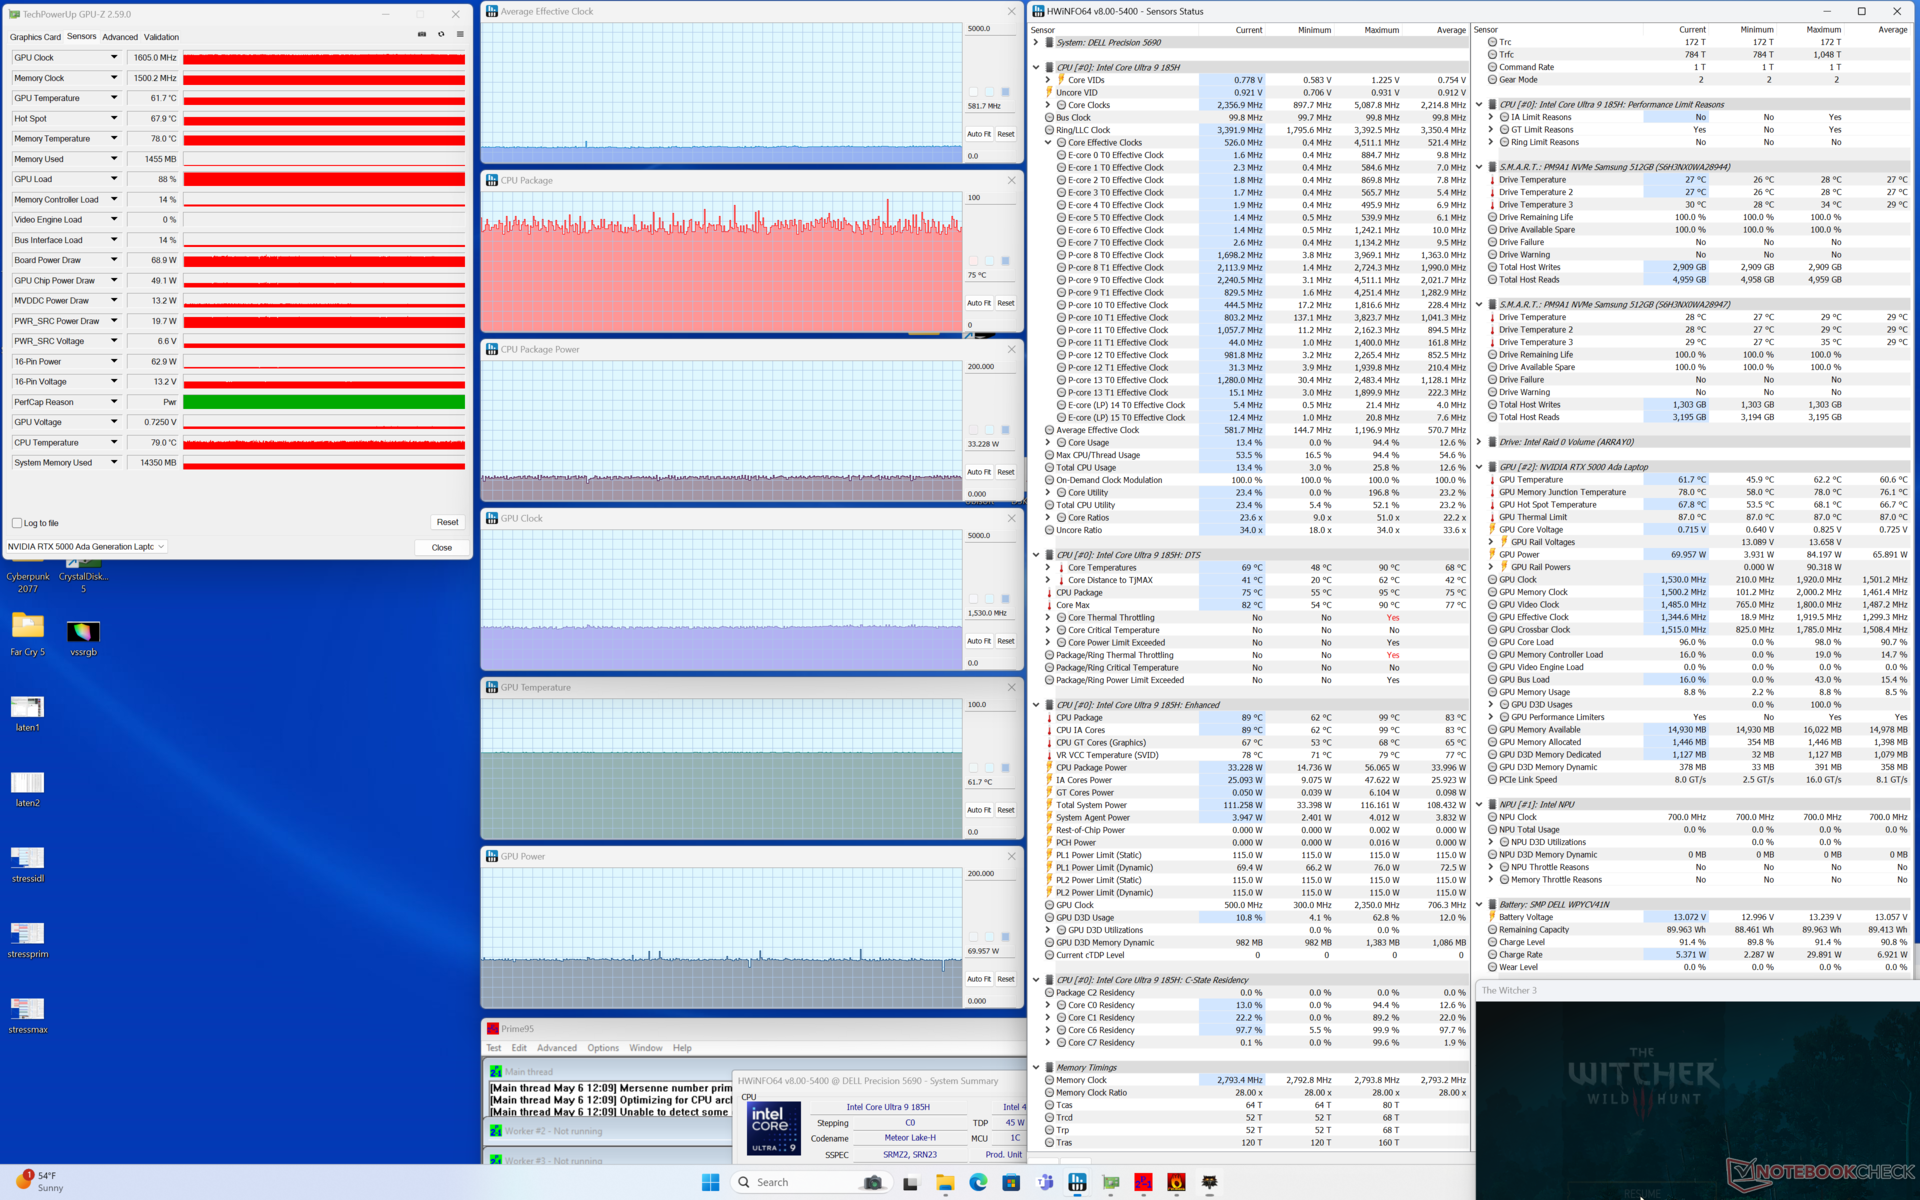
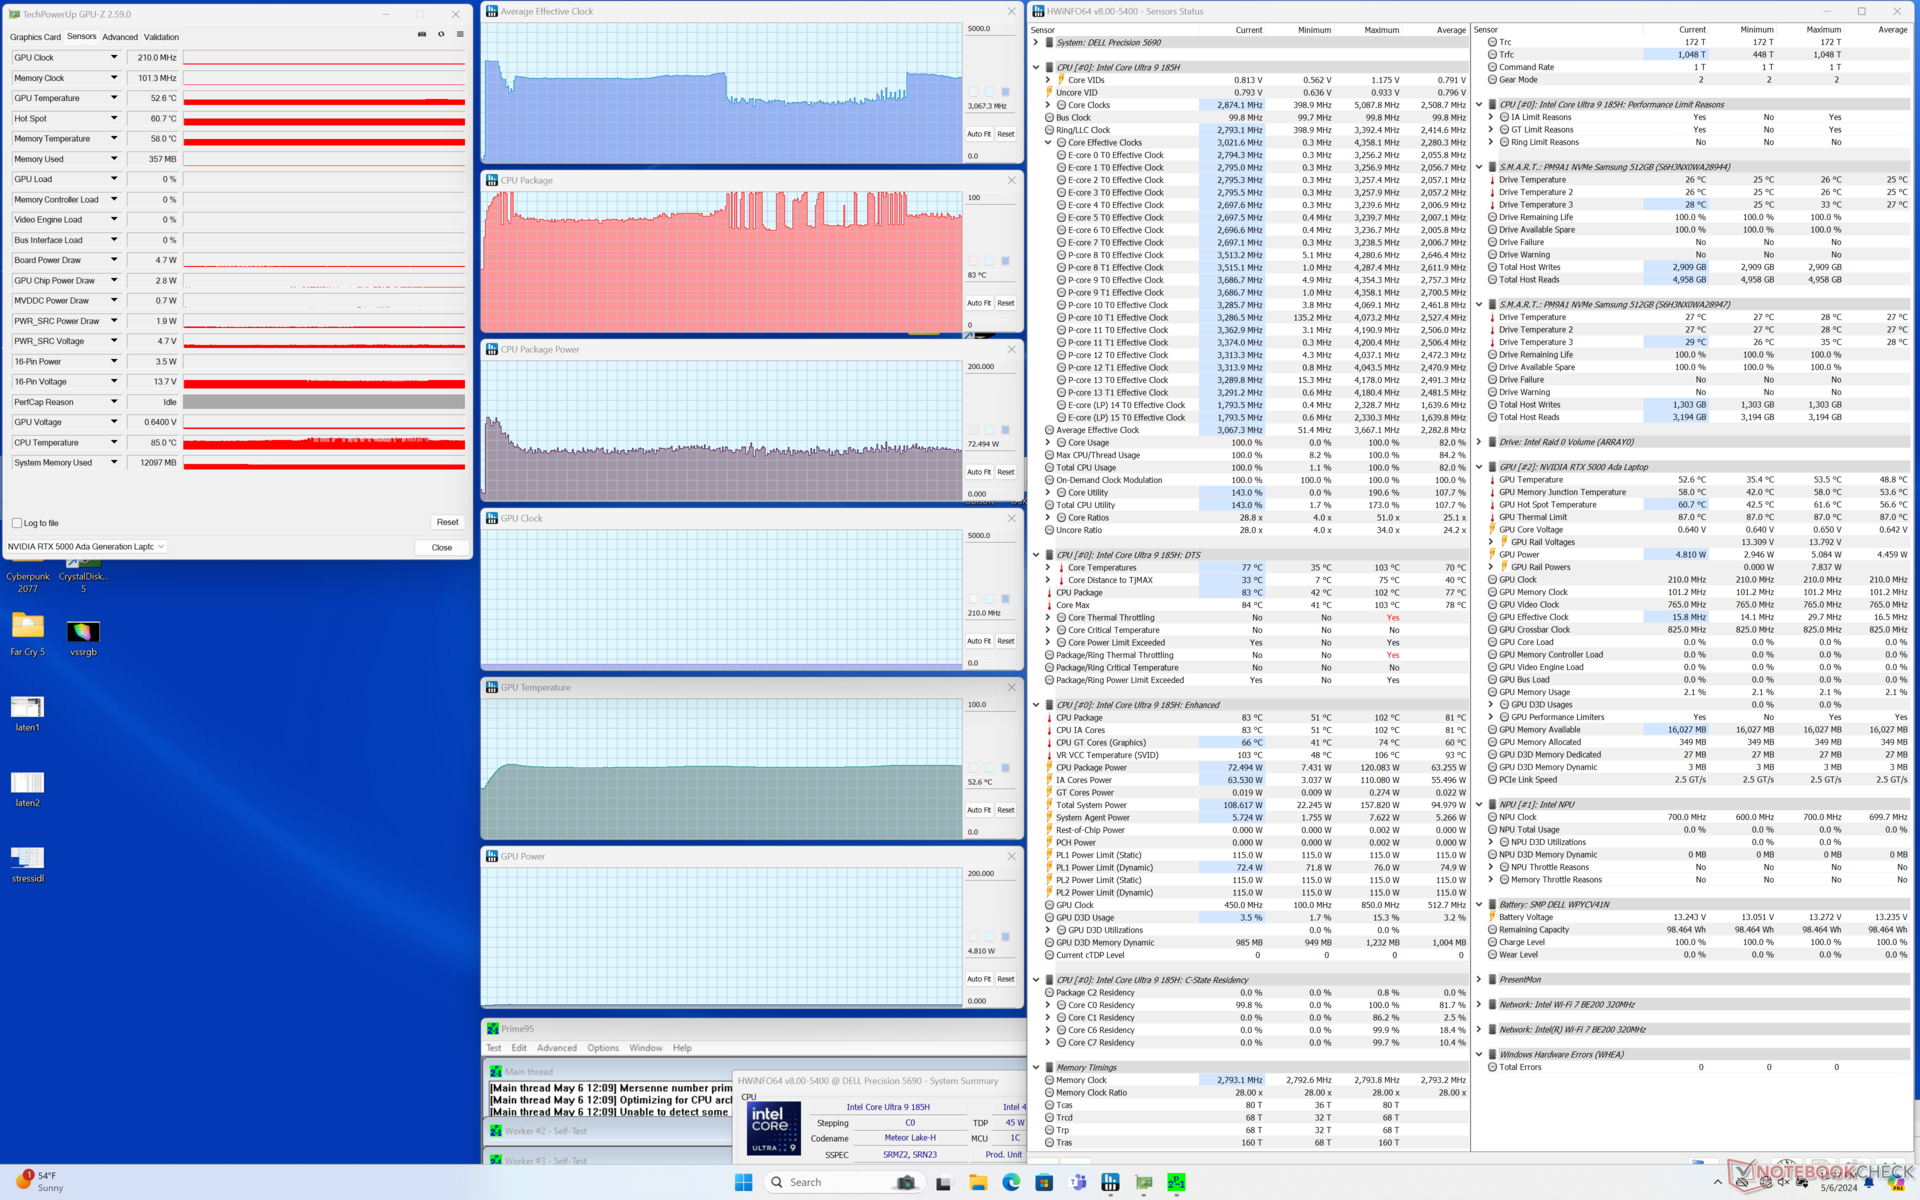
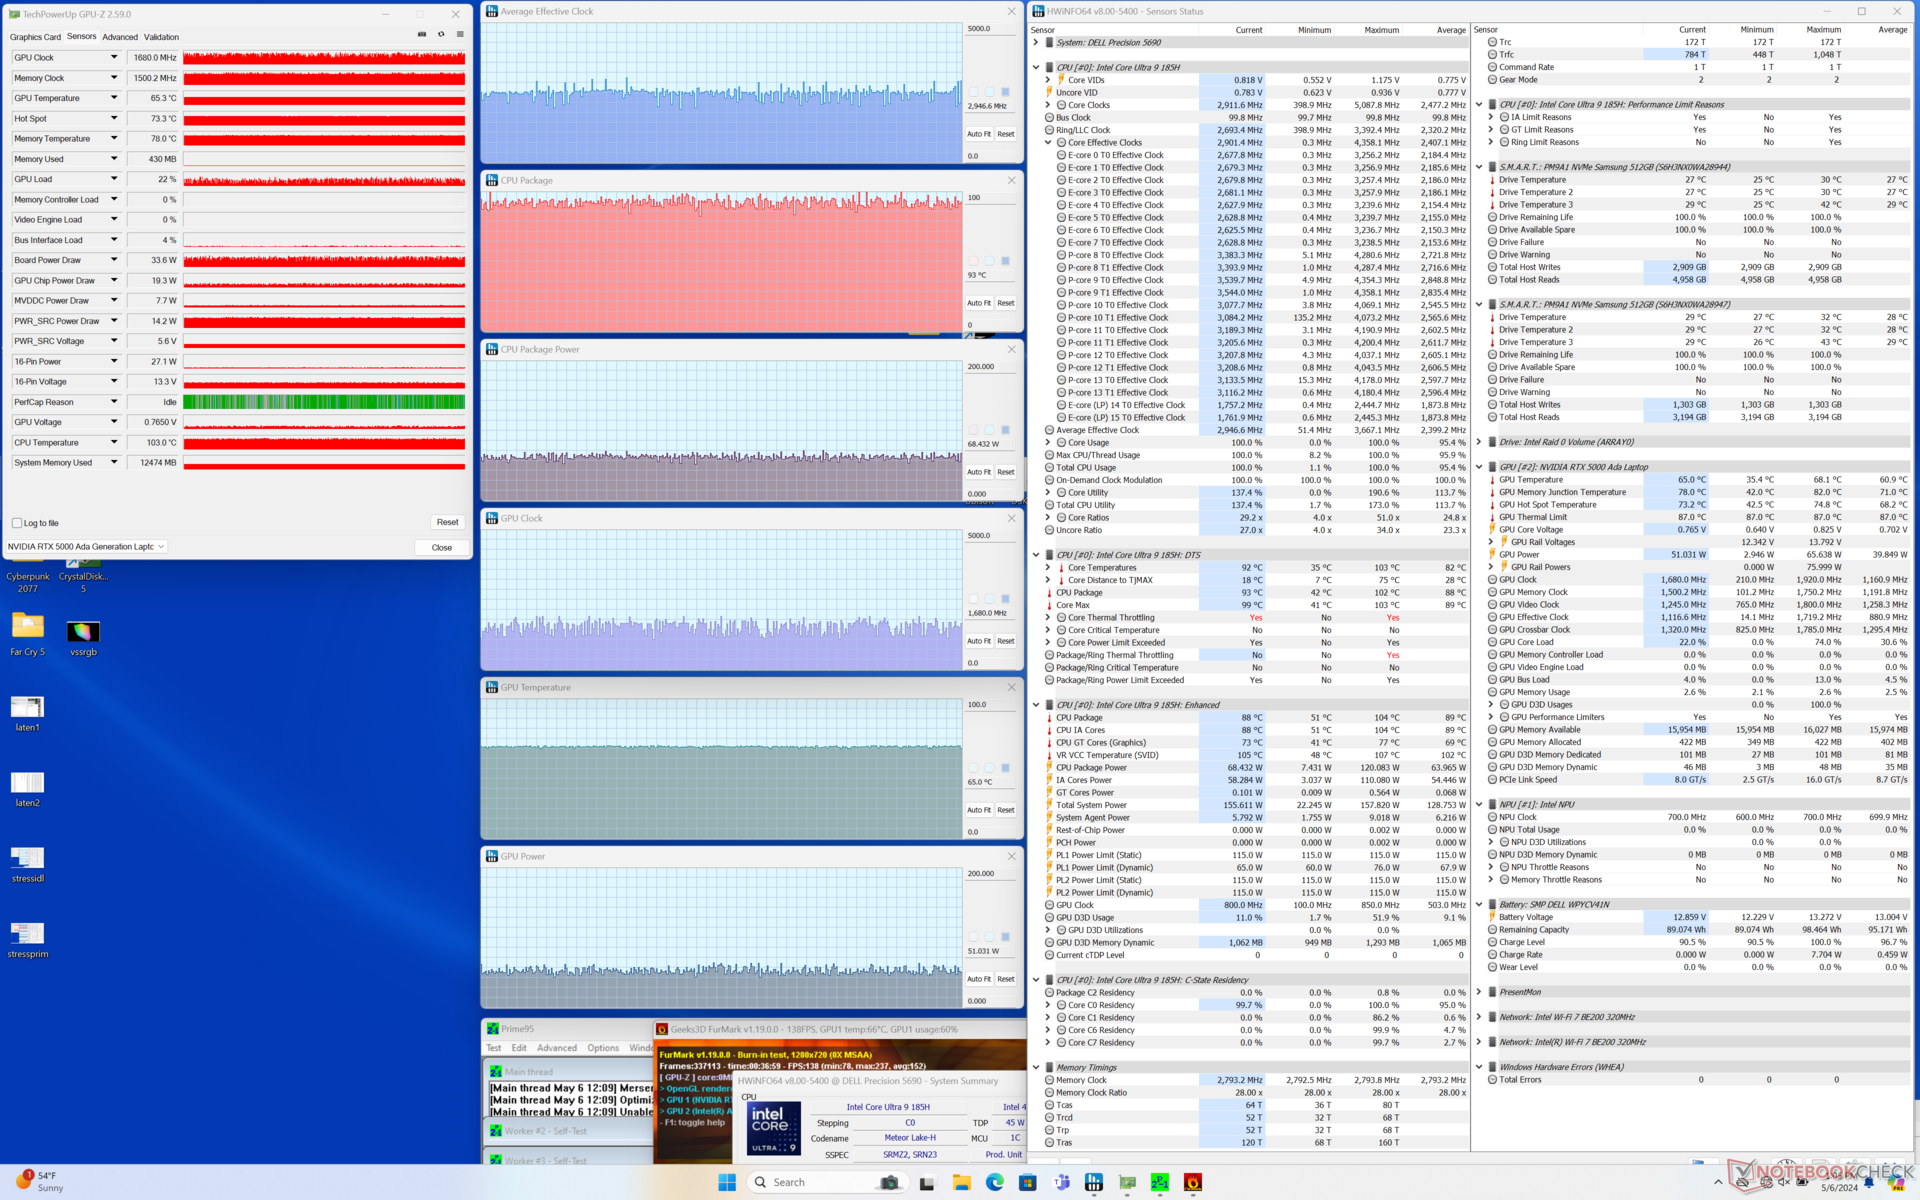
| Clock della CPU (GHz) | Clock della GPU (MHz) | Temperatura media della CPU (°C) | Temperatura media della GPU (°C) | |
| Sistema inattivo | -- | -- | 43 | 35 |
| Stress Prime95 | 3.0 | -- | 83 | 53 |
| Prime95 + FurMark Stress | ~3,0 | ~1680 | 93 | 65 |
| Witcher 3 Stress | ~0,6 | 1530 | 75 | 62 |
Prestazioni del sistema
I punteggi di PCMark 10 sono essenzialmente identici a quelli che abbiamo registrato su Precision 5680, il che suggerisce che non ci sono grandi differenze di prestazioni tra i due modelli per quanto riguarda i compiti tradizionali.
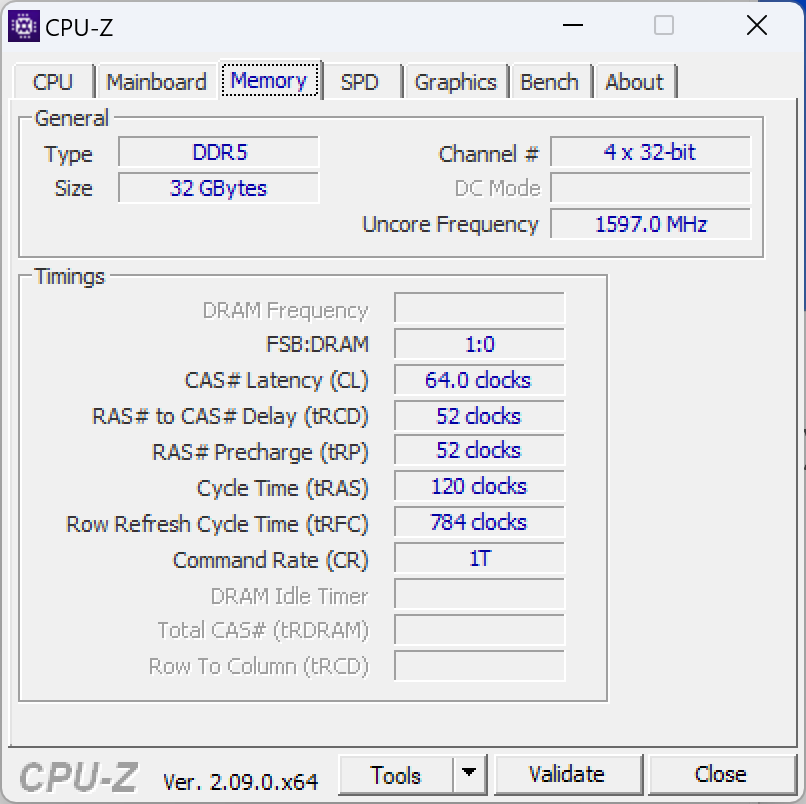
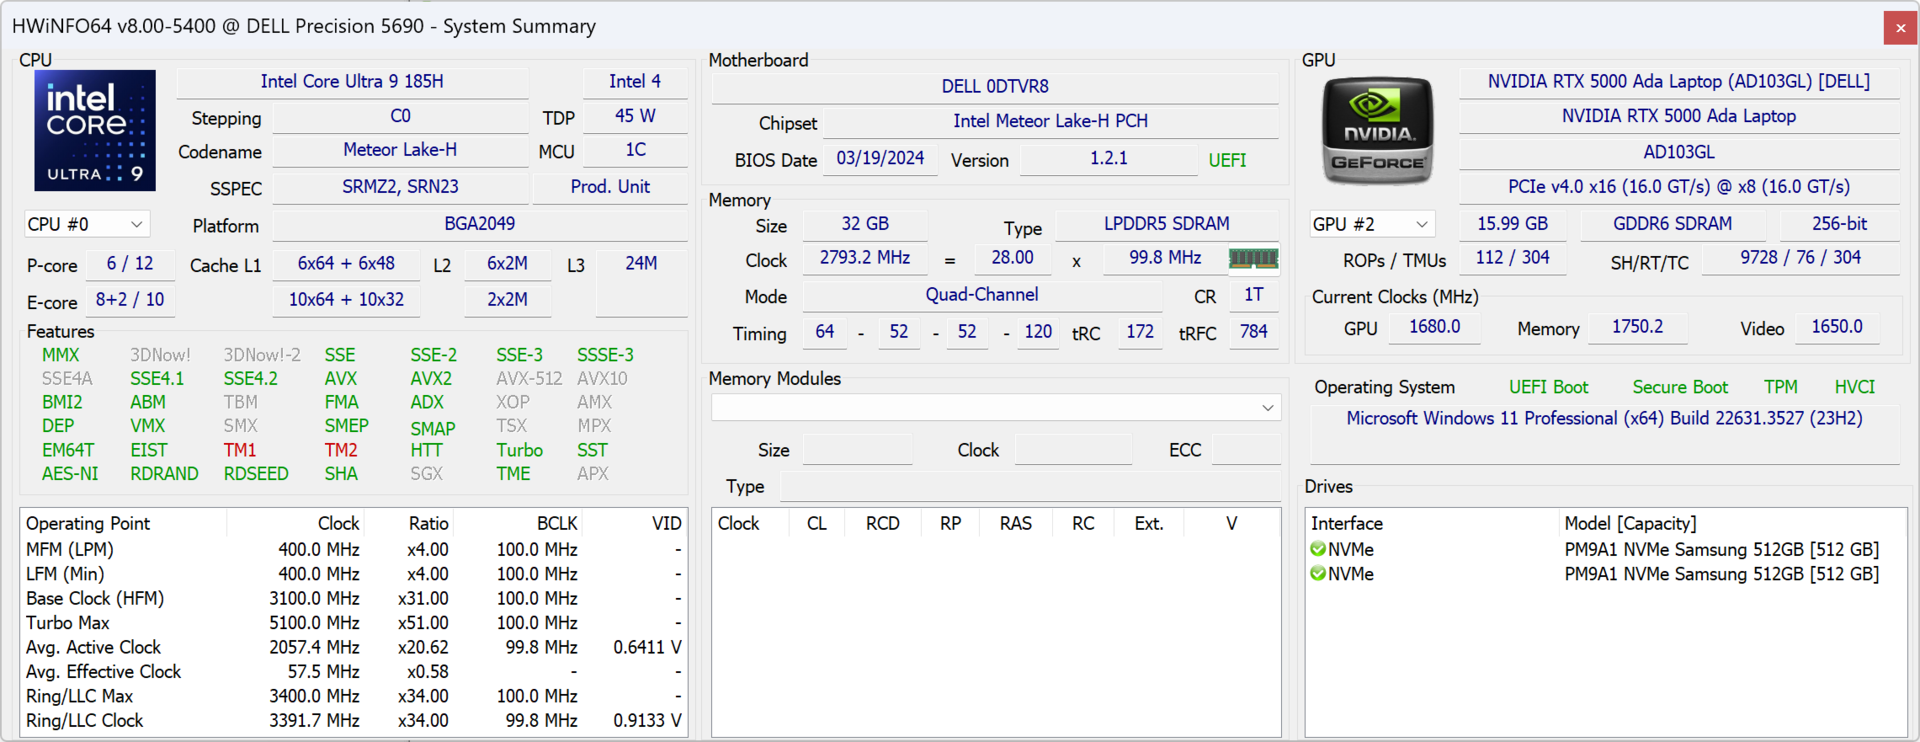
La RAM di sistema è leggermente più veloce quest'anno (7467 contro 6000 MT/s) e questo si riflette nei migliori risultati del benchmark AIDA64.

CrossMark: Overall | Productivity | Creativity | Responsiveness
WebXPRT 3: Overall
WebXPRT 4: Overall
Mozilla Kraken 1.1: Total
| PCMark 10 / Score | |
| Dell Precision 5000 5680 | |
| HP ZBook Fury 16 G10 | |
| Dell Precision 5690 | |
| Media Intel Core Ultra 9 185H, NVIDIA RTX 5000 Ada Generation Laptop GPU () | |
| Lenovo ThinkPad P1 G6-21FV000DGE | |
| Lenovo ThinkPad P16 G2 21FA000FGE | |
| MSI CreatorPro Z16P B12UKST | |
| PCMark 10 / Essentials | |
| Dell Precision 5000 5680 | |
| Lenovo ThinkPad P1 G6-21FV000DGE | |
| HP ZBook Fury 16 G10 | |
| Dell Precision 5690 | |
| Media Intel Core Ultra 9 185H, NVIDIA RTX 5000 Ada Generation Laptop GPU () | |
| Lenovo ThinkPad P16 G2 21FA000FGE | |
| MSI CreatorPro Z16P B12UKST | |
| PCMark 10 / Productivity | |
| Dell Precision 5000 5680 | |
| Dell Precision 5690 | |
| Media Intel Core Ultra 9 185H, NVIDIA RTX 5000 Ada Generation Laptop GPU () | |
| Lenovo ThinkPad P1 G6-21FV000DGE | |
| Lenovo ThinkPad P16 G2 21FA000FGE | |
| MSI CreatorPro Z16P B12UKST | |
| HP ZBook Fury 16 G10 | |
| PCMark 10 / Digital Content Creation | |
| HP ZBook Fury 16 G10 | |
| Dell Precision 5000 5680 | |
| Dell Precision 5690 | |
| Media Intel Core Ultra 9 185H, NVIDIA RTX 5000 Ada Generation Laptop GPU () | |
| Lenovo ThinkPad P1 G6-21FV000DGE | |
| MSI CreatorPro Z16P B12UKST | |
| Lenovo ThinkPad P16 G2 21FA000FGE | |
| CrossMark / Overall | |
| MSI CreatorPro Z16P B12UKST | |
| Dell Precision 5000 5680 | |
| HP ZBook Fury 16 G10 | |
| Lenovo ThinkPad P1 G6-21FV000DGE | |
| Lenovo ThinkPad P16 G2 21FA000FGE | |
| Dell Precision 5690 | |
| Media Intel Core Ultra 9 185H, NVIDIA RTX 5000 Ada Generation Laptop GPU () | |
| CrossMark / Productivity | |
| HP ZBook Fury 16 G10 | |
| MSI CreatorPro Z16P B12UKST | |
| Dell Precision 5000 5680 | |
| Lenovo ThinkPad P1 G6-21FV000DGE | |
| Dell Precision 5690 | |
| Media Intel Core Ultra 9 185H, NVIDIA RTX 5000 Ada Generation Laptop GPU () | |
| Lenovo ThinkPad P16 G2 21FA000FGE | |
| CrossMark / Creativity | |
| Dell Precision 5000 5680 | |
| Lenovo ThinkPad P16 G2 21FA000FGE | |
| HP ZBook Fury 16 G10 | |
| MSI CreatorPro Z16P B12UKST | |
| Lenovo ThinkPad P1 G6-21FV000DGE | |
| Dell Precision 5690 | |
| Media Intel Core Ultra 9 185H, NVIDIA RTX 5000 Ada Generation Laptop GPU () | |
| CrossMark / Responsiveness | |
| MSI CreatorPro Z16P B12UKST | |
| HP ZBook Fury 16 G10 | |
| Lenovo ThinkPad P1 G6-21FV000DGE | |
| Dell Precision 5000 5680 | |
| Dell Precision 5690 | |
| Media Intel Core Ultra 9 185H, NVIDIA RTX 5000 Ada Generation Laptop GPU () | |
| Lenovo ThinkPad P16 G2 21FA000FGE | |
| WebXPRT 3 / Overall | |
| Dell Precision 5000 5680 | |
| HP ZBook Fury 16 G10 | |
| Lenovo ThinkPad P16 G2 21FA000FGE | |
| Lenovo ThinkPad P1 G6-21FV000DGE | |
| MSI CreatorPro Z16P B12UKST | |
| Dell Precision 5690 | |
| Media Intel Core Ultra 9 185H, NVIDIA RTX 5000 Ada Generation Laptop GPU () | |
| WebXPRT 4 / Overall | |
| Lenovo ThinkPad P1 G6-21FV000DGE | |
| HP ZBook Fury 16 G10 | |
| Dell Precision 5000 5680 | |
| Dell Precision 5690 | |
| Media Intel Core Ultra 9 185H, NVIDIA RTX 5000 Ada Generation Laptop GPU () | |
| MSI CreatorPro Z16P B12UKST | |
| Mozilla Kraken 1.1 / Total | |
| MSI CreatorPro Z16P B12UKST | |
| Dell Precision 5690 | |
| Media Intel Core Ultra 9 185H, NVIDIA RTX 5000 Ada Generation Laptop GPU () | |
| Lenovo ThinkPad P16 G2 21FA000FGE | |
| Dell Precision 5000 5680 | |
| Lenovo ThinkPad P1 G6-21FV000DGE | |
| HP ZBook Fury 16 G10 | |
* ... Meglio usare valori piccoli
| PCMark 10 Score | 8065 punti | |
Aiuto | ||
| AIDA64 / Memory Copy | |
| Dell Precision 5690 | |
| Media Intel Core Ultra 9 185H (71990 - 95718, n=5) | |
| Dell Precision 5000 5680 | |
| MSI CreatorPro Z16P B12UKST | |
| HP ZBook Fury 16 G10 | |
| Lenovo ThinkPad P16 G2 21FA000FGE | |
| Lenovo ThinkPad P1 G6-21FV000DGE | |
| AIDA64 / Memory Read | |
| Dell Precision 5690 | |
| Media Intel Core Ultra 9 185H (75449 - 87768, n=5) | |
| Dell Precision 5000 5680 | |
| MSI CreatorPro Z16P B12UKST | |
| HP ZBook Fury 16 G10 | |
| Lenovo ThinkPad P16 G2 21FA000FGE | |
| Lenovo ThinkPad P1 G6-21FV000DGE | |
| AIDA64 / Memory Write | |
| Dell Precision 5000 5680 | |
| Media Intel Core Ultra 9 185H (70596 - 93871, n=5) | |
| Dell Precision 5690 | |
| MSI CreatorPro Z16P B12UKST | |
| HP ZBook Fury 16 G10 | |
| Lenovo ThinkPad P16 G2 21FA000FGE | |
| Lenovo ThinkPad P1 G6-21FV000DGE | |
| AIDA64 / Memory Latency | |
| Dell Precision 5690 | |
| Media Intel Core Ultra 9 185H (129.6 - 146.1, n=5) | |
| HP ZBook Fury 16 G10 | |
| Lenovo ThinkPad P16 G2 21FA000FGE | |
| MSI CreatorPro Z16P B12UKST | |
| Dell Precision 5000 5680 | |
| Lenovo ThinkPad P1 G6-21FV000DGE | |
* ... Meglio usare valori piccoli
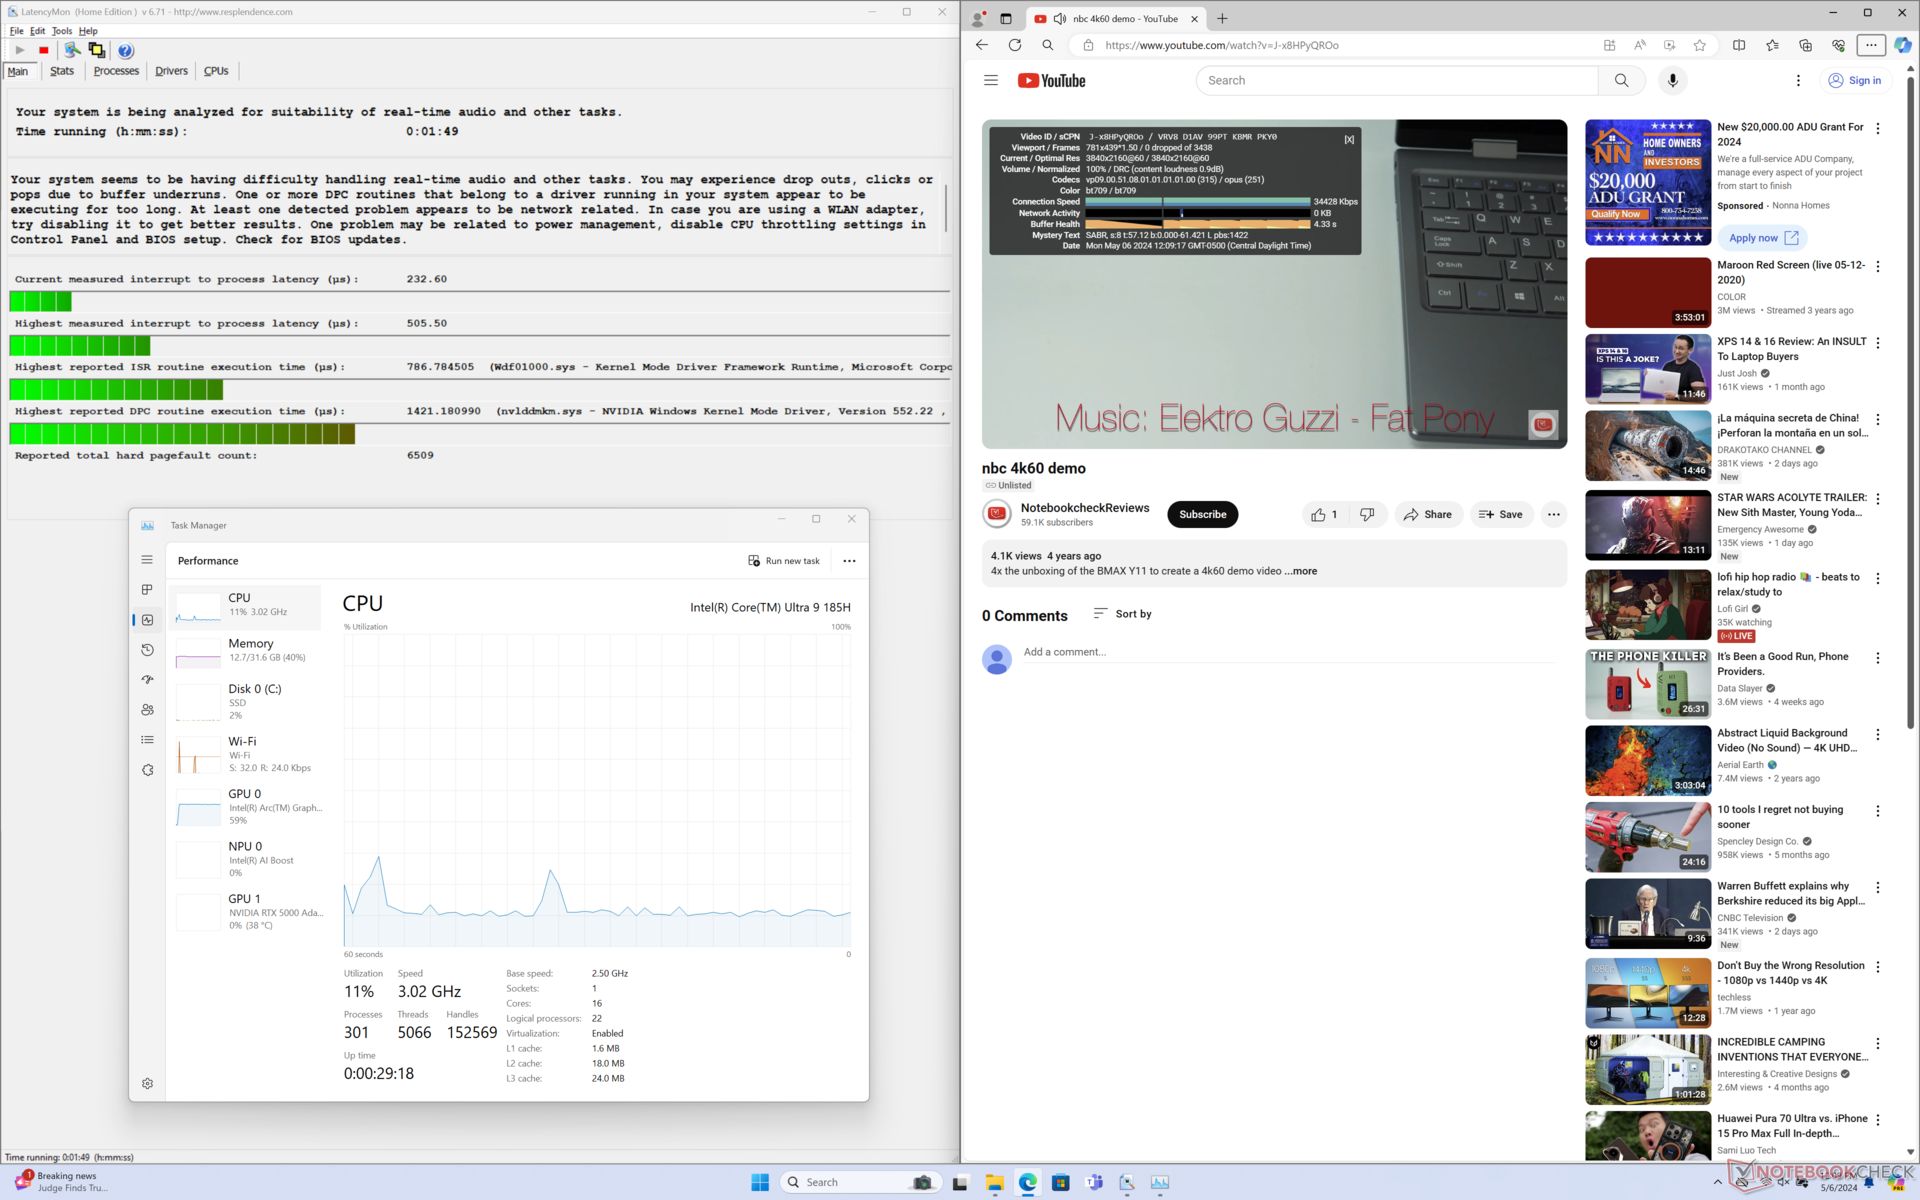
Latenza DPC
LatencyMon rivela solo lievi problemi di DPC quando si aprono più schede del browser della nostra homepage. la riproduzione di video 4K a 60 FPS è perfetta, senza alcuna perdita di fotogrammi.

| DPC Latencies / LatencyMon - interrupt to process latency (max), Web, Youtube, Prime95 | |
| HP ZBook Fury 16 G10 | |
| Lenovo ThinkPad P1 G6-21FV000DGE | |
| Dell Precision 5000 5680 | |
| Lenovo ThinkPad P16 G2 21FA000FGE | |
| MSI CreatorPro Z16P B12UKST | |
| Dell Precision 5690 | |
* ... Meglio usare valori piccoli
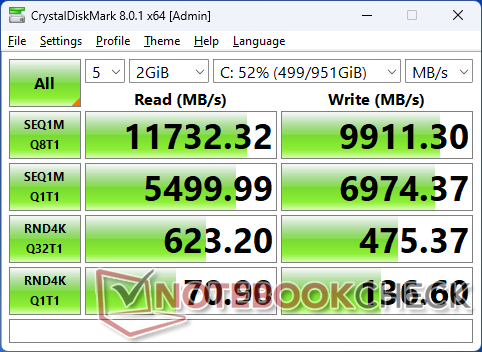
Dispositivi di archiviazione
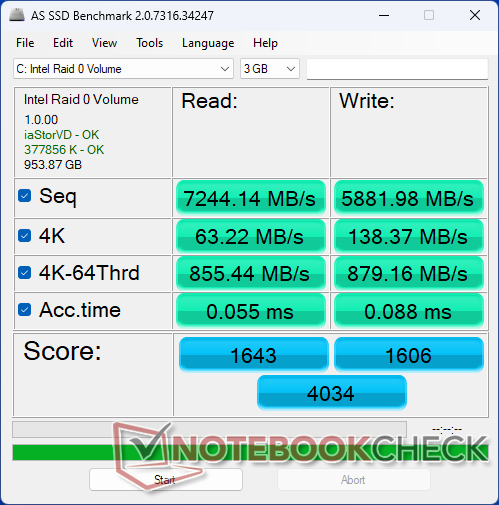
La nostra unità di prova è dotata di due Samsung PM9A1 PCIe4 x4 NVMe in configurazione RAID 0 per velocità di lettura e scrittura superiori a 12000 MB/s e 9000 MB/s, rispettivamente. Le prestazioni sono costanti, senza alcun throttling registrato durante l'esecuzione di DiskSpd in loop.

| Drive Performance Rating - Percent | |
| MSI CreatorPro Z16P B12UKST -8! | |
| Lenovo ThinkPad P1 G6-21FV000DGE | |
| Dell Precision 5690 | |
| HP ZBook Fury 16 G10 -11! | |
| Dell Precision 5000 5680 | |
| Lenovo ThinkPad P16 G2 21FA000FGE | |
* ... Meglio usare valori piccoli
Disk Throttling: DiskSpd Read Loop, Queue Depth 8
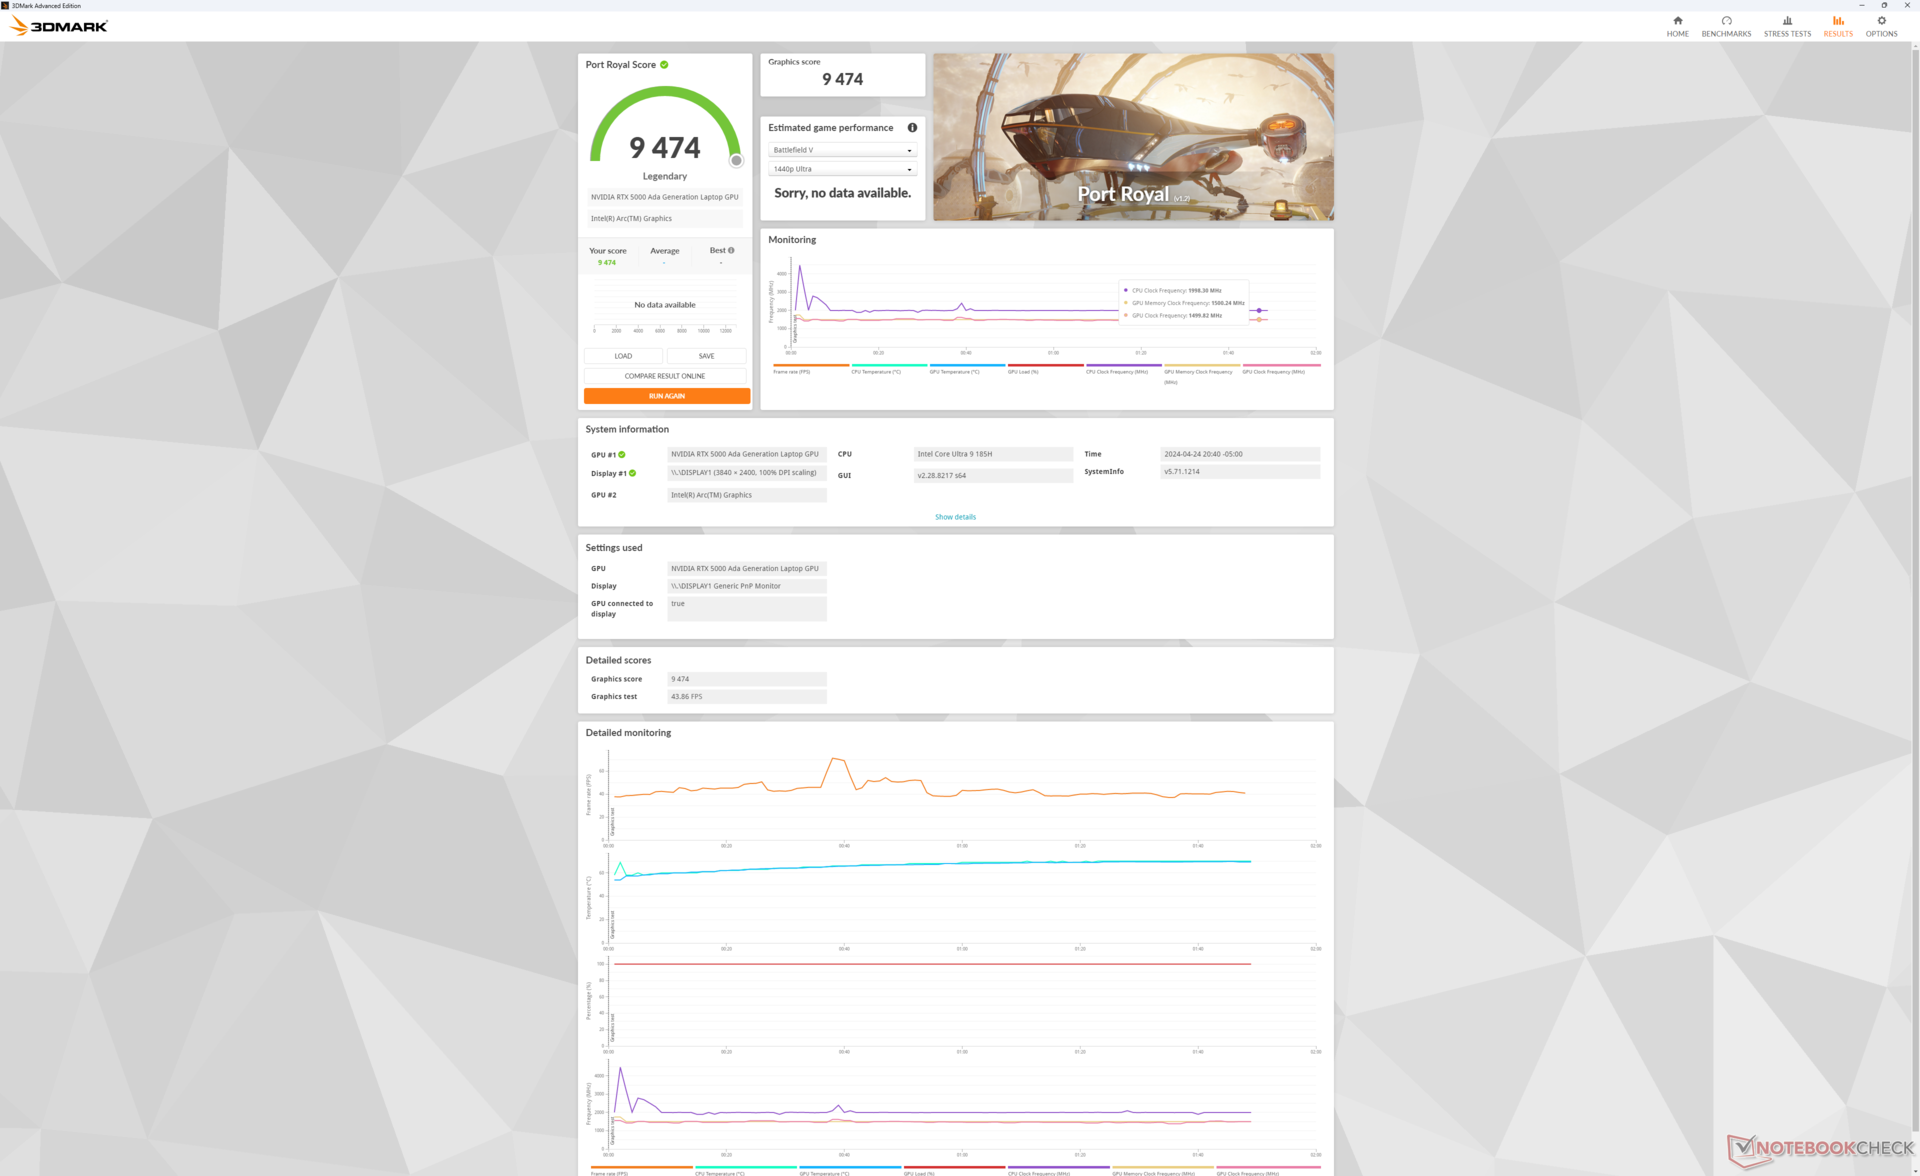
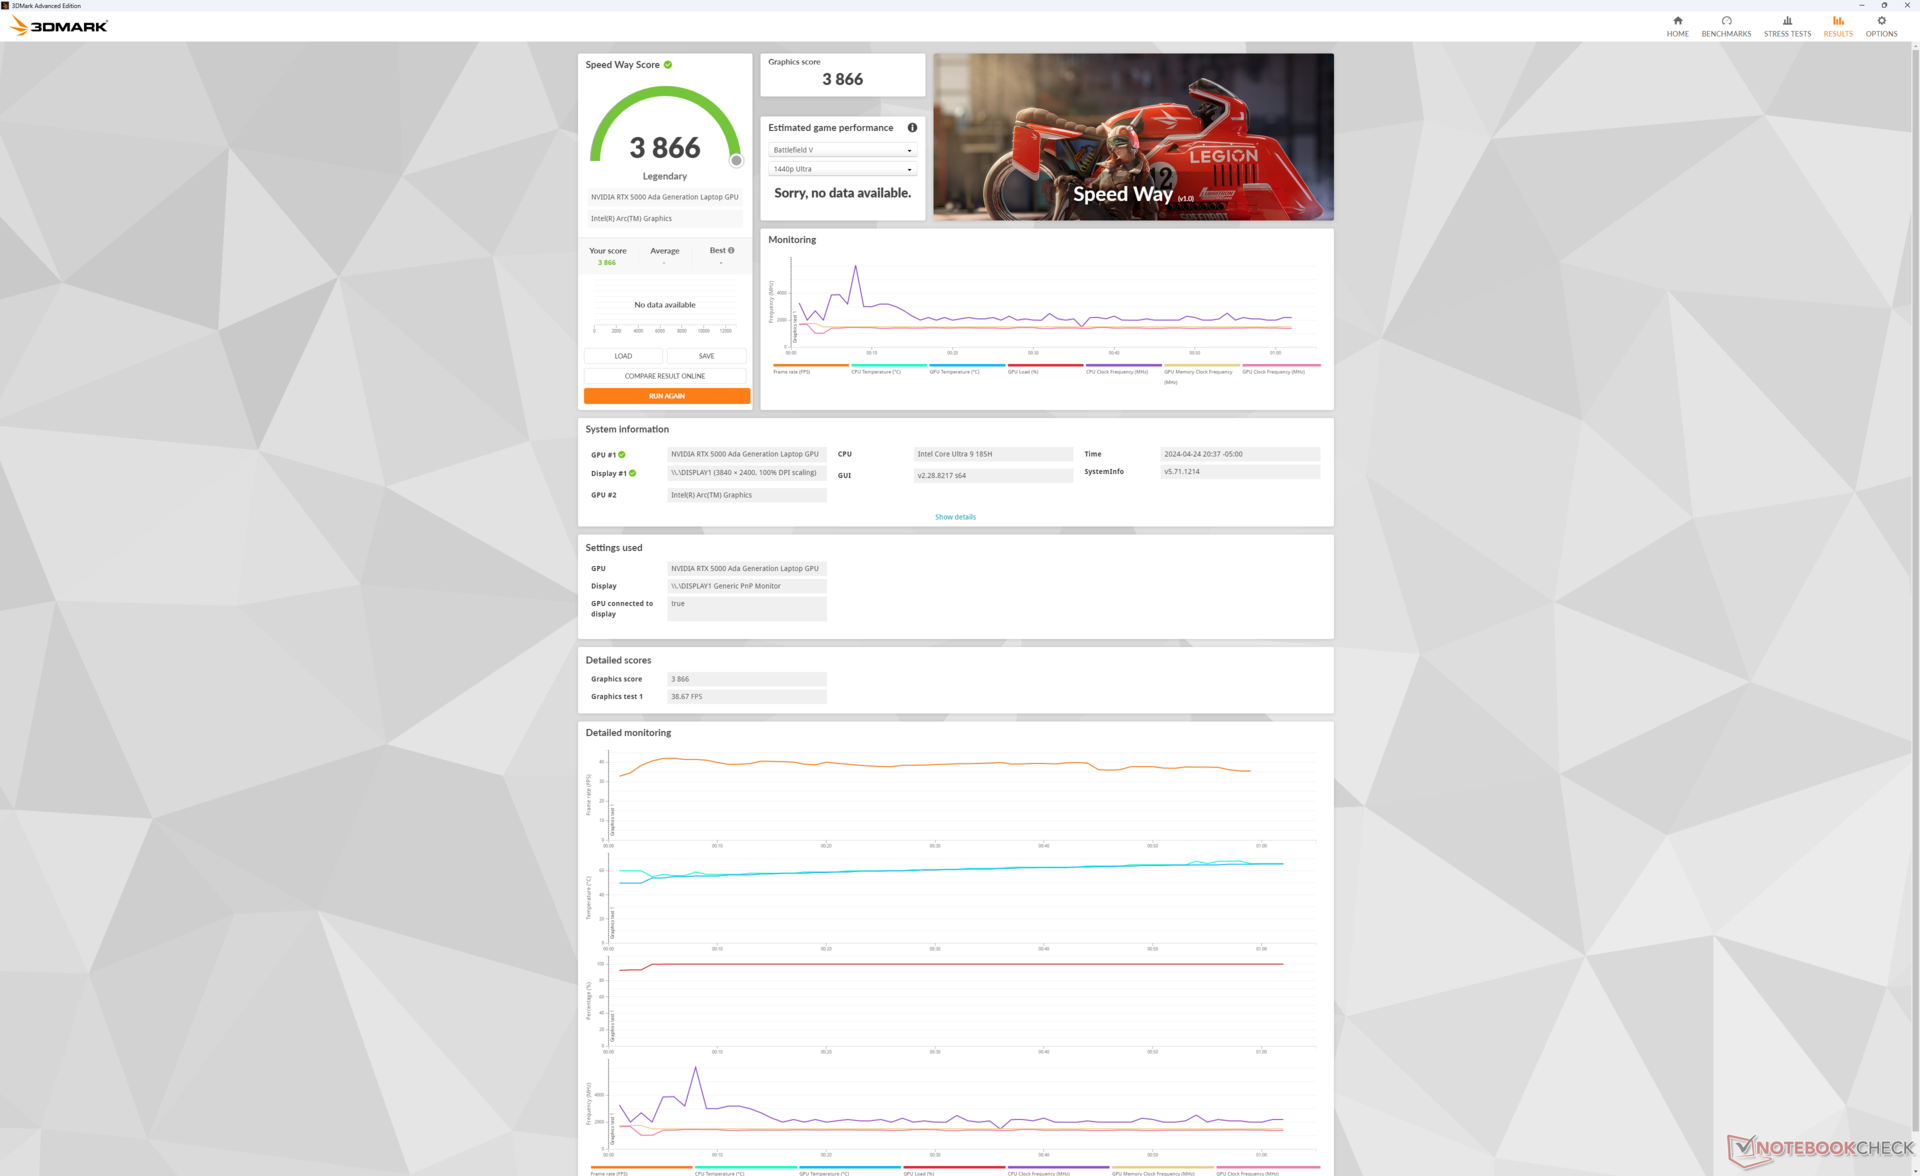
Prestazioni della GPU - Fino a RTX 5000 Ada
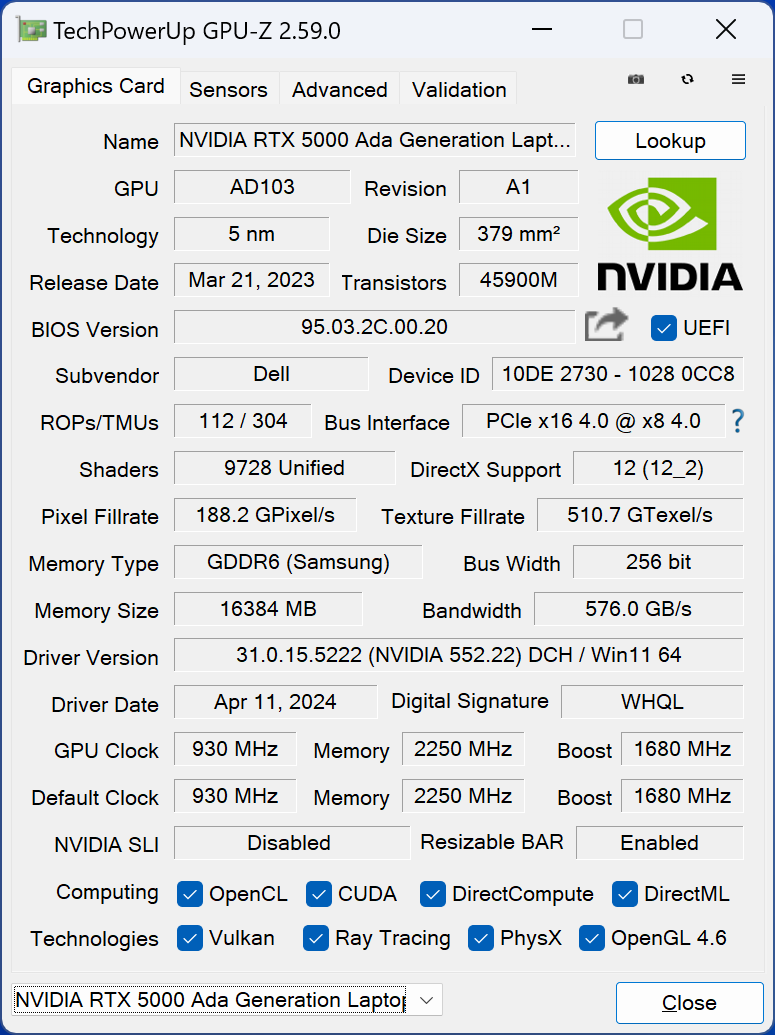
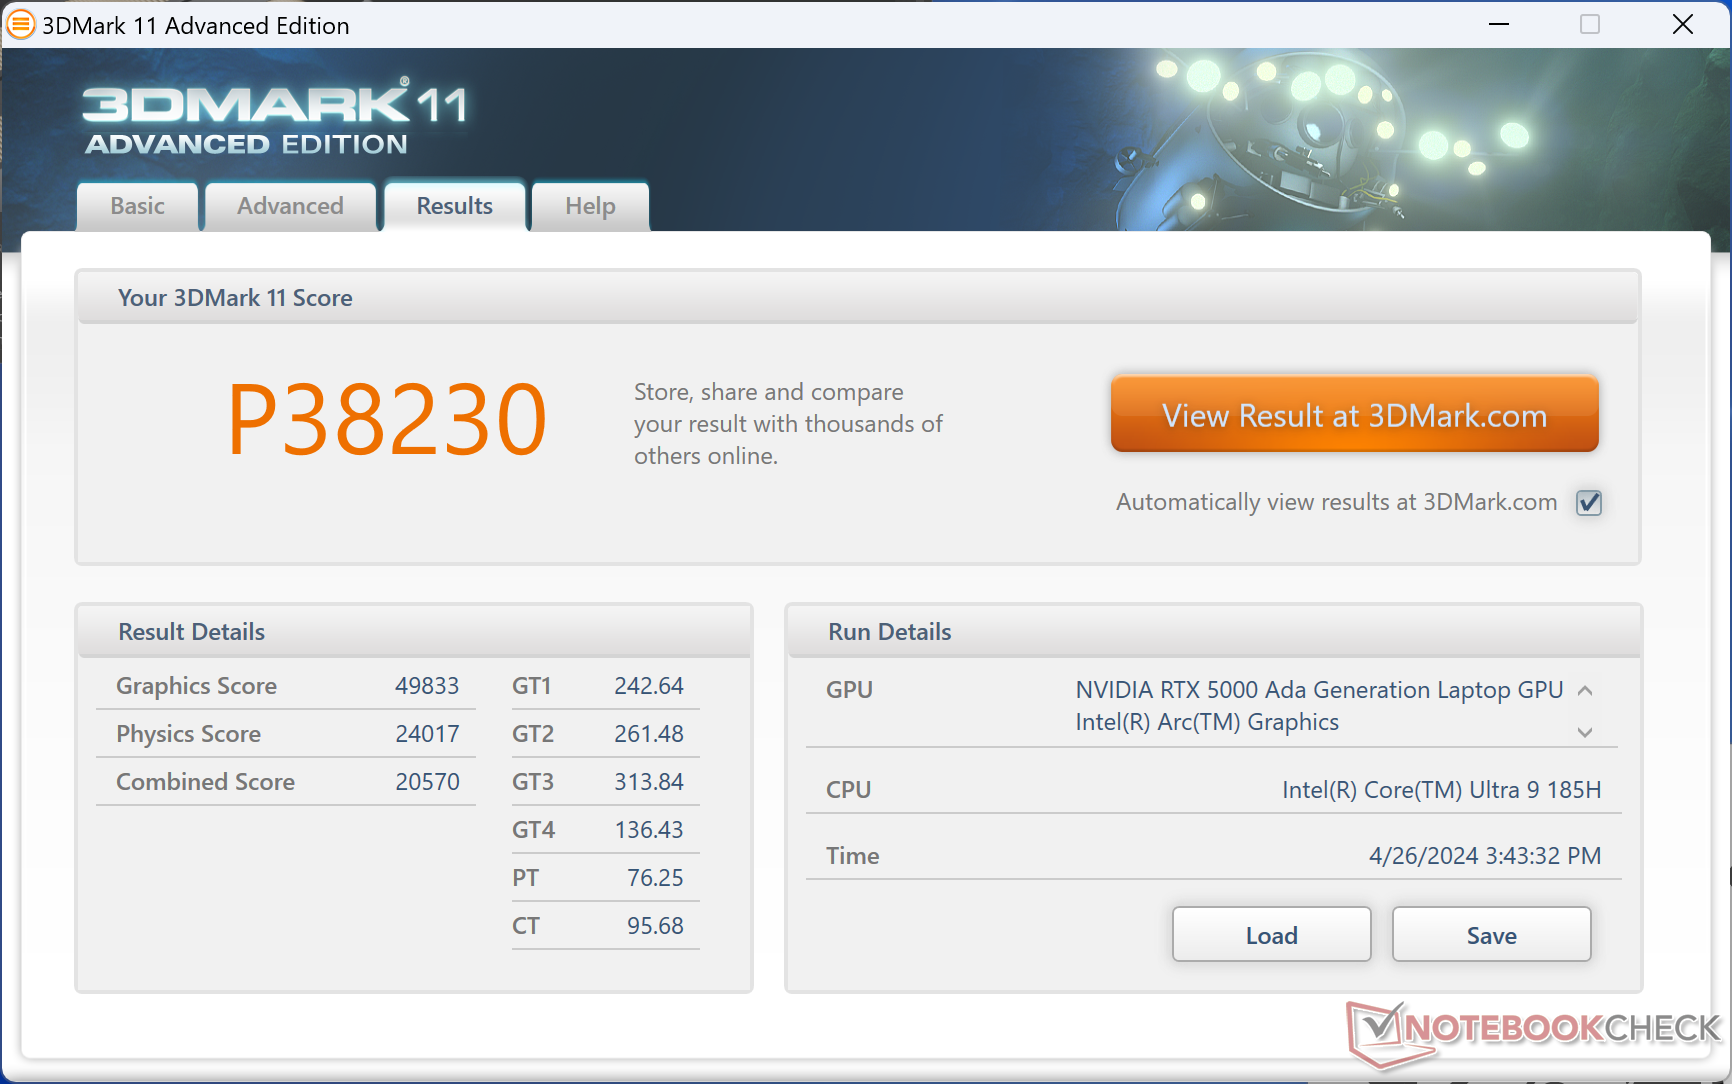
Le opzioni delle GPU Nvidia non sono cambiate rispetto al passato e quindi RTX 5000 Ada continua ad essere l'opzione top di gamma. Questa GPU è derivata dalla GeForce RTX 4090 e quindi include 16 GB di VRAM invece di 12 GB se configurata con le più lente RTX 4000 Ada o 3500 Ada. Gli utenti hanno a disposizione un'ampia gamma di GPU RTX Ada da configurare, tra cui la RTX 1000 Ada fino alla nostra configurazione RTX 5000 Ada.
| Profilo di potenza | Punteggio grafico | Punteggio di fisica | Punteggio combinato |
| Modalità Prestazioni | 29664 | 30416 | 12057 |
| Modalità equilibrata | 29771 (-0%) | 27199 (-11%) | 11770 (-2%) |
| Alimentazione a batteria | 26674 (-10%) | 20268 (-33%) | 9539 (-21%) |
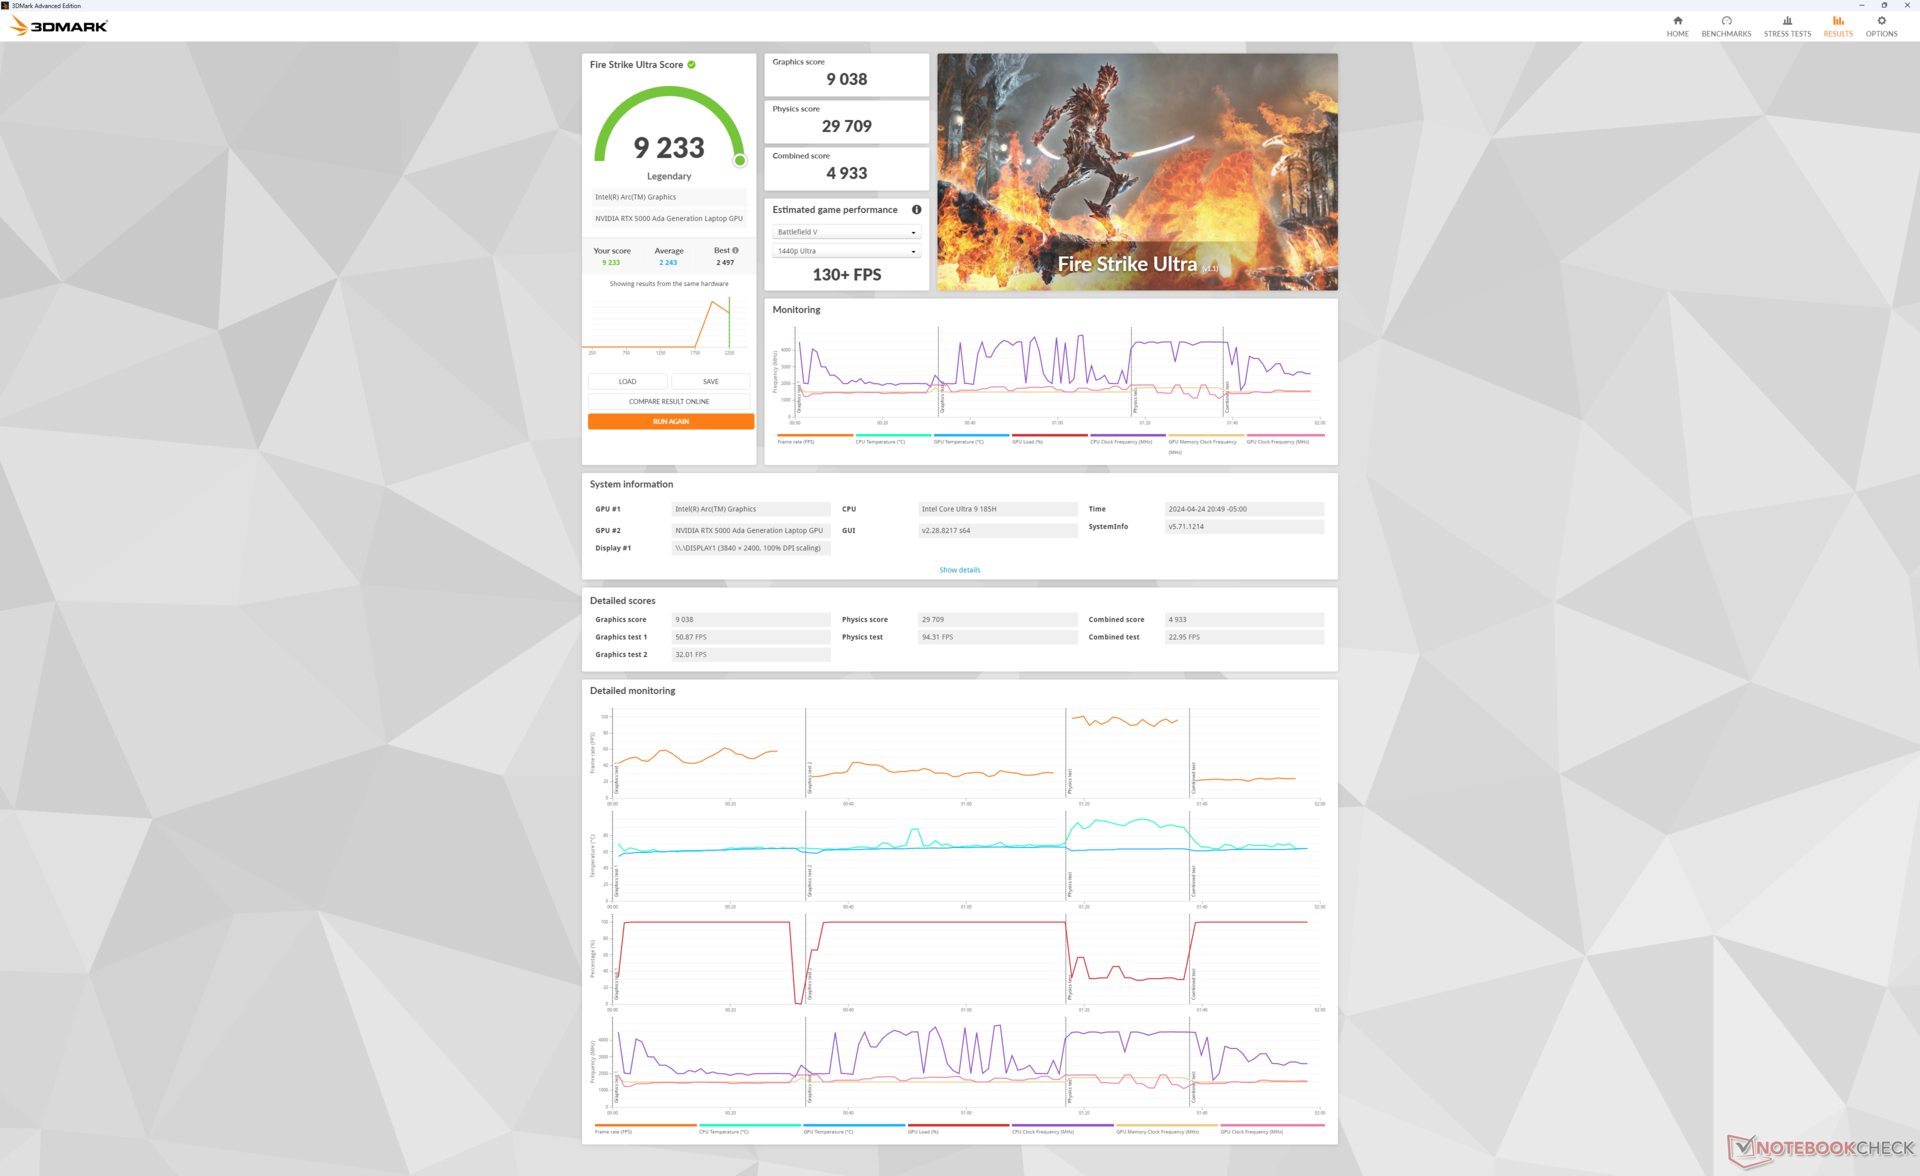
L'esecuzione in modalità Bilanciata influisce sulle prestazioni del processore, mentre le prestazioni grafiche rimangono invariate, come dimostrano i risultati di Fire Strike.

| 3DMark Performance Rating - Percent | |
| HP ZBook Fury 16 G10 -2! | |
| Media NVIDIA RTX 5000 Ada Generation Laptop GPU | |
| Dell Precision 5690 -2! | |
| Dell Precision 5000 5680 -2! | |
| Asus ProArt StudioBook 16 W7600H5A-2BL2 -20! | |
| HP ZBook Fury 16 G9 -2! | |
| Dell XPS 16 9640 -35! | |
| Lenovo ThinkPad P1 G6-21FV000DGE -16! | |
| Lenovo ThinkPad P16 G2 21FA000FGE -18! | |
| MSI CreatorPro Z16P B12UKST -17! | |
| Lenovo ThinkPad P16v G1 AMD -16! | |
| Lenovo ThinkPad P16 G1 21D6001DMB -18! | |
| Lenovo ThinkPad P1 G4-20Y30017GE -18! | |
| Lenovo ThinkPad P16s G2 21K9000CGE -18! | |
| 3DMark 11 Performance | 38230 punti | |
| 3DMark Fire Strike Score | 25968 punti | |
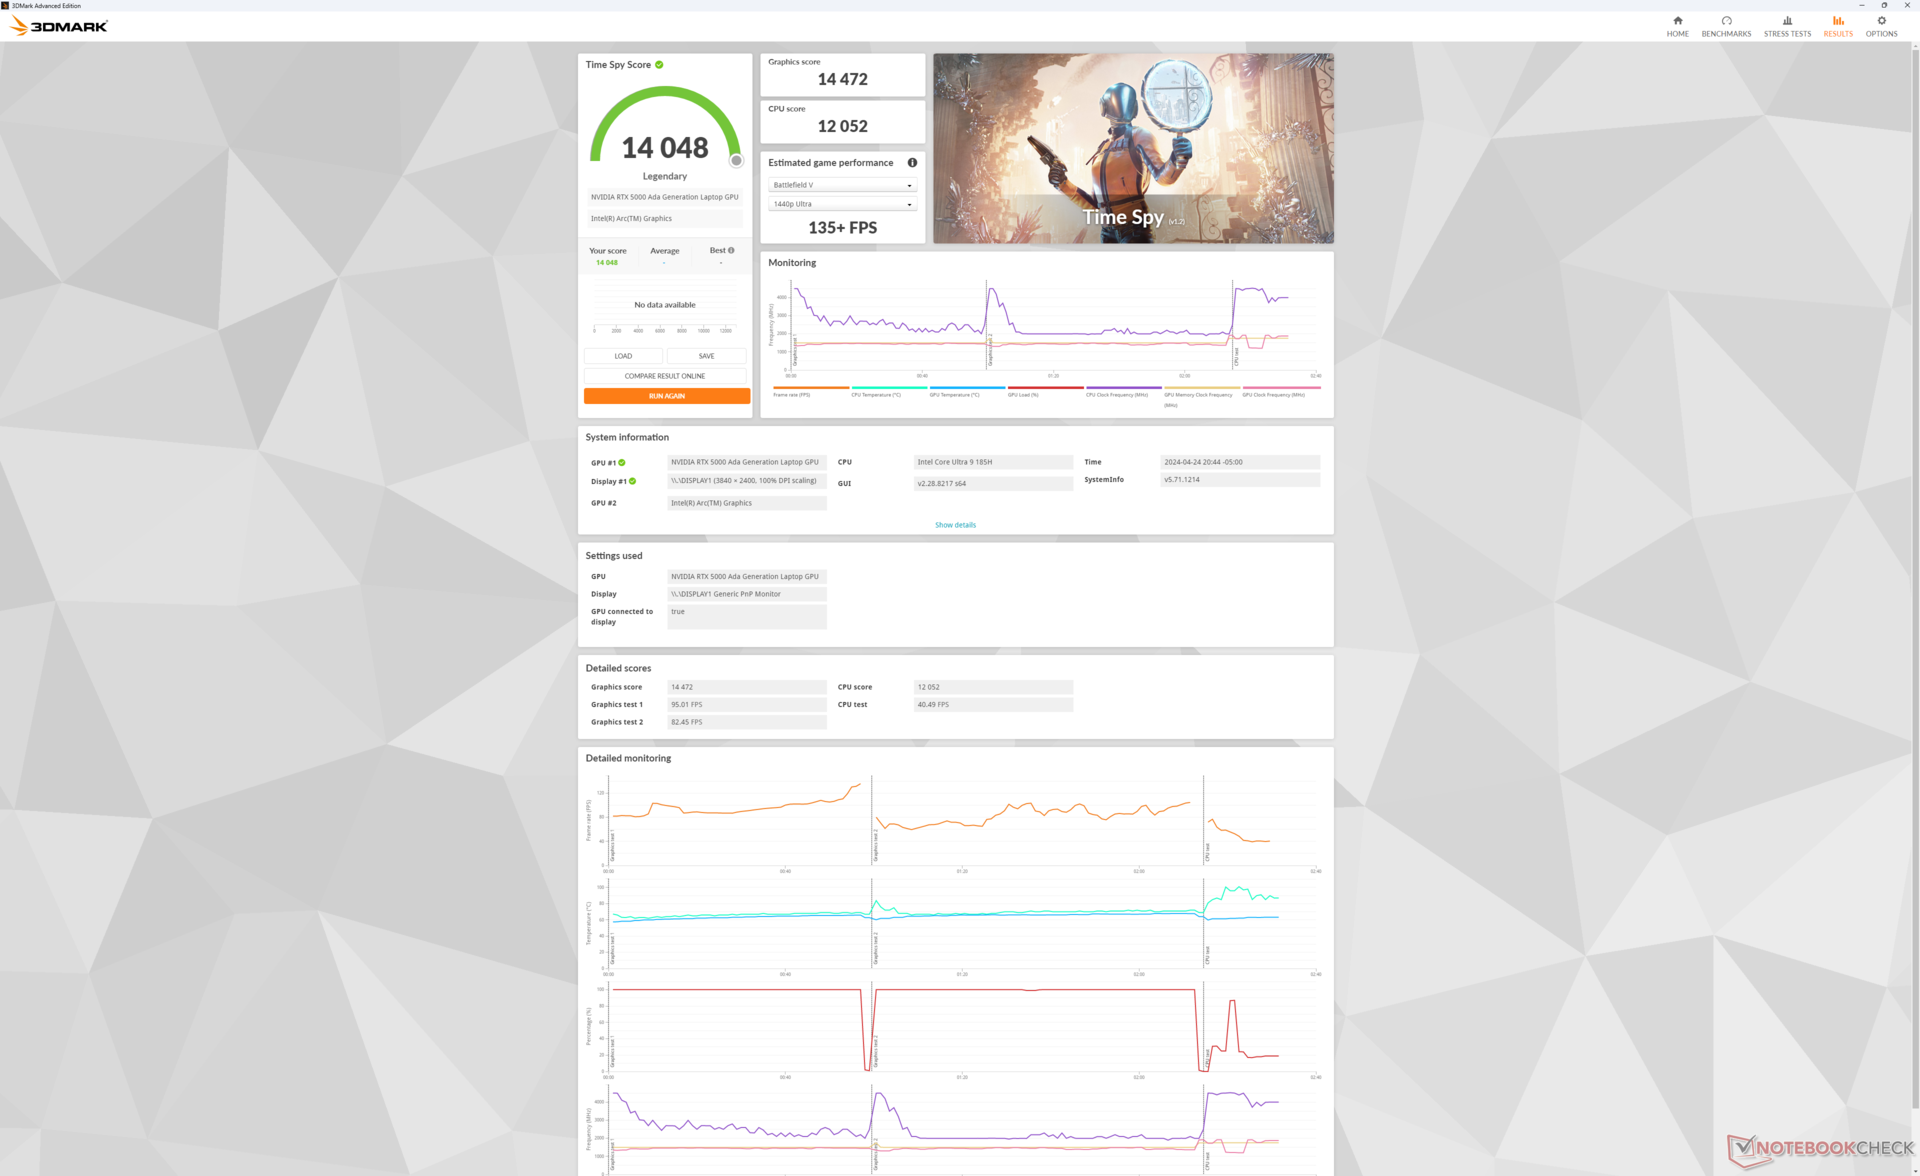
| 3DMark Time Spy Score | 14048 punti | |
Aiuto | ||
* ... Meglio usare valori piccoli
| Performance Rating - Percent | |
| HP ZBook Fury 16 G10 | |
| Dell Precision 5000 5680 -1! | |
| Dell Precision 5690 | |
| Lenovo ThinkPad P16 G2 21FA000FGE | |
| Lenovo ThinkPad P1 G6-21FV000DGE | |
| MSI CreatorPro Z16P B12UKST | |
| The Witcher 3 - 1920x1080 Ultra Graphics & Postprocessing (HBAO+) | |
| HP ZBook Fury 16 G10 | |
| Dell Precision 5690 | |
| Dell Precision 5000 5680 | |
| Lenovo ThinkPad P16 G2 21FA000FGE | |
| Lenovo ThinkPad P1 G6-21FV000DGE | |
| MSI CreatorPro Z16P B12UKST | |
| Final Fantasy XV Benchmark - 1920x1080 High Quality | |
| HP ZBook Fury 16 G10 | |
| Dell Precision 5690 | |
| Dell Precision 5000 5680 | |
| Lenovo ThinkPad P16 G2 21FA000FGE | |
| Lenovo ThinkPad P1 G6-21FV000DGE | |
| MSI CreatorPro Z16P B12UKST | |
| Strange Brigade - 1920x1080 ultra AA:ultra AF:16 | |
| HP ZBook Fury 16 G10 | |
| Dell Precision 5690 | |
| Lenovo ThinkPad P16 G2 21FA000FGE | |
| Lenovo ThinkPad P1 G6-21FV000DGE | |
| MSI CreatorPro Z16P B12UKST | |
| Dota 2 Reborn - 1920x1080 ultra (3/3) best looking | |
| HP ZBook Fury 16 G10 | |
| Lenovo ThinkPad P16 G2 21FA000FGE | |
| MSI CreatorPro Z16P B12UKST | |
| Dell Precision 5000 5680 | |
| Dell Precision 5690 | |
| Lenovo ThinkPad P1 G6-21FV000DGE | |
| X-Plane 11.11 - 1920x1080 high (fps_test=3) | |
| HP ZBook Fury 16 G10 | |
| Lenovo ThinkPad P1 G6-21FV000DGE | |
| Lenovo ThinkPad P16 G2 21FA000FGE | |
| Dell Precision 5000 5680 | |
| MSI CreatorPro Z16P B12UKST | |
| Dell Precision 5690 | |
| Baldur's Gate 3 | |
| 1920x1080 High Preset | |
| Dell Precision 5690 | |
| Media NVIDIA RTX 5000 Ada Generation Laptop GPU () | |
| Dell XPS 16 9640 | |
| 1920x1080 Ultra Preset | |
| Dell Precision 5690 | |
| Media NVIDIA RTX 5000 Ada Generation Laptop GPU () | |
| Dell XPS 16 9640 | |
| 2560x1440 Ultra Preset | |
| Dell Precision 5690 | |
| Media NVIDIA RTX 5000 Ada Generation Laptop GPU () | |
| Dell XPS 16 9640 | |
| 3840x2160 Ultra Preset | |
| Dell Precision 5690 | |
| Media NVIDIA RTX 5000 Ada Generation Laptop GPU () | |
| 3840x2160 Ultra Preset + Quality DLSS | |
| Dell Precision 5690 | |
| Media NVIDIA RTX 5000 Ada Generation Laptop GPU () | |
| Cyberpunk 2077 2.0 Phantom Liberty | |
| 1920x1080 High Preset (FSR off) | |
| Dell Precision 5690 | |
| Media NVIDIA RTX 5000 Ada Generation Laptop GPU () | |
| Dell XPS 16 9640 | |
| Lenovo ThinkPad P16v G1 AMD | |
| 1920x1080 Ultra Preset (FSR off) | |
| Dell Precision 5690 | |
| Media NVIDIA RTX 5000 Ada Generation Laptop GPU () | |
| Dell XPS 16 9640 | |
| Lenovo ThinkPad P16v G1 AMD | |
| 2560x1440 Ultra Preset (FSR off) | |
| Dell Precision 5690 | |
| Media NVIDIA RTX 5000 Ada Generation Laptop GPU () | |
| Dell XPS 16 9640 | |
| 3840x2160 Ultra Preset (FSR off) | |
| Dell Precision 5690 | |
| Media NVIDIA RTX 5000 Ada Generation Laptop GPU () | |
| 1920x1080 Ray Tracing Ultra Preset (DLSS off) | |
| Dell Precision 5690 | |
| Media NVIDIA RTX 5000 Ada Generation Laptop GPU () | |
| Tiny Tina's Wonderlands | |
| 1920x1080 High Preset (DX12) | |
| HP ZBook Fury 16 G10 | |
| Media NVIDIA RTX 5000 Ada Generation Laptop GPU (145.5 - 171.7, n=3) | |
| Dell Precision 5000 5680 | |
| Dell Precision 5690 | |
| HP ZBook Fury 16 G9 | |
| 1920x1080 Badass Preset (DX12) | |
| HP ZBook Fury 16 G10 | |
| Media NVIDIA RTX 5000 Ada Generation Laptop GPU (124 - 139.4, n=3) | |
| Dell Precision 5000 5680 | |
| Dell Precision 5690 | |
| HP ZBook Fury 16 G9 | |
| 2560x1440 Badass Preset (DX12) | |
| HP ZBook Fury 16 G10 | |
| Media NVIDIA RTX 5000 Ada Generation Laptop GPU (87.1 - 99.4, n=3) | |
| Dell Precision 5000 5680 | |
| Dell Precision 5690 | |
| HP ZBook Fury 16 G9 | |
| 3840x2160 Badass Preset (DX12) | |
| HP ZBook Fury 16 G10 | |
| Media NVIDIA RTX 5000 Ada Generation Laptop GPU (48.4 - 53.9, n=3) | |
| Dell Precision 5000 5680 | |
| Dell Precision 5690 | |
| HP ZBook Fury 16 G9 | |
Witcher 3 FPS Chart
| basso | medio | alto | ultra | QHD | 4K DLSS | 4K | |
| The Witcher 3 (2015) | 411.3 | 351.2 | 258.7 | 137.6 | 103.9 | ||
| Dota 2 Reborn (2015) | 169.4 | 149.2 | 150.1 | 139.9 | 130 | ||
| Final Fantasy XV Benchmark (2018) | 196.6 | 165.4 | 132.5 | 103.8 | 63.2 | ||
| X-Plane 11.11 (2018) | 132.8 | 113.9 | 88.7 | 74.8 | |||
| Far Cry 5 (2018) | 144 | 134 | 127 | 119 | 113 | 72 | |
| Strange Brigade (2018) | 405 | 314 | 276 | 252 | 190.6 | 105.3 | |
| Tiny Tina's Wonderlands (2022) | 196.5 | 179.4 | 145.5 | 124 | 87.1 | 48.4 | |
| F1 22 (2022) | 228 | 224 | 217 | 91.1 | 60.1 | 29.6 | |
| Baldur's Gate 3 (2023) | 172.3 | 155.2 | 139.2 | 134.6 | 100.5 | 87.8 | 53.3 |
| Cyberpunk 2077 2.0 Phantom Liberty (2023) | 125 | 116.6 | 94.6 | 108.5 | 63.7 | 28.8 |
Emissioni
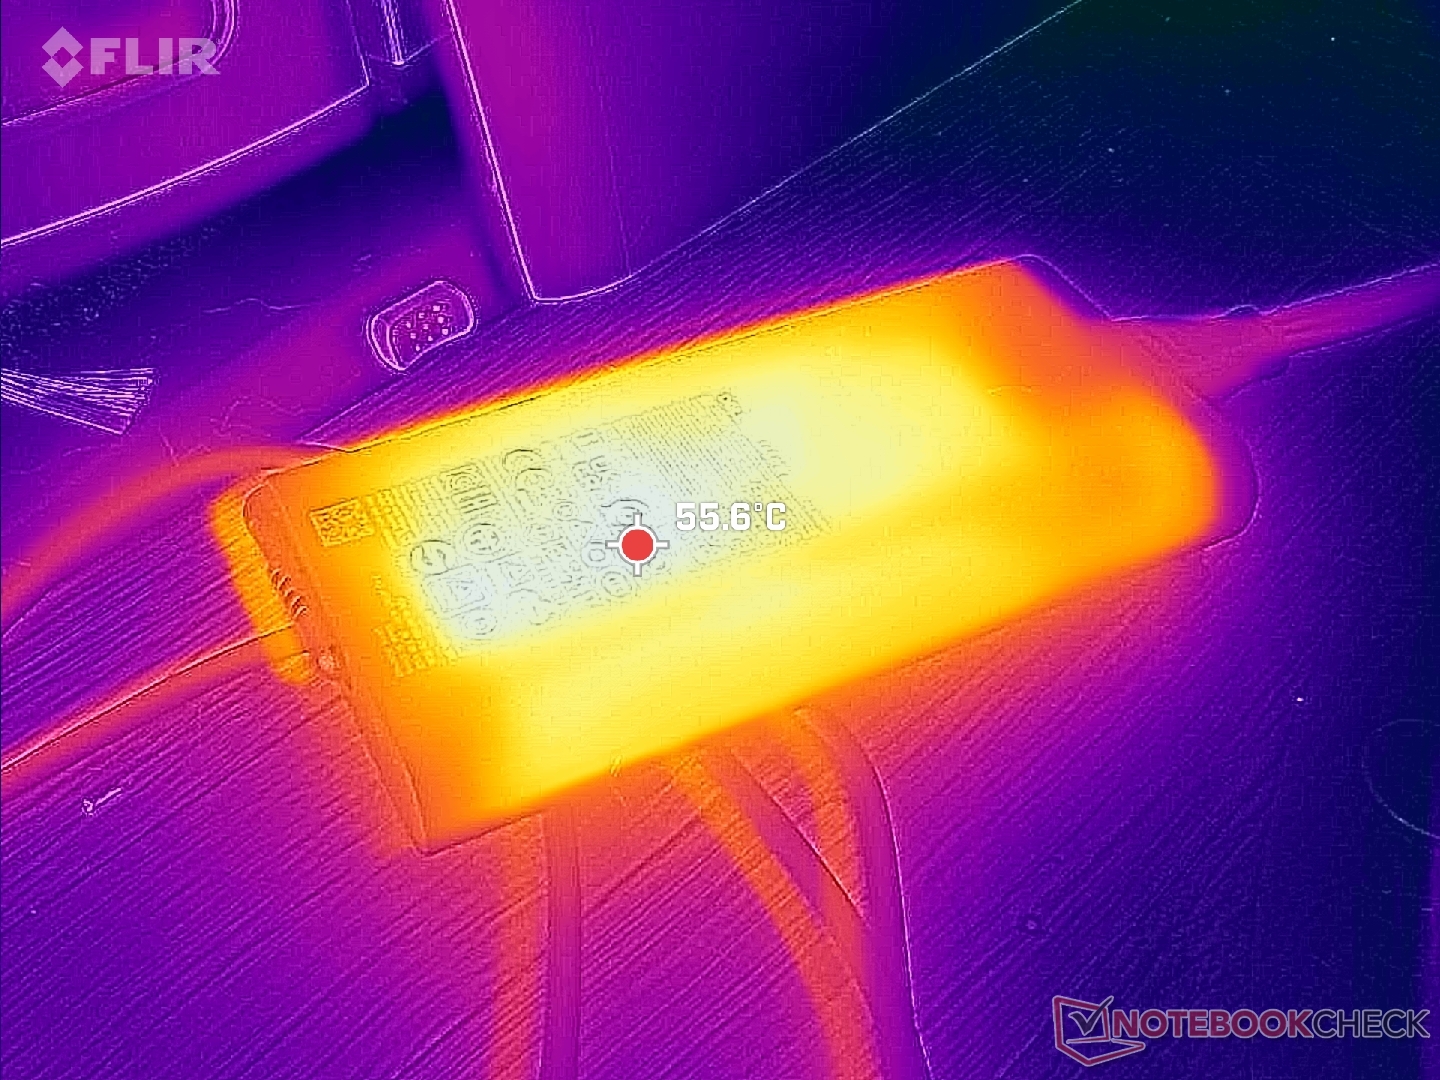
Rumore del sistema - Forte e in carica
Il rumore della ventola è sensibile al profilo di potenza selezionato. Se si attiva la modalità Quiet, ad esempio, il rumore della ventola tende a rimanere sotto i 25 dB(A), a fronte di uno sfondo silenzioso di 23,4 dB(A). Al contrario, le ventole tendono a pulsare più facilmente fino a 30 dB(A) se impostate sulle modalità Bilanciata o Prestazioni, anche durante attività banali come la navigazione web.
Il limite massimo del rumore della ventola è altrimenti uguale a quello che abbiamo registrato su Precision 5680, con 51 dB(A), che è pari a quello di molti computer portatili da gioco. Questo massimo può essere raggiunto quando si eseguono carichi impegnativi per la GPU per più di qualche minuto.
Rumorosità
| Idle |
| 23.6 / 24.9 / 30.9 dB(A) |
| Sotto carico |
| 40.4 / 51.9 dB(A) |
 | ||
30 dB silenzioso 40 dB(A) udibile 50 dB(A) rumoroso |
||
min: | ||
| Dell Precision 5690 NVIDIA RTX 5000 Ada Generation Laptop GPU, Ultra 9 185H | Dell Precision 5000 5680 NVIDIA RTX 5000 Ada Generation Laptop GPU, i9-13900H, 2x SK hynix PC801 HFS512GEJ9X101N RAID 0 | Lenovo ThinkPad P16 G2 21FA000FGE NVIDIA RTX 2000 Ada Generation Laptop GPU, i7-13700HX, SK hynix PC801 HFS001TEJ9X162N | Lenovo ThinkPad P1 G6-21FV000DGE NVIDIA RTX 2000 Ada Generation Laptop GPU, i9-13900H, SK Hynix PC711 1TB HFS001TDE9X084N | HP ZBook Fury 16 G10 NVIDIA RTX 5000 Ada Generation Laptop GPU, i9-13950HX, SK hynix PC801 HFS001TEJ9X101N | MSI CreatorPro Z16P B12UKST RTX A3000 Laptop GPU, i7-12700H, Samsung PM9A1 MZVL21T0HCLR | |
|---|---|---|---|---|---|---|
| Noise | 6% | -1% | 3% | 6% | -0% | |
| off /ambiente * | 23.4 | 22.8 3% | 23.5 -0% | 24.5 -5% | 22.9 2% | 24.1 -3% |
| Idle Minimum * | 23.6 | 23 3% | 23.5 -0% | 24.5 -4% | 22.9 3% | 27.1 -15% |
| Idle Average * | 24.9 | 23 8% | 29.2 -17% | 24.5 2% | 22.9 8% | 27.1 -9% |
| Idle Maximum * | 30.9 | 23 26% | 29.5 5% | 24.5 21% | 28.5 8% | 27.1 12% |
| Load Average * | 40.4 | 37.2 8% | 32.7 19% | 48 -19% | 40.6 -0% | 42.9 -6% |
| Witcher 3 ultra * | 48.3 | 51 -6% | 50.6 -5% | 40.7 16% | 44.1 9% | 44 9% |
| Load Maximum * | 51.9 | 51 2% | 56.6 -9% | 48 8% | 45.8 12% | 47 9% |
* ... Meglio usare valori piccoli
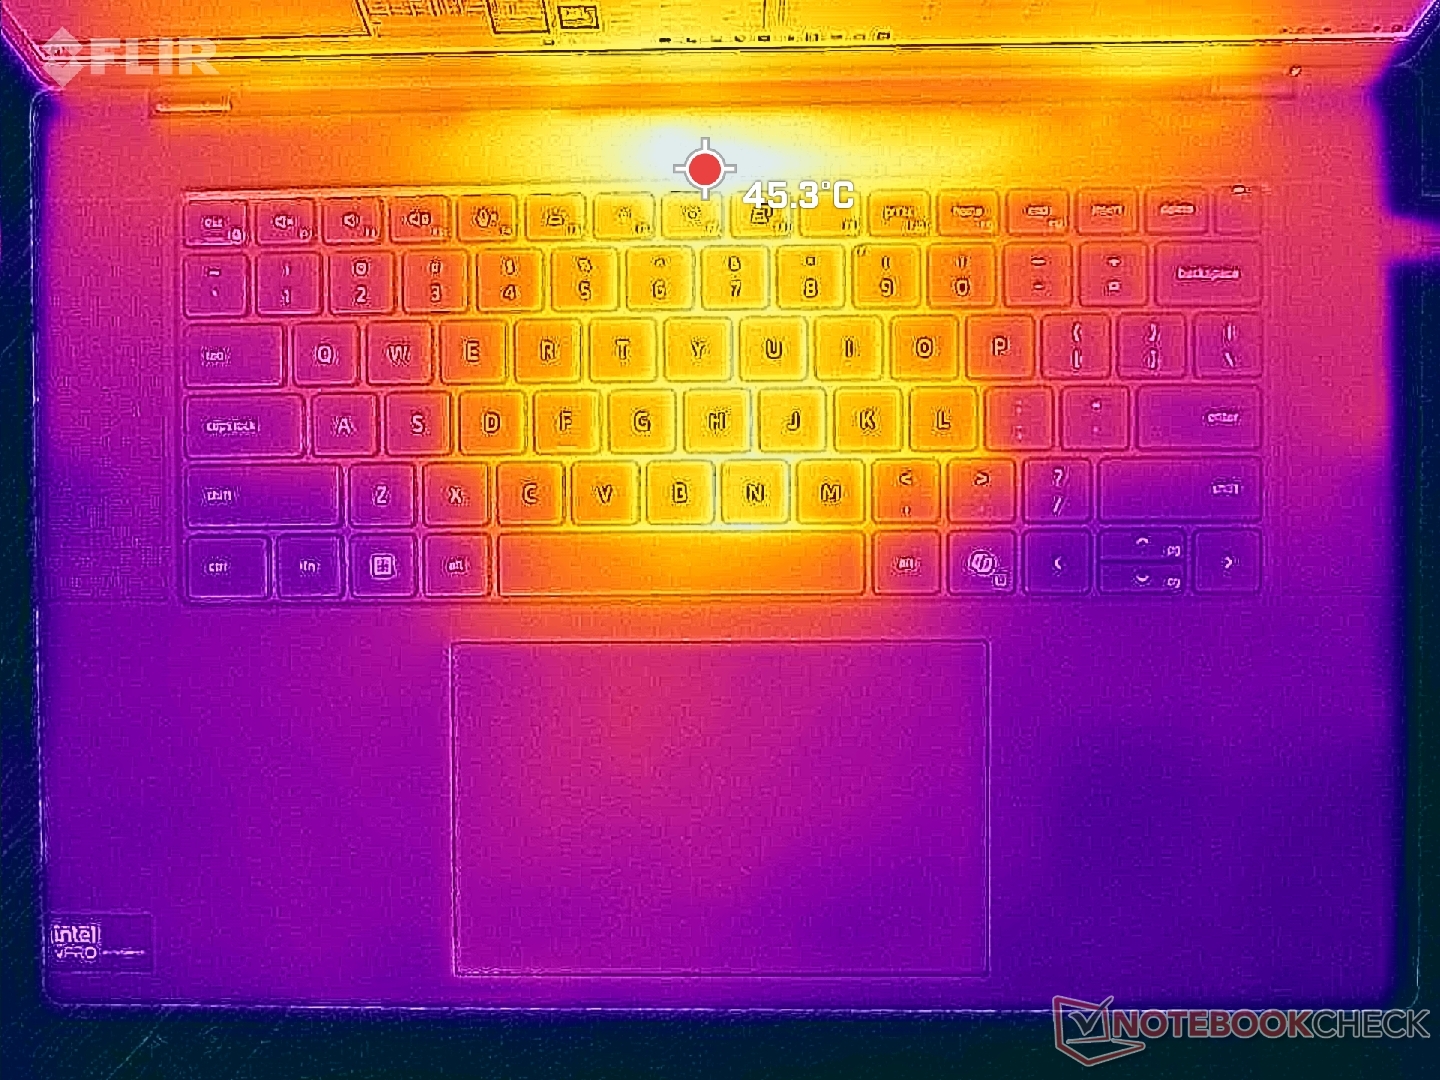
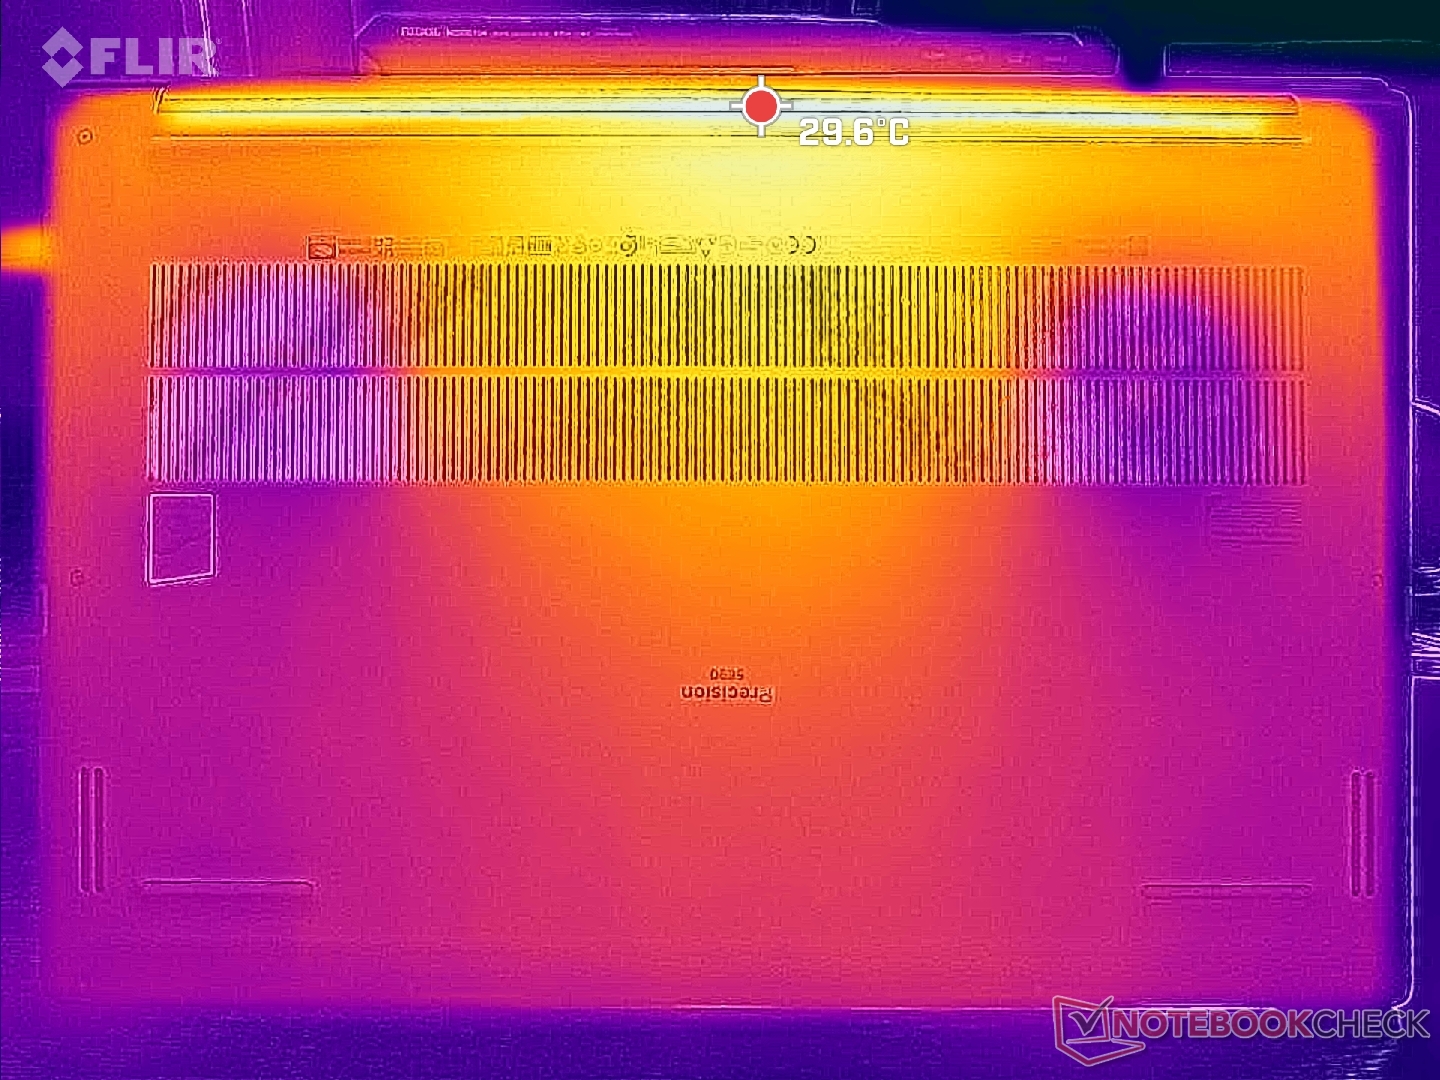
Temperatura
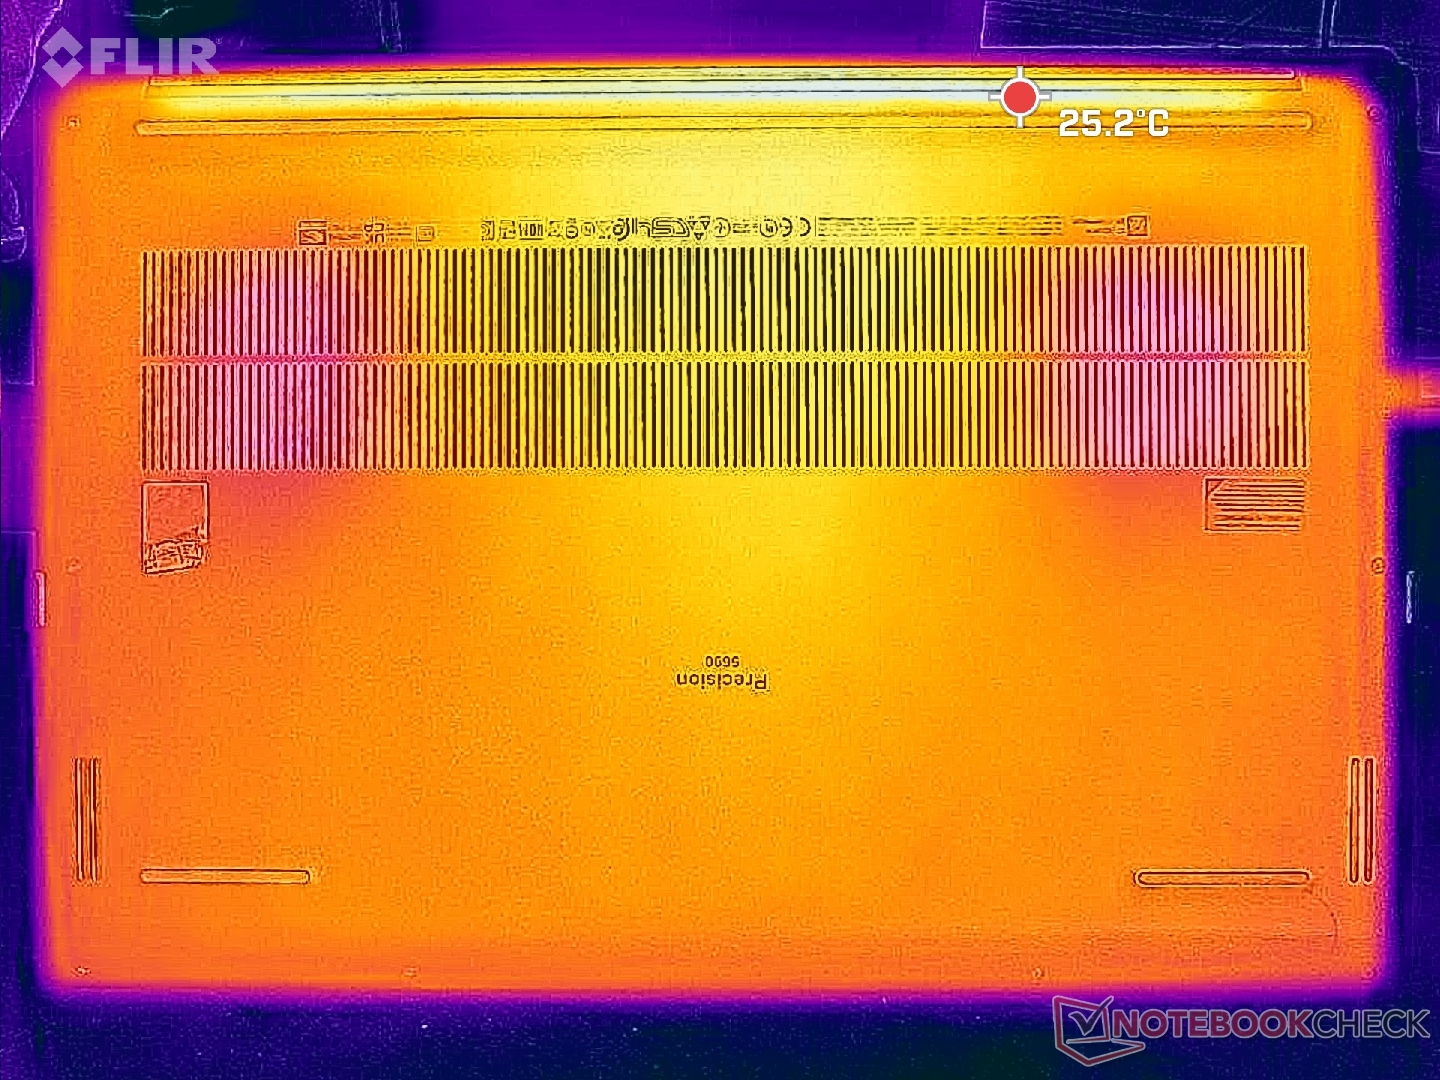
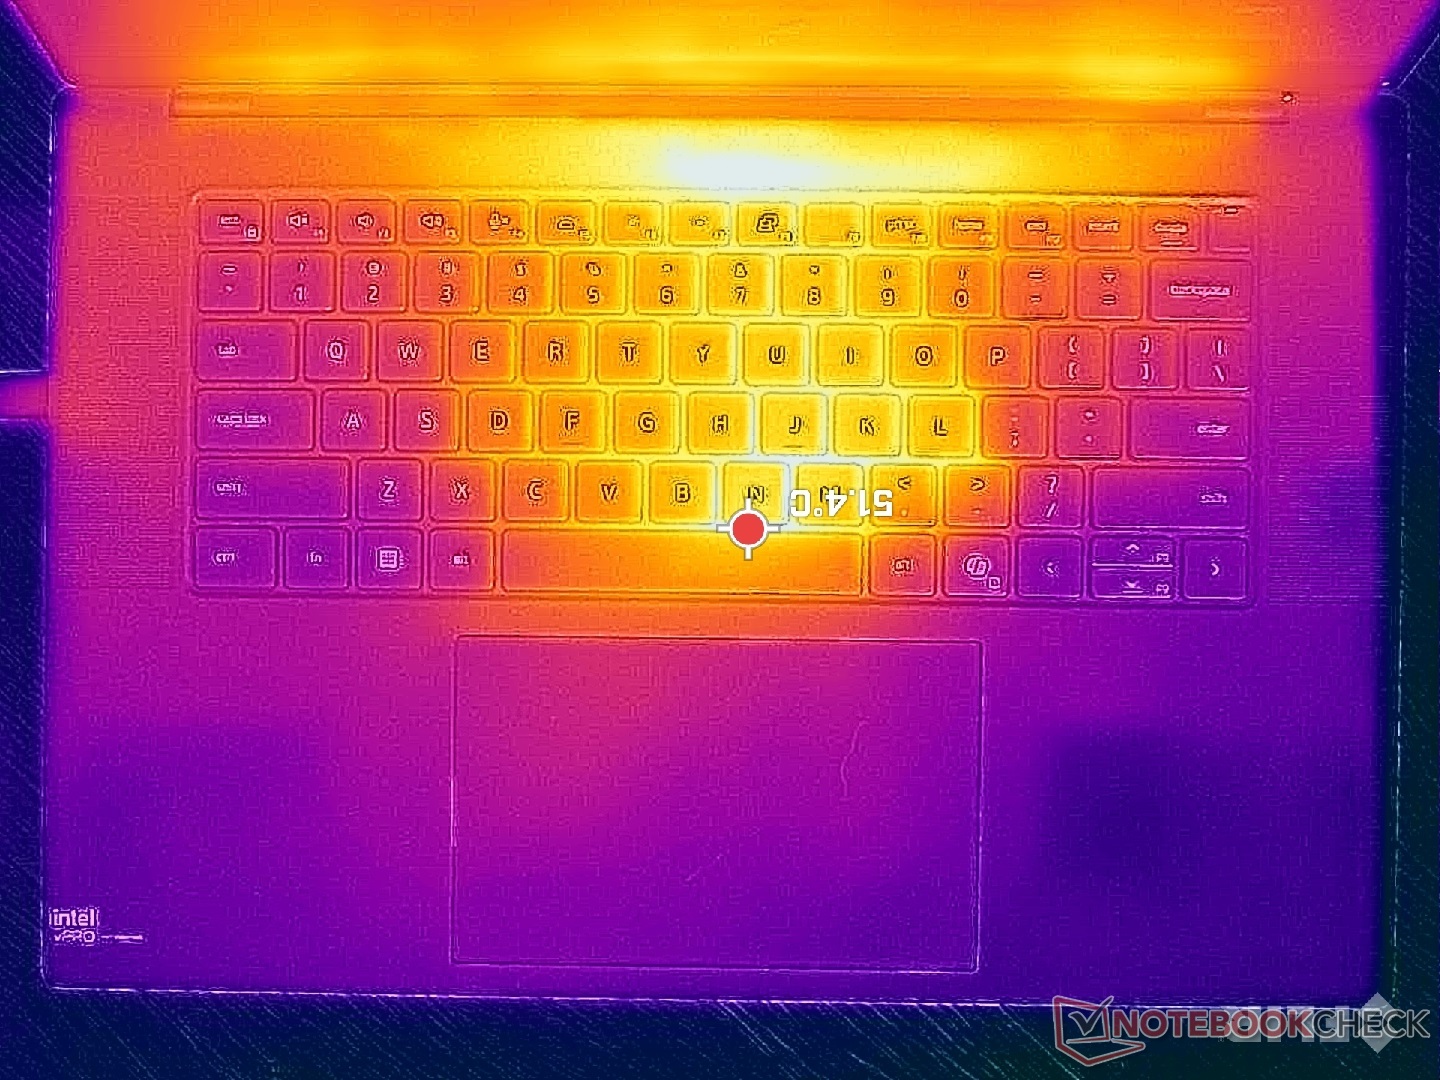
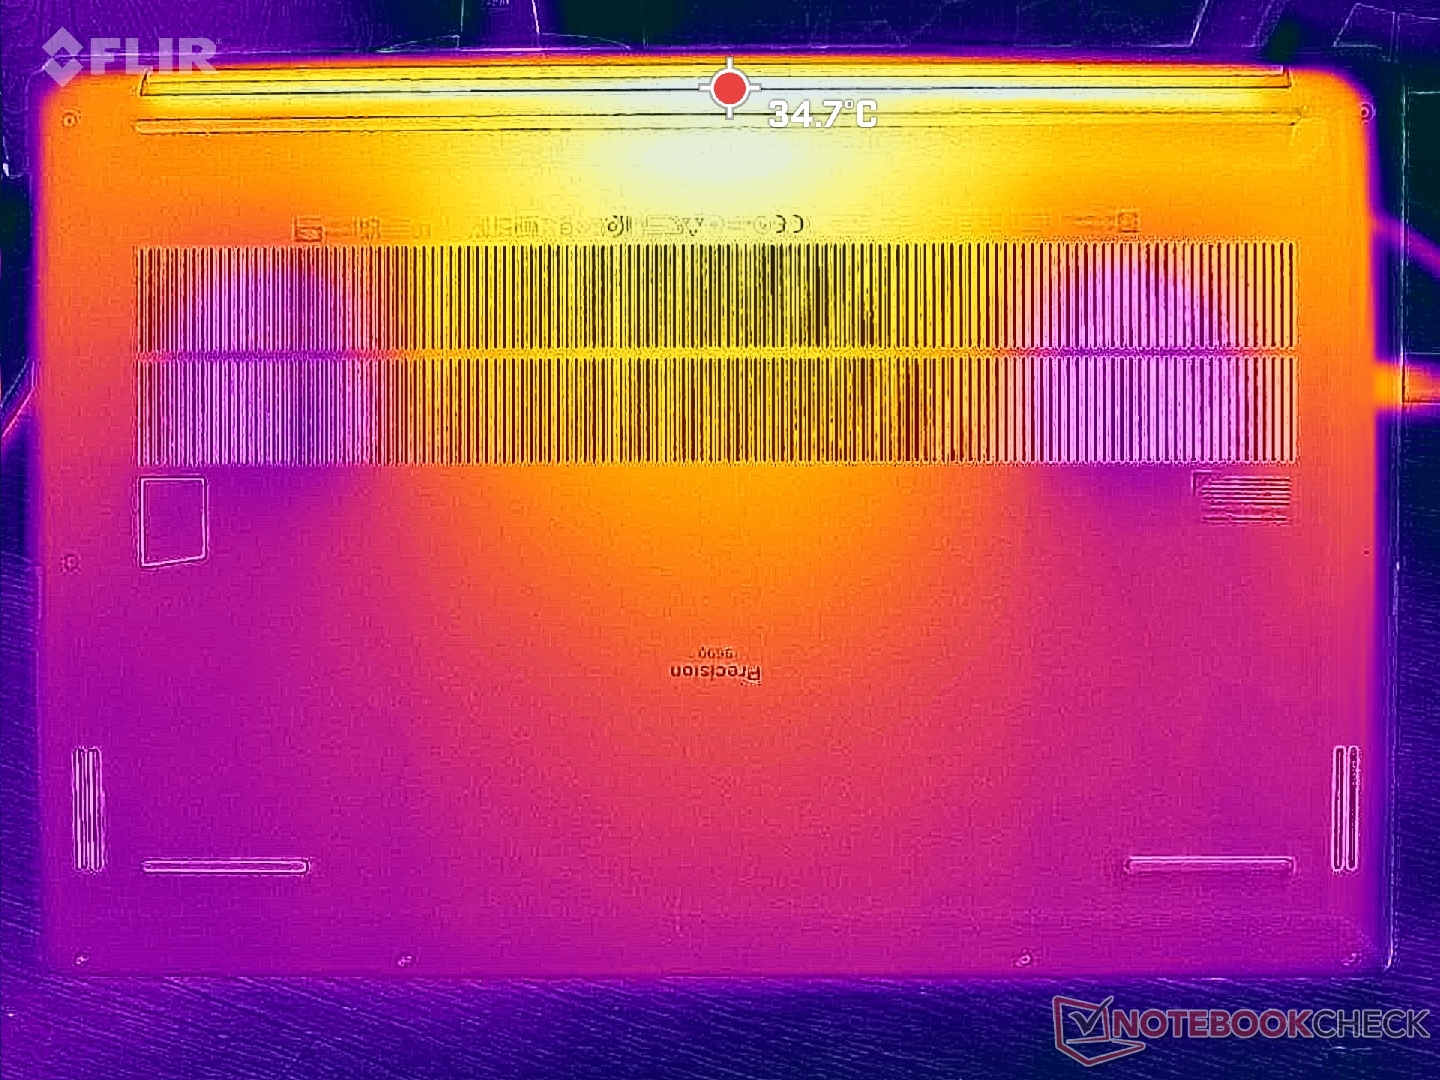
Lo sviluppo della temperatura superficiale è simmetrico, con punti caldi da 43 C a 47 C vicino al centro della tastiera. Il lato inferiore dello chassis rimane sensibilmente più freddo rispetto al piano della tastiera, anche quando si eseguono carichi impegnativi.
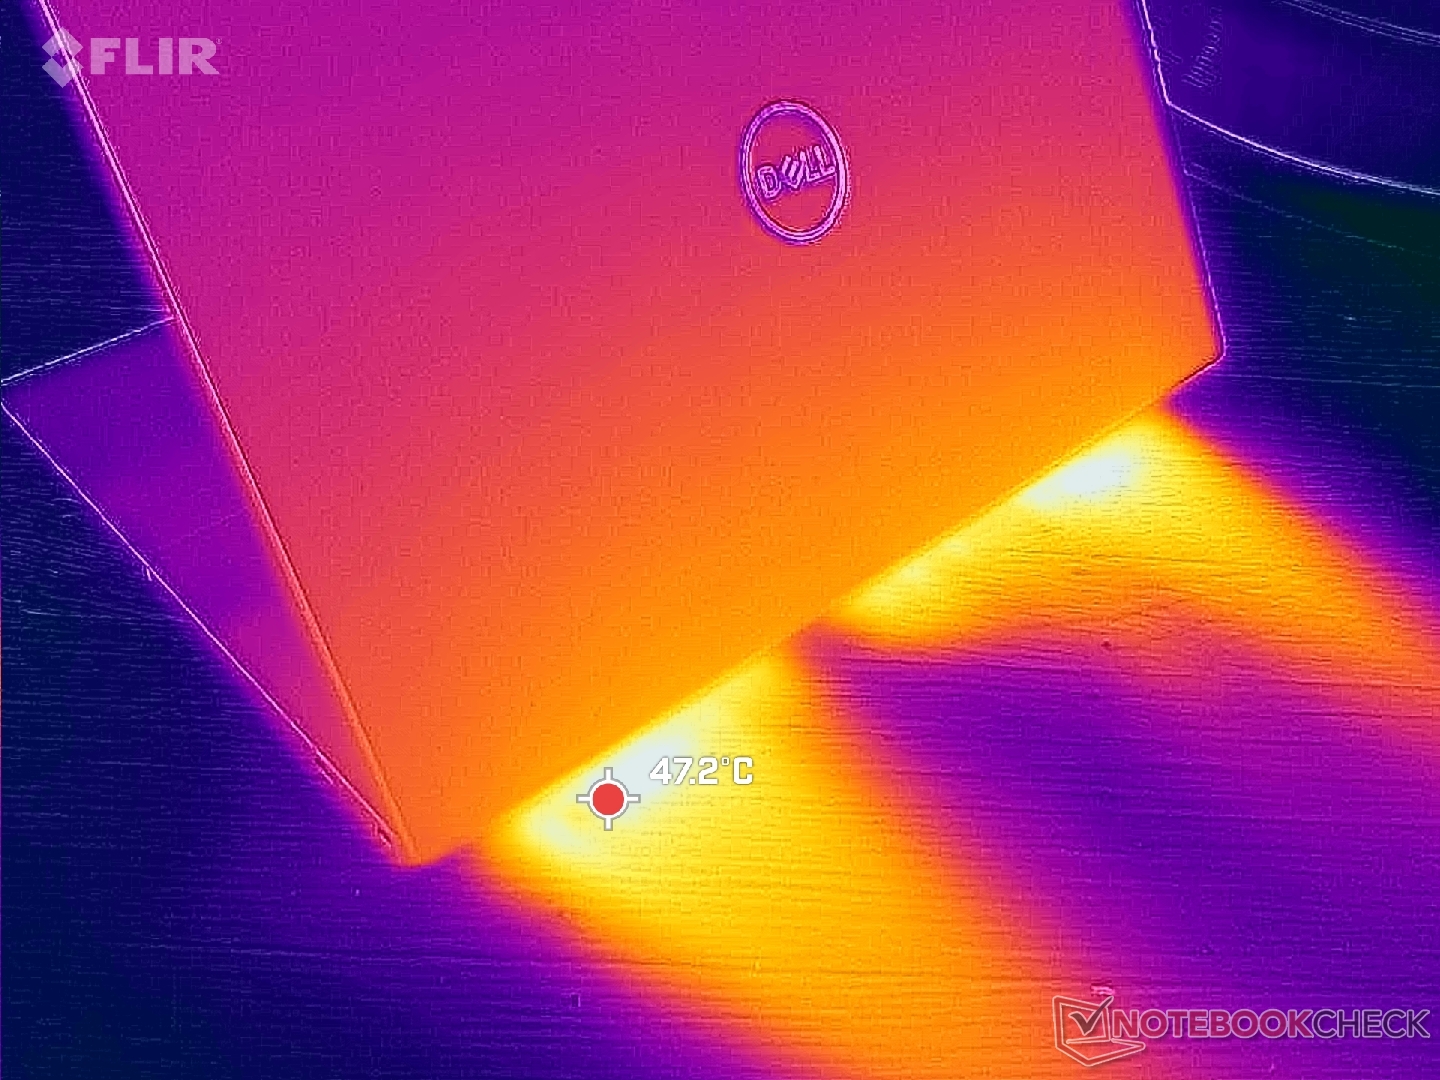
(-) La temperatura massima sul lato superiore è di 46.6 °C / 116 F, rispetto alla media di 38.2 °C / 101 F, che varia da 22.2 a 69.8 °C per questa classe Workstation.
(+) Il lato inferiore si riscalda fino ad un massimo di 33 °C / 91 F, rispetto alla media di 41.2 °C / 106 F
(+) In idle, la temperatura media del lato superiore è di 29.2 °C / 85 F, rispetto alla media deld ispositivo di 32 °C / 90 F.
(±) Riproducendo The Witcher 3, la temperatura media per il lato superiore e' di 34 °C / 93 F, rispetto alla media del dispositivo di 32 °C / 90 F.
(+) I poggiapolsi e il touchpad sono piu' freddi della temperatura della pelle con un massimo di 27.6 °C / 81.7 F e sono quindi freddi al tatto.
(±) La temperatura media della zona del palmo della mano di dispositivi simili e'stata di 27.8 °C / 82 F (+0.2 °C / 0.3 F).

| Dell Precision 5690 Intel Core Ultra 9 185H, NVIDIA RTX 5000 Ada Generation Laptop GPU | Dell Precision 5000 5680 Intel Core i9-13900H, NVIDIA RTX 5000 Ada Generation Laptop GPU | Lenovo ThinkPad P16 G2 21FA000FGE Intel Core i7-13700HX, NVIDIA RTX 2000 Ada Generation Laptop GPU | Lenovo ThinkPad P1 G6-21FV000DGE Intel Core i9-13900H, NVIDIA RTX 2000 Ada Generation Laptop GPU | HP ZBook Fury 16 G10 Intel Core i9-13950HX, NVIDIA RTX 5000 Ada Generation Laptop GPU | MSI CreatorPro Z16P B12UKST Intel Core i7-12700H, NVIDIA RTX A3000 Laptop GPU | |
|---|---|---|---|---|---|---|
| Heat | -7% | 2% | -13% | -16% | -24% | |
| Maximum Upper Side * | 46.6 | 50.2 -8% | 47.2 -1% | 47.1 -1% | 44.8 4% | 56.3 -21% |
| Maximum Bottom * | 33 | 32 3% | 39.5 -20% | 56.5 -71% | 50 -52% | 68.3 -107% |
| Idle Upper Side * | 32.4 | 37.4 -15% | 28.1 13% | 28.1 13% | 34.4 -6% | 25.2 22% |
| Idle Bottom * | 29.4 | 31.2 -6% | 25.3 14% | 27.6 6% | 31.8 -8% | 25.9 12% |
* ... Meglio usare valori piccoli
Altoparlanti
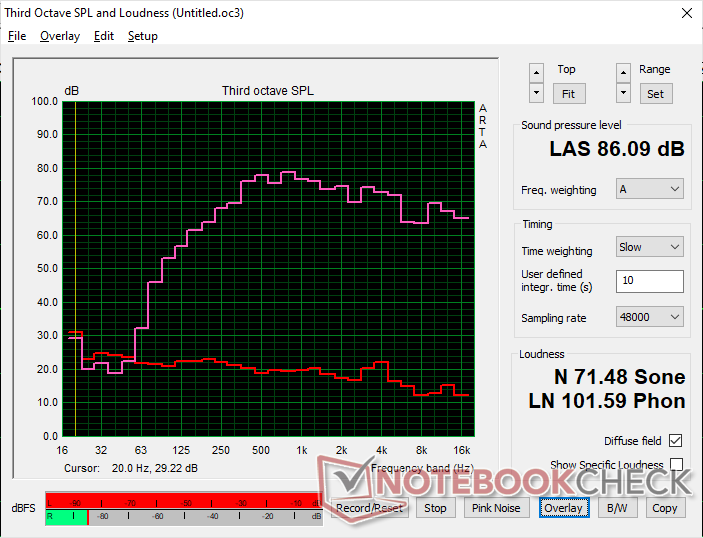
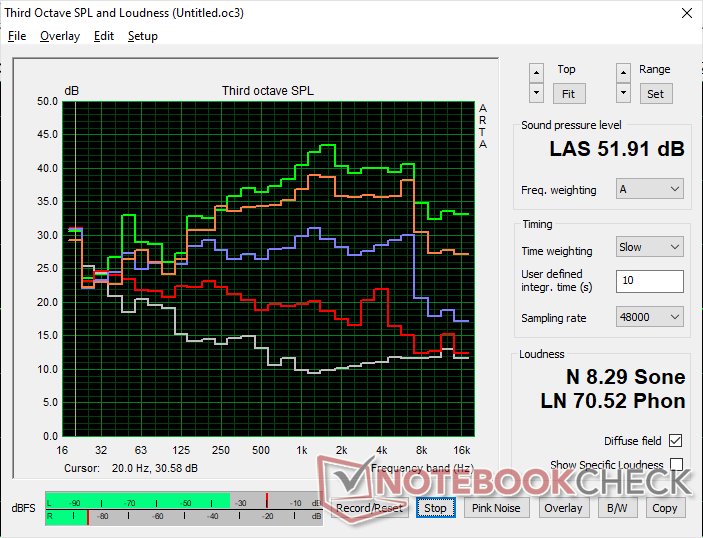
Dell Precision 5690 analisi audio
(+) | gli altoparlanti sono relativamente potenti (86.1 dB)
Bassi 100 - 315 Hz
(±) | bassi ridotti - in media 9.4% inferiori alla media
(±) | la linearità dei bassi è media (7.6% delta rispetto alla precedente frequenza)
Medi 400 - 2000 Hz
(+) | medi bilanciati - solo only 4.7% rispetto alla media
(+) | medi lineari (4.8% delta rispetto alla precedente frequenza)
Alti 2 - 16 kHz
(+) | Alti bilanciati - appena 3.4% dalla media
(±) | la linearità degli alti è media (7.3% delta rispetto alla precedente frequenza)
Nel complesso 100 - 16.000 Hz
(+) | suono nel complesso lineare (11.1% differenza dalla media)
Rispetto alla stessa classe
» 9% di tutti i dispositivi testati in questa classe è stato migliore, 3% simile, 89% peggiore
» Il migliore ha avuto un delta di 7%, medio di 18%, peggiore di 35%
Rispetto a tutti i dispositivi testati
» 5% di tutti i dispositivi testati in questa classe è stato migliore, 1% similare, 94% peggiore
» Il migliore ha avuto un delta di 4%, medio di 25%, peggiore di 134%
Apple MacBook Pro 16 2021 M1 Pro analisi audio
(+) | gli altoparlanti sono relativamente potenti (84.7 dB)
Bassi 100 - 315 Hz
(+) | bassi buoni - solo 3.8% dalla media
(+) | bassi in lineaa (5.2% delta rispetto alla precedente frequenza)
Medi 400 - 2000 Hz
(+) | medi bilanciati - solo only 1.3% rispetto alla media
(+) | medi lineari (2.1% delta rispetto alla precedente frequenza)
Alti 2 - 16 kHz
(+) | Alti bilanciati - appena 1.9% dalla media
(+) | alti lineari (2.7% delta rispetto alla precedente frequenza)
Nel complesso 100 - 16.000 Hz
(+) | suono nel complesso lineare (4.6% differenza dalla media)
Rispetto alla stessa classe
» 0% di tutti i dispositivi testati in questa classe è stato migliore, 0% simile, 100% peggiore
» Il migliore ha avuto un delta di 5%, medio di 18%, peggiore di 45%
Rispetto a tutti i dispositivi testati
» 0% di tutti i dispositivi testati in questa classe è stato migliore, 0% similare, 100% peggiore
» Il migliore ha avuto un delta di 4%, medio di 25%, peggiore di 134%
Gestione dell'energia
Consumo di energia
Il funzionamento al minimo su desktop può richiedere da 8 W con l'impostazione di luminosità minima fino a 29 W con l'impostazione di luminosità massima con uno sfondo completamente bianco. Questo intervallo è più ampio rispetto alla maggior parte dei computer portatili IPS, a causa del funzionamento dell'OLED. Attività come la navigazione web, l'elaborazione di testi o l'inserimento di fogli di calcolo possono scaricare la batteria più rapidamente di quanto ci si potrebbe aspettare, poiché queste finestre sono per lo più di colore bianco. Abbassare la luminosità o selezionare colori più scuri può aiutare a prolungare la durata della batteria più che su un'alternativa IPS.
Il consumo di energia quando si eseguono carichi più elevati come Witcher 3 sarebbe quasi uguale a quello che abbiamo registrato sul vecchio Precision 5680. Questo conferma i nostri dati di benchmark precedenti, che mostrano al massimo differenze di prestazioni marginali tra i due modelli.
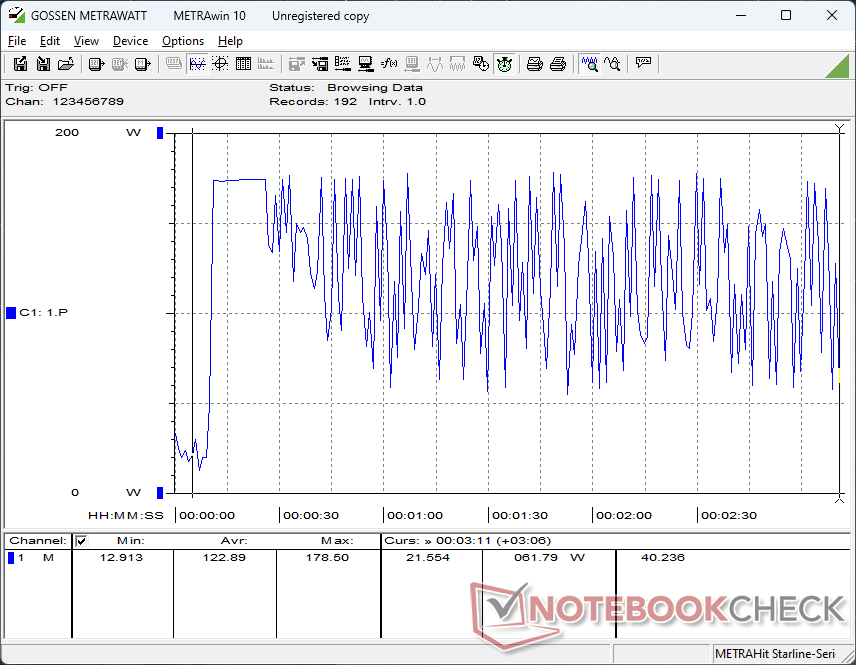
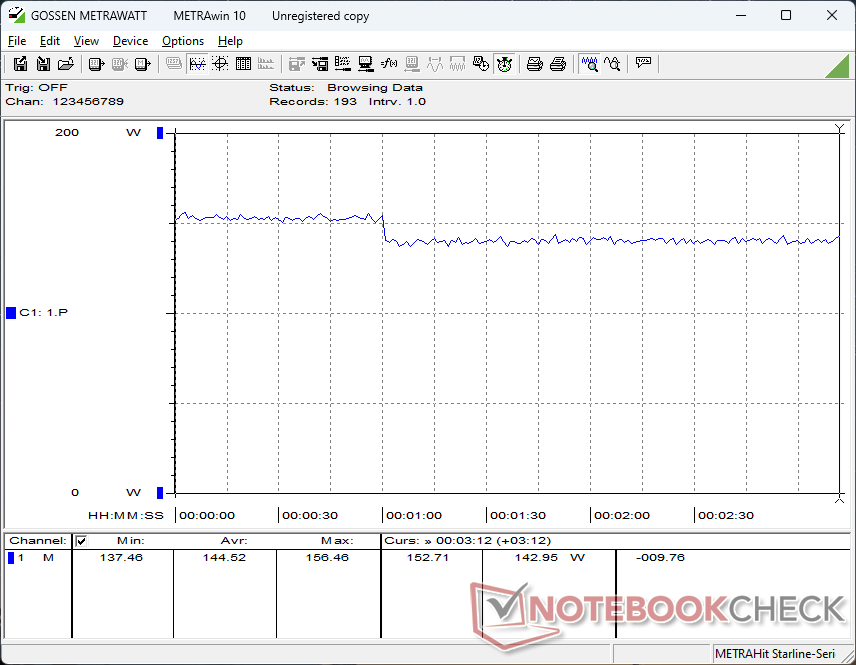
Stranamente, il consumo fluttuava in modo selvaggio quando si eseguiva lo stress Prime95, anche dopo diversi test. Per il resto, le prestazioni sembrano essere costanti.
| Off / Standby | |
| Idle | |
| Sotto carico |
|
Leggenda:
min: Attualmente utilizziamo il Metrahit Energy, un multimetro digitale professionale per la misurazione della qualità della potenza e dell'energia monofase, per le nostre misurazioni. | |
| Dell Precision 5690 Ultra 9 185H, NVIDIA RTX 5000 Ada Generation Laptop GPU, , OLED, 3840x2400, 16.00 | Dell Precision 5000 5680 i9-13900H, NVIDIA RTX 5000 Ada Generation Laptop GPU, 2x SK hynix PC801 HFS512GEJ9X101N RAID 0, OLED, 3840x2400, 16.00 | Lenovo ThinkPad P16 G2 21FA000FGE i7-13700HX, NVIDIA RTX 2000 Ada Generation Laptop GPU, SK hynix PC801 HFS001TEJ9X162N, IPS LED, 2560x1600, 16.00 | Lenovo ThinkPad P1 G6-21FV000DGE i9-13900H, NVIDIA RTX 2000 Ada Generation Laptop GPU, SK Hynix PC711 1TB HFS001TDE9X084N, IPS, 2560x1600, 16.00 | HP ZBook Fury 16 G10 i9-13950HX, NVIDIA RTX 5000 Ada Generation Laptop GPU, SK hynix PC801 HFS001TEJ9X101N, IPS, 3840x2400, 16.00 | MSI CreatorPro Z16P B12UKST i7-12700H, RTX A3000 Laptop GPU, Samsung PM9A1 MZVL21T0HCLR, IPS, 2560x1600, 16.00 | |
|---|---|---|---|---|---|---|
| Power Consumption | 6% | -5% | 10% | -39% | -9% | |
| Idle Minimum * | 7.9 | 8 -1% | 9.3 -18% | 8.3 -5% | 15.3 -94% | 10.8 -37% |
| Idle Average * | 12 | 10.4 13% | 14.1 -18% | 14.5 -21% | 18.2 -52% | 16.3 -36% |
| Idle Maximum * | 28.6 | 30.5 -7% | 15.5 46% | 15.3 47% | 28 2% | 16.9 41% |
| Load Average * | 98.8 | 75.4 24% | 133.6 -35% | 91.8 7% | 137.9 -40% | 111.7 -13% |
| Witcher 3 ultra * | 144.5 | 134 7% | 144.9 -0% | 104.7 28% | 189.4 -31% | 152.1 -5% |
| Load Maximum * | 174.8 | 175 -0% | 179.6 -3% | 164.5 6% | 202 -16% | 177.4 -1% |
* ... Meglio usare valori piccoli
Power Consumption Witcher 3 / Stresstest
Power Consumption external Monitor
Durata della batteria
I tempi di esecuzione sono circa gli stessi di prima, se non leggermente più brevi. Il nostro test WLAN durerebbe poco più di 9 ore, mentre Precision 5680 si avvicinerebbe alle 10 ore in condizioni simili.
| Dell Precision 5690 Ultra 9 185H, NVIDIA RTX 5000 Ada Generation Laptop GPU, 98 Wh | Dell Precision 5000 5680 i9-13900H, NVIDIA RTX 5000 Ada Generation Laptop GPU, 98 Wh | Lenovo ThinkPad P16 G2 21FA000FGE i7-13700HX, NVIDIA RTX 2000 Ada Generation Laptop GPU, 94 Wh | Lenovo ThinkPad P1 G6-21FV000DGE i9-13900H, NVIDIA RTX 2000 Ada Generation Laptop GPU, 90 Wh | HP ZBook Fury 16 G10 i9-13950HX, NVIDIA RTX 5000 Ada Generation Laptop GPU, 95 Wh | MSI CreatorPro Z16P B12UKST i7-12700H, RTX A3000 Laptop GPU, 90 Wh | |
|---|---|---|---|---|---|---|
| Autonomia della batteria | 8% | -6% | 3% | -21% | -37% | |
| WiFi v1.3 | 549 | 592 8% | 515 -6% | 567 3% | 435 -21% | 348 -37% |
| Reader / Idle | 1072 | |||||
| Load | 101 | 67 | ||||
| H.264 | 674 |
Pro
Contro
Verdetto - Pronto per la rivoluzione AI
Precision 5680 si presenta con un nuovo design elegante, derivato da quello dell' XPS 16 completo di CPU vPro e grafica Nvidia RTX Ada di fascia alta. In seguito sarebbe diventata una delle workstation da 16 pollici più veloci disponibili in relazione alle sue dimensioni e al suo peso. Il problema è che il Precision 5680 ha appena mezzo anno di vita ed è ancora abbastanza fresco. Il più recente Precision 5690 offre lo stesso telaio, GPU, display, livelli di consumo energetico, durata della batteria e prestazioni del processore di Precision 5680. Se vuole risparmiare un po' di soldi, il modello Precision 5680 dello scorso anno può offrire essenzialmente la stessa esperienza utente e le stesse prestazioni a un prezzo inferiore.
)(()()
Il principale fattore di differenziazione che separa il modello 2024 Precision 5690 dal modello 2023 Precision 5680 è rappresentato dalla NPU integrata nelle CPU della serie Meteor Lake-H. Il modello più recente di Dell è quindi "AI ready" quando Windows diventa ottimizzato per le attività AI locali. Se utilizza già Co-Pilot o prevede di eseguire altre applicazioni potenziate dall'AI nel prossimo futuro, ad esempio, il modello Precision 5690 dovrebbe avere un vantaggio notevole grazie all'accelerazione della NPU. Altrimenti, la maggior parte delle attività "tradizionali" non saranno notevolmente più veloci con l'ultimo modello.
Prezzo e disponibilità
Dell sta spedendo il modello Precision 5690 a partire da 2290 dollari per la CPU Core Ultra 5 135H, solo grafica integrata e display IPS da 1200p, fino a ben oltre 5000 dollari se configurato con Core Ultra 9 185H, RTX 5000 Ada e schermo OLED touchscreen da 2400p.
Dell Precision 5690
-
05/08/2024 v7
Allen Ngo
Transparency
The present review sample was made available to the author as a loan by the manufacturer or a shop for the purposes of review. The lender had no influence on this review, nor did the manufacturer receive a copy of this review before publication. There was no obligation to publish this review.
Pricecompare

