

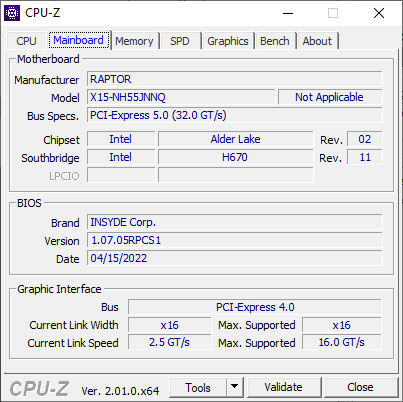
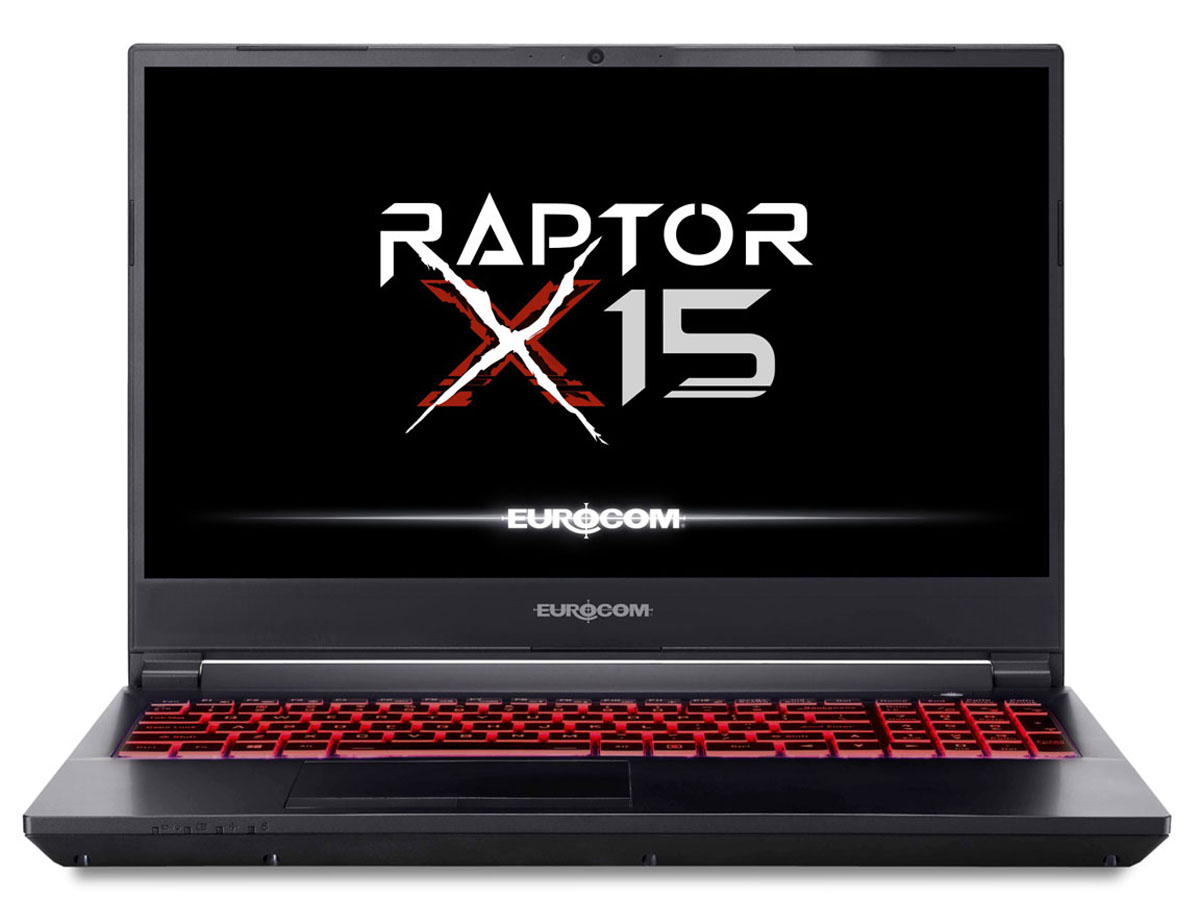
Recensione dell'Eurocom Raptor X15: Core i7-12700K LGA1700 in un portatile
Il telaio del Raptor X15 è il Clevo NH57AF1, che Schenker utilizza anche per il suo portatile XMG Apex 15. Pertanto, vi consigliamo di consultare la nostra Pagina delle recensioni di Schenker in quanto i nostri commenti sulle porte e sul design generale del modello si applicano anche al Raptor X15. Questa pagina si concentrerà invece sulle prestazioni del Raptor X15 e su ciò che gli utenti possono aspettarsi dalla CPU Core i7-12700K di 12a generazione applicata a un fattore di forma portatile.
Il Raptor X15 compete con altri portatili da gioco da 15,6 pollici non ultrasottili per appassionati, come il modello MSI GE66, Gigabyte A5 X1, Asus TUF Gaming A15, o Lenovo Legion 5 15. Tuttavia, un fattore chiave di differenziazione è l'uso di una CPU per desktop con socket LGA1700 invece di un tipico processore mobile della serie H.
Altre recensioni di Eurocom:
Potenziali concorrenti a confronto
Punteggio | Data | Modello | Peso | Altezza | Dimensione | Risoluzione | Prezzo |
|---|---|---|---|---|---|---|---|
| 86.1 % v7 (old) | 06/2022 | Eurocom Raptor X15 i7-12700K, GeForce RTX 3070 Ti Laptop GPU | 2.7 kg | 32.5 mm | 15.60" | 1920x1080 | |
| 87.4 % v7 (old) | 06/2022 | MSI Raider GE66 12UHS i9-12900HK, GeForce RTX 3080 Ti Laptop GPU | 2.4 kg | 23.4 mm | 15.60" | 3840x2160 | |
| 88.3 % v7 (old) | 05/2022 | Razer Blade 15 Advanced Model Early 2022 i7-12800H, GeForce RTX 3080 Ti Laptop GPU | 2.1 kg | 16.99 mm | 15.60" | 1920x1080 | |
| 85.2 % v7 (old) | 03/2022 | Eurocom RX315 NH57AF1 i7-11800H, GeForce RTX 3070 Laptop GPU | 2 kg | 20 mm | 15.60" | 1920x1080 | |
| 84.1 % v7 (old) | 01/2022 | Gigabyte A5 X1 R9 5900HX, GeForce RTX 3070 Laptop GPU | 2.2 kg | 25.3 mm | 15.60" | 1920x1080 | |
| 85 % v7 (old) | 07/2021 | Asus TUF Gaming A15 FA506QR-AZ061T R7 5800H, GeForce RTX 3070 Laptop GPU | 2.3 kg | 24 mm | 15.60" | 1920x1080 |
Caso
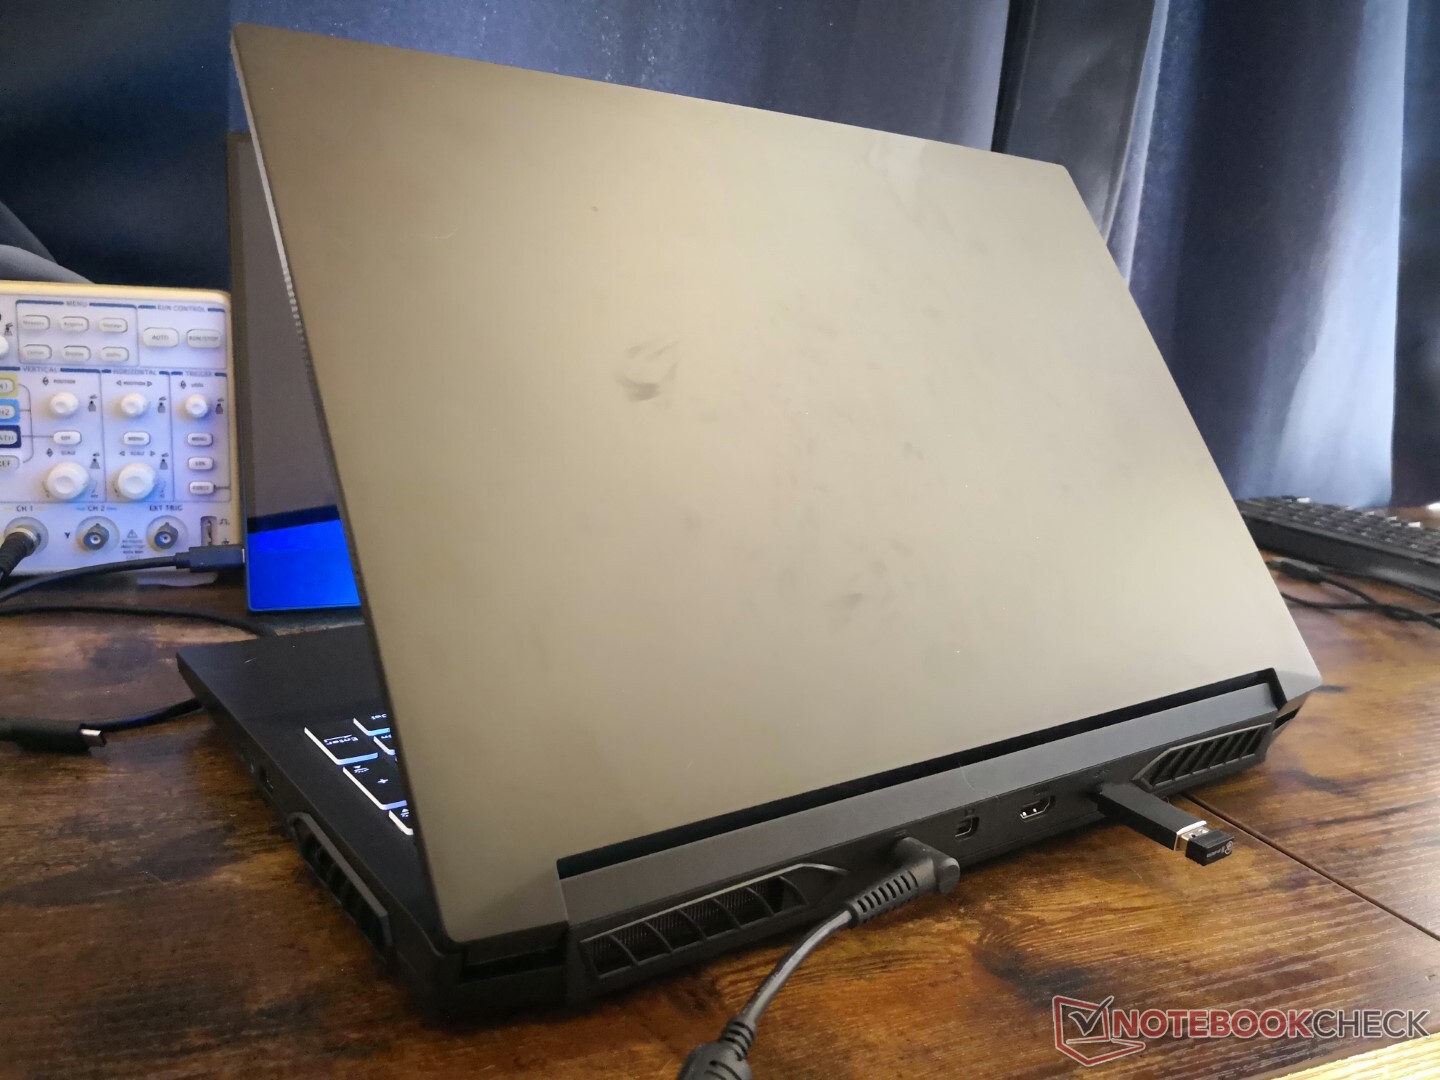
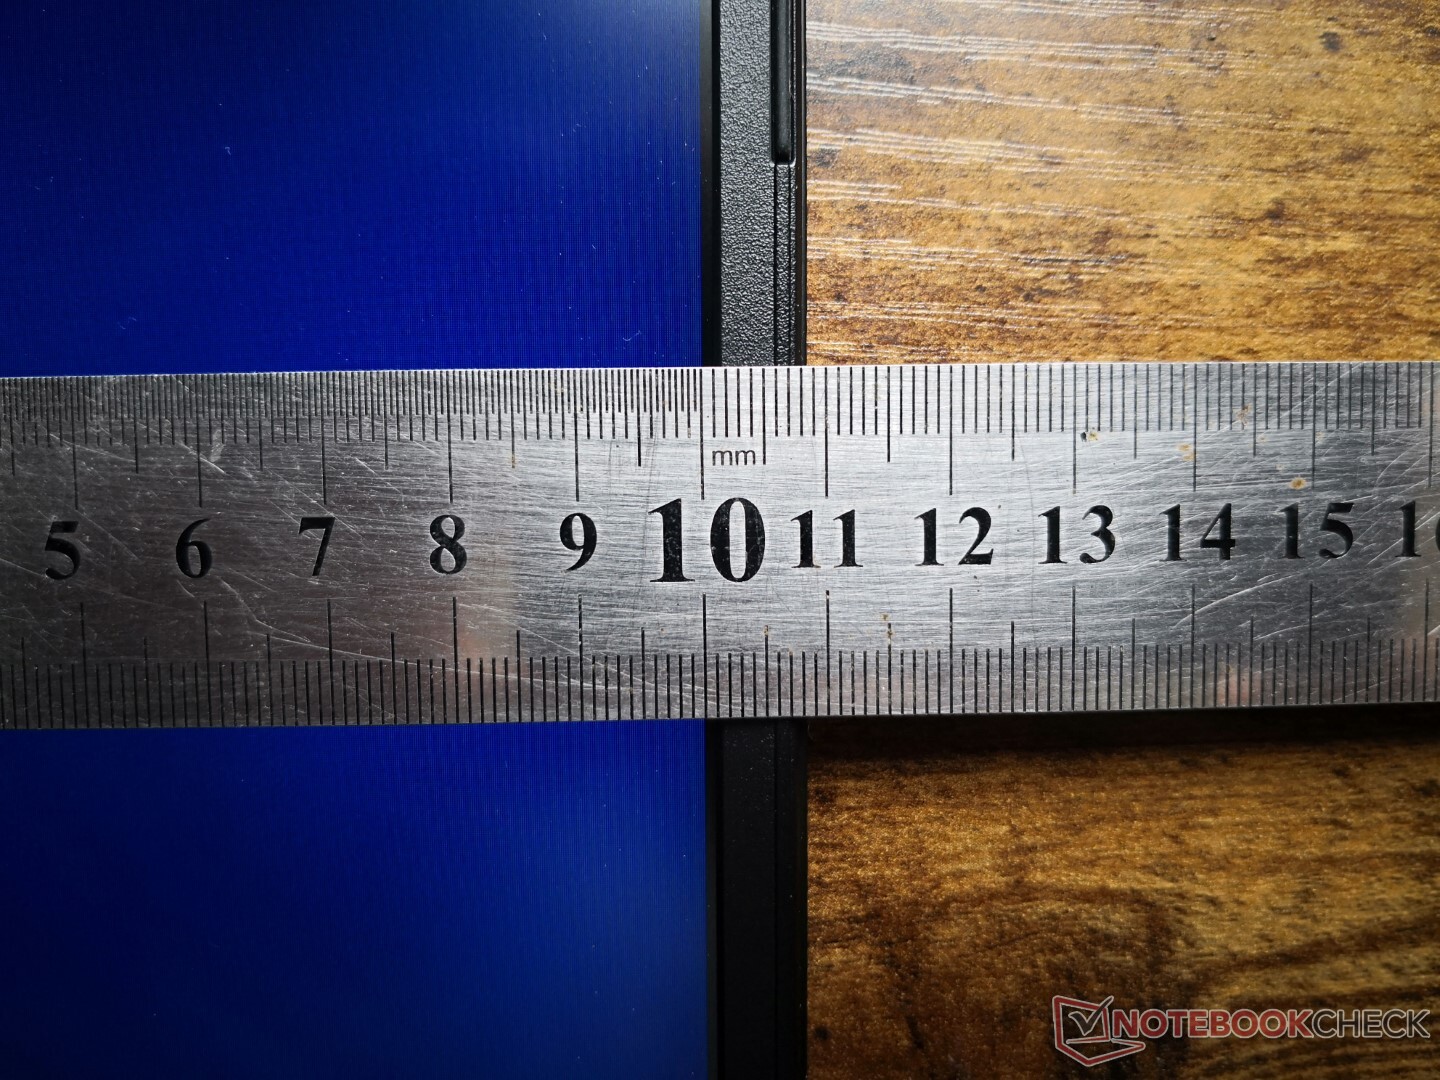
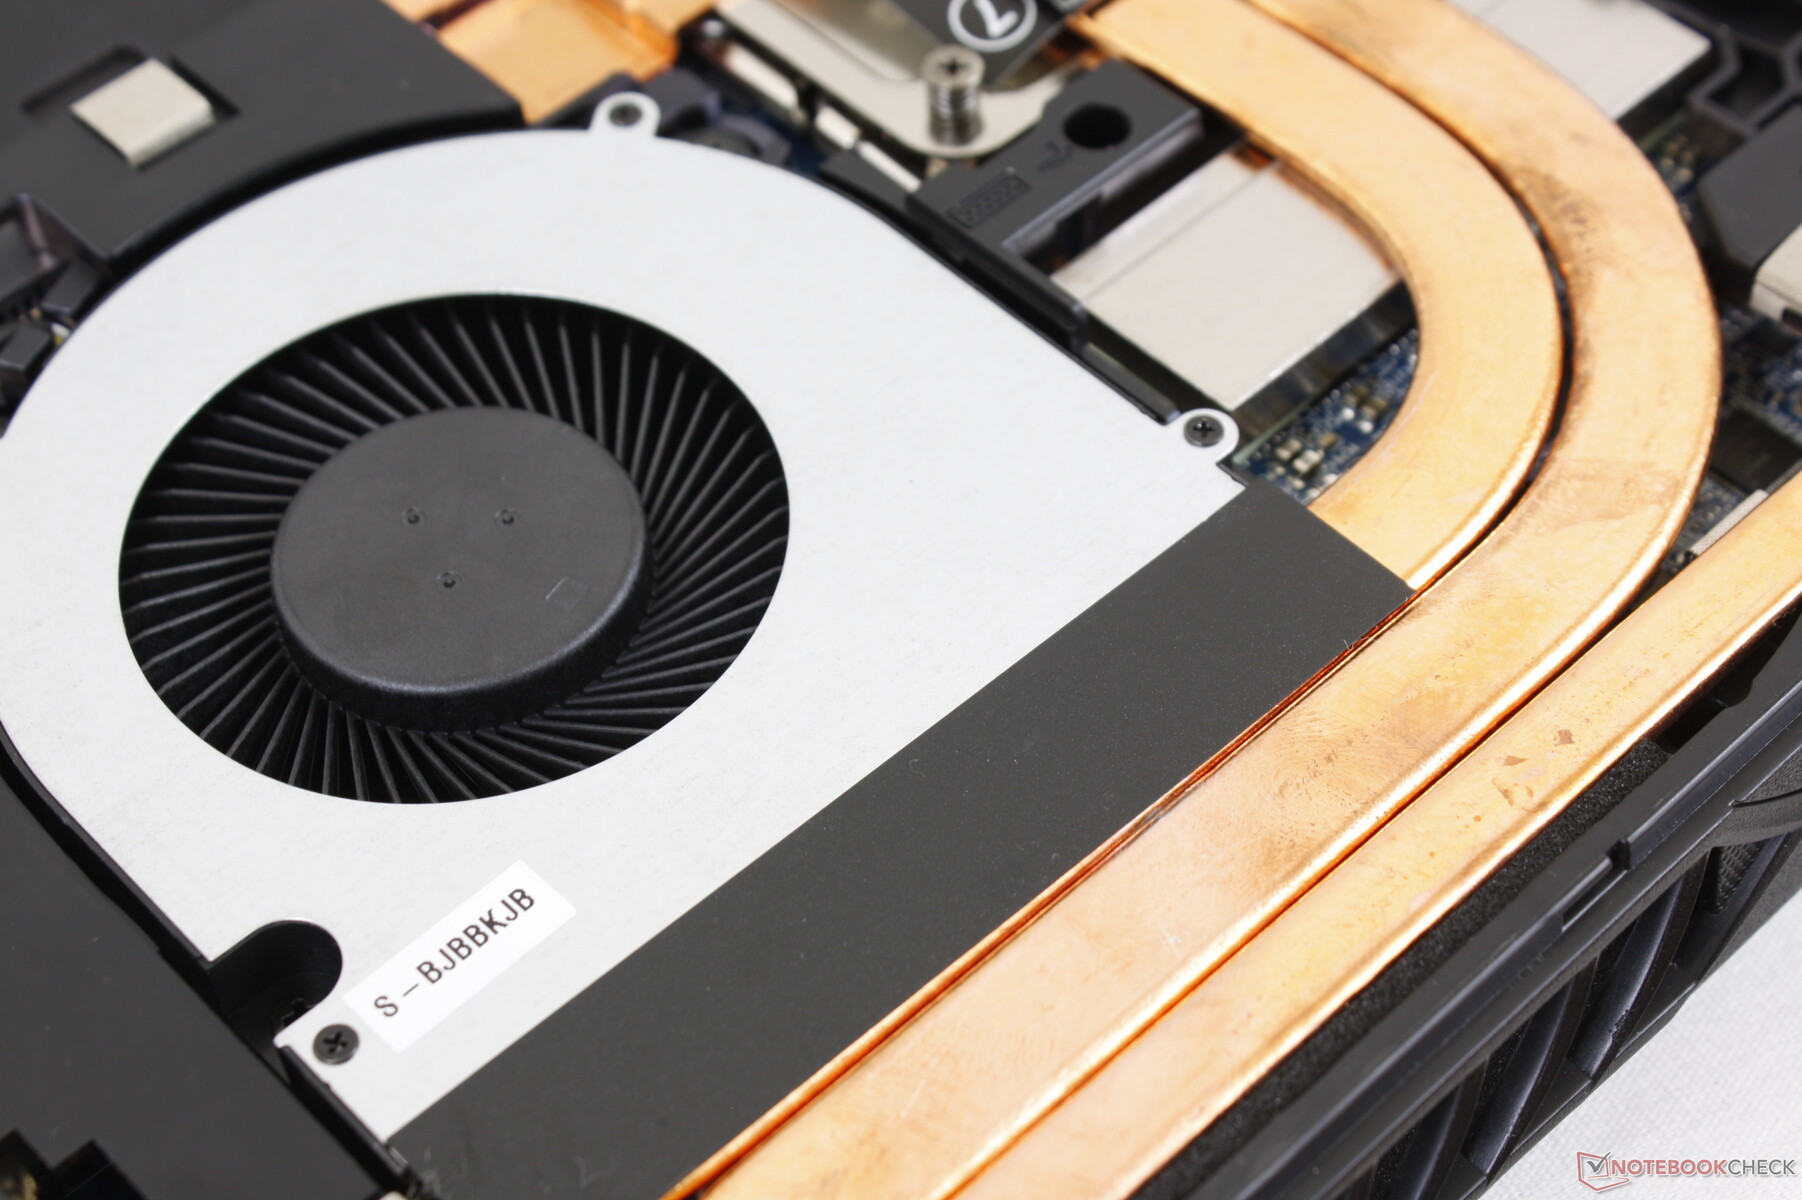
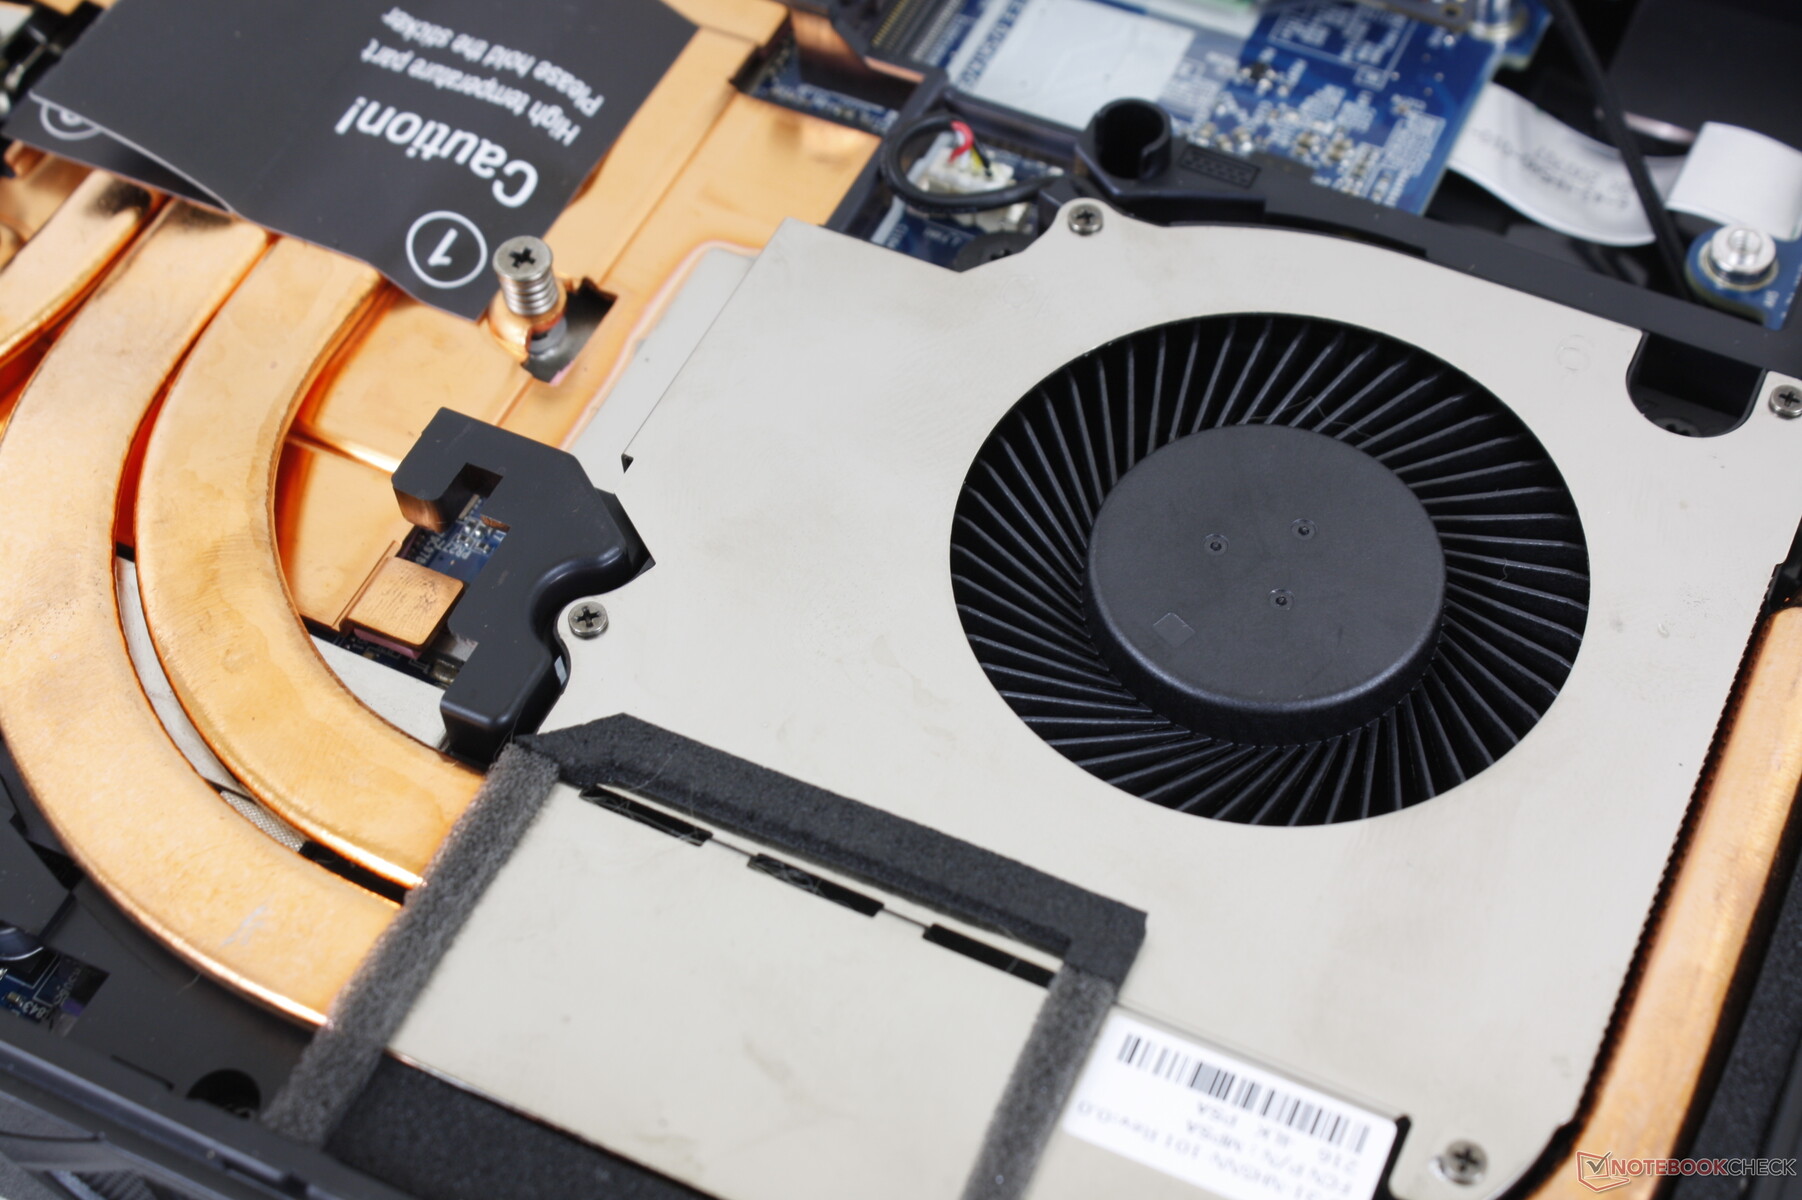
Con un peso di 2,7 kg e uno spessore di 32,5 mm, il Raptor X15 è più pesante e più spesso della maggior parte degli altri portatili da gioco da 15,6 pollici, come l'MSI GE66 o l'Asus TUF Gaming A15. Il peso extra può essere in parte attribuito alla soluzione di raffreddamento più ingombrante necessaria per ospitare e raffreddare adeguatamente il socket LGA1700 e il processore.
Connettività
Le opzioni per le porte sono varie e identiche a quelle dello Schenker XMG Apex 15. Si noti che c'è solo una porta USB-C con supporto per DisplayPort ma non per Thunderbolt o Power Delivery, a differenza di molti altri portatili da gioco alimentati da Intel come la serie Razer Blade o la serie MSI GS.
Lettore di schede SD
Stranamente, il modello integra un lettore di schede microSD invece di uno full-size, nonostante il fattore di forma grande e relativamente spesso. Le velocità di trasferimento sono nella media, meno della metà di quelle del lettore di schede del Dell XPS 15 Dell XPS 15.
| SD Card Reader | |
| average JPG Copy Test (av. of 3 runs) | |
| Dell XPS 15 9510 i5 11400H FHD (AV Pro V60) | |
| Asus ZenBook Flip 14 UN5401QA-KN085W (AV Pro SD microSD 128 GB V60) | |
| Asus Zenbook Pro 15 OLED UM535Q (Toshiba Exceria Pro SDXC 64 GB UHS-II) | |
| Eurocom Raptor X15 (AV Pro V60) | |
| Asus ZenBook 14X OLED UX5400EA-L7154W | |
| maximum AS SSD Seq Read Test (1GB) | |
| Dell XPS 15 9510 i5 11400H FHD (AV Pro V60) | |
| Eurocom Raptor X15 (AV Pro V60) | |
| Asus ZenBook Flip 14 UN5401QA-KN085W (AV Pro SD microSD 128 GB V60) | |
| Asus Zenbook Pro 15 OLED UM535Q (Toshiba Exceria Pro SDXC 64 GB UHS-II) | |
| Asus ZenBook 14X OLED UX5400EA-L7154W | |
Comunicazione
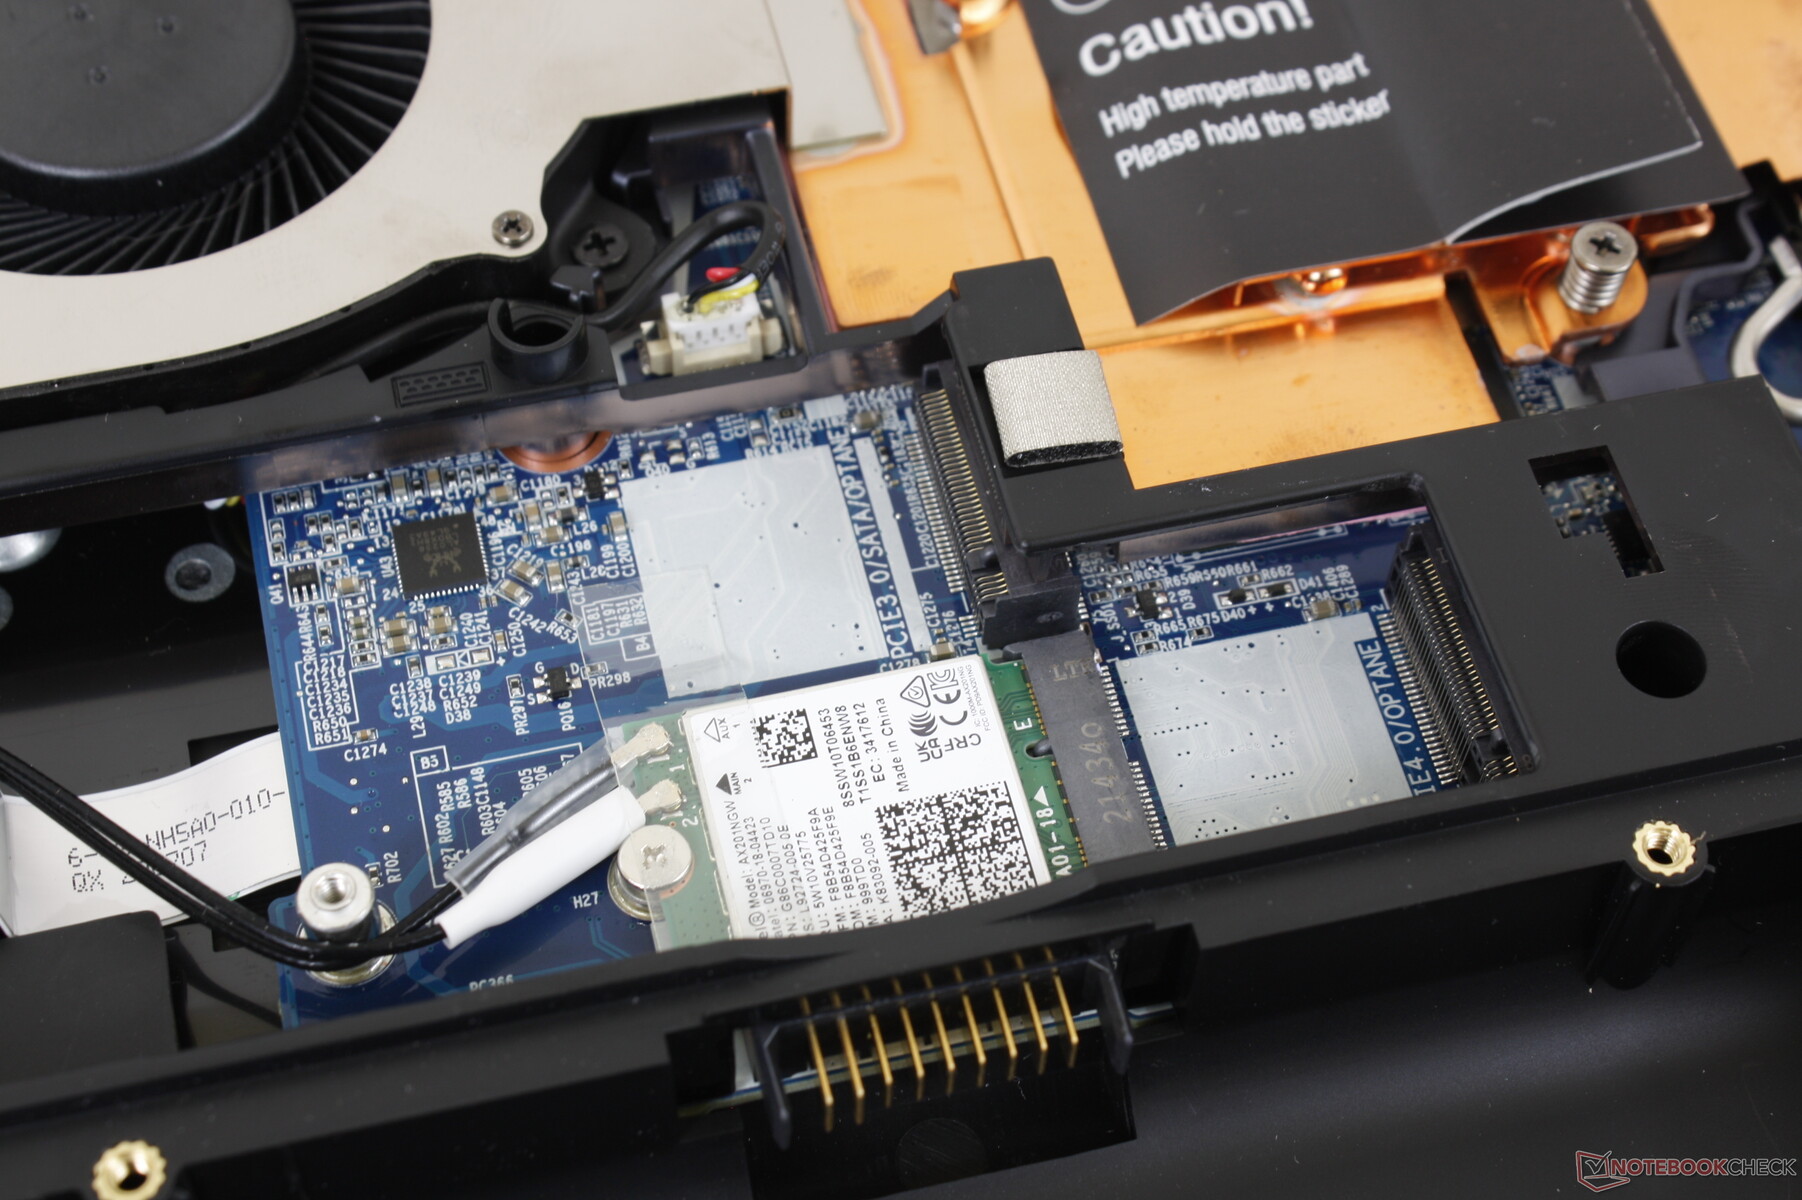
L'Intel AX200/201 è disponibile come opzione di fascia alta per la connettività Wi-Fi 6 e Bluetooth 5.2. Non abbiamo riscontrato alcun problema quando è stato abbinato al nostro router di prova Asus GT-AXE11000.
Il Wi-Fi 6E purtroppo non è compatibile.
| Networking | |
| iperf3 transmit AX12 | |
| Gigabyte A5 X1 | |
| Asus TUF Gaming A15 FA506QR-AZ061T | |
| Eurocom RX315 NH57AF1 | |
| iperf3 receive AX12 | |
| Asus TUF Gaming A15 FA506QR-AZ061T | |
| Gigabyte A5 X1 | |
| Eurocom RX315 NH57AF1 | |
| iperf3 receive AXE11000 | |
| Razer Blade 15 Advanced Model Early 2022 | |
| MSI Raider GE66 12UHS | |
| Eurocom Raptor X15 | |
| iperf3 transmit AXE11000 | |
| Razer Blade 15 Advanced Model Early 2022 | |
| MSI Raider GE66 12UHS | |
| Eurocom Raptor X15 | |
Webcam
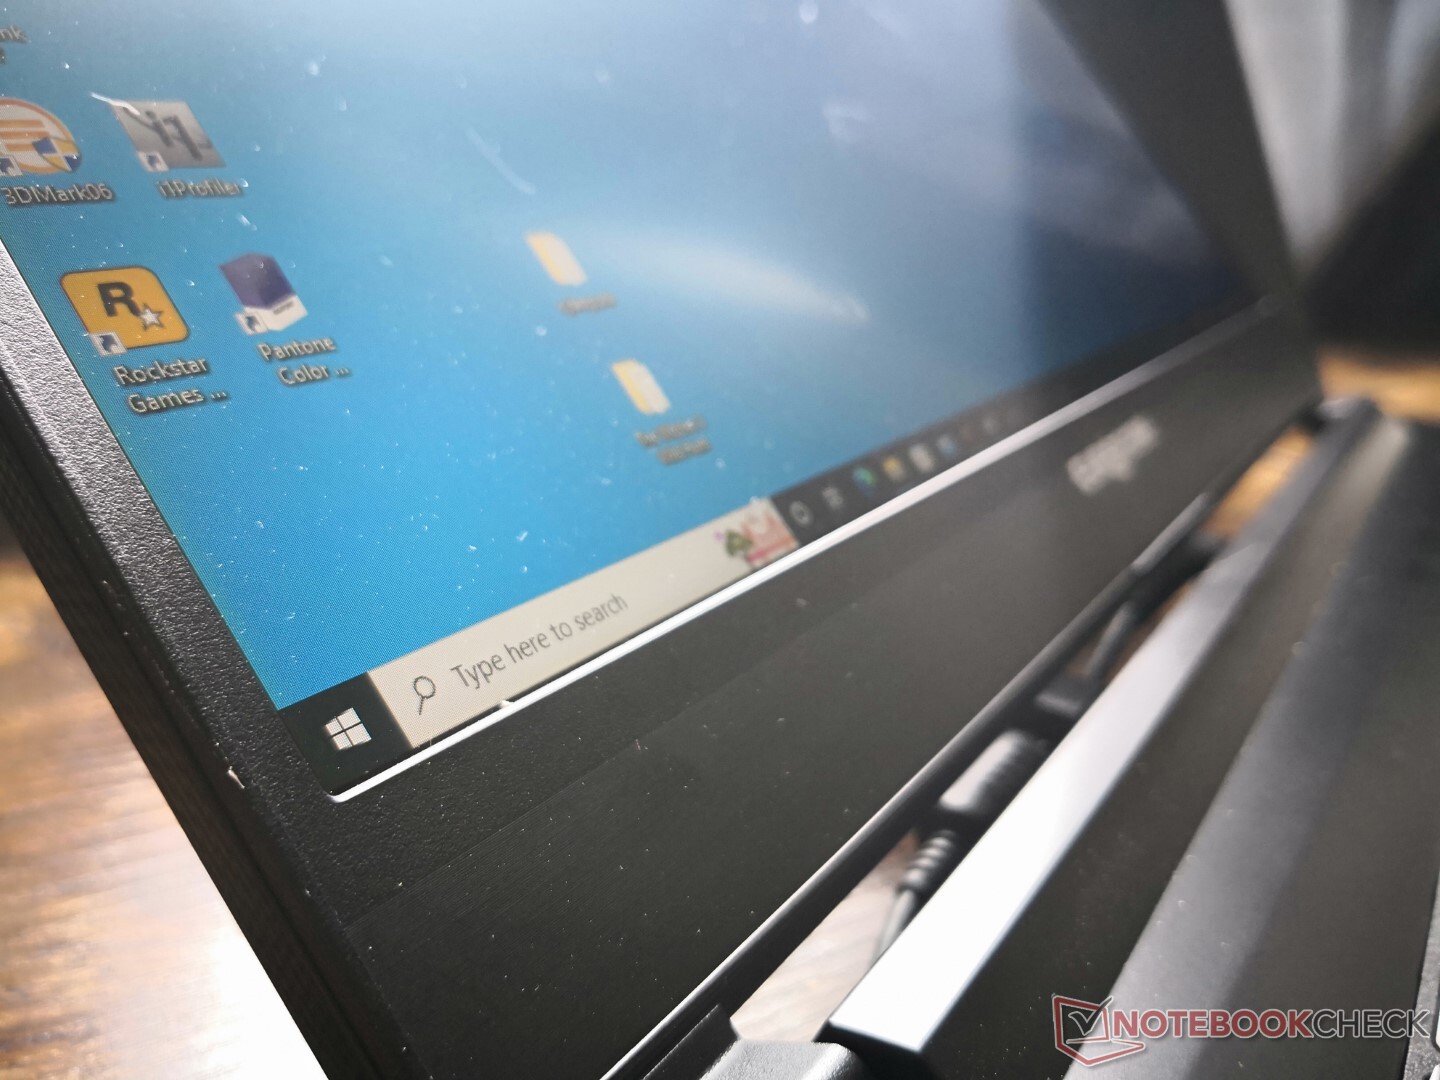
La webcam è scarsa, con una risoluzione di soli 720p rispetto ai 1080p di altri portatili da gioco come il Razer Blade 15. Non c'è nemmeno il supporto per Windows Hello. La fotocamera può essere disattivata elettronicamente tramite il tasto F10 al posto dell'otturatore fisico.


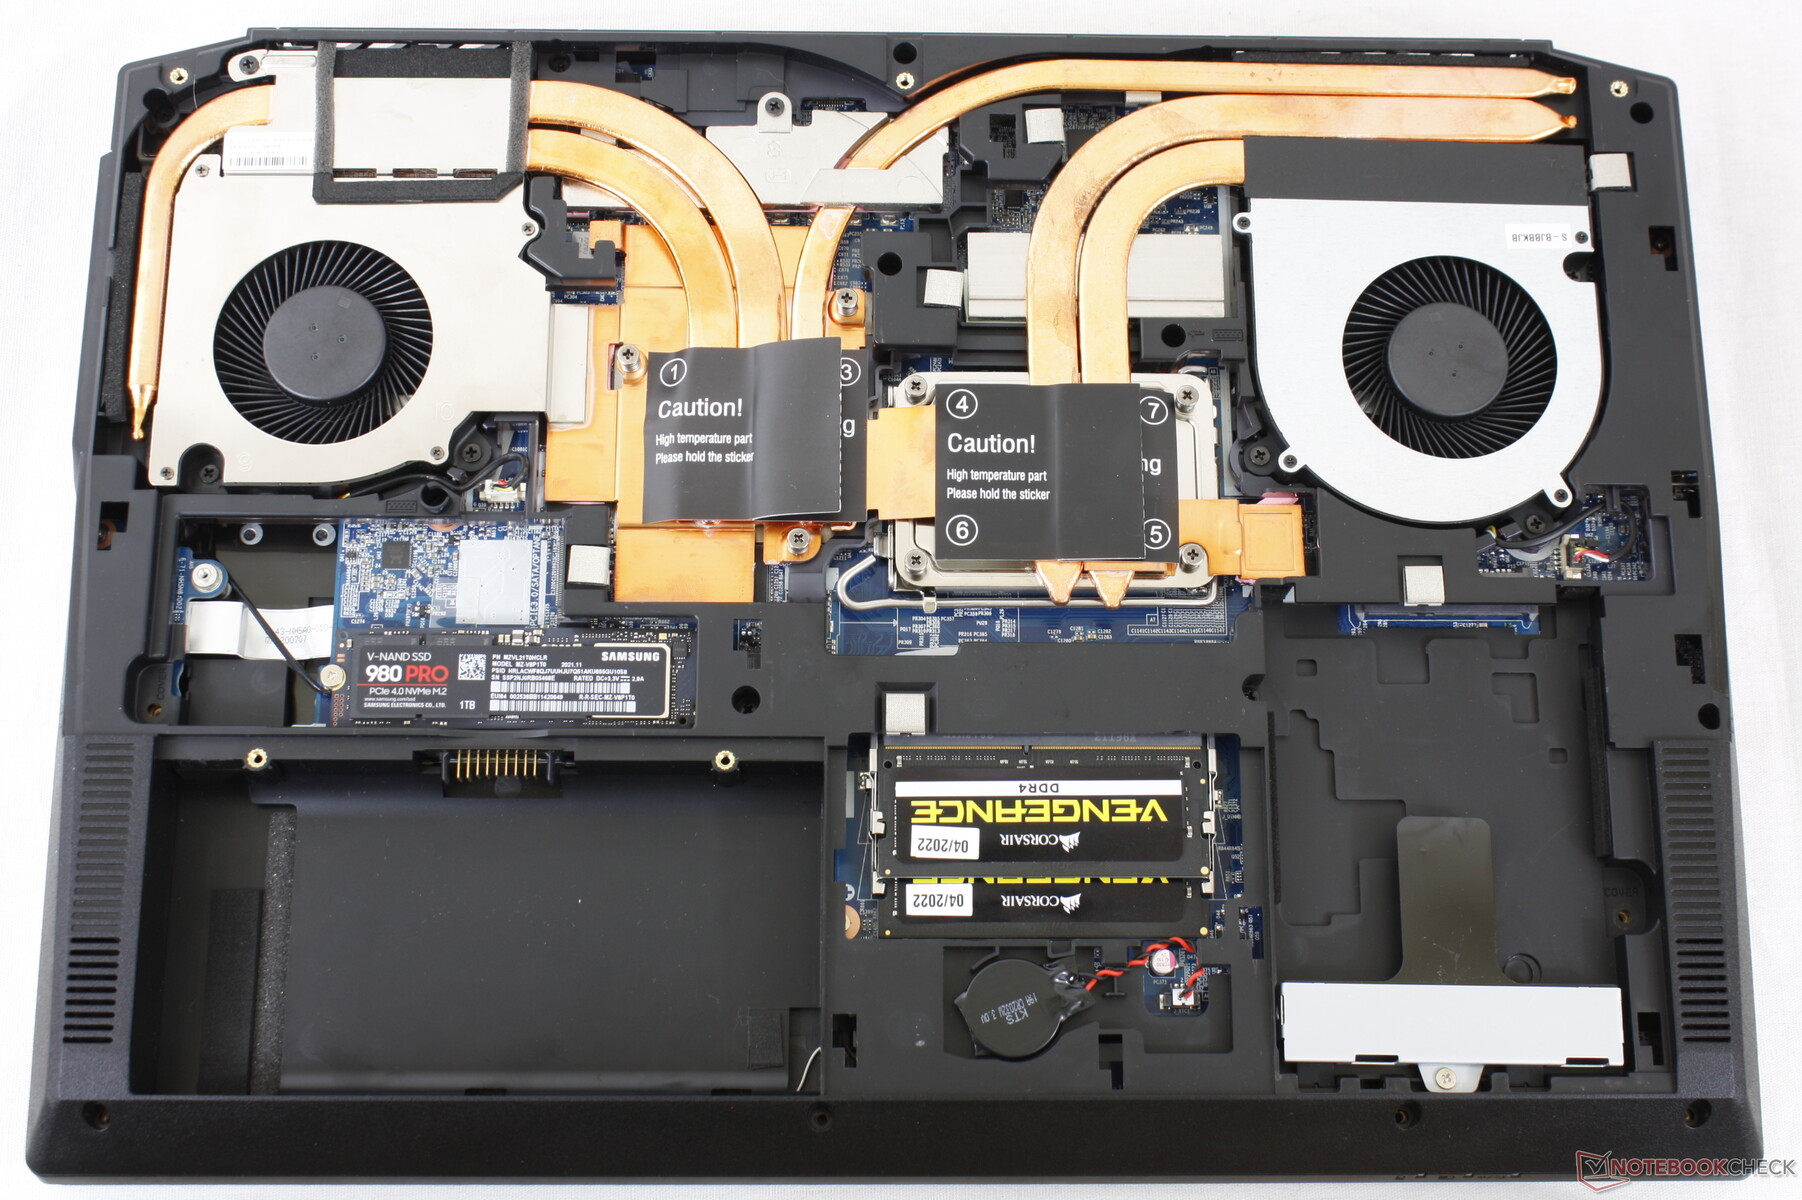
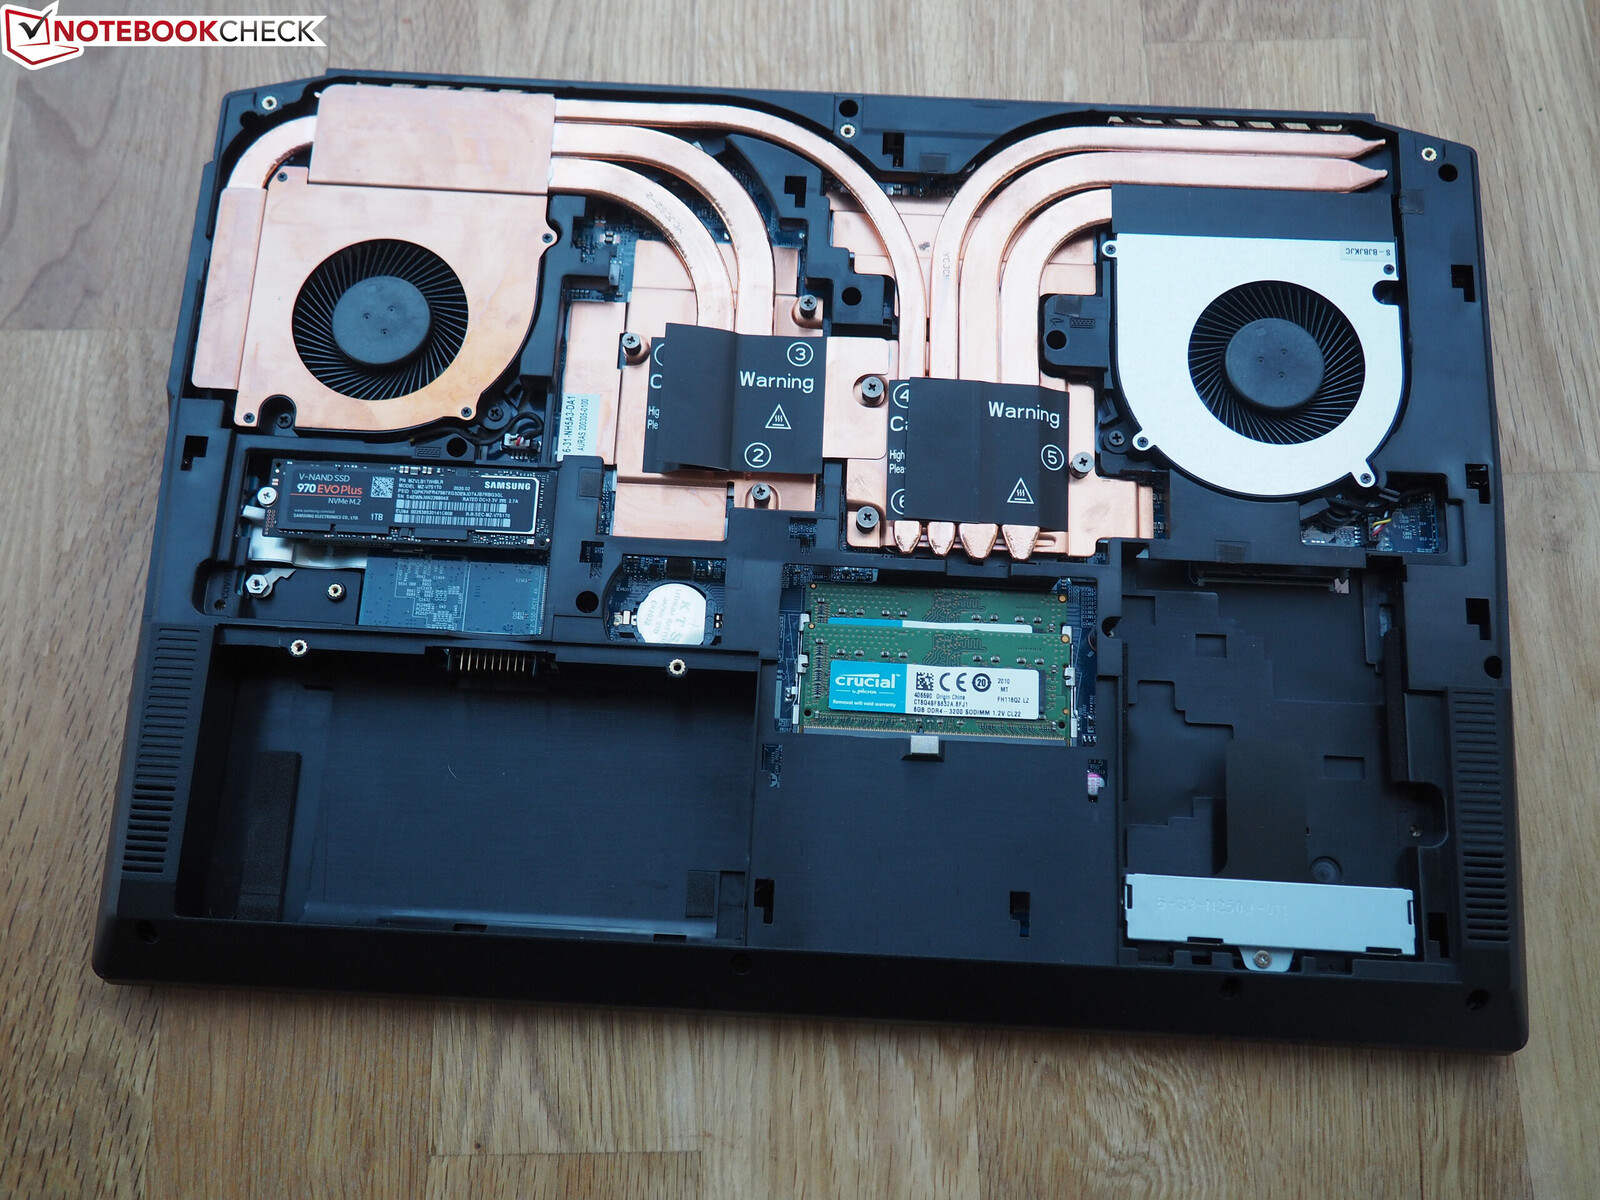
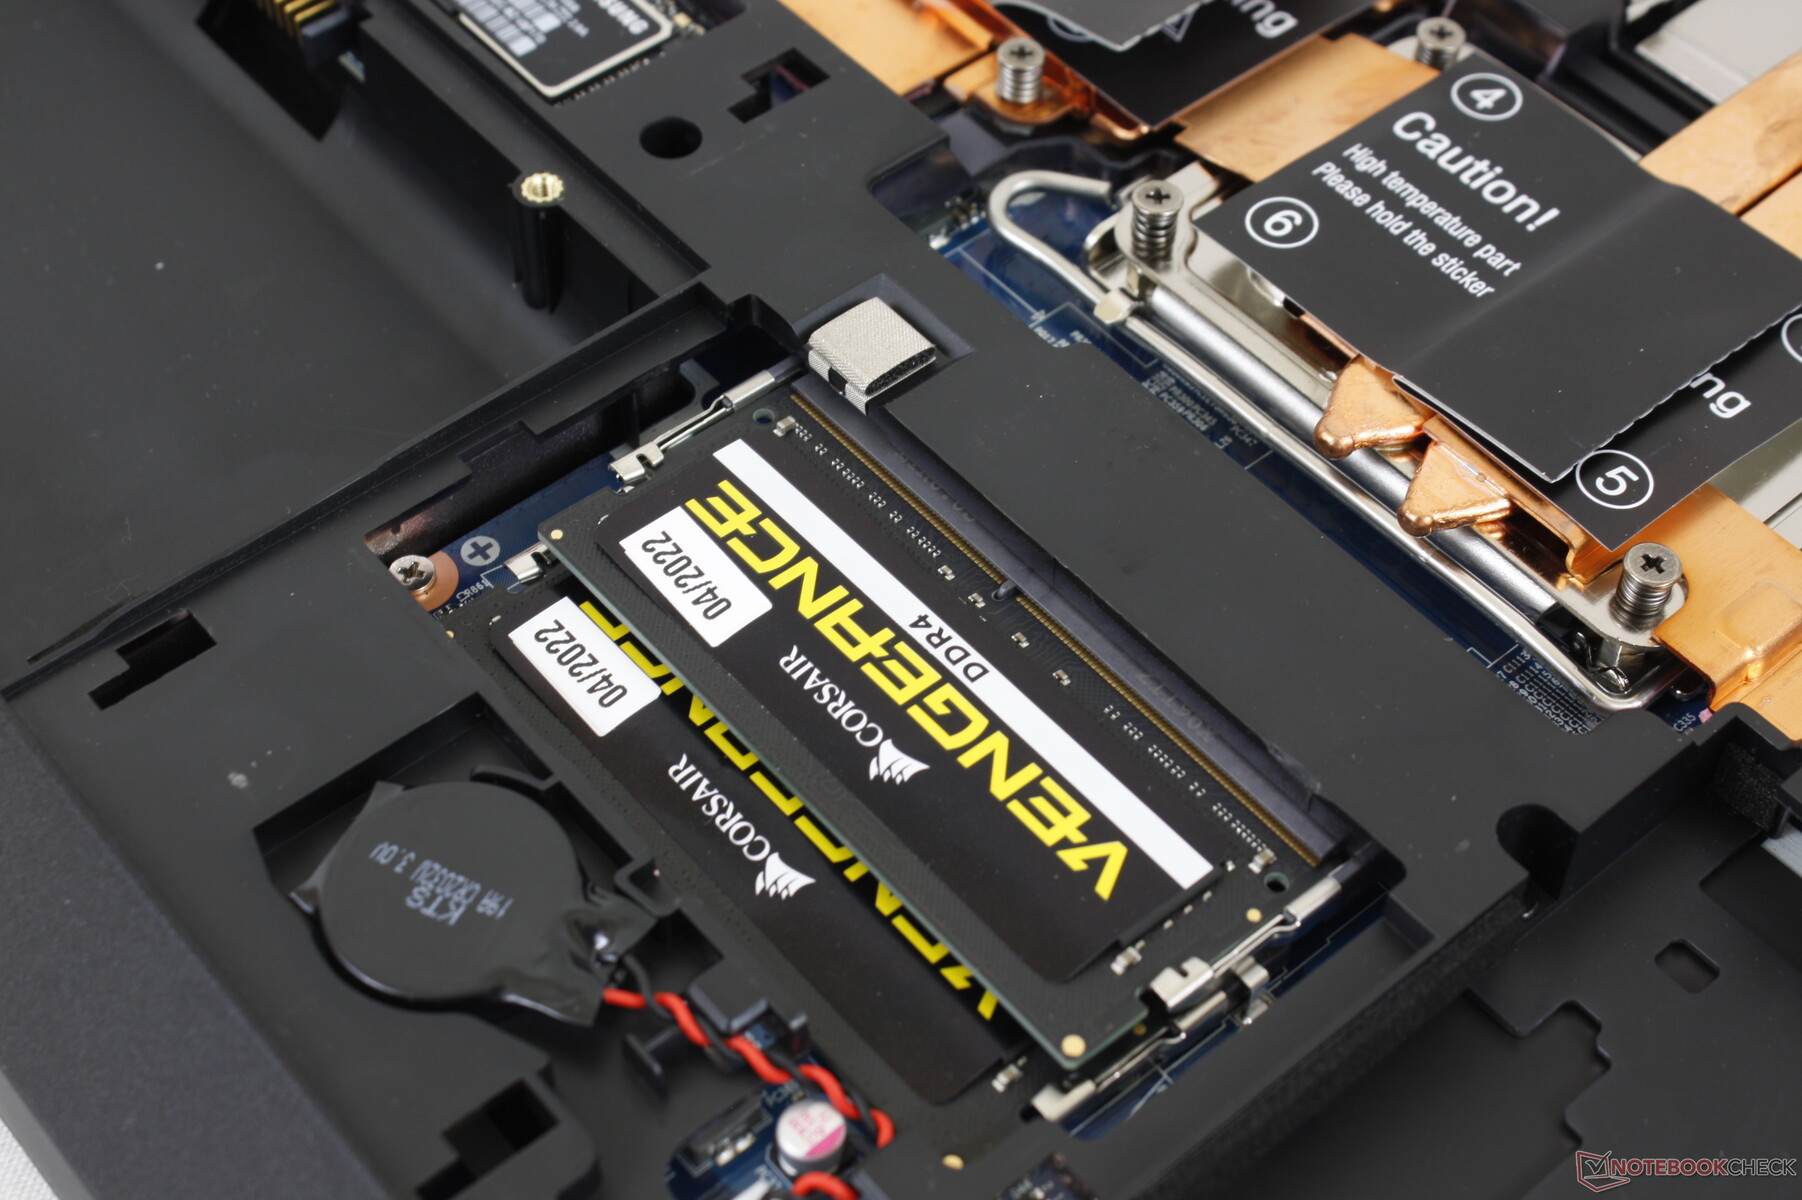
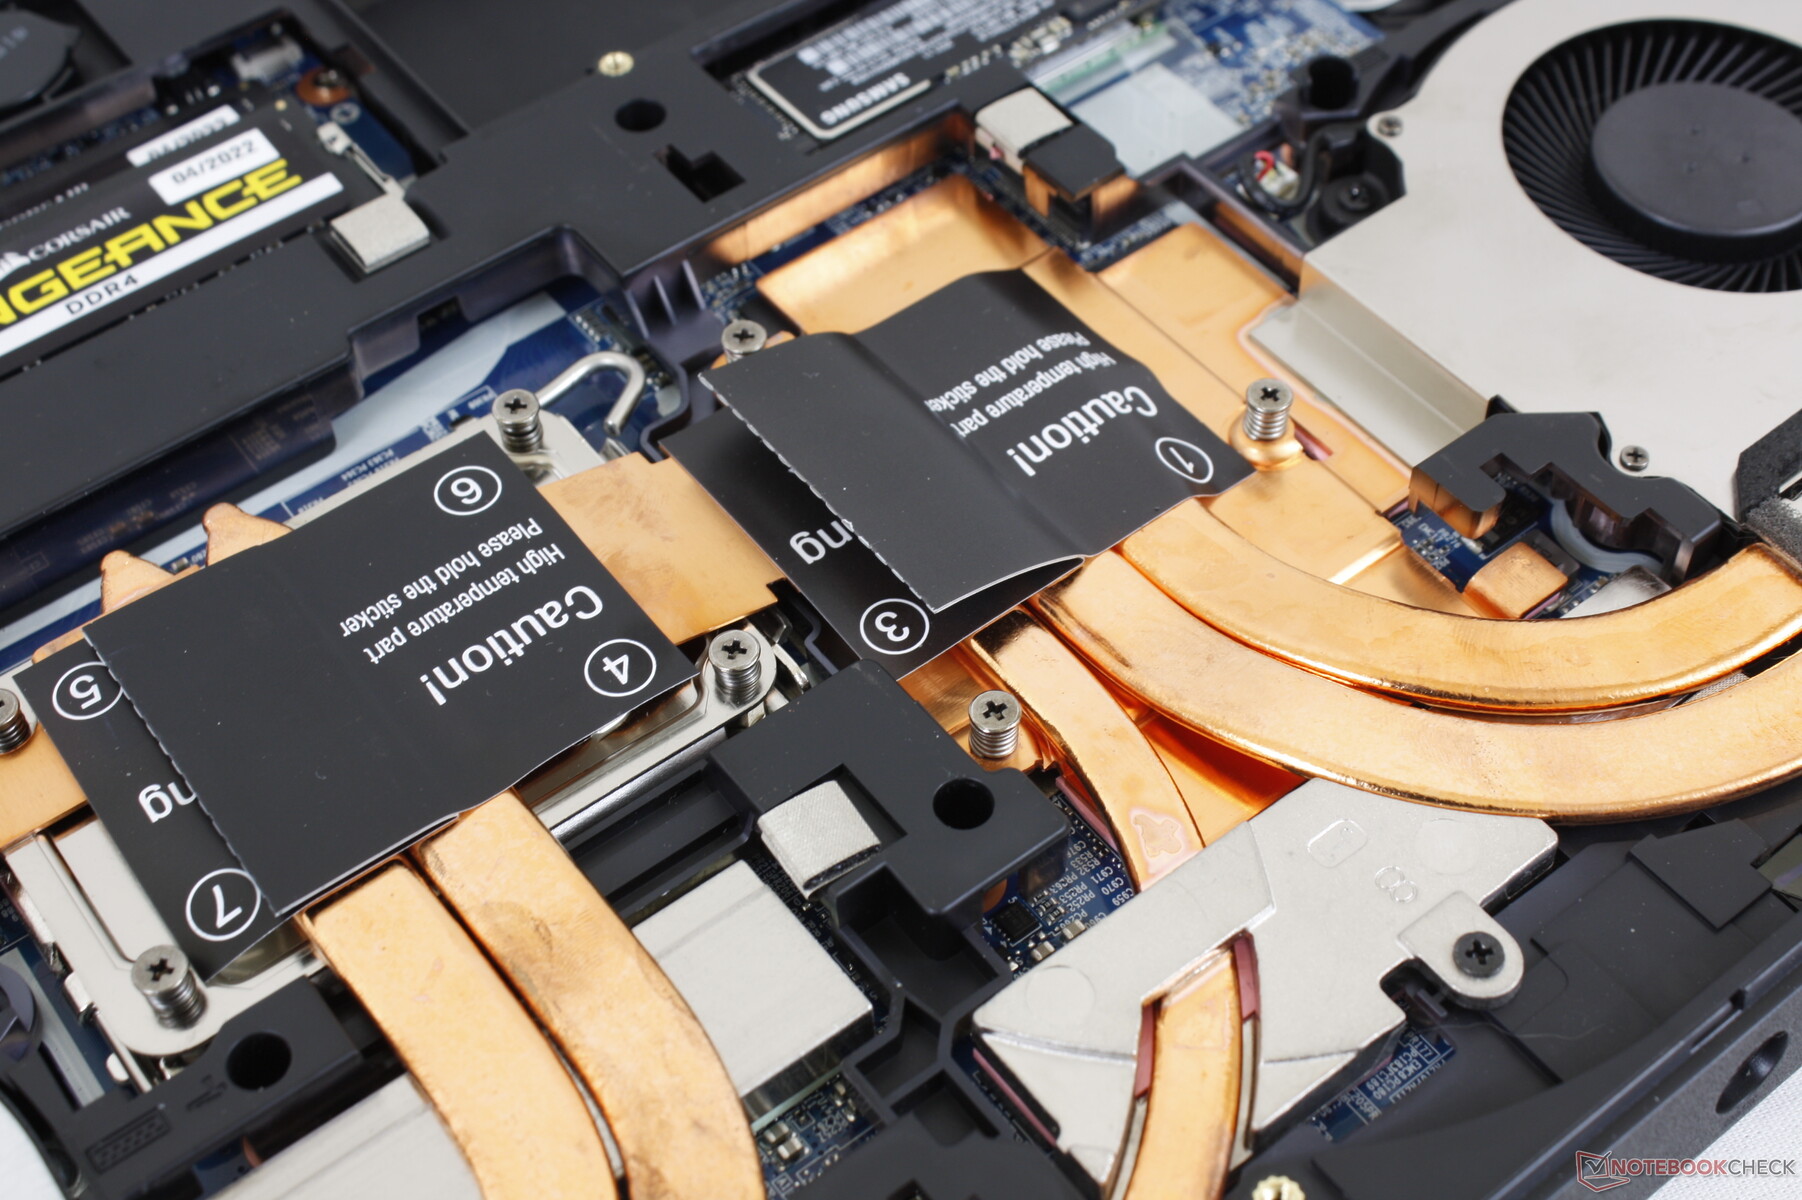
Manutenzione
Accessori e garanzia
La confezione include viti e pad per l'installazione di altre unità SSD e un disco di driver. La pasta termica per CPU non è inclusa.
La garanzia standard limitata di un anno si applica se acquistata negli Stati Uniti, con estensioni opzionali di due e tre anni.
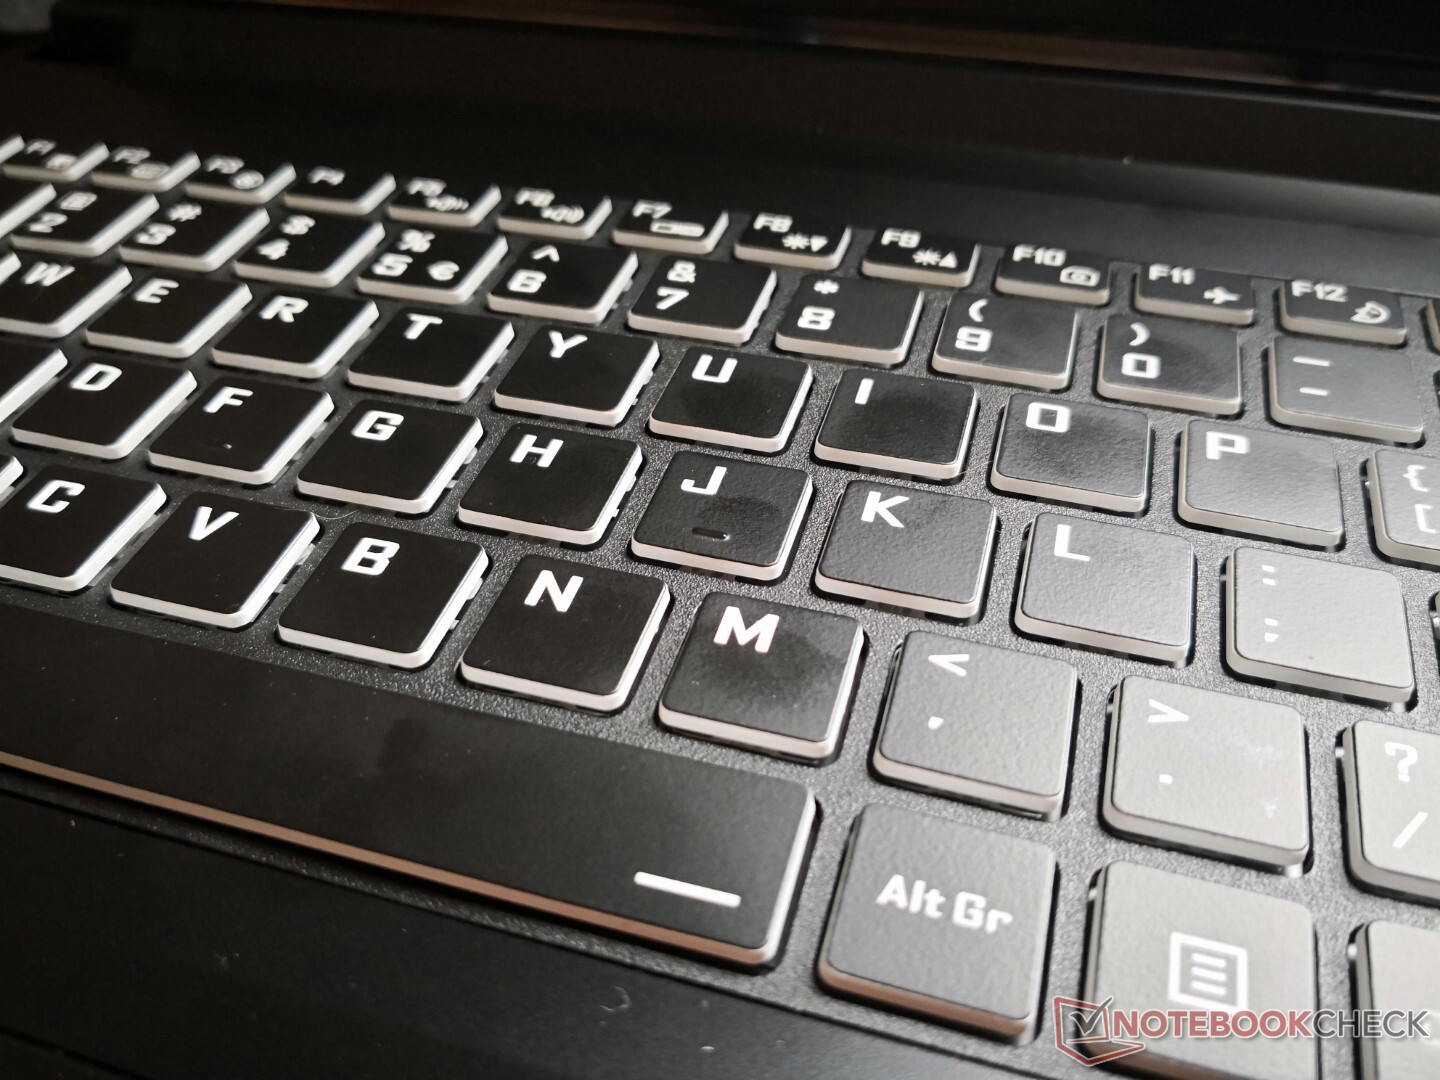
Dispositivi di ingresso
L'esperienza di digitazione è confortevole, con un feedback più deciso ma un rumore più forte rispetto a quello a cui siamo abituati su altri portatili da gioco.
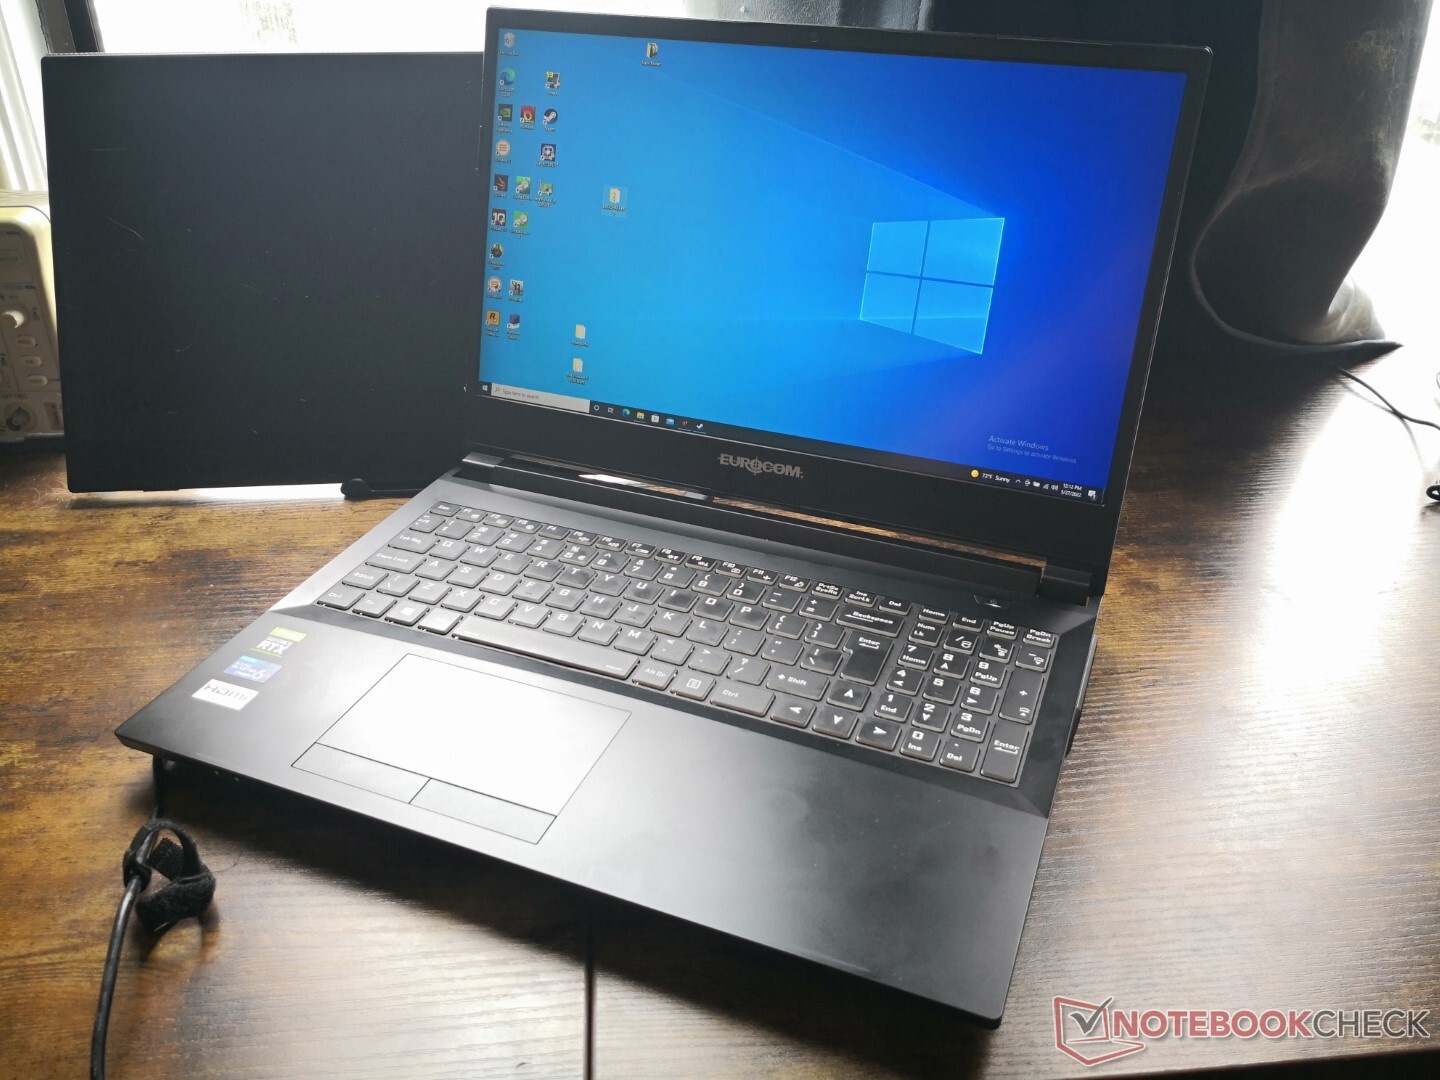
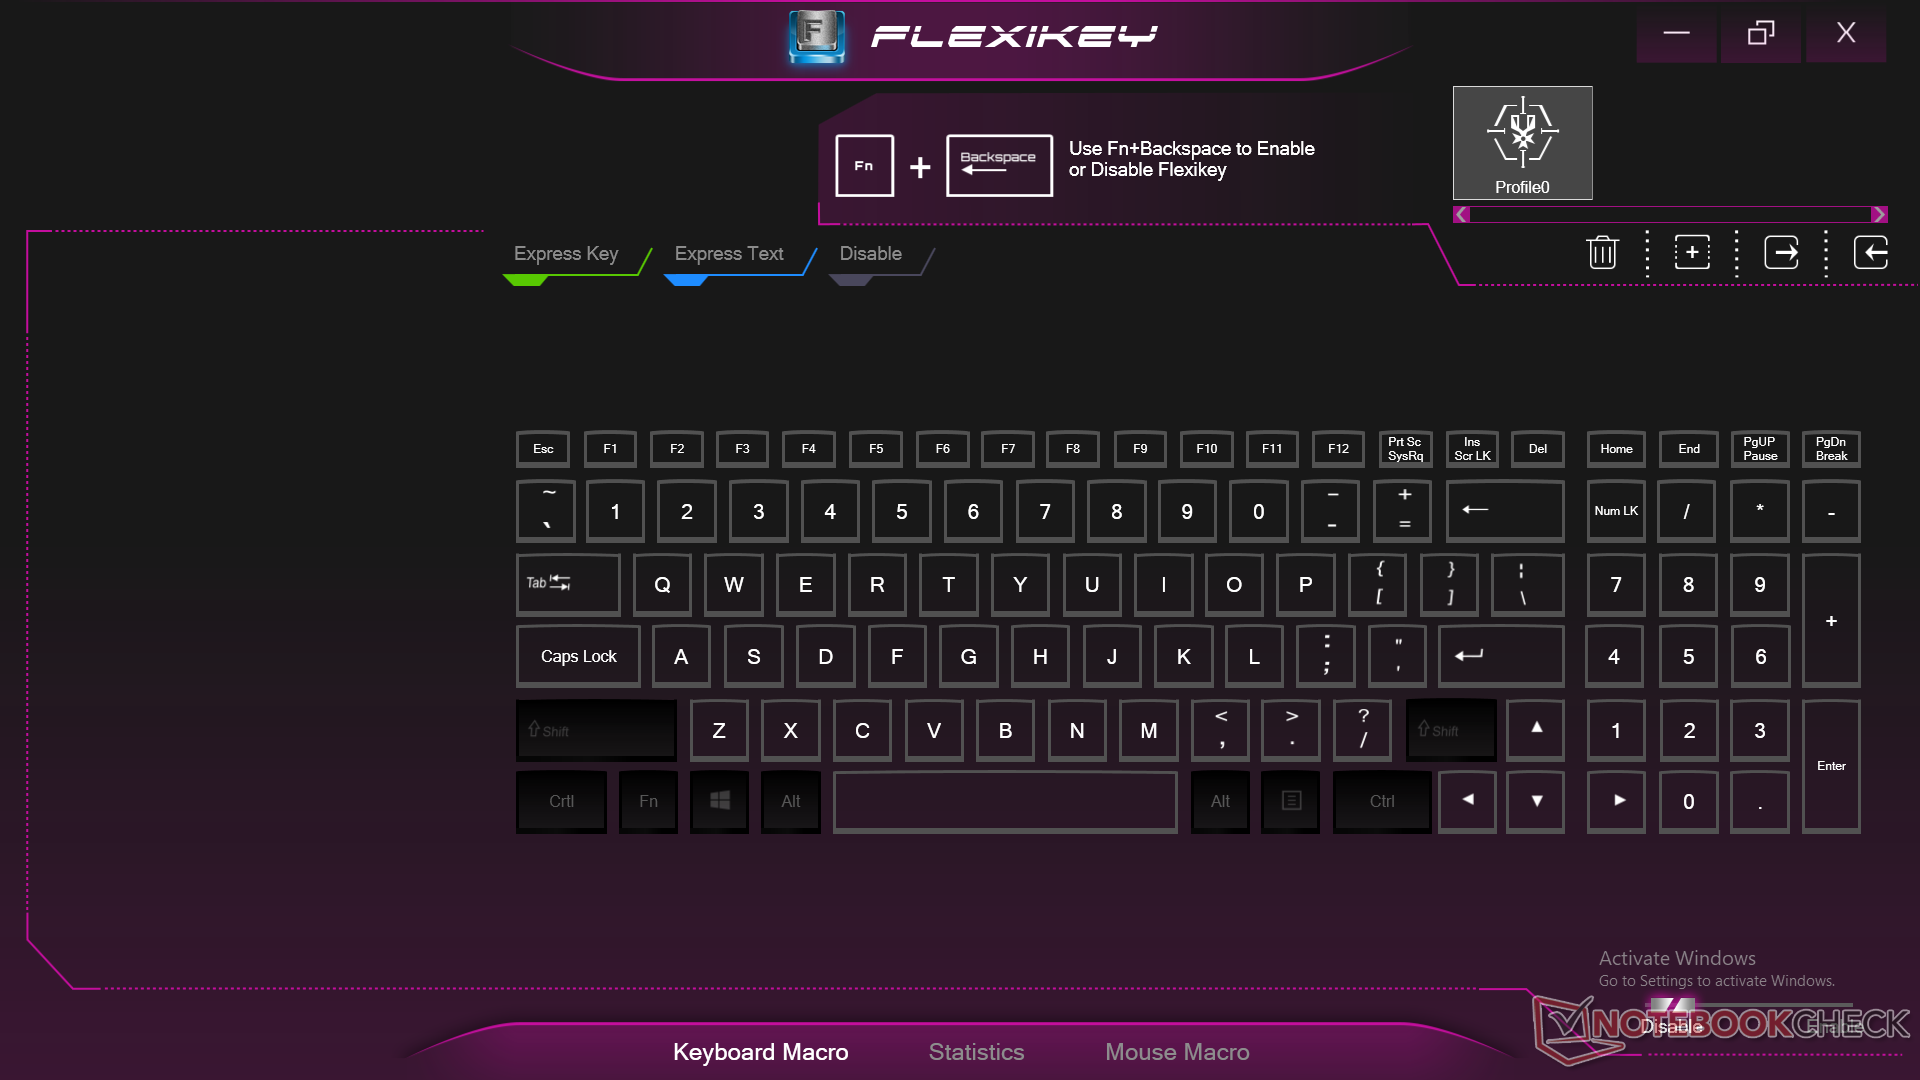
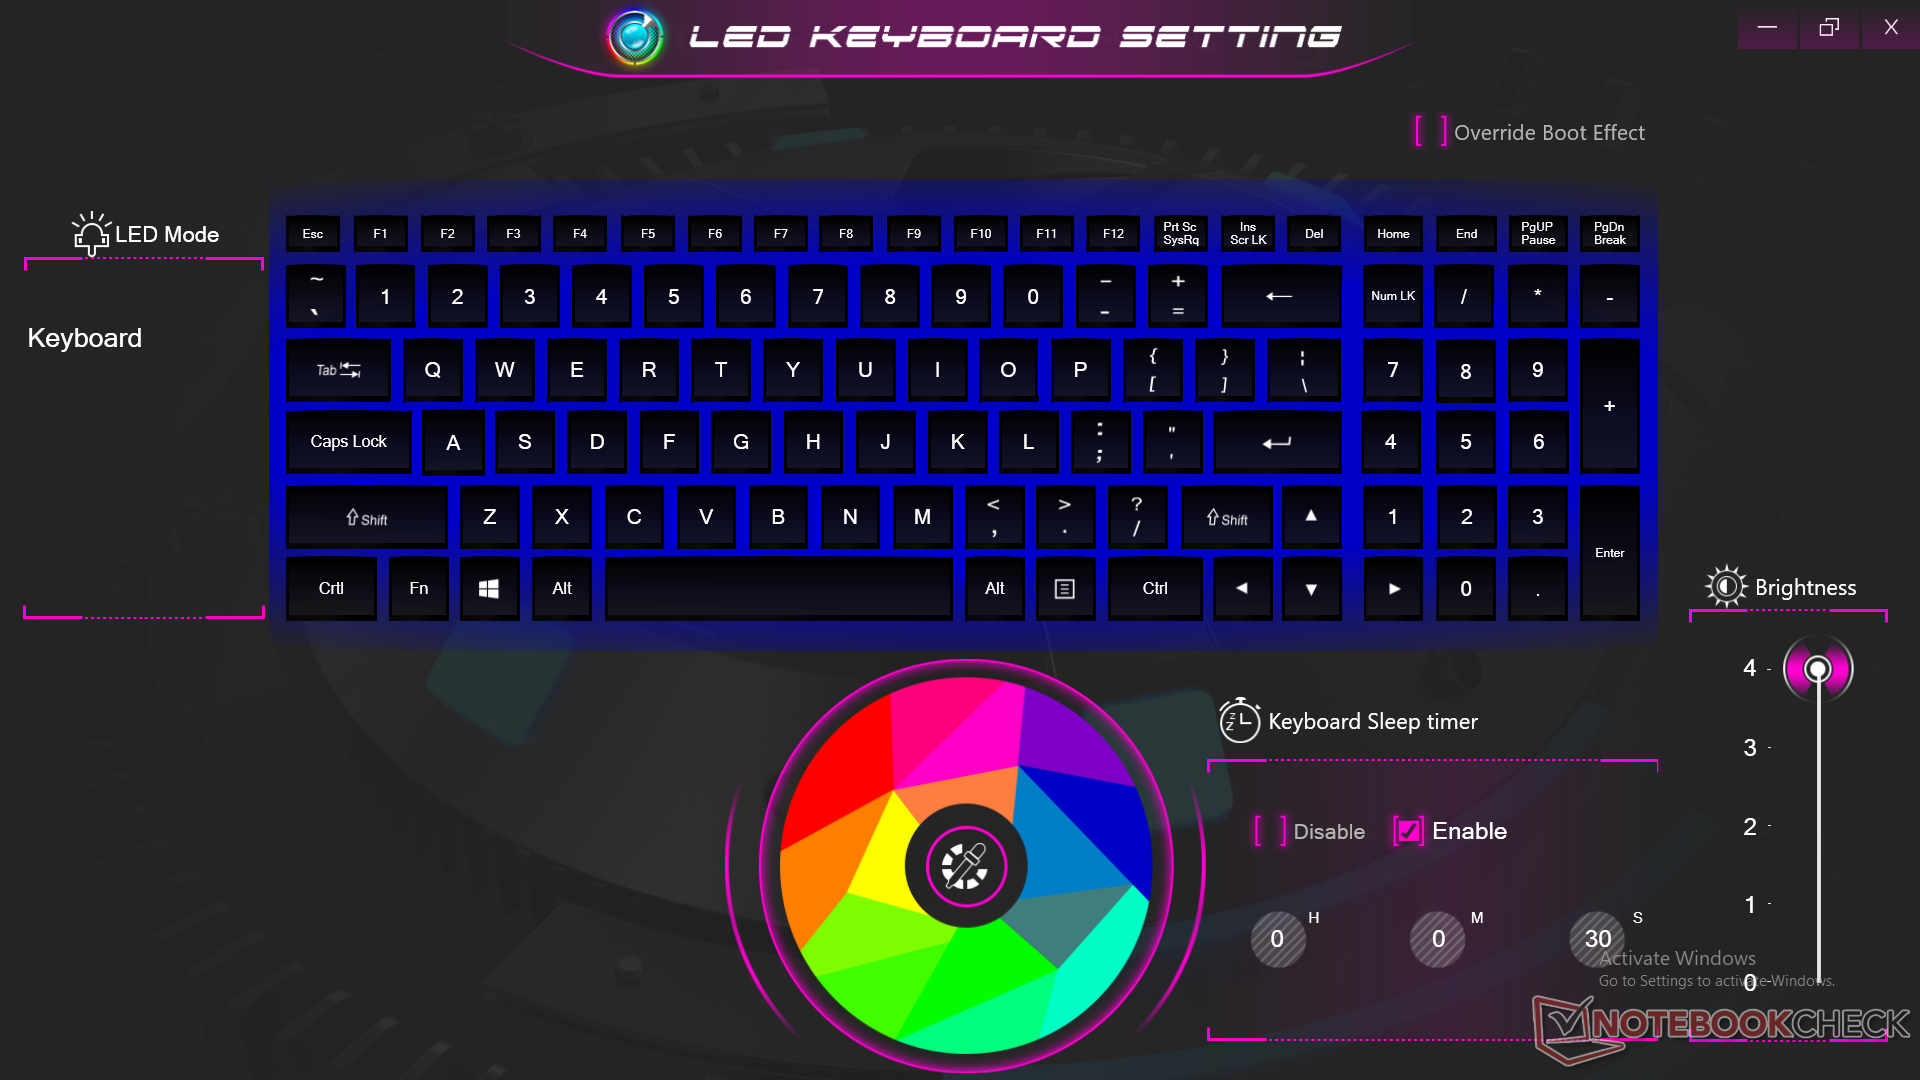
L'illuminazione della tastiera è purtroppo solo a zona singola rispetto all'illuminazione RGB a zona quadrupla o per tasto presente sulla maggior parte degli altri portatili ad alte prestazioni. Tuttavia, apprezziamo i pulsanti del mouse dedicati per facilitare gli input multi-touch.
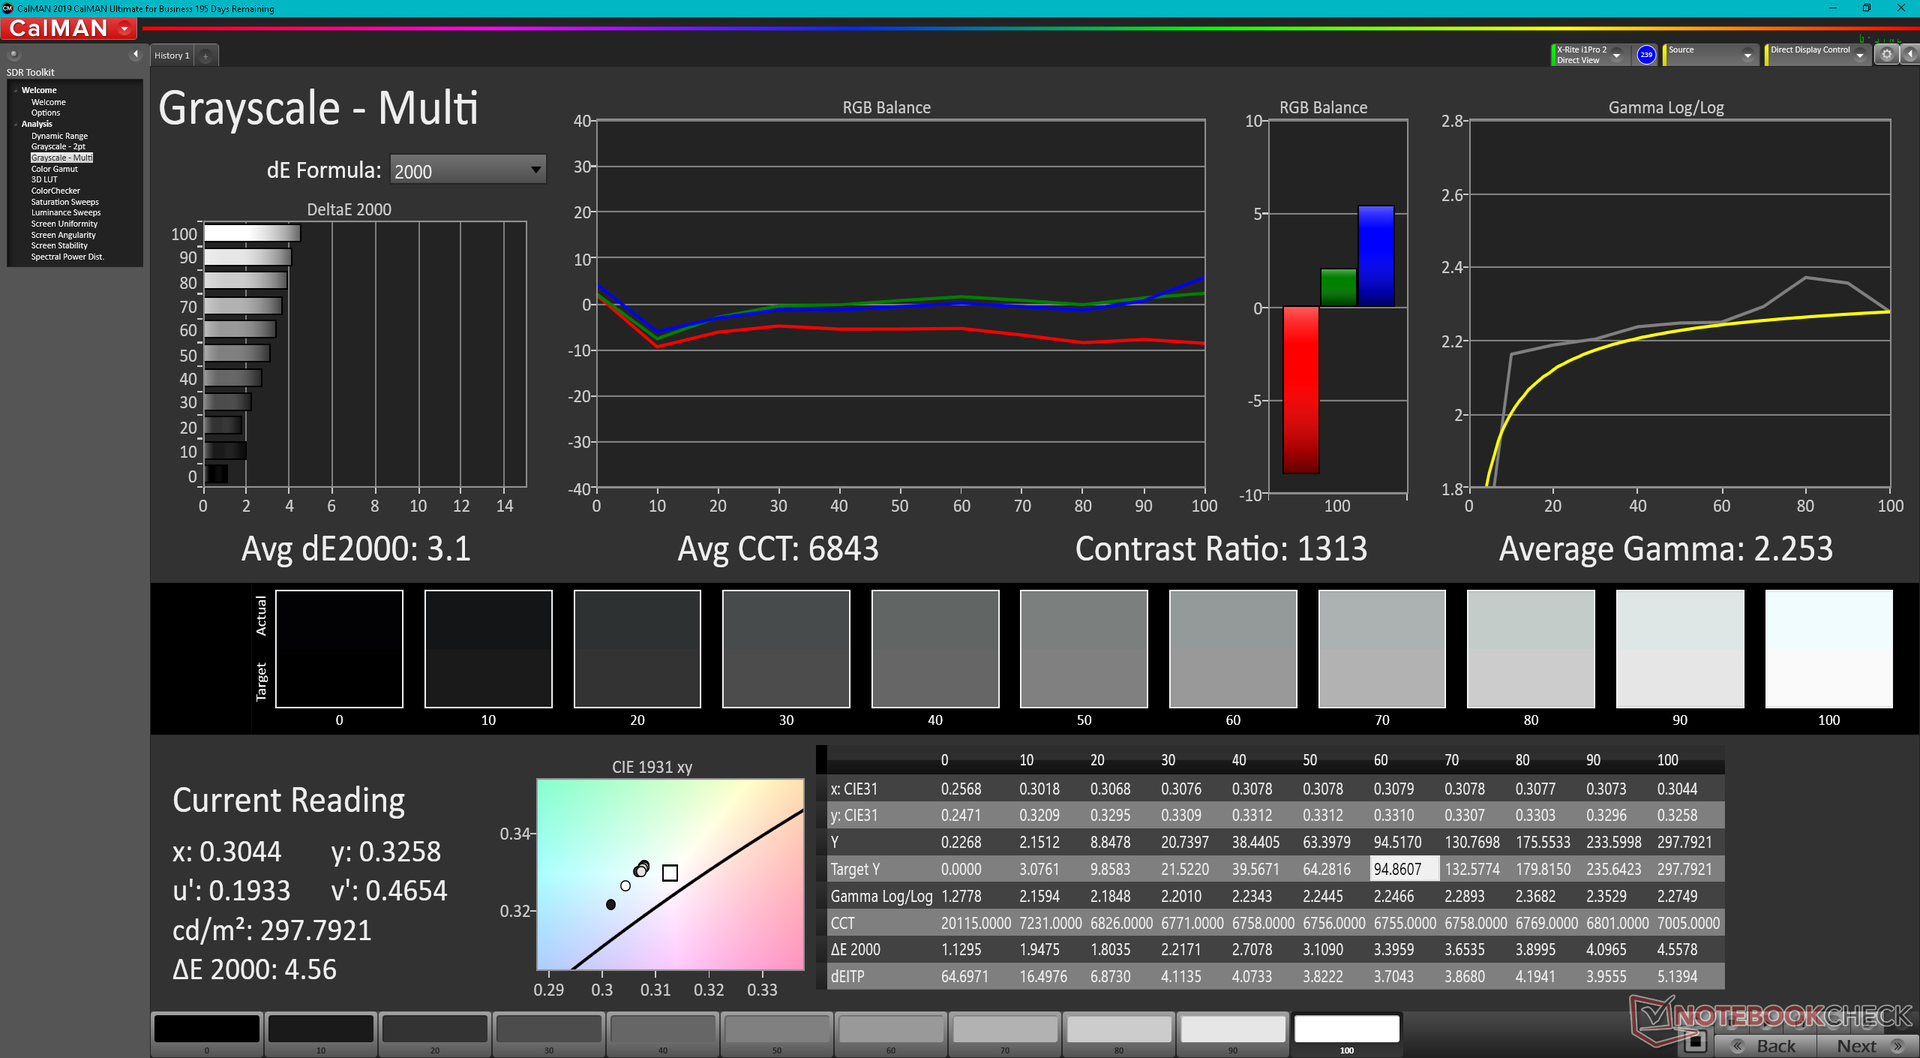
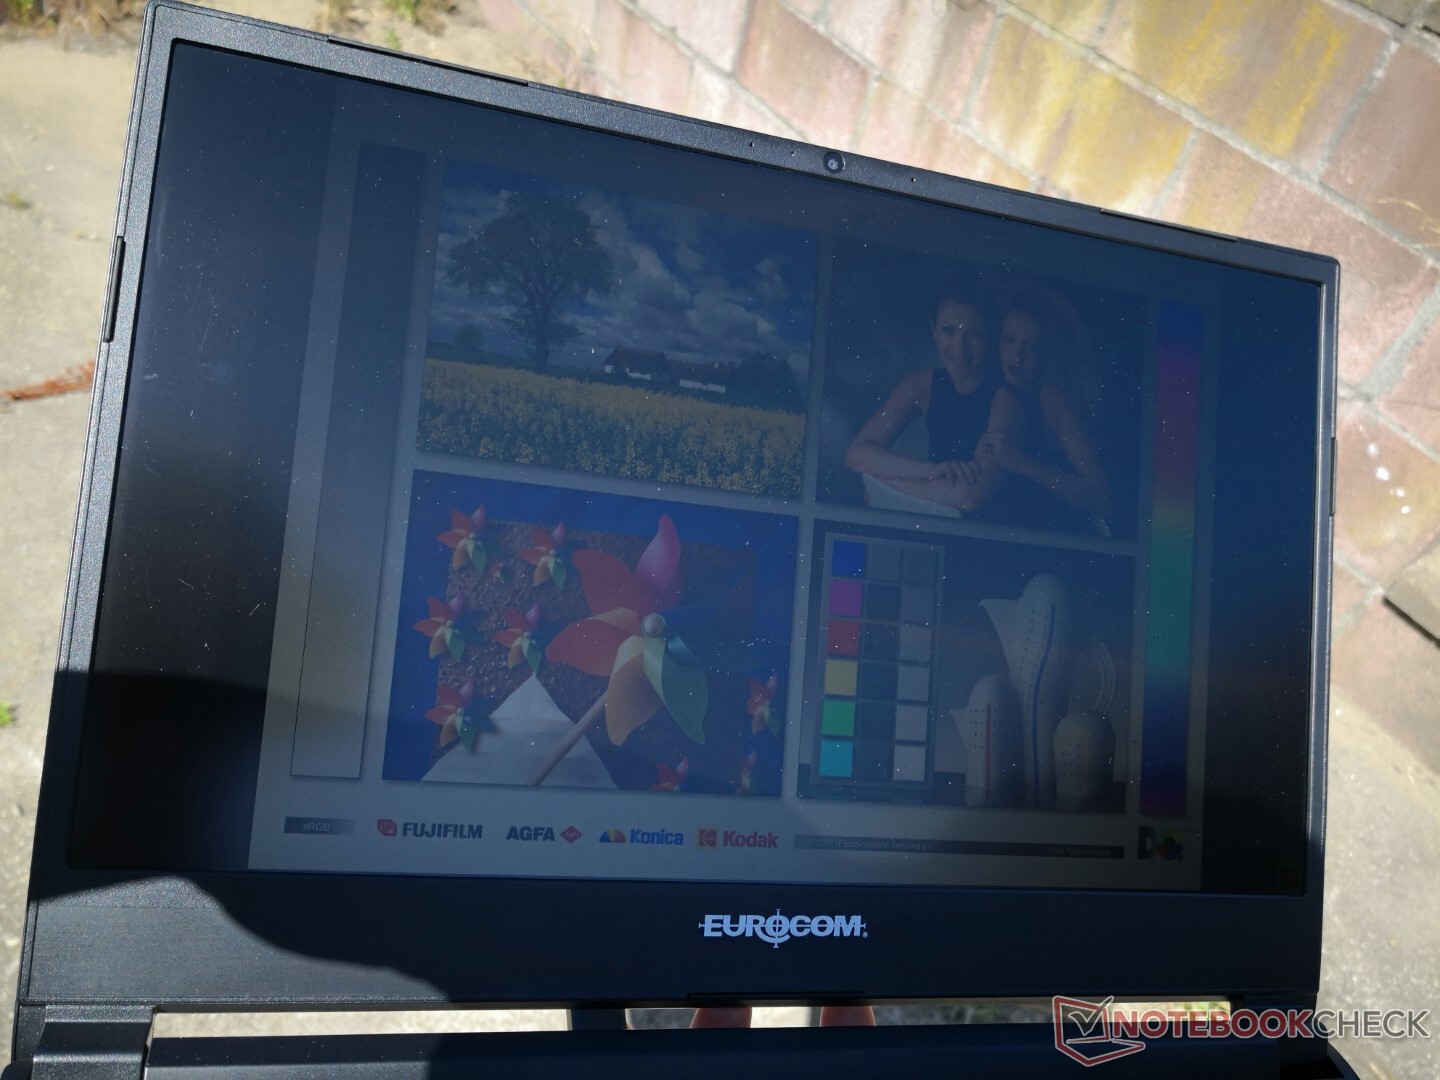
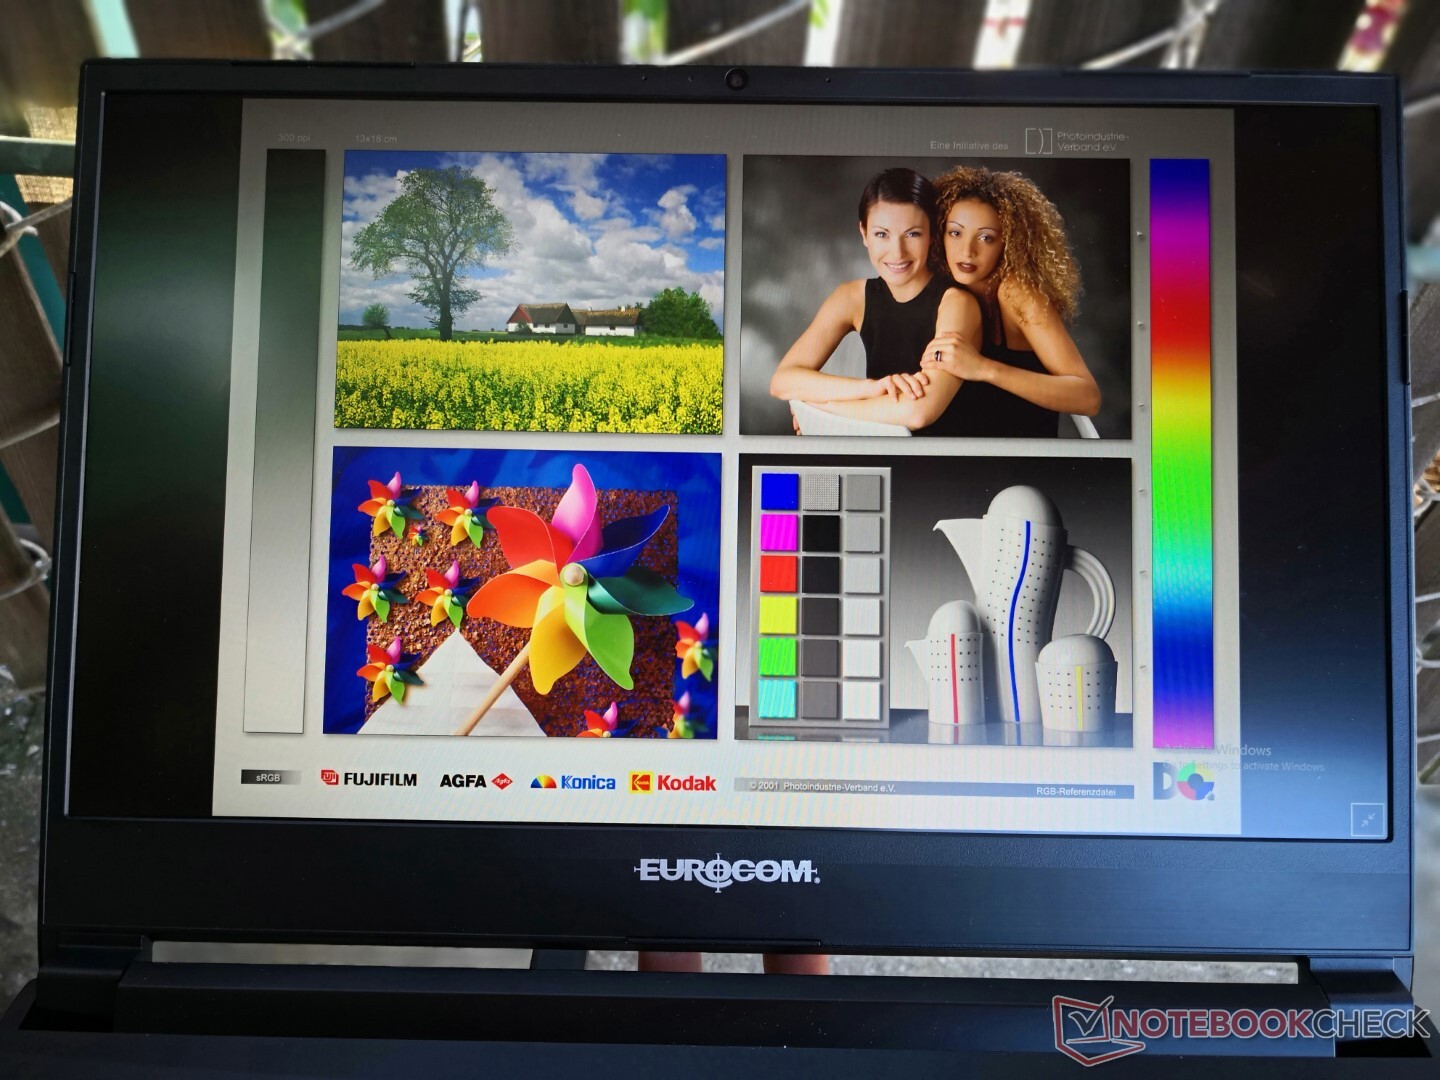
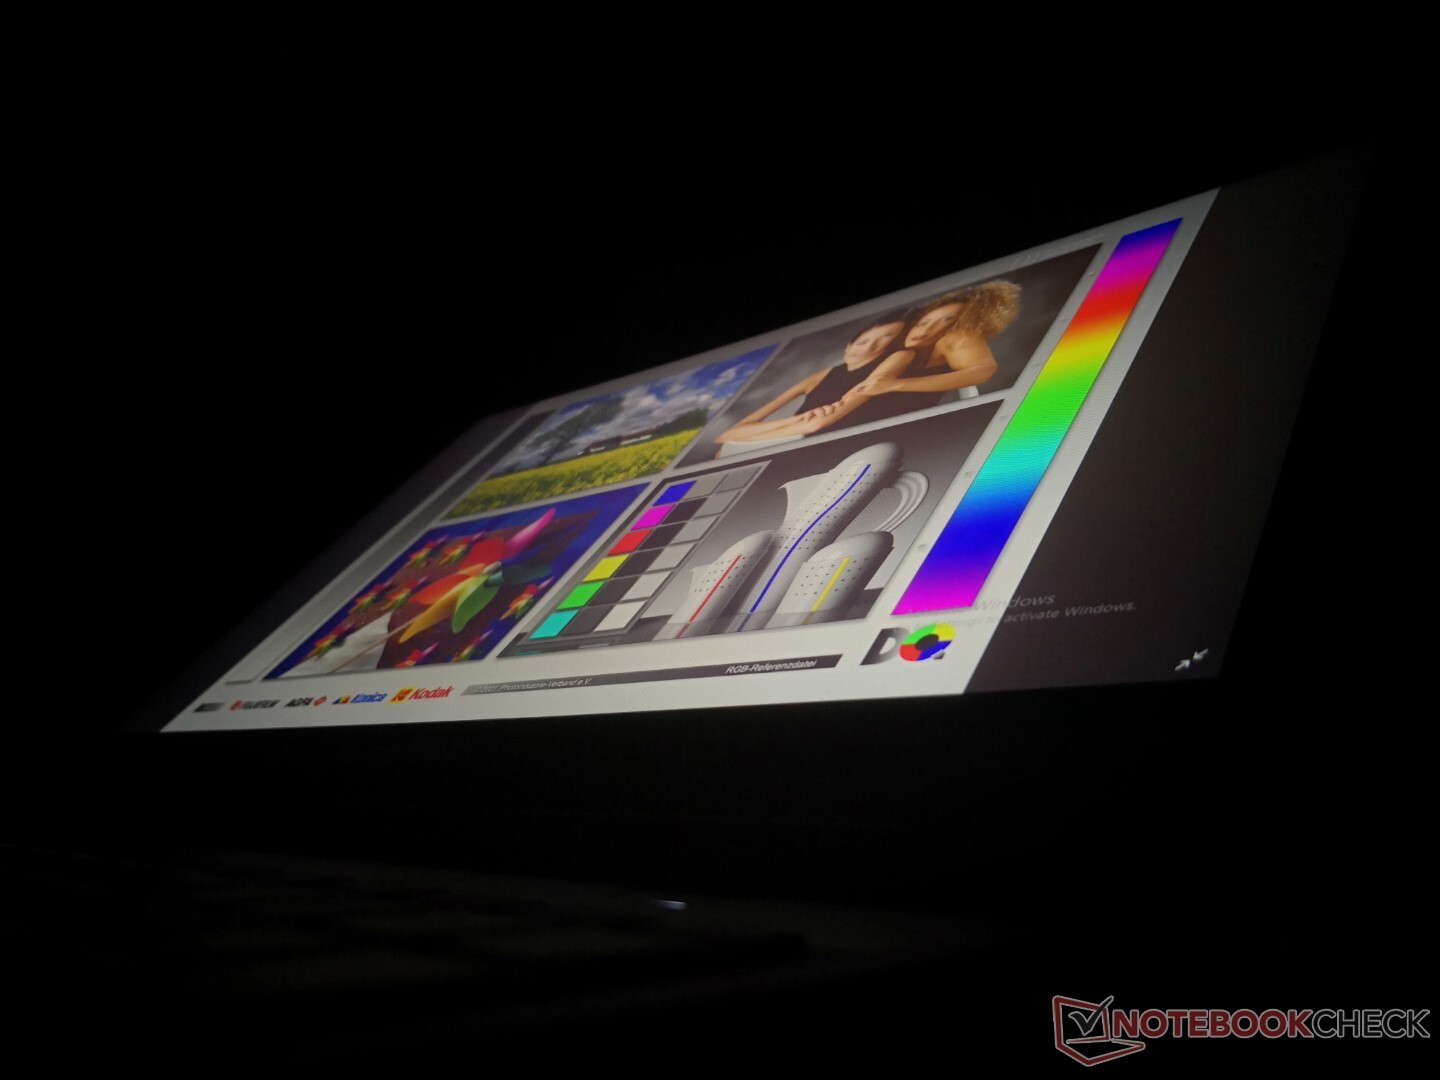
Display
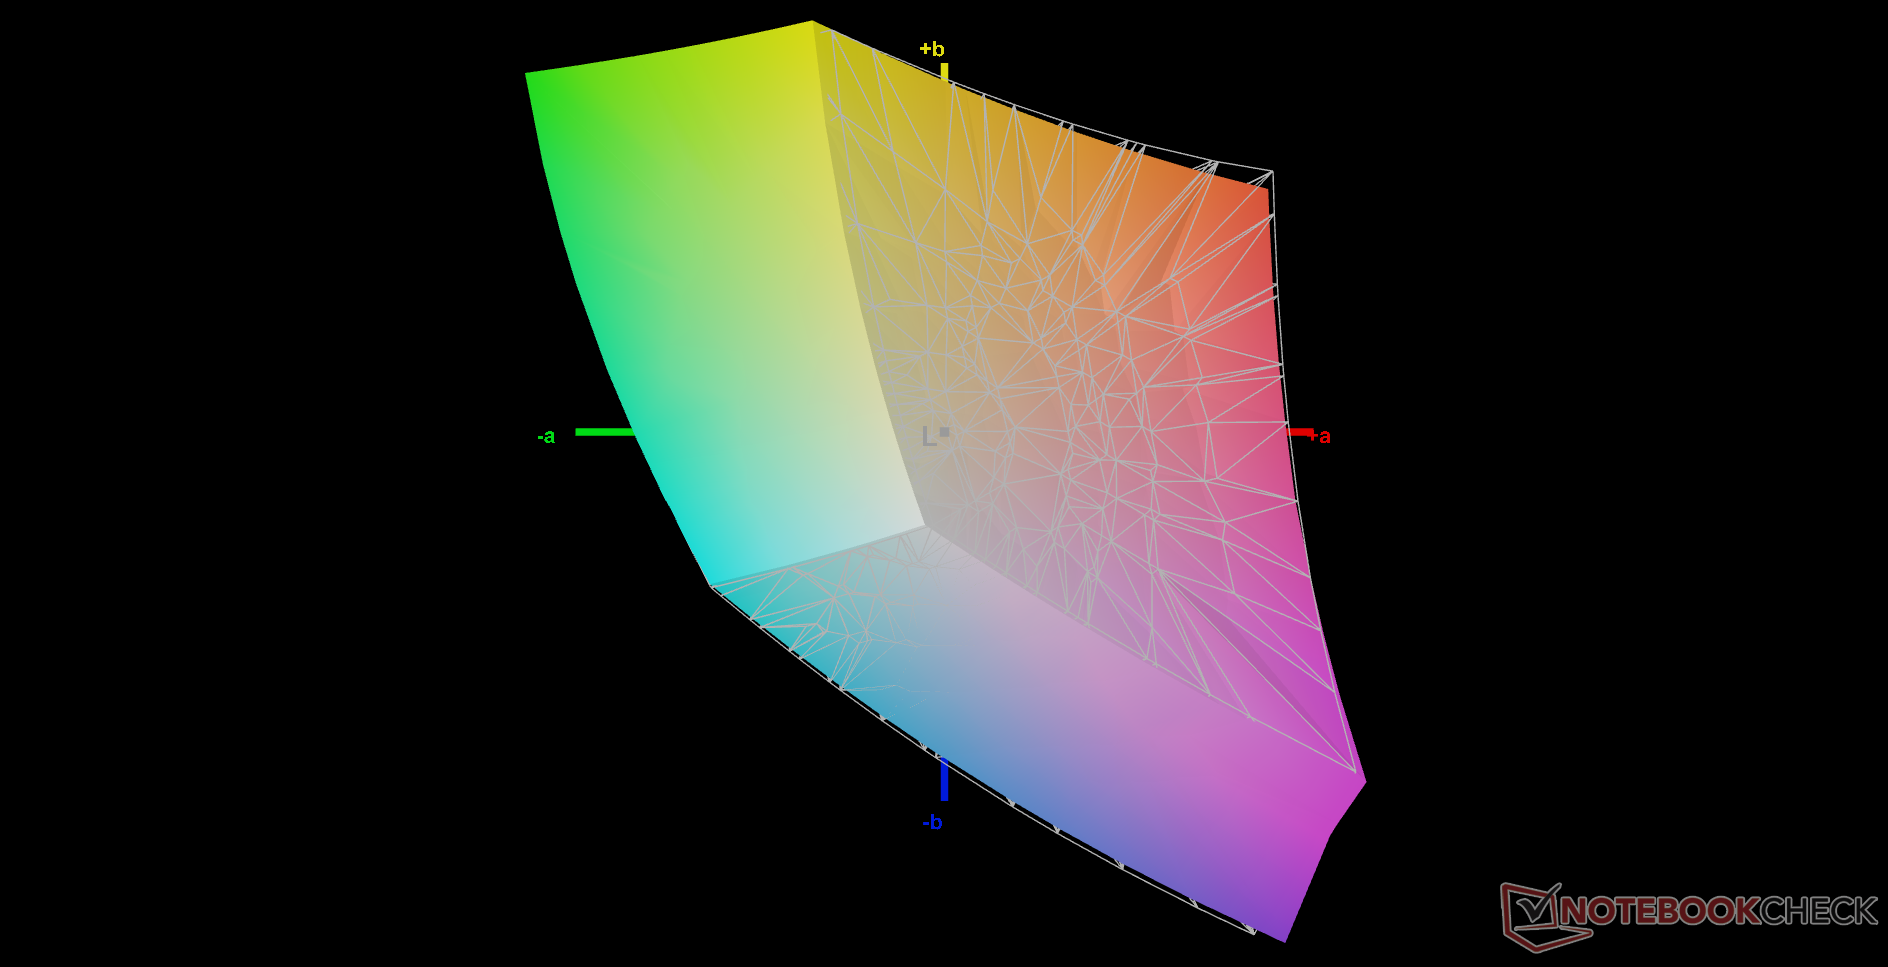
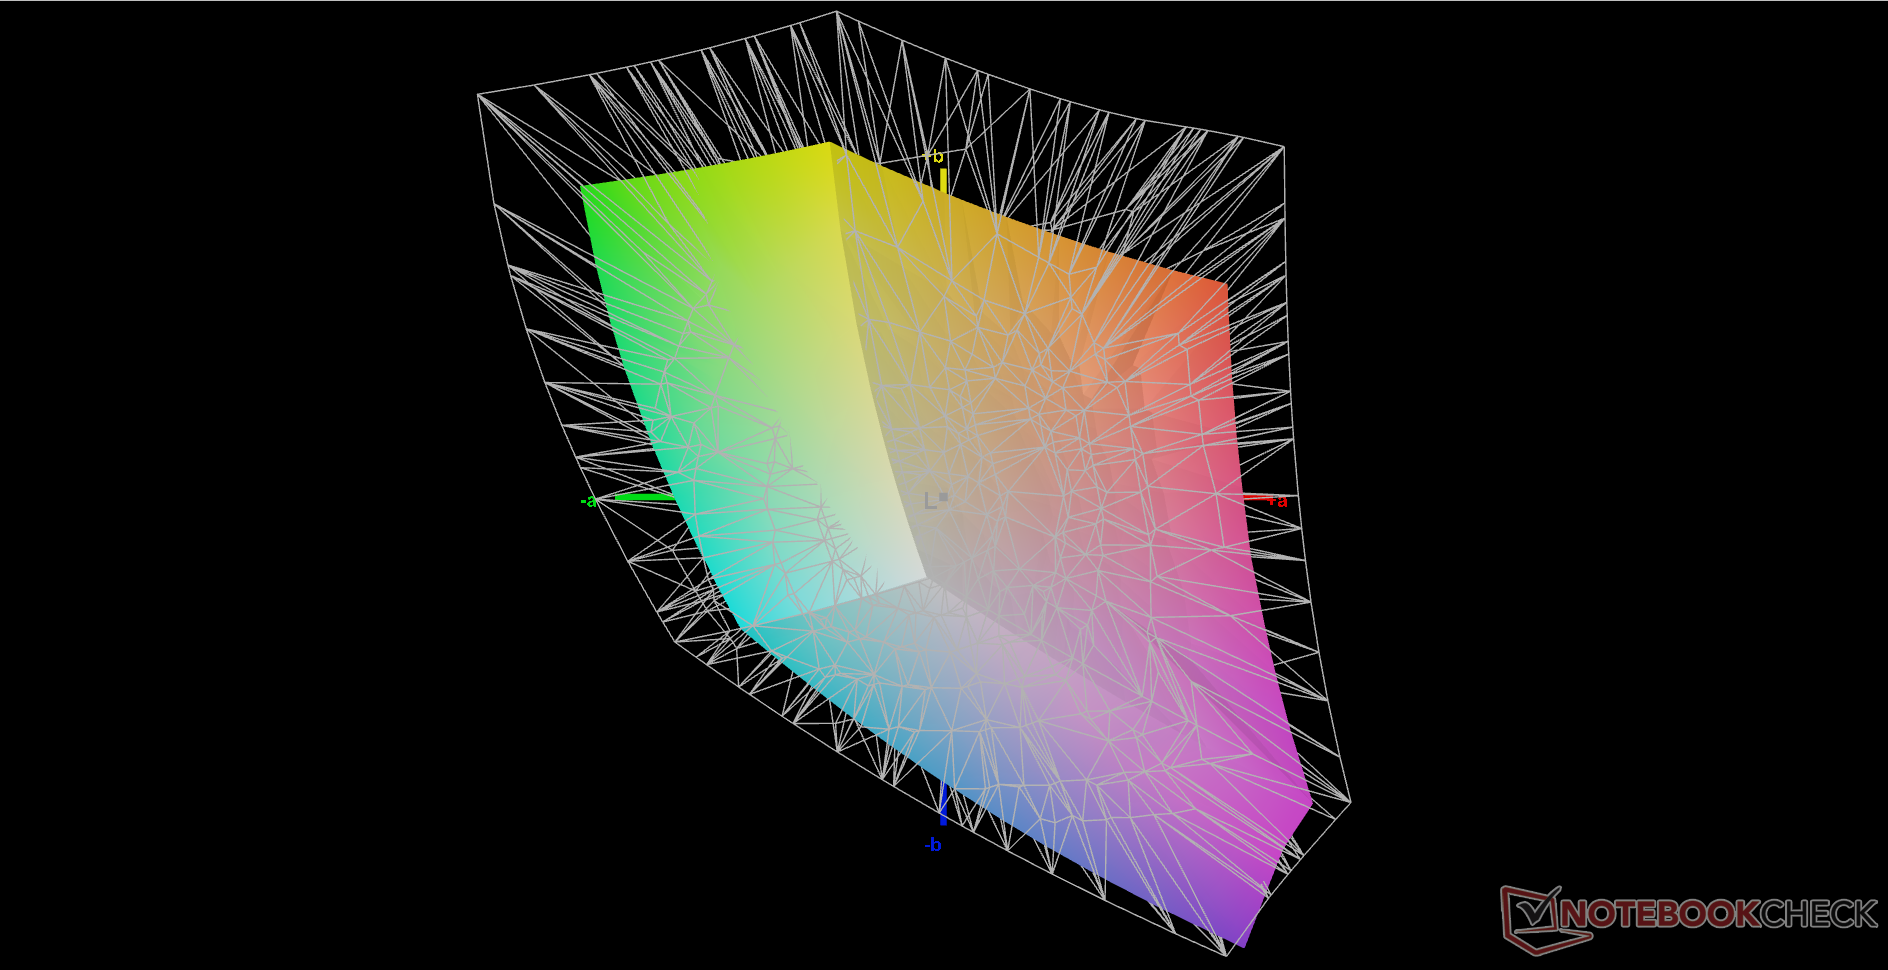
La nostra unità è configurata con lo stesso pannello IPS Sharp LQ156M1JW03 che si trova sul monitor Eurocom RX1515.Eurocom RX315. Questo pannello si distingue per la velocissima frequenza di aggiornamento di 240 Hz, per i tempi di risposta rapidi e per la copertura completa sRGB che lo rende adatto sia al gioco che alla maggior parte dell'editing grafico. È disponibile anche un pannello QHD a più alta risoluzione che promette una copertura completa DCI-P3, anche se con una frequenza di aggiornamento più lenta di 165 Hz.

| |||||||||||||||||||||||||
Distribuzione della luminosità: 91 %
Al centro con la batteria: 299.2 cd/m²
Contrasto: 997:1 (Nero: 0.3 cd/m²)
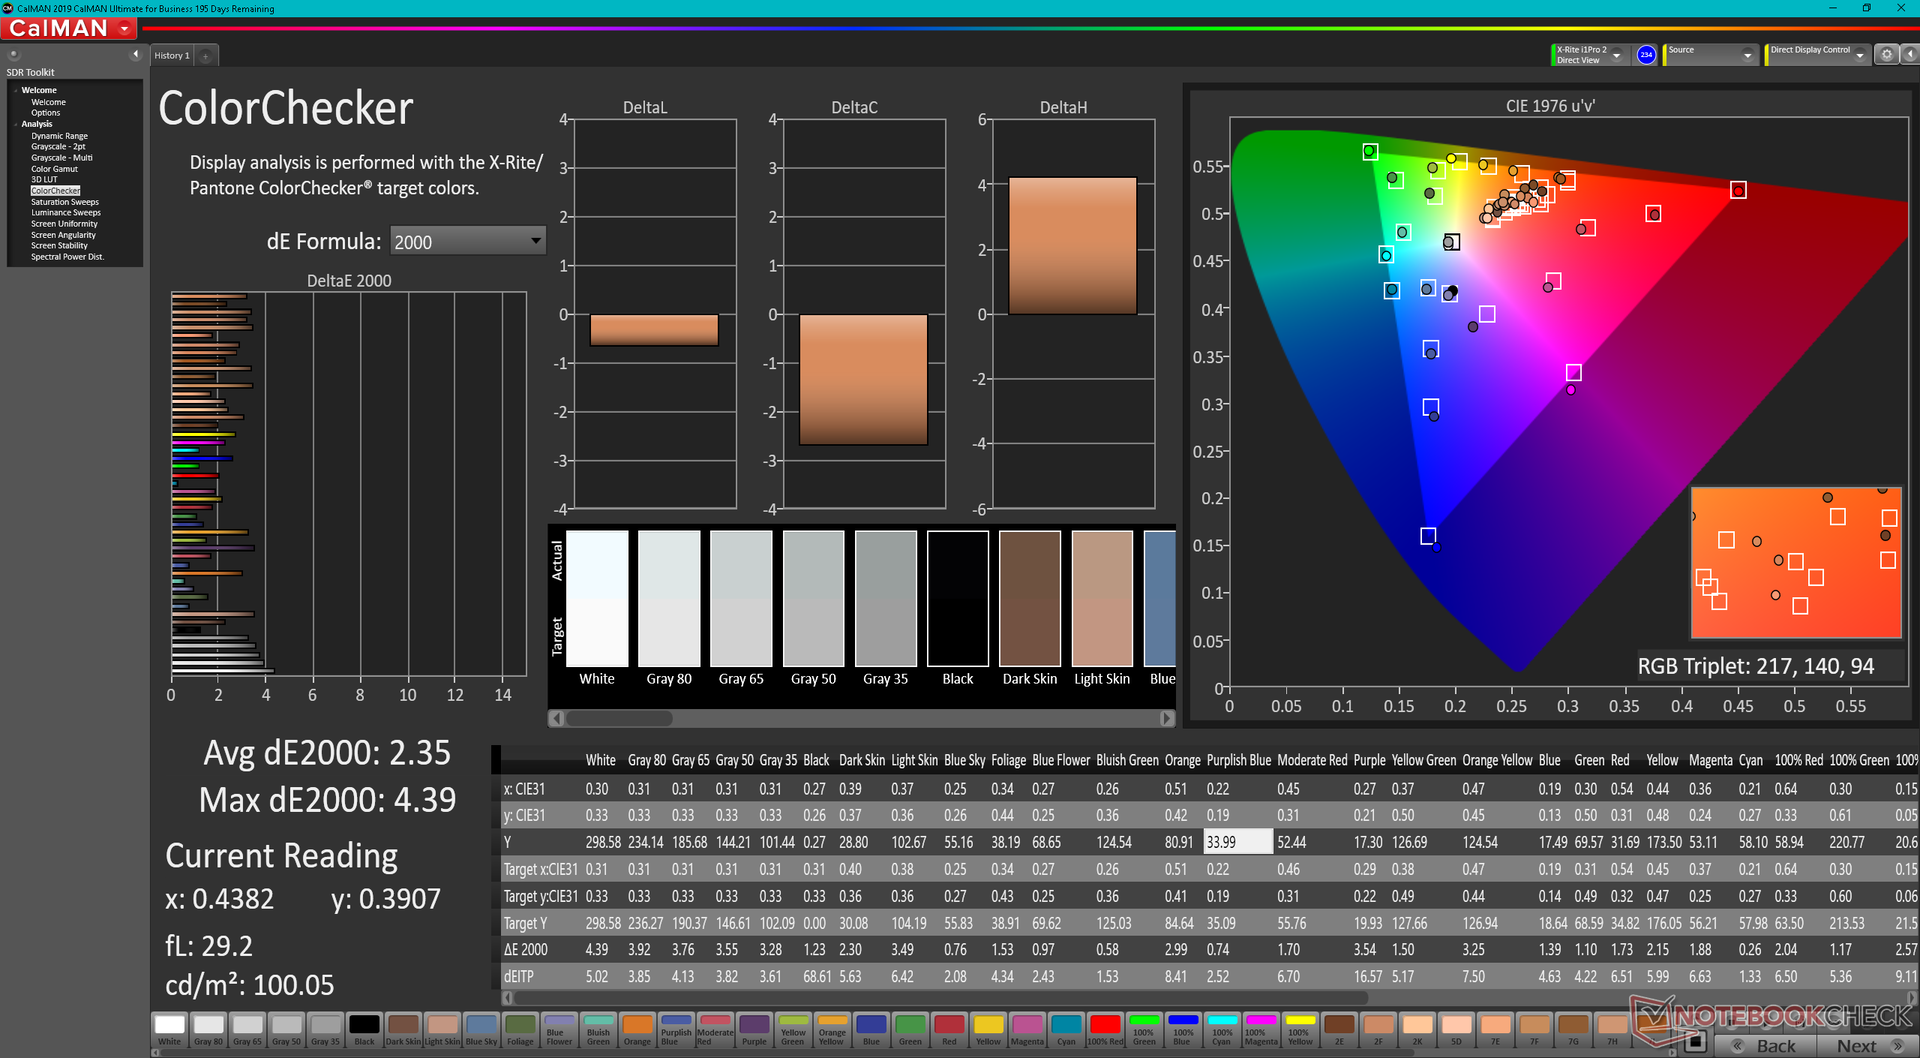
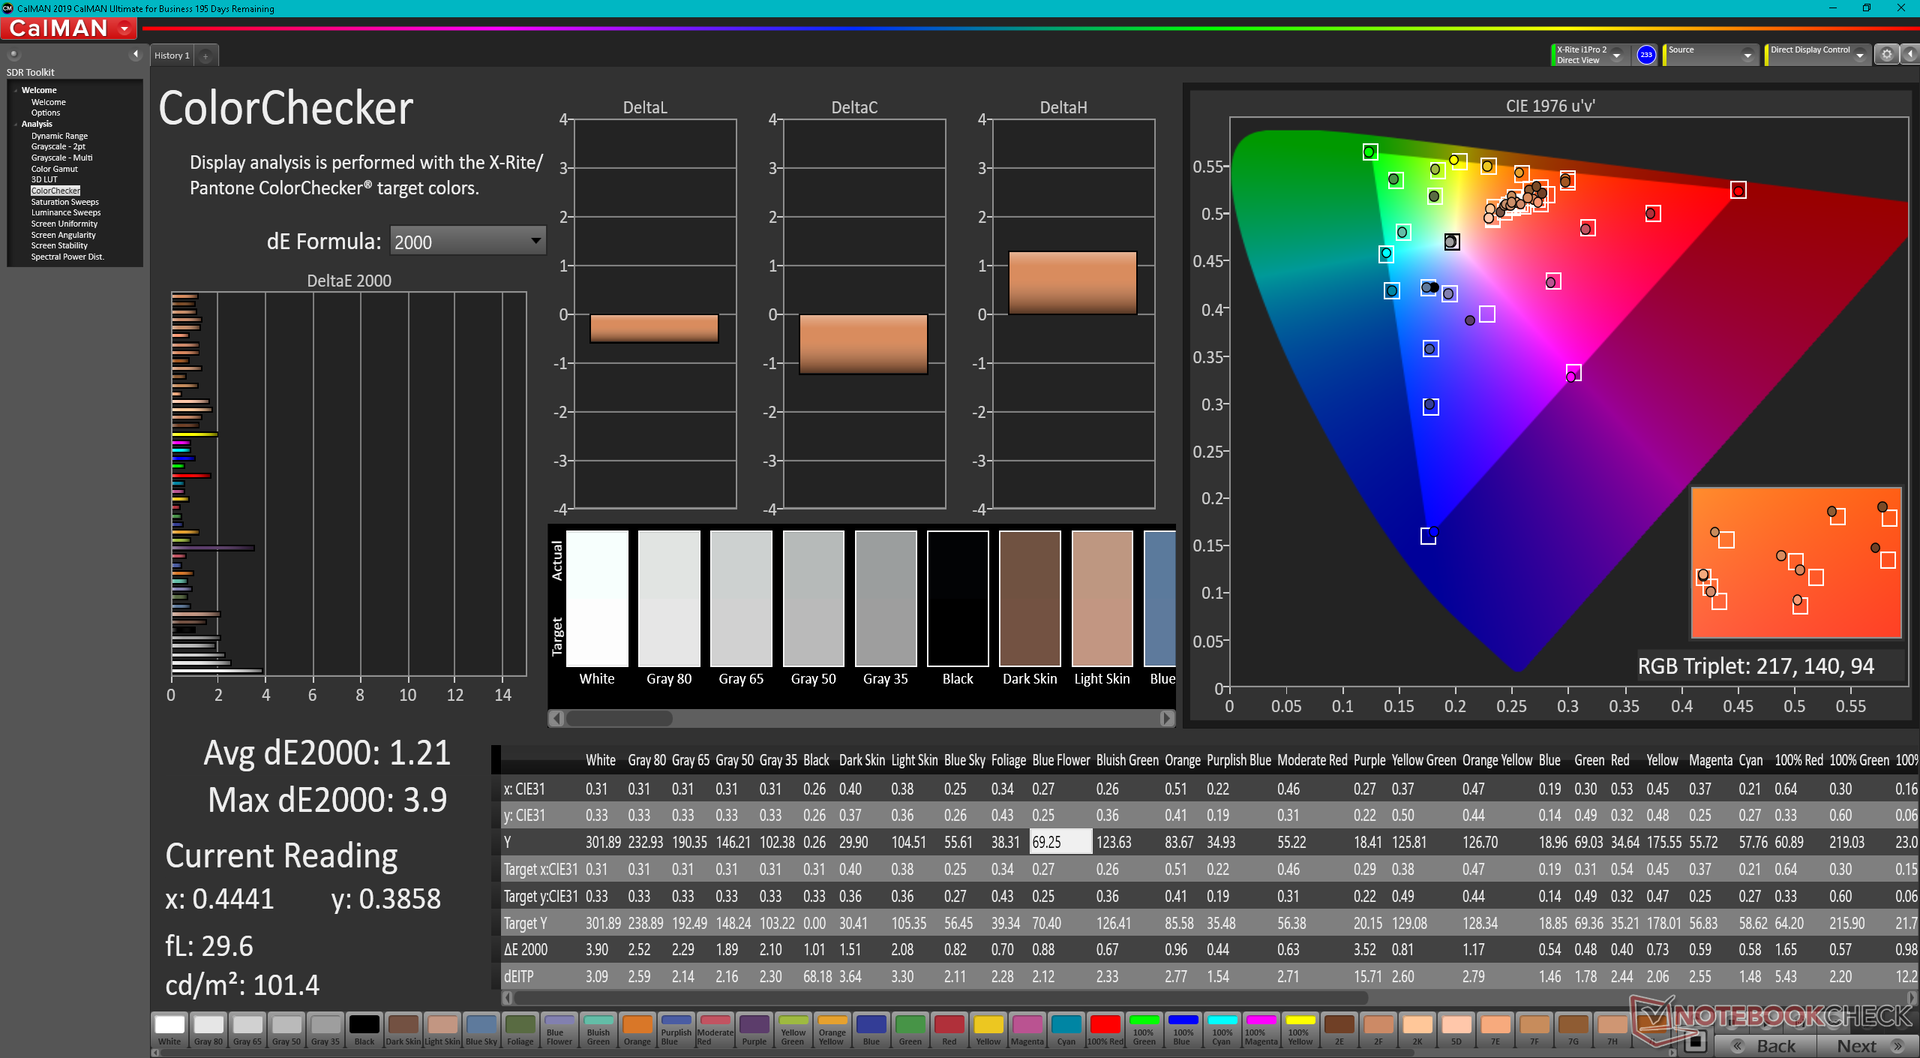
ΔE Color 2.35 | 0.5-29.43 Ø4.86, calibrated: 1.21
ΔE Greyscale 3.1 | 0.09-98 Ø5.1
67.7% AdobeRGB 1998 (Argyll 2.2.0 3D)
97.3% sRGB (Argyll 2.2.0 3D)
66.5% Display P3 (Argyll 2.2.0 3D)
Gamma: 2.25
| Eurocom Raptor X15 Sharp LQ156M1JW03, IPS, 1920x1080, 15.6" | MSI Raider GE66 12UHS AUO51EB, IPS, 3840x2160, 15.6" | Razer Blade 15 Advanced Model Early 2022 TL156VDXP02-0, IPS, 1920x1080, 15.6" | Eurocom RX315 NH57AF1 Sharp LQ156M1JW03, IPS, 1920x1080, 15.6" | Gigabyte A5 X1 AU Optronics B156HAN12.0, IPS, 1920x1080, 15.6" | Asus TUF Gaming A15 FA506QR-AZ061T Sharp SHP1532, IPS, 1920x1080, 15.6" | |
|---|---|---|---|---|---|---|
| Display | 21% | -5% | 1% | 4% | ||
| Display P3 Coverage | 66.5 | 80.4 21% | 65.3 -2% | 67.5 2% | 69.6 5% | |
| sRGB Coverage | 97.3 | 98.4 1% | 85.1 -13% | 98 1% | 98.6 1% | |
| AdobeRGB 1998 Coverage | 67.7 | 94.7 40% | 67.4 0% | 68.5 1% | 70.8 5% | |
| Response Times | -35% | 33% | 1% | 27% | -22% | |
| Response Time Grey 50% / Grey 80% * | 12.8 ? | 18.8 ? -47% | 4.3 ? 66% | 10.4 ? 19% | 4.8 ? 62% | 12 ? 6% |
| Response Time Black / White * | 10.4 ? | 12.8 ? -23% | 10.5 ? -1% | 11.6 ? -12% | 11.2 ? -8% | 8 ? 23% |
| PWM Frequency | 23810 ? | 22730 ? -5% | 1250 ? -95% | |||
| Screen | -7% | 27% | -23% | -13% | 18% | |
| Brightness middle | 299.2 | 351 17% | 330 10% | 291.3 -3% | 335 12% | 297 -1% |
| Brightness | 282 | 347 23% | 315 12% | 273 -3% | 325 15% | 268 -5% |
| Brightness Distribution | 91 | 90 -1% | 89 -2% | 91 0% | 90 -1% | 84 -8% |
| Black Level * | 0.3 | 0.35 -17% | 0.24 20% | 0.35 -17% | 0.4 -33% | 0.22 27% |
| Contrast | 997 | 1003 1% | 1375 38% | 832 -17% | 838 -16% | 1350 35% |
| Colorchecker dE 2000 * | 2.35 | 2.54 -8% | 1.47 37% | 2.39 -2% | 2.63 -12% | 1.36 42% |
| Colorchecker dE 2000 max. * | 4.39 | 8.36 -90% | 2.73 38% | 8.05 -83% | 7.71 -76% | 3.82 13% |
| Colorchecker dE 2000 calibrated * | 1.21 | 0.67 45% | 0.63 48% | 1.49 -23% | 0.97 20% | |
| Greyscale dE 2000 * | 3.1 | 4.1 -32% | 1.8 42% | 4.8 -55% | 4 -29% | 1.88 39% |
| Gamma | 2.25 98% | 2.089 105% | 2.282 96% | 2.25 98% | 2.129 103% | 2.48 89% |
| CCT | 6843 95% | 7036 92% | 6499 100% | 7124 91% | 7434 87% | 6768 96% |
| Color Space (Percent of AdobeRGB 1998) | 63 | |||||
| Color Space (Percent of sRGB) | 99 | |||||
| Media totale (Programma / Settaggio) | -7% /
-5% | 18% /
21% | -7% /
-13% | 6% /
-4% | -2% /
7% |
* ... Meglio usare valori piccoli
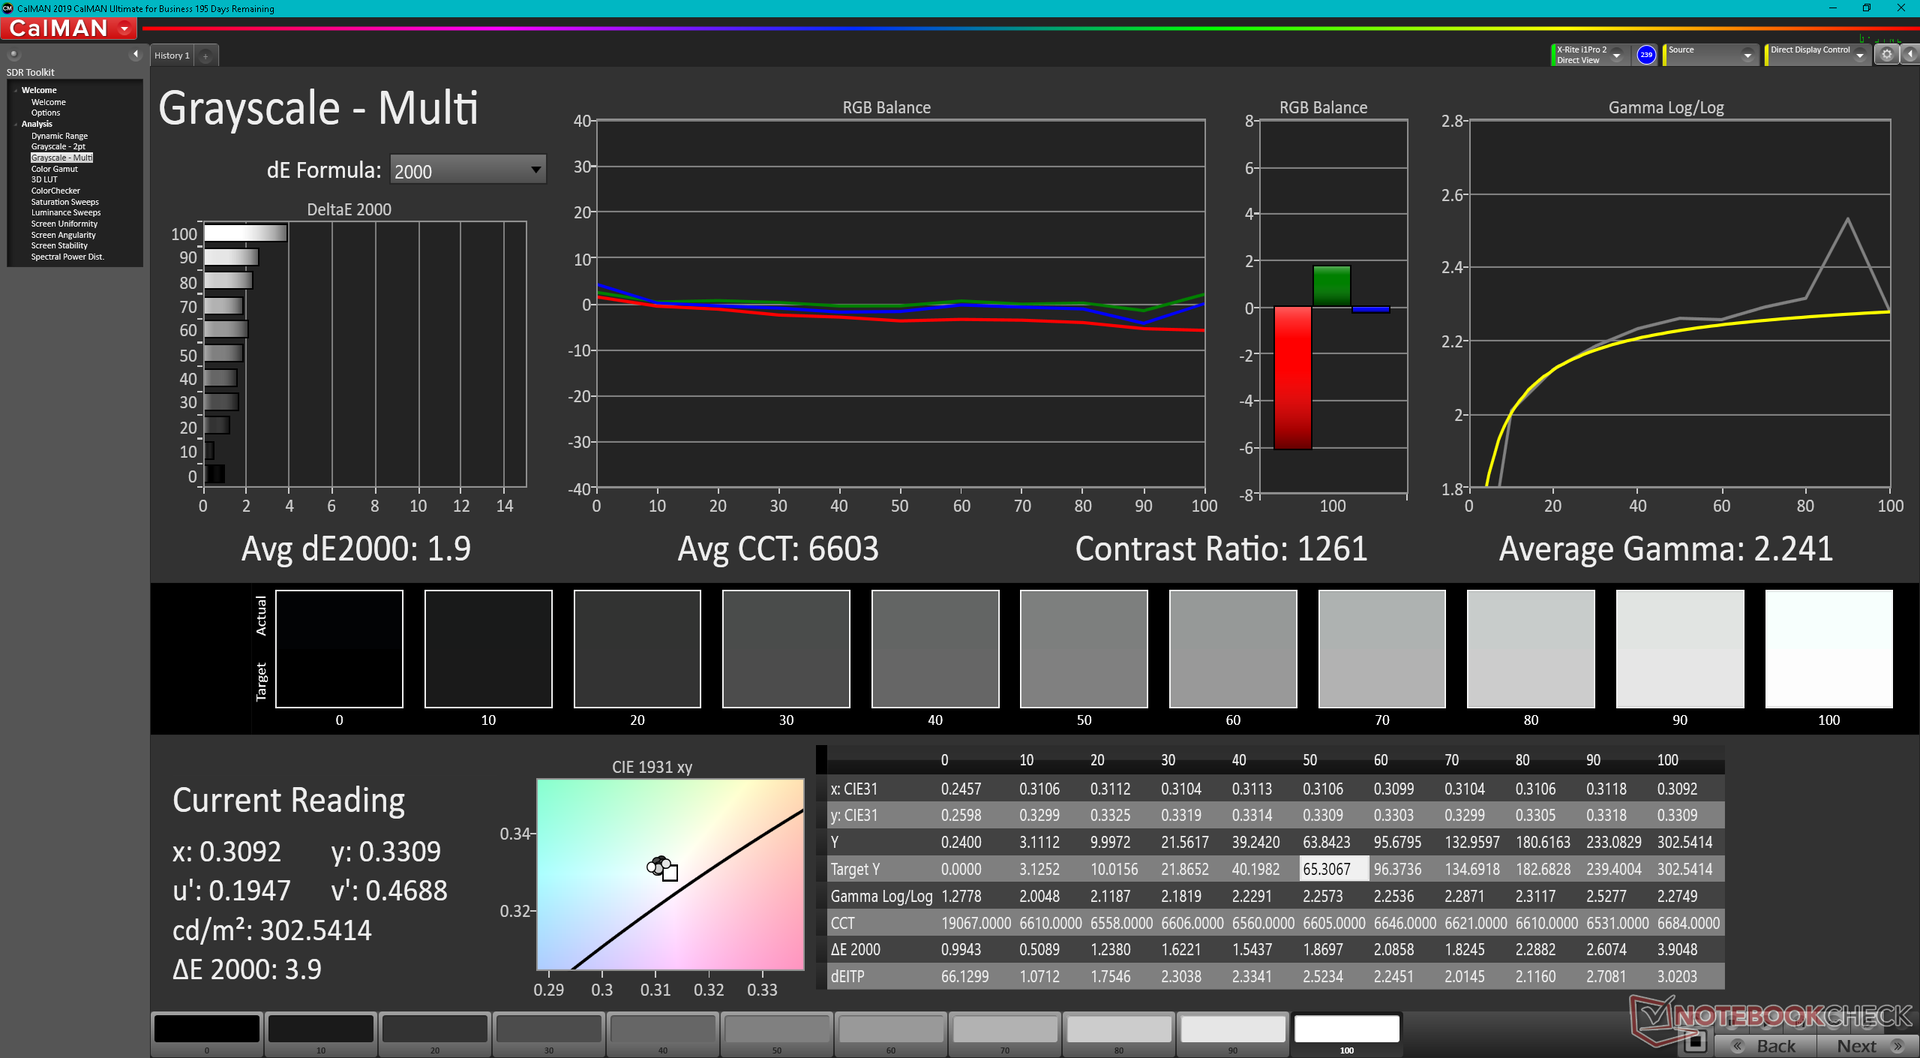
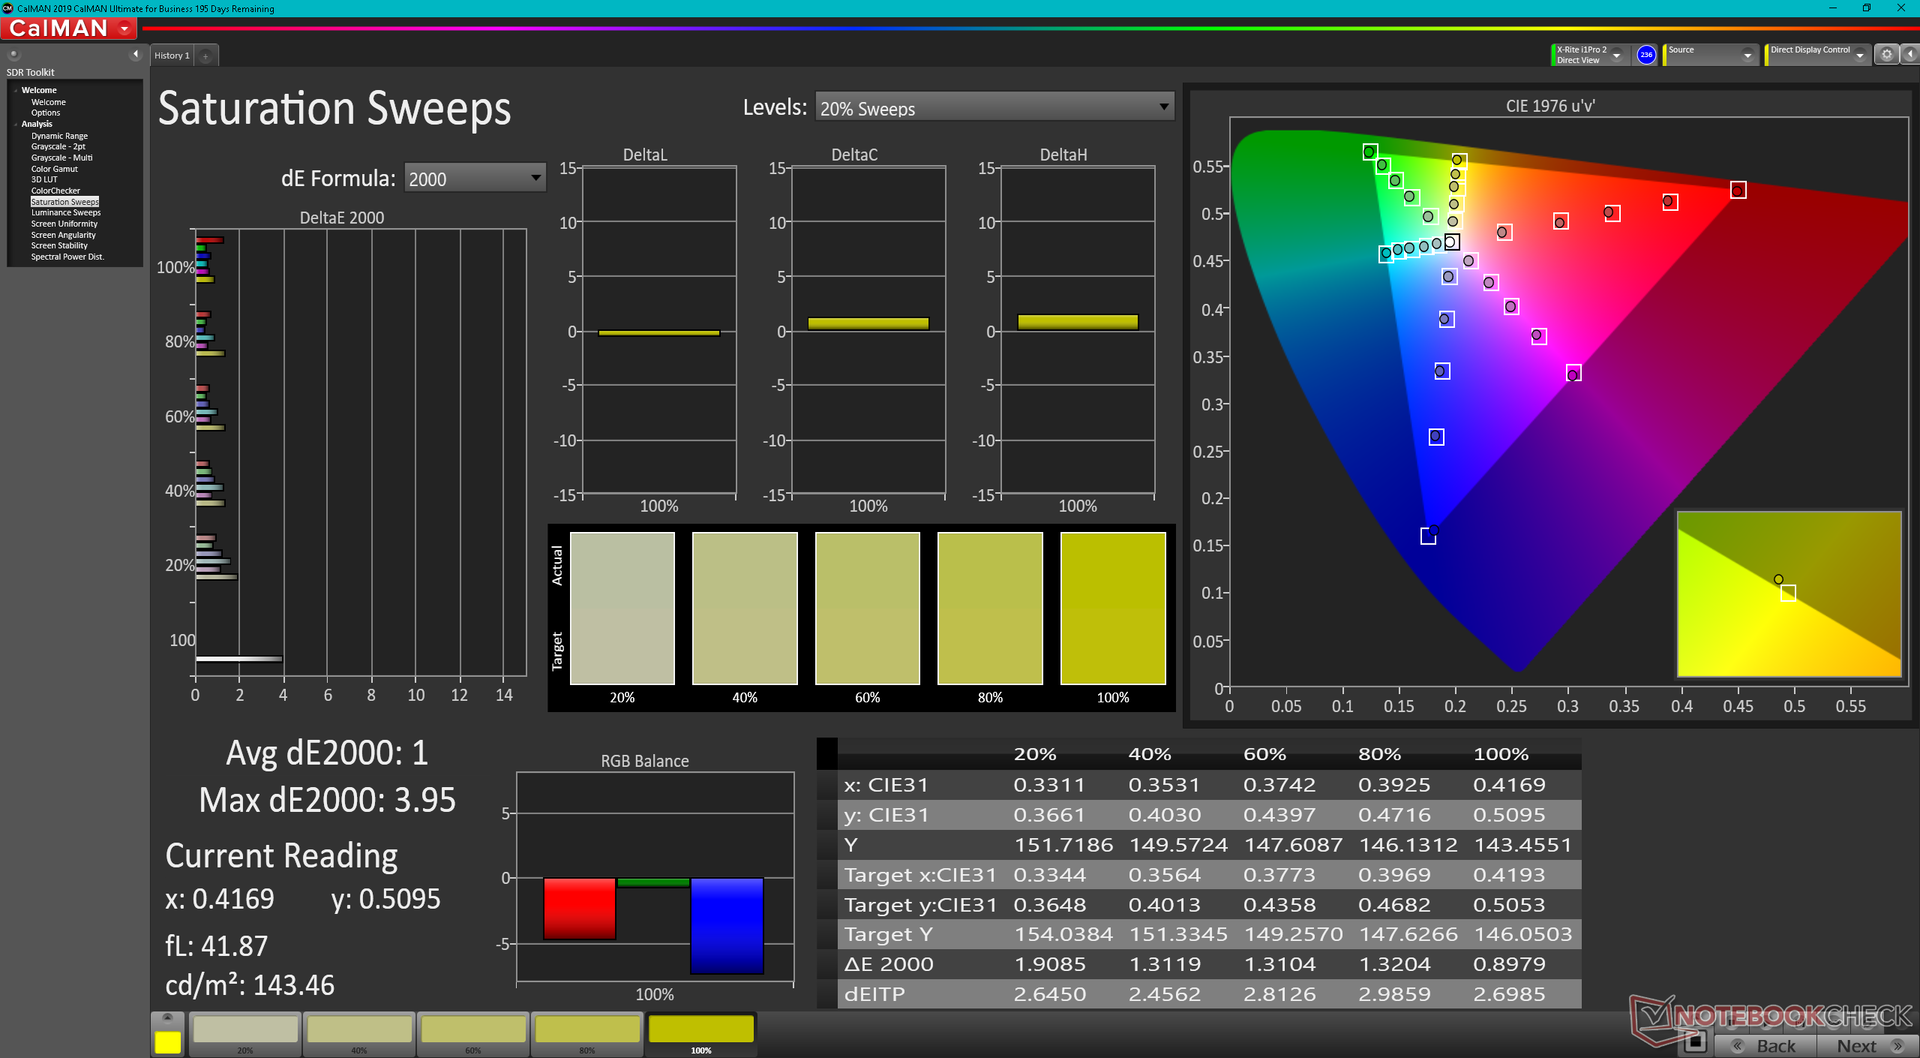
Il display è calibrato in modo decente, con valori medi di DeltaE della scala di grigi e di ColorChecker pari rispettivamente a 3,1 e 2,35. Siamo in grado di migliorare ulteriormente il DeltaE con il nostro colorimetro X-Rite, come mostrano gli screenshot qui sotto.

Tempi di risposta del Display
| ↔ Tempi di risposta dal Nero al Bianco | ||
|---|---|---|
| 10.4 ms ... aumenta ↗ e diminuisce ↘ combinato | ↗ 5.2 ms Incremento | 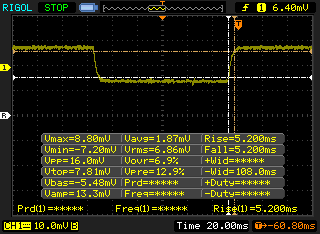 |
| ↘ 5.2 ms Calo | ||
| Lo schermo mostra buoni tempi di risposta durante i nostri tests, ma potrebbe essere troppo lento per i gamers competitivi. In confronto, tutti i dispositivi di test variano da 0.1 (minimo) a 240 (massimo) ms. » 25 % di tutti i dispositivi è migliore. Questo significa che i tempi di risposta rilevati sono migliori rispettto alla media di tutti i dispositivi testati (20.7 ms). | ||
| ↔ Tempo di risposta dal 50% Grigio all'80% Grigio | ||
| 12.8 ms ... aumenta ↗ e diminuisce ↘ combinato | ↗ 4.8 ms Incremento | 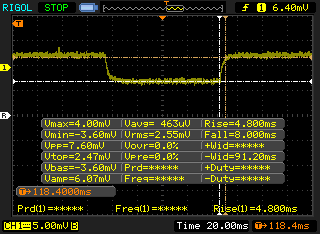 |
| ↘ 8 ms Calo | ||
| Lo schermo mostra buoni tempi di risposta durante i nostri tests, ma potrebbe essere troppo lento per i gamers competitivi. In confronto, tutti i dispositivi di test variano da 0.165 (minimo) a 636 (massimo) ms. » 24 % di tutti i dispositivi è migliore. Questo significa che i tempi di risposta rilevati sono migliori rispettto alla media di tutti i dispositivi testati (32.4 ms). | ||
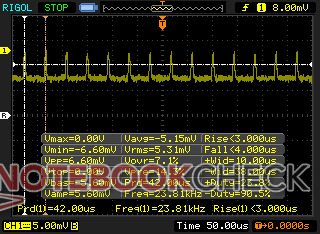
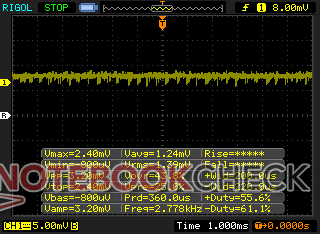
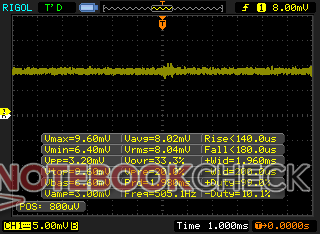
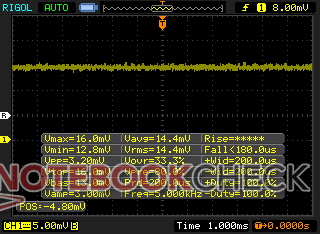
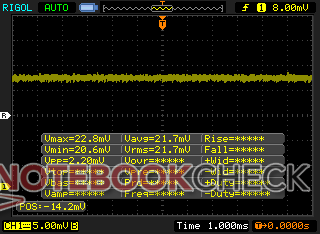
Sfarfallio dello schermo / PWM (Pulse-Width Modulation)
| flickering dello schermo / PWM rilevato | 23810 Hz | ≤ 25 % settaggio luminosita' | 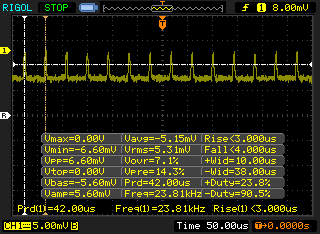 |
Il display sfarfalla a 23810 Hz (Probabilmente a causa dell'uso di PWM) Flickering rilevato ad una luminosita' di 25 % o inferiore. Non dovrebbe verificarsi flickering o PWM sopra questo valore di luminosita'. La frequenza di 23810 Hz è abbastanza alta, quindi la maggioranza degli utenti sensibili al PWM non dovrebbero notare alcun flickering. In confronto: 53 % di tutti i dispositivi testati non utilizza PWM per ridurre la luminosita' del display. Se è rilevato PWM, una media di 8439 (minimo: 5 - massimo: 343500) Hz è stata rilevata. | |||

Prestazioni
Condizioni di test
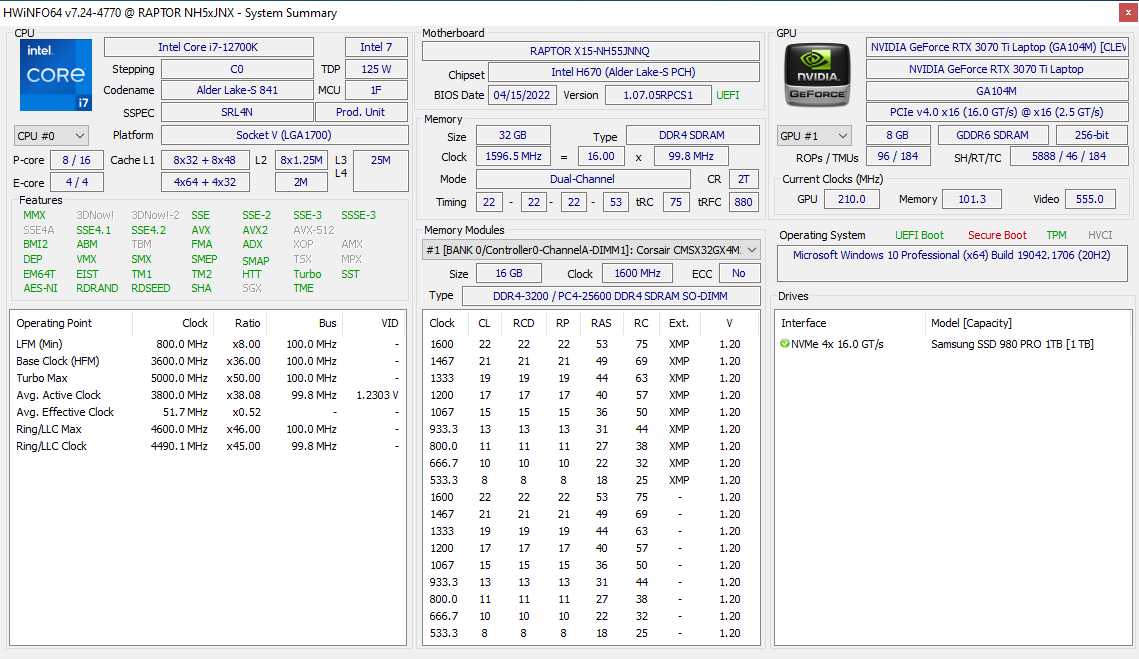
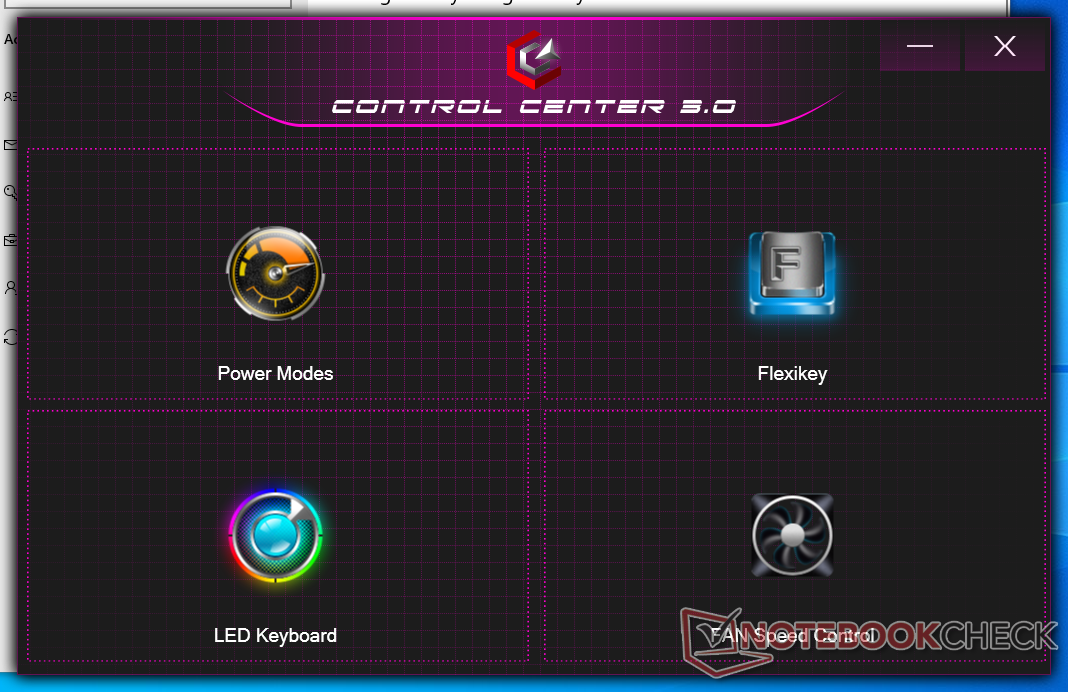
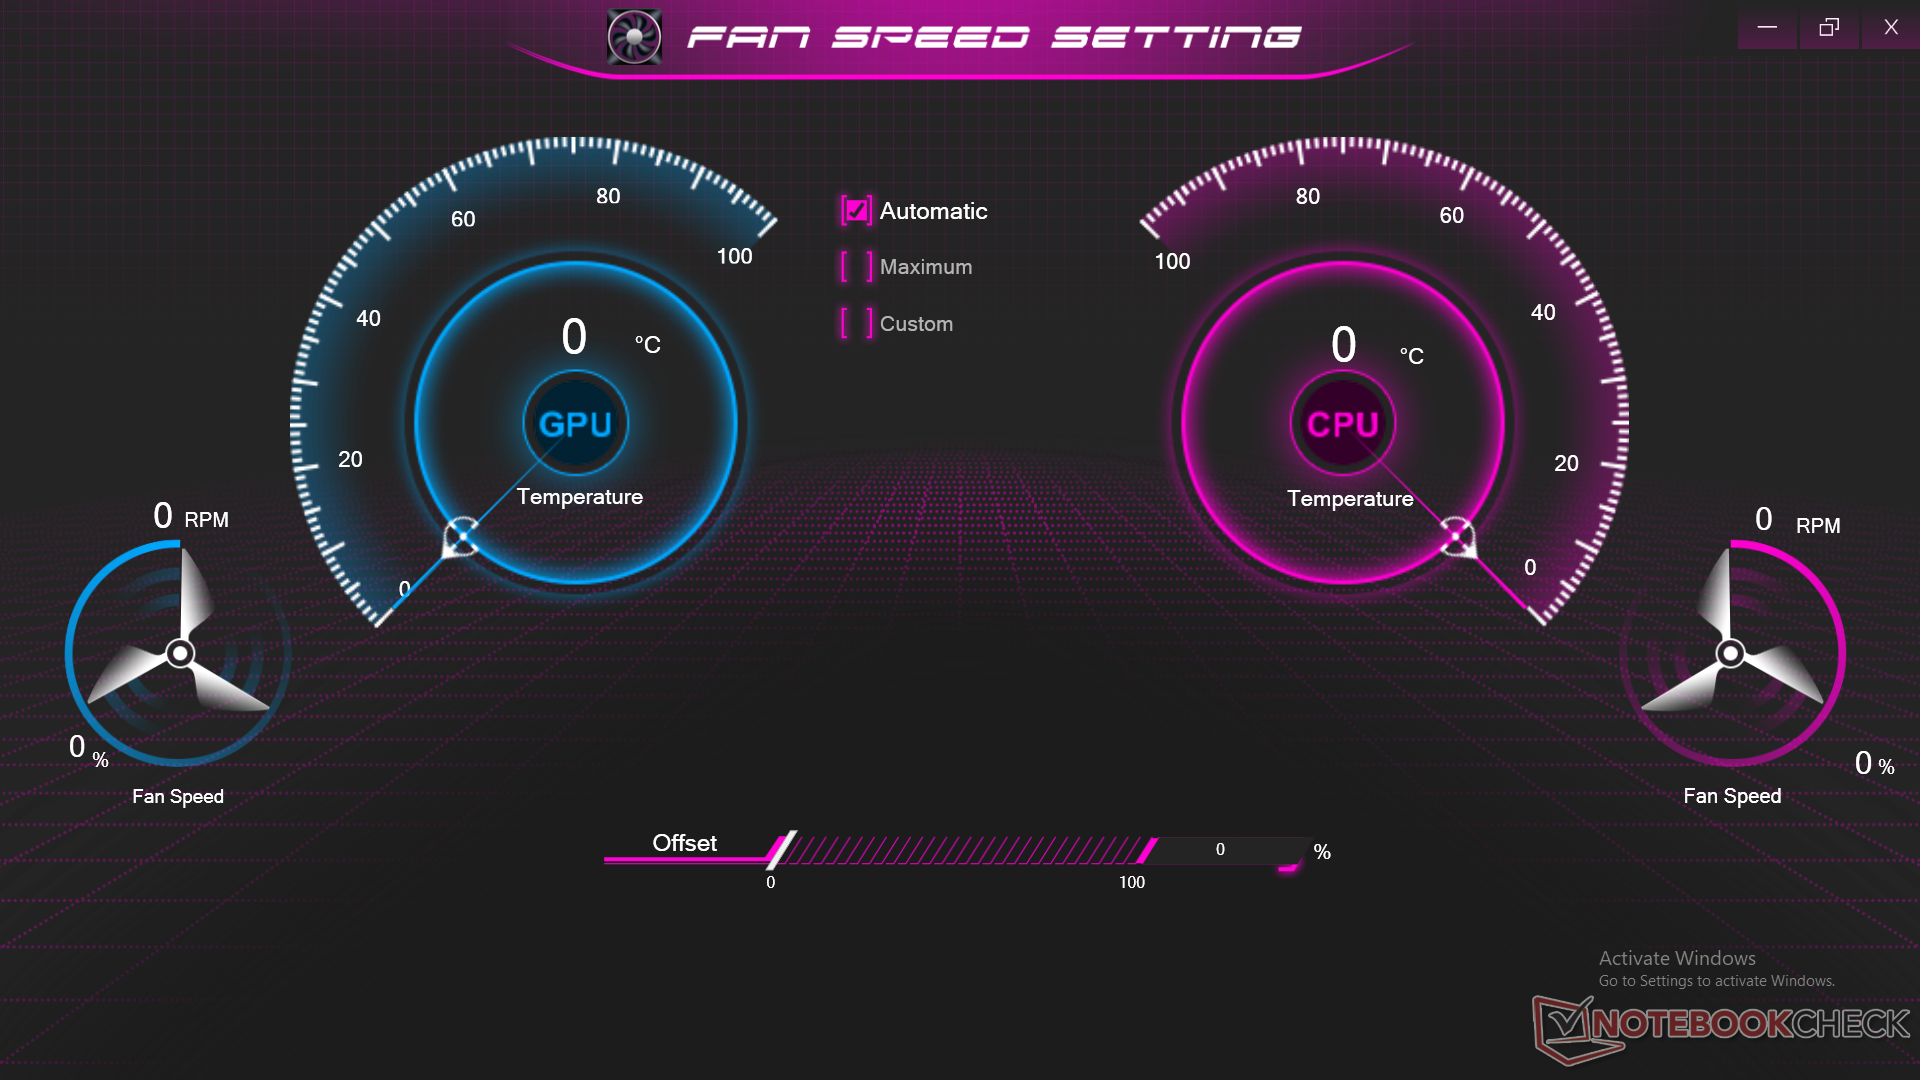
La nostra unità è stata impostata in modalità Performance sia tramite Windows che tramite il software Control Center 3.0 prima di eseguire i benchmark delle prestazioni per ottenere i punteggi più alti possibili senza overclock da parte dell'utente finale. Si consiglia di familiarizzare con il Control Center 3.0, in quanto qui è possibile controllare le ventole, le modalità di alimentazione e le funzioni LED/macro.
Non c'è un interruttore MUX e quindi c'è solo il supporto per Optimus 1.0. Eurocom afferma che il Raptor X15 non è stato progettato con un interruttore MUX in mente.
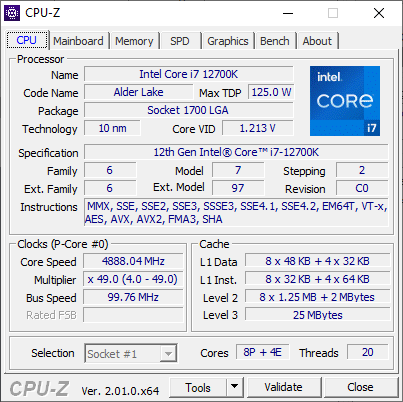
Processore
Sfortunatamente, la nostra unità presentava dei bug di prestazioni durante l'esecuzione di CineBench R15 che ci impedivano di registrare punteggi corretti con il benchmark. Eurocom ci ha confermato che il bug è riproducibile su più unità Raptor X15. Fortunatamente, tutti gli altri benchmark sono stati eseguiti senza problemi. Rispetto al nostro desktop di riferimento con lo stesso Core i7-12700K I7-12700K, l'i7-12700K del nostro Eurocom sarebbe dal 20 al 25% più lento nei carichi di lavoro multi-thread, per un livello di prestazioni complessivo più simile a quello del Core i7-12700H mobile Core i7-12700H.
Cinebench R15 Multi Loop
Cinebench R23: Multi Core | Single Core
Cinebench R15: CPU Multi 64Bit | CPU Single 64Bit
Blender: v2.79 BMW27 CPU
7-Zip 18.03: 7z b 4 | 7z b 4 -mmt1
Geekbench 5.5: Multi-Core | Single-Core
HWBOT x265 Benchmark v2.2: 4k Preset
LibreOffice : 20 Documents To PDF
R Benchmark 2.5: Overall mean
| Cinebench R20 / CPU (Multi Core) | |
| Intel Core i7-12700K | |
| Media Intel Core i7-12700K (6953 - 8648, n=2) | |
| Eurocom Raptor X15 | |
| MSI Vector GP76 12UGS-434 | |
| SCHENKER XMG Apex 15 NH57AF1 | |
| MSI Raider GE66 12UHS | |
| Razer Blade 15 2022 | |
| Razer Blade 14 Ryzen 9 6900HX | |
| Gigabyte A5 X1 | |
| Eurocom Nightsky ARX315 | |
| SCHENKER XMG Apex 15 NH57E PS | |
| Eurocom RX315 NH57AF1 | |
| Aorus 15P XC | |
| Lenovo Legion C7 15IMH05 82EH0030GE | |
| Cinebench R20 / CPU (Single Core) | |
| Eurocom Raptor X15 | |
| Media Intel Core i7-12700K (731 - 740, n=2) | |
| Intel Core i7-12700K | |
| MSI Raider GE66 12UHS | |
| Razer Blade 15 2022 | |
| MSI Vector GP76 12UGS-434 | |
| Razer Blade 14 Ryzen 9 6900HX | |
| Eurocom Nightsky ARX315 | |
| Gigabyte A5 X1 | |
| Eurocom RX315 NH57AF1 | |
| SCHENKER XMG Apex 15 NH57E PS | |
| SCHENKER XMG Apex 15 NH57AF1 | |
| Lenovo Legion C7 15IMH05 82EH0030GE | |
| Aorus 15P XC | |
| Cinebench R23 / Multi Core | |
| Intel Core i7-12700K | |
| Media Intel Core i7-12700K (17003 - 22565, n=2) | |
| MSI Vector GP76 12UGS-434 | |
| Eurocom Raptor X15 | |
| MSI Raider GE66 12UHS | |
| Razer Blade 15 2022 | |
| Razer Blade 14 Ryzen 9 6900HX | |
| Gigabyte A5 X1 | |
| Eurocom Nightsky ARX315 | |
| SCHENKER XMG Apex 15 NH57E PS | |
| Eurocom RX315 NH57AF1 | |
| Aorus 15P XC | |
| Lenovo Legion C7 15IMH05 82EH0030GE | |
| Cinebench R23 / Single Core | |
| Intel Core i7-12700K | |
| MSI Raider GE66 12UHS | |
| Media Intel Core i7-12700K (1806 - 1895, n=2) | |
| Eurocom Raptor X15 | |
| Razer Blade 15 2022 | |
| MSI Vector GP76 12UGS-434 | |
| Eurocom Nightsky ARX315 | |
| Razer Blade 14 Ryzen 9 6900HX | |
| Eurocom RX315 NH57AF1 | |
| Gigabyte A5 X1 | |
| SCHENKER XMG Apex 15 NH57E PS | |
| Lenovo Legion C7 15IMH05 82EH0030GE | |
| Aorus 15P XC | |
| Cinebench R15 / CPU Multi 64Bit | |
| Intel Core i7-12700K | |
| Media Intel Core i7-12700K (n=1) | |
| MSI Vector GP76 12UGS-434 | |
| SCHENKER XMG Apex 15 NH57AF1 | |
| MSI Raider GE66 12UHS | |
| Razer Blade 14 Ryzen 9 6900HX | |
| Eurocom Nightsky ARX315 | |
| Razer Blade 15 2022 | |
| Gigabyte A5 X1 | |
| SCHENKER XMG Apex 15 NH57E PS | |
| Eurocom RX315 NH57AF1 | |
| Aorus 15P XC | |
| Lenovo Legion C7 15IMH05 82EH0030GE | |
| Cinebench R15 / CPU Single 64Bit | |
| Intel Core i7-12700K | |
| Media Intel Core i7-12700K (n=1) | |
| MSI Raider GE66 12UHS | |
| Razer Blade 15 2022 | |
| MSI Vector GP76 12UGS-434 | |
| Eurocom Nightsky ARX315 | |
| Razer Blade 14 Ryzen 9 6900HX | |
| Gigabyte A5 X1 | |
| SCHENKER XMG Apex 15 NH57E PS | |
| Eurocom RX315 NH57AF1 | |
| Lenovo Legion C7 15IMH05 82EH0030GE | |
| Aorus 15P XC | |
| SCHENKER XMG Apex 15 NH57AF1 | |
| Blender / v2.79 BMW27 CPU | |
| Lenovo Legion C7 15IMH05 82EH0030GE | |
| Aorus 15P XC | |
| Eurocom RX315 NH57AF1 | |
| SCHENKER XMG Apex 15 NH57E PS | |
| Gigabyte A5 X1 | |
| Razer Blade 15 2022 | |
| Razer Blade 14 Ryzen 9 6900HX | |
| Eurocom Nightsky ARX315 | |
| MSI Vector GP76 12UGS-434 | |
| MSI Raider GE66 12UHS | |
| Eurocom Raptor X15 | |
| SCHENKER XMG Apex 15 NH57AF1 | |
| Media Intel Core i7-12700K (152.3 - 193.9, n=2) | |
| Intel Core i7-12700K | |
| 7-Zip 18.03 / 7z b 4 -mmt1 | |
| Eurocom Nightsky ARX315 | |
| Eurocom Raptor X15 | |
| Media Intel Core i7-12700K (6117 - 6422, n=2) | |
| Intel Core i7-12700K | |
| MSI Raider GE66 12UHS | |
| Razer Blade 14 Ryzen 9 6900HX | |
| Razer Blade 15 2022 | |
| Gigabyte A5 X1 | |
| SCHENKER XMG Apex 15 NH57E PS | |
| MSI Vector GP76 12UGS-434 | |
| Lenovo Legion C7 15IMH05 82EH0030GE | |
| Eurocom RX315 NH57AF1 | |
| Aorus 15P XC | |
| SCHENKER XMG Apex 15 NH57AF1 | |
| Geekbench 5.5 / Multi-Core | |
| Intel Core i7-12700K | |
| Media Intel Core i7-12700K (12475 - 15557, n=2) | |
| MSI Raider GE66 12UHS | |
| Eurocom Raptor X15 | |
| Razer Blade 15 2022 | |
| MSI Vector GP76 12UGS-434 | |
| SCHENKER XMG Apex 15 NH57AF1 | |
| Eurocom Nightsky ARX315 | |
| Razer Blade 14 Ryzen 9 6900HX | |
| Eurocom RX315 NH57AF1 | |
| Gigabyte A5 X1 | |
| SCHENKER XMG Apex 15 NH57E PS | |
| Lenovo Legion C7 15IMH05 82EH0030GE | |
| Aorus 15P XC | |
| Geekbench 5.5 / Single-Core | |
| Eurocom Raptor X15 | |
| Media Intel Core i7-12700K (1890 - 1933, n=2) | |
| Intel Core i7-12700K | |
| MSI Raider GE66 12UHS | |
| MSI Vector GP76 12UGS-434 | |
| Razer Blade 15 2022 | |
| Eurocom Nightsky ARX315 | |
| Razer Blade 14 Ryzen 9 6900HX | |
| Eurocom RX315 NH57AF1 | |
| Gigabyte A5 X1 | |
| SCHENKER XMG Apex 15 NH57E PS | |
| Lenovo Legion C7 15IMH05 82EH0030GE | |
| Aorus 15P XC | |
| SCHENKER XMG Apex 15 NH57AF1 | |
| HWBOT x265 Benchmark v2.2 / 4k Preset | |
| Intel Core i7-12700K | |
| Media Intel Core i7-12700K (14.9 - 26.1, n=2) | |
| MSI Vector GP76 12UGS-434 | |
| SCHENKER XMG Apex 15 NH57AF1 | |
| MSI Raider GE66 12UHS | |
| Razer Blade 14 Ryzen 9 6900HX | |
| Eurocom Nightsky ARX315 | |
| Razer Blade 15 2022 | |
| Gigabyte A5 X1 | |
| SCHENKER XMG Apex 15 NH57E PS | |
| Eurocom RX315 NH57AF1 | |
| Eurocom Raptor X15 | |
| Aorus 15P XC | |
| Lenovo Legion C7 15IMH05 82EH0030GE | |
| LibreOffice / 20 Documents To PDF | |
| Gigabyte A5 X1 | |
| SCHENKER XMG Apex 15 NH57AF1 | |
| Lenovo Legion C7 15IMH05 82EH0030GE | |
| SCHENKER XMG Apex 15 NH57E PS | |
| Aorus 15P XC | |
| Razer Blade 15 2022 | |
| Razer Blade 14 Ryzen 9 6900HX | |
| Eurocom RX315 NH57AF1 | |
| Eurocom Nightsky ARX315 | |
| MSI Vector GP76 12UGS-434 | |
| Intel Core i7-12700K | |
| Media Intel Core i7-12700K (37.8 - 39.8, n=2) | |
| Eurocom Raptor X15 | |
| MSI Raider GE66 12UHS | |
| R Benchmark 2.5 / Overall mean | |
| Aorus 15P XC | |
| Lenovo Legion C7 15IMH05 82EH0030GE | |
| Eurocom RX315 NH57AF1 | |
| SCHENKER XMG Apex 15 NH57AF1 | |
| SCHENKER XMG Apex 15 NH57E PS | |
| Gigabyte A5 X1 | |
| Eurocom Nightsky ARX315 | |
| Razer Blade 14 Ryzen 9 6900HX | |
| Razer Blade 15 2022 | |
| MSI Vector GP76 12UGS-434 | |
| MSI Raider GE66 12UHS | |
| Intel Core i7-12700K | |
| Media Intel Core i7-12700K (0.412 - 0.423, n=2) | |
| Eurocom Raptor X15 | |
Cinebench R23: Multi Core | Single Core
Cinebench R15: CPU Multi 64Bit | CPU Single 64Bit
Blender: v2.79 BMW27 CPU
7-Zip 18.03: 7z b 4 | 7z b 4 -mmt1
Geekbench 5.5: Multi-Core | Single-Core
HWBOT x265 Benchmark v2.2: 4k Preset
LibreOffice : 20 Documents To PDF
R Benchmark 2.5: Overall mean
* ... Meglio usare valori piccoli
AIDA64: FP32 Ray-Trace | FPU Julia | CPU SHA3 | CPU Queen | FPU SinJulia | FPU Mandel | CPU AES | CPU ZLib | FP64 Ray-Trace | CPU PhotoWorxx
| Performance Rating | |
| Gigabyte A5 X1 | |
| Eurocom RX315 NH57AF1 | |
| Asus TUF Gaming A15 FA506QR-AZ061T | |
| MSI Raider GE66 12UHS | |
| Eurocom Raptor X15 | |
| Media Intel Core i7-12700K | |
| Razer Blade 15 Advanced Model Early 2022 | |
| AIDA64 / FP32 Ray-Trace | |
| Gigabyte A5 X1 | |
| Eurocom RX315 NH57AF1 | |
| Asus TUF Gaming A15 FA506QR-AZ061T | |
| MSI Raider GE66 12UHS | |
| Eurocom Raptor X15 | |
| Media Intel Core i7-12700K (n=1) | |
| Razer Blade 15 Advanced Model Early 2022 | |
| AIDA64 / FPU Julia | |
| Gigabyte A5 X1 | |
| Asus TUF Gaming A15 FA506QR-AZ061T | |
| Eurocom RX315 NH57AF1 | |
| Eurocom Raptor X15 | |
| Media Intel Core i7-12700K (n=1) | |
| MSI Raider GE66 12UHS | |
| Razer Blade 15 Advanced Model Early 2022 | |
| AIDA64 / CPU SHA3 | |
| Eurocom RX315 NH57AF1 | |
| Gigabyte A5 X1 | |
| Eurocom Raptor X15 | |
| Media Intel Core i7-12700K (n=1) | |
| MSI Raider GE66 12UHS | |
| Asus TUF Gaming A15 FA506QR-AZ061T | |
| Razer Blade 15 Advanced Model Early 2022 | |
| AIDA64 / CPU Queen | |
| MSI Raider GE66 12UHS | |
| Gigabyte A5 X1 | |
| Eurocom Raptor X15 | |
| Media Intel Core i7-12700K (n=1) | |
| Asus TUF Gaming A15 FA506QR-AZ061T | |
| Eurocom RX315 NH57AF1 | |
| Razer Blade 15 Advanced Model Early 2022 | |
| AIDA64 / FPU SinJulia | |
| Gigabyte A5 X1 | |
| Asus TUF Gaming A15 FA506QR-AZ061T | |
| Eurocom Raptor X15 | |
| Media Intel Core i7-12700K (n=1) | |
| Eurocom RX315 NH57AF1 | |
| MSI Raider GE66 12UHS | |
| Razer Blade 15 Advanced Model Early 2022 | |
| AIDA64 / FPU Mandel | |
| Gigabyte A5 X1 | |
| Eurocom RX315 NH57AF1 | |
| Asus TUF Gaming A15 FA506QR-AZ061T | |
| MSI Raider GE66 12UHS | |
| Eurocom Raptor X15 | |
| Media Intel Core i7-12700K (n=1) | |
| Razer Blade 15 Advanced Model Early 2022 | |
| AIDA64 / CPU AES | |
| Eurocom RX315 NH57AF1 | |
| Gigabyte A5 X1 | |
| MSI Raider GE66 12UHS | |
| Eurocom Raptor X15 | |
| Media Intel Core i7-12700K (n=1) | |
| Asus TUF Gaming A15 FA506QR-AZ061T | |
| Razer Blade 15 Advanced Model Early 2022 | |
| AIDA64 / CPU ZLib | |
| Eurocom Raptor X15 | |
| Media Intel Core i7-12700K (n=1) | |
| MSI Raider GE66 12UHS | |
| Gigabyte A5 X1 | |
| Eurocom RX315 NH57AF1 | |
| Asus TUF Gaming A15 FA506QR-AZ061T | |
| Razer Blade 15 Advanced Model Early 2022 | |
| AIDA64 / FP64 Ray-Trace | |
| Eurocom RX315 NH57AF1 | |
| Gigabyte A5 X1 | |
| Asus TUF Gaming A15 FA506QR-AZ061T | |
| MSI Raider GE66 12UHS | |
| Eurocom Raptor X15 | |
| Media Intel Core i7-12700K (n=1) | |
| Razer Blade 15 Advanced Model Early 2022 | |
| AIDA64 / CPU PhotoWorxx | |
| MSI Raider GE66 12UHS | |
| Razer Blade 15 Advanced Model Early 2022 | |
| Eurocom Raptor X15 | |
| Media Intel Core i7-12700K (n=1) | |
| Eurocom RX315 NH57AF1 | |
| Gigabyte A5 X1 | |
| Asus TUF Gaming A15 FA506QR-AZ061T | |
Prestazioni del sistema
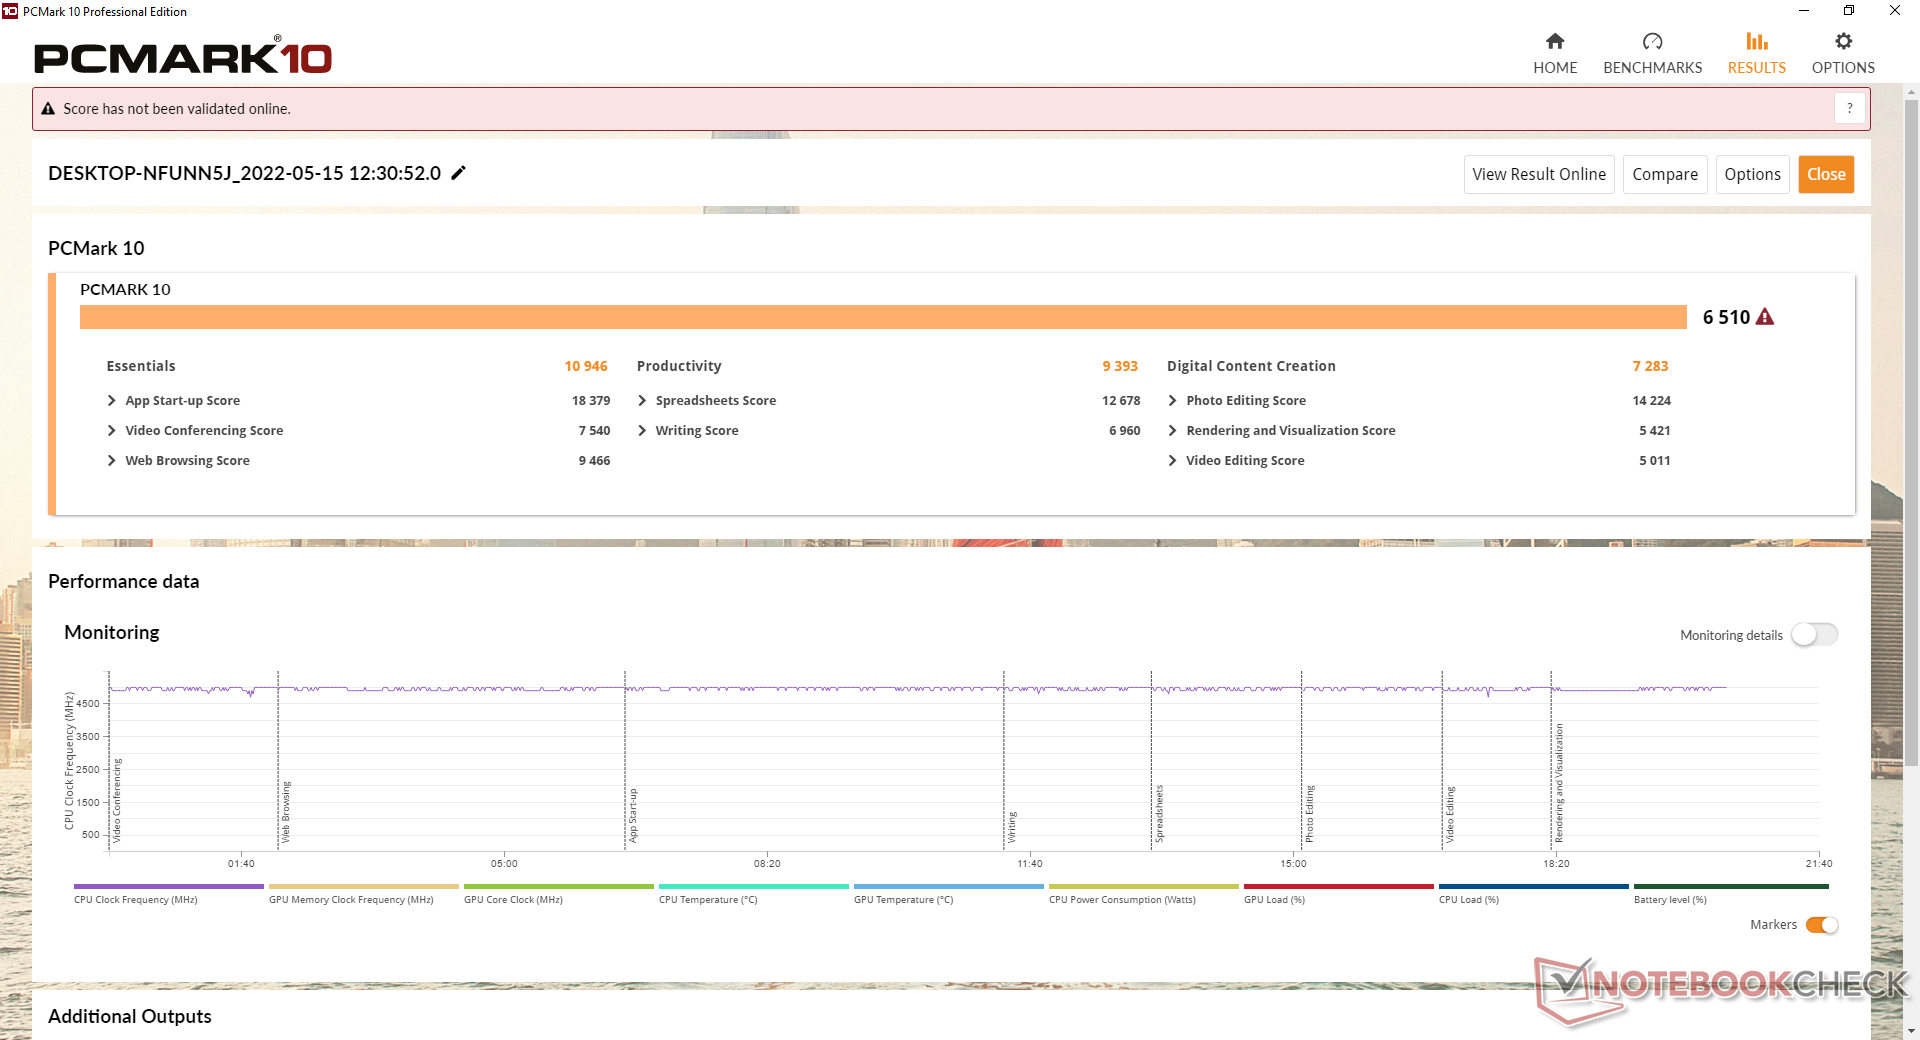
I punteggi di PCMark 10 sono paragonabili a quelli dei portatili da gioco di fascia alta dotati di "normali" CPU mobili, come l'MSI GE66 i9-12900K MSI GE66 i9-12900HK o Razer Blade 15 i7-12800H. Il punteggio del sottotest Creazione di contenuti digitali, tuttavia, è inferiore alle aspettative.
CrossMark: Overall | Productivity | Creativity | Responsiveness
| PCMark 10 / Score | |
| MSI Raider GE66 12UHS | |
| Razer Blade 15 Advanced Model Early 2022 | |
| Eurocom RX315 NH57AF1 | |
| Asus TUF Gaming A15 FA506QR-AZ061T | |
| Gigabyte A5 X1 | |
| Eurocom Raptor X15 | |
| Media Intel Core i7-12700K, NVIDIA GeForce RTX 3070 Ti Laptop GPU (n=1) | |
| PCMark 10 / Essentials | |
| MSI Raider GE66 12UHS | |
| Eurocom Raptor X15 | |
| Media Intel Core i7-12700K, NVIDIA GeForce RTX 3070 Ti Laptop GPU (n=1) | |
| Razer Blade 15 Advanced Model Early 2022 | |
| Eurocom RX315 NH57AF1 | |
| Asus TUF Gaming A15 FA506QR-AZ061T | |
| Gigabyte A5 X1 | |
| PCMark 10 / Productivity | |
| MSI Raider GE66 12UHS | |
| Razer Blade 15 Advanced Model Early 2022 | |
| Asus TUF Gaming A15 FA506QR-AZ061T | |
| Eurocom Raptor X15 | |
| Media Intel Core i7-12700K, NVIDIA GeForce RTX 3070 Ti Laptop GPU (n=1) | |
| Gigabyte A5 X1 | |
| Eurocom RX315 NH57AF1 | |
| PCMark 10 / Digital Content Creation | |
| MSI Raider GE66 12UHS | |
| Razer Blade 15 Advanced Model Early 2022 | |
| Eurocom RX315 NH57AF1 | |
| Gigabyte A5 X1 | |
| Asus TUF Gaming A15 FA506QR-AZ061T | |
| Eurocom Raptor X15 | |
| Media Intel Core i7-12700K, NVIDIA GeForce RTX 3070 Ti Laptop GPU (n=1) | |
| CrossMark / Overall | |
| Eurocom Raptor X15 | |
| Media Intel Core i7-12700K, NVIDIA GeForce RTX 3070 Ti Laptop GPU (n=1) | |
| Razer Blade 15 Advanced Model Early 2022 | |
| CrossMark / Productivity | |
| Eurocom Raptor X15 | |
| Media Intel Core i7-12700K, NVIDIA GeForce RTX 3070 Ti Laptop GPU (n=1) | |
| Razer Blade 15 Advanced Model Early 2022 | |
| CrossMark / Creativity | |
| Eurocom Raptor X15 | |
| Media Intel Core i7-12700K, NVIDIA GeForce RTX 3070 Ti Laptop GPU (n=1) | |
| Razer Blade 15 Advanced Model Early 2022 | |
| CrossMark / Responsiveness | |
| Eurocom Raptor X15 | |
| Media Intel Core i7-12700K, NVIDIA GeForce RTX 3070 Ti Laptop GPU (n=1) | |
| Razer Blade 15 Advanced Model Early 2022 | |
| PCMark 10 Score | 6510 punti | |
Aiuto | ||
| AIDA64 / Memory Copy | |
| MSI Raider GE66 12UHS | |
| Razer Blade 15 Advanced Model Early 2022 | |
| Eurocom Raptor X15 | |
| Media Intel Core i7-12700K (n=1) | |
| Eurocom RX315 NH57AF1 | |
| Gigabyte A5 X1 | |
| Asus TUF Gaming A15 FA506QR-AZ061T | |
| AIDA64 / Memory Read | |
| MSI Raider GE66 12UHS | |
| Razer Blade 15 Advanced Model Early 2022 | |
| Eurocom Raptor X15 | |
| Media Intel Core i7-12700K (n=1) | |
| Eurocom RX315 NH57AF1 | |
| Gigabyte A5 X1 | |
| Asus TUF Gaming A15 FA506QR-AZ061T | |
| AIDA64 / Memory Write | |
| Razer Blade 15 Advanced Model Early 2022 | |
| MSI Raider GE66 12UHS | |
| Eurocom Raptor X15 | |
| Media Intel Core i7-12700K (n=1) | |
| Eurocom RX315 NH57AF1 | |
| Gigabyte A5 X1 | |
| Asus TUF Gaming A15 FA506QR-AZ061T | |
| AIDA64 / Memory Latency | |
| Razer Blade 15 Advanced Model Early 2022 | |
| MSI Raider GE66 12UHS | |
| Eurocom RX315 NH57AF1 | |
| Asus TUF Gaming A15 FA506QR-AZ061T | |
| Gigabyte A5 X1 | |
| Eurocom Raptor X15 | |
| Media Intel Core i7-12700K (n=1) | |
* ... Meglio usare valori piccoli
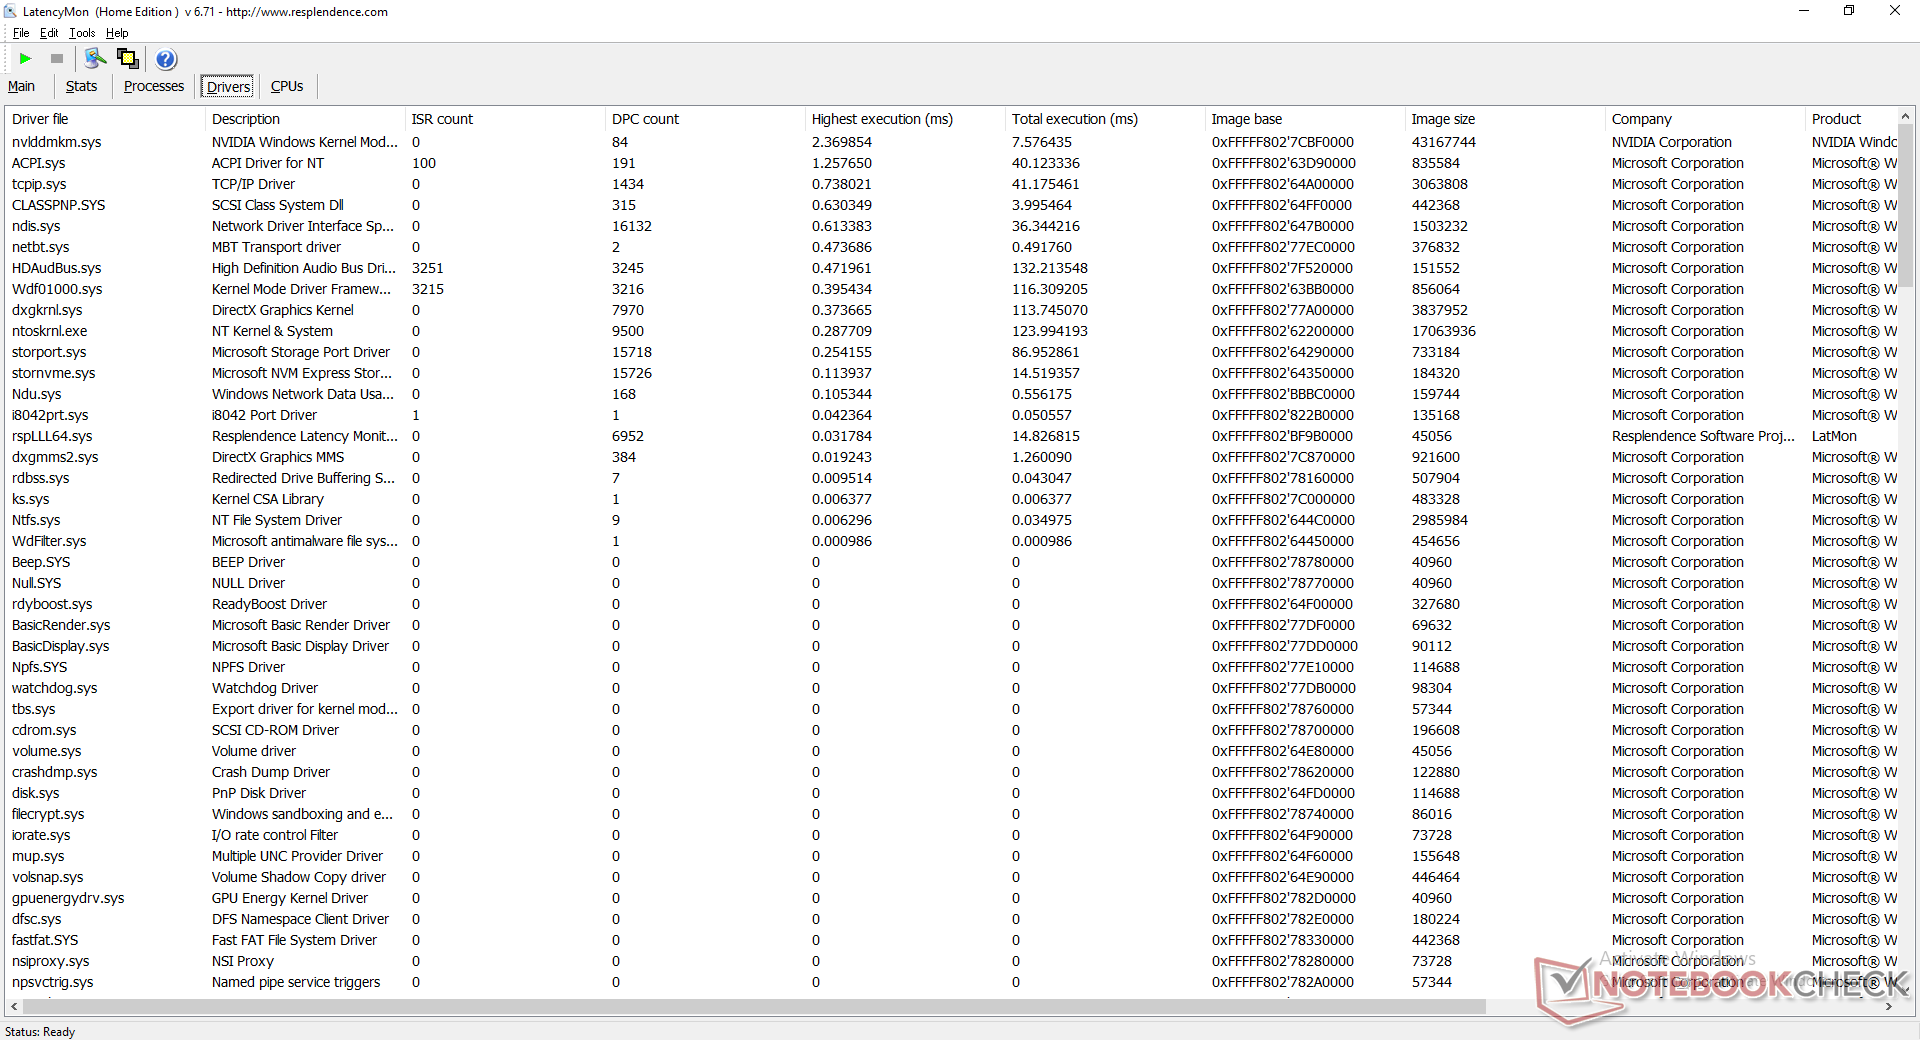
Latenza DPC
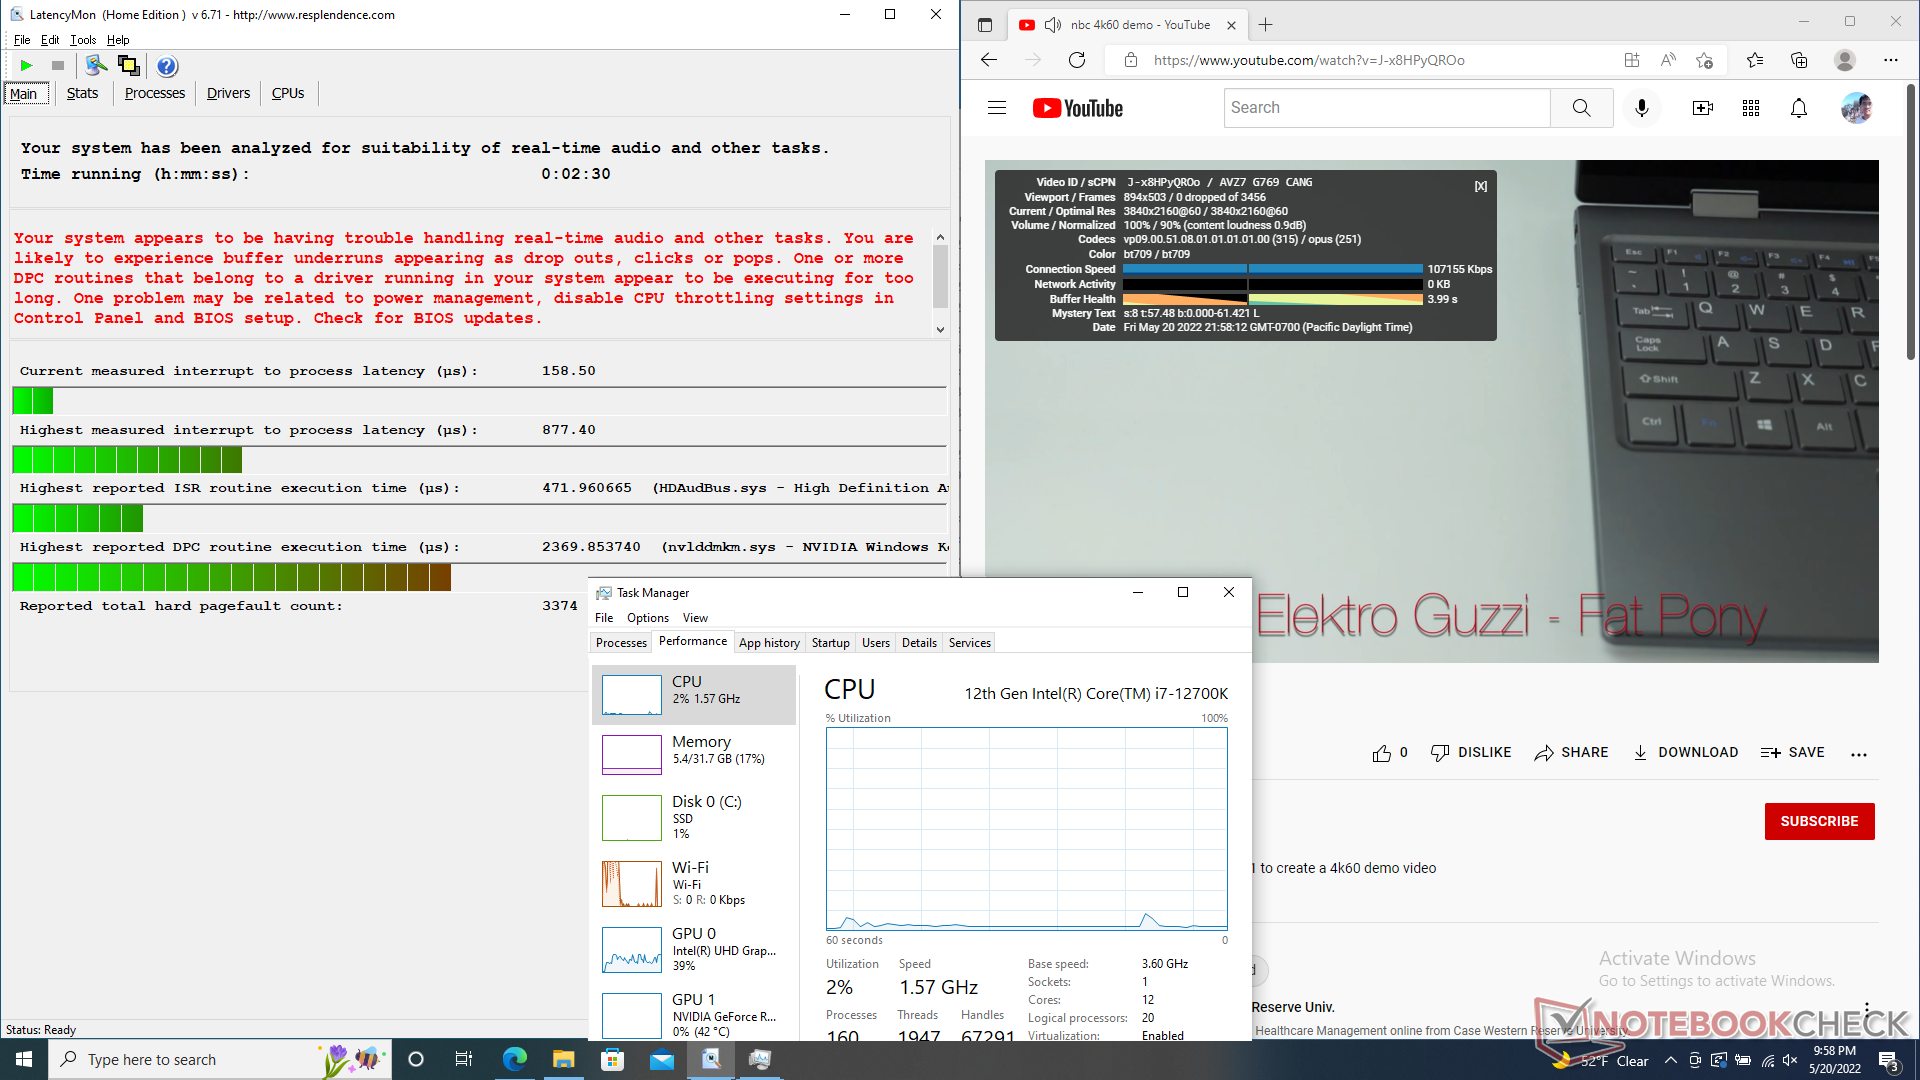
LatencyMon rivela problemi di DPC quando si aprono più schede del browser della nostra homepage. la riproduzione di video 4K a 60 FPS è invece perfetta e senza cadute di fotogrammi quando è impostata sulla GPU integrata.
| DPC Latencies / LatencyMon - interrupt to process latency (max), Web, Youtube, Prime95 | |
| MSI Raider GE66 12UHS | |
| Razer Blade 15 Advanced Model Early 2022 | |
| Eurocom RX315 NH57AF1 | |
| Asus TUF Gaming A15 FA506QR-AZ061T | |
| Eurocom Raptor X15 | |
| Gigabyte A5 X1 | |
* ... Meglio usare valori piccoli
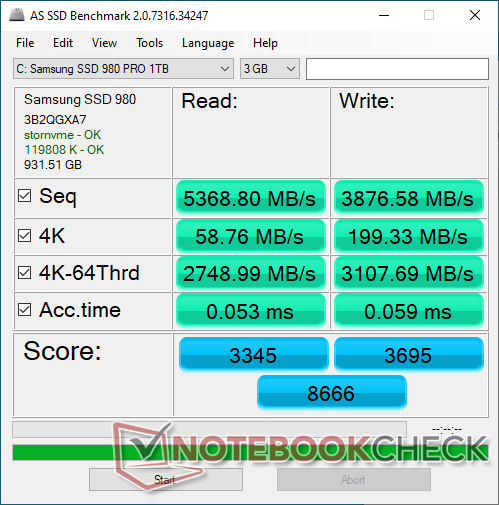
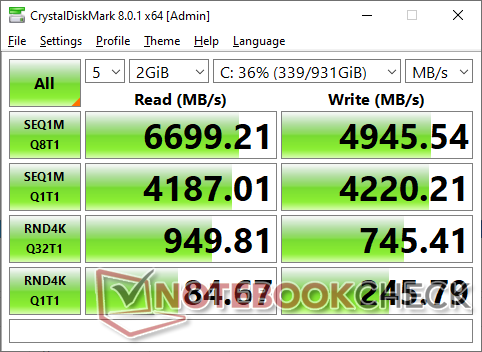
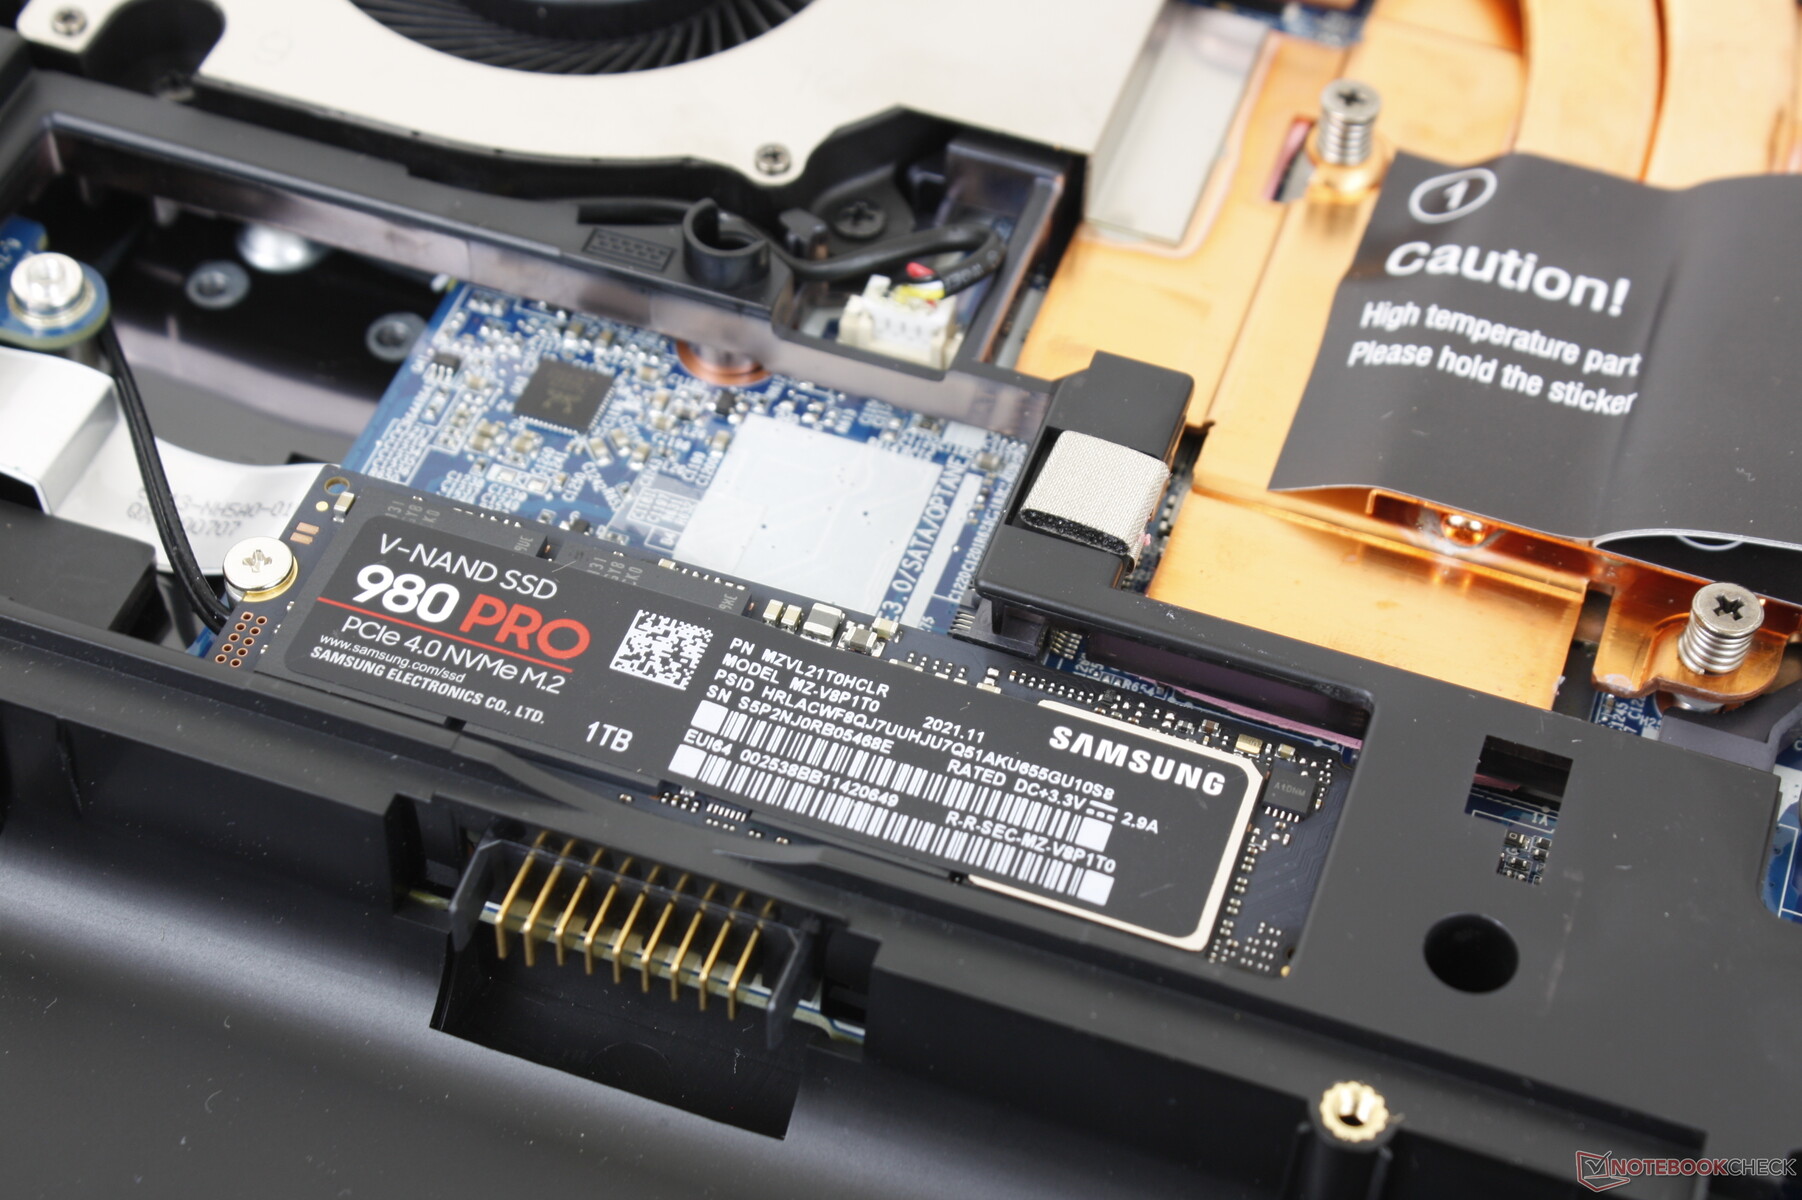
Dispositivi di archiviazione
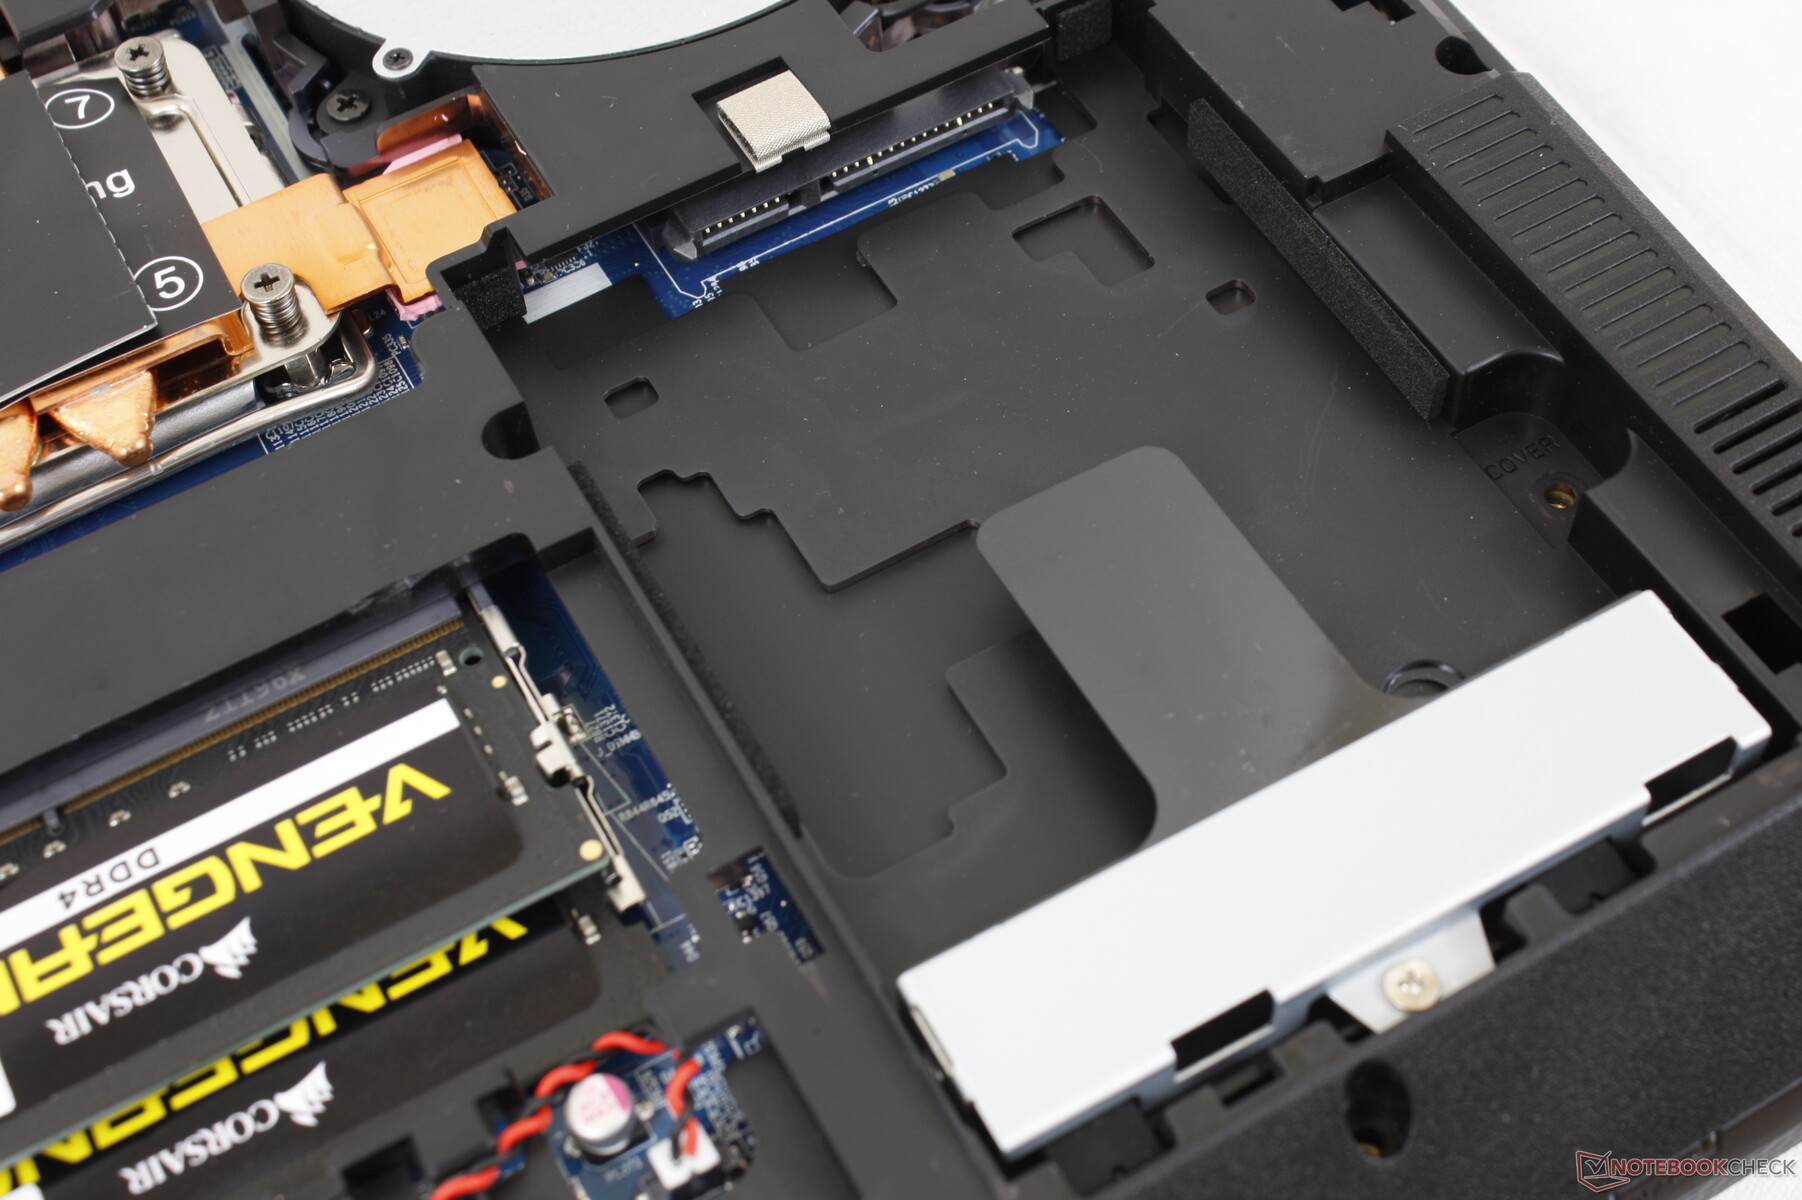
La sostenibilità delle prestazioni è scarsa quando si installa un'unità PCIe4. Come mostra il grafico sottostante, l'unitàSSD 980 Pro di Samsung ha problemi a mantenere la velocità di trasferimento massima anche per brevi periodi. Il rallentamento delle prestazioni si verifica presto a causa delle limitazioni termiche dovute alla mancanza di un dissipatore di calore incluso.

| Drive Performance Rating - Percent | |
| MSI Raider GE66 12UHS | |
| Razer Blade 15 Advanced Model Early 2022 | |
| Eurocom Raptor X15 | |
| Eurocom RX315 NH57AF1 | |
| Asus TUF Gaming A15 FA506QR-AZ061T | |
| Gigabyte A5 X1 | |
* ... Meglio usare valori piccoli
Disk Throttling: DiskSpd Read Loop, Queue Depth 8
Prestazioni della GPU
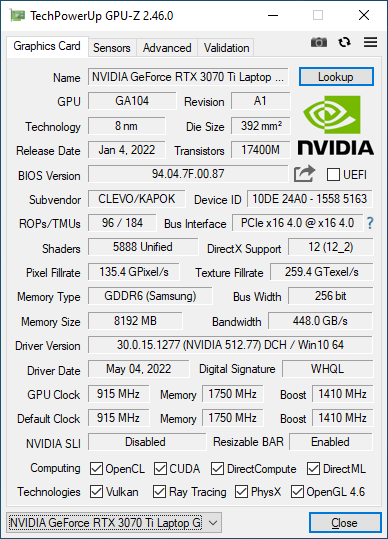
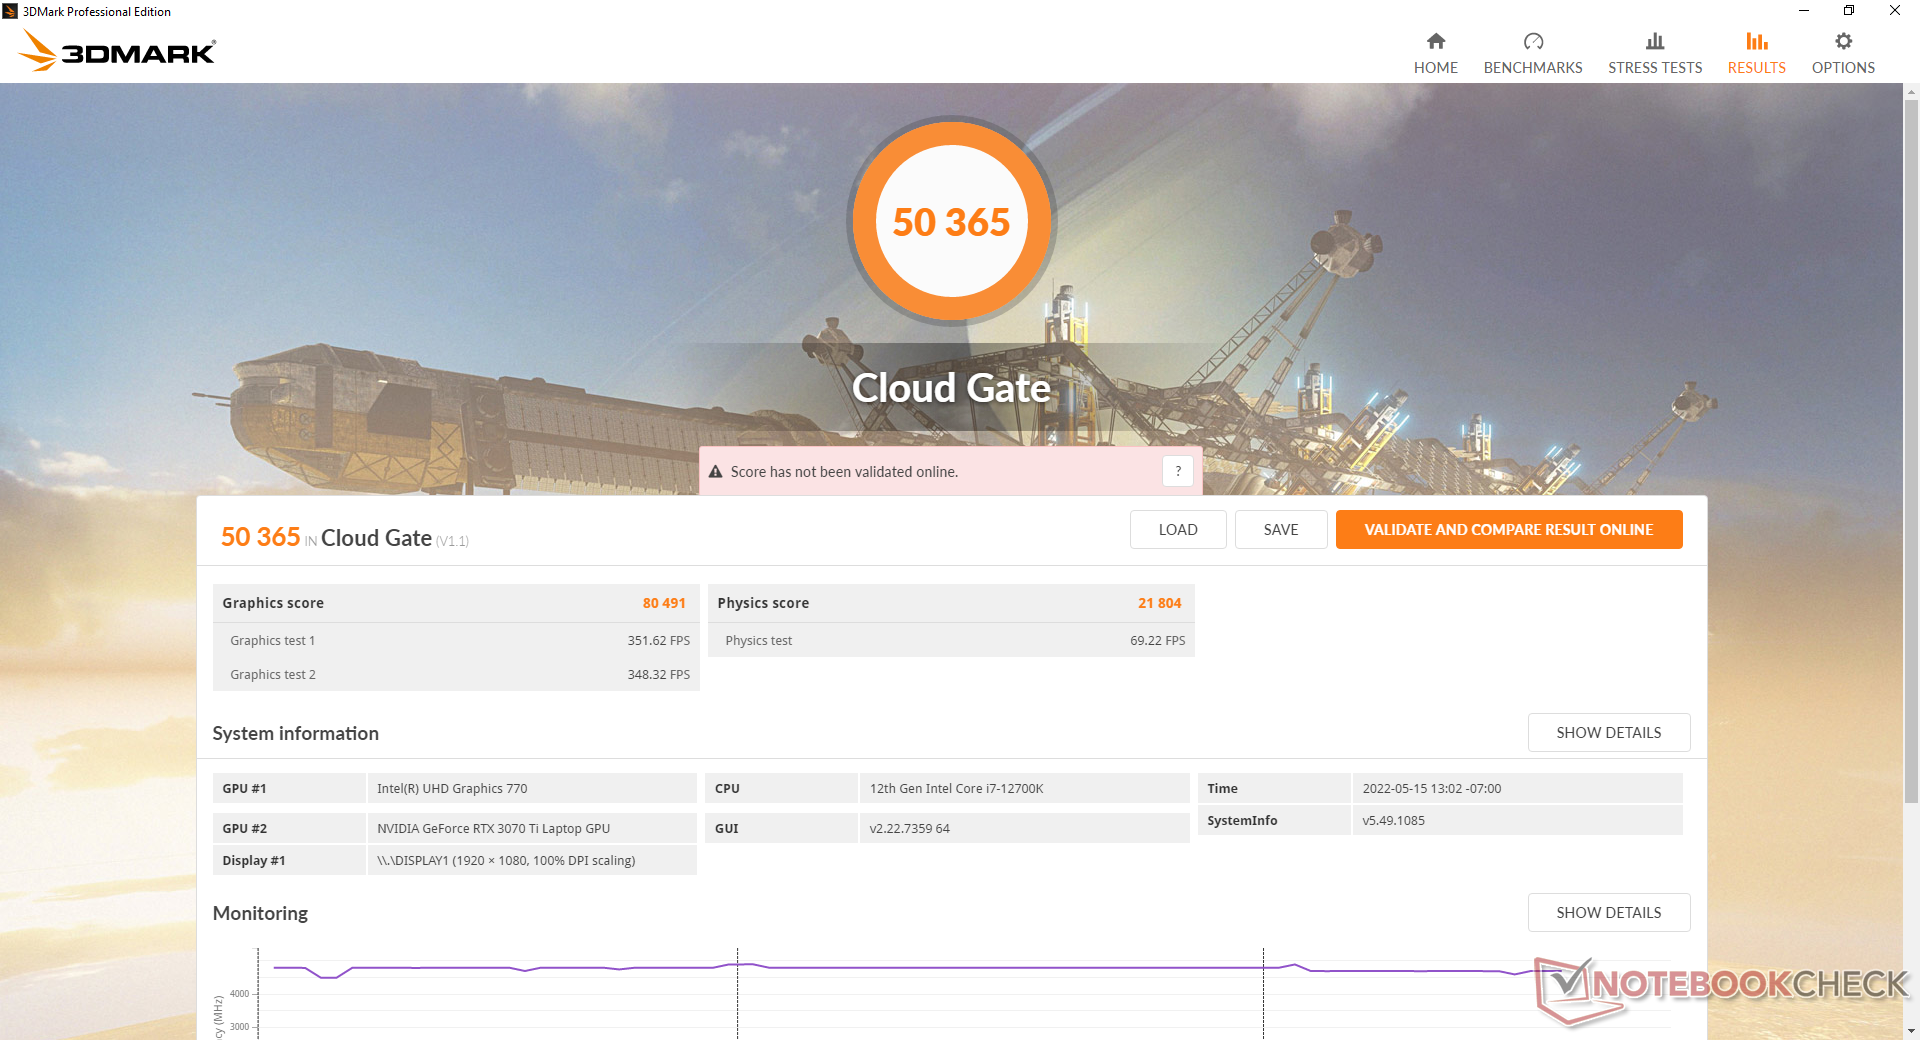
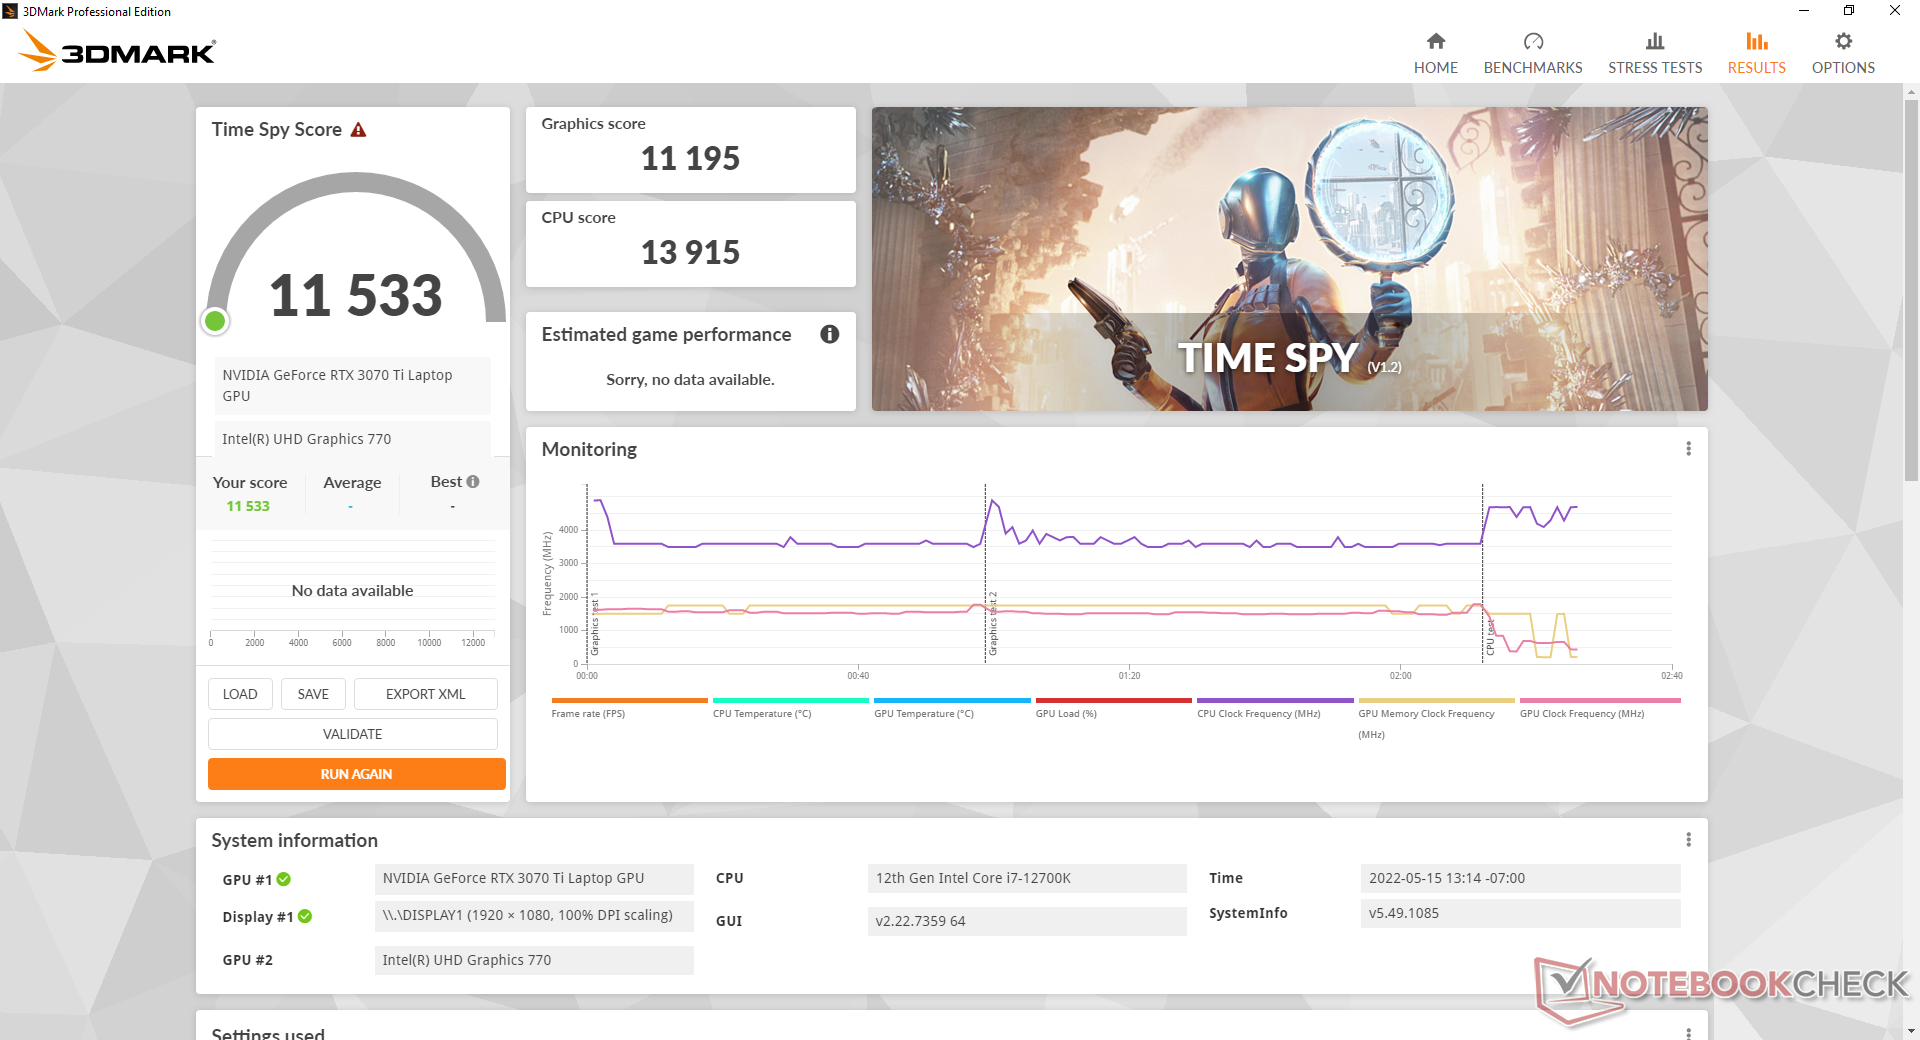
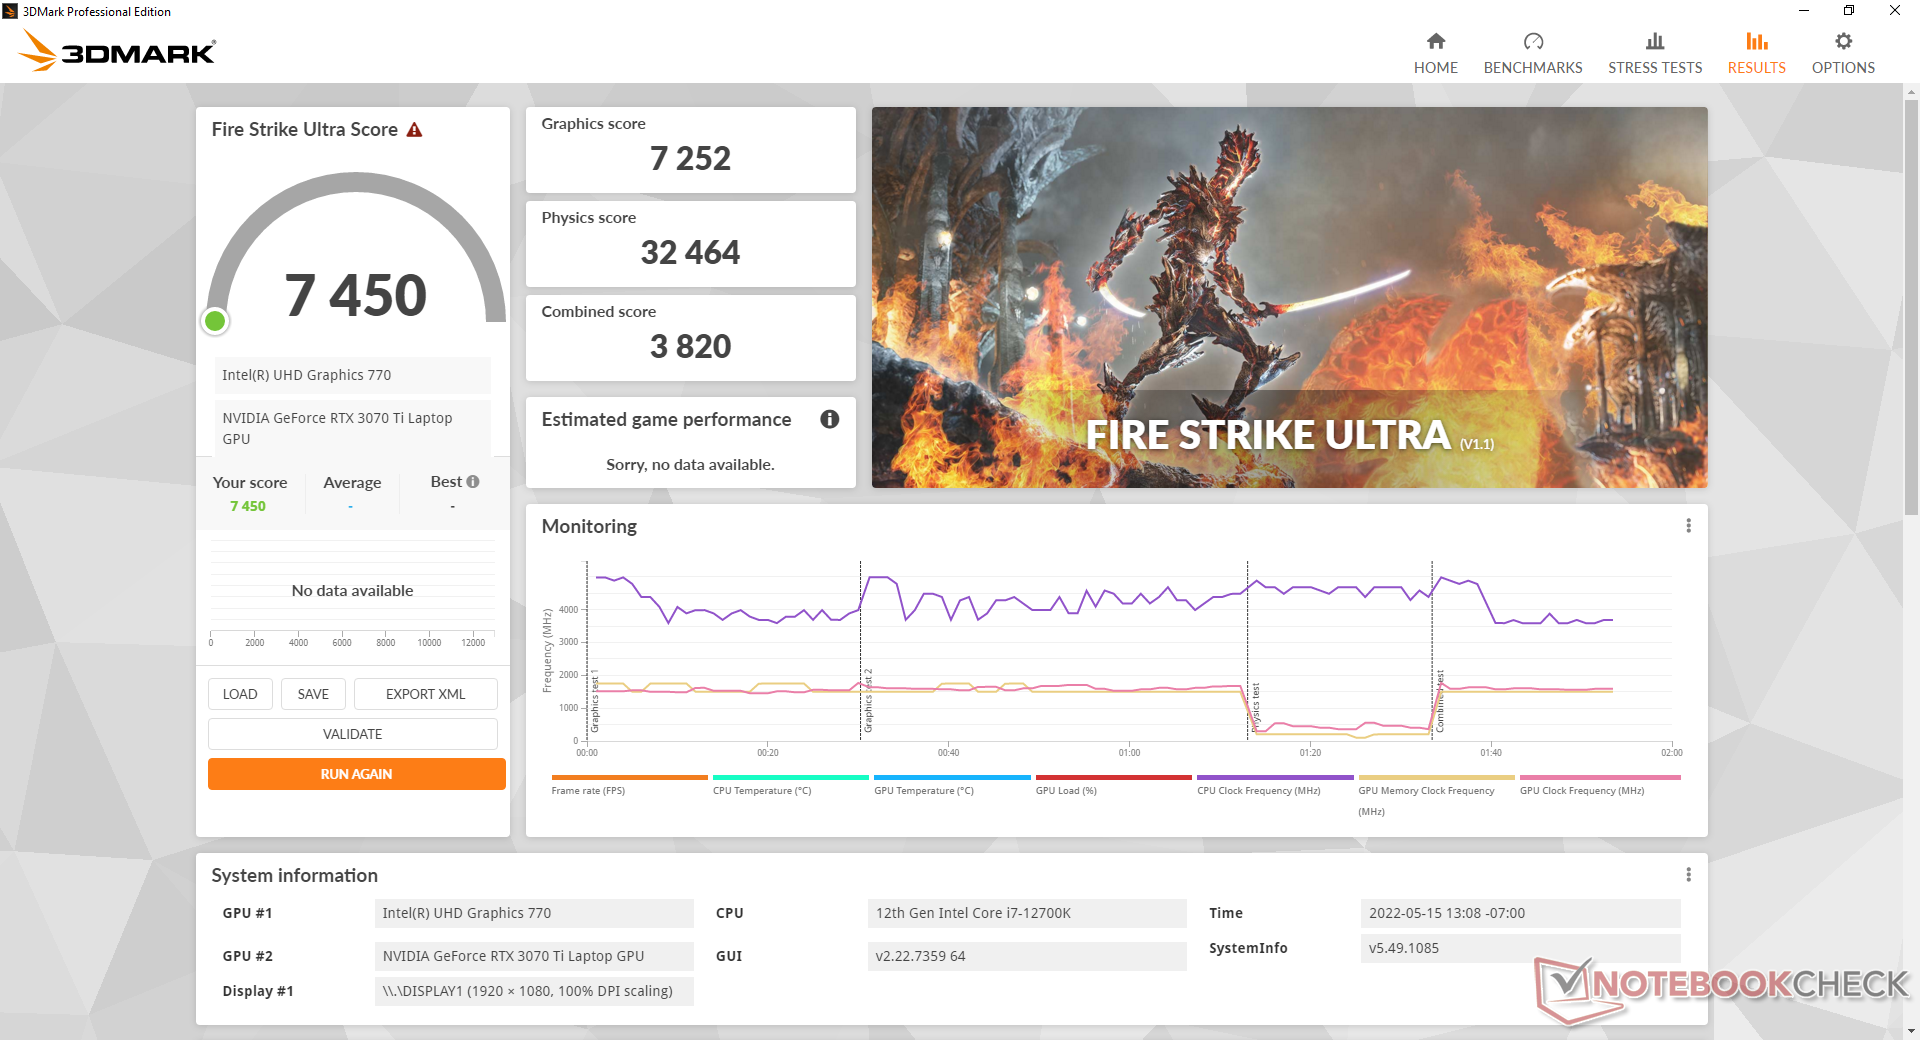
Le prestazioni grafiche sono eccellenti, fino al 10 percento più veloci rispetto alla media dei laptop del nostro database dotati della stessa GeForce RTX 3070 Ti GPU. Lo chassis relativamente spesso ha permesso di raggiungere un obiettivo di 140 W TGP superiore alla media, rispetto ai soli 105 W o meno del modello MSI GS66 MSI GS66. Le prestazioni sono appena inferiori a quelle della GeForce RTX 3070 per i desktop.
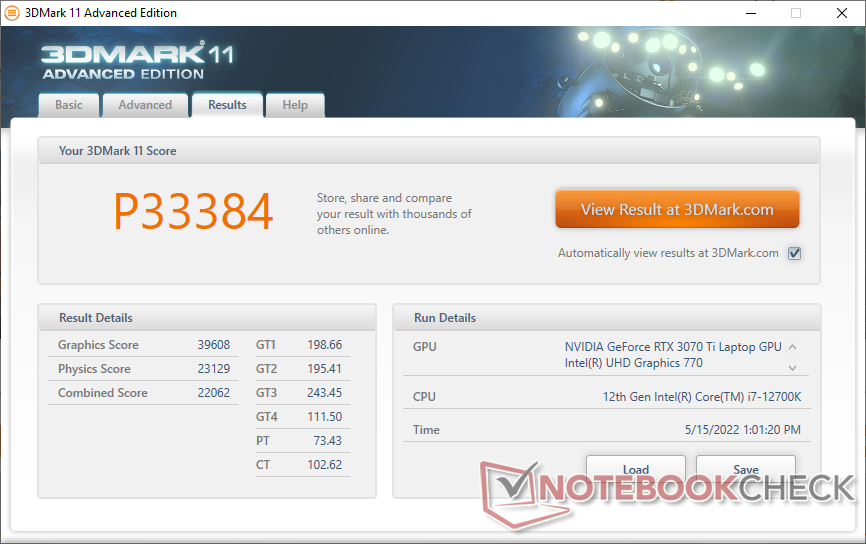
| 3DMark 11 Performance | 33384 punti | |
| 3DMark Cloud Gate Standard Score | 50365 punti | |
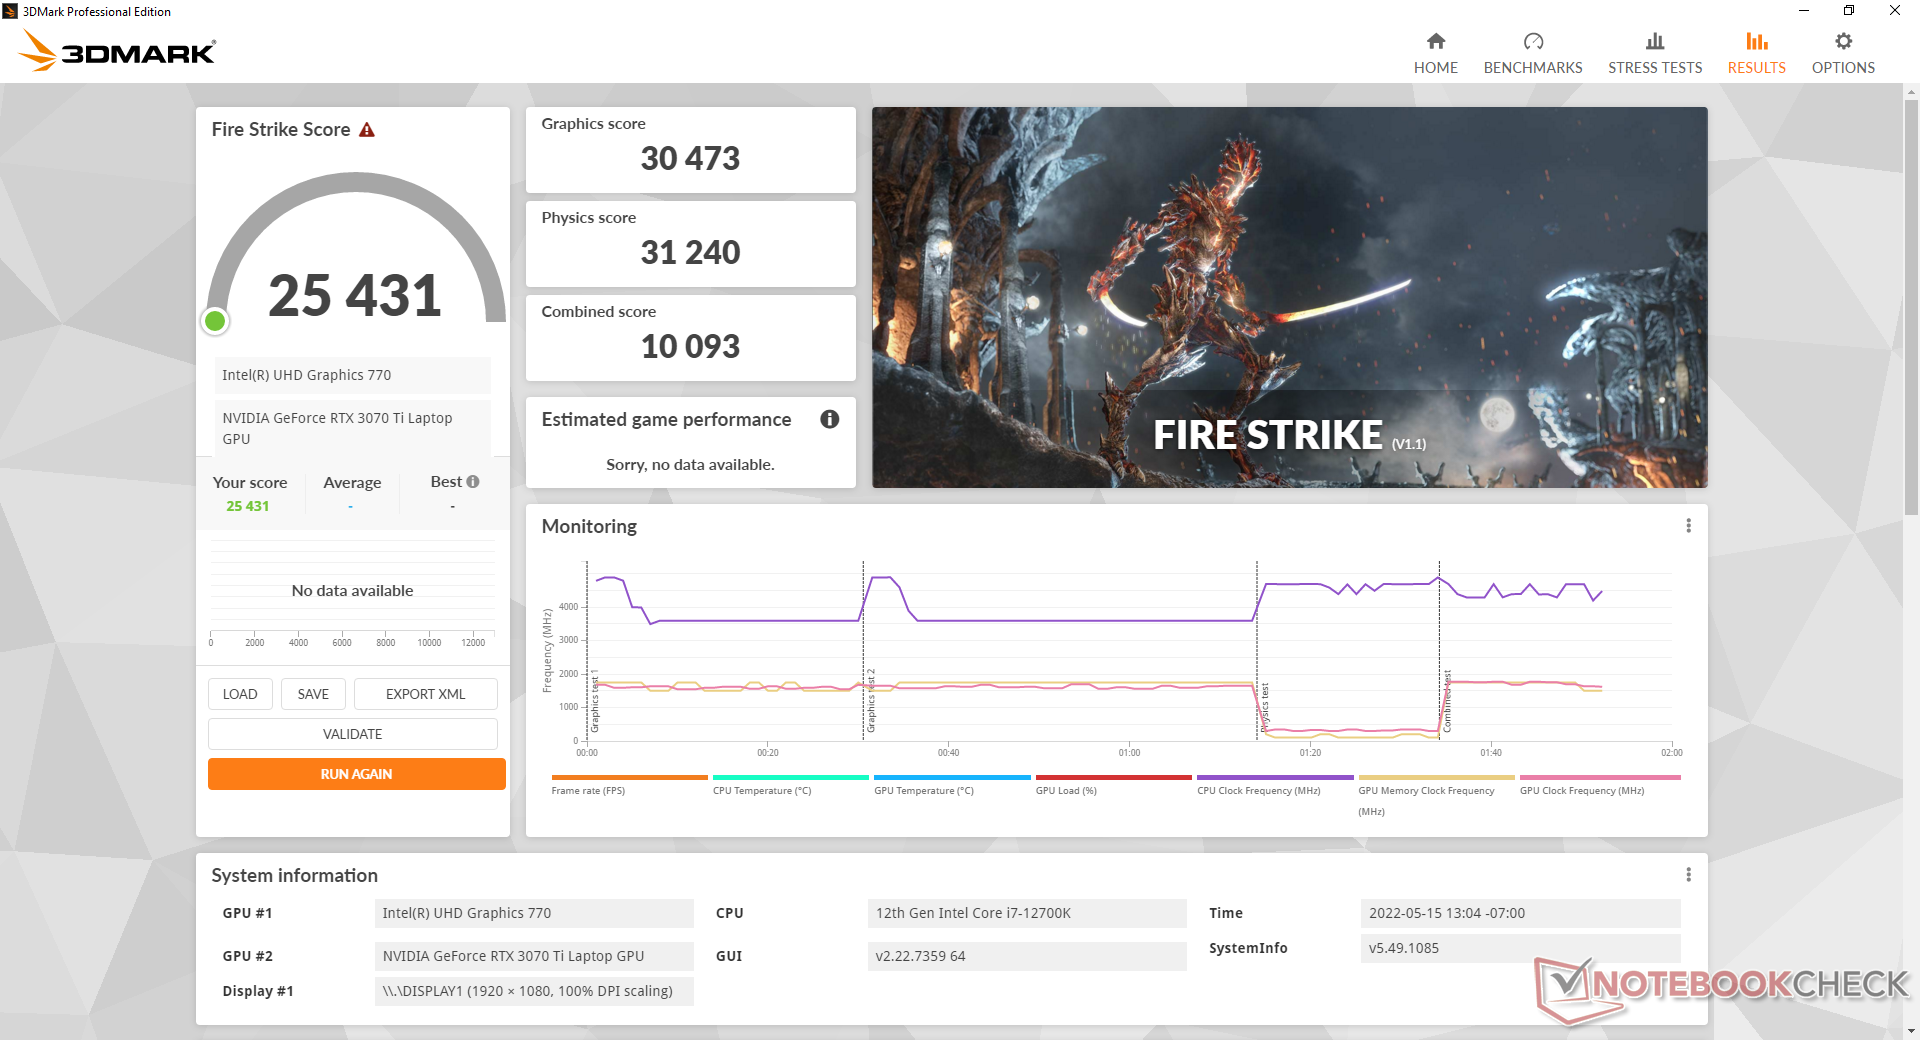
| 3DMark Fire Strike Score | 25431 punti | |
| 3DMark Time Spy Score | 11533 punti | |
Aiuto | ||
Witcher 3 FPS Chart
| basso | medio | alto | ultra | |
|---|---|---|---|---|
| GTA V (2015) | 186.6 | 182.8 | 174.6 | 116.5 |
| The Witcher 3 (2015) | 429 | 329.2 | 213.9 | 111.4 |
| Dota 2 Reborn (2015) | 199 | 178.4 | 166.3 | 155.6 |
| Final Fantasy XV Benchmark (2018) | 202 | 145.8 | 109.5 | |
| X-Plane 11.11 (2018) | 160.9 | 137.6 | 109.9 | |
| Strange Brigade (2018) | 490 | 271 | 223 | 194 |
| Cyberpunk 2077 1.6 (2022) | 140.4 | 124.6 | 132.3 | 81.8 |
Emissioni
Rumore del sistema
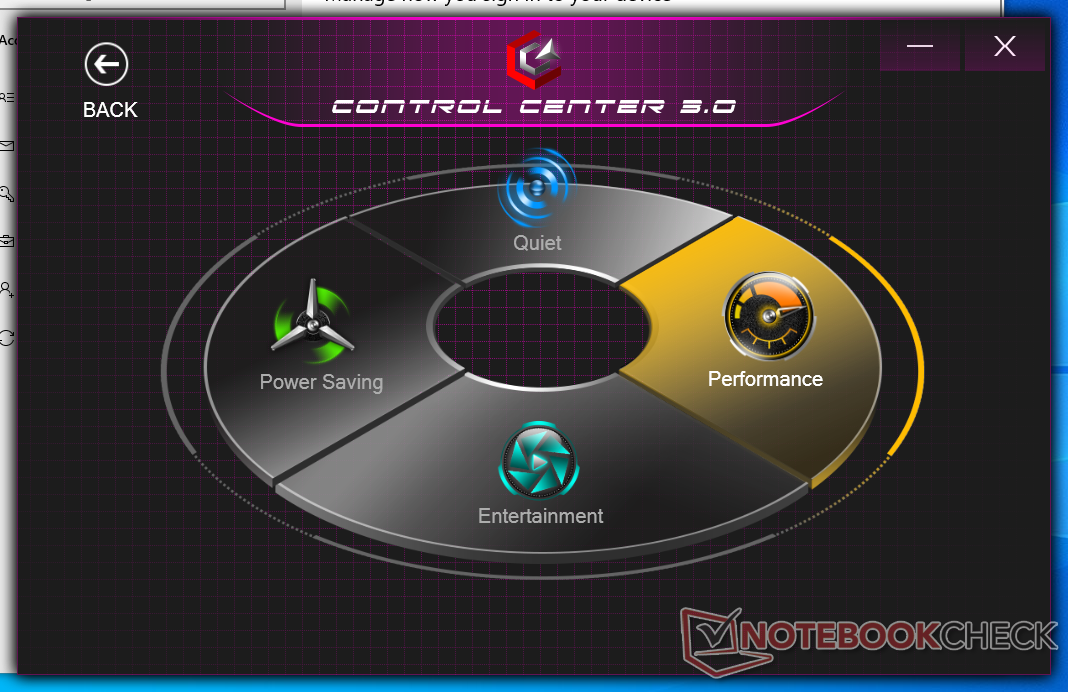
Il rumore della ventola dipende dalle cinque impostazioni della modalità di alimentazione del Control Center: Risparmio energetico, Silenzioso, Intrattenimento, Prestazioni e Modalità ventola massima. Le modalità Quiet o Power Saving sono consigliate quando si naviga semplicemente o si trasmettono video in streaming per mantenere al minimo il rumore della ventola. In caso contrario, le ventole pulseranno più frequentemente quando si eseguono applicazioni non impegnative in modalità Intrattenimento o Prestazioni
Il rumore della ventola si aggira tra i 50 e i 50 dB(A) quando si gioca, ed è più forte di quello di molti altri portatili da gioco in condizioni simili. Se sono attive sia la modalità Performance che la modalità Maximum Fan, il rumore della ventola può raggiungere i 55 dB(A).
Rumorosità
| Idle |
| 23.8 / 23.8 / 30.1 dB(A) |
| Sotto carico |
| 31.1 / 55.1 dB(A) |
 | ||
30 dB silenzioso 40 dB(A) udibile 50 dB(A) rumoroso |
||
min: | ||
| Eurocom Raptor X15 GeForce RTX 3070 Ti Laptop GPU, i7-12700K, Samsung SSD 980 Pro 1TB MZ-V8P1T0BW | MSI Raider GE66 12UHS GeForce RTX 3080 Ti Laptop GPU, i9-12900HK, Samsung PM9A1 MZVL22T0HBLB | Razer Blade 15 Advanced Model Early 2022 GeForce RTX 3080 Ti Laptop GPU, i7-12800H, Samsung PM9A1 MZVL21T0HCLR | Eurocom RX315 NH57AF1 GeForce RTX 3070 Laptop GPU, i7-11800H, Samsung SSD 980 Pro 1TB MZ-V8P1T0BW | Gigabyte A5 X1 GeForce RTX 3070 Laptop GPU, R9 5900HX, ADATA XPG SX8200 Pro (ASX8200PNP-512GT) | Asus TUF Gaming A15 FA506QR-AZ061T GeForce RTX 3070 Laptop GPU, R7 5800H, SK Hynix HFM001TD3JX013N | |
|---|---|---|---|---|---|---|
| Noise | -14% | -2% | -18% | -21% | -10% | |
| off /ambiente * | 23.3 | 26 -12% | 26 -12% | 26.3 -13% | 25 -7% | 26 -12% |
| Idle Minimum * | 23.8 | 27 -13% | 26 -9% | 26.4 -11% | 27 -13% | 26 -9% |
| Idle Average * | 23.8 | 30 -26% | 27 -13% | 31 -30% | 29 -22% | 26 -9% |
| Idle Maximum * | 30.1 | 39 -30% | 29 4% | 34 -13% | 32 -6% | 27.4 9% |
| Load Average * | 31.1 | 45 -45% | 37 -19% | 47.8 -54% | 57 -83% | 46.6 -50% |
| Witcher 3 ultra * | 51.3 | 45 12% | 44 14% | 51.7 -1% | 56 -9% | |
| Load Maximum * | 55.1 | 47 15% | 45 18% | 57.1 -4% | 58 -5% | 49.3 11% |
* ... Meglio usare valori piccoli
Temperatura
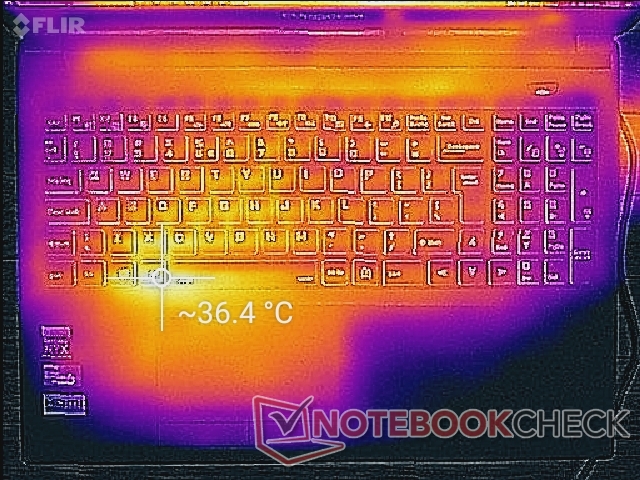
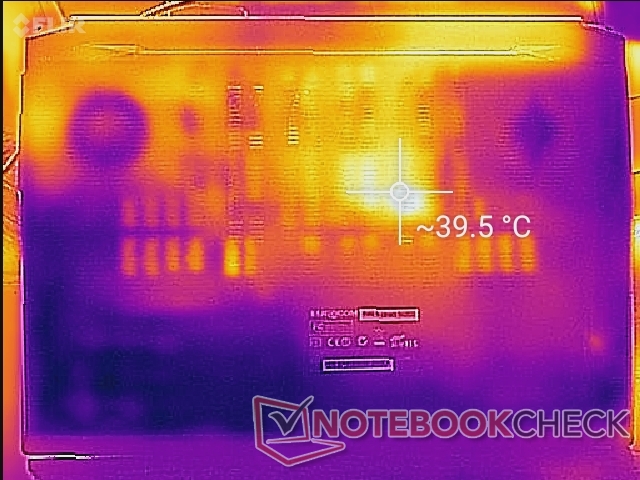
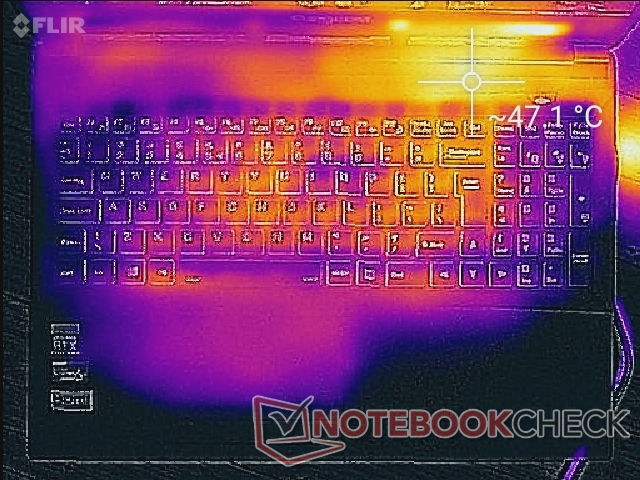
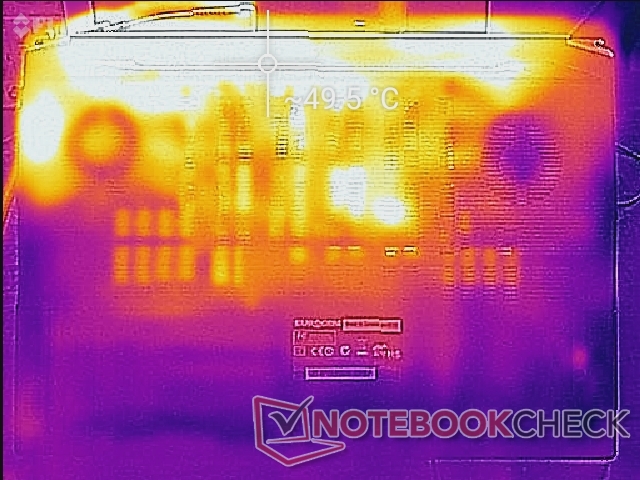
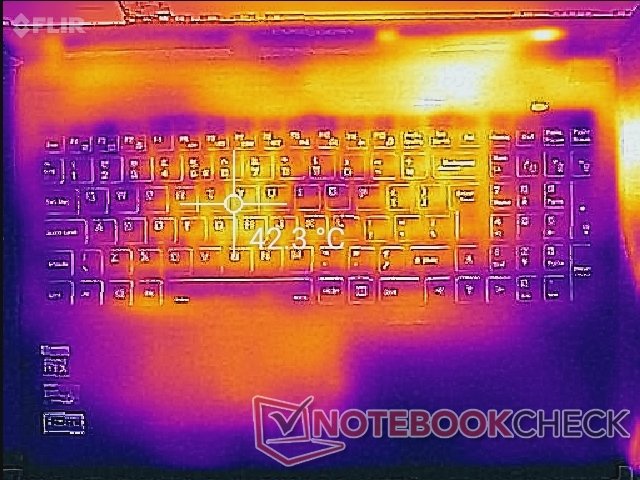
I punti caldi della superficie sono più vicini al poggiapolsi sinistro e al centro della tastiera quando si eseguono applicazioni impegnative. Il poggiapolsi sinistro è solitamente più caldo di quello destro, poiché l'unità SSD PCIe4 NVMe è posizionata al di sotto. I punti caldi possono raggiungere circa 50 C nelle aree superiore e inferiore, come mostrano le mappe di temperatura qui sotto.
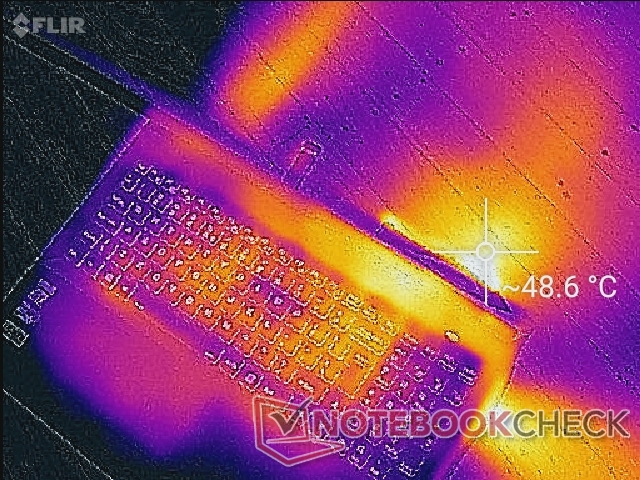
(-) La temperatura massima sul lato superiore è di 48.8 °C / 120 F, rispetto alla media di 40.4 °C / 105 F, che varia da 21.2 a 68.8 °C per questa classe Gaming.
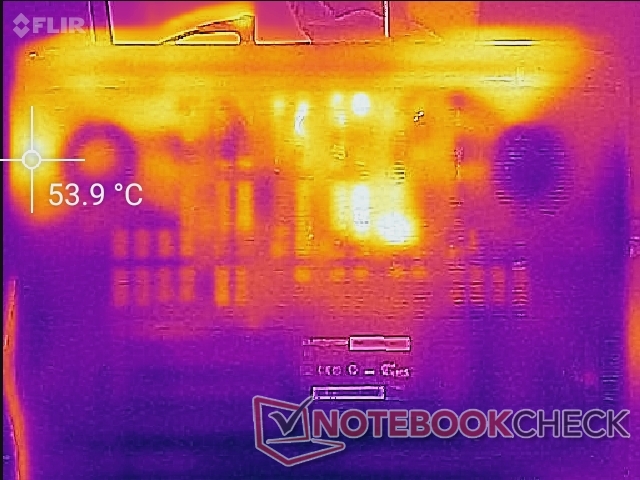
(-) Il lato inferiore si riscalda fino ad un massimo di 57.8 °C / 136 F, rispetto alla media di 43.3 °C / 110 F
(+) In idle, la temperatura media del lato superiore è di 30.2 °C / 86 F, rispetto alla media deld ispositivo di 33.9 °C / 93 F.
(±) Riproducendo The Witcher 3, la temperatura media per il lato superiore e' di 34.3 °C / 94 F, rispetto alla media del dispositivo di 33.9 °C / 93 F.
(±) I poggiapolsi e il touchpad possono diventare molto caldi al tatto con un massimo di 37.2 °C / 99 F.
(-) La temperatura media della zona del palmo della mano di dispositivi simili e'stata di 28.9 °C / 84 F (-8.3 °C / -15 F).
| Eurocom Raptor X15 Intel Core i7-12700K, NVIDIA GeForce RTX 3070 Ti Laptop GPU | MSI Raider GE66 12UHS Intel Core i9-12900HK, NVIDIA GeForce RTX 3080 Ti Laptop GPU | Razer Blade 15 Advanced Model Early 2022 Intel Core i7-12800H, NVIDIA GeForce RTX 3080 Ti Laptop GPU | Eurocom RX315 NH57AF1 Intel Core i7-11800H, NVIDIA GeForce RTX 3070 Laptop GPU | Gigabyte A5 X1 AMD Ryzen 9 5900HX, NVIDIA GeForce RTX 3070 Laptop GPU | Asus TUF Gaming A15 FA506QR-AZ061T AMD Ryzen 7 5800H, NVIDIA GeForce RTX 3070 Laptop GPU | |
|---|---|---|---|---|---|---|
| Heat | 2% | 2% | 14% | 17% | 3% | |
| Maximum Upper Side * | 48.8 | 54 -11% | 53 -9% | 36 26% | 47 4% | 46.7 4% |
| Maximum Bottom * | 57.8 | 65 -12% | 53 8% | 46 20% | 51 12% | 55.9 3% |
| Idle Upper Side * | 36.6 | 30 18% | 36 2% | 35.6 3% | 27 26% | 37.1 -1% |
| Idle Bottom * | 40.2 | 35 13% | 38 5% | 36.8 8% | 30 25% | 38.1 5% |
* ... Meglio usare valori piccoli
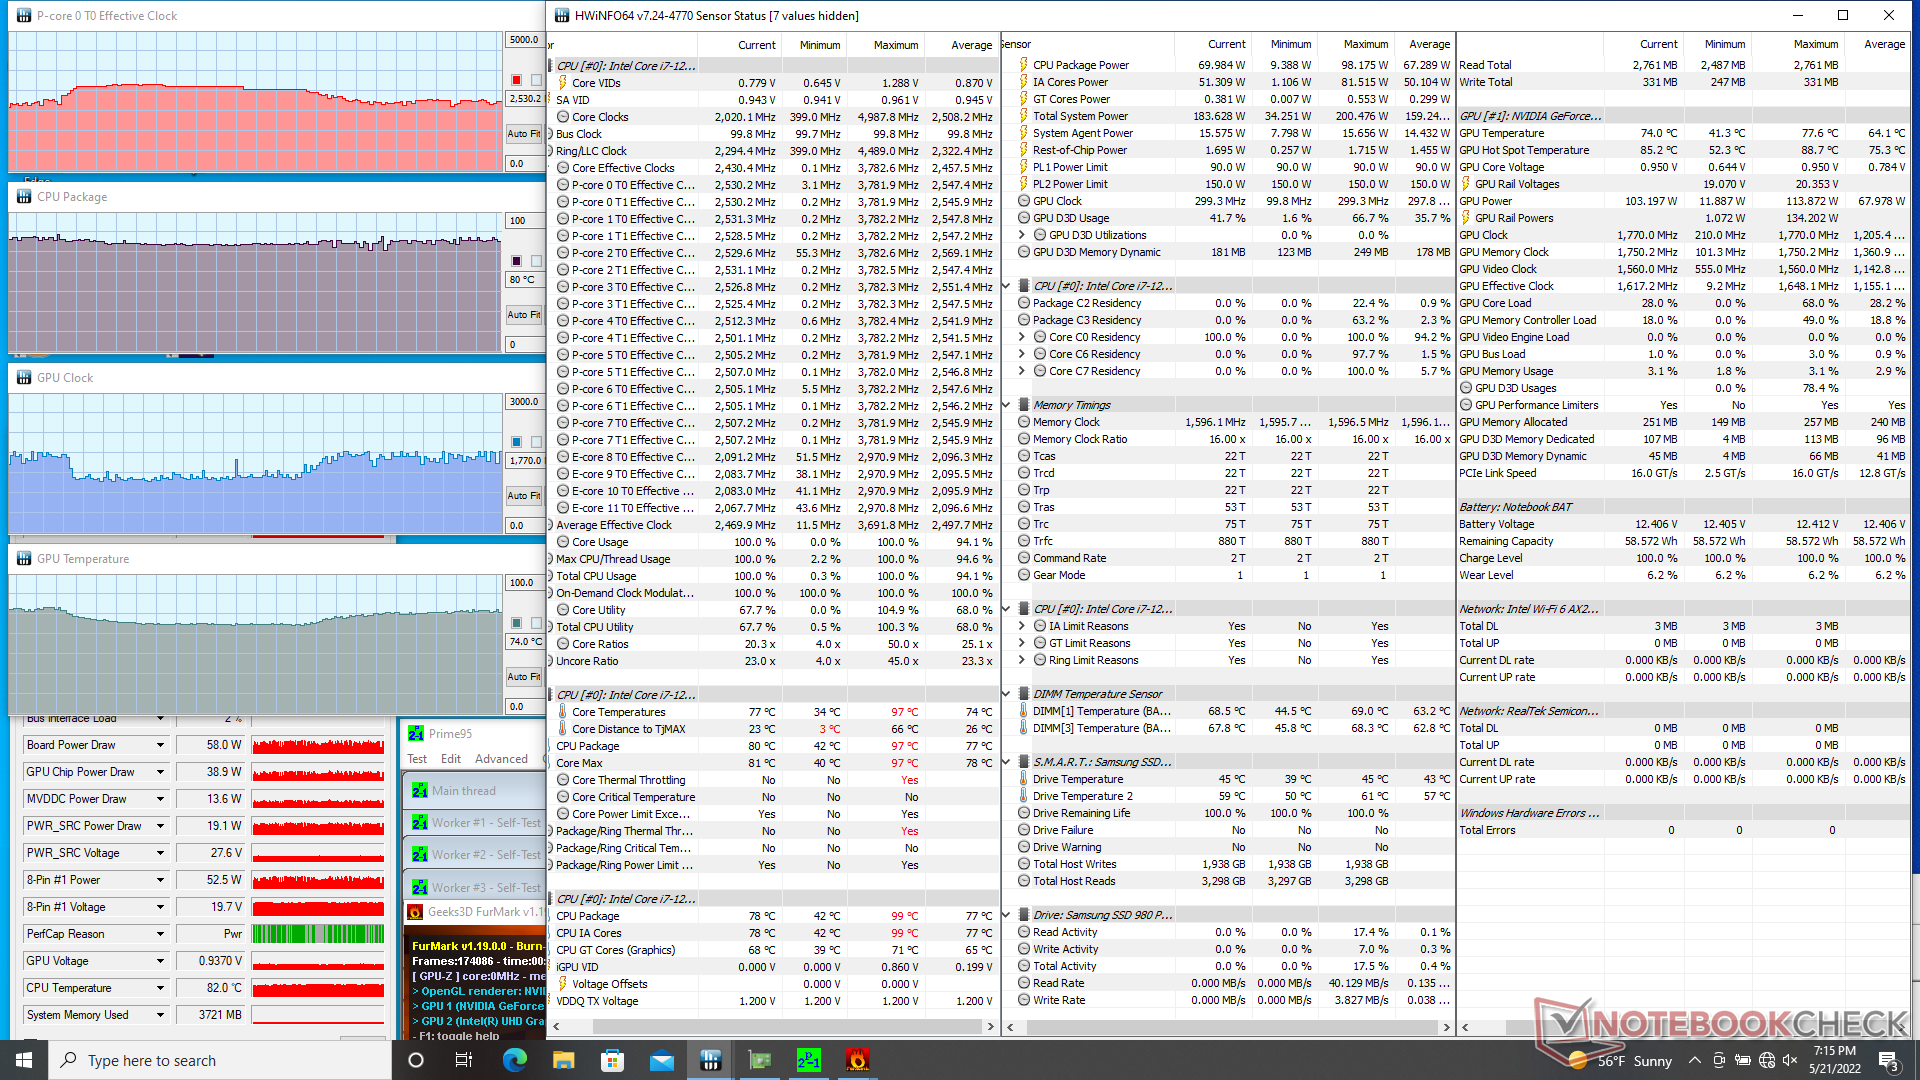
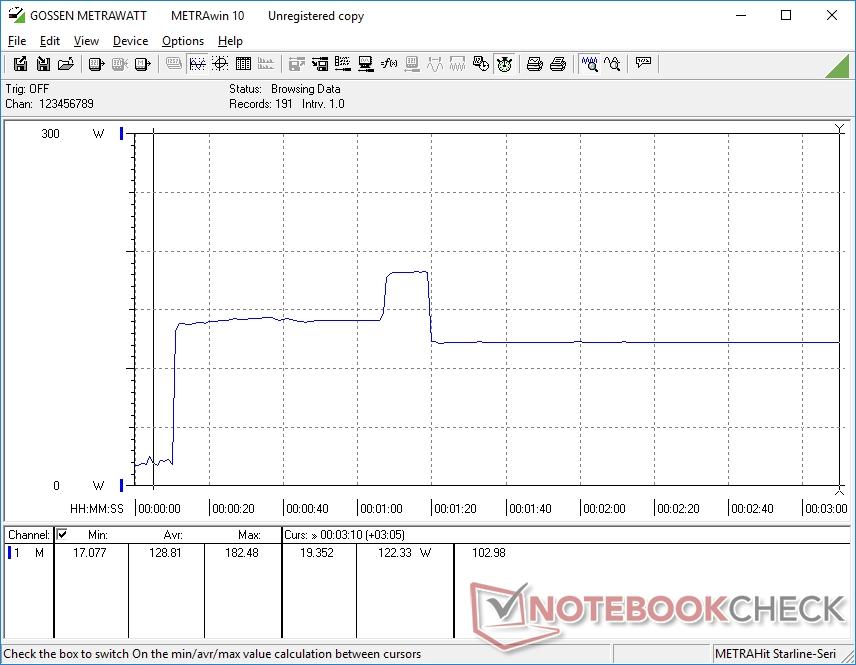
Stress test
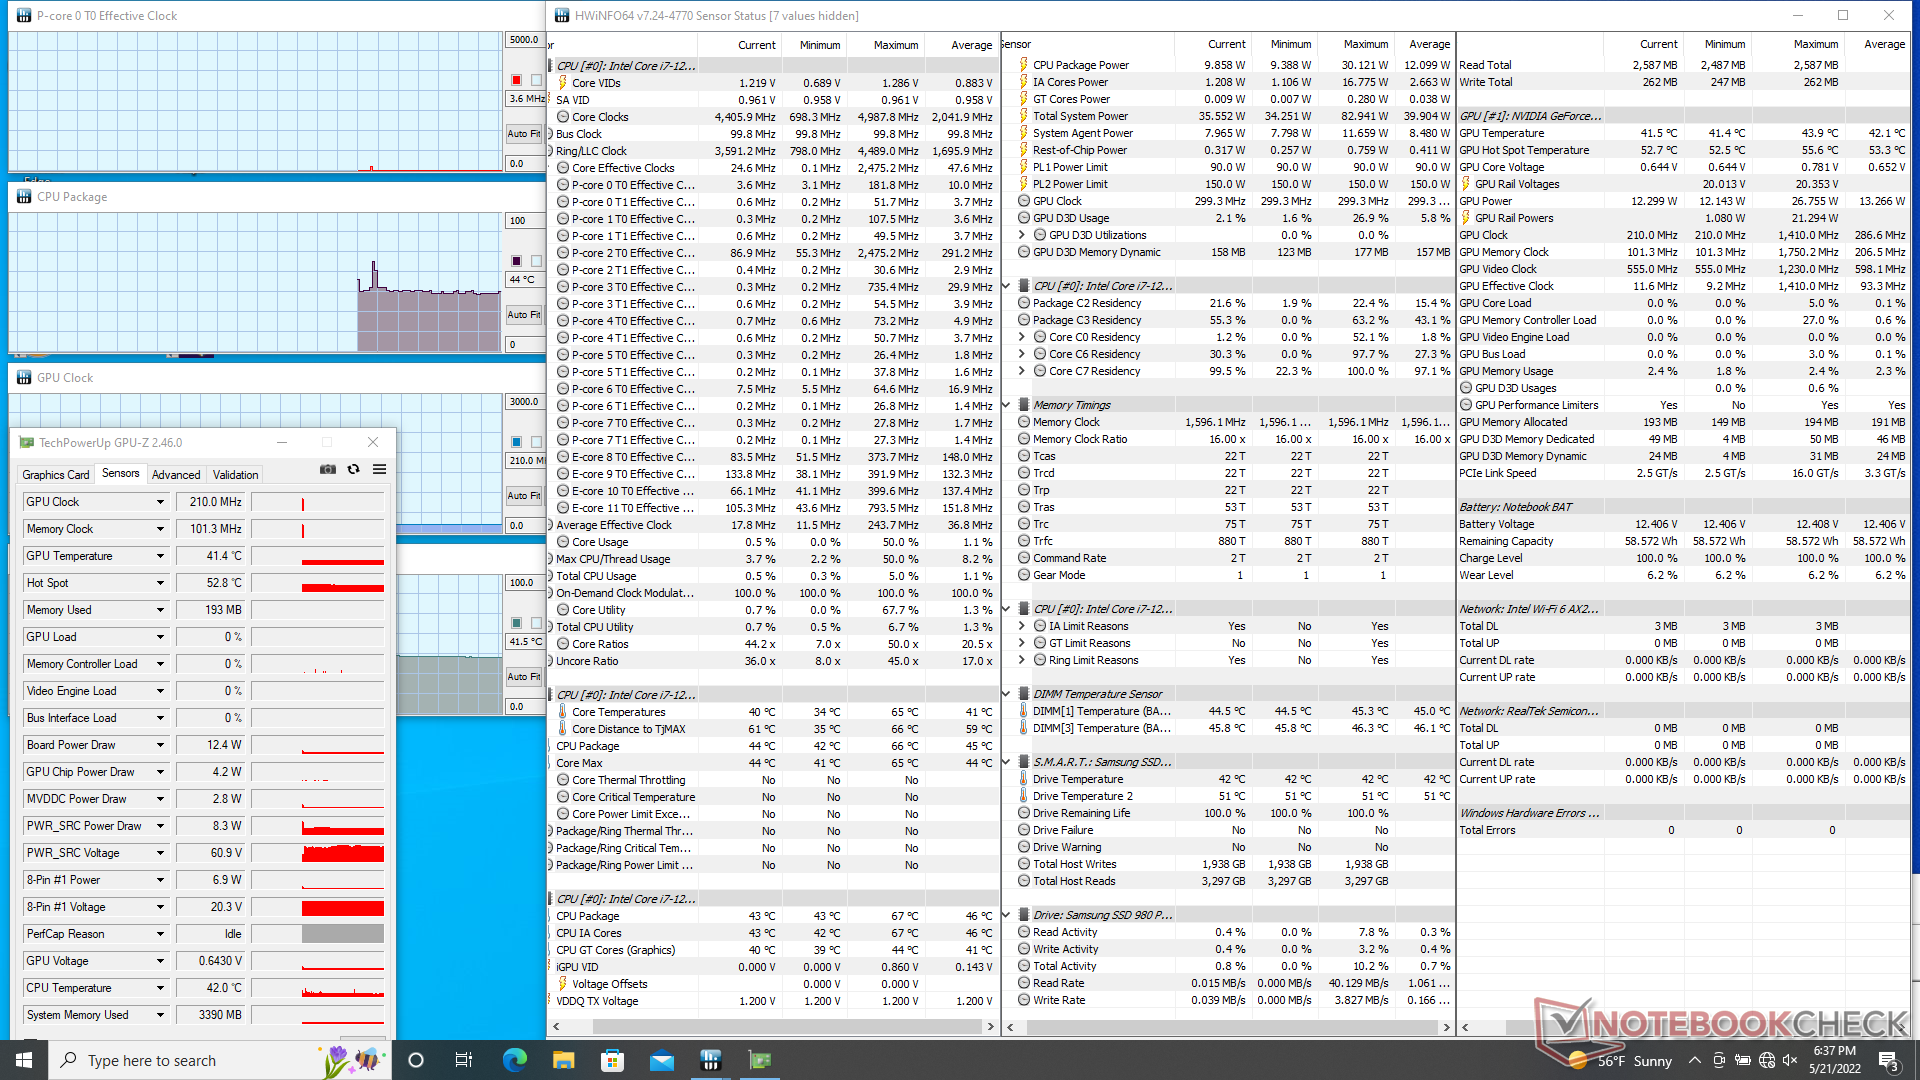
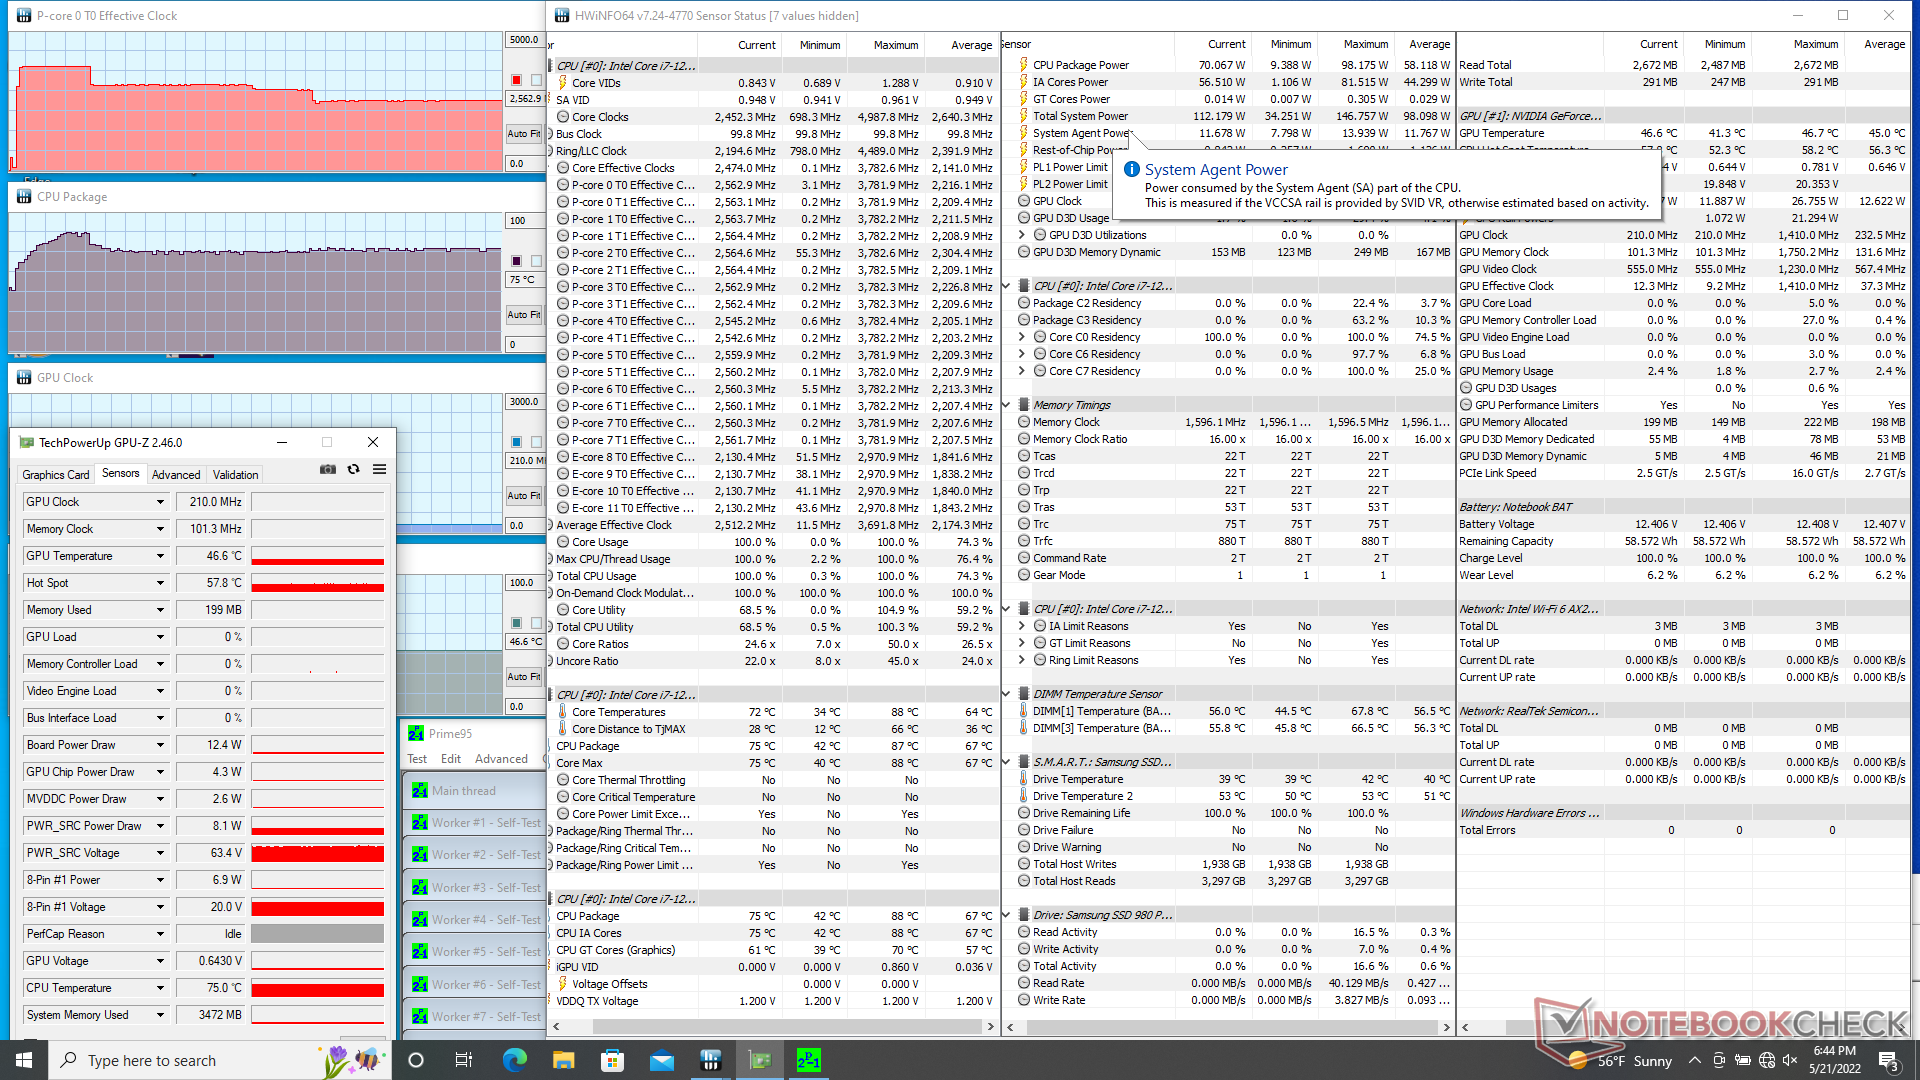
Quando è stata sottoposta a Prime95, la CPU ha raggiunto i 3,8 GHz e i 100 W per quasi un minuto intero prima di raggiungere una temperatura di 86 C. Successivamente, la velocità di clock è diminuita costantemente prima di stabilizzarsi a soli 2,6 GHz e 70 W per raggiungere una temperatura di 75 C. In altre parole, la CPU non è in grado di mantenere l'assorbimento di potenza di 100 W per periodi prolungati a causa delle limitazioni termiche.
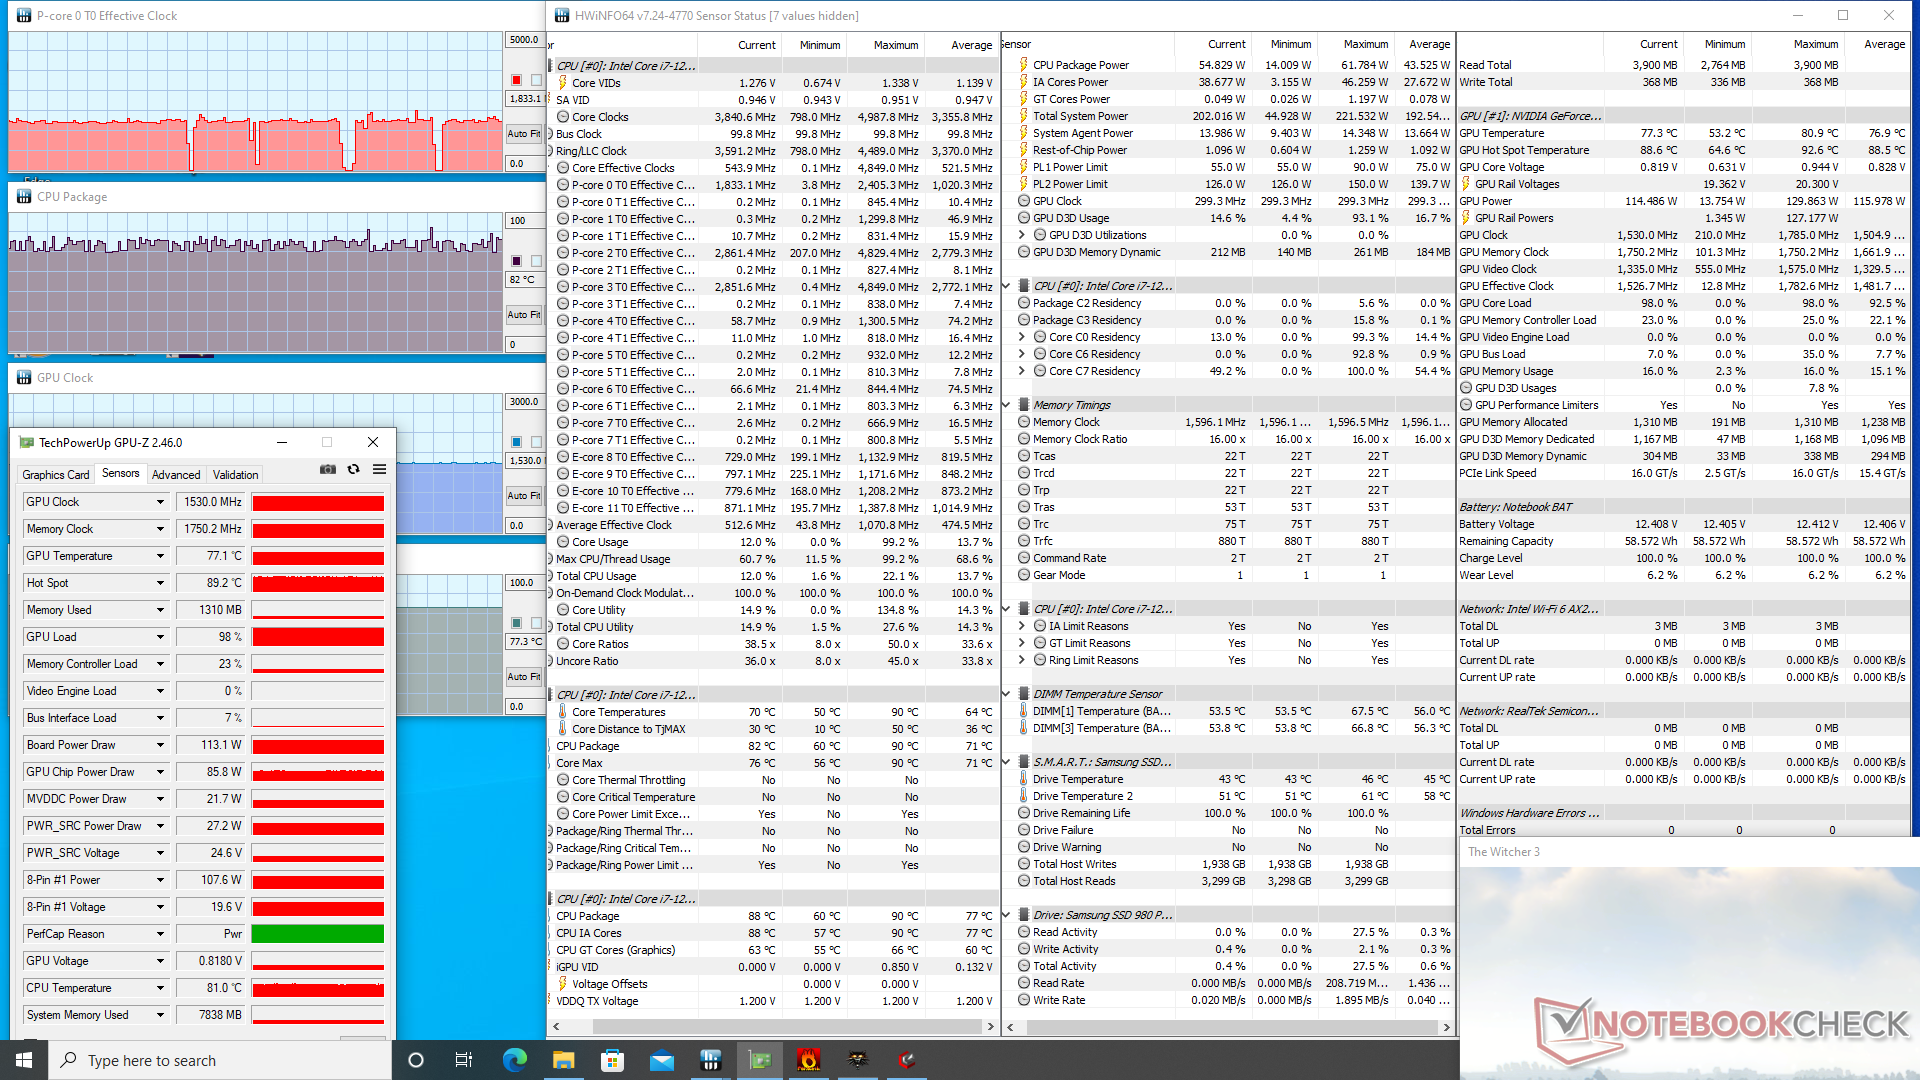
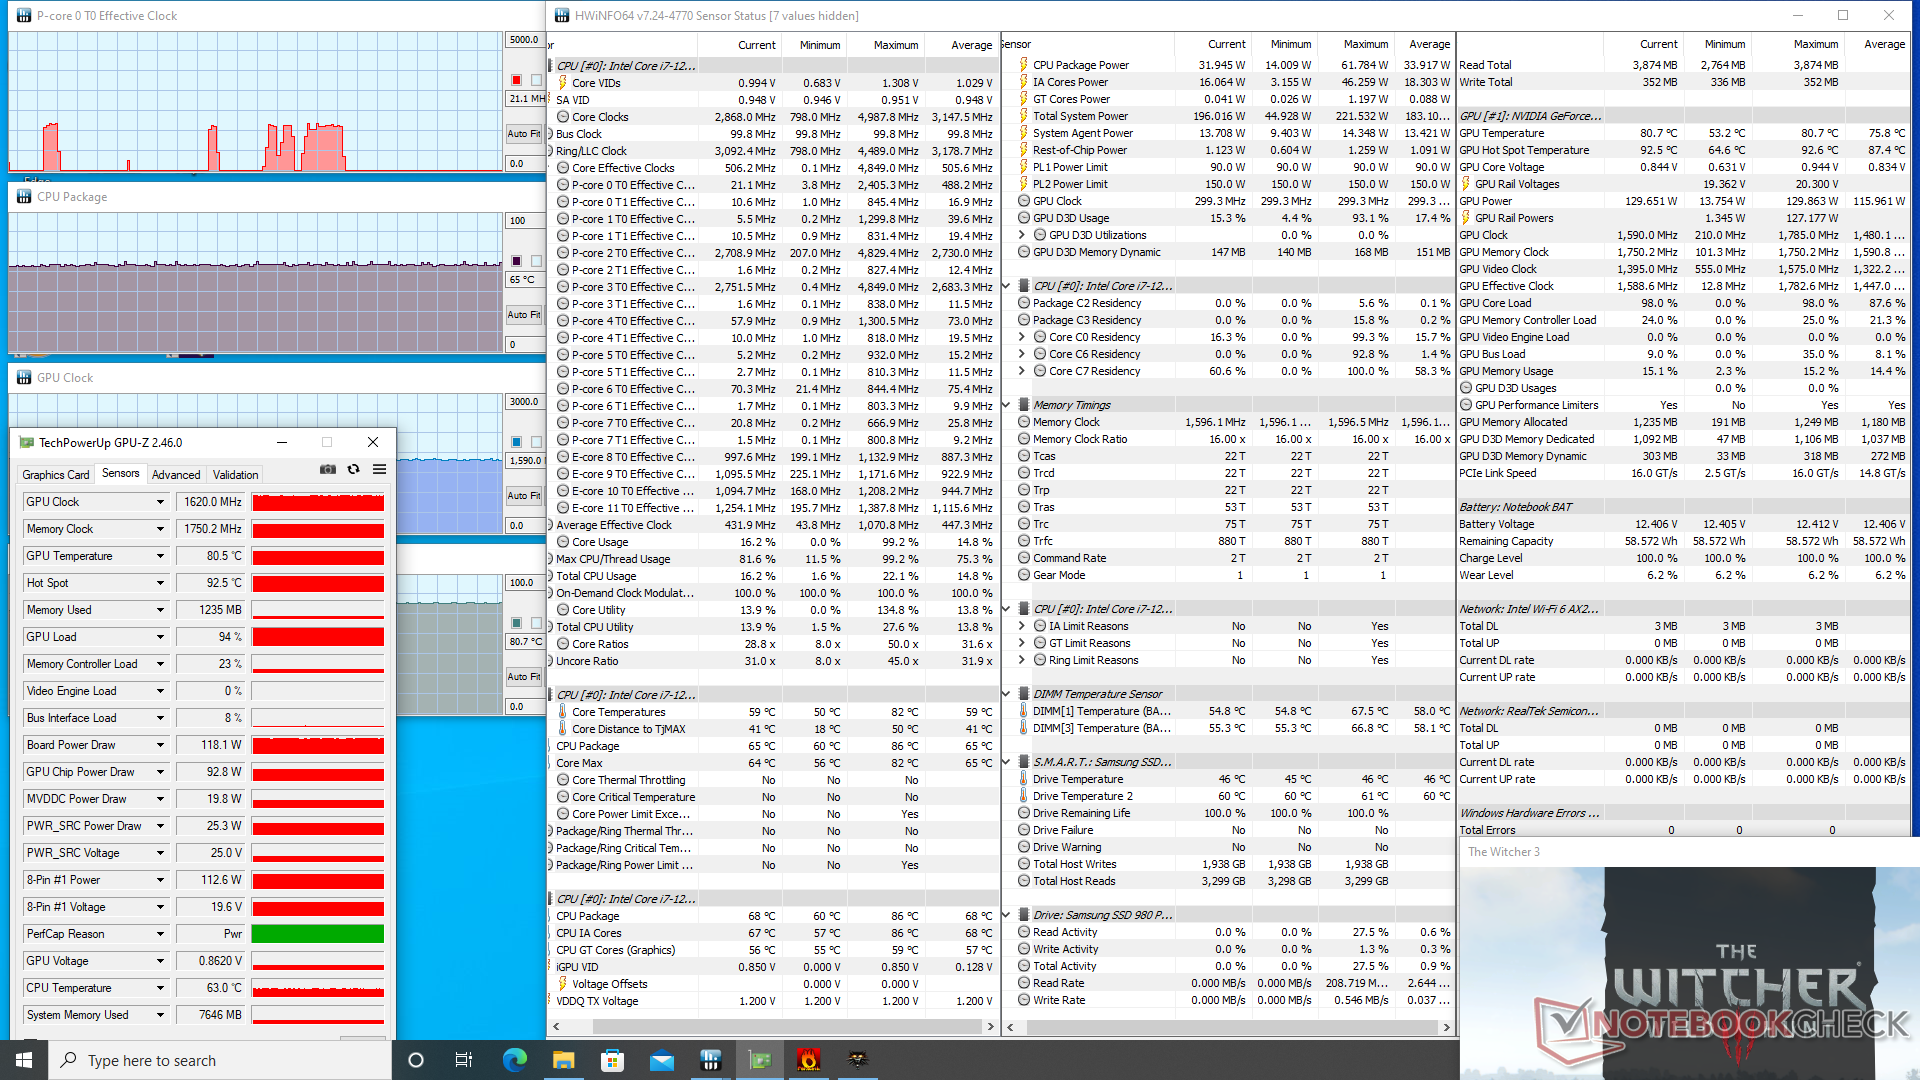
Le prestazioni grafiche aumentano leggermente quando si passa alla modalità Performance dalla modalità Entertainment. L'assorbimento di potenza della scheda GPU e la frequenza di clock si stabilizzano rispettivamente a 118 W e 1620 MHz quando si esegue Witcher 3 in modalità Prestazioni, contro 113 W e 1530 MHz quando si esegue lo stesso gioco in modalità Intrattenimento. Se si attiva la modalità Ventola massima, la velocità di clock della GPU e l'assorbimento di potenza della scheda si stabilizzano a valori ancora più elevati, rispettivamente 1725 MHz e 130 W. È deludente che la GPU non riesca ad avvicinarsi all'obiettivo dei 140 W, come dichiarato nel pannello di controllo Nvidia, e che gli utenti debbano attivare la modalità Ventola Massima per spremere il livello di prestazioni previsto dalla GPU.
Il funzionamento a batteria limita le prestazioni. Un test di Fire Strike a batteria restituirebbe punteggi di Fisica e Grafica pari a 12708 e 3419 punti, rispettivamente, rispetto a 31240 e 30473 punti con l'alimentazione di rete.
| Clock della CPU (GHz) | Clock della GPU (MHz) | Temperatura media della CPU (°C) | Temperatura media della GPU (°C) | |
| Sistema inattivo | -- | -- | 44 | 41 |
| Stress Prime95 | 2,6 | -- | 75 | 47 |
| StressPrime95 + FurMark | ~2,5 | ~1770 | 80 | 74 |
| Witcher 3 Stress (modalità Intrattenimento) | -- | 1530 | ~82 | 77 |
| Witcher 3 Stress (modalità Performance) | -- | 1620 | 65 | 81 |
Altoparlanti
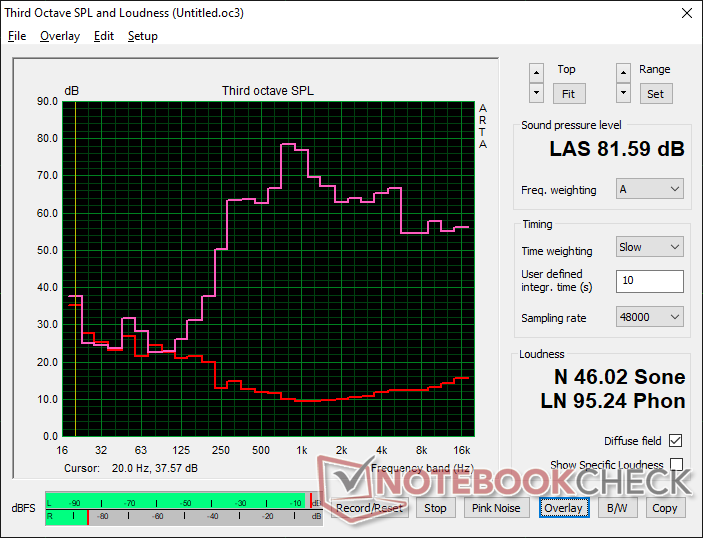
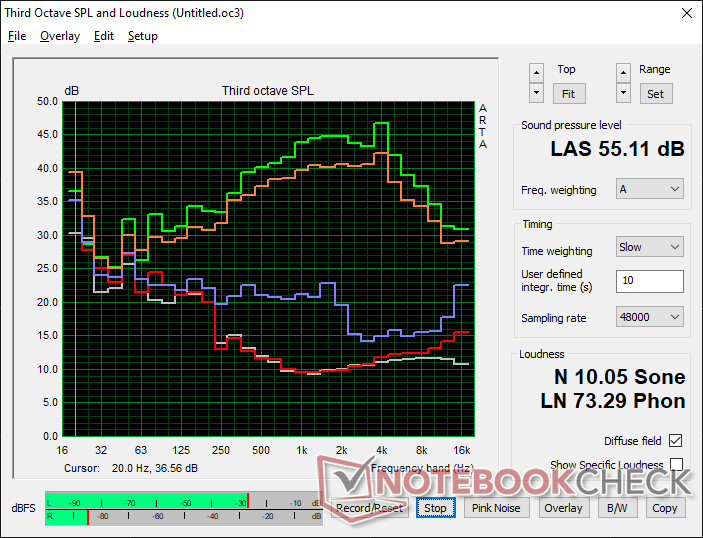
Eurocom Raptor X15 analisi audio
(±) | potenza degli altiparlanti media ma buona (81.6 dB)
Bassi 100 - 315 Hz
(-) | quasi nessun basso - in media 24.6% inferiori alla media
(±) | la linearità dei bassi è media (13.4% delta rispetto alla precedente frequenza)
Medi 400 - 2000 Hz
(±) | medi elevati - circa 5.6% superiore alla media
(±) | linearità dei medi adeguata (8.1% delta rispetto alla precedente frequenza)
Alti 2 - 16 kHz
(+) | Alti bilanciati - appena 4.2% dalla media
(+) | alti lineari (6% delta rispetto alla precedente frequenza)
Nel complesso 100 - 16.000 Hz
(±) | la linearità complessiva del suono è media (21.5% di differenza rispetto alla media
Rispetto alla stessa classe
» 76% di tutti i dispositivi testati in questa classe è stato migliore, 5% simile, 19% peggiore
» Il migliore ha avuto un delta di 6%, medio di 18%, peggiore di 132%
Rispetto a tutti i dispositivi testati
» 58% di tutti i dispositivi testati in questa classe è stato migliore, 7% similare, 35% peggiore
» Il migliore ha avuto un delta di 4%, medio di 24%, peggiore di 134%
Apple MacBook Pro 16 2021 M1 Pro analisi audio
(+) | gli altoparlanti sono relativamente potenti (84.7 dB)
Bassi 100 - 315 Hz
(+) | bassi buoni - solo 3.8% dalla media
(+) | bassi in lineaa (5.2% delta rispetto alla precedente frequenza)
Medi 400 - 2000 Hz
(+) | medi bilanciati - solo only 1.3% rispetto alla media
(+) | medi lineari (2.1% delta rispetto alla precedente frequenza)
Alti 2 - 16 kHz
(+) | Alti bilanciati - appena 1.9% dalla media
(+) | alti lineari (2.7% delta rispetto alla precedente frequenza)
Nel complesso 100 - 16.000 Hz
(+) | suono nel complesso lineare (4.6% differenza dalla media)
Rispetto alla stessa classe
» 0% di tutti i dispositivi testati in questa classe è stato migliore, 0% simile, 100% peggiore
» Il migliore ha avuto un delta di 5%, medio di 18%, peggiore di 45%
Rispetto a tutti i dispositivi testati
» 0% di tutti i dispositivi testati in questa classe è stato migliore, 0% similare, 100% peggiore
» Il migliore ha avuto un delta di 4%, medio di 24%, peggiore di 134%
Gestione dell'energia
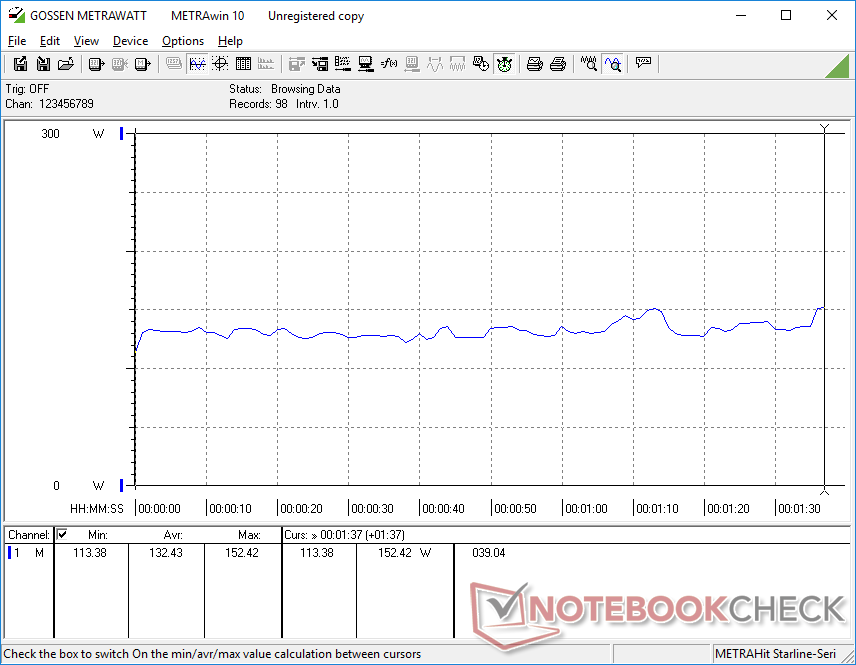
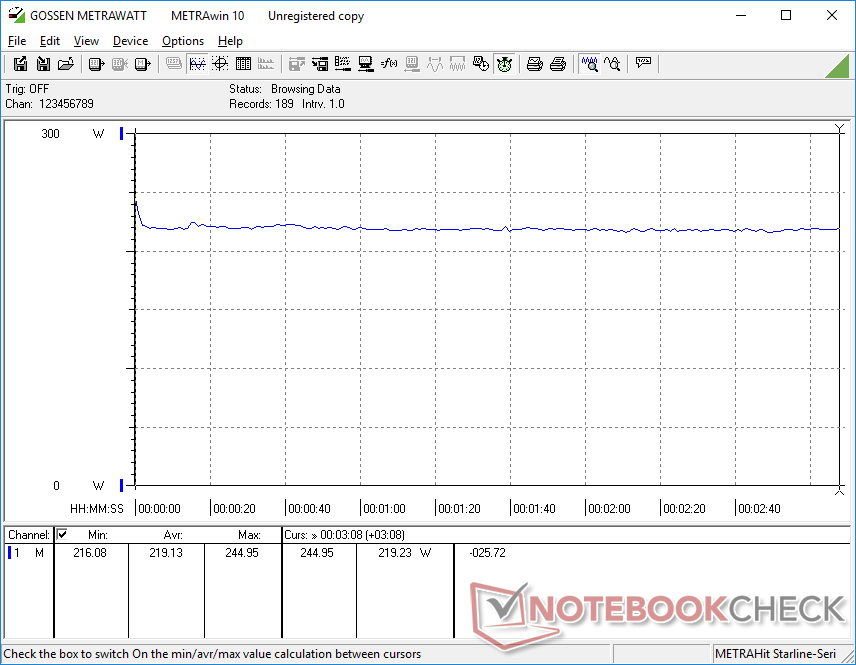
Consumo di energia
Il consumo energetico è ragionevolmente basso quando è al minimo sul desktop. La nostra unità consuma tra i 12 e i 22 W quando è al minimo su un desktop, rispetto ai 33-44 W del più vecchio Eurocom Sky X4C con CPU Intel di 9a generazione. Tuttavia, il consumo è ancora molto elevato quando si eseguono applicazioni più impegnative. Esecuzione Witcher 3ad esempio, richiede più energia della maggior parte dei laptop con CPU Intel o AMD serie H e GPU di classe GeForce RTX 3070 simile.
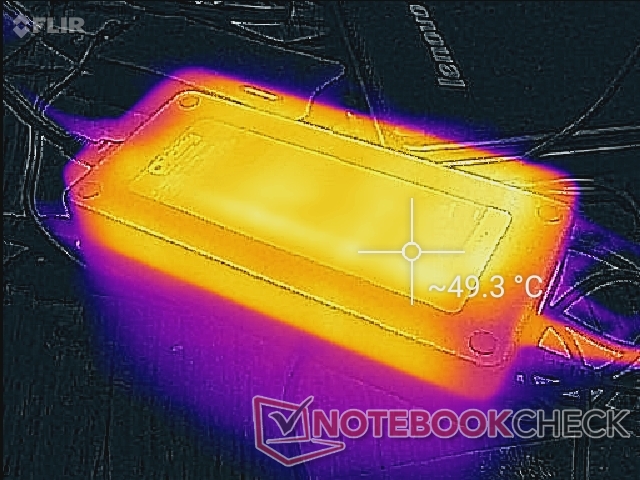
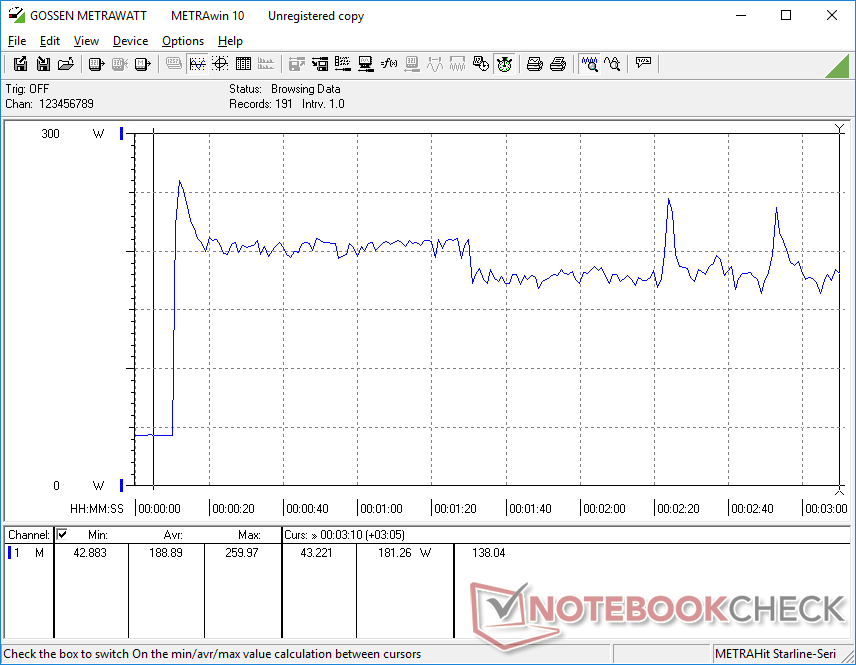
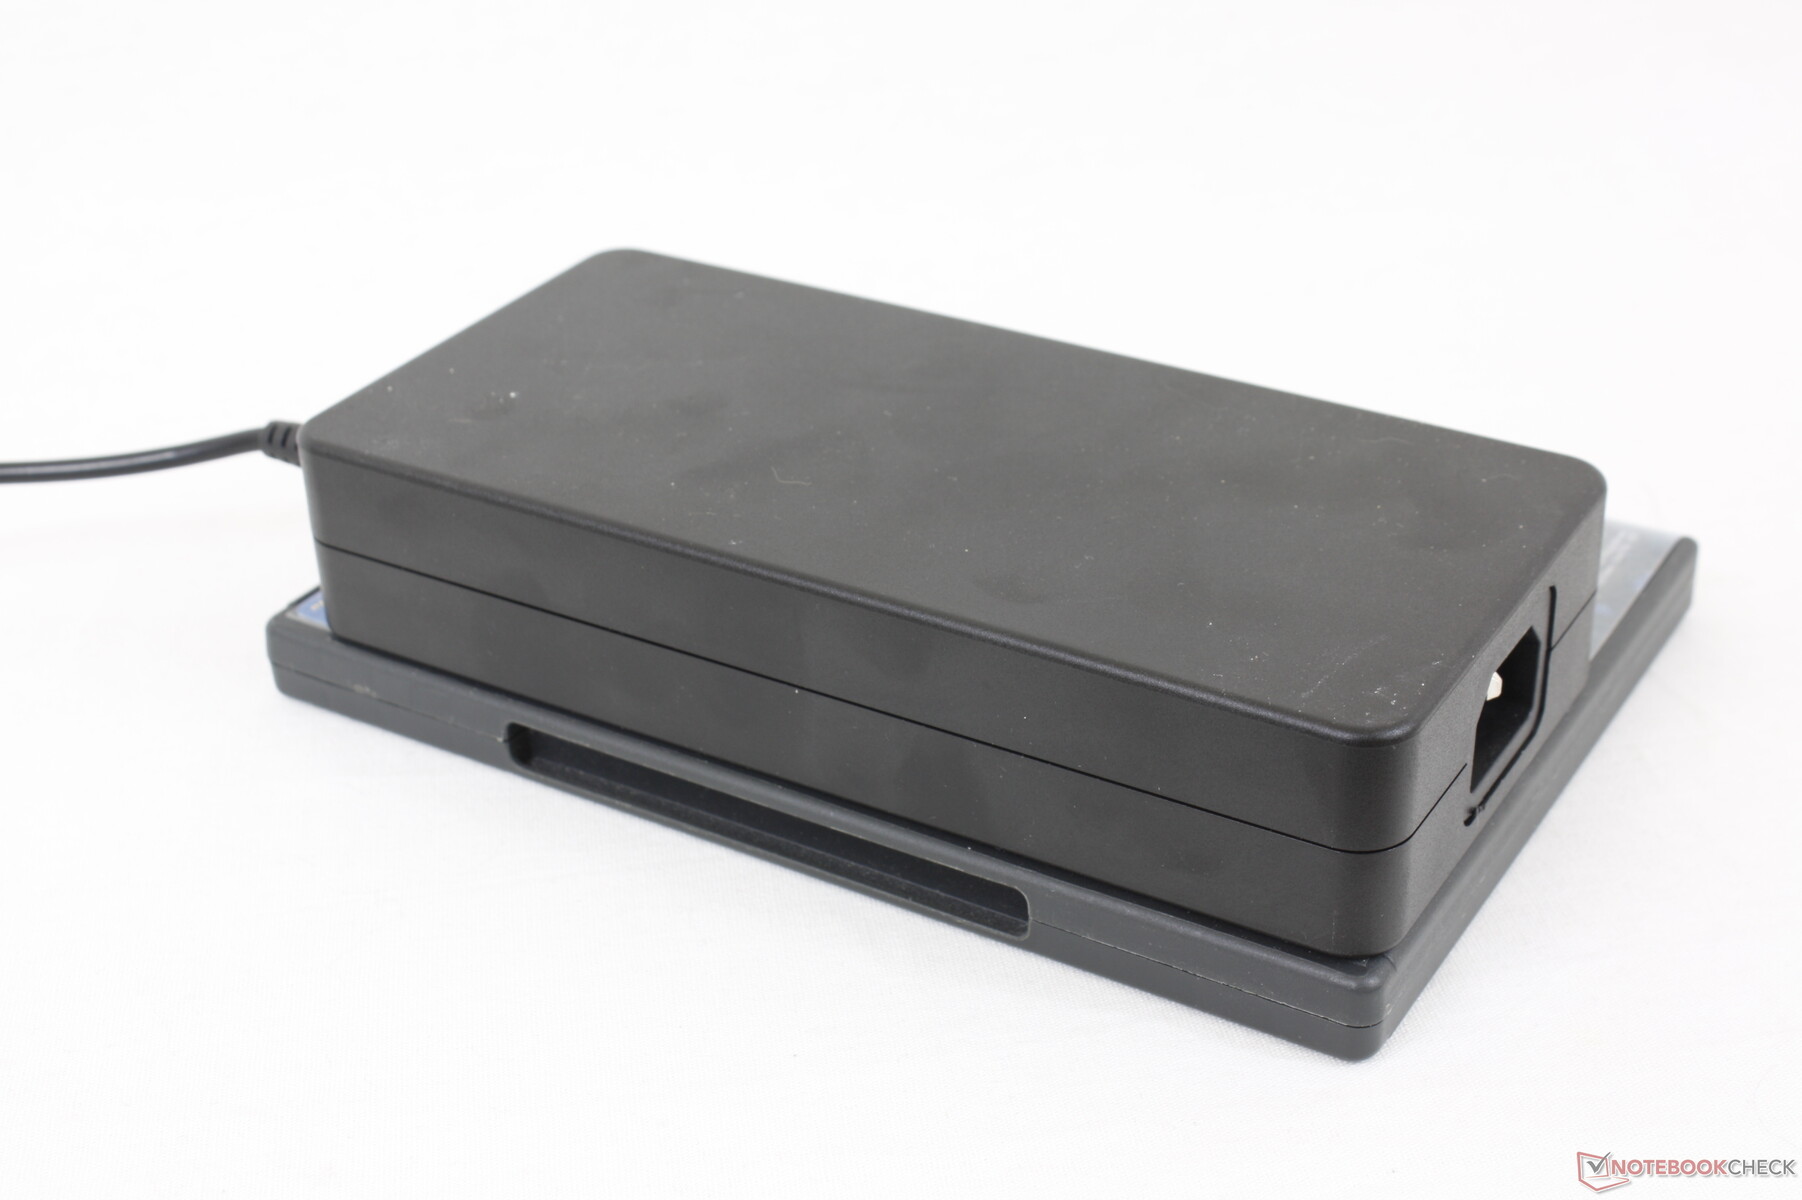
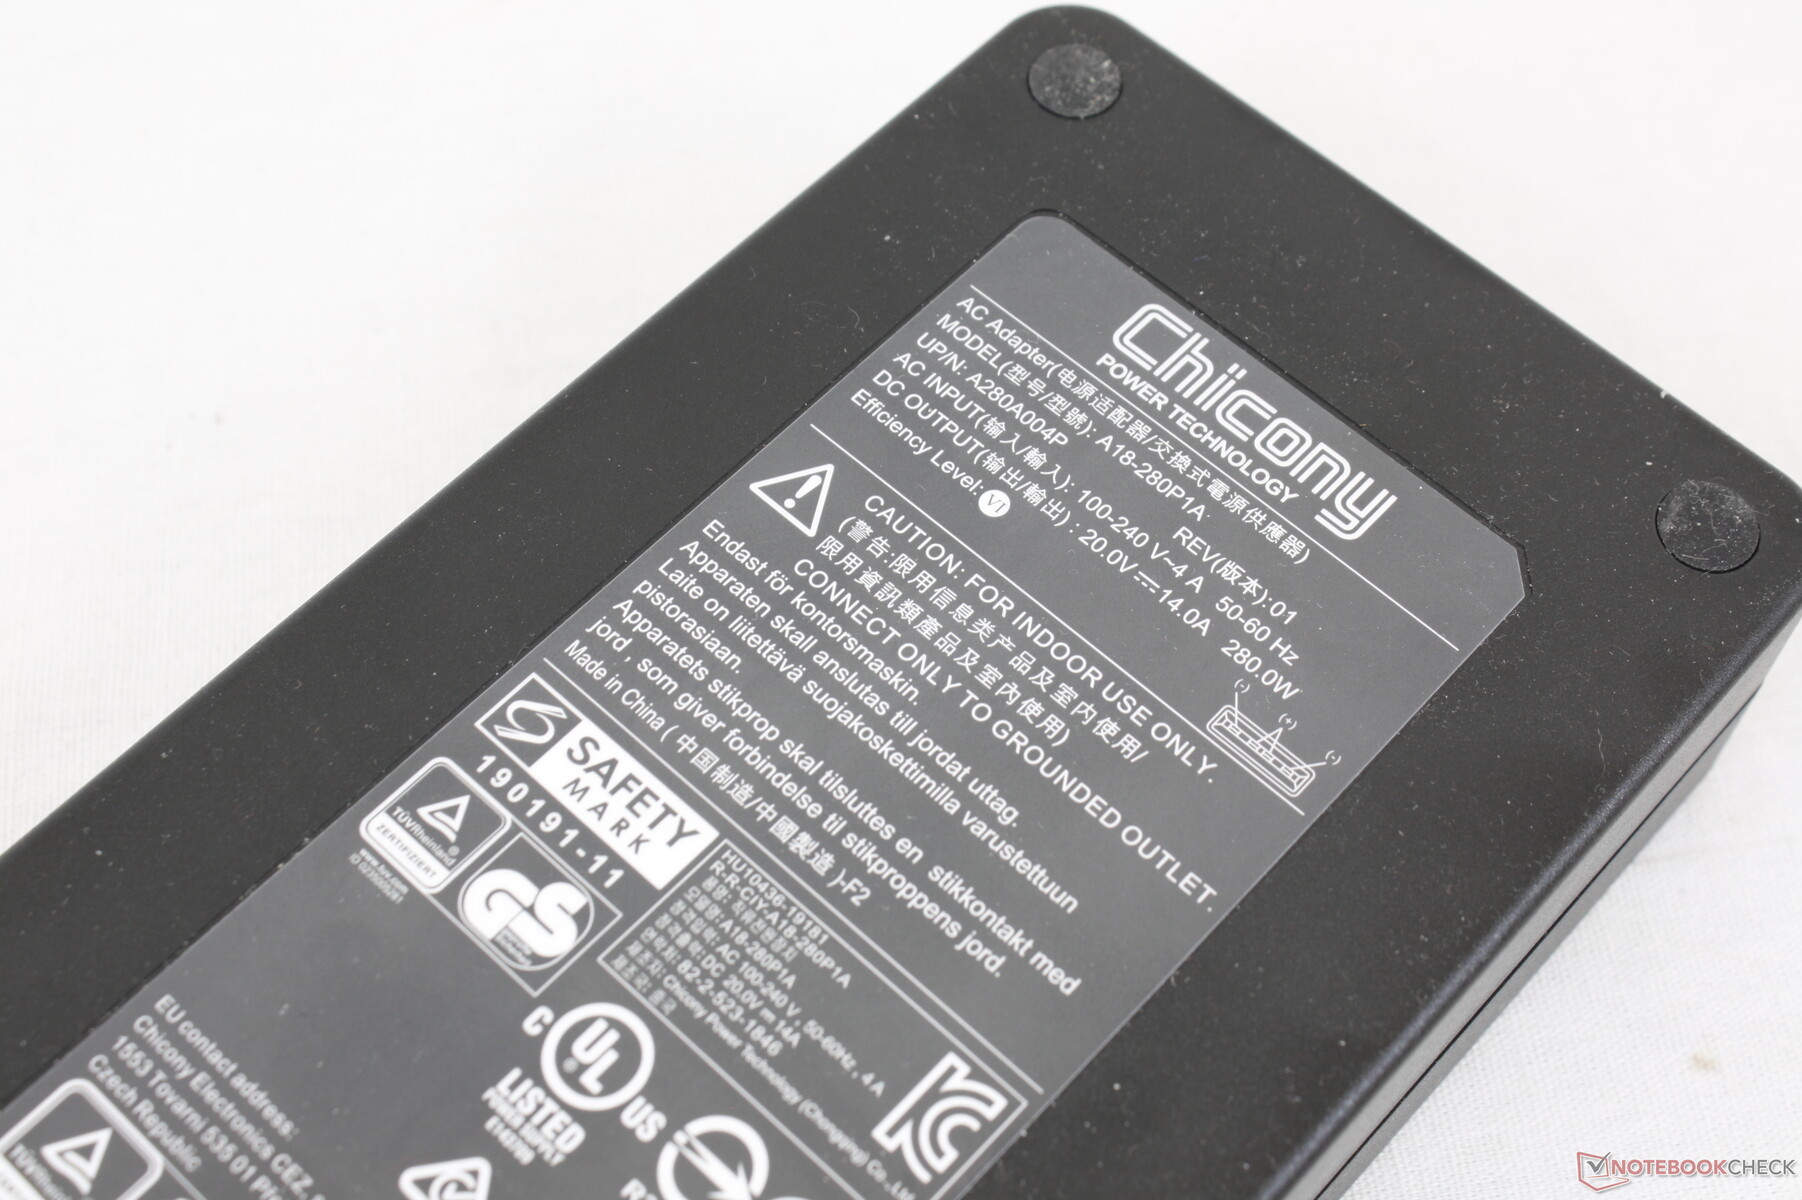
L'adattatore CA da 280 W può essere grande, ma è necessario per far funzionare il sistema alla massima potenza. Siamo in grado di raggiungere un consumo di 260 W quando sia la CPU che la GPU sono al massimo dell'utilizzo.
| Off / Standby | |
| Idle | |
| Sotto carico |
|
Leggenda:
min: | |
| Eurocom Raptor X15 i7-12700K, GeForce RTX 3070 Ti Laptop GPU, Samsung SSD 980 Pro 1TB MZ-V8P1T0BW, IPS, 1920x1080, 15.6" | MSI Raider GE66 12UHS i9-12900HK, GeForce RTX 3080 Ti Laptop GPU, Samsung PM9A1 MZVL22T0HBLB, IPS, 3840x2160, 15.6" | Razer Blade 15 Advanced Model Early 2022 i7-12800H, GeForce RTX 3080 Ti Laptop GPU, Samsung PM9A1 MZVL21T0HCLR, IPS, 1920x1080, 15.6" | Eurocom RX315 NH57AF1 i7-11800H, GeForce RTX 3070 Laptop GPU, Samsung SSD 980 Pro 1TB MZ-V8P1T0BW, IPS, 1920x1080, 15.6" | Gigabyte A5 X1 R9 5900HX, GeForce RTX 3070 Laptop GPU, ADATA XPG SX8200 Pro (ASX8200PNP-512GT), IPS, 1920x1080, 15.6" | Asus TUF Gaming A15 FA506QR-AZ061T R7 5800H, GeForce RTX 3070 Laptop GPU, SK Hynix HFM001TD3JX013N, IPS, 1920x1080, 15.6" | |
|---|---|---|---|---|---|---|
| Power Consumption | 0% | 8% | 3% | 17% | 27% | |
| Idle Minimum * | 12.8 | 16 -25% | 17 -33% | 12.7 1% | 10 22% | 10.2 20% |
| Idle Average * | 21.7 | 19 12% | 19 12% | 16.4 24% | 12 45% | 12.8 41% |
| Idle Maximum * | 21.8 | 26 -19% | 25 -15% | 36.1 -66% | 16 27% | 15 31% |
| Load Average * | 132.4 | 110 17% | 108 18% | 101.5 23% | 124 6% | 130 2% |
| Witcher 3 ultra * | 219 | 202 8% | 150 32% | 197 10% | 204 7% | 137 37% |
| Load Maximum * | 260 | 242 7% | 179 31% | 196.1 25% | 272 -5% | 184 29% |
* ... Meglio usare valori piccoli
Power Consumption Witcher 3 / Stresstest
Power Consumption external Monitor
Durata della batteria
I tempi di esecuzione sono brevi: poco meno di 4 ore di utilizzo reale della WLAN con il profilo di alimentazione bilanciato e con la GPU integrata attiva. La velocità di ricarica è discreta: da 2 a 2,5 ore da vuoto a pieno. Apprezziamo comunque il fatto che la batteria sia facilmente rimovibile, a differenza di molti altri portatili.
| Eurocom Raptor X15 i7-12700K, GeForce RTX 3070 Ti Laptop GPU, 62 Wh | MSI Raider GE66 12UHS i9-12900HK, GeForce RTX 3080 Ti Laptop GPU, 99 Wh | Razer Blade 15 Advanced Model Early 2022 i7-12800H, GeForce RTX 3080 Ti Laptop GPU, 80 Wh | Eurocom RX315 NH57AF1 i7-11800H, GeForce RTX 3070 Laptop GPU, 71 Wh | Gigabyte A5 X1 R9 5900HX, GeForce RTX 3070 Laptop GPU, 48.96 Wh | Asus TUF Gaming A15 FA506QR-AZ061T R7 5800H, GeForce RTX 3070 Laptop GPU, 90 Wh | |
|---|---|---|---|---|---|---|
| Autonomia della batteria | 43% | 24% | 21% | 61% | 189% | |
| WiFi v1.3 | 237 | 340 43% | 293 24% | 287 21% | 381 61% | 685 189% |
| H.264 | 426 | 356 | 435 | |||
| Load | 102 | 122 | 77 | 145 | ||
| Reader / Idle | 484 | 604 | 1043 |
Pro
Contro
Il verdetto
Il Raptor X15 utilizza le più recenti CPU Intel e GPU Nvidia intrappolate in uno chassis datato. Il modello manca di caratteristiche comunemente presenti su altri portatili da gioco da 15,6 pollici di fascia alta, come l'illuminazione RGB per tasto, DisplayPort-over-USB, Thunderbolt, il supporto Wi-Fi 6E e un migliore raffreddamento NVMe per le unità SSD. Quando modelli concorrenti come il MSI GE66 o Gigabyte A5 X1 possono essere più sottili e leggeri pur offrendo obiettivi TGP simili a quelli del Raptor, può essere difficile raccomandare l'Eurocom rispetto a queste alternative.
Tenete presente che le prestazioni massime sono legate alla modalità Maximum Fan. Pertanto, gli utenti devono impostare manualmente il profilo del sistema sulla modalità Ventola massima e sopportare ventole rumorose per ottenere le massime prestazioni dal sistema.
Il Raptor X15 dispone di una CPU LGA1700 rimovibile e di numerose opzioni di archiviazione, ma il design complessivo dello chassis avrebbe bisogno di un lifting.
Ci sono comunque alcune caratteristiche degne di nota che meritano di essere apprezzate. Ad esempio, il modello supporta unità SATA III da 2,5 pollici e una batteria facilmente rimovibile, che sono ormai una rarità nei moderni portatili da gioco. Tuttavia, se non si pensa di sfruttare il socket LGA1700, il principale punto di forza del Raptor X15 diventa irrilevante.
Prezzo e disponibilità
Eurocom sta spedendo il il Raptor X15 a partire da 2.000 dollari per la configurazione base o da circa 3.500 dollari come configurato nella nostra recensione.
Eurocom Raptor X15
- 06/09/2022 v7 (old)
Allen Ngo
Price comparison

