Recensione del notebook Eurocom Raptor X17 Core i9-14900HX: gPU da 175 W per le massime prestazioni

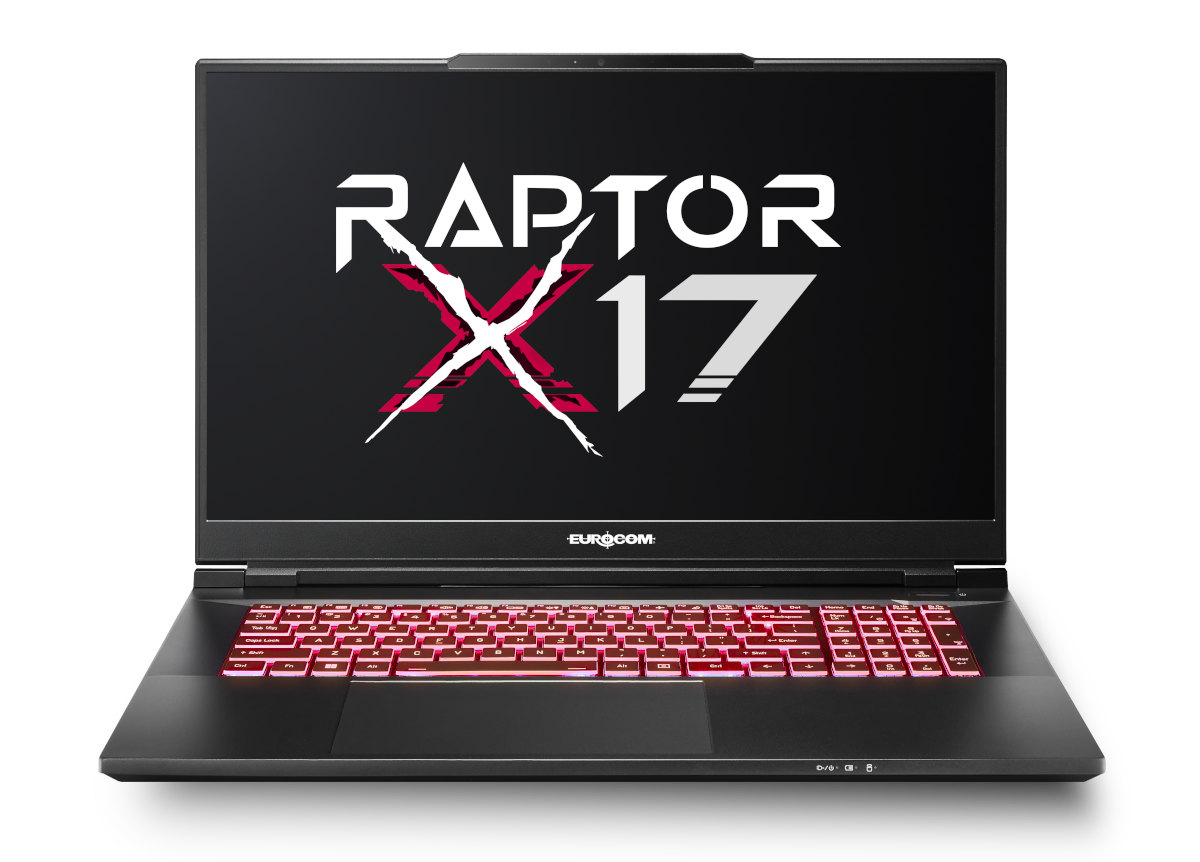
Il Raptor X17 è uno dei portatili più veloci disponibili da Eurocom. Il modello di quest'anno è stato aggiornato con le nuove opzioni Raptor Lake-HX, ma con la stessa GPU e lo stesso telaio di un tempo. Pertanto, le consigliamo di consultare le nostre recensioni sul modello 2023 Raptor X17 e Schenker Key 17 Pro per maggiori informazioni sulle caratteristiche fisiche del portatile, in quanto i nostri commenti esistenti sono ancora validi.
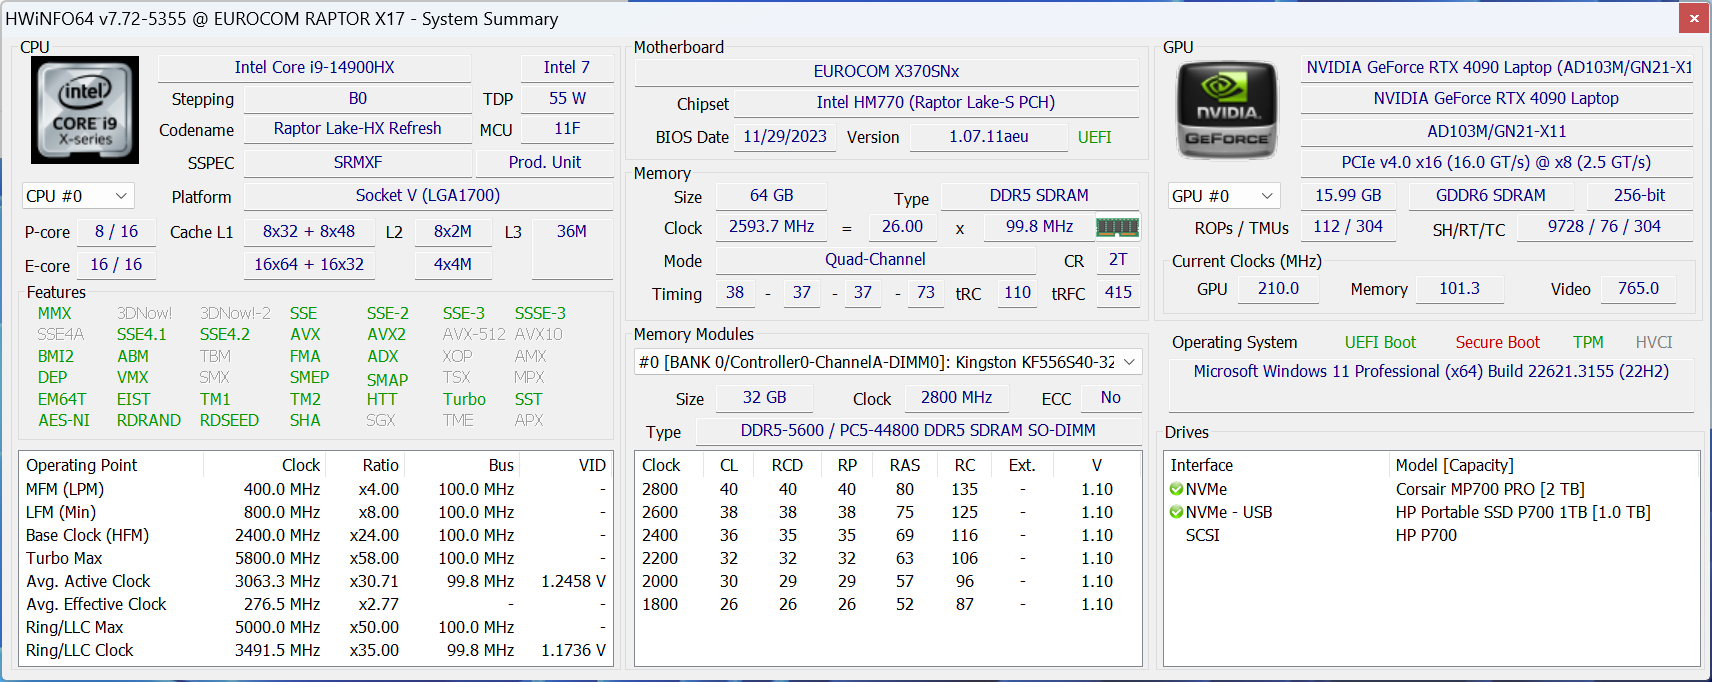
La nostra unità di prova Raptor X17 2024 viene fornita con Core i9-14900HX, SSD PCIe5 e display 4K 144 Hz, in contrasto con Core i9-13900HX, SSD PCIe4 e display 2K 240 Hz del nostro modello 2023. La RTX 4090 da 175 W di GeForce rimane invariata.
Tra le alternative al Raptor X17 ci sono altri portatili da gioco ad alte prestazioni come il modello Asus ROG Strix Scar 17, MSI Titan 18 HXo Alienware m18 R2. Vale la pena notare che Raptor X17 è uno dei pochi portatili da gioco RTX 4090 sul mercato con un display da 17,3 pollici in 16:9.
Altre recensioni di Eurocom:
Potenziali concorrenti a confrontos
Punteggio | Data | Modello | Peso | Altezza | Dimensione | Risoluzione | Prezzo |
|---|---|---|---|---|---|---|---|
| 85.2 % v7 (old) | 03/2024 | Eurocom Raptor X17 Core i9-14900HX i9-14900HX, GeForce RTX 4090 Laptop GPU | 3.4 kg | 24.9 mm | 17.30" | 3840x2160 | |
| 82.8 % v7 (old) | 05/2023 | Eurocom Raptor X17 i9-13900HX, GeForce RTX 4090 Laptop GPU | 3.5 kg | 24.9 mm | 17.30" | 2560x1440 | |
| 85.6 % v7 (old) | 01/2024 | Asus TUF Gaming A17 FA707XI-NS94 R9 7940HS, GeForce RTX 4070 Laptop GPU | 2.5 kg | 25.4 mm | 17.30" | 1920x1080 | |
| 88.3 % v7 (old) | 04/2023 | Asus ROG Strix Scar 17 G733PY-XS96 R9 7945HX, GeForce RTX 4090 Laptop GPU | 2.9 kg | 28.3 mm | 17.30" | 2560x1440 | |
v (old) | MSI Raider GE78 HX 13VI i9-13980HX, GeForce RTX 4090 Laptop GPU | 17.30" | 2560x1600 | ||||
| 88.8 % v7 (old) | 01/2024 | MSI Titan 18 HX A14VIG i9-14900HX, GeForce RTX 4090 Laptop GPU | 3.6 kg | 32.1 mm | 18.00" | 3840x2400 |
Comunicazione
Webcam


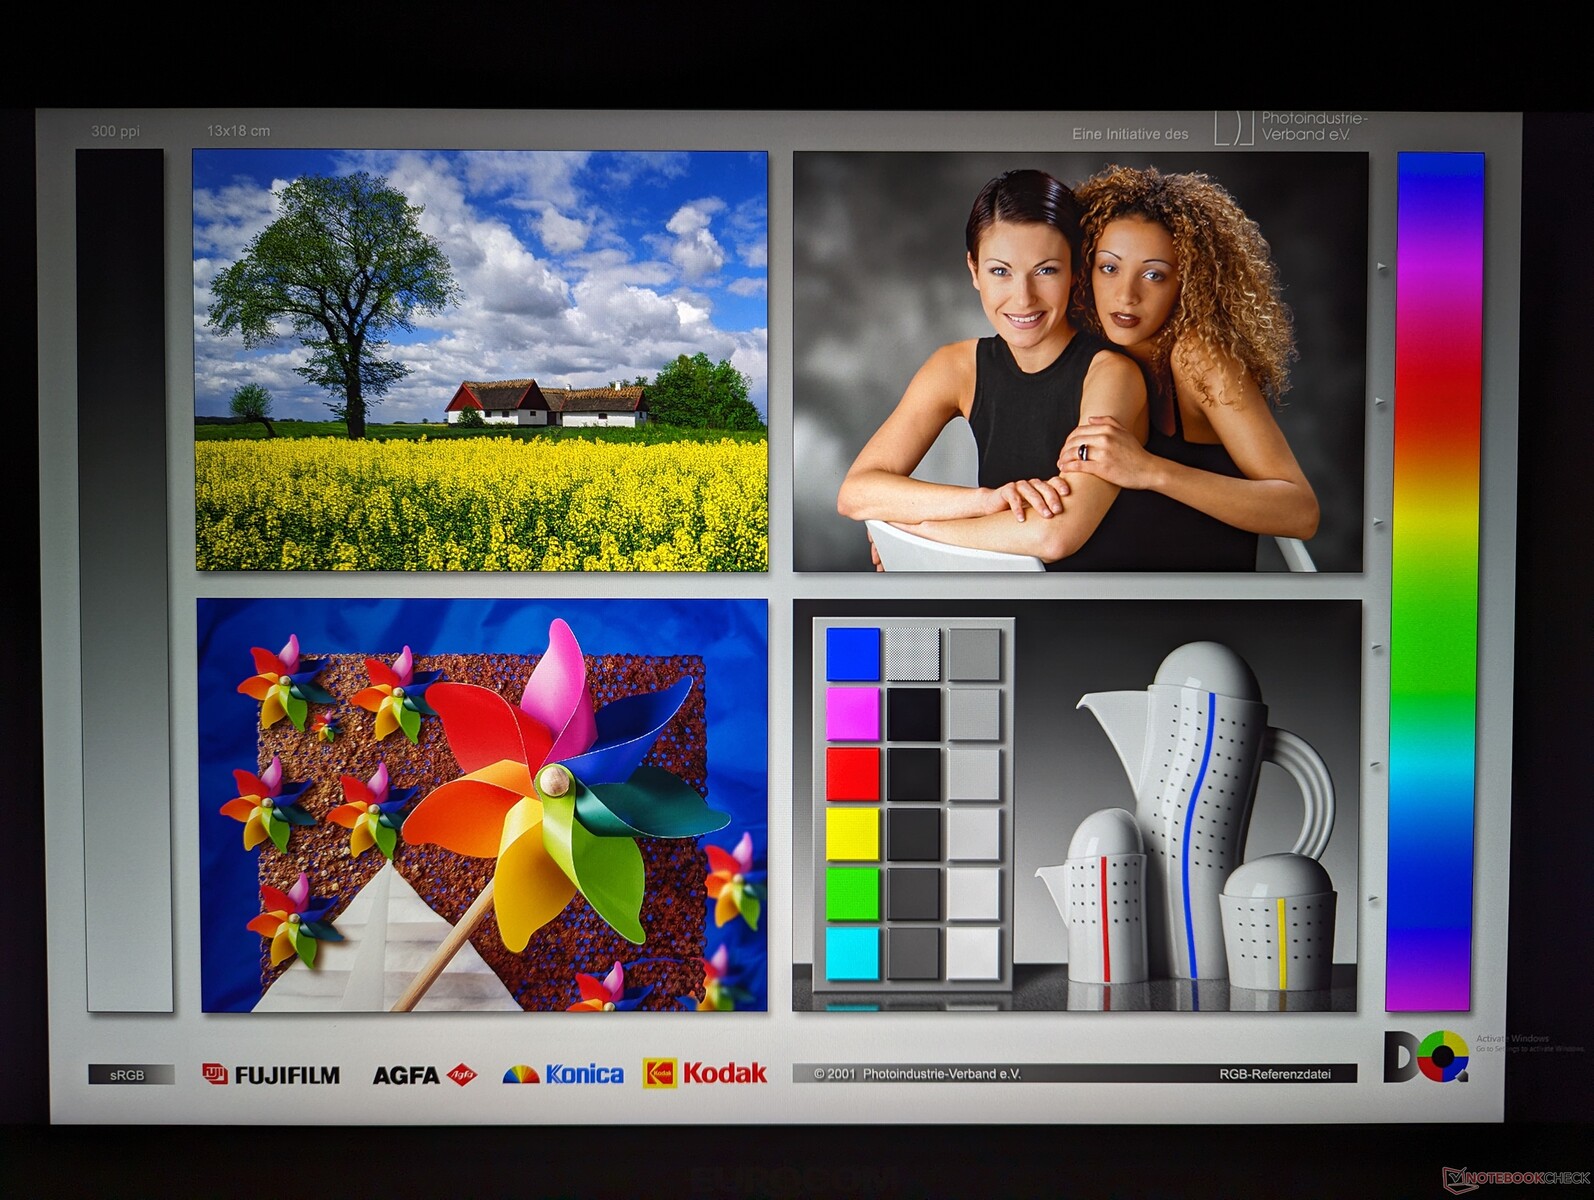
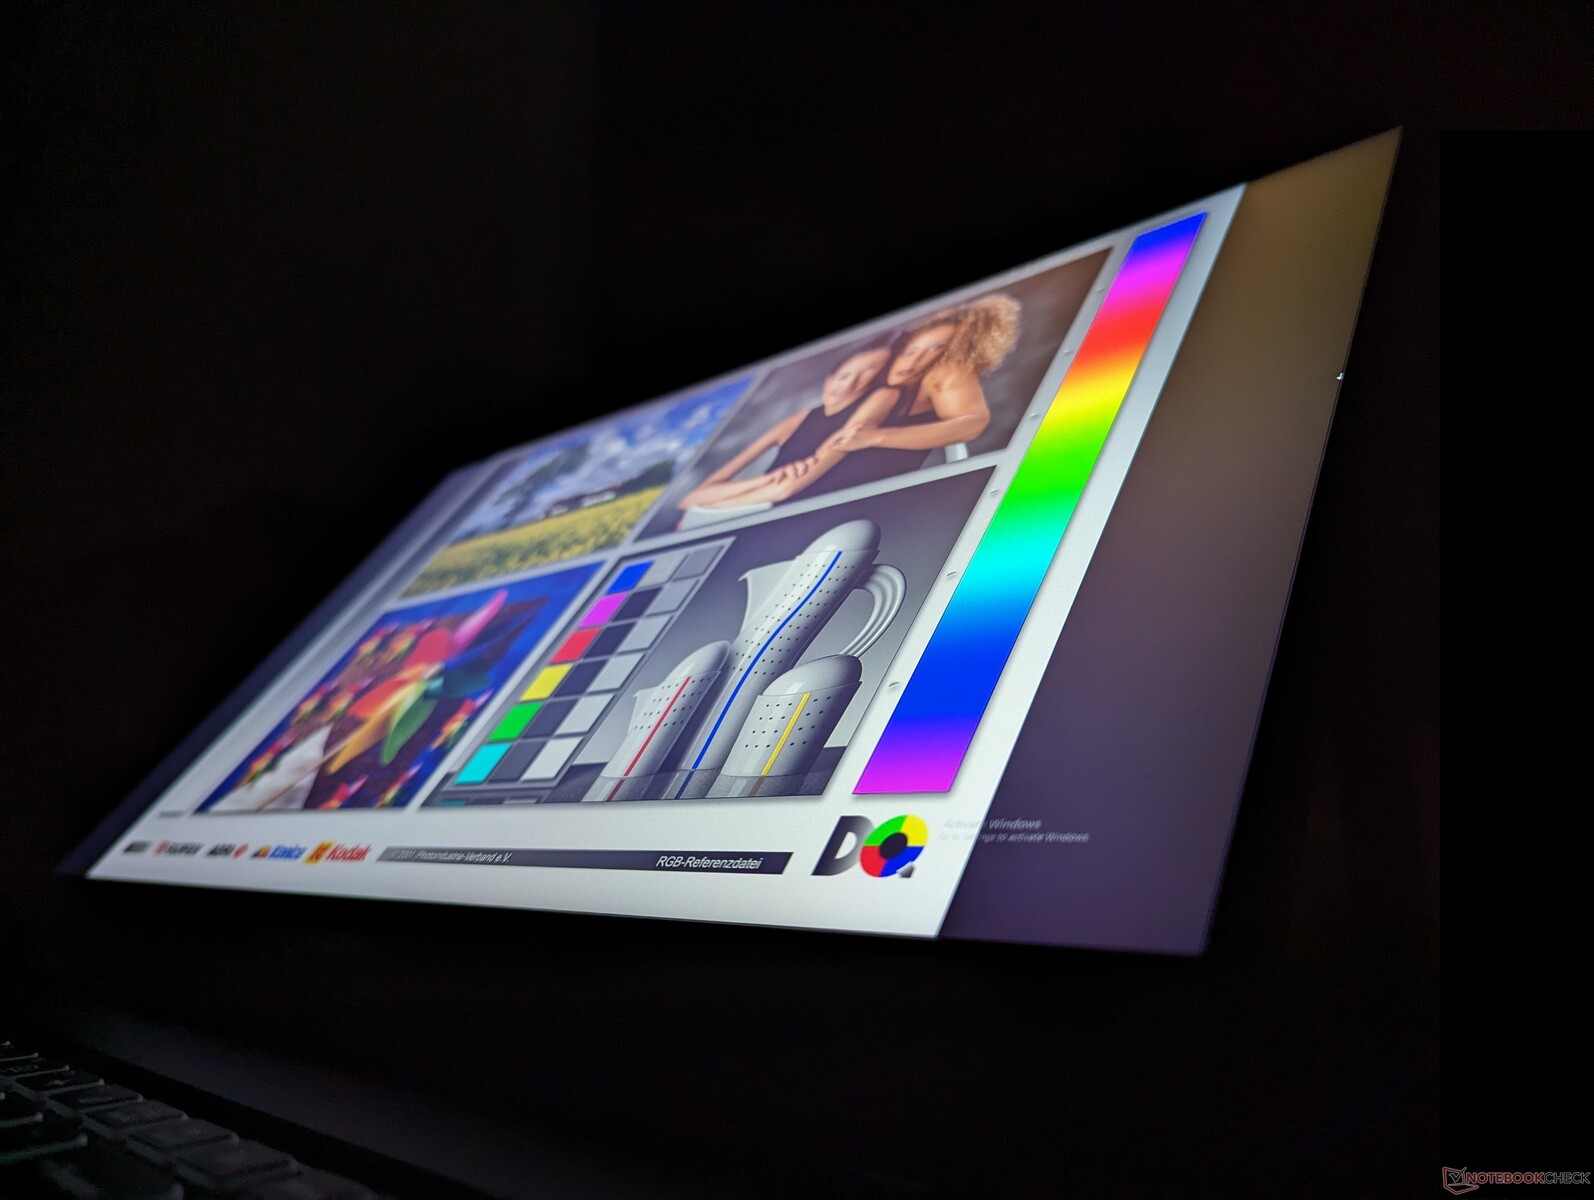
Display
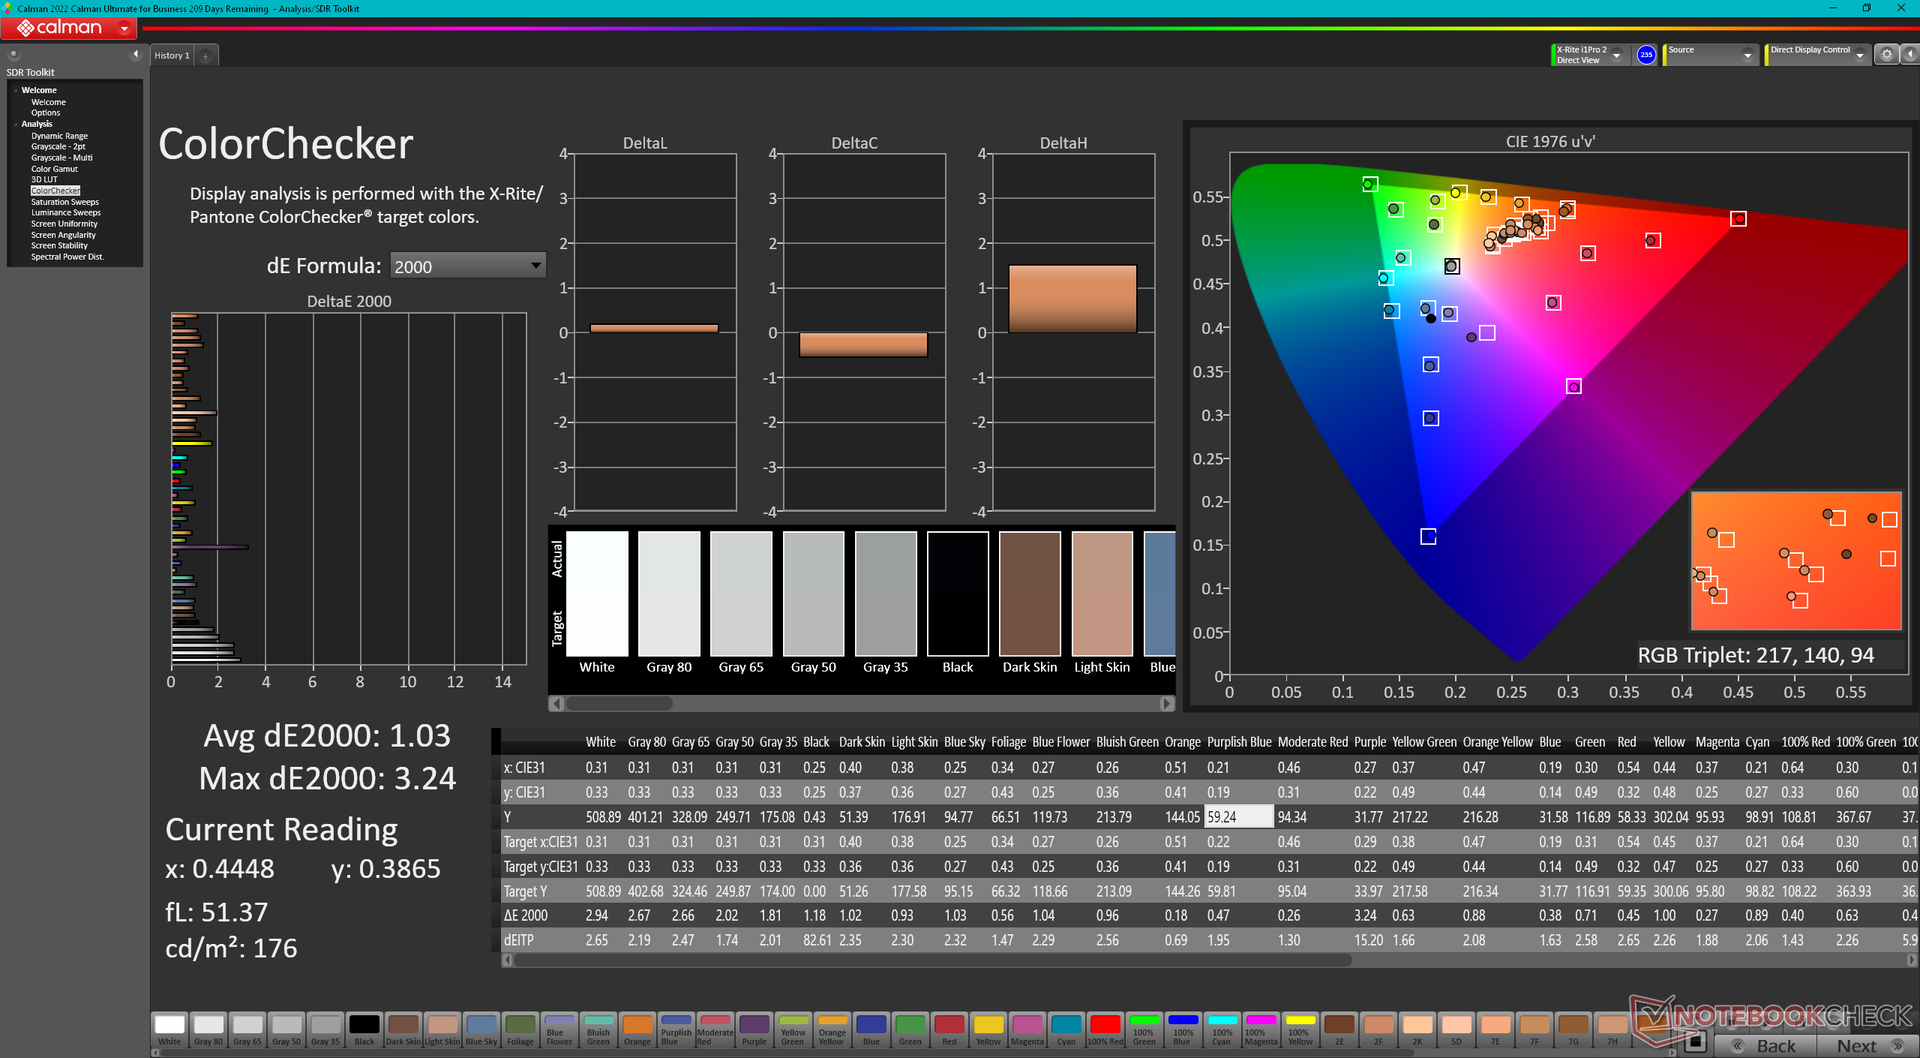
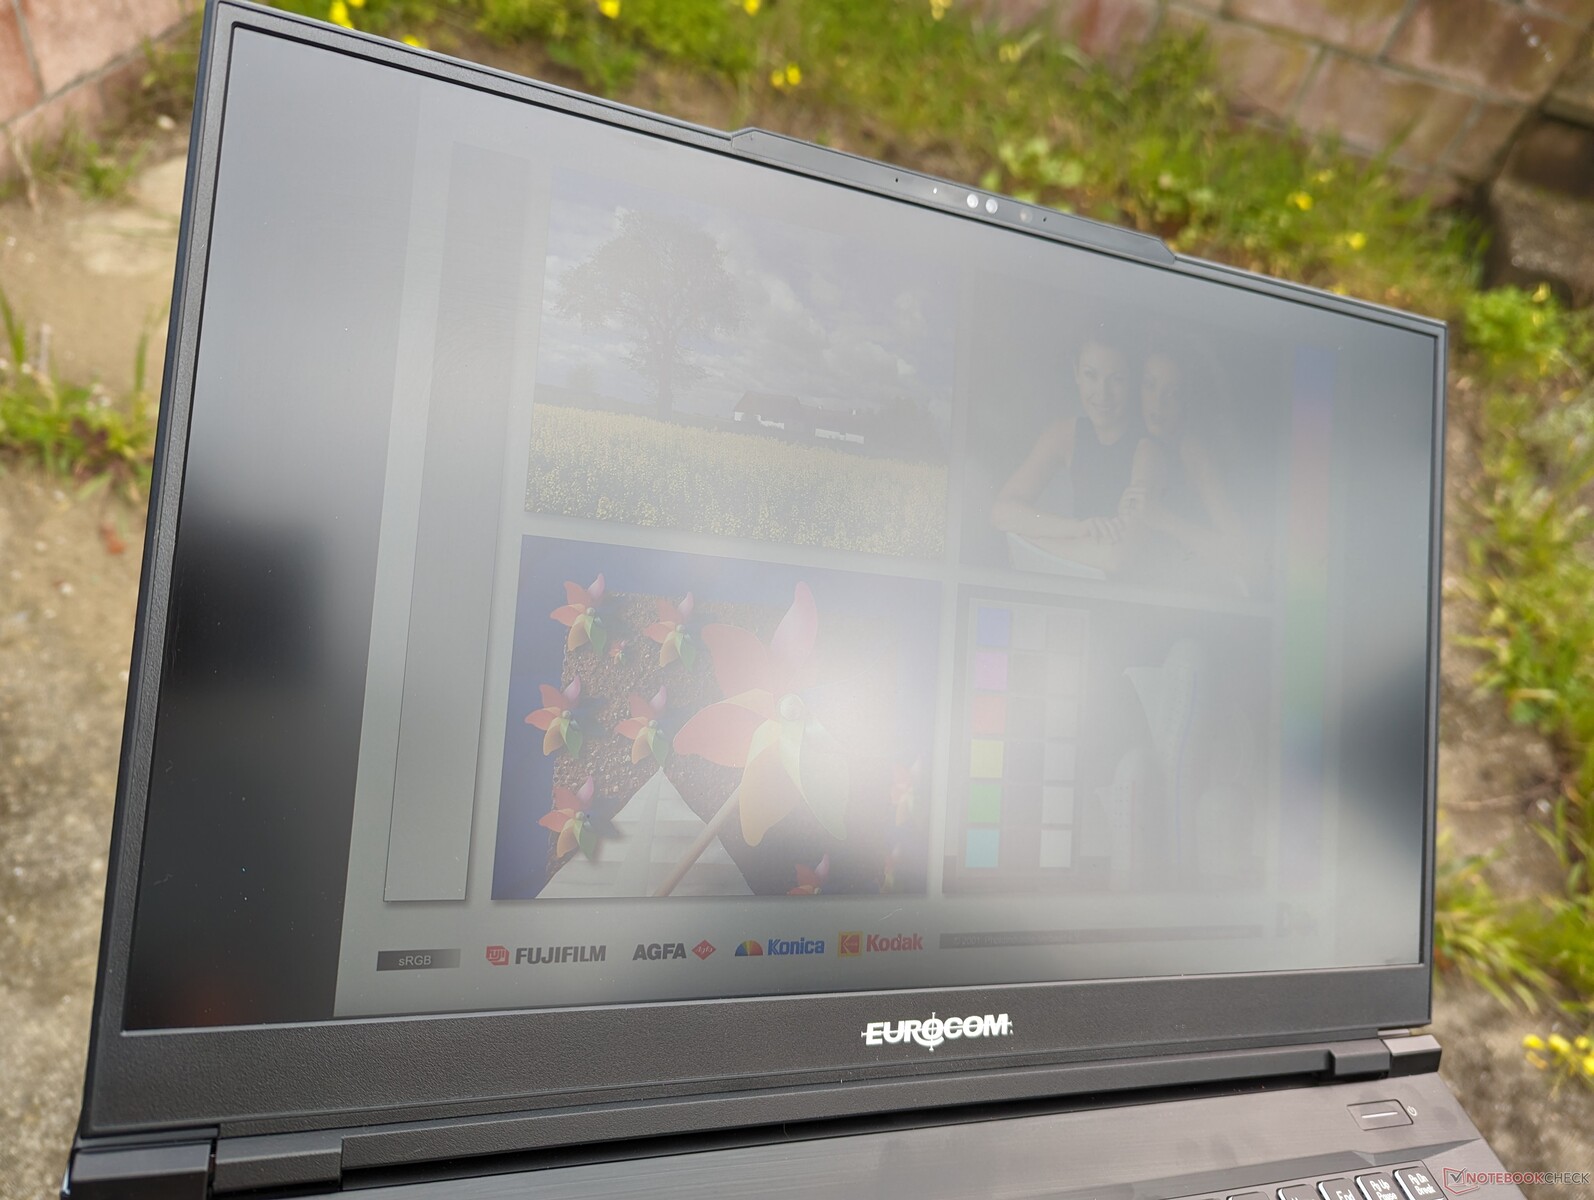
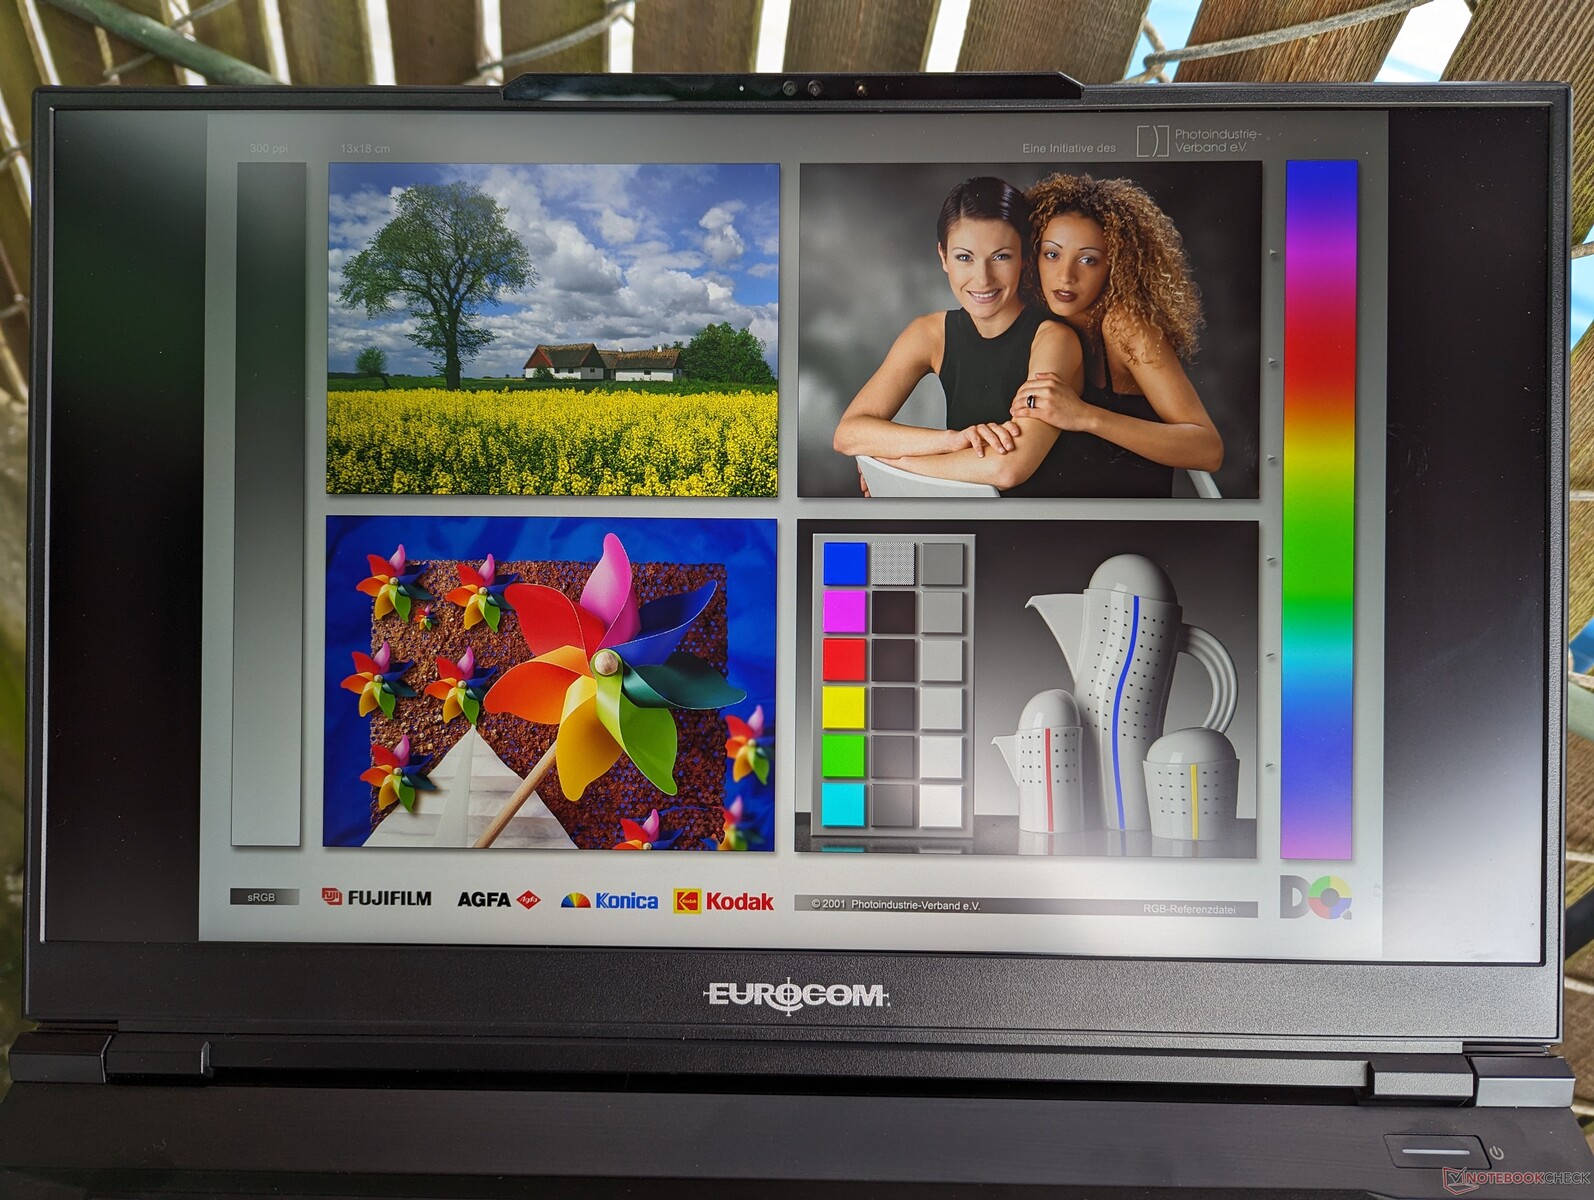
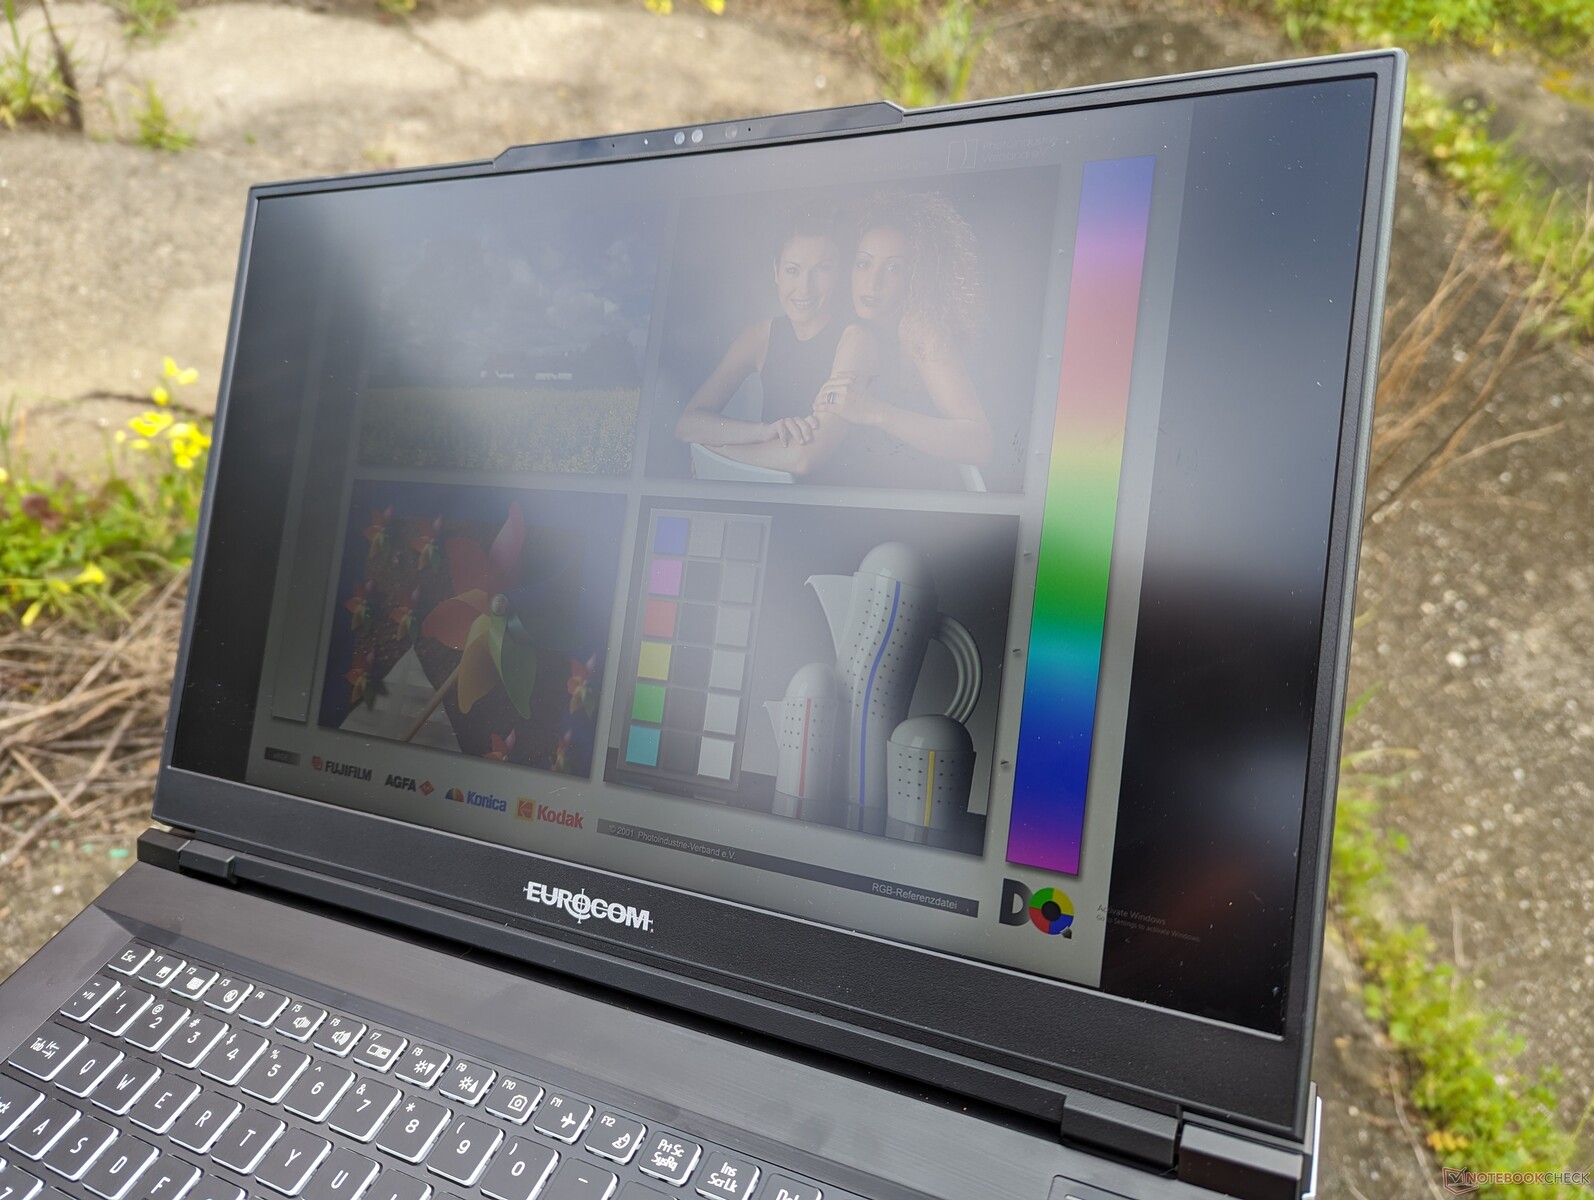
Rispetto al display 2K 240 Hz della nostra configurazione 2023, la nostra configurazione 2024 utilizza un pannello 4K 144 Hz, ma con coperture cromatiche, rapporti di contrasto e tempi di risposta simili. Il nostro pannello a risoluzione più elevata è anche sensibilmente più luminoso, con circa 500 nit in media.
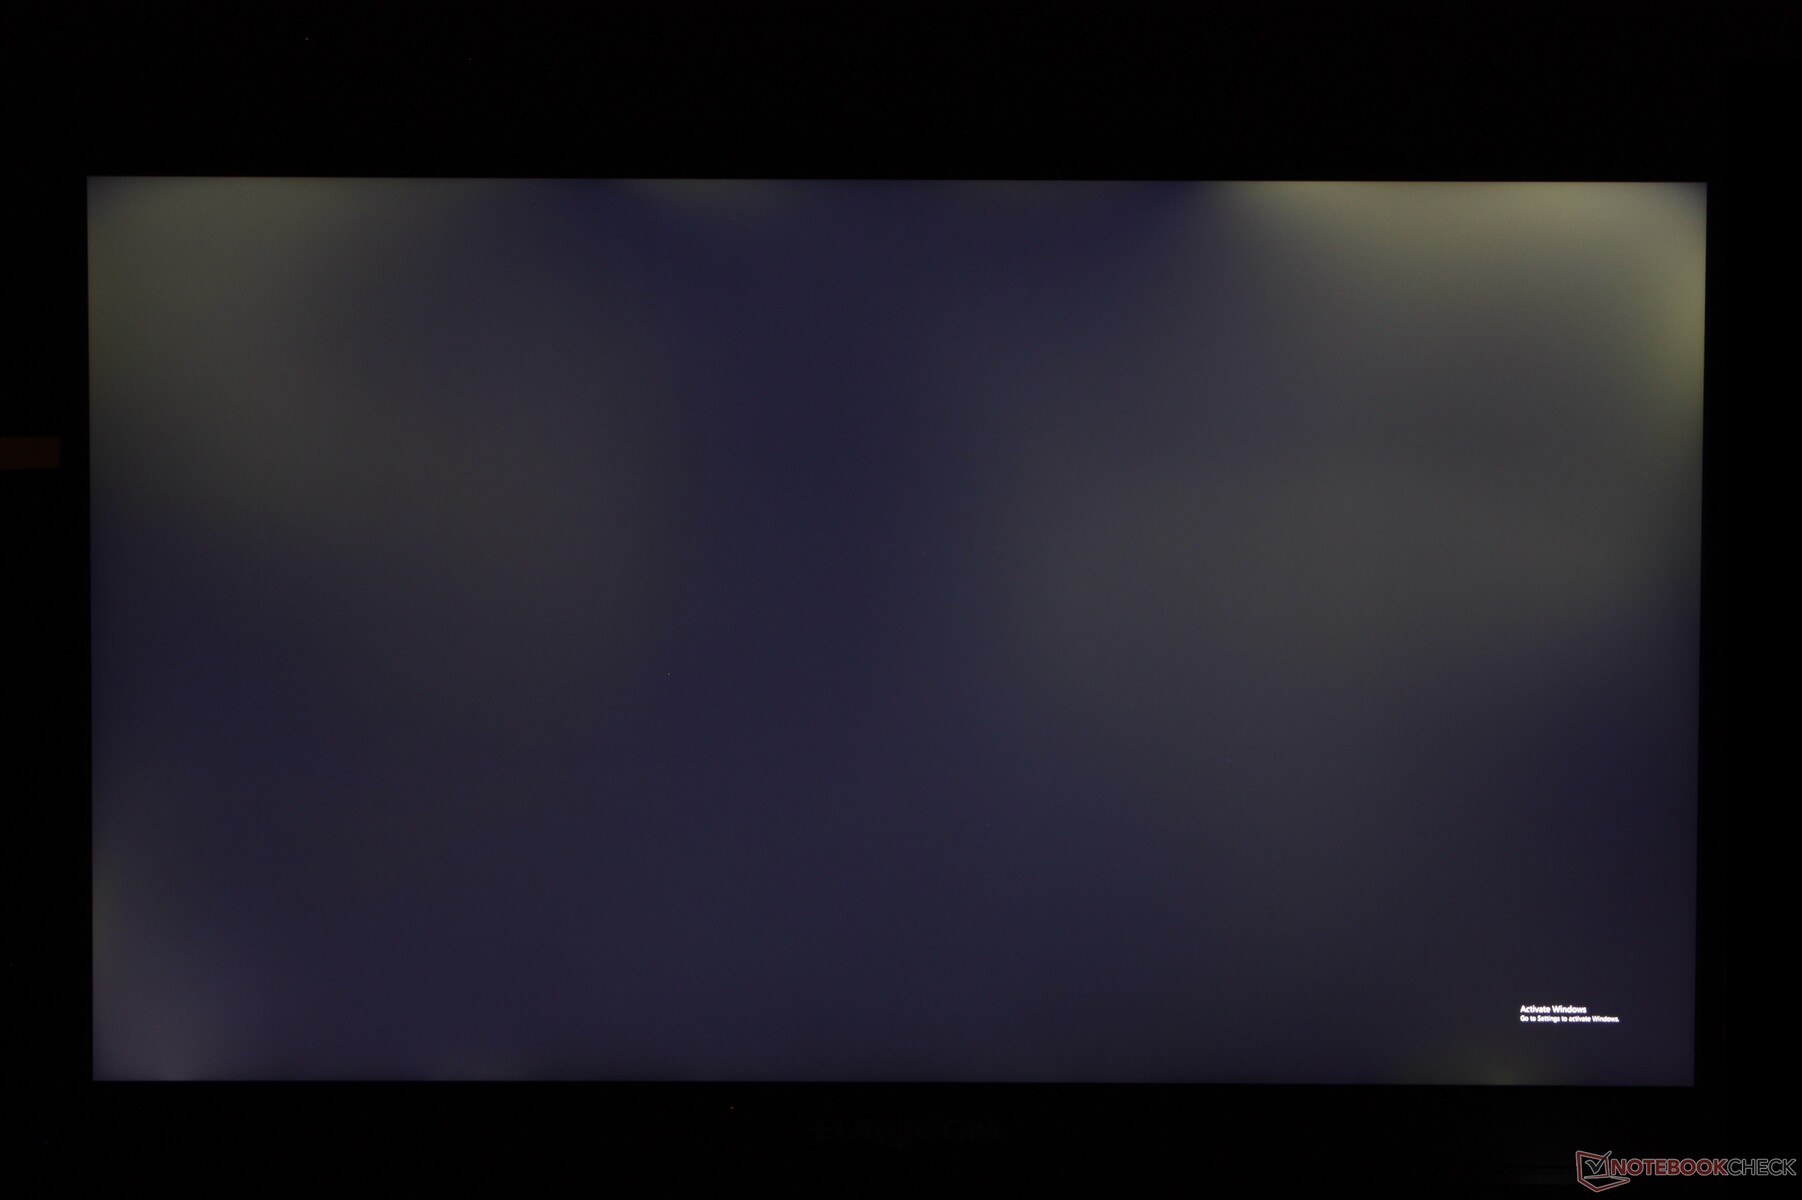
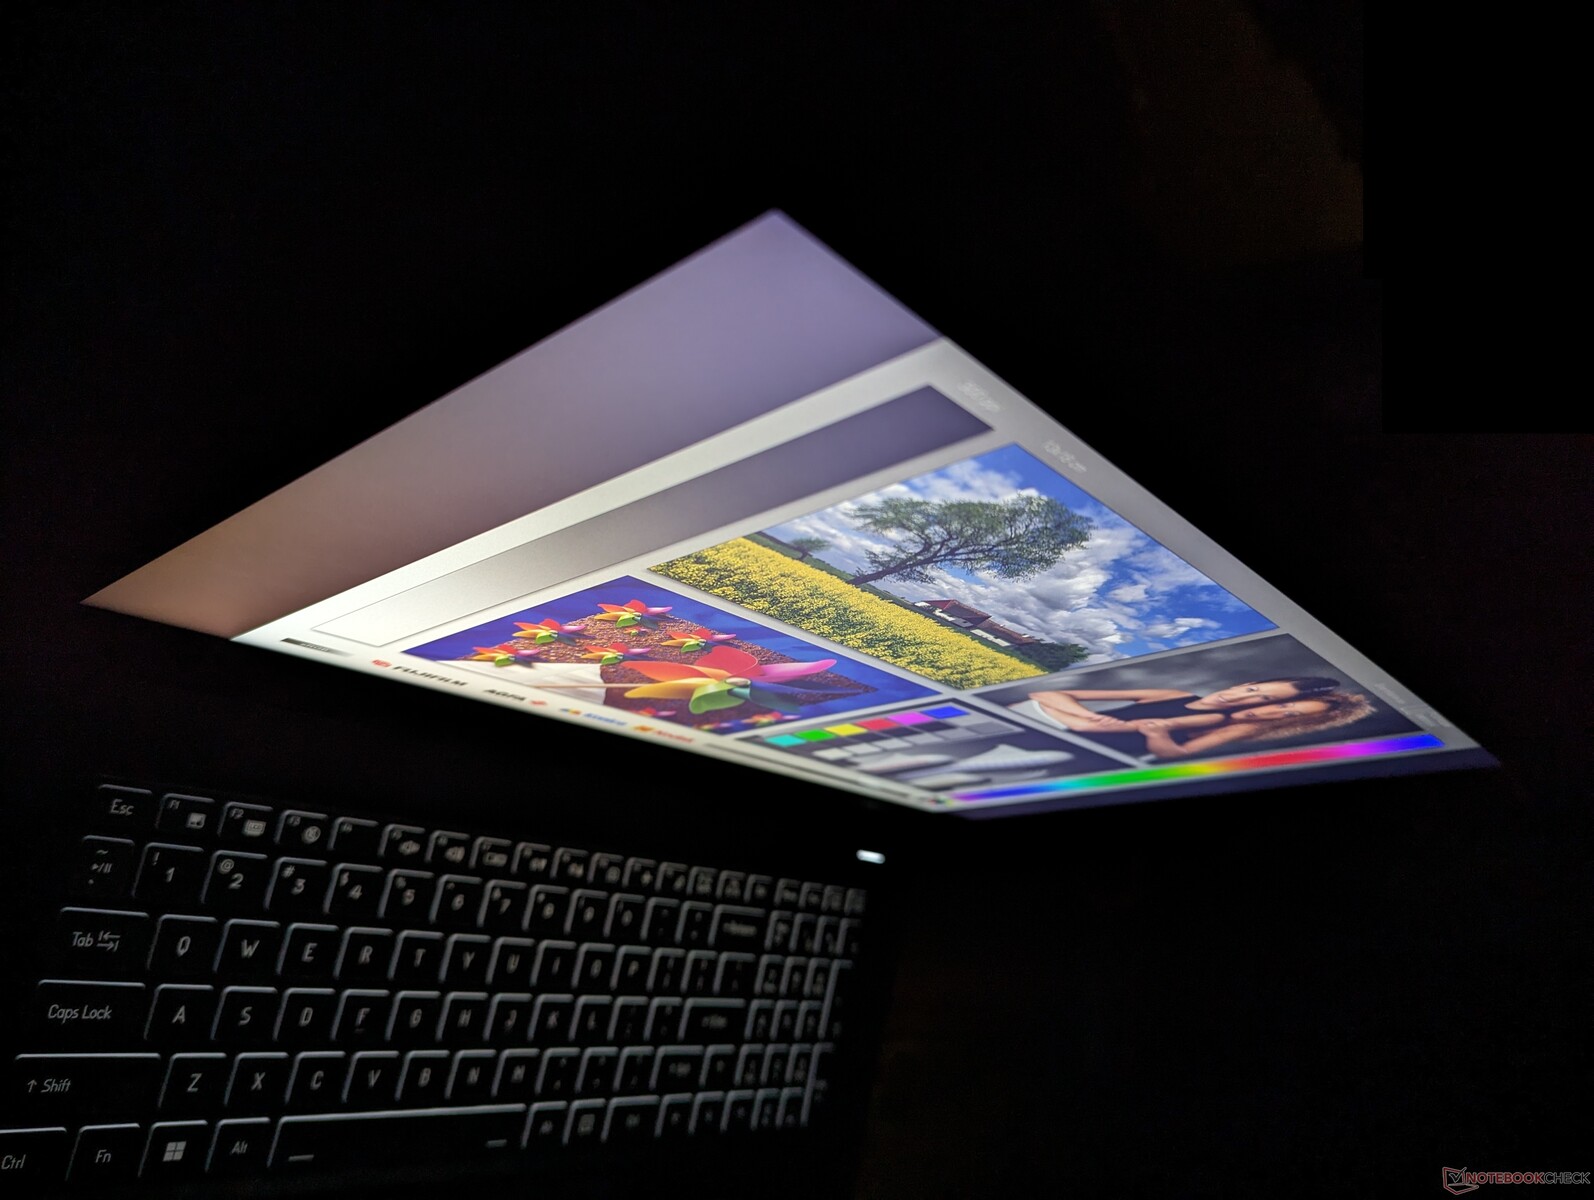
Uno dei principali svantaggi del display è il pannello opaco un po' sgranato, il notevole effetto di retroilluminazione nelle scene scure e la mancanza di supporto HDR. Le alternative OLED appaiono molto più nitide e vibranti rispetto a ciò che Raptor X17 ha da offrire in questo senso.
Il pannello BOE NE173QUM-NY1 si trova anche su altri modelli come lo Schenker Key 17 Pro.

| |||||||||||||||||||||||||
Distribuzione della luminosità: 77 %
Al centro con la batteria: 544.6 cd/m²
Contrasto: 1135:1 (Nero: 0.48 cd/m²)
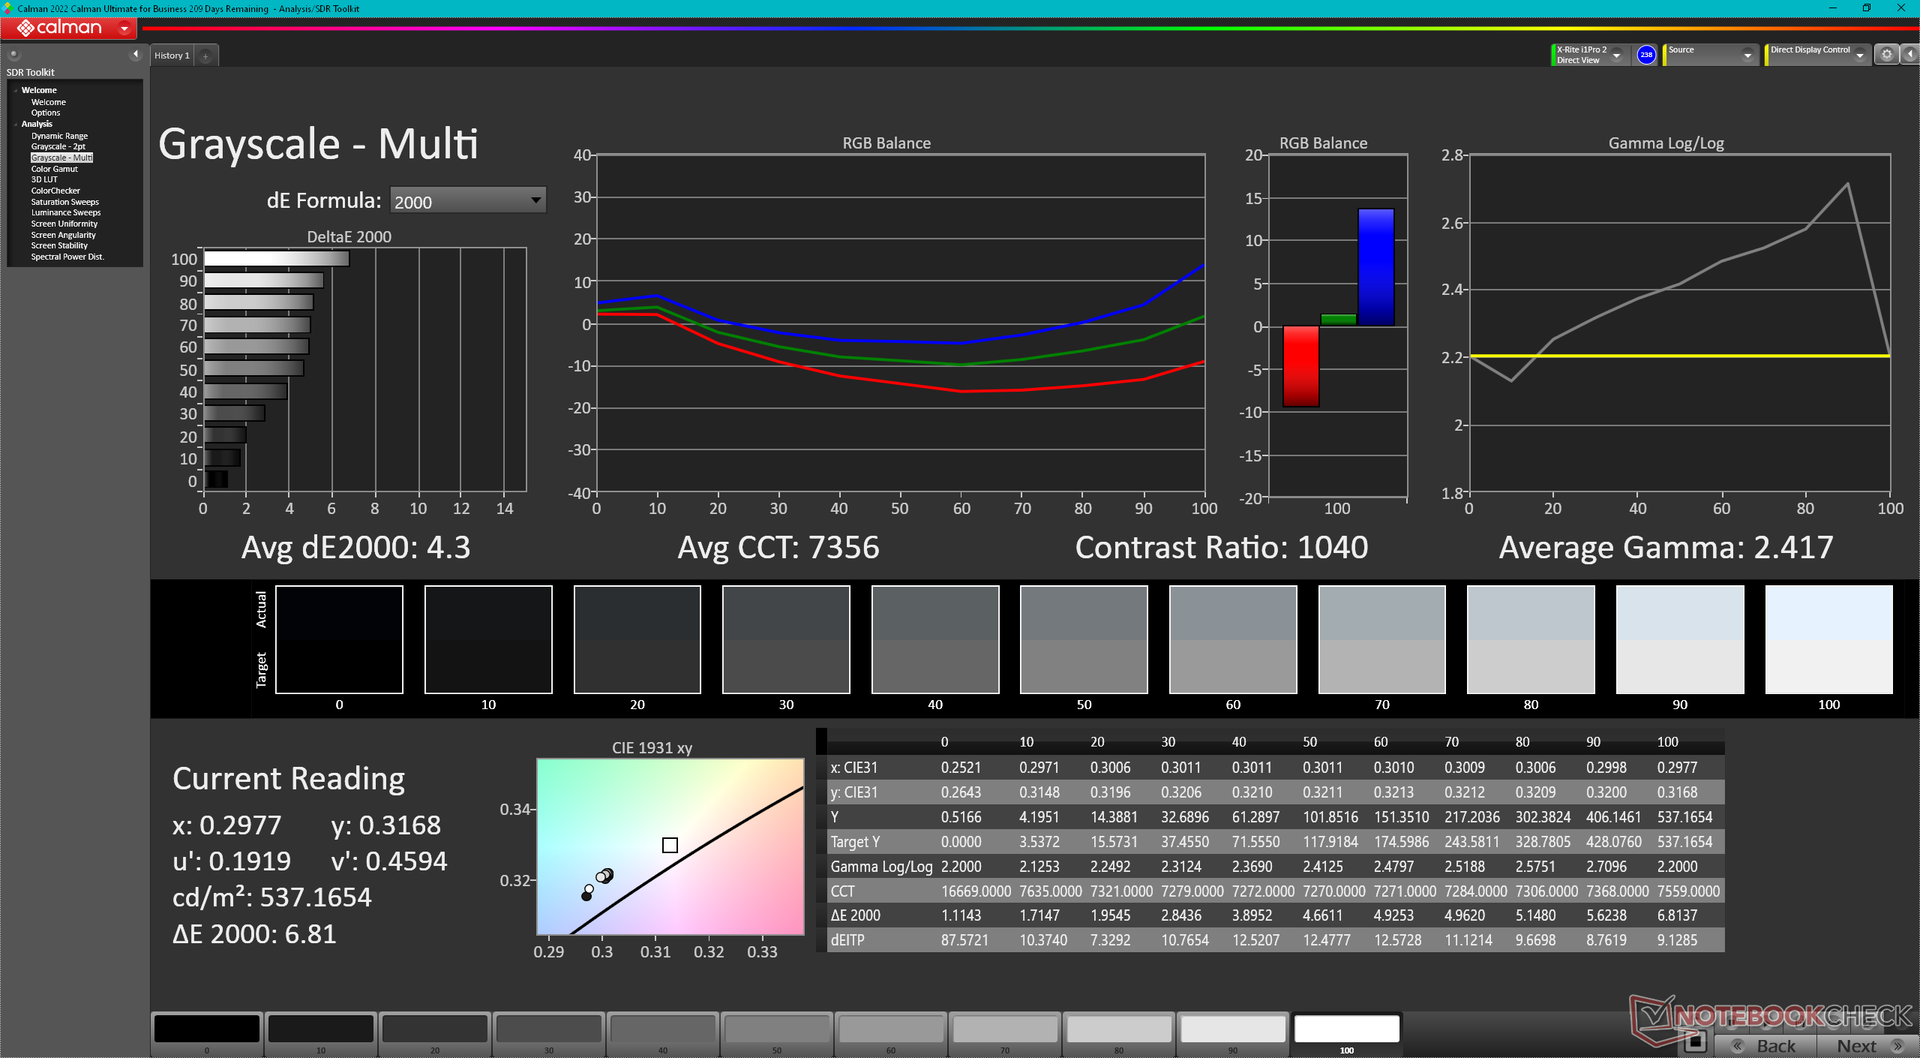
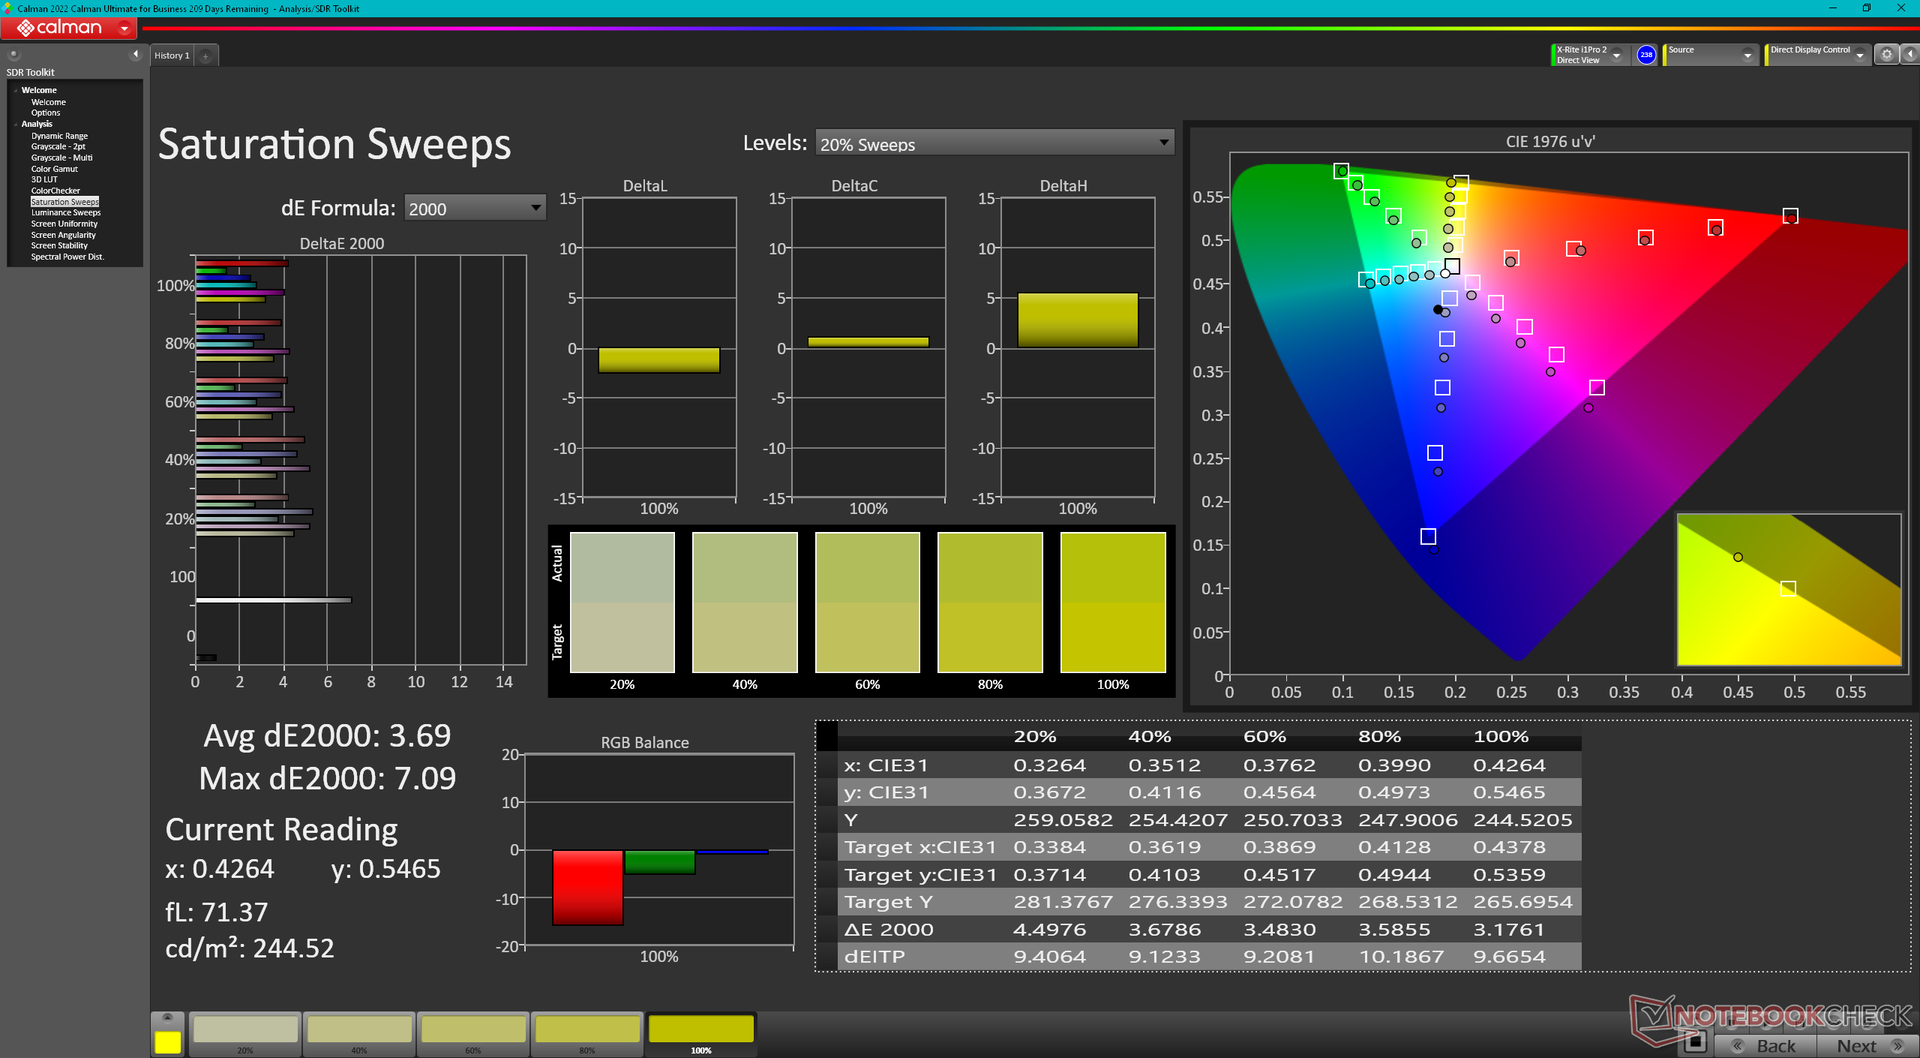
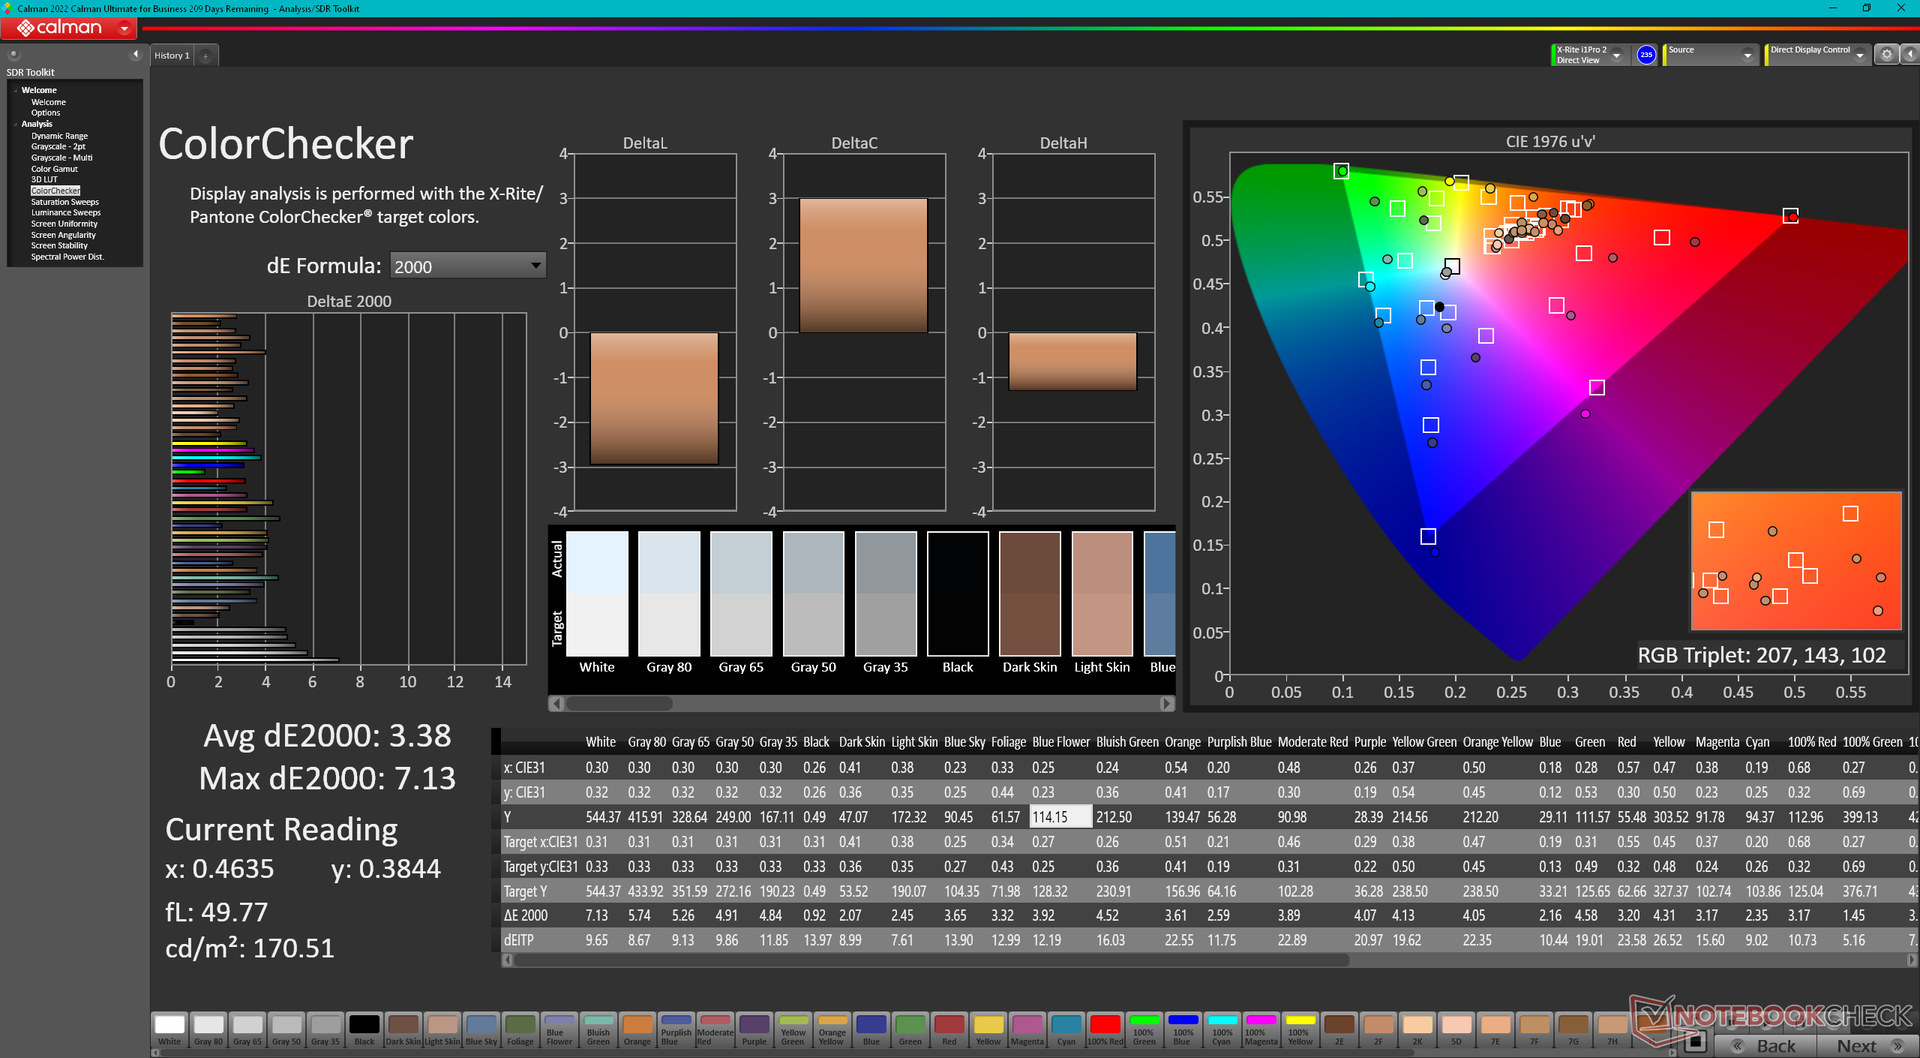
ΔE ColorChecker Calman: 3.38 | ∀{0.5-29.43 Ø4.73}
calibrated: 1.03
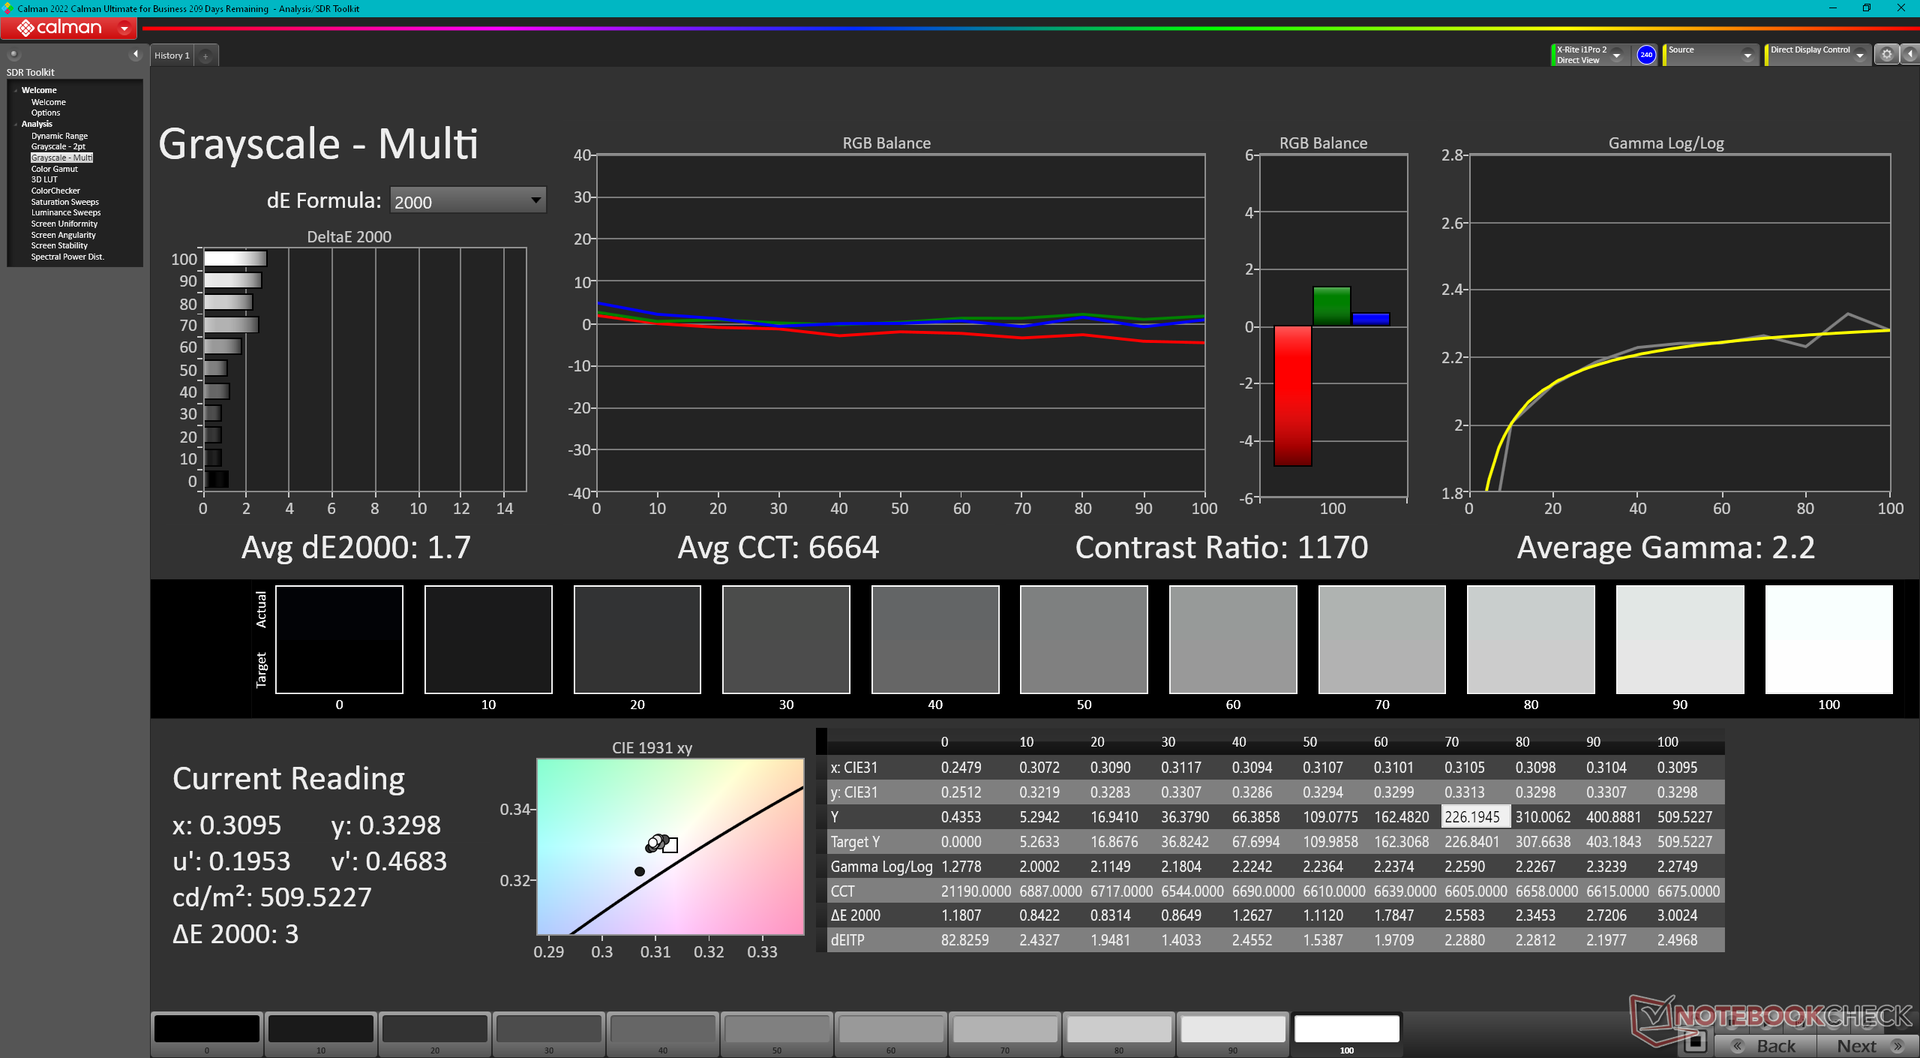
ΔE Greyscale Calman: 4.3 | ∀{0.09-98 Ø4.97}
84.2% AdobeRGB 1998 (Argyll 3D)
99.8% sRGB (Argyll 3D)
95.9% Display P3 (Argyll 3D)
Gamma: 2.42
CCT: 7356 K
| Eurocom Raptor X17 Core i9-14900HX BOE CQ NE173QUM-NY1, IPS, 3840x2160, 17.3" | Eurocom Raptor X17 BOE NE173QHM-NZ1, IPS, 2560x1440, 17.3" | Asus TUF Gaming A17 FA707XI-NS94 AU Optronics B173HAN04.9, IPS, 1920x1080, 17.3" | Asus ROG Strix Scar 17 G733PY-XS96 NE173QHM-NZ2, IPS, 2560x1440, 17.3" | MSI GE78HX 13VH-070US AU Optronics B170QAN01.2, IPS, 2560x1600, 17" | MSI Titan 18 HX A14VIG AU Optronics B180ZAN01.0, Mini-LED, 3840x2400, 18" | |
|---|---|---|---|---|---|---|
| Display | 1% | -50% | 1% | 2% | 1% | |
| Display P3 Coverage (%) | 95.9 | 97.8 2% | 39.7 -59% | 98 2% | 97.6 2% | 98.1 2% |
| sRGB Coverage (%) | 99.8 | 99.9 0% | 59.1 -41% | 100 0% | 99.9 0% | 99.8 0% |
| AdobeRGB 1998 Coverage (%) | 84.2 | 85.4 1% | 41 -51% | 85.6 2% | 86.5 3% | 86.2 2% |
| Response Times | 11% | -150% | 29% | 58% | -288% | |
| Response Time Grey 50% / Grey 80% * (ms) | 14.8 ? | 13.3 ? 10% | 39 ? -164% | 6.2 ? 58% | 4.2 ? 72% | 8.6 ? 42% |
| Response Time Black / White * (ms) | 11.4 ? | 10 ? 12% | 26.9 ? -136% | 11.4 ? -0% | 6.4 ? 44% | 81.8 ? -618% |
| PWM Frequency (Hz) | 2592 ? | |||||
| Screen | -4% | -33% | 22% | -16% | -23% | |
| Brightness middle (cd/m²) | 544.6 | 312.6 -43% | 255.9 -53% | 322.5 -41% | 398.6 -27% | 467.5 -14% |
| Brightness (cd/m²) | 507 | 292 -42% | 248 -51% | 317 -37% | 384 -24% | 459 -9% |
| Brightness Distribution (%) | 77 | 75 -3% | 91 18% | 86 12% | 89 16% | 90 17% |
| Black Level * (cd/m²) | 0.48 | 0.26 46% | 0.21 56% | 0.29 40% | 0.46 4% | |
| Contrast (:1) | 1135 | 1202 6% | 1219 7% | 1112 -2% | 867 -24% | |
| Colorchecker dE 2000 * | 3.38 | 3.43 -1% | 4.51 -33% | 1.15 66% | 4.05 -20% | 3.77 -12% |
| Colorchecker dE 2000 max. * | 7.13 | 8.31 -17% | 20.77 -191% | 3.03 58% | 8.68 -22% | 6.12 14% |
| Colorchecker dE 2000 calibrated * | 1.03 | 0.74 28% | 1.82 -77% | 0.56 46% | 1.02 1% | 2.94 -185% |
| Greyscale dE 2000 * | 4.3 | 4.8 -12% | 3.2 26% | 1.7 60% | 6.5 -51% | 3.2 26% |
| Gamma | 2.42 91% | 2.12 104% | 2.08 106% | 2.27 97% | 2.11 104% | 2.43 91% |
| CCT | 7356 88% | 7082 92% | 6054 107% | 6299 103% | 7518 86% | 6478 100% |
| Media totale (Programma / Settaggio) | 3% /
-1% | -78% /
-54% | 17% /
19% | 15% /
-2% | -103% /
-61% |
* ... Meglio usare valori piccoli
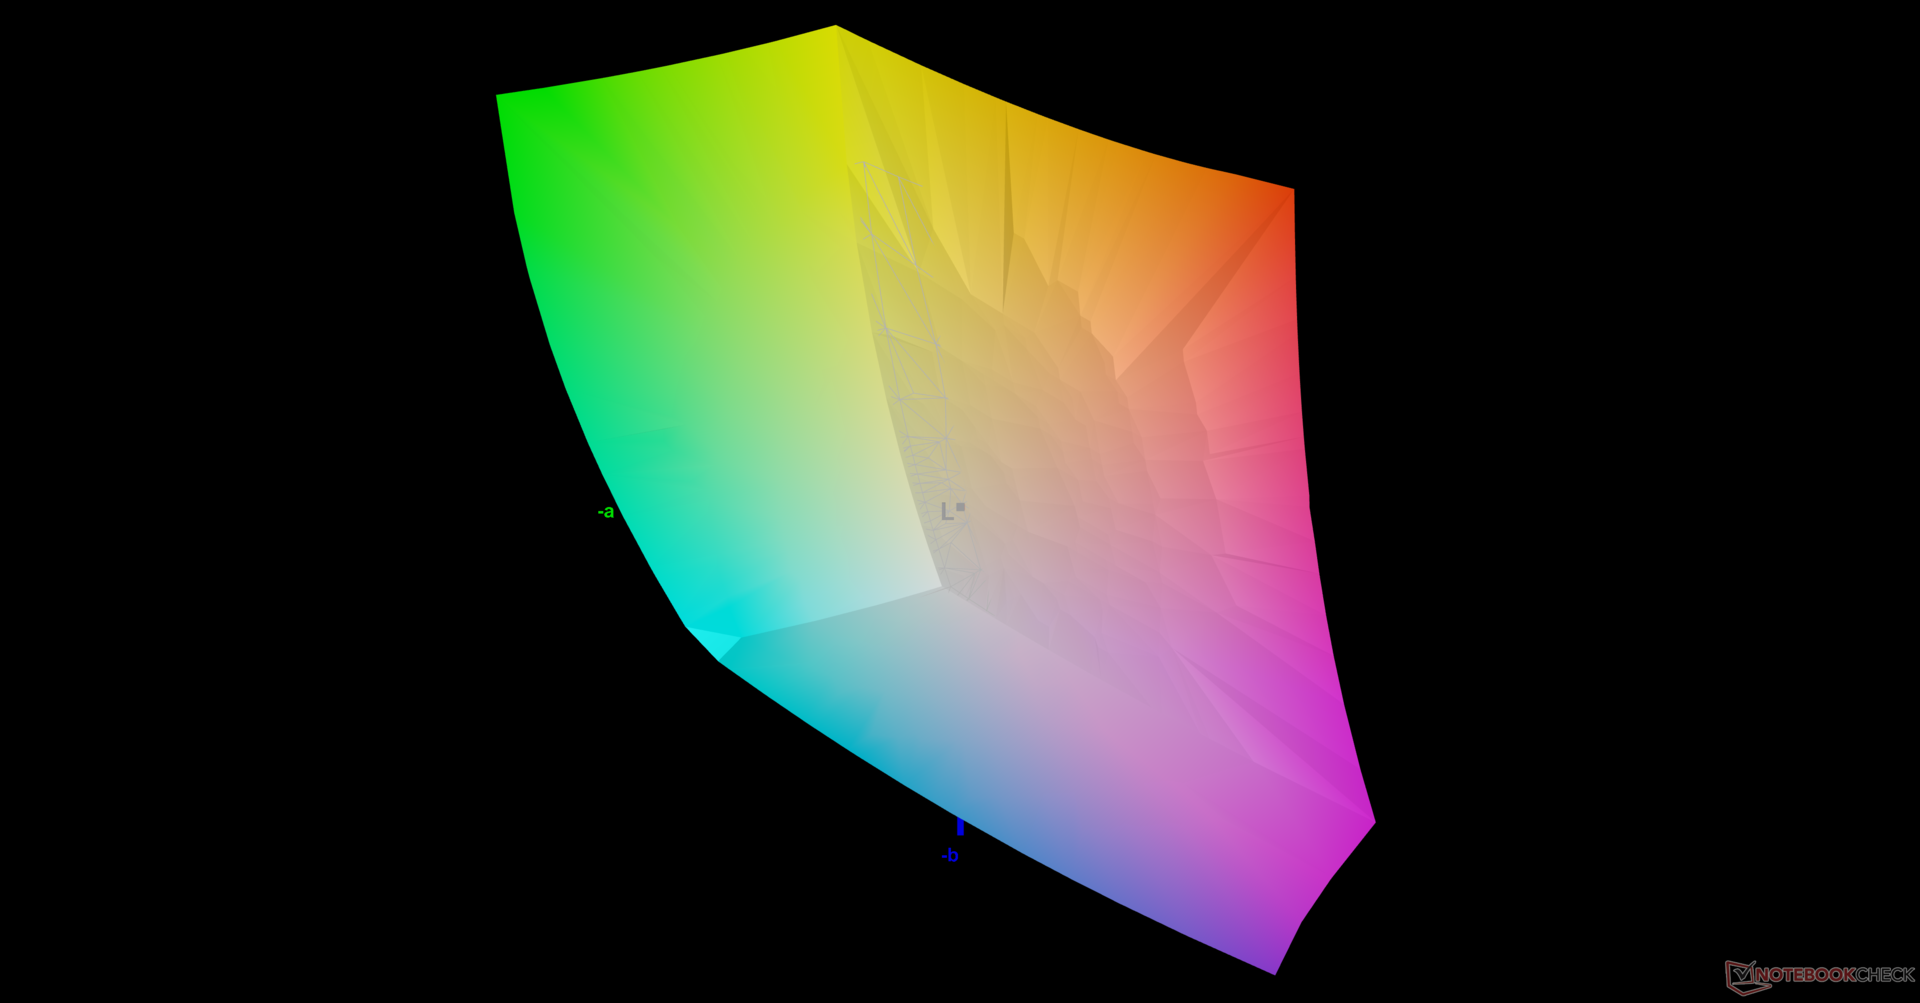
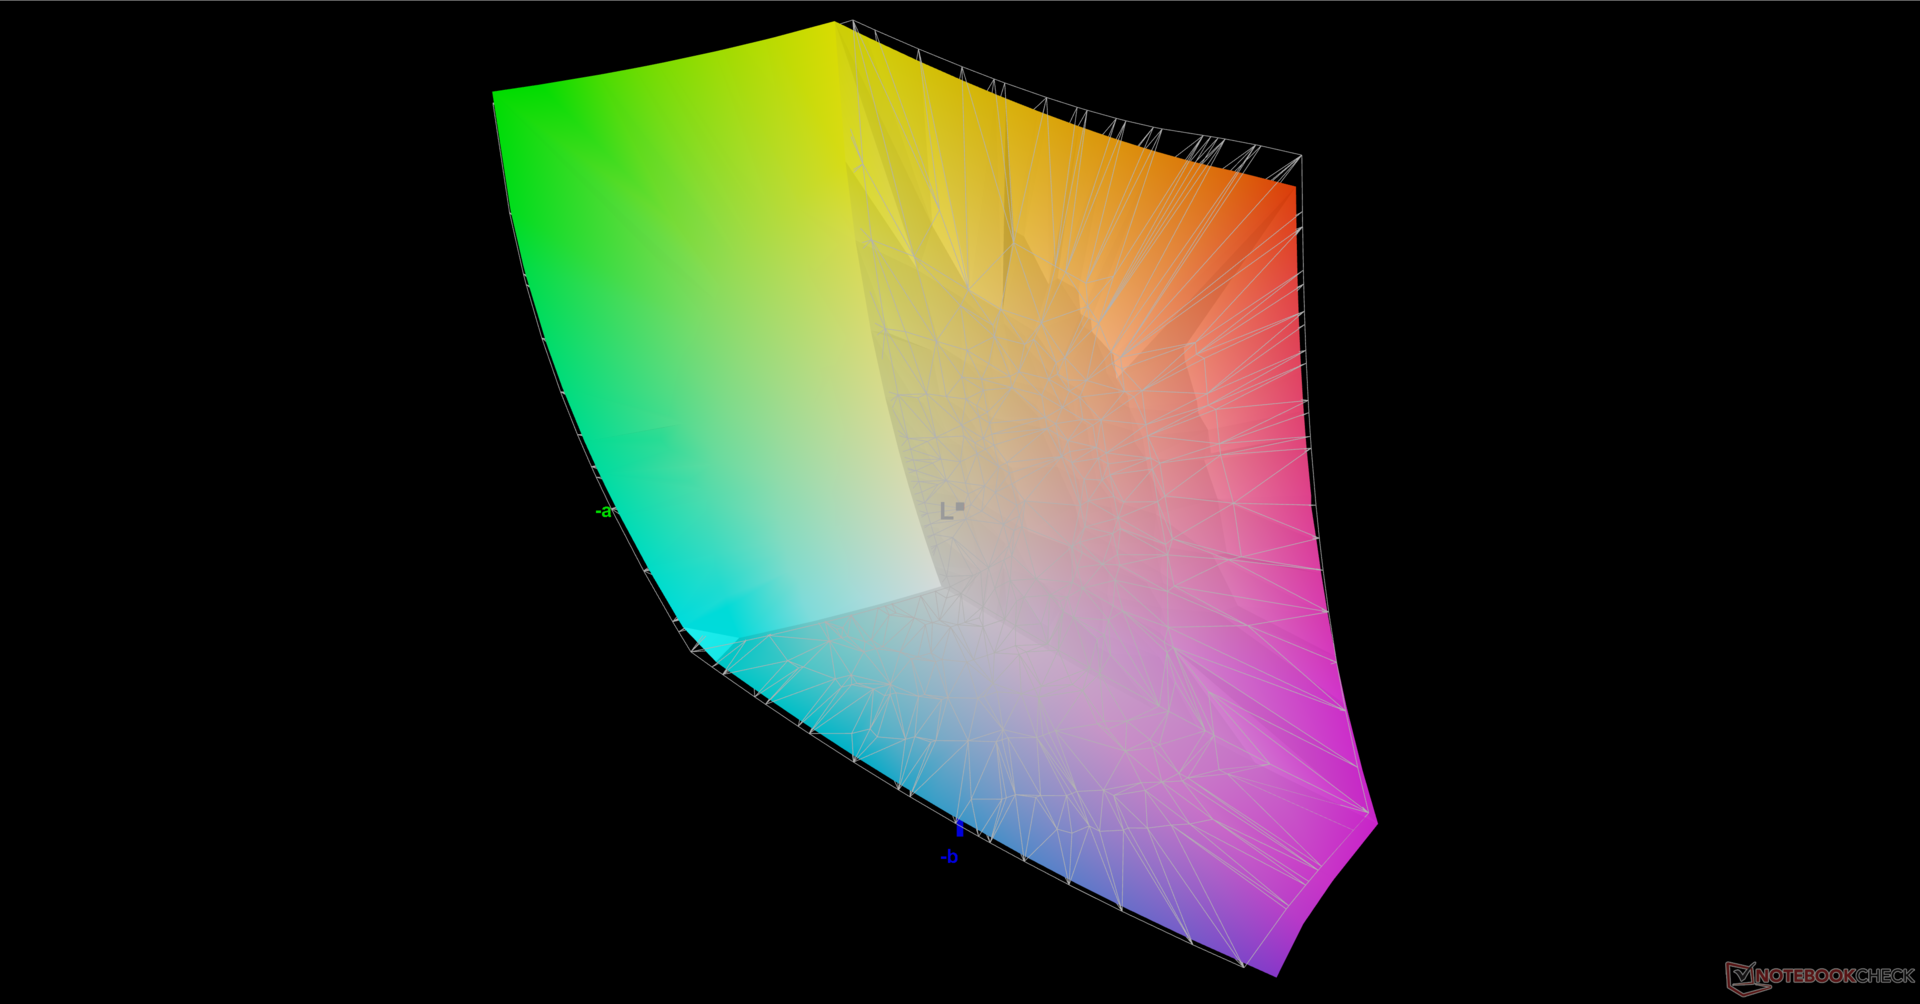
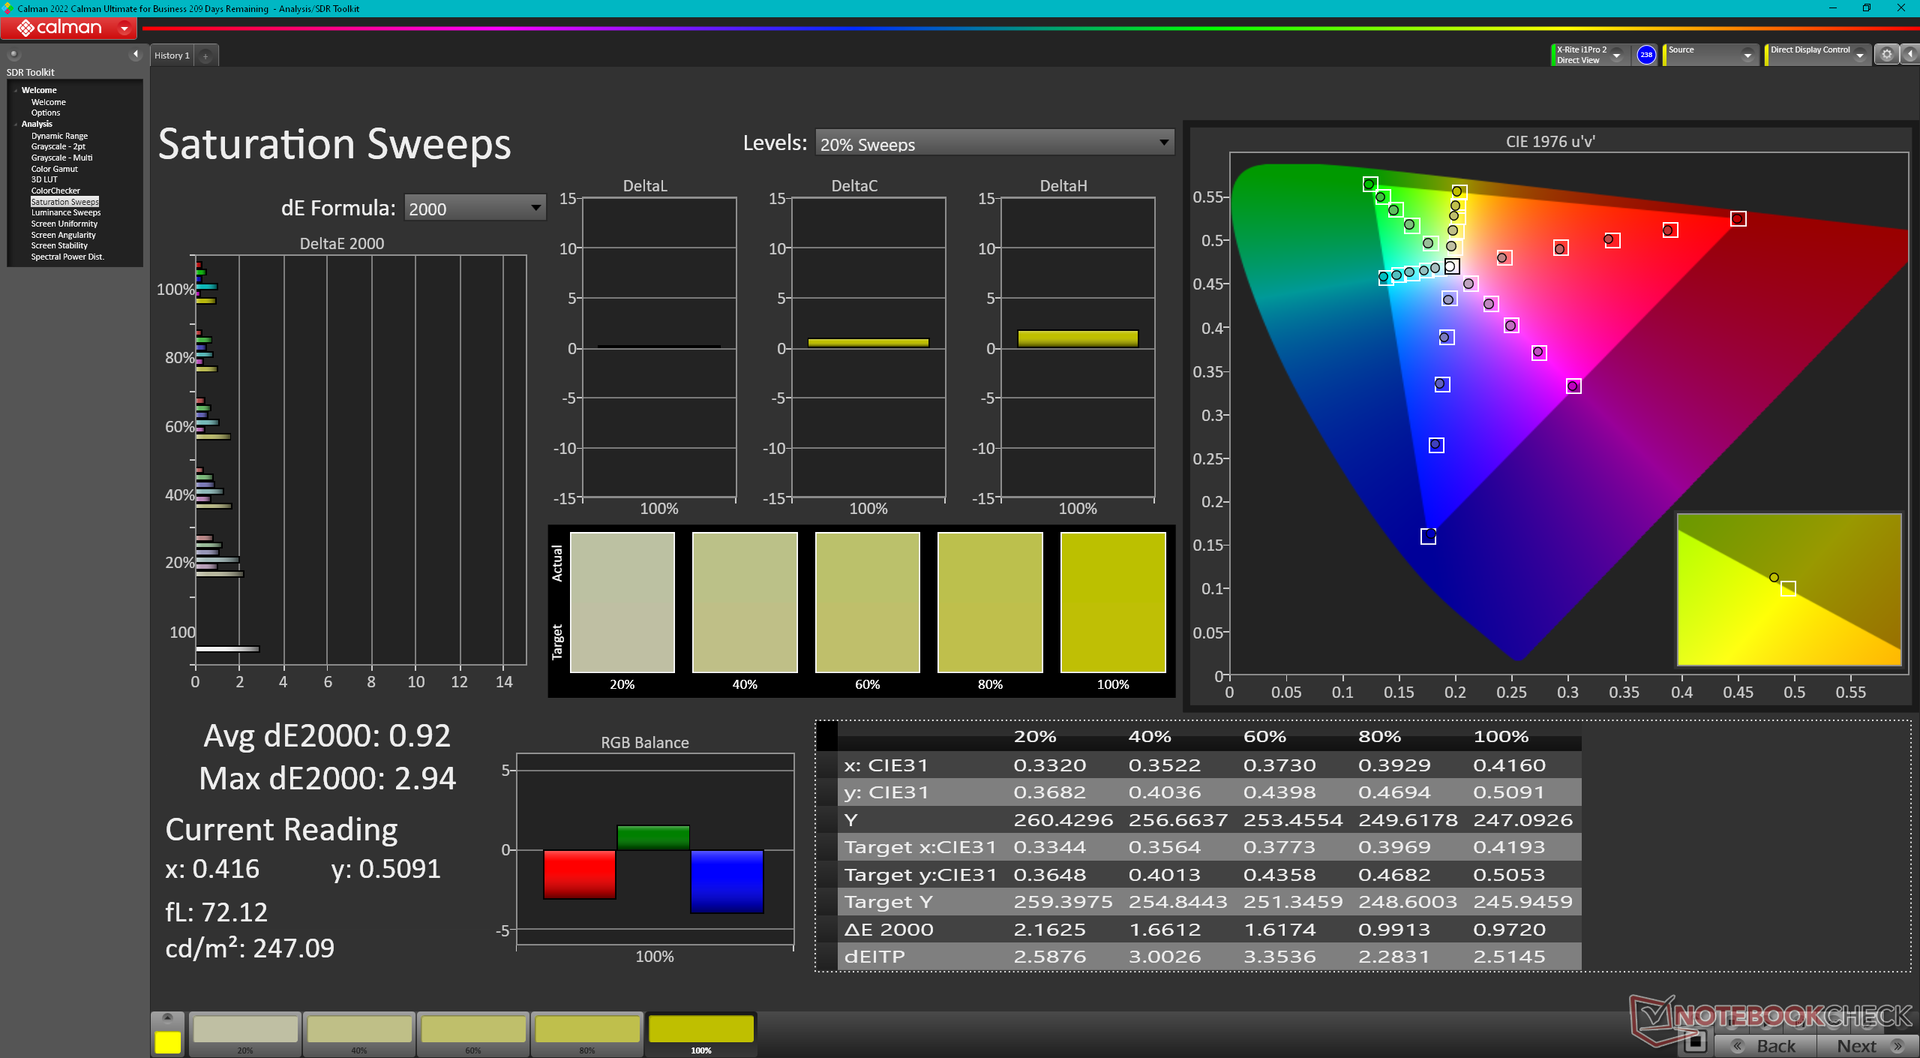
Sebbene lo standard P3 sia supportato, la precisione del colore avrebbe potuto essere migliore. La temperatura del colore è troppo fredda, il che influisce sui valori della scala di grigi e deltaE del colore. La calibrazione con il nostro colorimetro X-Rite risolve questo problema. Il nostro profilo ICM è disponibile gratuitamente per il download qui sopra.
Tempi di risposta del Display
| ↔ Tempi di risposta dal Nero al Bianco | ||
|---|---|---|
| 11.4 ms ... aumenta ↗ e diminuisce ↘ combinato | ↗ 6.1 ms Incremento | 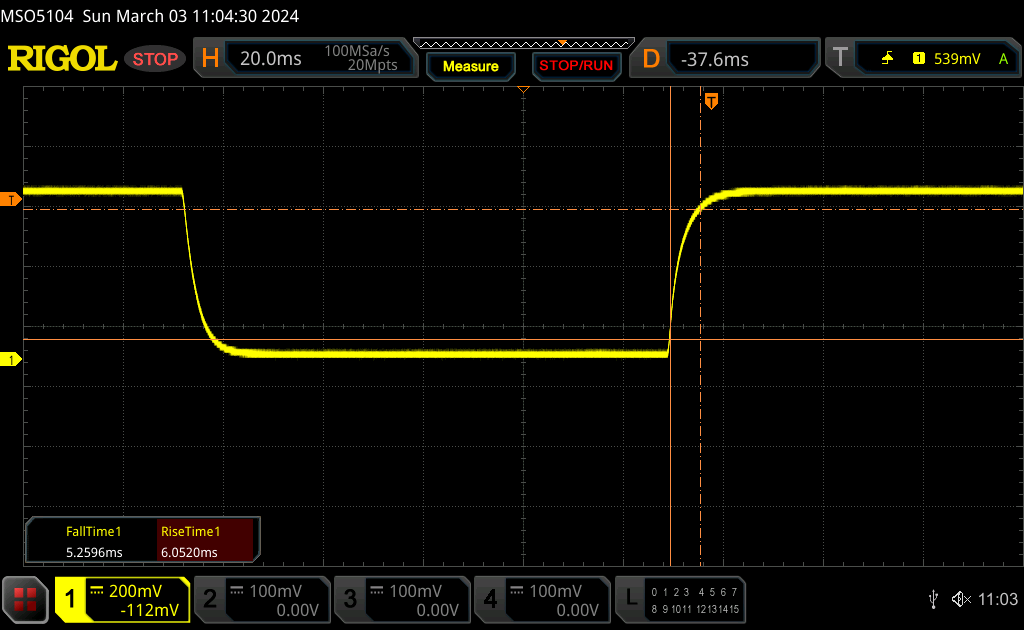 |
| ↘ 5.3 ms Calo | ||
| Lo schermo mostra buoni tempi di risposta durante i nostri tests, ma potrebbe essere troppo lento per i gamers competitivi. In confronto, tutti i dispositivi di test variano da 0.1 (minimo) a 240 (massimo) ms. » 31 % di tutti i dispositivi è migliore. Questo significa che i tempi di risposta rilevati sono migliori rispettto alla media di tutti i dispositivi testati (19.9 ms). | ||
| ↔ Tempo di risposta dal 50% Grigio all'80% Grigio | ||
| 14.8 ms ... aumenta ↗ e diminuisce ↘ combinato | ↗ 7.2 ms Incremento | 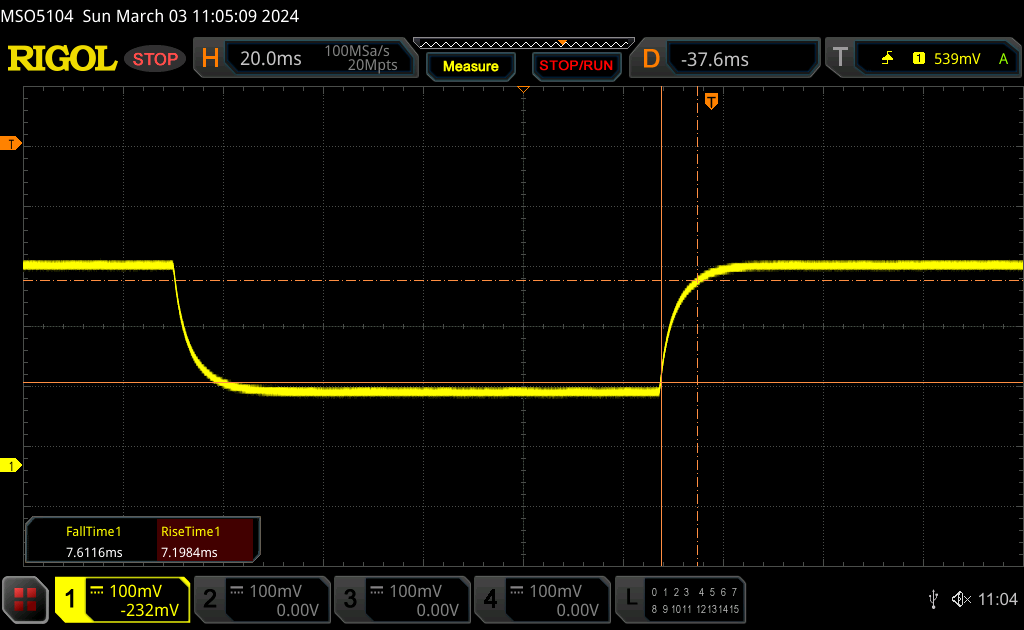 |
| ↘ 7.6 ms Calo | ||
| Lo schermo mostra buoni tempi di risposta durante i nostri tests, ma potrebbe essere troppo lento per i gamers competitivi. In confronto, tutti i dispositivi di test variano da 0.165 (minimo) a 636 (massimo) ms. » 29 % di tutti i dispositivi è migliore. Questo significa che i tempi di risposta rilevati sono migliori rispettto alla media di tutti i dispositivi testati (31.1 ms). | ||
Sfarfallio dello schermo / PWM (Pulse-Width Modulation)
| flickering dello schermo / PWM non rilevato | 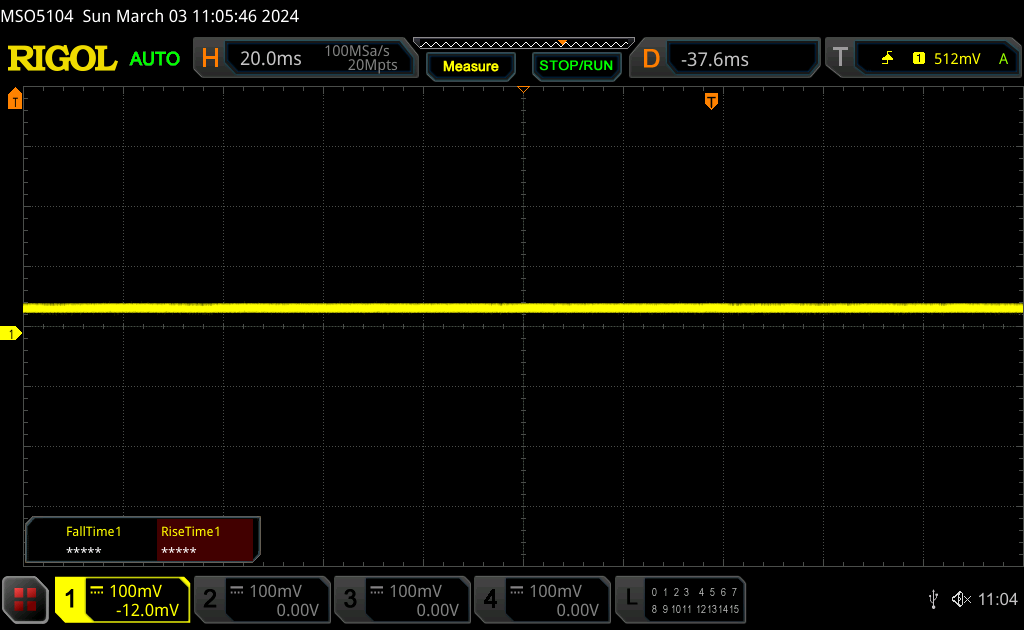 | ||
In confronto: 52 % di tutti i dispositivi testati non utilizza PWM per ridurre la luminosita' del display. Se è rilevato PWM, una media di 7784 (minimo: 5 - massimo: 343500) Hz è stata rilevata. | |||
Prestazioni - Aggiornamento Raptor Lake-HX
Condizioni del test
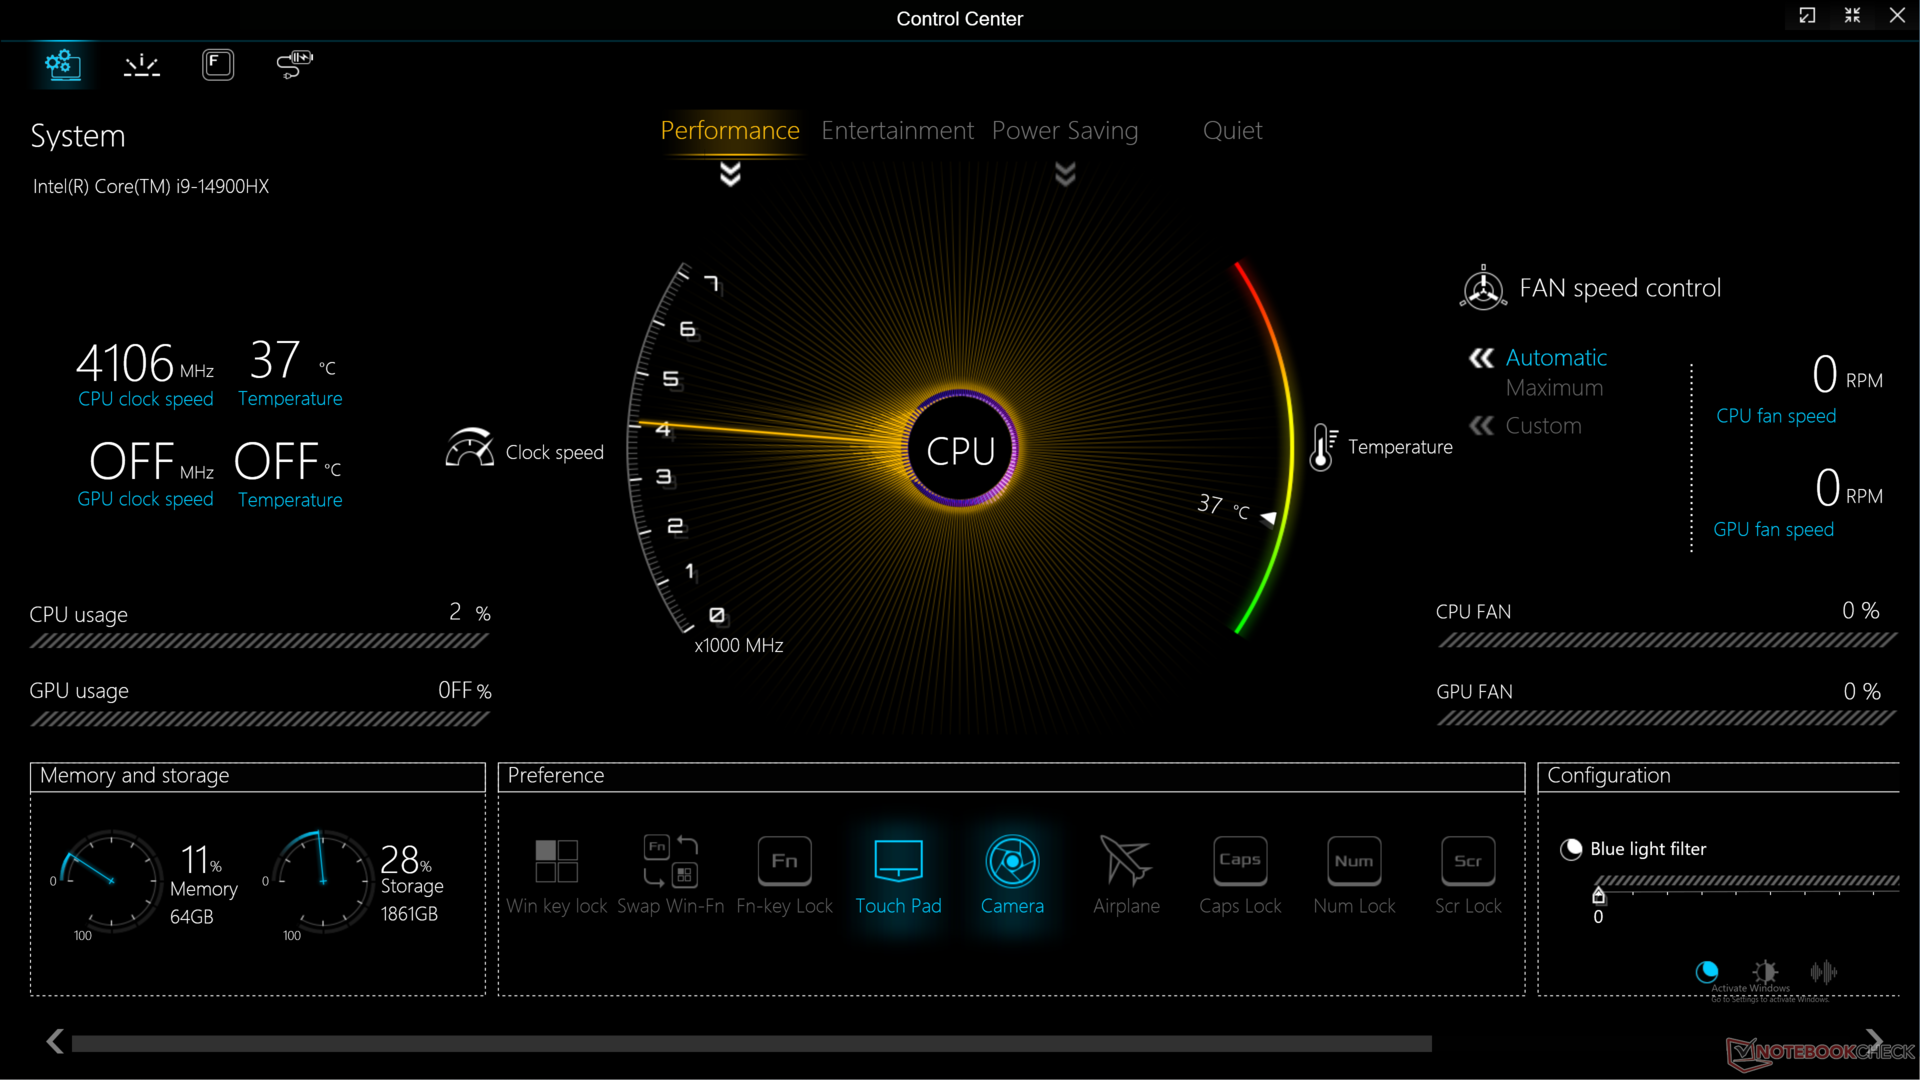
Abbiamo impostato Windows e Control Center sulla modalità Prestazioni con la ventola massima attiva prima di eseguire i benchmark qui sotto. L'interruttore manuale della GPU si trova anche nel Centro di controllo, ma è scomodamente nascosto dietro una barra di scorrimento. G-Sync è supportato mentre Advanced Optimus non lo è, il che significa che è necessario un riavvio quando si passa dalla iGPU alla dGPU.
Le modalità "Intrattenimento" e "Prestazioni" nel Centro di controllo possono creare un po' di confusione. Forse rinominare la modalità "Intrattenimento" in qualcosa come "Bilanciato" sarebbe più appropriato.
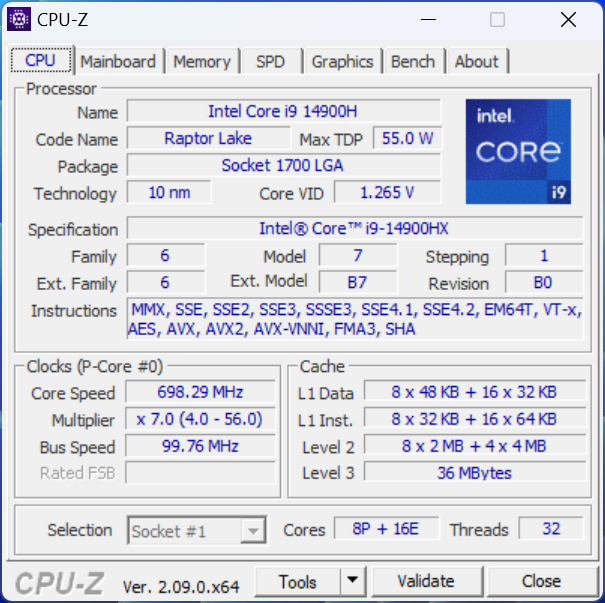
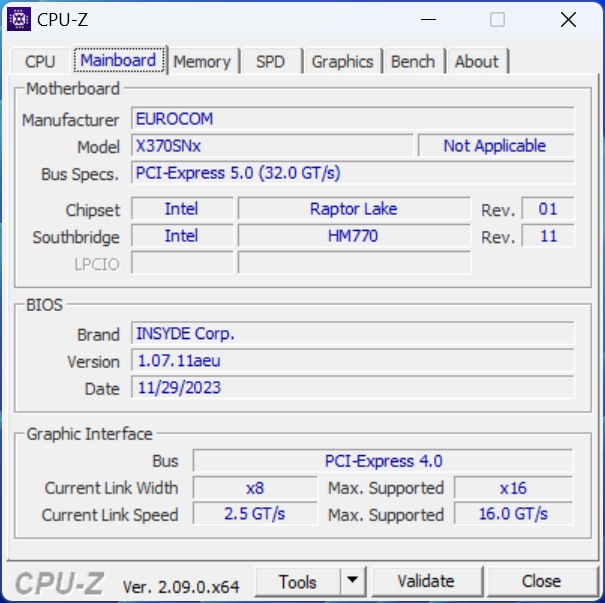
Processore
La serie Raptor Lake-HX è stata aggiornata per il 2024, ma i vantaggi in termini di prestazioni sono al massimo marginali rispetto alla serie 2023. Passando dal Core i9-13900HX del Raptor X17 dello scorso anno al Core i9-14900HX in questa configurazione più recente migliora le prestazioni di appena il 5-10%. Il chipset non presenta una NPU integrata, a differenza della piattaforma Meteor Lake.
Cinebench R15 Multi Loop
Cinebench R23: Multi Core | Single Core
Cinebench R20: CPU (Multi Core) | CPU (Single Core)
Cinebench R15: CPU Multi 64Bit | CPU Single 64Bit
Blender: v2.79 BMW27 CPU
7-Zip 18.03: 7z b 4 | 7z b 4 -mmt1
Geekbench 6.7: Multi-Core | Single-Core
Geekbench 5.5: Multi-Core | Single-Core
HWBOT x265 Benchmark v2.2: 4k Preset
LibreOffice : 20 Documents To PDF
R Benchmark 2.5: Overall mean
| CPU Performance rating | |
| KFA2 GeForce RTX 4080 Super SG -6! | |
| Asus ROG Strix Scar 17 G733PYV-LL053X | |
| Asus ROG Strix Scar 17 G733PY-XS96 -2! | |
| MSI GE78HX 13VH-070US -2! | |
| MSI Titan 18 HX A14VIG | |
| MSI Raider GE78 HX 13VI | |
| Media Intel Core i9-14900HX | |
| Eurocom Raptor X17 Core i9-14900HX | |
| Eurocom Raptor X17 -2! | |
| Alienware x16 R1 -3! | |
| Asus TUF Gaming A17 FA707XI-NS94 | |
| Dell XPS 17 9730 RTX 4070 -2! | |
| Medion Erazer Defender P40 -2! | |
| Eurocom Nightsky TXi317 -4! | |
| Acer Nitro 17 AN17-41-R9LN | |
| Alienware m17 R5 (R9 6900HX, RX 6850M XT) -2! | |
| Geekbench 6.7 / Multi-Core | |
| KFA2 GeForce RTX 4080 Super SG | |
| Eurocom Raptor X17 Core i9-14900HX | |
| MSI Raider GE78 HX 13VI | |
| Media Intel Core i9-14900HX (13158 - 19665, n=37) | |
| Asus ROG Strix Scar 17 G733PYV-LL053X | |
| MSI Titan 18 HX A14VIG | |
| Asus TUF Gaming A17 FA707XI-NS94 | |
| Acer Nitro 17 AN17-41-R9LN | |
| Geekbench 6.7 / Single-Core | |
| KFA2 GeForce RTX 4080 Super SG | |
| Media Intel Core i9-14900HX (2419 - 3129, n=37) | |
| Asus ROG Strix Scar 17 G733PYV-LL053X | |
| Eurocom Raptor X17 Core i9-14900HX | |
| MSI Titan 18 HX A14VIG | |
| MSI Raider GE78 HX 13VI | |
| Asus TUF Gaming A17 FA707XI-NS94 | |
| Acer Nitro 17 AN17-41-R9LN | |
Cinebench R23: Multi Core | Single Core
Cinebench R20: CPU (Multi Core) | CPU (Single Core)
Cinebench R15: CPU Multi 64Bit | CPU Single 64Bit
Blender: v2.79 BMW27 CPU
7-Zip 18.03: 7z b 4 | 7z b 4 -mmt1
Geekbench 6.7: Multi-Core | Single-Core
Geekbench 5.5: Multi-Core | Single-Core
HWBOT x265 Benchmark v2.2: 4k Preset
LibreOffice : 20 Documents To PDF
R Benchmark 2.5: Overall mean
* ... Meglio usare valori piccoli
AIDA64: FP32 Ray-Trace | FPU Julia | CPU SHA3 | CPU Queen | FPU SinJulia | FPU Mandel | CPU AES | CPU ZLib | FP64 Ray-Trace | CPU PhotoWorxx
| Performance rating | |
| Asus ROG Strix Scar 17 G733PY-XS96 | |
| Eurocom Raptor X17 Core i9-14900HX | |
| MSI GE78HX 13VH-070US | |
| MSI Titan 18 HX A14VIG | |
| Media Intel Core i9-14900HX | |
| Eurocom Raptor X17 | |
| Asus TUF Gaming A17 FA707XI-NS94 | |
| AIDA64 / FP32 Ray-Trace | |
| Asus ROG Strix Scar 17 G733PY-XS96 | |
| MSI Titan 18 HX A14VIG | |
| Asus TUF Gaming A17 FA707XI-NS94 | |
| MSI GE78HX 13VH-070US | |
| Eurocom Raptor X17 Core i9-14900HX | |
| Media Intel Core i9-14900HX (13098 - 33474, n=36) | |
| Eurocom Raptor X17 | |
| AIDA64 / FPU Julia | |
| Asus ROG Strix Scar 17 G733PY-XS96 | |
| MSI Titan 18 HX A14VIG | |
| MSI GE78HX 13VH-070US | |
| Eurocom Raptor X17 Core i9-14900HX | |
| Media Intel Core i9-14900HX (67573 - 166040, n=36) | |
| Asus TUF Gaming A17 FA707XI-NS94 | |
| Eurocom Raptor X17 | |
| AIDA64 / CPU SHA3 | |
| Asus ROG Strix Scar 17 G733PY-XS96 | |
| MSI Titan 18 HX A14VIG | |
| Eurocom Raptor X17 Core i9-14900HX | |
| MSI GE78HX 13VH-070US | |
| Media Intel Core i9-14900HX (3589 - 7979, n=36) | |
| Eurocom Raptor X17 | |
| Asus TUF Gaming A17 FA707XI-NS94 | |
| AIDA64 / CPU Queen | |
| Asus ROG Strix Scar 17 G733PY-XS96 | |
| MSI Titan 18 HX A14VIG | |
| Eurocom Raptor X17 Core i9-14900HX | |
| MSI GE78HX 13VH-070US | |
| Media Intel Core i9-14900HX (118405 - 148966, n=36) | |
| Eurocom Raptor X17 | |
| Asus TUF Gaming A17 FA707XI-NS94 | |
| AIDA64 / FPU SinJulia | |
| Asus ROG Strix Scar 17 G733PY-XS96 | |
| MSI Titan 18 HX A14VIG | |
| MSI GE78HX 13VH-070US | |
| Eurocom Raptor X17 Core i9-14900HX | |
| Asus TUF Gaming A17 FA707XI-NS94 | |
| Media Intel Core i9-14900HX (10475 - 18517, n=36) | |
| Eurocom Raptor X17 | |
| AIDA64 / FPU Mandel | |
| Asus ROG Strix Scar 17 G733PY-XS96 | |
| MSI Titan 18 HX A14VIG | |
| MSI GE78HX 13VH-070US | |
| Eurocom Raptor X17 Core i9-14900HX | |
| Asus TUF Gaming A17 FA707XI-NS94 | |
| Media Intel Core i9-14900HX (32543 - 83662, n=36) | |
| Eurocom Raptor X17 | |
| AIDA64 / CPU AES | |
| Eurocom Raptor X17 Core i9-14900HX | |
| Asus ROG Strix Scar 17 G733PY-XS96 | |
| Media Intel Core i9-14900HX (86964 - 241777, n=36) | |
| MSI Titan 18 HX A14VIG | |
| MSI GE78HX 13VH-070US | |
| Eurocom Raptor X17 | |
| Asus TUF Gaming A17 FA707XI-NS94 | |
| AIDA64 / CPU ZLib | |
| Asus ROG Strix Scar 17 G733PY-XS96 | |
| MSI Titan 18 HX A14VIG | |
| MSI GE78HX 13VH-070US | |
| Eurocom Raptor X17 Core i9-14900HX | |
| Eurocom Raptor X17 | |
| Media Intel Core i9-14900HX (1054 - 2292, n=36) | |
| Asus TUF Gaming A17 FA707XI-NS94 | |
| AIDA64 / FP64 Ray-Trace | |
| Asus ROG Strix Scar 17 G733PY-XS96 | |
| MSI Titan 18 HX A14VIG | |
| Asus TUF Gaming A17 FA707XI-NS94 | |
| MSI GE78HX 13VH-070US | |
| Eurocom Raptor X17 Core i9-14900HX | |
| Media Intel Core i9-14900HX (6809 - 18349, n=36) | |
| Eurocom Raptor X17 | |
| AIDA64 / CPU PhotoWorxx | |
| Eurocom Raptor X17 | |
| Eurocom Raptor X17 Core i9-14900HX | |
| MSI GE78HX 13VH-070US | |
| Media Intel Core i9-14900HX (23903 - 54702, n=36) | |
| Asus ROG Strix Scar 17 G733PY-XS96 | |
| MSI Titan 18 HX A14VIG | |
| Asus TUF Gaming A17 FA707XI-NS94 | |
Test da sforzo
La temperatura del core durante l'esecuzione dello stress Prime95 è leggermente più bassa questa volta, con 91 C rispetto ai 97 C del modello dell'anno scorso, il che suggerisce un lieve aumento dell'efficienza.
Eseguendo Witcher 3 per rappresentare i carichi di gioco tipici con la modalità Ventola massima attivata e disattivata, non mostra differenze di prestazioni importanti tra i due modelli. I risultati integrano i nostri risultati di Fire Strike nella sezione Prestazioni della GPU qui sotto. L'attivazione della modalità Ventola massima si limita a far girare le ventole al loro massimo numero di giri, indipendentemente dal carico sullo schermo; non aumenta effettivamente il tetto massimo della ventola. Pertanto, il rumore della ventola durante il gioco sarà lo stesso tra le due modalità.
L'assorbimento di potenza della scheda GPU durante il gioco è stabile a 169 W, che raggiunge quasi l'obiettivo massimo di 175 W. Passando alla modalità Intrattenimento, l'assorbimento di potenza della scheda scende a 148 W, con prestazioni grafiche leggermente inferiori.
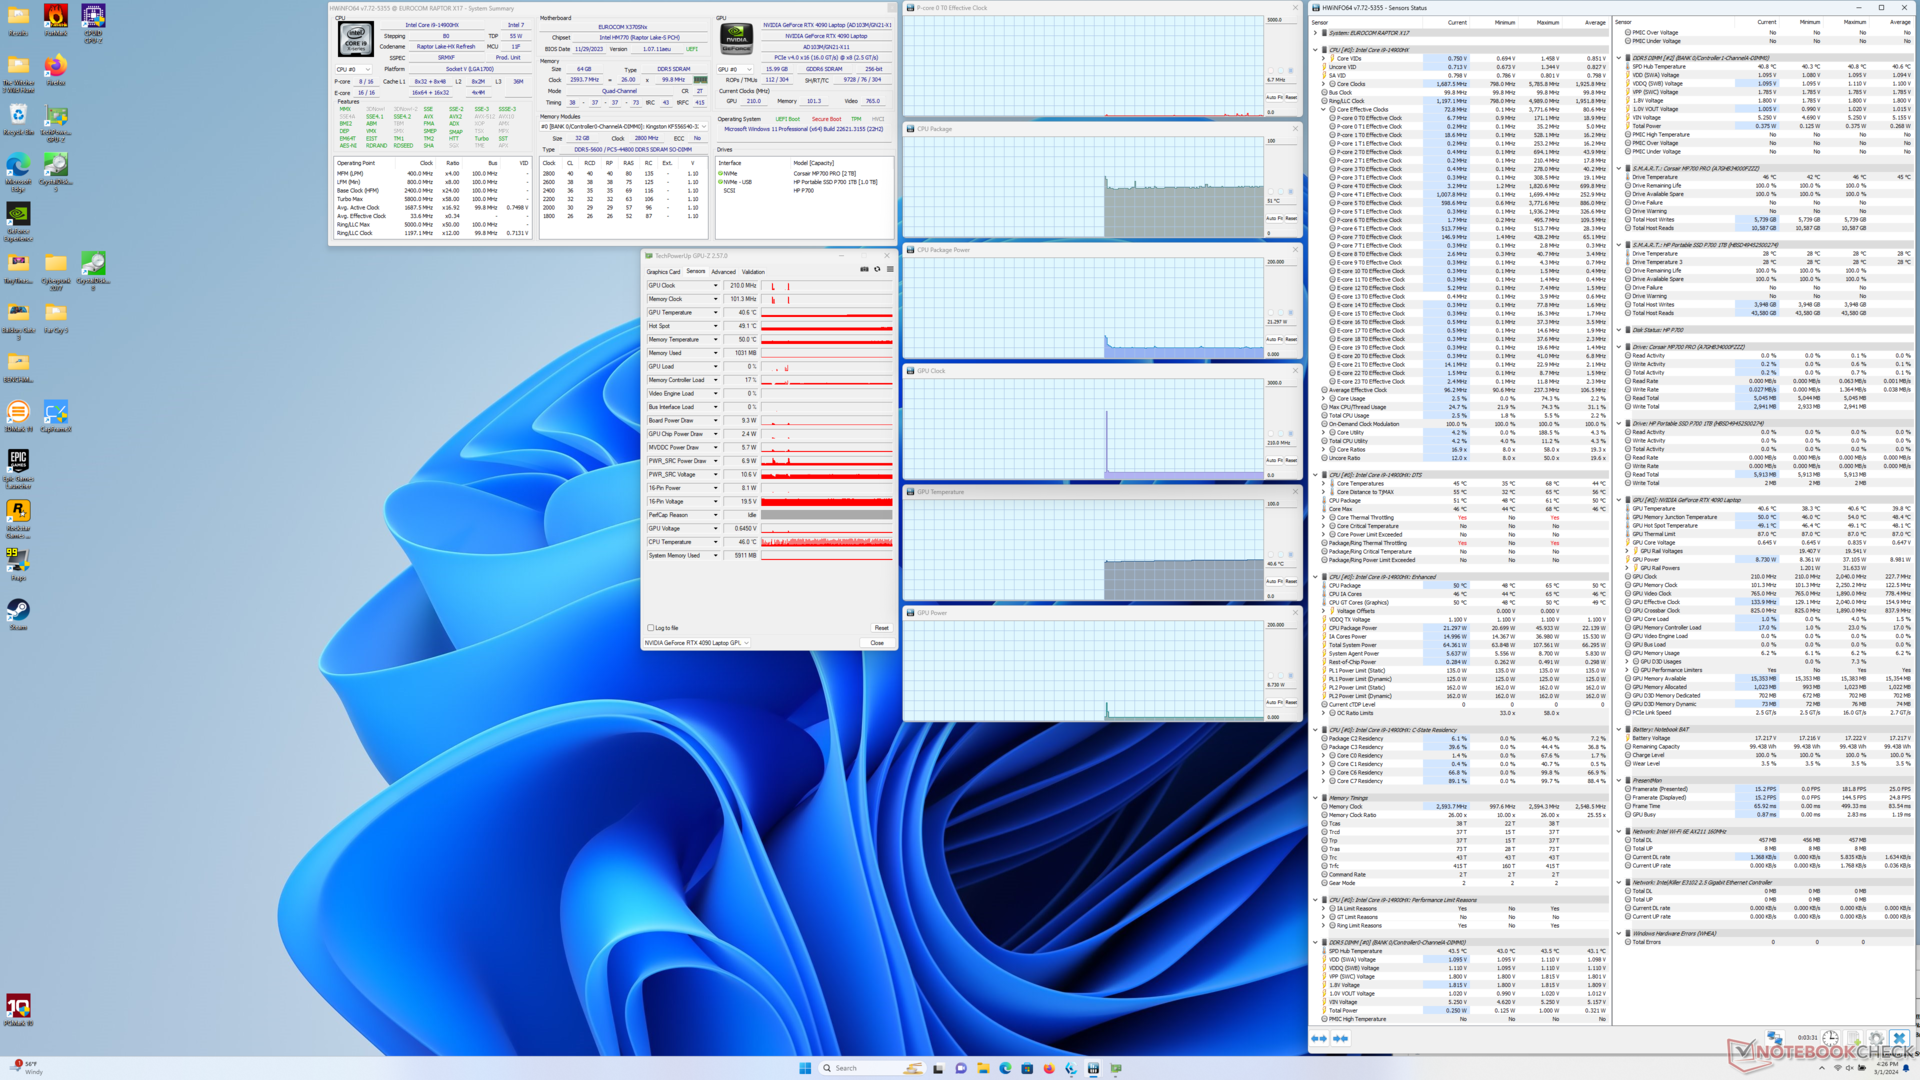
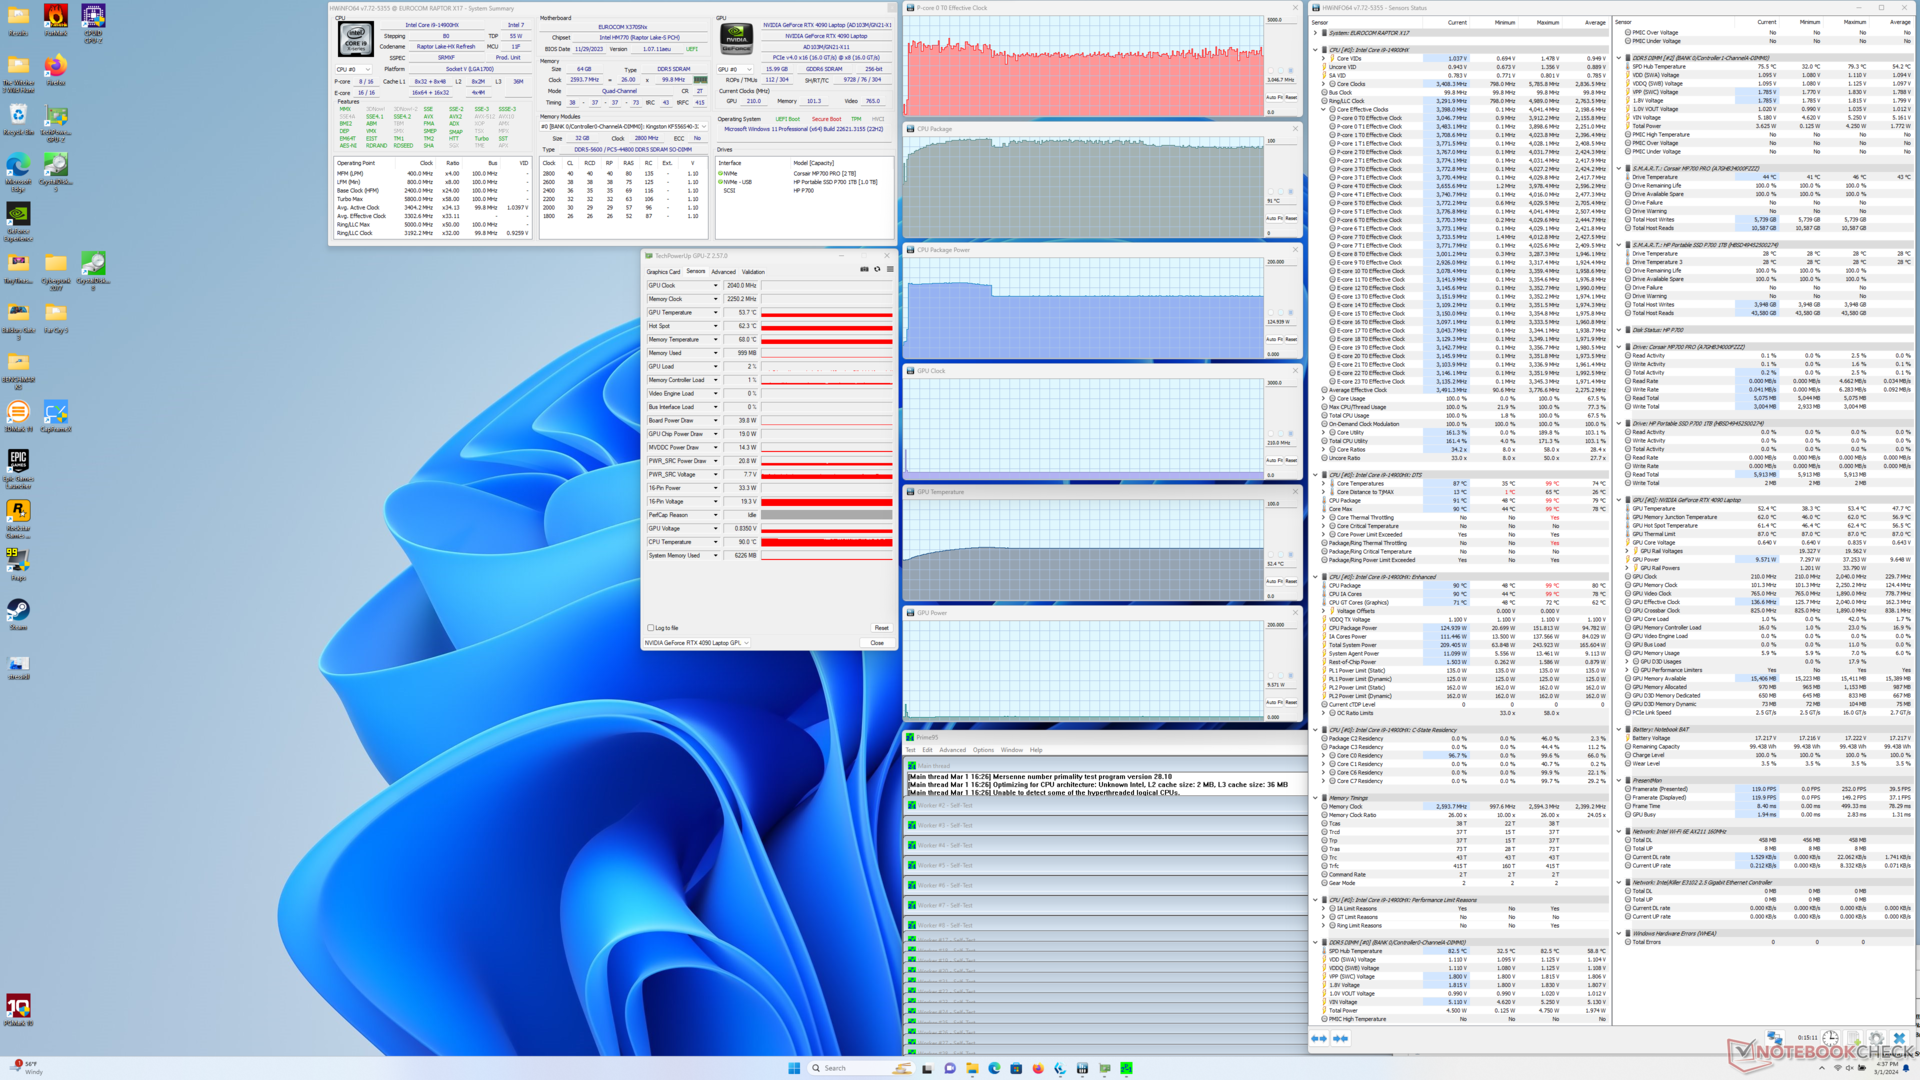
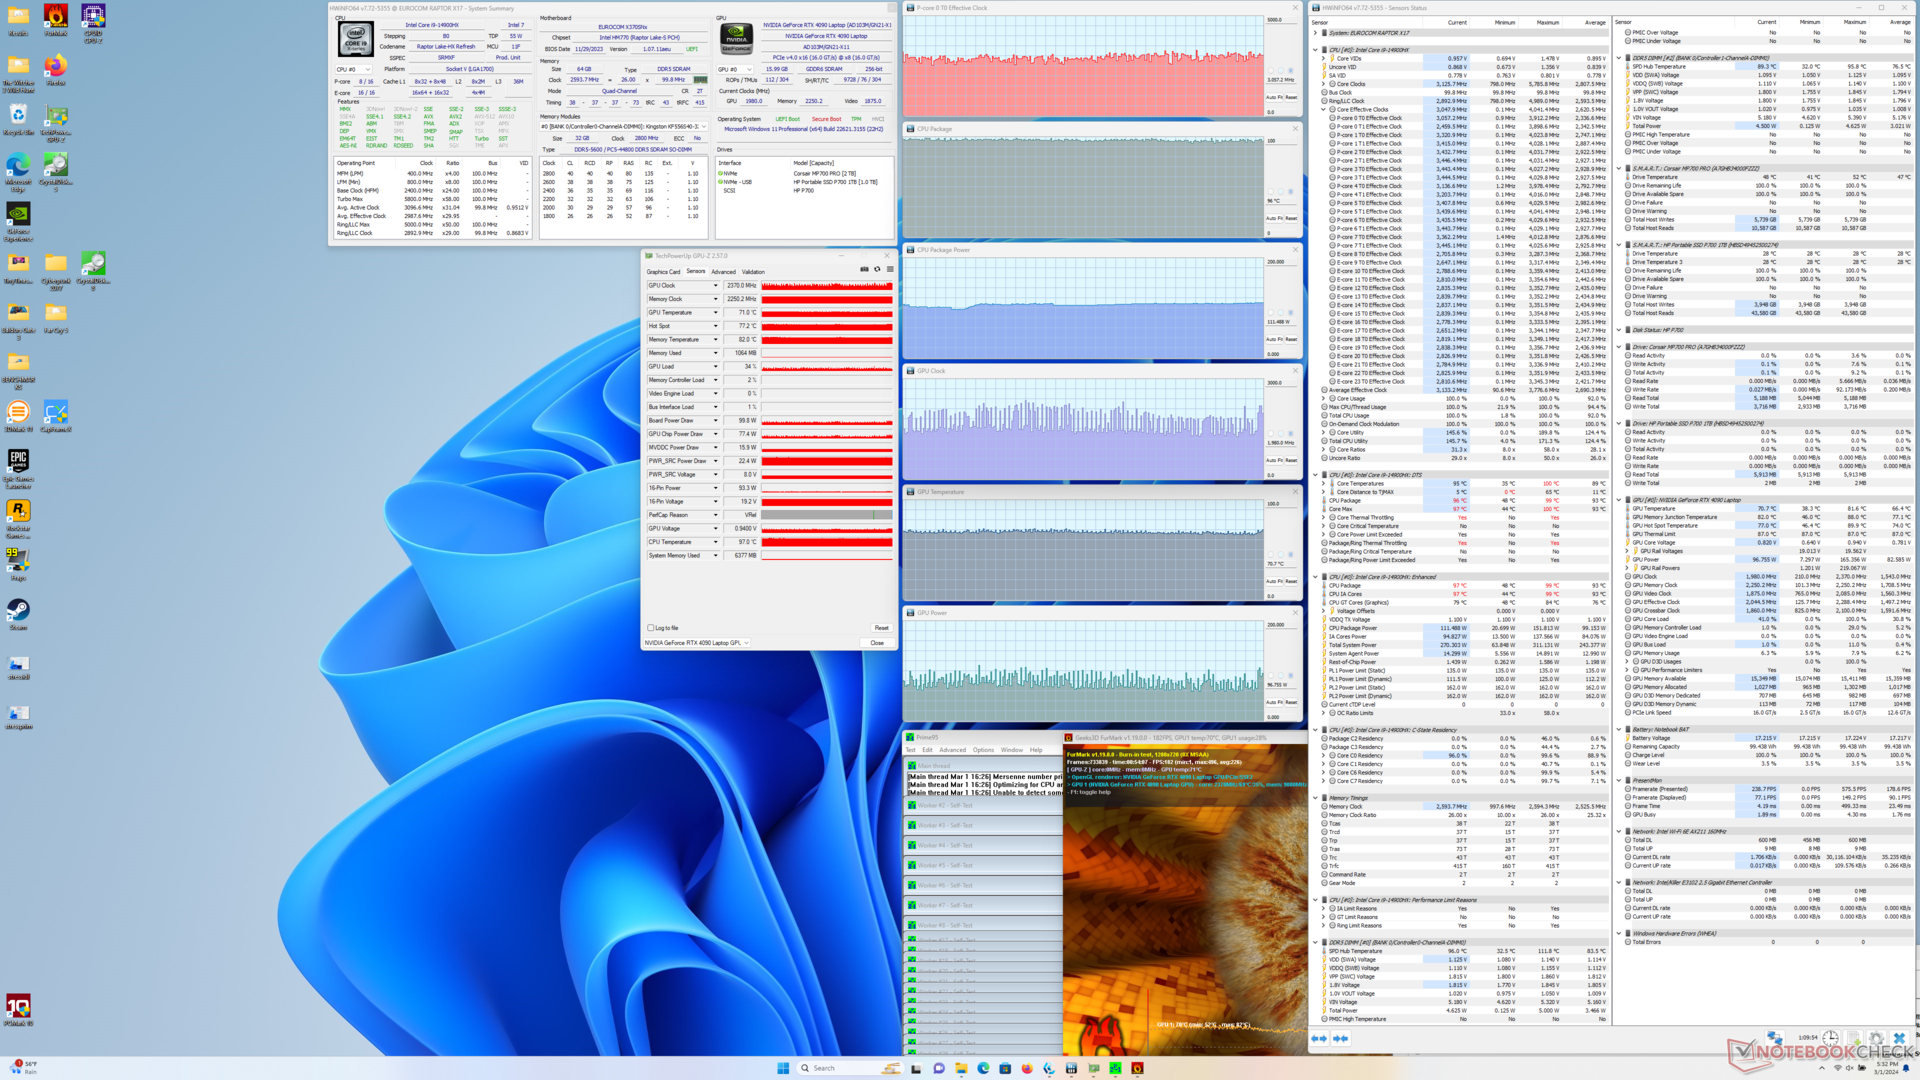
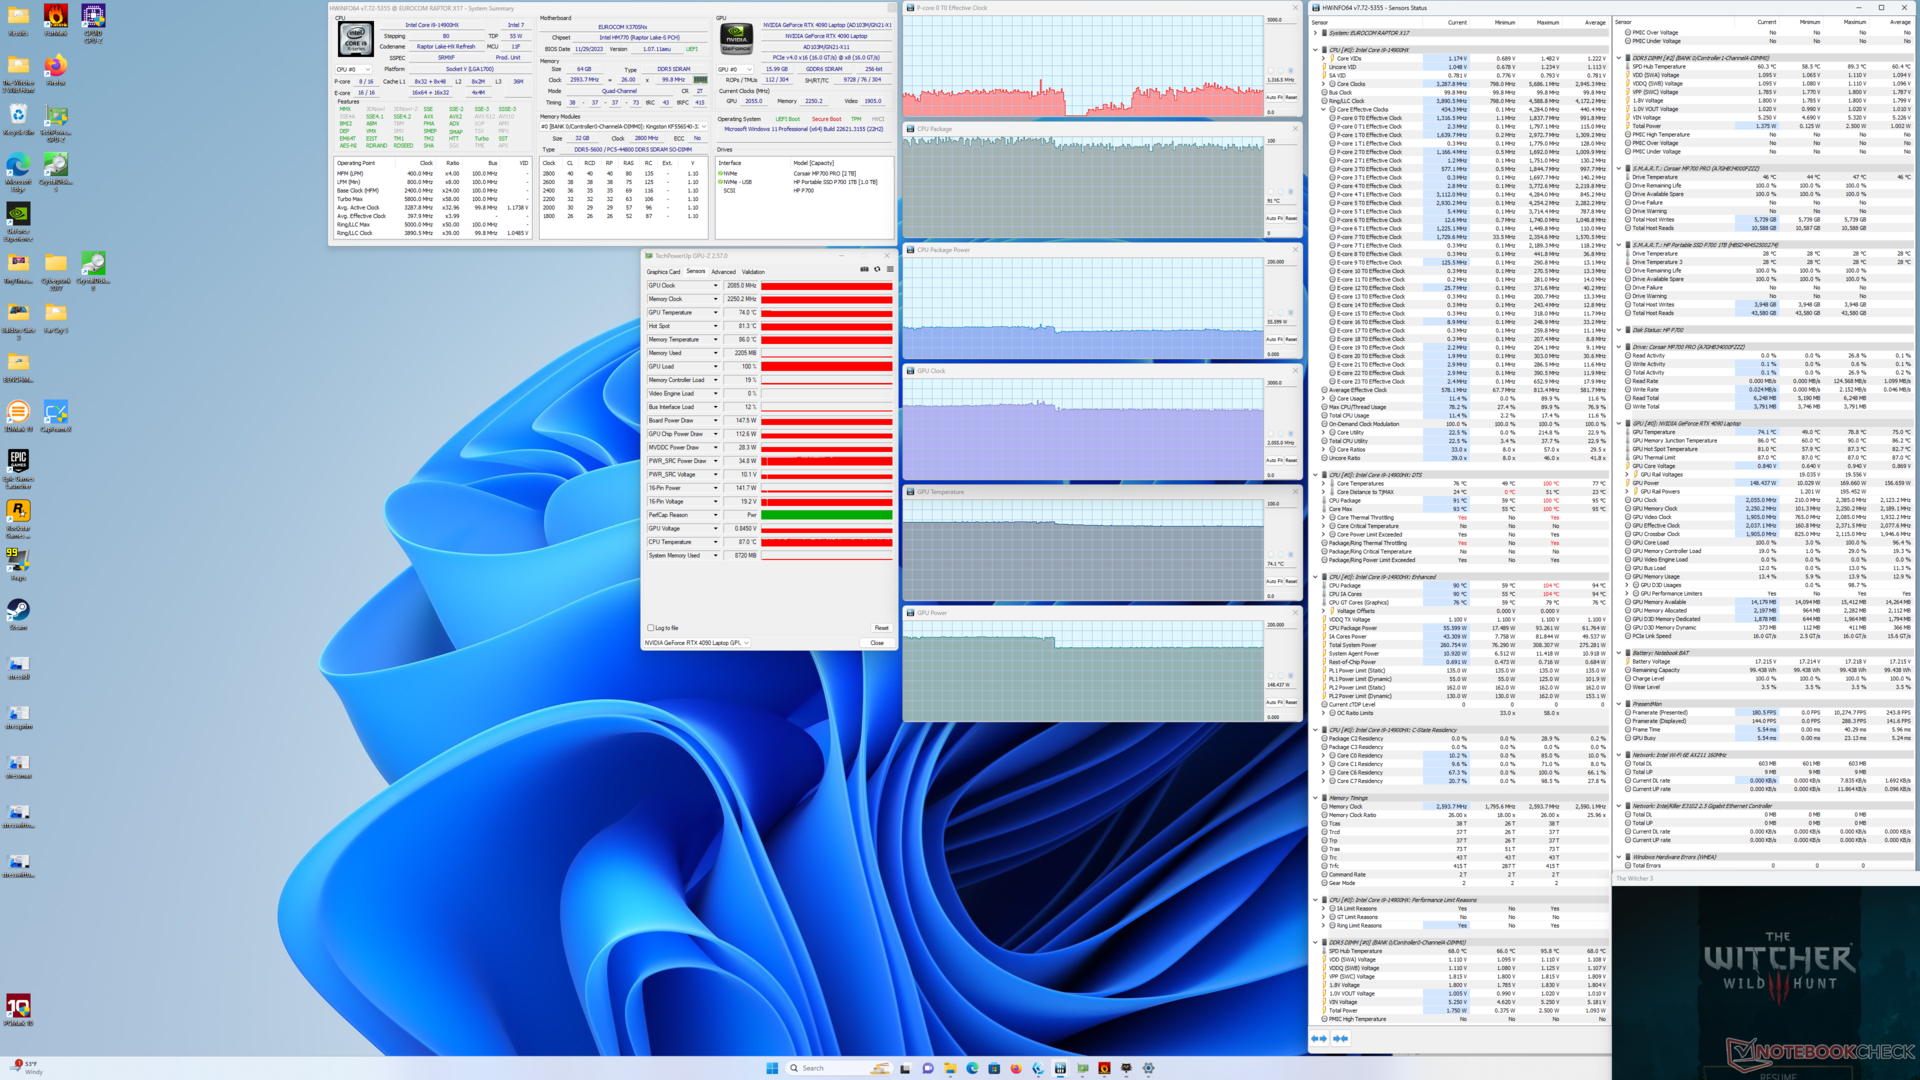

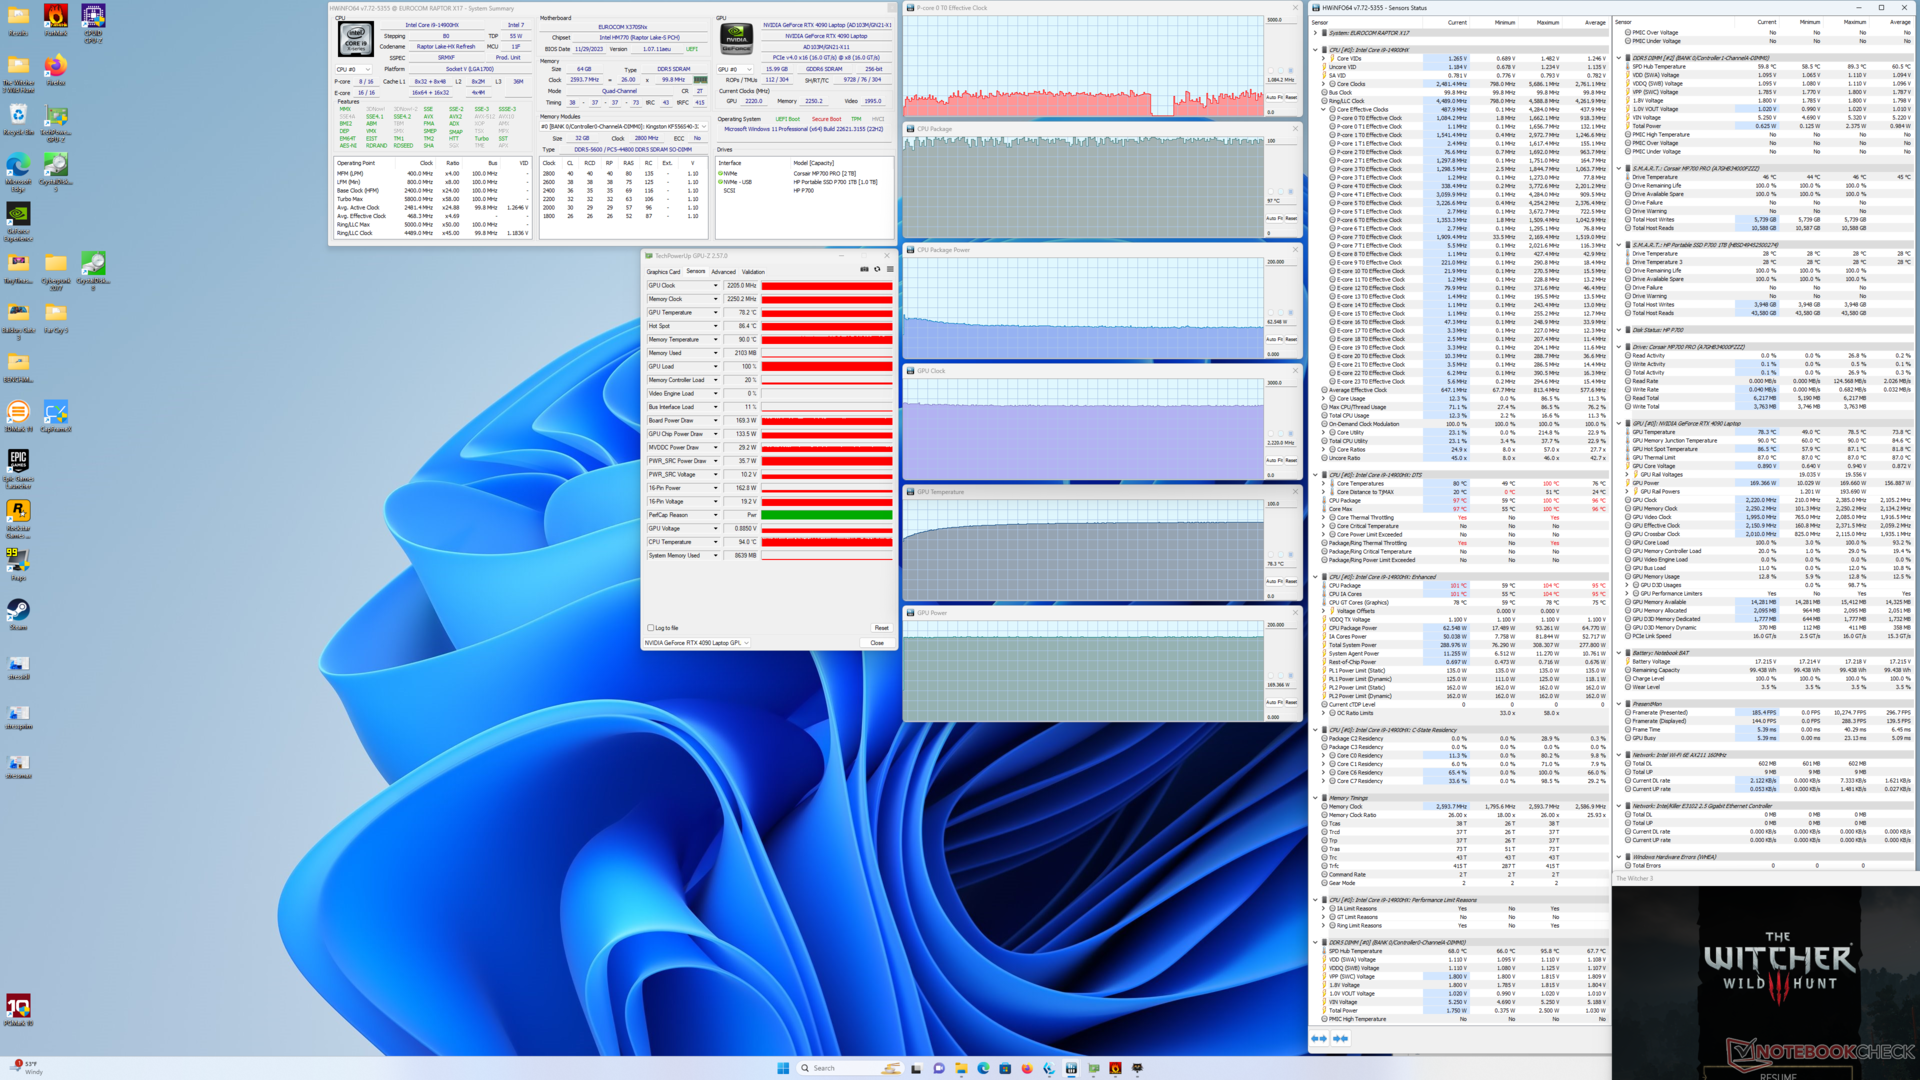
| Clock della CPU (GHz) | Clock della GPU (MHz) | Temperatura media della CPU (°C) | Temperatura media della GPU (°C) | |
| Sistema inattivo | -- | -- | 51 | 41 |
| Stress Prime95 | 3.1 | -- | 91 | 52 |
| Prime95 + FurMark Stress | 3.1 | 1000 - 2300 | 96 | 71 |
| Witcher 3 Stress (modalità Intrattenimento) | ~1,3 | 2085 | 91 | 74 |
| Witcher 3 Stress (modalità Prestazioni con ventola massima spenta) | 1,2 | 2250 | 99 | 78 |
| Witcher 3 Stress (modalità Performance con ventola massima attivata) | 1,2 | 2205 | 97 | 78 |
| AIDA64 / Memory Copy | |
| MSI GE78HX 13VH-070US | |
| Eurocom Raptor X17 | |
| Eurocom Raptor X17 Core i9-14900HX | |
| Media Intel Core i9-14900HX (38028 - 83392, n=36) | |
| Asus TUF Gaming A17 FA707XI-NS94 | |
| MSI Titan 18 HX A14VIG | |
| Asus ROG Strix Scar 17 G733PY-XS96 | |
| AIDA64 / Memory Read | |
| MSI GE78HX 13VH-070US | |
| Media Intel Core i9-14900HX (43306 - 87568, n=36) | |
| Eurocom Raptor X17 | |
| Eurocom Raptor X17 Core i9-14900HX | |
| Asus TUF Gaming A17 FA707XI-NS94 | |
| Asus ROG Strix Scar 17 G733PY-XS96 | |
| MSI Titan 18 HX A14VIG | |
| AIDA64 / Memory Write | |
| MSI GE78HX 13VH-070US | |
| Eurocom Raptor X17 Core i9-14900HX | |
| Eurocom Raptor X17 | |
| Asus TUF Gaming A17 FA707XI-NS94 | |
| Media Intel Core i9-14900HX (37146 - 80589, n=36) | |
| Asus ROG Strix Scar 17 G733PY-XS96 | |
| MSI Titan 18 HX A14VIG | |
| AIDA64 / Memory Latency | |
| MSI Titan 18 HX A14VIG | |
| Asus TUF Gaming A17 FA707XI-NS94 | |
| Eurocom Raptor X17 Core i9-14900HX | |
| Media Intel Core i9-14900HX (76.1 - 105, n=36) | |
| MSI GE78HX 13VH-070US | |
| Eurocom Raptor X17 | |
| Asus ROG Strix Scar 17 G733PY-XS96 | |
* ... Meglio usare valori piccoli
Latenza DPC
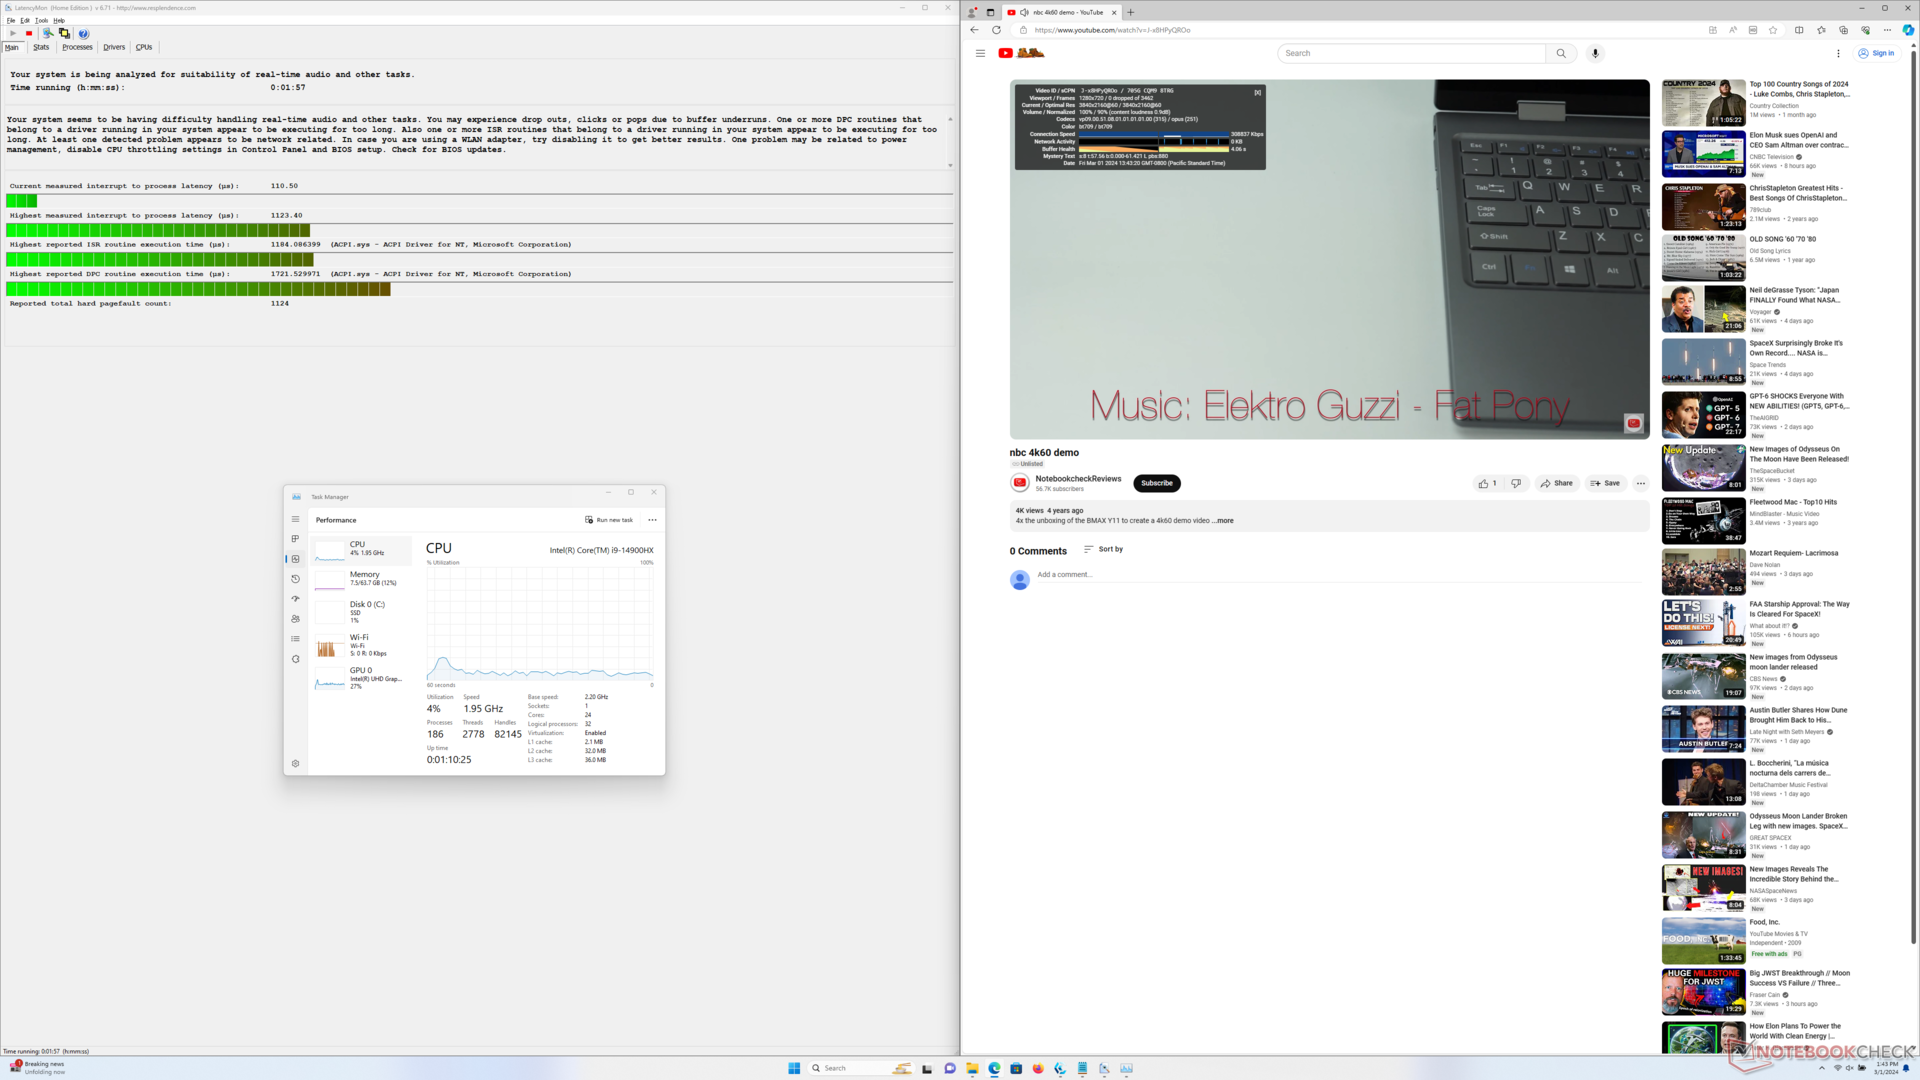
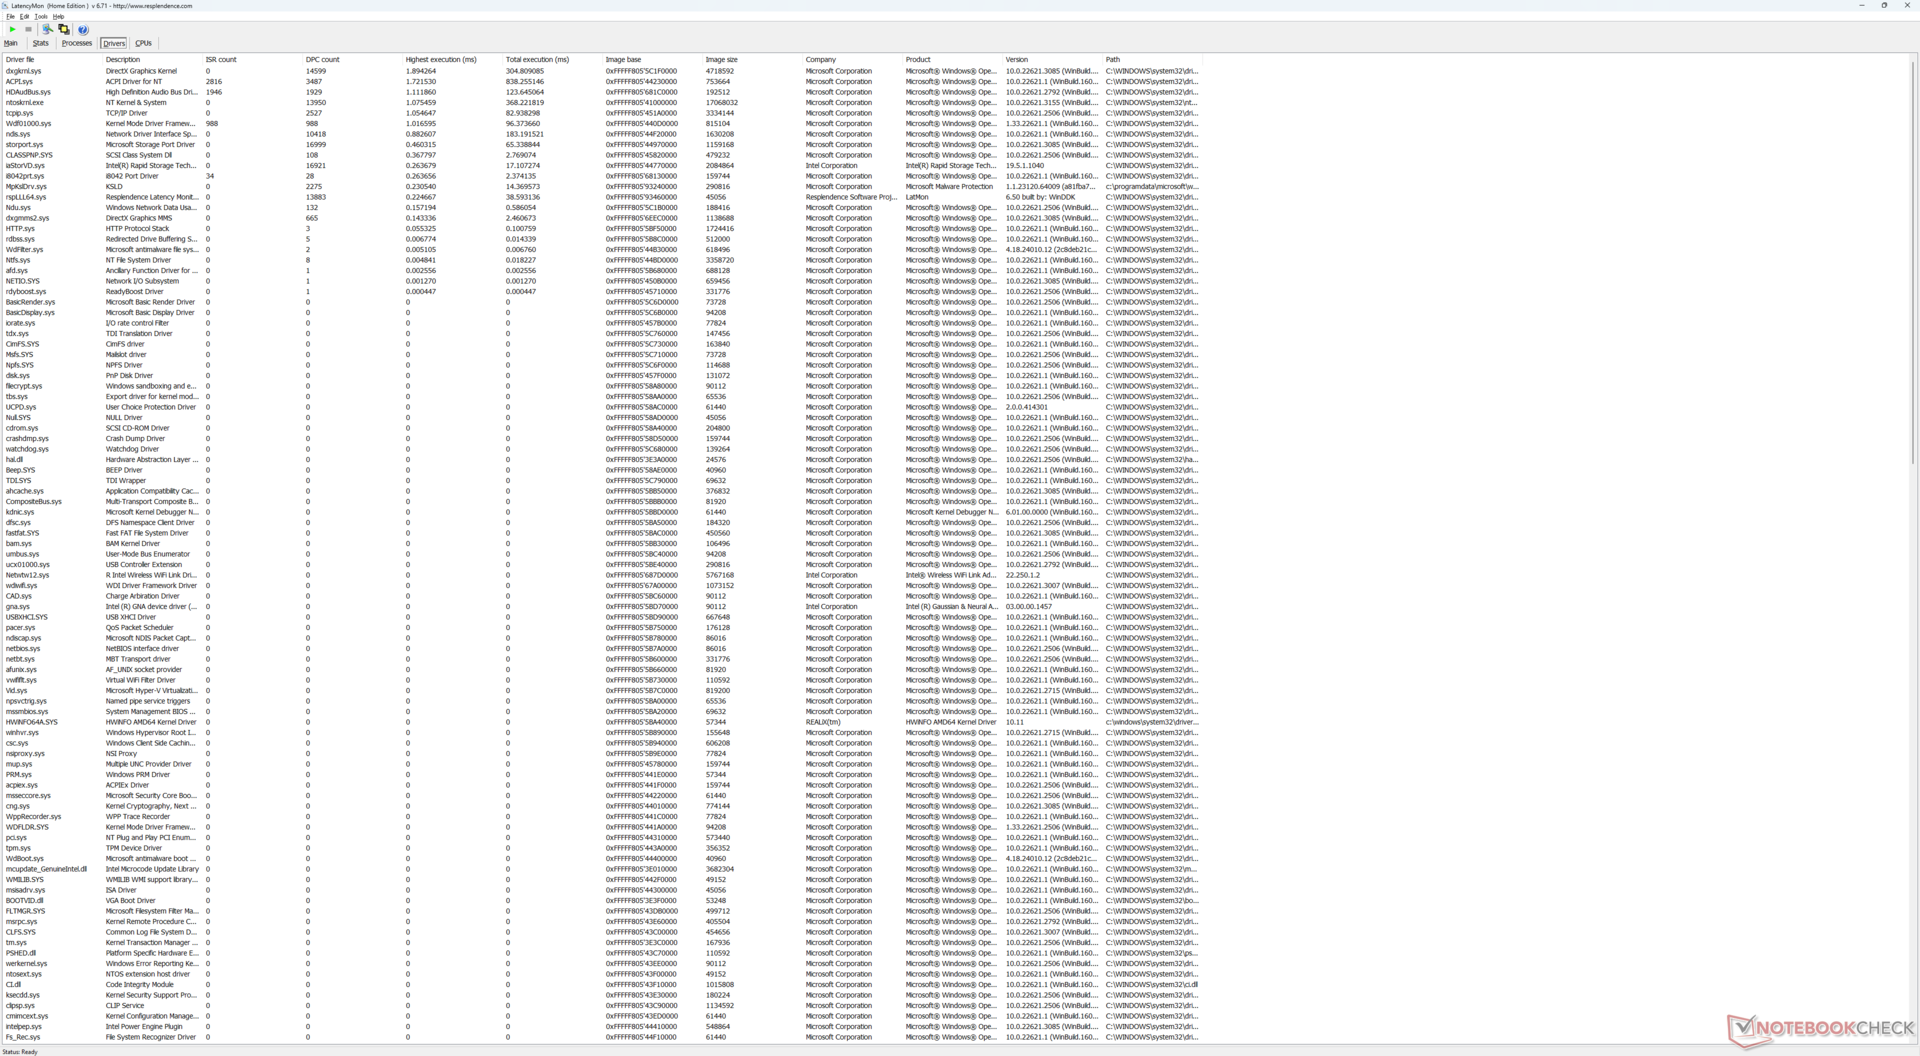
| DPC Latencies / LatencyMon - interrupt to process latency (max), Web, Youtube, Prime95 | |
| MSI GE78HX 13VH-070US | |
| Eurocom Raptor X17 | |
| MSI Titan 18 HX A14VIG | |
| Asus ROG Strix Scar 17 G733PY-XS96 | |
| Asus TUF Gaming A17 FA707XI-NS94 | |
| Eurocom Raptor X17 Core i9-14900HX | |
* ... Meglio usare valori piccoli
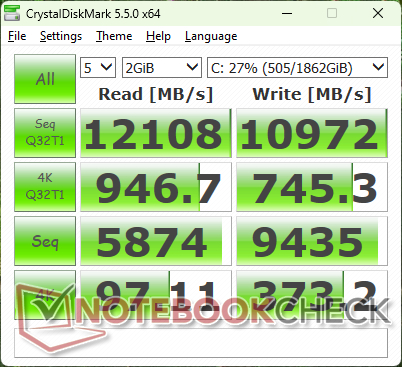
Dispositivi di archiviazione
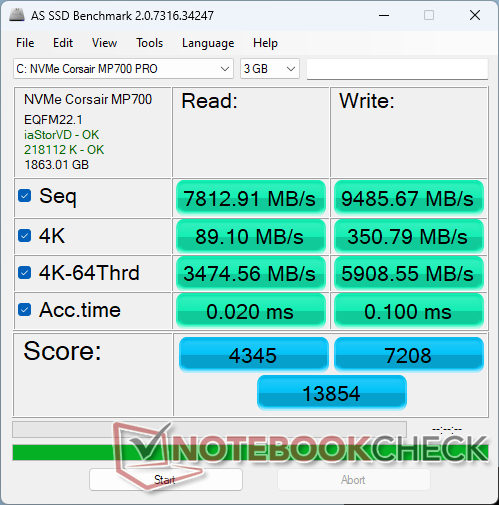
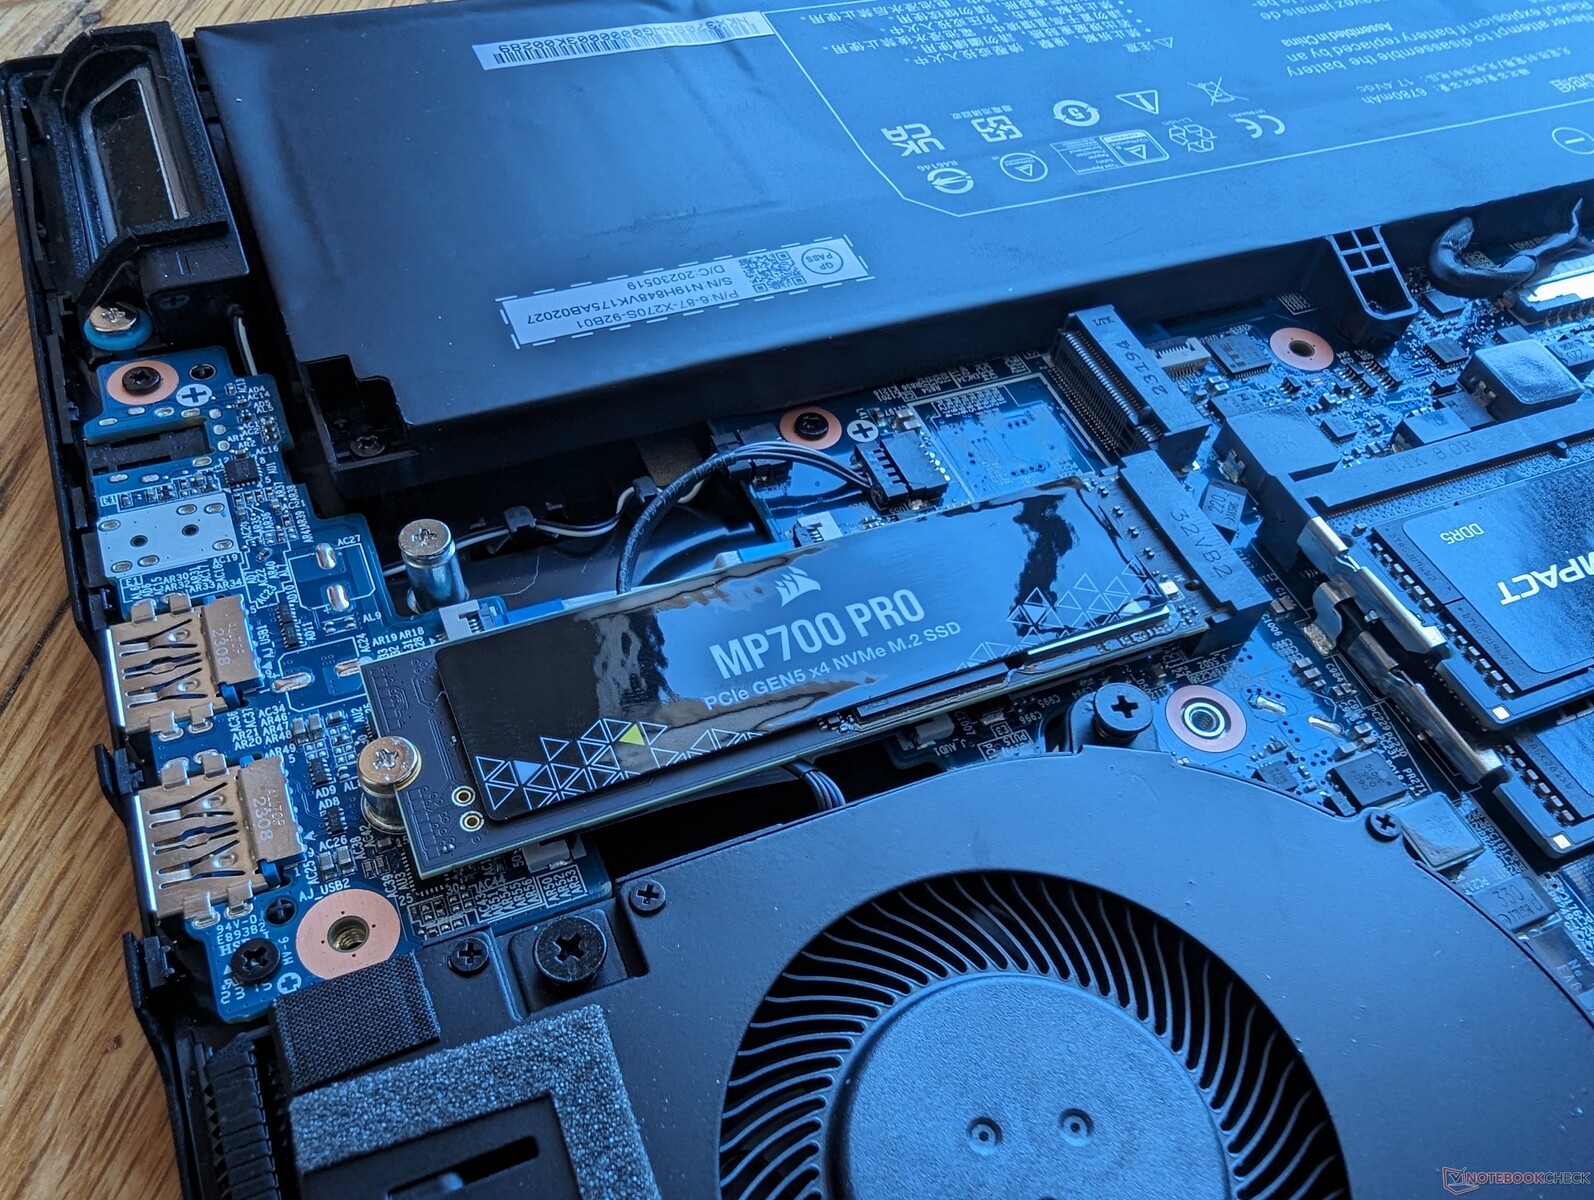
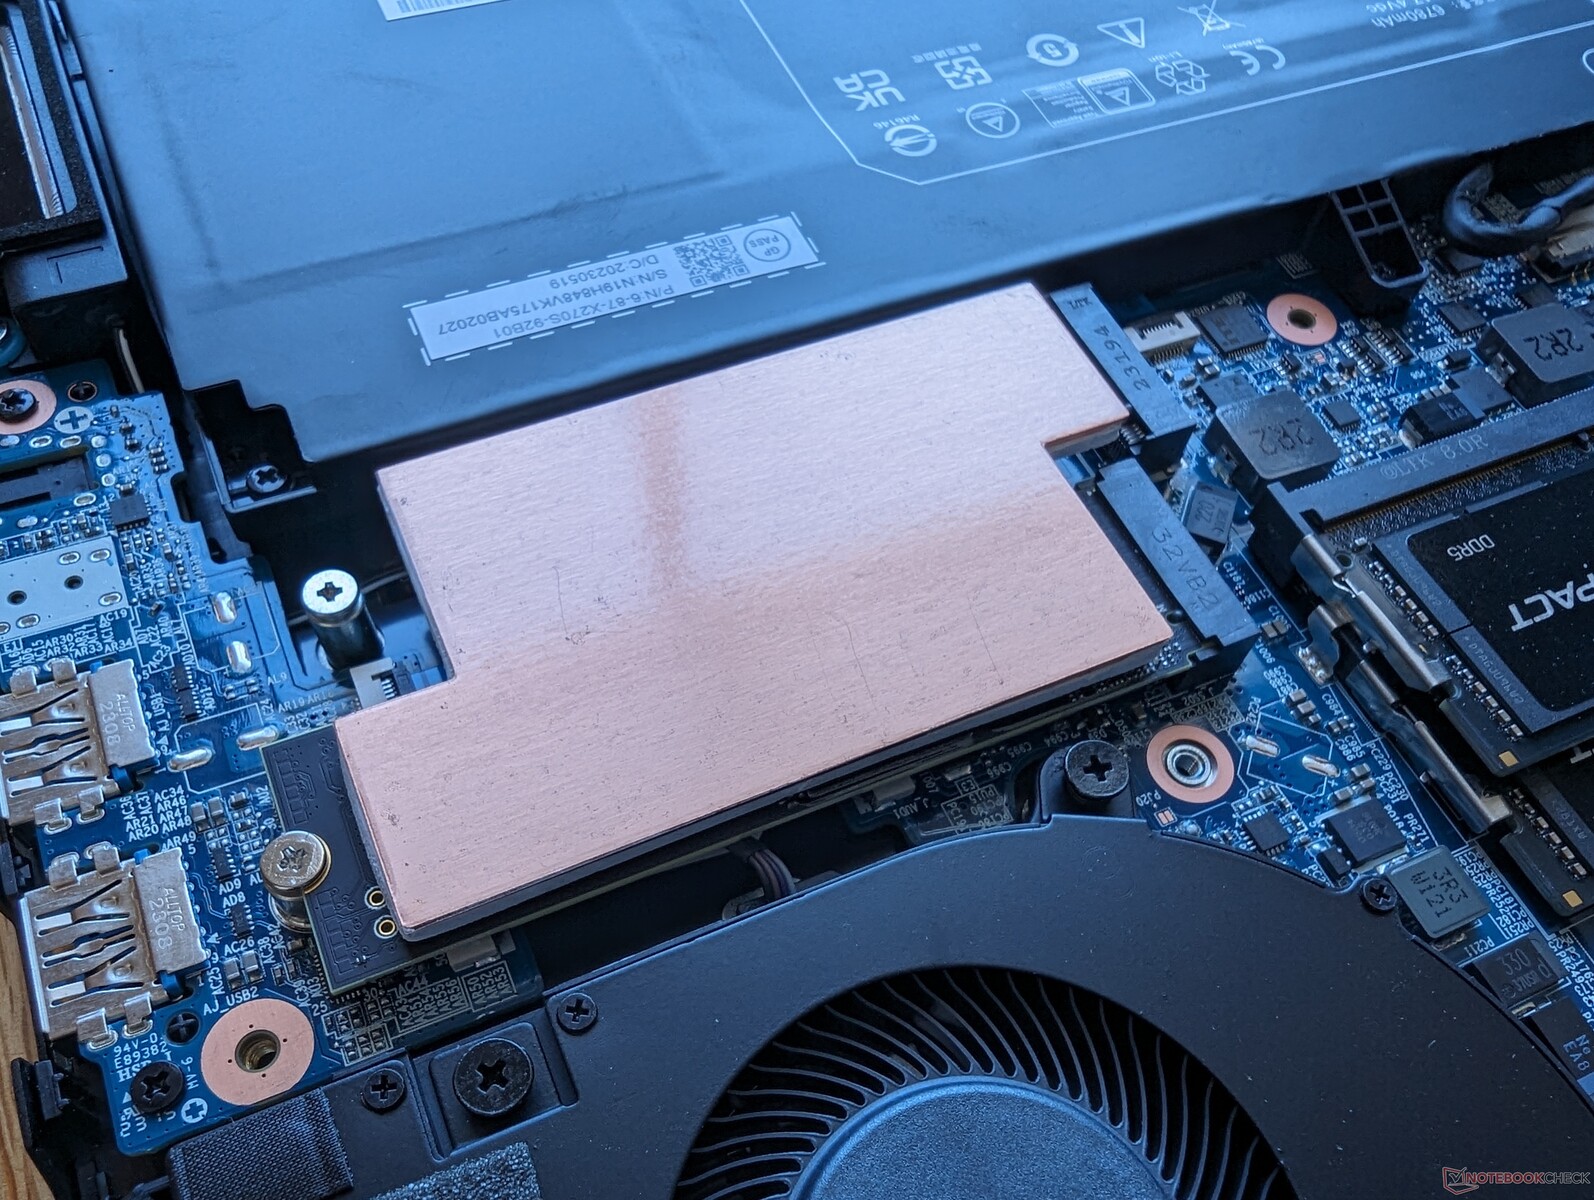
Eurocom è uno dei pochi venditori a configurare con un Corsair MP700 Pro SSD PCI5 x4 NVMe per velocità di lettura sequenziale fino a 13000 MB/s, quasi due volte più veloce delle unità PCIe4 più veloci. Per sostenere velocità di trasferimento così elevate, tuttavia, è necessario un diffusore di calore. I risultati del nostro loop DiskSpd qui di seguito mostrano le differenze di prestazioni con e senza il diffusore di calore. Se non è installato, le velocità di trasferimento massime possono essere raggiunte solo durante il primo minuto circa, prima di scendere nella fascia da 3500 MB/s a 6500 MB/s. L'installazione del diffusore di calore consente all'unità di funzionare molto più velocemente e più a lungo.

| Drive Performance rating - Percent | |
| Eurocom Raptor X17 Core i9-14900HX | |
| Eurocom Raptor X17 | |
| MSI GE78HX 13VH-070US | |
| MSI Titan 18 HX A14VIG | |
| Asus ROG Strix Scar 17 G733PY-XS96 | |
| Asus TUF Gaming A17 FA707XI-NS94 | |
* ... Meglio usare valori piccoli
Disk Throttling: DiskSpd Read Loop, Queue Depth 8
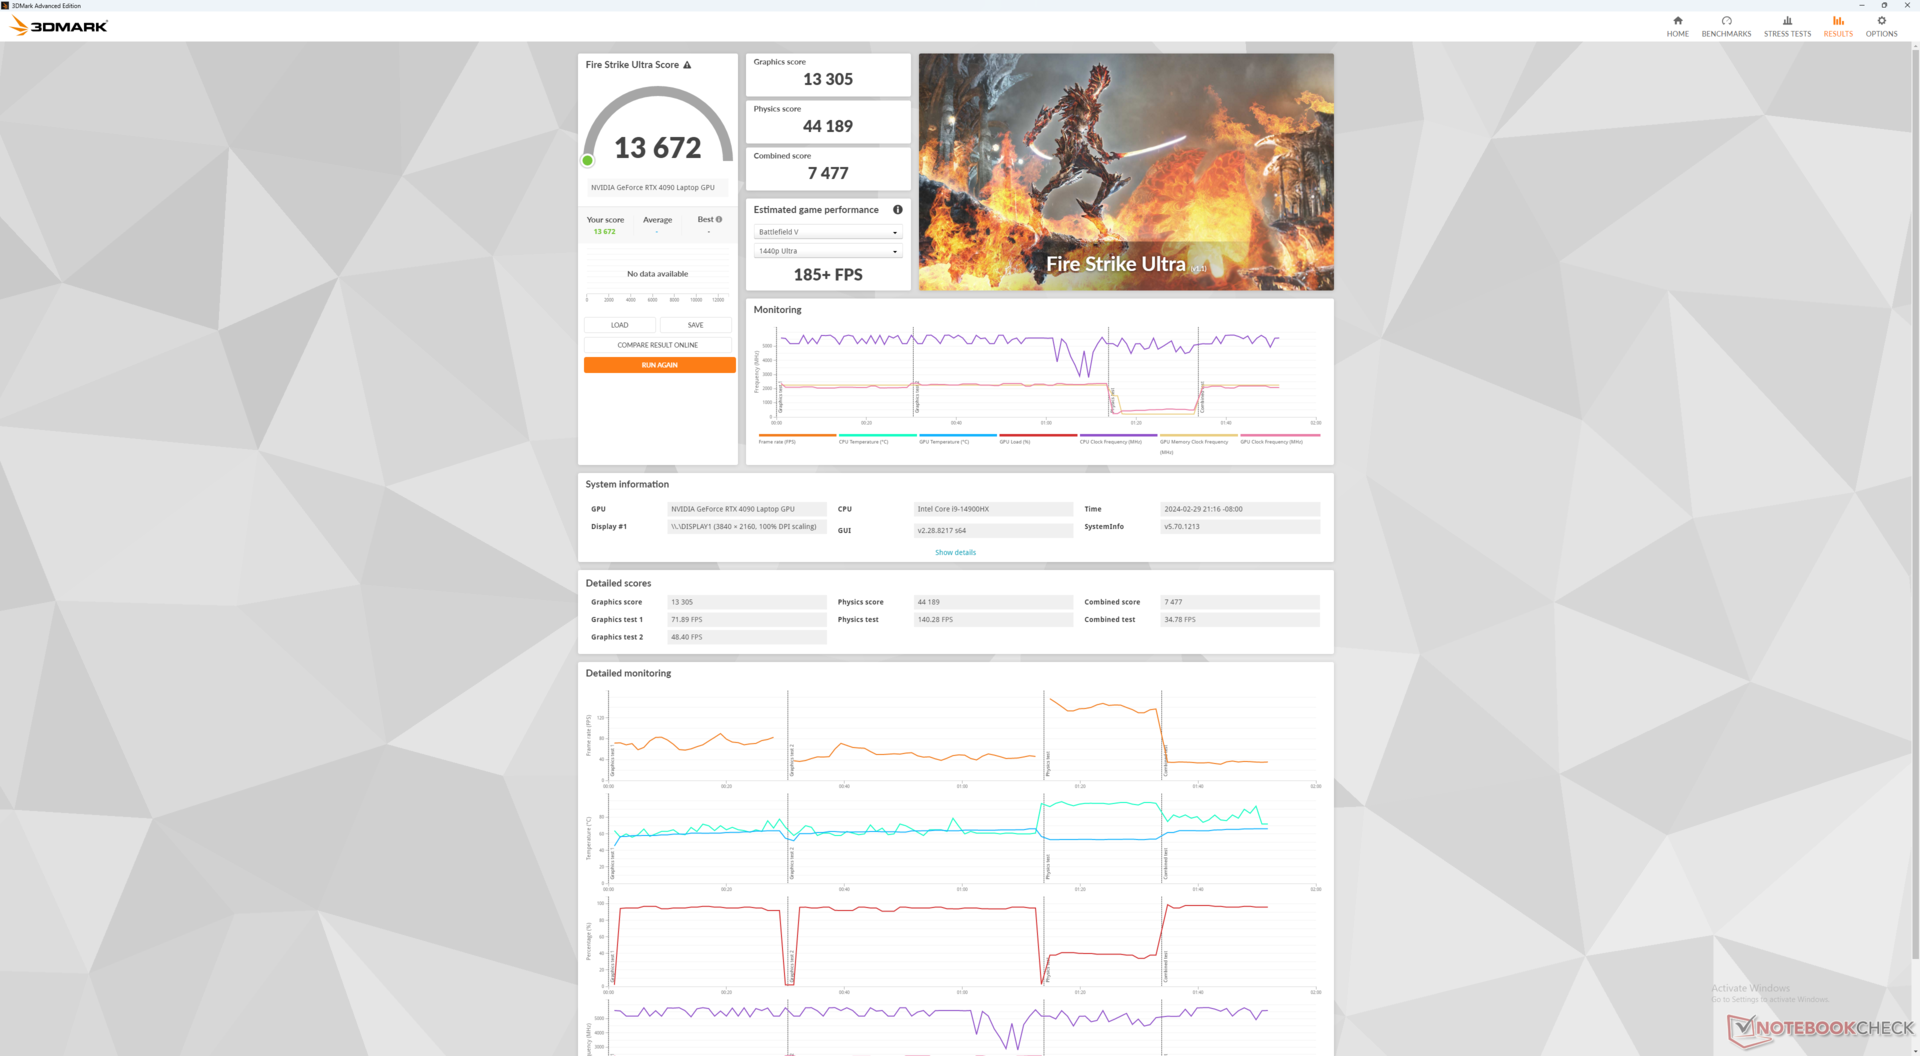
Prestazioni della GPU
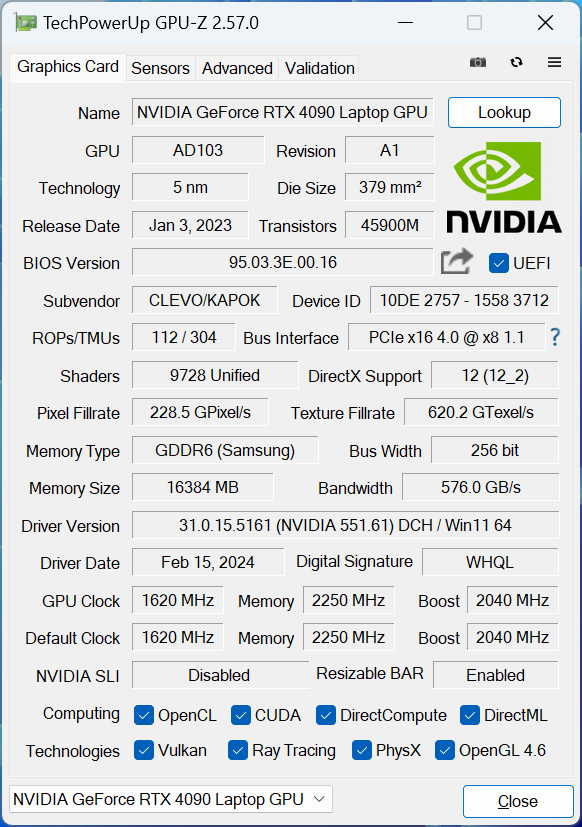
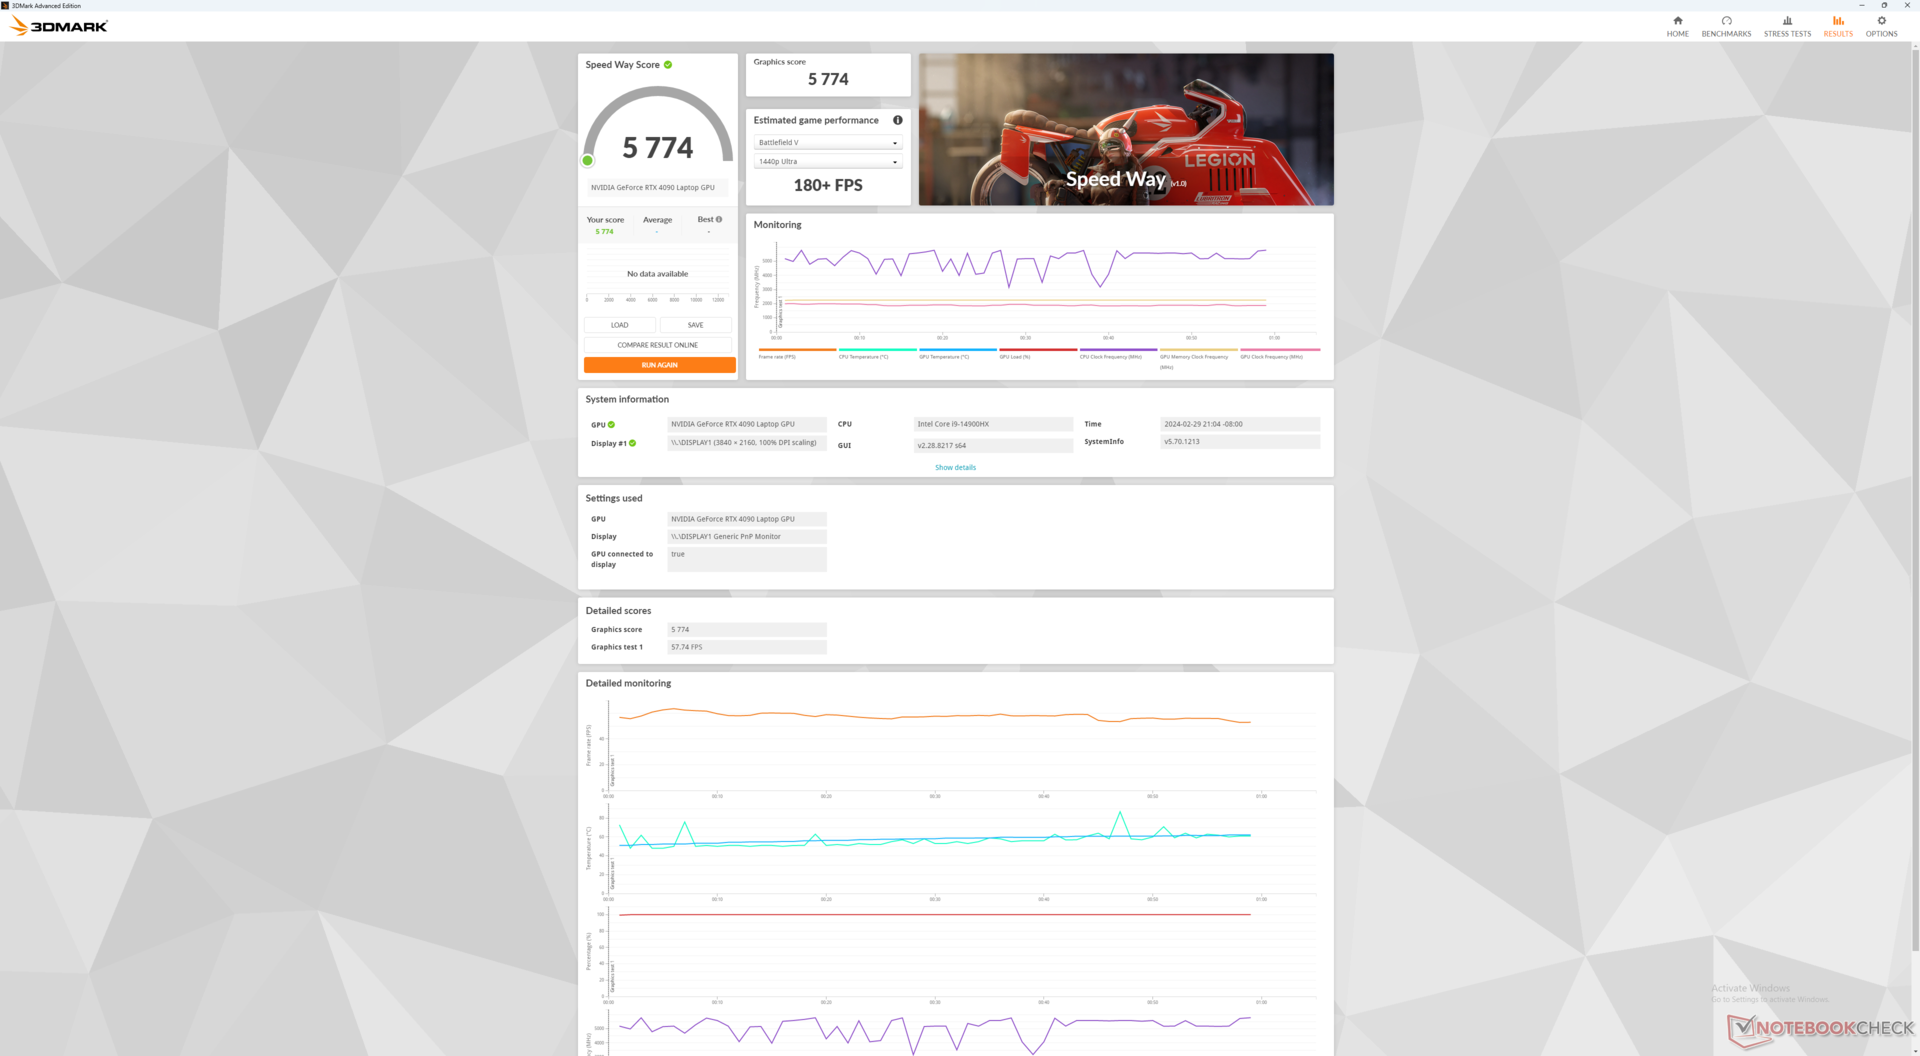
La nostra 175 W GeForce RTX 4090 È circa il 5% più veloce di quanto abbiamo registrato sul Raptor X17 dello scorso anno. Più o meno rivaleggia con la MSI Titan 18 HX che è più grande e più costosa della nostra unità Eurocom.
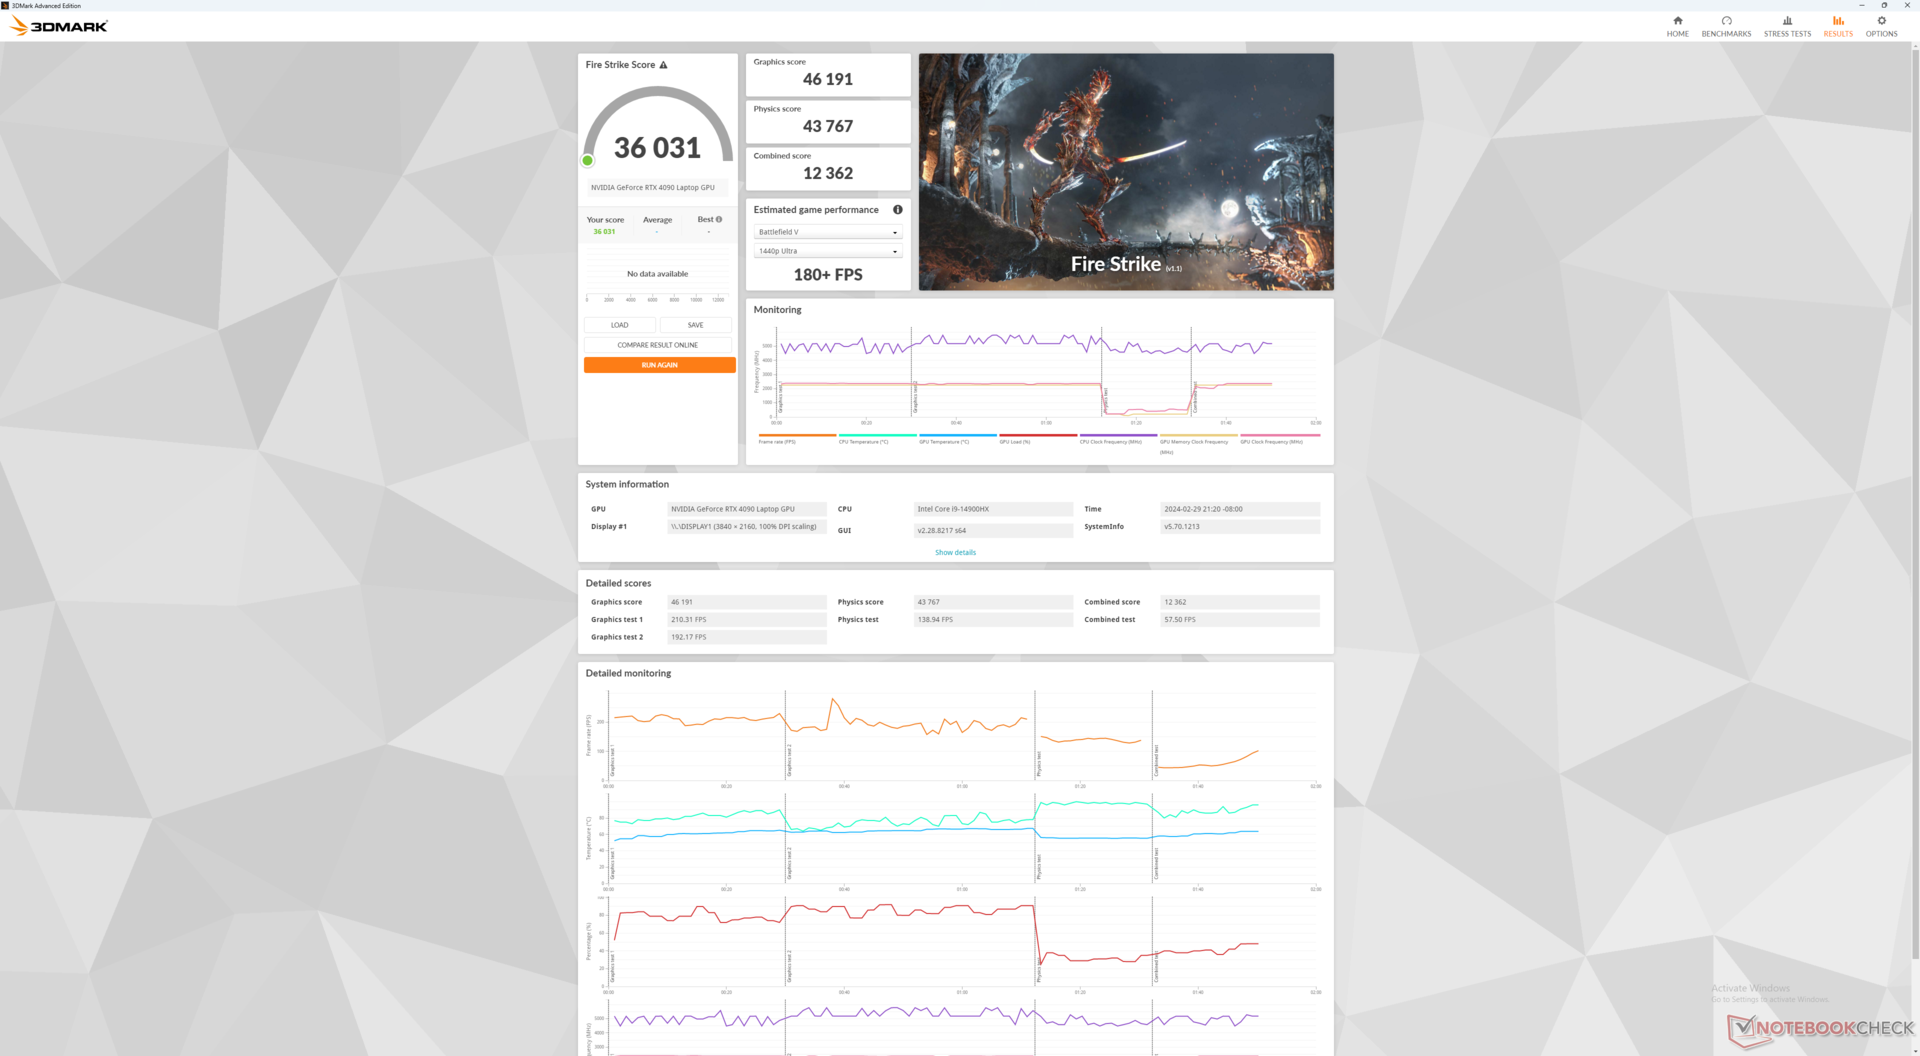
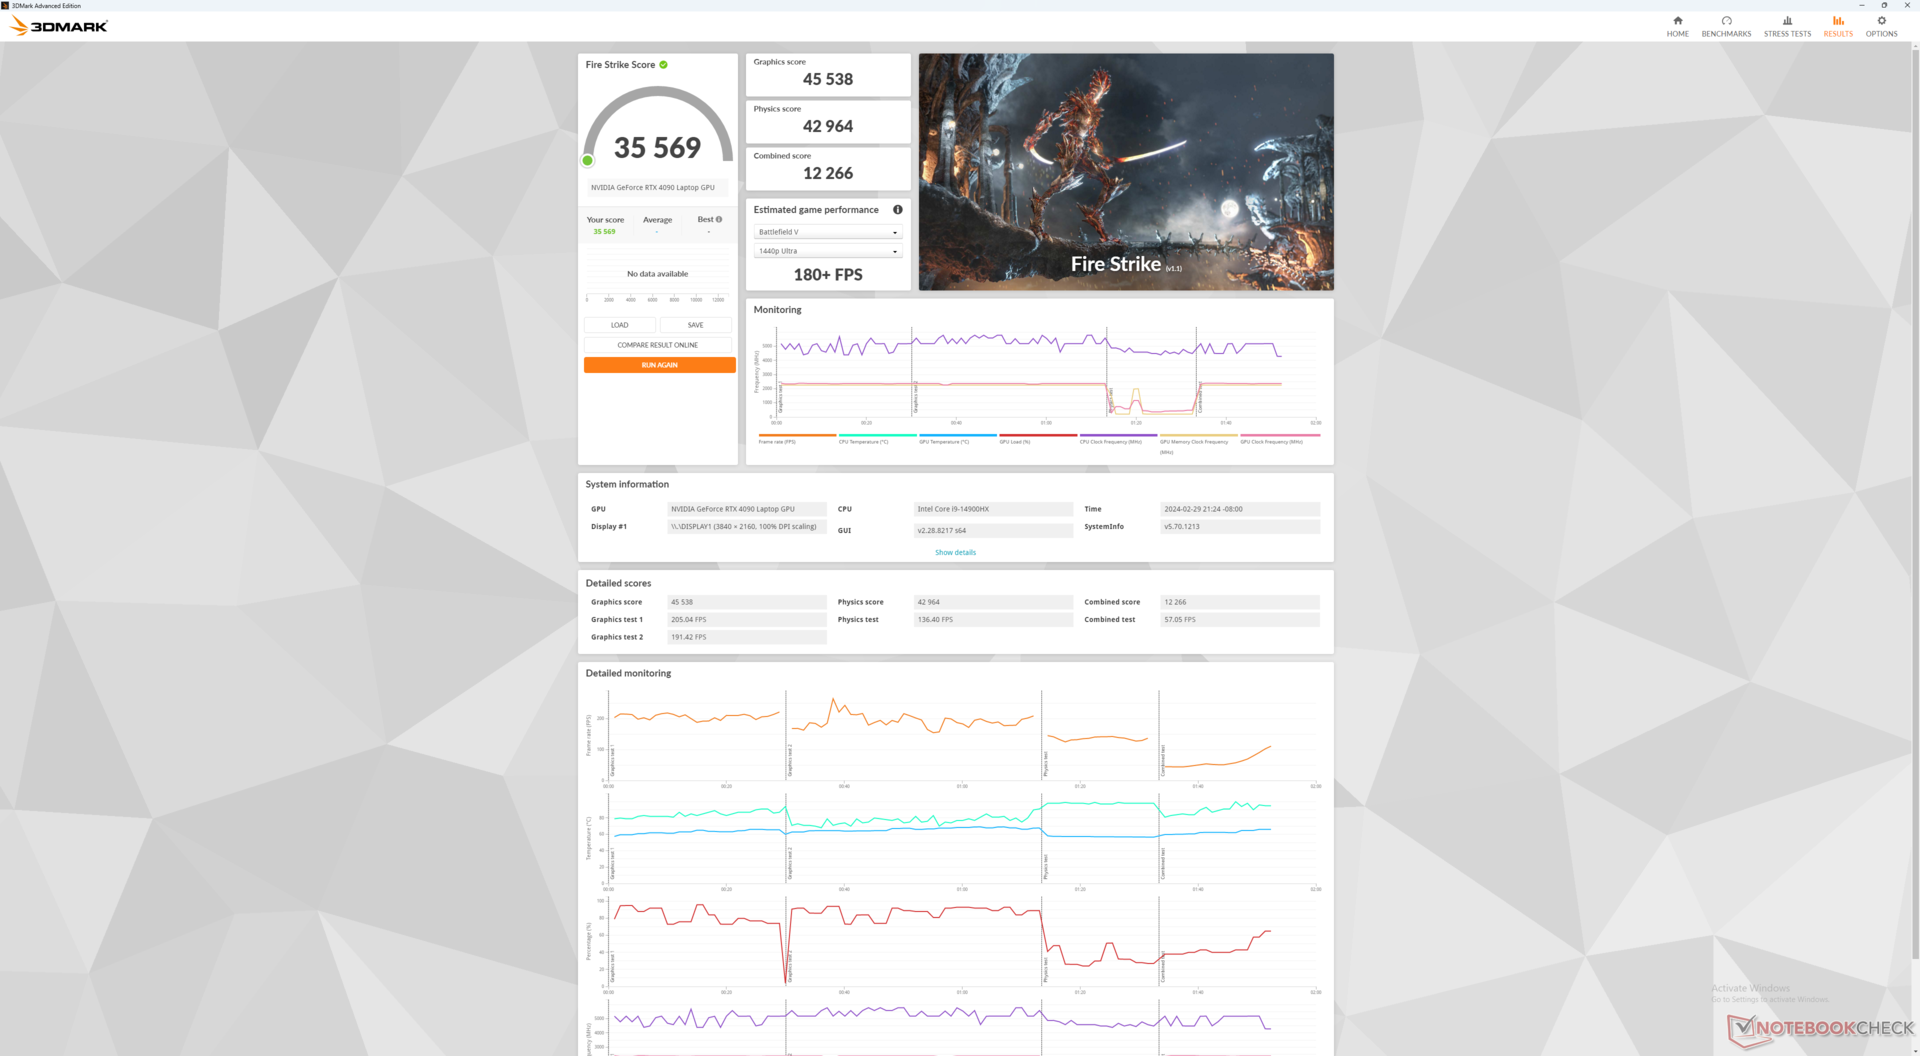
Tenga presente che l'attivazione della modalità Ventola massima non aumenta le prestazioni in modo sensibile, come dimostra la nostra tabella dei risultati di Fire Strike qui sotto. La modalità non è quindi essenziale per massimizzare le prestazioni con le impostazioni stock. Scendere alla modalità Intrattenimento, invece, ha un impatto maggiore sulle prestazioni.
| Profilo energetico | Punteggio grafico | Punteggio Fisica | Punteggio combinato |
| Modalità Prestazioni con ventola massima attivata | 46191 | 43767 | 12362 |
| Modalità Performance con ventola massima spenta | 45538 (-1%) | 42964 (-2%) | 12266 (-1%) |
| Modalità Bilanciata Windows | 45892 (-1%) | 42567 (-3%) | 13382 (-0%) |
| Modalità Intrattenimento | 44593 (-4%) | 36839 (-16%) | 9640 (-22%) |
| Alimentazione a batteria | 7324 (-84%) | 14932 (-66%) | 1901 (-85%) |
Tuttavia, abbiamo riscontrato diversi problemi che vale la pena menzionare. Ubisoft Connect non si avviava ogni volta, Final Fantasy XV si bloccava con le impostazioni alte e anche PCMark 10 si bloccava anche dopo l'aggiornamento all'ultima versione.
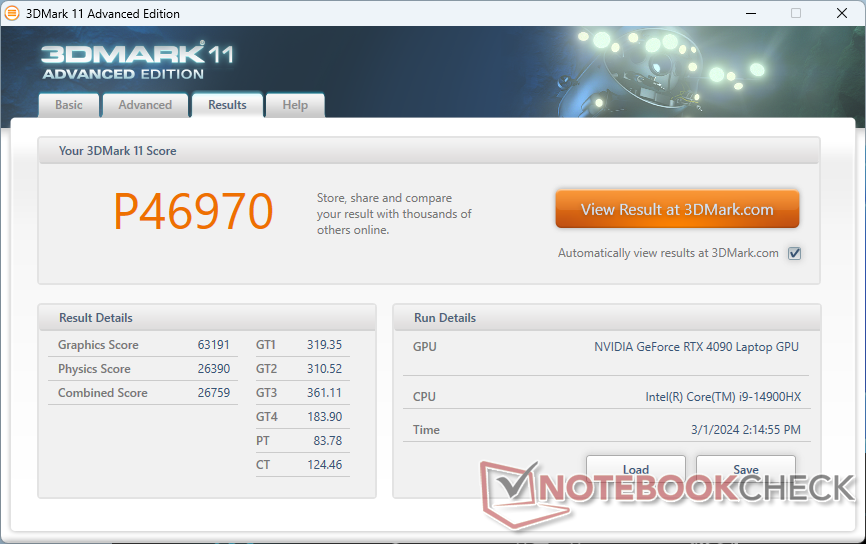
| 3DMark 11 Performance | 46970 punti | |
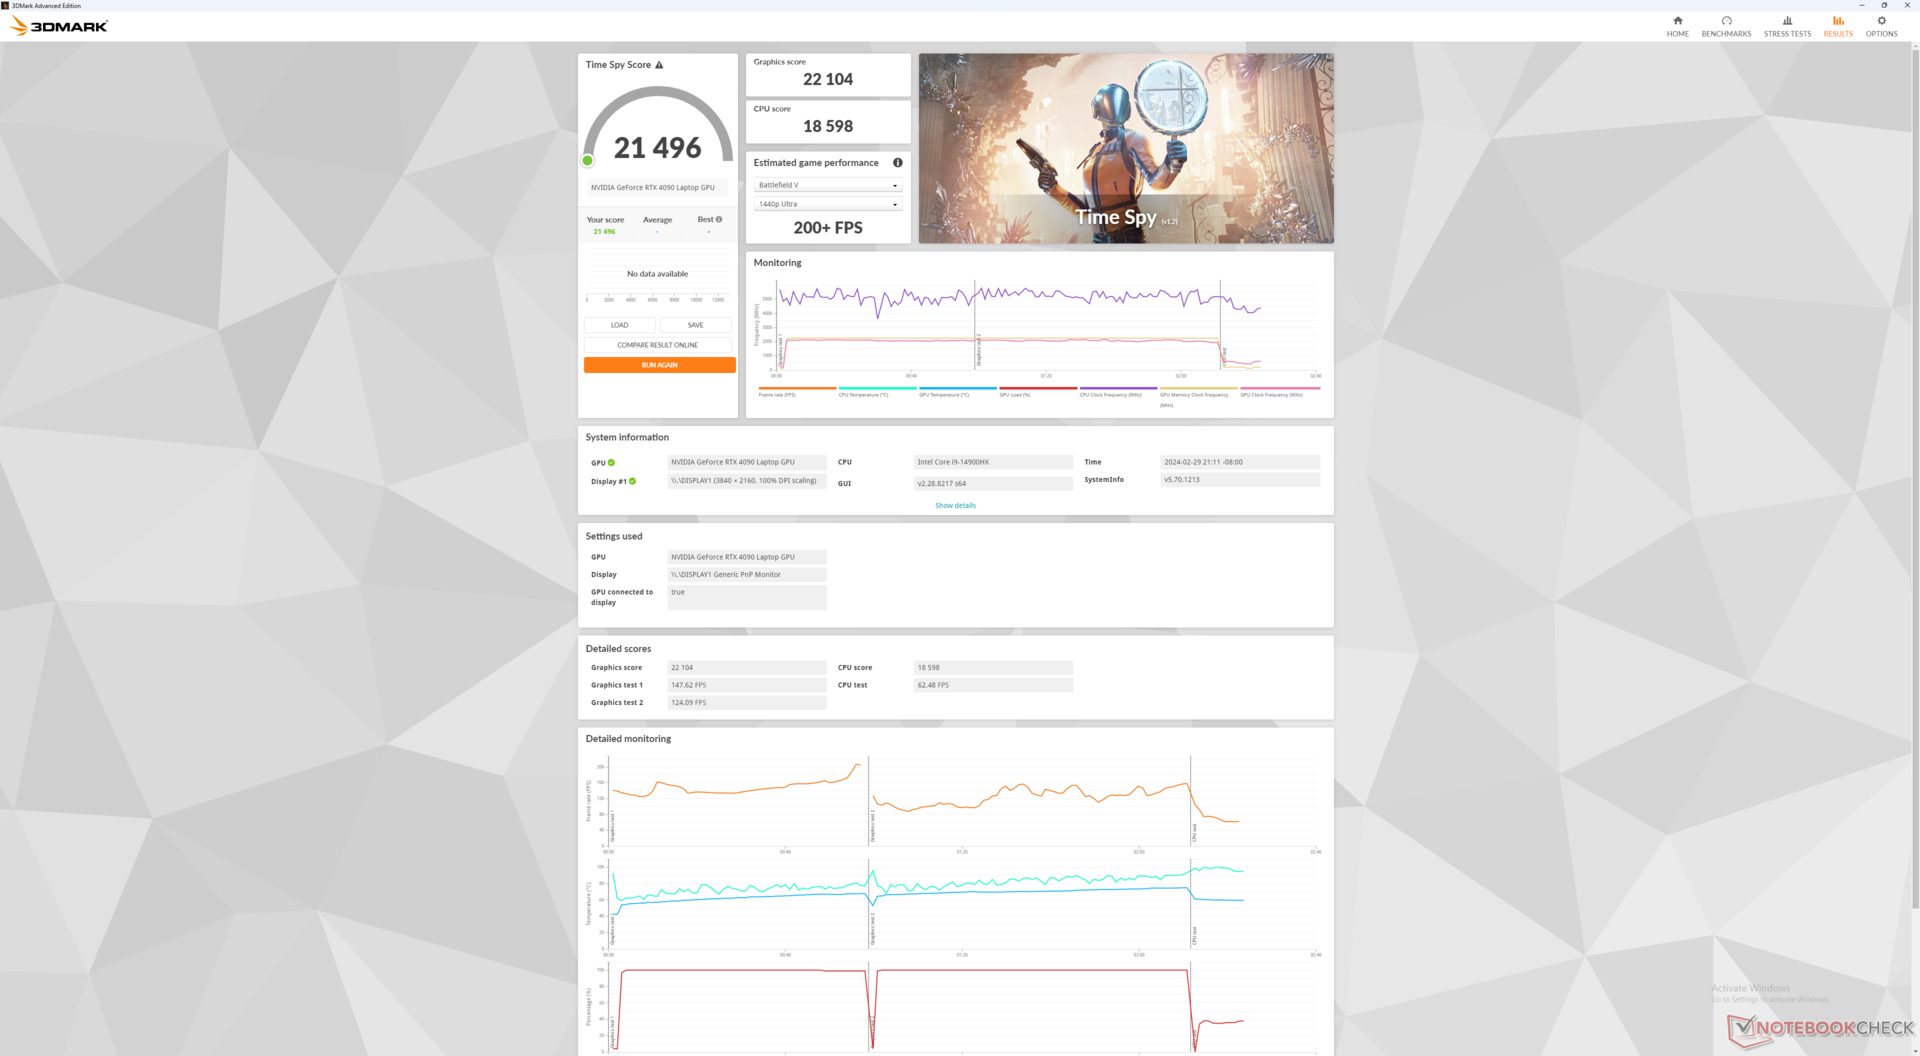
| 3DMark Fire Strike Score | 36031 punti | |
| 3DMark Time Spy Score | 21496 punti | |
Aiuto | ||
* ... Meglio usare valori piccoli
| Performance rating - Percent | |
| Eurocom Raptor X17 Core i9-14900HX -1! | |
| MSI Titan 18 HX A14VIG | |
| Eurocom Raptor X17 | |
| Asus ROG Strix Scar 17 G733PY-XS96 -1! | |
| MSI GE78HX 13VH-070US | |
| Asus TUF Gaming A17 FA707XI-NS94 -1! | |
| The Witcher 3 - 1920x1080 Ultra Graphics & Postprocessing (HBAO+) | |
| MSI Titan 18 HX A14VIG | |
| Eurocom Raptor X17 | |
| Asus ROG Strix Scar 17 G733PY-XS96 | |
| Eurocom Raptor X17 Core i9-14900HX | |
| MSI GE78HX 13VH-070US | |
| Asus TUF Gaming A17 FA707XI-NS94 | |
| GTA V - 1920x1080 Highest AA:4xMSAA + FX AF:16x | |
| Eurocom Raptor X17 Core i9-14900HX | |
| Eurocom Raptor X17 | |
| MSI Titan 18 HX A14VIG | |
| Asus ROG Strix Scar 17 G733PY-XS96 | |
| MSI GE78HX 13VH-070US | |
| Final Fantasy XV Benchmark - 1920x1080 High Quality | |
| MSI Titan 18 HX A14VIG | |
| Eurocom Raptor X17 | |
| Asus ROG Strix Scar 17 G733PY-XS96 | |
| MSI GE78HX 13VH-070US | |
| Asus TUF Gaming A17 FA707XI-NS94 | |
| Strange Brigade - 1920x1080 ultra AA:ultra AF:16 | |
| Eurocom Raptor X17 Core i9-14900HX | |
| MSI Titan 18 HX A14VIG | |
| Eurocom Raptor X17 | |
| MSI GE78HX 13VH-070US | |
| Asus TUF Gaming A17 FA707XI-NS94 | |
| Dota 2 Reborn - 1920x1080 ultra (3/3) best looking | |
| Eurocom Raptor X17 Core i9-14900HX | |
| Eurocom Raptor X17 | |
| MSI Titan 18 HX A14VIG | |
| MSI GE78HX 13VH-070US | |
| Asus ROG Strix Scar 17 G733PY-XS96 | |
| Asus TUF Gaming A17 FA707XI-NS94 | |
| X-Plane 11.11 - 1920x1080 high (fps_test=3) | |
| Eurocom Raptor X17 Core i9-14900HX | |
| Eurocom Raptor X17 | |
| MSI GE78HX 13VH-070US | |
| MSI Titan 18 HX A14VIG | |
| Asus ROG Strix Scar 17 G733PY-XS96 | |
| Asus TUF Gaming A17 FA707XI-NS94 | |
Witcher 3 FPS Chart
| basso | medio | alto | ultra | QHD | 4K | |
|---|---|---|---|---|---|---|
| GTA V (2015) | 187.6 | 186.9 | 185.8 | 152.2 | 145.7 | 178.8 |
| The Witcher 3 (2015) | 688.1 | 591.6 | 423.9 | 200 | 149.7 | |
| Dota 2 Reborn (2015) | 254 | 224 | 212 | 195.2 | 195 | |
| X-Plane 11.11 (2018) | 221 | 193.1 | 150.2 | 126.7 | ||
| Far Cry 5 (2018) | 222 | 195 | 186 | 174 | 171 | 113 |
| Strange Brigade (2018) | 567 | 459 | 433 | 402 | 309 | 156.8 |
| F1 22 (2022) | 360 | 331 | 116.3 | 87.8 | 44.2 | |
| Baldur's Gate 3 (2023) | 244.1 | 217.9 | 203.8 | 200.4 | 148.9 | 75.6 |
| Cyberpunk 2077 (2023) | 195.2 | 185.2 | 164.5 | 144.7 | 93.8 | 41.4 |
Emissioni
Rumore del sistema - Più forte di molti altri portatili da gioco
Le ventole non pulsano con la stessa frequenza con cui abbiamo sperimentato il modello dello scorso anno. Quando si lanciava 3DMark 06, ad esempio, le ventole rimanevano più silenziose per periodi più lunghi prima di aumentare lentamente, mentre il modello 2023 raggiungeva un picco di quasi 60 dB(A). Per il resto, il rumore delle ventole si stabilizza intorno agli stessi valori tra i due modelli quando si eseguono carichi impegnativi come i giochi.
Il gioco in modalità Intrattenimento è leggermente più silenzioso rispetto al gioco in modalità Prestazioni (58,3 dB(A) contro 61,4 dB(A)). Si ricordi che la modalità Intrattenimento comporta un costo in termini di prestazioni, come indicato sopra.
Rumorosità
| Idle |
| 31.7 / 31.7 / 32.9 dB(A) |
| Sotto carico |
| 34 / 61.6 dB(A) |
 | ||
30 dB silenzioso 40 dB(A) udibile 50 dB(A) rumoroso |
||
min: | ||
| Eurocom Raptor X17 Core i9-14900HX GeForce RTX 4090 Laptop GPU, i9-14900HX, Corsair MP700 Pro 2TB | Eurocom Raptor X17 GeForce RTX 4090 Laptop GPU, i9-13900HX, 3x Samsung SSD 980 Pro 1TB (RAID 0) | Asus TUF Gaming A17 FA707XI-NS94 GeForce RTX 4070 Laptop GPU, R9 7940HS, WD PC SN560 SDDPNQE-1T00 | Asus ROG Strix Scar 17 G733PY-XS96 GeForce RTX 4090 Laptop GPU, R9 7945HX, SK hynix PC801 HFS001TEJ9X101N | MSI GE78HX 13VH-070US GeForce RTX 4080 Laptop GPU, i9-13950HX, Samsung PM9A1 MZVL22T0HBLB | MSI Titan 18 HX A14VIG GeForce RTX 4090 Laptop GPU, i9-14900HX, 2x Samsung PM9A1a MZVL22T0HDLB (RAID 0) | |
|---|---|---|---|---|---|---|
| Noise | -15% | 3% | 14% | 5% | 9% | |
| off /ambiente * (dB) | 23.7 | 23.3 2% | 27.9 -18% | 22.7 4% | 23.4 1% | 22.8 4% |
| Idle Minimum * (dB) | 31.7 | 33.1 -4% | 28.5 10% | 23.5 26% | 24.2 24% | 23.8 25% |
| Idle Average * (dB) | 31.7 | 33.1 -4% | 29.8 6% | 27.7 13% | 25.6 19% | 23.8 25% |
| Idle Maximum * (dB) | 32.9 | 40.7 -24% | 29.8 9% | 27.7 16% | 31 6% | 28 15% |
| Load Average * (dB) | 34 | 59.9 -76% | 34.8 -2% | 30.5 10% | 43.3 -27% | 38 -12% |
| Witcher 3 ultra * (dB) | 61.6 | 60.8 1% | 57.1 7% | 51.4 17% | 56.3 9% | 57.3 7% |
| Load Maximum * (dB) | 61.6 | 61 1% | 57.3 7% | 54.1 12% | 59.1 4% | 62.8 -2% |
* ... Meglio usare valori piccoli
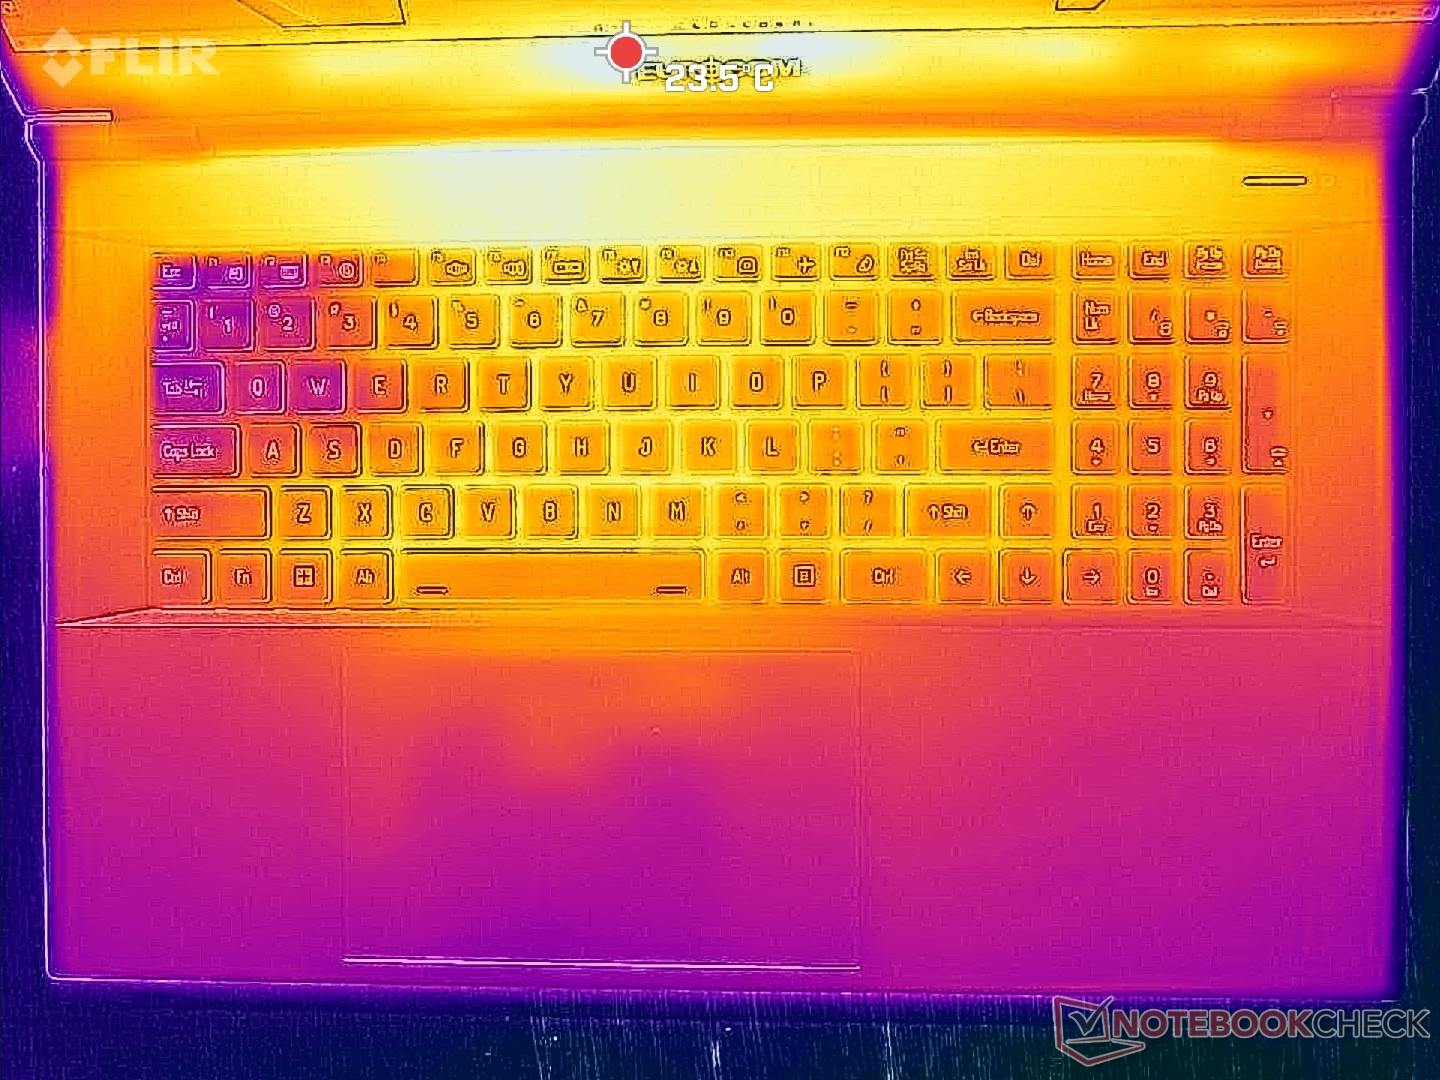
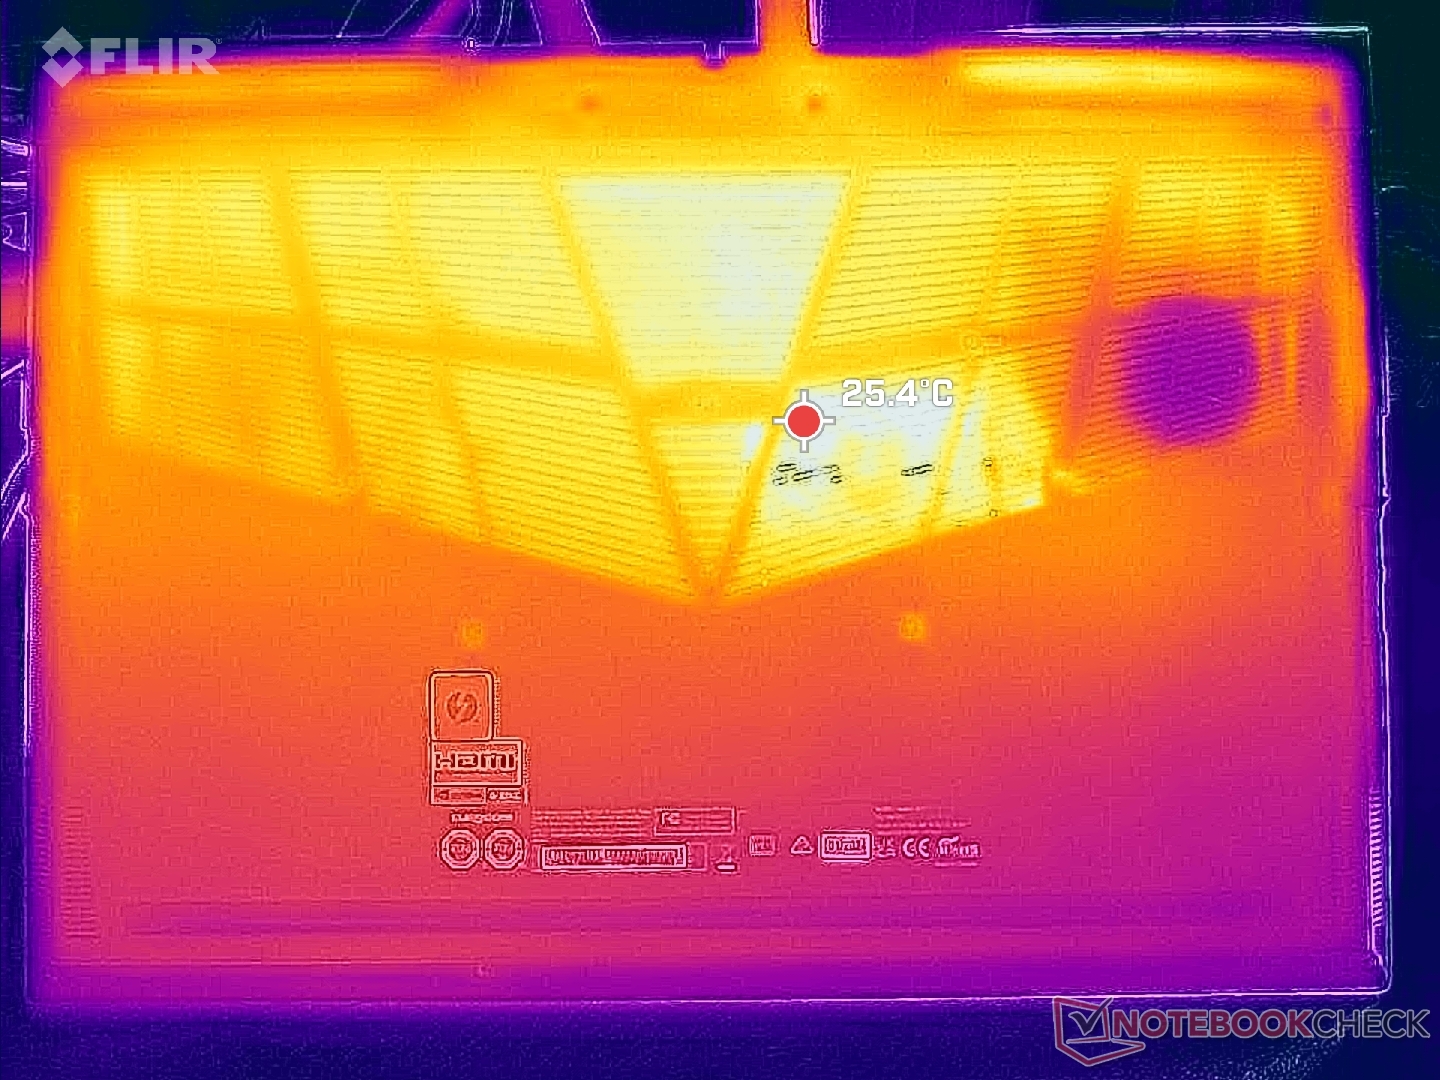
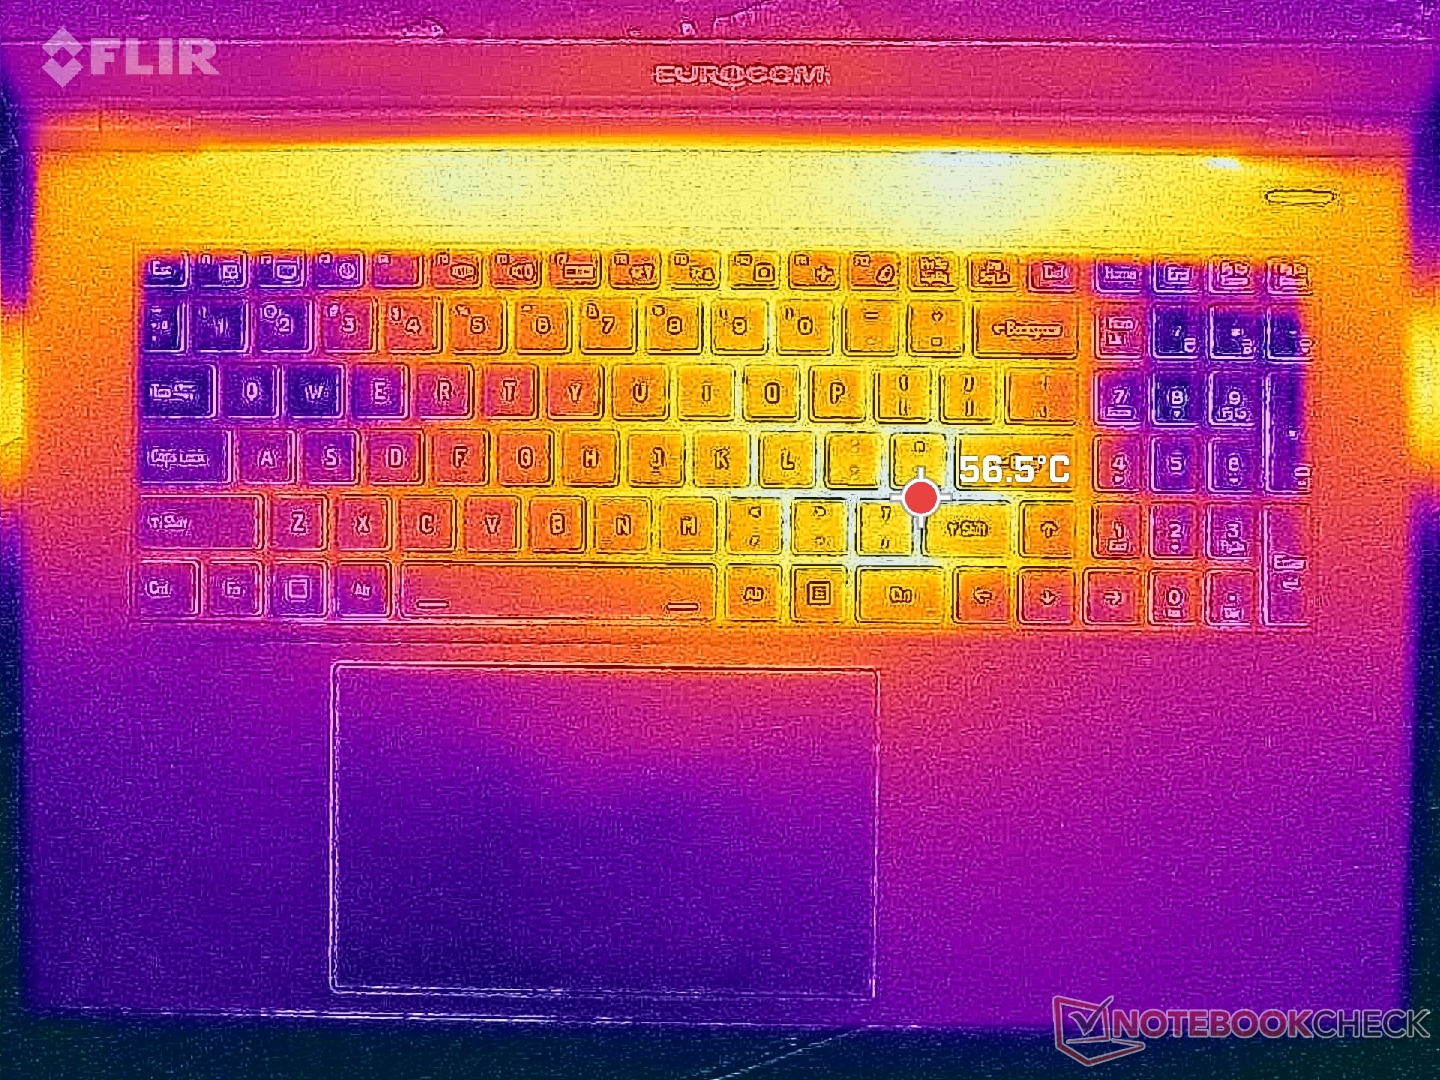
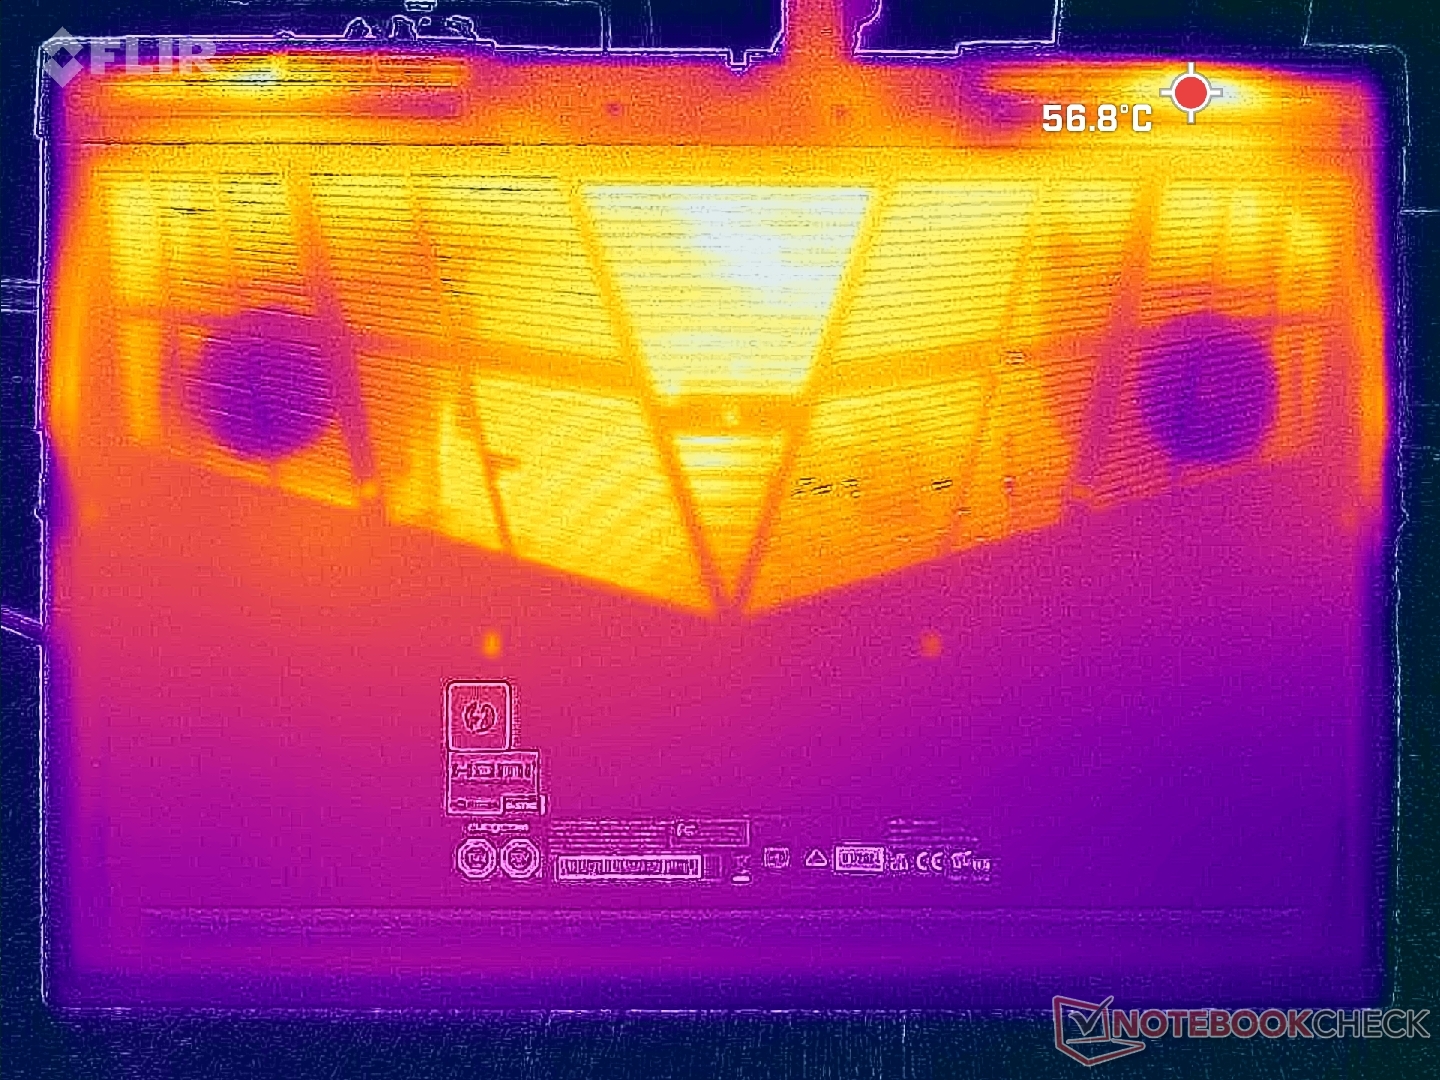
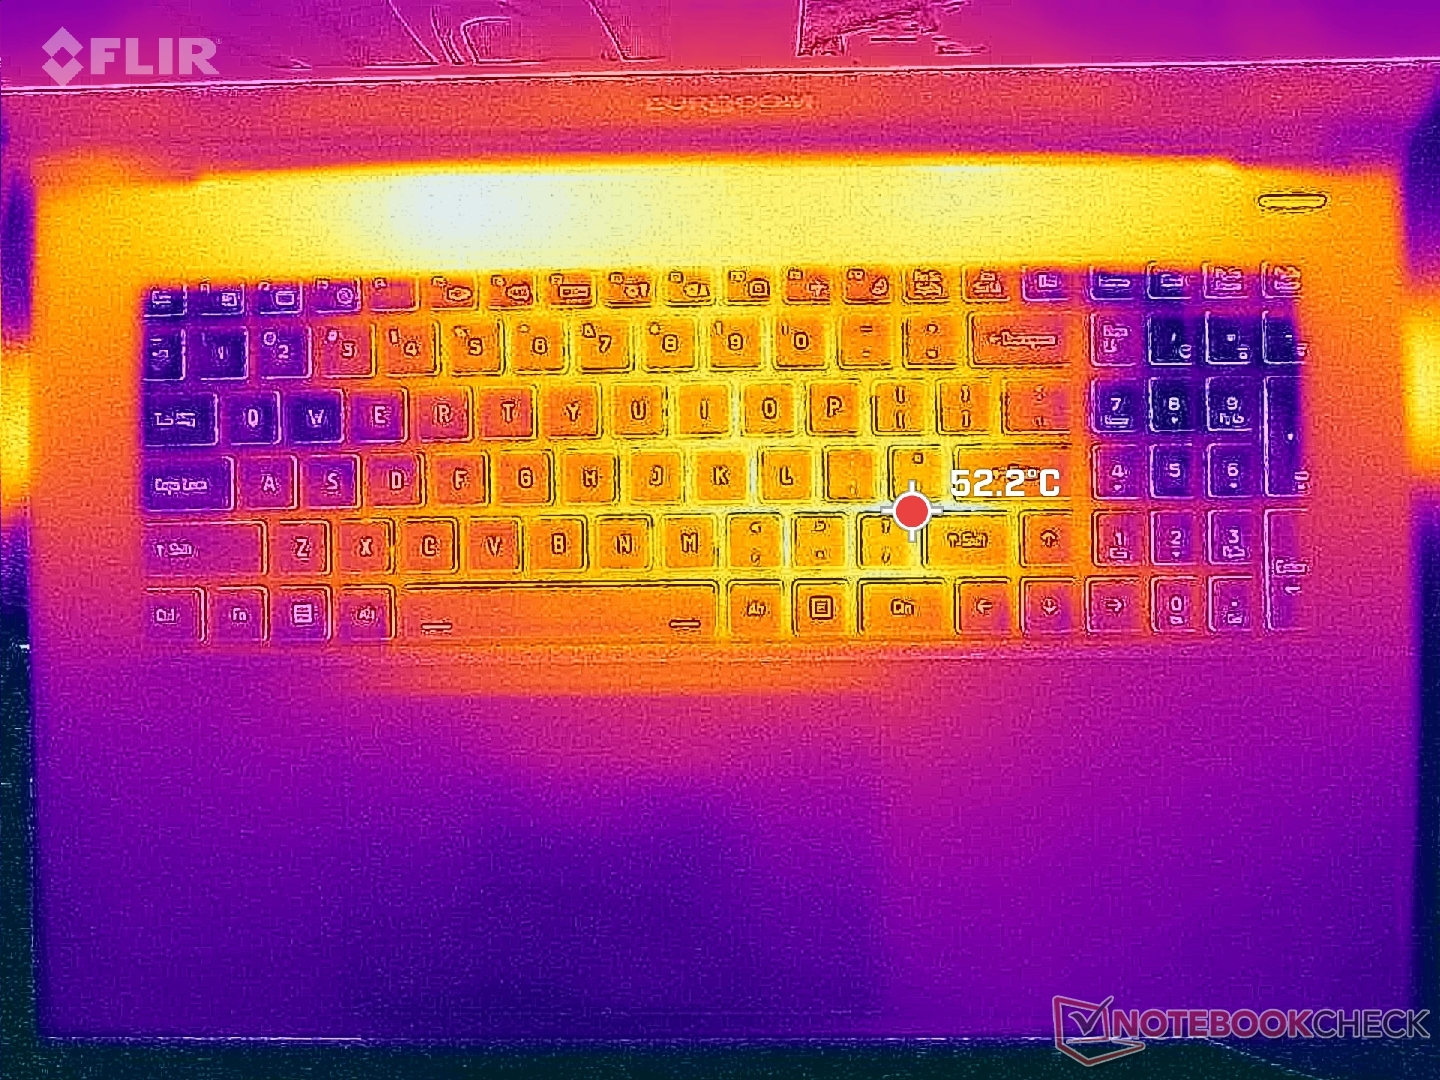
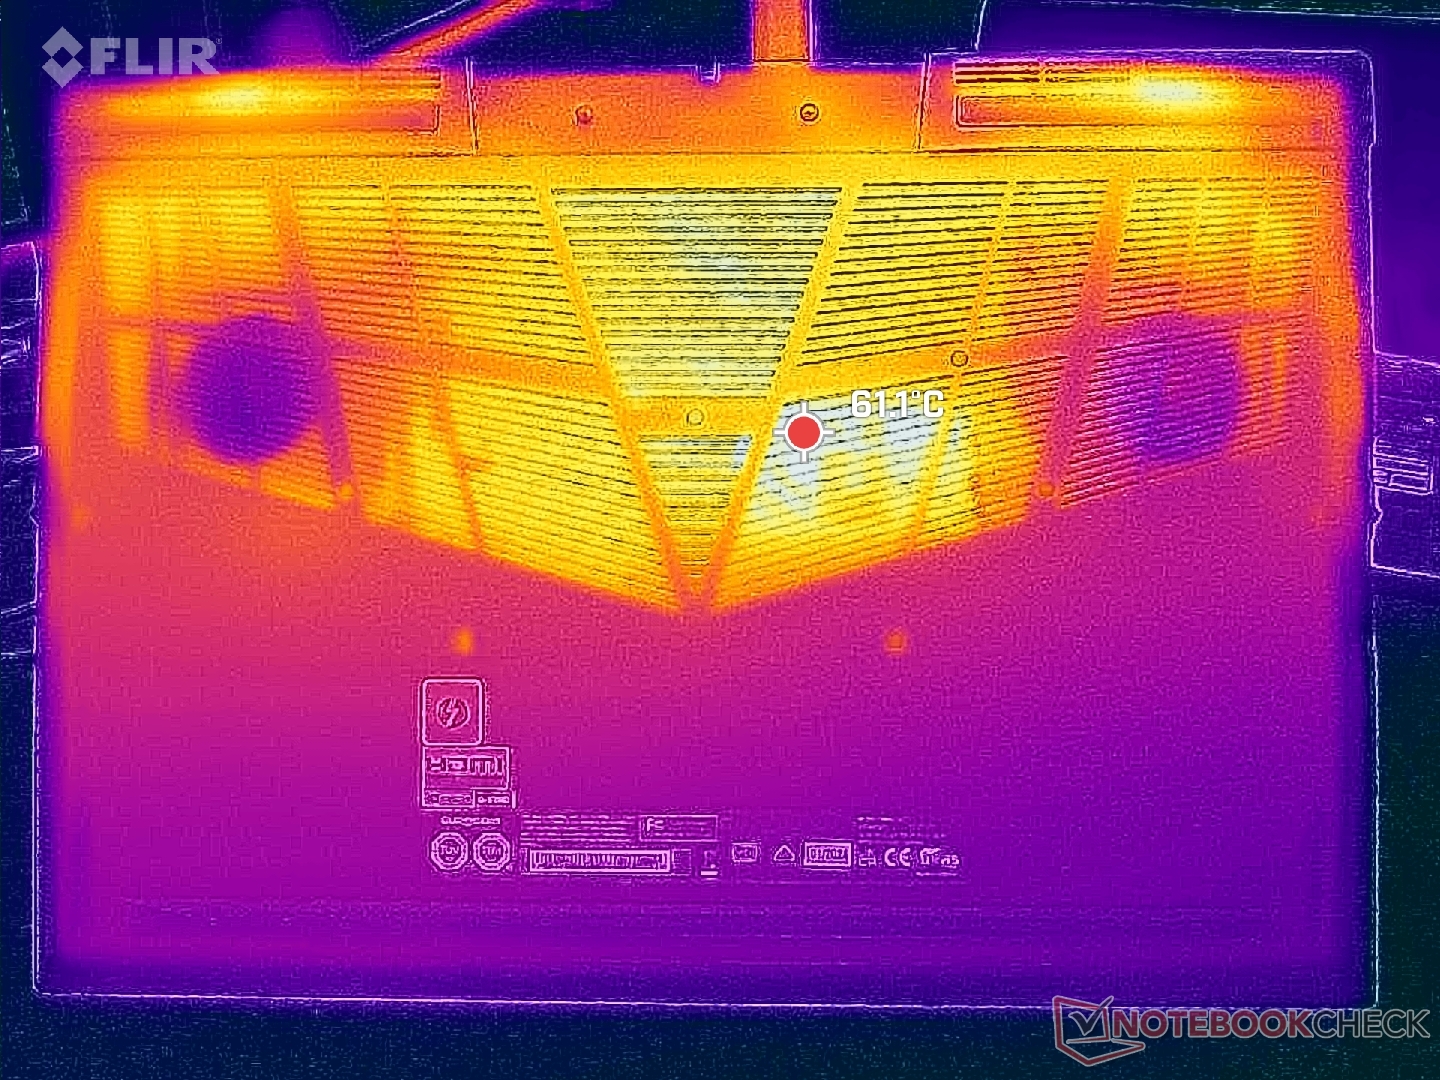
Temperatura
I punti caldi della temperatura superficiale sono sensibilmente più caldi rispetto ad altri computer portatili da gioco. In particolare, alcune aree della tastiera possono essere calde fino a 53 C durante il gioco, rispetto ai soli 37 C o 40 C di MSI GE78HX o Asus TUF Gaming A17.
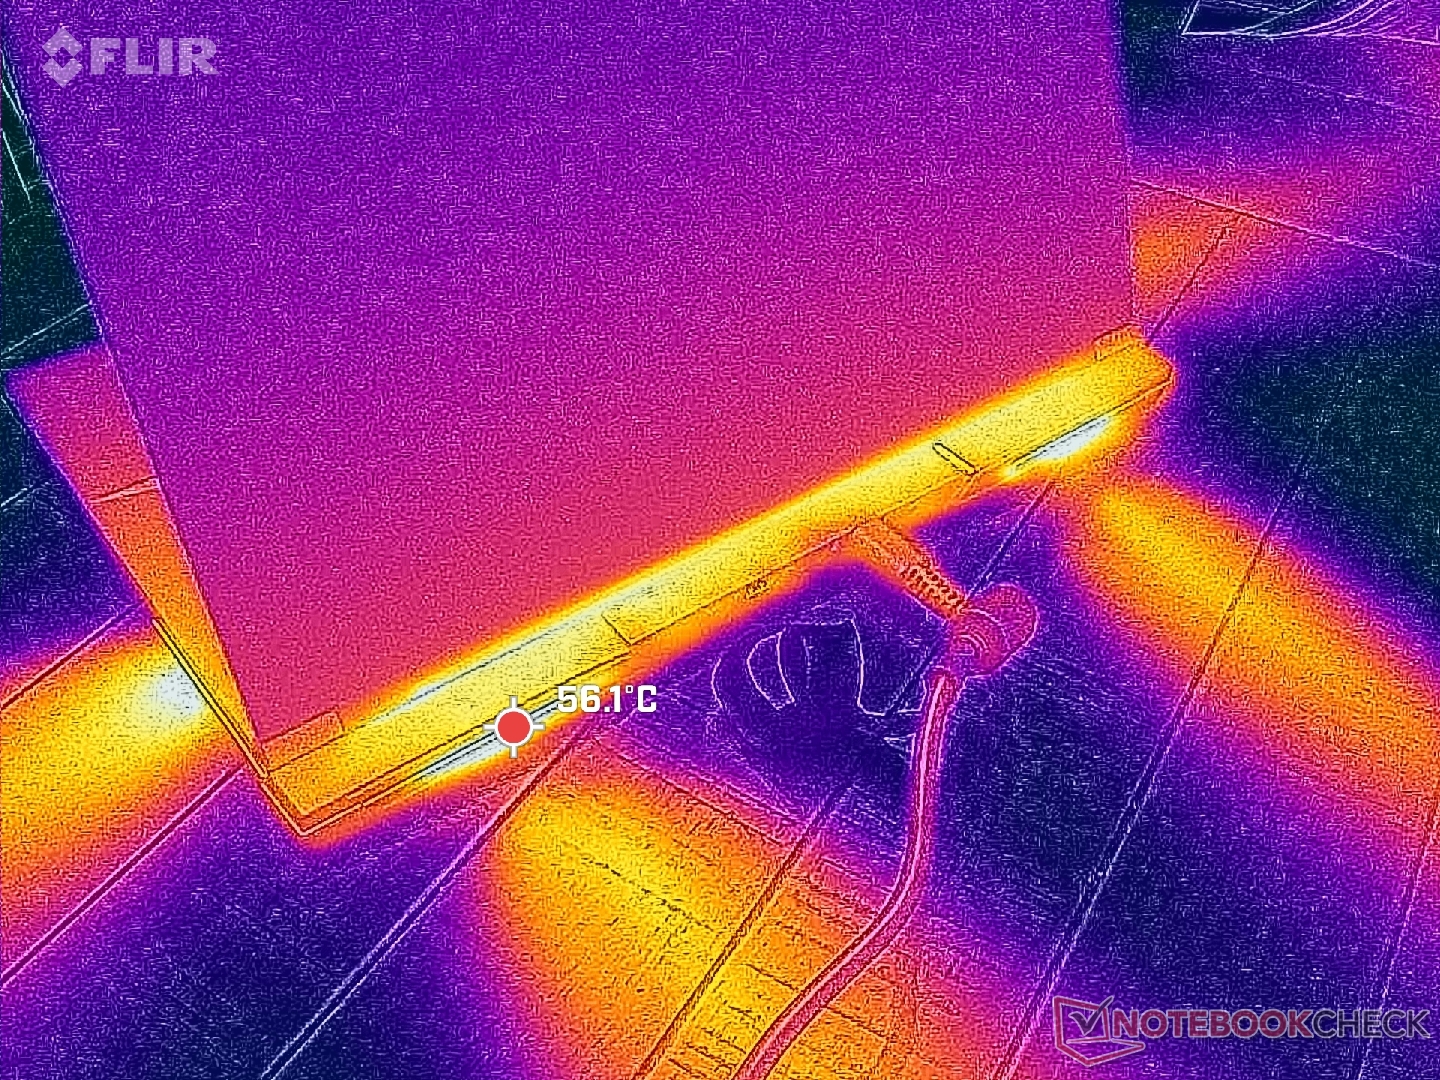
(-) La temperatura massima sul lato superiore è di 52.2 °C / 126 F, rispetto alla media di 40.4 °C / 105 F, che varia da 21.2 a 68.8 °C per questa classe Gaming.
(-) Il lato inferiore si riscalda fino ad un massimo di 53.2 °C / 128 F, rispetto alla media di 43.2 °C / 110 F
(+) In idle, la temperatura media del lato superiore è di 25.8 °C / 78 F, rispetto alla media deld ispositivo di 33.9 °C / 93 F.
(±) Riproducendo The Witcher 3, la temperatura media per il lato superiore e' di 36.7 °C / 98 F, rispetto alla media del dispositivo di 33.9 °C / 93 F.
(+) I poggiapolsi e il touchpad sono piu' freddi della temperatura della pelle con un massimo di 28.8 °C / 83.8 F e sono quindi freddi al tatto.
(±) La temperatura media della zona del palmo della mano di dispositivi simili e'stata di 28.8 °C / 83.8 F (0 °C / 0 F).
| Eurocom Raptor X17 Core i9-14900HX Intel Core i9-14900HX, NVIDIA GeForce RTX 4090 Laptop GPU | Eurocom Raptor X17 Intel Core i9-13900HX, NVIDIA GeForce RTX 4090 Laptop GPU | Asus TUF Gaming A17 FA707XI-NS94 AMD Ryzen 9 7940HS, NVIDIA GeForce RTX 4070 Laptop GPU | Asus ROG Strix Scar 17 G733PY-XS96 AMD Ryzen 9 7945HX, NVIDIA GeForce RTX 4090 Laptop GPU | MSI GE78HX 13VH-070US Intel Core i9-13950HX, NVIDIA GeForce RTX 4080 Laptop GPU | MSI Titan 18 HX A14VIG Intel Core i9-14900HX, NVIDIA GeForce RTX 4090 Laptop GPU | |
|---|---|---|---|---|---|---|
| Heat | -7% | 21% | 18% | 8% | 4% | |
| Maximum Upper Side * (°C) | 52.2 | 49.4 5% | 40 23% | 34.6 34% | 37.4 28% | 37.8 28% |
| Maximum Bottom * (°C) | 53.2 | 55.2 -4% | 33.6 37% | 35.6 33% | 45 15% | 37.6 29% |
| Idle Upper Side * (°C) | 28.6 | 33.4 -17% | 26.6 7% | 27.2 5% | 29.8 -4% | 34.8 -22% |
| Idle Bottom * (°C) | 29.8 | 33.4 -12% | 24.4 18% | 30 -1% | 32.4 -9% | 36 -21% |
* ... Meglio usare valori piccoli
Altoparlanti
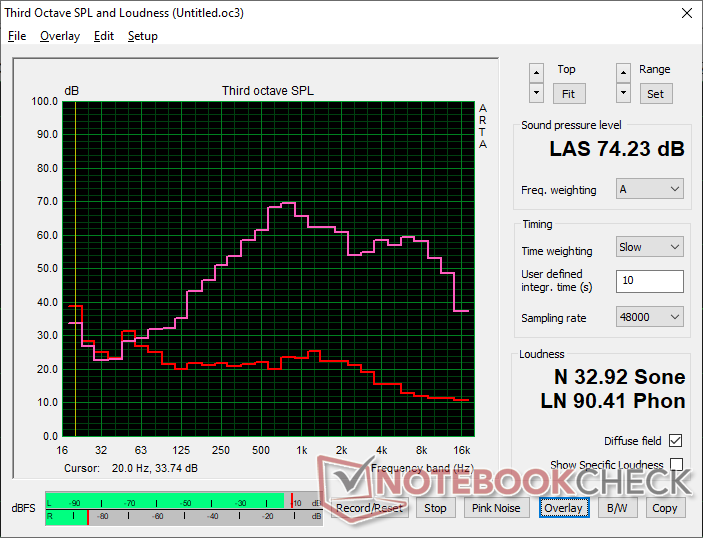
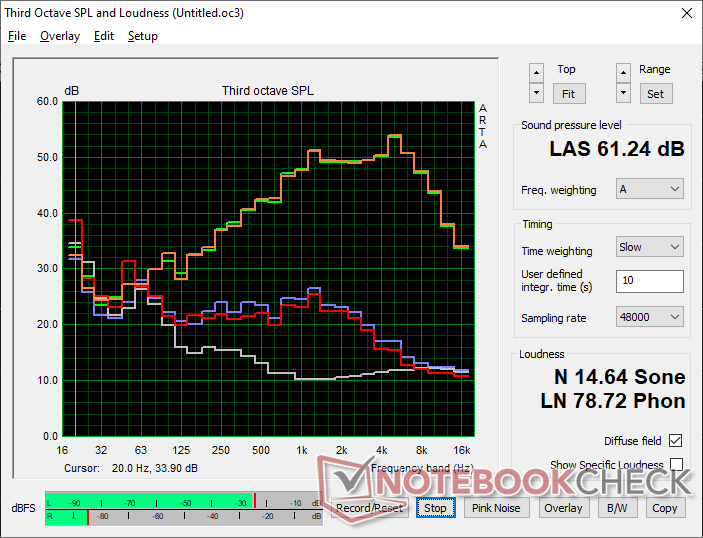
Eurocom Raptor X17 Core i9-14900HX analisi audio
(±) | potenza degli altiparlanti media ma buona (74.2 dB)
Bassi 100 - 315 Hz
(±) | bassi ridotti - in media 13.4% inferiori alla media
(±) | la linearità dei bassi è media (10.1% delta rispetto alla precedente frequenza)
Medi 400 - 2000 Hz
(±) | medi elevati - circa 6.6% superiore alla media
(±) | linearità dei medi adeguata (8.6% delta rispetto alla precedente frequenza)
Alti 2 - 16 kHz
(+) | Alti bilanciati - appena 2% dalla media
(±) | la linearità degli alti è media (8.5% delta rispetto alla precedente frequenza)
Nel complesso 100 - 16.000 Hz
(±) | la linearità complessiva del suono è media (24% di differenza rispetto alla media
Rispetto alla stessa classe
» 86% di tutti i dispositivi testati in questa classe è stato migliore, 4% simile, 9% peggiore
» Il migliore ha avuto un delta di 6%, medio di 18%, peggiore di 132%
Rispetto a tutti i dispositivi testati
» 72% di tutti i dispositivi testati in questa classe è stato migliore, 6% similare, 22% peggiore
» Il migliore ha avuto un delta di 4%, medio di 24%, peggiore di 134%
Apple MacBook Pro 16 2021 M1 Pro analisi audio
(+) | gli altoparlanti sono relativamente potenti (84.7 dB)
Bassi 100 - 315 Hz
(+) | bassi buoni - solo 3.8% dalla media
(+) | bassi in lineaa (5.2% delta rispetto alla precedente frequenza)
Medi 400 - 2000 Hz
(+) | medi bilanciati - solo only 1.3% rispetto alla media
(+) | medi lineari (2.1% delta rispetto alla precedente frequenza)
Alti 2 - 16 kHz
(+) | Alti bilanciati - appena 1.9% dalla media
(+) | alti lineari (2.7% delta rispetto alla precedente frequenza)
Nel complesso 100 - 16.000 Hz
(+) | suono nel complesso lineare (4.6% differenza dalla media)
Rispetto alla stessa classe
» 0% di tutti i dispositivi testati in questa classe è stato migliore, 0% simile, 100% peggiore
» Il migliore ha avuto un delta di 5%, medio di 17%, peggiore di 45%
Rispetto a tutti i dispositivi testati
» 0% di tutti i dispositivi testati in questa classe è stato migliore, 0% similare, 100% peggiore
» Il migliore ha avuto un delta di 4%, medio di 24%, peggiore di 134%
Gestione dell'energia
Consumo di energia
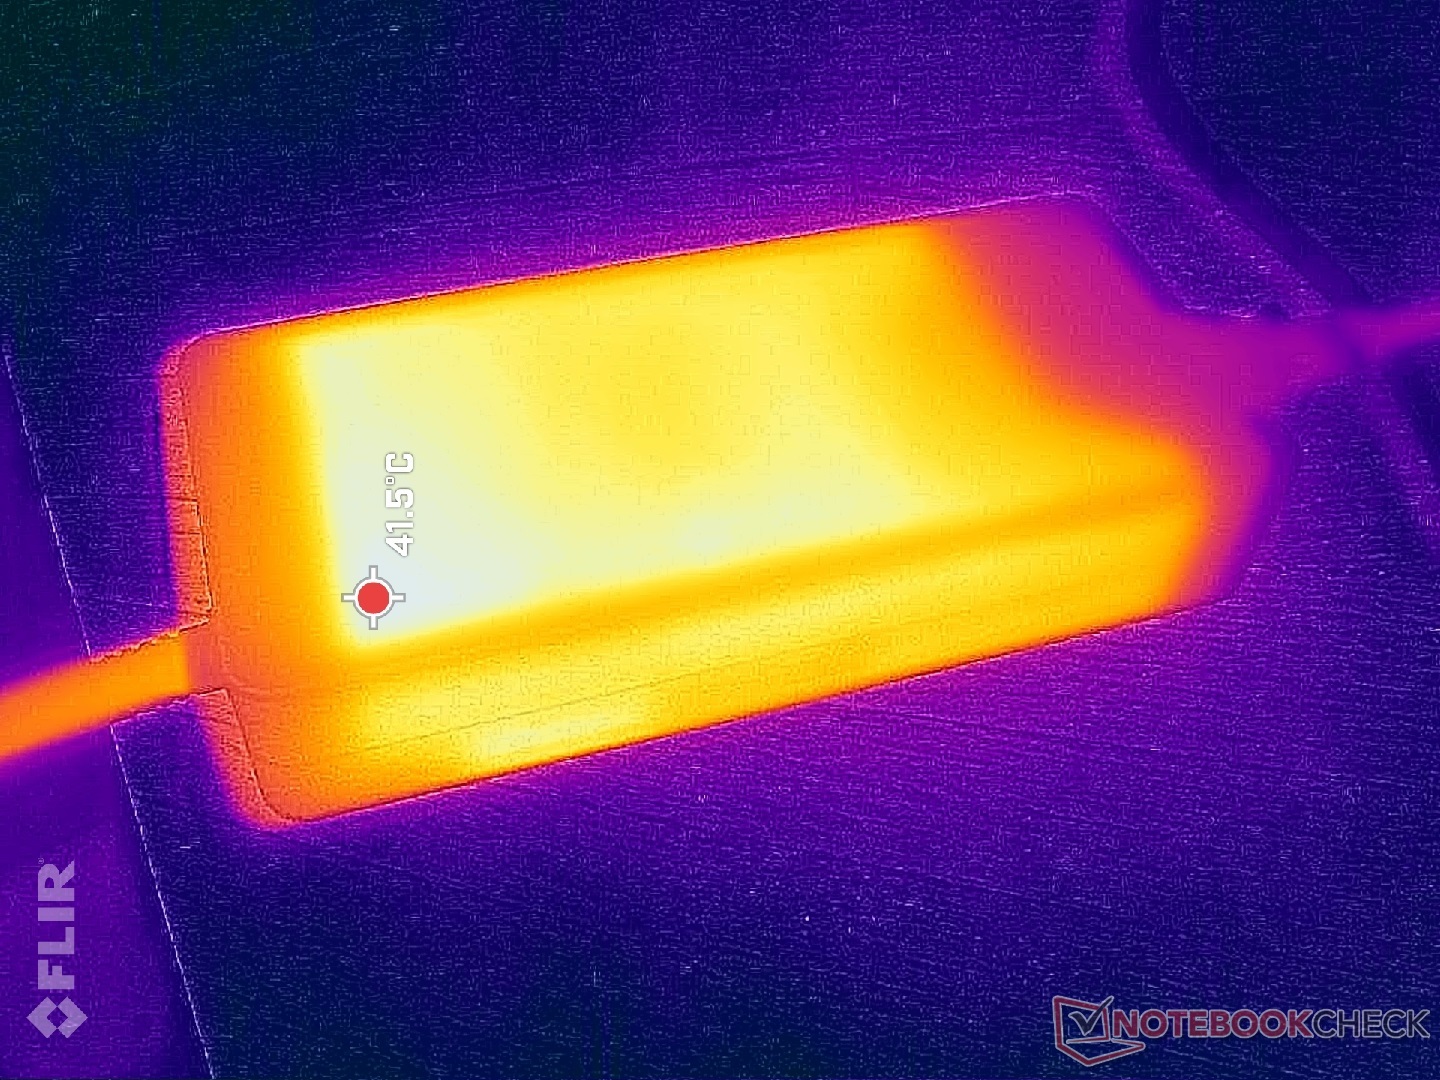
In esecuzione Witcher 3 richiede una potenza leggermente superiore rispetto a prima, circa 325 W, per essere quasi uguale a quella della Titan 18 HX. Il consumo più elevato rispetto al nostro modello 2023 può essere probabilmente attribuito al pannello 4K più luminoso e a più alta risoluzione della nostra configurazione più recente.
Il grande adattatore CA da 330 W rimane lo stesso di prima. Poiché il gioco richiede già quasi l'intera potenza dell'adattatore, il tentativo di caricare la batteria durante il gioco richiederà molto, molto più tempo.
(Nota dell'editore: questa sezione sarà aggiornata quando le riparazioni del nostro multimetro Metrahit Energy saranno completate. Ci scusiamo per l'inconveniente)
| Off / Standby | |
| Idle | |
| Sotto carico |
|
Leggenda:
min: | |
| Eurocom Raptor X17 Core i9-14900HX i9-14900HX, GeForce RTX 4090 Laptop GPU, Corsair MP700 Pro 2TB, IPS, 3840x2160, 17.3" | Eurocom Raptor X17 i9-13900HX, GeForce RTX 4090 Laptop GPU, 3x Samsung SSD 980 Pro 1TB (RAID 0), IPS, 2560x1440, 17.3" | Asus TUF Gaming A17 FA707XI-NS94 R9 7940HS, GeForce RTX 4070 Laptop GPU, WD PC SN560 SDDPNQE-1T00, IPS, 1920x1080, 17.3" | Asus ROG Strix Scar 17 G733PY-XS96 R9 7945HX, GeForce RTX 4090 Laptop GPU, SK hynix PC801 HFS001TEJ9X101N, IPS, 2560x1440, 17.3" | MSI GE78HX 13VH-070US i9-13950HX, GeForce RTX 4080 Laptop GPU, Samsung PM9A1 MZVL22T0HBLB, IPS, 2560x1600, 17" | MSI Titan 18 HX A14VIG i9-14900HX, GeForce RTX 4090 Laptop GPU, 2x Samsung PM9A1a MZVL22T0HDLB (RAID 0), Mini-LED, 3840x2400, 18" | |
|---|---|---|---|---|---|---|
| Power Consumption | 13% | 45% | 17% | 16% | -1% | |
| Idle Minimum * (Watt) | 18.7 | 13.4 28% | 6.2 67% | 14.5 22% | 16.1 14% | 13.2 29% |
| Idle Average * (Watt) | 29.9 | 22.2 26% | 21.8 27% | 21.1 29% | 24 20% | 25.4 15% |
| Idle Maximum * (Watt) | 43.8 | 42.4 3% | 22 50% | 42.8 2% | 34 22% | 53.5 -22% |
| Load Average * (Watt) | 148.9 | 132.8 11% | 59.2 60% | 116.7 22% | 123.6 17% | 151.4 -2% |
| Witcher 3 ultra * (Watt) | 310.5 | 304 2% | 189.7 39% | 278 10% | 286 8% | 336 -8% |
| Load Maximum * (Watt) | 340.2 | 319.8 6% | 247.8 27% | 279.6 18% | 285.7 16% | 395.2 -16% |
* ... Meglio usare valori piccoli
Power Consumption Witcher 3 / Stresstest
Power Consumption external Monitor
Durata della batteria
I tempi di esecuzione sono leggermente più brevi rispetto alla configurazione dello scorso anno, probabilmente a causa della risoluzione 4K più esigente.
| Eurocom Raptor X17 Core i9-14900HX i9-14900HX, GeForce RTX 4090 Laptop GPU, 99 Wh | Eurocom Raptor X17 i9-13900HX, GeForce RTX 4090 Laptop GPU, 99 Wh | Asus TUF Gaming A17 FA707XI-NS94 R9 7940HS, GeForce RTX 4070 Laptop GPU, 90 Wh | Asus ROG Strix Scar 17 G733PY-XS96 R9 7945HX, GeForce RTX 4090 Laptop GPU, 90 Wh | MSI GE78HX 13VH-070US i9-13950HX, GeForce RTX 4080 Laptop GPU, 99 Wh | MSI Titan 18 HX A14VIG i9-14900HX, GeForce RTX 4090 Laptop GPU, 99.9 Wh | |
|---|---|---|---|---|---|---|
| Autonomia della batteria | 6% | 94% | -13% | 30% | -11% | |
| WiFi v1.3 (h) | 4.7 | 5 6% | 9.1 94% | 4.1 -13% | 6.1 30% | 4.2 -11% |
| Reader / Idle (h) | 10.2 | 19.7 | 7.3 | 5.9 | ||
| Load (h) | 1.5 | 1.7 | 1.5 | 1.2 |
Pro
Contro
Verdetto - Nuovo processore, stesso aspetto
Dal momento che il Core i9-14900HX è in gran parte un rebrand del precedente Core i9-13900HX, l'Eurocom Raptor X17 2024 non offre molto rispetto alla versione 2023. Le prestazioni del processore possono essere leggermente più veloci, ma quasi tutto il resto rimane invariato. Le prestazioni complessive sono comunque paragonabili a quelle di alcuni dei computer portatili più veloci disponibili, tra cui l' MSI Titan HX o Asus ROG Strix Scar 18. Eurocom non offre mini-LED o OLED per questo modello, ma queste opzioni si rivolgono agli utenti multimediali, mentre Raptor X17 è progettato più per gli spazi professionali ad alte prestazioni.
Il rumore della ventola potrebbe essere un po' più costante, ma non si aspetti un aumento significativo delle prestazioni rispetto alle opzioni già superveloci della generazione precedente.
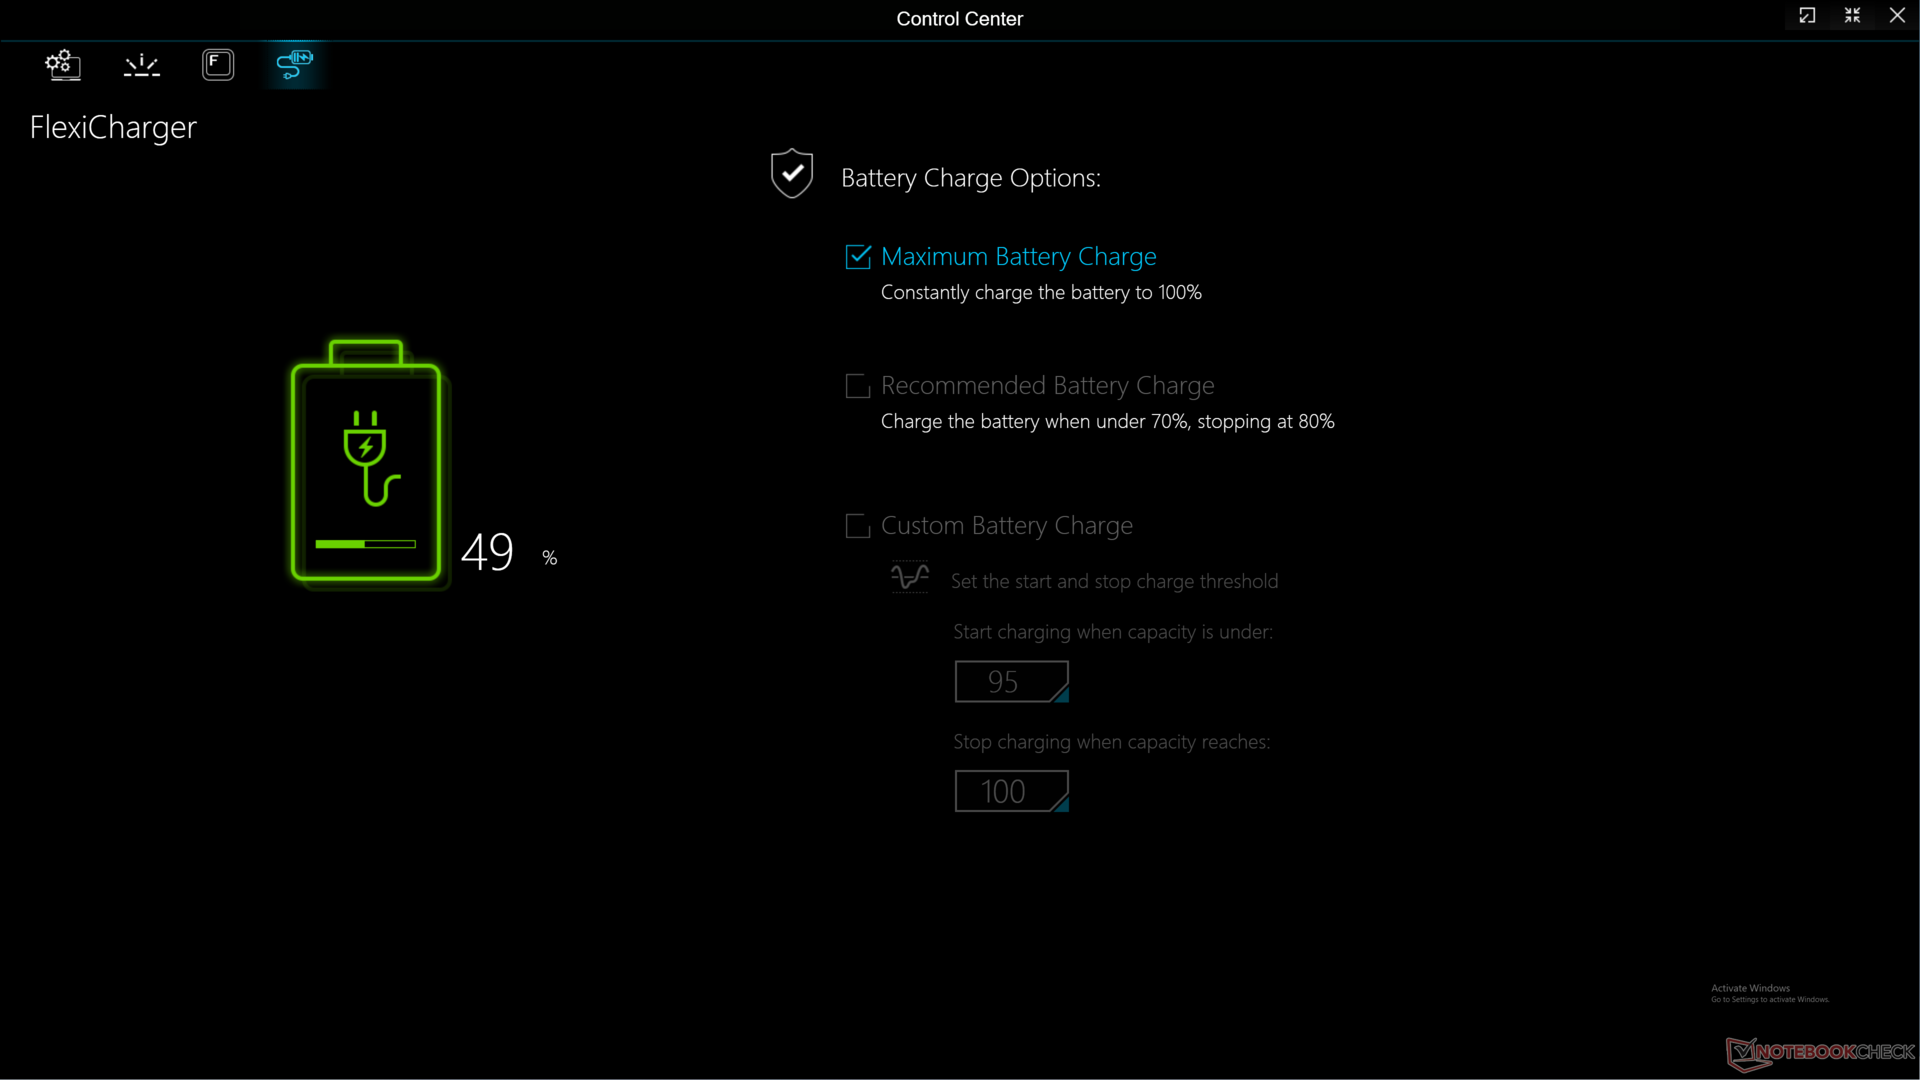
I power user che decidono di configurare con un SSD PCIe5 devono assolutamente considerare di ordinare anche lo spargi calore. Altrimenti, l'unità PCIe5 si comporterà più come un'unità PCIe4 dopo pochi minuti di utilizzo intenso.
Prezzo e disponibilità
Eurocom sta distribuendo raptor X17 2024 a partire da 3500 dollari per la RTX 4080 e il display 2K. La configurazione con RTX 4090 e display 4K, come nella nostra unità di recensione, aumenterà il prezzo a oltre 4200 dollari.
Eurocom Raptor X17 Core i9-14900HX
- 03/15/2024 v7 (old)
Allen Ngo
Transparency
La selezione dei dispositivi da recensire viene effettuata dalla nostra redazione. Il campione di prova è stato fornito all'autore come prestito dal produttore o dal rivenditore ai fini di questa recensione. L'istituto di credito non ha avuto alcuna influenza su questa recensione, né il produttore ne ha ricevuto una copia prima della pubblicazione. Non vi era alcun obbligo di pubblicare questa recensione. In quanto società mediatica indipendente, Notebookcheck non è soggetta all'autorità di produttori, rivenditori o editori.
Ecco come Notebookcheck esegue i test
Ogni anno, Notebookcheck esamina in modo indipendente centinaia di laptop e smartphone utilizzando procedure standardizzate per garantire che tutti i risultati siano comparabili. Da circa 20 anni sviluppiamo continuamente i nostri metodi di prova e nel frattempo stabiliamo gli standard di settore. Nei nostri laboratori di prova, tecnici ed editori esperti utilizzano apparecchiature di misurazione di alta qualità. Questi test comportano un processo di validazione in più fasi. Il nostro complesso sistema di valutazione si basa su centinaia di misurazioni e parametri di riferimento ben fondati, che mantengono l'obiettività.Price comparison

