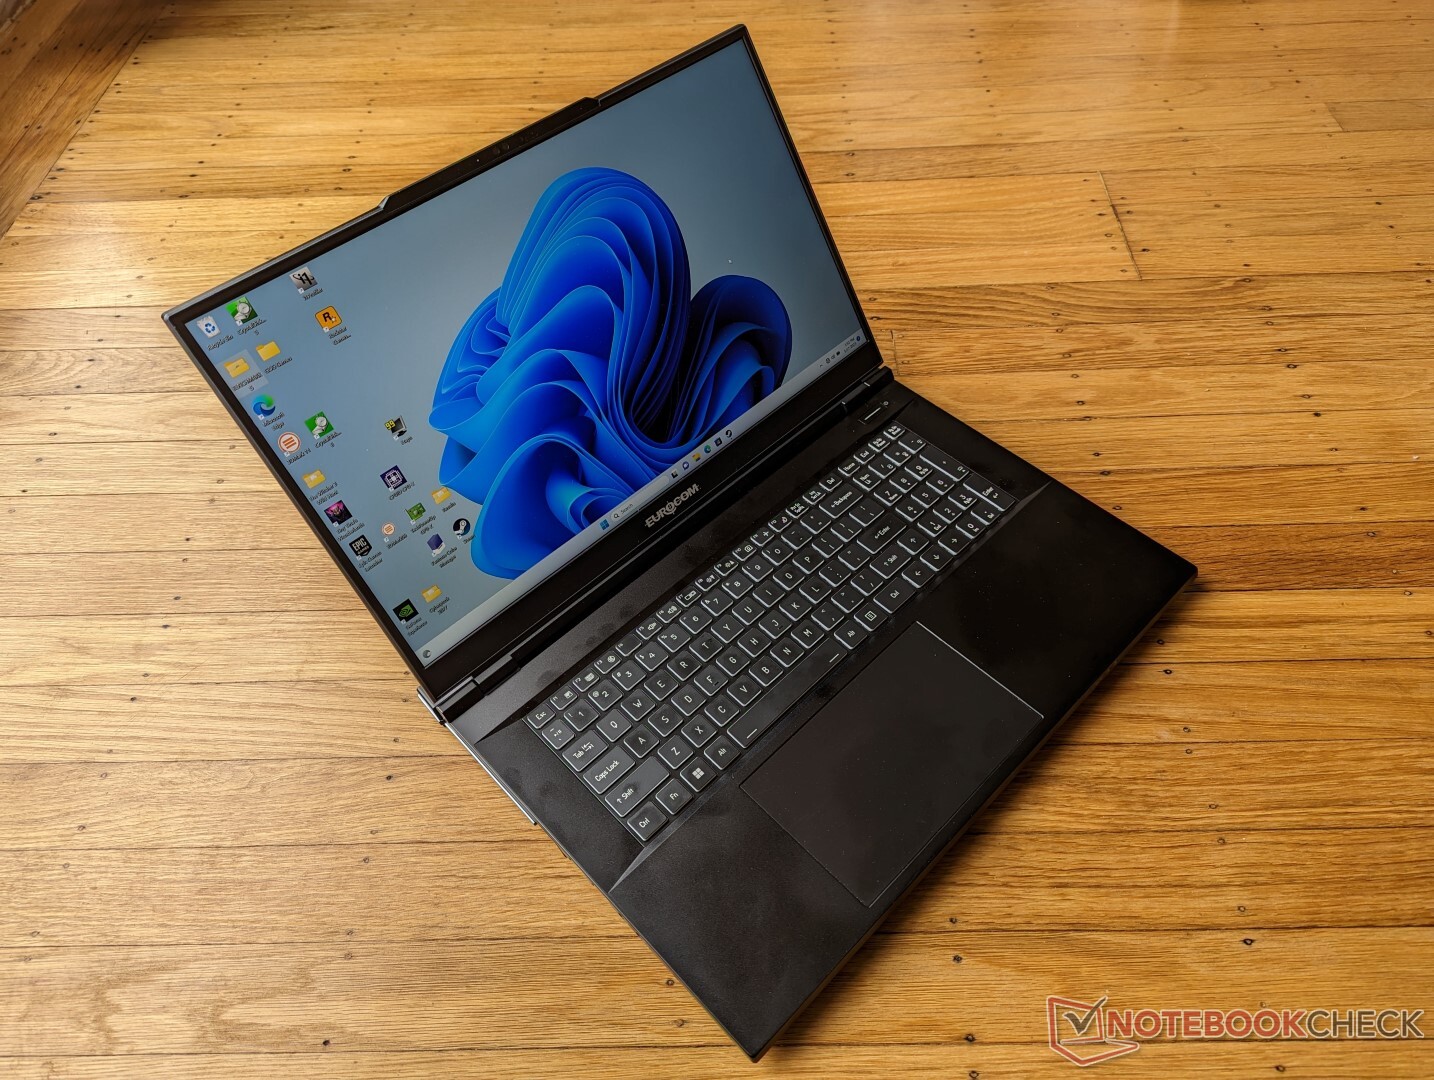
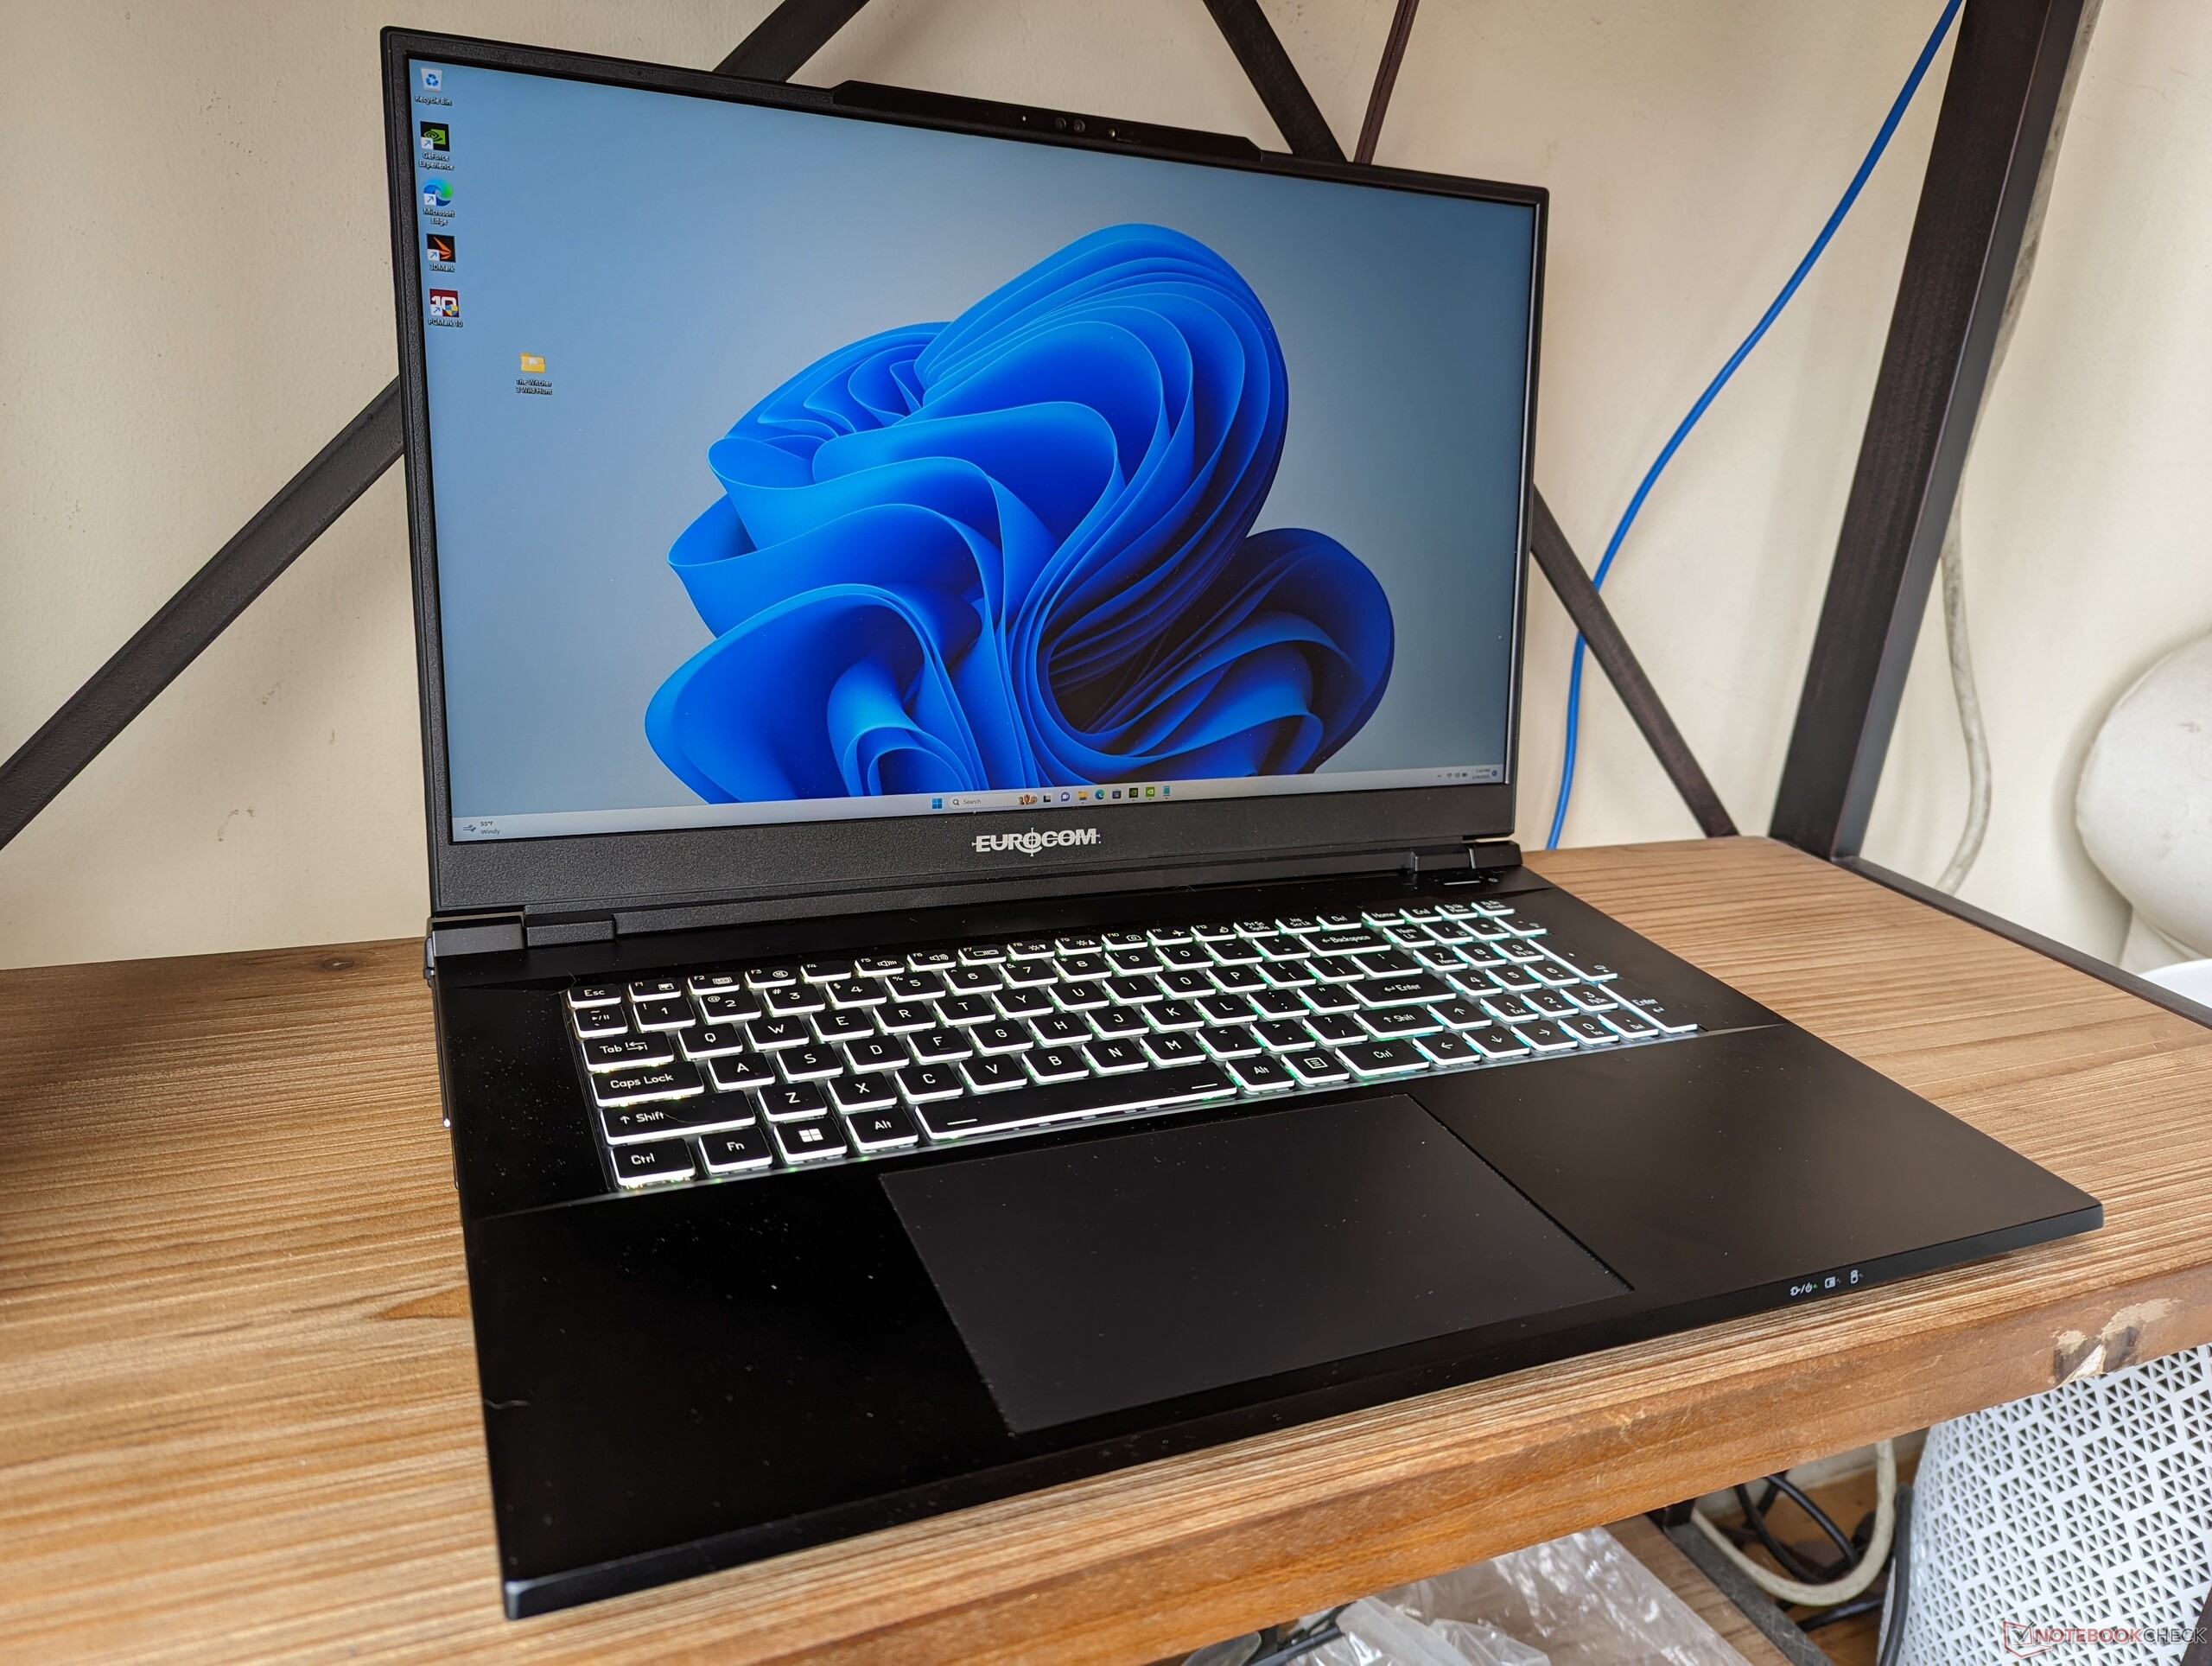
Recensione del portatile Eurocom Raptor X17: L'alternativa ad MSI e Asus ROG

Dopo aver provato di recente il modello da 15,6 pollici Raptor X15siamo ora pronti ad affrontare il fratello maggiore Raptor X17 da 17,3 pollici. Il suo telaio è di nuova concezione (X370), che al momento della recensione non abbiamo ancora visto da altri marchi. Tuttavia, ci aspettiamo che altri rivenditori come Schenker offrano questo stesso chassis con un marchio diverso per i mercati esteri.
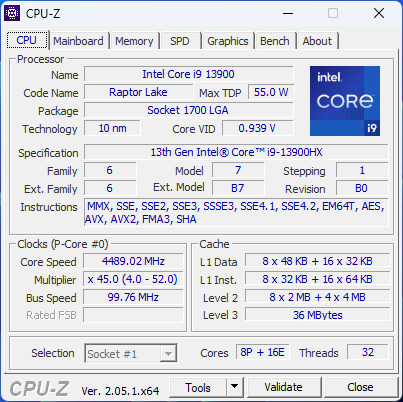
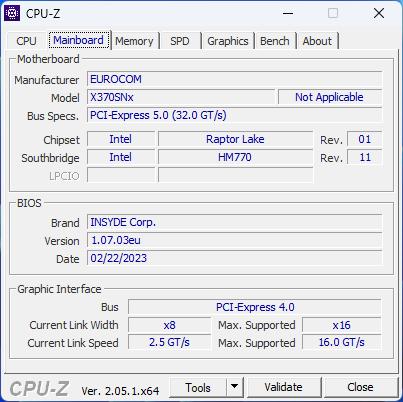
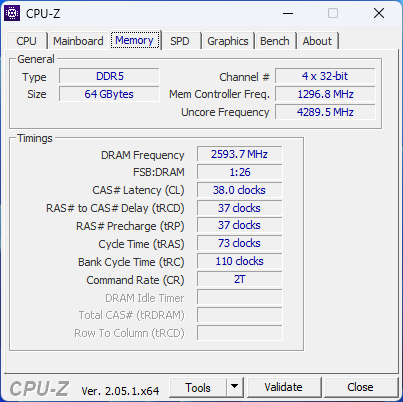
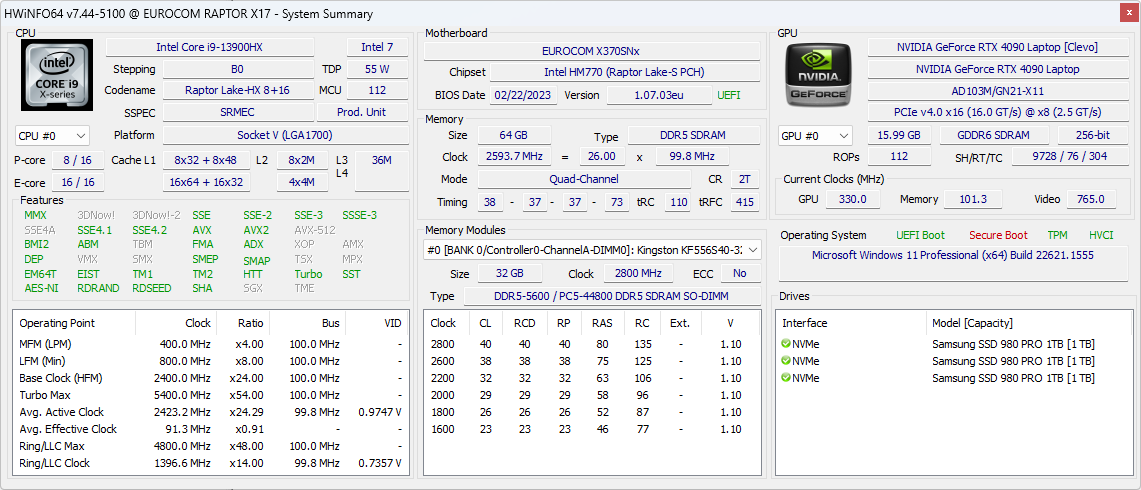
La configurazione in esame è una SKU di fascia alta con CPU Raptor Lake Core i9-13900HX di 13a generazione, GPU RTX 4090 da 175 W GeForce, 64 GB di RAM DDR5, 3 SSD da 1 TB e display 1440p 240 Hz per circa 6.600 dollari. Naturalmente, gli utenti possono configurare con meno RAM e memoria e un i7-13700HX o una RTX 4080 per prezzi di partenza inferiori.
Tra i concorrenti del Raptor X17 ci sono altri portatili da gioco da 17 pollici di dimensioni medio-sottili come il Razer Blade 17, Asus ROG Strix Scar 17, Gigabyte Aorus 17Xo il modello MSI GS77.
Altre recensioni di Eurocom:
Potenziali concorrenti a confronto
Punteggio | Data | Modello | Peso | Altezza | Dimensione | Risoluzione | Prezzo |
|---|---|---|---|---|---|---|---|
| 82.8 % v7 (old) | 05/2023 | Eurocom Raptor X17 i9-13900HX, GeForce RTX 4090 Laptop GPU | 3.5 kg | 24.9 mm | 17.30" | 2560x1440 | |
| 88.3 % v7 (old) | 04/2023 | Asus ROG Strix Scar 17 G733PY-XS96 R9 7945HX, GeForce RTX 4090 Laptop GPU | 2.9 kg | 28.3 mm | 17.30" | 2560x1440 | |
| 86 % v7 (old) | 04/2023 | Aorus 17X AZF i9-13900HX, GeForce RTX 4090 Laptop GPU | 2.9 kg | 21.8 mm | 17.30" | 2560x1440 | |
| 88.3 % v7 (old) | 03/2023 | MSI GE78HX 13VH-070US i9-13950HX, GeForce RTX 4080 Laptop GPU | 3 kg | 23 mm | 17.00" | 2560x1600 | |
| 89.9 % v7 (old) | 03/2023 | Eluktronics Mech-17 GP2 i9-13900HX, GeForce RTX 4090 Laptop GPU | 2.9 kg | 27 mm | 17.00" | 2560x1600 | |
| 86.1 % v7 (old) | 01/2023 | Alienware m17 R5 (R9 6900HX, RX 6850M XT) R9 6900HX, Radeon RX 6850M XT | 3.4 kg | 26.7 mm | 17.00" | 3840x2160 |
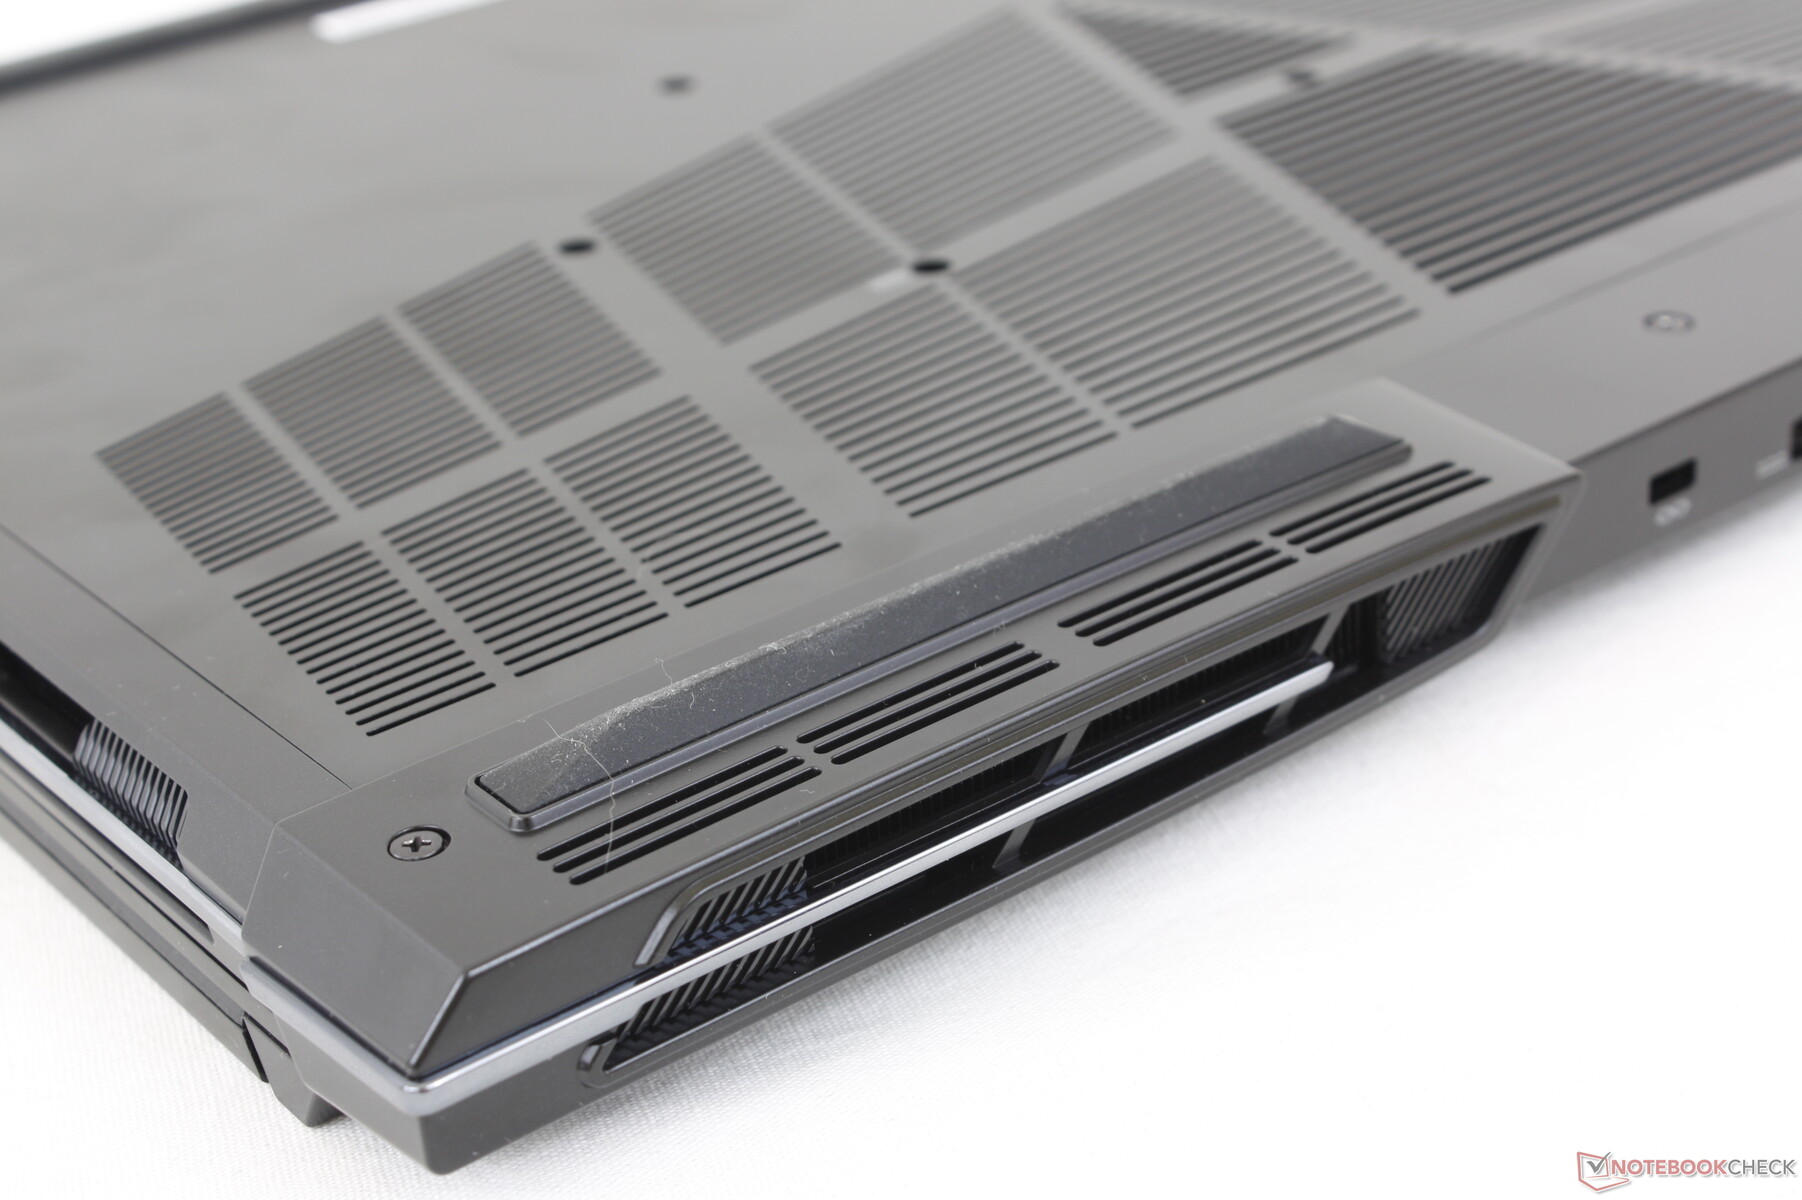
Il caso - Una nuova ripartenza
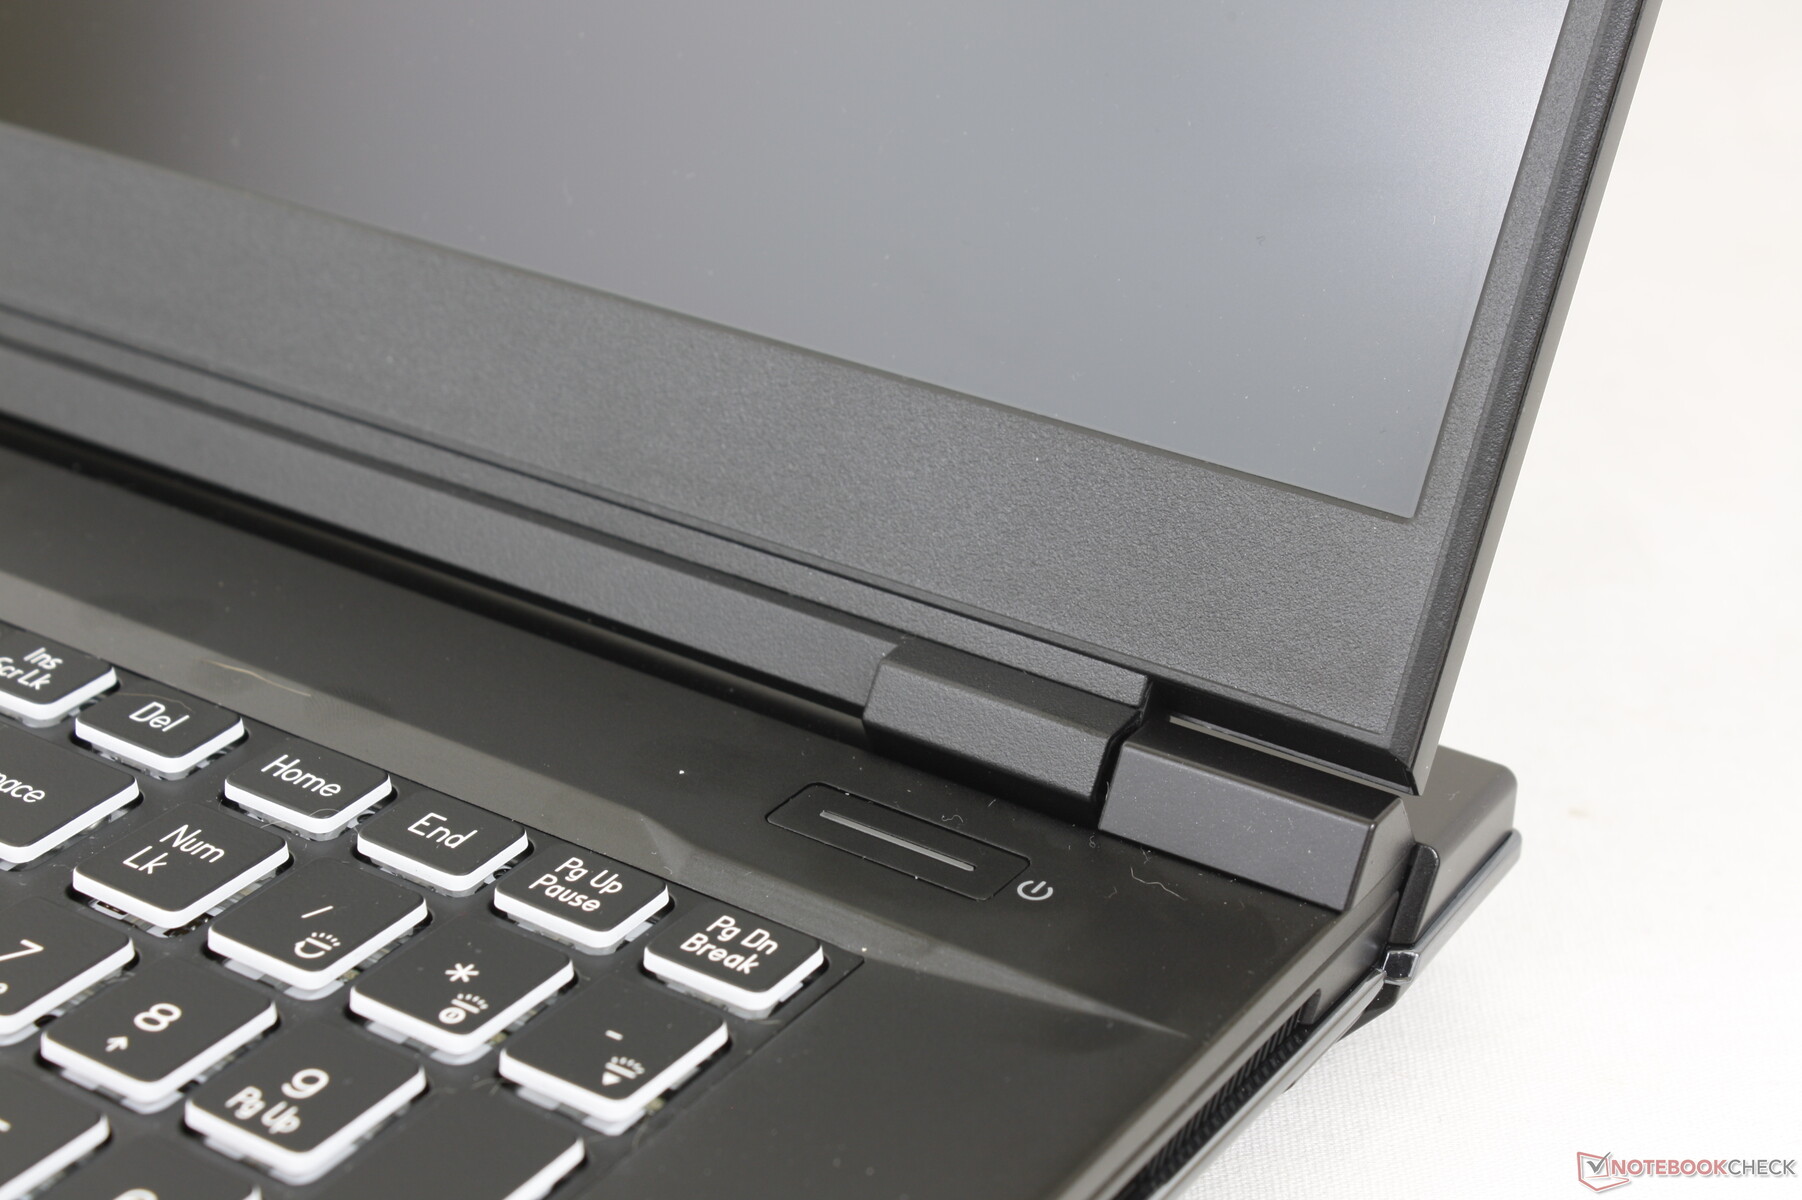
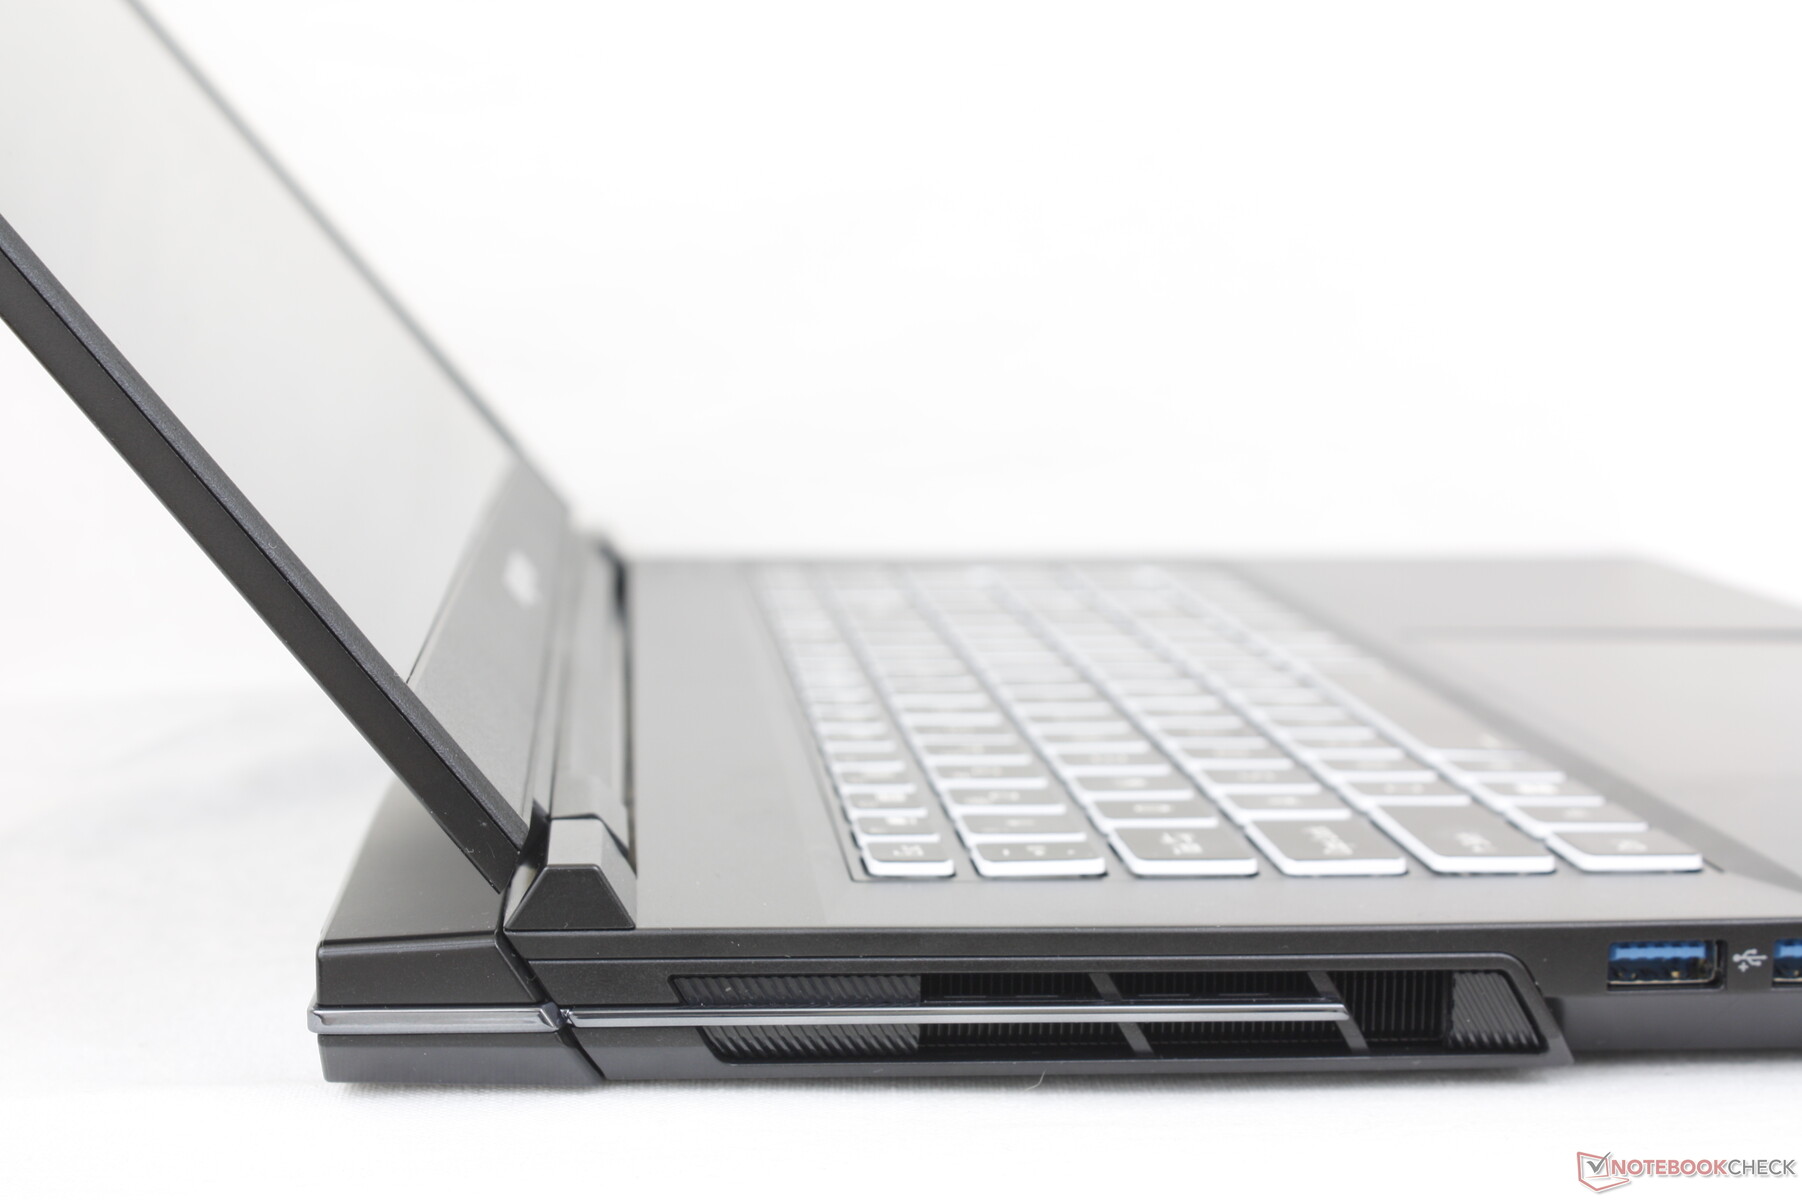
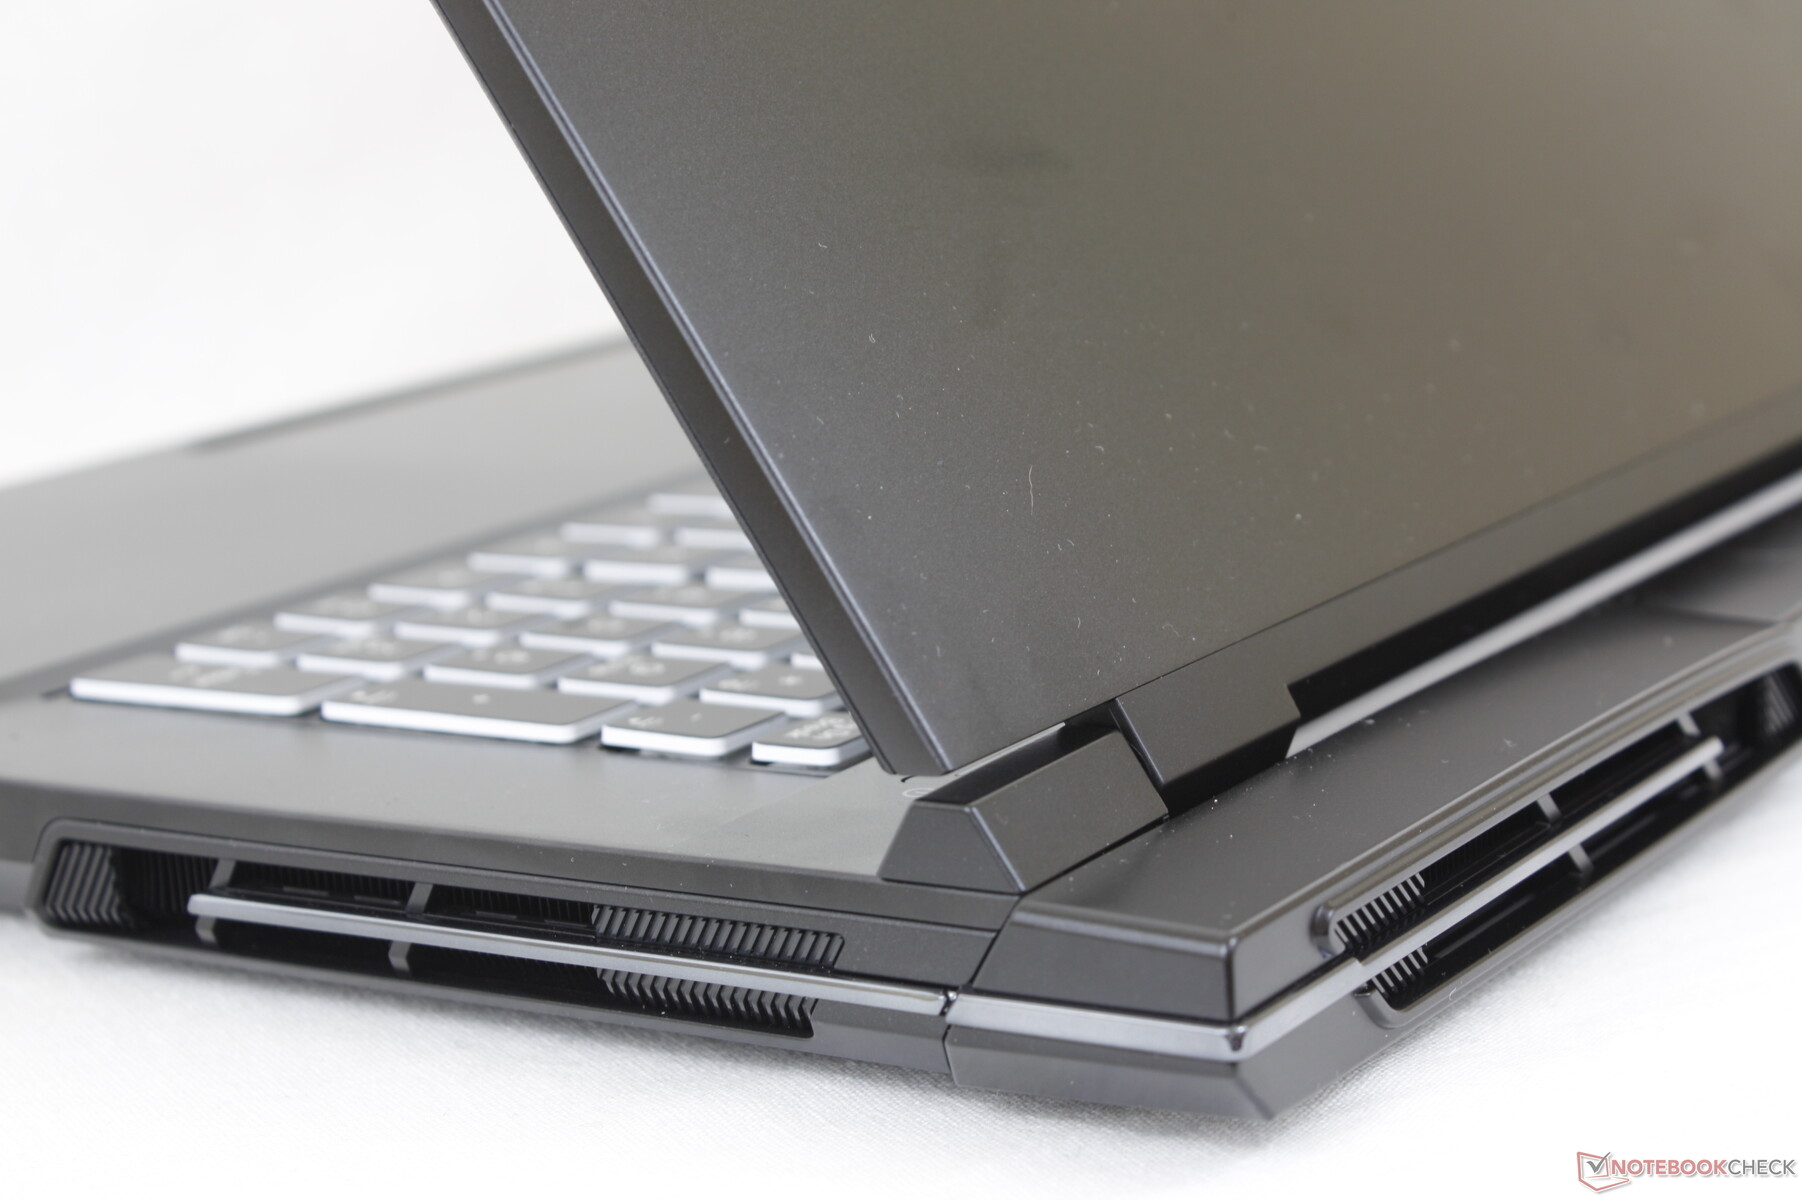
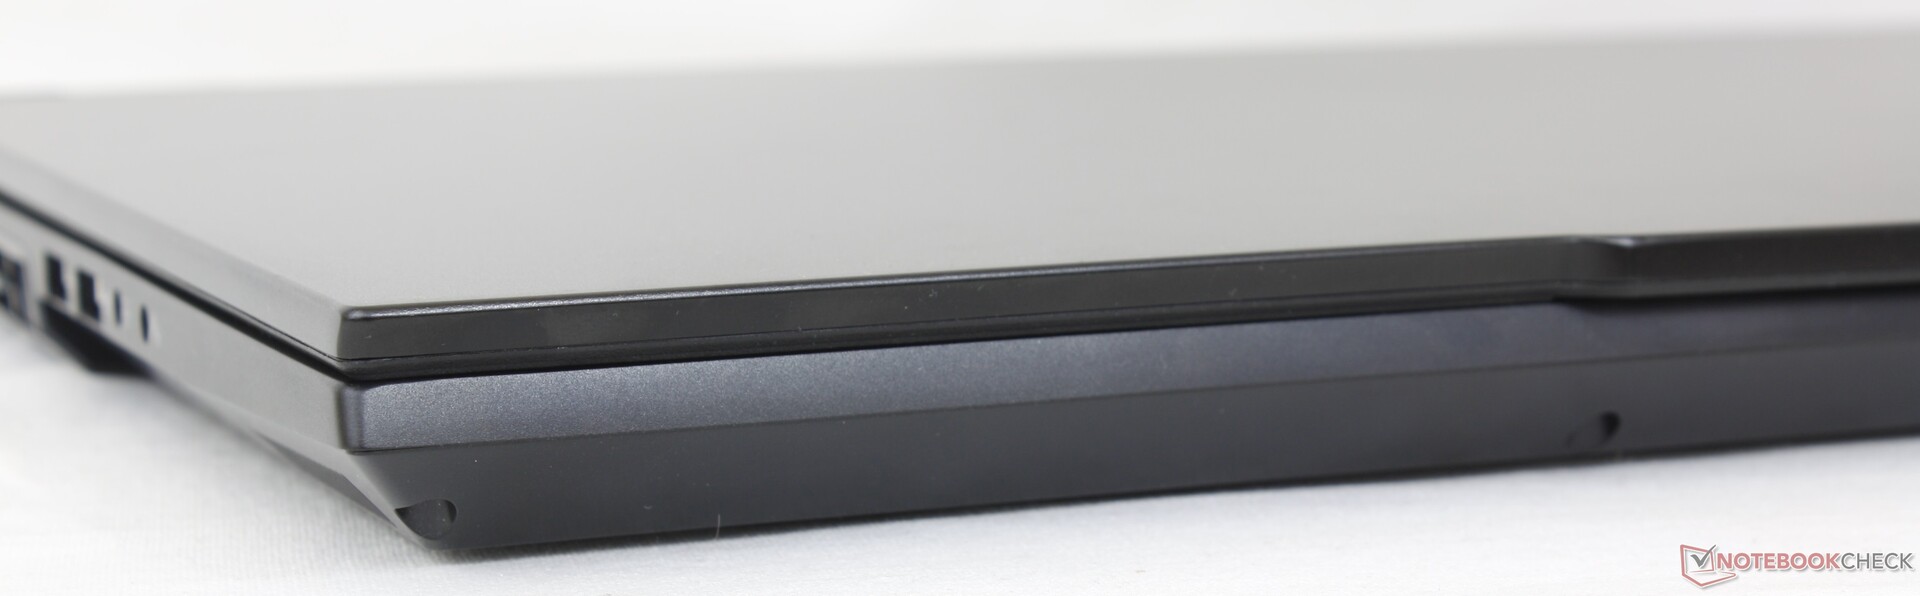
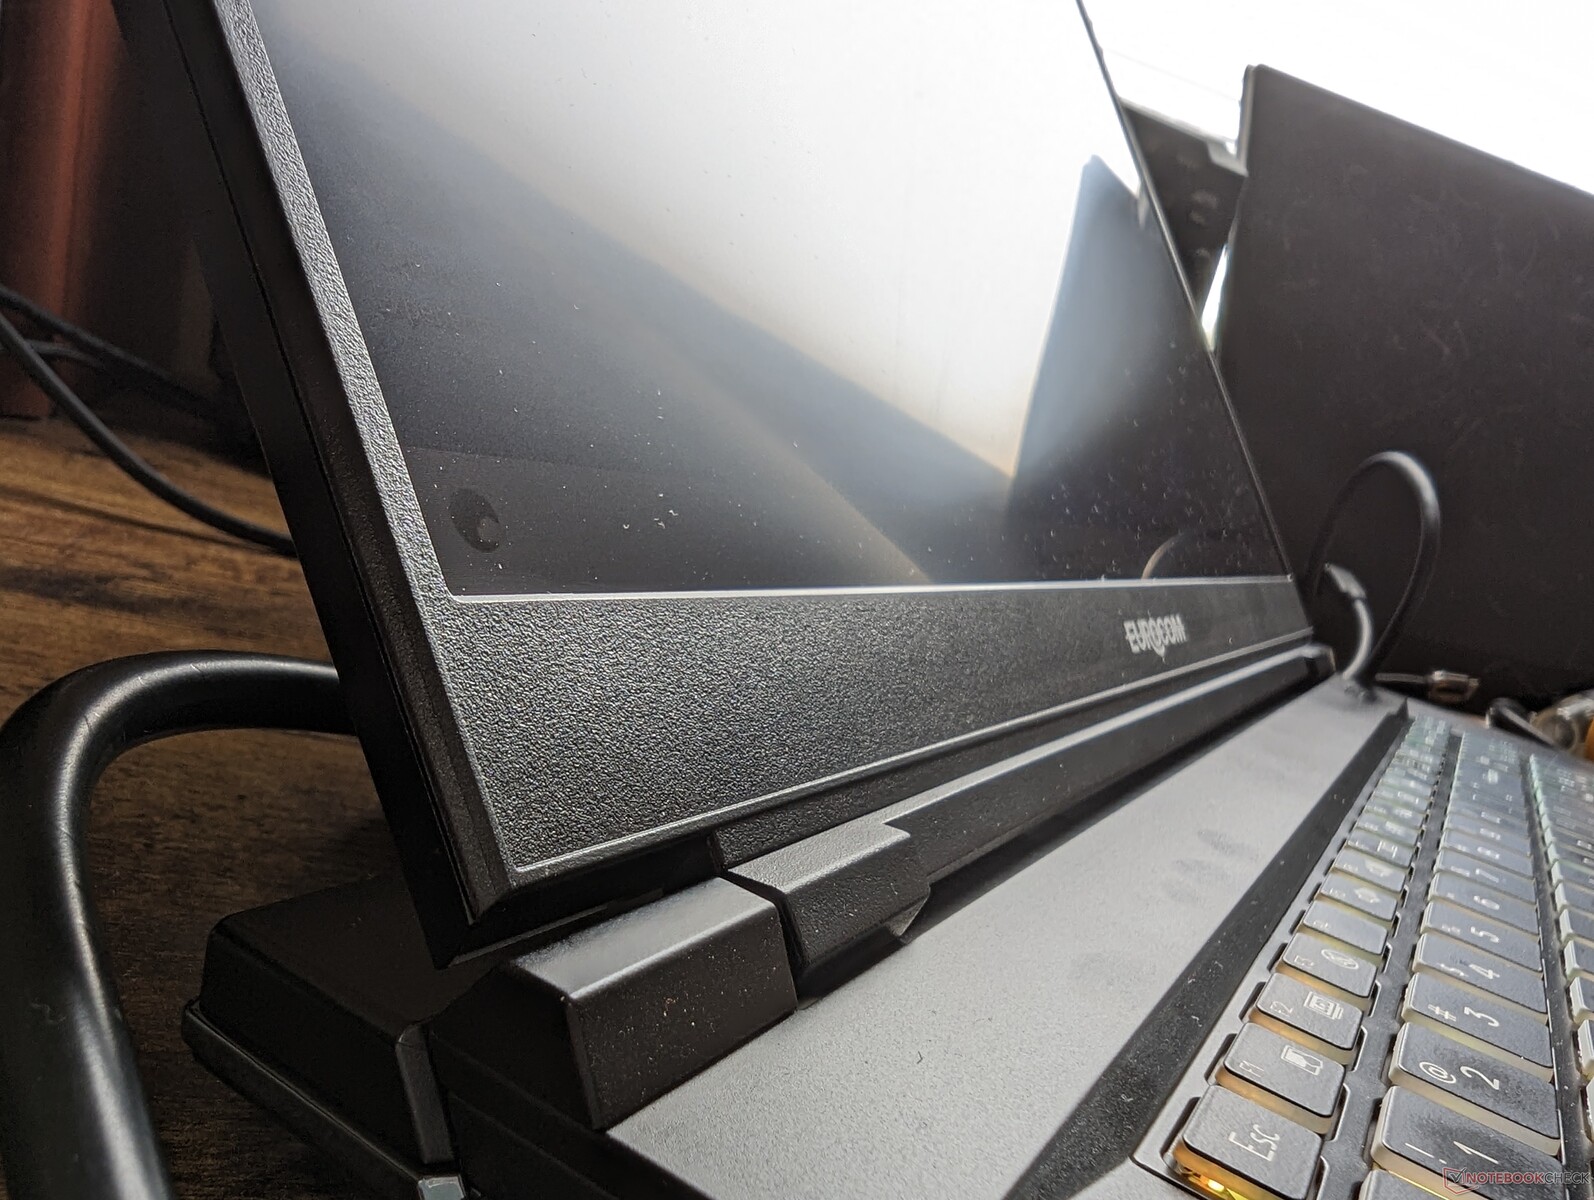
Il Raptor X17 è probabilmente il portatile più elegante che abbiamo visto da Eurocom. Lo scheletro super liscio e prevalentemente in metallo contrasta fortemente con i vecchi e più spessi modelli in ABS della stessa azienda. Anche la rigidità dello chassis è eccellente, con flessioni minime lungo la base e il coperchio esterno, per una prima impressione di solidità.
Forse l'aspetto più debole dello chassis è la cerniera, in quanto il display traballa un po' più aggressivamente quando si regolano gli angoli rispetto alle cerniere più rigide e più grandi di un portatile Asus ROG Portatile Asus ROG. Anche il centro della tastiera si flette leggermente quando si applica la pressione con le dita, il che influisce negativamente sul feedback dei tasti durante la digitazione. Speriamo che le future riprogettazioni possano risolvere questi problemi.
Con un peso di 3,5 kg, il Raptor X17 è uno dei portatili da gioco più pesanti della sua categoria, superando anche il modello da 3,4 kg Alienware m17 Alienware m17 R5. In particolare, il sistema è leggermente più piccolo del ROG Strix Scar 17 G733, ma è anche più pesante del 20%, per una sensazione di grande densità. Per qualcosa di significativamente più leggero e più piccolo, gli utenti potrebbero prendere in considerazione il Razer Blade 17 al suo posto.
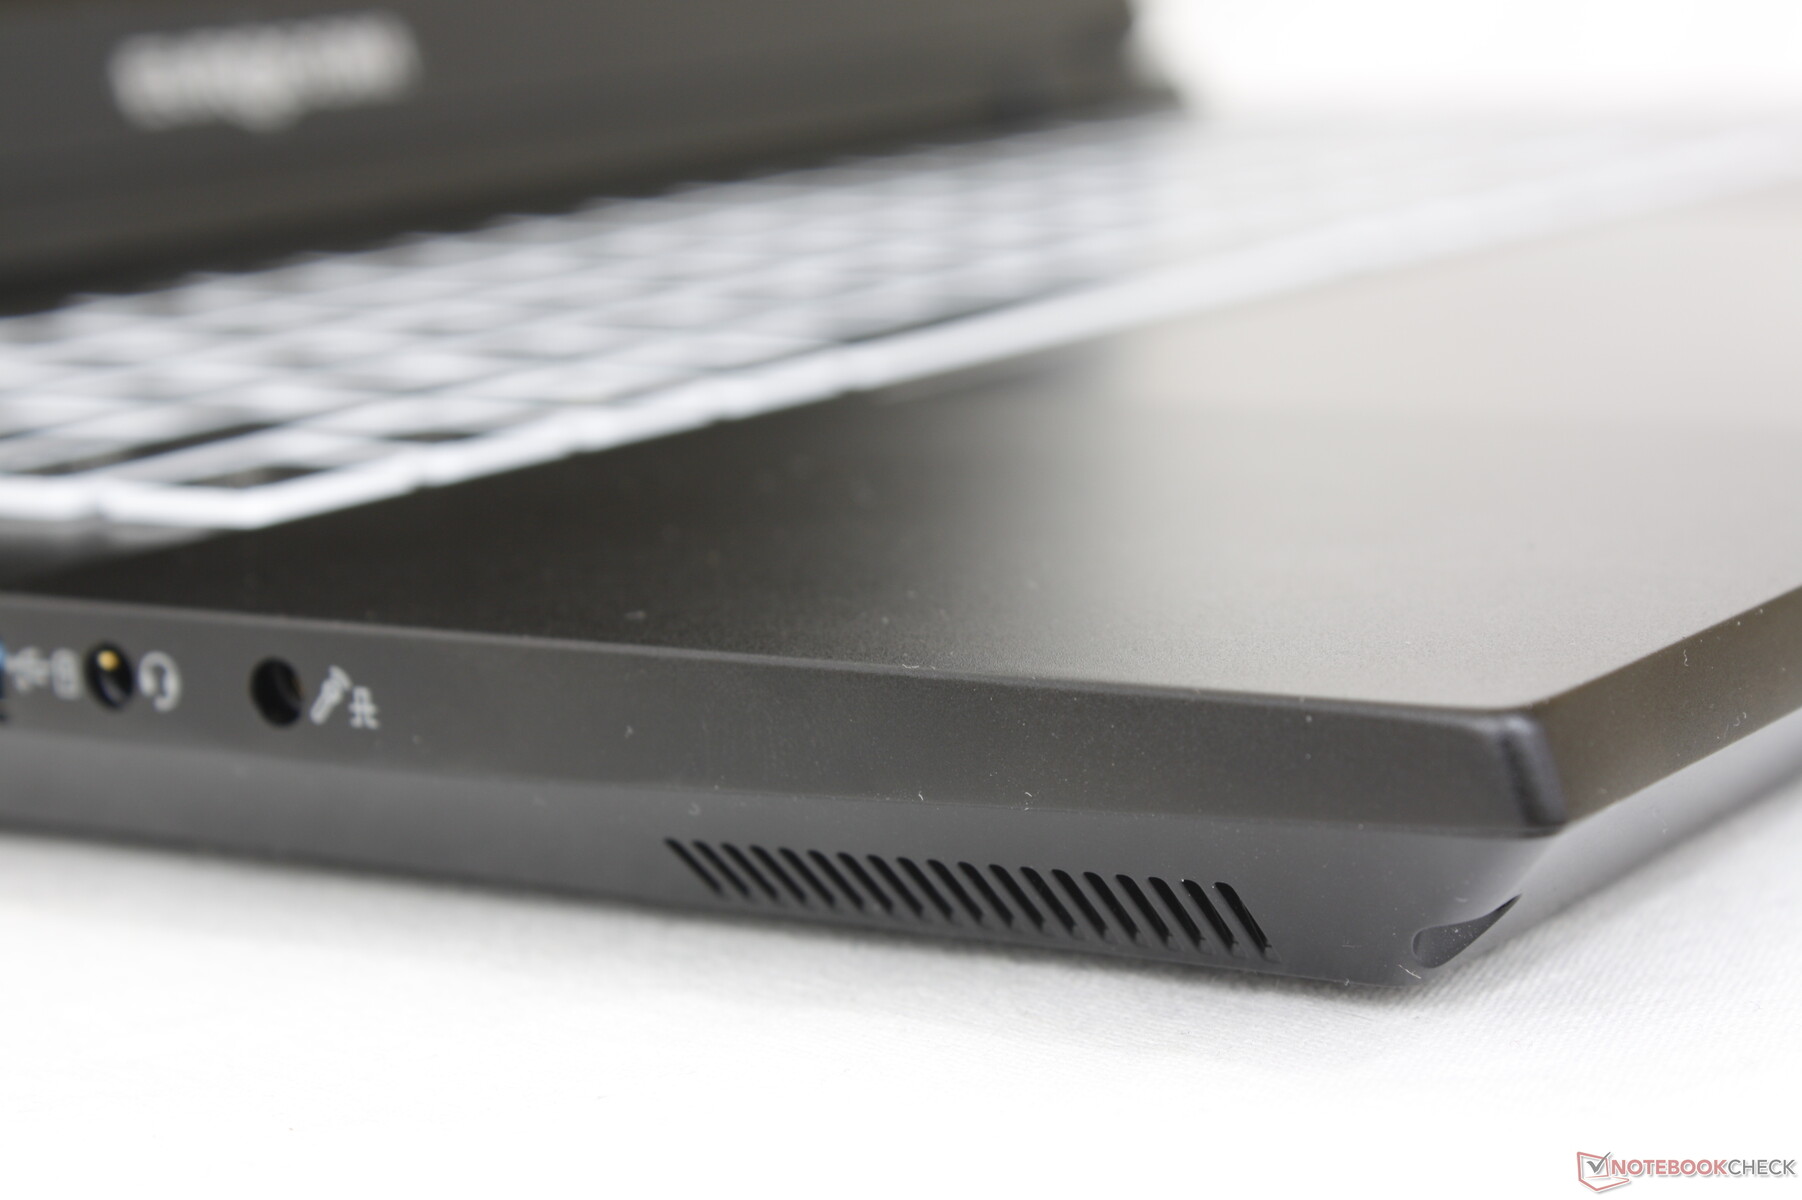
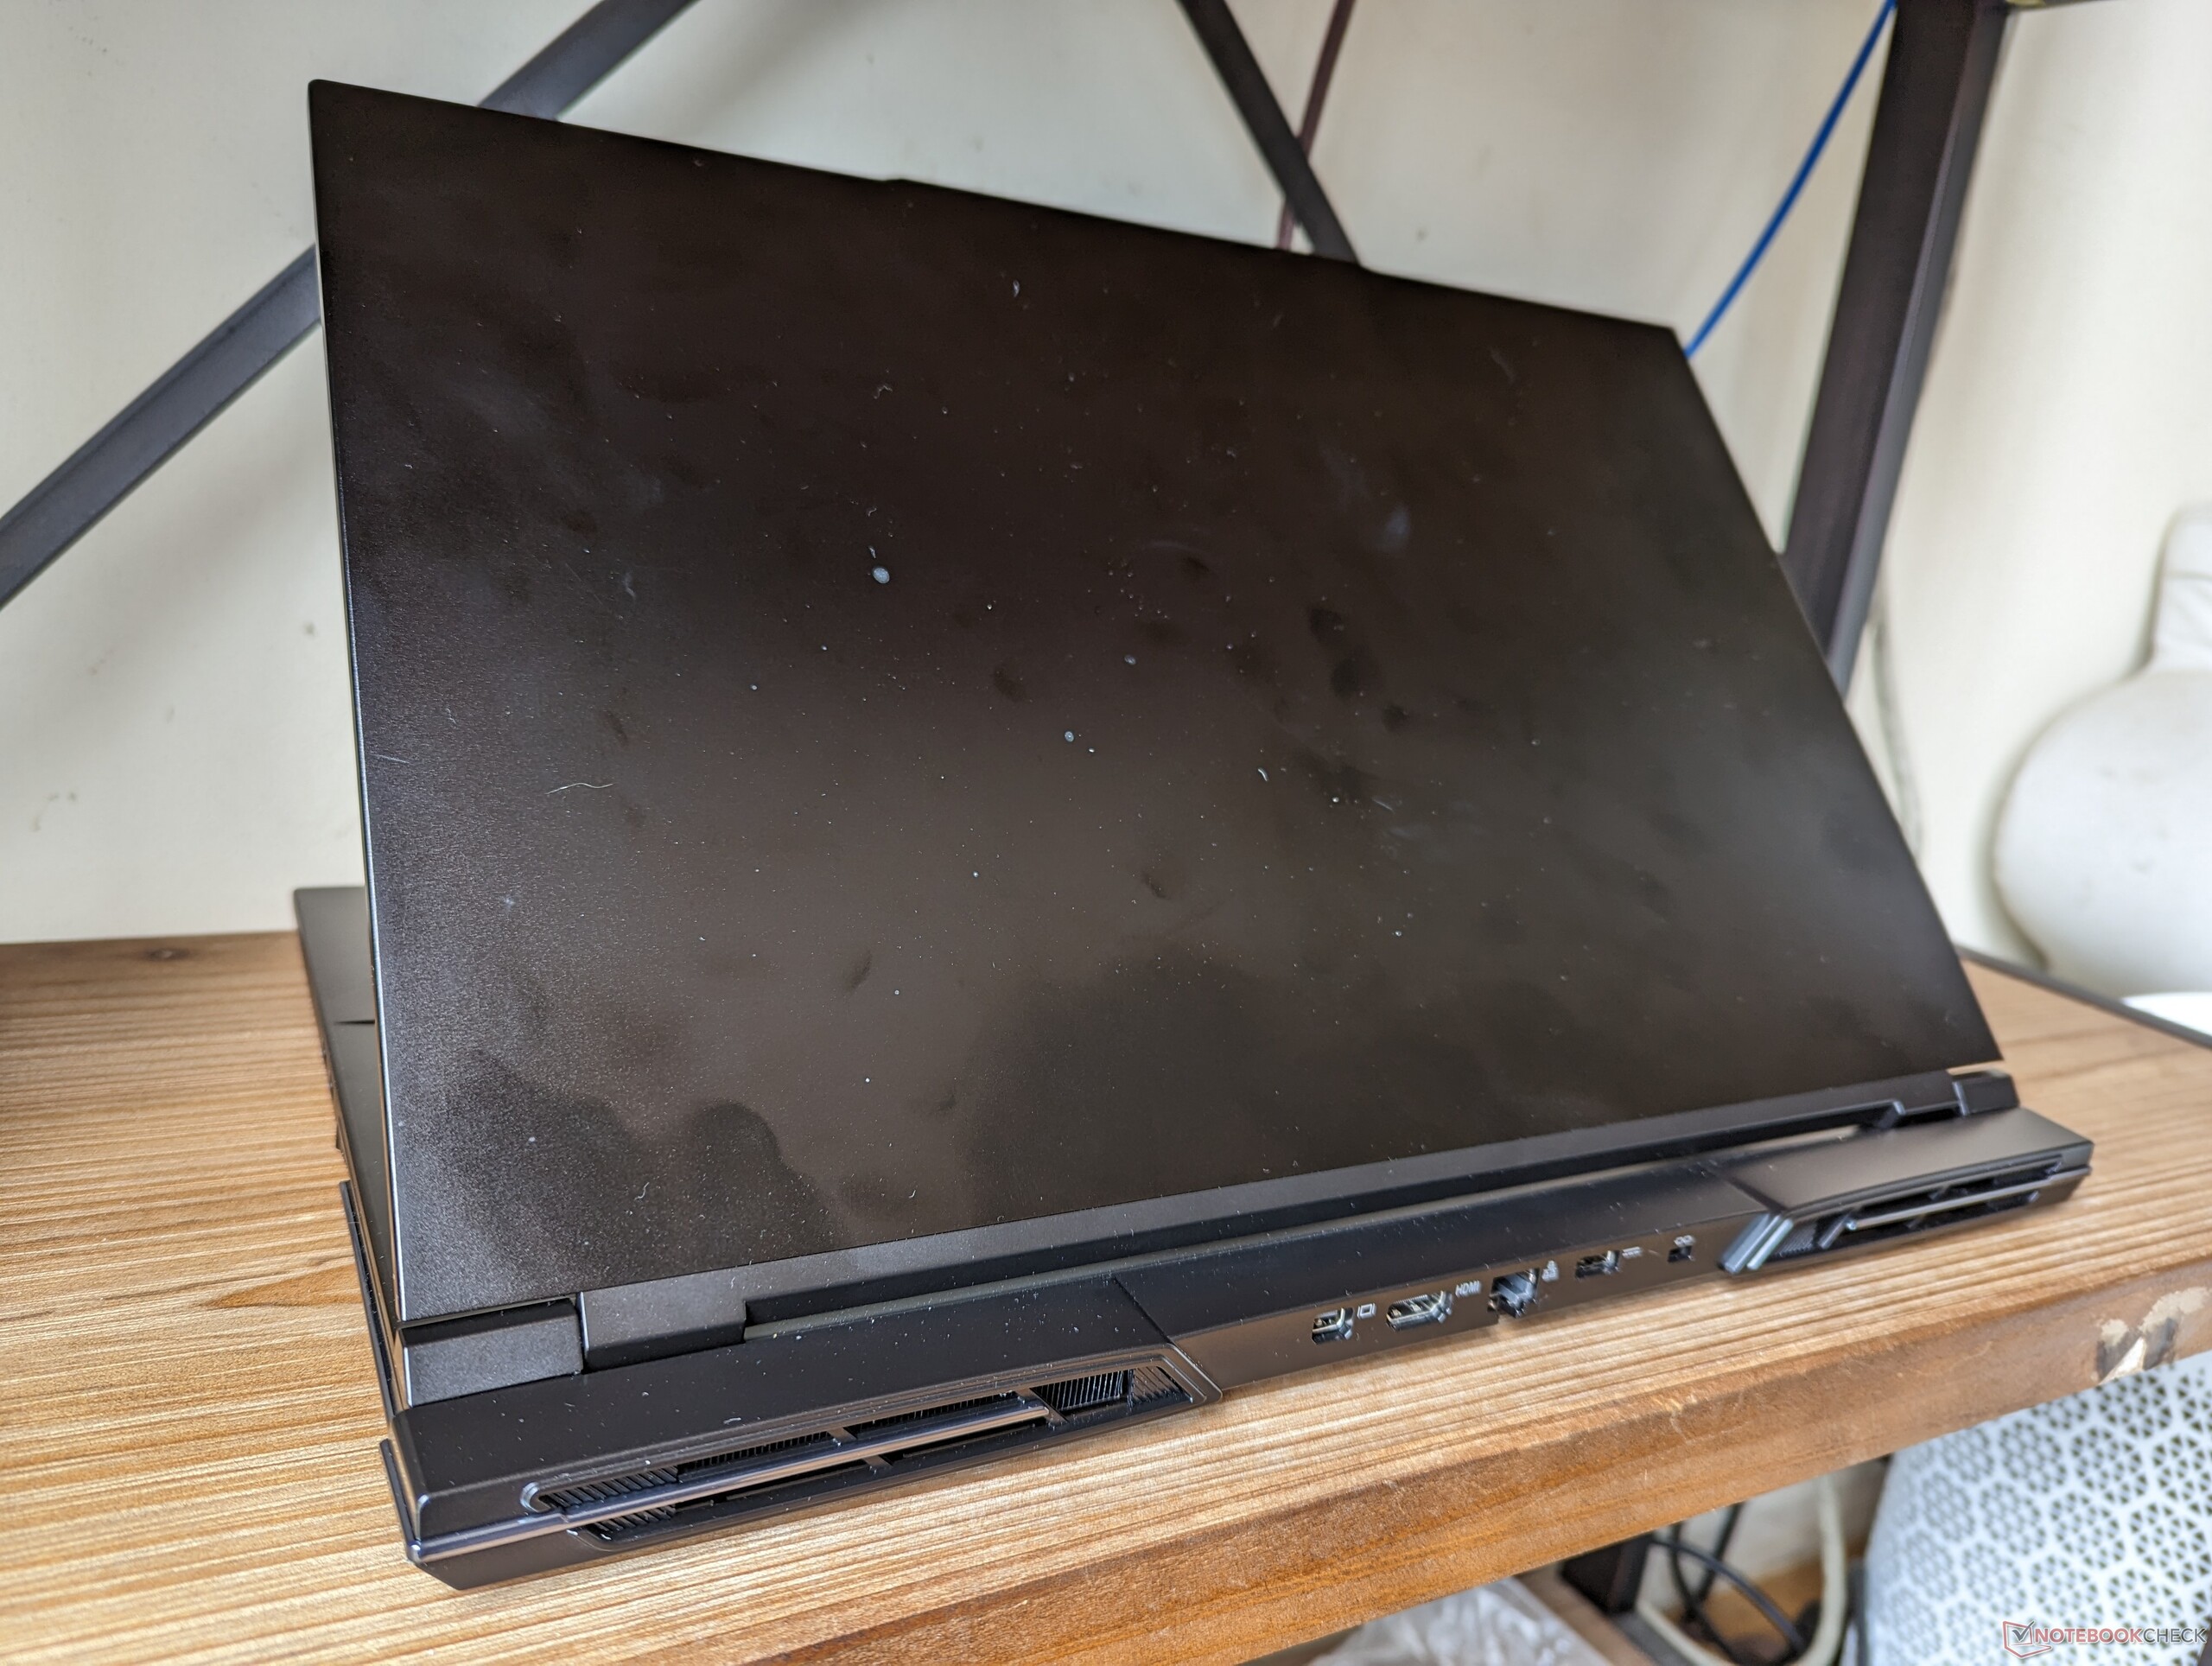
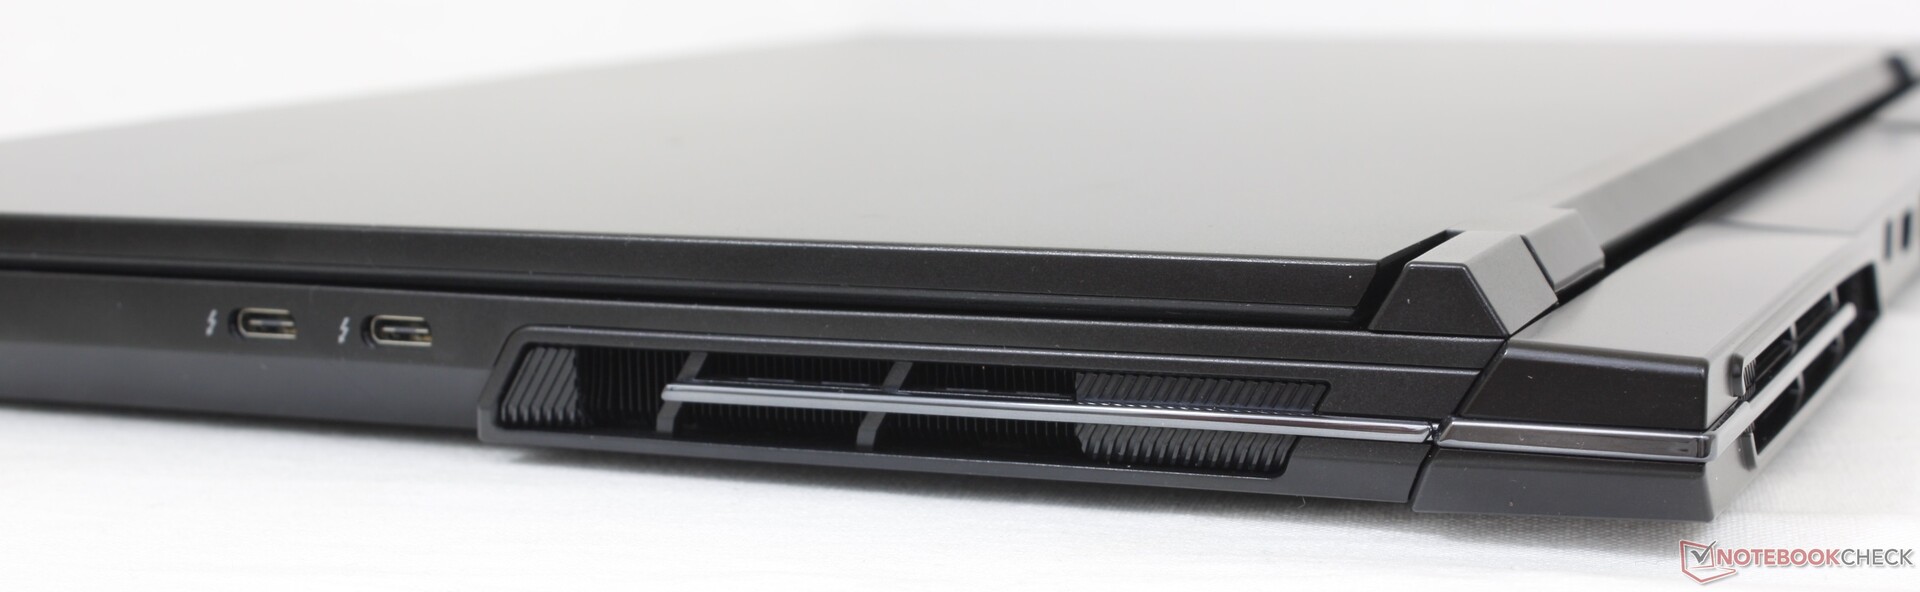
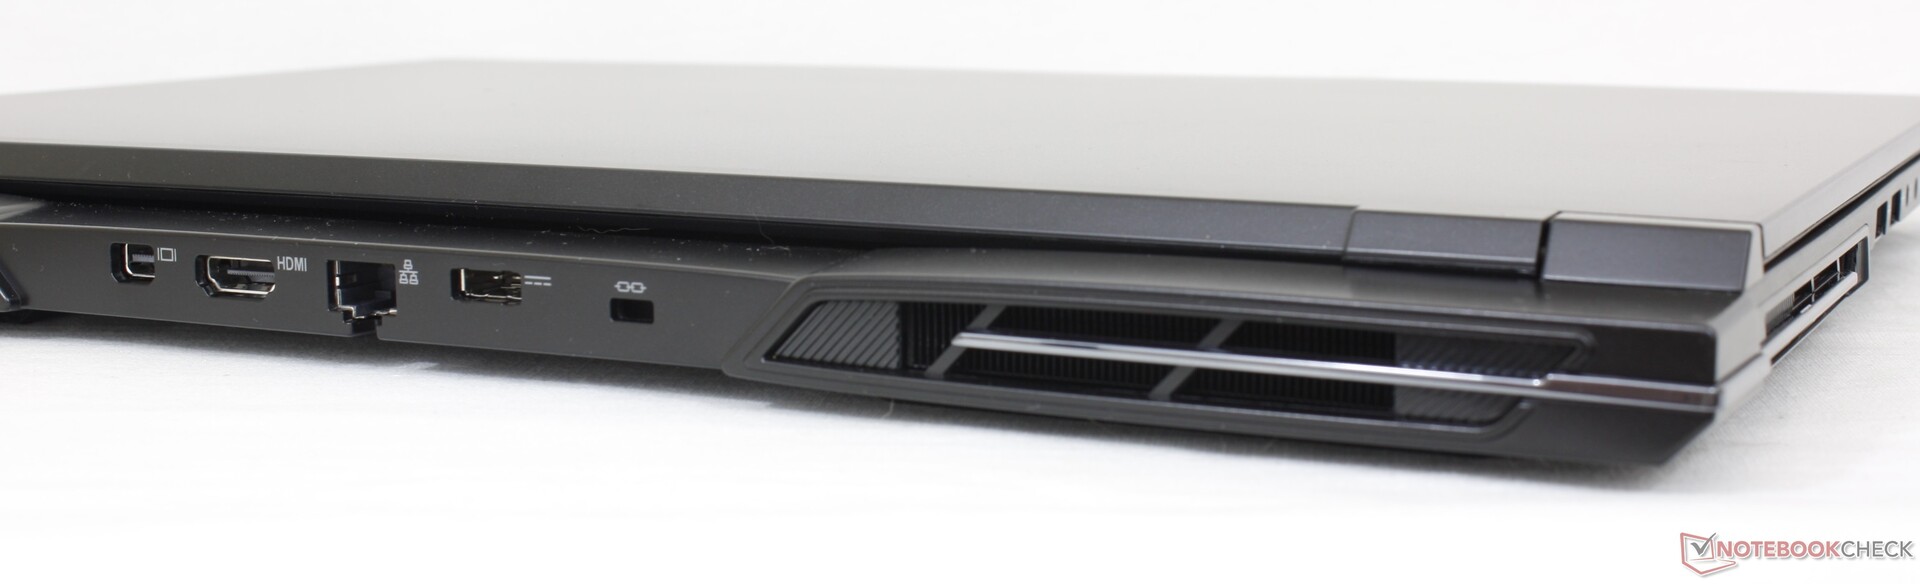
Connettività - Un po' di tutto
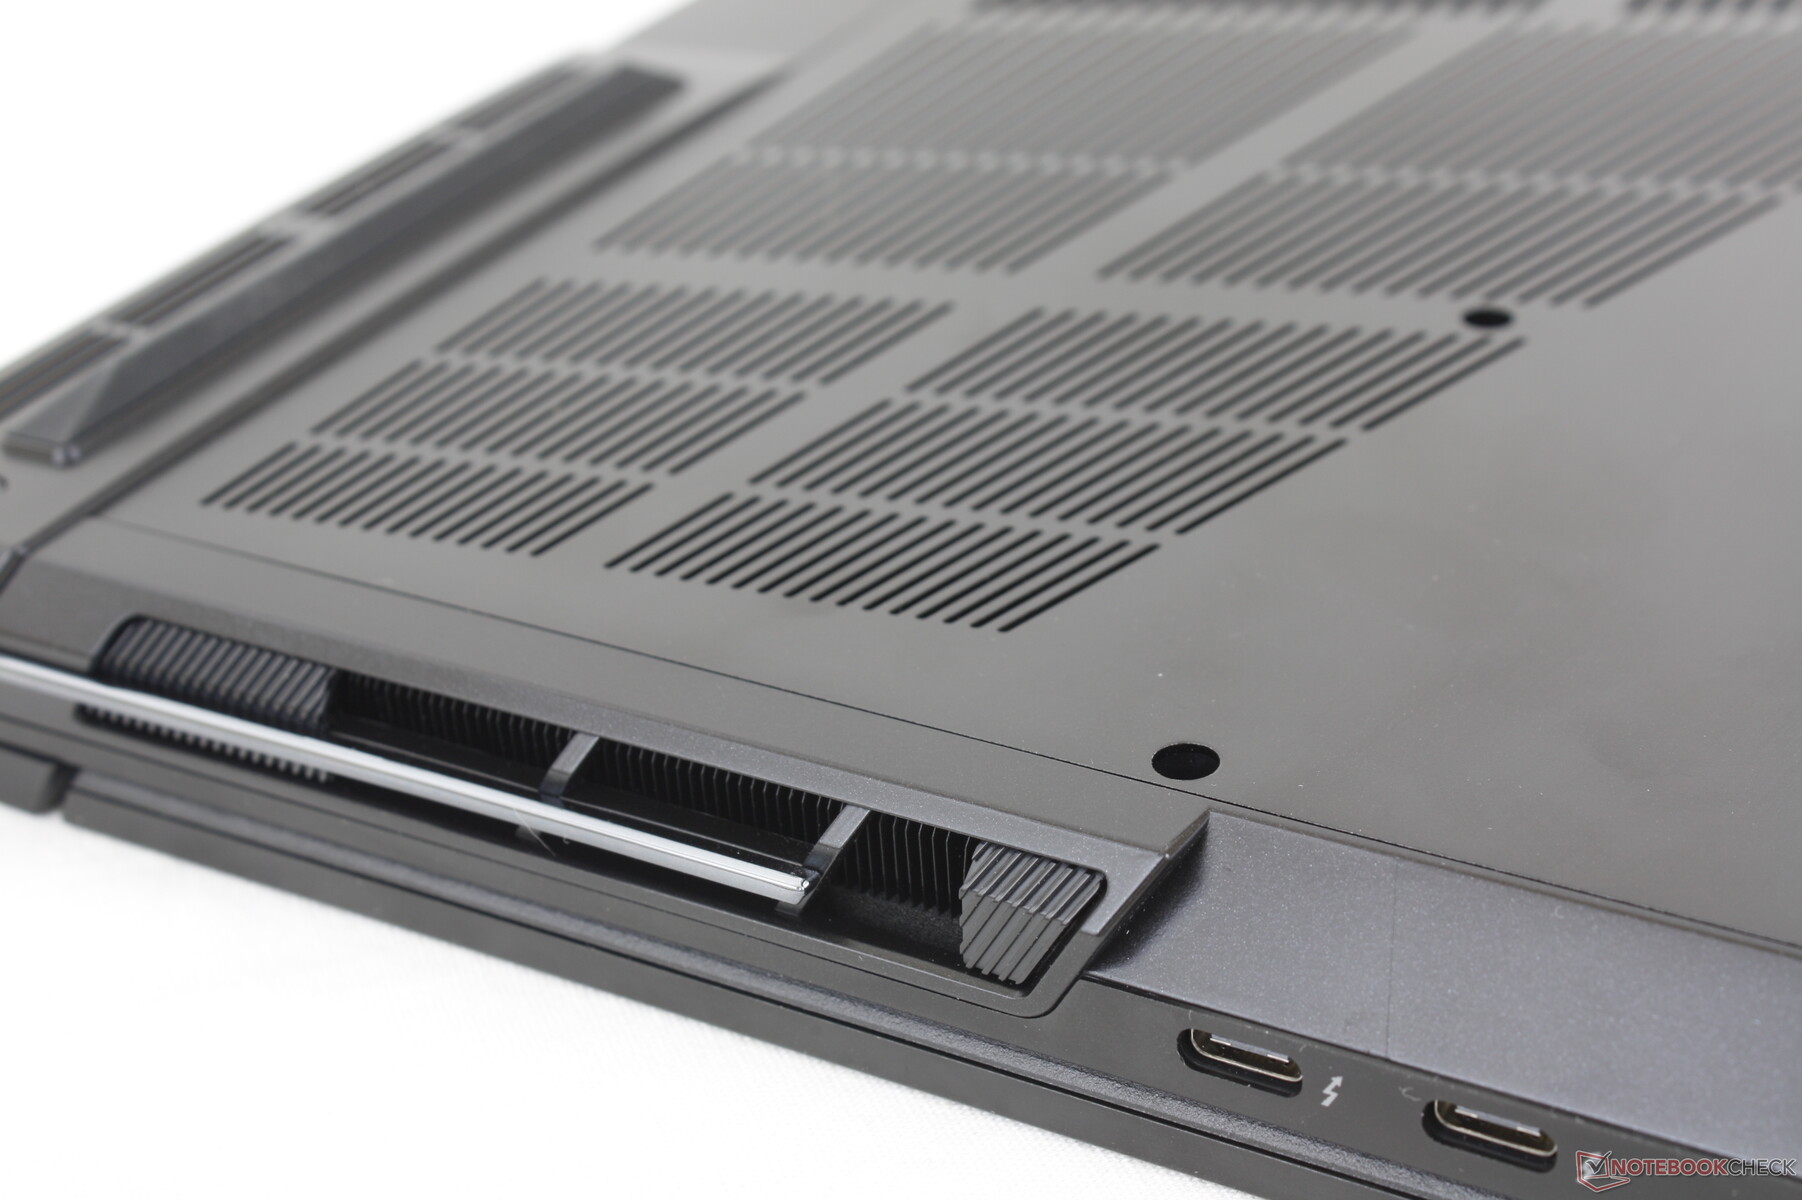
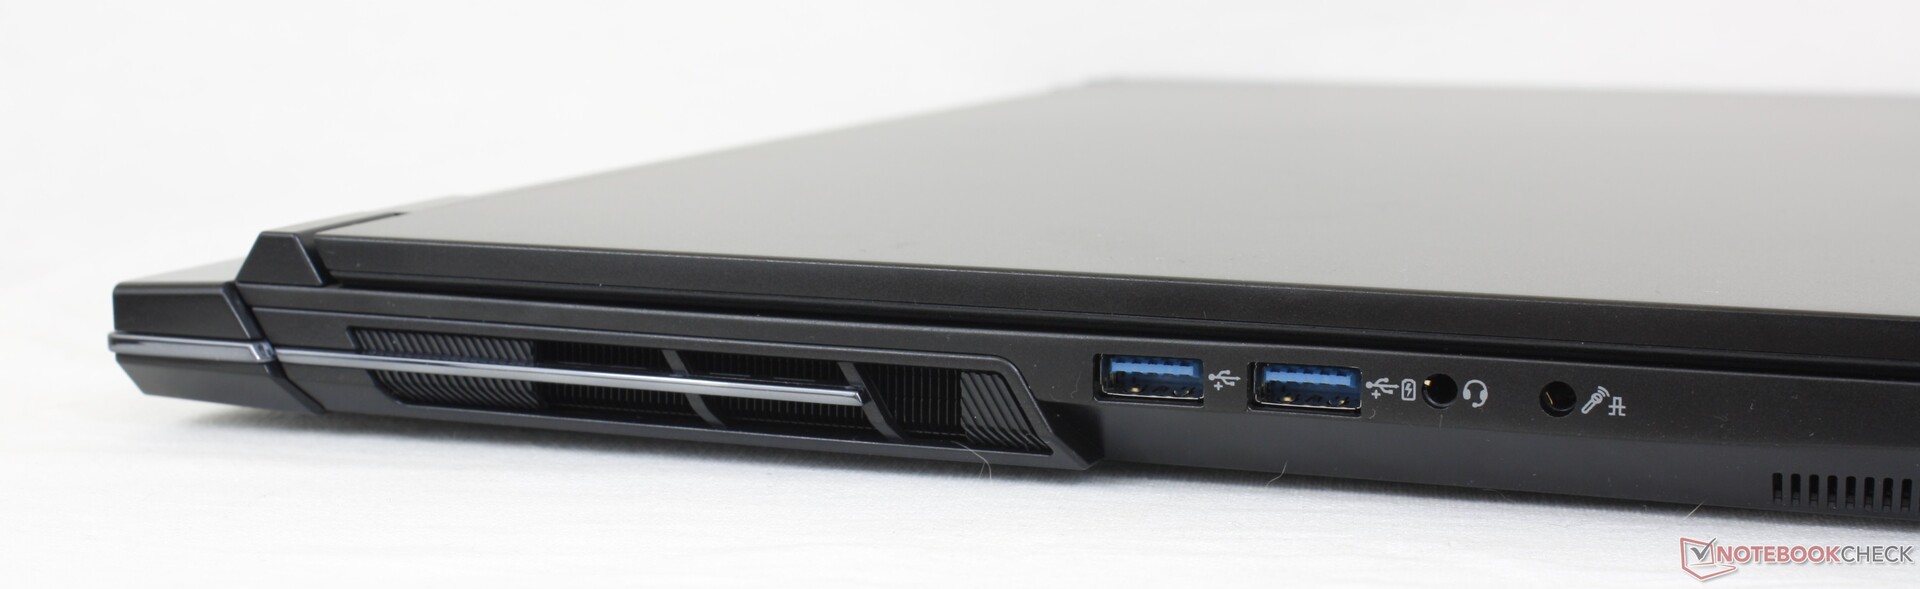
Le opzioni delle porte sono più varie rispetto alla maggior parte dei portatili da gioco da 17 pollici. Per esempio, è raro trovare un modello che integri sia la mini DisplayPort che la RJ-45. Tutte le porte USB si trovano lungo i lati dello chassis, mentre la parte posteriore ospita quasi tutto il resto.
Comunicazione
| Networking | |
| iperf3 transmit AXE11000 | |
| Aorus 17X AZF | |
| Eluktronics Mech-17 GP2 | |
| MSI GE78HX 13VH-070US | |
| Eurocom Raptor X17 | |
| Alienware m17 R5 (R9 6900HX, RX 6850M XT) | |
| Asus ROG Strix Scar 17 G733PY-XS96 | |
| iperf3 receive AXE11000 | |
| Aorus 17X AZF | |
| Eluktronics Mech-17 GP2 | |
| Asus ROG Strix Scar 17 G733PY-XS96 | |
| MSI GE78HX 13VH-070US | |
| Eurocom Raptor X17 | |
| Alienware m17 R5 (R9 6900HX, RX 6850M XT) | |
| iperf3 transmit AXE11000 6GHz | |
| Asus ROG Strix Scar 17 G733PY-XS96 | |
| MSI GE78HX 13VH-070US | |
| Eurocom Raptor X17 | |
| iperf3 receive AXE11000 6GHz | |
| MSI GE78HX 13VH-070US | |
| Asus ROG Strix Scar 17 G733PY-XS96 | |
| Eurocom Raptor X17 | |
Webcam
La webcam da 2 MP è tipica della maggior parte dei portatili, indipendentemente dal prezzo. Almeno l'IR è integrato per il supporto di Hello e c'è un otturatore elettronico per la privacy. Si spera che i modelli di prossima generazione integrino webcam da 5 MP, come nei più recenti modelli di Razer Blade 18 Razer Blade 18.

")
")
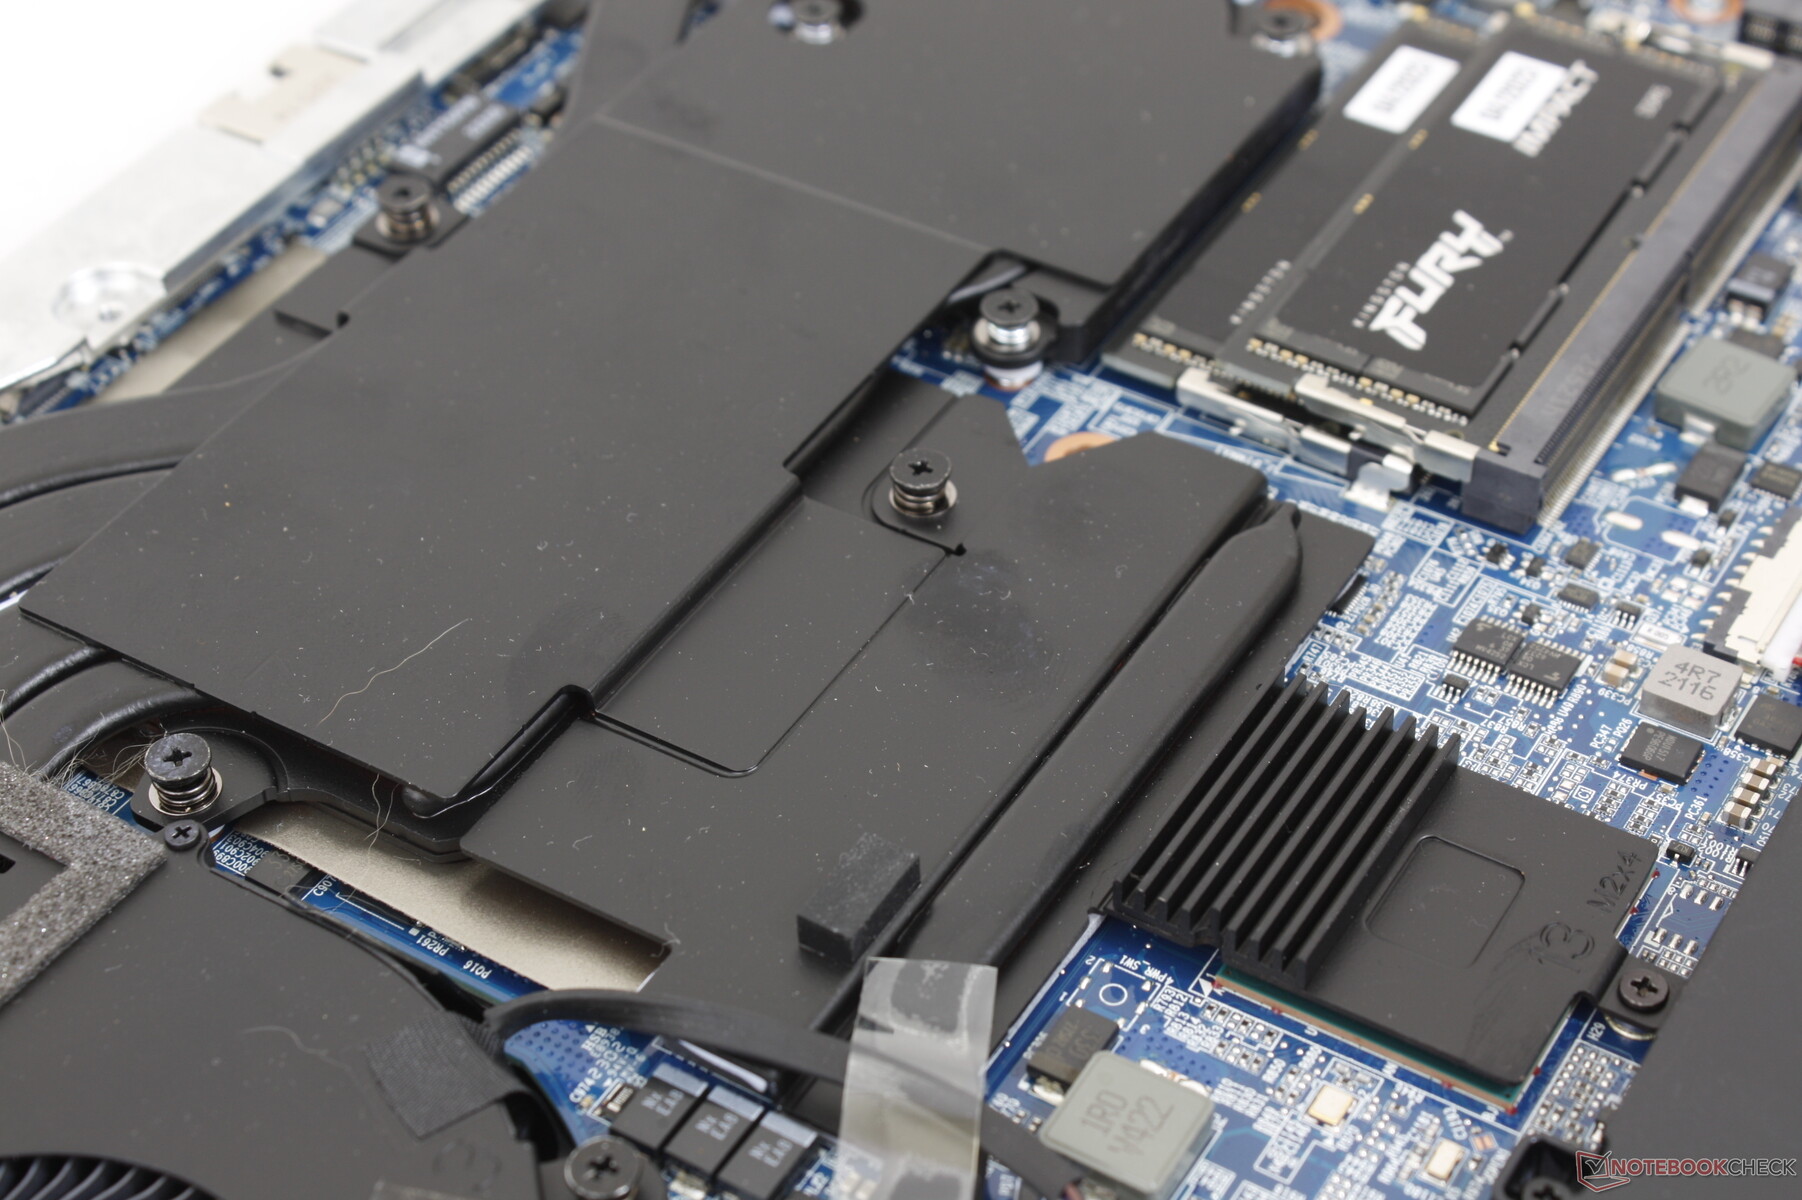
Manutenzione
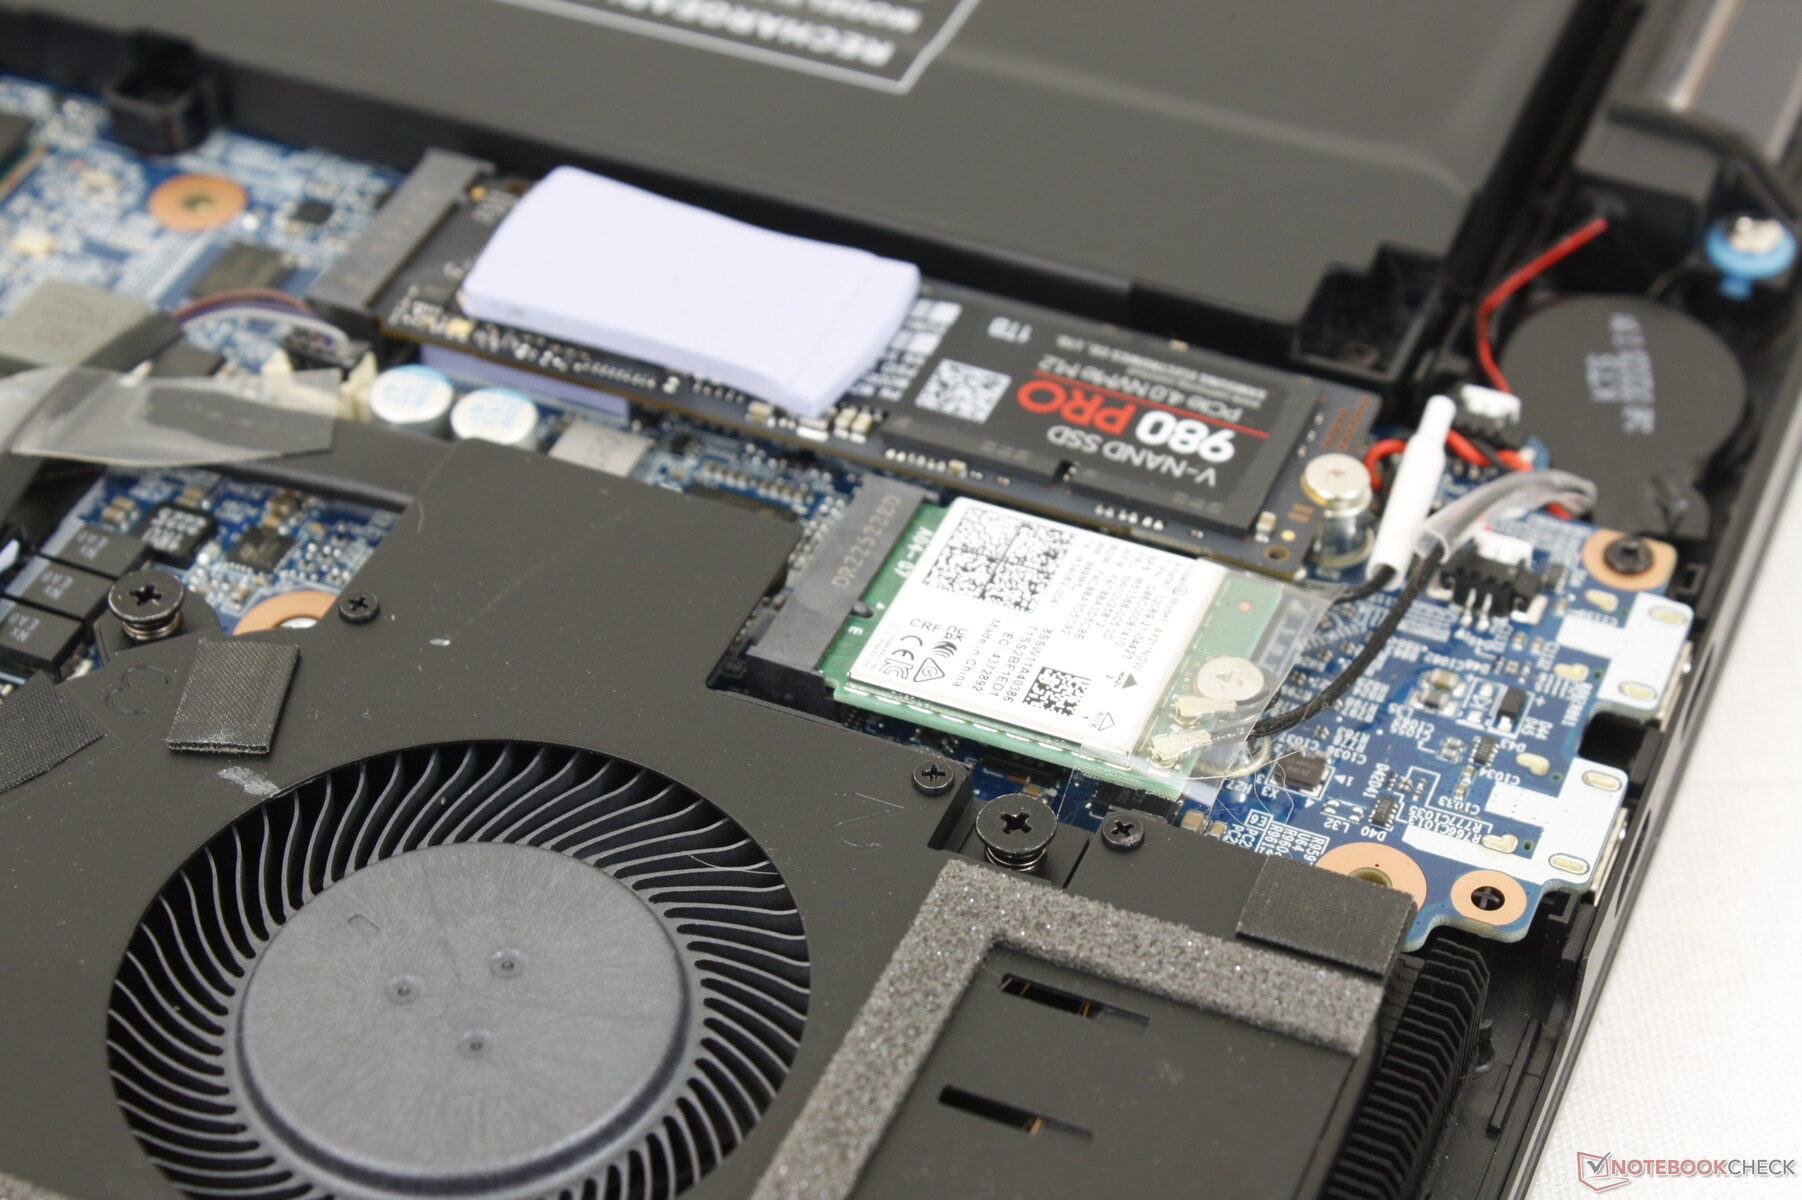
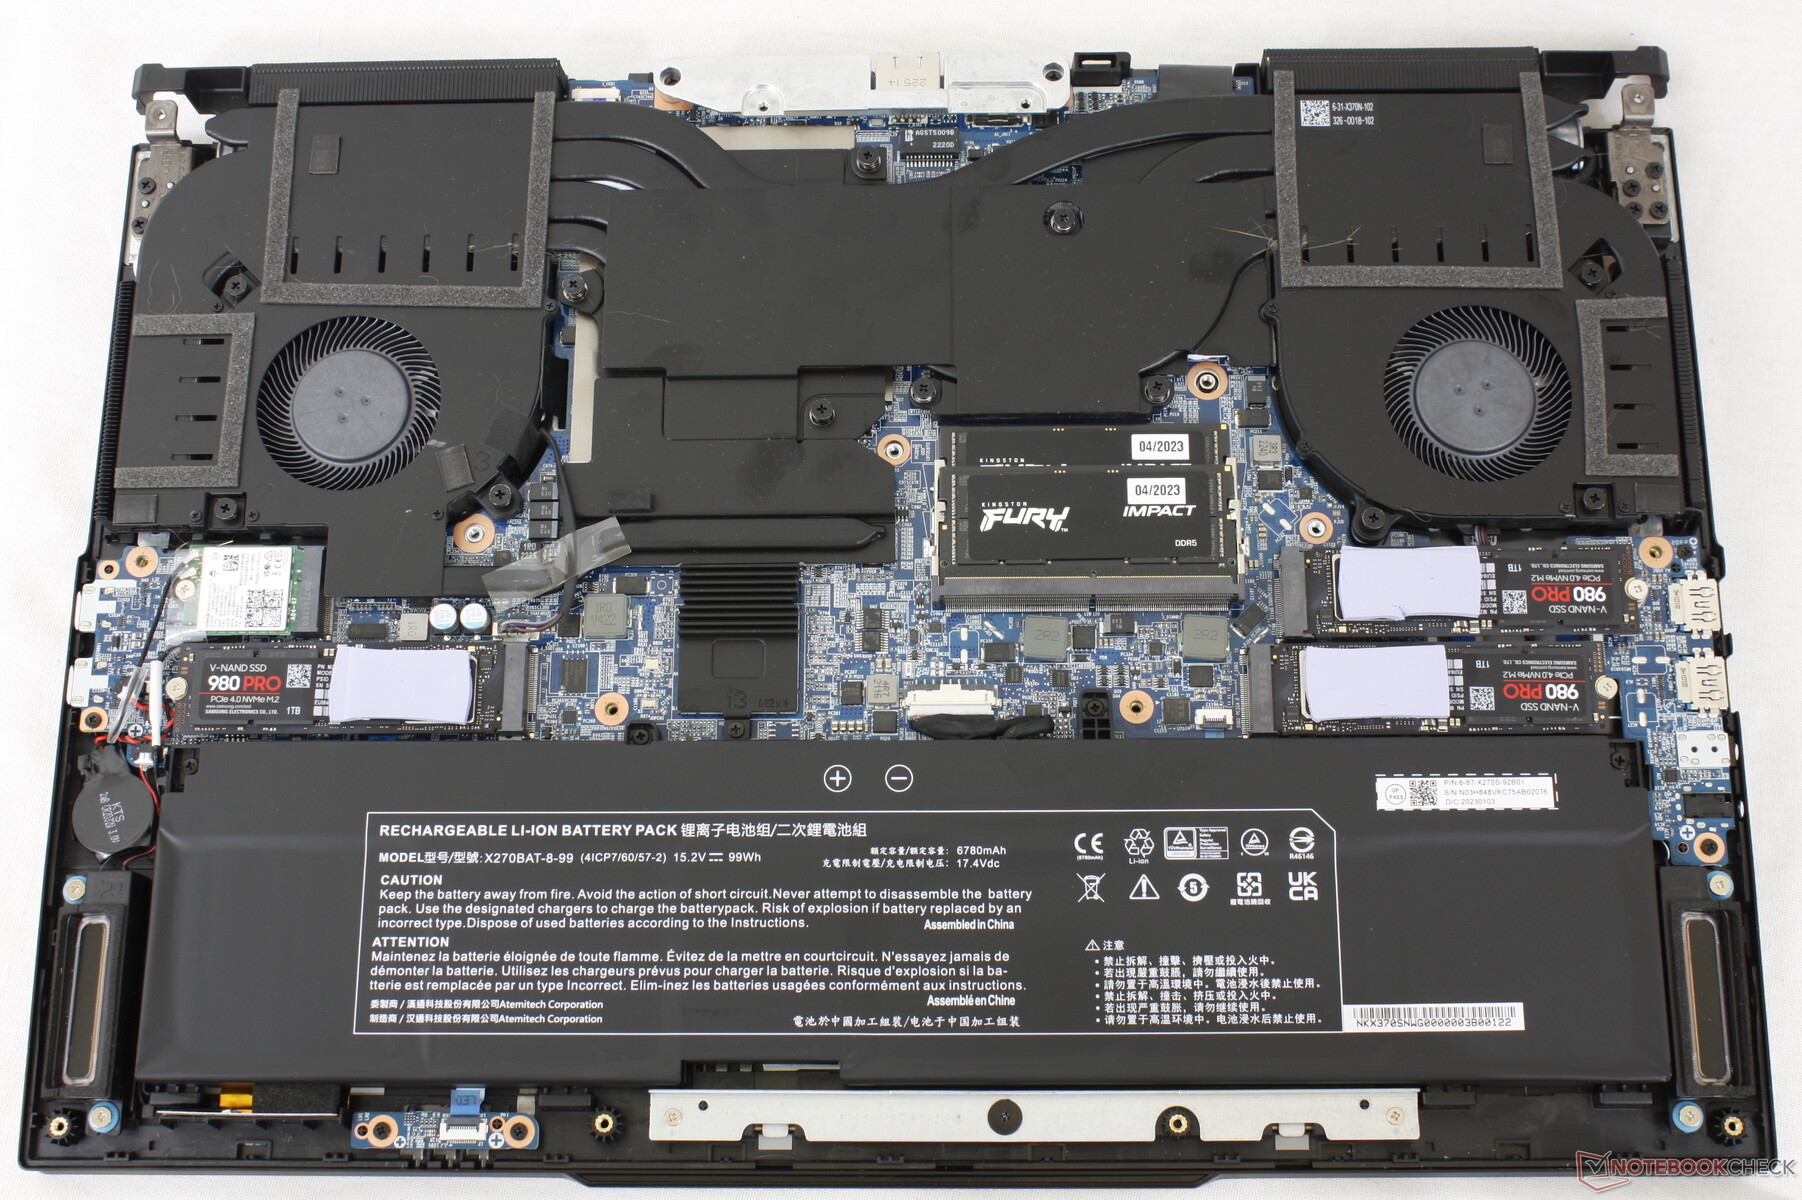
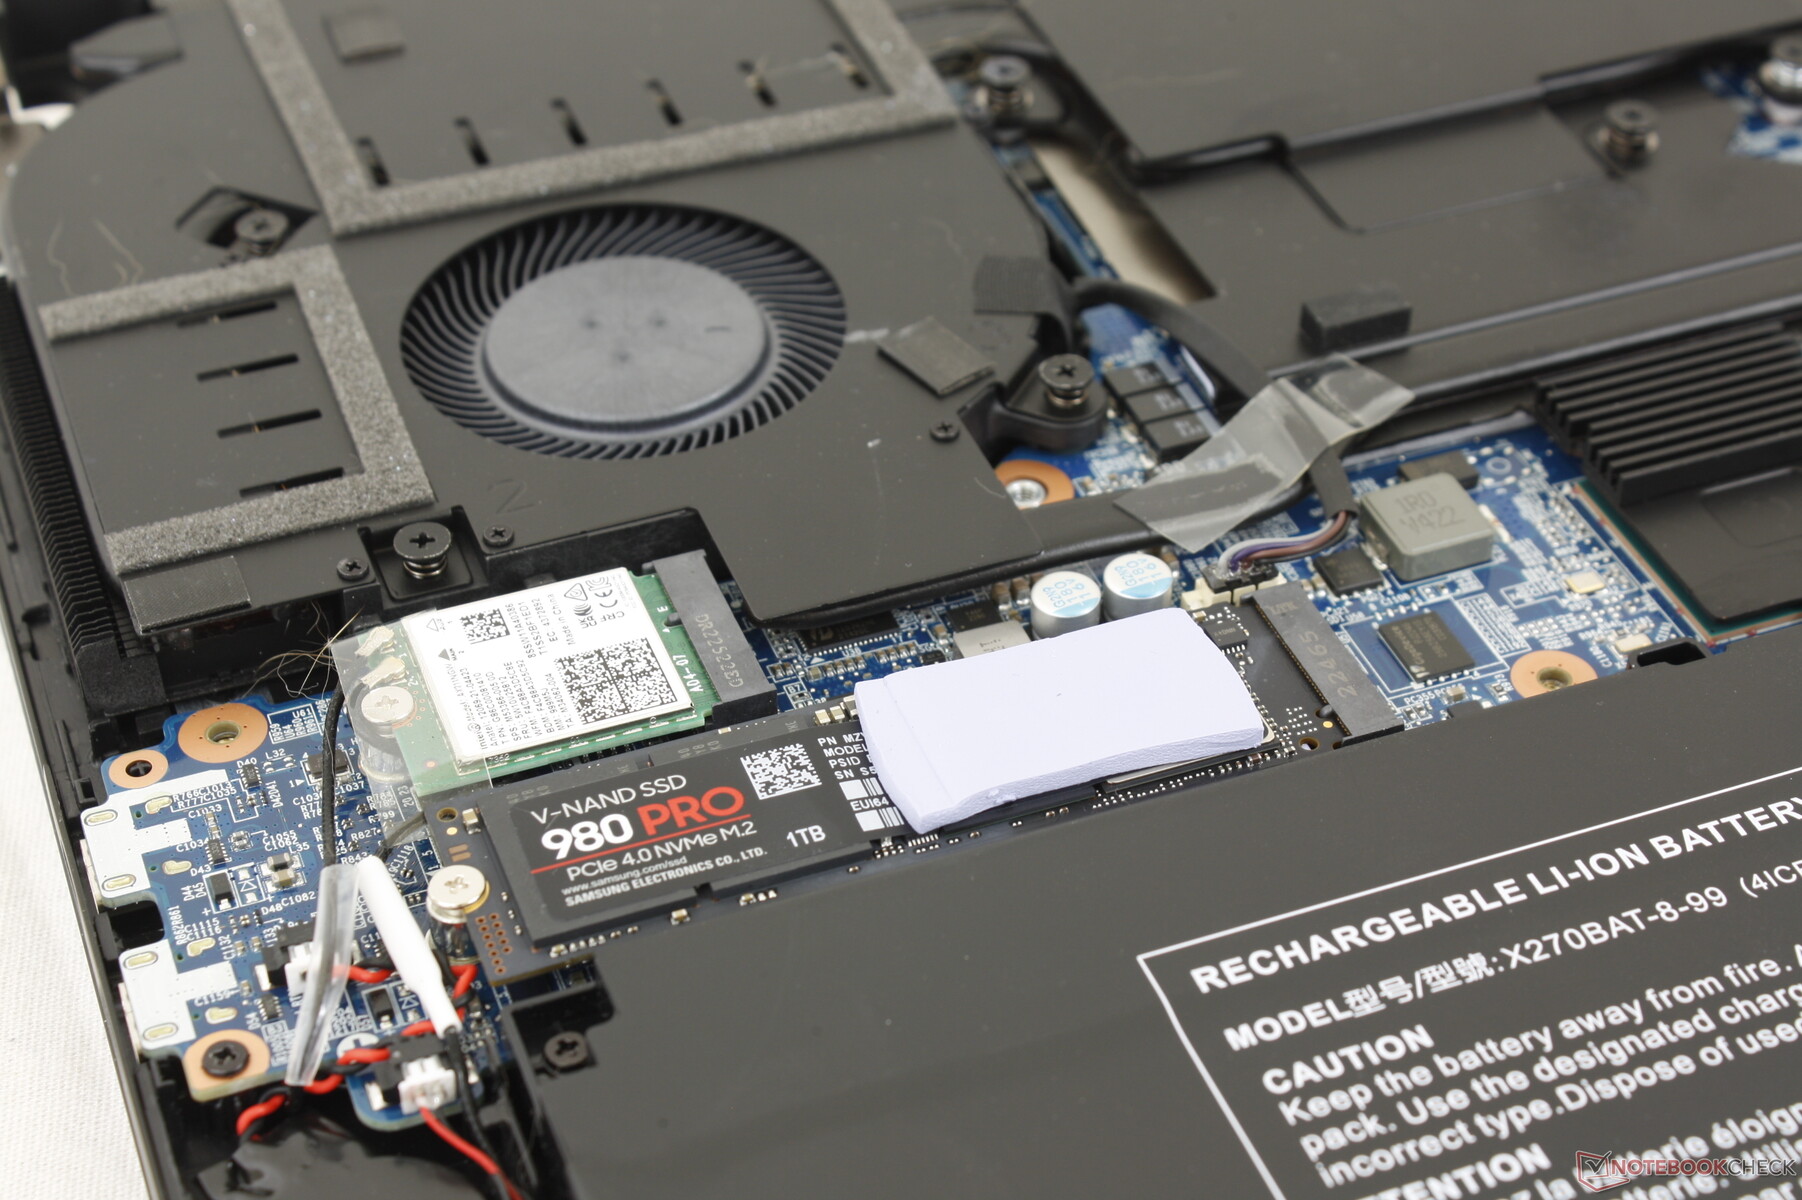
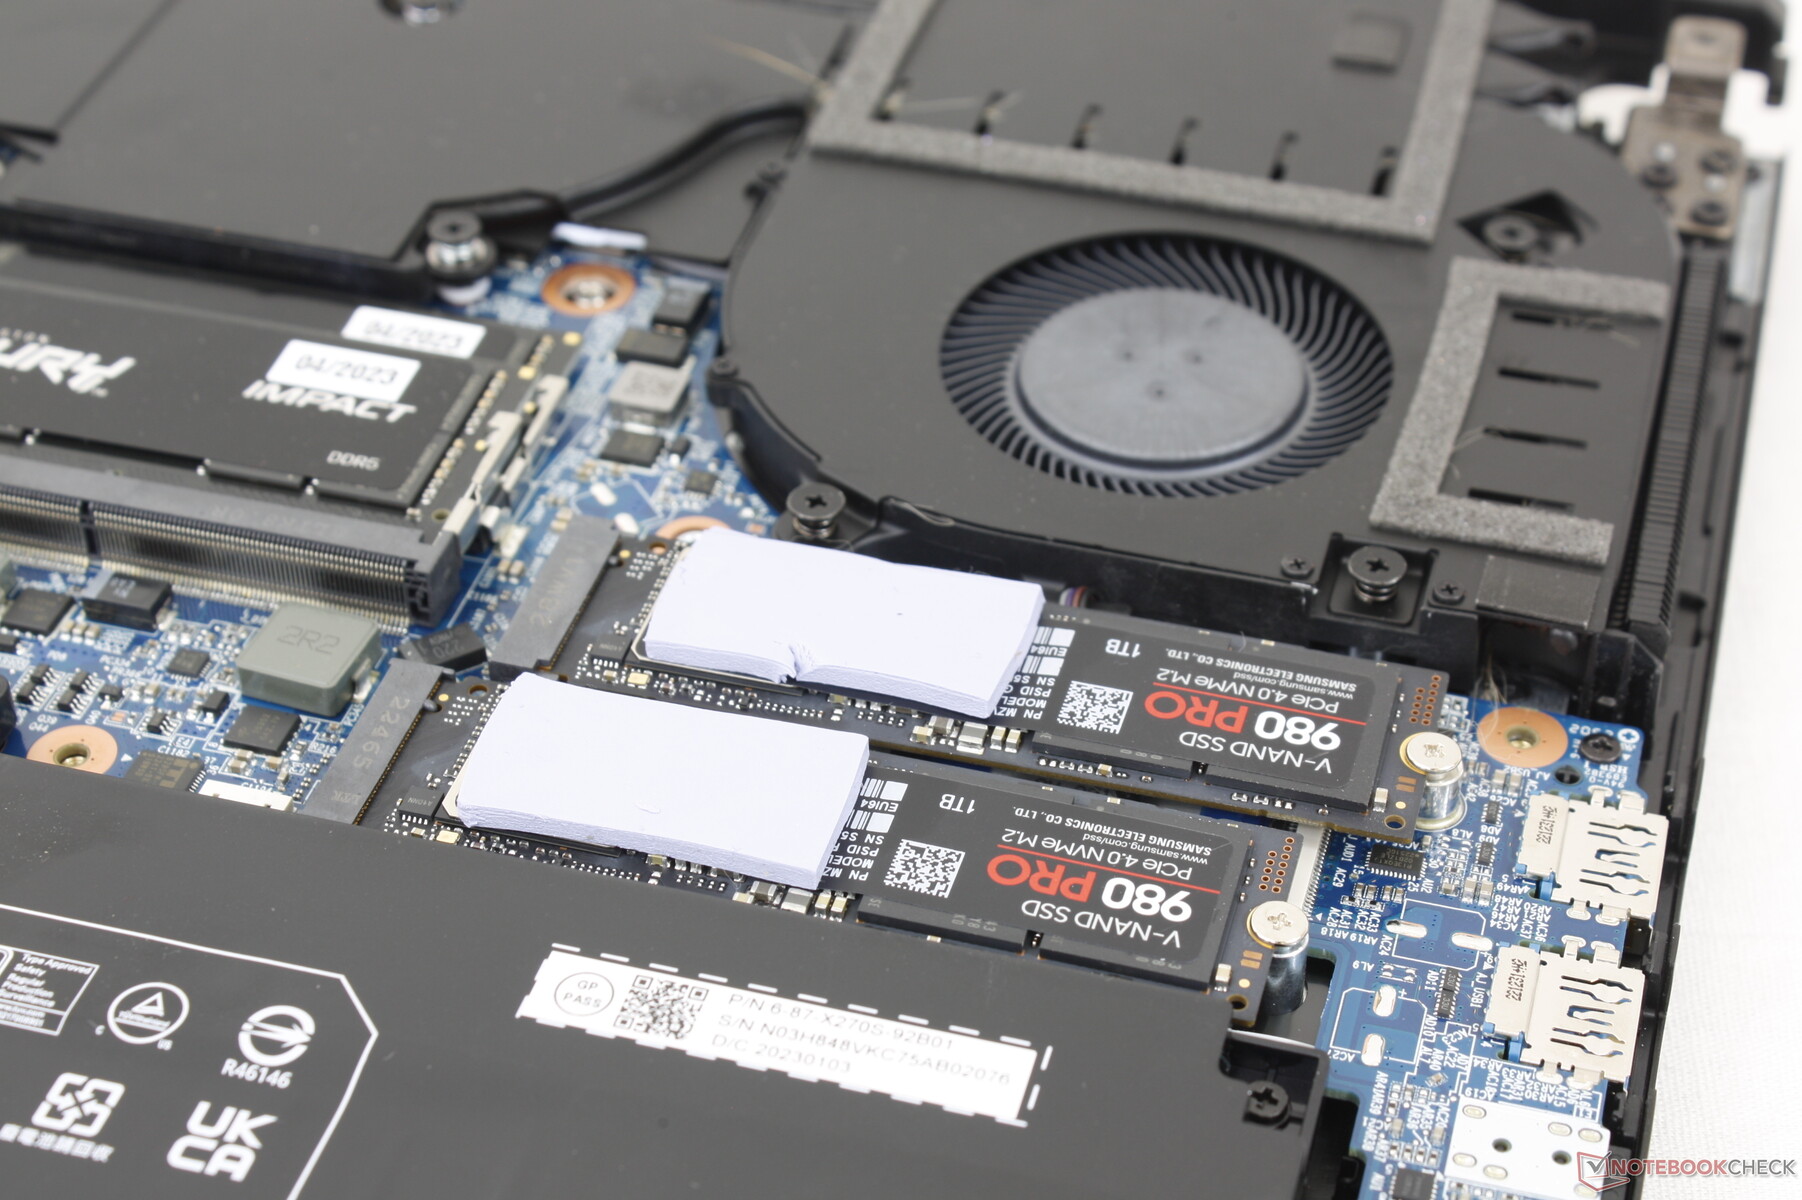
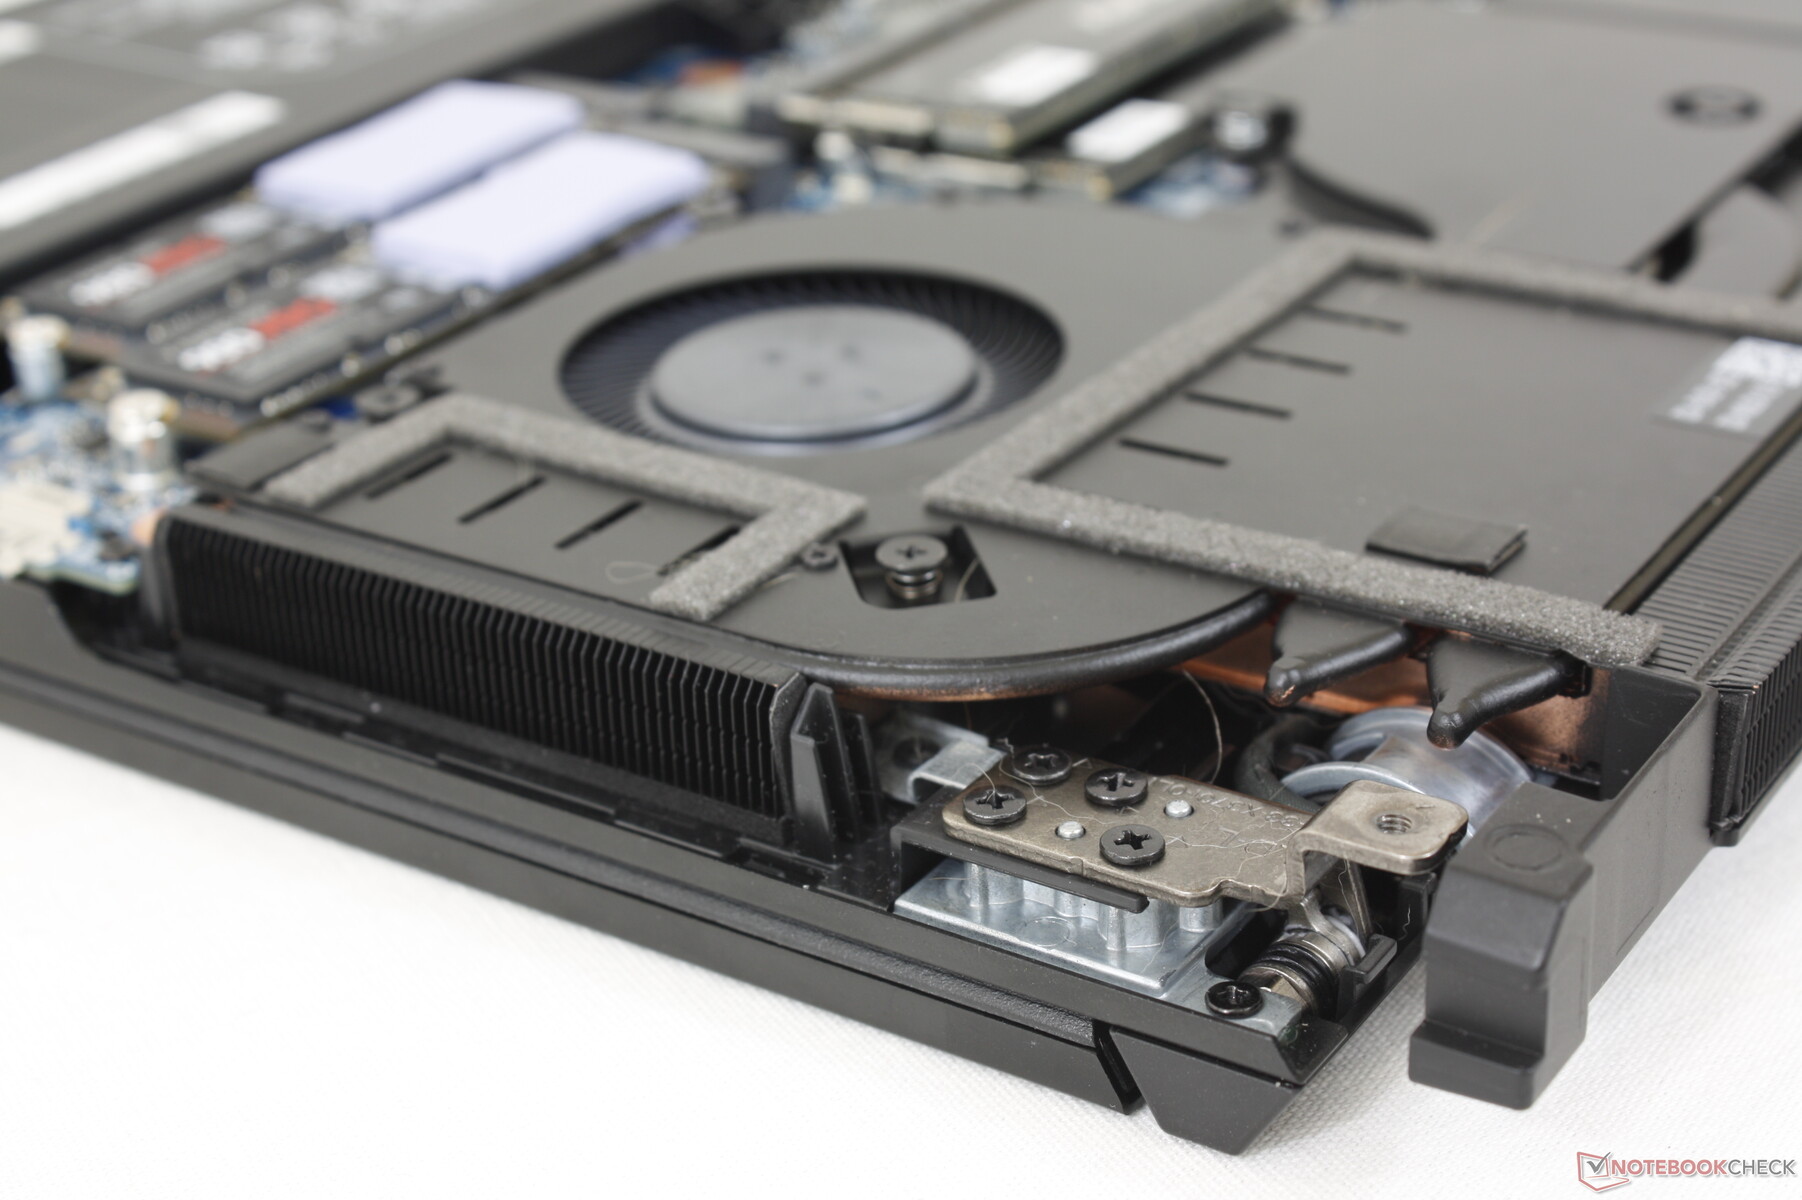
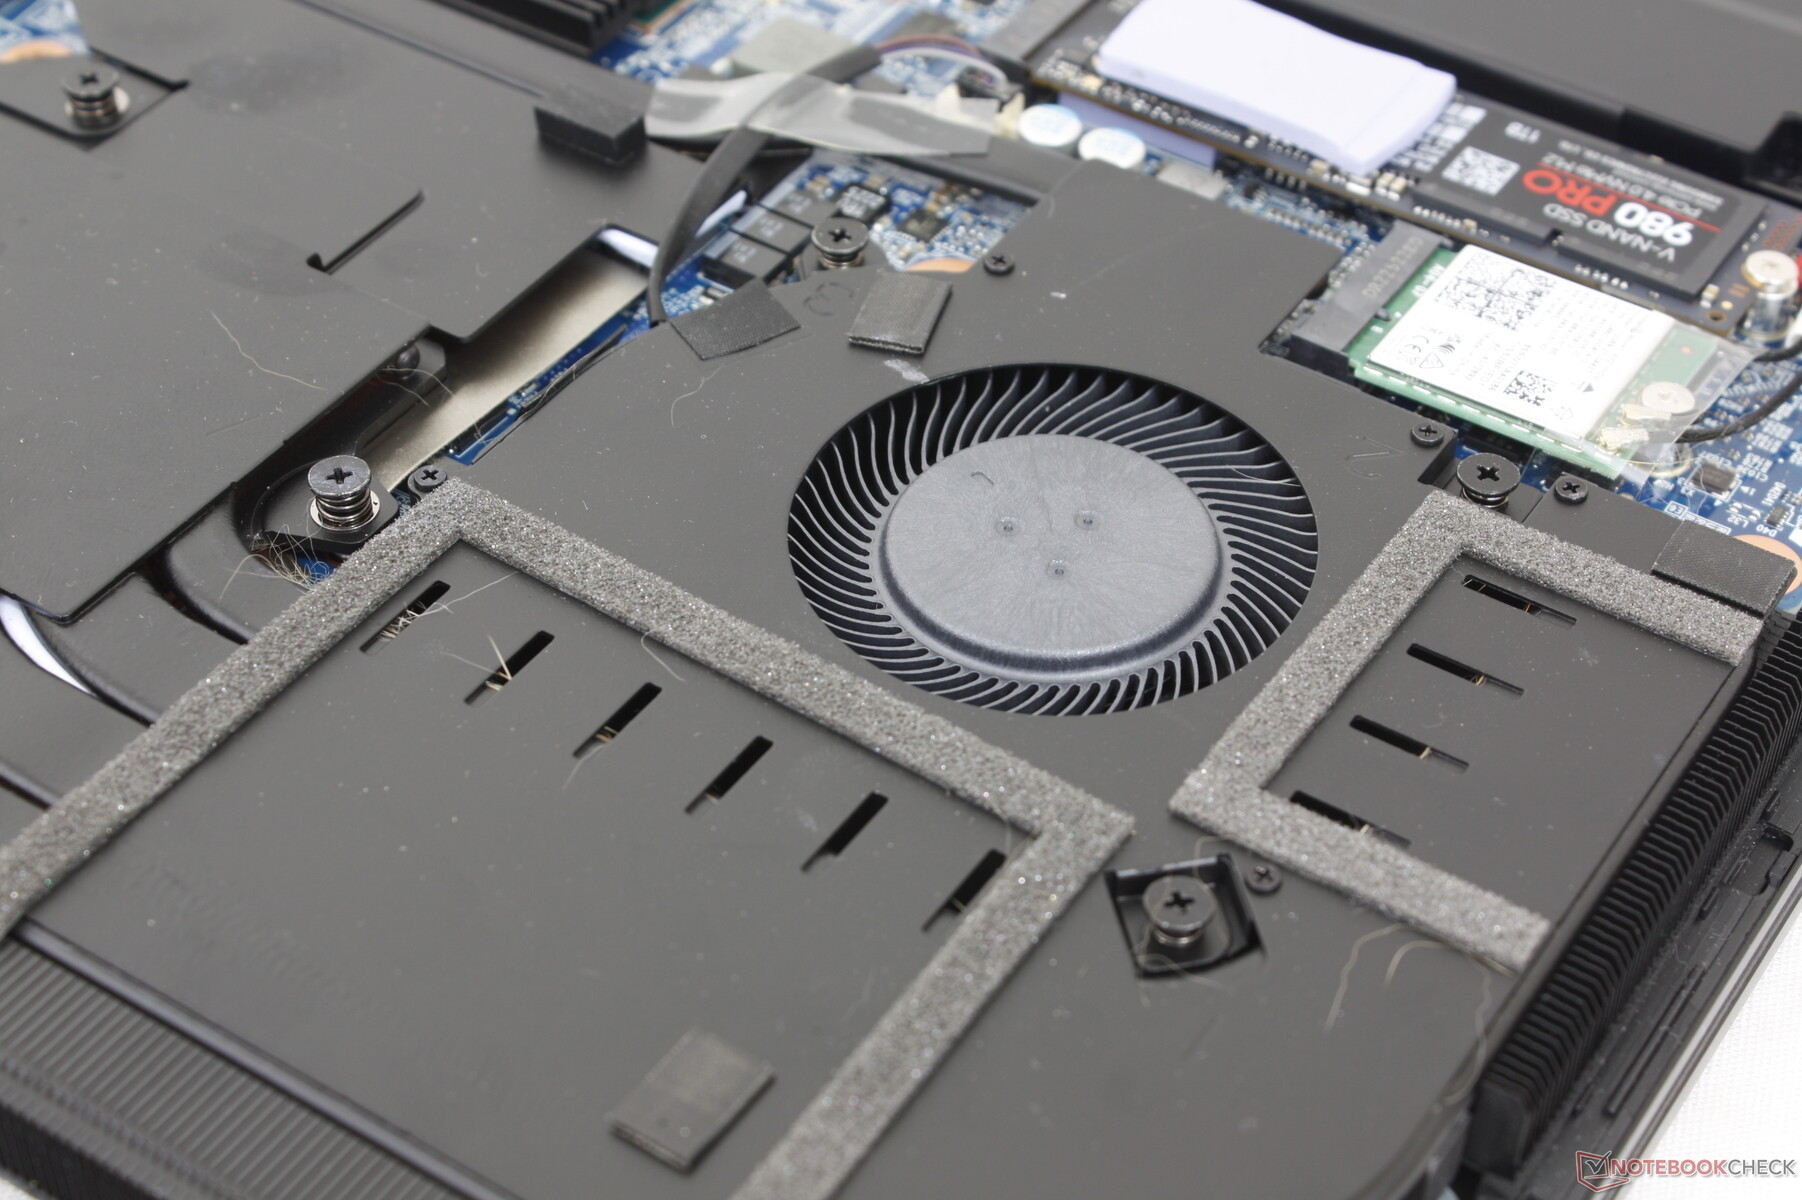
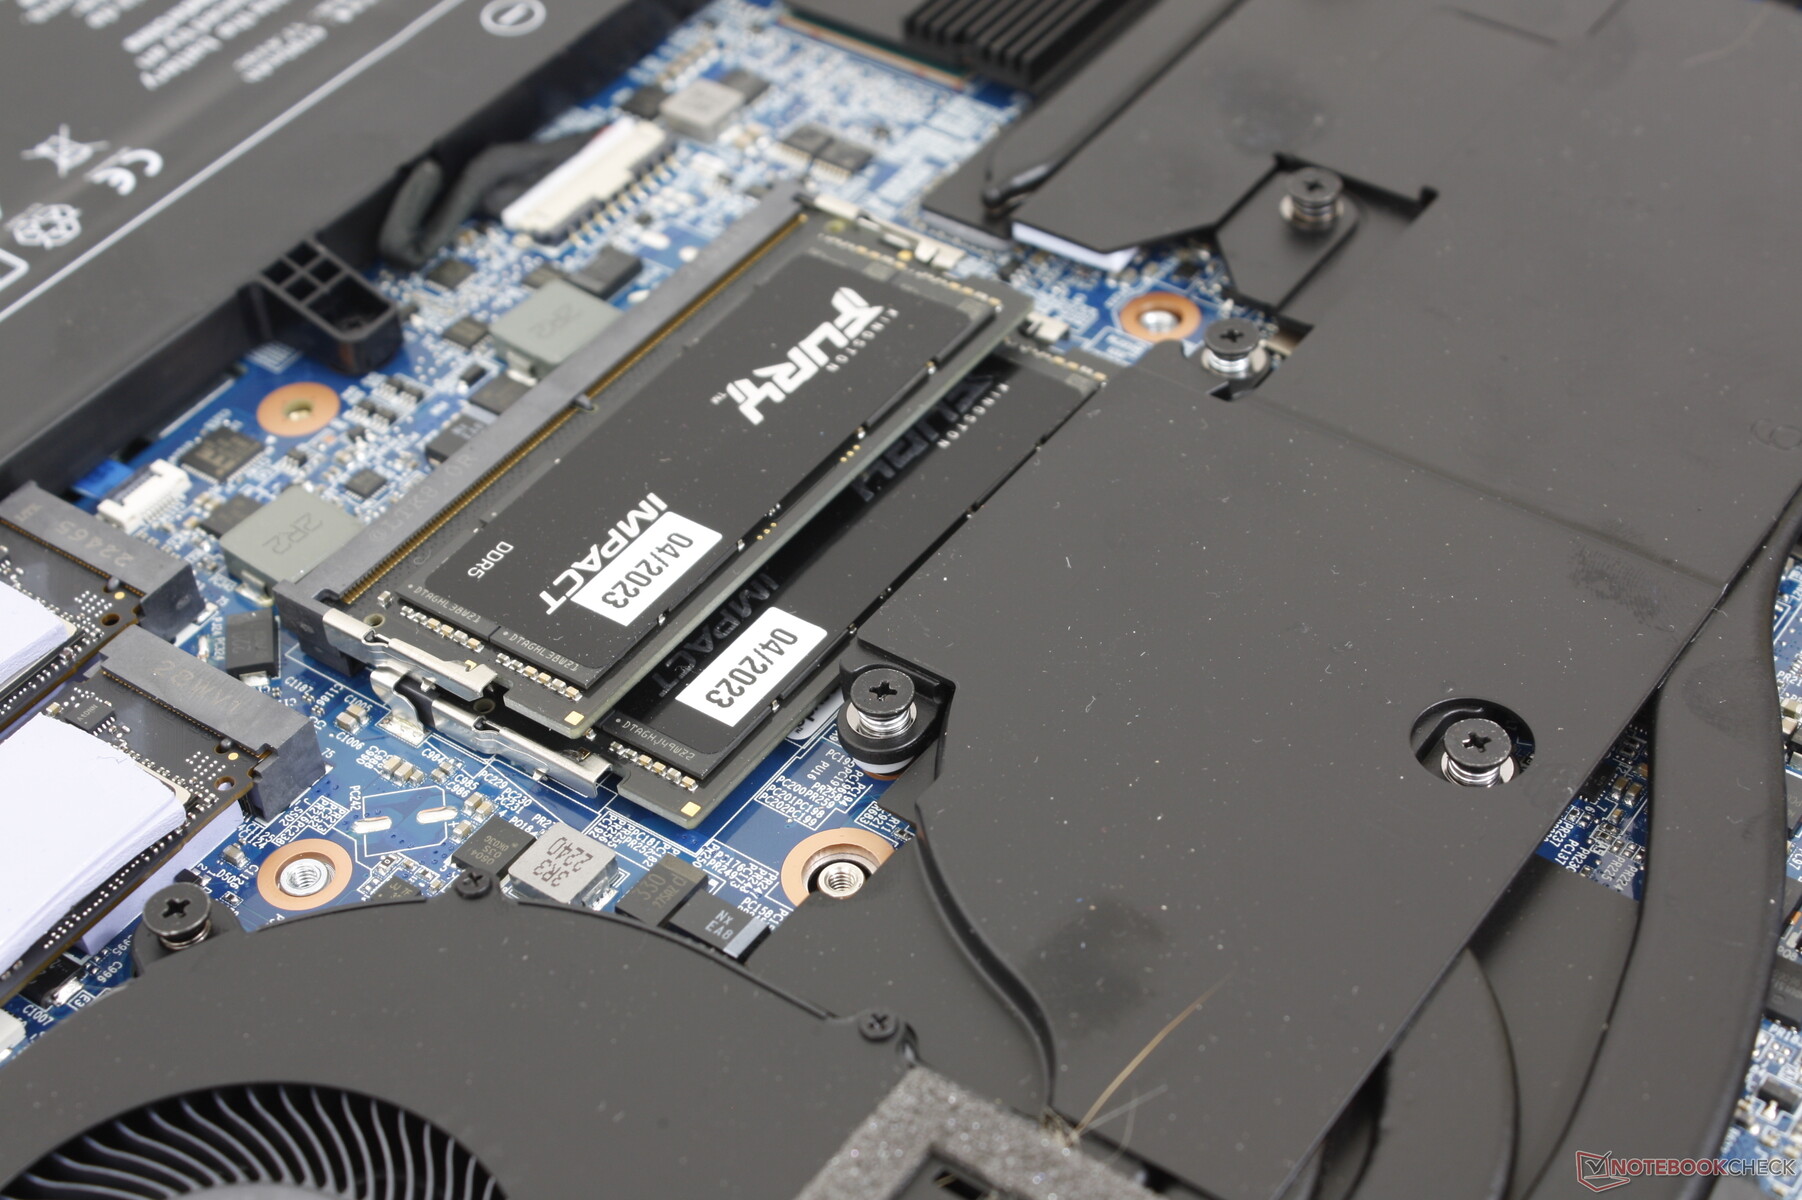
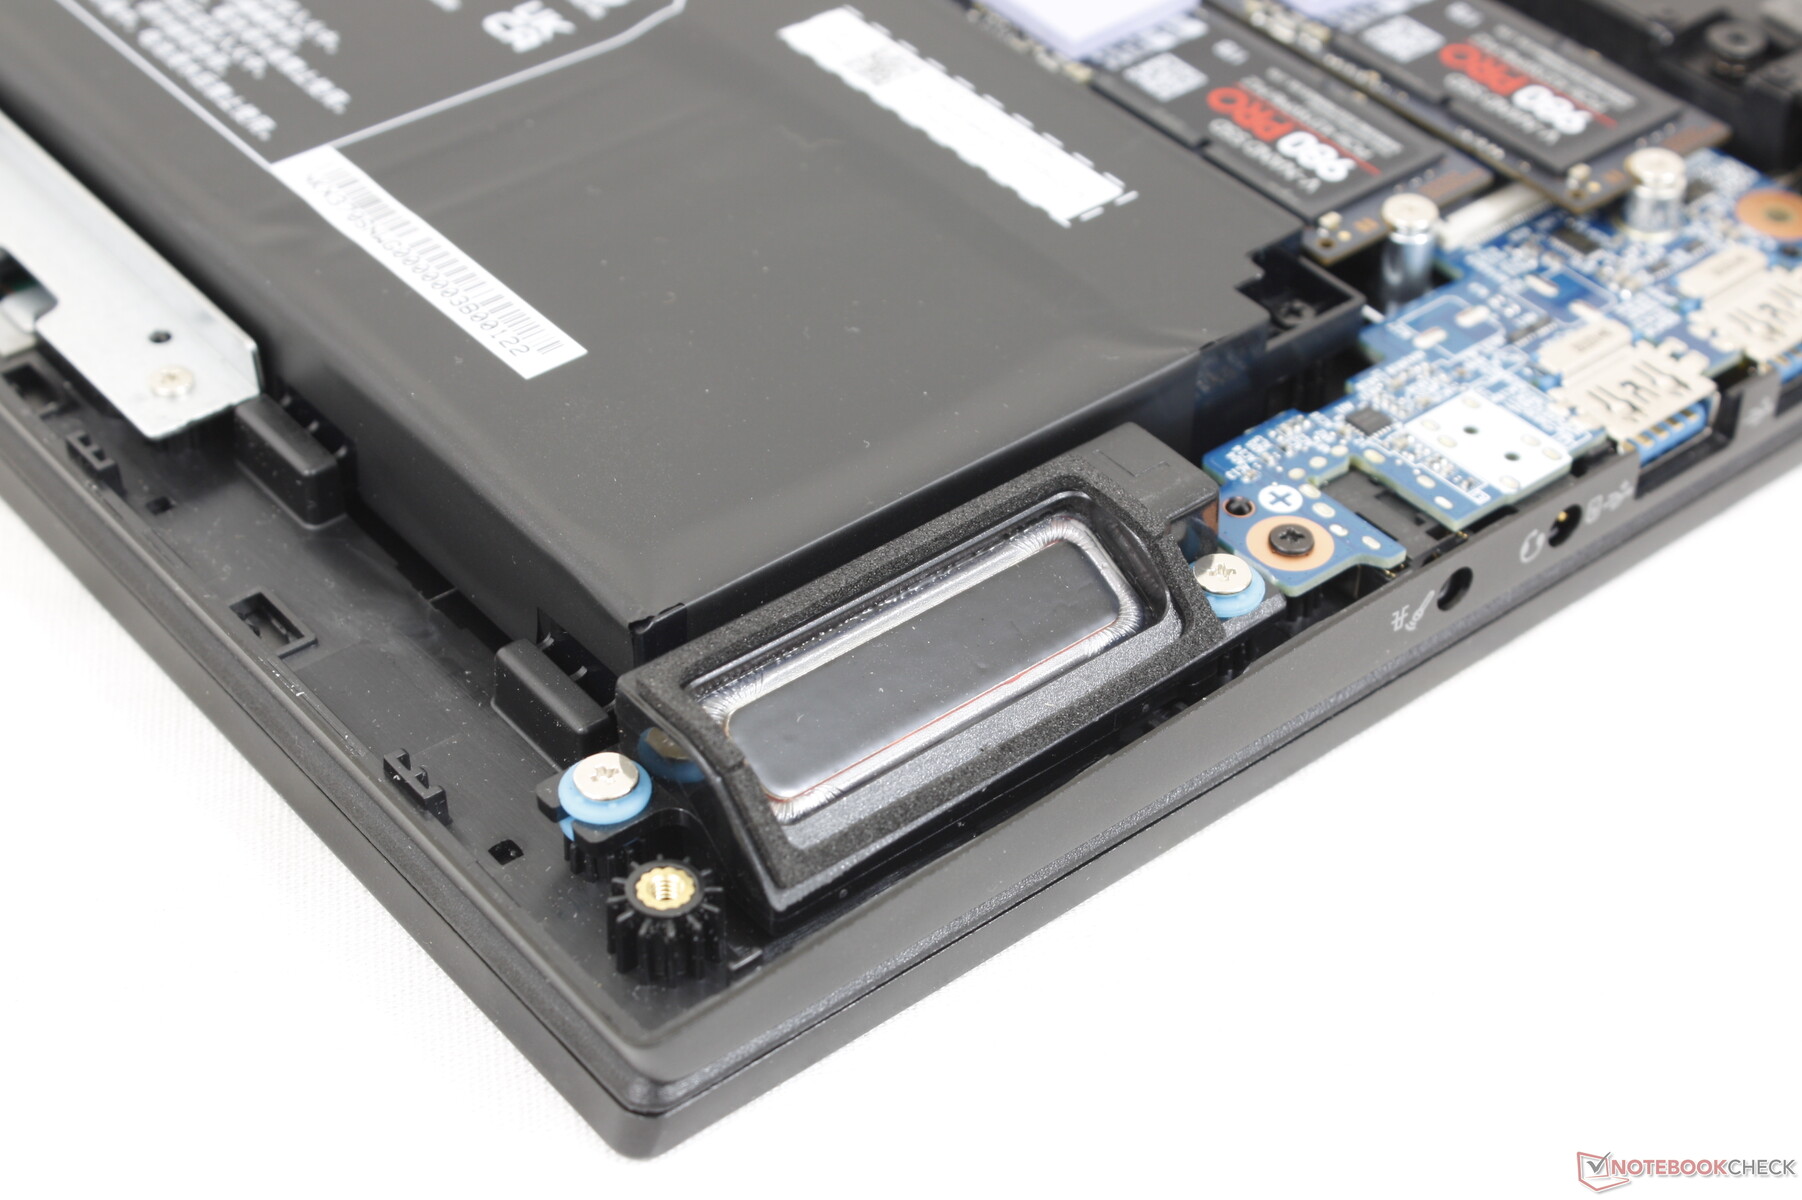
Il pannello inferiore è fissato da 16 viti Philips per una rimozione relativamente facile. Una volta dentro, gli utenti hanno accesso al modulo WLAN rimovibile, a 2 slot SODIMM e a 3 slot PCIe4 x4 M.2 2280. Il sistema non supporta le velocità PCIe5, a differenza dei recenti MSI GE e GT.
Accessori e garanzia
La confezione di vendita comprende un CD con i driver del dispositivo, una chiavetta USB con i driver di Windows 11 e una salvietta di velluto, oltre ai consueti documenti e all'adattatore CA. Si applica la garanzia limitata standard di un anno con possibilità di estensione fino a tre anni.
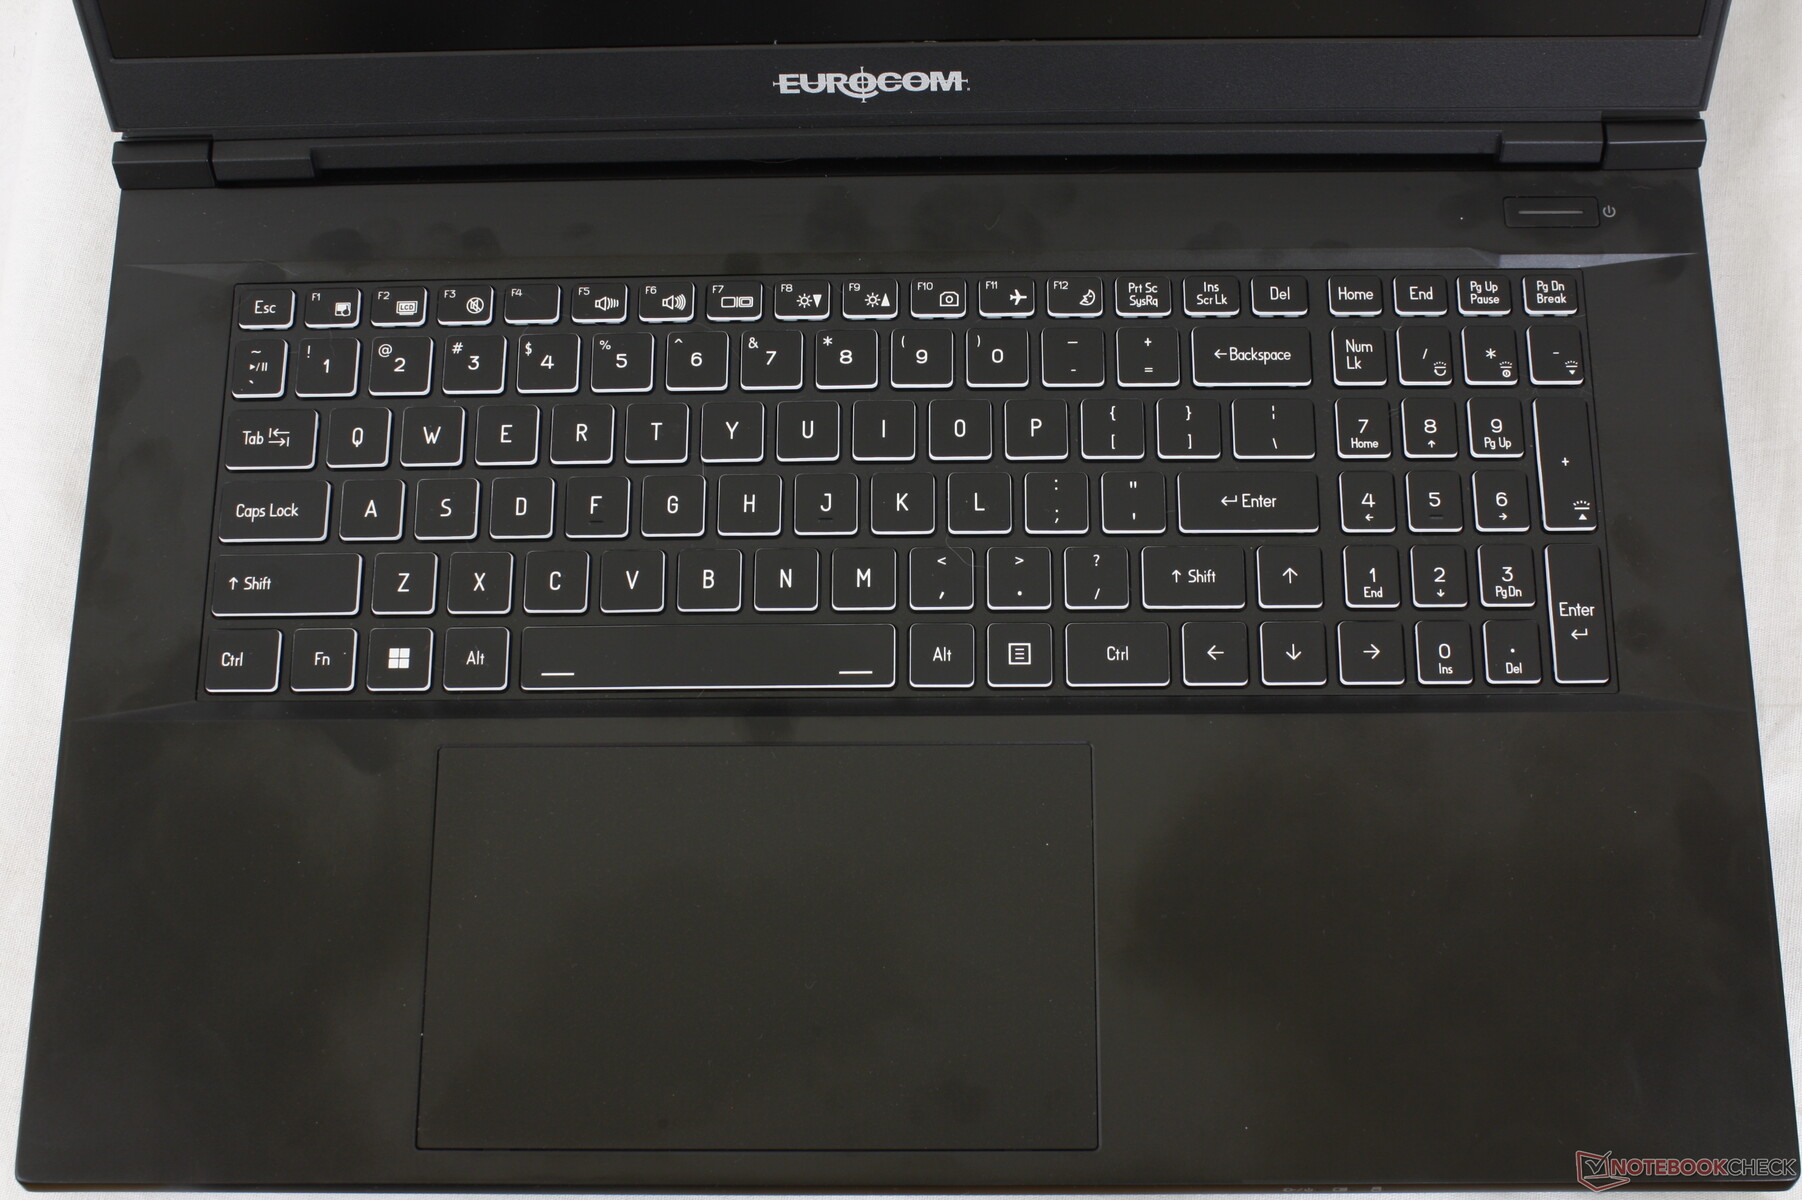
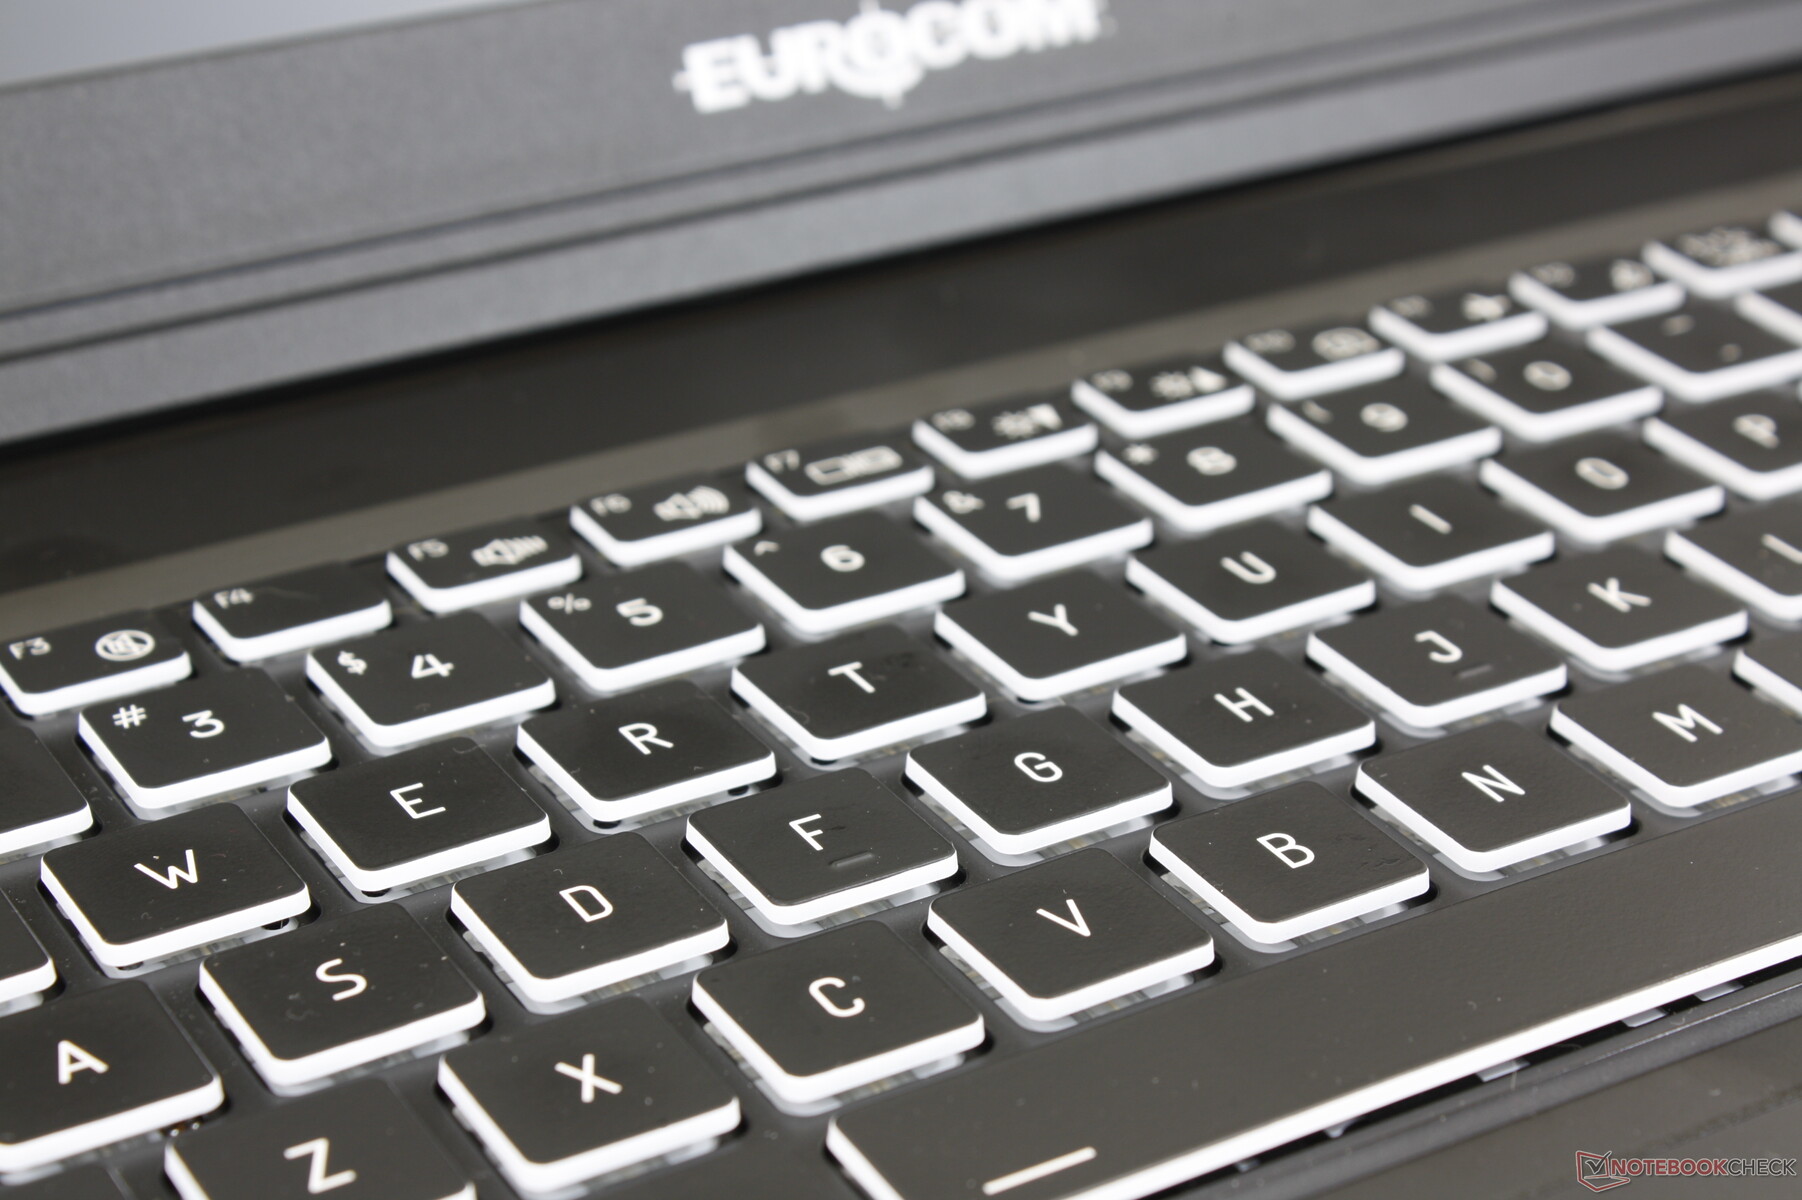
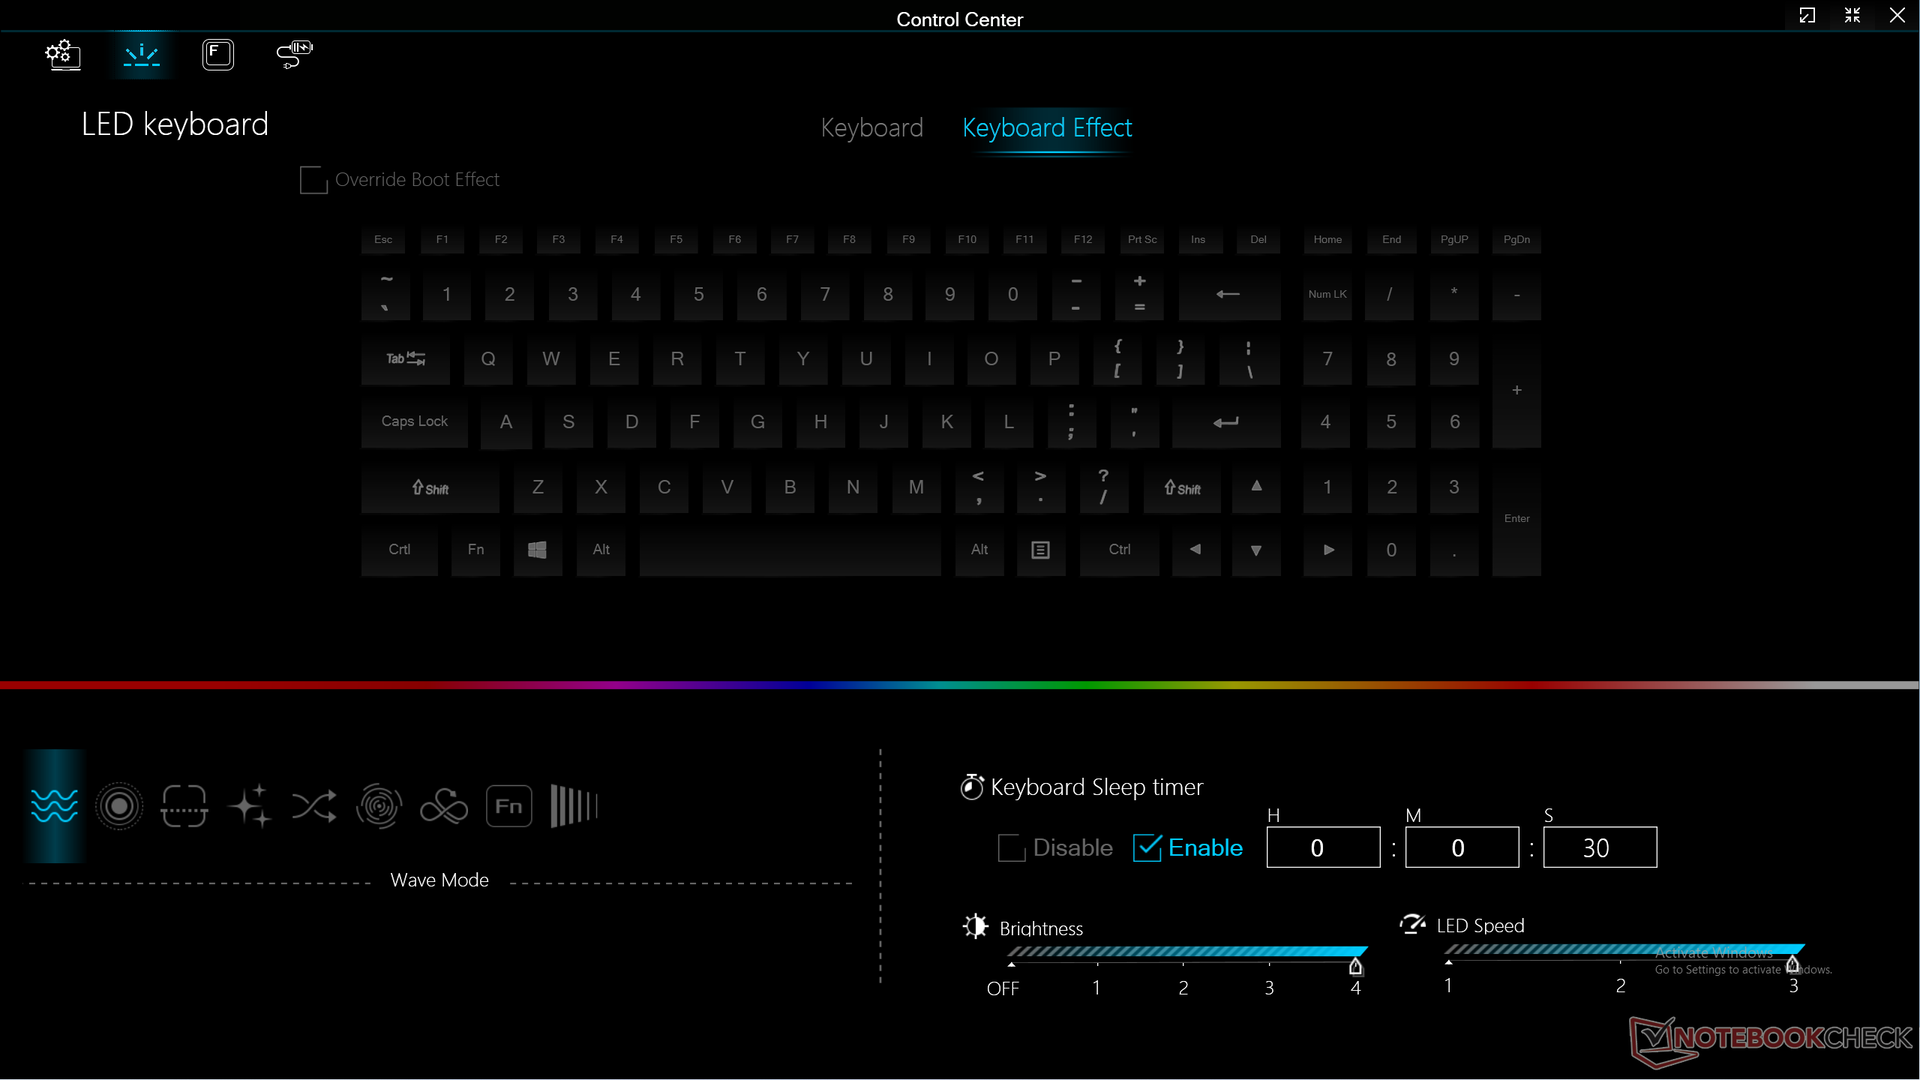
Dispositivi di input - Eurocom tradizionale
Tastiera
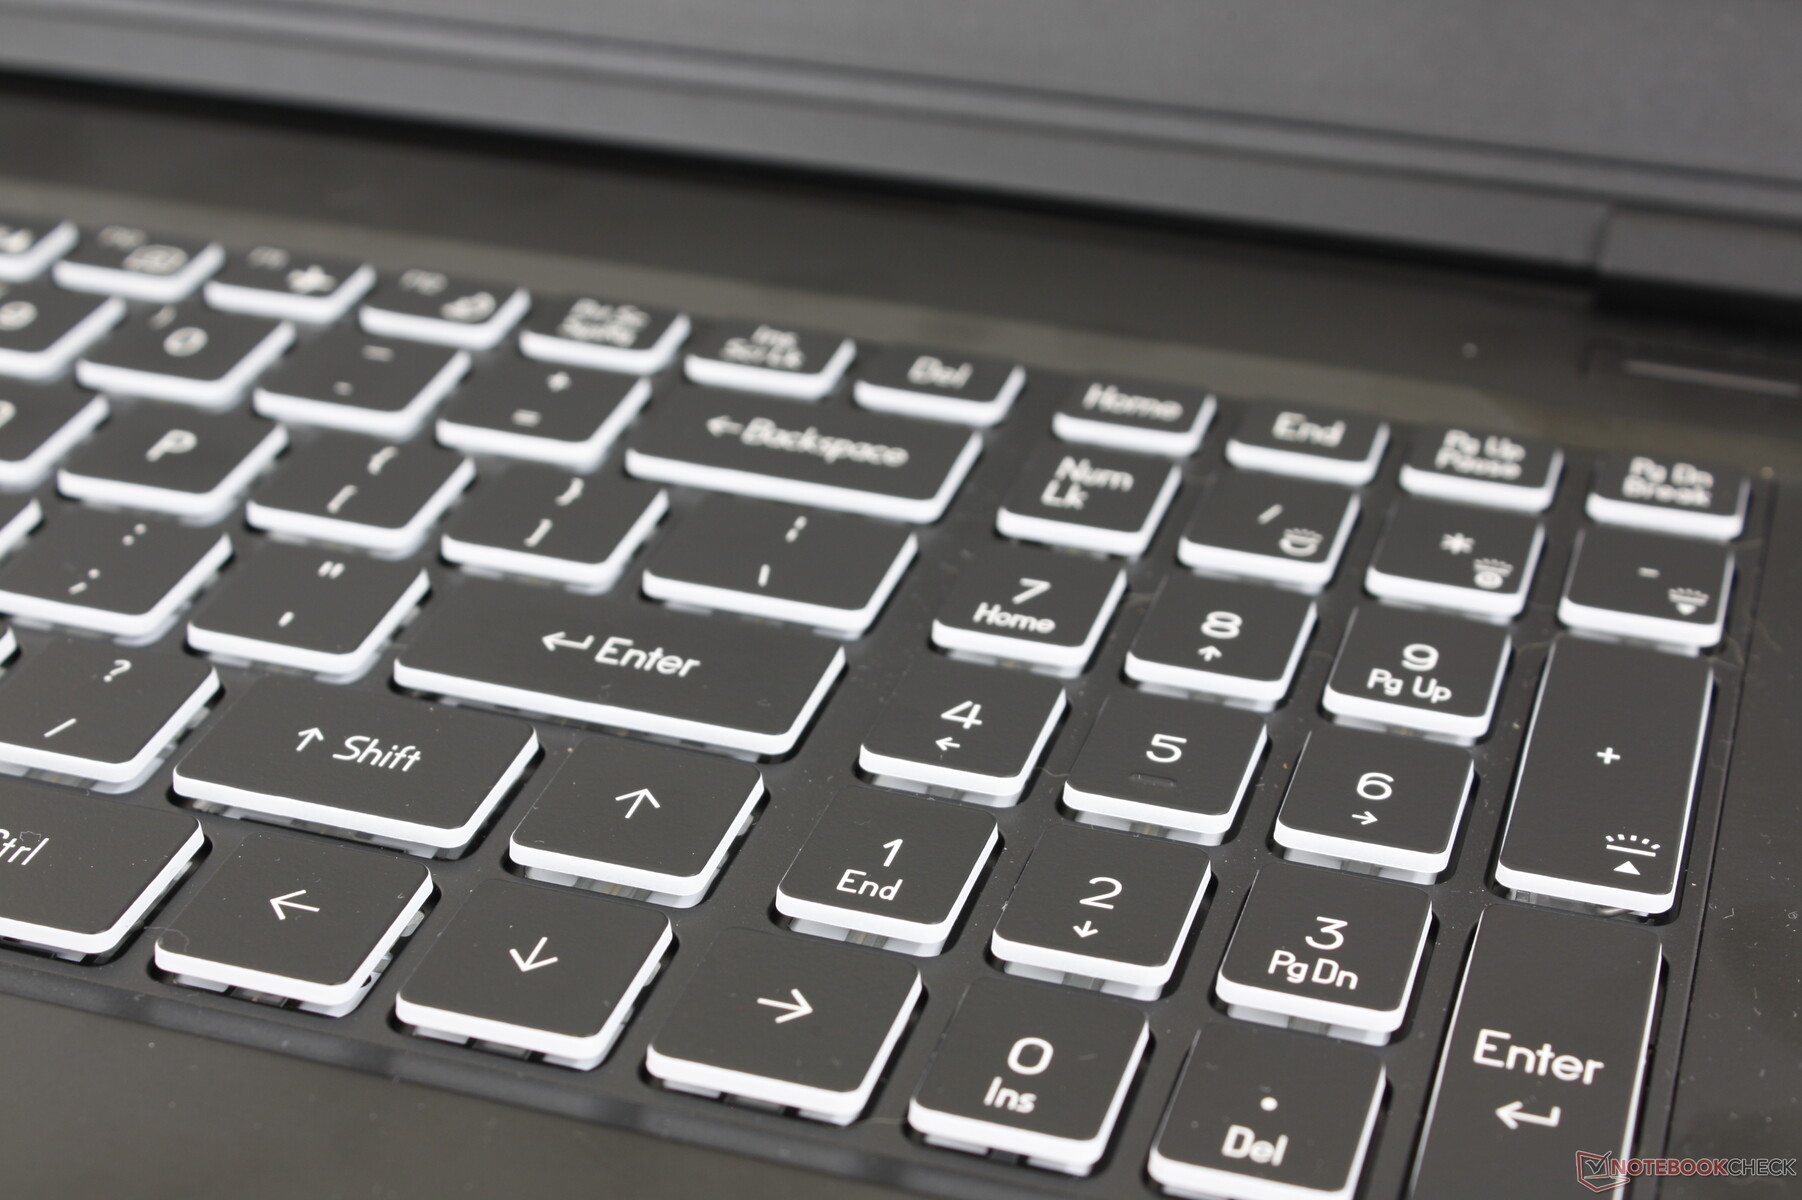
L'esperienza di digitazione è coerente con la maggior parte dei modelli Eurocom, poiché l'ODM sottostante rimane lo stesso. Il Raptor X17 ha la stessa tastiera a membrana del Raptor X15, nonostante le differenze di dimensioni dello schermo, ed è un peccato perché i tasti del tastierino numerico continuano a essere più stretti e angusti dei tasti QWERTY principali.
Il feedback dei tasti è più morbido rispetto a quello dei tasti dell'MSI GE78 X15 MSI GE78 o dell'Asus ROG Strix Scar 17. Il ticchettio è relativamente silenzioso, cosa che alcuni dattilografi potrebbero preferire, ma i giocatori più accaniti potrebbero rimanere delusi dalla mancanza di "click".
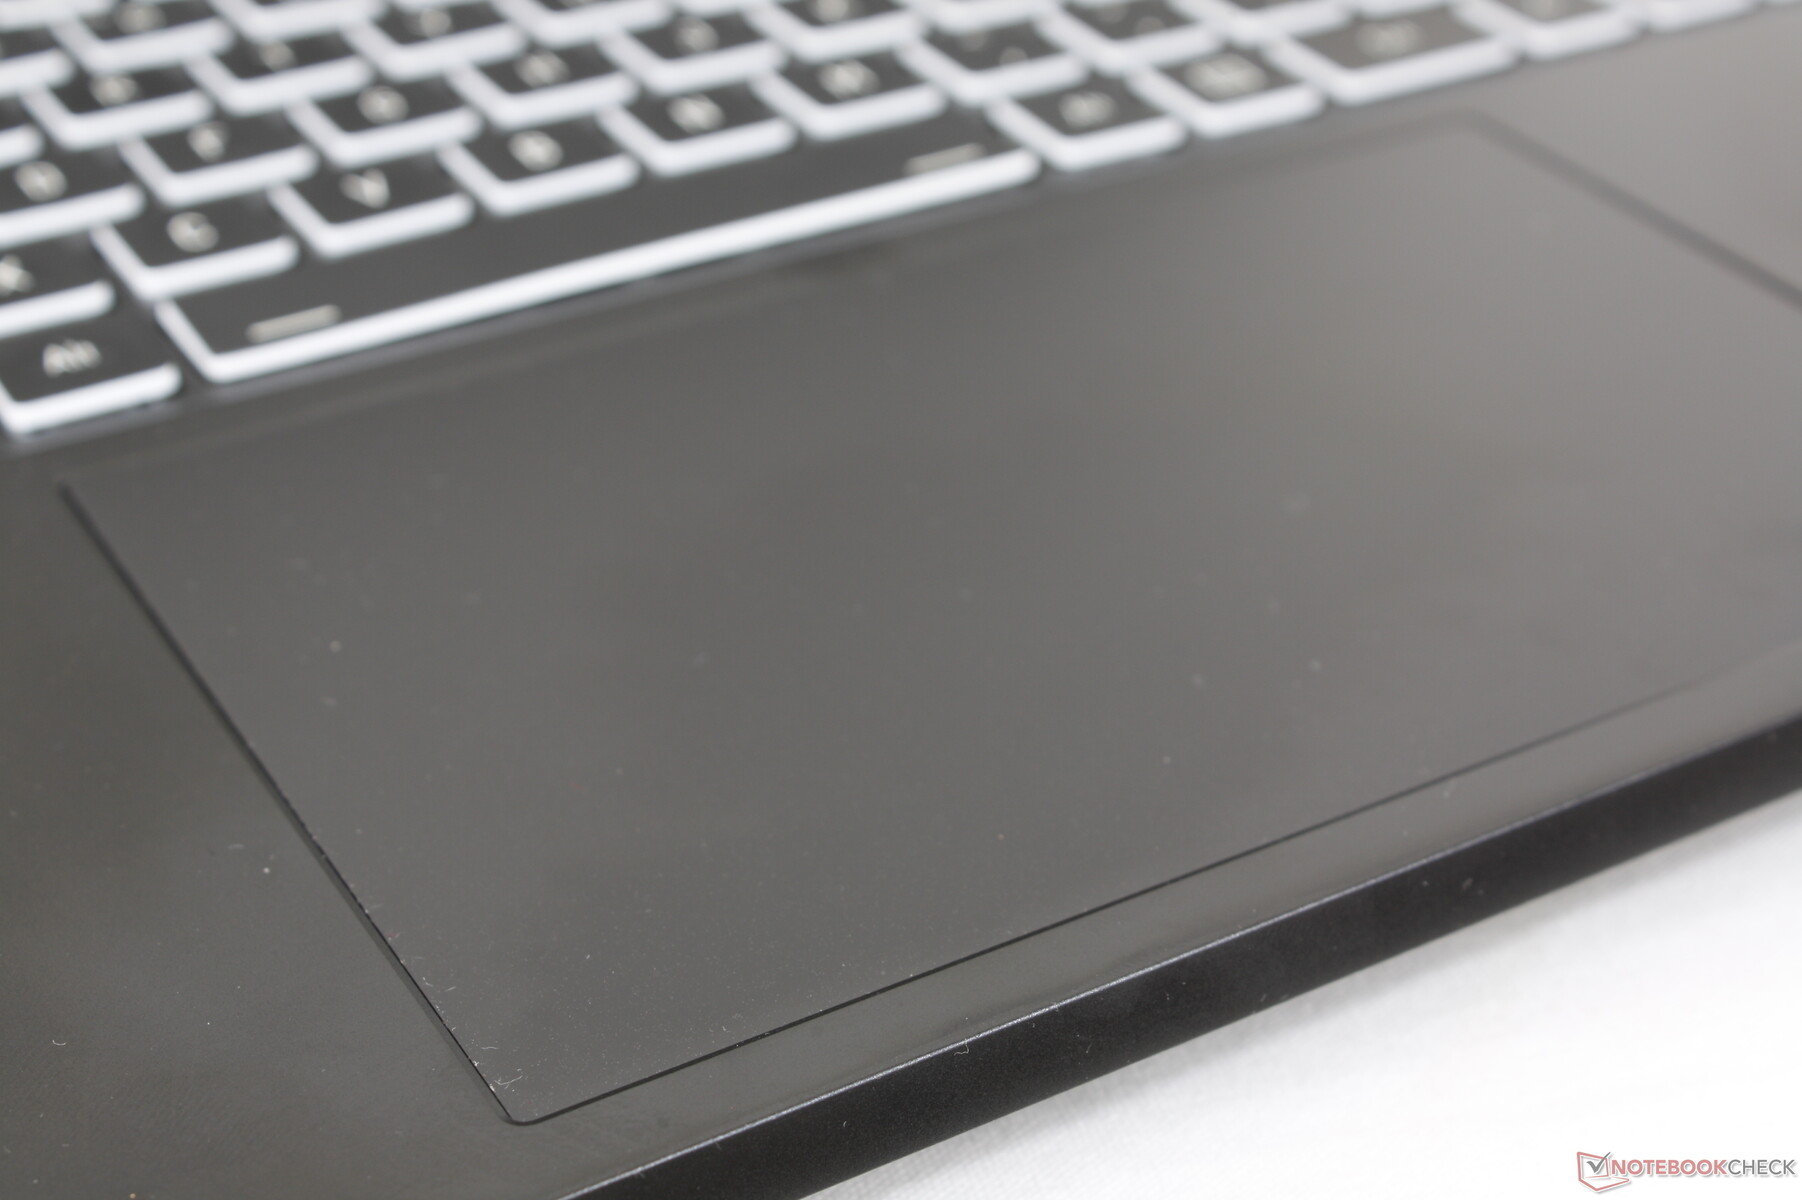
Touchpad
Il clickpad è grande 15 x 9 cm rispetto a quello più piccolo di 13 x 8,2 cm dell'MSI GE78 HX. Lo scorrimento è fluido a velocità medio-alte, mentre a velocità più basse c'è un po' di aderenza per favorire la precisione.
Il feedback quando si fa clic sul clickpad è morbido, con una corsa ridotta, non diversamente da quanto accade sul Razer Blade 17 Razer Blade 17. Le azioni di trascinamento e rilascio sono quindi un po' complicate da eseguire nonostante l'ampia superficie. Un mouse USB dedicato è sempre la soluzione migliore, se possibile.
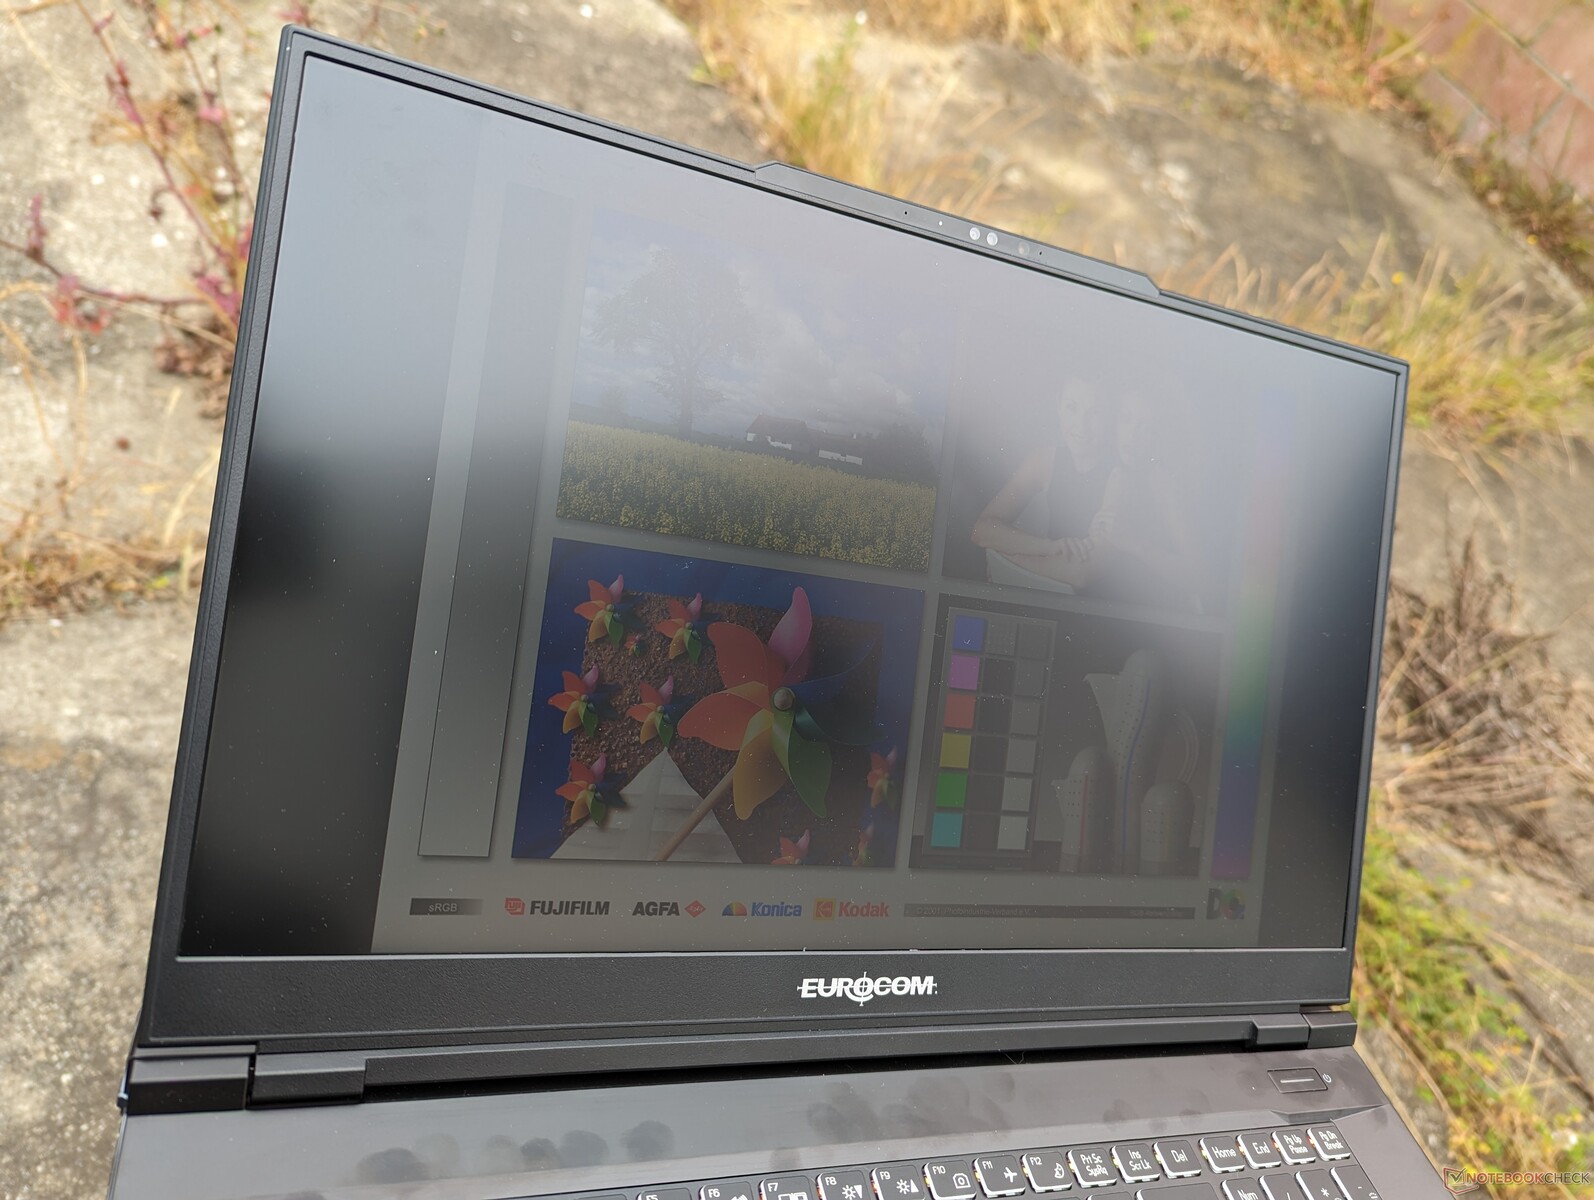
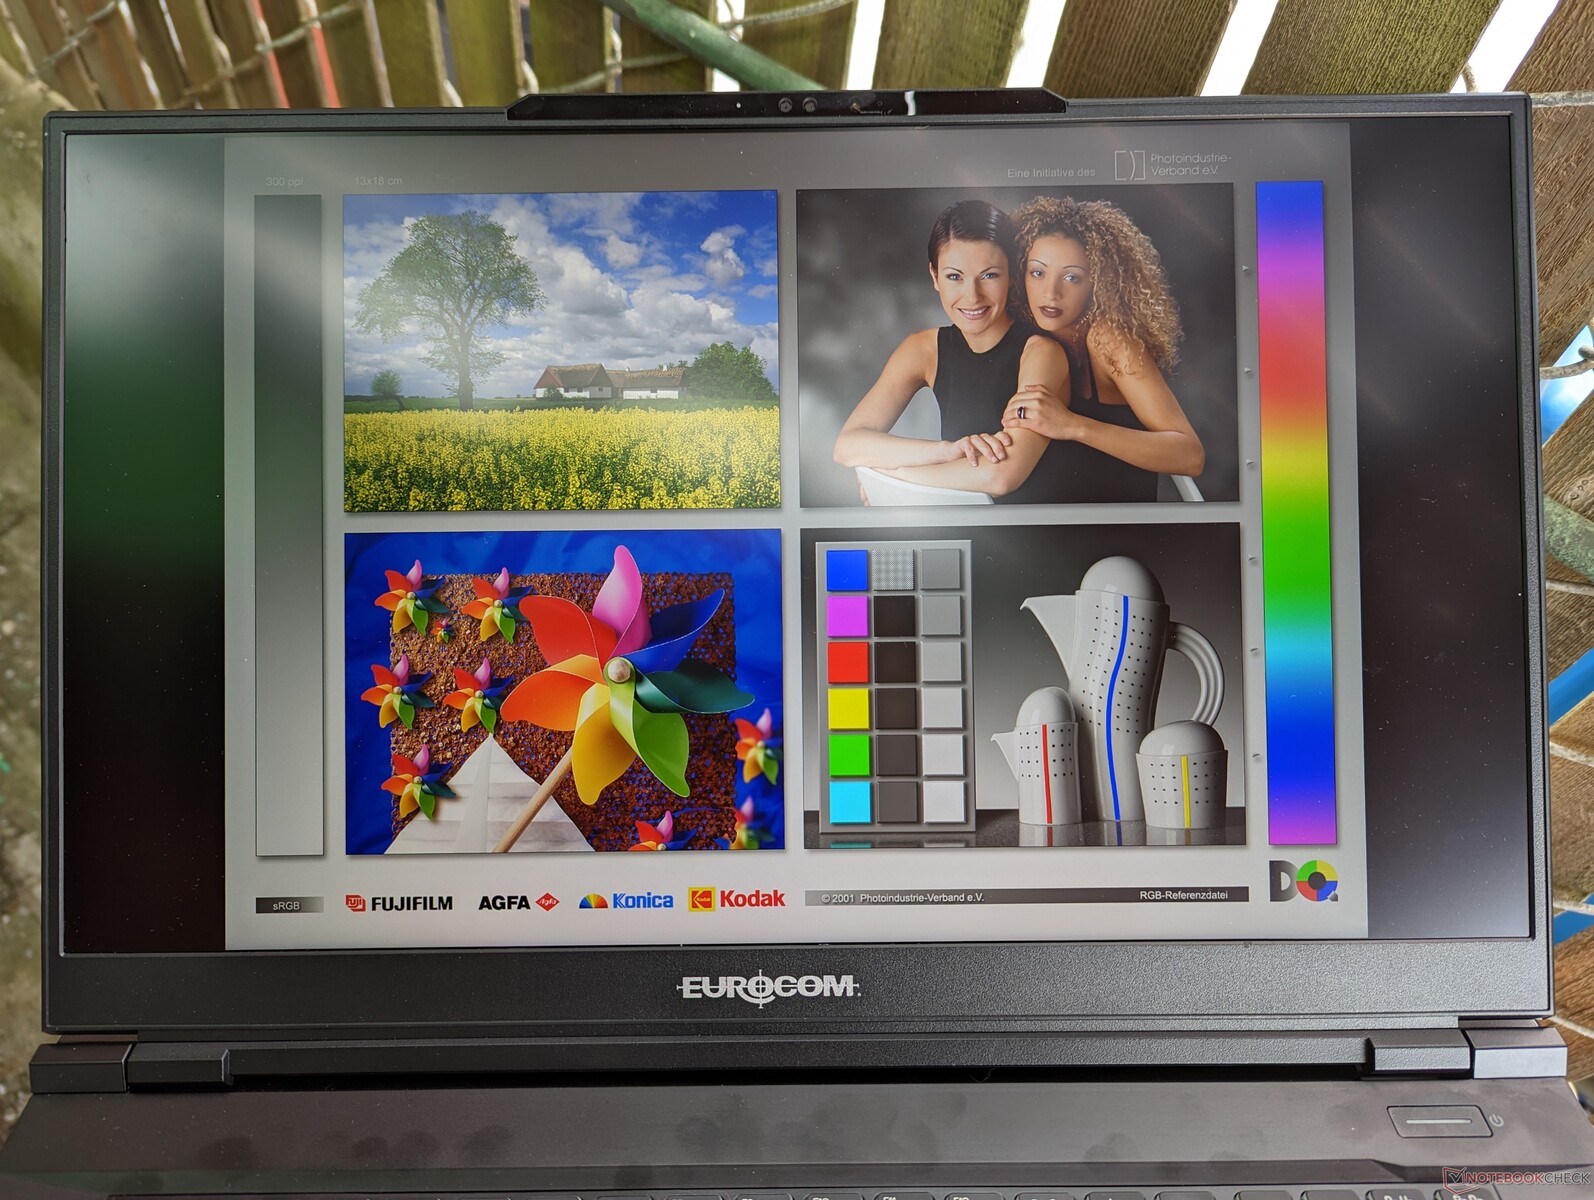
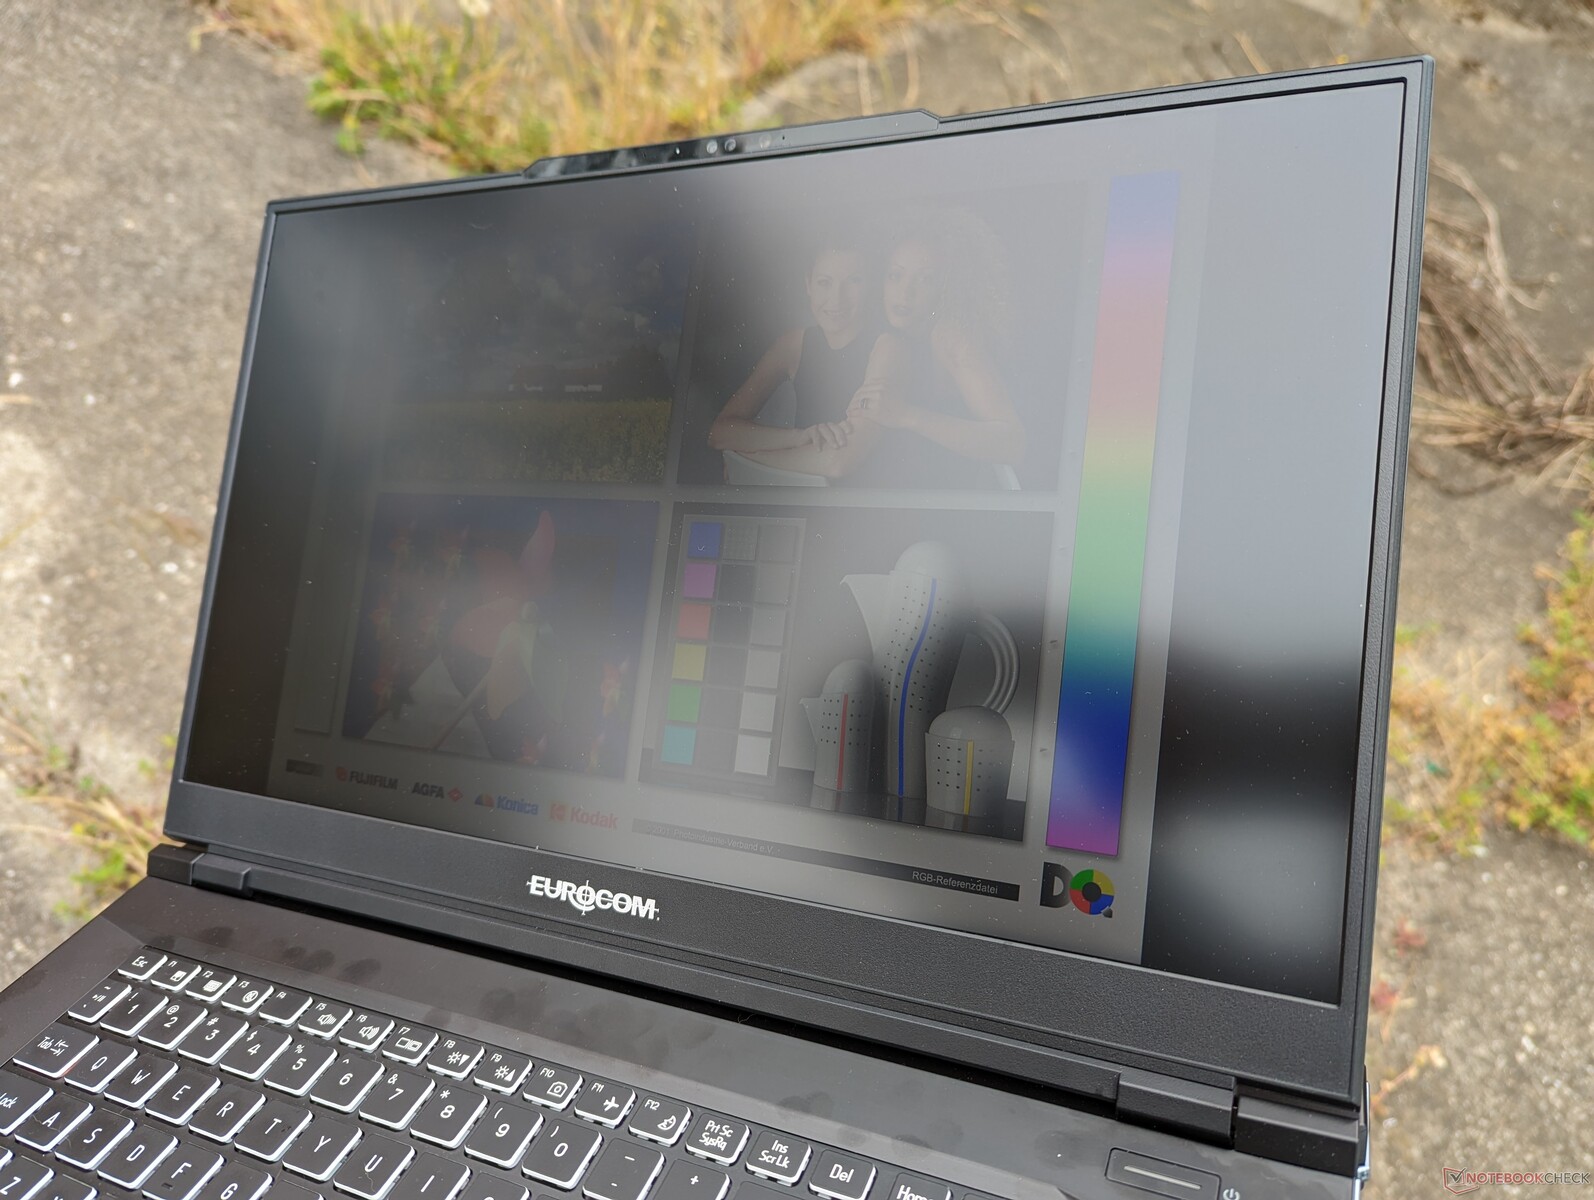
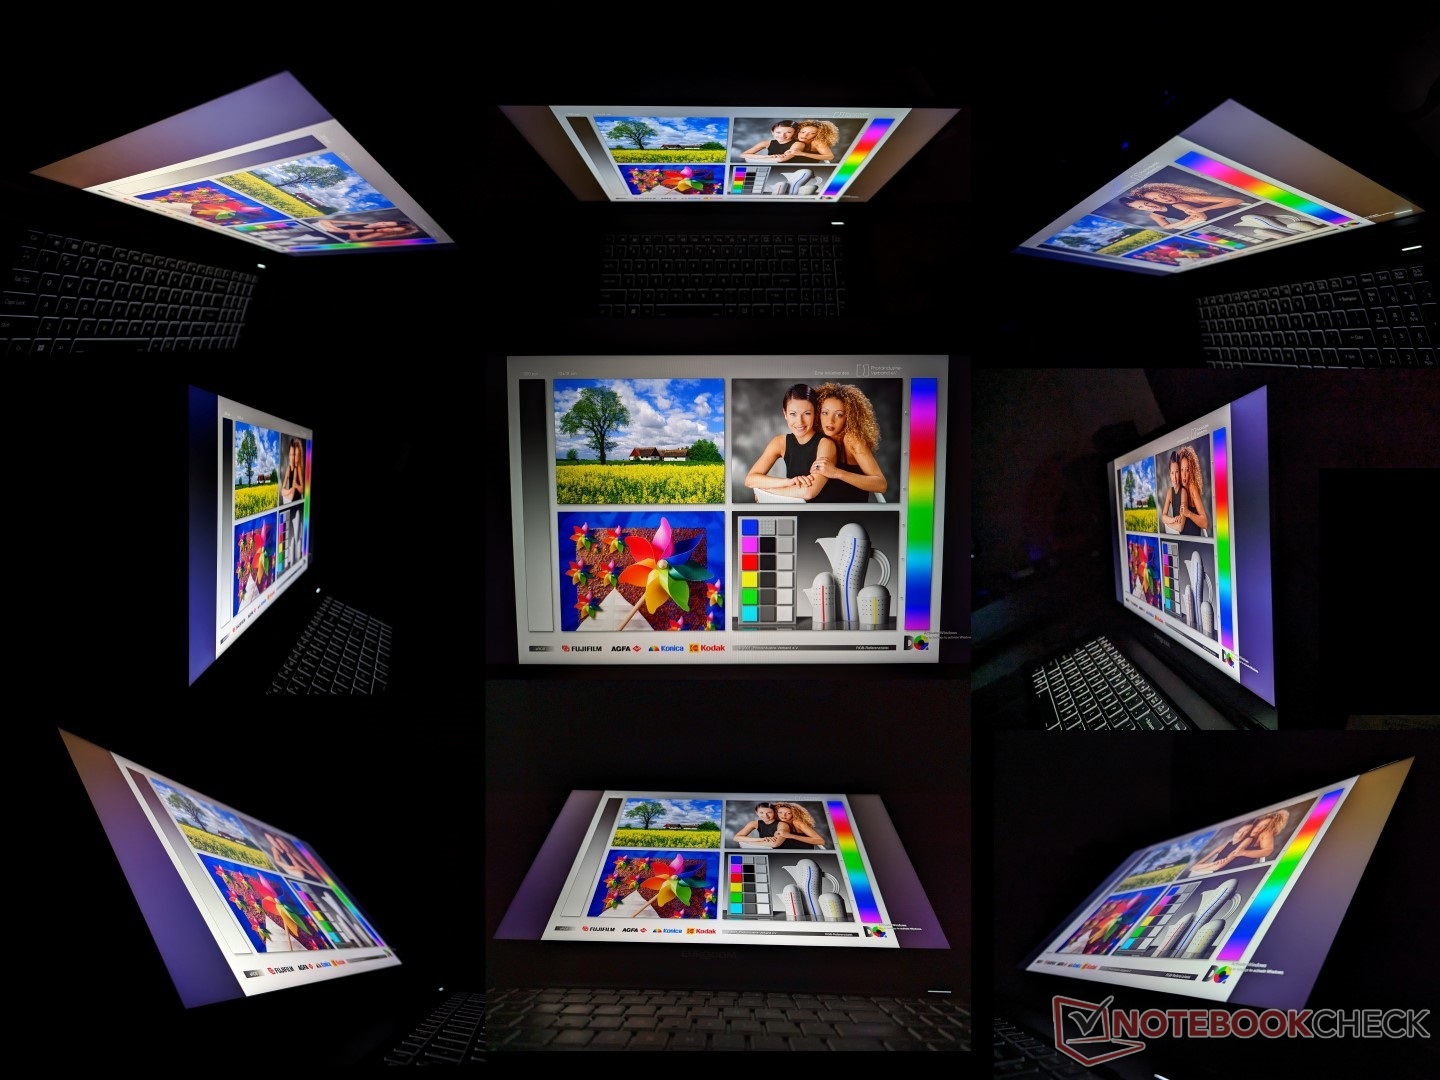
Display - 240 Hz, QHD, G-Sync, colori DCI-P3 completi
Sono disponibili due opzioni di visualizzazione: QHD a 240 Hz o 4K UHD a 144 Hz, ciascuno con il 100% dei colori DCI-P3 e il supporto G-Sync. La nostra unità di prova specifica viene fornita con la prima.
Il nostro sistema impiega un pannello IPS di BOE molto simile a quello presente sulROG Strix Scar 17 (NE173QHM-NZ1 vs. NE173QHM-NZ2). Non notiamo differenze sostanziali tra i due pannelli, grazie alla velocità di aggiornamento, ai tempi di risposta rapidi, all'ampia copertura dei colori, agli obiettivi di luminosità e al rapporto di contrasto decente. Si tratta di un pannello di fascia alta adatto sia per i giochi che per l'editing di contenuti.
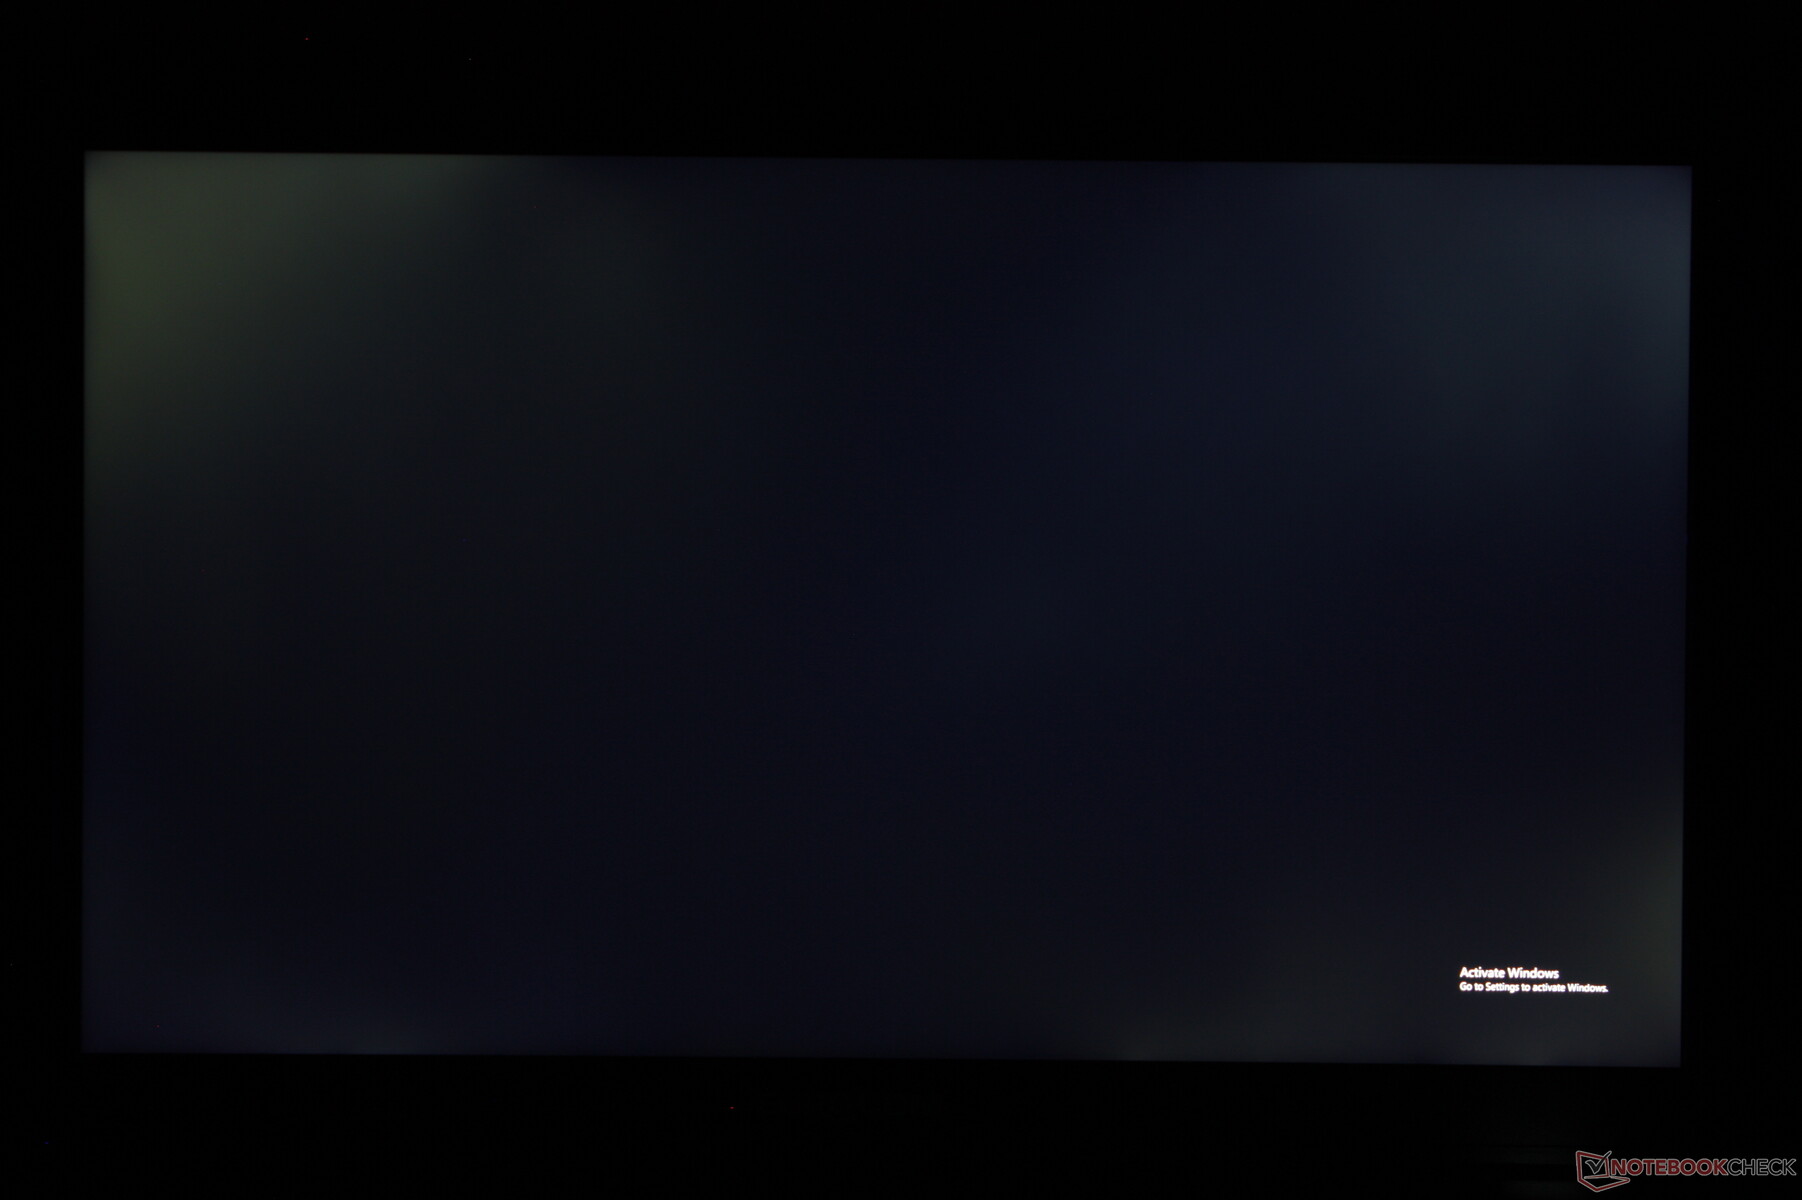
Una lamentela che abbiamo riguarda il notevole bleeding della retroilluminazione sulla nostra unità di test. Sebbene un po' di bleeding sia prevedibile per la maggior parte dei pannelli IPS, in questo caso è più grave che in altri portatili che abbiamo testato e che costano meno della metà.
| |||||||||||||||||||||||||
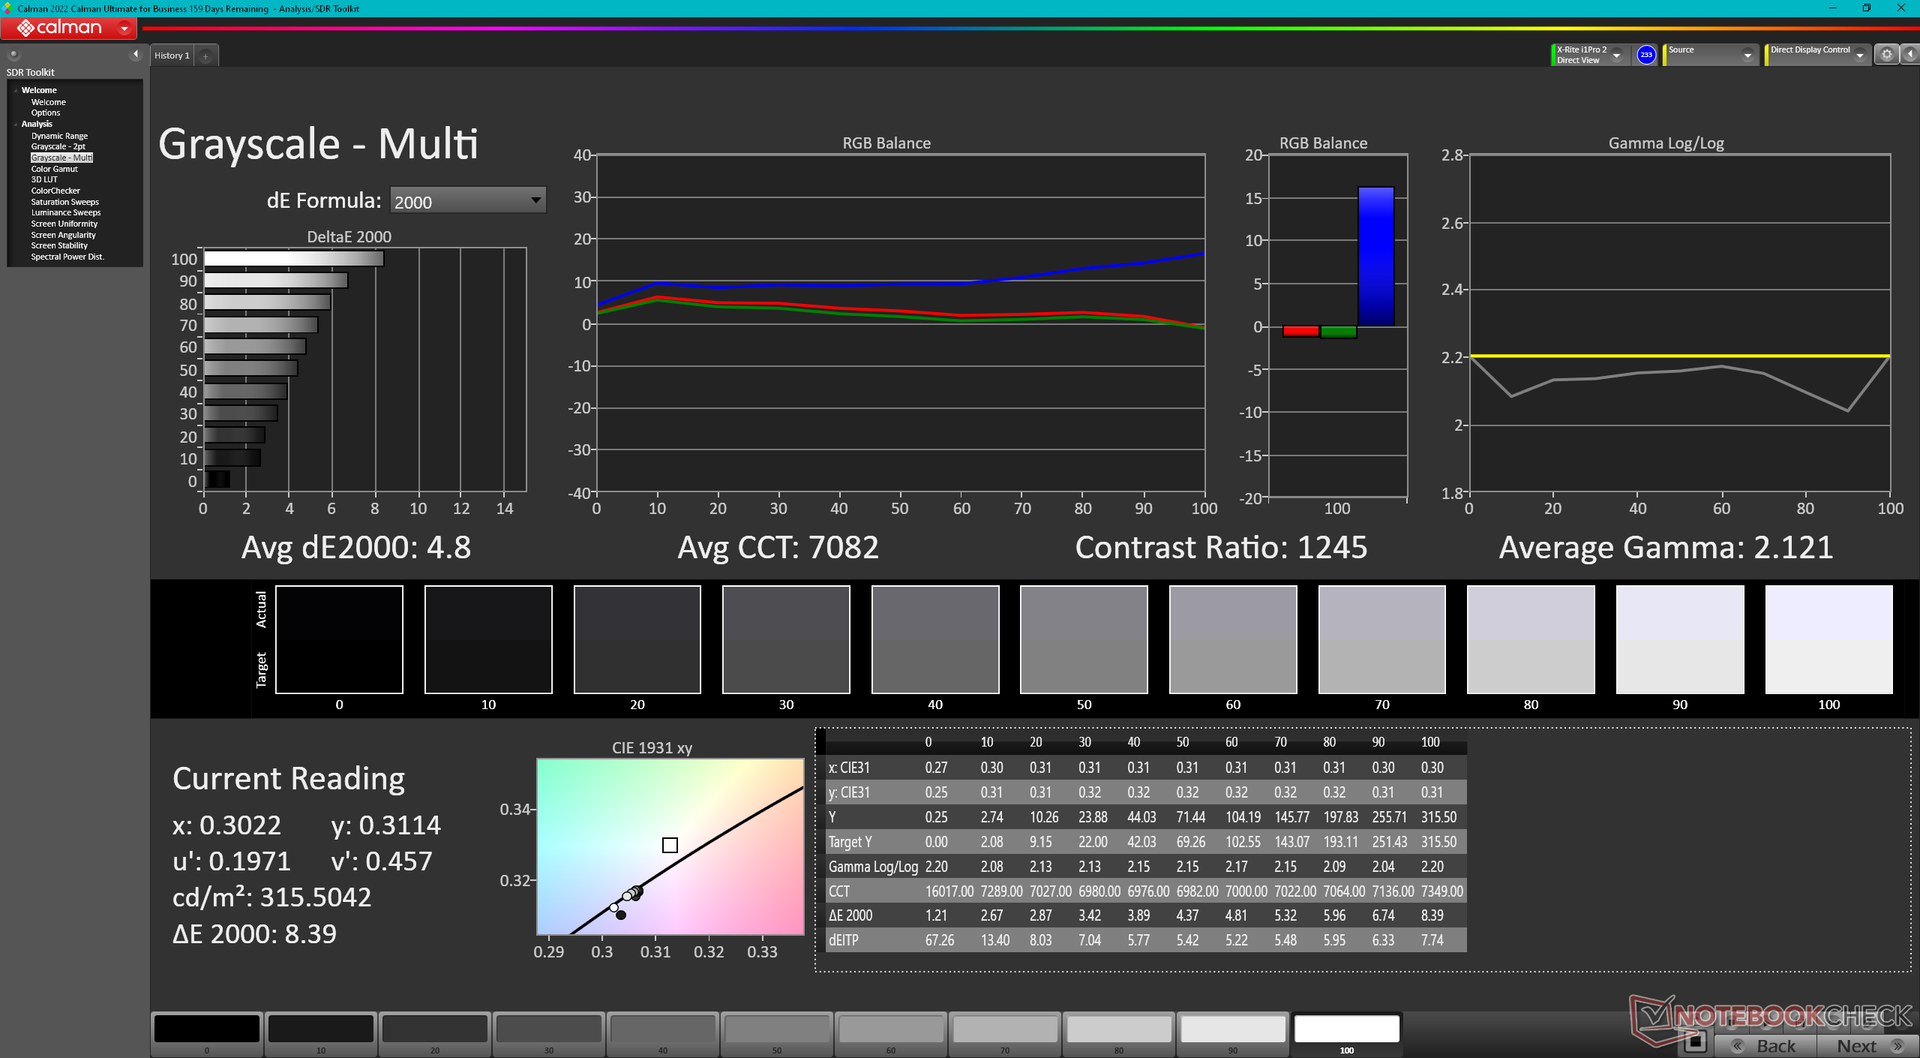
Distribuzione della luminosità: 75 %
Al centro con la batteria: 312.6 cd/m²
Contrasto: 1202:1 (Nero: 0.26 cd/m²)
ΔE ColorChecker Calman: 3.43 | ∀{0.5-29.43 Ø4.71}
calibrated: 0.74
ΔE Greyscale Calman: 4.8 | ∀{0.09-98 Ø4.96}
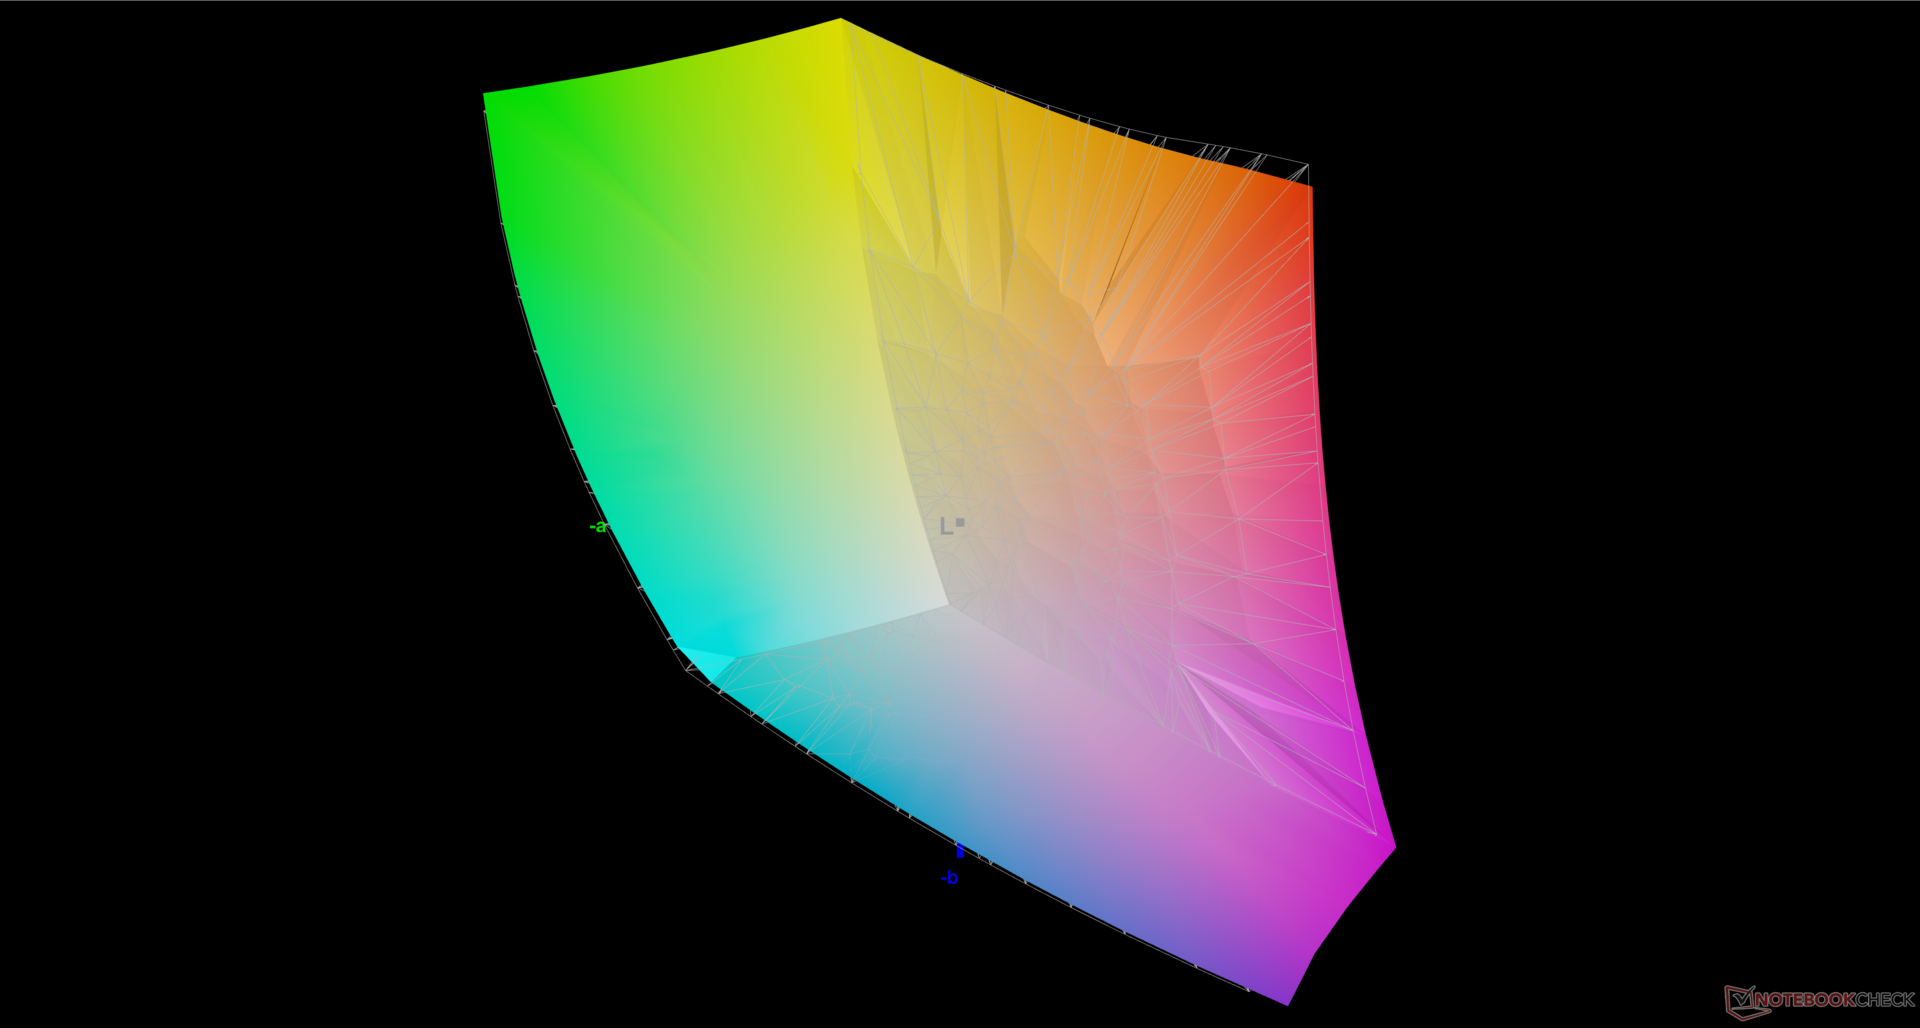
85.4% AdobeRGB 1998 (Argyll 3D)
99.9% sRGB (Argyll 3D)
97.8% Display P3 (Argyll 3D)
Gamma: 2.12
CCT: 7082 K
| Eurocom Raptor X17 BOE NE173QHM-NZ1, IPS, 2560x1440, 17.3" | Asus ROG Strix Scar 17 G733PY-XS96 NE173QHM-NZ2, IPS, 2560x1440, 17.3" | Aorus 17X AZF BOE09F9, IPS, 2560x1440, 17.3" | MSI GE78HX 13VH-070US AU Optronics B170QAN01.2, IPS, 2560x1600, 17" | Eluktronics Mech-17 GP2 BOE NE170QDM-NZ1, IPS, 2560x1600, 17" | Alienware m17 R5 (R9 6900HX, RX 6850M XT) AU Optronics AUODBA3, IPS, 3840x2160, 17" | |
|---|---|---|---|---|---|---|
| Display | 0% | -1% | 0% | -16% | 1% | |
| Display P3 Coverage (%) | 97.8 | 98 0% | 96.7 -1% | 97.6 0% | 69.1 -29% | 97.2 -1% |
| sRGB Coverage (%) | 99.9 | 100 0% | 99.9 0% | 99.9 0% | 99.7 0% | 99.6 0% |
| AdobeRGB 1998 Coverage (%) | 85.4 | 85.6 0% | 84.5 -1% | 86.5 1% | 69.8 -18% | 88.4 4% |
| Response Times | 20% | -3% | 52% | 8% | -20% | |
| Response Time Grey 50% / Grey 80% * (ms) | 13.3 ? | 6.2 ? 53% | 14 ? -5% | 4.2 ? 68% | 12 ? 10% | 16.4 ? -23% |
| Response Time Black / White * (ms) | 10 ? | 11.4 ? -14% | 10.1 ? -1% | 6.4 ? 36% | 9.4 ? 6% | 11.6 ? -16% |
| PWM Frequency (Hz) | ||||||
| Screen | 25% | 6% | -13% | 19% | -67% | |
| Brightness middle (cd/m²) | 312.6 | 322.5 3% | 294 -6% | 398.6 28% | 417.3 33% | 484 55% |
| Brightness (cd/m²) | 292 | 317 9% | 276 -5% | 384 32% | 387 33% | 449 54% |
| Brightness Distribution (%) | 75 | 86 15% | 90 20% | 89 19% | 87 16% | 87 16% |
| Black Level * (cd/m²) | 0.26 | 0.29 -12% | 0.28 -8% | 0.46 -77% | 0.42 -62% | 0.55 -112% |
| Contrast (:1) | 1202 | 1112 -7% | 1050 -13% | 867 -28% | 994 -17% | 880 -27% |
| Colorchecker dE 2000 * | 3.43 | 1.15 66% | 2.81 18% | 4.05 -18% | 2.14 38% | 4.8 -40% |
| Colorchecker dE 2000 max. * | 8.31 | 3.03 64% | 5.7 31% | 8.68 -4% | 4.09 51% | 7.48 10% |
| Colorchecker dE 2000 calibrated * | 0.74 | 0.56 24% | 0.86 -16% | 1.02 -38% | 0.42 43% | 4.74 -541% |
| Greyscale dE 2000 * | 4.8 | 1.7 65% | 3.4 29% | 6.5 -35% | 3.1 35% | 5.5 -15% |
| Gamma | 2.12 104% | 2.27 97% | 2.301 96% | 2.11 104% | 2.19 100% | 2.42 91% |
| CCT | 7082 92% | 6299 103% | 7389 88% | 7518 86% | 6040 108% | 6148 106% |
| Media totale (Programma / Settaggio) | 15% /
19% | 1% /
3% | 13% /
-1% | 4% /
10% | -29% /
-45% |
* ... Meglio usare valori piccoli

Il display non viene fornito pre-calibrato. Al contrario, Eurocom chiede un supplemento per la calibrazione di fabbrica, che riteniamo assurda visto il prezzo già elevato. Altri produttori come MSI, Asus, Dell e altri offrono la pre-calibrazione come standard per molti dei loro rispettivi modelli.
Tempi di risposta del Display
| ↔ Tempi di risposta dal Nero al Bianco | ||
|---|---|---|
| 10 ms ... aumenta ↗ e diminuisce ↘ combinato | ↗ 5 ms Incremento | 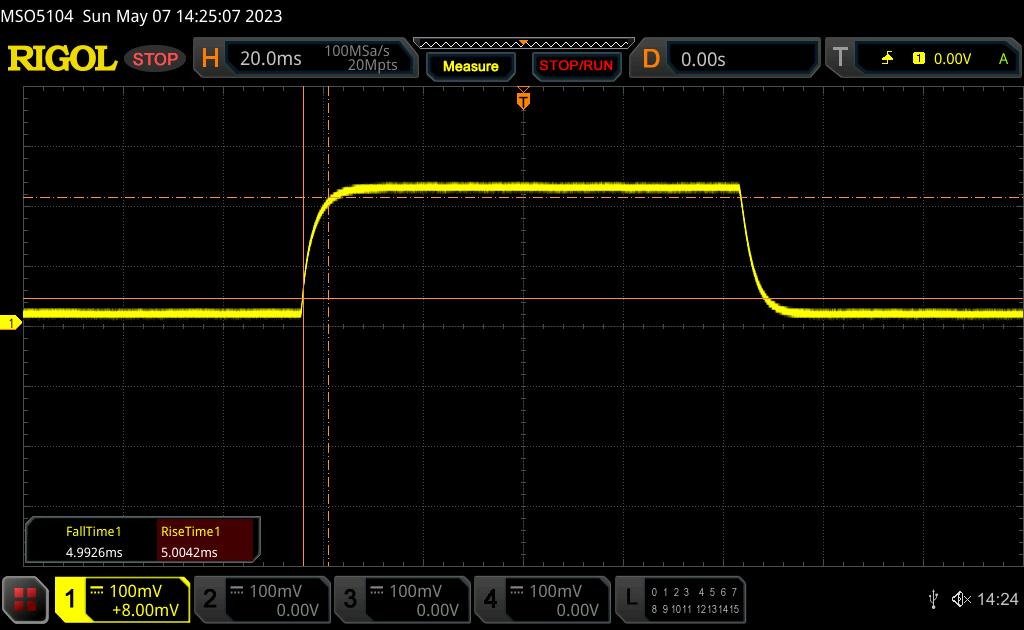 |
| ↘ 5 ms Calo | ||
| Lo schermo mostra buoni tempi di risposta durante i nostri tests, ma potrebbe essere troppo lento per i gamers competitivi. In confronto, tutti i dispositivi di test variano da 0.1 (minimo) a 240 (massimo) ms. » 27 % di tutti i dispositivi è migliore. Questo significa che i tempi di risposta rilevati sono migliori rispettto alla media di tutti i dispositivi testati (19.8 ms). | ||
| ↔ Tempo di risposta dal 50% Grigio all'80% Grigio | ||
| 13.3 ms ... aumenta ↗ e diminuisce ↘ combinato | ↗ 6 ms Incremento | 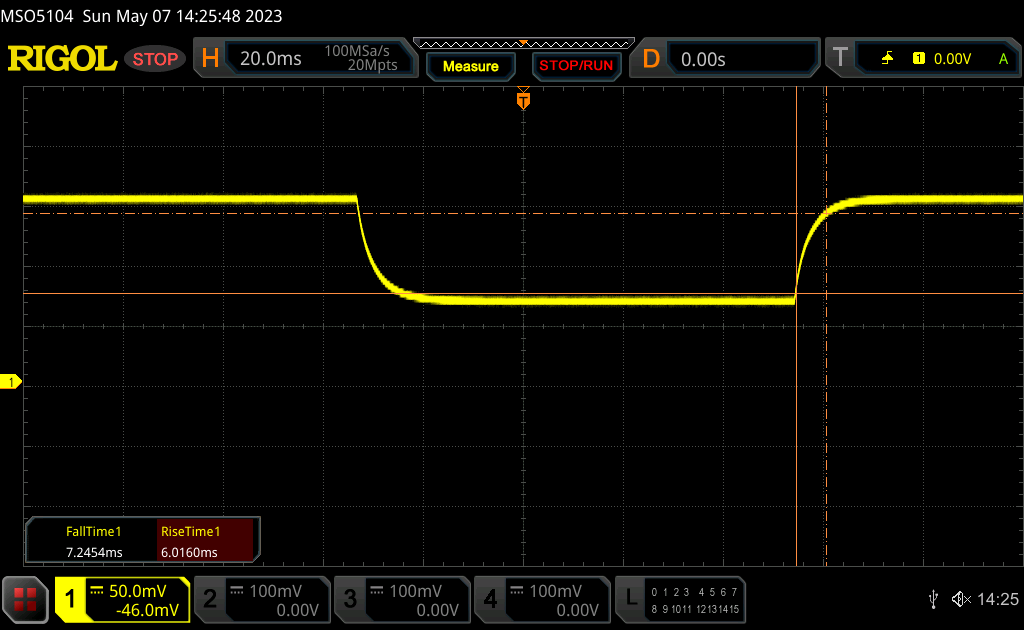 |
| ↘ 7.3 ms Calo | ||
| Lo schermo mostra buoni tempi di risposta durante i nostri tests, ma potrebbe essere troppo lento per i gamers competitivi. In confronto, tutti i dispositivi di test variano da 0.165 (minimo) a 636 (massimo) ms. » 27 % di tutti i dispositivi è migliore. Questo significa che i tempi di risposta rilevati sono migliori rispettto alla media di tutti i dispositivi testati (31 ms). | ||
Sfarfallio dello schermo / PWM (Pulse-Width Modulation)
| flickering dello schermo / PWM non rilevato | 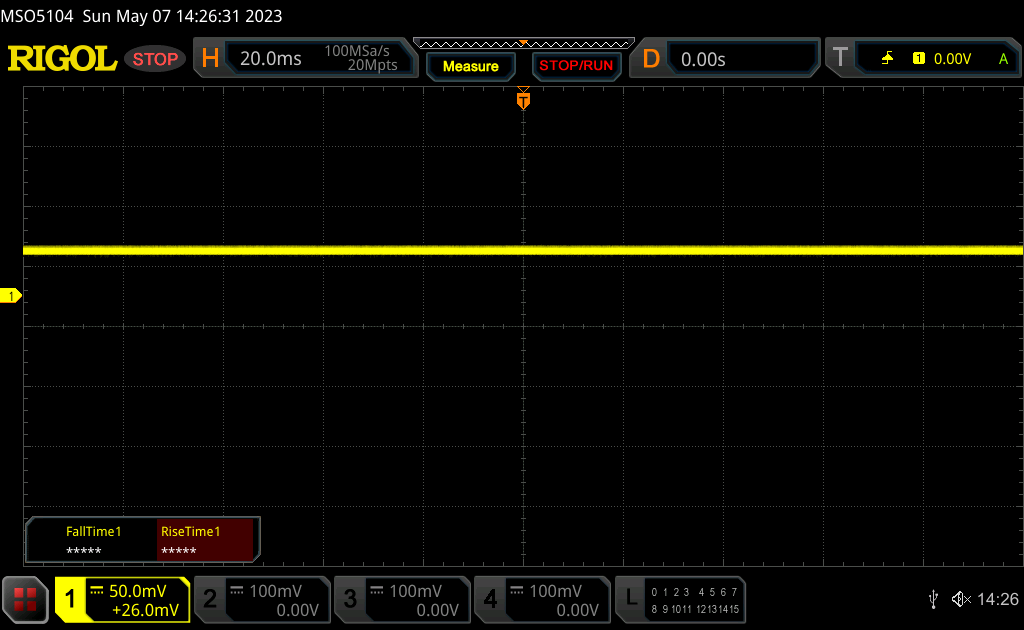 | ||
In confronto: 52 % di tutti i dispositivi testati non utilizza PWM per ridurre la luminosita' del display. Se è rilevato PWM, una media di 7754 (minimo: 5 - massimo: 343500) Hz è stata rilevata. | |||
La visibilità all'aperto è tipica della maggior parte dei portatili da gioco, poiché 300 nits sono la media della categoria. I pannelli di alcuni modelli concorrenti possono raggiungere i 500 nits, come nel caso dell'Alienware m17 R5.Alienware m17 R5 o Razer Blade 17 per una visione più agevole all'aperto, ma non riteniamo che questo sia un vantaggio enorme rispetto all'Eurocom, considerando le dimensioni e il peso dei portatili da gioco da 17 pollici.
Prestazioni - Lago Raptor per il Raptor X17
Condizioni di test
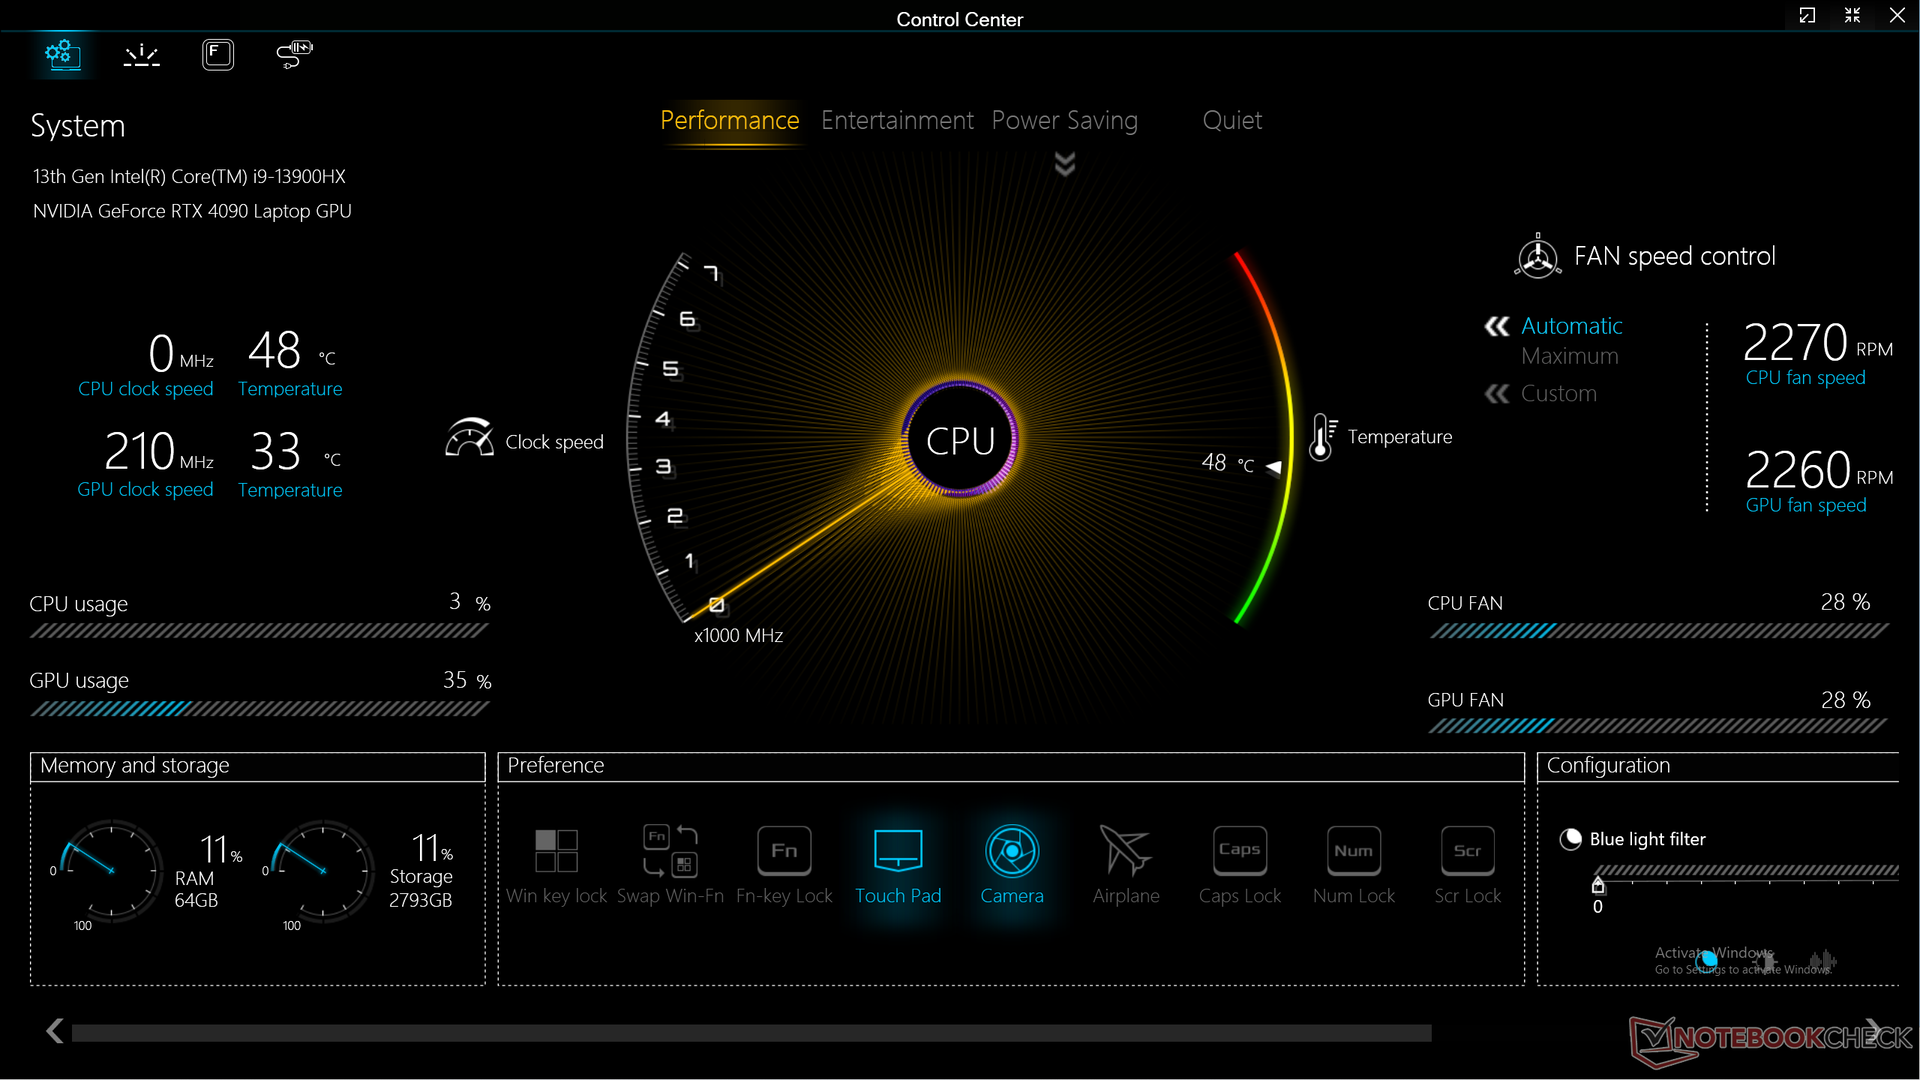
Abbiamo impostato la nostra unità in modalità Performance sia tramite Control Center che tramite Windows prima di eseguire i benchmark qui sotto. Purtroppo, le impostazioni di alimentazione del Control Center non sono legate a quelle di Windows, il che significa che potrebbe verificarsi un conflitto se le due impostazioni non sono identiche. Ad esempio, è possibile impostare Windows in modalità Risparmio energetico e Control Center in modalità Prestazioni contemporaneamente. OEM come Dell hanno già affrontato questo problema sulla loro serie Alienware.
Abbiamo anche impostato la nostra unità in modalità dGPU prima del benchmark. Il Raptor X17 supporta la modalità grafica ibrida (Optimus), la modalità dGPU e la modalità dinamica (detta anche Advanced Optimus). Sebbene apprezziamo le opzioni, le impostazioni sono sepolte in diversi livelli di sottomenu nel BIOS. In confronto, concorrenti come MSI e Asus hanno impostazioni simili nelle rispettive applicazioni Control Center per un accesso più semplice.
Processore
IlCore i9-13900HX nella nostra unità è leggermente più lento rispetto ad altri portatili con lo stesso processore di circa il 5%. In ogni caso, è ancora una delle CPU della serie H più veloci sul mercato, in grado di rivaleggiare con il concorrente Ryzen 9 7945HX. L'aggiornamento rispetto al modello dello scorso anno Core i9-12900HX aumenterà le prestazioni multi-thread di circa il 20%.
La sostenibilità delle prestazioni è eccellente, soprattutto se confrontata con il modello Aorus 17X che monta lo stesso Core i9-13900HX. I punteggi dei loop di CineBench R15 xT sono più stabili sulla nostra unità durante tutto lo stress test, come mostra il grafico di confronto qui sotto.
Il passaggio alla configurazione Core i7-13700HX dal nostro Core i9-13900HX dovrebbe ridurre le prestazioni multi-thread di circa il 20-25%.
Cinebench R15 Multi Loop
Cinebench R23: Multi Core | Single Core
Cinebench R20: CPU (Multi Core) | CPU (Single Core)
Cinebench R15: CPU Multi 64Bit | CPU Single 64Bit
Blender: v2.79 BMW27 CPU
7-Zip 18.03: 7z b 4 | 7z b 4 -mmt1
Geekbench 5.5: Multi-Core | Single-Core
HWBOT x265 Benchmark v2.2: 4k Preset
LibreOffice : 20 Documents To PDF
R Benchmark 2.5: Overall mean
* ... Meglio usare valori piccoli
AIDA64: FP32 Ray-Trace | FPU Julia | CPU SHA3 | CPU Queen | FPU SinJulia | FPU Mandel | CPU AES | CPU ZLib | FP64 Ray-Trace | CPU PhotoWorxx
| Performance rating | |
| Asus ROG Strix Scar 17 G733PY-XS96 | |
| Eluktronics Mech-17 GP2 | |
| MSI GE78HX 13VH-070US | |
| Media Intel Core i9-13900HX | |
| Eurocom Raptor X17 | |
| Aorus 17X AZF | |
| Alienware m17 R5 (R9 6900HX, RX 6850M XT) | |
| AIDA64 / FP32 Ray-Trace | |
| Asus ROG Strix Scar 17 G733PY-XS96 | |
| MSI GE78HX 13VH-070US | |
| Eluktronics Mech-17 GP2 | |
| Media Intel Core i9-13900HX (17589 - 27615, n=22) | |
| Eurocom Raptor X17 | |
| Aorus 17X AZF | |
| Alienware m17 R5 (R9 6900HX, RX 6850M XT) | |
| AIDA64 / FPU Julia | |
| Asus ROG Strix Scar 17 G733PY-XS96 | |
| MSI GE78HX 13VH-070US | |
| Eluktronics Mech-17 GP2 | |
| Eurocom Raptor X17 | |
| Media Intel Core i9-13900HX (88686 - 137015, n=22) | |
| Alienware m17 R5 (R9 6900HX, RX 6850M XT) | |
| Aorus 17X AZF | |
| AIDA64 / CPU SHA3 | |
| Asus ROG Strix Scar 17 G733PY-XS96 | |
| Eluktronics Mech-17 GP2 | |
| MSI GE78HX 13VH-070US | |
| Eurocom Raptor X17 | |
| Media Intel Core i9-13900HX (4362 - 7029, n=22) | |
| Aorus 17X AZF | |
| Alienware m17 R5 (R9 6900HX, RX 6850M XT) | |
| AIDA64 / CPU Queen | |
| Asus ROG Strix Scar 17 G733PY-XS96 | |
| Eluktronics Mech-17 GP2 | |
| MSI GE78HX 13VH-070US | |
| Eurocom Raptor X17 | |
| Media Intel Core i9-13900HX (125644 - 141385, n=22) | |
| Aorus 17X AZF | |
| Alienware m17 R5 (R9 6900HX, RX 6850M XT) | |
| AIDA64 / FPU SinJulia | |
| Asus ROG Strix Scar 17 G733PY-XS96 | |
| Eluktronics Mech-17 GP2 | |
| MSI GE78HX 13VH-070US | |
| Media Intel Core i9-13900HX (12334 - 17179, n=22) | |
| Eurocom Raptor X17 | |
| Aorus 17X AZF | |
| Alienware m17 R5 (R9 6900HX, RX 6850M XT) | |
| AIDA64 / FPU Mandel | |
| Asus ROG Strix Scar 17 G733PY-XS96 | |
| MSI GE78HX 13VH-070US | |
| Eluktronics Mech-17 GP2 | |
| Media Intel Core i9-13900HX (43850 - 69202, n=22) | |
| Eurocom Raptor X17 | |
| Alienware m17 R5 (R9 6900HX, RX 6850M XT) | |
| Aorus 17X AZF | |
| AIDA64 / CPU AES | |
| Eluktronics Mech-17 GP2 | |
| Asus ROG Strix Scar 17 G733PY-XS96 | |
| Aorus 17X AZF | |
| Media Intel Core i9-13900HX (89413 - 237881, n=22) | |
| MSI GE78HX 13VH-070US | |
| Eurocom Raptor X17 | |
| Alienware m17 R5 (R9 6900HX, RX 6850M XT) | |
| AIDA64 / CPU ZLib | |
| Asus ROG Strix Scar 17 G733PY-XS96 | |
| MSI GE78HX 13VH-070US | |
| Eluktronics Mech-17 GP2 | |
| Eurocom Raptor X17 | |
| Media Intel Core i9-13900HX (1284 - 1958, n=22) | |
| Aorus 17X AZF | |
| Alienware m17 R5 (R9 6900HX, RX 6850M XT) | |
| AIDA64 / FP64 Ray-Trace | |
| Asus ROG Strix Scar 17 G733PY-XS96 | |
| MSI GE78HX 13VH-070US | |
| Eluktronics Mech-17 GP2 | |
| Media Intel Core i9-13900HX (9481 - 15279, n=22) | |
| Eurocom Raptor X17 | |
| Aorus 17X AZF | |
| Alienware m17 R5 (R9 6900HX, RX 6850M XT) | |
| AIDA64 / CPU PhotoWorxx | |
| Eurocom Raptor X17 | |
| Aorus 17X AZF | |
| MSI GE78HX 13VH-070US | |
| Media Intel Core i9-13900HX (42994 - 51994, n=22) | |
| Eluktronics Mech-17 GP2 | |
| Asus ROG Strix Scar 17 G733PY-XS96 | |
| Alienware m17 R5 (R9 6900HX, RX 6850M XT) | |
Prestazioni del sistema
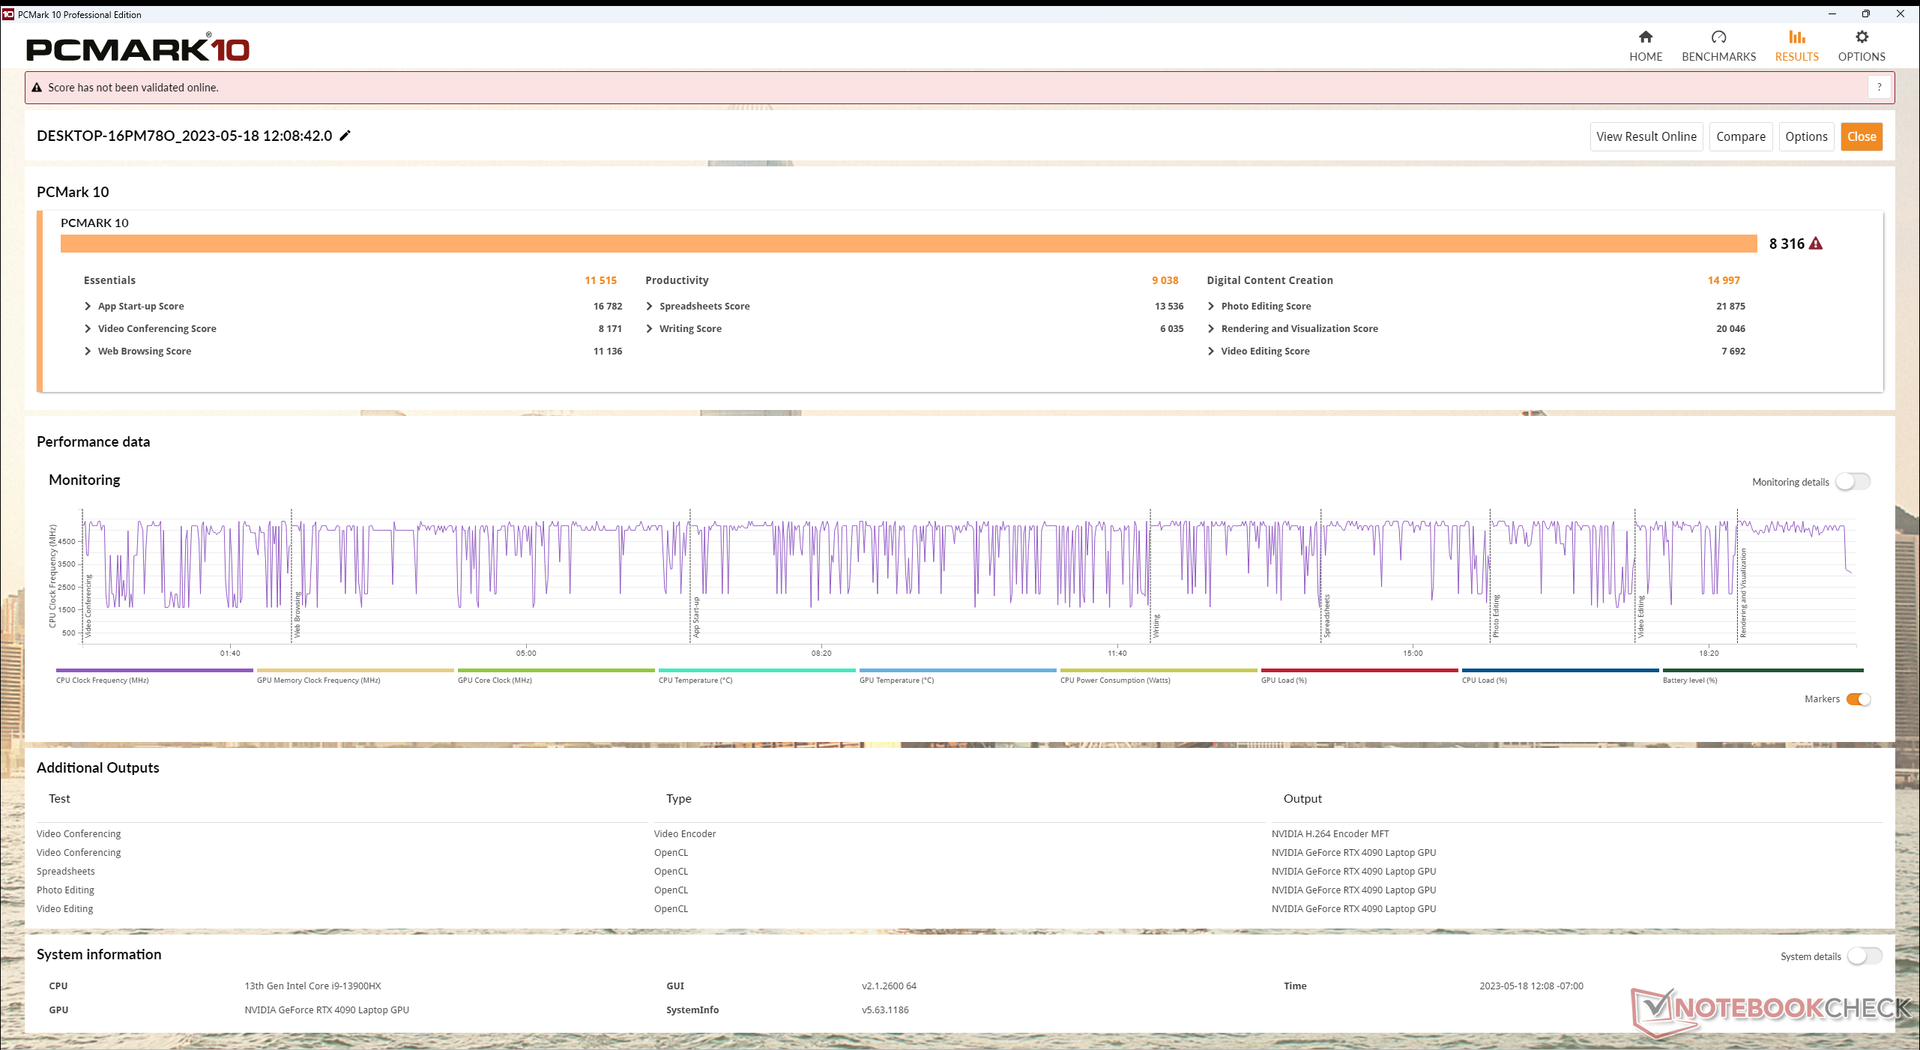
CrossMark: Overall | Productivity | Creativity | Responsiveness
| PCMark 10 / Score | |
| Eluktronics Mech-17 GP2 | |
| MSI GE78HX 13VH-070US | |
| Asus ROG Strix Scar 17 G733PY-XS96 | |
| Media Intel Core i9-13900HX, NVIDIA GeForce RTX 4090 Laptop GPU (7690 - 9331, n=8) | |
| Eurocom Raptor X17 | |
| Aorus 17X AZF | |
| Alienware m17 R5 (R9 6900HX, RX 6850M XT) | |
| PCMark 10 / Essentials | |
| Eluktronics Mech-17 GP2 | |
| Eurocom Raptor X17 | |
| MSI GE78HX 13VH-070US | |
| Media Intel Core i9-13900HX, NVIDIA GeForce RTX 4090 Laptop GPU (10972 - 11983, n=8) | |
| Aorus 17X AZF | |
| Asus ROG Strix Scar 17 G733PY-XS96 | |
| Alienware m17 R5 (R9 6900HX, RX 6850M XT) | |
| PCMark 10 / Productivity | |
| Eluktronics Mech-17 GP2 | |
| MSI GE78HX 13VH-070US | |
| Media Intel Core i9-13900HX, NVIDIA GeForce RTX 4090 Laptop GPU (9038 - 11680, n=8) | |
| Aorus 17X AZF | |
| Asus ROG Strix Scar 17 G733PY-XS96 | |
| Alienware m17 R5 (R9 6900HX, RX 6850M XT) | |
| Eurocom Raptor X17 | |
| PCMark 10 / Digital Content Creation | |
| Asus ROG Strix Scar 17 G733PY-XS96 | |
| Eluktronics Mech-17 GP2 | |
| MSI GE78HX 13VH-070US | |
| Eurocom Raptor X17 | |
| Media Intel Core i9-13900HX, NVIDIA GeForce RTX 4090 Laptop GPU (10605 - 16395, n=8) | |
| Alienware m17 R5 (R9 6900HX, RX 6850M XT) | |
| Aorus 17X AZF | |
| CrossMark / Overall | |
| Eluktronics Mech-17 GP2 | |
| Aorus 17X AZF | |
| Media Intel Core i9-13900HX, NVIDIA GeForce RTX 4090 Laptop GPU (1825 - 2295, n=8) | |
| Asus ROG Strix Scar 17 G733PY-XS96 | |
| MSI GE78HX 13VH-070US | |
| Eurocom Raptor X17 | |
| Alienware m17 R5 (R9 6900HX, RX 6850M XT) | |
| CrossMark / Productivity | |
| Aorus 17X AZF | |
| Eluktronics Mech-17 GP2 | |
| Media Intel Core i9-13900HX, NVIDIA GeForce RTX 4090 Laptop GPU (1666 - 2166, n=8) | |
| MSI GE78HX 13VH-070US | |
| Asus ROG Strix Scar 17 G733PY-XS96 | |
| Eurocom Raptor X17 | |
| Alienware m17 R5 (R9 6900HX, RX 6850M XT) | |
| CrossMark / Creativity | |
| Eluktronics Mech-17 GP2 | |
| Media Intel Core i9-13900HX, NVIDIA GeForce RTX 4090 Laptop GPU (2162 - 2514, n=8) | |
| Asus ROG Strix Scar 17 G733PY-XS96 | |
| Aorus 17X AZF | |
| Eurocom Raptor X17 | |
| MSI GE78HX 13VH-070US | |
| Alienware m17 R5 (R9 6900HX, RX 6850M XT) | |
| CrossMark / Responsiveness | |
| Aorus 17X AZF | |
| Eluktronics Mech-17 GP2 | |
| Media Intel Core i9-13900HX, NVIDIA GeForce RTX 4090 Laptop GPU (1441 - 2275, n=8) | |
| MSI GE78HX 13VH-070US | |
| Asus ROG Strix Scar 17 G733PY-XS96 | |
| Eurocom Raptor X17 | |
| Alienware m17 R5 (R9 6900HX, RX 6850M XT) | |
| PCMark 10 Score | 8316 punti | |
Aiuto | ||
| AIDA64 / Memory Copy | |
| Aorus 17X AZF | |
| MSI GE78HX 13VH-070US | |
| Eurocom Raptor X17 | |
| Media Intel Core i9-13900HX (67716 - 79193, n=22) | |
| Eluktronics Mech-17 GP2 | |
| Alienware m17 R5 (R9 6900HX, RX 6850M XT) | |
| Asus ROG Strix Scar 17 G733PY-XS96 | |
| AIDA64 / Memory Read | |
| Aorus 17X AZF | |
| MSI GE78HX 13VH-070US | |
| Media Intel Core i9-13900HX (73998 - 88462, n=22) | |
| Eurocom Raptor X17 | |
| Eluktronics Mech-17 GP2 | |
| Asus ROG Strix Scar 17 G733PY-XS96 | |
| Alienware m17 R5 (R9 6900HX, RX 6850M XT) | |
| AIDA64 / Memory Write | |
| Aorus 17X AZF | |
| MSI GE78HX 13VH-070US | |
| Eurocom Raptor X17 | |
| Media Intel Core i9-13900HX (65472 - 77045, n=22) | |
| Eluktronics Mech-17 GP2 | |
| Asus ROG Strix Scar 17 G733PY-XS96 | |
| Alienware m17 R5 (R9 6900HX, RX 6850M XT) | |
| AIDA64 / Memory Latency | |
| Alienware m17 R5 (R9 6900HX, RX 6850M XT) | |
| Eluktronics Mech-17 GP2 | |
| Media Intel Core i9-13900HX (75.3 - 91.1, n=22) | |
| MSI GE78HX 13VH-070US | |
| Eurocom Raptor X17 | |
| Asus ROG Strix Scar 17 G733PY-XS96 | |
| Aorus 17X AZF | |
* ... Meglio usare valori piccoli
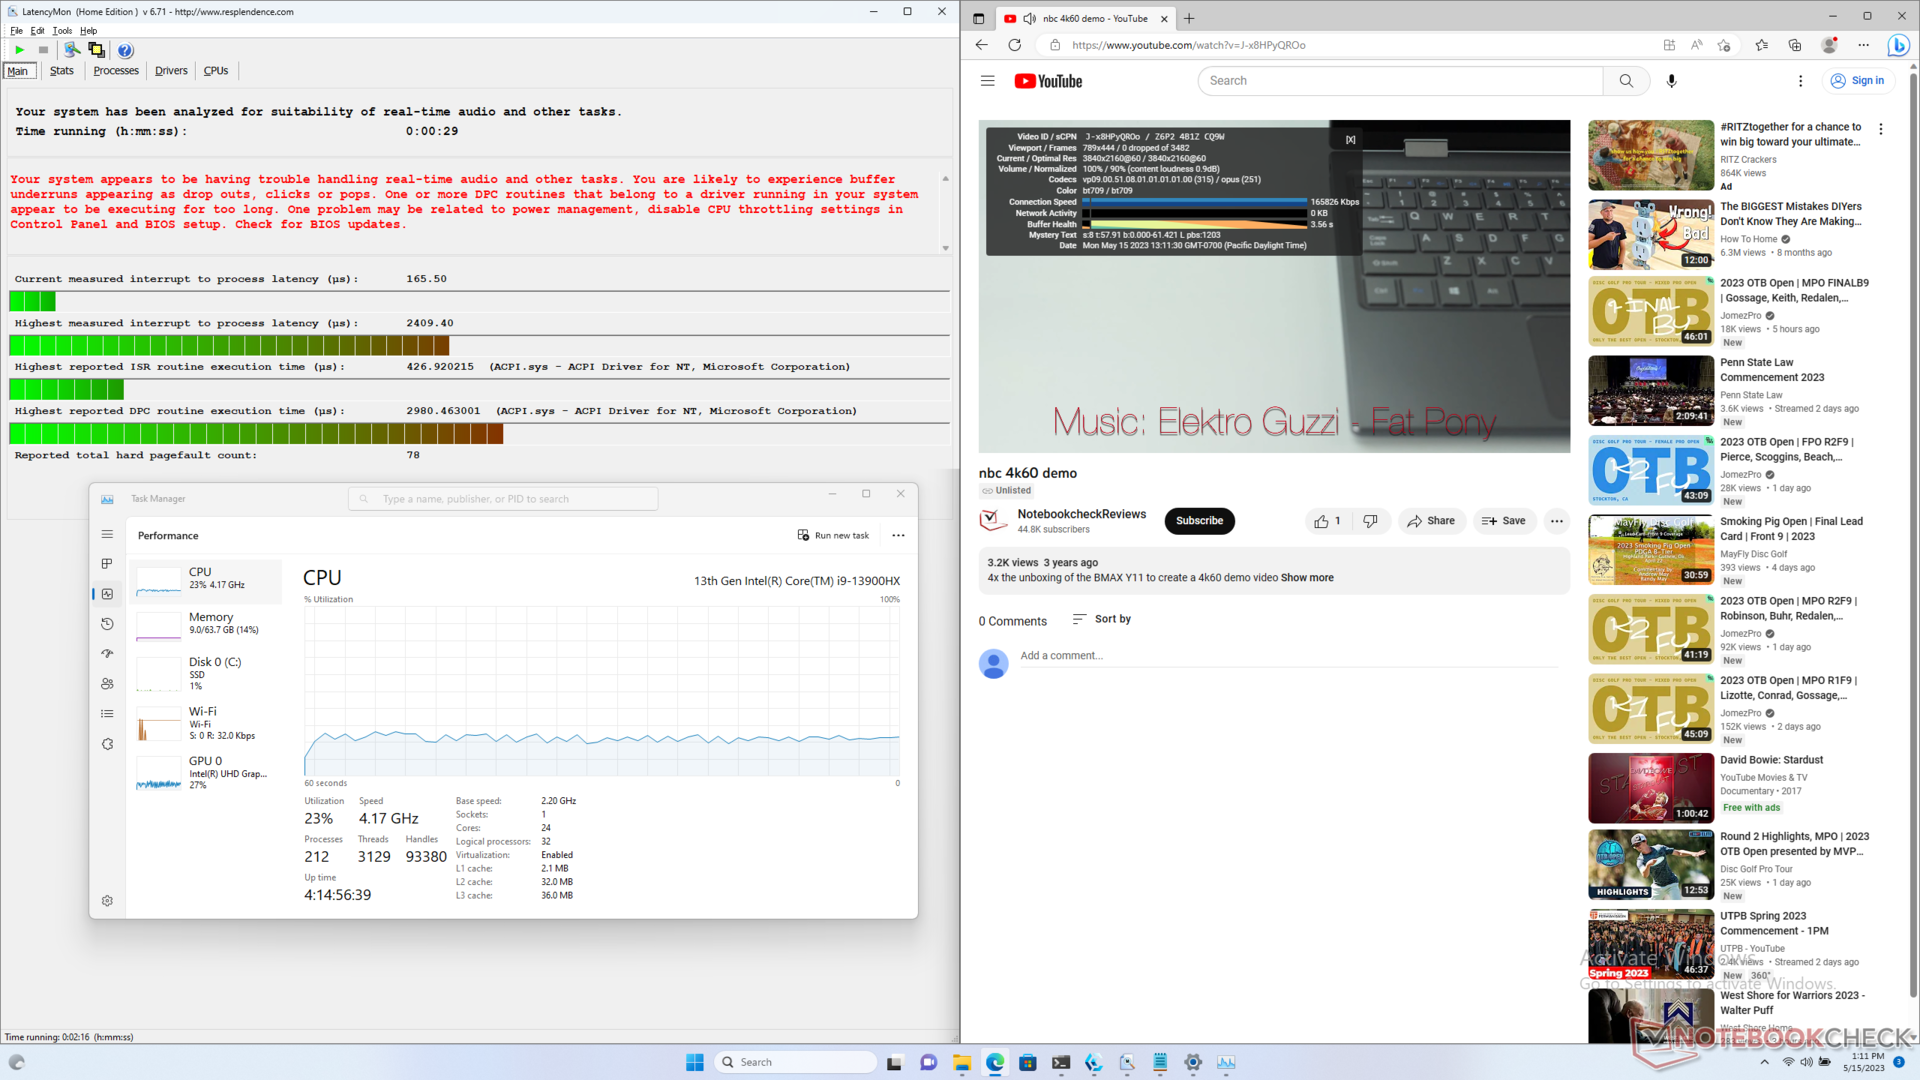
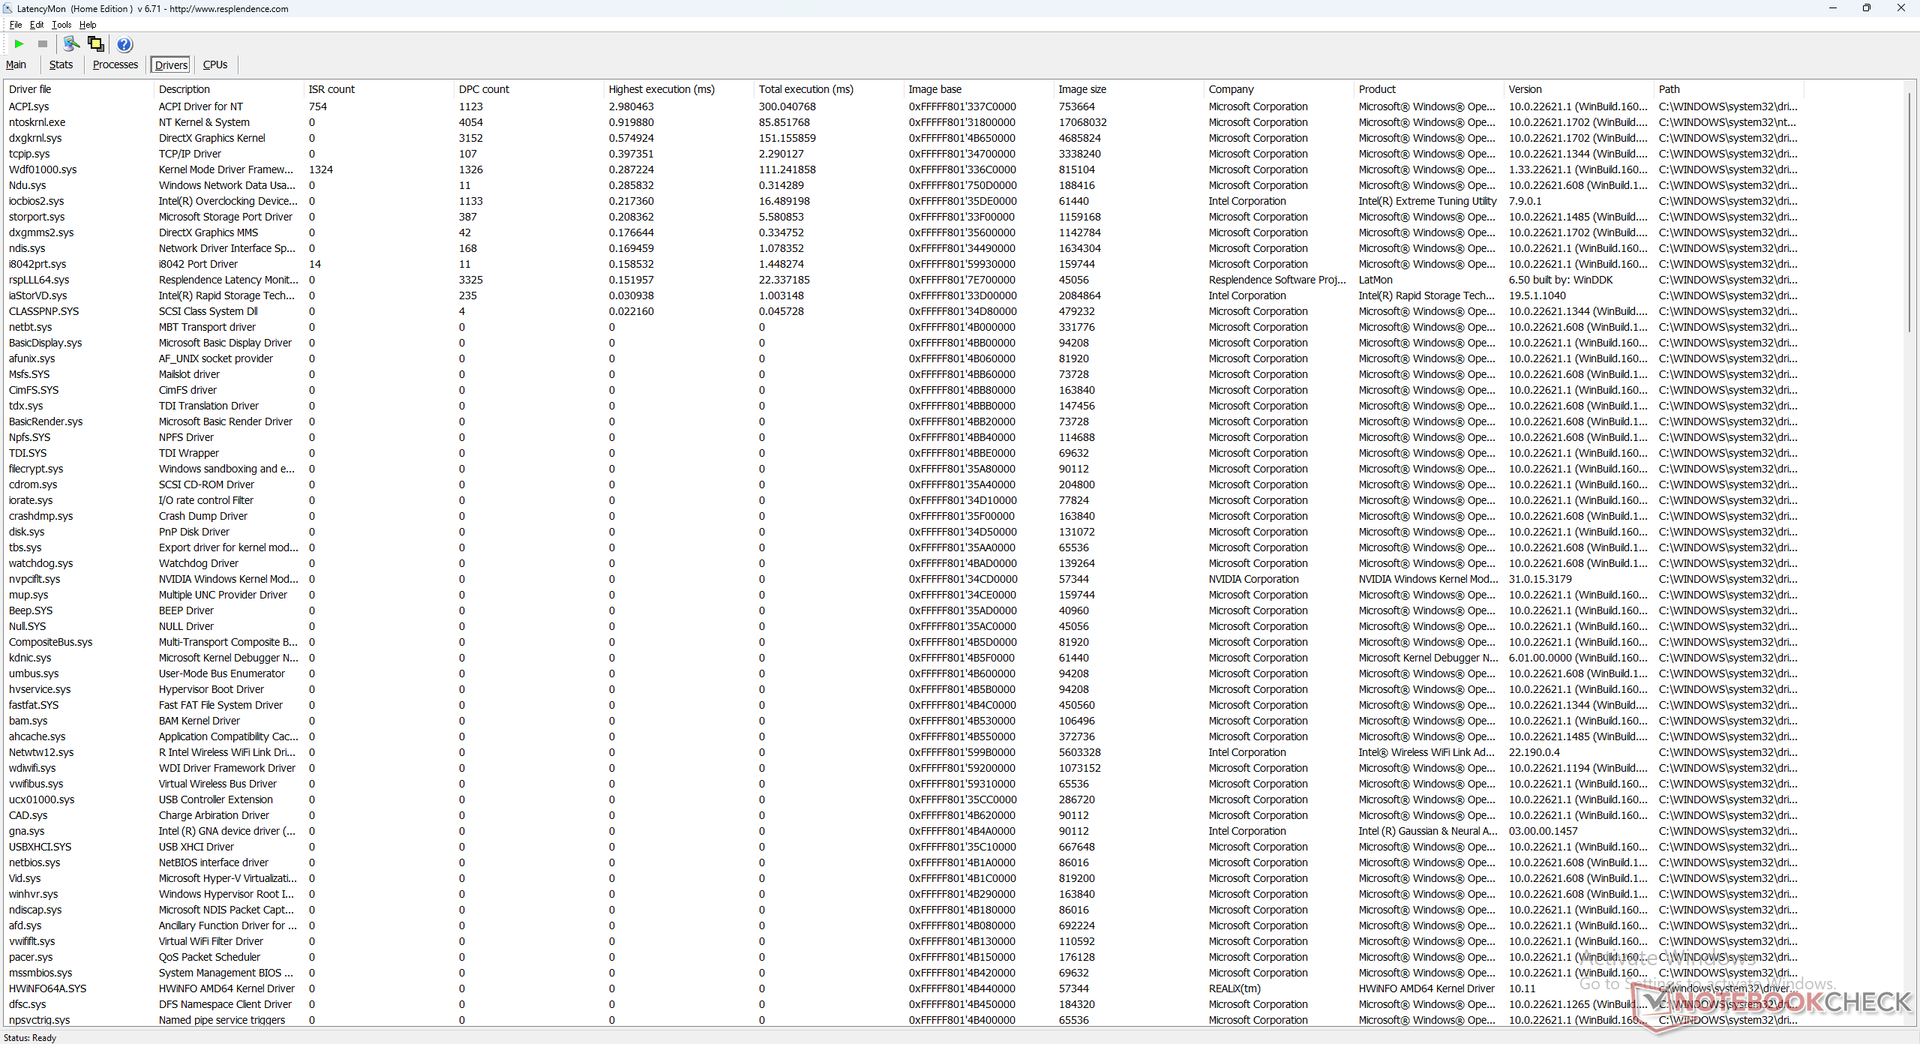
Latenza DPC
LatencyMon rivela problemi di DPC quando si aprono più schede del browser della nostra homepage. la riproduzione di video 4K a 60 FPS è invece perfetta, con un basso utilizzo della CPU e nessuna caduta di fotogrammi.
| DPC Latencies / LatencyMon - interrupt to process latency (max), Web, Youtube, Prime95 | |
| Aorus 17X AZF | |
| MSI GE78HX 13VH-070US | |
| Eurocom Raptor X17 | |
| Asus ROG Strix Scar 17 G733PY-XS96 | |
| Alienware m17 R5 (R9 6900HX, RX 6850M XT) | |
| Eluktronics Mech-17 GP2 | |
* ... Meglio usare valori piccoli
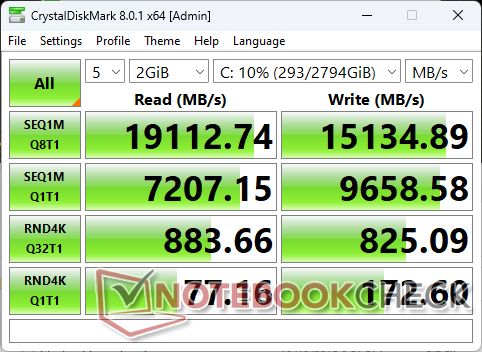
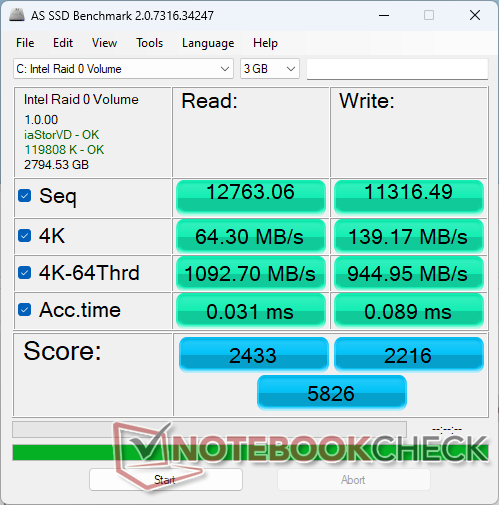
Dispositivi di archiviazione - 3x SSD PCIe4 x4 NVMe
La nostra unità è configurata con tre Samsung 980 Pro PCIe4 x4 NVMe in RAID 0 per massimizzare le prestazioni. In effetti, questo è uno dei pochi portatili da gioco a supportare un numero così elevato di unità in configurazione RAID. Le velocità di trasferimento massime raggiungono circa 19000 MB/s, ma ci si aspetta che le prestazioni si aggirino tra i 15000 e i 18000 MB/s quando si è sotto stress, il che è comunque impressionante. Non notiamo alcun problema di throttling in questo senso.

| Drive Performance rating - Percent | |
| Aorus 17X AZF | |
| MSI GE78HX 13VH-070US | |
| Eurocom Raptor X17 | |
| Asus ROG Strix Scar 17 G733PY-XS96 | |
| Eluktronics Mech-17 GP2 | |
| Alienware m17 R5 (R9 6900HX, RX 6850M XT) | |
* ... Meglio usare valori piccoli
Disk Throttling: DiskSpd Read Loop, Queue Depth 8
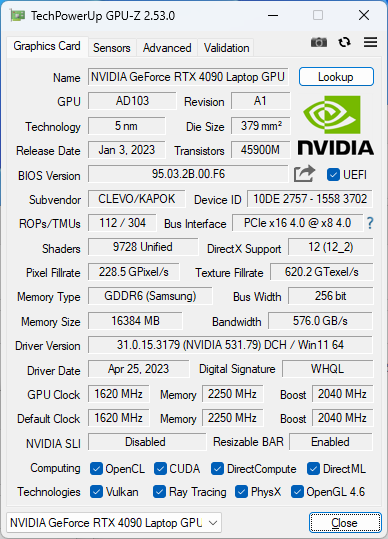
Prestazioni della GPU - Grafica TGP da 175 W
Le prestazioni grafiche si collocano entro pochi punti percentuali rispetto alla media dei portatili del nostro database con la stessa stesso GeForce RTX 4090 GPU. L'esecuzione in modalità Intrattenimento invece che in modalità Prestazioni ridurrebbe le prestazioni grafiche di circa il 4-5%. Un "corretto" desktop GeForce RTX 4090 è ancora significativamente più veloce della nostra RTX 4090 mobile di circa il 60-80% a causa delle pesanti limitazioni termiche delle GPU mobili.
Si noti che il downgrade alla GeForce RTX 4080 mobile mobile ridurrebbe le prestazioni grafiche solo di circa il 5-10%. Pertanto, vale la pena prendere in considerazione la RTX 4080 mobile, dato che le prestazioni sono così simili tra le due GPU.
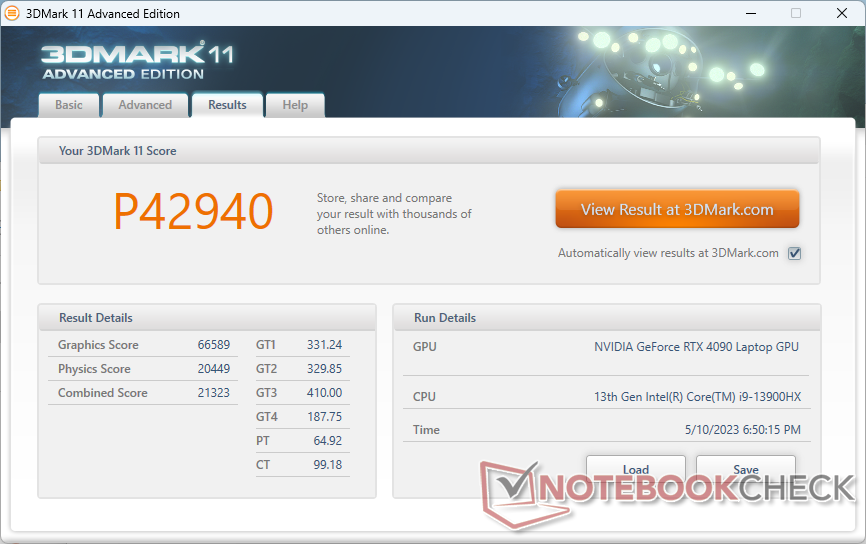
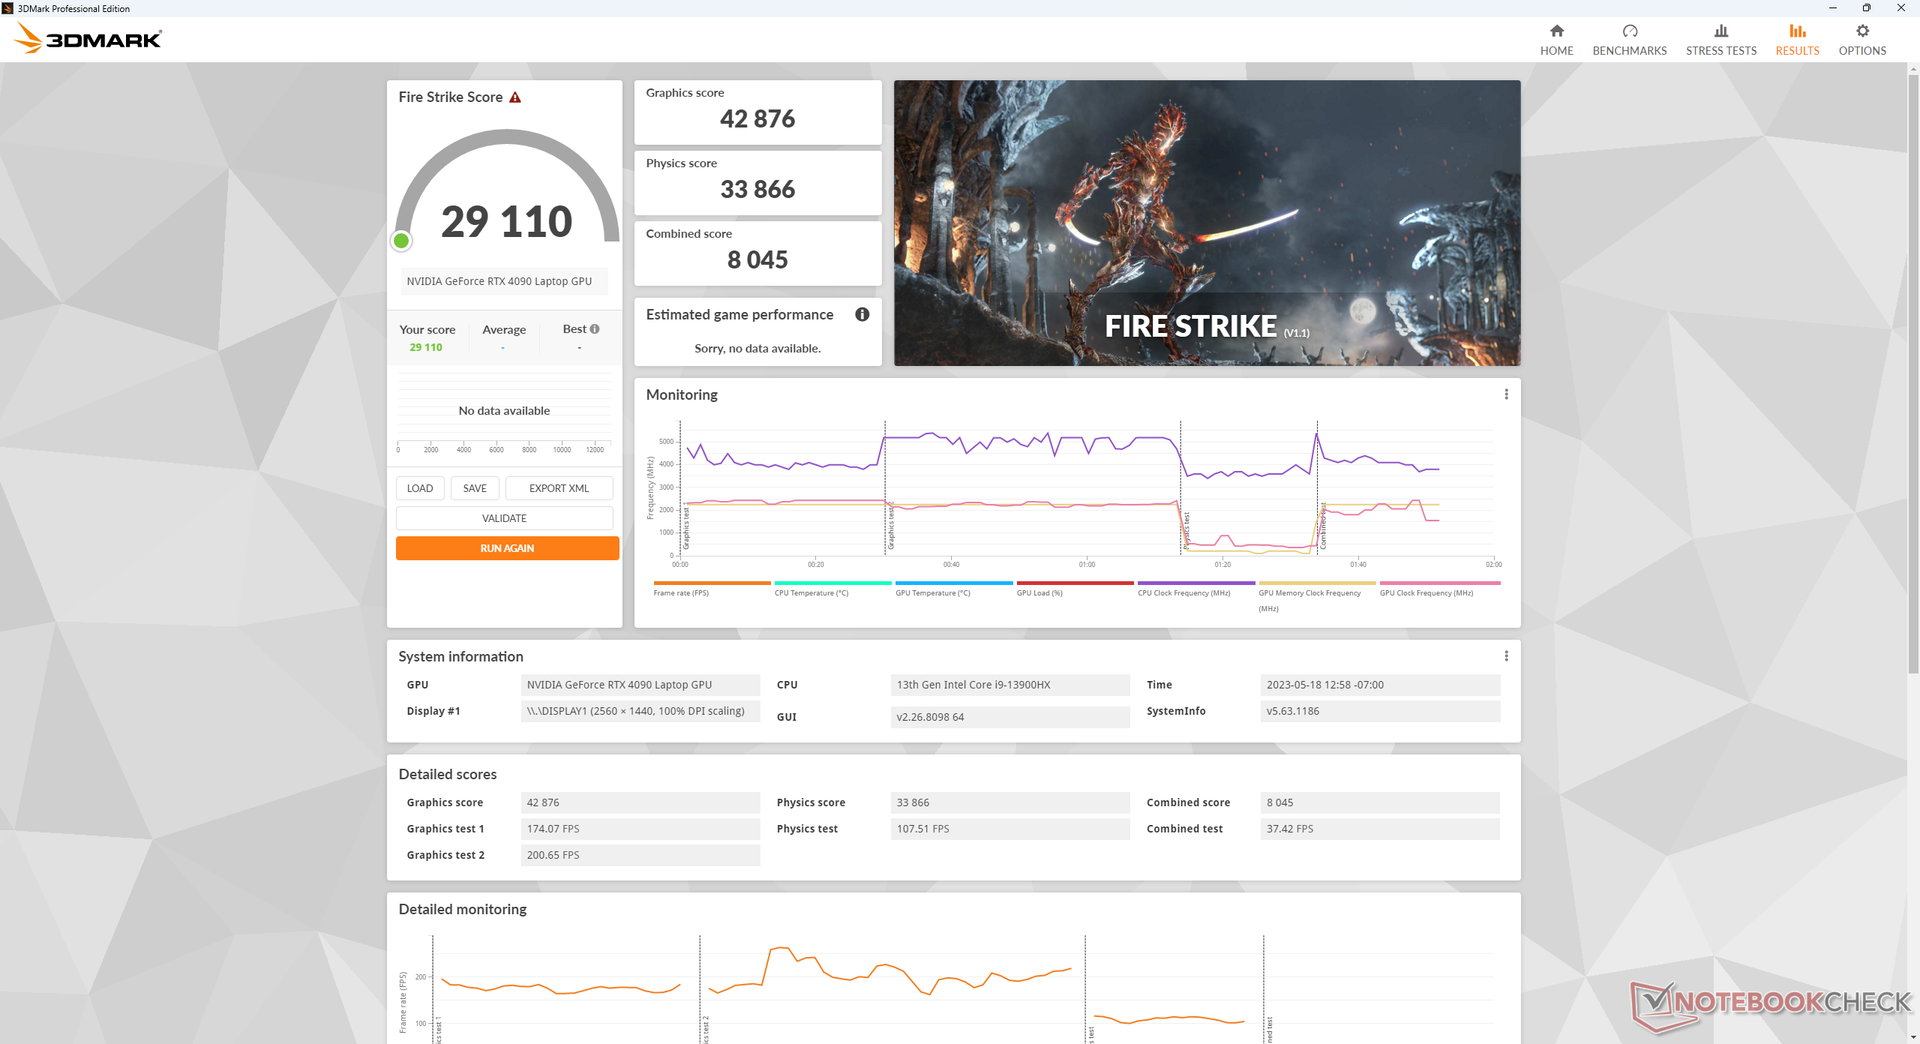
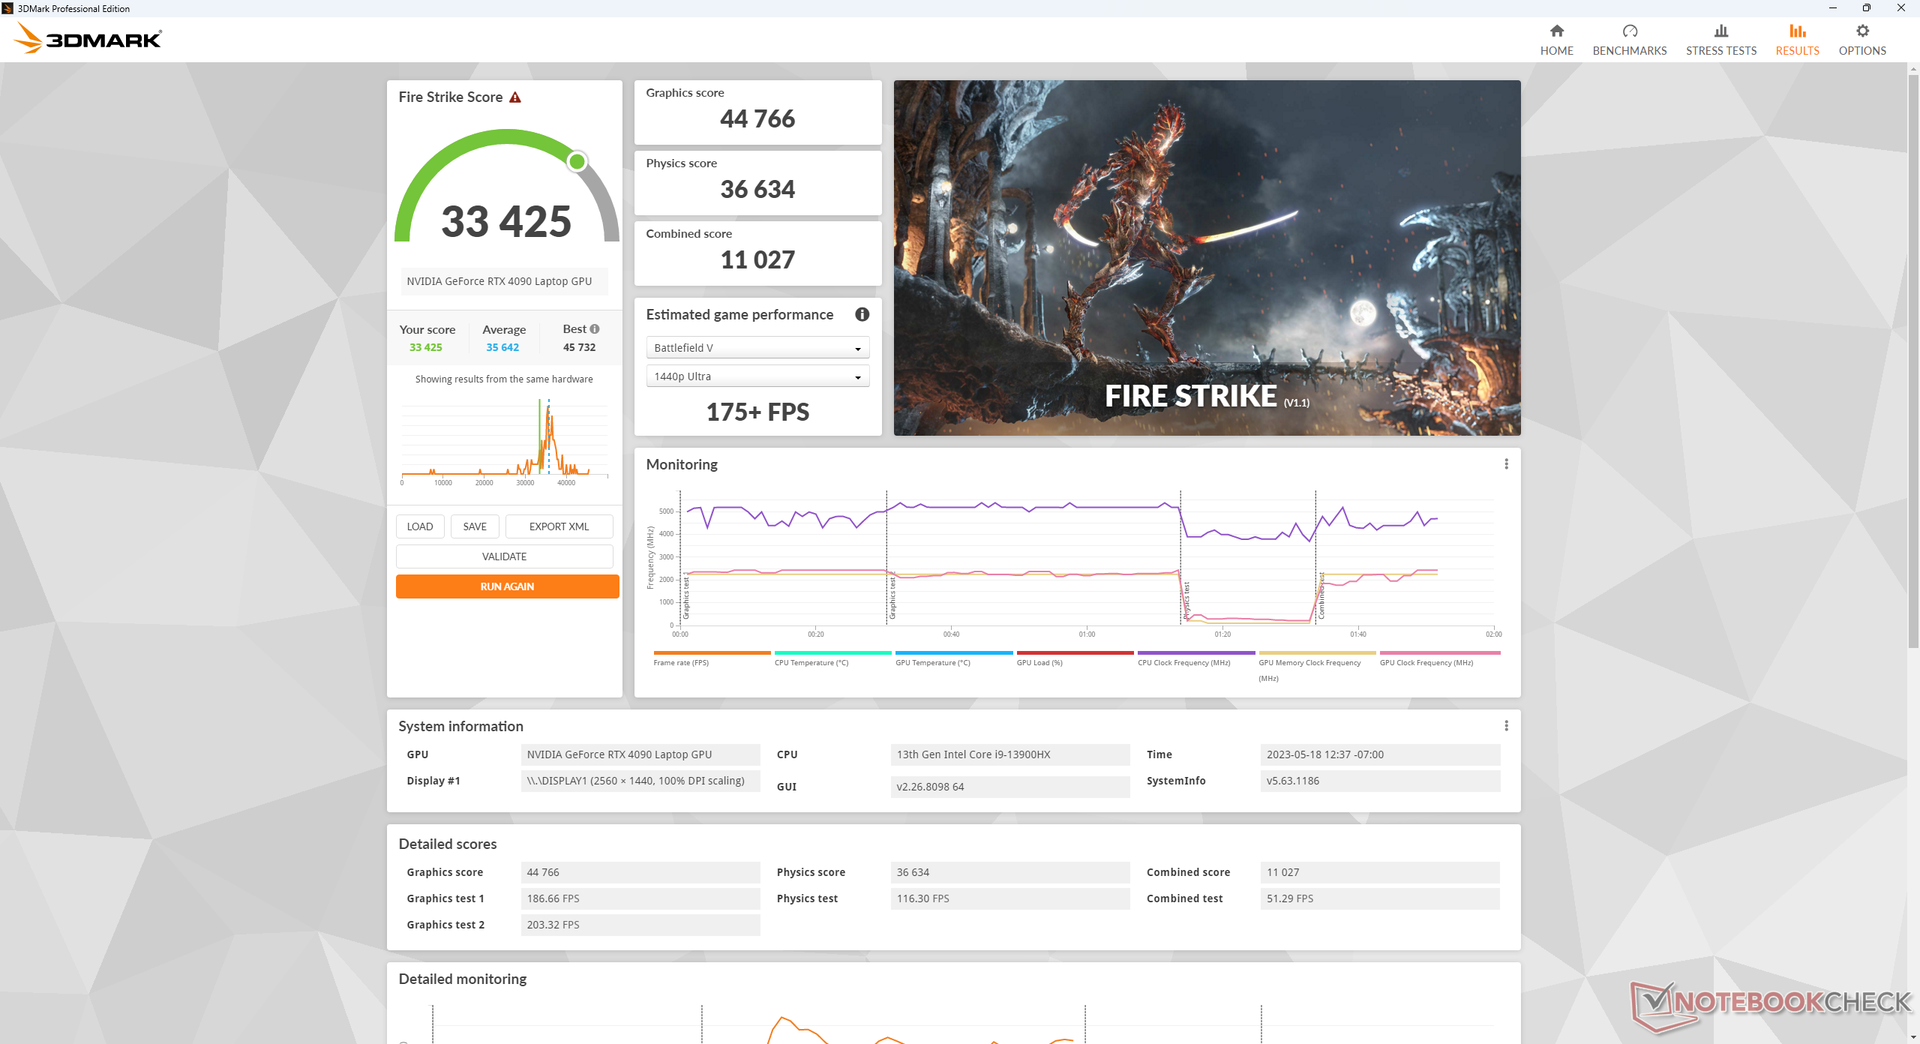
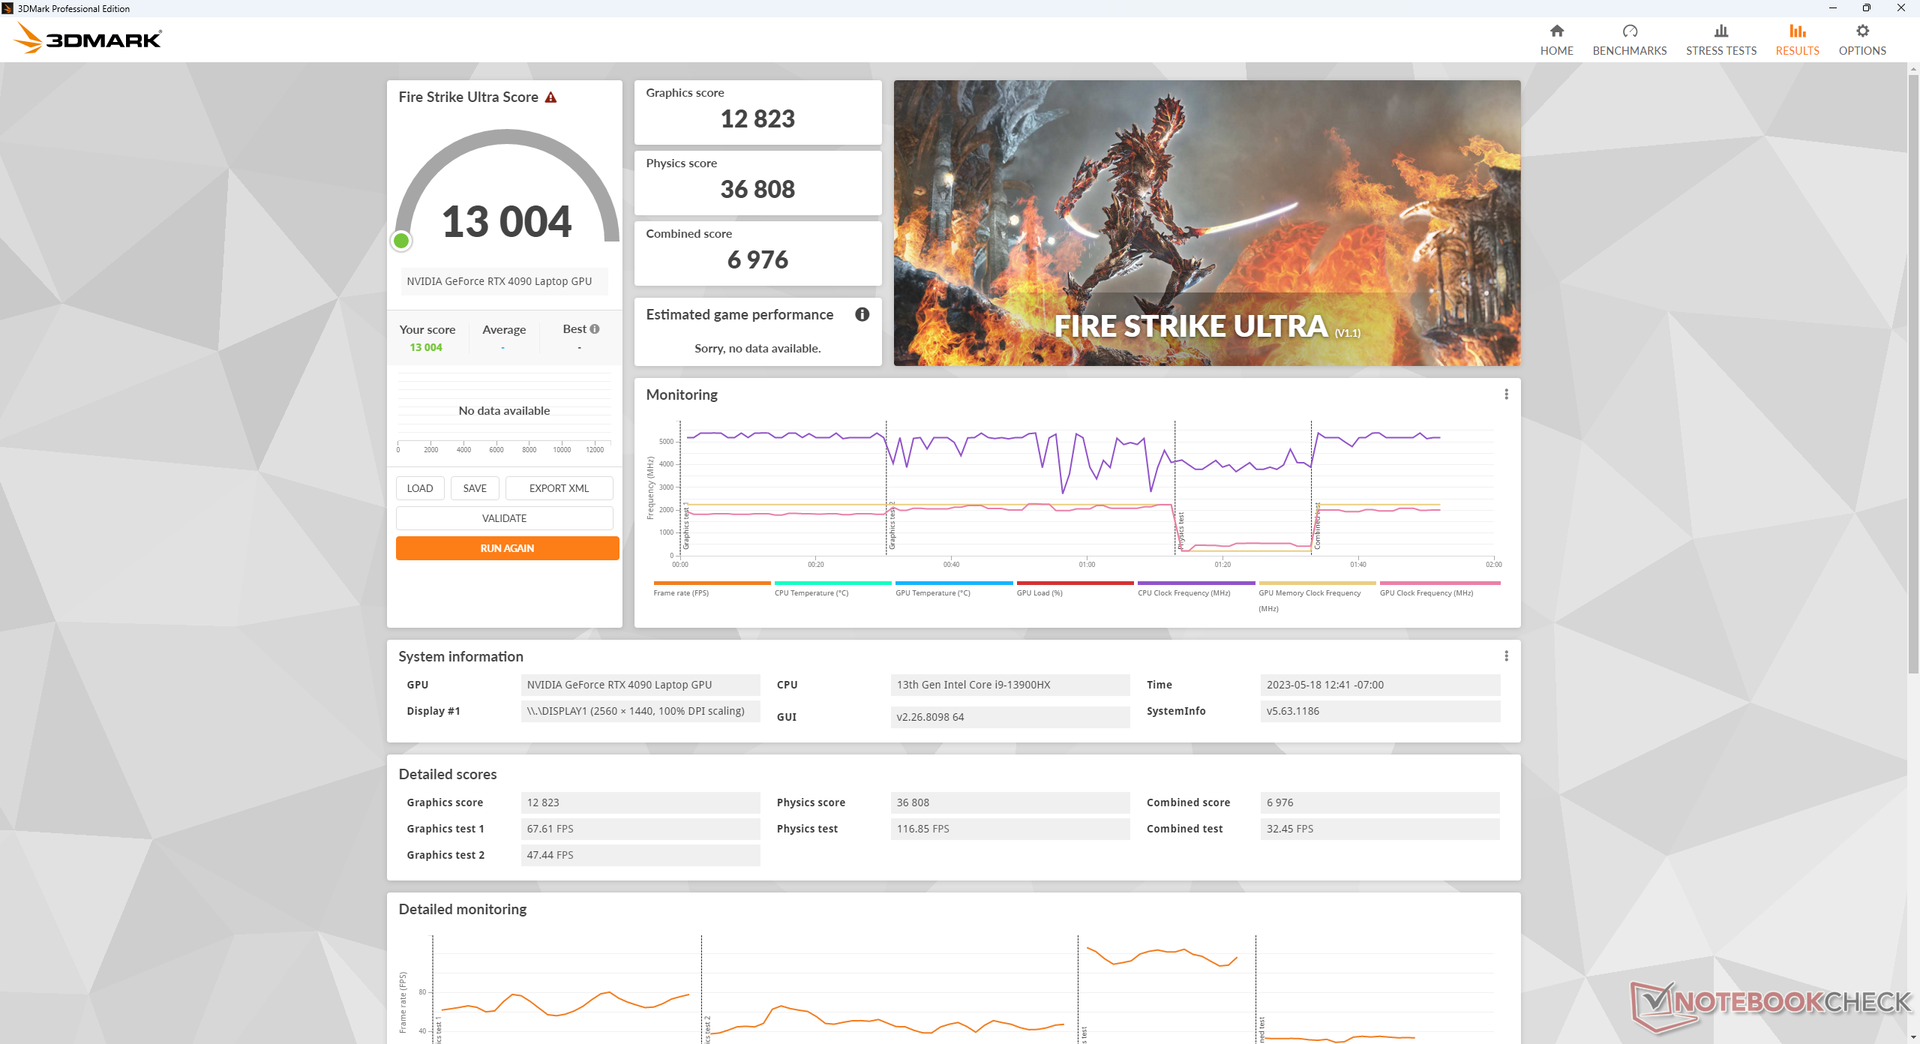
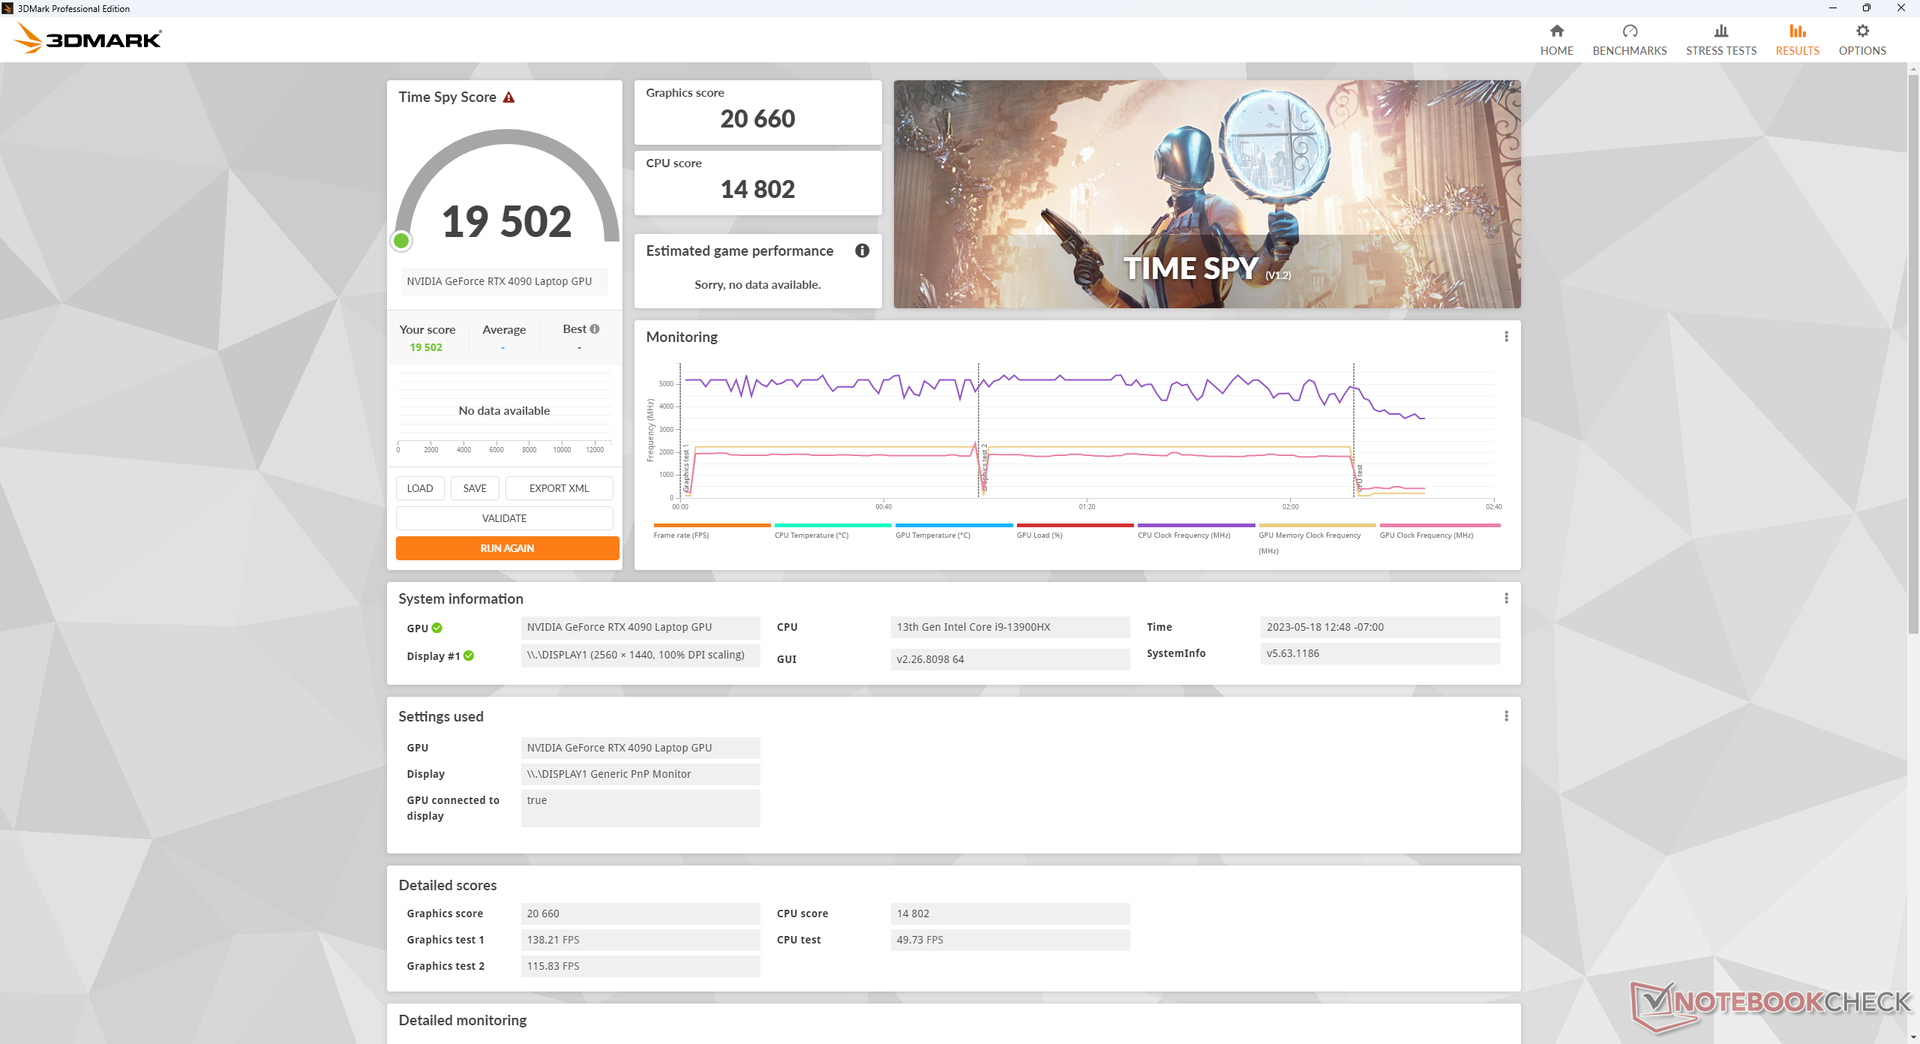
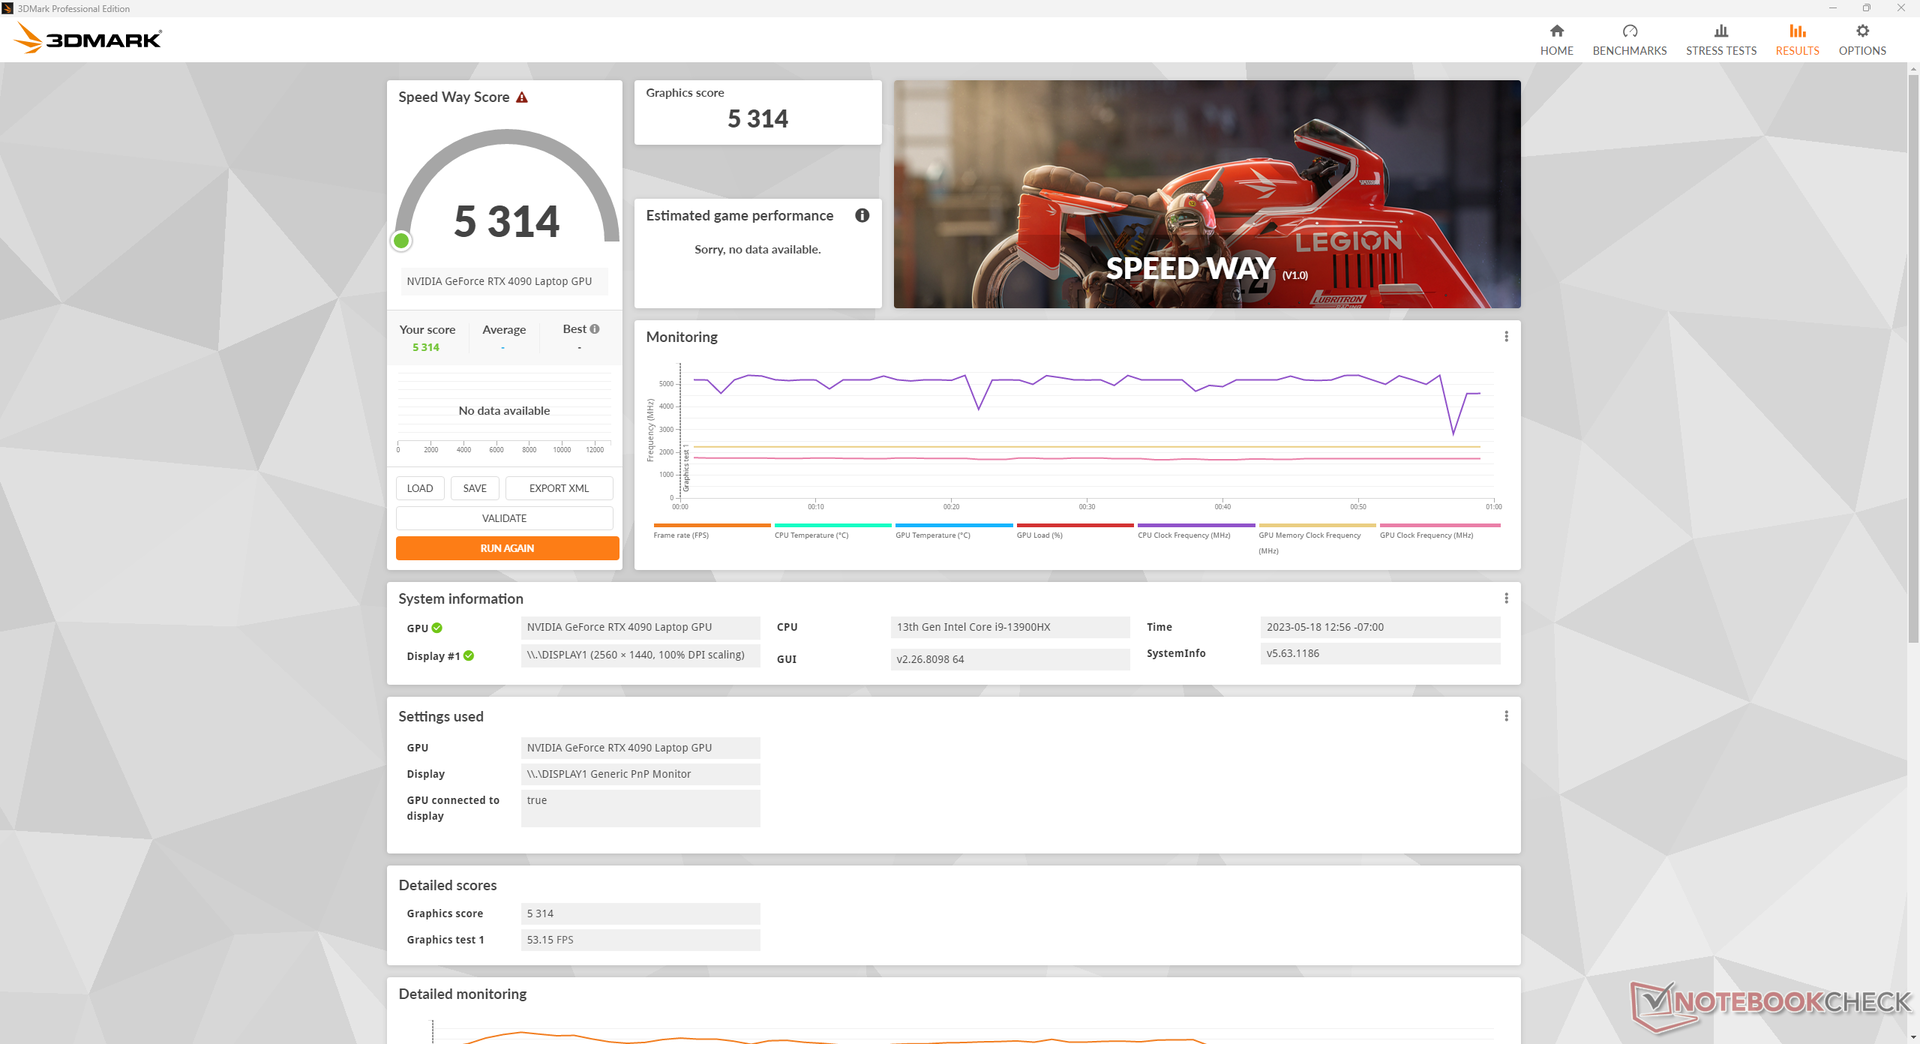
| 3DMark 11 Performance | 42940 punti | |
| 3DMark Fire Strike Score | 33425 punti | |
| 3DMark Time Spy Score | 19502 punti | |
Aiuto | ||
* ... Meglio usare valori piccoli
Prestazioni di gioco
Sebbene la RTX 4090 mobile non sia neanche lontanamente veloce come una RTX 4090 desktop, è comunque potente anche per i titoli più impegnativi come F1 22, Returnal o Cyberpunk 2077. In particolare, la RTX 4090 mobile sembra essere ideale per giocare a 1440p a 120 FPS o a 4K a 60 FPS con impostazioni da alte a ultra. È consigliabile utilizzare la modalità dGPU o la modalità Advanced Optimus quando possibile, soprattutto perché il G-Sync non è disponibile in modalità grafica ibrida.
Witcher 3 FPS Chart
| basso | medio | alto | ultra | QHD | 4K | |
|---|---|---|---|---|---|---|
| GTA V (2015) | 187.2 | 186.4 | 183.7 | 139.5 | 134.3 | 173.6 |
| The Witcher 3 (2015) | 512.8 | 448.8 | 388.1 | 207.2 | 163.8 | |
| Dota 2 Reborn (2015) | 234 | 207 | 199.4 | 184.9 | 178.5 | |
| Final Fantasy XV Benchmark (2018) | 219 | 204 | 172.2 | 149 | 88.8 | |
| X-Plane 11.11 (2018) | 192.9 | 172.1 | 136.2 | 117.3 | ||
| Strange Brigade (2018) | 439 | 351 | 341 | 328 | 300 | 155.2 |
| Cyberpunk 2077 1.6 (2022) | 114 | 109.4 | 103.7 | 91 | 87.3 | 47.3 |
| Tiny Tina's Wonderlands (2022) | 271.8 | 238.8 | 203.3 | 183.1 | 130.7 | 68.7 |
| F1 22 (2022) | 210 | 209 | 199 | 120.8 | 90.2 | 44.3 |
| Returnal (2023) | 145 | 153 | 159 | 141 | 115 | 69 |
Emissioni
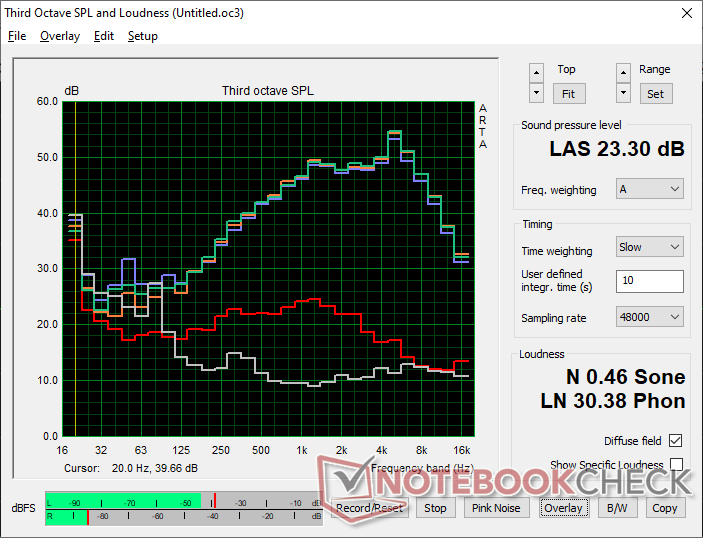
Rumore del sistema - Molto forte durante il gioco
Le ventole sono sempre attive, indipendentemente dall'impostazione della potenza o dal carico sullo schermo. Anche quando è impostata la modalità Quiet, ad esempio, il rumore minimo della ventola è di 33 dB(A) a fronte di uno sfondo silenzioso di 23 dB(A). Questo livello è superiore a quello della maggior parte degli altri portatili da gioco ed è udibile in ambienti d'ufficio. Se impostato in modalità Performance o Entertainment, le ventole pulsano regolarmente anche durante la semplice navigazione o lo streaming video. È preferibile utilizzare un'impostazione di potenza più bassa quando la potenza extra non è necessaria.
Se si gioca in modalità Performance, il rumore delle ventole è di quasi 61 dB(A), molto più forte rispetto a quello dei portatili da gioco della concorrenza, come l'Alienware m17 R5 o l'MSI GE78XX.MSI GE78HX. Gli oltre 50 dB(A) sono rumorosi ma tollerabili con un buon paio di cuffie, ma gli oltre 60 dB(A) rendono estremamente difficile giocare a giochi sensibili al rumore come Fortnite o Overwatch , dove i passi e le altre code audio sono fondamentali per il gameplay.
Cambiando l'impostazione di potenza dalla modalità Performance a quella Entertainment, il rumore della ventola diminuisce di poco, passando da 60,7 dB(A) a 59,7 dB(A). La differenza è così piccola che si può benissimo utilizzare la modalità Prestazioni quando si gioca e saltare del tutto la modalità Intrattenimento.
Rumorosità
| Idle |
| 33.1 / 33.1 / 40.7 dB(A) |
| Sotto carico |
| 59.9 / 61 dB(A) |
 | ||
30 dB silenzioso 40 dB(A) udibile 50 dB(A) rumoroso |
||
min: | ||
| Eurocom Raptor X17 GeForce RTX 4090 Laptop GPU, i9-13900HX, 3x Samsung SSD 980 Pro 1TB (RAID 0) | Asus ROG Strix Scar 17 G733PY-XS96 GeForce RTX 4090 Laptop GPU, R9 7945HX, SK hynix PC801 HFS001TEJ9X101N | Aorus 17X AZF GeForce RTX 4090 Laptop GPU, i9-13900HX, Gigabyte AG470S1TB-SI B10 | MSI GE78HX 13VH-070US GeForce RTX 4080 Laptop GPU, i9-13950HX, Samsung PM9A1 MZVL22T0HBLB | Eluktronics Mech-17 GP2 GeForce RTX 4090 Laptop GPU, i9-13900HX, Samsung PM9A1 MZVL21T0HCLR | Alienware m17 R5 (R9 6900HX, RX 6850M XT) Radeon RX 6850M XT, R9 6900HX, SSSTC CA6-8D1024 | |
|---|---|---|---|---|---|---|
| Noise | 22% | 10% | 16% | 16% | 23% | |
| off /ambiente * (dB) | 23.3 | 22.7 3% | 25 -7% | 23.4 -0% | 25.2 -8% | 23 1% |
| Idle Minimum * (dB) | 33.1 | 23.5 29% | 28 15% | 24.2 27% | 28 15% | 23 31% |
| Idle Average * (dB) | 33.1 | 27.7 16% | 29 12% | 25.6 23% | 28 15% | 28.11 15% |
| Idle Maximum * (dB) | 40.7 | 27.7 32% | 34 16% | 31 24% | 30.4 25% | 28.11 31% |
| Load Average * (dB) | 59.9 | 30.5 49% | 51 15% | 43.3 28% | 41 32% | 30.62 49% |
| Witcher 3 ultra * (dB) | 60.8 | 51.4 15% | 57 6% | 56.3 7% | 50.7 17% | 49.75 18% |
| Load Maximum * (dB) | 61 | 54.1 11% | 54 11% | 59.1 3% | 52.6 14% | 50.17 18% |
* ... Meglio usare valori piccoli
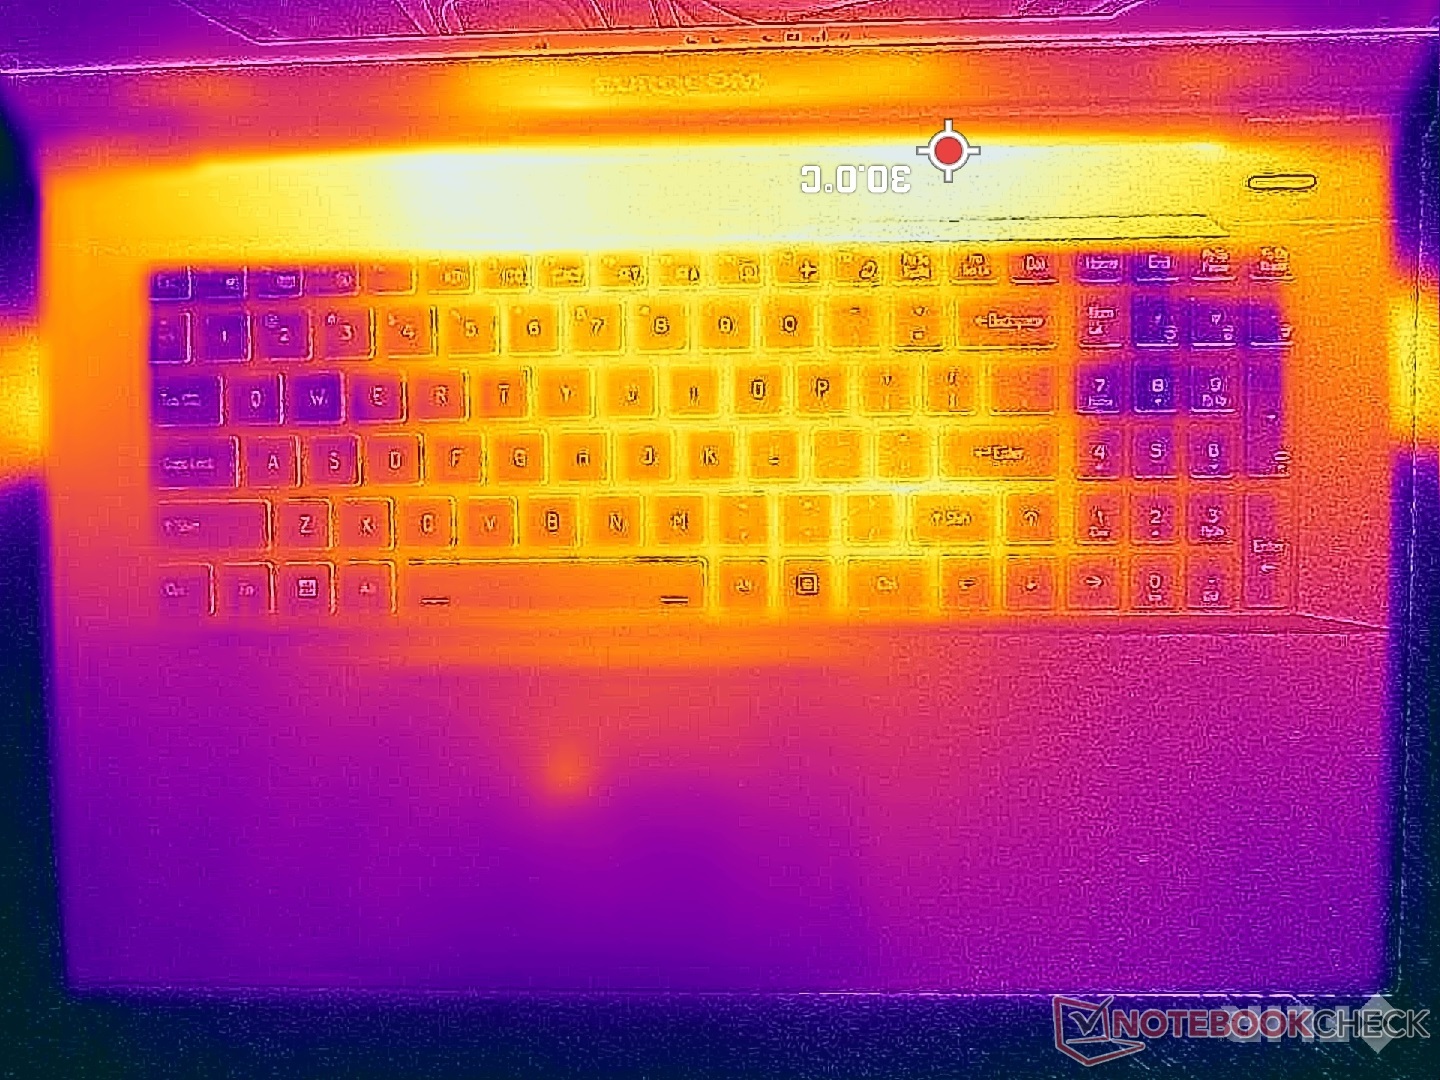
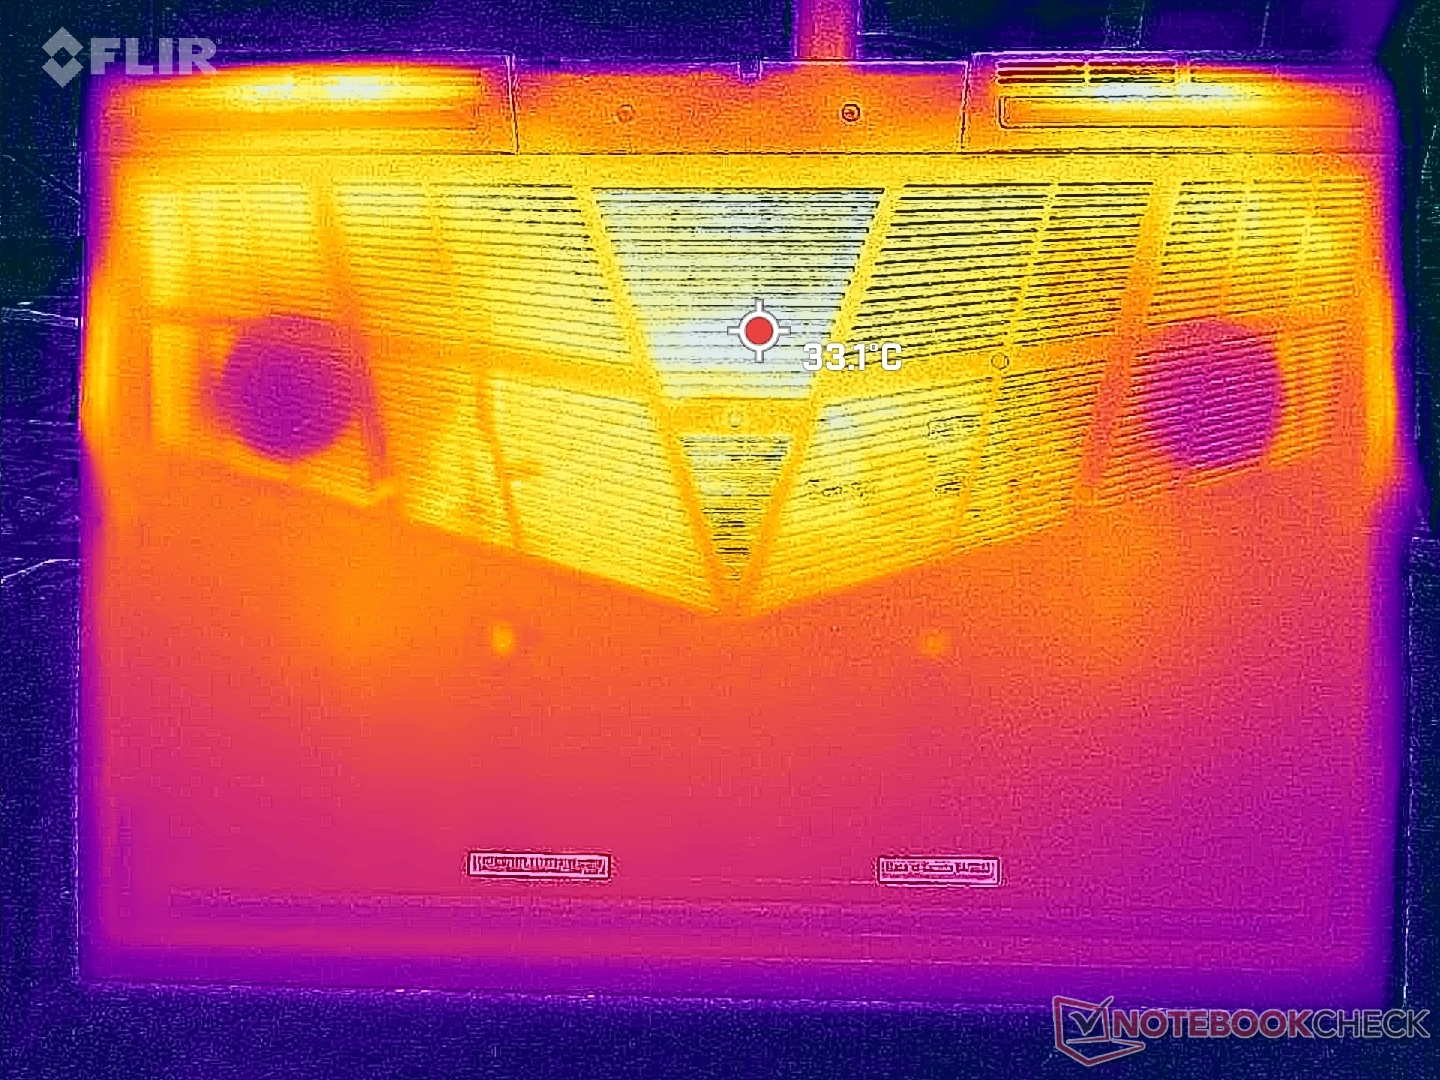
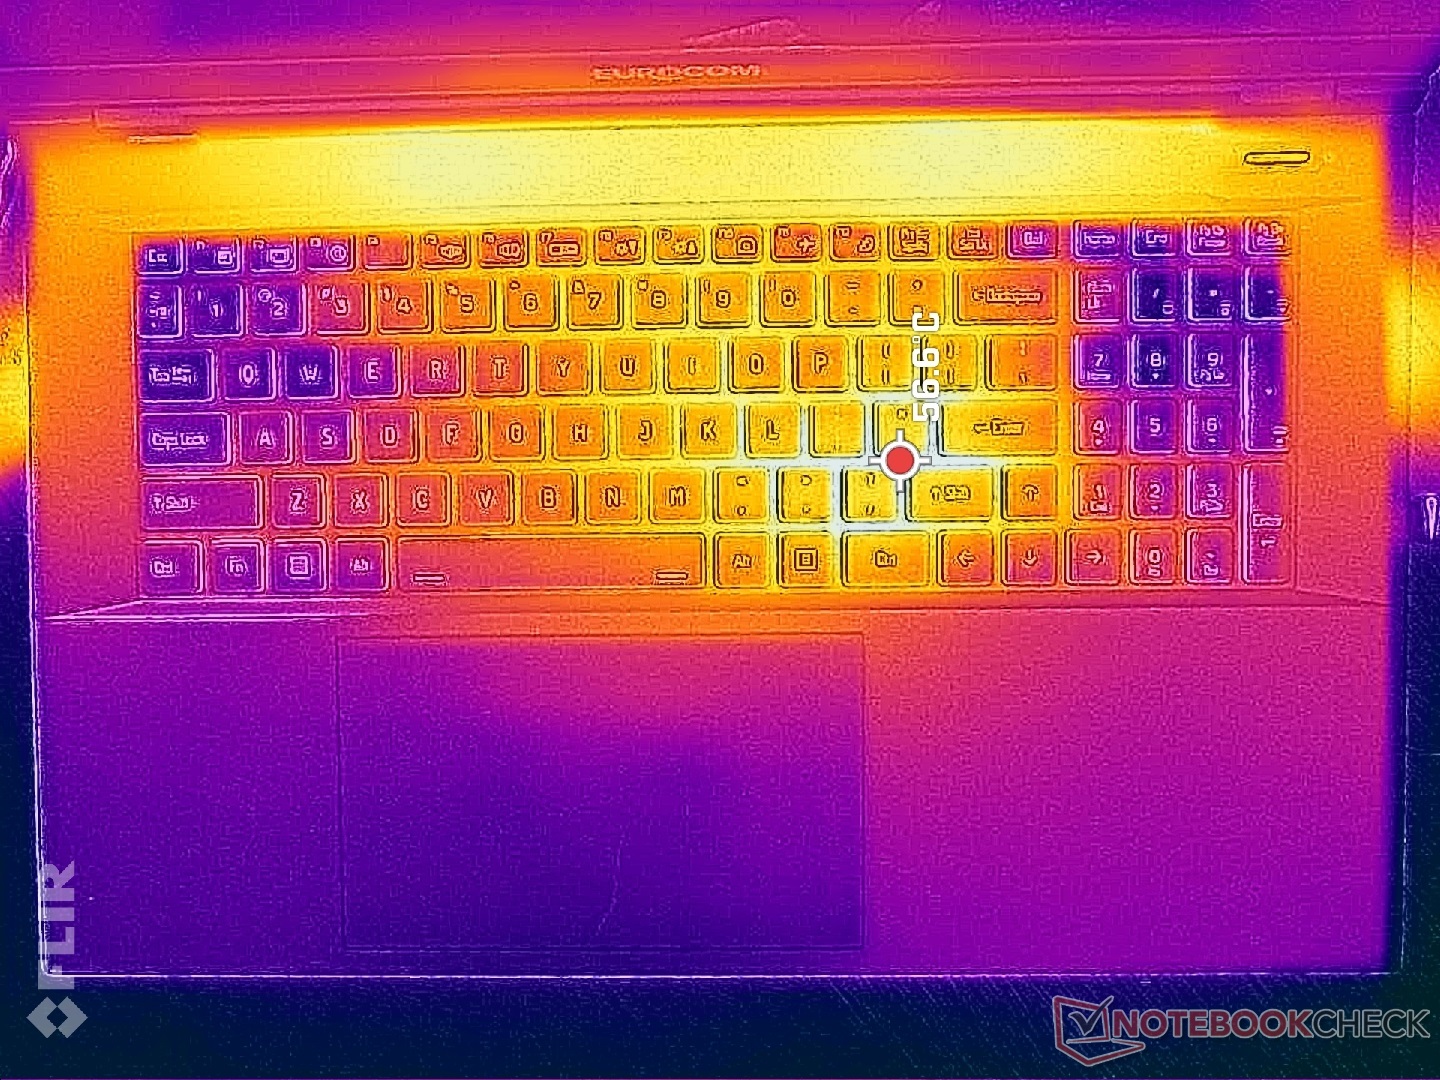
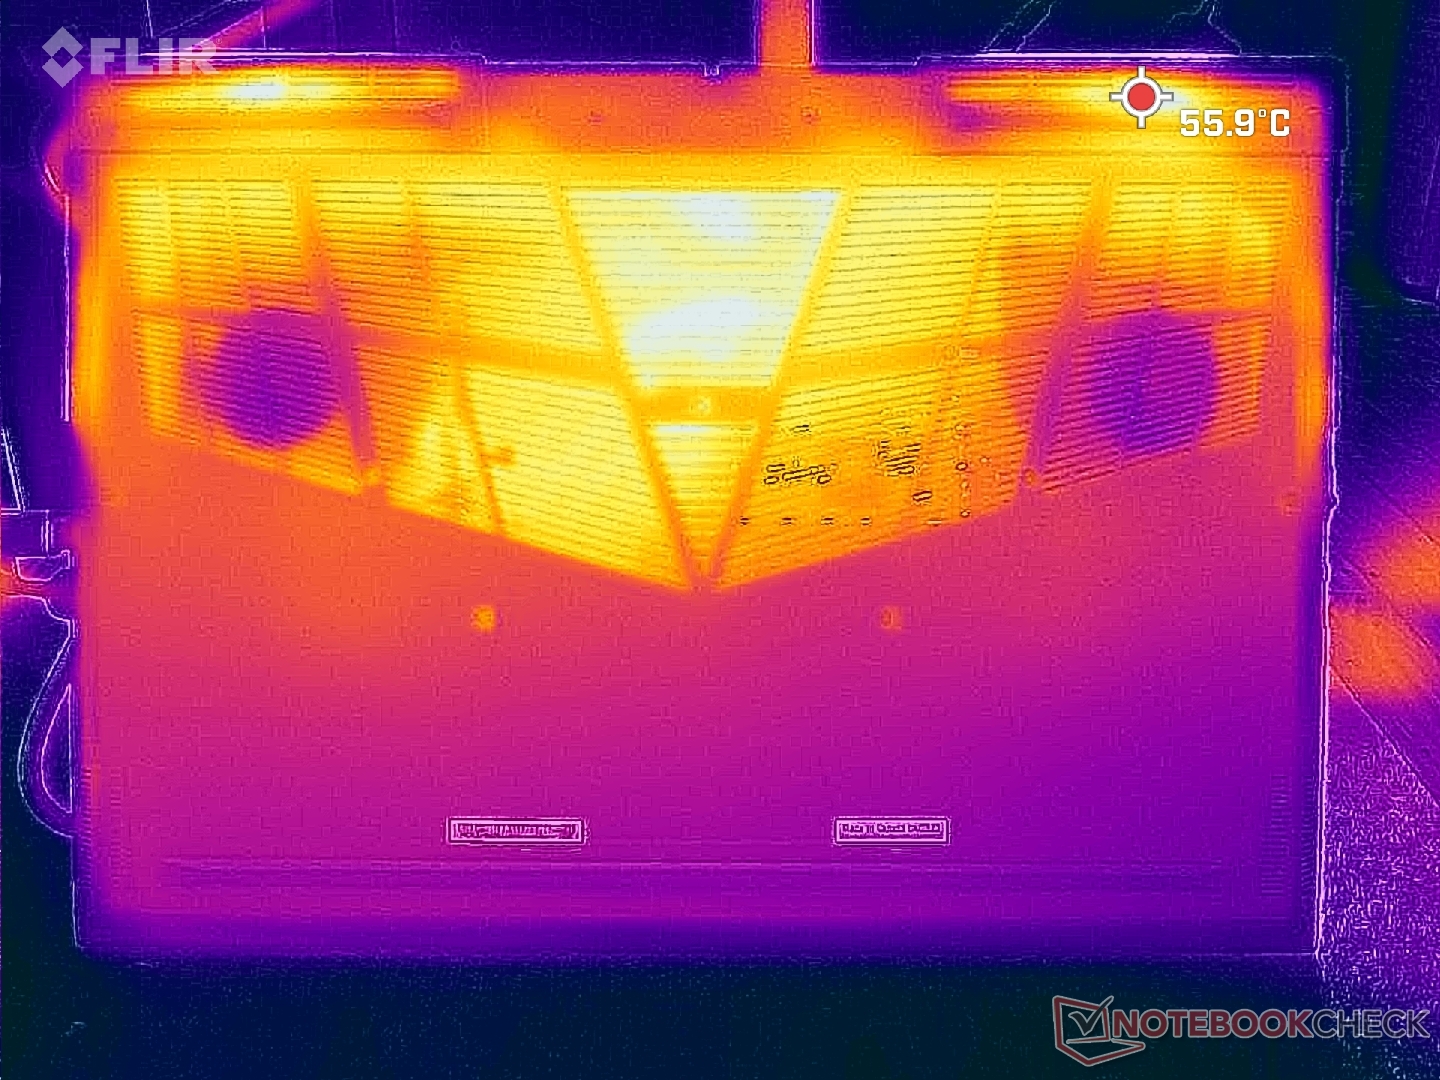
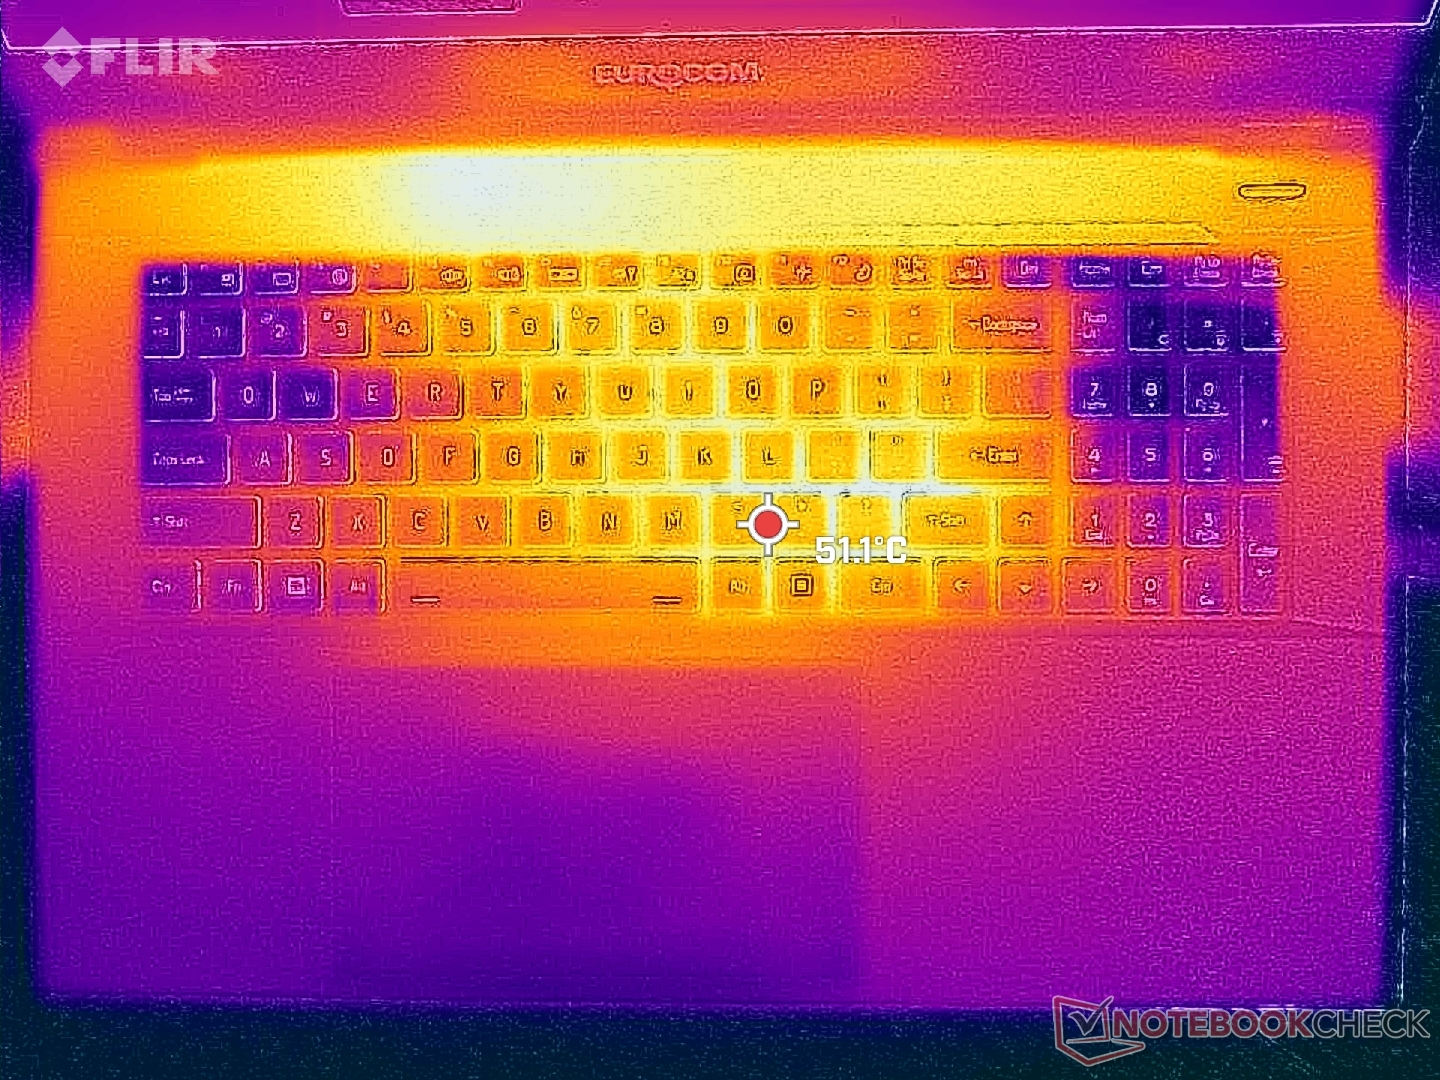
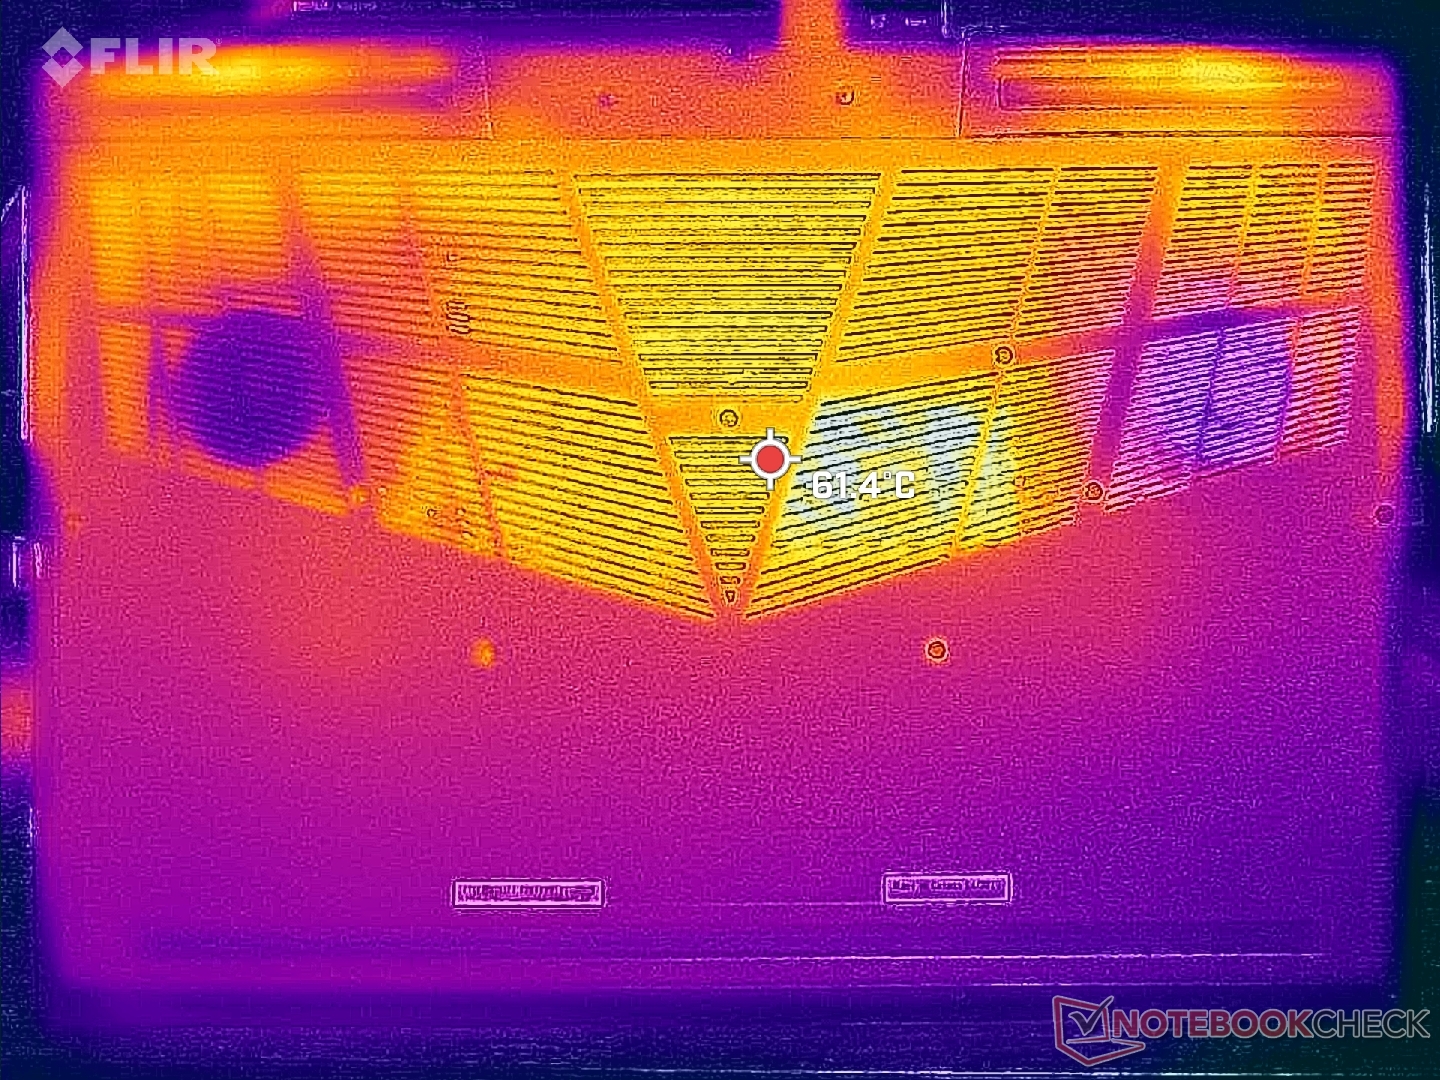
Temperatura
Le temperature di superficie sono più calde verso il centro della tastiera, poiché la CPU e la GPU si trovano direttamente sotto di essa. I punti caldi possono raggiungere oltre 56 C in questa regione, rispetto ai 46 C e ai 35 C dell'Aorus 17X.Aorus 17X e MSI Raider GE78 HX, rispettivamente. Fortunatamente, i poggiapolsi, i tasti WASD e il tastierino numerico non sono così caldi da mantenere le mani comode durante il gioco.
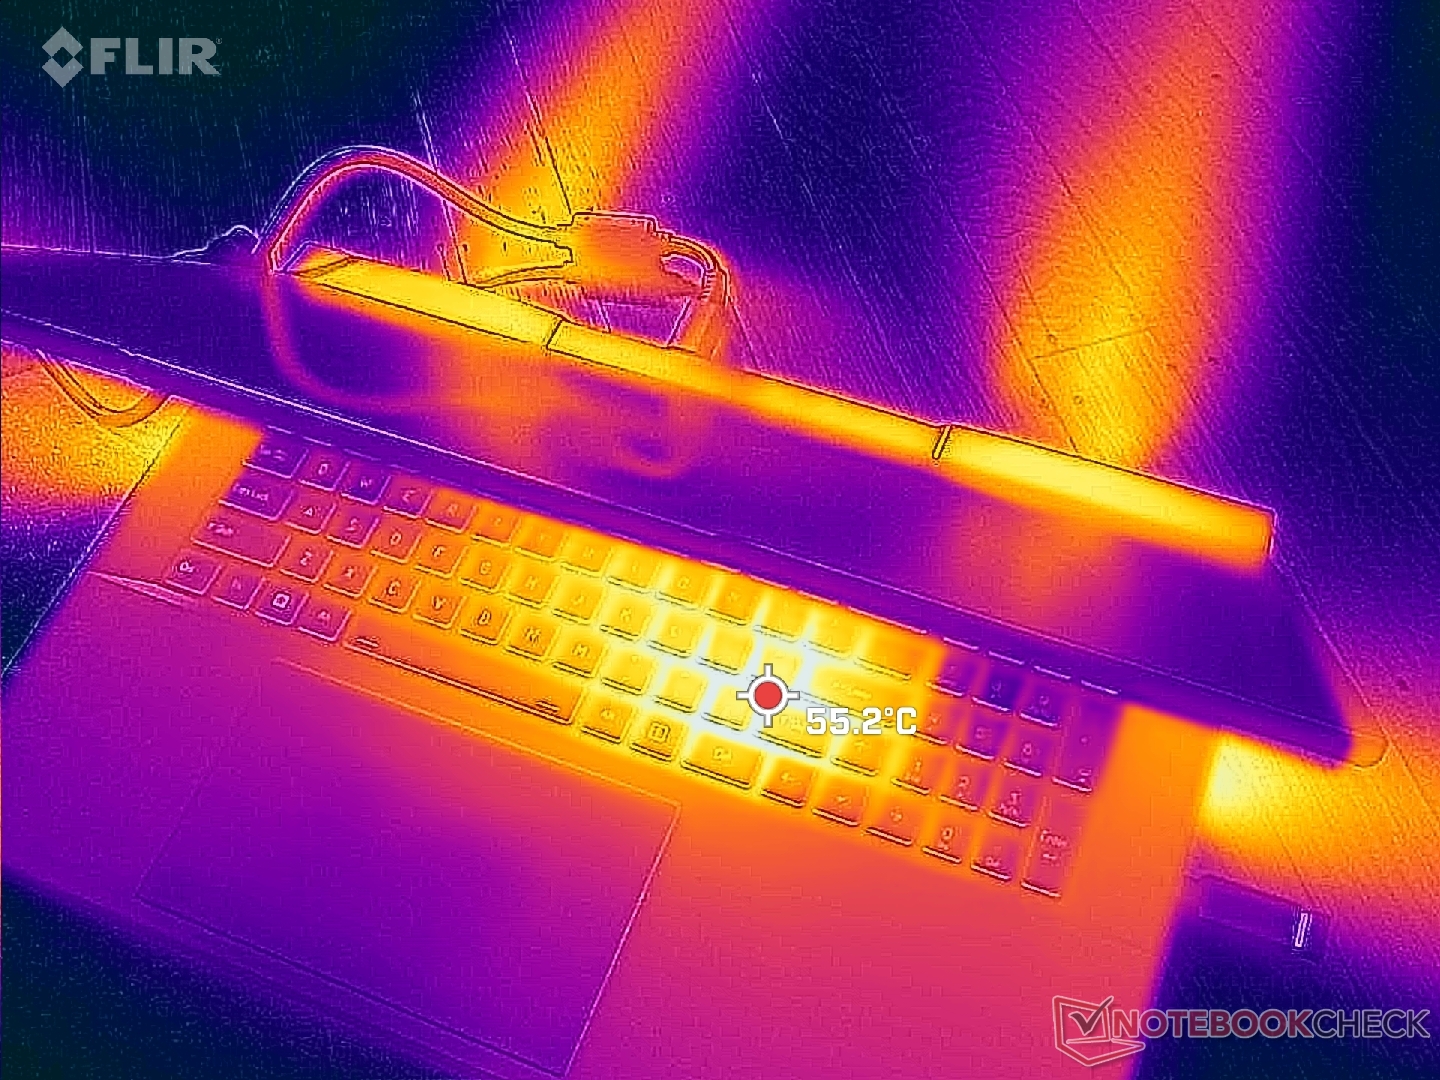
(-) La temperatura massima sul lato superiore è di 49.4 °C / 121 F, rispetto alla media di 40.4 °C / 105 F, che varia da 21.2 a 68.8 °C per questa classe Gaming.
(-) Il lato inferiore si riscalda fino ad un massimo di 55.2 °C / 131 F, rispetto alla media di 43.2 °C / 110 F
(+) In idle, la temperatura media del lato superiore è di 28.8 °C / 84 F, rispetto alla media deld ispositivo di 33.9 °C / 93 F.
(-) Riproducendo The Witcher 3, la temperatura media per il lato superiore e' di 40.4 °C / 105 F, rispetto alla media del dispositivo di 33.9 °C / 93 F.
(+) I poggiapolsi e il touchpad sono piu' freddi della temperatura della pelle con un massimo di 31.2 °C / 88.2 F e sono quindi freddi al tatto.
(-) La temperatura media della zona del palmo della mano di dispositivi simili e'stata di 28.8 °C / 83.8 F (-2.4 °C / -4.4 F).
| Eurocom Raptor X17 Intel Core i9-13900HX, NVIDIA GeForce RTX 4090 Laptop GPU | Asus ROG Strix Scar 17 G733PY-XS96 AMD Ryzen 9 7945HX, NVIDIA GeForce RTX 4090 Laptop GPU | Aorus 17X AZF Intel Core i9-13900HX, NVIDIA GeForce RTX 4090 Laptop GPU | MSI GE78HX 13VH-070US Intel Core i9-13950HX, NVIDIA GeForce RTX 4080 Laptop GPU | Eluktronics Mech-17 GP2 Intel Core i9-13900HX, NVIDIA GeForce RTX 4090 Laptop GPU | Alienware m17 R5 (R9 6900HX, RX 6850M XT) AMD Ryzen 9 6900HX, AMD Radeon RX 6850M XT | |
|---|---|---|---|---|---|---|
| Heat | 24% | 8% | 14% | 15% | 4% | |
| Maximum Upper Side * (°C) | 49.4 | 34.6 30% | 47 5% | 37.4 24% | 39 21% | 53 -7% |
| Maximum Bottom * (°C) | 55.2 | 35.6 36% | 51 8% | 45 18% | 44 20% | 56 -1% |
| Idle Upper Side * (°C) | 33.4 | 27.2 19% | 30 10% | 29.8 11% | 31 7% | 30 10% |
| Idle Bottom * (°C) | 33.4 | 30 10% | 31 7% | 32.4 3% | 29.8 11% | 29 13% |
* ... Meglio usare valori piccoli
Stress test
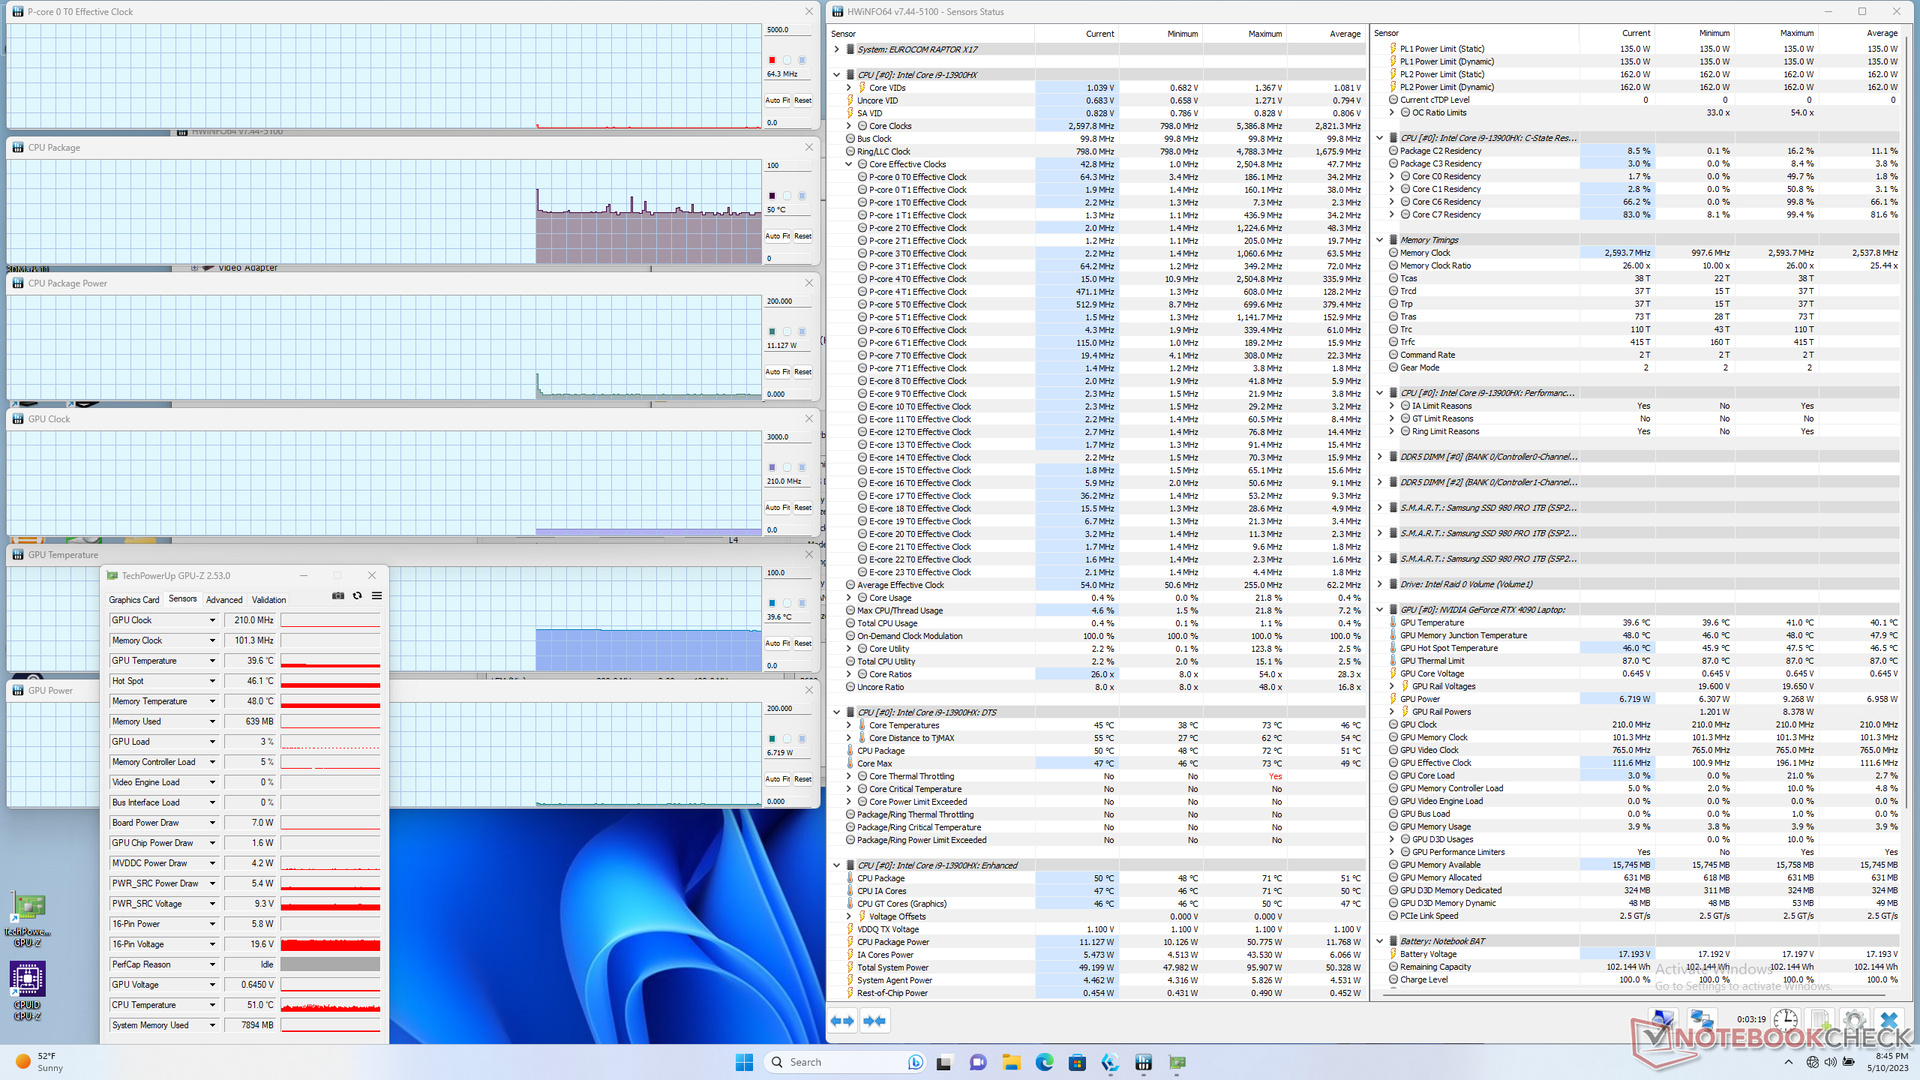
Quando si esegue Prime95 per stressare la CPU, la velocità di clock e l'assorbimento di potenza della scheda aumentano rispettivamente a 4 GHz e 155 W, solo per un momento, prima di scendere rapidamente a 3,3 GHz e 110 W. La temperatura del core rimaneva molto calda a 97 C, il che è probabilmente la ragione del Turbo Boost massimo di breve durata. Ripetendo questo test su MSI GE78HX o su Eluktronics Mech-17 GP2 avrebbero prodotto temperature del core simili, superiori a 90 C, suggerendo che la maggior parte delle CPU di 13a generazione della serie H sono generalmente più calde della media quando sono sotto carico.
Quando si esegue Witcher 3 in modalità Performance, per rappresentare i carichi di gioco tipici, la GPU si stabilizzerebbe a 2235 MHz di clock del core, 81 C e 170 W di assorbimento di potenza della scheda, a fronte di un obiettivo TGP di 175 W. La regolazione del sistema in modalità Balanced (o Entertainment) abbasserebbe la GPU a 2055 MHz di clock, 76 C e appena 146 W. Pertanto, è necessario attivare la modalità Performance e sopportare il rumore della ventola più forte se si desidera ottenere il massimo dalla GPU.
Il funzionamento a batteria limita le prestazioni. Un test di Fire Strike a batteria restituirebbe punteggi di Fisica e Grafica rispettivamente di 12863 e 10075 punti, contro 36634 e 44766 punti con l'alimentazione a rete.
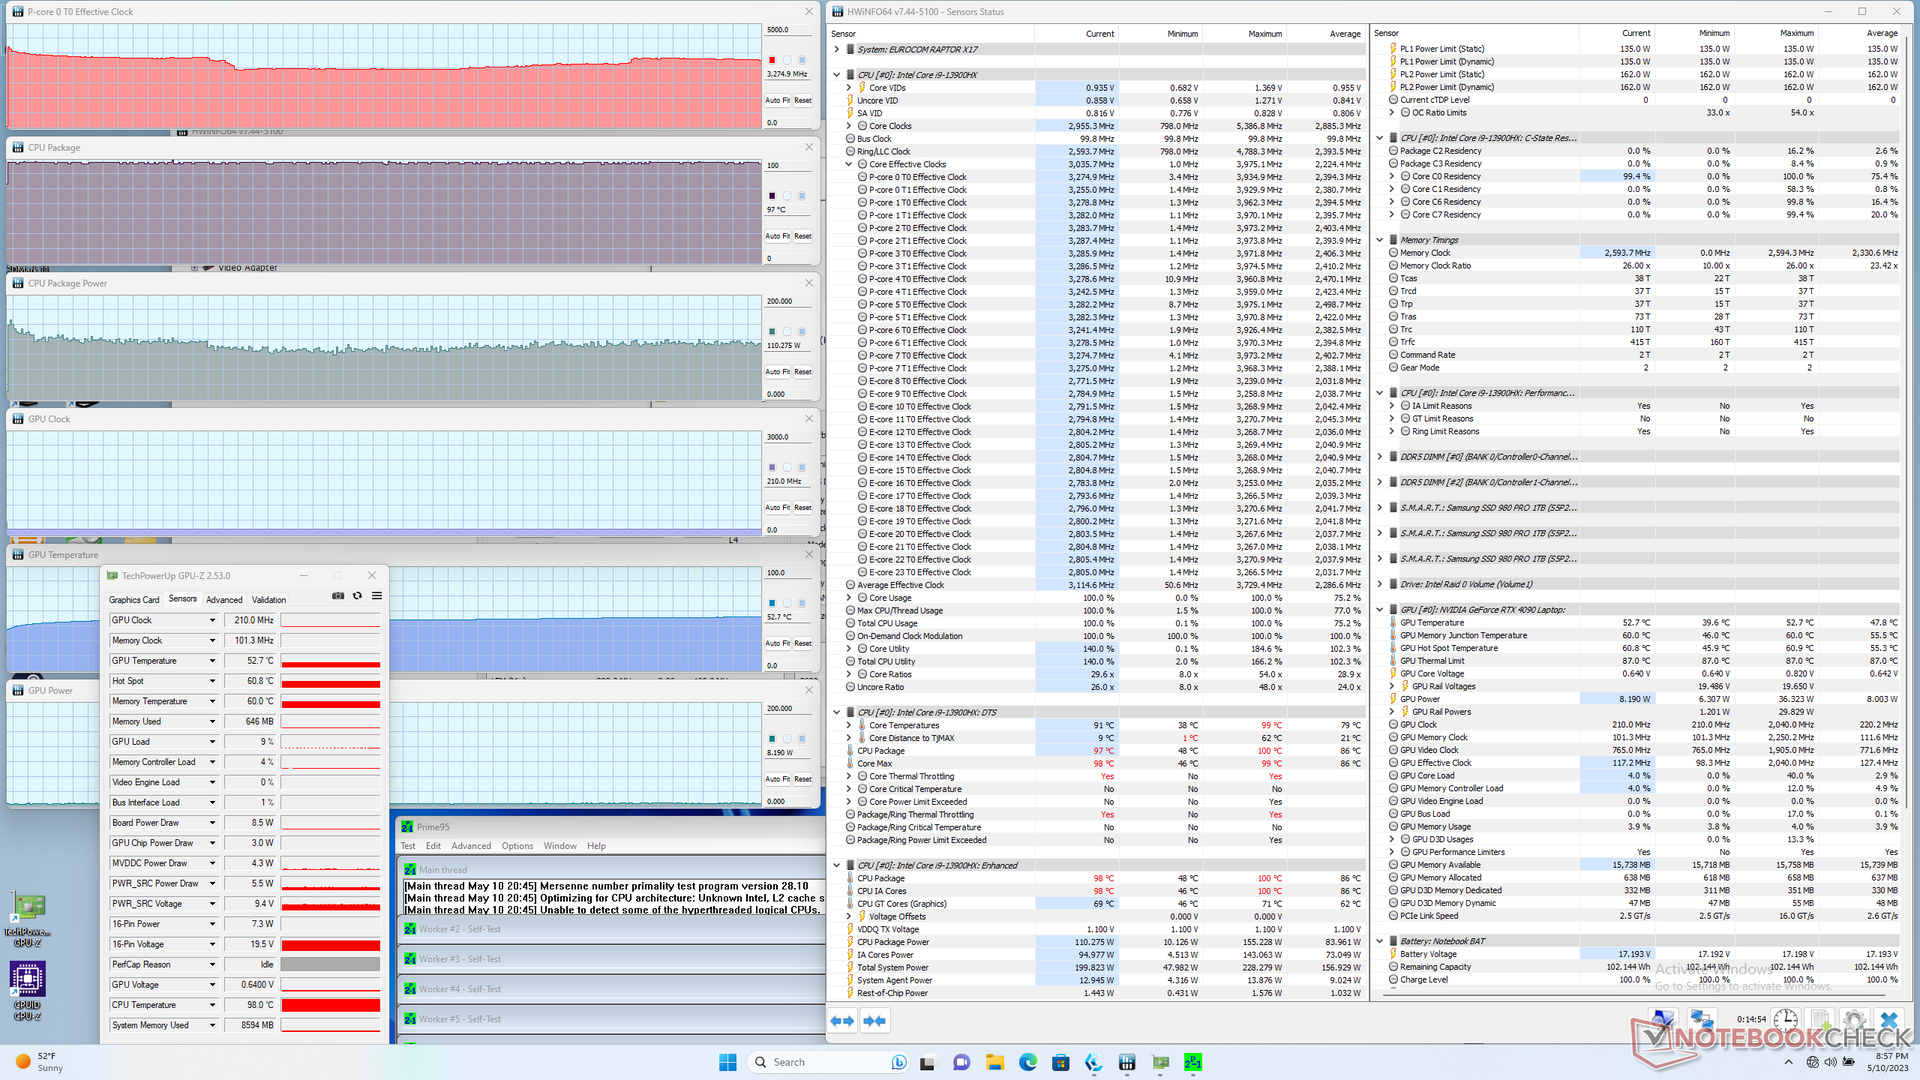
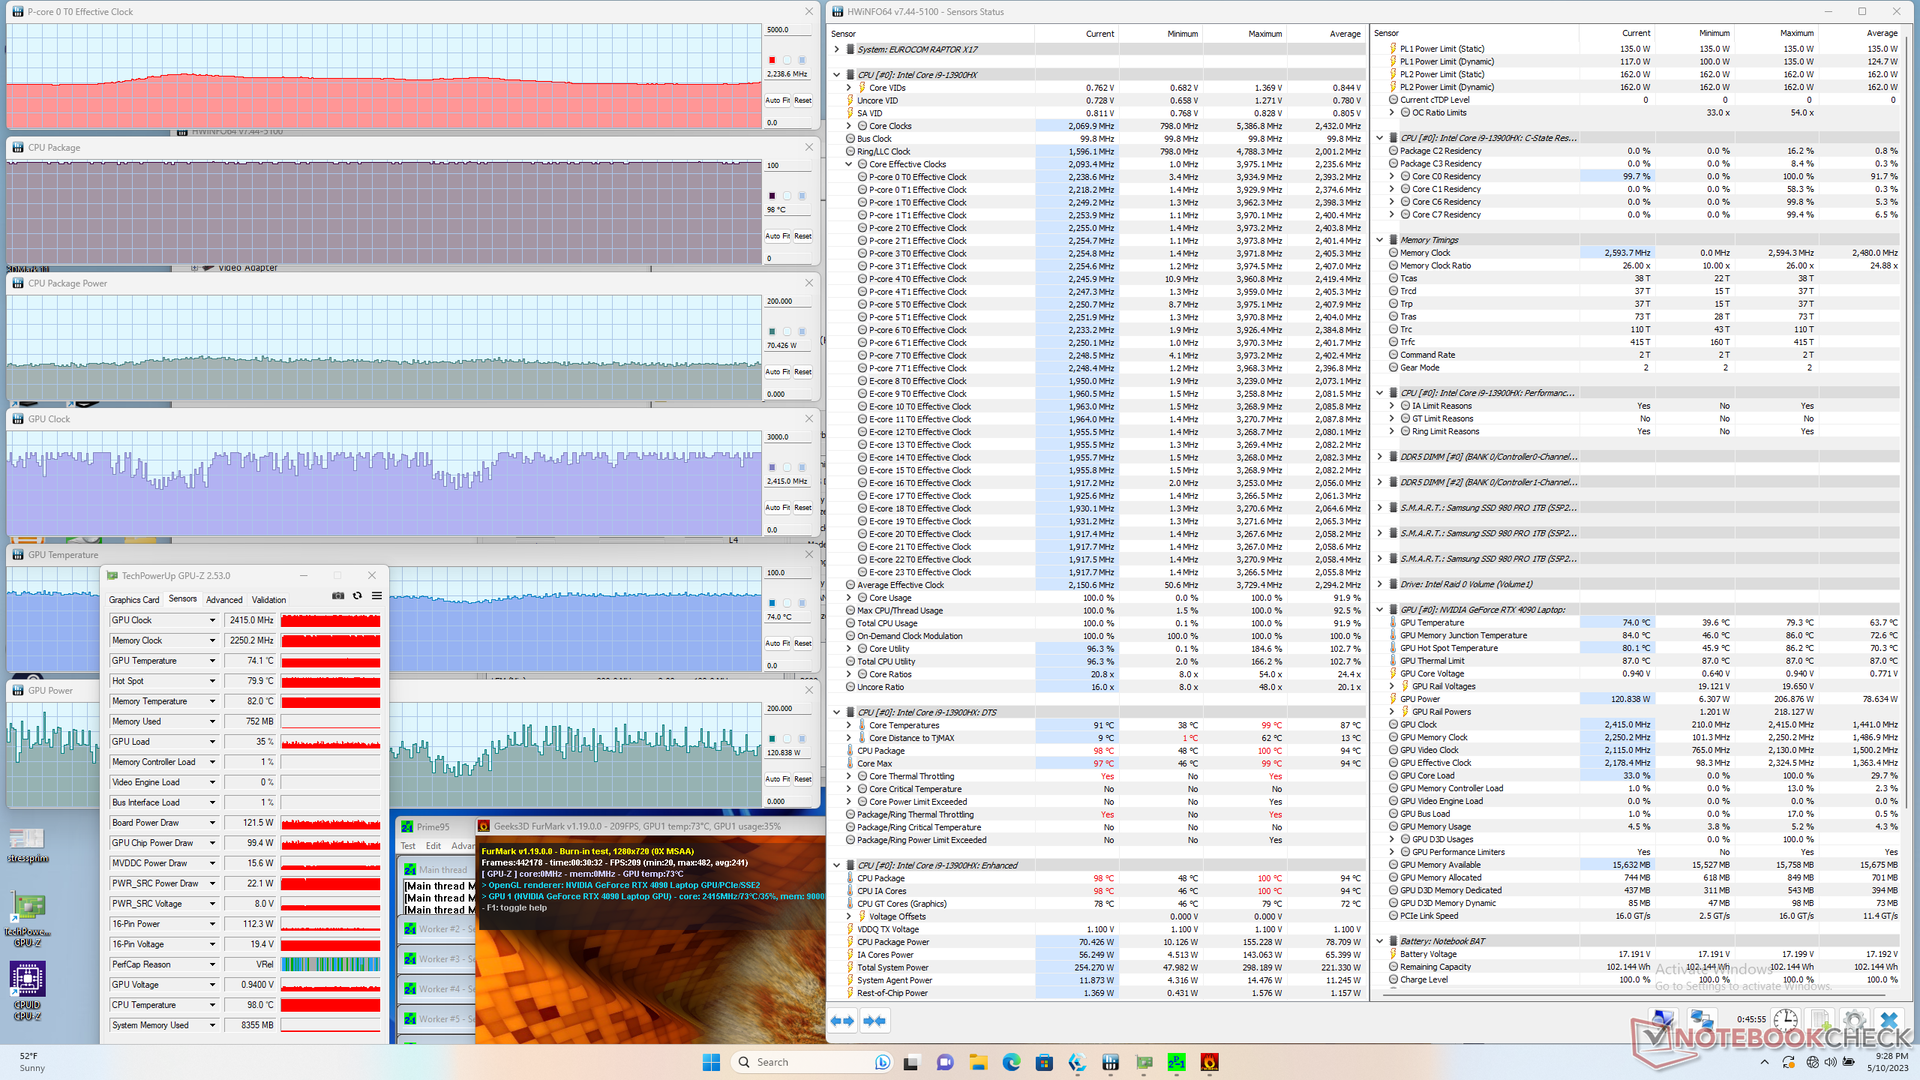
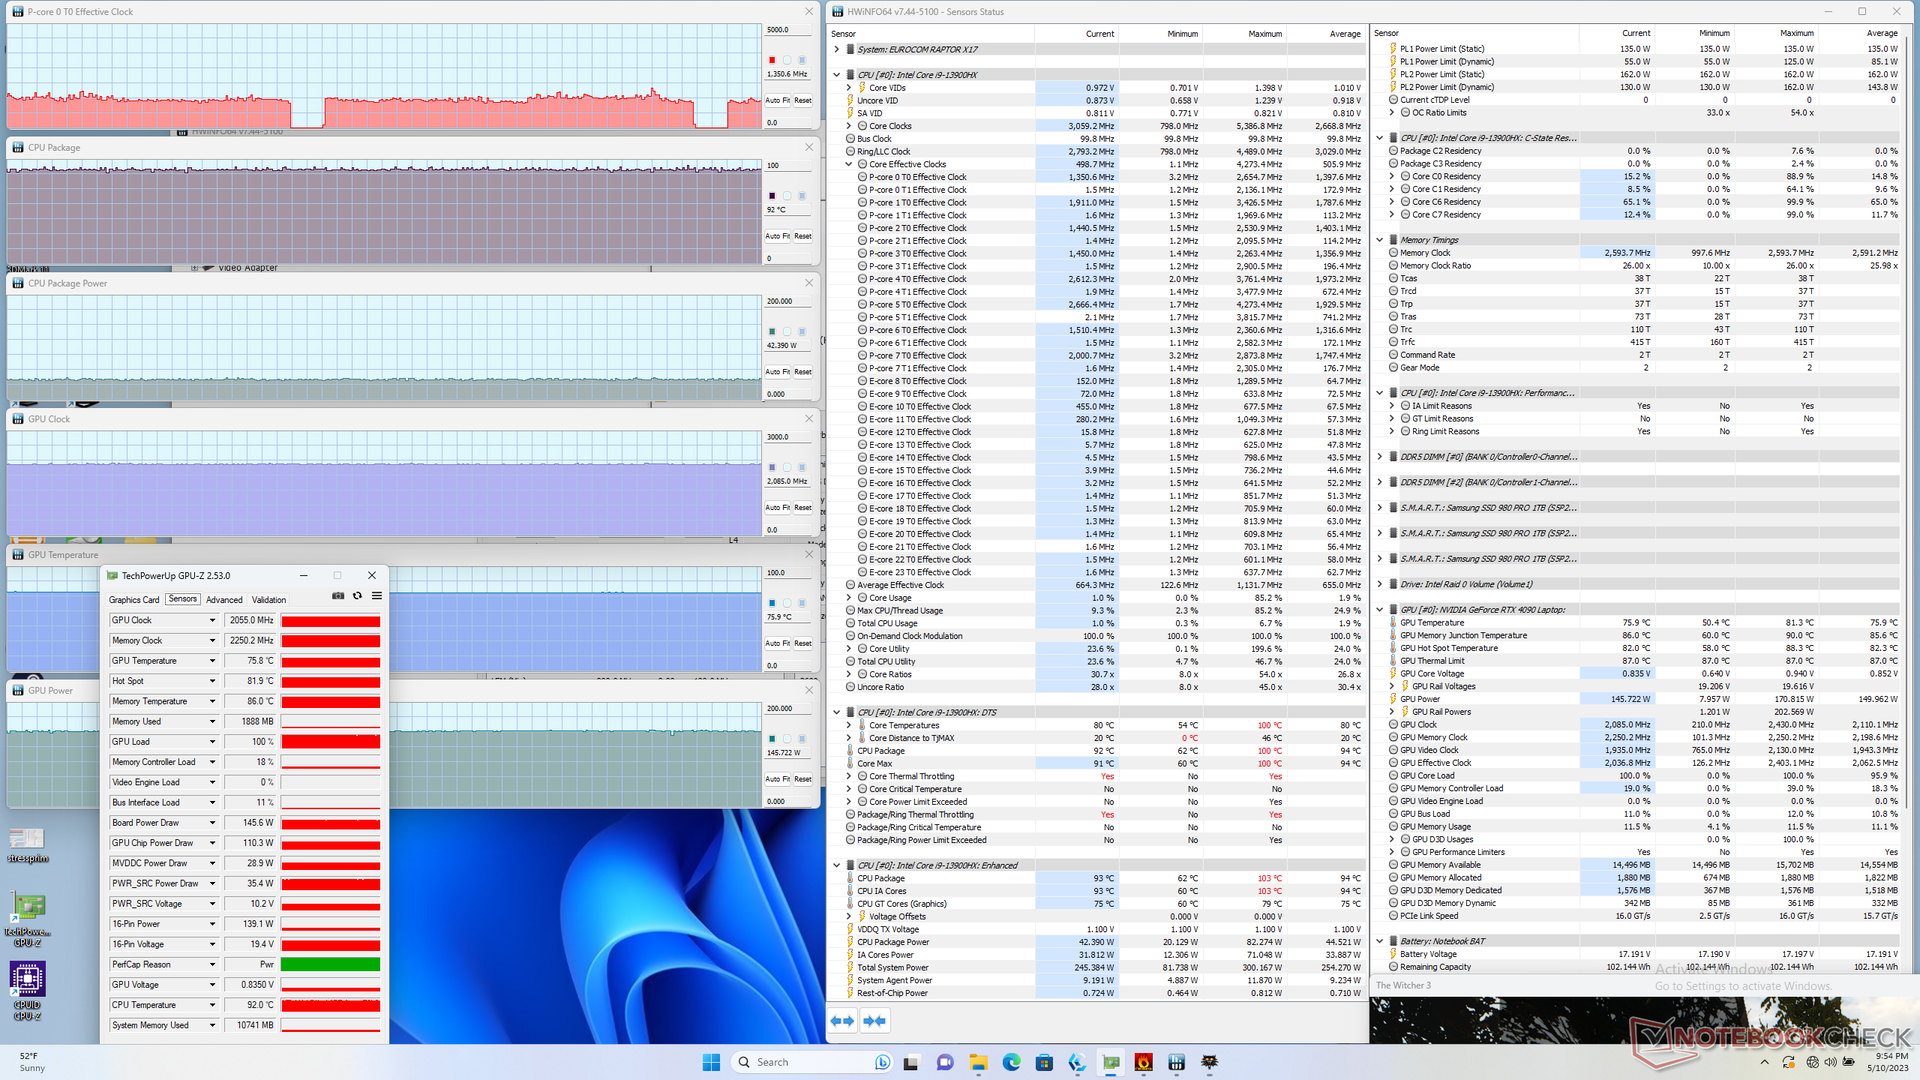
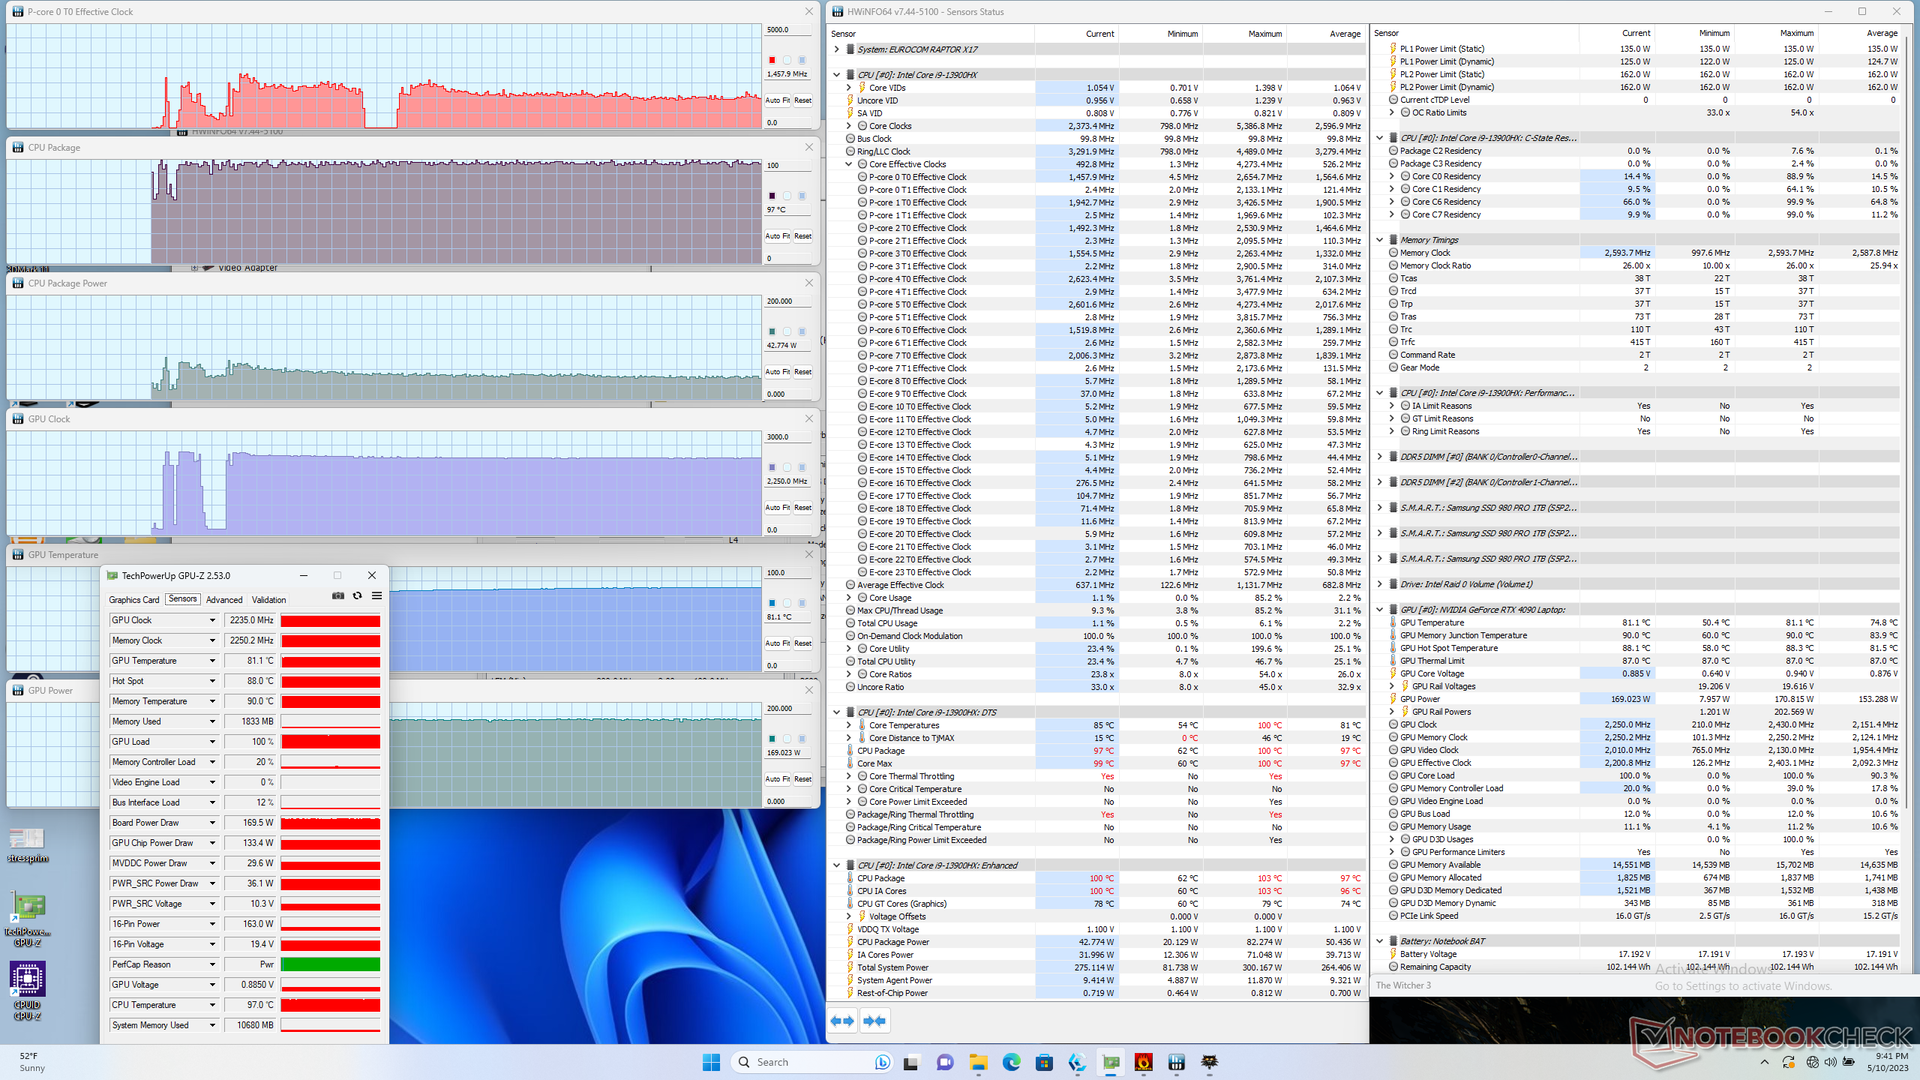
| Clock della CPU (GHz) | Clock della GPU (MHz) | Temperatura media della CPU (°C) | Temperatura media della GPU (°C) | |
| Sistema inattivo | -- | -- | 50 | 40 |
| Stress Prime95 | 3,3 | -- | 97 | 53 |
| StressPrime95 + FurMark | 2,2 | 840 - 2400 | 98 | 74 |
| Witcher 3 Stress (modalità bilanciata) | 1,4 | 2055 | 92 | 76 |
| Witcher 3 Stress (modalità Performance) | 1,5 | 2250 | 97 | 81 |
Altoparlanti
Gli altoparlanti integrati sono deludenti. Non solo la riproduzione dei bassi è scarsa, ma il volume massimo di 71 dB(A) è notevolmente più silenzioso rispetto alla maggior parte degli altri portatili da gioco, dove 80 dB(A) o più sono comuni. Questo sembra decisamente un taglio al design di questo nuovo chassis.
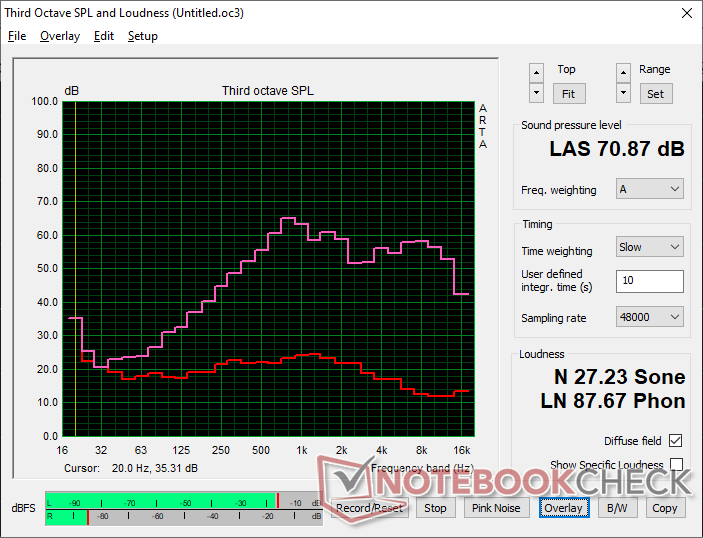
Eurocom Raptor X17 analisi audio
(-) | altoparlanti non molto potenti (70.9 dB)
Bassi 100 - 315 Hz
(-) | quasi nessun basso - in media 15.5% inferiori alla media
(±) | la linearità dei bassi è media (10.3% delta rispetto alla precedente frequenza)
Medi 400 - 2000 Hz
(±) | medi elevati - circa 5.4% superiore alla media
(±) | linearità dei medi adeguata (9.6% delta rispetto alla precedente frequenza)
Alti 2 - 16 kHz
(+) | Alti bilanciati - appena 2.3% dalla media
(±) | la linearità degli alti è media (7.5% delta rispetto alla precedente frequenza)
Nel complesso 100 - 16.000 Hz
(±) | la linearità complessiva del suono è media (23.7% di differenza rispetto alla media
Rispetto alla stessa classe
» 86% di tutti i dispositivi testati in questa classe è stato migliore, 5% simile, 10% peggiore
» Il migliore ha avuto un delta di 6%, medio di 18%, peggiore di 132%
Rispetto a tutti i dispositivi testati
» 71% di tutti i dispositivi testati in questa classe è stato migliore, 6% similare, 23% peggiore
» Il migliore ha avuto un delta di 4%, medio di 23%, peggiore di 134%
Apple MacBook Pro 16 2021 M1 Pro analisi audio
(+) | gli altoparlanti sono relativamente potenti (84.7 dB)
Bassi 100 - 315 Hz
(+) | bassi buoni - solo 3.8% dalla media
(+) | bassi in lineaa (5.2% delta rispetto alla precedente frequenza)
Medi 400 - 2000 Hz
(+) | medi bilanciati - solo only 1.3% rispetto alla media
(+) | medi lineari (2.1% delta rispetto alla precedente frequenza)
Alti 2 - 16 kHz
(+) | Alti bilanciati - appena 1.9% dalla media
(+) | alti lineari (2.7% delta rispetto alla precedente frequenza)
Nel complesso 100 - 16.000 Hz
(+) | suono nel complesso lineare (4.6% differenza dalla media)
Rispetto alla stessa classe
» 0% di tutti i dispositivi testati in questa classe è stato migliore, 0% simile, 100% peggiore
» Il migliore ha avuto un delta di 5%, medio di 17%, peggiore di 45%
Rispetto a tutti i dispositivi testati
» 0% di tutti i dispositivi testati in questa classe è stato migliore, 0% similare, 100% peggiore
» Il migliore ha avuto un delta di 4%, medio di 23%, peggiore di 134%
Gestione dell'energia
Consumo di energia: oltre 300 W quando si gioca
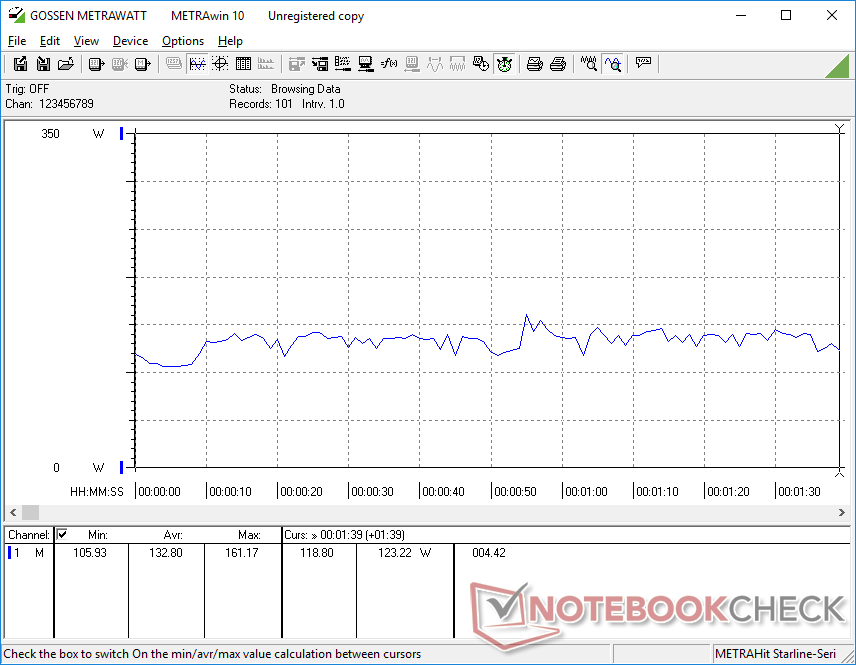
Il funzionamento al minimo su desktop consuma tra i 13 W e i 43 W, a seconda del profilo energetico, delle impostazioni della GPU e della luminosità del display. In effetti, 43 W sono circa gli stessi di un Ultrabook alimentato da Core U come il Samsung Galaxy Book3 15 a carico massimo. Il semplice passaggio dalla modalità iGPU alla modalità dGPU aumenterebbe il consumo di energia di circa 9 W sull'Eurocom. Il consumo energetico è quindi molto sensibile al profilo energetico attivo.
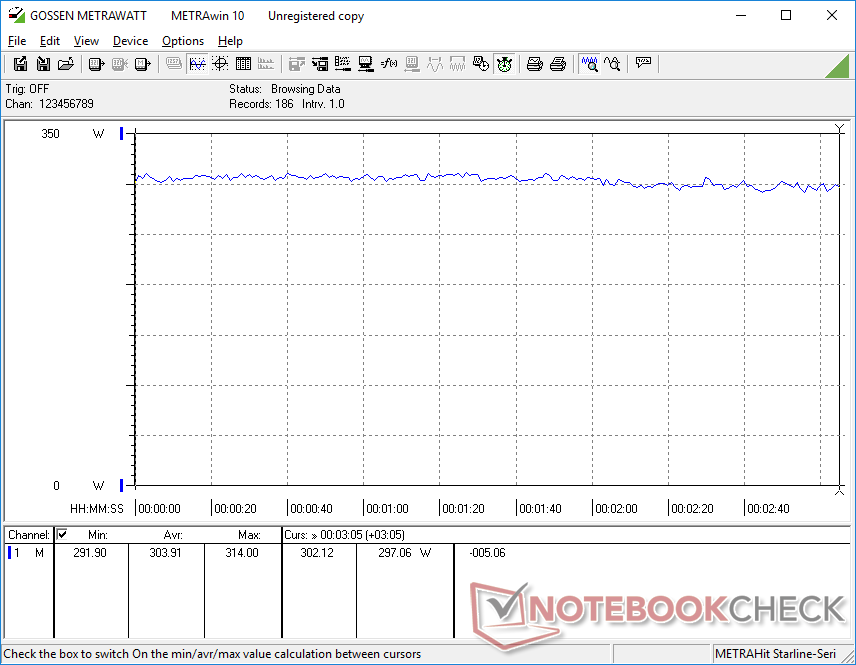
Il consumo medio di energia durante il gioco è molto alto, 304 W rispetto ai 278 W dei concorrenti.Asus ROG Strix Scar 17 o Aorus 17X con la stessa GPU GeForce RTX 4090. La tripla unità SSD, la veloce frequenza di aggiornamento a 240 Hz, l'elevata capacità della RAM e il consumo leggermente superiore della GPU contribuiscono al consumo più elevato dell'Eurocom.
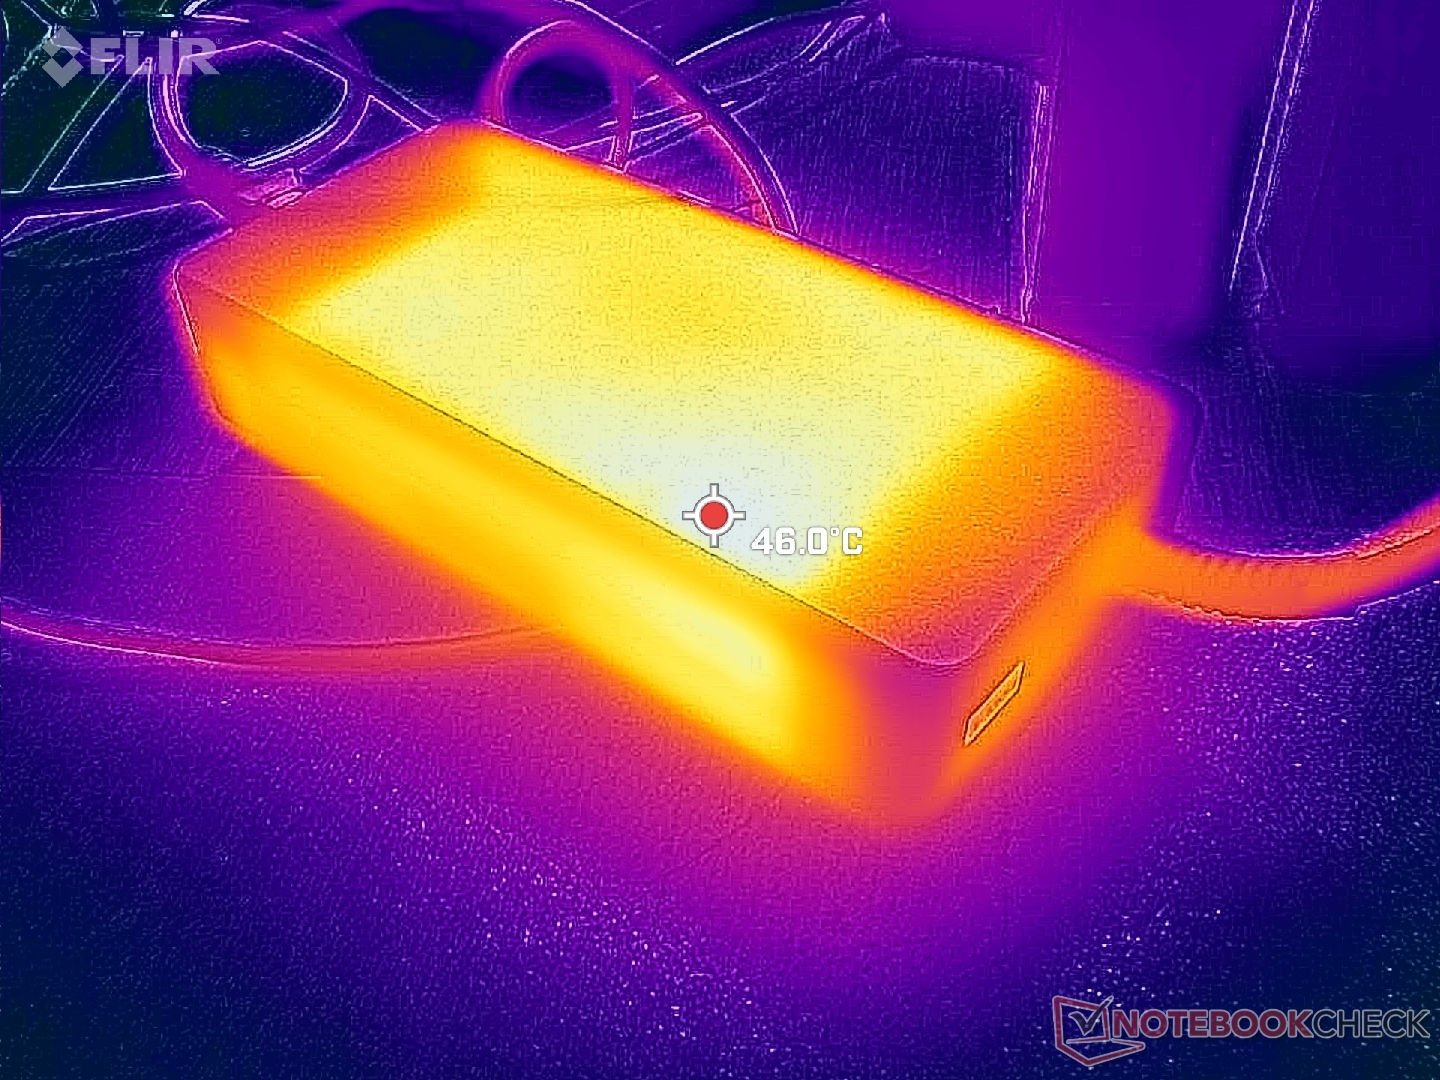
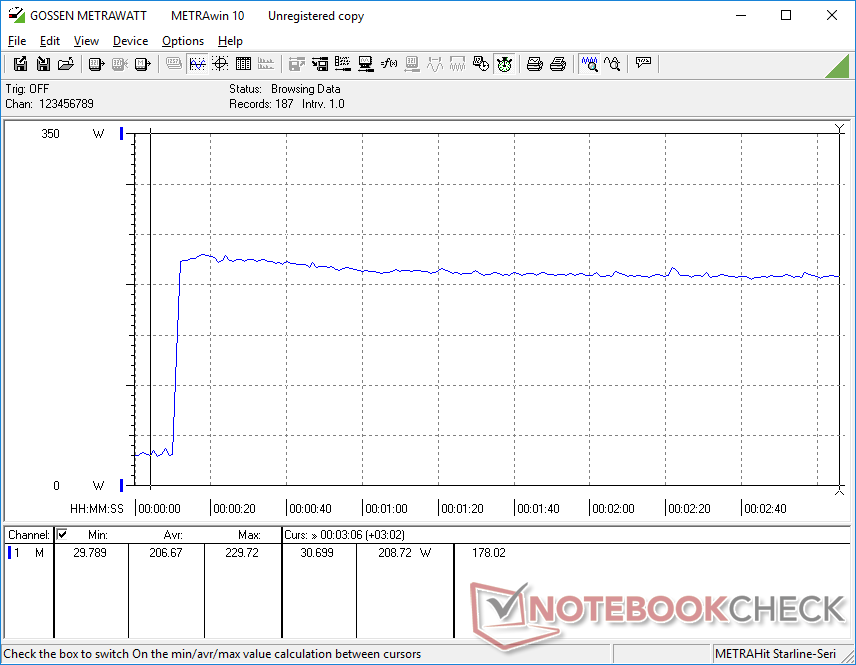
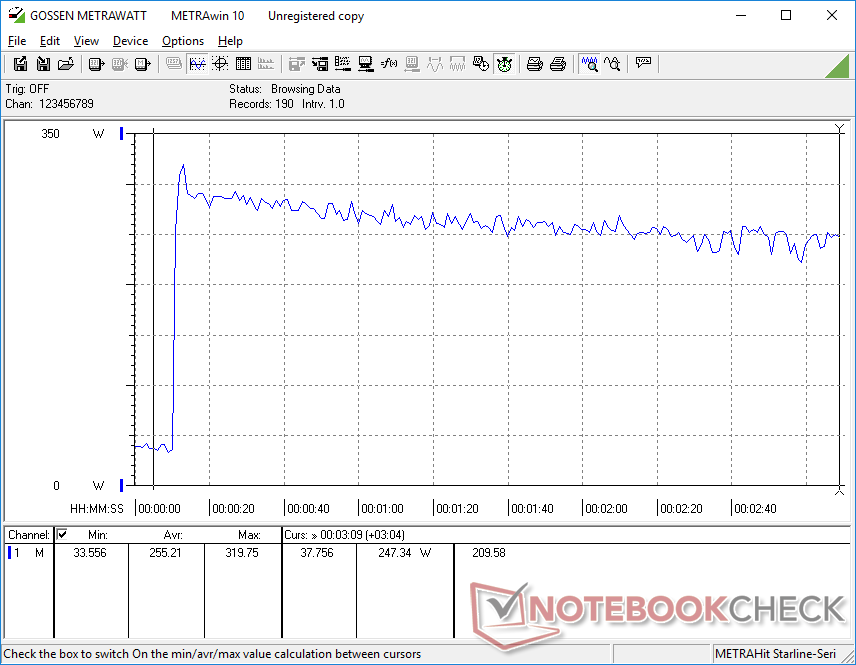
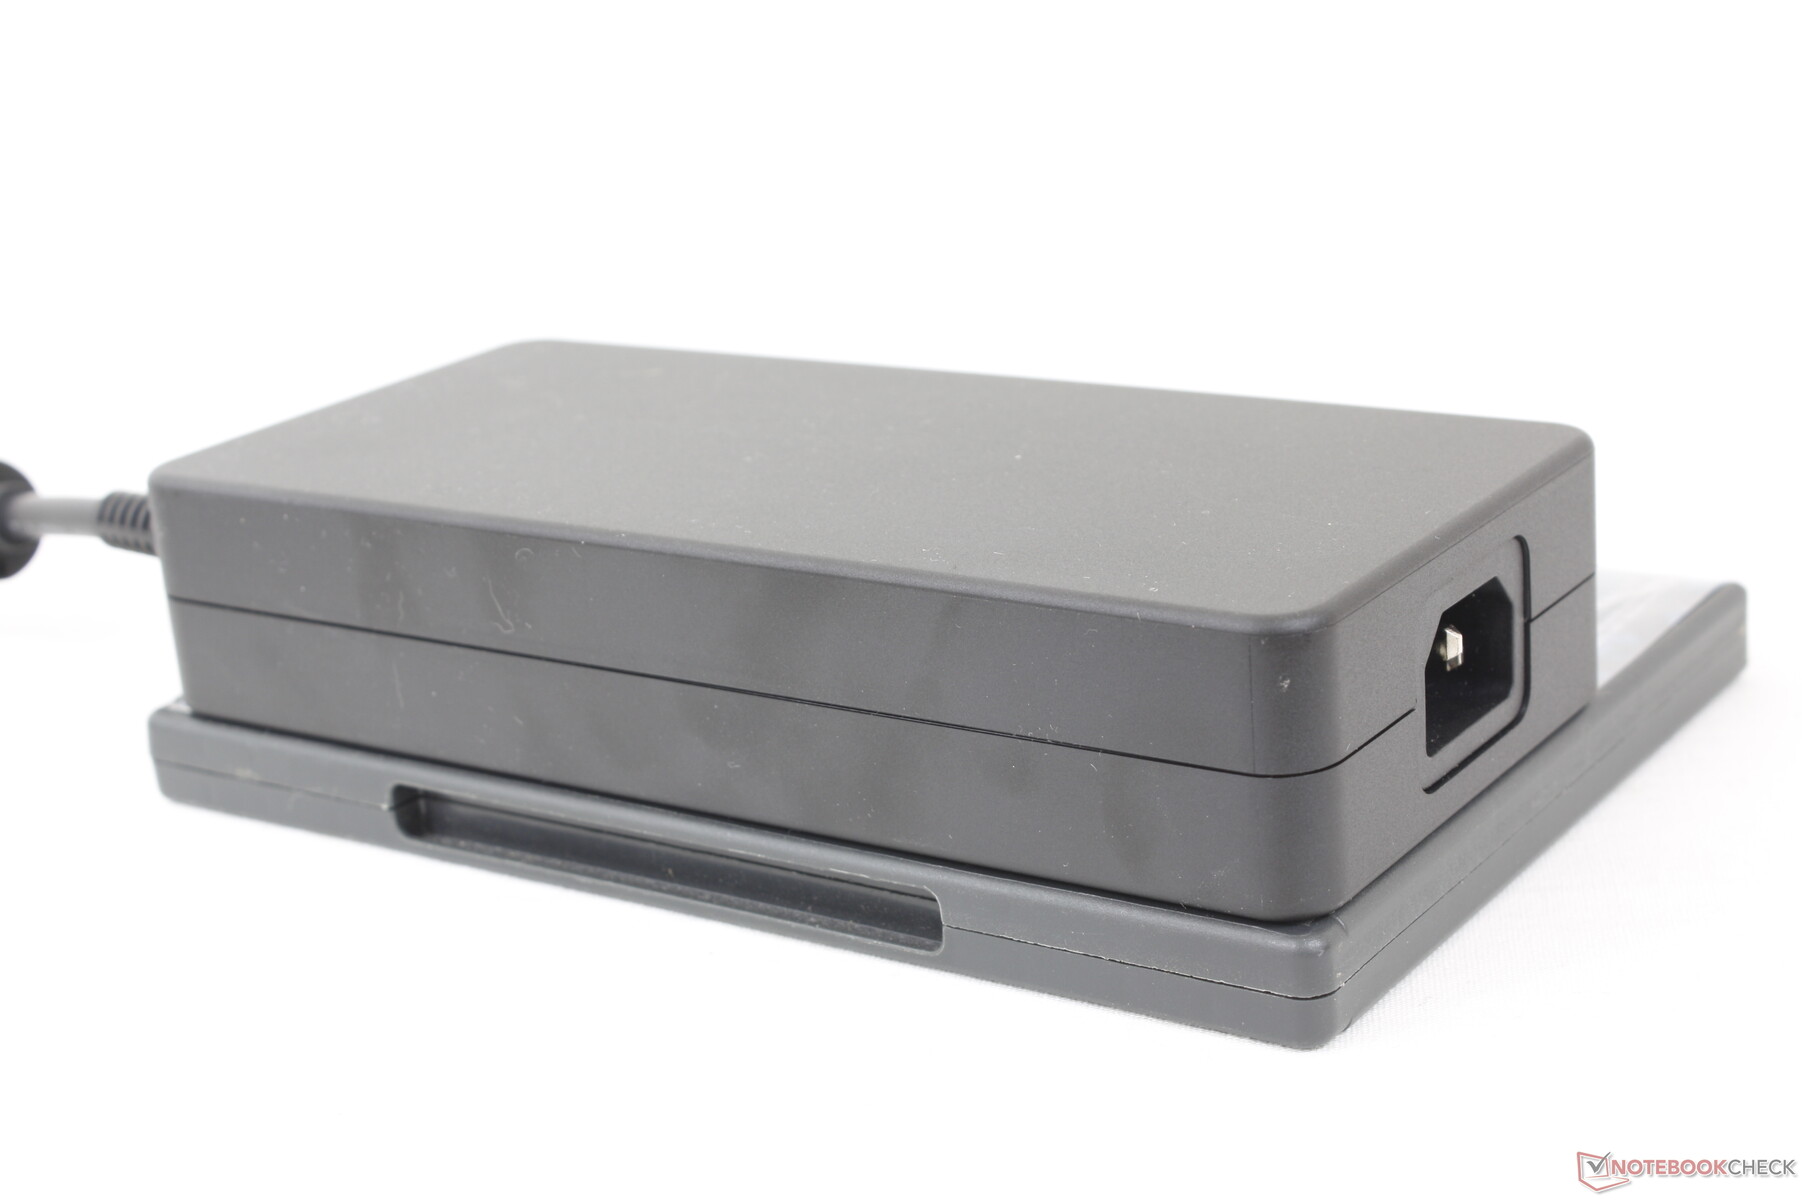
Siamo riusciti a registrare un consumo massimo di 320 W dall'adattatore CA da 330 W di grandi dimensioni (~18,5 x 8,5 x 3,5 cm) quando sia la CPU che la GPU sono al 100% di utilizzo. Questa percentuale diminuisce nel tempo, come mostra il grafico sottostante, a causa delle limitazioni termiche.
| Off / Standby | |
| Idle | |
| Sotto carico |
|
Leggenda:
min: | |
| Eurocom Raptor X17 i9-13900HX, GeForce RTX 4090 Laptop GPU, 3x Samsung SSD 980 Pro 1TB (RAID 0), IPS, 2560x1440, 17.3" | Asus ROG Strix Scar 17 G733PY-XS96 R9 7945HX, GeForce RTX 4090 Laptop GPU, SK hynix PC801 HFS001TEJ9X101N, IPS, 2560x1440, 17.3" | Aorus 17X AZF i9-13900HX, GeForce RTX 4090 Laptop GPU, Gigabyte AG470S1TB-SI B10, IPS, 2560x1440, 17.3" | MSI GE78HX 13VH-070US i9-13950HX, GeForce RTX 4080 Laptop GPU, Samsung PM9A1 MZVL22T0HBLB, IPS, 2560x1600, 17" | Eluktronics Mech-17 GP2 i9-13900HX, GeForce RTX 4090 Laptop GPU, Samsung PM9A1 MZVL21T0HCLR, IPS, 2560x1600, 17" | Alienware m17 R5 (R9 6900HX, RX 6850M XT) R9 6900HX, Radeon RX 6850M XT, SSSTC CA6-8D1024, IPS, 3840x2160, 17" | |
|---|---|---|---|---|---|---|
| Power Consumption | 5% | 13% | 3% | 5% | 27% | |
| Idle Minimum * (Watt) | 13.4 | 14.5 -8% | 11 18% | 16.1 -20% | 14 -4% | 13 3% |
| Idle Average * (Watt) | 22.2 | 21.1 5% | 17 23% | 24 -8% | 19.3 13% | 16.5 26% |
| Idle Maximum * (Watt) | 42.4 | 42.8 -1% | 29 32% | 34 20% | 36.8 13% | 17 60% |
| Load Average * (Watt) | 132.8 | 116.7 12% | 134 -1% | 123.6 7% | 117.2 12% | 93 30% |
| Witcher 3 ultra * (Watt) | 304 | 278 9% | 278 9% | 286 6% | 304 -0% | 239 21% |
| Load Maximum * (Watt) | 319.8 | 279.6 13% | 334 -4% | 285.7 11% | 342.5 -7% | 251 22% |
* ... Meglio usare valori piccoli
Power Consumption Witcher 3 / Stresstest
Power Consumption external Monitor
Durata della batteria
I tempi di esecuzione sono piuttosto buoni, considerando la potenza dei componenti interni. Siamo riusciti a registrare poco meno di 5 ore di navigazione WLAN nel mondo reale con il profilo di alimentazione bilanciato e la iGPU attiva. Tuttavia, modelli concorrenti come l'Aorus 17X o l'MSI GE78HX sono in grado di durare più di un'ora rispetto al nostro Eurocom.
La ricarica da vuoto a pieno regime con l'adattatore CA da 330 W in dotazione è relativamente lenta: da 2 a 2,5 ore. La ricarica tramite adattatori CA USB-C di terze parti è supportata, ma si noti che funziona solo su una delle due porte USB-C (quella più vicina alla parte posteriore).
| Eurocom Raptor X17 i9-13900HX, GeForce RTX 4090 Laptop GPU, 99 Wh | Asus ROG Strix Scar 17 G733PY-XS96 R9 7945HX, GeForce RTX 4090 Laptop GPU, 90 Wh | Aorus 17X AZF i9-13900HX, GeForce RTX 4090 Laptop GPU, 99 Wh | MSI GE78HX 13VH-070US i9-13950HX, GeForce RTX 4080 Laptop GPU, 99 Wh | Eluktronics Mech-17 GP2 i9-13900HX, GeForce RTX 4090 Laptop GPU, 99 Wh | Alienware m17 R5 (R9 6900HX, RX 6850M XT) R9 6900HX, Radeon RX 6850M XT, 97 Wh | |
|---|---|---|---|---|---|---|
| Autonomia della batteria | -18% | 19% | -2% | 2% | 8% | |
| Reader / Idle (h) | 10.2 | 9 -12% | 7.3 -28% | |||
| WiFi v1.3 (h) | 5 | 4.1 -18% | 6.5 30% | 6.1 22% | 5.1 2% | 4.8 -4% |
| Load (h) | 1.5 | 2.1 40% | 1.5 0% | 1.8 20% | ||
| H.264 (h) | 6.7 | 4.9 |
Pro
Contro
Verdetto - Prestazioni ineccepibili, ma potrebbe essere utilizzato con maggiore cura

L'aspetto migliore del Raptor X17 sono le sue prestazioni molto veloci rispetto al profilo sottile. Il Raptor X17 è in grado di funzionare in modo molto caldo e rumoroso per spremere il più possibile le prestazioni della CPU e della GPU. I cacciatori di prestazioni in particolare apprezzeranno questo approccio, così come il supporto per un massimo di tre SSD PCIe4 x4 NVMe.
Sfortunatamente, ci sono una serie di svantaggi da tenere in considerazione. Con oltre 60 dB(A) quando si gioca, il sistema è notevolmente più rumoroso della maggior parte dei portatili da gioco presenti sul mercato. Quando i modelli concorrenti, come l'MSI GE78HXMSI GE78HX o Asus ROG Strix Scar 17 sono in grado di offrire opzioni di processore simili pur essendo più silenziosi di 10 dB(A) quando si gioca, diventa più difficile preferire il Raptor X17 a molte altre alternative presenti sul mercato. Anche il peso molto più elevato non lo favorisce.
L'hardware e le prestazioni sono solidi, ma altri aspetti come gli altoparlanti deboli, le ventole molto rumorose e il software del Control Center poco raffinato non riflettono adeguatamente l'elevato prezzo richiesto.
Ci sono anche altri dettagli che secondo noi avrebbero potuto essere migliorati. I profili di alimentazione confusi, il comportamento pulsante della ventola, le modalità nascoste della GPU, la retroilluminazione moderatamente irregolare e il display calibrato opzionale sono tutti aspetti spiacevoli da vedere su un portatile di fascia alta che parte da ben oltre 3000 dollari. Eurocom ha dichiarato di essere in procinto di ridisegnare il menu del BIOS e il software del Control Center, che si spera possa risolvere alcune delle nostre lamentele.
Prezzo e disponibilità
Eurocom sta spedendo il il Raptor X17 è in vendita in Nord America a partire da 3550 dollari per la configurazione base fino a oltre 6000 dollari per la configurazione della nostra unità di prova.
Eurocom Raptor X17
- 05/18/2023 v7 (old)
Allen Ngo
Transparency
La selezione dei dispositivi da recensire viene effettuata dalla nostra redazione. Il campione di prova è stato fornito all'autore come prestito dal produttore o dal rivenditore ai fini di questa recensione. L'istituto di credito non ha avuto alcuna influenza su questa recensione, né il produttore ne ha ricevuto una copia prima della pubblicazione. Non vi era alcun obbligo di pubblicare questa recensione. In quanto società mediatica indipendente, Notebookcheck non è soggetta all'autorità di produttori, rivenditori o editori.
Ecco come Notebookcheck esegue i test
Ogni anno, Notebookcheck esamina in modo indipendente centinaia di laptop e smartphone utilizzando procedure standardizzate per garantire che tutti i risultati siano comparabili. Da circa 20 anni sviluppiamo continuamente i nostri metodi di prova e nel frattempo stabiliamo gli standard di settore. Nei nostri laboratori di prova, tecnici ed editori esperti utilizzano apparecchiature di misurazione di alta qualità. Questi test comportano un processo di validazione in più fasi. Il nostro complesso sistema di valutazione si basa su centinaia di misurazioni e parametri di riferimento ben fondati, che mantengono l'obiettività.Price comparison

