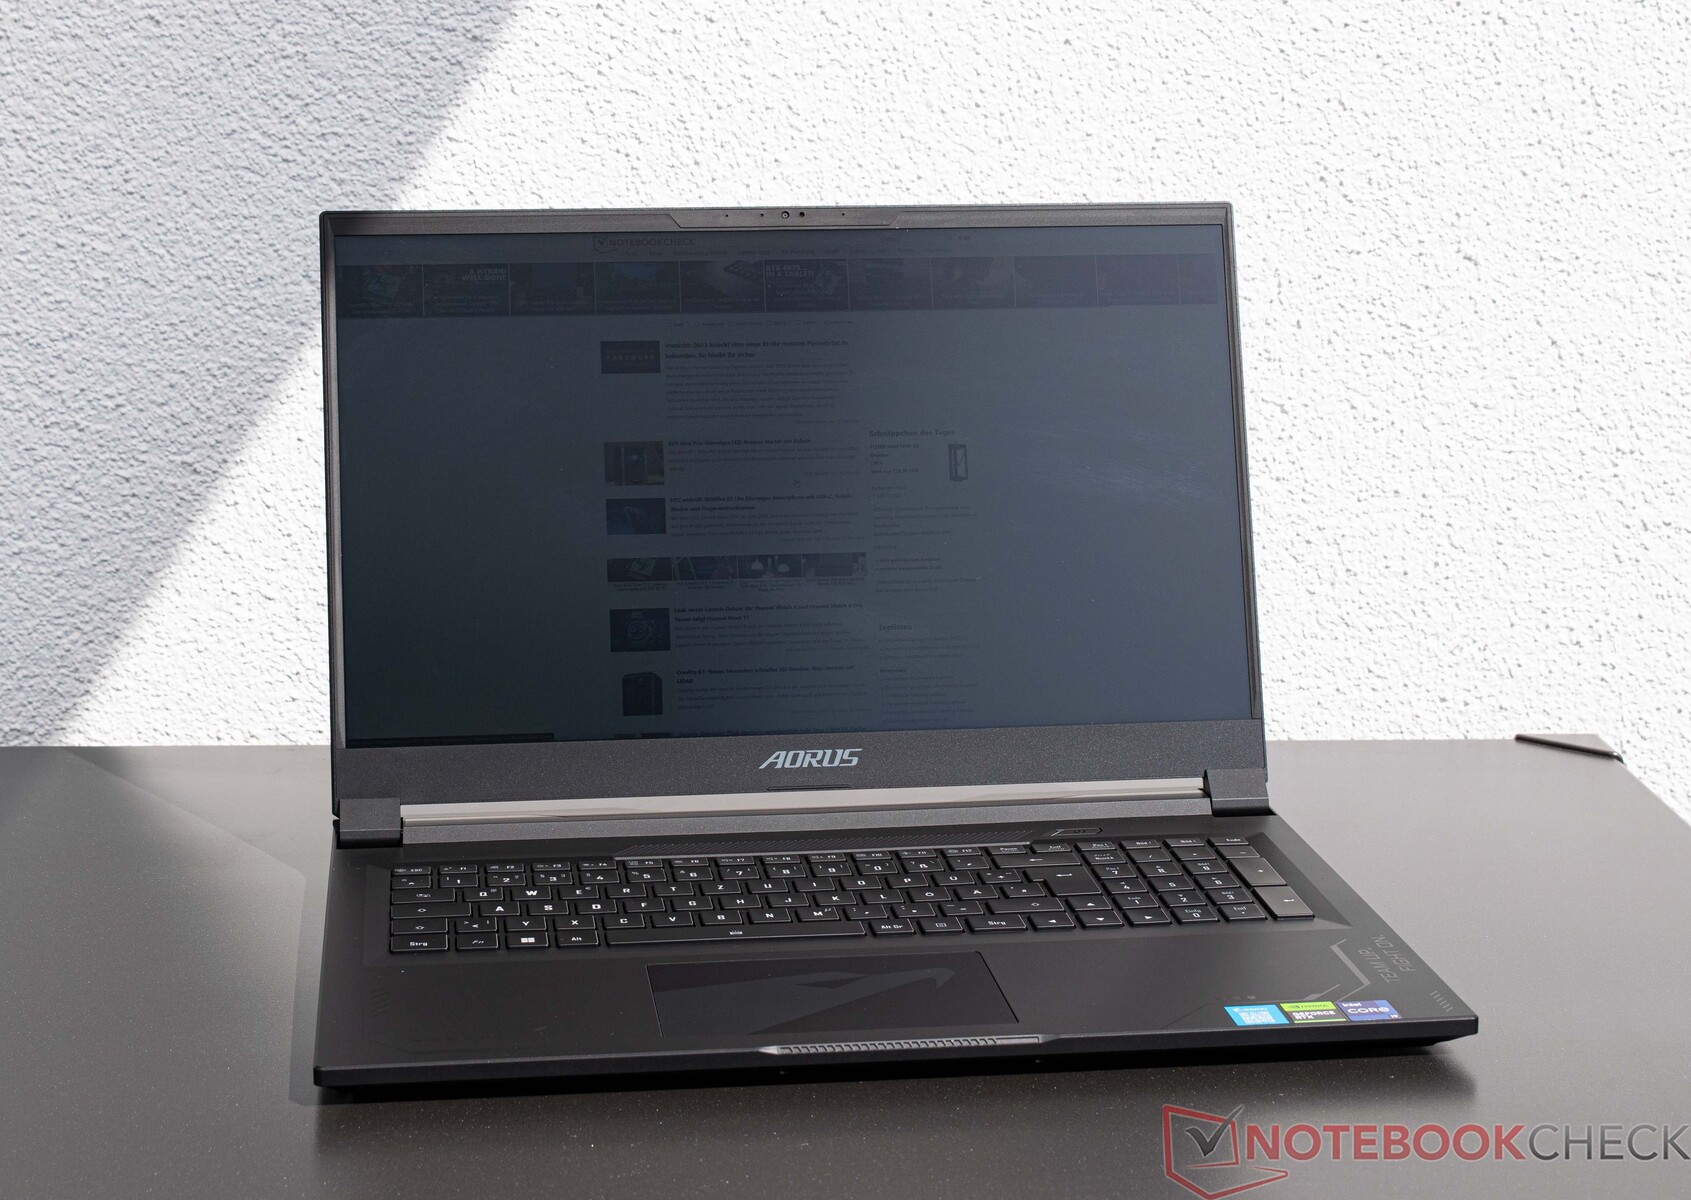
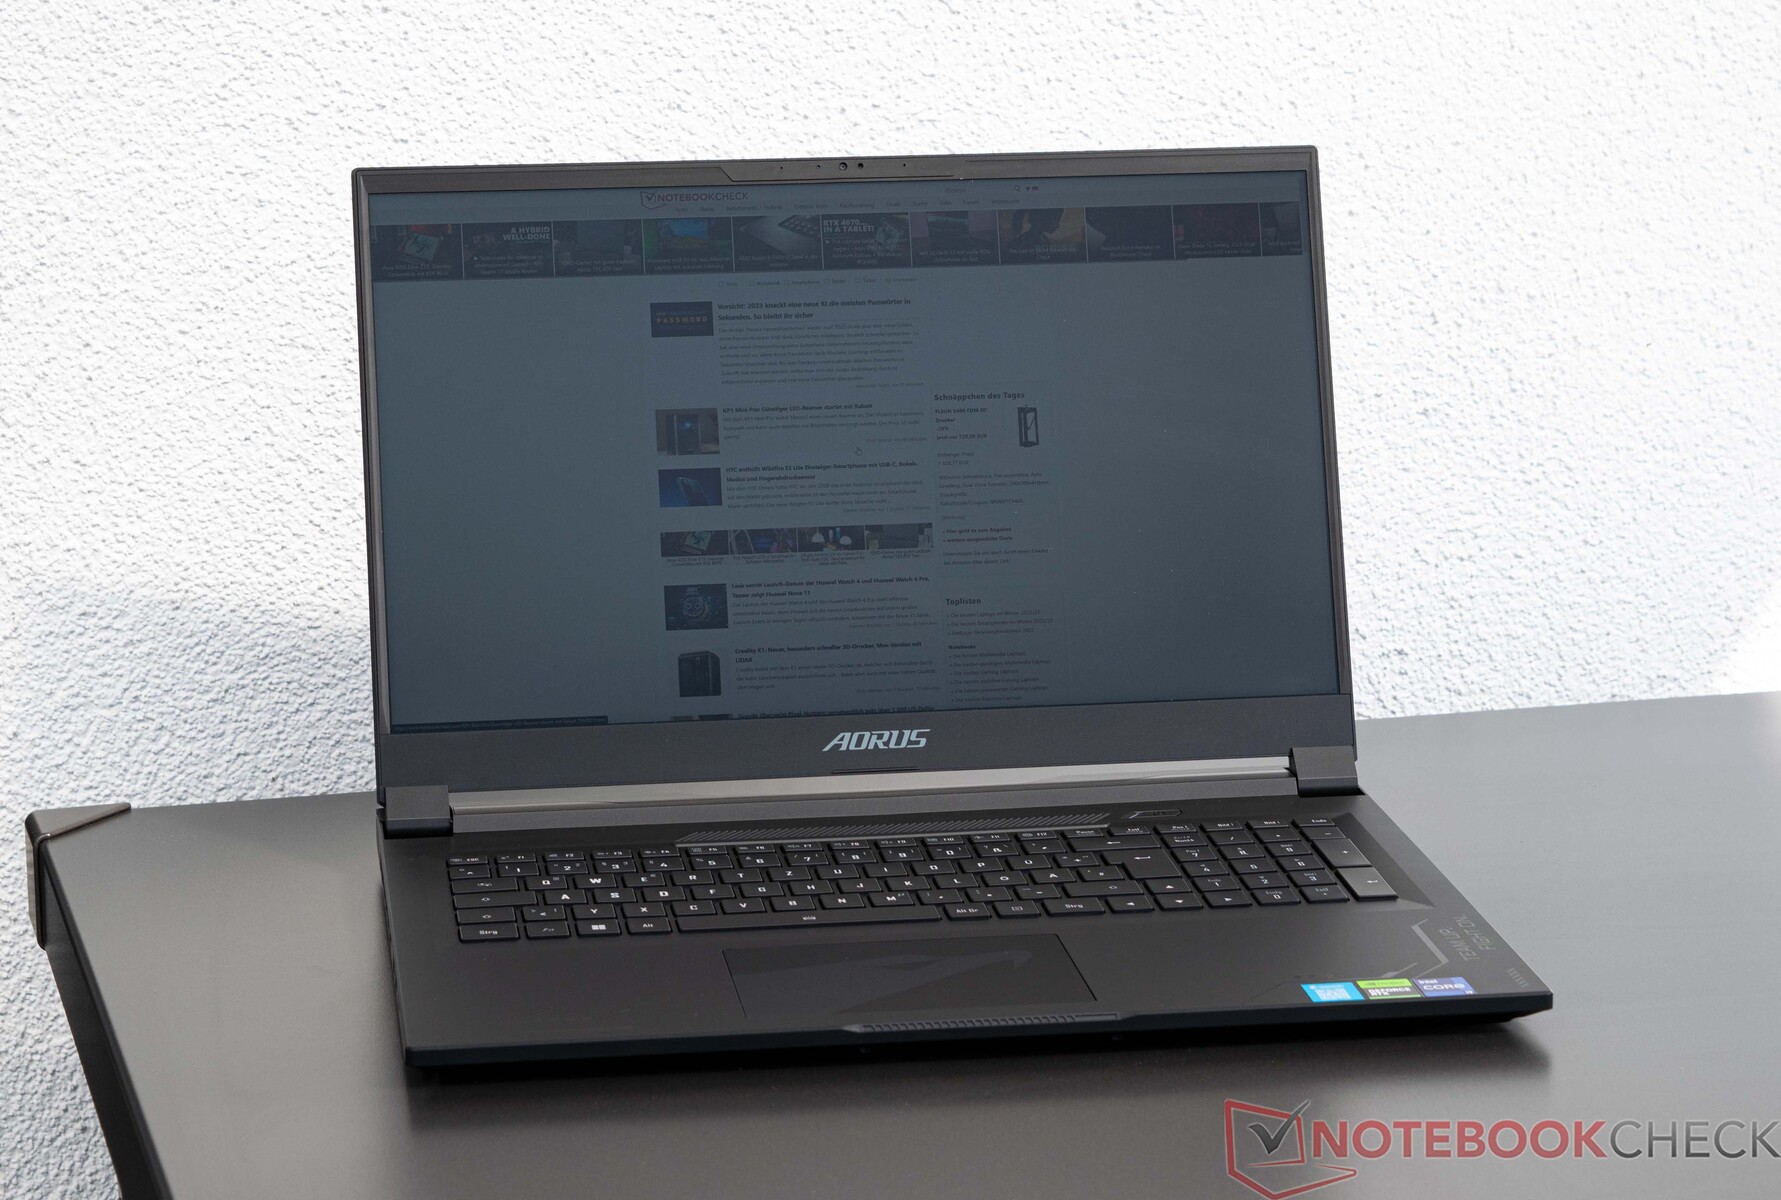
Recensione di Aorus 17X AZF: Laptop da gioco di fascia alta con i9-13900HX e RTX 4090 in un case sottile
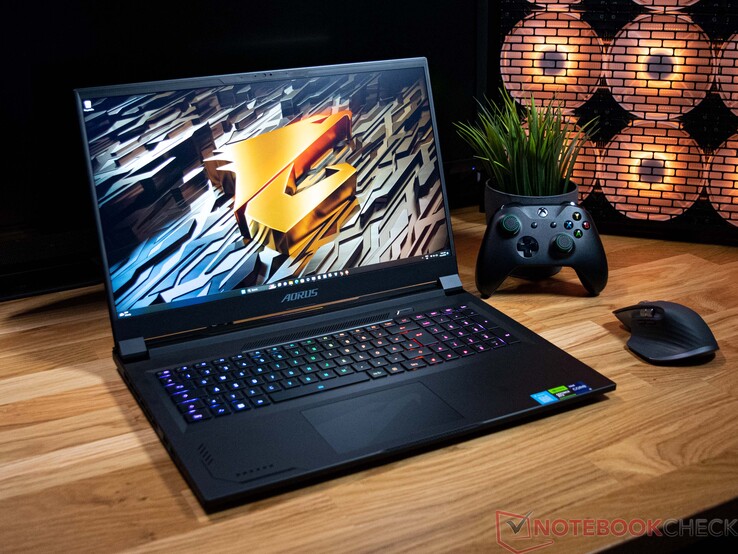
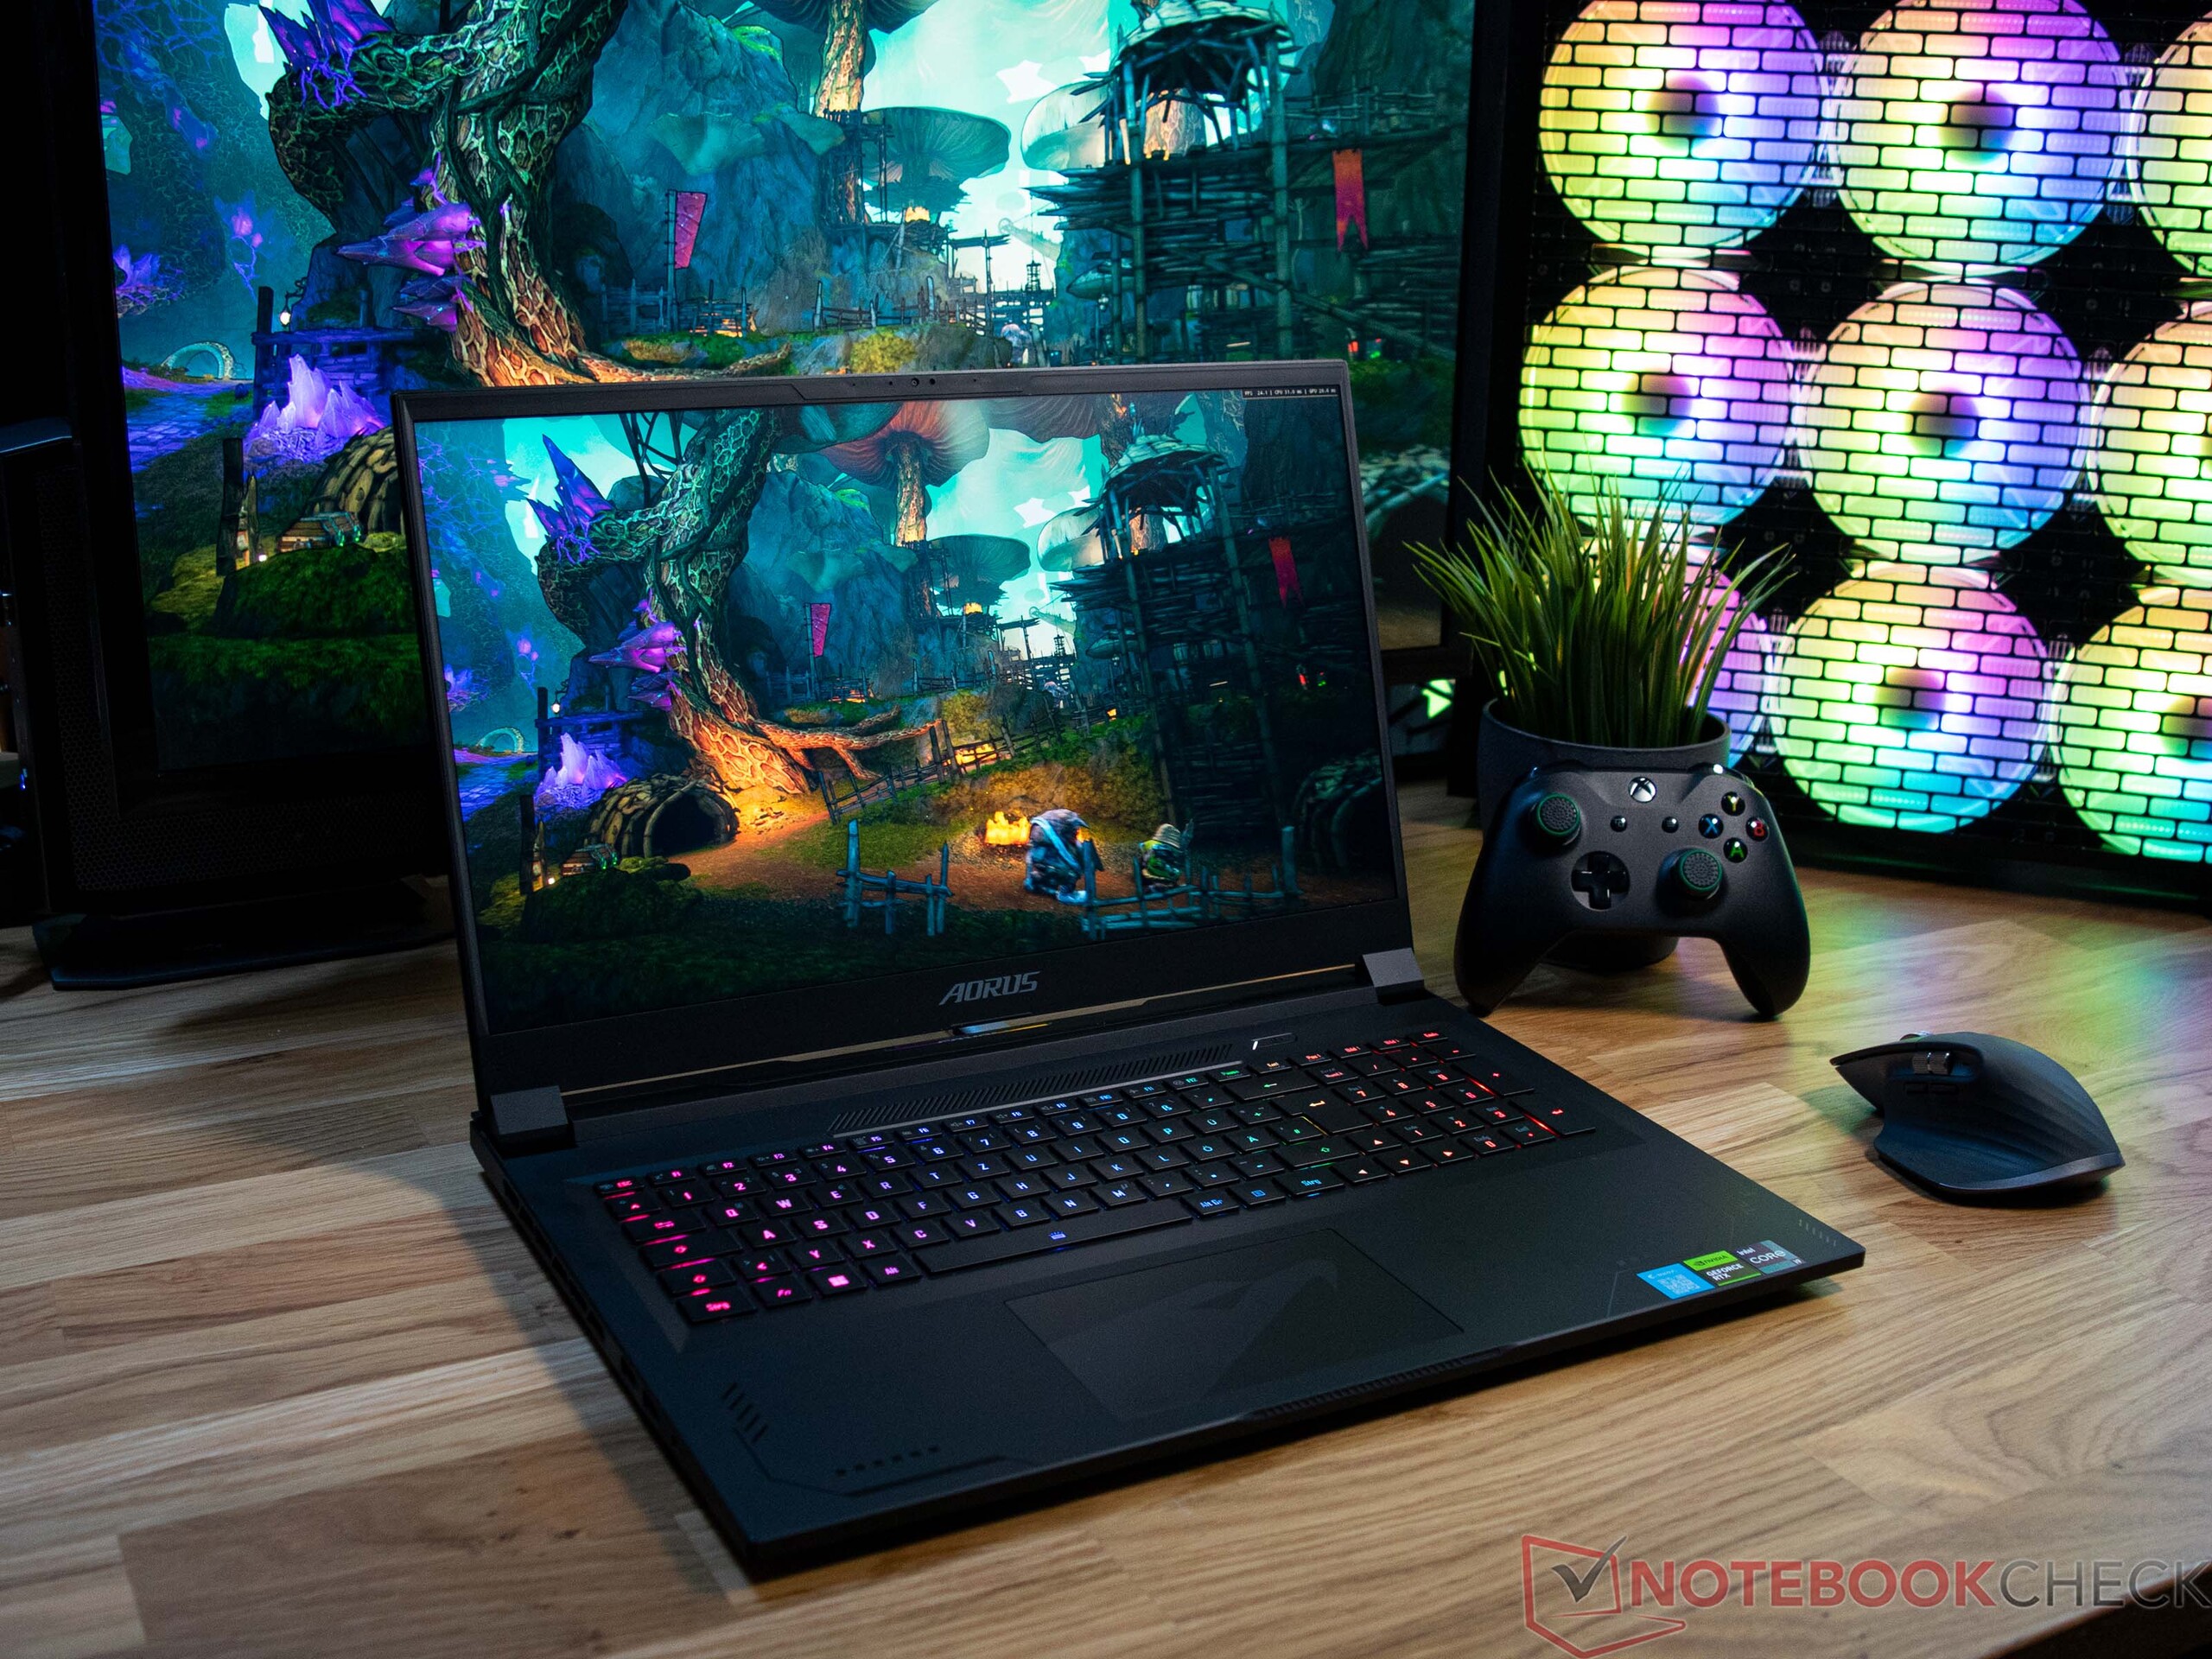
Il nuovo Aorus 17X AZF si basa su un processore Intel Raptor Lake H e sull'ultima GPU mobile di punta di Nvidia. Un Intel Core i9 13900HX lavora insieme a una GPU per laptop Nvidia GeForce RTX 4090 sotto il cofano. Questi due componenti, da soli, danno un'idea della destinazione d'uso del portatile. Ma come si comporta l'hardware in un case così sottile? Abbiamo dato un'occhiata a questo aspetto e lo approfondiremo in seguito. Ma la CPU e la GPU da sole non bastano a creare un buon portatile da gioco: nel modello Aorus 17X AZF sono accompagnate da uno schermo da 17 pollici a 240 Hz e da un'unità di archiviazione SSD da 2 TB, in grado di memorizzare facilmente un gran numero di giochi e altri programmi. Questa configurazione costa 3.499,00 dollari.
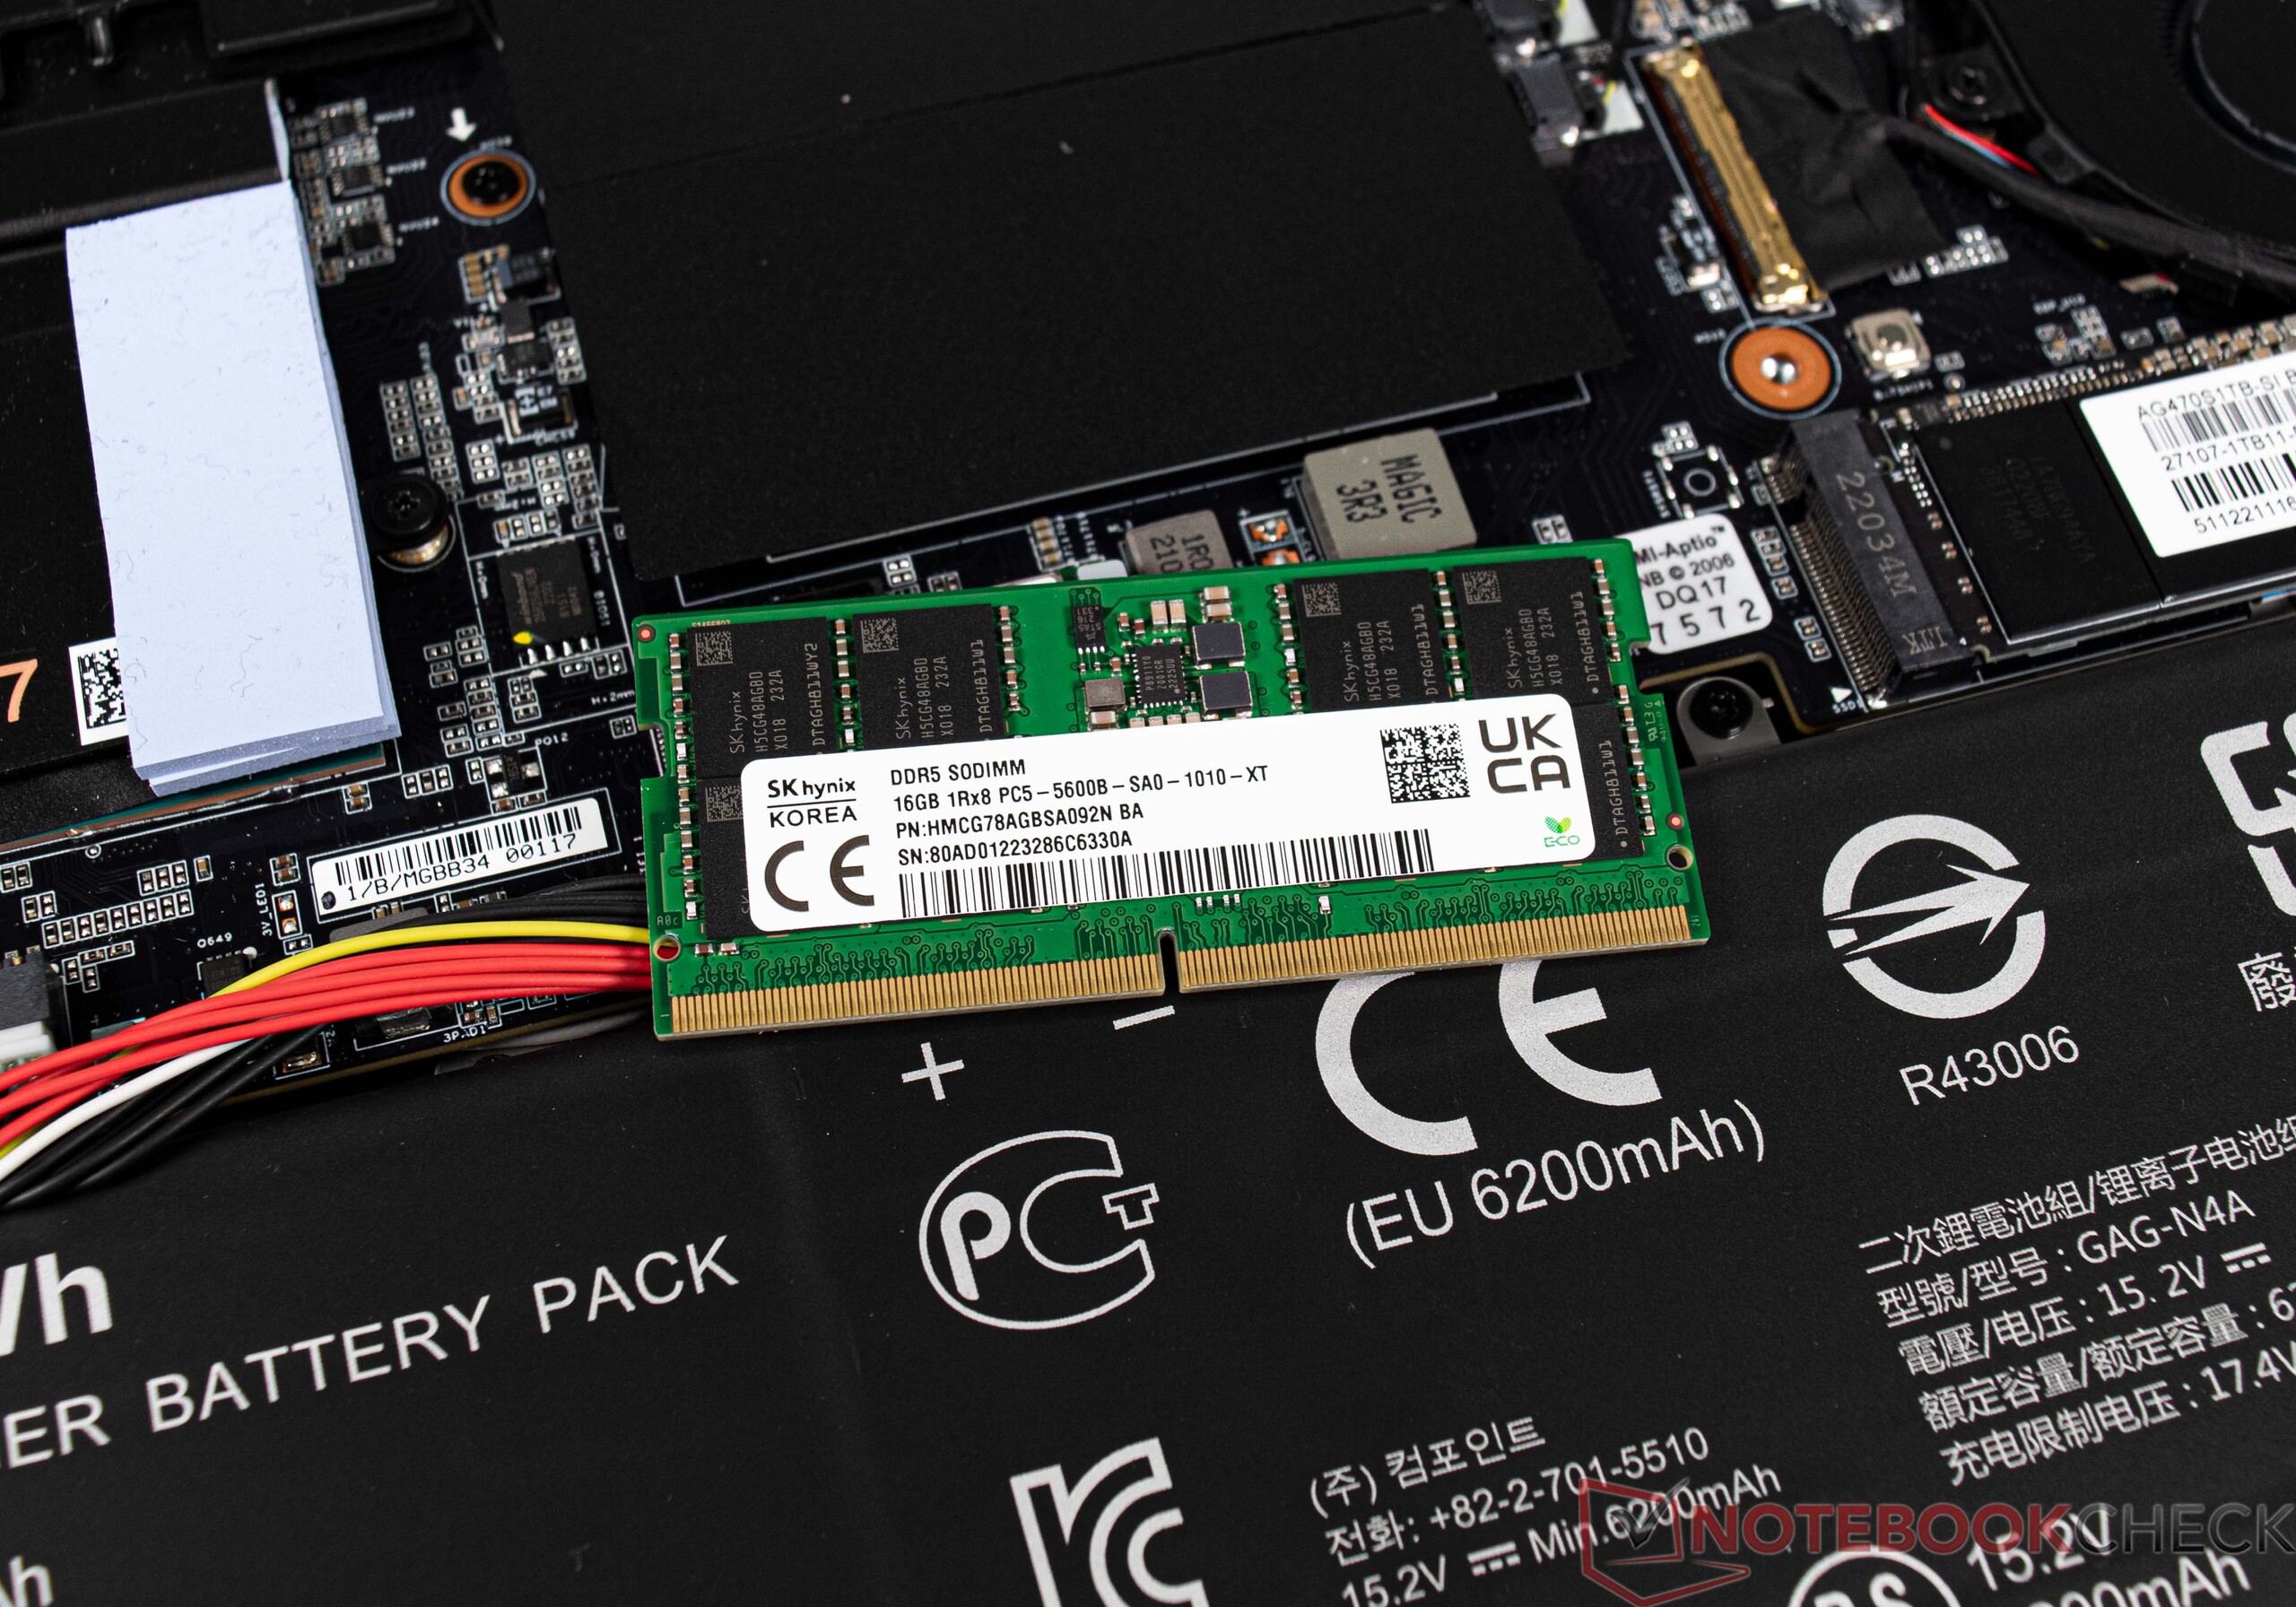
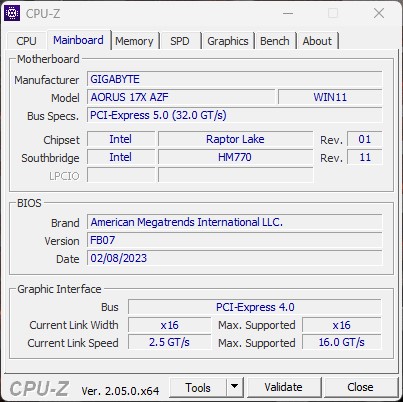
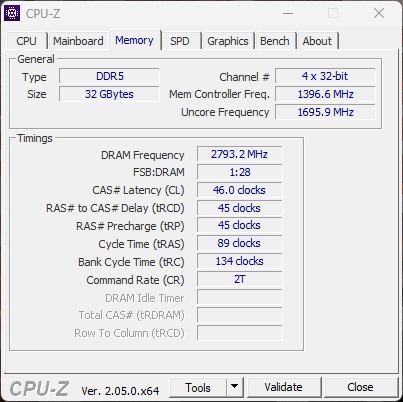
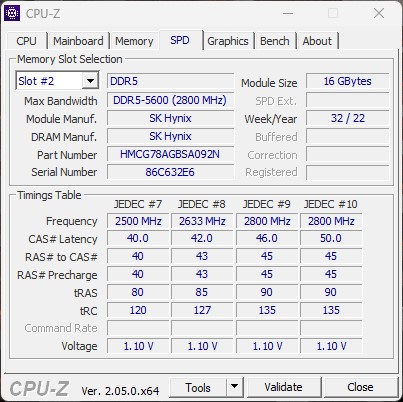
In alternativa, l'Aorus 17X è disponibile con un processore Intel Core i7 13700HX. Mentre non ci sono altre scelte in termini di scheda grafica, la velocità della RAM DDR5 può variare. Il Core i7 è tecnicamente limitato a un massimo di 4800 MT/s, mentre il modello Core i9 ha un massimo di 5600 MT/s a disposizione.
Anche i portatili concorrenti di questa classe offrono livelli di prestazioni simili se si considerano le specifiche tecniche, poiché sono anch'essi dotati di processori Intel Raptor-Lake H e GPU mobile Ada-Lovelace. Una panoramica dettagliata dei dispositivi a confronto è riportata nella tabella seguente.
Potenziali concorrenti a confronto
Punteggio | Data | Modello | Peso | Altezza | Dimensione | Risoluzione | Prezzo |
|---|---|---|---|---|---|---|---|
| 86 % v7 (old) | 04/2023 | Aorus 17X AZF i9-13900HX, GeForce RTX 4090 Laptop GPU | 2.9 kg | 21.8 mm | 17.30" | 2560x1440 | |
| 88.4 % v7 (old) | 03/2023 | Medion Erazer Beast X40 i9-13900HX, GeForce RTX 4090 Laptop GPU | 2.9 kg | 33 mm | 17.00" | 2560x1600 | |
| 88.3 % v7 (old) | 03/2023 | MSI GE78HX 13VH-070US i9-13950HX, GeForce RTX 4080 Laptop GPU | 3 kg | 23 mm | 17.00" | 2560x1600 | |
| 85.4 % v7 (old) | 03/2023 | HP Omen 17-ck2097ng i9-13900HX, GeForce RTX 4080 Laptop GPU | 2.8 kg | 27 mm | 17.30" | 2560x1440 | |
| 90.7 % v7 (old) | 04/2023 | Alienware m18 R1 i9-13980HX, GeForce RTX 4090 Laptop GPU | 3.9 kg | 26.7 mm | 18.00" | 1920x1200 | |
| 89 % v7 (old) | 02/2023 | MSI Titan GT77 HX 13VI i9-13950HX, GeForce RTX 4090 Laptop GPU | 3.5 kg | 23 mm | 17.30" | 3840x2160 |
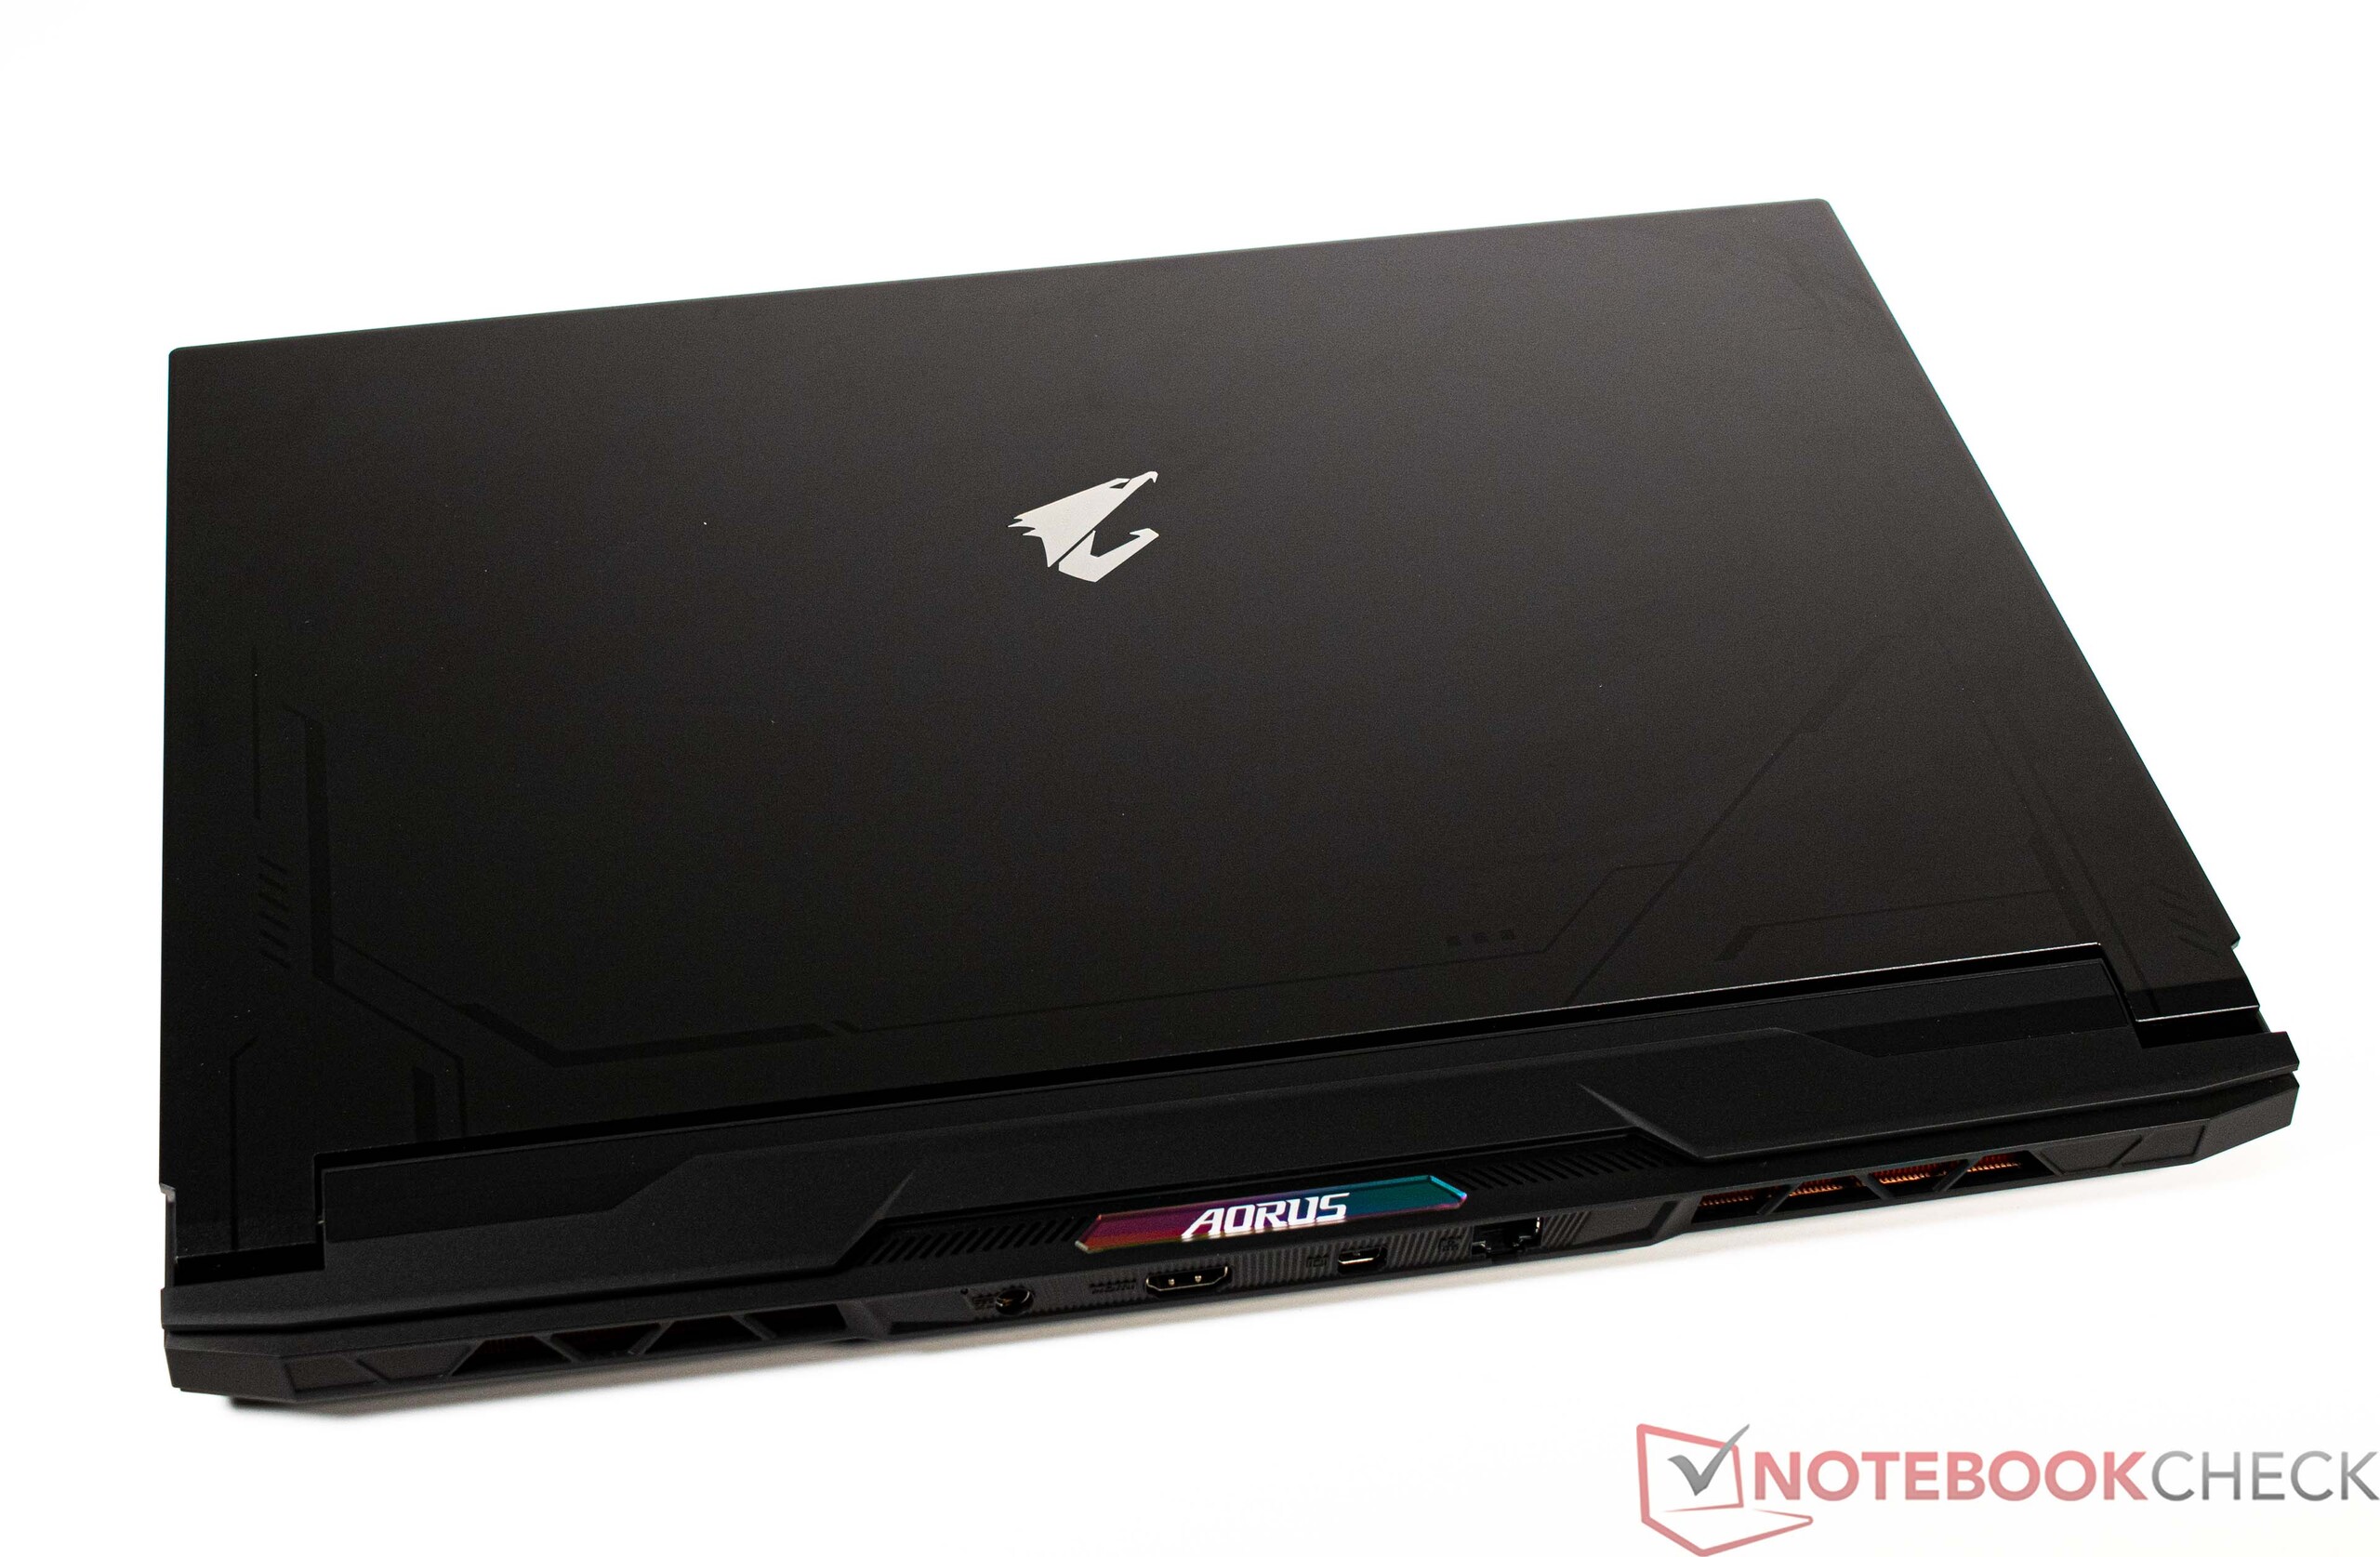
Custodia - Alluminio e plastica per l'Aorus 17X
L'Aorus 17X è realizzato principalmente in alluminio e plastica. Questo ha il vantaggio del peso ridotto, perché con meno di 3 chilogrammi, il dispositivo è uno dei rappresentanti più leggeri del confronto. Solo l'HP Omen 17 è leggermente più leggero.
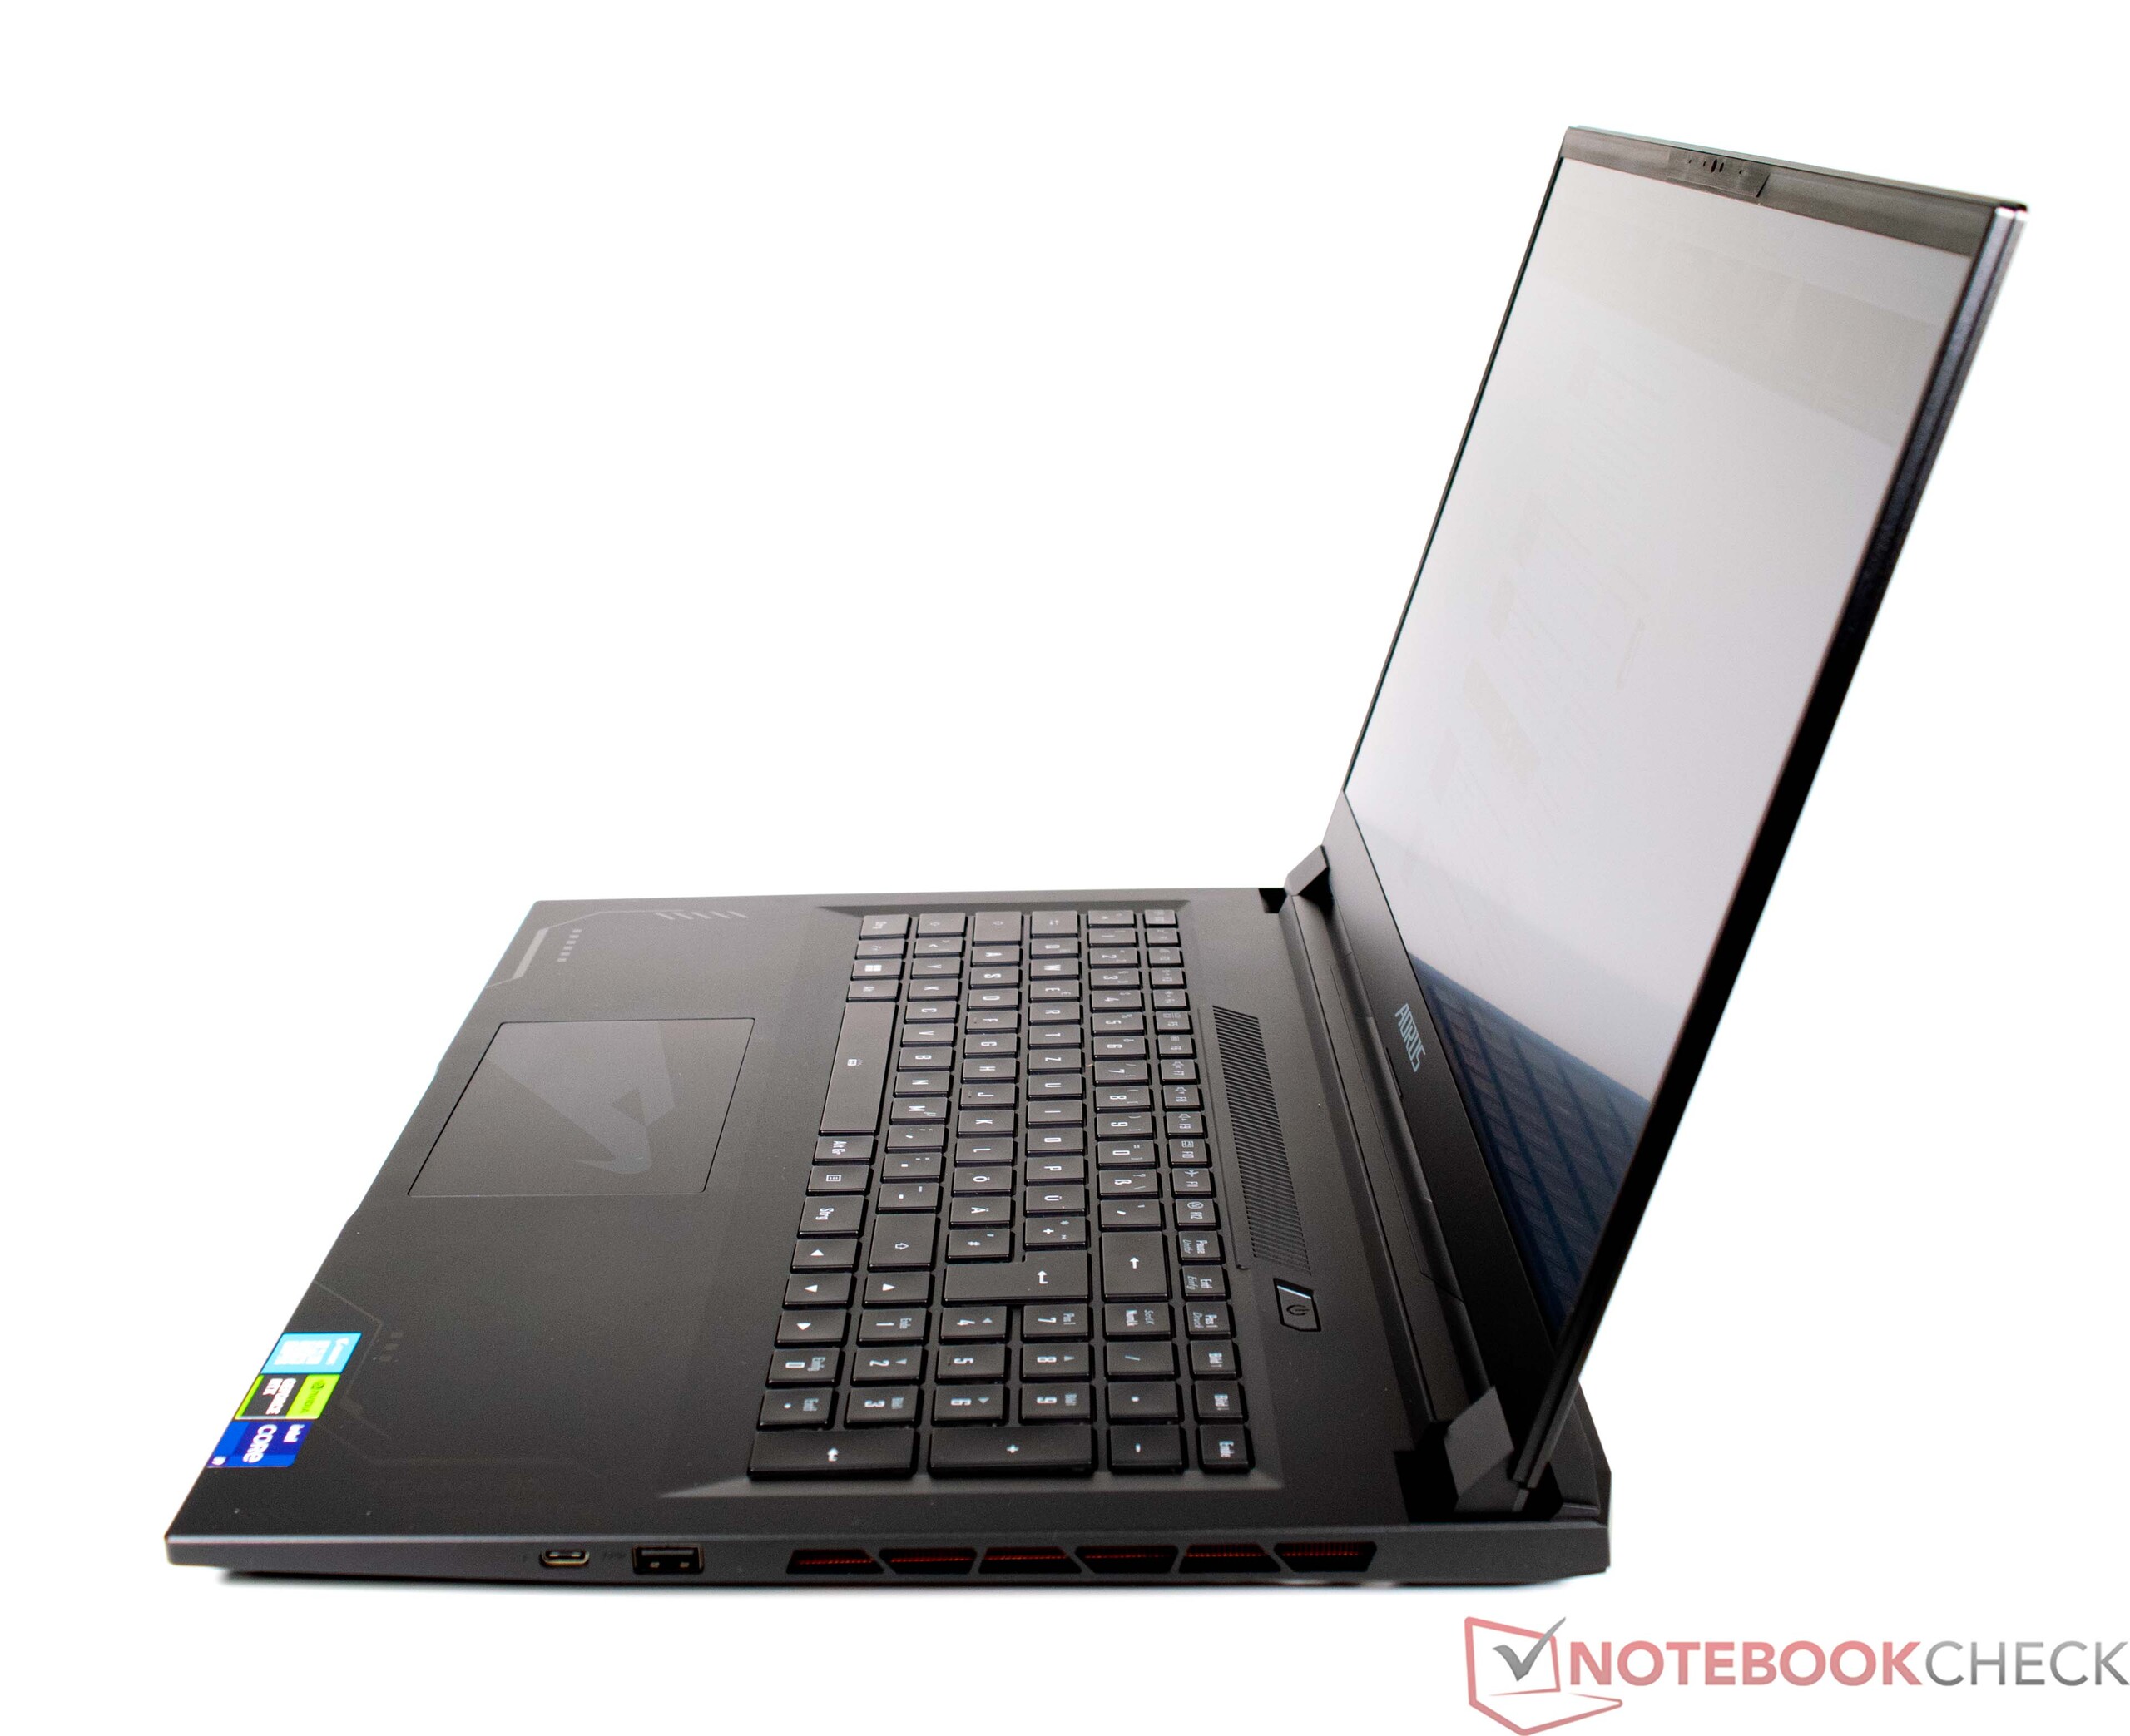
In termini di stabilità, la scelta dei materiali si rivela un po' svantaggiosa, ma si è comunque dimostrata solida nel nostro test di pressione. I produttori devono sempre trovare un equilibrio tra stabilità e mobilità nei portatili da 17 pollici di grandi dimensioni, e pensiamo che l'Aorus 17X AZF sia riuscito nel suo intento. Il coperchio del display, realizzato in alluminio sul lato superiore, è relativamente stabile, anche se può essere ruotato con un po' di sforzo. Anche le cerniere sono stabili, si sentono solide e riducono al minimo le oscillazioni. Inoltre, è possibile aprire il display con una sola mano.
Gli unici elementi colorati si trovano sul retro sotto forma di scritte Aorus illuminate. C'è anche un logo Aorus argentato sul coperchio del display, che spezza la monotonia del dispositivo, altrimenti completamente nero.
Attrezzatura
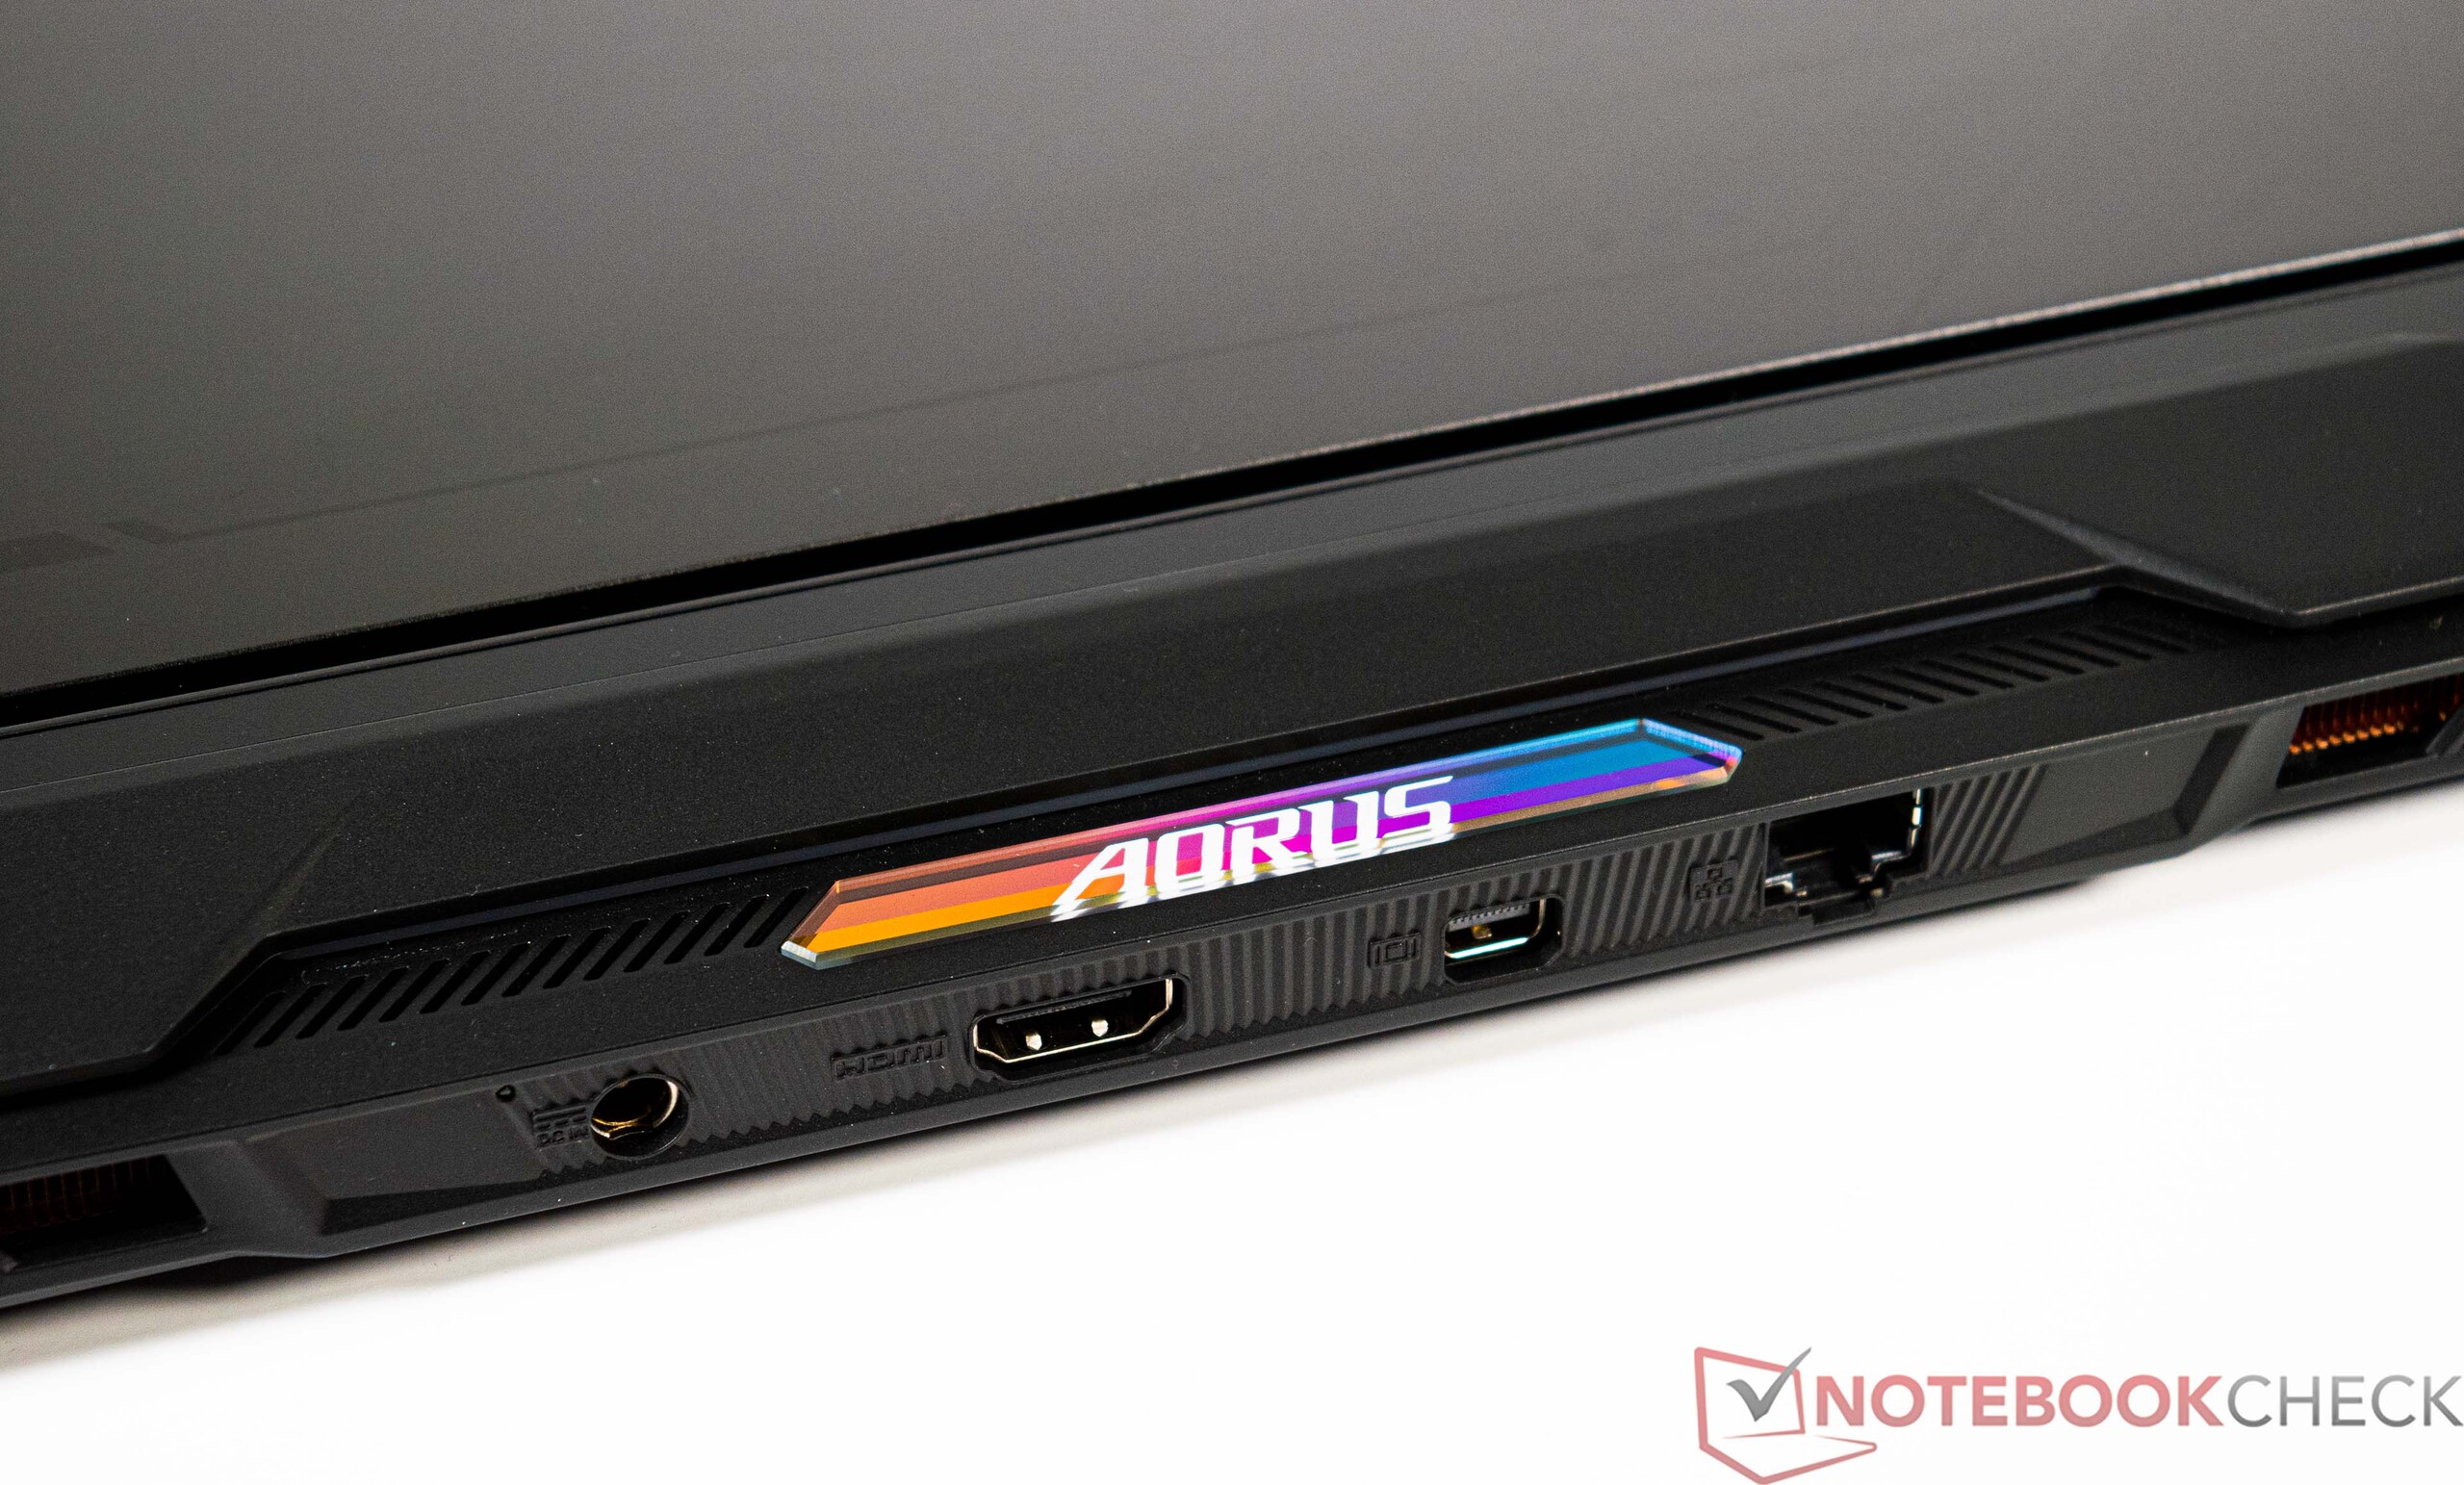
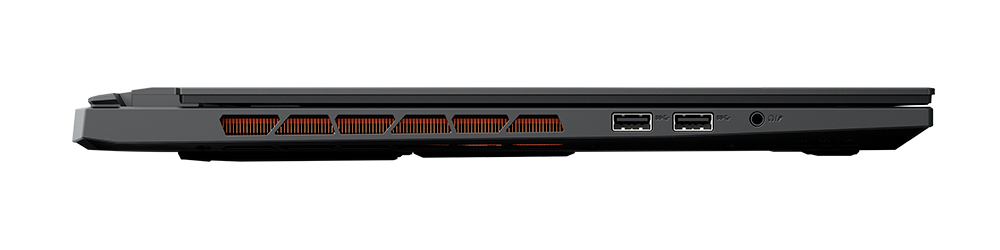
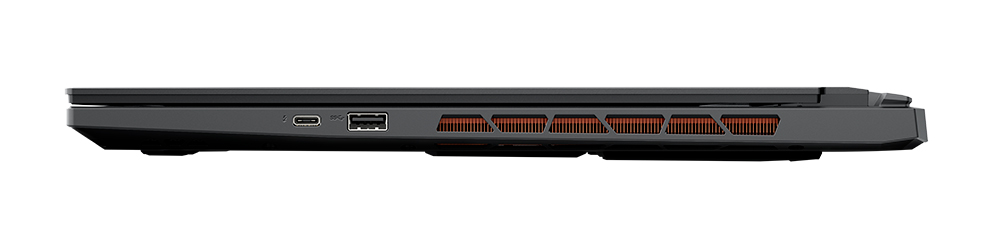
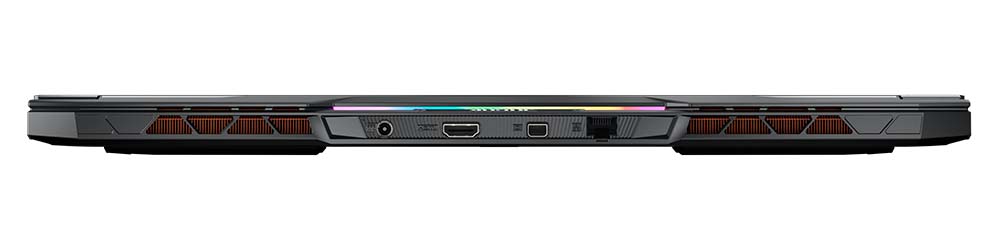
L'Aorus 17X AZF purtroppo non offre una selezione così ampia di porte, ma le interfacce disponibili dovrebbero comunque soddisfare la maggior parte degli utenti. Dopo tutto, c'è una moderna porta Thunderbolt 4 con Power Delivery (PD) e tre porte USB convenzionali. Nel frattempo, gli schermi esterni possono essere collegati tramite HDMI o DisplayPort. La posizione delle interfacce è decente, anche se il produttore non ha avuto molte opzioni a causa dell'ampia costruzione di heat pipe all'interno.
Comunicazione
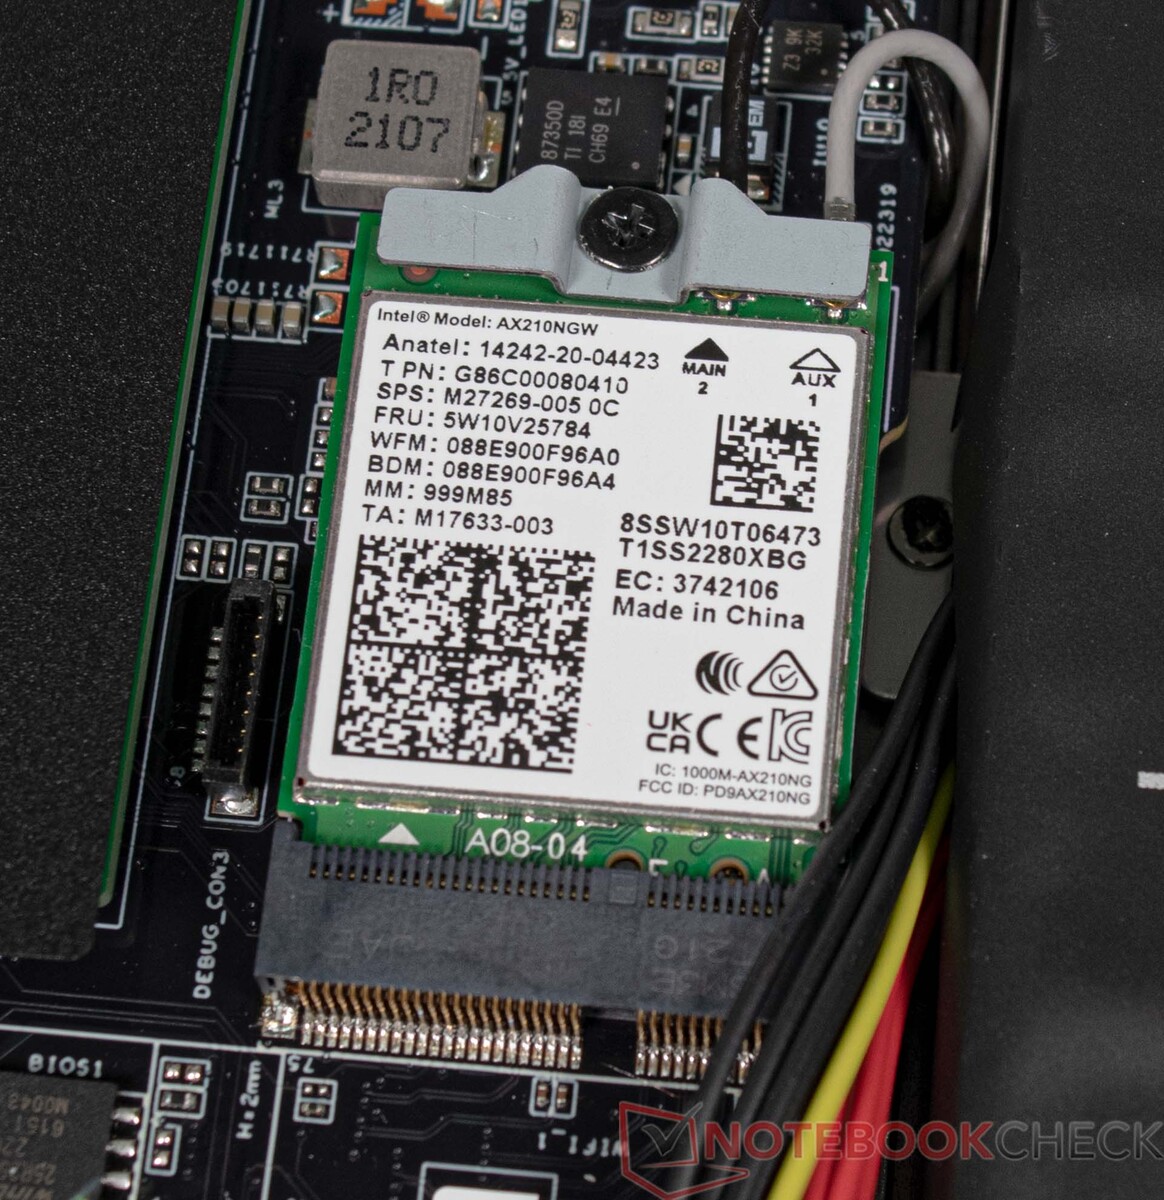
Il modulo WLAN installato offre buone prestazioni, quindi l'Aorus 17X AZF non ha nulla da invidiare alla concorrenza. Come router di prova è stato utilizzato il nostro Asus ROG Rapture GT-AXE11000. In alternativa, l'Aorus 17X AZF offre anche una porta Ethernet, che offre velocità fino a 2,5 GBit/s.
Webcam
La webcam dell'Aorus 17X AZF ha una risoluzione FHD, che la rende adatta alla semplice videotelefonia. Alcuni punti sono stati sottratti a causa della mancanza di fedeltà dei colori. Il microfono a doppio array, invece, fa un buon lavoro, in quanto le registrazioni da diverse direzioni vengono riprodotte con un volume simile.


Manutenzione
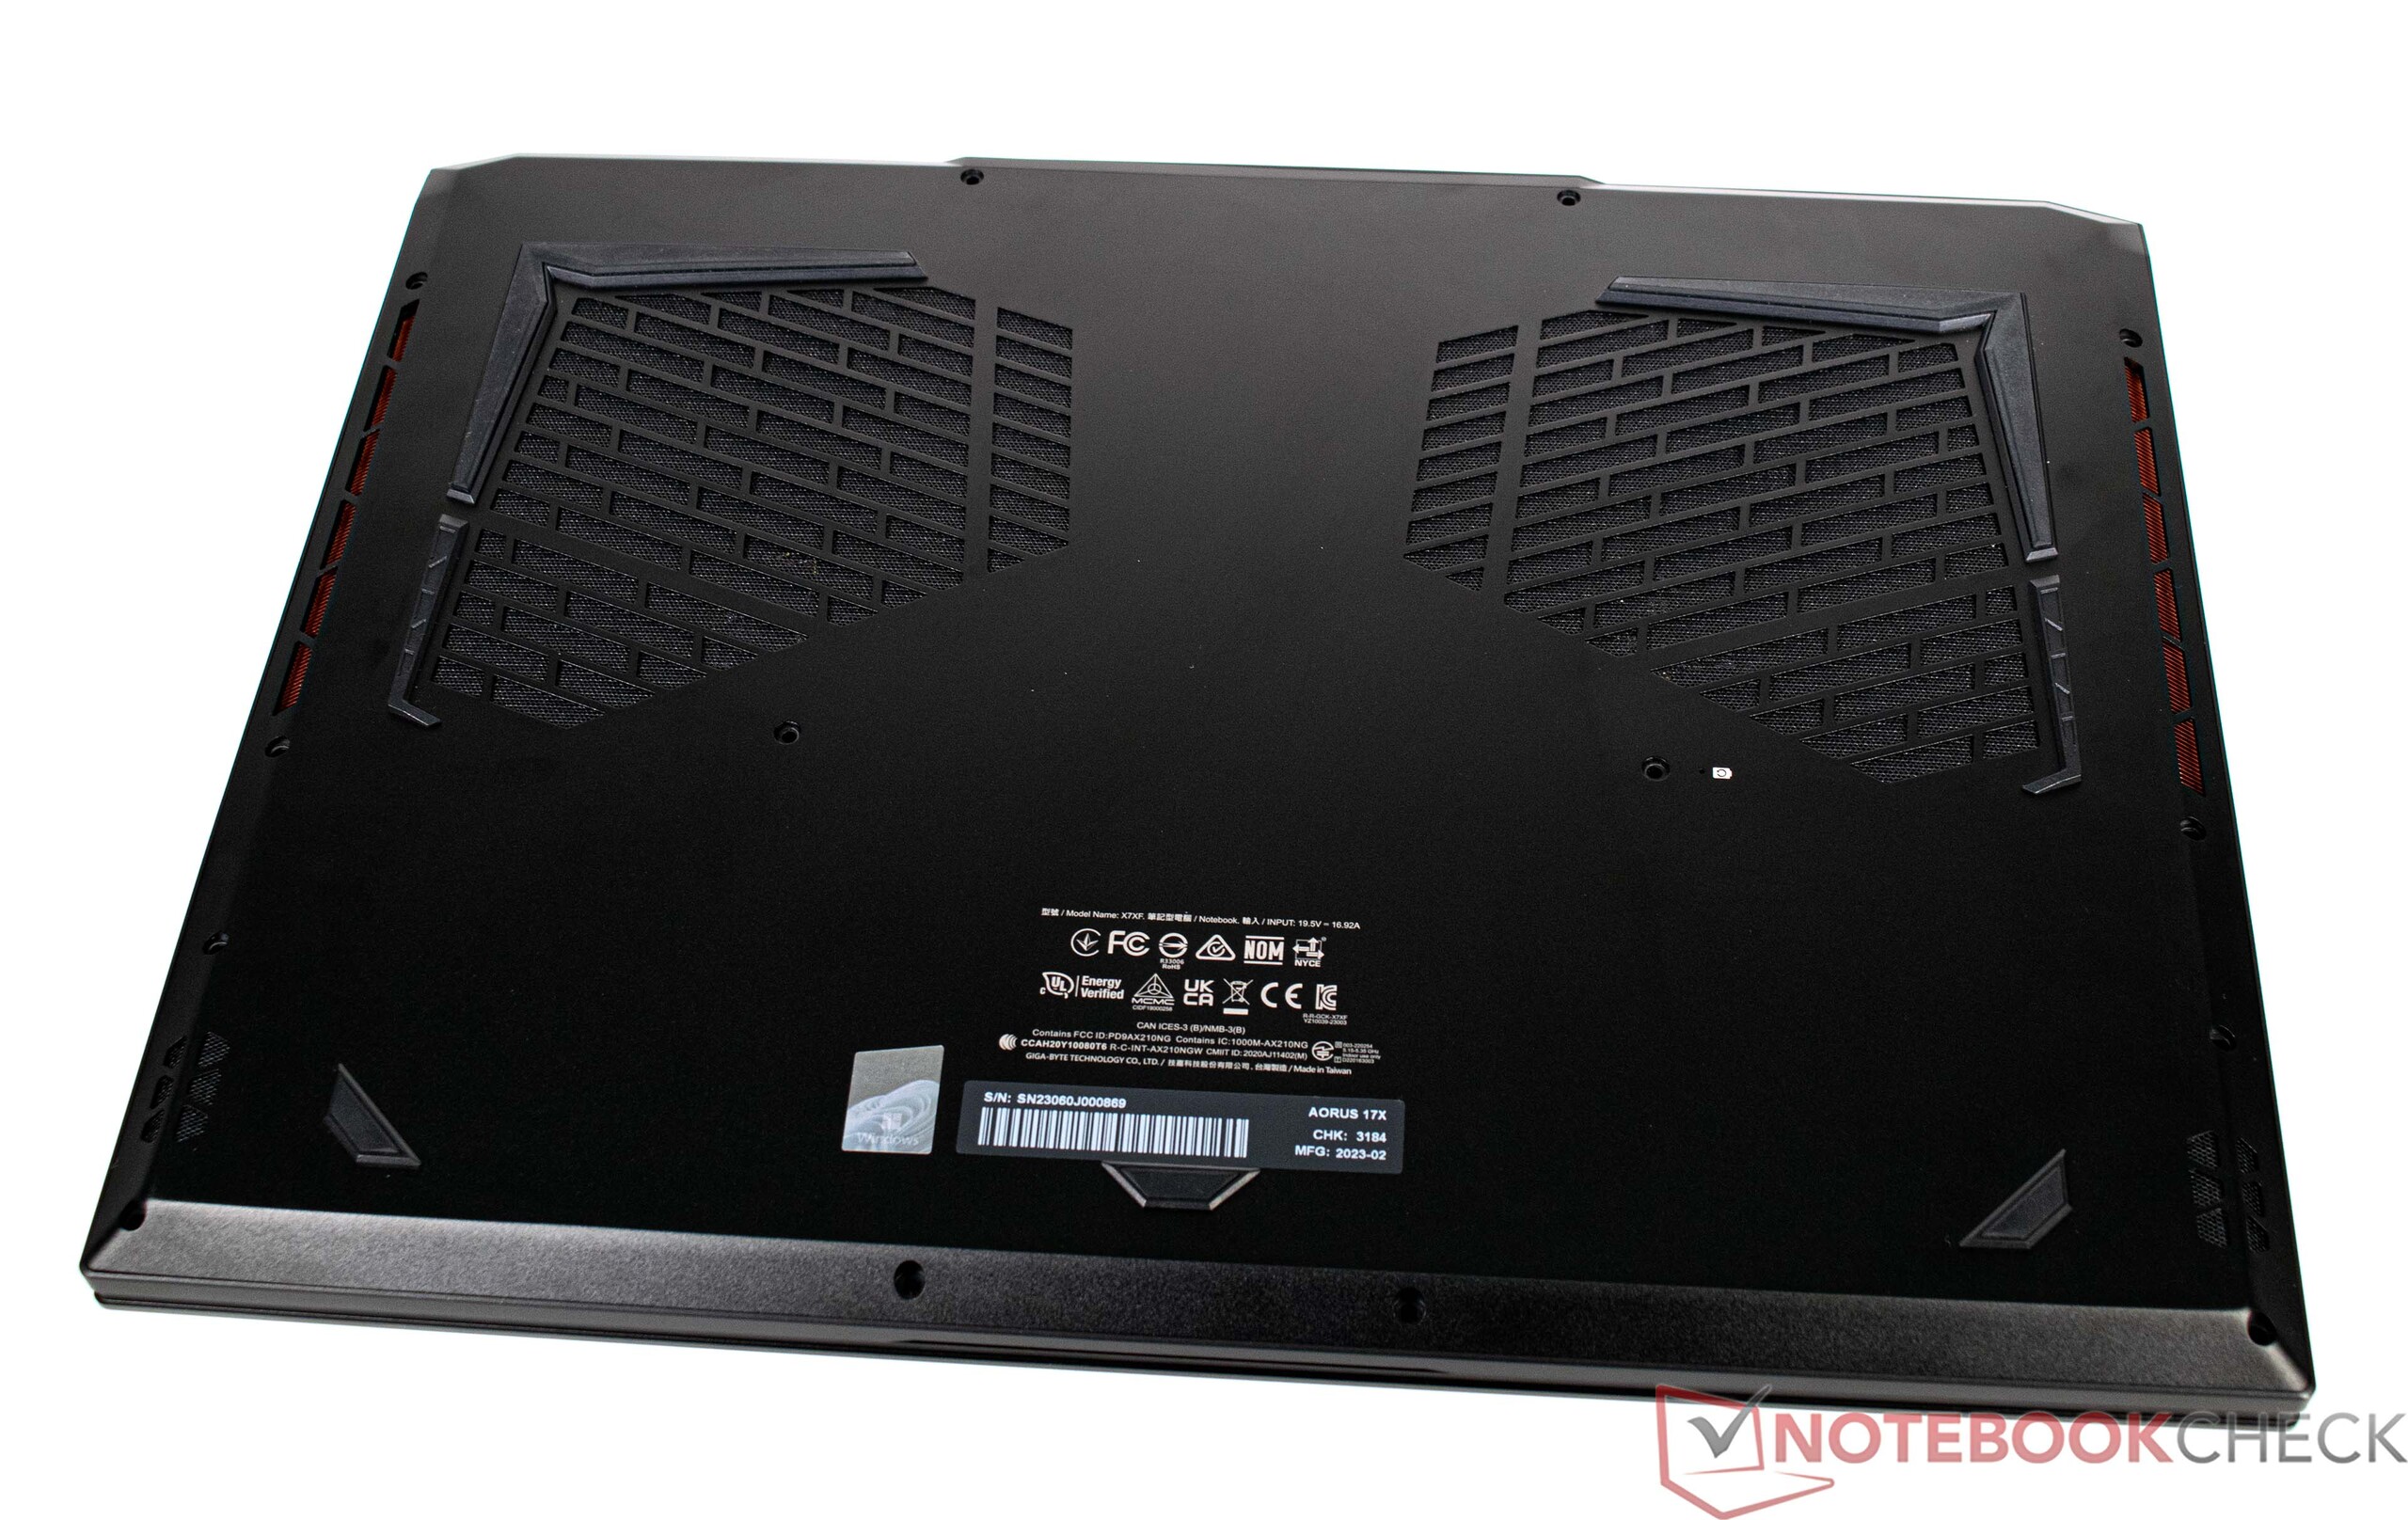
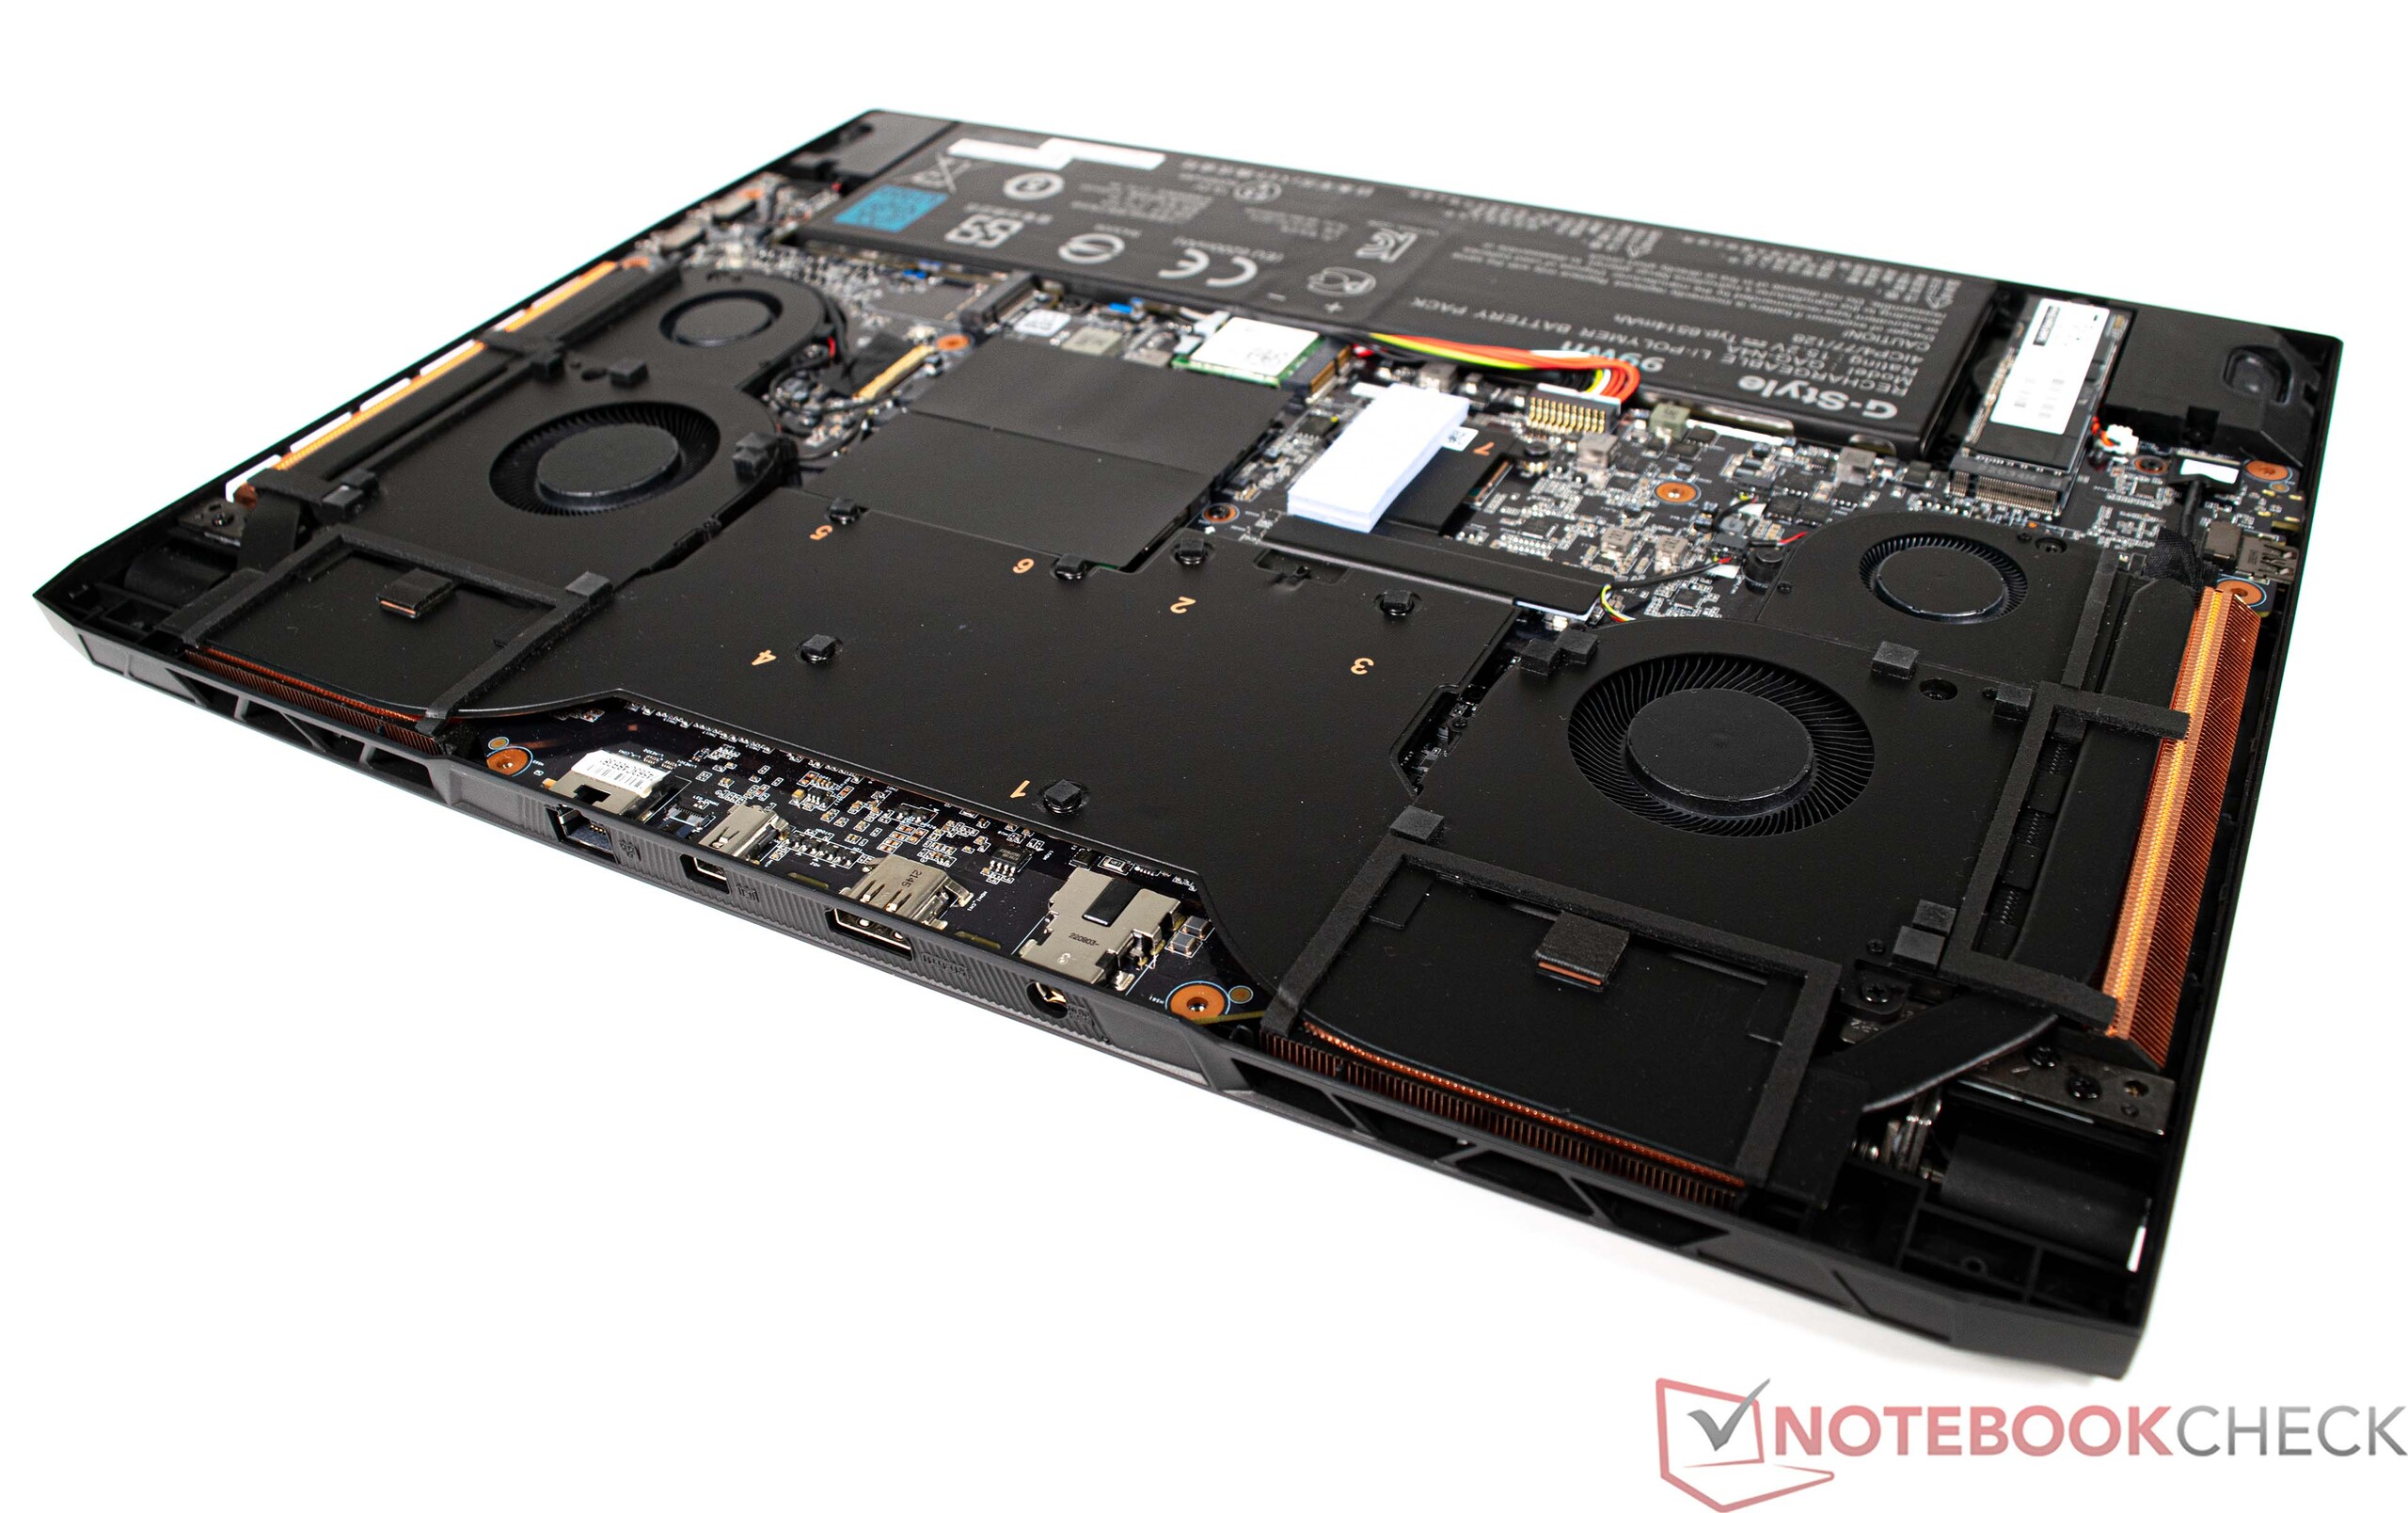
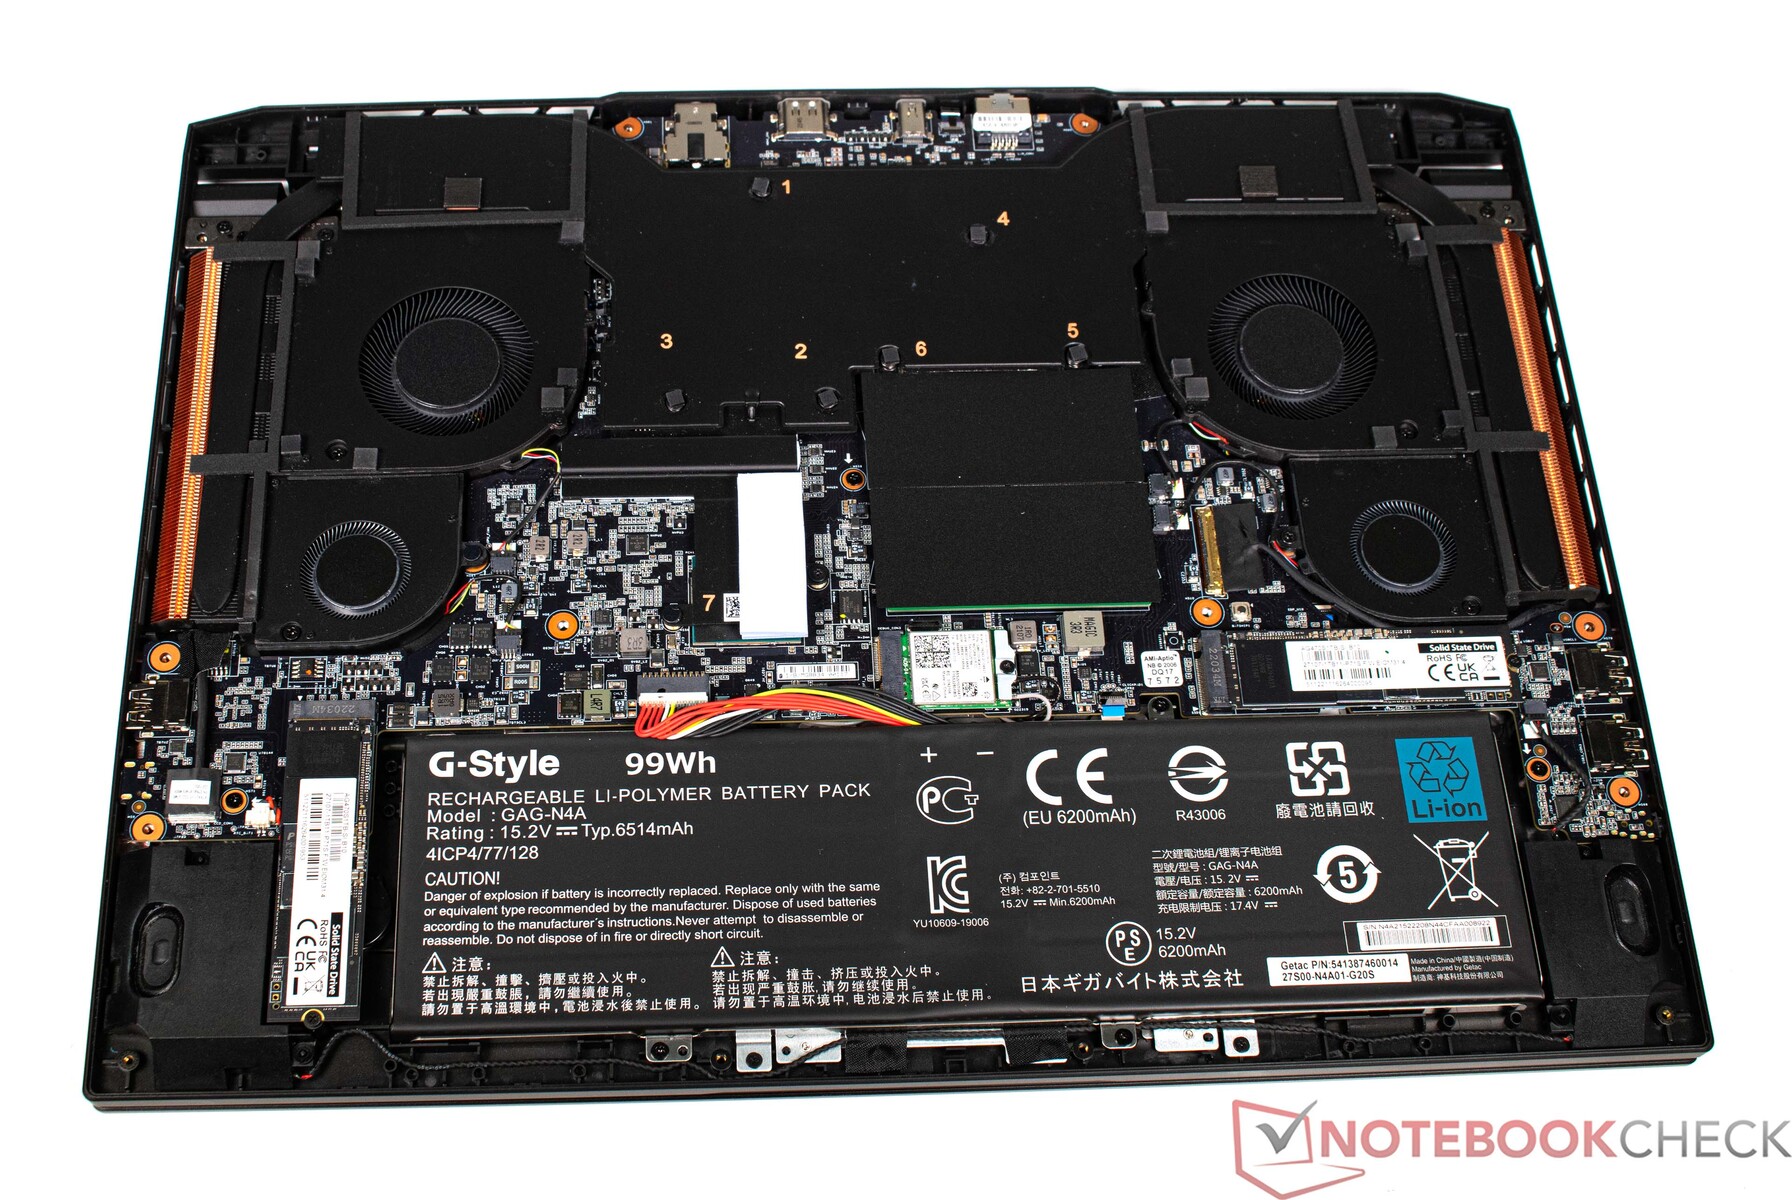
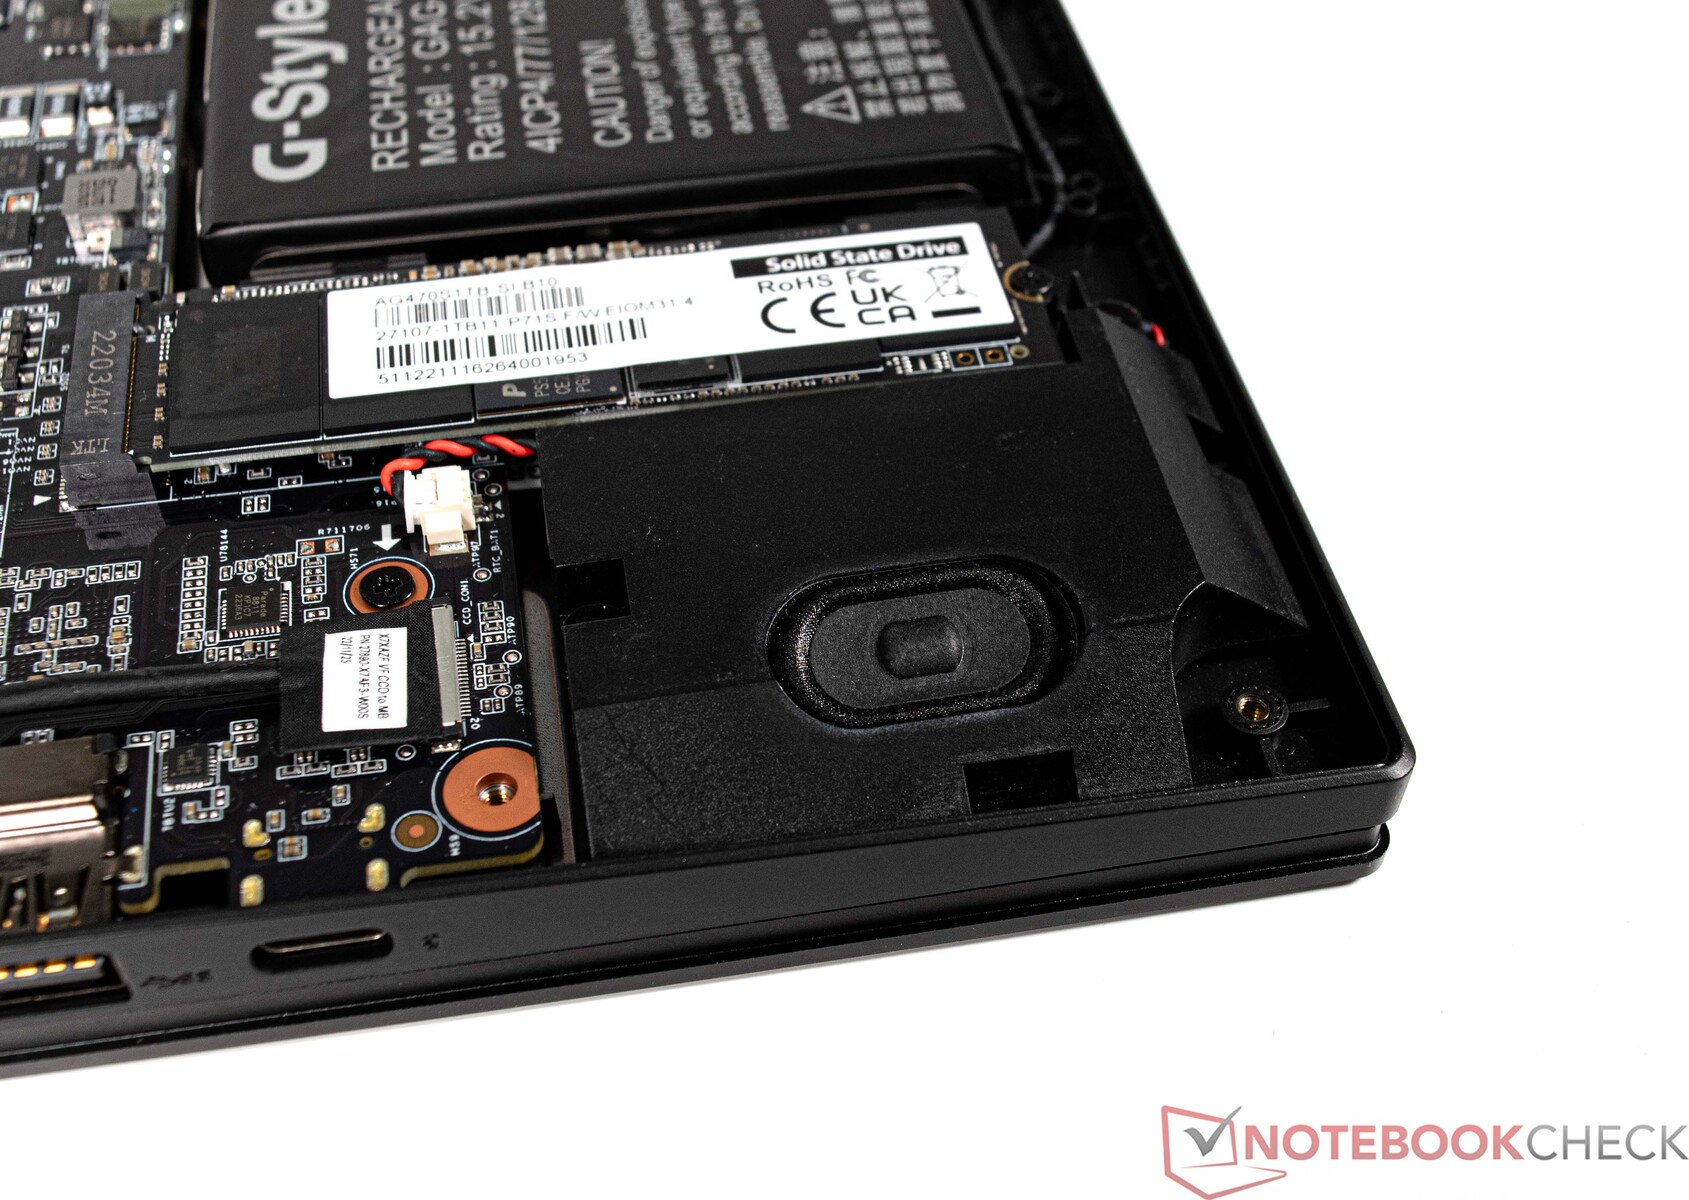
I lavori di manutenzione sono fondamentalmente possibili sull'Aorus 17X AZF. Tuttavia, per farlo è necessario rimuovere la piastra di base, fissata con numerose viti. Tutto ciò che è importante si trova sotto la piastra di base, come le quattro ventole, la memoria di massa e la RAM. Nel nostro caso, il portatile è completamente equipaggiato e non ci sono slot liberi per RAM o SSD.
Garanzia
In Germania, l'Aorus 17X AZF viene fornito con una garanzia di 24 mesi con servizio di ritiro e restituzione incluso. Naturalmente, questa garanzia può variare da paese a paese, per cui gli acquirenti dovrebbero controllare due volte prima dell'acquisto.
Software
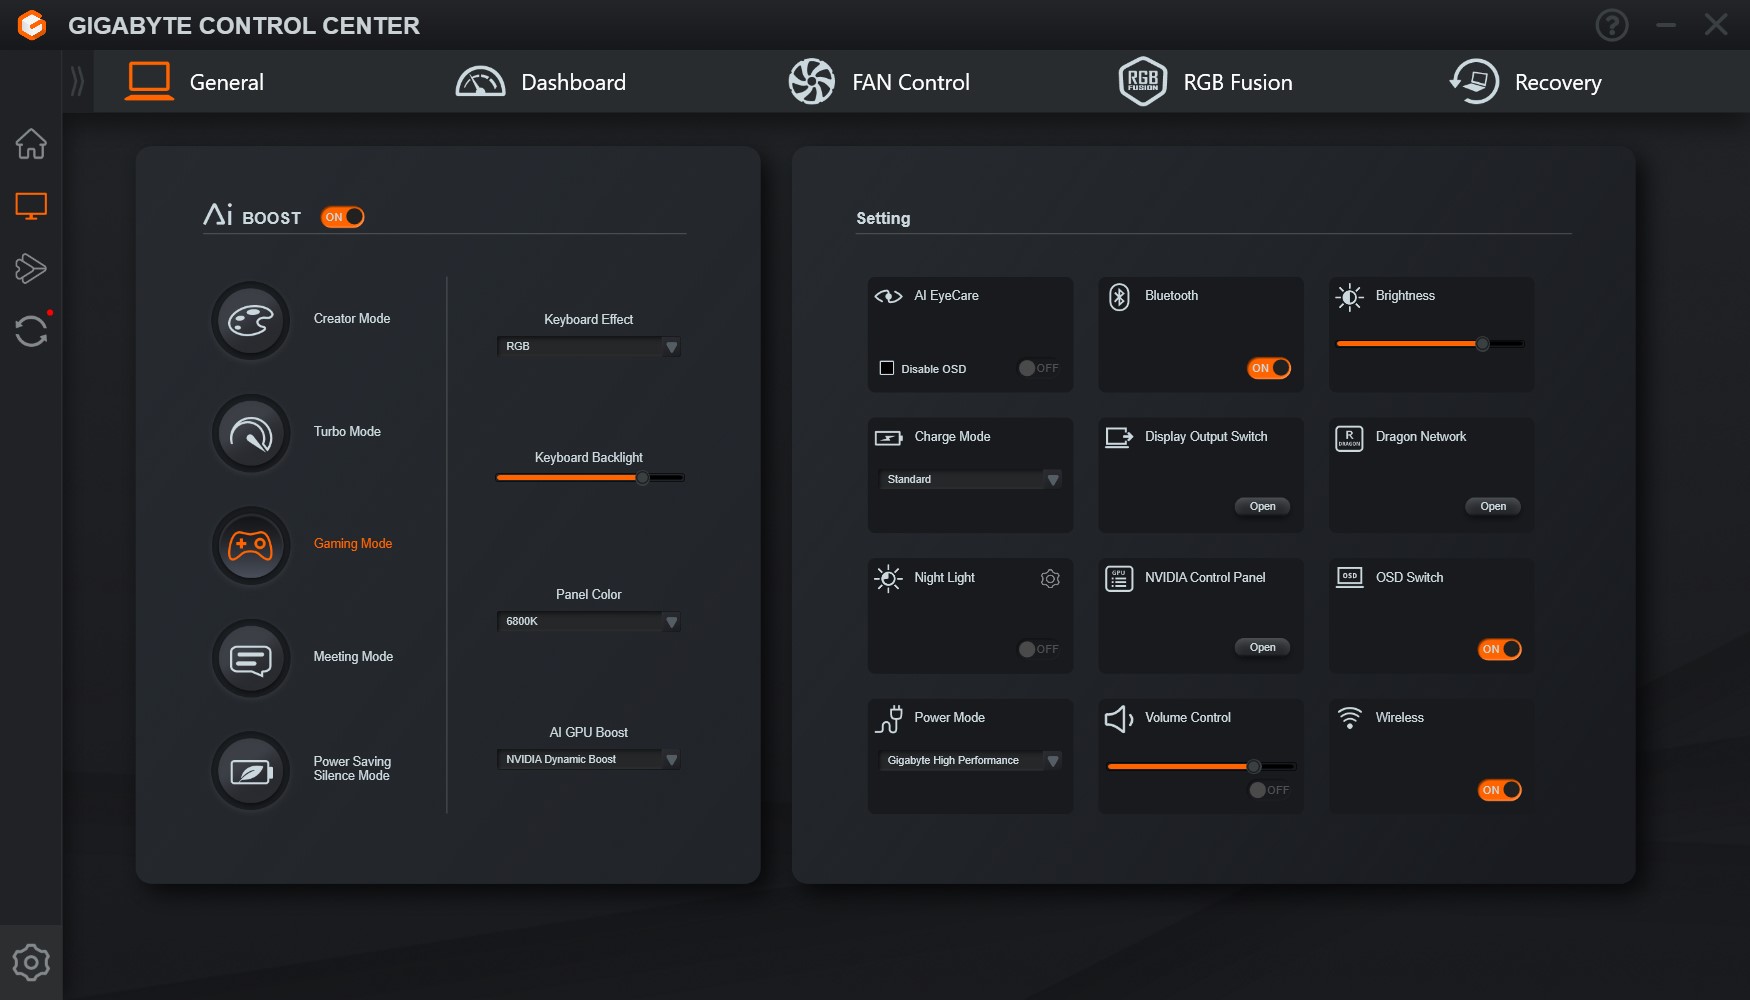
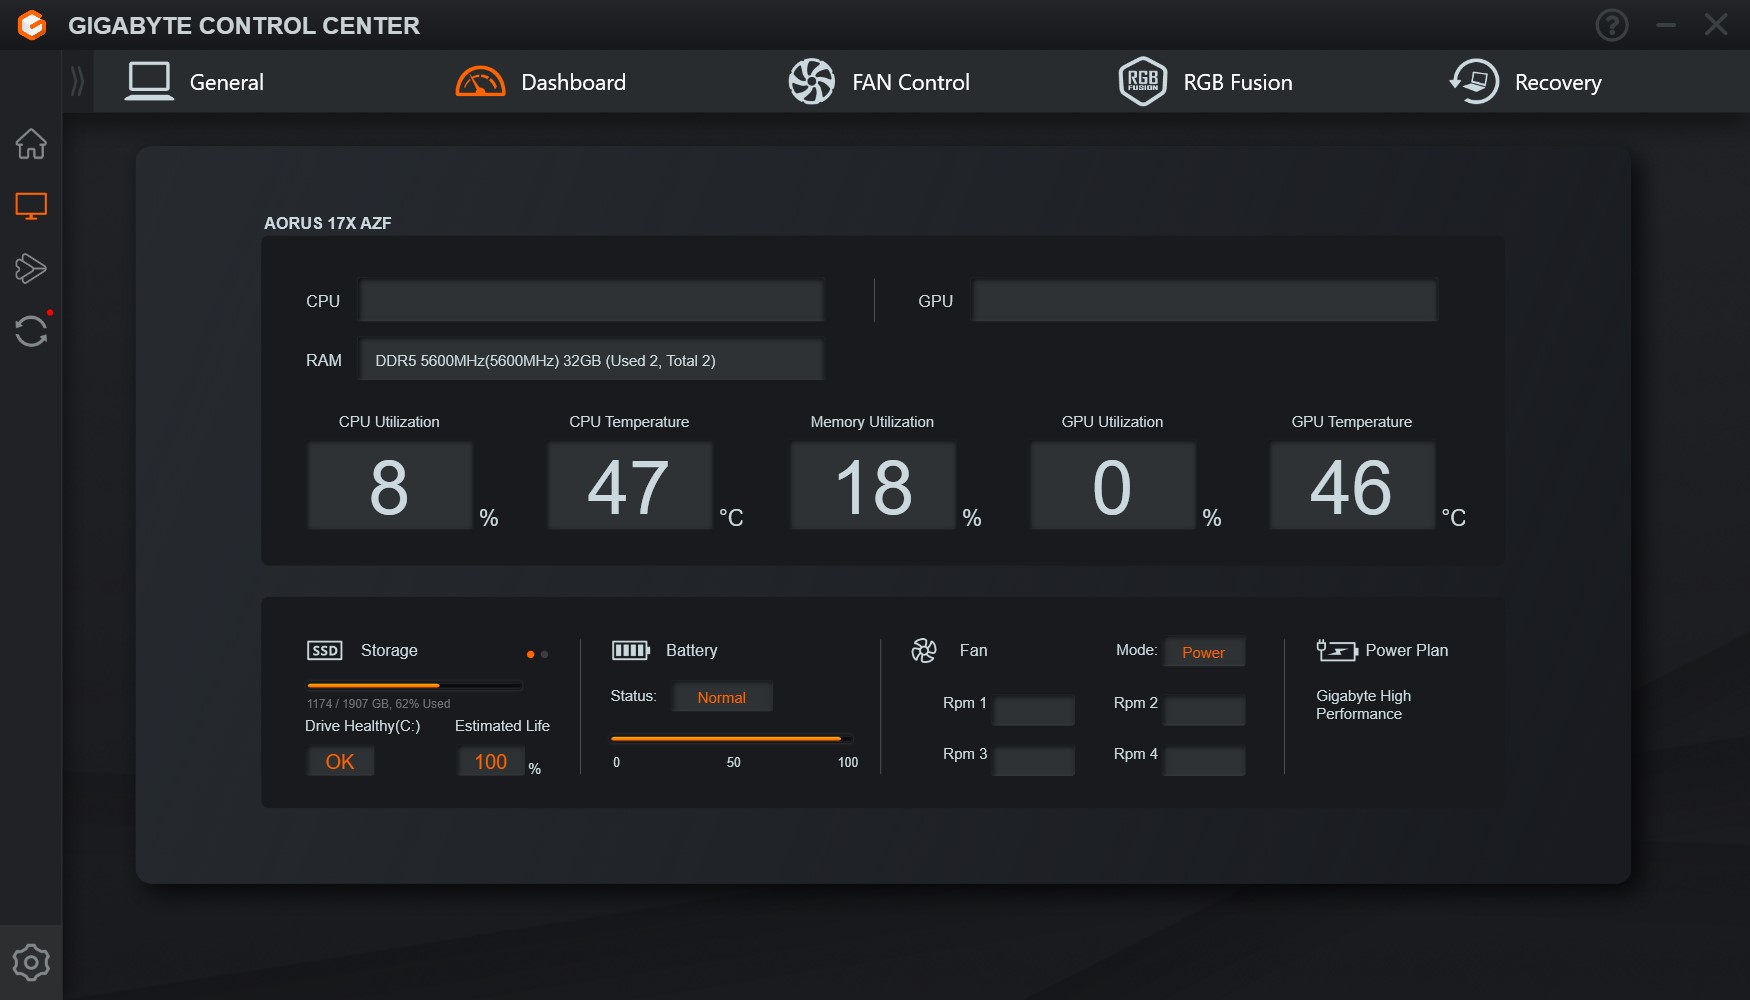
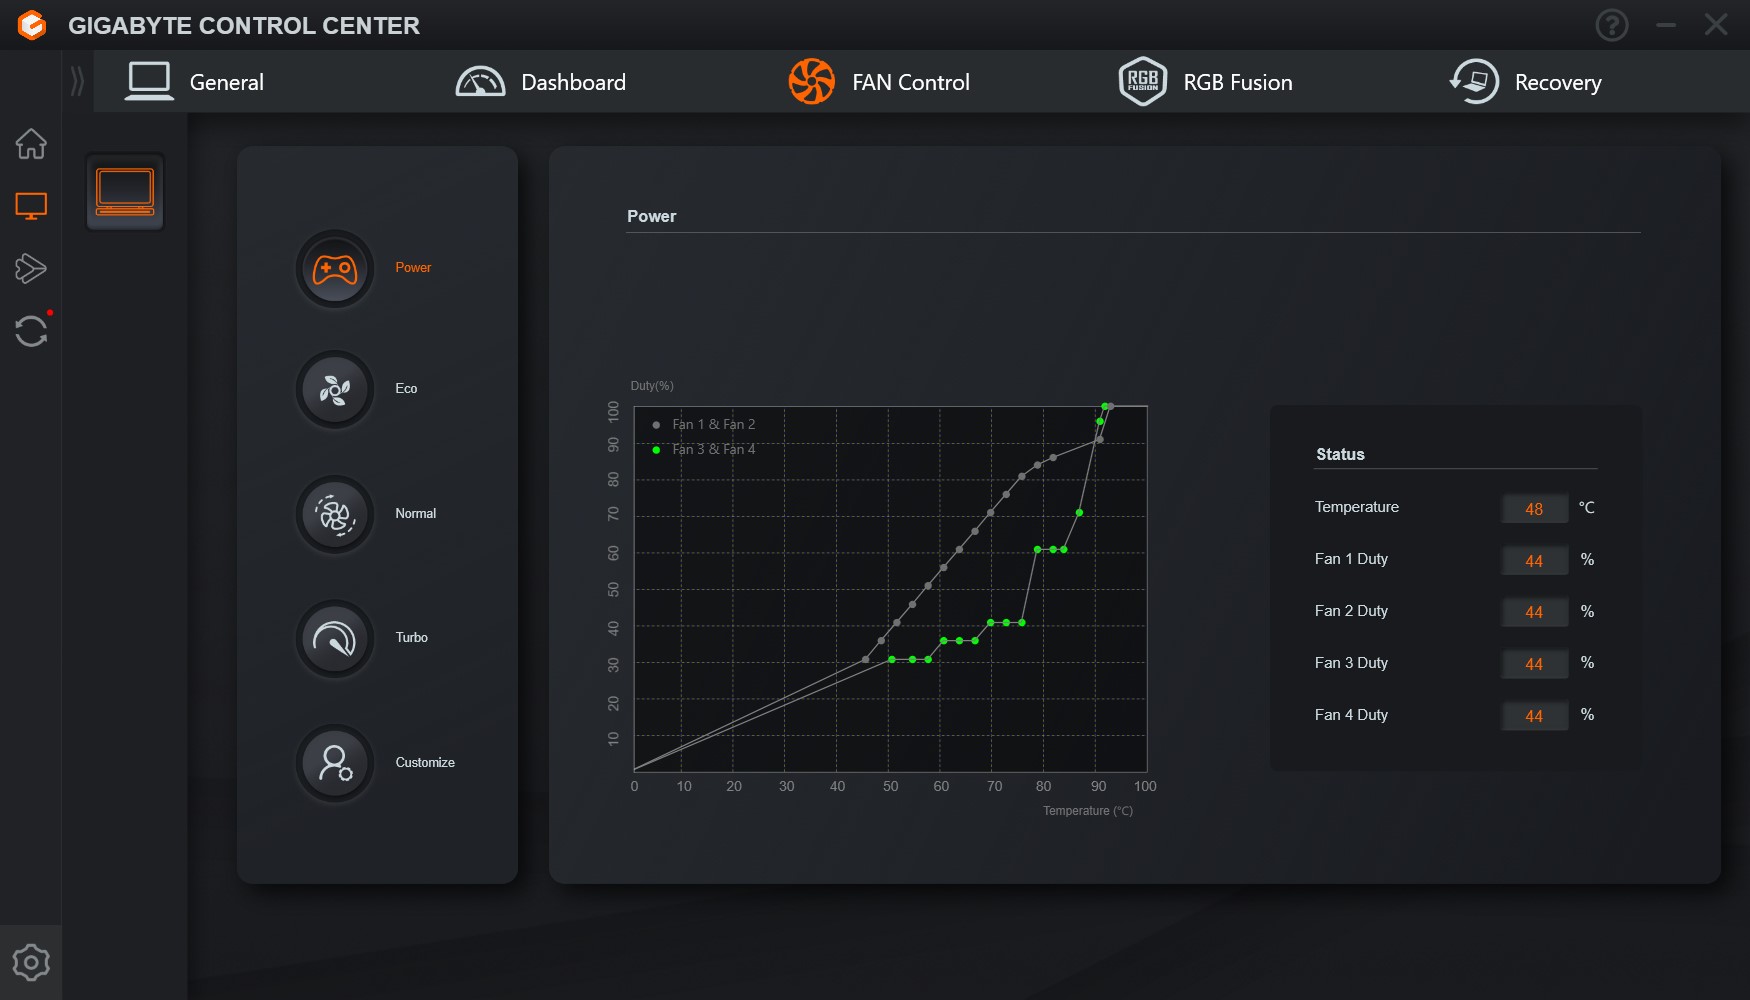
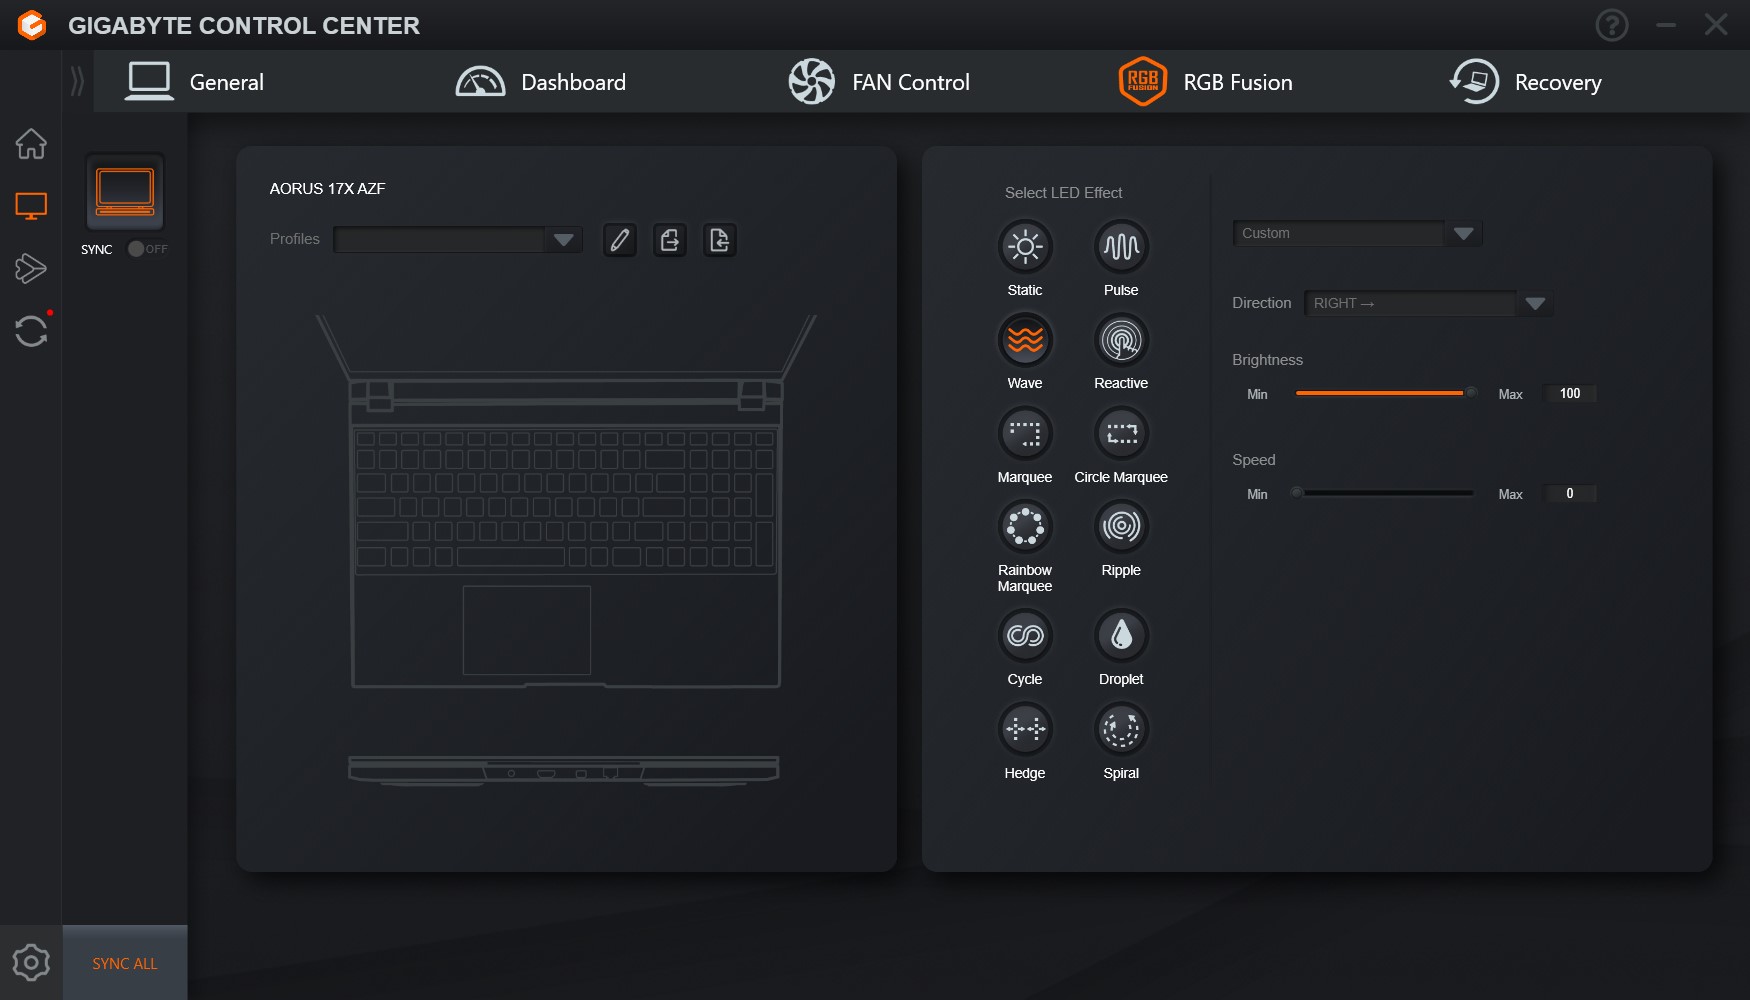
Il Gigabyte Control Center (GCC) è utilizzato per controllare e monitorare i componenti dell'Aorus 17X AZF. Nei nostri test non abbiamo riscontrato problemi con il GCC, che può essere utilizzato per regolare le prestazioni del portatile e quindi influenzare il rumore di fondo. La curva della ventola può essere leggermente regolata tramite la scheda FAN Control. Inoltre, è possibile selezionare un gran numero di effetti di retroilluminazione per la tastiera.
Dispositivi di ingresso
Tastiera
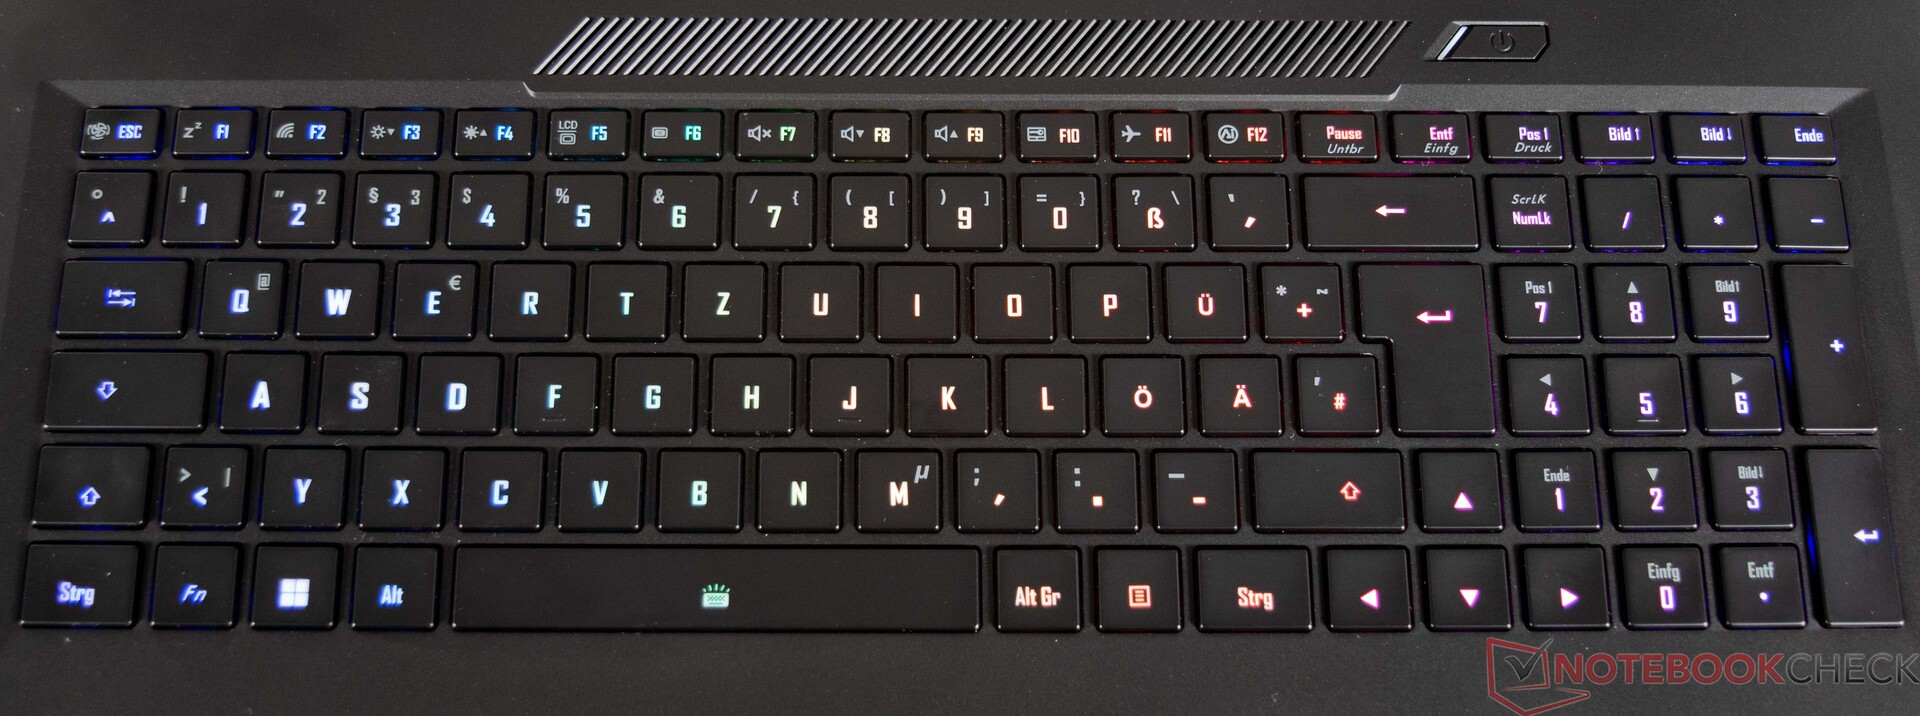
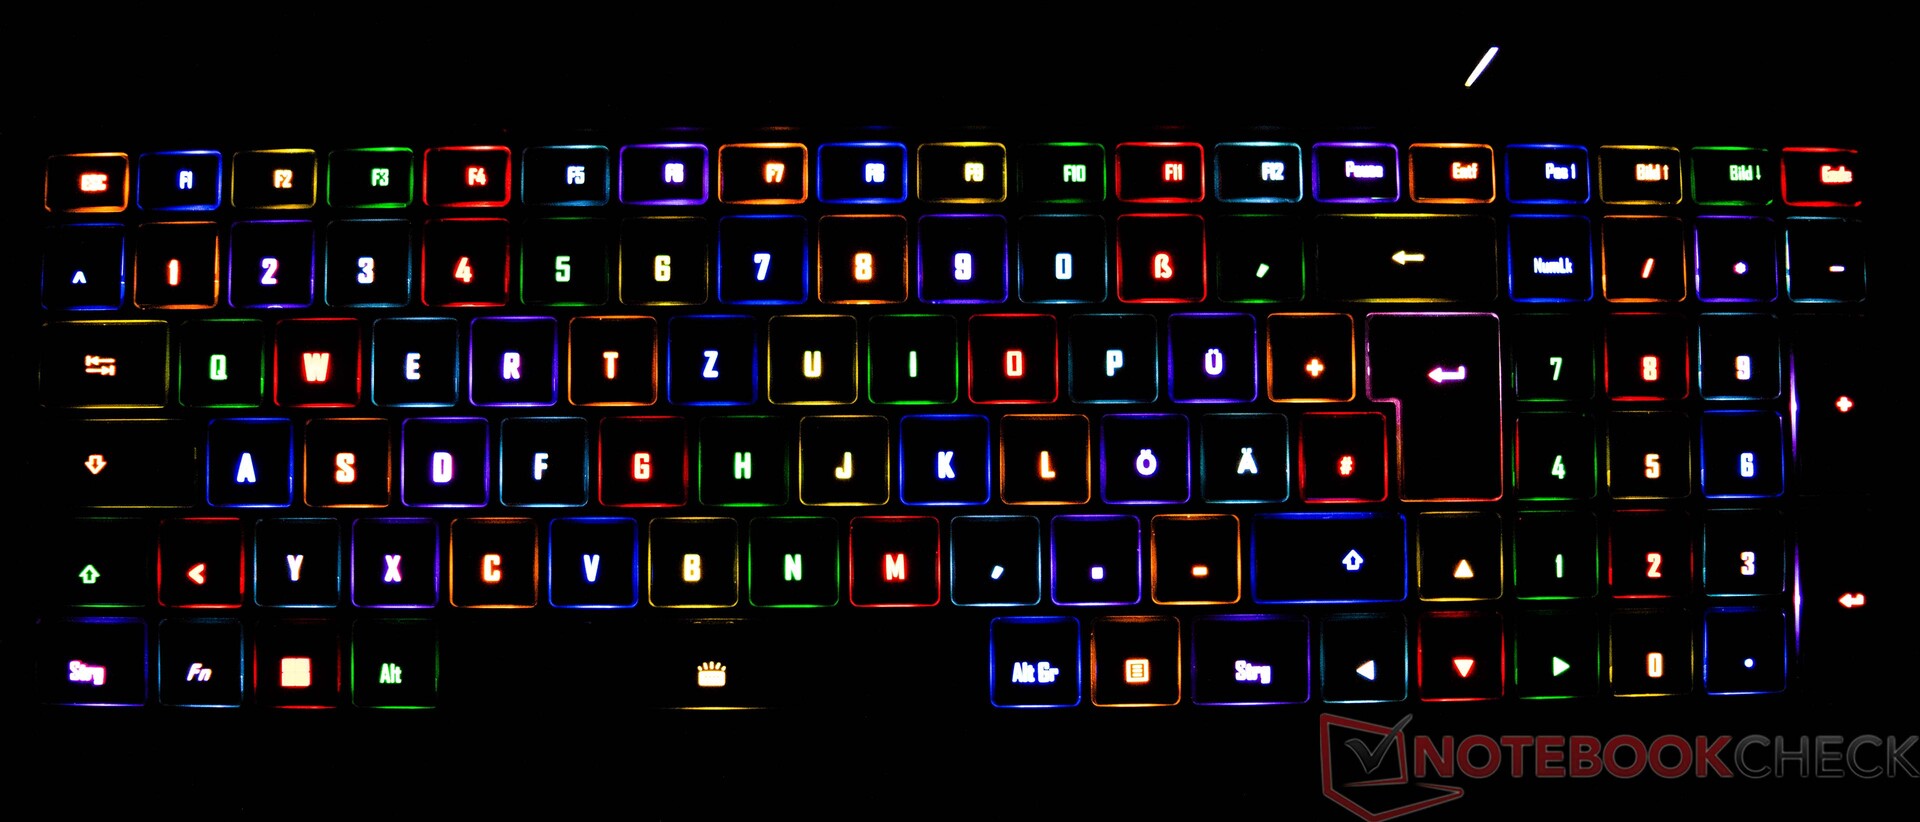
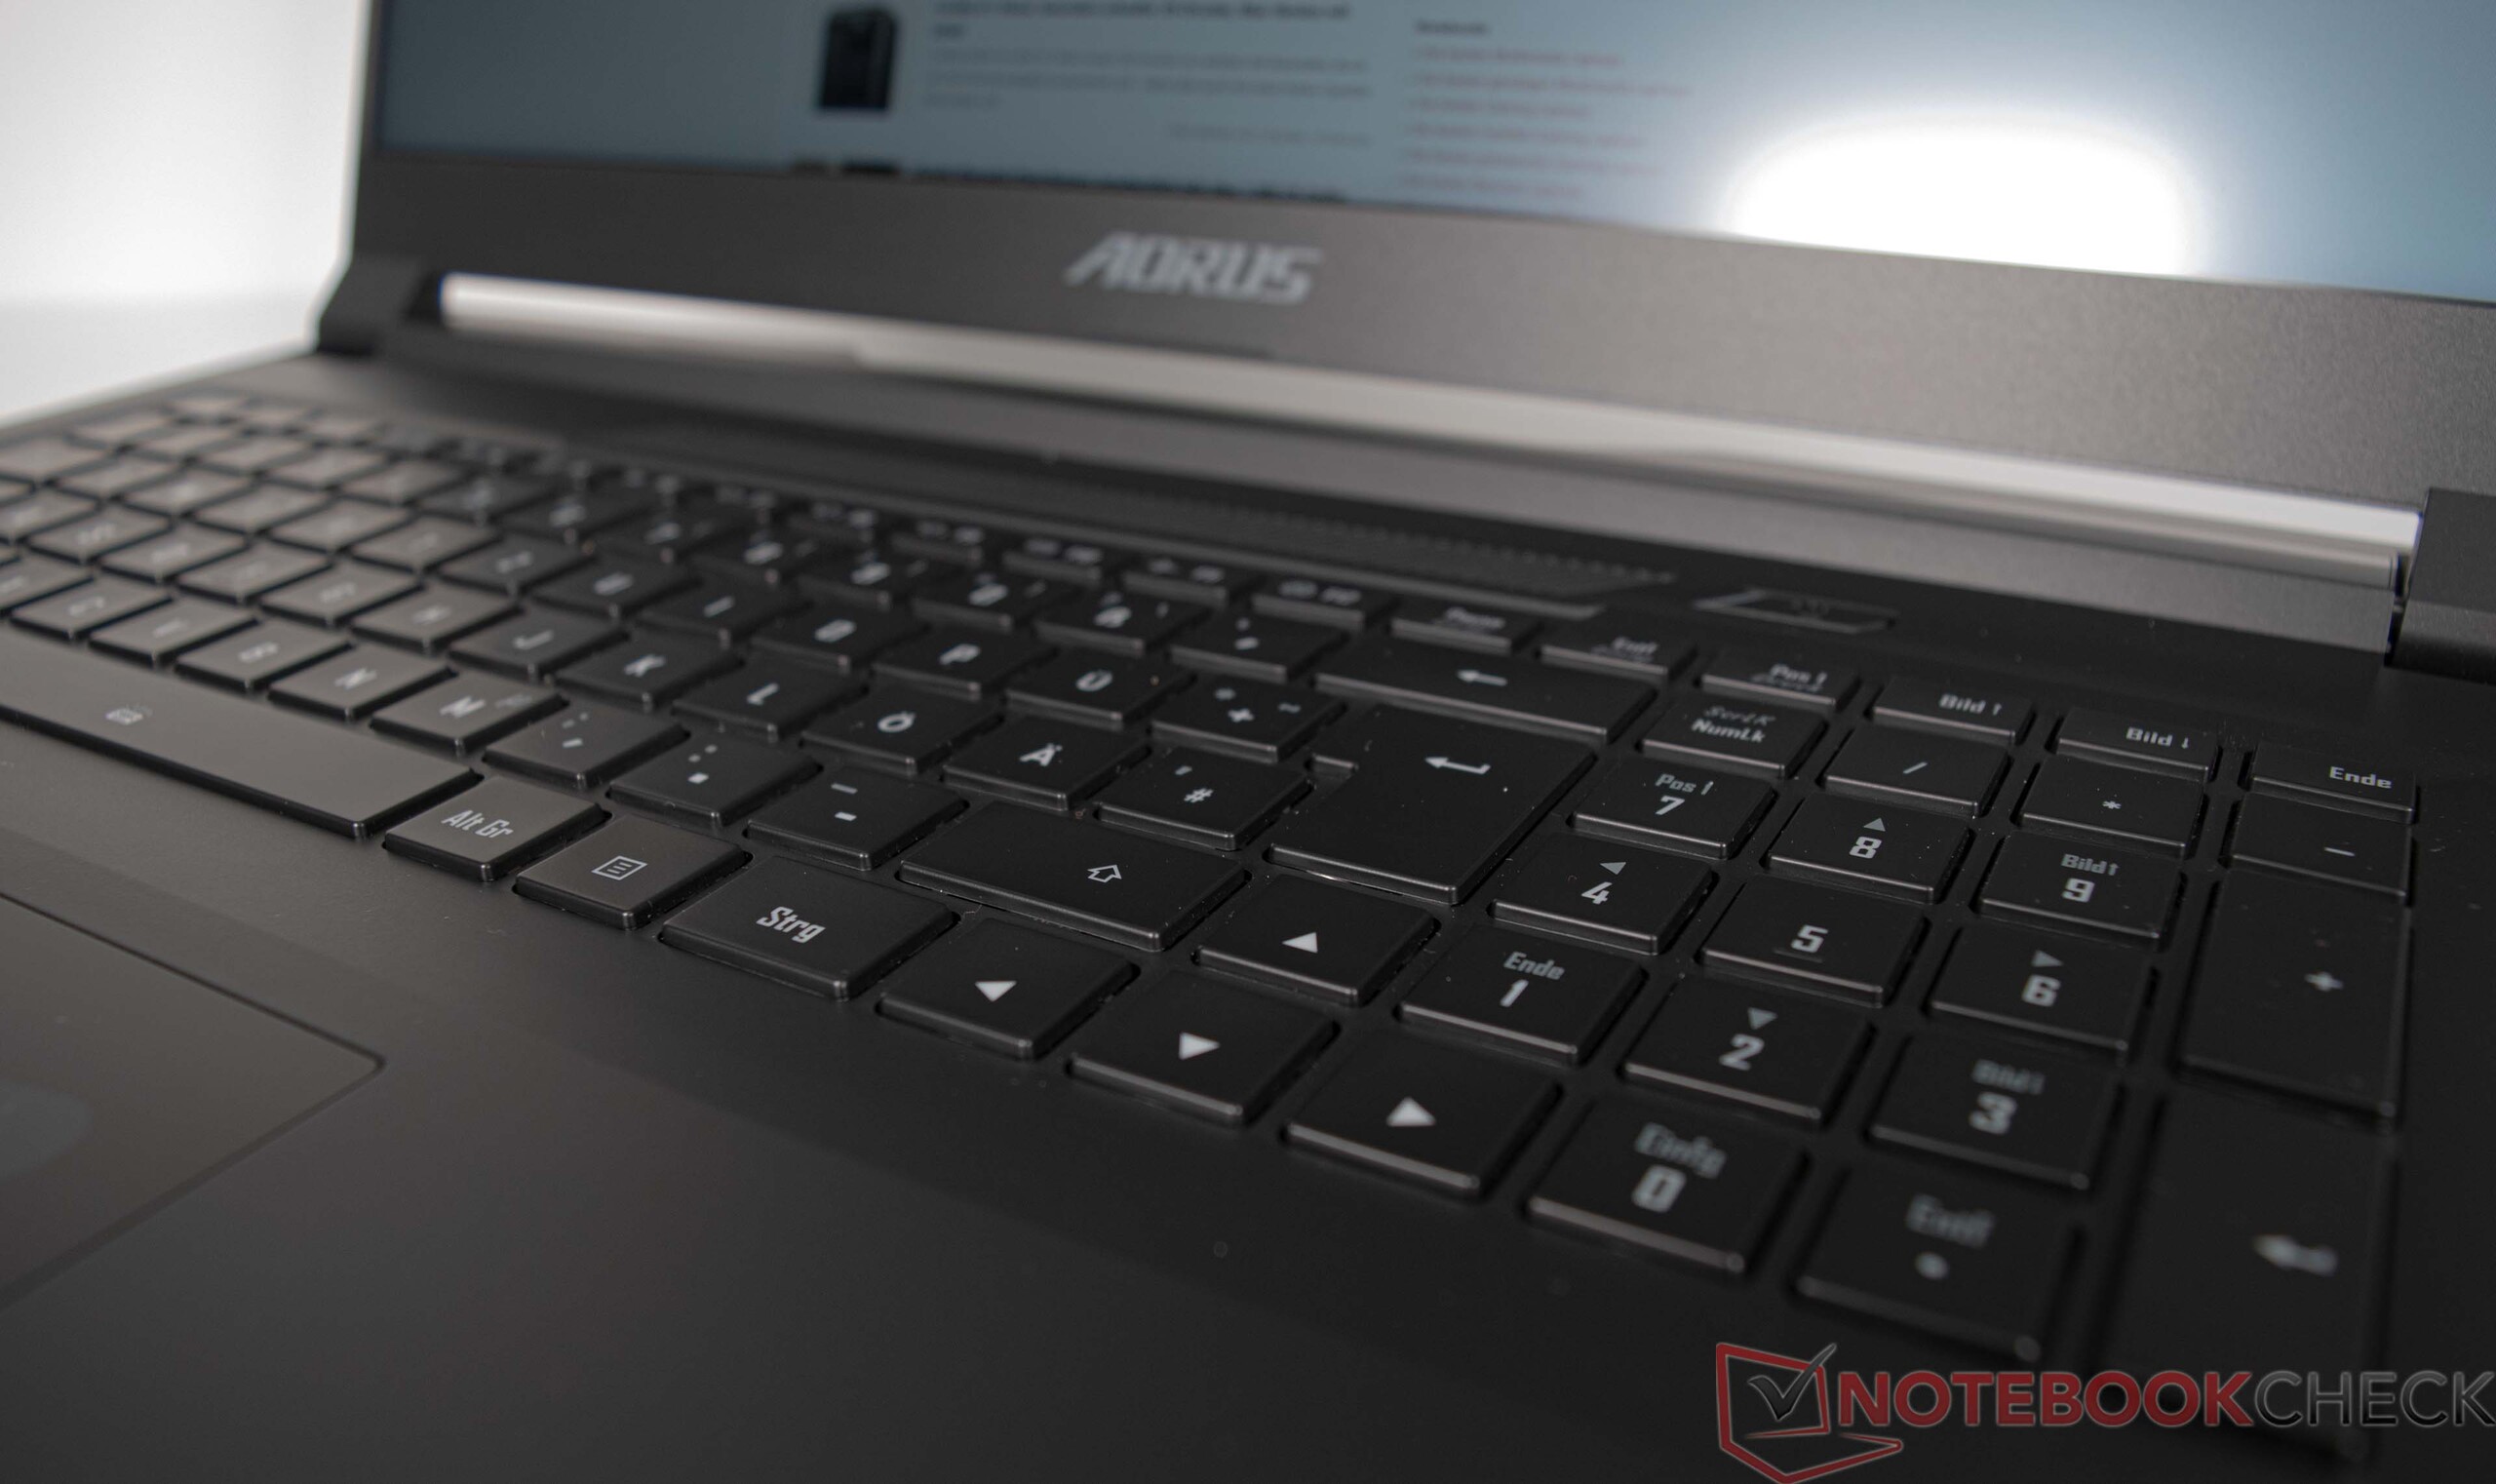
L'Aorus 17X AZF è dotato di una tastiera chiclet retroilluminata a 6 file, con tastierino numerico. I tasti lisci hanno una corsa media e un punto di pressione chiaro. La tastiera cede leggermente durante la digitazione, ma non è eccessivamente pronunciata. La retroilluminazione può essere regolata su tre livelli di luminosità tramite una combinazione di tasti e sono disponibili molte altre opzioni per gli effetti di illuminazione tramite il GCC (Gigabyte Control Center).
Touchpad
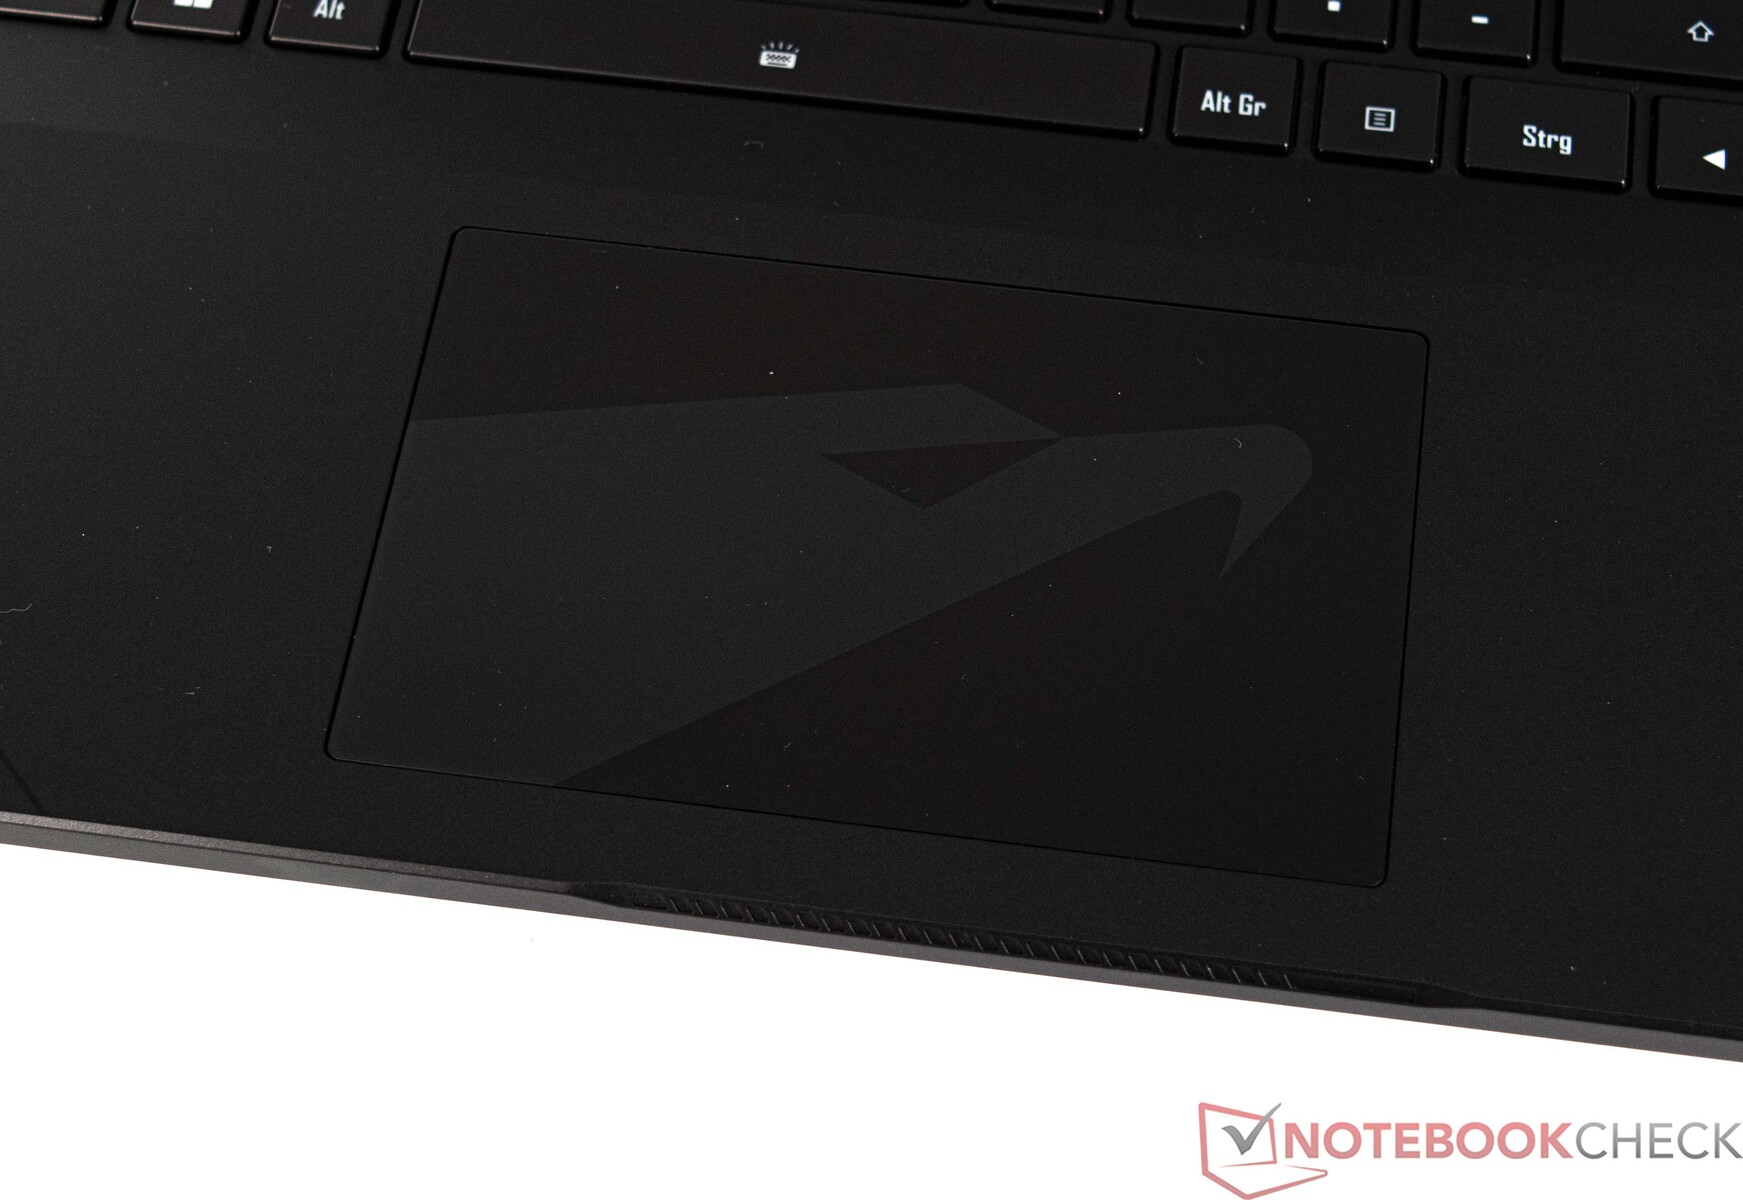
Il sostituto del mouse sotto forma di ClickPad multi-touch (circa 12,1 x 7,6 cm) offre una dimensione piacevole. Aorus ha anche sovrapposto il proprio logo al touchpad, che è visivamente piacevole da vedere. Il ClickPad offre una superficie liscia, che consente un agevole scorrimento delle dita. La superficie di input può essere utilizzata nella sua interezza e reagisce bene anche negli angoli. Il pad offre una corsa breve per gli input e fornisce un feedback chiaro grazie al suo chiaro punto di pressione.
Display
L'Aorus 17X AZF è dotato di un buon pannello QHD, che dovrebbe soddisfare le esigenze della maggior parte dei giocatori con una frequenza di aggiornamento di 240 Hz. Tuttavia, la luminosità media della nostra unità di test è chiaramente più debole rispetto alla concorrenza. Una media di soli 276 cd/m² è troppo bassa ed è sufficiente per l'ultimo posto. L'Aorus 17X AZF perde anche punti importanti nel punteggio del display con leggeri aloni. Non è stato rilevato alcun PWM
Opzioni di visualizzazione alternative, come un pannello 4K, non sono previste per l'Aorus 17X AZF.
| |||||||||||||||||||||||||
Distribuzione della luminosità: 90 %
Al centro con la batteria: 294 cd/m²
Contrasto: 1050:1 (Nero: 0.28 cd/m²)
ΔE ColorChecker Calman: 2.81 | ∀{0.5-29.43 Ø4.71}
calibrated: 0.86
ΔE Greyscale Calman: 3.4 | ∀{0.09-98 Ø4.96}
84.5% AdobeRGB 1998 (Argyll 3D)
99.9% sRGB (Argyll 3D)
96.7% Display P3 (Argyll 3D)
Gamma: 2.301
CCT: 7389 K
| Aorus 17X AZF BOE09F9, IPS, 2560x1440, 17.3" | Medion Erazer Beast X40 BOE NE170QDM-NZ1, IPS, 2560x1600, 17" | MSI GE78HX 13VH-070US AU Optronics B170QAN01.2, IPS, 2560x1600, 17" | HP Omen 17-ck2097ng BOE BOE09BF, IPS, 2560x1440, 17.3" | MSI Titan GT77 HX 13VI B173ZAN06.C, Mini-LED, 3840x2160, 17.3" | Alienware m18 R1 Chi Mei 180JME, IPS, 1920x1200, 18" | |
|---|---|---|---|---|---|---|
| Display | -16% | 1% | -17% | 2% | 2% | |
| Display P3 Coverage (%) | 96.7 | 68.6 -29% | 97.6 1% | 67.4 -30% | 94.9 -2% | 97.7 1% |
| sRGB Coverage (%) | 99.9 | 99.8 0% | 99.9 0% | 97.6 -2% | 99.9 0% | 100 0% |
| AdobeRGB 1998 Coverage (%) | 84.5 | 69.4 -18% | 86.5 2% | 69.6 -18% | 92.4 9% | 89.8 6% |
| Response Times | 23% | 54% | 1% | -169% | 41% | |
| Response Time Grey 50% / Grey 80% * (ms) | 14 ? | 11.3 ? 19% | 4.2 ? 70% | 15.6 ? -11% | 38.4 ? -174% | 3 ? 79% |
| Response Time Black / White * (ms) | 10.1 ? | 7.5 ? 26% | 6.4 ? 37% | 8.9 ? 12% | 26.6 ? -163% | 9.9 ? 2% |
| PWM Frequency (Hz) | 2380 ? | |||||
| Screen | 11% | -24% | 14% | 64117% | 26% | |
| Brightness middle (cd/m²) | 294 | 384 31% | 398.6 36% | 371 26% | 606 106% | 372.8 27% |
| Brightness (cd/m²) | 276 | 377 37% | 384 39% | 350 27% | 602 118% | 367 33% |
| Brightness Distribution (%) | 90 | 90 0% | 89 -1% | 90 0% | 93 3% | 97 8% |
| Black Level * (cd/m²) | 0.28 | 0.45 -61% | 0.46 -64% | 0.32 -14% | 0.0001 100% | 0.32 -14% |
| Contrast (:1) | 1050 | 853 -19% | 867 -17% | 1159 10% | 6060000 577043% | 1165 11% |
| Colorchecker dE 2000 * | 2.81 | 2.05 27% | 4.05 -44% | 1.74 38% | 4.8 -71% | 1.92 32% |
| Colorchecker dE 2000 max. * | 5.7 | 3.64 36% | 8.68 -52% | 3.59 37% | 8.2 -44% | 3.65 36% |
| Colorchecker dE 2000 calibrated * | 0.86 | 0.74 14% | 1.02 -19% | 1.01 -17% | 1.8 -109% | 0.51 41% |
| Greyscale dE 2000 * | 3.4 | 2.3 32% | 6.5 -91% | 2.8 18% | 6.5 -91% | 1.5 56% |
| Gamma | 2.301 96% | 2.017 109% | 2.11 104% | 2.19 100% | 2.63 84% | 2.34 94% |
| CCT | 7389 88% | 6546 99% | 7518 86% | 6474 100% | 6596 99% | 6607 98% |
| Media totale (Programma / Settaggio) | 6% /
7% | 10% /
-7% | -1% /
5% | 21317% /
41195% | 23% /
23% |
* ... Meglio usare valori piccoli
Soggettivamente, la qualità di visualizzazione dello schermo è impeccabile e non vi è alcuna grana visibile nonostante la superficie opaca. In sintesi, i valori DeltaE-2000 misurati sono relativamente vicini al valore target di 3 in fase di consegna. Tuttavia, altri portatili della stessa categoria dimostrano che si può fare di meglio. Siamo stati in grado di migliorare notevolmente i valori attraverso la calibrazione manuale. Inoltre, siamo riusciti a ridurre leggermente il colore blu. Pertanto, se si desidera utilizzare il dispositivo per l'editing di immagini, si consiglia di utilizzare il profilo ICC indicato sopra.
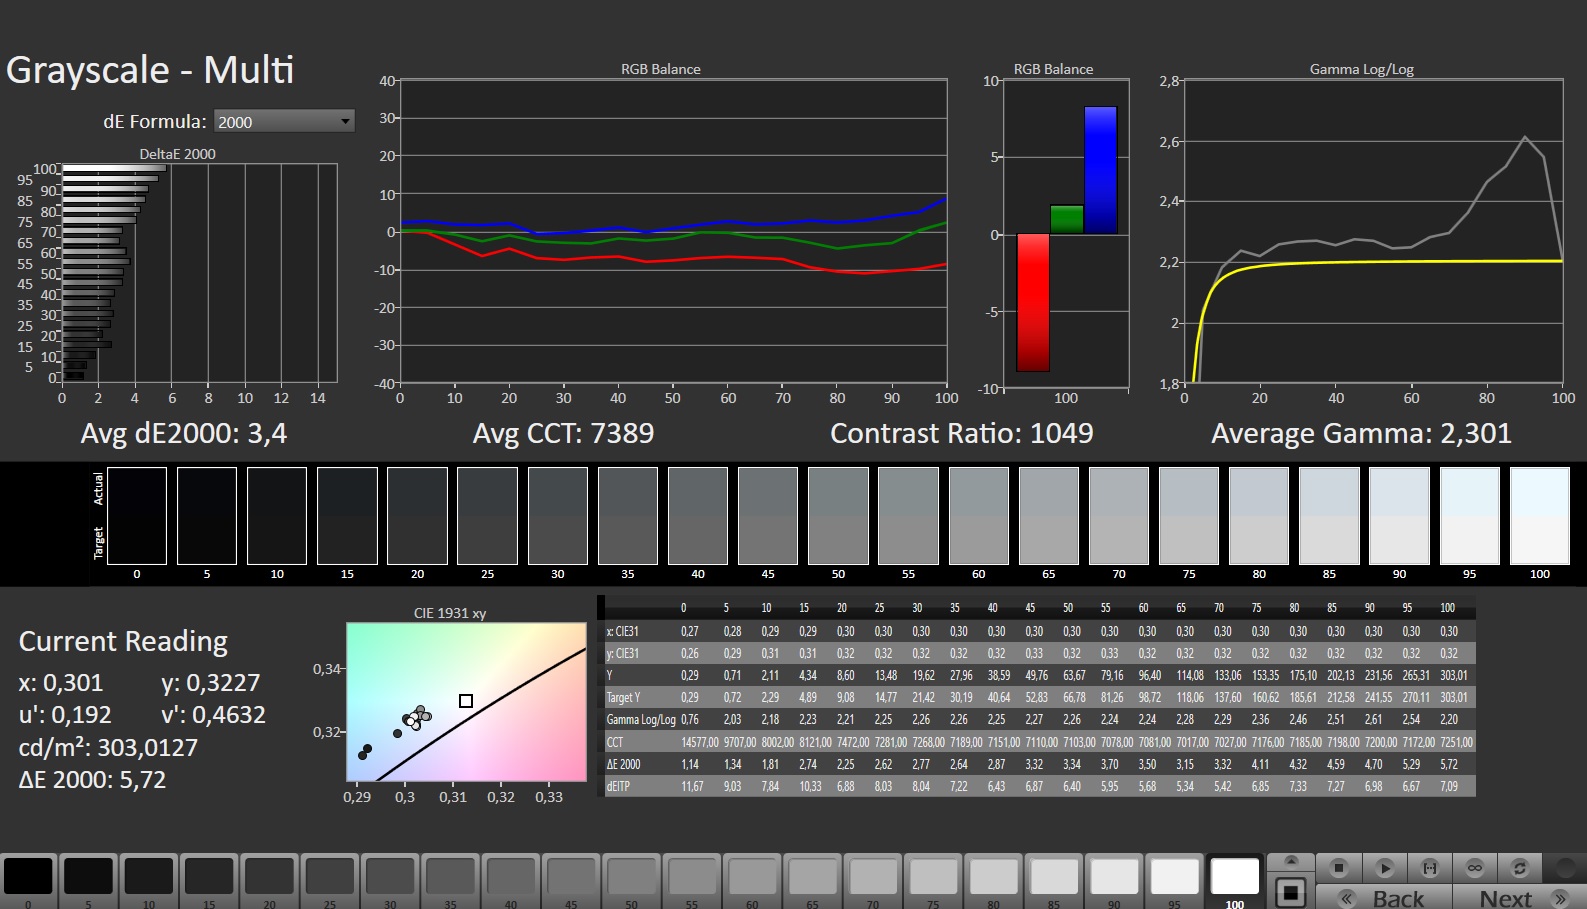
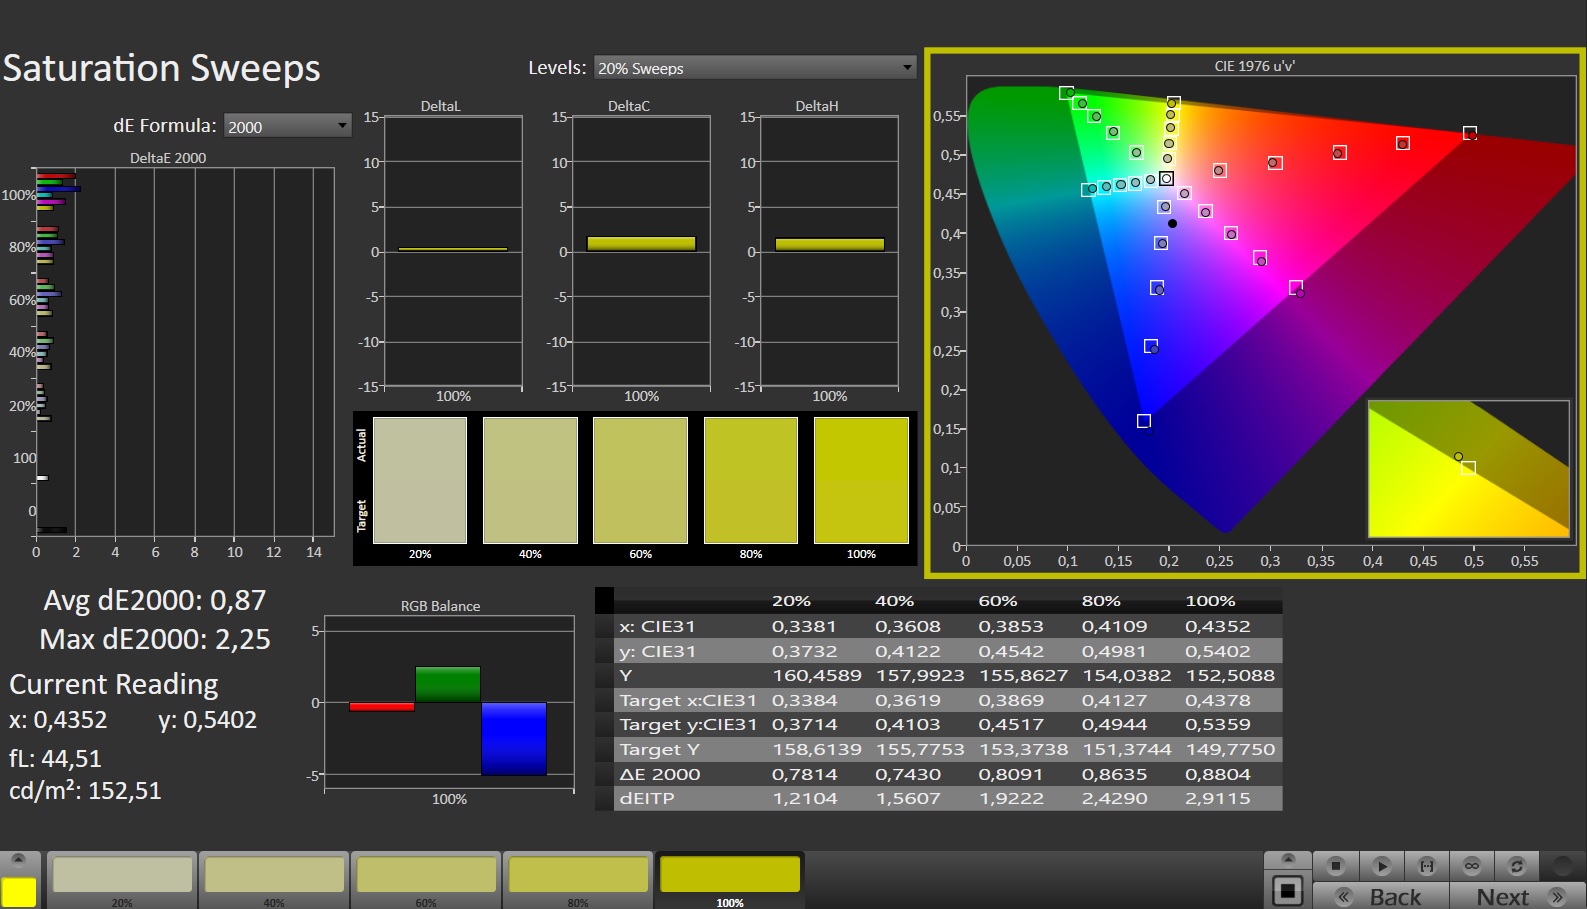
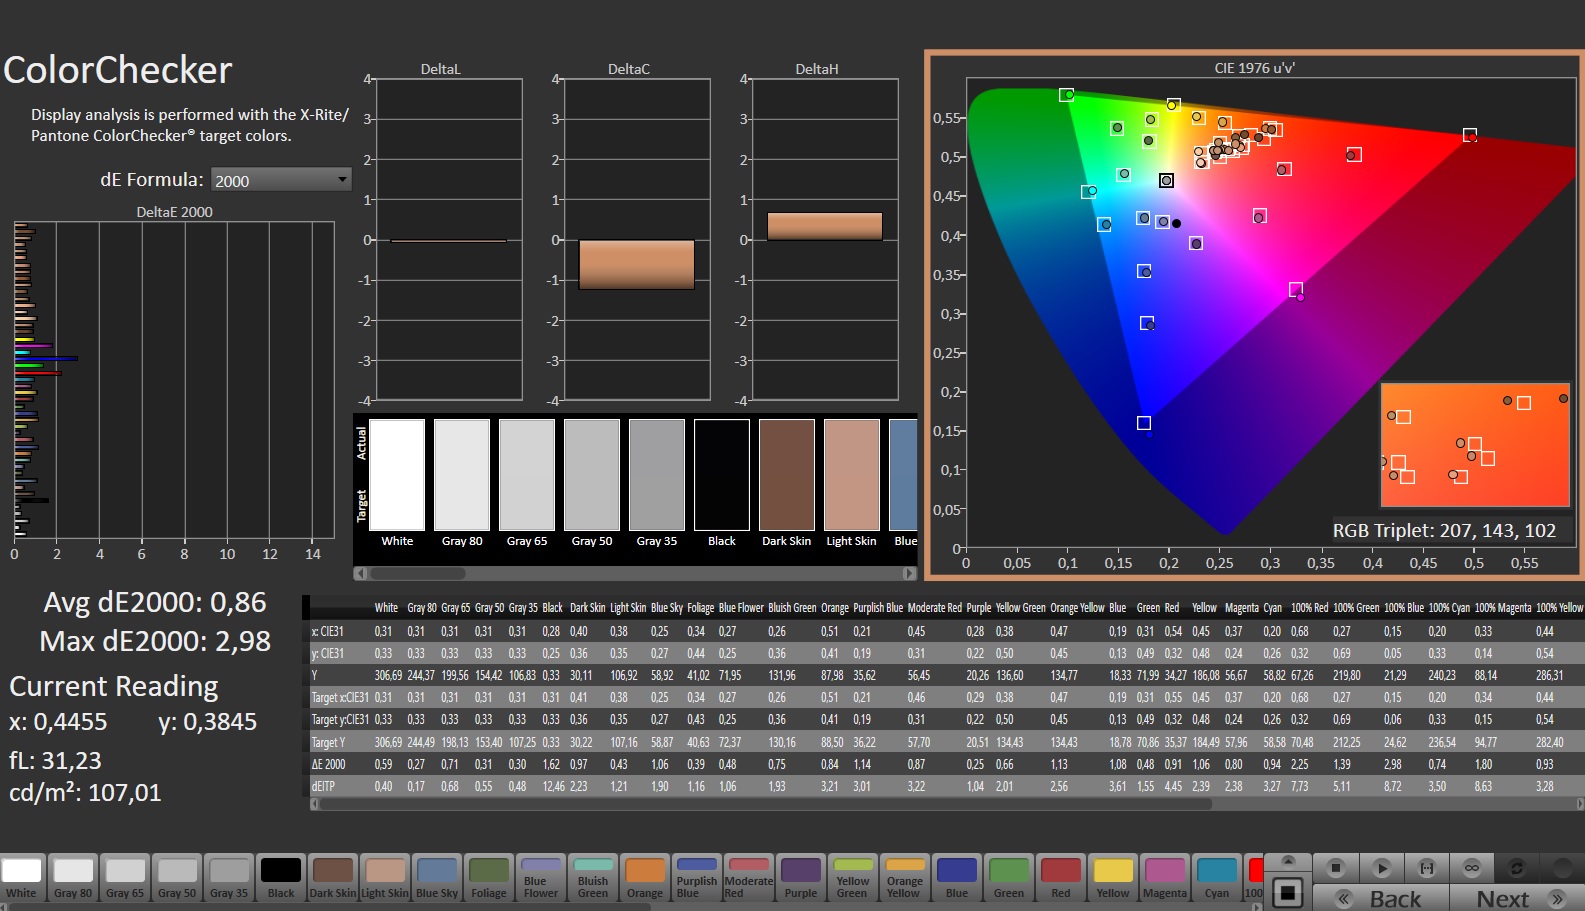
La copertura dello spazio colore misurato è buona e lo spazio colore sRGB è completamente coperto al 100%. Lo spazio di colore AdobeRGB esteso è sufficientemente coperto all'84,5% e lo spazio di colore P3 al 96,7%.

Tempi di risposta del Display
| ↔ Tempi di risposta dal Nero al Bianco | ||
|---|---|---|
| 10.1 ms ... aumenta ↗ e diminuisce ↘ combinato | ↗ 5.3 ms Incremento | 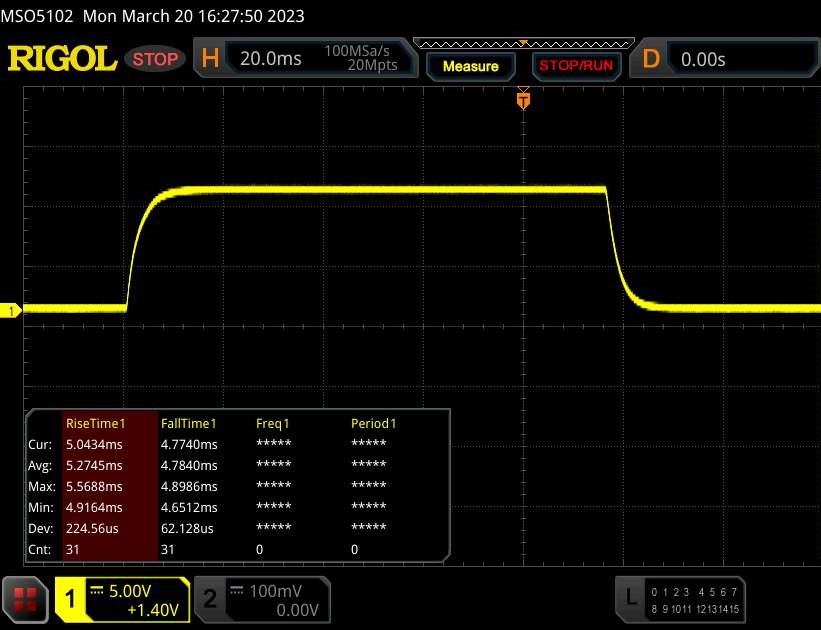 |
| ↘ 4.8 ms Calo | ||
| Lo schermo mostra buoni tempi di risposta durante i nostri tests, ma potrebbe essere troppo lento per i gamers competitivi. In confronto, tutti i dispositivi di test variano da 0.1 (minimo) a 240 (massimo) ms. » 28 % di tutti i dispositivi è migliore. Questo significa che i tempi di risposta rilevati sono migliori rispettto alla media di tutti i dispositivi testati (19.8 ms). | ||
| ↔ Tempo di risposta dal 50% Grigio all'80% Grigio | ||
| 14 ms ... aumenta ↗ e diminuisce ↘ combinato | ↗ 6.9 ms Incremento | 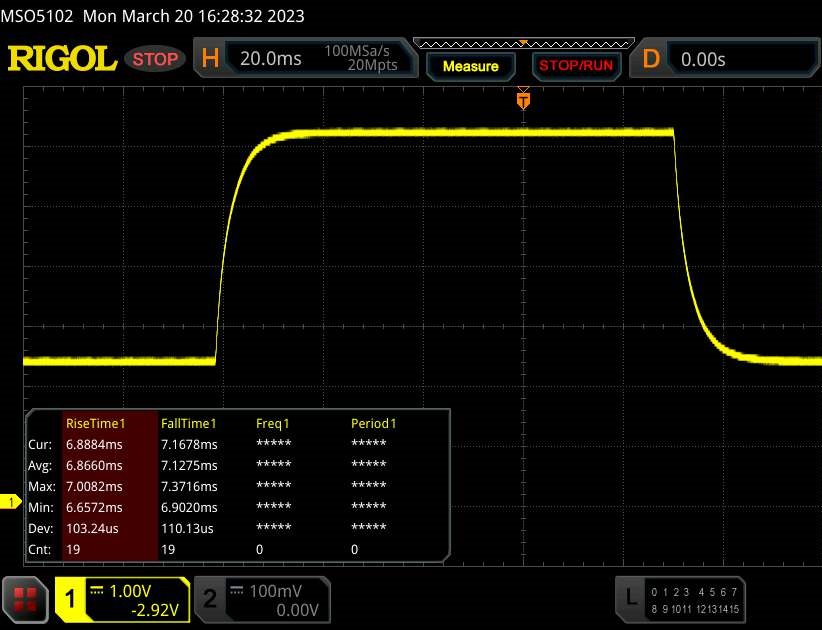 |
| ↘ 7.1 ms Calo | ||
| Lo schermo mostra buoni tempi di risposta durante i nostri tests, ma potrebbe essere troppo lento per i gamers competitivi. In confronto, tutti i dispositivi di test variano da 0.165 (minimo) a 636 (massimo) ms. » 28 % di tutti i dispositivi è migliore. Questo significa che i tempi di risposta rilevati sono migliori rispettto alla media di tutti i dispositivi testati (31 ms). | ||
Sfarfallio dello schermo / PWM (Pulse-Width Modulation)
| flickering dello schermo / PWM non rilevato | 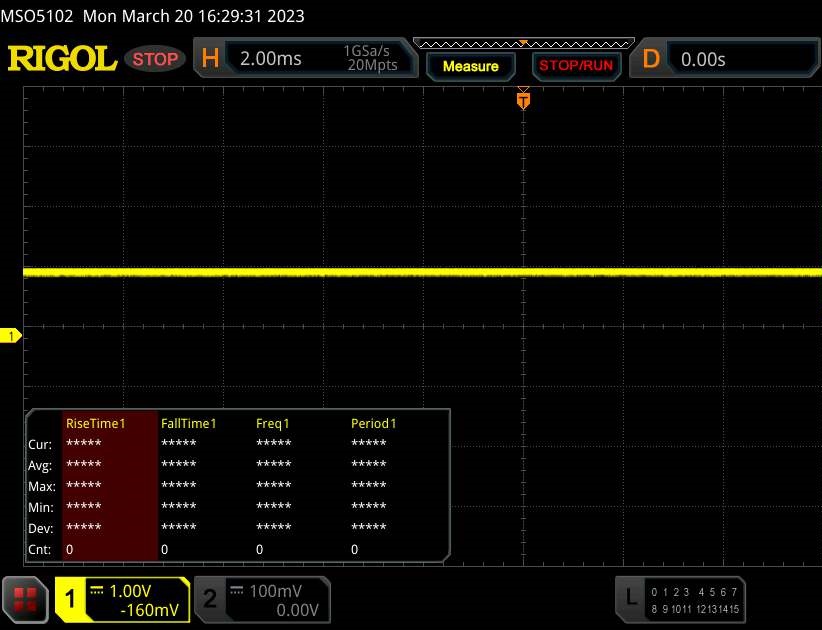 | ||
In confronto: 52 % di tutti i dispositivi testati non utilizza PWM per ridurre la luminosita' del display. Se è rilevato PWM, una media di 7757 (minimo: 5 - massimo: 343500) Hz è stata rilevata. | |||
La luminosità relativamente bassa del display non favorisce l'uso all'aperto. Tuttavia, è possibile lavorare all'aperto con la massima luminosità, anche se con alcune limitazioni. È necessario evitare la luce diretta del sole.
Il pannello IPS installato offre un'eccellente qualità dell'immagine nell'uso normale. I problemi, sotto forma di leggero appannamento, si verificano solo nelle immagini dei quattro angoli.

Performance - Raptor Lake in combinazione con Ada Lovelace
L'Aorus 17X AZF è attualmente uno dei notebook da gioco più potenti e offre prestazioni eccellenti, grazie a Raptor Lake e Ada Lovelace. La configurazione di questa unità di prova è disponibile a 3499,99 dollari.
Condizioni di test
Oltre alle tipiche modalità di prestazioni (vedi tabella), il centro di controllo dell'Aorus 17X AZF (Gigabyte Control Center) offre una funzione AI Boost di livello superiore che abbiamo utilizzato. Il Control Center ha poi selezionato il profilo appropriato: modalità Gaming e modalità Creator per i benchmark, modalità sleep a risparmio energetico per i test della batteria
Lamodalità Turbo si attiva in singoli casi per un piccolo aumento delle prestazioni, ma ha un prezzo: Le ventole lavorano costantemente a piena potenza. In modalità Meeting il dispositivo lavora in modo molto silenzioso, quasi al limite del silenzio. Le prestazioni diminuiscono sensibilmente, anche se le prestazioni multi-thread ne risentono più di quelle single-thread.
| Creator Modus | Turbo Modus | Gaming Modus | Meeting Modus | Energiespar Ruhemodus | |
|---|---|---|---|---|---|
| Limite di potenza 1 | 86 Watt | 86 Watt | 86 Watt | 15 Watt | 15 Watt |
| Limite di potenza 2 | 157 Watt | 157 Watt | 157 Watt | 30 Watt | 30 Watt |
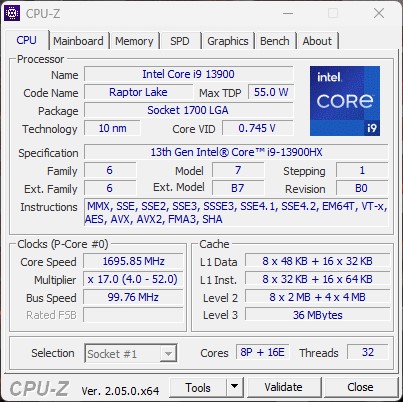
Processore
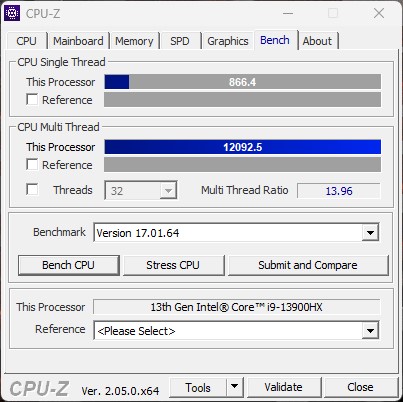
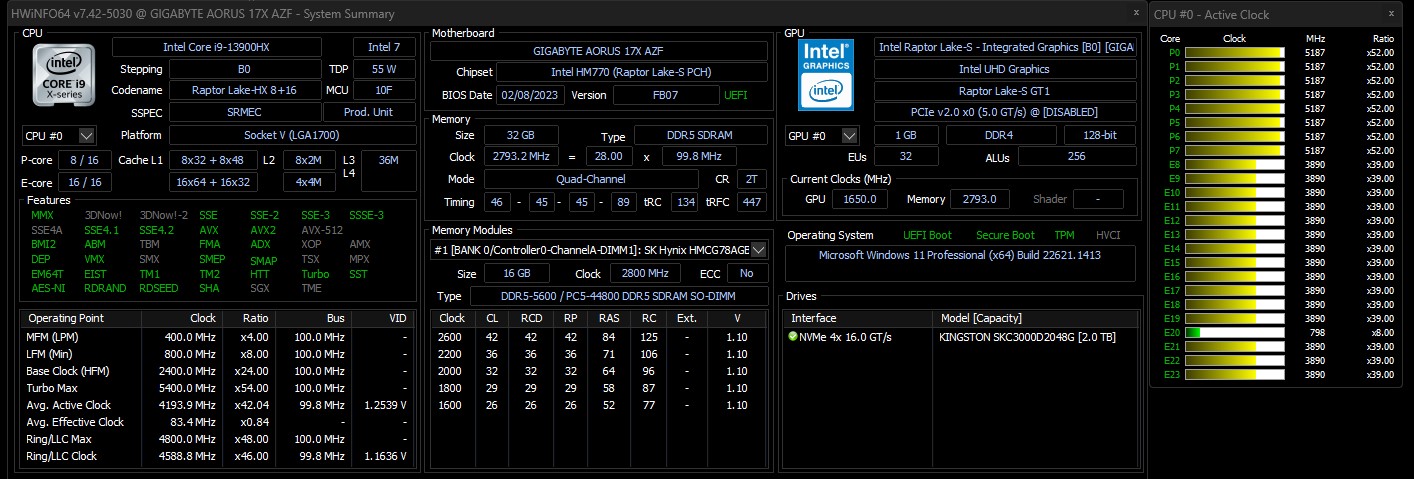
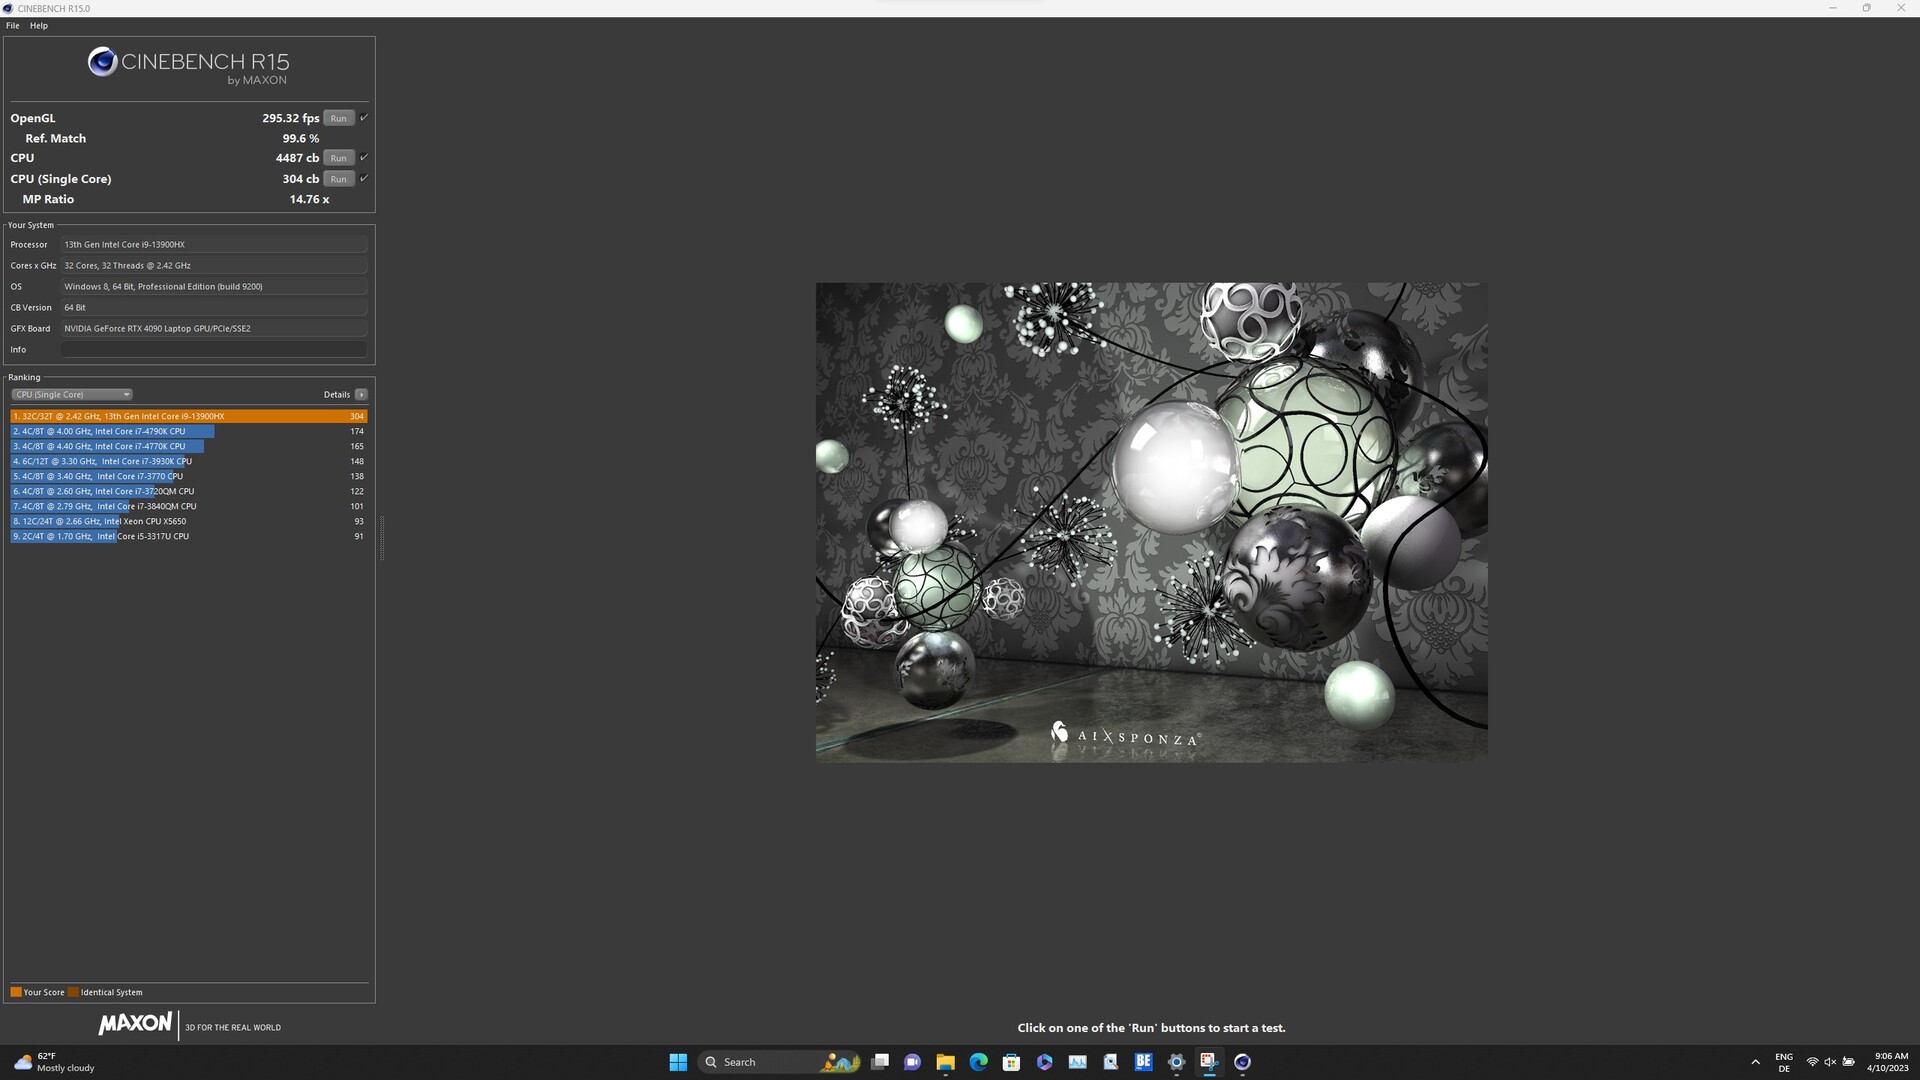
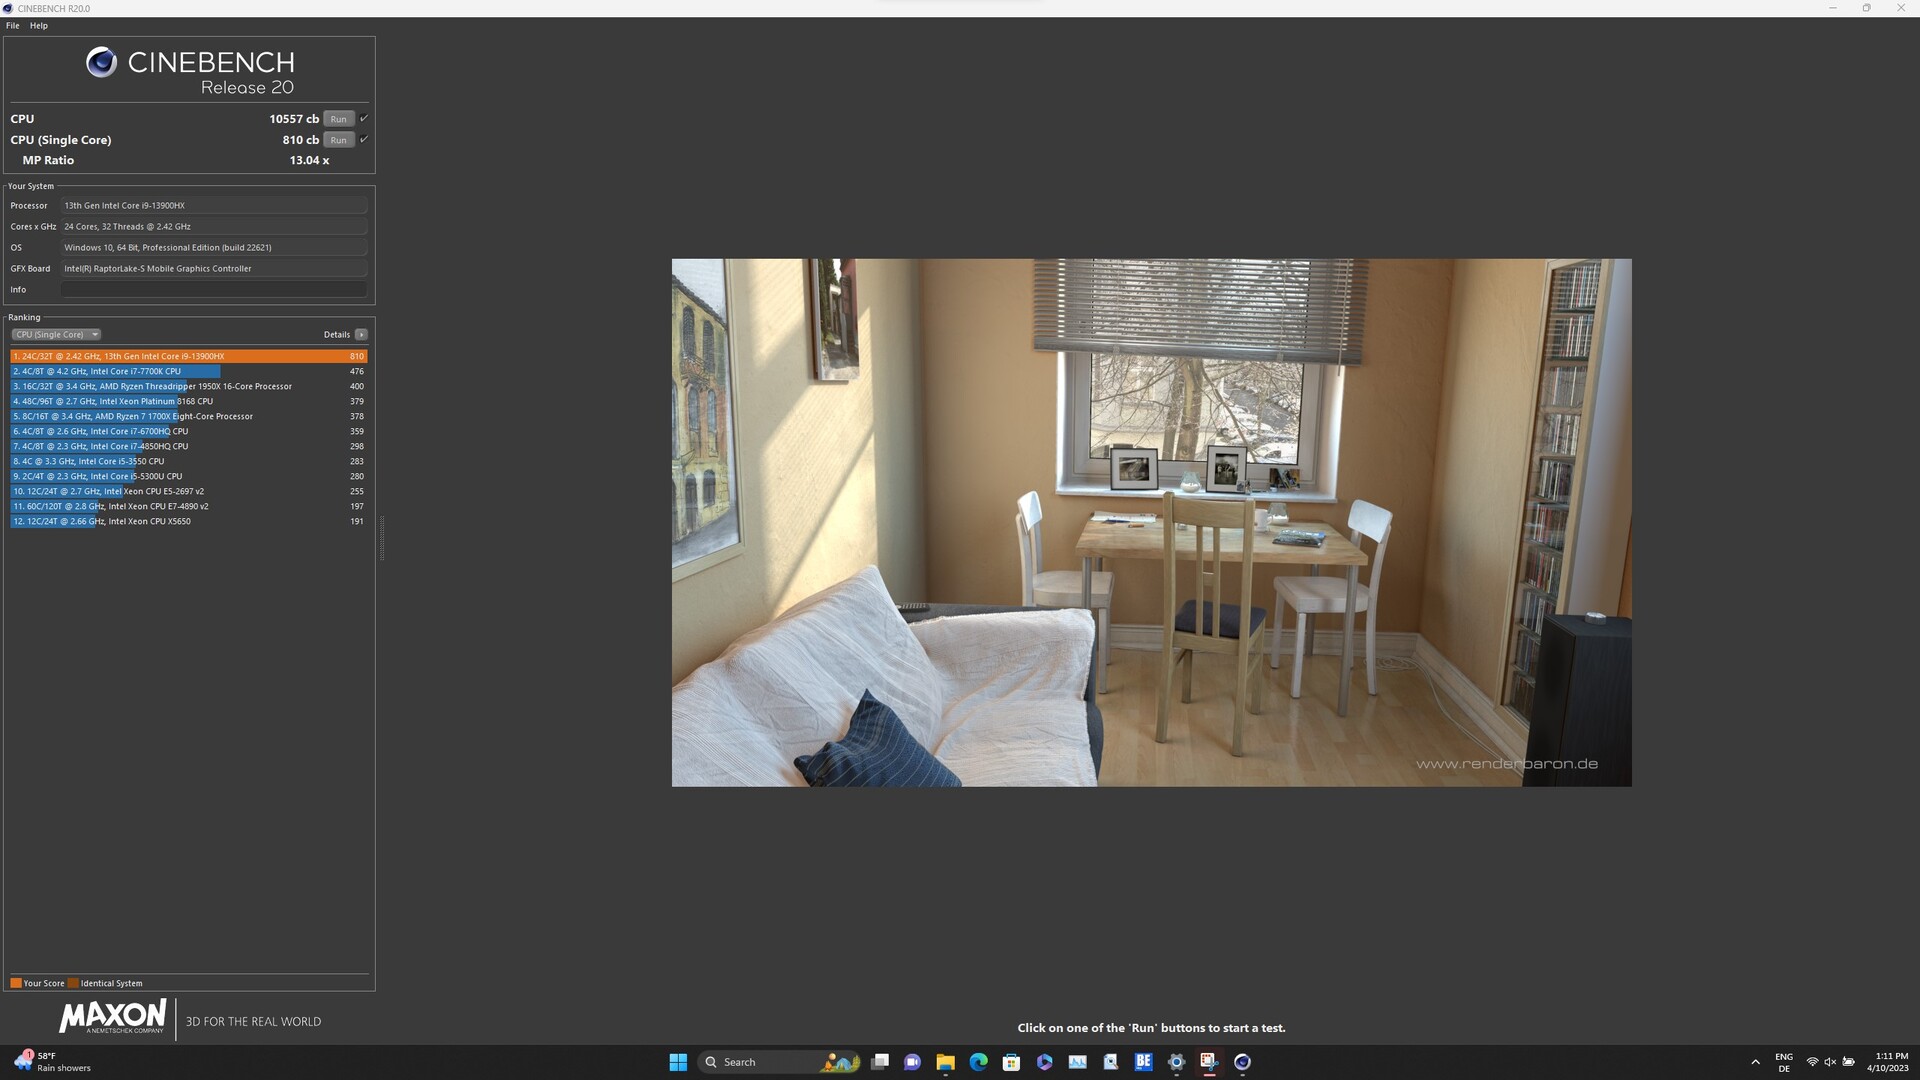
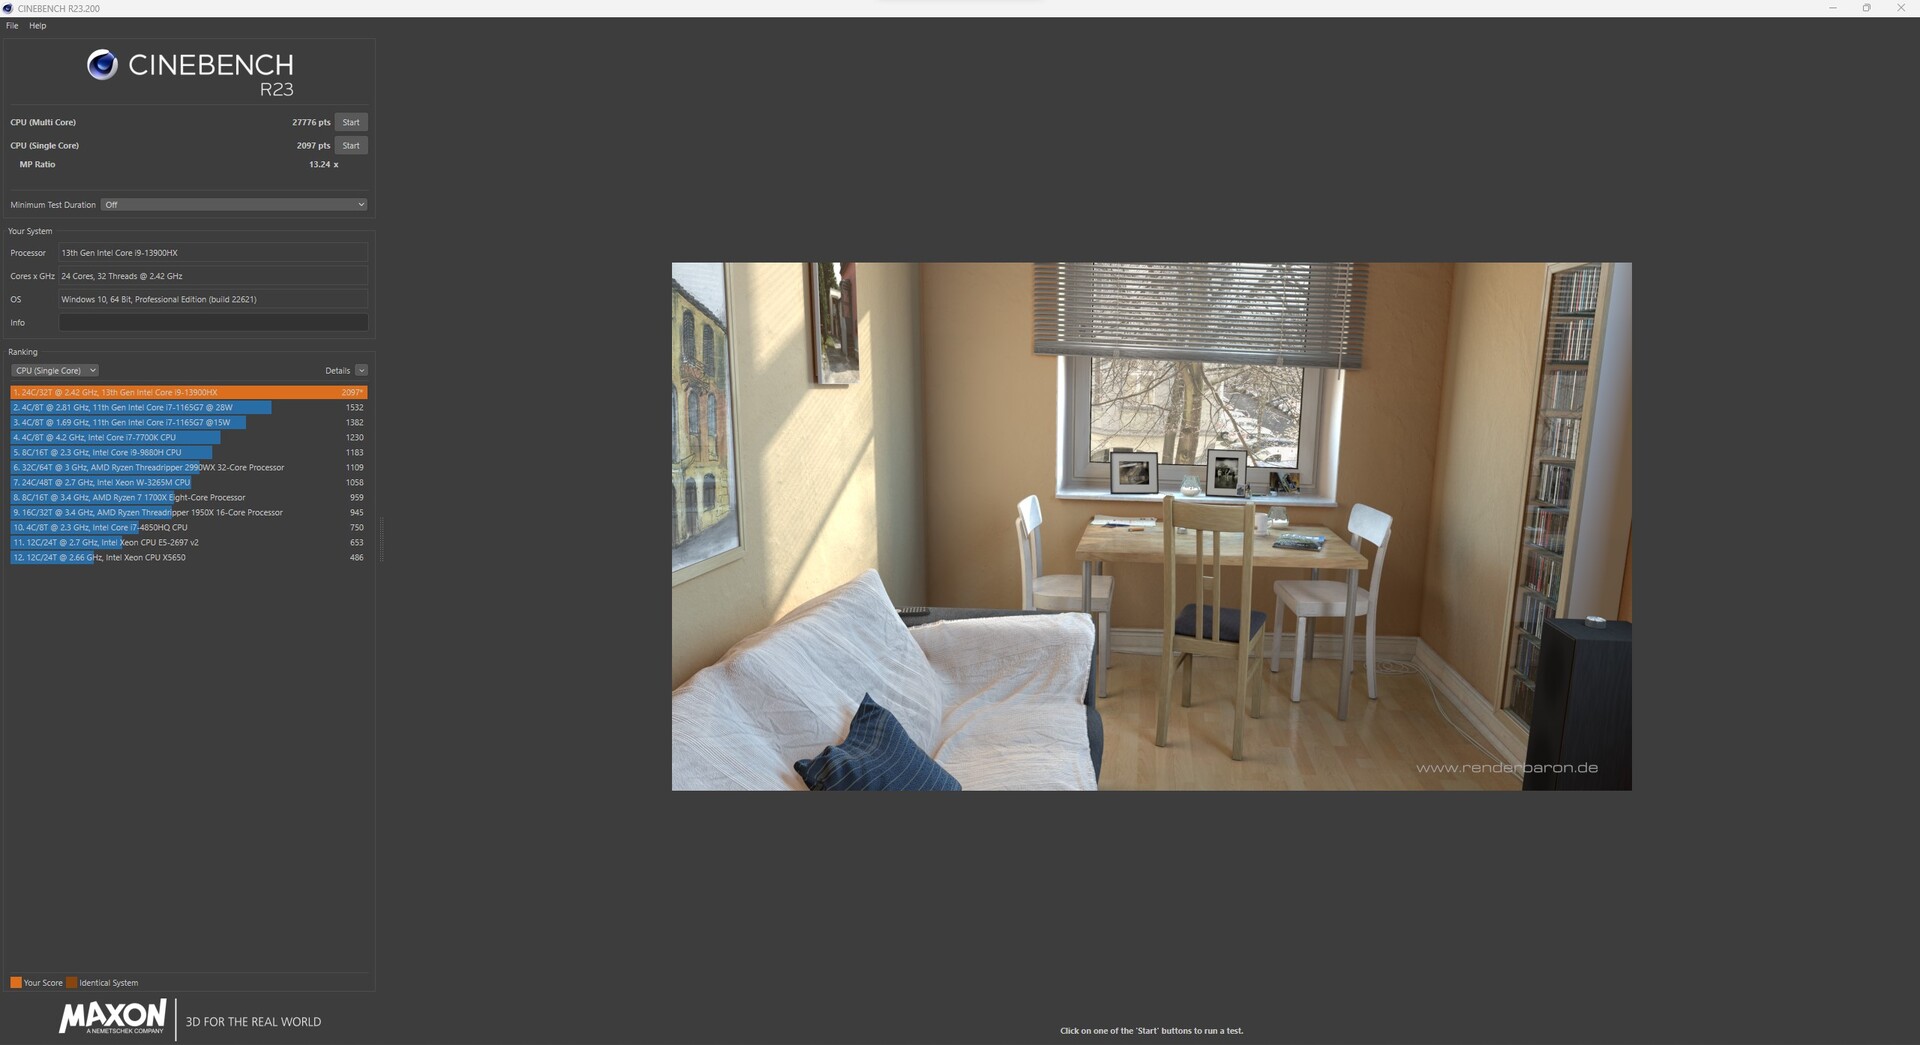
Il Intel Core-i7-13900HX-Prozessor (Raptor Lake) è composto da 16 core efficienti (senza hyperthreading, da 1,6 a 3,9 GHz) e 8 core performanti (hyperthreading, da 2,2 a 5,4 GHz). In totale ci sono 32 core logici della CPU, il che è stato accompagnato da enormi prestazioni multi-thread nei nostri test. Nei benchmark, tutti i contendenti sono in un serrato testa a testa. Tuttavia, nella valutazione delle prestazioni della CPU, che rappresenta il valore medio dei benchmark presentati, la nostra unità di test si è piazzata al penultimo posto. Solo il HP Omen 17, che utilizza lo stesso SoC, può essere battuto in questo caso, mentre il Medion Erazer Beastoffre prestazioni leggermente migliori. Gli altri concorrenti fanno meglio grazie ai loro SoC leggermente più veloci. Tuttavia, il divario con il MSI GE78HX è gestibile: solo il 12%.
Il test CB15 mostra che il boost della CPU viene utilizzato solo all'inizio. Il carico multi-thread permanente simulato causa un leggero calo del clock dopo la prima esecuzione, anche se le prestazioni rimangono stabili a partire dalla terza esecuzione.
Cinebench R15 Multi Sustained Load
Cinebench R23: Multi Core | Single Core
Cinebench R20: CPU (Multi Core) | CPU (Single Core)
Cinebench R15: CPU Multi 64Bit | CPU Single 64Bit
Blender: v2.79 BMW27 CPU
7-Zip 18.03: 7z b 4 | 7z b 4 -mmt1
Geekbench 5.5: Multi-Core | Single-Core
HWBOT x265 Benchmark v2.2: 4k Preset
LibreOffice : 20 Documents To PDF
R Benchmark 2.5: Overall mean
| CPU Performance rating | |
| MSI GE78HX 13VH-070US | |
| Alienware m18 R1 | |
| MSI Titan GT77 HX 13VI | |
| Medion Erazer Beast X40 | |
| Media Intel Core i9-13900HX | |
| Aorus 17X AZF | |
| HP Omen 17-ck2097ng | |
| Media della classe Gaming | |
| Cinebench R23 / Multi Core | |
| MSI Titan GT77 HX 13VI | |
| MSI GE78HX 13VH-070US | |
| Alienware m18 R1 | |
| Medion Erazer Beast X40 | |
| Media Intel Core i9-13900HX (24270 - 32623, n=23) | |
| Aorus 17X AZF | |
| HP Omen 17-ck2097ng | |
| Media della classe Gaming (10488 - 42661, n=107, ultimi 2 anni) | |
| Cinebench R23 / Single Core | |
| MSI GE78HX 13VH-070US | |
| Alienware m18 R1 | |
| MSI Titan GT77 HX 13VI | |
| Aorus 17X AZF | |
| HP Omen 17-ck2097ng | |
| Media Intel Core i9-13900HX (1867 - 2105, n=20) | |
| Medion Erazer Beast X40 | |
| Media della classe Gaming (1166 - 2415, n=107, ultimi 2 anni) | |
| Cinebench R20 / CPU (Multi Core) | |
| MSI Titan GT77 HX 13VI | |
| MSI GE78HX 13VH-070US | |
| Alienware m18 R1 | |
| Medion Erazer Beast X40 | |
| Media Intel Core i9-13900HX (9152 - 12541, n=21) | |
| Aorus 17X AZF | |
| Media della classe Gaming (4029 - 16433, n=106, ultimi 2 anni) | |
| HP Omen 17-ck2097ng | |
| Cinebench R20 / CPU (Single Core) | |
| Aorus 17X AZF | |
| Alienware m18 R1 | |
| HP Omen 17-ck2097ng | |
| MSI Titan GT77 HX 13VI | |
| MSI GE78HX 13VH-070US | |
| Media Intel Core i9-13900HX (722 - 810, n=21) | |
| Medion Erazer Beast X40 | |
| Media della classe Gaming (442 - 913, n=106, ultimi 2 anni) | |
| Cinebench R15 / CPU Multi 64Bit | |
| MSI Titan GT77 HX 13VI | |
| MSI GE78HX 13VH-070US | |
| Alienware m18 R1 | |
| Medion Erazer Beast X40 | |
| Media Intel Core i9-13900HX (3913 - 4970, n=22) | |
| Aorus 17X AZF | |
| HP Omen 17-ck2097ng | |
| Media della classe Gaming (1578 - 6330, n=105, ultimi 2 anni) | |
| Cinebench R15 / CPU Single 64Bit | |
| Aorus 17X AZF | |
| MSI GE78HX 13VH-070US | |
| Alienware m18 R1 | |
| HP Omen 17-ck2097ng | |
| MSI Titan GT77 HX 13VI | |
| Medion Erazer Beast X40 | |
| Media della classe Gaming (188.8 - 350, n=106, ultimi 2 anni) | |
| Media Intel Core i9-13900HX (247 - 304, n=22) | |
| Blender / v2.79 BMW27 CPU | |
| HP Omen 17-ck2097ng | |
| Media della classe Gaming (79 - 330, n=104, ultimi 2 anni) | |
| Aorus 17X AZF | |
| Media Intel Core i9-13900HX (101 - 153, n=22) | |
| Medion Erazer Beast X40 | |
| MSI GE78HX 13VH-070US | |
| MSI Titan GT77 HX 13VI | |
| Alienware m18 R1 | |
| 7-Zip 18.03 / 7z b 4 | |
| Alienware m18 R1 | |
| MSI Titan GT77 HX 13VI | |
| MSI GE78HX 13VH-070US | |
| Medion Erazer Beast X40 | |
| Media Intel Core i9-13900HX (90675 - 127283, n=21) | |
| HP Omen 17-ck2097ng | |
| Aorus 17X AZF | |
| Media della classe Gaming (33491 - 148086, n=105, ultimi 2 anni) | |
| 7-Zip 18.03 / 7z b 4 -mmt1 | |
| Aorus 17X AZF | |
| MSI GE78HX 13VH-070US | |
| HP Omen 17-ck2097ng | |
| MSI Titan GT77 HX 13VI | |
| Medion Erazer Beast X40 | |
| Alienware m18 R1 | |
| Media Intel Core i9-13900HX (6340 - 7177, n=21) | |
| Media della classe Gaming (4199 - 7436, n=105, ultimi 2 anni) | |
| Geekbench 5.5 / Multi-Core | |
| Alienware m18 R1 | |
| MSI GE78HX 13VH-070US | |
| MSI Titan GT77 HX 13VI | |
| HP Omen 17-ck2097ng | |
| Medion Erazer Beast X40 | |
| Media Intel Core i9-13900HX (17614 - 21075, n=22) | |
| Aorus 17X AZF | |
| Media della classe Gaming (6460 - 28263, n=105, ultimi 2 anni) | |
| Geekbench 5.5 / Single-Core | |
| MSI GE78HX 13VH-070US | |
| HP Omen 17-ck2097ng | |
| Aorus 17X AZF | |
| Alienware m18 R1 | |
| Media della classe Gaming (986 - 2474, n=105, ultimi 2 anni) | |
| MSI Titan GT77 HX 13VI | |
| Medion Erazer Beast X40 | |
| Media Intel Core i9-13900HX (1345 - 2093, n=22) | |
| HWBOT x265 Benchmark v2.2 / 4k Preset | |
| MSI GE78HX 13VH-070US | |
| Alienware m18 R1 | |
| MSI Titan GT77 HX 13VI | |
| Medion Erazer Beast X40 | |
| Media Intel Core i9-13900HX (23.5 - 34.4, n=22) | |
| Media della classe Gaming (11.5 - 44.4, n=105, ultimi 2 anni) | |
| HP Omen 17-ck2097ng | |
| Aorus 17X AZF | |
| LibreOffice / 20 Documents To PDF | |
| Media della classe Gaming (33.2 - 88.8, n=105, ultimi 2 anni) | |
| MSI GE78HX 13VH-070US | |
| Alienware m18 R1 | |
| MSI Titan GT77 HX 13VI | |
| Aorus 17X AZF | |
| HP Omen 17-ck2097ng | |
| Medion Erazer Beast X40 | |
| Media Intel Core i9-13900HX (32.8 - 51.1, n=21) | |
| R Benchmark 2.5 / Overall mean | |
| Media della classe Gaming (0.3439 - 0.759, n=106, ultimi 2 anni) | |
| MSI Titan GT77 HX 13VI | |
| Media Intel Core i9-13900HX (0.375 - 0.4564, n=22) | |
| Medion Erazer Beast X40 | |
| Aorus 17X AZF | |
| Alienware m18 R1 | |
| HP Omen 17-ck2097ng | |
| MSI GE78HX 13VH-070US | |
* ... Meglio usare valori piccoli
AIDA64: FP32 Ray-Trace | FPU Julia | CPU SHA3 | CPU Queen | FPU SinJulia | FPU Mandel | CPU AES | CPU ZLib | FP64 Ray-Trace | CPU PhotoWorxx
| Performance rating | |
| Alienware m18 R1 | |
| MSI GE78HX 13VH-070US | |
| MSI Titan GT77 HX 13VI | |
| Medion Erazer Beast X40 | |
| Media della classe Gaming | |
| Media Intel Core i9-13900HX | |
| Aorus 17X AZF | |
| HP Omen 17-ck2097ng | |
| AIDA64 / FP32 Ray-Trace | |
| Media della classe Gaming (10227 - 85542, n=105, ultimi 2 anni) | |
| Alienware m18 R1 | |
| MSI Titan GT77 HX 13VI | |
| MSI GE78HX 13VH-070US | |
| Medion Erazer Beast X40 | |
| Media Intel Core i9-13900HX (17589 - 27615, n=22) | |
| Aorus 17X AZF | |
| HP Omen 17-ck2097ng | |
| AIDA64 / FPU Julia | |
| Alienware m18 R1 | |
| MSI Titan GT77 HX 13VI | |
| MSI GE78HX 13VH-070US | |
| Media della classe Gaming (51376 - 238426, n=105, ultimi 2 anni) | |
| Medion Erazer Beast X40 | |
| Media Intel Core i9-13900HX (88686 - 137015, n=22) | |
| Aorus 17X AZF | |
| HP Omen 17-ck2097ng | |
| AIDA64 / CPU SHA3 | |
| Alienware m18 R1 | |
| MSI Titan GT77 HX 13VI | |
| MSI GE78HX 13VH-070US | |
| Medion Erazer Beast X40 | |
| Media della classe Gaming (2180 - 10115, n=105, ultimi 2 anni) | |
| Media Intel Core i9-13900HX (4362 - 7029, n=22) | |
| Aorus 17X AZF | |
| HP Omen 17-ck2097ng | |
| AIDA64 / CPU Queen | |
| Alienware m18 R1 | |
| MSI GE78HX 13VH-070US | |
| MSI Titan GT77 HX 13VI | |
| HP Omen 17-ck2097ng | |
| Media Intel Core i9-13900HX (125644 - 141385, n=22) | |
| Medion Erazer Beast X40 | |
| Aorus 17X AZF | |
| Media della classe Gaming (49785 - 173351, n=90, ultimi 2 anni) | |
| AIDA64 / FPU SinJulia | |
| MSI Titan GT77 HX 13VI | |
| MSI GE78HX 13VH-070US | |
| Alienware m18 R1 | |
| Medion Erazer Beast X40 | |
| Media Intel Core i9-13900HX (12334 - 17179, n=22) | |
| Media della classe Gaming (4424 - 33636, n=105, ultimi 2 anni) | |
| Aorus 17X AZF | |
| HP Omen 17-ck2097ng | |
| AIDA64 / FPU Mandel | |
| Alienware m18 R1 | |
| Media della classe Gaming (25115 - 128721, n=105, ultimi 2 anni) | |
| MSI Titan GT77 HX 13VI | |
| MSI GE78HX 13VH-070US | |
| Medion Erazer Beast X40 | |
| Media Intel Core i9-13900HX (43850 - 69202, n=22) | |
| Aorus 17X AZF | |
| HP Omen 17-ck2097ng | |
| AIDA64 / CPU AES | |
| Aorus 17X AZF | |
| Media Intel Core i9-13900HX (89413 - 237881, n=22) | |
| MSI Titan GT77 HX 13VI | |
| Alienware m18 R1 | |
| MSI GE78HX 13VH-070US | |
| Medion Erazer Beast X40 | |
| Media della classe Gaming (39258 - 247074, n=105, ultimi 2 anni) | |
| HP Omen 17-ck2097ng | |
| AIDA64 / CPU ZLib | |
| MSI GE78HX 13VH-070US | |
| MSI Titan GT77 HX 13VI | |
| Alienware m18 R1 | |
| Medion Erazer Beast X40 | |
| Media Intel Core i9-13900HX (1284 - 1958, n=22) | |
| Media della classe Gaming (574 - 2531, n=105, ultimi 2 anni) | |
| Aorus 17X AZF | |
| HP Omen 17-ck2097ng | |
| AIDA64 / FP64 Ray-Trace | |
| Media della classe Gaming (5509 - 45446, n=105, ultimi 2 anni) | |
| Alienware m18 R1 | |
| MSI Titan GT77 HX 13VI | |
| MSI GE78HX 13VH-070US | |
| Medion Erazer Beast X40 | |
| Media Intel Core i9-13900HX (9481 - 15279, n=22) | |
| Aorus 17X AZF | |
| HP Omen 17-ck2097ng | |
| AIDA64 / CPU PhotoWorxx | |
| Alienware m18 R1 | |
| HP Omen 17-ck2097ng | |
| Aorus 17X AZF | |
| MSI GE78HX 13VH-070US | |
| Media Intel Core i9-13900HX (42994 - 51994, n=22) | |
| Media della classe Gaming (12271 - 89891, n=105, ultimi 2 anni) | |
| Medion Erazer Beast X40 | |
| MSI Titan GT77 HX 13VI | |
Prestazioni del sistema
Nei benchmark delle prestazioni di sistema, l'Aorus 17X AZF si posiziona allo stesso modo dei test della CPU. Tuttavia, le prestazioni di sistema sono eccellenti e ben al di sopra della media della categoria dei portatili da gioco degli ultimi due anni. Nei benchmark AIDA64, l'Aorus 17X AZF offre risultati impeccabili grazie alla veloce RAM DDR5, che colloca la nostra unità di recensione al secondo posto dietro l'Alienware m18 R1.Alienware m18 R1.
CrossMark: Overall | Productivity | Creativity | Responsiveness
| PCMark 10 / Score | |
| MSI Titan GT77 HX 13VI | |
| MSI GE78HX 13VH-070US | |
| Alienware m18 R1 | |
| Media Intel Core i9-13900HX, NVIDIA GeForce RTX 4090 Laptop GPU (7690 - 9331, n=8) | |
| Media della classe Gaming (5828 - 12414, n=93, ultimi 2 anni) | |
| Medion Erazer Beast X40 | |
| Aorus 17X AZF | |
| HP Omen 17-ck2097ng | |
| PCMark 10 / Essentials | |
| HP Omen 17-ck2097ng | |
| MSI Titan GT77 HX 13VI | |
| MSI GE78HX 13VH-070US | |
| Media Intel Core i9-13900HX, NVIDIA GeForce RTX 4090 Laptop GPU (10972 - 11983, n=8) | |
| Medion Erazer Beast X40 | |
| Alienware m18 R1 | |
| Aorus 17X AZF | |
| Media della classe Gaming (8810 - 11935, n=97, ultimi 2 anni) | |
| PCMark 10 / Productivity | |
| Medion Erazer Beast X40 | |
| Media della classe Gaming (6845 - 25323, n=95, ultimi 2 anni) | |
| MSI GE78HX 13VH-070US | |
| Media Intel Core i9-13900HX, NVIDIA GeForce RTX 4090 Laptop GPU (9038 - 11680, n=8) | |
| Aorus 17X AZF | |
| Alienware m18 R1 | |
| HP Omen 17-ck2097ng | |
| MSI Titan GT77 HX 13VI | |
| PCMark 10 / Digital Content Creation | |
| MSI Titan GT77 HX 13VI | |
| Alienware m18 R1 | |
| MSI GE78HX 13VH-070US | |
| Media della classe Gaming (7602 - 19954, n=95, ultimi 2 anni) | |
| Media Intel Core i9-13900HX, NVIDIA GeForce RTX 4090 Laptop GPU (10605 - 16395, n=8) | |
| Medion Erazer Beast X40 | |
| Aorus 17X AZF | |
| HP Omen 17-ck2097ng | |
| CrossMark / Overall | |
| Alienware m18 R1 | |
| Aorus 17X AZF | |
| MSI Titan GT77 HX 13VI | |
| Medion Erazer Beast X40 | |
| Media Intel Core i9-13900HX, NVIDIA GeForce RTX 4090 Laptop GPU (1825 - 2295, n=8) | |
| HP Omen 17-ck2097ng | |
| Media della classe Gaming (1366 - 2409, n=94, ultimi 2 anni) | |
| MSI GE78HX 13VH-070US | |
| CrossMark / Productivity | |
| Aorus 17X AZF | |
| Alienware m18 R1 | |
| Medion Erazer Beast X40 | |
| MSI Titan GT77 HX 13VI | |
| Media Intel Core i9-13900HX, NVIDIA GeForce RTX 4090 Laptop GPU (1666 - 2166, n=8) | |
| Media della classe Gaming (1386 - 2254, n=94, ultimi 2 anni) | |
| MSI GE78HX 13VH-070US | |
| HP Omen 17-ck2097ng | |
| CrossMark / Creativity | |
| Alienware m18 R1 | |
| MSI Titan GT77 HX 13VI | |
| Medion Erazer Beast X40 | |
| Media Intel Core i9-13900HX, NVIDIA GeForce RTX 4090 Laptop GPU (2162 - 2514, n=8) | |
| Aorus 17X AZF | |
| Media della classe Gaming (1343 - 2786, n=94, ultimi 2 anni) | |
| HP Omen 17-ck2097ng | |
| MSI GE78HX 13VH-070US | |
| CrossMark / Responsiveness | |
| Aorus 17X AZF | |
| Alienware m18 R1 | |
| MSI Titan GT77 HX 13VI | |
| Medion Erazer Beast X40 | |
| Media Intel Core i9-13900HX, NVIDIA GeForce RTX 4090 Laptop GPU (1441 - 2275, n=8) | |
| HP Omen 17-ck2097ng | |
| Media della classe Gaming (1226 - 2334, n=94, ultimi 2 anni) | |
| MSI GE78HX 13VH-070US | |
| PCMark 10 Score | 7690 punti | |
Aiuto | ||
| AIDA64 / Memory Copy | |
| Alienware m18 R1 | |
| Aorus 17X AZF | |
| HP Omen 17-ck2097ng | |
| MSI GE78HX 13VH-070US | |
| Media Intel Core i9-13900HX (67716 - 79193, n=22) | |
| Media della classe Gaming (21750 - 129946, n=105, ultimi 2 anni) | |
| Medion Erazer Beast X40 | |
| MSI Titan GT77 HX 13VI | |
| AIDA64 / Memory Read | |
| Alienware m18 R1 | |
| Aorus 17X AZF | |
| HP Omen 17-ck2097ng | |
| MSI GE78HX 13VH-070US | |
| Media Intel Core i9-13900HX (73998 - 88462, n=22) | |
| Medion Erazer Beast X40 | |
| Media della classe Gaming (22956 - 118858, n=105, ultimi 2 anni) | |
| MSI Titan GT77 HX 13VI | |
| AIDA64 / Memory Write | |
| Alienware m18 R1 | |
| HP Omen 17-ck2097ng | |
| Aorus 17X AZF | |
| MSI GE78HX 13VH-070US | |
| Media della classe Gaming (22297 - 135096, n=105, ultimi 2 anni) | |
| Media Intel Core i9-13900HX (65472 - 77045, n=22) | |
| Medion Erazer Beast X40 | |
| MSI Titan GT77 HX 13VI | |
| AIDA64 / Memory Latency | |
| Media della classe Gaming (75.3 - 259, n=105, ultimi 2 anni) | |
| MSI Titan GT77 HX 13VI | |
| Medion Erazer Beast X40 | |
| Media Intel Core i9-13900HX (75.3 - 91.1, n=22) | |
| HP Omen 17-ck2097ng | |
| MSI GE78HX 13VH-070US | |
| Aorus 17X AZF | |
| Alienware m18 R1 | |
* ... Meglio usare valori piccoli
Latenze DPC
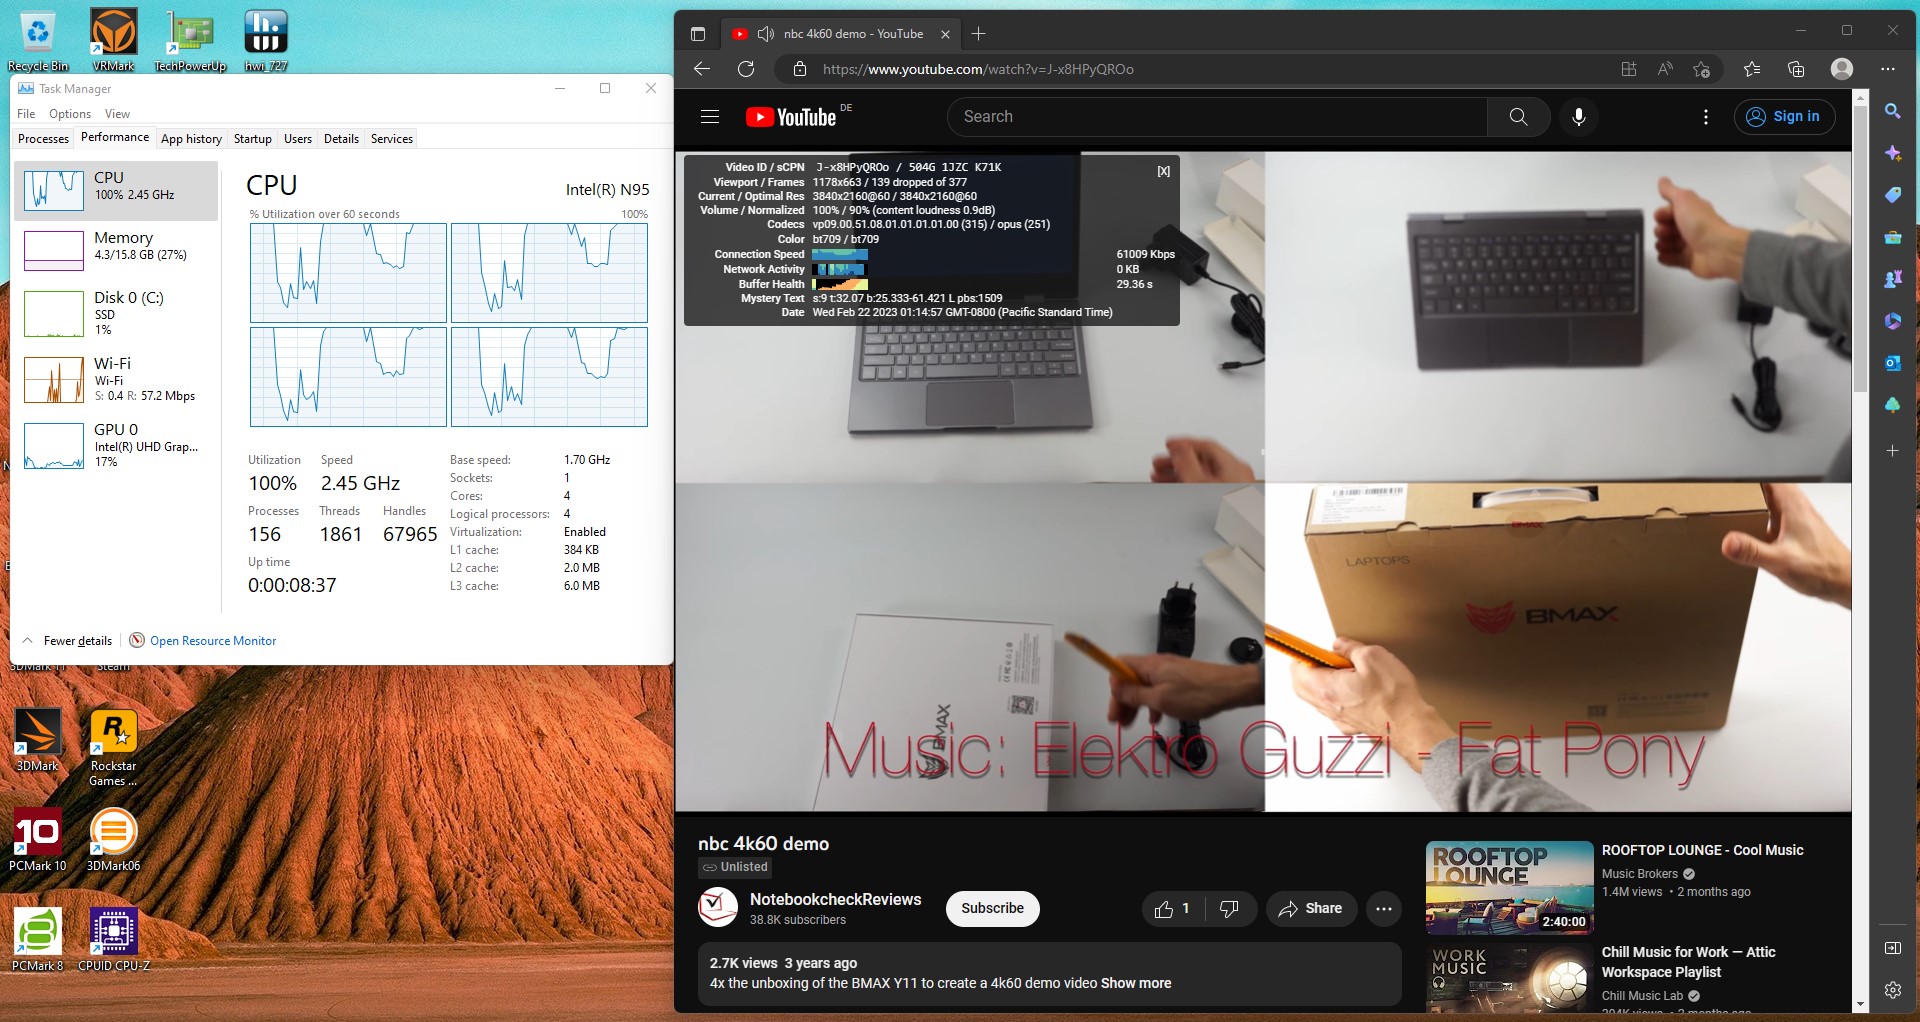
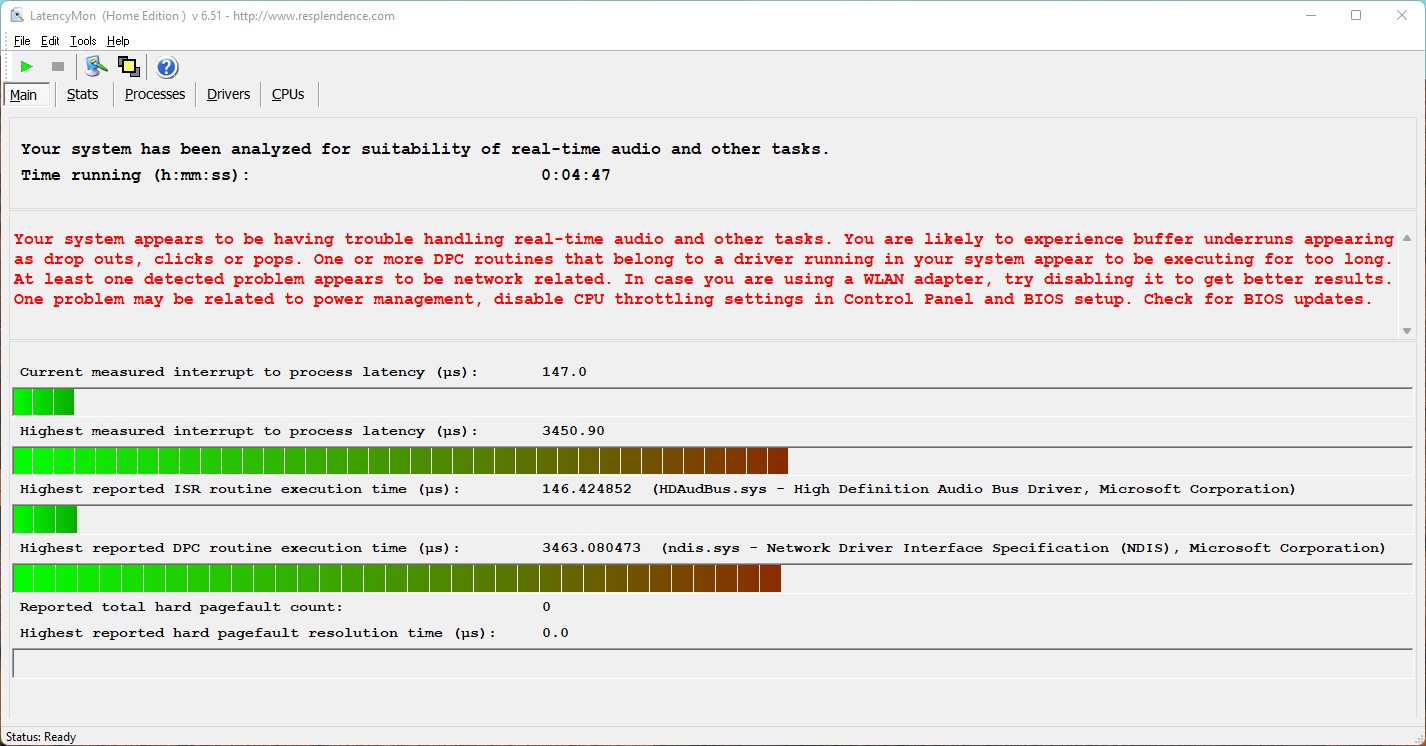
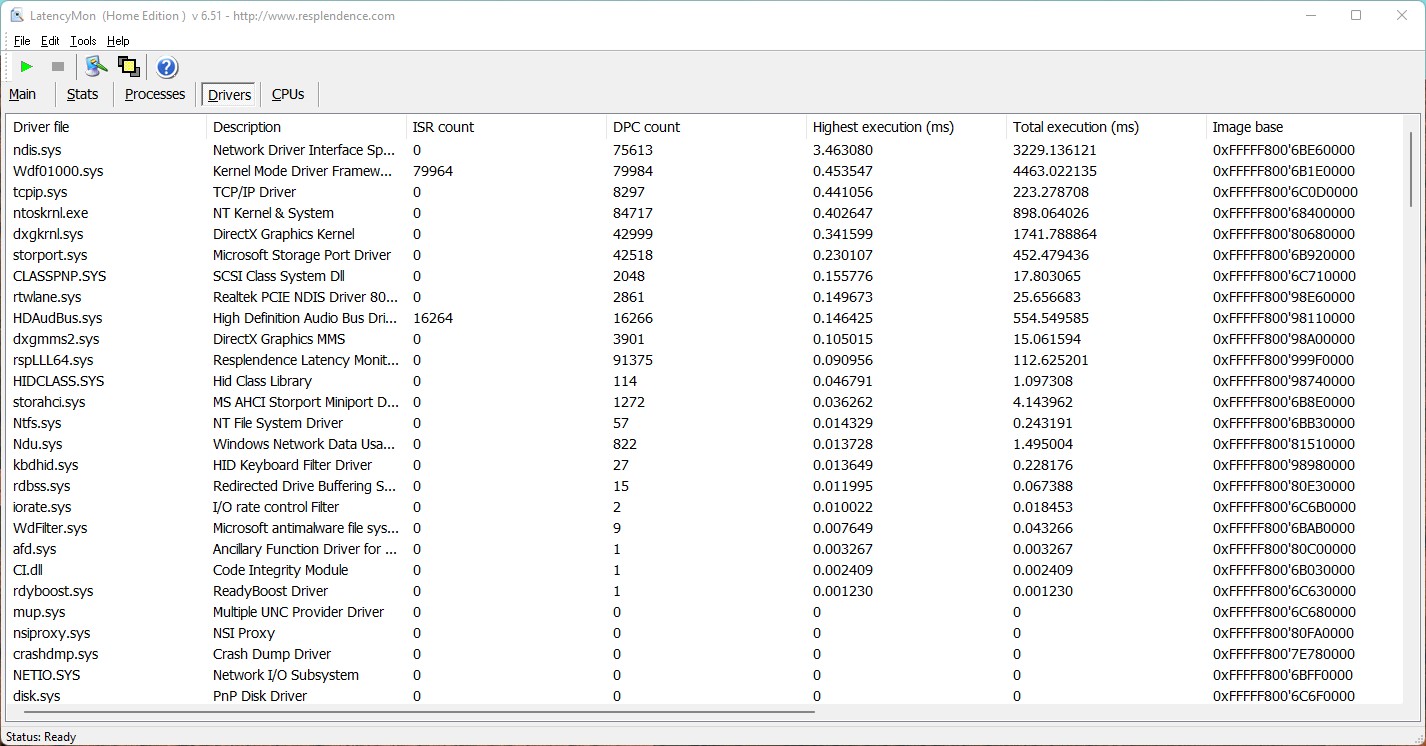
Il nostro test standardizzato di monitoraggio della latenza (navigazione web, riproduzione video 4k, Prime95 ad alto carico) rivela valori estremi nell'Aorus 17X AZF. I futuri aggiornamenti software dovrebbero migliorare questo aspetto in modo che il sistema sia adatto all'editing video e audio in tempo reale senza limitazioni.
| DPC Latencies / LatencyMon - interrupt to process latency (max), Web, Youtube, Prime95 | |
| Aorus 17X AZF | |
| MSI Titan GT77 HX 13VI | |
| MSI GE78HX 13VH-070US | |
| Alienware m18 R1 | |
| Medion Erazer Beast X40 | |
| HP Omen 17-ck2097ng | |
* ... Meglio usare valori piccoli
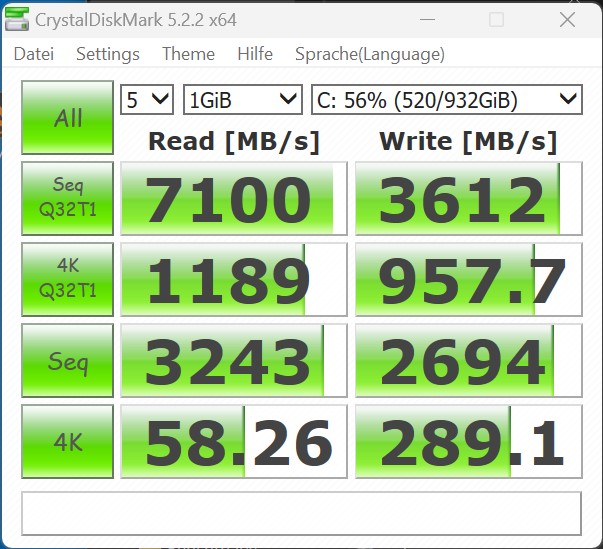
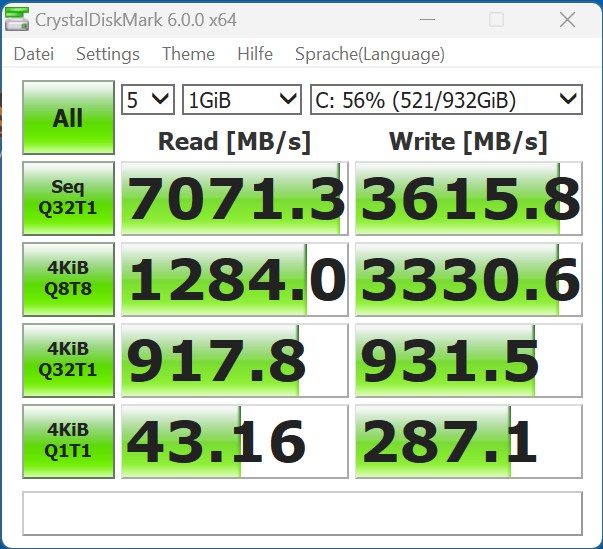
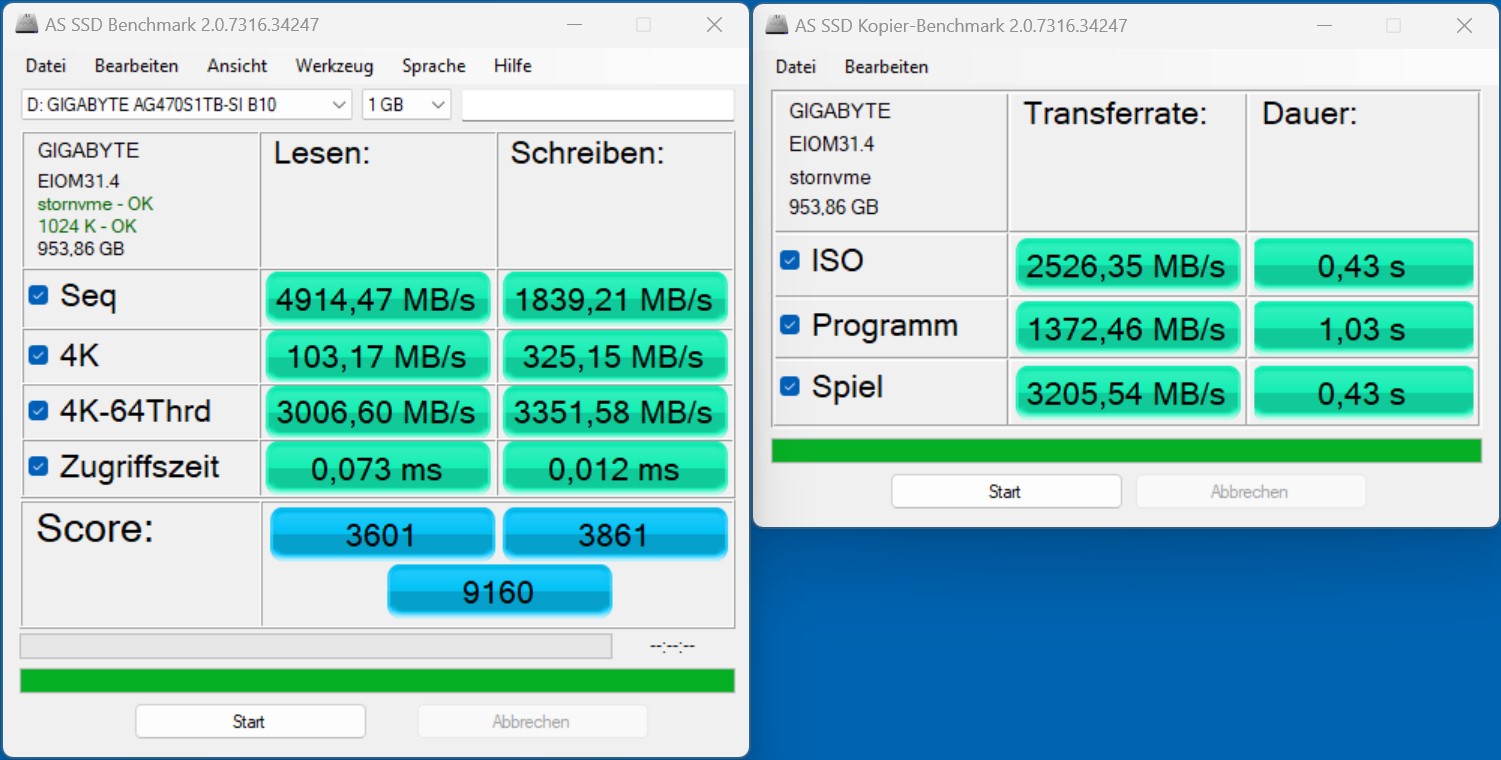
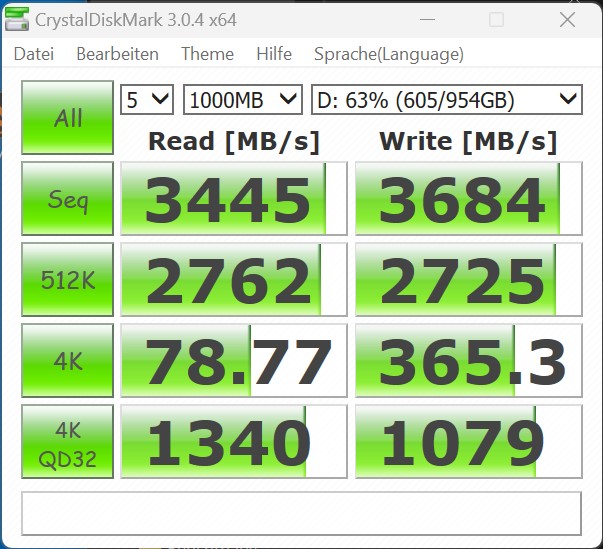
Dispositivi di archiviazione
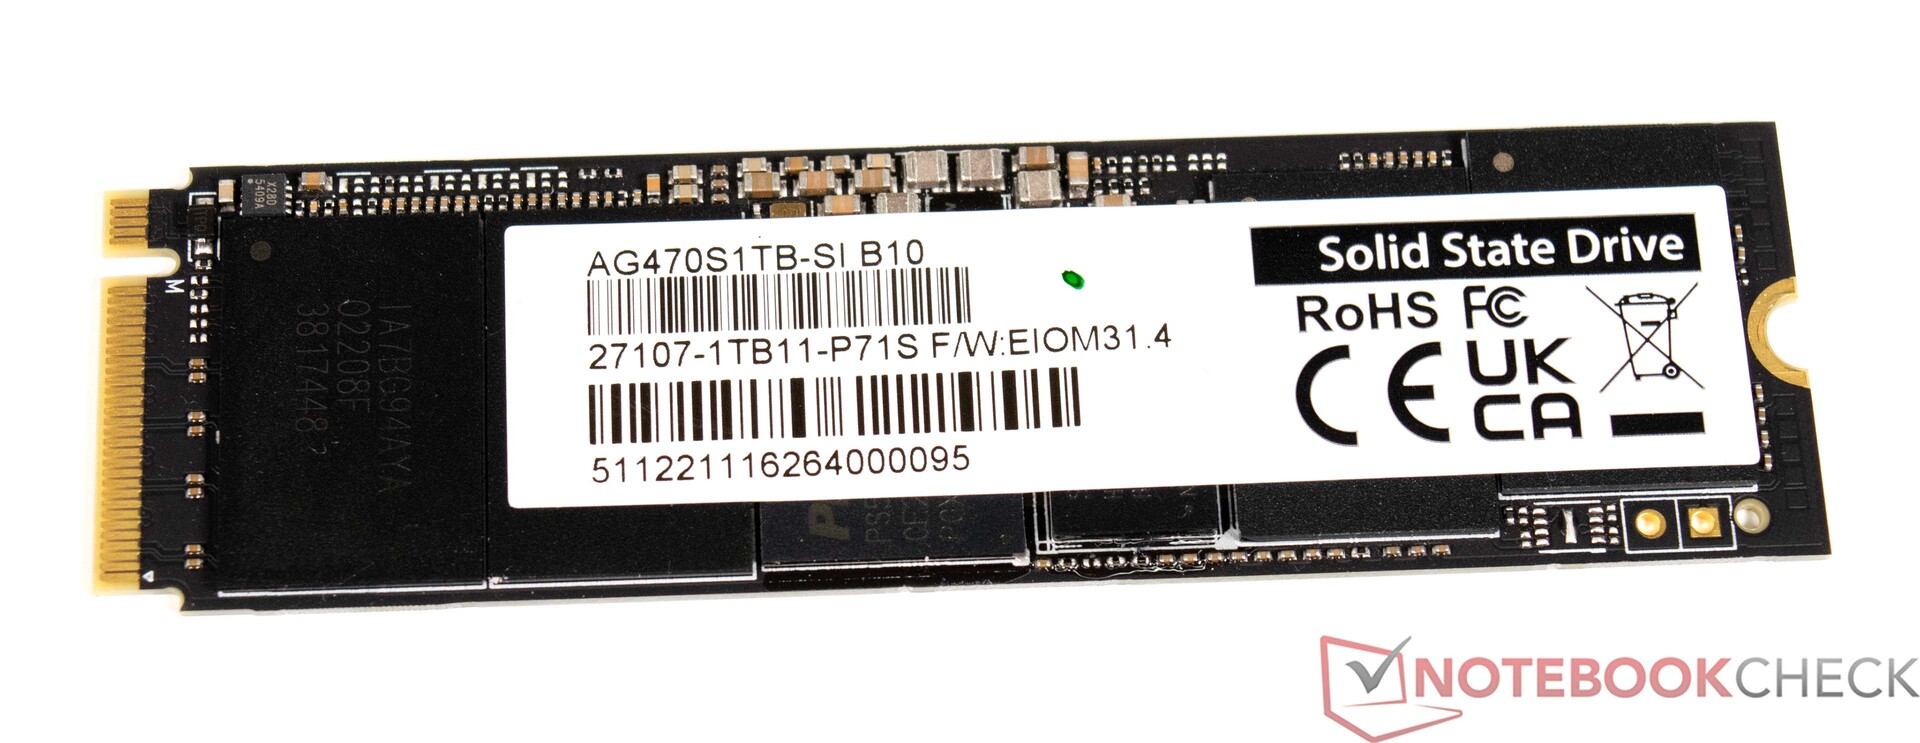
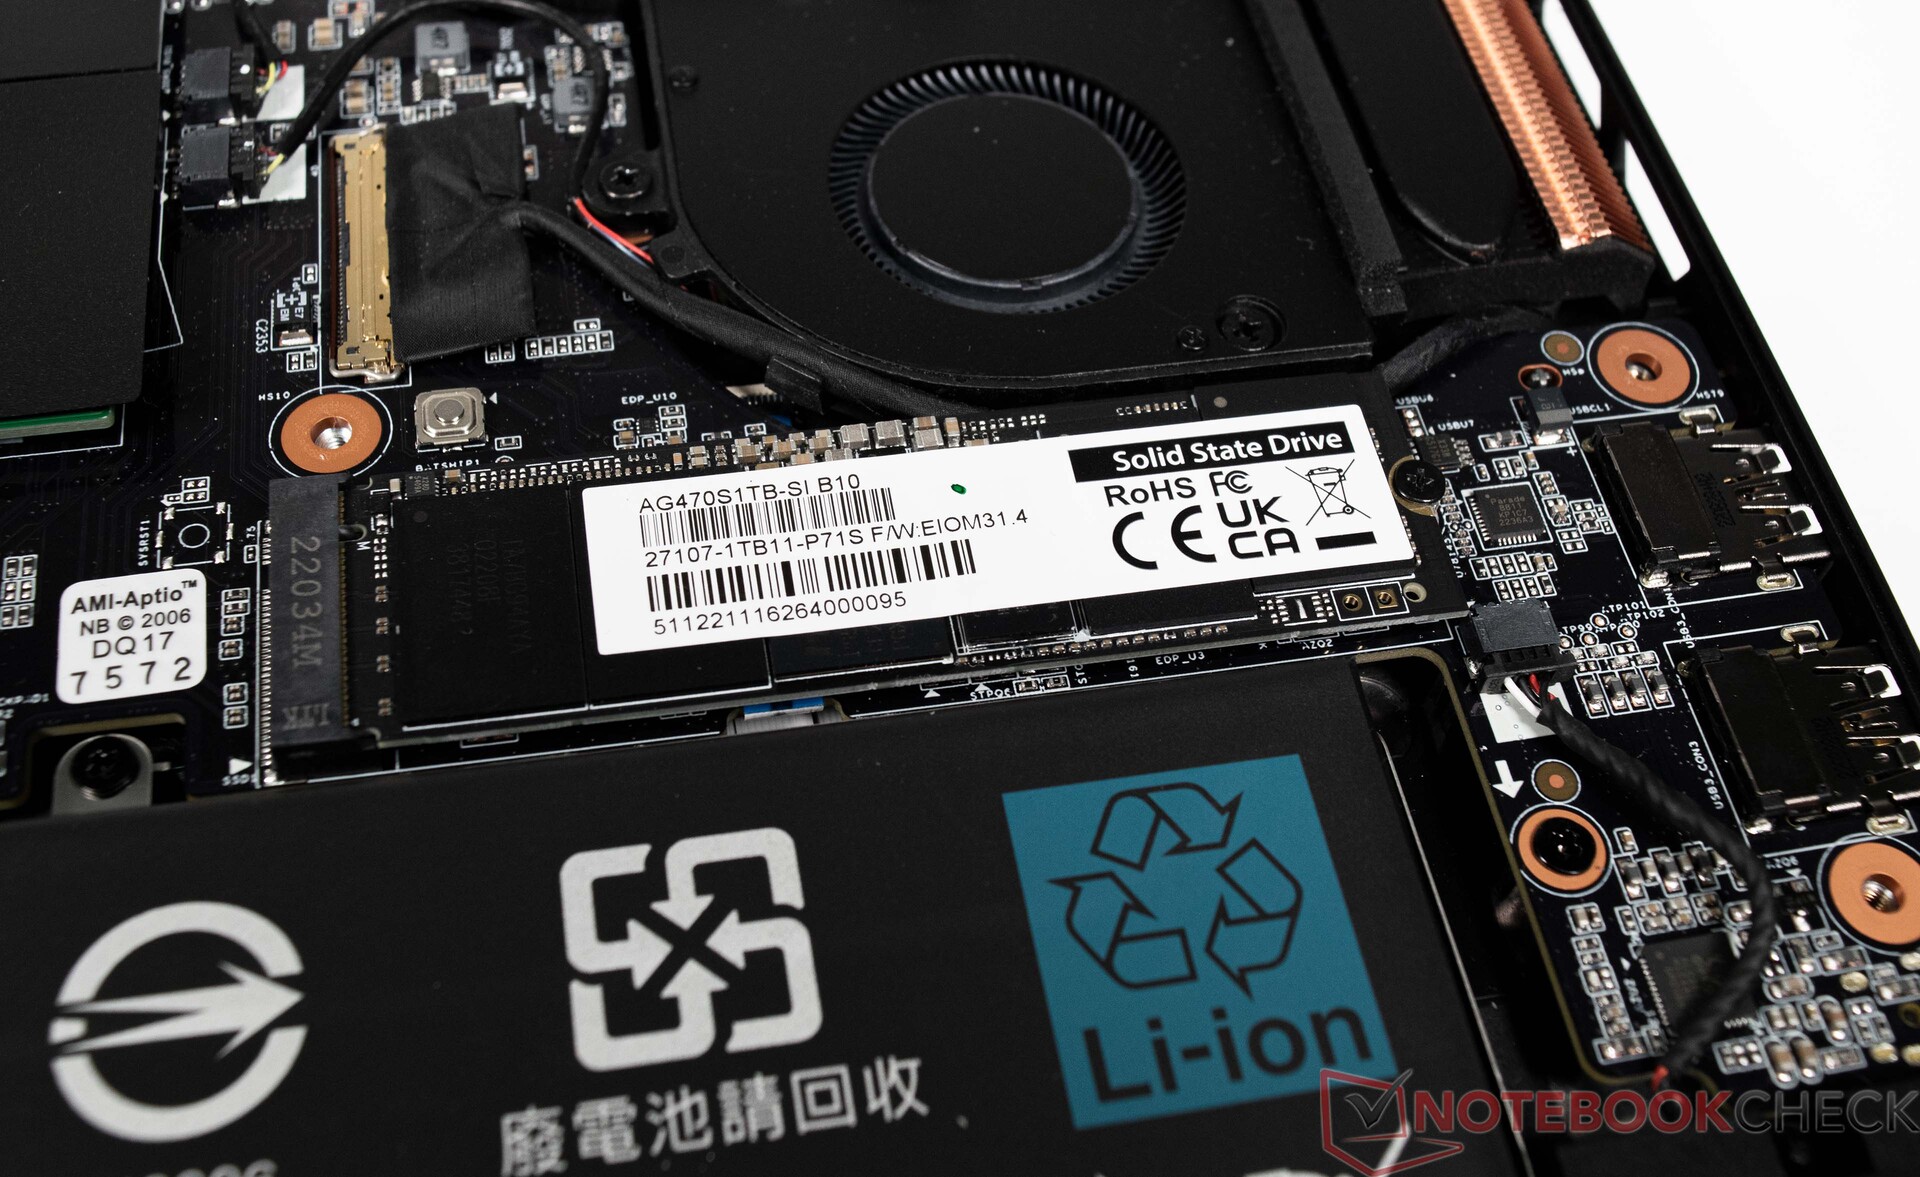
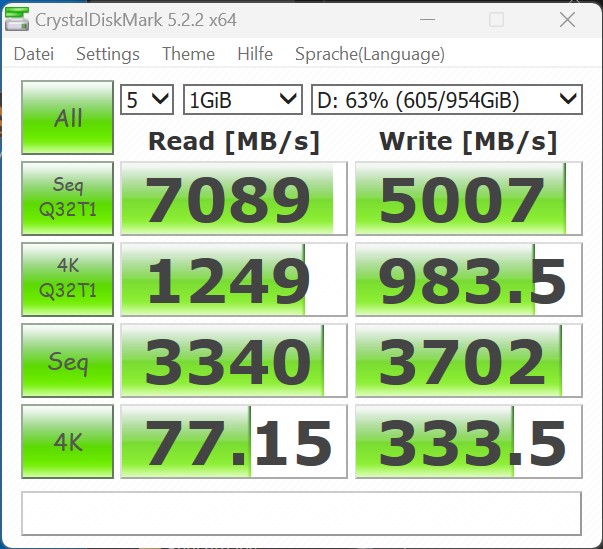
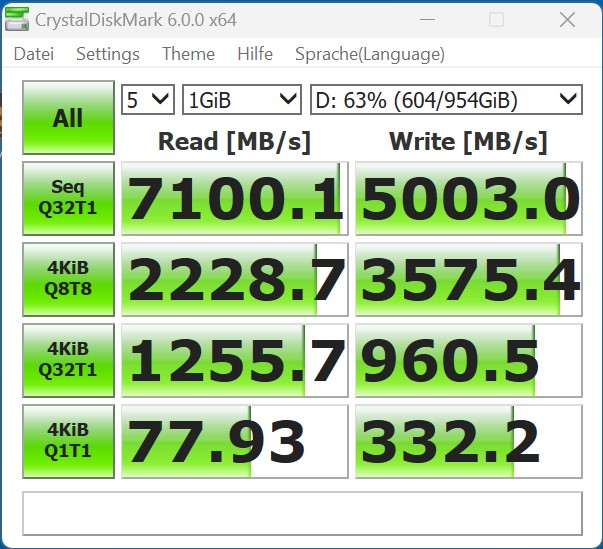
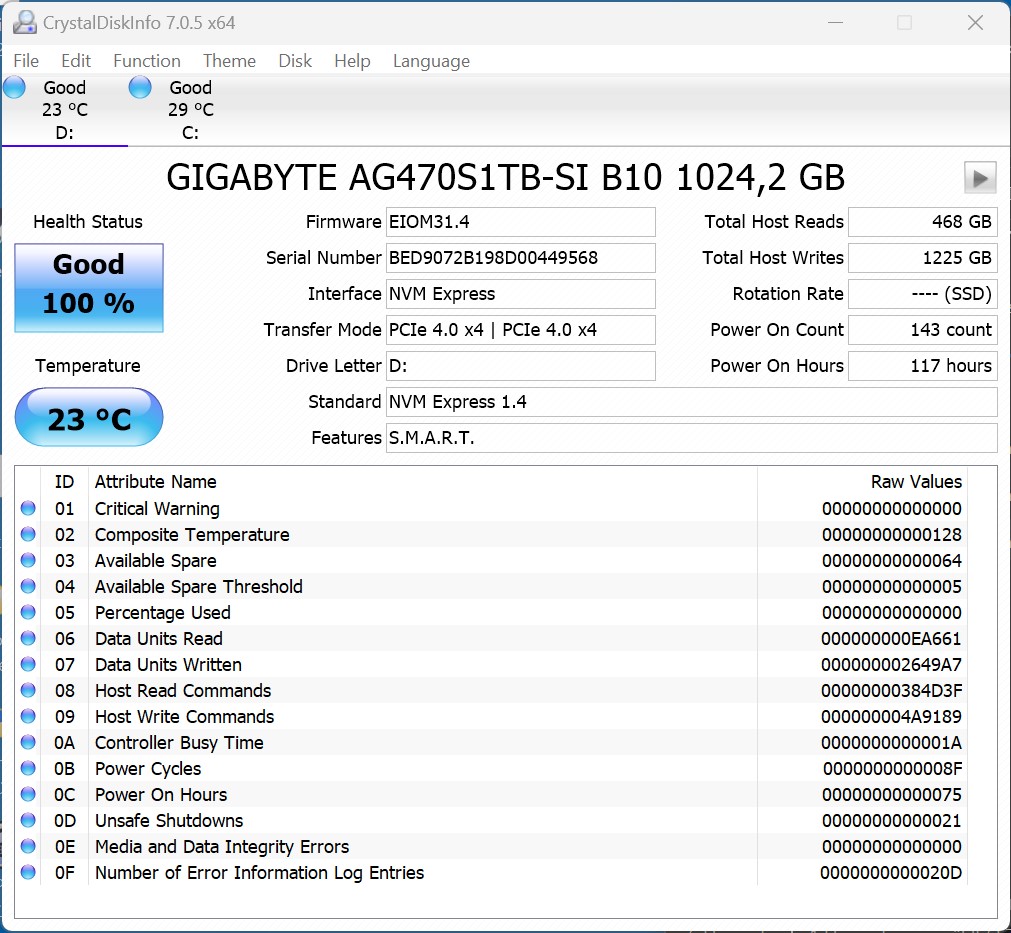
L'Aorus 17X AZF utilizza un'unità SSD interna. Per essere più precisi, la nostra unità di prova offre due SSD NVMe, ciascuna con 1 TB di spazio di archiviazione, che è adatto per lo scopo previsto. Sui due dispositivi di archiviazione di massa è possibile memorizzare una grande quantità di dati. Le due unità supportano il protocollo PCIe 4.0 e sono collegate all'intera larghezza di banda con quattro corsie. Le prestazioni sono solide, anche se diversi dispositivi di confronto mostrano prestazioni migliori in alcuni casi. Tuttavia, l'Aorus 17X AZF è già completamente equipaggiato con due SSD. In alternativa, è possibile installare nel dispositivo anche modelli da 2 TB. Nel frattempo, la parte inferiore del case è utilizzata per un raffreddamento efficace, quindi il dispositivo ha superato il nostro stress test a pieni voti.
Per ulteriori confronti e benchmark, facciamo riferimento al nostrotabella di confronto qui.
SSD 1
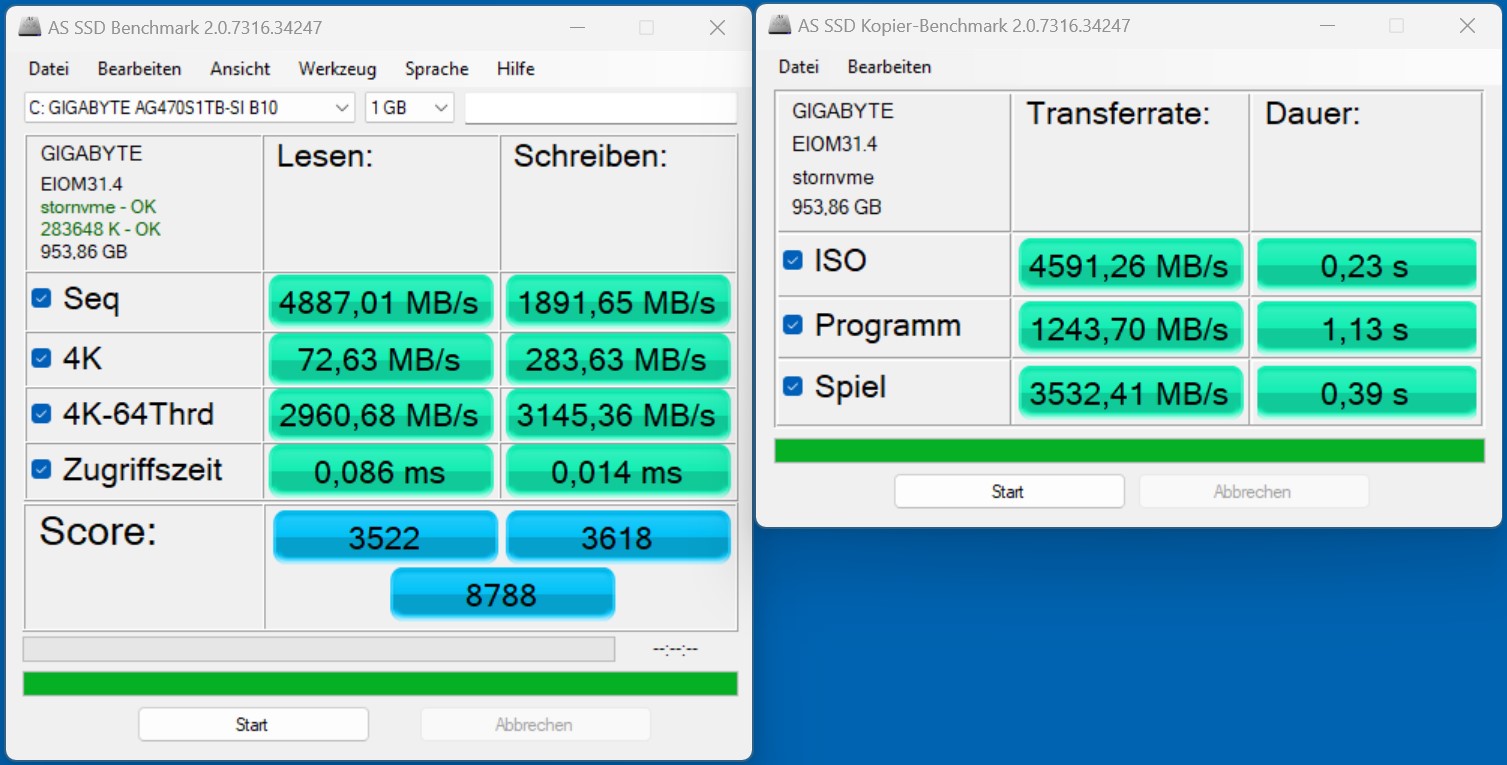
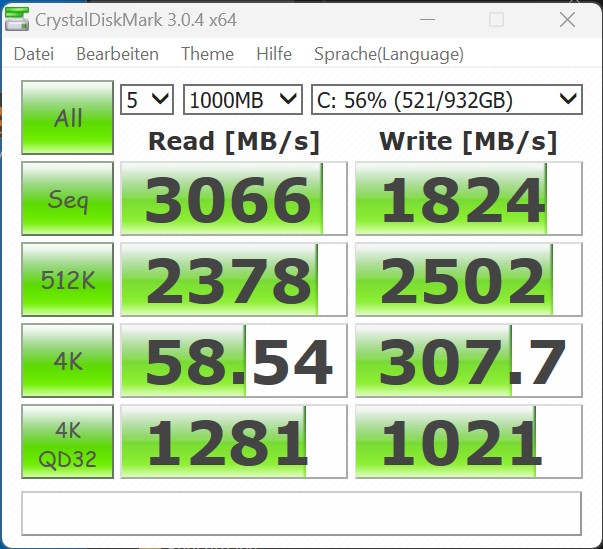

SSD 2

* ... Meglio usare valori piccoli
Sustained Read Performance: DiskSpd Read Loop, Queue Depth 8
Scheda grafica
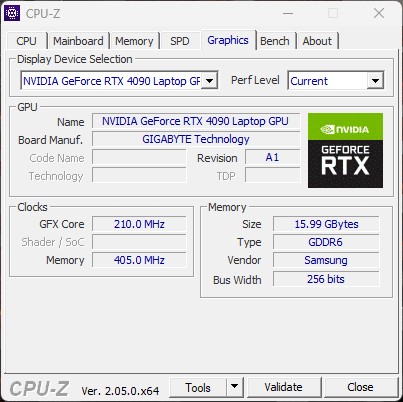
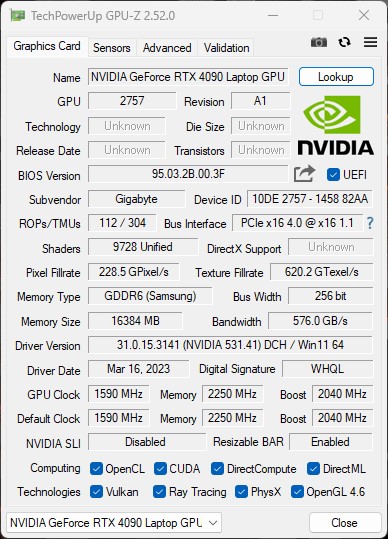
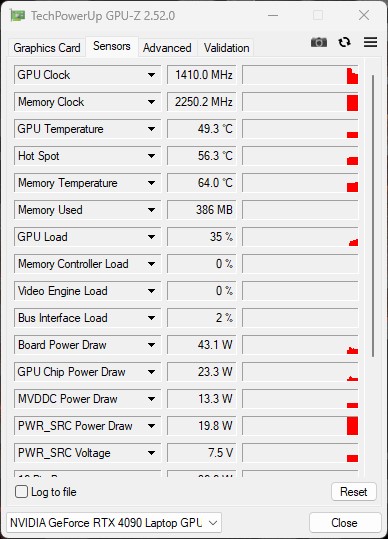
L'Aorus 17X AZF utilizza unaGPU per computer portatili Nvidia GeForce RTX 4090che ha un TGP massimo possibile di 175 watt (150 watt + 25 watt di Dynamic Boost). Le prestazioni 3D sono altrettanto buone, anche se i portatili della concorrenza con la stessa scheda grafica riescono a ottenere prestazioni leggermente superiori. Il divario con la GPU per laptop Nvidia GeForce RTX 4080 è notevolmente maggiore, rispettivamente del 9 e del 18%. Rispetto al Medion Erazer Beast, vediamo praticamente le stesse prestazioni nel nostro Aorus 17X AZF.
Altri benchmark per la GPU Nvidia GeForce RTX 4090 per laptop sono disponibili qui.
| 3DMark 05 Standard | 61850 punti | |
| 3DMark 06 Standard Score | 61681 punti | |
| 3DMark 11 Performance | 43896 punti | |
| 3DMark Ice Storm Standard Score | 247981 punti | |
| 3DMark Cloud Gate Standard Score | 58934 punti | |
| 3DMark Fire Strike Score | 35428 punti | |
| 3DMark Fire Strike Extreme Score | 24235 punti | |
| 3DMark Time Spy Score | 20085 punti | |
Aiuto | ||
* ... Meglio usare valori piccoli
Prestazioni di gioco
Il notebook è dotato di un display QHD, il che significa che tutti i titoli attuali possono essere riprodotti al massimo dei dettagli senza problemi. A volte le prestazioni dellaGPU Nvidia GeForce RTX 4090 per notebookpossono facilmente alimentare display esterni 4K a risoluzione nativa. La VRAM da 16 GB è buona, a prova di futuro e non rappresenta un collo di bottiglia, anche in QHD. Nei nostri test di gioco, l'Aorus 17X AZF occupa un solido terzo posto. Tutti i rappresentanti che utilizzano la GPU per laptop Nvidia GeForce RTX 4090offrono prestazioni simili.
| Performance rating - Percent | |
| Alienware m18 R1 | |
| MSI Titan GT77 HX 13VI | |
| Aorus 17X AZF | |
| Medion Erazer Beast X40 | |
| MSI GE78HX 13VH-070US | |
| HP Omen 17-ck2097ng | |
| Media della classe Gaming | |
| The Witcher 3 - 1920x1080 Ultra Graphics & Postprocessing (HBAO+) | |
| Alienware m18 R1 | |
| Aorus 17X AZF | |
| MSI Titan GT77 HX 13VI | |
| Media della classe Gaming (104.7 - 240, n=7, ultimi 2 anni) | |
| Medion Erazer Beast X40 | |
| MSI GE78HX 13VH-070US | |
| HP Omen 17-ck2097ng | |
| GTA V - 1920x1080 Highest AA:4xMSAA + FX AF:16x | |
| Medion Erazer Beast X40 | |
| Alienware m18 R1 | |
| MSI Titan GT77 HX 13VI | |
| Aorus 17X AZF | |
| Media della classe Gaming (48.3 - 186.9, n=94, ultimi 2 anni) | |
| HP Omen 17-ck2097ng | |
| MSI GE78HX 13VH-070US | |
| Final Fantasy XV Benchmark - 1920x1080 High Quality | |
| Alienware m18 R1 | |
| MSI Titan GT77 HX 13VI | |
| Aorus 17X AZF | |
| Medion Erazer Beast X40 | |
| Media della classe Gaming (41 - 215, n=95, ultimi 2 anni) | |
| MSI GE78HX 13VH-070US | |
| HP Omen 17-ck2097ng | |
| Strange Brigade - 1920x1080 ultra AA:ultra AF:16 | |
| Aorus 17X AZF | |
| MSI Titan GT77 HX 13VI | |
| Alienware m18 R1 | |
| Medion Erazer Beast X40 | |
| Media della classe Gaming (76.3 - 458, n=87, ultimi 2 anni) | |
| HP Omen 17-ck2097ng | |
| MSI GE78HX 13VH-070US | |
| Dota 2 Reborn - 1920x1080 ultra (3/3) best looking | |
| Alienware m18 R1 | |
| MSI Titan GT77 HX 13VI | |
| Aorus 17X AZF | |
| Medion Erazer Beast X40 | |
| HP Omen 17-ck2097ng | |
| Media della classe Gaming (84.8 - 248, n=107, ultimi 2 anni) | |
| MSI GE78HX 13VH-070US | |
| F1 22 - 1920x1080 Ultra High Preset AA:T AF:16x | |
| Alienware m18 R1 | |
| MSI Titan GT77 HX 13VI | |
| Aorus 17X AZF | |
| Medion Erazer Beast X40 | |
| MSI GE78HX 13VH-070US | |
| HP Omen 17-ck2097ng | |
| Media della classe Gaming (40.1 - 121.2, n=4, ultimi 2 anni) | |
| The Callisto Protocol - 1920x1080 Ultra Preset (without FSR Upscaling) | |
| MSI Titan GT77 HX 13VI | |
| Aorus 17X AZF | |
| Media NVIDIA GeForce RTX 4090 Laptop GPU (102.6 - 150.7, n=6) | |
| Media NVIDIA GeForce RTX 4080 Laptop GPU (111.5 - 120.4, n=2) | |
| HP Omen 17-ck2097ng | |
| Atomic Heart - 1920x1080 Atomic Preset | |
| Media NVIDIA GeForce RTX 4090 Laptop GPU (128.6 - 166, n=3) | |
| Aorus 17X AZF | |
| Medion Erazer Beast X40 | |
| HP Omen 17-ck2097ng | |
| Media NVIDIA GeForce RTX 4080 Laptop GPU (n=1) | |
| Company of Heroes 3 - 1920x1080 Maximum Settings | |
| Aorus 17X AZF | |
| Media NVIDIA GeForce RTX 4090 Laptop GPU (215 - 235, n=2) | |
| Medion Erazer Beast X40 | |
| HP Omen 17-ck2097ng | |
| Media NVIDIA GeForce RTX 4080 Laptop GPU (n=1) | |
| Dead Space Remake - 1920x1080 Ultra Preset AA:T | |
| Aorus 17X AZF | |
| Media NVIDIA GeForce RTX 4090 Laptop GPU (129 - 140.8, n=2) | |
| MSI Titan GT77 HX 13VI | |
| Media NVIDIA GeForce RTX 4080 Laptop GPU (n=1) | |
| Media della classe Gaming (n=1ultimi 2 anni) | |
| Tiny Tina's Wonderlands - 1920x1080 Badass Preset (DX12) | |
| Alienware m18 R1 | |
| MSI Titan GT77 HX 13VI | |
| Media NVIDIA GeForce RTX 4090 Laptop GPU (141.1 - 189.4, n=14) | |
| Aorus 17X AZF | |
| Media NVIDIA GeForce RTX 4080 Laptop GPU (112.9 - 167.1, n=9) | |
| Media della classe Gaming (55 - 159.4, n=4, ultimi 2 anni) | |
| High On Life - 1920x1080 Very High Preset | |
| Aorus 17X AZF | |
| Media NVIDIA GeForce RTX 4090 Laptop GPU (180.3 - 185.2, n=2) | |
| Media NVIDIA GeForce RTX 4080 Laptop GPU (n=1) | |
| The Witcher 3 / High Graphics & Postprocessing (Nvidia HairWorks Off) | |
| Alienware m18 R1 | |
| MSI Titan GT77 HX 13VI | |
| Aorus 17X AZF | |
| MSI GE78HX 13VH-070US | |
| Media NVIDIA GeForce RTX 4090 Laptop GPU (290 - 449, n=23) | |
| Media della classe Gaming (341 - 404, n=2, ultimi 2 anni) | |
| Medion Erazer Beast X40 | |
| HP Omen 17-ck2097ng | |
| The Witcher 3 / Ultra Graphics & Postprocessing (HBAO+) | |
| Alienware m18 R1 | |
| Aorus 17X AZF | |
| MSI Titan GT77 HX 13VI | |
| Media NVIDIA GeForce RTX 4090 Laptop GPU (139.2 - 216, n=35) | |
| Media della classe Gaming (104.7 - 240, n=7, ultimi 2 anni) | |
| Medion Erazer Beast X40 | |
| MSI GE78HX 13VH-070US | |
| HP Omen 17-ck2097ng | |
Per verificare se la frequenza dei fotogrammi rimane stabile e costante per un periodo di tempo più lungo, abbiamo eseguito "The Witcher 3" per 60 minuti alla risoluzione Full HD e con i dettagli al massimo. Il personaggio del gioco non è stato spostato. La frequenza di aggiornamento è costante, come mostra il grafico.
Witcher 3 FPS chart
| basso | medio | alto | ultra | QHD | 4K | |
|---|---|---|---|---|---|---|
| GTA V (2015) | 187 | 186.1 | 182.2 | 135.3 | 132.9 | 174.3 |
| The Witcher 3 (2015) | 554.3 | 506.7 | 395.8 | 200 | 145.9 | |
| Dota 2 Reborn (2015) | 235.6 | 199.8 | 191.6 | 176.1 | 175.75 | |
| Final Fantasy XV Benchmark (2018) | 222 | 205 | 177.6 | 152.4 | 89.9 | |
| X-Plane 11.11 (2018) | 195.9 | 173.5 | 138.5 | 118.5 | ||
| Far Cry 5 (2018) | 186 | 170 | 161 | 162 | 152 | 98 |
| Strange Brigade (2018) | 527 | 441 | 414 | 386 | 300 | 154.6 |
| Shadow of the Tomb Raider (2018) | 247 | 219 | 210 | 198.6 | 162.5 | 95.2 |
| Far Cry New Dawn (2019) | 170 | 148 | 145 | 131 | 128 | 102 |
| Metro Exodus (2019) | 187.7 | 160.6 | 134.5 | 112.9 | 98 | 68.6 |
| Borderlands 3 (2019) | 208 | 182.1 | 163.6 | 146.5 | 115.8 | 67.9 |
| F1 2020 (2020) | 413 | 354 | 344 | 305 | 253 | 148.7 |
| F1 2021 (2021) | 466 | 421 | 356 | 204 | 182.7 | 107.8 |
| Far Cry 6 (2021) | 175.7 | 154.3 | 136.3 | 128.9 | 115.1 | 73.1 |
| God of War (2022) | 176.8 | 176.7 | 166.8 | 123.6 | 101.5 | 72.7 |
| GRID Legends (2022) | 227 | 209 | 190.1 | 183.2 | 178.9 | 128.6 |
| Tiny Tina's Wonderlands (2022) | 320 | 263 | 194 | 158.3 | 112.5 | 65.7 |
| F1 22 (2022) | 315 | 299 | 283 | 128.9 | 83.5 | 43 |
| The Callisto Protocol (2022) | 193.3 | 168.2 | 166.4 | 131.1 | 101.3 | 61.6 |
| High On Life (2023) | 277 | 246 | 211 | 185.2 | 126.1 | 56.9 |
| Dead Space Remake (2023) | 153.4 | 150.7 | 142.3 | 140.8 | 105.6 | 56.2 |
| Hogwarts Legacy (2023) | 116 | 100.7 | 93.7 | 89.7 | 80.9 | 50.5 |
| Returnal (2023) | 195 | 191 | 176 | 155 | 119 | 70 |
| Atomic Heart (2023) | 217 | 187.1 | 166.6 | 138.5 | 107.8 | 62.7 |
| Company of Heroes 3 (2023) | 308.5 | 280.4 | 239.6 | 235.2 | 194.8 | 117.4 |
| Resident Evil 4 Remake (2023) | 232 | 189.7 | 187.3 | 136.3 | 109.2 | 63.4 |
| The Last of Us (2023) | 113.7 | 110.8 | 109 | 105 | 81.8 | 43.8 |
Emissioni - L'Aorus 17X AZF può anche essere silenzioso
Rumore
Durante l'utilizzo inattivo e quotidiano (ufficio e internet), le quattro ventole girano spesso a bassa velocità. Con un massimo di 34 dB(A), l'Aorus 17X AZF è molto tollerabile. Sotto carico, può occasionalmente diventare molto rumoroso, con valori massimi di 54 dB(A) registrati nel nostro stress test. Inoltre, le ventole producono un suono ad alta frequenza, che soggettivamente rende il volume ancora più alto.
In linea di principio, l'Aorus 17X AZF consente anche un funzionamento quasi silenzioso. Ciò richiede l'uso dei profili Meeting mode o Energy-saving sleep mode, che possono essere selezionati tramite il GCC (Gigabyte Control Center). La riduzione del consumo energetico della CPU che ne deriva è comunque sufficiente per l'uso quotidiano.
Il GCC può essere utilizzato anche per controllare manualmente la ventola. Oltre ai profili predefiniti, è possibile utilizzare le proprie curve della ventola.
Rumorosità
| Idle |
| 28 / 29 / 34 dB(A) |
| Sotto carico |
| 51 / 54 dB(A) |
 | ||
30 dB silenzioso 40 dB(A) udibile 50 dB(A) rumoroso |
||
min: | ||
| Aorus 17X AZF i9-13900HX, GeForce RTX 4090 Laptop GPU | Medion Erazer Beast X40 i9-13900HX, GeForce RTX 4090 Laptop GPU | MSI GE78HX 13VH-070US i9-13950HX, GeForce RTX 4080 Laptop GPU | HP Omen 17-ck2097ng i9-13900HX, GeForce RTX 4080 Laptop GPU | MSI Titan GT77 HX 13VI i9-13950HX, GeForce RTX 4090 Laptop GPU | Alienware m18 R1 i9-13980HX, GeForce RTX 4090 Laptop GPU | |
|---|---|---|---|---|---|---|
| Noise | 4% | 7% | 4% | 1% | 16% | |
| off /ambiente * (dB) | 25 | 24 4% | 23.4 6% | 24 4% | 24.6 2% | 22.8 9% |
| Idle Minimum * (dB) | 28 | 25 11% | 24.2 14% | 31 -11% | 29.2 -4% | 23 18% |
| Idle Average * (dB) | 29 | 29 -0% | 25.6 12% | 32 -10% | 29.2 -1% | 23 21% |
| Idle Maximum * (dB) | 34 | 35 -3% | 31 9% | 33 3% | 29.2 14% | 23 32% |
| Load Average * (dB) | 51 | 51 -0% | 43.3 15% | 45 12% | 50.7 1% | 35.6 30% |
| Witcher 3 ultra * (dB) | 57 | 51 11% | 56.3 1% | 45 21% | 53.3 6% | 51.3 10% |
| Load Maximum * (dB) | 54 | 53 2% | 59.1 -9% | 50 7% | 61 -13% | 56.7 -5% |
* ... Meglio usare valori piccoli
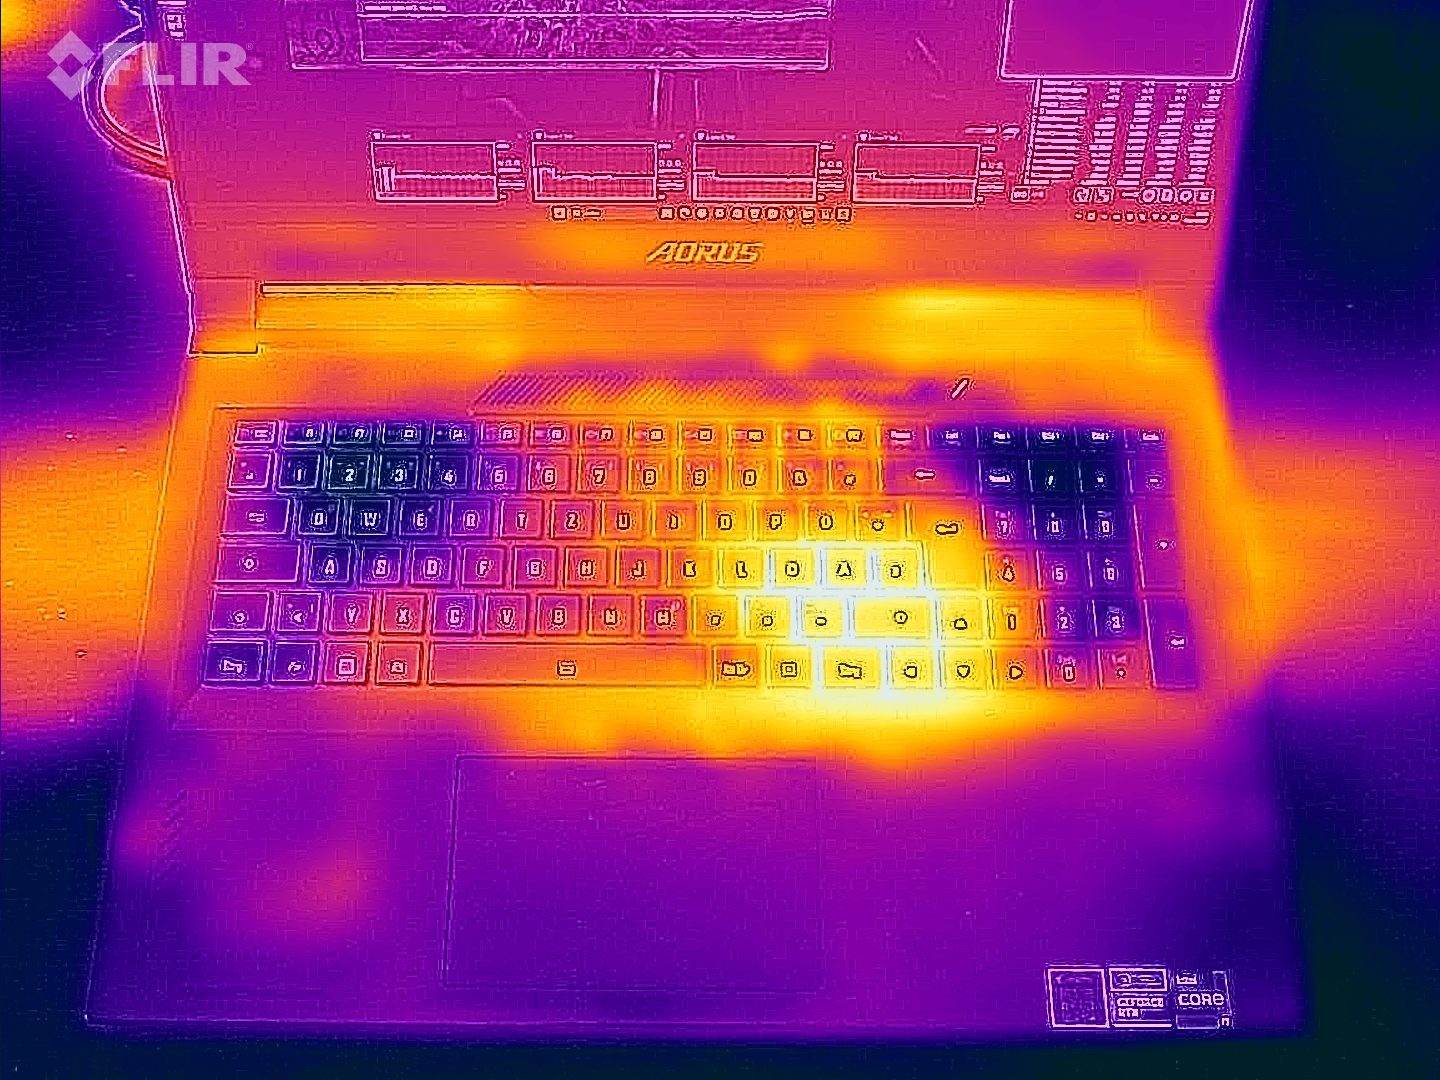
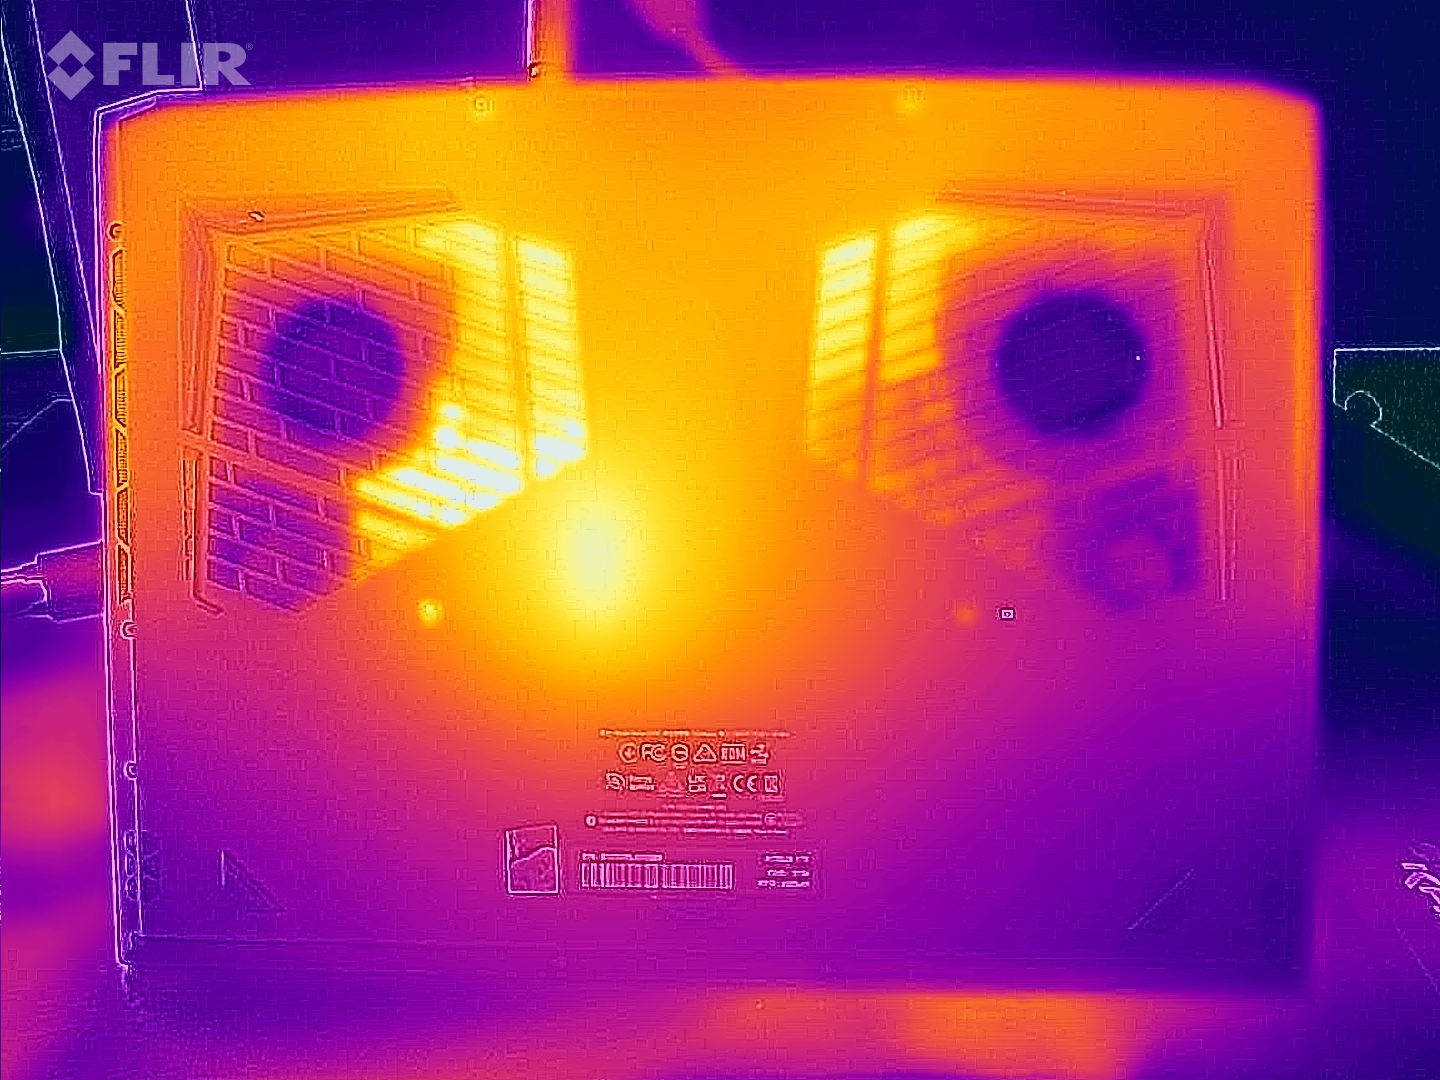
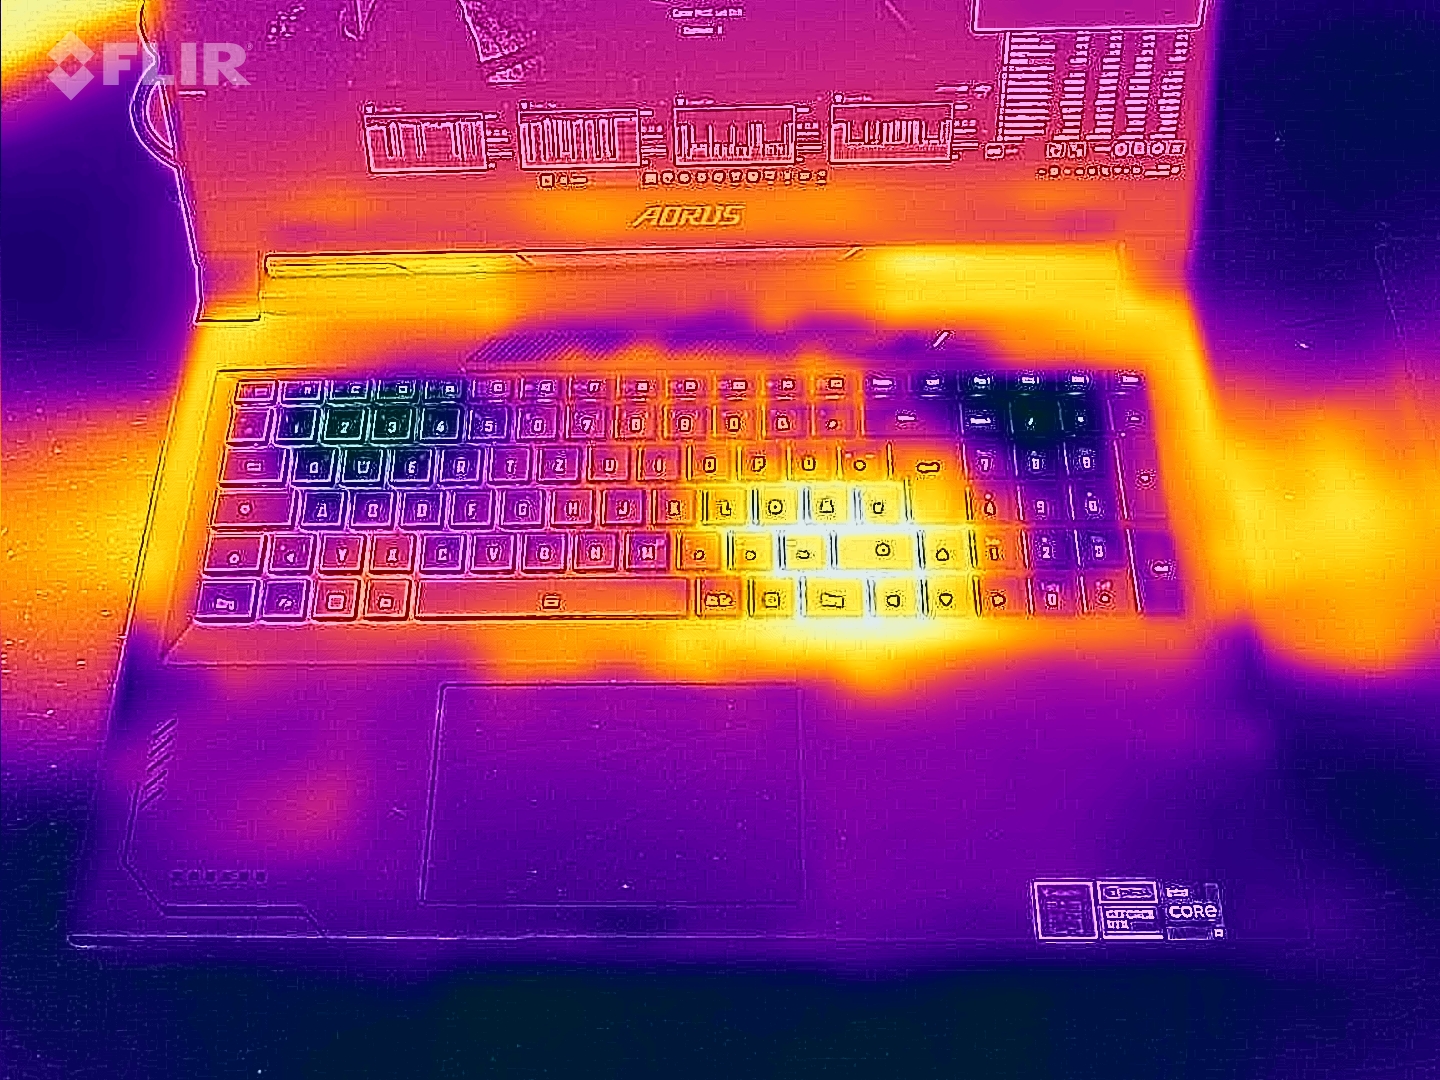
Temperatura
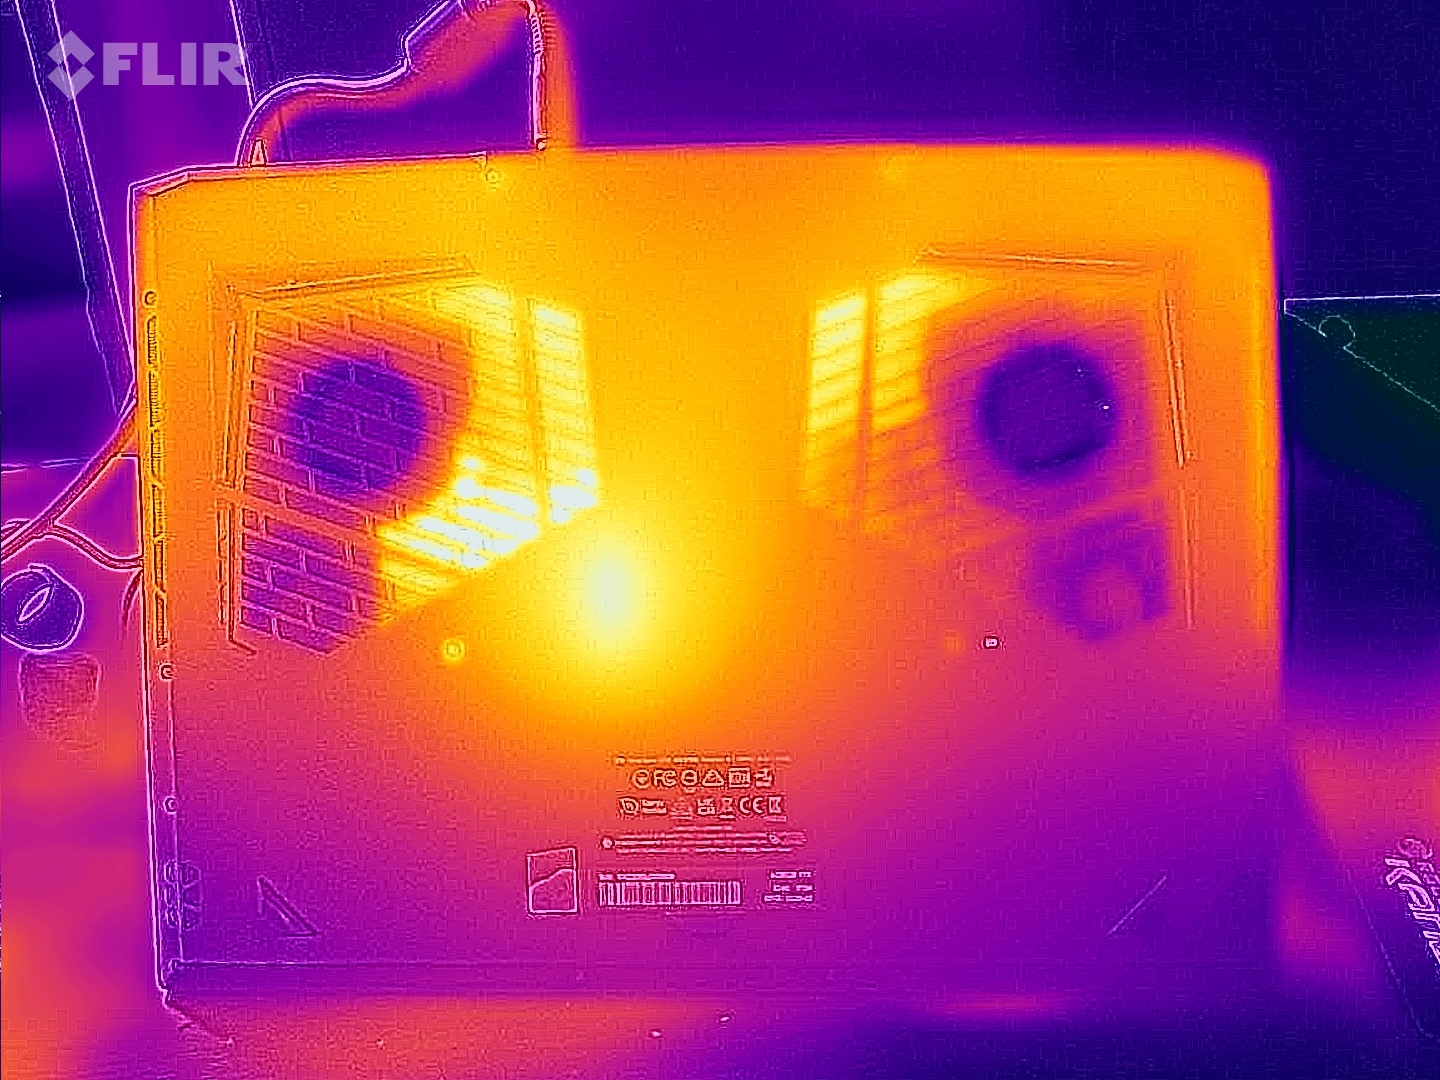
Le temperature elevate del case non sono state osservate durante il semplice utilizzo quotidiano in ufficio e su Internet. Solo sotto carico, ad esempio durante gli stress test o i giochi, il notebook si riscalda in modo significativo. Abbiamo registrato i tassi più elevati sul lato inferiore e nell'area delle uscite della ventola.
(-) La temperatura massima sul lato superiore è di 47 °C / 117 F, rispetto alla media di 40.4 °C / 105 F, che varia da 21.2 a 68.8 °C per questa classe Gaming.
(-) Il lato inferiore si riscalda fino ad un massimo di 51 °C / 124 F, rispetto alla media di 43.2 °C / 110 F
(+) In idle, la temperatura media del lato superiore è di 28.1 °C / 83 F, rispetto alla media deld ispositivo di 33.9 °C / 93 F.
(±) Riproducendo The Witcher 3, la temperatura media per il lato superiore e' di 38 °C / 100 F, rispetto alla media del dispositivo di 33.9 °C / 93 F.
(+) I poggiapolsi e il touchpad raggiungono la temperatura massima della pelle (34 °C / 93.2 F) e quindi non sono caldi.
(-) La temperatura media della zona del palmo della mano di dispositivi simili e'stata di 28.8 °C / 83.8 F (-5.2 °C / -9.4 F).
| Aorus 17X AZF Intel Core i9-13900HX, NVIDIA GeForce RTX 4090 Laptop GPU | Medion Erazer Beast X40 Intel Core i9-13900HX, NVIDIA GeForce RTX 4090 Laptop GPU | MSI GE78HX 13VH-070US Intel Core i9-13950HX, NVIDIA GeForce RTX 4080 Laptop GPU | HP Omen 17-ck2097ng Intel Core i9-13900HX, NVIDIA GeForce RTX 4080 Laptop GPU | MSI Titan GT77 HX 13VI Intel Core i9-13950HX, NVIDIA GeForce RTX 4090 Laptop GPU | Alienware m18 R1 Intel Core i9-13980HX, NVIDIA GeForce RTX 4090 Laptop GPU | |
|---|---|---|---|---|---|---|
| Heat | -1% | 7% | 13% | 12% | 15% | |
| Maximum Upper Side * (°C) | 47 | 48 -2% | 37.4 20% | 41 13% | 40.6 14% | 39 17% |
| Maximum Bottom * (°C) | 51 | 52 -2% | 45 12% | 51 -0% | 41.1 19% | 36.4 29% |
| Idle Upper Side * (°C) | 30 | 30 -0% | 29.8 1% | 24 20% | 26.2 13% | 29.2 3% |
| Idle Bottom * (°C) | 31 | 31 -0% | 32.4 -5% | 25 19% | 30.3 2% | 27.8 10% |
* ... Meglio usare valori piccoli
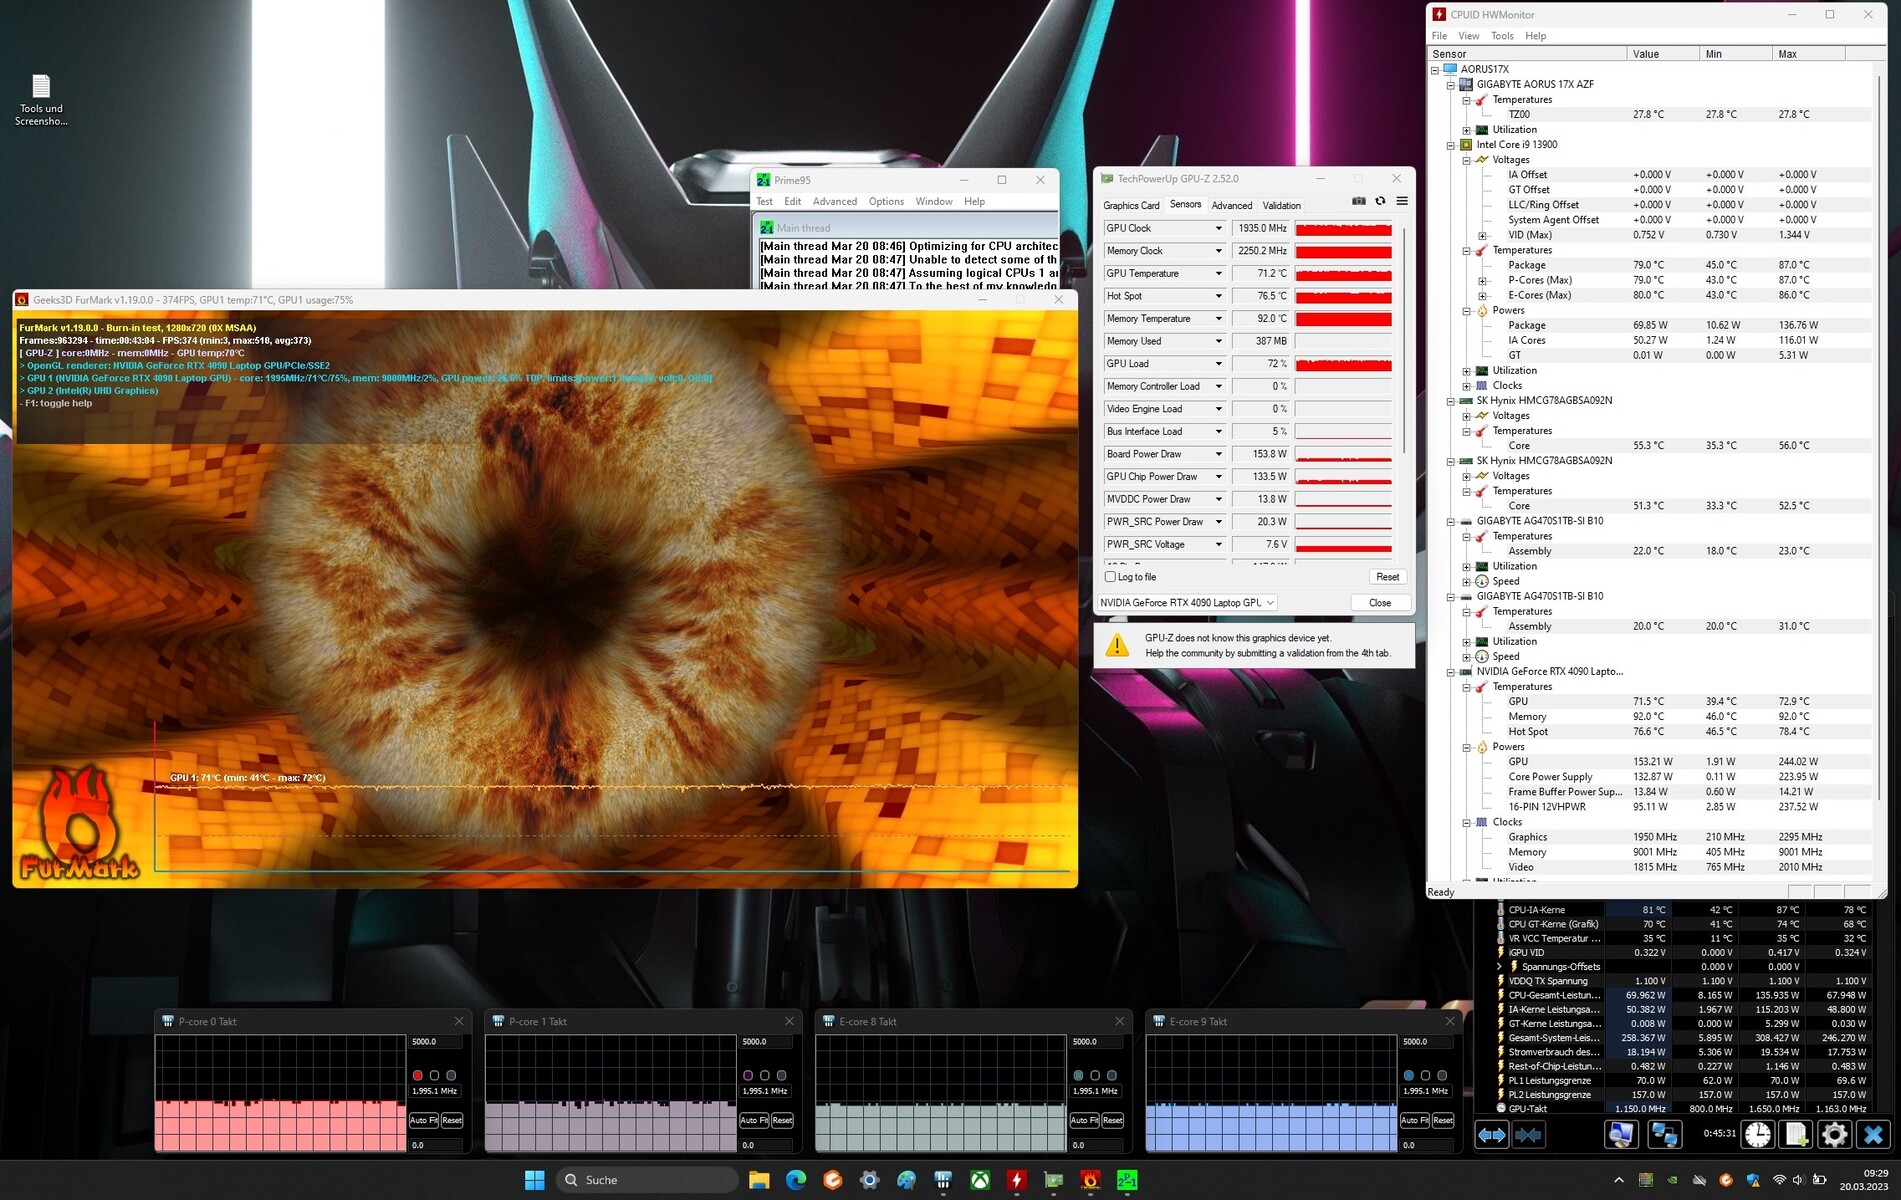
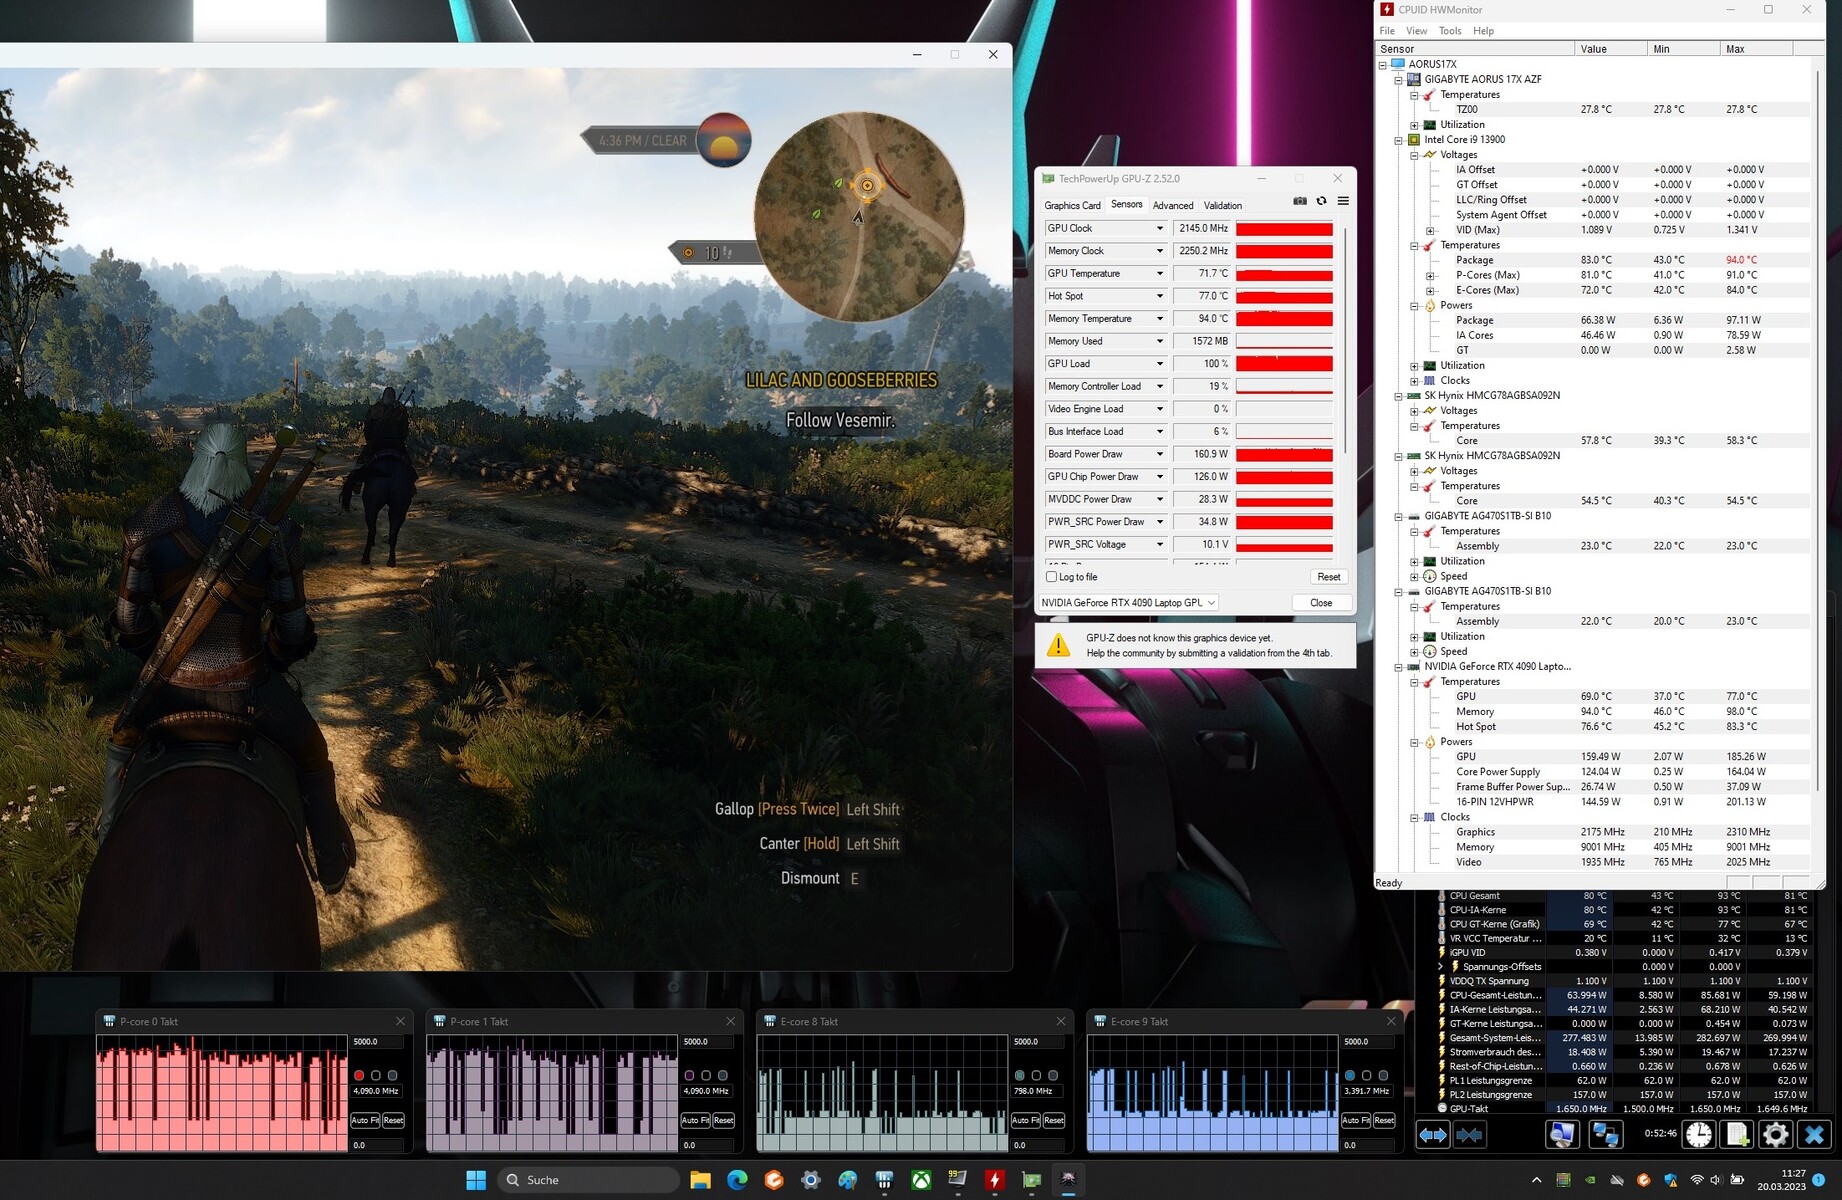
Stress test
Lo stress test, simulato con Prime95 e Furmark in funzionamento continuo, rappresenta uno scenario estremo per verificare la stabilità del sistema a pieno carico. La CPU inizia con velocità di clock elevate, che vengono ridotte dopo poco tempo perché PL2 non può essere mantenuto in modo permanente. I core P ed E del Intel Core i7 13900HX funzionano costantemente a poco meno di 2 GHz per lunghi periodi di tempo.
Altoparlanti
Gli altoparlanti stereo producono un suono solido, ma i bassi sono meno impressionanti a causa della mancanza di volume. Per una migliore esperienza sonora si consiglia di utilizzare delle cuffie o un sistema di altoparlanti esterni.
Aorus 17X AZF analisi audio
(+) | gli altoparlanti sono relativamente potenti (83 dB)
Bassi 100 - 315 Hz
(-) | quasi nessun basso - in media 27.1% inferiori alla media
(±) | la linearità dei bassi è media (13% delta rispetto alla precedente frequenza)
Medi 400 - 2000 Hz
(+) | medi bilanciati - solo only 4.5% rispetto alla media
(+) | medi lineari (5% delta rispetto alla precedente frequenza)
Alti 2 - 16 kHz
(+) | Alti bilanciati - appena 1.4% dalla media
(+) | alti lineari (4.3% delta rispetto alla precedente frequenza)
Nel complesso 100 - 16.000 Hz
(±) | la linearità complessiva del suono è media (17.9% di differenza rispetto alla media
Rispetto alla stessa classe
» 55% di tutti i dispositivi testati in questa classe è stato migliore, 9% simile, 37% peggiore
» Il migliore ha avuto un delta di 6%, medio di 18%, peggiore di 132%
Rispetto a tutti i dispositivi testati
» 37% di tutti i dispositivi testati in questa classe è stato migliore, 8% similare, 55% peggiore
» Il migliore ha avuto un delta di 4%, medio di 23%, peggiore di 134%
Medion Erazer Beast X40 analisi audio
(+) | gli altoparlanti sono relativamente potenti (88 dB)
Bassi 100 - 315 Hz
(-) | quasi nessun basso - in media 20.2% inferiori alla media
(±) | la linearità dei bassi è media (8.4% delta rispetto alla precedente frequenza)
Medi 400 - 2000 Hz
(±) | medi elevati - circa 5.5% superiore alla media
(+) | medi lineari (6.5% delta rispetto alla precedente frequenza)
Alti 2 - 16 kHz
(+) | Alti bilanciati - appena 3.1% dalla media
(+) | alti lineari (5.8% delta rispetto alla precedente frequenza)
Nel complesso 100 - 16.000 Hz
(±) | la linearità complessiva del suono è media (16.1% di differenza rispetto alla media
Rispetto alla stessa classe
» 39% di tutti i dispositivi testati in questa classe è stato migliore, 7% simile, 54% peggiore
» Il migliore ha avuto un delta di 6%, medio di 18%, peggiore di 132%
Rispetto a tutti i dispositivi testati
» 26% di tutti i dispositivi testati in questa classe è stato migliore, 5% similare, 69% peggiore
» Il migliore ha avuto un delta di 4%, medio di 23%, peggiore di 134%
Gestione dell'energia
Consumo di energia
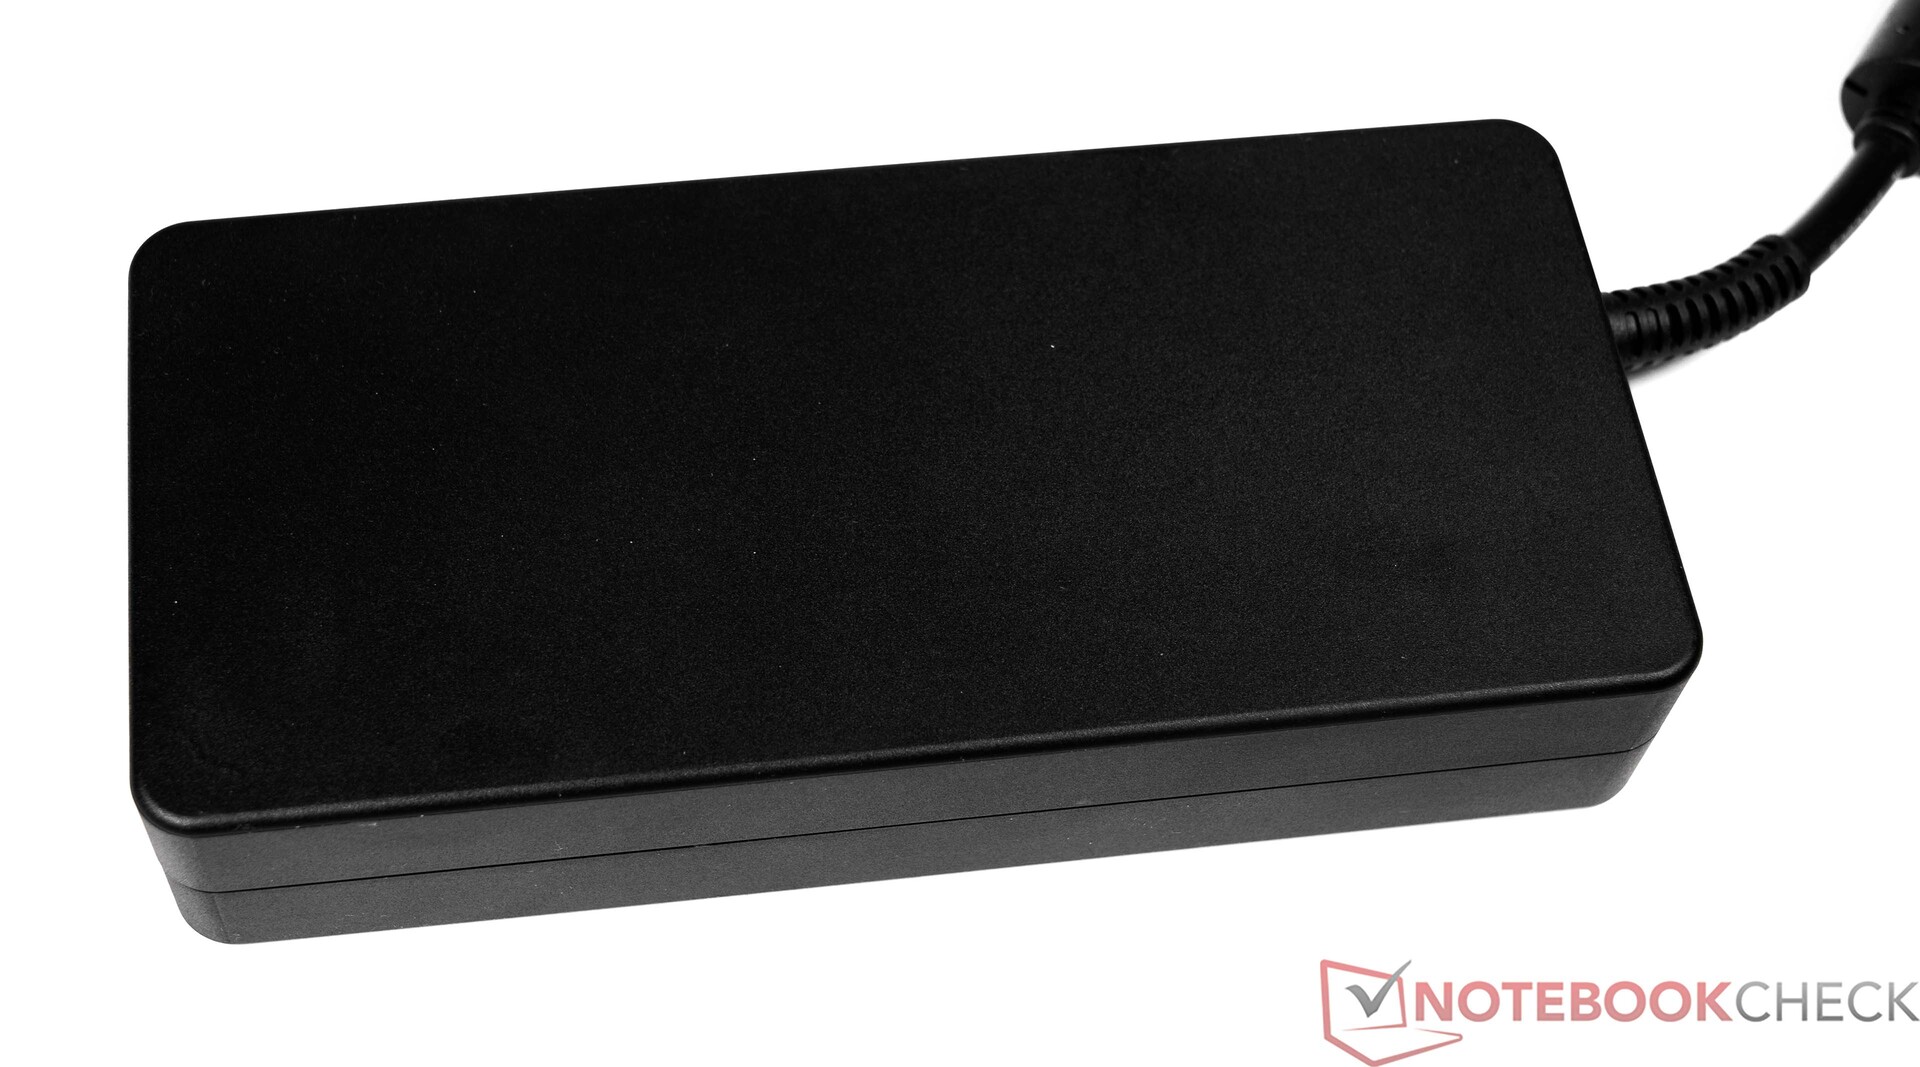
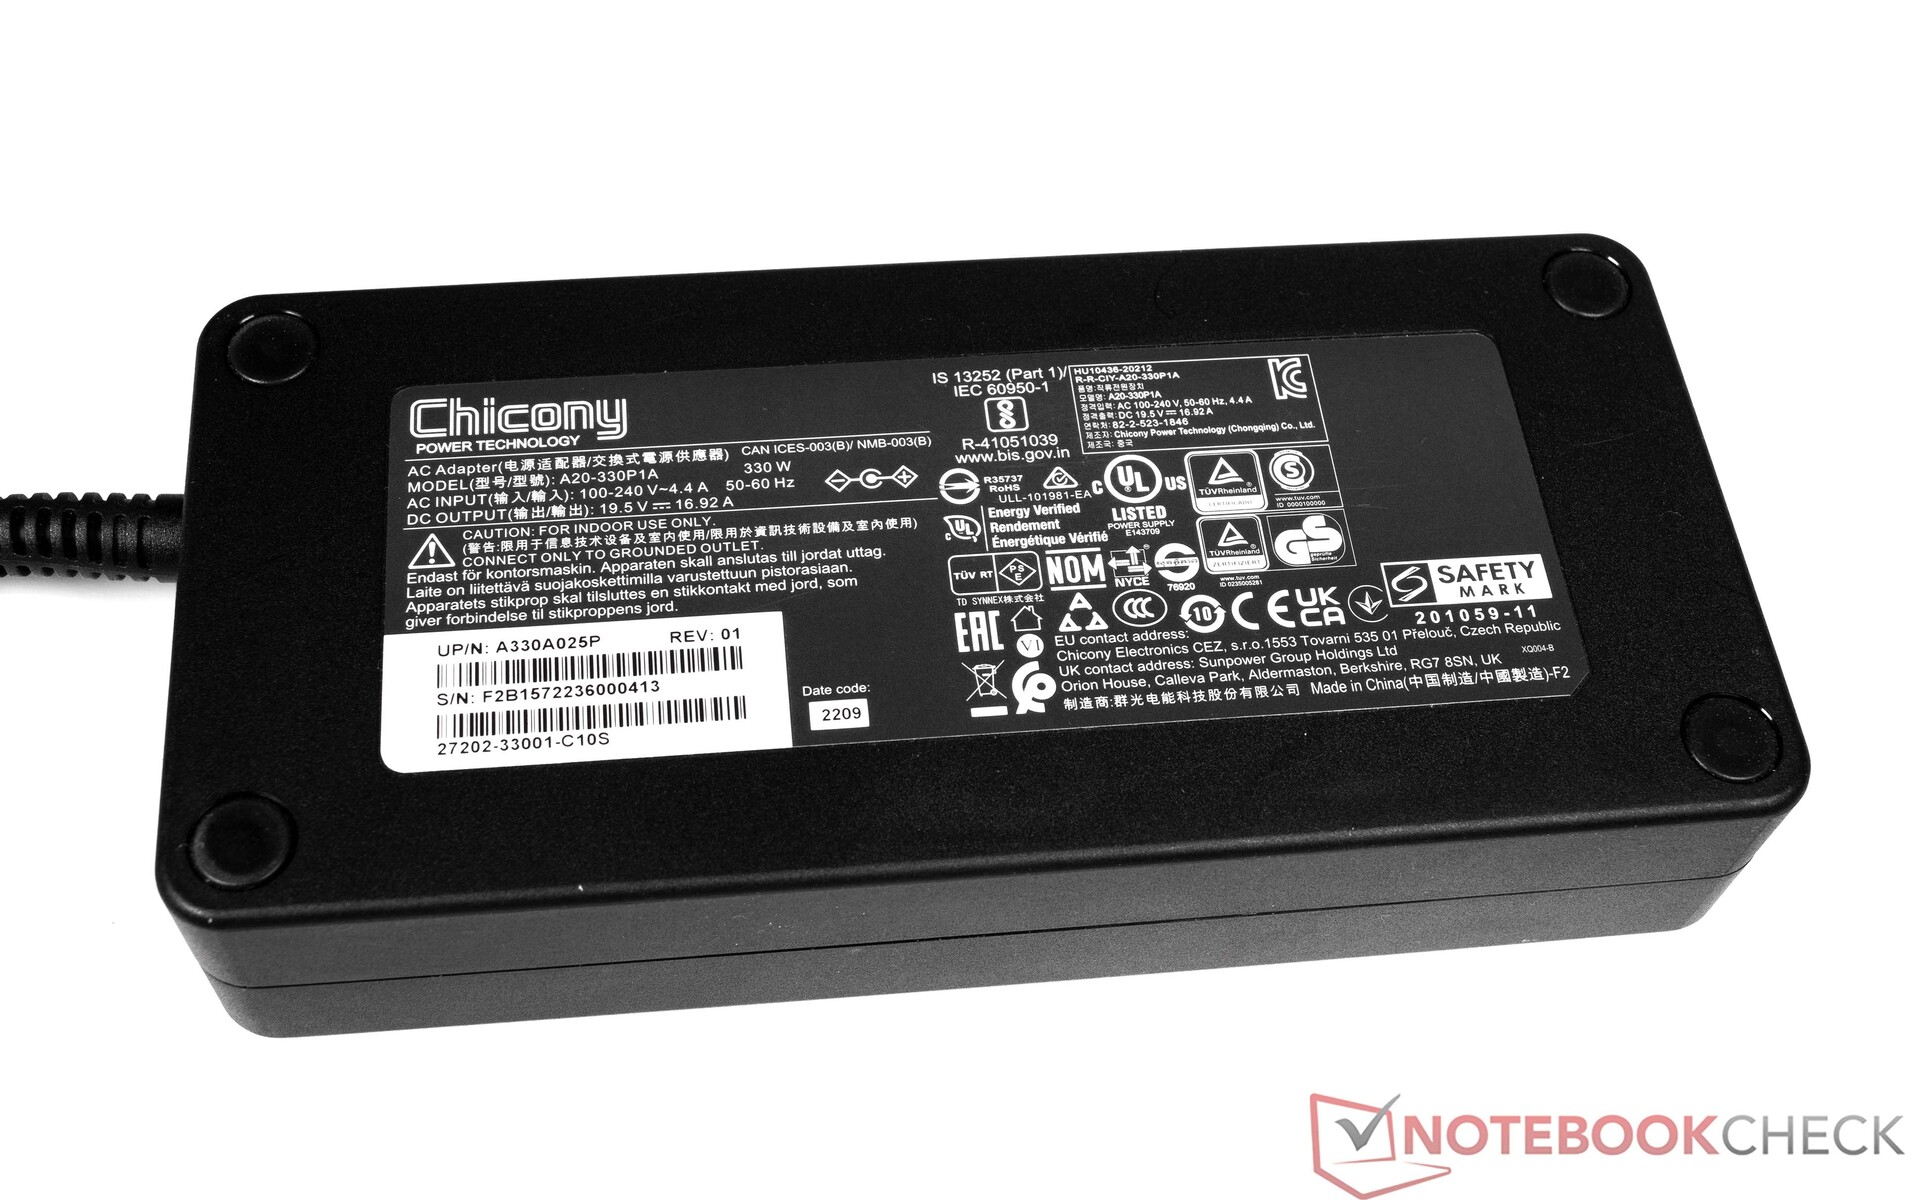
L'Aorus 17X AZF non mostra alcuna anomalia in termini di consumo energetico. I valori accertati in idle appaiono abbastanza buoni e in alcuni casi sono significativamente migliori rispetto alla concorrenza. Sotto carico i valori sono normali. L'alimentatore è sufficientemente dimensionato a 330 watt, anche se per brevi periodi sono necessari 334 watt.
| Off / Standby | |
| Idle | |
| Sotto carico |
|
Leggenda:
min: | |
| Aorus 17X AZF i9-13900HX, GeForce RTX 4090 Laptop GPU | Medion Erazer Beast X40 i9-13900HX, GeForce RTX 4090 Laptop GPU | MSI GE78HX 13VH-070US i9-13950HX, GeForce RTX 4080 Laptop GPU | HP Omen 17-ck2097ng i9-13900HX, GeForce RTX 4080 Laptop GPU | MSI Titan GT77 HX 13VI i9-13950HX, GeForce RTX 4090 Laptop GPU | Alienware m18 R1 i9-13980HX, GeForce RTX 4090 Laptop GPU | Media NVIDIA GeForce RTX 4090 Laptop GPU | Media della classe Gaming | |
|---|---|---|---|---|---|---|---|---|
| Power Consumption | -3% | -14% | -4% | -9% | -46% | -19% | 5% | |
| Idle Minimum * (Watt) | 11 | 11 -0% | 16.1 -46% | 16 -45% | 14 -27% | 21.6 -96% | 16.2 ? -47% | 13 ? -18% |
| Idle Average * (Watt) | 17 | 18 -6% | 24 -41% | 20 -18% | 21.6 -27% | 25.2 -48% | 23.1 ? -36% | 19 ? -12% |
| Idle Maximum * (Watt) | 29 | 30 -3% | 34 -17% | 26 10% | 24.8 14% | 56.7 -96% | 34.2 ? -18% | 24.6 ? 15% |
| Load Average * (Watt) | 134 | 136 -1% | 123.6 8% | 135 -1% | 122.5 9% | 164.1 -22% | 130.5 ? 3% | 110.7 ? 17% |
| Witcher 3 ultra * (Watt) | 278 | 280 -1% | 286 -3% | 215 23% | 265 5% | 311 -12% | ||
| Load Maximum * (Watt) | 334 | 363 -9% | 285.7 14% | 299 10% | 418 -25% | 338.9 -1% | 324 ? 3% | 259 ? 22% |
* ... Meglio usare valori piccoli
Power consumption Witcher 3 / Stress test
Power consumption with an external monitor
Durata della batteria
L'Aorus 17X AZF ha raggiunto tempi di esecuzione di 6:29 ore e 6:43 ore rispettivamente nel nostro test WLAN (richiamo di siti web tramite uno script) e nel test video (breve film Big Buck Bunny, codifica H.264, FHD, in loop). Si tratta di velocità accettabili, che rispecchiano la media della categoria dei portatili da gioco. Durante entrambi i test, le funzioni di risparmio energetico del portatile sono state disattivate e la luminosità del display è stata impostata a circa 150 cd/m². Nel nostro caso, questo ha significato una riduzione del 50% della luminosità.
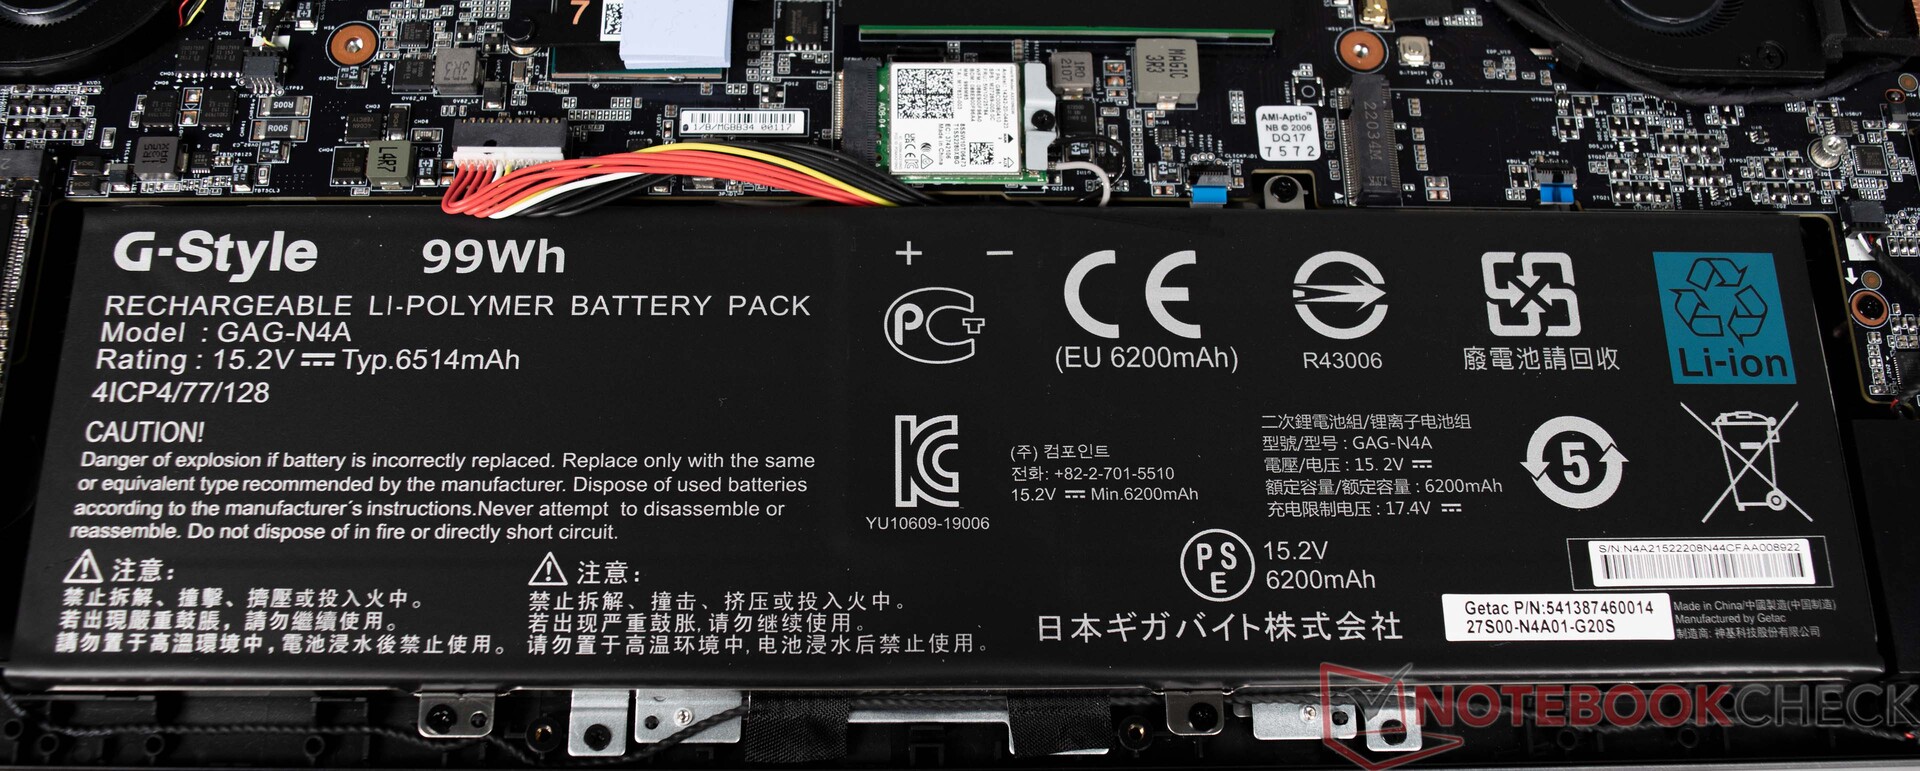
L'Aorus 17X AZF è dotato di una grande batteria da 99 Wh, che è anche il massimo per un portatile. Quasi tutti i dispositivi di confronto offrono una batteria con la stessa capacità. Solo l'HP Omen 17 deve accontentarsi di una batteria più piccola, da 83 Wh, e quindi rimane notevolmente indietro.
| Aorus 17X AZF i9-13900HX, GeForce RTX 4090 Laptop GPU, 99 Wh | Medion Erazer Beast X40 i9-13900HX, GeForce RTX 4090 Laptop GPU, 99.8 Wh | MSI GE78HX 13VH-070US i9-13950HX, GeForce RTX 4080 Laptop GPU, 99 Wh | HP Omen 17-ck2097ng i9-13900HX, GeForce RTX 4080 Laptop GPU, 83 Wh | MSI Titan GT77 HX 13VI i9-13950HX, GeForce RTX 4090 Laptop GPU, 99.9 Wh | Alienware m18 R1 i9-13980HX, GeForce RTX 4090 Laptop GPU, 97 Wh | Media della classe Gaming | |
|---|---|---|---|---|---|---|---|
| Autonomia della batteria | -1% | -18% | -44% | -20% | -46% | -1% | |
| Reader / Idle (h) | 9 | 9.4 4% | 7.3 -19% | 4.2 -53% | 5.6 -38% | 8.27 ? -8% | |
| H.264 (h) | 6.7 | 6.9 3% | 3.7 -45% | 6 -10% | 8.32 ? 24% | ||
| WiFi v1.3 (h) | 6.5 | 6.4 -2% | 6.1 -6% | 3.6 -45% | 5.3 -18% | 4.3 -34% | 7.11 ? 9% |
| Load (h) | 2.1 | 1.9 -10% | 1.5 -29% | 1.4 -33% | 1.4 -33% | 0.7 -67% | 1.502 ? -28% |
Pro
Contro
Verdetto - Una potenza mobile per il gioco senza compromessi
L'Aorus 17X AZF è un notebook da gioco progettato per esigenze estreme. Il 17 pollici è stato in grado di eseguire tutti i giochi testati senza problemi alla risoluzione nativa del display e senza perdite di qualità. Tuttavia, si è limitati a giocare a 1440p, il che va bene. Le riserve di prestazioni sono disponibili e si può accedere a display esterni 4K. LaGPU Nvidia GeForce RTX 4090 per laptop offre un'enorme quantità di prestazioni ed è in grado di mantenerle costantemente. È affiancata da un potente Intel Core-i7-13900HX. In un confronto diretto con dispositivi analoghi, tuttavia, la CPU dell'Aorus 17X AZF non è sempre in grado di affermarsi. Tuttavia, il divario non è così grande ed è improbabile che lo si noti nella vita di tutti i giorni.
Il resto dell'hardware ci piace molto: 32 GB di RAM DDR5 e un totale di 2 TB di memoria SSD costituiscono un sistema complessivamente eccellente, tanto che non sarà necessario effettuare aggiornamenti per un po' di tempo. Anche il display QHD si adatta bene al portatile ed è adatto all'editing di foto e video
D'altra parte, ci sono limitazioni nel volume, che non possono essere ignorate durante il caricamento. Anche in questo caso, il problema è comune ad altri portatili da gioco e non è unico per l'Aorus 17X AZF. Anche la connettività necessita di miglioramenti e potrebbe essere più ampia per un dispositivo da 17 pollici. Almeno il portatile dispone di una moderna connessione Thunderbolt
In termini di mobilità, l'Aorus 17X AZF è ben posizionato perché i tempi di esecuzione della batteria registrati riflettono una buona media della categoria. Il dispositivo può anche essere gestito quasi silenziosamente tramite il Gigabyte Control Center, che offre numerose opzioni di regolazione
Chi è alla ricerca di un'alternativa più economica dovrebbe dare un'occhiata all'HP Omen 17, che offre anch'esso prestazioni eccellenti a 1.440p con l'unità Nvidia RTX 4095.GPU per laptop Nvidia GeForce RTX 4080.
Prezzo e disponibilità
Gli acquirenti interessati sono invitati a controllare direttamente la pagina del prodotto corrispondente sul webstore di Gigabyte, dove è possibile trovare un elenco di rivenditori/distributori ufficiali. Negli Stati Uniti, ad esempio, l'Aorus 17X AZF è elencato sia su Amazon e Newegg al prezzo di 3.499,00 dollari (ma attualmente è esaurito su entrambe le piattaforme).
I prezzi sono aggiornati al 17.04.2023 e sono soggetti a modifiche.
Aorus 17X AZF
- 04/14/2023 v7 (old)
Sebastian Bade
Transparency
La selezione dei dispositivi da recensire viene effettuata dalla nostra redazione. Il campione di prova è stato fornito all'autore come prestito dal produttore o dal rivenditore ai fini di questa recensione. L'istituto di credito non ha avuto alcuna influenza su questa recensione, né il produttore ne ha ricevuto una copia prima della pubblicazione. Non vi era alcun obbligo di pubblicare questa recensione. In quanto società mediatica indipendente, Notebookcheck non è soggetta all'autorità di produttori, rivenditori o editori.
Ecco come Notebookcheck esegue i test
Ogni anno, Notebookcheck esamina in modo indipendente centinaia di laptop e smartphone utilizzando procedure standardizzate per garantire che tutti i risultati siano comparabili. Da circa 20 anni sviluppiamo continuamente i nostri metodi di prova e nel frattempo stabiliamo gli standard di settore. Nei nostri laboratori di prova, tecnici ed editori esperti utilizzano apparecchiature di misurazione di alta qualità. Questi test comportano un processo di validazione in più fasi. Il nostro complesso sistema di valutazione si basa su centinaia di misurazioni e parametri di riferimento ben fondati, che mantengono l'obiettività.Price comparison

