

Verdetto - Prestazioni equilibrate e portabilità
Lo ZBook X G1i 16 si colloca comodamente nel mezzo tra la serie ZBook 8, più lenta, e la serie ZBook Fury, più veloce ma più pesante. Esternamente, non è cambiato quasi nulla rispetto allo ZBook Power 16 G11 e quindi l'esperienza utente rimane identica, comprese le porte ricche di funzioni e i tasti confortevoli. Sia la durata della batteria che le prestazioni sono migliorate, ma anche il consumo energetico è leggermente superiore quando si eseguono carichi impegnativi.
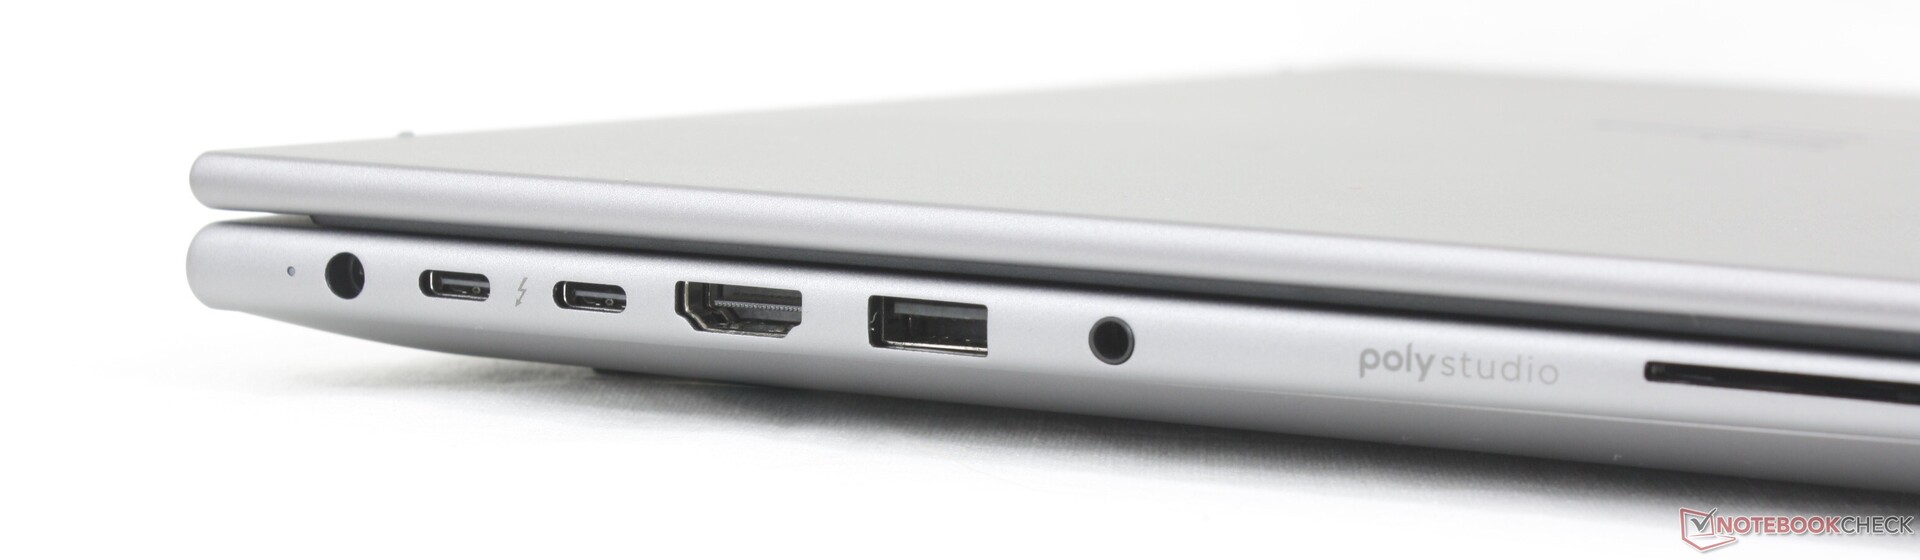
Alcune caratteristiche rimangono mancanti sulla macchina. Mentre le opzioni di CPU e GPU di fascia più alta sono fuori portata, come prevedibile, il modello manca del supporto OLED, HDR e RAM ECC, che potrebbe infastidire un piccolo sottoinsieme di utenti. Le porte sono affollate lungo il bordo sinistro, soprattutto perché non ci sono porte USB-C lungo il bordo destro. Gli utenti che amano stressare la CPU e la GPU scopriranno che il sistema non sarà più silenzioso della sua controparte di ultima generazione.
Per i modelli futuri, vorremmo vedere la serie ZBook X allontanarsi dalla ricarica proprietaria a barile CA, offrendo al contempo migliori prestazioni Turbo Boost della CPU. Il processore raggiunge abbastanza rapidamente i 100 C quando viene sollecitato, il che suggerisce che una soluzione di raffreddamento più potente potrebbe essere utile.
Pro
Contro
Prezzo e disponibilità
La configurazione recensita è in vendita su HP.com al prezzo di 2900 dollari, insieme a molte altre opzioni. La configurazione con Core Ultra 9 e 2400p è disponibile su Amazon a 3500 dollari.
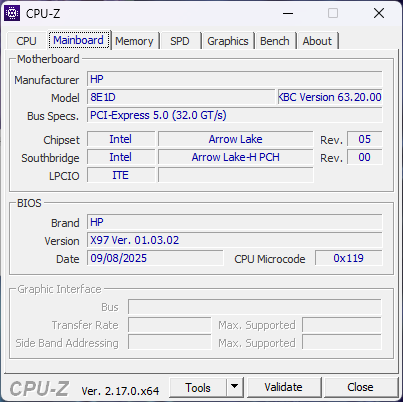
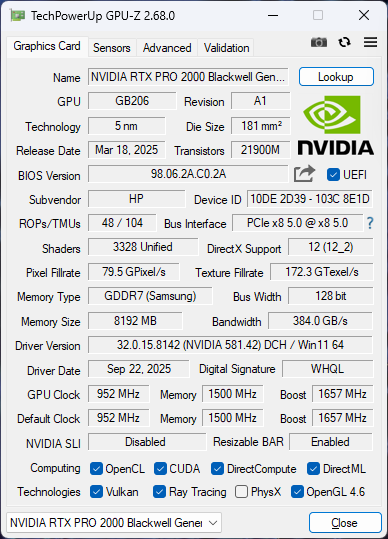
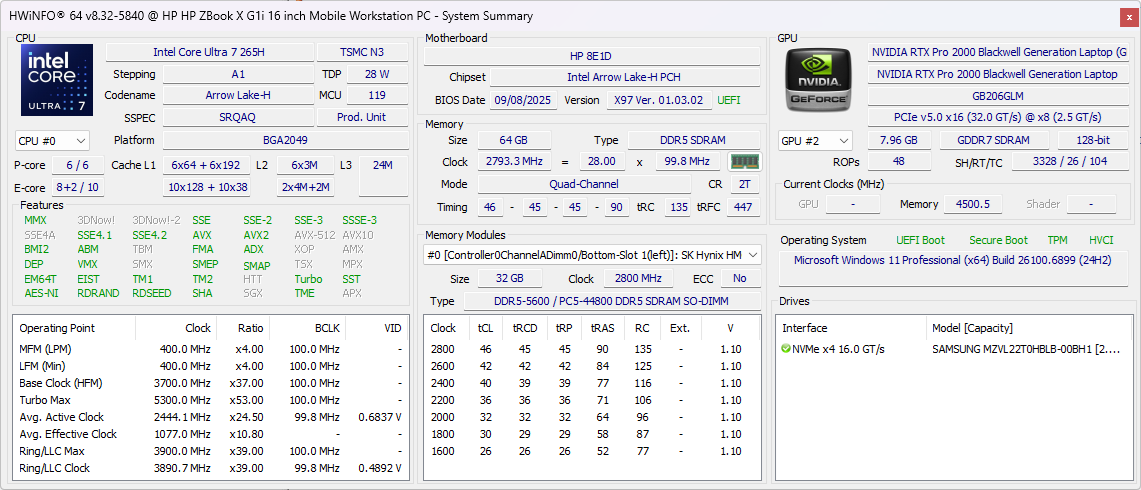
HP ZBook X G1i 16 è una workstation mobile ultrasottile con processori Arrow Lake-H di fascia media e grafica GPU Nvidia RTX Pro Blackwell. Il massimo è la CPU Core Ultra 9 285H e la GPU RTX Pro 2000, mentre il più spesso ZBook Fury G1i 16 può essere equipaggiato con i più veloci Arrow Lake-HX e la grafica RTX Pro 5000.
La nostra unità di prova è la configurazione intermedia con il Core Ultra 7 265H, display 2K 1600p120 e GPU RTX Pro 2000 per circa 2.700 dollari. L'elenco completo delle configurazioni disponibili può essere consultato qui https://www.hp.com/us-en/workstations/zbook-x-configure.html.
Le alternative allo ZBook X G1i 16 includono altre workstation ultrasottili da 16 pollici come il modello Dell Precision 5690, Lenovo ThinkPad P16s G2o la MSI CreatorPro. Lo ZBook X G1i 16 non deve essere confuso con lo ZBook 8 G1i 16, che è una versione di fascia bassa che raggiunge la GPU RTX Pro 500, più lenta.
Altre recensioni HP:
Specifiche
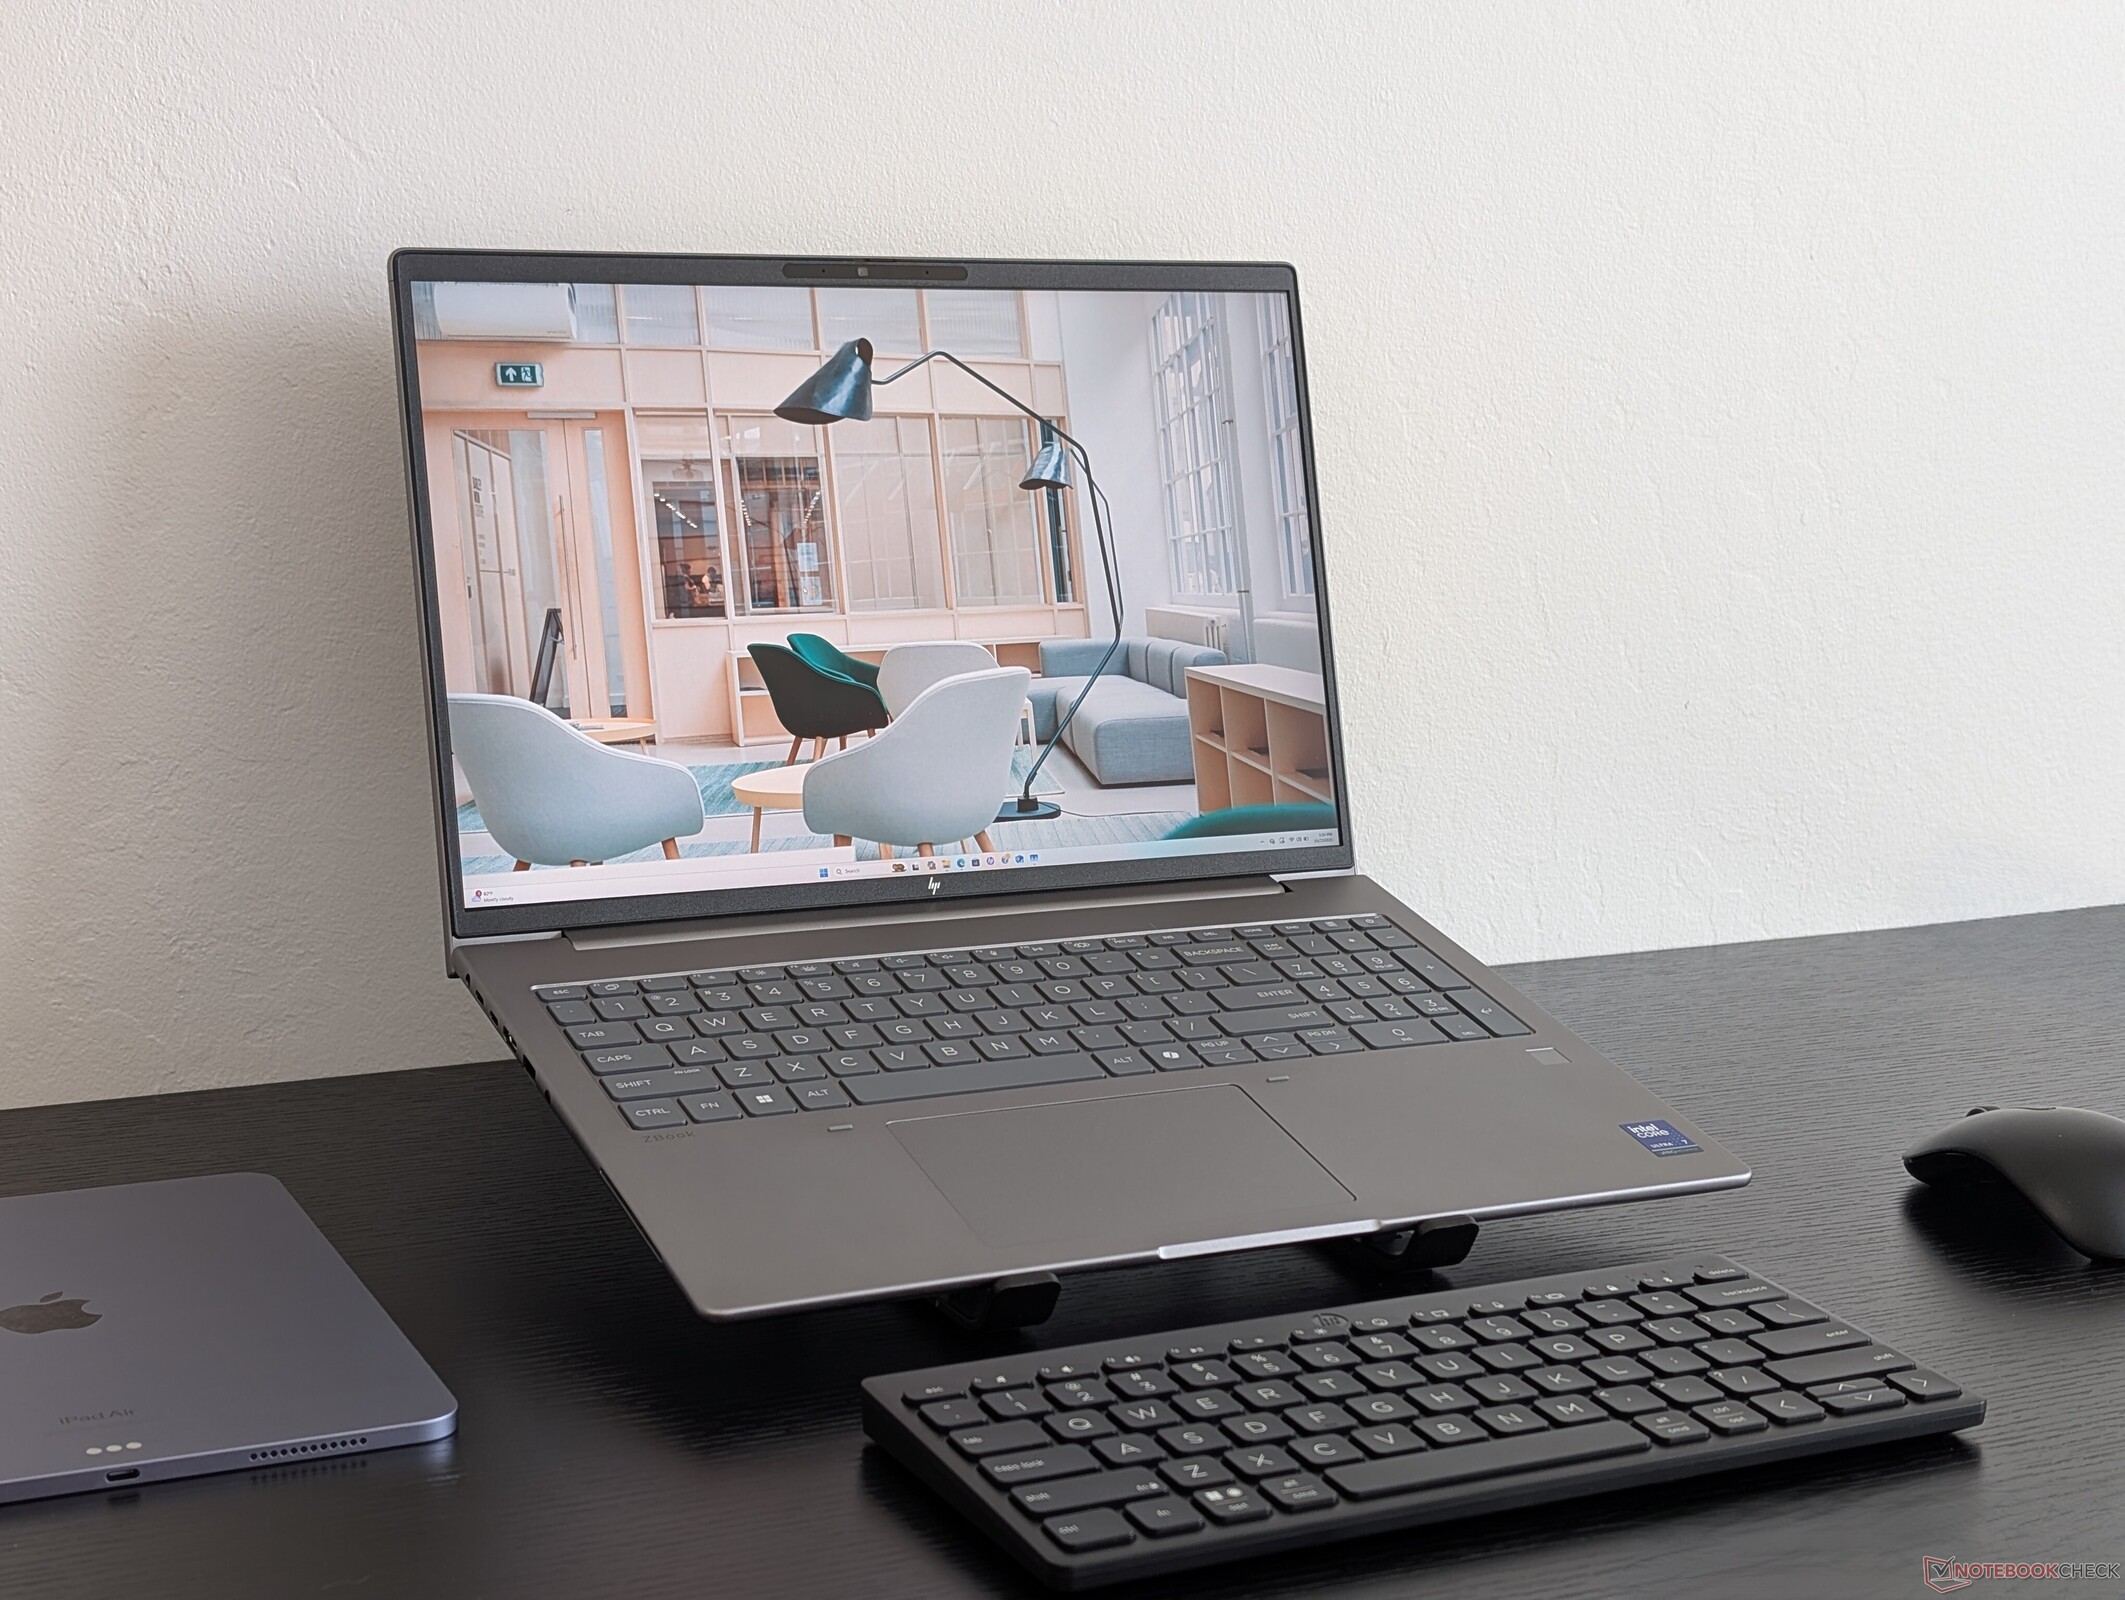
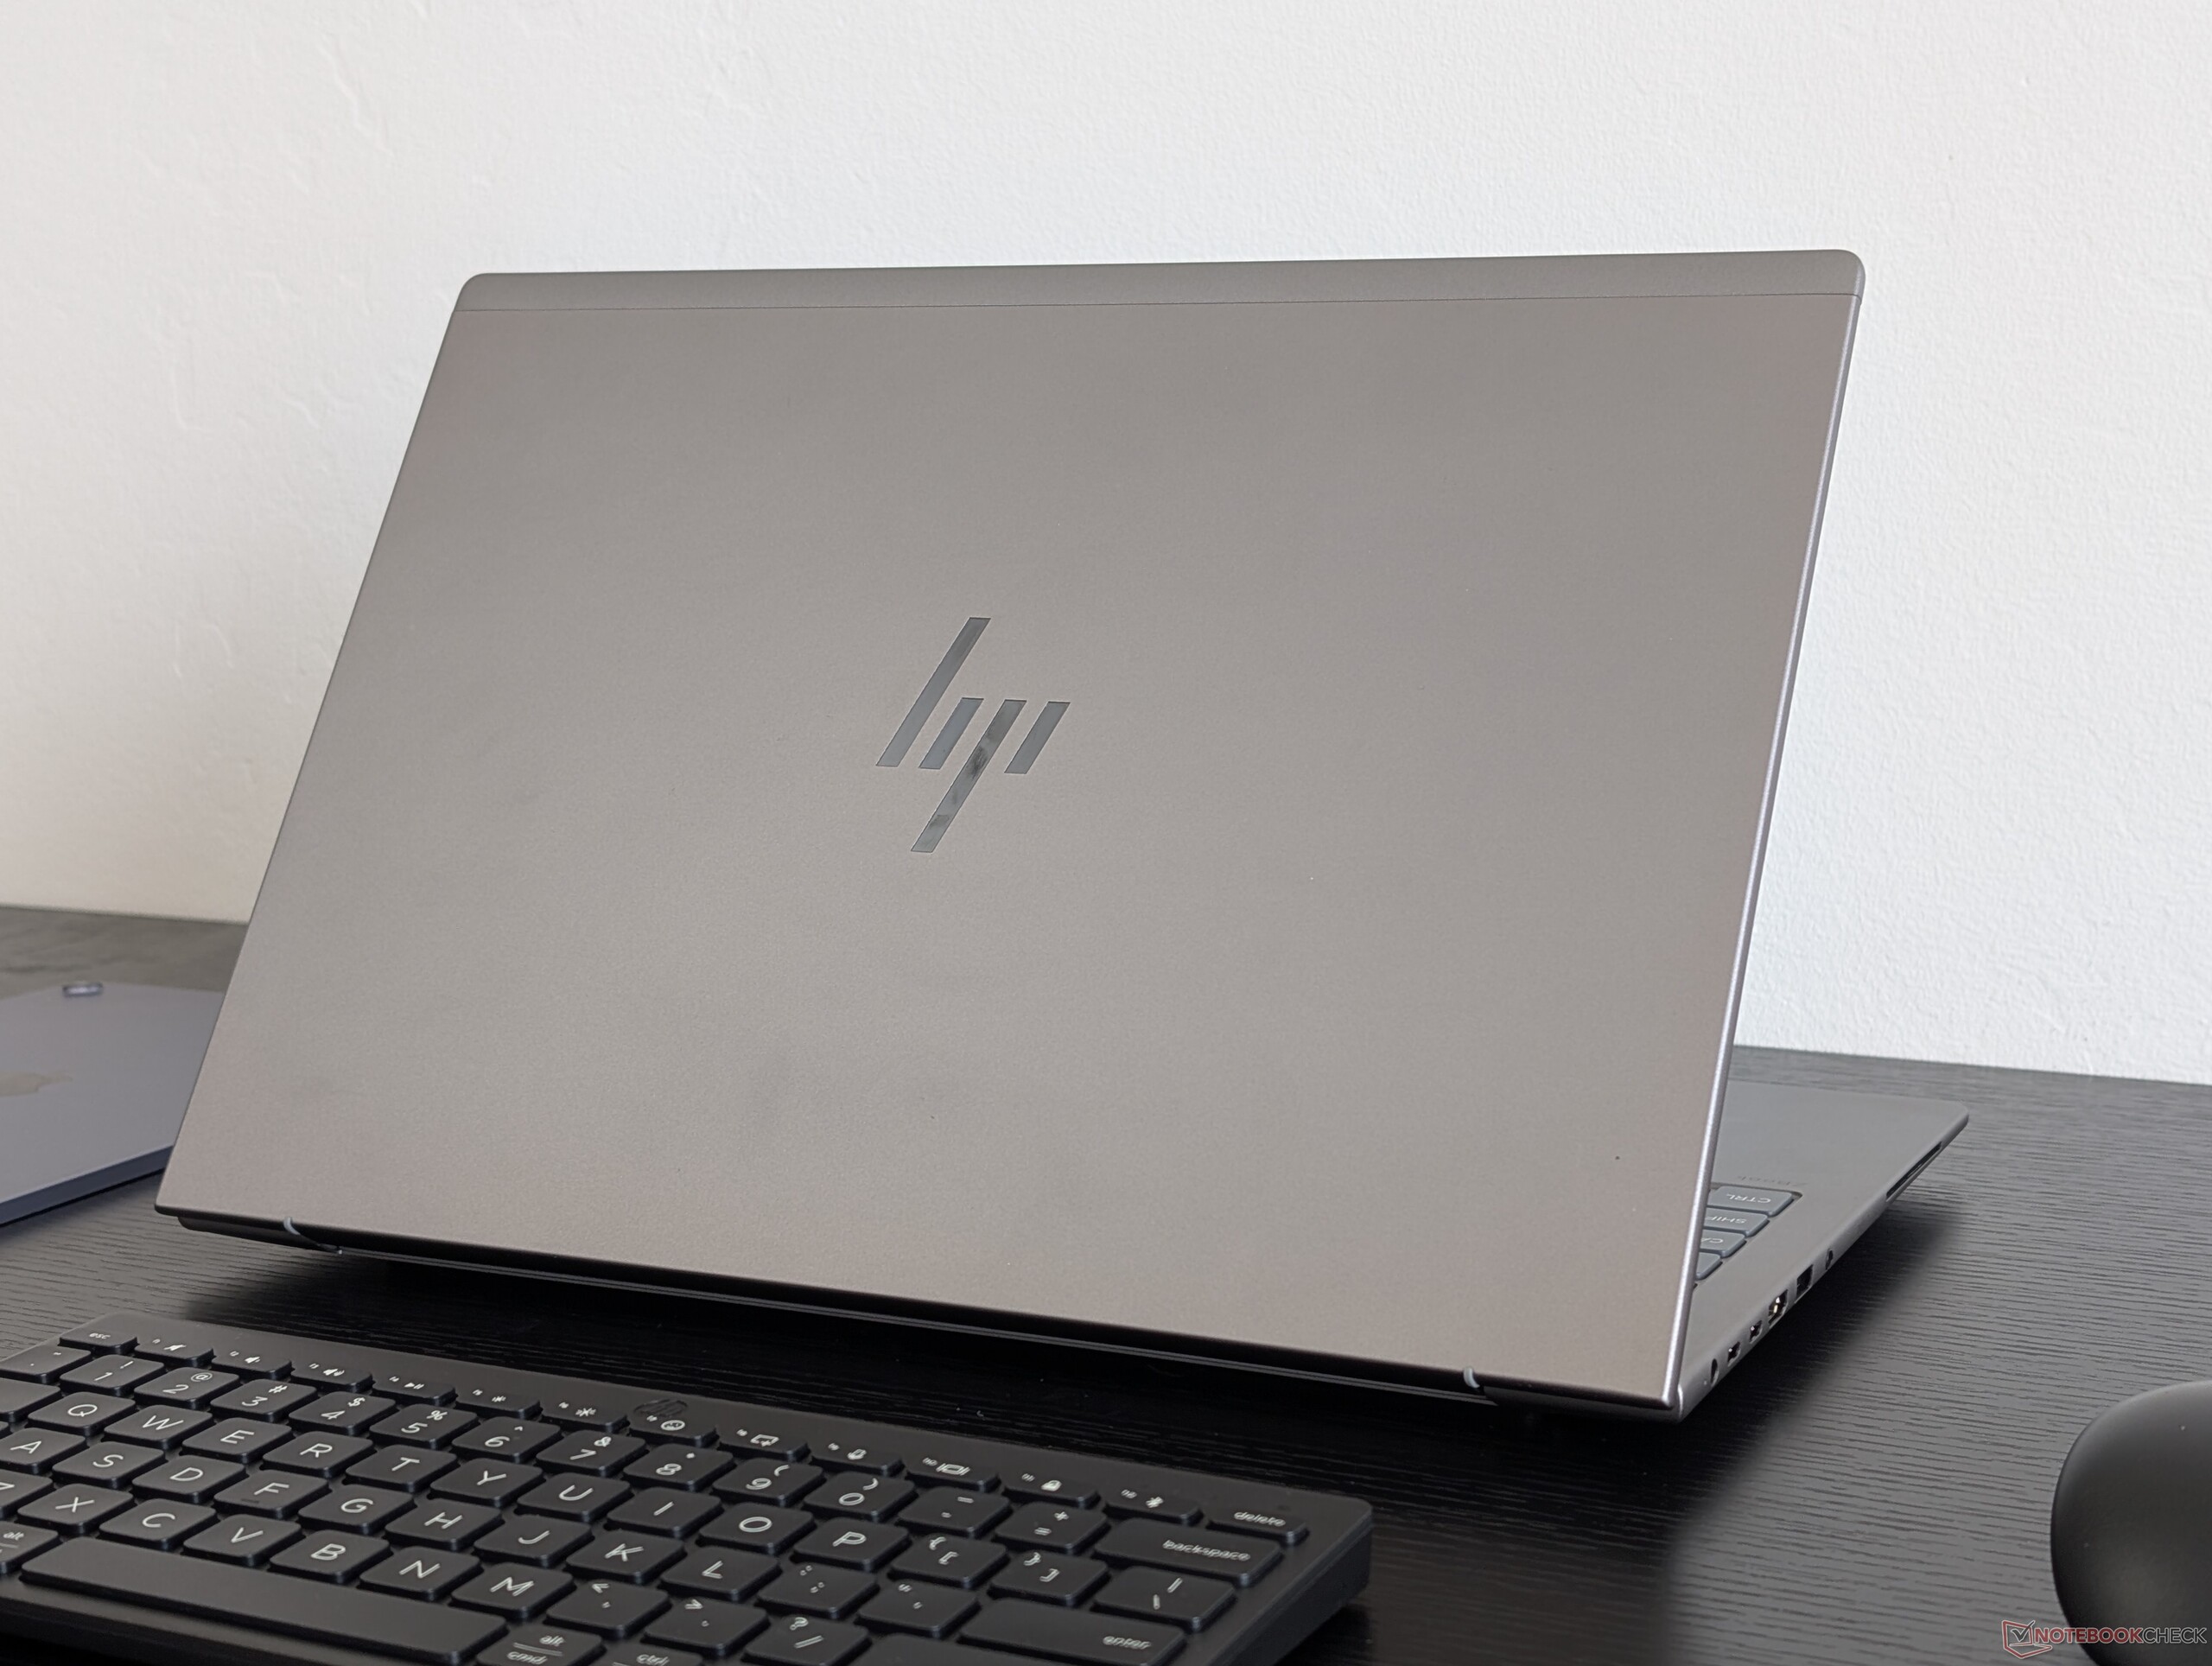
Caso
Lo ZBook X G1i 16 sostituisce direttamente lo ZBook Power 16 G11 dello scorso anno ZBook Power 16 G11 e, nonostante il cambio di nome, i due modelli sono quasi identici dal punto di vista visivo. Le caratteristiche fisiche rimangono pressoché invariate, compresi il peso, le dimensioni e le porte, per cui i nostri commenti sullo ZBook Power 16 G11 sono ancora validi per lo ZBook X G1i 16.
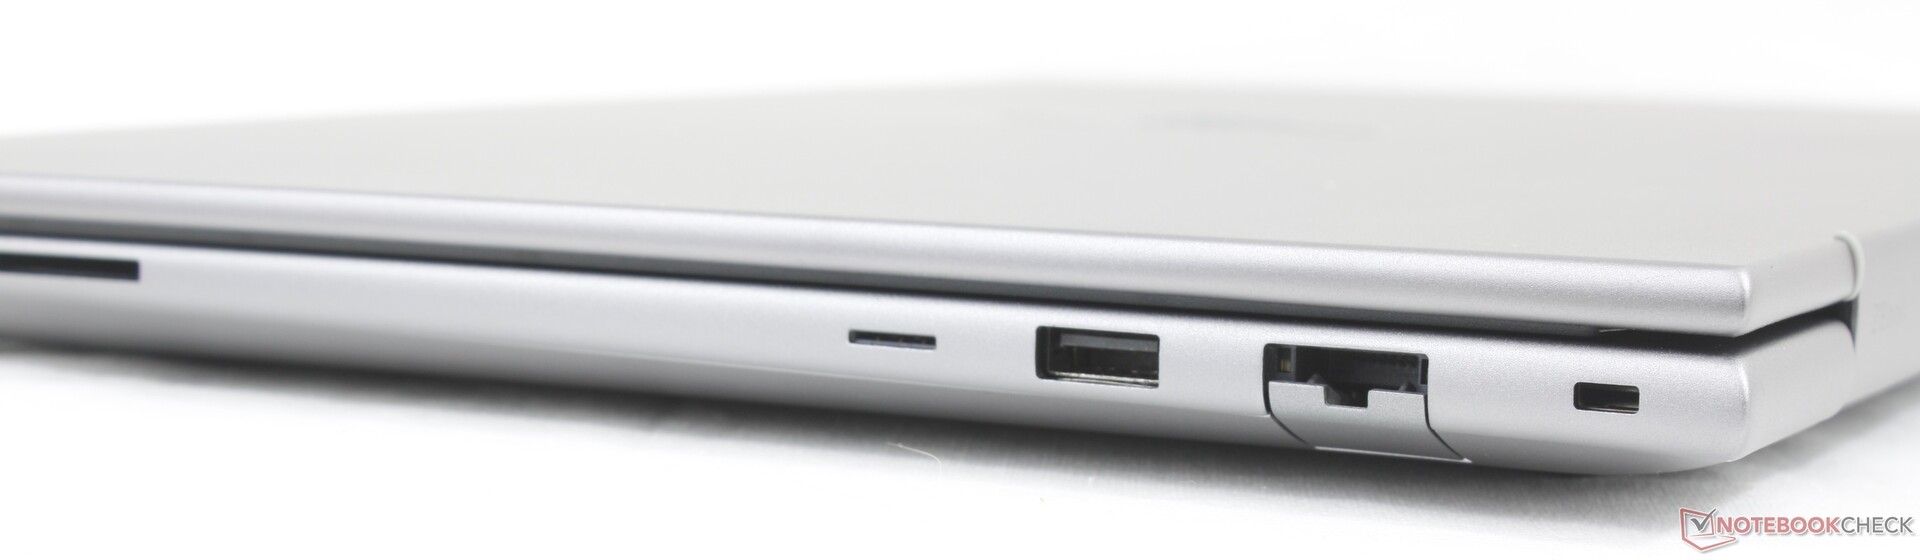
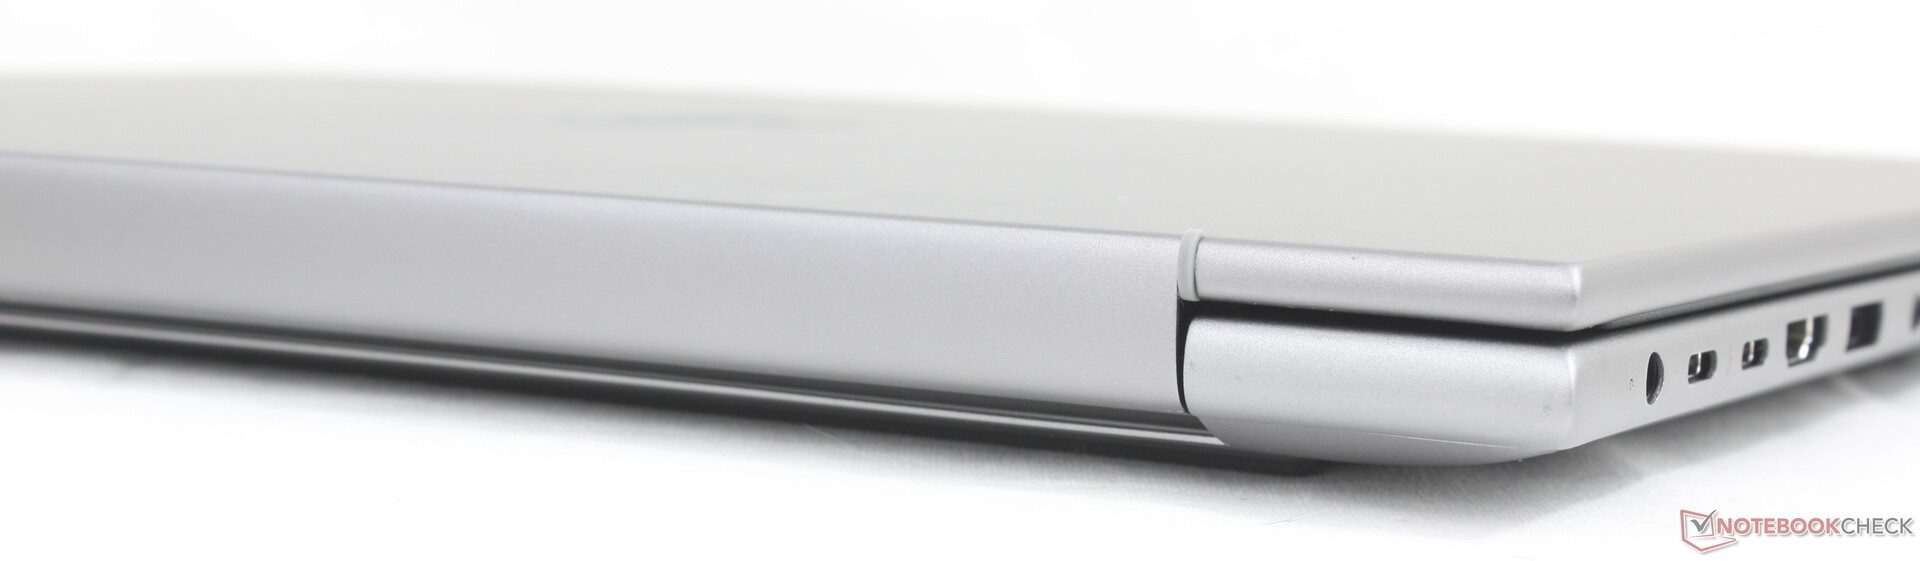
Connettività
Le opzioni delle porte sono migliorate rispetto allo scorso anno ZBook Studio 16 G11 con un'eccezione. Sebbene lo ZBook X G1i 16 includa porte aggiuntive come RJ-45, HDMI e più porte USB-A, ha rimosso una delle porte USB-C. Inoltre, vorremmo vedere una transizione completa verso la ricarica USB-C, simile a quella del recente Dell Pro Max 16 Plus.

Lettore di schede SD
| SD Card Reader | |
| average JPG Copy Test (av. of 3 runs) | |
| HP ZBook X G1i 16 (Toshiba Exceria Pro SDXC 64 GB UHS-II) | |
| HP ZBook Power 16 G11 A (Toshiba Exceria Pro SDXC 64 GB UHS-II) | |
| Lenovo ThinkPad P16 Gen 2 (Toshiba Exceria Pro SDXC 64 GB UHS-II) | |
| Dell Pro Max 16 Plus (Toshiba Exceria Pro SDXC 64 GB UHS-II) | |
| maximum AS SSD Seq Read Test (1GB) | |
| HP ZBook Power 16 G11 A (Toshiba Exceria Pro SDXC 64 GB UHS-II) | |
| HP ZBook X G1i 16 (Toshiba Exceria Pro SDXC 64 GB UHS-II) | |
| Dell Pro Max 16 Plus (Toshiba Exceria Pro SDXC 64 GB UHS-II) | |
| Lenovo ThinkPad P16 Gen 2 (Toshiba Exceria Pro SDXC 64 GB UHS-II) | |
Comunicazione
Webcam
Le opzioni della webcam includono 2 MP o 5 MP con IR e un otturatore fisico.


Manutenzione
HP mette a disposizione video di disassemblaggio e guide scritte per la manutenzione di ZBook X G1i 16.
Sostenibilità
Tutte le workstation HP Z sono certificate EPEAT Gold o Silver e incorporano plastiche o metalli riciclati e provenienti dagli oceani durante il processo di produzione.
Accessori e garanzia
Nella confezione non ci sono altri extra oltre all'adattatore CA e alla documentazione cartacea. La garanzia limitata di tre anni è standard se acquistata attraverso il sito web del produttore.
Dispositivi di ingresso
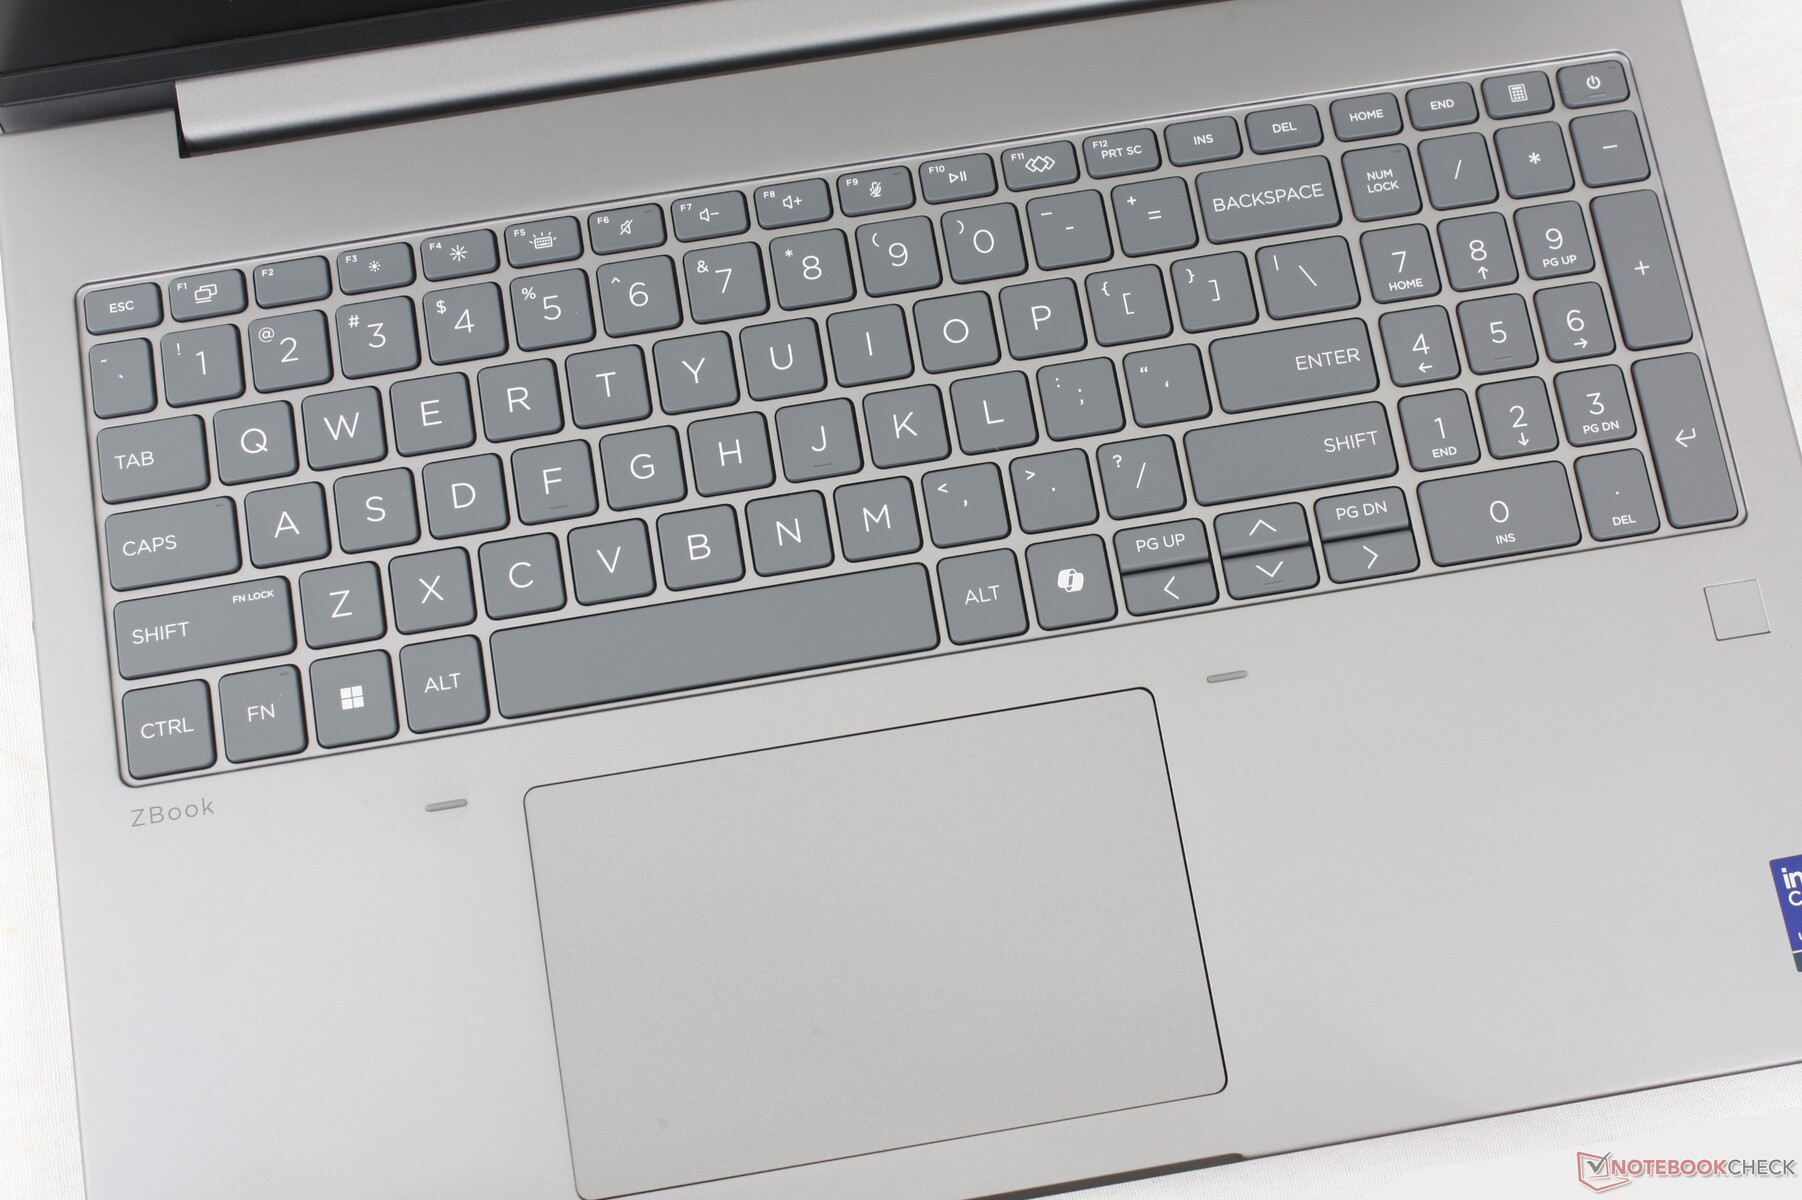
L'esperienza di digitazione è simile a quella del vecchio ZBook Fury 16 G9 poiché il layout della tastiera è cambiato poco nel corso delle generazioni ZBook. Sullo ZBook X G1i 16, tuttavia, HP ha eliminato i pulsanti del mouse dedicati senza aumentare la superficie (12 x 8 cm contro i 12,4 x 8,3 cm dello ZBook Fury 16 G9).
Display
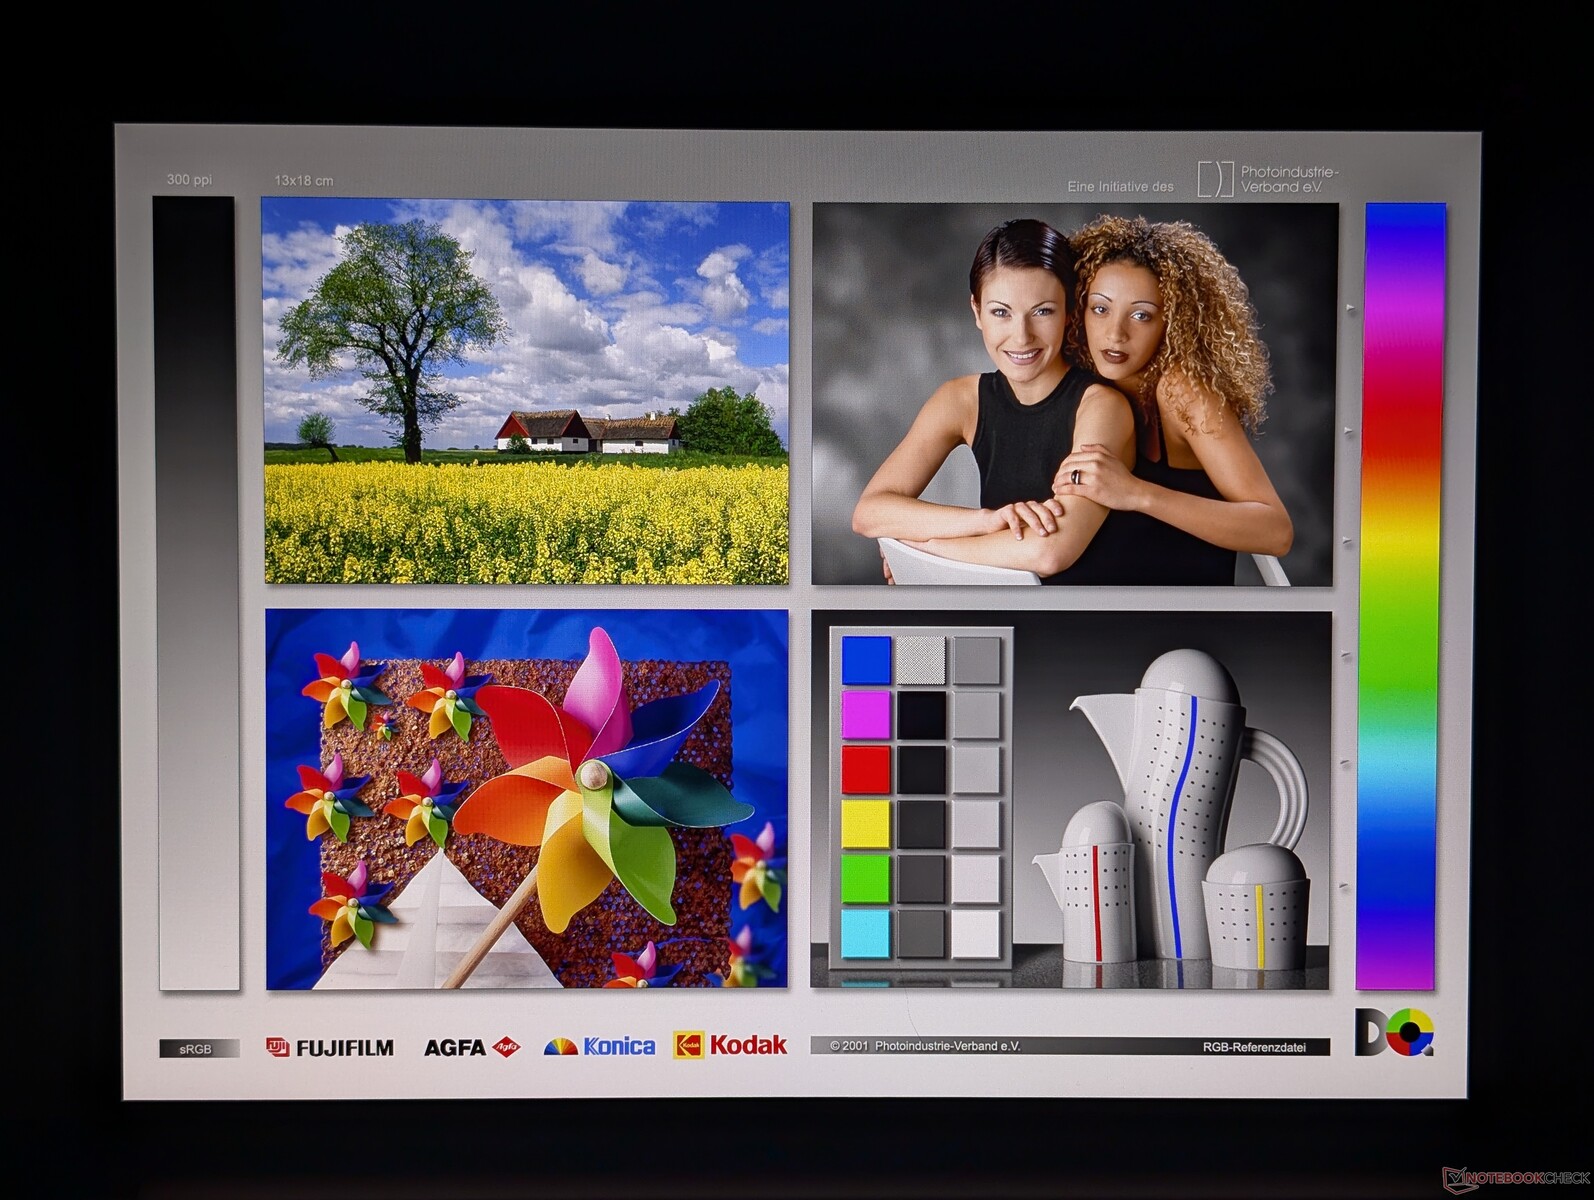
Sono disponibili sei opzioni di display IPS che vanno da 1200p60 e 300 nits fino a 2400p120 e 500 nits con colori DCI-P3 completi. La nostra unità di prova viene fornita con l'opzione opaca intermedia da 1600p 120 Hz, che offre ancora colori P3, ma senza funzionalità touchscreen o Sure View. Infatti, quest'ultima è disponibile solo sul pannello non-touch da 1200p.
Si noti che non ci sono opzioni OLED o supporto HDR per questo modello. Se l'accuratezza del colore è importante, consigliamo di evitare alcune opzioni 1200p di fascia bassa, in quanto offrono solo ~60% dei colori sRGB.

| |||||||||||||||||||||||||
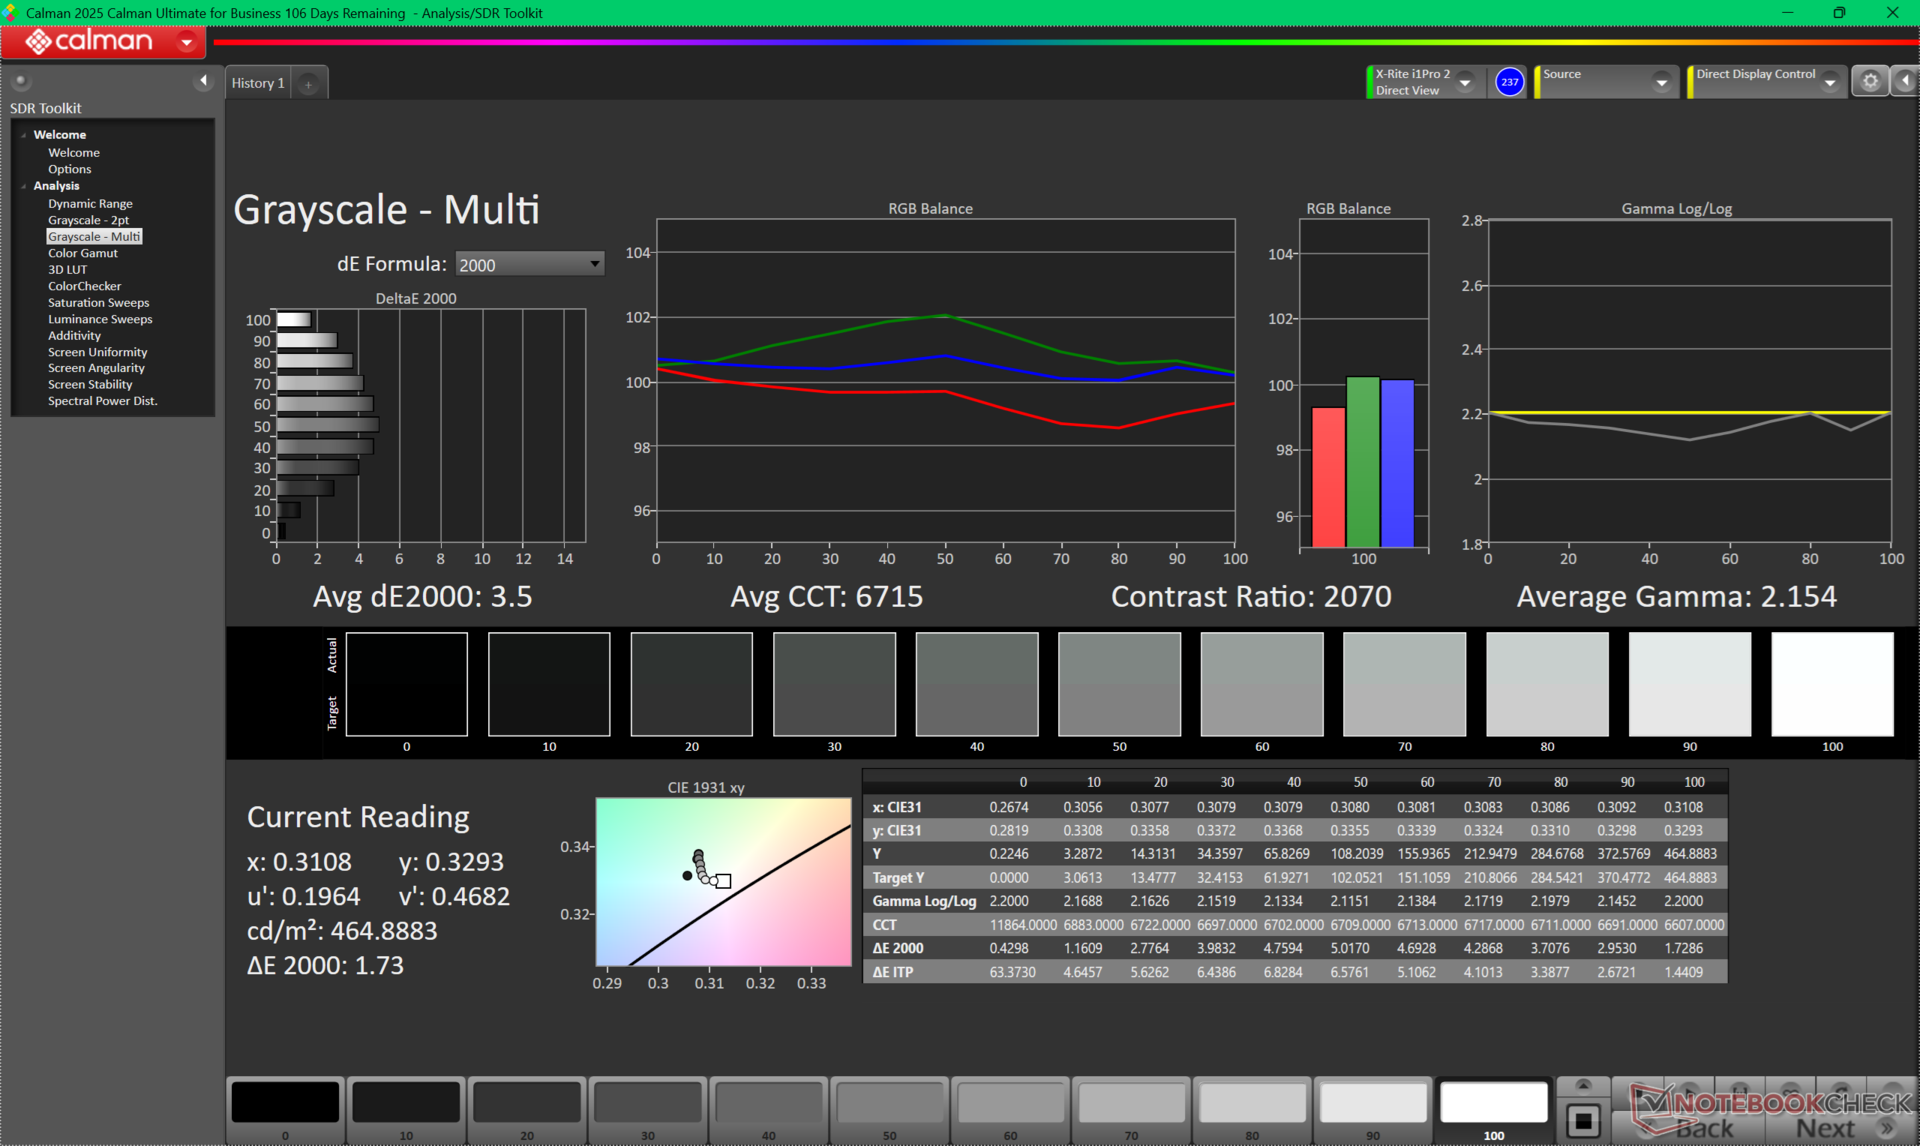
Distribuzione della luminosità: 88 %
Al centro con la batteria: 461.8 cd/m²
Contrasto: 1004:1 (Nero: 0.46 cd/m²)
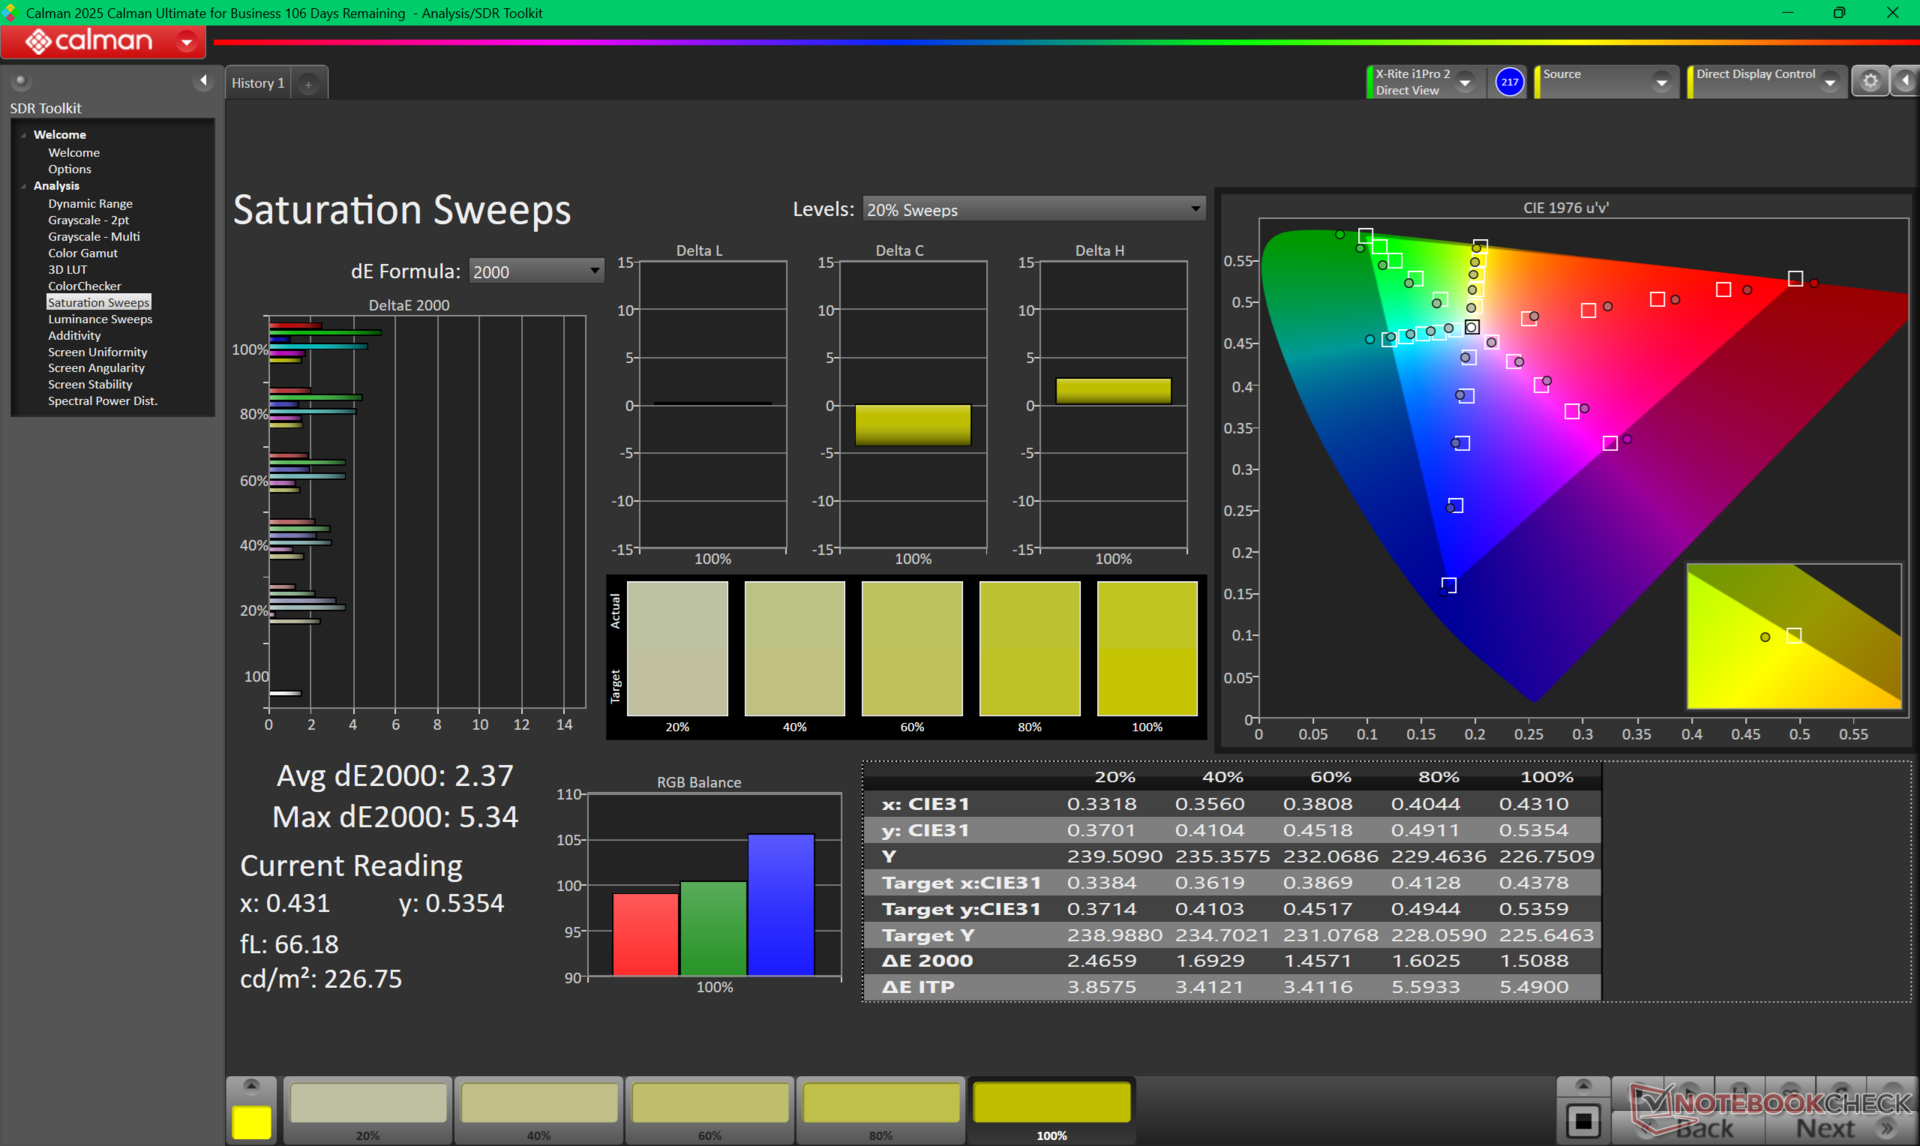
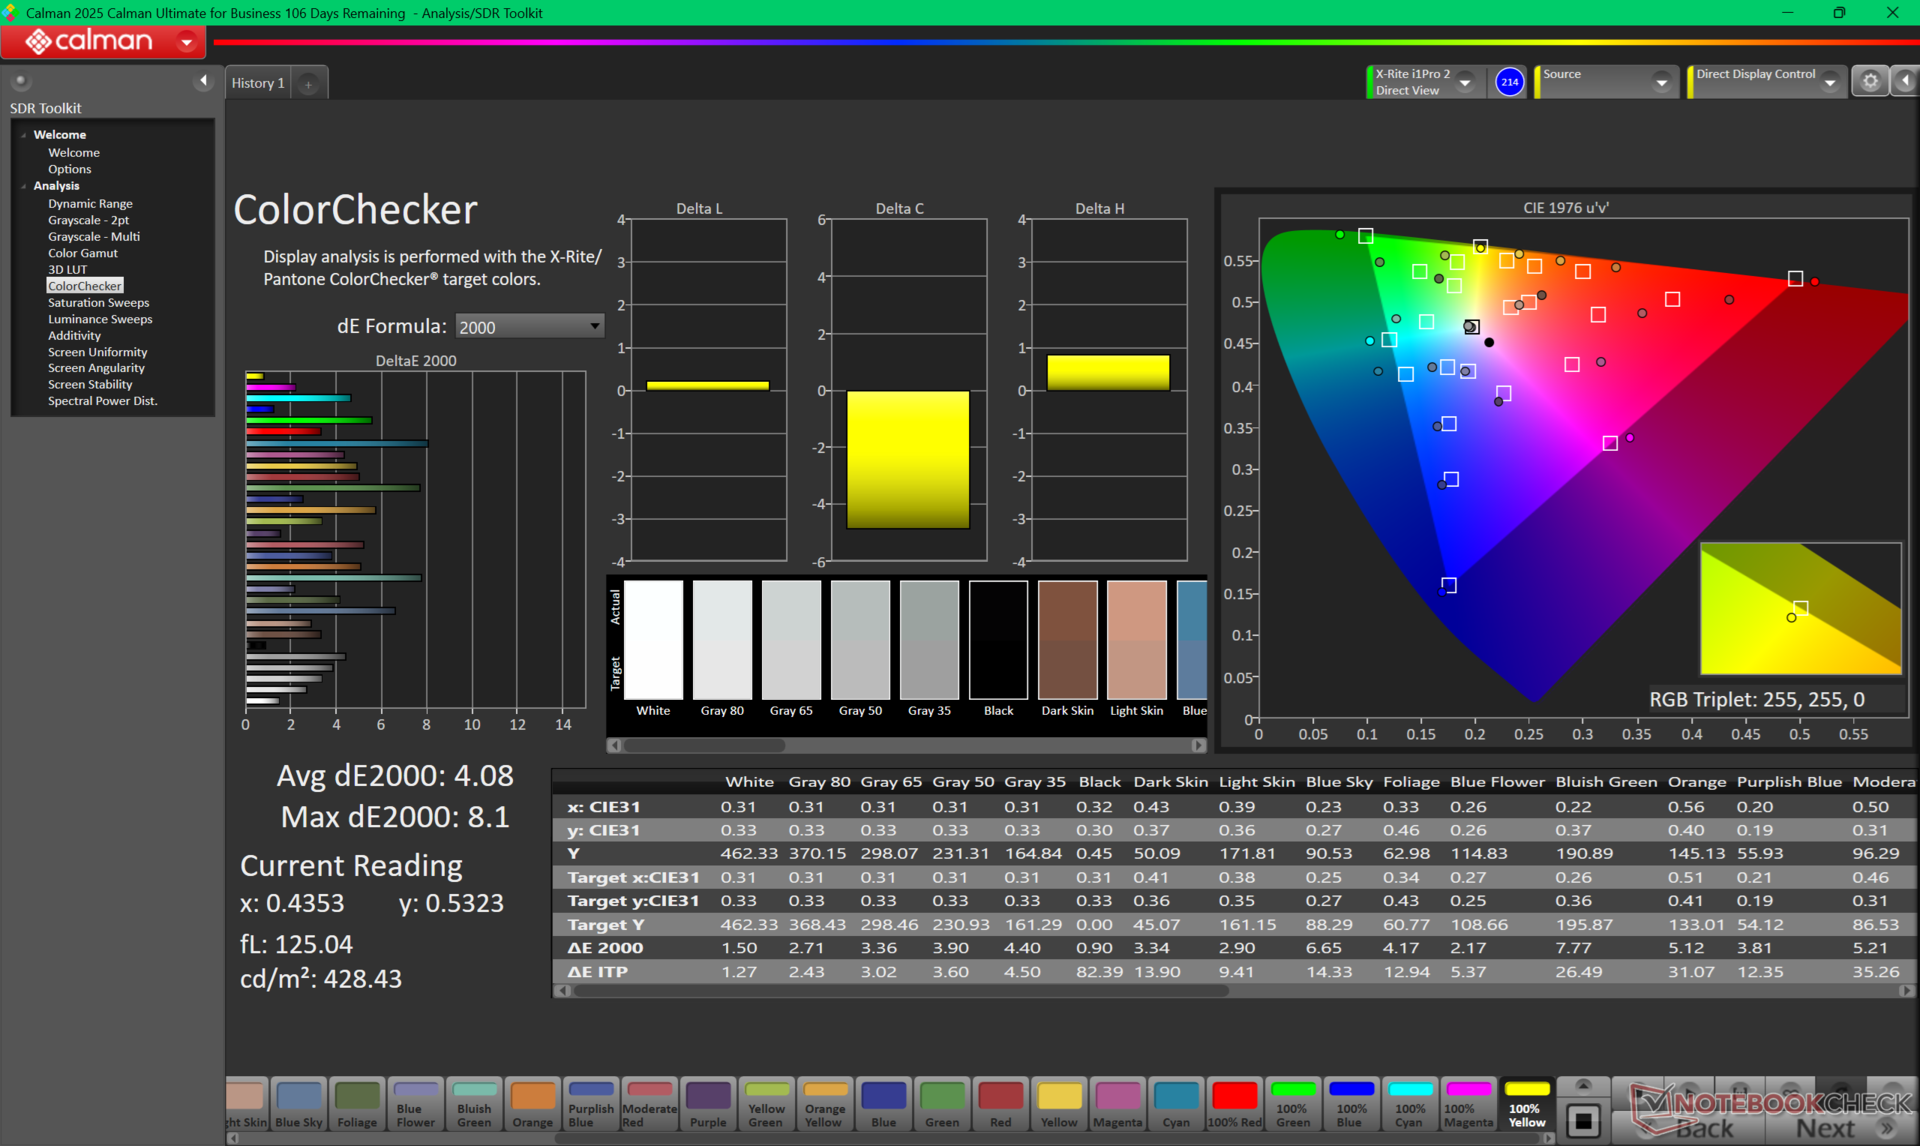
ΔE ColorChecker Calman: 4.08 | ∀{0.5-29.43 Ø4.79}
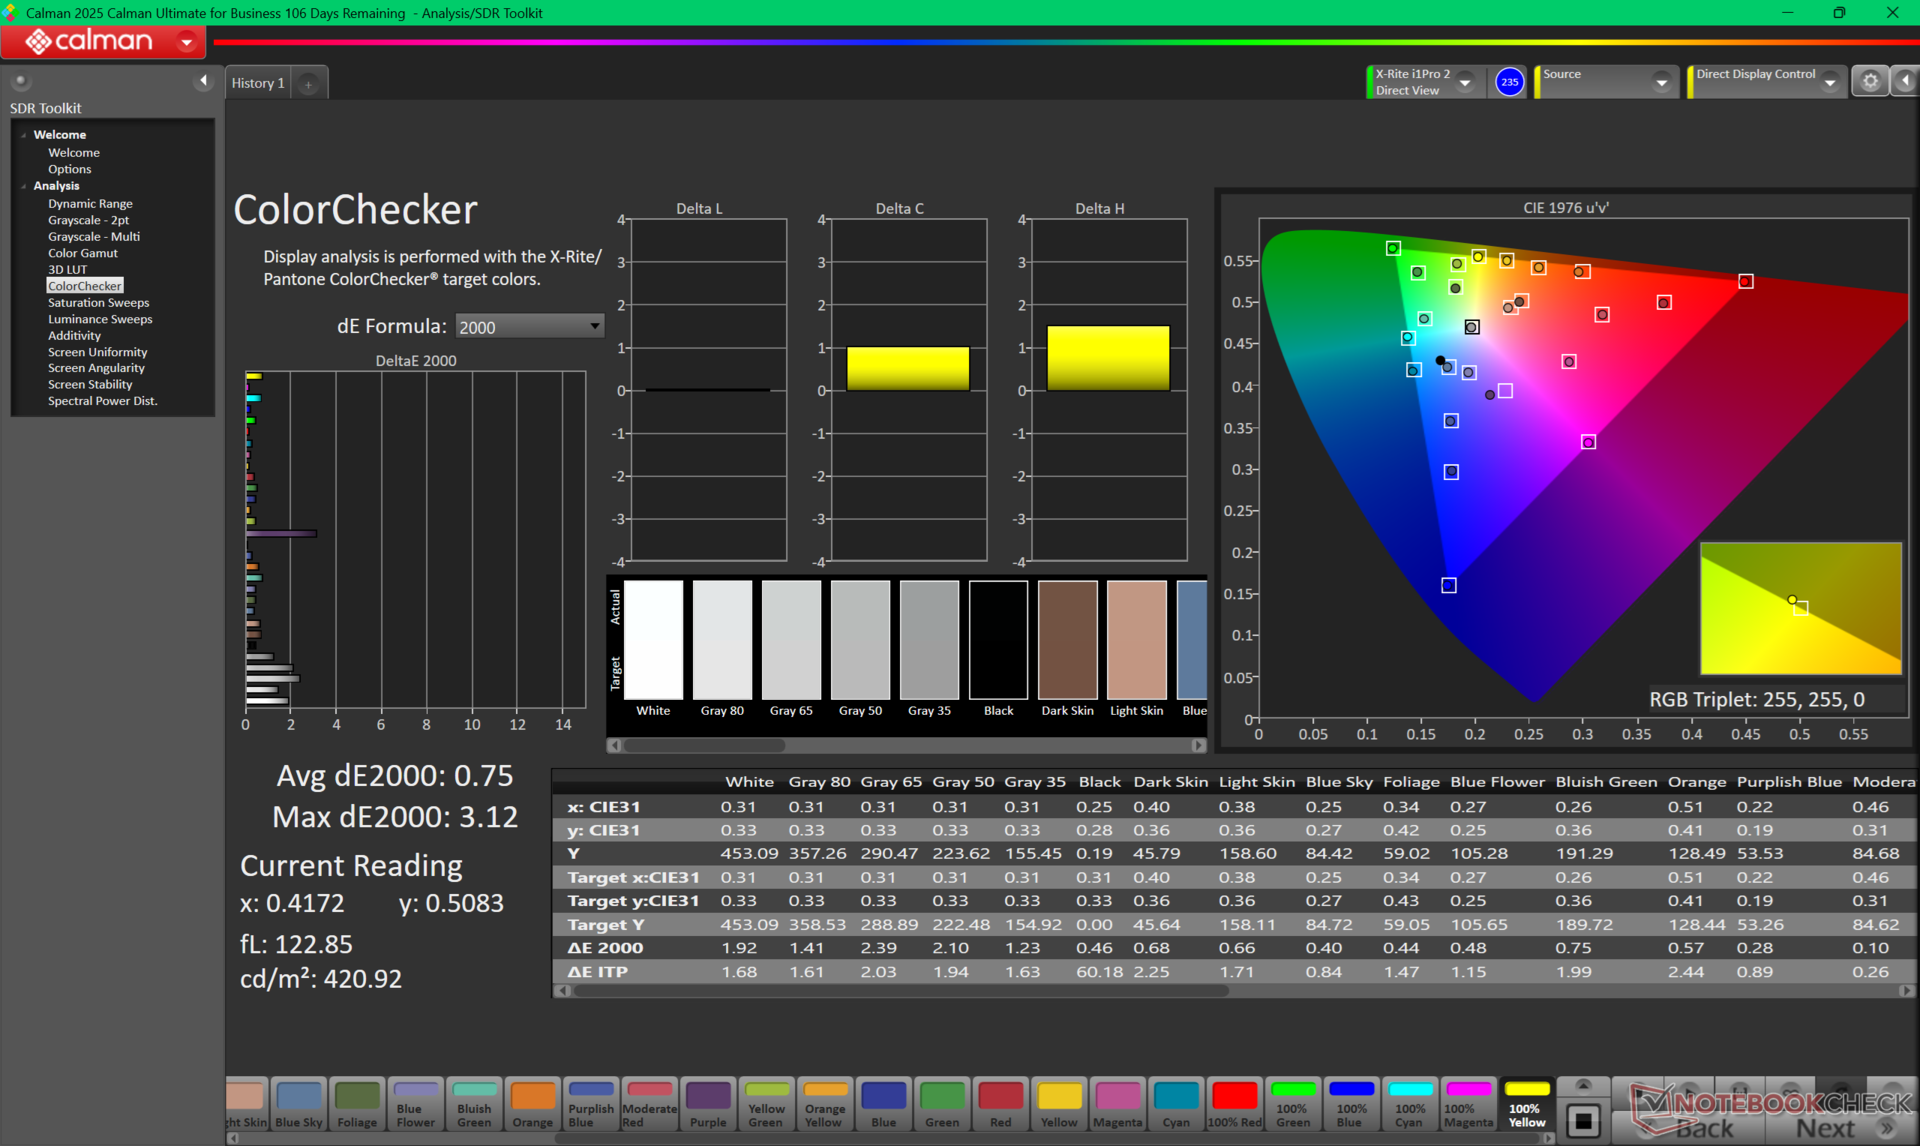
calibrated: 0.75
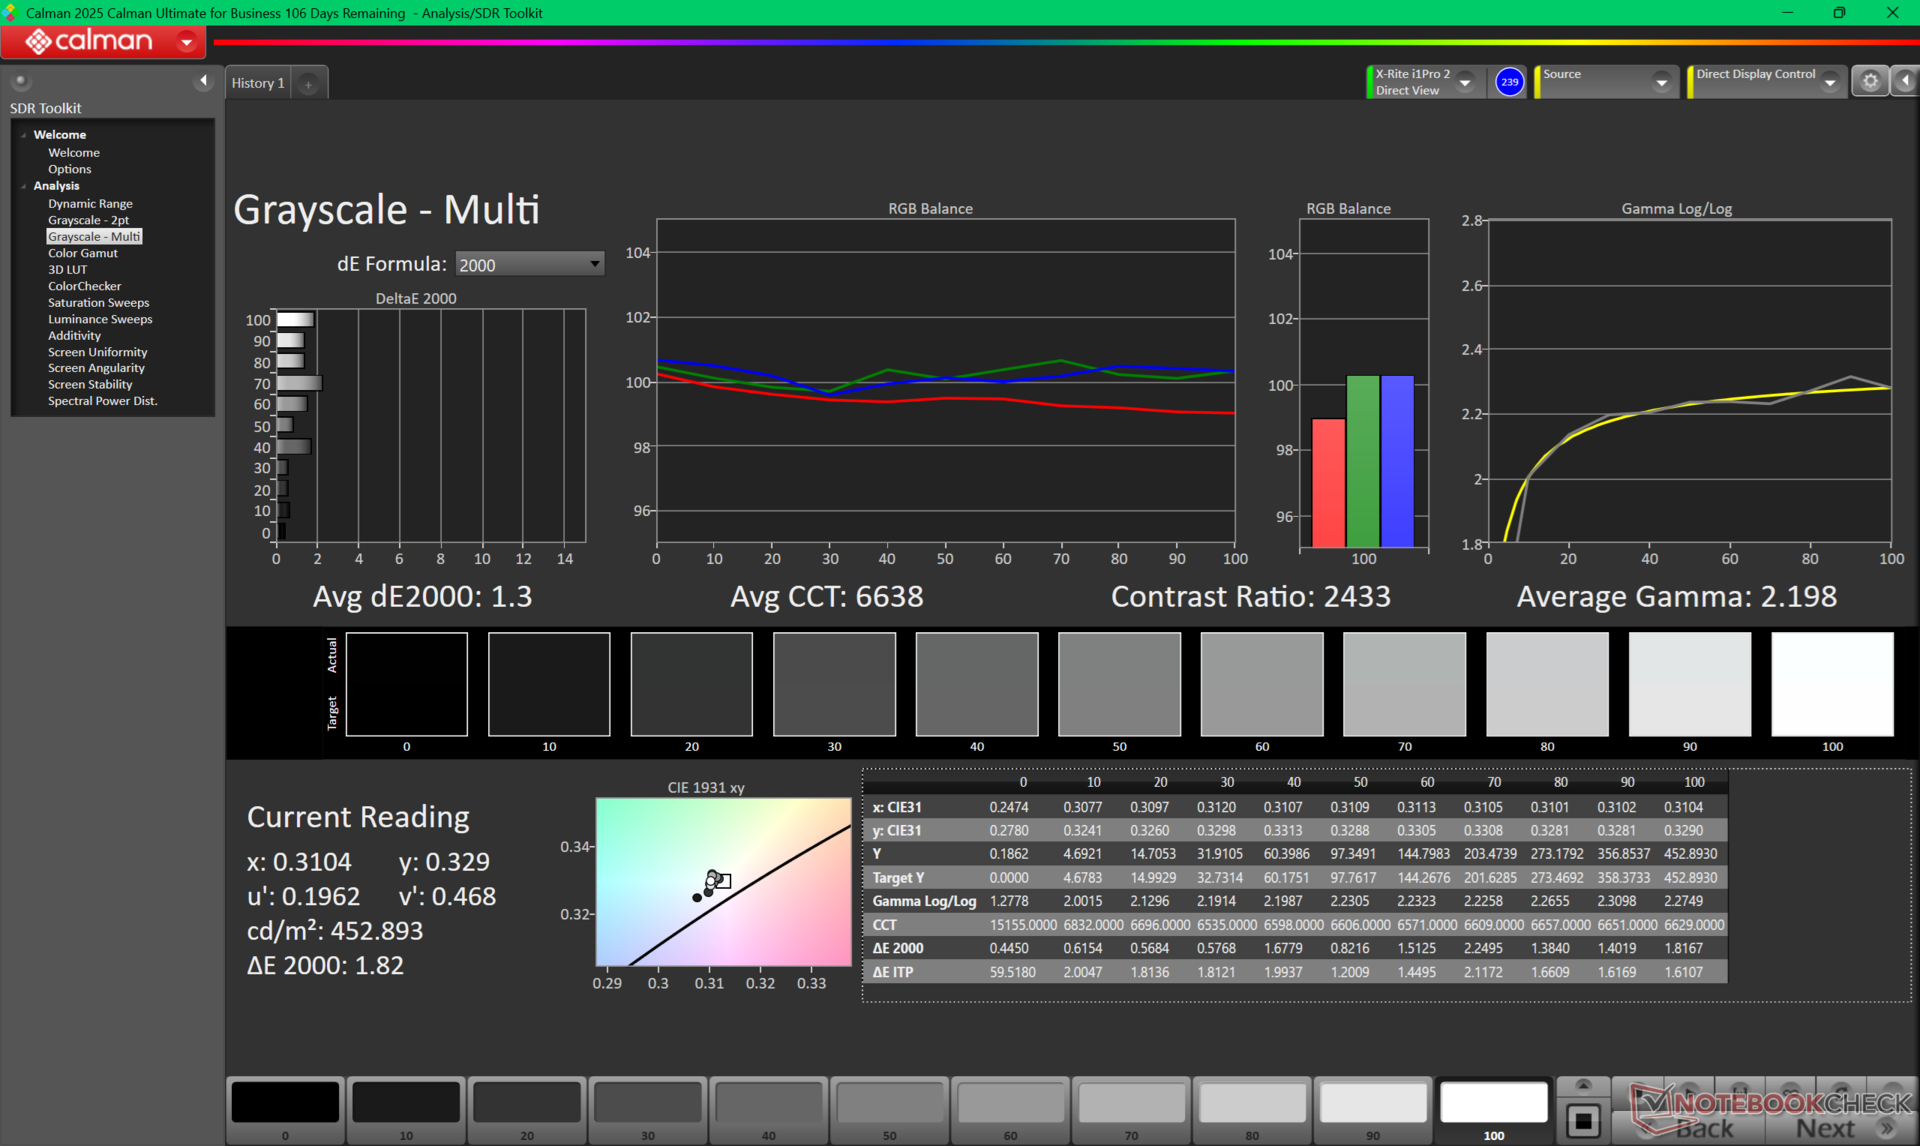
ΔE Greyscale Calman: 3.5 | ∀{0.09-98 Ø5}
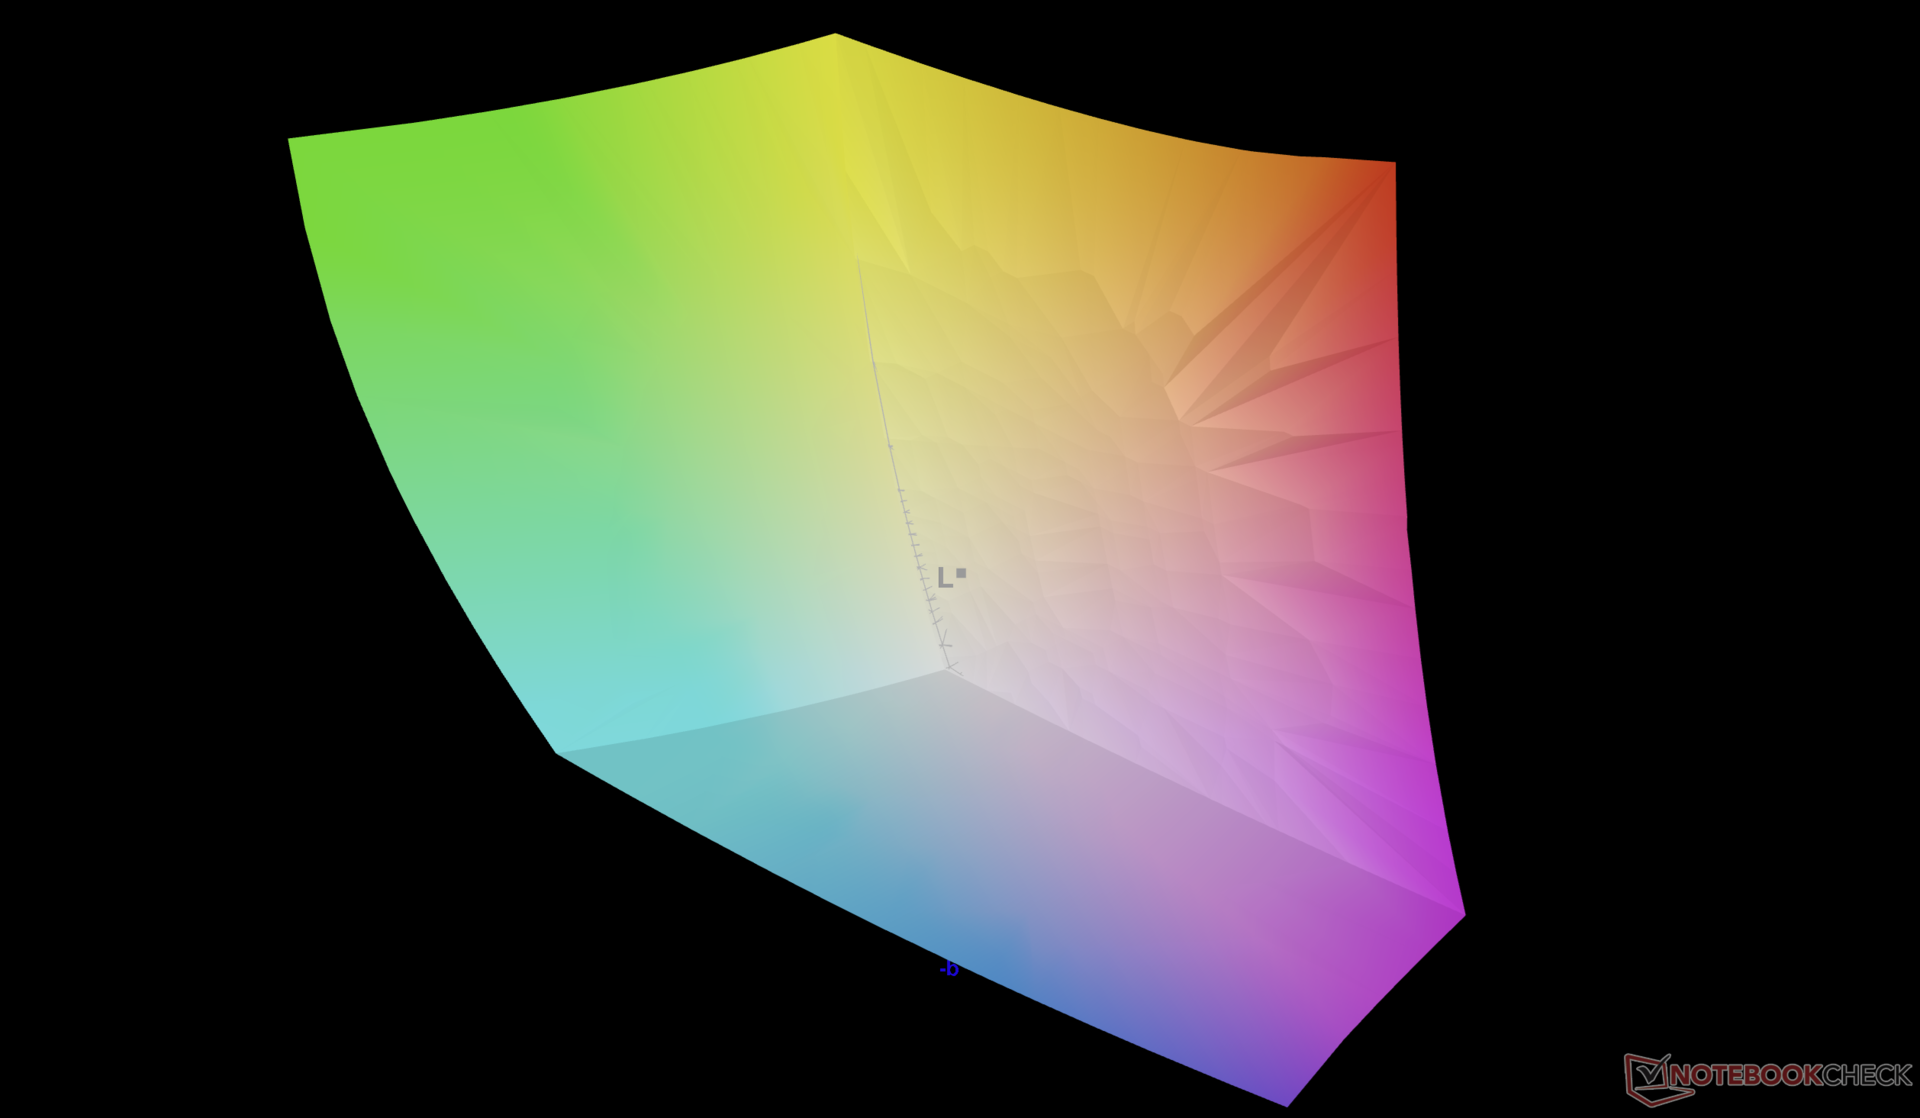
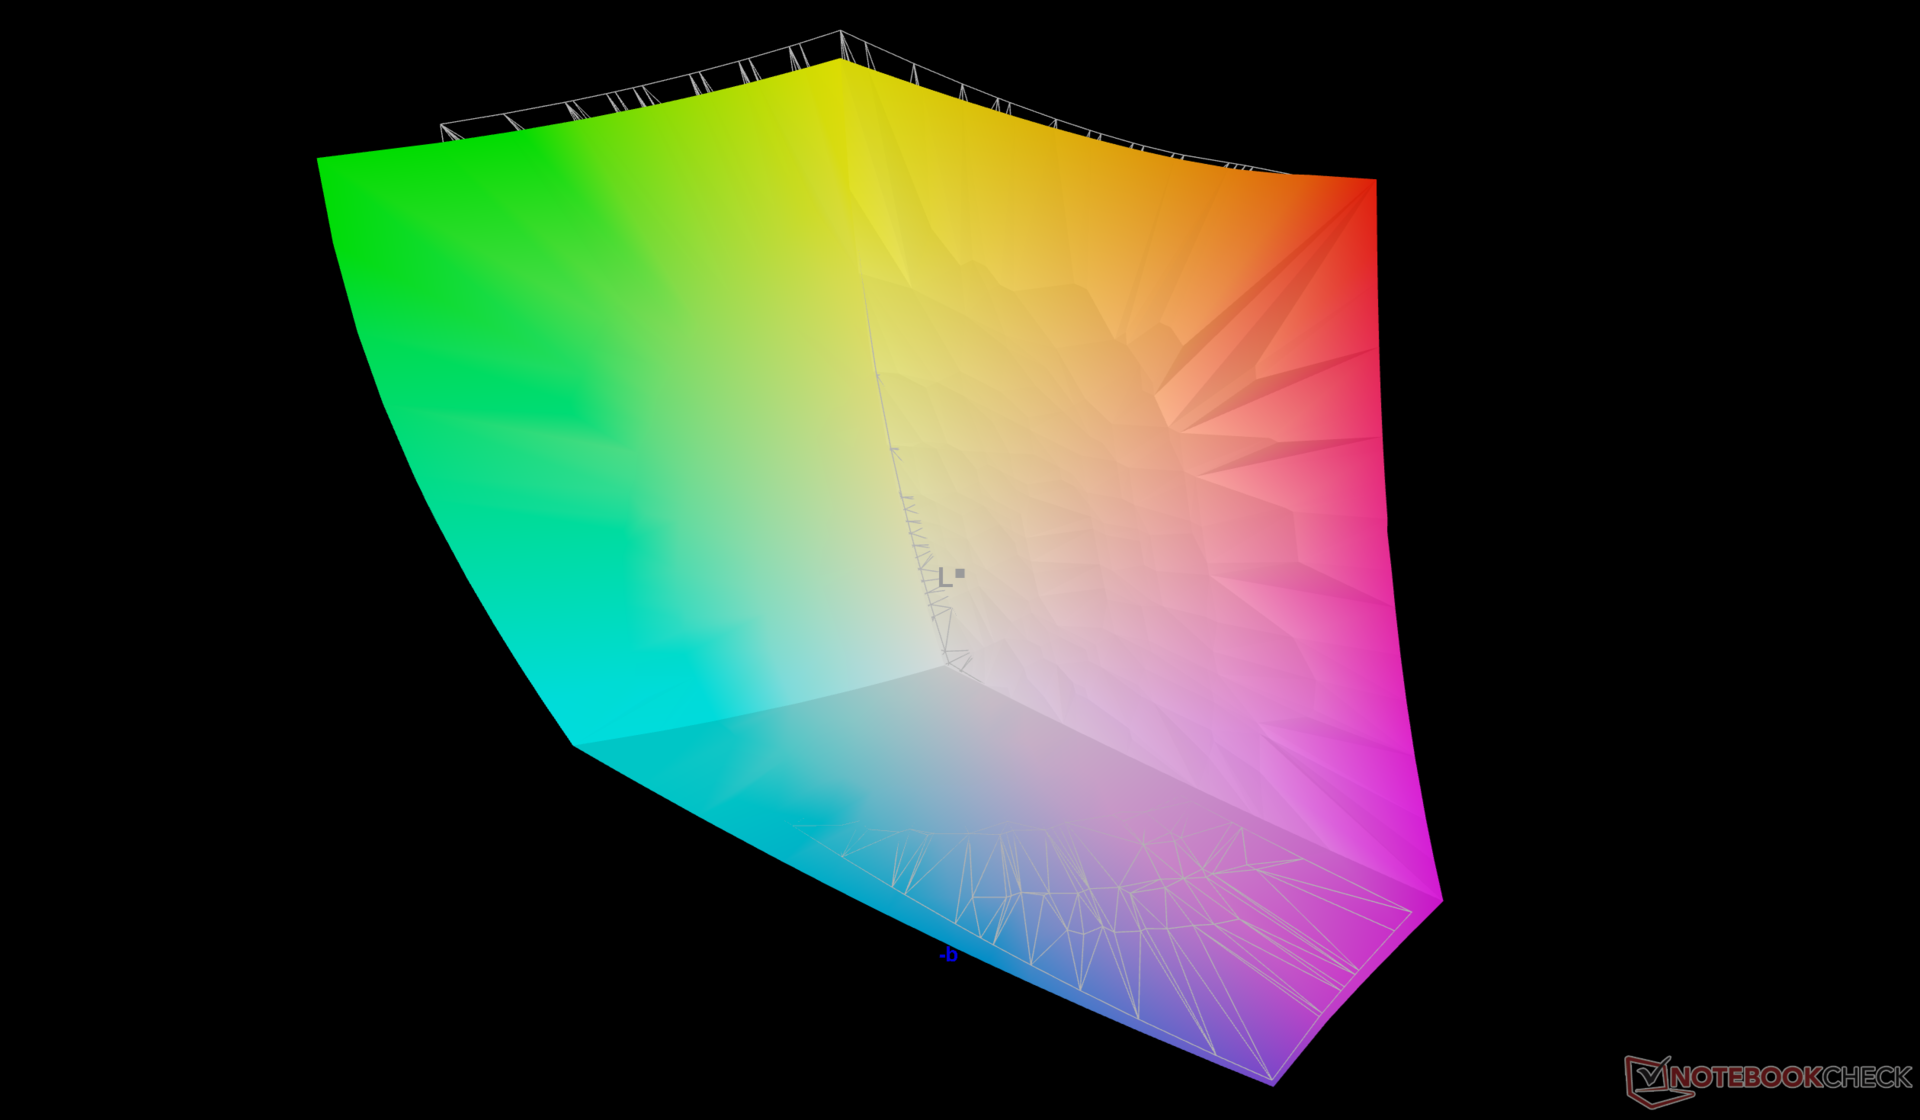
99.9% AdobeRGB 1998 (Argyll 3D)
100% sRGB (Argyll 3D)
97.2% Display P3 (Argyll 3D)
Gamma: 2.15
CCT: 6715 K
| HP ZBook X G1i 16 LG Philips LGD07B3, IPS, 2560x1600, 16", 120 Hz | HP ZBook Power 16 G11 A AUOA0A9, IPS, 2560x1600, 16", 120 Hz | HP ZBook Studio 16 G11 AUO87A8, IPS, 3840x2400, 16", 120 Hz | Lenovo ThinkPad P16 Gen 2 NE160QDM-NY1, IPS, 2560x1600, 16", 165 Hz | Dell Pro Max 16 Plus Samsung 160HC01, OLED, 3840x2400, 16", 120 Hz | Dell Precision 5690 Samsung 160YV03, OLED, 3840x2400, 16", 60 Hz | |
|---|---|---|---|---|---|---|
| Display | -20% | -4% | -21% | -4% | 0% | |
| Display P3 Coverage (%) | 97.2 | 69.1 -29% | 97.7 1% | 68.4 -30% | 97.3 0% | 99.8 3% |
| sRGB Coverage (%) | 100 | 97.7 -2% | 99.9 0% | 96.9 -3% | 100 0% | 100 0% |
| AdobeRGB 1998 Coverage (%) | 99.9 | 71 -29% | 85.7 -14% | 70.6 -29% | 88.8 -11% | 96.6 -3% |
| Response Times | 69% | 64% | 66% | 79% | 95% | |
| Response Time Grey 50% / Grey 80% * (ms) | 45.5 ? | 13.6 ? 70% | 14.2 ? 69% | 14.1 ? 69% | 0.63 ? 99% | 1.7 ? 96% |
| Response Time Black / White * (ms) | 26.1 ? | 8.4 ? 68% | 10.6 ? 59% | 9.9 ? 62% | 0.89 ? 97% | 1.7 ? 93% |
| PWM Frequency (Hz) | 26536 ? | 479.9 ? | 60 ? | |||
| PWM Amplitude * (%) | 47 | 28 40% | ||||
| Screen | -4% | 11% | 31% | 29% | 1% | |
| Brightness middle (cd/m²) | 461.8 | 470.7 2% | 404.3 -12% | 531.5 15% | 530.9 15% | 348.1 -25% |
| Brightness (cd/m²) | 427 | 431 1% | 405 -5% | 499 17% | 540 26% | 351 -18% |
| Brightness Distribution (%) | 88 | 88 0% | 92 5% | 89 1% | 95 8% | 97 10% |
| Black Level * (cd/m²) | 0.46 | 0.57 -24% | 0.28 39% | 0.38 17% | ||
| Contrast (:1) | 1004 | 826 -18% | 1444 44% | 1399 39% | ||
| Colorchecker dE 2000 * | 4.08 | 2.16 47% | 2.63 36% | 1.82 55% | 2.42 41% | 4.18 -2% |
| Colorchecker dE 2000 max. * | 8.1 | 4.39 46% | 4.48 45% | 4.1 49% | 5.76 29% | 6.68 18% |
| Colorchecker dE 2000 calibrated * | 0.75 | 1.37 -83% | 1.46 -95% | 0.63 16% | 0.7 7% | 0.97 -29% |
| Greyscale dE 2000 * | 3.5 | 3.7 -6% | 2.1 40% | 1.2 66% | 0.8 77% | 1.7 51% |
| Gamma | 2.15 102% | 2.38 92% | 2.3 96% | 2.15 102% | 2.23 99% | 2.2 100% |
| CCT | 6715 97% | 6765 96% | 6810 95% | 6484 100% | 6488 100% | 6198 105% |
| Media totale (Programma / Settaggio) | 15% /
3% | 24% /
15% | 25% /
25% | 35% /
33% | 32% /
16% |
* ... Meglio usare valori piccoli
Tempi di risposta del Display
| ↔ Tempi di risposta dal Nero al Bianco | ||
|---|---|---|
| 26.1 ms ... aumenta ↗ e diminuisce ↘ combinato | ↗ 11.8 ms Incremento | 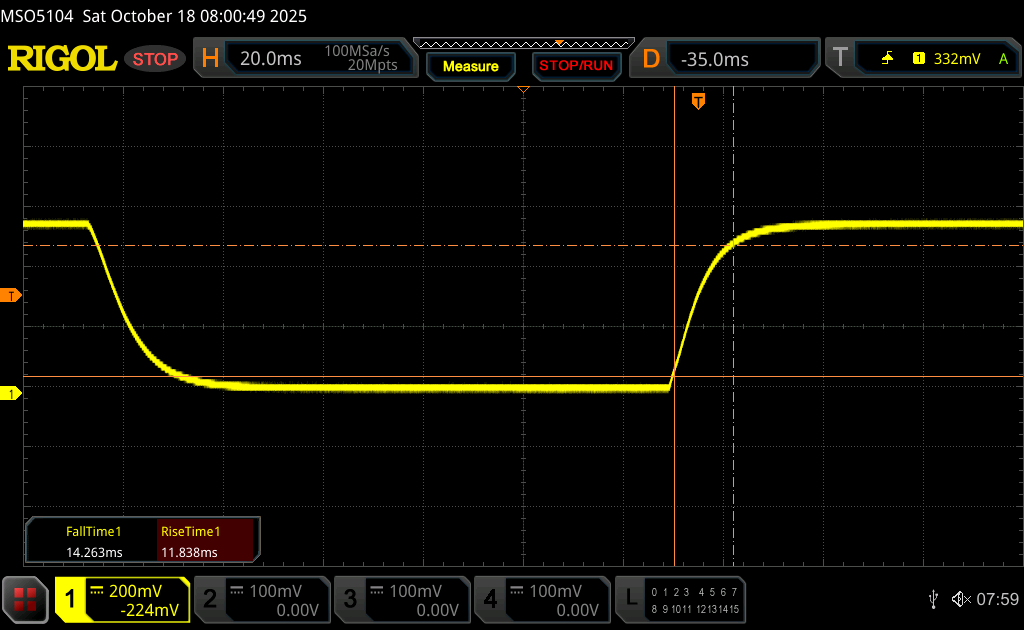 |
| ↘ 14.3 ms Calo | ||
| Lo schermo mostra tempi di risposta relativamente lenti nei nostri tests e potrebbe essere troppo lento per i gamers. In confronto, tutti i dispositivi di test variano da 0.1 (minimo) a 240 (massimo) ms. » 64 % di tutti i dispositivi è migliore. Questo significa che i tempi di risposta rilevati sono peggiori rispetto alla media di tutti i dispositivi testati (20.3 ms). | ||
| ↔ Tempo di risposta dal 50% Grigio all'80% Grigio | ||
| 45.5 ms ... aumenta ↗ e diminuisce ↘ combinato | ↗ 21.1 ms Incremento | 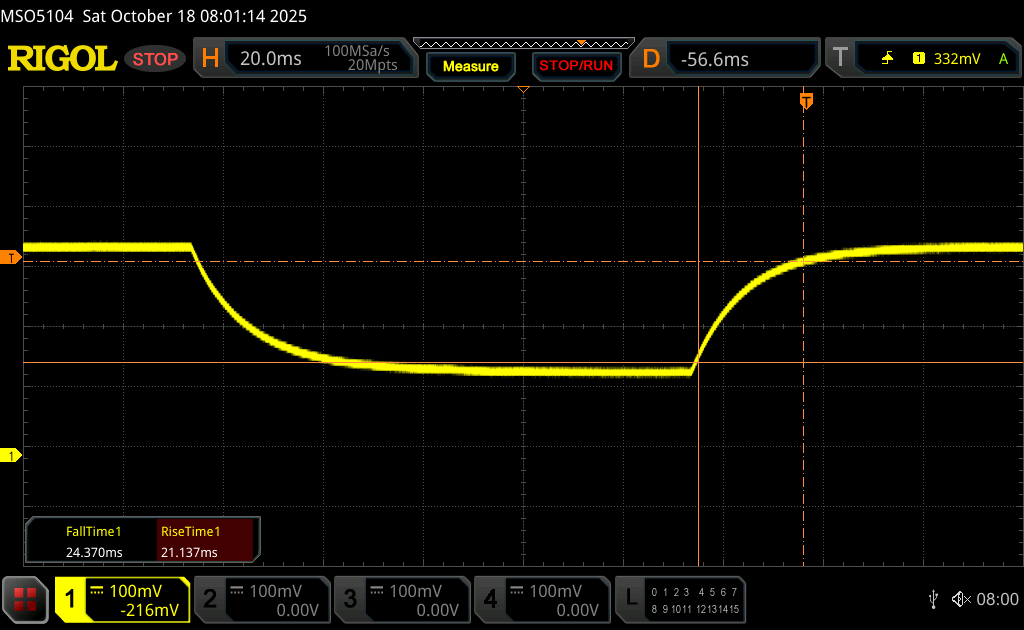 |
| ↘ 24.4 ms Calo | ||
| Lo schermo mostra tempi di risposta lenti nei nostri tests e sarà insoddisfacente per i gamers. In confronto, tutti i dispositivi di test variano da 0.165 (minimo) a 636 (massimo) ms. » 77 % di tutti i dispositivi è migliore. Questo significa che i tempi di risposta rilevati sono peggiori rispetto alla media di tutti i dispositivi testati (31.7 ms). | ||
Sfarfallio dello schermo / PWM (Pulse-Width Modulation)
| flickering dello schermo / PWM rilevato | 26536 Hz Amplitude: 47 % | ≤ 74 % settaggio luminosita' | 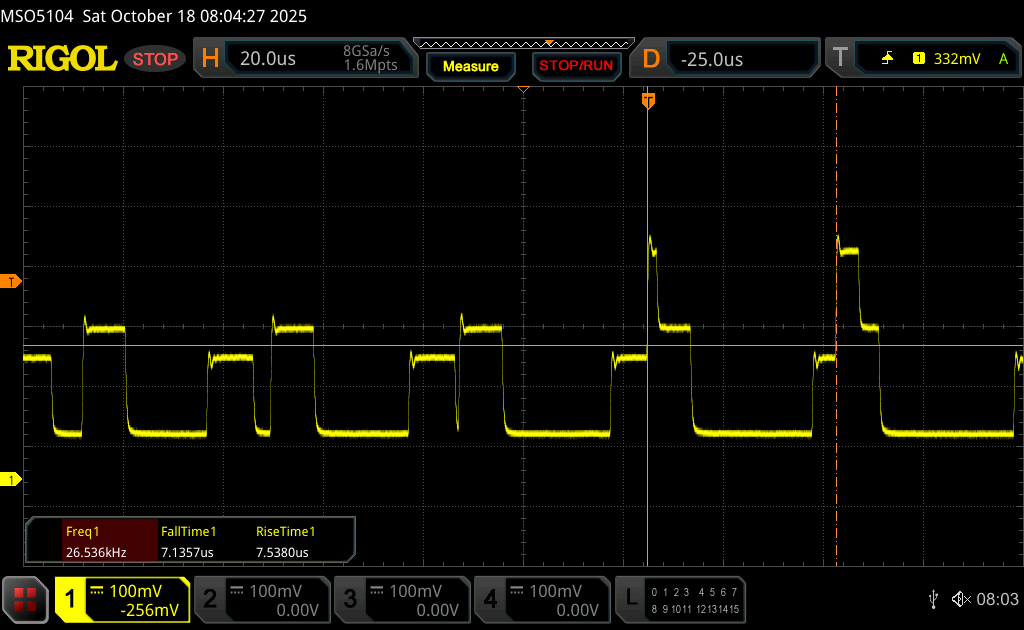 |
Il display sfarfalla a 26536 Hz (Probabilmente a causa dell'uso di PWM) Flickering rilevato ad una luminosita' di 74 % o inferiore. Non dovrebbe verificarsi flickering o PWM sopra questo valore di luminosita'. La frequenza di 26536 Hz è abbastanza alta, quindi la maggioranza degli utenti sensibili al PWM non dovrebbero notare alcun flickering. In confronto: 53 % di tutti i dispositivi testati non utilizza PWM per ridurre la luminosita' del display. Se è rilevato PWM, una media di 8170 (minimo: 5 - massimo: 343500) Hz è stata rilevata. | |||


Prestazioni
Condizioni del test
Abbiamo impostato Windows in modalità Prestazioni prima di eseguire i benchmark qui sotto.
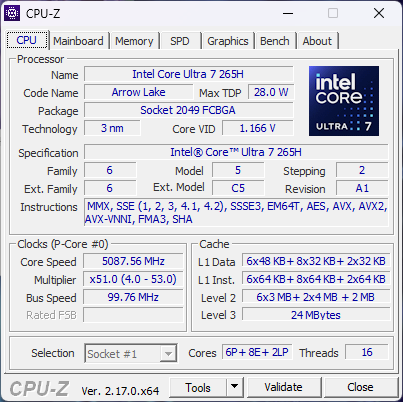
Processore
Il Core Ultra 7 265H offre solo un aumento relativamente minore delle prestazioni rispetto al modello dello scorso anno Core Ultra 7 155H di circa il 15 percento. Gli utenti che passano da un modello molto più vecchio, come HP ZBook Studio 16 G9, vedranno un incremento più significativo, di circa il 30 percento.
Le prestazioni calano di circa il 10 percento quando si esegue il nostro test di stress CineBench R15 xT in loop, a causa delle limitazioni del Turbo Boost, come descritto nella sezione Stress Test di seguito.
Cinebench R15 Multi Loop
Cinebench R23: Multi Core | Single Core
Cinebench R20: CPU (Multi Core) | CPU (Single Core)
Cinebench R15: CPU Multi 64Bit | CPU Single 64Bit
Blender: v2.79 BMW27 CPU
7-Zip 18.03: 7z b 4 | 7z b 4 -mmt1
Geekbench 6.5: Multi-Core | Single-Core
Geekbench 5.5: Multi-Core | Single-Core
HWBOT x265 Benchmark v2.2: 4k Preset
LibreOffice : 20 Documents To PDF
R Benchmark 2.5: Overall mean
| CPU Performance rating | |
| Dell Pro Max 16 Plus | |
| HP ZBook Fury 16 G11 | |
| HP ZBook Fury 16 G10 | |
| Lenovo ThinkPad P16 Gen 2 | |
| HP ZBook X G1i 16 | |
| Media Intel Core Ultra 7 265H | |
| Lenovo ThinkPad P16s Gen 4 AMD | |
| Lenovo ThinkPad P16 G2 21FA000FGE -2! | |
| Lenovo ThinkPad P1 G6-21FV000DGE | |
| Dell Precision 5690 | |
| HP ZBook Studio 16 G11 | |
| Lenovo ThinkPad P1 Gen 7 21KV001SGE | |
| HP ZBook Power 16 G11 A | |
| HP ZBook Studio 16 G9 62U04EA -2! | |
| Lenovo ThinkPad P16s G2 21K9000CGE | |
| Cinebench R23 / Multi Core | |
| Dell Pro Max 16 Plus | |
| HP ZBook Fury 16 G11 | |
| Lenovo ThinkPad P16 Gen 2 | |
| HP ZBook Fury 16 G10 | |
| HP ZBook X G1i 16 | |
| Lenovo ThinkPad P16 G2 21FA000FGE | |
| Media Intel Core Ultra 7 265H (19421 - 21369, n=2) | |
| Dell Precision 5690 | |
| Lenovo ThinkPad P1 Gen 7 21KV001SGE | |
| Lenovo ThinkPad P1 G6-21FV000DGE | |
| Lenovo ThinkPad P16s Gen 4 AMD | |
| HP ZBook Studio 16 G11 | |
| HP ZBook Studio 16 G9 62U04EA | |
| HP ZBook Power 16 G11 A | |
| Lenovo ThinkPad P16s G2 21K9000CGE | |
| Cinebench R23 / Single Core | |
| HP ZBook Fury 16 G11 | |
| HP ZBook Fury 16 G10 | |
| Lenovo ThinkPad P16 Gen 2 | |
| Dell Pro Max 16 Plus | |
| Media Intel Core Ultra 7 265H (2011 - 2081, n=2) | |
| Lenovo ThinkPad P1 G6-21FV000DGE | |
| HP ZBook X G1i 16 | |
| Lenovo ThinkPad P16s Gen 4 AMD | |
| Lenovo ThinkPad P16 G2 21FA000FGE | |
| HP ZBook Studio 16 G9 62U04EA | |
| Dell Precision 5690 | |
| Lenovo ThinkPad P1 Gen 7 21KV001SGE | |
| HP ZBook Studio 16 G11 | |
| HP ZBook Power 16 G11 A | |
| Lenovo ThinkPad P16s G2 21K9000CGE | |
| Cinebench R20 / CPU (Multi Core) | |
| Dell Pro Max 16 Plus | |
| HP ZBook Fury 16 G11 | |
| Lenovo ThinkPad P16 Gen 2 | |
| HP ZBook Fury 16 G10 | |
| HP ZBook X G1i 16 | |
| Media Intel Core Ultra 7 265H (7532 - 8400, n=2) | |
| Lenovo ThinkPad P16 G2 21FA000FGE | |
| Dell Precision 5690 | |
| Lenovo ThinkPad P1 Gen 7 21KV001SGE | |
| Lenovo ThinkPad P16s Gen 4 AMD | |
| Lenovo ThinkPad P1 G6-21FV000DGE | |
| HP ZBook Studio 16 G11 | |
| HP ZBook Studio 16 G9 62U04EA | |
| HP ZBook Power 16 G11 A | |
| Lenovo ThinkPad P16s G2 21K9000CGE | |
| Cinebench R20 / CPU (Single Core) | |
| HP ZBook Fury 16 G11 | |
| HP ZBook Fury 16 G10 | |
| Dell Pro Max 16 Plus | |
| Lenovo ThinkPad P16s Gen 4 AMD | |
| Lenovo ThinkPad P16 Gen 2 | |
| Media Intel Core Ultra 7 265H (776 - 791, n=2) | |
| Lenovo ThinkPad P1 G6-21FV000DGE | |
| HP ZBook X G1i 16 | |
| Lenovo ThinkPad P16 G2 21FA000FGE | |
| HP ZBook Studio 16 G9 62U04EA | |
| Dell Precision 5690 | |
| HP ZBook Studio 16 G11 | |
| Lenovo ThinkPad P1 Gen 7 21KV001SGE | |
| HP ZBook Power 16 G11 A | |
| Lenovo ThinkPad P16s G2 21K9000CGE | |
| Cinebench R15 / CPU Multi 64Bit | |
| Dell Pro Max 16 Plus | |
| HP ZBook Fury 16 G11 | |
| Lenovo ThinkPad P16 Gen 2 | |
| HP ZBook Fury 16 G10 | |
| HP ZBook X G1i 16 | |
| Lenovo ThinkPad P16s Gen 4 AMD | |
| Dell Precision 5690 | |
| Media Intel Core Ultra 7 265H (2851 - 3440, n=2) | |
| Lenovo ThinkPad P16 G2 21FA000FGE | |
| Lenovo ThinkPad P1 Gen 7 21KV001SGE | |
| HP ZBook Studio 16 G11 | |
| Lenovo ThinkPad P1 G6-21FV000DGE | |
| HP ZBook Power 16 G11 A | |
| HP ZBook Studio 16 G9 62U04EA | |
| Lenovo ThinkPad P16s G2 21K9000CGE | |
| Cinebench R15 / CPU Single 64Bit | |
| Lenovo ThinkPad P16s Gen 4 AMD | |
| Media Intel Core Ultra 7 265H (305 - 312, n=2) | |
| Dell Pro Max 16 Plus | |
| HP ZBook X G1i 16 | |
| HP ZBook Fury 16 G10 | |
| HP ZBook Fury 16 G11 | |
| Lenovo ThinkPad P16 Gen 2 | |
| Lenovo ThinkPad P1 G6-21FV000DGE | |
| Lenovo ThinkPad P16 G2 21FA000FGE | |
| HP ZBook Power 16 G11 A | |
| Dell Precision 5690 | |
| HP ZBook Studio 16 G9 62U04EA | |
| Lenovo ThinkPad P1 Gen 7 21KV001SGE | |
| Lenovo ThinkPad P16s G2 21K9000CGE | |
| HP ZBook Studio 16 G11 | |
| Blender / v2.79 BMW27 CPU | |
| Lenovo ThinkPad P16s G2 21K9000CGE | |
| Dell Precision 5690 | |
| HP ZBook Power 16 G11 A | |
| Lenovo ThinkPad P1 G6-21FV000DGE | |
| HP ZBook Studio 16 G9 62U04EA | |
| HP ZBook Studio 16 G11 | |
| Lenovo ThinkPad P1 Gen 7 21KV001SGE | |
| Lenovo ThinkPad P16s Gen 4 AMD | |
| Media Intel Core Ultra 7 265H (164 - 172, n=2) | |
| HP ZBook X G1i 16 | |
| Lenovo ThinkPad P16 G2 21FA000FGE | |
| HP ZBook Fury 16 G10 | |
| Lenovo ThinkPad P16 Gen 2 | |
| HP ZBook Fury 16 G11 | |
| Dell Pro Max 16 Plus | |
| 7-Zip 18.03 / 7z b 4 -mmt1 | |
| HP ZBook Fury 16 G11 | |
| Lenovo ThinkPad P16 Gen 2 | |
| HP ZBook Fury 16 G10 | |
| Dell Pro Max 16 Plus | |
| Lenovo ThinkPad P1 G6-21FV000DGE | |
| Lenovo ThinkPad P16 G2 21FA000FGE | |
| HP ZBook Power 16 G11 A | |
| Lenovo ThinkPad P16s Gen 4 AMD | |
| Media Intel Core Ultra 7 265H (6160 - 6304, n=2) | |
| HP ZBook X G1i 16 | |
| HP ZBook Studio 16 G9 62U04EA | |
| Lenovo ThinkPad P16s G2 21K9000CGE | |
| Lenovo ThinkPad P1 Gen 7 21KV001SGE | |
| HP ZBook Studio 16 G11 | |
| Dell Precision 5690 | |
| Geekbench 6.5 / Multi-Core | |
| Dell Pro Max 16 Plus | |
| HP ZBook X G1i 16 | |
| Lenovo ThinkPad P16 Gen 2 | |
| HP ZBook Fury 16 G10 | |
| Media Intel Core Ultra 7 265H (14502 - 17144, n=3) | |
| HP ZBook Fury 16 G11 | |
| Lenovo ThinkPad P16s Gen 4 AMD | |
| Dell Precision 5690 | |
| HP ZBook Studio 16 G11 | |
| Lenovo ThinkPad P1 Gen 7 21KV001SGE | |
| HP ZBook Power 16 G11 A | |
| Lenovo ThinkPad P1 G6-21FV000DGE | |
| Lenovo ThinkPad P16s G2 21K9000CGE | |
| Geekbench 6.5 / Single-Core | |
| HP ZBook Fury 16 G10 | |
| Lenovo ThinkPad P16s Gen 4 AMD | |
| HP ZBook Fury 16 G11 | |
| HP ZBook X G1i 16 | |
| Media Intel Core Ultra 7 265H (2905 - 2911, n=3) | |
| Dell Pro Max 16 Plus | |
| Lenovo ThinkPad P16 Gen 2 | |
| Lenovo ThinkPad P1 G6-21FV000DGE | |
| HP ZBook Power 16 G11 A | |
| Dell Precision 5690 | |
| HP ZBook Studio 16 G11 | |
| Lenovo ThinkPad P16s G2 21K9000CGE | |
| Lenovo ThinkPad P1 Gen 7 21KV001SGE | |
| Geekbench 5.5 / Multi-Core | |
| Dell Pro Max 16 Plus | |
| HP ZBook Fury 16 G11 | |
| Lenovo ThinkPad P16 Gen 2 | |
| HP ZBook Fury 16 G10 | |
| HP ZBook X G1i 16 | |
| Media Intel Core Ultra 7 265H (14945 - 16453, n=2) | |
| Lenovo ThinkPad P16s Gen 4 AMD | |
| Lenovo ThinkPad P16 G2 21FA000FGE | |
| Dell Precision 5690 | |
| HP ZBook Studio 16 G11 | |
| Lenovo ThinkPad P1 Gen 7 21KV001SGE | |
| HP ZBook Studio 16 G9 62U04EA | |
| HP ZBook Power 16 G11 A | |
| Lenovo ThinkPad P1 G6-21FV000DGE | |
| Lenovo ThinkPad P16s G2 21K9000CGE | |
| Geekbench 5.5 / Single-Core | |
| Lenovo ThinkPad P16s Gen 4 AMD | |
| Dell Pro Max 16 Plus | |
| HP ZBook Fury 16 G10 | |
| Media Intel Core Ultra 7 265H (2079 - 2110, n=2) | |
| HP ZBook X G1i 16 | |
| HP ZBook Fury 16 G11 | |
| Lenovo ThinkPad P16 Gen 2 | |
| Lenovo ThinkPad P1 G6-21FV000DGE | |
| HP ZBook Power 16 G11 A | |
| Lenovo ThinkPad P16 G2 21FA000FGE | |
| Dell Precision 5690 | |
| HP ZBook Studio 16 G11 | |
| HP ZBook Studio 16 G9 62U04EA | |
| Lenovo ThinkPad P1 Gen 7 21KV001SGE | |
| Lenovo ThinkPad P16s G2 21K9000CGE | |
| HWBOT x265 Benchmark v2.2 / 4k Preset | |
| Dell Pro Max 16 Plus | |
| HP ZBook Fury 16 G11 | |
| HP ZBook Fury 16 G10 | |
| HP ZBook X G1i 16 | |
| Lenovo ThinkPad P16 Gen 2 | |
| Media Intel Core Ultra 7 265H (23.1 - 25.3, n=2) | |
| Lenovo ThinkPad P16s Gen 4 AMD | |
| Lenovo ThinkPad P16 G2 21FA000FGE | |
| Dell Precision 5690 | |
| Lenovo ThinkPad P1 Gen 7 21KV001SGE | |
| HP ZBook Studio 16 G11 | |
| HP ZBook Power 16 G11 A | |
| HP ZBook Studio 16 G9 62U04EA | |
| Lenovo ThinkPad P1 G6-21FV000DGE | |
| Lenovo ThinkPad P16s G2 21K9000CGE | |
| LibreOffice / 20 Documents To PDF | |
| Lenovo ThinkPad P16s Gen 4 AMD | |
| Media Intel Core Ultra 7 265H (42.2 - 74.7, n=2) | |
| Lenovo ThinkPad P16s G2 21K9000CGE | |
| HP ZBook Power 16 G11 A | |
| Lenovo ThinkPad P16 G2 21FA000FGE | |
| HP ZBook Fury 16 G11 | |
| Lenovo ThinkPad P1 G6-21FV000DGE | |
| Lenovo ThinkPad P16 Gen 2 | |
| HP ZBook Studio 16 G11 | |
| Lenovo ThinkPad P1 Gen 7 21KV001SGE | |
| HP ZBook Fury 16 G10 | |
| HP ZBook Studio 16 G9 62U04EA | |
| Dell Pro Max 16 Plus | |
| HP ZBook X G1i 16 | |
| Dell Precision 5690 | |
| R Benchmark 2.5 / Overall mean | |
| Lenovo ThinkPad P16s Gen 4 AMD | |
| Lenovo ThinkPad P16s G2 21K9000CGE | |
| Lenovo ThinkPad P1 Gen 7 21KV001SGE | |
| Dell Precision 5690 | |
| HP ZBook Studio 16 G11 | |
| HP ZBook Power 16 G11 A | |
| HP ZBook Studio 16 G9 62U04EA | |
| Lenovo ThinkPad P16 G2 21FA000FGE | |
| Dell Pro Max 16 Plus | |
| Media Intel Core Ultra 7 265H (0.4241 - 0.4291, n=2) | |
| HP ZBook X G1i 16 | |
| Lenovo ThinkPad P1 G6-21FV000DGE | |
| Lenovo ThinkPad P16 Gen 2 | |
| HP ZBook Fury 16 G10 | |
| HP ZBook Fury 16 G11 | |
Cinebench R23: Multi Core | Single Core
Cinebench R20: CPU (Multi Core) | CPU (Single Core)
Cinebench R15: CPU Multi 64Bit | CPU Single 64Bit
Blender: v2.79 BMW27 CPU
7-Zip 18.03: 7z b 4 | 7z b 4 -mmt1
Geekbench 6.5: Multi-Core | Single-Core
Geekbench 5.5: Multi-Core | Single-Core
HWBOT x265 Benchmark v2.2: 4k Preset
LibreOffice : 20 Documents To PDF
R Benchmark 2.5: Overall mean
* ... Meglio usare valori piccoli
Prestazioni del sistema
Una piccola manciata di benchmark si bloccava o non riusciva a completarsi sulla nostra unità di prova, tra cui PCMark 10, SpecViewPerf 13 Maya e AIDA64 Engineer.
CrossMark: Overall | Productivity | Creativity | Responsiveness
WebXPRT 3: Overall
WebXPRT 4: Overall
Mozilla Kraken 1.1: Total
| Performance rating | |
| Dell Pro Max 16 Plus | |
| Lenovo ThinkPad P16 Gen 2 | |
| HP ZBook X G1i 16 | |
| Media Intel Core Ultra 7 265H, Nvidia RTX PRO 2000 Blackwell Generation Laptop | |
| Dell Precision 5690 | |
| HP ZBook Studio 16 G11 | |
| HP ZBook Power 16 G11 A | |
| CrossMark / Overall | |
| Dell Pro Max 16 Plus | |
| Lenovo ThinkPad P16 Gen 2 | |
| HP ZBook X G1i 16 | |
| Media Intel Core Ultra 7 265H, Nvidia RTX PRO 2000 Blackwell Generation Laptop (n=1) | |
| Dell Precision 5690 | |
| HP ZBook Power 16 G11 A | |
| HP ZBook Studio 16 G11 | |
| CrossMark / Productivity | |
| Dell Pro Max 16 Plus | |
| HP ZBook X G1i 16 | |
| Media Intel Core Ultra 7 265H, Nvidia RTX PRO 2000 Blackwell Generation Laptop (n=1) | |
| Lenovo ThinkPad P16 Gen 2 | |
| Dell Precision 5690 | |
| HP ZBook Power 16 G11 A | |
| HP ZBook Studio 16 G11 | |
| CrossMark / Creativity | |
| Dell Pro Max 16 Plus | |
| Lenovo ThinkPad P16 Gen 2 | |
| HP ZBook X G1i 16 | |
| Media Intel Core Ultra 7 265H, Nvidia RTX PRO 2000 Blackwell Generation Laptop (n=1) | |
| HP ZBook Power 16 G11 A | |
| Dell Precision 5690 | |
| HP ZBook Studio 16 G11 | |
| CrossMark / Responsiveness | |
| Dell Pro Max 16 Plus | |
| Lenovo ThinkPad P16 Gen 2 | |
| Dell Precision 5690 | |
| HP ZBook X G1i 16 | |
| Media Intel Core Ultra 7 265H, Nvidia RTX PRO 2000 Blackwell Generation Laptop (n=1) | |
| HP ZBook Studio 16 G11 | |
| HP ZBook Power 16 G11 A | |
| WebXPRT 3 / Overall | |
| Lenovo ThinkPad P16 Gen 2 | |
| Dell Pro Max 16 Plus | |
| HP ZBook X G1i 16 | |
| Media Intel Core Ultra 7 265H, Nvidia RTX PRO 2000 Blackwell Generation Laptop (n=1) | |
| HP ZBook Power 16 G11 A | |
| HP ZBook Studio 16 G11 | |
| Dell Precision 5690 | |
| WebXPRT 4 / Overall | |
| Dell Pro Max 16 Plus | |
| Lenovo ThinkPad P16 Gen 2 | |
| HP ZBook X G1i 16 | |
| Media Intel Core Ultra 7 265H, Nvidia RTX PRO 2000 Blackwell Generation Laptop (n=1) | |
| Dell Precision 5690 | |
| HP ZBook Studio 16 G11 | |
| HP ZBook Power 16 G11 A | |
| Mozilla Kraken 1.1 / Total | |
| HP ZBook Power 16 G11 A | |
| HP ZBook Studio 16 G11 | |
| Dell Precision 5690 | |
| HP ZBook X G1i 16 | |
| Media Intel Core Ultra 7 265H, Nvidia RTX PRO 2000 Blackwell Generation Laptop (n=1) | |
| Lenovo ThinkPad P16 Gen 2 | |
| Dell Pro Max 16 Plus | |
* ... Meglio usare valori piccoli
» No benchmarks for this notebook found!
Latenza DPC
| DPC Latencies / LatencyMon - interrupt to process latency (max), Web, Youtube, Prime95 | |
| HP ZBook Power 16 G11 A | |
| Dell Pro Max 16 Plus | |
| HP ZBook Studio 16 G11 | |
| Lenovo ThinkPad P16 Gen 2 | |
| HP ZBook X G1i 16 | |
| Dell Precision 5690 | |
* ... Meglio usare valori piccoli
Dispositivi di archiviazione
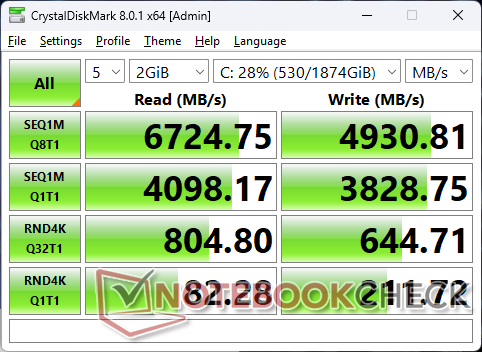
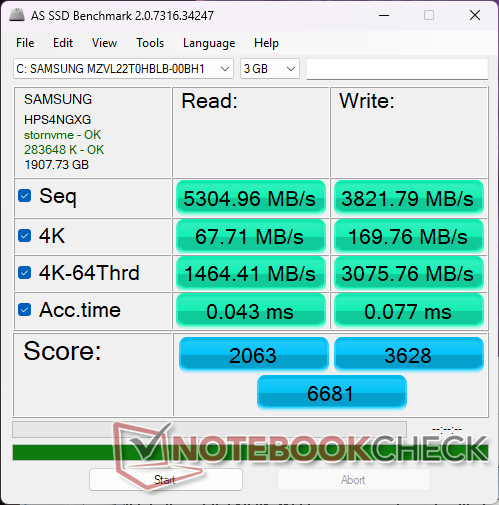

| Drive Performance rating - Percent | |
| HP ZBook X G1i 16 | |
| Dell Pro Max 16 Plus | |
| Dell Precision 5690 | |
| Lenovo ThinkPad P16 Gen 2 | |
| HP ZBook Power 16 G11 A | |
| HP ZBook Studio 16 G11 | |
* ... Meglio usare valori piccoli
Strozzatura del disco: DiskSpd Lettura in loop, Profondità coda 8
Prestazioni della GPU
Il RTX Pro 2000 Blackwell di HP punta a 60 W per un livello di prestazioni grezze solo leggermente superiore a quello dell'ultima generazione di RTX 2000 Ada Lovelace. Nel frattempo, gli utenti che passano dalla più vecchia RTX A2000 su modelli come il 2022 ZBook Studio 16 G9 vedranno incrementi più significativi, da 1,5x a 1,9x.
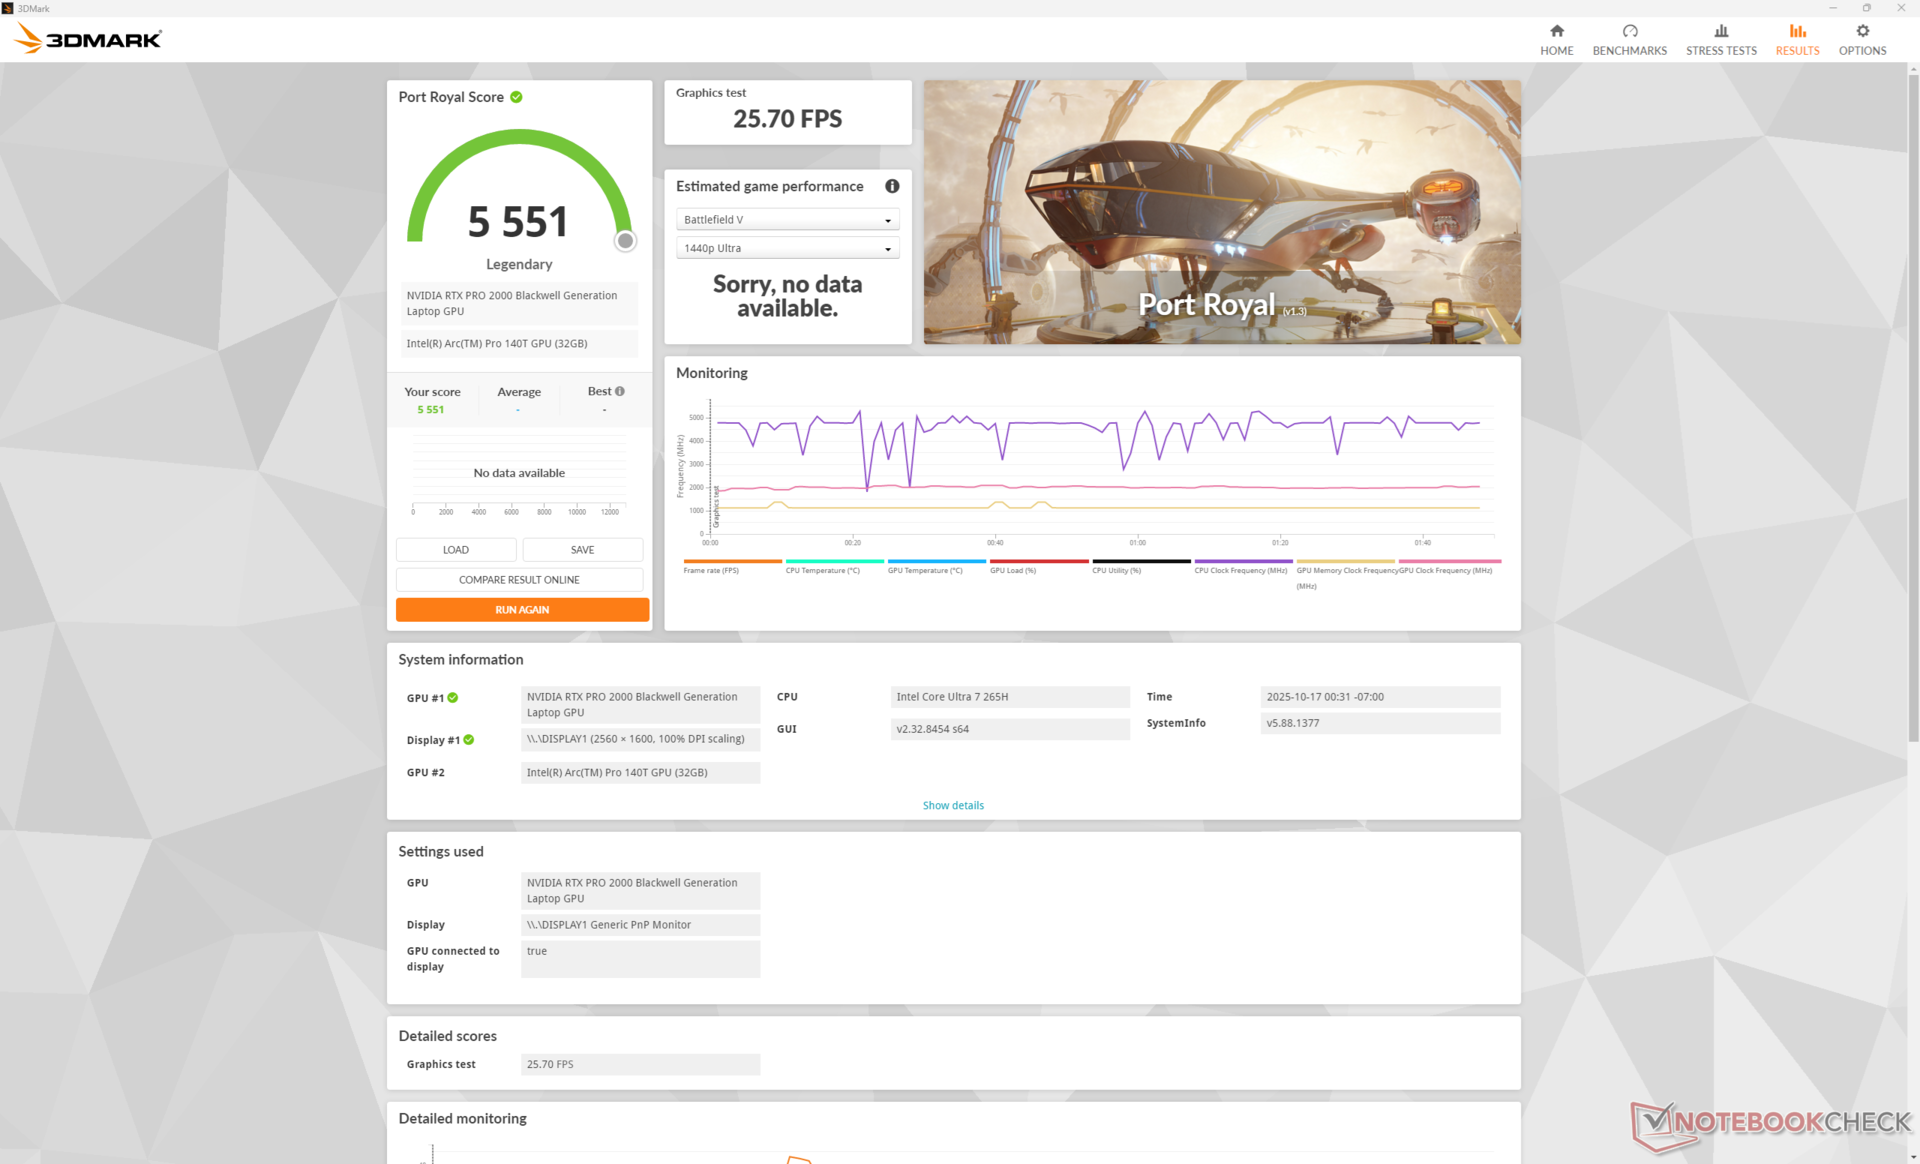
L'esecuzione in modalità Bilanciata invece che in modalità Performance avrebbe un impatto sulle prestazioni grafiche di circa il 5 percento, come mostra la nostra tabella dei risultati di Fire Strike qui sotto. Nei giochi, la RTX Pro 2000 ha prestazioni molto simili a quelle della RTX 4060 mobile GeForce RTX 4060 mobile o 5060.
| Profilo di potenza | Punteggio di grafica | Punteggio di fisica | Punteggio combinato |
| Modalità Prestazioni | 25085 | 33858 | 11010 |
| Modalità equilibrata | 23771 (-5%) | 35309 (+4%) | 9366 (-15%) |
| Alimentazione a batteria | 18195 (-27%) | 25739 (-24%) | 5646 (-49%) |

| 3DMark Performance rating - Percent | |
| Dell Pro Max 16 Plus | |
| Lenovo ThinkPad P16 Gen 2 -1! | |
| HP ZBook Fury 16 G10 -3! | |
| Dell Precision 5690 -1! | |
| HP ZBook Fury 16 G11 | |
| HP ZBook X G1i 16 | |
| Media Nvidia RTX PRO 2000 Blackwell Generation Laptop | |
| Lenovo ThinkPad P1 G6-21FV000DGE -10! | |
| HP ZBook Studio 16 G11 -1! | |
| Lenovo ThinkPad P16 G2 21FA000FGE -12! | |
| HP ZBook Power 16 G11 A | |
| Lenovo ThinkPad P1 Gen 7 21KV001SGE -20! | |
| HP ZBook Studio 16 G9 62U04EA -5! | |
| Lenovo ThinkPad P16s Gen 4 AMD -20! | |
| Lenovo ThinkPad P16s G2 21K9000CGE -12! | |
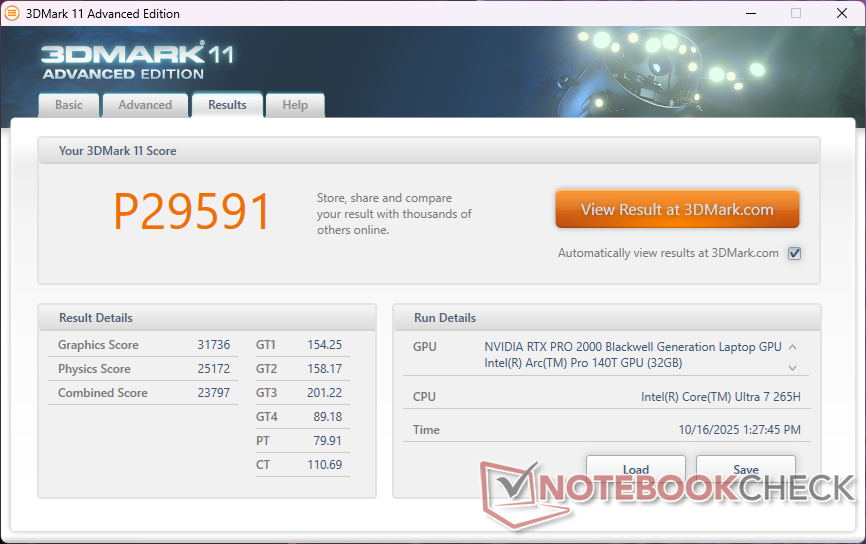
| 3DMark 11 Performance | 29591 punti | |
| 3DMark Cloud Gate Standard Score | 60675 punti | |
| 3DMark Fire Strike Score | 23035 punti | |
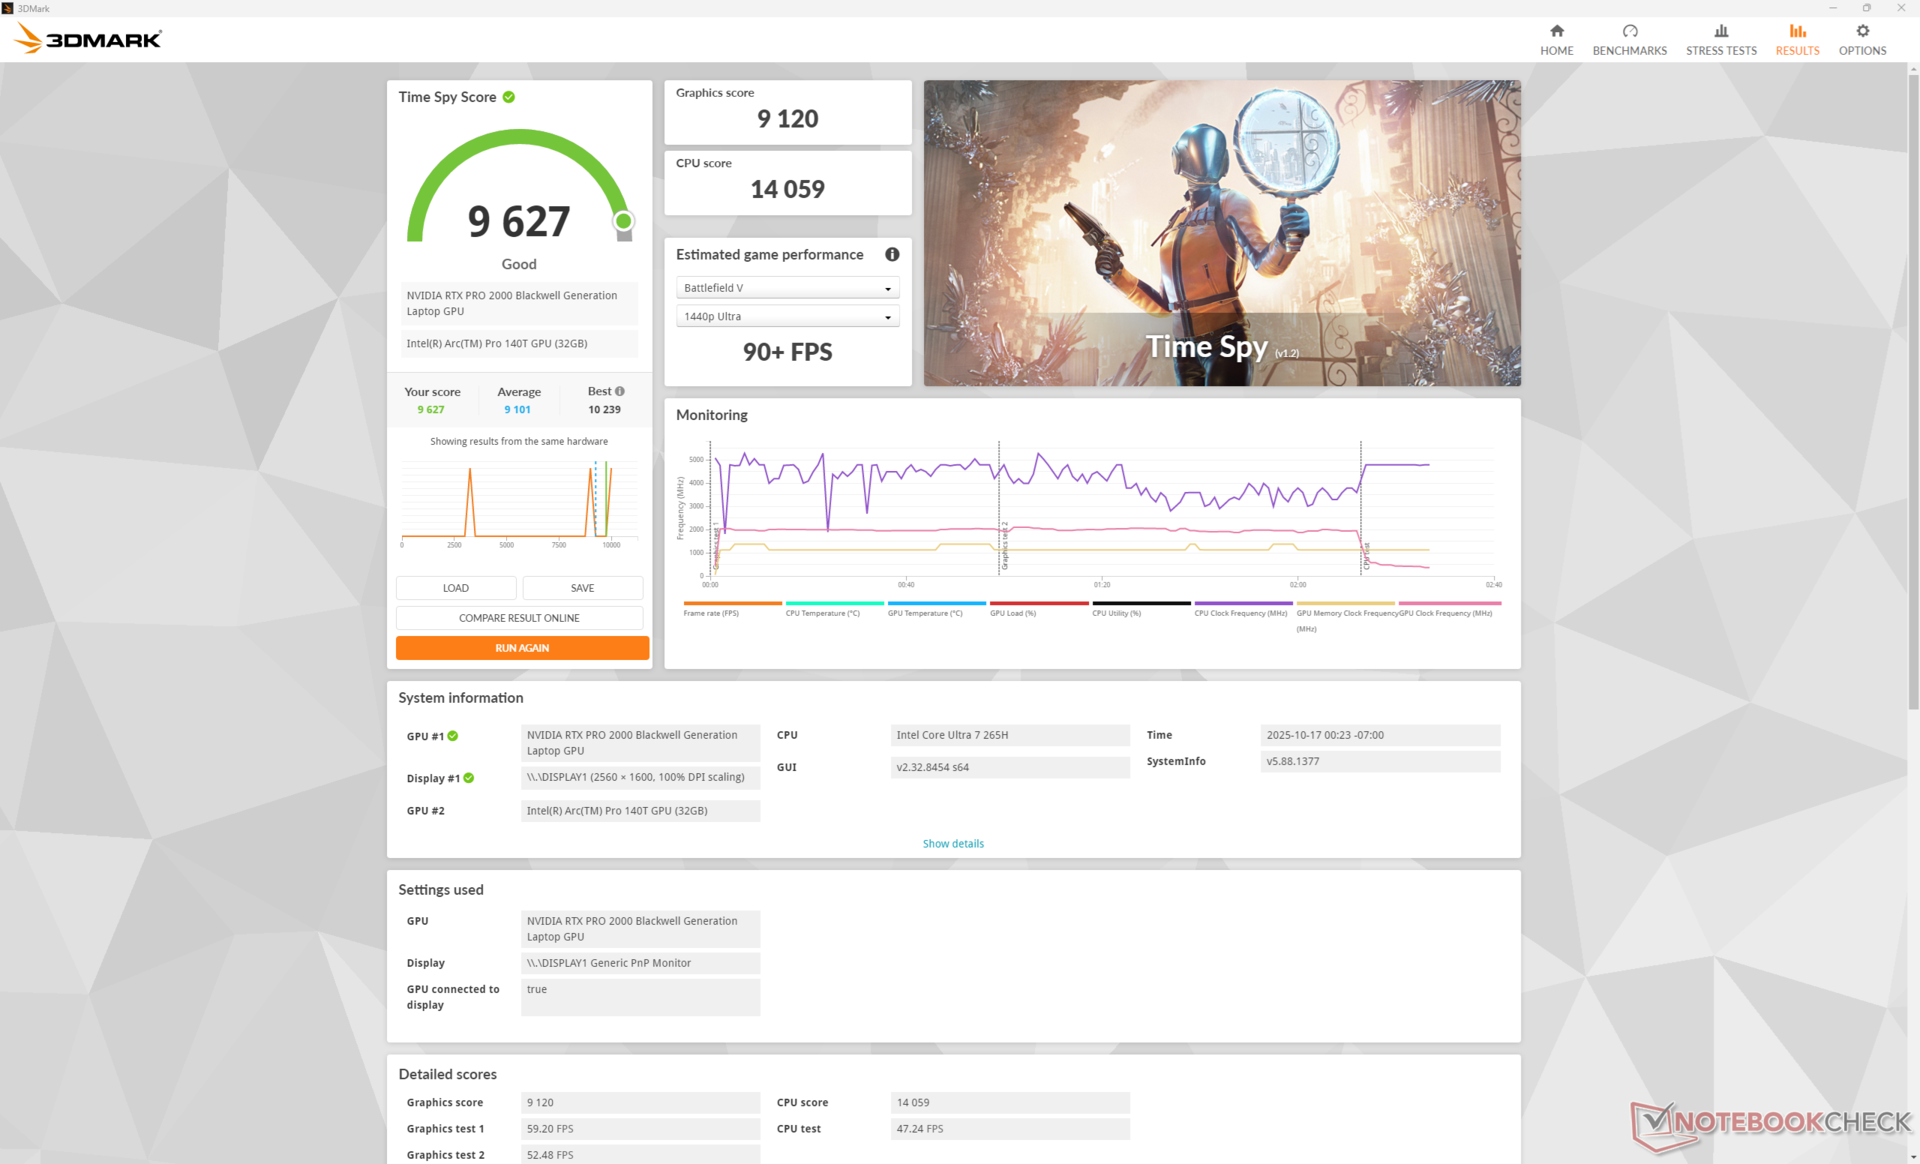
| 3DMark Time Spy Score | 9627 punti | |
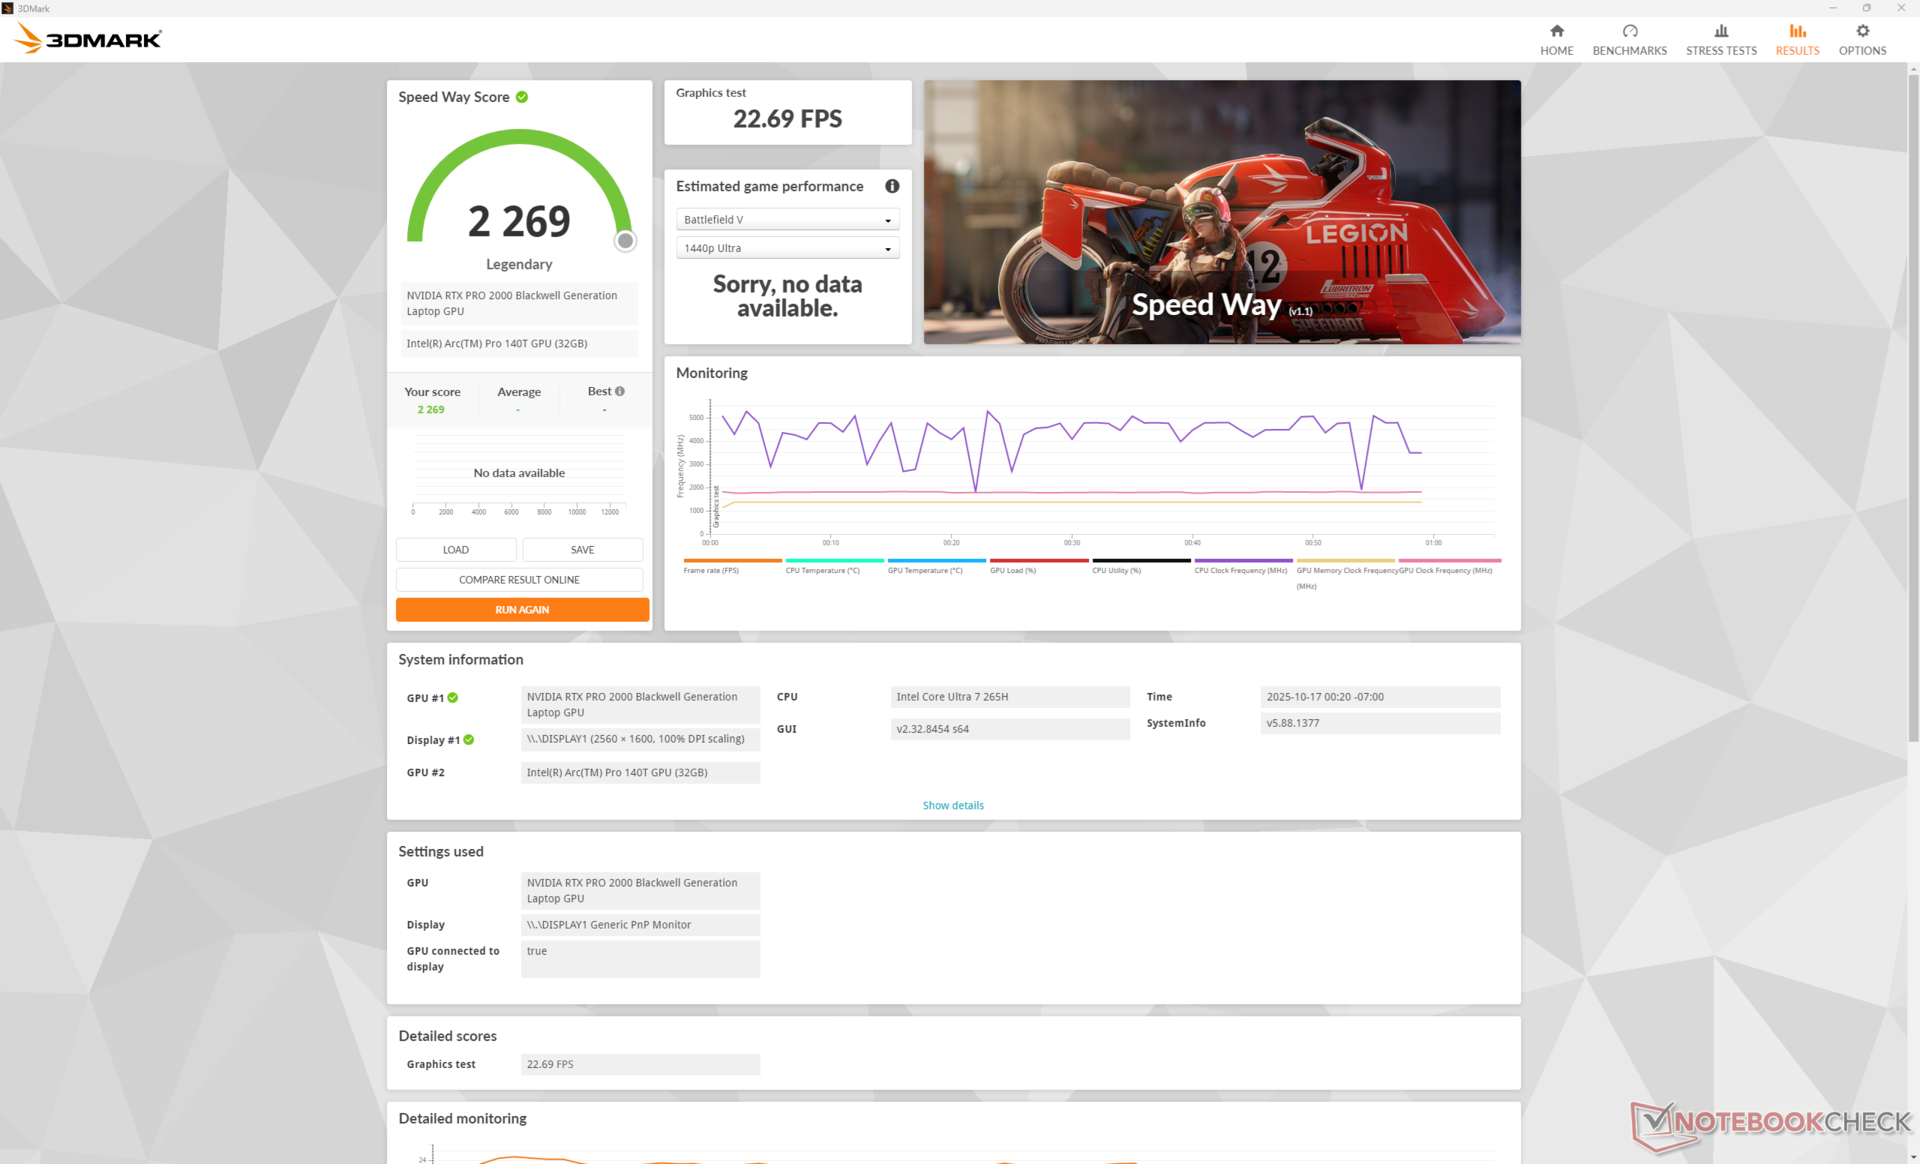
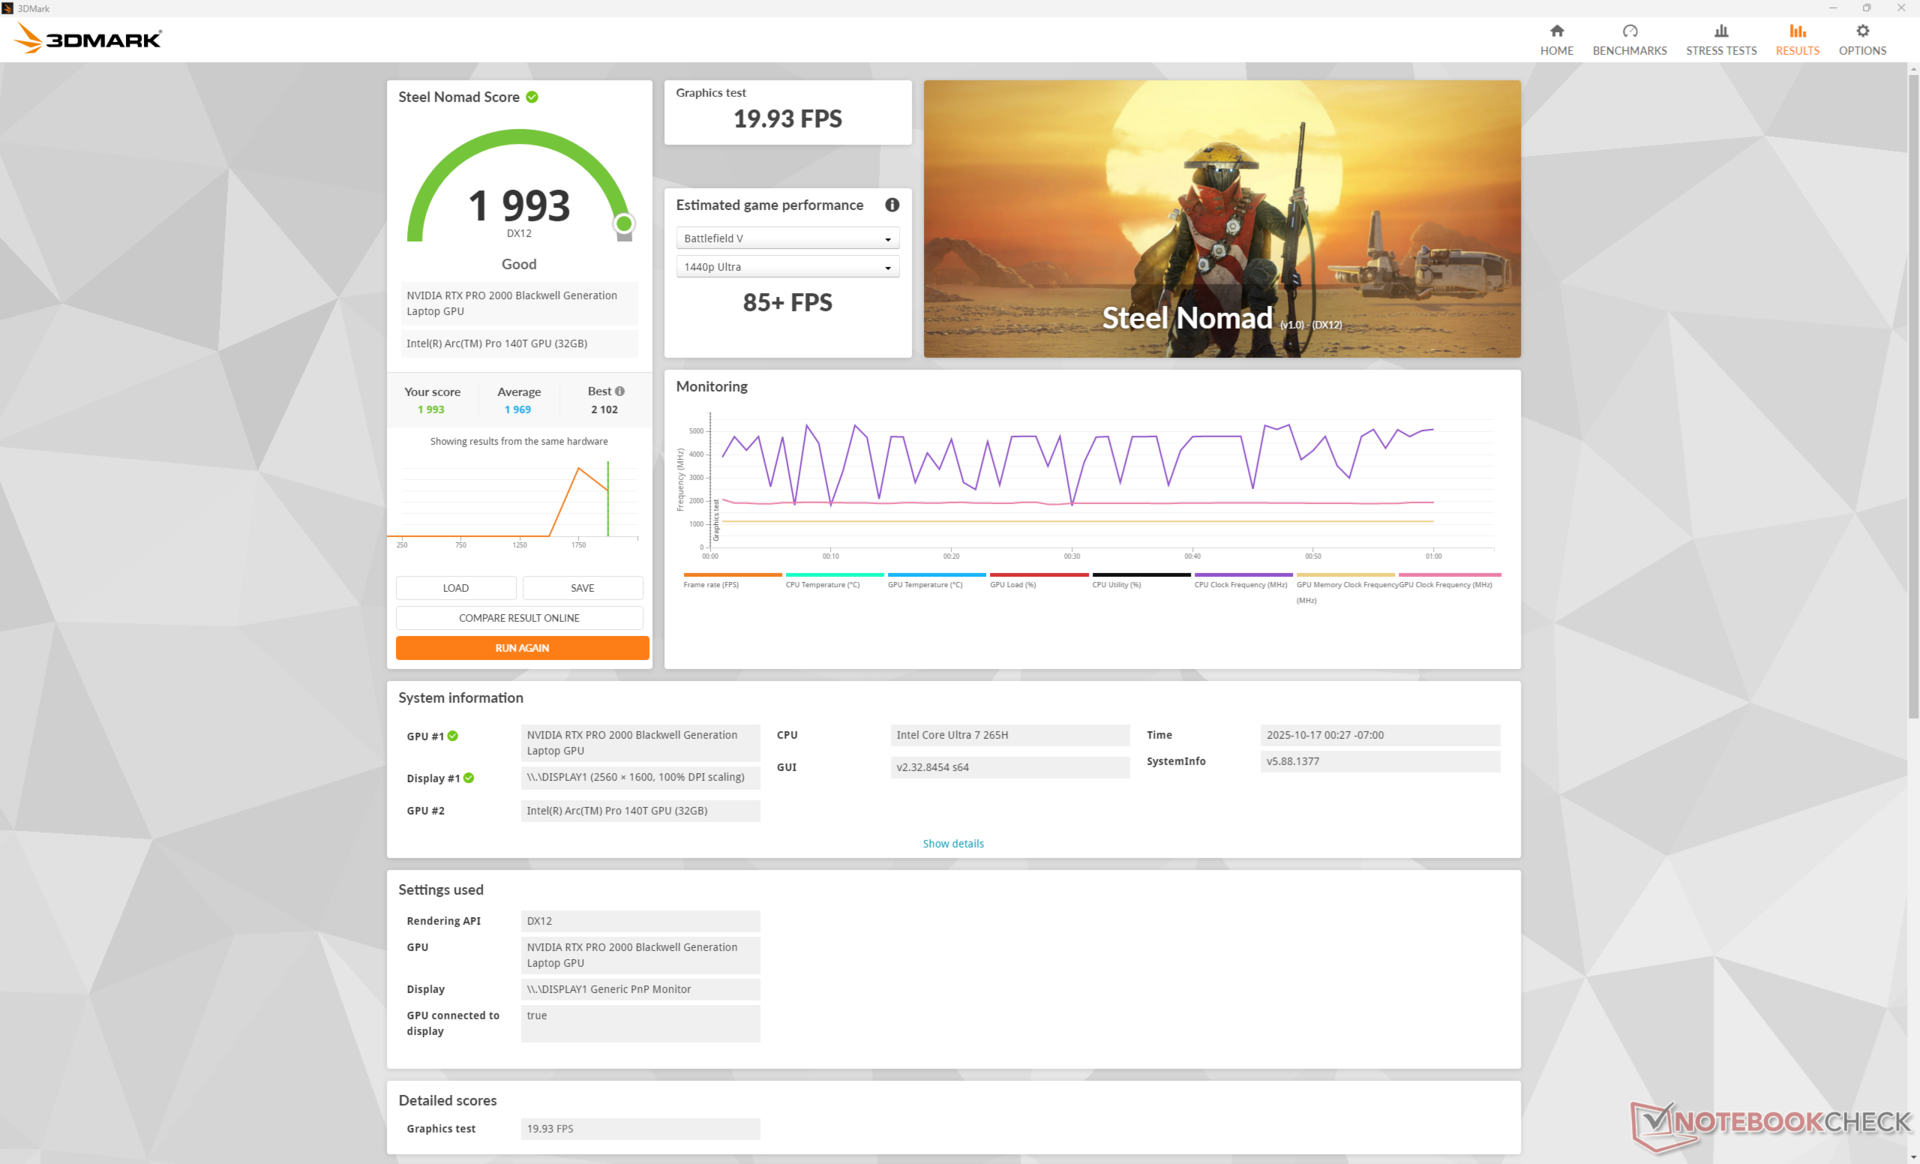
| 3DMark Steel Nomad Score | 1993 punti | |
Aiuto | ||
* ... Meglio usare valori piccoli
| Performance rating - Percent | |
| Dell Pro Max 16 Plus | |
| Lenovo ThinkPad P16 Gen 2 | |
| Dell Precision 5690 -1! | |
| HP ZBook X G1i 16 | |
| HP ZBook Studio 16 G11 | |
| HP ZBook Power 16 G11 A | |
| Cyberpunk 2077 2.2 Phantom Liberty - 1920x1080 Ultra Preset (FSR off) | |
| Dell Pro Max 16 Plus | |
| Dell Precision 5690 | |
| Lenovo ThinkPad P16 Gen 2 | |
| HP ZBook X G1i 16 | |
| HP ZBook Studio 16 G11 | |
| HP ZBook Power 16 G11 A | |
| Baldur's Gate 3 - 1920x1080 Ultra Preset AA:T | |
| Dell Pro Max 16 Plus | |
| Lenovo ThinkPad P16 Gen 2 | |
| Dell Precision 5690 | |
| HP ZBook Studio 16 G11 | |
| HP ZBook X G1i 16 | |
| HP ZBook Power 16 G11 A | |
| GTA V - 1920x1080 Highest Settings possible AA:4xMSAA + FX AF:16x | |
| Dell Pro Max 16 Plus | |
| Lenovo ThinkPad P16 Gen 2 | |
| HP ZBook X G1i 16 | |
| HP ZBook Studio 16 G11 | |
| HP ZBook Power 16 G11 A | |
| Final Fantasy XV Benchmark - 1920x1080 High Quality | |
| Dell Pro Max 16 Plus | |
| Lenovo ThinkPad P16 Gen 2 | |
| Dell Precision 5690 | |
| HP ZBook X G1i 16 | |
| HP ZBook Studio 16 G11 | |
| HP ZBook Power 16 G11 A | |
| Strange Brigade - 1920x1080 ultra AA:ultra AF:16 | |
| Lenovo ThinkPad P16 Gen 2 | |
| Dell Pro Max 16 Plus | |
| Dell Precision 5690 | |
| HP ZBook Studio 16 G11 | |
| HP ZBook X G1i 16 | |
| HP ZBook Power 16 G11 A | |
| Dota 2 Reborn - 1920x1080 ultra (3/3) best looking | |
| Dell Pro Max 16 Plus | |
| Lenovo ThinkPad P16 Gen 2 | |
| HP ZBook Studio 16 G11 | |
| HP ZBook X G1i 16 | |
| Dell Precision 5690 | |
| HP ZBook Power 16 G11 A | |
| X-Plane 11.11 - 1920x1080 high (fps_test=3) | |
| Lenovo ThinkPad P16 Gen 2 | |
| Dell Pro Max 16 Plus | |
| Dell Precision 5690 | |
| HP ZBook Studio 16 G11 | |
| HP ZBook X G1i 16 | |
| HP ZBook Power 16 G11 A | |
Grafico Cyberpunk 2077 ultra FPS
| basso | medio | alto | ultra | QHD DLSS | QHD | |
|---|---|---|---|---|---|---|
| GTA V (2015) | 186.2 | 183.1 | 177.8 | 112.7 | 88.4 | |
| Dota 2 Reborn (2015) | 170.1 | 158.1 | 151.1 | 141.8 | ||
| Final Fantasy XV Benchmark (2018) | 206 | 129.5 | 100.2 | 71 | ||
| X-Plane 11.11 (2018) | 102 | 92.2 | 80.6 | |||
| Strange Brigade (2018) | 480 | 252 | 198.7 | 171.3 | 119.2 | |
| Baldur's Gate 3 (2023) | 116.1 | 99.7 | 89.6 | 89.5 | 90 | 60.4 |
| Cyberpunk 2077 2.2 Phantom Liberty (2023) | 112.5 | 93.5 | 80 | 72.1 | 52.4 | 43.6 |
| F1 24 (2024) | 214 | 205 | 161.4 | 48.2 | 48.8 | 32.2 |
Emissioni
Rumore del sistema
Le ventole sono letargiche quando si eseguono carichi poco impegnativi, ma possono diventare piuttosto rumorose, con poco più di 50 dB(A), quando si eseguono carichi più impegnativi per periodi prolungati, come Cyberpunk 2077.
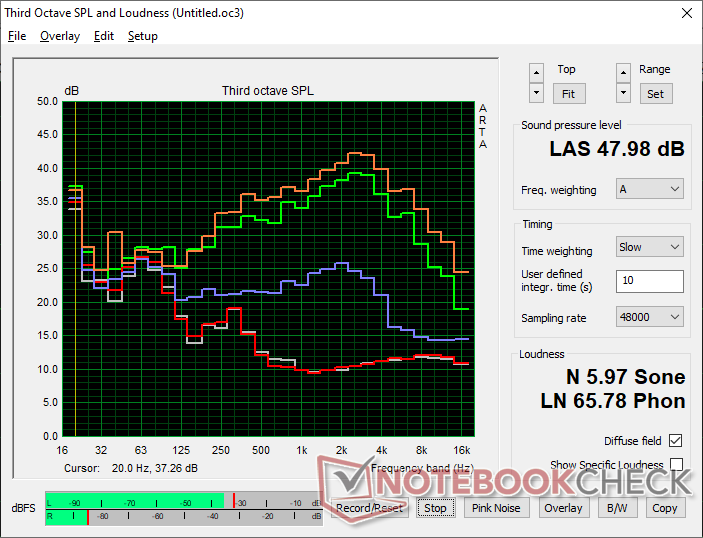
Rumorosità
| Idle |
| 23.7 / 23.7 / 23.7 dB(A) |
| Sotto carico |
| 32.7 / 48 dB(A) |
 | ||
30 dB silenzioso 40 dB(A) udibile 50 dB(A) rumoroso |
||
min: | ||
| HP ZBook X G1i 16 RTX PRO 2000 Blackwell Generation Laptop, Ultra 7 265H, Samsung PM9A1 MZVL22T0HBLB | HP ZBook Power 16 G11 A NVIDIA RTX 2000 Ada Generation Laptop, R7 8845HS, Samsung PM9A1 MZVL22T0HBLB | HP ZBook Studio 16 G11 NVIDIA RTX 3000 Ada Generation Laptop, Ultra 9 185H, Kioxia XG8 KXG80ZNV1T02 | Lenovo ThinkPad P16 Gen 2 NVIDIA RTX 4000 Ada Generation Laptop, i7-14700HX, SK hynix PC801 HFS001TEJ9X162N | Dell Pro Max 16 Plus RTX PRO 5000 Blackwell Generation Laptop, Ultra 9 285HX, SK hynix PCB01 HFS001TFM9X186N | Dell Precision 5690 NVIDIA RTX 5000 Ada Generation Laptop, Ultra 9 185H, 2x Samsung PM9A1 1TB (RAID 0) | |
|---|---|---|---|---|---|---|
| Noise | 6% | -4% | -16% | -18% | -11% | |
| off /ambiente * (dB) | 23.7 | 23.5 1% | 23.8 -0% | 23.9 -1% | 23.2 2% | 23.4 1% |
| Idle Minimum * (dB) | 23.7 | 23.8 -0% | 23.8 -0% | 29.1 -23% | 26.7 -13% | 23.6 -0% |
| Idle Average * (dB) | 23.7 | 24.2 -2% | 26.4 -11% | 29.1 -23% | 30.5 -29% | 24.9 -5% |
| Idle Maximum * (dB) | 23.7 | 24.2 -2% | 26.4 -11% | 29.1 -23% | 34 -43% | 30.9 -30% |
| Load Average * (dB) | 32.7 | 25.4 22% | 33.7 -3% | 41 -25% | 39.8 -22% | 40.4 -24% |
| Cyberpunk 2077 ultra * (dB) | 50.9 | 43 16% | 46.1 9% | 52.8 -4% | 54.3 -7% | |
| Load Maximum * (dB) | 48 | 45 6% | 53.2 -11% | 52.9 -10% | 54.3 -13% | 51.9 -8% |
| Witcher 3 ultra * (dB) | 48.3 |
* ... Meglio usare valori piccoli
Temperatura
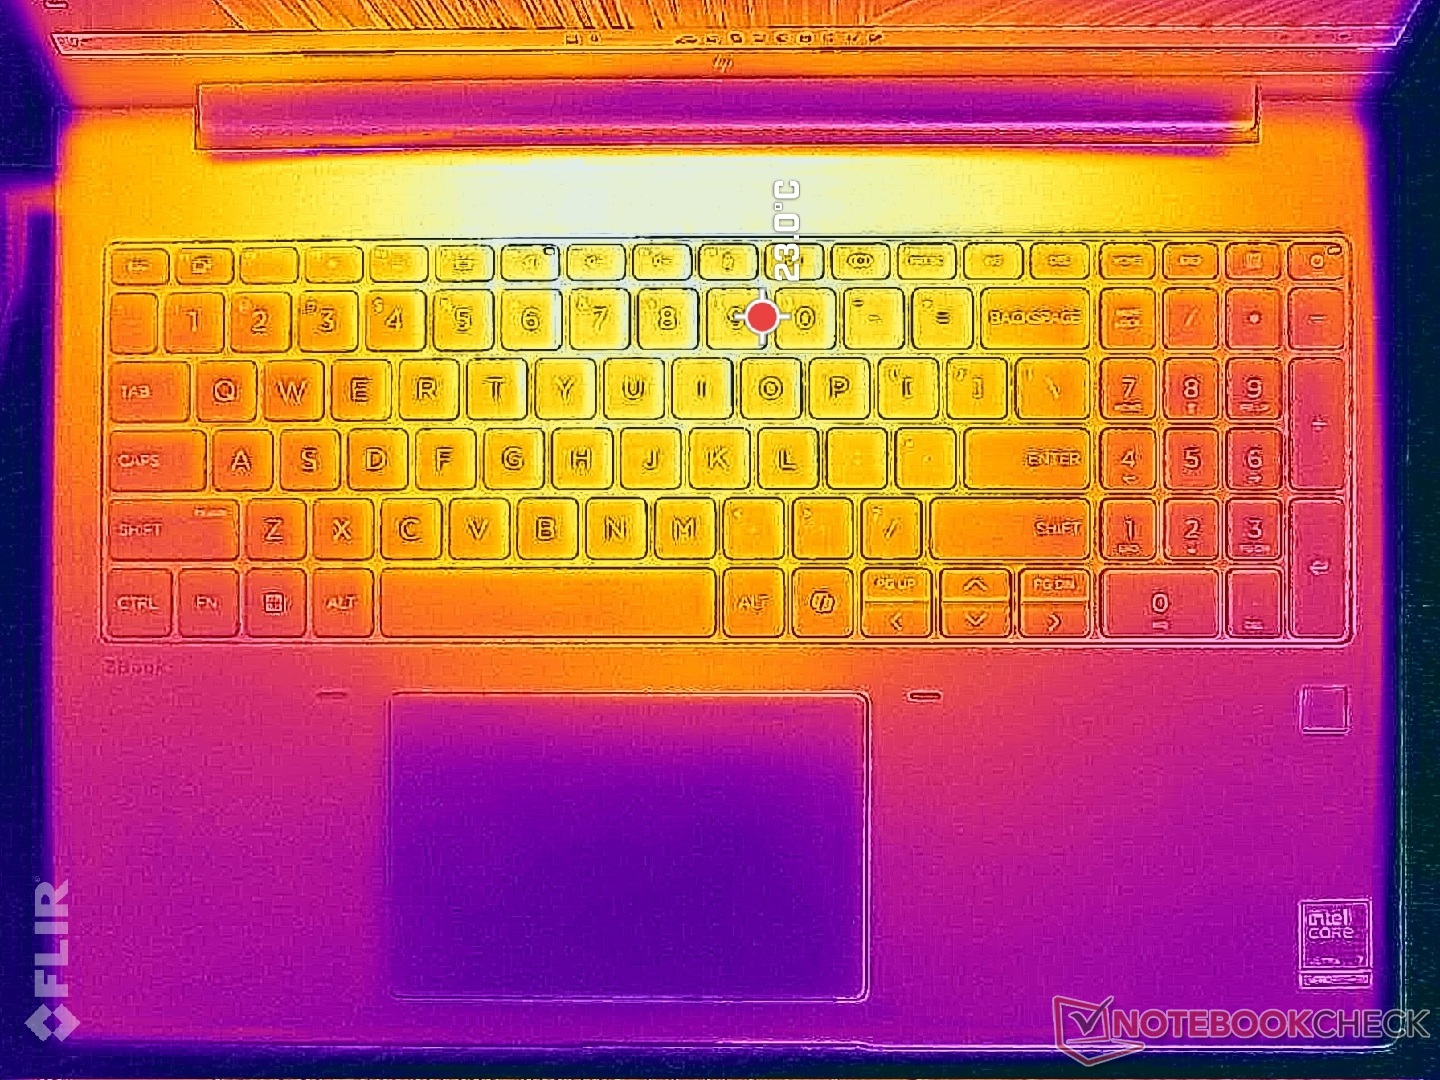
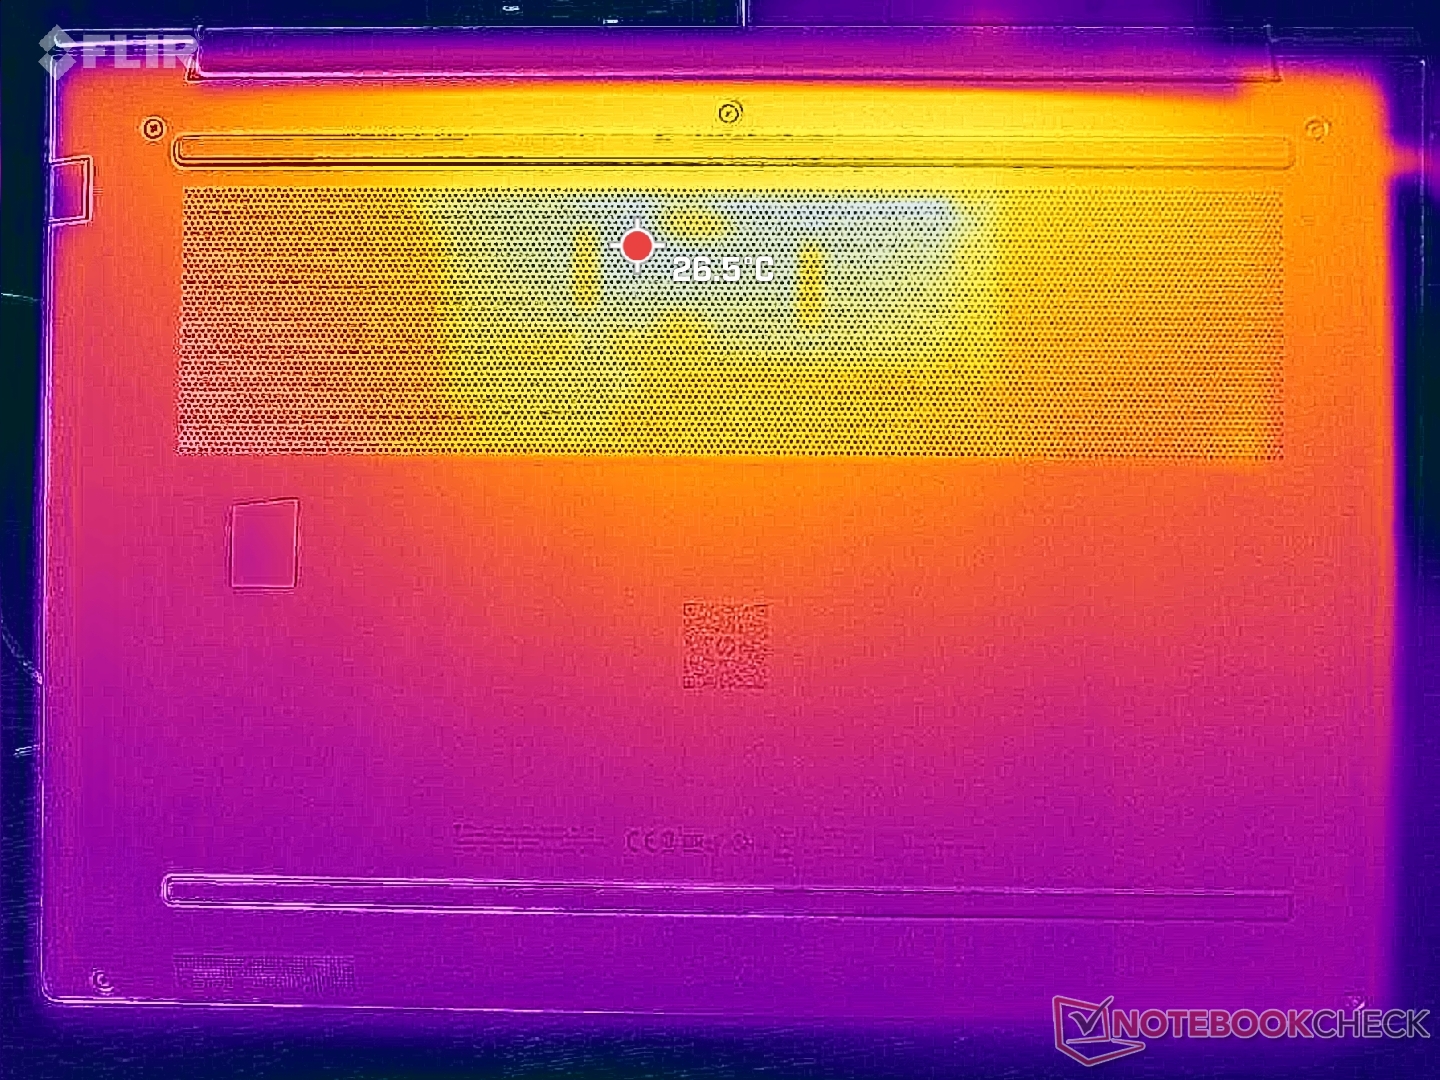
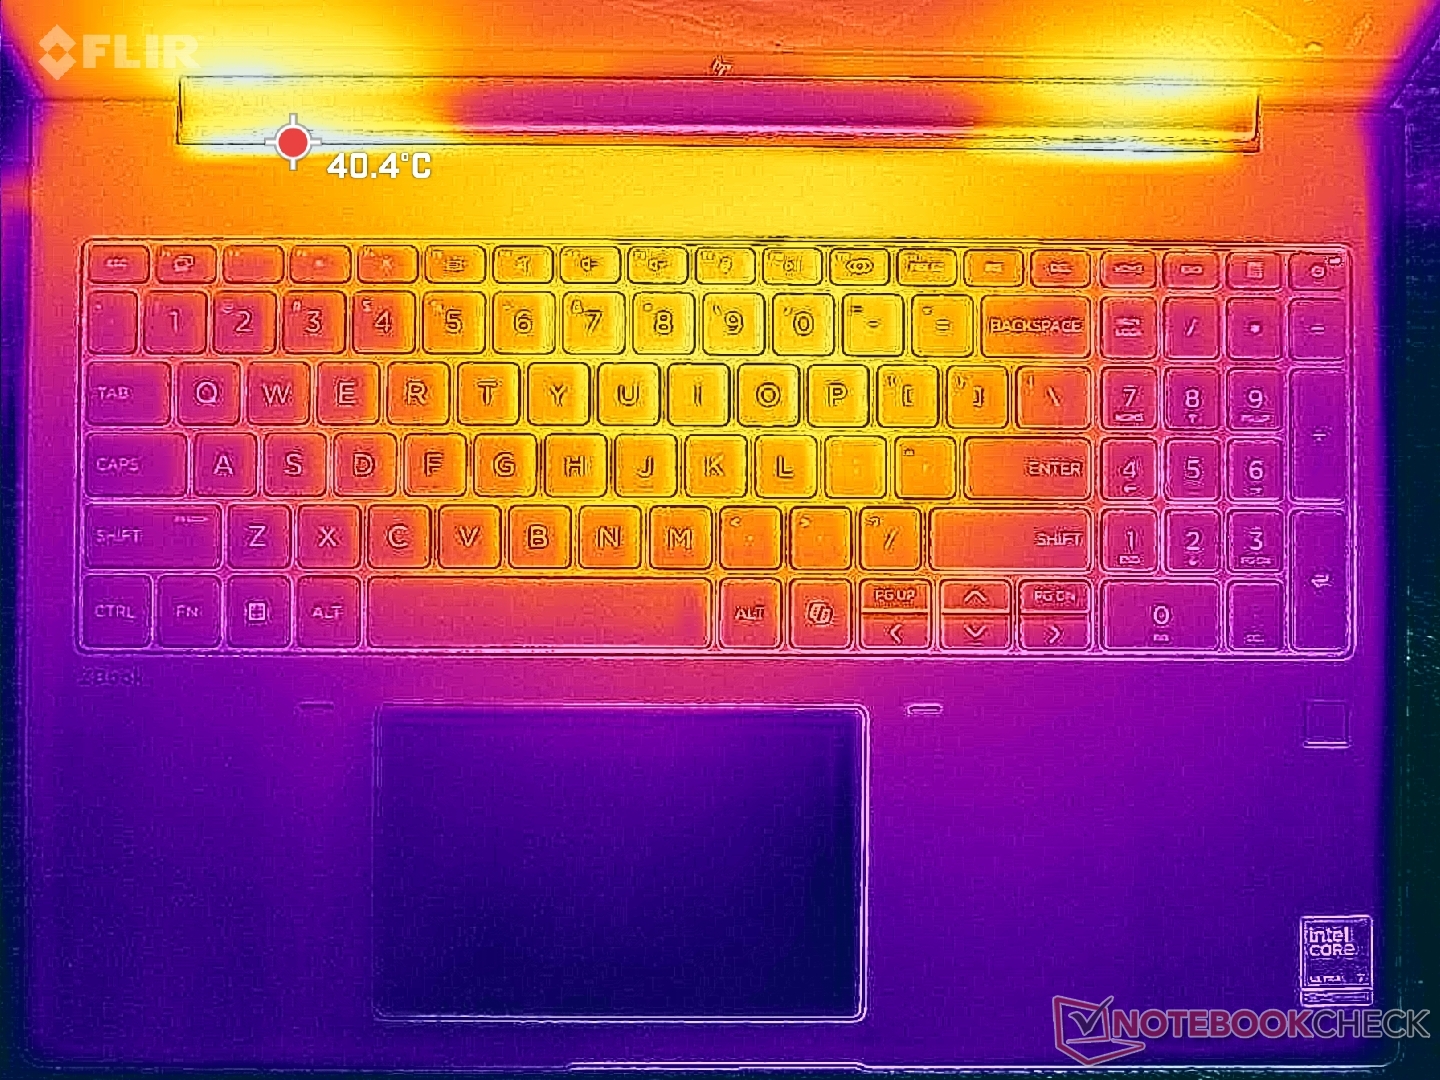
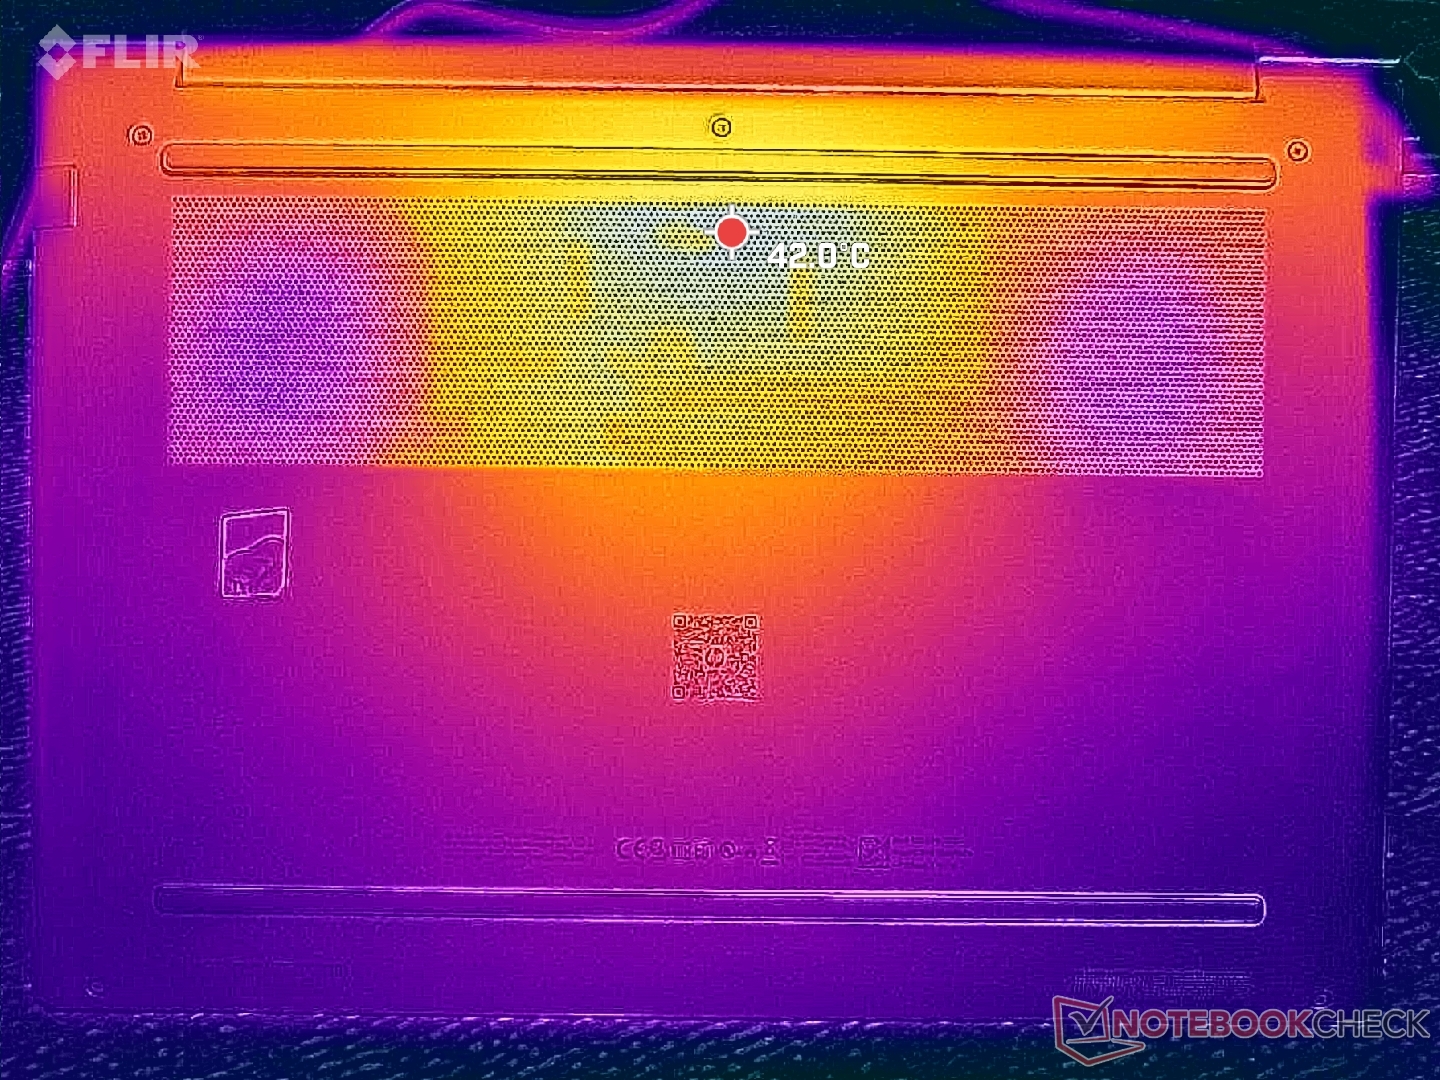
Lo sviluppo della temperatura superficiale è più caldo verso il centro, dove può raggiungere oltre 36 C quando si eseguono carichi impegnativi, il che è significativamente più fresco rispetto a quello che abbiamo registrato su ThinkPad P16 Gen 2 o Dell Precision 5690.
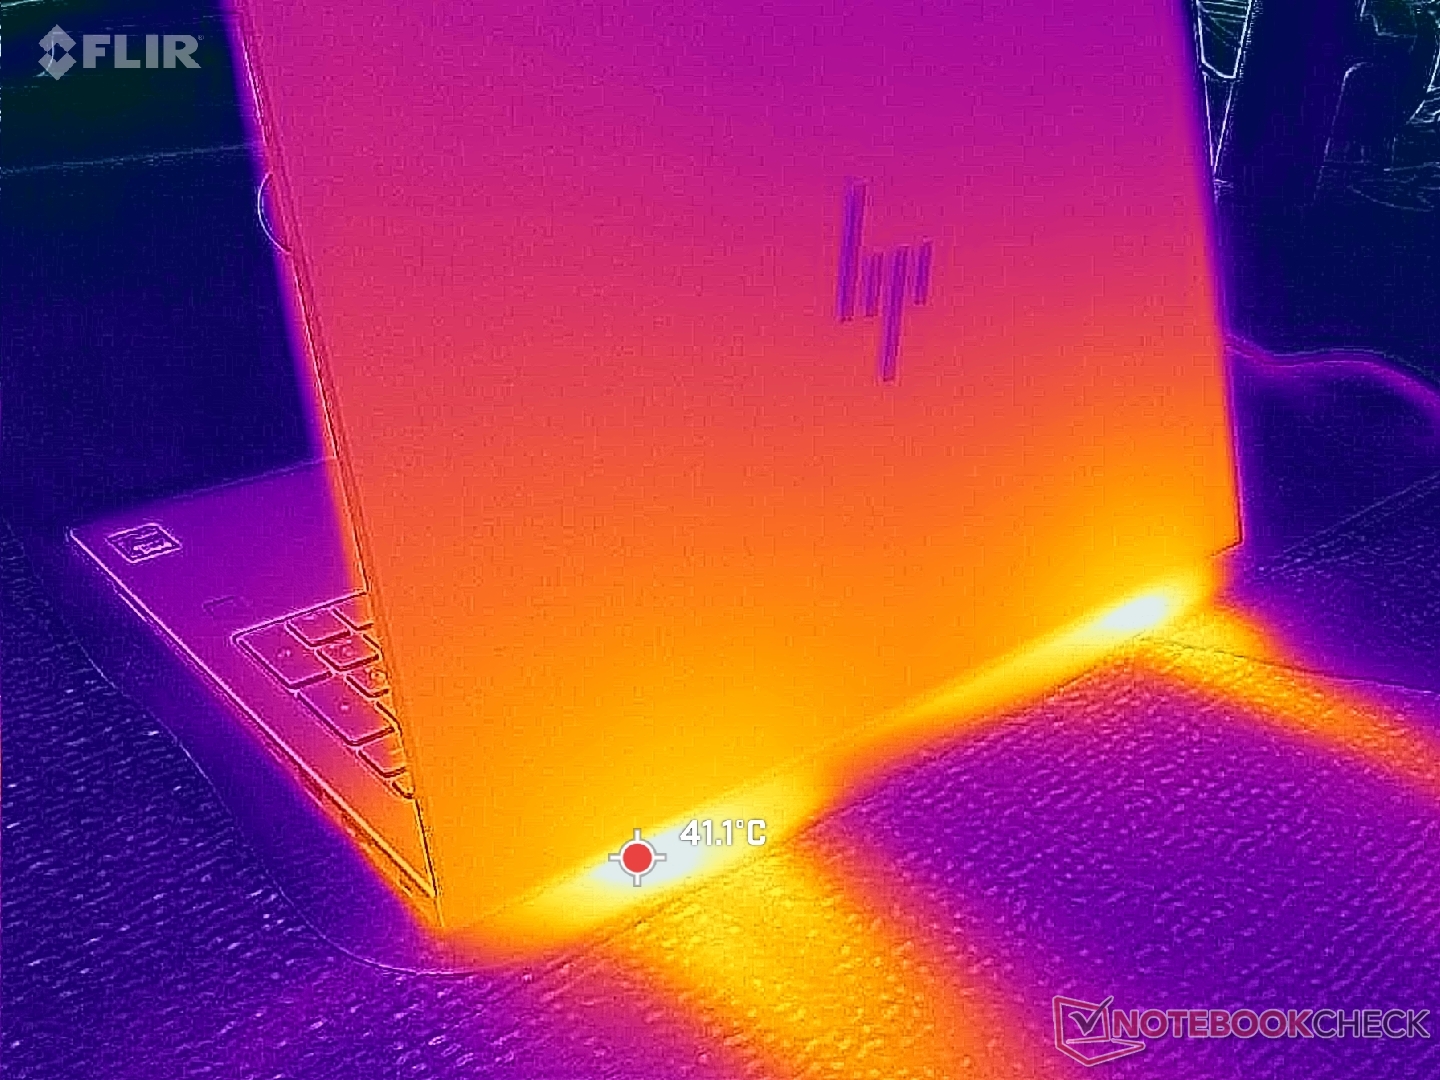
(+) La temperatura massima sul lato superiore è di 36 °C / 97 F, rispetto alla media di 38.2 °C / 101 F, che varia da 22.2 a 69.8 °C per questa classe Workstation.
(+) Il lato inferiore si riscalda fino ad un massimo di 39.4 °C / 103 F, rispetto alla media di 41.2 °C / 106 F
(+) In idle, la temperatura media del lato superiore è di 26.9 °C / 80 F, rispetto alla media deld ispositivo di 32 °C / 90 F.
(+) I poggiapolsi e il touchpad sono piu' freddi della temperatura della pelle con un massimo di 24.2 °C / 75.6 F e sono quindi freddi al tatto.
(+) La temperatura media della zona del palmo della mano di dispositivi simili e'stata di 27.9 °C / 82.2 F (+3.7 °C / 6.6 F).
| HP ZBook X G1i 16 Intel Core Ultra 7 265H, Nvidia RTX PRO 2000 Blackwell Generation Laptop | HP ZBook Power 16 G11 A AMD Ryzen 7 8845HS, NVIDIA RTX 2000 Ada Generation Laptop | HP ZBook Studio 16 G11 Intel Core Ultra 9 185H, NVIDIA RTX 3000 Ada Generation Laptop | Lenovo ThinkPad P16 Gen 2 Intel Core i7-14700HX, NVIDIA RTX 4000 Ada Generation Laptop | Dell Pro Max 16 Plus Intel Core Ultra 9 285HX, Nvidia RTX PRO 5000 Blackwell Generation Laptop | Dell Precision 5690 Intel Core Ultra 9 185H, Nvidia RTX 5000 Ada Generation Laptop | |
|---|---|---|---|---|---|---|
| Heat | 4% | -10% | -5% | -10% | -3% | |
| Maximum Upper Side * (°C) | 36 | 40.6 -13% | 36.6 -2% | 46.6 -29% | 40.4 -12% | 46.6 -29% |
| Maximum Bottom * (°C) | 39.4 | 40.6 -3% | 47.8 -21% | 51 -29% | 45.6 -16% | 33 16% |
| Idle Upper Side * (°C) | 30.4 | 26 14% | 31.4 -3% | 24.8 18% | 32.8 -8% | 32.4 -7% |
| Idle Bottom * (°C) | 31.8 | 26.6 16% | 35.6 -12% | 25.6 19% | 33 -4% | 29.4 8% |
* ... Meglio usare valori piccoli
Test da sforzo
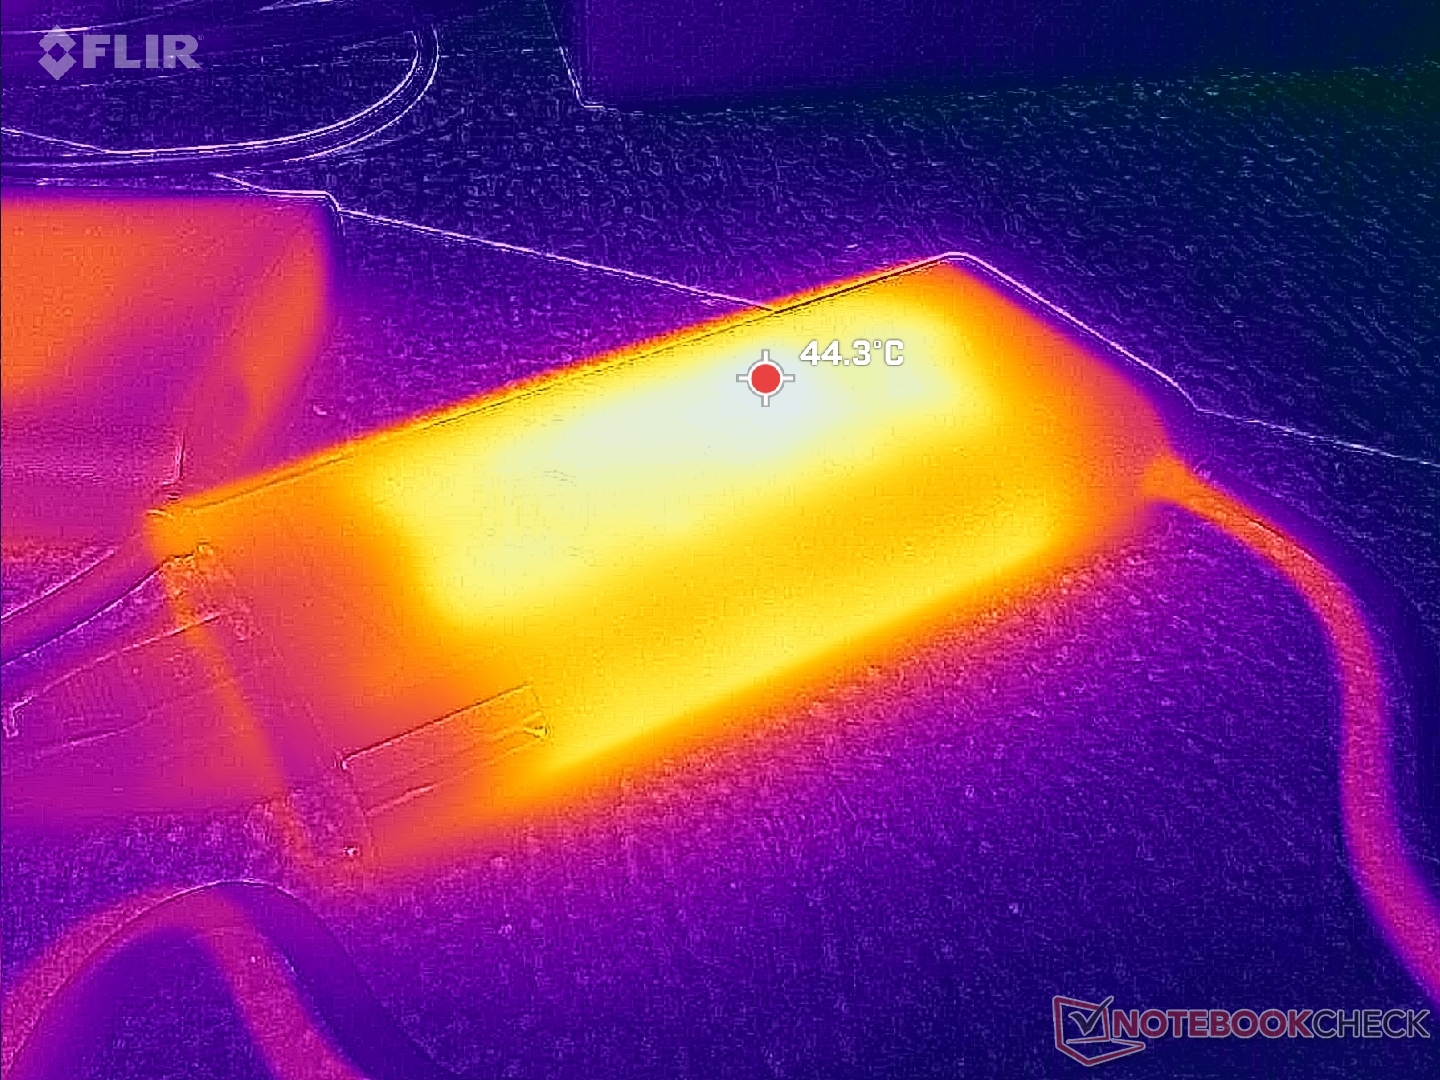
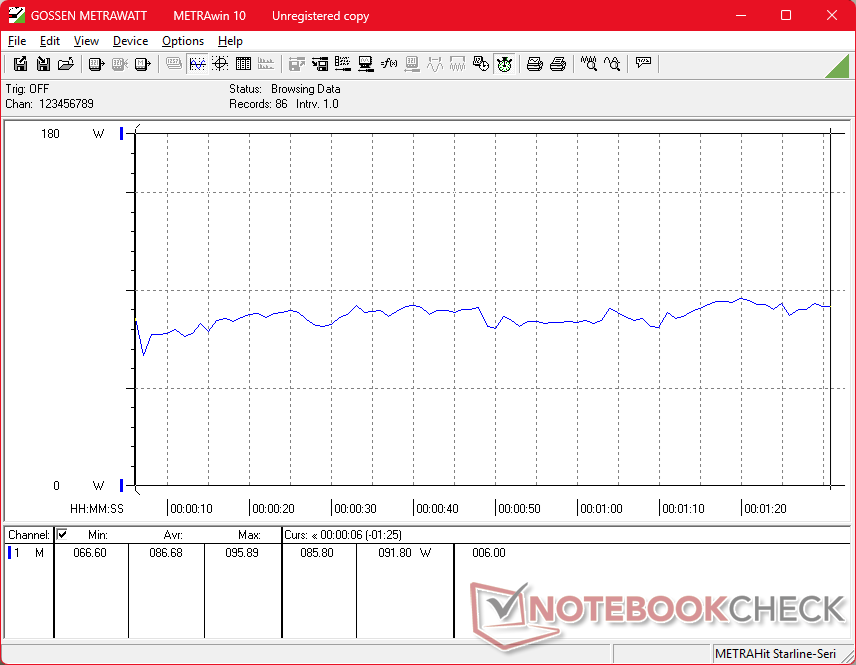
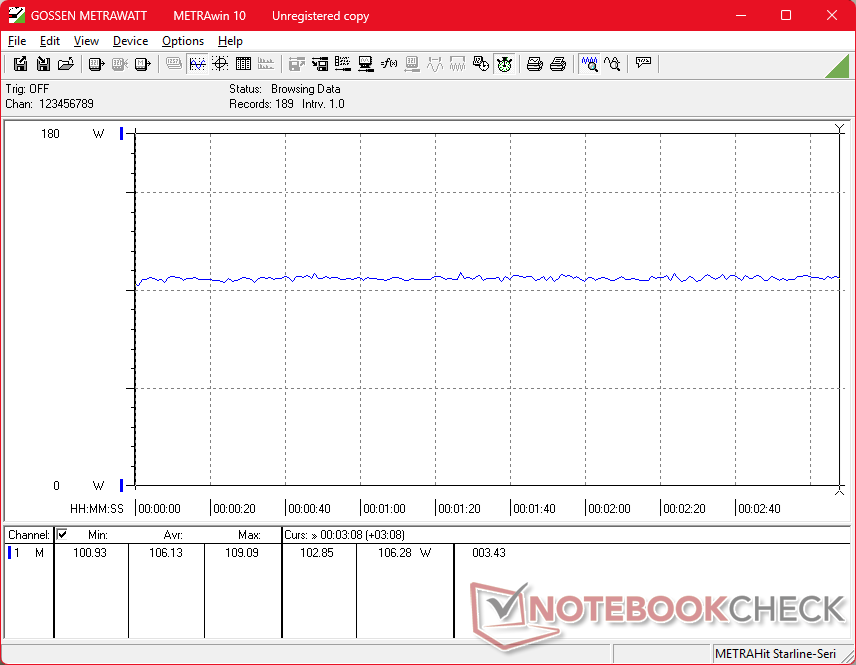
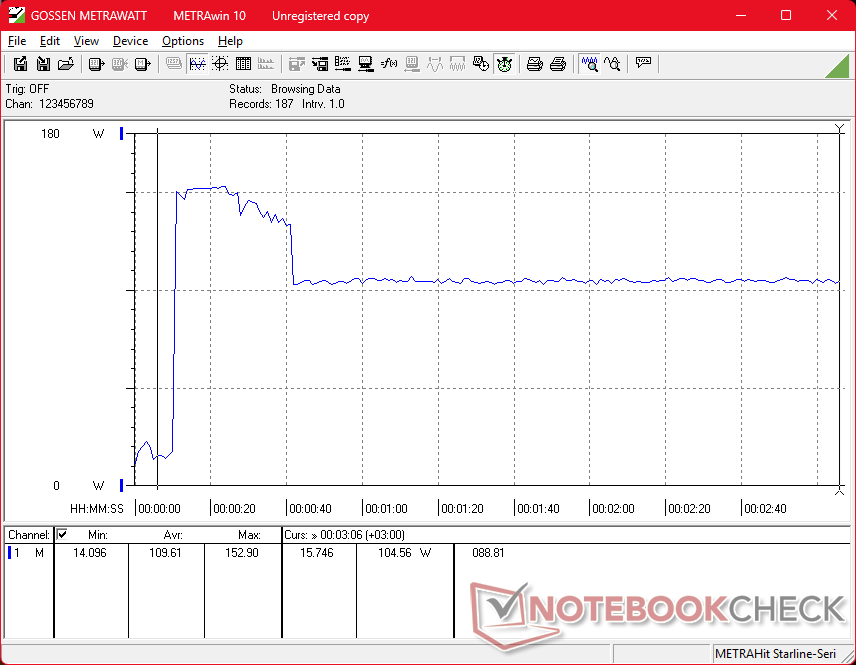
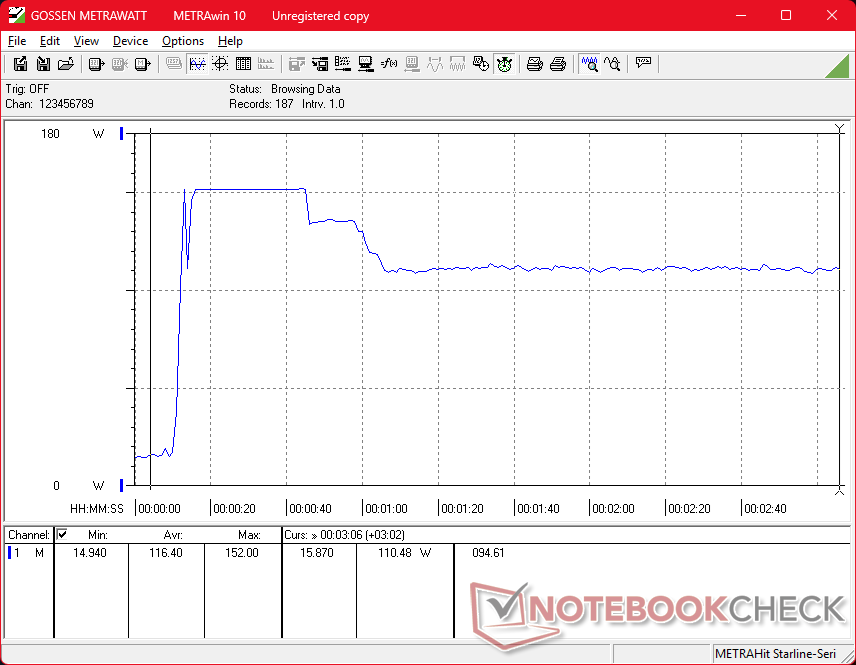
La CPU raggiungeva 3,6 GHz, 108 W e 104 C all'avvio dello stress Prime95, prima di scendere e stabilizzarsi a 3,0 GHz, 62 W e 88 C pochi istanti dopo, per rappresentare la sostenibilità massima limitata del Turbo Boost. È interessante notare che le frequenze di clock della CPU si ciclano mentre le frequenze di clock della GPU rimangono costanti quando si eseguono Prime95 e FurMark contemporaneamente.
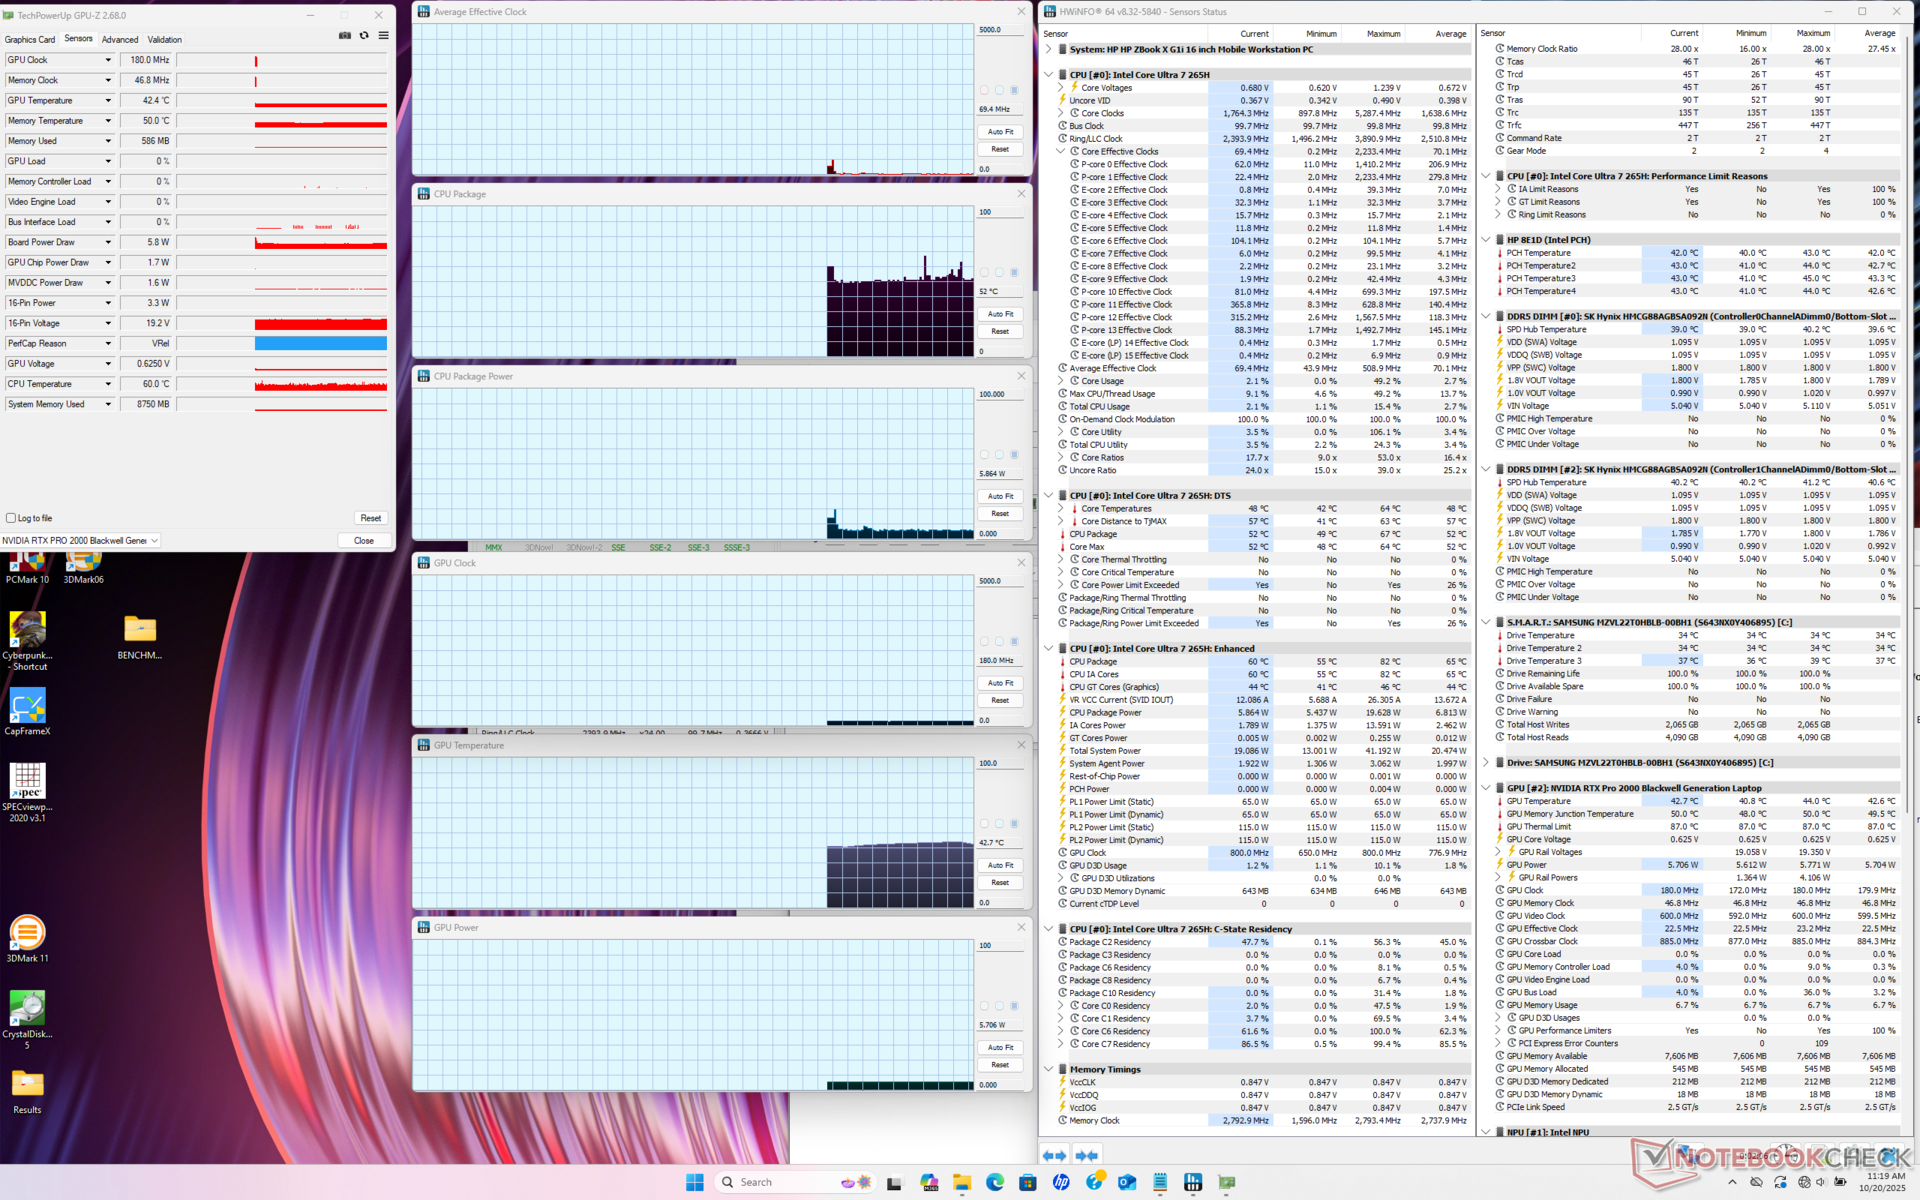
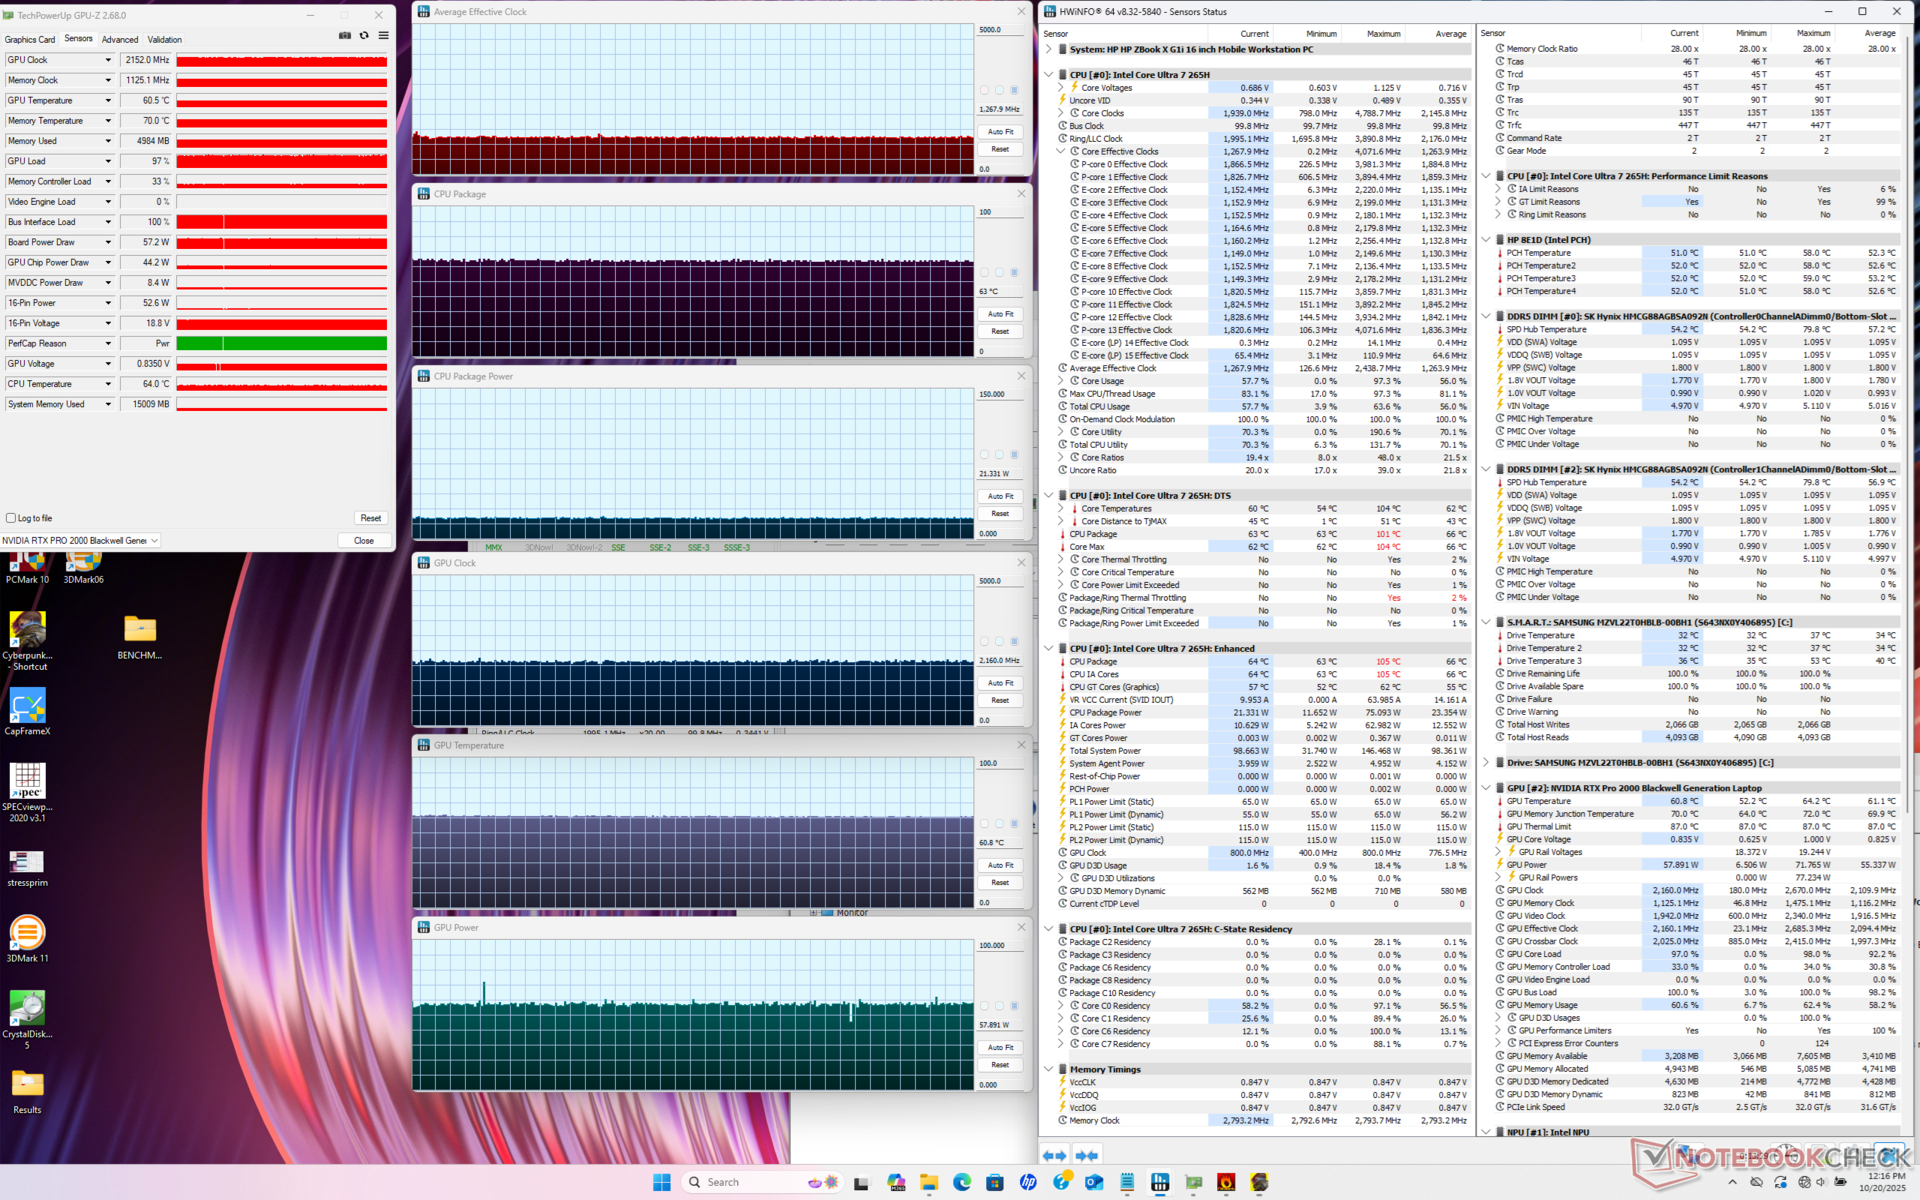
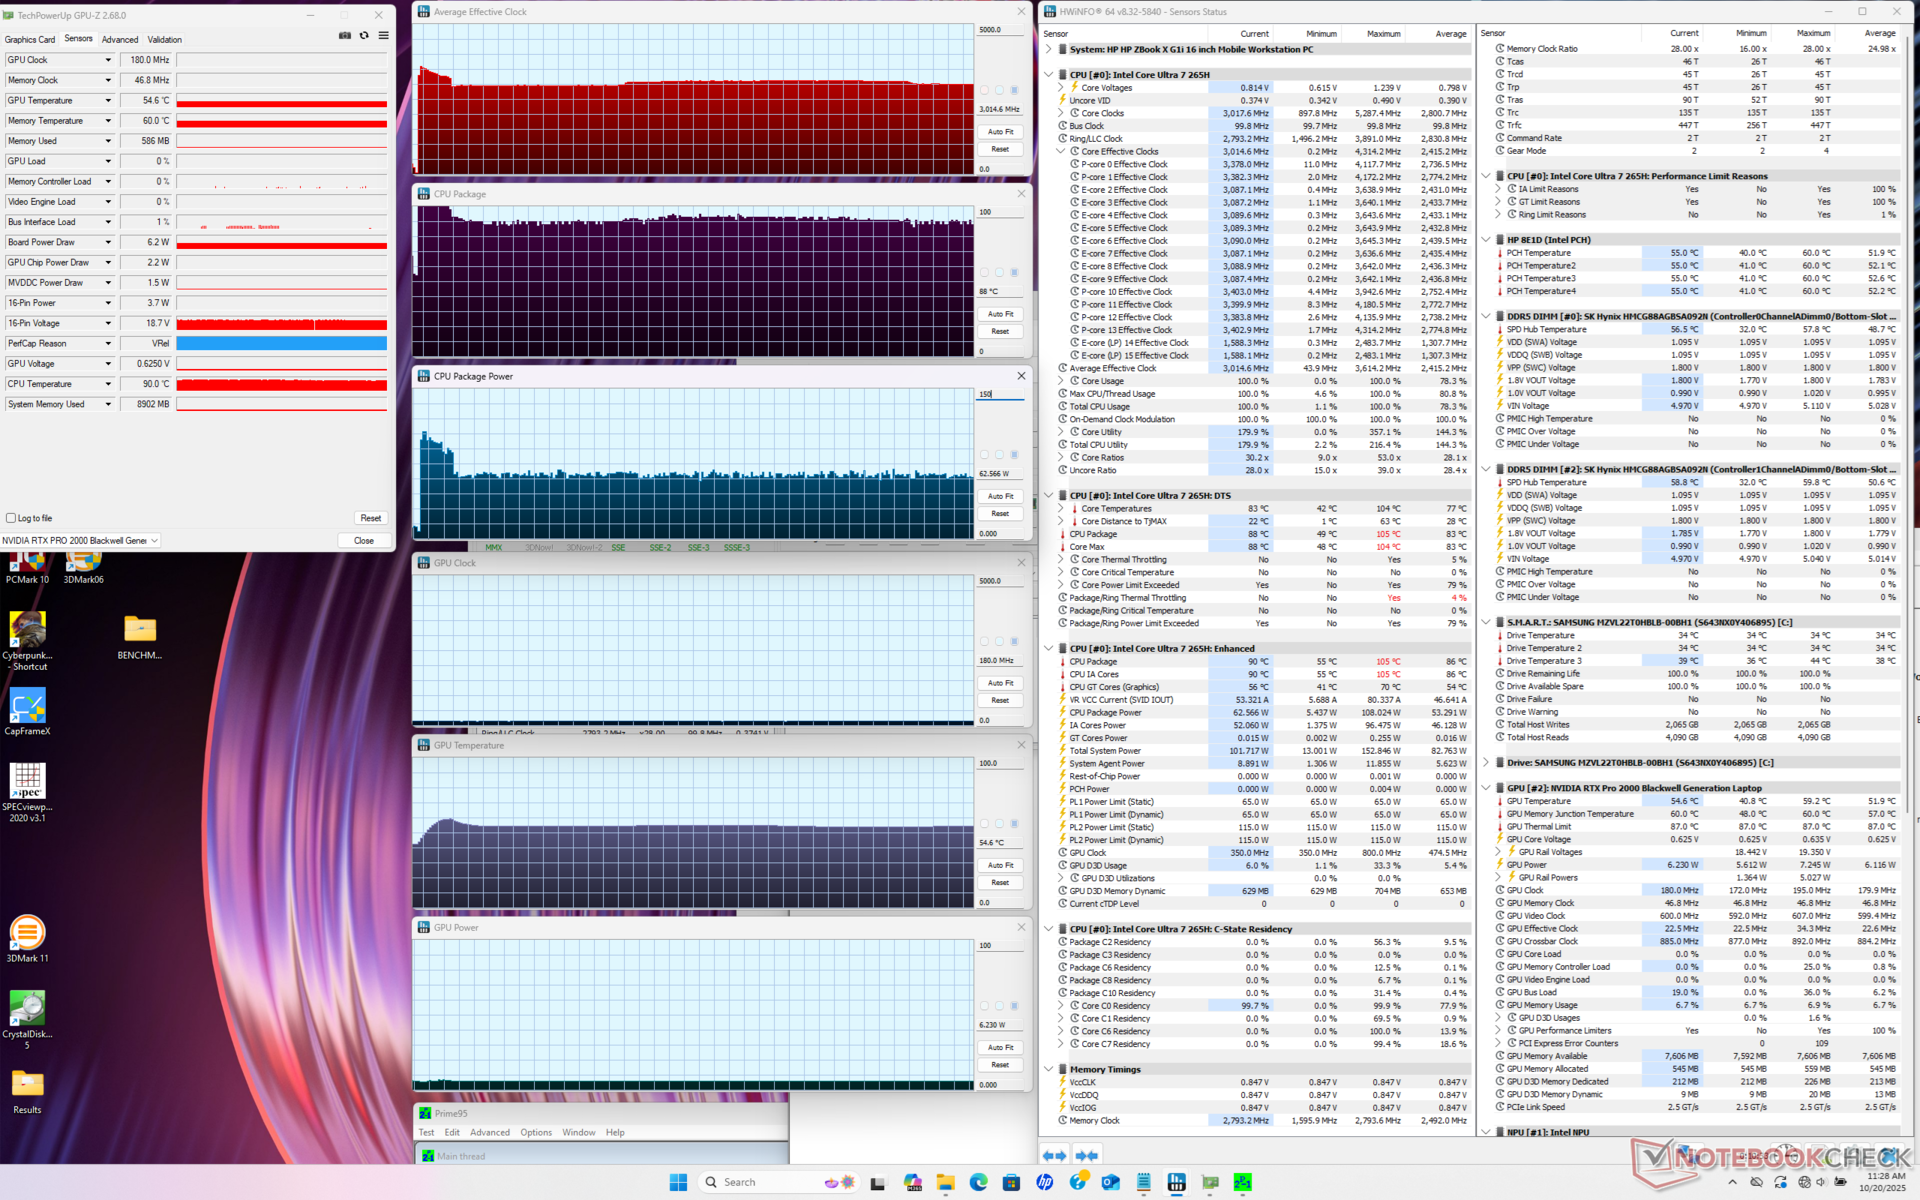

| Clock medio della CPU (GHz) | Clock della GPU (MHz) | Temperatura media della CPU (°C) | Temperatura media della GPU (°C) | |
| Sistema inattivo | -- | -- | 52 | 43 |
| Stress Prime95 | 3.0 | -- | 88 | 55 |
| Prime95 + FurMark Stress | 2,5 - 2,9 | 1215 | 83 - 91 | 65 |
| Cyberpunk 2077 Stress | 1,3 | 2160 | 63 | 61 |
Altoparlanti
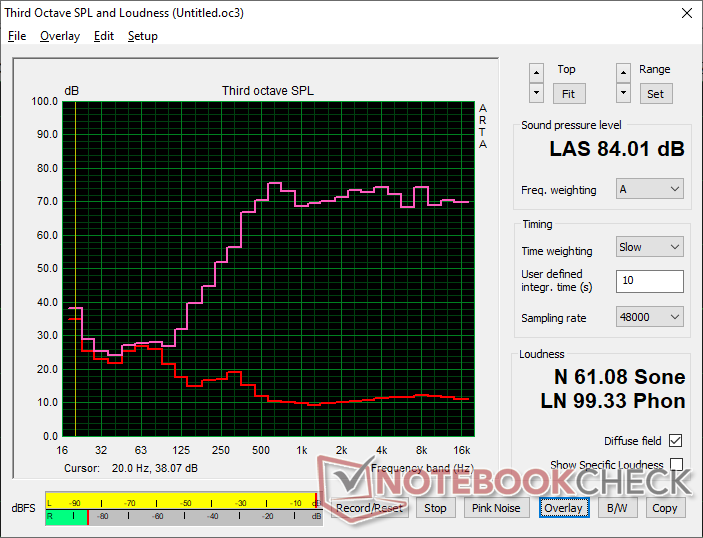
HP ZBook X G1i 16 analisi audio
(+) | gli altoparlanti sono relativamente potenti (84 dB)
Bassi 100 - 315 Hz
(-) | quasi nessun basso - in media 28% inferiori alla media
(±) | la linearità dei bassi è media (8.8% delta rispetto alla precedente frequenza)
Medi 400 - 2000 Hz
(+) | medi bilanciati - solo only 1.9% rispetto alla media
(+) | medi lineari (6.1% delta rispetto alla precedente frequenza)
Alti 2 - 16 kHz
(+) | Alti bilanciati - appena 2.9% dalla media
(+) | alti lineari (5.1% delta rispetto alla precedente frequenza)
Nel complesso 100 - 16.000 Hz
(±) | la linearità complessiva del suono è media (15.6% di differenza rispetto alla media
Rispetto alla stessa classe
» 33% di tutti i dispositivi testati in questa classe è stato migliore, 11% simile, 56% peggiore
» Il migliore ha avuto un delta di 7%, medio di 18%, peggiore di 35%
Rispetto a tutti i dispositivi testati
» 22% di tutti i dispositivi testati in questa classe è stato migliore, 4% similare, 73% peggiore
» Il migliore ha avuto un delta di 4%, medio di 24%, peggiore di 134%
Apple MacBook Pro 16 2021 M1 Pro analisi audio
(+) | gli altoparlanti sono relativamente potenti (84.7 dB)
Bassi 100 - 315 Hz
(+) | bassi buoni - solo 3.8% dalla media
(+) | bassi in lineaa (5.2% delta rispetto alla precedente frequenza)
Medi 400 - 2000 Hz
(+) | medi bilanciati - solo only 1.3% rispetto alla media
(+) | medi lineari (2.1% delta rispetto alla precedente frequenza)
Alti 2 - 16 kHz
(+) | Alti bilanciati - appena 1.9% dalla media
(+) | alti lineari (2.7% delta rispetto alla precedente frequenza)
Nel complesso 100 - 16.000 Hz
(+) | suono nel complesso lineare (4.6% differenza dalla media)
Rispetto alla stessa classe
» 0% di tutti i dispositivi testati in questa classe è stato migliore, 0% simile, 100% peggiore
» Il migliore ha avuto un delta di 5%, medio di 17%, peggiore di 45%
Rispetto a tutti i dispositivi testati
» 0% di tutti i dispositivi testati in questa classe è stato migliore, 0% similare, 100% peggiore
» Il migliore ha avuto un delta di 4%, medio di 24%, peggiore di 134%
Gestione dell'energia
Consumo di energia
Il consumo sotto carico è leggermente superiore in media a quello che abbiamo registrato sul vecchio ZBook Power 16 G11 con processore AMD ZBook Power 16 G11 A. Tuttavia, il nostro ZBook X G1i 16 è anche la macchina più veloce e più snella, per cui le elevate prestazioni per watt sono conservate.
Siamo in grado di misurare un assorbimento massimo temporaneo di 153 W dal piccolo (~13,8 x 6,5 x 2,2 cm) adattatore CA da 150 W quando la CPU e la GPU sono completamente sollecitate.
| Off / Standby | |
| Idle | |
| Sotto carico |
|
Leggenda:
min: | |
| HP ZBook X G1i 16 Ultra 7 265H, RTX PRO 2000 Blackwell Generation Laptop, Samsung PM9A1 MZVL22T0HBLB, IPS, 2560x1600, 16" | HP ZBook Power 16 G11 A R7 8845HS, NVIDIA RTX 2000 Ada Generation Laptop, Samsung PM9A1 MZVL22T0HBLB, IPS, 2560x1600, 16" | HP ZBook Studio 16 G11 Ultra 9 185H, NVIDIA RTX 3000 Ada Generation Laptop, Kioxia XG8 KXG80ZNV1T02, IPS, 3840x2400, 16" | Lenovo ThinkPad P16 Gen 2 i7-14700HX, NVIDIA RTX 4000 Ada Generation Laptop, SK hynix PC801 HFS001TEJ9X162N, IPS, 2560x1600, 16" | Dell Pro Max 16 Plus Ultra 9 285HX, RTX PRO 5000 Blackwell Generation Laptop, SK hynix PCB01 HFS001TFM9X186N, OLED, 3840x2400, 16" | Dell Precision 5690 Ultra 9 185H, NVIDIA RTX 5000 Ada Generation Laptop, 2x Samsung PM9A1 1TB (RAID 0), OLED, 3840x2400, 16" | |
|---|---|---|---|---|---|---|
| Power Consumption | 2% | -85% | -90% | -279% | -72% | |
| Idle Minimum * (Watt) | 4.1 | 4.6 -12% | 14 -241% | 7.9 -93% | 35.1 -756% | 7.9 -93% |
| Idle Average * (Watt) | 9 | 10 -11% | 22.4 -149% | 13.1 -46% | 39.2 -336% | 12 -33% |
| Idle Maximum * (Watt) | 9.4 | 10.6 -13% | 25.7 -173% | 24.2 -157% | 56 -496% | 28.6 -204% |
| Load Average * (Watt) | 86.7 | 60.9 30% | 90.2 -4% | 127.4 -47% | 130.2 -50% | 98.8 -14% |
| Cyberpunk 2077 ultra external monitor * (Watt) | 102 | 92.8 9% | 120.3 -18% | 219 -115% | 213 -109% | |
| Cyberpunk 2077 ultra * (Watt) | 106.1 | 96.8 9% | 125.4 -18% | 225 -112% | 229 -116% | |
| Load Maximum * (Watt) | 152.9 | 154.8 -1% | 142 7% | 248.5 -63% | 285.2 -87% | 174.8 -14% |
| Witcher 3 ultra * (Watt) | 144.5 |
* ... Meglio usare valori piccoli
Consumo di energia Cyberpunk / Stress Test
Consumo di energia del monitor esterno
Durata della batteria
L'autonomia della WLAN è eccellente, con 12,5 ore, superando di qualche ora l'ultima generazione di Precision 5690 o ZBook Power 16 G11 A.
| HP ZBook X G1i 16 Ultra 7 265H, RTX PRO 2000 Blackwell Generation Laptop, 83 Wh | HP ZBook Power 16 G11 A R7 8845HS, NVIDIA RTX 2000 Ada Generation Laptop, 83 Wh | HP ZBook Studio 16 G11 Ultra 9 185H, NVIDIA RTX 3000 Ada Generation Laptop, 86 Wh | Lenovo ThinkPad P16 Gen 2 i7-14700HX, NVIDIA RTX 4000 Ada Generation Laptop, 94 Wh | Dell Pro Max 16 Plus Ultra 9 285HX, RTX PRO 5000 Blackwell Generation Laptop, 96 Wh | Dell Precision 5690 Ultra 9 185H, NVIDIA RTX 5000 Ada Generation Laptop, 98 Wh | |
|---|---|---|---|---|---|---|
| Autonomia della batteria | -22% | -62% | -80% | -71% | -26% | |
| WiFi v1.3 (h) | 12.5 | 9.7 -22% | 4.8 -62% | 2.5 -80% | 3.6 -71% | 9.2 -26% |
| Reader / Idle (h) | 26.1 | |||||
| Load (h) | 1.7 |
Valutazione Notebookcheck
Workstation mobile di alta qualità e snella con prestazioni di fascia media.
HP ZBook X G1i 16
- 10/22/2025 v8
Allen Ngo
 Total Sustainability Score:
 Potenziali concorrenti a confronto
Immagine | Modello | Prezzo | Peso | Altezza | Schermo |
|---|---|---|---|---|---|
1. 87.4%  | HP ZBook X G1i 16 Intel Core Ultra 7 265H ⎘ Nvidia RTX PRO 2000 Blackwell Generation Laptop ⎘ 64 GB Memoria, 2048 GB SSD | Amazon: $3,035.43 Prezzo di listino: 2700 USD | 2.2 kg | 23 mm | 16.00" 2560x1600 189 PPI IPS |
2. 85.4%  | HP ZBook Power 16 G11 A AMD Ryzen 7 8845HS ⎘ NVIDIA RTX 2000 Ada Generation Laptop ⎘ 64 GB Memoria, 2048 GB SSD | Amazon: 1. $1,949.99 HP New ZBook Studio G11 16" ... 2. $1,860.23 HP ZBook Power G11 A 16" Mob... 3. $2,893.43 HP ZBook Power G11 16" Mobil... Prezzo di listino: 2100 USD | 2.2 kg | 22.9 mm | 16.00" 2560x1600 189 PPI IPS |
3. 84.2%  | HP ZBook Studio 16 G11 Intel Core Ultra 9 185H ⎘ NVIDIA RTX 3000 Ada Generation Laptop ⎘ 64 GB Memoria, 1024 GB SSD | Amazon: $4,261.65 Prezzo di listino: 4300 USD | 1.8 kg | 19 mm | 16.00" 3840x2400 283 PPI IPS |
4. 85.9%  | Lenovo ThinkPad P16 Gen 2 Intel Core i7-14700HX ⎘ NVIDIA RTX 4000 Ada Generation Laptop ⎘ 32 GB Memoria, 1024 GB SSD | Amazon: Prezzo di listino: 3500 USD | 3.1 kg | 30.23 mm | 16.00" 2560x1600 189 PPI IPS |
5. 88.4%  | Dell Pro Max 16 Plus Intel Core Ultra 9 285HX ⎘ Nvidia RTX PRO 5000 Blackwell Generation Laptop ⎘ 128 GB Memoria, SSD | Amazon: 1. $1,419.95 Dell Pro 16 Plus PB16250 (Re... 2. $1,519.00 Dell 16 Plus 2-in-1 Laptop, ... 3. $1,199.99 Dell 2025 Inspiron 16 5640 T... Prezzo di listino: 5000 USD | 2.8 kg | 30.9 mm | 16.00" 3840x2400 283 PPI OLED |
6. 88.3% v7 (old)  | Dell Precision 5690 Intel Core Ultra 9 185H ⎘ Nvidia RTX 5000 Ada Generation Laptop ⎘ 32 GB Memoria, 2048 GB SSD | Amazon: $1,799.99 Prezzo di listino: 5900 USD | 2.3 kg | 22.17 mm | 16.00" 3840x2400 283 PPI OLED |
Transparency
La selezione dei dispositivi da recensire viene effettuata dalla nostra redazione. Il campione di prova è stato fornito all'autore come prestito dal produttore o dal rivenditore ai fini di questa recensione. L'istituto di credito non ha avuto alcuna influenza su questa recensione, né il produttore ne ha ricevuto una copia prima della pubblicazione. Non vi era alcun obbligo di pubblicare questa recensione. In quanto società mediatica indipendente, Notebookcheck non è soggetta all'autorità di produttori, rivenditori o editori.
Ecco come Notebookcheck esegue i test
Ogni anno, Notebookcheck esamina in modo indipendente centinaia di laptop e smartphone utilizzando procedure standardizzate per garantire che tutti i risultati siano comparabili. Da circa 20 anni sviluppiamo continuamente i nostri metodi di prova e nel frattempo stabiliamo gli standard di settore. Nei nostri laboratori di prova, tecnici ed editori esperti utilizzano apparecchiature di misurazione di alta qualità. Questi test comportano un processo di validazione in più fasi. Il nostro complesso sistema di valutazione si basa su centinaia di misurazioni e parametri di riferimento ben fondati, che mantengono l'obiettività.
