

Verdetto - Workstation ultrasottile con funzionalità equilibrate
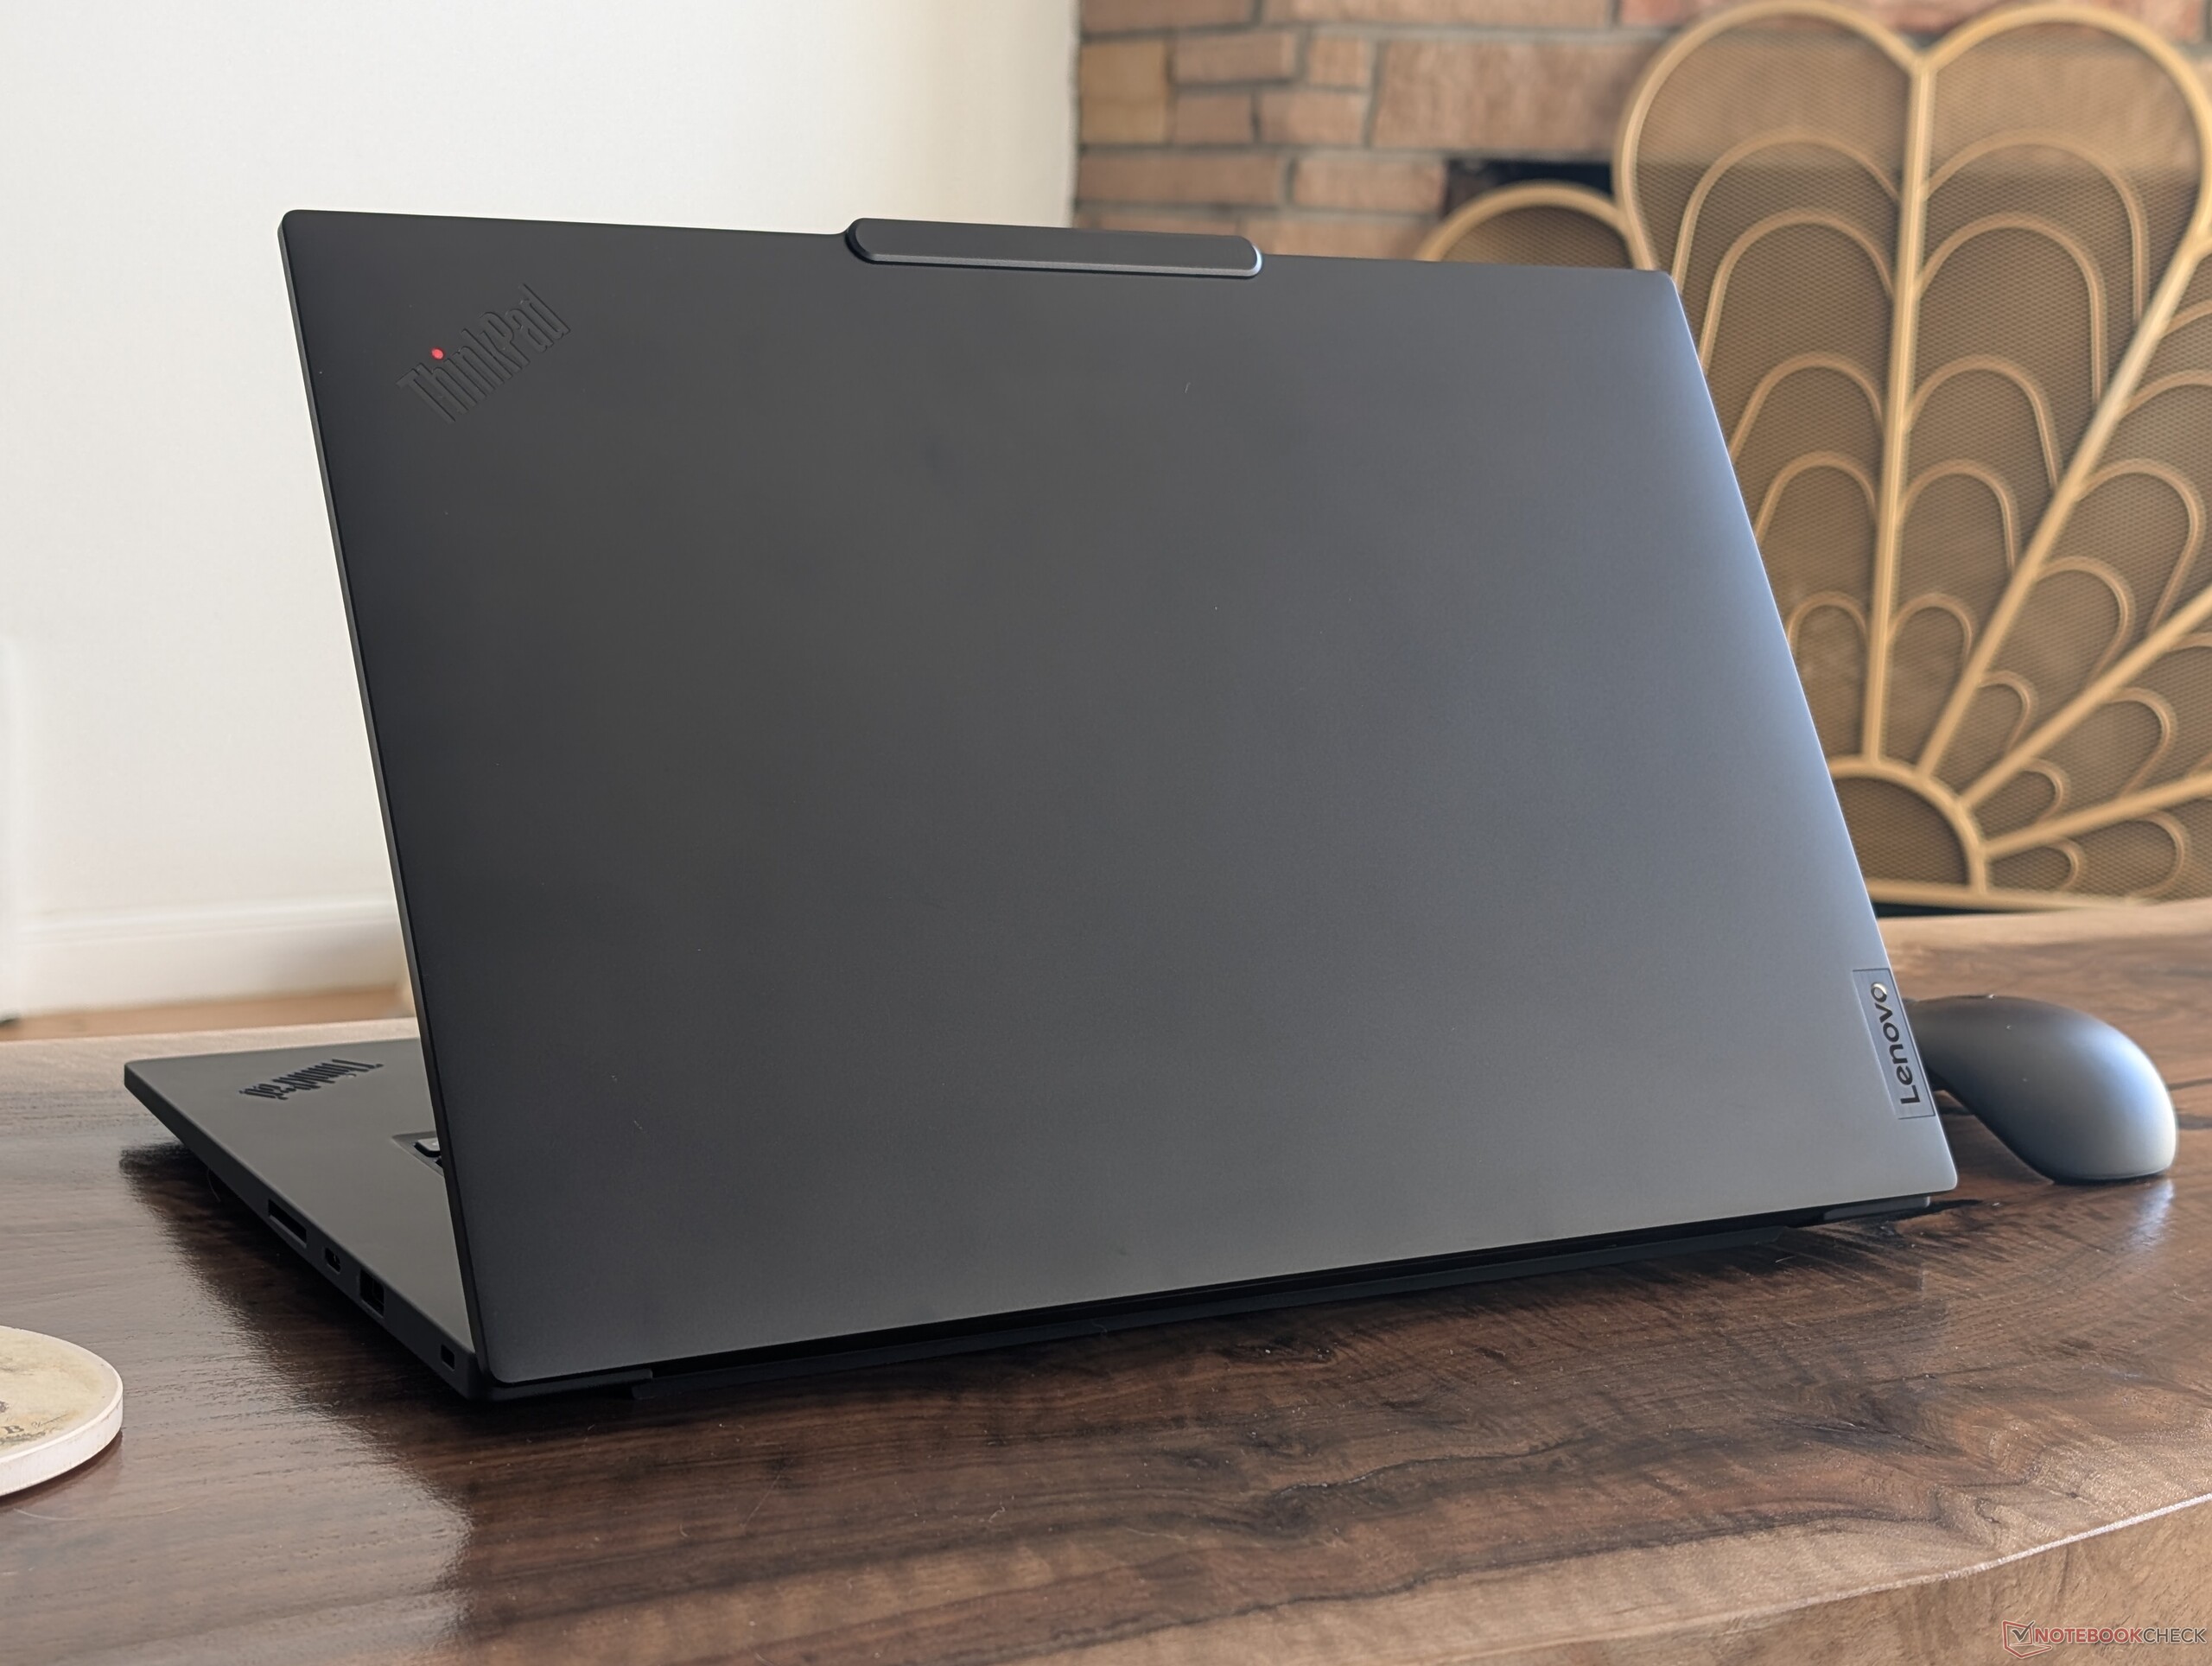
Il ThinkPad P1 Gen 8 è un passo più veloce rispetto al ThinkPad P1 Gen 7 e aggiunge il supporto per la connettività Thunderbolt 5 e un nuovo adattatore AC USB-C più piccolo. La serie è nota per l'offerta di opzioni di grafica discreta Nvidia, nonostante il profilo ultrasottile per ottenere elevate prestazioni per volume, e questo ultimo modello continua la tendenza. Per il resto, non ci sono cambiamenti esterni per la revisione di quest'anno.
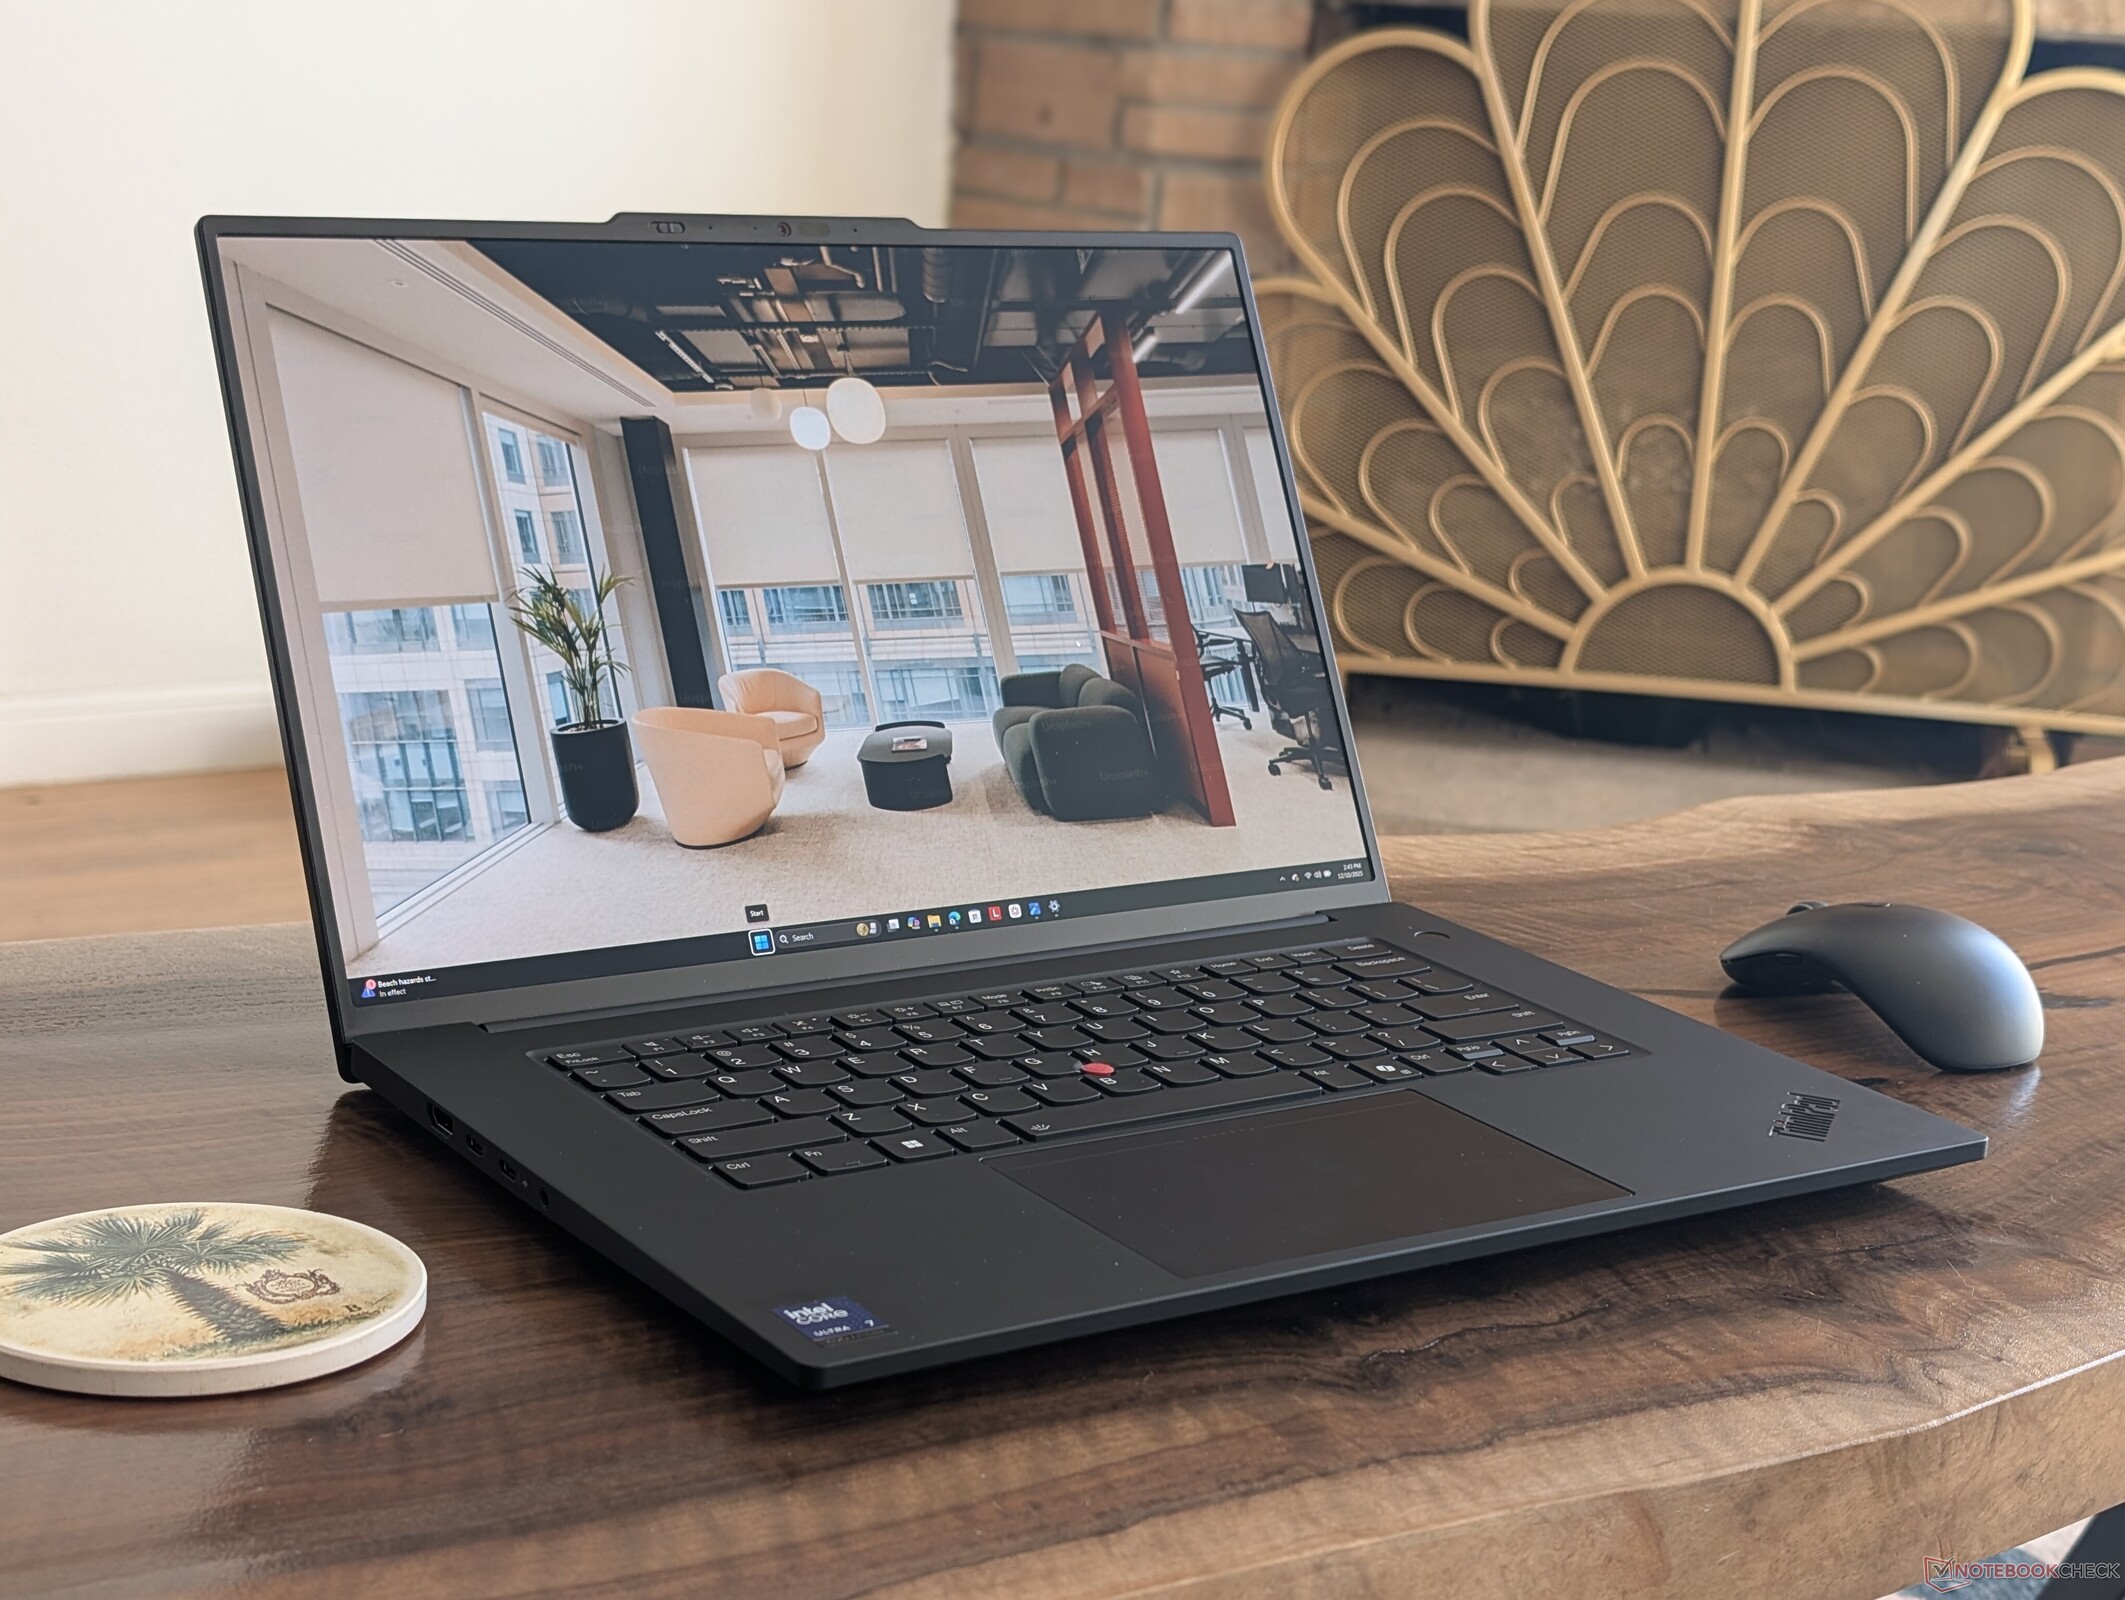
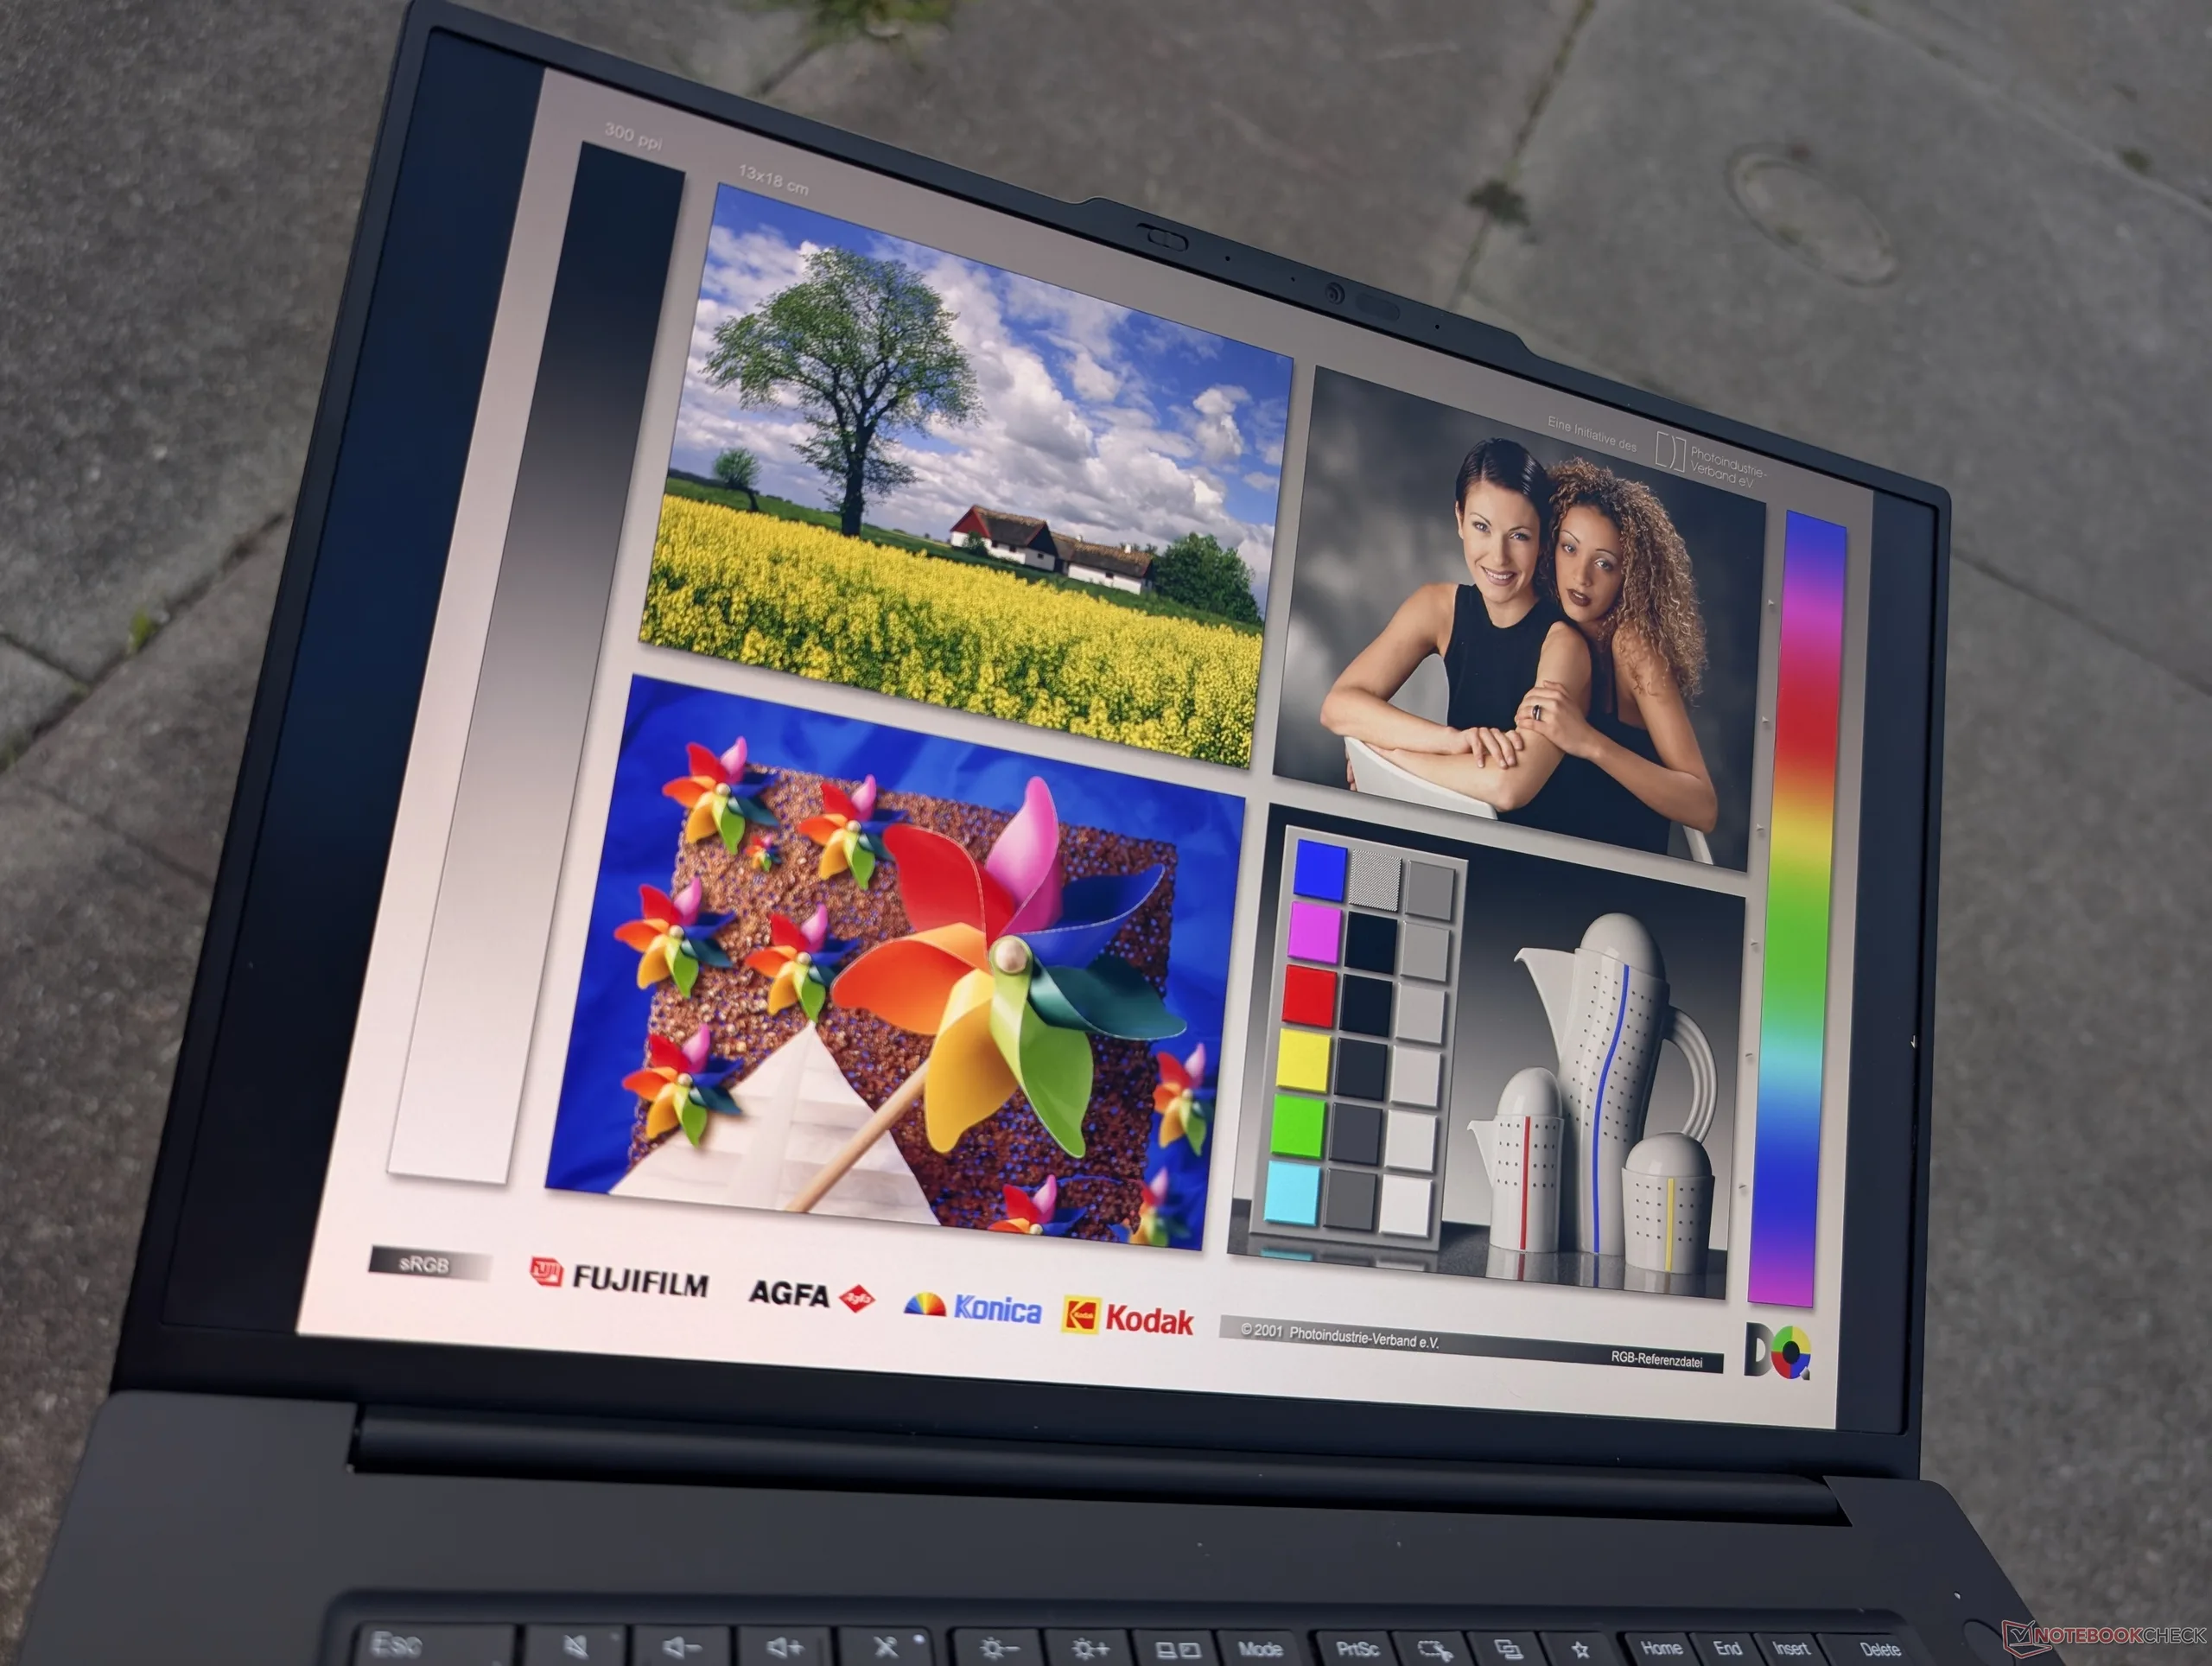
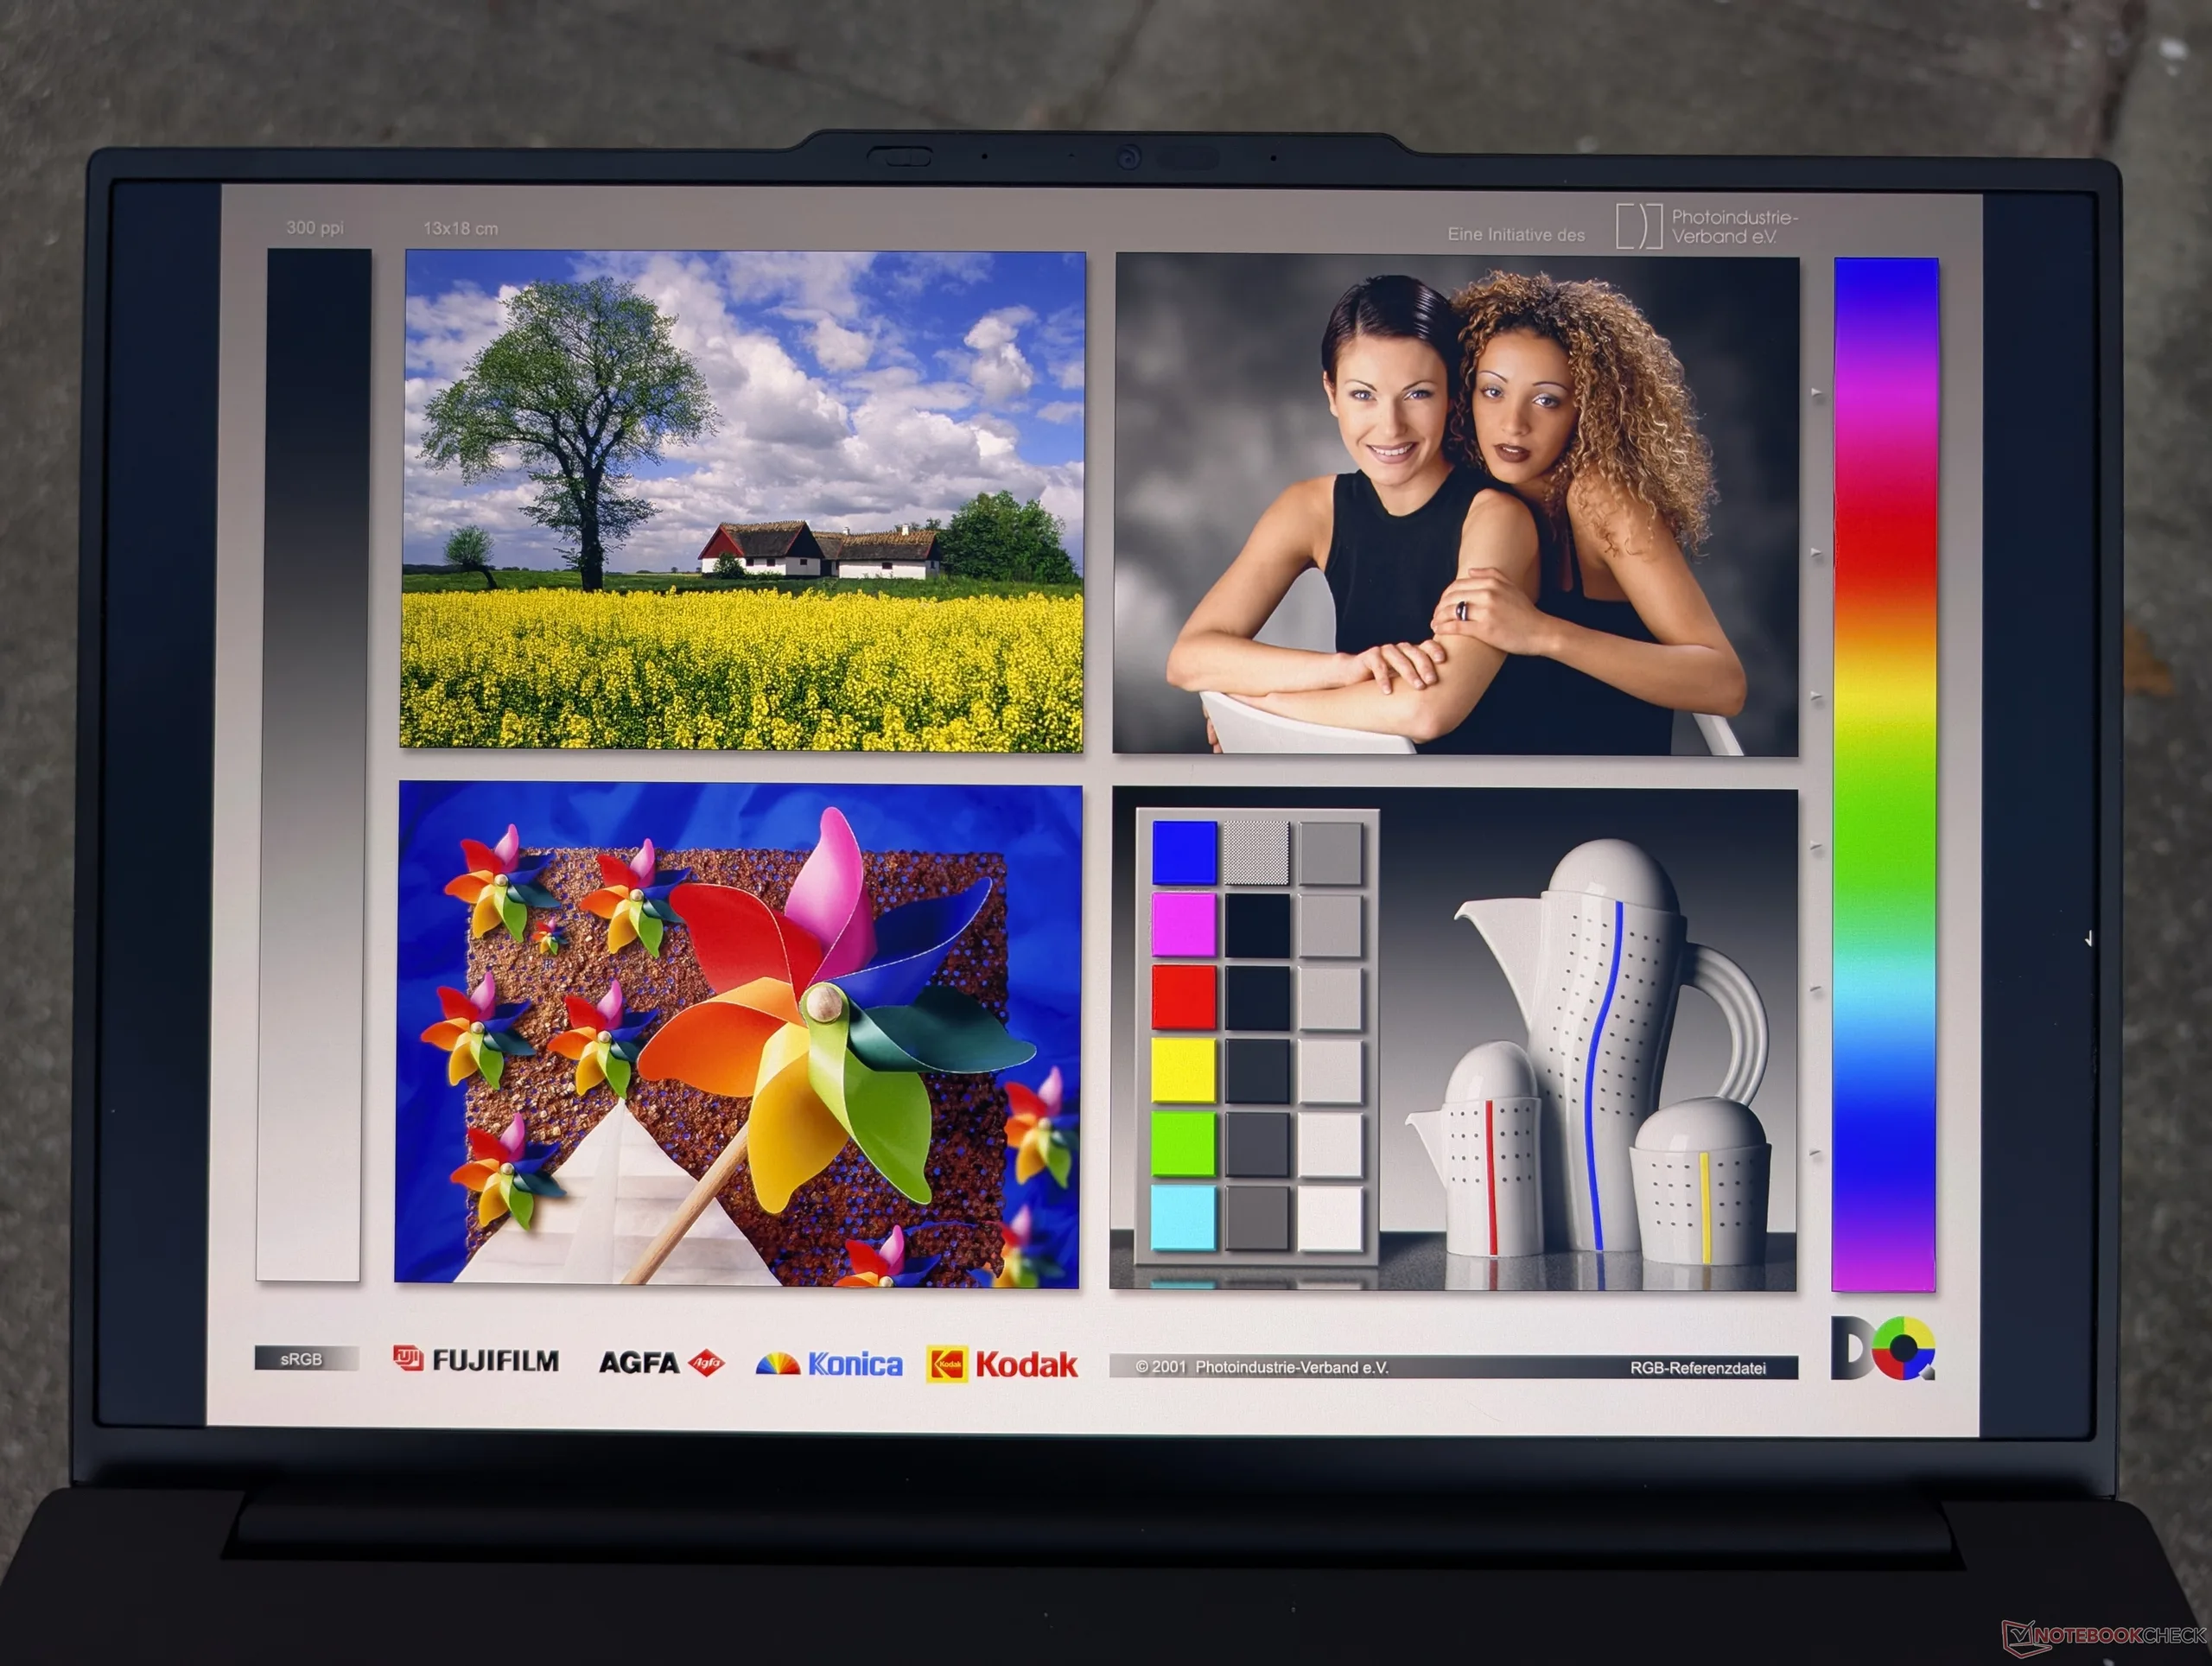
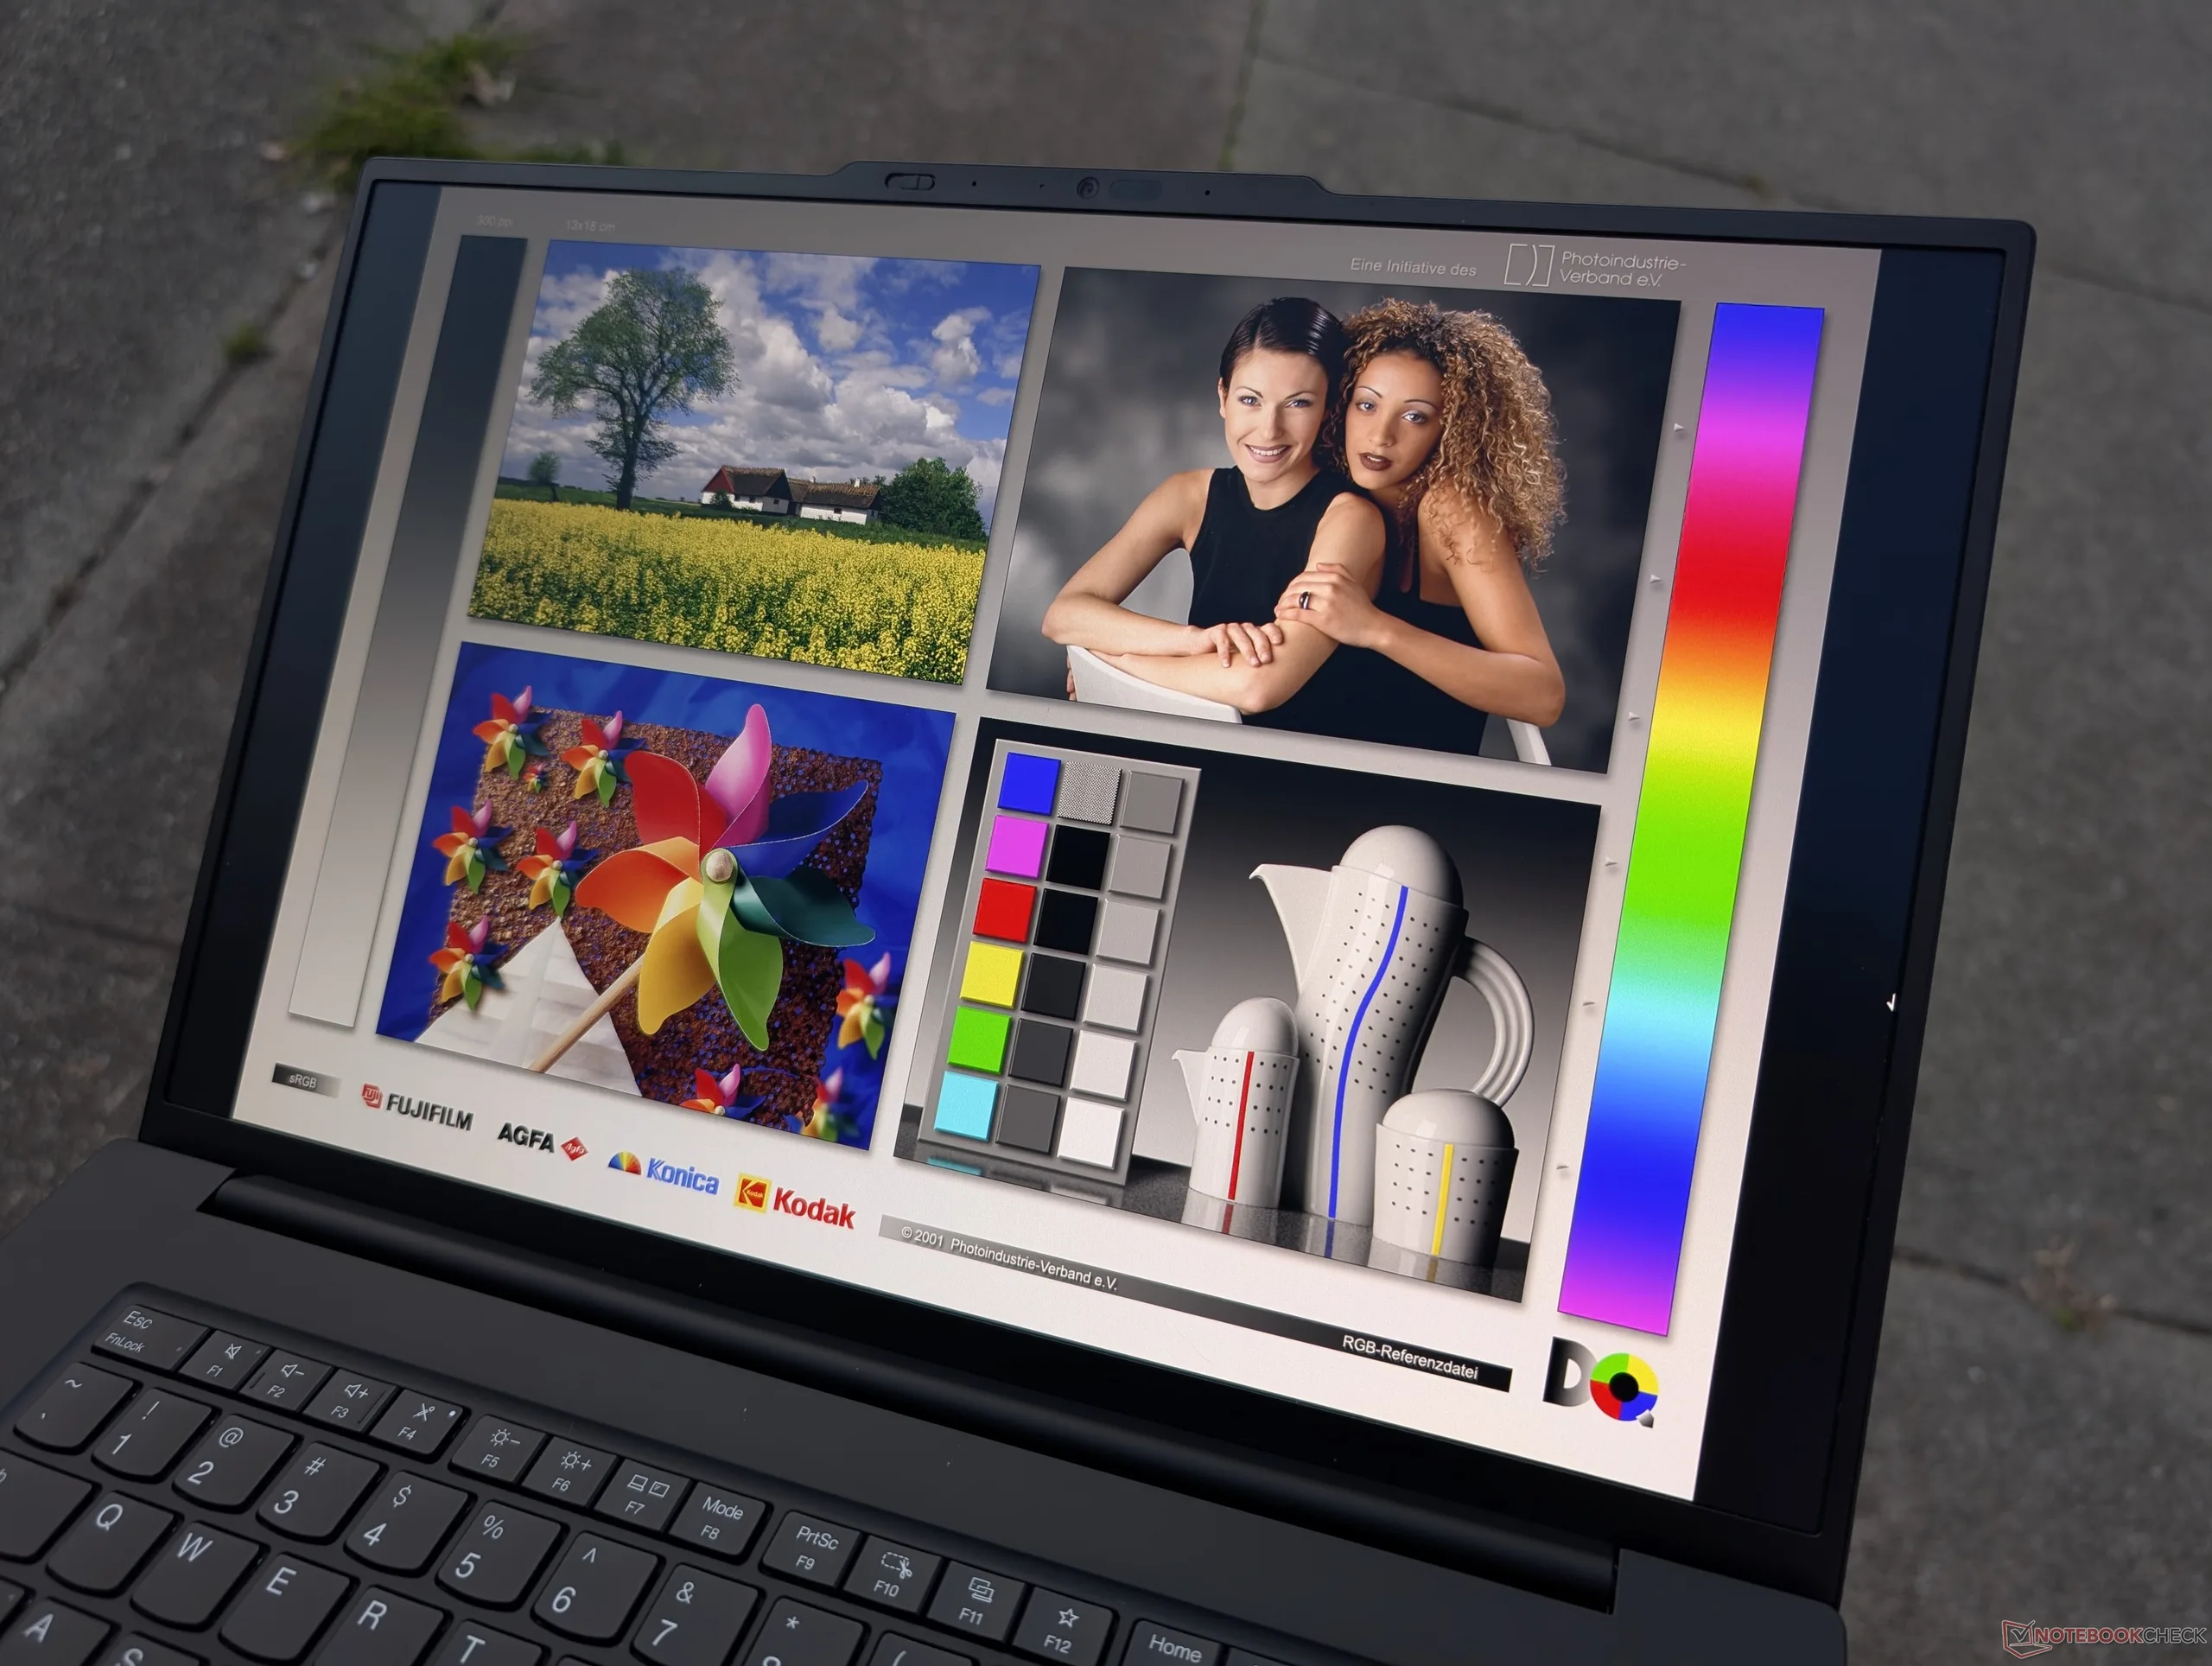
La caratteristica più interessante del ThinkPad P1 Gen 8, tuttavia, è probabilmente la sua nuova opzione di touchscreen OLED in tandem. Con un massimo di 1500 nit, si tratta di una delle workstation mobili da 16 pollici più luminose disponibili, per una riproduzione HDR migliore rispetto alla maggior parte dei computer portatili in circolazione. È strano, quindi, vedere un'opzione del genere su una workstation, poiché è improbabile che il pubblico target di professionisti abbia bisogno di touchscreen HDR super-luminosi per i propri carichi di lavoro quotidiani. In effetti, la durata della batteria è inferiore con questa configurazione e quindi gli utenti potrebbero voler configurare con il normale pannello IPS 4K, che offre colori simili e una risoluzione nativa superiore. Il Tandem OLED potrebbe invece essere più adatto ai computer portatili incentrati sul gioco o sulla multimedialità, come quelli della serie Yoga o Legion.
Gli utenti potenti che richiedono una maggiore potenza possono prendere in considerazione la più spessa Serie P16 che offre opzioni grafiche oltre alla RTX Pro 2000 Blackwell.
Pro
Contro
Prezzo e disponibilità
Il Lenovo ThinkPad P1 16 Gen 8 viene ora spedito direttamente dal produttore al prezzo di 2220 dollari come configurazione. Configurazioni simili sono disponibili anche su Amazon.
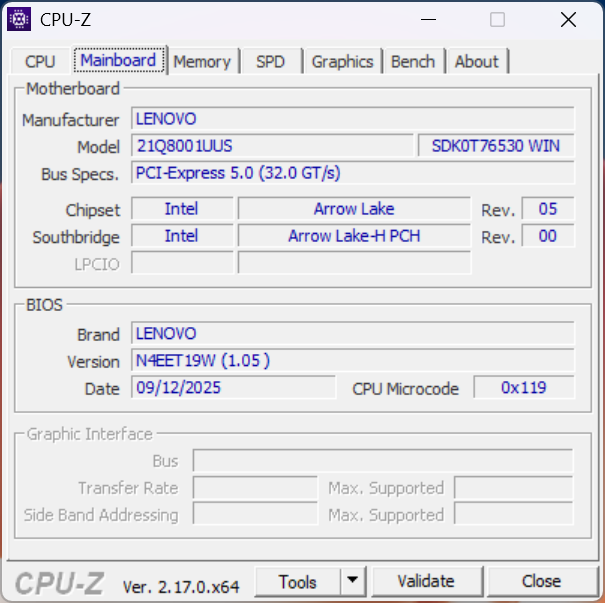
Il ThinkPad P1 Gen 8 succede al ThinkPad P1 Gen 7 dello scorso anno, introducendo le opzioni Intel Arrow Lake-H e Nvidia Blackwell, che sostituiscono rispettivamente le vecchie opzioni Meteor Lake-H e Ada Lovelace. Viene inoltre fornito con nuove opzioni di display, tra cui IPS 4K o OLED in tandem. Per il resto, il telaio è rimasto invariato, per cui le consigliamo di consultare la nostra recensione del ThinkPad P1 Gen 7 per saperne di più sulle caratteristiche fisiche del sistema.
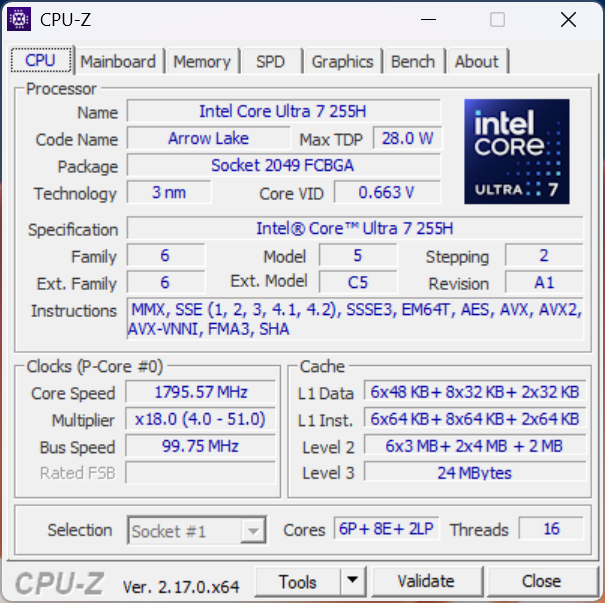
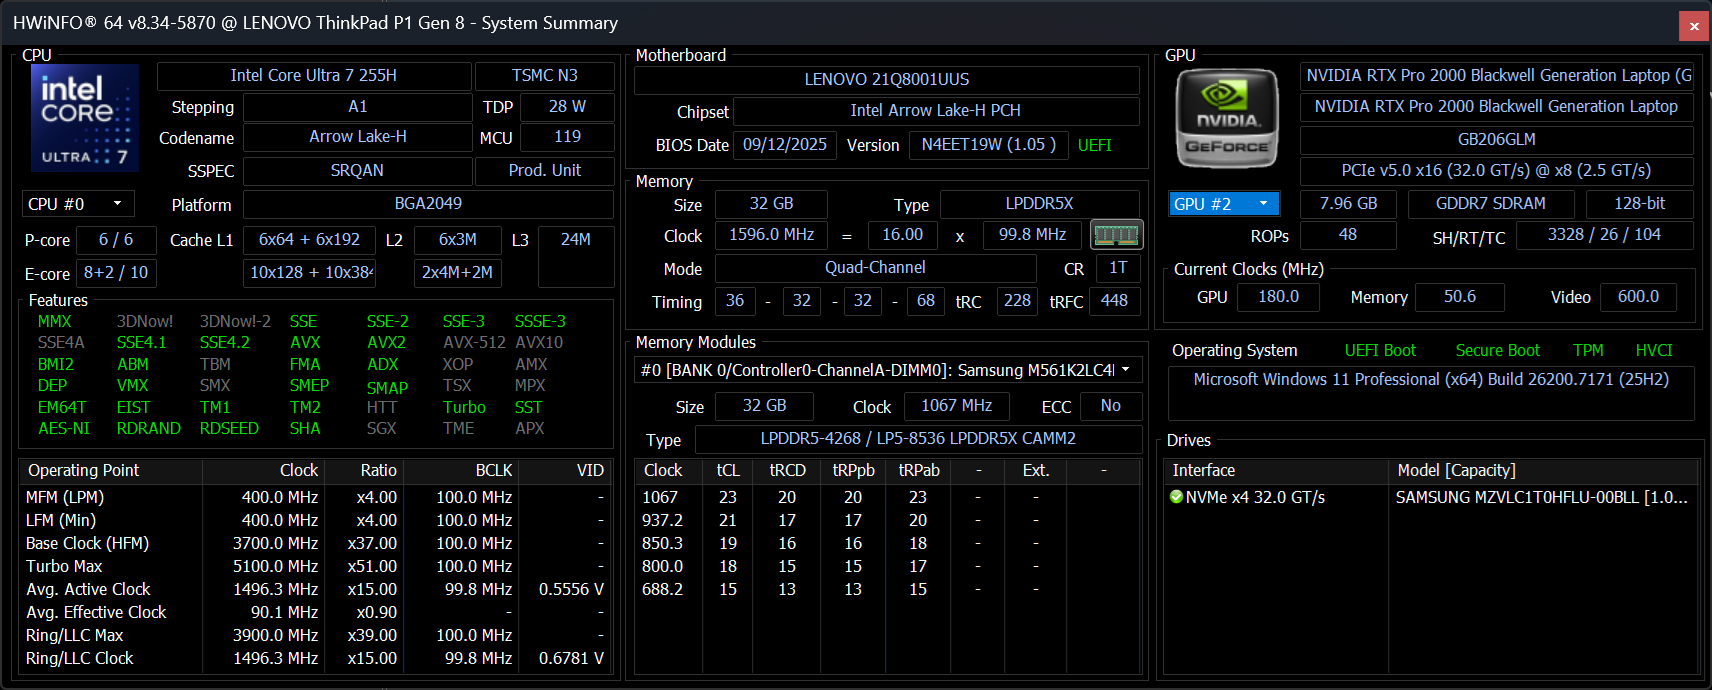
La nostra unità di prova è una configurazione intermedia con CPU Core Ultra 7 255H, GPU RTX Pro 2000 Blackwell da 75 W e touchscreen OLED in tandem da 3,2K per circa 2220 dollari. Le SKU di fascia bassa iniziano con il Core Ultra 5 235H e solo la grafica Arc 140T integrata con un display IPS standard da 1200p60, mentre le SKU di fascia più alta sono dotate di Core Ultra 9 285H e display IPS 4K. Non ci sono opzioni grafiche superiori alla RTX Pro 2000 Blackwell.
Le alternative al ThinkPad P1 Gen 8 includono altre workstation ultrasottili da 16 pollici come il modello HP ZBook X G1i 16, Dell Pro 16 Plus, o la serie Serie Asus ExpertBook.
Altre recensioni Lenovo:
Specifiche
Caso
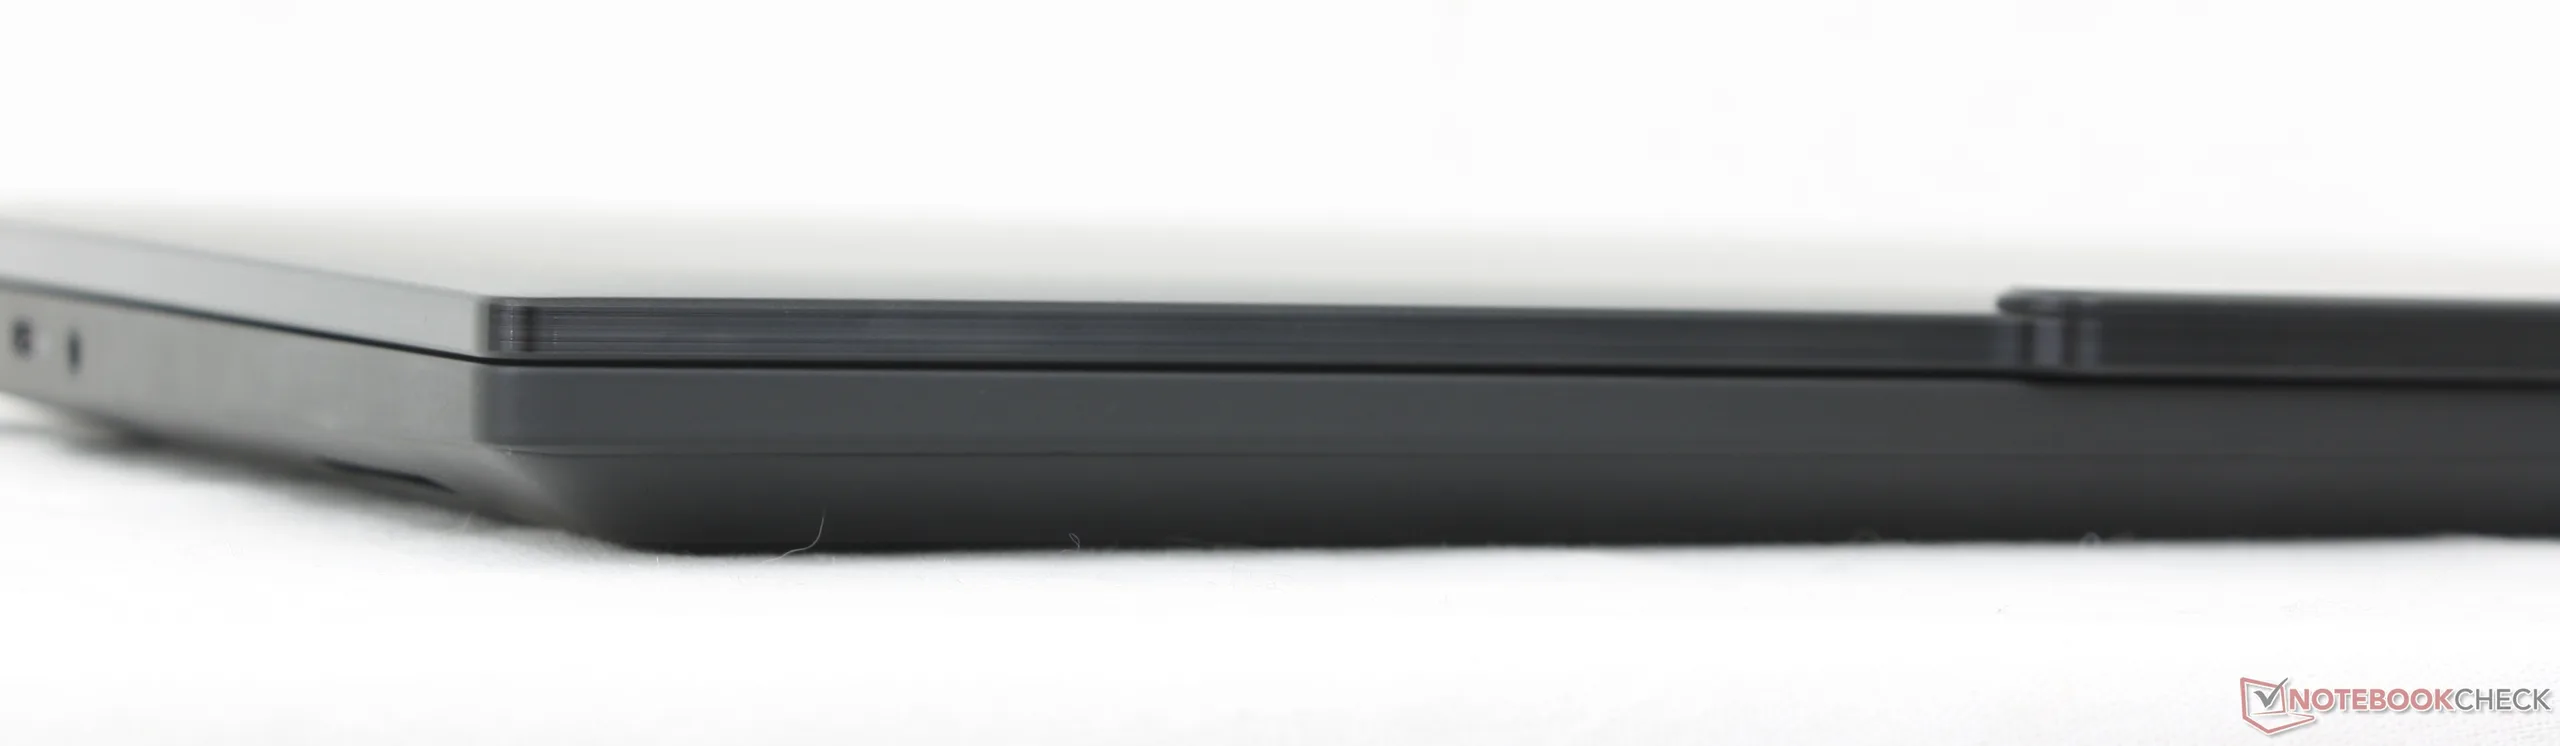
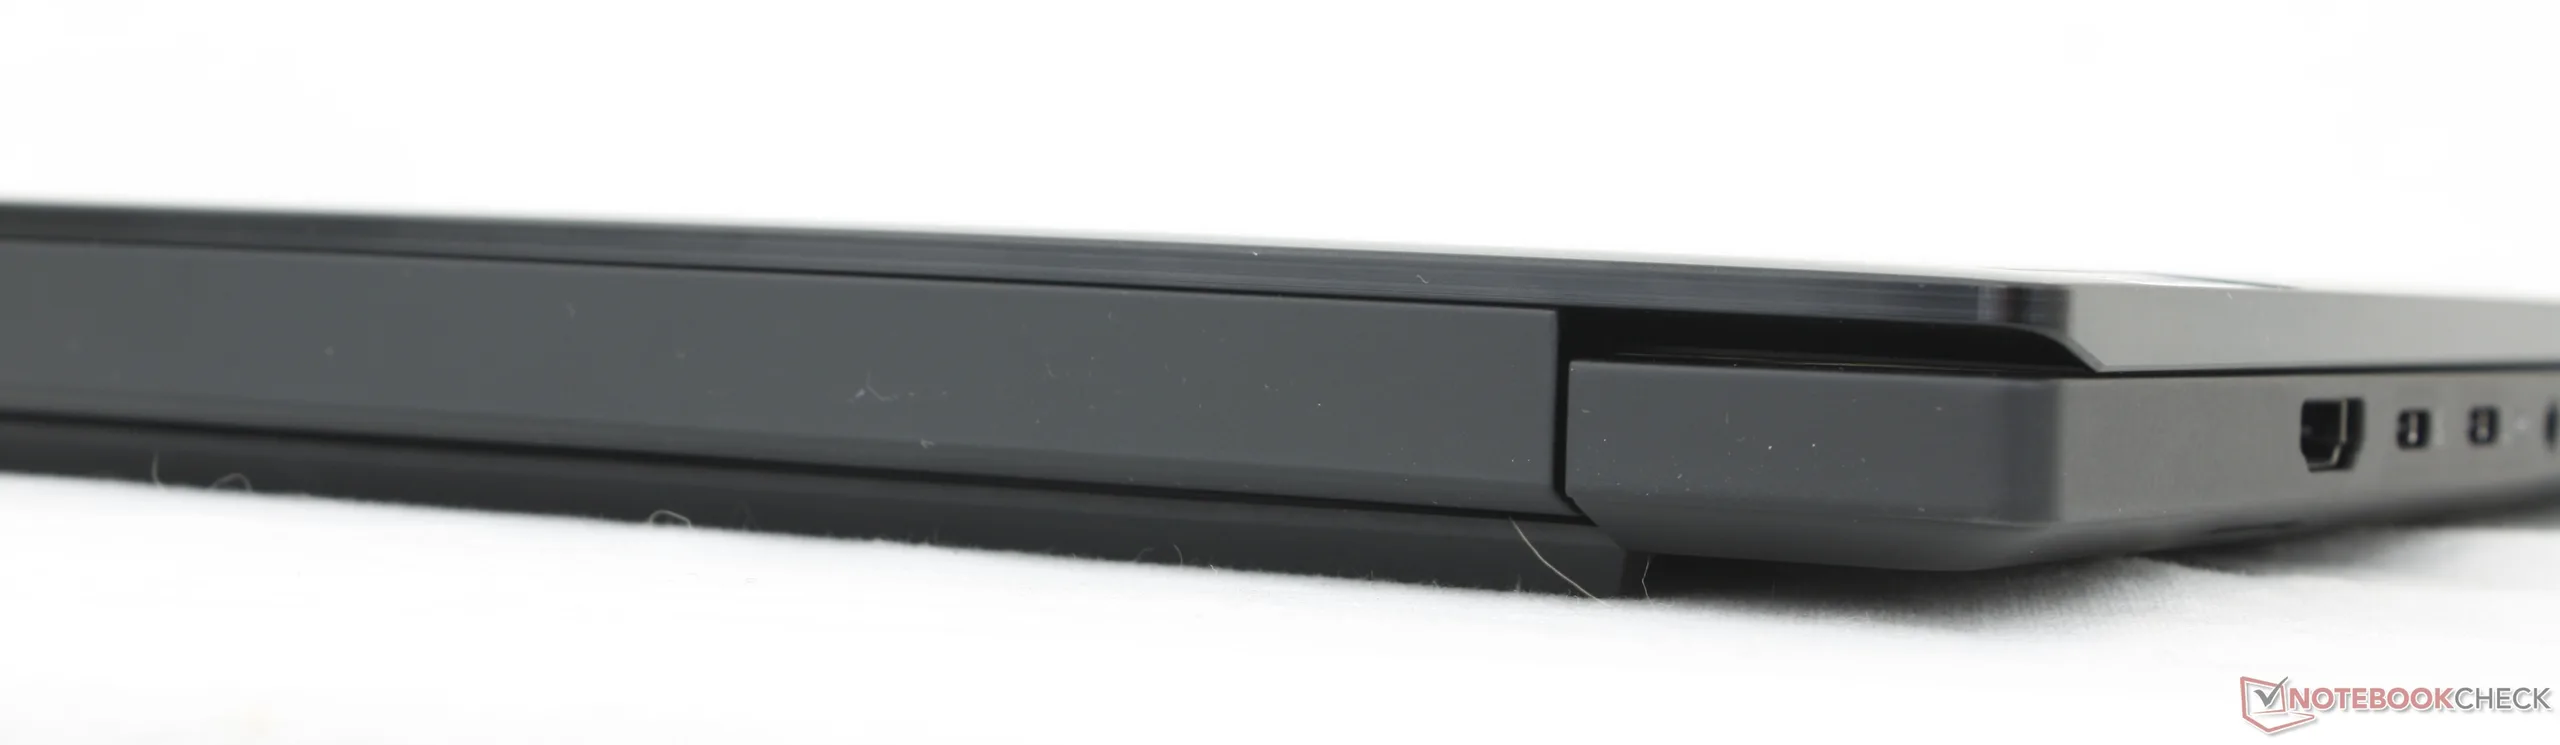
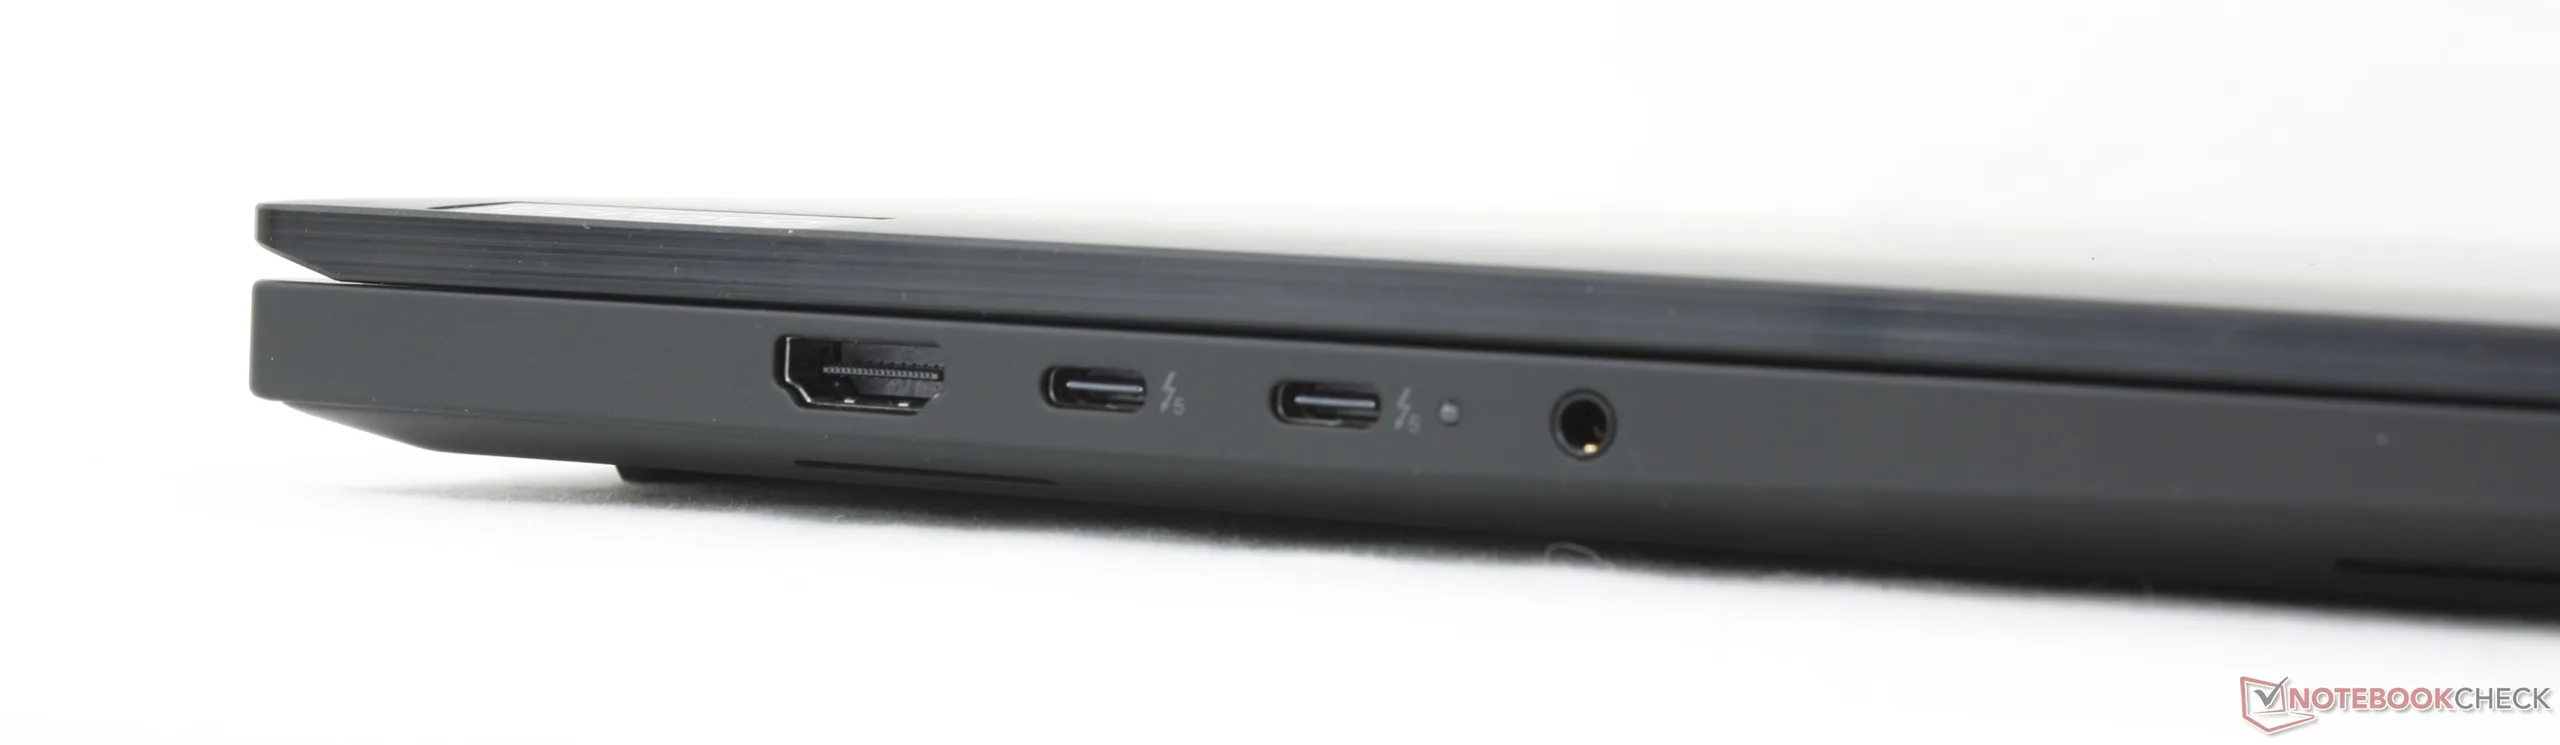
Mentre il telaio e le dimensioni rimangono invariate rispetto al passato, il modello Gen 8 introduce alcune modifiche degne di nota alle porte rispetto alla Gen 7. Il supporto per Thunderbolt 5 è ora presente, mentre la porta proprietaria dell'adattatore CA è stata abbandonata in favore di USB-C per la sola erogazione di energia. Pertanto, una delle tre porte USB-C sarà sempre occupata per l'alimentazione dell'adattatore AC, mentre questo non era vero per il modello dello scorso anno.
Connettività
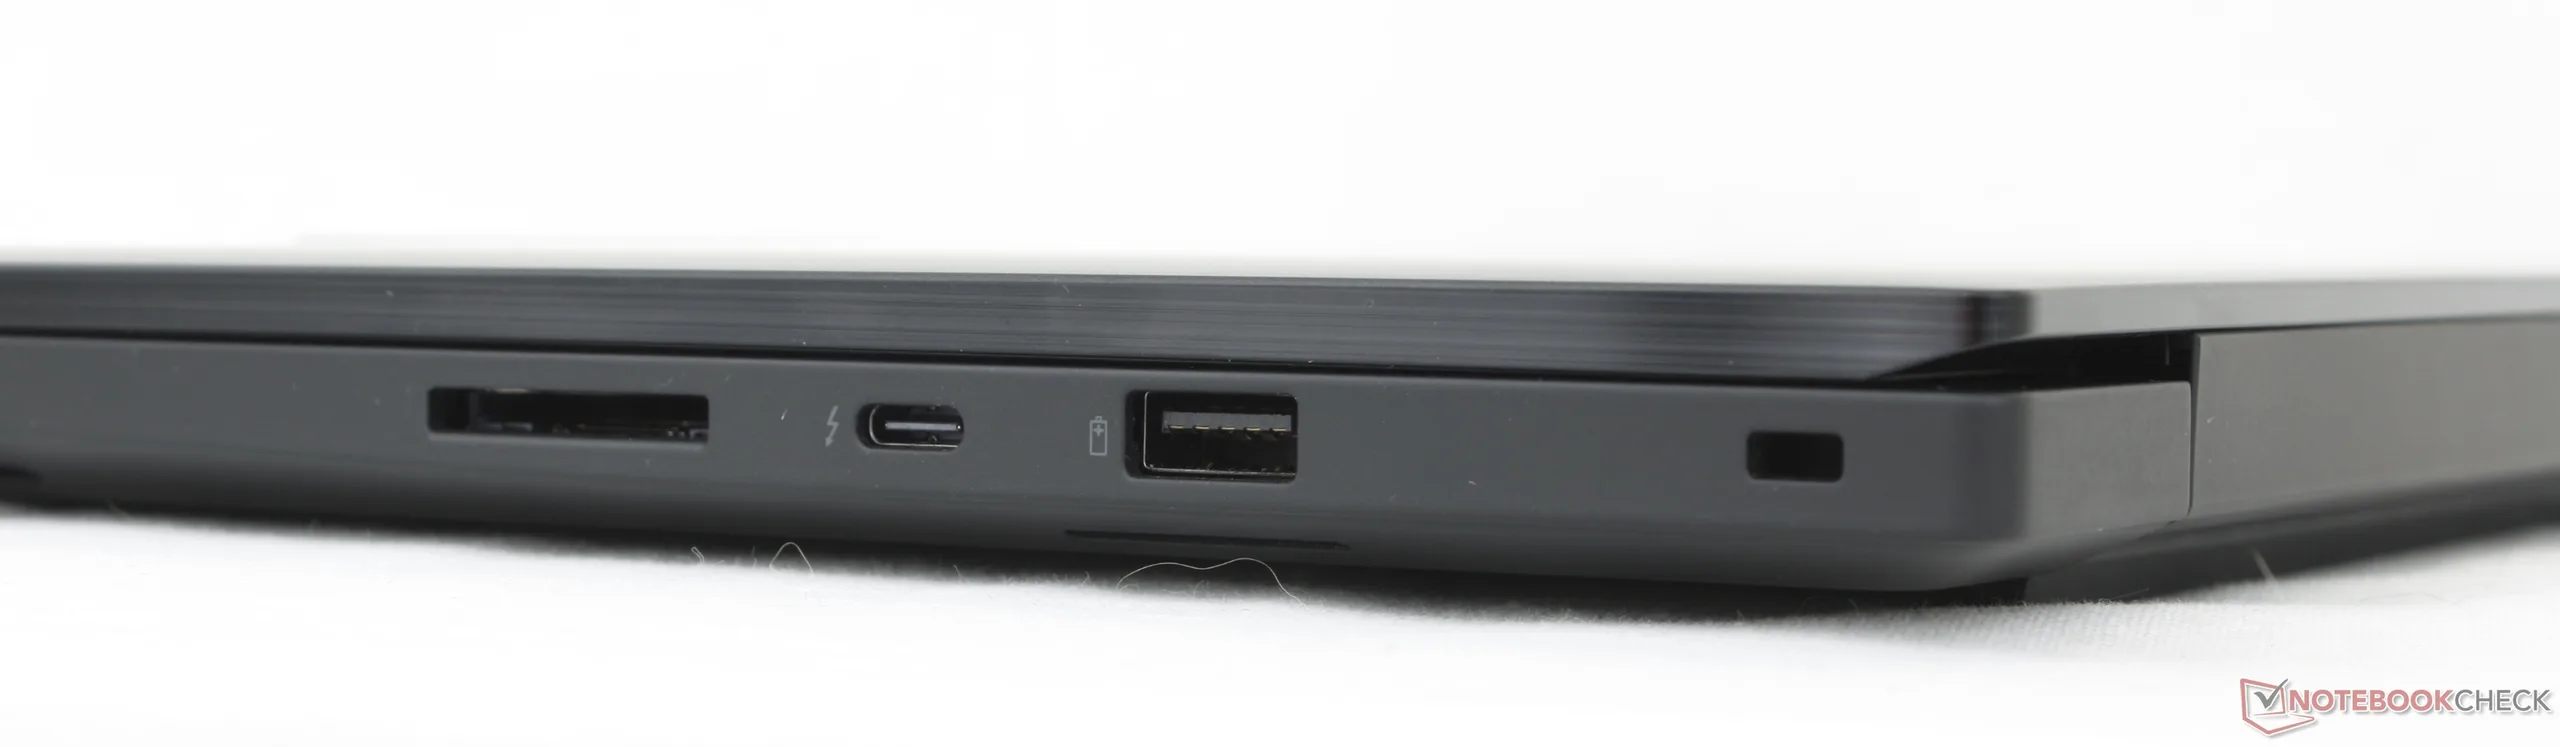
Lettore di schede SD
| SD Card Reader | |
| average JPG Copy Test (av. of 3 runs) | |
| HP ZBook X G1i 16 (Toshiba Exceria Pro SDXC 64 GB UHS-II) | |
| Lenovo ThinkPad P1 Gen 8 (Toshiba Exceria Pro SDXC 64 GB UHS-II) | |
| Dell Pro Max 16 Plus (Toshiba Exceria Pro SDXC 64 GB UHS-II) | |
| Lenovo ThinkPad P1 Gen 7 21KV001SGE (AV Pro V60) | |
| maximum AS SSD Seq Read Test (1GB) | |
| HP ZBook X G1i 16 (Toshiba Exceria Pro SDXC 64 GB UHS-II) | |
| Dell Pro Max 16 Plus (Toshiba Exceria Pro SDXC 64 GB UHS-II) | |
| Lenovo ThinkPad P1 Gen 8 (Toshiba Exceria Pro SDXC 64 GB UHS-II) | |
| Lenovo ThinkPad P1 Gen 7 21KV001SGE (AV Pro V60) | |
Comunicazione
| Networking | |
| iperf3 transmit AXE11000 | |
| Lenovo ThinkPad P1 Gen 7 21KV001SGE | |
| Asus ExpertBook B6 Flip B6602FC2 | |
| Lenovo ThinkPad P16s Gen 4 AMD | |
| Lenovo ThinkPad P1 Gen 8 | |
| Dell Pro Max 16 Plus | |
| HP ZBook X G1i 16 | |
| iperf3 receive AXE11000 | |
| Lenovo ThinkPad P1 Gen 7 21KV001SGE | |
| Lenovo ThinkPad P16s Gen 4 AMD | |
| Asus ExpertBook B6 Flip B6602FC2 | |
| Dell Pro Max 16 Plus | |
| Lenovo ThinkPad P1 Gen 8 | |
| HP ZBook X G1i 16 | |
| iperf3 transmit AXE11000 6GHz | |
| Asus ExpertBook B6 Flip B6602FC2 | |
| Lenovo ThinkPad P16s Gen 4 AMD | |
| Lenovo ThinkPad P1 Gen 7 21KV001SGE | |
| Lenovo ThinkPad P1 Gen 8 | |
| HP ZBook X G1i 16 | |
| Dell Pro Max 16 Plus | |
| iperf3 receive AXE11000 6GHz | |
| Lenovo ThinkPad P16s Gen 4 AMD | |
| Lenovo ThinkPad P1 Gen 7 21KV001SGE | |
| Asus ExpertBook B6 Flip B6602FC2 | |
| Lenovo ThinkPad P1 Gen 8 | |
| HP ZBook X G1i 16 | |
| Dell Pro Max 16 Plus | |
Webcam


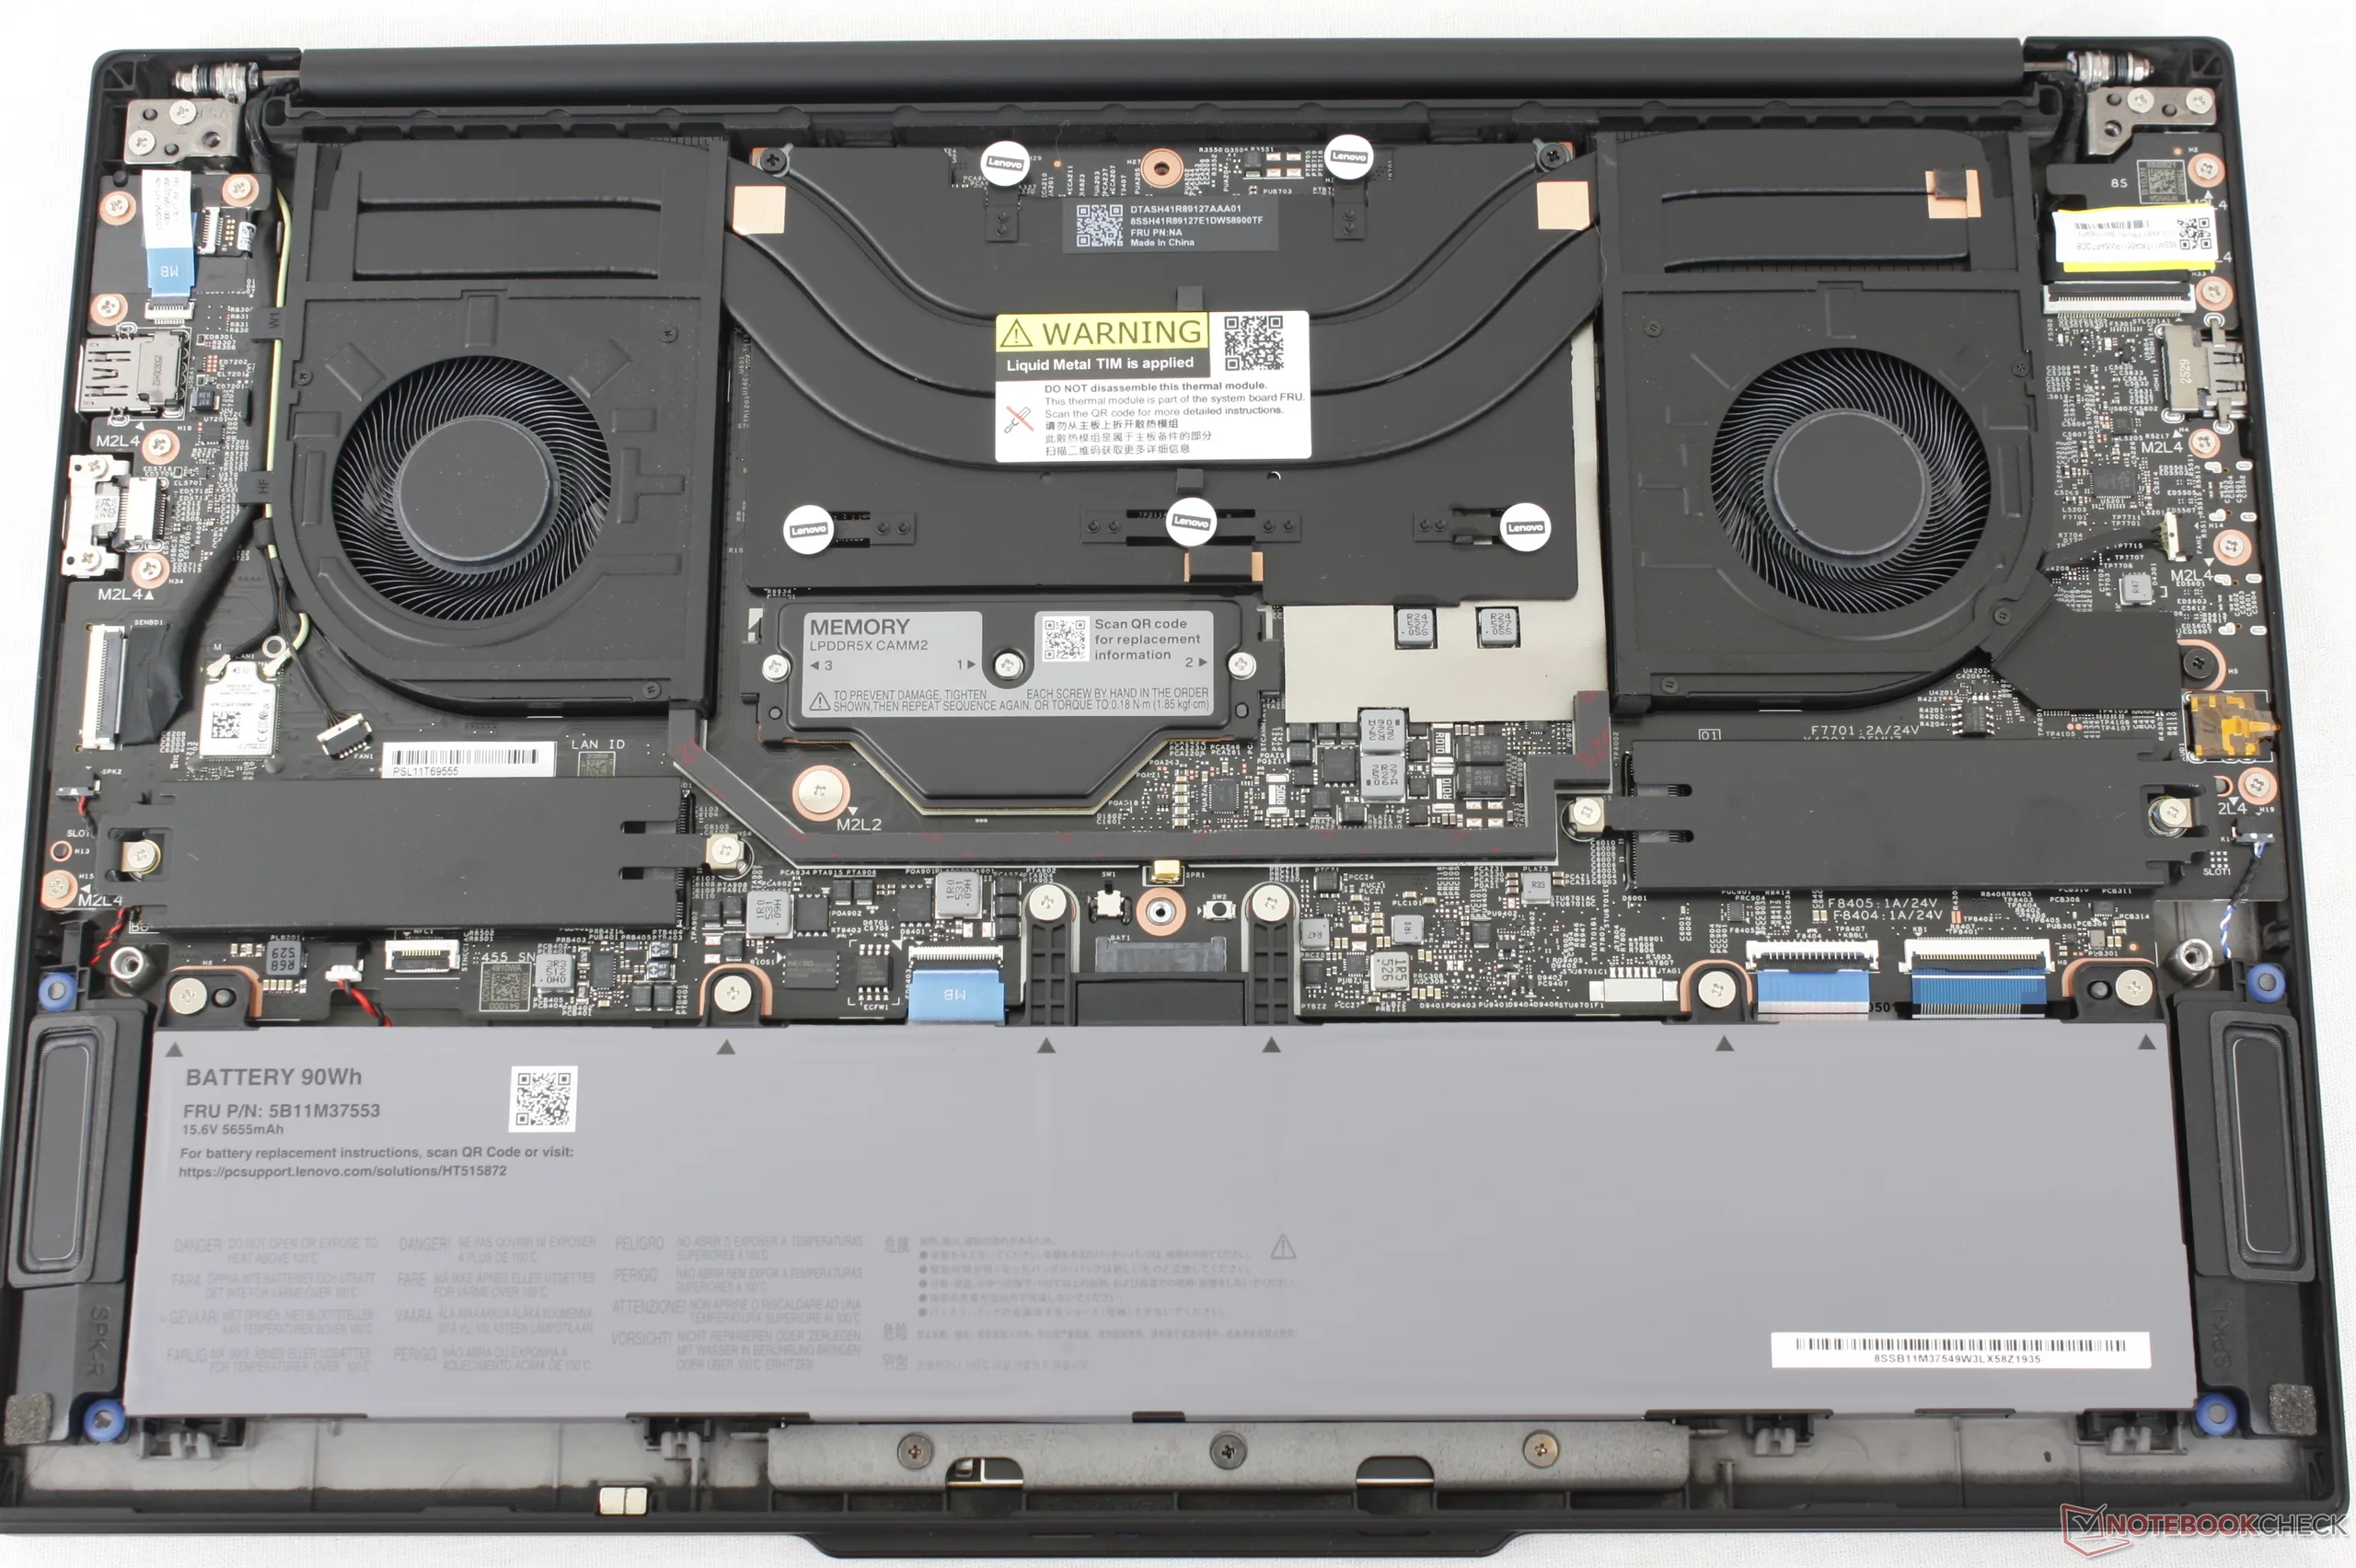
Manutenzione
Sostenibilità
Lo scheletro è costituito dal 90 percento di magnesio e alluminio riciclato per la base della tastiera, dal 55 al 75 percento di alluminio riciclato per le coperture superiore e inferiore, e dal 50 al 90 percento di plastica per quasi tutto il resto. Anche l'imballaggio è privo di plastica.
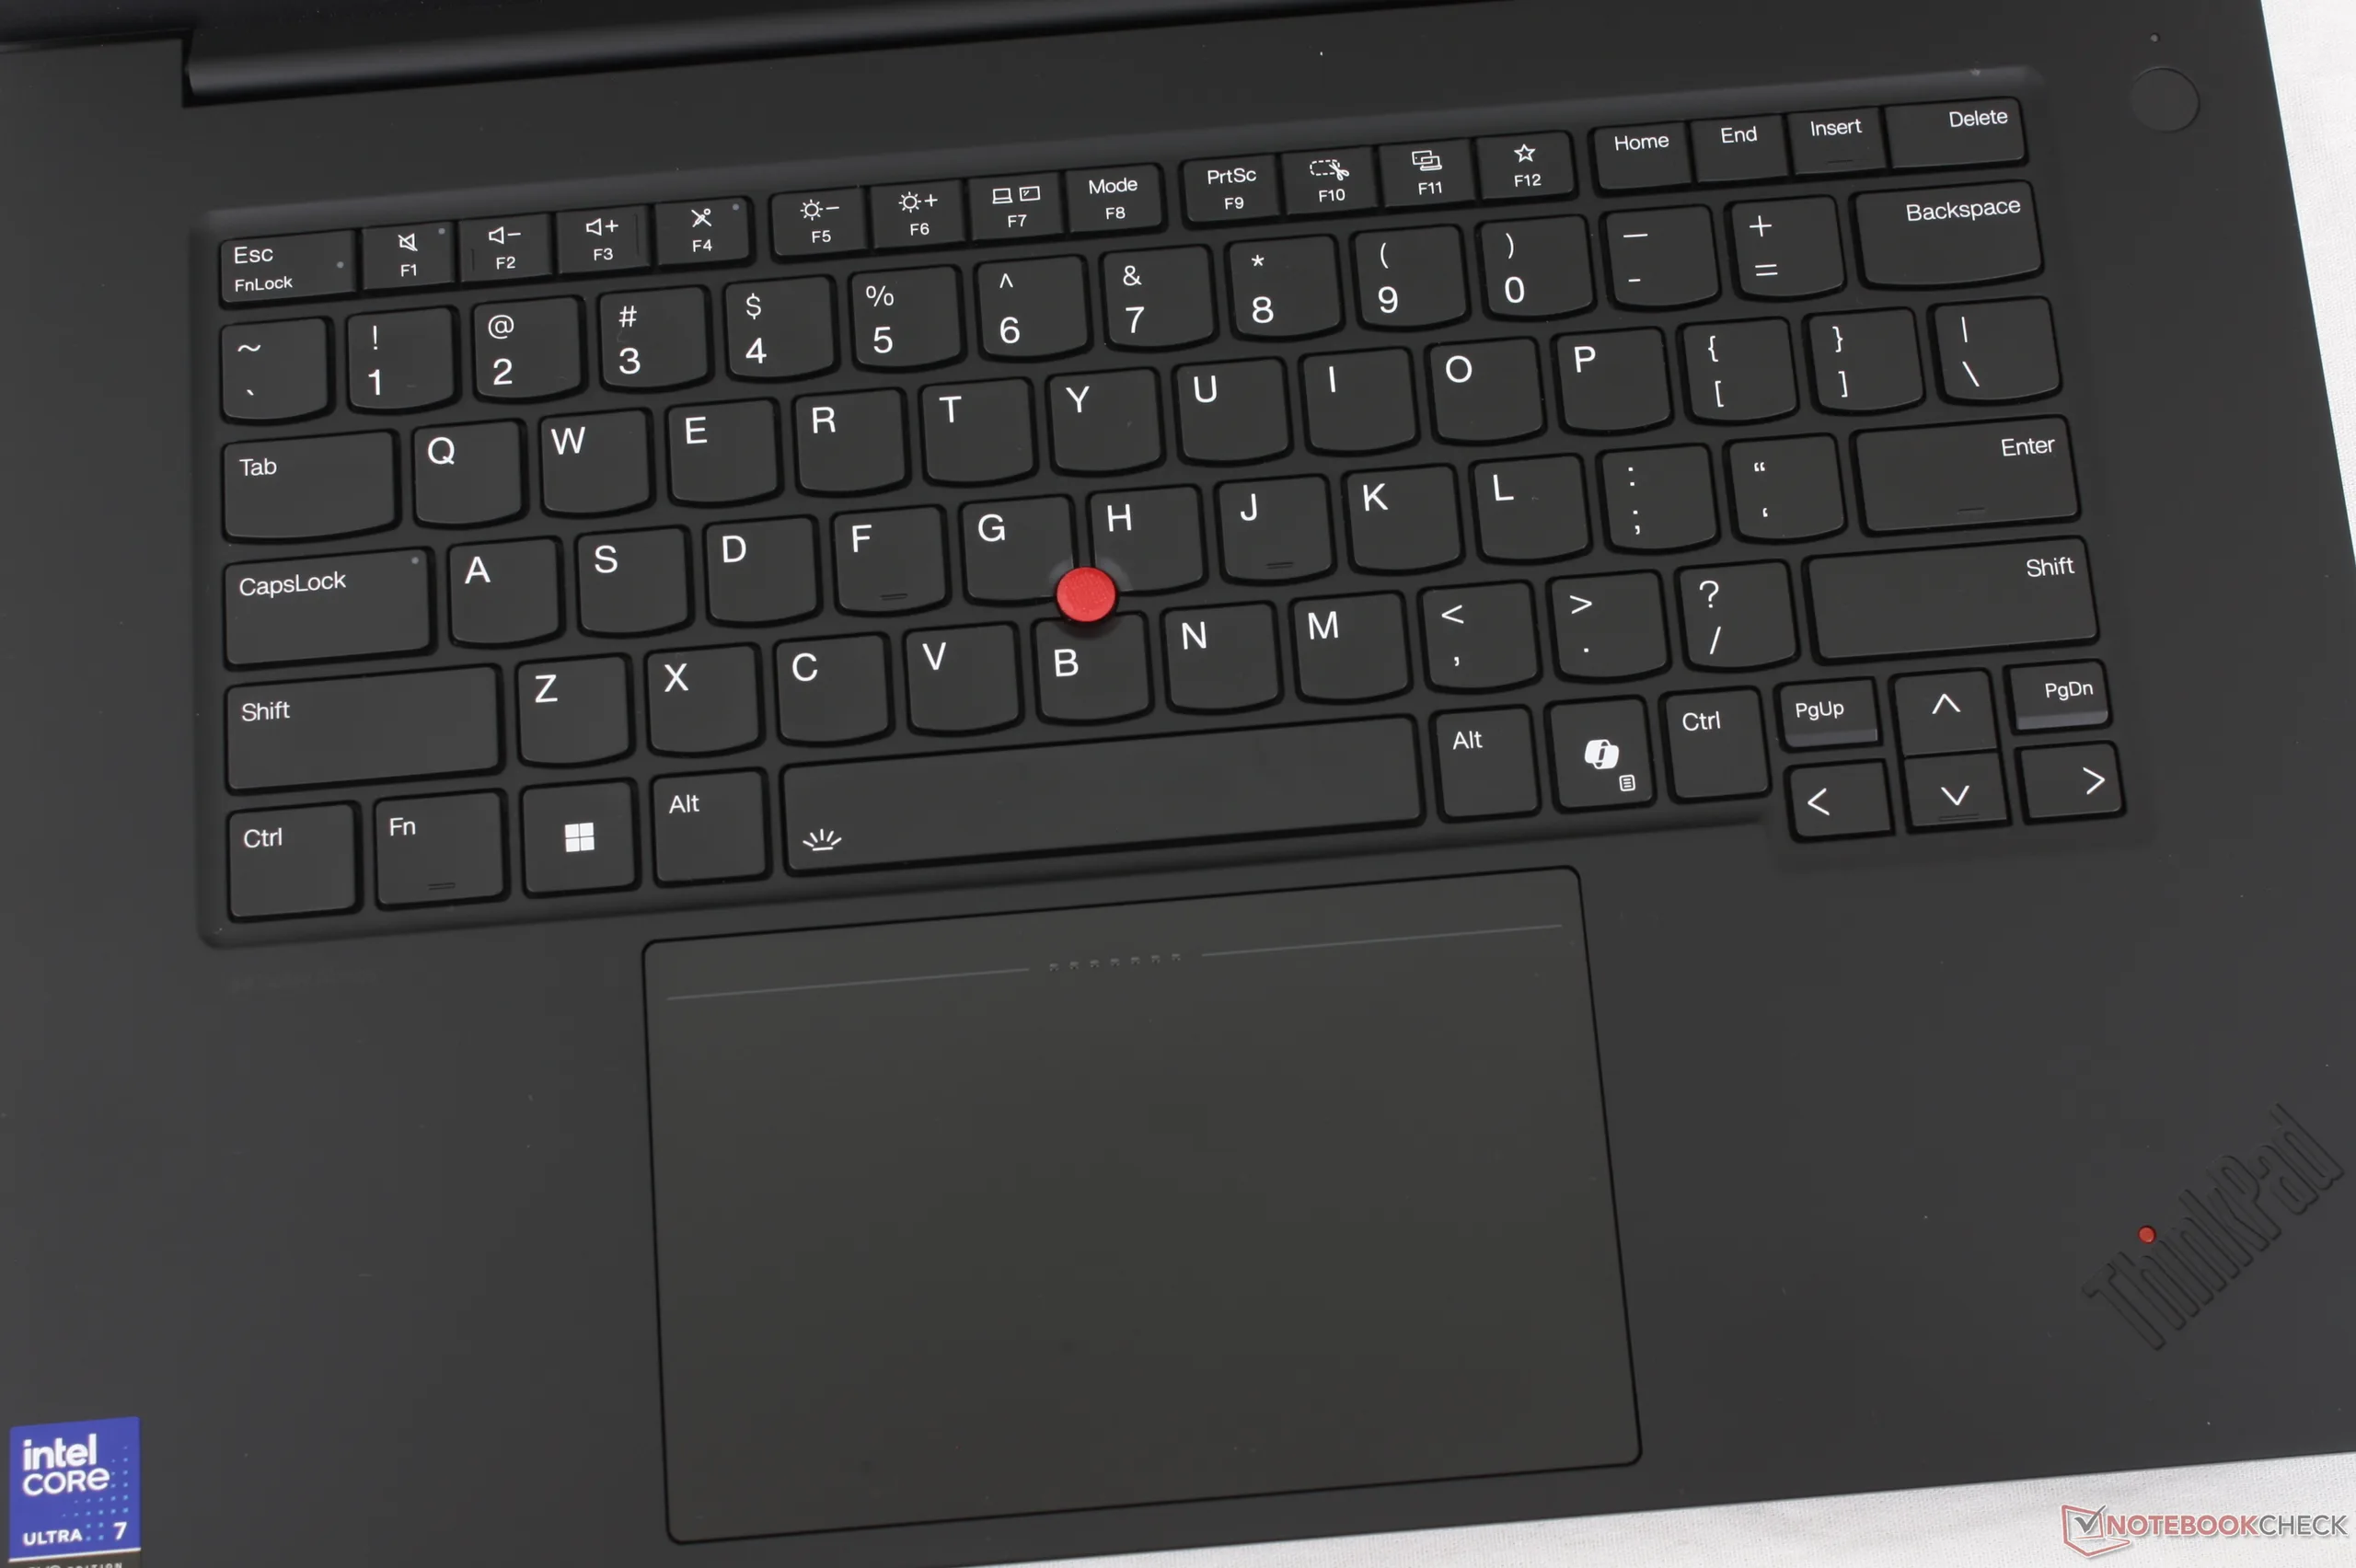
Dispositivi di ingresso
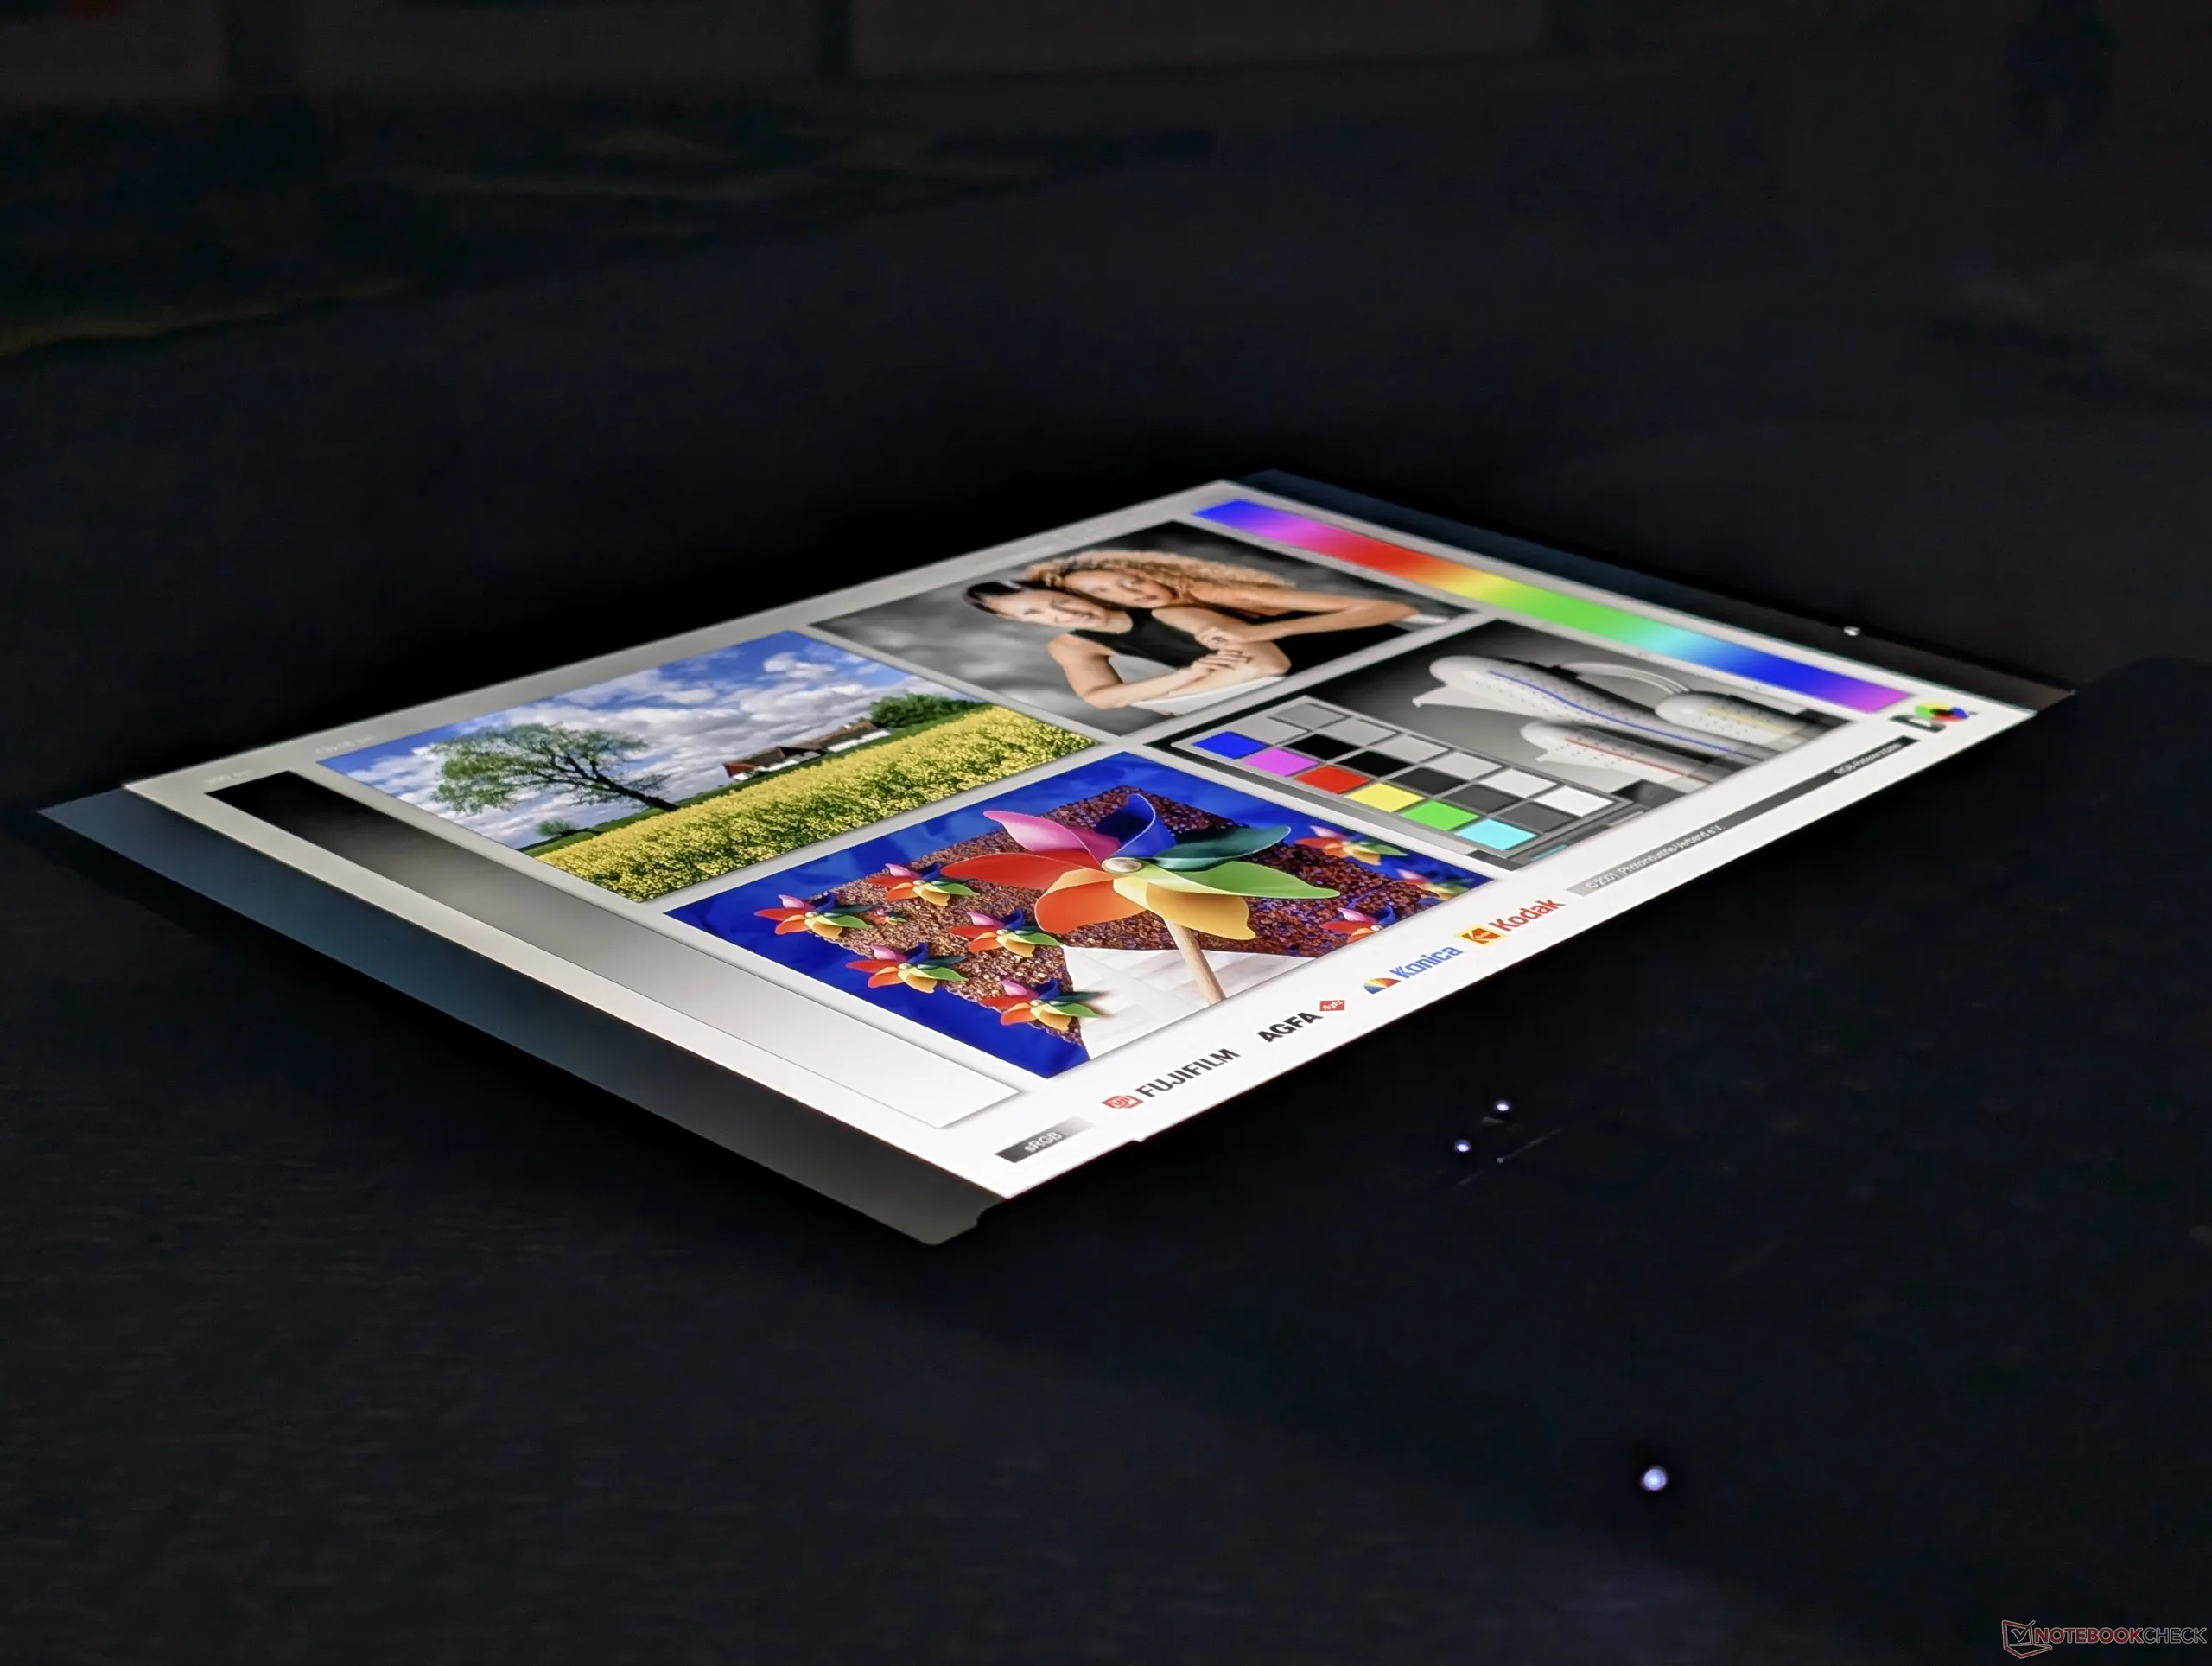
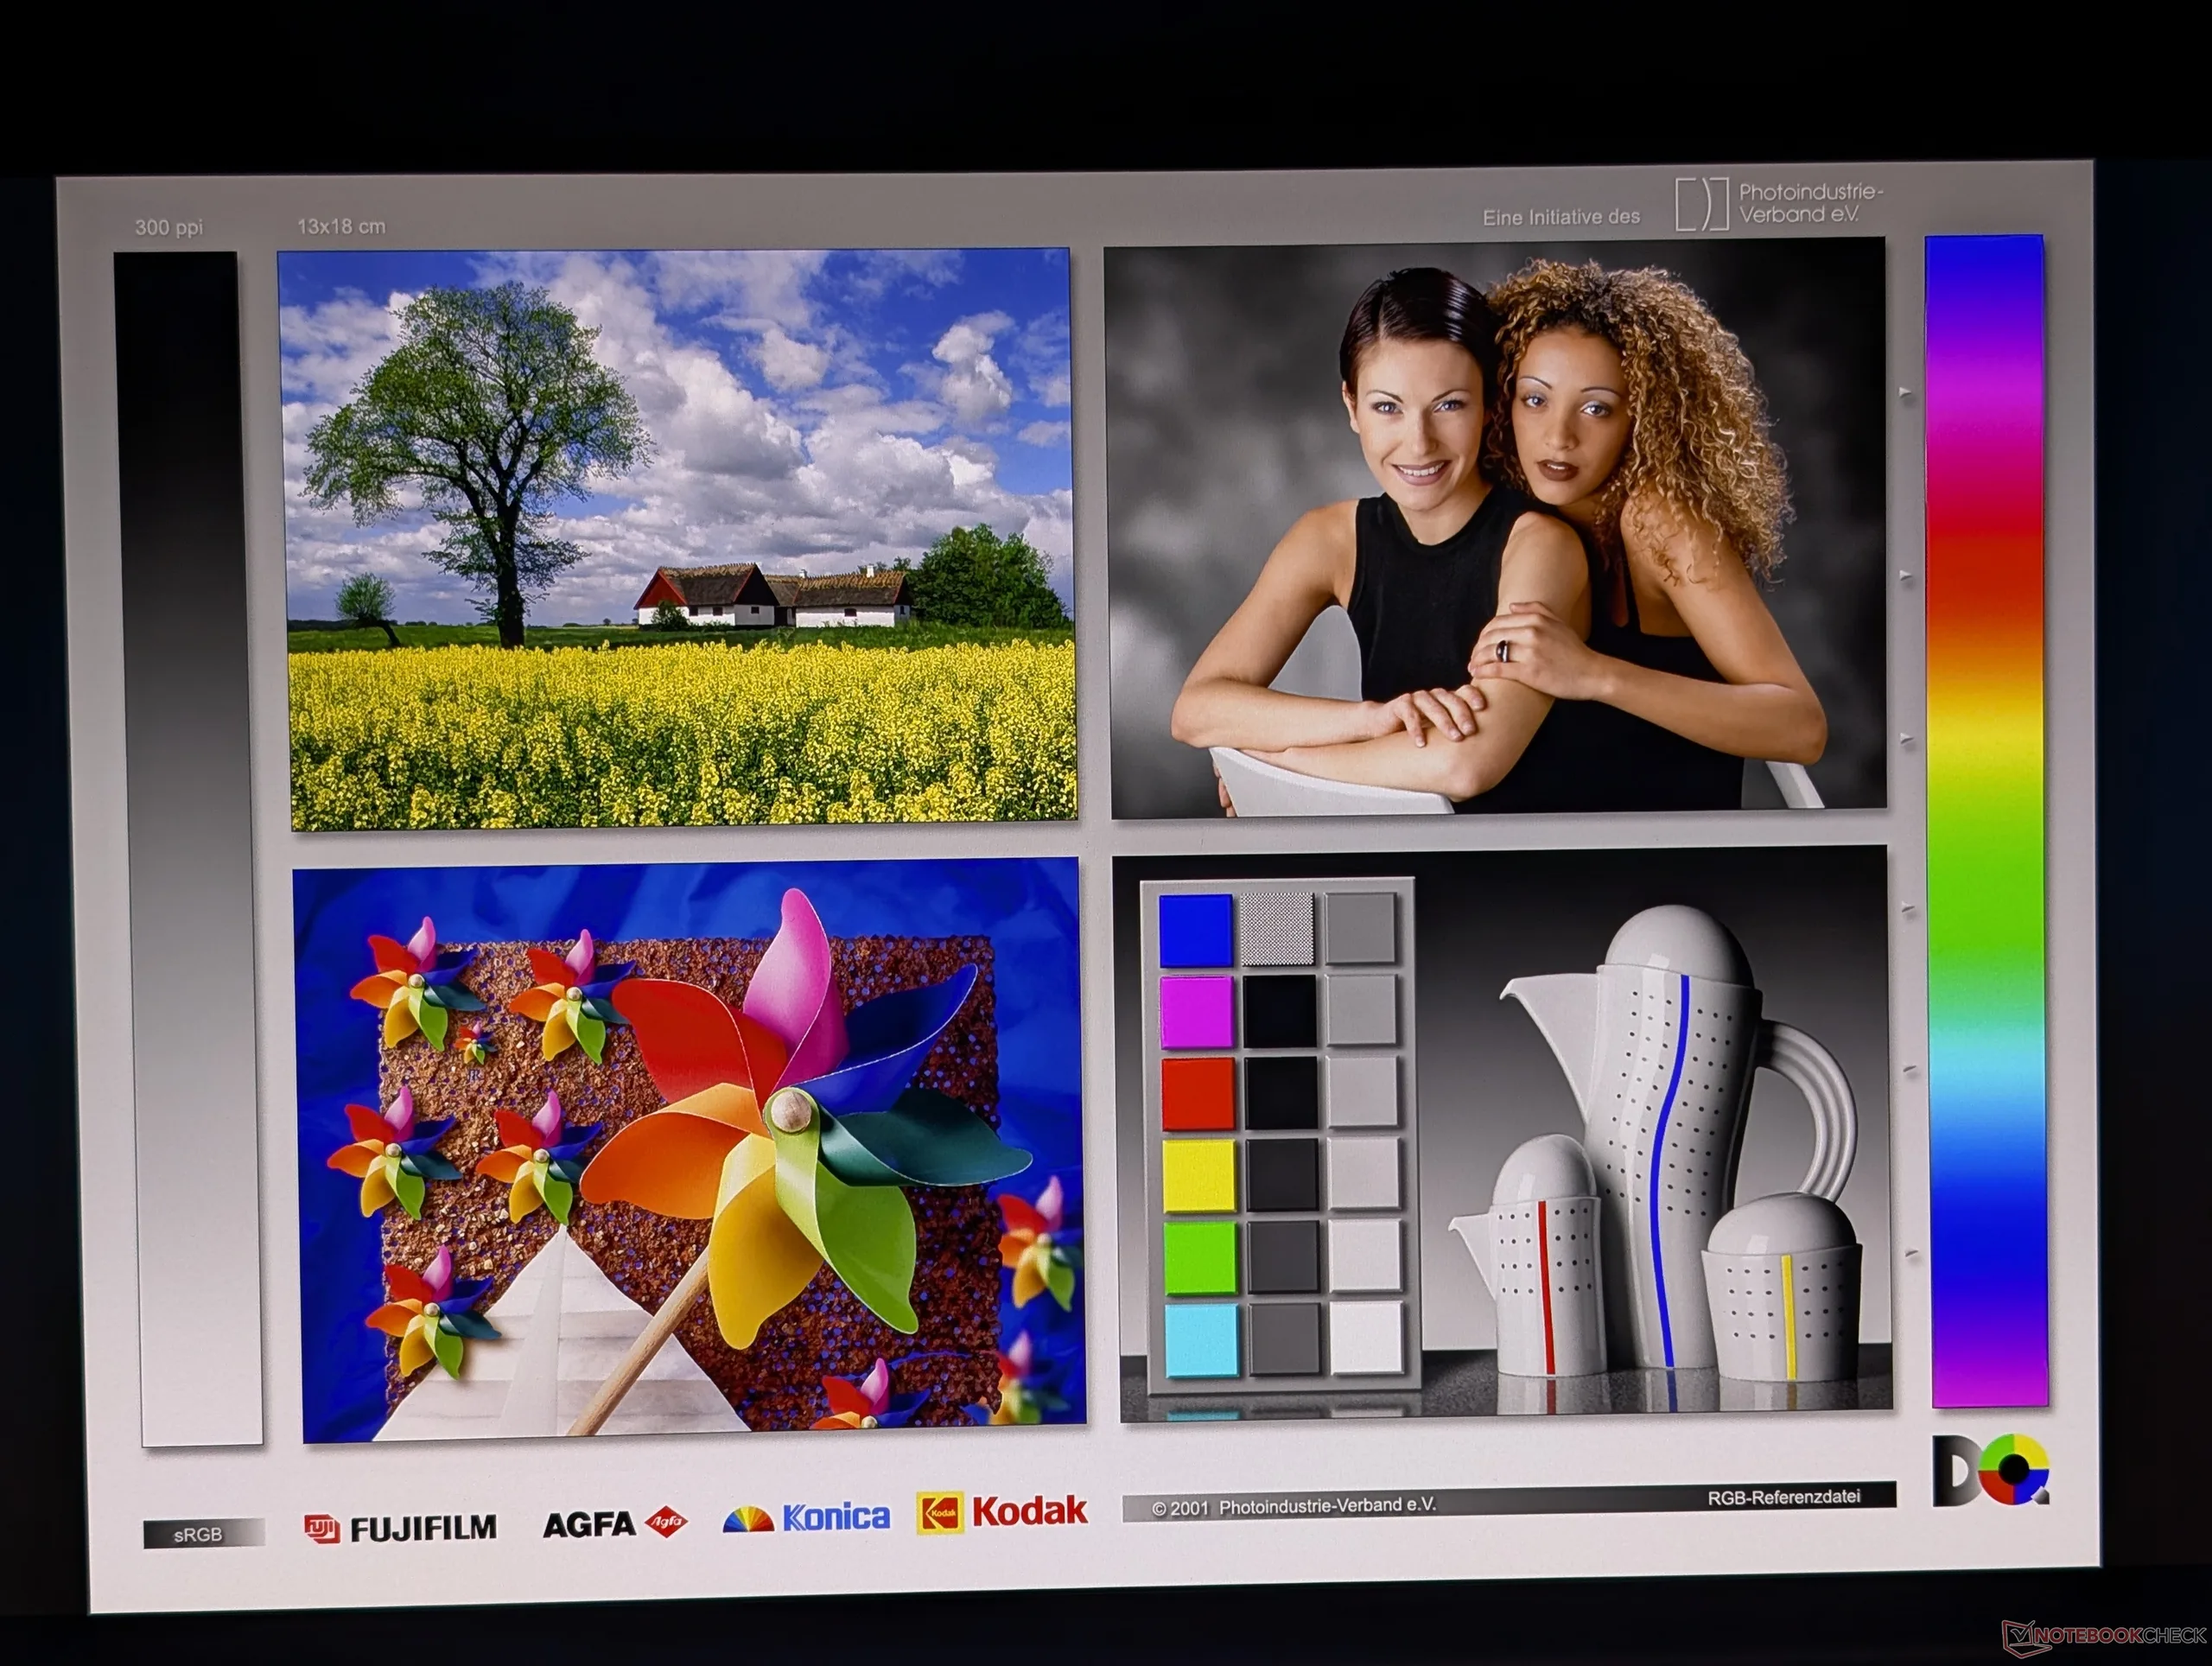
Display

Sono disponibili tre opzioni di display, come segue. Si noti che l'opzione con la risoluzione più alta sacrifica la frequenza di aggiornamento più rapida, i livelli di nero profondo, la funzionalità touch e il supporto HDR superiore dell'opzione OLED in tandem.
- 1920 x 1200, non touch, IPS, 500 nits, opaco, 100% sRGB, 60 Hz, oscuramento DC
- 3200 x 2000, touch, OLED tandem, 1500 nits HDR, opaco, 100% DCI-P3, 120 Hz, oscuramento PWM
- 3840 x 2400, non touch, IPS, 800 nits, 100% DCI-P3, 60 Hz, dimmerazione DC
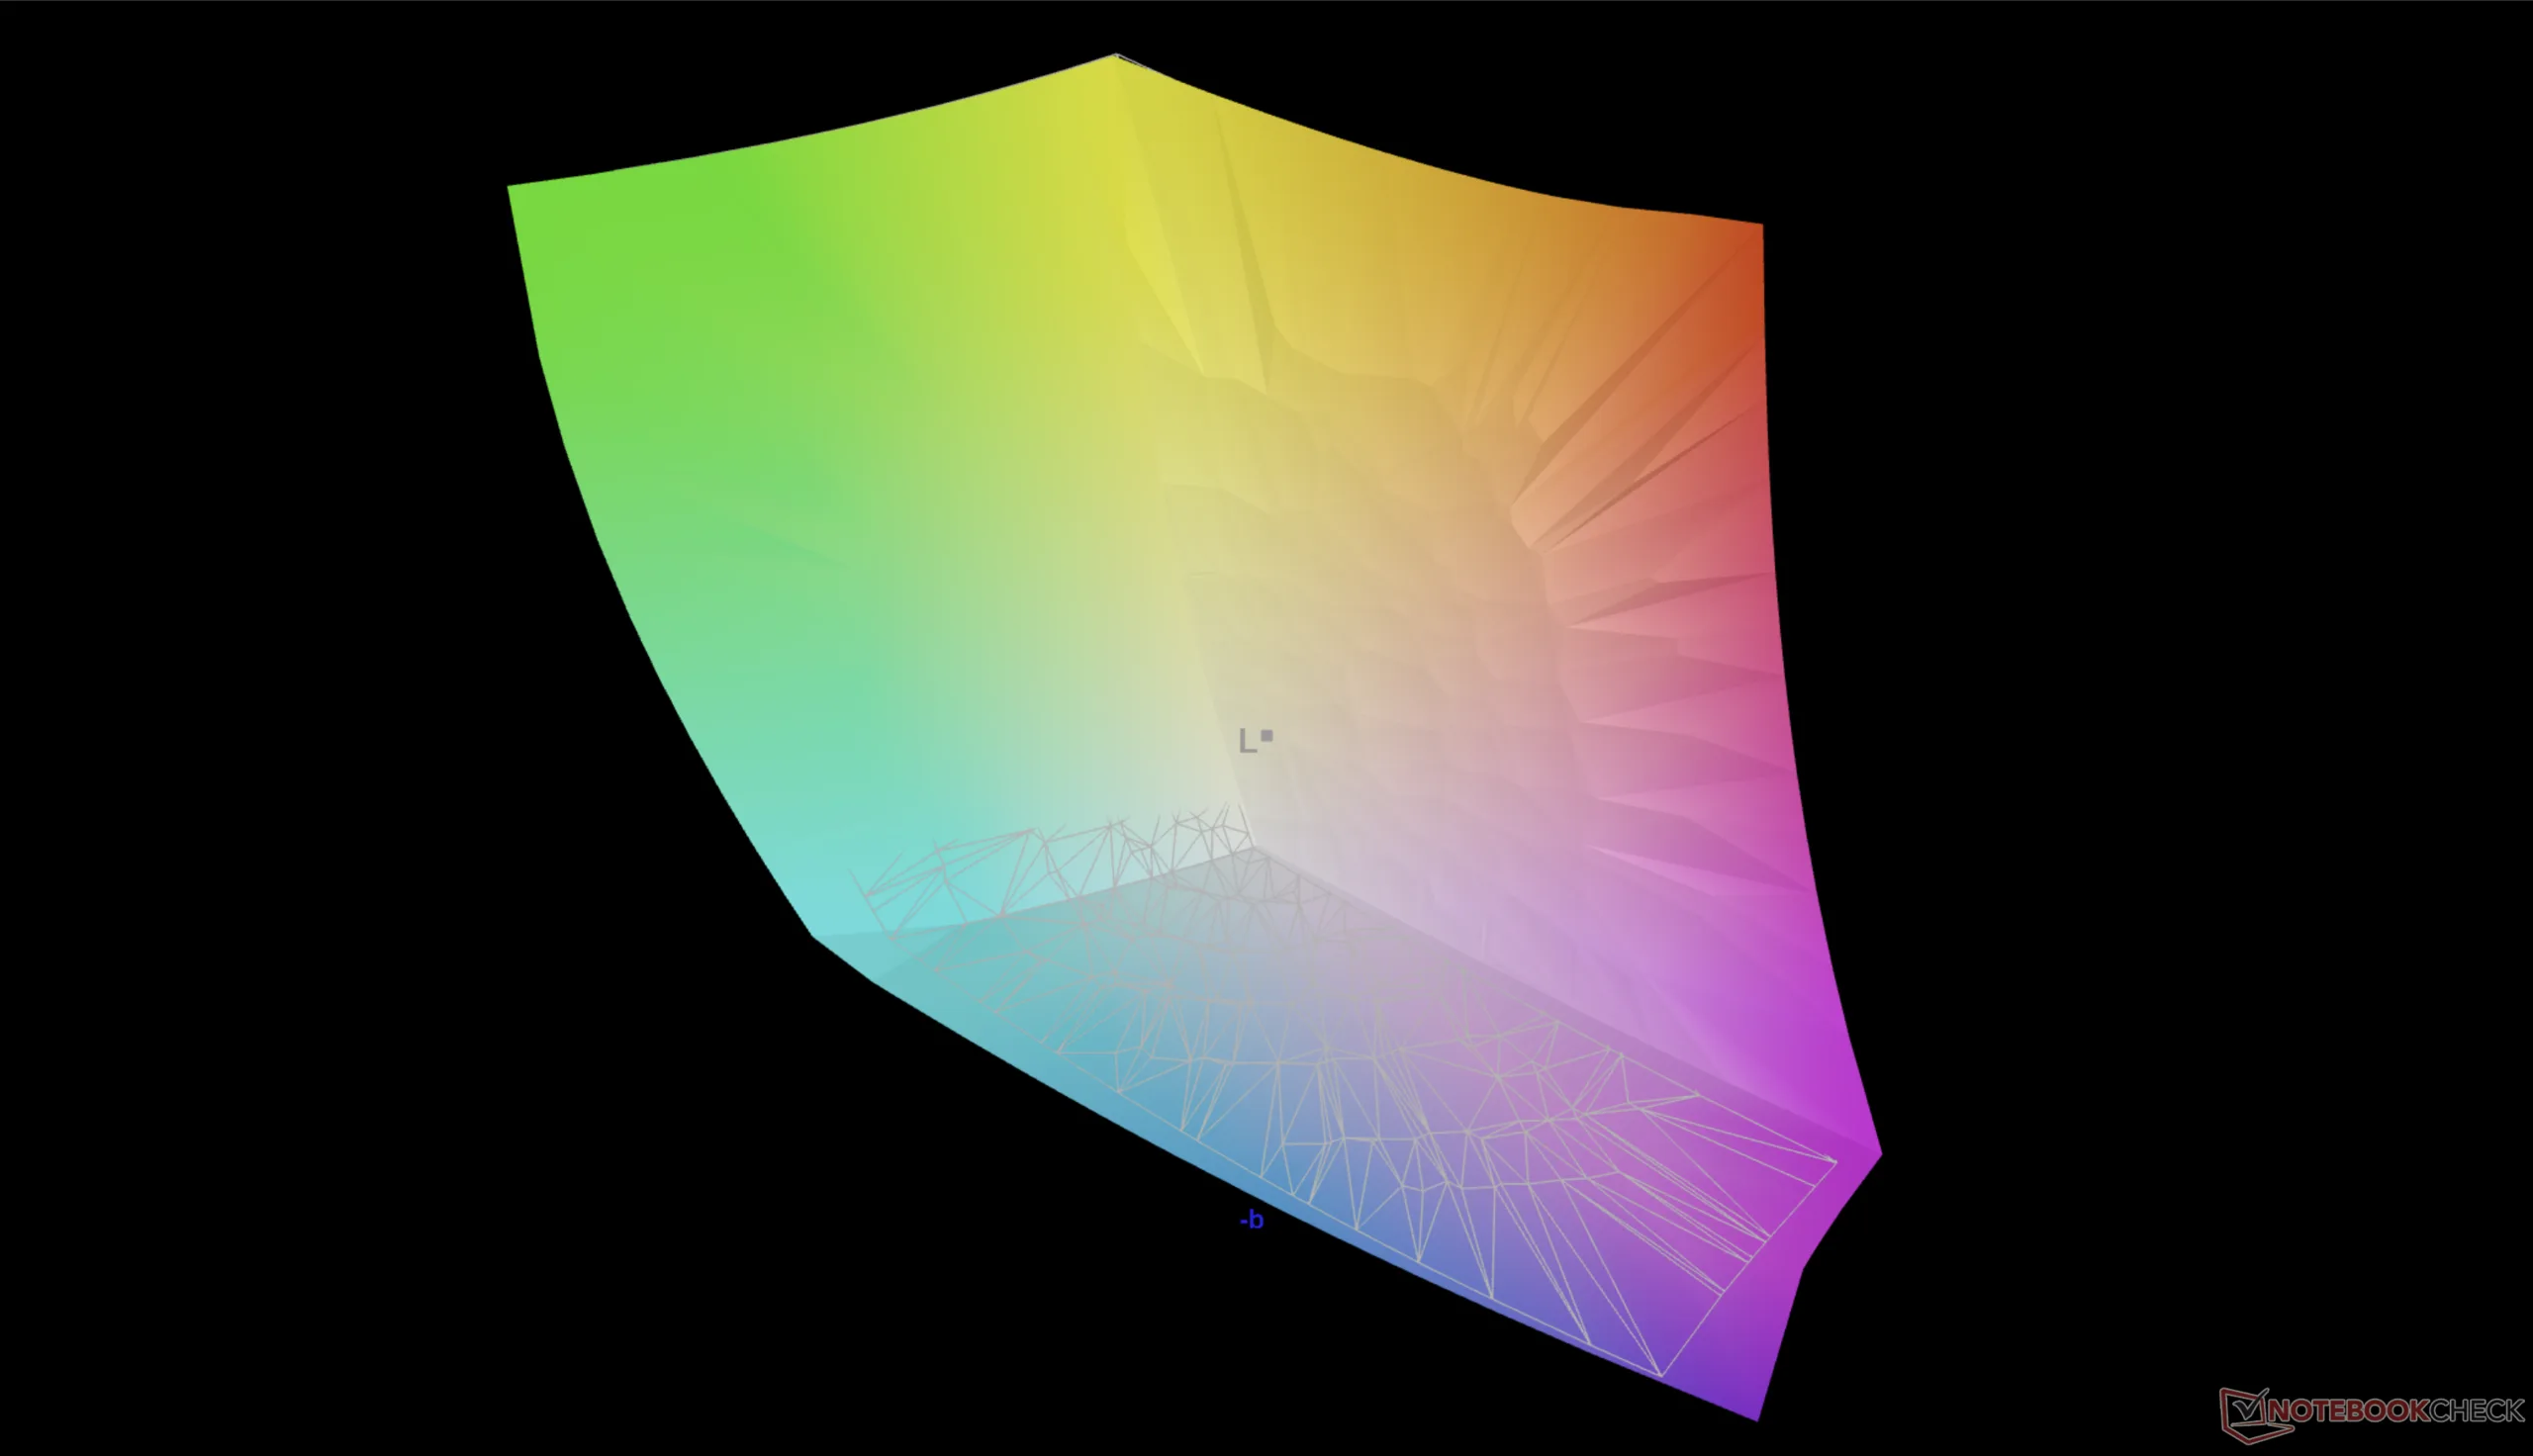
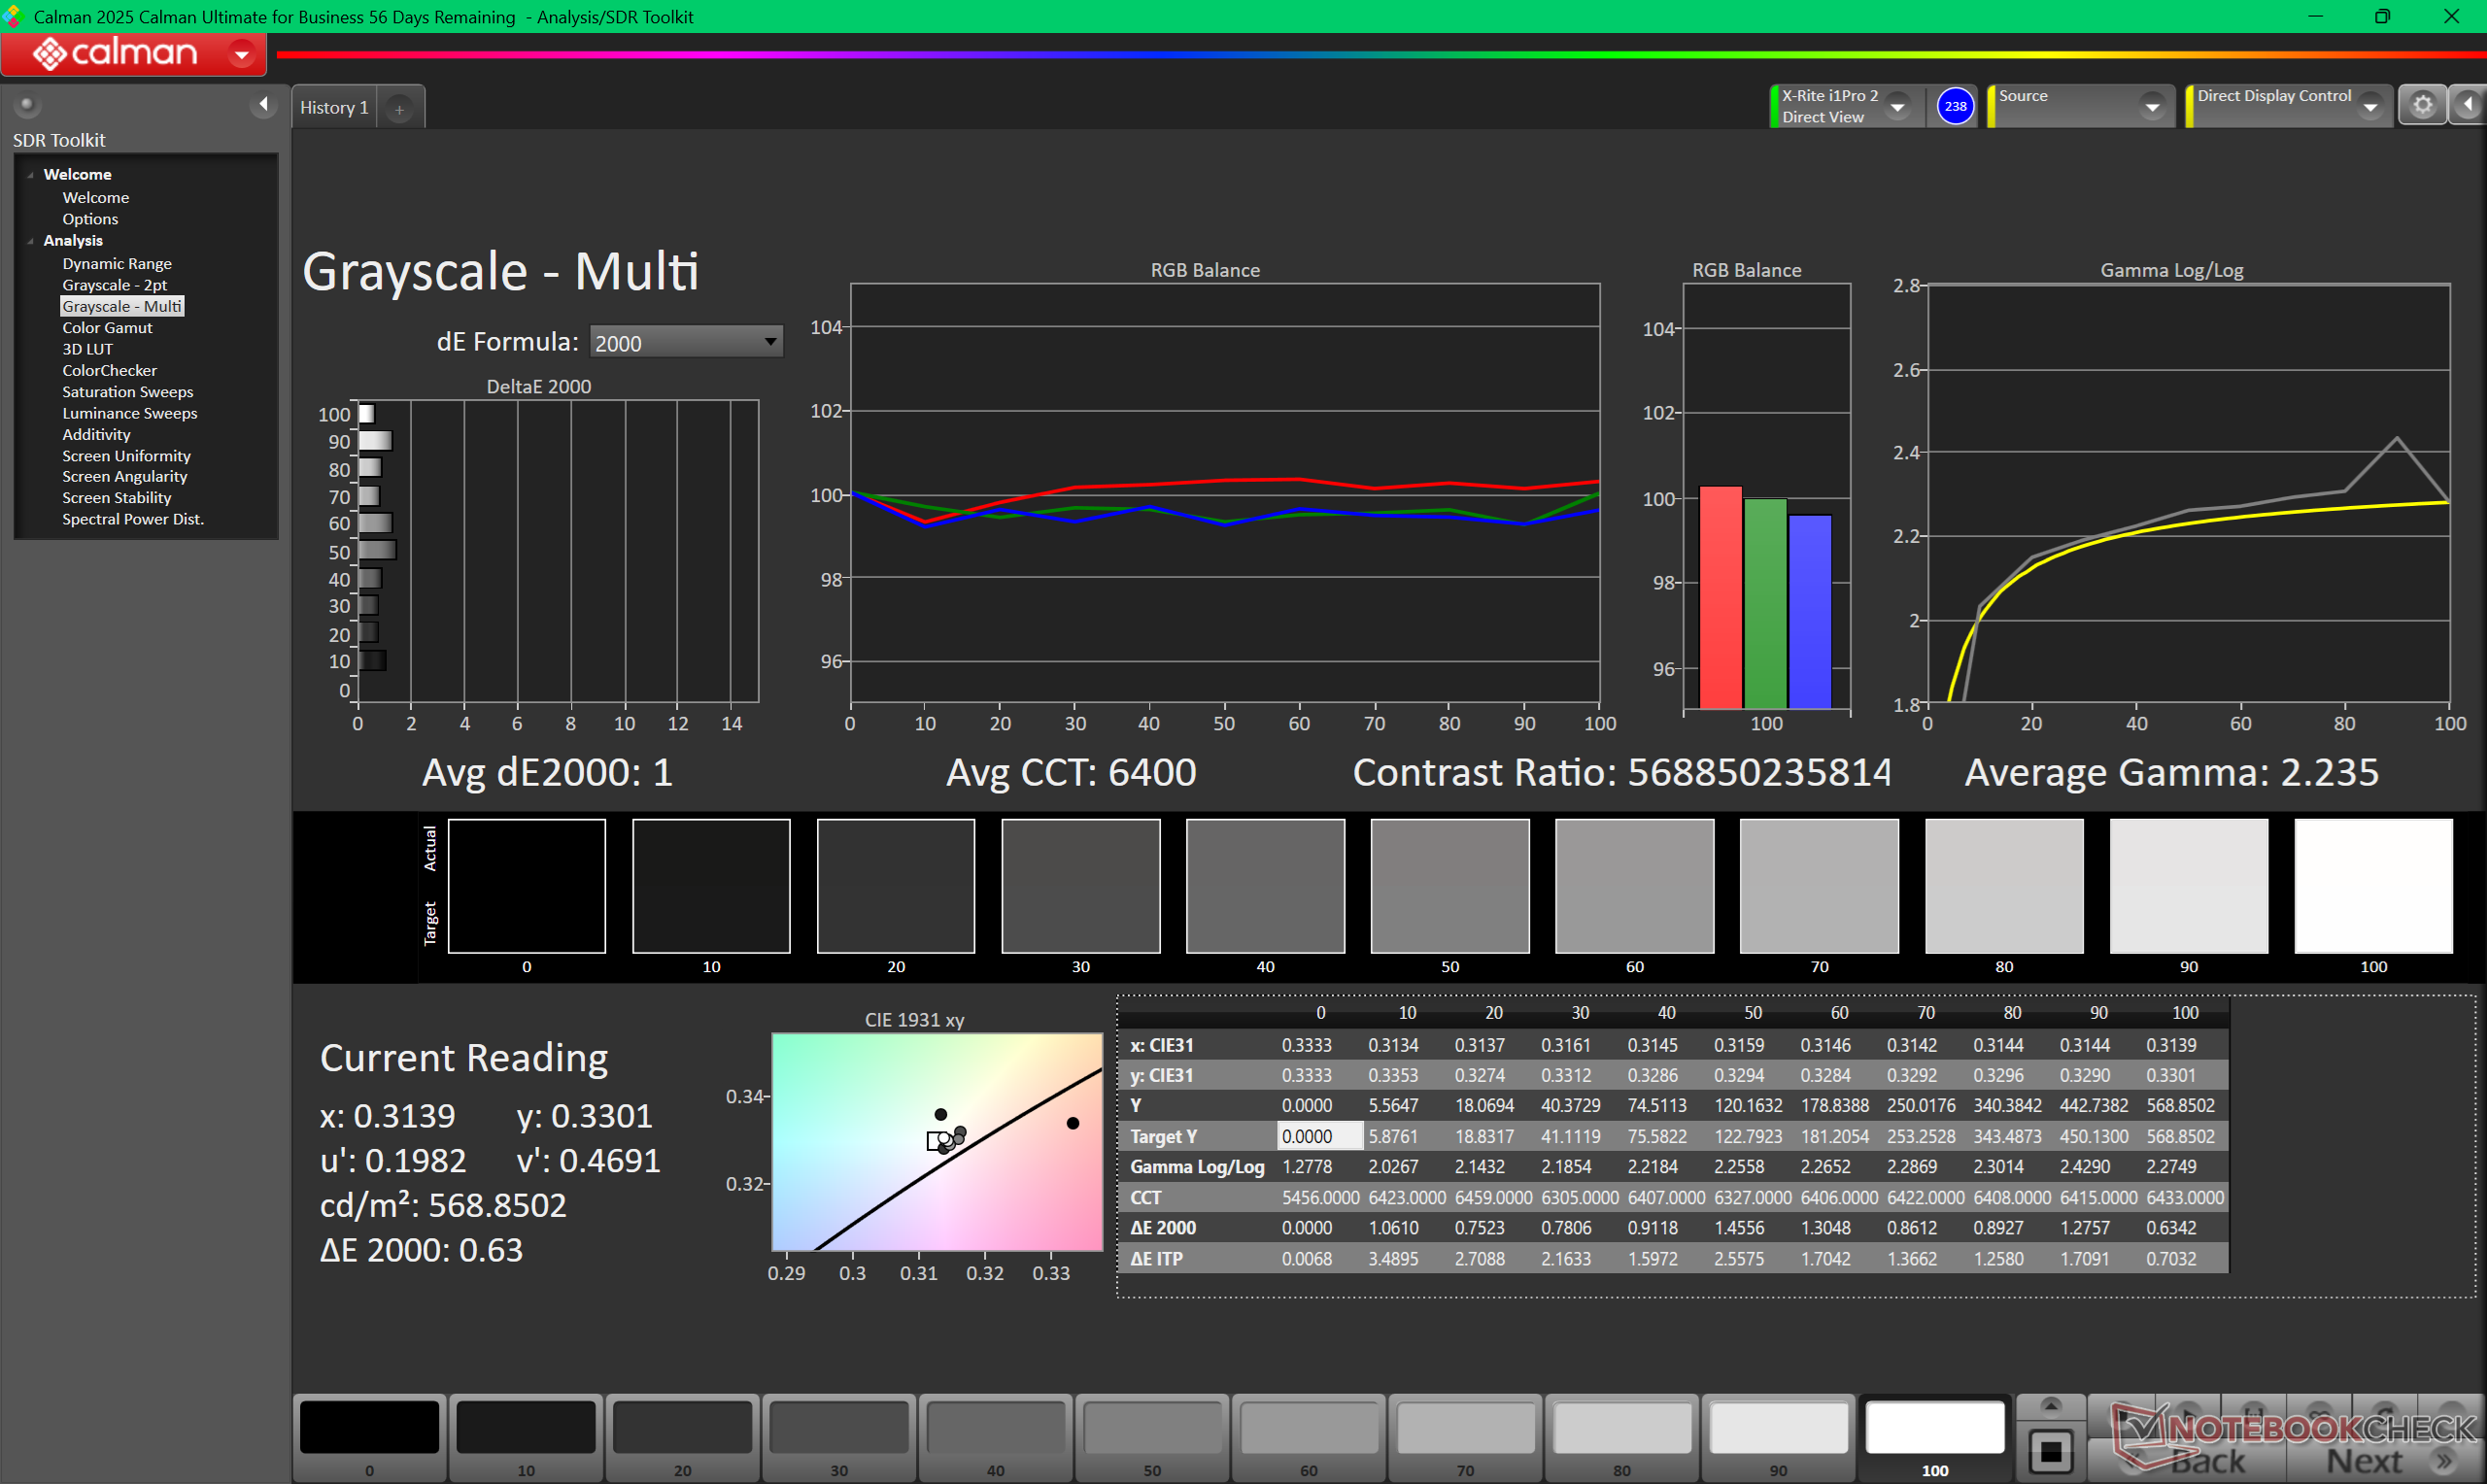
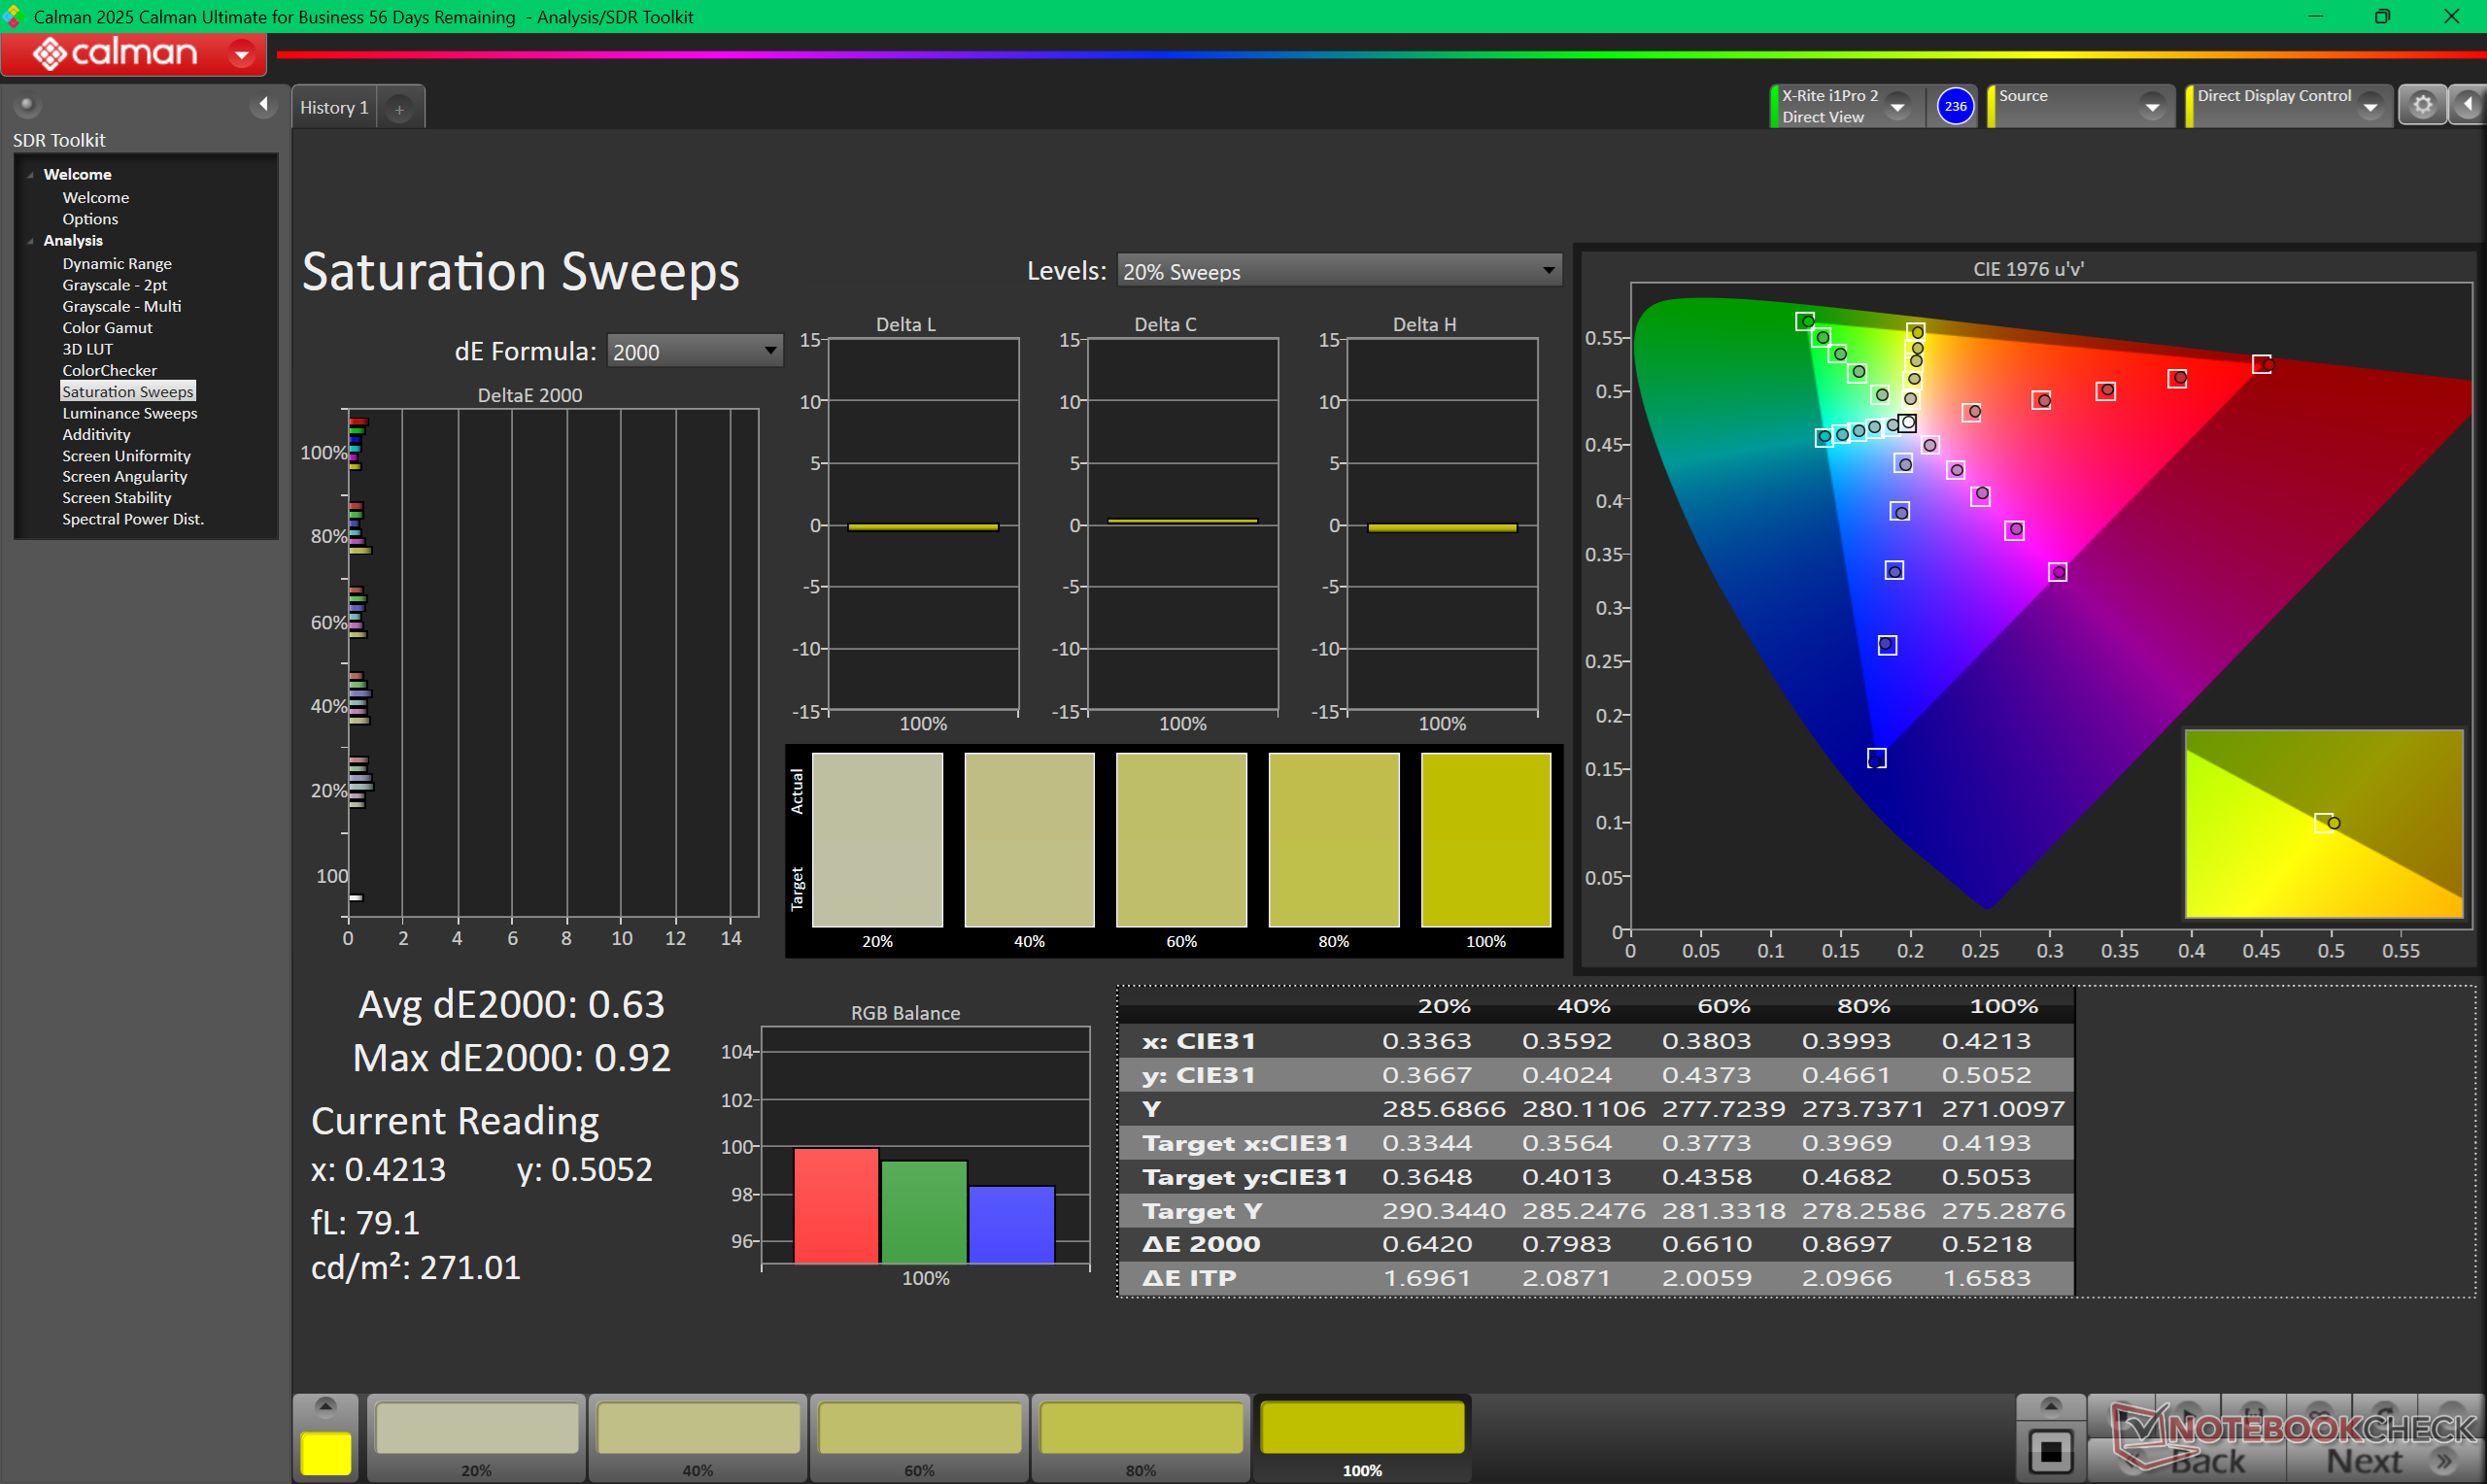
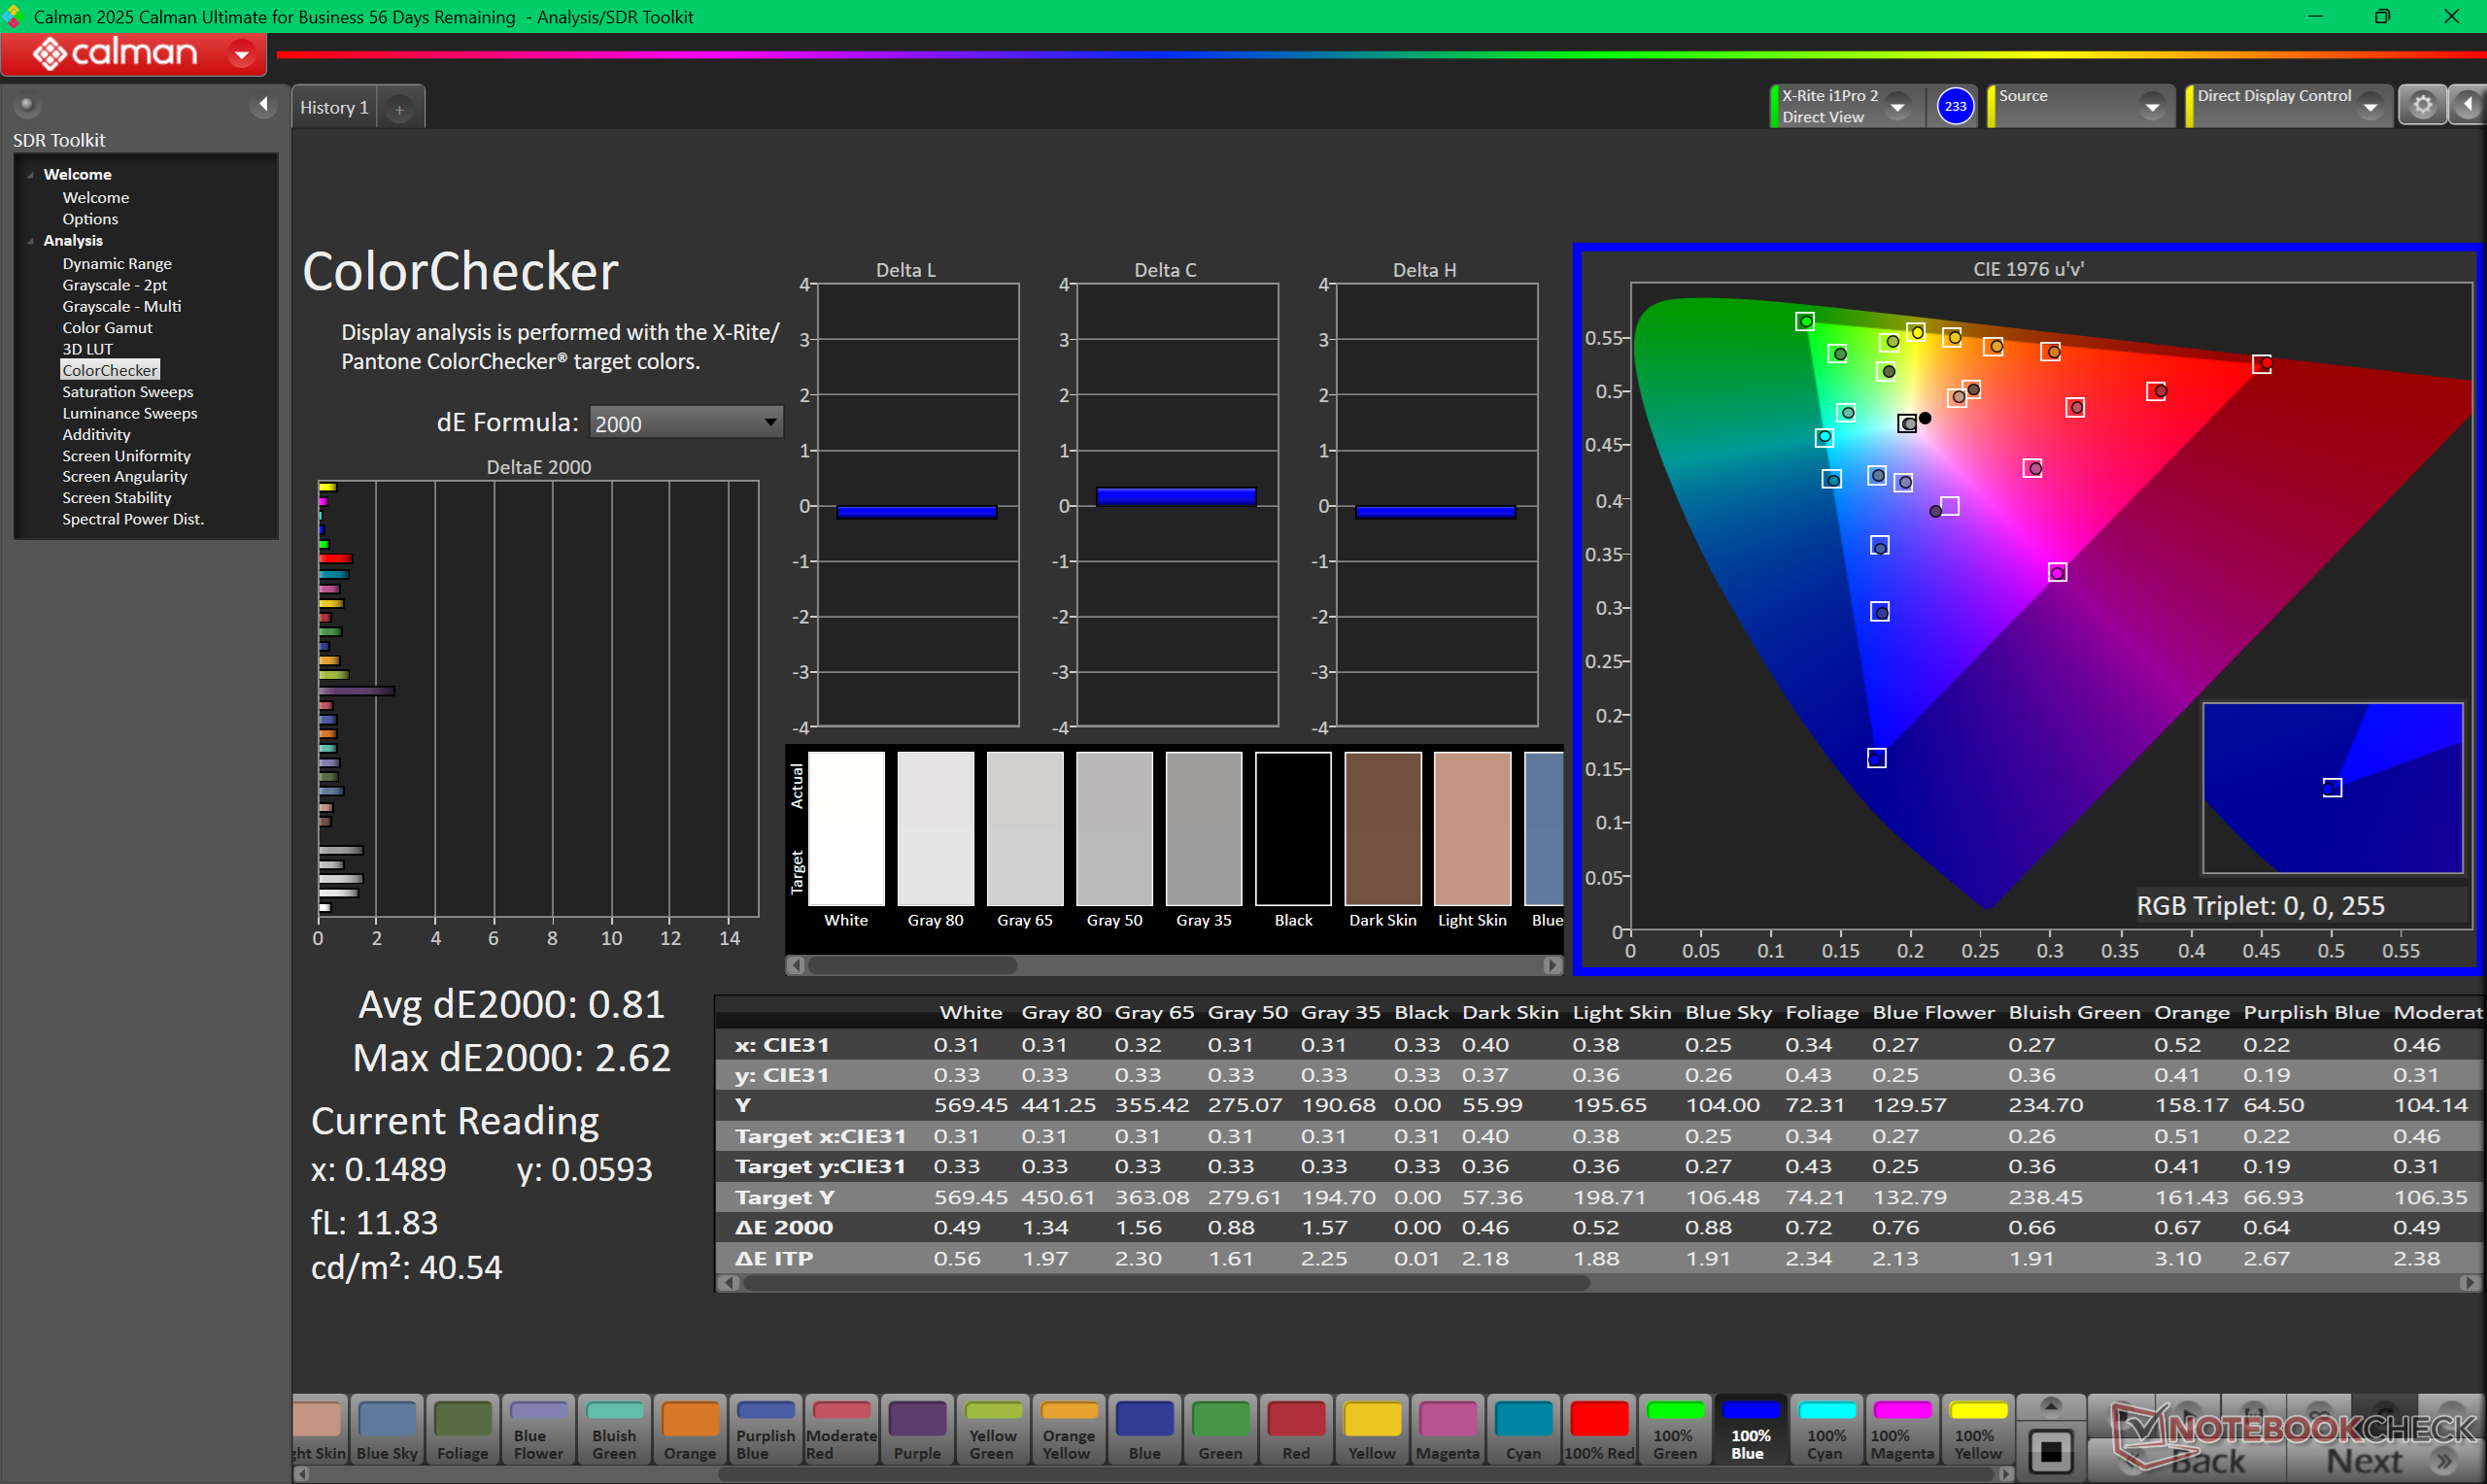
Soggettivamente, lo schermo OLED opaco in tandem sulla nostra unità di prova appare più granuloso rispetto a un'alternativa lucida tradizionale, soprattutto quando si visualizza un'immagine completamente bianca. Tuttavia, eccelle ancora nella riproduzione HDR per i suoi livelli di luminosità molto elevati, soprattutto per un pannello OLED. Le nostre misurazioni indipendenti con un colorimetro X-Rite mostrano una luminosità massima di 566 nits in modalità SDR e 1430 nits in modalità HDR, che si avvicinano ai valori pubblicizzati di 600 nits e 1500 nits, rispettivamente. Se le caratteristiche del touchscreen e dell'HDR non sono importanti, tuttavia, l'opzione 2400p potrebbe essere più conveniente per il suo numero di pixel più denso.
| |||||||||||||||||||||||||
Distribuzione della luminosità: 99 %
Al centro con la batteria: 561.8 cd/m²
Contrasto: ∞:1 (Nero: 0 cd/m²)
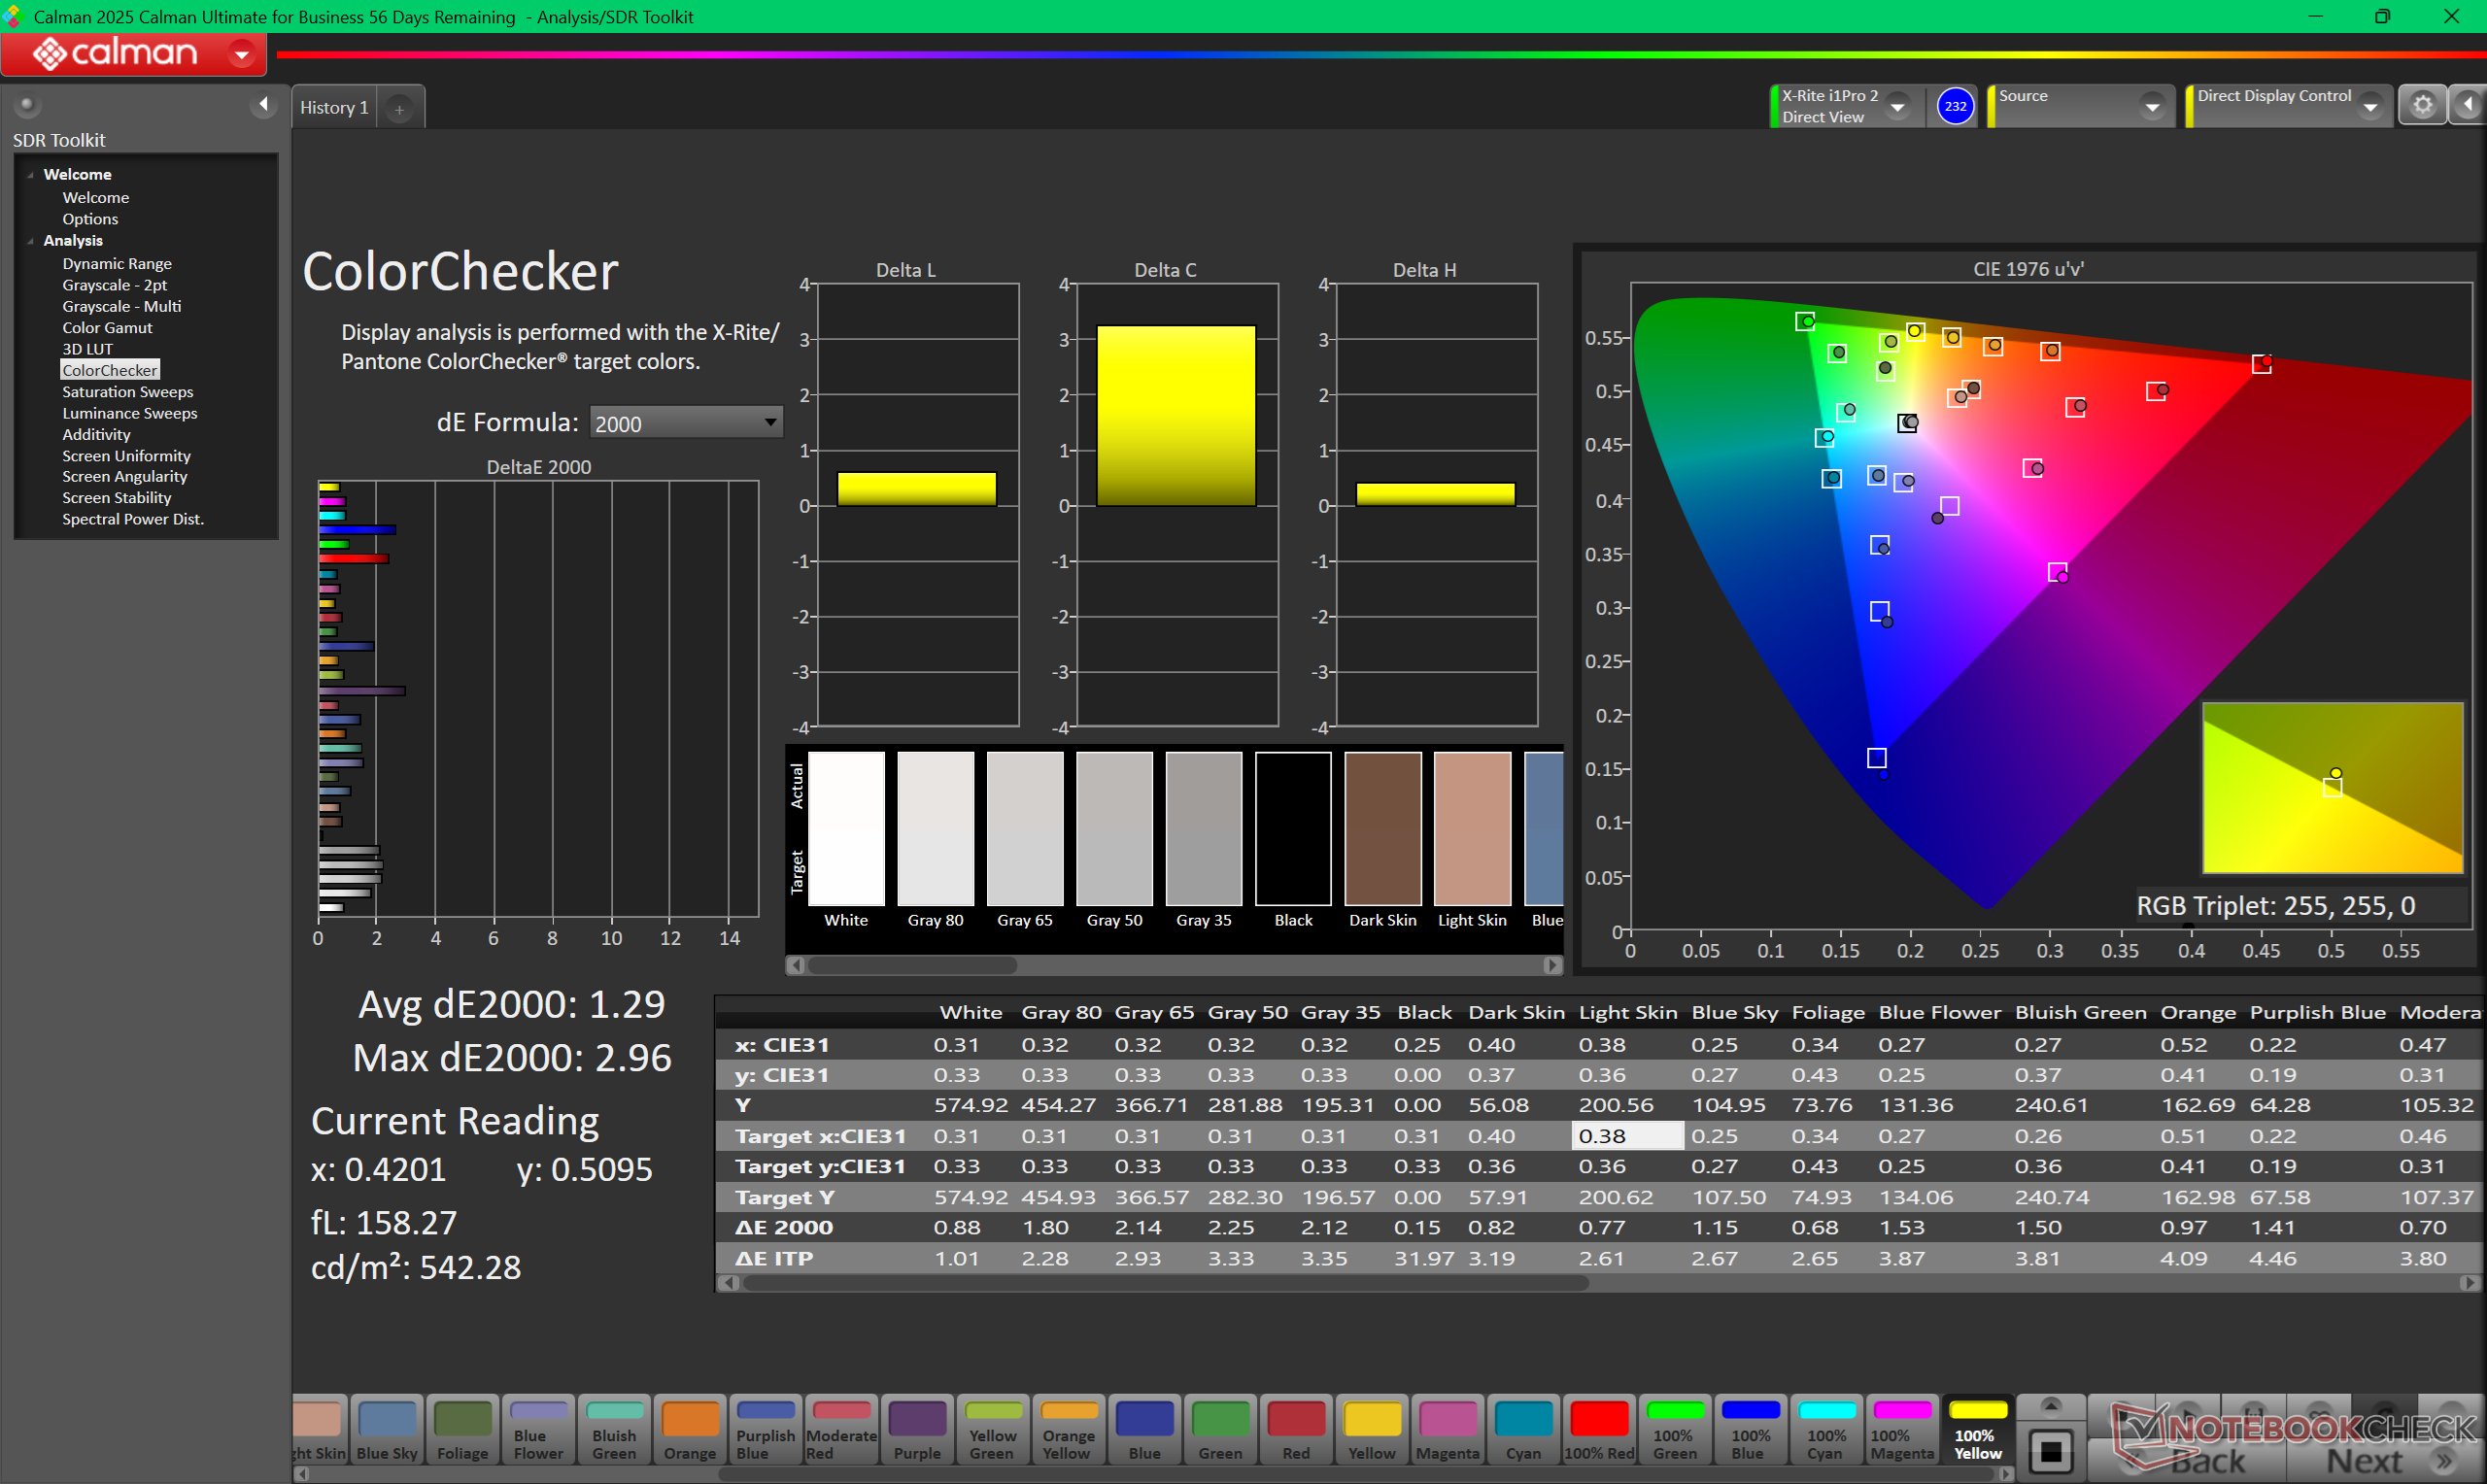
ΔE ColorChecker Calman: 1.29 | ∀{0.5-29.43 Ø4.78}
calibrated: 0.81
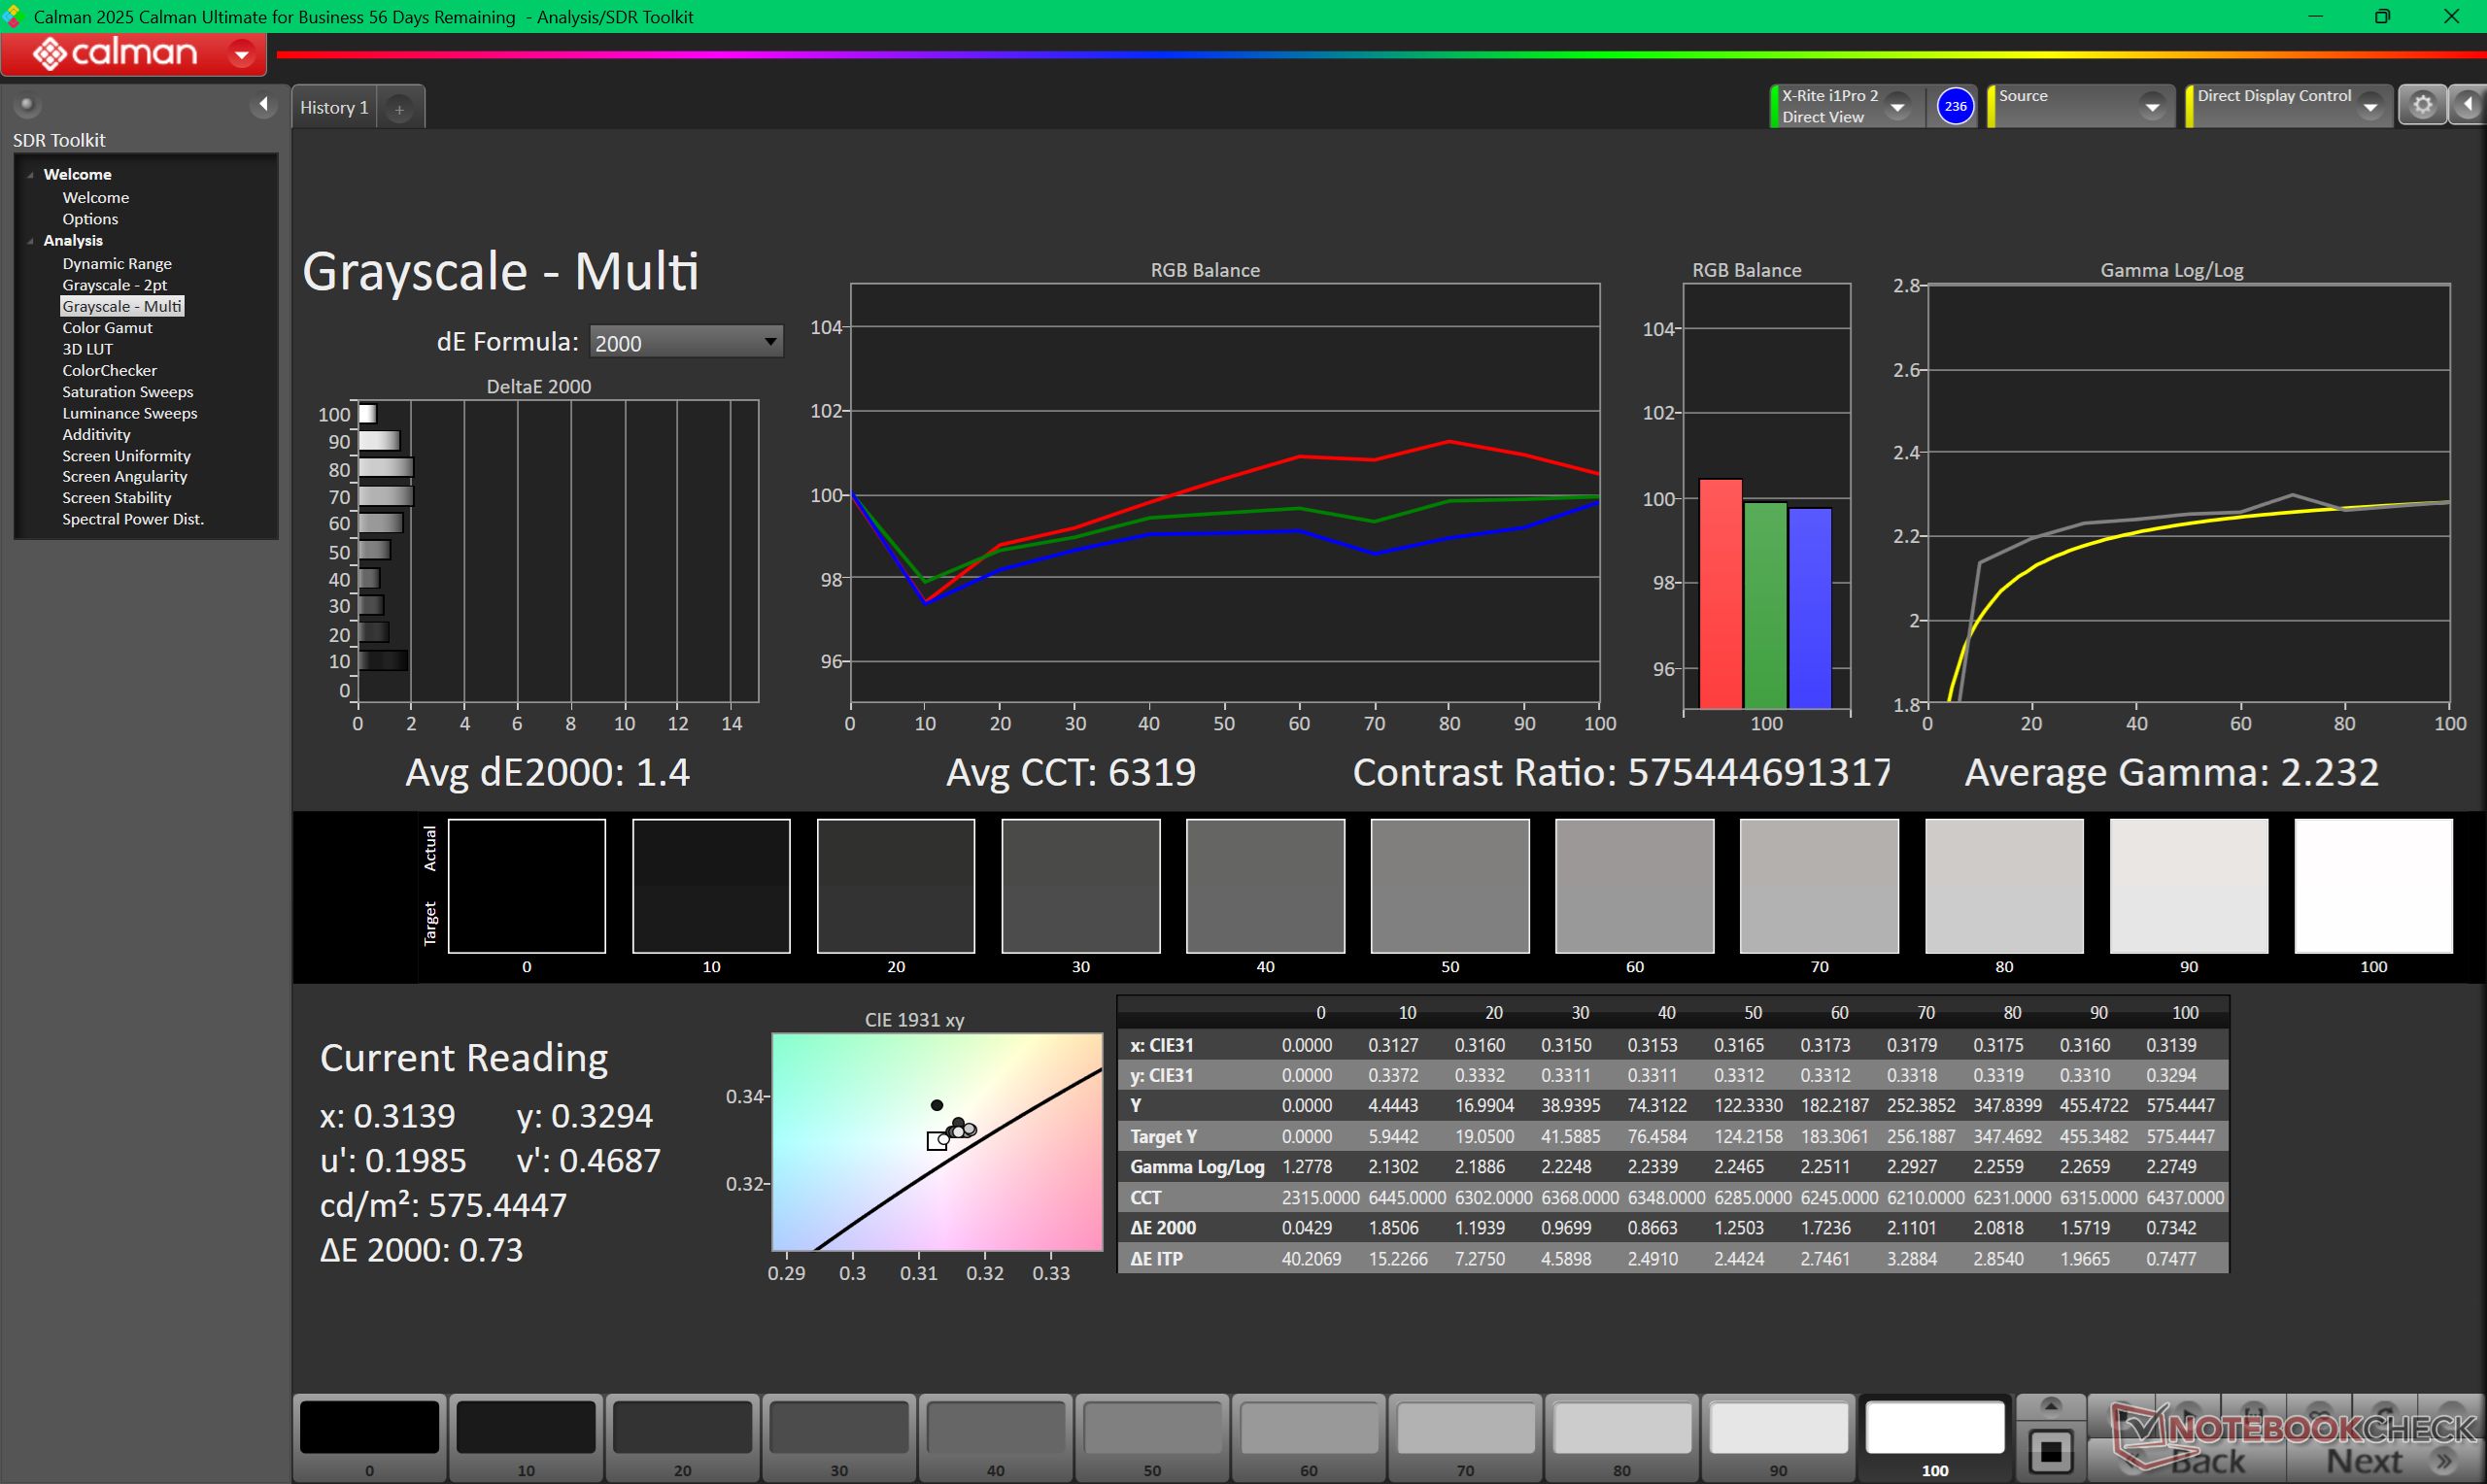
ΔE Greyscale Calman: 1.4 | ∀{0.09-98 Ø5}
97.5% AdobeRGB 1998 (Argyll 3D)
100% sRGB (Argyll 3D)
98.8% Display P3 (Argyll 3D)
Gamma: 2.23
CCT: 6319 K
| Lenovo ThinkPad P1 Gen 8 Samsung ATNA60KA02-0, Tandem OLED, 3200x2000, 16", 120 Hz | Lenovo ThinkPad P16s Gen 4 AMD N160JCA-GT1, , 1920x1200, 16", 60 Hz | Lenovo ThinkPad P1 Gen 7 21KV001SGE MNG007DA1-9 , IPS LED, 2560x1600, 16", 165 Hz | HP ZBook X G1i 16 LG Philips LGD07B3, IPS, 2560x1600, 16", 120 Hz | Dell Pro Max 16 Plus Samsung 160HC01, OLED, 3840x2400, 16", 120 Hz | Asus ExpertBook B6 Flip B6602FC2 AU Optronics Model: AUOE495, IPS, 2560x1600, 16", 120 Hz | |
|---|---|---|---|---|---|---|
| Display | -22% | -19% | 0% | -4% | -4% | |
| Display P3 Coverage (%) | 98.8 | 65.8 -33% | 69.4 -30% | 97.2 -2% | 97.3 -2% | 97.9 -1% |
| sRGB Coverage (%) | 100 | 96.8 -3% | 97.6 -2% | 100 0% | 100 0% | 99.89 0% |
| AdobeRGB 1998 Coverage (%) | 97.5 | 67.8 -30% | 71.8 -26% | 99.9 2% | 88.8 -9% | 85.52 -12% |
| Response Times | -1609% | -3839% | -30% | -4223% | ||
| Response Time Grey 50% / Grey 80% * (ms) | 0.57 ? | 11.2 ? -1865% | 45.5 ? -7882% | 0.63 ? -11% | 36 ? -6216% | |
| Response Time Black / White * (ms) | 0.73 ? | 10.6 ? -1352% | 26.1 ? -3475% | 0.89 ? -22% | 17 ? -2229% | |
| PWM Frequency (Hz) | 1199 | 26536 ? | 479.9 ? | |||
| PWM Amplitude * (%) | 18 | 47 -161% | 28 -56% | |||
| Screen | -72% | -106% | -84% | -20% | -68% | |
| Brightness middle (cd/m²) | 561.8 | 540 -4% | 516 -8% | 461.8 -18% | 530.9 -6% | 440 -22% |
| Brightness (cd/m²) | 566 | 516 -9% | 505 -11% | 427 -25% | 540 -5% | 418 -26% |
| Brightness Distribution (%) | 99 | 93 -6% | 89 -10% | 88 -11% | 95 -4% | 82 -17% |
| Black Level * (cd/m²) | 0.37 | 0.41 | 0.46 | 0.3 | ||
| Colorchecker dE 2000 * | 1.29 | 3.4 -164% | 3.5 -171% | 4.08 -216% | 2.42 -88% | 2.81 -118% |
| Colorchecker dE 2000 max. * | 2.96 | 5.6 -89% | 8.8 -197% | 8.1 -174% | 5.76 -95% | 4.62 -56% |
| Colorchecker dE 2000 calibrated * | 0.81 | 0.9 -11% | 1.2 -48% | 0.75 7% | 0.7 14% | 2.99 -269% |
| Greyscale dE 2000 * | 1.4 | 4.5 -221% | 5.6 -300% | 3.5 -150% | 0.8 43% | 0.91 35% |
| Gamma | 2.23 99% | 2.51 88% | 2.27 97% | 2.15 102% | 2.23 99% | 2.2 100% |
| CCT | 6319 103% | 6294 103% | 6071 107% | 6715 97% | 6488 100% | 6600 98% |
| Contrast (:1) | 1459 | 1259 | 1004 | 1467 | ||
| Media totale (Programma / Settaggio) | -47% /
-57% | -578% /
-335% | -1308% /
-931% | -18% /
-19% | -1432% /
-744% |
* ... Meglio usare valori piccoli

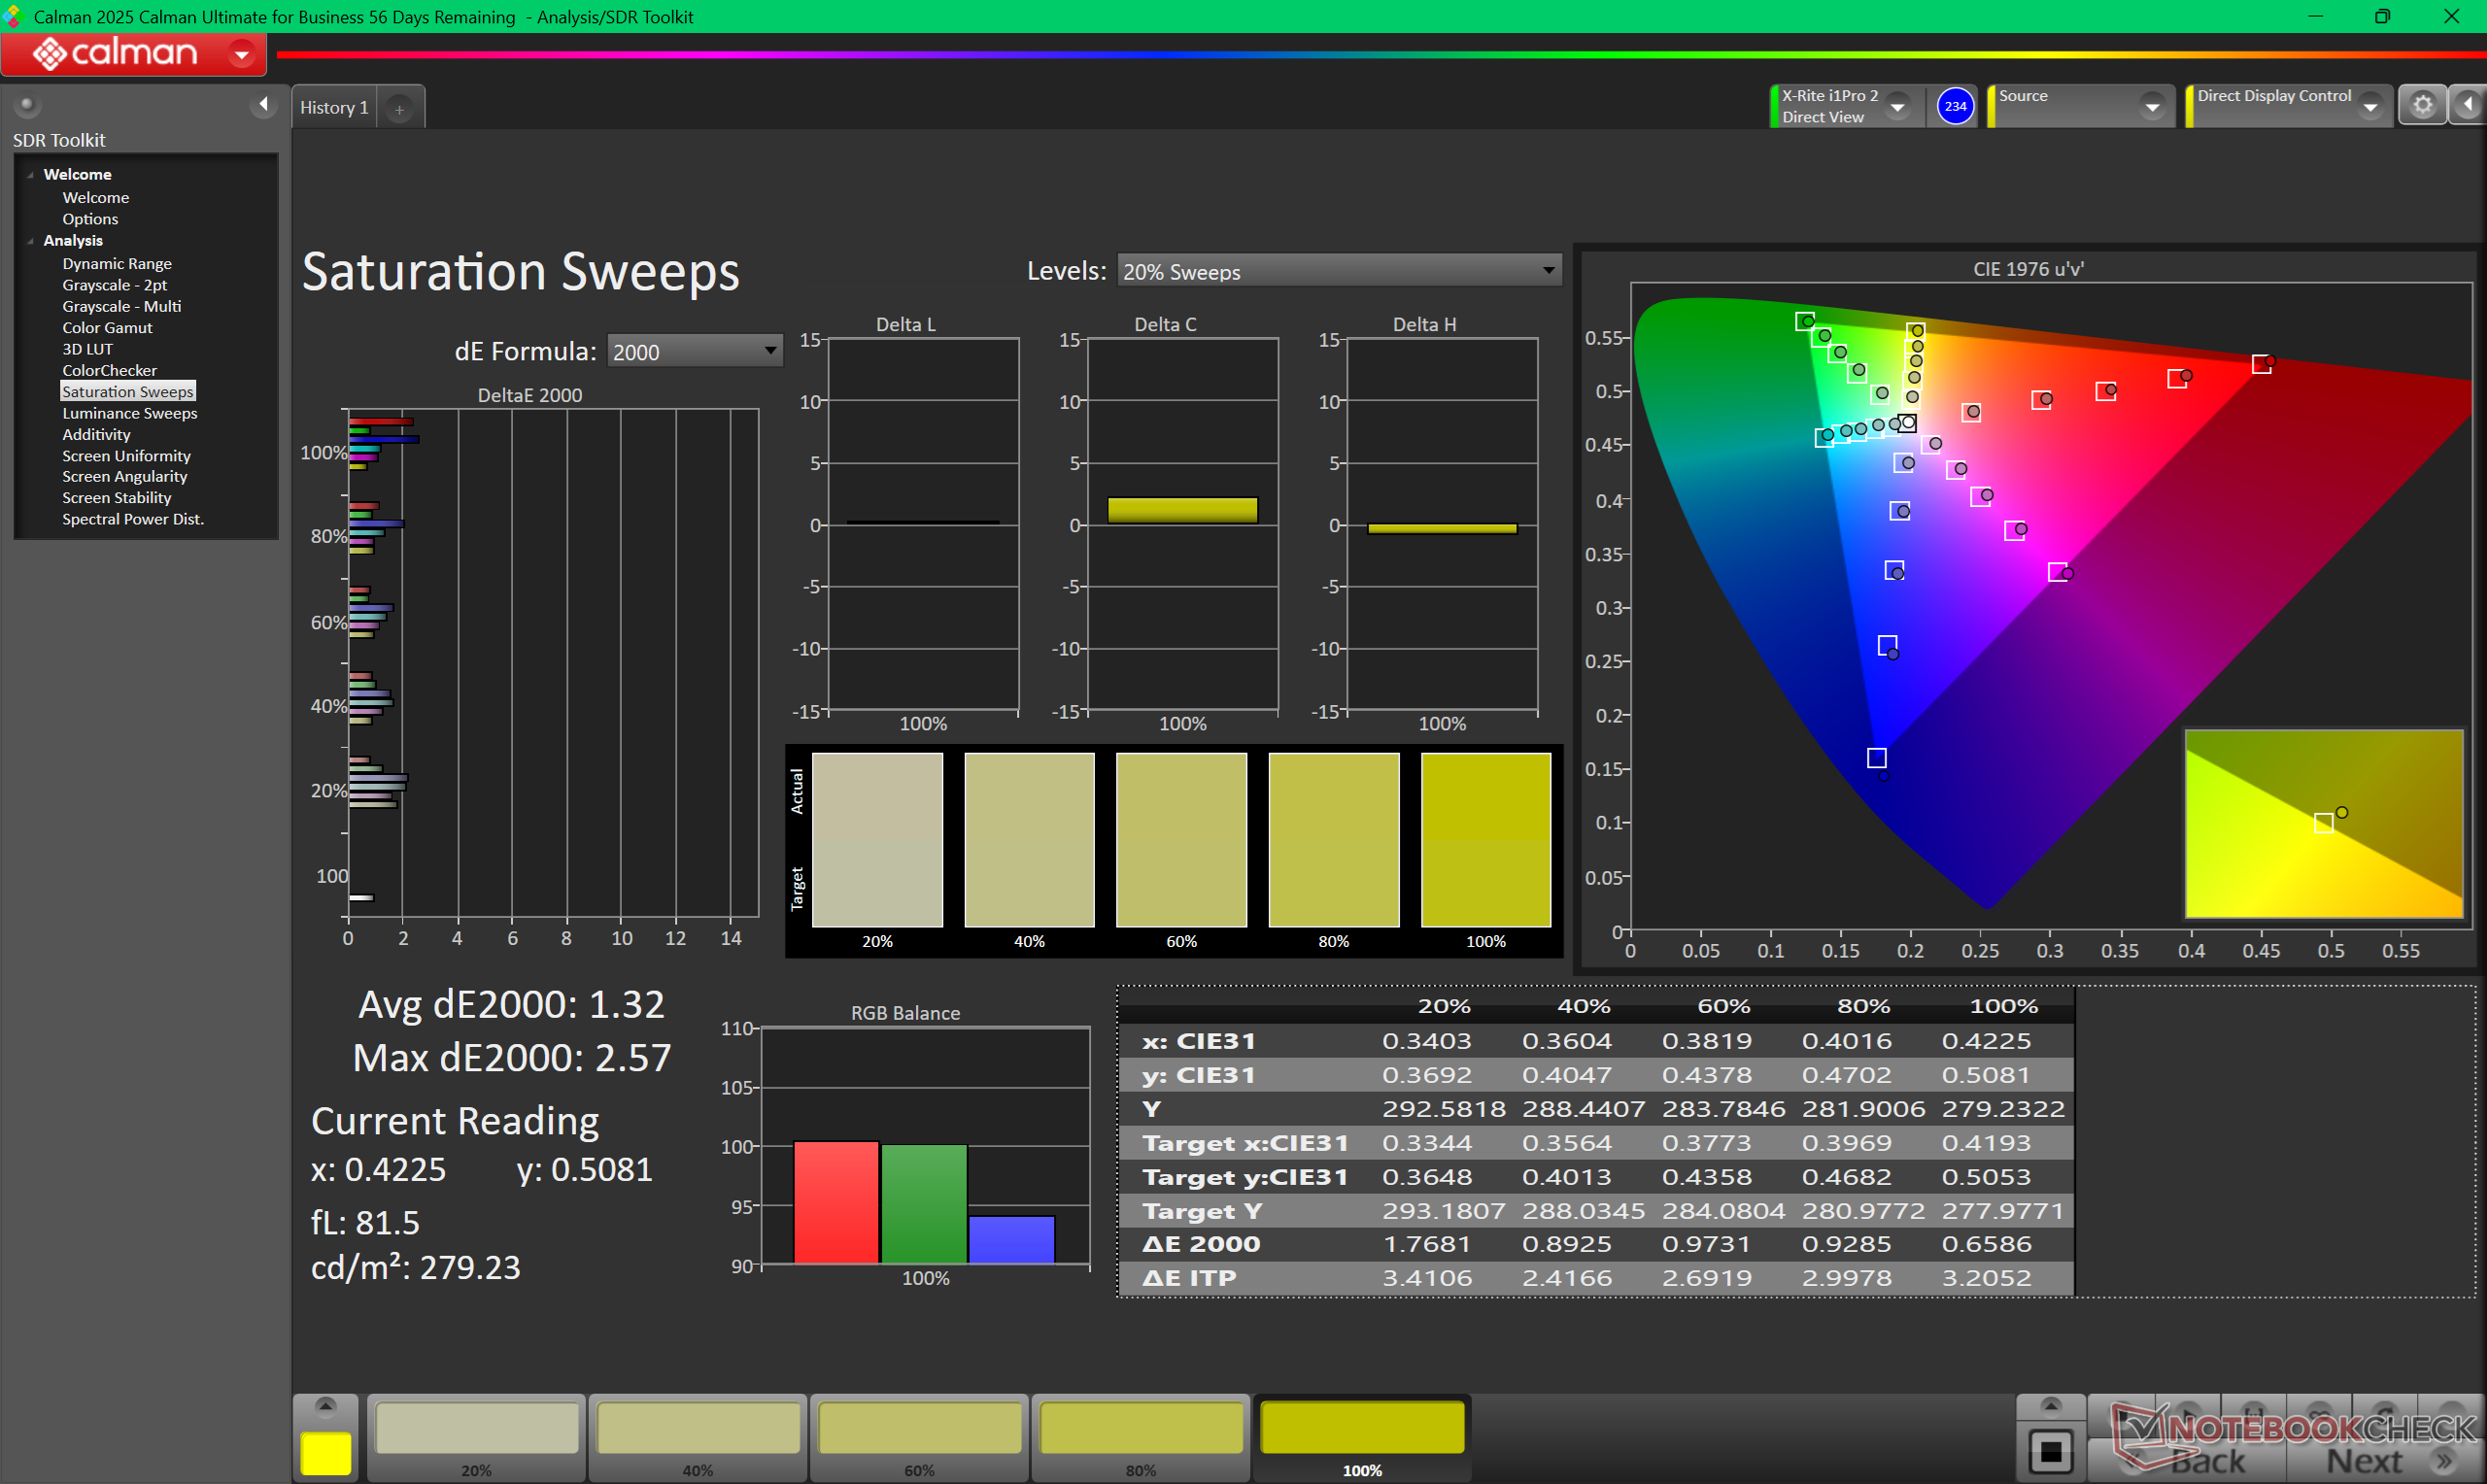
Il display viene fornito pre-calibrato e quindi i valori medi di deltaE sono già piuttosto bassi, come dimostrano i nostri risultati CalMAN qui sotto.
Tempi di risposta del Display
| ↔ Tempi di risposta dal Nero al Bianco | ||
|---|---|---|
| 0.73 ms ... aumenta ↗ e diminuisce ↘ combinato | ↗ 0.34 ms Incremento | 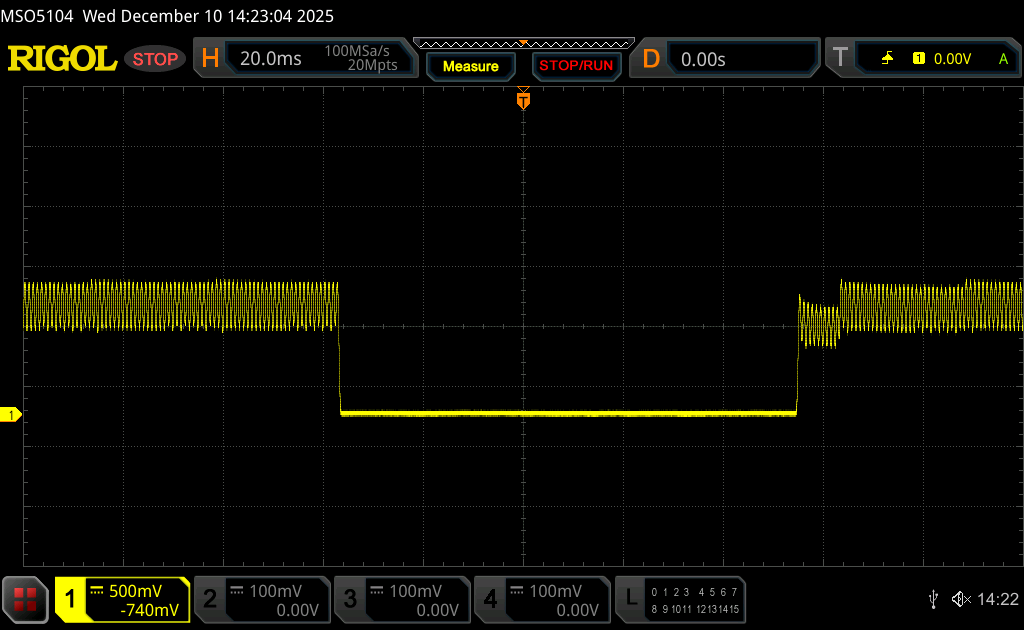 |
| ↘ 0.39 ms Calo | ||
| Lo schermo ha mostrato valori di risposta molto veloci nei nostri tests ed è molto adatto per i gaming veloce. In confronto, tutti i dispositivi di test variano da 0.1 (minimo) a 240 (massimo) ms. » 2 % di tutti i dispositivi è migliore. Questo significa che i tempi di risposta rilevati sono migliori rispettto alla media di tutti i dispositivi testati (20.2 ms). | ||
| ↔ Tempo di risposta dal 50% Grigio all'80% Grigio | ||
| 0.57 ms ... aumenta ↗ e diminuisce ↘ combinato | ↗ 0.29 ms Incremento | 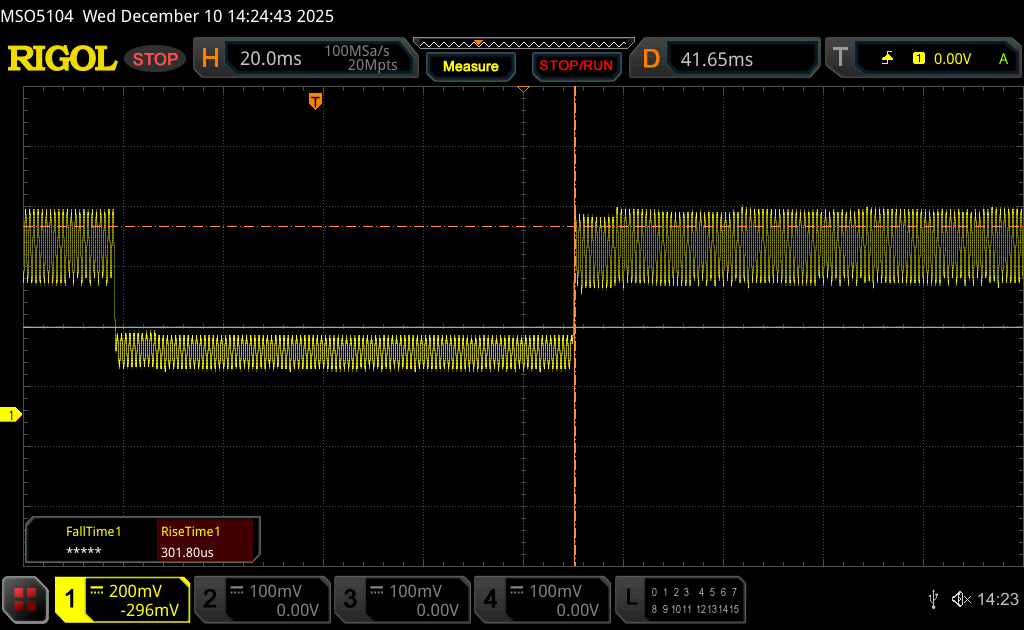 |
| ↘ 0.28 ms Calo | ||
| Lo schermo ha mostrato valori di risposta molto veloci nei nostri tests ed è molto adatto per i gaming veloce. In confronto, tutti i dispositivi di test variano da 0.165 (minimo) a 636 (massimo) ms. » 1 % di tutti i dispositivi è migliore. Questo significa che i tempi di risposta rilevati sono migliori rispettto alla media di tutti i dispositivi testati (31.6 ms). | ||
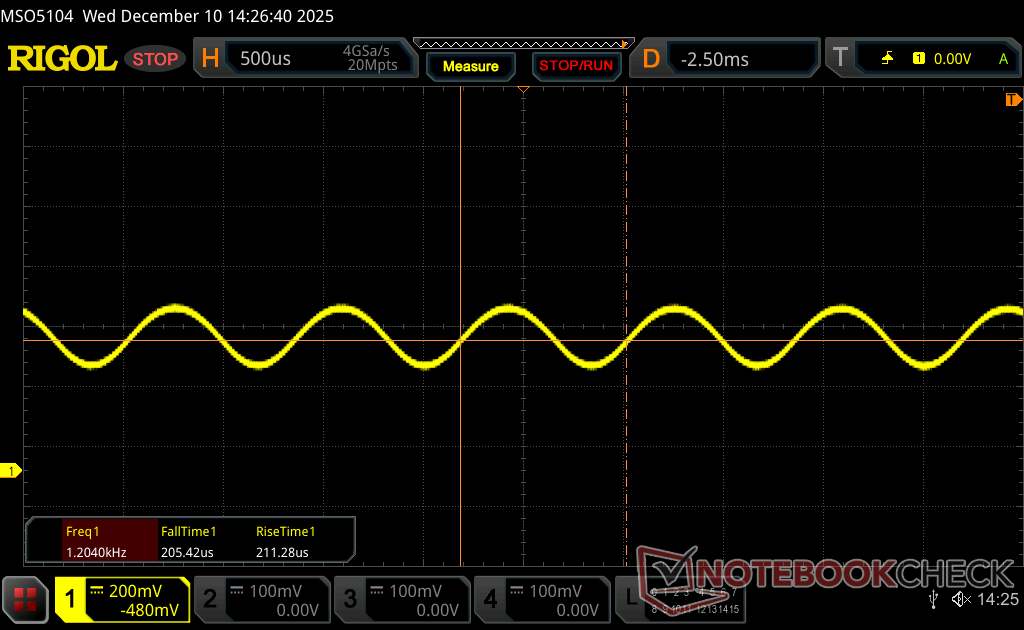
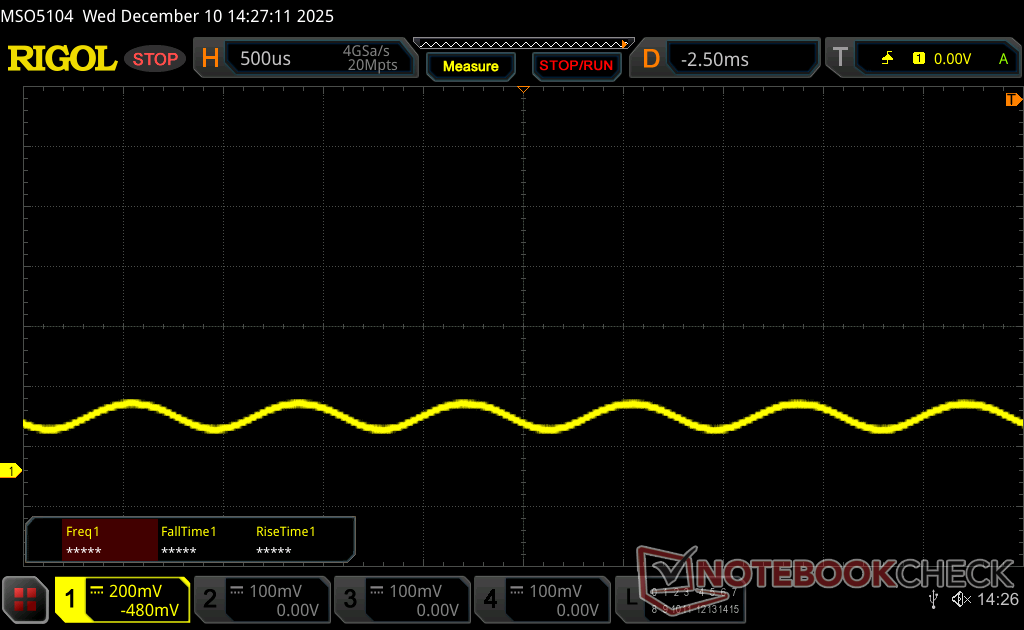
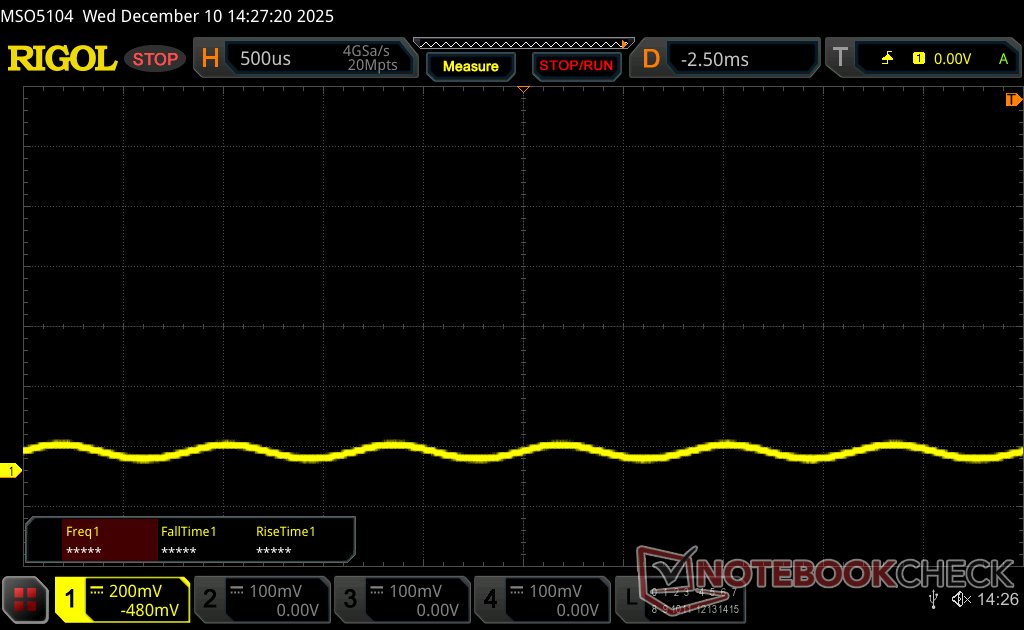
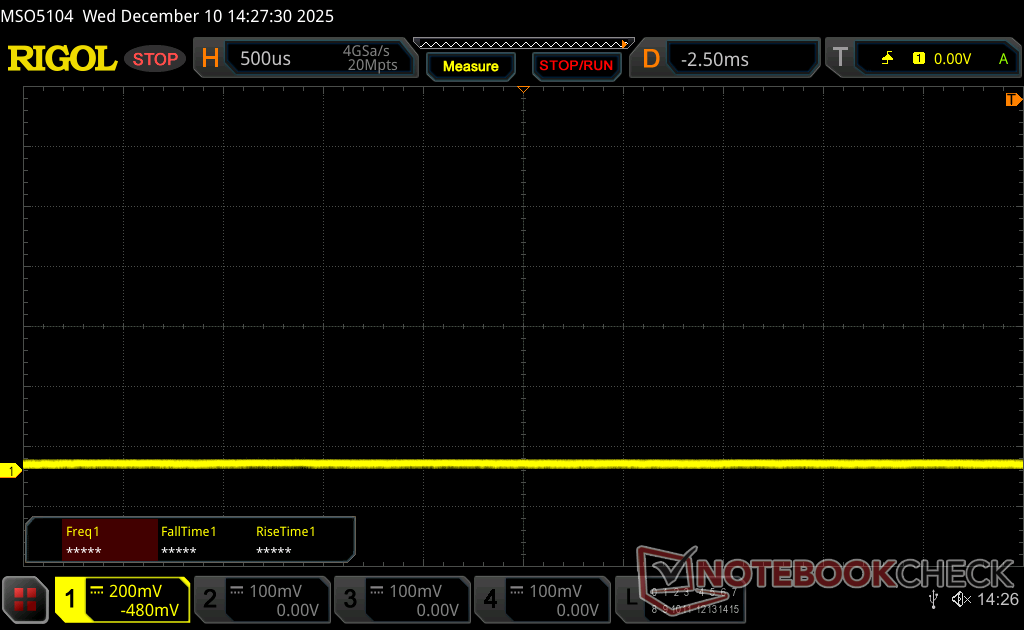
Sfarfallio dello schermo / PWM (Pulse-Width Modulation)
| flickering dello schermo / PWM rilevato | 1199 Hz Amplitude: 18 % | 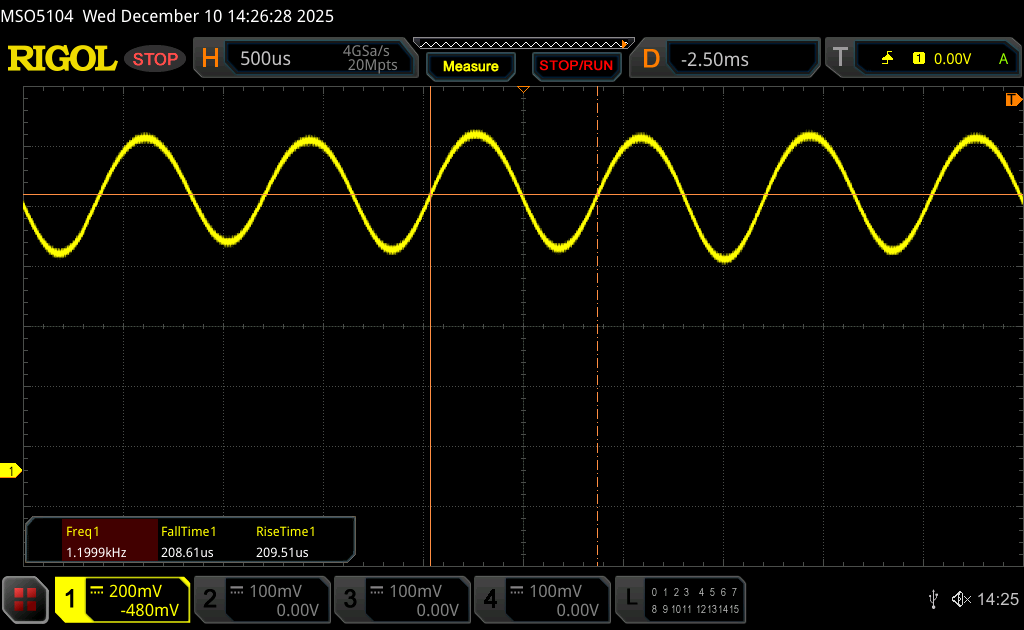 | |
Il display sfarfalla a 1199 Hz (Probabilmente a causa dell'uso di PWM) . La frequenza di 1199 Hz è abbastanza alta, quindi la maggioranza degli utenti sensibili al PWM non dovrebbero notare alcun flickering. In confronto: 53 % di tutti i dispositivi testati non utilizza PWM per ridurre la luminosita' del display. Se è rilevato PWM, una media di 8118 (minimo: 5 - massimo: 343500) Hz è stata rilevata. | |||

Prestazioni
Condizioni del test
Abbiamo impostato Windows e Nvidia sulla modalità Prestazioni prima di eseguire i benchmark qui sotto. Advanced Optimus e GPU ECC non sono supportati.
Processore
Il Core Ultra 7 255H offre prestazioni multi-thread più veloci del 15-20% rispetto al Core Ultra 7 155H del ThinkPad P1 Gen 7 dello scorso anno. L'aggiornamento al modello di fascia più alta Core Ultra 9 285H si prevede un ulteriore aumento delle prestazioni, anche se solo marginalmente, dal 5 al 10 percento rispetto al Core Ultra 7 255H.
La sostenibilità delle prestazioni è buona ma non perfetta; quando si esegue CineBench R15 xT in loop, il punteggio originale di 3388 punti si riduce di quasi il 13% dopo appena 4 o 5 cicli.
Cinebench R15 Multi Loop
Cinebench R23: Multi Core | Single Core
Cinebench R20: CPU (Multi Core) | CPU (Single Core)
Cinebench R15: CPU Multi 64Bit | CPU Single 64Bit
Blender: v2.79 BMW27 CPU
7-Zip 18.03: 7z b 4 | 7z b 4 -mmt1
Geekbench 6.5: Multi-Core | Single-Core
Geekbench 5.5: Multi-Core | Single-Core
HWBOT x265 Benchmark v2.2: 4k Preset
LibreOffice : 20 Documents To PDF
R Benchmark 2.5: Overall mean
| CPU Performance rating | |
| Dell Pro Max 16 Plus | |
| HP ZBook Fury 16 G11 | |
| HP ZBook X G1i 16 | |
| Lenovo ThinkPad P1 Gen 8 | |
| Media Intel Core Ultra 7 255H | |
| Lenovo ThinkPad P16s Gen 4 AMD | |
| Asus ExpertBook B6 Flip B6602FC2 -2! | |
| HP ZBook Studio 16 G11 | |
| Lenovo ThinkPad P1 Gen 7 21KV001SGE | |
| HP ZBook Power 16 G11 A | |
| HP ZBook Studio 16 G9 62U04EA -2! | |
| Lenovo ThinkPad P16s G2 21K9000CGE | |
| Lenovo ThinkPad P1 G4-20Y4Z9DVUS -2! | |
| Cinebench R23 / Multi Core | |
| Dell Pro Max 16 Plus | |
| HP ZBook Fury 16 G11 | |
| Lenovo ThinkPad P1 Gen 8 | |
| HP ZBook X G1i 16 | |
| Asus ExpertBook B6 Flip B6602FC2 | |
| Lenovo ThinkPad P1 Gen 7 21KV001SGE | |
| Lenovo ThinkPad P16s Gen 4 AMD | |
| Media Intel Core Ultra 7 255H (16105 - 22578, n=17) | |
| HP ZBook Studio 16 G11 | |
| HP ZBook Studio 16 G9 62U04EA | |
| HP ZBook Power 16 G11 A | |
| Lenovo ThinkPad P16s G2 21K9000CGE | |
| Lenovo ThinkPad P1 G4-20Y4Z9DVUS | |
| Cinebench R23 / Single Core | |
| HP ZBook Fury 16 G11 | |
| Media Intel Core Ultra 7 255H (1874 - 2152, n=17) | |
| Dell Pro Max 16 Plus | |
| HP ZBook X G1i 16 | |
| Lenovo ThinkPad P1 Gen 8 | |
| Lenovo ThinkPad P16s Gen 4 AMD | |
| Asus ExpertBook B6 Flip B6602FC2 | |
| HP ZBook Studio 16 G9 62U04EA | |
| Lenovo ThinkPad P1 Gen 7 21KV001SGE | |
| HP ZBook Studio 16 G11 | |
| HP ZBook Power 16 G11 A | |
| Lenovo ThinkPad P16s G2 21K9000CGE | |
| Lenovo ThinkPad P1 G4-20Y4Z9DVUS | |
| Cinebench R20 / CPU (Multi Core) | |
| Dell Pro Max 16 Plus | |
| HP ZBook Fury 16 G11 | |
| Lenovo ThinkPad P1 Gen 8 | |
| HP ZBook X G1i 16 | |
| Asus ExpertBook B6 Flip B6602FC2 | |
| Lenovo ThinkPad P1 Gen 7 21KV001SGE | |
| Media Intel Core Ultra 7 255H (6356 - 8860, n=16) | |
| Lenovo ThinkPad P16s Gen 4 AMD | |
| HP ZBook Studio 16 G11 | |
| HP ZBook Studio 16 G9 62U04EA | |
| HP ZBook Power 16 G11 A | |
| Lenovo ThinkPad P16s G2 21K9000CGE | |
| Lenovo ThinkPad P1 G4-20Y4Z9DVUS | |
| Cinebench R20 / CPU (Single Core) | |
| HP ZBook Fury 16 G11 | |
| Dell Pro Max 16 Plus | |
| Lenovo ThinkPad P16s Gen 4 AMD | |
| Media Intel Core Ultra 7 255H (748 - 826, n=16) | |
| HP ZBook X G1i 16 | |
| Lenovo ThinkPad P1 Gen 8 | |
| Asus ExpertBook B6 Flip B6602FC2 | |
| HP ZBook Studio 16 G9 62U04EA | |
| HP ZBook Studio 16 G11 | |
| Lenovo ThinkPad P1 Gen 7 21KV001SGE | |
| HP ZBook Power 16 G11 A | |
| Lenovo ThinkPad P16s G2 21K9000CGE | |
| Lenovo ThinkPad P1 G4-20Y4Z9DVUS | |
| Cinebench R15 / CPU Multi 64Bit | |
| Dell Pro Max 16 Plus | |
| HP ZBook Fury 16 G11 | |
| Asus ExpertBook B6 Flip B6602FC2 | |
| HP ZBook X G1i 16 | |
| Lenovo ThinkPad P1 Gen 8 | |
| Lenovo ThinkPad P16s Gen 4 AMD | |
| Lenovo ThinkPad P1 Gen 7 21KV001SGE | |
| HP ZBook Studio 16 G11 | |
| Media Intel Core Ultra 7 255H (2414 - 3444, n=16) | |
| HP ZBook Power 16 G11 A | |
| HP ZBook Studio 16 G9 62U04EA | |
| Lenovo ThinkPad P16s G2 21K9000CGE | |
| Lenovo ThinkPad P1 G4-20Y4Z9DVUS | |
| Cinebench R15 / CPU Single 64Bit | |
| Lenovo ThinkPad P16s Gen 4 AMD | |
| Dell Pro Max 16 Plus | |
| HP ZBook X G1i 16 | |
| Media Intel Core Ultra 7 255H (258 - 322, n=17) | |
| Lenovo ThinkPad P1 Gen 8 | |
| HP ZBook Fury 16 G11 | |
| HP ZBook Power 16 G11 A | |
| Asus ExpertBook B6 Flip B6602FC2 | |
| HP ZBook Studio 16 G9 62U04EA | |
| Lenovo ThinkPad P1 Gen 7 21KV001SGE | |
| Lenovo ThinkPad P16s G2 21K9000CGE | |
| HP ZBook Studio 16 G11 | |
| Lenovo ThinkPad P1 G4-20Y4Z9DVUS | |
| Blender / v2.79 BMW27 CPU | |
| Lenovo ThinkPad P1 G4-20Y4Z9DVUS | |
| Lenovo ThinkPad P16s G2 21K9000CGE | |
| Media Intel Core Ultra 7 255H (157 - 293, n=16) | |
| HP ZBook Power 16 G11 A | |
| HP ZBook Studio 16 G9 62U04EA | |
| Asus ExpertBook B6 Flip B6602FC2 | |
| HP ZBook Studio 16 G11 | |
| Lenovo ThinkPad P1 Gen 7 21KV001SGE | |
| Lenovo ThinkPad P16s Gen 4 AMD | |
| Lenovo ThinkPad P1 Gen 8 | |
| HP ZBook X G1i 16 | |
| HP ZBook Fury 16 G11 | |
| Dell Pro Max 16 Plus | |
| 7-Zip 18.03 / 7z b 4 | |
| Dell Pro Max 16 Plus | |
| HP ZBook Fury 16 G11 | |
| HP ZBook Studio 16 G11 | |
| Lenovo ThinkPad P16s Gen 4 AMD | |
| Asus ExpertBook B6 Flip B6602FC2 | |
| Lenovo ThinkPad P1 Gen 7 21KV001SGE | |
| HP ZBook Studio 16 G9 62U04EA | |
| HP ZBook X G1i 16 | |
| HP ZBook Power 16 G11 A | |
| Lenovo ThinkPad P1 Gen 8 | |
| Lenovo ThinkPad P16s G2 21K9000CGE | |
| Media Intel Core Ultra 7 255H (42155 - 68652, n=17) | |
| Lenovo ThinkPad P1 G4-20Y4Z9DVUS | |
| 7-Zip 18.03 / 7z b 4 -mmt1 | |
| HP ZBook Fury 16 G11 | |
| Dell Pro Max 16 Plus | |
| HP ZBook Power 16 G11 A | |
| Lenovo ThinkPad P16s Gen 4 AMD | |
| Asus ExpertBook B6 Flip B6602FC2 | |
| HP ZBook X G1i 16 | |
| HP ZBook Studio 16 G9 62U04EA | |
| Lenovo ThinkPad P16s G2 21K9000CGE | |
| Media Intel Core Ultra 7 255H (4589 - 6385, n=17) | |
| Lenovo ThinkPad P1 G4-20Y4Z9DVUS | |
| Lenovo ThinkPad P1 Gen 7 21KV001SGE | |
| HP ZBook Studio 16 G11 | |
| Lenovo ThinkPad P1 Gen 8 | |
| Geekbench 6.5 / Multi-Core | |
| Dell Pro Max 16 Plus | |
| HP ZBook X G1i 16 | |
| Lenovo ThinkPad P1 Gen 8 | |
| HP ZBook Fury 16 G11 | |
| Media Intel Core Ultra 7 255H (11979 - 17489, n=17) | |
| Lenovo ThinkPad P16s Gen 4 AMD | |
| HP ZBook Studio 16 G11 | |
| Lenovo ThinkPad P1 Gen 7 21KV001SGE | |
| HP ZBook Power 16 G11 A | |
| Lenovo ThinkPad P16s G2 21K9000CGE | |
| Geekbench 6.5 / Single-Core | |
| Lenovo ThinkPad P16s Gen 4 AMD | |
| HP ZBook Fury 16 G11 | |
| HP ZBook X G1i 16 | |
| Dell Pro Max 16 Plus | |
| Media Intel Core Ultra 7 255H (2712 - 2925, n=17) | |
| Lenovo ThinkPad P1 Gen 8 | |
| HP ZBook Power 16 G11 A | |
| HP ZBook Studio 16 G11 | |
| Lenovo ThinkPad P16s G2 21K9000CGE | |
| Lenovo ThinkPad P1 Gen 7 21KV001SGE | |
| Geekbench 5.5 / Multi-Core | |
| Dell Pro Max 16 Plus | |
| HP ZBook Fury 16 G11 | |
| Lenovo ThinkPad P1 Gen 8 | |
| HP ZBook X G1i 16 | |
| Asus ExpertBook B6 Flip B6602FC2 | |
| Lenovo ThinkPad P16s Gen 4 AMD | |
| Media Intel Core Ultra 7 255H (11348 - 17218, n=16) | |
| HP ZBook Studio 16 G11 | |
| Lenovo ThinkPad P1 Gen 7 21KV001SGE | |
| HP ZBook Studio 16 G9 62U04EA | |
| HP ZBook Power 16 G11 A | |
| Lenovo ThinkPad P16s G2 21K9000CGE | |
| Lenovo ThinkPad P1 G4-20Y4Z9DVUS | |
| Geekbench 5.5 / Single-Core | |
| Lenovo ThinkPad P16s Gen 4 AMD | |
| Dell Pro Max 16 Plus | |
| HP ZBook X G1i 16 | |
| Media Intel Core Ultra 7 255H (1938 - 2121, n=16) | |
| HP ZBook Fury 16 G11 | |
| Lenovo ThinkPad P1 Gen 8 | |
| HP ZBook Power 16 G11 A | |
| Asus ExpertBook B6 Flip B6602FC2 | |
| HP ZBook Studio 16 G11 | |
| HP ZBook Studio 16 G9 62U04EA | |
| Lenovo ThinkPad P1 Gen 7 21KV001SGE | |
| Lenovo ThinkPad P16s G2 21K9000CGE | |
| Lenovo ThinkPad P1 G4-20Y4Z9DVUS | |
| HWBOT x265 Benchmark v2.2 / 4k Preset | |
| Dell Pro Max 16 Plus | |
| HP ZBook Fury 16 G11 | |
| Lenovo ThinkPad P1 Gen 8 | |
| HP ZBook X G1i 16 | |
| Lenovo ThinkPad P16s Gen 4 AMD | |
| Asus ExpertBook B6 Flip B6602FC2 | |
| Lenovo ThinkPad P1 Gen 7 21KV001SGE | |
| Media Intel Core Ultra 7 255H (13.7 - 26.5, n=16) | |
| HP ZBook Studio 16 G11 | |
| HP ZBook Power 16 G11 A | |
| HP ZBook Studio 16 G9 62U04EA | |
| Lenovo ThinkPad P16s G2 21K9000CGE | |
| Lenovo ThinkPad P1 G4-20Y4Z9DVUS | |
| LibreOffice / 20 Documents To PDF | |
| Lenovo ThinkPad P16s Gen 4 AMD | |
| Lenovo ThinkPad P16s G2 21K9000CGE | |
| HP ZBook Power 16 G11 A | |
| Lenovo ThinkPad P1 G4-20Y4Z9DVUS | |
| Media Intel Core Ultra 7 255H (41.2 - 61.6, n=16) | |
| HP ZBook Fury 16 G11 | |
| HP ZBook Studio 16 G11 | |
| Lenovo ThinkPad P1 Gen 7 21KV001SGE | |
| HP ZBook Studio 16 G9 62U04EA | |
| Dell Pro Max 16 Plus | |
| Asus ExpertBook B6 Flip B6602FC2 | |
| HP ZBook X G1i 16 | |
| Lenovo ThinkPad P1 Gen 8 | |
| R Benchmark 2.5 / Overall mean | |
| Lenovo ThinkPad P16s Gen 4 AMD | |
| Lenovo ThinkPad P1 G4-20Y4Z9DVUS | |
| Lenovo ThinkPad P16s G2 21K9000CGE | |
| Lenovo ThinkPad P1 Gen 7 21KV001SGE | |
| HP ZBook Studio 16 G11 | |
| Asus ExpertBook B6 Flip B6602FC2 | |
| Media Intel Core Ultra 7 255H (0.4233 - 0.515, n=16) | |
| HP ZBook Power 16 G11 A | |
| HP ZBook Studio 16 G9 62U04EA | |
| Lenovo ThinkPad P1 Gen 8 | |
| Dell Pro Max 16 Plus | |
| HP ZBook X G1i 16 | |
| HP ZBook Fury 16 G11 | |
Cinebench R23: Multi Core | Single Core
Cinebench R20: CPU (Multi Core) | CPU (Single Core)
Cinebench R15: CPU Multi 64Bit | CPU Single 64Bit
Blender: v2.79 BMW27 CPU
7-Zip 18.03: 7z b 4 | 7z b 4 -mmt1
Geekbench 6.5: Multi-Core | Single-Core
Geekbench 5.5: Multi-Core | Single-Core
HWBOT x265 Benchmark v2.2: 4k Preset
LibreOffice : 20 Documents To PDF
R Benchmark 2.5: Overall mean
* ... Meglio usare valori piccoli
AIDA64: FP32 Ray-Trace | FPU Julia | CPU SHA3 | CPU Queen | FPU SinJulia | FPU Mandel | CPU AES | CPU ZLib | FP64 Ray-Trace | CPU PhotoWorxx
| Performance rating | |
| Dell Pro Max 16 Plus | |
| Lenovo ThinkPad P16s Gen 4 AMD | |
| Lenovo ThinkPad P1 Gen 8 | |
| Lenovo ThinkPad P1 Gen 7 21KV001SGE | |
| Media Intel Core Ultra 7 255H | |
| Asus ExpertBook B6 Flip B6602FC2 | |
| AIDA64 / FP32 Ray-Trace | |
| Dell Pro Max 16 Plus | |
| Lenovo ThinkPad P16s Gen 4 AMD | |
| Lenovo ThinkPad P1 Gen 8 | |
| Media Intel Core Ultra 7 255H (13863 - 24741, n=14) | |
| Lenovo ThinkPad P1 Gen 7 21KV001SGE | |
| Asus ExpertBook B6 Flip B6602FC2 | |
| AIDA64 / FPU Julia | |
| Dell Pro Max 16 Plus | |
| Lenovo ThinkPad P1 Gen 8 | |
| Lenovo ThinkPad P16s Gen 4 AMD | |
| Media Intel Core Ultra 7 255H (71030 - 119222, n=14) | |
| Lenovo ThinkPad P1 Gen 7 21KV001SGE | |
| Asus ExpertBook B6 Flip B6602FC2 | |
| AIDA64 / CPU SHA3 | |
| Dell Pro Max 16 Plus | |
| Lenovo ThinkPad P1 Gen 8 | |
| Lenovo ThinkPad P16s Gen 4 AMD | |
| Media Intel Core Ultra 7 255H (3408 - 5548, n=14) | |
| Lenovo ThinkPad P1 Gen 7 21KV001SGE | |
| Asus ExpertBook B6 Flip B6602FC2 | |
| AIDA64 / CPU Queen | |
| Dell Pro Max 16 Plus | |
| Asus ExpertBook B6 Flip B6602FC2 | |
| Lenovo ThinkPad P16s Gen 4 AMD | |
| Lenovo ThinkPad P1 Gen 7 21KV001SGE | |
| Lenovo ThinkPad P1 Gen 8 | |
| Media Intel Core Ultra 7 255H (59098 - 68460, n=14) | |
| AIDA64 / FPU SinJulia | |
| Lenovo ThinkPad P16s Gen 4 AMD | |
| Dell Pro Max 16 Plus | |
| Asus ExpertBook B6 Flip B6602FC2 | |
| Lenovo ThinkPad P1 Gen 7 21KV001SGE | |
| Lenovo ThinkPad P1 Gen 8 | |
| Media Intel Core Ultra 7 255H (6716 - 8971, n=14) | |
| AIDA64 / FPU Mandel | |
| Dell Pro Max 16 Plus | |
| Lenovo ThinkPad P1 Gen 8 | |
| Lenovo ThinkPad P16s Gen 4 AMD | |
| Media Intel Core Ultra 7 255H (37031 - 63347, n=14) | |
| Lenovo ThinkPad P1 Gen 7 21KV001SGE | |
| Asus ExpertBook B6 Flip B6602FC2 | |
| AIDA64 / CPU AES | |
| Dell Pro Max 16 Plus | |
| Lenovo ThinkPad P16s Gen 4 AMD | |
| Lenovo ThinkPad P1 Gen 7 21KV001SGE | |
| Lenovo ThinkPad P1 Gen 8 | |
| Asus ExpertBook B6 Flip B6602FC2 | |
| Media Intel Core Ultra 7 255H (58402 - 83568, n=14) | |
| AIDA64 / CPU ZLib | |
| Dell Pro Max 16 Plus | |
| Lenovo ThinkPad P1 Gen 8 | |
| Lenovo ThinkPad P16s Gen 4 AMD | |
| Lenovo ThinkPad P1 Gen 7 21KV001SGE | |
| Media Intel Core Ultra 7 255H (822 - 1316, n=14) | |
| Asus ExpertBook B6 Flip B6602FC2 | |
| AIDA64 / FP64 Ray-Trace | |
| Dell Pro Max 16 Plus | |
| Lenovo ThinkPad P16s Gen 4 AMD | |
| Lenovo ThinkPad P1 Gen 8 | |
| Media Intel Core Ultra 7 255H (7384 - 13231, n=14) | |
| Lenovo ThinkPad P1 Gen 7 21KV001SGE | |
| Asus ExpertBook B6 Flip B6602FC2 | |
| AIDA64 / CPU PhotoWorxx | |
| Dell Pro Max 16 Plus | |
| Lenovo ThinkPad P1 Gen 8 | |
| Media Intel Core Ultra 7 255H (23836 - 65787, n=14) | |
| Lenovo ThinkPad P16s Gen 4 AMD | |
| Lenovo ThinkPad P1 Gen 7 21KV001SGE | |
| Asus ExpertBook B6 Flip B6602FC2 | |
Prestazioni del sistema
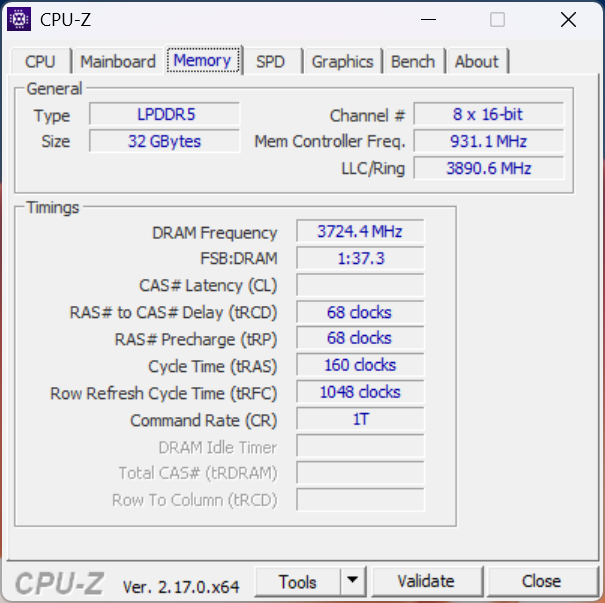
I punteggi del benchmark AIDA64 sulla RAM sono notevolmente buoni per un portatile con 32 GB di memoria rimovibile. Il modello è dotato di serie di LPDDR5x-7467 LPCAMM2, progettato per superare molte delle limitazioni delle SODIMM.
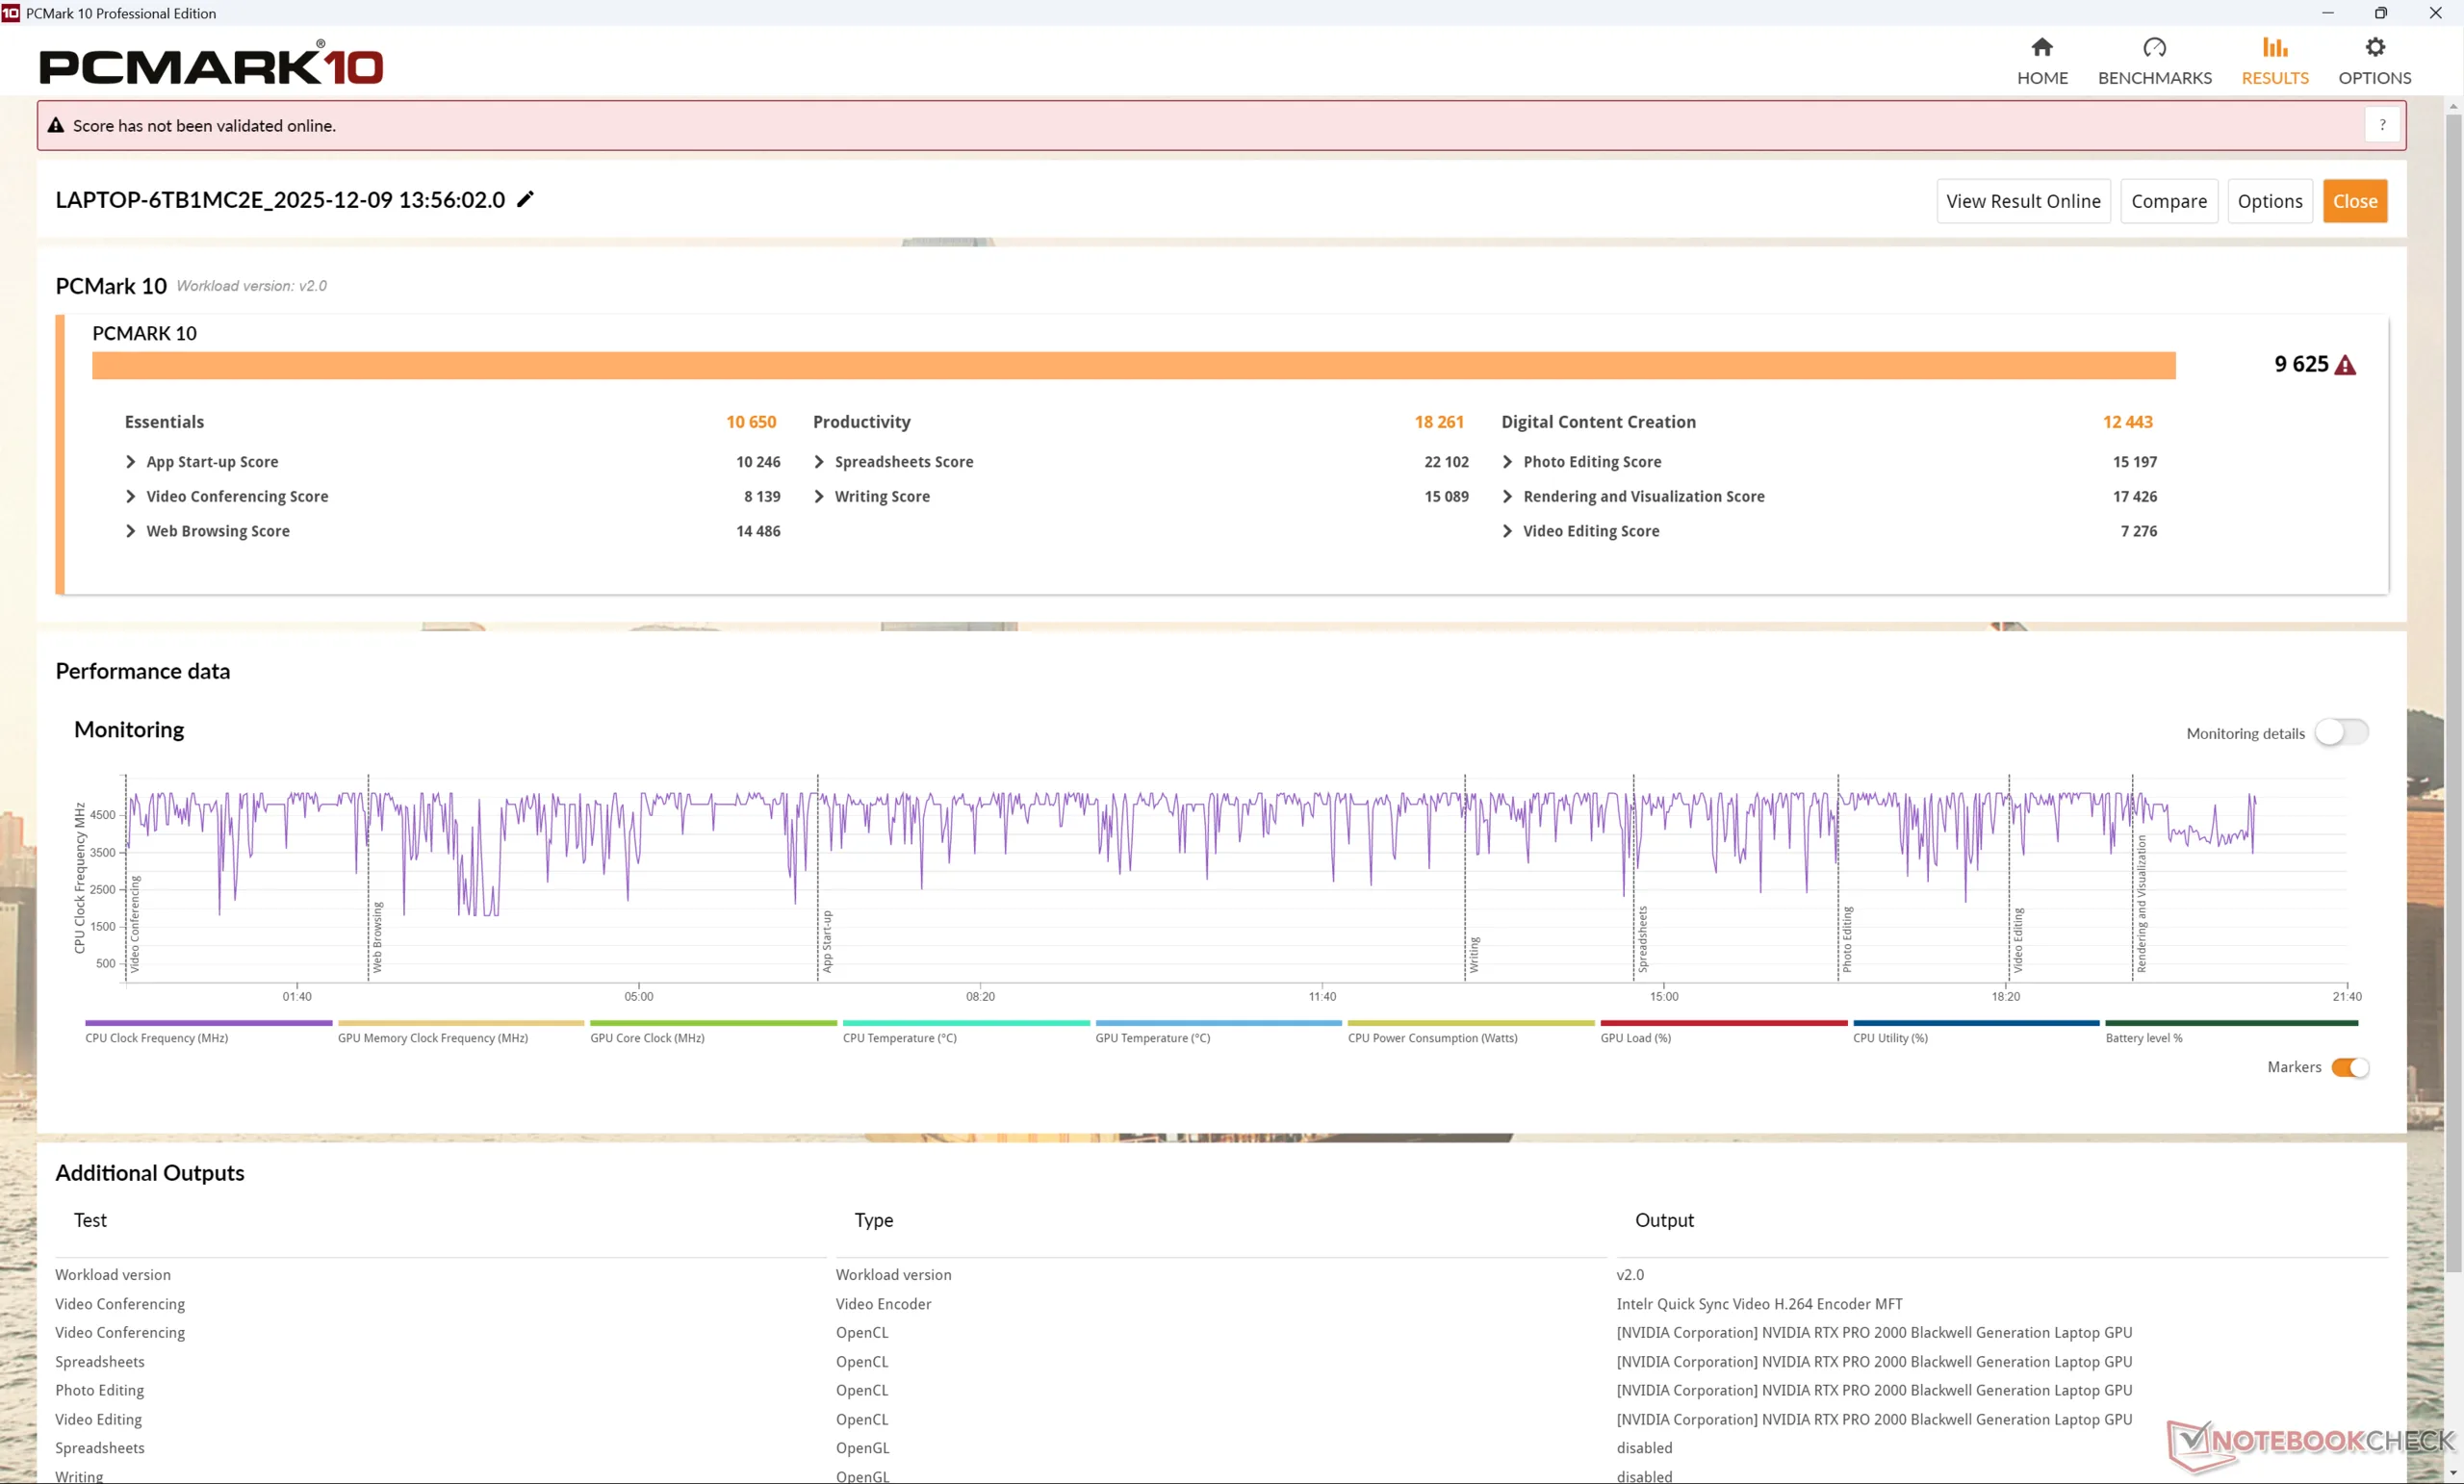
PCMark 10: Score | Essentials | Productivity | Digital Content Creation
CrossMark: Overall | Productivity | Creativity | Responsiveness
WebXPRT 3: Overall
WebXPRT 4: Overall
Mozilla Kraken 1.1: Total
| Performance rating | |
| Dell Pro Max 16 Plus -4! | |
| Lenovo ThinkPad P1 Gen 8 | |
| Media Intel Core Ultra 7 255H, NVIDIA RTX PRO 2000 Blackwell Generation Laptop | |
| HP ZBook X G1i 16 -4! | |
| Asus ExpertBook B6 Flip B6602FC2 | |
| Lenovo ThinkPad P1 Gen 7 21KV001SGE | |
| Lenovo ThinkPad P16s Gen 4 AMD | |
| PCMark 10 / Score | |
| Lenovo ThinkPad P1 Gen 8 | |
| Media Intel Core Ultra 7 255H, NVIDIA RTX PRO 2000 Blackwell Generation Laptop (n=1) | |
| Lenovo ThinkPad P16s Gen 4 AMD | |
| Lenovo ThinkPad P1 Gen 7 21KV001SGE | |
| Asus ExpertBook B6 Flip B6602FC2 | |
| PCMark 10 / Essentials | |
| Asus ExpertBook B6 Flip B6602FC2 | |
| Lenovo ThinkPad P16s Gen 4 AMD | |
| Lenovo ThinkPad P1 Gen 8 | |
| Media Intel Core Ultra 7 255H, NVIDIA RTX PRO 2000 Blackwell Generation Laptop (n=1) | |
| Lenovo ThinkPad P1 Gen 7 21KV001SGE | |
| PCMark 10 / Productivity | |
| Lenovo ThinkPad P1 Gen 8 | |
| Media Intel Core Ultra 7 255H, NVIDIA RTX PRO 2000 Blackwell Generation Laptop (n=1) | |
| Asus ExpertBook B6 Flip B6602FC2 | |
| Lenovo ThinkPad P16s Gen 4 AMD | |
| Lenovo ThinkPad P1 Gen 7 21KV001SGE | |
| PCMark 10 / Digital Content Creation | |
| Lenovo ThinkPad P1 Gen 8 | |
| Media Intel Core Ultra 7 255H, NVIDIA RTX PRO 2000 Blackwell Generation Laptop (n=1) | |
| Lenovo ThinkPad P1 Gen 7 21KV001SGE | |
| Lenovo ThinkPad P16s Gen 4 AMD | |
| Asus ExpertBook B6 Flip B6602FC2 | |
| CrossMark / Overall | |
| Dell Pro Max 16 Plus | |
| HP ZBook X G1i 16 | |
| Asus ExpertBook B6 Flip B6602FC2 | |
| Lenovo ThinkPad P1 Gen 8 | |
| Media Intel Core Ultra 7 255H, NVIDIA RTX PRO 2000 Blackwell Generation Laptop (n=1) | |
| Lenovo ThinkPad P1 Gen 7 21KV001SGE | |
| Lenovo ThinkPad P16s Gen 4 AMD | |
| CrossMark / Productivity | |
| Dell Pro Max 16 Plus | |
| HP ZBook X G1i 16 | |
| Asus ExpertBook B6 Flip B6602FC2 | |
| Lenovo ThinkPad P1 Gen 8 | |
| Media Intel Core Ultra 7 255H, NVIDIA RTX PRO 2000 Blackwell Generation Laptop (n=1) | |
| Lenovo ThinkPad P1 Gen 7 21KV001SGE | |
| Lenovo ThinkPad P16s Gen 4 AMD | |
| CrossMark / Creativity | |
| Dell Pro Max 16 Plus | |
| HP ZBook X G1i 16 | |
| Lenovo ThinkPad P1 Gen 8 | |
| Media Intel Core Ultra 7 255H, NVIDIA RTX PRO 2000 Blackwell Generation Laptop (n=1) | |
| Asus ExpertBook B6 Flip B6602FC2 | |
| Lenovo ThinkPad P1 Gen 7 21KV001SGE | |
| Lenovo ThinkPad P16s Gen 4 AMD | |
| CrossMark / Responsiveness | |
| Dell Pro Max 16 Plus | |
| Asus ExpertBook B6 Flip B6602FC2 | |
| Lenovo ThinkPad P1 Gen 8 | |
| Media Intel Core Ultra 7 255H, NVIDIA RTX PRO 2000 Blackwell Generation Laptop (n=1) | |
| HP ZBook X G1i 16 | |
| Lenovo ThinkPad P1 Gen 7 21KV001SGE | |
| Lenovo ThinkPad P16s Gen 4 AMD | |
| WebXPRT 3 / Overall | |
| Lenovo ThinkPad P1 Gen 8 | |
| Media Intel Core Ultra 7 255H, NVIDIA RTX PRO 2000 Blackwell Generation Laptop (n=1) | |
| Dell Pro Max 16 Plus | |
| HP ZBook X G1i 16 | |
| Lenovo ThinkPad P16s Gen 4 AMD | |
| Asus ExpertBook B6 Flip B6602FC2 | |
| Lenovo ThinkPad P1 Gen 7 21KV001SGE | |
| WebXPRT 4 / Overall | |
| Dell Pro Max 16 Plus | |
| HP ZBook X G1i 16 | |
| Lenovo ThinkPad P1 Gen 8 | |
| Media Intel Core Ultra 7 255H, NVIDIA RTX PRO 2000 Blackwell Generation Laptop (n=1) | |
| Asus ExpertBook B6 Flip B6602FC2 | |
| Lenovo ThinkPad P1 Gen 7 21KV001SGE | |
| Lenovo ThinkPad P16s Gen 4 AMD | |
| Mozilla Kraken 1.1 / Total | |
| Lenovo ThinkPad P1 Gen 7 21KV001SGE | |
| Asus ExpertBook B6 Flip B6602FC2 | |
| Lenovo ThinkPad P16s Gen 4 AMD | |
| Lenovo ThinkPad P1 Gen 8 | |
| Media Intel Core Ultra 7 255H, NVIDIA RTX PRO 2000 Blackwell Generation Laptop (n=1) | |
| HP ZBook X G1i 16 | |
| Dell Pro Max 16 Plus | |
* ... Meglio usare valori piccoli
| PCMark 10 Score | 9625 punti | |
Aiuto | ||
| AIDA64 / Memory Copy | |
| Lenovo ThinkPad P1 Gen 8 | |
| Dell Pro Max 16 Plus | |
| Media Intel Core Ultra 7 255H (39188 - 110930, n=14) | |
| Lenovo ThinkPad P16s Gen 4 AMD | |
| Lenovo ThinkPad P1 Gen 7 21KV001SGE | |
| Asus ExpertBook B6 Flip B6602FC2 | |
| AIDA64 / Memory Read | |
| Dell Pro Max 16 Plus | |
| Lenovo ThinkPad P16s Gen 4 AMD | |
| Media Intel Core Ultra 7 255H (43703 - 90552, n=14) | |
| Lenovo ThinkPad P1 Gen 8 | |
| Lenovo ThinkPad P1 Gen 7 21KV001SGE | |
| Asus ExpertBook B6 Flip B6602FC2 | |
| AIDA64 / Memory Write | |
| Dell Pro Max 16 Plus | |
| Lenovo ThinkPad P16s Gen 4 AMD | |
| Media Intel Core Ultra 7 255H (36438 - 82641, n=14) | |
| Lenovo ThinkPad P1 Gen 7 21KV001SGE | |
| Lenovo ThinkPad P1 Gen 8 | |
| Asus ExpertBook B6 Flip B6602FC2 | |
| AIDA64 / Memory Latency | |
| Lenovo ThinkPad P1 Gen 8 | |
| Lenovo ThinkPad P1 Gen 7 21KV001SGE | |
| Media Intel Core Ultra 7 255H (110.1 - 147.2, n=14) | |
| Dell Pro Max 16 Plus | |
| Lenovo ThinkPad P16s Gen 4 AMD | |
| Asus ExpertBook B6 Flip B6602FC2 | |
* ... Meglio usare valori piccoli
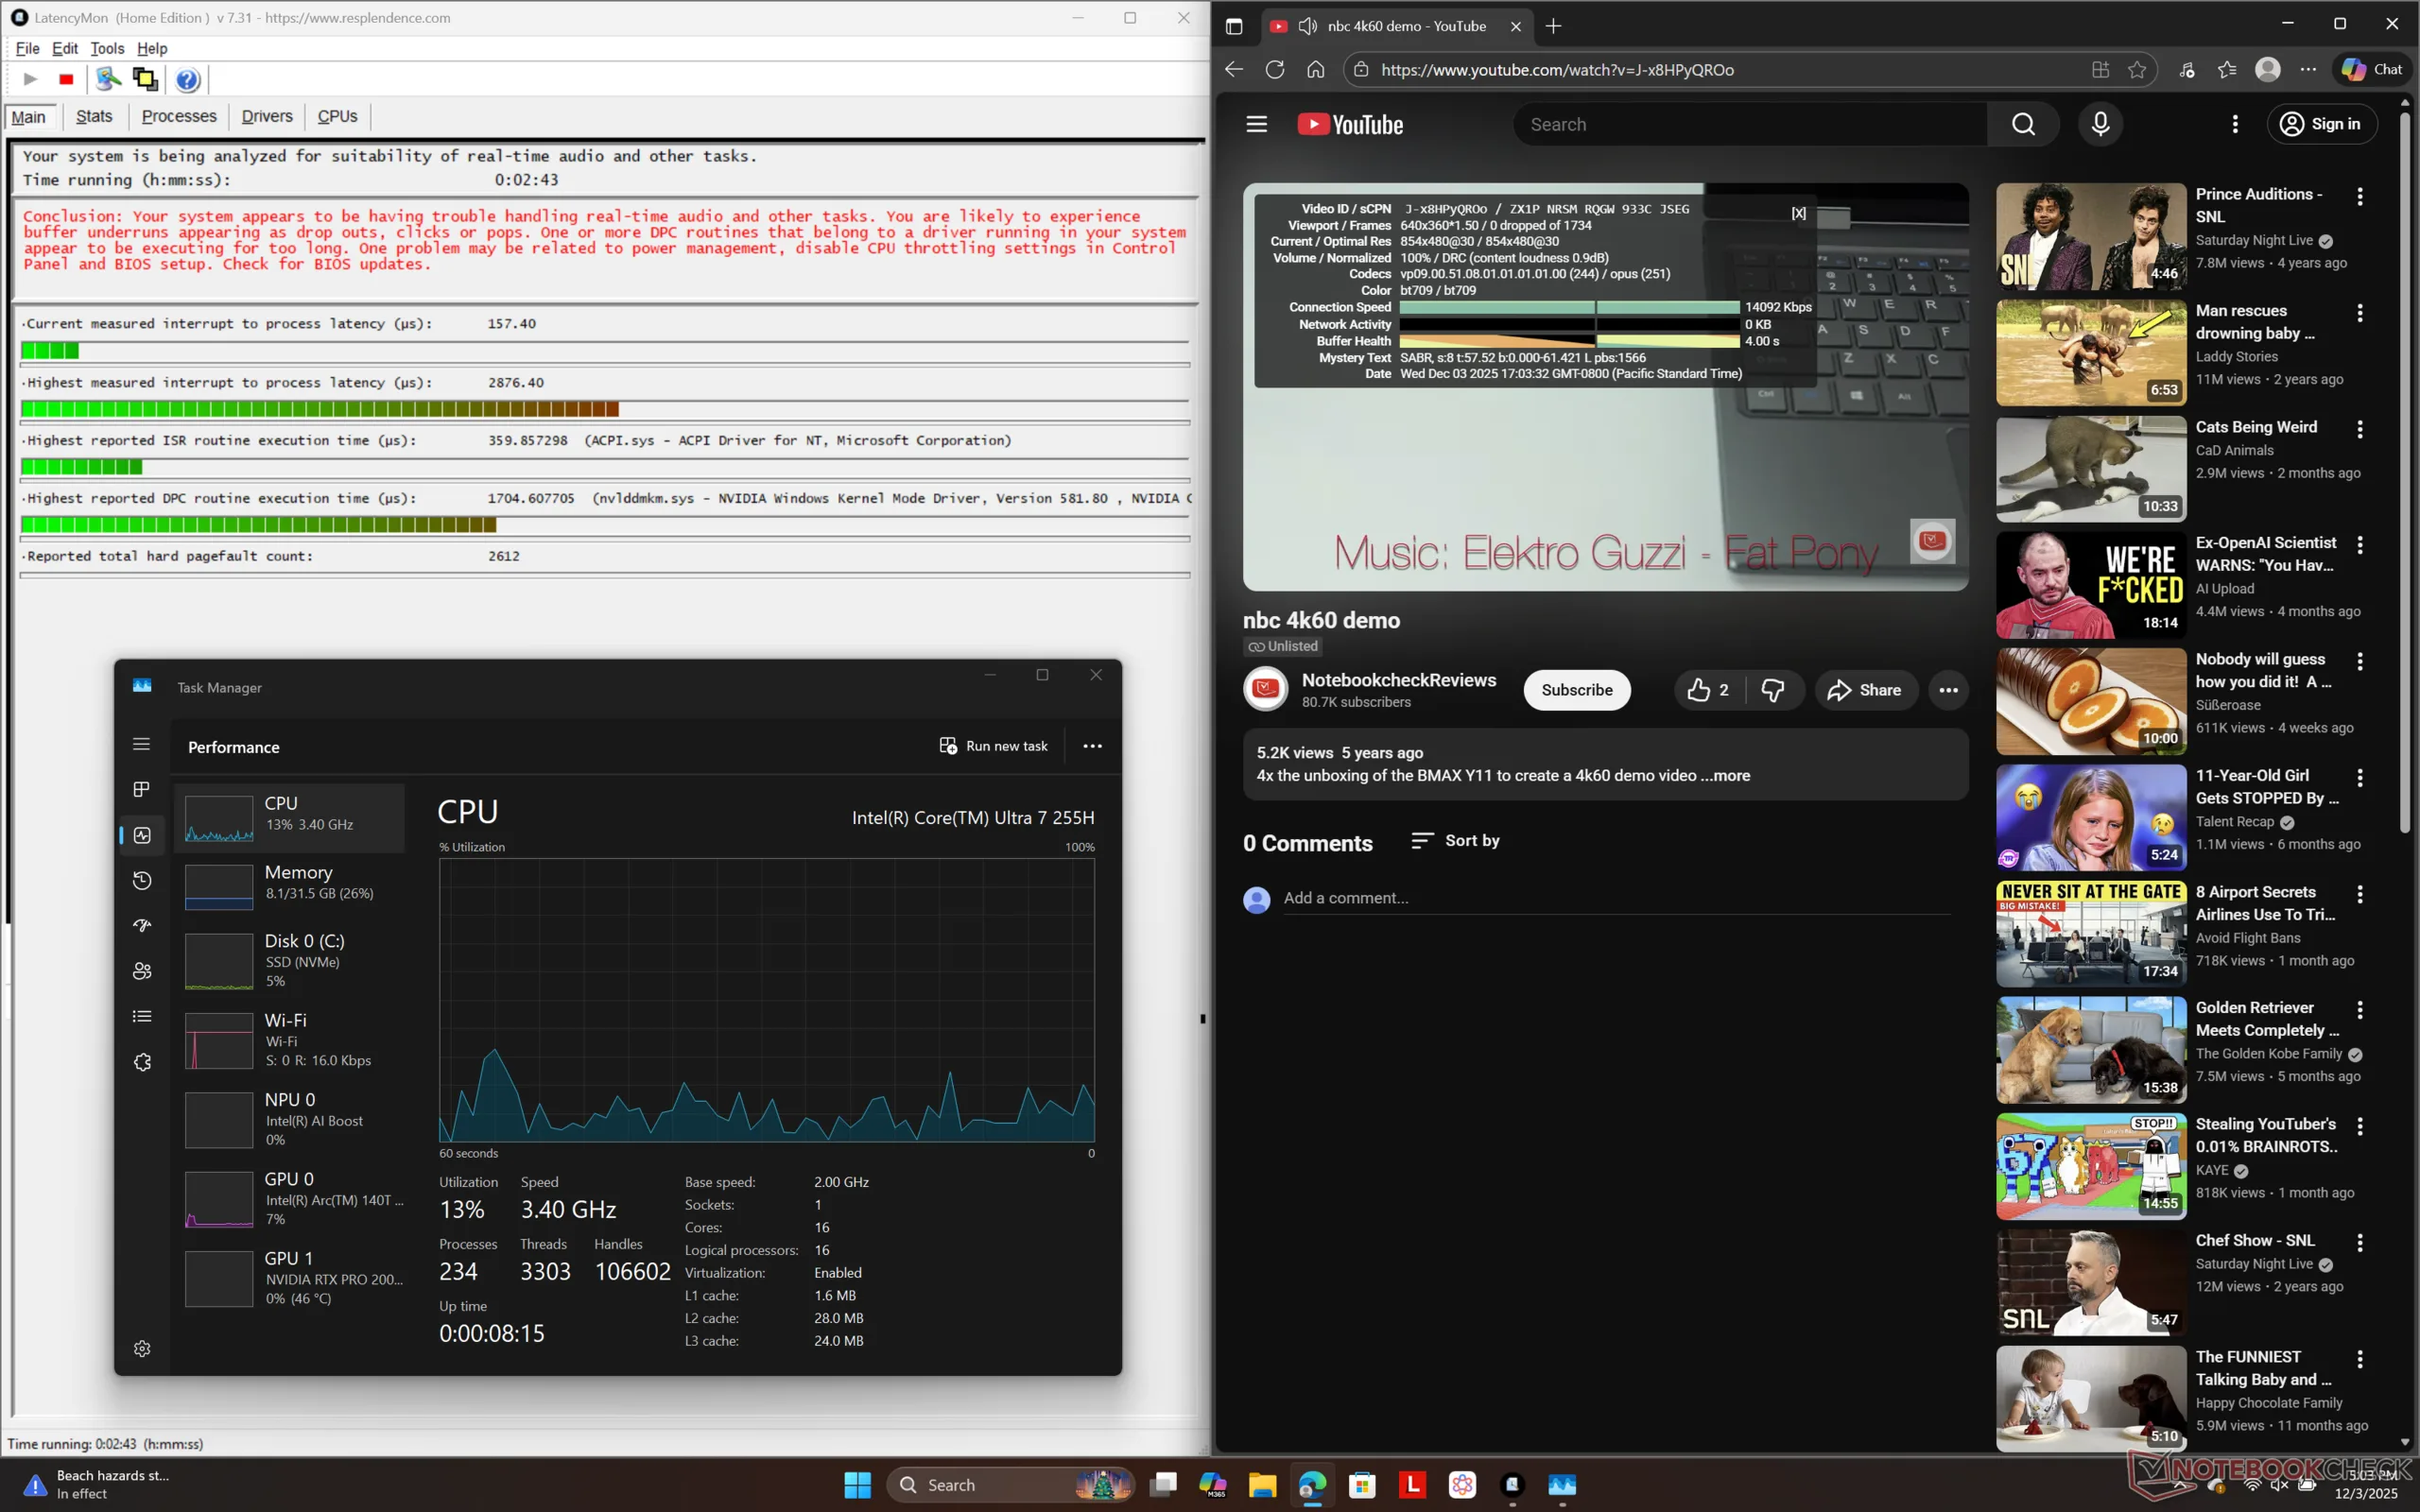
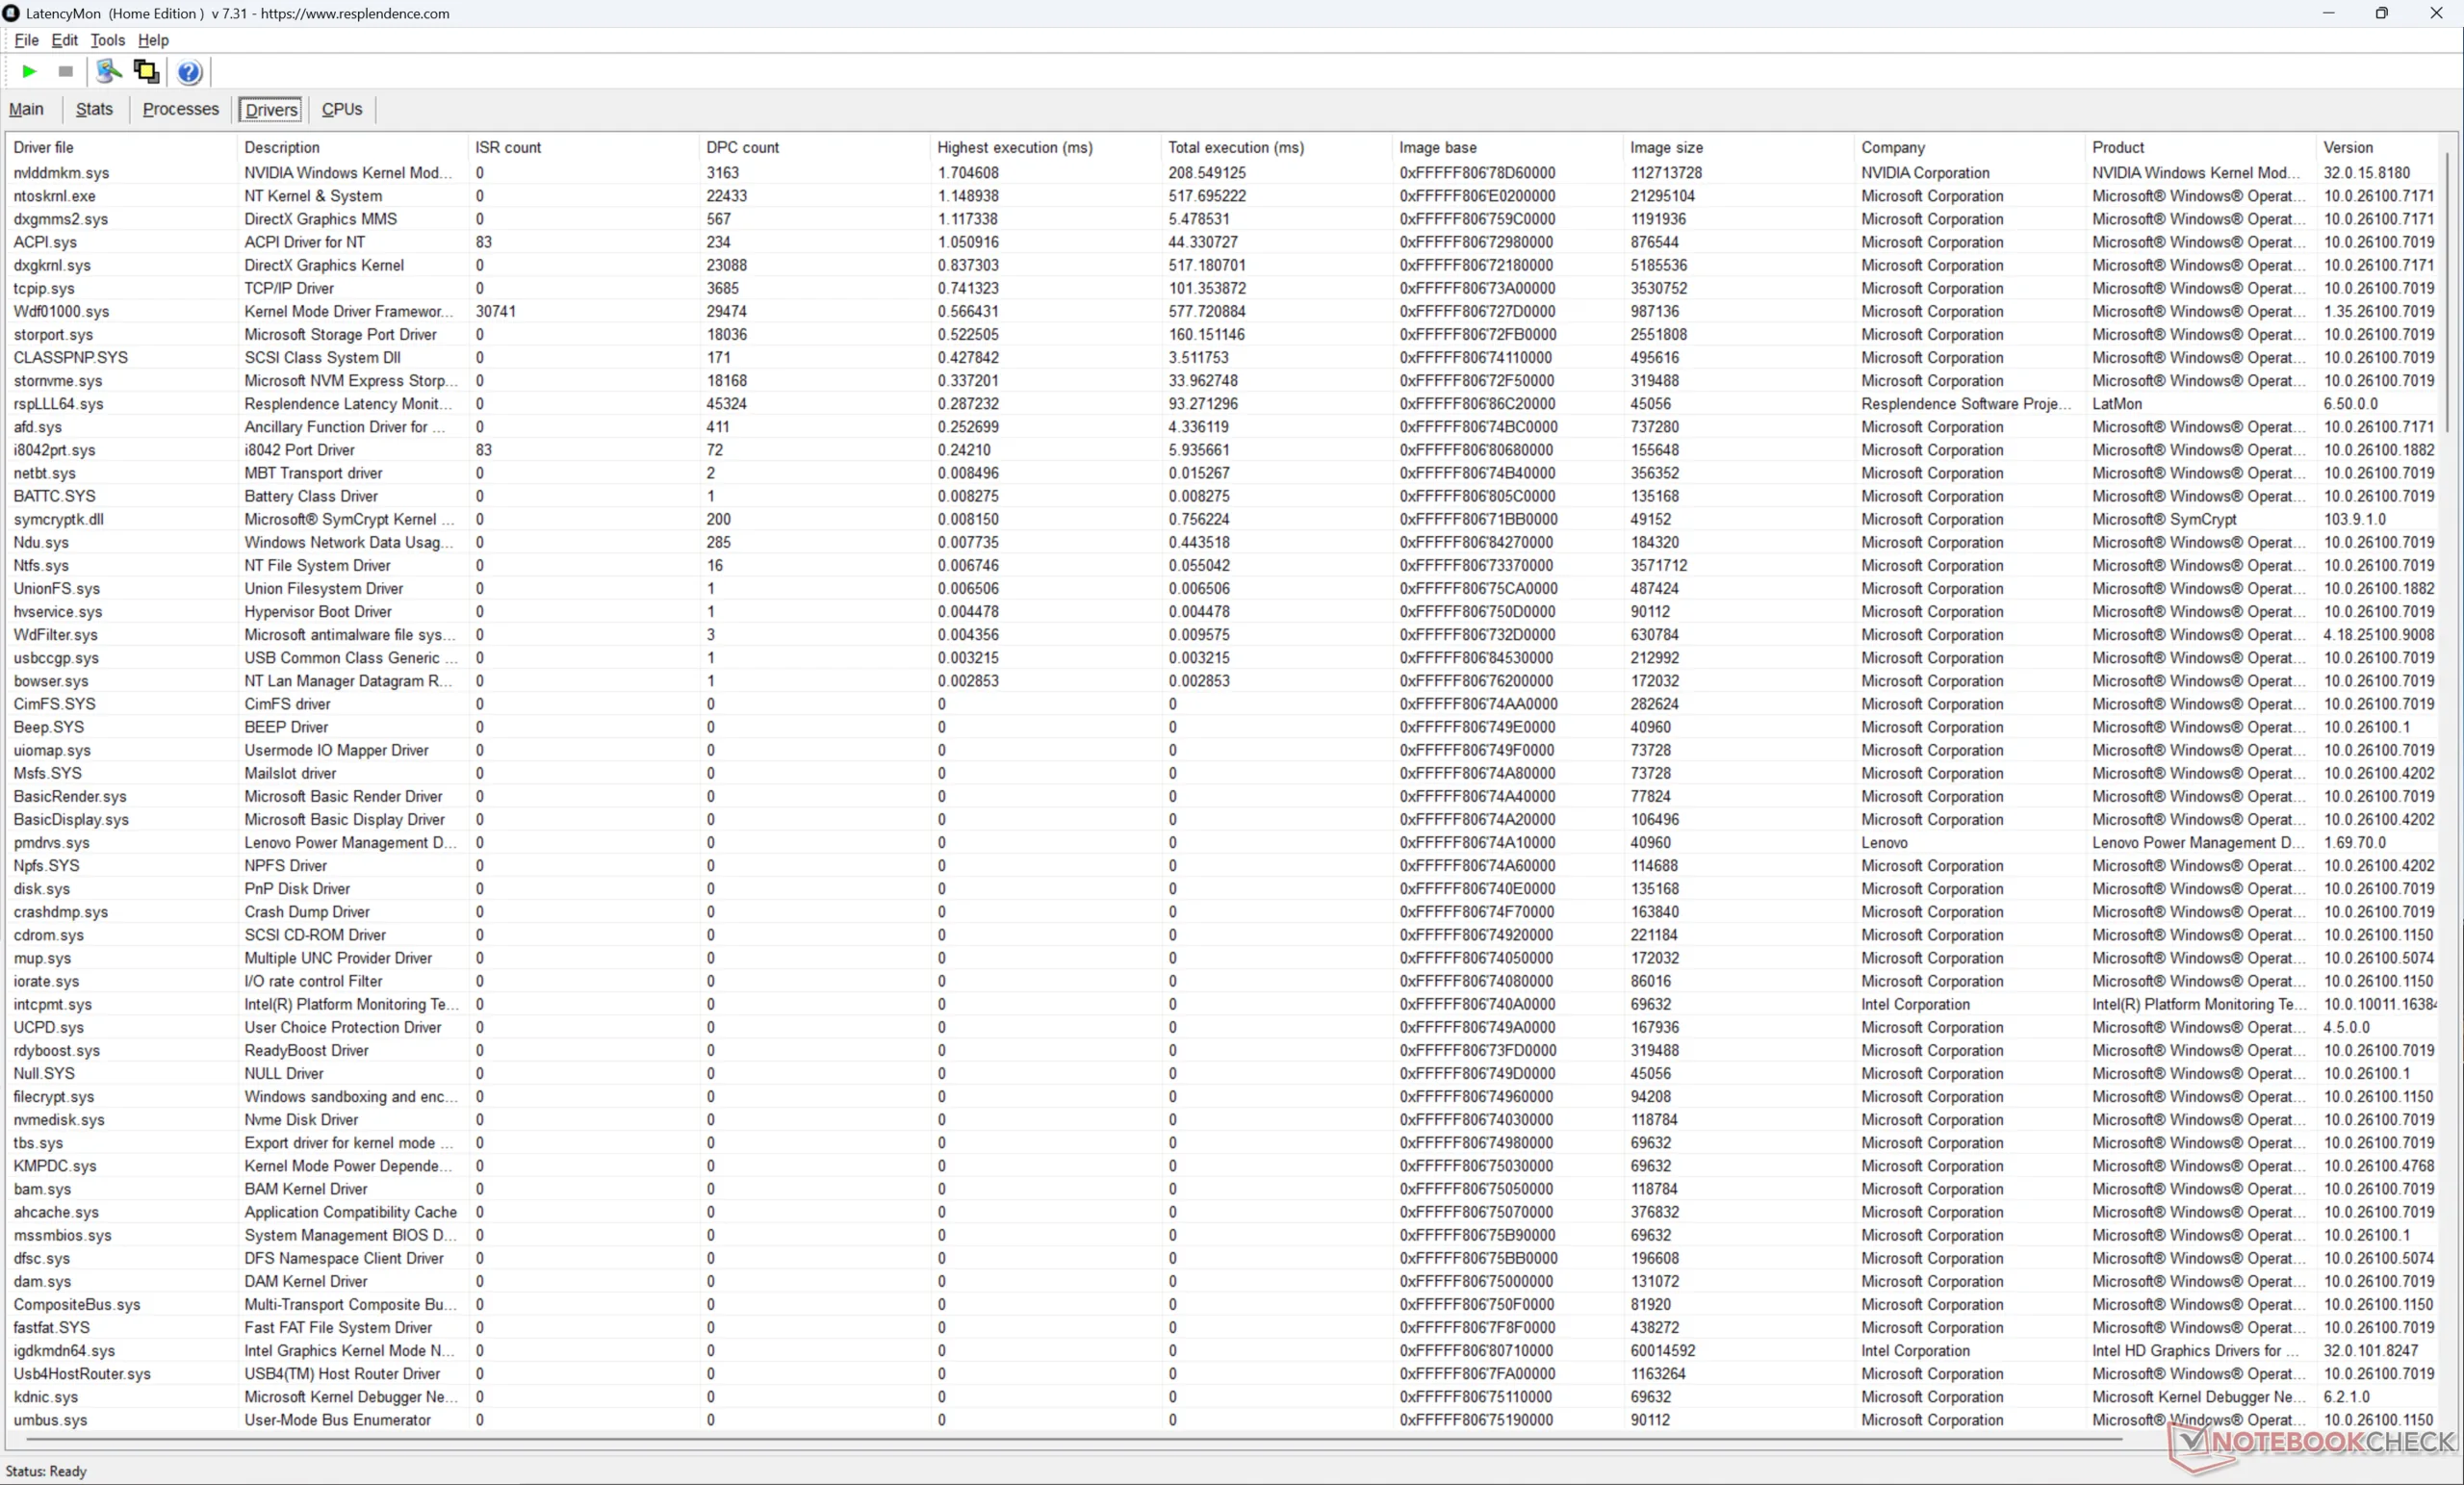
Latenza DPC
LatencyMon rivela lievi problemi di DPC, ma per il resto nessuna caduta di fotogrammi durante la riproduzione di video 4K60.
| DPC Latencies / LatencyMon - interrupt to process latency (max), Web, Youtube, Prime95 | |
| Lenovo ThinkPad P1 Gen 8 | |
| Dell Pro Max 16 Plus | |
| Asus ExpertBook B6 Flip B6602FC2 | |
| Lenovo ThinkPad P1 Gen 7 21KV001SGE | |
| HP ZBook X G1i 16 | |
* ... Meglio usare valori piccoli
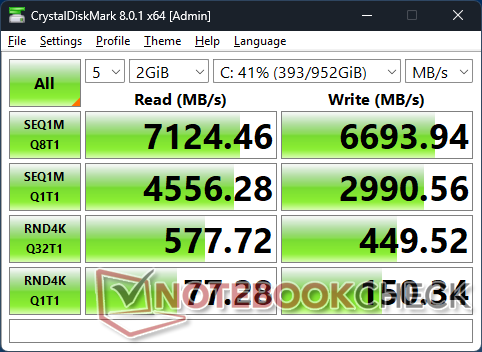
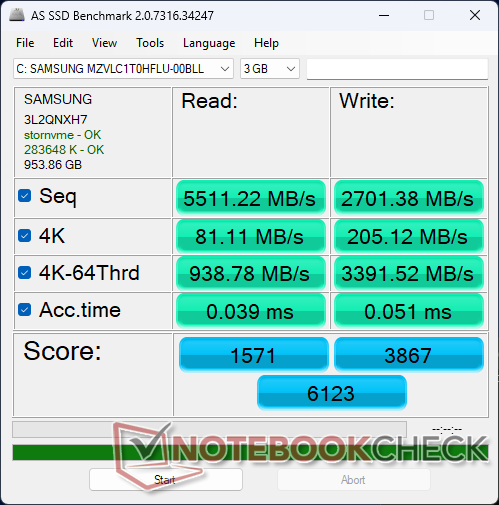
Dispositivi di archiviazione
La nostra unità di prova viene fornita con il Samsung PM9E1 SSD PCIe5 NVMe, mentre il ThinkPad P1 Gen 7 dell'anno scorso era dotato di SSD Kioxia XG8 KXG8AZNV1T02 PCIe4 NVMe. Le velocità di trasferimento sono più elevate, fino a 7000 MB/s stabili.

| Drive Performance rating - Percent | |
| Asus ExpertBook B6 Flip B6602FC2 | |
| HP ZBook X G1i 16 | |
| Dell Pro Max 16 Plus | |
| Lenovo ThinkPad P1 Gen 8 | |
| Lenovo ThinkPad P1 Gen 7 21KV001SGE | |
| Lenovo ThinkPad P16s Gen 4 AMD -11! | |
* ... Meglio usare valori piccoli
Strozzatura del disco: DiskSpd Lettura in loop, Profondità coda 8
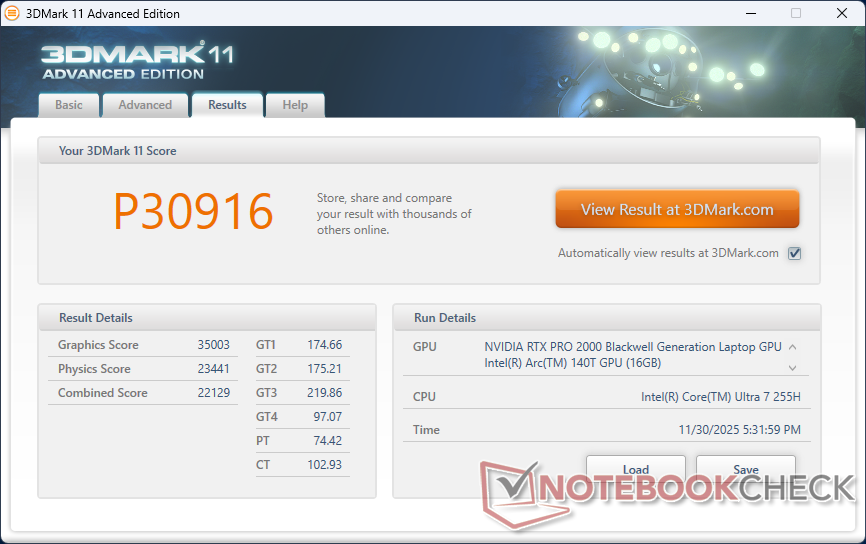
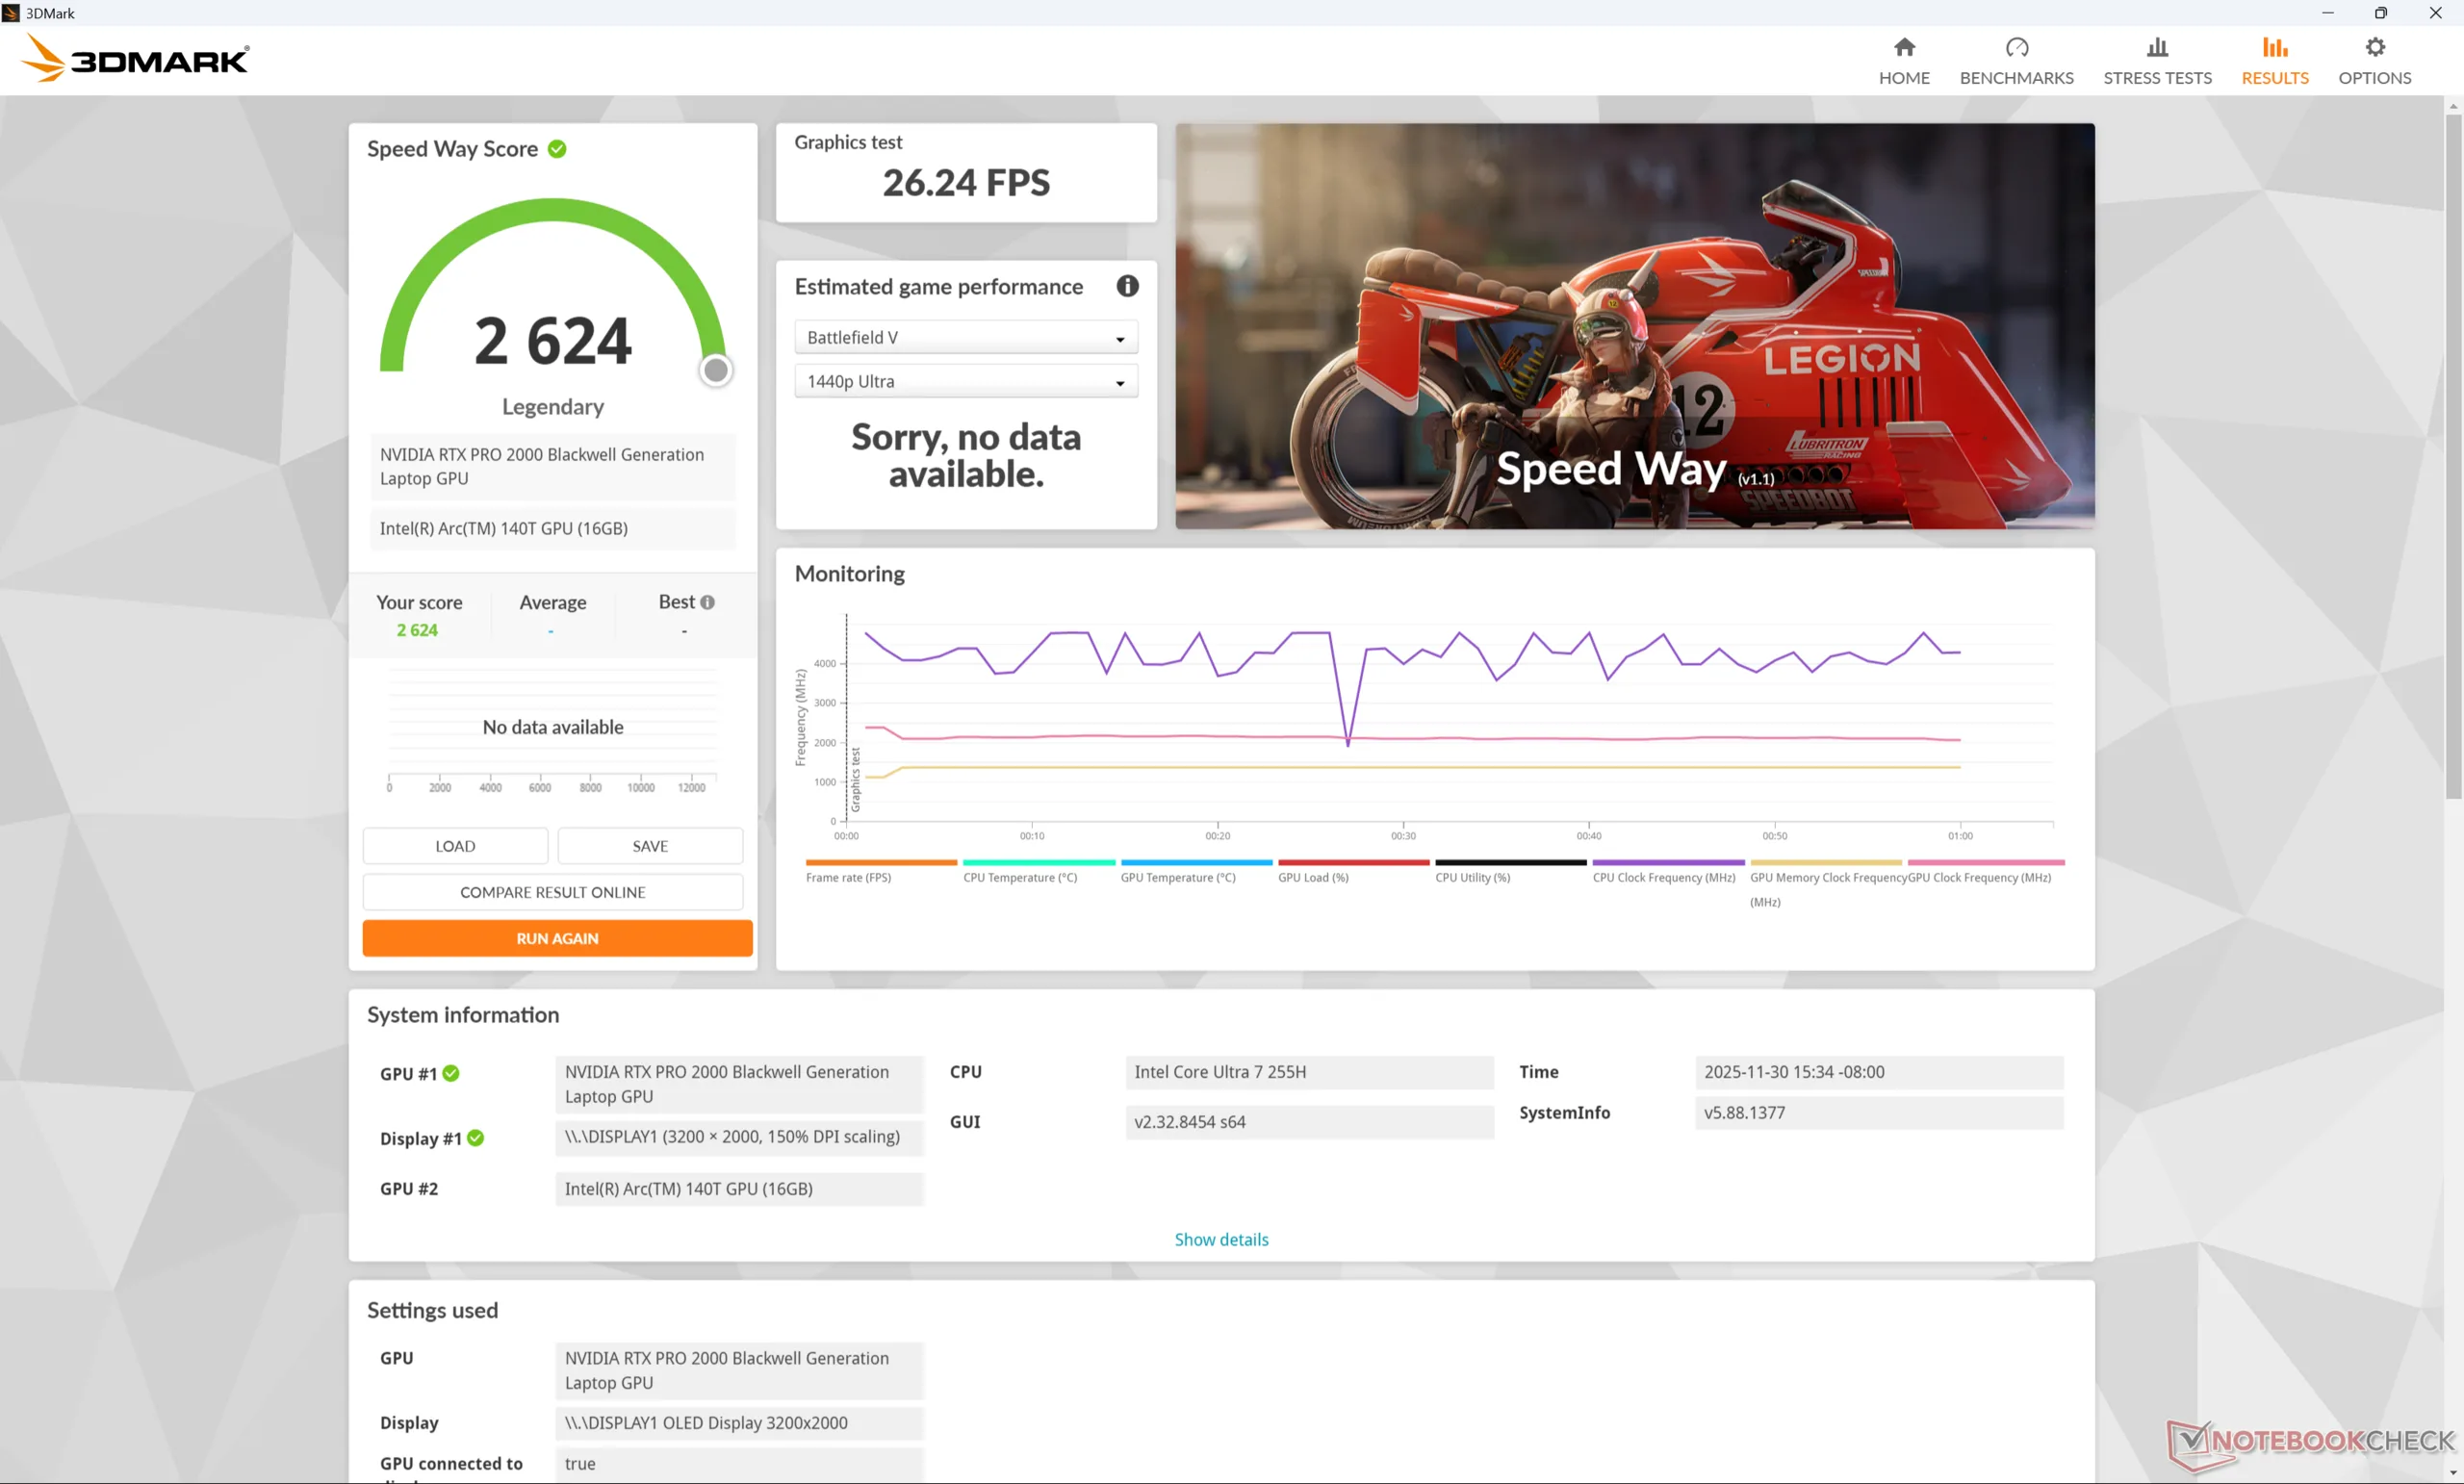
Prestazioni della GPU
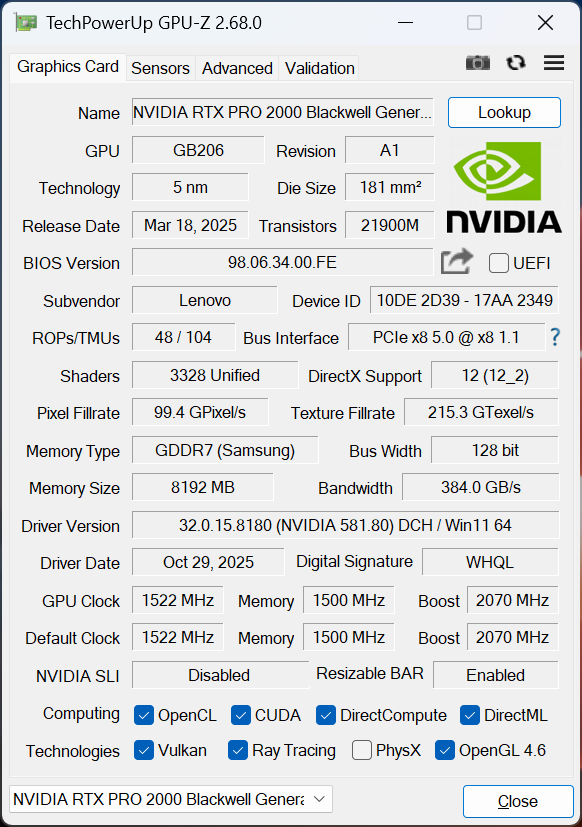
Il rTX Pro 2000 Blackwell mobile è derivato dal mobile GeForce RTX 5060 e quindi entrambi condividono caratteristiche simili, compreso il numero totale di pipeline unificate, TMU, core tensoriali e larghezza di banda della memoria. Le prestazioni grezze sono generalmente alla pari con la rTX Pro 3000 Ada mobile prima di tenere conto dei miglioramenti specifici di Blackwell, come i core tensoriali di quinta generazione o i motori NVDEC di sesta generazione.
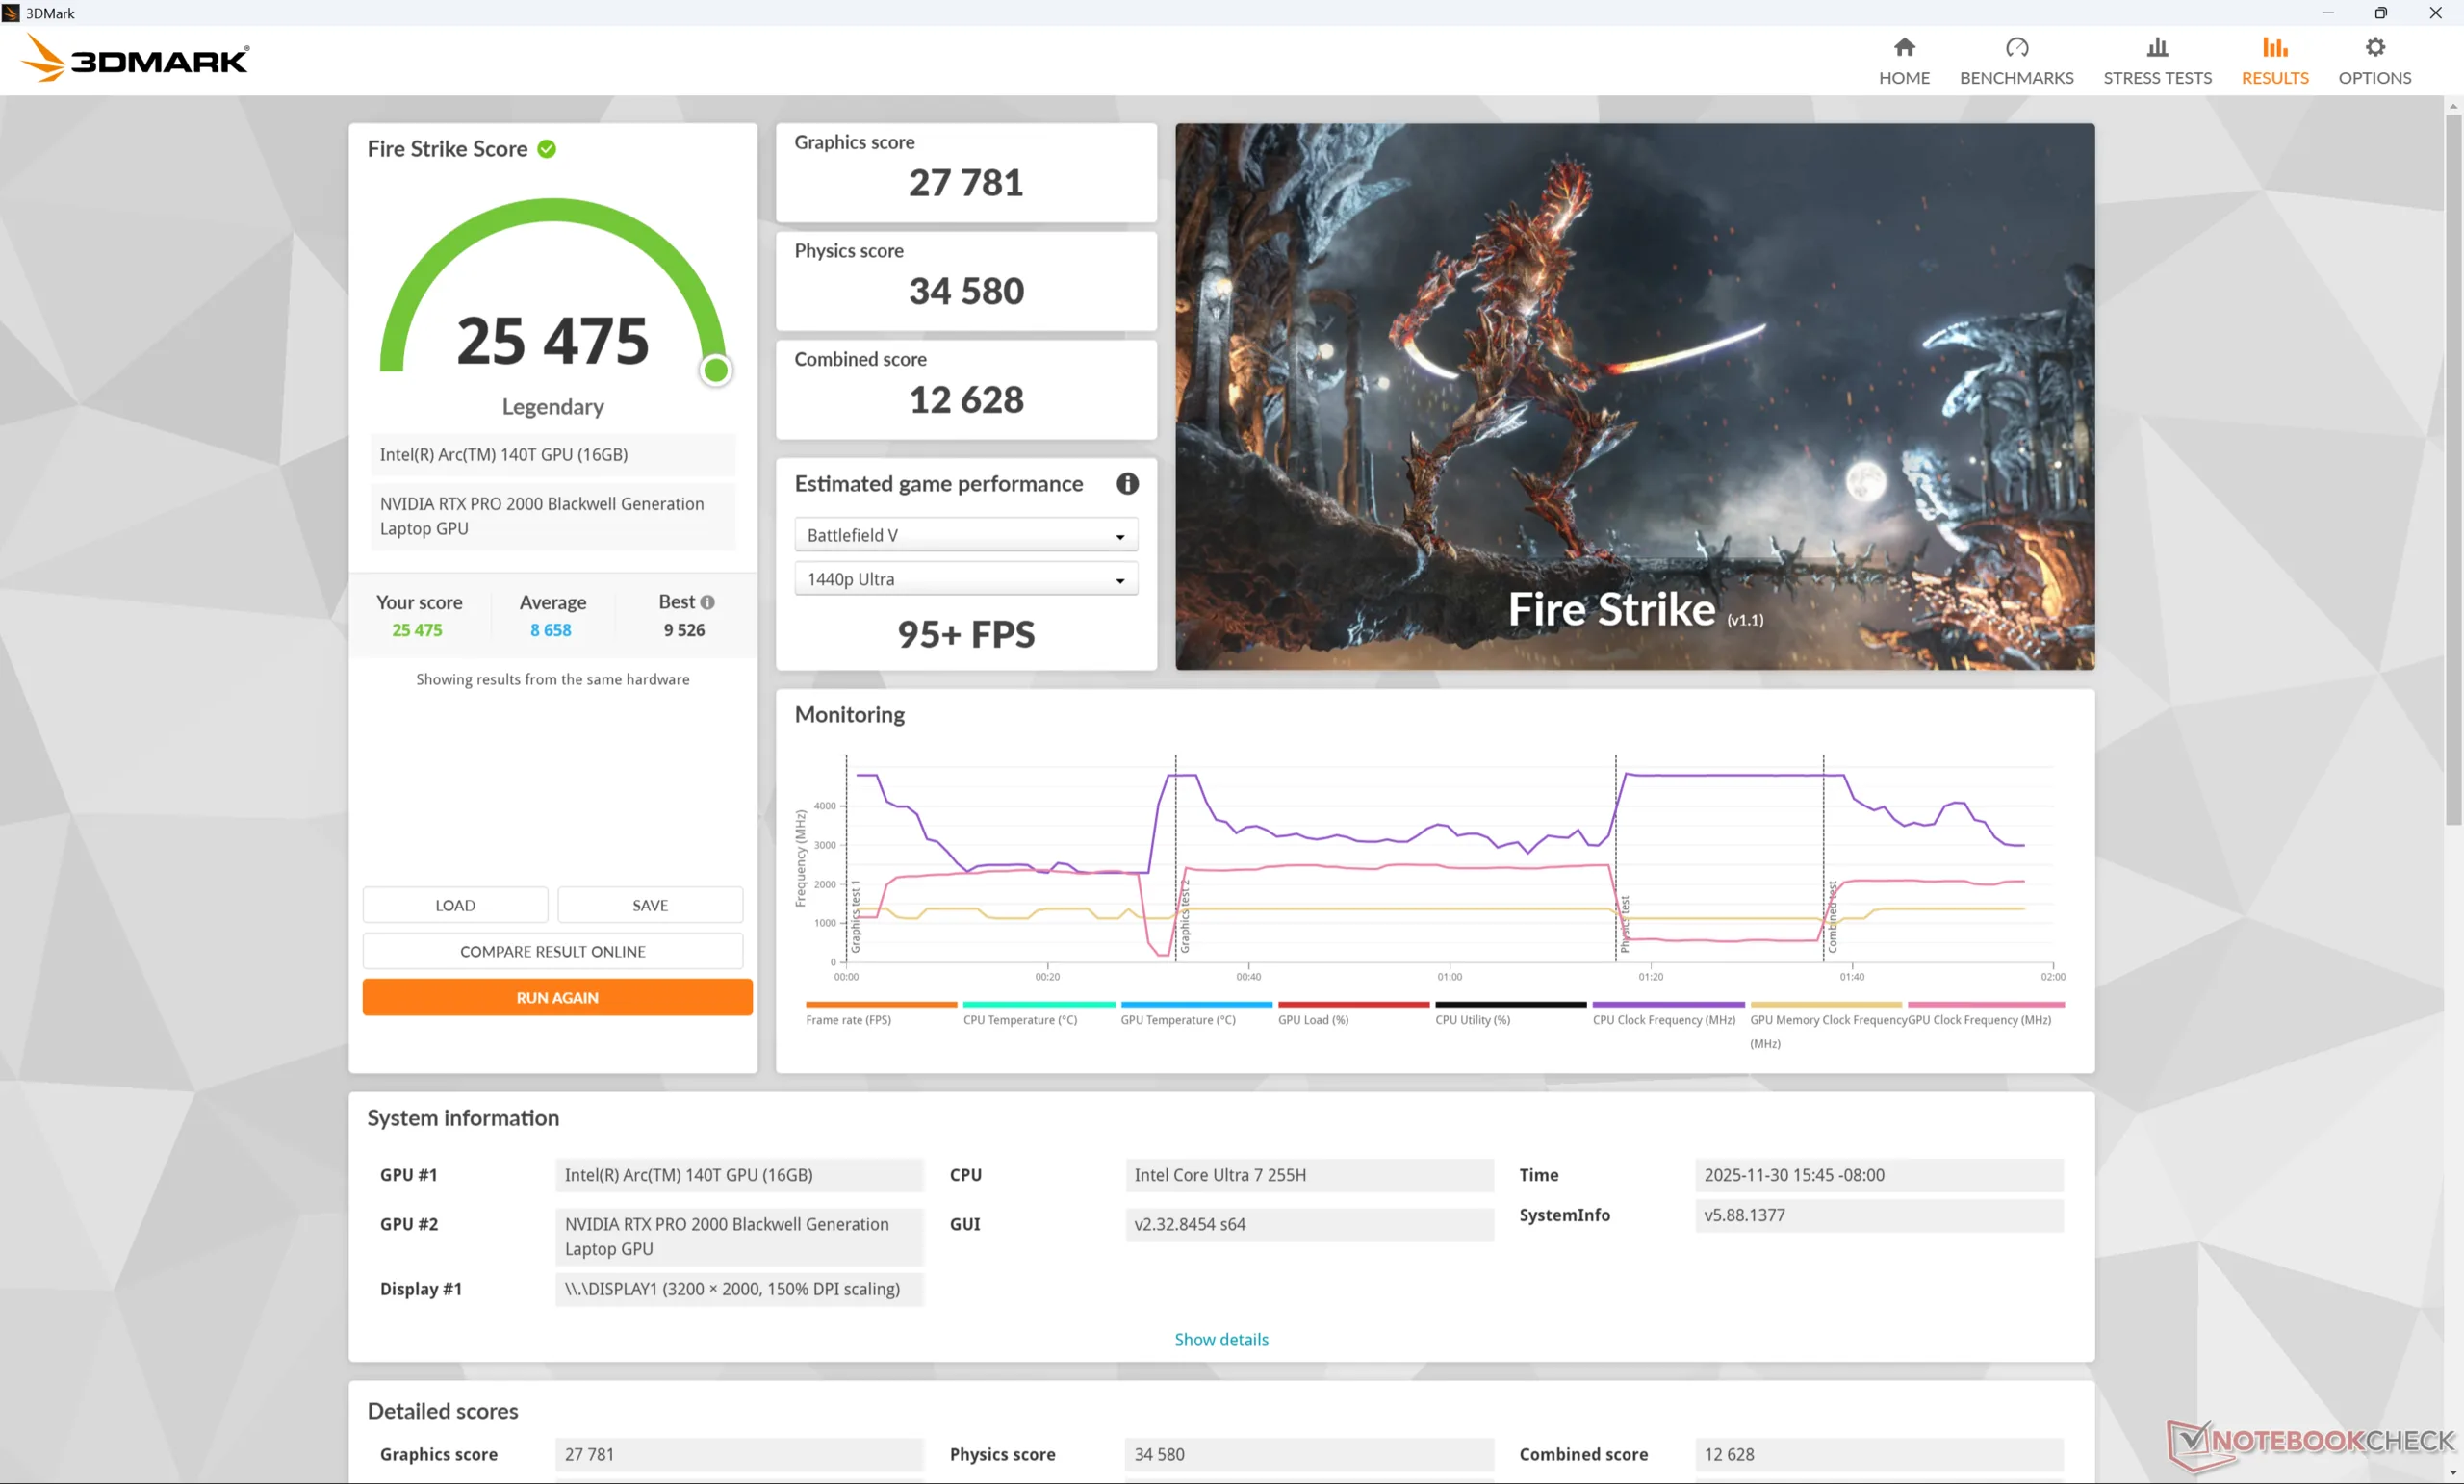
| Profilo di potenza | Punteggio grafico | Punteggio di fisica | Punteggio combinato |
| Modalità Prestazioni | 27781 | 34580 | 12628 |
| Modalità equilibrata | 26859 (-3%) | 35322 (+2%) | 11593 (-8%) |
| Alimentazione a batteria | 25193 (-9%) | 26579 (-23%) | 10800 (-15%) |
| 3DMark Performance rating - Percent | |
| Dell Pro Max 16 Plus -10! | |
| Lenovo ThinkPad P1 Gen 8 -1! | |
| Media NVIDIA RTX PRO 2000 Blackwell Generation Laptop -1! | |
| HP ZBook Fury 16 G11 -9! | |
| HP ZBook X G1i 16 -10! | |
| HP ZBook Studio 16 G11 -9! | |
| HP ZBook Power 16 G11 A -9! | |
| Lenovo ThinkPad P1 Gen 7 21KV001SGE -26! | |
| Asus ExpertBook B6 Flip B6602FC2 -18! | |
| HP ZBook Studio 16 G9 62U04EA -11! | |
| Lenovo ThinkPad P1 G4-20Y4Z9DVUS -18! | |
| Lenovo ThinkPad P16s Gen 4 AMD -26! | |
| Lenovo ThinkPad P16s G2 21K9000CGE -18! | |
| 3DMark 11 - 1280x720 Performance GPU | |
| Dell Pro Max 16 Plus | |
| HP ZBook Fury 16 G11 | |
| Lenovo ThinkPad P1 Gen 8 | |
| HP ZBook Studio 16 G11 | |
| Media NVIDIA RTX PRO 2000 Blackwell Generation Laptop (31736 - 35003, n=2) | |
| Lenovo ThinkPad P1 Gen 7 21KV001SGE | |
| HP ZBook X G1i 16 | |
| HP ZBook Power 16 G11 A | |
| Asus ExpertBook B6 Flip B6602FC2 | |
| HP ZBook Studio 16 G9 62U04EA | |
| Lenovo ThinkPad P1 G4-20Y4Z9DVUS | |
| Lenovo ThinkPad P16s Gen 4 AMD | |
| Lenovo ThinkPad P16s G2 21K9000CGE | |
| 3DMark 11 Performance | 30916 punti | |
| 3DMark Cloud Gate Standard Score | 62652 punti | |
| 3DMark Fire Strike Score | 25475 punti | |
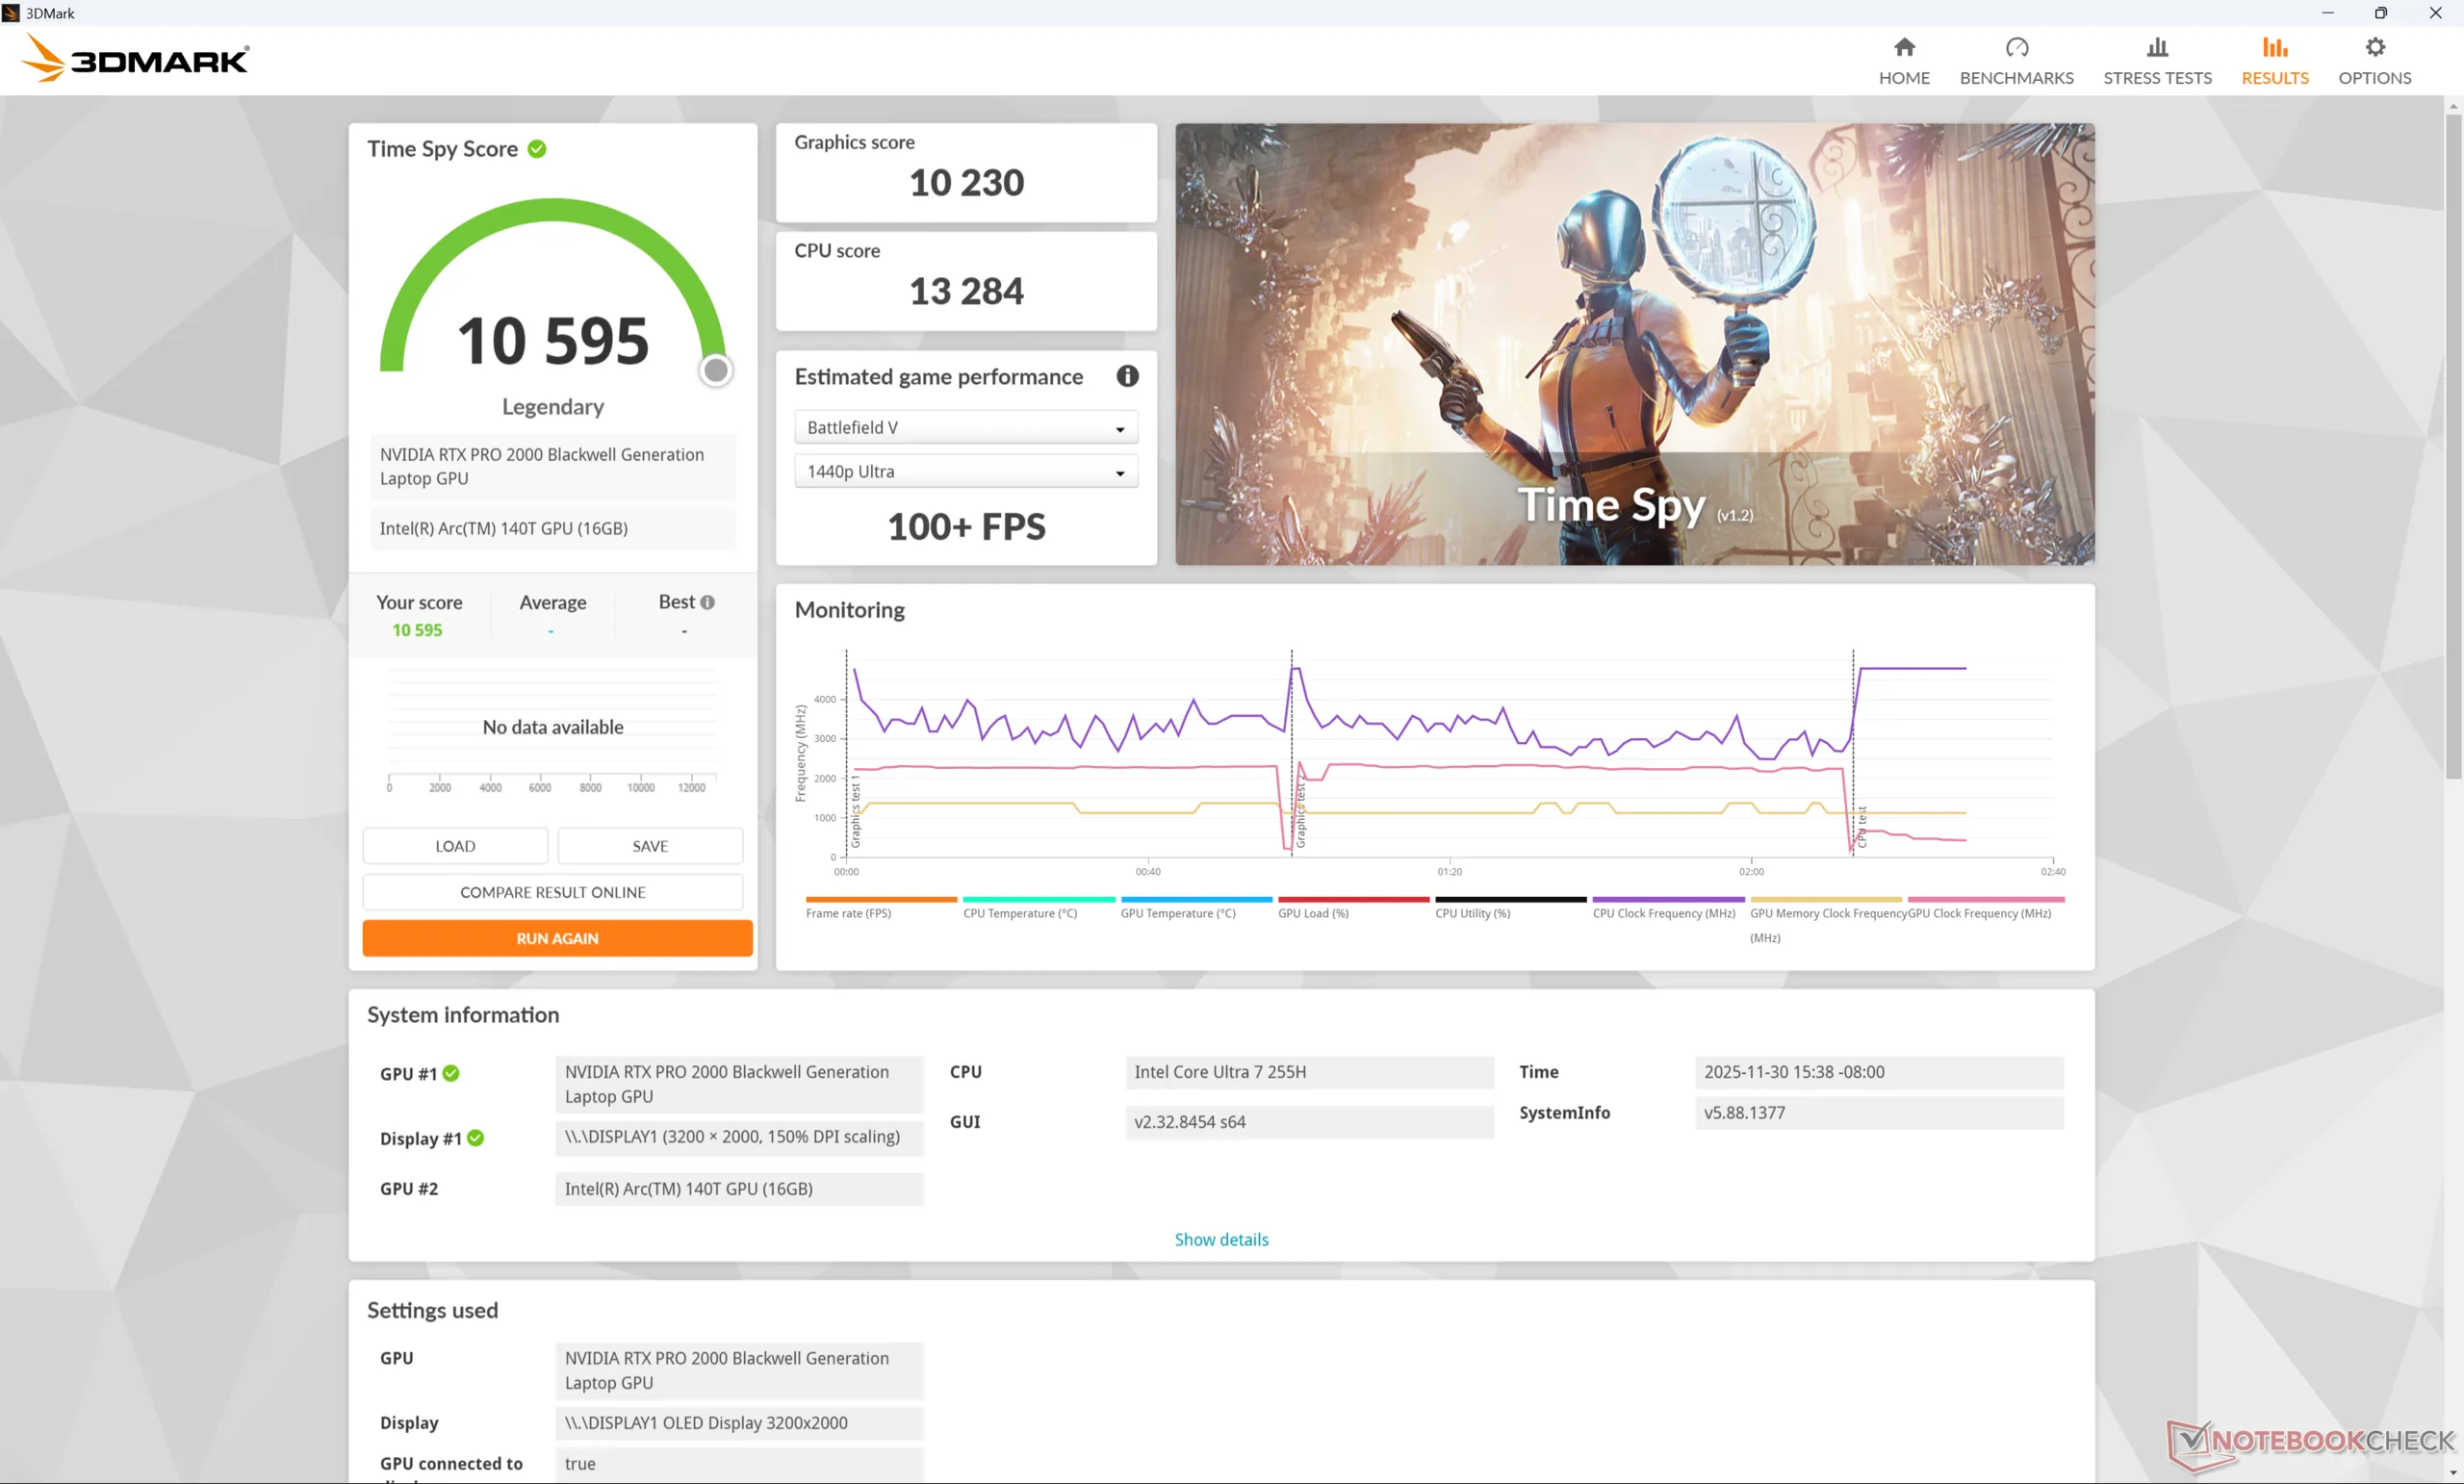
| 3DMark Time Spy Score | 10595 punti | |
Aiuto | ||
* ... Meglio usare valori piccoli
Prestazioni di gioco
Anche se il gioco non è la sua funzione principale, il ThinkPad P1 Gen 8 è più che in grado di eseguire giochi impegnativi con risoluzioni da 1080p a 2K, con livelli di prestazioni inferiori di circa il 10 percento rispetto al modello HP Omen HP Omen 16 alimentato dalla RTX 5060.
| Performance rating - Percent | |
| Dell Pro Max 16 Plus | |
| Lenovo ThinkPad P1 Gen 8 | |
| HP ZBook X G1i 16 | |
| Asus ExpertBook B6 Flip B6602FC2 -2! | |
| Lenovo ThinkPad P1 Gen 7 21KV001SGE -1! | |
| Lenovo ThinkPad P16s Gen 4 AMD -1! | |
| Cyberpunk 2077 - 1920x1080 Ultra Preset (FSR off) | |
| Dell Pro Max 16 Plus | |
| Lenovo ThinkPad P1 Gen 8 | |
| HP ZBook X G1i 16 | |
| Lenovo ThinkPad P1 Gen 7 21KV001SGE | |
| Lenovo ThinkPad P16s Gen 4 AMD | |
| Baldur's Gate 3 - 1920x1080 Ultra Preset AA:T | |
| Dell Pro Max 16 Plus | |
| Lenovo ThinkPad P1 Gen 8 | |
| HP ZBook X G1i 16 | |
| Lenovo ThinkPad P1 Gen 7 21KV001SGE | |
| Lenovo ThinkPad P16s Gen 4 AMD | |
| GTA V - 1920x1080 Highest AA:4xMSAA + FX AF:16x | |
| Dell Pro Max 16 Plus | |
| Lenovo ThinkPad P1 Gen 8 | |
| HP ZBook X G1i 16 | |
| Lenovo ThinkPad P1 Gen 7 21KV001SGE | |
| Asus ExpertBook B6 Flip B6602FC2 | |
| Lenovo ThinkPad P16s Gen 4 AMD | |
| Final Fantasy XV Benchmark - 1920x1080 High Quality | |
| Dell Pro Max 16 Plus | |
| Lenovo ThinkPad P1 Gen 8 | |
| HP ZBook X G1i 16 | |
| Lenovo ThinkPad P1 Gen 7 21KV001SGE | |
| Asus ExpertBook B6 Flip B6602FC2 | |
| Lenovo ThinkPad P16s Gen 4 AMD | |
| Strange Brigade - 1920x1080 ultra AA:ultra AF:16 | |
| Dell Pro Max 16 Plus | |
| Lenovo ThinkPad P1 Gen 8 | |
| HP ZBook X G1i 16 | |
| Asus ExpertBook B6 Flip B6602FC2 | |
| Dota 2 Reborn - 1920x1080 ultra (3/3) best looking | |
| Dell Pro Max 16 Plus | |
| Asus ExpertBook B6 Flip B6602FC2 | |
| HP ZBook X G1i 16 | |
| Lenovo ThinkPad P1 Gen 7 21KV001SGE | |
| Lenovo ThinkPad P1 Gen 8 | |
| Lenovo ThinkPad P16s Gen 4 AMD | |
| X-Plane 11.11 - 1920x1080 high (fps_test=3) | |
| Asus ExpertBook B6 Flip B6602FC2 | |
| Dell Pro Max 16 Plus | |
| Lenovo ThinkPad P1 Gen 7 21KV001SGE | |
| HP ZBook X G1i 16 | |
| Lenovo ThinkPad P1 Gen 8 | |
| Lenovo ThinkPad P16s Gen 4 AMD | |
| X-Plane 11.11 - 1920x1080 high (fps_test=3) | |
| HP ZBook Fury 16 G11 | |
| Asus ExpertBook B6 Flip B6602FC2 | |
| Dell Pro Max 16 Plus | |
| HP ZBook Studio 16 G9 62U04EA | |
| HP ZBook Studio 16 G11 | |
| Lenovo ThinkPad P1 Gen 7 21KV001SGE | |
| HP ZBook X G1i 16 | |
| Media NVIDIA RTX PRO 2000 Blackwell Generation Laptop (76.3 - 80.6, n=2) | |
| Lenovo ThinkPad P1 Gen 8 | |
| Lenovo ThinkPad P1 G4-20Y4Z9DVUS | |
| HP ZBook Power 16 G11 A | |
| Lenovo ThinkPad P16s Gen 4 AMD | |
| Lenovo ThinkPad P16s G2 21K9000CGE | |
| Lenovo ThinkPad P16s G2 21K9000CGE | |
| F1 24 | |
| 1920x1080 High Preset AA:T AF:16x | |
| Dell Pro Max 16 Plus | |
| Lenovo ThinkPad P1 Gen 8 | |
| Media NVIDIA RTX PRO 2000 Blackwell Generation Laptop (161.4 - 185.2, n=2) | |
| HP ZBook X G1i 16 | |
| Lenovo ThinkPad P1 Gen 7 21KV001SGE | |
| 1920x1080 Ultra High Preset AA:T AF:16x | |
| Dell Pro Max 16 Plus | |
| Lenovo ThinkPad P1 Gen 8 | |
| Media NVIDIA RTX PRO 2000 Blackwell Generation Laptop (48.2 - 57.2, n=2) | |
| HP ZBook X G1i 16 | |
| Lenovo ThinkPad P1 Gen 7 21KV001SGE | |
| 2560x1440 Ultra High Preset AA:T AF:16x | |
| Dell Pro Max 16 Plus | |
| Lenovo ThinkPad P1 Gen 8 | |
| Media NVIDIA RTX PRO 2000 Blackwell Generation Laptop (32.2 - 36.5, n=2) | |
| HP ZBook X G1i 16 | |
| Lenovo ThinkPad P1 Gen 7 21KV001SGE | |
| 2560x1440 Ultra High Preset + Quality DLSS AF:16x | |
| Dell Pro Max 16 Plus | |
| HP ZBook X G1i 16 | |
| Media NVIDIA RTX PRO 2000 Blackwell Generation Laptop (n=1) | |
| Lenovo ThinkPad P1 Gen 7 21KV001SGE | |
| Dota 2 Reborn - 1920x1080 ultra (3/3) best looking | |
| Dell Pro Max 16 Plus | |
| HP ZBook Fury 16 G11 | |
| HP ZBook Studio 16 G9 62U04EA | |
| HP ZBook Studio 16 G11 | |
| Asus ExpertBook B6 Flip B6602FC2 | |
| HP ZBook X G1i 16 | |
| Media NVIDIA RTX PRO 2000 Blackwell Generation Laptop (125.7 - 141.8, n=2) | |
| Lenovo ThinkPad P1 Gen 7 21KV001SGE | |
| Lenovo ThinkPad P1 Gen 8 | |
| HP ZBook Power 16 G11 A | |
| Lenovo ThinkPad P1 G4-20Y4Z9DVUS | |
| Lenovo ThinkPad P16s Gen 4 AMD | |
| Lenovo ThinkPad P16s G2 21K9000CGE | |
Grafico Cyberpunk 2077 ultra FPS
| basso | medio | alto | ultra | QHD DLSS | QHD | 4K | |
|---|---|---|---|---|---|---|---|
| GTA V (2015) | 184.4 | 179.9 | 175 | 119.3 | 97.2 | ||
| Dota 2 Reborn (2015) | 149.2 | 137.2 | 132.5 | 125.7 | 103.5 | ||
| Final Fantasy XV Benchmark (2018) | 204 | 142.7 | 106.5 | 79.4 | |||
| X-Plane 11.11 (2018) | 108.6 | 91 | 76.3 | 58.7 | |||
| Strange Brigade (2018) | 502 | 281 | 229 | 199.8 | 142.4 | ||
| Baldur's Gate 3 (2023) | 132.2 | 116.4 | 101.4 | 102 | 101.3 | 69.9 | |
| Cyberpunk 2077 (2023) | 124 | 101.5 | 86.4 | 77.8 | 57.9 | 48.9 | |
| F1 24 (2024) | 250 | 229 | 185.2 | 57.2 | 36.5 |
Emissioni
Rumore del sistema
Le ventole sono silenziose durante la navigazione o l'esecuzione di carichi non impegnativi e rimangono silenziose a soli 27 dB(A) durante lo streaming, anche quando sono impostate sulla modalità Performance. Il massimo di 48 dB(A) può essere raggiunto quando si gioca o quando la CPU e la GPU vengono sollecitate per lunghi periodi.
Rumorosità
| Idle |
| 23.1 / 23.1 / 23.1 dB(A) |
| Sotto carico |
| 27.3 / 47.9 dB(A) |
 | ||
30 dB silenzioso 40 dB(A) udibile 50 dB(A) rumoroso |
||
min: | ||
| Lenovo ThinkPad P1 Gen 8 Ultra 7 255H, RTX PRO 2000 Blackwell Generation Laptop | Lenovo ThinkPad P16s Gen 4 AMD Ryzen AI 9 HX 370, Radeon 890M | Lenovo ThinkPad P1 Gen 7 21KV001SGE Ultra 7 155H, GeForce RTX 4060 Laptop GPU | HP ZBook X G1i 16 Ultra 7 265H, RTX PRO 2000 Blackwell Generation Laptop | Dell Pro Max 16 Plus Ultra 9 285HX, RTX PRO 5000 Blackwell Generation Laptop | Asus ExpertBook B6 Flip B6602FC2 i9-12950HX, RTX A2000 Laptop GPU | |
|---|---|---|---|---|---|---|
| Noise | -20% | -17% | -5% | -26% | -39% | |
| off /ambiente * (dB) | 23.1 | 25.9 -12% | 24.7 -7% | 23.7 -3% | 23.2 -0% | 26 -13% |
| Idle Minimum * (dB) | 23.1 | 25.9 -12% | 24.7 -7% | 23.7 -3% | 26.7 -16% | 32.4 -40% |
| Idle Average * (dB) | 23.1 | 25.9 -12% | 24.7 -7% | 23.7 -3% | 30.5 -32% | 32.4 -40% |
| Idle Maximum * (dB) | 23.1 | 28.5 -23% | 24.7 -7% | 23.7 -3% | 34 -47% | 32.4 -40% |
| Load Average * (dB) | 27.3 | 42.9 -57% | 43.7 -60% | 32.7 -20% | 39.8 -46% | 51.9 -90% |
| Load Maximum * (dB) | 47.9 | 48.5 -1% | 53.3 -11% | 48 -0% | 54.3 -13% | 52.1 -9% |
| Cyberpunk 2077 ultra * (dB) | 48.7 | 53.2 | 50.9 | 54.3 |
* ... Meglio usare valori piccoli
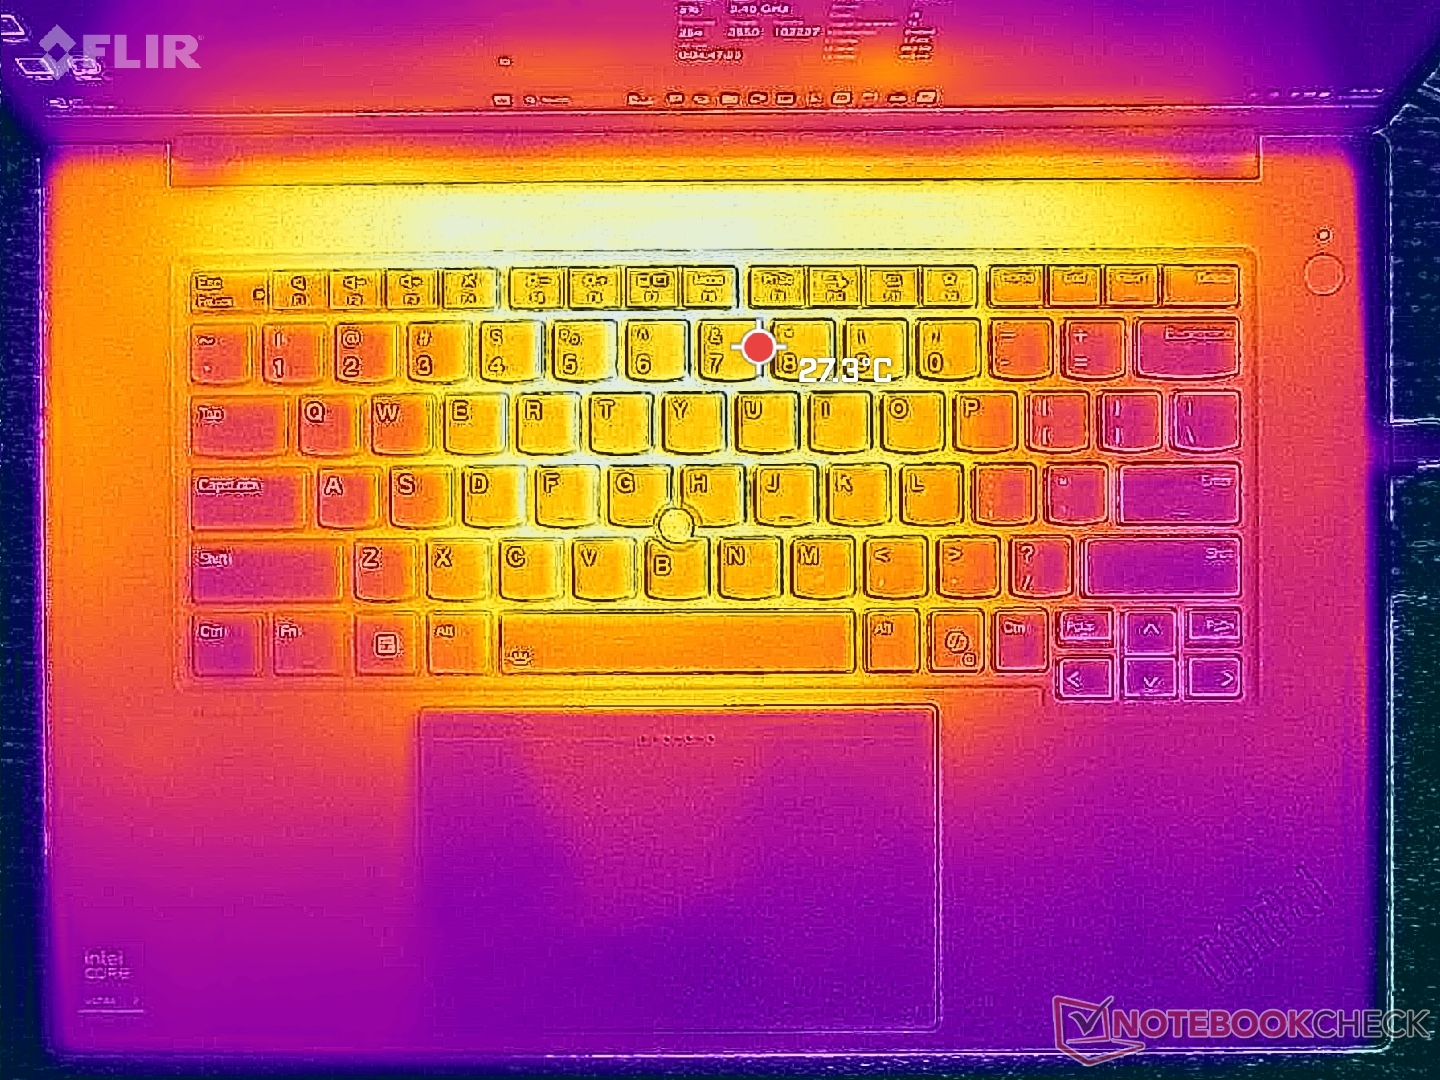
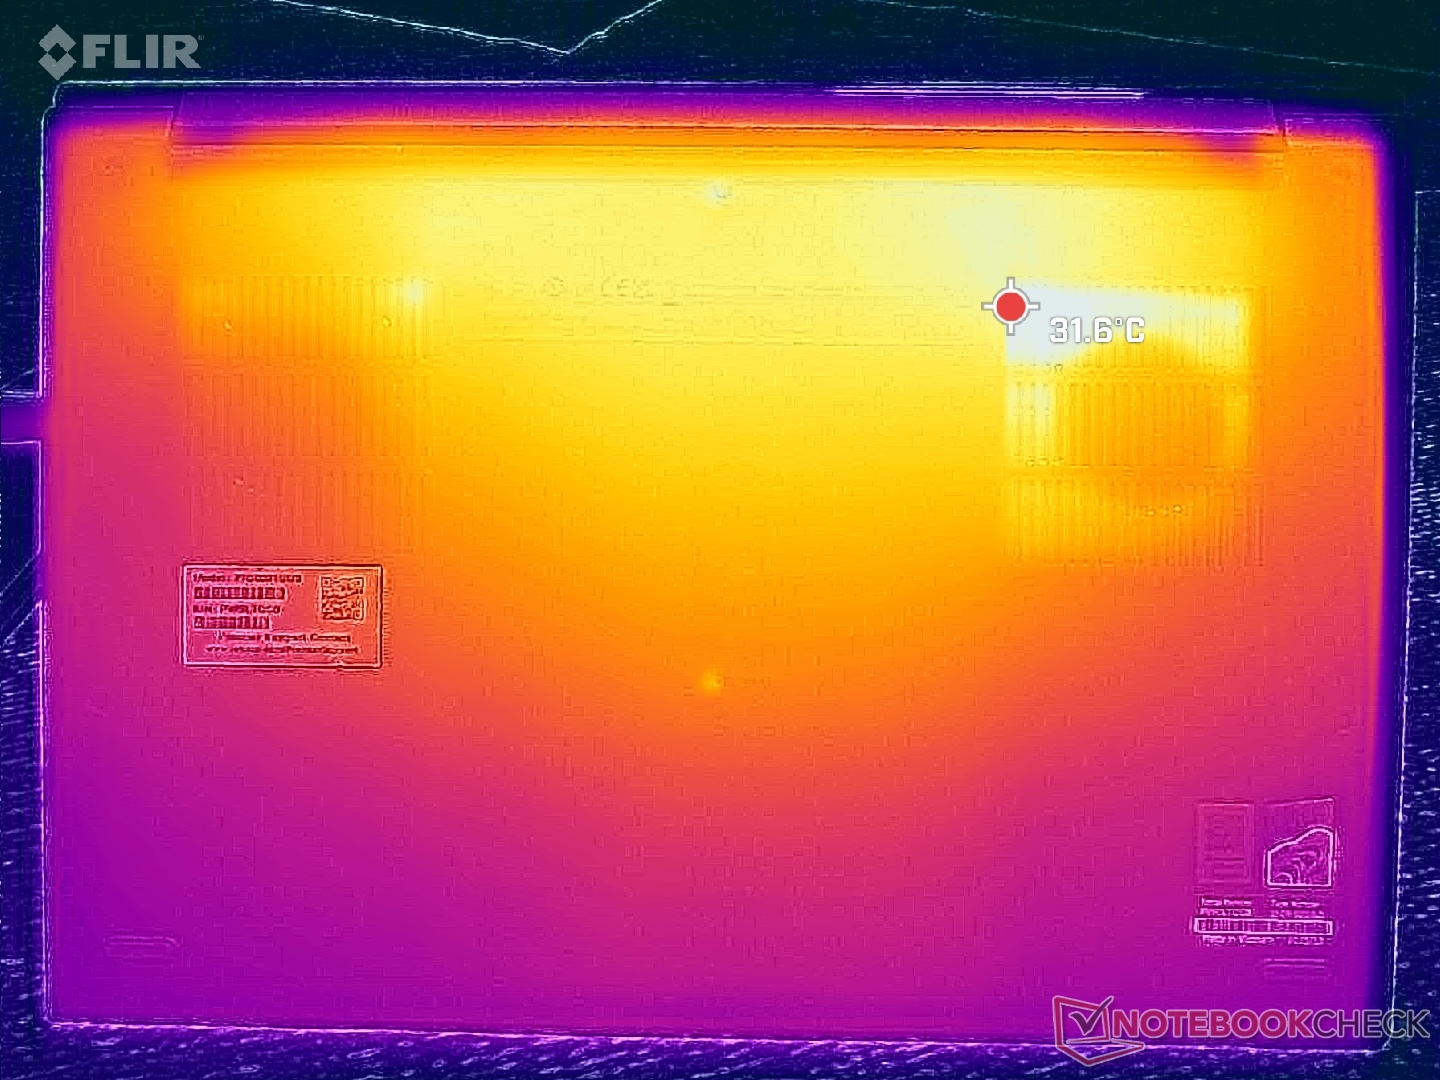
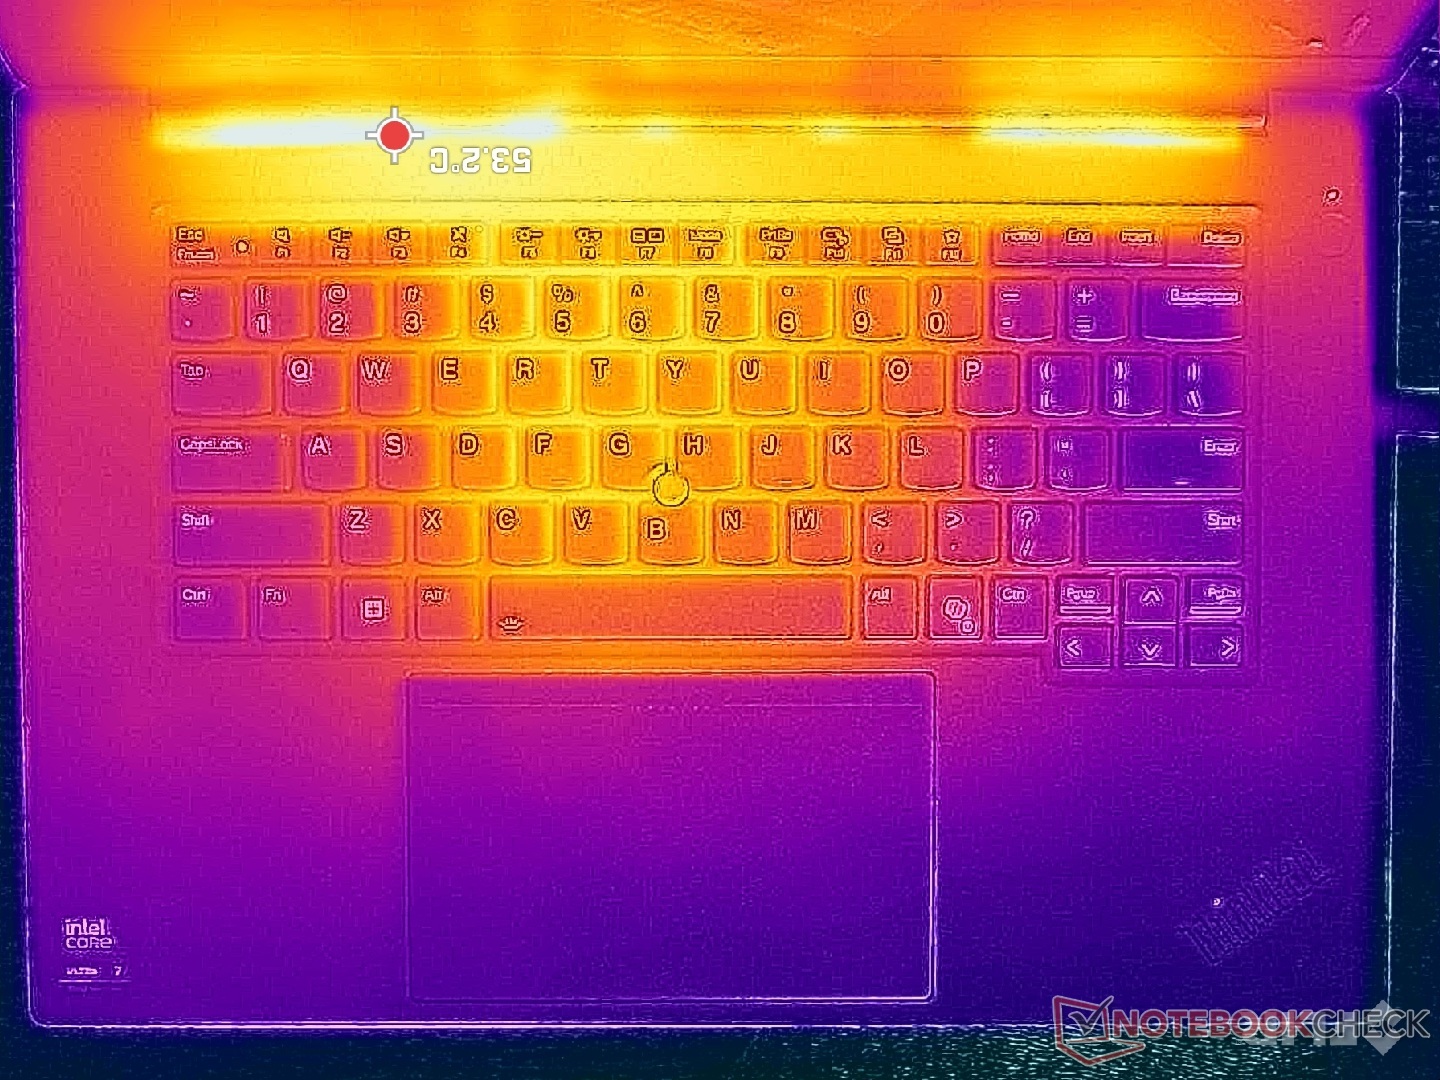
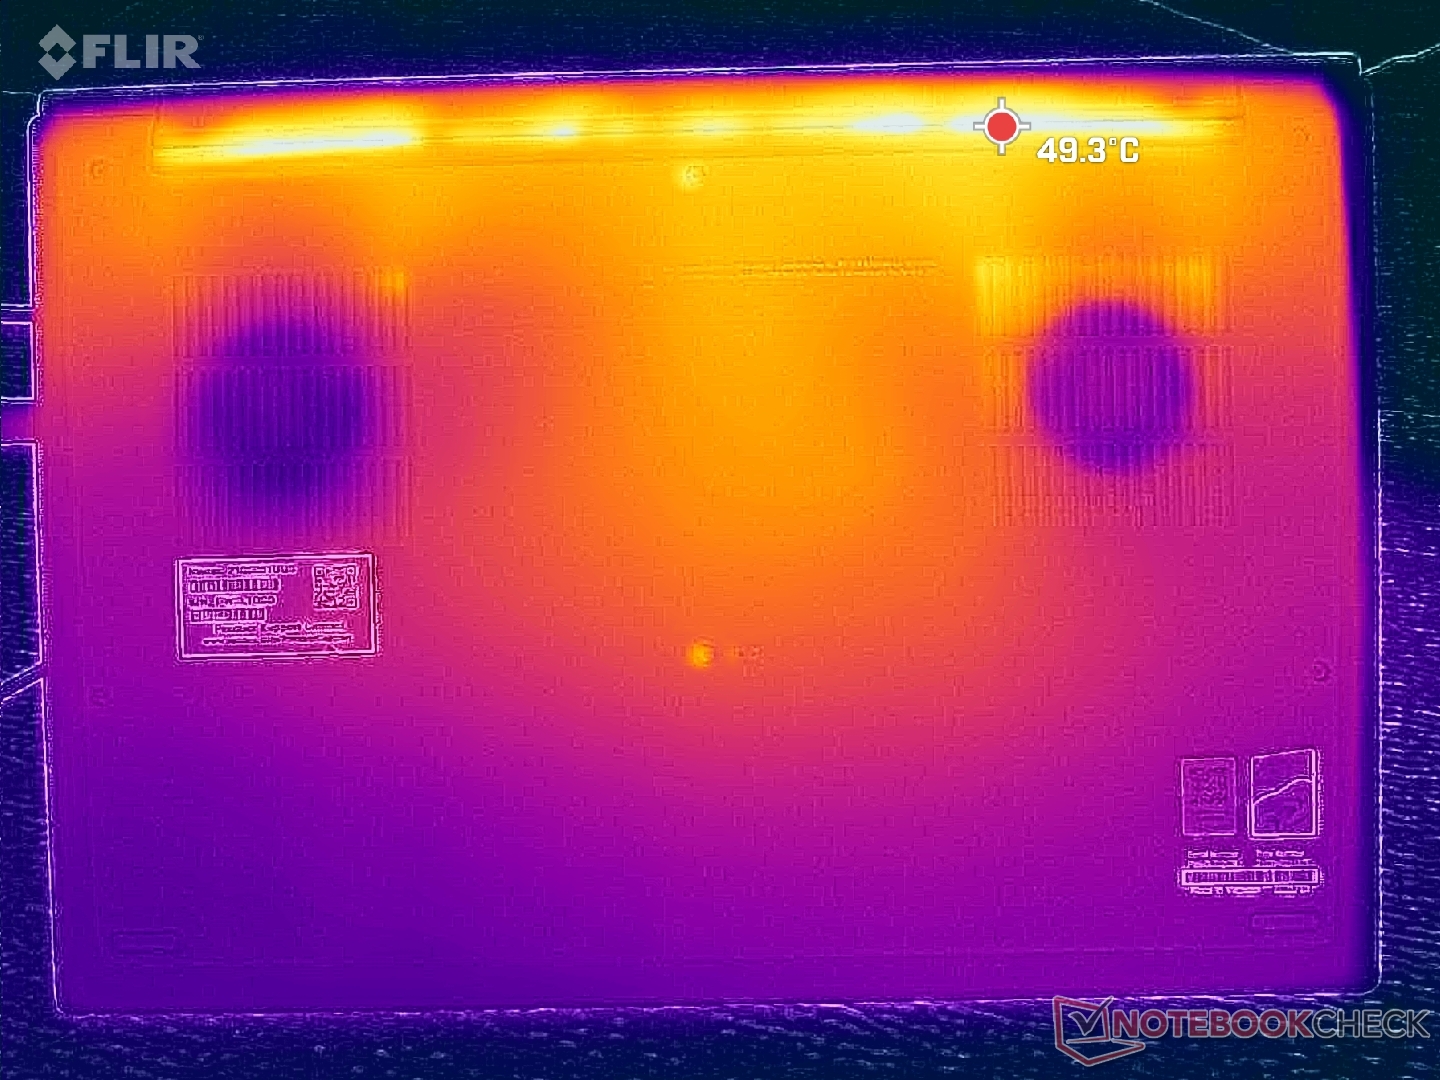
Temperatura
Lo sviluppo della temperatura superficiale è simmetrico, con punti caldi vicino al centro della tastiera che raggiungono i 40 C - 45 C quando si eseguono carichi molto impegnativi come Prime95 o FurMark. I risultati sono più freddi del previsto, considerando il design sottile dello chassis. Il ThinkPad P1 Gen 7 dello scorso anno raggiungeva temperature superficiali più calde in confronto, probabilmente a causa della sua potenza di 170 W più elevata.
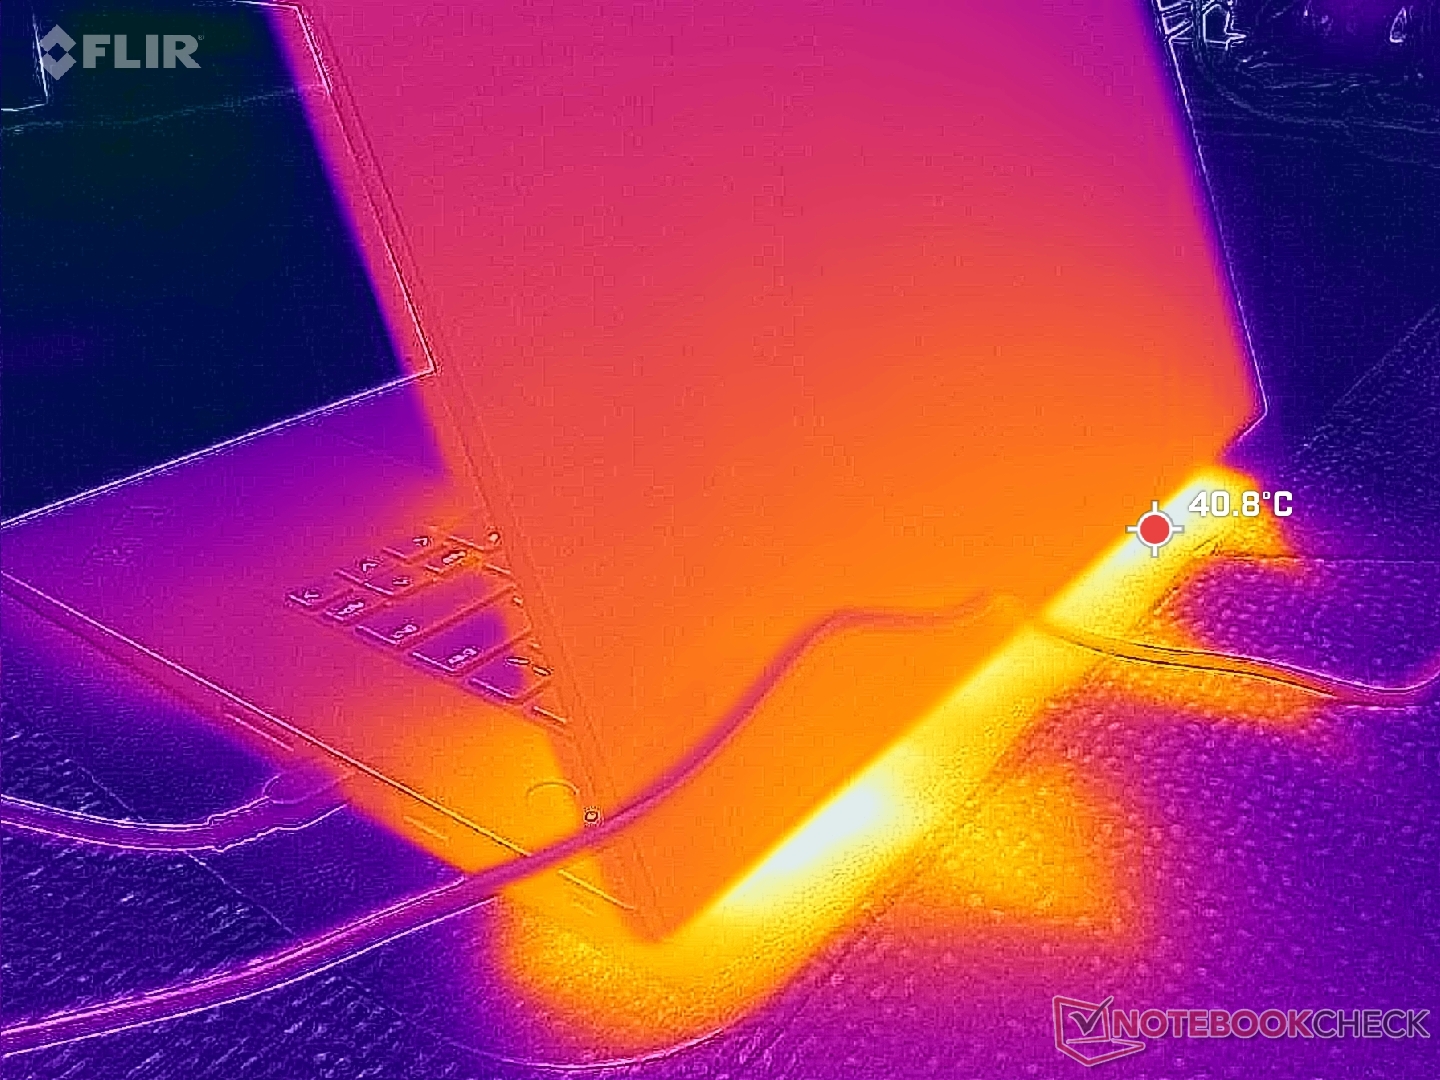
(±) La temperatura massima sul lato superiore è di 45 °C / 113 F, rispetto alla media di 38.2 °C / 101 F, che varia da 22.2 a 69.8 °C per questa classe Workstation.
(+) Il lato inferiore si riscalda fino ad un massimo di 33 °C / 91 F, rispetto alla media di 41.1 °C / 106 F
(+) In idle, la temperatura media del lato superiore è di 26 °C / 79 F, rispetto alla media deld ispositivo di 32 °C / 90 F.
(+) I poggiapolsi e il touchpad sono piu' freddi della temperatura della pelle con un massimo di 23.2 °C / 73.8 F e sono quindi freddi al tatto.
(+) La temperatura media della zona del palmo della mano di dispositivi simili e'stata di 27.8 °C / 82 F (+4.6 °C / 8.2 F).
| Lenovo ThinkPad P1 Gen 8 Ultra 7 255H, RTX PRO 2000 Blackwell Generation Laptop | Lenovo ThinkPad P16s Gen 4 AMD Ryzen AI 9 HX 370, Radeon 890M | Lenovo ThinkPad P1 Gen 7 21KV001SGE Ultra 7 155H, GeForce RTX 4060 Laptop GPU | HP ZBook X G1i 16 Ultra 7 265H, RTX PRO 2000 Blackwell Generation Laptop | Dell Pro Max 16 Plus Ultra 9 285HX, RTX PRO 5000 Blackwell Generation Laptop | Asus ExpertBook B6 Flip B6602FC2 i9-12950HX, RTX A2000 Laptop GPU | |
|---|---|---|---|---|---|---|
| Heat | -29% | -1% | 0% | -10% | -13% | |
| Maximum Upper Side * (°C) | 45 | 50.6 -12% | 50.3 -12% | 36 20% | 40.4 10% | 48.4 -8% |
| Maximum Bottom * (°C) | 33 | 54.3 -65% | 38 -15% | 39.4 -19% | 45.6 -38% | 52.3 -58% |
| Idle Upper Side * (°C) | 30.6 | 35.3 -15% | 28.3 8% | 30.4 1% | 32.8 -7% | 27.8 9% |
| Idle Bottom * (°C) | 31.6 | 38.5 -22% | 27.3 14% | 31.8 -1% | 33 -4% | 30.3 4% |
* ... Meglio usare valori piccoli
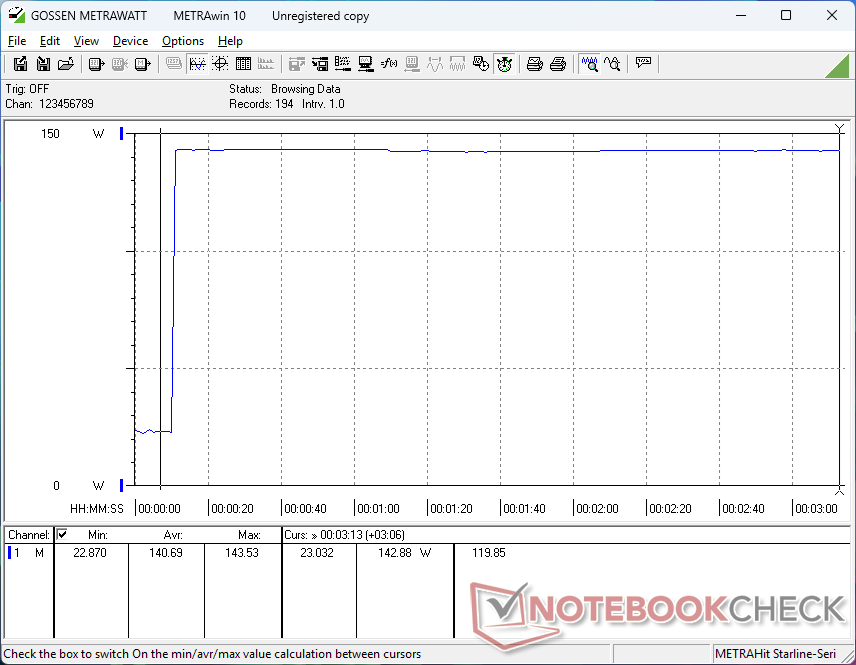
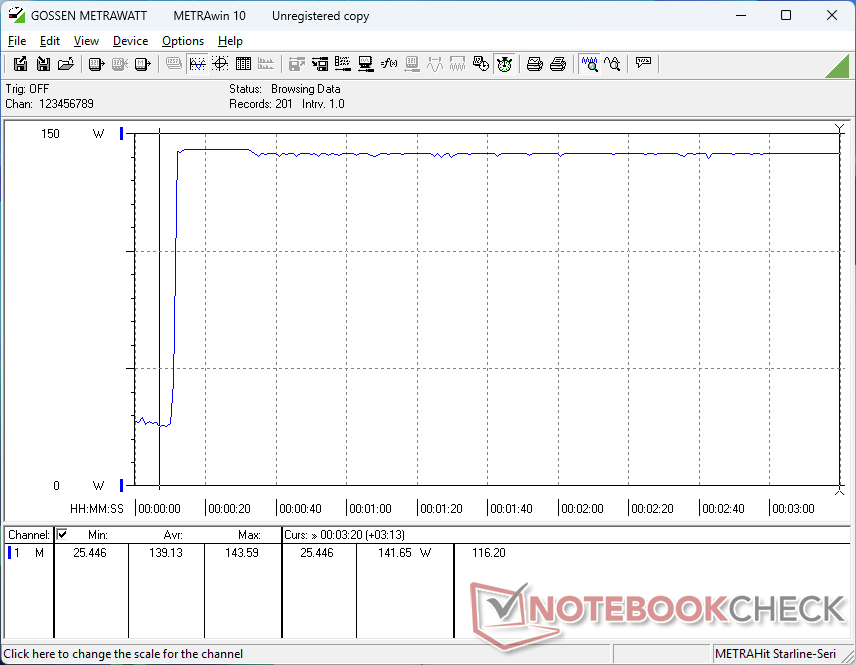
Test da sforzo
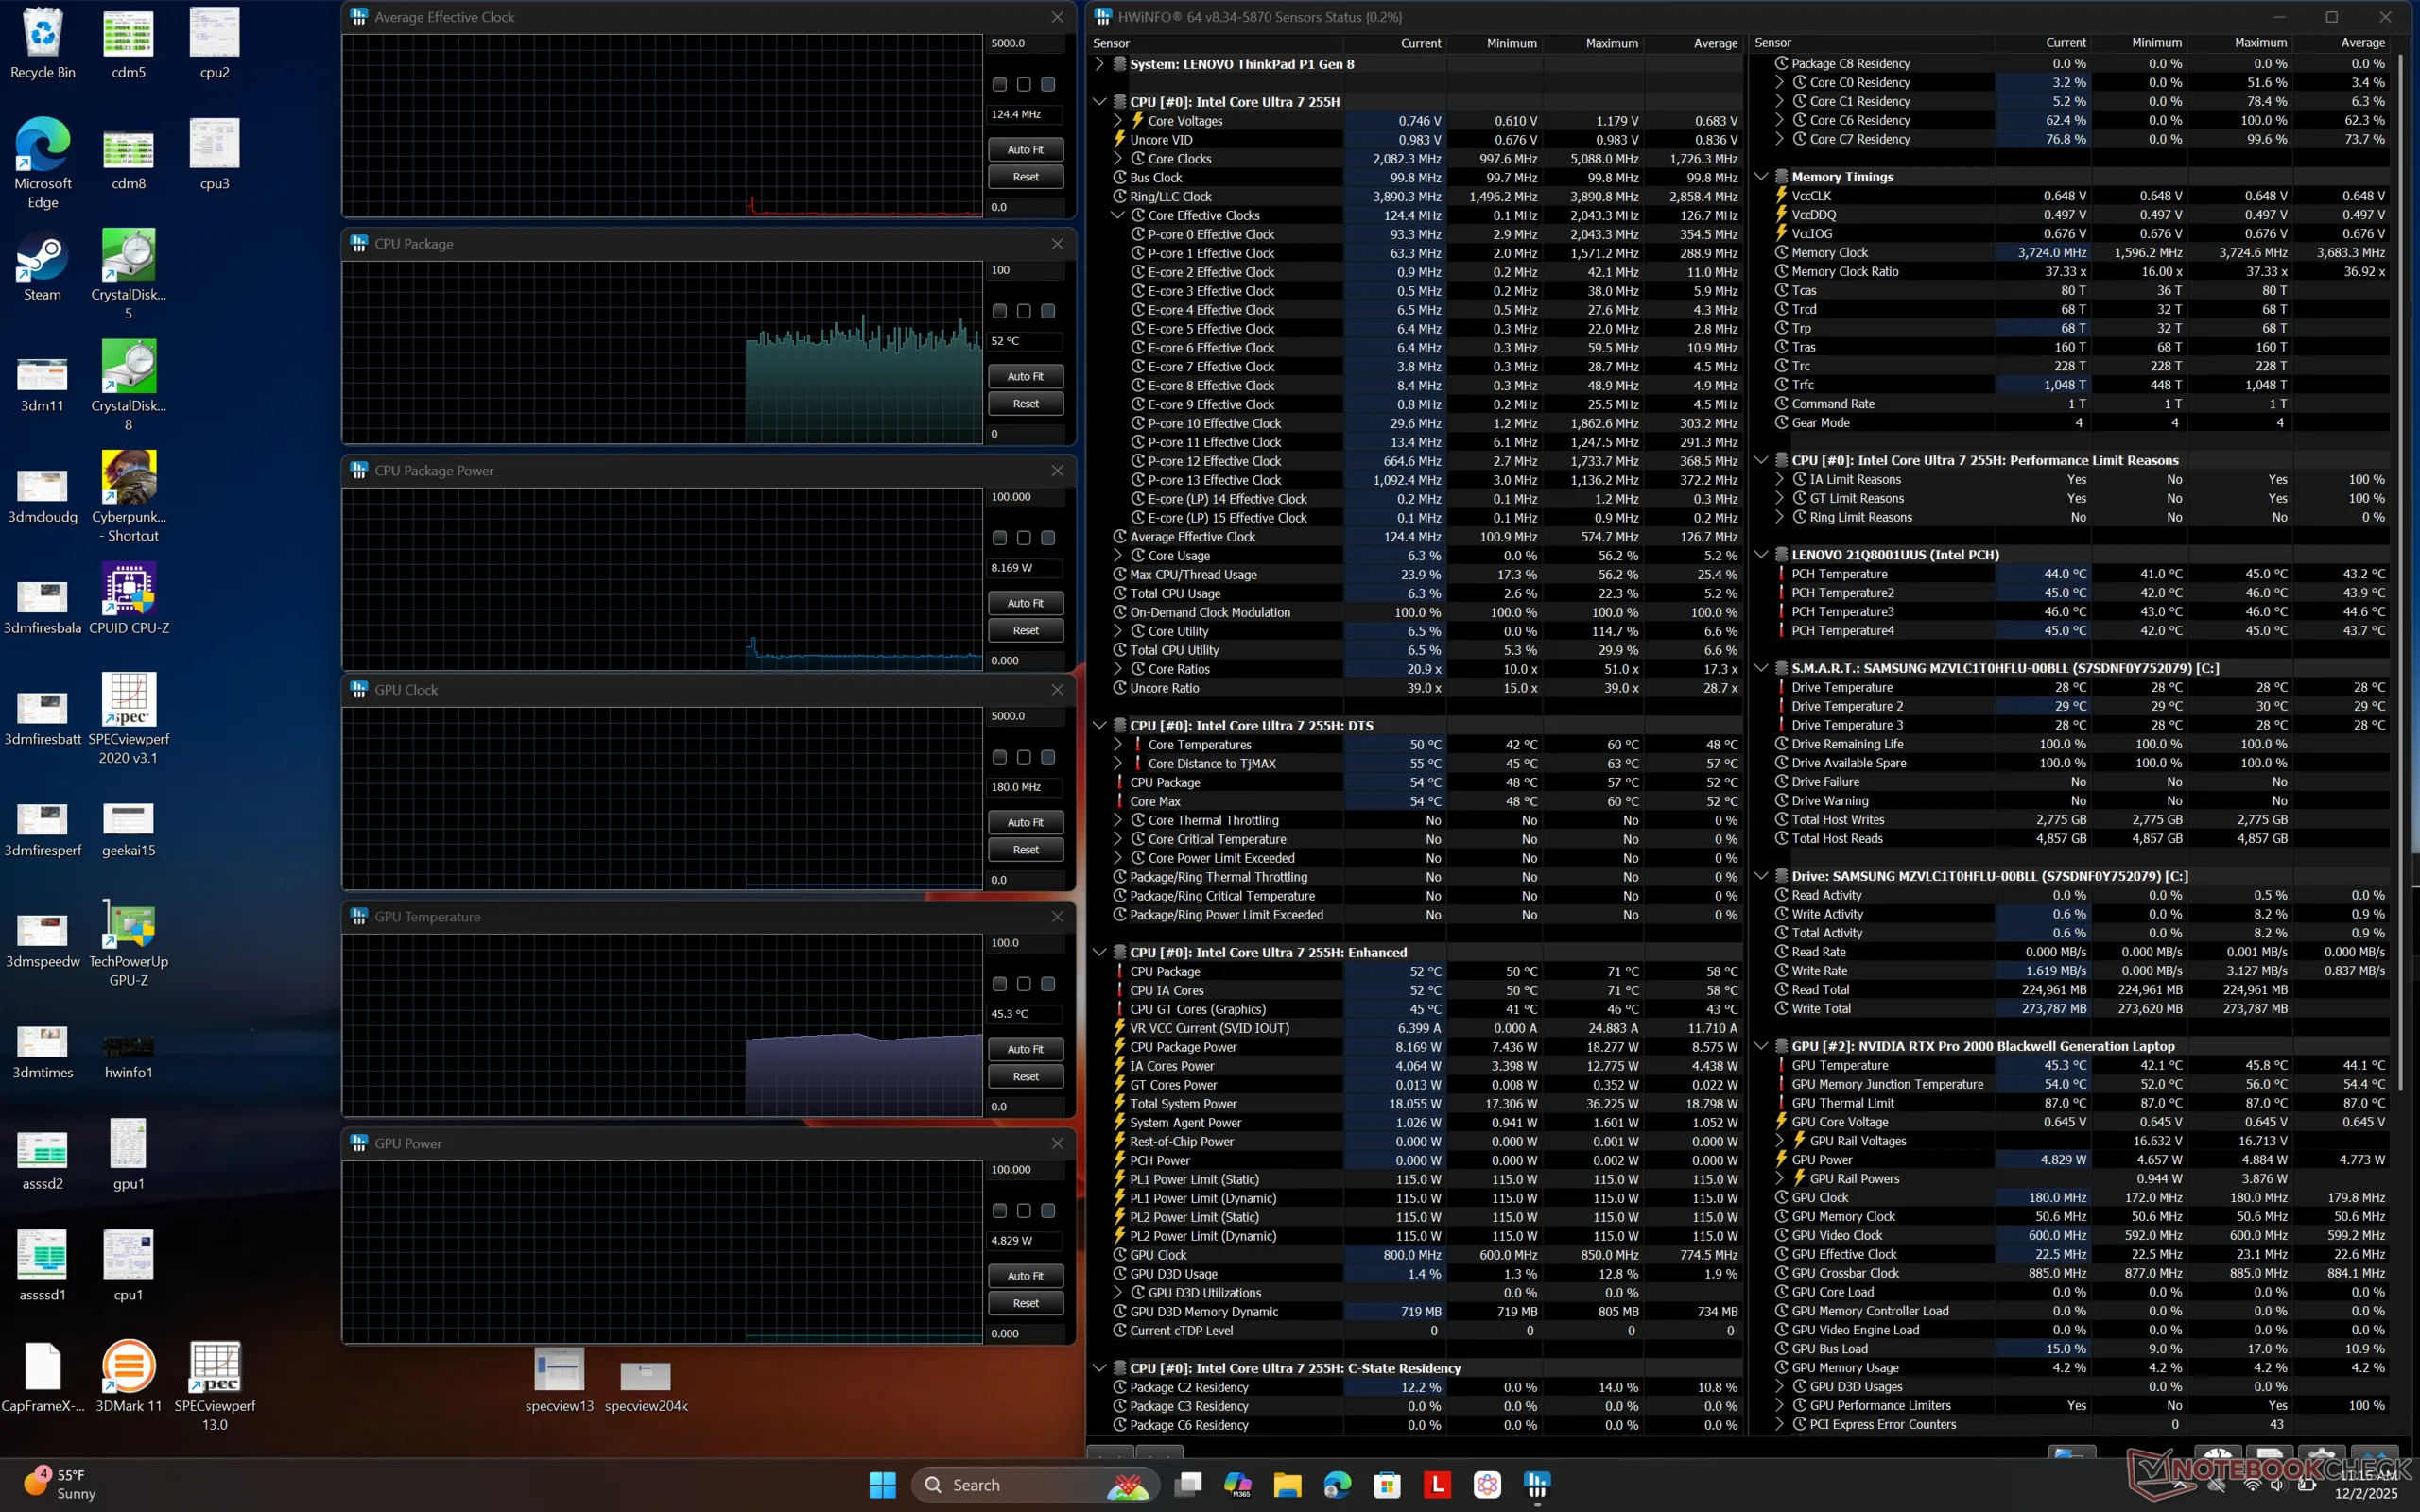
La CPU raggiunge i 3,8 GHz, 120 W e 100 C quando si avvia lo stress Prime95, prima di scendere leggermente e stabilizzarsi a 3,6 GHz e 101 W per mantenere una temperatura del core più gestibile di 91 C. L'assorbimento di potenza della scheda GPU salta da 63 W a quasi 70 W quando si passa dalla modalità Bilanciata a quella Prestazioni, per cui suggeriamo di eseguire l'operazione in modalità Prestazioni, nonostante le temperature del core leggermente più elevate di ~75 C. Il clock della memoria della GPU, in particolare, salta da 1125 MHz a 1375 MHz quando si passa alla modalità Prestazioni.
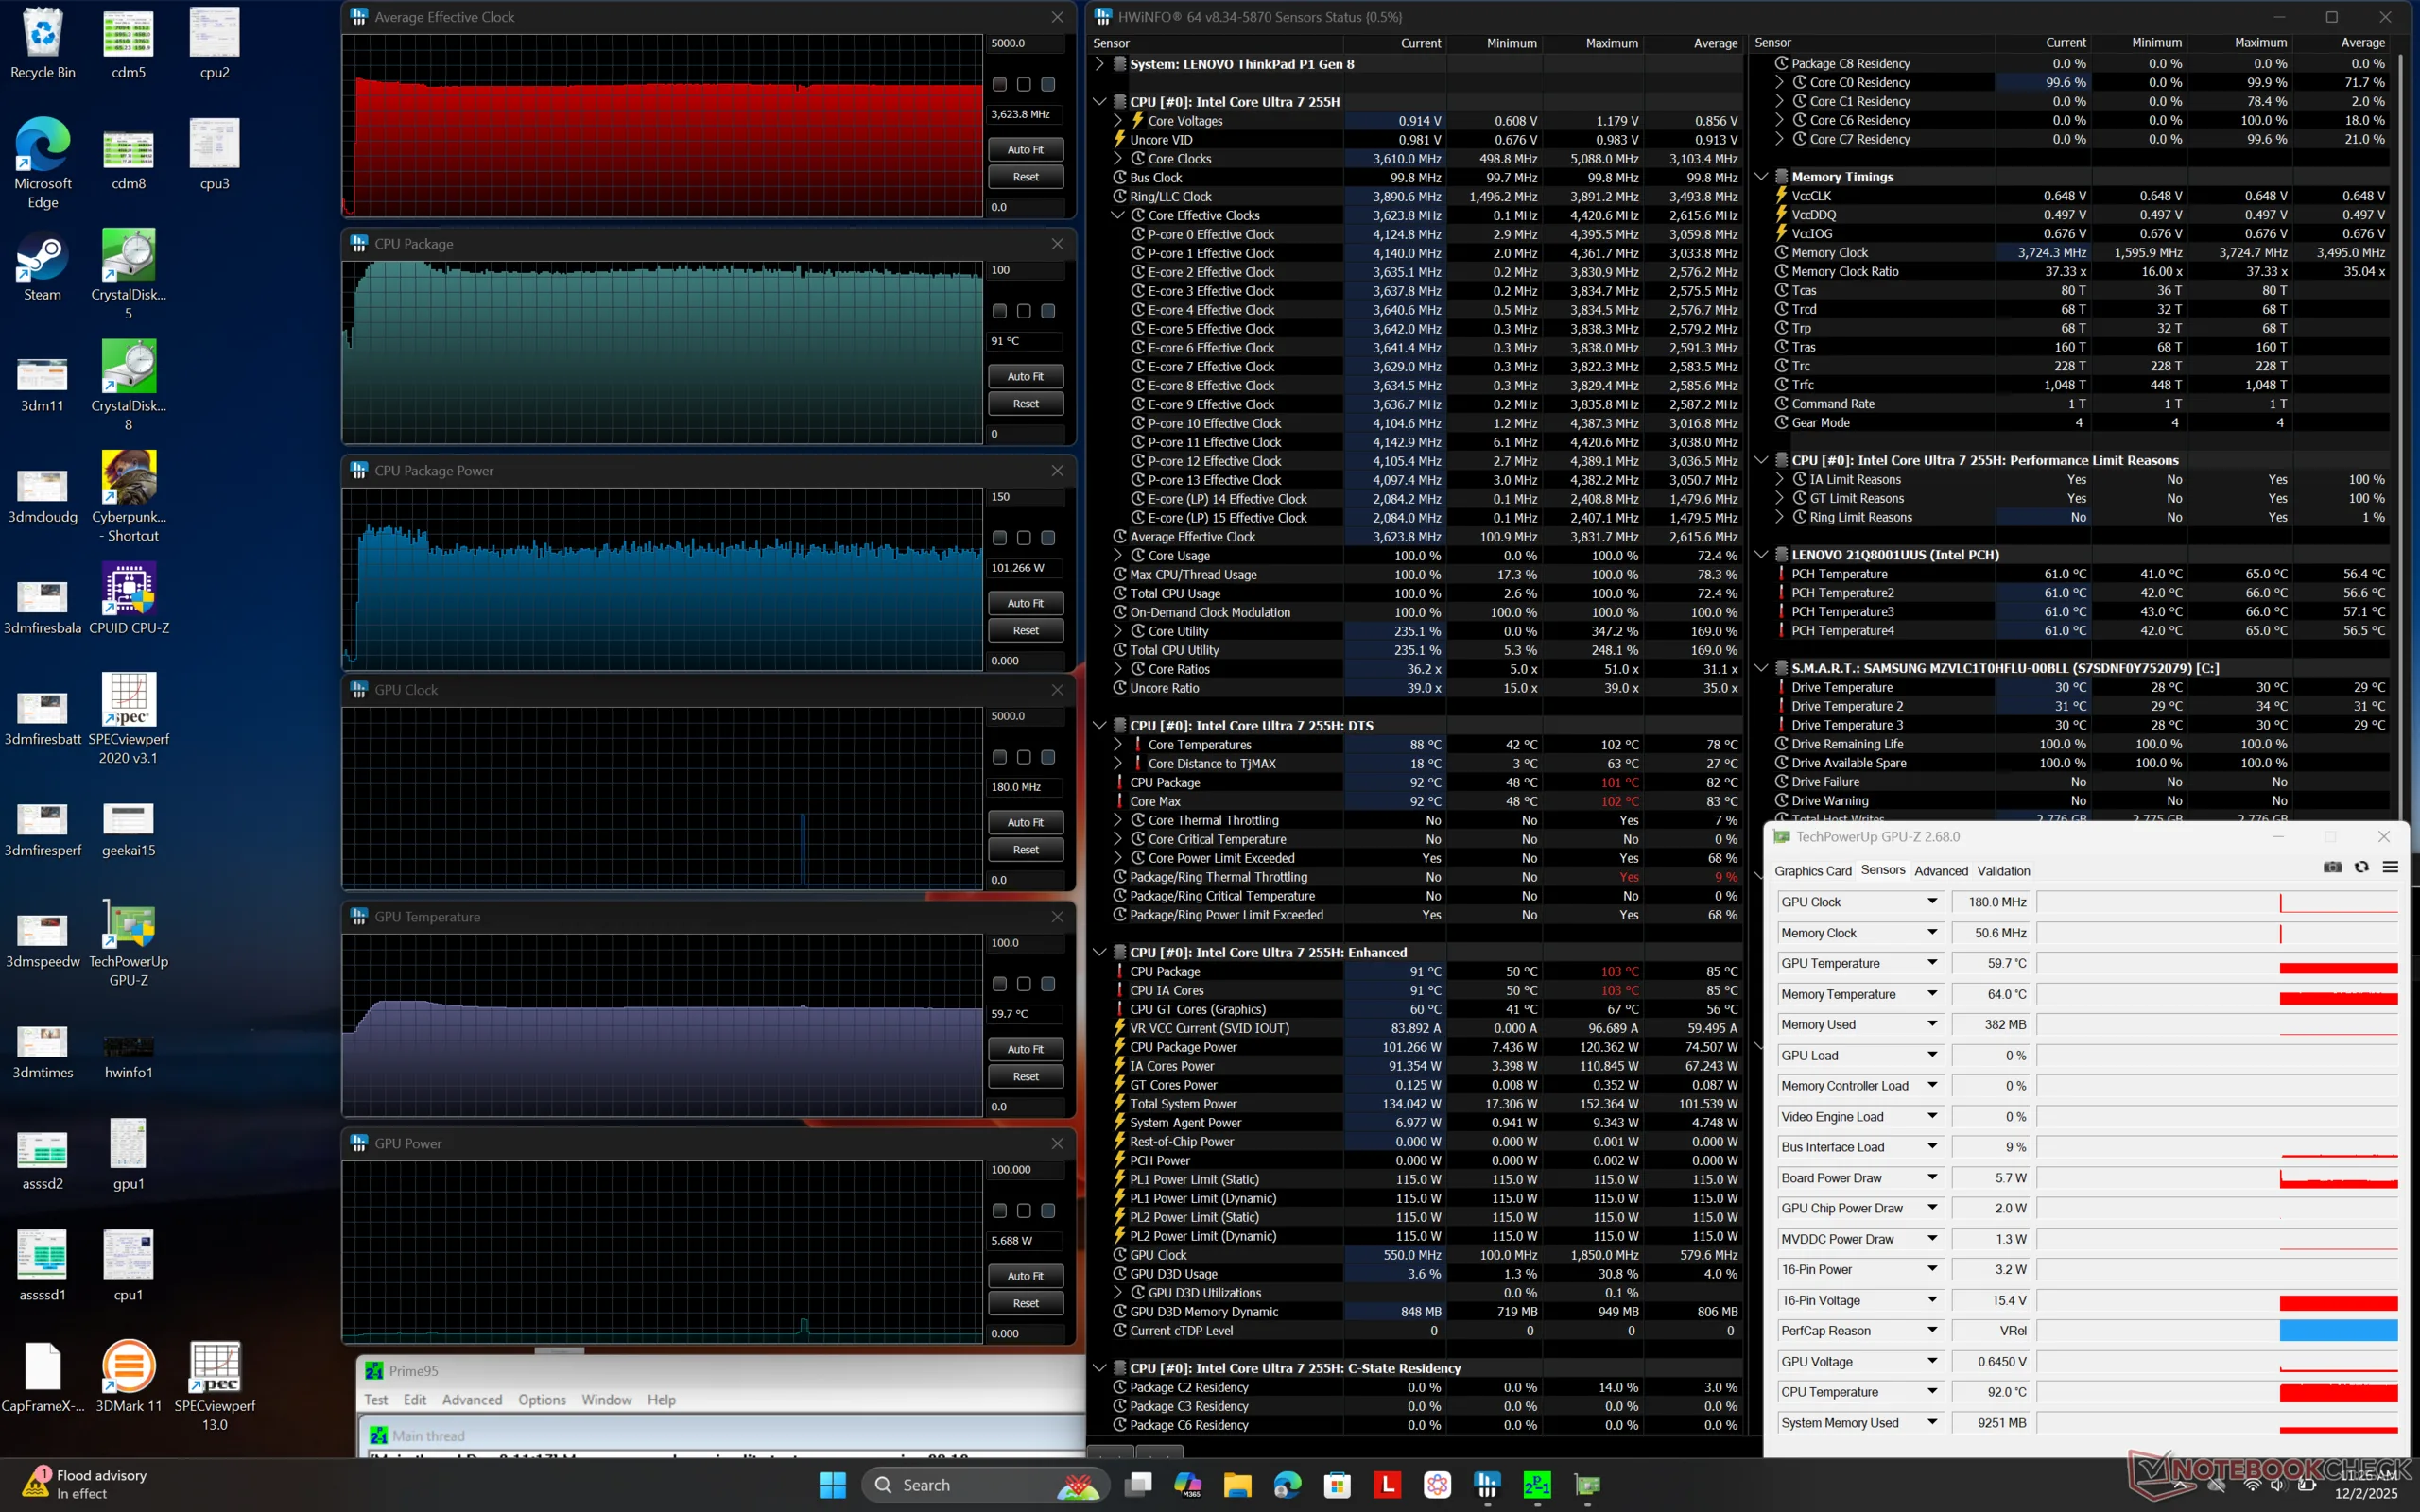
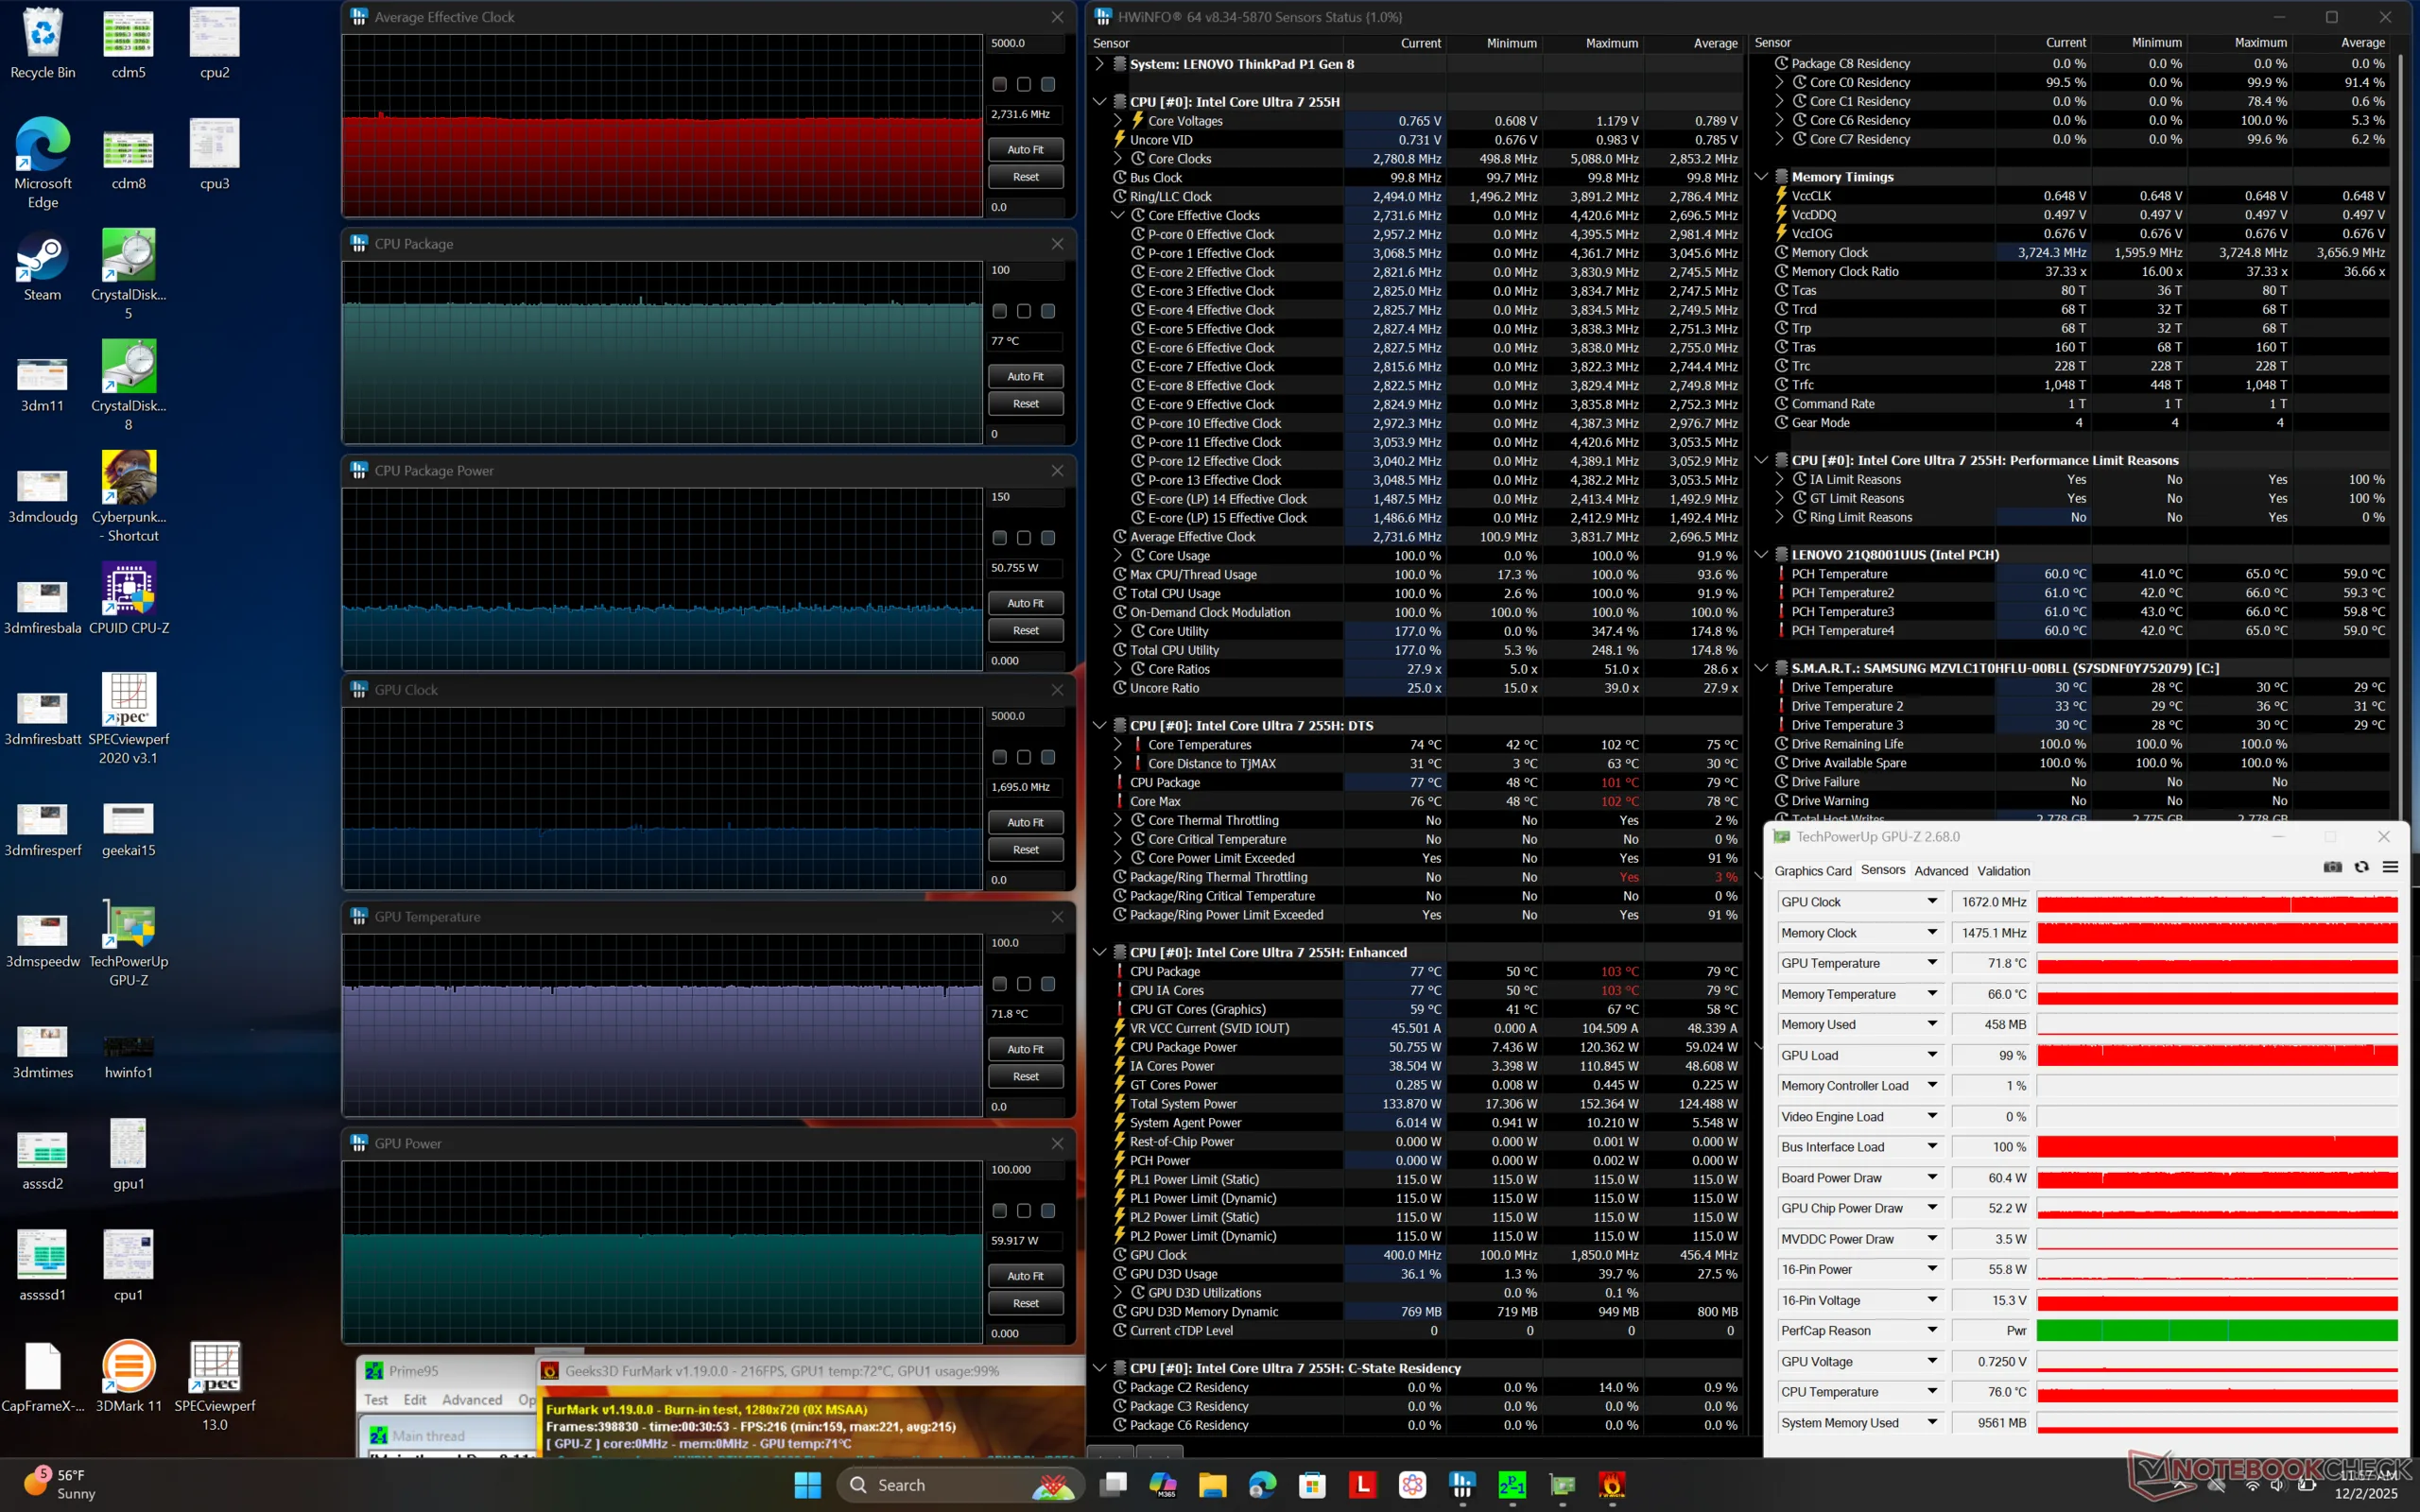
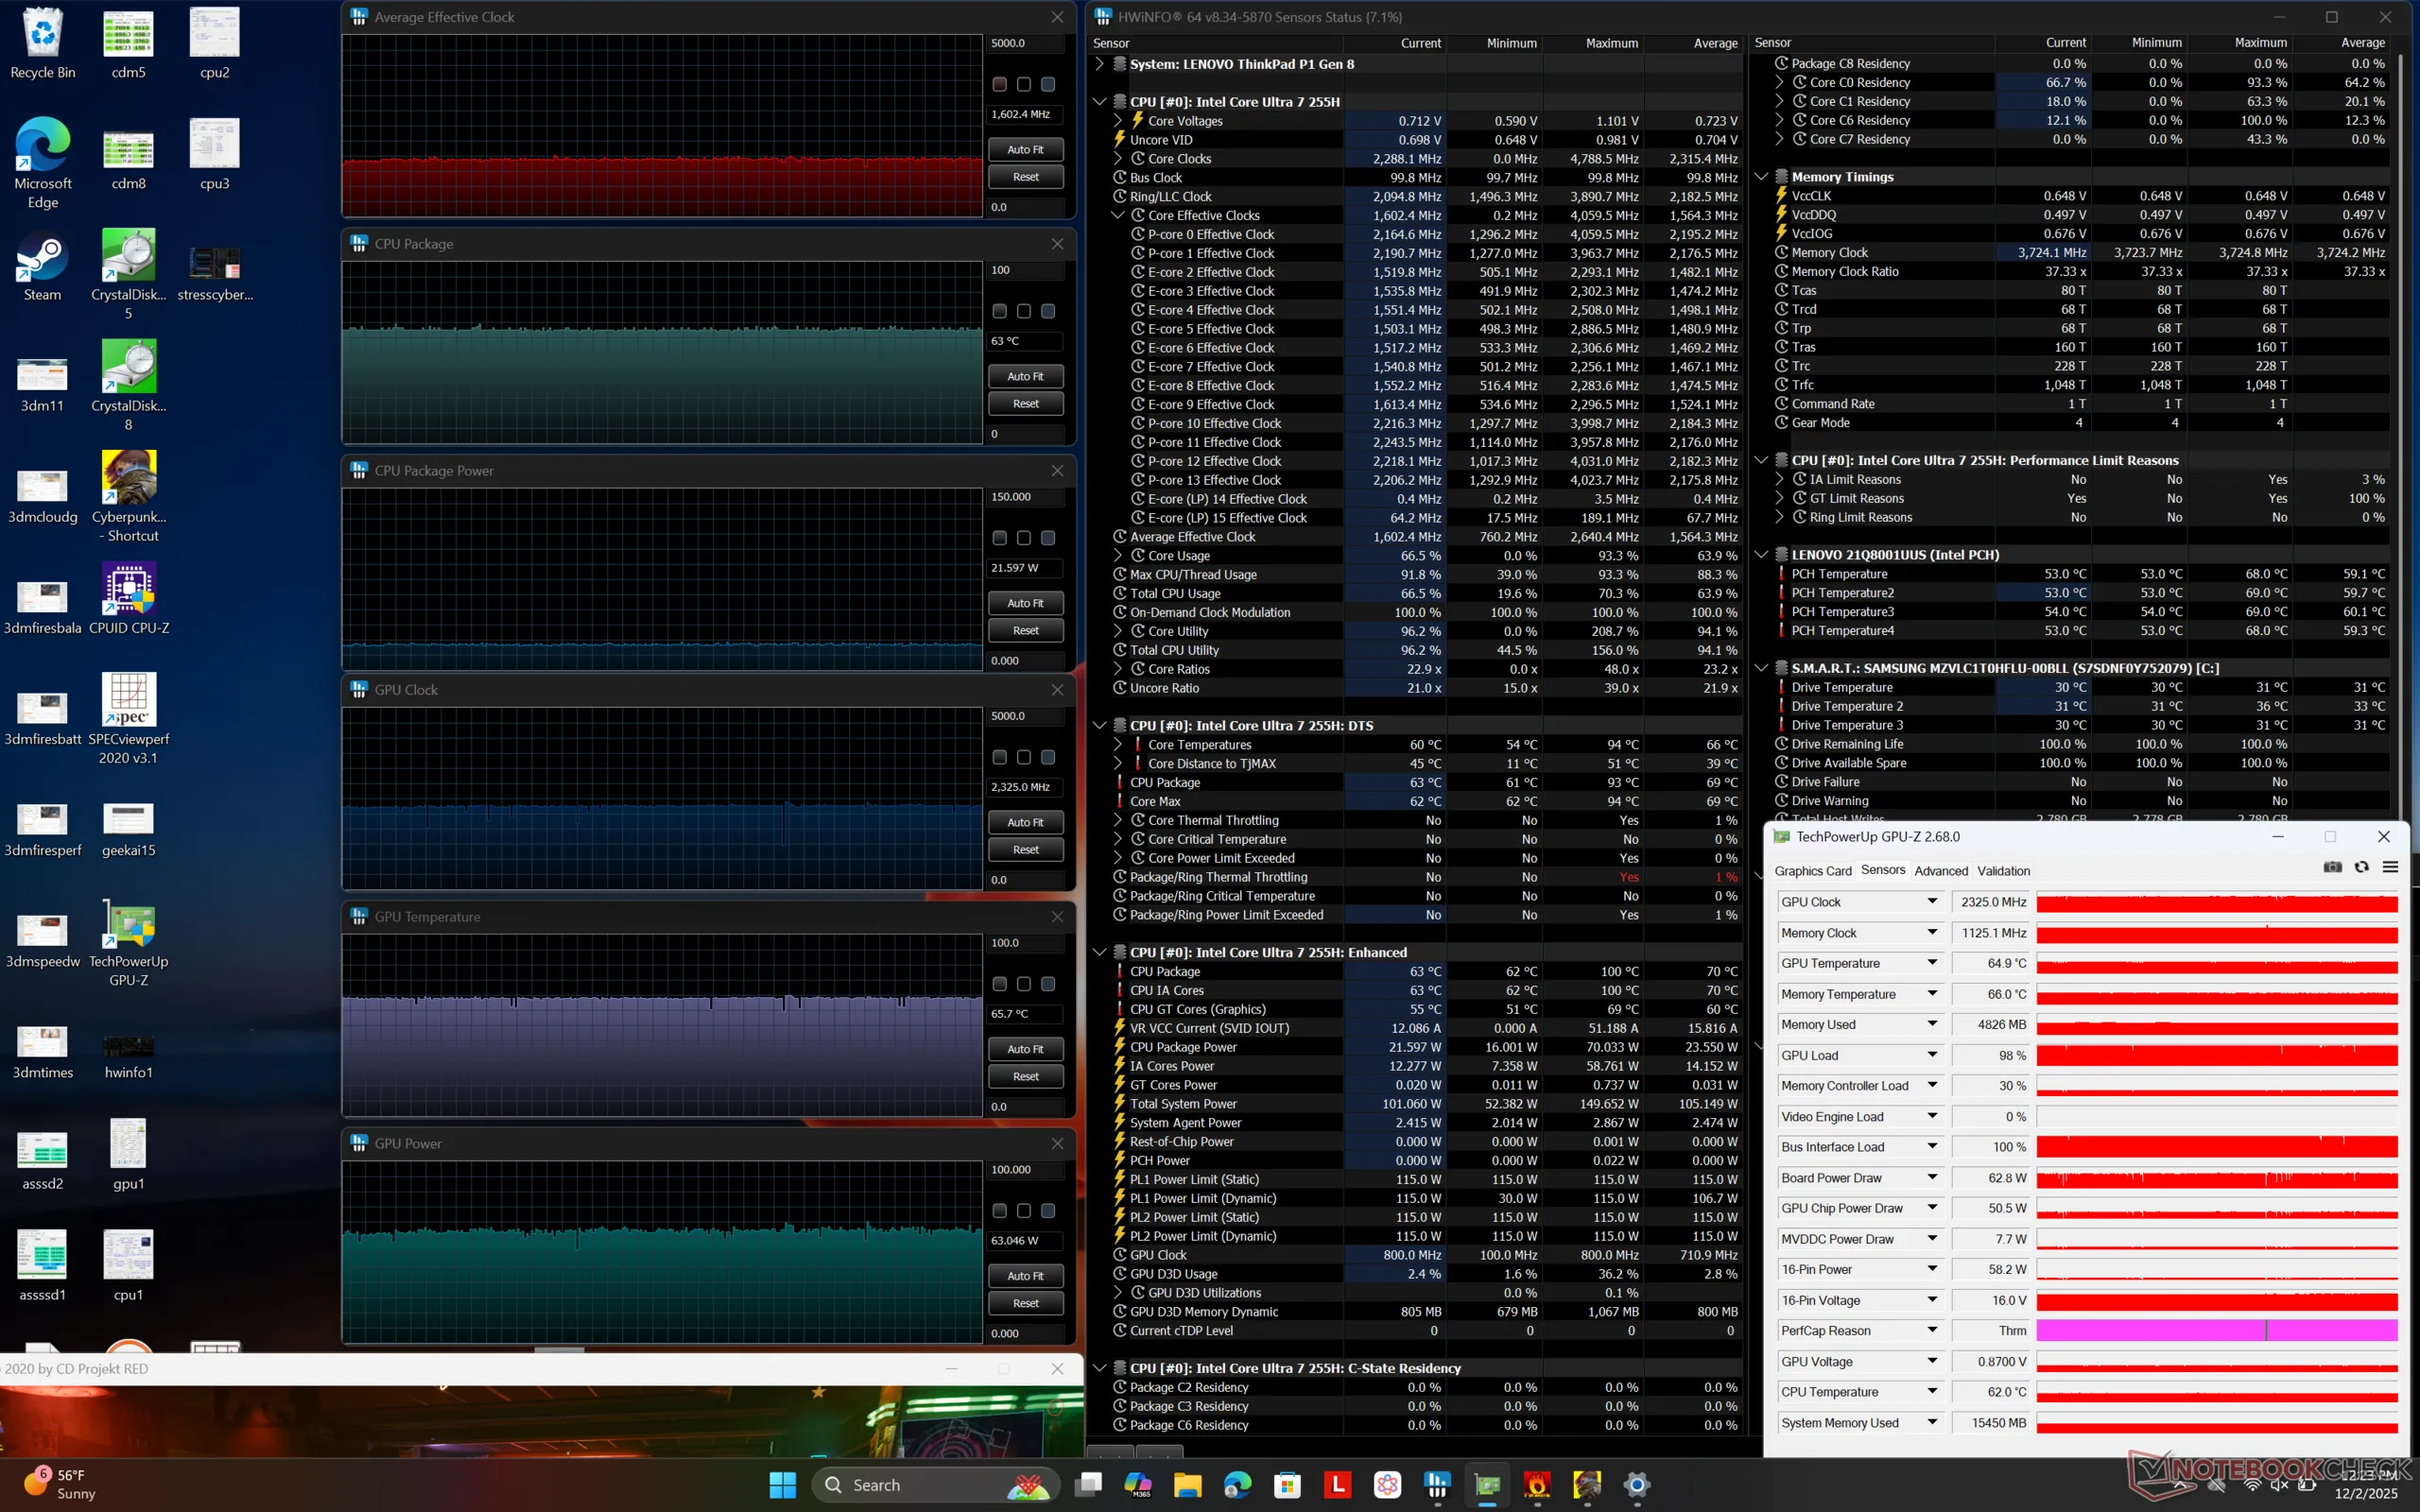
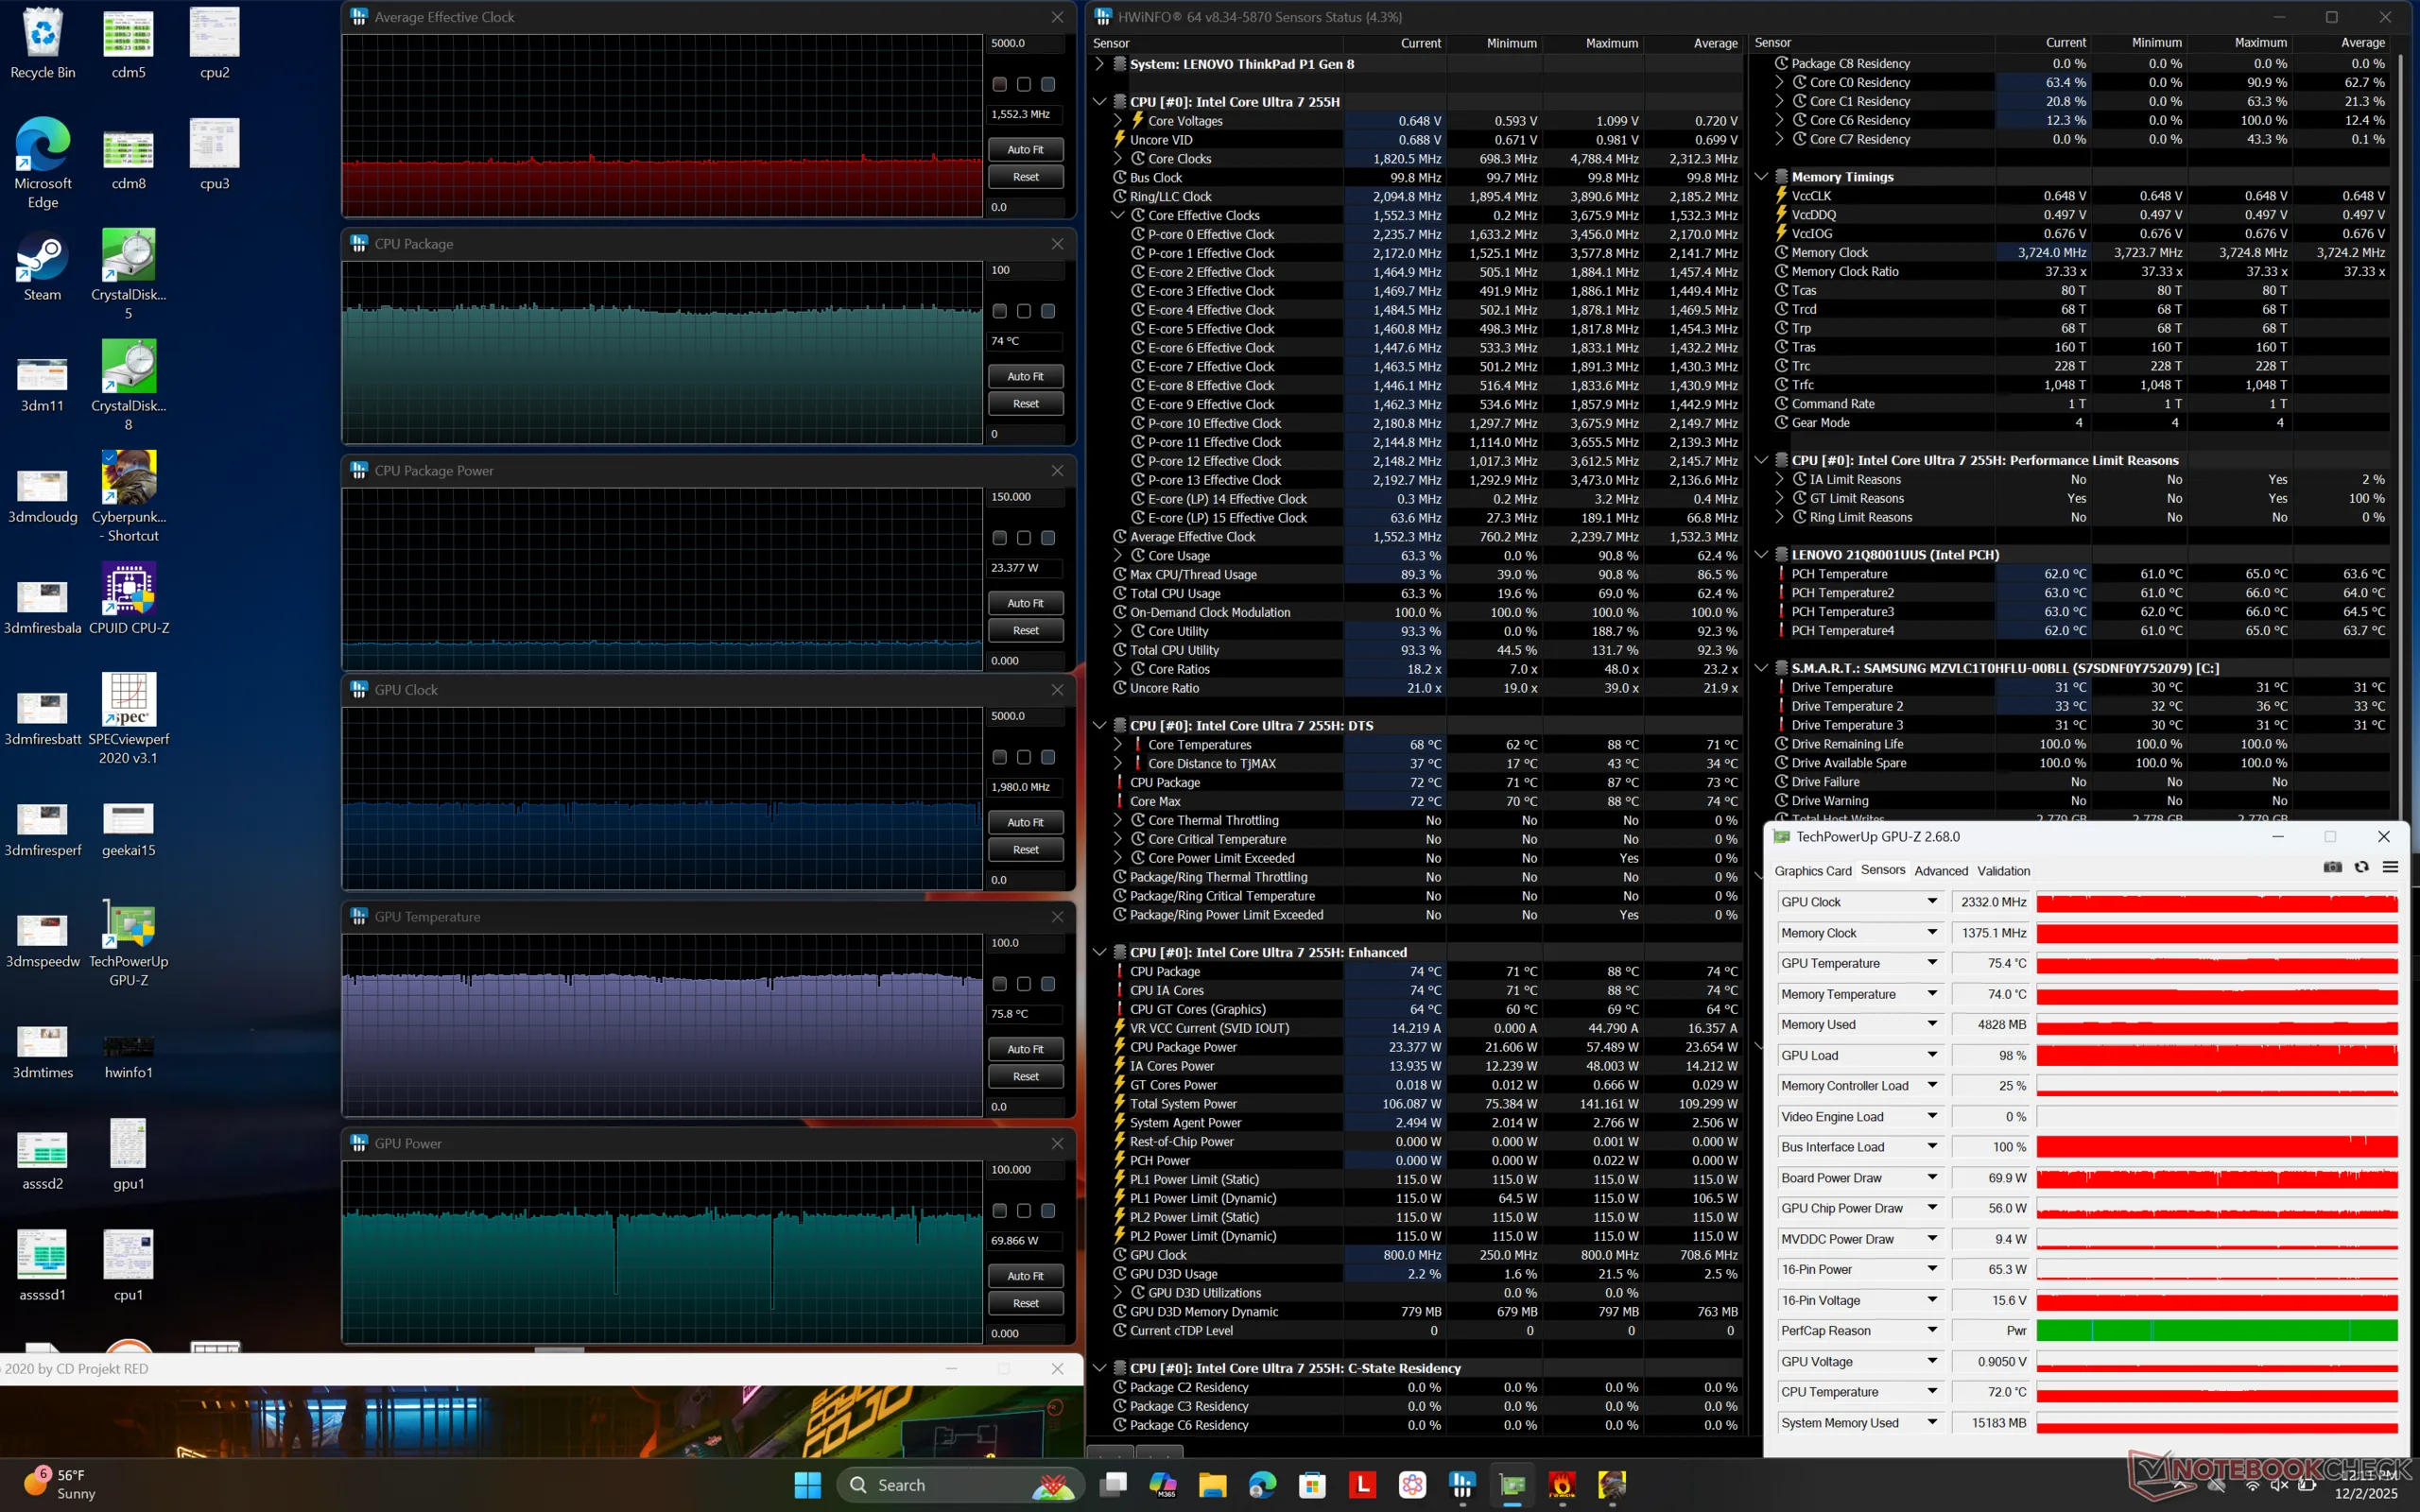
| Clock della CPU (GHz) | Clock della GPU (MHz) | Temperatura media della CPU (°C) | Temperatura media della GPU (°C) | |
| Sistema inattivo | -- | -- | 52 | 45 |
| Stress Prime95 | 3,6 | -- | 91 | 60 |
| Prime95 + FurMark Stress | 2,7 | 1672 | 77 | 72 |
| Cyberpunk 2077 Stress (modalità Bilanciata) | 1,6 | 2325 | 63 | 66 |
| Cyberpunk 2077 Stress (modalità Performance) | 1,6 | 2332 | 74 | 76 |
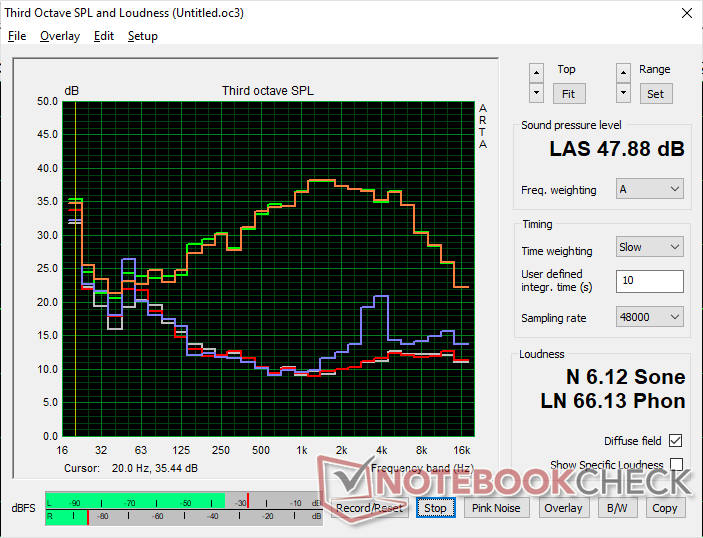
Altoparlanti
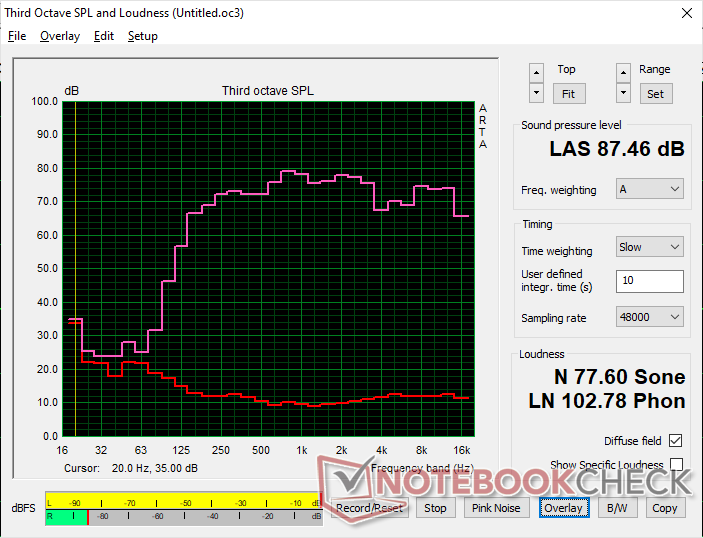
Lenovo ThinkPad P1 Gen 8 analisi audio
(+) | gli altoparlanti sono relativamente potenti (87.5 dB)
Bassi 100 - 315 Hz
(±) | bassi ridotti - in media 9.8% inferiori alla media
(±) | la linearità dei bassi è media (11.2% delta rispetto alla precedente frequenza)
Medi 400 - 2000 Hz
(+) | medi bilanciati - solo only 2.9% rispetto alla media
(+) | medi lineari (2.8% delta rispetto alla precedente frequenza)
Alti 2 - 16 kHz
(+) | Alti bilanciati - appena 3% dalla media
(+) | alti lineari (4.7% delta rispetto alla precedente frequenza)
Nel complesso 100 - 16.000 Hz
(+) | suono nel complesso lineare (8.3% differenza dalla media)
Rispetto alla stessa classe
» 1% di tutti i dispositivi testati in questa classe è stato migliore, 1% simile, 97% peggiore
» Il migliore ha avuto un delta di 7%, medio di 17%, peggiore di 35%
Rispetto a tutti i dispositivi testati
» 2% di tutti i dispositivi testati in questa classe è stato migliore, 1% similare, 98% peggiore
» Il migliore ha avuto un delta di 4%, medio di 24%, peggiore di 134%
Apple MacBook Pro 16 2021 M1 Pro analisi audio
(+) | gli altoparlanti sono relativamente potenti (84.7 dB)
Bassi 100 - 315 Hz
(+) | bassi buoni - solo 3.8% dalla media
(+) | bassi in lineaa (5.2% delta rispetto alla precedente frequenza)
Medi 400 - 2000 Hz
(+) | medi bilanciati - solo only 1.3% rispetto alla media
(+) | medi lineari (2.1% delta rispetto alla precedente frequenza)
Alti 2 - 16 kHz
(+) | Alti bilanciati - appena 1.9% dalla media
(+) | alti lineari (2.7% delta rispetto alla precedente frequenza)
Nel complesso 100 - 16.000 Hz
(+) | suono nel complesso lineare (4.6% differenza dalla media)
Rispetto alla stessa classe
» 0% di tutti i dispositivi testati in questa classe è stato migliore, 0% simile, 100% peggiore
» Il migliore ha avuto un delta di 5%, medio di 17%, peggiore di 45%
Rispetto a tutti i dispositivi testati
» 0% di tutti i dispositivi testati in questa classe è stato migliore, 0% similare, 100% peggiore
» Il migliore ha avuto un delta di 4%, medio di 24%, peggiore di 134%
Gestione dell'energia
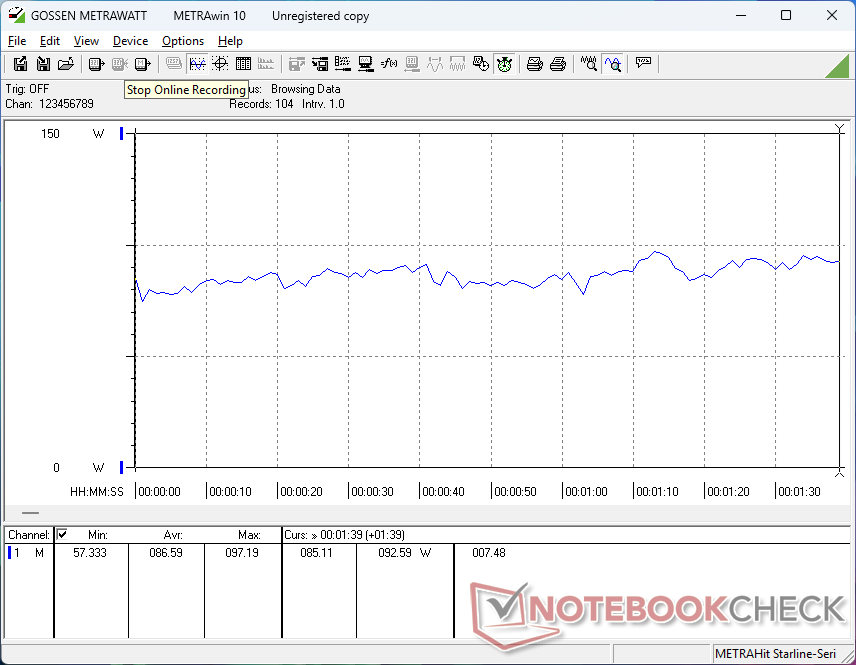
Consumo di energia
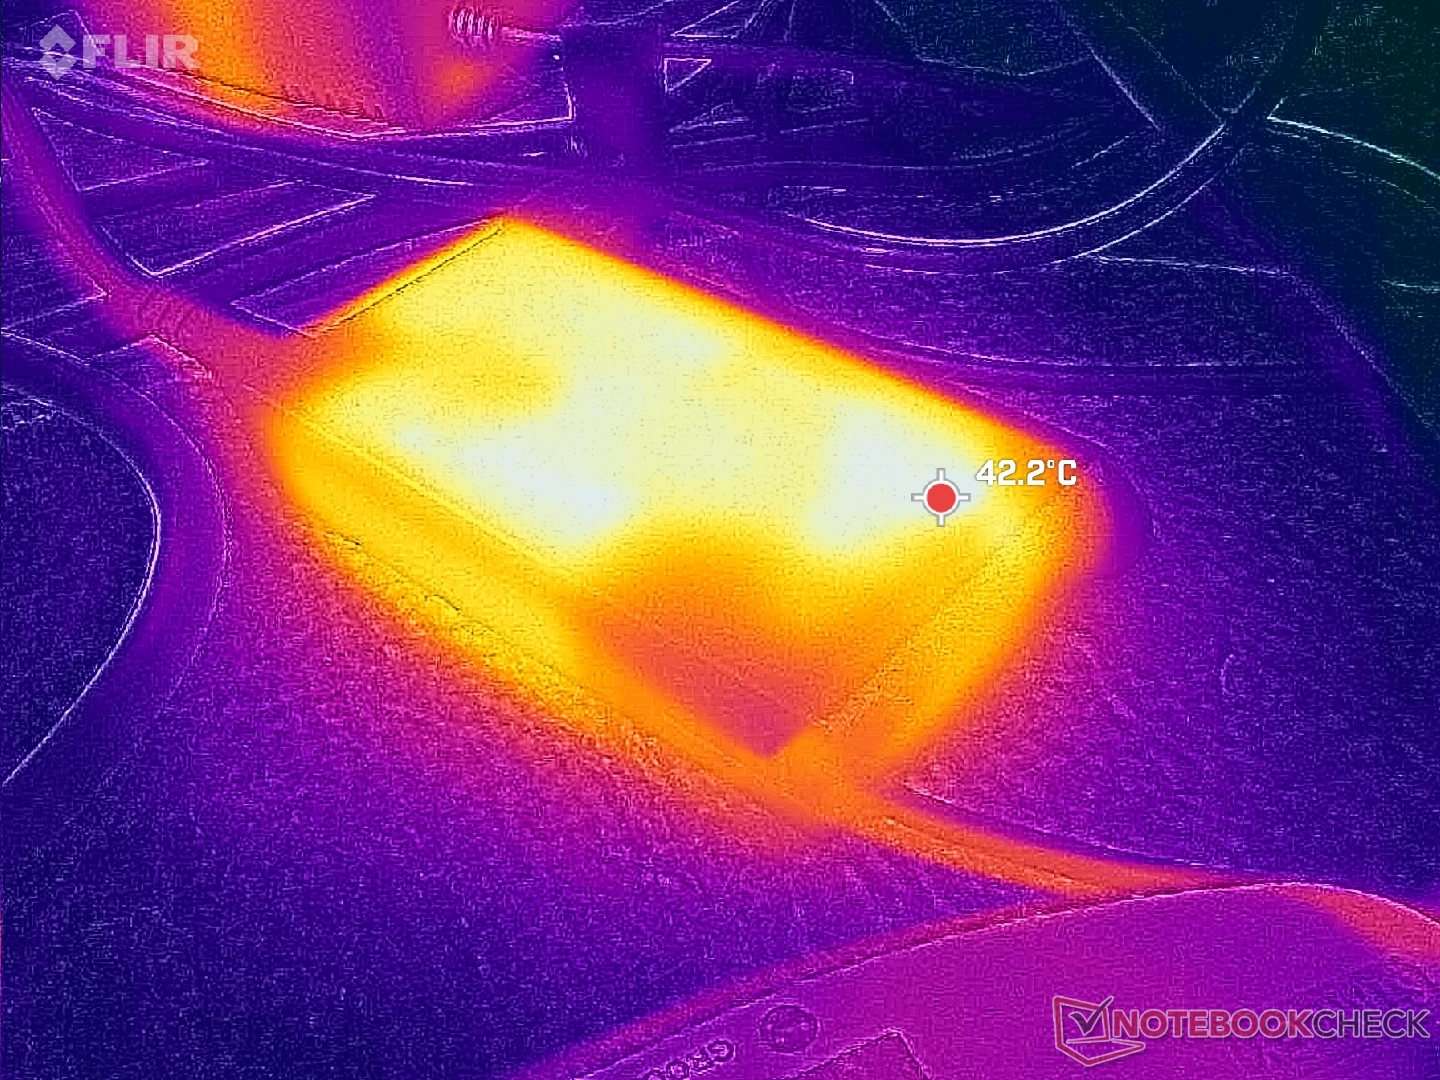
Il consumo al minimo è generalmente più elevato rispetto a quello che abbiamo registrato sul modello IPS dello scorso anno, il che porta a tempi di funzionamento più brevi. Per il resto, i tassi di consumo sono molto simili tra i due modelli quando si eseguono carichi più impegnativi, nonostante i livelli di prestazioni più elevati del modello Gen 8 per migliorare le prestazioni per watt.
Si noti che il ThinkPad P1 Gen 8 viene fornito con un adattatore CA USB-C più piccolo da 140 W (~12,8 x 6,2 x 2,3 cm), mentre il ThinkPad P1 Gen 7 viene fornito con un adattatore da 170 W.
| Off / Standby | |
| Idle | |
| Sotto carico |
|
Leggenda:
min: | |
| Lenovo ThinkPad P1 Gen 8 Ultra 7 255H, RTX PRO 2000 Blackwell Generation Laptop, Samsung PM9E1 1 TB MZVLC1T0HFLU, Tandem OLED, 3200x2000, 16" | Lenovo ThinkPad P16s Gen 4 AMD Ryzen AI 9 HX 370, Radeon 890M, , , 1920x1200, 16" | Lenovo ThinkPad P1 Gen 7 21KV001SGE Ultra 7 155H, GeForce RTX 4060 Laptop GPU, Kioxia XG8 KXG8AZNV1T02, IPS LED, 2560x1600, 16" | HP ZBook X G1i 16 Ultra 7 265H, RTX PRO 2000 Blackwell Generation Laptop, Samsung PM9A1 MZVL22T0HBLB, IPS, 2560x1600, 16" | Dell Pro Max 16 Plus Ultra 9 285HX, RTX PRO 5000 Blackwell Generation Laptop, SK hynix PCB01 HFS001TFM9X186N, OLED, 3840x2400, 16" | Asus ExpertBook B6 Flip B6602FC2 i9-12950HX, RTX A2000 Laptop GPU, Samsung PM9A1 MZVL21T0HCLR, IPS, 2560x1600, 16" | |
|---|---|---|---|---|---|---|
| Power Consumption | 56% | 14% | 29% | -103% | -17% | |
| Idle Minimum * (Watt) | 15.4 | 3.9 75% | 7.3 53% | 4.1 73% | 35.1 -128% | 10.5 32% |
| Idle Average * (Watt) | 16.5 | 8.3 50% | 12.3 25% | 9 45% | 39.2 -138% | 11.9 28% |
| Idle Maximum * (Watt) | 23.1 | 8.7 62% | 17.9 23% | 9.4 59% | 56 -142% | 18 22% |
| Load Average * (Watt) | 86.6 | 51.6 40% | 78.2 10% | 86.7 -0% | 130.2 -50% | 182 -110% |
| Cyberpunk 2077 ultra external monitor * (Watt) | 121.8 | 54.6 55% | 117.7 3% | 102 16% | 213 -75% | |
| Cyberpunk 2077 ultra * (Watt) | 123.1 | 55.4 55% | 123.5 -0% | 106.1 14% | 229 -86% | |
| Load Maximum * (Watt) | 143.6 | 63.7 56% | 167.5 -17% | 152.9 -6% | 285.2 -99% | 229 -59% |
| Witcher 3 ultra * (Watt) | 177.5 |
* ... Meglio usare valori piccoli
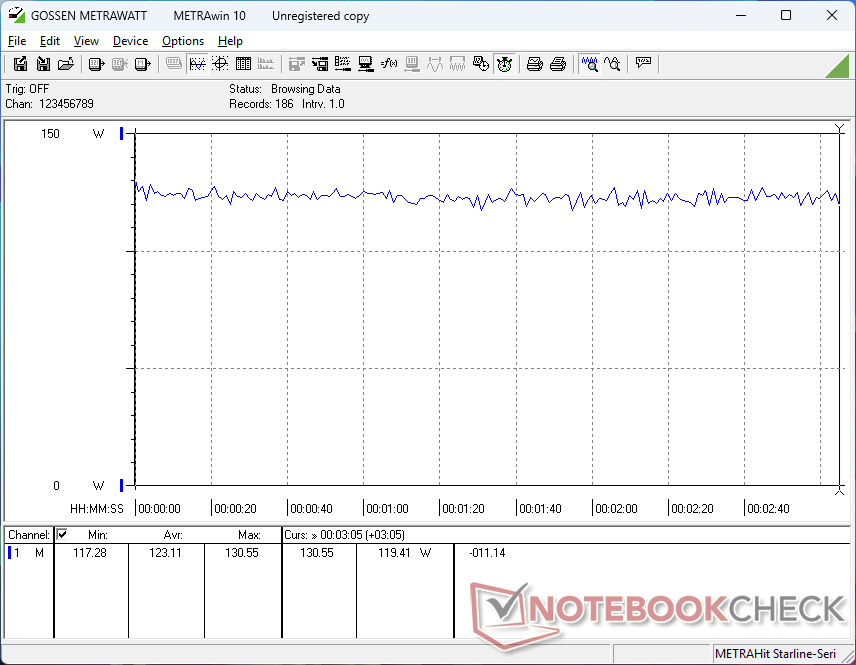
Consumo di energia Cyberpunk / Stress Test
Consumo di energia del monitor esterno
Durata della batteria
L'autonomia è sensibilmente più breve rispetto alla configurazione IPS dello scorso anno, di diverse ore, anche quando si imposta la modalità Bilanciata e lo stesso livello di luminosità di ~150 nit.
| Lenovo ThinkPad P1 Gen 8 Ultra 7 255H, RTX PRO 2000 Blackwell Generation Laptop, 90 Wh | Lenovo ThinkPad P1 Gen 7 21KV001SGE Ultra 7 155H, GeForce RTX 4060 Laptop GPU, 90 Wh | HP ZBook X G1i 16 Ultra 7 265H, RTX PRO 2000 Blackwell Generation Laptop, 83 Wh | Dell Pro Max 16 Plus Ultra 9 285HX, RTX PRO 5000 Blackwell Generation Laptop, 96 Wh | Asus ExpertBook B6 Flip B6602FC2 i9-12950HX, RTX A2000 Laptop GPU, 90 Wh | |
|---|---|---|---|---|---|
| Autonomia della batteria | 80% | 127% | -35% | 58% | |
| WiFi v1.3 (h) | 5.5 | 9.9 80% | 12.5 127% | 3.6 -35% | 8.7 58% |
| Load (h) | 1.9 | 1.7 | |||
| Reader / Idle (h) | 12.5 | ||||
| H.264 (h) | 5.8 |
Valutazione Notebookcheck
Il ThinkPad P1 Gen 8 eccelle per essere una workstation super-sottile da 16 pollici con CPU Core serie H di fascia media e grafica discreta Nvidia Pro RTX.
Lenovo ThinkPad P1 Gen 8
- 12/10/2025 v8
Allen Ngo
 Total Sustainability Score:
 Potenziali concorrenti a confronto
Immagine | Modello | Prezzo | Peso | Altezza | Schermo |
|---|---|---|---|---|---|
1. 91.6%  | Lenovo ThinkPad P1 Gen 8 Intel Core Ultra 7 255H ⎘ NVIDIA RTX PRO 2000 Blackwell Generation Laptop ⎘ 32 GB Memoria, 1024 GB SSD | Amazon: $4,299.00 Prezzo di listino: 2000 USD | 1.9 kg | 20.6 mm | 16.00" 3200x2000 236 PPI Tandem OLED |
2.  | Lenovo ThinkPad P16s Gen 4 AMD AMD Ryzen AI 9 HX 370 ⎘ AMD Radeon 890M ⎘ 64 GB Memoria | Amazon: $2,965.45 Prezzo di listino: 2440€ | 2 kg | 23 mm | 16.00" 1920x1200 142 PPI |
3. 83.5%  | Lenovo ThinkPad P1 Gen 7 21KV001SGE Intel Core Ultra 7 155H ⎘ NVIDIA GeForce RTX 4060 Laptop GPU ⎘ 32 GB Memoria, 1024 GB SSD | Amazon: $2,199.00 Prezzo di listino: 3239 Euro | 2 kg | 20.5 mm | 16.00" 2560x1600 189 PPI IPS LED |
4. 87.4%  | HP ZBook X G1i 16 Intel Core Ultra 7 265H ⎘ NVIDIA RTX PRO 2000 Blackwell Generation Laptop ⎘ 64 GB Memoria, 2048 GB SSD | Amazon: $2,999.00 Prezzo di listino: 2700 USD | 2.2 kg | 23 mm | 16.00" 2560x1600 189 PPI IPS |
5. 88.4%  | Dell Pro Max 16 Plus Intel Core Ultra 9 285HX ⎘ Nvidia RTX PRO 5000 Blackwell Generation Laptop ⎘ 128 GB Memoria, SSD | Amazon: 1. $1,299.95 Dell Pro 16 Plus PB16250 (Re... 2. $27.99 SLRIOYS 130W USB-C Charger C... 3. $45.99 Smatree Hard EVA Protective ... Prezzo di listino: 5000 USD | 2.8 kg | 30.9 mm | 16.00" 3840x2400 283 PPI OLED |
6. 89.6% v7 (old)  | Asus ExpertBook B6 Flip B6602FC2 Intel Core i9-12950HX ⎘ NVIDIA RTX A2000 Laptop GPU ⎘ 32 GB Memoria, 1024 GB SSD | Amazon: 1. $80.99 20V 12A 240W Charger for Asu... 2. $101.50 Adamanta 8GB (1x8GB) Compati... 3. $440.00 Adamanta 32GB (2x16GB) Compa... | 2.8 kg | 27.2 mm | 16.00" 2560x1600 189 PPI IPS |
Transparency
La selezione dei dispositivi da recensire viene effettuata dalla nostra redazione. Il campione di prova è stato fornito all'autore come prestito dal produttore o dal rivenditore ai fini di questa recensione. L'istituto di credito non ha avuto alcuna influenza su questa recensione, né il produttore ne ha ricevuto una copia prima della pubblicazione. Non vi era alcun obbligo di pubblicare questa recensione. In quanto società mediatica indipendente, Notebookcheck non è soggetta all'autorità di produttori, rivenditori o editori.
Ecco come Notebookcheck esegue i test
Ogni anno, Notebookcheck esamina in modo indipendente centinaia di laptop e smartphone utilizzando procedure standardizzate per garantire che tutti i risultati siano comparabili. Da circa 20 anni sviluppiamo continuamente i nostri metodi di prova e nel frattempo stabiliamo gli standard di settore. Nei nostri laboratori di prova, tecnici ed editori esperti utilizzano apparecchiature di misurazione di alta qualità. Questi test comportano un processo di validazione in più fasi. Il nostro complesso sistema di valutazione si basa su centinaia di misurazioni e parametri di riferimento ben fondati, che mantengono l'obiettività.
