Verdetto - XPS rinato
Come il nuovo XPS 14, l'XPS 16 2026 risolve alcune delle principali preoccupazioni del modello 2025 per un'esperienza utente complessivamente migliore. Il sistema è ora molto più leggero e più facile da trasportare, con un'estetica più pulita e senza frustranti tasti sensibili al tocco. Il passaggio a Panther Lake ha anche migliorato in modo significativo le prestazioni per watt per aumentare i tempi di esecuzione di almeno diverse ore.
Un motivo fondamentale per il design più snello, silenzioso e compatto di quest'anno può essere attribuito a un cambiamento importante: nessuna opzione di grafica discreta. L'assenza di una dGPU significa che il sistema può essere dotato di PCB più piccoli, di una soluzione di raffreddamento più piccola e di un profilo più sottile, per un modello complessivamente più leggero. Gli utenti sacrificheranno le prestazioni grafiche, in quanto la GPU integrata di Panther Lake - per quanto efficiente - non è in grado di eguagliare la potenza grezza di una RTX 5070 di GeForce sul Dell 16 Premium in uscita. Le GPU esterne possono aggirare questa limitazione, ma i creatori di contenuti o i giocatori che richiedono maggiori prestazioni grafiche in movimento potrebbero trovare un valore migliore nel modello 2025.
Il design più sottile e focalizzato del nuovo XPS 16 può talvolta sembrare scarno rispetto ad alcuni concorrenti. Alternative come il Samsung Galaxy Book6 Ultra o Asus Zenbook S16 presentano un maggior numero di porte integrate o addirittura il supporto per SSD M.2 secondari, per ridurre la dipendenza da adattatori o docking station.
Pro
Contro
Prezzo e disponibilità
Dell distribuisce ora l'XPS 16 a partire da 1750 dollari per la configurazione Core Ultra 5 325, come recensito, fino a 2160 dollari per la configurazione Core Ultra X7 358H OLED touchscreen.
Sommario
- Verdetto - XPS rinato
- Specifiche
- Caso - Molto più leggero di prima
- Connettività
- Dispositivi di input - Dica addio ai tasti sensibili al tocco
- Display - Uno dei migliori pannelli FHD+ IPS
- Performance - Puntare tutto sul Lago Panther
- Emissioni - Più silenzioso, ma ancora abbastanza caldo
- Gestione dell'energia - Panther Lake è il re dell'efficienza
- Valutazione Notebookcheck
- Potenziali concorrenti a confronto
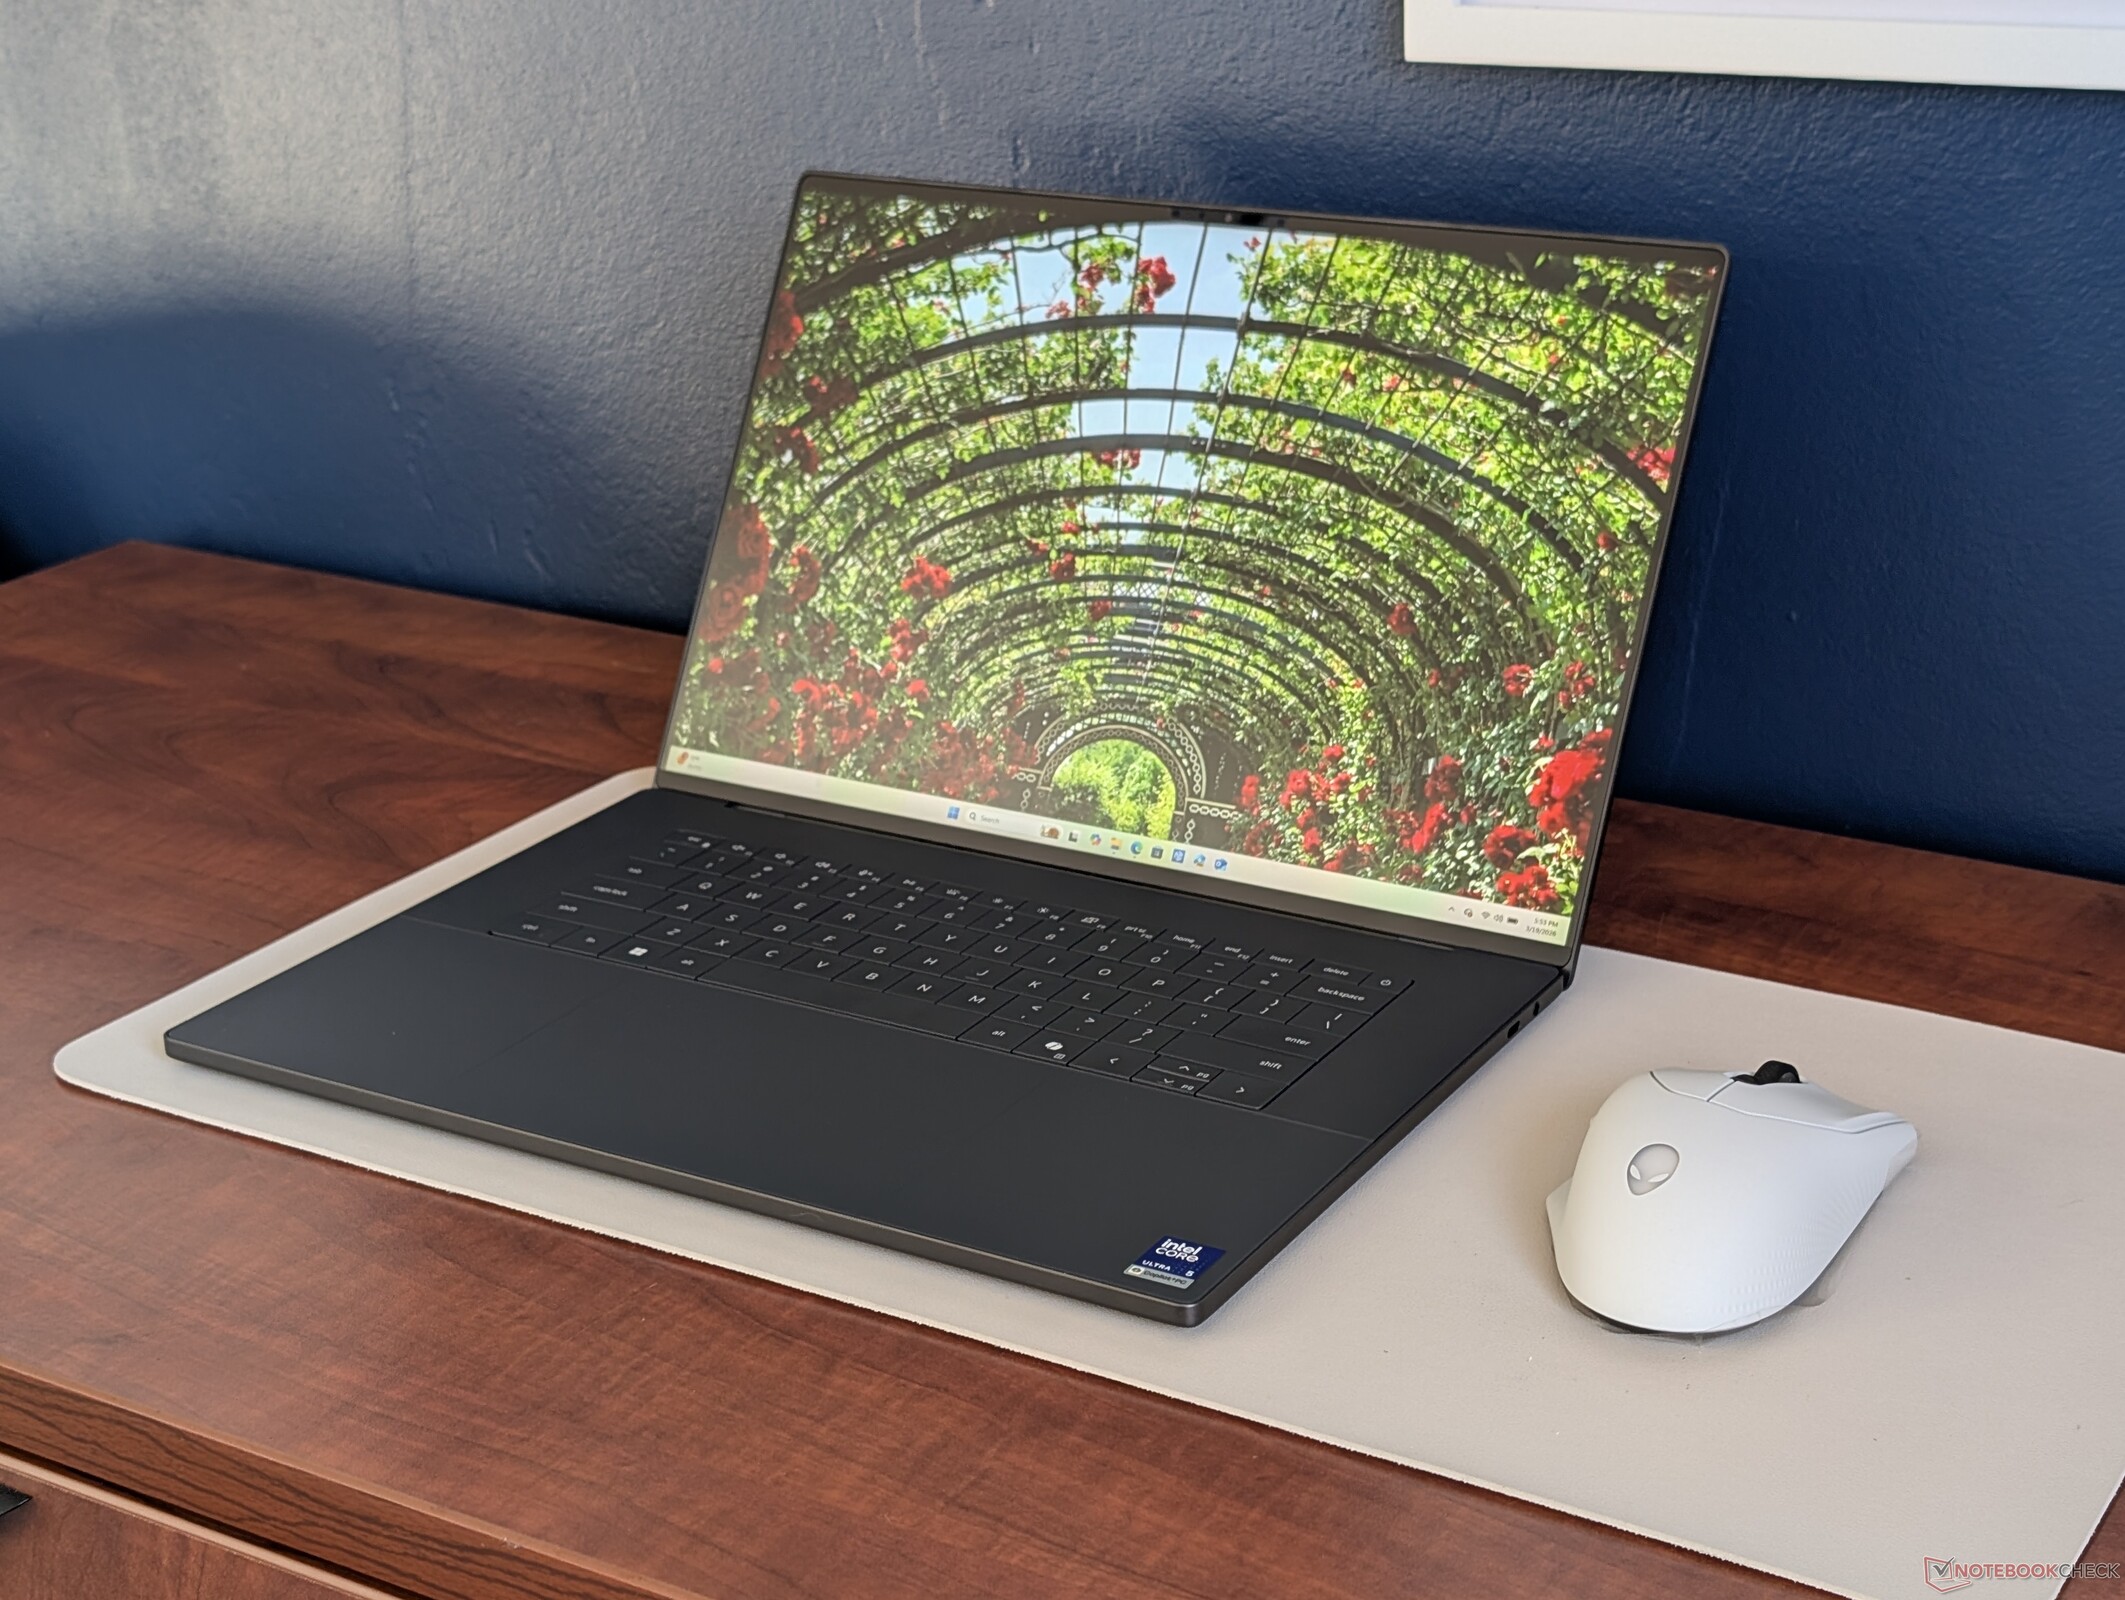
Presentato al CES 2026 accanto al nuovo XPS 14, l'XPS 16 2026 rappresenta una rinascita per la serie, dopo che l'anno scorso aveva abbandonato il marchio "XPS" a favore del marchio "Dell 16 Premium". Il nuovo modello non solo porta con sé le ultime opzioni di processore Intel Panther Lake, ma anche un design del telaio aggiornato per un'esperienza utente rinnovata rispetto agli anni precedenti.
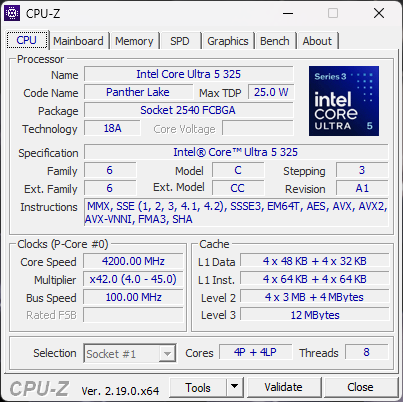
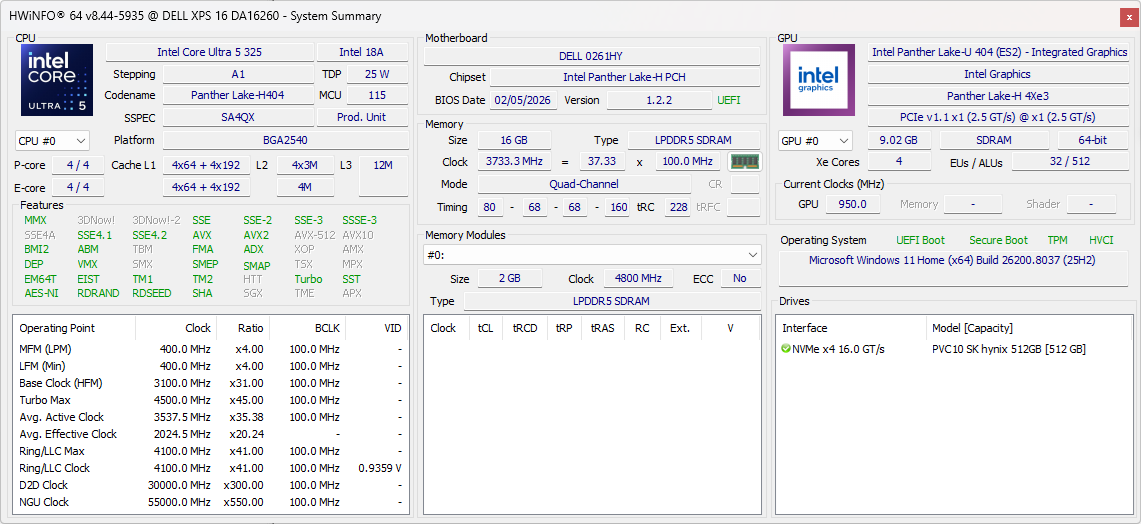
La nostra unità di prova è la configurazione base con CPU Core Ultra 5 325 e display IPS FHD+ 120 Hz per circa 1.700 dollari. Le configurazioni di fascia più alta includono il Core Ultra 7 355, il Core Ultra X7 358H e il touchscreen OLED a 120 Hz per circa 2.200 dollari. Tutte le opzioni al momento della pubblicazione vengono fornite solo con grafica integrata.
Le alternative al Dell XPS 16 includono altre macchine multimediali di fascia alta da 16 pollici, come il modello Samsung Galaxy Book6 Ultra, Asus Zenbook S16o Lenovo Yoga Pro 9 16.
Altre recensioni di Dell:
Specifiche
Caso - Molto più leggero di prima
Il telaio ridisegnato non assomiglia molto a quello dell'uscente Dell 16 Premium o dell'XPS 2024 2024 XPS 16. Tuttavia, è composto dagli stessi materiali dell'XPS 14 2026 e quindi le nostre impressioni sull'XPS 14 si traducono nel nuovo XPS 16. La rigidità è buona come in passato, ma con bordi più squadrati e angoli che imitano più da vicino lo stile visivo del MacBook Pro 16.
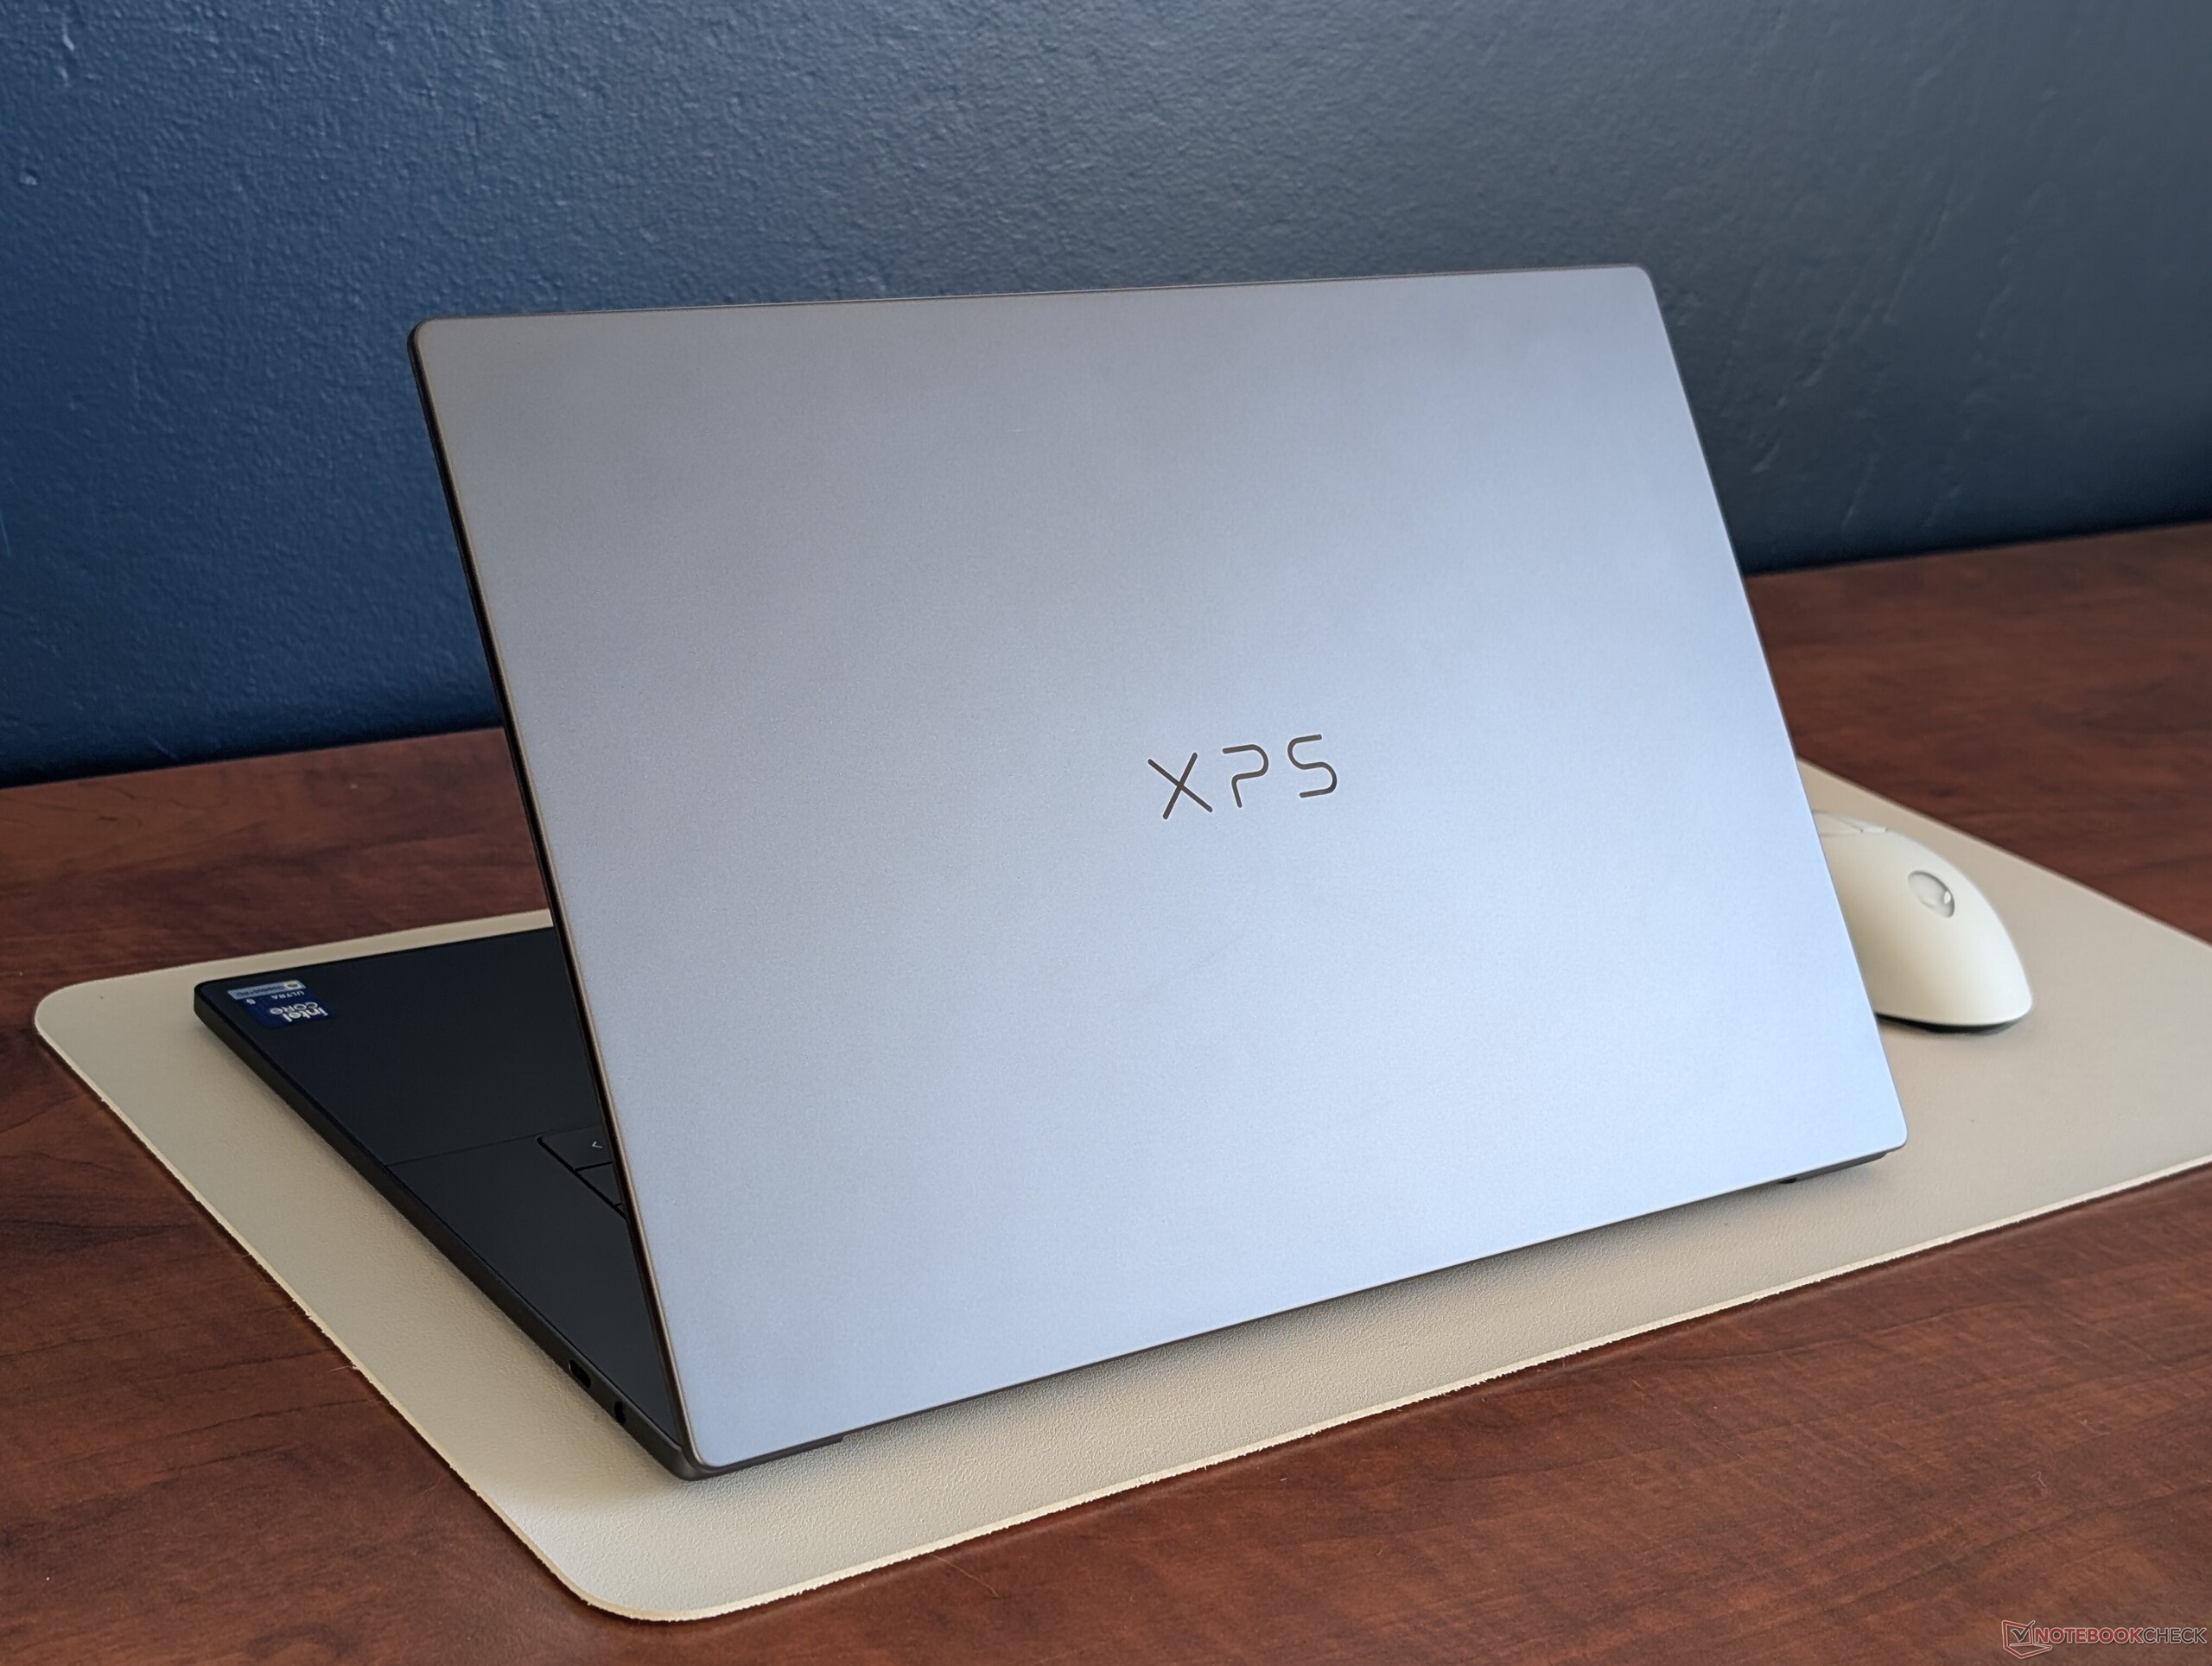
Le differenze di dimensioni e peso tra il nuovo XPS 16 e il vecchio XPS 16 (o Dell 16 Premium) sono significative. Il modello aggiornato è notevolmente più piccolo in lunghezza, larghezza e altezza, mentre è molto più leggero di circa 600 grammi. Queste modifiche sono state rese possibili in gran parte dall'abbandono delle opzioni di grafica discreta e del raffreddamento a camera di vapore durante la transizione al nuovo design dell'XPS 16. Anche le dimensioni dello schermo sono state leggermente ridotte da 16,3 pollici a 16,0 pollici.


Connettività
Tutte e tre le porte USB-C ora supportano Thunderbolt 4, mentre questo non era vero sul modello dello scorso anno. Purtroppo, Dell ha abbandonato lo slot per schede MicroSD, con grande dispiacere dei proprietari di DSLR.
I modelli concorrenti, come l' Asus Zenbook S16 o Lenovo Yoga Pro 9 16IAH10 tendono ad avere più porte e opzioni integrate rispetto a Dell.


Comunicazione

Webcam
La fotocamera è stata migliorata da 2 MP sul Dell 16 Premium a 8 MP sul nuovo XPS 16. Sebbene sia supportato l'IR, non c'è ancora l'otturatore fisico della fotocamera.


Manutenzione
Le procedure di manutenzione sono completamente diverse rispetto al design dell'XPS 16 dello scorso anno, ma per il resto sono quasi identiche a quelle del nuovo XPS 14, come dettagliato qui. Invece di rimuovere il pannello inferiore, gli utenti devono rimuovere con attenzione il piano della tastiera per accedere alla scheda madre e quindi il processo è leggermente più complesso.
Le opzioni di aggiornamento sono purtroppo molto limitate. Il modello supporta un solo SSD M.2 e nessun altro componente aggiornabile, nonostante il grande fattore di forma da 16 pollici.

Sostenibilità
Dell dichiara il 75 percento di alluminio riciclato per le coperture superiore e inferiore, il 50 percento di cobalto riciclato per la batteria, il 90 percento di acciaio riciclato per i copritasti, il 100 percento di rame riciclato per il PCB della batteria e il 10 percento di vetro riciclato per la configurazione OLED. L'imballaggio è completamente riciclabile e privo di plastica.
Accessori e garanzia
La confezione non contiene altri extra oltre all'adattatore CA e alla documentazione cartacea. Se acquistato negli Stati Uniti, si applica la consueta garanzia limitata di un anno del produttore, con opzioni di estensione fino a quattro anni.
Dispositivi di input - Dica addio ai tasti sensibili al tocco
Tastiera
Dell ha (fortunatamente) abbandonato i controversi tasti sensibili al tocco del modello dello scorso anno per un approccio più tradizionale. In effetti, le dimensioni dei tasti e il feedback sono identici a quelli del nuovo XPS 14 per un'esperienza di digitazione identica tra i due, nonostante il fattore di forma più grande del nostro XPS 16.
Touchpad
A differenza della tastiera, il clickpad sfrutta il fattore di forma più grande da 16 pollici, in quanto la sua superficie è leggermente più ampia rispetto al clickpad dell'XPS 14 (~15,2 x 9 cm contro ~15,2 x 7,5 cm). La trazione è ultra-liscia, ma le azioni multi-touch o di trascinamento sono ancora difficili a causa del feedback debole e superficiale. Il clickpad "invisibile" probabilmente privilegia ancora la forma rispetto alla funzione.


Display - Uno dei migliori pannelli FHD+ IPS
Sono disponibili due opzioni di visualizzazione:
- 1920 x 1200, 100% sRGB, IPS, non touch, 1 - 120 Hz, opaco
- 3200 x 2000, 100% DCI-P3, OLED, touchscreen, 20 - 120 Hz, DisplayHDR 500, lucido
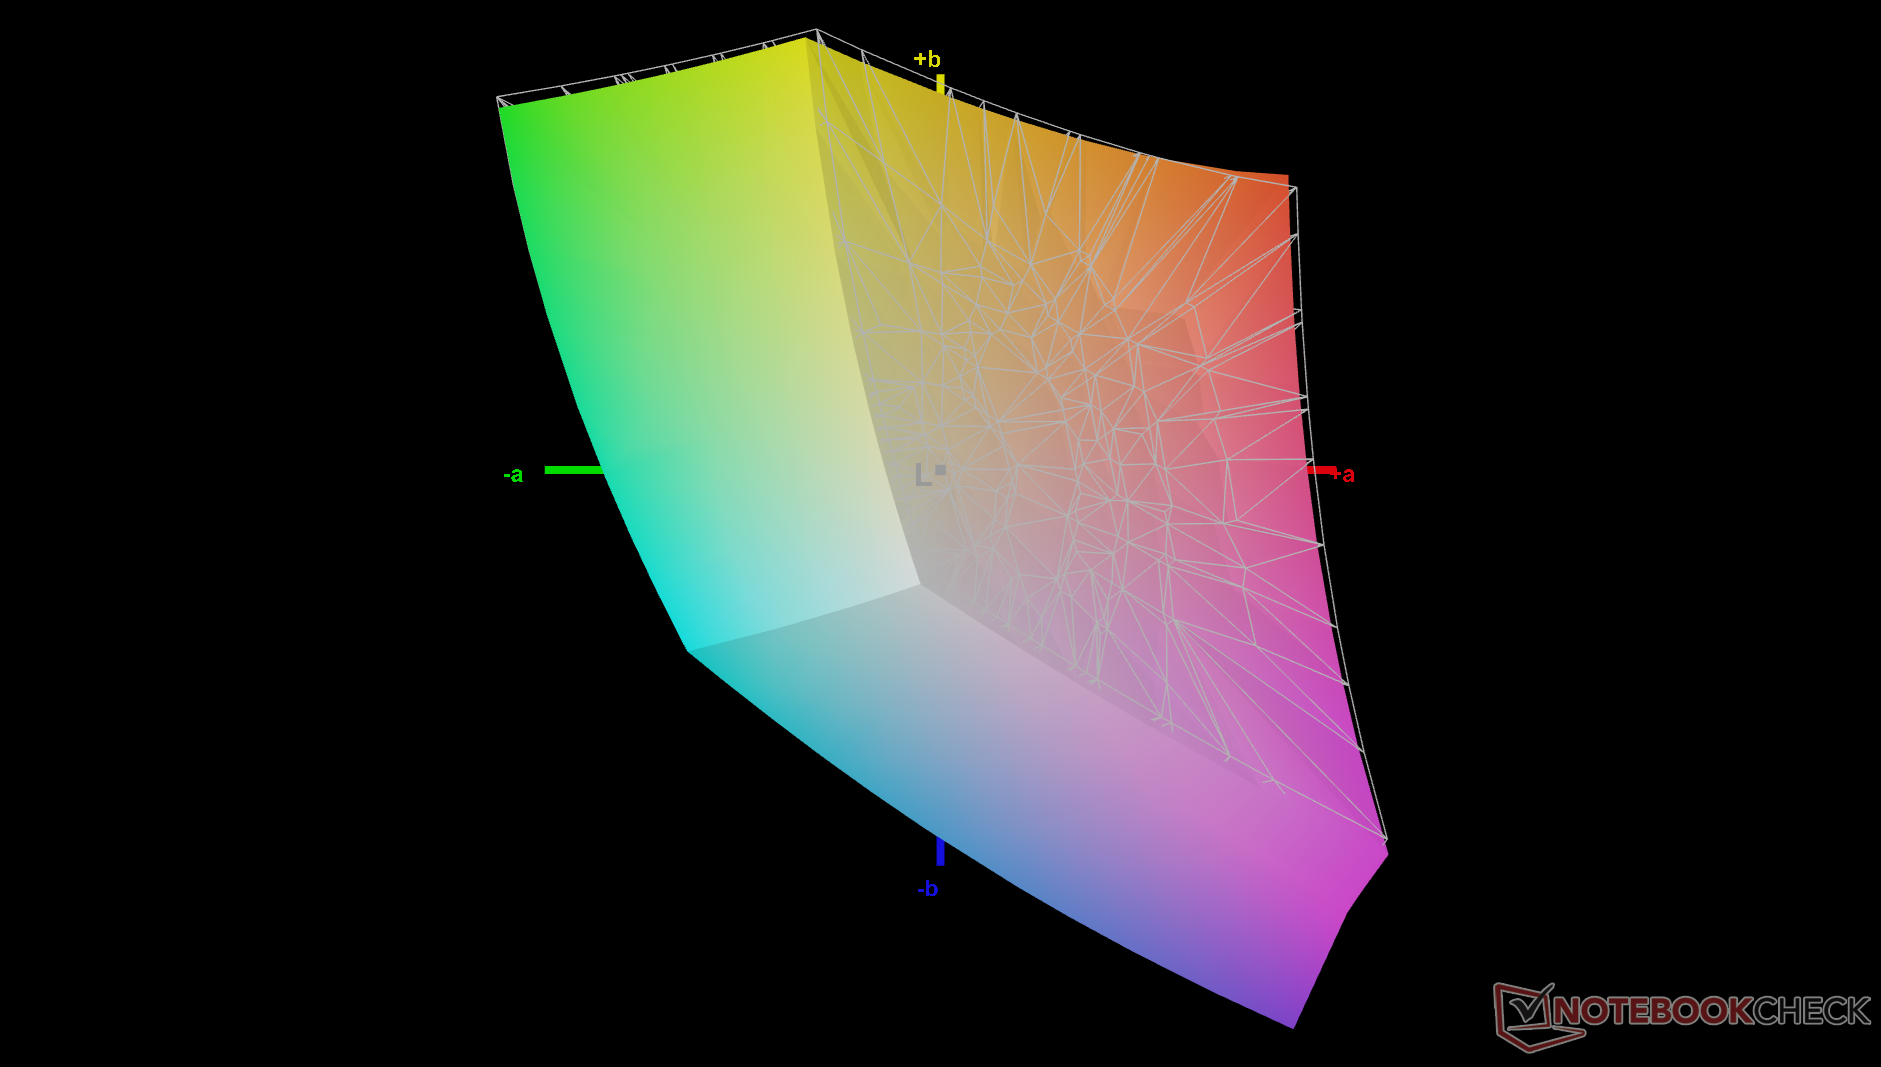
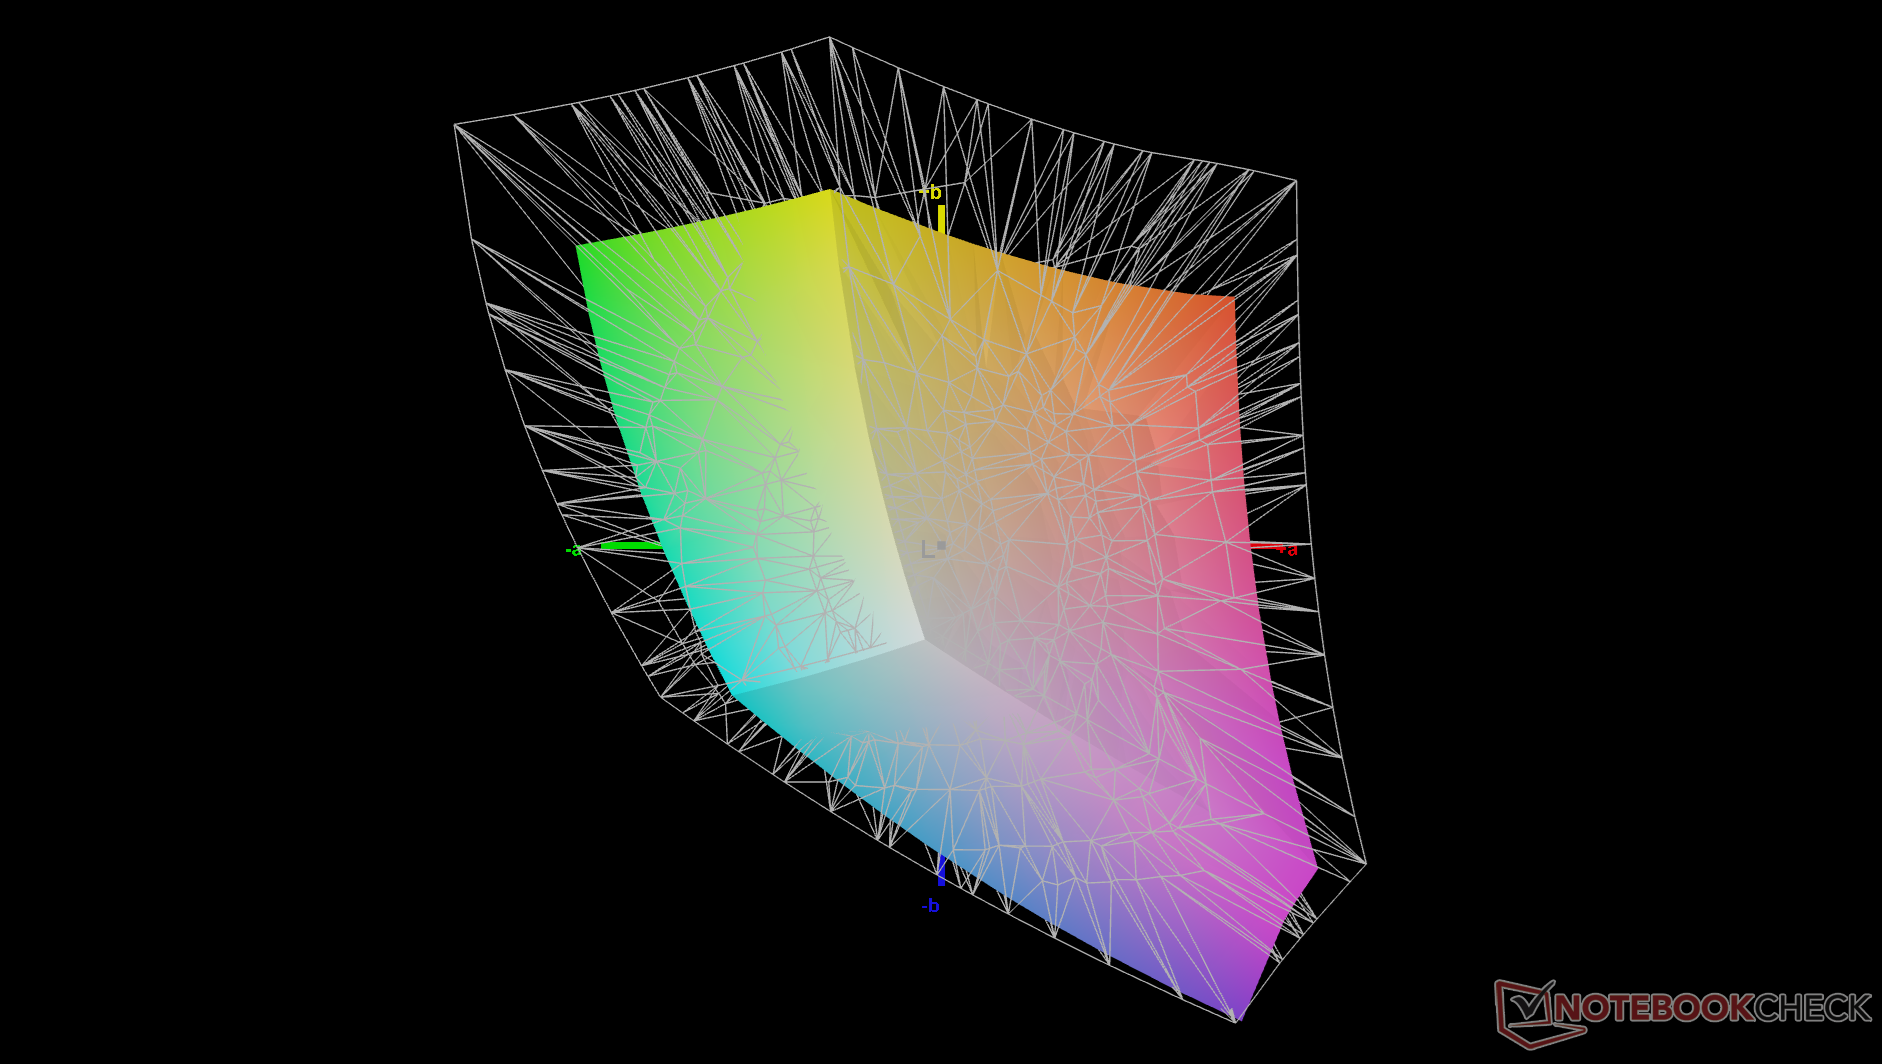
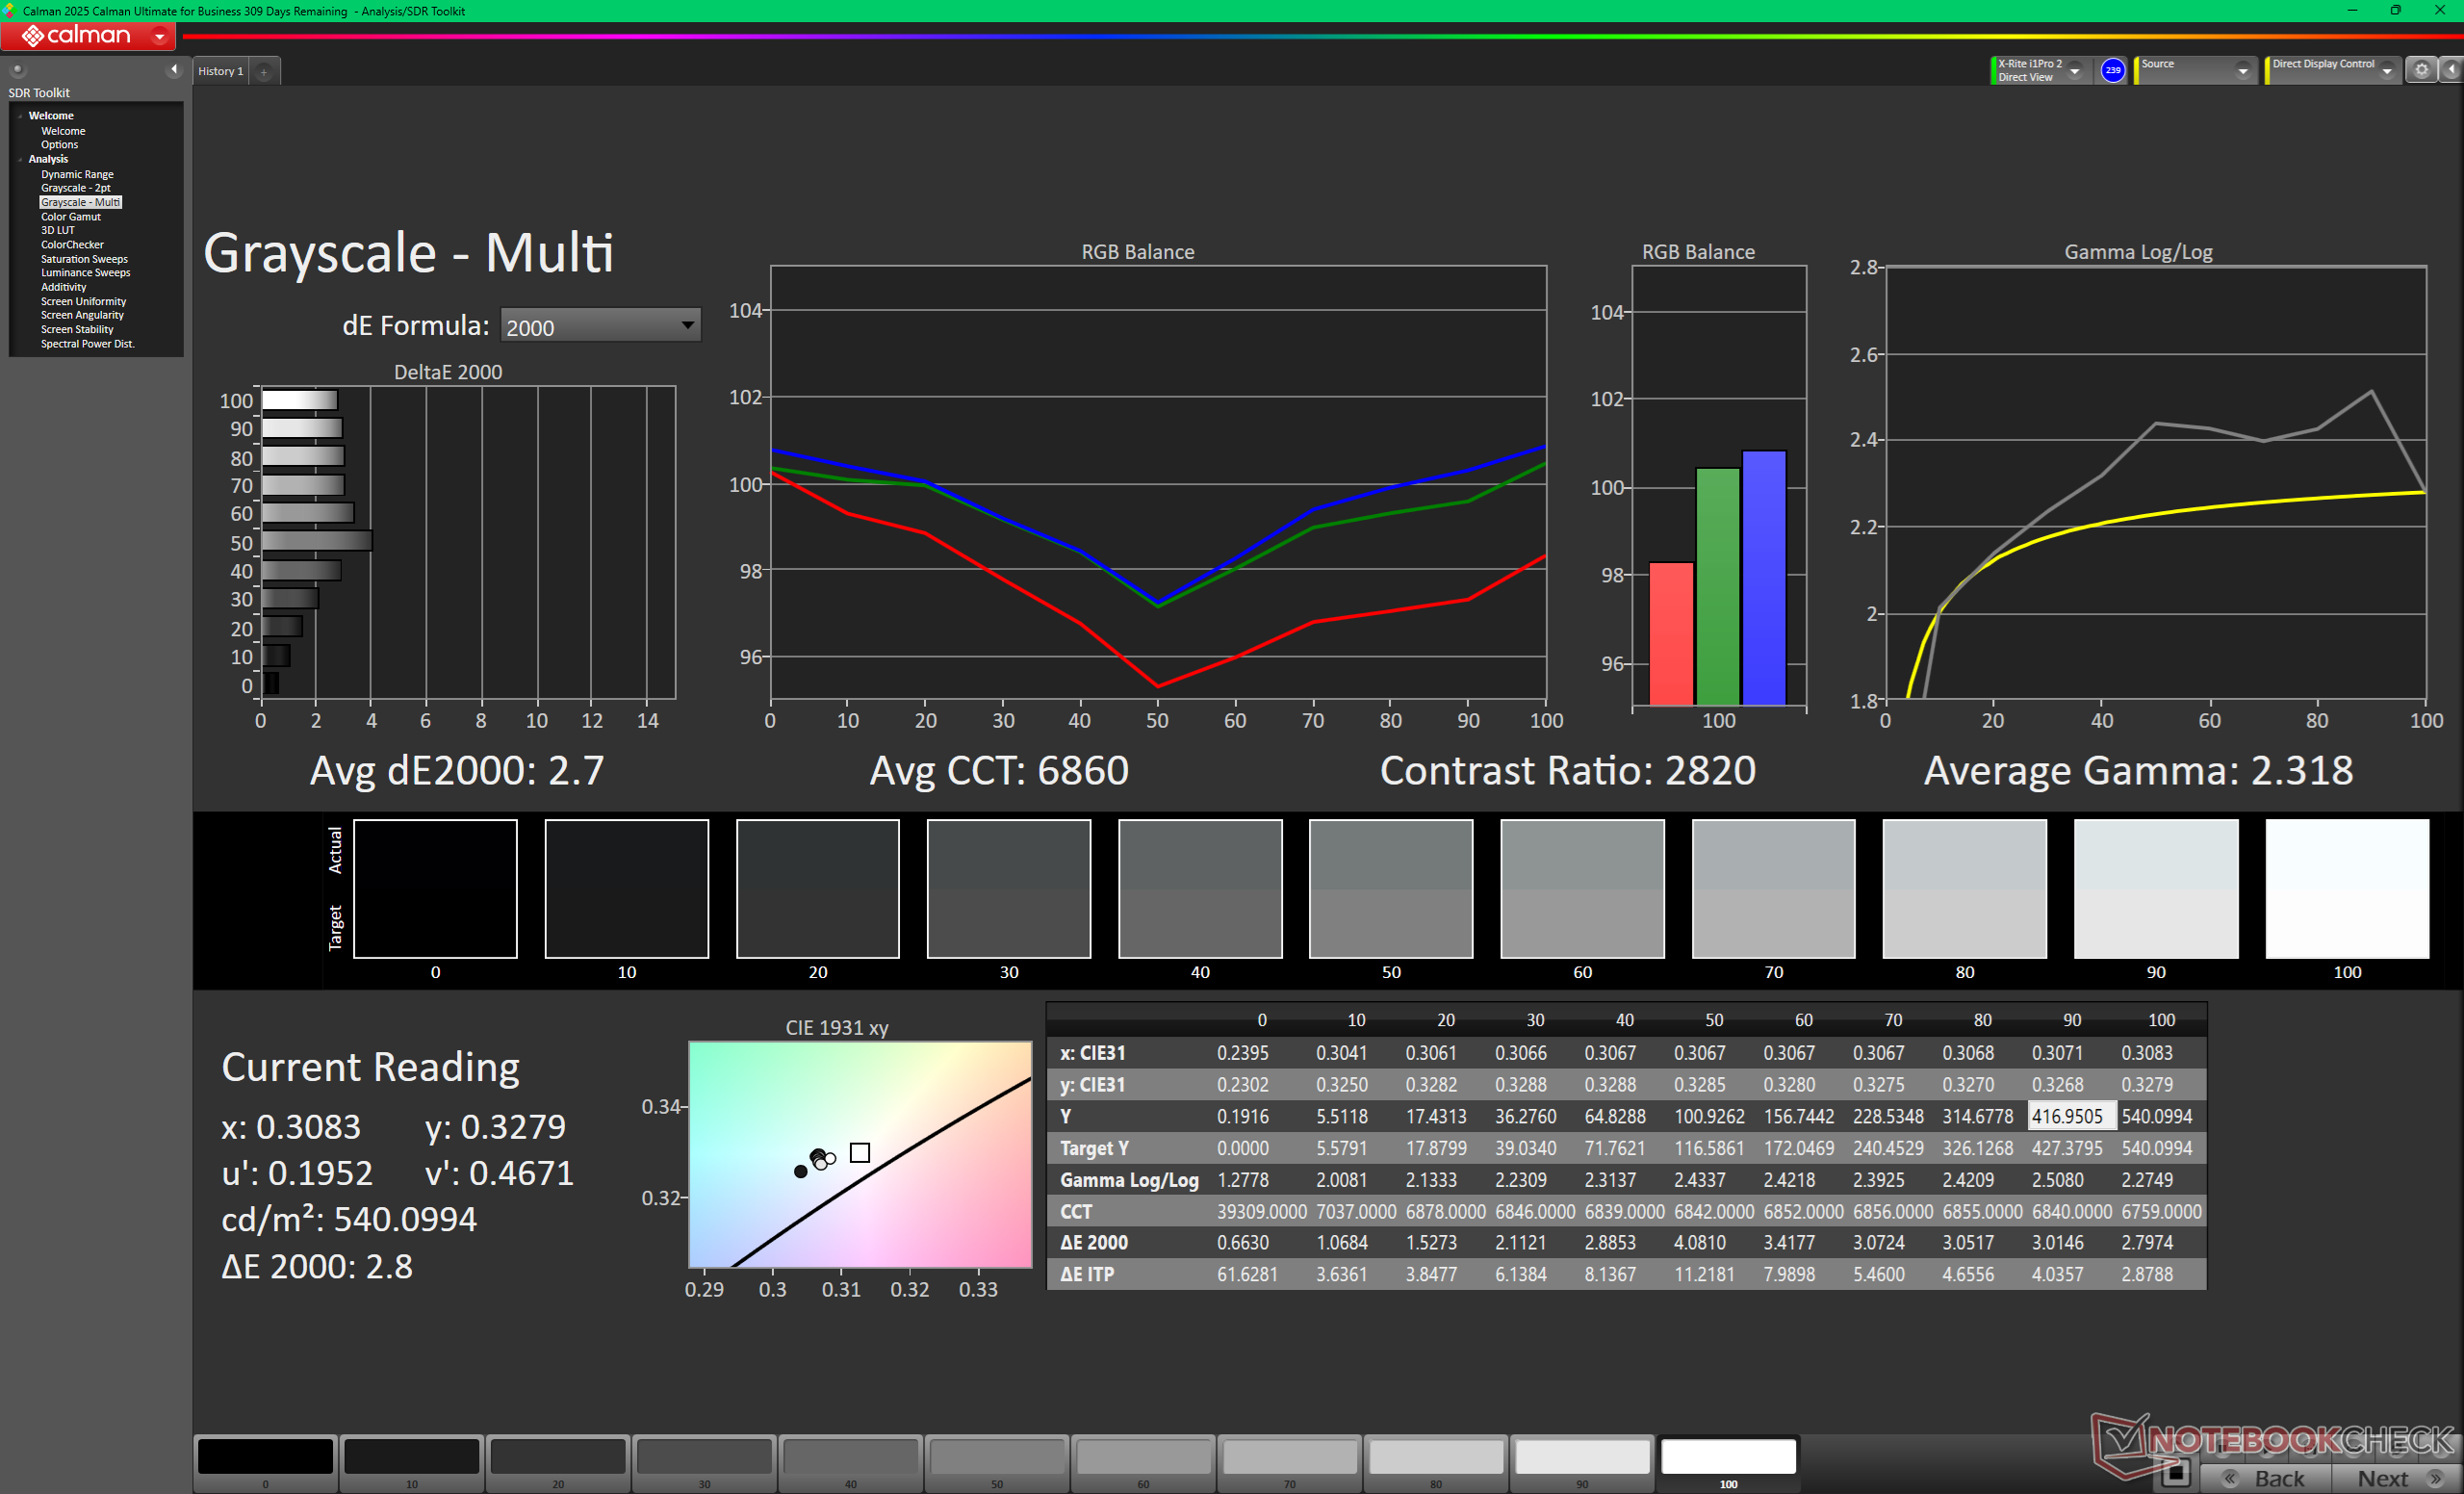
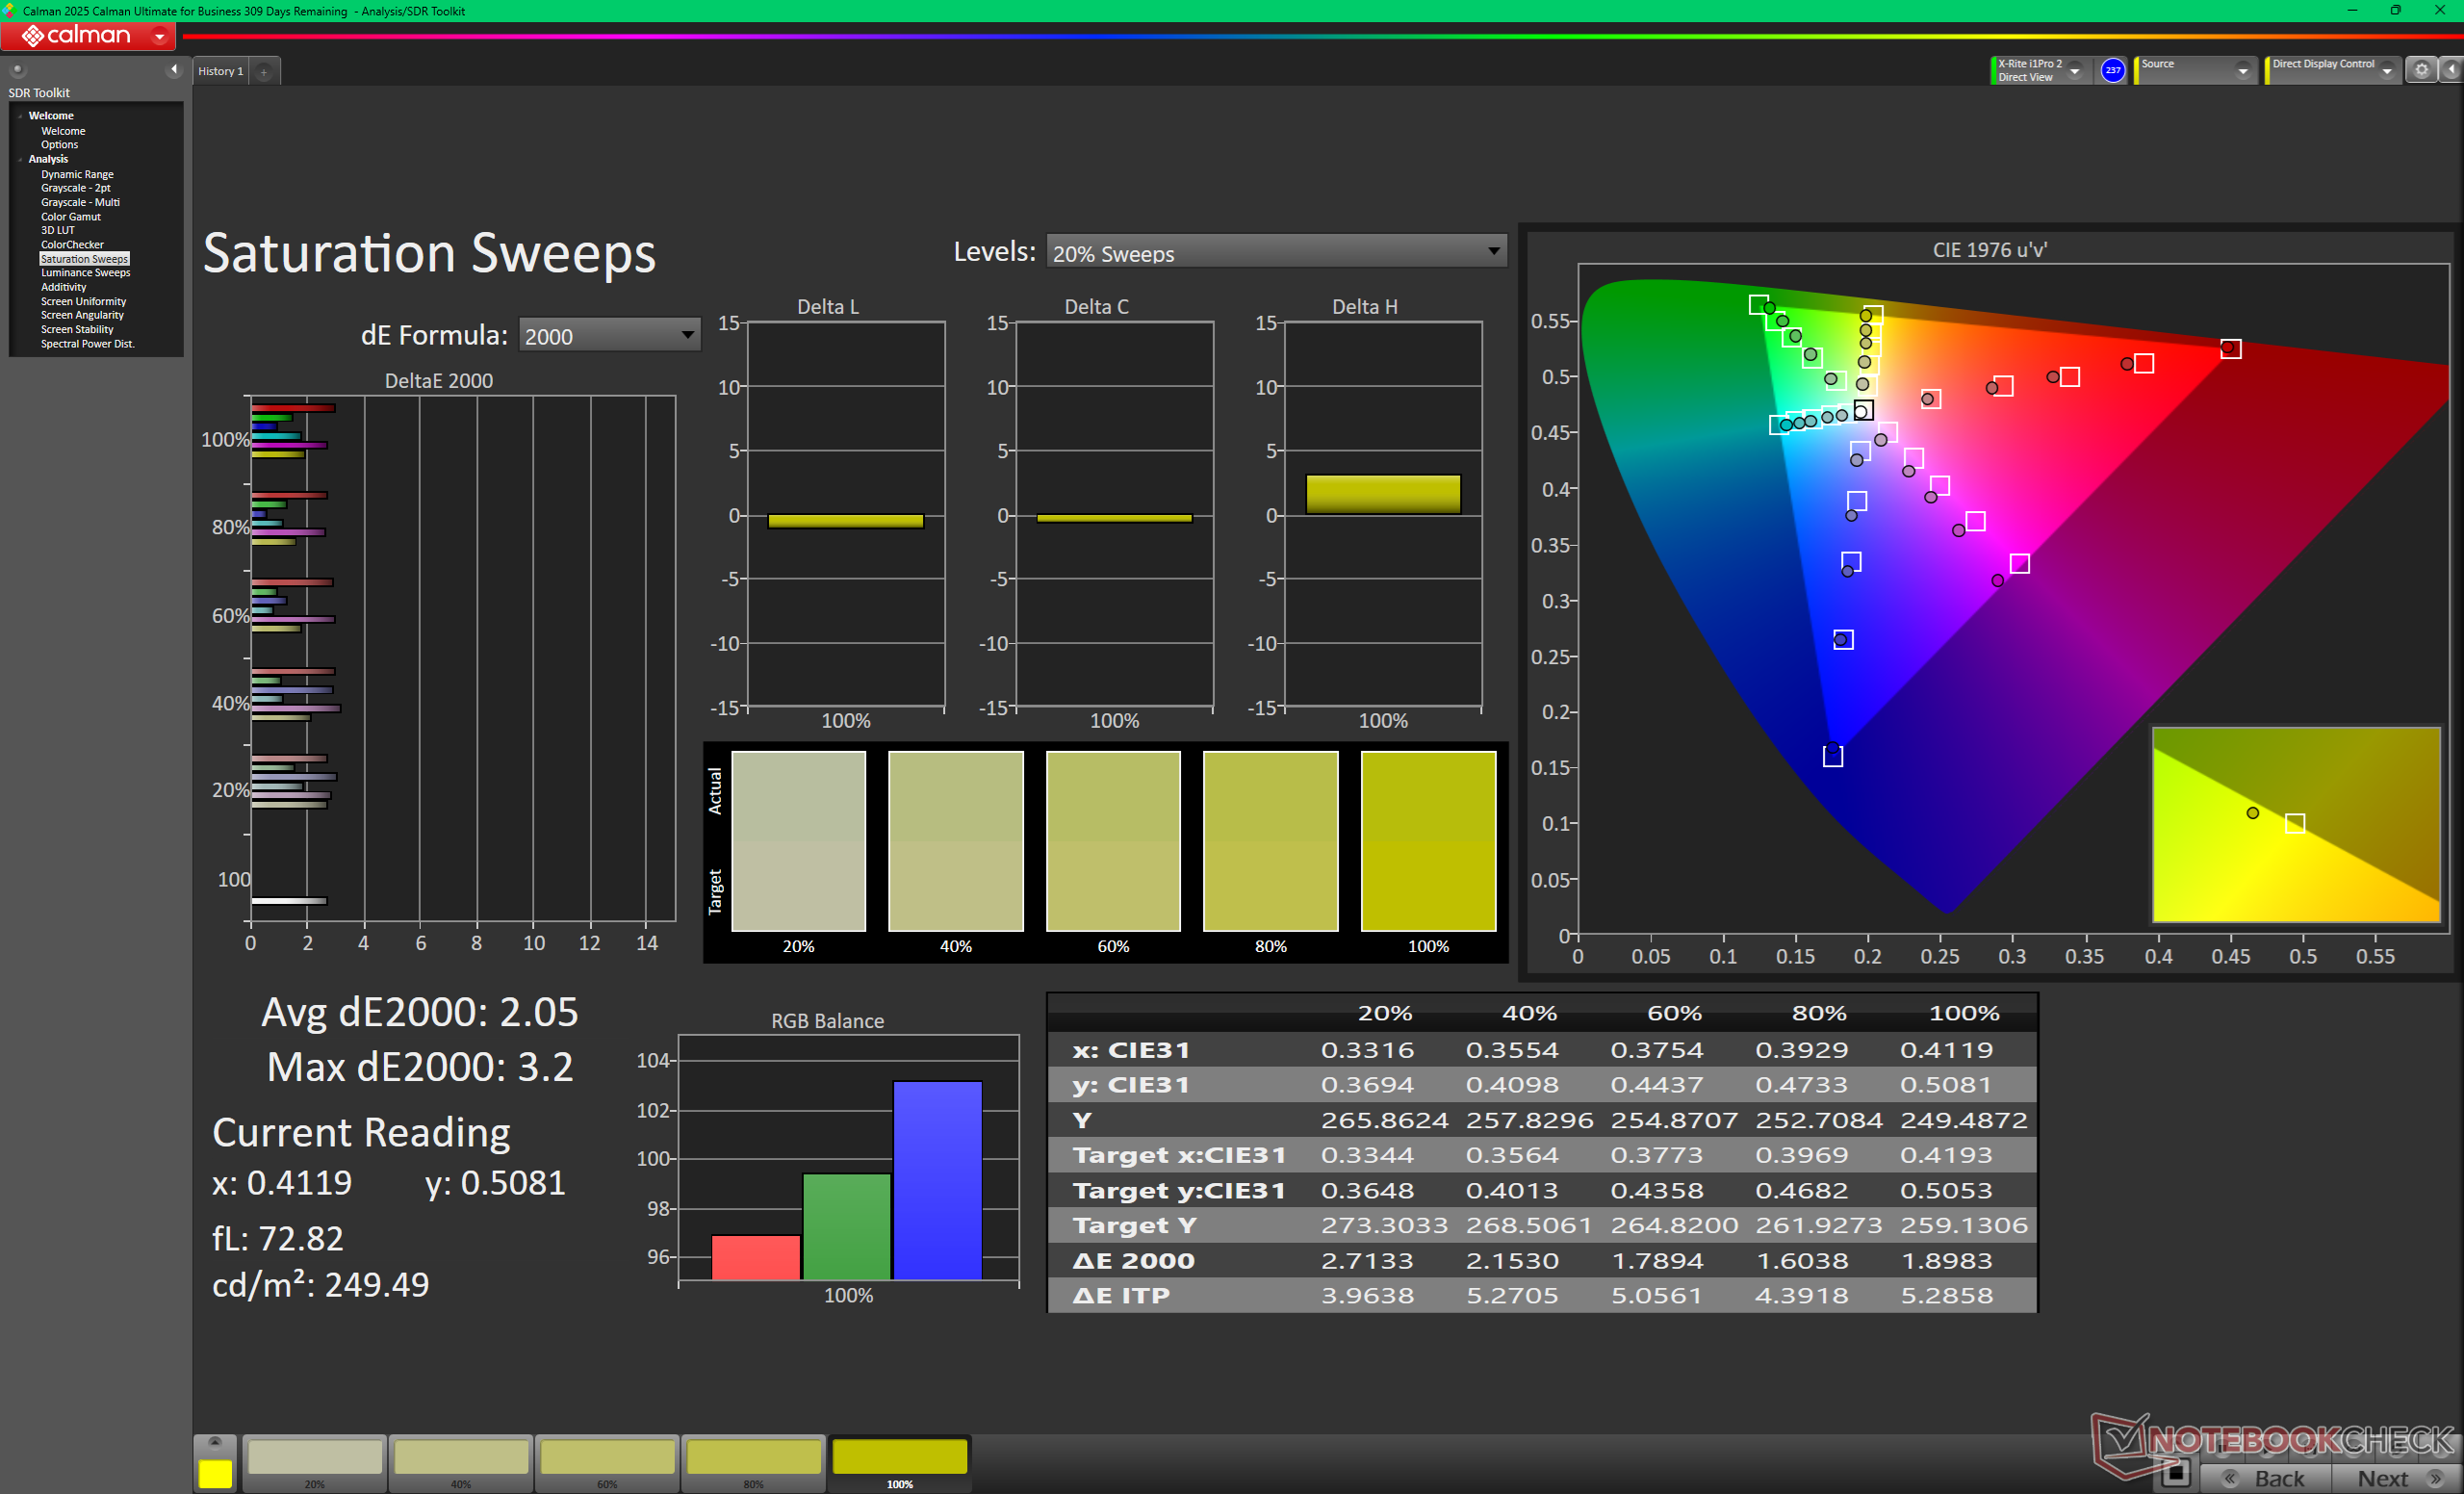
Il display di base offre un rapporto di contrasto molto elevato di ~2000:1, soprattutto per un pannello IPS. La qualità dell'immagine è sorprendentemente nitida per un overlay opaco, mentre i colori sRGB completi dovrebbero soddisfare la maggior parte degli utenti generici o dei creatori di contenuti occasionali. I colori P3 più profondi, il supporto HDR o la funzionalità touchscreen sono disponibili solo sulla configurazione OLED più costosa.
Si noti che il VRR è disattivato per impostazione predefinita. Gli utenti possono attivare il VRR tramite le opzioni di visualizzazione avanzate di Windows. La frequenza di aggiornamento minima di 1 Hz è una caratteristica unica del pannello di base, non presente nella maggior parte degli altri computer portatili.


| |||||||||||||||||||||||||
Distribuzione della luminosità: 92 %
Al centro con la batteria: 534.6 cd/m²
Contrasto: 2056:1 (Nero: 0.26 cd/m²)
ΔE ColorChecker Calman: 2.53 | ∀{0.5-29.43 Ø4.75}
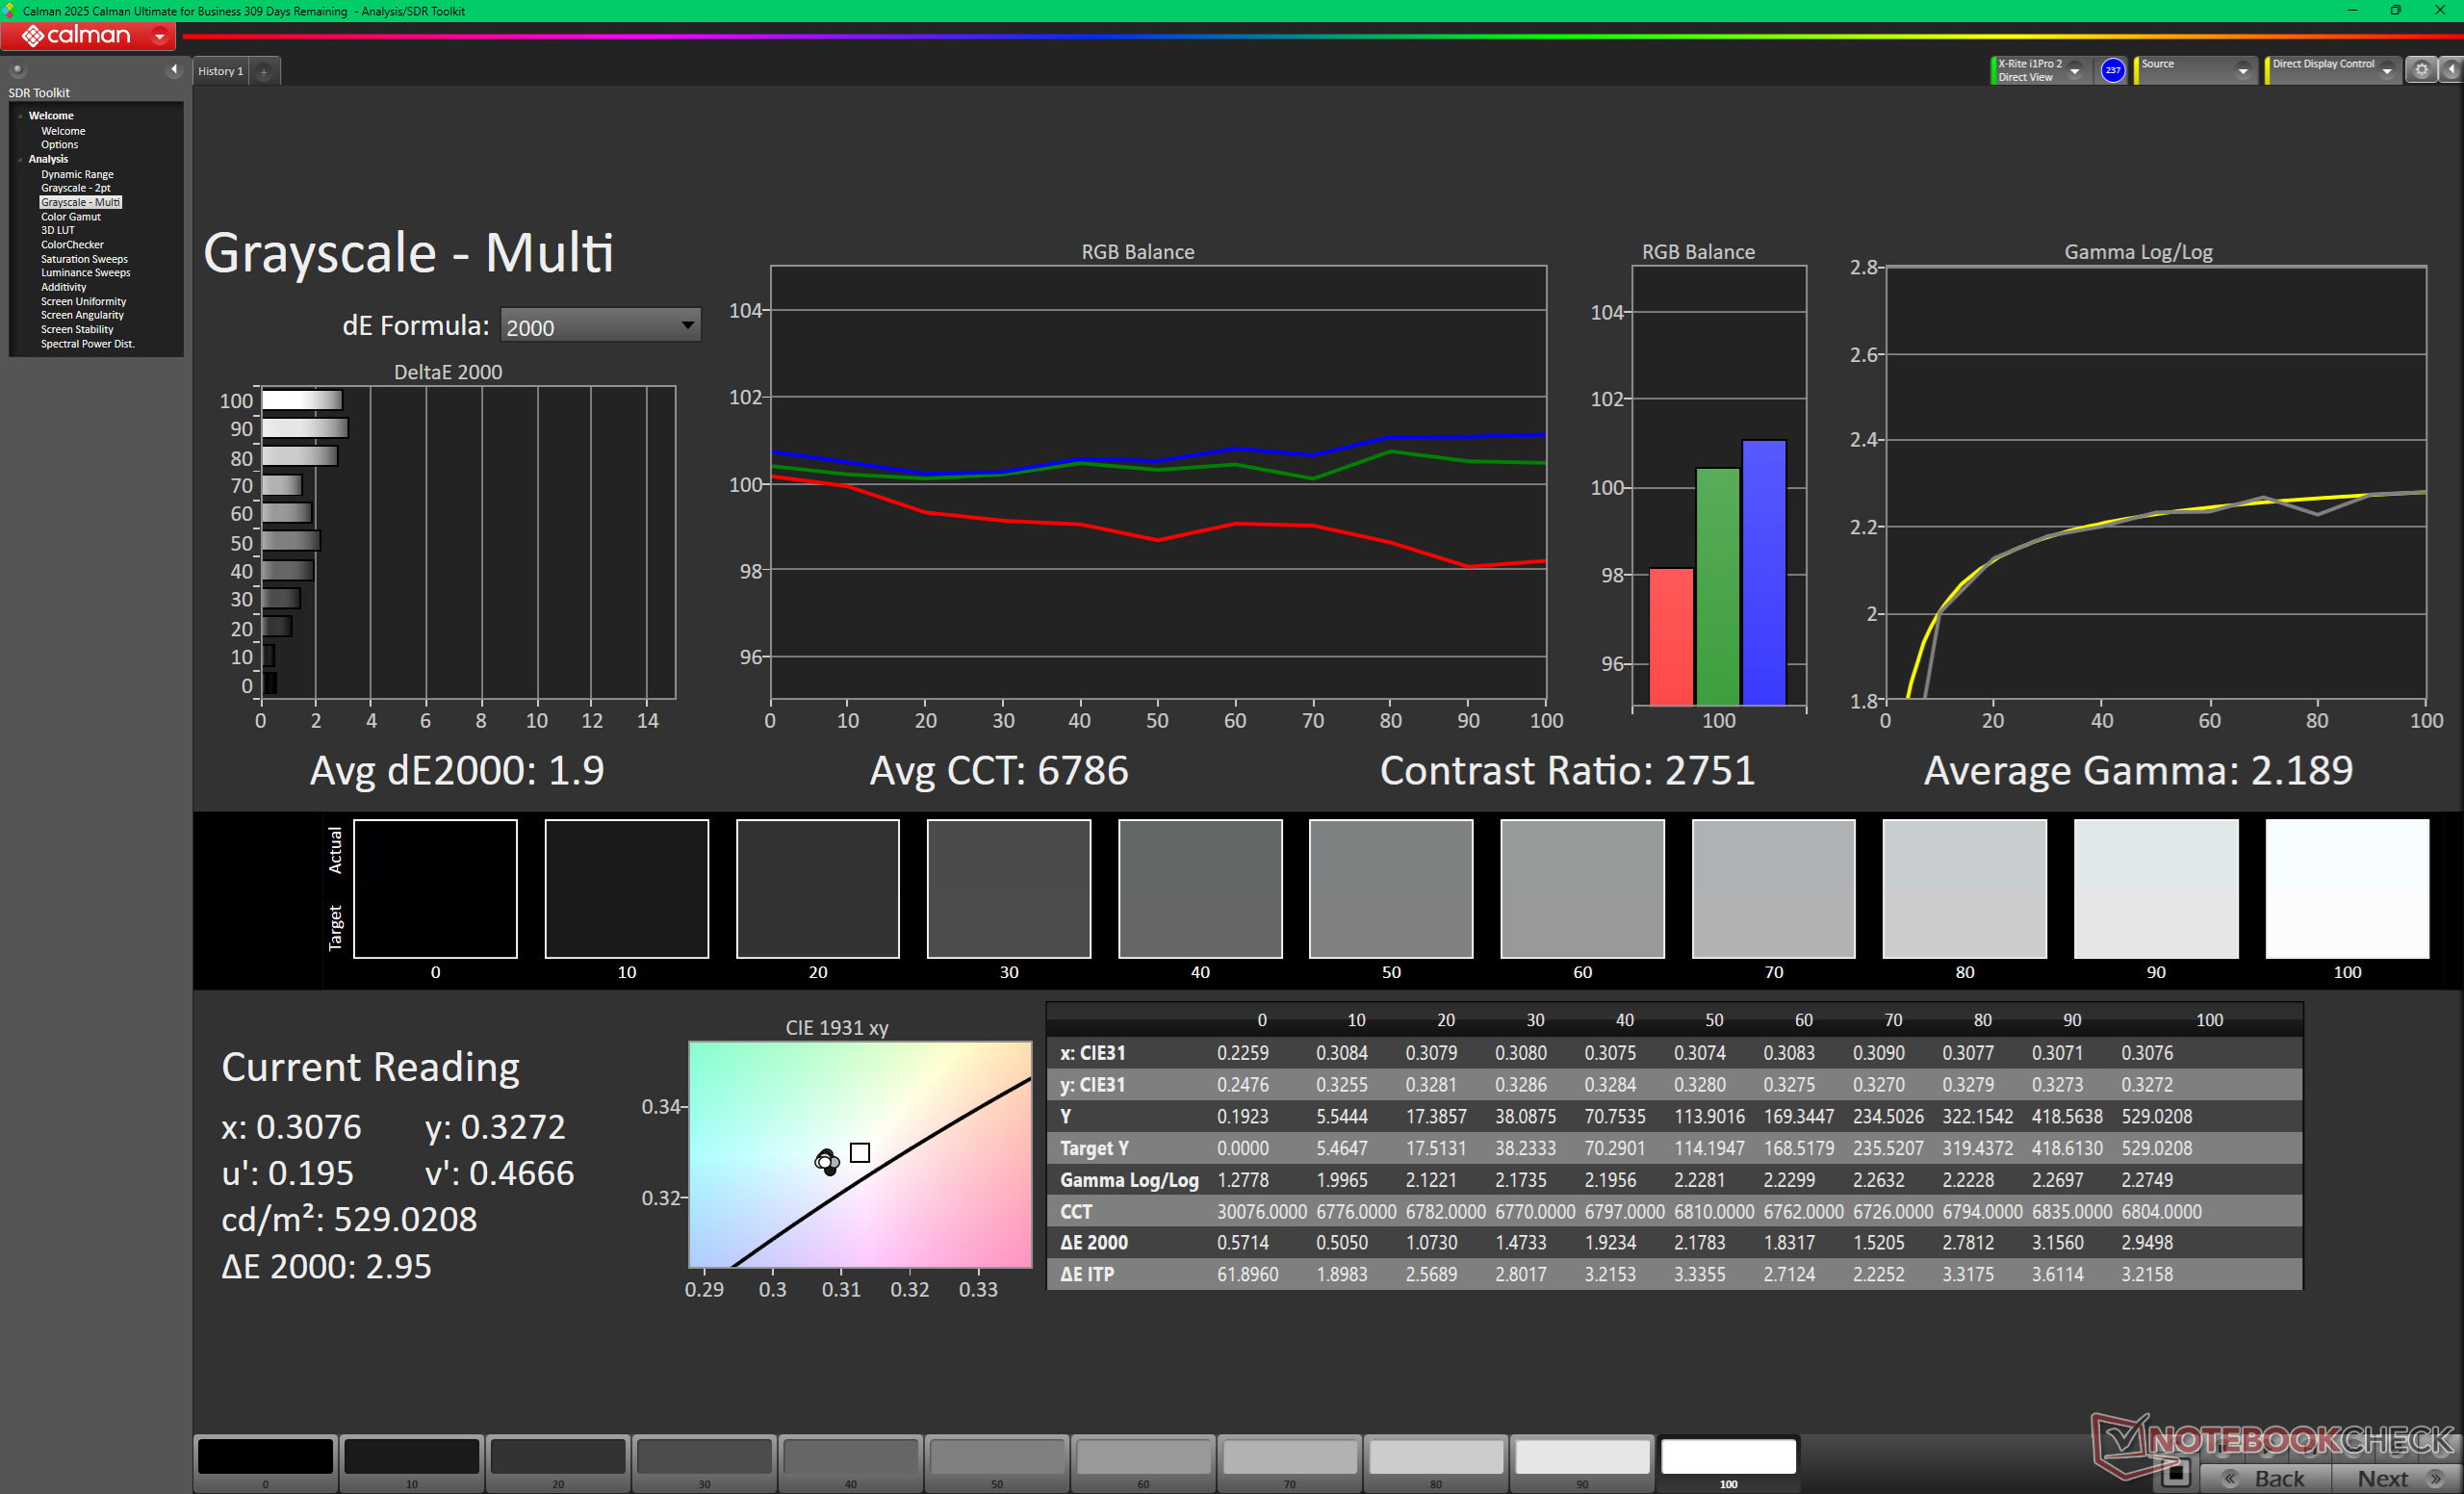
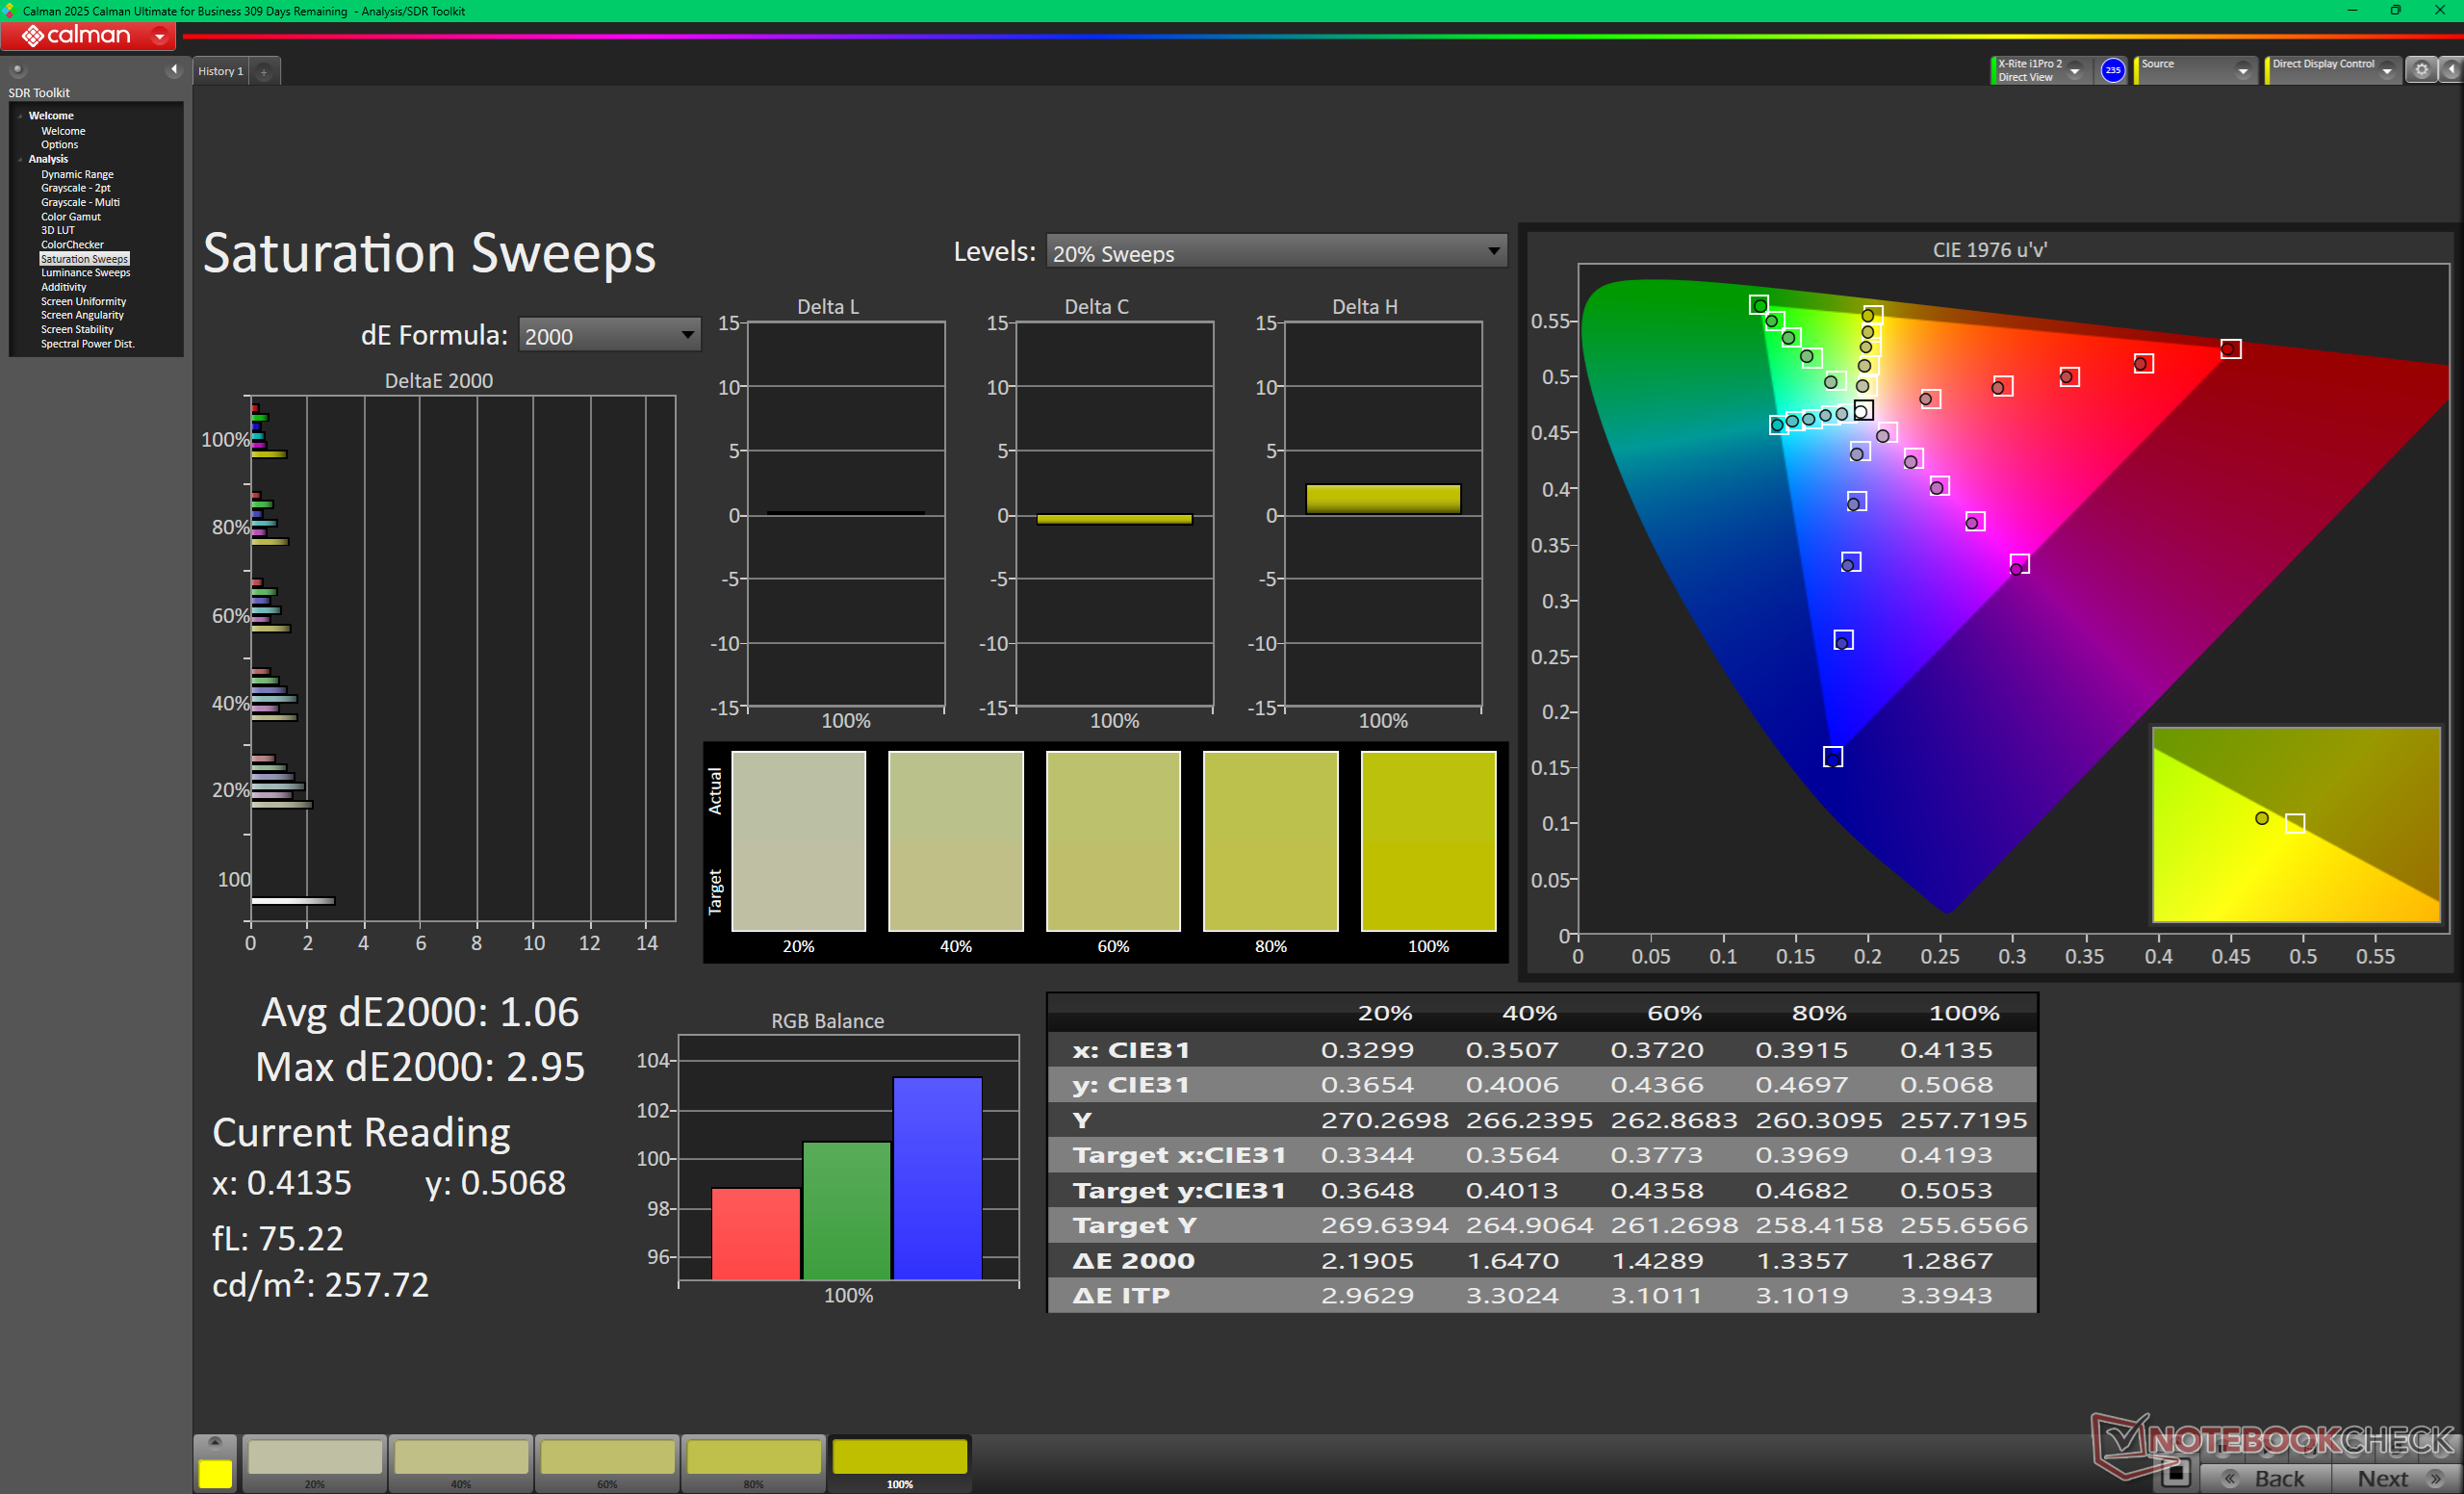
calibrated: 1.26
ΔE Greyscale Calman: 2.7 | ∀{0.09-98 Ø5}
67.7% AdobeRGB 1998 (Argyll 3D)
97.4% sRGB (Argyll 3D)
66.2% Display P3 (Argyll 3D)
Gamma: 2.32
CCT: 6860 K
| Dell XPS 16 Core Ultra 5 325 LG Philips 160WUX, IPS, 1920x1200, 16", 120 Hz | Dell XPS 16 9640 SDC4196, OLED, 3840x2400, 16.3", 90 Hz | Lenovo Yoga Pro 9 16IAH10 RTX 5050 ATNA60HR04-0, OLED, 2880x1800, 16", 120 Hz | Samsung Galaxy Book6 Ultra ATNA60HR05-0, OLED, 2880x1800, 16", 120 Hz | Asus ZenBook S16 UM5606GA ATNA60HR07-0, OLED, 2880x1800, 16", 120 Hz | MSI Prestige 16 AI Evo B2HMG B160QAN03_R, IPS, 2560x1600, 16", 60 Hz | |
|---|---|---|---|---|---|---|
| Display | 27% | 25% | 31% | 24% | ||
| Display P3 Coverage (%) | 66.2 | 98.3 48% | 97 47% | 99.8 51% | 96.4 46% | |
| sRGB Coverage (%) | 97.4 | 100 3% | 99.9 3% | 100 3% | 99.7 2% | |
| AdobeRGB 1998 Coverage (%) | 67.7 | 87.8 30% | 85.3 26% | 94 39% | 84.3 25% | |
| Response Times | 98% | 99% | 98% | -12% | ||
| Response Time Grey 50% / Grey 80% * (ms) | 39.3 ? | 0.82 ? 98% | 0.5 ? 99% | 1.27 ? 97% | 51.5 ? -31% | |
| Response Time Black / White * (ms) | 26 ? | 0.85 ? 97% | 0.4 ? 98% | 0.43 ? 98% | 24.3 ? 7% | |
| PWM Frequency (Hz) | 360 ? | 1200 | 240 ? | 960 ? | ||
| PWM Amplitude * (%) | 37 | 100 | 56 | |||
| Screen | 8% | -15% | 26% | 18% | -55% | |
| Brightness middle (cd/m²) | 534.6 | 366 -32% | 471.7 -12% | 499 -7% | 465 -13% | 471 -12% |
| Brightness (cd/m²) | 515 | 367 -29% | 474 -8% | 505 -2% | 466 -10% | 455 -12% |
| Brightness Distribution (%) | 92 | 96 4% | 98 7% | 97 5% | 99 8% | 92 0% |
| Black Level * (cd/m²) | 0.26 | 0.2 23% | ||||
| Contrast (:1) | 2056 | 2355 15% | ||||
| Colorchecker dE 2000 * | 2.53 | 1.3 49% | 3.53 -40% | 0.9 64% | 1 60% | 5.8 -129% |
| Colorchecker dE 2000 max. * | 4.57 | 3.6 21% | 6.31 -38% | 2.1 54% | 3 34% | 10.8 -136% |
| Colorchecker dE 2000 calibrated * | 1.26 | 1 21% | 1.9 -51% | |||
| Greyscale dE 2000 * | 2.7 | 2.2 19% | 2.6 4% | 1.6 41% | 1.9 30% | 7.8 -189% |
| Gamma | 2.32 95% | 2.14 103% | 2.24 98% | 2.22 99% | 2.19 100% | 2.07 106% |
| CCT | 6860 95% | 6680 97% | 6292 103% | 6445 101% | 6458 101% | 7262 90% |
| Media totale (Programma / Settaggio) | 44% /
27% | -15% /
-15% | 50% /
39% | 49% /
36% | -14% /
-32% |
* ... Meglio usare valori piccoli
Il display viene fornito con una calibrazione decente, ma con un certo margine di miglioramento. La calibrazione con il nostro colorimetro X-Rite, ad esempio, migliorerebbe i già bassi valori medi deltaE della scala di grigi e del colore da 2,7 e 2,53 ad appena 1,9 e 1,26, rispettivamente. Il nostro profilo ICM calibrato di cui sopra è disponibile per il download gratuito.


Tempi di risposta del Display
| ↔ Tempi di risposta dal Nero al Bianco | ||
|---|---|---|
| 26 ms ... aumenta ↗ e diminuisce ↘ combinato | ↗ 11.7 ms Incremento |  |
| ↘ 14.3 ms Calo | ||
| Lo schermo mostra tempi di risposta relativamente lenti nei nostri tests e potrebbe essere troppo lento per i gamers. In confronto, tutti i dispositivi di test variano da 0.1 (minimo) a 240 (massimo) ms. » 62 % di tutti i dispositivi è migliore. Questo significa che i tempi di risposta rilevati sono peggiori rispetto alla media di tutti i dispositivi testati (20.1 ms). | ||
| ↔ Tempo di risposta dal 50% Grigio all'80% Grigio | ||
| 39.3 ms ... aumenta ↗ e diminuisce ↘ combinato | ↗ 18.1 ms Incremento | 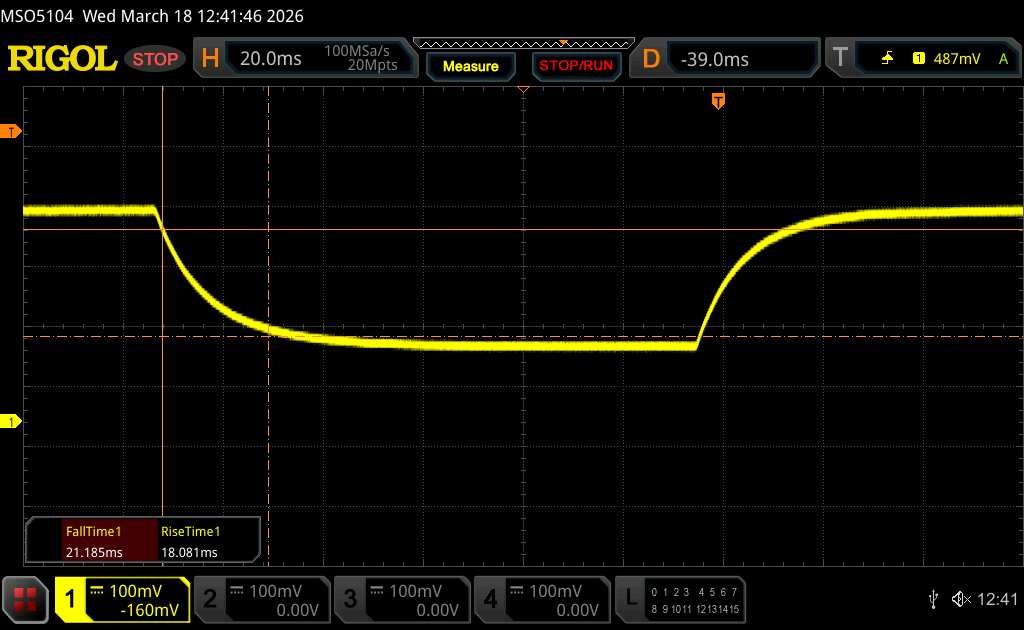 |
| ↘ 21.2 ms Calo | ||
| Lo schermo mostra tempi di risposta lenti nei nostri tests e sarà insoddisfacente per i gamers. In confronto, tutti i dispositivi di test variano da 0.165 (minimo) a 636 (massimo) ms. » 60 % di tutti i dispositivi è migliore. Questo significa che i tempi di risposta rilevati sono peggiori rispetto alla media di tutti i dispositivi testati (31.4 ms). | ||
Sfarfallio dello schermo / PWM (Pulse-Width Modulation)
| flickering dello schermo / PWM non rilevato | 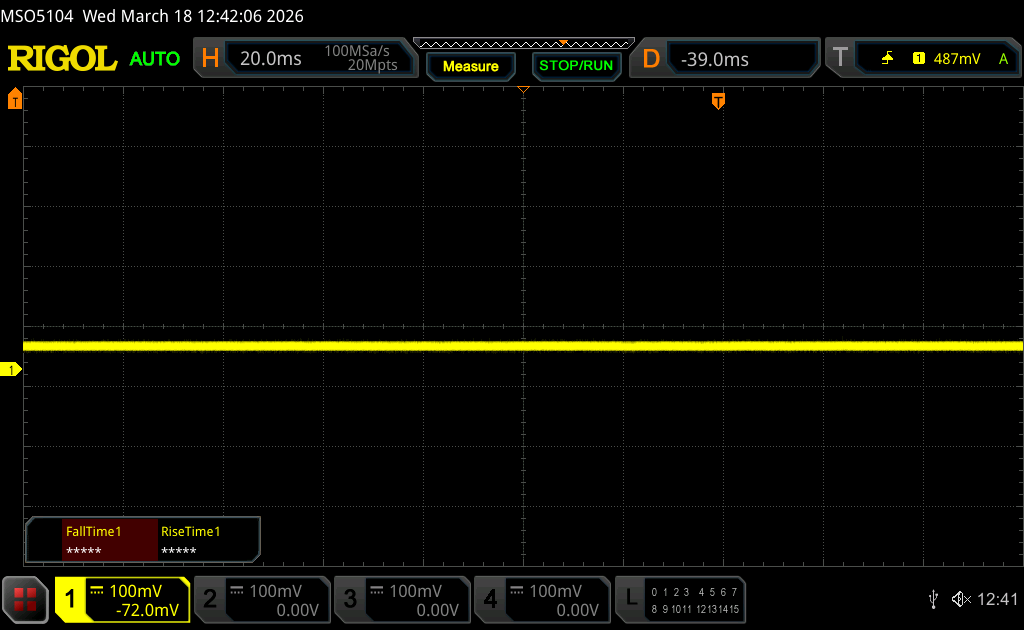 | ||
In confronto: 53 % di tutti i dispositivi testati non utilizza PWM per ridurre la luminosita' del display. Se è rilevato PWM, una media di 7986 (minimo: 5 - massimo: 343500) Hz è stata rilevata. | |||
La visibilità all'aperto è discreta quando si trova all'ombra, grazie alla retroilluminazione relativamente luminosa da 500 nit e al rivestimento opaco. Altrimenti, i colori diventano troppo sbiaditi se esposti alla luce diretta del sole.


Performance - Puntare tutto sul Lago Panther
Condizioni del test
Abbiamo impostato Windows e Dell Optimizer in modalità Prestazioni prima di eseguire i benchmark qui sotto.
Processore
La base Core Ultra 5 325 è un po' lento per una CPU della serie H, in quanto è solo il 10 percento più veloce dell'ULV Core Ultra 7 258V quando si tratta di prestazioni multi-thread. Infatti, passando dal Core Ultra 5 325 al Core Ultra 7 355 dovrebbe migliorare le prestazioni solo del 5 percento circa, dato che entrambi condividono lo stesso numero di core e le stesse dimensioni della cache. Gli utenti dovrebbero passare alla configurazione di fascia alta Core Ultra X7 358H per ottenere un aumento molto più significativo del 70 percento delle prestazioni del processore grezzo.
Cinebench R15 Multi Loop
Cinebench R23: Multi Core | Single Core
Cinebench R20: CPU (Multi Core) | CPU (Single Core)
Cinebench R15: CPU Multi 64Bit | CPU Single 64Bit
Blender: v2.79 BMW27 CPU
7-Zip 18.03: 7z b 4 | 7z b 4 -mmt1
Geekbench 6.5: Multi-Core | Single-Core
Geekbench 5.5: Multi-Core | Single-Core
HWBOT x265 Benchmark v2.2: 4k Preset
LibreOffice : 20 Documents To PDF
R Benchmark 2.5: Overall mean
| CPU Performance rating | |
| Schenker XMG APEX 16 MAX | |
| Lenovo ThinkPad P16 Gen 3 | |
| HP ZBook X G1i 16 | |
| Samsung Galaxy Book6 Ultra | |
| MSI Prestige 16 AI Evo B2HMG | |
| Dell XPS 14 Core Ultra X7 358H | |
| Dell 16 Premium DA16250 | |
| Lenovo ThinkPad P1 G6 21FV001KUS | |
| Asus ZenBook S16 UM5606GA | |
| Dell XPS 16 9640 | |
| Dell XPS 14 Core Ultra 7 355 | |
| Gigabyte Gaming A16 Pro GA6DH (Core 7 240H, RTX 5070 Ti) | |
| Dell XPS 16 Core Ultra 5 325 | |
| Media Intel Core Ultra 5 325 | |
| Lenovo IdeaPad 5 2-in-1 16IAL10 | |
| Dell 16 Plus 2-in-1 | |
| Cinebench R23 / Multi Core | |
| Schenker XMG APEX 16 MAX | |
| Lenovo ThinkPad P16 Gen 3 | |
| Dell 16 Premium DA16250 | |
| HP ZBook X G1i 16 | |
| Samsung Galaxy Book6 Ultra | |
| MSI Prestige 16 AI Evo B2HMG | |
| Dell XPS 14 Core Ultra X7 358H | |
| Dell XPS 16 9640 | |
| Lenovo ThinkPad P1 G6 21FV001KUS | |
| Asus ZenBook S16 UM5606GA | |
| Gigabyte Gaming A16 Pro GA6DH (Core 7 240H, RTX 5070 Ti) | |
| Lenovo IdeaPad 5 2-in-1 16IAL10 | |
| Dell XPS 14 Core Ultra 7 355 | |
| Dell XPS 16 Core Ultra 5 325 | |
| Media Intel Core Ultra 5 325 (n=1) | |
| Dell 16 Plus 2-in-1 | |
| Cinebench R23 / Single Core | |
| Lenovo ThinkPad P16 Gen 3 | |
| Schenker XMG APEX 16 MAX | |
| MSI Prestige 16 AI Evo B2HMG | |
| Dell XPS 14 Core Ultra X7 358H | |
| Samsung Galaxy Book6 Ultra | |
| Lenovo ThinkPad P1 G6 21FV001KUS | |
| HP ZBook X G1i 16 | |
| Asus ZenBook S16 UM5606GA | |
| Dell XPS 14 Core Ultra 7 355 | |
| Lenovo IdeaPad 5 2-in-1 16IAL10 | |
| Dell 16 Premium DA16250 | |
| Dell 16 Plus 2-in-1 | |
| Dell XPS 16 Core Ultra 5 325 | |
| Media Intel Core Ultra 5 325 (n=1) | |
| Dell XPS 16 9640 | |
| Gigabyte Gaming A16 Pro GA6DH (Core 7 240H, RTX 5070 Ti) | |
| Cinebench R20 / CPU (Multi Core) | |
| Schenker XMG APEX 16 MAX | |
| Lenovo ThinkPad P16 Gen 3 | |
| Dell 16 Premium DA16250 | |
| HP ZBook X G1i 16 | |
| Samsung Galaxy Book6 Ultra | |
| MSI Prestige 16 AI Evo B2HMG | |
| Dell XPS 14 Core Ultra X7 358H | |
| Dell XPS 16 9640 | |
| Asus ZenBook S16 UM5606GA | |
| Lenovo ThinkPad P1 G6 21FV001KUS | |
| Gigabyte Gaming A16 Pro GA6DH (Core 7 240H, RTX 5070 Ti) | |
| Lenovo IdeaPad 5 2-in-1 16IAL10 | |
| Dell XPS 14 Core Ultra 7 355 | |
| Dell XPS 16 Core Ultra 5 325 | |
| Media Intel Core Ultra 5 325 (n=1) | |
| Dell 16 Plus 2-in-1 | |
| Cinebench R20 / CPU (Single Core) | |
| Lenovo ThinkPad P16 Gen 3 | |
| Schenker XMG APEX 16 MAX | |
| MSI Prestige 16 AI Evo B2HMG | |
| Dell XPS 14 Core Ultra X7 358H | |
| Asus ZenBook S16 UM5606GA | |
| Lenovo ThinkPad P1 G6 21FV001KUS | |
| HP ZBook X G1i 16 | |
| Samsung Galaxy Book6 Ultra | |
| Dell 16 Premium DA16250 | |
| Lenovo IdeaPad 5 2-in-1 16IAL10 | |
| Dell XPS 14 Core Ultra 7 355 | |
| Dell 16 Plus 2-in-1 | |
| Dell XPS 16 Core Ultra 5 325 | |
| Media Intel Core Ultra 5 325 (n=1) | |
| Dell XPS 16 9640 | |
| Gigabyte Gaming A16 Pro GA6DH (Core 7 240H, RTX 5070 Ti) | |
| Cinebench R15 / CPU Multi 64Bit | |
| Lenovo ThinkPad P16 Gen 3 | |
| Schenker XMG APEX 16 MAX | |
| HP ZBook X G1i 16 | |
| Dell 16 Premium DA16250 | |
| MSI Prestige 16 AI Evo B2HMG | |
| Samsung Galaxy Book6 Ultra | |
| Dell XPS 14 Core Ultra X7 358H | |
| Dell XPS 16 9640 | |
| Lenovo ThinkPad P1 G6 21FV001KUS | |
| Asus ZenBook S16 UM5606GA | |
| Gigabyte Gaming A16 Pro GA6DH (Core 7 240H, RTX 5070 Ti) | |
| Lenovo IdeaPad 5 2-in-1 16IAL10 | |
| Dell XPS 14 Core Ultra 7 355 | |
| Dell XPS 16 Core Ultra 5 325 | |
| Media Intel Core Ultra 5 325 (n=1) | |
| Dell 16 Plus 2-in-1 | |
| Cinebench R15 / CPU Single 64Bit | |
| Schenker XMG APEX 16 MAX | |
| Lenovo ThinkPad P16 Gen 3 | |
| MSI Prestige 16 AI Evo B2HMG | |
| Dell XPS 14 Core Ultra X7 358H | |
| Samsung Galaxy Book6 Ultra | |
| HP ZBook X G1i 16 | |
| Dell 16 Premium DA16250 | |
| Dell XPS 14 Core Ultra 7 355 | |
| Lenovo ThinkPad P1 G6 21FV001KUS | |
| Dell 16 Plus 2-in-1 | |
| Dell XPS 16 Core Ultra 5 325 | |
| Media Intel Core Ultra 5 325 (n=1) | |
| Dell XPS 16 9640 | |
| Lenovo IdeaPad 5 2-in-1 16IAL10 | |
| Gigabyte Gaming A16 Pro GA6DH (Core 7 240H, RTX 5070 Ti) | |
| Asus ZenBook S16 UM5606GA | |
| Blender / v2.79 BMW27 CPU | |
| Dell 16 Plus 2-in-1 | |
| Dell XPS 16 Core Ultra 5 325 | |
| Media Intel Core Ultra 5 325 (n=1) | |
| Lenovo IdeaPad 5 2-in-1 16IAL10 | |
| Dell XPS 14 Core Ultra 7 355 | |
| Gigabyte Gaming A16 Pro GA6DH (Core 7 240H, RTX 5070 Ti) | |
| MSI Prestige 16 AI Evo B2HMG | |
| Dell XPS 14 Core Ultra X7 358H | |
| Lenovo ThinkPad P1 G6 21FV001KUS | |
| Asus ZenBook S16 UM5606GA | |
| Dell XPS 16 9640 | |
| Dell 16 Premium DA16250 | |
| HP ZBook X G1i 16 | |
| Samsung Galaxy Book6 Ultra | |
| Lenovo ThinkPad P16 Gen 3 | |
| Schenker XMG APEX 16 MAX | |
| 7-Zip 18.03 / 7z b 4 | |
| Schenker XMG APEX 16 MAX | |
| Lenovo ThinkPad P16 Gen 3 | |
| Lenovo ThinkPad P1 G6 21FV001KUS | |
| Dell XPS 16 9640 | |
| Samsung Galaxy Book6 Ultra | |
| HP ZBook X G1i 16 | |
| Dell 16 Premium DA16250 | |
| Asus ZenBook S16 UM5606GA | |
| Dell XPS 14 Core Ultra X7 358H | |
| MSI Prestige 16 AI Evo B2HMG | |
| Gigabyte Gaming A16 Pro GA6DH (Core 7 240H, RTX 5070 Ti) | |
| Lenovo IdeaPad 5 2-in-1 16IAL10 | |
| Dell XPS 14 Core Ultra 7 355 | |
| Dell XPS 16 Core Ultra 5 325 | |
| Media Intel Core Ultra 5 325 (n=1) | |
| Dell 16 Plus 2-in-1 | |
| 7-Zip 18.03 / 7z b 4 -mmt1 | |
| Schenker XMG APEX 16 MAX | |
| Dell XPS 14 Core Ultra X7 358H | |
| Lenovo ThinkPad P16 Gen 3 | |
| Lenovo ThinkPad P1 G6 21FV001KUS | |
| Samsung Galaxy Book6 Ultra | |
| HP ZBook X G1i 16 | |
| Asus ZenBook S16 UM5606GA | |
| MSI Prestige 16 AI Evo B2HMG | |
| Dell XPS 14 Core Ultra 7 355 | |
| Dell 16 Premium DA16250 | |
| Dell XPS 16 Core Ultra 5 325 | |
| Media Intel Core Ultra 5 325 (n=1) | |
| Dell 16 Plus 2-in-1 | |
| Dell XPS 16 9640 | |
| Gigabyte Gaming A16 Pro GA6DH (Core 7 240H, RTX 5070 Ti) | |
| Lenovo IdeaPad 5 2-in-1 16IAL10 | |
| Geekbench 6.5 / Multi-Core | |
| Schenker XMG APEX 16 MAX | |
| Lenovo ThinkPad P16 Gen 3 | |
| Dell 16 Premium DA16250 | |
| MSI Prestige 16 AI Evo B2HMG | |
| HP ZBook X G1i 16 | |
| Dell XPS 14 Core Ultra X7 358H | |
| Samsung Galaxy Book6 Ultra | |
| Asus ZenBook S16 UM5606GA | |
| Dell XPS 16 9640 | |
| Lenovo ThinkPad P1 G6 21FV001KUS | |
| Gigabyte Gaming A16 Pro GA6DH (Core 7 240H, RTX 5070 Ti) | |
| Dell XPS 14 Core Ultra 7 355 | |
| Dell XPS 16 Core Ultra 5 325 | |
| Media Intel Core Ultra 5 325 (11033 - 11088, n=2) | |
| Dell 16 Plus 2-in-1 | |
| Lenovo IdeaPad 5 2-in-1 16IAL10 | |
| Geekbench 6.5 / Single-Core | |
| Schenker XMG APEX 16 MAX | |
| Lenovo ThinkPad P16 Gen 3 | |
| Dell XPS 14 Core Ultra X7 358H | |
| MSI Prestige 16 AI Evo B2HMG | |
| HP ZBook X G1i 16 | |
| Samsung Galaxy Book6 Ultra | |
| Asus ZenBook S16 UM5606GA | |
| Dell 16 Premium DA16250 | |
| Lenovo ThinkPad P1 G6 21FV001KUS | |
| Dell XPS 14 Core Ultra 7 355 | |
| Dell 16 Plus 2-in-1 | |
| Dell XPS 16 Core Ultra 5 325 | |
| Media Intel Core Ultra 5 325 (2562 - 2622, n=2) | |
| Lenovo IdeaPad 5 2-in-1 16IAL10 | |
| Dell XPS 16 9640 | |
| Gigabyte Gaming A16 Pro GA6DH (Core 7 240H, RTX 5070 Ti) | |
| Geekbench 5.5 / Multi-Core | |
| Schenker XMG APEX 16 MAX | |
| Lenovo ThinkPad P16 Gen 3 | |
| Dell XPS 14 Core Ultra X7 358H | |
| Samsung Galaxy Book6 Ultra | |
| MSI Prestige 16 AI Evo B2HMG | |
| Dell 16 Premium DA16250 | |
| HP ZBook X G1i 16 | |
| Dell XPS 16 9640 | |
| Asus ZenBook S16 UM5606GA | |
| Lenovo ThinkPad P1 G6 21FV001KUS | |
| Gigabyte Gaming A16 Pro GA6DH (Core 7 240H, RTX 5070 Ti) | |
| Dell XPS 14 Core Ultra 7 355 | |
| Lenovo IdeaPad 5 2-in-1 16IAL10 | |
| Dell XPS 16 Core Ultra 5 325 | |
| Media Intel Core Ultra 5 325 (9528 - 9854, n=2) | |
| Dell 16 Plus 2-in-1 | |
| Geekbench 5.5 / Single-Core | |
| Schenker XMG APEX 16 MAX | |
| Lenovo ThinkPad P16 Gen 3 | |
| Dell XPS 14 Core Ultra X7 358H | |
| Asus ZenBook S16 UM5606GA | |
| MSI Prestige 16 AI Evo B2HMG | |
| Samsung Galaxy Book6 Ultra | |
| HP ZBook X G1i 16 | |
| Dell XPS 14 Core Ultra 7 355 | |
| Lenovo ThinkPad P1 G6 21FV001KUS | |
| Dell 16 Premium DA16250 | |
| Media Intel Core Ultra 5 325 (1945 - 1946, n=2) | |
| Dell XPS 16 Core Ultra 5 325 | |
| Dell 16 Plus 2-in-1 | |
| Dell XPS 16 9640 | |
| Lenovo IdeaPad 5 2-in-1 16IAL10 | |
| Gigabyte Gaming A16 Pro GA6DH (Core 7 240H, RTX 5070 Ti) | |
| HWBOT x265 Benchmark v2.2 / 4k Preset | |
| Schenker XMG APEX 16 MAX | |
| Lenovo ThinkPad P16 Gen 3 | |
| HP ZBook X G1i 16 | |
| Samsung Galaxy Book6 Ultra | |
| MSI Prestige 16 AI Evo B2HMG | |
| Dell 16 Premium DA16250 | |
| Asus ZenBook S16 UM5606GA | |
| Dell XPS 16 9640 | |
| Dell XPS 14 Core Ultra X7 358H | |
| Lenovo ThinkPad P1 G6 21FV001KUS | |
| Gigabyte Gaming A16 Pro GA6DH (Core 7 240H, RTX 5070 Ti) | |
| Dell XPS 14 Core Ultra 7 355 | |
| Dell XPS 16 Core Ultra 5 325 | |
| Media Intel Core Ultra 5 325 (n=1) | |
| Dell 16 Plus 2-in-1 | |
| Lenovo IdeaPad 5 2-in-1 16IAL10 | |
| LibreOffice / 20 Documents To PDF | |
| Gigabyte Gaming A16 Pro GA6DH (Core 7 240H, RTX 5070 Ti) | |
| Asus ZenBook S16 UM5606GA | |
| Schenker XMG APEX 16 MAX | |
| Dell 16 Plus 2-in-1 | |
| Dell XPS 16 Core Ultra 5 325 | |
| Media Intel Core Ultra 5 325 (n=1) | |
| Lenovo IdeaPad 5 2-in-1 16IAL10 | |
| Samsung Galaxy Book6 Ultra | |
| Dell XPS 14 Core Ultra X7 358H | |
| Dell XPS 16 9640 | |
| Lenovo ThinkPad P1 G6 21FV001KUS | |
| MSI Prestige 16 AI Evo B2HMG | |
| Dell 16 Premium DA16250 | |
| Dell XPS 14 Core Ultra 7 355 | |
| Lenovo ThinkPad P16 Gen 3 | |
| HP ZBook X G1i 16 | |
| R Benchmark 2.5 / Overall mean | |
| Gigabyte Gaming A16 Pro GA6DH (Core 7 240H, RTX 5070 Ti) | |
| Dell XPS 16 9640 | |
| Dell 16 Plus 2-in-1 | |
| Lenovo IdeaPad 5 2-in-1 16IAL10 | |
| Dell XPS 16 Core Ultra 5 325 | |
| Media Intel Core Ultra 5 325 (n=1) | |
| Dell 16 Premium DA16250 | |
| Dell XPS 14 Core Ultra 7 355 | |
| MSI Prestige 16 AI Evo B2HMG | |
| Samsung Galaxy Book6 Ultra | |
| Asus ZenBook S16 UM5606GA | |
| HP ZBook X G1i 16 | |
| Lenovo ThinkPad P16 Gen 3 | |
| Dell XPS 14 Core Ultra X7 358H | |
| Lenovo ThinkPad P1 G6 21FV001KUS | |
| Schenker XMG APEX 16 MAX | |
Cinebench R23: Multi Core | Single Core
Cinebench R20: CPU (Multi Core) | CPU (Single Core)
Cinebench R15: CPU Multi 64Bit | CPU Single 64Bit
Blender: v2.79 BMW27 CPU
7-Zip 18.03: 7z b 4 | 7z b 4 -mmt1
Geekbench 6.5: Multi-Core | Single-Core
Geekbench 5.5: Multi-Core | Single-Core
HWBOT x265 Benchmark v2.2: 4k Preset
LibreOffice : 20 Documents To PDF
R Benchmark 2.5: Overall mean
* ... Meglio usare valori piccoli
AIDA64: FP32 Ray-Trace | FPU Julia | CPU SHA3 | CPU Queen | FPU SinJulia | FPU Mandel | CPU AES | CPU ZLib | FP64 Ray-Trace | CPU PhotoWorxx | CPU CheckMate
| Performance rating | |
| Asus ZenBook S16 UM5606GA -1! | |
| Lenovo Yoga Pro 9 16IAH10 RTX 5050 -1! | |
| Samsung Galaxy Book6 Ultra -1! | |
| Dell XPS 16 9640 -1! | |
| MSI Prestige 16 AI Evo B2HMG -1! | |
| Dell XPS 16 Core Ultra 5 325 -1! | |
| Media Intel Core Ultra 5 325 -1! | |
| AIDA64 / FP32 Ray-Trace | |
| Asus ZenBook S16 UM5606GA (v6.92.6600) | |
| Lenovo Yoga Pro 9 16IAH10 RTX 5050 (v6.92.6600) | |
| Samsung Galaxy Book6 Ultra (v8.20.8100) | |
| MSI Prestige 16 AI Evo B2HMG (v6.92.6600) | |
| Dell XPS 16 9640 (v6.92.6600) | |
| Dell XPS 16 Core Ultra 5 325 (v8.20.8100) | |
| Media Intel Core Ultra 5 325 (n=1) | |
| AIDA64 / FPU Julia | |
| Lenovo Yoga Pro 9 16IAH10 RTX 5050 (v6.92.6600) | |
| Samsung Galaxy Book6 Ultra (v8.20.8100) | |
| Asus ZenBook S16 UM5606GA (v6.92.6600) | |
| MSI Prestige 16 AI Evo B2HMG (v6.92.6600) | |
| Dell XPS 16 9640 (v6.92.6600) | |
| Dell XPS 16 Core Ultra 5 325 (v8.20.8100) | |
| Media Intel Core Ultra 5 325 (n=1) | |
| AIDA64 / CPU SHA3 | |
| Samsung Galaxy Book6 Ultra (v8.20.8100) | |
| Lenovo Yoga Pro 9 16IAH10 RTX 5050 (v6.92.6600) | |
| Asus ZenBook S16 UM5606GA (v6.92.6600) | |
| MSI Prestige 16 AI Evo B2HMG (v6.92.6600) | |
| Dell XPS 16 9640 (v6.92.6600) | |
| Dell XPS 16 Core Ultra 5 325 (v8.20.8100) | |
| Media Intel Core Ultra 5 325 (n=1) | |
| AIDA64 / CPU Queen | |
| Asus ZenBook S16 UM5606GA (v6.92.6600) | |
| Dell XPS 16 9640 (v6.92.6600) | |
| MSI Prestige 16 AI Evo B2HMG (v6.92.6600) | |
| Lenovo Yoga Pro 9 16IAH10 RTX 5050 (v6.92.6600) | |
| AIDA64 / FPU SinJulia | |
| Asus ZenBook S16 UM5606GA (v6.92.6600) | |
| Dell XPS 16 9640 (v6.92.6600) | |
| Lenovo Yoga Pro 9 16IAH10 RTX 5050 (v6.92.6600) | |
| MSI Prestige 16 AI Evo B2HMG (v6.92.6600) | |
| Samsung Galaxy Book6 Ultra (v8.20.8100) | |
| Dell XPS 16 Core Ultra 5 325 (v8.20.8100) | |
| Media Intel Core Ultra 5 325 (n=1) | |
| AIDA64 / FPU Mandel | |
| Lenovo Yoga Pro 9 16IAH10 RTX 5050 (v6.92.6600) | |
| Samsung Galaxy Book6 Ultra (v8.20.8100) | |
| Asus ZenBook S16 UM5606GA (v6.92.6600) | |
| MSI Prestige 16 AI Evo B2HMG (v6.92.6600) | |
| Dell XPS 16 9640 (v6.92.6600) | |
| Dell XPS 16 Core Ultra 5 325 (v8.20.8100) | |
| Media Intel Core Ultra 5 325 (n=1) | |
| AIDA64 / CPU AES | |
| Asus ZenBook S16 UM5606GA (v6.92.6600) | |
| Dell XPS 16 9640 (v6.92.6600) | |
| Lenovo Yoga Pro 9 16IAH10 RTX 5050 (v6.92.6600) | |
| MSI Prestige 16 AI Evo B2HMG (v6.92.6600) | |
| Samsung Galaxy Book6 Ultra (v8.20.8100) | |
| Dell XPS 16 Core Ultra 5 325 (v8.20.8100) | |
| Media Intel Core Ultra 5 325 (n=1) | |
| AIDA64 / CPU ZLib | |
| Lenovo Yoga Pro 9 16IAH10 RTX 5050 (v6.92.6600) | |
| Dell XPS 16 9640 (v6.92.6600) | |
| Samsung Galaxy Book6 Ultra (v8.20.8100) | |
| Asus ZenBook S16 UM5606GA (v6.92.6600) | |
| MSI Prestige 16 AI Evo B2HMG (v6.92.6600) | |
| Dell XPS 16 Core Ultra 5 325 (v8.20.8100) | |
| Media Intel Core Ultra 5 325 (n=1) | |
| AIDA64 / FP64 Ray-Trace | |
| Asus ZenBook S16 UM5606GA (v6.92.6600) | |
| Lenovo Yoga Pro 9 16IAH10 RTX 5050 (v6.92.6600) | |
| Samsung Galaxy Book6 Ultra (v8.20.8100) | |
| MSI Prestige 16 AI Evo B2HMG (v6.92.6600) | |
| Dell XPS 16 9640 (v6.92.6600) | |
| Dell XPS 16 Core Ultra 5 325 (v8.20.8100) | |
| Media Intel Core Ultra 5 325 (n=1) | |
| AIDA64 / CPU PhotoWorxx | |
| Samsung Galaxy Book6 Ultra (v8.20.8100) | |
| Lenovo Yoga Pro 9 16IAH10 RTX 5050 (v6.92.6600) | |
| MSI Prestige 16 AI Evo B2HMG (v6.92.6600) | |
| Dell XPS 16 Core Ultra 5 325 (v8.20.8100) | |
| Media Intel Core Ultra 5 325 (n=1) | |
| Asus ZenBook S16 UM5606GA (v6.92.6600) | |
| Dell XPS 16 9640 (v6.92.6600) | |
| AIDA64 / CPU CheckMate | |
| Samsung Galaxy Book6 Ultra (v8.20.8100) | |
| Dell XPS 16 Core Ultra 5 325 (v8.20.8100) | |
| Media Intel Core Ultra 5 325 (n=1) | |
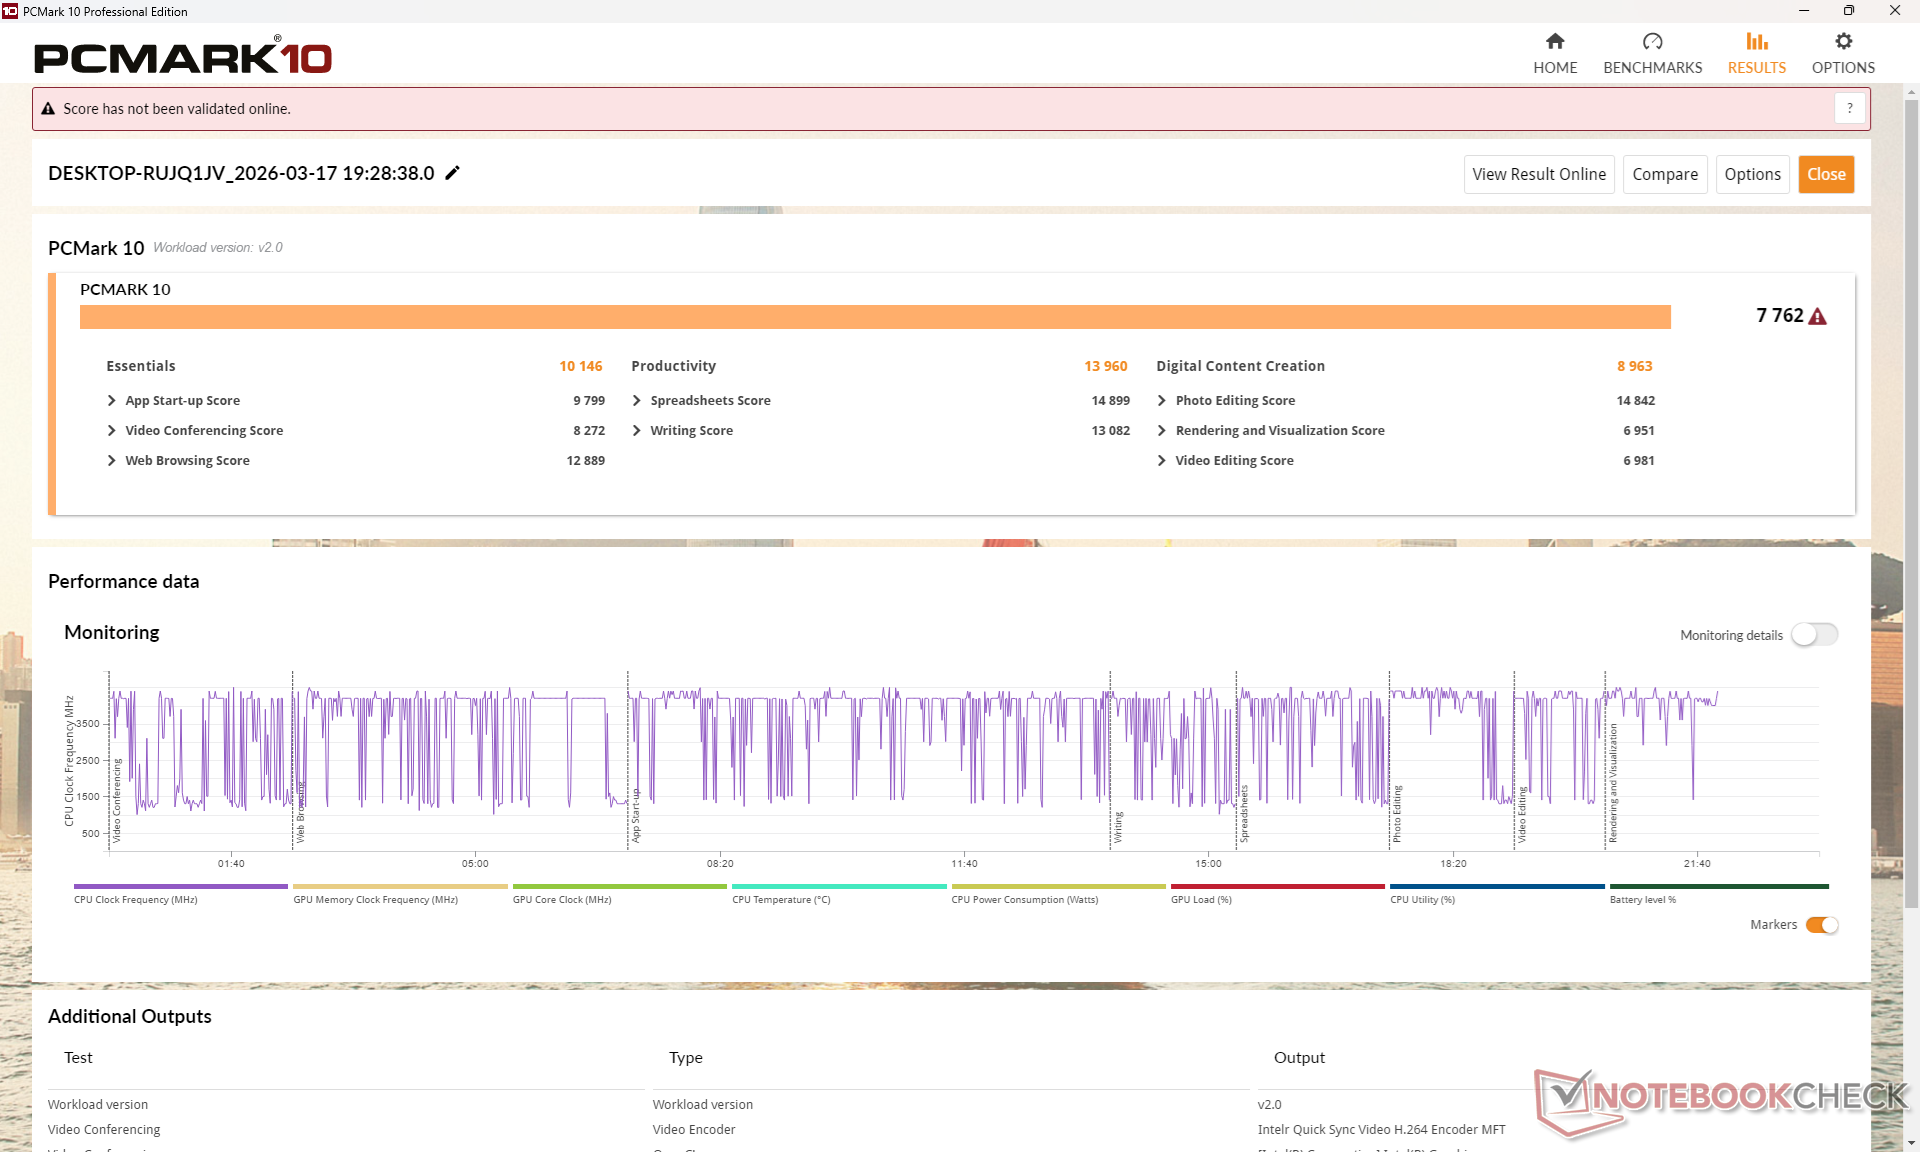
Prestazioni del sistema
PCMark 10: Score | Essentials | Productivity | Digital Content Creation
CrossMark: Overall | Productivity | Creativity | Responsiveness
WebXPRT 3: Overall
WebXPRT 4: Overall
Mozilla Kraken 1.1: Total
Geekbench AI: Single Precision GPU 1.7 | Half Precision GPU 1.7 | Quantized GPU 1.7
| Performance rating | |
| Lenovo Yoga Pro 9 16IAH10 RTX 5050 | |
| Samsung Galaxy Book6 Ultra | |
| MSI Prestige 16 AI Evo B2HMG -3! | |
| Dell XPS 16 9640 -4! | |
| Asus ZenBook S16 UM5606GA -3! | |
| Dell XPS 16 Core Ultra 5 325 | |
| Media Intel Core Ultra 5 325, Intel Graphics 4 Xe3 Panther Lake iGPU | |
| PCMark 10 / Score | |
| Lenovo Yoga Pro 9 16IAH10 RTX 5050 | |
| Samsung Galaxy Book6 Ultra | |
| Asus ZenBook S16 UM5606GA | |
| MSI Prestige 16 AI Evo B2HMG | |
| Dell XPS 16 Core Ultra 5 325 | |
| Media Intel Core Ultra 5 325, Intel Graphics 4 Xe3 Panther Lake iGPU (n=1) | |
| Dell XPS 16 9640 | |
| PCMark 10 / Essentials | |
| MSI Prestige 16 AI Evo B2HMG | |
| Lenovo Yoga Pro 9 16IAH10 RTX 5050 | |
| Asus ZenBook S16 UM5606GA | |
| Dell XPS 16 9640 | |
| Dell XPS 16 Core Ultra 5 325 | |
| Media Intel Core Ultra 5 325, Intel Graphics 4 Xe3 Panther Lake iGPU (n=1) | |
| Samsung Galaxy Book6 Ultra | |
| PCMark 10 / Productivity | |
| Samsung Galaxy Book6 Ultra | |
| Lenovo Yoga Pro 9 16IAH10 RTX 5050 | |
| Asus ZenBook S16 UM5606GA | |
| Dell XPS 16 Core Ultra 5 325 | |
| Media Intel Core Ultra 5 325, Intel Graphics 4 Xe3 Panther Lake iGPU (n=1) | |
| MSI Prestige 16 AI Evo B2HMG | |
| Dell XPS 16 9640 | |
| PCMark 10 / Digital Content Creation | |
| Lenovo Yoga Pro 9 16IAH10 RTX 5050 | |
| Samsung Galaxy Book6 Ultra | |
| MSI Prestige 16 AI Evo B2HMG | |
| Dell XPS 16 9640 | |
| Asus ZenBook S16 UM5606GA | |
| Dell XPS 16 Core Ultra 5 325 | |
| Media Intel Core Ultra 5 325, Intel Graphics 4 Xe3 Panther Lake iGPU (n=1) | |
| CrossMark / Overall | |
| MSI Prestige 16 AI Evo B2HMG | |
| Lenovo Yoga Pro 9 16IAH10 RTX 5050 | |
| Samsung Galaxy Book6 Ultra | |
| Dell XPS 16 9640 | |
| Dell XPS 16 Core Ultra 5 325 | |
| Media Intel Core Ultra 5 325, Intel Graphics 4 Xe3 Panther Lake iGPU (n=1) | |
| Asus ZenBook S16 UM5606GA | |
| CrossMark / Productivity | |
| MSI Prestige 16 AI Evo B2HMG | |
| Lenovo Yoga Pro 9 16IAH10 RTX 5050 | |
| Dell XPS 16 9640 | |
| Samsung Galaxy Book6 Ultra | |
| Asus ZenBook S16 UM5606GA | |
| Dell XPS 16 Core Ultra 5 325 | |
| Media Intel Core Ultra 5 325, Intel Graphics 4 Xe3 Panther Lake iGPU (n=1) | |
| CrossMark / Creativity | |
| MSI Prestige 16 AI Evo B2HMG | |
| Lenovo Yoga Pro 9 16IAH10 RTX 5050 | |
| Samsung Galaxy Book6 Ultra | |
| Dell XPS 16 9640 | |
| Asus ZenBook S16 UM5606GA | |
| Dell XPS 16 Core Ultra 5 325 | |
| Media Intel Core Ultra 5 325, Intel Graphics 4 Xe3 Panther Lake iGPU (n=1) | |
| CrossMark / Responsiveness | |
| MSI Prestige 16 AI Evo B2HMG | |
| Dell XPS 16 9640 | |
| Samsung Galaxy Book6 Ultra | |
| Lenovo Yoga Pro 9 16IAH10 RTX 5050 | |
| Asus ZenBook S16 UM5606GA | |
| Dell XPS 16 Core Ultra 5 325 | |
| Media Intel Core Ultra 5 325, Intel Graphics 4 Xe3 Panther Lake iGPU (n=1) | |
| WebXPRT 3 / Overall | |
| MSI Prestige 16 AI Evo B2HMG | |
| Lenovo Yoga Pro 9 16IAH10 RTX 5050 | |
| Samsung Galaxy Book6 Ultra | |
| Asus ZenBook S16 UM5606GA | |
| Dell XPS 16 9640 | |
| Dell XPS 16 Core Ultra 5 325 | |
| Media Intel Core Ultra 5 325, Intel Graphics 4 Xe3 Panther Lake iGPU (n=1) | |
| WebXPRT 4 / Overall | |
| MSI Prestige 16 AI Evo B2HMG | |
| Lenovo Yoga Pro 9 16IAH10 RTX 5050 | |
| Samsung Galaxy Book6 Ultra | |
| Dell XPS 16 Core Ultra 5 325 | |
| Media Intel Core Ultra 5 325, Intel Graphics 4 Xe3 Panther Lake iGPU (n=1) | |
| Dell XPS 16 9640 | |
| Asus ZenBook S16 UM5606GA | |
| Mozilla Kraken 1.1 / Total | |
| Dell XPS 16 Core Ultra 5 325 | |
| Media Intel Core Ultra 5 325, Intel Graphics 4 Xe3 Panther Lake iGPU (n=1) | |
| Asus ZenBook S16 UM5606GA | |
| Samsung Galaxy Book6 Ultra | |
| Lenovo Yoga Pro 9 16IAH10 RTX 5050 | |
| MSI Prestige 16 AI Evo B2HMG | |
| Geekbench AI / Single Precision GPU 1.7 | |
| Samsung Galaxy Book6 Ultra | |
| Lenovo Yoga Pro 9 16IAH10 RTX 5050 | |
| Dell XPS 16 Core Ultra 5 325 | |
| Media Intel Core Ultra 5 325, Intel Graphics 4 Xe3 Panther Lake iGPU (n=1) | |
| Geekbench AI / Half Precision GPU 1.7 | |
| Lenovo Yoga Pro 9 16IAH10 RTX 5050 | |
| Samsung Galaxy Book6 Ultra | |
| Dell XPS 16 Core Ultra 5 325 | |
| Media Intel Core Ultra 5 325, Intel Graphics 4 Xe3 Panther Lake iGPU (n=1) | |
| Geekbench AI / Quantized GPU 1.7 | |
| Samsung Galaxy Book6 Ultra | |
| Lenovo Yoga Pro 9 16IAH10 RTX 5050 | |
| Dell XPS 16 Core Ultra 5 325 | |
| Media Intel Core Ultra 5 325, Intel Graphics 4 Xe3 Panther Lake iGPU (n=1) | |
* ... Meglio usare valori piccoli
| PCMark 10 Score | 7762 punti | |
Aiuto | ||
| AIDA64 / Memory Copy | |
| Samsung Galaxy Book6 Ultra | |
| Dell XPS 16 Core Ultra 5 325 | |
| Media Intel Core Ultra 5 325 (n=1) | |
| Lenovo Yoga Pro 9 16IAH10 RTX 5050 | |
| MSI Prestige 16 AI Evo B2HMG | |
| Asus ZenBook S16 UM5606GA | |
| Dell XPS 16 9640 | |
| AIDA64 / Memory Read | |
| Samsung Galaxy Book6 Ultra | |
| Asus ZenBook S16 UM5606GA | |
| Lenovo Yoga Pro 9 16IAH10 RTX 5050 | |
| Dell XPS 16 Core Ultra 5 325 | |
| Media Intel Core Ultra 5 325 (n=1) | |
| Dell XPS 16 9640 | |
| MSI Prestige 16 AI Evo B2HMG | |
| AIDA64 / Memory Write | |
| Samsung Galaxy Book6 Ultra | |
| Asus ZenBook S16 UM5606GA | |
| Dell XPS 16 Core Ultra 5 325 | |
| Media Intel Core Ultra 5 325 (n=1) | |
| Lenovo Yoga Pro 9 16IAH10 RTX 5050 | |
| Dell XPS 16 9640 | |
| MSI Prestige 16 AI Evo B2HMG | |
| AIDA64 / Memory Latency | |
| Dell XPS 16 9640 | |
| MSI Prestige 16 AI Evo B2HMG | |
| Lenovo Yoga Pro 9 16IAH10 RTX 5050 | |
| Asus ZenBook S16 UM5606GA | |
| Dell XPS 16 Core Ultra 5 325 | |
| Media Intel Core Ultra 5 325 (n=1) | |
| Samsung Galaxy Book6 Ultra | |
* ... Meglio usare valori piccoli
Latenza DPC
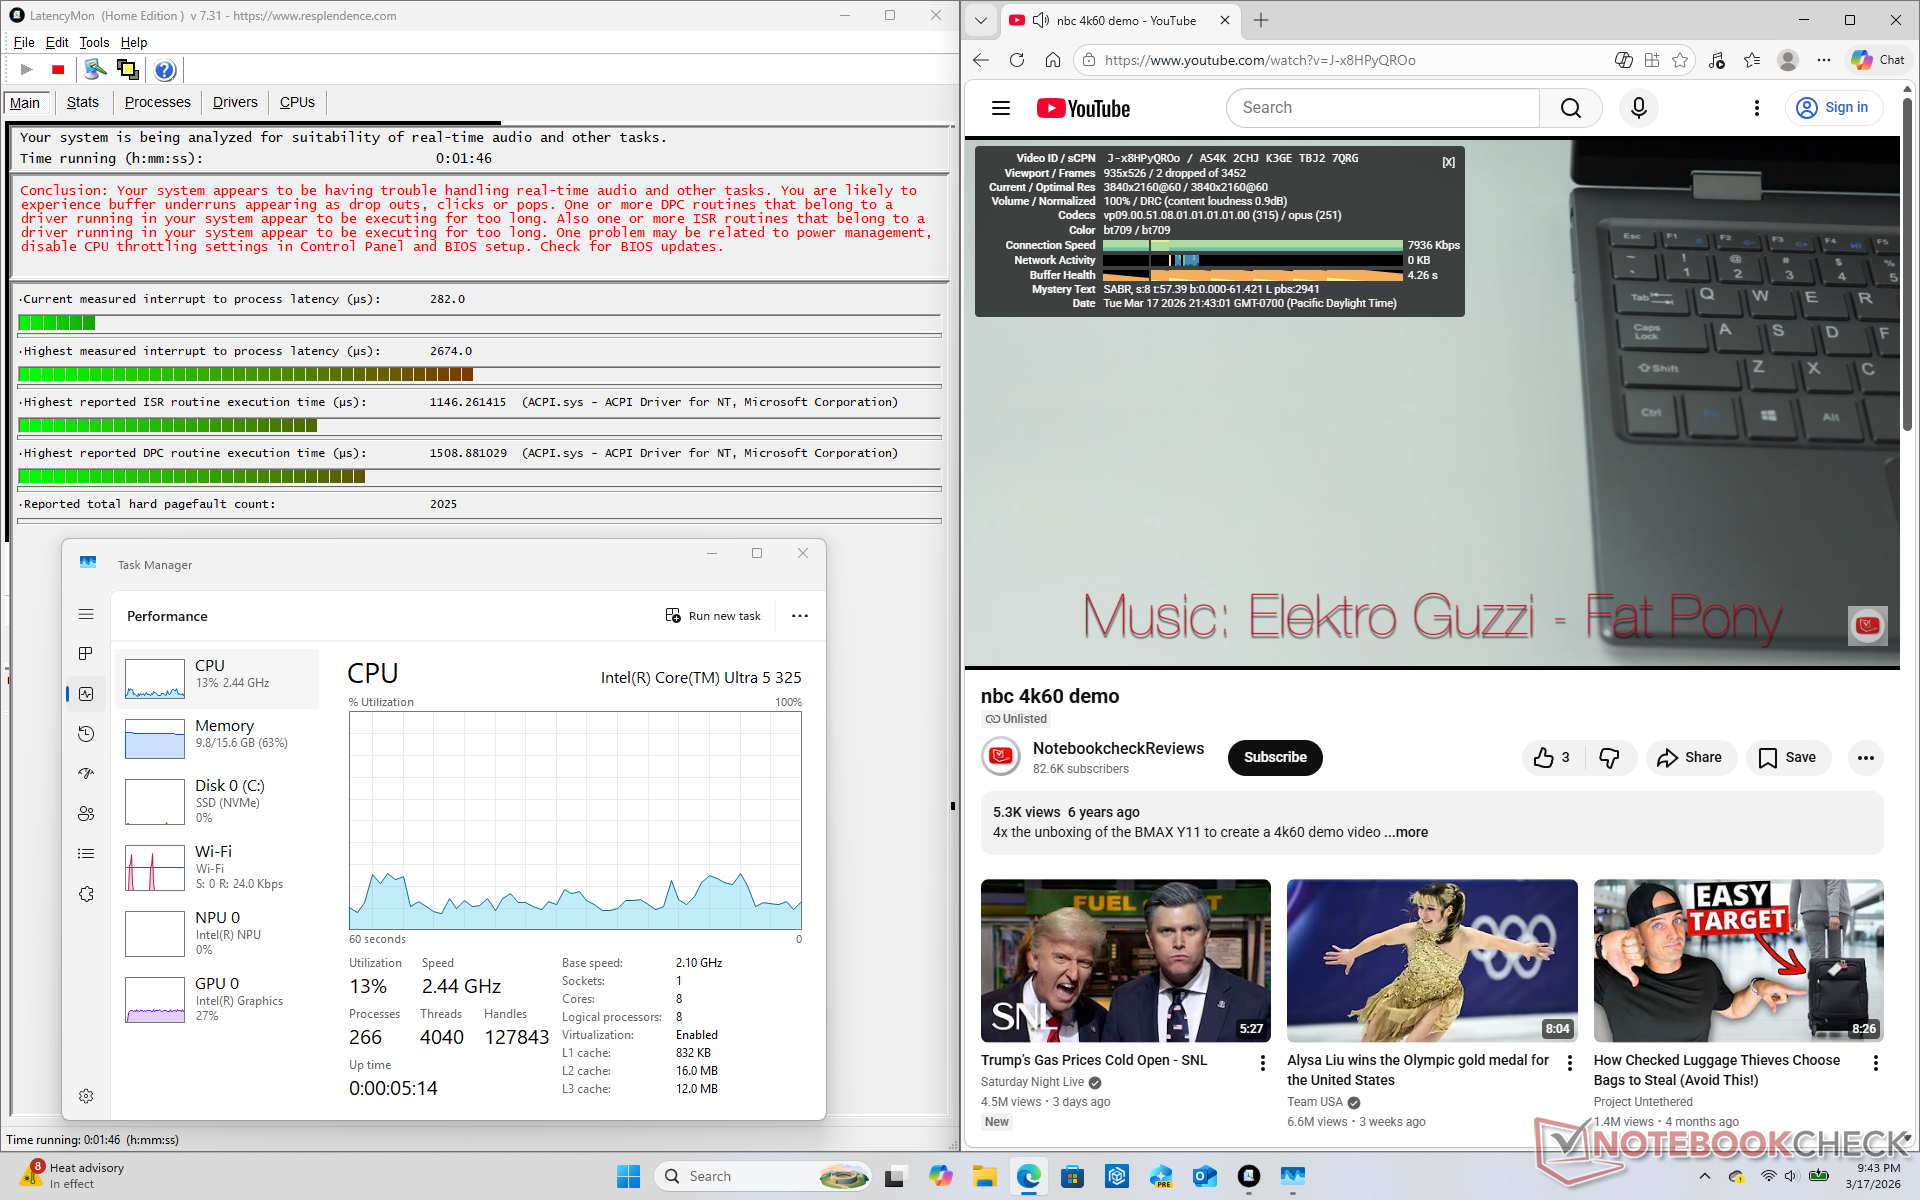
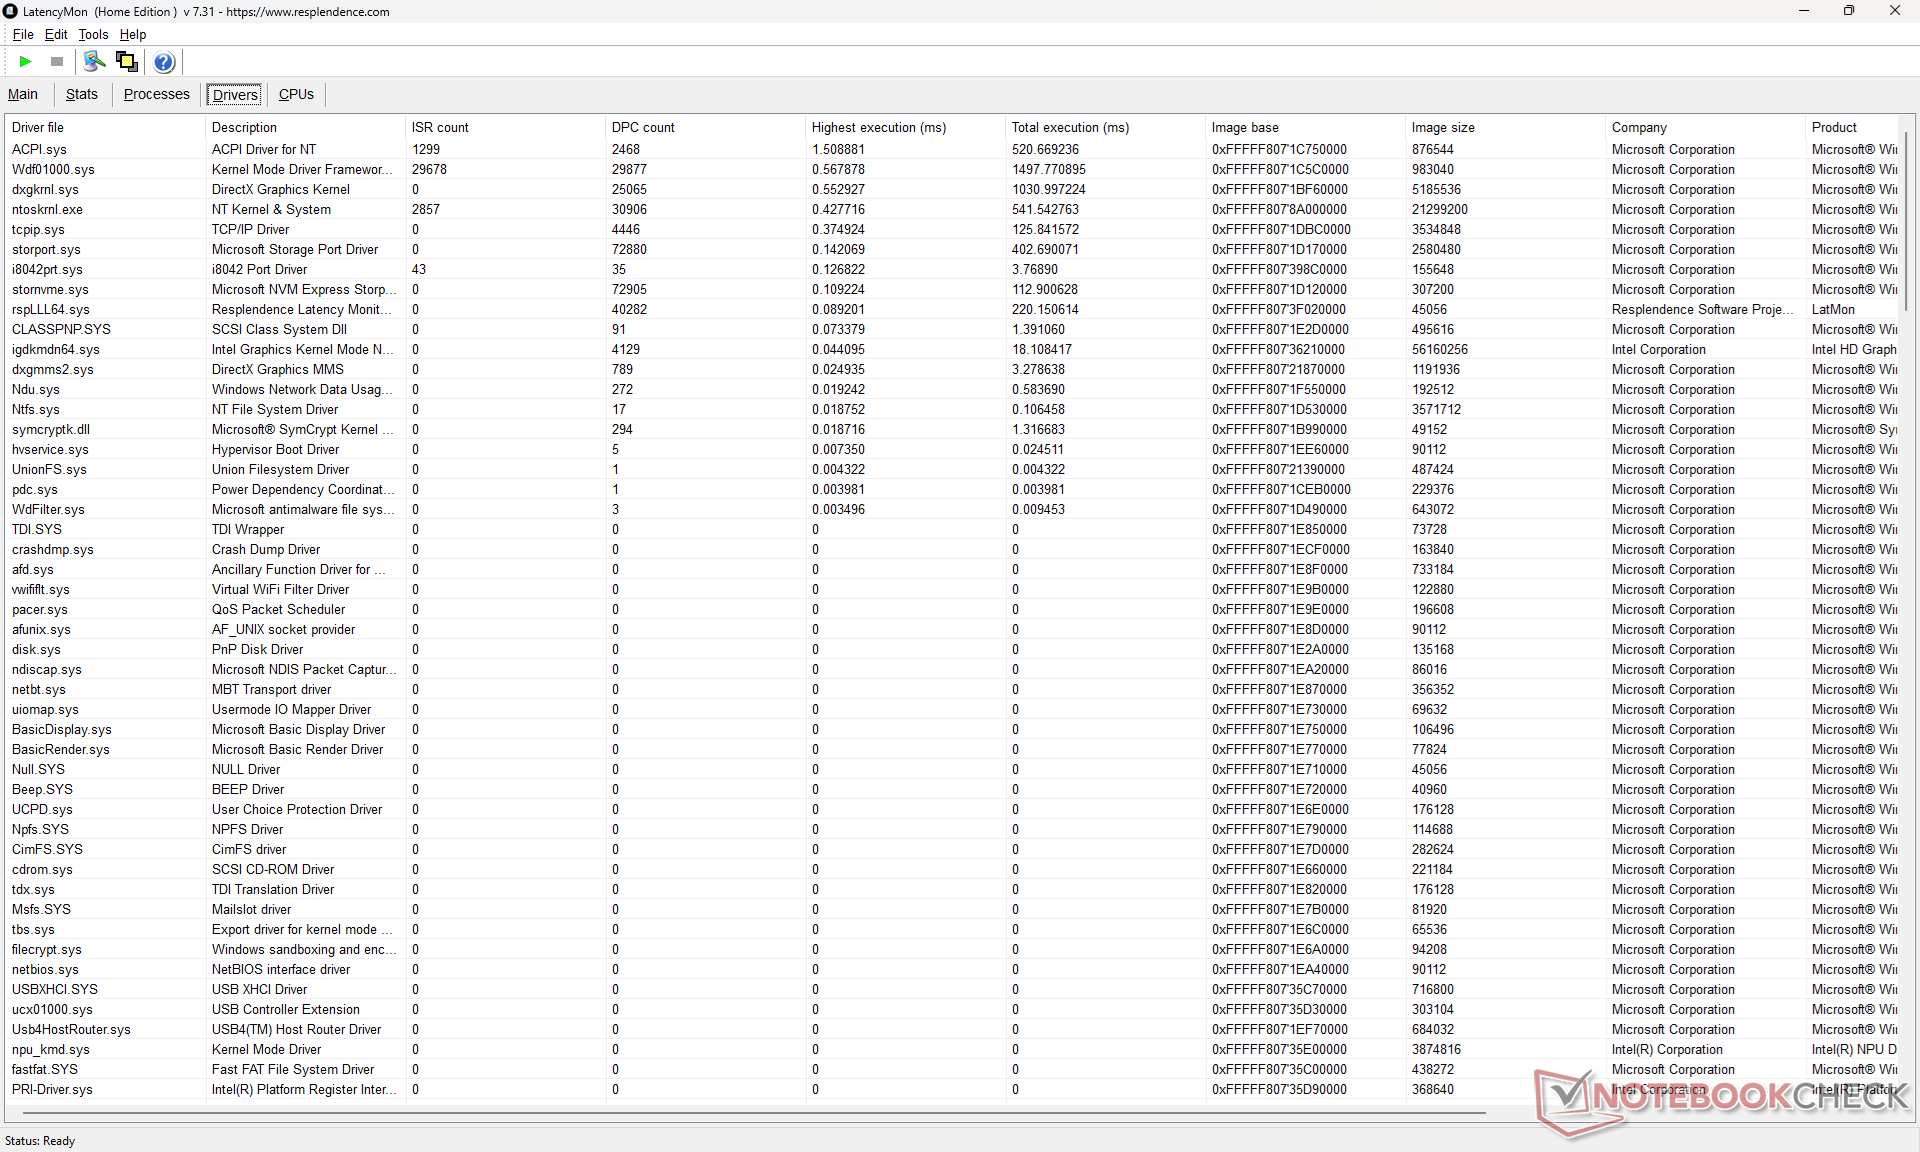
| DPC Latencies / LatencyMon - interrupt to process latency (max), Web, Youtube, Prime95 | |
| Lenovo Yoga Pro 9 16IAH10 RTX 5050 | |
| Dell XPS 16 Core Ultra 5 325 | |
| MSI Prestige 16 AI Evo B2HMG | |
| Dell XPS 16 9640 | |
| Samsung Galaxy Book6 Ultra | |
| Asus ZenBook S16 UM5606GA | |
* ... Meglio usare valori piccoli
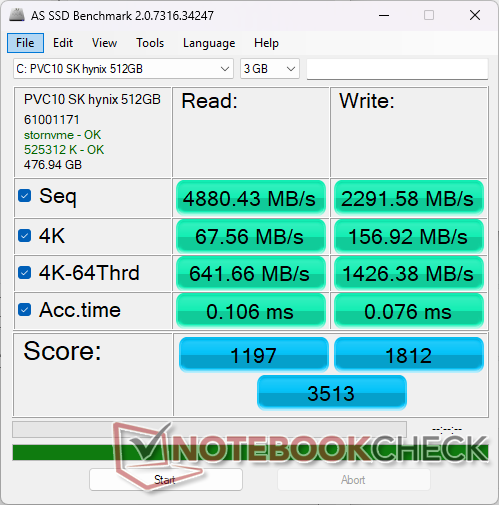
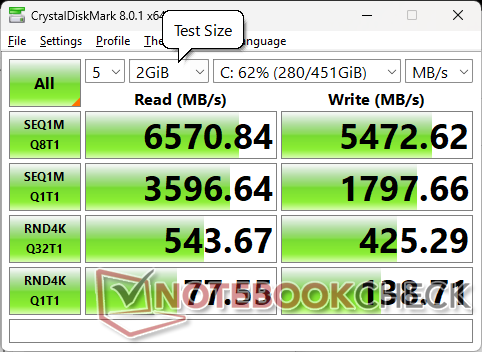
Dispositivi di archiviazione
Il SK Hynix PVC10 PCIe4 x4 NVMe è in grado di sostenere velocità di trasferimento fino a 6600 MB/s senza problemi di throttling, come dimostrano i risultati del test DiskSpd loop qui sotto. Si noti che le configurazioni di fascia alta dell'XPS 16 sono dotate di SSD PCIe5 opzionali.


| Drive Performance rating - Percent | |
| MSI Prestige 16 AI Evo B2HMG | |
| Dell XPS 16 9640 | |
| Lenovo Yoga Pro 9 16IAH10 RTX 5050 | |
| Asus ZenBook S16 UM5606GA | |
| Samsung Galaxy Book6 Ultra | |
| Dell XPS 16 Core Ultra 5 325 | |
* ... Meglio usare valori piccoli
Strozzatura del disco: DiskSpd Lettura in loop, Profondità coda 8
Prestazioni della GPU
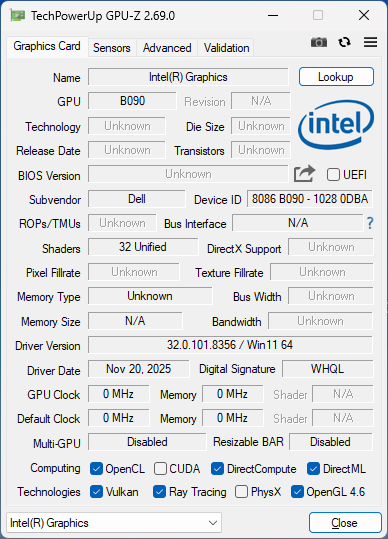
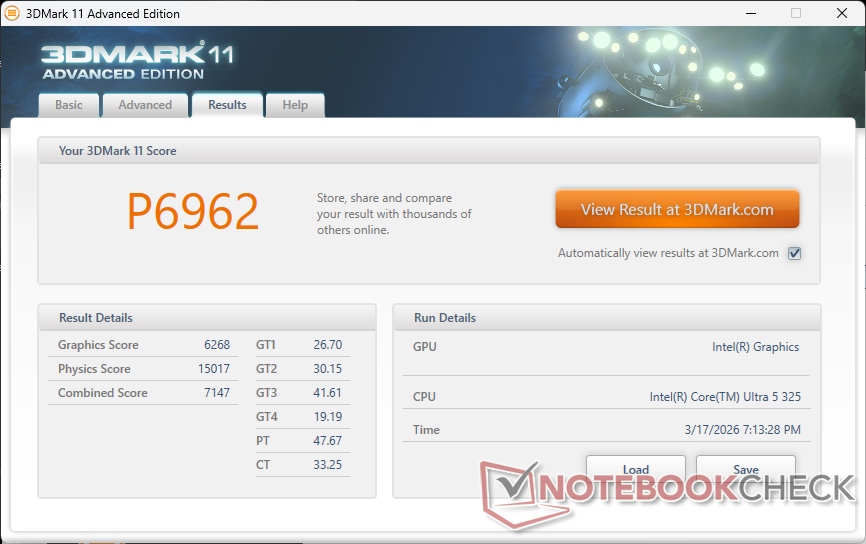
Il Panther Lake Xe3 4 è una delle soluzioni integrate più lente della linea Panther Lake. I livelli di prestazioni sono molto simili a quelli della vecchia generazione di Arc 8 o alla AMD Radeon 680M. L'aggiornamento alla configurazione Core Ultra 7 355 non migliorerà le prestazioni grafiche in modo significativo, in quanto la CPU utilizza la stessa iGPU Xe3 4. Gli utenti devono invece passare al Core Ultra X7 358H con iGPU integrata Arc B390 per ottenere un aumento delle prestazioni di 2,5 volte, come mostrano le tabelle seguenti.
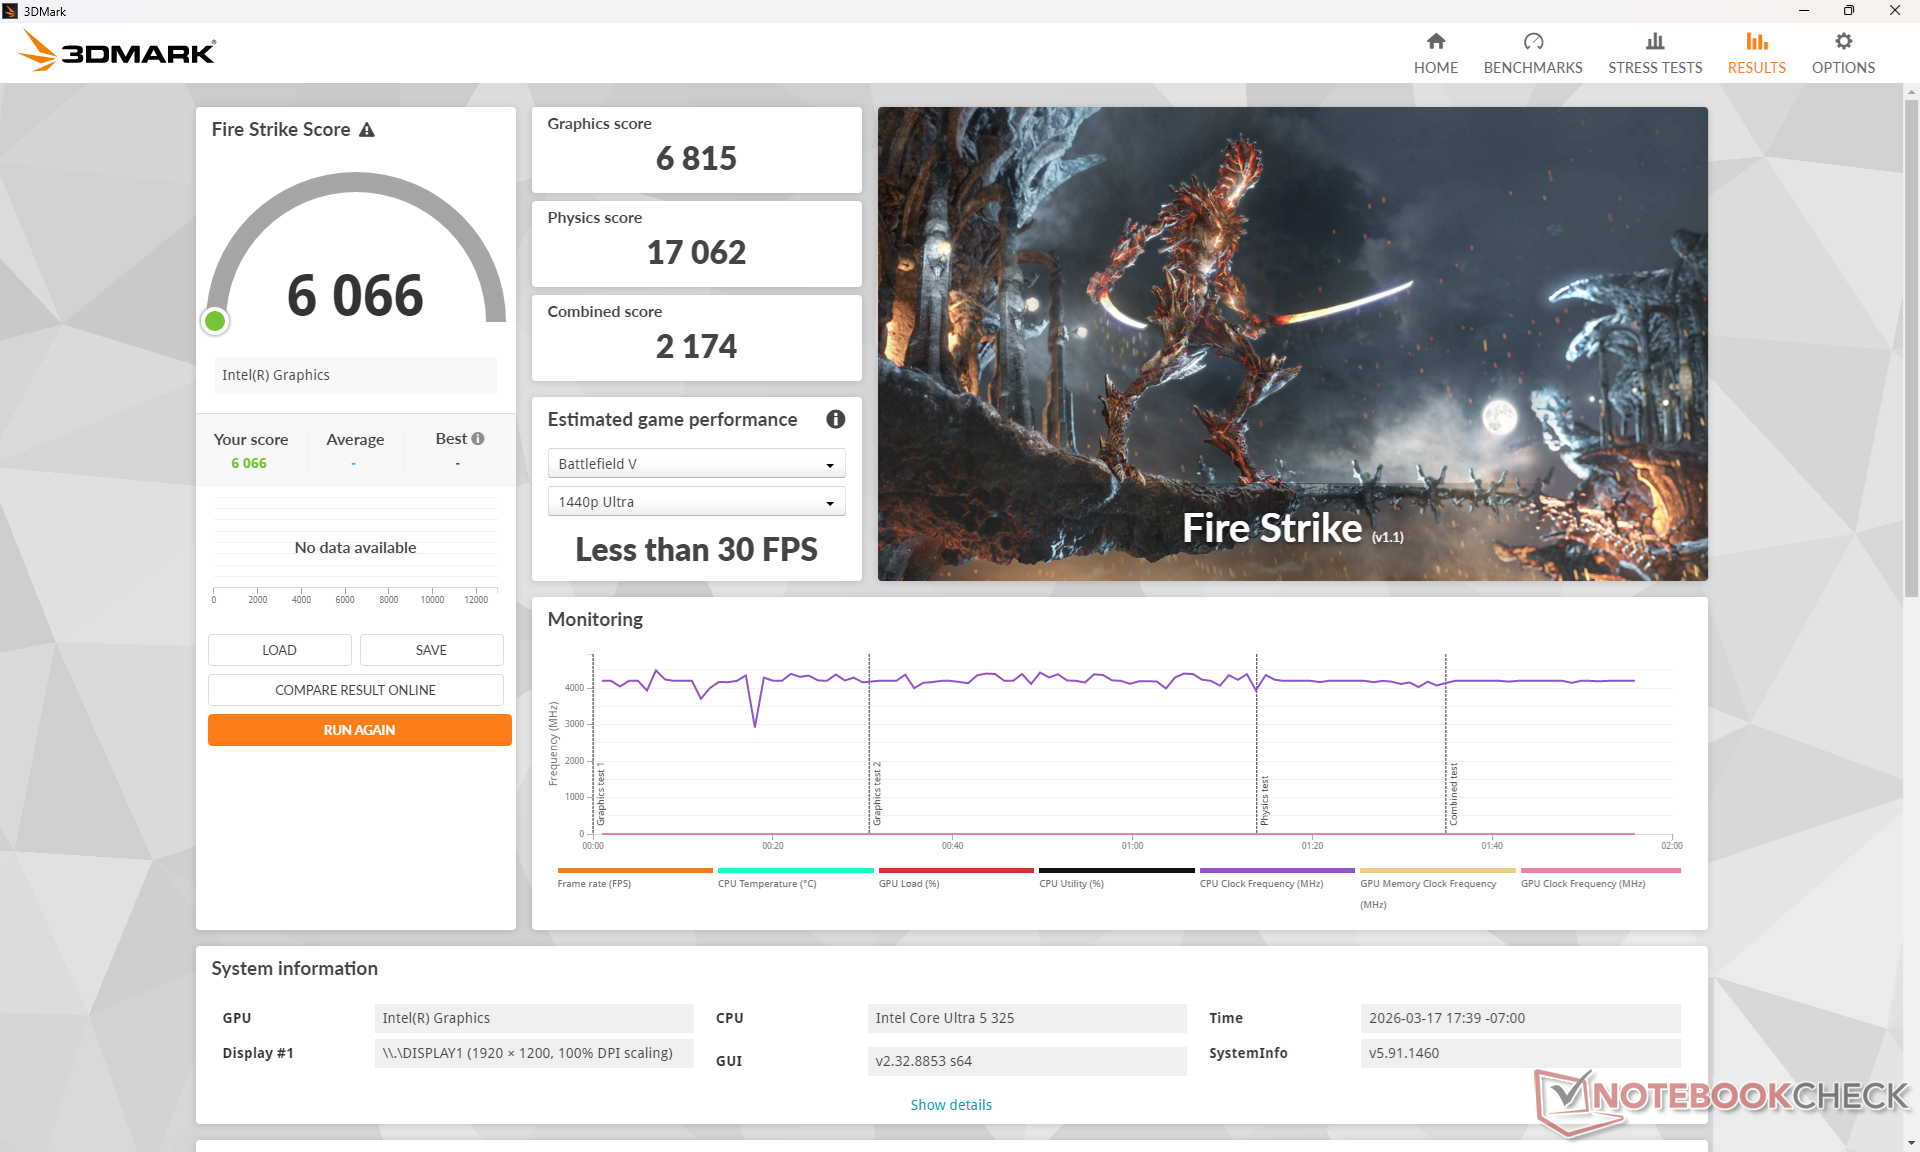
| Profilo di potenza | Punteggio grafico | Punteggio di fisica | Punteggio combinato |
| Modalità Prestazioni | 6815 | 17062 | 2174 |
| Modalità equilibrata | 6633 (-3%) | 16820 (-1%) | 2039 (-6%) |
| Alimentazione a batteria | 6480 (-5%) | 17601 (+3%) | 2140 (-2%) |
| 3DMark Performance rating - Percent | |
| Gigabyte Gaming A16 Pro GA6DH (Core 7 240H, RTX 5070 Ti) | |
| Dell 16 Premium DA16250 | |
| Dell XPS 16 9640 | |
| HP ZBook X G1i 16 | |
| Lenovo Yoga Pro 9 16IAH10 RTX 5050 | |
| Dell XPS 14 Core Ultra X7 358H | |
| MSI Prestige 16 AI Evo B2HMG | |
| Asus ZenBook S16 UM5606GA | |
| Dell 16 Plus 2-in-1 | |
| Dell XPS 14 Core Ultra 7 355 | |
| Media Intel Graphics 4 Xe3 Panther Lake iGPU | |
| Dell XPS 16 Core Ultra 5 325 | |
| Lenovo IdeaPad 5 2-in-1 16IAL10 | |
| 3DMark 11 - 1280x720 Performance GPU | |
| Gigabyte Gaming A16 Pro GA6DH (Core 7 240H, RTX 5070 Ti) | |
| Dell 16 Premium DA16250 | |
| Dell XPS 16 9640 | |
| HP ZBook X G1i 16 | |
| Lenovo Yoga Pro 9 16IAH10 RTX 5050 | |
| Dell XPS 14 Core Ultra X7 358H | |
| Asus ZenBook S16 UM5606GA | |
| MSI Prestige 16 AI Evo B2HMG | |
| Dell 16 Plus 2-in-1 | |
| Dell XPS 14 Core Ultra 7 355 | |
| Media Intel Graphics 4 Xe3 Panther Lake iGPU (6268 - 7317, n=2) | |
| Dell XPS 16 Core Ultra 5 325 | |
| Lenovo IdeaPad 5 2-in-1 16IAL10 | |
| 3DMark 11 Performance | 6962 punti | |
| 3DMark Cloud Gate Standard Score | 26419 punti | |
| 3DMark Fire Strike Score | 6066 punti | |
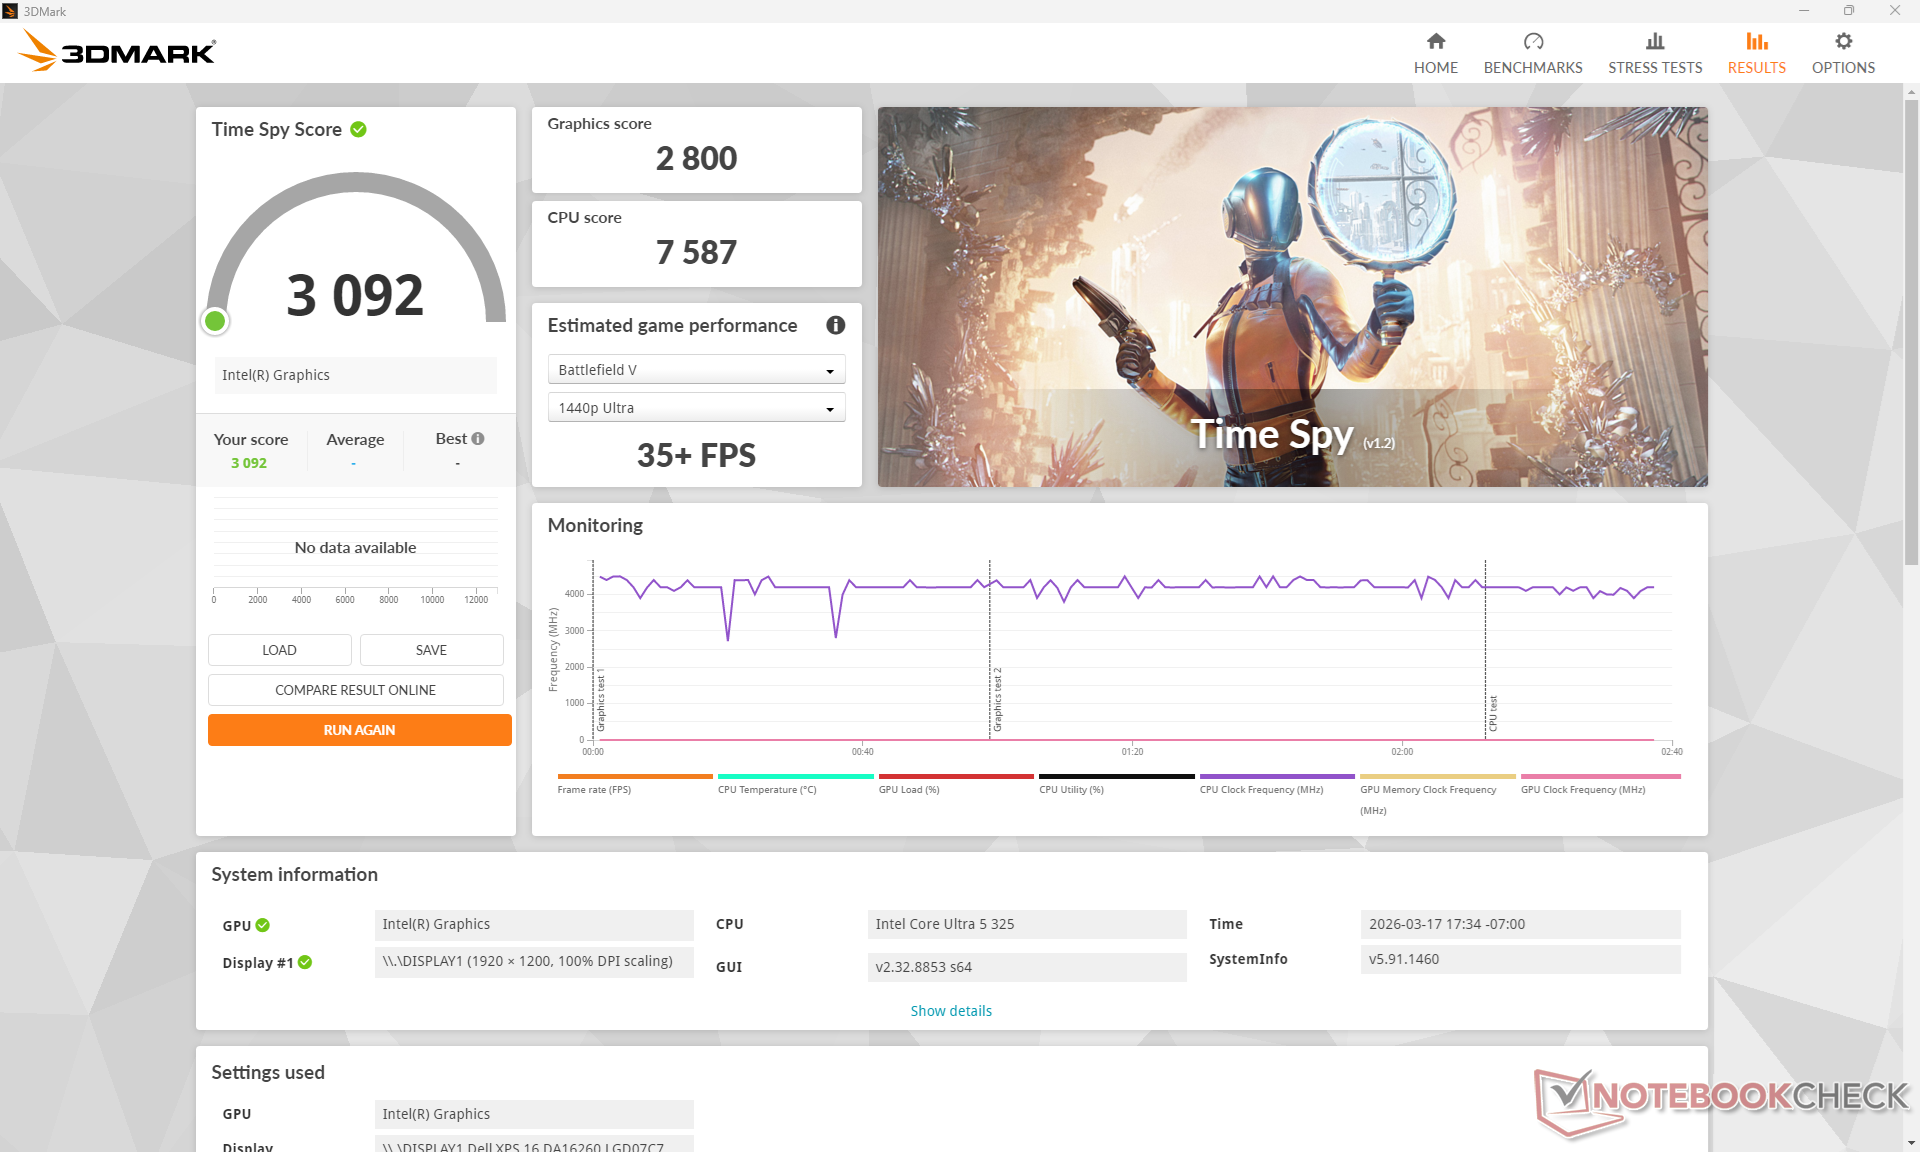
| 3DMark Time Spy Score | 3092 punti | |
Aiuto | ||
* ... Meglio usare valori piccoli
| Performance rating - Percent | |
| Samsung Galaxy Book6 Ultra | |
| Lenovo Yoga Pro 9 16IAH10 RTX 5050 | |
| Dell XPS 16 9640 | |
| Asus ZenBook S16 UM5606GA | |
| MSI Prestige 16 AI Evo B2HMG | |
| Dell XPS 16 Core Ultra 5 325 | |
| Cyberpunk 2077 - 1920x1080 Ultra Preset (FSR off) | |
| Samsung Galaxy Book6 Ultra | |
| Lenovo Yoga Pro 9 16IAH10 RTX 5050 | |
| Dell XPS 16 9640 | |
| MSI Prestige 16 AI Evo B2HMG | |
| Asus ZenBook S16 UM5606GA | |
| Dell XPS 16 Core Ultra 5 325 | |
| Baldur's Gate 3 - 1920x1080 Ultra Preset AA:T | |
| Samsung Galaxy Book6 Ultra | |
| Lenovo Yoga Pro 9 16IAH10 RTX 5050 | |
| Dell XPS 16 9640 | |
| Asus ZenBook S16 UM5606GA | |
| MSI Prestige 16 AI Evo B2HMG | |
| Dell XPS 16 Core Ultra 5 325 | |
| GTA V - 1920x1080 Highest AA:4xMSAA + FX AF:16x | |
| Samsung Galaxy Book6 Ultra | |
| Lenovo Yoga Pro 9 16IAH10 RTX 5050 | |
| Dell XPS 16 9640 | |
| Asus ZenBook S16 UM5606GA | |
| Dell XPS 16 Core Ultra 5 325 | |
| MSI Prestige 16 AI Evo B2HMG | |
| Final Fantasy XV Benchmark - 1920x1080 High Quality | |
| Samsung Galaxy Book6 Ultra | |
| Lenovo Yoga Pro 9 16IAH10 RTX 5050 | |
| Dell XPS 16 9640 | |
| MSI Prestige 16 AI Evo B2HMG | |
| Asus ZenBook S16 UM5606GA | |
| Dell XPS 16 Core Ultra 5 325 | |
| Strange Brigade - 1920x1080 ultra AA:ultra AF:16 | |
| Samsung Galaxy Book6 Ultra | |
| Lenovo Yoga Pro 9 16IAH10 RTX 5050 | |
| Dell XPS 16 9640 | |
| MSI Prestige 16 AI Evo B2HMG | |
| Asus ZenBook S16 UM5606GA | |
| Dell XPS 16 Core Ultra 5 325 | |
| Dota 2 Reborn - 1920x1080 ultra (3/3) best looking | |
| Lenovo Yoga Pro 9 16IAH10 RTX 5050 | |
| Samsung Galaxy Book6 Ultra | |
| Dell XPS 16 9640 | |
| Asus ZenBook S16 UM5606GA | |
| MSI Prestige 16 AI Evo B2HMG | |
| Dell XPS 16 Core Ultra 5 325 | |
| X-Plane 11.11 - 1920x1080 high (fps_test=3) | |
| Lenovo Yoga Pro 9 16IAH10 RTX 5050 | |
| Dell XPS 16 9640 | |
| Dell XPS 16 9640 | |
| Samsung Galaxy Book6 Ultra | |
| Asus ZenBook S16 UM5606GA | |
| MSI Prestige 16 AI Evo B2HMG | |
| Dell XPS 16 Core Ultra 5 325 | |
Grafico Cyberpunk 2077 ultra FPS
| basso | medio | alto | ultra | |
|---|---|---|---|---|
| GTA V (2015) | 162.4 | 158.1 | 51.8 | 20.8 |
| Dota 2 Reborn (2015) | 102.9 | 89 | 72.6 | 68.4 |
| Final Fantasy XV Benchmark (2018) | 66.3 | 35.4 | 25.1 | |
| X-Plane 11.11 (2018) | 37.8 | 30.6 | 22.9 | |
| Strange Brigade (2018) | 107.3 | 38.2 | 35.9 | 43.3 |
| Baldur's Gate 3 (2023) | 27.4 | 22.2 | 19 | 18.7 |
| Cyberpunk 2077 (2023) | 35.2 | 27 | 23.8 | 19.9 |
| F1 24 (2024) | 55.6 | 52.7 | 40.8 | 13.2 |
Emissioni - Più silenzioso, ma ancora abbastanza caldo
Rumore del sistema
Il rumore della ventola è molto più silenzioso rispetto al Dell 16 Premium uscente, essenzialmente in tutti gli scenari. Il sistema è in grado di rimanere silenzioso o impercettibile per periodi più lunghi rispetto alla maggior parte degli altri computer portatili. Ad esempio, il rumore della ventola non si avverte durante l'esecuzione di 3DMark06 fino a più di due terzi della prima scena del benchmark, mentre il rumore si avverte molto prima e in modo più forte sul modello ZenBook S16 ZenBook S16.
Il rumore della ventola durante il gioco si assesta tra i 38 e i 44 dB(A), che è comunque più silenzioso del modello dello scorso anno o del già citato Asus in condizioni simili.


Rumorosità
| Idle |
| 22.9 / 22.9 / 23.9 dB(A) |
| Sotto carico |
| 34.8 / 43.3 dB(A) |
 | ||
30 dB silenzioso 40 dB(A) udibile 50 dB(A) rumoroso |
||
min: | ||
| Dell XPS 16 Core Ultra 5 325 Ultra 5 325, Intel Graphics 4 Xe3 | Dell XPS 16 9640 Ultra 7 155H, GeForce RTX 4070 Laptop GPU | Lenovo Yoga Pro 9 16IAH10 RTX 5050 Ultra 9 285H, GeForce RTX 5050 Laptop | Samsung Galaxy Book6 Ultra Ultra 7 356H, GeForce RTX 5070 Laptop | Asus ZenBook S16 UM5606GA Ryzen AI 9 465, Radeon 880M | MSI Prestige 16 AI Evo B2HMG Ultra 9 285H, Arc 140T | |
|---|---|---|---|---|---|---|
| Noise | -11% | -12% | -12% | -15% | -5% | |
| off /ambiente * (dB) | 22.8 | 24.5 -7% | 24.6 -8% | 25.1 -10% | 24.9 -9% | 23.6 -4% |
| Idle Minimum * (dB) | 22.9 | 24.5 -7% | 24.6 -7% | 25.1 -10% | 24.9 -9% | 23.6 -3% |
| Idle Average * (dB) | 22.9 | 24.5 -7% | 24.6 -7% | 25.1 -10% | 24.9 -9% | 23.6 -3% |
| Idle Maximum * (dB) | 23.9 | 27.5 -15% | 26.8 -12% | 25.1 -5% | 24.9 -4% | 26.2 -10% |
| Load Average * (dB) | 34.8 | 39.6 -14% | 32.8 6% | 36.9 -6% | 45.7 -31% | 37.1 -7% |
| Cyberpunk 2077 ultra * (dB) | 38 | 51.8 -36% | 48.5 -28% | 49 -29% | 42.1 -11% | |
| Load Maximum * (dB) | 43.3 | 49.7 -15% | 51.8 -20% | 48.5 -12% | 50.4 -16% | 42.1 3% |
| Witcher 3 ultra * (dB) | 49.7 |
* ... Meglio usare valori piccoli
Temperatura
Le temperature di superficie sono più calde del previsto, soprattutto perché il nuovo XPS 16 non ha una grafica discreta. I punti caldi possono raggiungere oltre 43 C quando si eseguono carichi impegnativi come i giochi, rispetto ai soli 37 C del modello più pesante dello scorso anno Dell 16 Premium dello scorso anno con grafica discreta GeForce RTX 5070.


(±) La temperatura massima sul lato superiore è di 43.8 °C / 111 F, rispetto alla media di 36.9 °C / 98 F, che varia da 21 a 71 °C per questa classe Multimedia.
(±) Il lato inferiore si riscalda fino ad un massimo di 42 °C / 108 F, rispetto alla media di 39.1 °C / 102 F
(+) In idle, la temperatura media del lato superiore è di 22.4 °C / 72 F, rispetto alla media deld ispositivo di 31.3 °C / 88 F.
(±) 3: The average temperature for the upper side is 35.3 °C / 96 F, compared to the average of 31.3 °C / 88 F for the class Multimedia.
(+) I poggiapolsi e il touchpad sono piu' freddi della temperatura della pelle con un massimo di 31.6 °C / 88.9 F e sono quindi freddi al tatto.
(-) La temperatura media della zona del palmo della mano di dispositivi simili e'stata di 28.7 °C / 83.7 F (-2.9 °C / -5.2 F).


| Dell XPS 16 Core Ultra 5 325 Ultra 5 325, Intel Graphics 4 Xe3 | Dell XPS 16 9640 Ultra 7 155H, GeForce RTX 4070 Laptop GPU | Lenovo Yoga Pro 9 16IAH10 RTX 5050 Ultra 9 285H, GeForce RTX 5050 Laptop | Samsung Galaxy Book6 Ultra Ultra 7 356H, GeForce RTX 5070 Laptop | Asus ZenBook S16 UM5606GA Ryzen AI 9 465, Radeon 880M | MSI Prestige 16 AI Evo B2HMG Ultra 9 285H, Arc 140T | |
|---|---|---|---|---|---|---|
| Heat | -4% | -9% | -8% | -9% | -13% | |
| Maximum Upper Side * (°C) | 43.8 | 39.4 10% | 34.4 21% | 42.7 3% | 43.4 1% | 48.1 -10% |
| Maximum Bottom * (°C) | 42 | 36.9 12% | 41.4 1% | 49.1 -17% | 46.2 -10% | 51.6 -23% |
| Idle Upper Side * (°C) | 23.2 | 28.2 -22% | 28.6 -23% | 25.4 -9% | 26.5 -14% | 25.9 -12% |
| Idle Bottom * (°C) | 23.6 | 27.4 -16% | 31.8 -35% | 25.5 -8% | 27 -14% | 25.2 -7% |
* ... Meglio usare valori piccoli
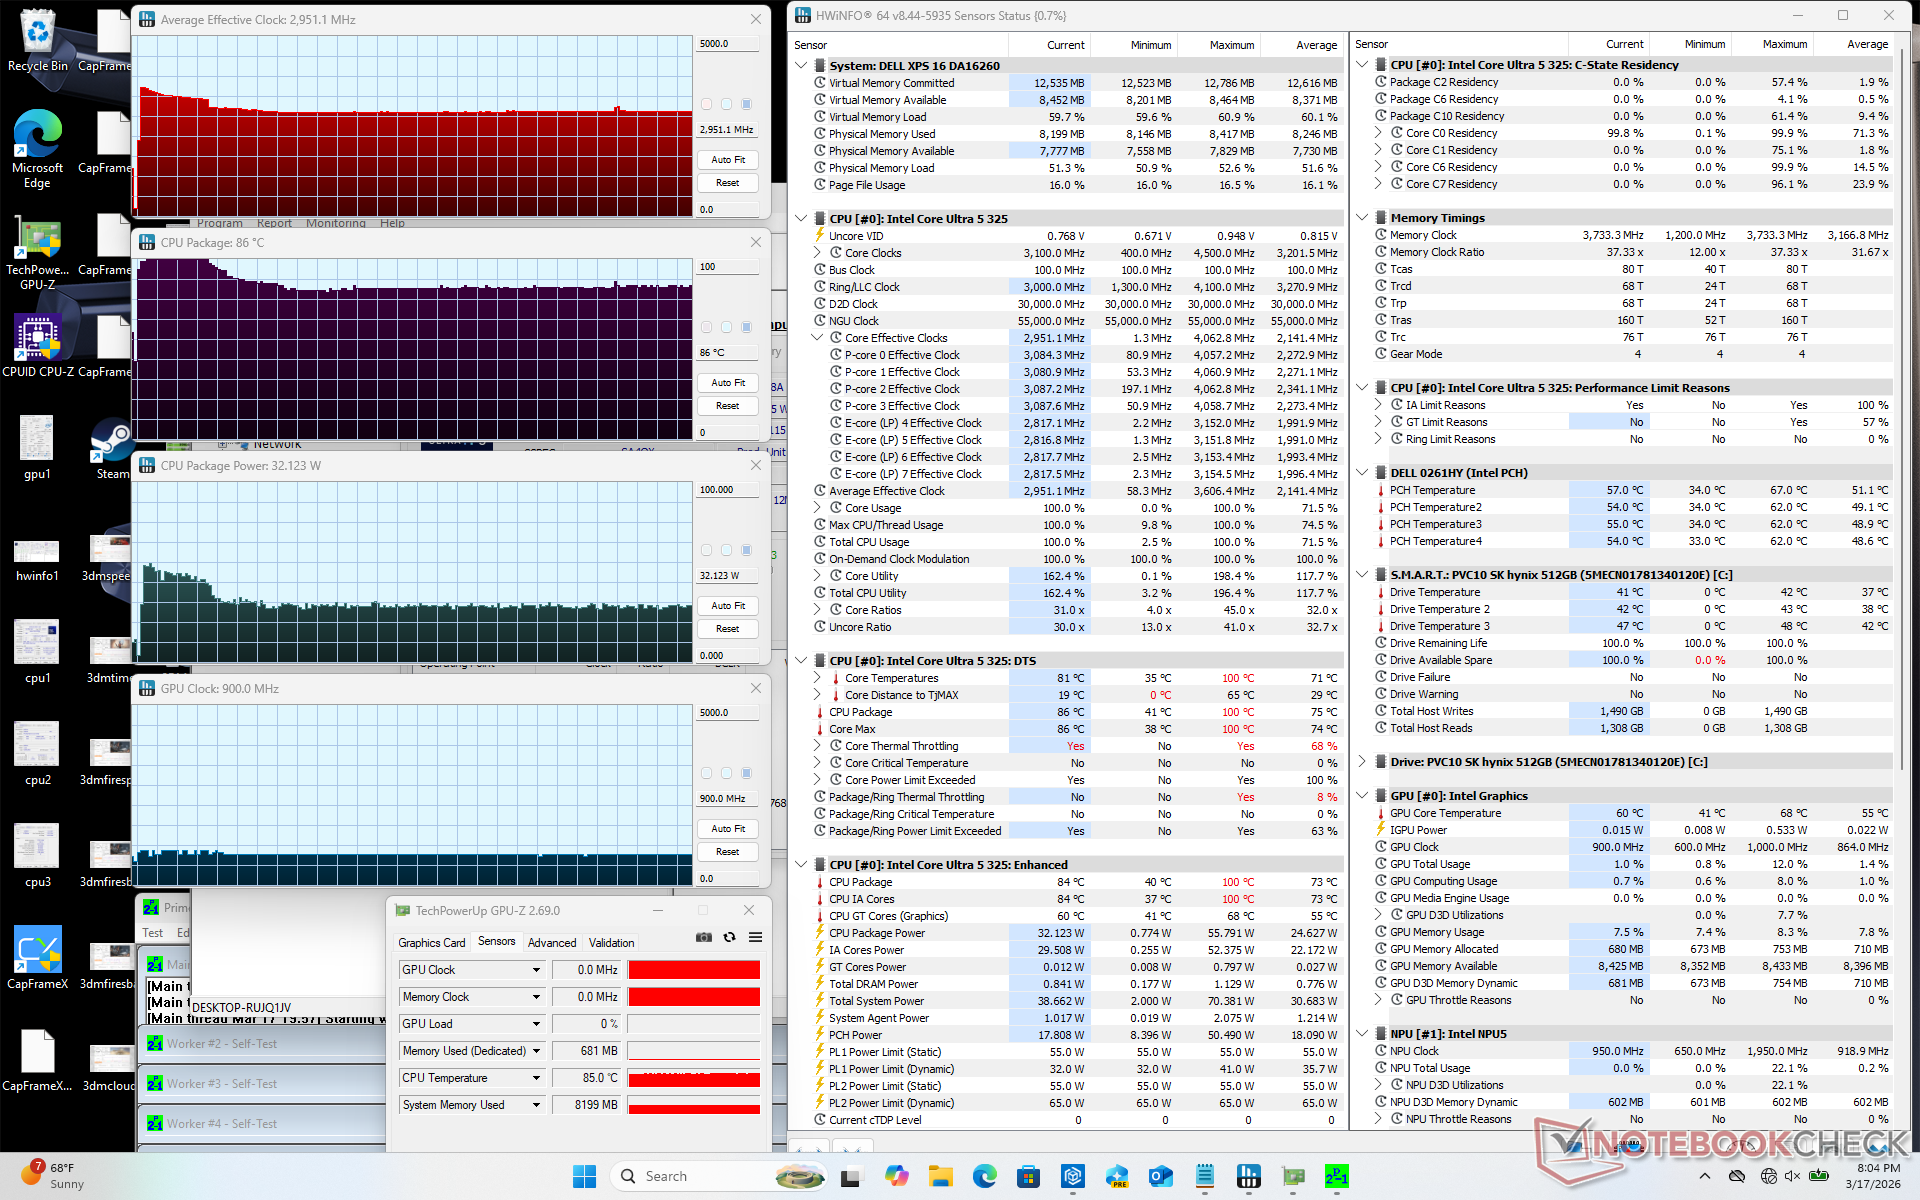
Test da sforzo
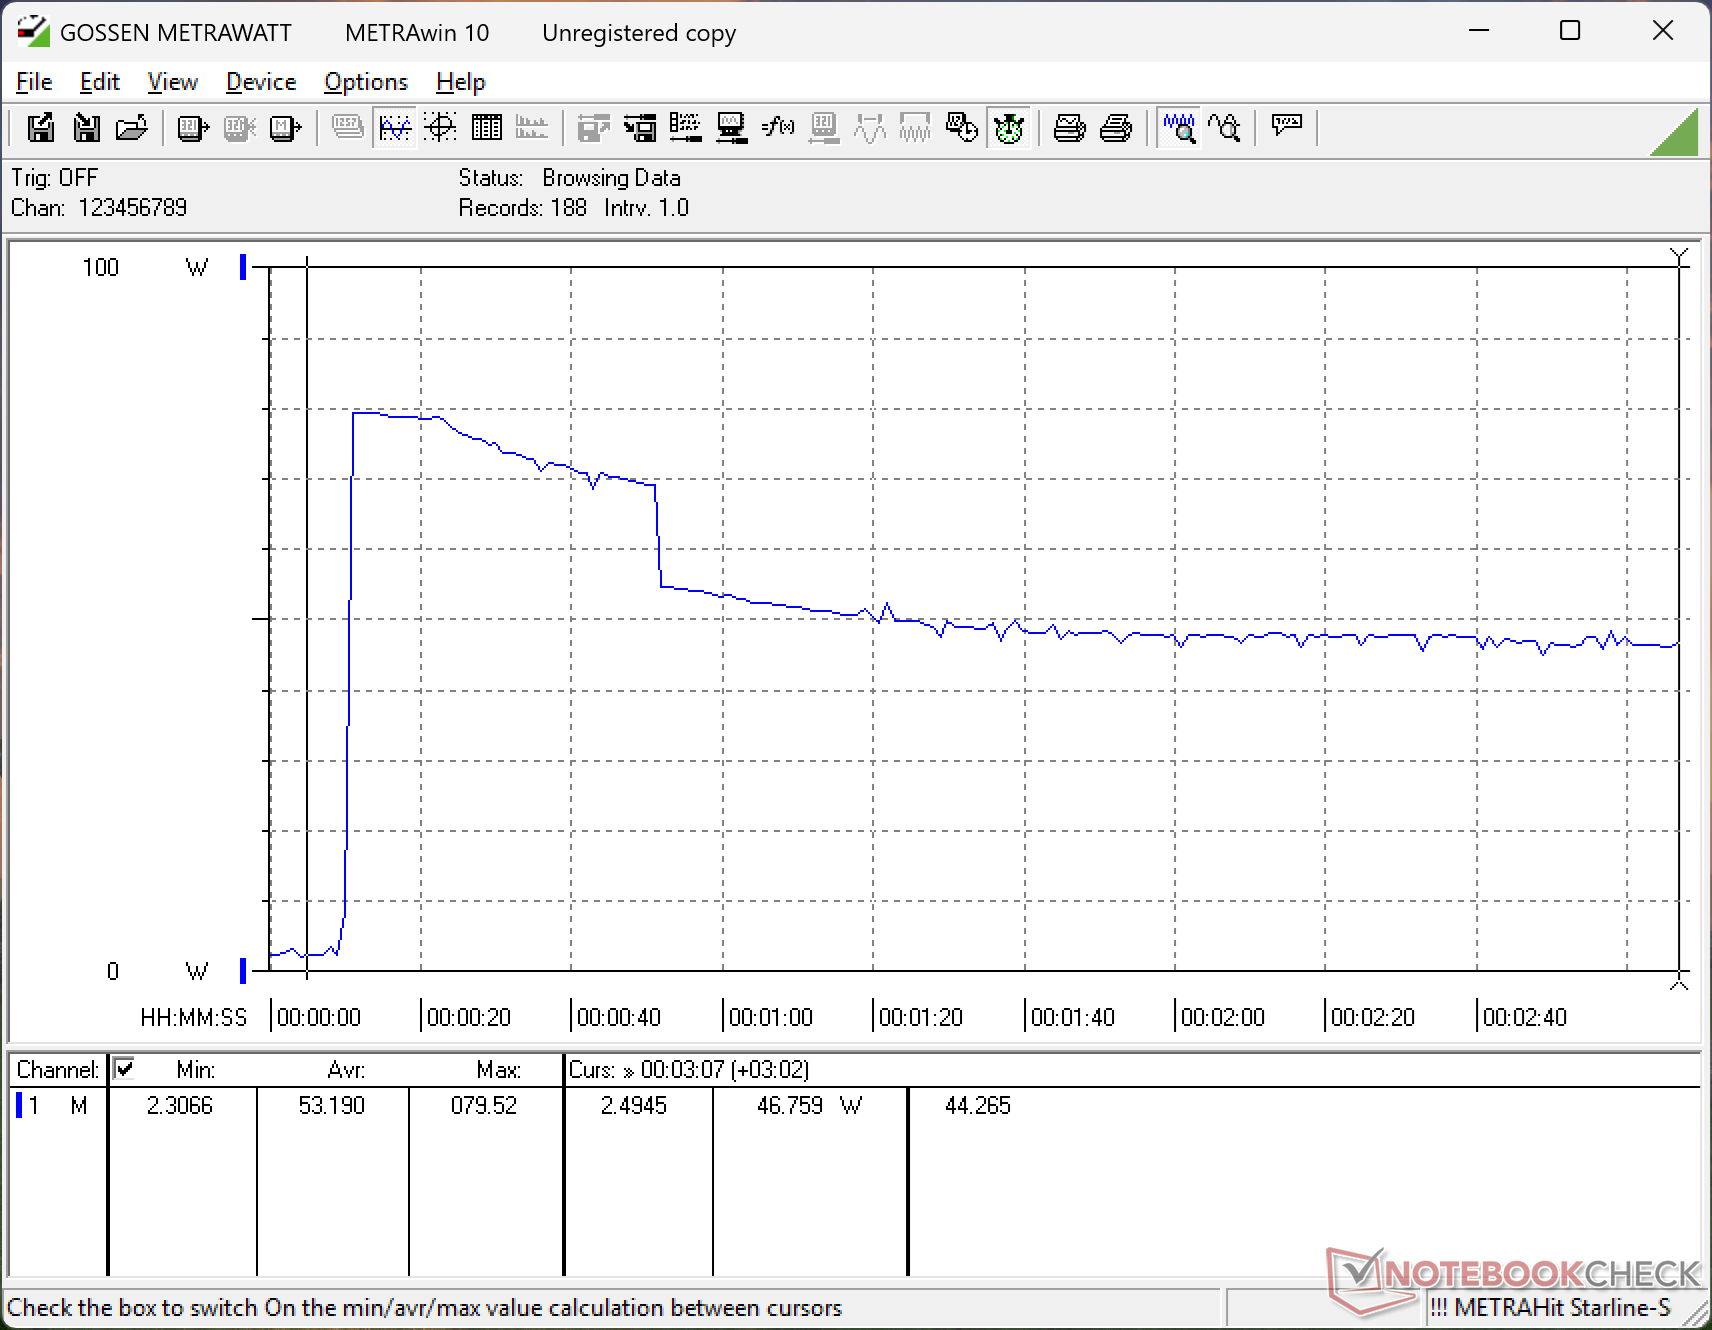
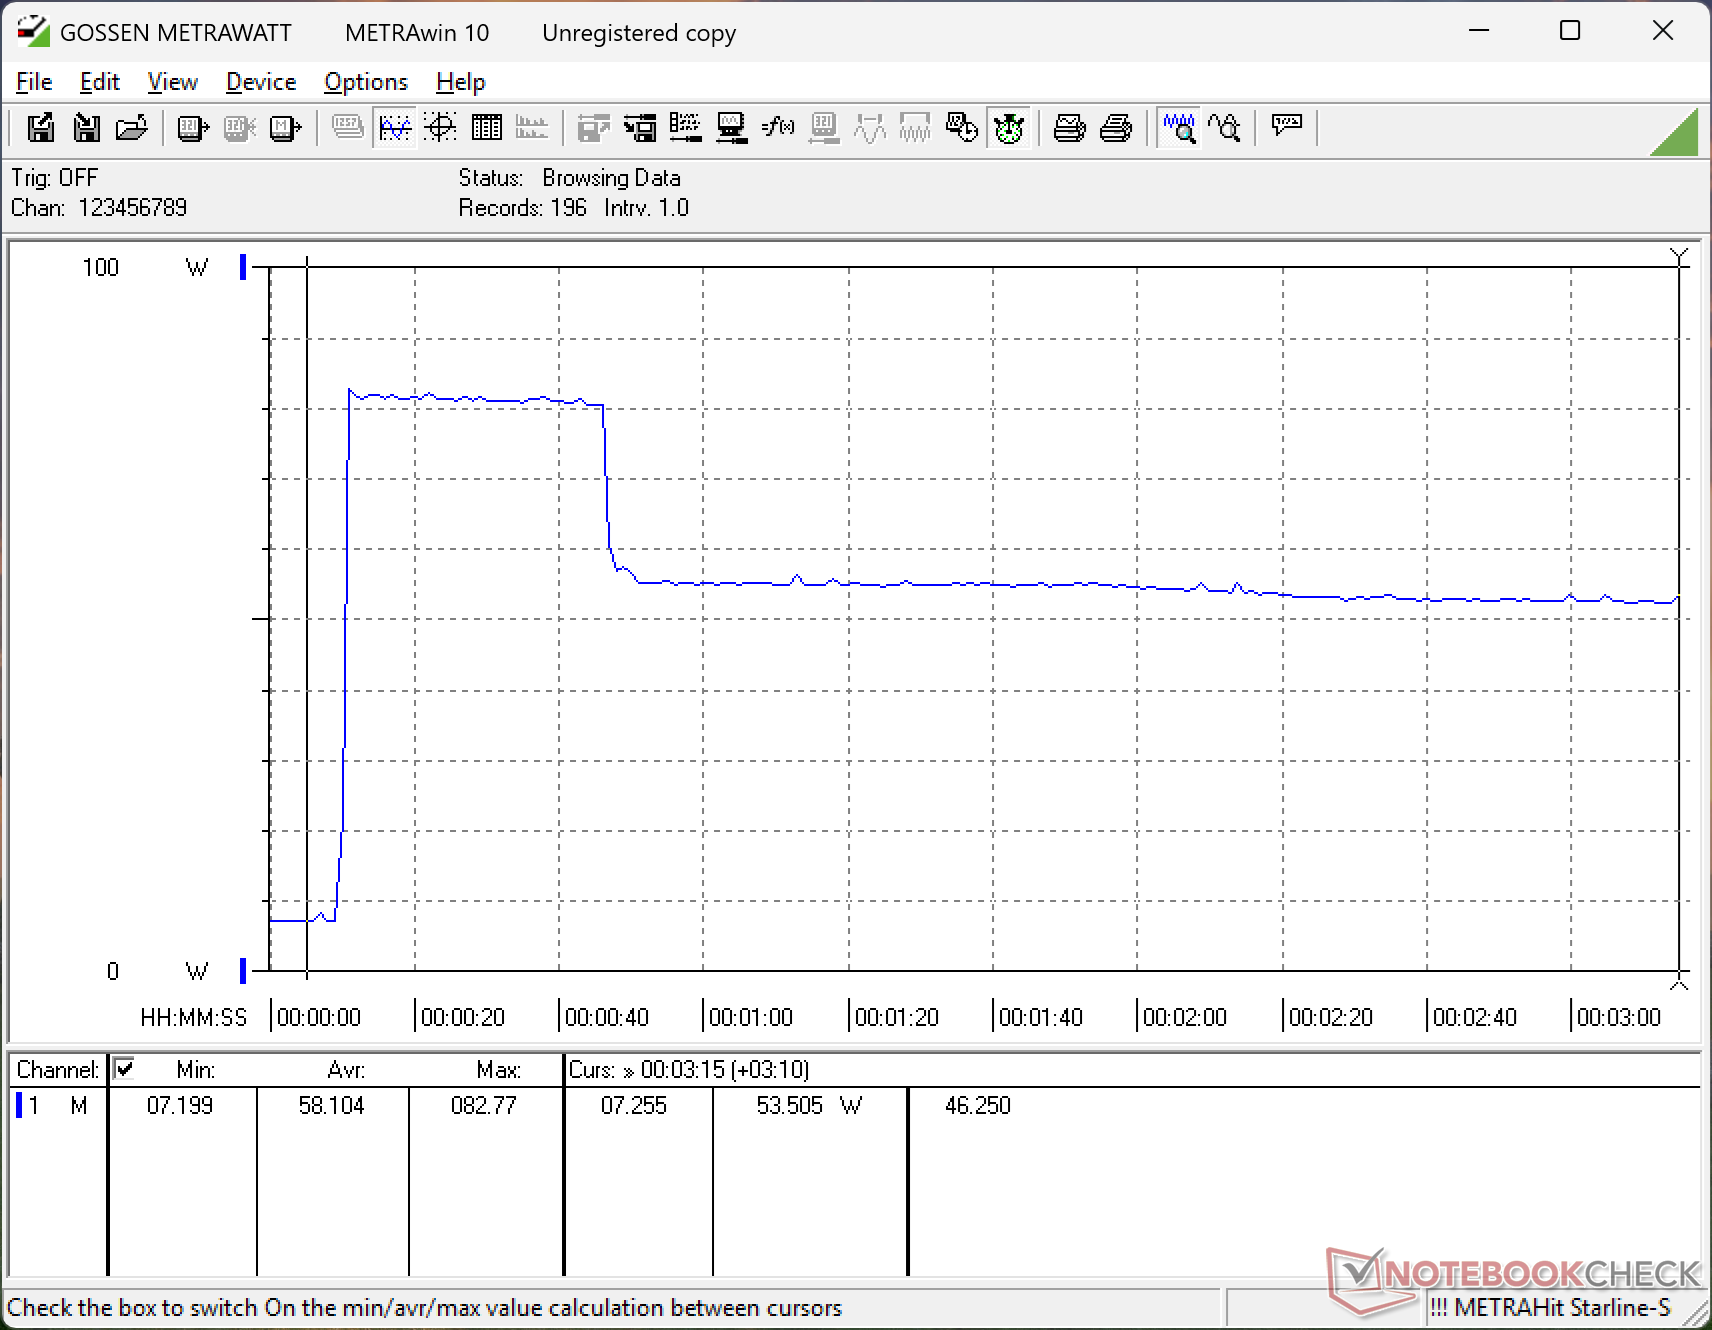
Il processore può diventare piuttosto caldo quando viene sollecitato. Quando si esegue Prime95, ad esempio, la CPU sale a 3,6 GHz, 54 W e 100 C per pochi secondi, prima di scendere e stabilizzarsi a 3,0 GHz e 32 W per mantenere una temperatura del nucleo più ragionevole di 86 C. In confronto, il Core Ultra 7 nel Dell 16 Premium 2025 si stabilizza a una temperatura più calda di 93 C in condizioni simili. È probabile che anche il nuovo XPS 16 si stabilizzi a temperature del nucleo superiori a 90 C, se configurato con il Core Ultra X7, molto più veloce, anziché con il nostro Core Ultra 5.
Quando si esegue Cyberpunk 2077 per rappresentare un carico CPU-GPU più bilanciato, la temperatura del core si stabilizza a 89 C, rispetto ai 75 C dell'XPS 16 2025 con la grafica RTX GeForce più veloce. Le temperature del nucleo generalmente più calde sono probabilmente responsabili delle temperature superficiali più calde menzionate sopra.
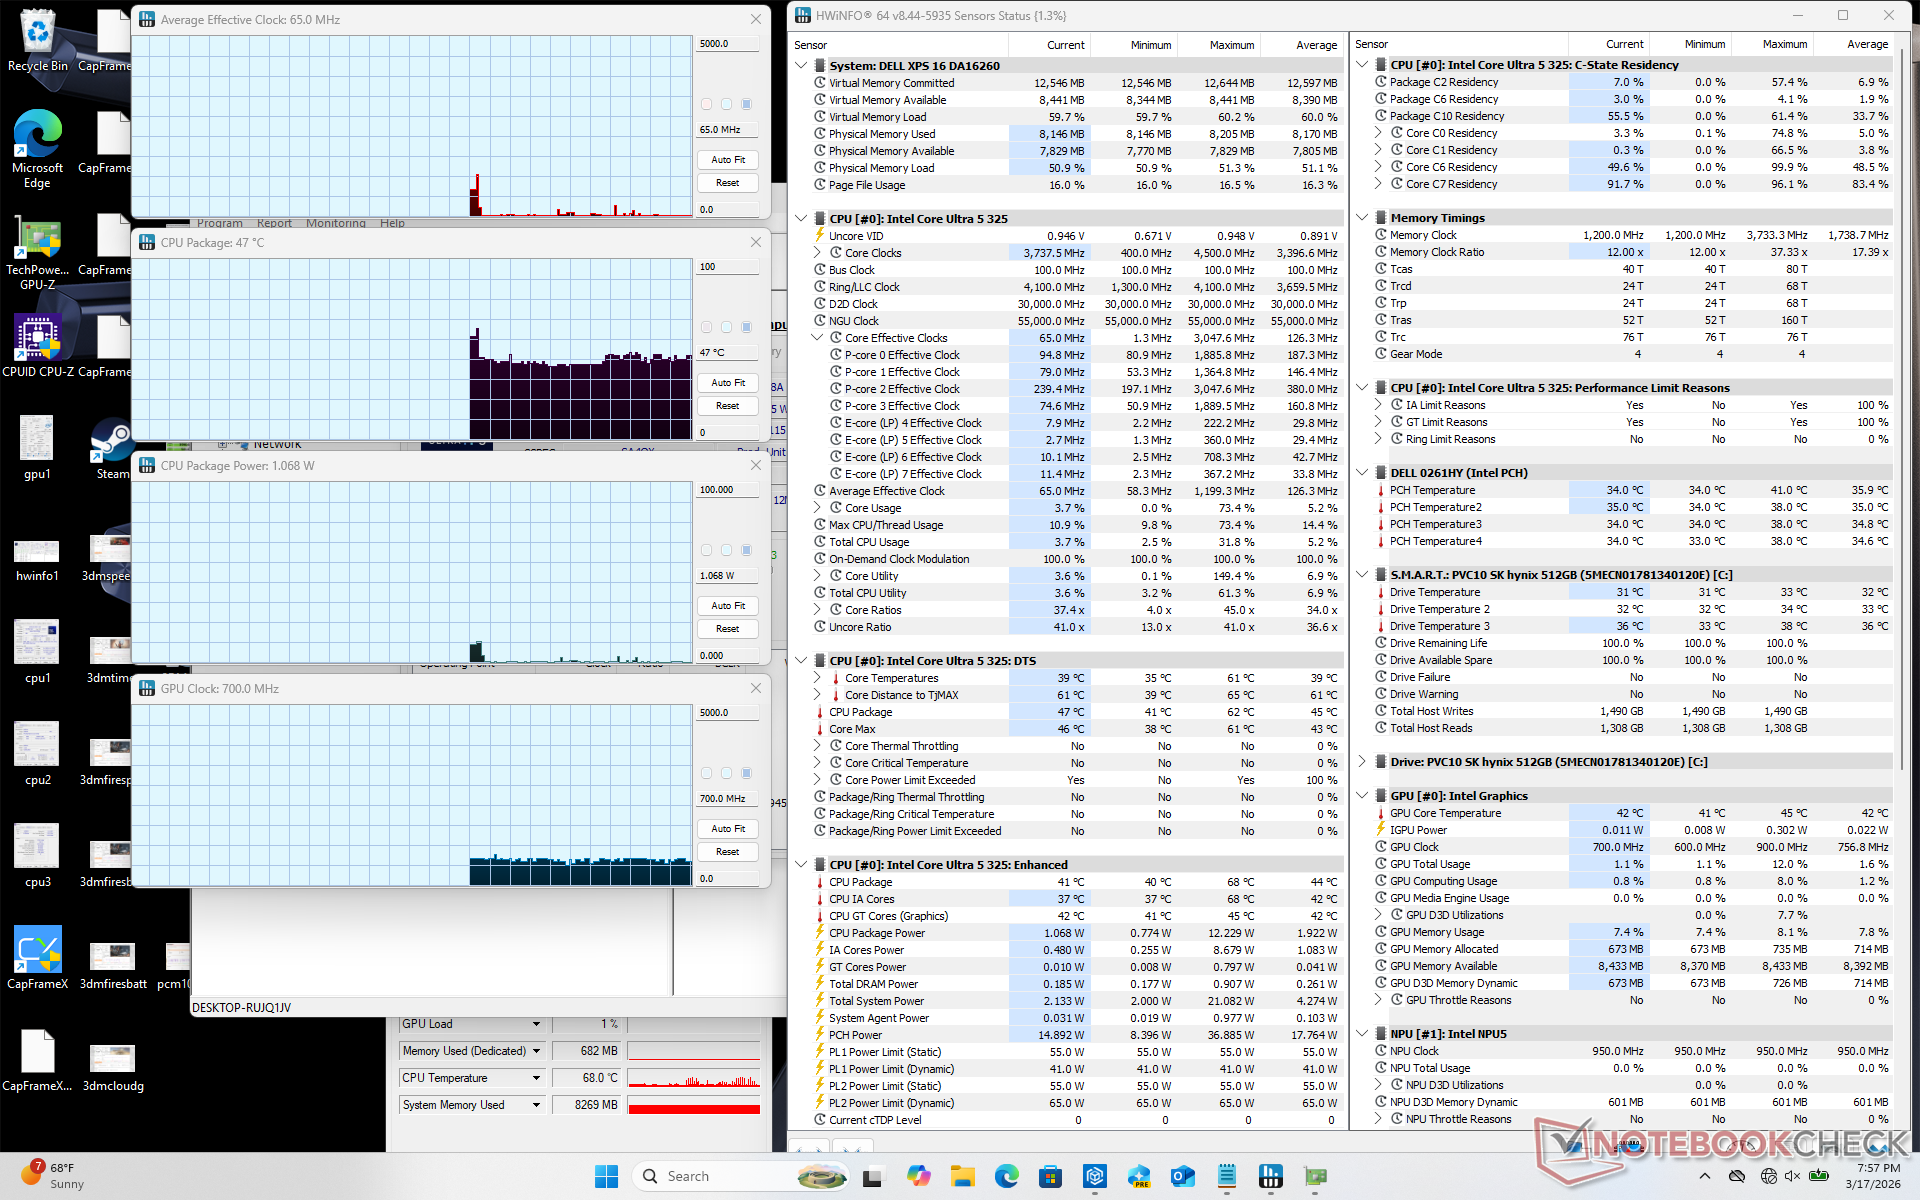
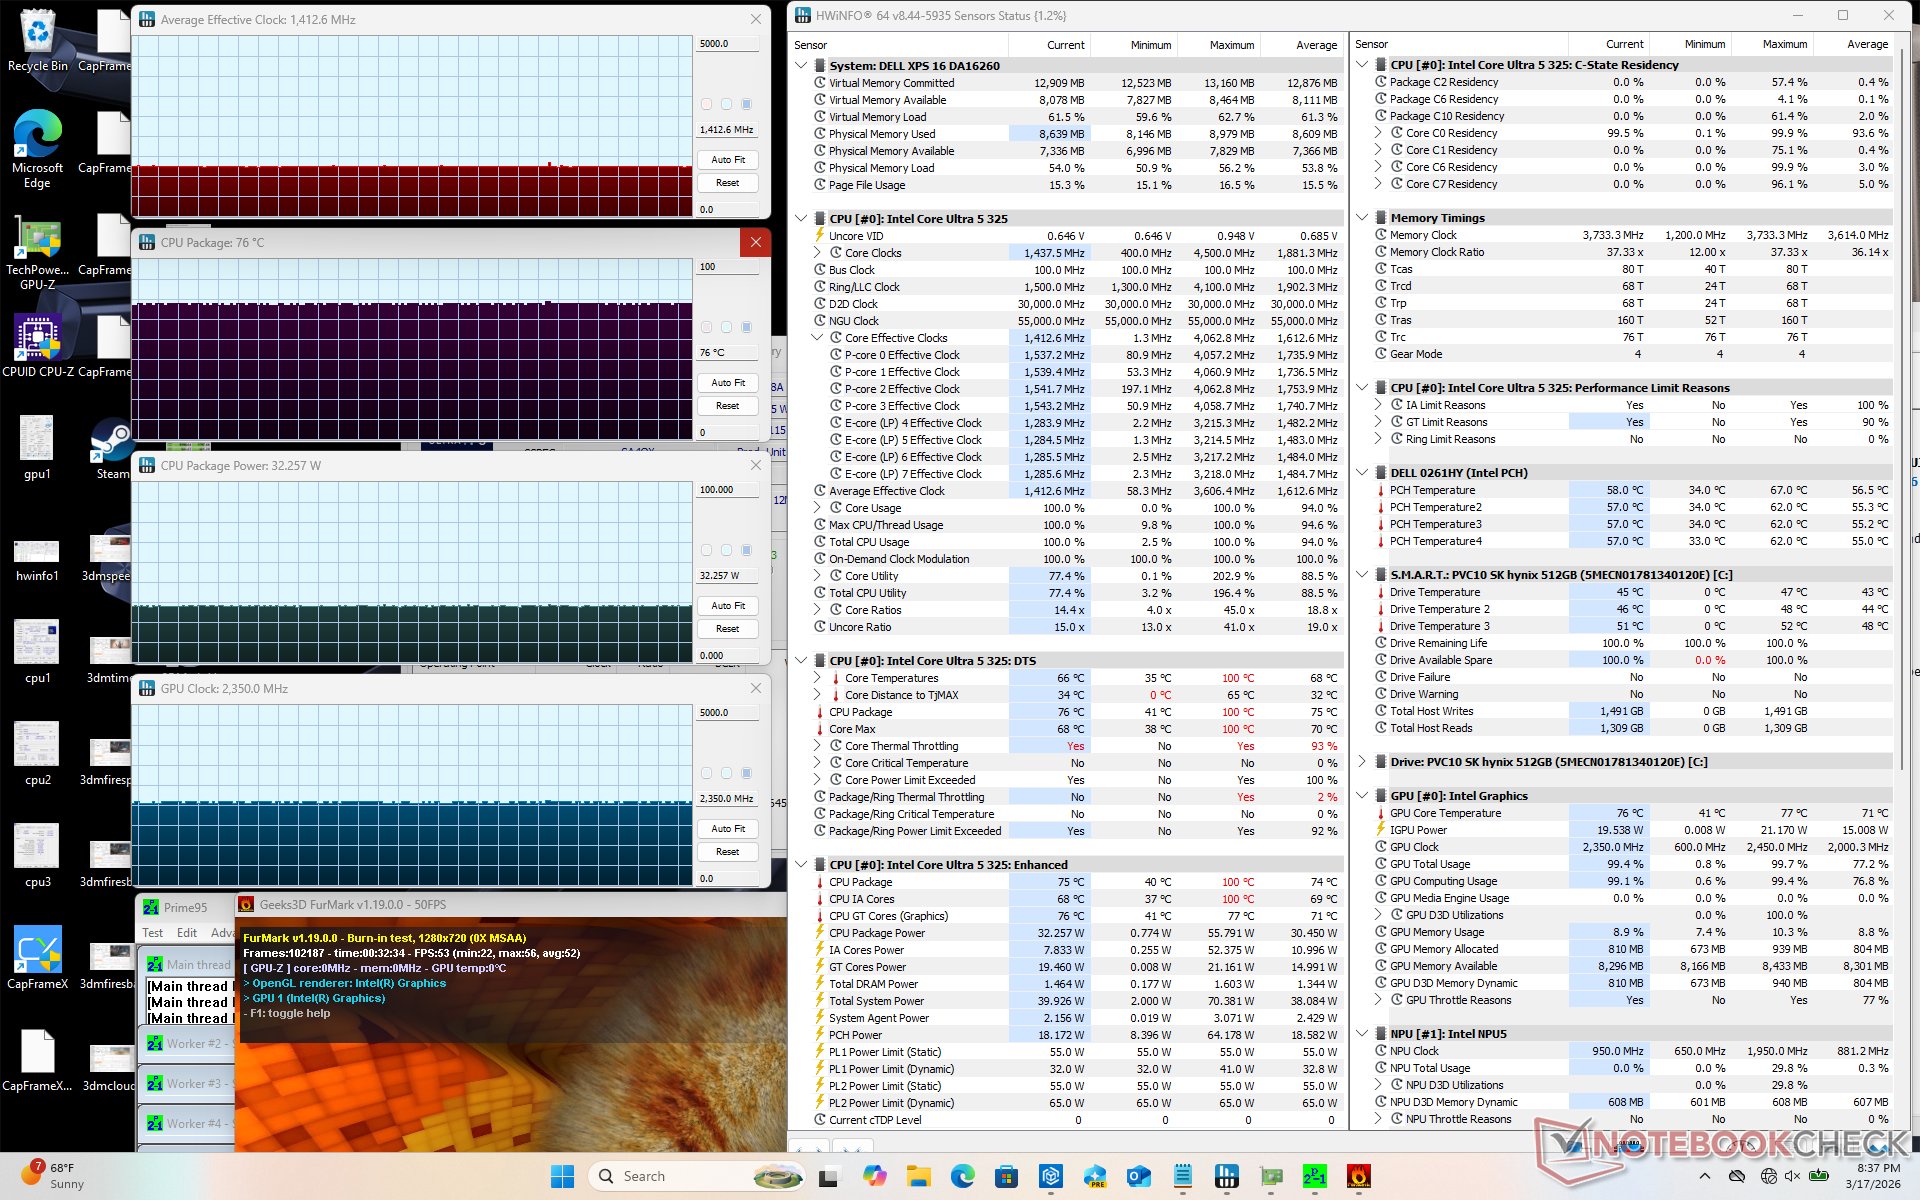
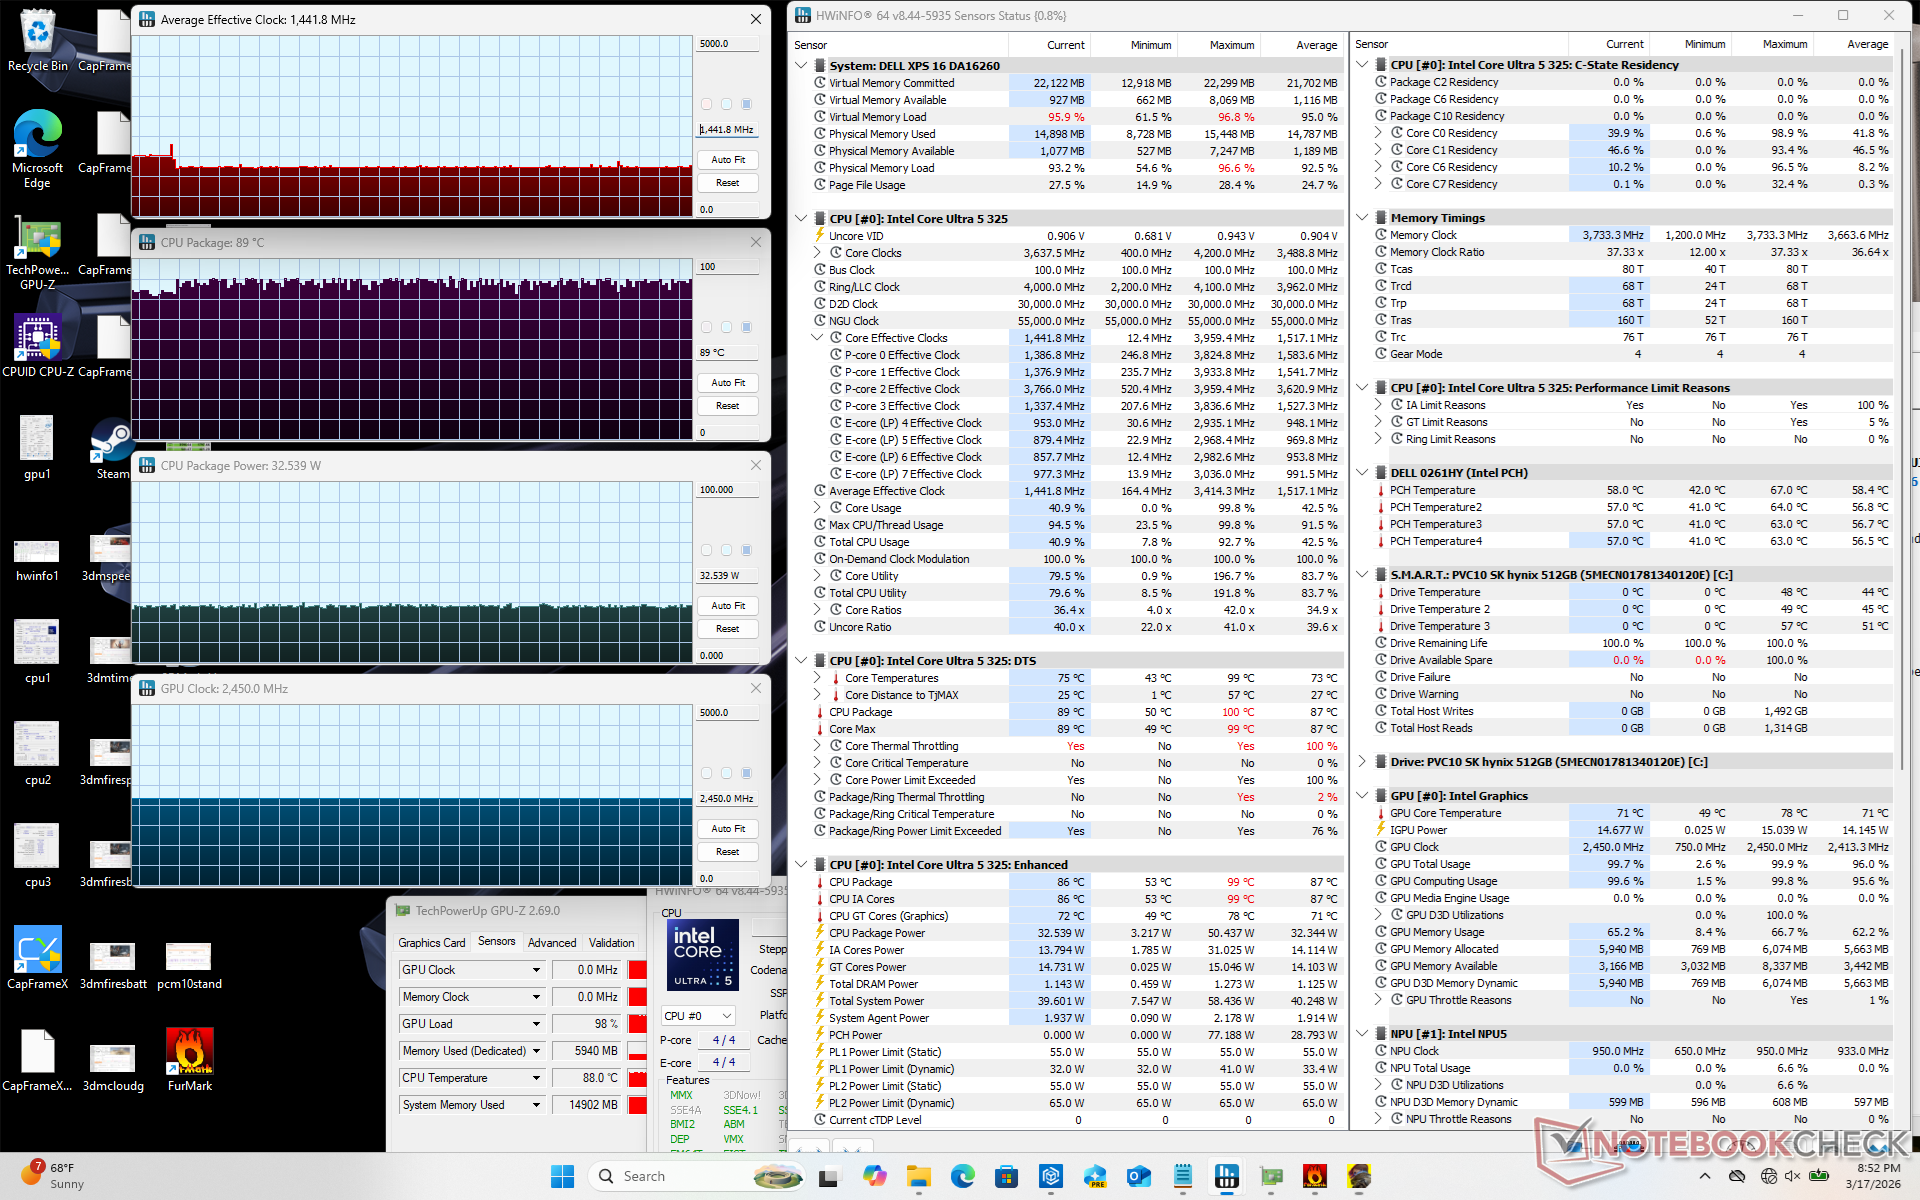
| Clock medio della CPU (GHz) | Clock della GPU (MHz) | Temperatura media della CPU (°C) | |
| Sistema inattivo | -- | -- | 47 |
| Prime95 Stress | 3.0 | -- | 86 |
| Prime95 + FurMark Stress | 1.4 | 2350 | 76 |
| Cyberpunk 2077 Stress | 1,4 | 2450 | 89 |
Altoparlanti

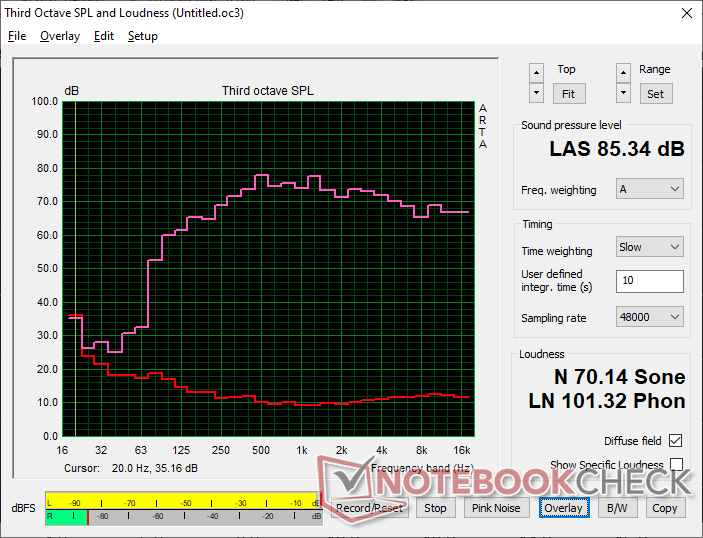
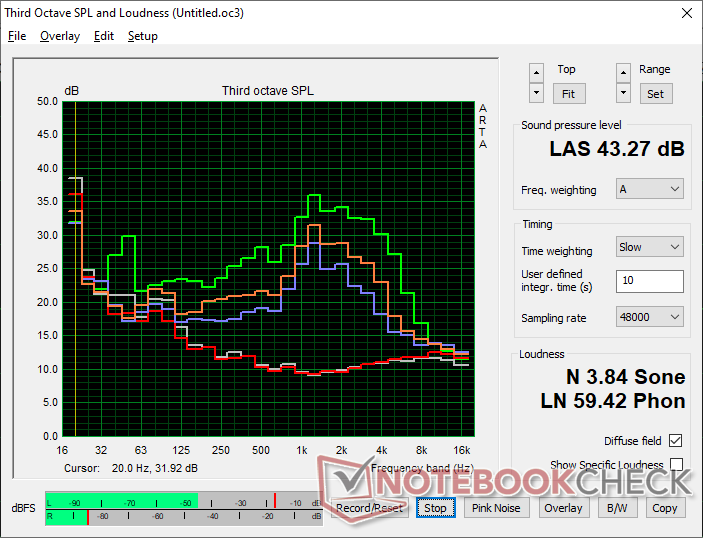
Dell XPS 16 Core Ultra 5 325 analisi audio
(+) | gli altoparlanti sono relativamente potenti (85.3 dB)
Bassi 100 - 315 Hz
(±) | bassi ridotti - in media 6.1% inferiori alla media
(+) | bassi in lineaa (5.6% delta rispetto alla precedente frequenza)
Medi 400 - 2000 Hz
(+) | medi bilanciati - solo only 3.2% rispetto alla media
(+) | medi lineari (4.6% delta rispetto alla precedente frequenza)
Alti 2 - 16 kHz
(+) | Alti bilanciati - appena 2.4% dalla media
(+) | alti lineari (3.3% delta rispetto alla precedente frequenza)
Nel complesso 100 - 16.000 Hz
(+) | suono nel complesso lineare (7% differenza dalla media)
Rispetto alla stessa classe
» 5% di tutti i dispositivi testati in questa classe è stato migliore, 1% simile, 95% peggiore
» Il migliore ha avuto un delta di 5%, medio di 17%, peggiore di 45%
Rispetto a tutti i dispositivi testati
» 1% di tutti i dispositivi testati in questa classe è stato migliore, 0% similare, 99% peggiore
» Il migliore ha avuto un delta di 4%, medio di 24%, peggiore di 134%
Apple MacBook Pro 16 2021 M1 Pro analisi audio
(+) | gli altoparlanti sono relativamente potenti (84.7 dB)
Bassi 100 - 315 Hz
(+) | bassi buoni - solo 3.8% dalla media
(+) | bassi in lineaa (5.2% delta rispetto alla precedente frequenza)
Medi 400 - 2000 Hz
(+) | medi bilanciati - solo only 1.3% rispetto alla media
(+) | medi lineari (2.1% delta rispetto alla precedente frequenza)
Alti 2 - 16 kHz
(+) | Alti bilanciati - appena 1.9% dalla media
(+) | alti lineari (2.7% delta rispetto alla precedente frequenza)
Nel complesso 100 - 16.000 Hz
(+) | suono nel complesso lineare (4.6% differenza dalla media)
Rispetto alla stessa classe
» 0% di tutti i dispositivi testati in questa classe è stato migliore, 0% simile, 100% peggiore
» Il migliore ha avuto un delta di 5%, medio di 17%, peggiore di 45%
Rispetto a tutti i dispositivi testati
» 0% di tutti i dispositivi testati in questa classe è stato migliore, 0% similare, 100% peggiore
» Il migliore ha avuto un delta di 4%, medio di 24%, peggiore di 134%
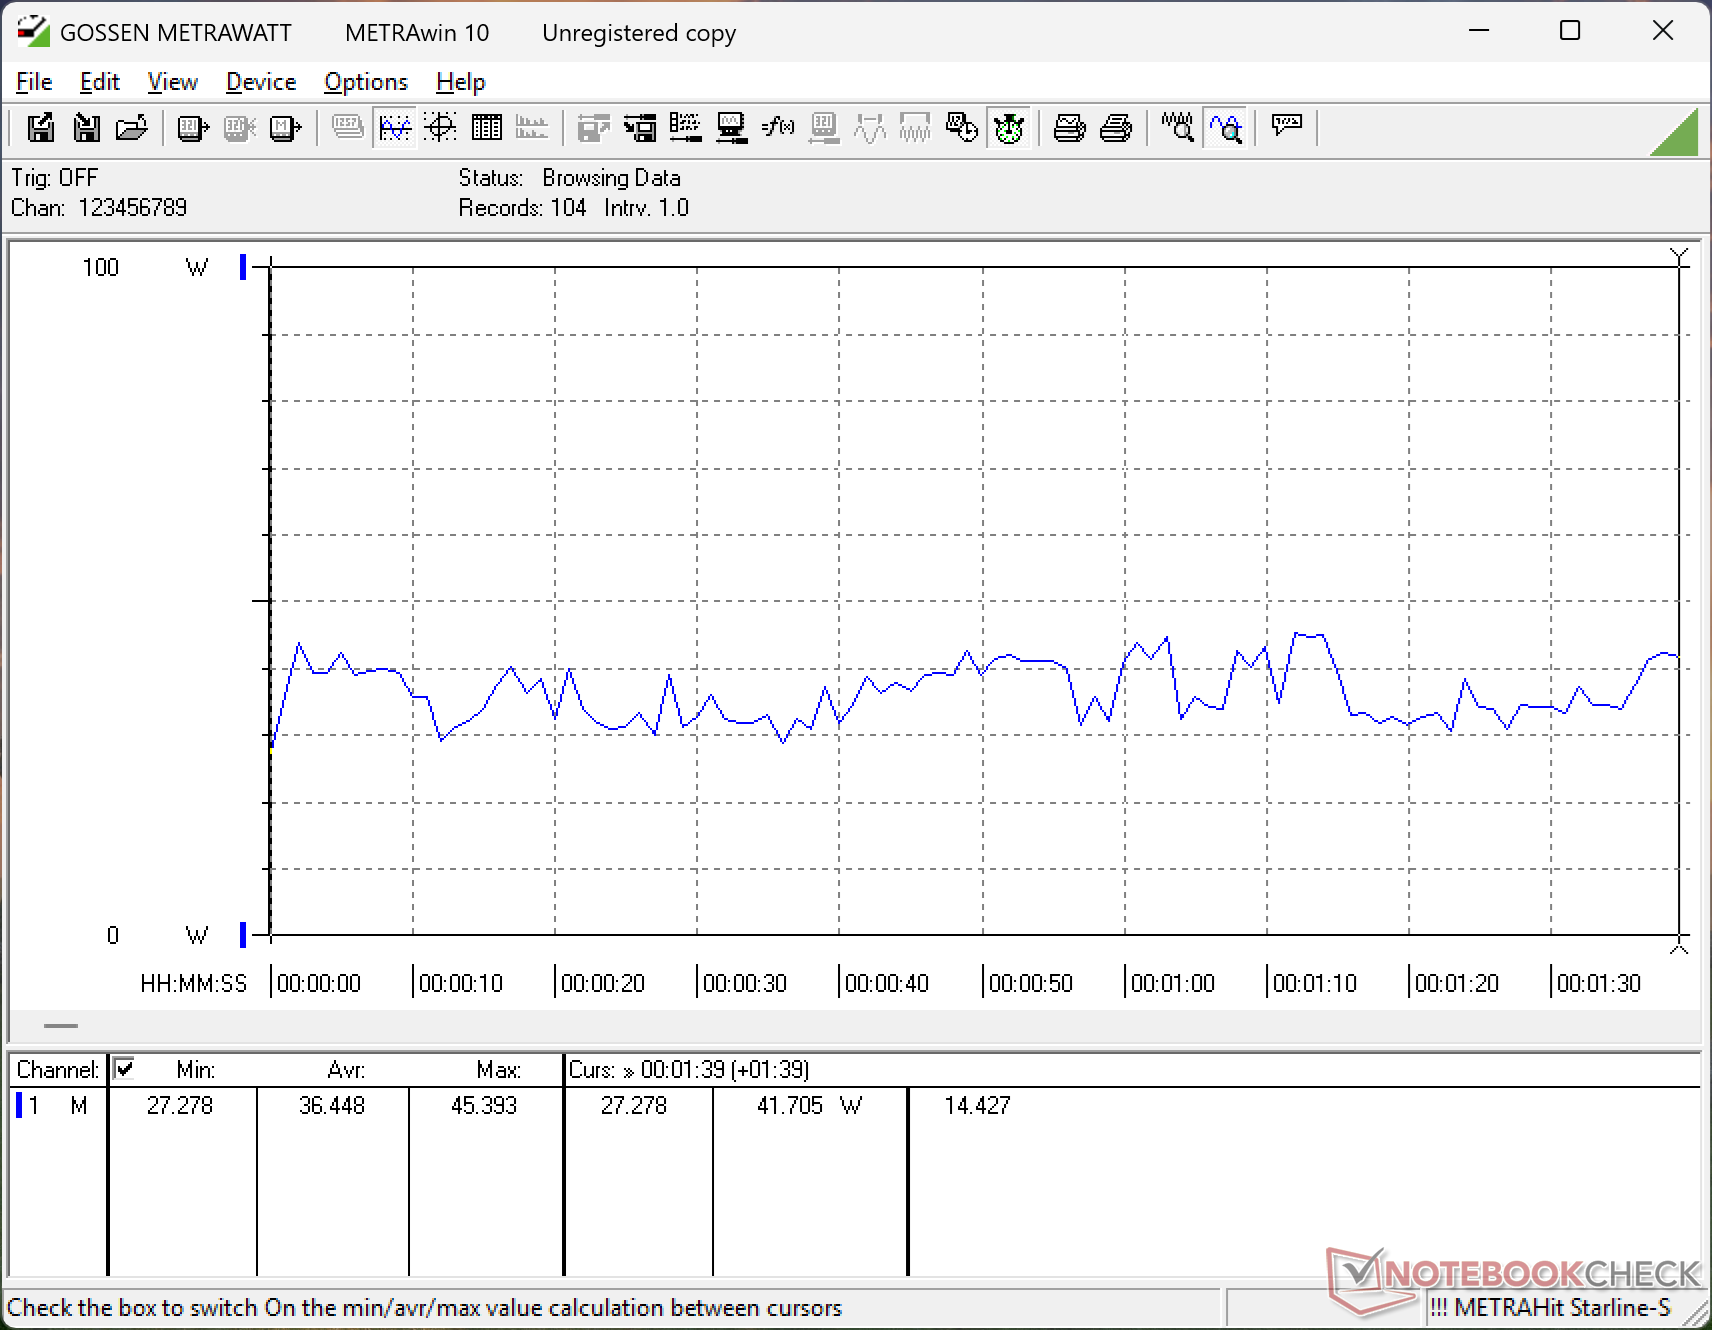
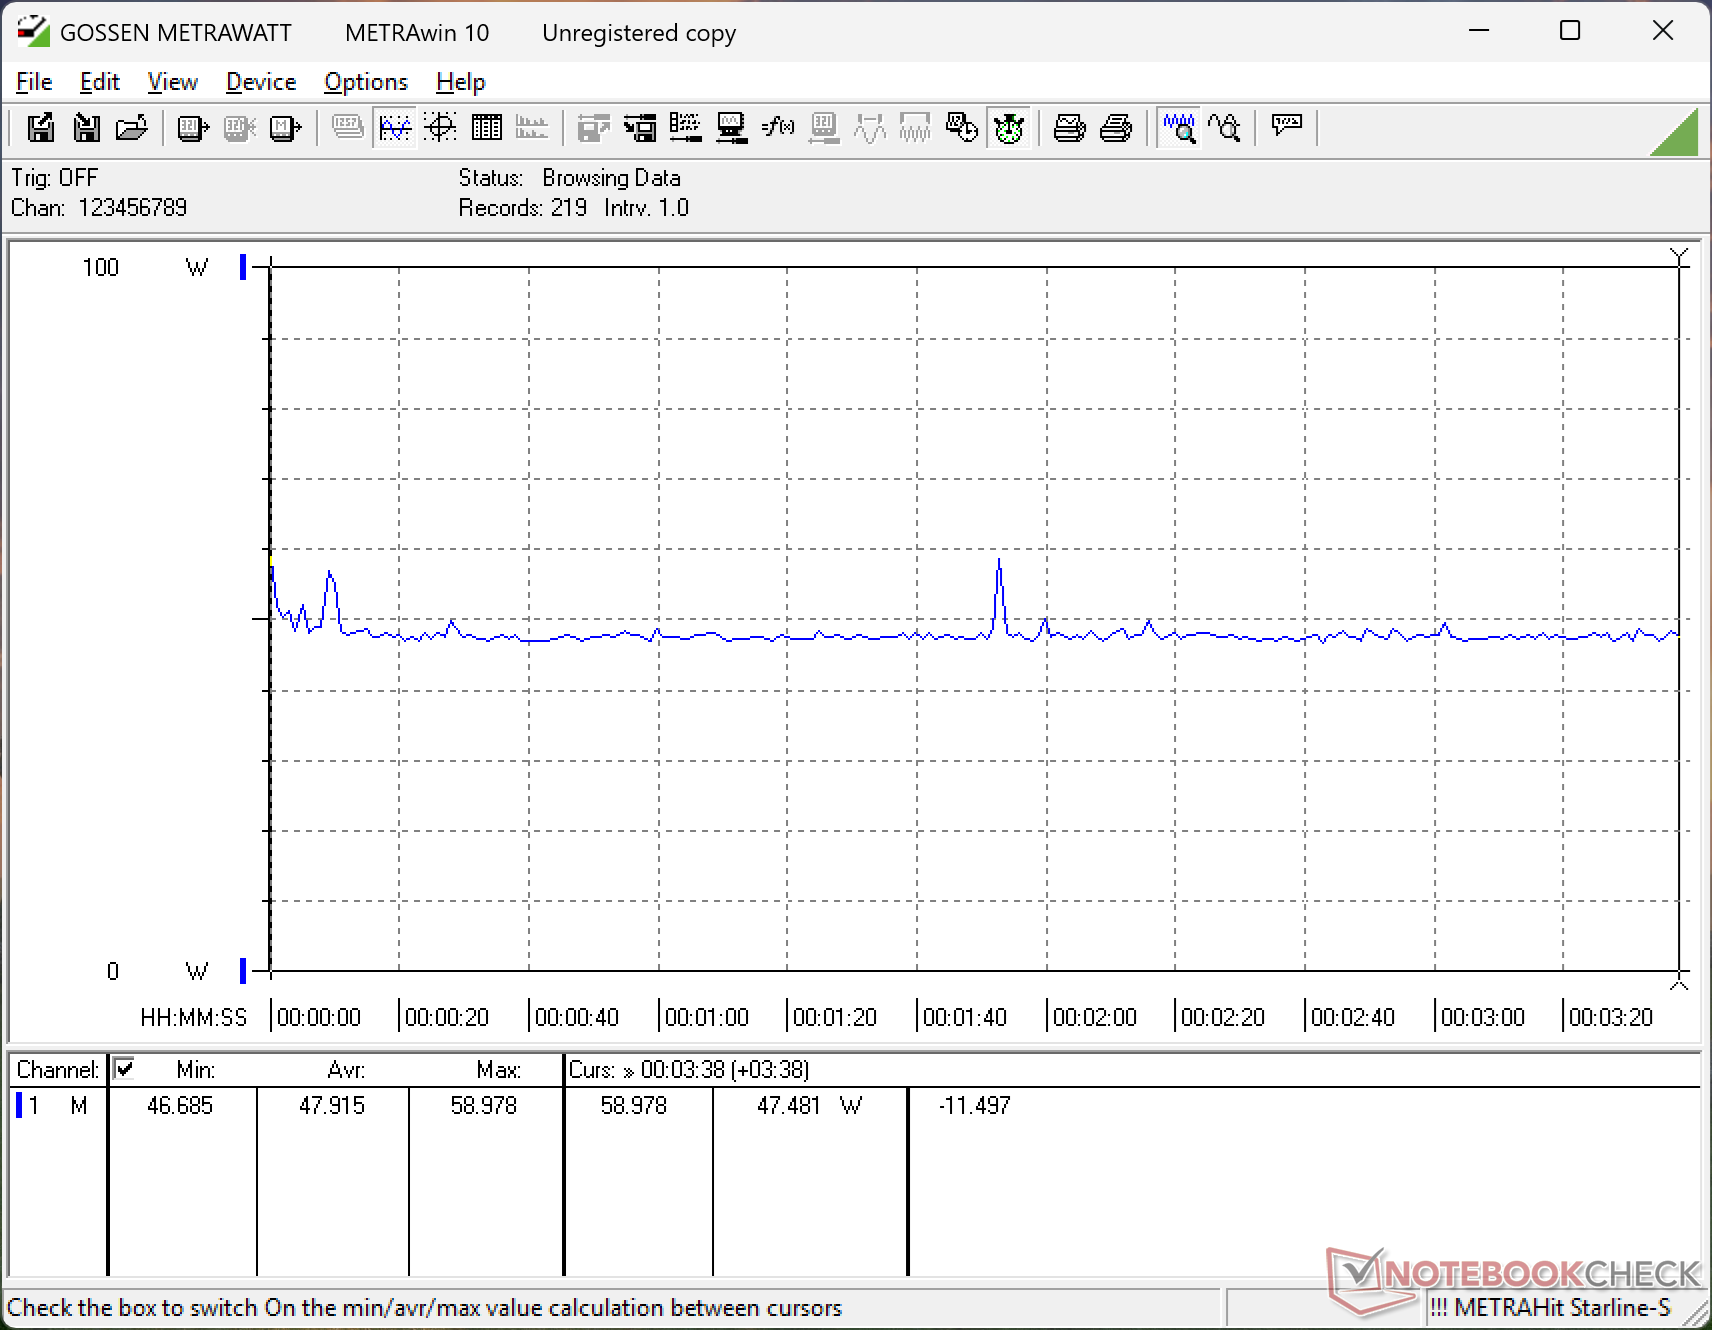
Gestione dell'energia - Panther Lake è il re dell'efficienza
Consumo di energia
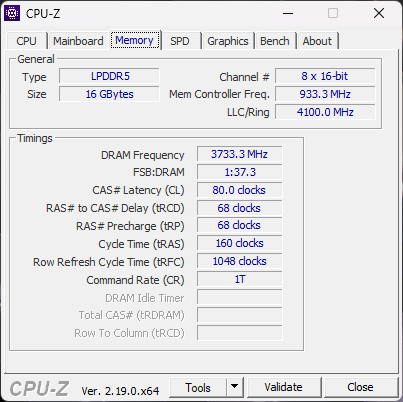
Panther Lake adotta l'efficienza di Lunar Lake-V con le prestazioni grezze di Arrow Lake-H per ottenere il meglio di entrambi i mondi. L'inattività su desktop, con l'impostazione di luminosità più bassa, consuma solo 1,3 W, un valore estremamente basso, soprattutto per un formato da 16 pollici. Il consumo rimarrebbe molto basso, appena sotto i 50 W, quando si eseguono i giochi, grazie alla mancanza di una GPU discreta. Se invece fosse configurato con il Core Ultra X7, il consumo durante i giochi sarebbe di pochi watt in più, in base al tempo trascorso con l' XPS 14 per alcuni dei numeri più alti di prestazioni per watt di qualsiasi laptop con iGPU.
Siamo riusciti a registrare un consumo massimo temporaneo di 83 W dal piccolo (~10,2 x 5,5 x 2,2 cm) adattatore universale USB-C da 100 W quando la CPU è completamente sotto sforzo.
| Off / Standby | |
| Idle | |
| Sotto carico |
|
Leggenda:
min: | |
| Dell XPS 16 Core Ultra 5 325 Ultra 5 325, Intel Graphics 4 Xe3, SK hynix PVC10 HFS512GEM4X182N, IPS, 1920x1200, 16" | Dell 16 Premium DA16250 Ultra 7 255H, GeForce RTX 5070 Laptop, Kioxia BG6 KBG6AZNV1T02, OLED, 3840x2400, 16.3" | Lenovo Yoga Pro 9 16IAH10 RTX 5050 Ultra 9 285H, GeForce RTX 5050 Laptop, WD PC SN7100S SDFPMSL-1T00-1101, OLED, 2880x1800, 16" | Samsung Galaxy Book6 Ultra Ultra 7 356H, GeForce RTX 5070 Laptop, Samsung PM9C1b MZVL81T0HFLB-00BH1, OLED, 2880x1800, 16" | Asus ZenBook S16 UM5606GA Ryzen AI 9 465, Radeon 880M, SanDisk PC SN5100S, OLED, 2880x1800, 16" | MSI Prestige 16 AI Evo B2HMG Ultra 9 285H, Arc 140T, Micron 2500 1TB MTFDKBA1T0QGN, IPS, 2560x1600, 16" | |
|---|---|---|---|---|---|---|
| Power Consumption | -225% | -261% | -119% | -65% | -93% | |
| Idle Minimum * (Watt) | 1.3 | 6.5 -400% | 6.8 -423% | 4.4 -238% | 3.7 -185% | 4.4 -238% |
| Idle Average * (Watt) | 4.5 | 8.1 -80% | 20.1 -347% | 6.4 -42% | 7.4 -64% | 9.2 -104% |
| Idle Maximum * (Watt) | 4.6 | 33 -617% | 21.6 -370% | 7.1 -54% | 9.5 -107% | 9.5 -107% |
| Load Average * (Watt) | 36.5 | 88.9 -144% | 87.6 -140% | 55.1 -51% | 57.9 -59% | 66.9 -83% |
| Cyberpunk 2077 ultra external monitor * (Watt) | 45.4 | 108.9 -140% | 147.9 -226% | 133 -193% | 57 -26% | 67.4 -48% |
| Cyberpunk 2077 ultra * (Watt) | 47.9 | 108.7 -127% | 148.2 -209% | 134.3 -180% | 58.5 -22% | 68.8 -44% |
| Load Maximum * (Watt) | 82.8 | 138.3 -67% | 173.5 -110% | 143.9 -74% | 76.9 7% | 102.9 -24% |
* ... Meglio usare valori piccoli
Consumo energetico Cyberpunk / Stress Test
Consumo di energia del monitor esterno
Durata della batteria

Dell pubblicizza una durata della batteria fino a 31 ore in base ai criteri di test WLAN interni. Tuttavia, quando abbiamo effettuato il test nelle nostre condizioni WLAN, siamo stati in grado di registrare un'autonomia di quasi 27 ore, che è ancora incredibilmente impressionante se si considera che la capacità della batteria da 70 Wh è in realtà sul lato piccolo per un formato da 16 pollici.
| Dell XPS 16 Core Ultra 5 325 Ultra 5 325, Intel Graphics 4 Xe3, 70 Wh | Dell XPS 16 9640 Ultra 7 155H, GeForce RTX 4070 Laptop GPU, 99.5 Wh | Lenovo Yoga Pro 9 16IAH10 RTX 5050 Ultra 9 285H, GeForce RTX 5050 Laptop, 84 Wh | Samsung Galaxy Book6 Ultra Ultra 7 356H, GeForce RTX 5070 Laptop, 80.2 Wh | Asus ZenBook S16 UM5606GA Ryzen AI 9 465, Radeon 880M, 83 Wh | MSI Prestige 16 AI Evo B2HMG Ultra 9 285H, Arc 140T, 99.9 Wh | |
|---|---|---|---|---|---|---|
| Autonomia della batteria | -61% | -60% | -37% | -51% | -38% | |
| WiFi v1.3 (h) | 26.6 | 10.5 -61% | 10.7 -60% | 16.8 -37% | 13.1 -51% | 16.5 -38% |
| H.264 (h) | 16.5 | 20.8 | ||||
| Load (h) | 1.5 | 2.4 |
Valutazione Notebookcheck
L'XPS 16 2026 sacrifica le opzioni di GPU discrete per un design più snello, leggero, silenzioso, duraturo ed efficiente.
Dell XPS 16 Core Ultra 5 325
- 03/20/2026 v8
Allen Ngo
 Total Sustainability Score:
 Potenziali concorrenti a confronto
Immagine | Modello | Prezzo | Peso | Altezza | Schermo |
|---|---|---|---|---|---|
1. 84.2%  | Dell XPS 16 Core Ultra 5 325 Intel Core Ultra 5 325 ⎘ Intel Graphics 4 Xe3 Panther Lake iGPU ⎘ 16 GB Memoria, 512 GB SSD | Prezzo di listino: 1600 USD | 1.7 kg | 15.4 mm | 16.00" 1920x1200 142 PPI IPS |
2. 87.9%  | Dell 16 Premium DA16250 Intel Core Ultra 7 255H ⎘ NVIDIA GeForce RTX 5070 Laptop ⎘ 32 GB Memoria, 1024 GB SSD | Prezzo di listino: 3300 USD | 2.3 kg | 18.7 mm | 16.30" 3840x2400 278 PPI OLED |
3. 88.8%  | Lenovo Yoga Pro 9 16IAH10 RTX 5050 Intel Core Ultra 9 285H ⎘ NVIDIA GeForce RTX 5050 Laptop ⎘ 32 GB Memoria, 1024 GB SSD | Prezzo di listino: 1800 USD | 2 kg | 17.9 mm | 16.00" 2880x1800 212 PPI OLED |
4. 90.7%  | Samsung Galaxy Book6 Ultra Intel Core Ultra 7 356H ⎘ NVIDIA GeForce RTX 5070 Laptop ⎘ 32 GB Memoria, 1000 GB SSD | Prezzo di listino: 3599€ | 1.9 kg | 15.4 mm | 16.00" 2880x1800 212 PPI OLED |
5. 86.6%  | Asus ZenBook S16 UM5606GA AMD Ryzen AI 9 465 ⎘ AMD Radeon 880M ⎘ 32 GB Memoria, 1024 GB SSD | Prezzo di listino: 1799€ | 1.5 kg | 12.9 mm | 16.00" 2880x1800 212 PPI OLED |
6. 82.8%  | MSI Prestige 16 AI Evo B2HMG Intel Core Ultra 9 285H ⎘ Intel Arc Graphics 140T ⎘ 32 GB Memoria, 1024 GB SSD | Amazon: 1. $1,469.00 MSI Prestige 16 AI+ Evo 16" ... 2. $1,364.28 msi Prestige 16 AI Evo Lapto... 3. $26.99 100W USB C Charger Fits for ... | 1.6 kg | 18.95 mm | 16.00" 2560x1600 189 PPI IPS |
Transparency
La selezione dei dispositivi da recensire viene effettuata dalla nostra redazione. Il campione di prova è stato acquistato gratuitamente dall'autore a proprie spese. L'istituto di credito non ha avuto alcuna influenza su questa recensione, né il produttore ne ha ricevuto una copia prima della pubblicazione. Non vi era alcun obbligo di pubblicare questa recensione. In quanto società mediatica indipendente, Notebookcheck non è soggetta all'autorità di produttori, rivenditori o editori.
Ecco come Notebookcheck esegue i test
Ogni anno, Notebookcheck esamina in modo indipendente centinaia di laptop e smartphone utilizzando procedure standardizzate per garantire che tutti i risultati siano comparabili. Da circa 20 anni sviluppiamo continuamente i nostri metodi di prova e nel frattempo stabiliamo gli standard di settore. Nei nostri laboratori di prova, tecnici ed editori esperti utilizzano apparecchiature di misurazione di alta qualità. Questi test comportano un processo di validazione in più fasi. Il nostro complesso sistema di valutazione si basa su centinaia di misurazioni e parametri di riferimento ben fondati, che mantengono l'obiettività.
