Il verdetto
Sebbene XMG Core 16 VE sia commercializzato come Value Edition, questo laptop da gioco da 16 pollici non è esattamente tra i modelli RTX 5060 più economici. Con un prezzo di partenza di 1.479 euro (circa 1.711 dollari) e un prezzo configurato di oltre 1.900 euro (circa 2.198 dollari con 64 GB di RAM, 2 TB di SSD, Windows 11), compete più nella fascia di prezzo di molti dispositivi RTX 5070 Ti. In base alle nostre misurazioni e ai nostri test, il prezzo è almeno in parte giustificato.
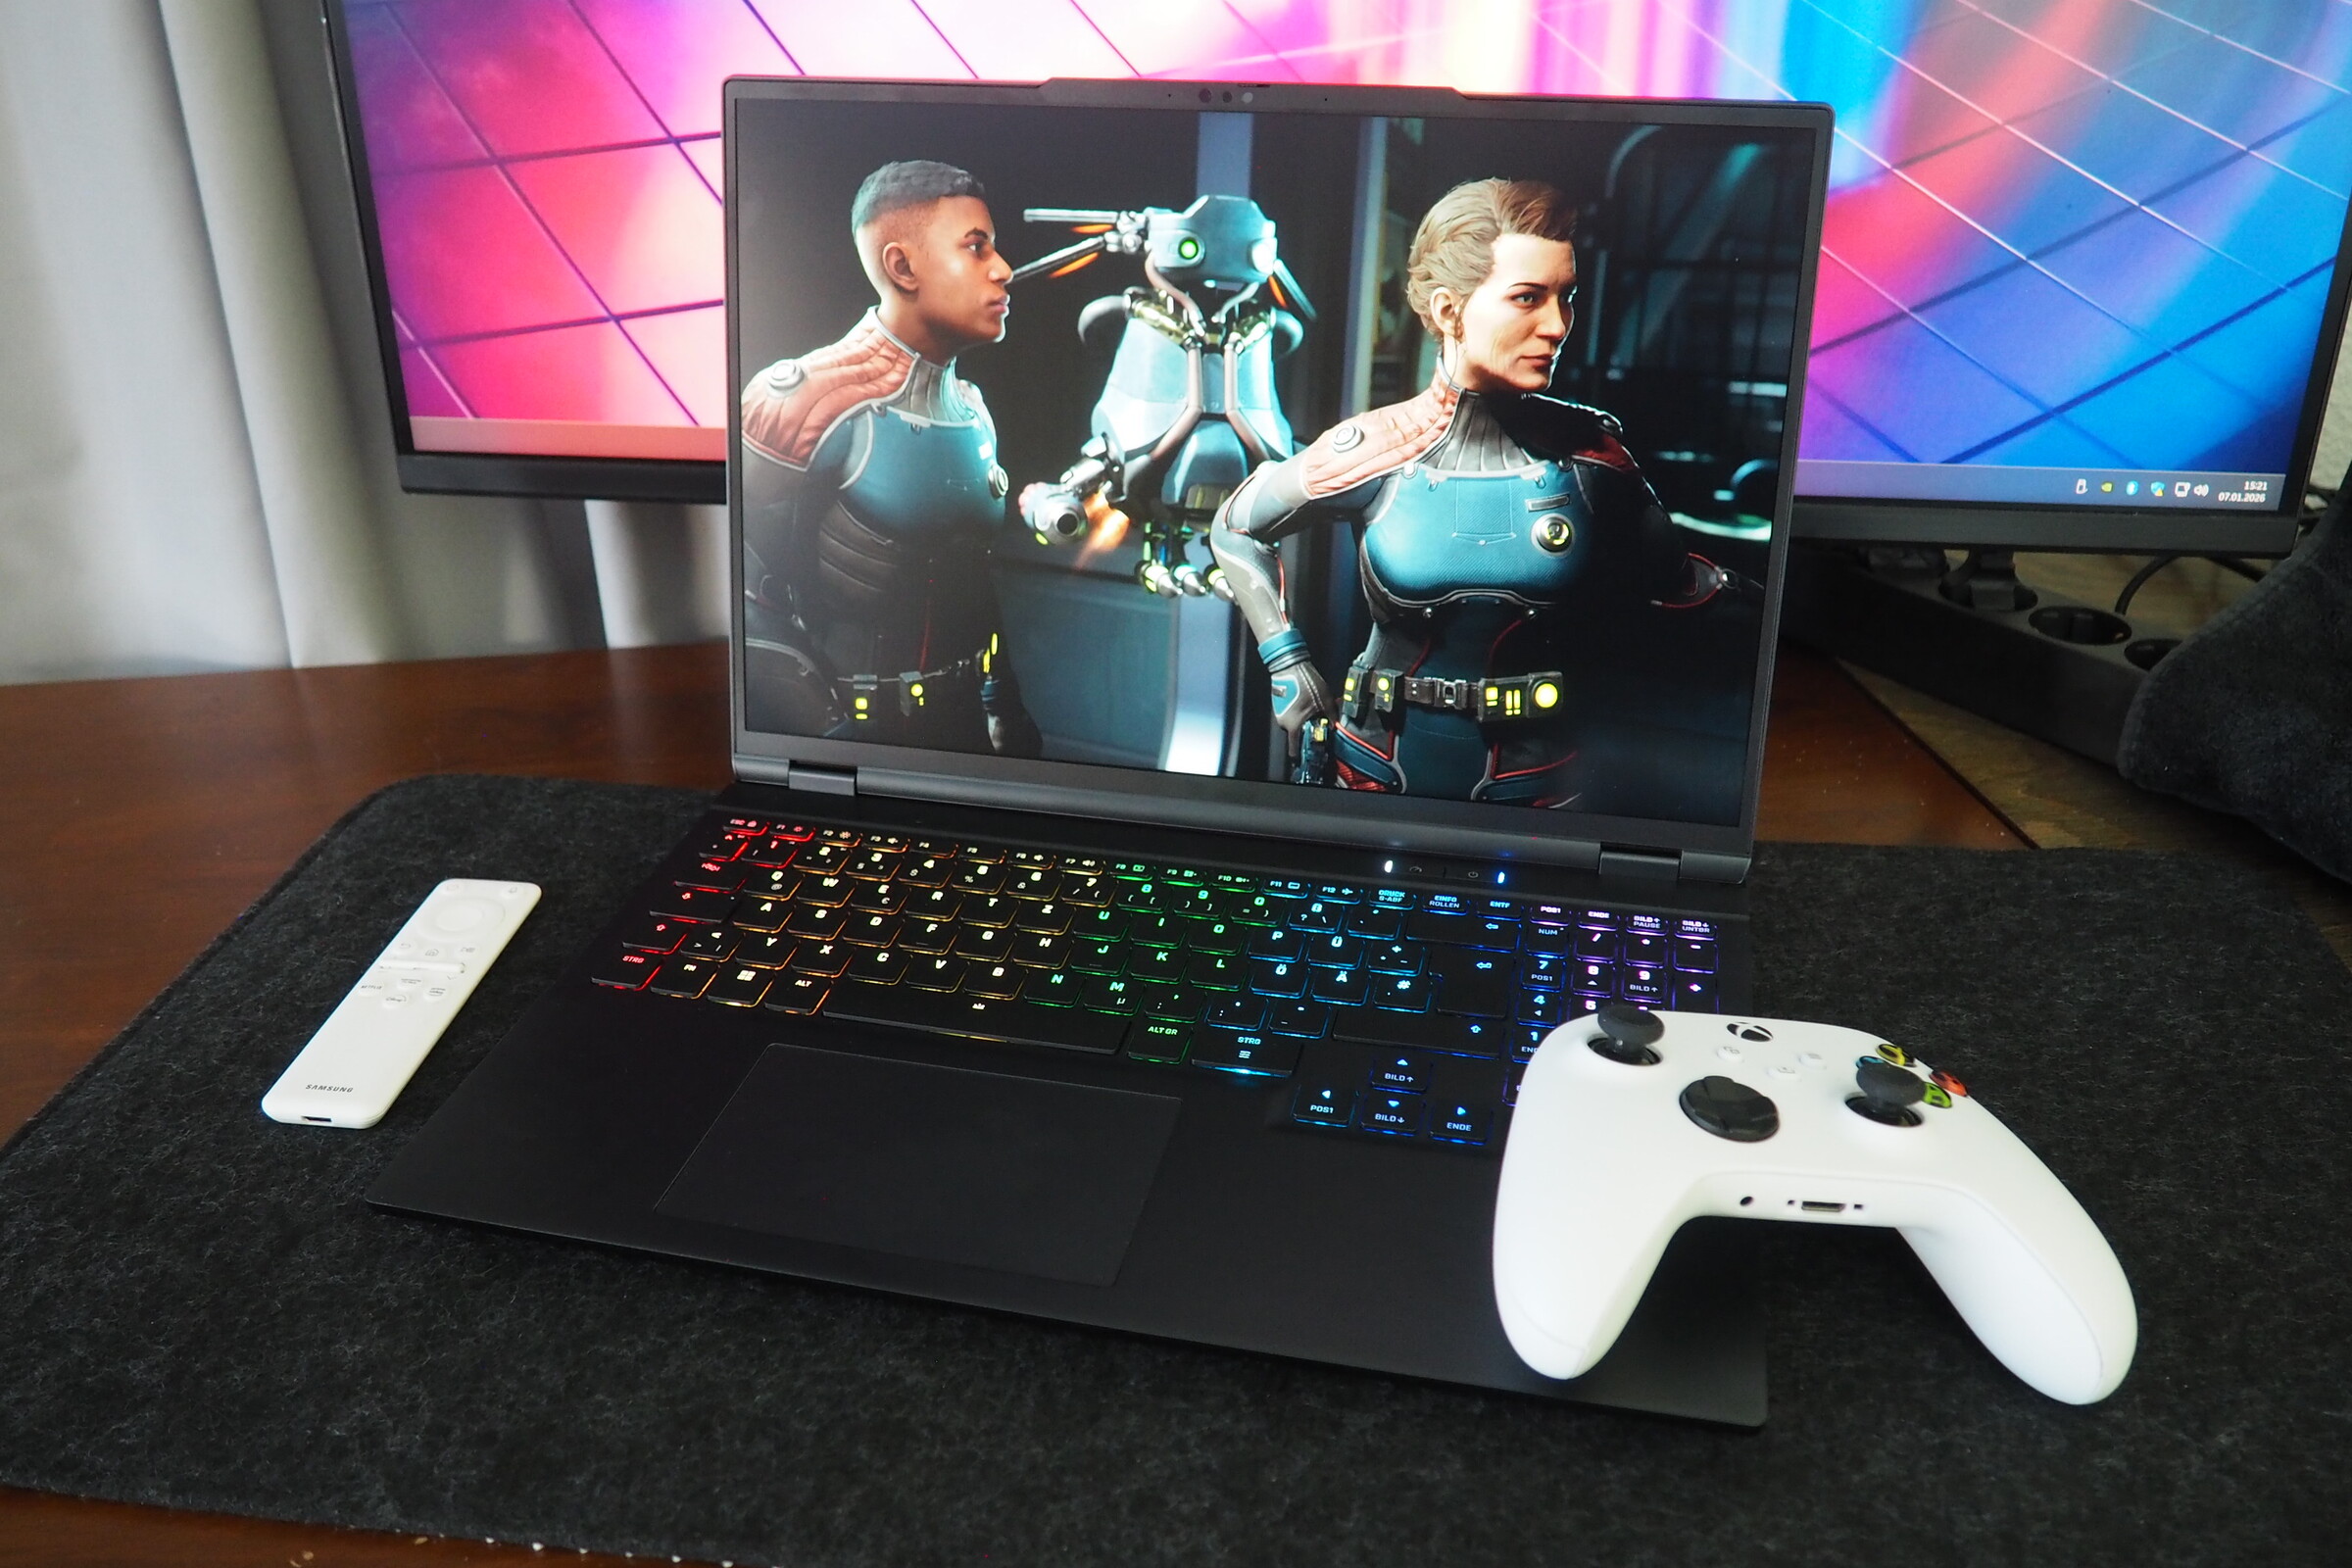
Uno dei suoi maggiori punti di forza è il telaio in metallo elegante e ampiamente robusto, che combina buoni dispositivi di input con un'ampia selezione di porte e un display IPS abbastanza luminoso. Anche le opzioni di manutenzione e aggiornamento sono solide. Anche le prestazioni della CPU e della GPU sono convincenti. Sebbene Ryzen 7 255 non sia un concentrato di potenza rispetto ad altre CPU da gioco, il chip Zen 4 offre prestazioni costanti. La qualità del suono, tuttavia, potrebbe essere migliorata. Gli altoparlanti integrati offrono un audio piuttosto modesto.
Nel complesso, il punteggio non è all'altezza di quello del suo principale rivale, il Lenovo Legion 7 16, ma l'XMG Core 16 VE supera molti altri portatili RTX 5060, come il Tulpar T6 V3.5 e l'HP Omen 16. Le nostre tabelle di confronto includono anche un notebook RTX 5070 o RTX 5070 Ti più potente, come contesto.
Pro
Contro
Prezzo e disponibilità
Come già detto, il modello XMG Core 16 VE (M25) è disponibile direttamente dal produttore a partire da 1.479 euro (circa 1.711 dollari).
Nota del traduttore: i computer portatili XMG non sono ufficialmente disponibili in Nord America.
Specifiche
Caso
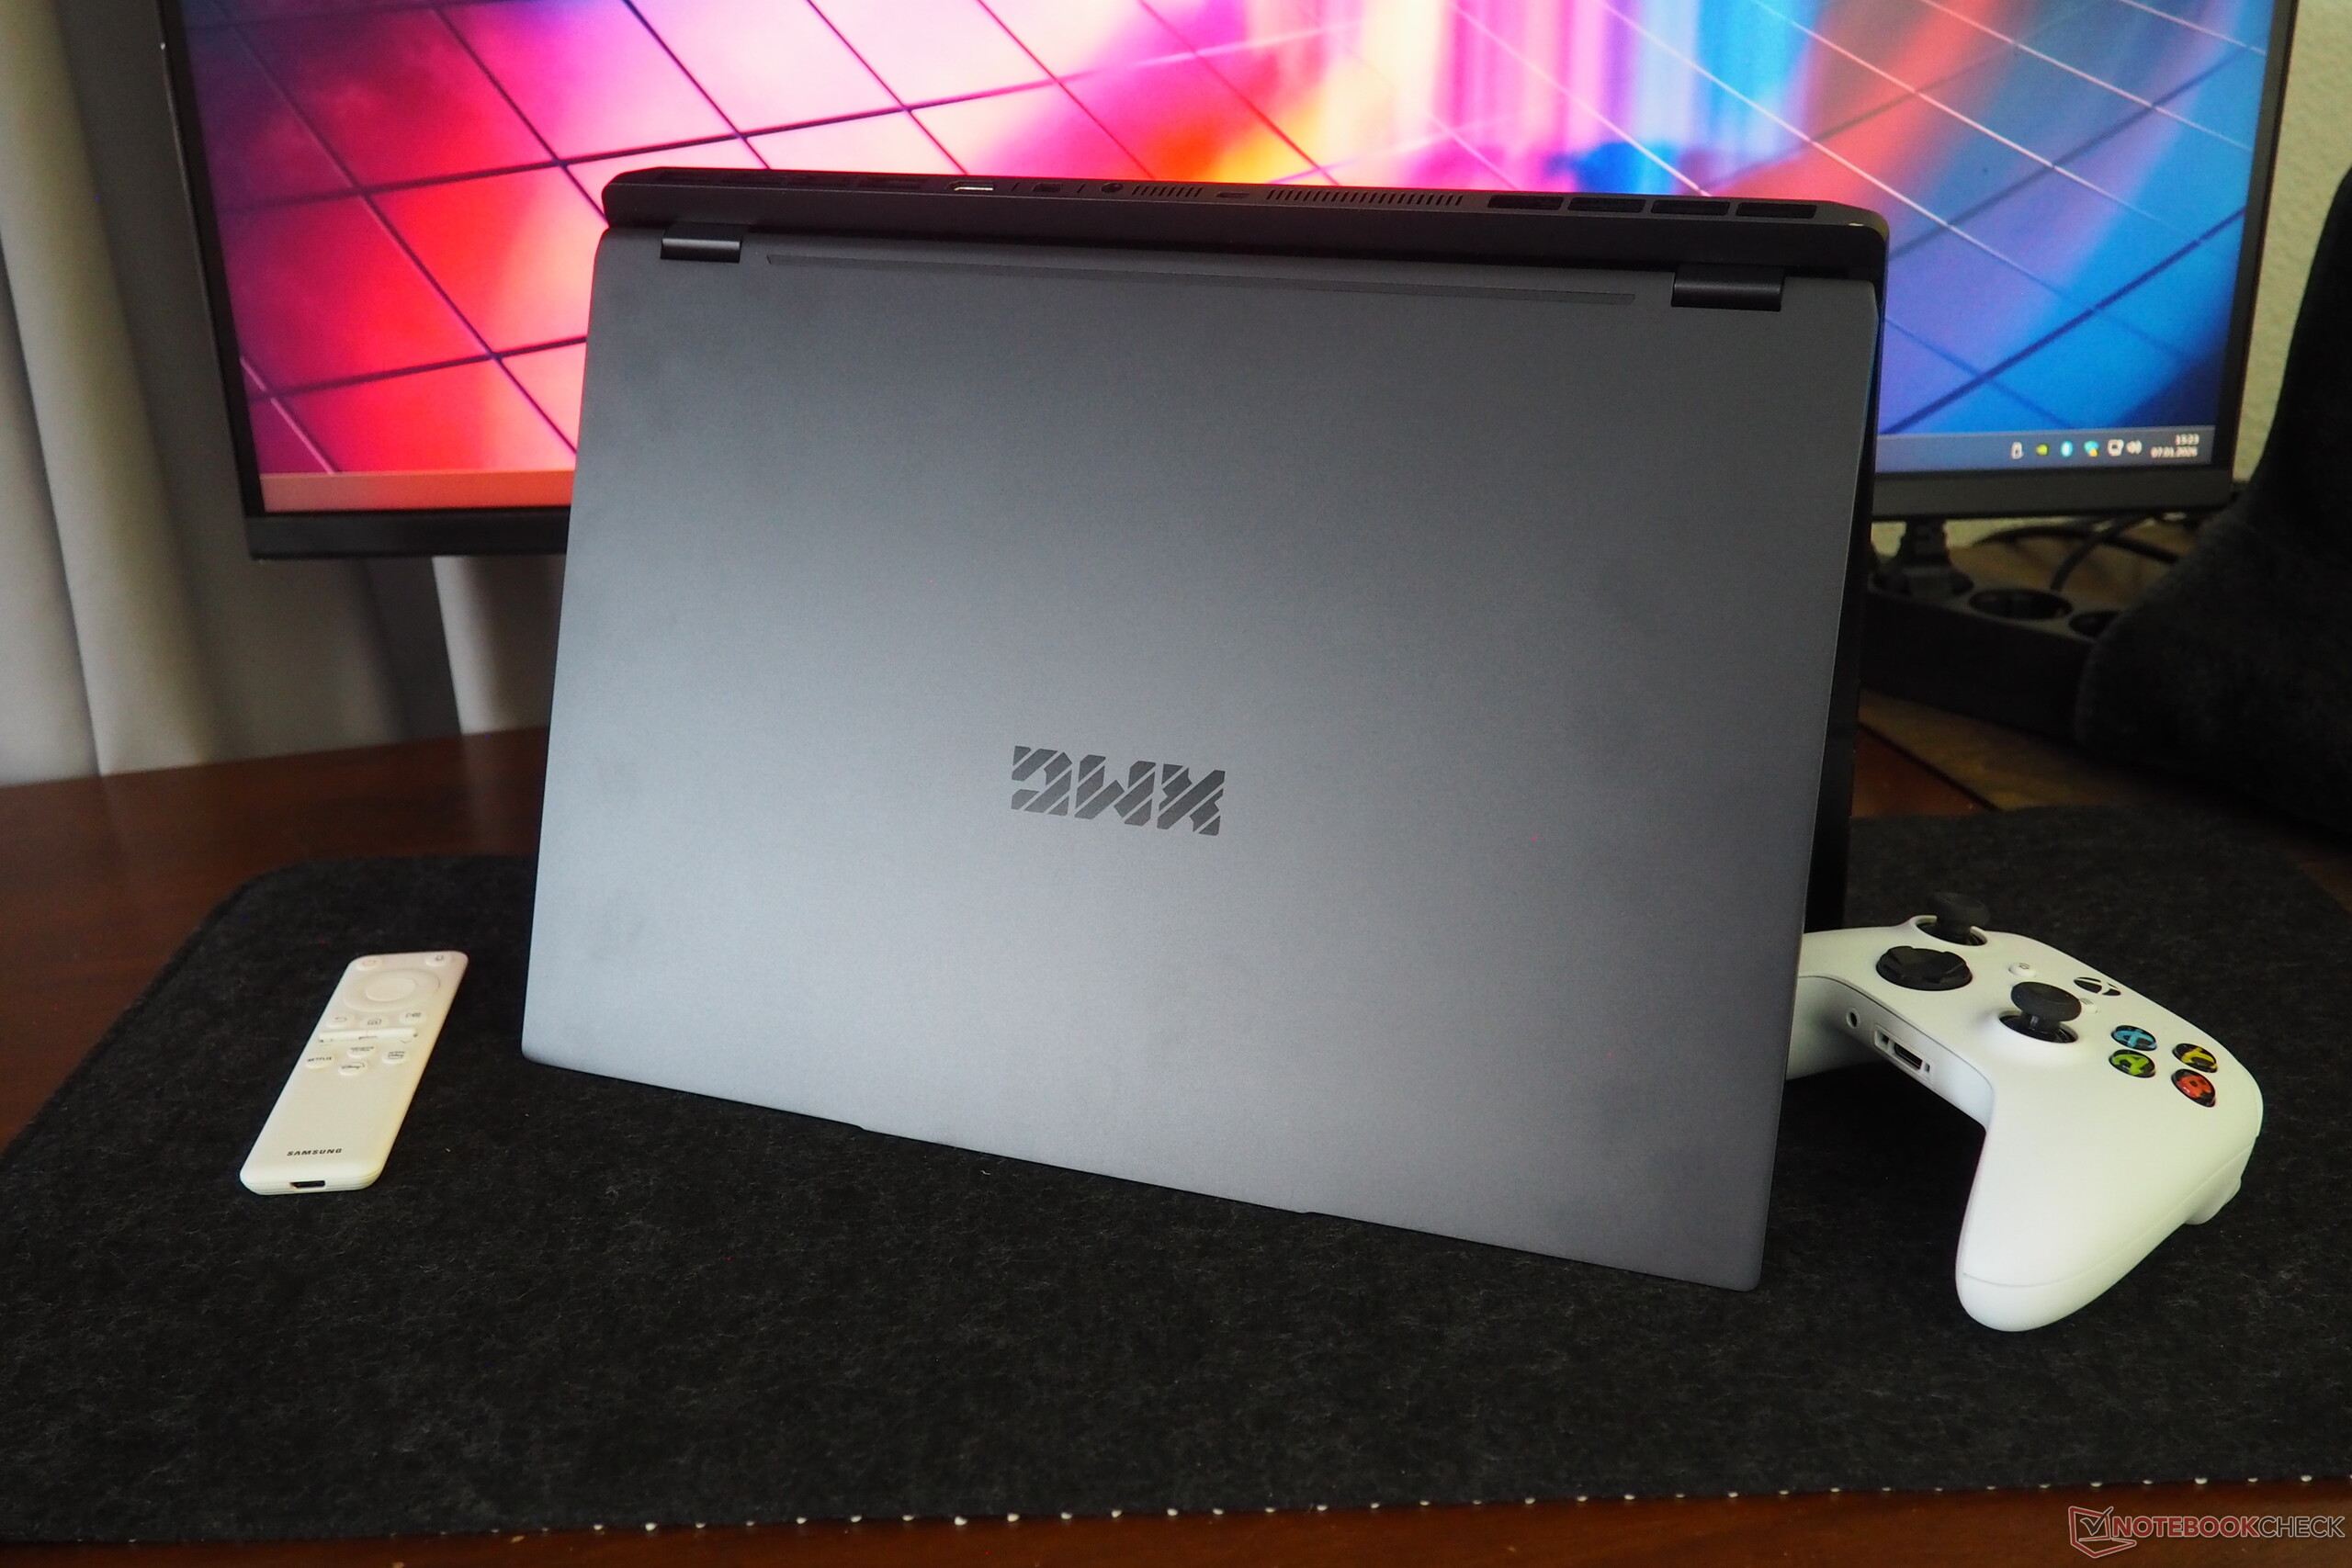
Il telaio è di qualità superiore, grazie all'uso di componenti in metallo. Mentre le superfici scure sono soggette a impronte digitali, la rigidità è impressionante nella maggior parte delle aree. Anche il generoso angolo di apertura a 180° merita un elogio. Con un peso di 2,1 kg, XMG Core 16 VE si colloca all'estremità inferiore del gruppo di confronto e non è quindi eccessivamente pesante. Con uno spessore di 2,3 cm, rimane anch'esso entro limiti ragionevoli.
Attrezzatura
Schenker non lascia molto di cui lamentarsi quando si tratta di connettività. Oltre a tre porte USB-A e due porte USB-C, ci sono anche due uscite per il display (HDMI e Mini DisplayPort). Il portatile include anche un jack audio, una porta LAN, un lettore di schede molto veloce e uno slot per il lucchetto Kensington.
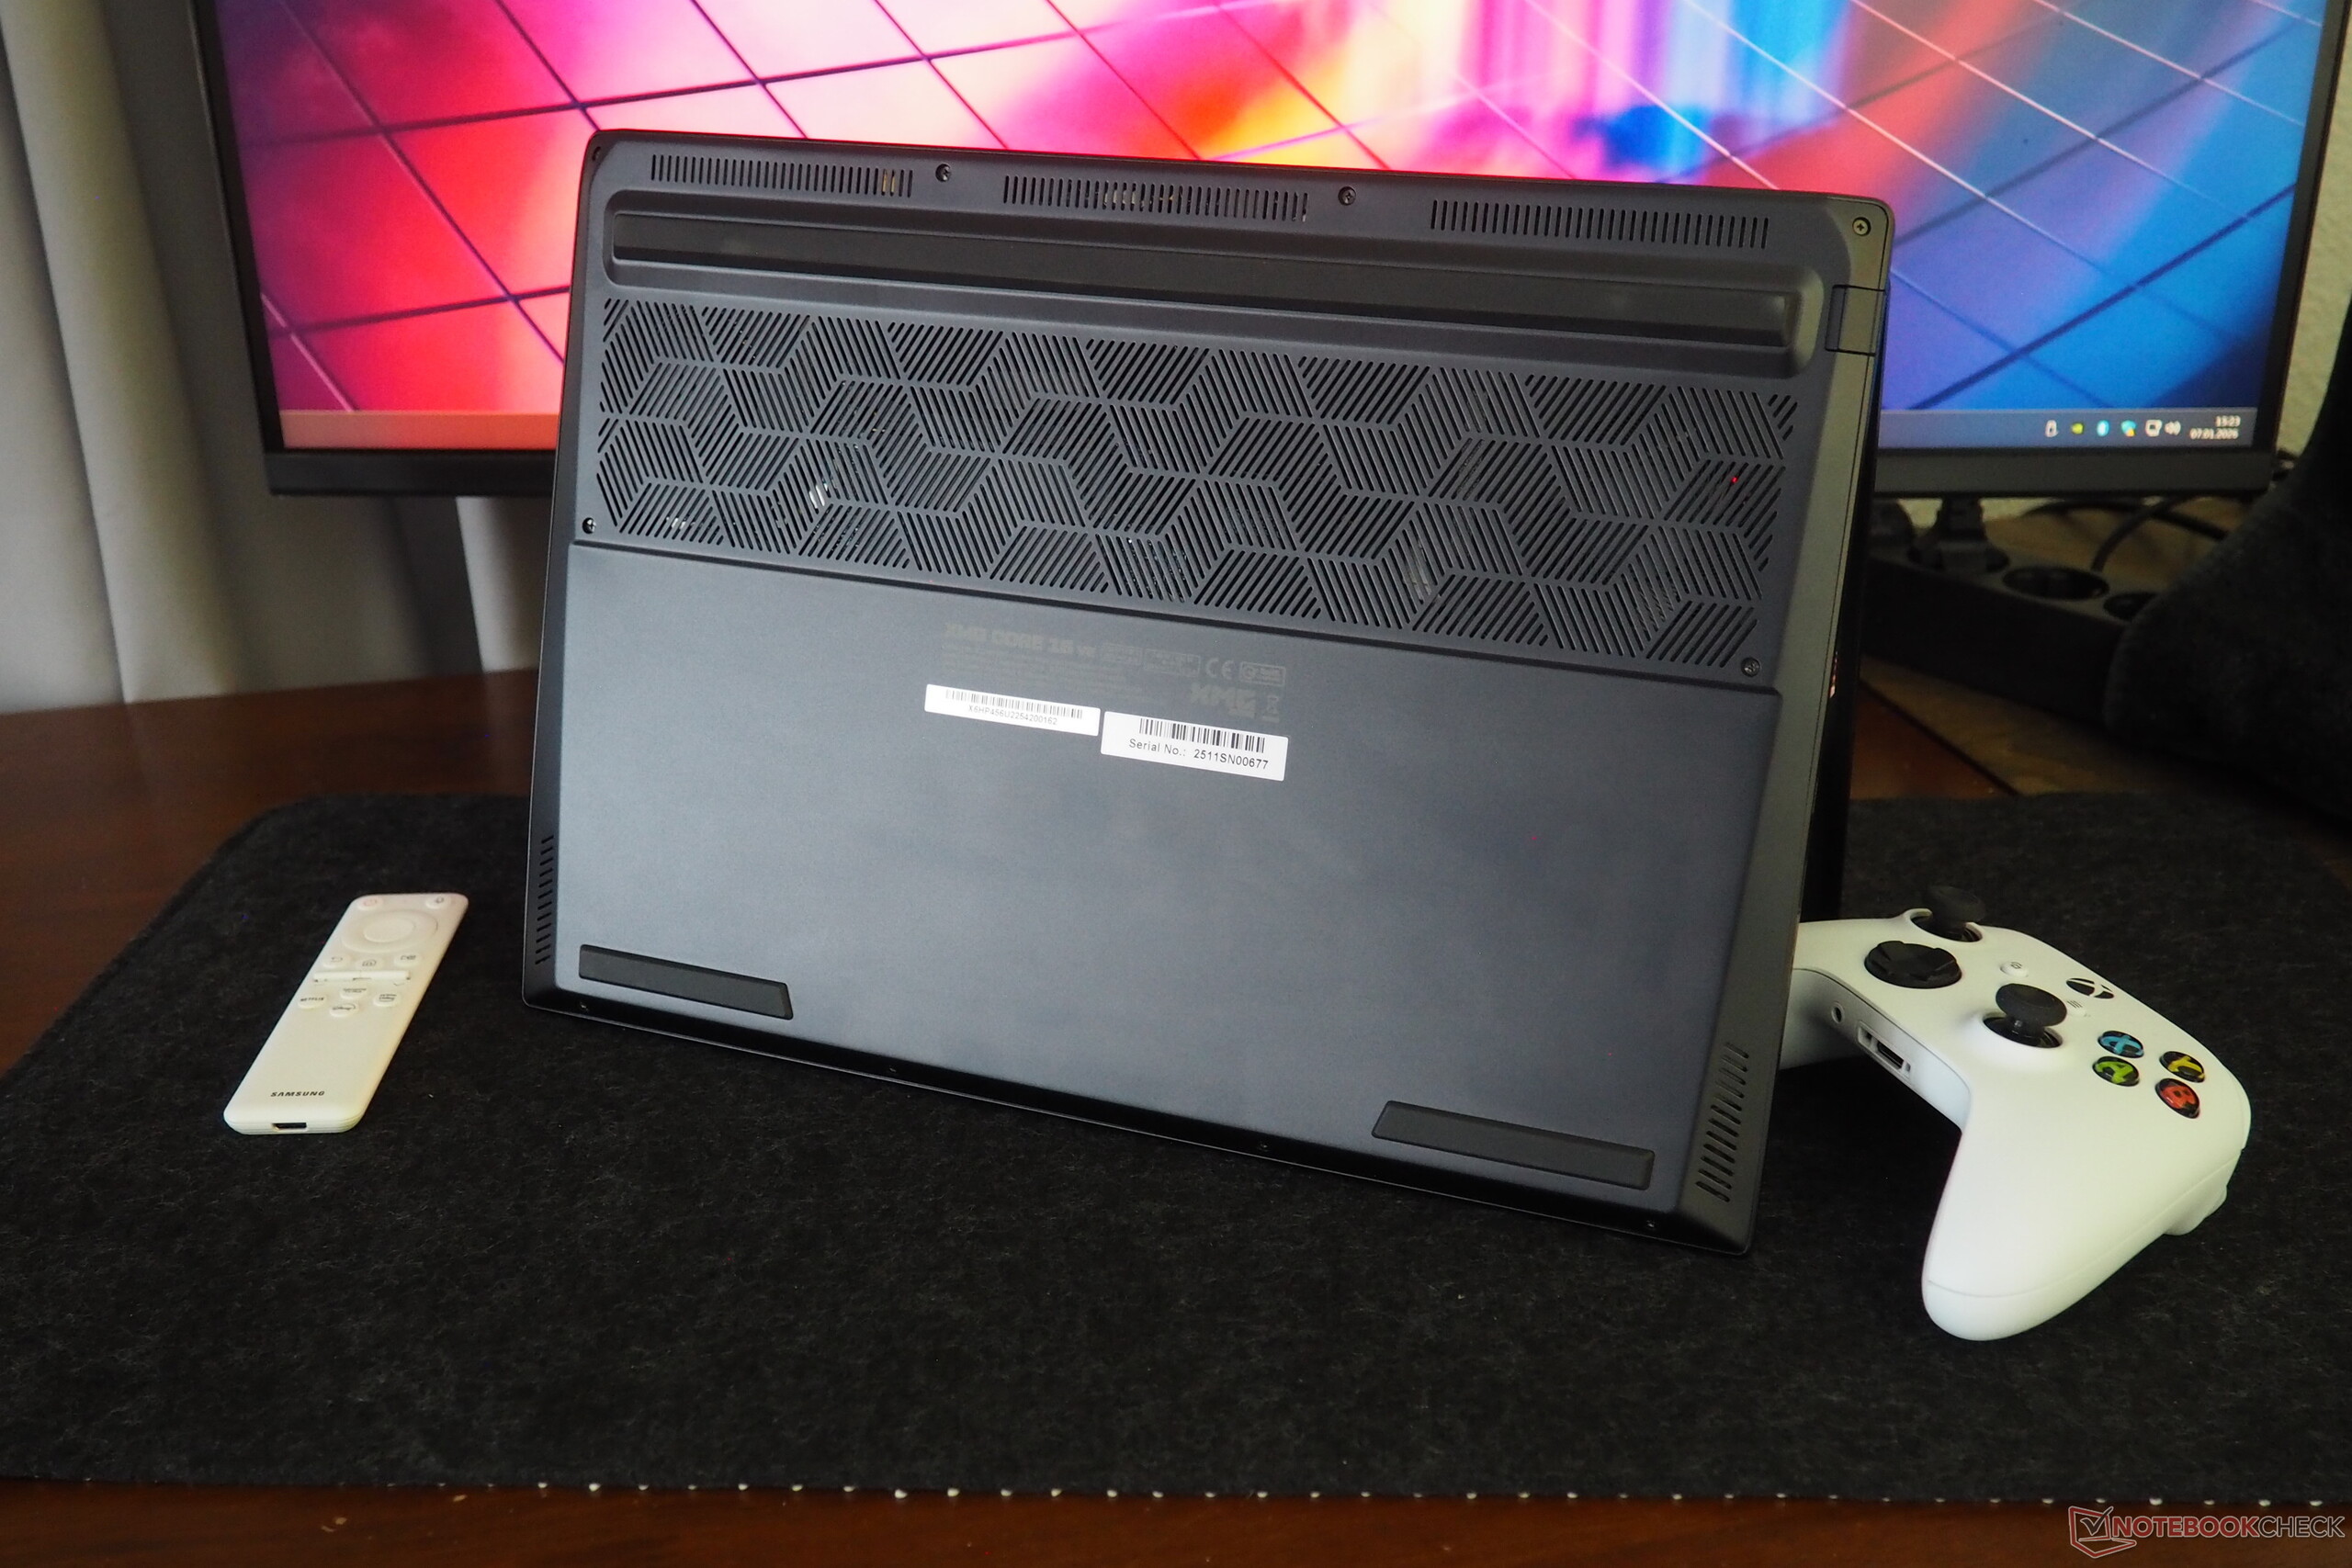
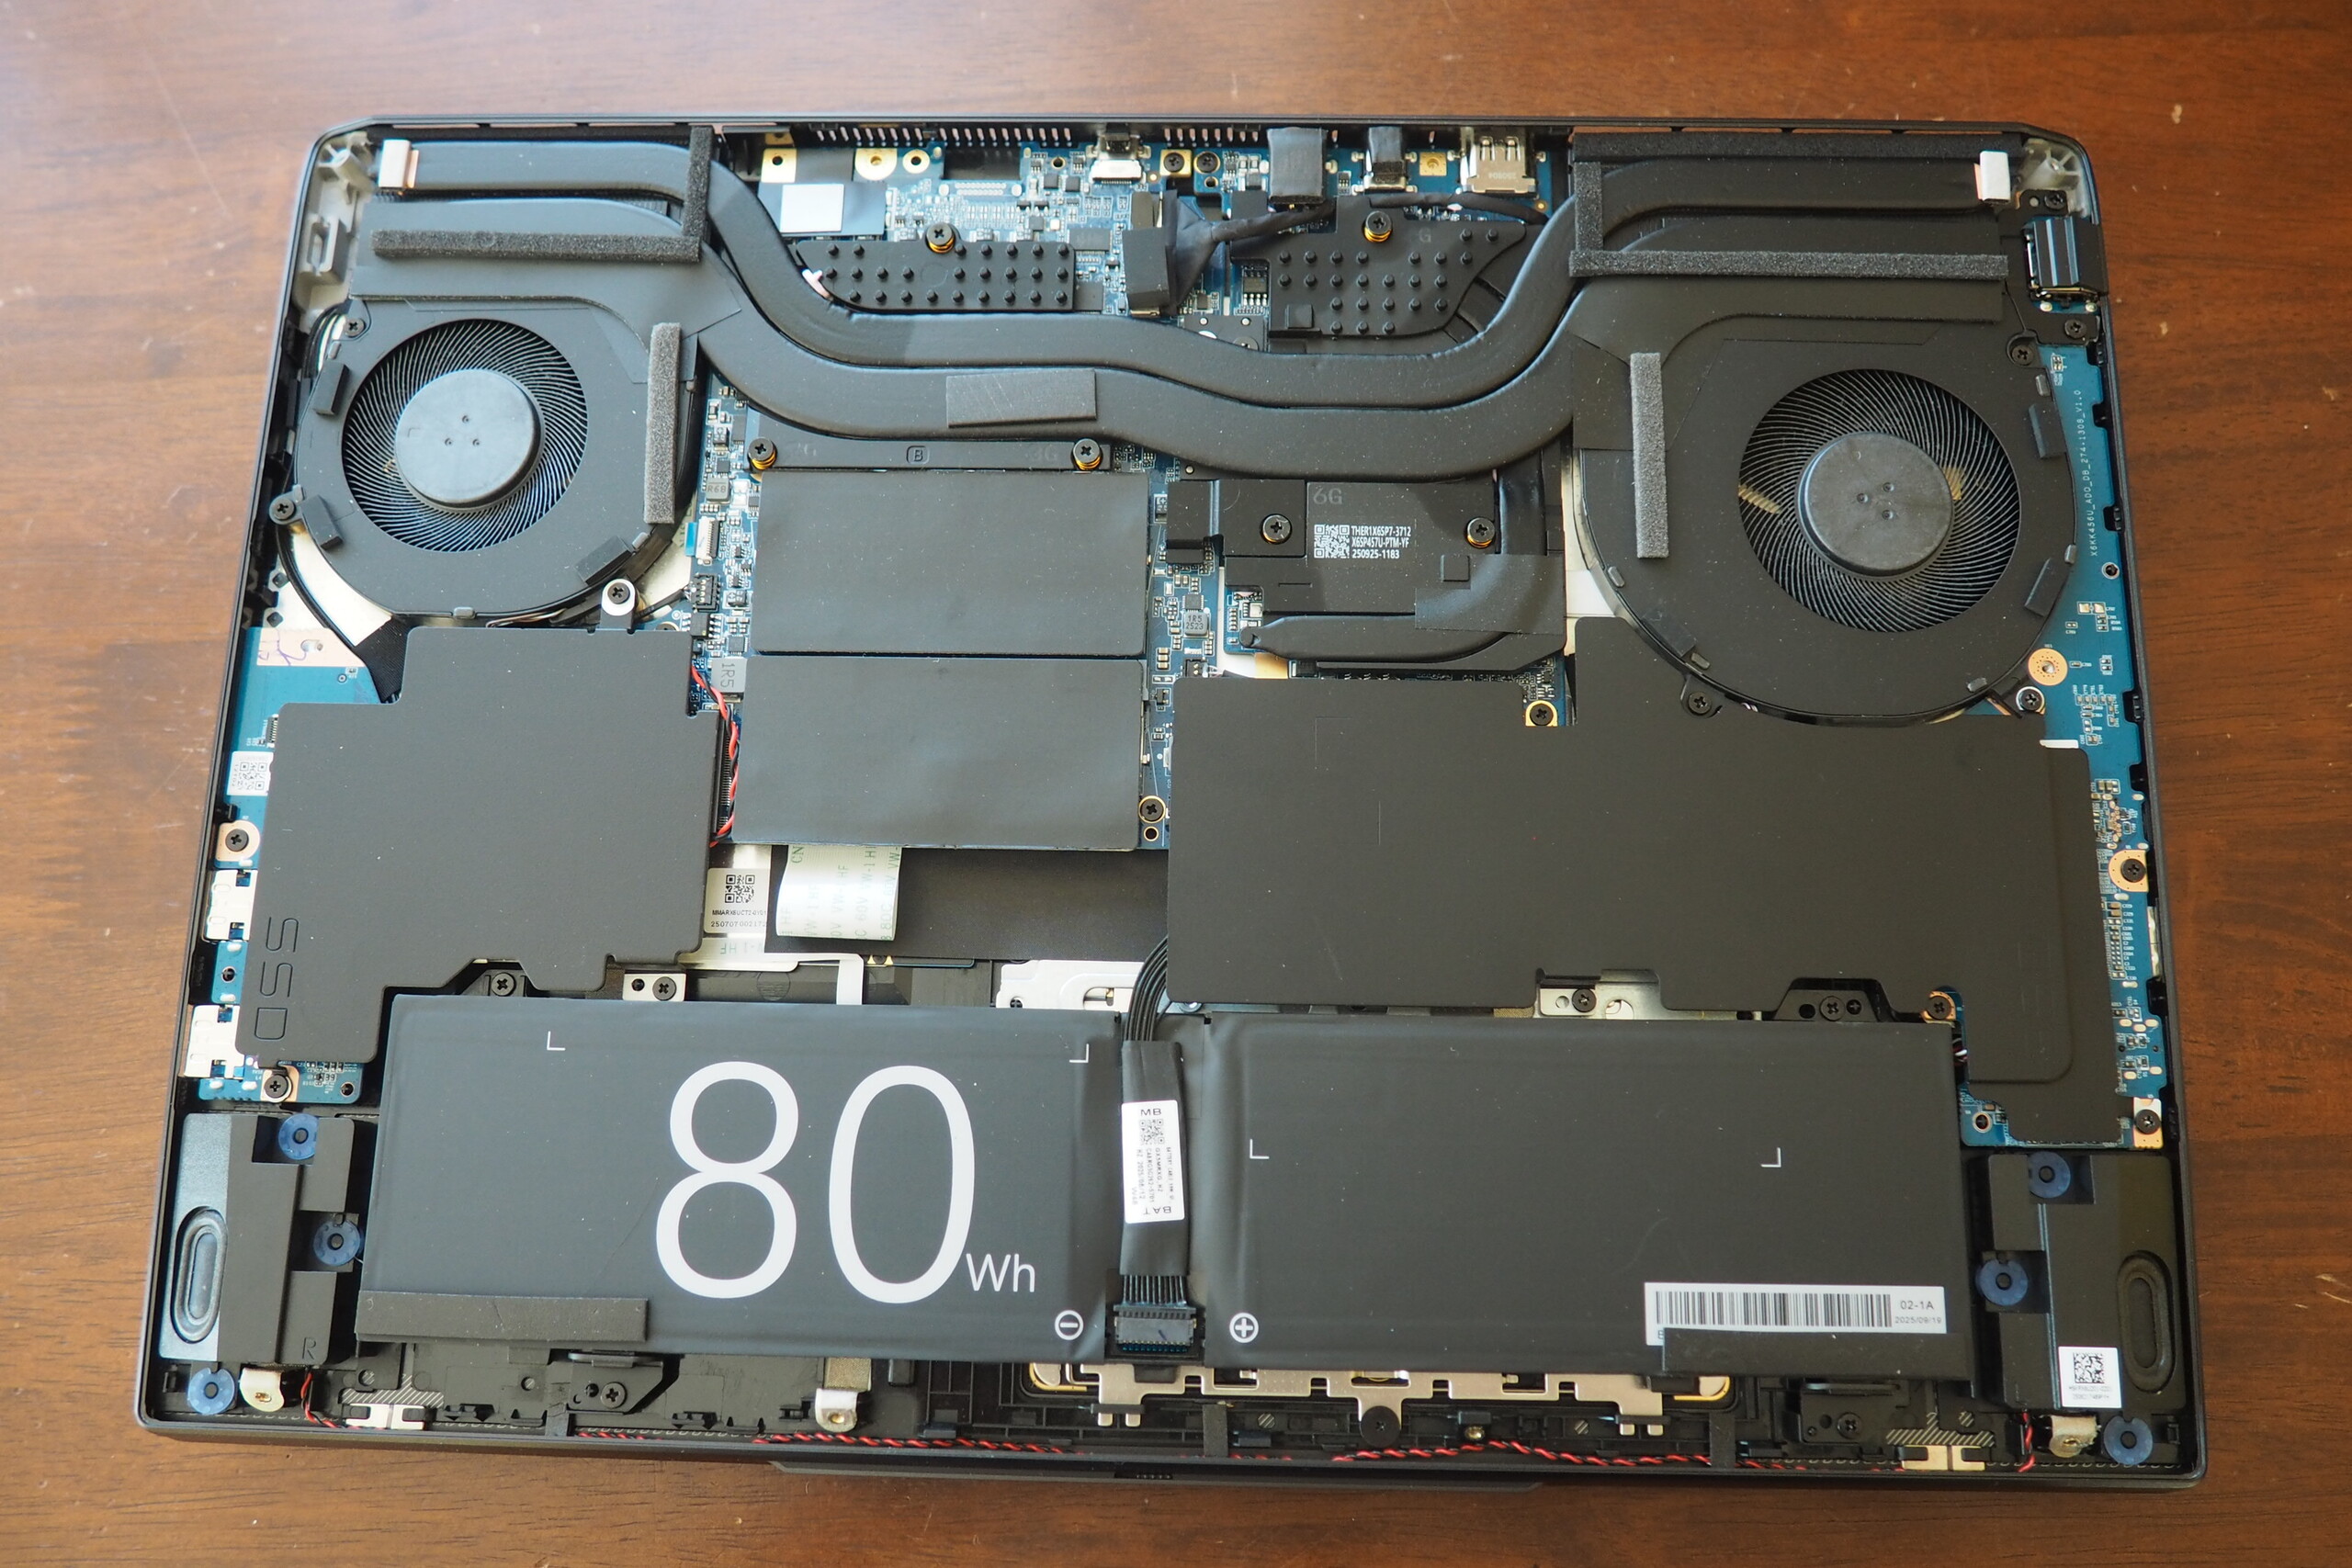
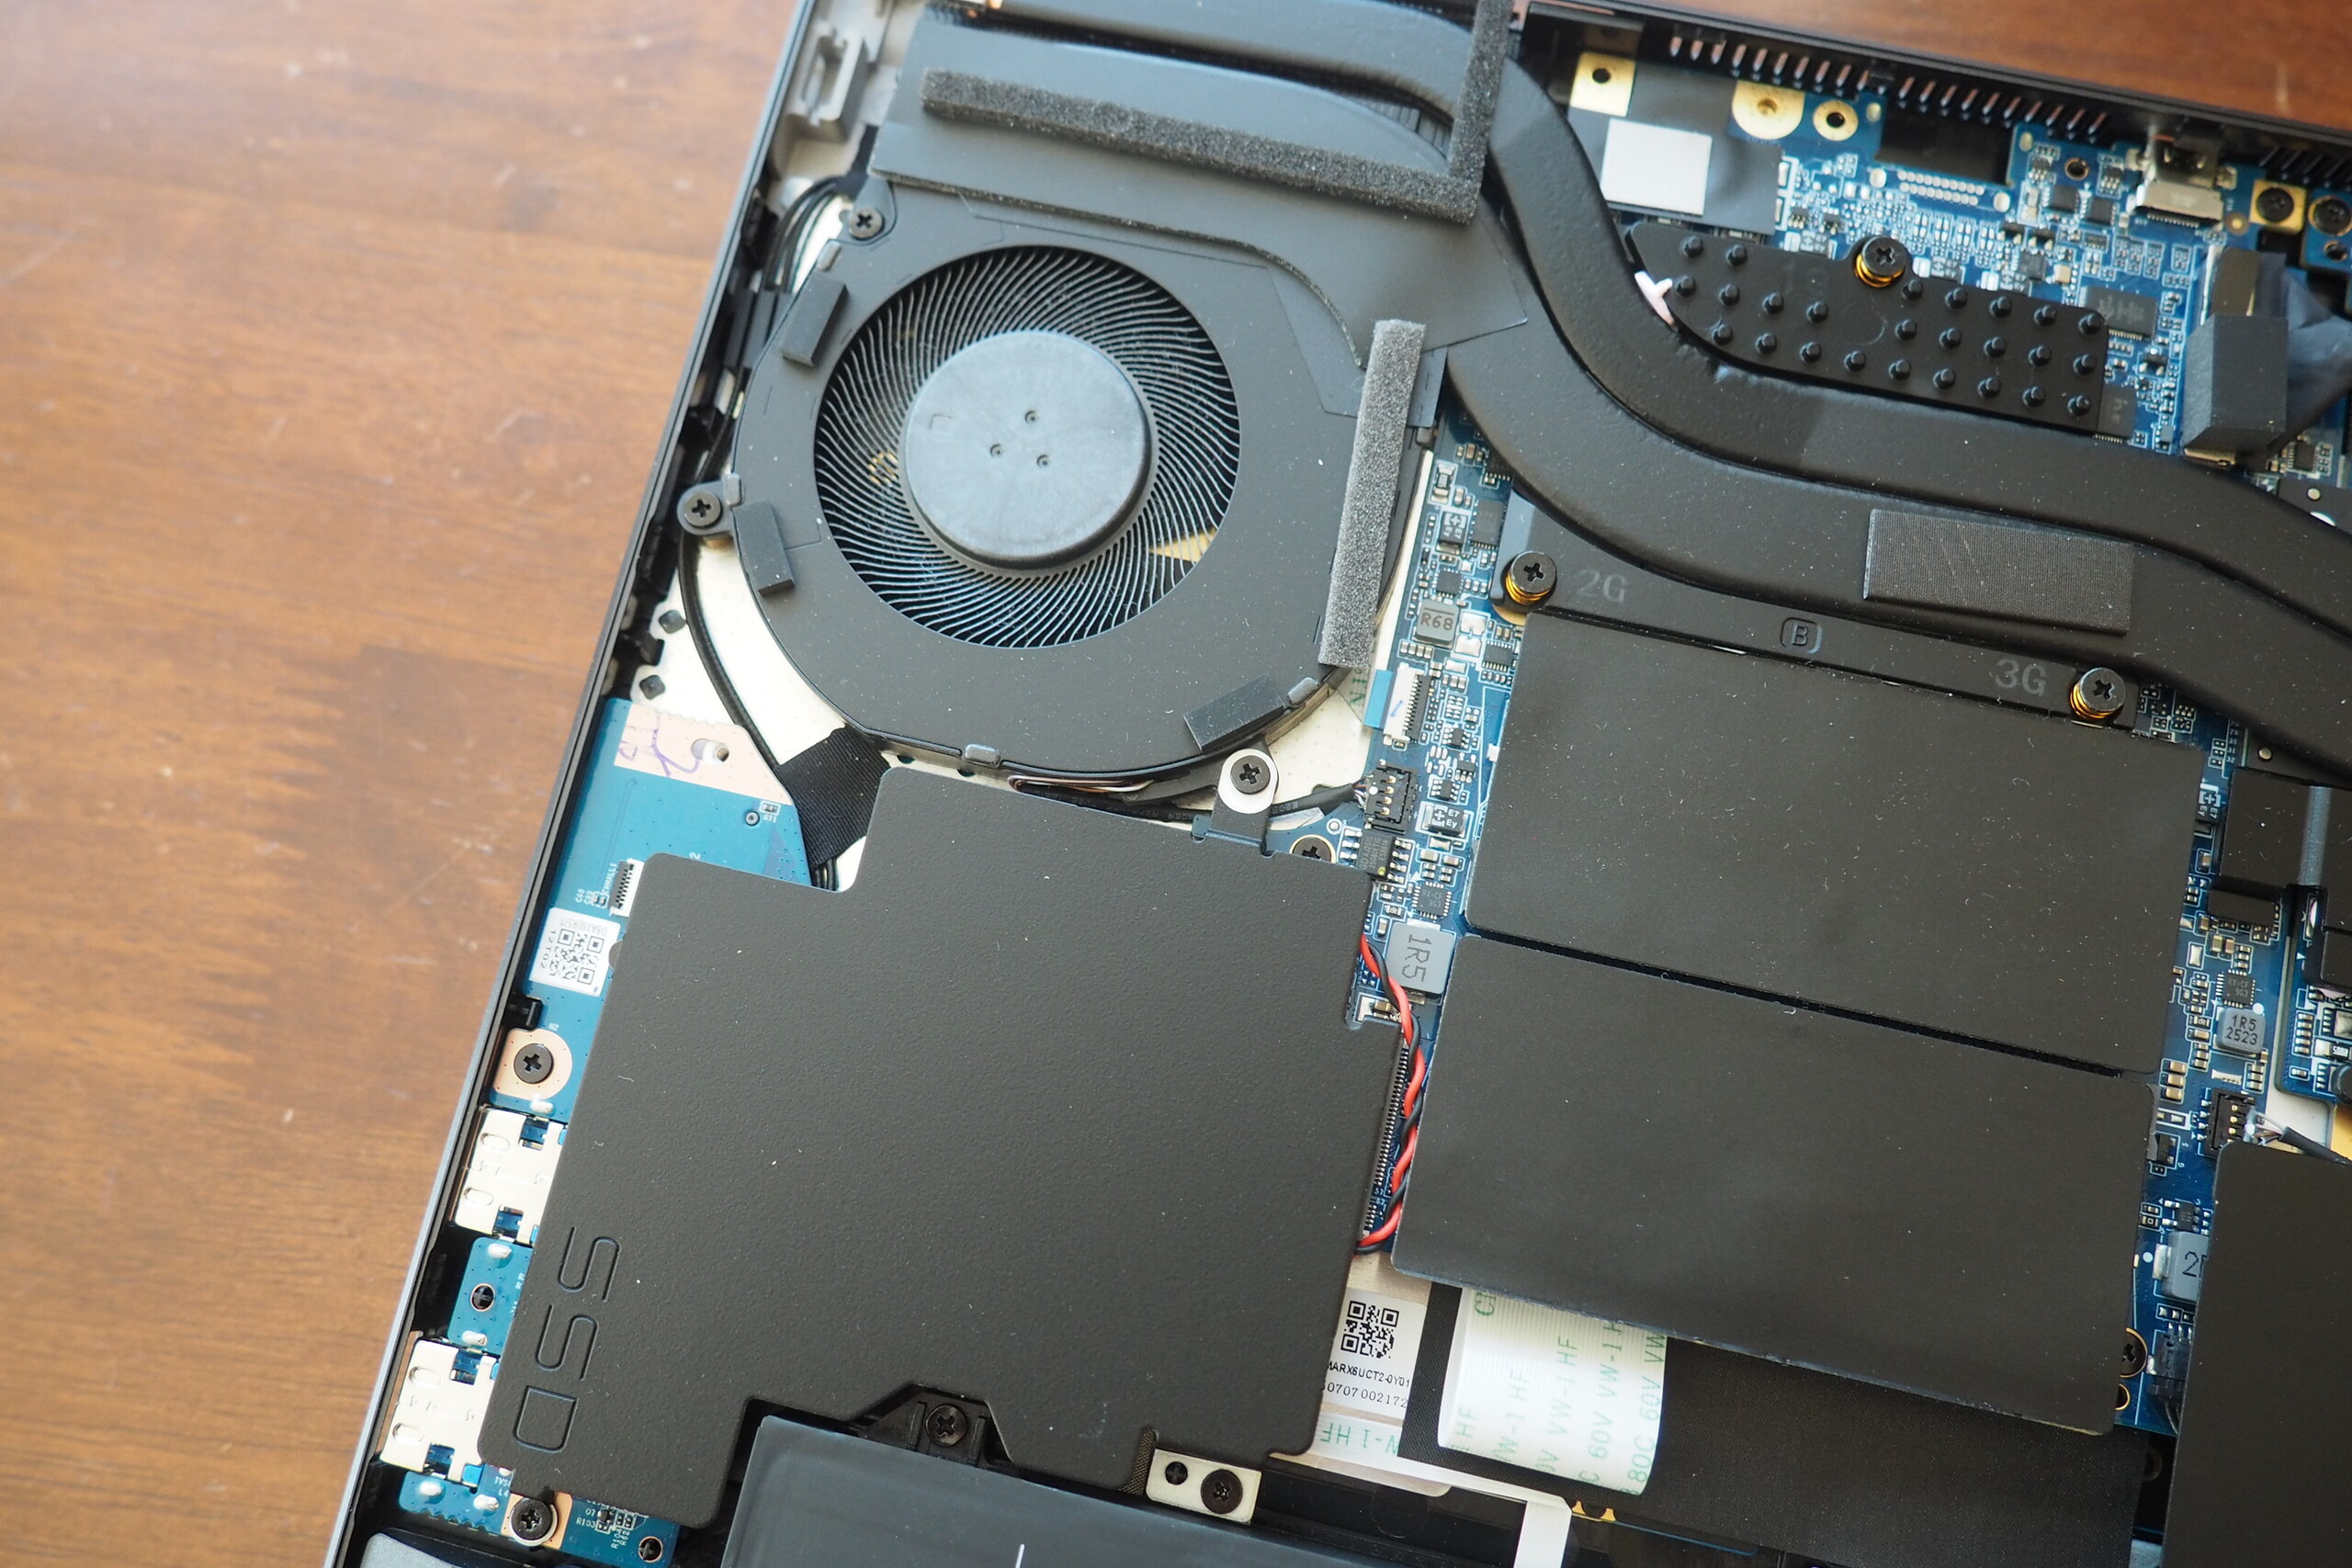
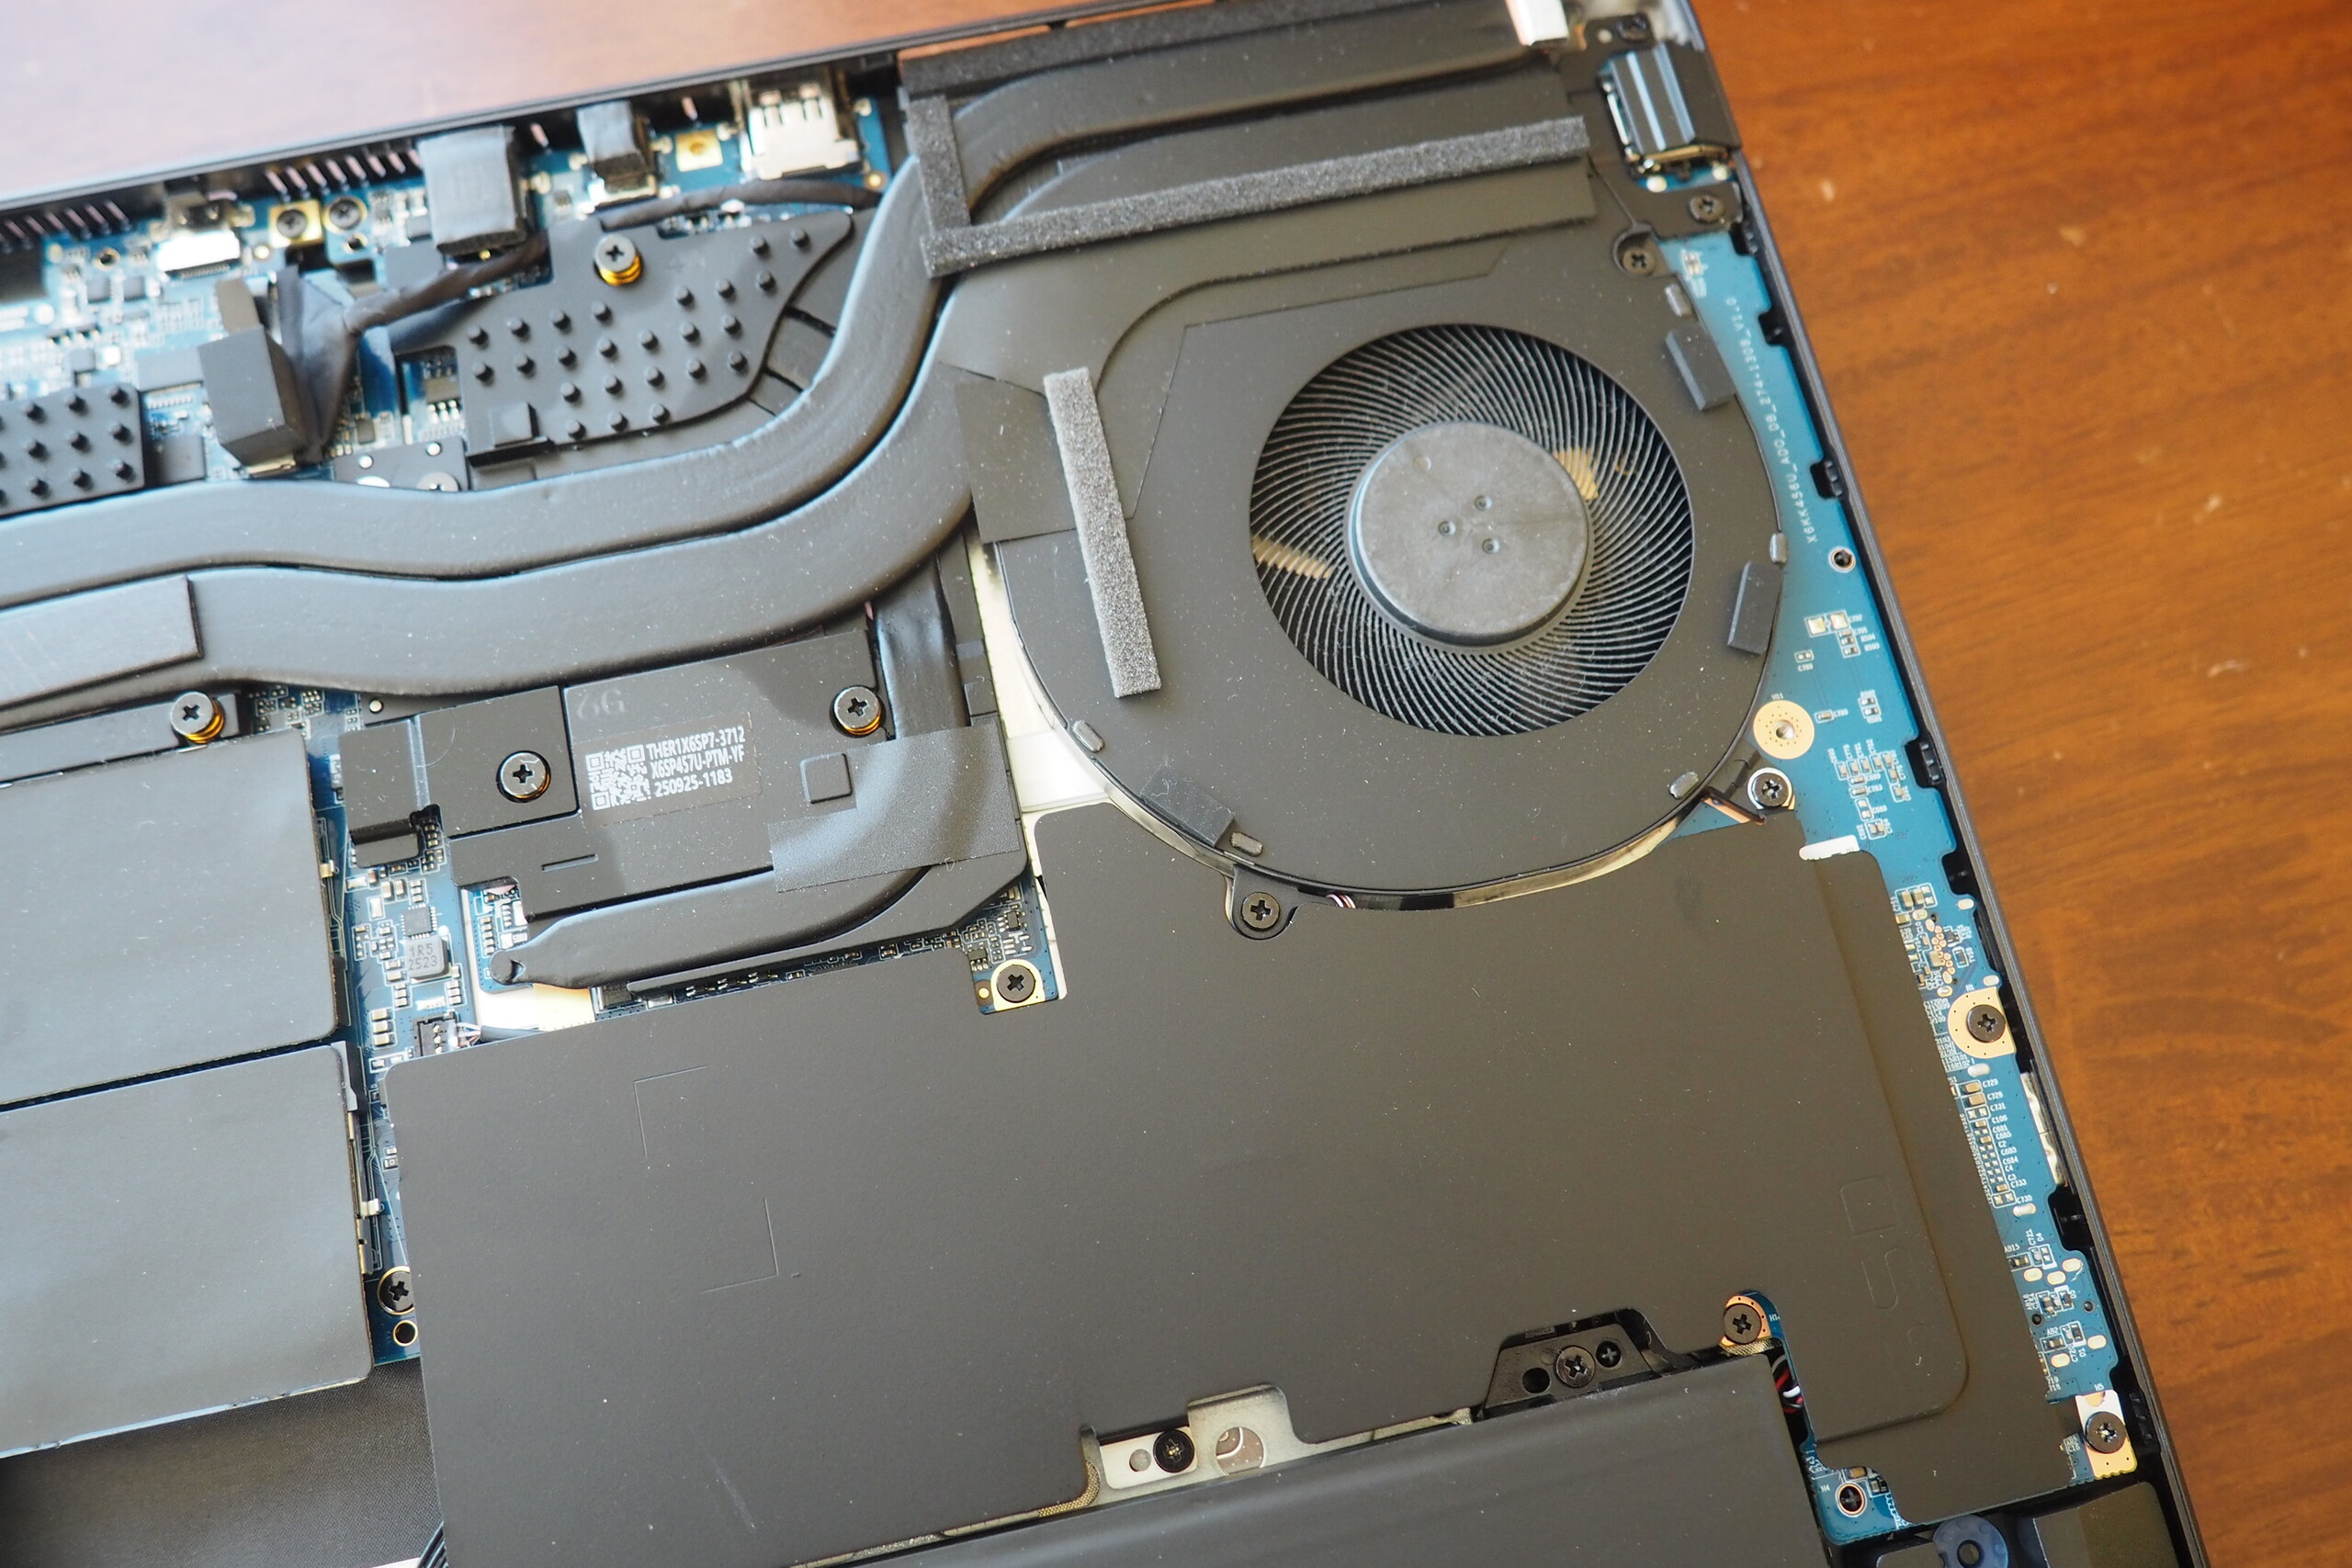
Il modulo Wi-Fi MediaTek offre una discreta velocità di upload e un'ottima velocità di download. Poi c'è la webcam FHD, che offre immagini abbastanza nitide per gli standard dei laptop e include un otturatore fisico per la privacy. L'accesso agli interni è facile dopo aver rimosso 10 viti con testa a croce; le foto degli interni si trovano qui sotto.


Lettore di schede SD
| SD Card Reader - average JPG Copy Test (av. of 3 runs) | |
| Schenker XMG Core 16 VE M25 (AV PRO microSD 128 GB V60) | |
| Schenker XMG Core 16 M25 (Angelbird AV Pro V60) | |
| Lenovo Legion 7 16IAX10 (Toshiba Exceria Pro SDXC 64 GB UHS-II) | |
| Media della classe Gaming (20.9 - 210, n=60, ultimi 2 anni) | |
| Acer Predator Helios Neo 16S AI PHN16S-71-94L9 (AV PRO microSD 128 GB V60) | |
Comunicazione
Webcam


Manutenzione
Dispositivi di ingresso
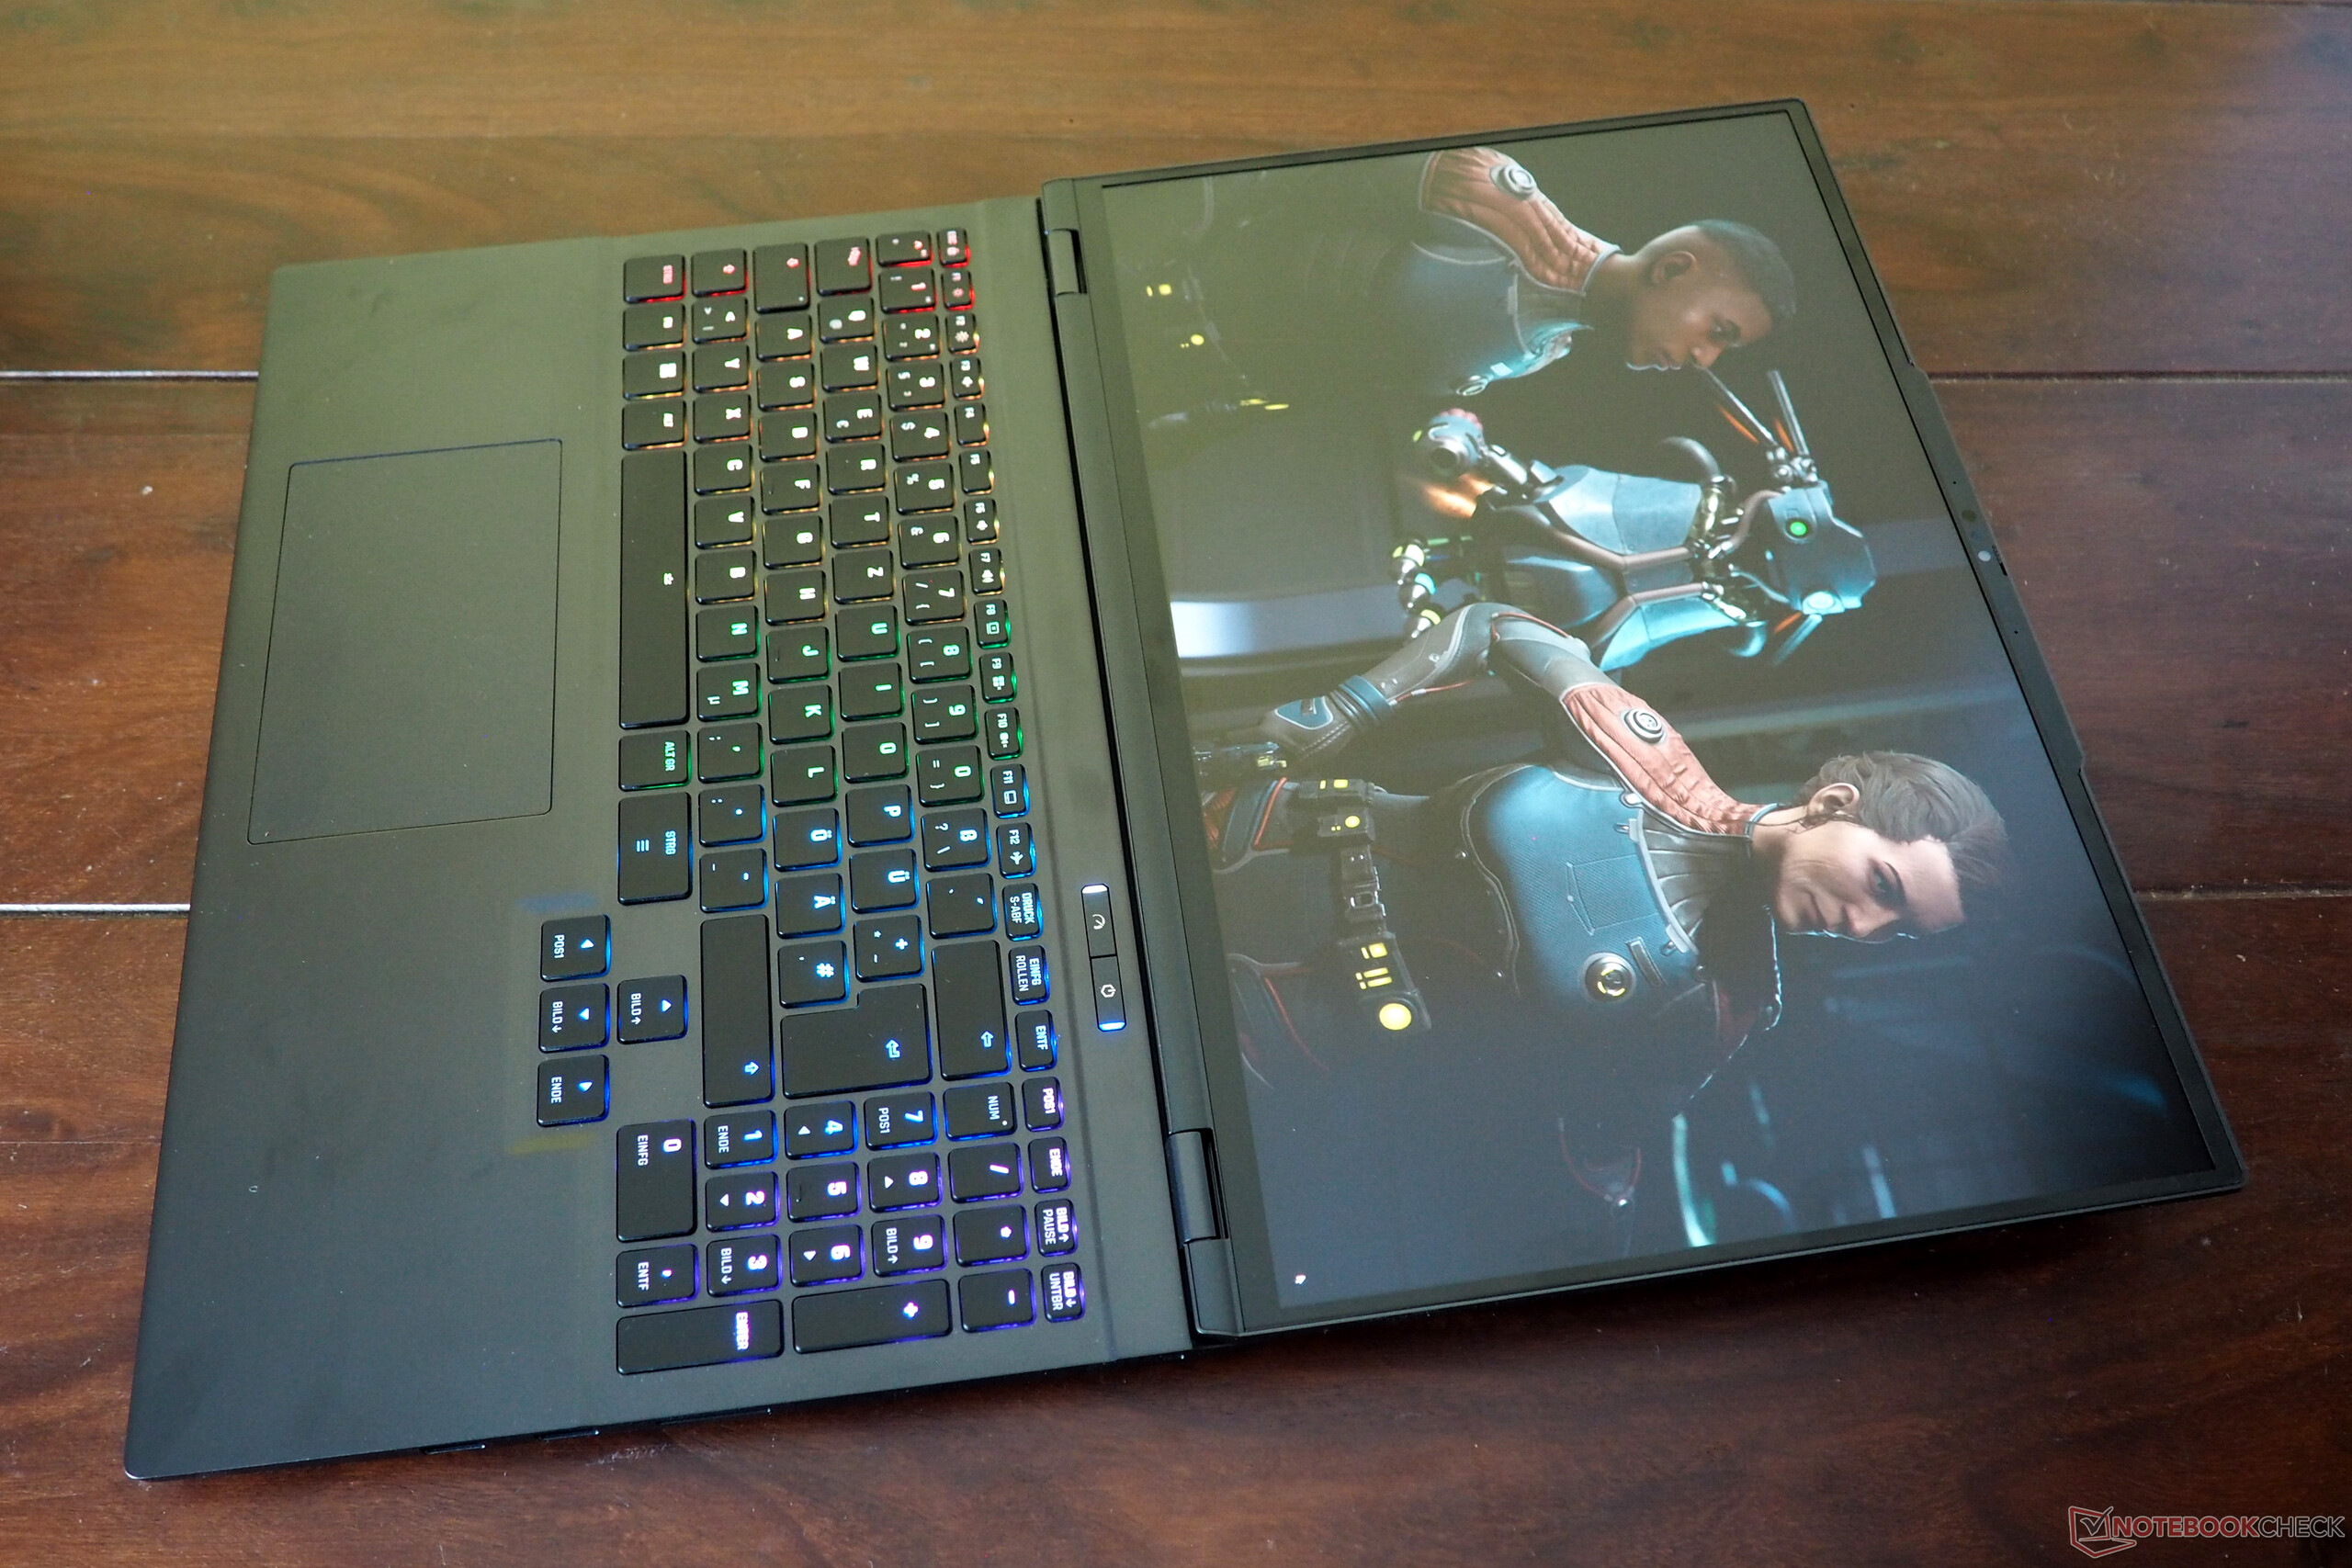
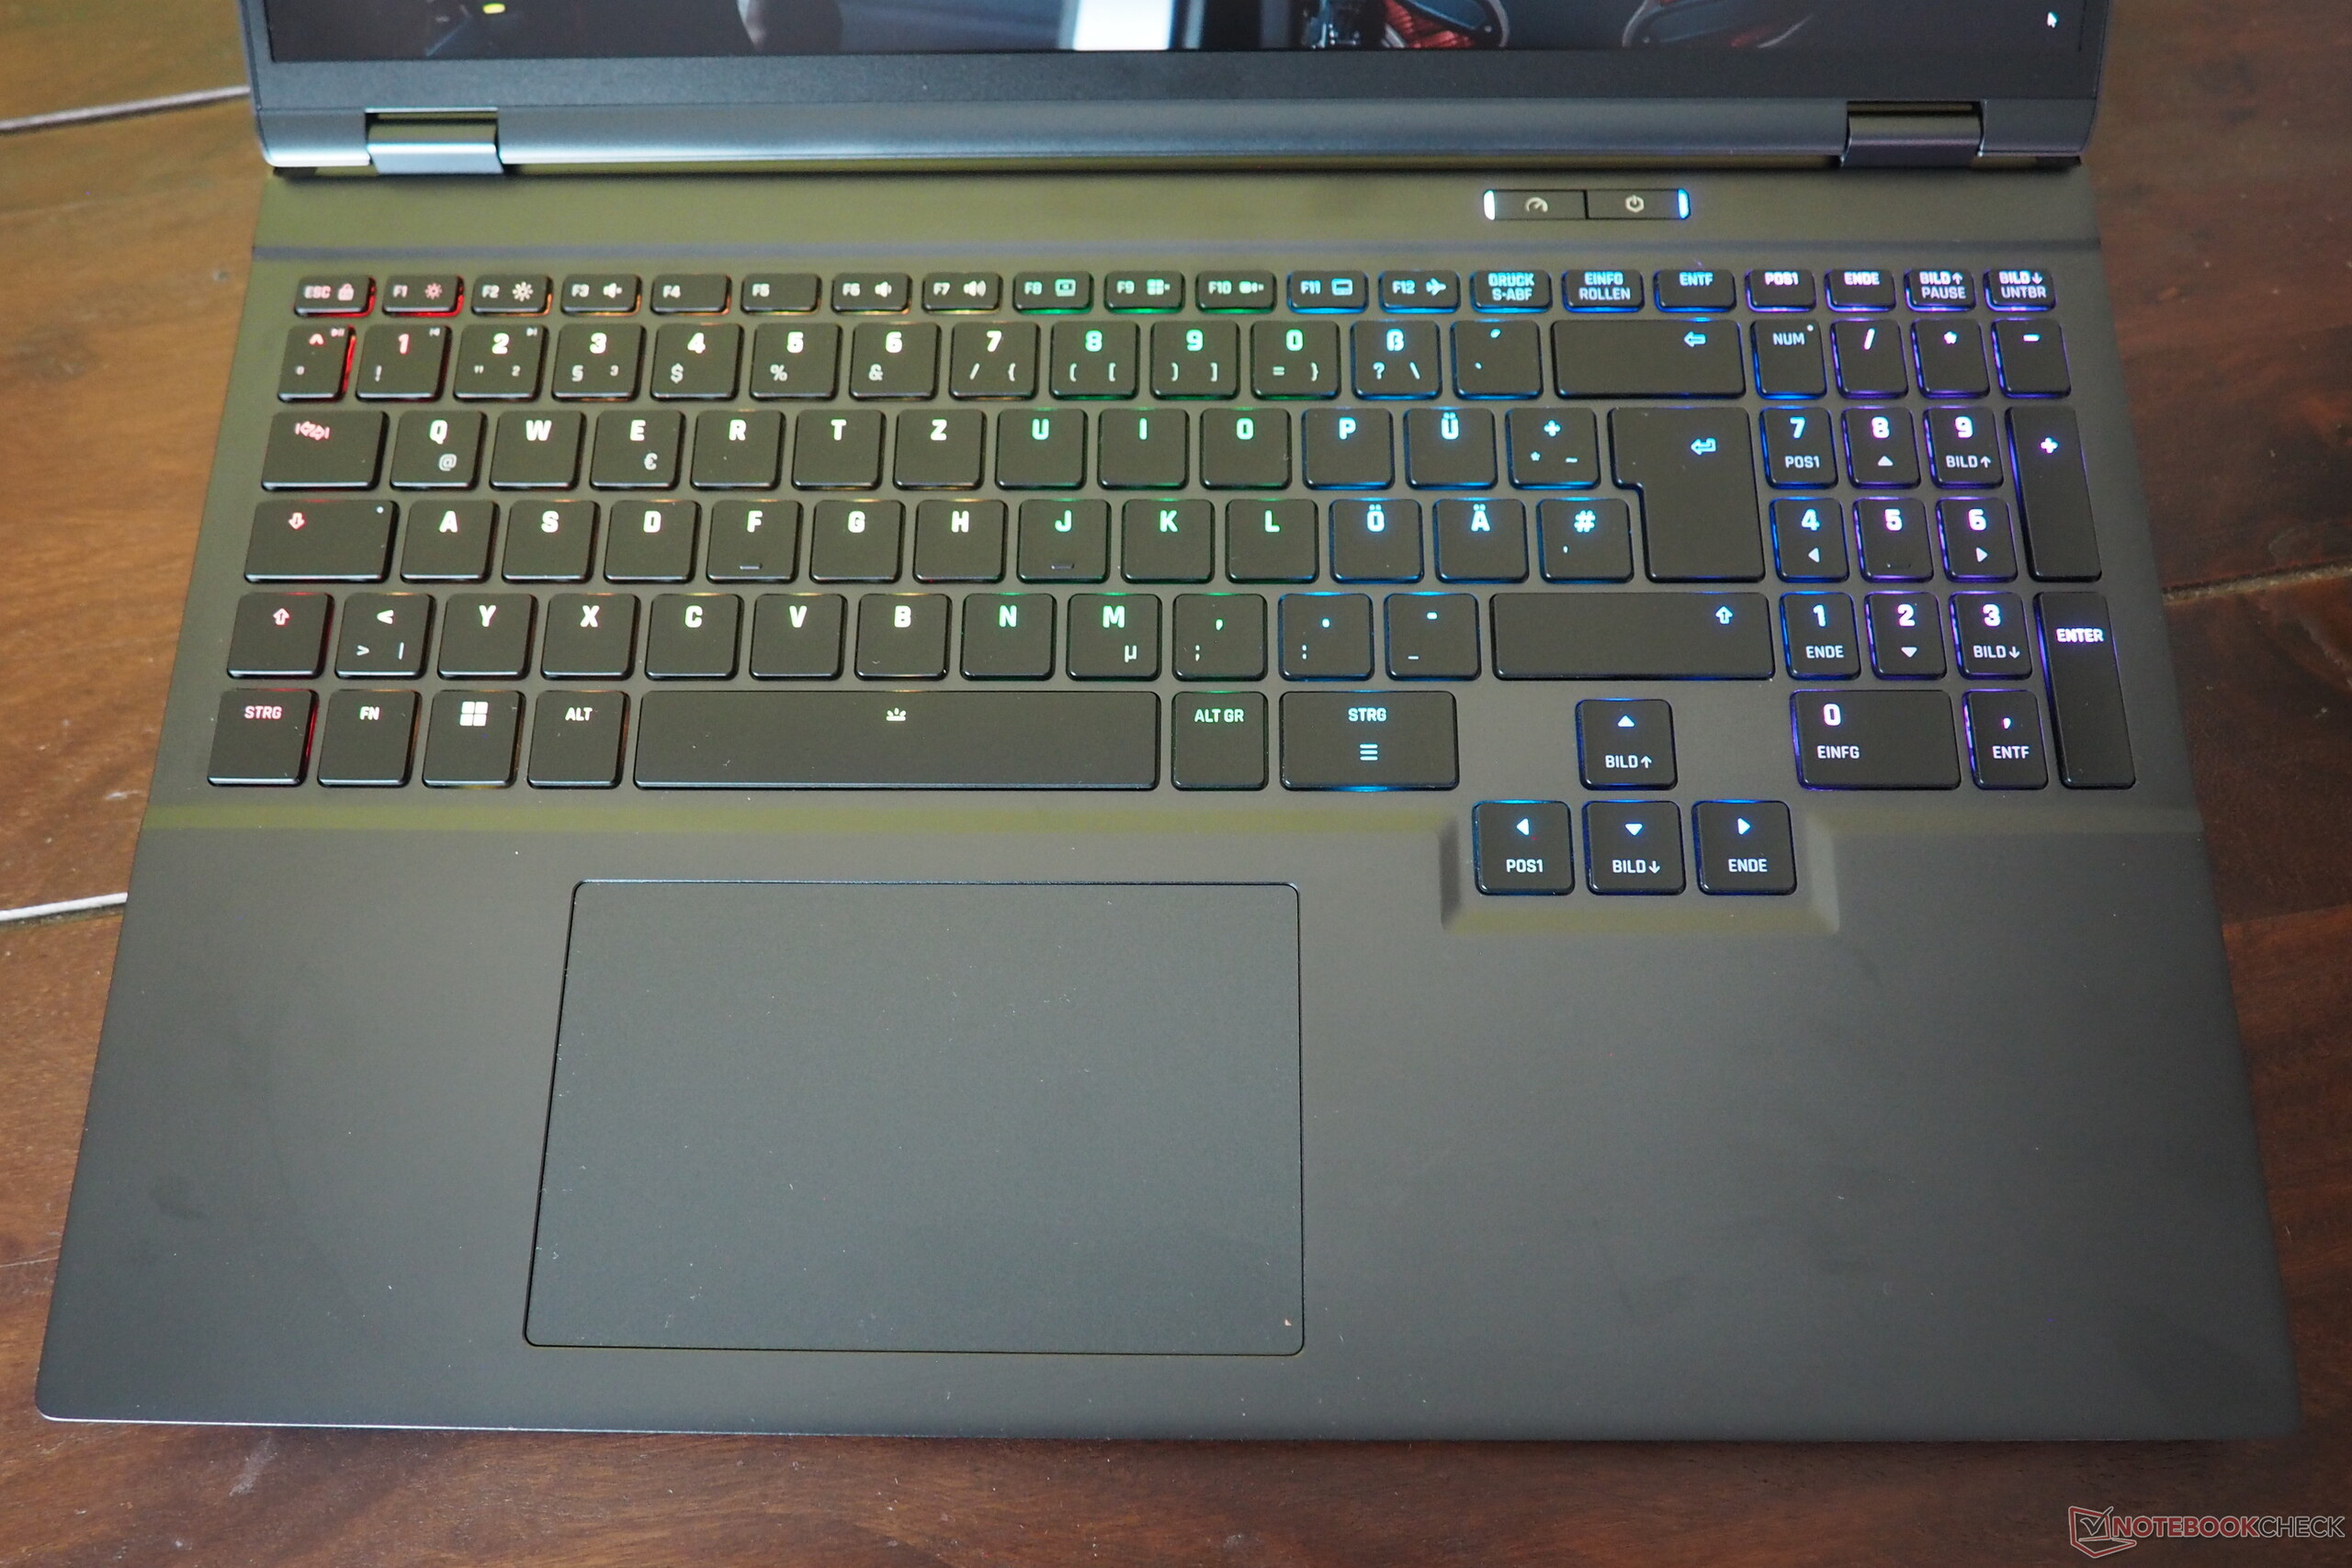
Per una tastiera con cupola in gomma, la sensazione di digitazione è relativamente buona. Siamo rimasti particolarmente colpiti dal layout, che presenta tasti freccia a grandezza naturale e una disposizione dei tasti ben eseguita che segue in gran parte le convenzioni standard. Naturalmente, è inclusa anche la retroilluminazione RGB.
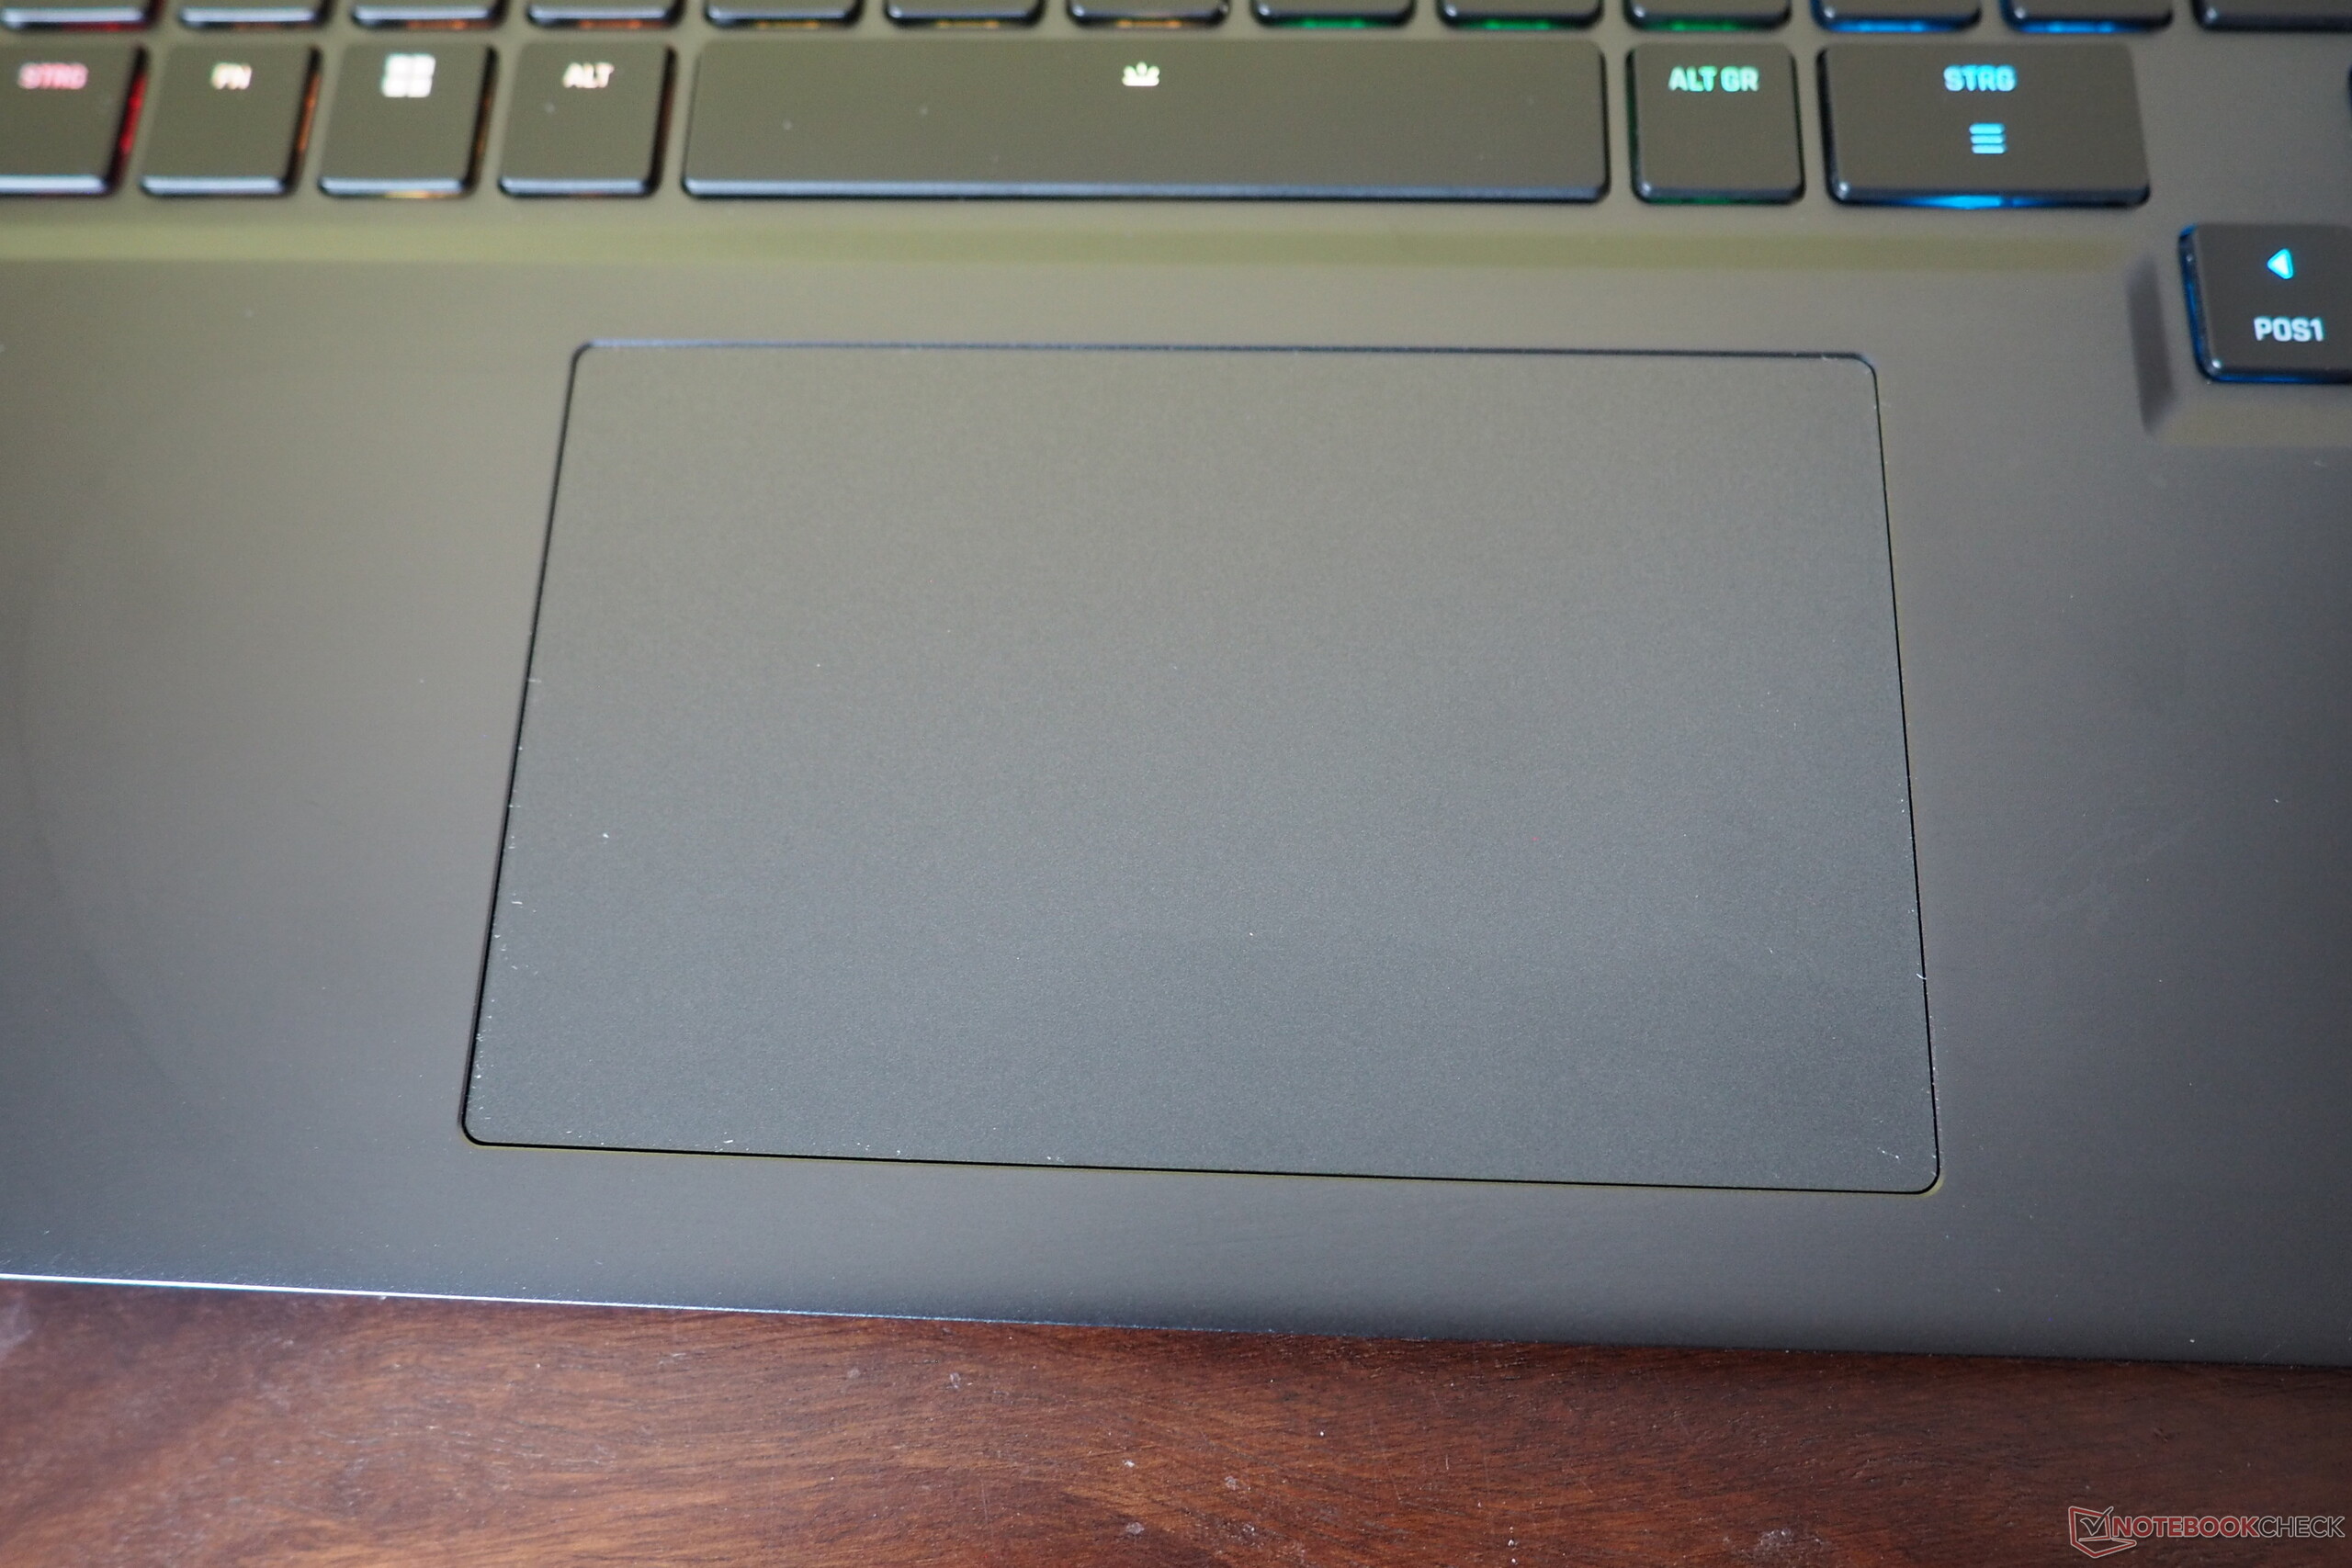
Il touchpad misura circa 12,3 × 7,6 cm, il che è appropriato per un portatile di queste dimensioni. Un piccolo inconveniente: le zone di clic sono piuttosto rumorose e si sentono un po' stridenti.

Display
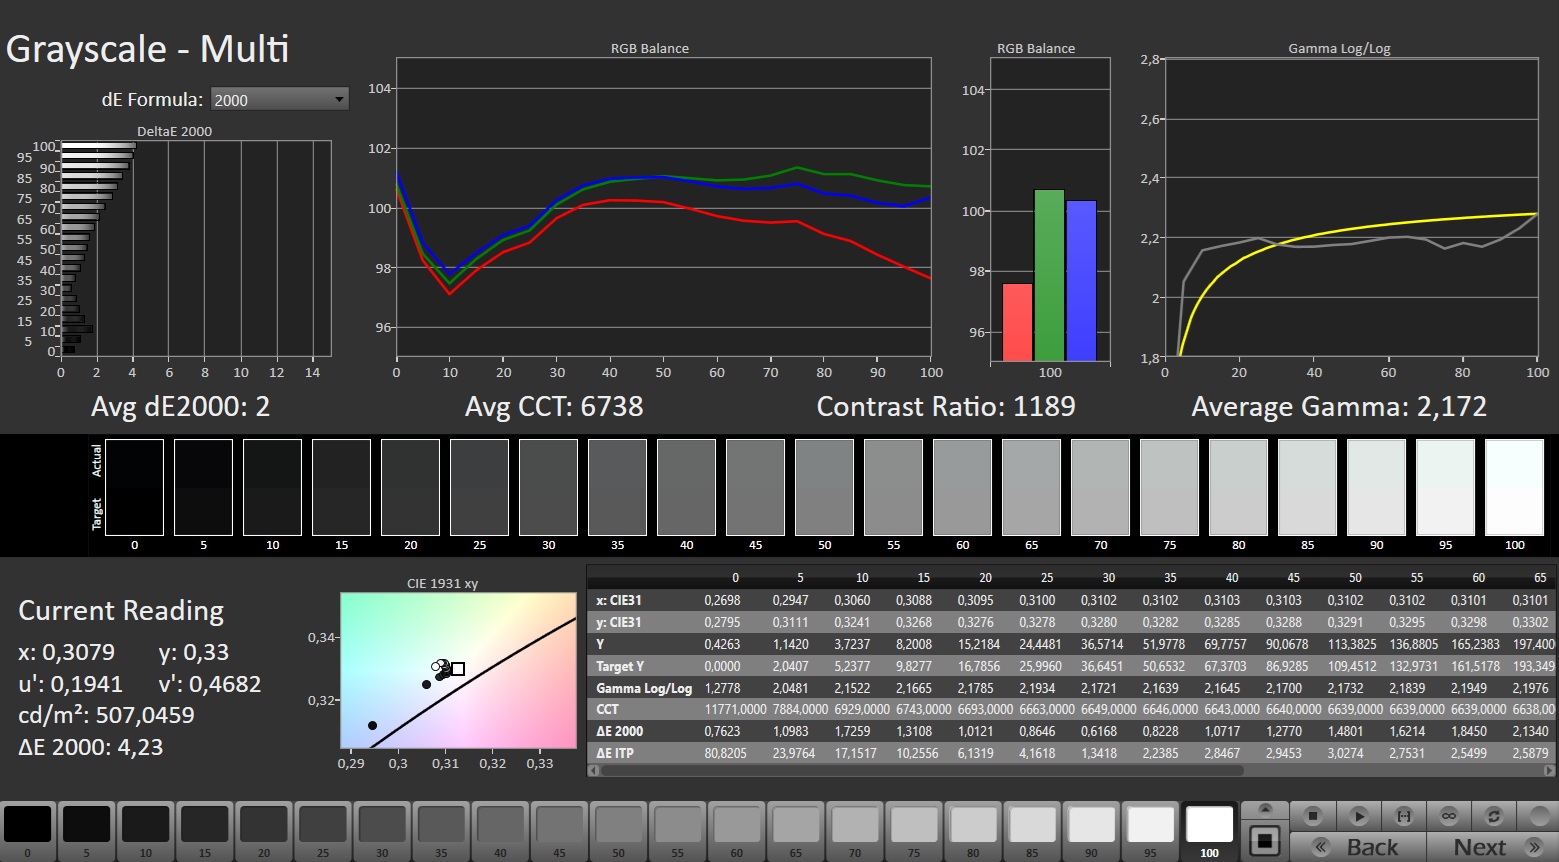
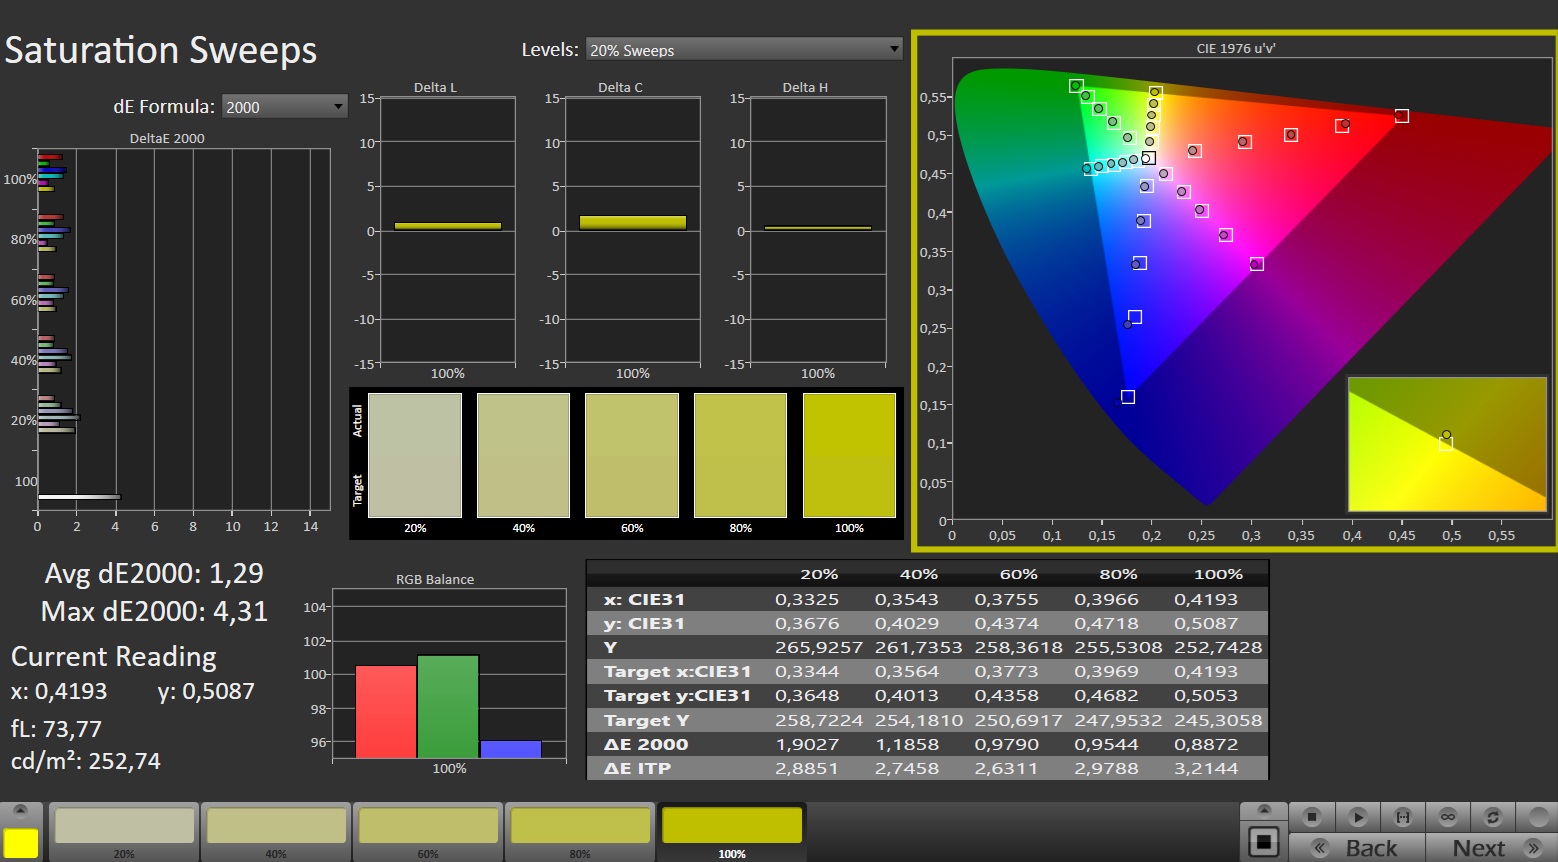
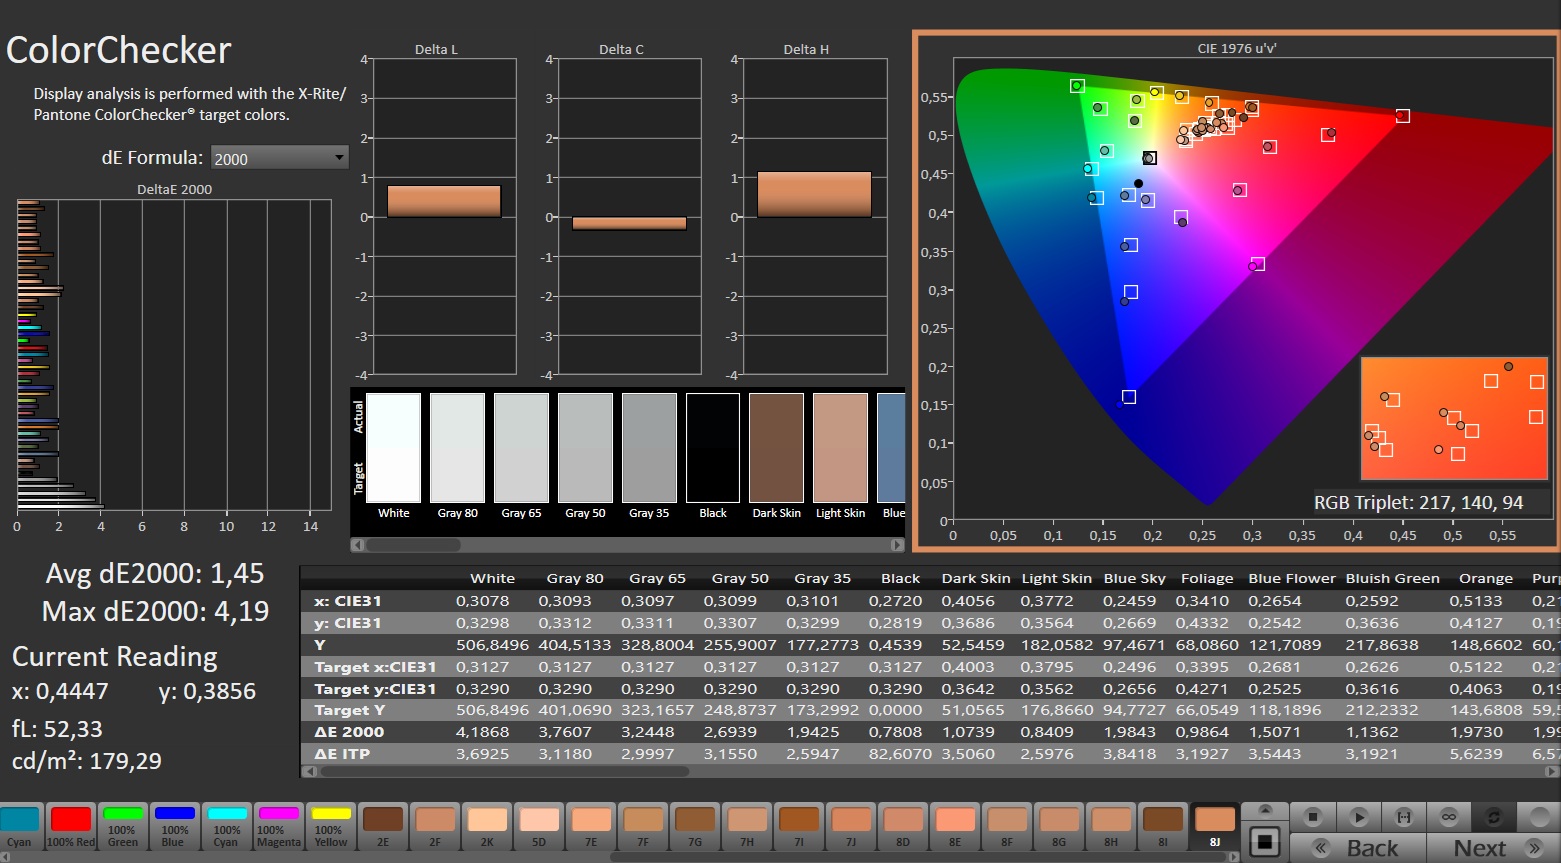
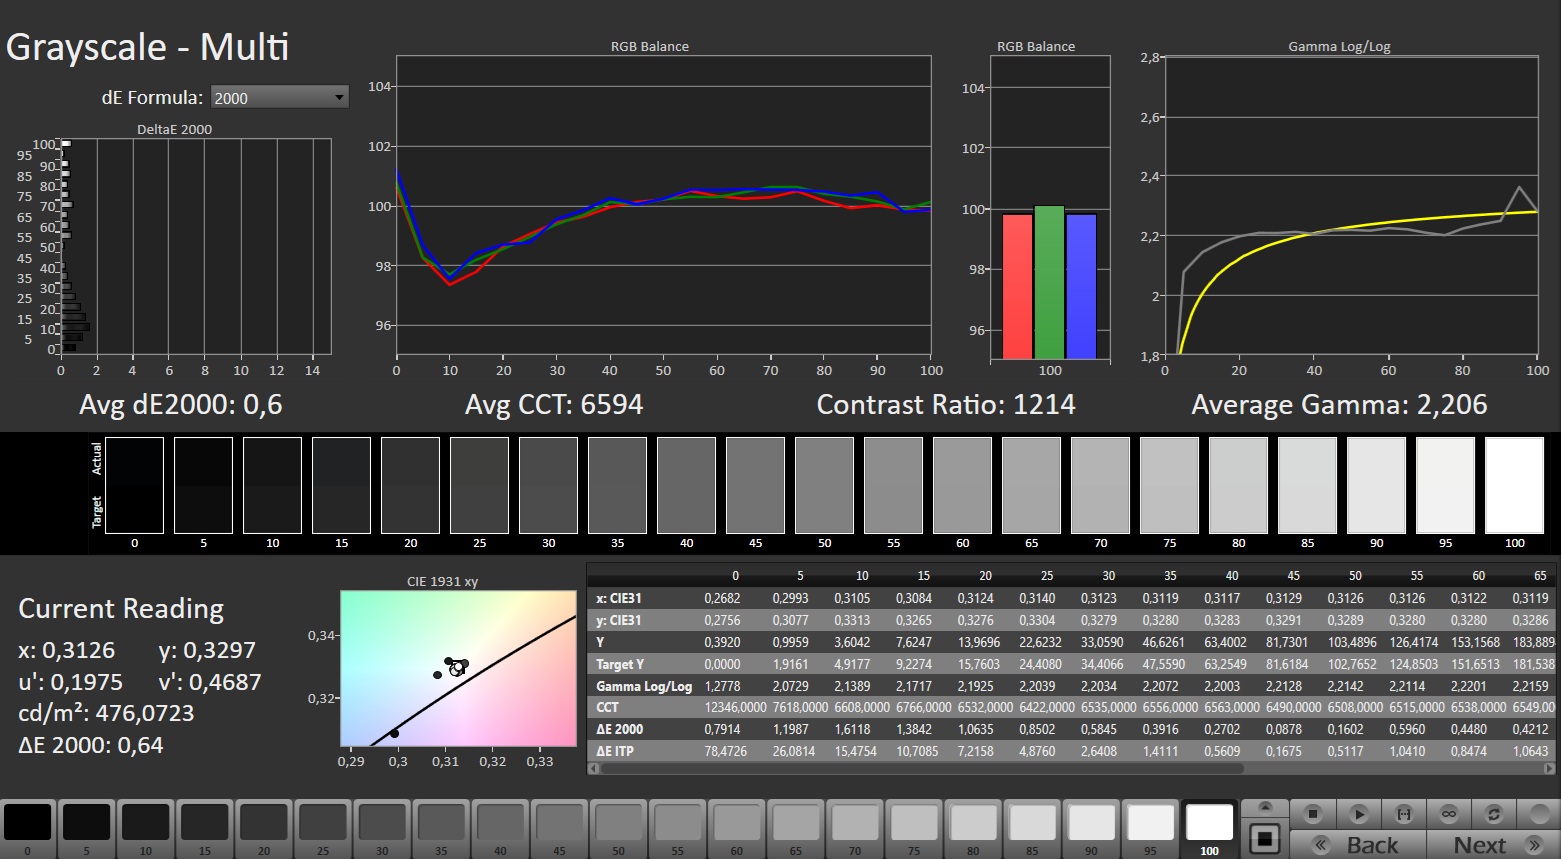
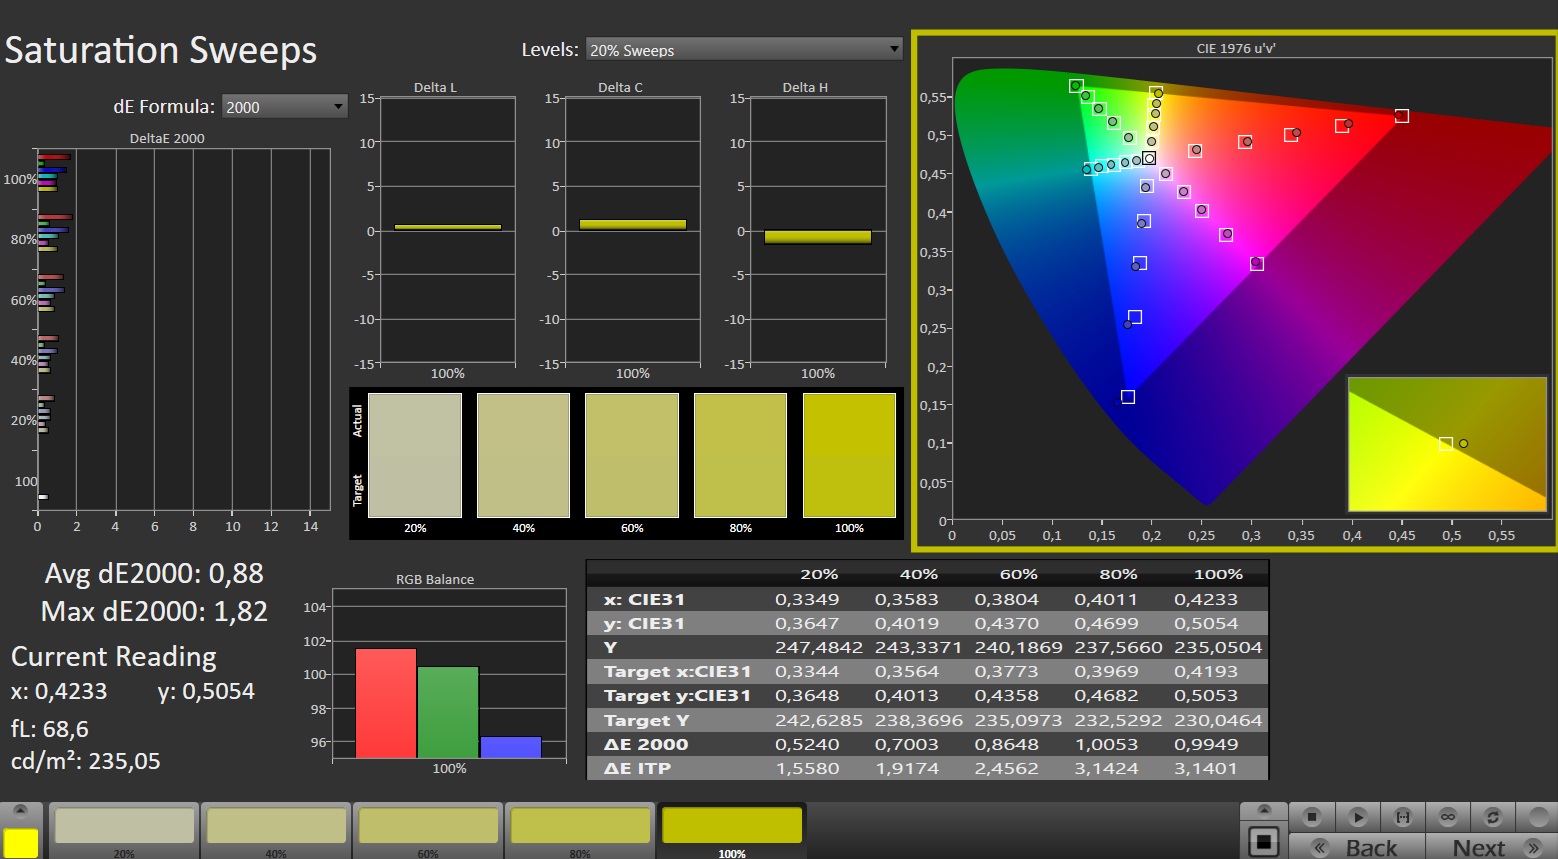
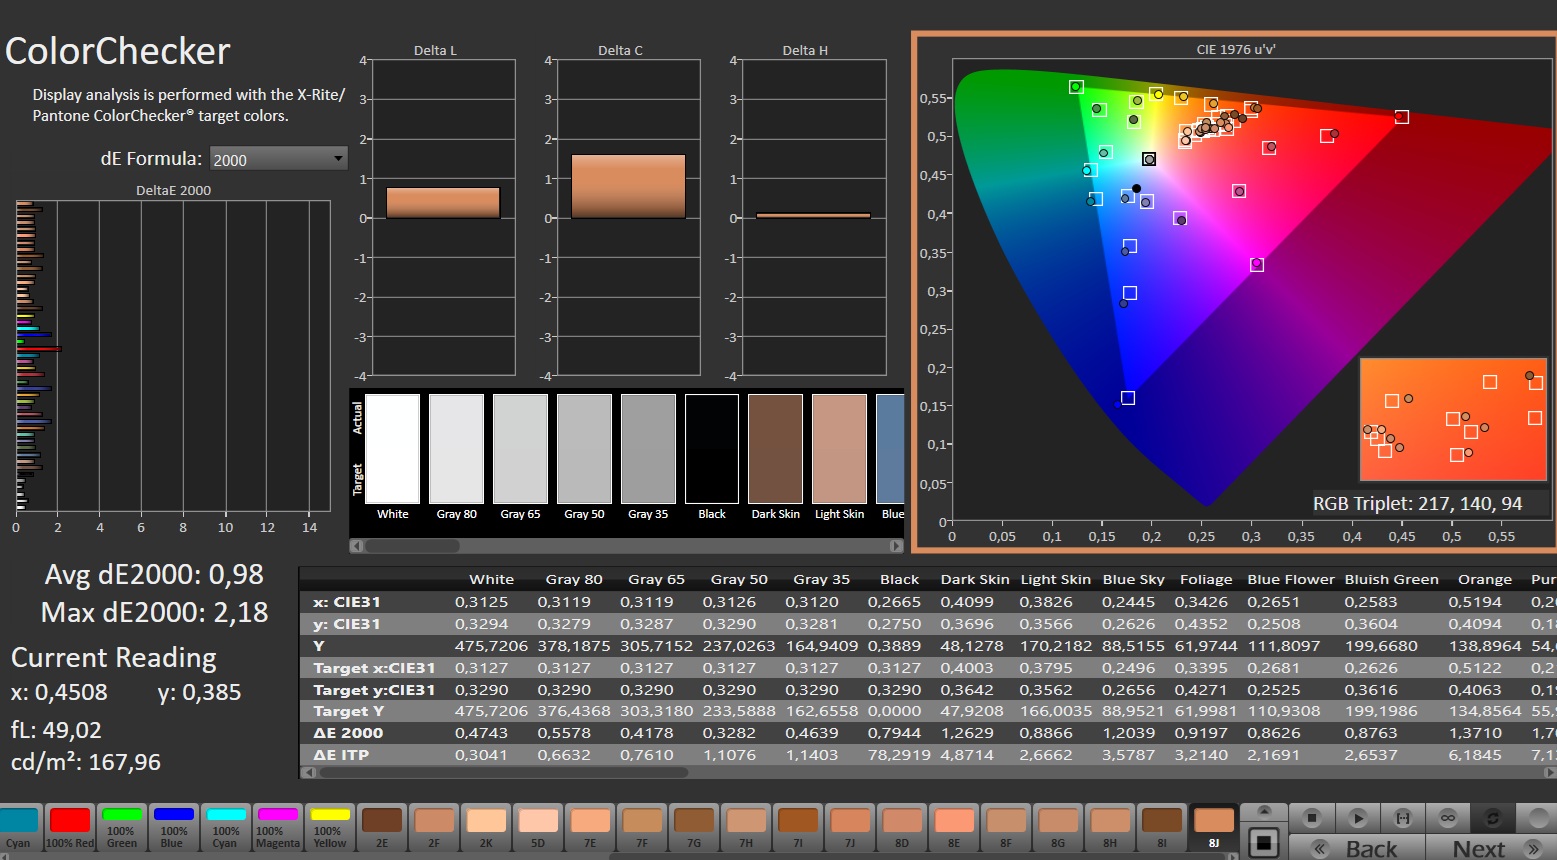
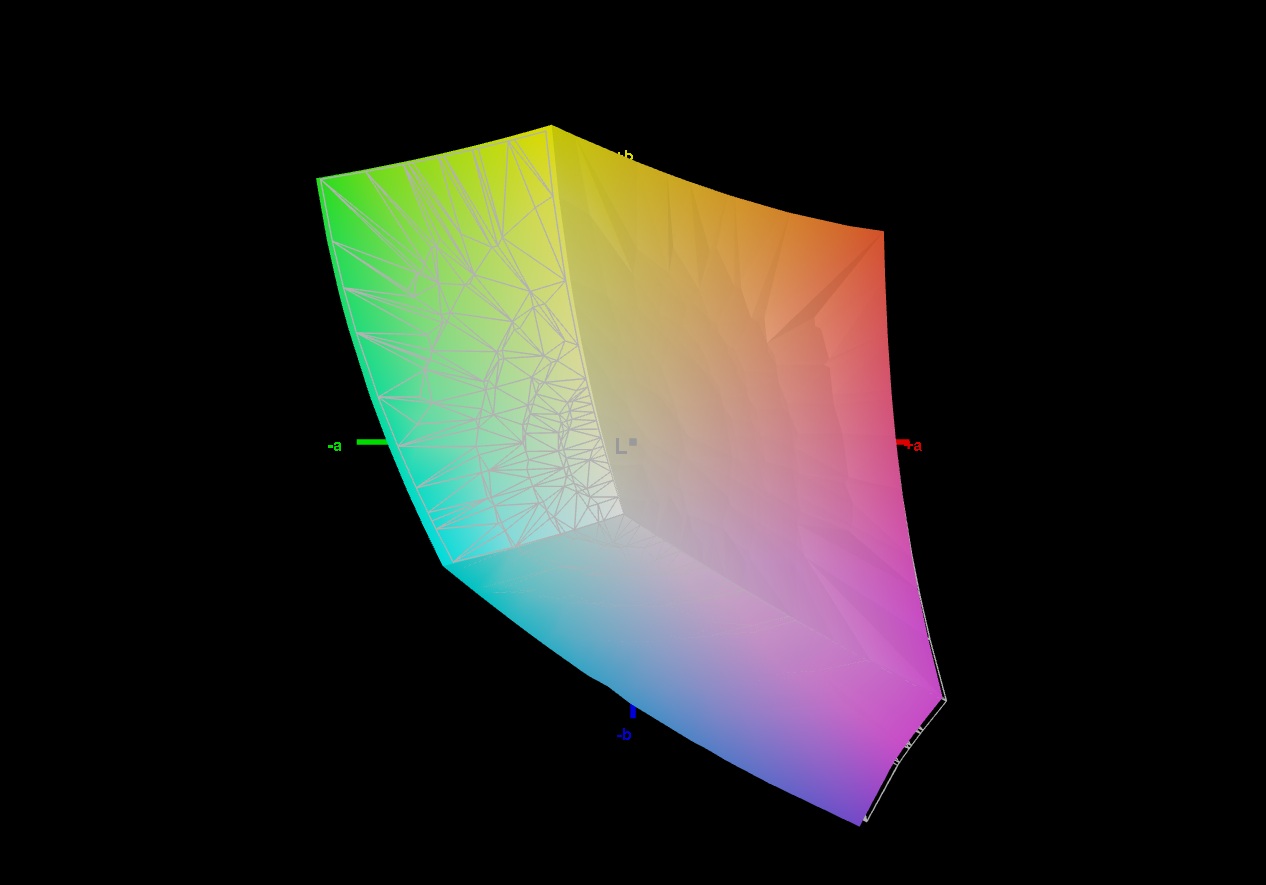
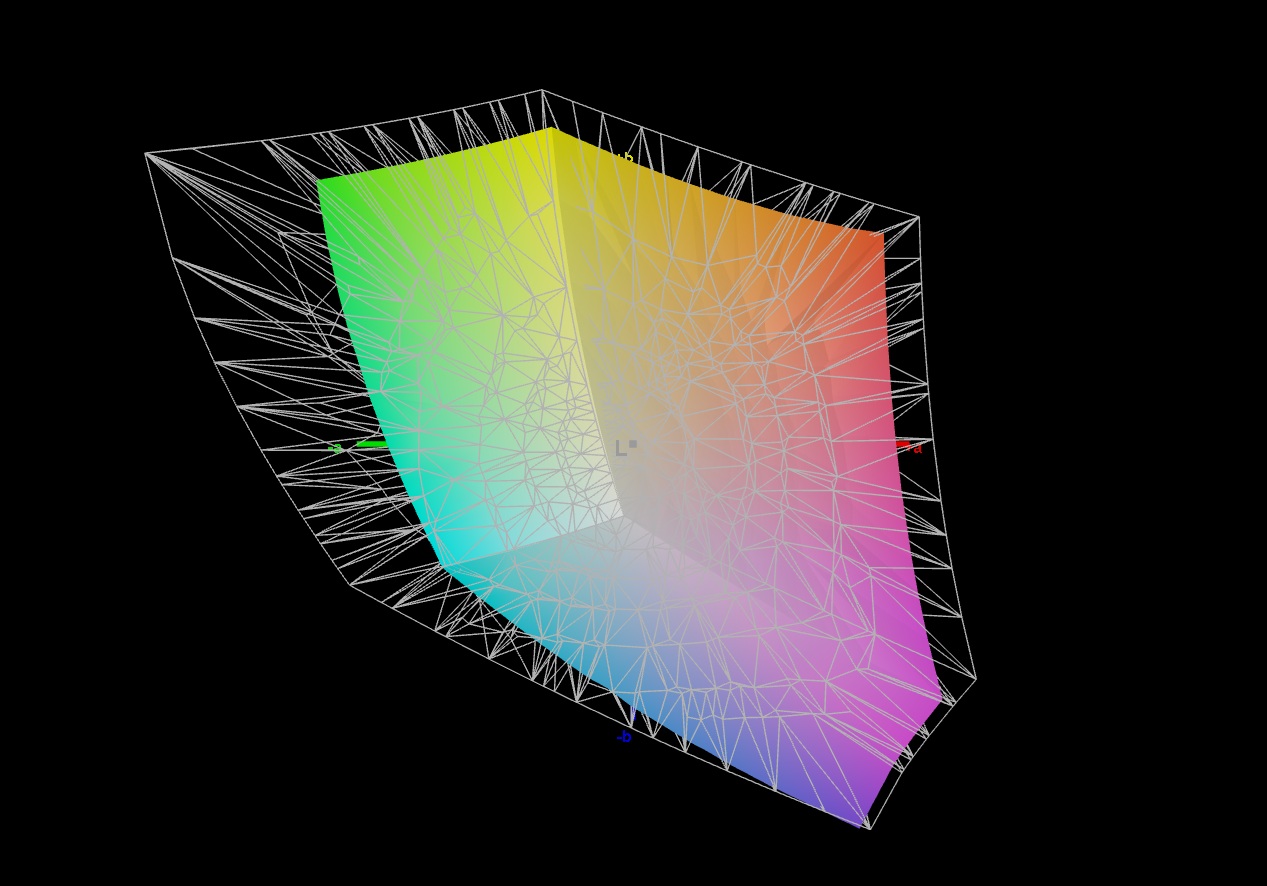
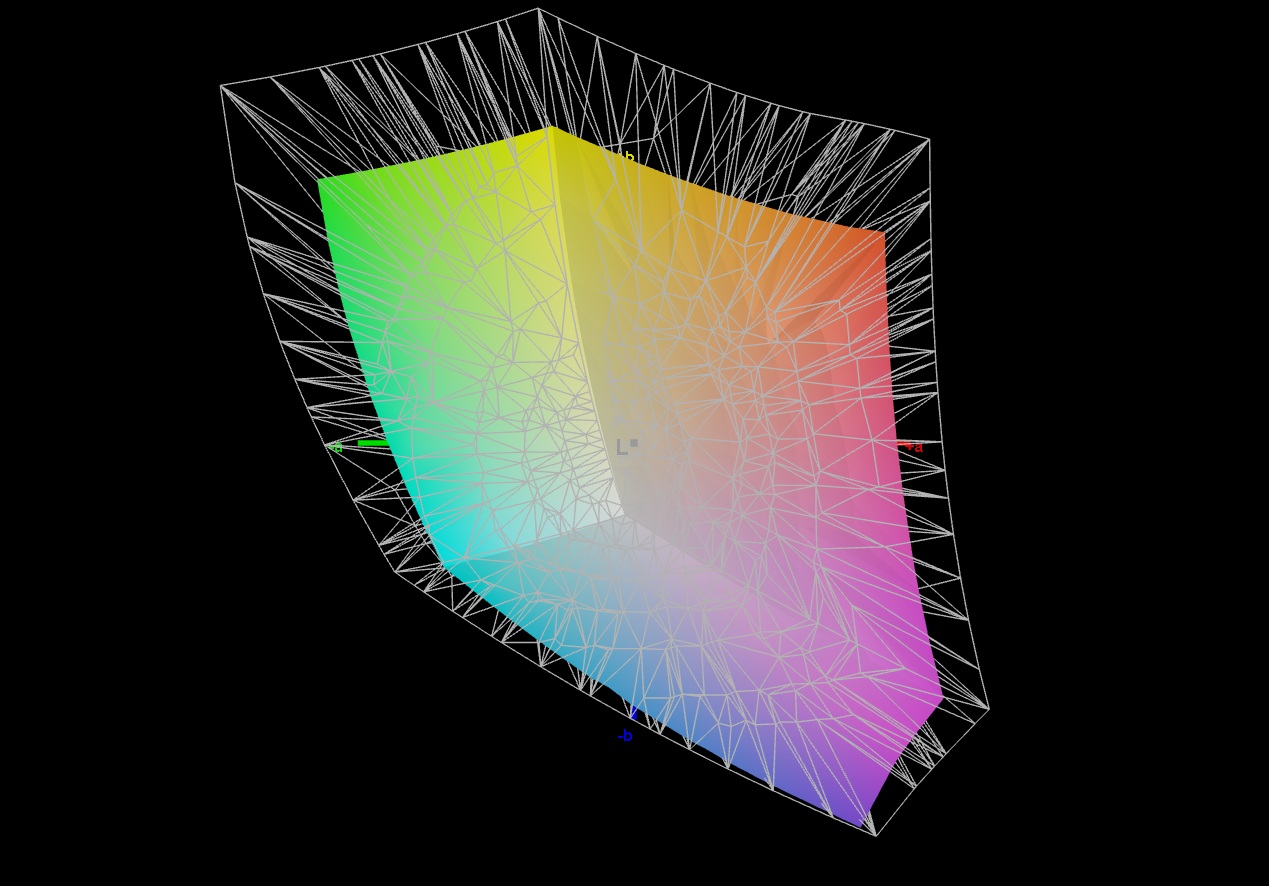
Schenker fa a meno dell'OLED e si affida a un classico pannello IPS, che è particolarmente gradevole in termini di luminosità. Una media di 488 cd/m² è piuttosto buona e consente un utilizzo all'aperto, se necessario. 2б560 x 1.600 pixel e 180 Hz dovrebbero soddisfare la maggior parte degli acquirenti. Il livello di nero e il contrasto si basano sul tipico livello IPS. Lo spazio colore (copertura completa sRGB) e gli angoli di visione sono simili. C'è poco da lamentarsi anche in termini di tempo di risposta.
| |||||||||||||||||||||||||
Distribuzione della luminosità: 95 %
Al centro con la batteria: 490 cd/m²
Contrasto: 1167:1 (Nero: 0.42 cd/m²)
ΔE ColorChecker Calman: 1.45 | ∀{0.5-29.43 Ø4.75}
calibrated: 0.98
ΔE Greyscale Calman: 2 | ∀{0.09-98 Ø5}
71.4% AdobeRGB 1998 (Argyll 3D)
98.7% sRGB (Argyll 3D)
69% Display P3 (Argyll 3D)
Gamma: 2.172
CCT: 6738 K
| Schenker XMG Core 16 VE M25 MNG007DA5-4, IPS, 2560x1600, 16", 180 Hz | Tulpar T6 V3.5 B160UANAC.J (AUO33B7), IPS, 1920x1200, 16", 165 Hz | HP Omen 16-ap0091ng AUODBB2, IPS, 1920x1200, 16", 144 Hz | Lenovo Legion 7 16IAX10 Samsung ATNA60HS01-0, OLED, 2560x1600, 16", 165 Hz | Schenker XMG Core 16 M25 MNG007DA6-4, IPS, 2560x1600, 16", 300 Hz | Acer Predator Helios Neo 16S AI PHN16S-71-94L9 Samsung ATNA60DL03-0, OLED, 2560x1600, 16", 240 Hz | |
|---|---|---|---|---|---|---|
| Display | -1% | -43% | 25% | 23% | 27% | |
| Display P3 Coverage (%) | 69 | 68.6 -1% | 40 -42% | 99.6 44% | 98.8 43% | 99.9 45% |
| sRGB Coverage (%) | 98.7 | 98.7 0% | 58.1 -41% | 100 1% | 100 1% | 100 1% |
| AdobeRGB 1998 Coverage (%) | 71.4 | 70.6 -1% | 38.7 -46% | 93.5 31% | 88.4 24% | 96.5 35% |
| Response Times | -32% | -208% | 90% | 7% | 97% | |
| Response Time Grey 50% / Grey 80% * (ms) | 12.1 ? | 12.4 ? -2% | 27.6 ? -128% | 0.6 ? 95% | 10.7 ? 12% | 0.2 ? 98% |
| Response Time Black / White * (ms) | 5 ? | 8.1 ? -62% | 19.4 ? -288% | 0.8 ? 84% | 4.9 ? 2% | 0.25 ? 95% |
| PWM Frequency (Hz) | 1317 ? | 960 | ||||
| PWM Amplitude * (%) | 23 | 50 | ||||
| Screen | -33% | -100% | -12% | -12% | 86% | |
| Brightness middle (cd/m²) | 490 | 456 -7% | 328 -33% | 477.6 -3% | 512 4% | 390 -20% |
| Brightness (cd/m²) | 488 | 403 -17% | 313 -36% | 483 -1% | 483 -1% | 394 -19% |
| Brightness Distribution (%) | 95 | 79 -17% | 91 -4% | 95 0% | 91 -4% | 98 3% |
| Black Level * (cd/m²) | 0.42 | 0.39 7% | 0.26 38% | 0.43 -2% | 0.04 90% | |
| Contrast (:1) | 1167 | 1169 0% | 1262 8% | 1191 2% | 9750 735% | |
| Colorchecker dE 2000 * | 1.45 | 3.05 -110% | 4.73 -226% | 3.11 -114% | 2.4 -66% | 1.61 -11% |
| Colorchecker dE 2000 max. * | 4.19 | 6.56 -57% | 17.47 -317% | 5.99 -43% | 3.8 9% | 3.49 17% |
| Colorchecker dE 2000 calibrated * | 0.98 | 1.03 -5% | 4.22 -331% | 0.79 19% | 0.9 8% | 1.59 -62% |
| Greyscale dE 2000 * | 2 | 3.9 -95% | 2.05 -2% | 0.9 55% | 3.1 -55% | 1.2 40% |
| Gamma | 2.172 101% | 2.279 97% | 2.63 84% | 2.18 101% | 2.41 91% | 2.235 98% |
| CCT | 6738 96% | 7198 90% | 6718 97% | 6405 101% | 6534 99% | 6580 99% |
| Media totale (Programma / Settaggio) | -22% /
-26% | -117% /
-103% | 34% /
14% | 6% /
-2% | 70% /
75% |
* ... Meglio usare valori piccoli


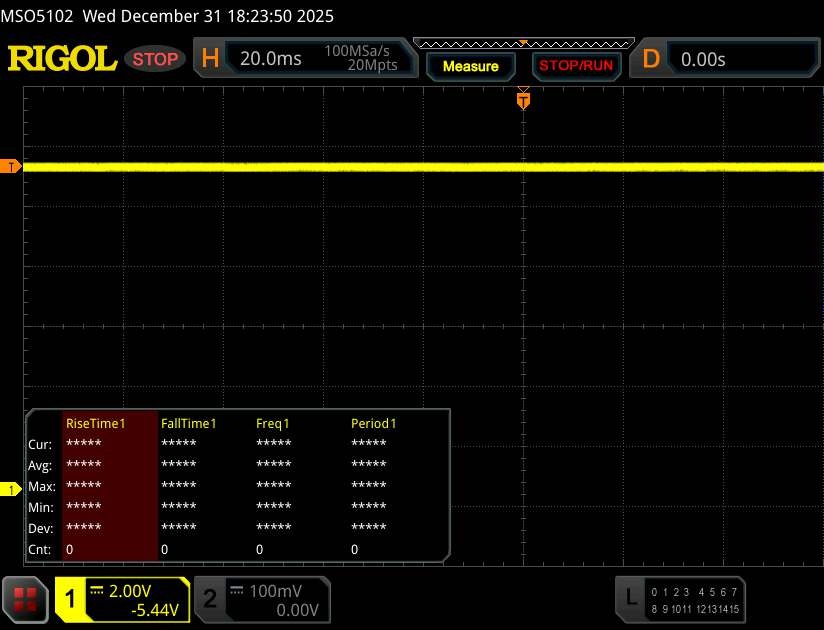
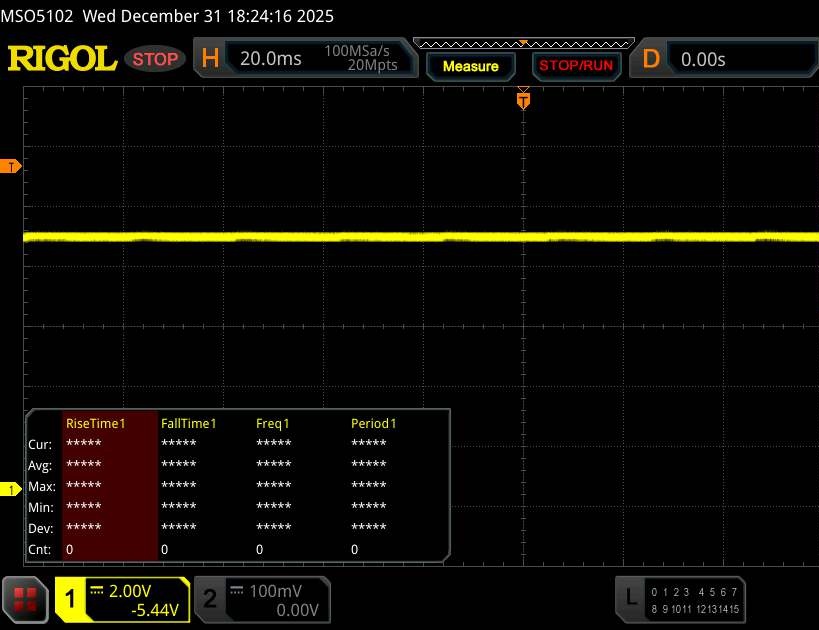
Sfarfallio dello schermo / PWM (Pulse-Width Modulation)
| flickering dello schermo / PWM non rilevato | 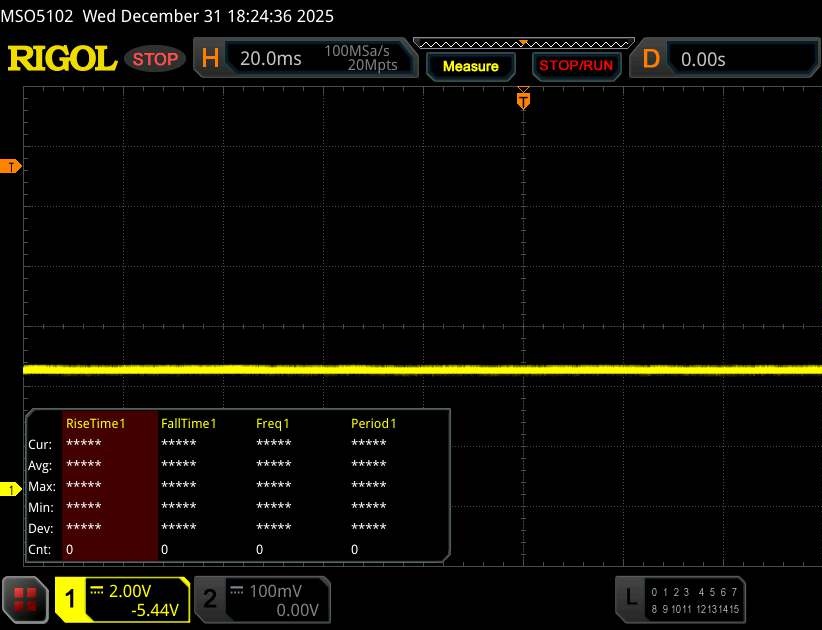 | ||
In confronto: 53 % di tutti i dispositivi testati non utilizza PWM per ridurre la luminosita' del display. Se è rilevato PWM, una media di 7962 (minimo: 5 - massimo: 343500) Hz è stata rilevata. | |||
Tempi di risposta del Display
| ↔ Tempi di risposta dal Nero al Bianco | ||
|---|---|---|
| 5 ms ... aumenta ↗ e diminuisce ↘ combinato | ↗ 1.8 ms Incremento | 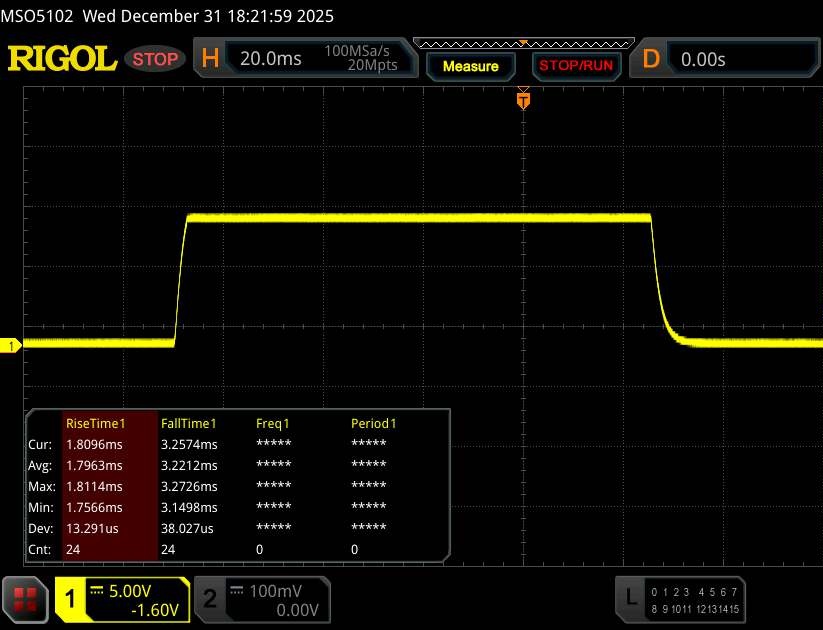 |
| ↘ 3.2 ms Calo | ||
| Lo schermo ha mostrato valori di risposta molto veloci nei nostri tests ed è molto adatto per i gaming veloce. In confronto, tutti i dispositivi di test variano da 0.1 (minimo) a 240 (massimo) ms. » 17 % di tutti i dispositivi è migliore. Questo significa che i tempi di risposta rilevati sono migliori rispettto alla media di tutti i dispositivi testati (20 ms). | ||
| ↔ Tempo di risposta dal 50% Grigio all'80% Grigio | ||
| 12.1 ms ... aumenta ↗ e diminuisce ↘ combinato | ↗ 5.9 ms Incremento | 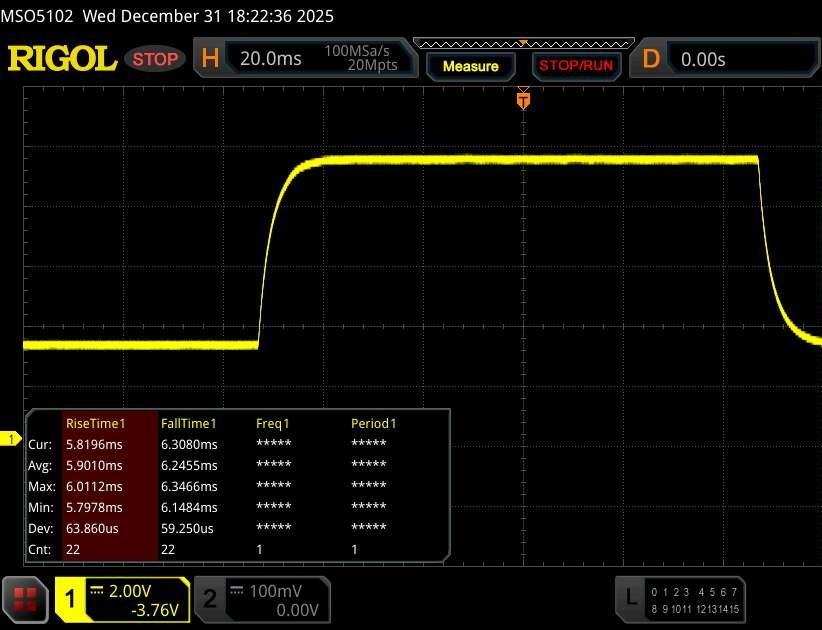 |
| ↘ 6.2 ms Calo | ||
| Lo schermo mostra buoni tempi di risposta durante i nostri tests, ma potrebbe essere troppo lento per i gamers competitivi. In confronto, tutti i dispositivi di test variano da 0.165 (minimo) a 636 (massimo) ms. » 25 % di tutti i dispositivi è migliore. Questo significa che i tempi di risposta rilevati sono migliori rispettto alla media di tutti i dispositivi testati (31.3 ms). | ||
Prestazioni
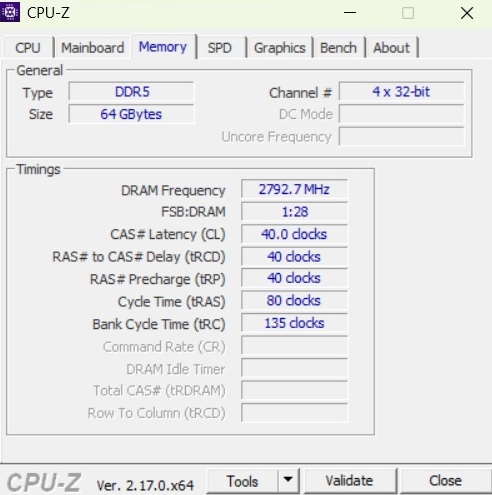
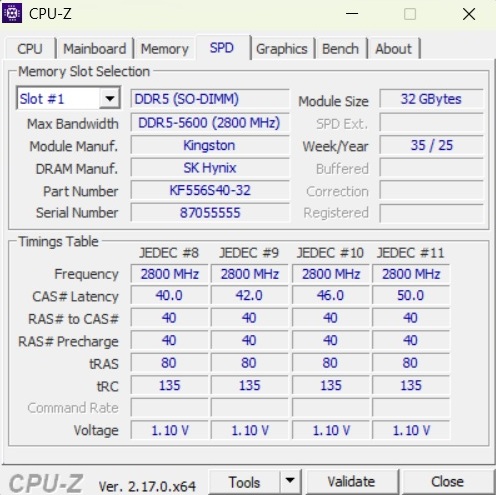
In termini di prestazioni della CPU e della GPU, XMG Core 16 VE si colloca nella fascia media. Due slot SO-DIMM e due slot M.2 facilitano gli aggiornamenti futuri.
Condizioni del test
Nel Centro di controllo, gli utenti possono scegliere tra tre diverse modalità (vedere la tabella per i dettagli). Ad eccezione del test della batteria, tutte le misurazioni sono state effettuate nella modalità Overboost "Normale" senza overclocking della GPU.
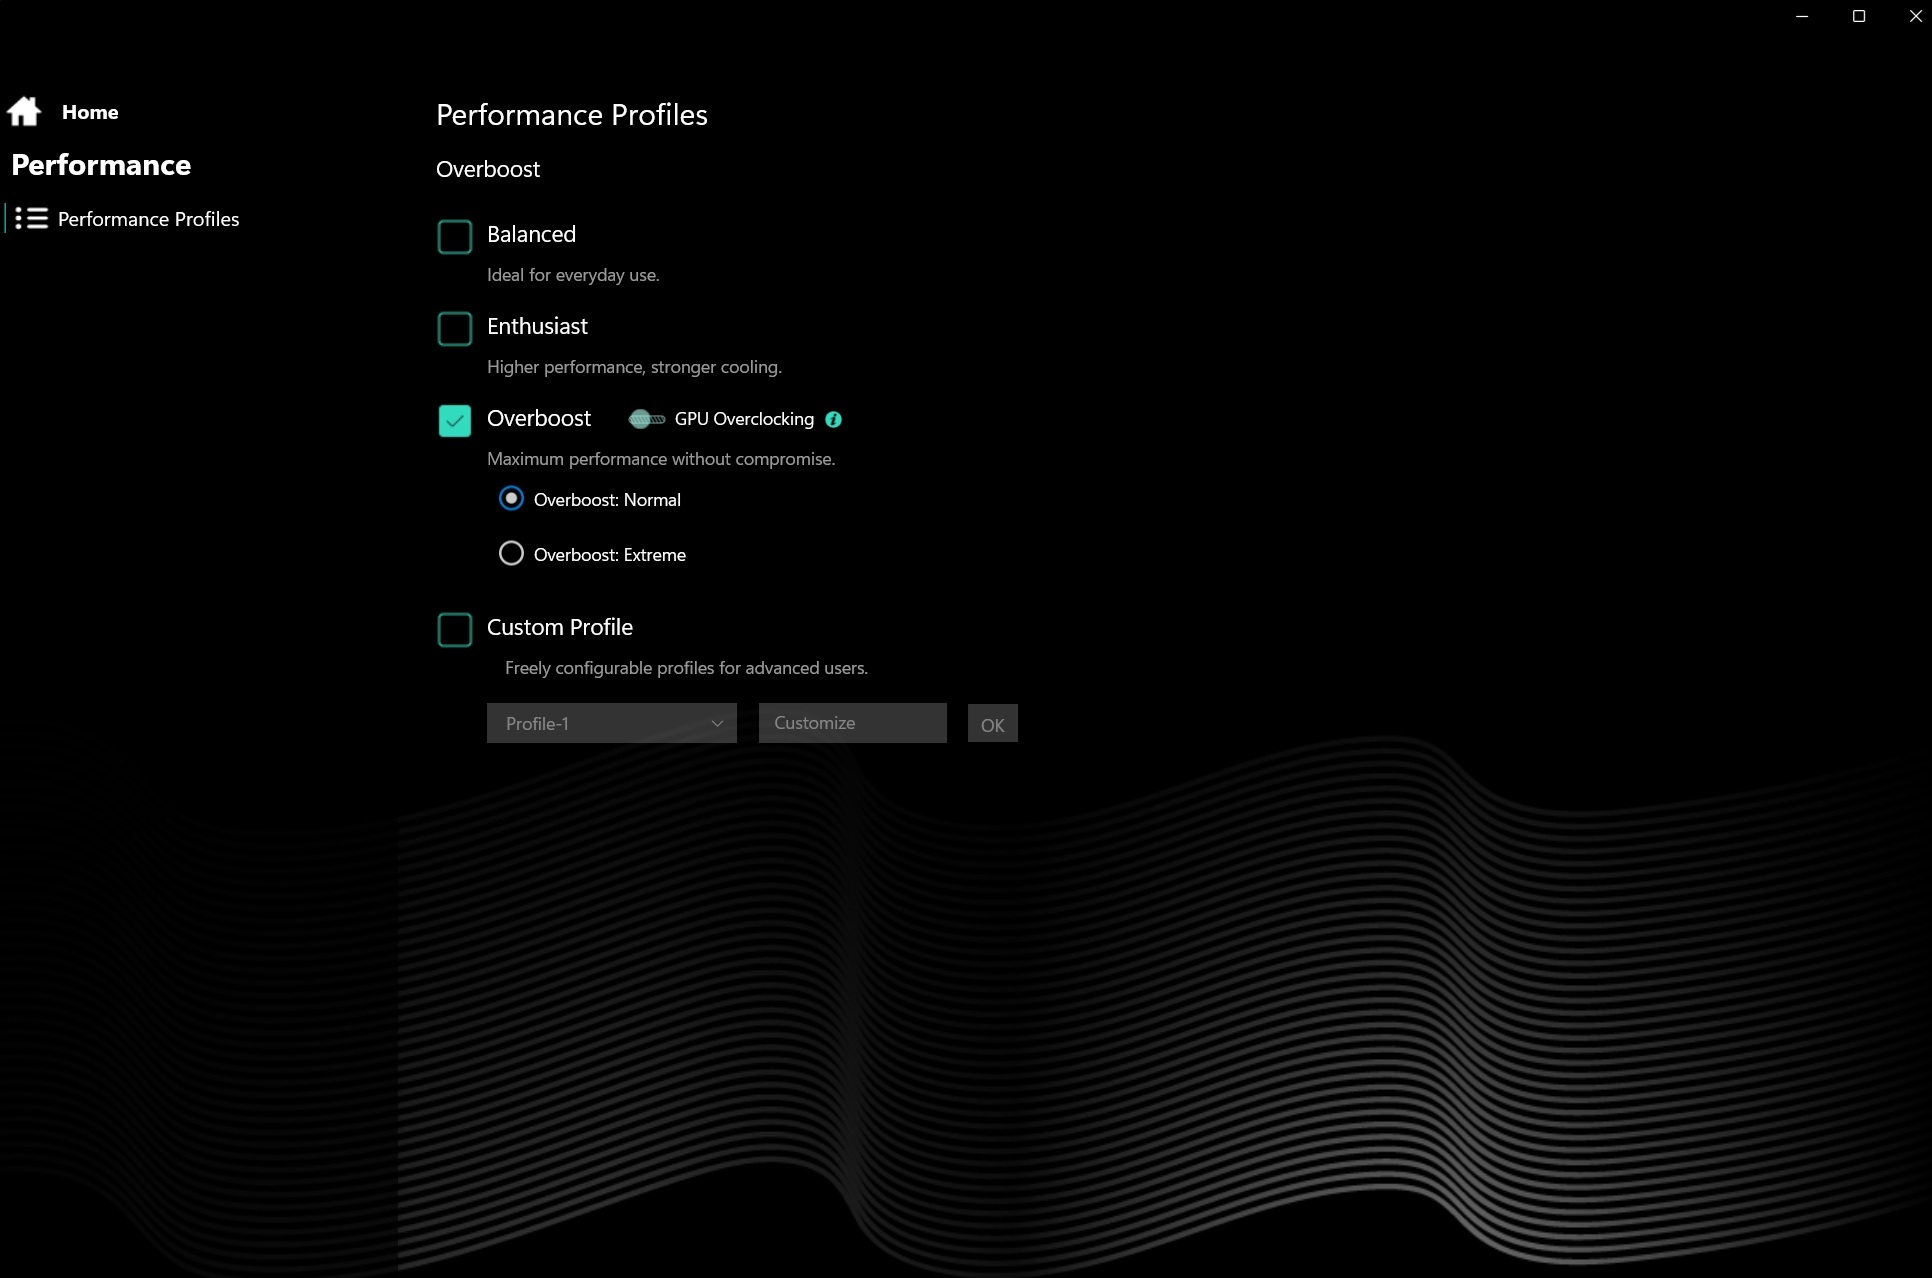
| Modalità | Bilanciato | Entusiasta | Overboost |
| Cyberpunk 2077 Rumore | 33 dB(A) | 46 dB(A) | 49 dB(A) |
| Framerate di Cyberpunk 2077 (FHD/Ultra) | 35,4 fps | 78,6 fps | 85 fps |
| Assorbimento GPU | ~30 W | ~80 W | ~110 W |
| CPU PL1 | 45 W | 54 W | 70 W |
| CPU PL2 | 65 W | 65 W | 105 W |
| Cinebench R15 Multi Score | 2075 Punti | 2670 Punti | 2815 Punti |
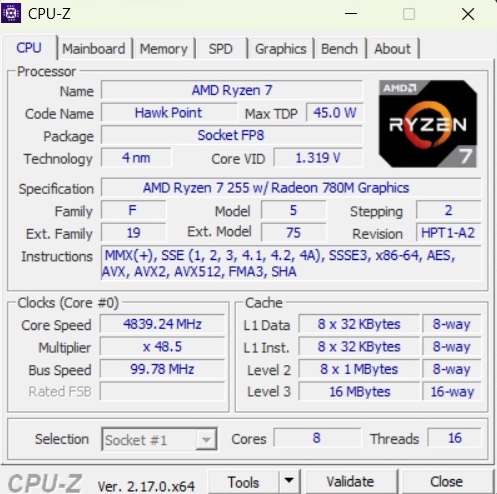
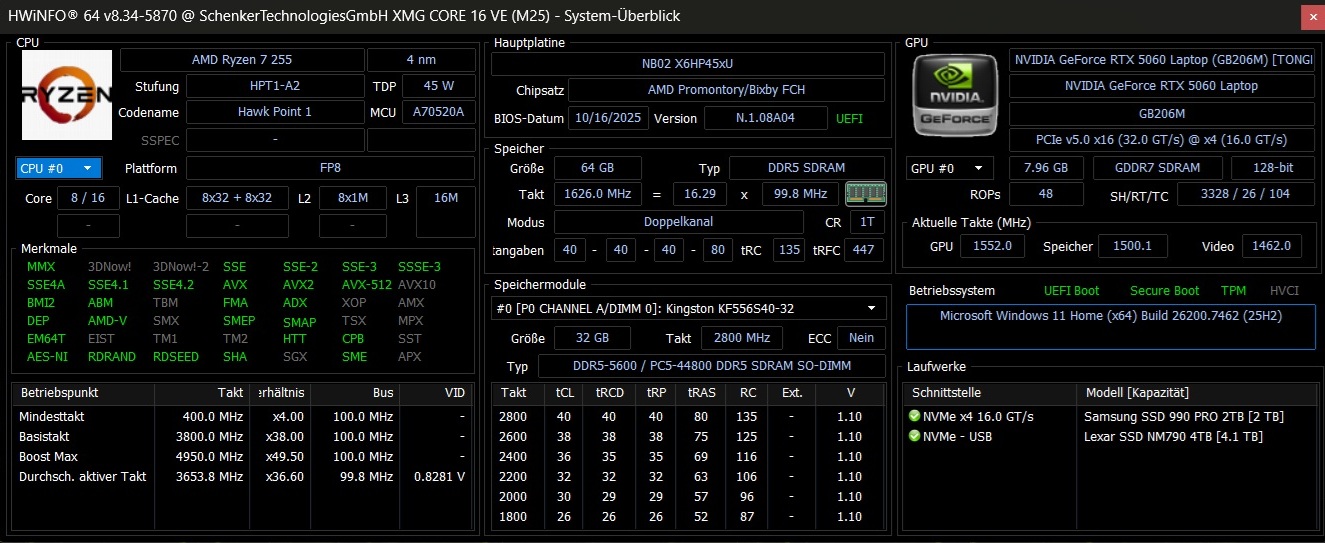
Processore
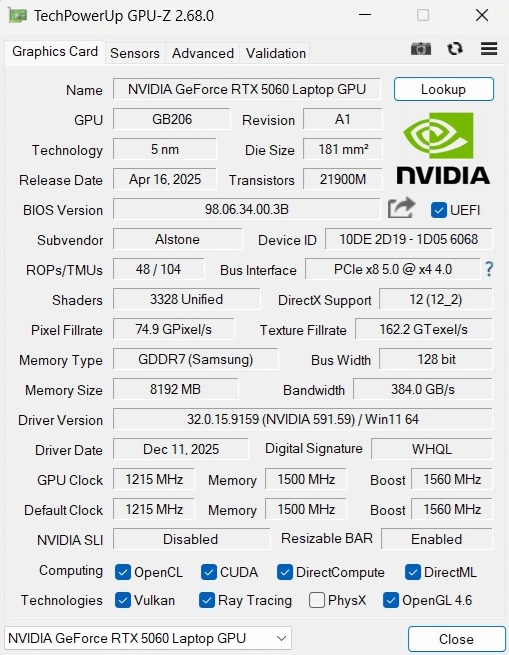
Il Ryzen 7 255 è ancora raramente presente nei computer portatili. Costruito su un processo a 4 nm, il chip offre otto core e può gestire fino a 16 thread. A differenza del Core i7-14700HX nel Tulpar T6 V3.5, le prestazioni rimangono costanti anche in caso di carico prolungato - sebbene sia ancora inferiore a processori come il Core Ultra 7 255HX, Core Ultra 9 275HX, Ryzen 9 8940HX e Ryzen AI 9 HX 370.
Test di resistenza multipla Cinebench R15
* ... Meglio usare valori piccoli
AIDA64: FP32 Ray-Trace | FPU Julia | CPU SHA3 | CPU Queen | FPU SinJulia | FPU Mandel | CPU AES | CPU ZLib | FP64 Ray-Trace | CPU PhotoWorxx
| Performance rating | |
| HP Omen 16-ap0091ng | |
| Schenker XMG Core 16 M25 | |
| Lenovo Legion 7 16IAX10 | |
| Acer Predator Helios Neo 16S AI PHN16S-71-94L9 | |
| Media della classe Gaming | |
| Schenker XMG Core 16 VE M25 | |
| Media AMD Ryzen 7 255 | |
| Tulpar T6 V3.5 | |
| AIDA64 / FP32 Ray-Trace | |
| HP Omen 16-ap0091ng | |
| Schenker XMG Core 16 M25 | |
| Media della classe Gaming (10227 - 85542, n=123, ultimi 2 anni) | |
| Lenovo Legion 7 16IAX10 | |
| Schenker XMG Core 16 VE M25 | |
| Acer Predator Helios Neo 16S AI PHN16S-71-94L9 | |
| Media AMD Ryzen 7 255 (27202 - 28101, n=2) | |
| Tulpar T6 V3.5 | |
| AIDA64 / FPU Julia | |
| HP Omen 16-ap0091ng | |
| Lenovo Legion 7 16IAX10 | |
| Schenker XMG Core 16 M25 | |
| Acer Predator Helios Neo 16S AI PHN16S-71-94L9 | |
| Media della classe Gaming (51376 - 238426, n=123, ultimi 2 anni) | |
| Schenker XMG Core 16 VE M25 | |
| Media AMD Ryzen 7 255 (110760 - 114847, n=2) | |
| Tulpar T6 V3.5 | |
| AIDA64 / CPU SHA3 | |
| HP Omen 16-ap0091ng | |
| Lenovo Legion 7 16IAX10 | |
| Acer Predator Helios Neo 16S AI PHN16S-71-94L9 | |
| Media della classe Gaming (2180 - 9817, n=123, ultimi 2 anni) | |
| Schenker XMG Core 16 M25 | |
| Schenker XMG Core 16 VE M25 | |
| Media AMD Ryzen 7 255 (4831 - 5045, n=2) | |
| Tulpar T6 V3.5 | |
| AIDA64 / CPU Queen | |
| HP Omen 16-ap0091ng | |
| Lenovo Legion 7 16IAX10 | |
| Tulpar T6 V3.5 | |
| Schenker XMG Core 16 VE M25 | |
| Acer Predator Helios Neo 16S AI PHN16S-71-94L9 | |
| Media AMD Ryzen 7 255 (118448 - 124528, n=2) | |
| Media della classe Gaming (49785 - 173351, n=121, ultimi 2 anni) | |
| Schenker XMG Core 16 M25 | |
| AIDA64 / FPU SinJulia | |
| HP Omen 16-ap0091ng | |
| Schenker XMG Core 16 M25 | |
| Schenker XMG Core 16 VE M25 | |
| Media AMD Ryzen 7 255 (15213 - 15342, n=2) | |
| Media della classe Gaming (4424 - 33636, n=123, ultimi 2 anni) | |
| Lenovo Legion 7 16IAX10 | |
| Acer Predator Helios Neo 16S AI PHN16S-71-94L9 | |
| Tulpar T6 V3.5 | |
| AIDA64 / FPU Mandel | |
| HP Omen 16-ap0091ng | |
| Schenker XMG Core 16 M25 | |
| Lenovo Legion 7 16IAX10 | |
| Acer Predator Helios Neo 16S AI PHN16S-71-94L9 | |
| Media della classe Gaming (25115 - 128721, n=123, ultimi 2 anni) | |
| Schenker XMG Core 16 VE M25 | |
| Media AMD Ryzen 7 255 (59408 - 61675, n=2) | |
| Tulpar T6 V3.5 | |
| AIDA64 / CPU AES | |
| HP Omen 16-ap0091ng | |
| Schenker XMG Core 16 M25 | |
| Lenovo Legion 7 16IAX10 | |
| Media della classe Gaming (39258 - 247074, n=123, ultimi 2 anni) | |
| Acer Predator Helios Neo 16S AI PHN16S-71-94L9 | |
| Schenker XMG Core 16 VE M25 | |
| Media AMD Ryzen 7 255 (88405 - 90655, n=2) | |
| Tulpar T6 V3.5 | |
| AIDA64 / CPU ZLib | |
| Lenovo Legion 7 16IAX10 | |
| HP Omen 16-ap0091ng | |
| Acer Predator Helios Neo 16S AI PHN16S-71-94L9 | |
| Schenker XMG Core 16 M25 | |
| Media della classe Gaming (574 - 2531, n=123, ultimi 2 anni) | |
| Schenker XMG Core 16 VE M25 | |
| Media AMD Ryzen 7 255 (1088 - 1134, n=2) | |
| Tulpar T6 V3.5 | |
| AIDA64 / FP64 Ray-Trace | |
| HP Omen 16-ap0091ng | |
| Schenker XMG Core 16 M25 | |
| Lenovo Legion 7 16IAX10 | |
| Media della classe Gaming (5509 - 45446, n=123, ultimi 2 anni) | |
| Acer Predator Helios Neo 16S AI PHN16S-71-94L9 | |
| Schenker XMG Core 16 VE M25 | |
| Media AMD Ryzen 7 255 (13661 - 14945, n=2) | |
| Tulpar T6 V3.5 | |
| AIDA64 / CPU PhotoWorxx | |
| Acer Predator Helios Neo 16S AI PHN16S-71-94L9 | |
| Schenker XMG Core 16 M25 | |
| Lenovo Legion 7 16IAX10 | |
| Tulpar T6 V3.5 | |
| Schenker XMG Core 16 VE M25 | |
| Media AMD Ryzen 7 255 (39932 - 45359, n=2) | |
| Media della classe Gaming (10805 - 62916, n=123, ultimi 2 anni) | |
| HP Omen 16-ap0091ng | |
Prestazioni del sistema
Le prestazioni complessive del sistema non sono degne di nota - in senso positivo. Non ci sono stati valori anomali durante i test.
PCMark 10: Score | Essentials | Productivity | Digital Content Creation
CrossMark: Overall | Productivity | Creativity | Responsiveness
WebXPRT 3: Overall
WebXPRT 4: Overall
Mozilla Kraken 1.1: Total
| Performance rating | |
| Acer Predator Helios Neo 16S AI PHN16S-71-94L9 | |
| Schenker XMG Core 16 M25 -4! | |
| Lenovo Legion 7 16IAX10 | |
| Media della classe Gaming | |
| Schenker XMG Core 16 VE M25 | |
| Media AMD Ryzen 7 255, NVIDIA GeForce RTX 5060 Laptop | |
| HP Omen 16-ap0091ng | |
| Tulpar T6 V3.5 | |
| PCMark 10 / Score | |
| Acer Predator Helios Neo 16S AI PHN16S-71-94L9 | |
| Schenker XMG Core 16 VE M25 | |
| Media AMD Ryzen 7 255, NVIDIA GeForce RTX 5060 Laptop (n=1) | |
| Media della classe Gaming (5828 - 10060, n=106, ultimi 2 anni) | |
| HP Omen 16-ap0091ng | |
| Lenovo Legion 7 16IAX10 | |
| Tulpar T6 V3.5 | |
| PCMark 10 / Essentials | |
| Lenovo Legion 7 16IAX10 | |
| Acer Predator Helios Neo 16S AI PHN16S-71-94L9 | |
| HP Omen 16-ap0091ng | |
| Media della classe Gaming (8810 - 12600, n=110, ultimi 2 anni) | |
| Tulpar T6 V3.5 | |
| Schenker XMG Core 16 VE M25 | |
| Media AMD Ryzen 7 255, NVIDIA GeForce RTX 5060 Laptop (n=1) | |
| PCMark 10 / Productivity | |
| Schenker XMG Core 16 VE M25 | |
| Media AMD Ryzen 7 255, NVIDIA GeForce RTX 5060 Laptop (n=1) | |
| Lenovo Legion 7 16IAX10 | |
| Media della classe Gaming (6662 - 16716, n=108, ultimi 2 anni) | |
| HP Omen 16-ap0091ng | |
| Acer Predator Helios Neo 16S AI PHN16S-71-94L9 | |
| Tulpar T6 V3.5 | |
| PCMark 10 / Digital Content Creation | |
| Acer Predator Helios Neo 16S AI PHN16S-71-94L9 | |
| Media della classe Gaming (7505 - 19351, n=108, ultimi 2 anni) | |
| HP Omen 16-ap0091ng | |
| Tulpar T6 V3.5 | |
| Schenker XMG Core 16 VE M25 | |
| Media AMD Ryzen 7 255, NVIDIA GeForce RTX 5060 Laptop (n=1) | |
| Lenovo Legion 7 16IAX10 | |
| CrossMark / Overall | |
| Acer Predator Helios Neo 16S AI PHN16S-71-94L9 | |
| Lenovo Legion 7 16IAX10 | |
| Schenker XMG Core 16 M25 | |
| Media della classe Gaming (1247 - 2344, n=107, ultimi 2 anni) | |
| Schenker XMG Core 16 VE M25 | |
| Media AMD Ryzen 7 255, NVIDIA GeForce RTX 5060 Laptop (n=1) | |
| HP Omen 16-ap0091ng | |
| Tulpar T6 V3.5 | |
| CrossMark / Productivity | |
| Acer Predator Helios Neo 16S AI PHN16S-71-94L9 | |
| Lenovo Legion 7 16IAX10 | |
| Media della classe Gaming (1299 - 2211, n=107, ultimi 2 anni) | |
| HP Omen 16-ap0091ng | |
| Schenker XMG Core 16 M25 | |
| Schenker XMG Core 16 VE M25 | |
| Media AMD Ryzen 7 255, NVIDIA GeForce RTX 5060 Laptop (n=1) | |
| Tulpar T6 V3.5 | |
| CrossMark / Creativity | |
| Schenker XMG Core 16 M25 | |
| Acer Predator Helios Neo 16S AI PHN16S-71-94L9 | |
| Lenovo Legion 7 16IAX10 | |
| Tulpar T6 V3.5 | |
| Media della classe Gaming (1275 - 2729, n=107, ultimi 2 anni) | |
| HP Omen 16-ap0091ng | |
| Schenker XMG Core 16 VE M25 | |
| Media AMD Ryzen 7 255, NVIDIA GeForce RTX 5060 Laptop (n=1) | |
| CrossMark / Responsiveness | |
| Lenovo Legion 7 16IAX10 | |
| Acer Predator Helios Neo 16S AI PHN16S-71-94L9 | |
| Media della classe Gaming (1030 - 2330, n=107, ultimi 2 anni) | |
| Schenker XMG Core 16 VE M25 | |
| Media AMD Ryzen 7 255, NVIDIA GeForce RTX 5060 Laptop (n=1) | |
| Schenker XMG Core 16 M25 | |
| HP Omen 16-ap0091ng | |
| Tulpar T6 V3.5 | |
| WebXPRT 3 / Overall | |
| Schenker XMG Core 16 M25 | |
| Lenovo Legion 7 16IAX10 | |
| Acer Predator Helios Neo 16S AI PHN16S-71-94L9 | |
| HP Omen 16-ap0091ng | |
| Media della classe Gaming (237 - 532, n=110, ultimi 2 anni) | |
| Tulpar T6 V3.5 | |
| Schenker XMG Core 16 VE M25 | |
| Media AMD Ryzen 7 255, NVIDIA GeForce RTX 5060 Laptop (n=1) | |
| WebXPRT 4 / Overall | |
| Schenker XMG Core 16 M25 | |
| Lenovo Legion 7 16IAX10 | |
| Acer Predator Helios Neo 16S AI PHN16S-71-94L9 | |
| Tulpar T6 V3.5 | |
| Media della classe Gaming (176.4 - 345, n=109, ultimi 2 anni) | |
| Schenker XMG Core 16 VE M25 | |
| Media AMD Ryzen 7 255, NVIDIA GeForce RTX 5060 Laptop (n=1) | |
| HP Omen 16-ap0091ng | |
| Mozilla Kraken 1.1 / Total | |
| HP Omen 16-ap0091ng | |
| Schenker XMG Core 16 VE M25 | |
| Media AMD Ryzen 7 255, NVIDIA GeForce RTX 5060 Laptop (n=1) | |
| Media della classe Gaming (397 - 674, n=116, ultimi 2 anni) | |
| Tulpar T6 V3.5 | |
| Lenovo Legion 7 16IAX10 | |
| Schenker XMG Core 16 M25 | |
| Acer Predator Helios Neo 16S AI PHN16S-71-94L9 | |
* ... Meglio usare valori piccoli
| PCMark 10 Score | 8166 punti | |
Aiuto | ||
| AIDA64 / Memory Copy | |
| Lenovo Legion 7 16IAX10 | |
| Acer Predator Helios Neo 16S AI PHN16S-71-94L9 | |
| Tulpar T6 V3.5 | |
| Schenker XMG Core 16 M25 | |
| Media della classe Gaming (21750 - 108104, n=123, ultimi 2 anni) | |
| Schenker XMG Core 16 VE M25 | |
| Media AMD Ryzen 7 255 (67909 - 69008, n=2) | |
| HP Omen 16-ap0091ng | |
| AIDA64 / Memory Read | |
| Acer Predator Helios Neo 16S AI PHN16S-71-94L9 | |
| Tulpar T6 V3.5 | |
| Lenovo Legion 7 16IAX10 | |
| Schenker XMG Core 16 M25 | |
| Media della classe Gaming (22956 - 104349, n=123, ultimi 2 anni) | |
| Media AMD Ryzen 7 255 (60500 - 61434, n=2) | |
| Schenker XMG Core 16 VE M25 | |
| HP Omen 16-ap0091ng | |
| AIDA64 / Memory Write | |
| Acer Predator Helios Neo 16S AI PHN16S-71-94L9 | |
| Schenker XMG Core 16 VE M25 | |
| Media AMD Ryzen 7 255 (82539 - 83452, n=2) | |
| Schenker XMG Core 16 M25 | |
| Lenovo Legion 7 16IAX10 | |
| Tulpar T6 V3.5 | |
| Media della classe Gaming (22297 - 133486, n=123, ultimi 2 anni) | |
| HP Omen 16-ap0091ng | |
| AIDA64 / Memory Latency | |
| Acer Predator Helios Neo 16S AI PHN16S-71-94L9 | |
| Lenovo Legion 7 16IAX10 | |
| Media della classe Gaming (75.3 - 259, n=123, ultimi 2 anni) | |
| Media AMD Ryzen 7 255 (87 - 91.2, n=2) | |
| Schenker XMG Core 16 VE M25 | |
| Schenker XMG Core 16 M25 | |
| Tulpar T6 V3.5 | |
| HP Omen 16-ap0091ng | |
* ... Meglio usare valori piccoli
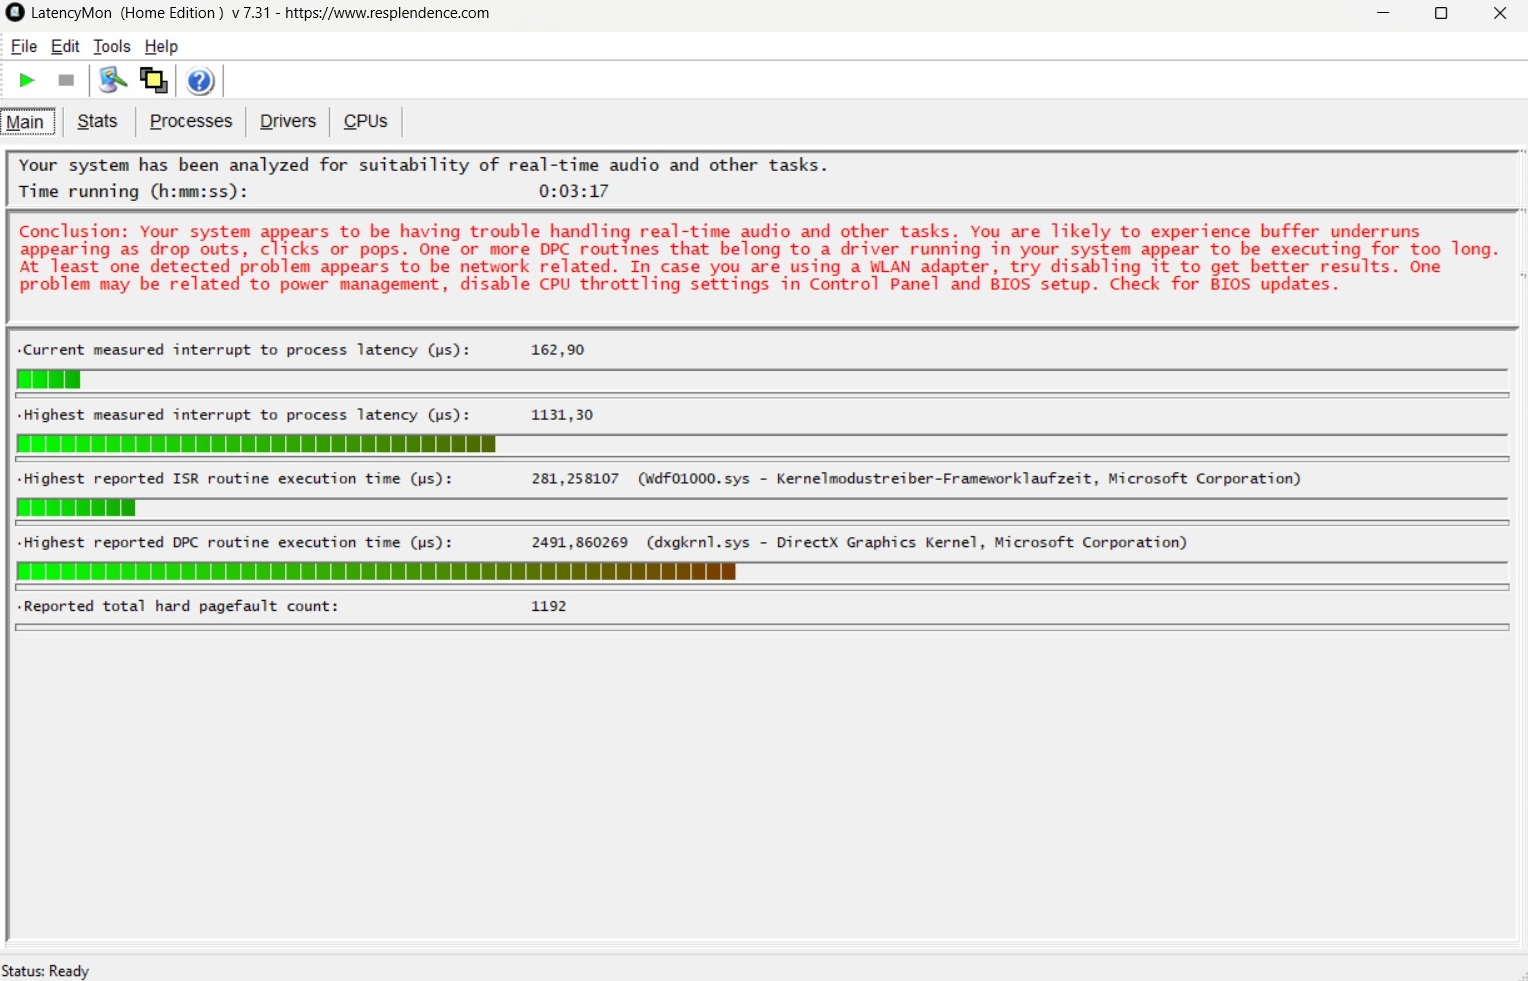
Latenze DPC
In termini di latenza, XMG Core 16 VE si colloca perfettamente a metà del gruppo dei suoi concorrenti.
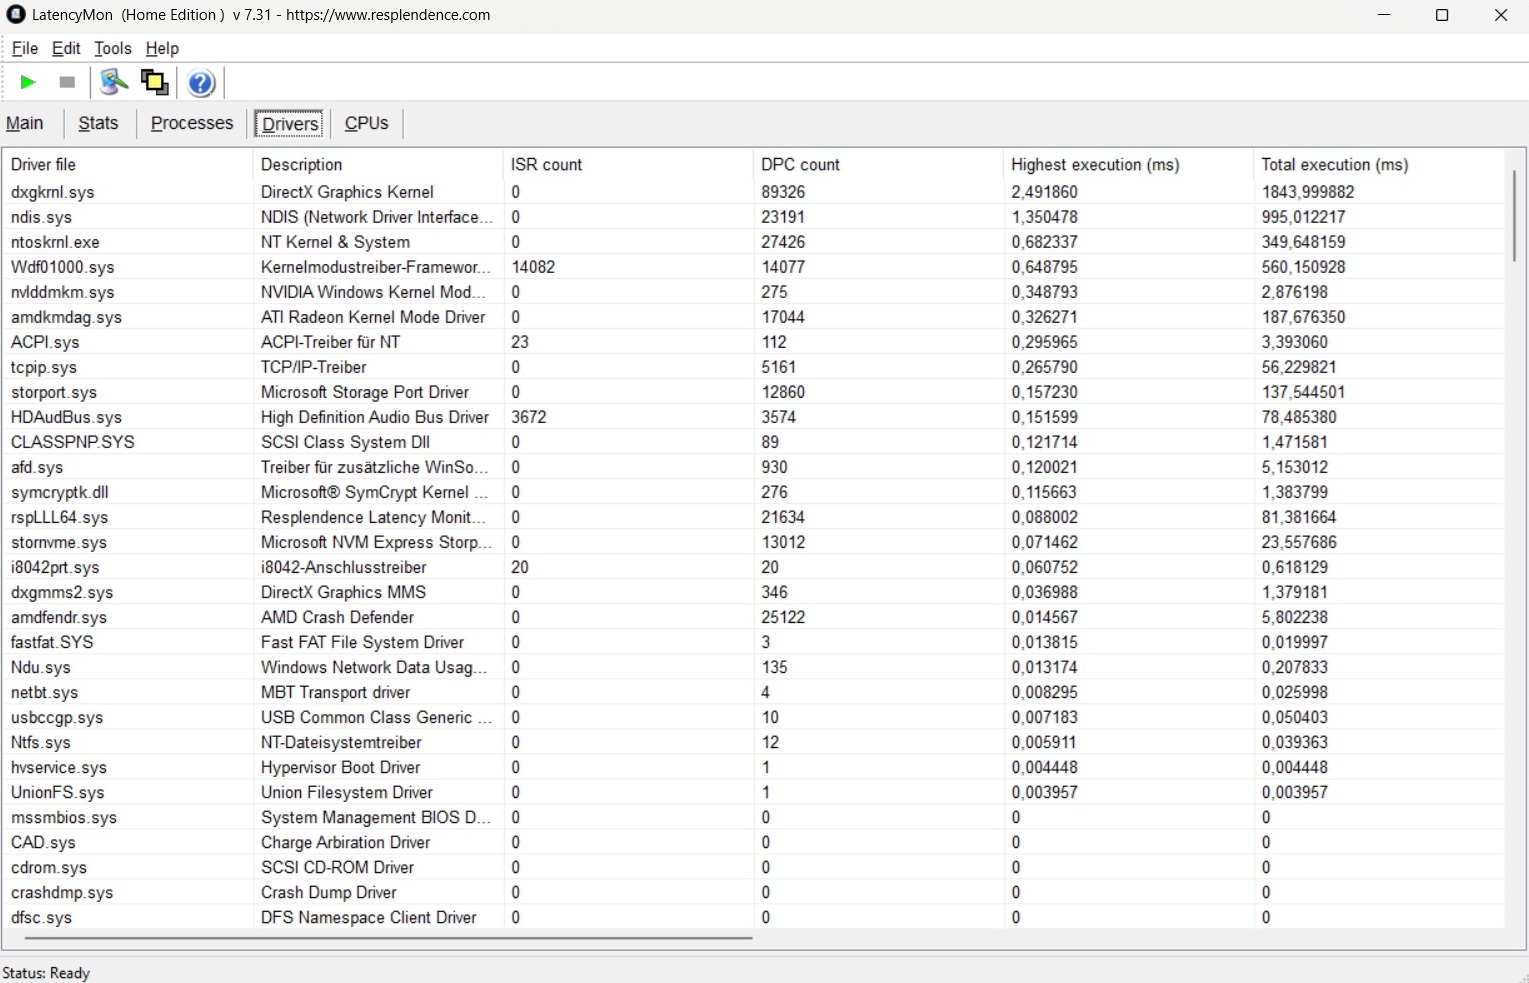
| DPC Latencies / LatencyMon - interrupt to process latency (max), Web, Youtube, Prime95 | |
| Tulpar T6 V3.5 | |
| Acer Predator Helios Neo 16S AI PHN16S-71-94L9 | |
| HP Omen 16-ap0091ng | |
| Schenker XMG Core 16 VE M25 | |
| Lenovo Legion 7 16IAX10 | |
| Schenker XMG Core 16 M25 | |
* ... Meglio usare valori piccoli
Dispositivi di archiviazione
Un punto di forza della nostra unità di prova è stato l'SSD relativamente veloce. Il 990 Pro di Samsung ha ottenuto un eccellente punteggio complessivo nel benchmark AS SSD.

* ... Meglio usare valori piccoli
Prestazioni in lettura continua: Loop di lettura DiskSpd, profondità della coda 8
Prestazioni della GPU
| 3DMark 11 Performance | 33268 punti | |
| 3DMark Cloud Gate Standard Score | 50474 punti | |
| 3DMark Fire Strike Score | 25692 punti | |
| 3DMark Time Spy Score | 11440 punti | |
Aiuto | ||
* ... Meglio usare valori piccoli
Prestazioni di gioco
Senza DLSS e tecnologie simili, l'esecuzione alla risoluzione nativa (2.560 × 1.440) può essere a volte un po' impegnativa. I titoli ad alta intensità di CPU, come The Outer Worlds 2, Anno 117 e Black Ops 7 funzionano senza problemi solo con l'upscaling attivato o con impostazioni ridotte.
Le cose sembrano migliori in ARC Raidersad esempio: con le impostazioni massime, il gioco offre un solido 48 FPS. A titolo di confronto, la Qualità DLSS aumenta le prestazioni fino a 76 FPS, mentre la Generazione di fotogrammi 4× la spinge a 174 FPS sulla carta (la fluidità percepita nel mondo reale può variare).
| Final Fantasy XV Benchmark - 1920x1080 High Quality | |
| Schenker XMG Core 16 M25 | |
| Media della classe Gaming (37.9 - 215, n=117, ultimi 2 anni) | |
| Lenovo Legion 7 16IAX10 | |
| Media NVIDIA GeForce RTX 5060 Laptop (107 - 133.6, n=10) | |
| HP Omen 16-ap0091ng | |
| Tulpar T6 V3.5 | |
| Schenker XMG Core 16 VE M25 | |
| basso | medio | alto | ultra | QHD | |
|---|---|---|---|---|---|
| Dota 2 Reborn (2015) | 145.2 | 140.7 | 133.2 | ||
| Final Fantasy XV Benchmark (2018) | 143.9 | 107 | |||
| X-Plane 11.11 (2018) | 97.7 | 79.6 | |||
| Baldur's Gate 3 (2023) | 114.2 | 95.4 | 90.7 | ||
| Cyberpunk 2077 (2023) | 107.6 | 93.4 | 85 | ||
| The Outer Worlds 2 (2025) | 91.7 | 72.7 | 40.9 | 26.7 | |
| ARC Raiders (2025) | 136.7 | 104.9 | 70.2 | 47.8 | |
| Anno 117: Pax Romana (2025) | 91.3 | 67 | 33.9 | 23.4 | |
| Call of Duty Black Ops 7 (2025) | 138 | 103 | 38 | 18 |
| ARC Raiders | |
| 1920x1080 Epic Preset + Epic Raytracing AA:TSR | |
| Acer Predator Helios Neo 16S AI PHN16S-71-94L9 | |
| Schenker XMG Core 16 VE M25 | |
| Media della classe Gaming (43.5 - 89.5, n=10, ultimi 2 anni) | |
| Media NVIDIA GeForce RTX 5060 Laptop (55 - 70.2, n=4) | |
| Tulpar T6 V3.5 | |
| 2560x1440 Epic Preset + Epic Raytracing AA:TSR | |
| Acer Predator Helios Neo 16S AI PHN16S-71-94L9 | |
| Media della classe Gaming (47.8 - 64, n=4, ultimi 2 anni) | |
| Schenker XMG Core 16 VE M25 | |
| Media NVIDIA GeForce RTX 5060 Laptop (n=1) | |
| The Outer Worlds 2 | |
| 1920x1080 Very High Preset AA:T | |
| Acer Predator Helios Neo 16S AI PHN16S-71-94L9 | |
| Schenker XMG Core 16 VE M25 | |
| Media della classe Gaming (26.4 - 53.9, n=10, ultimi 2 anni) | |
| Media NVIDIA GeForce RTX 5060 Laptop (31.1 - 40.9, n=4) | |
| Tulpar T6 V3.5 | |
| 2560x1440 Very High Preset AA:T | |
| Acer Predator Helios Neo 16S AI PHN16S-71-94L9 | |
| Media della classe Gaming (21.5 - 36.1, n=5, ultimi 2 anni) | |
| Schenker XMG Core 16 VE M25 | |
| Media NVIDIA GeForce RTX 5060 Laptop (n=1) | |
| Call of Duty Black Ops 7 | |
| 1920x1080 Extreme Preset + Raytracing | |
| Acer Predator Helios Neo 16S AI PHN16S-71-94L9 | |
| Media della classe Gaming (24 - 60, n=10, ultimi 2 anni) | |
| Schenker XMG Core 16 VE M25 | |
| Media NVIDIA GeForce RTX 5060 Laptop (32 - 38, n=4) | |
| Tulpar T6 V3.5 | |
| 2560x1440 Extreme Preset + Raytracing | |
| Acer Predator Helios Neo 16S AI PHN16S-71-94L9 | |
| Media della classe Gaming (18 - 39, n=6, ultimi 2 anni) | |
| Media NVIDIA GeForce RTX 5060 Laptop (18 - 23, n=2) | |
| Schenker XMG Core 16 VE M25 | |
Cyberpunk 2077 grafico FPS ultra
Emissioni ed energia
Emissioni di rumore
Sotto carico, i livelli di rumore sono simili a quelli dell'HP Omen 16 e del Core 16 "normale". A 49 dB(A) in Cyberpunk 2077le ventole sono chiaramente udibili, ma non eccessivamente rumorose. Al minimo, il portatile da 16 pollici rimane di solito piacevolmente silenzioso. Le ventole si spengono completamente o funzionano a un livello abbastanza discreto.
Rumorosità
| Idle |
| 24 / 27 / 32 dB(A) |
| Sotto carico |
| 41 / 50 dB(A) |
 | ||
30 dB silenzioso 40 dB(A) udibile 50 dB(A) rumoroso |
||
min: | ||
| Schenker XMG Core 16 VE M25 Ryzen 7 255, GeForce RTX 5060 Laptop | Tulpar T6 V3.5 i7-14700HX, GeForce RTX 5060 Laptop | HP Omen 16-ap0091ng R9 8940HX, GeForce RTX 5060 Laptop | Lenovo Legion 7 16IAX10 Ultra 7 255HX, GeForce RTX 5060 Laptop | Schenker XMG Core 16 M25 Ryzen AI 9 HX 370, GeForce RTX 5070 Laptop | Acer Predator Helios Neo 16S AI PHN16S-71-94L9 Ultra 9 275HX, GeForce RTX 5070 Ti Laptop | |
|---|---|---|---|---|---|---|
| Noise | -7% | 1% | 1% | 3% | -9% | |
| off /ambiente * (dB) | 24 | 24 -0% | 23 4% | 23.9 -0% | 24.8 -3% | 24 -0% |
| Idle Minimum * (dB) | 24 | 26 -8% | 23 4% | 24 -0% | 24.8 -3% | 24 -0% |
| Idle Average * (dB) | 27 | 29 -7% | 23 15% | 26 4% | 24.8 8% | 30 -11% |
| Idle Maximum * (dB) | 32 | 31 3% | 27.64 14% | 29.4 8% | 27.1 15% | 35 -9% |
| Load Average * (dB) | 41 | 52 -27% | 49.5 -21% | 35.4 14% | 40.2 2% | 53 -29% |
| Cyberpunk 2077 ultra * (dB) | 49 | 52 -6% | 49.5 -1% | 54.6 -11% | 49.2 -0% | 52 -6% |
| Load Maximum * (dB) | 50 | 53 -6% | 52.73 -5% | 54.7 -9% | 49.2 2% | 54 -8% |
* ... Meglio usare valori piccoli
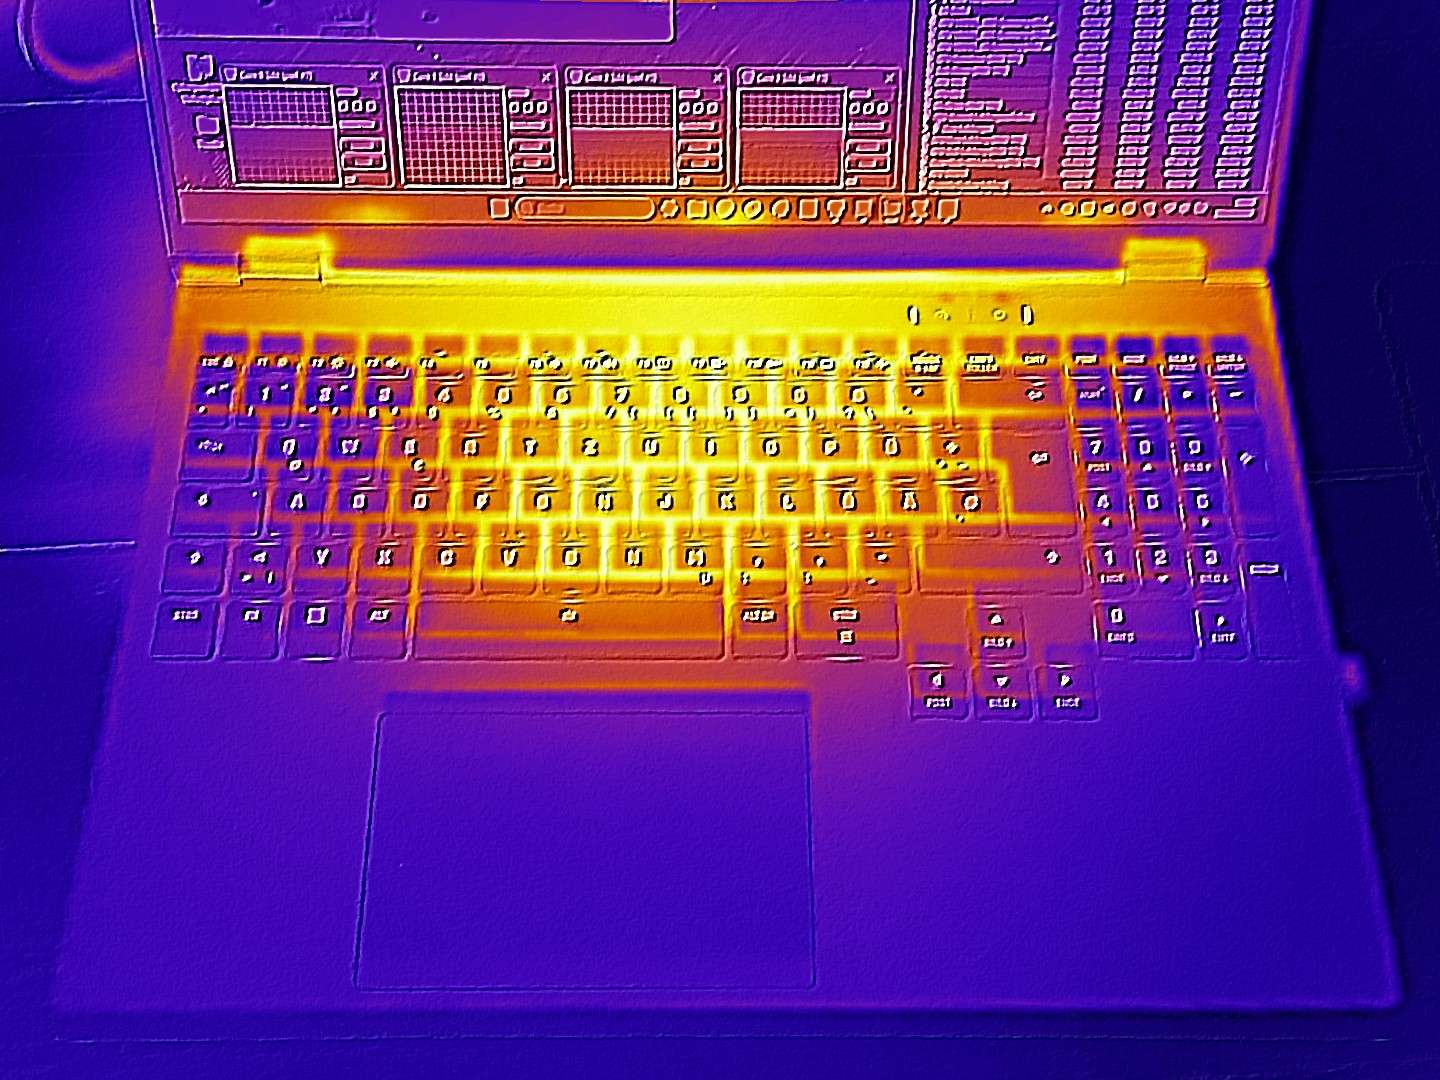
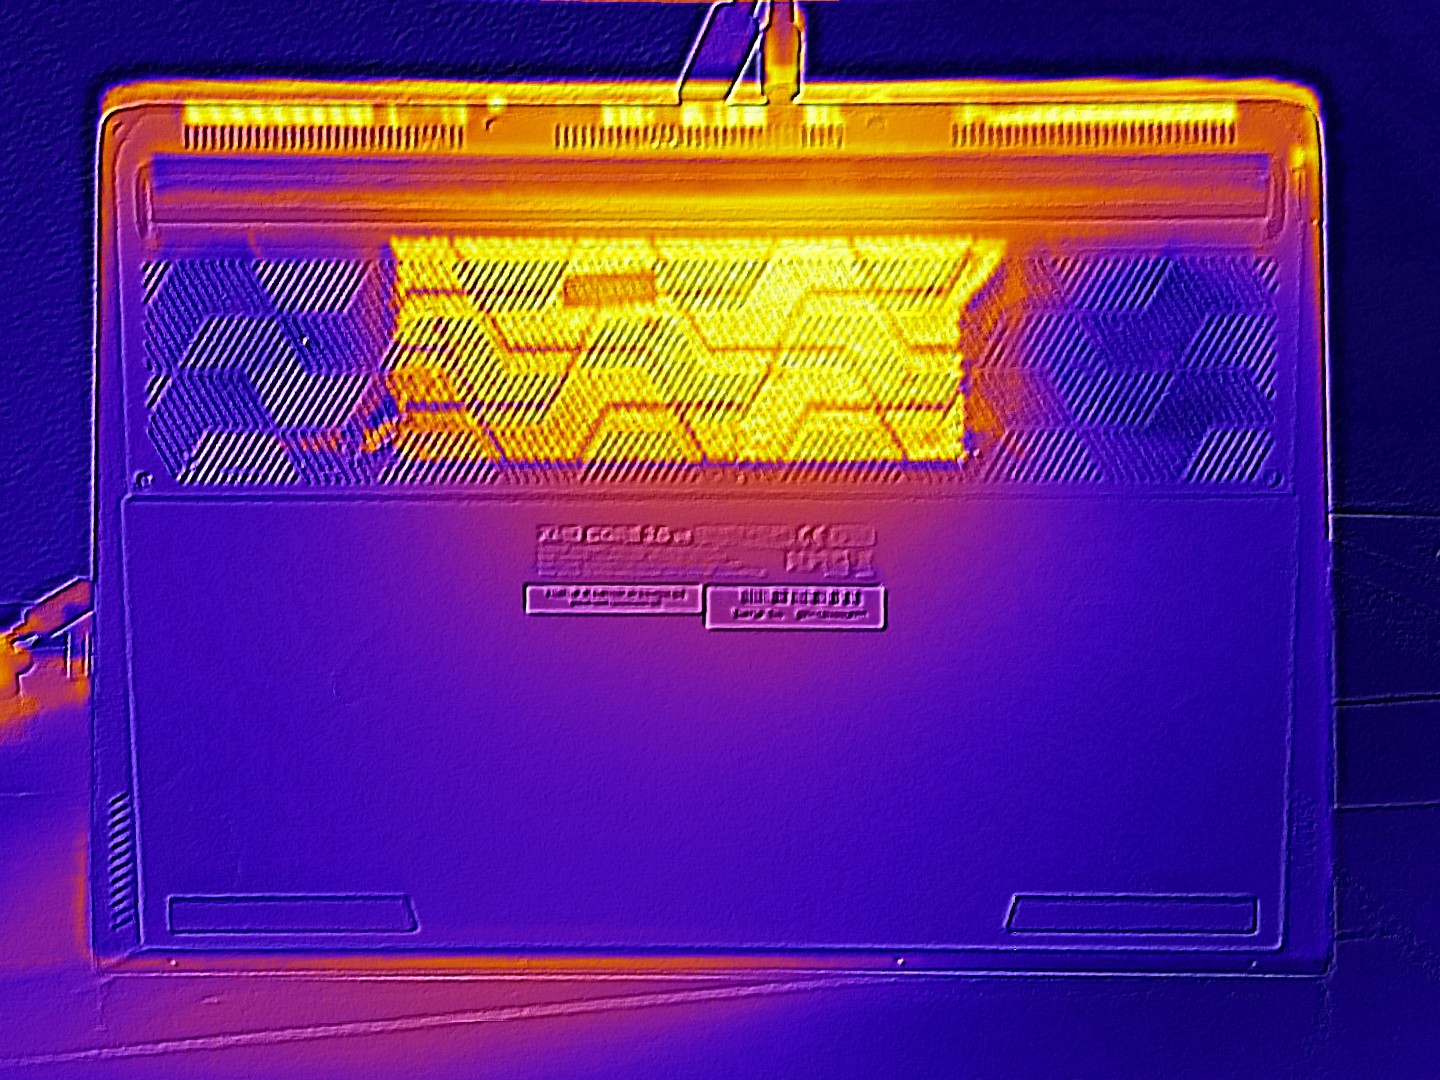
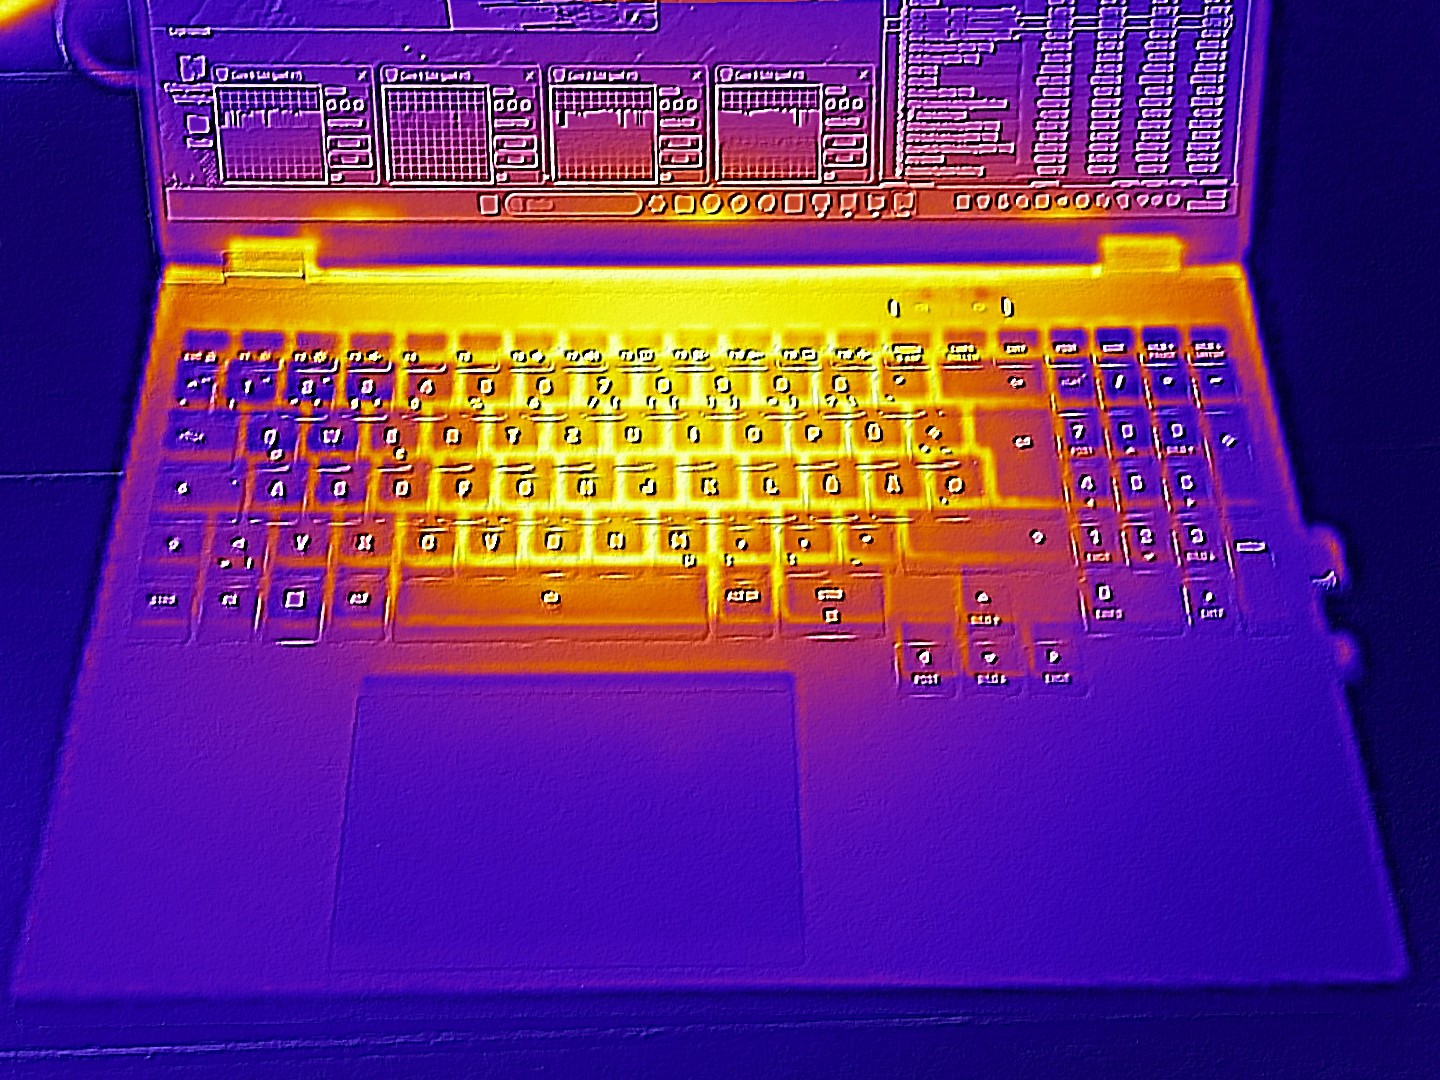
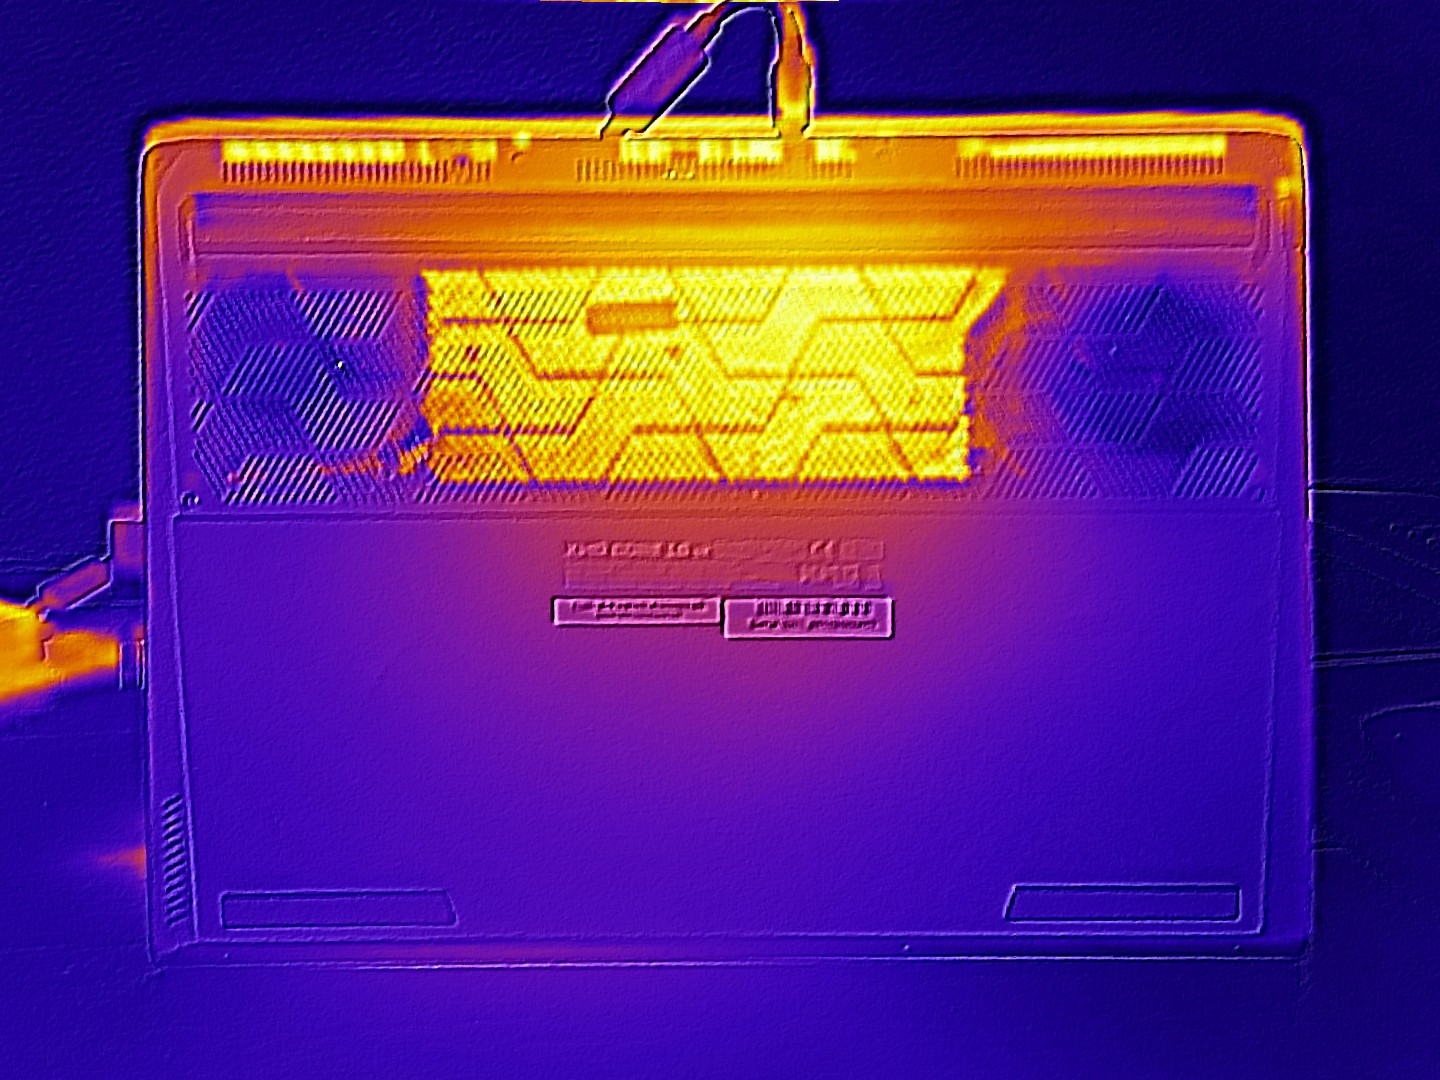
Temperatura
Sotto carico, la parte inferiore dello chassis si riscalda di più, raggiungendo un massimo di 57 °C, mentre la parte superiore raggiunge i 46 °C. In condizioni di inattività, lo chassis si assesta su una temperatura moderata di 25-31 °C.
(-) La temperatura massima sul lato superiore è di 46 °C / 115 F, rispetto alla media di 40.4 °C / 105 F, che varia da 21.2 a 68.8 °C per questa classe Gaming.
(-) Il lato inferiore si riscalda fino ad un massimo di 57 °C / 135 F, rispetto alla media di 43.3 °C / 110 F
(+) In idle, la temperatura media del lato superiore è di 27.3 °C / 81 F, rispetto alla media deld ispositivo di 33.9 °C / 93 F.
(-) 3: The average temperature for the upper side is 39.7 °C / 103 F, compared to the average of 33.9 °C / 93 F for the class Gaming.
(+) I poggiapolsi e il touchpad sono piu' freddi della temperatura della pelle con un massimo di 31 °C / 87.8 F e sono quindi freddi al tatto.
(-) La temperatura media della zona del palmo della mano di dispositivi simili e'stata di 28.8 °C / 83.8 F (-2.2 °C / -4 F).
| Schenker XMG Core 16 VE M25 Ryzen 7 255, GeForce RTX 5060 Laptop | Tulpar T6 V3.5 i7-14700HX, GeForce RTX 5060 Laptop | HP Omen 16-ap0091ng R9 8940HX, GeForce RTX 5060 Laptop | Lenovo Legion 7 16IAX10 Ultra 7 255HX, GeForce RTX 5060 Laptop | Schenker XMG Core 16 M25 Ryzen AI 9 HX 370, GeForce RTX 5070 Laptop | Acer Predator Helios Neo 16S AI PHN16S-71-94L9 Ultra 9 275HX, GeForce RTX 5070 Ti Laptop | |
|---|---|---|---|---|---|---|
| Heat | 4% | 13% | -4% | 0% | 3% | |
| Maximum Upper Side * (°C) | 46 | 40 13% | 36 22% | 47 -2% | 46.7 -2% | 47 -2% |
| Maximum Bottom * (°C) | 57 | 47 18% | 37 35% | 44 23% | 58.5 -3% | 55 4% |
| Idle Upper Side * (°C) | 29 | 30 -3% | 30 -3% | 35.6 -23% | 28.3 2% | 28 3% |
| Idle Bottom * (°C) | 31 | 35 -13% | 32 -3% | 35.2 -14% | 29.9 4% | 29 6% |
* ... Meglio usare valori piccoli
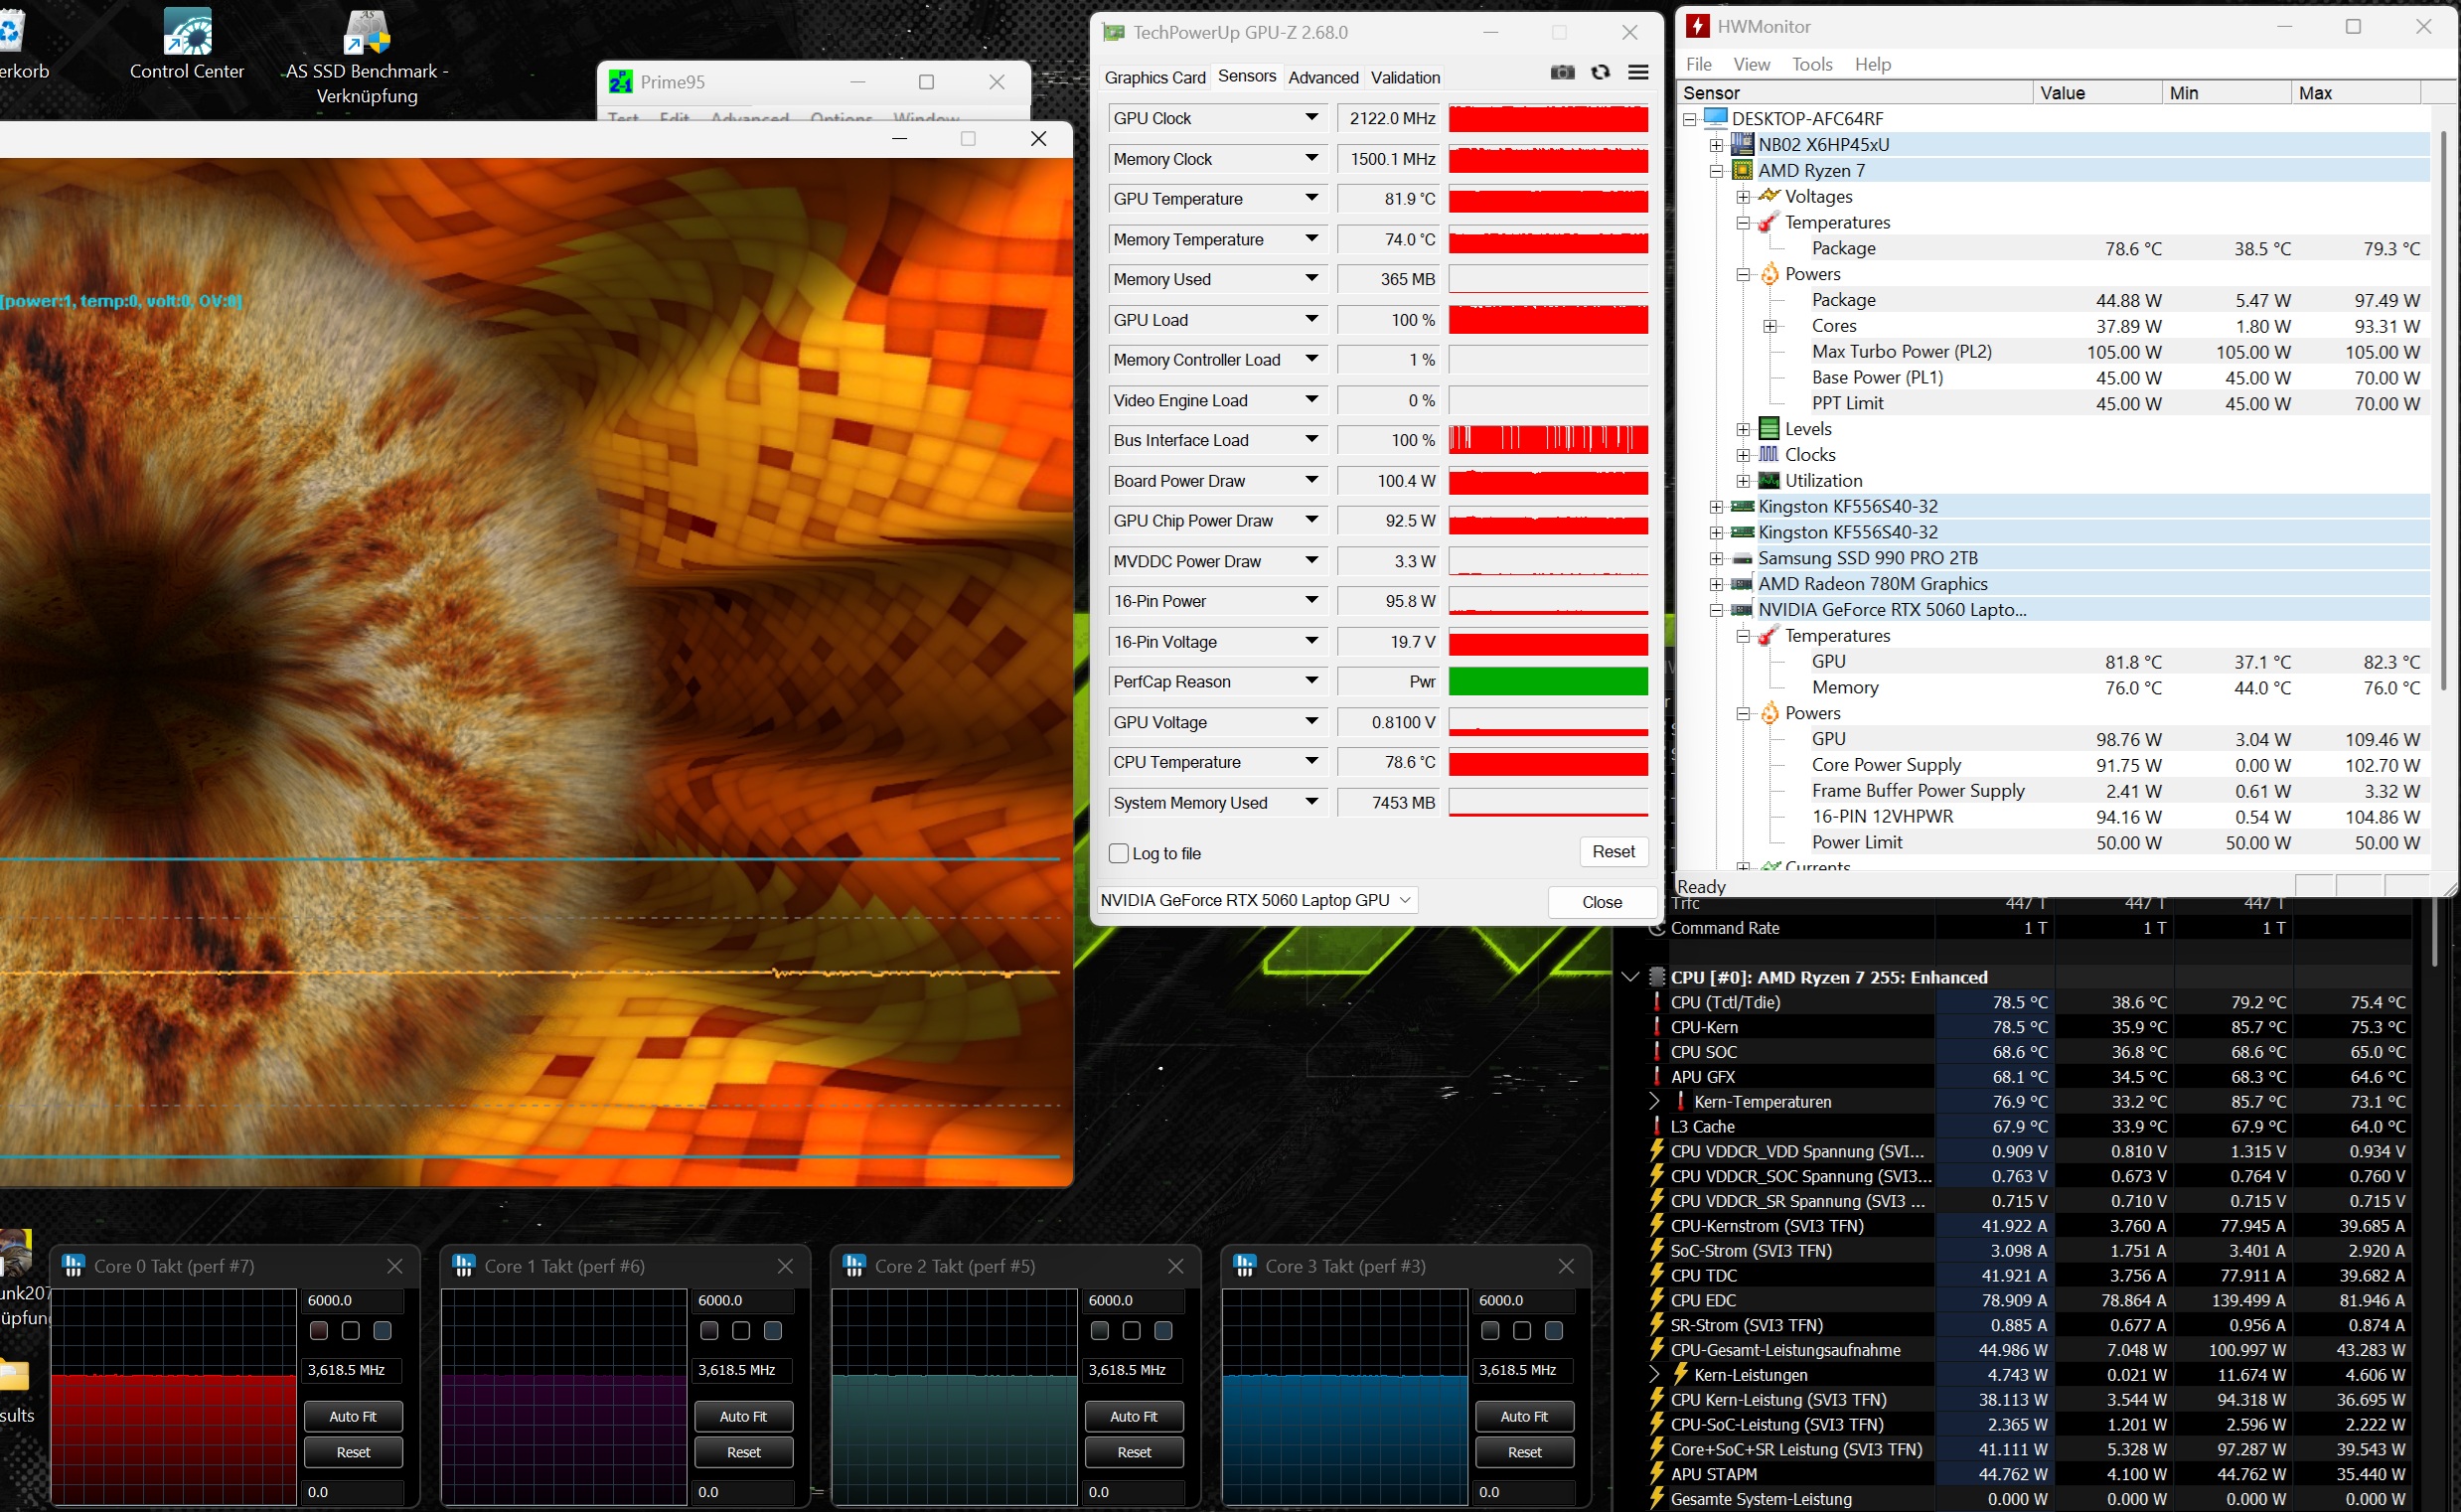
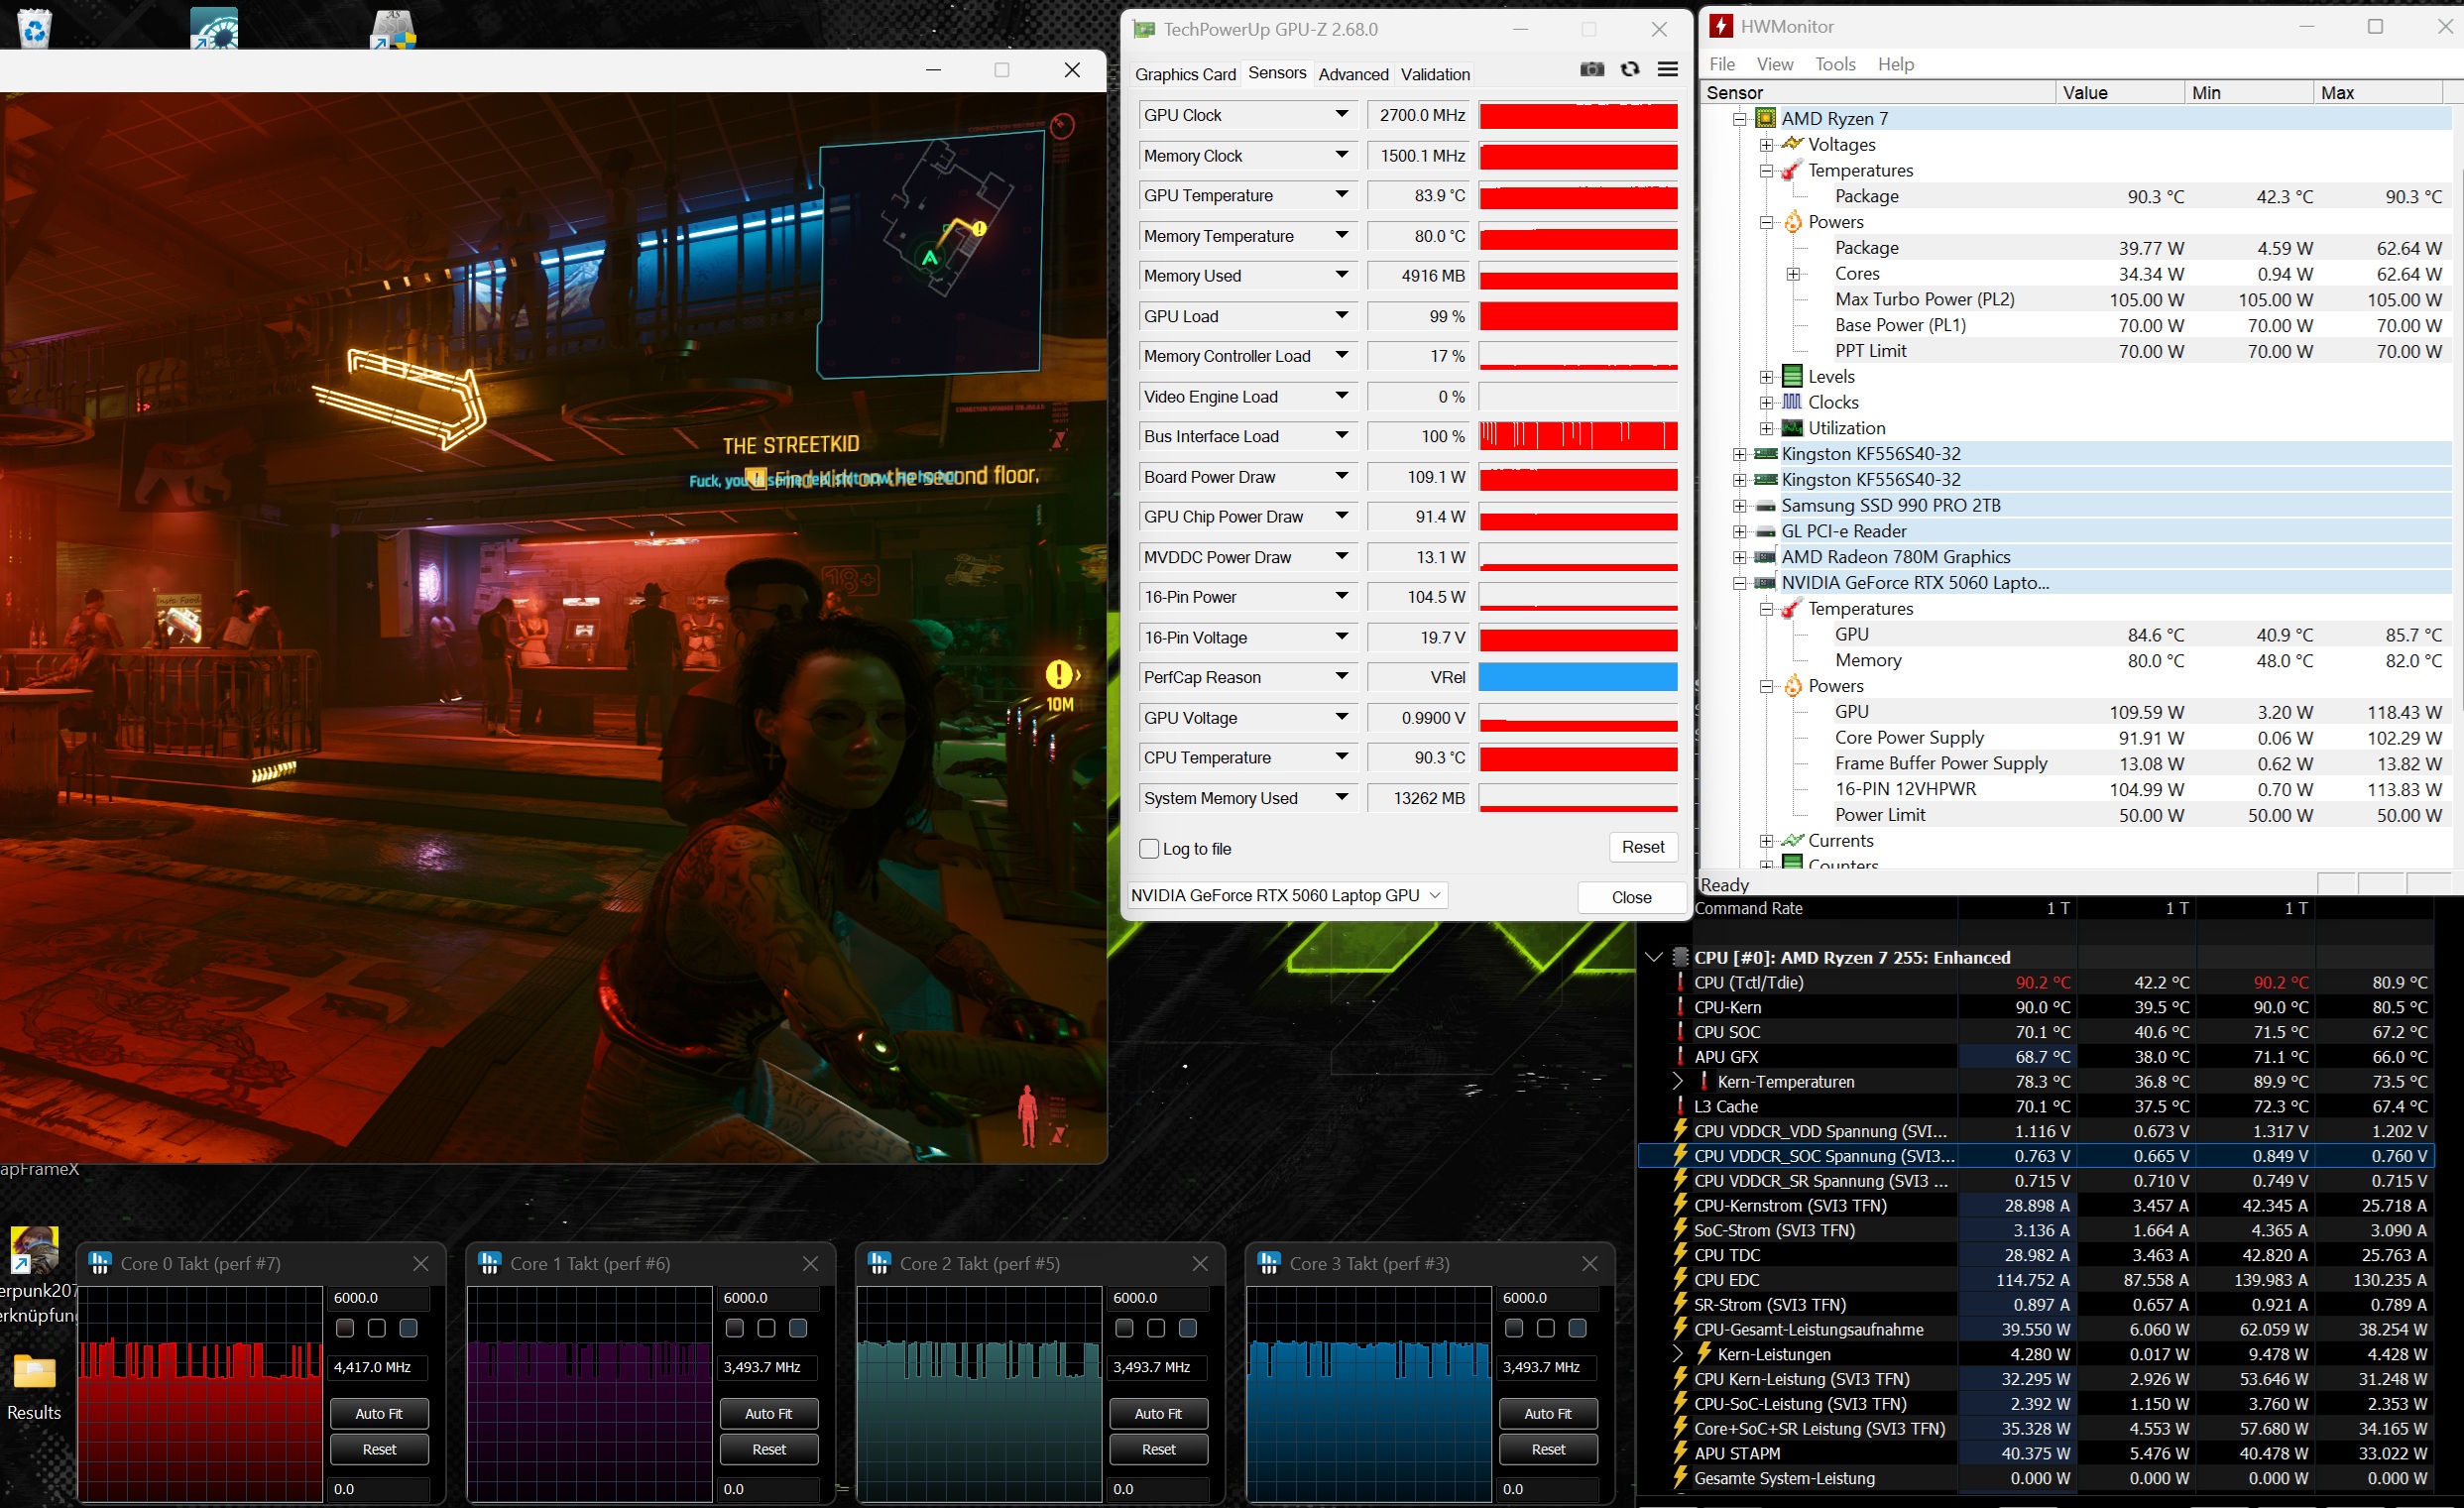
Test da sforzo
Anche i componenti non muoiono di caldo. Il nostro test di stress con gli strumenti Furmark e Prime ha portato la CPU e la GPU a poco meno di 80°C.
Altoparlanti
La qualità del suono è piuttosto debole. Il Lenovo Legion 7 ha prestazioni nettamente migliori in questo ambito.
Schenker XMG Core 16 VE M25 analisi audio
(±) | potenza degli altiparlanti media ma buona (76 dB)
Bassi 100 - 315 Hz
(-) | quasi nessun basso - in media 19.1% inferiori alla media
(±) | la linearità dei bassi è media (10.5% delta rispetto alla precedente frequenza)
Medi 400 - 2000 Hz
(±) | medi elevati - circa 6.3% superiore alla media
(±) | linearità dei medi adeguata (7.2% delta rispetto alla precedente frequenza)
Alti 2 - 16 kHz
(+) | Alti bilanciati - appena 1.8% dalla media
(+) | alti lineari (6% delta rispetto alla precedente frequenza)
Nel complesso 100 - 16.000 Hz
(±) | la linearità complessiva del suono è media (18.7% di differenza rispetto alla media
Rispetto alla stessa classe
» 61% di tutti i dispositivi testati in questa classe è stato migliore, 8% simile, 31% peggiore
» Il migliore ha avuto un delta di 6%, medio di 18%, peggiore di 132%
Rispetto a tutti i dispositivi testati
» 42% di tutti i dispositivi testati in questa classe è stato migliore, 8% similare, 50% peggiore
» Il migliore ha avuto un delta di 4%, medio di 24%, peggiore di 134%
Lenovo Legion 7 16IAX10 analisi audio
(±) | potenza degli altiparlanti media ma buona (77.6 dB)
Bassi 100 - 315 Hz
(±) | bassi ridotti - in media 9.5% inferiori alla media
(±) | la linearità dei bassi è media (9.8% delta rispetto alla precedente frequenza)
Medi 400 - 2000 Hz
(+) | medi bilanciati - solo only 1.5% rispetto alla media
(+) | medi lineari (4% delta rispetto alla precedente frequenza)
Alti 2 - 16 kHz
(+) | Alti bilanciati - appena 3% dalla media
(+) | alti lineari (4.9% delta rispetto alla precedente frequenza)
Nel complesso 100 - 16.000 Hz
(+) | suono nel complesso lineare (11.5% differenza dalla media)
Rispetto alla stessa classe
» 9% di tutti i dispositivi testati in questa classe è stato migliore, 3% simile, 88% peggiore
» Il migliore ha avuto un delta di 6%, medio di 18%, peggiore di 132%
Rispetto a tutti i dispositivi testati
» 7% di tutti i dispositivi testati in questa classe è stato migliore, 2% similare, 90% peggiore
» Il migliore ha avuto un delta di 4%, medio di 24%, peggiore di 134%
Consumo di energia
Consumo di energia
Con 10-19 watt al minimo e 181-246 watt sotto carico, il consumo energetico è in linea con le aspettative.
| Off / Standby | |
| Idle | |
| Sotto carico |
|
Leggenda:
min: | |
| Schenker XMG Core 16 VE M25 Ryzen 7 255, GeForce RTX 5060 Laptop | Tulpar T6 V3.5 i7-14700HX, GeForce RTX 5060 Laptop | HP Omen 16-ap0091ng R9 8940HX, GeForce RTX 5060 Laptop | Lenovo Legion 7 16IAX10 Ultra 7 255HX, GeForce RTX 5060 Laptop | Schenker XMG Core 16 M25 Ryzen AI 9 HX 370, GeForce RTX 5070 Laptop | Acer Predator Helios Neo 16S AI PHN16S-71-94L9 Ultra 9 275HX, GeForce RTX 5070 Ti Laptop | Media della classe Gaming | |
|---|---|---|---|---|---|---|---|
| Power Consumption | 8% | 11% | -12% | 5% | 22% | -28% | |
| Idle Minimum * (Watt) | 10.5 | 6.7 36% | 7.8 26% | 9.4 10% | 7.4 30% | 3.9 63% | 13.5 ? -29% |
| Idle Average * (Watt) | 13 | 13.7 -5% | 8.8 32% | 10.6 18% | 14.9 -15% | 11 15% | 19.3 ? -48% |
| Idle Maximum * (Watt) | 18.8 | 21.8 -16% | 21.5 -14% | 36.4 -94% | 15.2 19% | 16.9 10% | 24.7 ? -31% |
| Cyberpunk 2077 ultra * (Watt) | 182.5 | 156.7 14% | 192 -5% | 188 -3% | 184.8 -1% | 152.7 16% | |
| Cyberpunk 2077 ultra external monitor * (Watt) | 181.1 | 151.9 16% | 164.5 9% | 187.5 -4% | 181.4 -0% | 144.9 20% | |
| Load Maximum * (Watt) | 246 | 242 2% | 208 15% | 247 -0% | 251.1 -2% | 229 7% | 254 ? -3% |
| Load Average * (Watt) | 127 | 119 | 107.7 | 100.8 | 123 | 108.6 ? |
* ... Meglio usare valori piccoli
consumo energetico Cyberpunk / Stress test
consumo energetico con monitor esterno
Durata della batteria
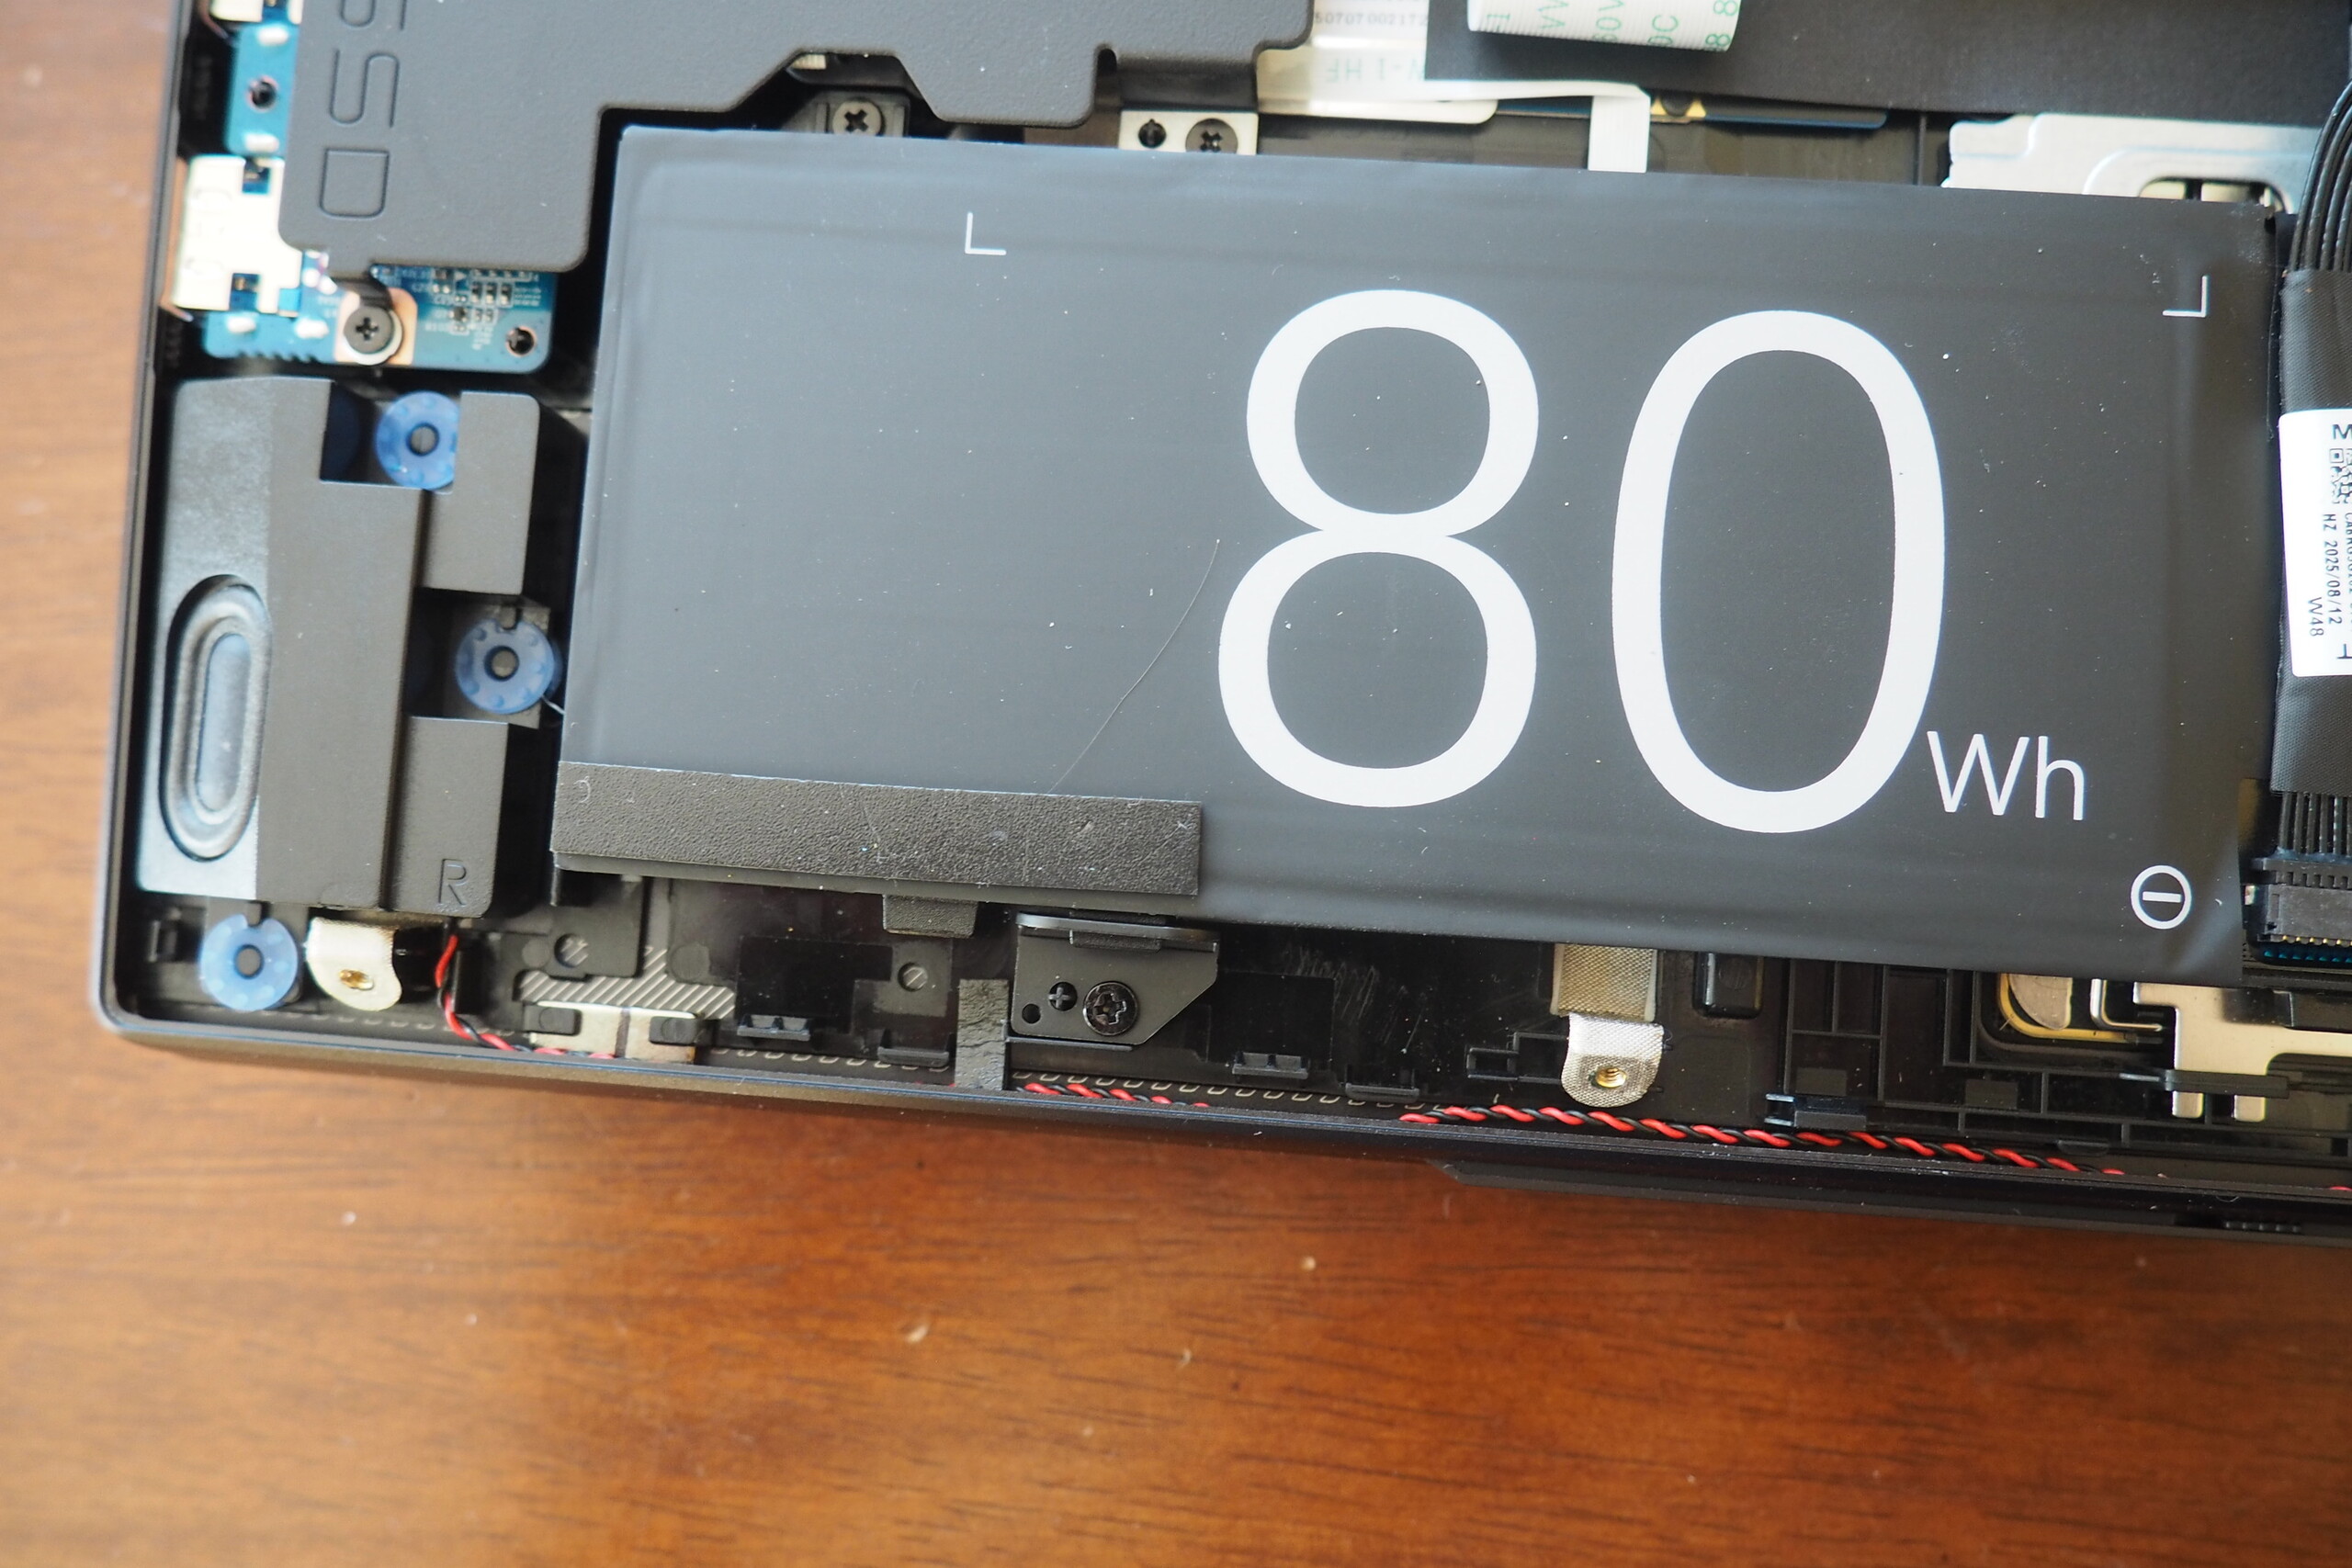
Descriviamo la durata della batteria come relativamente buona. Quasi nessun dispositivo paragonabile è riuscito a superare le 7 ore nel nostro test Wi-Fi (luminosità ridotta a 150 cd/m²). Il Core 16 normale, dotato di una batteria da 99 Wh anziché 80 Wh, raggiunge addirittura circa 11 ore.
| Schenker XMG Core 16 VE M25 Ryzen 7 255, GeForce RTX 5060 Laptop, 80 Wh | Tulpar T6 V3.5 i7-14700HX, GeForce RTX 5060 Laptop, 53.35 Wh | HP Omen 16-ap0091ng R9 8940HX, GeForce RTX 5060 Laptop, 70 Wh | Lenovo Legion 7 16IAX10 Ultra 7 255HX, GeForce RTX 5060 Laptop, 84 Wh | Schenker XMG Core 16 M25 Ryzen AI 9 HX 370, GeForce RTX 5070 Laptop, 99.8 Wh | Acer Predator Helios Neo 16S AI PHN16S-71-94L9 Ultra 9 275HX, GeForce RTX 5070 Ti Laptop, 76 Wh | Media della classe Gaming | |
|---|---|---|---|---|---|---|---|
| Autonomia della batteria | -40% | -32% | -36% | 49% | -32% | -7% | |
| WiFi v1.3 (h) | 7.3 | 4.4 -40% | 5 -32% | 4.7 -36% | 10.9 49% | 5 -32% | 6.8 ? -7% |
| H.264 (h) | 5.1 | 8.02 ? | |||||
| Load (h) | 1.3 | 1.512 ? |
Valutazione complessiva di Notebookcheck
Anche se l'XMG Core 16 VE non è all'altezza del modello Lenovo Legion 7 16si dimostra comunque un computer portatile per il gioco di alta qualità e ben assortito, con pochissimi punti deboli.
Schenker XMG Core 16 VE M25
- 01/09/2026 v8
Florian Glaser
 Total Sustainability Score:
 Possibili alternative a confronto
Immagine | Modello | Prezzo | Peso | Altezza | Schermo |
|---|---|---|---|---|---|
1. 83.9%  | Schenker XMG Core 16 VE M25 AMD Ryzen 7 255 ⎘ NVIDIA GeForce RTX 5060 Laptop ⎘ 64 GB Memoria, 2048 GB SSD | Amazon: Prezzo di listino: 1935 EUR | 2.1 kg | 23 mm | 16.00" 2560x1600 189 PPI IPS |
2. 77.8%  | Tulpar T6 V3.5 Intel Core i7-14700HX ⎘ NVIDIA GeForce RTX 5060 Laptop ⎘ 32 GB Memoria, 1000 GB SSD | Prezzo di listino: 1160 EUR | 2.4 kg | 25 mm | 16.00" 1920x1200 142 PPI IPS |
3. 82.5%  | HP Omen 16-ap0091ng AMD Ryzen 9 8940HX ⎘ NVIDIA GeForce RTX 5060 Laptop ⎘ 16 GB Memoria, 1000 GB SSD | Amazon: Prezzo di listino: 1500 Euro | 2.4 kg | 23.7 mm | 16.00" 1920x1200 162 PPI IPS |
4. 86.6%  | Lenovo Legion 7 16IAX10 Intel Core Ultra 7 255HX ⎘ NVIDIA GeForce RTX 5060 Laptop ⎘ 32 GB Memoria, 1024 GB SSD | Prezzo di listino: 1650 USD | 2 kg | 17.9 mm | 16.00" 2560x1600 189 PPI OLED |
5. 86.2%  | Schenker XMG Core 16 M25 AMD Ryzen AI 9 HX 370 ⎘ NVIDIA GeForce RTX 5070 Laptop ⎘ 64 GB Memoria, 2048 GB SSD | Prezzo di listino: 2100€ | 2.1 kg | 23 mm | 16.00" 2560x1600 189 PPI IPS |
6. 82%  | Acer Predator Helios Neo 16S AI PHN16S-71-94L9 Intel Core Ultra 9 275HX ⎘ NVIDIA GeForce RTX 5070 Ti Laptop ⎘ 32 GB Memoria, 1024 GB SSD | Amazon: Prezzo di listino: 2400 EUR | 2.2 kg | 19.9 mm | 16.00" 2560x1600 189 PPI OLED |
Transparency
La selezione dei dispositivi da recensire viene effettuata dalla nostra redazione. Il campione di prova è stato fornito all'autore come prestito dal produttore o dal rivenditore ai fini di questa recensione. L'istituto di credito non ha avuto alcuna influenza su questa recensione, né il produttore ne ha ricevuto una copia prima della pubblicazione. Non vi era alcun obbligo di pubblicare questa recensione. In quanto società mediatica indipendente, Notebookcheck non è soggetta all'autorità di produttori, rivenditori o editori.
Ecco come Notebookcheck esegue i test
Ogni anno, Notebookcheck esamina in modo indipendente centinaia di laptop e smartphone utilizzando procedure standardizzate per garantire che tutti i risultati siano comparabili. Da circa 20 anni sviluppiamo continuamente i nostri metodi di prova e nel frattempo stabiliamo gli standard di settore. Nei nostri laboratori di prova, tecnici ed editori esperti utilizzano apparecchiature di misurazione di alta qualità. Questi test comportano un processo di validazione in più fasi. Il nostro complesso sistema di valutazione si basa su centinaia di misurazioni e parametri di riferimento ben fondati, che mantengono l'obiettività.