Verdetto - L'XMG Apex 17 vale la pena?
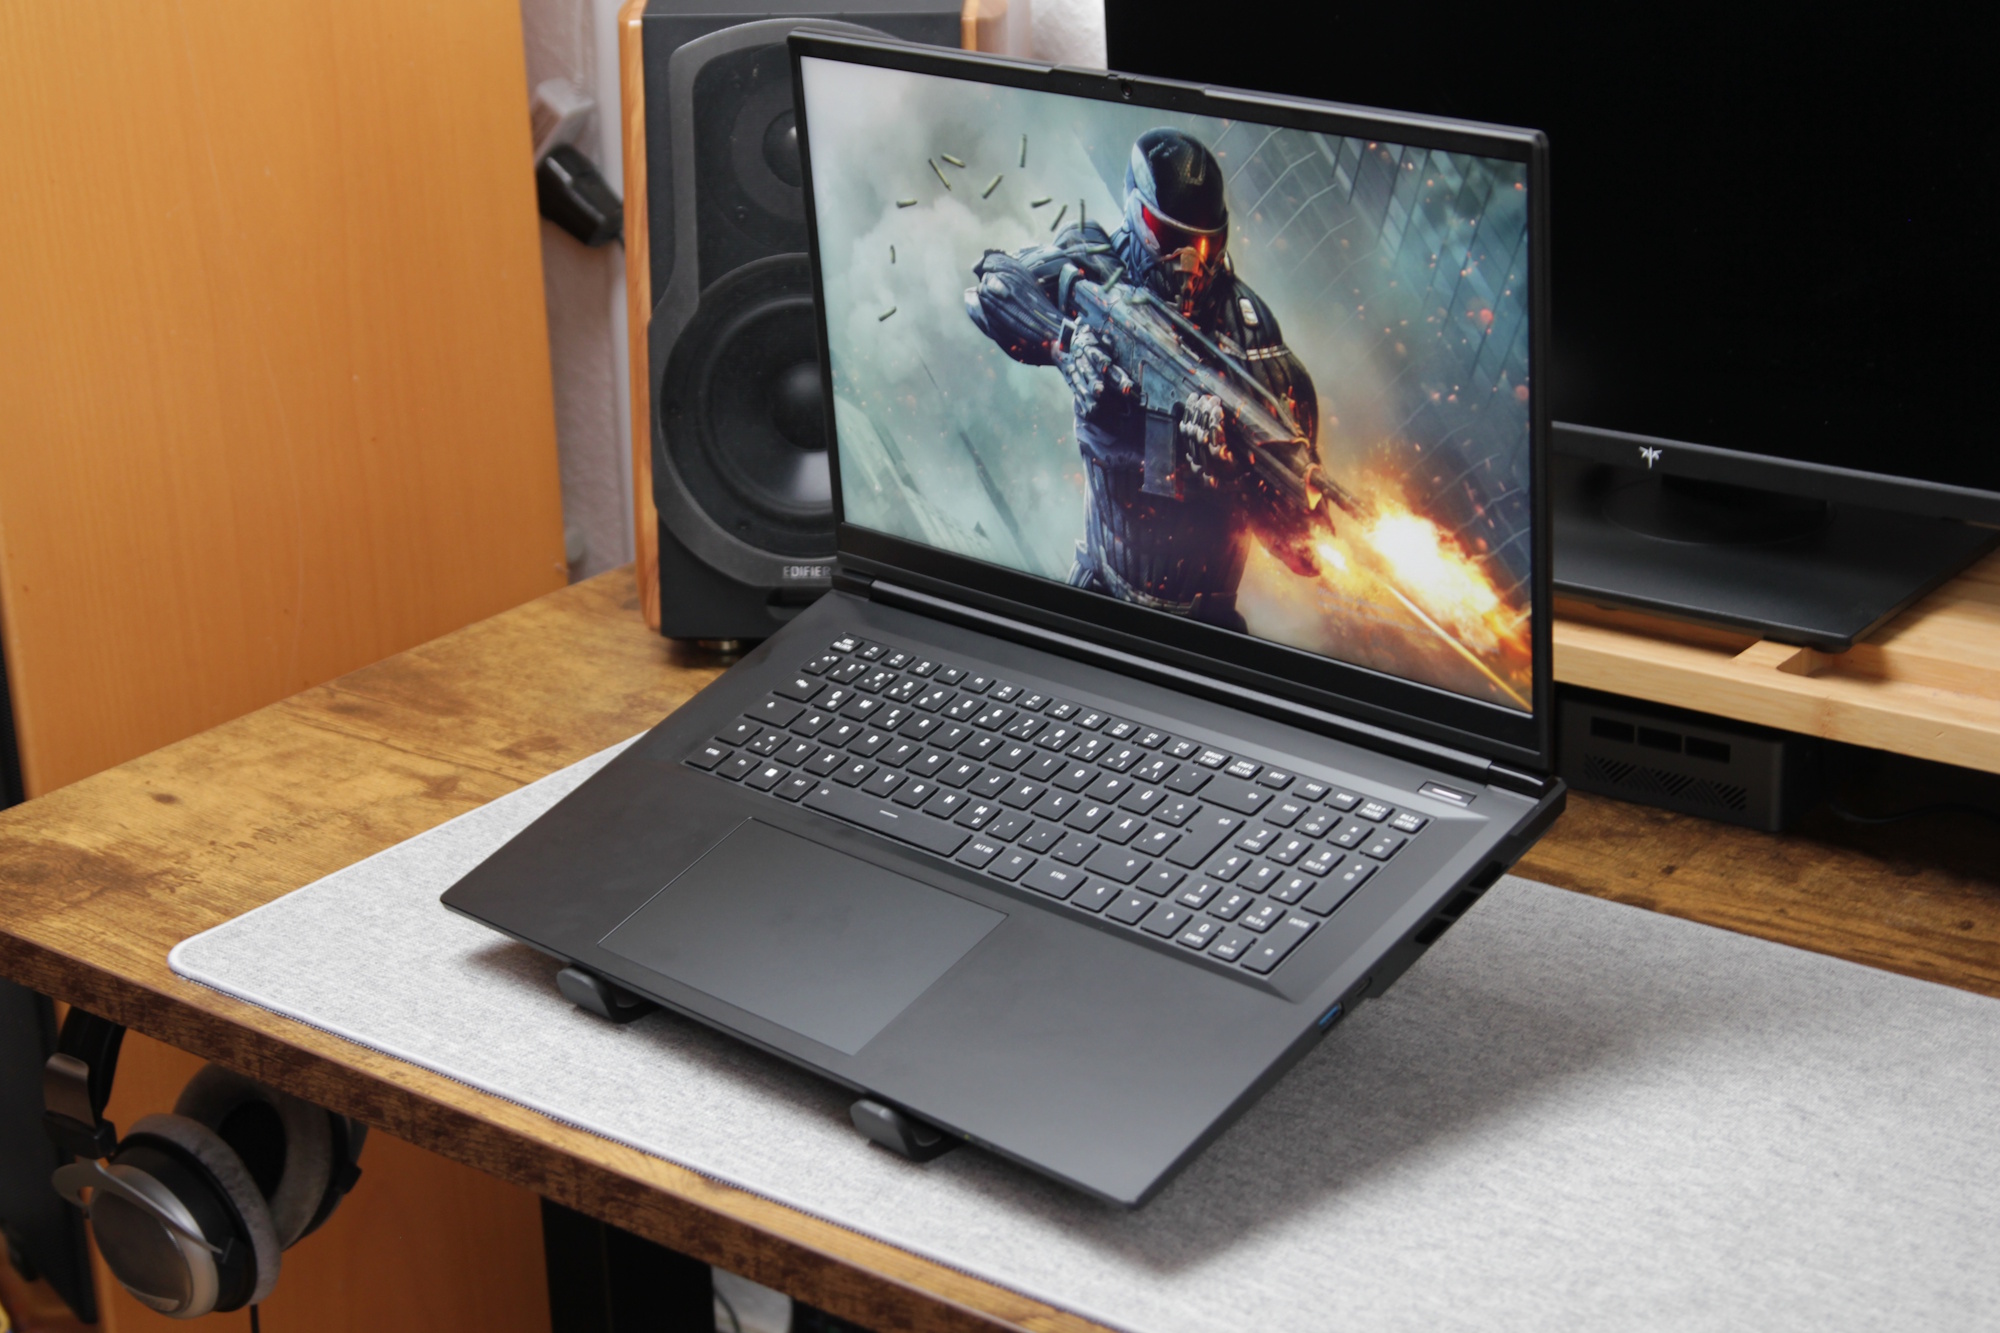
Con Apex 17, Schenker/XMG offre ancora una volta prestazioni senza limiti in uno chassis pulito e sobrio. La combinazione di un Ryzen 9 9955HX molto veloce, di una RTX 5060 scatenata, di un solido display a 1440p, di un Wi-Fi veloce e di un'unità SSD veloce costituisce un pacchetto complessivo convincente.
L'Apex 17 si rivolge in modo deciso ai giocatori che desiderano il laptop RTX 5060 più veloce possibile a un prezzo ragionevole. Anche nella modalità Entertainment, notevolmente più silenziosa, le prestazioni non sono inferiori alla concorrenza.
Il rovescio della medaglia di queste prestazioni elevate sono i livelli di rumore e il consumo energetico altrettanto elevati in modalità Performance. Anche la selezione delle porte potrebbe essere più moderna.
Pro
Contro
Prezzo e disponibilità
Il prezzo parte da 1.899 euro tramite bestware (circa 2.251 dollari). La nostra configurazione di prova, dotata dell'SSD più grande, ha un prezzo di 2.084 euro.
Sommario
- Verdetto - L'XMG Apex 17 vale la pena?
- Specifiche - Ryzen 9 9955HX & RTX 5060
- Telaio e connettività - Design pulito da 17 pollici, con alcune limitazioni delle porte
- Dispositivi di input - Corsa dei tasti ridotta, touchpad grande da 15 cm
- Display - Quanto è buono il pannello QHD 240 Hz?
- Prestazioni - Quanto è davvero veloce l'Apex 17?
- Emissioni e potenza - Quanto è rumoroso l'Apex 17 sotto carico di gioco?
- Possibili alternative a confronto
Recentemente abbiamo recensito il Apex 16 Maxche offriva prestazioni di gioco complete e un pannello Mini-LED - ma a 2.800 euro, non è adatto a tutti. Ecco perché stiamo esaminando più da vicino l'Apex 17 a 1.899 euro. Offre un livello simile di prestazioni ed esperienza per un prezzo significativamente inferiore? Scopriamolo.
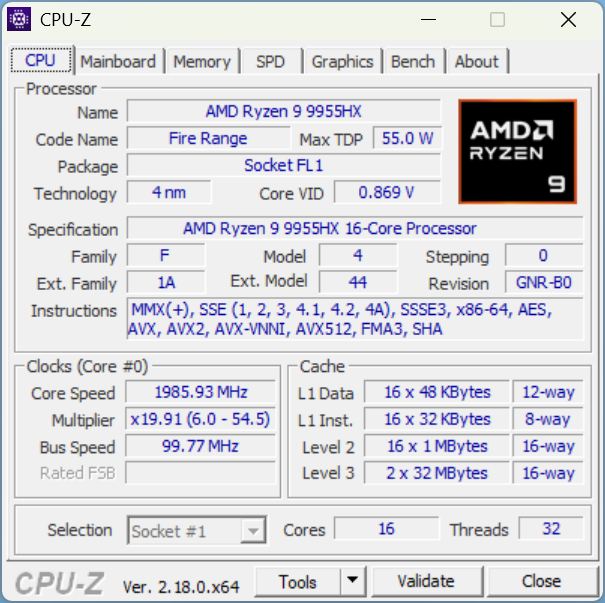
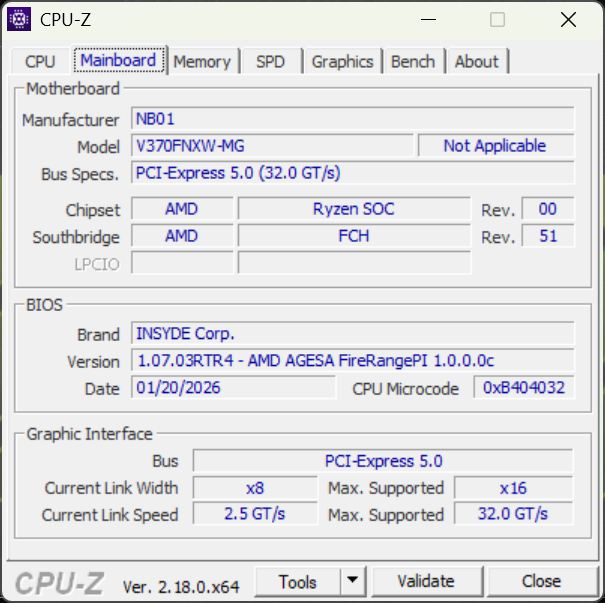
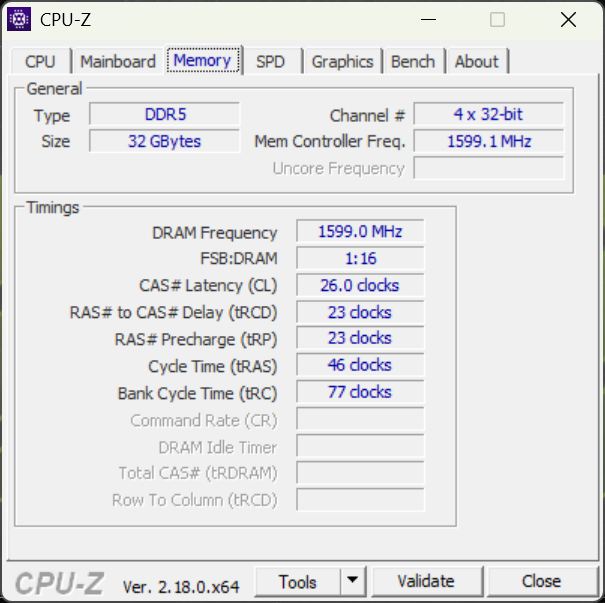
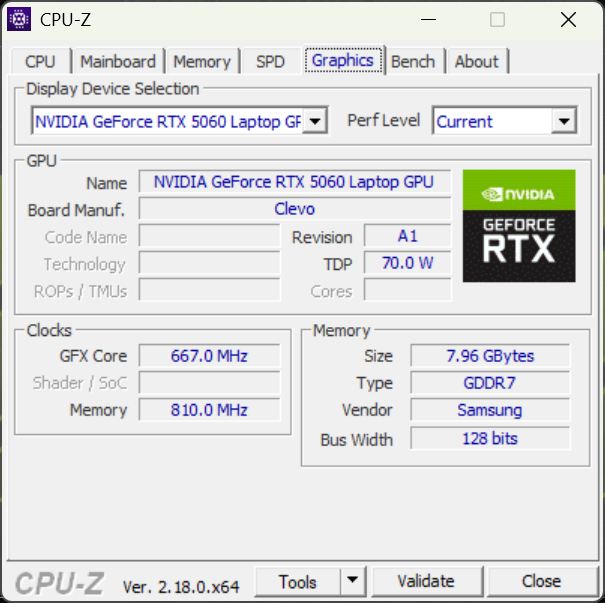
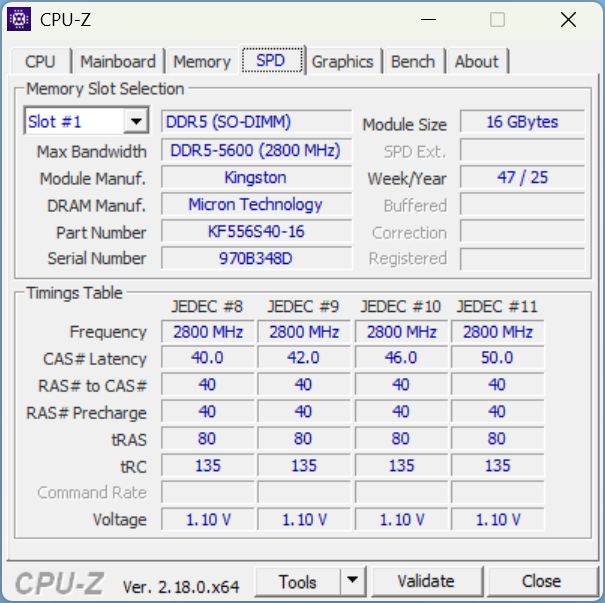
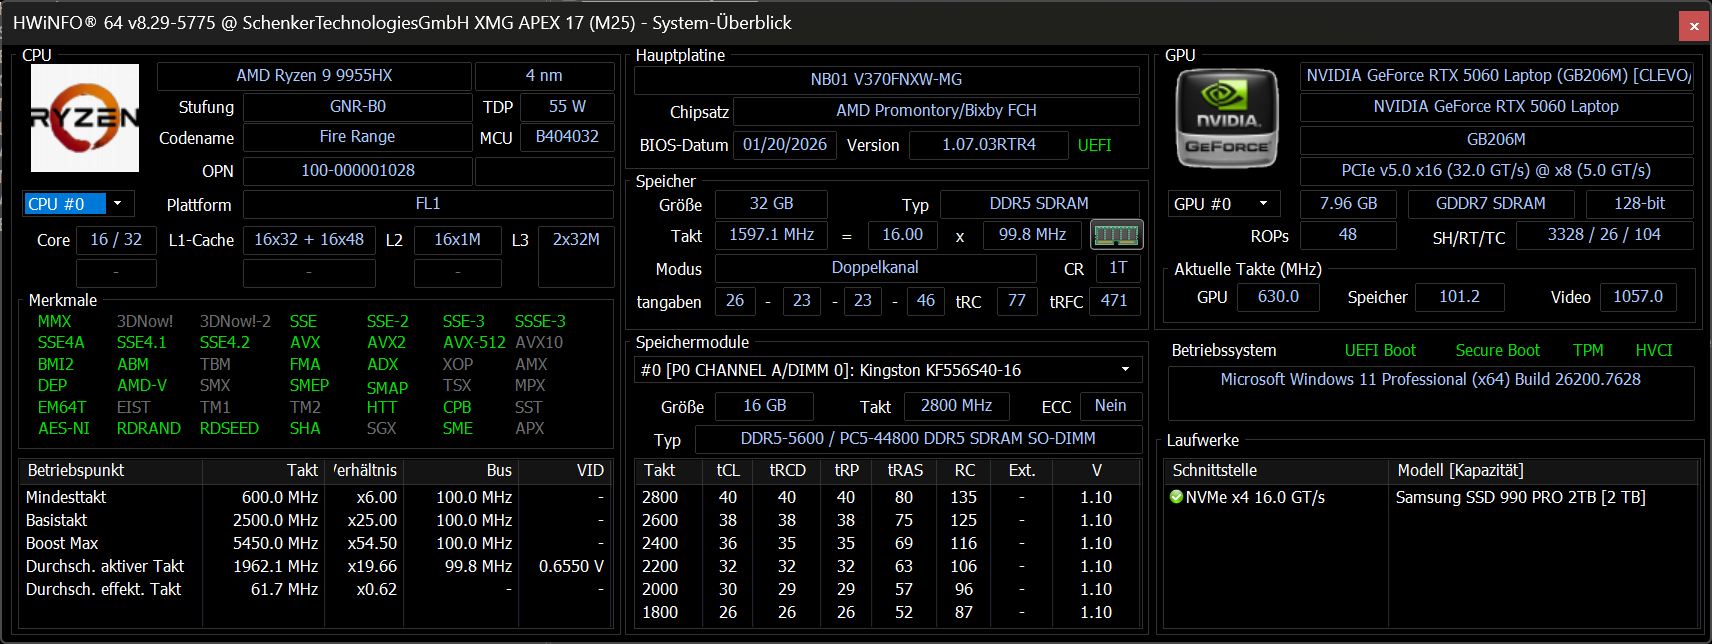
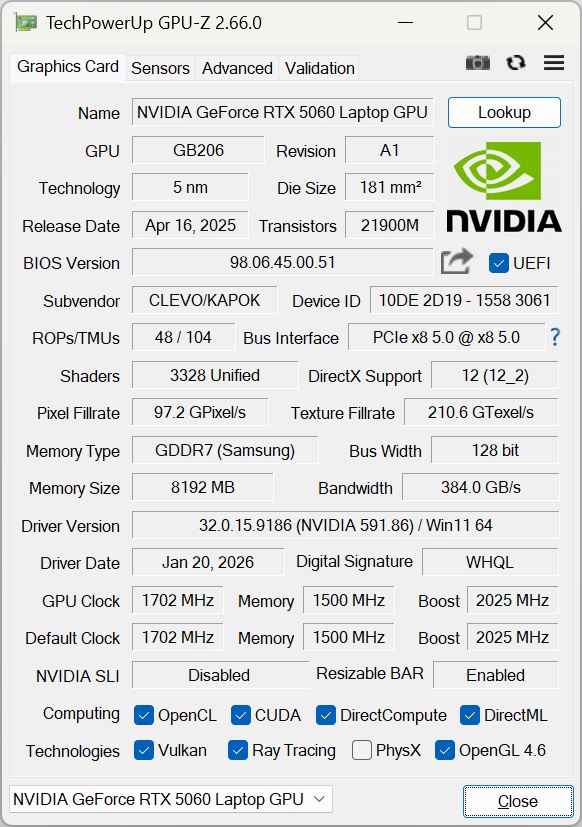
Specifiche - Ryzen 9 9955HX & RTX 5060
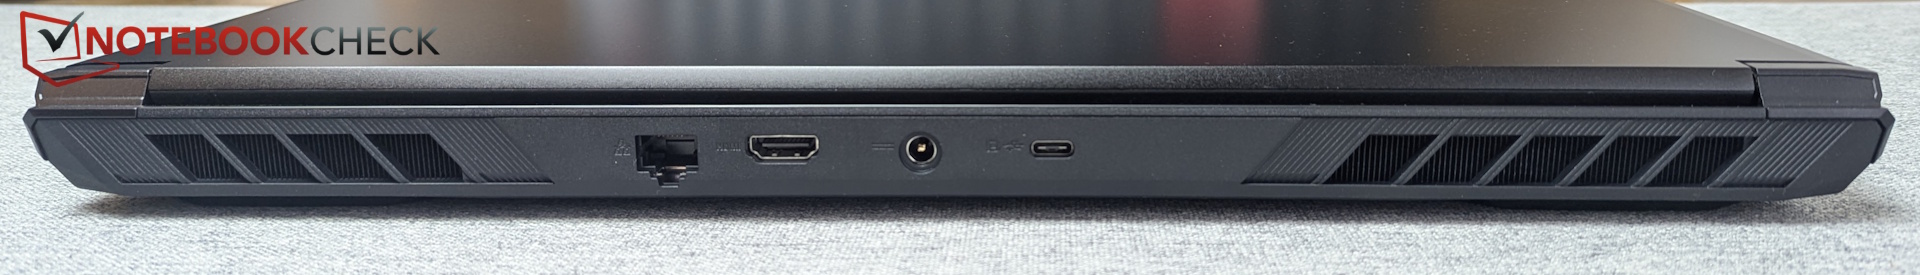
Telaio e connettività - Design pulito da 17 pollici, con alcune limitazioni delle porte
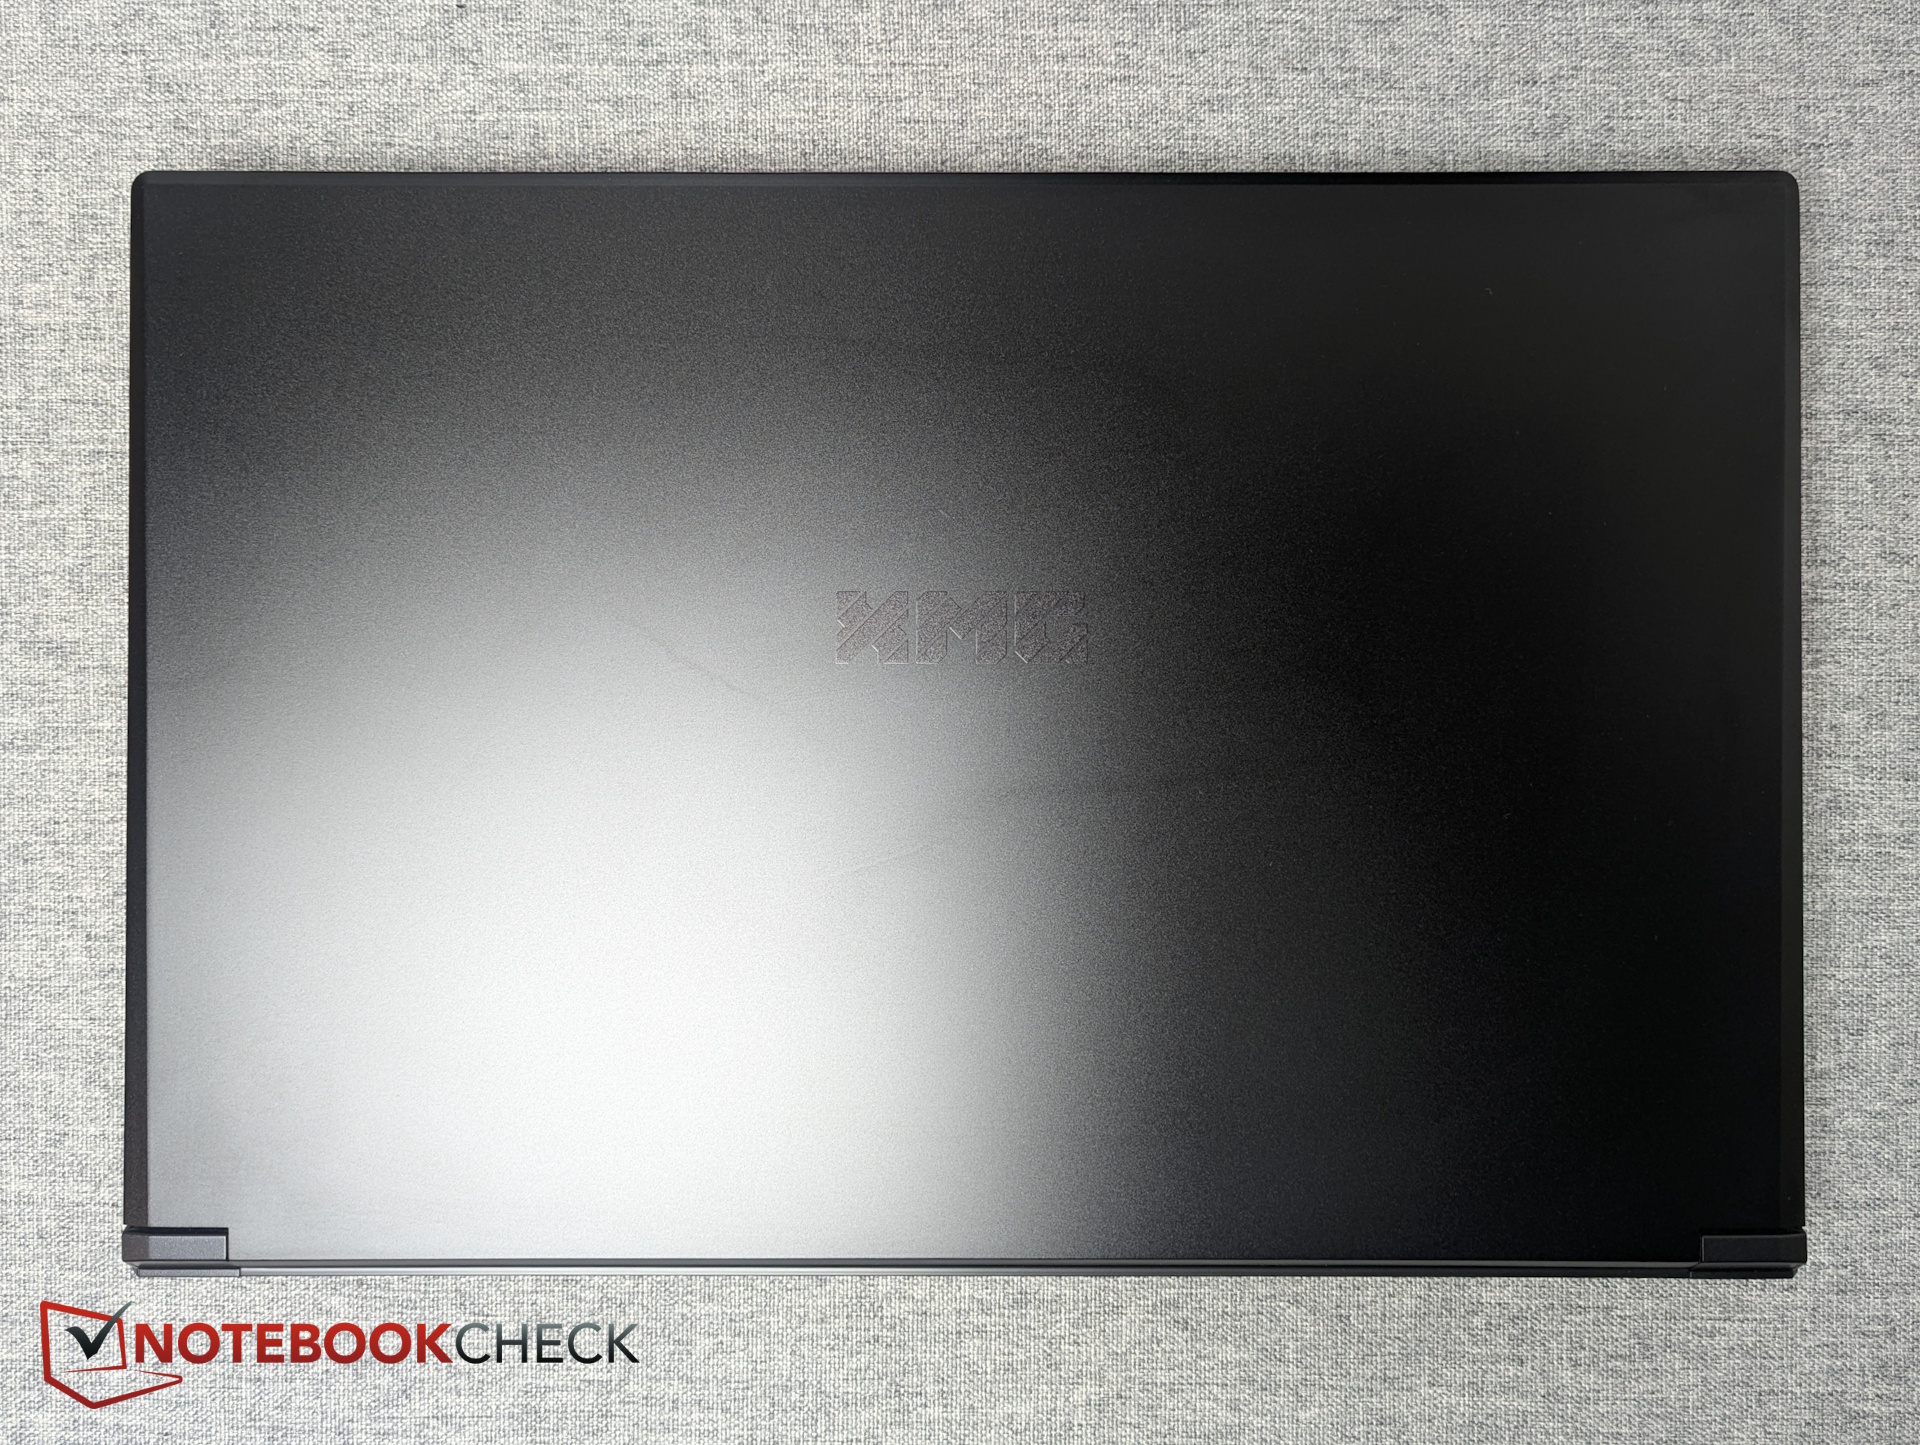
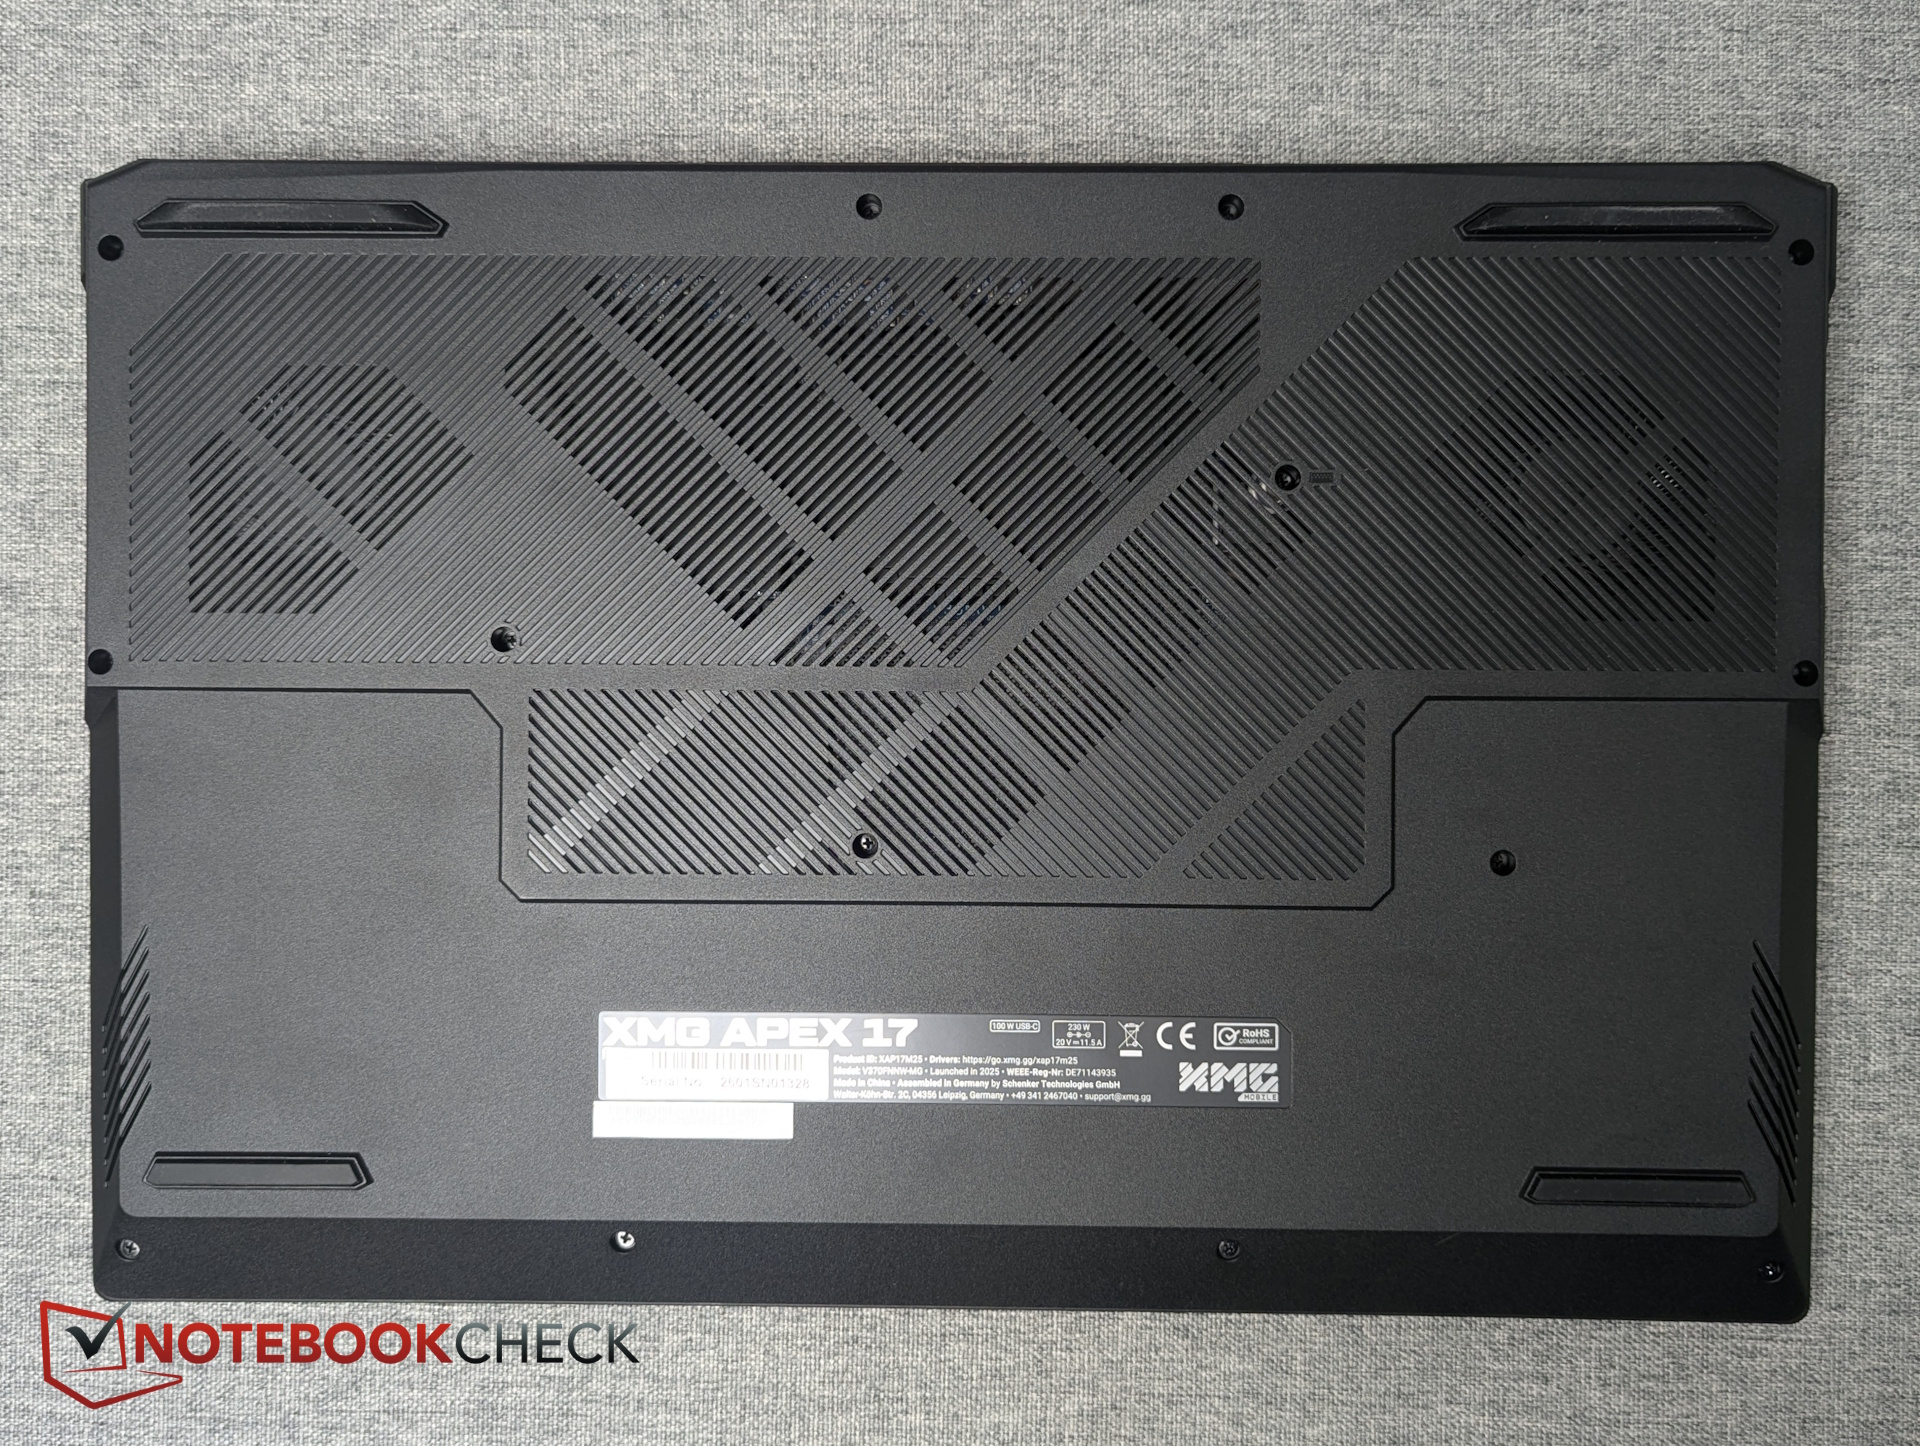
Visivamente, il robusto e sobrio chassis nero è più vicino al Focus 17 M25 che all'Apex 16 Max. Il coperchio è in metallo (e soggetto a impronte digitali), mentre il resto dello chassis utilizza plastica rigida. All'interno, troverà due slot SO-DIMM e due slot M.2 PCIe 4.0.
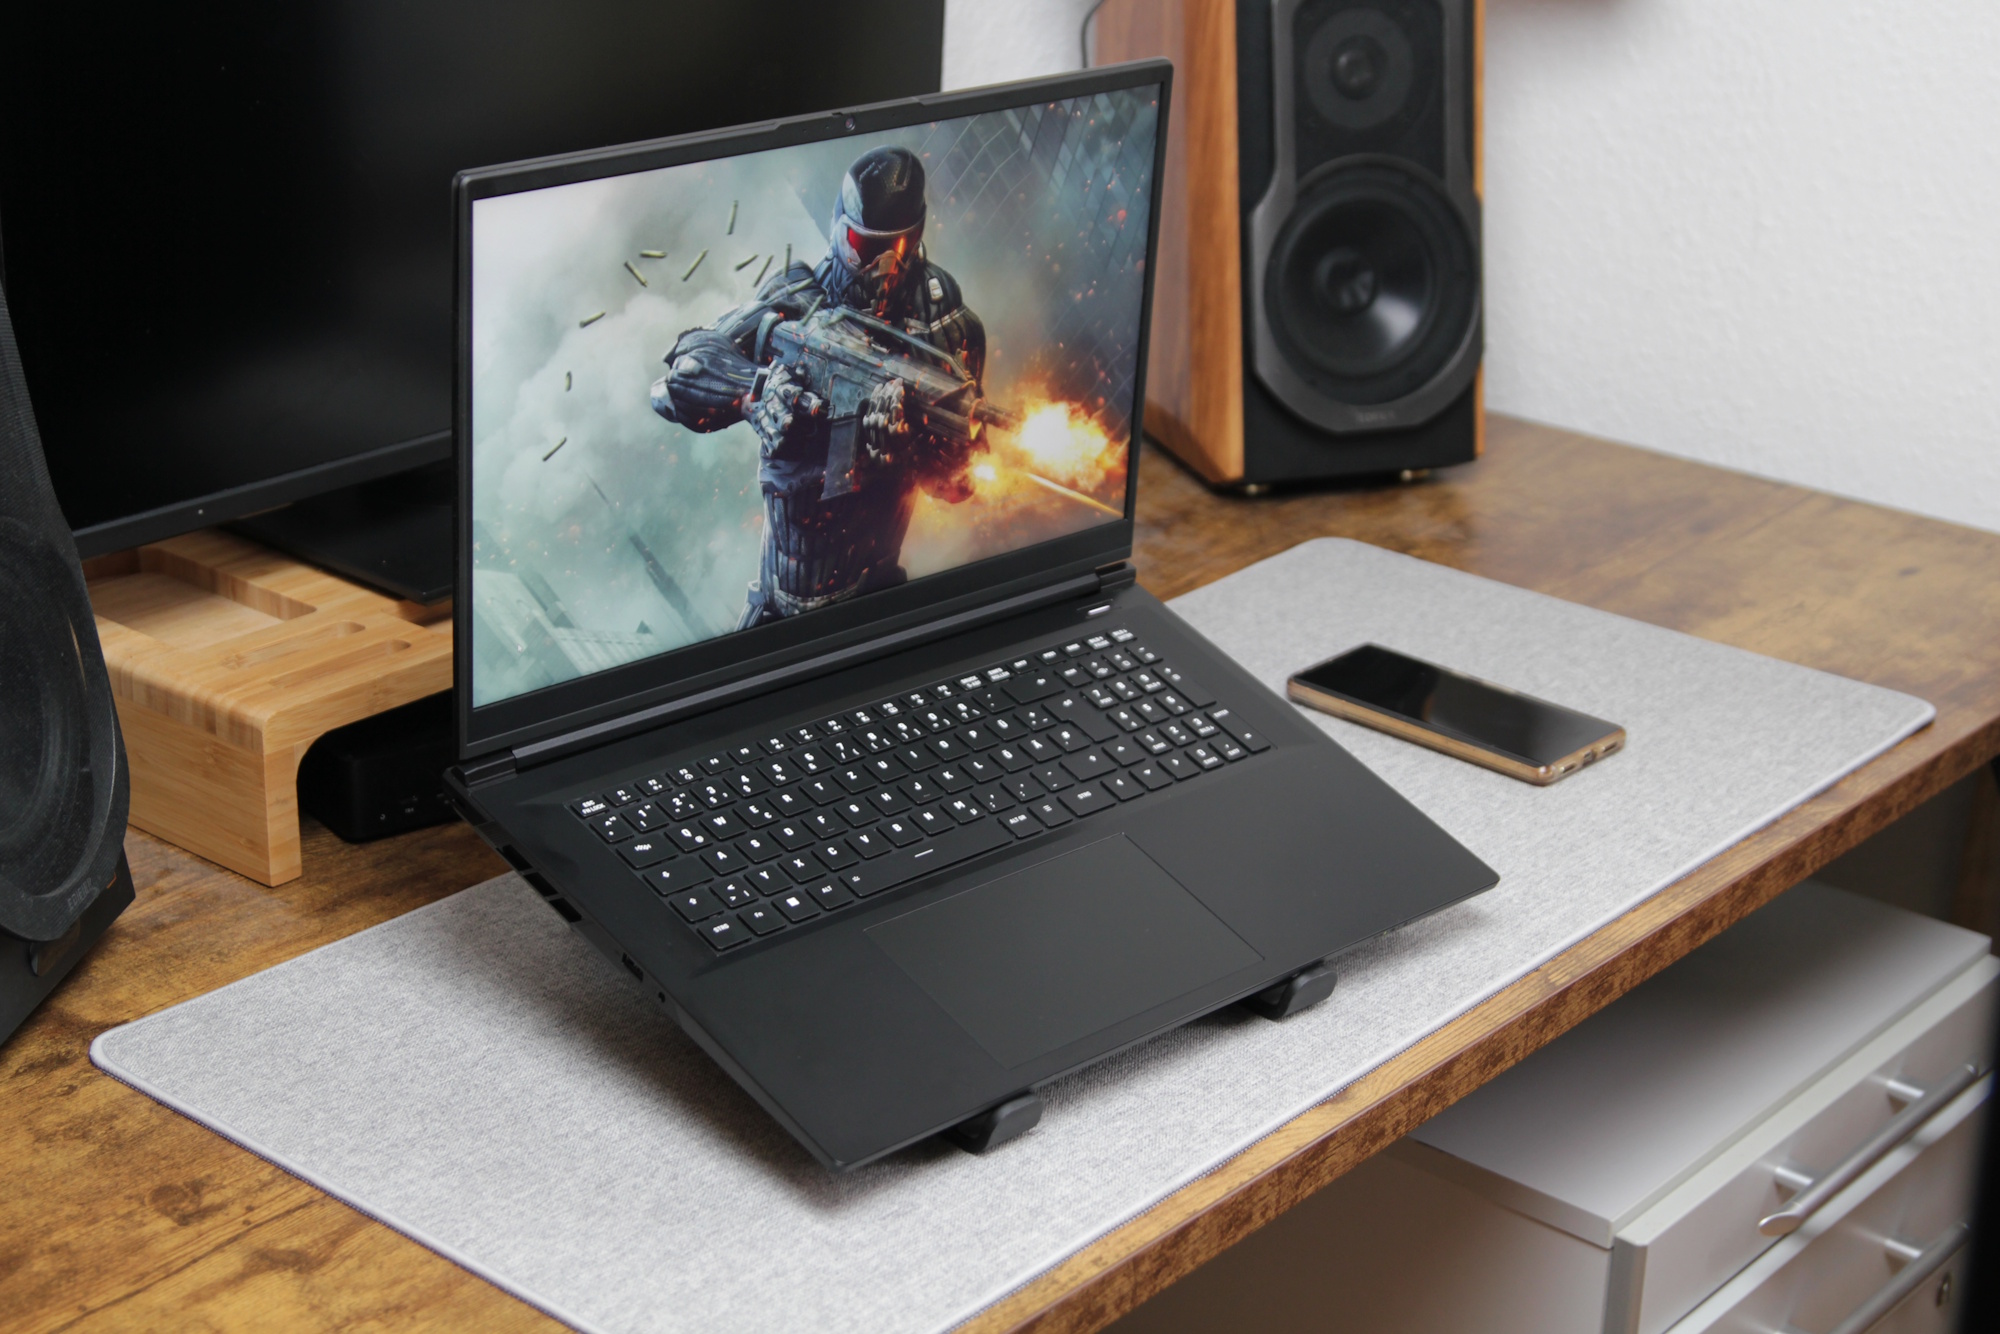
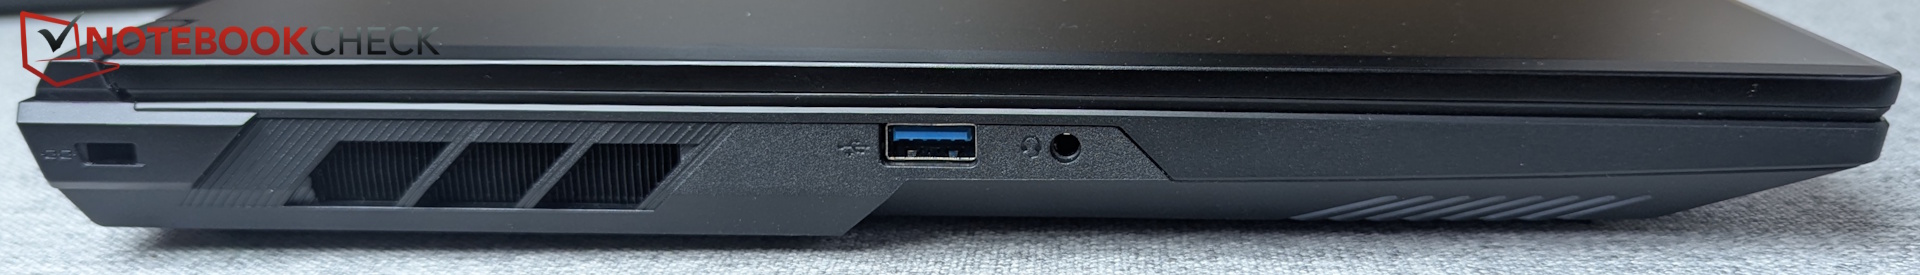
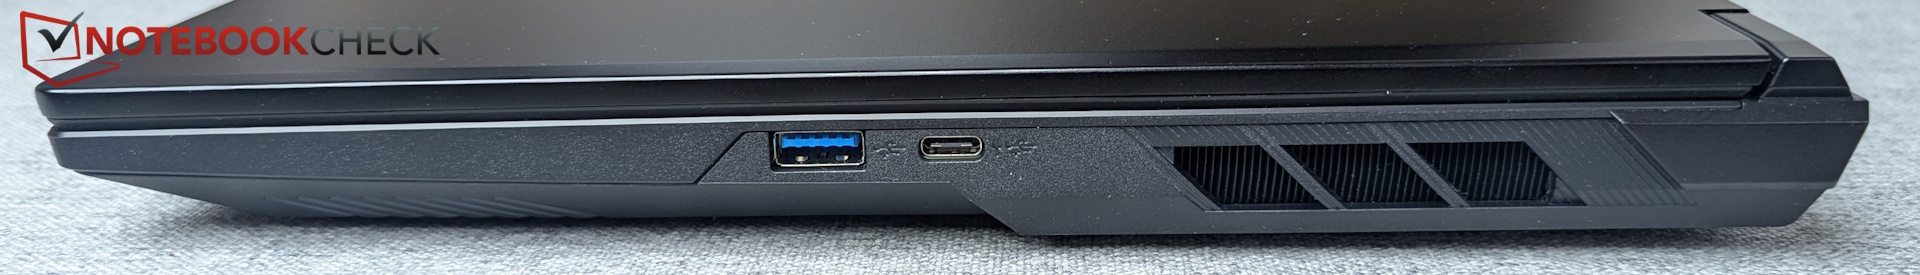
Nella selezione delle porte manca un lettore di schede SD, oltre a USB4 e Thunderbolt, il che significa che è limitato a un massimo di 10 Gb/s. In termini di dimensioni e peso, si colloca all'incirca a metà del segmento dei 17 pollici. Grazie al suo display 16:9, è spesso più stretto dei modelli da 17 pollici della concorrenza.

Webcam
La webcam IR Full HD include un otturatore fisico. La riproduzione dei colori è accettabile, anche se la nitidezza delle immagini potrebbe essere migliore.


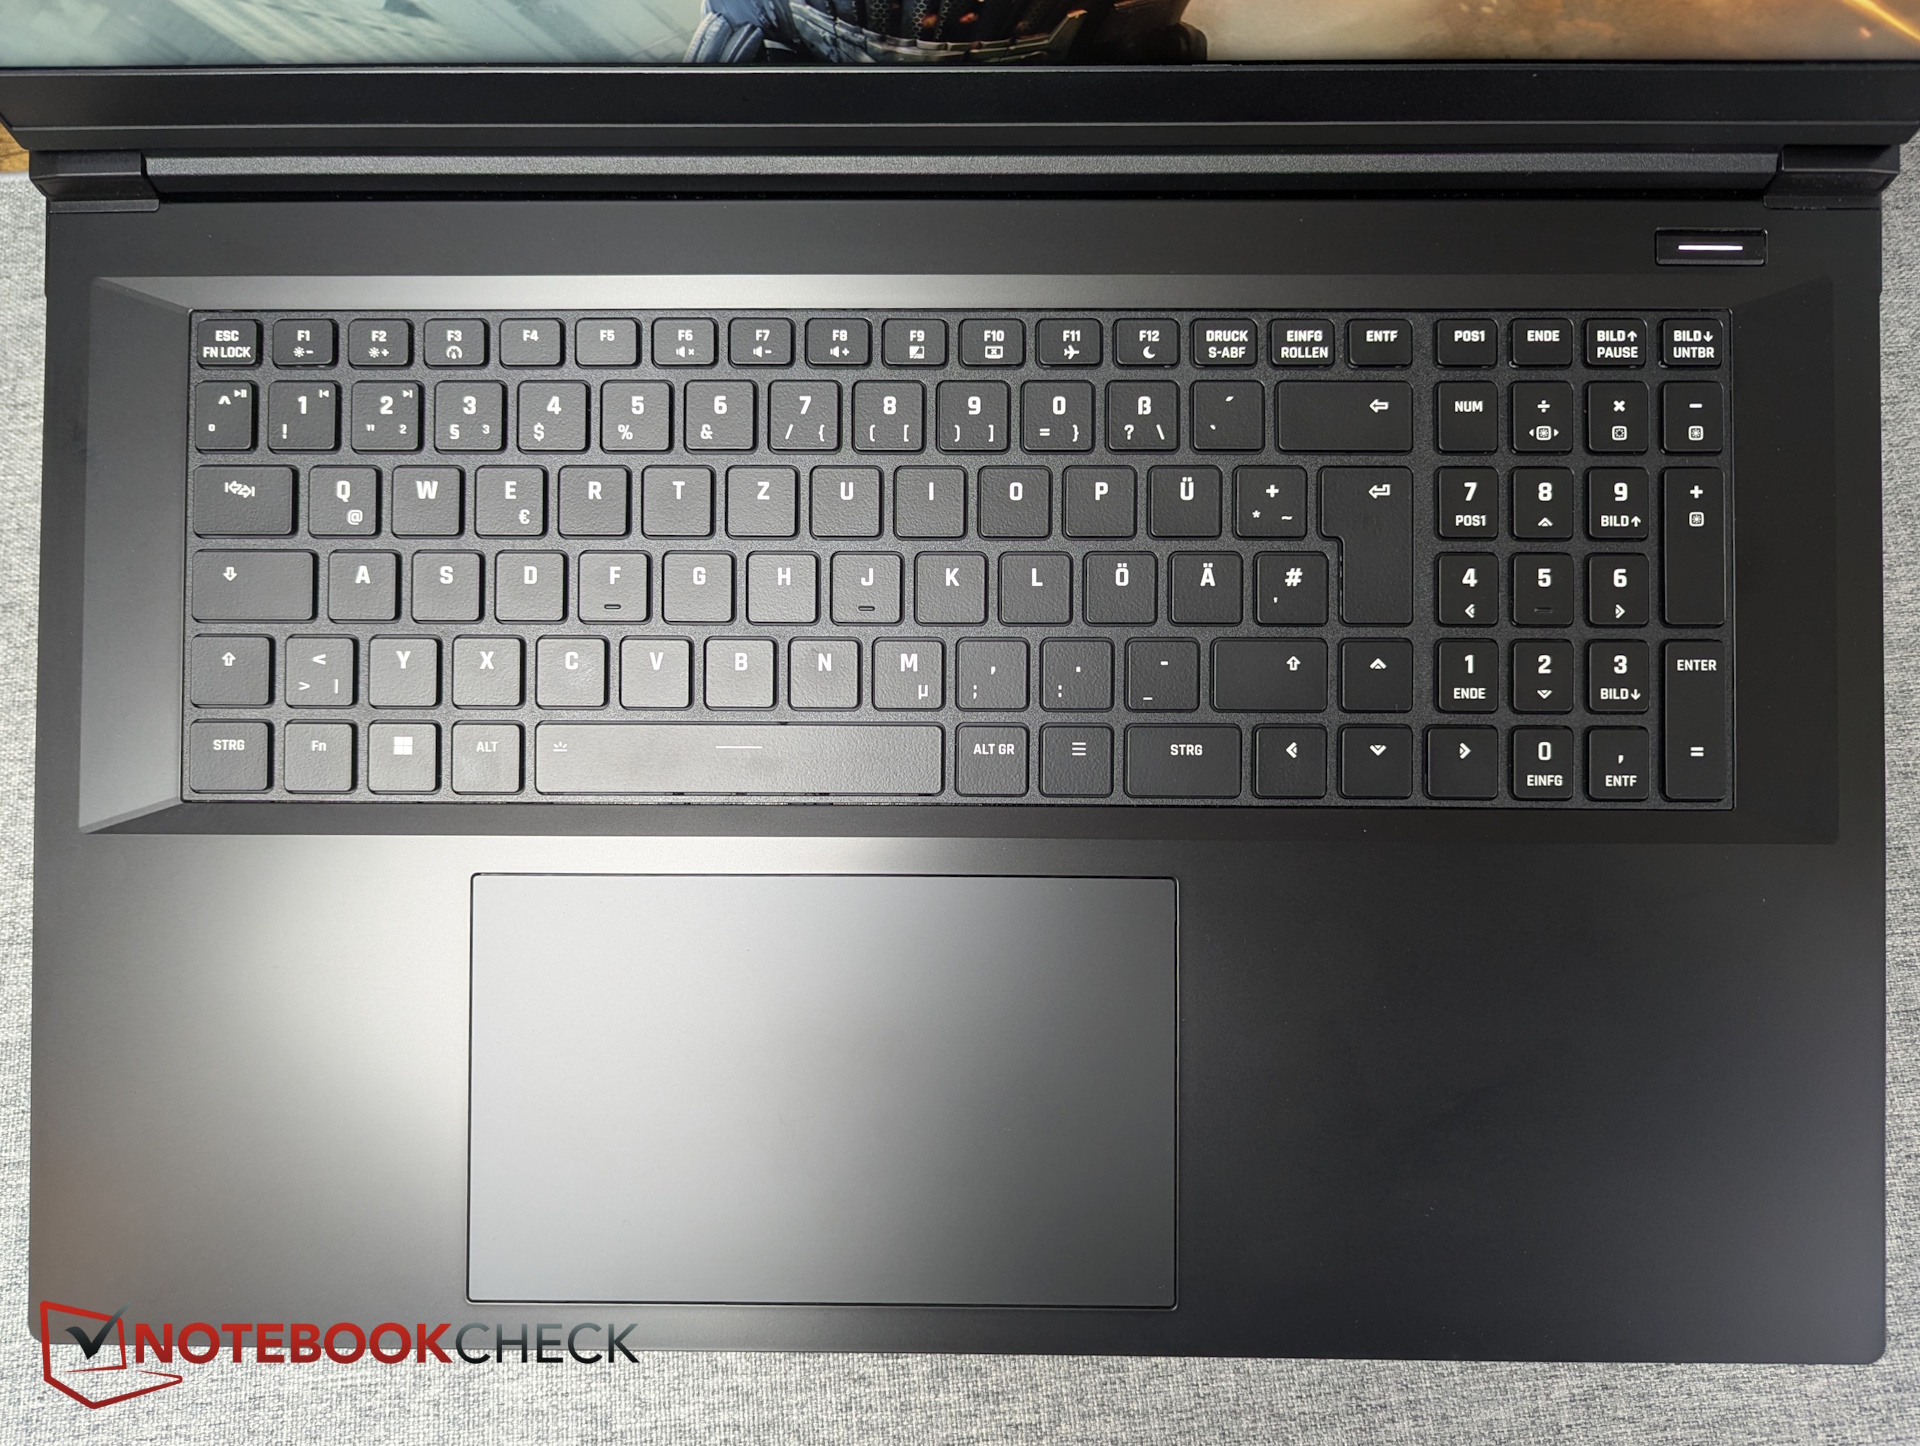
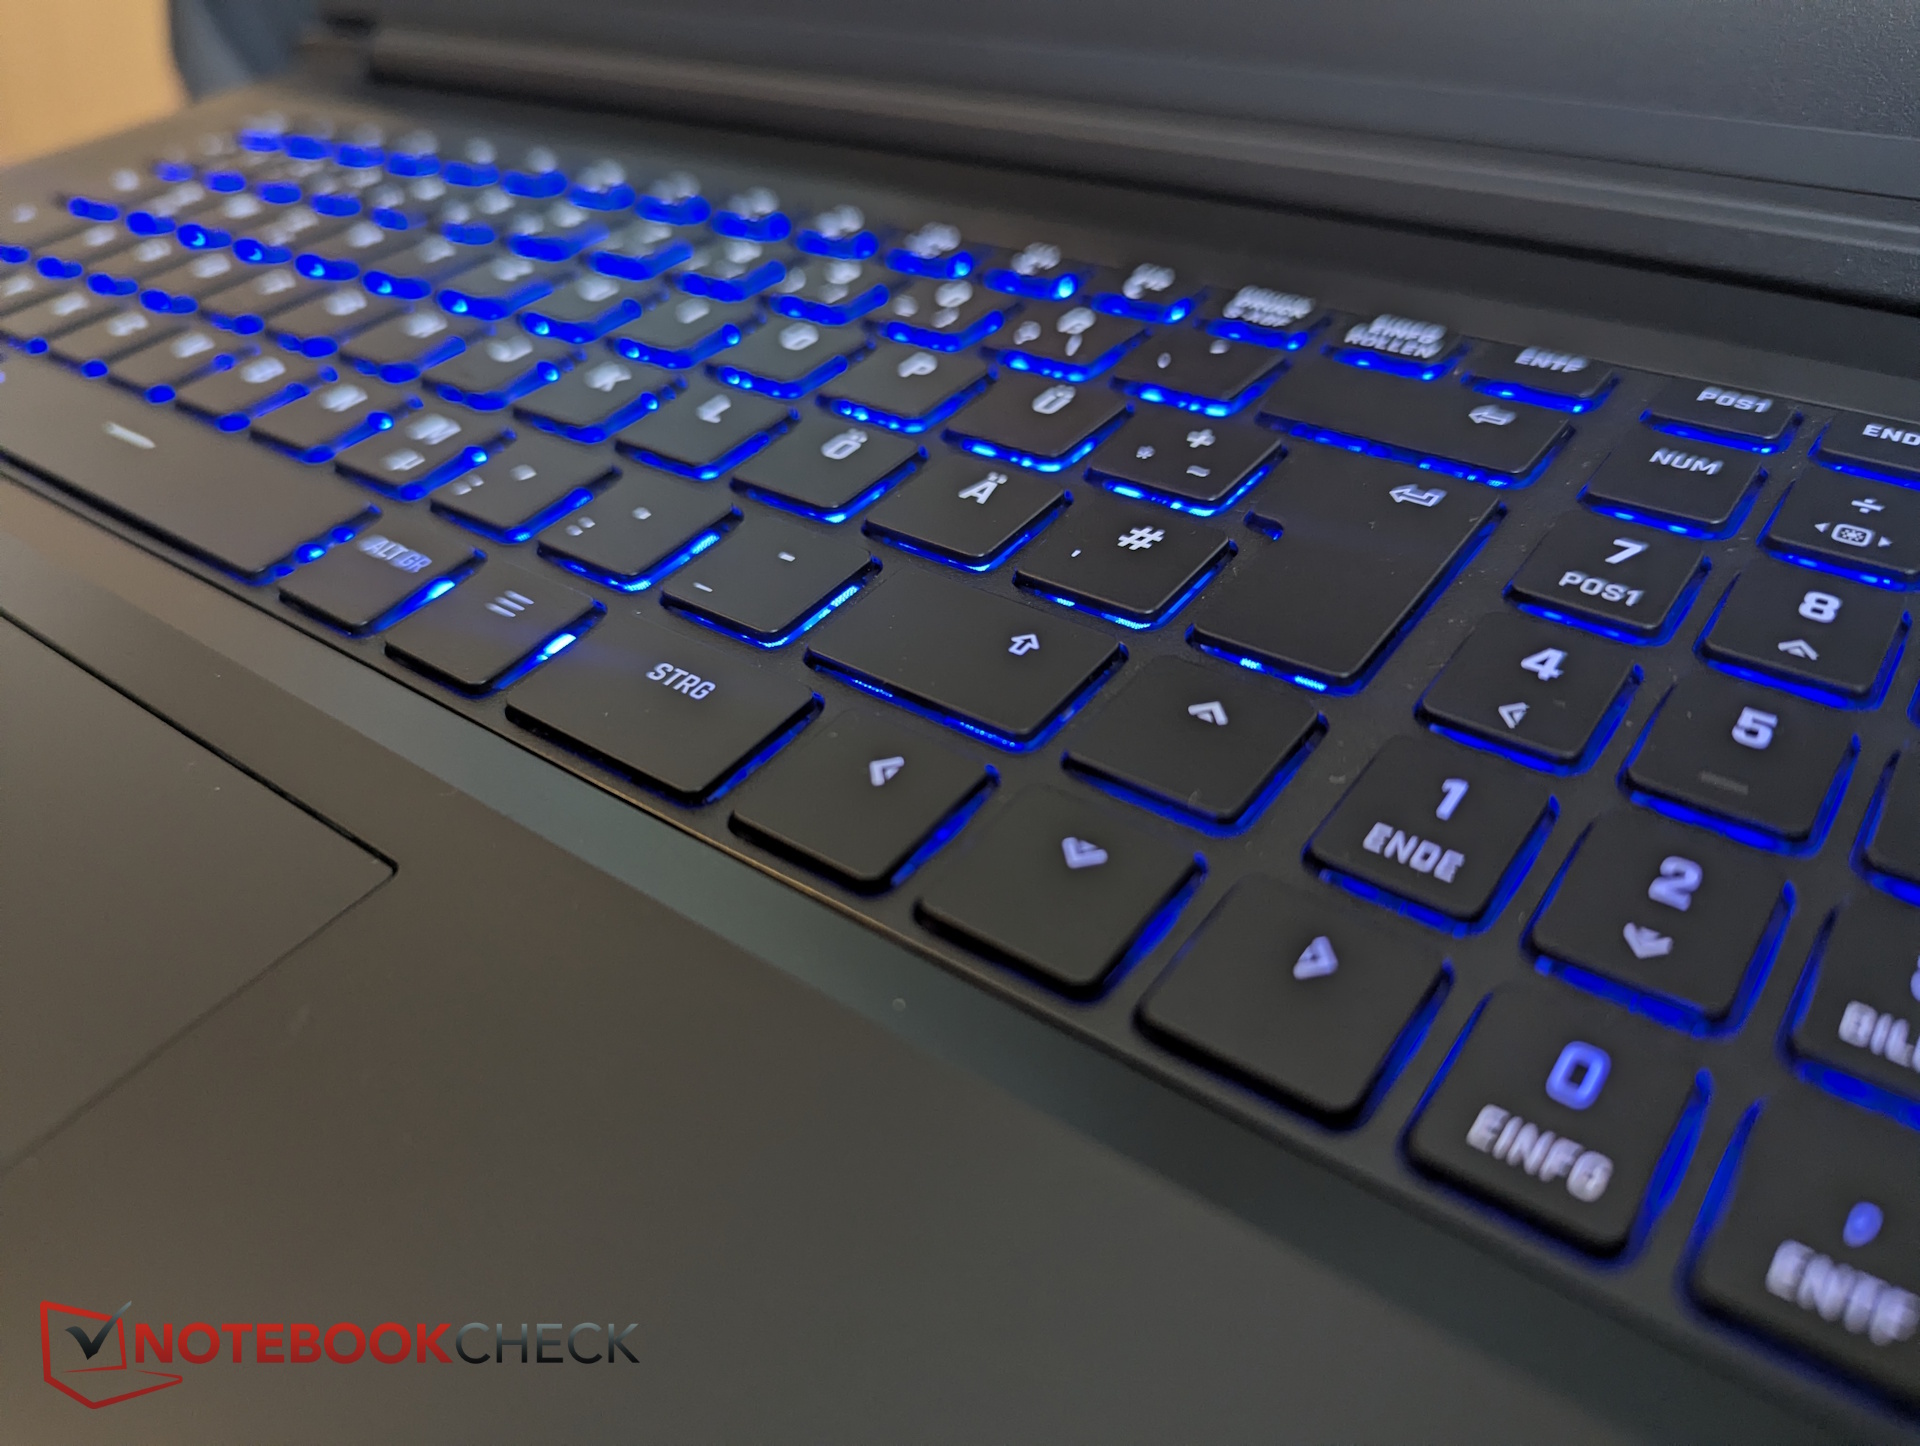
Dispositivi di input - Corsa dei tasti ridotta, touchpad grande da 15 cm
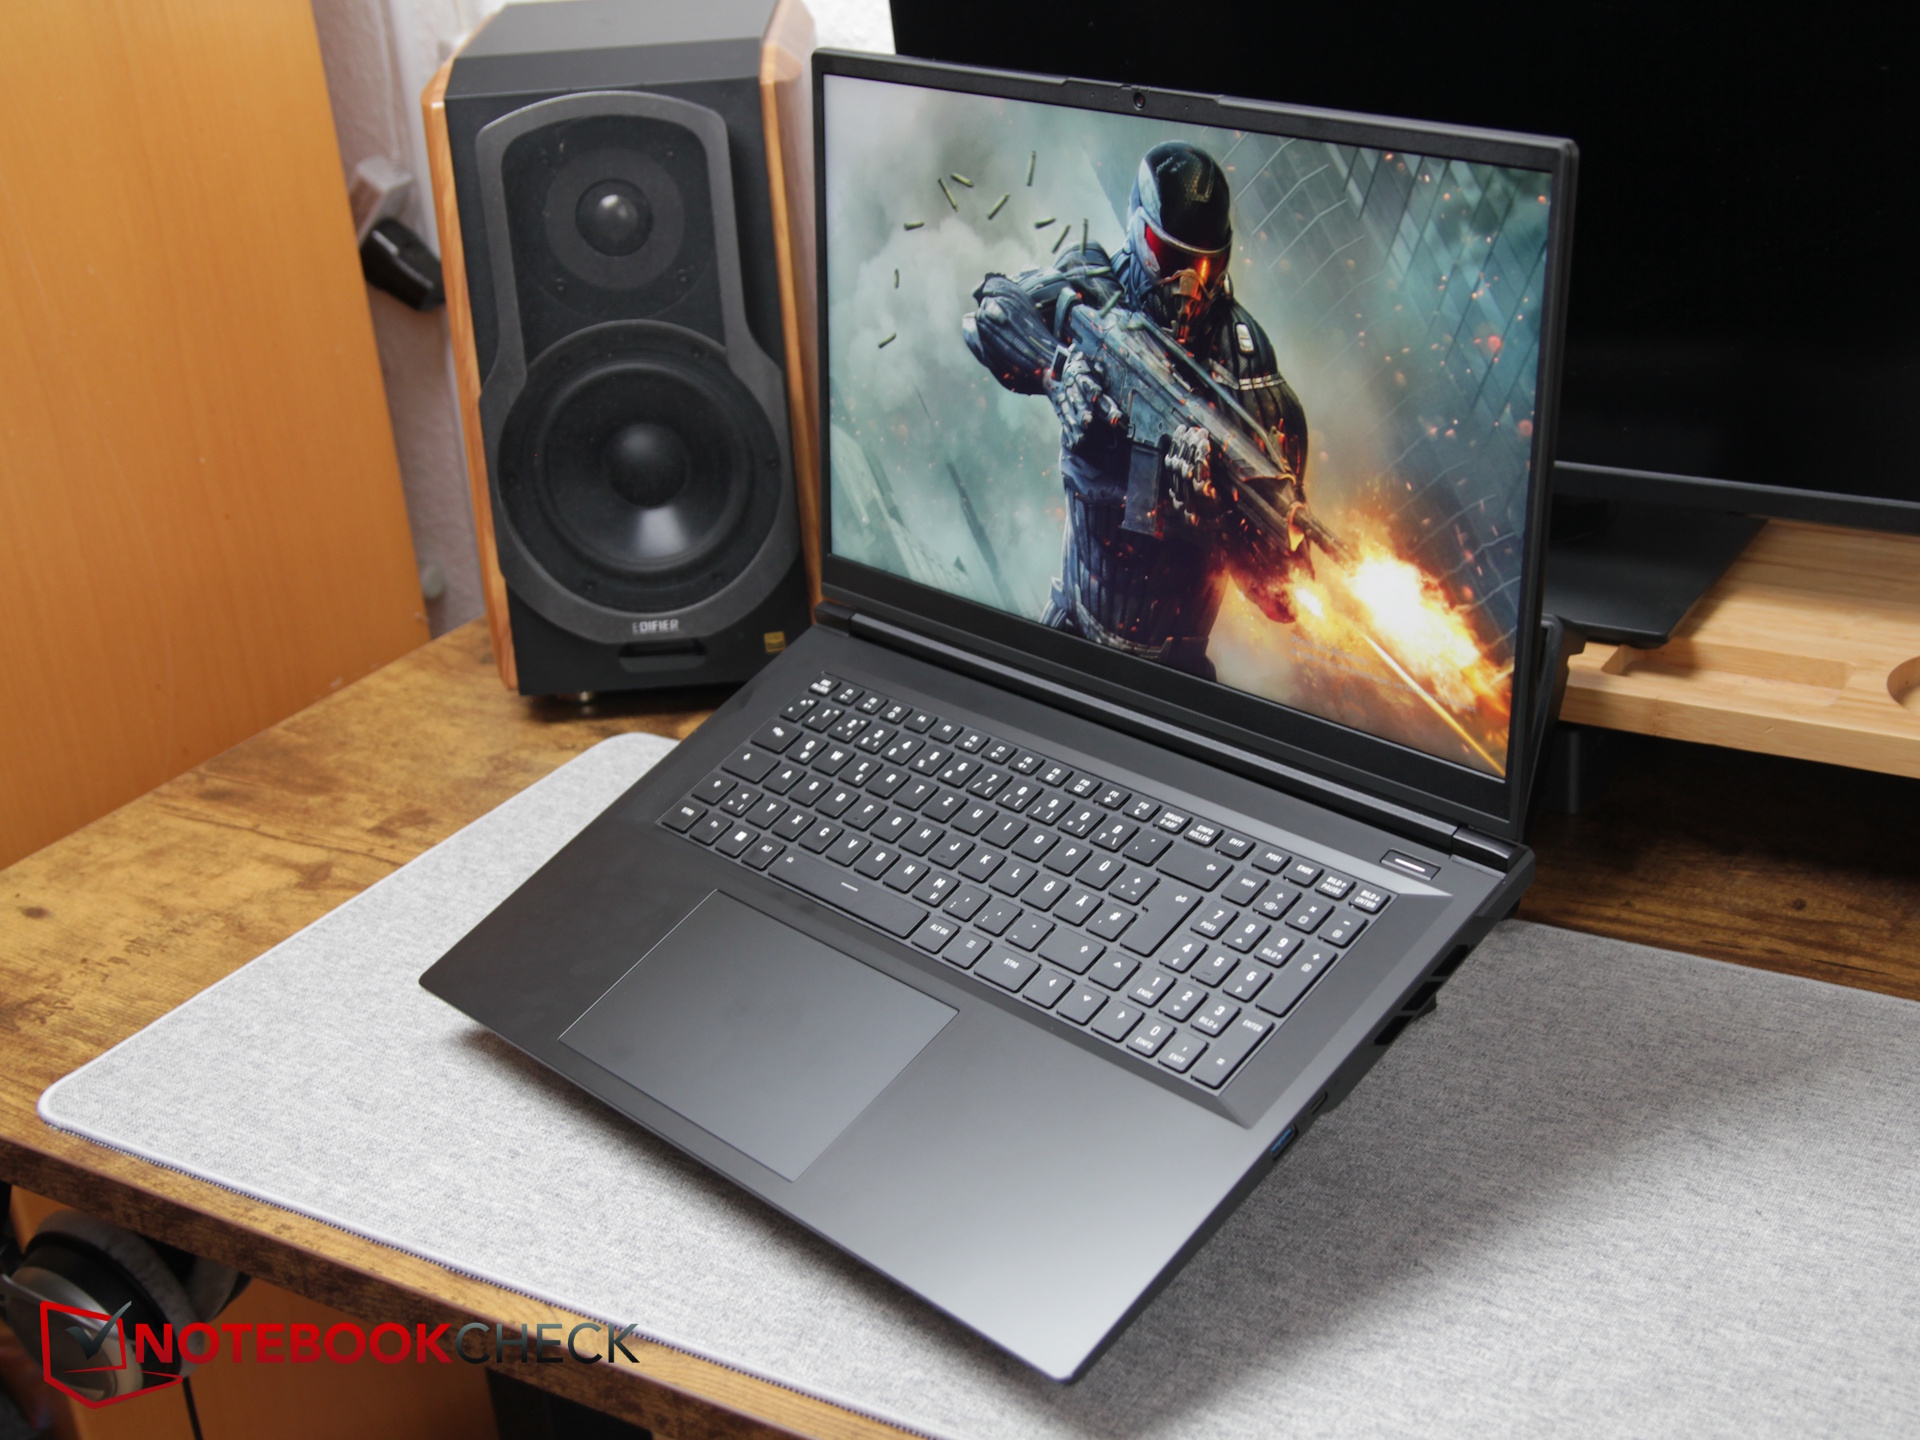
A differenza della maggior parte dei computer portatili XMG, i tasti freccia non sono separati dal gruppo di tasti principale, come nel Focus 17. Per il resto, il layout è pulito e comprende un tastierino numerico dedicato sulla destra.
La corsa dei tasti è molto ridotta e, sebbene il punto di pressione sia evidente, il feedback potrebbe essere più pronunciato. Tuttavia, la digitazione rimane veloce e confortevole.
L'ampio touchpad da 15 x 9 cm offre buone proprietà di scorrimento. I suoi pulsanti integrati rispondono in modo affidabile con livelli di rumore moderati, e non si sente alcun rumore quando si tocca.
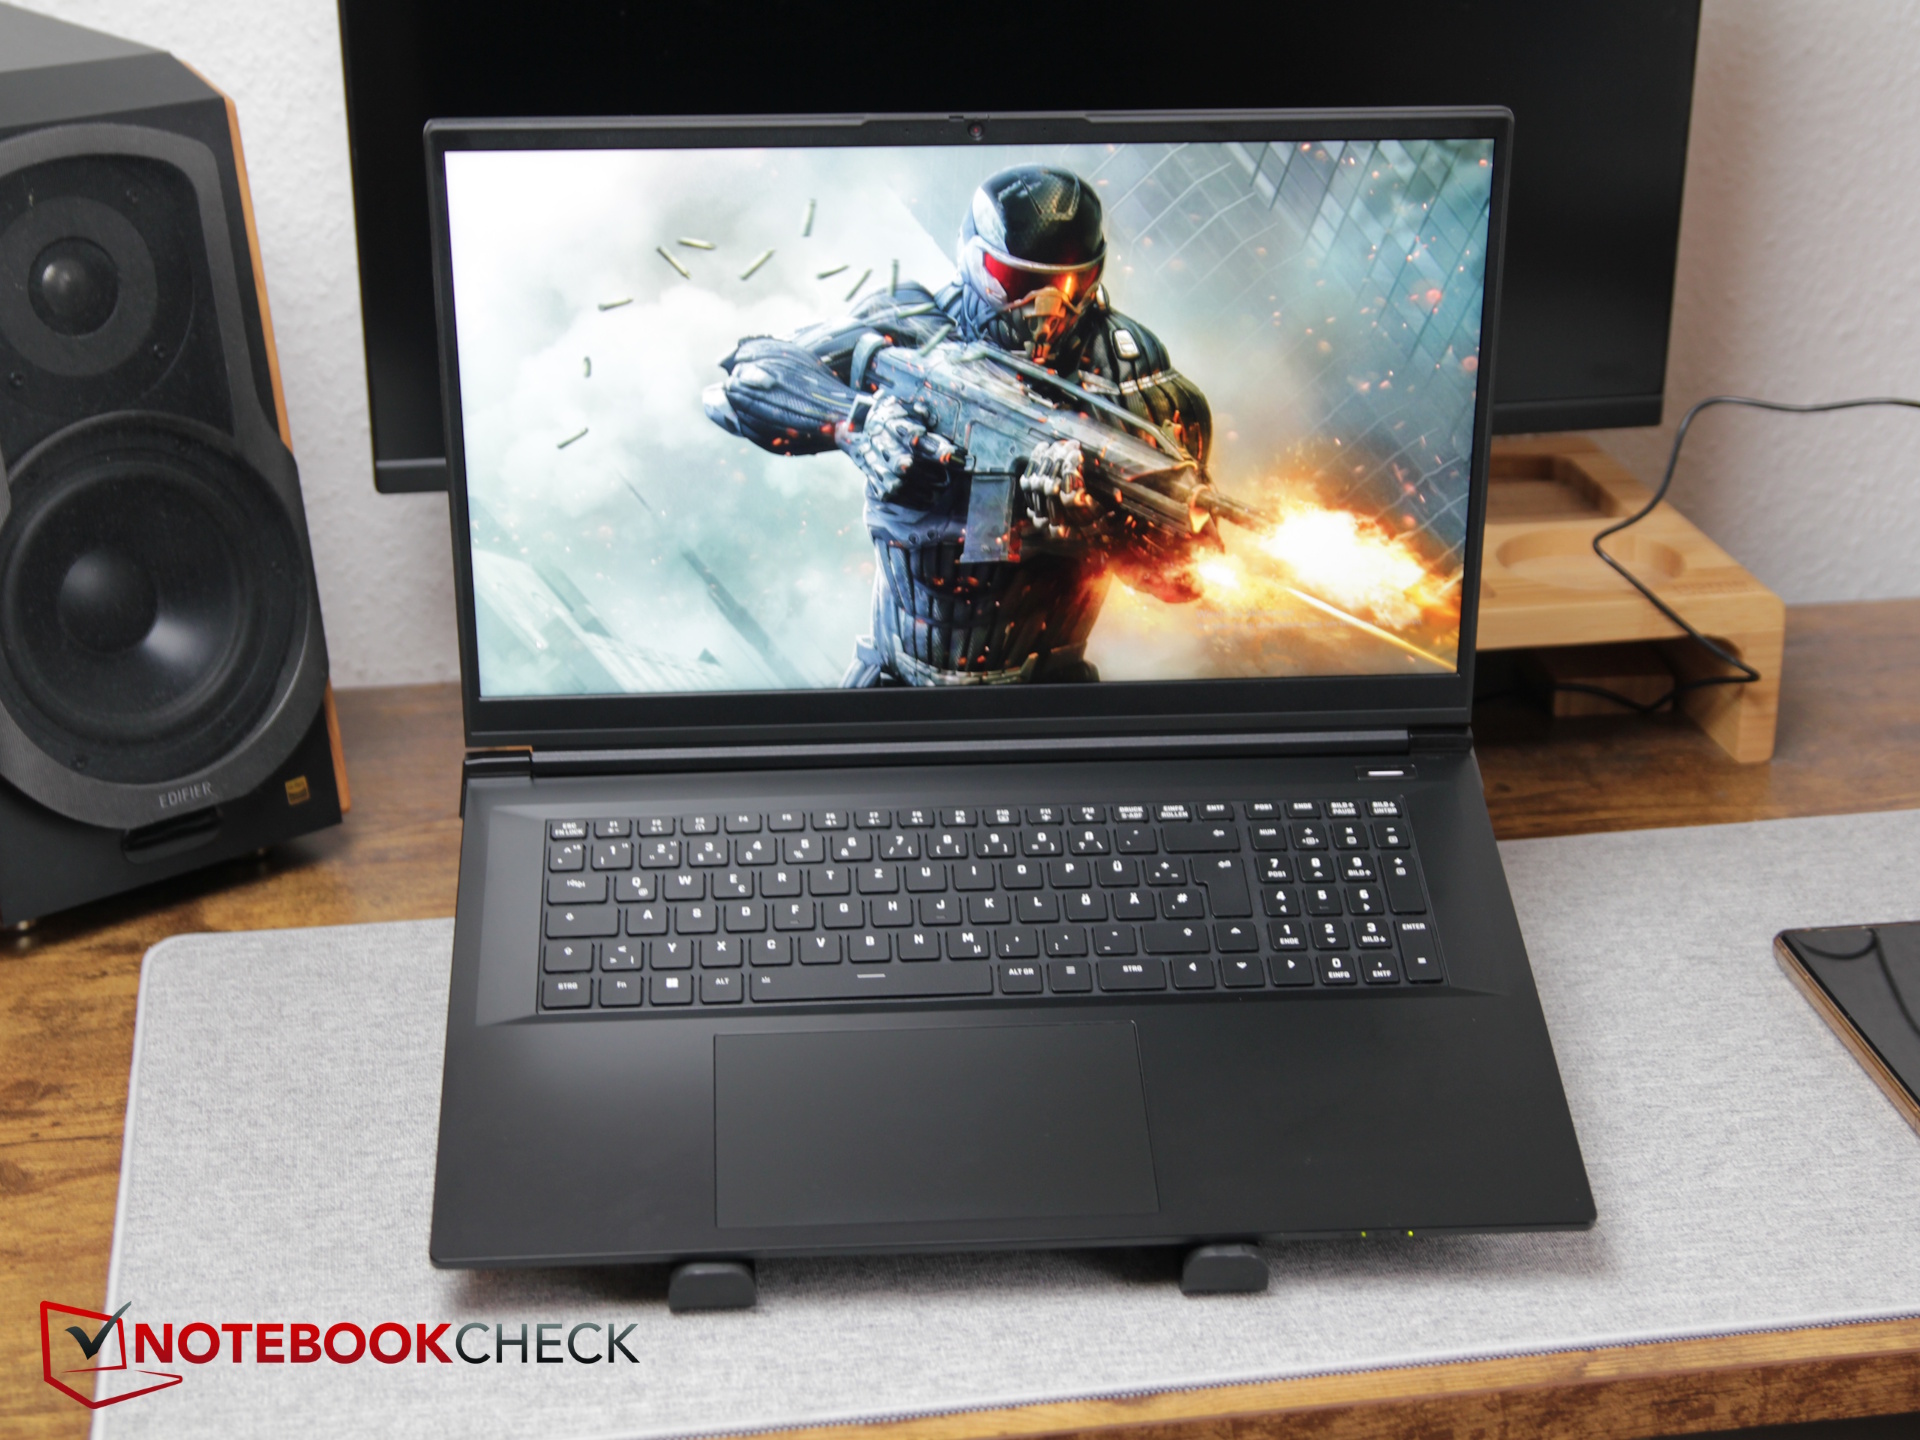
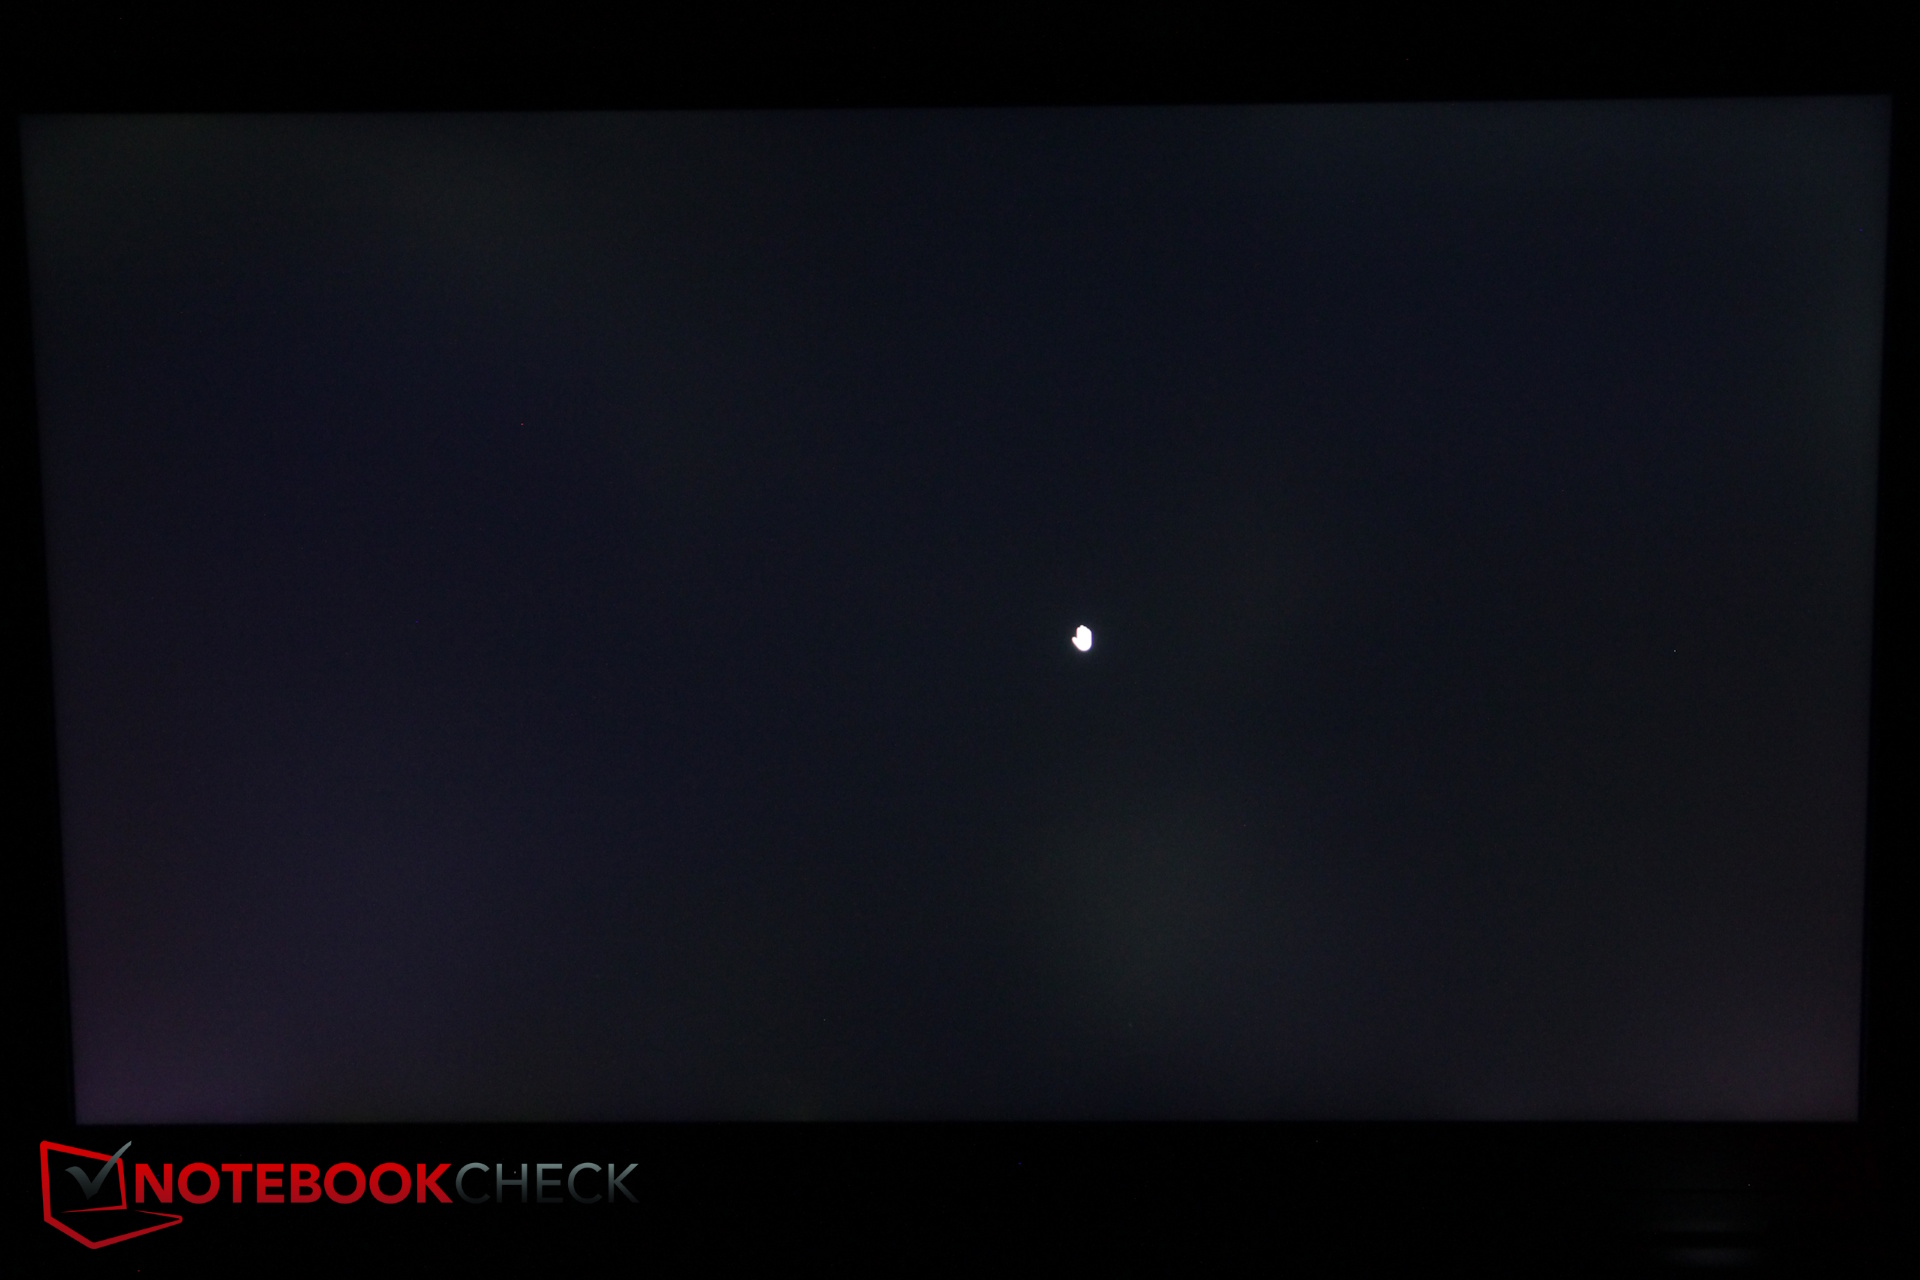
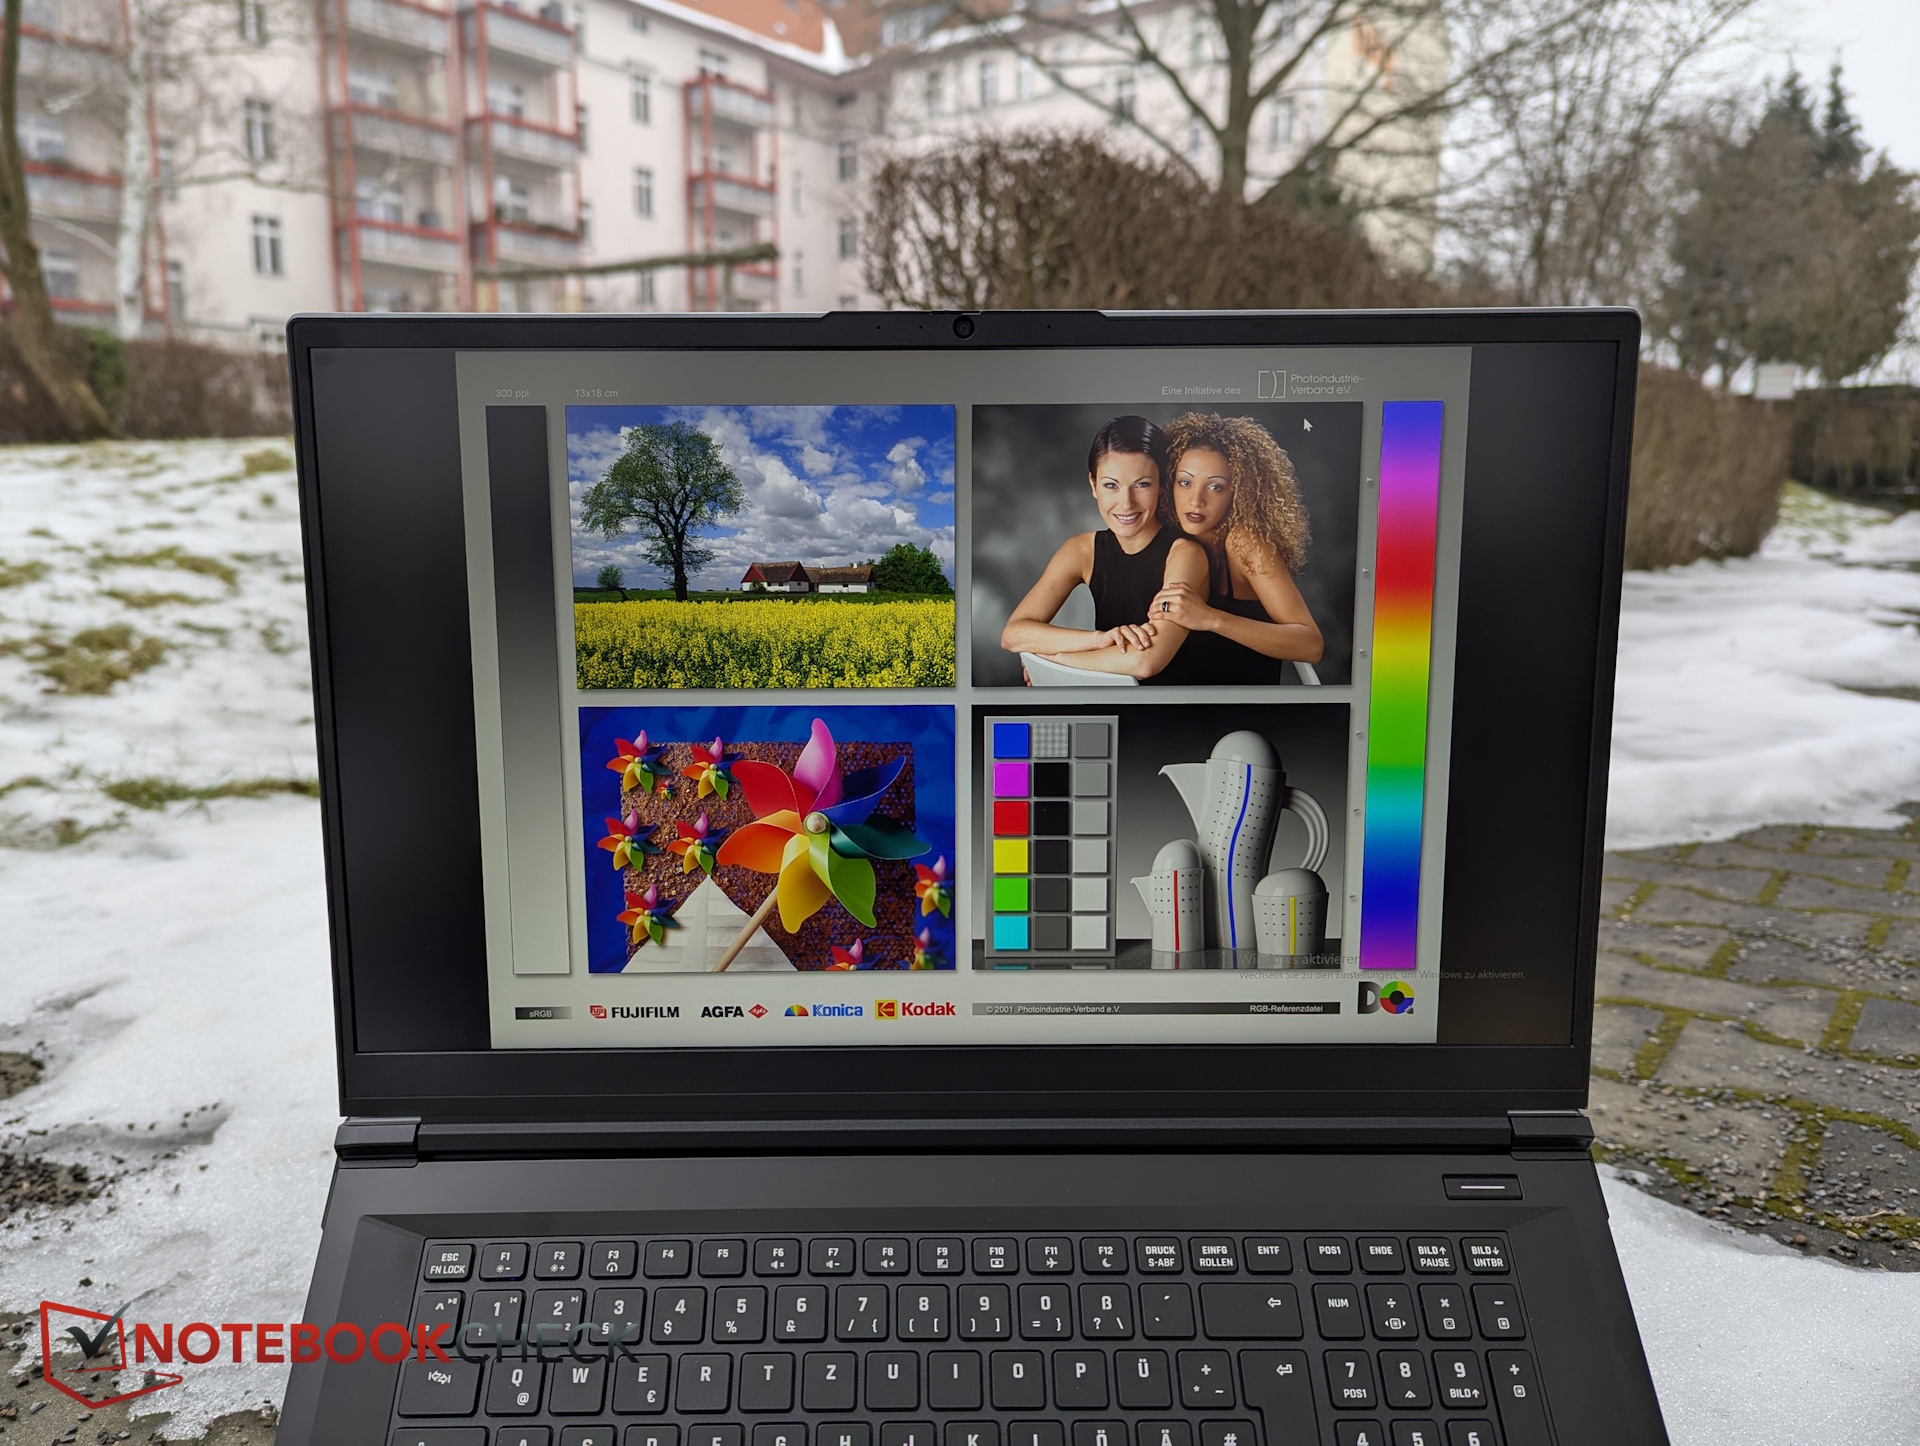
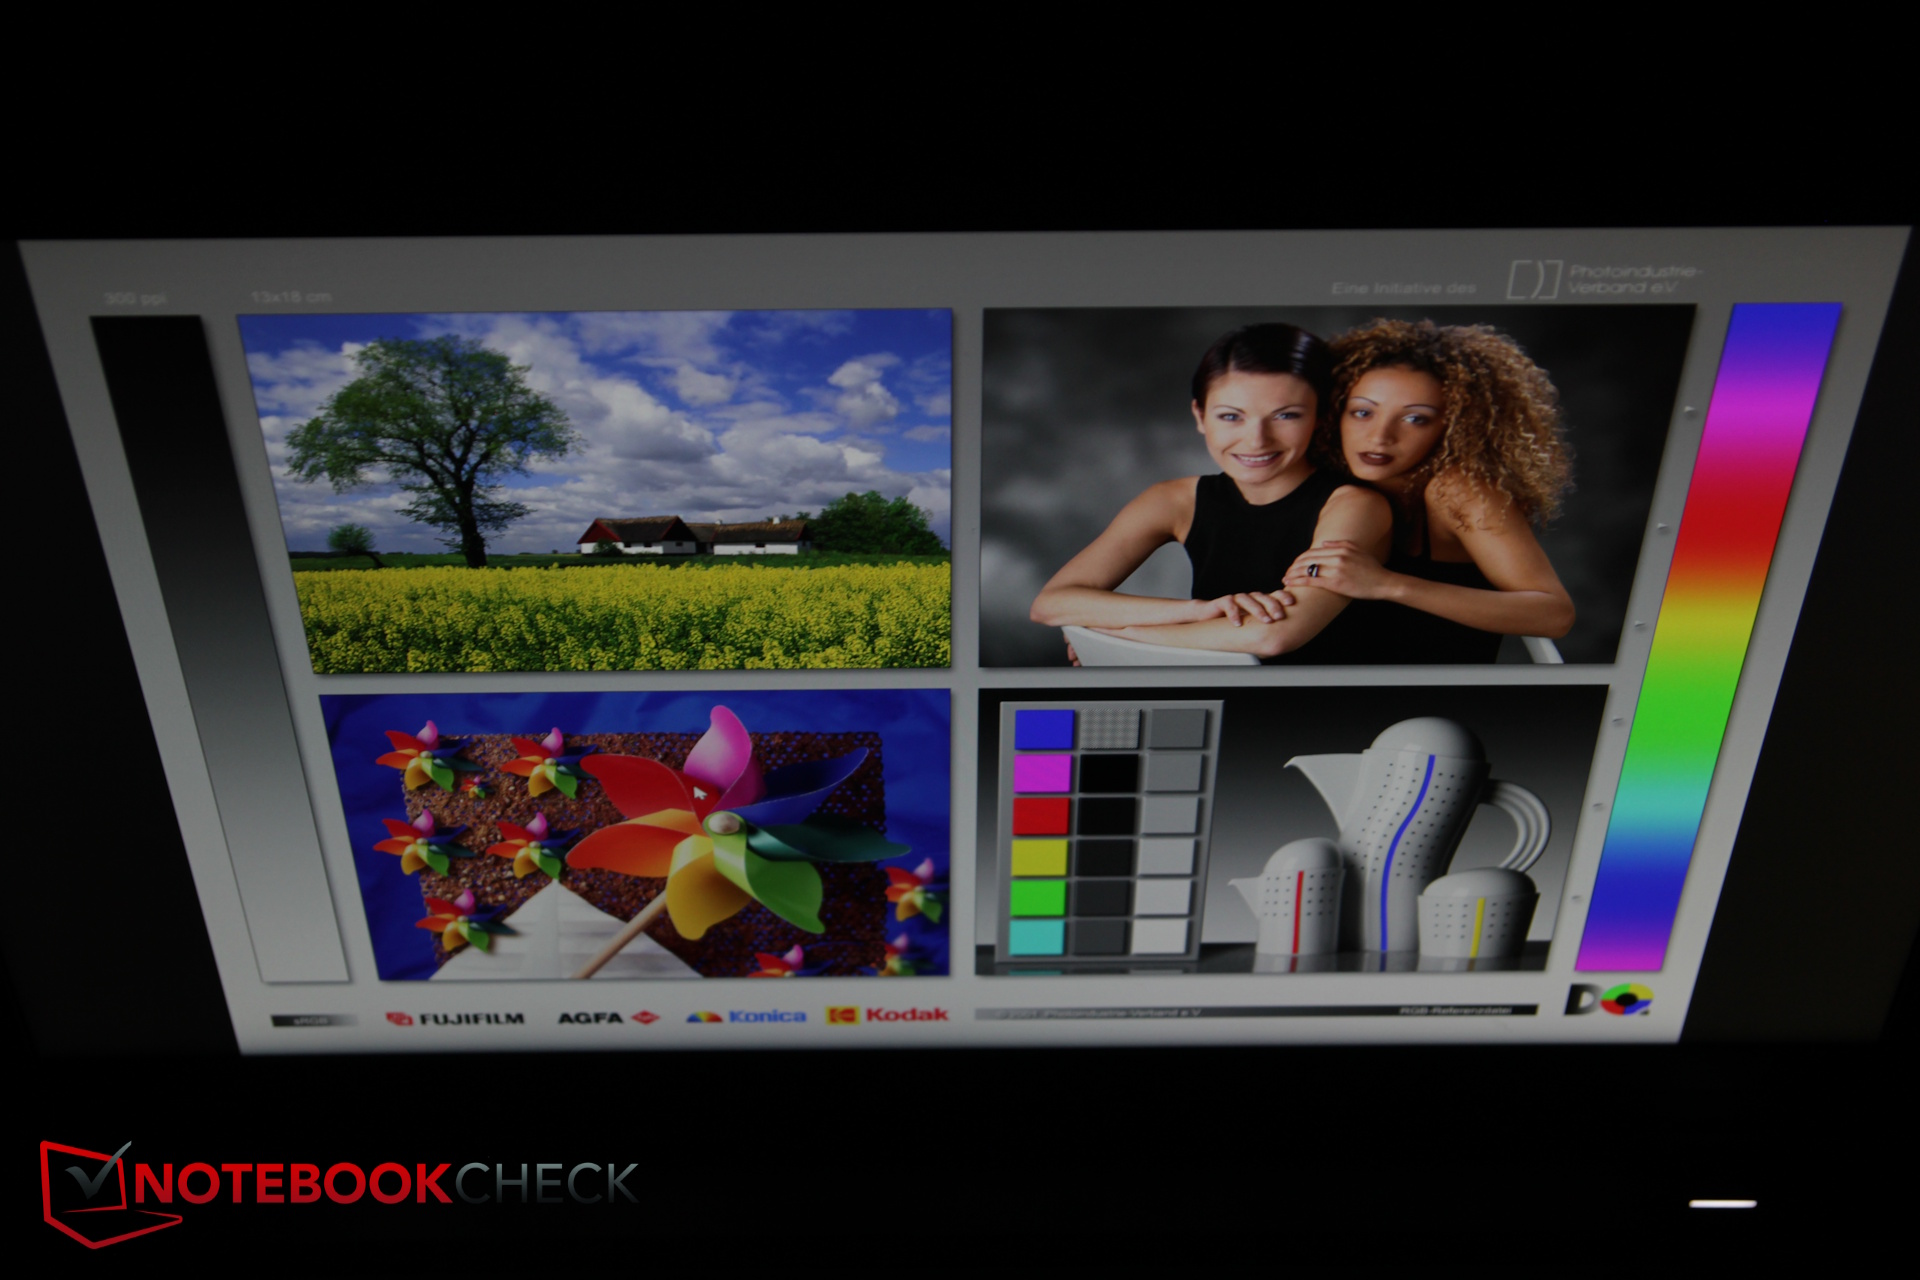
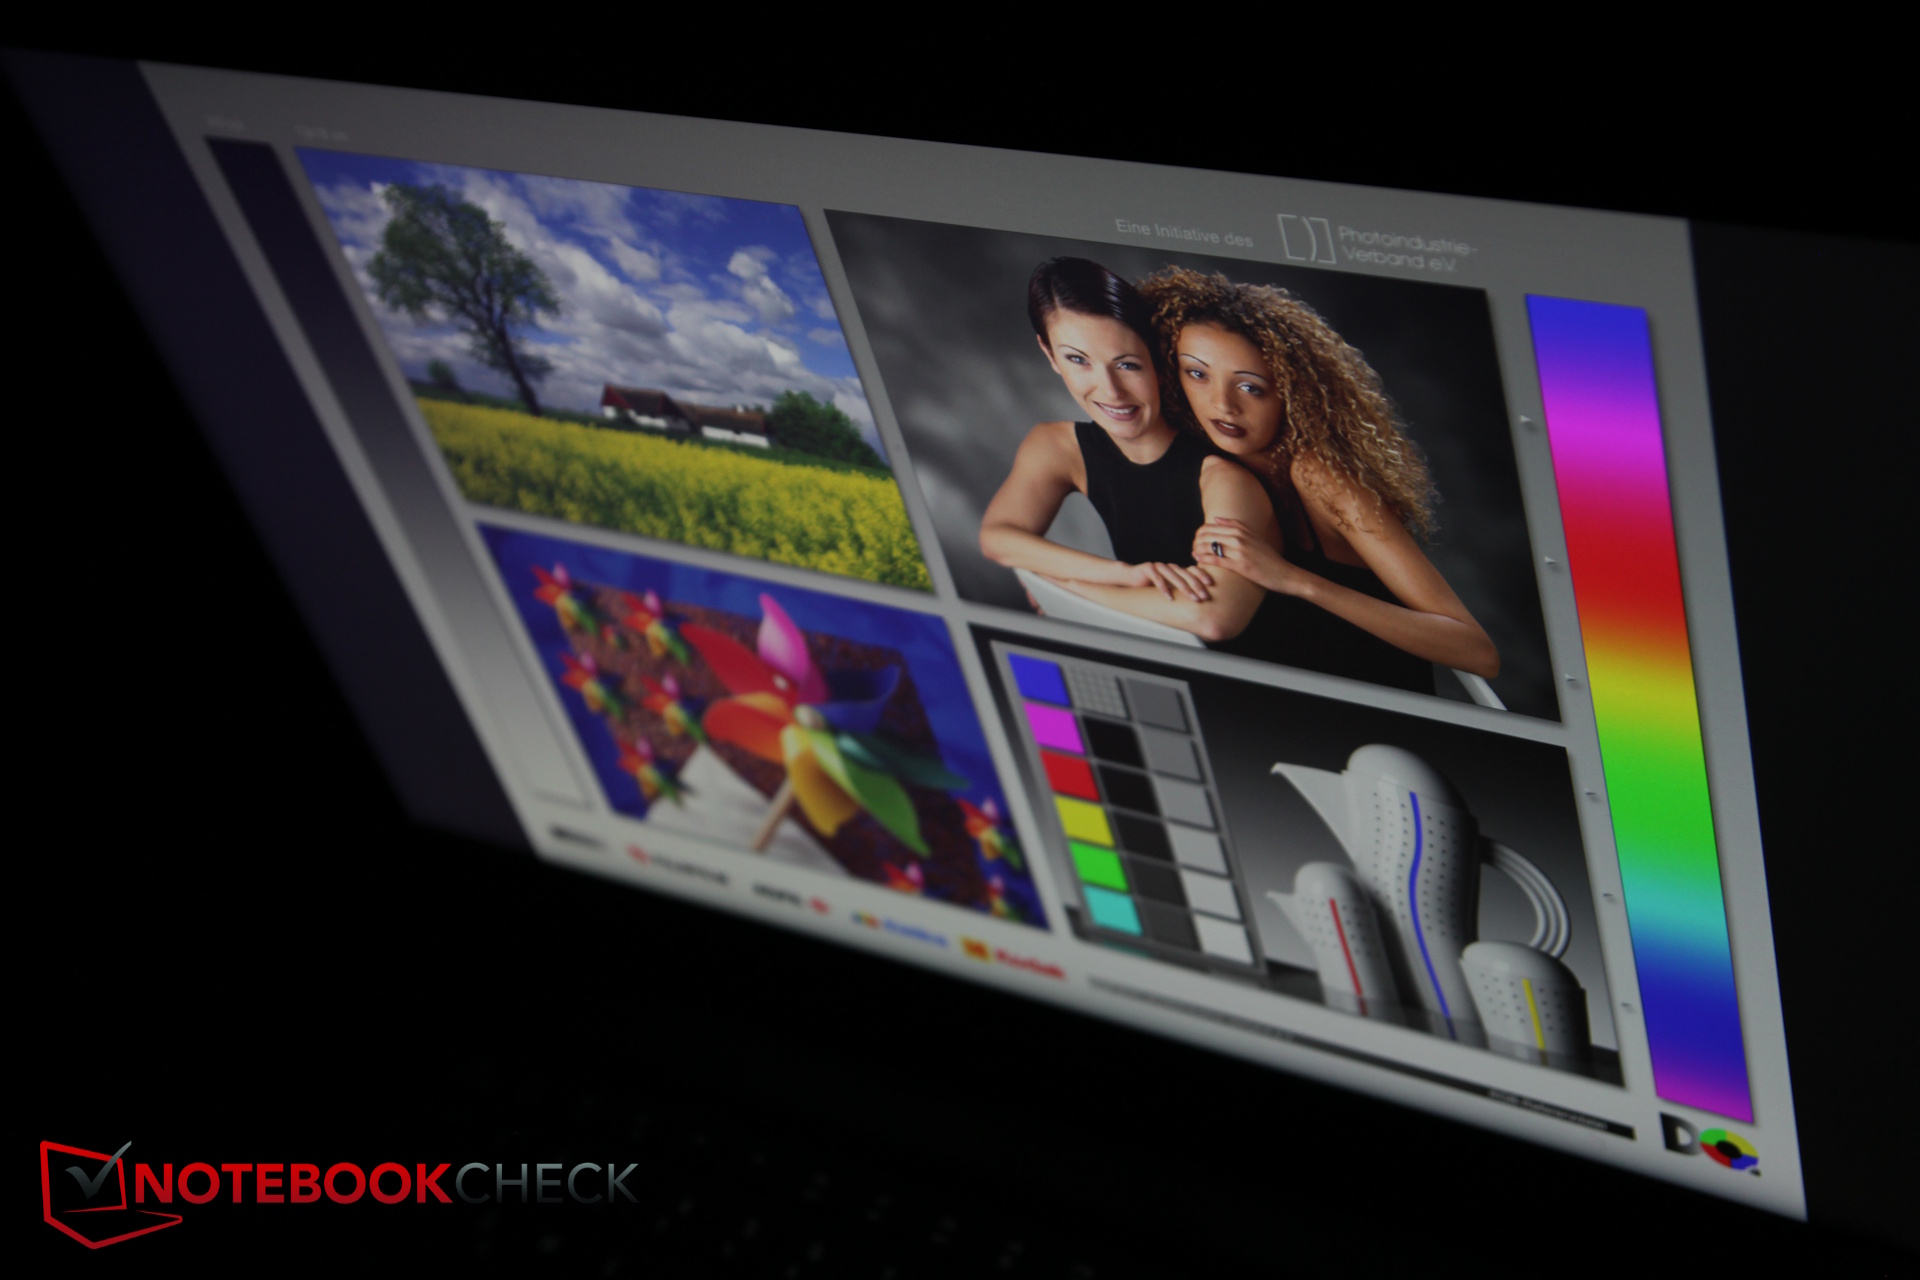
Display - Quanto è buono il pannello QHD 240 Hz?
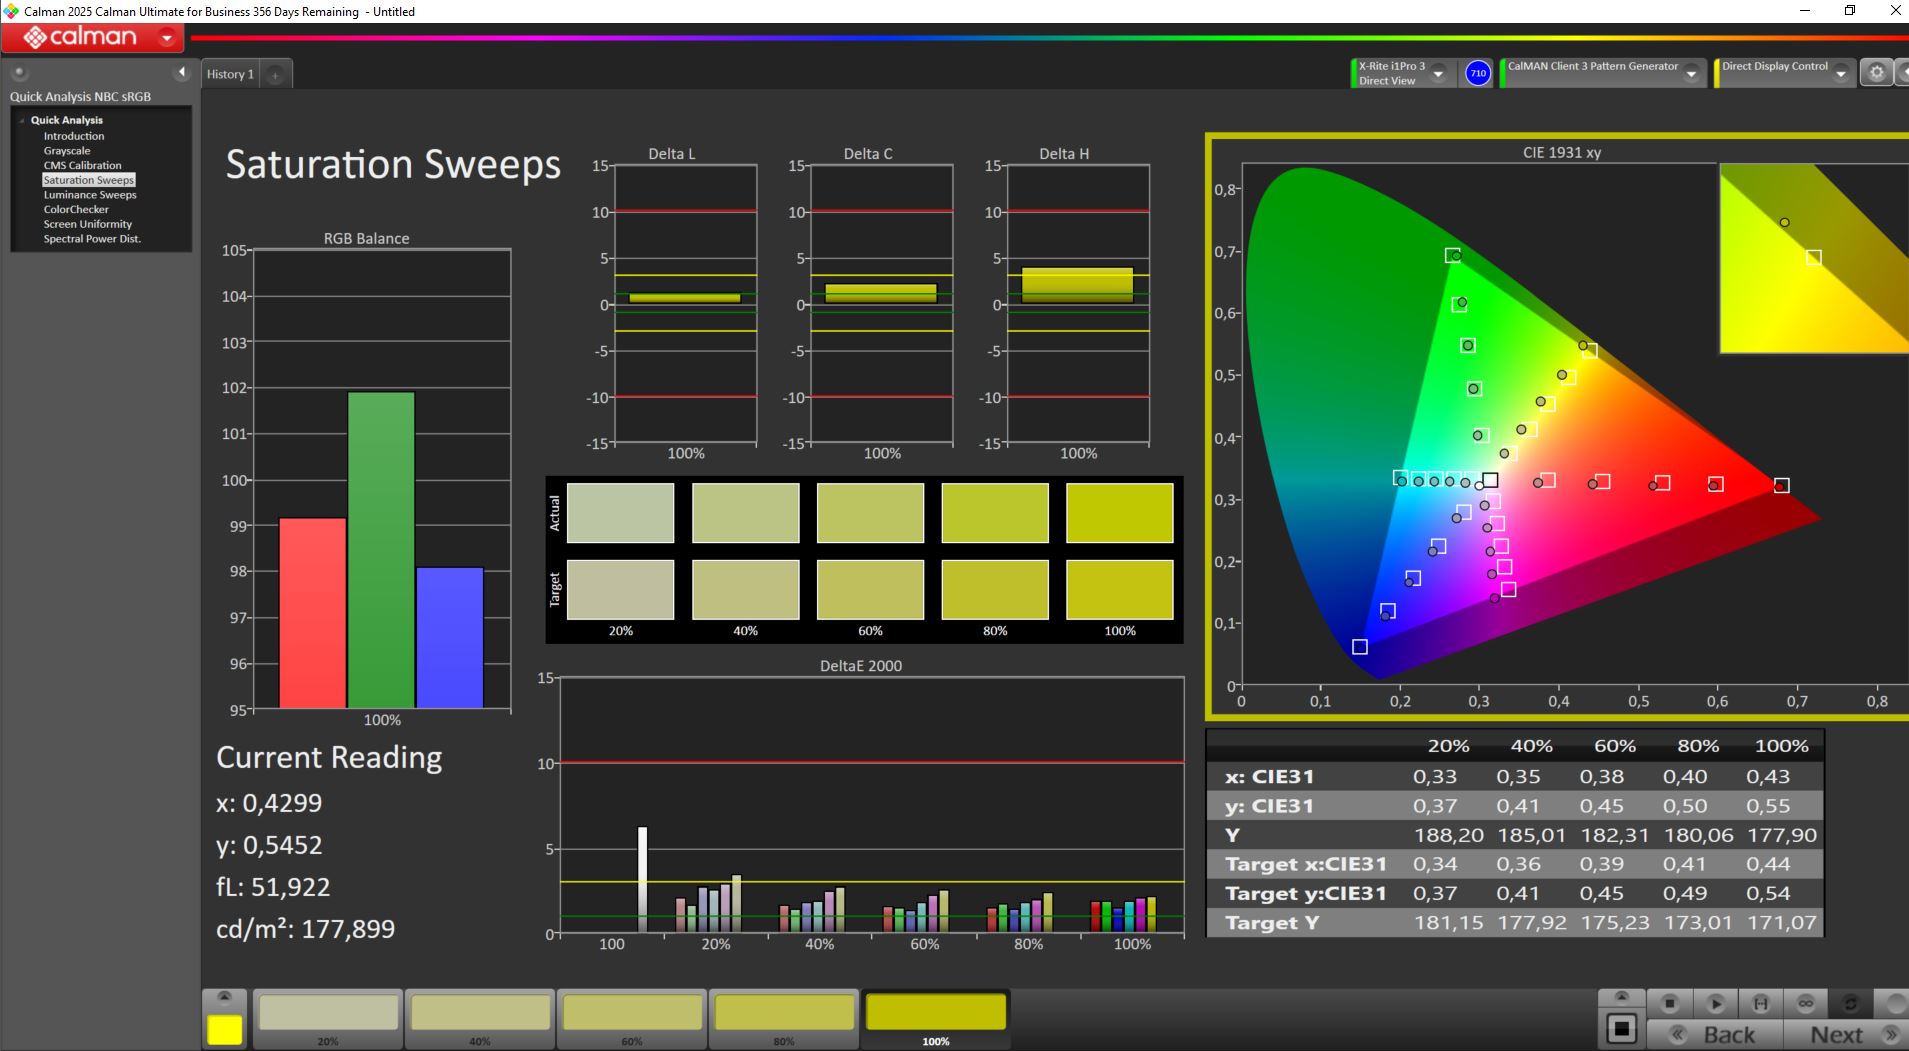
Il pannello opaco da 17,3 pollici (240 Hz) ha una risoluzione di 2.560 x 1.440 e copre sia sRGB che DCI-P3.
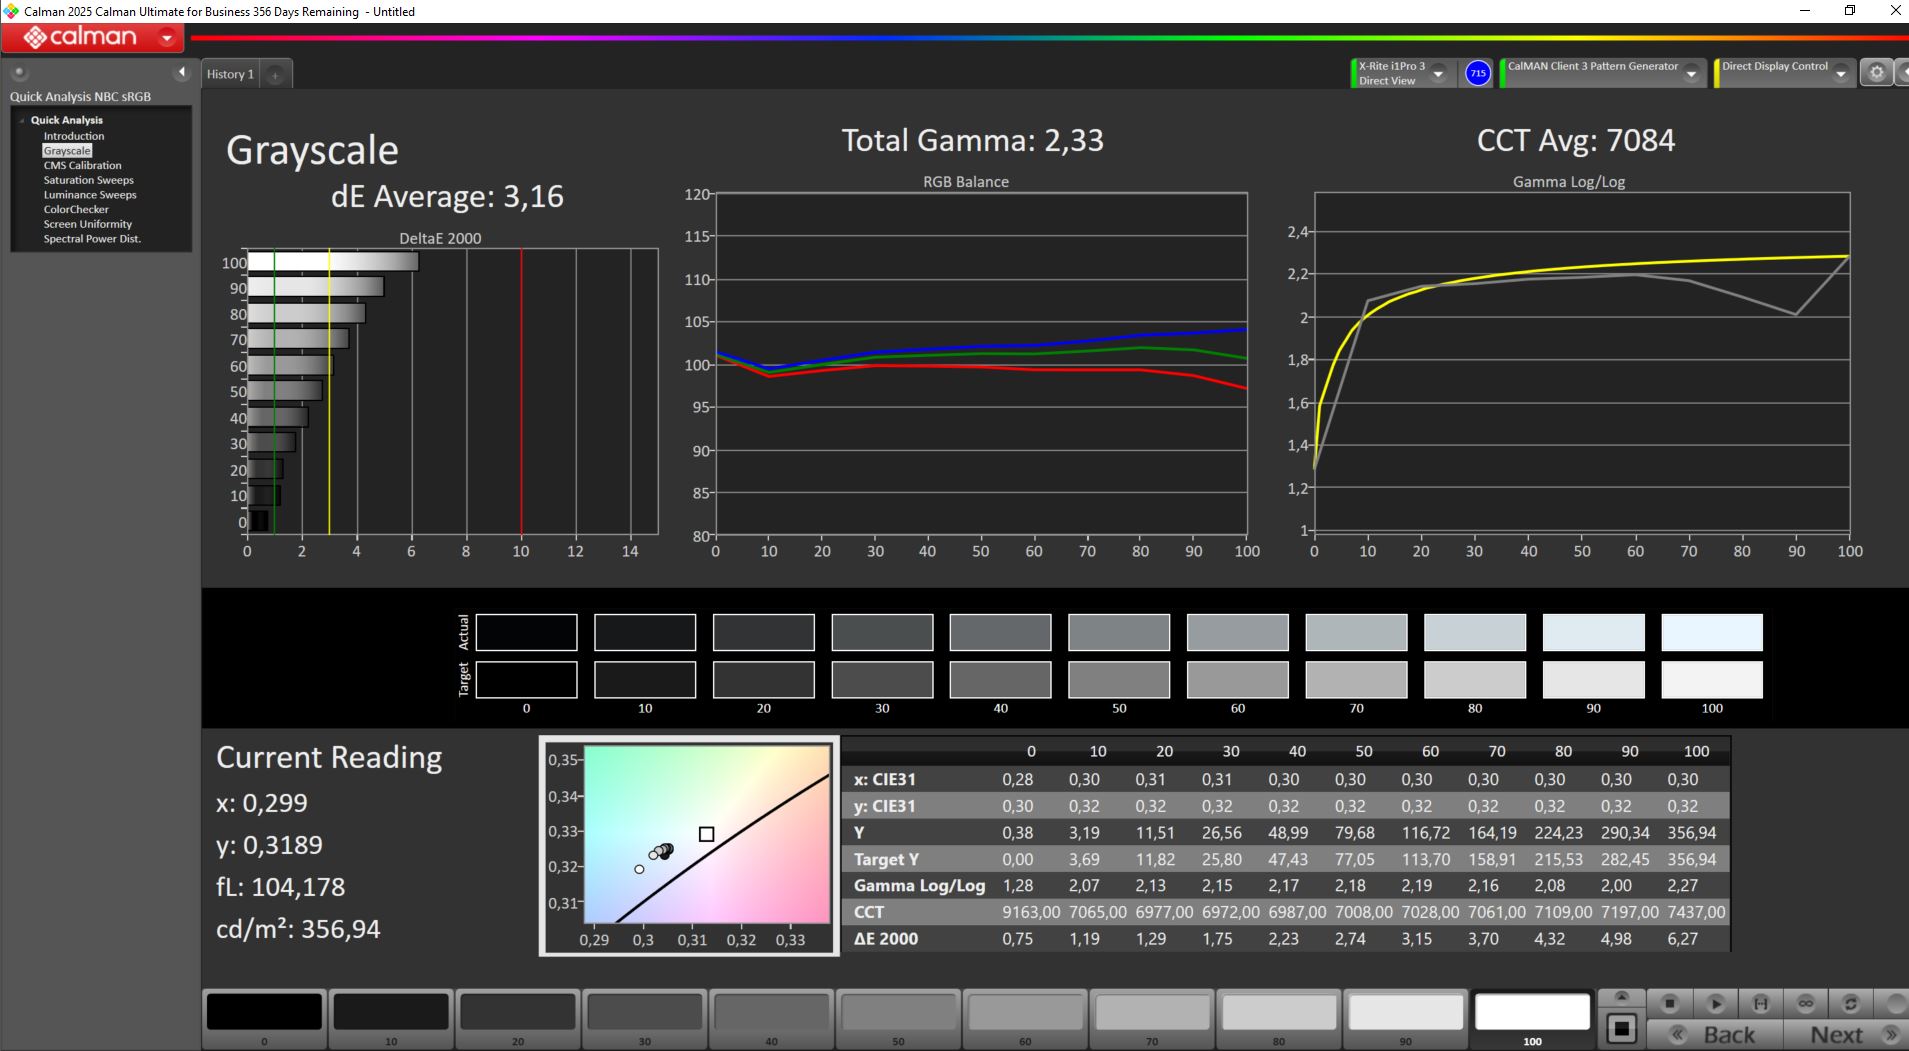
Abbiamo misurato una luminosità media di 325 nit. I livelli di nero sono un po' elevati, il che riduce leggermente il contrasto. Non viene utilizzato il PWM e i tempi di risposta sono abbastanza rapidi.

| |||||||||||||||||||||||||
Distribuzione della luminosità: 85 %
Al centro con la batteria: 355 cd/m²
Contrasto: 890:1 (Nero: 0.4 cd/m²)
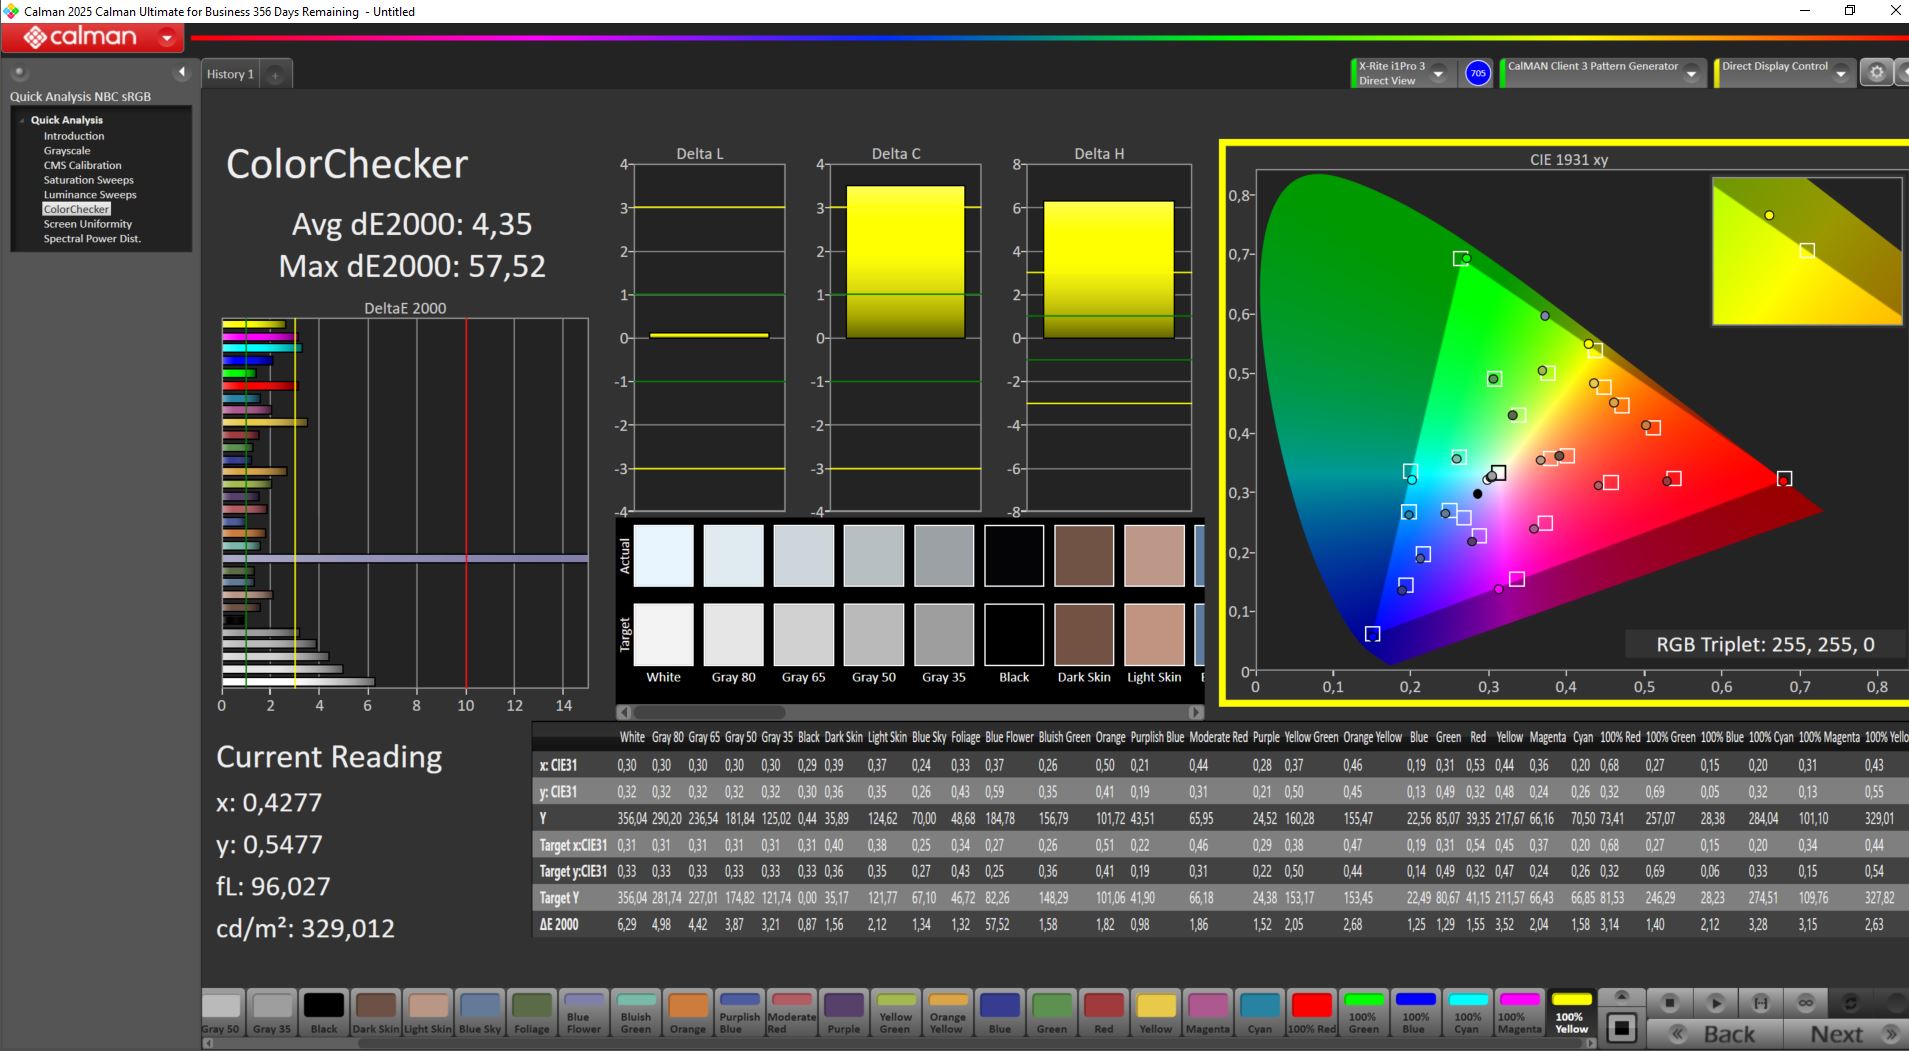
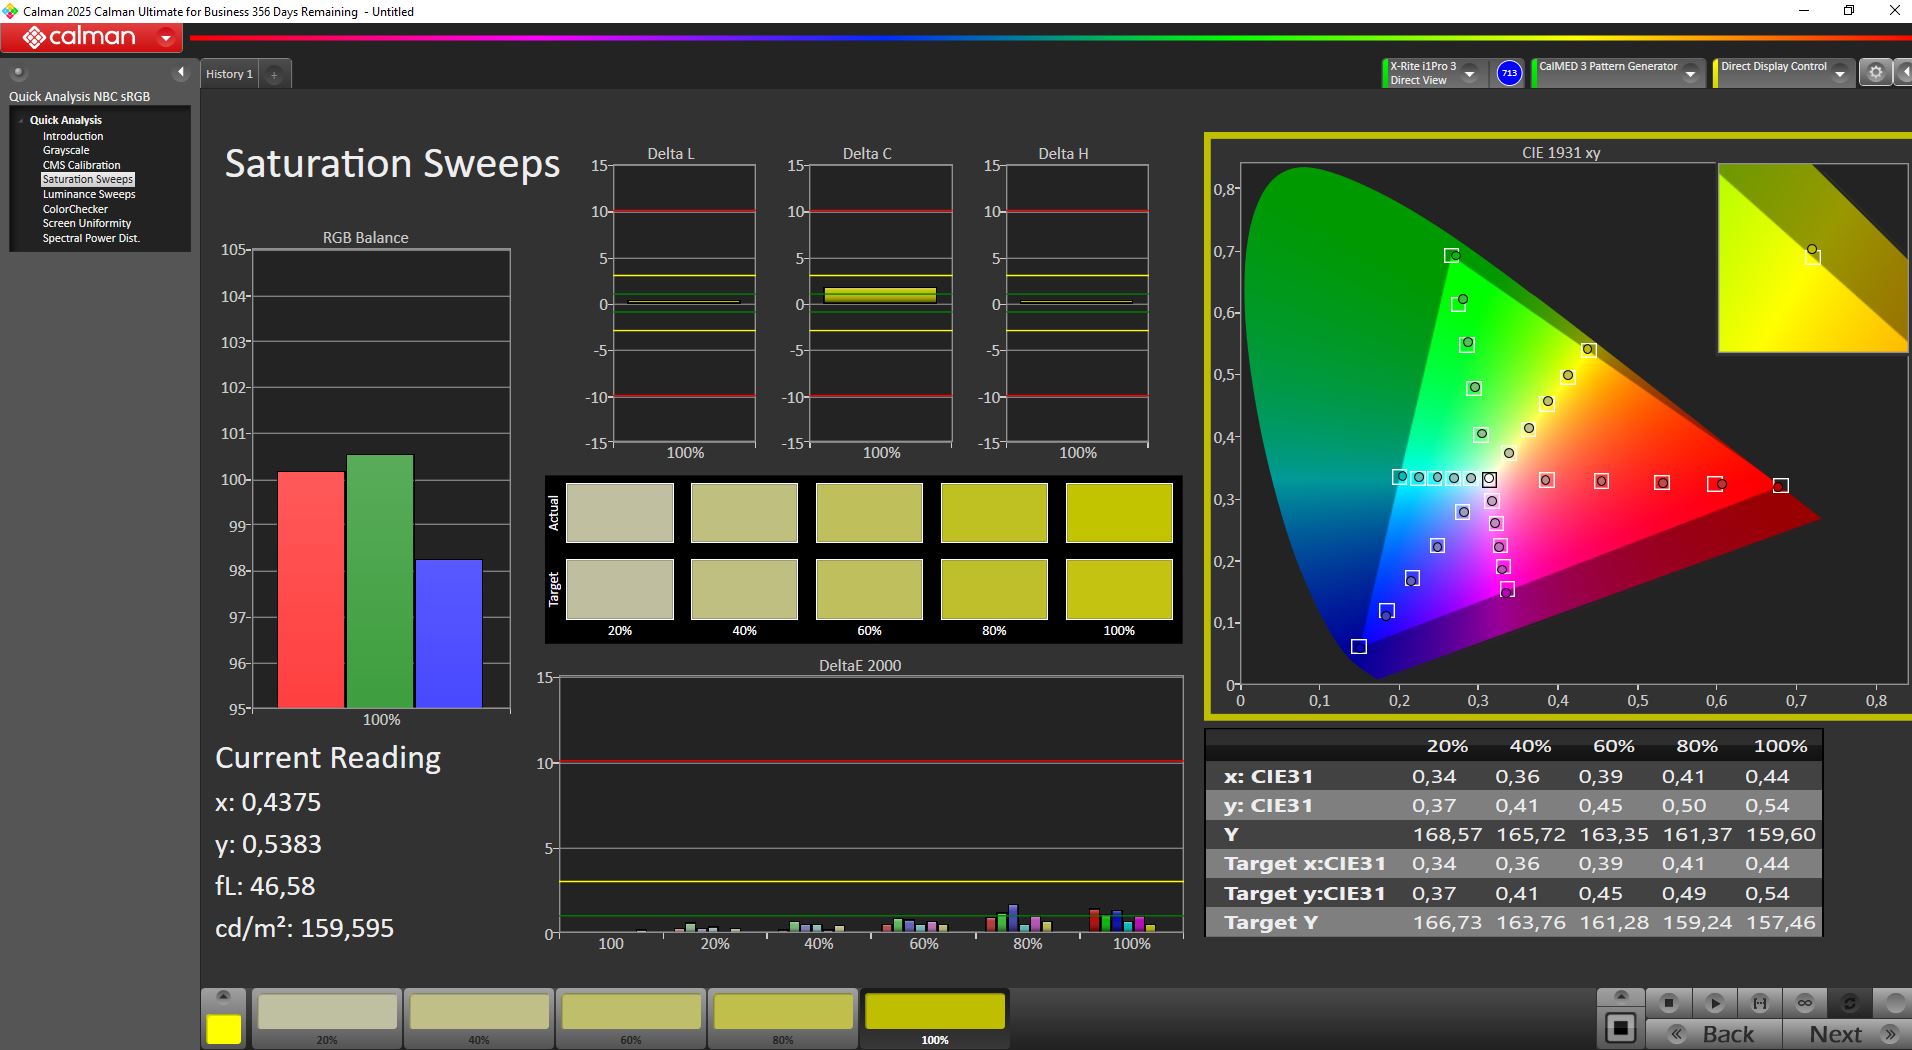
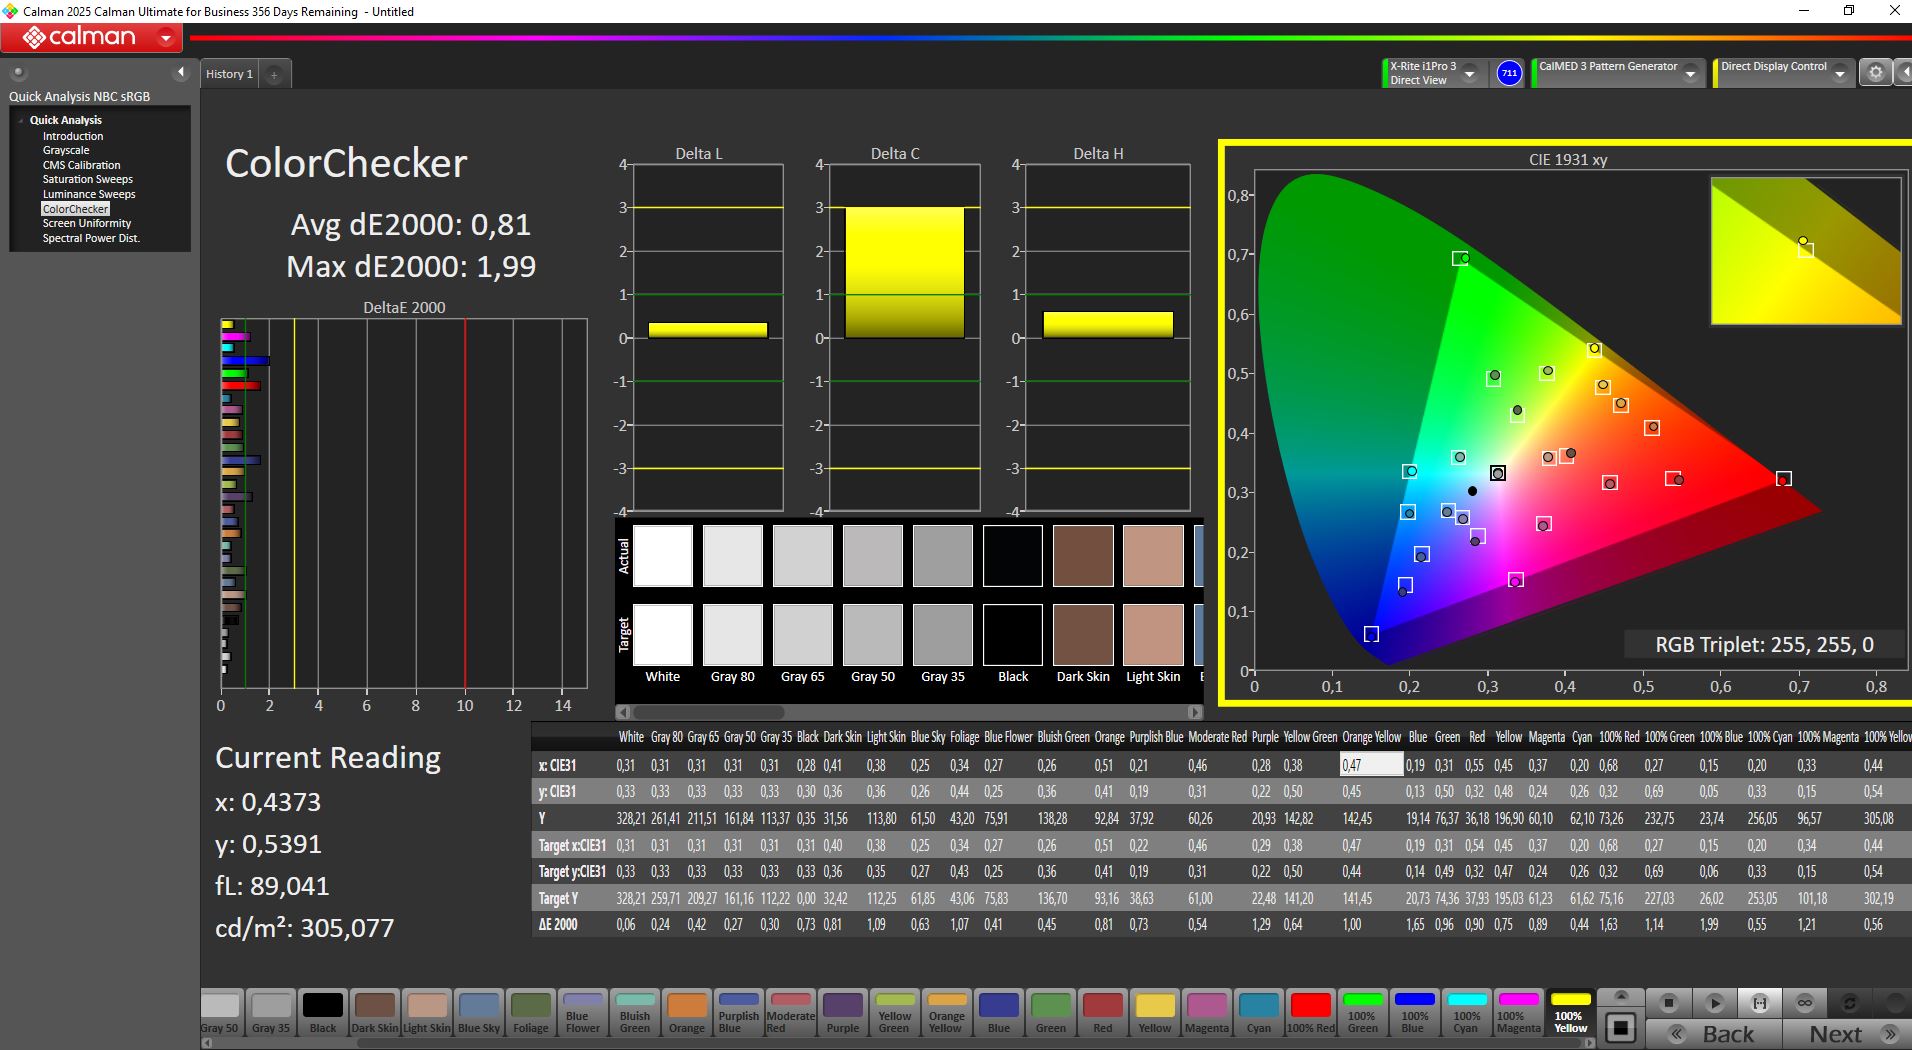
ΔE ColorChecker Calman: 4.35 | ∀{0.5-29.43 Ø4.76}
calibrated: 0.81
ΔE Greyscale Calman: 3.16 | ∀{0.09-98 Ø5}
85.1% AdobeRGB 1998 (Argyll 3D)
99.9% sRGB (Argyll 3D)
97.4% Display P3 (Argyll 3D)
Gamma: 2.33
CCT: 7084 K
| Schenker XMG Apex 17 M25 BOE09F9 (NE173QHM-NZ1), IPS, 2560x1440, 17.3", 240 Hz | HP Omen 17z-db100 BOE0B67, IPS, 2560x1440, 17.3", 240 Hz | Acer Nitro v 17 (ANV17-41-R4CJ) AUOB39E (B173HAN04.9), IPS, 1920x1080, 17.3", 144 Hz | MSI Crosshair A17 HX D8WGKG B170QAN01.2, IPS, 2560x1600, 17", 240 Hz | MSI Katana 17 HX B14WGK CSOT MNH301CA3-1, IPS, 2560x1440, 17.3", 240 Hz | |
|---|---|---|---|---|---|
| Display | -18% | -49% | 0% | 2% | |
| Display P3 Coverage (%) | 97.4 | 66.6 -32% | 42.2 -57% | 97.1 0% | 97.3 0% |
| sRGB Coverage (%) | 99.9 | 96.8 -3% | 60.9 -39% | 99.9 0% | 99.6 0% |
| AdobeRGB 1998 Coverage (%) | 85.1 | 68.6 -19% | 40.8 -52% | 84.9 0% | 89 5% |
| Response Times | -18% | -218% | 20% | 29% | |
| Response Time Grey 50% / Grey 80% * (ms) | 14 ? | 15.1 ? -8% | 42 ? -200% | 13.3 ? 5% | 5.2 ? 63% |
| Response Time Black / White * (ms) | 8.8 ? | 11.3 ? -28% | 29.6 ? -236% | 5.7 ? 35% | 9.2 ? -5% |
| PWM Frequency (Hz) | |||||
| PWM Amplitude * (%) | |||||
| Screen | -5% | -66% | 23% | 23% | |
| Brightness middle (cd/m²) | 356 | 373.2 5% | 258 -28% | 471 32% | 296 -17% |
| Brightness (cd/m²) | 325 | 341 5% | 238 -27% | 468 44% | 272 -16% |
| Brightness Distribution (%) | 85 | 84 -1% | 82 -4% | 96 13% | 87 2% |
| Black Level * (cd/m²) | 0.4 | 0.62 -55% | 0.19 52% | 0.4 -0% | 0.27 32% |
| Contrast (:1) | 890 | 602 -32% | 1358 53% | 1178 32% | 1096 23% |
| Colorchecker dE 2000 * | 4.35 | 2.53 42% | 7.4 -70% | 2.72 37% | 1.35 69% |
| Colorchecker dE 2000 max. * | 57.52 | 5.03 91% | 19.59 66% | 5.49 90% | 4.76 92% |
| Colorchecker dE 2000 calibrated * | 0.81 | 1.39 -72% | 5.88 -626% | 1.12 -38% | 0.78 4% |
| Greyscale dE 2000 * | 3.16 | 4.1 -30% | 3.54 -12% | 3.2 -1% | 2.7 15% |
| Gamma | 2.33 94% | 2.23 99% | 2.1 105% | 2.227 99% | 2.201 100% |
| CCT | 7084 92% | 6257 104% | 6836 95% | 6925 94% | 6770 96% |
| Media totale (Programma / Settaggio) | -14% /
-10% | -111% /
-84% | 14% /
18% | 18% /
19% |
* ... Meglio usare valori piccoli
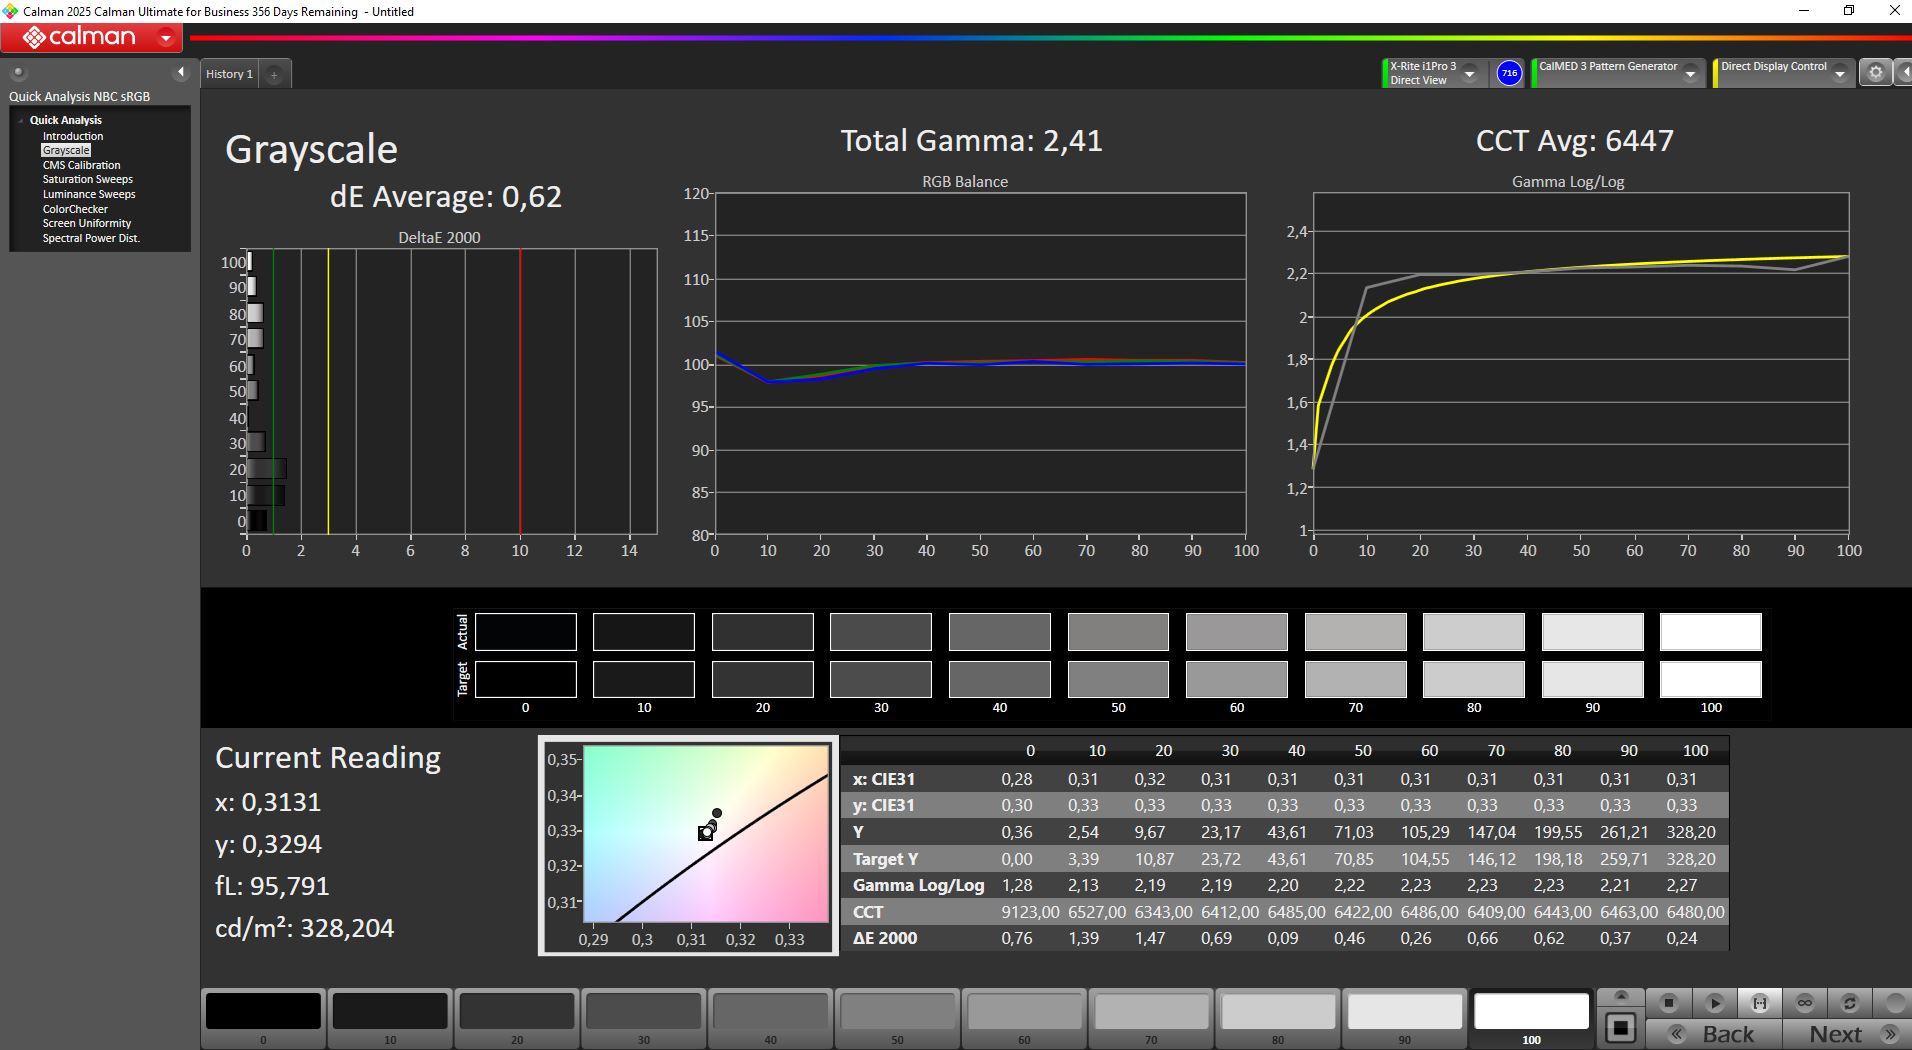
Fuori dalla scatola, la calibrazione è scarsa, con deviazioni DeltaE elevate. Dopo la ricalibrazione manuale, abbiamo ridotto le deviazioni della scala di grigi e del colore a meno di 1 - risultati eccellenti. Il nostro profilo ICC calibrato è disponibile per il download qui sopra.
Tempi di risposta del Display
| ↔ Tempi di risposta dal Nero al Bianco | ||
|---|---|---|
| 8.8 ms ... aumenta ↗ e diminuisce ↘ combinato | ↗ 3.4 ms Incremento | 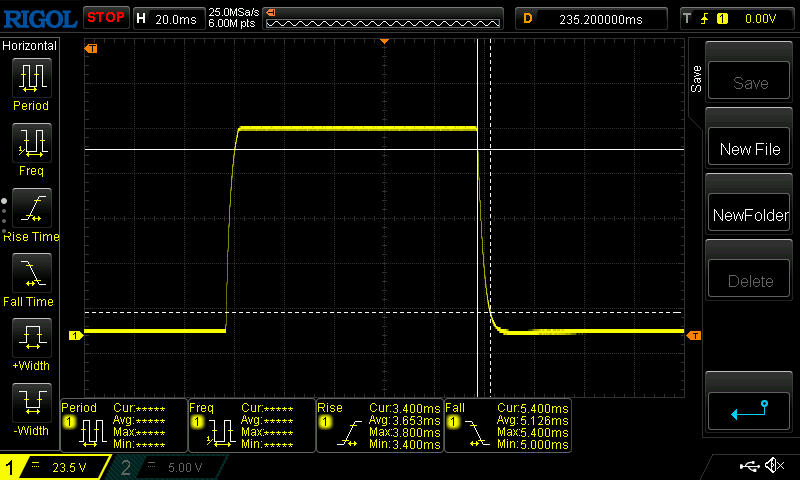 |
| ↘ 5.4 ms Calo | ||
| Lo schermo mostra veloci tempi di risposta durante i nostri tests e dovrebbe esere adatto al gaming In confronto, tutti i dispositivi di test variano da 0.1 (minimo) a 240 (massimo) ms. » 24 % di tutti i dispositivi è migliore. Questo significa che i tempi di risposta rilevati sono migliori rispettto alla media di tutti i dispositivi testati (20.1 ms). | ||
| ↔ Tempo di risposta dal 50% Grigio all'80% Grigio | ||
| 14 ms ... aumenta ↗ e diminuisce ↘ combinato | ↗ 6.6 ms Incremento | 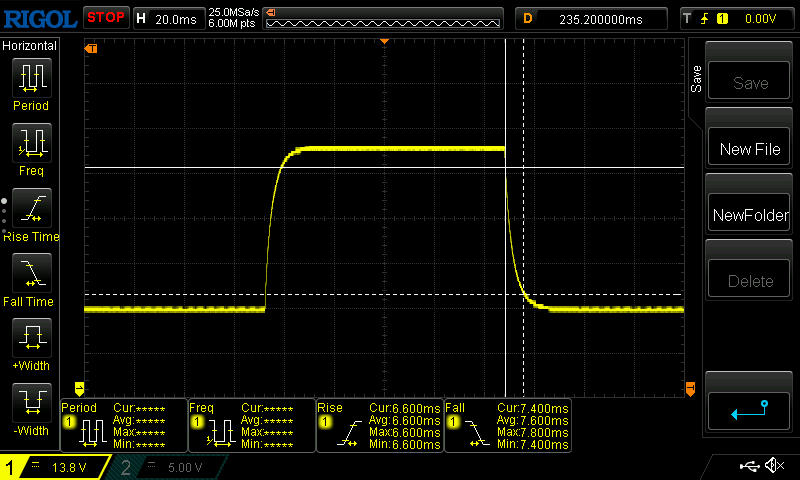 |
| ↘ 7.4 ms Calo | ||
| Lo schermo mostra buoni tempi di risposta durante i nostri tests, ma potrebbe essere troppo lento per i gamers competitivi. In confronto, tutti i dispositivi di test variano da 0.165 (minimo) a 636 (massimo) ms. » 27 % di tutti i dispositivi è migliore. Questo significa che i tempi di risposta rilevati sono migliori rispettto alla media di tutti i dispositivi testati (31.5 ms). | ||
Sfarfallio dello schermo / PWM (Pulse-Width Modulation)
| flickering dello schermo / PWM non rilevato |  | ||
In confronto: 53 % di tutti i dispositivi testati non utilizza PWM per ridurre la luminosita' del display. Se è rilevato PWM, una media di 8023 (minimo: 5 - massimo: 343500) Hz è stata rilevata. | |||
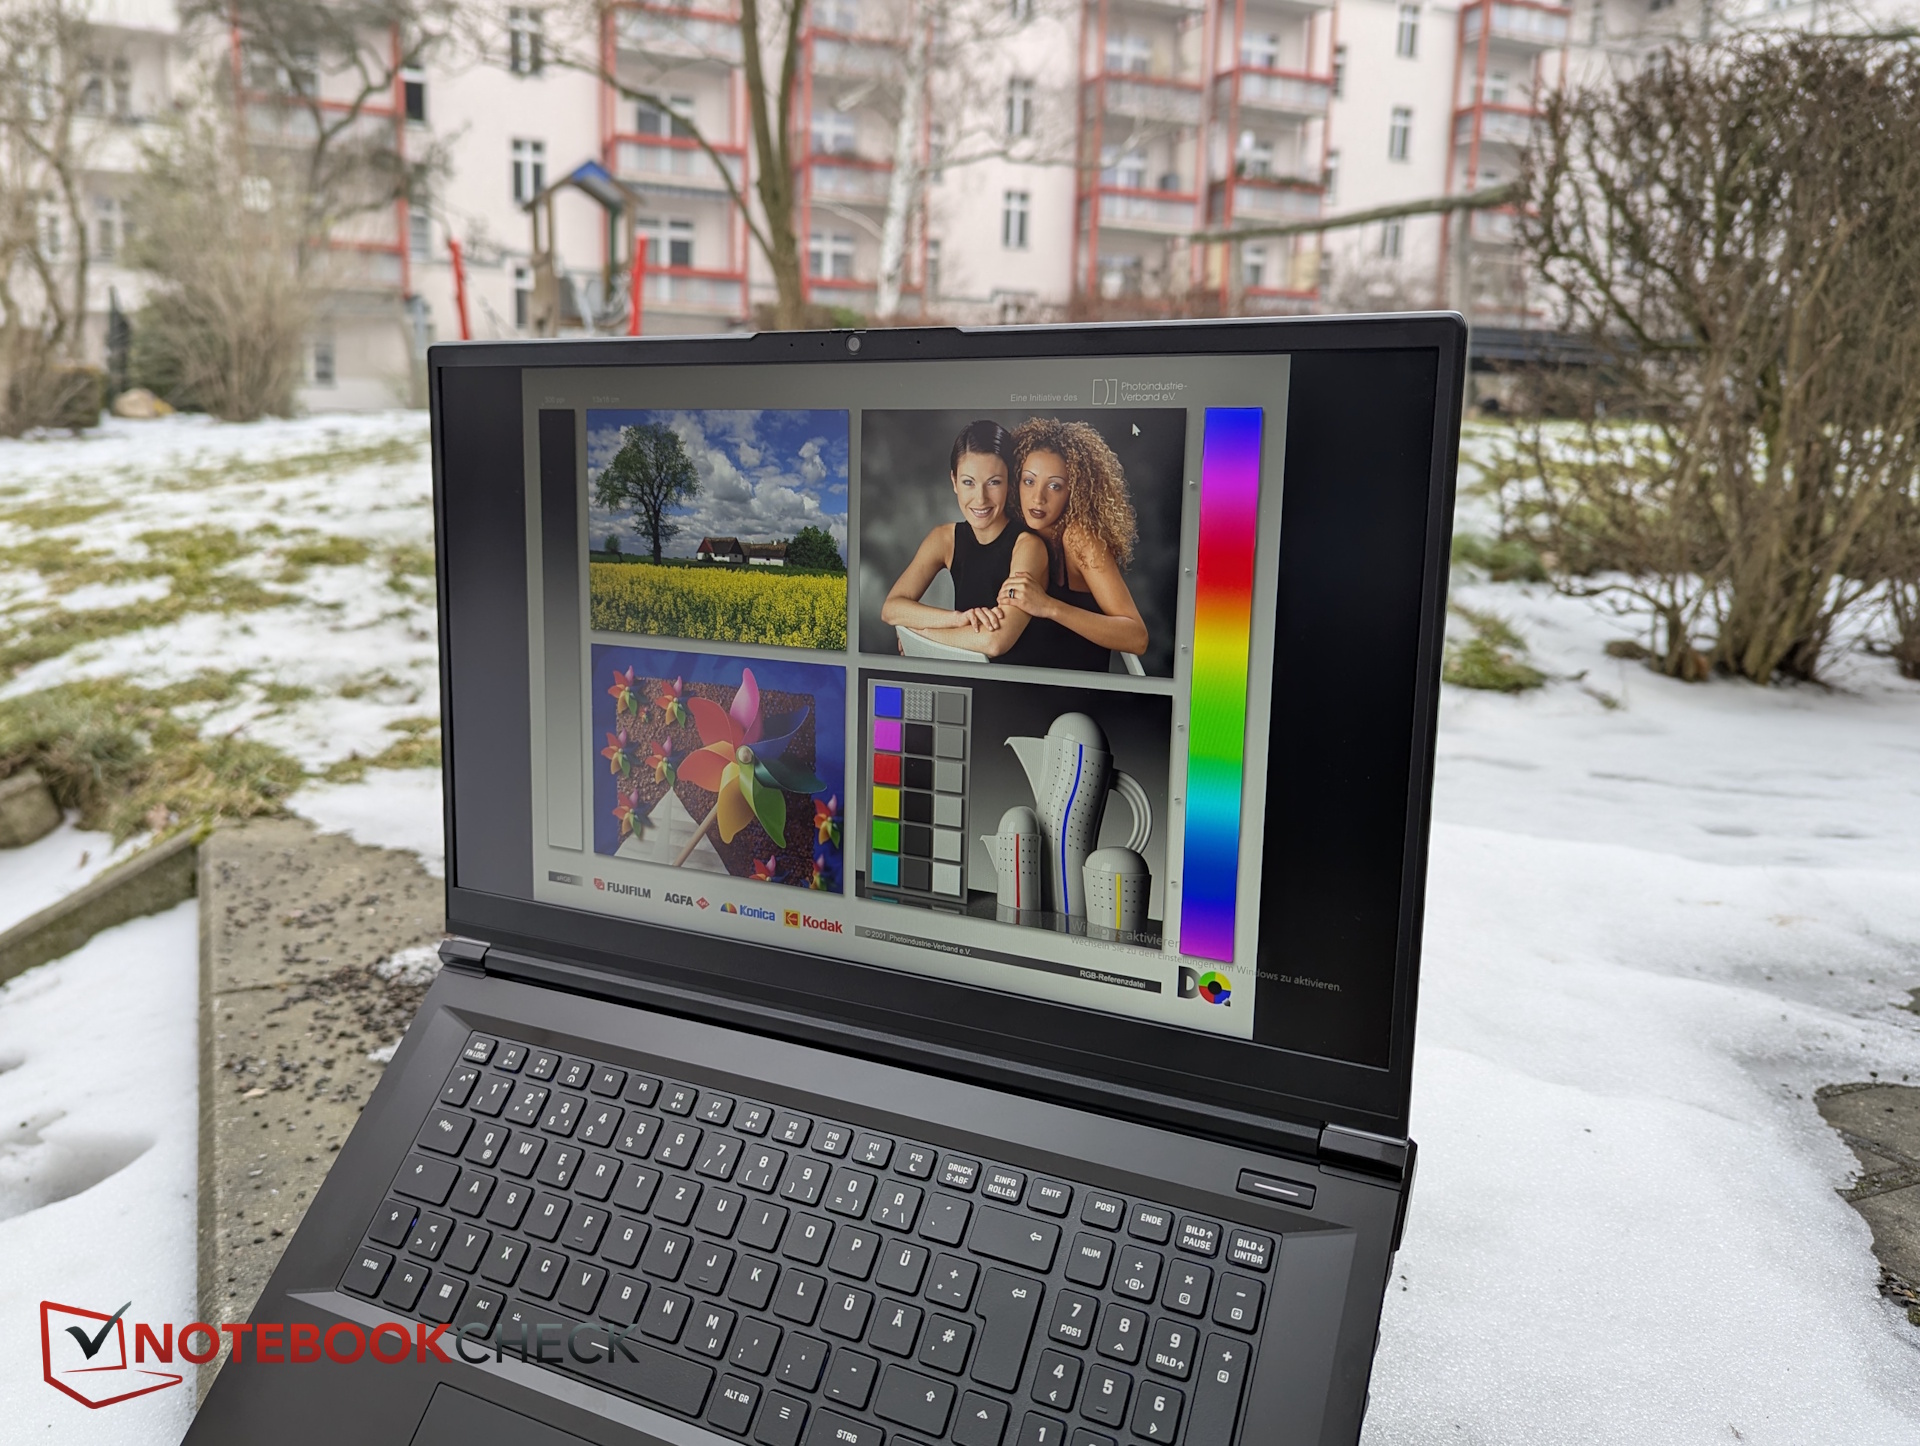
Grazie alla finitura opaca e alla luminosità superiore a 300 nit, i contenuti rimangono facilmente visibili anche in condizioni di ombra all'aperto.
Prestazioni - Quanto è davvero veloce l'Apex 17?
Equipaggiato con il AMD Ryzen 9 9955HX, RTX 5060e 32 GB di RAM, Apex è adatto ai giochi in Full HD. Il suo design sobrio e il display QHD ben calibrato possono interessare anche i creatori di contenuti.
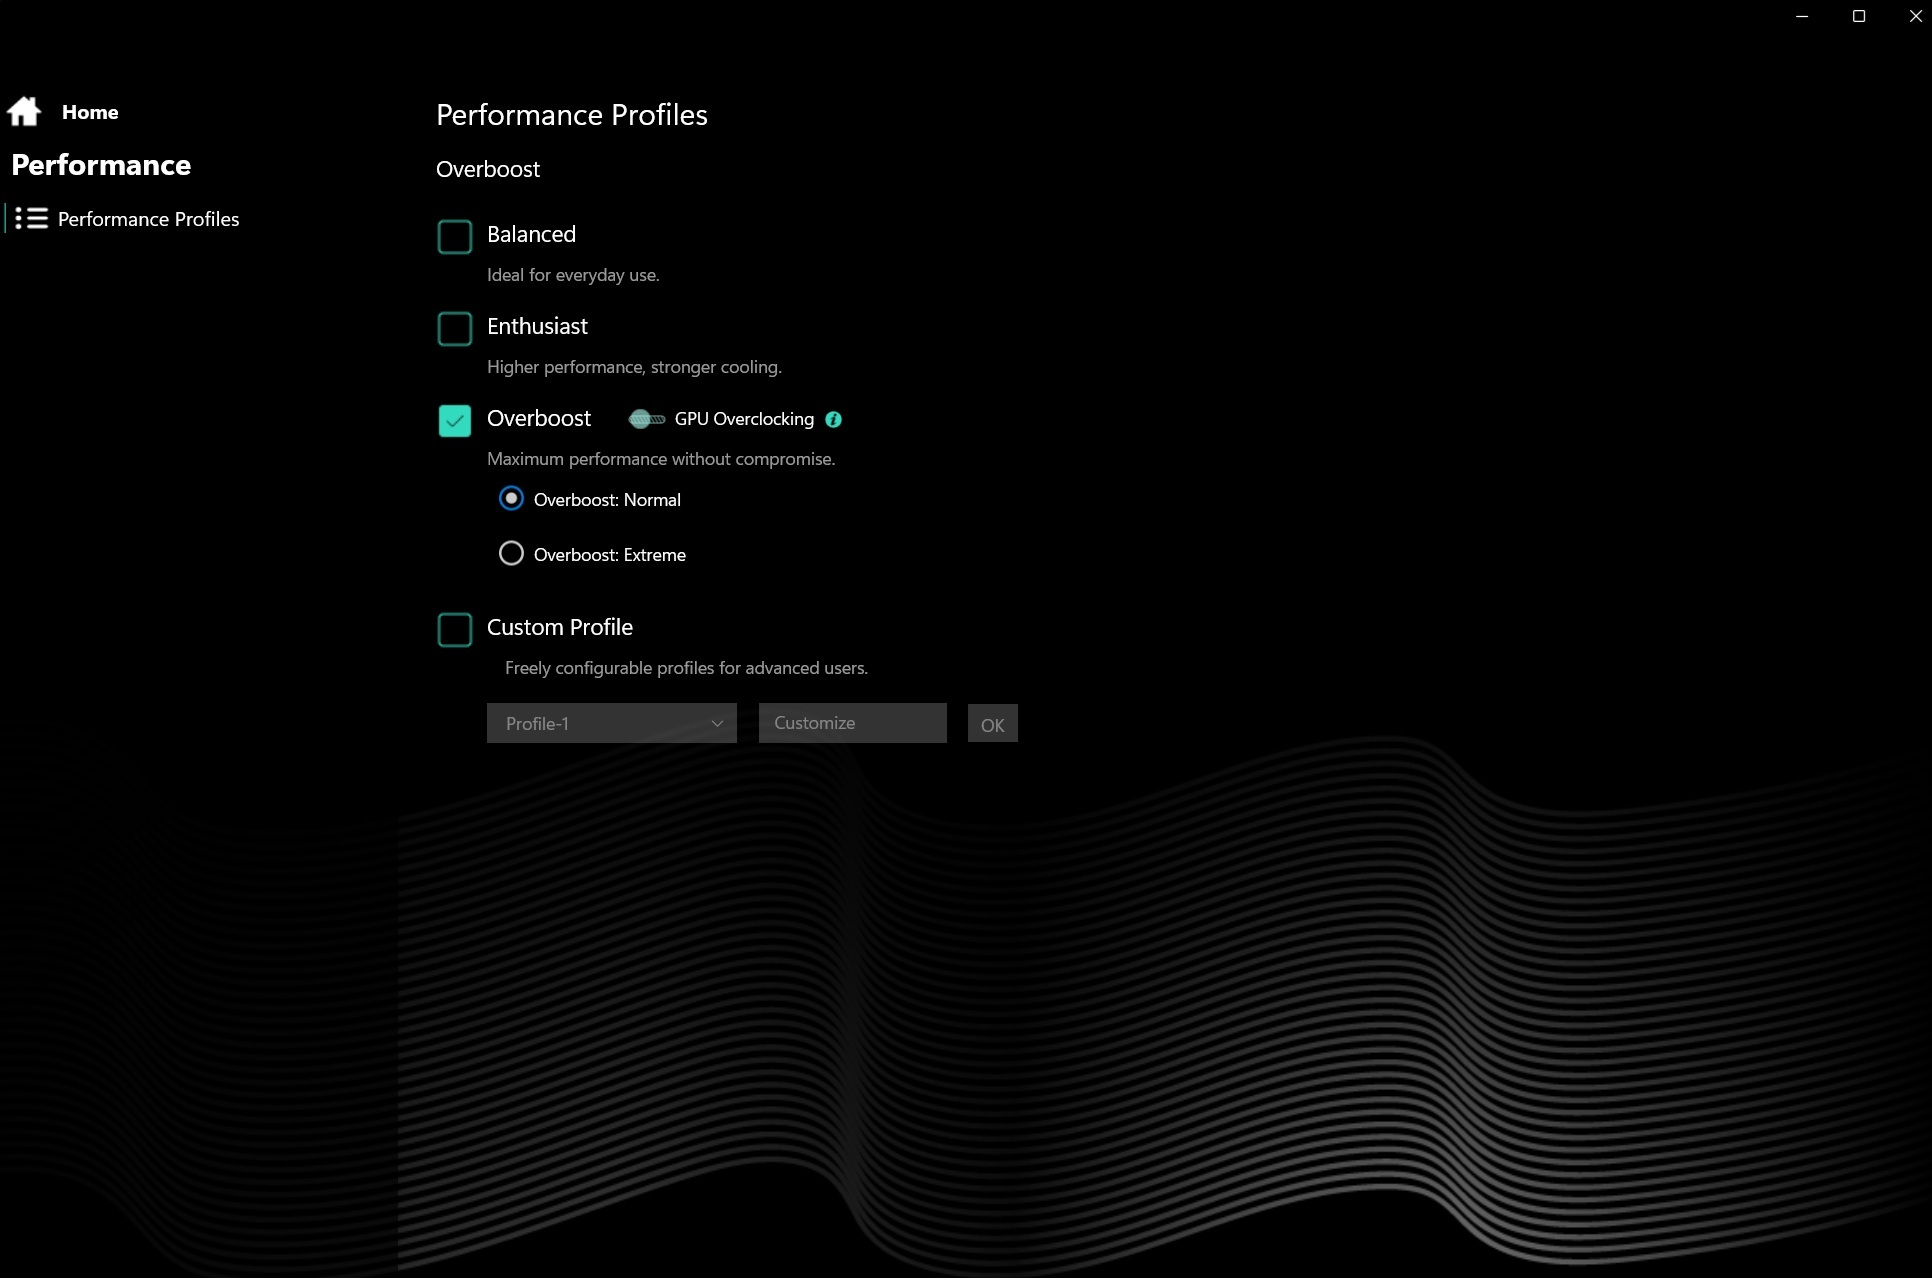
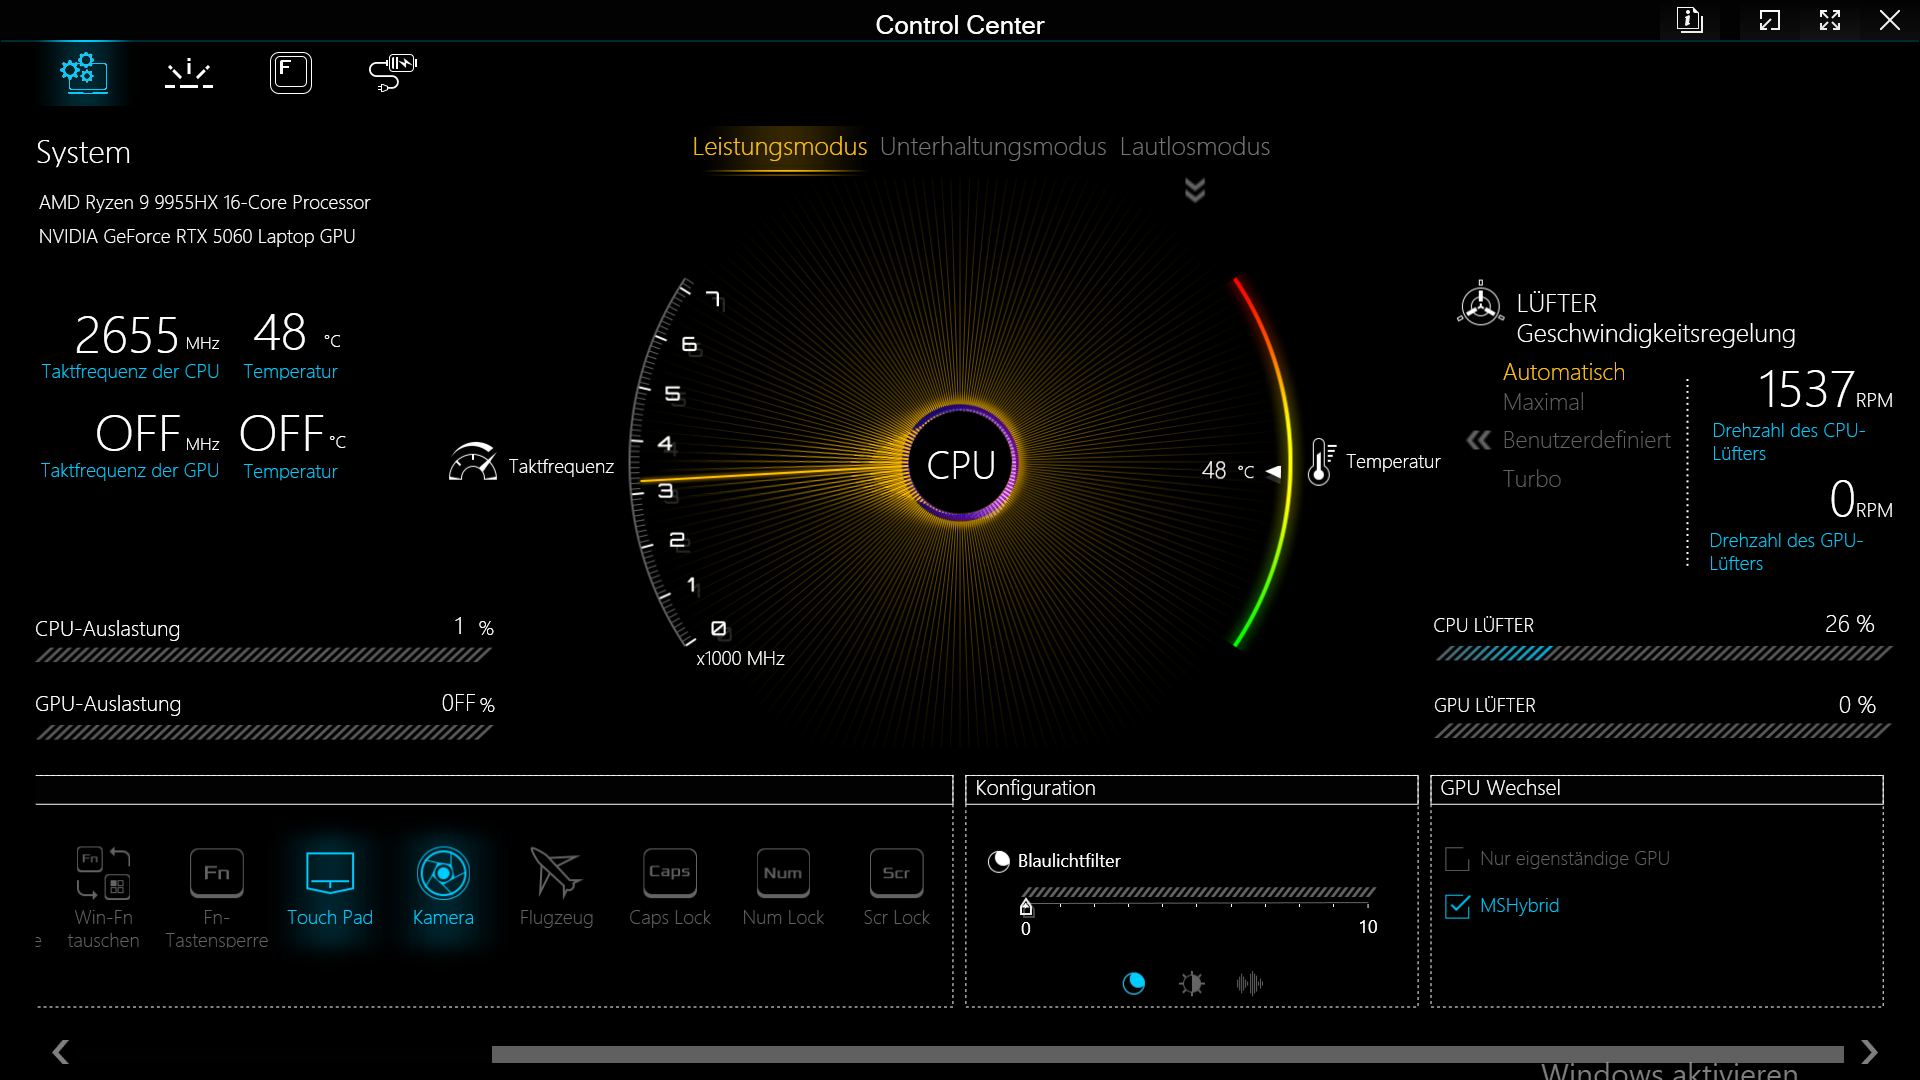
Condizioni del test
Per i benchmark, abbiamo utilizzato la modalità Performance (Performance, Entertainment, Silent) nel Centro di controllo.
| Prestazioni Modalità | Cinebench R15 Multi | Fire Strike Grafica | Cyberpunk 2077 FHD Ultra (fps) | Rumore della ventola Cyberpunk (dB) | Consumo di energia Cyberpunk (W) |
|---|---|---|---|---|---|
| Prestazioni | 5739 | 33011 | 84,4 | 55,05 | 220 |
| Intrattenimento | 4921 | 29792 | 74,4 | 40,5 - 43,5 | 170 |
| Silenziosità | 1227 | 23364 | 34,9 | 29 | 100 |
| Batteria (Prestazioni) | 2759 | 2578 | 30 | 23,5 - 33,5 |
Processore - Il primo posto nel ciclo di Cinebench
L'AMD Ryzen 9 9955HX AMD Ryzen 9 9955HX con 16 core Zen 5 offre prestazioni estremamente costanti nel ciclo Cinebench - e i punteggi CPU più alti nel campo di confronto.
Nella più tranquilla modalità Intrattenimento, le prestazioni di Cinebench R15 sono ancora pari a quelle di Legion 7. Con l'alimentazione a batteria, le prestazioni della CPU si riducono di oltre il 50 percento, ma rimangono comunque alla pari con le prestazioni di un computer collegato alla rete Katana 17 o Omen 17z.
Cinebench R15 Multi Loop
Cinebench R23: Multi Core | Single Core
Cinebench R20: CPU (Multi Core) | CPU (Single Core)
Cinebench R15: CPU Multi 64Bit | CPU Single 64Bit
Blender: v2.79 BMW27 CPU
7-Zip 18.03: 7z b 4 | 7z b 4 -mmt1
Geekbench 6.5: Multi-Core | Single-Core
Geekbench 5.5: Multi-Core | Single-Core
HWBOT x265 Benchmark v2.2: 4k Preset
LibreOffice : 20 Documents To PDF
R Benchmark 2.5: Overall mean
| CPU Performance rating | |
| Media AMD Ryzen 9 9955HX | |
| Schenker XMG Apex 17 M25 | |
| Lenovo Legion 7 16IAX10 | |
| MSI Crosshair A17 HX D8WGKG | |
| Media della classe Gaming | |
| MSI Katana 17 HX B14WGK | |
| HP Omen 17z-db100 | |
| Acer Nitro v 17 (ANV17-41-R4CJ) | |
| Cinebench R23 / Multi Core | |
| Media AMD Ryzen 9 9955HX (35960 - 39690, n=9) | |
| Schenker XMG Apex 17 M25 | |
| Lenovo Legion 7 16IAX10 | |
| MSI Crosshair A17 HX D8WGKG | |
| Media della classe Gaming (5668 - 40970, n=136, ultimi 2 anni) | |
| HP Omen 17z-db100 | |
| MSI Katana 17 HX B14WGK | |
| Acer Nitro v 17 (ANV17-41-R4CJ) | |
| Cinebench R23 / Single Core | |
| Schenker XMG Apex 17 M25 | |
| Lenovo Legion 7 16IAX10 | |
| Media AMD Ryzen 9 9955HX (1828 - 2183, n=9) | |
| Media della classe Gaming (1136 - 2267, n=136, ultimi 2 anni) | |
| MSI Katana 17 HX B14WGK | |
| HP Omen 17z-db100 | |
| MSI Crosshair A17 HX D8WGKG | |
| Acer Nitro v 17 (ANV17-41-R4CJ) | |
| Cinebench R20 / CPU (Multi Core) | |
| Media AMD Ryzen 9 9955HX (13963 - 15524, n=9) | |
| Schenker XMG Apex 17 M25 | |
| Lenovo Legion 7 16IAX10 | |
| MSI Crosshair A17 HX D8WGKG | |
| Media della classe Gaming (2179 - 16108, n=135, ultimi 2 anni) | |
| HP Omen 17z-db100 | |
| Acer Nitro v 17 (ANV17-41-R4CJ) | |
| MSI Katana 17 HX B14WGK | |
| Cinebench R20 / CPU (Single Core) | |
| Schenker XMG Apex 17 M25 | |
| Media AMD Ryzen 9 9955HX (819 - 856, n=9) | |
| Lenovo Legion 7 16IAX10 | |
| HP Omen 17z-db100 | |
| Media della classe Gaming (439 - 870, n=135, ultimi 2 anni) | |
| MSI Katana 17 HX B14WGK | |
| MSI Crosshair A17 HX D8WGKG | |
| Acer Nitro v 17 (ANV17-41-R4CJ) | |
| Cinebench R15 / CPU Multi 64Bit | |
| Media AMD Ryzen 9 9955HX (5624 - 6103, n=9) | |
| Schenker XMG Apex 17 M25 | |
| MSI Crosshair A17 HX D8WGKG | |
| Lenovo Legion 7 16IAX10 | |
| Media della classe Gaming (1537 - 6271, n=135, ultimi 2 anni) | |
| MSI Katana 17 HX B14WGK | |
| HP Omen 17z-db100 | |
| Acer Nitro v 17 (ANV17-41-R4CJ) | |
| Cinebench R15 / CPU Single 64Bit | |
| Schenker XMG Apex 17 M25 | |
| Media AMD Ryzen 9 9955HX (320 - 338, n=9) | |
| Lenovo Legion 7 16IAX10 | |
| HP Omen 17z-db100 | |
| Media della classe Gaming (188.8 - 343, n=134, ultimi 2 anni) | |
| MSI Crosshair A17 HX D8WGKG | |
| MSI Katana 17 HX B14WGK | |
| Acer Nitro v 17 (ANV17-41-R4CJ) | |
| Blender / v2.79 BMW27 CPU | |
| MSI Katana 17 HX B14WGK | |
| Acer Nitro v 17 (ANV17-41-R4CJ) | |
| HP Omen 17z-db100 | |
| Media della classe Gaming (80 - 517, n=131, ultimi 2 anni) | |
| Lenovo Legion 7 16IAX10 | |
| MSI Crosshair A17 HX D8WGKG | |
| Schenker XMG Apex 17 M25 | |
| Media AMD Ryzen 9 9955HX (80 - 91, n=9) | |
| 7-Zip 18.03 / 7z b 4 | |
| Media AMD Ryzen 9 9955HX (132435 - 144064, n=9) | |
| MSI Crosshair A17 HX D8WGKG | |
| Schenker XMG Apex 17 M25 | |
| Lenovo Legion 7 16IAX10 | |
| Media della classe Gaming (23795 - 148086, n=133, ultimi 2 anni) | |
| MSI Katana 17 HX B14WGK | |
| Acer Nitro v 17 (ANV17-41-R4CJ) | |
| HP Omen 17z-db100 | |
| 7-Zip 18.03 / 7z b 4 -mmt1 | |
| Schenker XMG Apex 17 M25 | |
| MSI Crosshair A17 HX D8WGKG | |
| Media AMD Ryzen 9 9955HX (7061 - 7462, n=9) | |
| Acer Nitro v 17 (ANV17-41-R4CJ) | |
| Lenovo Legion 7 16IAX10 | |
| Media della classe Gaming (4199 - 7508, n=133, ultimi 2 anni) | |
| MSI Katana 17 HX B14WGK | |
| HP Omen 17z-db100 | |
| Geekbench 6.5 / Multi-Core | |
| Schenker XMG Apex 17 M25 | |
| Media AMD Ryzen 9 9955HX (16313 - 19725, n=9) | |
| Lenovo Legion 7 16IAX10 | |
| MSI Crosshair A17 HX D8WGKG | |
| Media della classe Gaming (5340 - 22104, n=134, ultimi 2 anni) | |
| MSI Katana 17 HX B14WGK | |
| HP Omen 17z-db100 | |
| Acer Nitro v 17 (ANV17-41-R4CJ) | |
| Geekbench 6.5 / Single-Core | |
| Schenker XMG Apex 17 M25 | |
| Media AMD Ryzen 9 9955HX (3156 - 3259, n=9) | |
| Lenovo Legion 7 16IAX10 | |
| MSI Crosshair A17 HX D8WGKG | |
| Media della classe Gaming (1490 - 3259, n=134, ultimi 2 anni) | |
| MSI Katana 17 HX B14WGK | |
| Acer Nitro v 17 (ANV17-41-R4CJ) | |
| HP Omen 17z-db100 | |
| Geekbench 5.5 / Multi-Core | |
| Media AMD Ryzen 9 9955HX (20576 - 22716, n=9) | |
| Schenker XMG Apex 17 M25 | |
| MSI Crosshair A17 HX D8WGKG | |
| Lenovo Legion 7 16IAX10 | |
| Media della classe Gaming (4557 - 27010, n=133, ultimi 2 anni) | |
| MSI Katana 17 HX B14WGK | |
| HP Omen 17z-db100 | |
| Acer Nitro v 17 (ANV17-41-R4CJ) | |
| Geekbench 5.5 / Single-Core | |
| Schenker XMG Apex 17 M25 | |
| Media AMD Ryzen 9 9955HX (2307 - 2474, n=9) | |
| Lenovo Legion 7 16IAX10 | |
| Media della classe Gaming (986 - 2474, n=133, ultimi 2 anni) | |
| MSI Katana 17 HX B14WGK | |
| MSI Crosshair A17 HX D8WGKG | |
| Acer Nitro v 17 (ANV17-41-R4CJ) | |
| HP Omen 17z-db100 | |
| HWBOT x265 Benchmark v2.2 / 4k Preset | |
| Media AMD Ryzen 9 9955HX (38.9 - 43, n=9) | |
| Schenker XMG Apex 17 M25 | |
| MSI Crosshair A17 HX D8WGKG | |
| Lenovo Legion 7 16IAX10 | |
| Media della classe Gaming (7.7 - 44.3, n=133, ultimi 2 anni) | |
| HP Omen 17z-db100 | |
| Acer Nitro v 17 (ANV17-41-R4CJ) | |
| MSI Katana 17 HX B14WGK | |
| LibreOffice / 20 Documents To PDF | |
| Acer Nitro v 17 (ANV17-41-R4CJ) | |
| MSI Katana 17 HX B14WGK | |
| Schenker XMG Apex 17 M25 | |
| HP Omen 17z-db100 | |
| Media della classe Gaming (19 - 88.8, n=133, ultimi 2 anni) | |
| Media AMD Ryzen 9 9955HX (42.2 - 52.4, n=9) | |
| MSI Crosshair A17 HX D8WGKG | |
| Lenovo Legion 7 16IAX10 | |
| R Benchmark 2.5 / Overall mean | |
| Acer Nitro v 17 (ANV17-41-R4CJ) | |
| MSI Crosshair A17 HX D8WGKG | |
| Media della classe Gaming (0.3439 - 0.759, n=134, ultimi 2 anni) | |
| Lenovo Legion 7 16IAX10 | |
| MSI Katana 17 HX B14WGK | |
| HP Omen 17z-db100 | |
| Schenker XMG Apex 17 M25 | |
| Media AMD Ryzen 9 9955HX (0.3439 - 0.3737, n=9) | |
* ... Meglio usare valori piccoli
AIDA64: FP32 Ray-Trace | FPU Julia | CPU SHA3 | CPU Queen | FPU SinJulia | FPU Mandel | CPU AES | CPU ZLib | FP64 Ray-Trace | CPU PhotoWorxx
| Performance rating | |
| Media AMD Ryzen 9 9955HX | |
| Schenker XMG Apex 17 M25 | |
| MSI Crosshair A17 HX D8WGKG | |
| Lenovo Legion 7 16IAX10 | |
| Media della classe Gaming | |
| HP Omen 17z-db100 | |
| Acer Nitro v 17 (ANV17-41-R4CJ) | |
| MSI Katana 17 HX B14WGK | |
| AIDA64 / FP32 Ray-Trace | |
| Media AMD Ryzen 9 9955HX (66596 - 85542, n=9) | |
| Schenker XMG Apex 17 M25 | |
| MSI Crosshair A17 HX D8WGKG | |
| Media della classe Gaming (7192 - 85542, n=133, ultimi 2 anni) | |
| Lenovo Legion 7 16IAX10 | |
| HP Omen 17z-db100 | |
| Acer Nitro v 17 (ANV17-41-R4CJ) | |
| MSI Katana 17 HX B14WGK | |
| AIDA64 / FPU Julia | |
| Media AMD Ryzen 9 9955HX (191535 - 232031, n=9) | |
| Schenker XMG Apex 17 M25 | |
| MSI Crosshair A17 HX D8WGKG | |
| Lenovo Legion 7 16IAX10 | |
| Media della classe Gaming (35040 - 238426, n=133, ultimi 2 anni) | |
| Acer Nitro v 17 (ANV17-41-R4CJ) | |
| HP Omen 17z-db100 | |
| MSI Katana 17 HX B14WGK | |
| AIDA64 / CPU SHA3 | |
| Media AMD Ryzen 9 9955HX (8489 - 9780, n=9) | |
| MSI Crosshair A17 HX D8WGKG | |
| Schenker XMG Apex 17 M25 | |
| Lenovo Legion 7 16IAX10 | |
| Media della classe Gaming (1728 - 9817, n=133, ultimi 2 anni) | |
| Acer Nitro v 17 (ANV17-41-R4CJ) | |
| HP Omen 17z-db100 | |
| MSI Katana 17 HX B14WGK | |
| AIDA64 / CPU Queen | |
| MSI Crosshair A17 HX D8WGKG | |
| Media AMD Ryzen 9 9955HX (153027 - 164154, n=9) | |
| Schenker XMG Apex 17 M25 | |
| Lenovo Legion 7 16IAX10 | |
| Media della classe Gaming (49785 - 173351, n=133, ultimi 2 anni) | |
| Acer Nitro v 17 (ANV17-41-R4CJ) | |
| MSI Katana 17 HX B14WGK | |
| HP Omen 17z-db100 | |
| AIDA64 / FPU SinJulia | |
| Media AMD Ryzen 9 9955HX (29876 - 32647, n=9) | |
| Schenker XMG Apex 17 M25 | |
| MSI Crosshair A17 HX D8WGKG | |
| Acer Nitro v 17 (ANV17-41-R4CJ) | |
| Media della classe Gaming (4424 - 33636, n=133, ultimi 2 anni) | |
| HP Omen 17z-db100 | |
| Lenovo Legion 7 16IAX10 | |
| MSI Katana 17 HX B14WGK | |
| AIDA64 / FPU Mandel | |
| Media AMD Ryzen 9 9955HX (101131 - 128721, n=9) | |
| MSI Crosshair A17 HX D8WGKG | |
| Schenker XMG Apex 17 M25 | |
| Lenovo Legion 7 16IAX10 | |
| Media della classe Gaming (17585 - 128721, n=133, ultimi 2 anni) | |
| HP Omen 17z-db100 | |
| Acer Nitro v 17 (ANV17-41-R4CJ) | |
| MSI Katana 17 HX B14WGK | |
| AIDA64 / CPU AES | |
| Media AMD Ryzen 9 9955HX (146979 - 218385, n=9) | |
| MSI Crosshair A17 HX D8WGKG | |
| Schenker XMG Apex 17 M25 | |
| Lenovo Legion 7 16IAX10 | |
| Media della classe Gaming (19065 - 247074, n=133, ultimi 2 anni) | |
| HP Omen 17z-db100 | |
| Acer Nitro v 17 (ANV17-41-R4CJ) | |
| MSI Katana 17 HX B14WGK | |
| AIDA64 / CPU ZLib | |
| Media AMD Ryzen 9 9955HX (2186 - 2531, n=9) | |
| Schenker XMG Apex 17 M25 | |
| MSI Crosshair A17 HX D8WGKG | |
| Lenovo Legion 7 16IAX10 | |
| Media della classe Gaming (373 - 2531, n=133, ultimi 2 anni) | |
| HP Omen 17z-db100 | |
| Acer Nitro v 17 (ANV17-41-R4CJ) | |
| MSI Katana 17 HX B14WGK | |
| AIDA64 / FP64 Ray-Trace | |
| Media AMD Ryzen 9 9955HX (35252 - 45446, n=9) | |
| Schenker XMG Apex 17 M25 | |
| MSI Crosshair A17 HX D8WGKG | |
| Lenovo Legion 7 16IAX10 | |
| Media della classe Gaming (3856 - 45446, n=133, ultimi 2 anni) | |
| HP Omen 17z-db100 | |
| Acer Nitro v 17 (ANV17-41-R4CJ) | |
| MSI Katana 17 HX B14WGK | |
| AIDA64 / CPU PhotoWorxx | |
| Lenovo Legion 7 16IAX10 | |
| HP Omen 17z-db100 | |
| Media della classe Gaming (10805 - 62916, n=133, ultimi 2 anni) | |
| Schenker XMG Apex 17 M25 | |
| Media AMD Ryzen 9 9955HX (35974 - 42495, n=9) | |
| MSI Crosshair A17 HX D8WGKG | |
| MSI Katana 17 HX B14WGK | |
| Acer Nitro v 17 (ANV17-41-R4CJ) | |
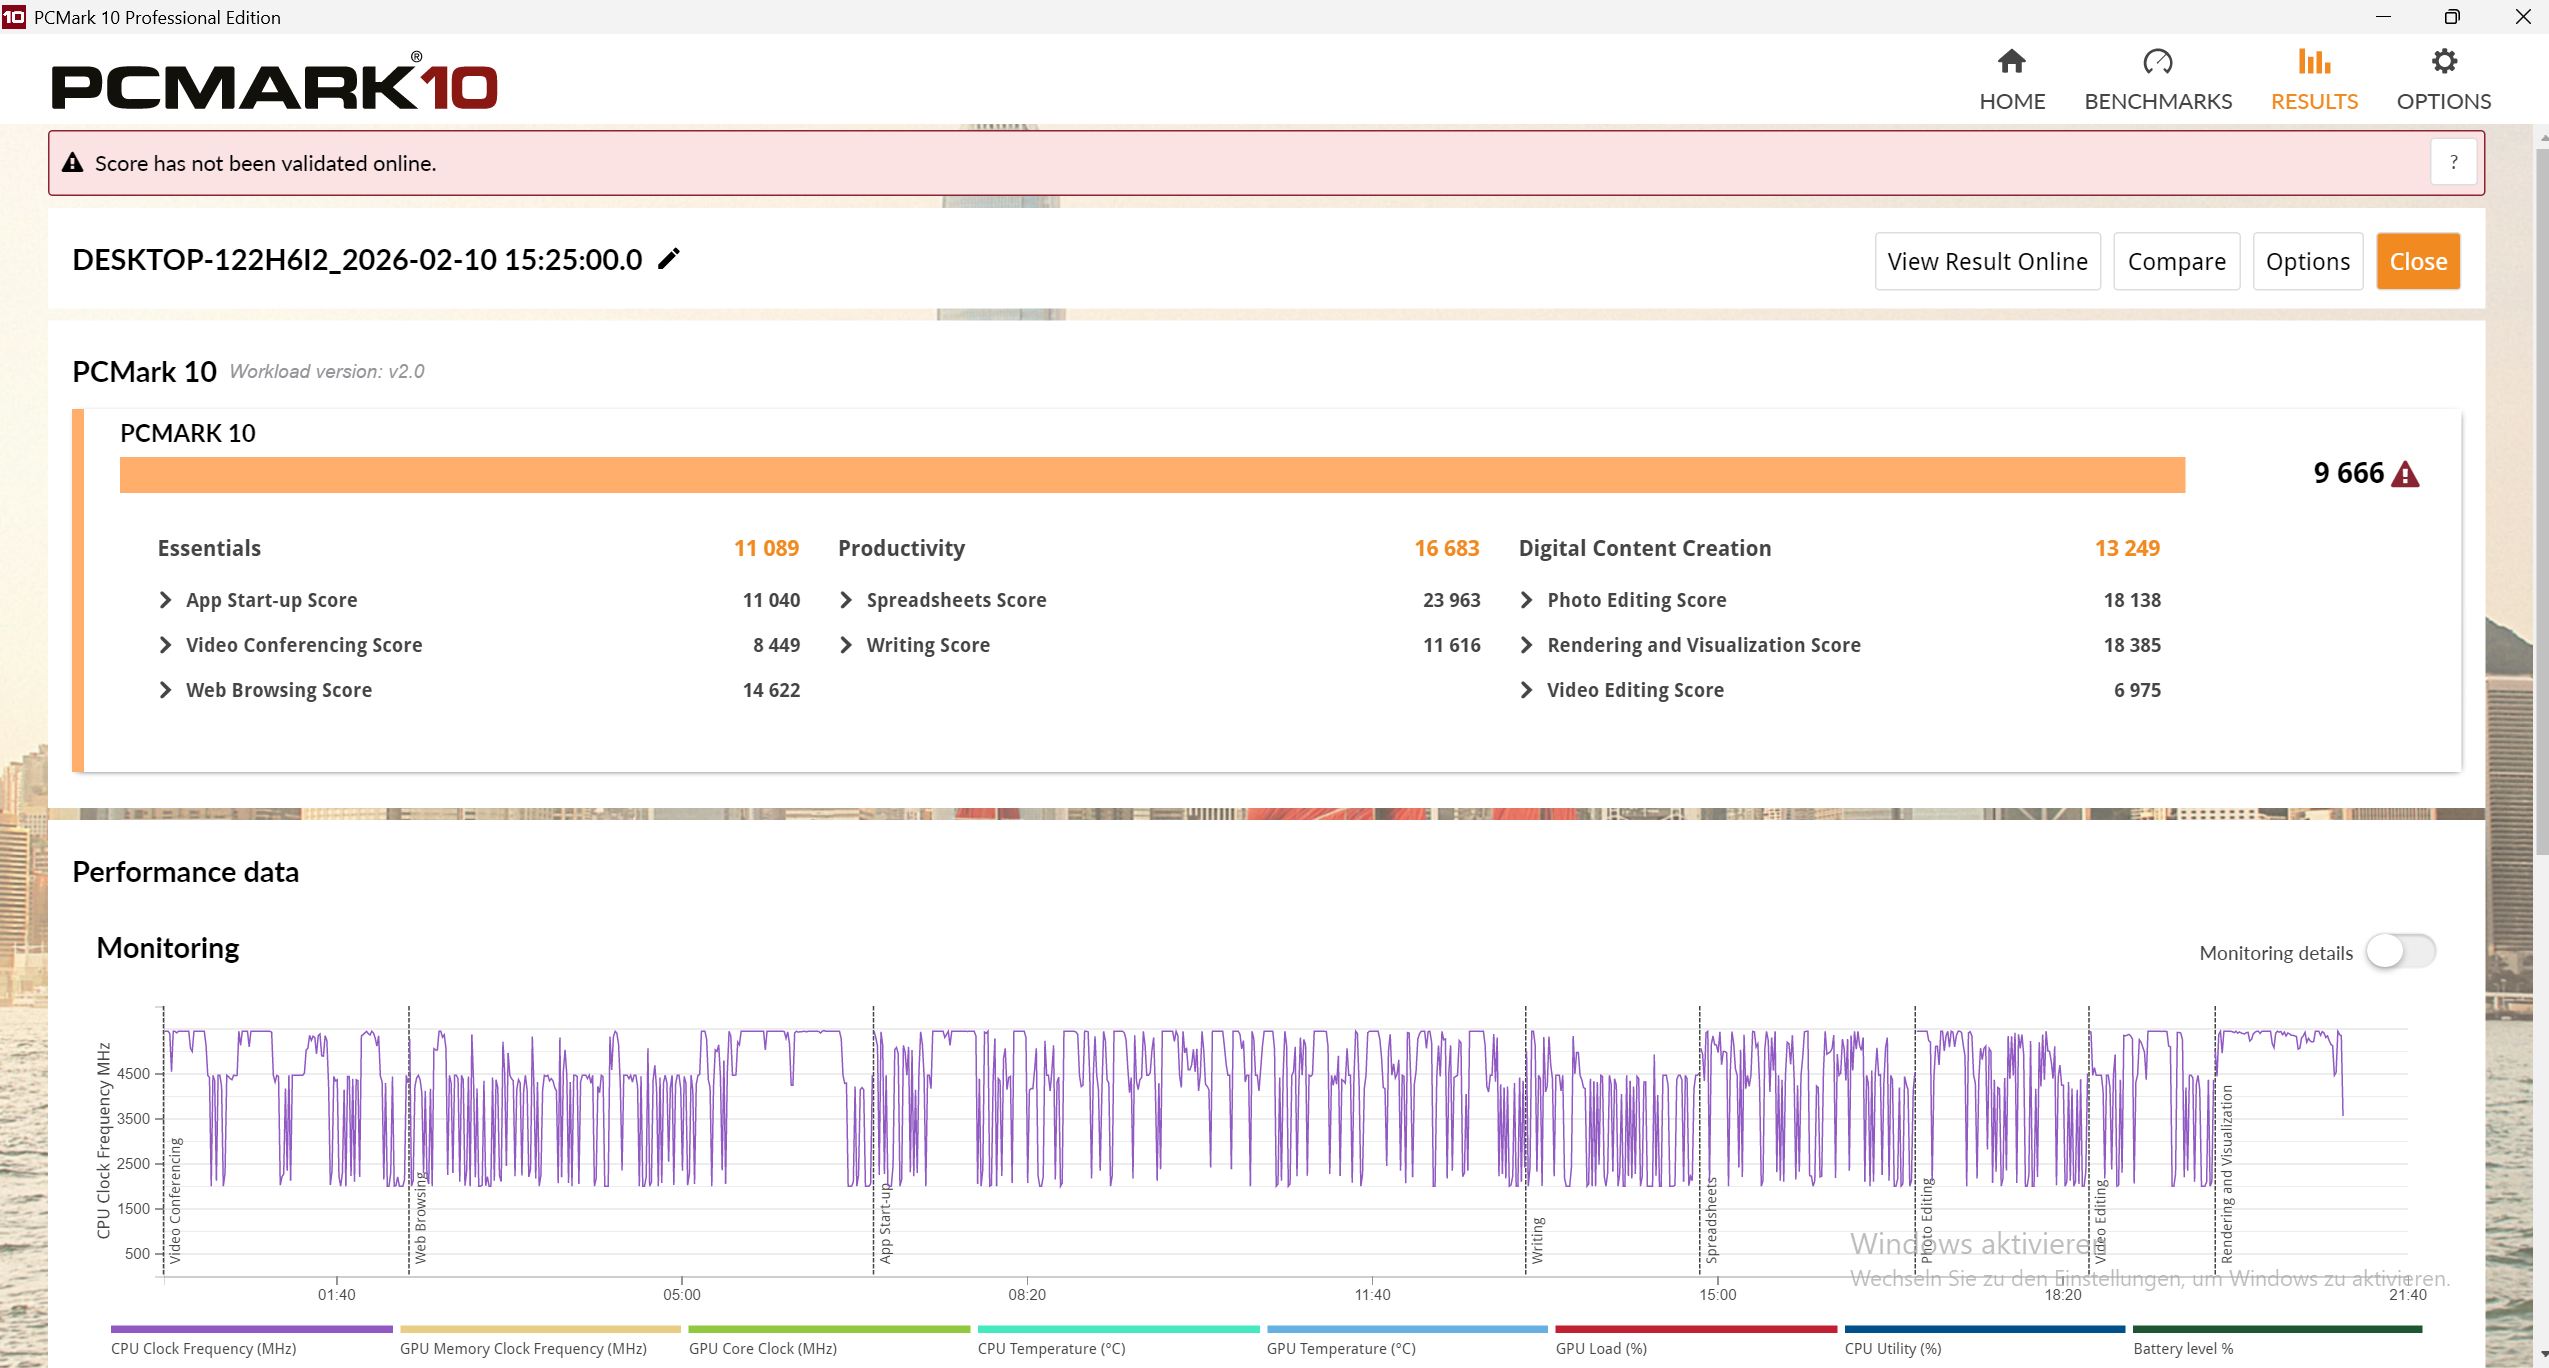
Prestazioni del sistema
Sia in PCMark 10 che in CrossMark, Apex è in testa al gruppo di confronto. Soggettivamente, il sistema è molto reattivo. I risultati del benchmark della memoria AIDA sono nella media.
PCMark 10: Score | Essentials | Productivity | Digital Content Creation
CrossMark: Overall | Productivity | Creativity | Responsiveness
WebXPRT 3: Overall
WebXPRT 4: Overall
Mozilla Kraken 1.1: Total
| Performance rating | |
| Schenker XMG Apex 17 M25 | |
| Media AMD Ryzen 9 9955HX, NVIDIA GeForce RTX 5060 Laptop | |
| Lenovo Legion 7 16IAX10 | |
| Media della classe Gaming | |
| MSI Crosshair A17 HX D8WGKG | |
| MSI Katana 17 HX B14WGK | |
| HP Omen 17z-db100 | |
| Acer Nitro v 17 (ANV17-41-R4CJ) | |
| PCMark 10 / Score | |
| Schenker XMG Apex 17 M25 | |
| Media AMD Ryzen 9 9955HX, NVIDIA GeForce RTX 5060 Laptop (n=1) | |
| MSI Crosshair A17 HX D8WGKG | |
| Media della classe Gaming (5776 - 10060, n=113, ultimi 2 anni) | |
| Acer Nitro v 17 (ANV17-41-R4CJ) | |
| HP Omen 17z-db100 | |
| Lenovo Legion 7 16IAX10 | |
| MSI Katana 17 HX B14WGK | |
| PCMark 10 / Essentials | |
| HP Omen 17z-db100 | |
| Lenovo Legion 7 16IAX10 | |
| MSI Crosshair A17 HX D8WGKG | |
| Schenker XMG Apex 17 M25 | |
| Media AMD Ryzen 9 9955HX, NVIDIA GeForce RTX 5060 Laptop (n=1) | |
| Media della classe Gaming (8810 - 12600, n=117, ultimi 2 anni) | |
| MSI Katana 17 HX B14WGK | |
| Acer Nitro v 17 (ANV17-41-R4CJ) | |
| PCMark 10 / Productivity | |
| Schenker XMG Apex 17 M25 | |
| Media AMD Ryzen 9 9955HX, NVIDIA GeForce RTX 5060 Laptop (n=1) | |
| Acer Nitro v 17 (ANV17-41-R4CJ) | |
| HP Omen 17z-db100 | |
| Lenovo Legion 7 16IAX10 | |
| Media della classe Gaming (6662 - 16716, n=115, ultimi 2 anni) | |
| MSI Crosshair A17 HX D8WGKG | |
| MSI Katana 17 HX B14WGK | |
| PCMark 10 / Digital Content Creation | |
| Media della classe Gaming (7440 - 19351, n=115, ultimi 2 anni) | |
| MSI Crosshair A17 HX D8WGKG | |
| Schenker XMG Apex 17 M25 | |
| Media AMD Ryzen 9 9955HX, NVIDIA GeForce RTX 5060 Laptop (n=1) | |
| MSI Katana 17 HX B14WGK | |
| Acer Nitro v 17 (ANV17-41-R4CJ) | |
| Lenovo Legion 7 16IAX10 | |
| HP Omen 17z-db100 | |
| CrossMark / Overall | |
| Schenker XMG Apex 17 M25 | |
| Media AMD Ryzen 9 9955HX, NVIDIA GeForce RTX 5060 Laptop (n=1) | |
| Lenovo Legion 7 16IAX10 | |
| MSI Crosshair A17 HX D8WGKG | |
| Media della classe Gaming (1247 - 2344, n=113, ultimi 2 anni) | |
| MSI Katana 17 HX B14WGK | |
| HP Omen 17z-db100 | |
| Acer Nitro v 17 (ANV17-41-R4CJ) | |
| CrossMark / Productivity | |
| Schenker XMG Apex 17 M25 | |
| Media AMD Ryzen 9 9955HX, NVIDIA GeForce RTX 5060 Laptop (n=1) | |
| Lenovo Legion 7 16IAX10 | |
| MSI Katana 17 HX B14WGK | |
| Media della classe Gaming (1299 - 2211, n=113, ultimi 2 anni) | |
| MSI Crosshair A17 HX D8WGKG | |
| HP Omen 17z-db100 | |
| Acer Nitro v 17 (ANV17-41-R4CJ) | |
| CrossMark / Creativity | |
| Schenker XMG Apex 17 M25 | |
| Media AMD Ryzen 9 9955HX, NVIDIA GeForce RTX 5060 Laptop (n=1) | |
| Lenovo Legion 7 16IAX10 | |
| MSI Crosshair A17 HX D8WGKG | |
| Media della classe Gaming (1275 - 2729, n=113, ultimi 2 anni) | |
| HP Omen 17z-db100 | |
| MSI Katana 17 HX B14WGK | |
| Acer Nitro v 17 (ANV17-41-R4CJ) | |
| CrossMark / Responsiveness | |
| Schenker XMG Apex 17 M25 | |
| Media AMD Ryzen 9 9955HX, NVIDIA GeForce RTX 5060 Laptop (n=1) | |
| MSI Katana 17 HX B14WGK | |
| Lenovo Legion 7 16IAX10 | |
| Media della classe Gaming (1030 - 2330, n=113, ultimi 2 anni) | |
| MSI Crosshair A17 HX D8WGKG | |
| HP Omen 17z-db100 | |
| Acer Nitro v 17 (ANV17-41-R4CJ) | |
| WebXPRT 3 / Overall | |
| Lenovo Legion 7 16IAX10 | |
| Media della classe Gaming (237 - 532, n=115, ultimi 2 anni) | |
| Schenker XMG Apex 17 M25 | |
| Media AMD Ryzen 9 9955HX, NVIDIA GeForce RTX 5060 Laptop (n=1) | |
| MSI Katana 17 HX B14WGK | |
| HP Omen 17z-db100 | |
| Acer Nitro v 17 (ANV17-41-R4CJ) | |
| MSI Crosshair A17 HX D8WGKG | |
| WebXPRT 4 / Overall | |
| Lenovo Legion 7 16IAX10 | |
| Schenker XMG Apex 17 M25 | |
| Media AMD Ryzen 9 9955HX, NVIDIA GeForce RTX 5060 Laptop (n=1) | |
| Media della classe Gaming (176.4 - 345, n=114, ultimi 2 anni) | |
| MSI Katana 17 HX B14WGK | |
| HP Omen 17z-db100 | |
| Acer Nitro v 17 (ANV17-41-R4CJ) | |
| MSI Crosshair A17 HX D8WGKG | |
| Mozilla Kraken 1.1 / Total | |
| Acer Nitro v 17 (ANV17-41-R4CJ) | |
| MSI Crosshair A17 HX D8WGKG | |
| MSI Katana 17 HX B14WGK | |
| Media della classe Gaming (397 - 674, n=124, ultimi 2 anni) | |
| HP Omen 17z-db100 | |
| Lenovo Legion 7 16IAX10 | |
| Schenker XMG Apex 17 M25 | |
| Media AMD Ryzen 9 9955HX, NVIDIA GeForce RTX 5060 Laptop (n=1) | |
* ... Meglio usare valori piccoli
| PCMark 10 Score | 9666 punti | |
Aiuto | ||
| AIDA64 / Memory Copy | |
| Lenovo Legion 7 16IAX10 | |
| HP Omen 17z-db100 | |
| Media della classe Gaming (21750 - 108104, n=133, ultimi 2 anni) | |
| Schenker XMG Apex 17 M25 | |
| Media AMD Ryzen 9 9955HX (53598 - 62777, n=9) | |
| MSI Katana 17 HX B14WGK | |
| MSI Crosshair A17 HX D8WGKG | |
| Acer Nitro v 17 (ANV17-41-R4CJ) | |
| AIDA64 / Memory Read | |
| Lenovo Legion 7 16IAX10 | |
| Media della classe Gaming (22956 - 104349, n=133, ultimi 2 anni) | |
| MSI Katana 17 HX B14WGK | |
| Schenker XMG Apex 17 M25 | |
| Media AMD Ryzen 9 9955HX (63953 - 67256, n=9) | |
| HP Omen 17z-db100 | |
| MSI Crosshair A17 HX D8WGKG | |
| Acer Nitro v 17 (ANV17-41-R4CJ) | |
| AIDA64 / Memory Write | |
| HP Omen 17z-db100 | |
| Lenovo Legion 7 16IAX10 | |
| Media della classe Gaming (22297 - 133486, n=133, ultimi 2 anni) | |
| Schenker XMG Apex 17 M25 | |
| Media AMD Ryzen 9 9955HX (65421 - 72060, n=9) | |
| MSI Crosshair A17 HX D8WGKG | |
| MSI Katana 17 HX B14WGK | |
| Acer Nitro v 17 (ANV17-41-R4CJ) | |
| AIDA64 / Memory Latency | |
| Lenovo Legion 7 16IAX10 | |
| Media della classe Gaming (59.5 - 259, n=133, ultimi 2 anni) | |
| HP Omen 17z-db100 | |
| Media AMD Ryzen 9 9955HX (92.1 - 103.5, n=9) | |
| Schenker XMG Apex 17 M25 | |
| MSI Katana 17 HX B14WGK | |
| Acer Nitro v 17 (ANV17-41-R4CJ) | |
| MSI Crosshair A17 HX D8WGKG | |
* ... Meglio usare valori piccoli
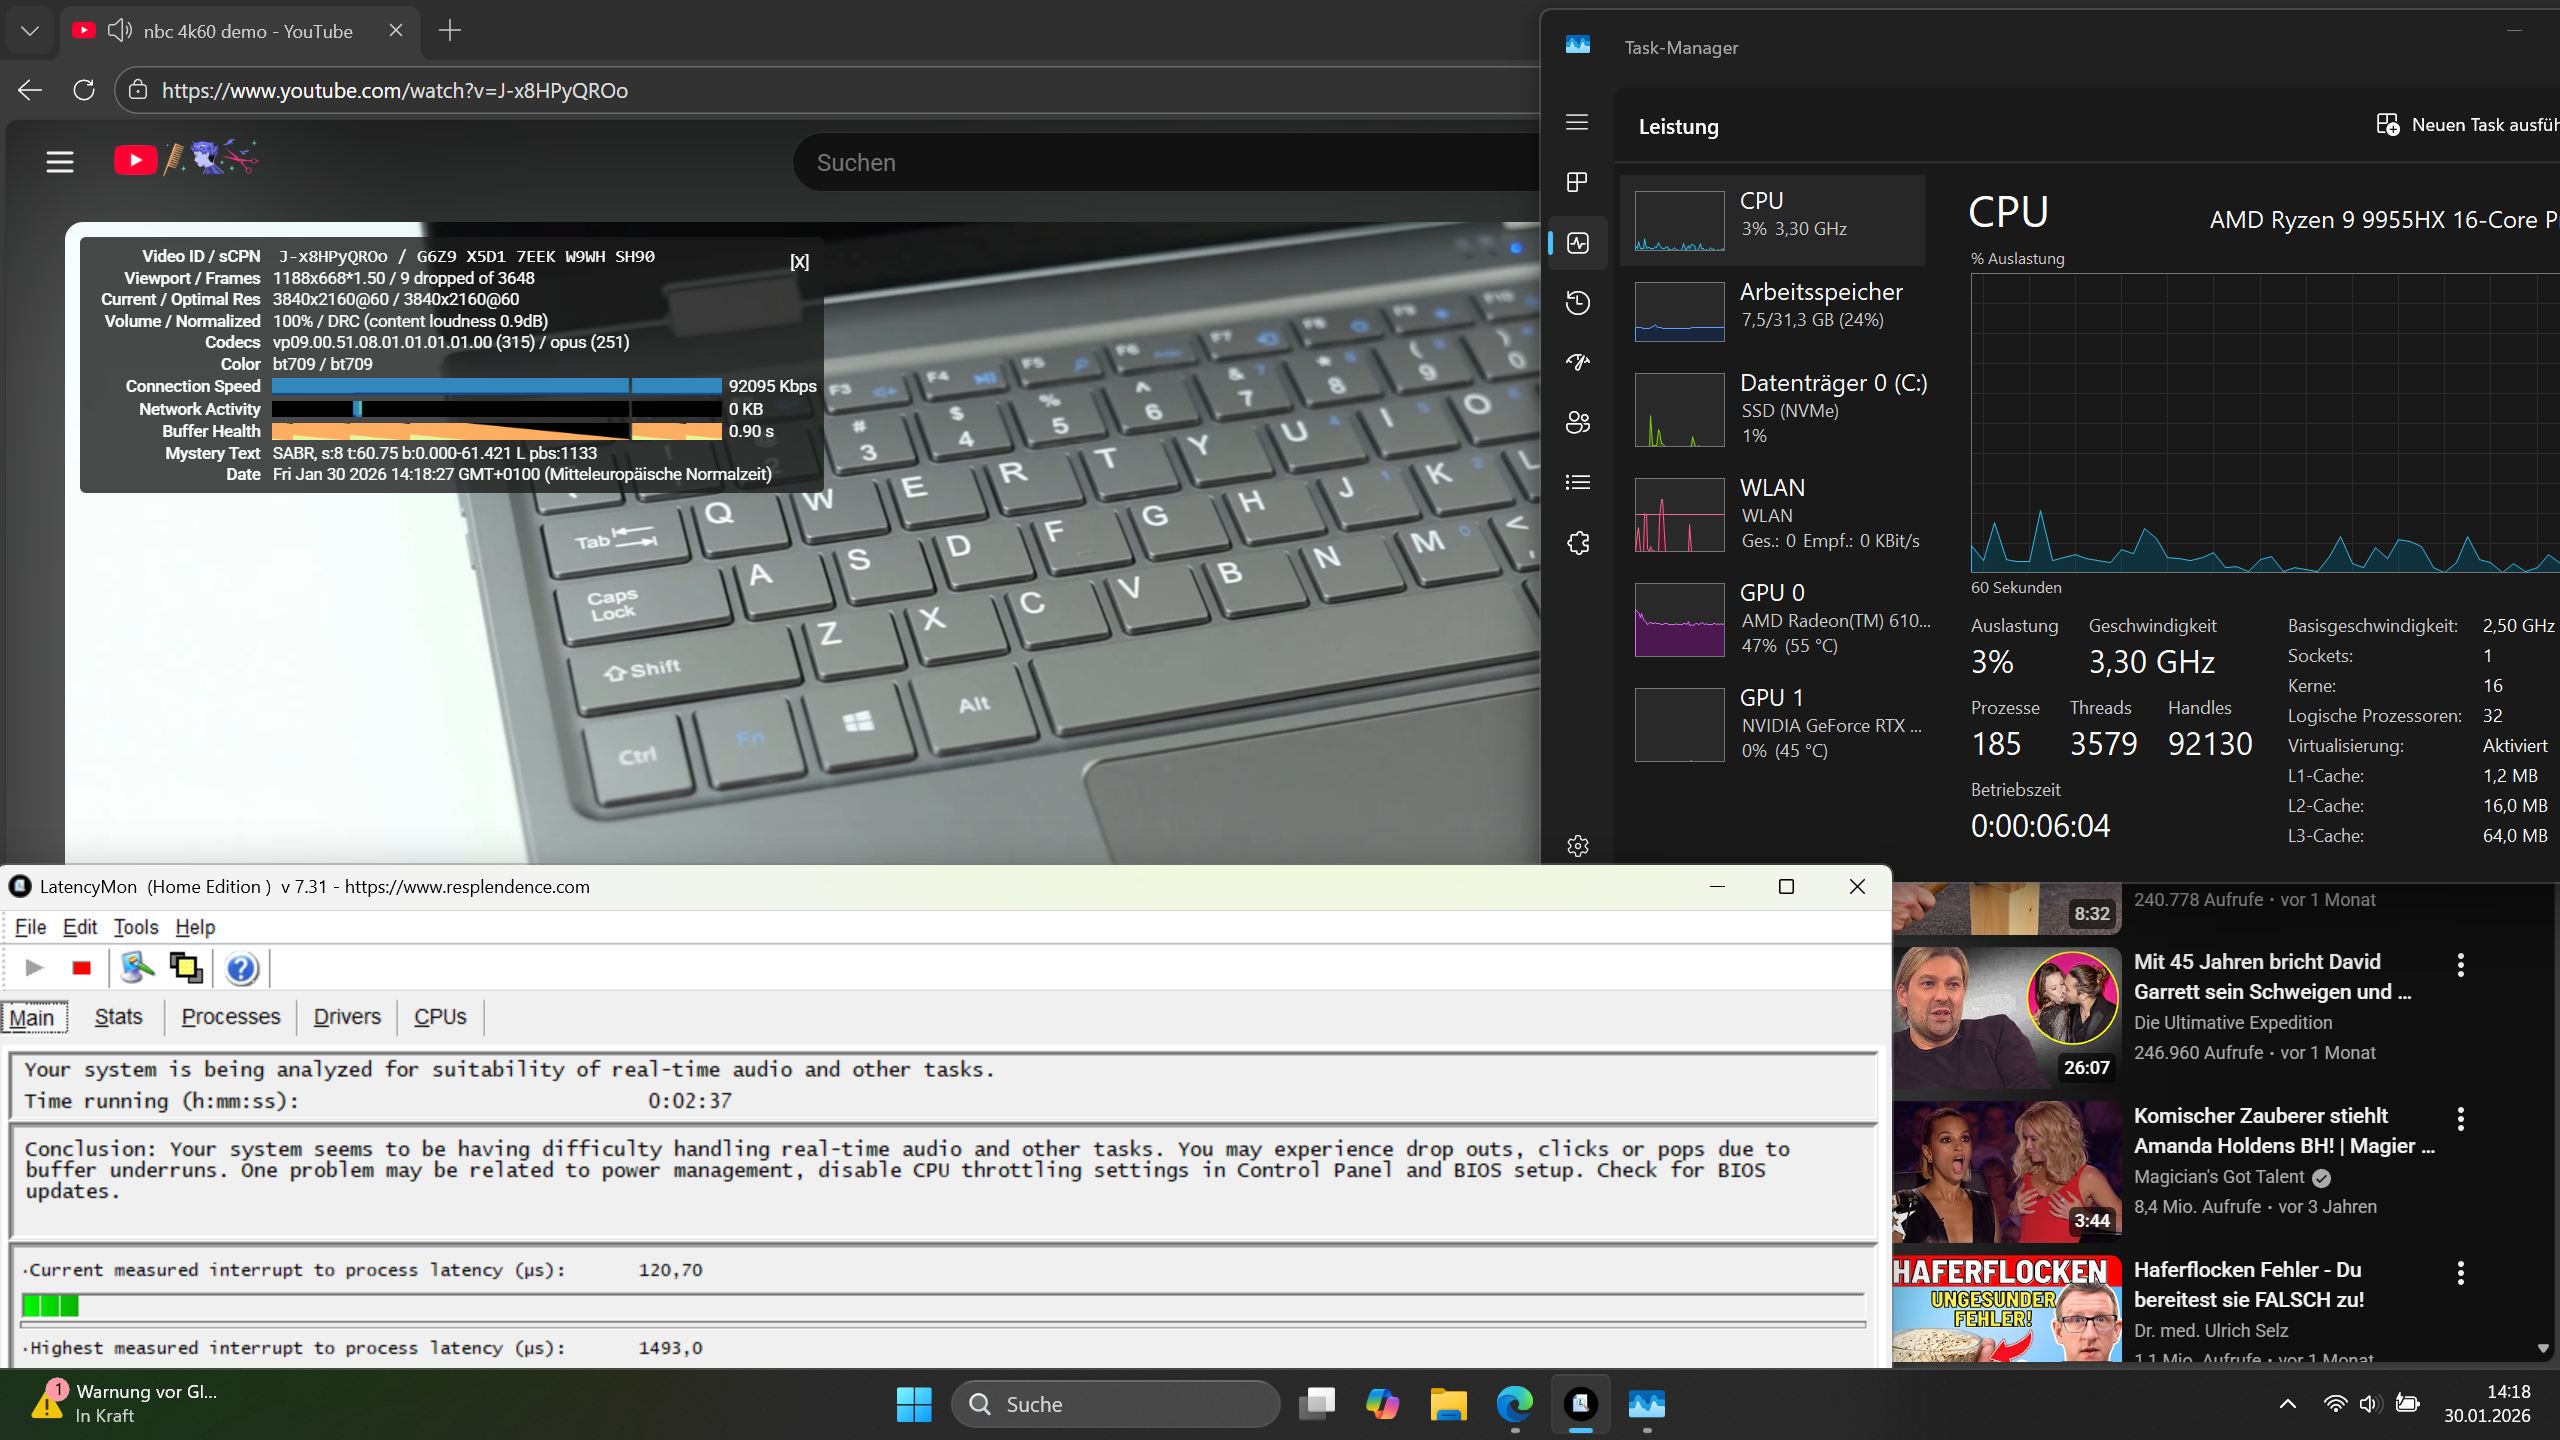
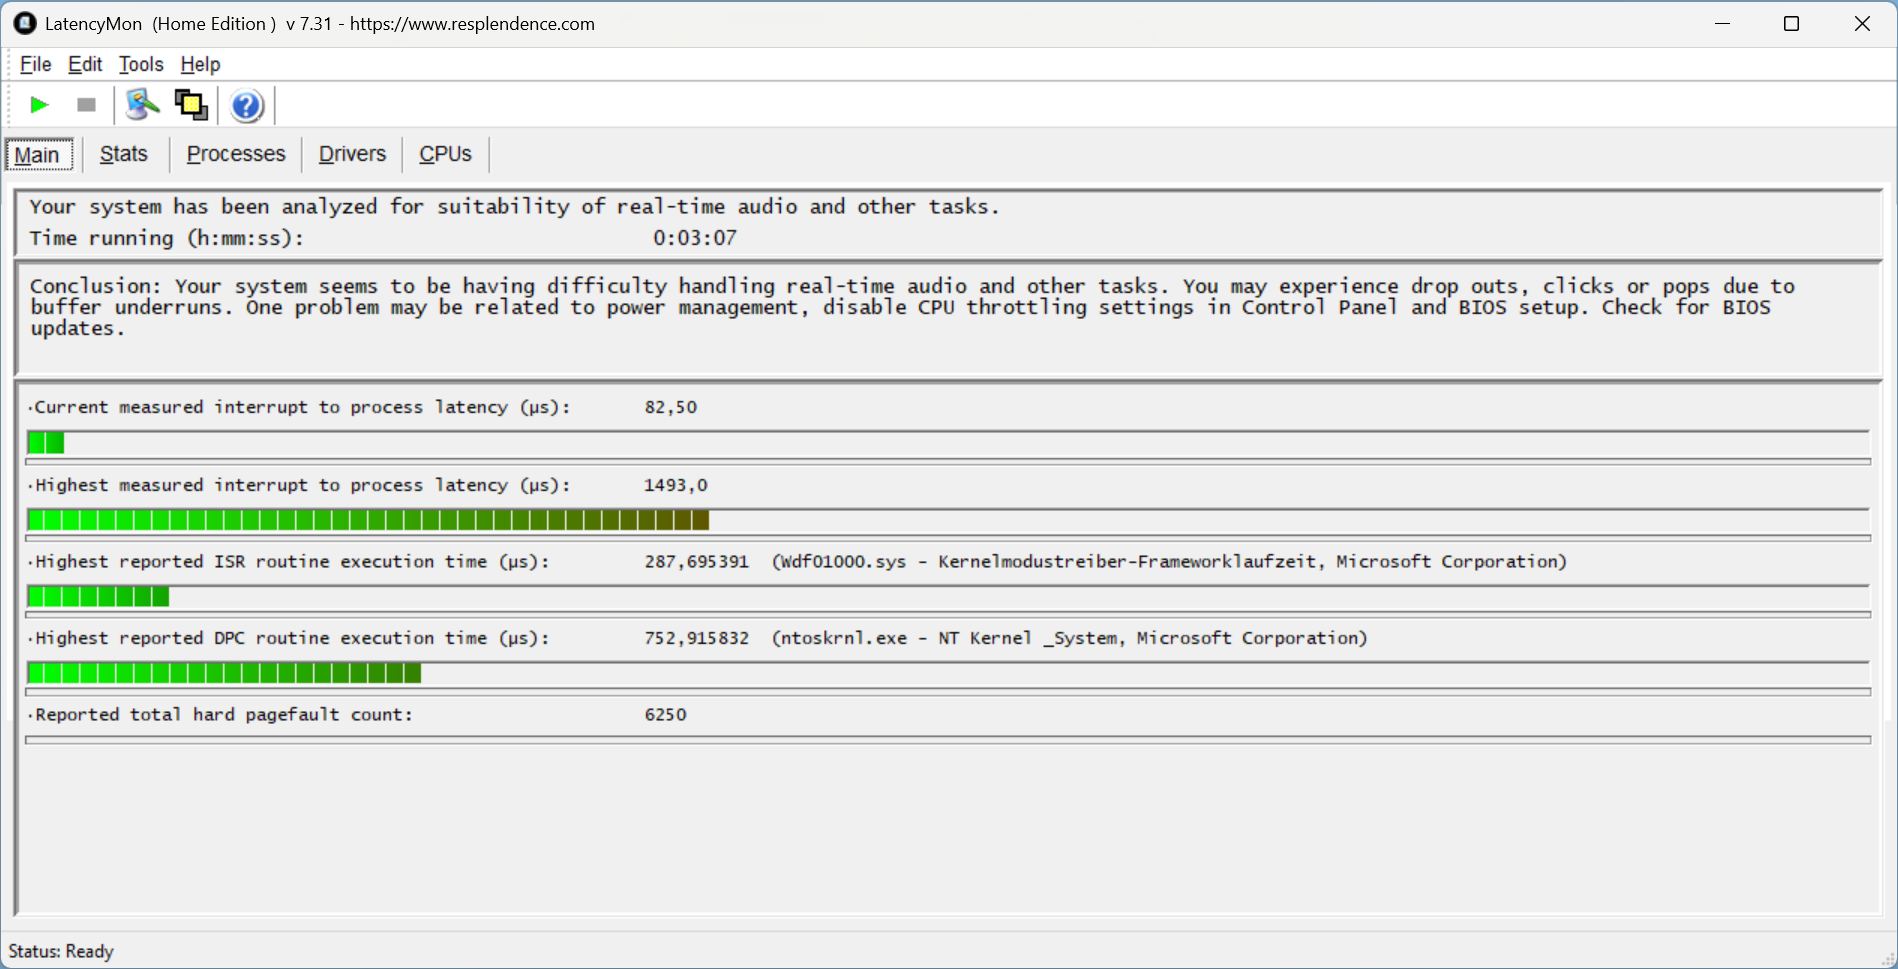
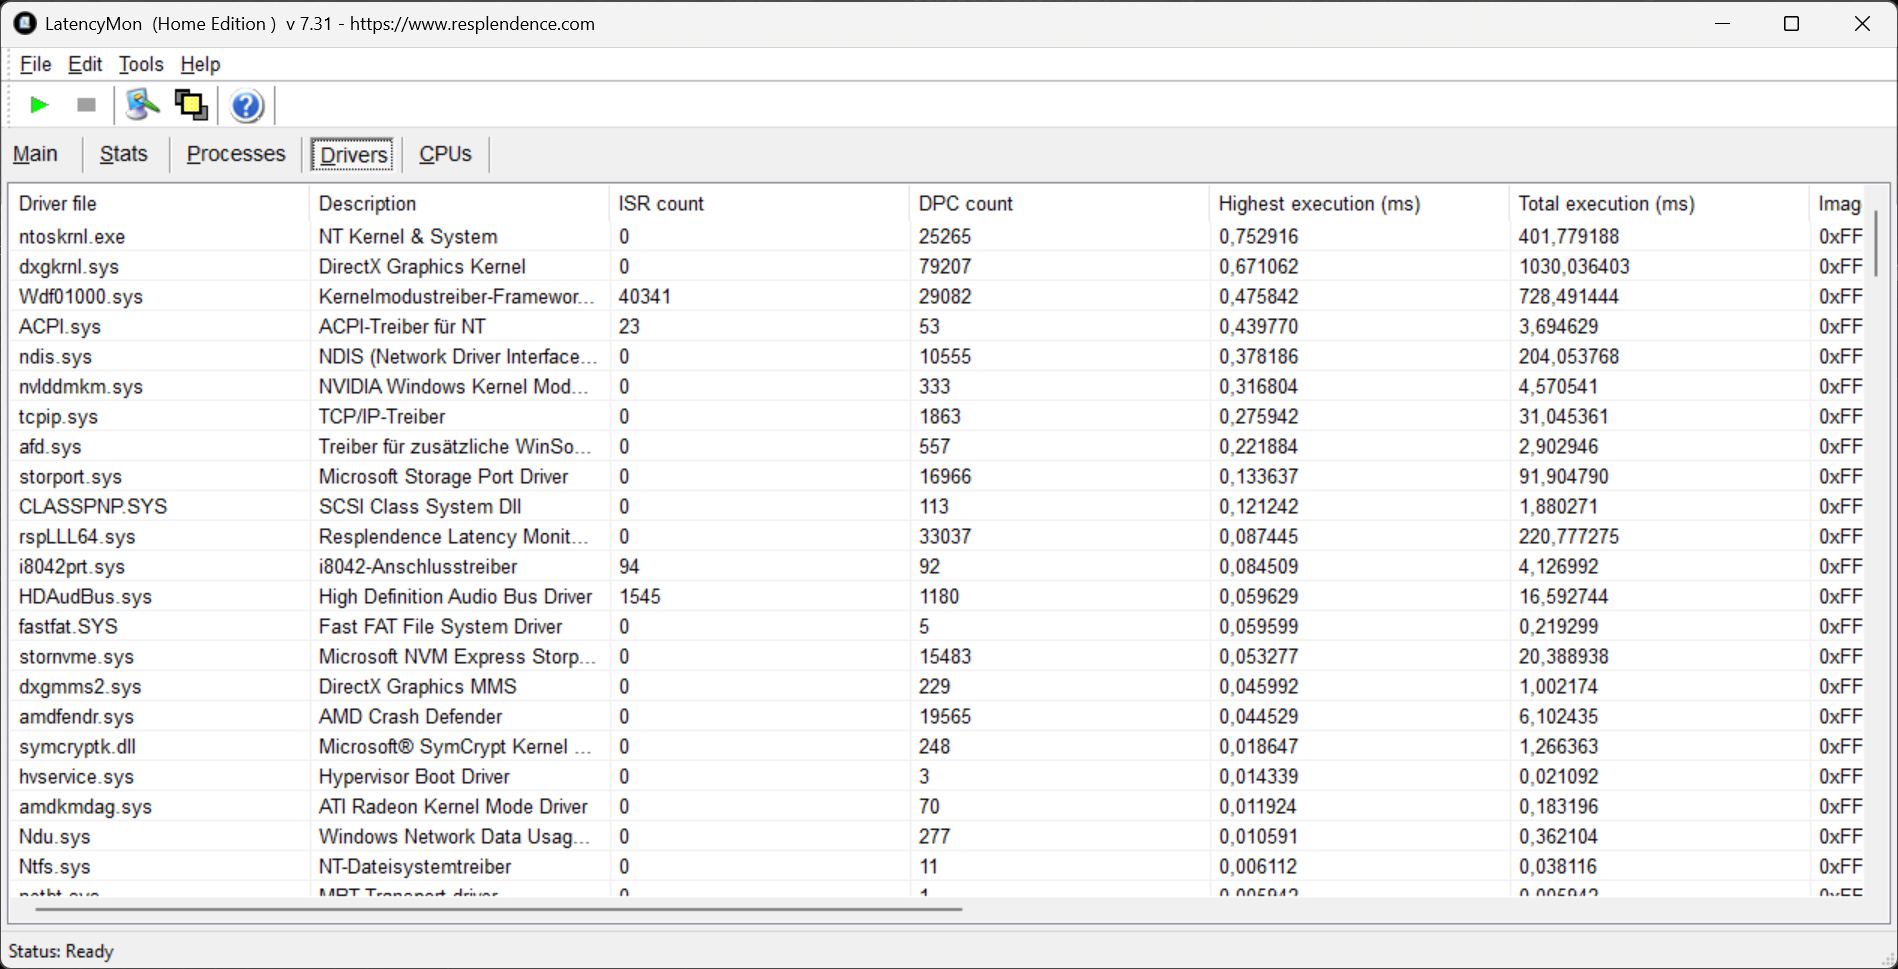
Latenze DPC
I picchi di latenza si verificano quando si aprono più schede del browser. In generale, i valori rimangono in un intervallo accettabile, anche se sono stati registrati nove fotogrammi caduti durante la riproduzione di YouTube.
| DPC Latencies / LatencyMon - interrupt to process latency (max), Web, Youtube, Prime95 | |
| HP Omen 17z-db100 | |
| MSI Katana 17 HX B14WGK | |
| Acer Nitro v 17 (ANV17-41-R4CJ) | |
| Schenker XMG Apex 17 M25 | |
| HP Omen 16-ap0091ng | |
| Lenovo Legion 7 16IAX10 | |
| MSI Crosshair A17 HX D8WGKG | |
* ... Meglio usare valori piccoli
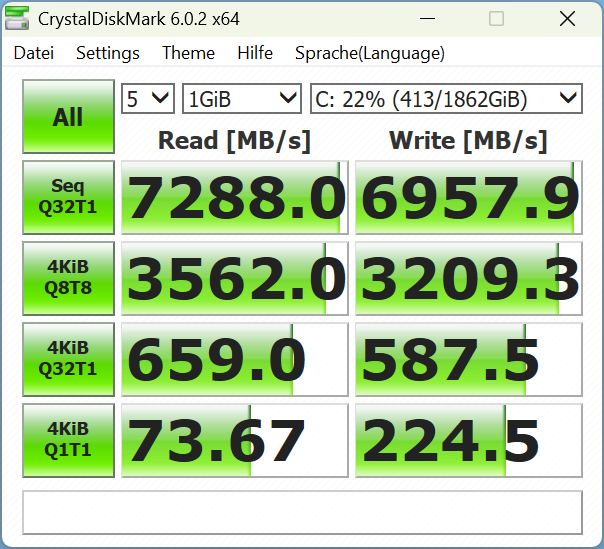
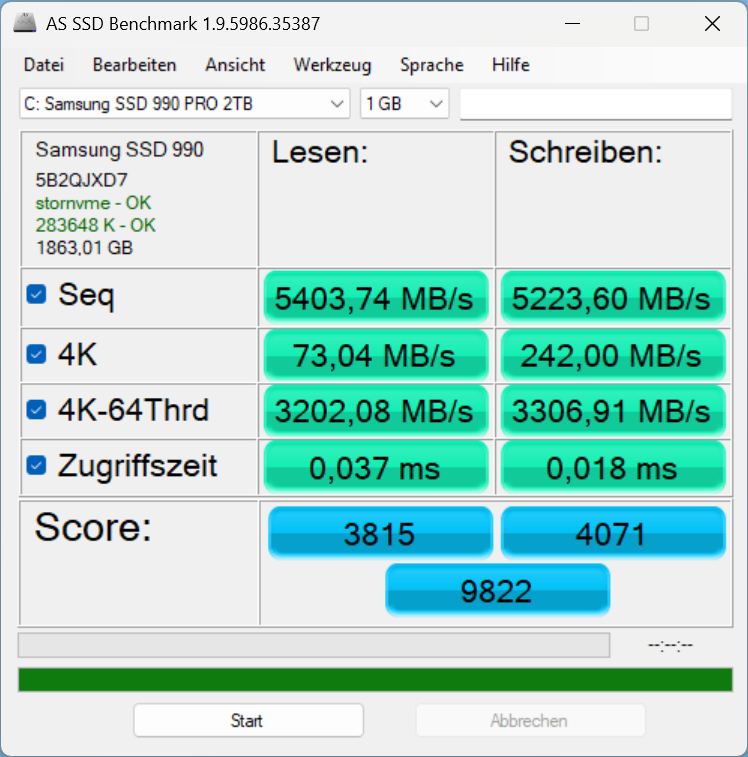
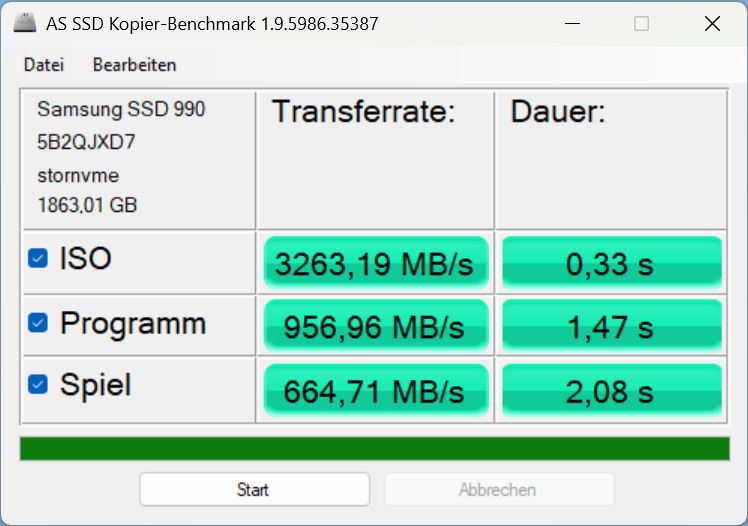
Memoria di massa
Il nostro Samsung 990 Pro (2 TB) ha un sovrapprezzo di 146 euro rispetto al WD Blue SN5100 da 1 TB standard. Le prestazioni rimangono stabili anche sotto carico sostenuto e superano quelle dei sistemi concorrenti.

| Drive Performance rating - Percent | |
| Schenker XMG Apex 17 M25 | |
| Media Samsung 990 Pro 2 TB MZVL72T0HDLB | |
| MSI Katana 17 HX B14WGK | |
| MSI Crosshair A17 HX D8WGKG | |
| Media della classe Gaming | |
| HP Omen 17z-db100 | |
| Acer Nitro v 17 (ANV17-41-R4CJ) | |
| Lenovo Legion 7 16IAX10 | |
* ... Meglio usare valori piccoli
Lettura continua: Loop di lettura DiskSpd, profondità coda 8
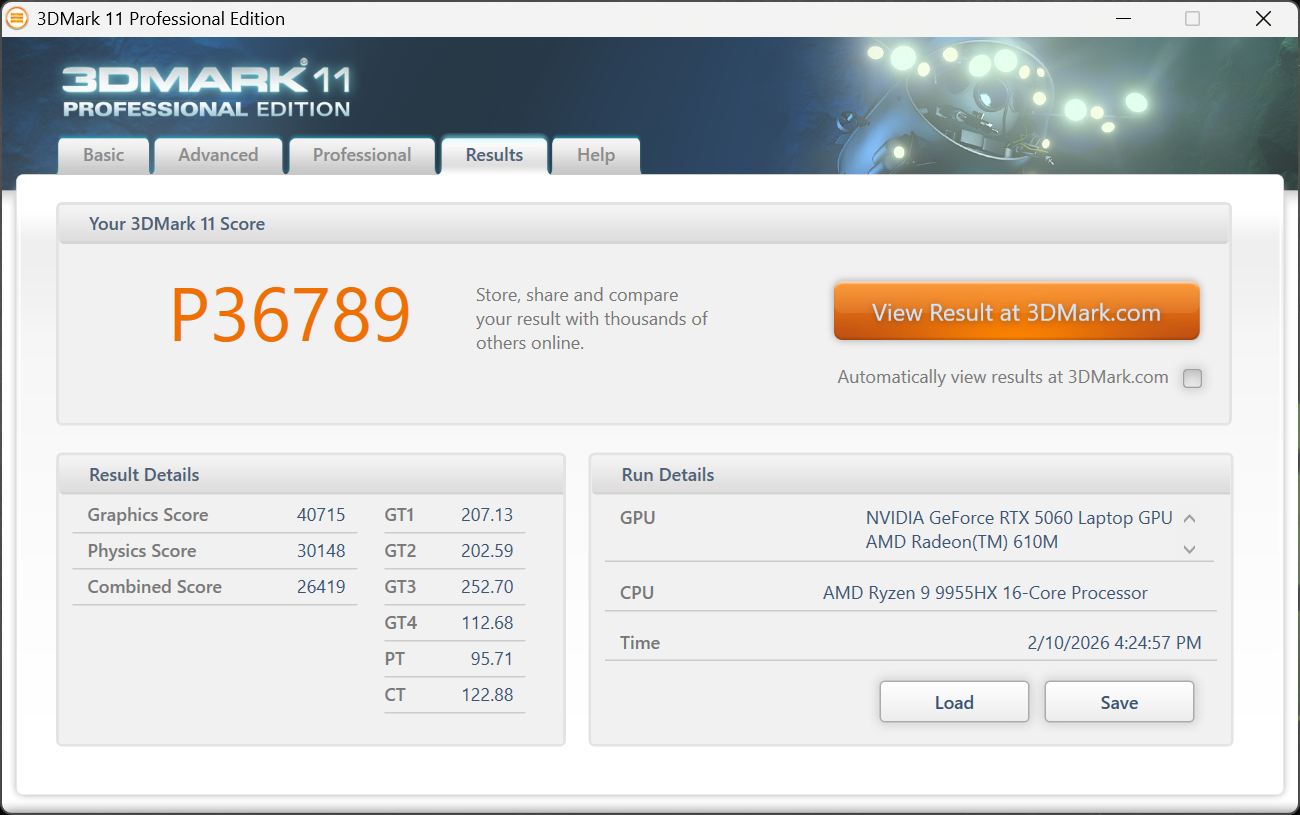
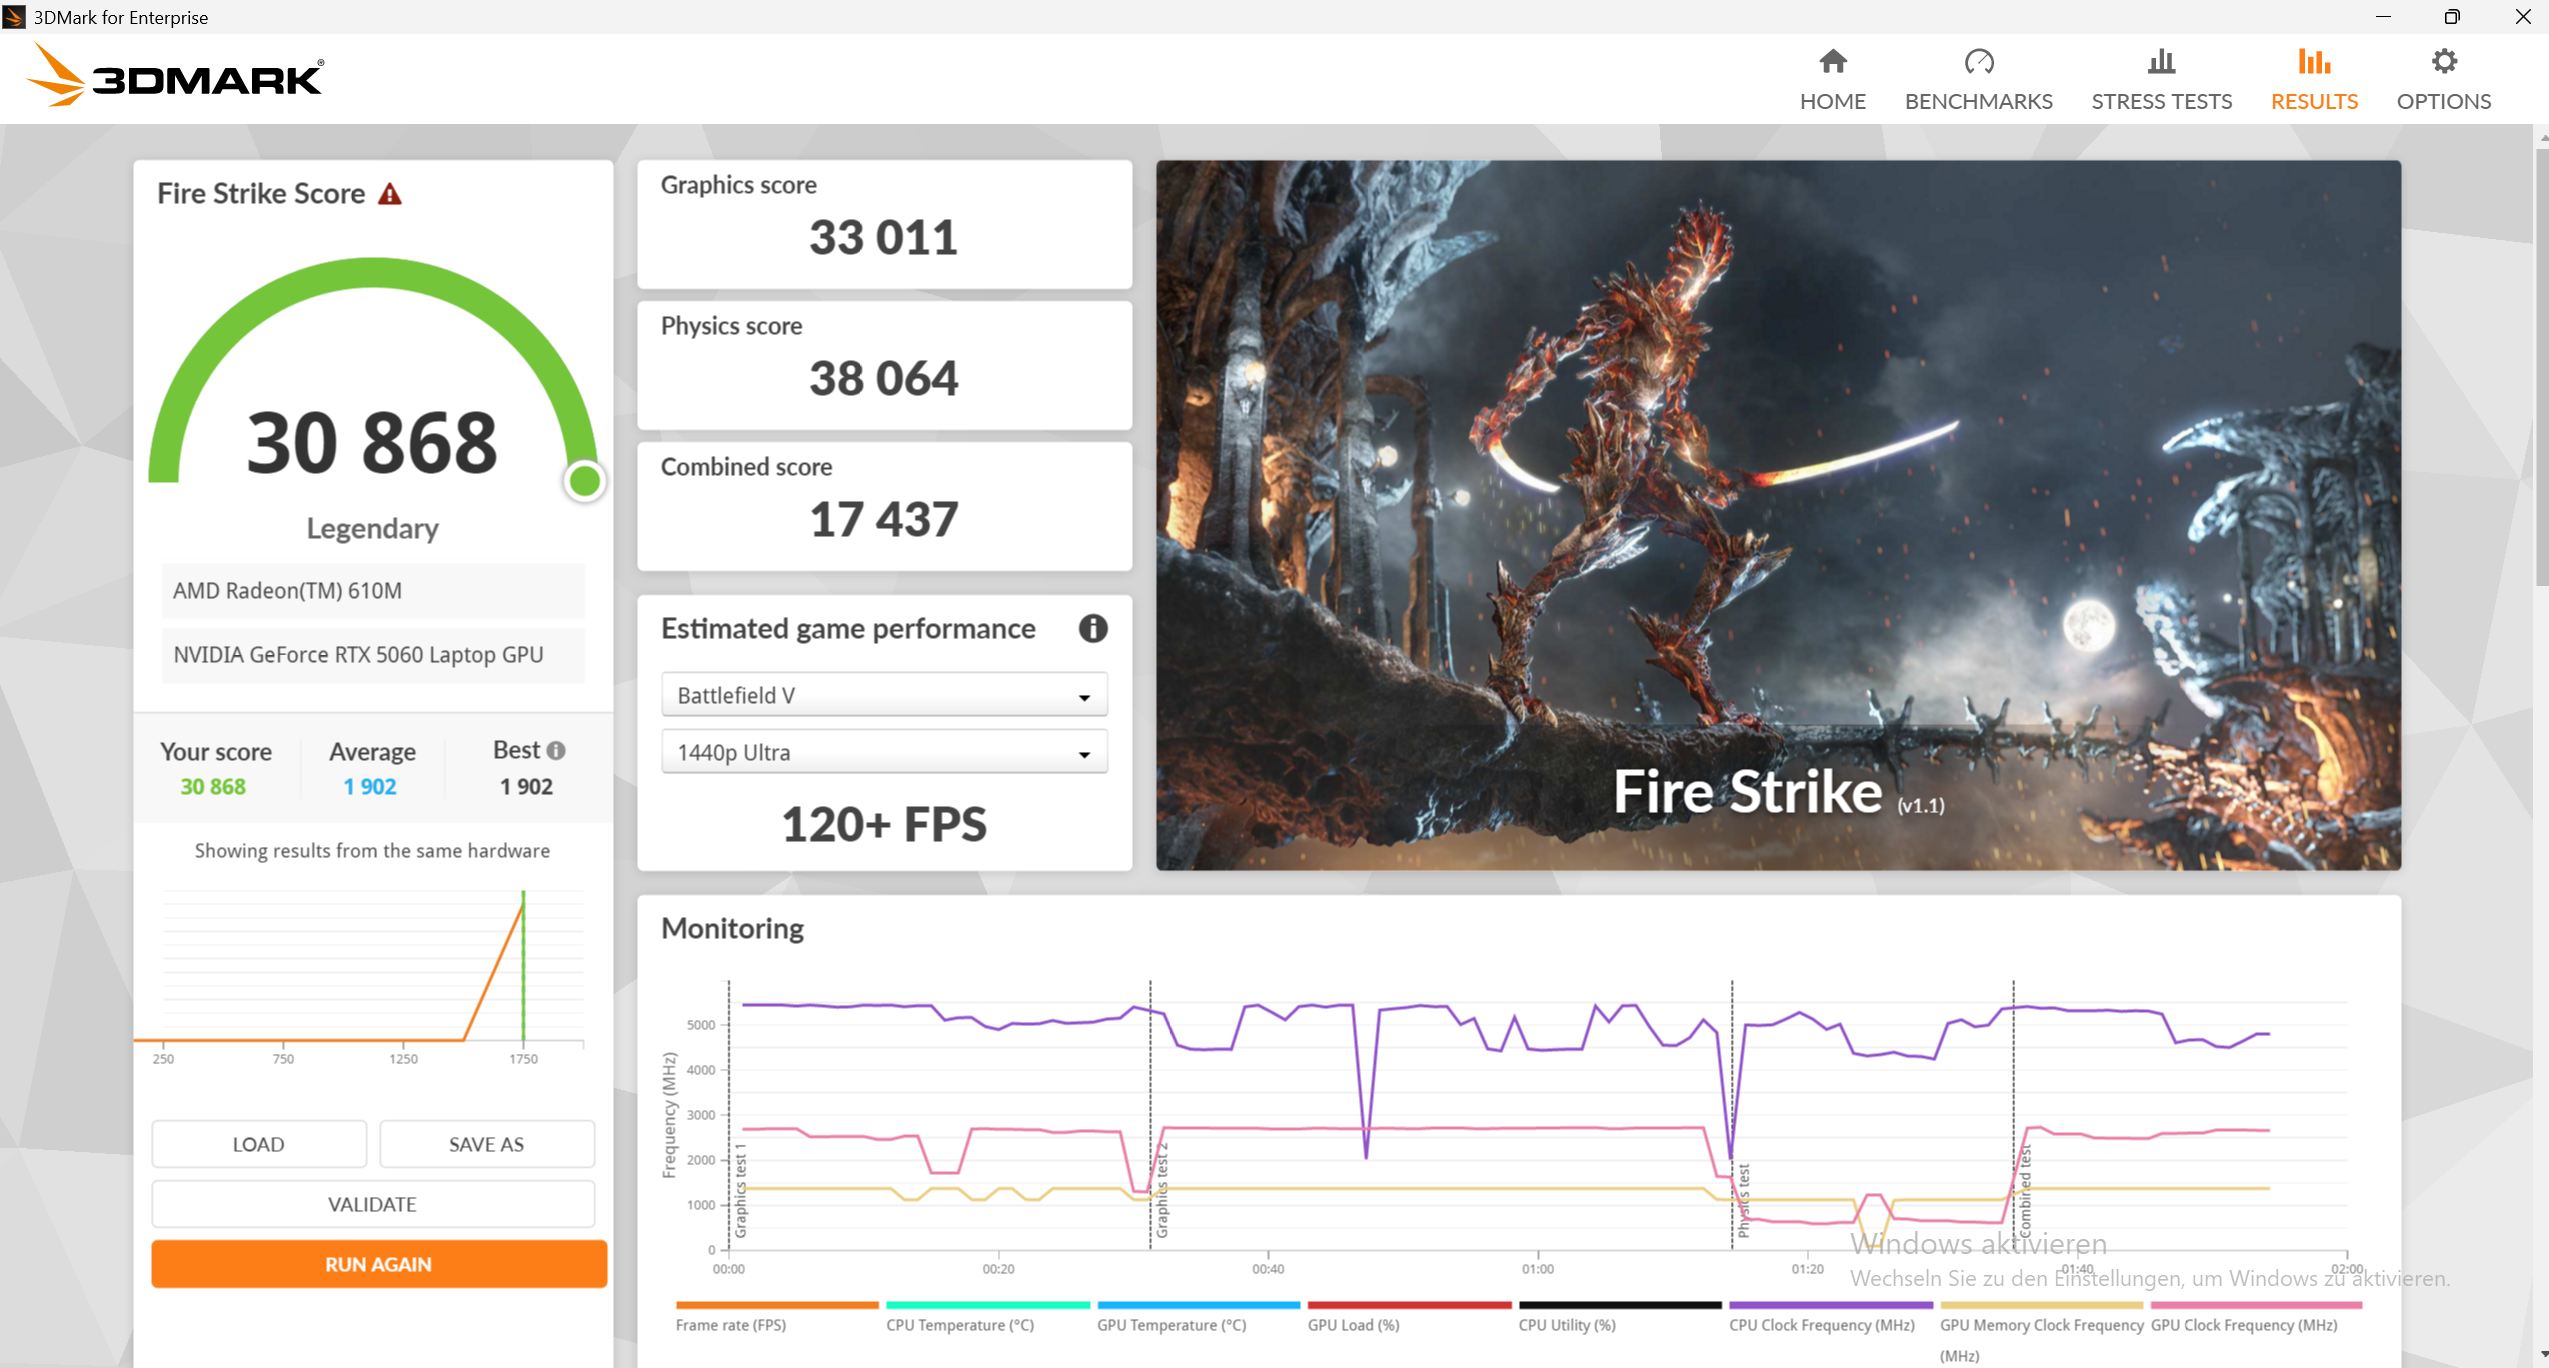
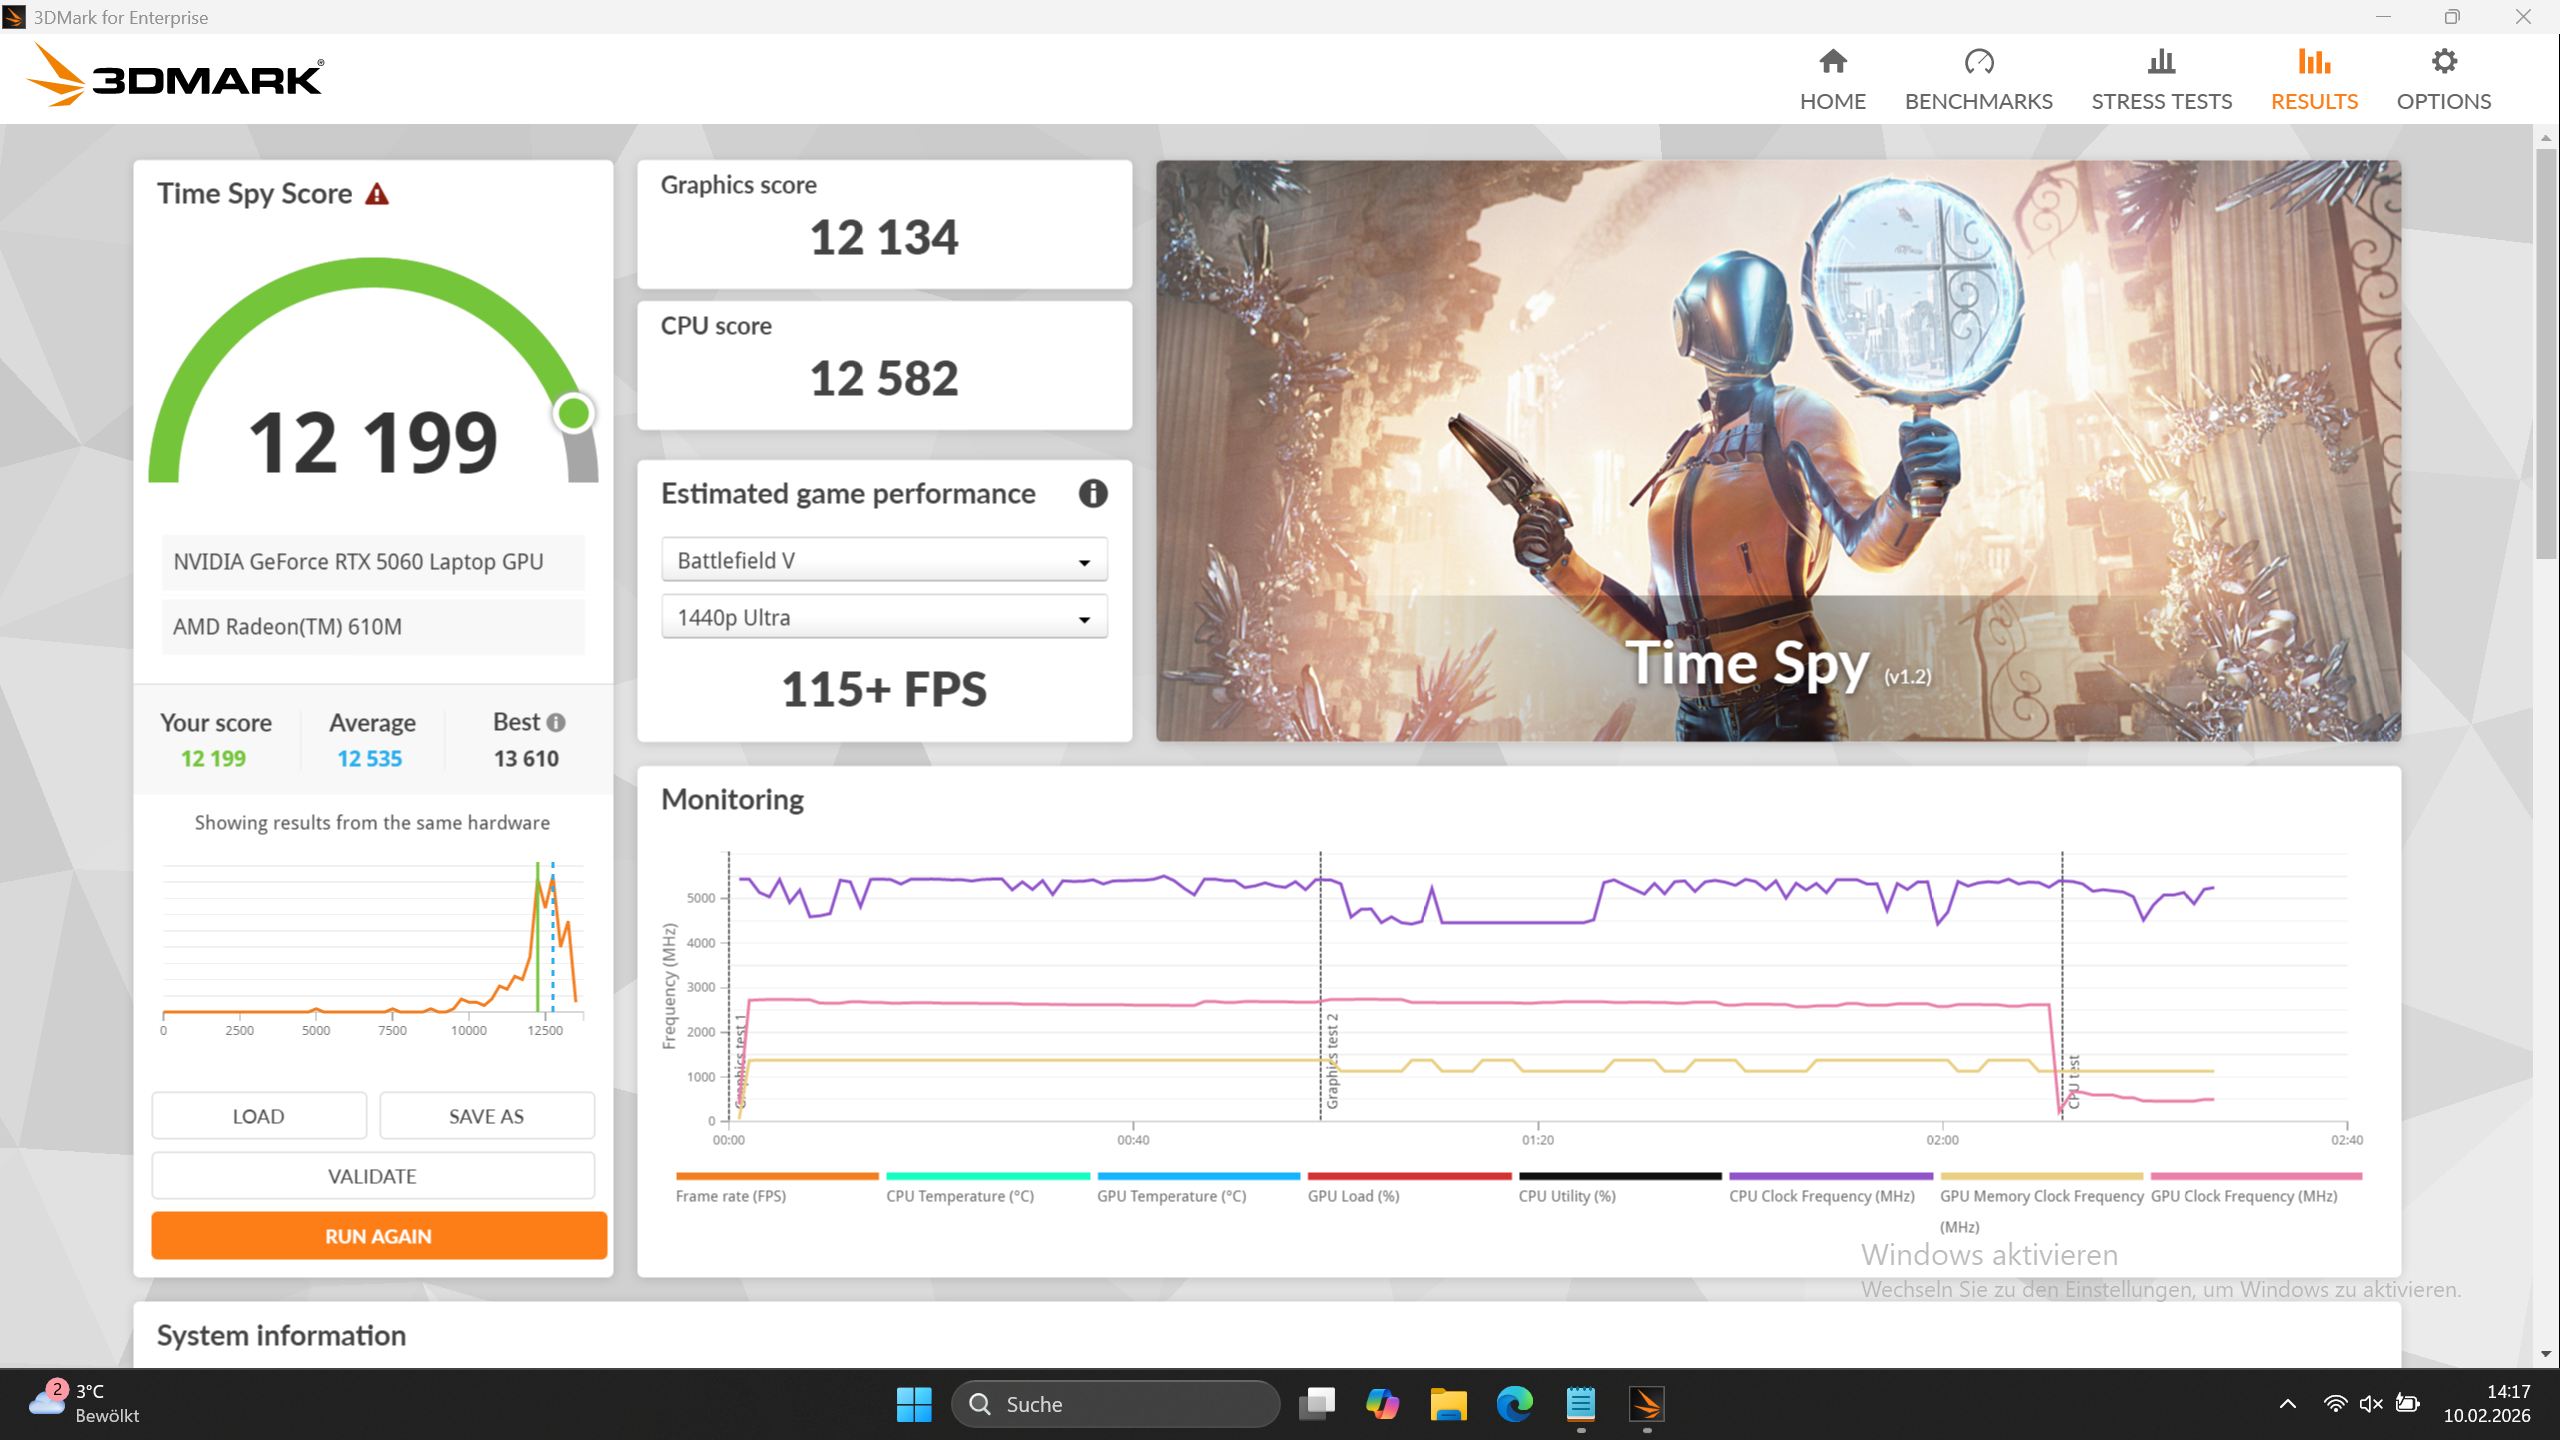
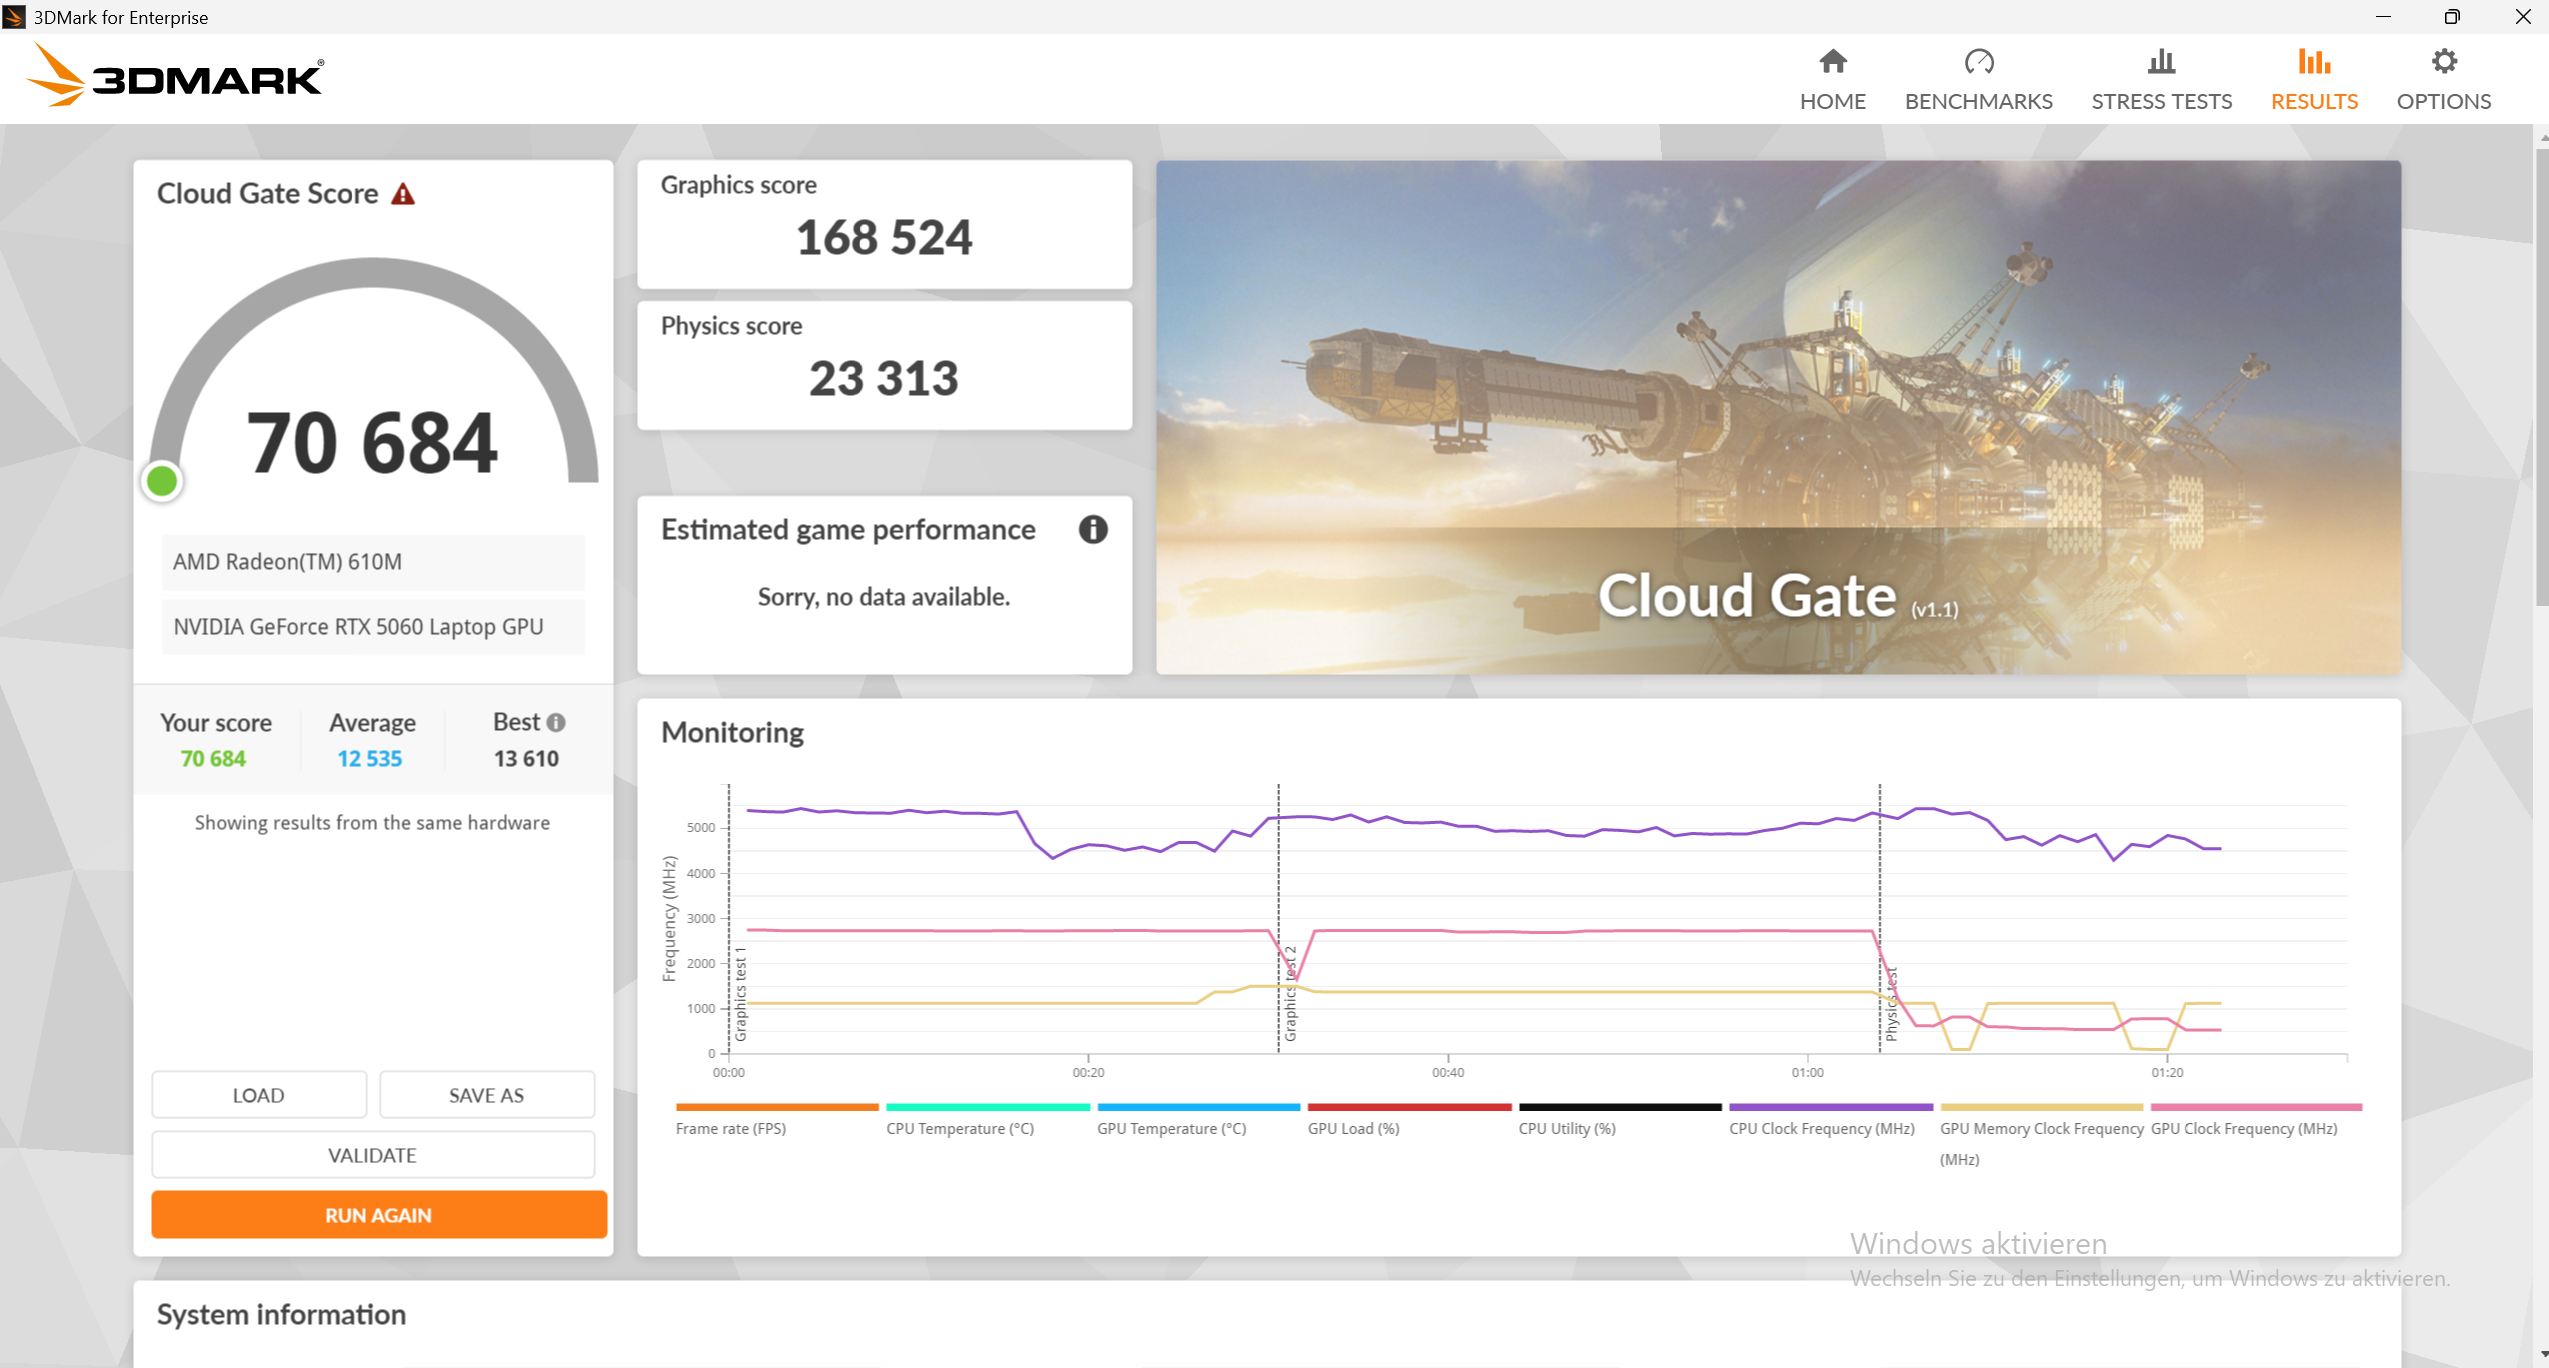
Prestazioni della GPU - Il portatile RTX 5060 più veloce a confronto?
Nei test sintetici di 3DMark, la RTX 5060 nell'Apex 17 supera chiaramente gli altri concorrenti RTX 5060. In modalità Intrattenimento, si comporta alla pari con la concorrenza. Con l'alimentazione a batteria, la GPU si ferma a 30 fps in Cyberpunk.
| 3DMark Performance rating - Percent | |
| Media della classe Gaming | |
| Schenker XMG Apex 17 M25 | |
| Lenovo Legion 7 16IAX10 | |
| HP Omen 16-ap0091ng | |
| Media NVIDIA GeForce RTX 5060 Laptop | |
| Tulpar T6 V3.5 | |
| Alienware 16 Aurora -1! | |
| MSI Cyborg 17 B13WFKG | |
| 3DMark 11 - 1280x720 Performance GPU | |
| Media della classe Gaming (16033 - 80022, n=129, ultimi 2 anni) | |
| Schenker XMG Apex 17 M25 | |
| Lenovo Legion 7 16IAX10 | |
| Media NVIDIA GeForce RTX 5060 Laptop (31549 - 41490, n=13) | |
| HP Omen 16-ap0091ng | |
| Alienware 16 Aurora | |
| Tulpar T6 V3.5 | |
| MSI Cyborg 17 B13WFKG | |
| 3DMark | |
| 1280x720 Cloud Gate Standard Graphics | |
| Schenker XMG Apex 17 M25 | |
| HP Omen 16-ap0091ng | |
| Media della classe Gaming (84648 - 223650, n=63, ultimi 2 anni) | |
| Lenovo Legion 7 16IAX10 | |
| MSI Cyborg 17 B13WFKG | |
| Media NVIDIA GeForce RTX 5060 Laptop (86886 - 168524, n=8) | |
| Tulpar T6 V3.5 | |
| 1920x1080 Fire Strike Graphics | |
| Media della classe Gaming (12242 - 62849, n=141, ultimi 2 anni) | |
| Lenovo Legion 7 16IAX10 | |
| Schenker XMG Apex 17 M25 | |
| Media NVIDIA GeForce RTX 5060 Laptop (26022 - 33912, n=14) | |
| HP Omen 16-ap0091ng | |
| Tulpar T6 V3.5 | |
| Alienware 16 Aurora | |
| MSI Cyborg 17 B13WFKG | |
| 2560x1440 Time Spy Graphics | |
| Media della classe Gaming (4310 - 25984, n=138, ultimi 2 anni) | |
| Lenovo Legion 7 16IAX10 | |
| Schenker XMG Apex 17 M25 | |
| HP Omen 16-ap0091ng | |
| Media NVIDIA GeForce RTX 5060 Laptop (9090 - 12322, n=15) | |
| Tulpar T6 V3.5 | |
| Alienware 16 Aurora | |
| MSI Cyborg 17 B13WFKG | |
| 3DMark 11 Performance | 36789 punti | |
| 3DMark Cloud Gate Standard Score | 70684 punti | |
| 3DMark Fire Strike Score | 30868 punti | |
| 3DMark Time Spy Score | 12199 punti | |
Aiuto | ||
* ... Meglio usare valori piccoli
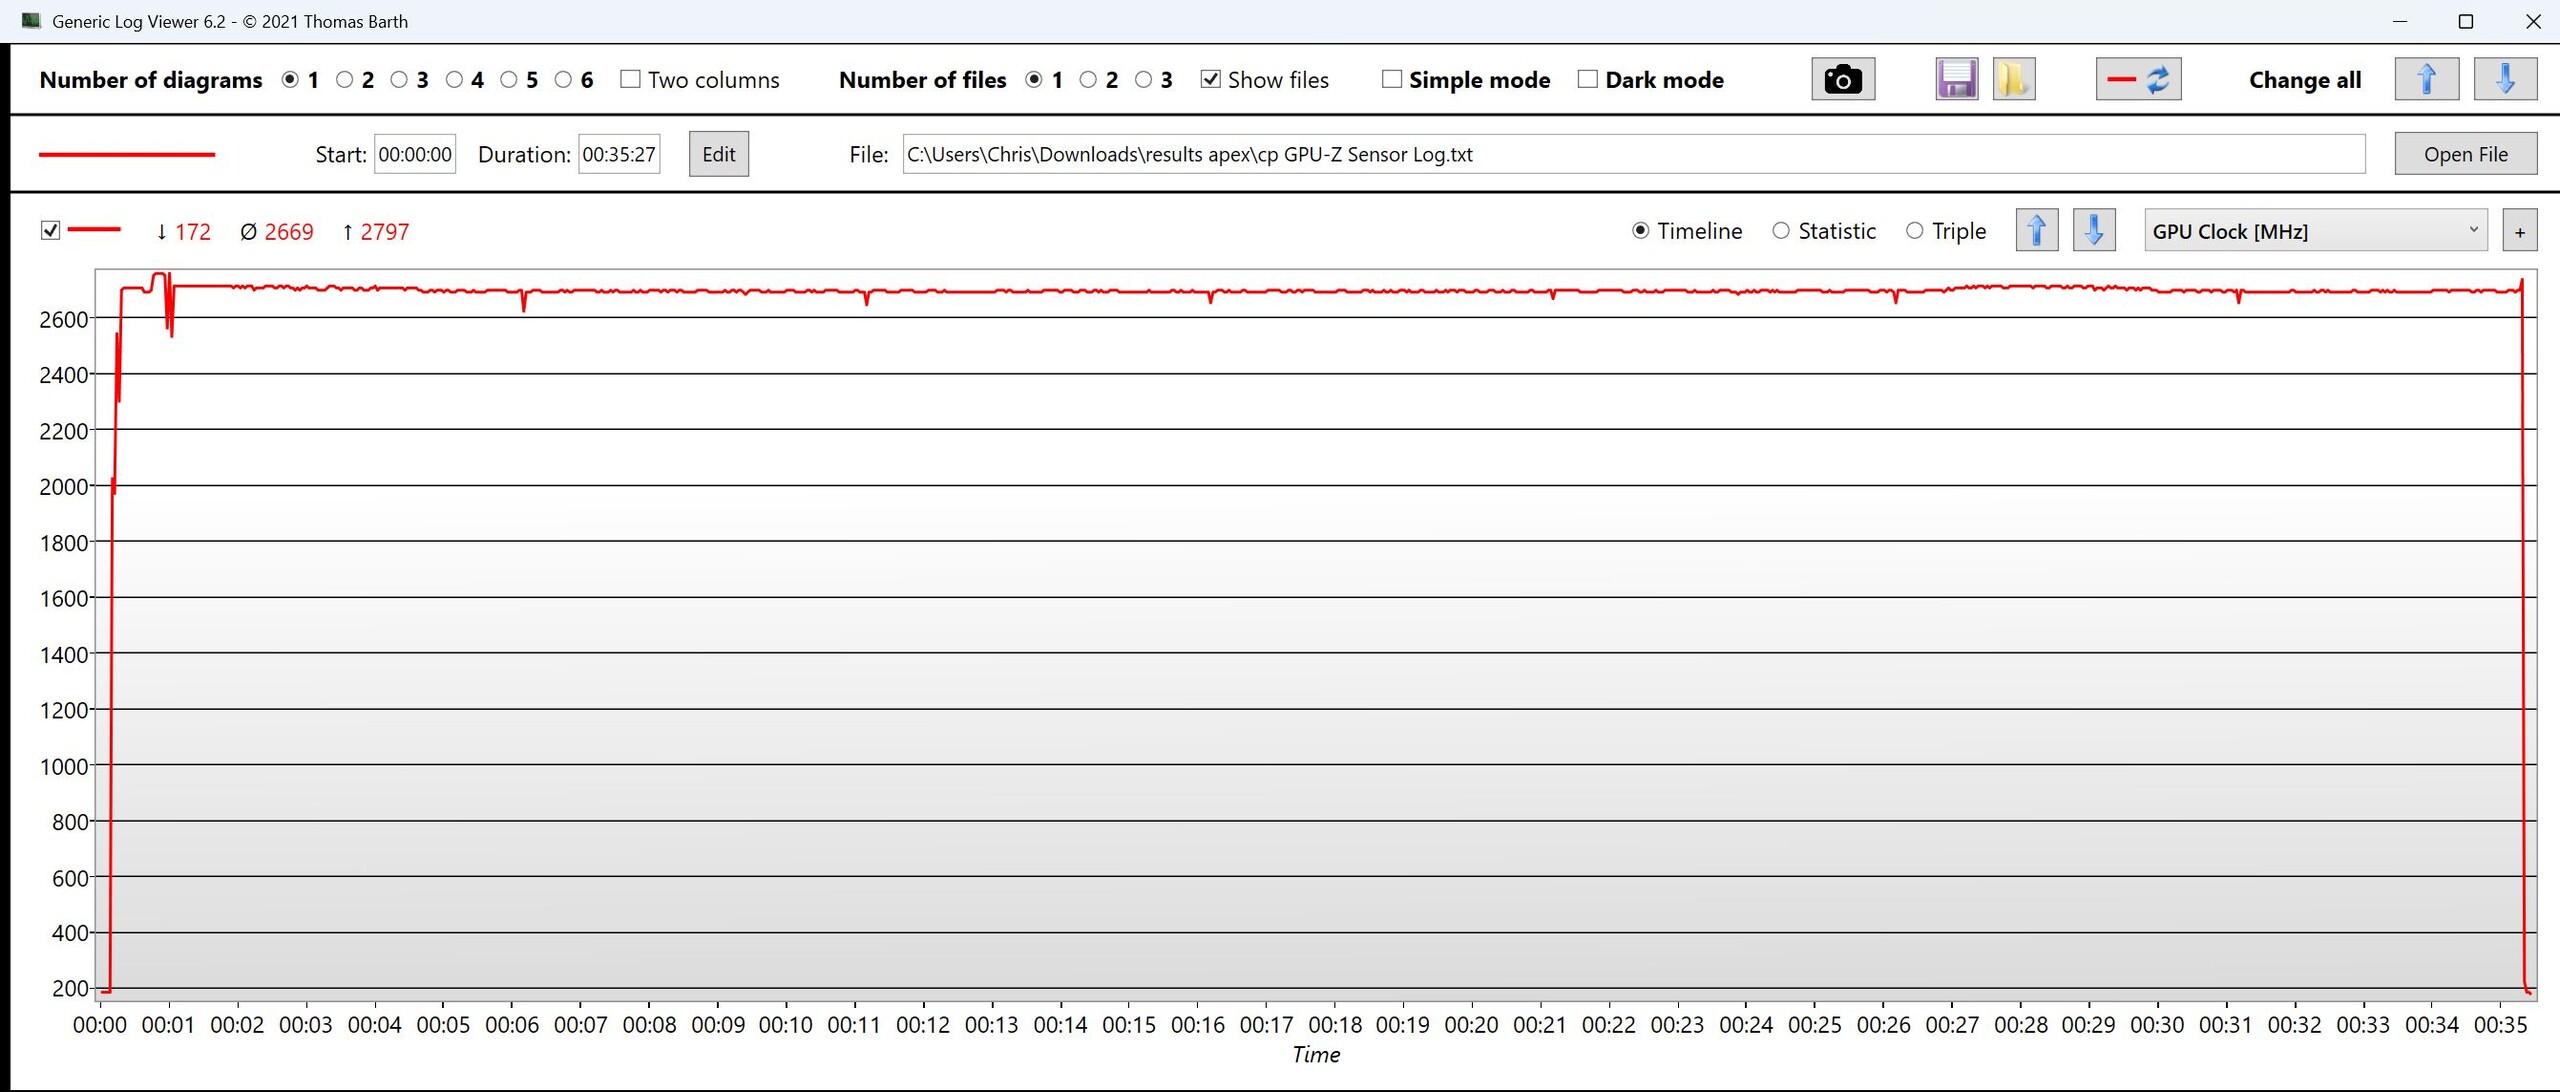
Prestazioni di gioco
In tutti i giochi testati, l'Apex supera persino alcuni portatili RTX 5070 più deboli (Acer Nitro V17, Omen 17z). Offre anche prestazioni sostenute molto elevate e completamente stabili in Cyberpunk.
In modalità Intrattenimento, le prestazioni di gioco diminuiscono di circa il 12%.
Senza ray tracing o path tracing, tutti i giochi funzionano senza problemi alla risoluzione nativa con impostazioni elevate. C'è spazio per il QHD, anche se spesso è necessario il DLSS. A 4K, i titoli più vecchi rimangono giocabili, mentre i giochi moderni faticano anche con l'upscaling.
| Performance rating - Percent | |
| Media della classe Gaming | |
| Schenker XMG Apex 17 M25 | |
| Lenovo Legion 7 16IAX10 | |
| HP Omen 17z-db100 | |
| HP Omen 16-ap0091ng | |
| Acer Nitro v 17 (ANV17-41-R4CJ) | |
| Tulpar T6 V3.5 | |
| Alienware 16 Aurora | |
| MSI Cyborg 17 B13WFKG -2! | |
| Cyberpunk 2077 - 1920x1080 Ultra Preset (FSR off) | |
| HP Omen 17z-db100 | |
| Media della classe Gaming (17.7 - 169.9, n=140, ultimi 2 anni) | |
| Acer Nitro v 17 (ANV17-41-R4CJ) | |
| Lenovo Legion 7 16IAX10 | |
| Schenker XMG Apex 17 M25 | |
| HP Omen 16-ap0091ng | |
| Tulpar T6 V3.5 | |
| Alienware 16 Aurora | |
| MSI Cyborg 17 B13WFKG | |
| Baldur's Gate 3 - 1920x1080 Ultra Preset AA:T | |
| HP Omen 17z-db100 | |
| Media della classe Gaming (37.2 - 246, n=116, ultimi 2 anni) | |
| Acer Nitro v 17 (ANV17-41-R4CJ) | |
| Schenker XMG Apex 17 M25 | |
| Lenovo Legion 7 16IAX10 | |
| HP Omen 16-ap0091ng | |
| Alienware 16 Aurora | |
| Tulpar T6 V3.5 | |
| MSI Cyborg 17 B13WFKG | |
| GTA V - 1920x1080 Highest AA:4xMSAA + FX AF:16x | |
| Schenker XMG Apex 17 M25 | |
| Lenovo Legion 7 16IAX10 | |
| Media della classe Gaming (47.9 - 186.9, n=118, ultimi 2 anni) | |
| HP Omen 16-ap0091ng | |
| Tulpar T6 V3.5 | |
| Alienware 16 Aurora | |
| HP Omen 17z-db100 | |
| Acer Nitro v 17 (ANV17-41-R4CJ) | |
| MSI Cyborg 17 B13WFKG | |
| Final Fantasy XV Benchmark - 1920x1080 High Quality | |
| HP Omen 17z-db100 | |
| Media della classe Gaming (37.9 - 215, n=126, ultimi 2 anni) | |
| Lenovo Legion 7 16IAX10 | |
| Acer Nitro v 17 (ANV17-41-R4CJ) | |
| Schenker XMG Apex 17 M25 | |
| HP Omen 16-ap0091ng | |
| Tulpar T6 V3.5 | |
| Alienware 16 Aurora | |
| Strange Brigade - 1920x1080 ultra AA:ultra AF:16 | |
| Media della classe Gaming (76.3 - 456, n=116, ultimi 2 anni) | |
| HP Omen 17z-db100 | |
| Lenovo Legion 7 16IAX10 | |
| Acer Nitro v 17 (ANV17-41-R4CJ) | |
| Schenker XMG Apex 17 M25 | |
| HP Omen 16-ap0091ng | |
| Tulpar T6 V3.5 | |
| Alienware 16 Aurora | |
| Dota 2 Reborn - 1920x1080 ultra (3/3) best looking | |
| Schenker XMG Apex 17 M25 | |
| Lenovo Legion 7 16IAX10 | |
| HP Omen 16-ap0091ng | |
| Alienware 16 Aurora | |
| Media della classe Gaming (65.1 - 248, n=133, ultimi 2 anni) | |
| Tulpar T6 V3.5 | |
| HP Omen 17z-db100 | |
| Acer Nitro v 17 (ANV17-41-R4CJ) | |
| MSI Cyborg 17 B13WFKG | |
| X-Plane 11.11 - 1920x1080 high (fps_test=3) | |
| Schenker XMG Apex 17 M25 | |
| Lenovo Legion 7 16IAX10 | |
| Tulpar T6 V3.5 | |
| Media della classe Gaming (33.4 - 150.2, n=136, ultimi 2 anni) | |
| HP Omen 16-ap0091ng | |
| Alienware 16 Aurora | |
| HP Omen 17z-db100 | |
| Acer Nitro v 17 (ANV17-41-R4CJ) | |
| MSI Cyborg 17 B13WFKG | |
Cyberpunk 2077 diagramma FPS ultra

| basso | medio | alto | ultra | QHD DLSS | QHD | 4K DLSS | 4K | |
|---|---|---|---|---|---|---|---|---|
| GTA V (2015) | 187.9 | 187.8 | 185.7 | 146.3 | 114.3 | 106 | ||
| Dota 2 Reborn (2015) | 268 | 232 | 223 | 201 | 124.4 | |||
| Final Fantasy XV Benchmark (2018) | 227 | 167.4 | 119.5 | 89.9 | 50.7 | |||
| X-Plane 11.11 (2018) | 164.2 | 142.9 | 118.4 | 99.2 | ||||
| Strange Brigade (2018) | 648 | 348 | 273 | 231 | 162 | 86.1 | ||
| Baldur's Gate 3 (2023) | 170 | 133 | 118 | 113.4 | 114.1 | 78.1 | 65.8 | 38.8 |
| Cyberpunk 2077 (2023) | 128.9 | 124.5 | 104 | 87.2 | 70 | 58.8 | 32.7 | 25.1 |
| Doom: The Dark Ages (2025) | 58.5 | 49.6 | 44.1 | 43.8 | 48 | 30.4 | 22.7 | 11.7 |
| F1 25 (2025) | 263 | 217 | 174.4 | 25.8 |
Emissioni e potenza - Quanto è rumoroso l'Apex 17 sotto carico di gioco?
Emissioni di rumore
Sotto carico, le ventole sono generalmente più rumorose di quelle dei concorrenti a potenza parzialmente limitata. Anche in 3DMark06, i livelli di rumore superano i 50 dB. Durante il gioco, è il sistema più rumoroso nel confronto, anche se il più debole Legion 7 non è molto distante.
Nella modalità Intrattenimento, molto più silenziosa, funziona in modo più silenzioso rispetto ai concorrenti, pur mantenendo prestazioni competitive.
Il comportamento della ventola è un po' aggressivo e volatile, e a volte aumenta brevemente anche al minimo.
Rumorosità
| Idle |
| 23 / 23 / 23 dB(A) |
| Sotto carico |
| 51.41 / 55.5 dB(A) |
 | ||
30 dB silenzioso 40 dB(A) udibile 50 dB(A) rumoroso |
||
min: | ||
| Schenker XMG Apex 17 M25 R9 9955HX, GeForce RTX 5060 Laptop | Lenovo Legion 7 16IAX10 Ultra 7 255HX, GeForce RTX 5060 Laptop | HP Omen 16-ap0091ng R9 8940HX, GeForce RTX 5060 Laptop | MSI Cyborg 17 B13WFKG i7-13620H, GeForce RTX 5060 Laptop | Tulpar T6 V3.5 i7-14700HX, GeForce RTX 5060 Laptop | Alienware 16 Aurora Core 7 240H, GeForce RTX 5060 Laptop | |
|---|---|---|---|---|---|---|
| Noise | -2% | 0% | -6% | -10% | -1% | |
| off /ambiente * (dB) | 23 | 23.9 -4% | 23 -0% | 25 -9% | 24 -4% | 22.9 -0% |
| Idle Minimum * (dB) | 23 | 24 -4% | 23 -0% | 25 -9% | 26 -13% | 24 -4% |
| Idle Average * (dB) | 23 | 26 -13% | 23 -0% | 27 -17% | 29 -26% | 25.6 -11% |
| Idle Maximum * (dB) | 23 | 29.4 -28% | 27.64 -20% | 34 -48% | 31 -35% | 25.6 -11% |
| Load Average * (dB) | 51.41 | 35.4 31% | 49.5 4% | 44 14% | 52 -1% | 46.8 9% |
| Cyberpunk 2077 ultra * (dB) | 55.5 | 54.6 2% | 49.5 11% | 48 14% | 52 6% | 49.9 10% |
| Load Maximum * (dB) | 55.5 | 54.7 1% | 52.73 5% | 50 10% | 53 5% | 55.6 -0% |
* ... Meglio usare valori piccoli
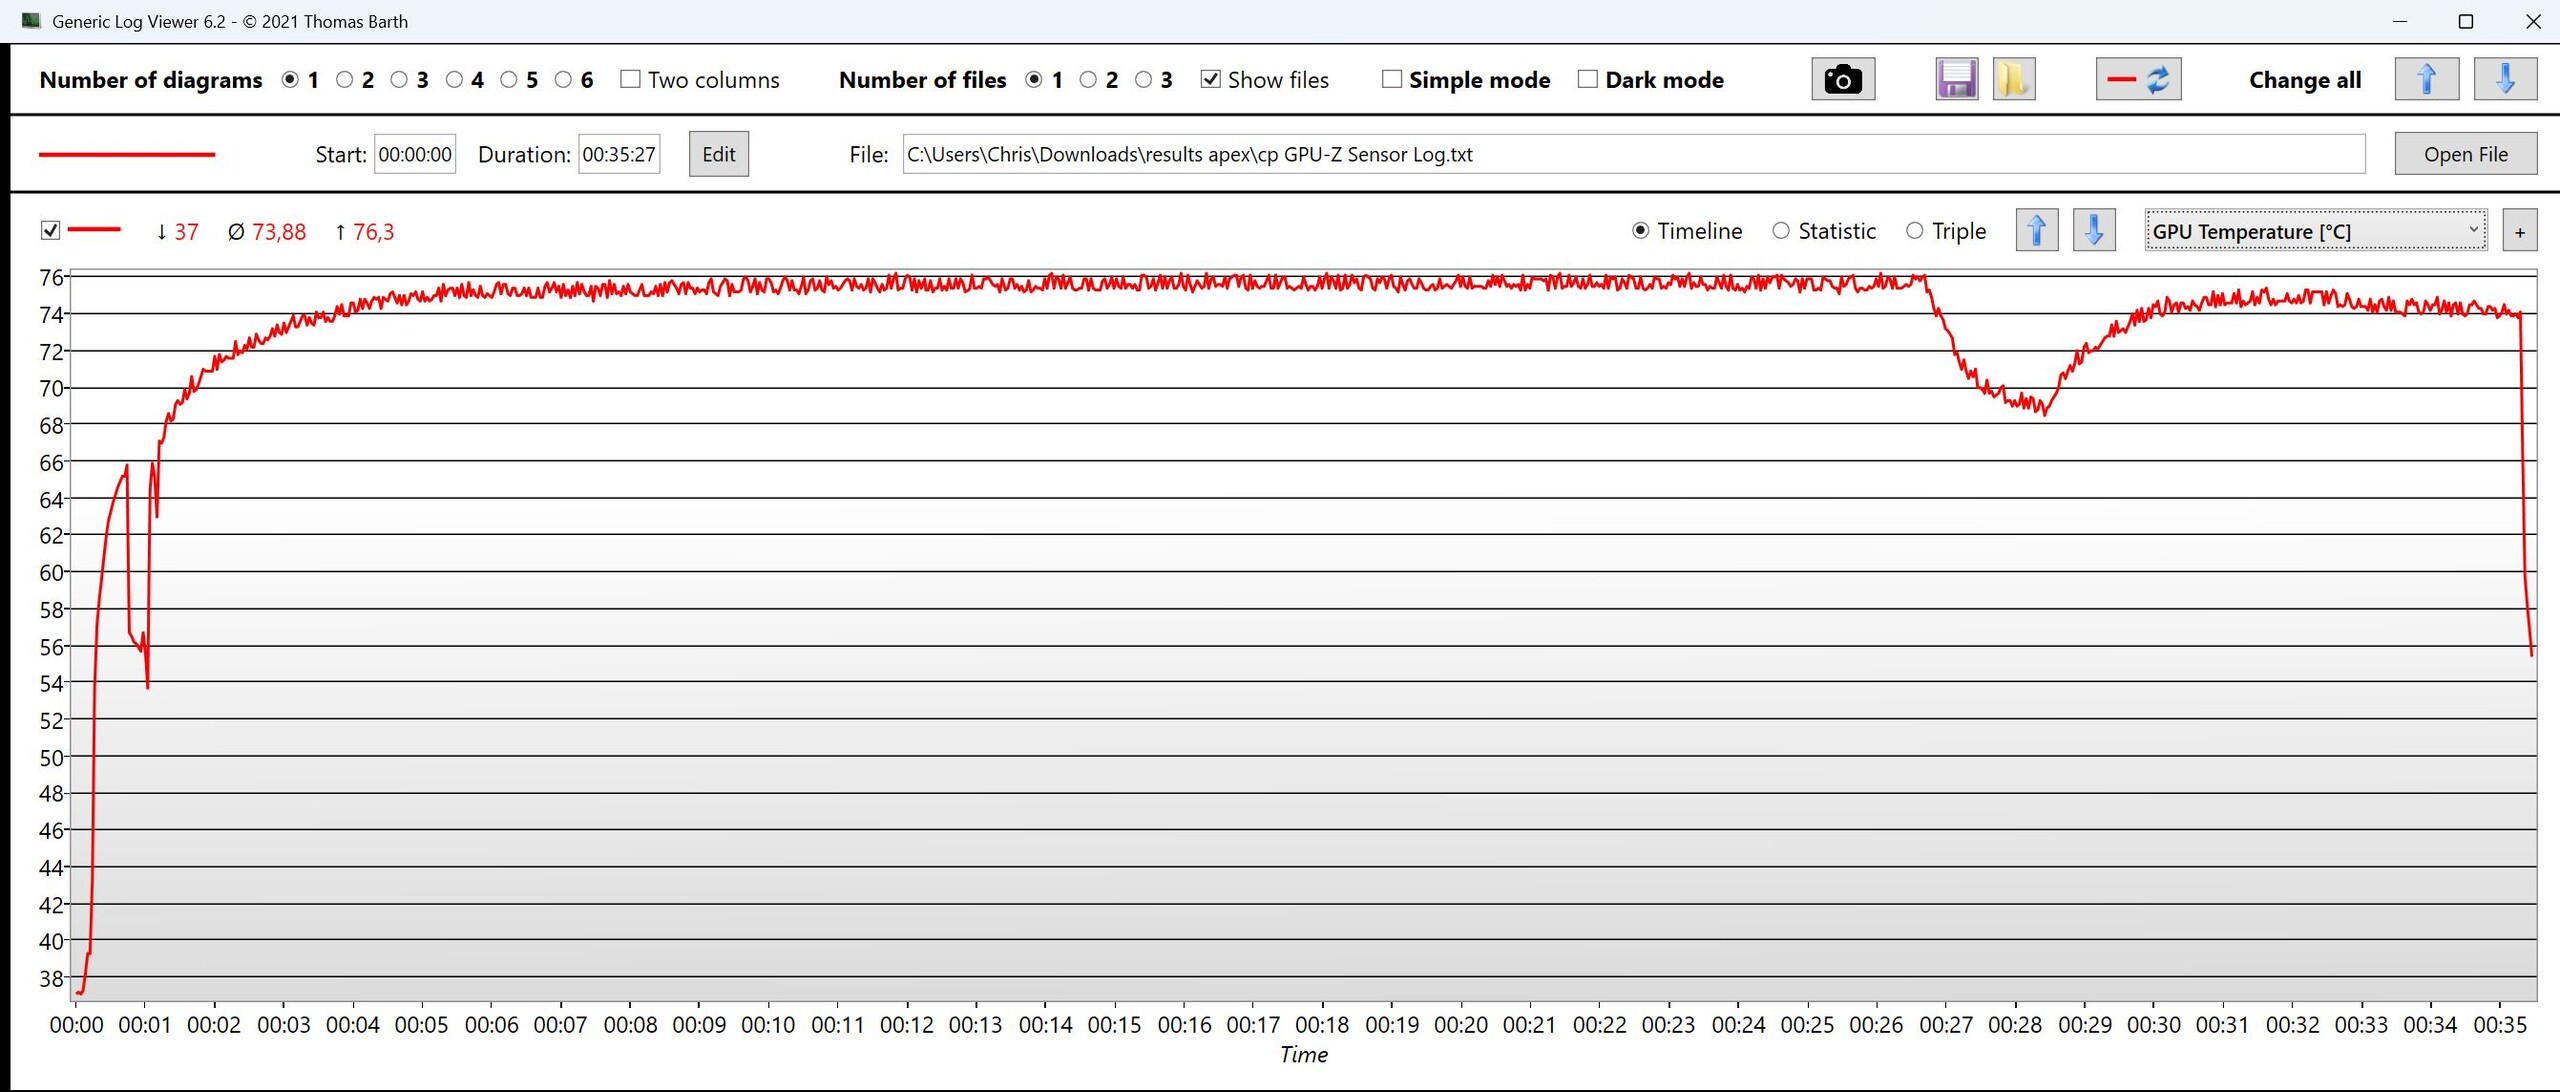
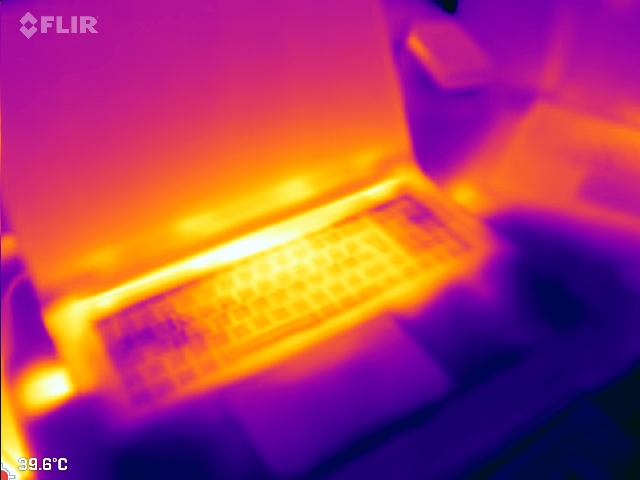
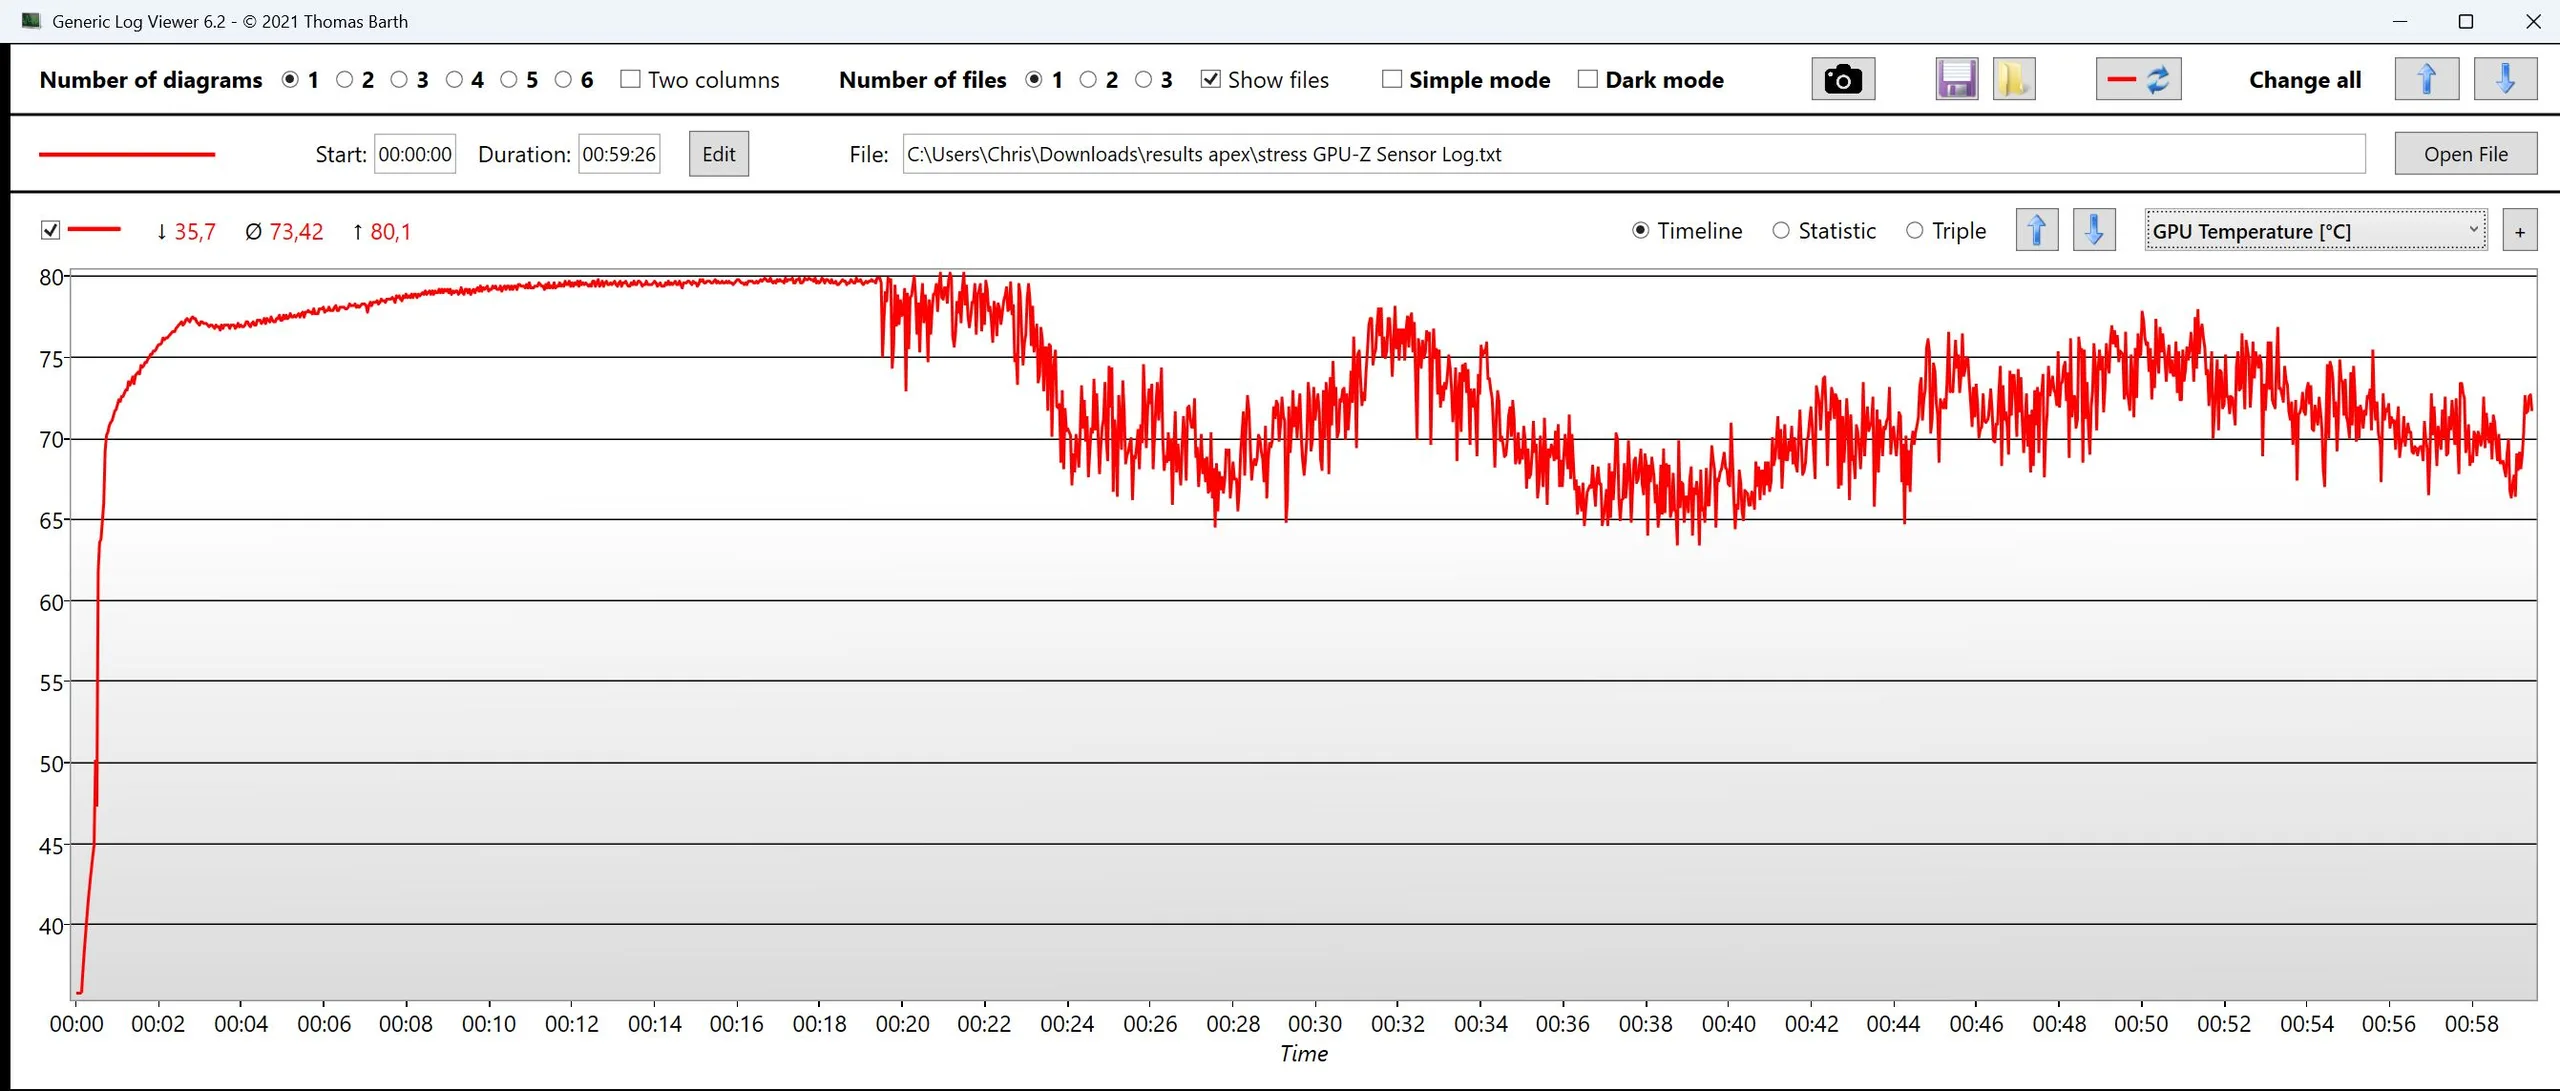
Temperatura
Il forte sistema di raffreddamento mantiene le temperature generalmente basse. Sotto carico, si misurano punti caldi di circa 45°C al centro della parte inferiore, mentre altre aree rimangono significativamente più fredde.
(+) La temperatura massima sul lato superiore è di 36 °C / 97 F, rispetto alla media di 40.4 °C / 105 F, che varia da 21.2 a 68.8 °C per questa classe Gaming.
(±) Il lato inferiore si riscalda fino ad un massimo di 43 °C / 109 F, rispetto alla media di 43.3 °C / 110 F
(+) In idle, la temperatura media del lato superiore è di 24.4 °C / 76 F, rispetto alla media deld ispositivo di 33.9 °C / 93 F.
(+) 3: The average temperature for the upper side is 29.4 °C / 85 F, compared to the average of 33.9 °C / 93 F for the class Gaming.
(+) I poggiapolsi e il touchpad sono piu' freddi della temperatura della pelle con un massimo di 27 °C / 80.6 F e sono quindi freddi al tatto.
(±) La temperatura media della zona del palmo della mano di dispositivi simili e'stata di 28.8 °C / 83.8 F (+1.8 °C / 3.2 F).

| Schenker XMG Apex 17 M25 R9 9955HX, GeForce RTX 5060 Laptop | Lenovo Legion 7 16IAX10 Ultra 7 255HX, GeForce RTX 5060 Laptop | HP Omen 16-ap0091ng R9 8940HX, GeForce RTX 5060 Laptop | MSI Cyborg 17 B13WFKG i7-13620H, GeForce RTX 5060 Laptop | Tulpar T6 V3.5 i7-14700HX, GeForce RTX 5060 Laptop | |
|---|---|---|---|---|---|
| Heat | -24% | -4% | -33% | -15% | |
| Maximum Upper Side * (°C) | 36 | 47 -31% | 36 -0% | 49 -36% | 40 -11% |
| Maximum Bottom * (°C) | 43 | 44 -2% | 37 14% | 49 -14% | 47 -9% |
| Idle Upper Side * (°C) | 27 | 35.6 -32% | 30 -11% | 37 -37% | 30 -11% |
| Idle Bottom * (°C) | 27 | 35.2 -30% | 32 -19% | 39 -44% | 35 -30% |
* ... Meglio usare valori piccoli
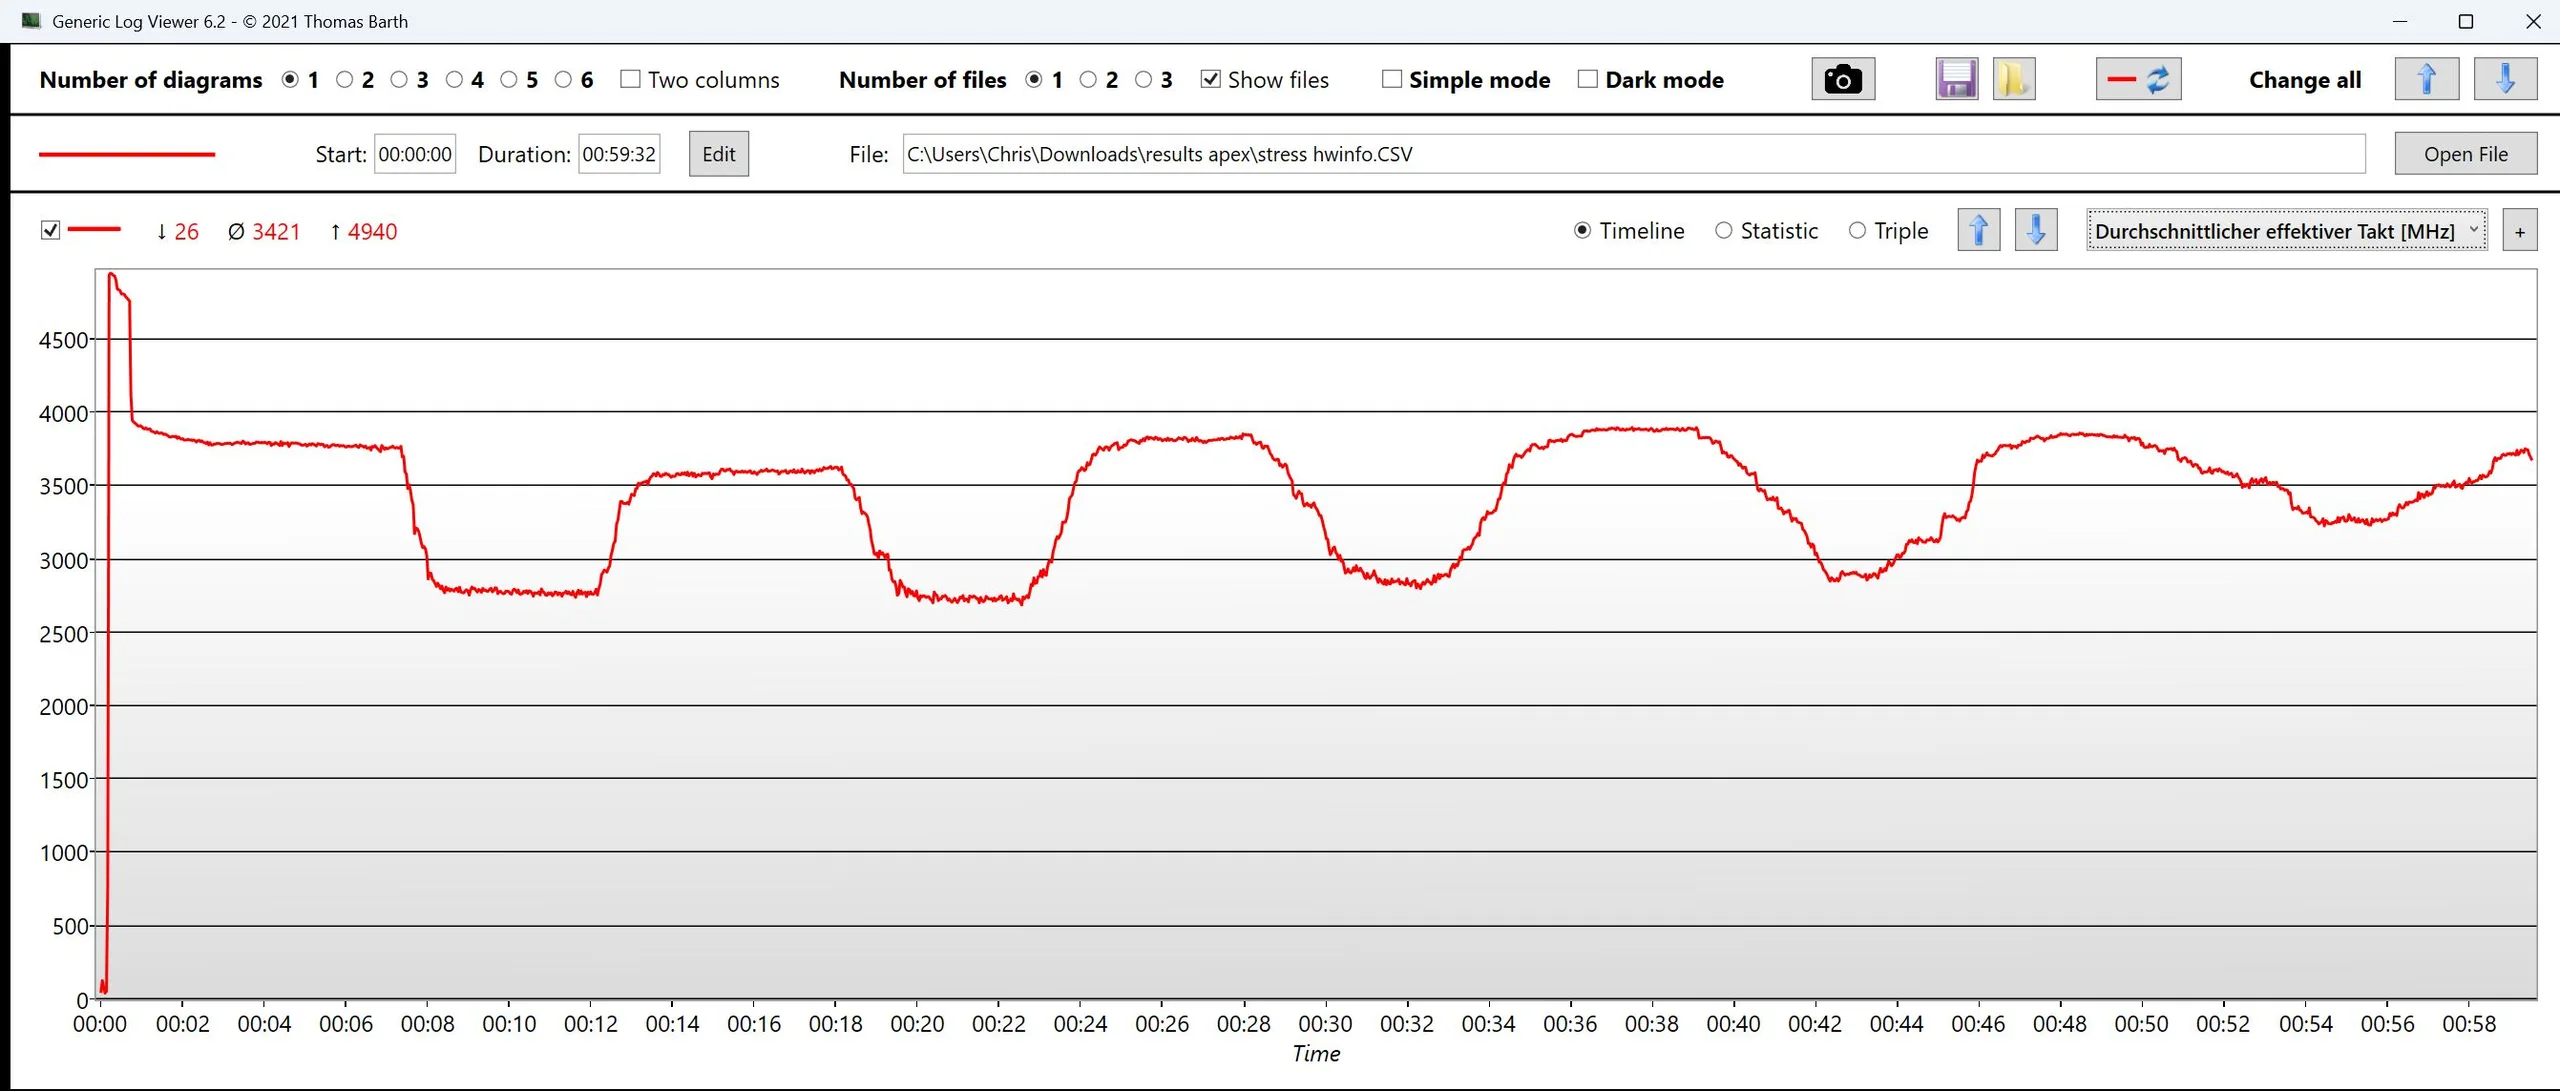
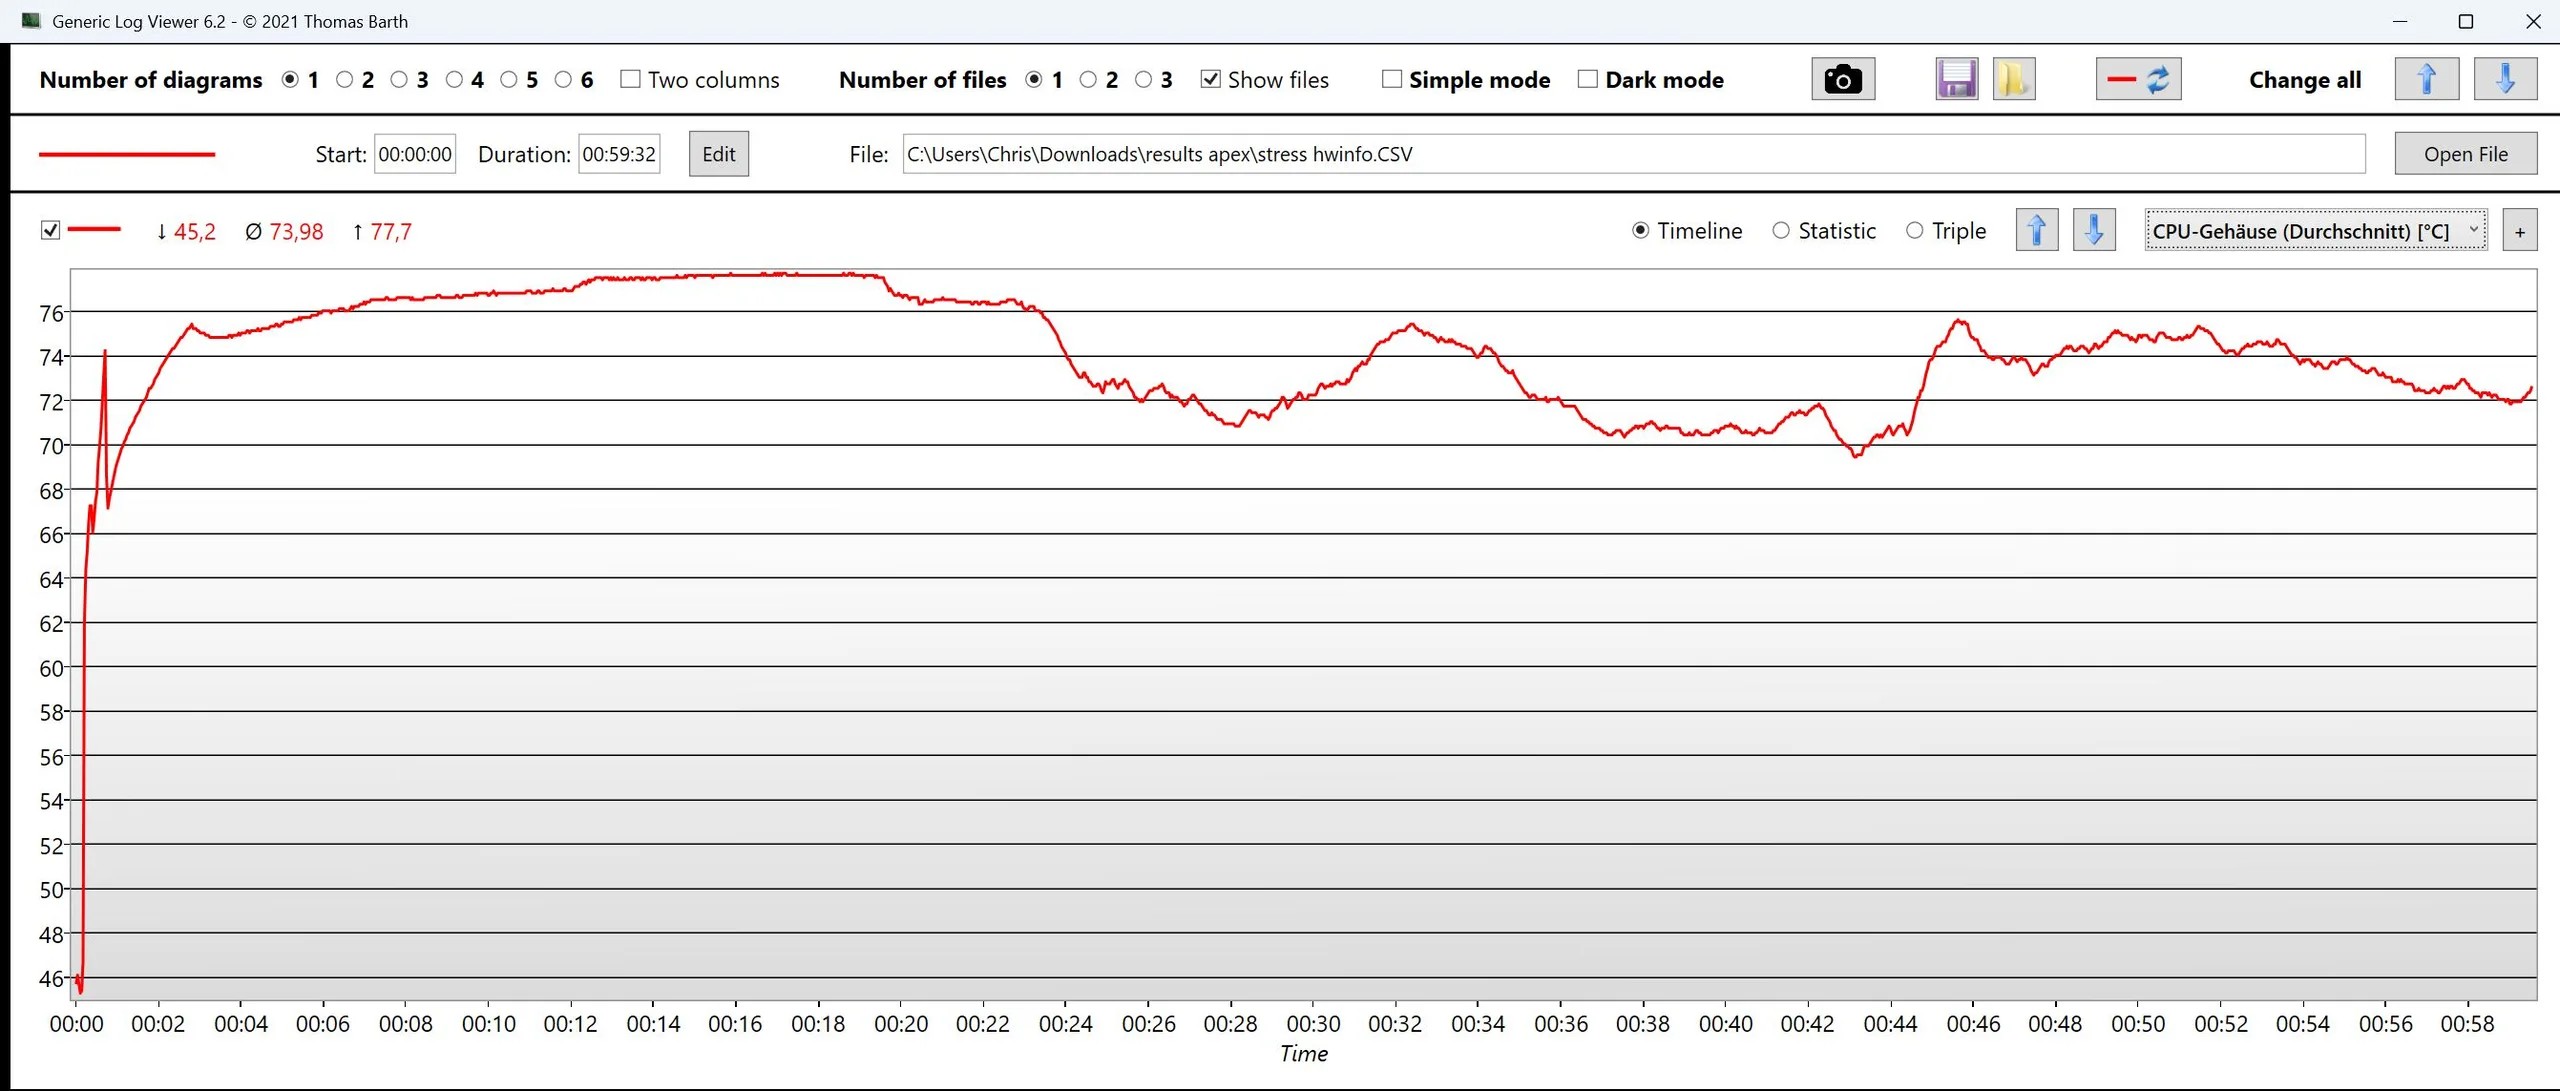
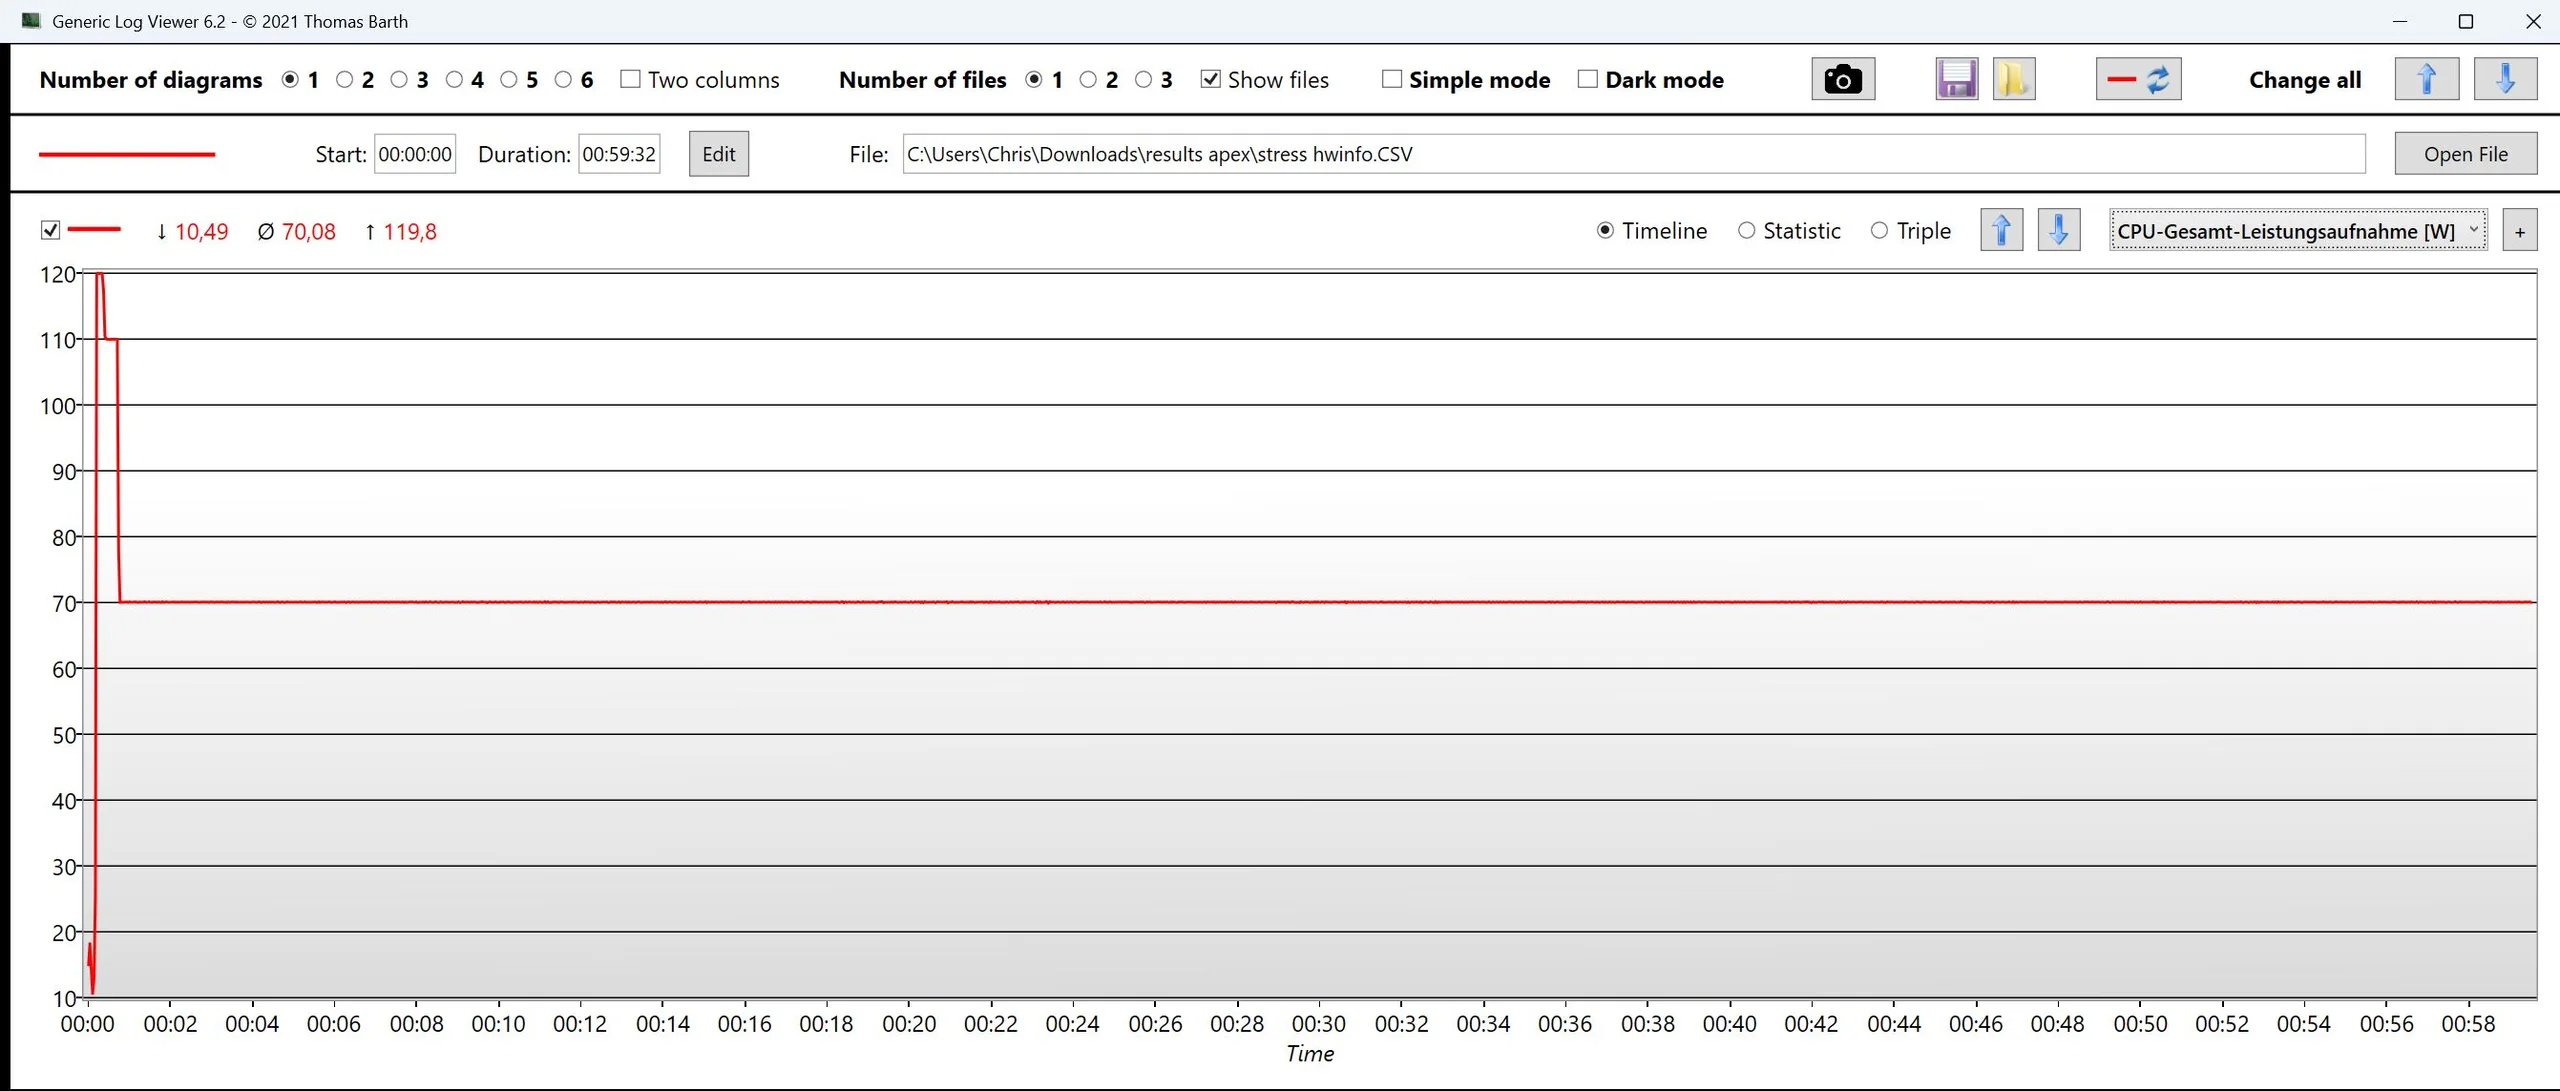
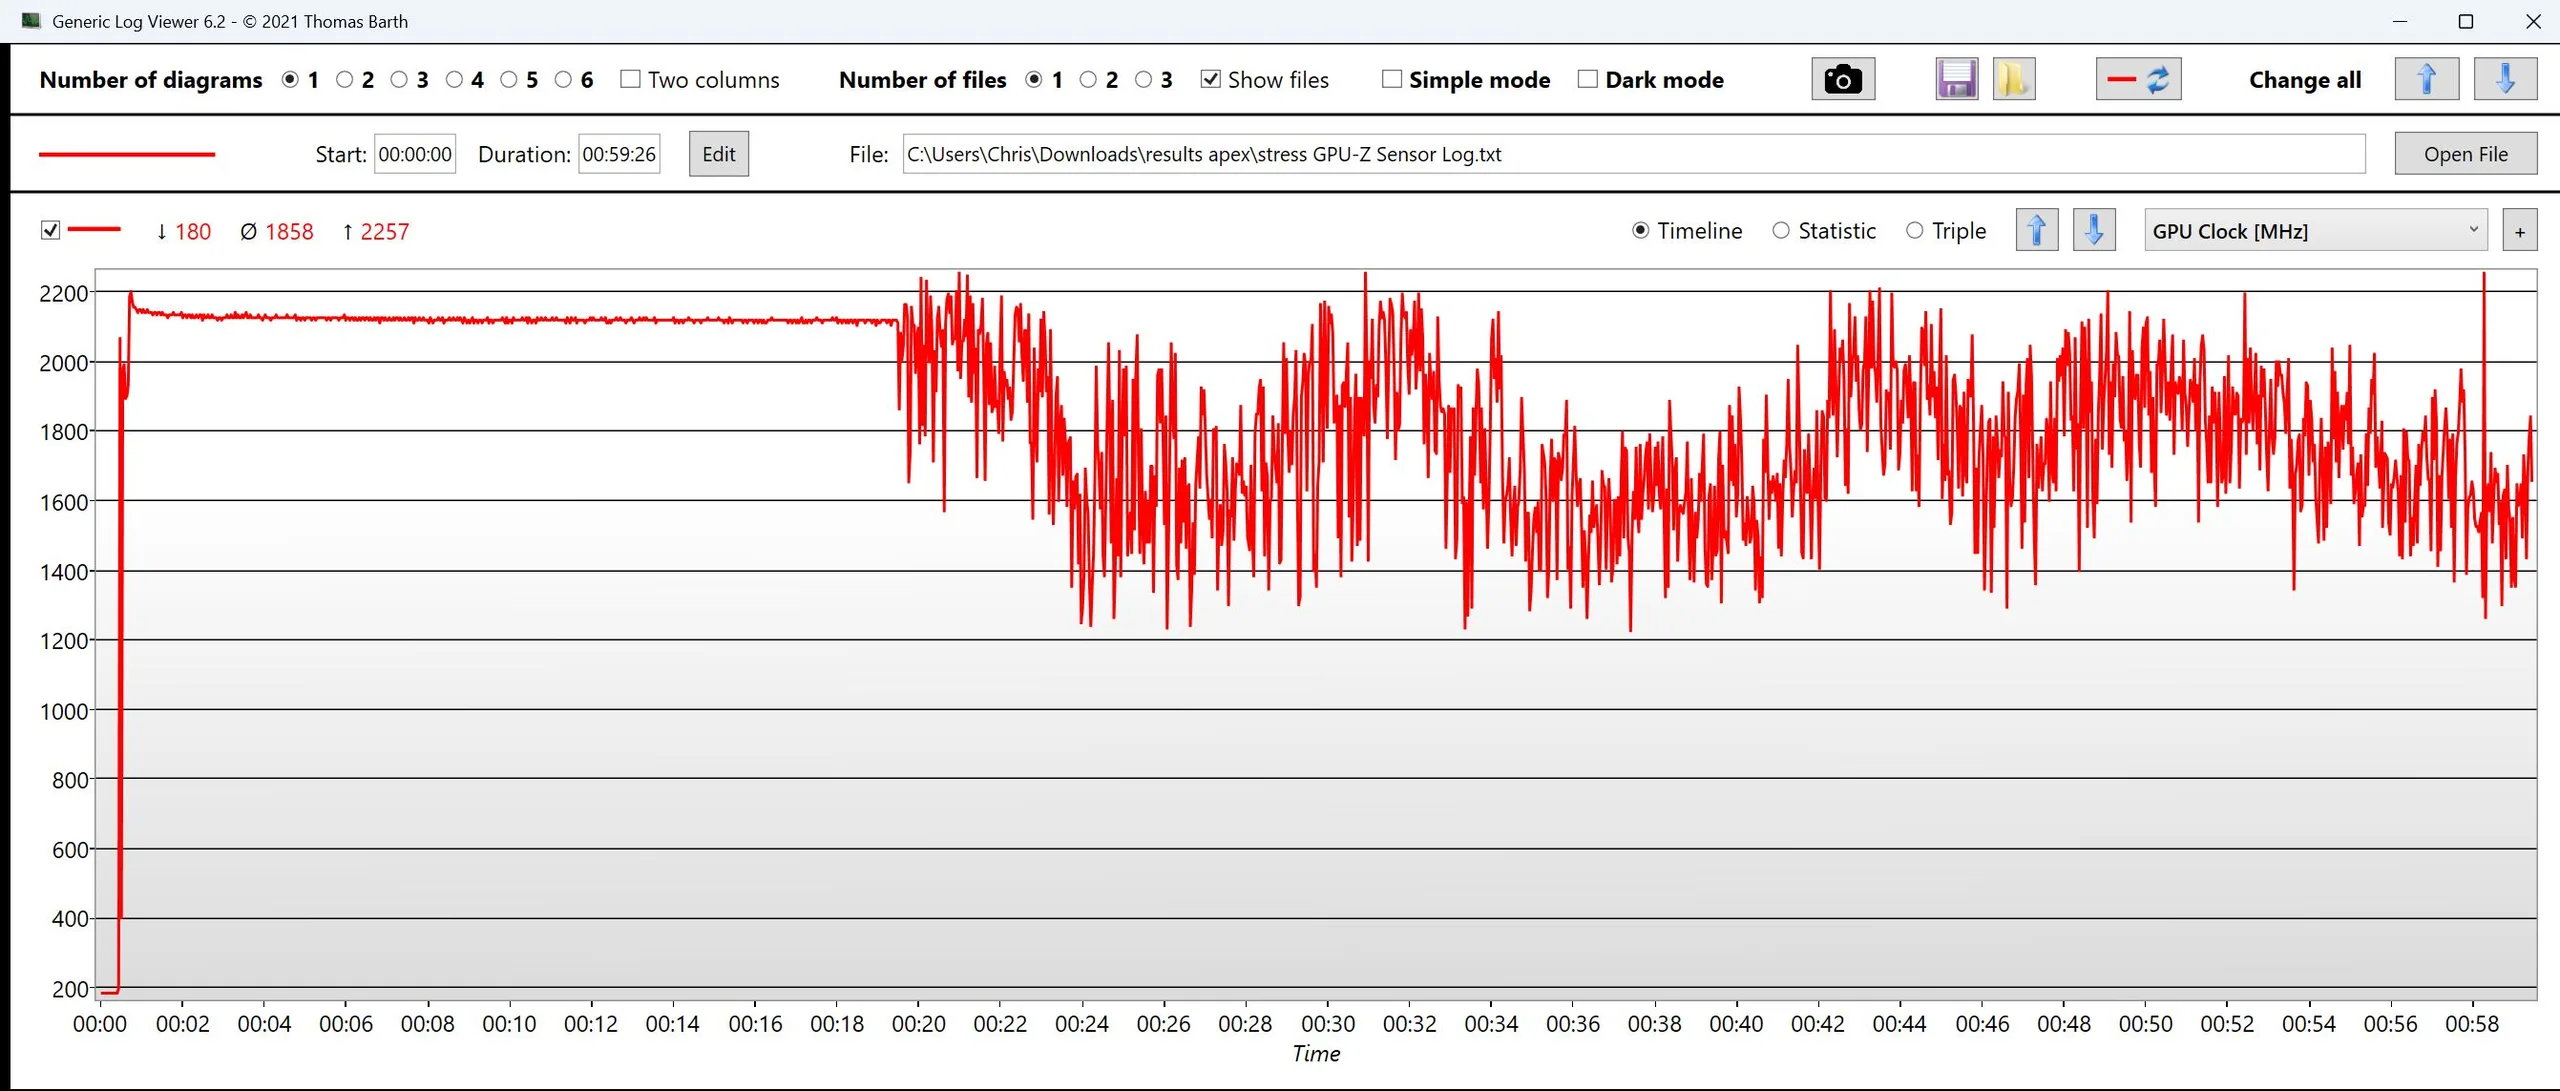
| Clock della CPU (GHz) | Clock della GPU (MHz) | Temperatura media della CPU (°C) | Temperatura media della GPU (°C) | |
| Prime95 + FurMark Stress | 3,4 | 1853 | 74 | 73 |
| Cyberpunk 2077 Stress | 1,1 | 2700 | 84 | 74 |
Altoparlanti
Gli alti e i medi sono bilanciati, ma i bassi sono quasi assenti e l'uscita complessiva è leggermente sottopotenziata. La qualità degli altoparlanti è media. È incluso un jack audio combinato.
Schenker XMG Apex 17 M25 analisi audio
(±) | potenza degli altiparlanti media ma buona (80.19 dB)
Bassi 100 - 315 Hz
(-) | quasi nessun basso - in media 29.9% inferiori alla media
(±) | la linearità dei bassi è media (14.6% delta rispetto alla precedente frequenza)
Medi 400 - 2000 Hz
(+) | medi bilanciati - solo only 4.7% rispetto alla media
(+) | medi lineari (6.7% delta rispetto alla precedente frequenza)
Alti 2 - 16 kHz
(+) | Alti bilanciati - appena 4.1% dalla media
(+) | alti lineari (6% delta rispetto alla precedente frequenza)
Nel complesso 100 - 16.000 Hz
(±) | la linearità complessiva del suono è media (22.3% di differenza rispetto alla media
Rispetto alla stessa classe
» 80% di tutti i dispositivi testati in questa classe è stato migliore, 6% simile, 15% peggiore
» Il migliore ha avuto un delta di 6%, medio di 18%, peggiore di 132%
Rispetto a tutti i dispositivi testati
» 64% di tutti i dispositivi testati in questa classe è stato migliore, 6% similare, 29% peggiore
» Il migliore ha avuto un delta di 4%, medio di 24%, peggiore di 134%
Lenovo Legion 7 16IAX10 analisi audio
(±) | potenza degli altiparlanti media ma buona (77.6 dB)
Bassi 100 - 315 Hz
(±) | bassi ridotti - in media 9.5% inferiori alla media
(±) | la linearità dei bassi è media (9.8% delta rispetto alla precedente frequenza)
Medi 400 - 2000 Hz
(+) | medi bilanciati - solo only 1.5% rispetto alla media
(+) | medi lineari (4% delta rispetto alla precedente frequenza)
Alti 2 - 16 kHz
(+) | Alti bilanciati - appena 3% dalla media
(+) | alti lineari (4.9% delta rispetto alla precedente frequenza)
Nel complesso 100 - 16.000 Hz
(+) | suono nel complesso lineare (11.5% differenza dalla media)
Rispetto alla stessa classe
» 10% di tutti i dispositivi testati in questa classe è stato migliore, 3% simile, 87% peggiore
» Il migliore ha avuto un delta di 6%, medio di 18%, peggiore di 132%
Rispetto a tutti i dispositivi testati
» 7% di tutti i dispositivi testati in questa classe è stato migliore, 2% similare, 91% peggiore
» Il migliore ha avuto un delta di 4%, medio di 24%, peggiore di 134%
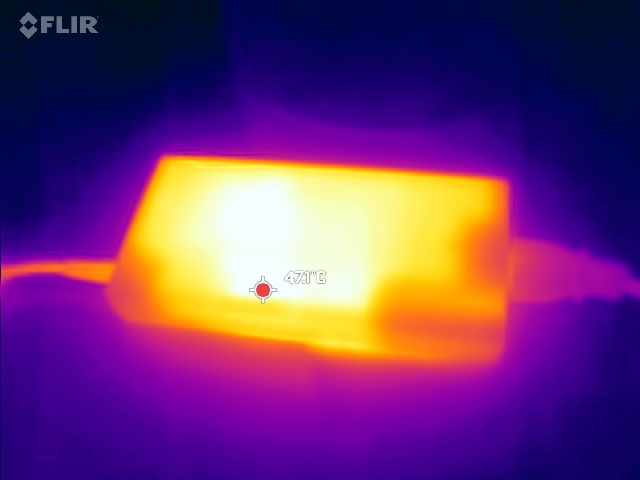
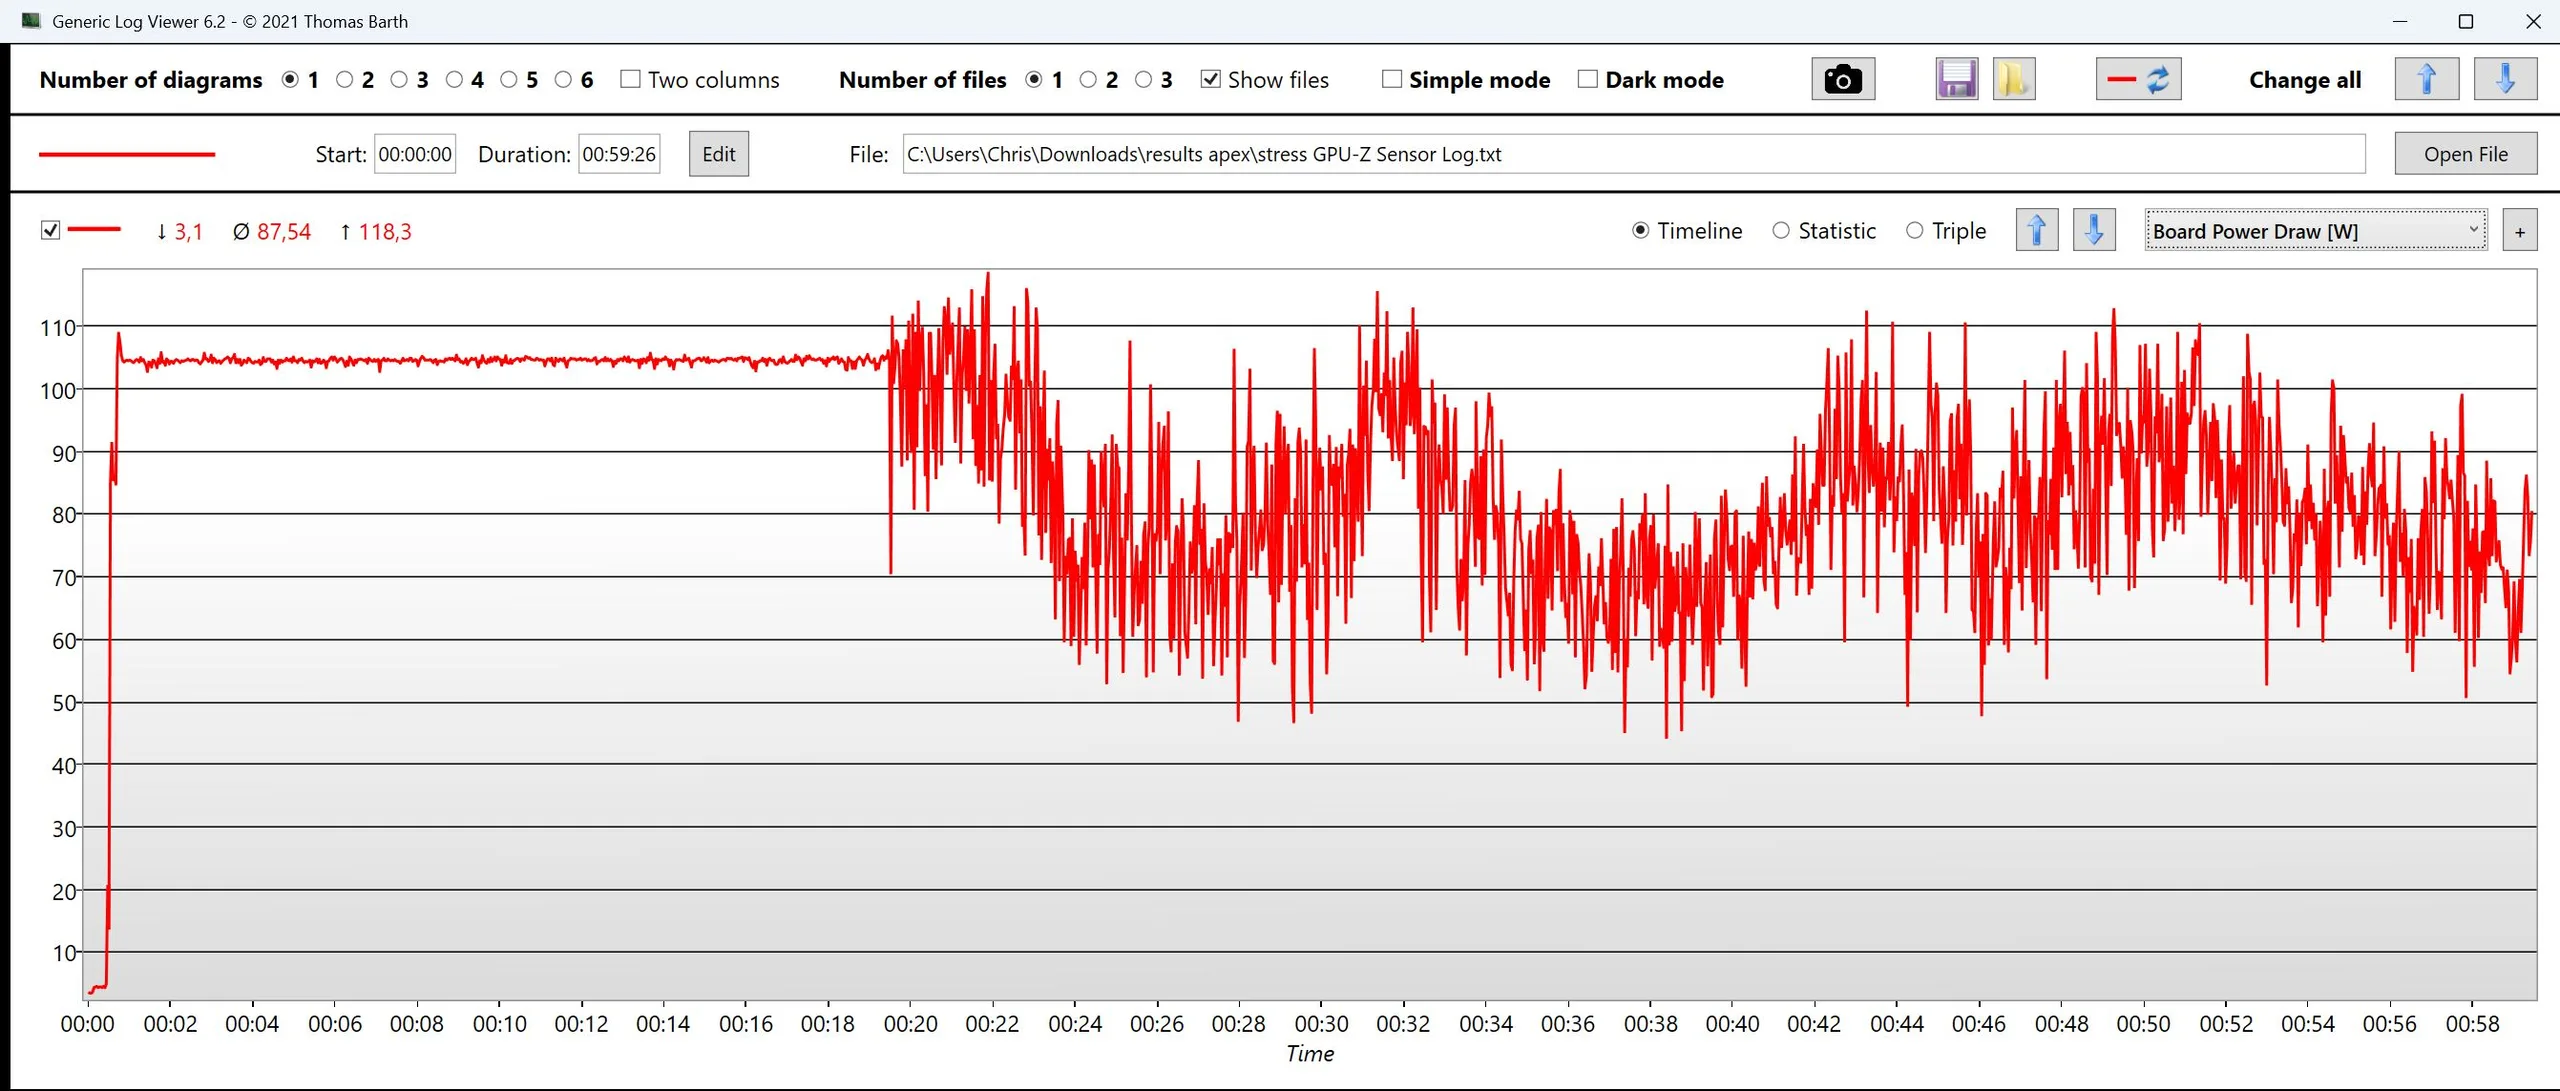
Consumo di energia
Le prestazioni elevate hanno il costo di un maggiore consumo di energia sotto carico rispetto ai concorrenti. Il consumo di energia al minimo ha particolarmente bisogno di essere ottimizzato, in quanto il sistema impiega un tempo insolitamente lungo per stabilizzarsi al suo livello di minimo relativamente alto.
L'alimentatore da 230 W incluso potrebbe essere un po' sottodimensionato. Mentre il consumo di gioco si aggira in media intorno ai 220 W, si verificano brevi picchi fino a 280 W.
| Off / Standby | |
| Idle | |
| Sotto carico |
|
Leggenda:
min: | |
| Schenker XMG Apex 17 M25 R9 9955HX, GeForce RTX 5060 Laptop, Samsung 990 Pro 2 TB MZVL72T0HDLB, IPS, 2560x1440, 17.3" | Lenovo Legion 7 16IAX10 Ultra 7 255HX, GeForce RTX 5060 Laptop, WD PC SN7100S SDFPMSL-1T00-1101, OLED, 2560x1600, 16" | HP Omen 16-ap0091ng R9 8940HX, GeForce RTX 5060 Laptop, Samsung PM9C1b MZVL81T0HFLB-00BH1, IPS, 1920x1200, 16" | MSI Cyborg 17 B13WFKG i7-13620H, GeForce RTX 5060 Laptop, Western Digital PC SN5000S SDEPMSJ-512G, IPS, 1920x1080, 17.3" | Tulpar T6 V3.5 i7-14700HX, GeForce RTX 5060 Laptop, Western Digital PC SN5000S SDEPNSJ-1T00-1006, IPS, 1920x1200, 16" | Alienware 16 Aurora Core 7 240H, GeForce RTX 5060 Laptop, , IPS, 2560x1600, 16" | Media NVIDIA GeForce RTX 5060 Laptop | Media della classe Gaming | |
|---|---|---|---|---|---|---|---|---|
| Power Consumption | 4% | 19% | 36% | 17% | 31% | 17% | -9% | |
| Idle Minimum * (Watt) | 11.3 | 9.4 17% | 7.8 31% | 7.9 30% | 6.7 41% | 4.4 61% | 9.12 ? 19% | 13.7 ? -21% |
| Idle Average * (Watt) | 16.7 | 10.6 37% | 8.8 47% | 12.7 24% | 13.7 18% | 18 -8% | 13.6 ? 19% | 19.5 ? -17% |
| Idle Maximum * (Watt) | 20.7 | 36.4 -76% | 21.5 -4% | 18.1 13% | 21.8 -5% | 18.2 12% | 19.5 ? 6% | 25.6 ? -24% |
| Load Average * (Watt) | 121 | 107.7 11% | 119 2% | 90 26% | 127 -5% | 87.1 28% | 97.2 ? 20% | 110.3 ? 9% |
| Cyberpunk 2077 ultra * (Watt) | 220 | 188 15% | 192 13% | 109.7 50% | 156.7 29% | 123 44% | ||
| Cyberpunk 2077 ultra external monitor * (Watt) | 209 | 187.5 10% | 164.5 21% | 108.4 48% | 151.9 27% | 120.6 42% | ||
| Load Maximum * (Watt) | 281 | 247 12% | 208 26% | 115 59% | 242 14% | 183 35% | 215 ? 23% | 257 ? 9% |
* ... Meglio usare valori piccoli
Consumo energetico Cyberpunk / Stress test
Consumo di energia con monitor esterno
Durata della batteria
Con 73 Wh, la capacità della batteria è nella fascia bassa per questa classe. Tuttavia, l'Apex raggiunge poco meno di sei ore nel nostro test Wi-Fi, un risultato solido.
| Schenker XMG Apex 17 M25 R9 9955HX, GeForce RTX 5060 Laptop, 73 Wh | HP Omen 17z-db100 Ryzen AI 7 350, GeForce RTX 5070 Laptop, 83 Wh | Acer Nitro v 17 (ANV17-41-R4CJ) R7 260, GeForce RTX 5070 Laptop, 76 Wh | MSI Katana 17 HX B14WGK i7-14650HX, GeForce RTX 5070 Laptop, 75 Wh | Lenovo Legion 7 16IAX10 Ultra 7 255HX, GeForce RTX 5060 Laptop, 84 Wh | Media della classe Gaming | |
|---|---|---|---|---|---|---|
| Autonomia della batteria | ||||||
| WiFi v1.3 (h) | 5.8 | 8 38% | 4.7 -19% | 5.1 -12% | 4.7 -19% | 6.7 ? 16% |
Schenker XMG Apex 17 M25
- 02/12/2026 v8
Christian Hintze
 Total Sustainability Score:
 Possibili alternative a confronto
Immagine | Modello | Prezzo | Peso | Altezza | Schermo |
|---|---|---|---|---|---|
1. 82.1%  | Schenker XMG Apex 17 M25 AMD Ryzen 9 9955HX ⎘ NVIDIA GeForce RTX 5060 Laptop ⎘ 32 GB Memoria, 2048 GB SSD | Prezzo di listino: 1899 Euro | 2.8 kg | 28.6 mm | 17.30" 2560x1440 170 PPI IPS |
2. 81.8% 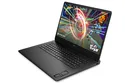 | HP Omen 17z-db100 AMD Ryzen AI 7 350 ⎘ NVIDIA GeForce RTX 5070 Laptop ⎘ 96 GB Memoria, 4000 GB SSD | Amazon: Prezzo di listino: 1550 USD | 2.9 kg | 30.1 mm | 17.30" 2560x1440 170 PPI IPS |
3. 80.2%  | Acer Nitro v 17 (ANV17-41-R4CJ) AMD Ryzen 7 260 ⎘ NVIDIA GeForce RTX 5070 Laptop ⎘ 16 GB Memoria, 1024 GB SSD | Prezzo di listino: 1199 Euro | 2.7 kg | 24 mm | 17.30" 1920x1080 127 PPI IPS |
4. 79.6%  | MSI Crosshair A17 HX D8WGKG AMD Ryzen 9 8940HX ⎘ NVIDIA GeForce RTX 5070 Laptop ⎘ 32 GB Memoria, 1024 GB SSD | Amazon: 1. SLRIOYS 240W 200W Charger Co... 2. Foldable Keyboard and Mouse ... 3. USB 3.0 Hub for MSI Crosshai... Prezzo di listino: 2000 EUR | 2.9 kg | 29.7 mm | 17.00" 2560x1600 178 PPI IPS |
5. 77.3%  | MSI Katana 17 HX B14WGK Intel Core i7-14650HX ⎘ NVIDIA GeForce RTX 5070 Laptop ⎘ 16 GB Memoria, 1024 GB SSD | Amazon: 1. 240W 200W Katana Laptop Char... 2. 240W 12A Adapter fit for Ori... 3. GVKRLXZ 230W AC Adapter Comp... Prezzo di listino: 1800 EUR | 2.7 kg | 28 mm | 17.30" 2560x1440 170 PPI IPS |
6. 86.6% 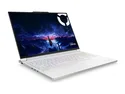 | Lenovo Legion 7 16IAX10 Intel Core Ultra 7 255HX ⎘ NVIDIA GeForce RTX 5060 Laptop ⎘ 32 GB Memoria, 1024 GB SSD | Amazon: Prezzo di listino: 1650 USD | 2 kg | 17.9 mm | 16.00" 2560x1600 189 PPI OLED |
7. 82.5% 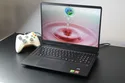 | HP Omen 16-ap0091ng AMD Ryzen 9 8940HX ⎘ NVIDIA GeForce RTX 5060 Laptop ⎘ 16 GB Memoria, 1000 GB SSD | Amazon: 1. Fleshy Leaf CPU+GPU Cooling ... 2. ZAHARA Laptop Complete Set o... 3. LAOKOEN New Cooling Fan for ... Prezzo di listino: 1500 Euro | 2.4 kg | 23.7 mm | 16.00" 1920x1200 162 PPI IPS |
Transparency
La selezione dei dispositivi da recensire viene effettuata dalla nostra redazione. Il campione di prova è stato fornito all'autore come prestito dal produttore o dal rivenditore ai fini di questa recensione. L'istituto di credito non ha avuto alcuna influenza su questa recensione, né il produttore ne ha ricevuto una copia prima della pubblicazione. Non vi era alcun obbligo di pubblicare questa recensione. In quanto società mediatica indipendente, Notebookcheck non è soggetta all'autorità di produttori, rivenditori o editori.
Ecco come Notebookcheck esegue i test
Ogni anno, Notebookcheck esamina in modo indipendente centinaia di laptop e smartphone utilizzando procedure standardizzate per garantire che tutti i risultati siano comparabili. Da circa 20 anni sviluppiamo continuamente i nostri metodi di prova e nel frattempo stabiliamo gli standard di settore. Nei nostri laboratori di prova, tecnici ed editori esperti utilizzano apparecchiature di misurazione di alta qualità. Questi test comportano un processo di validazione in più fasi. Il nostro complesso sistema di valutazione si basa su centinaia di misurazioni e parametri di riferimento ben fondati, che mantengono l'obiettività.
