Verdetto - Un enorme risparmio di spazio per l'ufficio
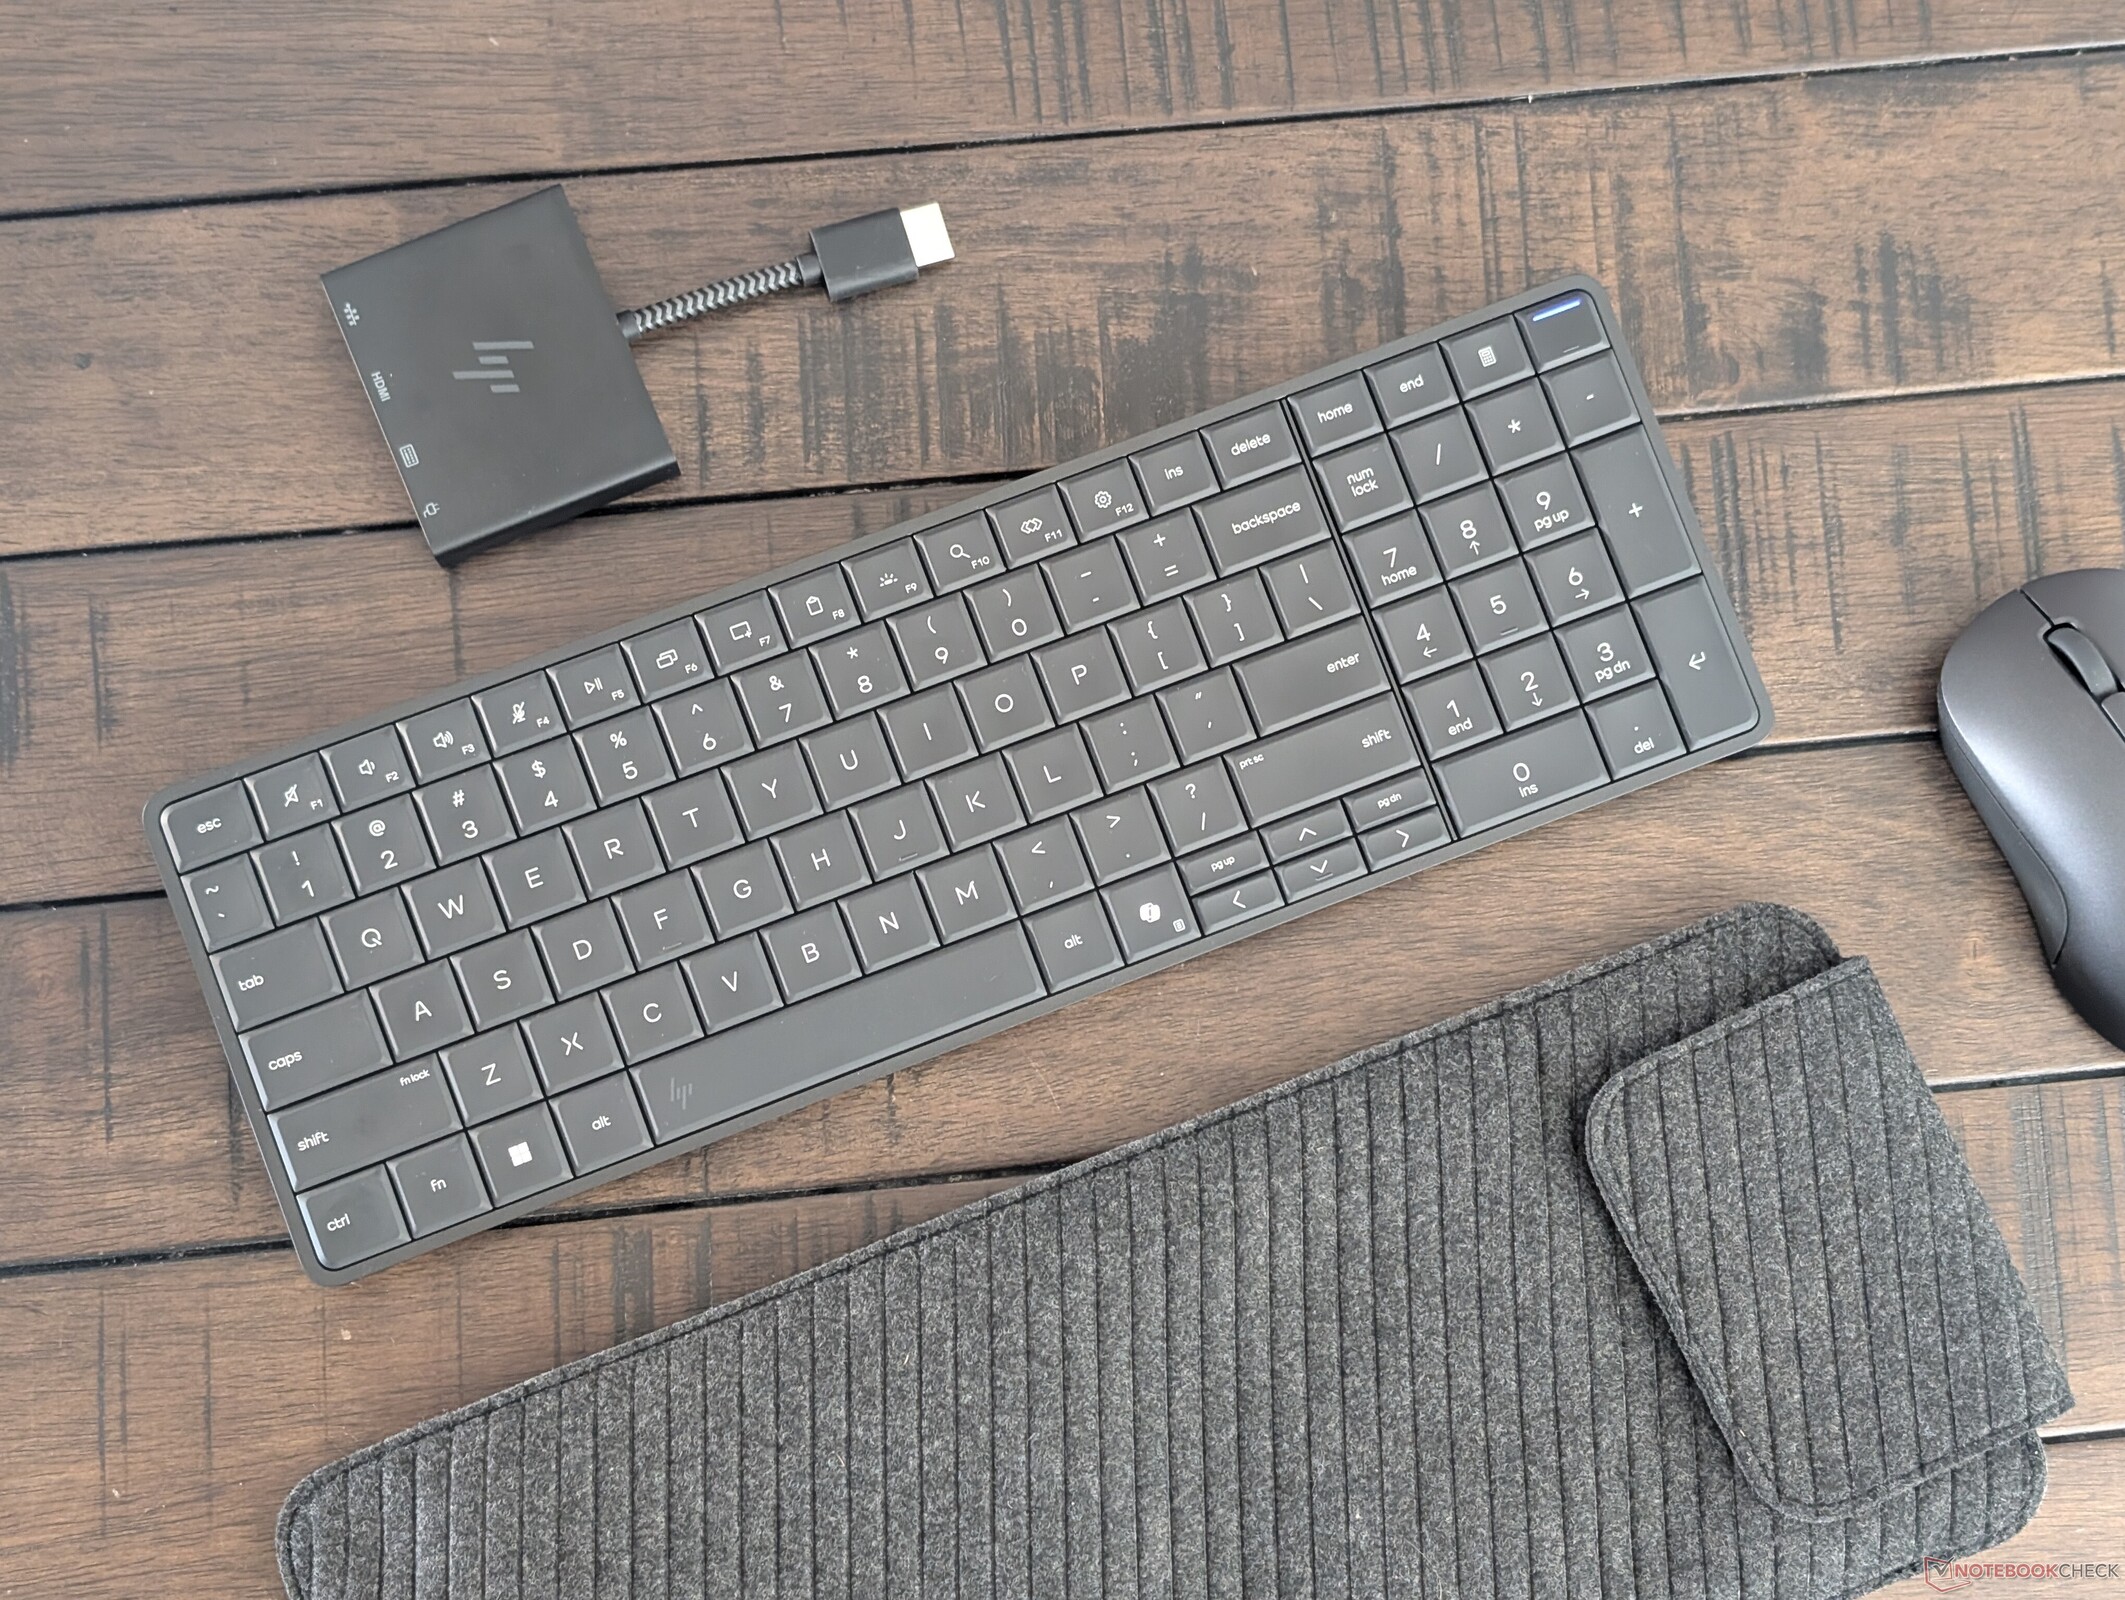
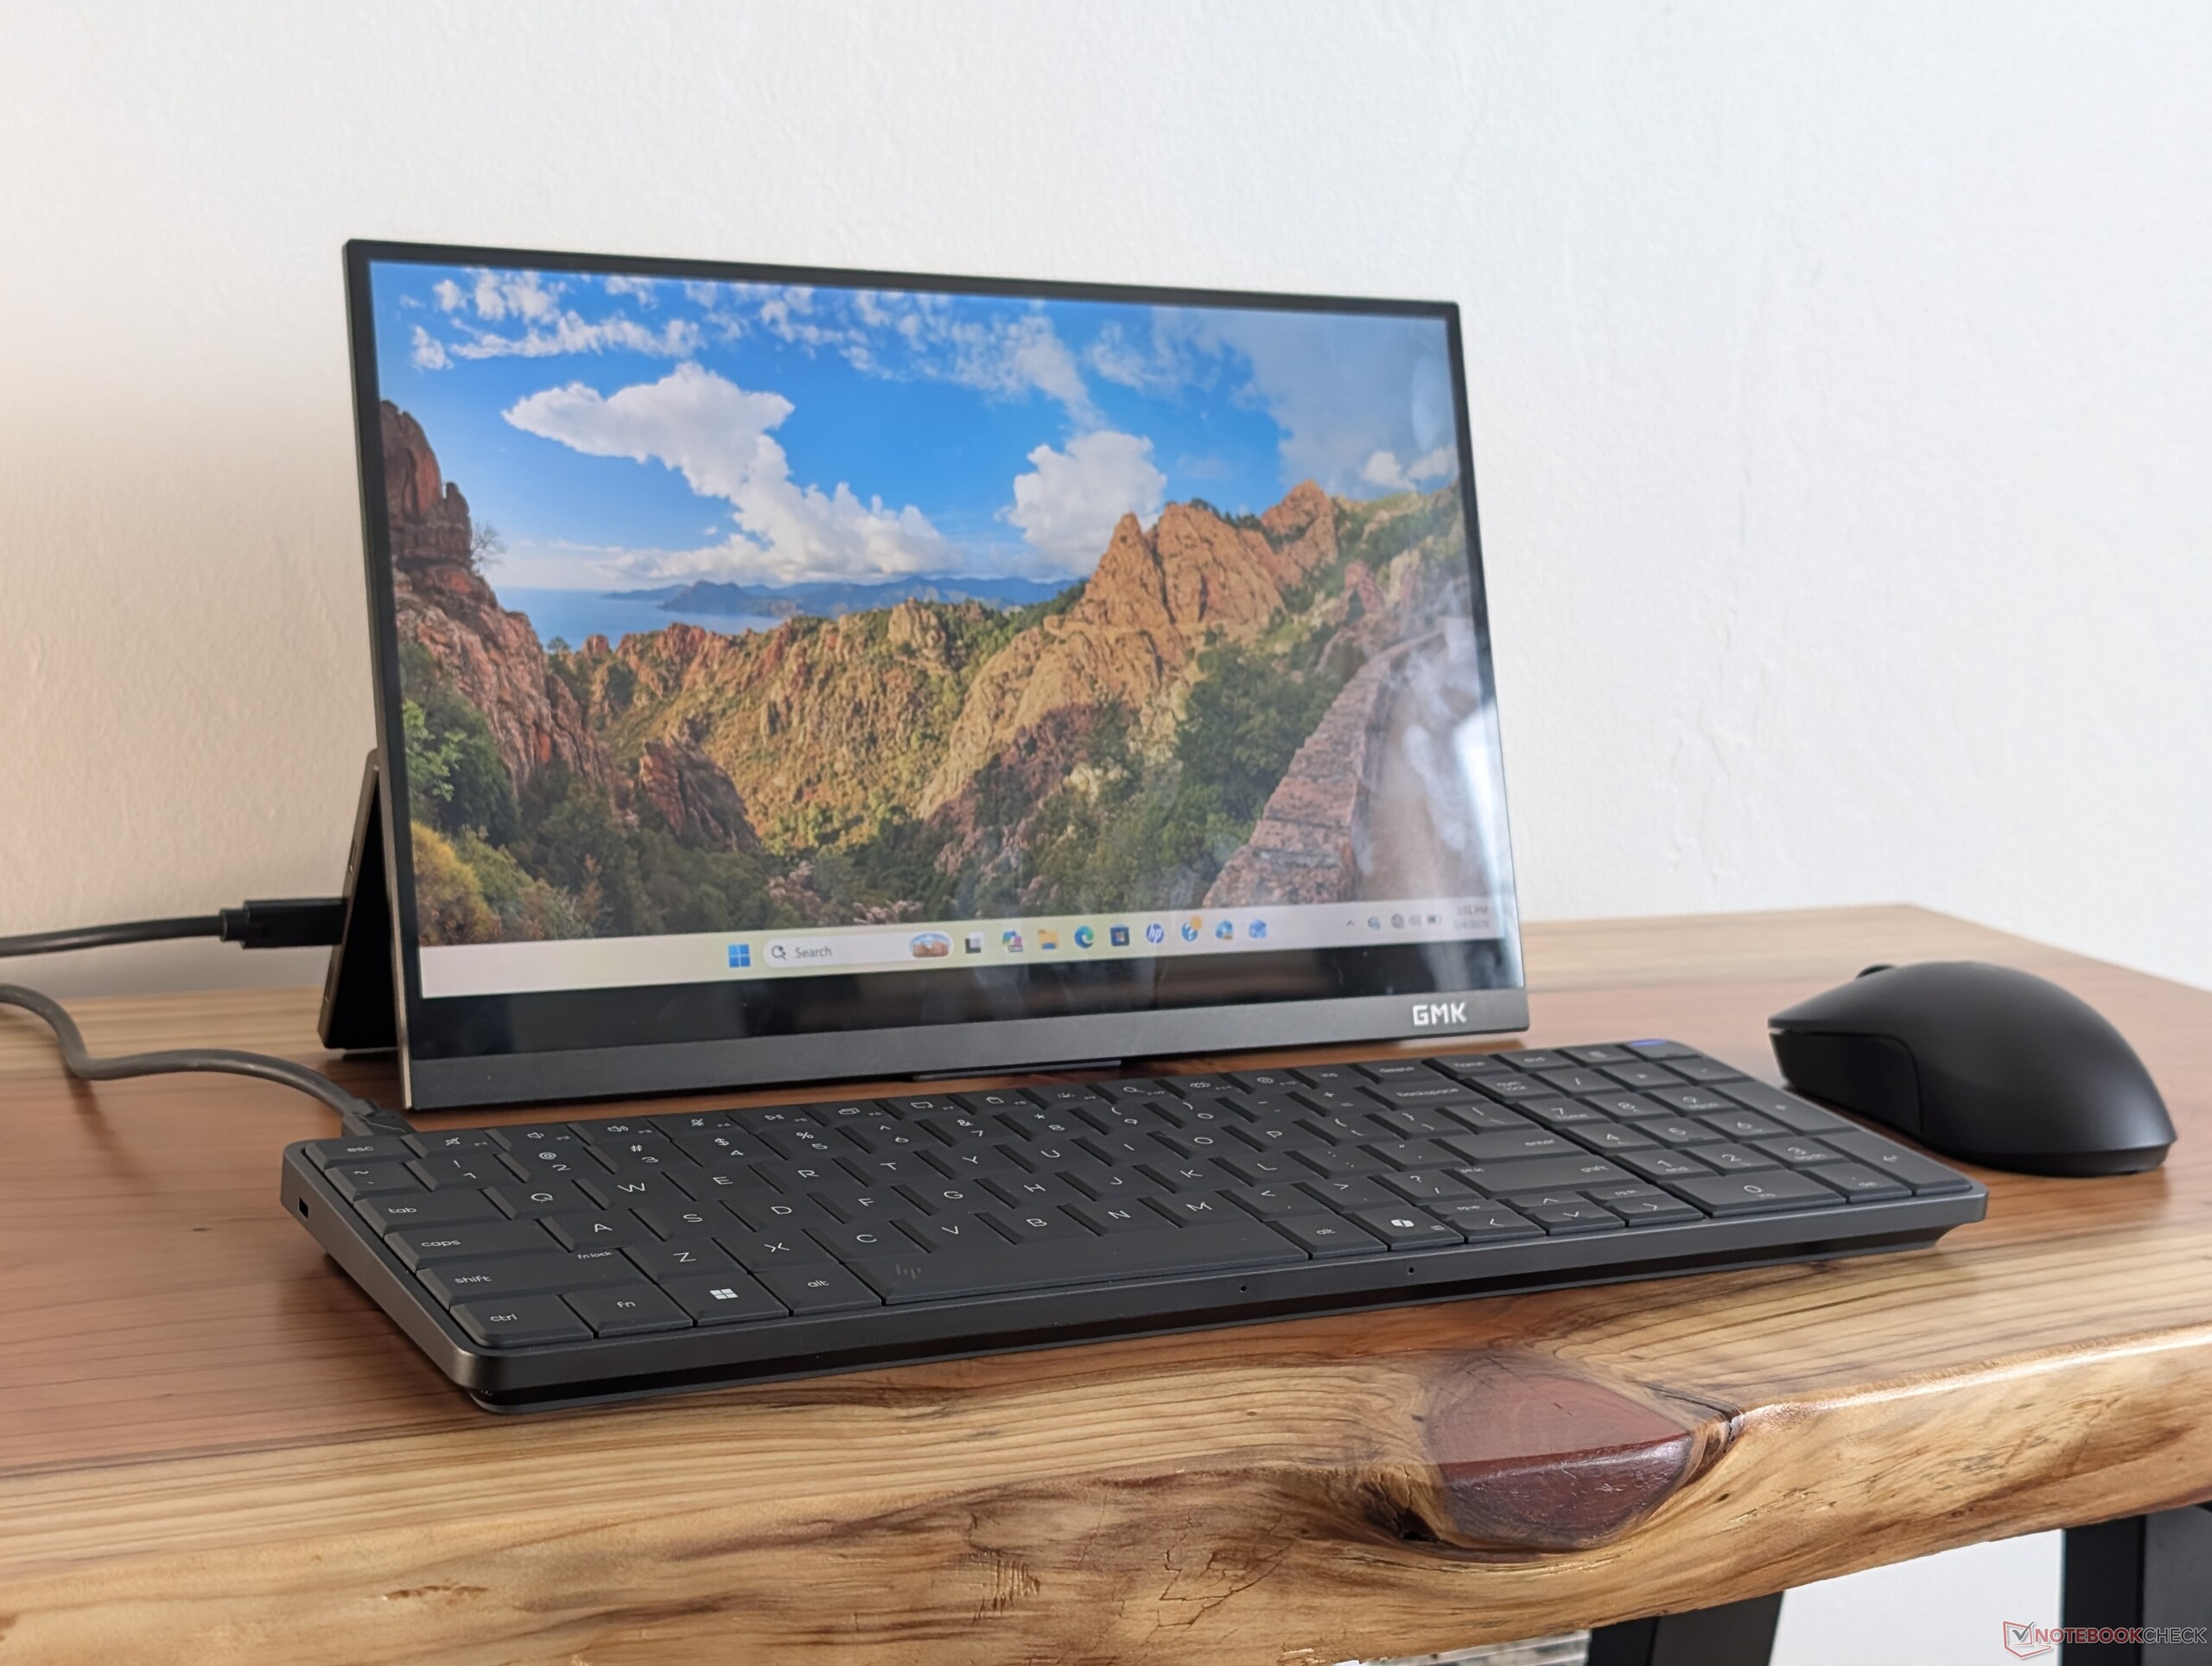
Il modo migliore per sperimentare EliteBoard G1a è con un monitor USB-C esistente, per ridurre l'ingombro dei cavi in uno spazio limitato sulla scrivania. Il design pulito e con un solo cavo plug-and-play è probabilmente l'aspetto più interessante di EliteBoard rispetto ai mini PC o agli AIO tradizionali.
Per gli utenti che si spostano continuamente da un posto di lavoro all'altro o da un terminale all'altro, EliteBoard può essere configurato con una piccola batteria che consente di viaggiare senza dover prima spegnere il computer da un posto all'altro. Un normale computer portatile può certamente raggiungere obiettivi simili, ma senza i vantaggi di una tastiera più ergonomica.
I due aspetti peggiori di EliteBoard sono le opzioni di porte limitate e i tasti freccia angusti. Per un design che è più spesso e più largo di molti computer portatili, è sconcertante vedere che l'EliteBoard ha meno porte o tasti freccia più piccoli rispetto a modelli popolari come lo Yoga Pro 9 16 o LG Gram. Una volta coinvolti gli adattatori USB-C e l'HDMI, la configurazione minimalista scompare. I mini PC tradizionali, come il MSI Cubi NUC o GMK NucBox hanno un vantaggio in questo senso, grazie al loro supporto nativo per i vecchi monitor HDMI, che sono ancora comuni nella maggior parte delle aziende. In altre parole, non ci dispiacerebbe un design EliteBoard leggermente più grande, se significasse tasti più grandi, più funzioni ausiliarie e porte integrate aggiuntive.
Pro
Contro
Prezzo e disponibilità
Come dispositivo premium incentrato sul business, EliteBoard G1a parte da 1.500 dollari con la CPU Ryzen AI 5 Pro 340, 16 GB di RAM e 256 GB di SSD.
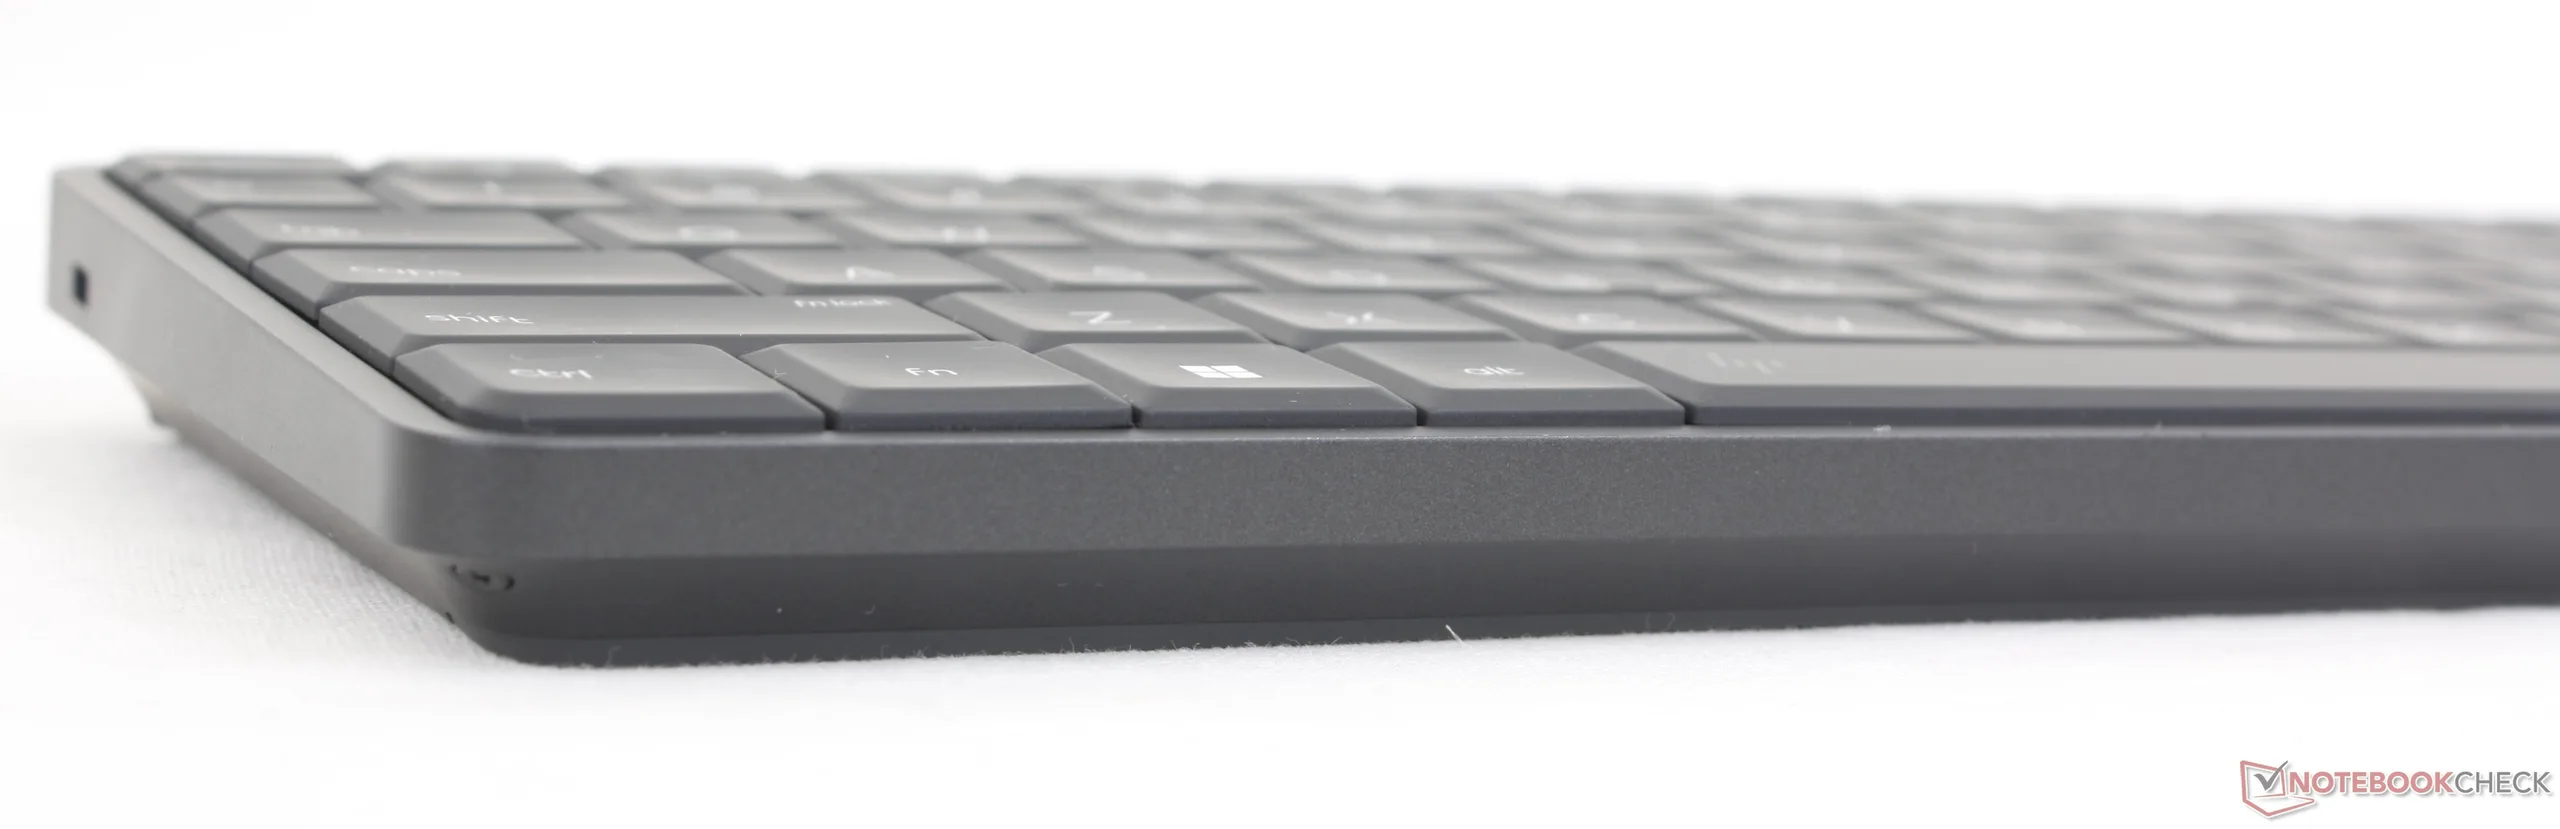
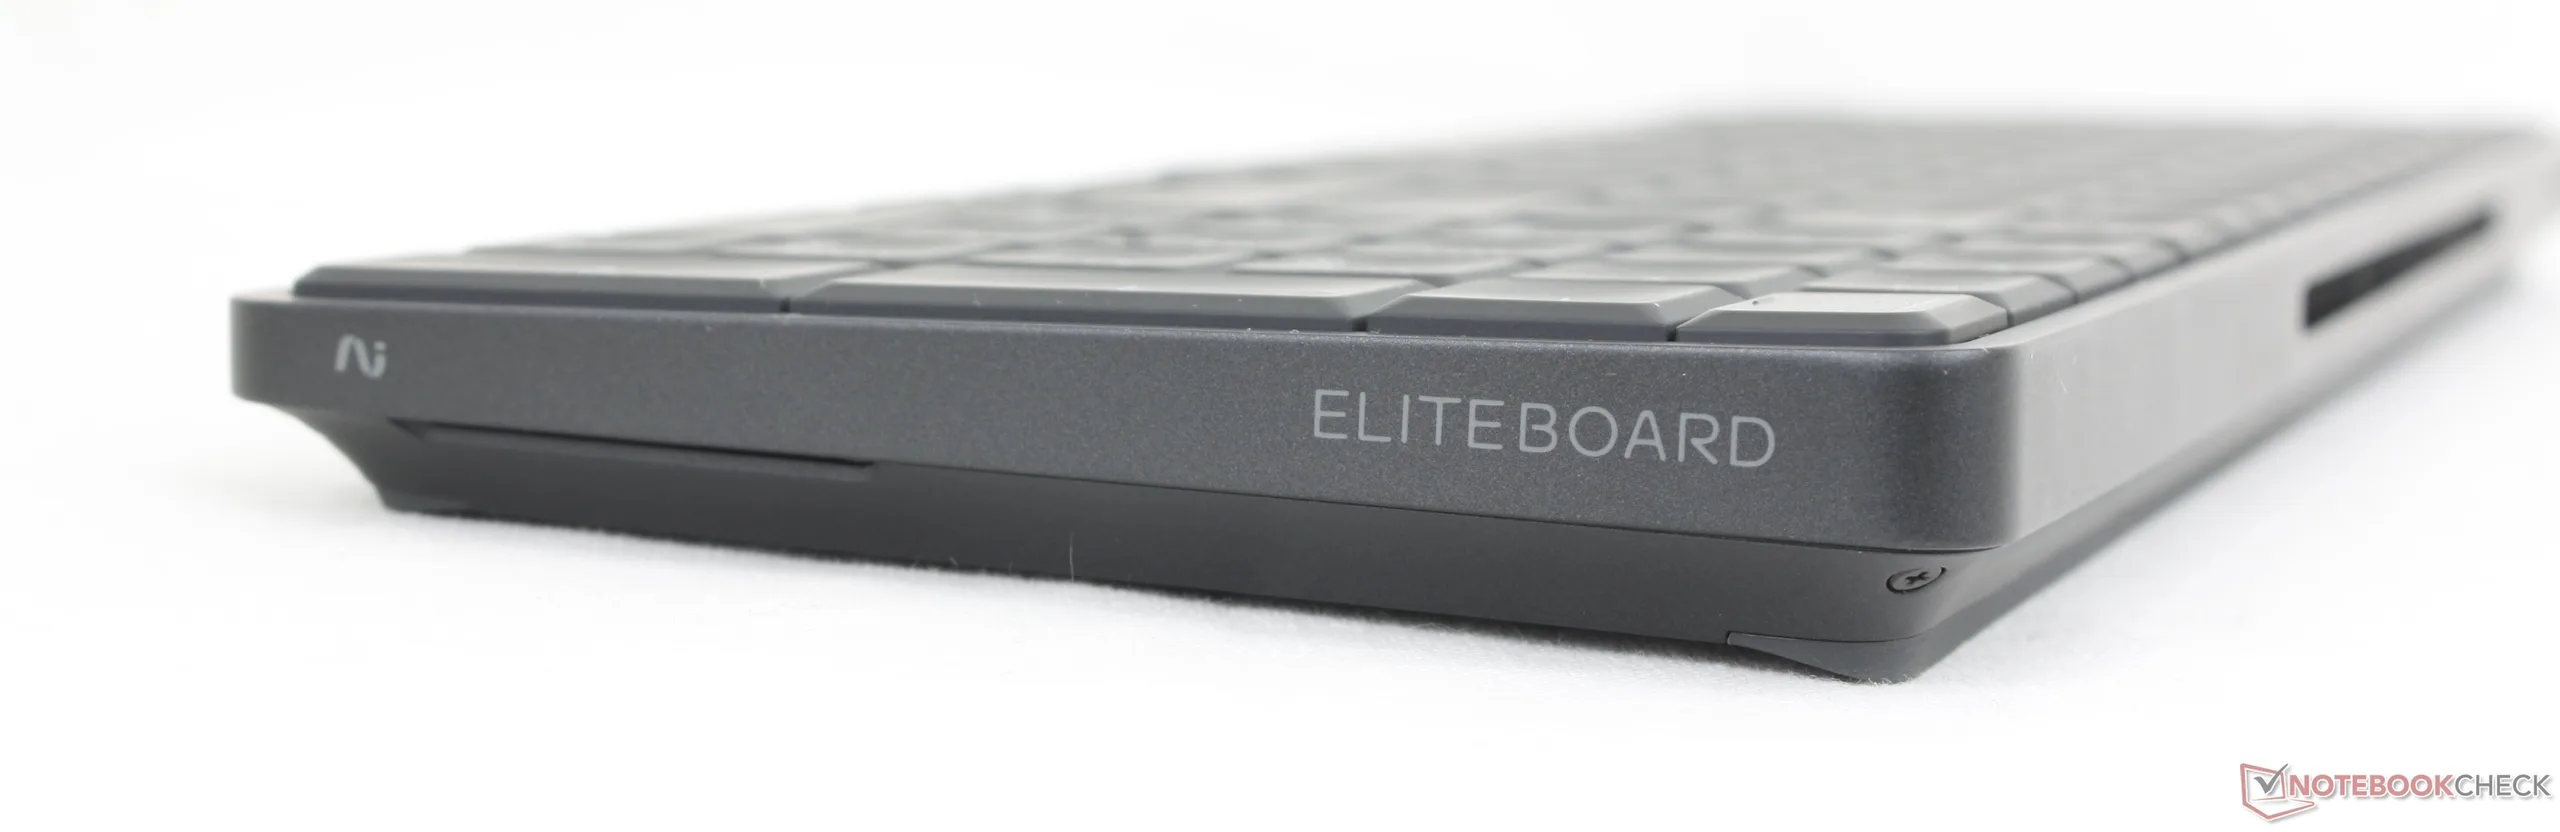
EliteBoard G1a AI è un PC-in-tastiera progettato per i lavoratori ibridi e gli spazi di lavoro semplificati. Si tratta essenzialmente di una tastiera con un PC miniaturizzato integrato, come il Commodore 64 originale. Per questo modello di prima generazione, HP lo ha configurato con CPU Ryzen AI 300 PRO per attirare le aziende e le applicazioni professionali piuttosto che il tipico utente domestico.
La nostra unità di prova viene fornita con Ryzen AI 5 Pro 340 e 32 GB di RAM per circa 1.600 dollari. Altre configurazioni arrivano al massimo a Ryzen AI 7 Pro 350 con un massimo di 24 GB di RAM e 2 TB di memoria.
L'EliteBoard è unica nel suo genere, in quanto è la prima del suo genere con una CPU moderna che esegue Windows 11. Tuttavia, è in concorrenza con i mini PC tradizionali progettati per le aziende, tra cui il MSI Cubi NUC, Asus ExpertCentero il GMK EVO-X1.
Altre recensioni di HP:
Specifiche
Caso
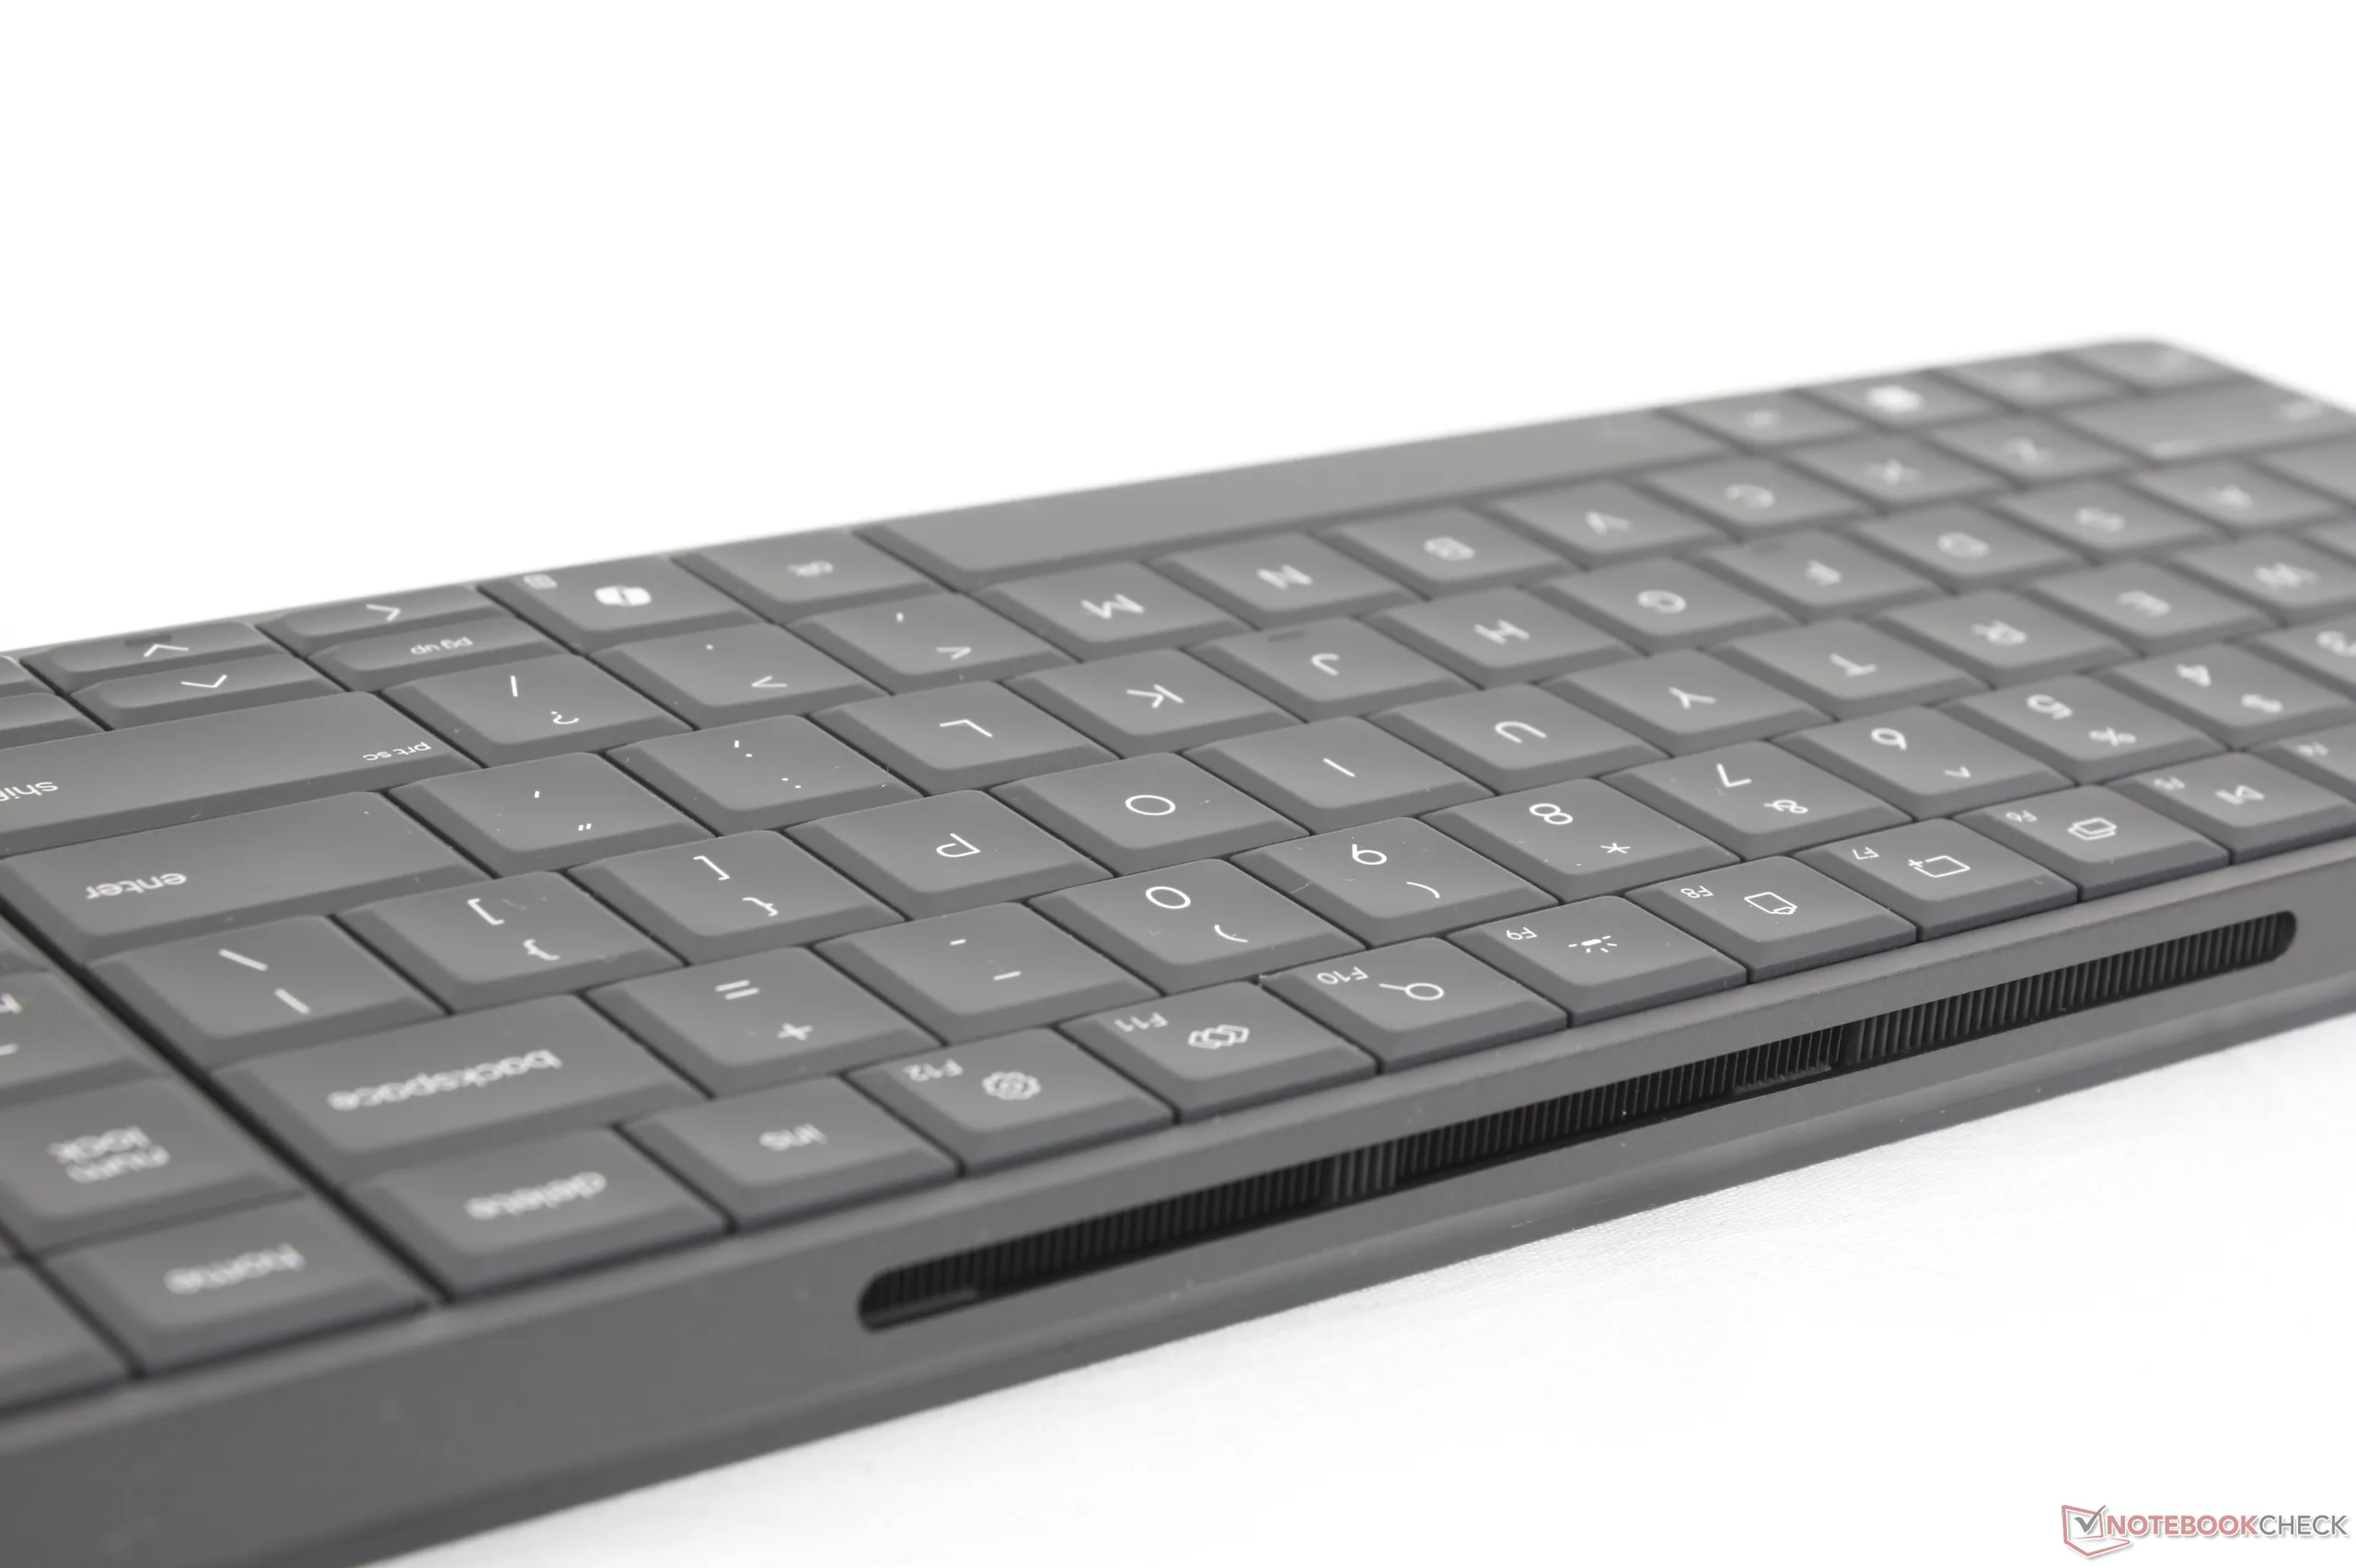
Il telaio in plastica spessa e gli interni densi del PC contribuiscono a fortificare EliteBoard per una sensazione più forte e più rigida rispetto alla tastiera tradizionale. Il suo design senza pretese non fa nemmeno sembrare che ci sia un PC all'interno, il che contribuisce all'approccio minimalista.
Connettività
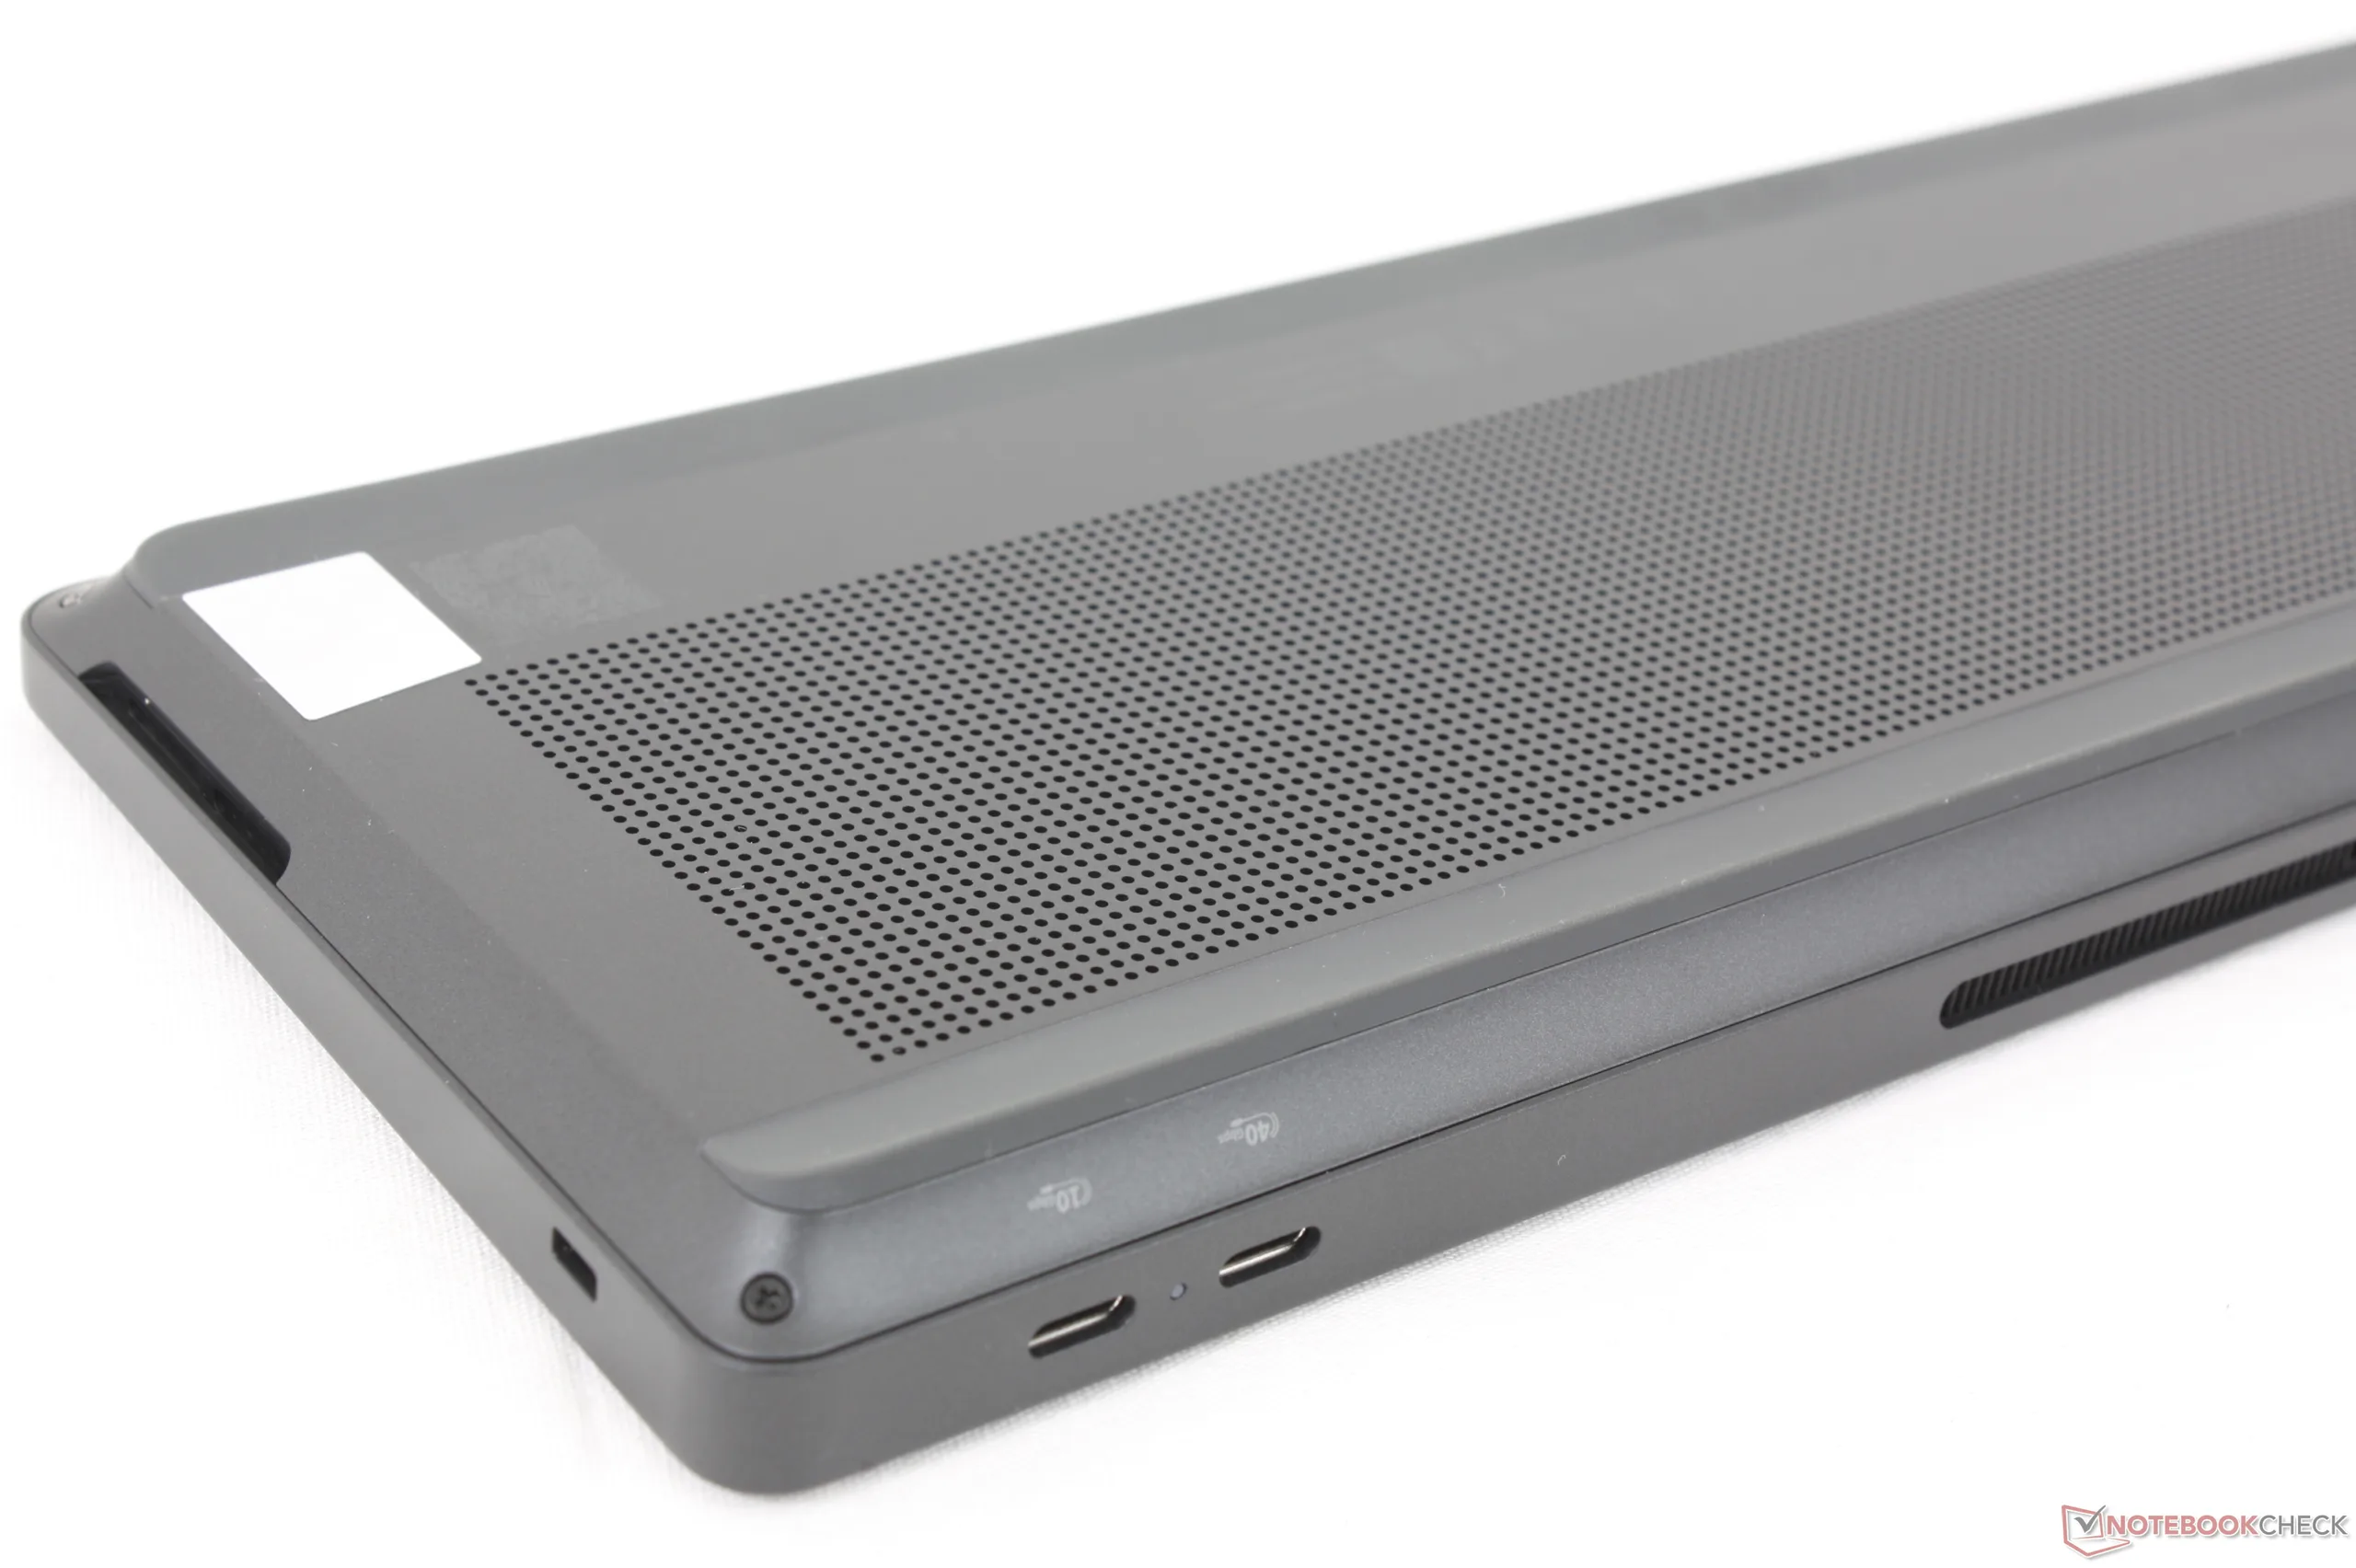
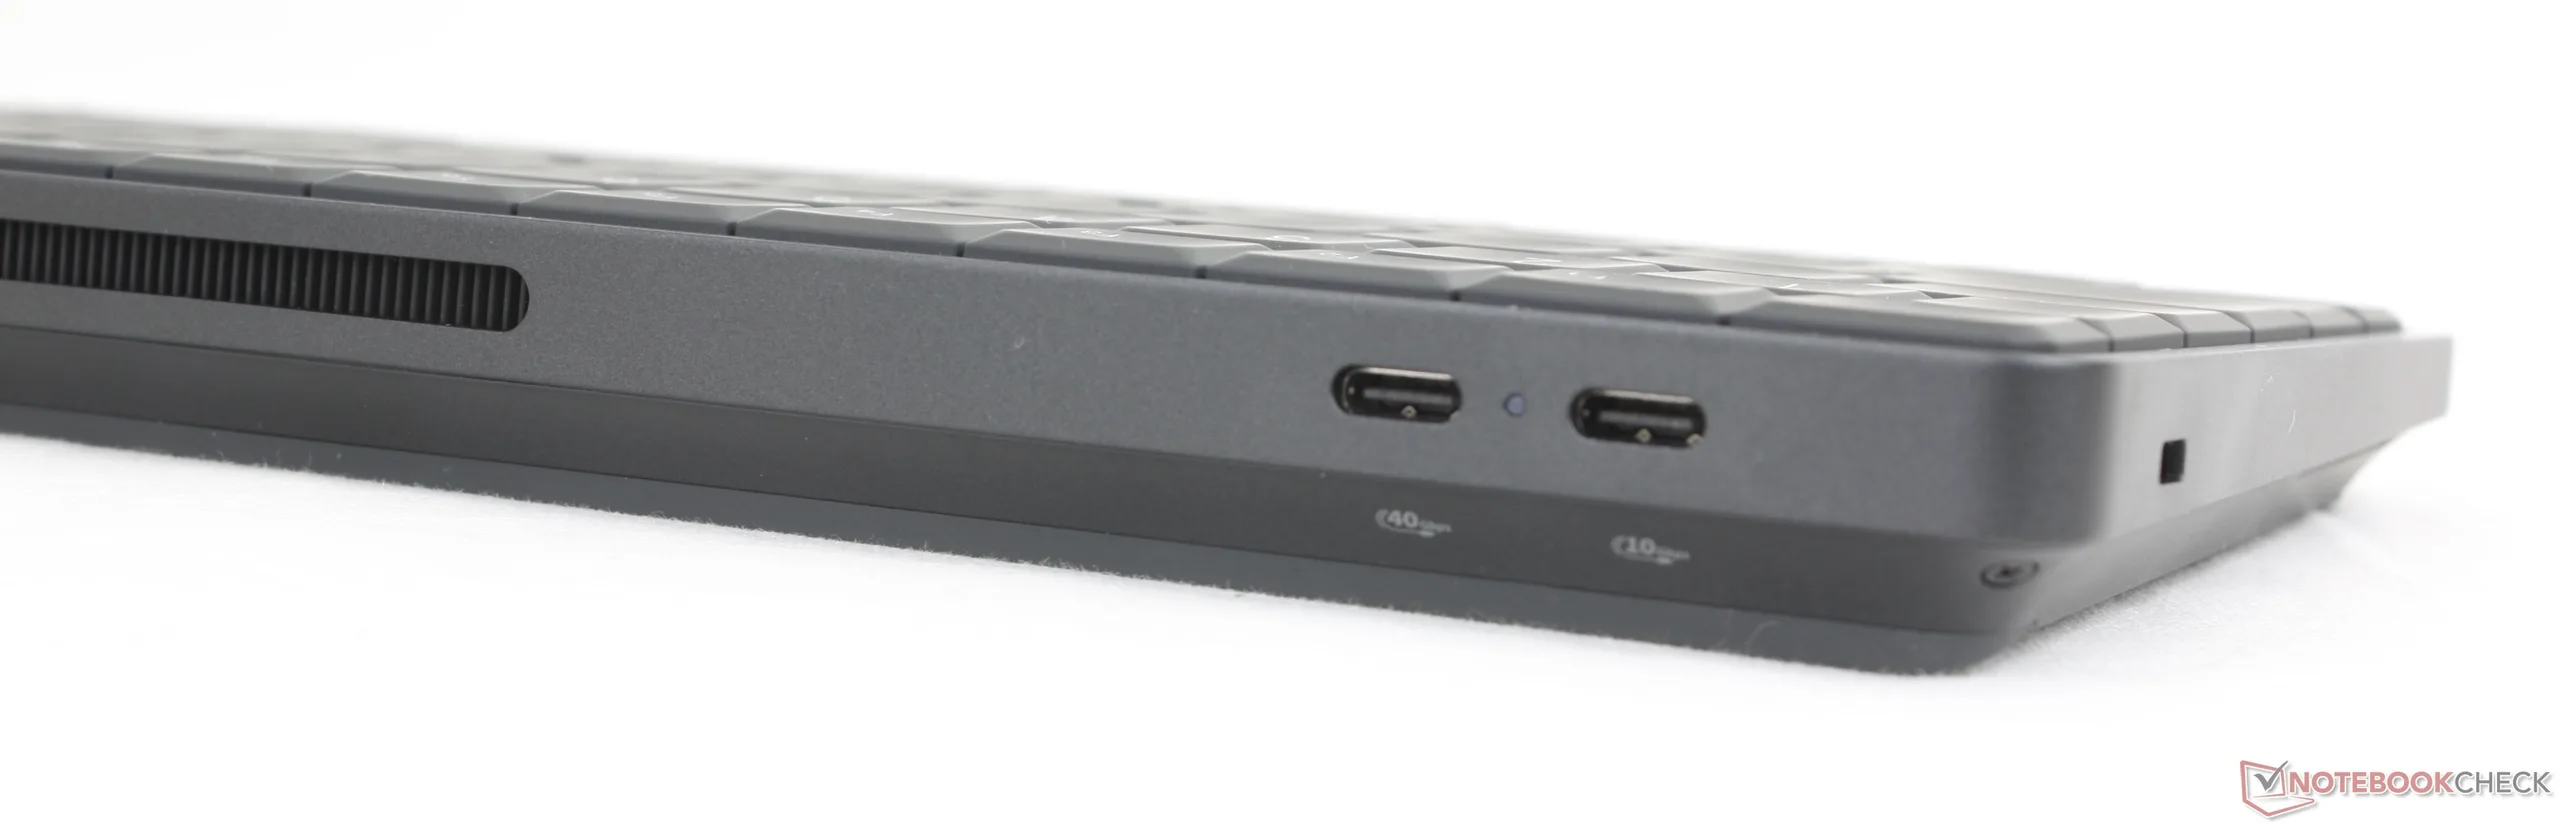
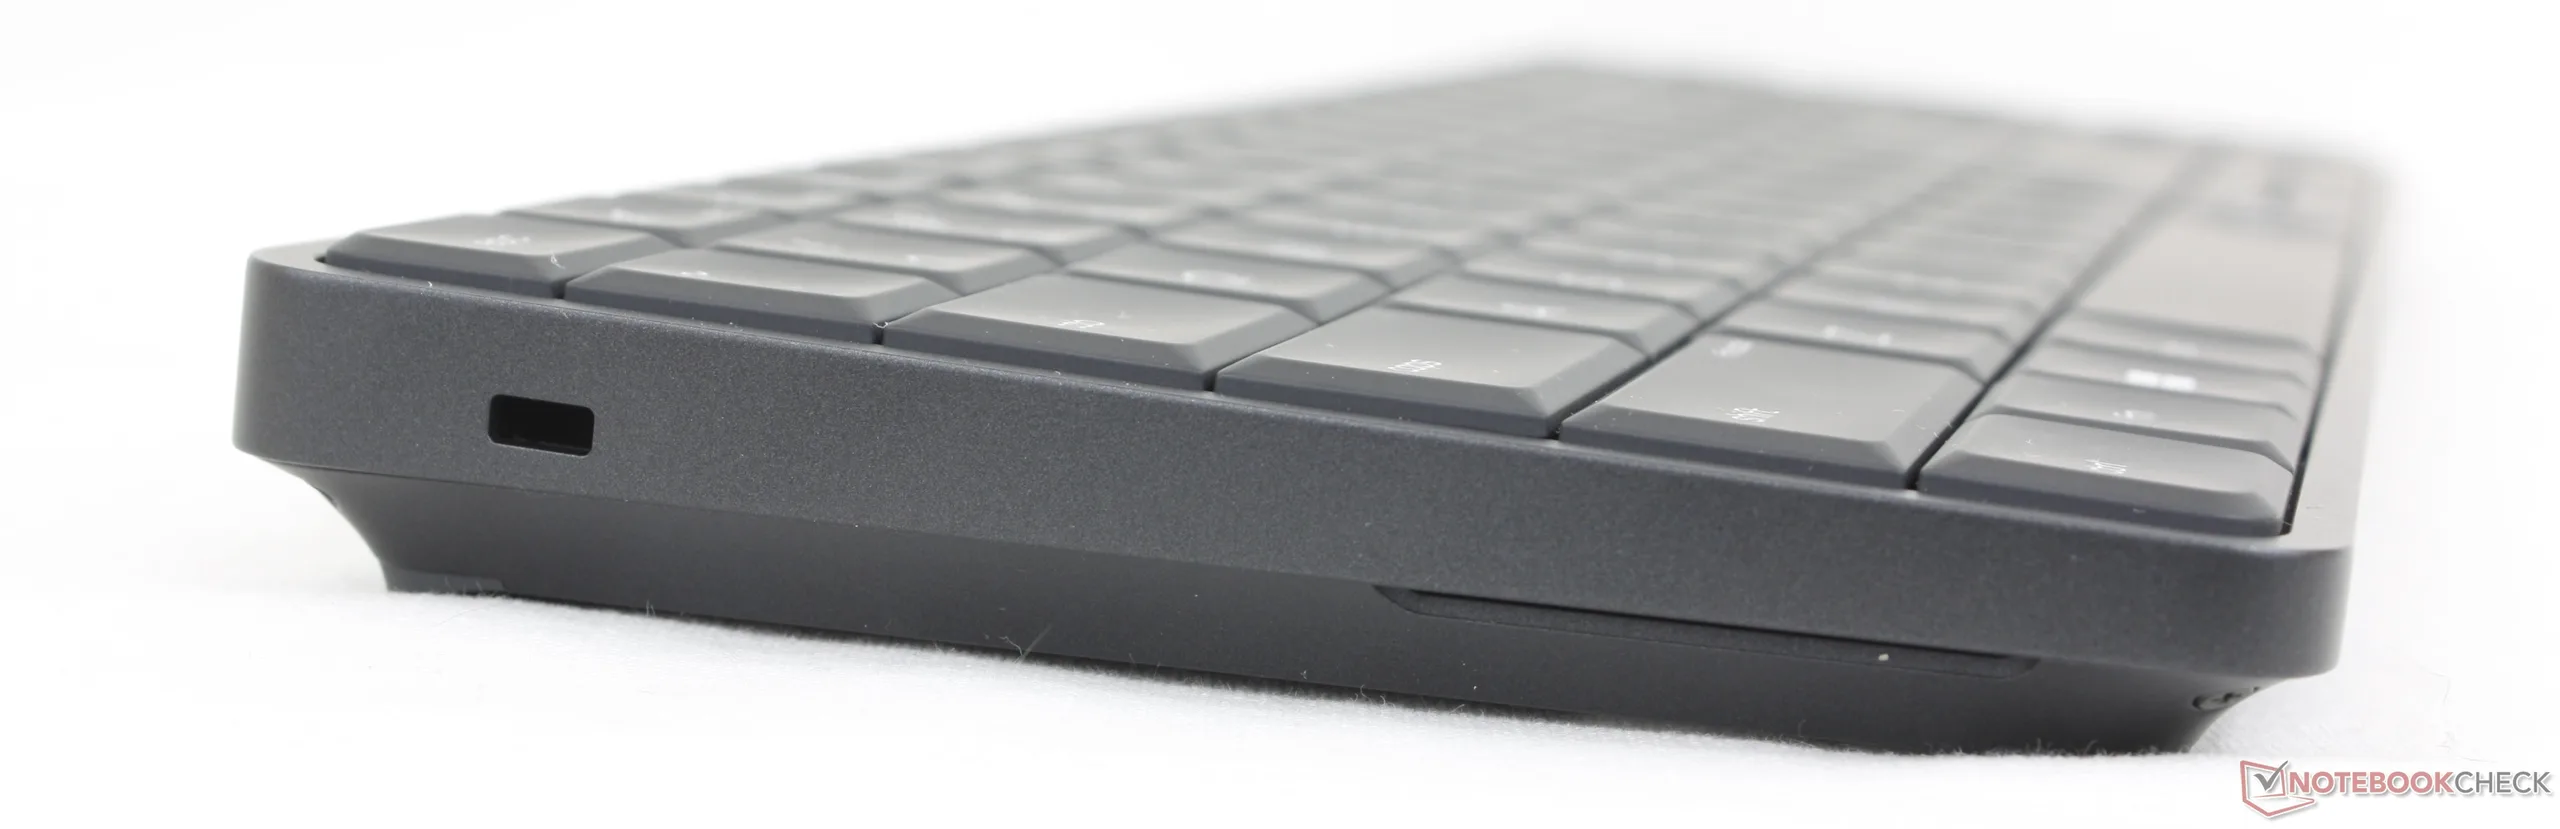
Ci sono solo due porte USB-C con cui lavorare, per un'atmosfera essenziale. Idealmente, gli utenti avranno già un monitor esistente con video USB-C e passthrough Power Delivery per un'esperienza plug-and-play con un solo cavo. In caso contrario, si prepari ad avere dongle e docking station disordinate per configurare correttamente EliteBoard.
Purtroppo, le due porte USB-C sono asimmetriche, ossia solo una porta supporta USB4 o 40 Gbps, mentre l'altra è solo USB 3.2 Gen. 2 o 10 Gbps, probabilmente a causa delle limitazioni del chipset AMD.
Ciascuna porta USB-C può anche essere utilizzata per caricare o alimentare i dispositivi collegati, come i monitor esterni portatili o gli smartphone, anche se solo con un massimo di 7,5 W.
Comunicazione
| Networking | |
| iperf3 transmit AXE11000 | |
| Asus NUC 15 Pro+ | |
| HP EliteBoard G1a AI | |
| MSI Cubi NUC AI+ 2MG | |
| HP Pro Mini 400 G9-937U0EA | |
| Geekom A5 Pro | |
| GMK NucBox K13 | |
| iperf3 receive AXE11000 | |
| Asus NUC 15 Pro+ | |
| HP EliteBoard G1a AI | |
| MSI Cubi NUC AI+ 2MG | |
| HP Pro Mini 400 G9-937U0EA | |
| Geekom A5 Pro | |
| GMK NucBox K13 | |
| iperf3 transmit AXE11000 6GHz | |
| HP EliteBoard G1a AI | |
| Asus NUC 15 Pro+ | |
| HP Pro Mini 400 G9-937U0EA | |
| MSI Cubi NUC AI+ 2MG | |
| GMK NucBox K13 | |
| iperf3 receive AXE11000 6GHz | |
| HP EliteBoard G1a AI | |
| GMK NucBox K13 | |
| MSI Cubi NUC AI+ 2MG | |
| Asus NUC 15 Pro+ | |
| HP Pro Mini 400 G9-937U0EA | |
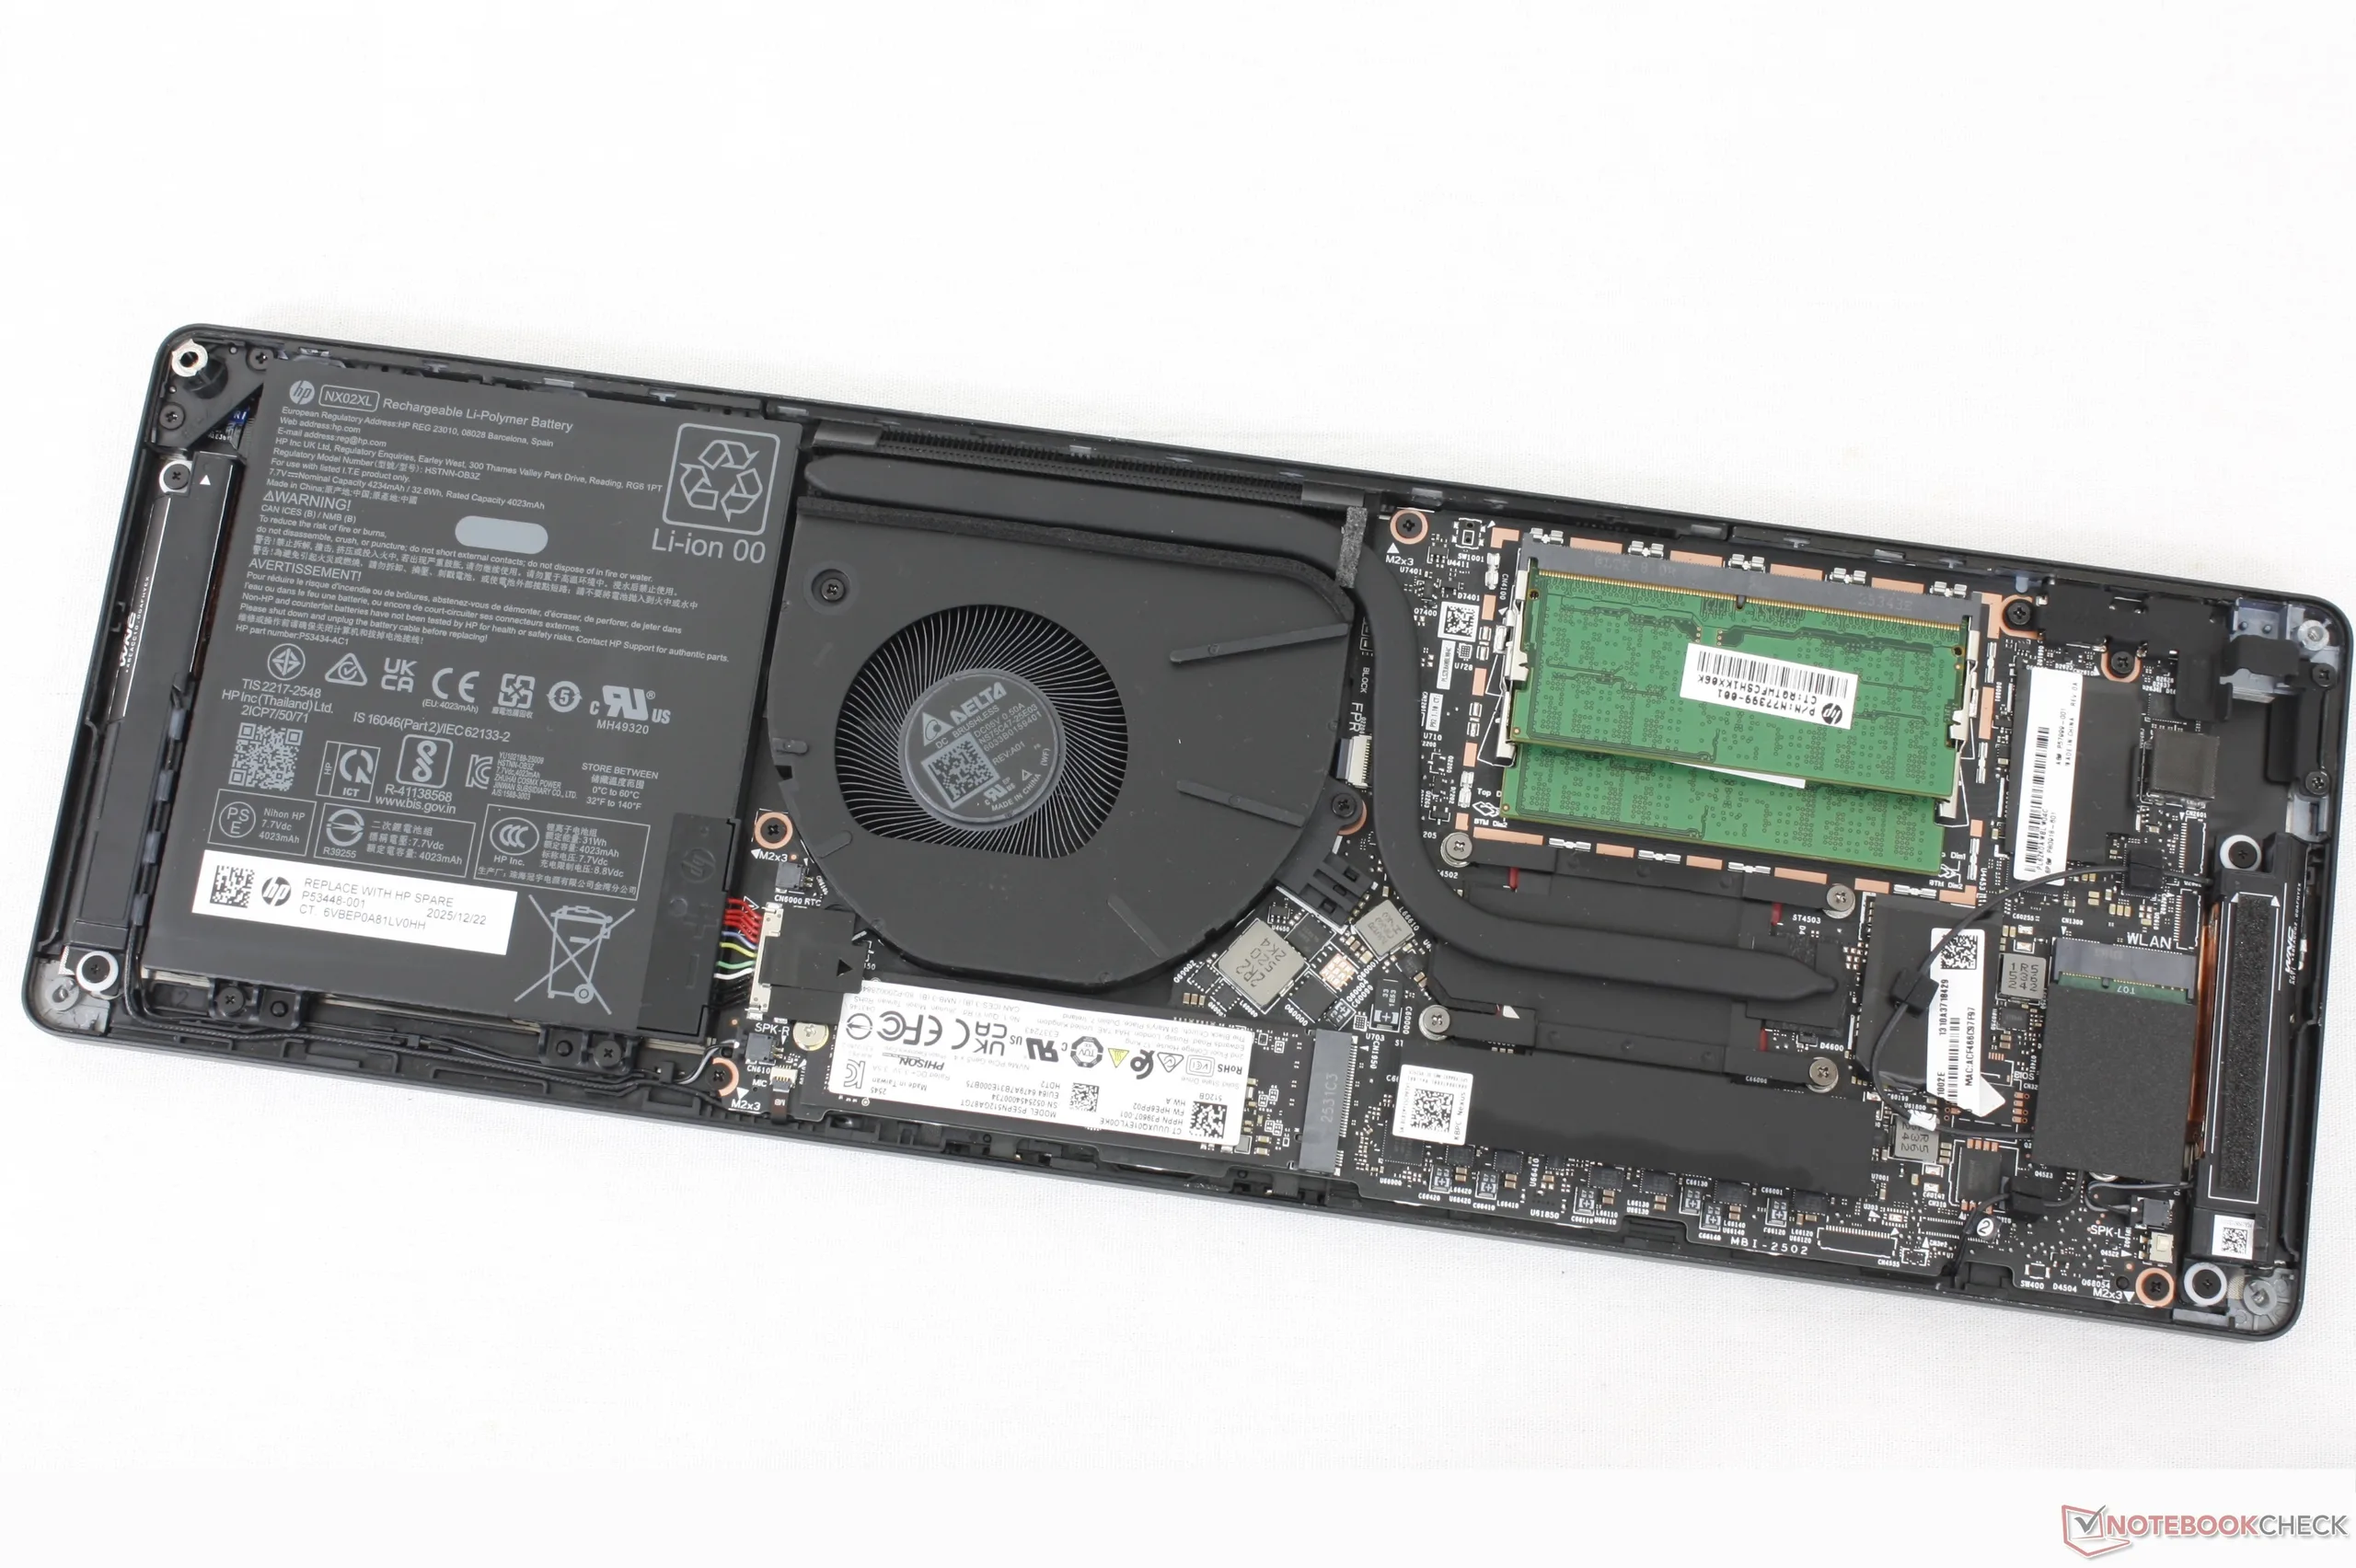
Manutenzione
Fedele alla tradizione della serie Elite, la EliteBoard è facile da manutenere con due slot SODIMM DDR5 accessibili, un modulo WLAN M.2 rimovibile e un singolo slot SSD M.2 2280.
Sostenibilità
Il sistema è prodotto con plastica e rame riciclati, rispettivamente fino al 75% e al 45%. Inoltre, l'imballaggio è privo di plastica e completamente riciclabile.
Mentre i singoli tappi dei tasti sono sostituibili, il ponte o lo strato di membrana sottostante non è stato progettato per essere facilmente sostituibile.
Accessori
La confezione di vendita include un adattatore CA USB-C GaN da 65 W, un cavo USB-C e un mouse Bluetooth HP 675M con batterie. Una custodia da viaggio soft-touch è standard solo se configurato con un pacco batterie.
Si noti che l'adattatore AC non è necessario per gli utenti con monitor esistenti che supportano il video USB-C e Power Delivery.
Gli extra opzionali includono docking station e adattatori per i monitor esterni più vecchi che utilizzano l'HDMI per il video invece dell'USB-C.
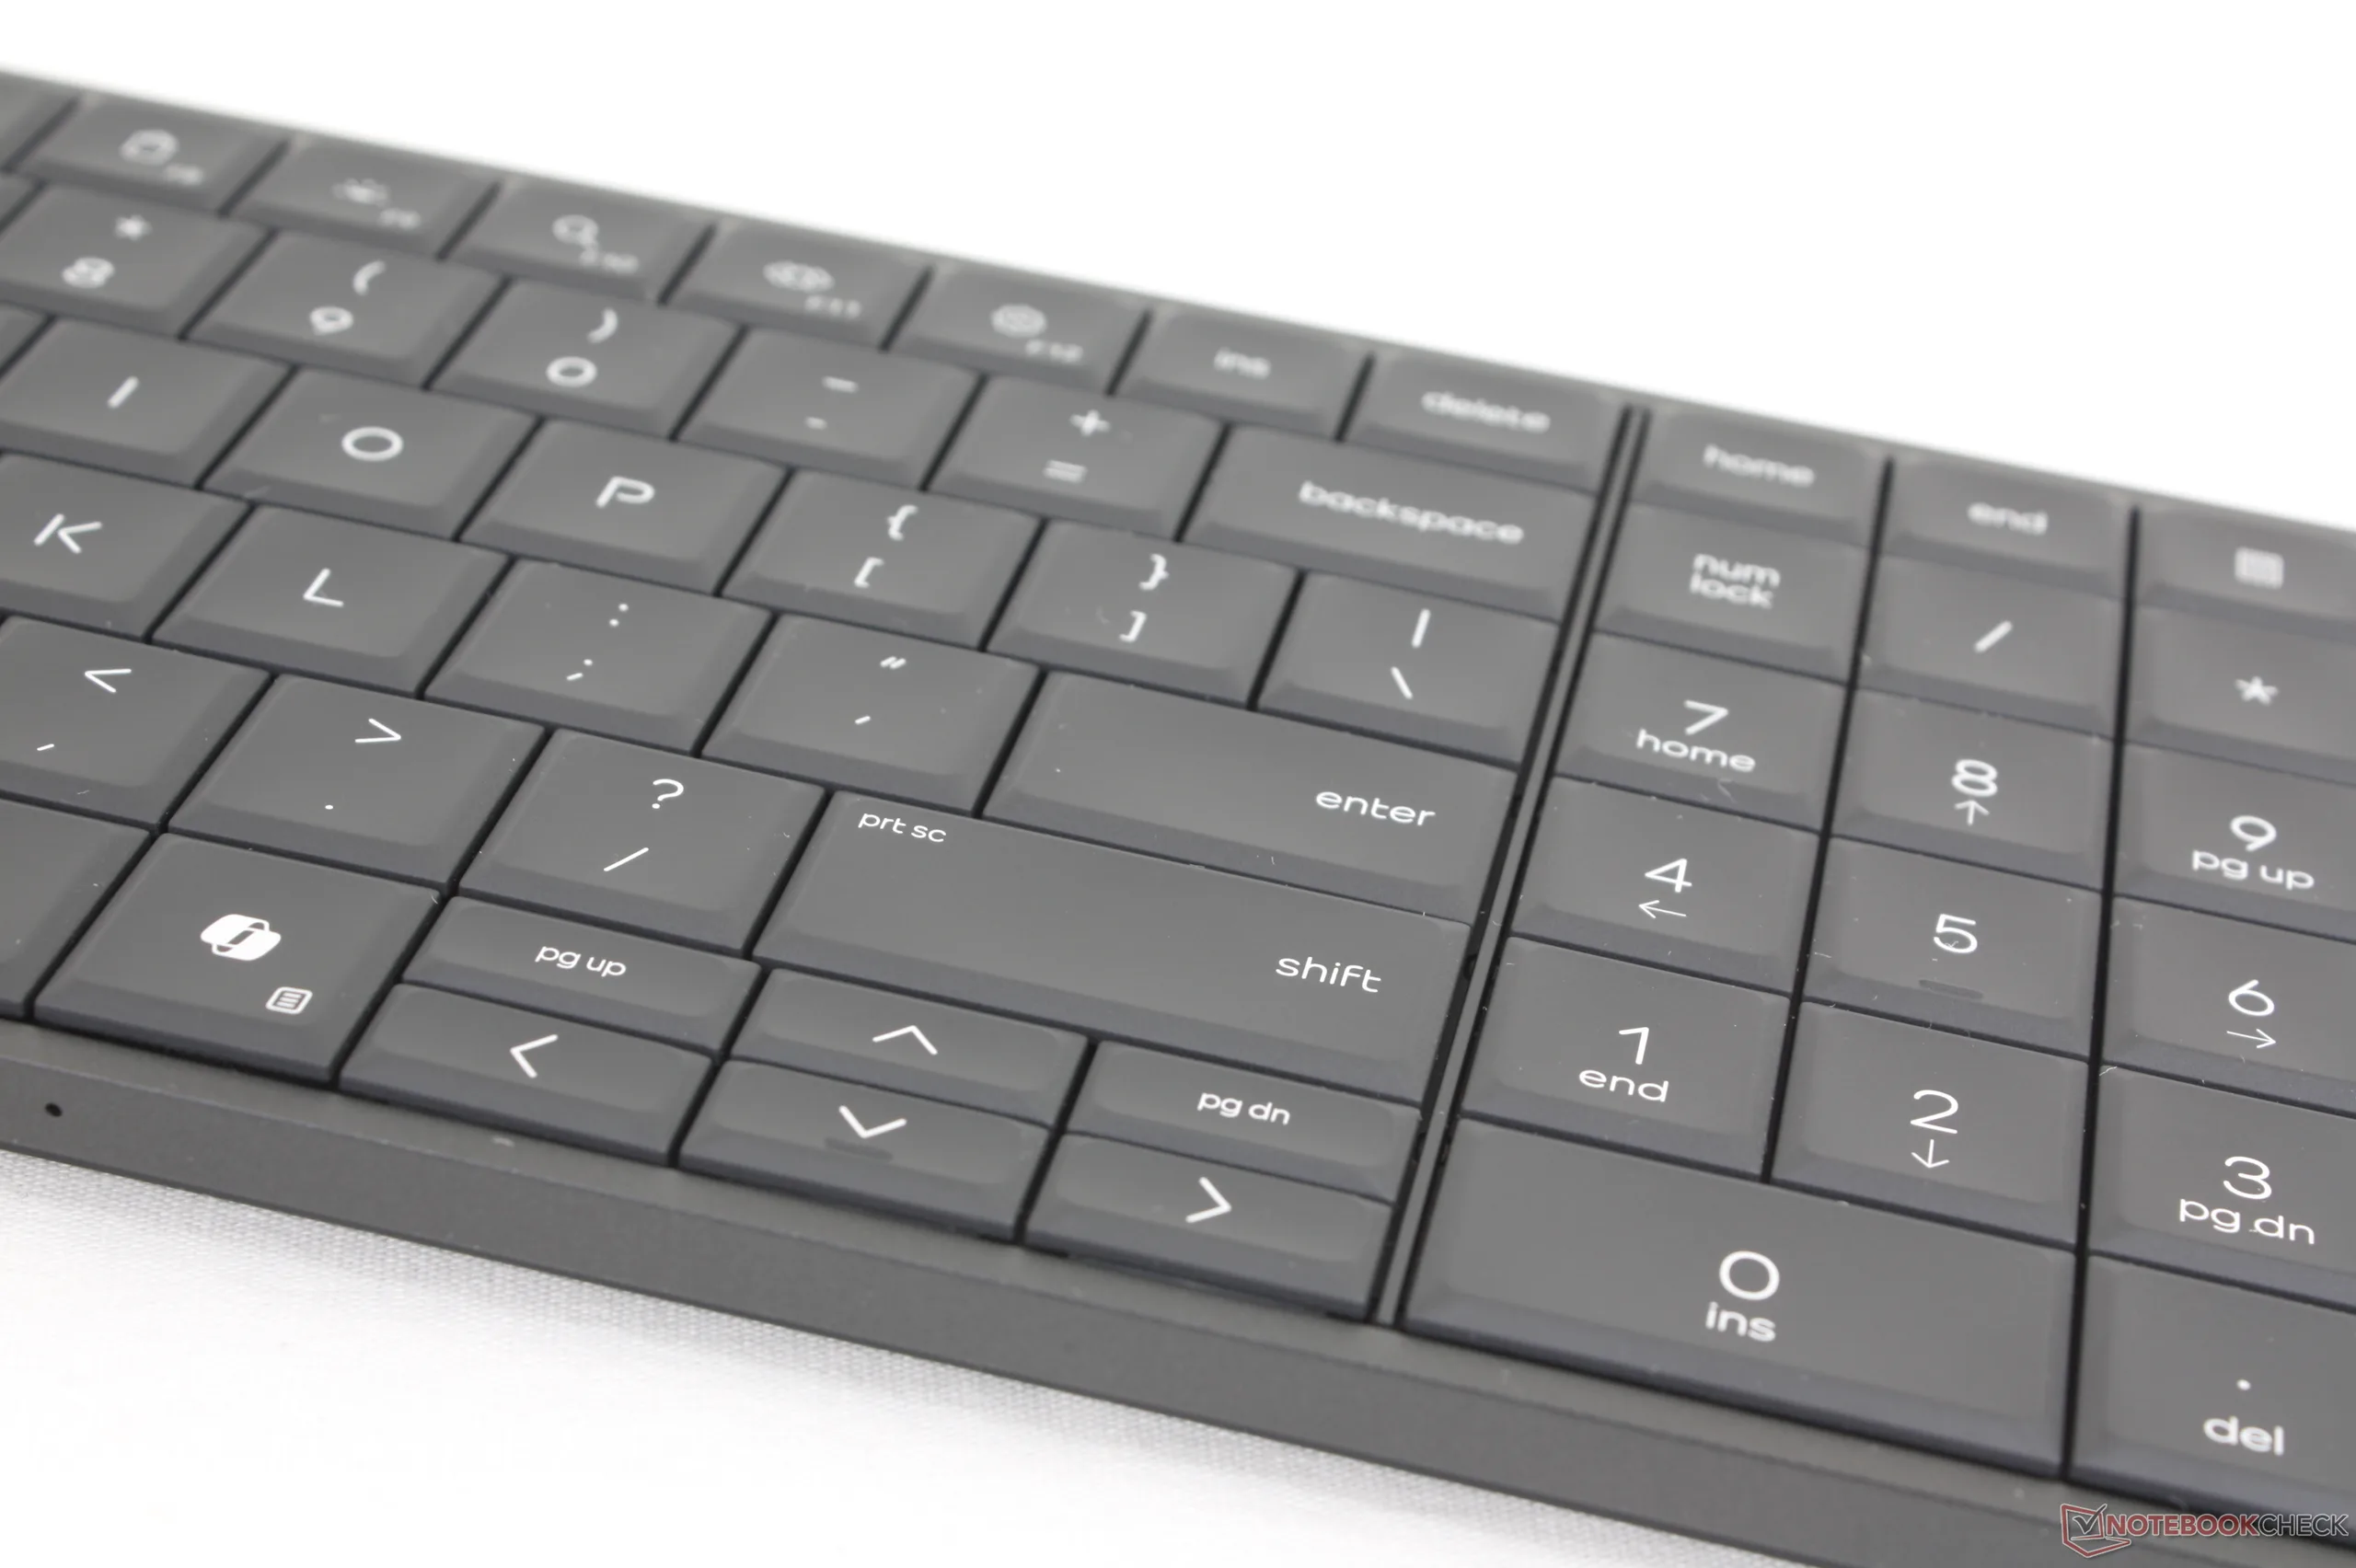
Dispositivi di ingresso
Tastiera
La corsa dei tasti di 2 mm è più profonda rispetto alla maggior parte delle tastiere per computer portatili, per un'esperienza di digitazione più vicina a quella di una tipica tastiera da tavolo. Sebbene ci piaccia il feedback deciso, il tastierino numerico a grandezza naturale e il rumore dei tasti particolarmente silenzioso, i tasti freccia sono più piccoli rispetto ai tasti freccia di molti computer portatili. HP afferma che questo è stato fatto di proposito per aderire alle specifiche di design più severe.
Inoltre, la tastiera è "incatenata" al PC EliteBoard, il che significa che non può essere utilizzata per controllare altri computer, a differenza della tastiera desktop di base.
Prestazioni
Condizioni del test
Abbiamo impostato Windows in modalità Prestazioni prima di eseguire i benchmark qui sotto.
Processore
Il Ryzen AI 5 PRO 340 ha prestazioni simili a quelle del Lunar Lake Core Ultra 7 256V in termini di prestazioni grezze. Sebbene non sia particolarmente veloce, rappresenta un netto miglioramento rispetto alle CPU della serie U più vecchie, come il modello Ryzen 5 7530U o Core i7-1335U.
L'aggiornamento al Ryzen AI 7 PRO 350 dovrebbe migliorare le prestazioni multi-thread di circa il 50 percento, in base al tempo trascorso con l' Asus ExpertCenter grazie al maggior numero di core fisici.
Cinebench R15 Multi Loop
Cinebench R23: Multi Core | Single Core
Cinebench R20: CPU (Multi Core) | CPU (Single Core)
Cinebench R15: CPU Multi 64Bit | CPU Single 64Bit
Blender: v2.79 BMW27 CPU
7-Zip 18.03: 7z b 4 | 7z b 4 -mmt1
Geekbench 6.6: Multi-Core | Single-Core
Geekbench 5.5: Multi-Core | Single-Core
HWBOT x265 Benchmark v2.2: 4k Preset
LibreOffice : 20 Documents To PDF
R Benchmark 2.5: Overall mean
| CPU Performance rating | |
| Asus NUC 15 Pro+ | |
| Khadas Mind Pro | |
| Beelink GTI15 Ultra | |
| Asus ExpertCenter PN54-S70012NN | |
| Media AMD Ryzen AI 5 PRO 340 | |
| HP EliteBoard G1a AI | |
| GMK NucBox K13 | |
| HP Pro Mini 400 G9-937U0EA | |
| MSI Cubi NUC AI+ 2MG | |
| Geekom A5 Pro | |
| Aoostar WTR Pro, N150 | |
| Cinebench R23 / Multi Core | |
| Asus NUC 15 Pro+ | |
| Khadas Mind Pro | |
| Beelink GTI15 Ultra | |
| Asus ExpertCenter PN54-S70012NN | |
| HP Pro Mini 400 G9-937U0EA | |
| HP EliteBoard G1a AI | |
| Media AMD Ryzen AI 5 PRO 340 (n=1) | |
| GMK NucBox K13 | |
| MSI Cubi NUC AI+ 2MG | |
| Geekom A5 Pro | |
| Aoostar WTR Pro, N150 | |
| Cinebench R23 / Single Core | |
| Asus NUC 15 Pro+ | |
| Khadas Mind Pro | |
| Beelink GTI15 Ultra | |
| Asus ExpertCenter PN54-S70012NN | |
| MSI Cubi NUC AI+ 2MG | |
| GMK NucBox K13 | |
| HP Pro Mini 400 G9-937U0EA | |
| HP EliteBoard G1a AI | |
| Media AMD Ryzen AI 5 PRO 340 (n=1) | |
| Geekom A5 Pro | |
| Aoostar WTR Pro, N150 | |
| Cinebench R20 / CPU (Multi Core) | |
| Asus NUC 15 Pro+ | |
| Khadas Mind Pro | |
| Beelink GTI15 Ultra | |
| Asus ExpertCenter PN54-S70012NN | |
| HP EliteBoard G1a AI | |
| Media AMD Ryzen AI 5 PRO 340 (n=1) | |
| HP Pro Mini 400 G9-937U0EA | |
| GMK NucBox K13 | |
| MSI Cubi NUC AI+ 2MG | |
| Geekom A5 Pro | |
| Aoostar WTR Pro, N150 | |
| Cinebench R20 / CPU (Single Core) | |
| Asus NUC 15 Pro+ | |
| Beelink GTI15 Ultra | |
| Khadas Mind Pro | |
| Asus ExpertCenter PN54-S70012NN | |
| MSI Cubi NUC AI+ 2MG | |
| GMK NucBox K13 | |
| HP Pro Mini 400 G9-937U0EA | |
| HP EliteBoard G1a AI | |
| Media AMD Ryzen AI 5 PRO 340 (n=1) | |
| Geekom A5 Pro | |
| Aoostar WTR Pro, N150 | |
| Cinebench R15 / CPU Multi 64Bit | |
| Asus NUC 15 Pro+ | |
| Khadas Mind Pro | |
| Asus ExpertCenter PN54-S70012NN | |
| Beelink GTI15 Ultra | |
| HP Pro Mini 400 G9-937U0EA | |
| HP EliteBoard G1a AI | |
| Media AMD Ryzen AI 5 PRO 340 (n=1) | |
| GMK NucBox K13 | |
| MSI Cubi NUC AI+ 2MG | |
| Geekom A5 Pro | |
| Aoostar WTR Pro, N150 | |
| Cinebench R15 / CPU Single 64Bit | |
| Asus NUC 15 Pro+ | |
| Khadas Mind Pro | |
| Beelink GTI15 Ultra | |
| Asus ExpertCenter PN54-S70012NN | |
| MSI Cubi NUC AI+ 2MG | |
| GMK NucBox K13 | |
| HP EliteBoard G1a AI | |
| Media AMD Ryzen AI 5 PRO 340 (n=1) | |
| HP Pro Mini 400 G9-937U0EA | |
| Geekom A5 Pro | |
| Aoostar WTR Pro, N150 | |
| Blender / v2.79 BMW27 CPU | |
| Aoostar WTR Pro, N150 | |
| Geekom A5 Pro | |
| MSI Cubi NUC AI+ 2MG | |
| GMK NucBox K13 | |
| HP Pro Mini 400 G9-937U0EA | |
| HP EliteBoard G1a AI | |
| Media AMD Ryzen AI 5 PRO 340 (n=1) | |
| Asus ExpertCenter PN54-S70012NN | |
| Beelink GTI15 Ultra | |
| Khadas Mind Pro | |
| Asus NUC 15 Pro+ | |
| 7-Zip 18.03 / 7z b 4 | |
| Asus NUC 15 Pro+ | |
| Khadas Mind Pro | |
| Beelink GTI15 Ultra | |
| Asus ExpertCenter PN54-S70012NN | |
| HP Pro Mini 400 G9-937U0EA | |
| HP EliteBoard G1a AI | |
| Media AMD Ryzen AI 5 PRO 340 (n=1) | |
| GMK NucBox K13 | |
| Geekom A5 Pro | |
| MSI Cubi NUC AI+ 2MG | |
| Aoostar WTR Pro, N150 | |
| 7-Zip 18.03 / 7z b 4 -mmt1 | |
| Khadas Mind Pro | |
| Beelink GTI15 Ultra | |
| Asus NUC 15 Pro+ | |
| HP Pro Mini 400 G9-937U0EA | |
| MSI Cubi NUC AI+ 2MG | |
| GMK NucBox K13 | |
| HP EliteBoard G1a AI | |
| Media AMD Ryzen AI 5 PRO 340 (n=1) | |
| Asus ExpertCenter PN54-S70012NN | |
| Geekom A5 Pro | |
| Aoostar WTR Pro, N150 | |
| Geekbench 6.6 / Multi-Core | |
| Asus NUC 15 Pro+ | |
| Khadas Mind Pro | |
| Beelink GTI15 Ultra | |
| Asus ExpertCenter PN54-S70012NN | |
| Media AMD Ryzen AI 5 PRO 340 (11409 - 11455, n=2) | |
| HP EliteBoard G1a AI | |
| GMK NucBox K13 | |
| HP Pro Mini 400 G9-937U0EA | |
| MSI Cubi NUC AI+ 2MG | |
| Geekom A5 Pro | |
| Aoostar WTR Pro, N150 | |
| Geekbench 6.6 / Single-Core | |
| Beelink GTI15 Ultra | |
| Asus ExpertCenter PN54-S70012NN | |
| Khadas Mind Pro | |
| GMK NucBox K13 | |
| MSI Cubi NUC AI+ 2MG | |
| Media AMD Ryzen AI 5 PRO 340 (2640 - 2771, n=2) | |
| Asus NUC 15 Pro+ | |
| HP EliteBoard G1a AI | |
| HP Pro Mini 400 G9-937U0EA | |
| Geekom A5 Pro | |
| Aoostar WTR Pro, N150 | |
| Geekbench 5.5 / Multi-Core | |
| Khadas Mind Pro | |
| Asus NUC 15 Pro+ | |
| Beelink GTI15 Ultra | |
| Asus ExpertCenter PN54-S70012NN | |
| HP EliteBoard G1a AI | |
| Media AMD Ryzen AI 5 PRO 340 (n=1) | |
| HP Pro Mini 400 G9-937U0EA | |
| GMK NucBox K13 | |
| MSI Cubi NUC AI+ 2MG | |
| Geekom A5 Pro | |
| Aoostar WTR Pro, N150 | |
| Geekbench 5.5 / Single-Core | |
| Beelink GTI15 Ultra | |
| Khadas Mind Pro | |
| Asus ExpertCenter PN54-S70012NN | |
| MSI Cubi NUC AI+ 2MG | |
| GMK NucBox K13 | |
| HP EliteBoard G1a AI | |
| Media AMD Ryzen AI 5 PRO 340 (n=1) | |
| HP Pro Mini 400 G9-937U0EA | |
| Asus NUC 15 Pro+ | |
| Geekom A5 Pro | |
| Aoostar WTR Pro, N150 | |
| HWBOT x265 Benchmark v2.2 / 4k Preset | |
| Asus NUC 15 Pro+ | |
| Khadas Mind Pro | |
| Beelink GTI15 Ultra | |
| Asus ExpertCenter PN54-S70012NN | |
| HP EliteBoard G1a AI | |
| Media AMD Ryzen AI 5 PRO 340 (n=1) | |
| GMK NucBox K13 | |
| MSI Cubi NUC AI+ 2MG | |
| HP Pro Mini 400 G9-937U0EA | |
| Geekom A5 Pro | |
| Aoostar WTR Pro, N150 | |
| LibreOffice / 20 Documents To PDF | |
| Aoostar WTR Pro, N150 | |
| HP EliteBoard G1a AI | |
| Media AMD Ryzen AI 5 PRO 340 (n=1) | |
| Geekom A5 Pro | |
| Asus NUC 15 Pro+ | |
| GMK NucBox K13 | |
| Asus ExpertCenter PN54-S70012NN | |
| HP Pro Mini 400 G9-937U0EA | |
| Khadas Mind Pro | |
| MSI Cubi NUC AI+ 2MG | |
| Beelink GTI15 Ultra | |
| R Benchmark 2.5 / Overall mean | |
| Aoostar WTR Pro, N150 | |
| Geekom A5 Pro | |
| MSI Cubi NUC AI+ 2MG | |
| HP EliteBoard G1a AI | |
| Media AMD Ryzen AI 5 PRO 340 (n=1) | |
| GMK NucBox K13 | |
| HP Pro Mini 400 G9-937U0EA | |
| Asus NUC 15 Pro+ | |
| Beelink GTI15 Ultra | |
| Khadas Mind Pro | |
| Khadas Mind Pro | |
| Asus ExpertCenter PN54-S70012NN | |
* ... Meglio usare valori piccoli
AIDA64: FP32 Ray-Trace | FPU Julia | CPU SHA3 | CPU Queen | FPU SinJulia | FPU Mandel | CPU AES | CPU ZLib | FP64 Ray-Trace | CPU PhotoWorxx | CPU CheckMate
| Performance rating | |
| Asus NUC 15 Pro+ -1! | |
| HP EliteBoard G1a AI -1! | |
| Media AMD Ryzen AI 5 PRO 340 -1! | |
| GMK NucBox K13 -1! | |
| HP Pro Mini 400 G9-937U0EA -1! | |
| MSI Cubi NUC AI+ 2MG -1! | |
| Geekom A5 Pro | |
| AIDA64 / FP32 Ray-Trace | |
| Asus NUC 15 Pro+ (v6.92.6600) | |
| HP EliteBoard G1a AI (v8.20.8100) | |
| Media AMD Ryzen AI 5 PRO 340 (n=1) | |
| GMK NucBox K13 (v8.20.8100) | |
| MSI Cubi NUC AI+ 2MG (v6.92.6600) | |
| HP Pro Mini 400 G9-937U0EA (v6.92.6600) | |
| Geekom A5 Pro (v8.20.8100) | |
| Geekom A5 Pro (v6.92.6600) | |
| AIDA64 / FPU Julia | |
| Asus NUC 15 Pro+ (v6.92.6600) | |
| HP EliteBoard G1a AI (v8.20.8100) | |
| Media AMD Ryzen AI 5 PRO 340 (n=1) | |
| GMK NucBox K13 (v8.20.8100) | |
| MSI Cubi NUC AI+ 2MG (v6.92.6600) | |
| HP Pro Mini 400 G9-937U0EA (v6.92.6600) | |
| Geekom A5 Pro (v8.20.8100) | |
| Geekom A5 Pro (v6.92.6600) | |
| AIDA64 / CPU SHA3 | |
| Asus NUC 15 Pro+ (v6.92.6600) | |
| GMK NucBox K13 (v8.20.8100) | |
| MSI Cubi NUC AI+ 2MG (v6.92.6600) | |
| HP Pro Mini 400 G9-937U0EA (v6.92.6600) | |
| HP EliteBoard G1a AI (v8.20.8100) | |
| Media AMD Ryzen AI 5 PRO 340 (n=1) | |
| Geekom A5 Pro (v6.92.6600) | |
| Geekom A5 Pro (v8.20.8100) | |
| AIDA64 / CPU Queen | |
| HP Pro Mini 400 G9-937U0EA (v6.92.6600) | |
| Asus NUC 15 Pro+ (v6.92.6600) | |
| Geekom A5 Pro (v6.92.6600) | |
| MSI Cubi NUC AI+ 2MG (v6.92.6600) | |
| AIDA64 / FPU SinJulia | |
| HP EliteBoard G1a AI (v8.20.8100) | |
| Media AMD Ryzen AI 5 PRO 340 (n=1) | |
| Asus NUC 15 Pro+ (v6.92.6600) | |
| Geekom A5 Pro (v6.92.6600) | |
| Geekom A5 Pro (v8.20.8100) | |
| HP Pro Mini 400 G9-937U0EA (v6.92.6600) | |
| GMK NucBox K13 (v8.20.8100) | |
| MSI Cubi NUC AI+ 2MG (v6.92.6600) | |
| AIDA64 / FPU Mandel | |
| Asus NUC 15 Pro+ (v6.92.6600) | |
| HP EliteBoard G1a AI (v8.20.8100) | |
| Media AMD Ryzen AI 5 PRO 340 (n=1) | |
| GMK NucBox K13 (v8.20.8100) | |
| MSI Cubi NUC AI+ 2MG (v6.92.6600) | |
| Geekom A5 Pro (v6.92.6600) | |
| Geekom A5 Pro (v8.20.8100) | |
| HP Pro Mini 400 G9-937U0EA (v6.92.6600) | |
| AIDA64 / CPU AES | |
| Asus NUC 15 Pro+ (v6.92.6600) | |
| GMK NucBox K13 (v8.20.8100) | |
| HP Pro Mini 400 G9-937U0EA (v6.92.6600) | |
| HP EliteBoard G1a AI (v8.20.8100) | |
| Media AMD Ryzen AI 5 PRO 340 (n=1) | |
| MSI Cubi NUC AI+ 2MG (v6.92.6600) | |
| Geekom A5 Pro (v6.92.6600) | |
| Geekom A5 Pro (v8.20.8100) | |
| AIDA64 / CPU ZLib | |
| Asus NUC 15 Pro+ (v6.92.6600) | |
| HP Pro Mini 400 G9-937U0EA (v6.92.6600) | |
| HP EliteBoard G1a AI (v8.20.8100) | |
| Media AMD Ryzen AI 5 PRO 340 (n=1) | |
| GMK NucBox K13 (v8.20.8100) | |
| MSI Cubi NUC AI+ 2MG (v6.92.6600) | |
| Geekom A5 Pro (v6.92.6600) | |
| Geekom A5 Pro (v8.20.8100) | |
| AIDA64 / FP64 Ray-Trace | |
| Asus NUC 15 Pro+ (v6.92.6600) | |
| HP EliteBoard G1a AI (v8.20.8100) | |
| Media AMD Ryzen AI 5 PRO 340 (n=1) | |
| GMK NucBox K13 (v8.20.8100) | |
| MSI Cubi NUC AI+ 2MG (v6.92.6600) | |
| HP Pro Mini 400 G9-937U0EA (v6.92.6600) | |
| Geekom A5 Pro (v8.20.8100) | |
| Geekom A5 Pro (v6.92.6600) | |
| AIDA64 / CPU PhotoWorxx | |
| GMK NucBox K13 (v8.20.8100) | |
| Asus NUC 15 Pro+ (v6.92.6600) | |
| MSI Cubi NUC AI+ 2MG (v6.92.6600) | |
| HP EliteBoard G1a AI (v8.20.8100) | |
| Media AMD Ryzen AI 5 PRO 340 (n=1) | |
| HP Pro Mini 400 G9-937U0EA (v6.92.6600) | |
| Geekom A5 Pro (v6.92.6600) | |
| Geekom A5 Pro (v8.20.8100) | |
| AIDA64 / CPU CheckMate | |
| HP EliteBoard G1a AI (v8.20.8100) | |
| Media AMD Ryzen AI 5 PRO 340 (n=1) | |
| GMK NucBox K13 (v8.20.8100) | |
| Geekom A5 Pro (v8.20.8100) | |
Prestazioni del sistema
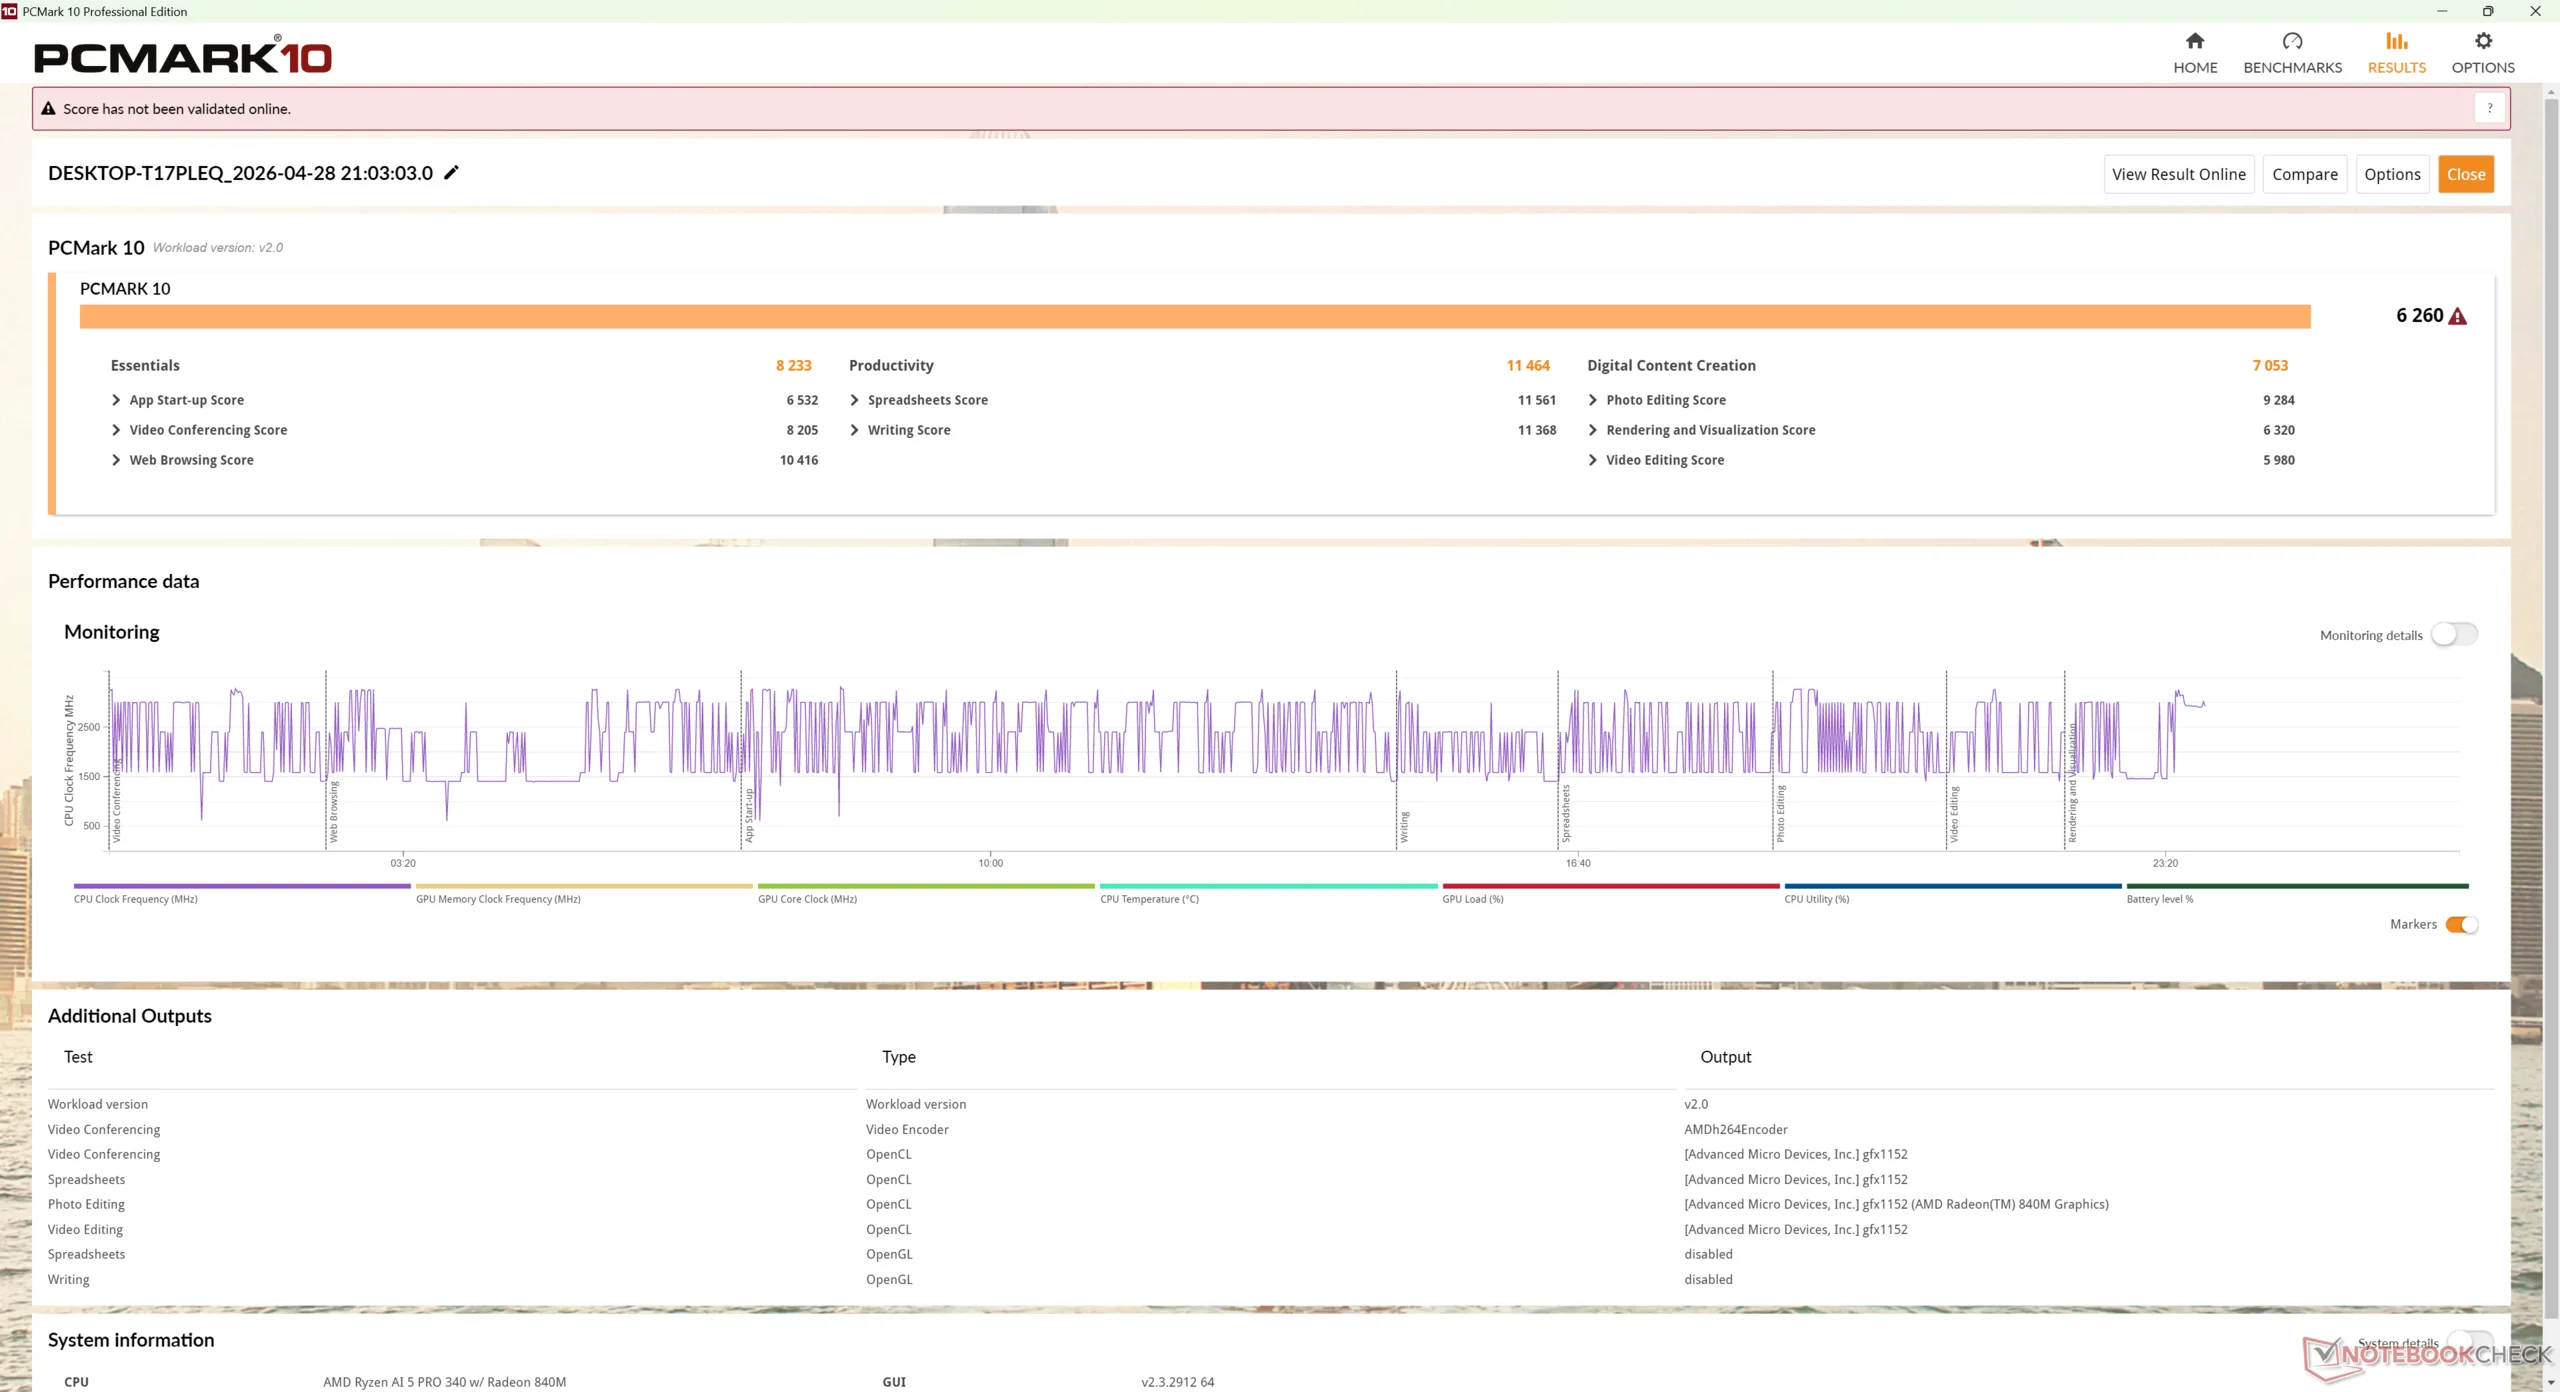
PCMark 10: Score | Essentials | Productivity | Digital Content Creation
CrossMark: Overall | Productivity | Creativity | Responsiveness
WebXPRT 3: Overall
WebXPRT 4: Overall
Mozilla Kraken 1.1: Total
Geekbench AI: Quantized GPU 1.7 | Half Precision GPU 1.7 | Single Precision GPU 1.7
| Performance rating | |
| MSI Cubi NUC AI+ 2MG | |
| GMK NucBox K13 | |
| Asus NUC 15 Pro+ | |
| HP EliteBoard G1a AI | |
| Media AMD Ryzen AI 5 PRO 340, AMD Radeon 840M | |
| HP Pro Mini 400 G9-937U0EA -3! | |
| Geekom A5 Pro | |
| PCMark 10 / Score | |
| GMK NucBox K13 | |
| Asus NUC 15 Pro+ | |
| MSI Cubi NUC AI+ 2MG | |
| HP EliteBoard G1a AI | |
| Media AMD Ryzen AI 5 PRO 340, AMD Radeon 840M (n=1) | |
| Geekom A5 Pro | |
| HP Pro Mini 400 G9-937U0EA | |
| PCMark 10 / Essentials | |
| MSI Cubi NUC AI+ 2MG | |
| GMK NucBox K13 | |
| Asus NUC 15 Pro+ | |
| HP Pro Mini 400 G9-937U0EA | |
| Geekom A5 Pro | |
| HP EliteBoard G1a AI | |
| Media AMD Ryzen AI 5 PRO 340, AMD Radeon 840M (n=1) | |
| PCMark 10 / Productivity | |
| Geekom A5 Pro | |
| GMK NucBox K13 | |
| HP EliteBoard G1a AI | |
| Media AMD Ryzen AI 5 PRO 340, AMD Radeon 840M (n=1) | |
| MSI Cubi NUC AI+ 2MG | |
| Asus NUC 15 Pro+ | |
| HP Pro Mini 400 G9-937U0EA | |
| PCMark 10 / Digital Content Creation | |
| Asus NUC 15 Pro+ | |
| GMK NucBox K13 | |
| MSI Cubi NUC AI+ 2MG | |
| HP EliteBoard G1a AI | |
| Media AMD Ryzen AI 5 PRO 340, AMD Radeon 840M (n=1) | |
| HP Pro Mini 400 G9-937U0EA | |
| Geekom A5 Pro | |
| CrossMark / Overall | |
| Asus NUC 15 Pro+ | |
| GMK NucBox K13 | |
| HP EliteBoard G1a AI | |
| Media AMD Ryzen AI 5 PRO 340, AMD Radeon 840M (n=1) | |
| MSI Cubi NUC AI+ 2MG | |
| HP Pro Mini 400 G9-937U0EA | |
| Geekom A5 Pro | |
| CrossMark / Productivity | |
| GMK NucBox K13 | |
| Asus NUC 15 Pro+ | |
| HP EliteBoard G1a AI | |
| Media AMD Ryzen AI 5 PRO 340, AMD Radeon 840M (n=1) | |
| MSI Cubi NUC AI+ 2MG | |
| HP Pro Mini 400 G9-937U0EA | |
| Geekom A5 Pro | |
| CrossMark / Creativity | |
| Asus NUC 15 Pro+ | |
| HP EliteBoard G1a AI | |
| Media AMD Ryzen AI 5 PRO 340, AMD Radeon 840M (n=1) | |
| GMK NucBox K13 | |
| MSI Cubi NUC AI+ 2MG | |
| HP Pro Mini 400 G9-937U0EA | |
| Geekom A5 Pro | |
| CrossMark / Responsiveness | |
| GMK NucBox K13 | |
| Asus NUC 15 Pro+ | |
| HP EliteBoard G1a AI | |
| Media AMD Ryzen AI 5 PRO 340, AMD Radeon 840M (n=1) | |
| MSI Cubi NUC AI+ 2MG | |
| HP Pro Mini 400 G9-937U0EA | |
| Geekom A5 Pro | |
| WebXPRT 3 / Overall | |
| HP EliteBoard G1a AI | |
| Media AMD Ryzen AI 5 PRO 340, AMD Radeon 840M (n=1) | |
| MSI Cubi NUC AI+ 2MG | |
| GMK NucBox K13 | |
| HP Pro Mini 400 G9-937U0EA | |
| Geekom A5 Pro | |
| Asus NUC 15 Pro+ | |
| WebXPRT 4 / Overall | |
| GMK NucBox K13 | |
| MSI Cubi NUC AI+ 2MG | |
| HP EliteBoard G1a AI | |
| Media AMD Ryzen AI 5 PRO 340, AMD Radeon 840M (n=1) | |
| HP Pro Mini 400 G9-937U0EA | |
| Asus NUC 15 Pro+ | |
| Geekom A5 Pro | |
| Mozilla Kraken 1.1 / Total | |
| Geekom A5 Pro | |
| HP Pro Mini 400 G9-937U0EA | |
| MSI Cubi NUC AI+ 2MG | |
| HP EliteBoard G1a AI | |
| Media AMD Ryzen AI 5 PRO 340, AMD Radeon 840M (n=1) | |
| Asus NUC 15 Pro+ | |
| GMK NucBox K13 | |
| Geekbench AI / Quantized GPU 1.7 | |
| MSI Cubi NUC AI+ 2MG | |
| Asus NUC 15 Pro+ | |
| GMK NucBox K13 | |
| HP EliteBoard G1a AI | |
| Media AMD Ryzen AI 5 PRO 340, AMD Radeon 840M (n=1) | |
| Geekom A5 Pro | |
| Geekbench AI / Half Precision GPU 1.7 | |
| MSI Cubi NUC AI+ 2MG | |
| Asus NUC 15 Pro+ | |
| GMK NucBox K13 | |
| HP EliteBoard G1a AI | |
| Media AMD Ryzen AI 5 PRO 340, AMD Radeon 840M (n=1) | |
| Geekom A5 Pro | |
| Geekbench AI / Single Precision GPU 1.7 | |
| MSI Cubi NUC AI+ 2MG | |
| Asus NUC 15 Pro+ | |
| GMK NucBox K13 | |
| HP EliteBoard G1a AI | |
| Media AMD Ryzen AI 5 PRO 340, AMD Radeon 840M (n=1) | |
| Geekom A5 Pro | |
* ... Meglio usare valori piccoli
| PCMark 10 Score | 6260 punti | |
Aiuto | ||
| AIDA64 / Memory Copy | |
| MSI Cubi NUC AI+ 2MG | |
| GMK NucBox K13 | |
| Asus NUC 15 Pro+ | |
| HP EliteBoard G1a AI | |
| Media AMD Ryzen AI 5 PRO 340 (n=1) | |
| Geekom A5 Pro | |
| Geekom A5 Pro | |
| HP Pro Mini 400 G9-937U0EA | |
| AIDA64 / Memory Read | |
| GMK NucBox K13 | |
| Asus NUC 15 Pro+ | |
| MSI Cubi NUC AI+ 2MG | |
| HP EliteBoard G1a AI | |
| Media AMD Ryzen AI 5 PRO 340 (n=1) | |
| Geekom A5 Pro | |
| Geekom A5 Pro | |
| HP Pro Mini 400 G9-937U0EA | |
| AIDA64 / Memory Write | |
| MSI Cubi NUC AI+ 2MG | |
| GMK NucBox K13 | |
| HP EliteBoard G1a AI | |
| Media AMD Ryzen AI 5 PRO 340 (n=1) | |
| Asus NUC 15 Pro+ | |
| Geekom A5 Pro | |
| Geekom A5 Pro | |
| HP Pro Mini 400 G9-937U0EA | |
| AIDA64 / Memory Latency | |
| HP EliteBoard G1a AI | |
| Media AMD Ryzen AI 5 PRO 340 (n=1) | |
| Asus NUC 15 Pro+ | |
| GMK NucBox K13 | |
| Geekom A5 Pro | |
| Geekom A5 Pro | |
| MSI Cubi NUC AI+ 2MG | |
| HP Pro Mini 400 G9-937U0EA | |
* ... Meglio usare valori piccoli
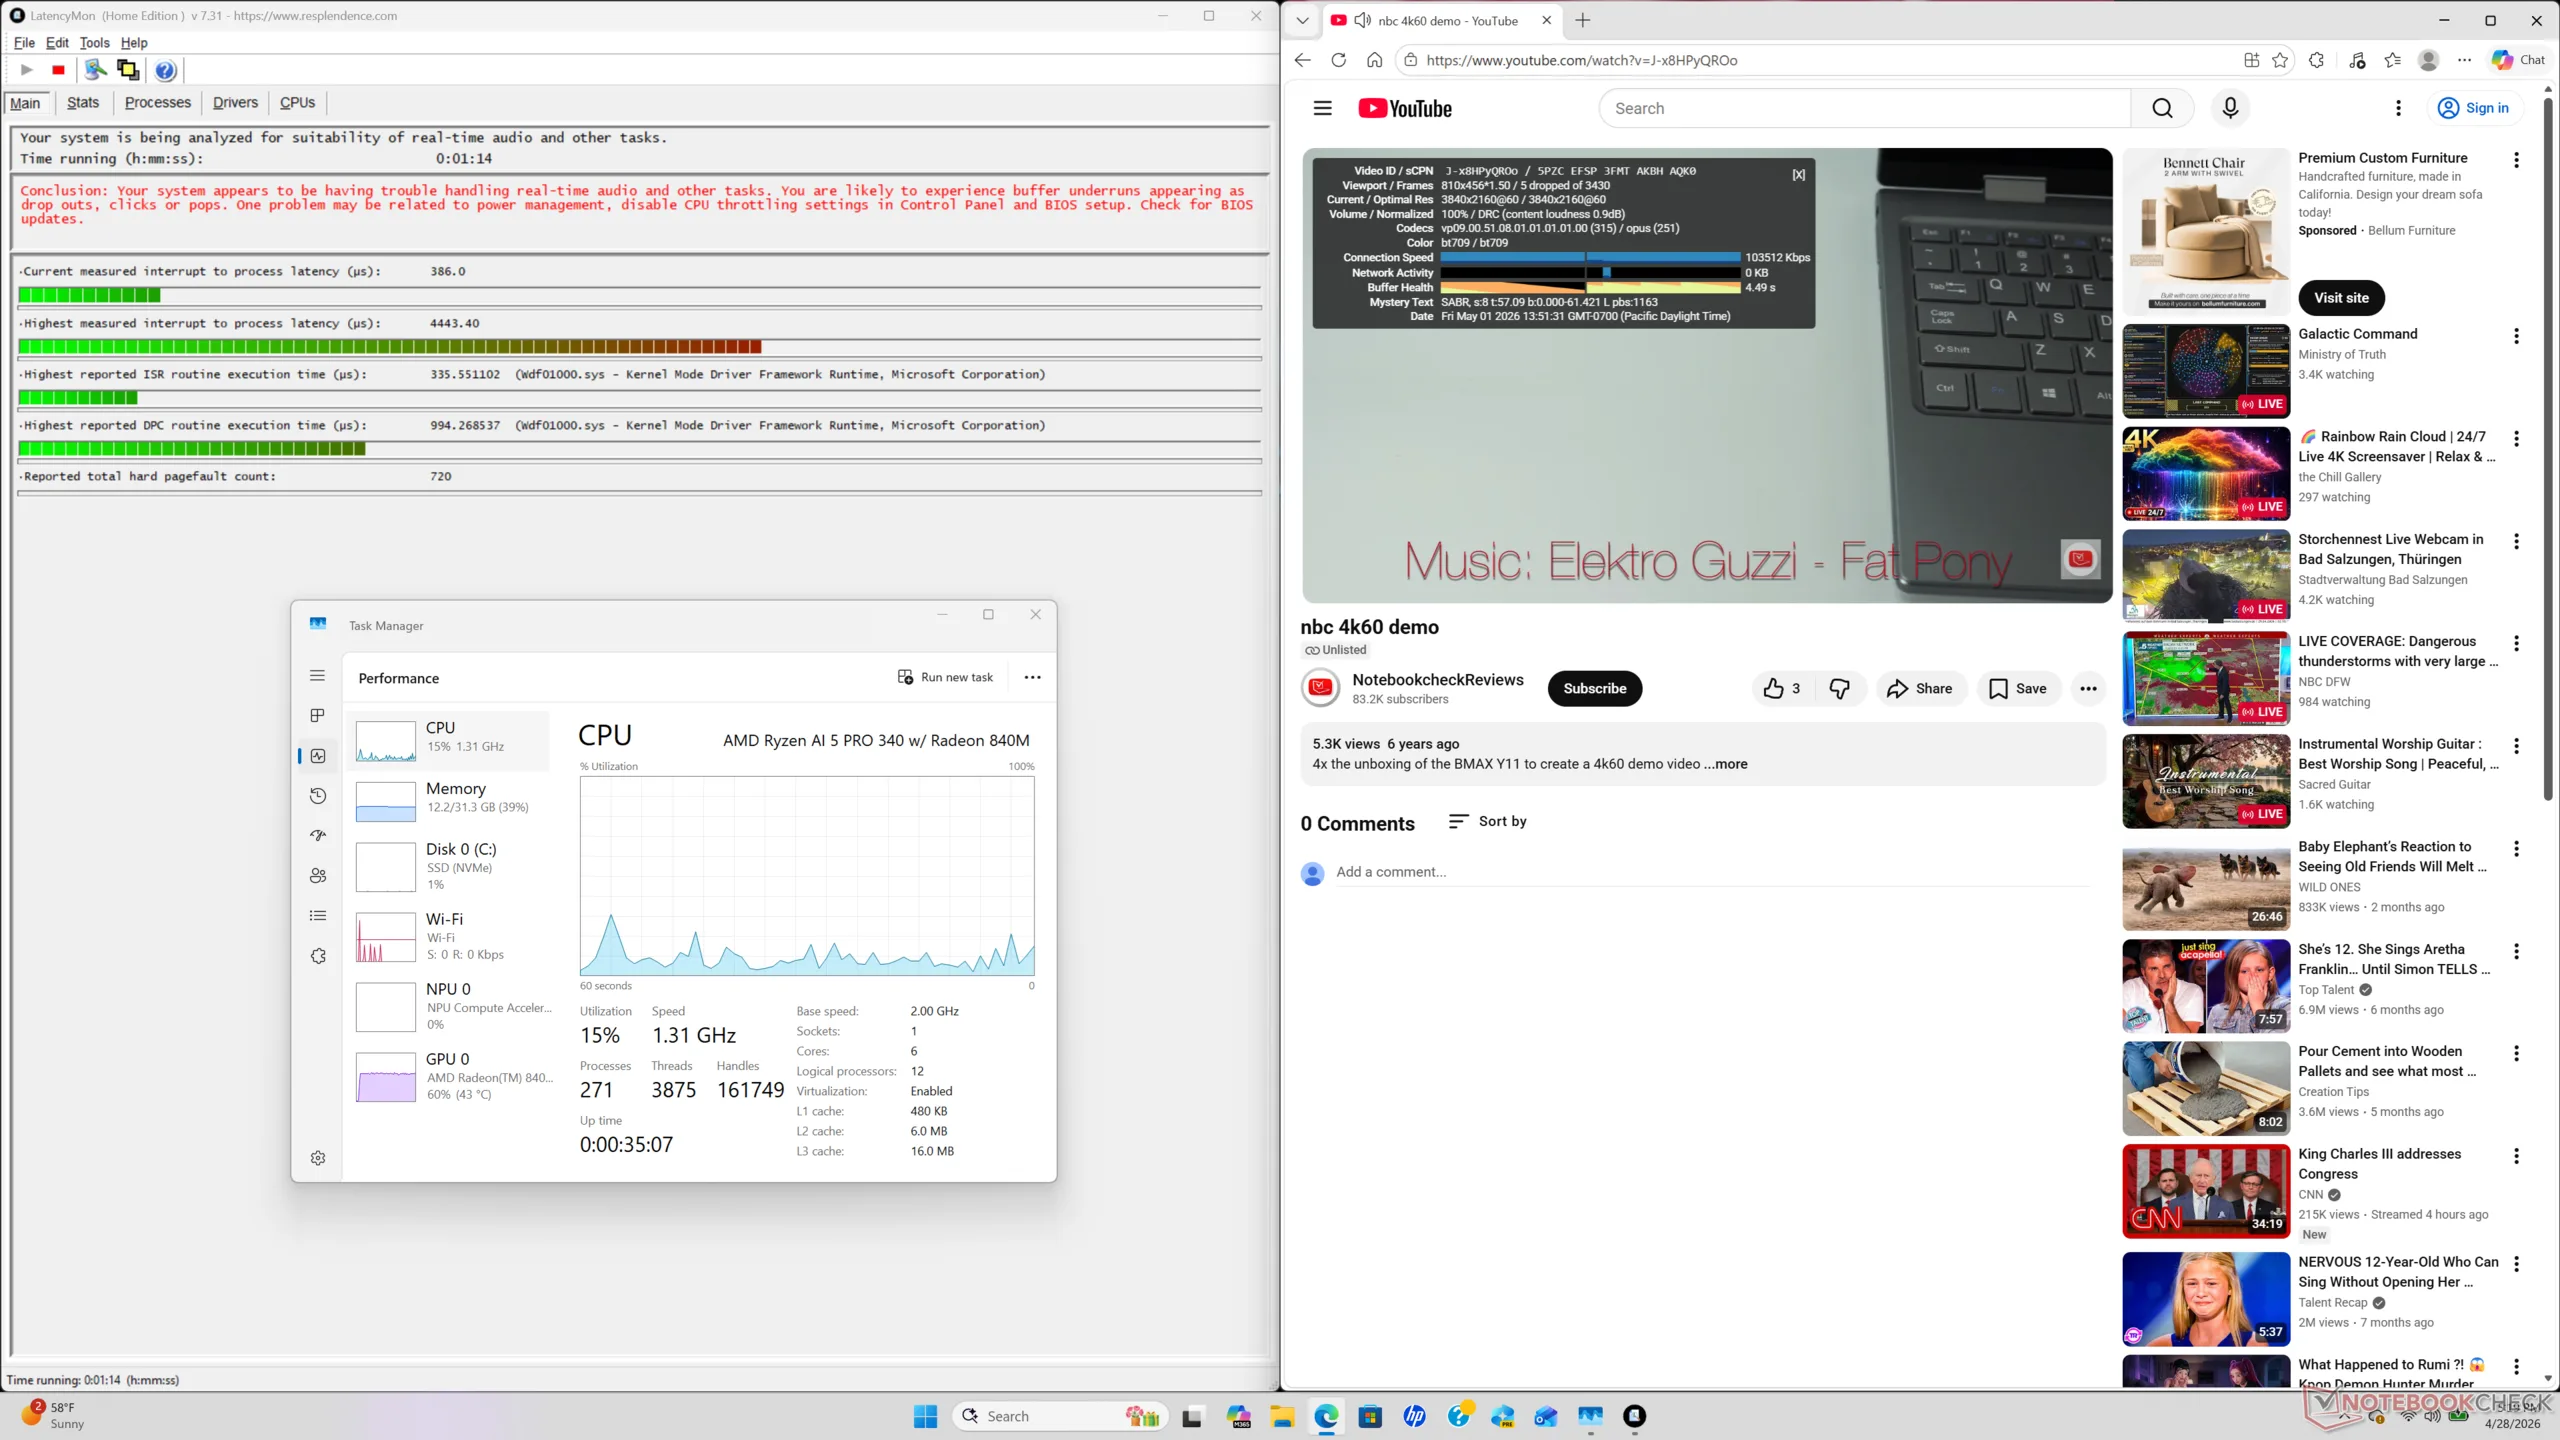
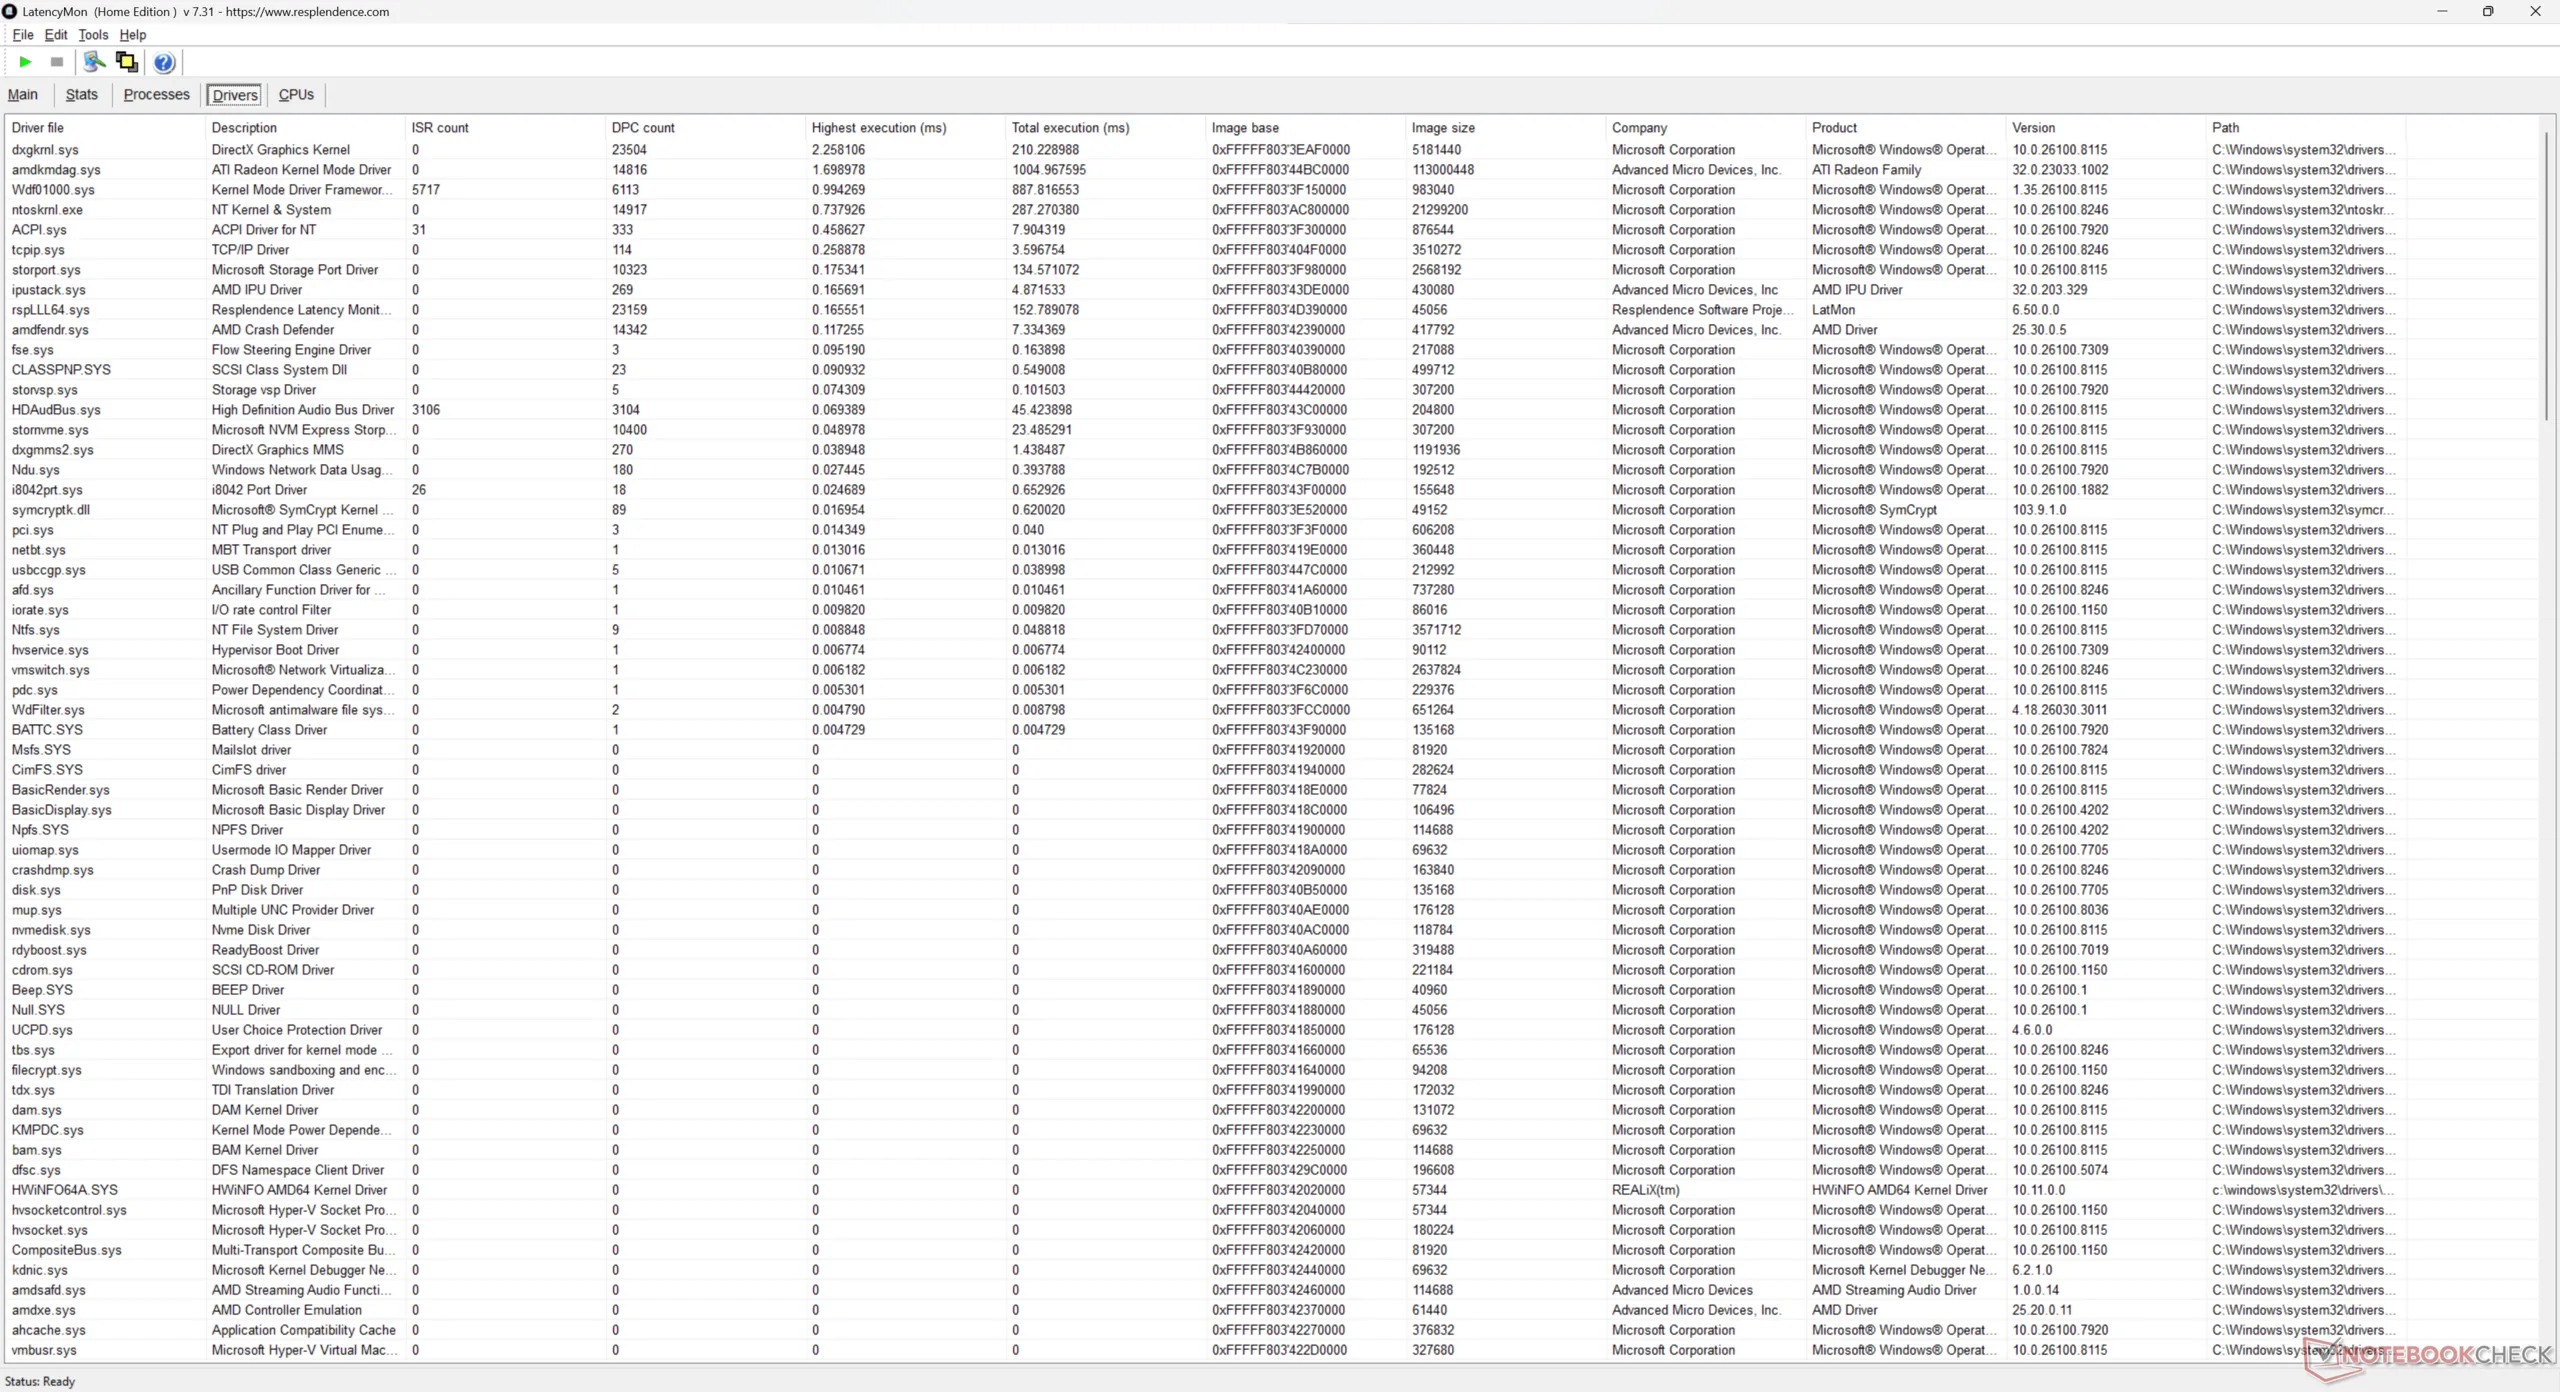
Latenza DPC
LatencyMon rivela problemi di DPC e una piccola manciata di fotogrammi caduti durante la riproduzione di contenuti video 4K60. I risultati non cambiano nemmeno dopo aver ripetuto i test con i driver grafici e la versione di Edge più recenti al momento della pubblicazione. Sebbene i pochi fotogrammi che si perdono durante lo streaming video siano quasi impercettibili, non averne affatto è l'ideale.
| DPC Latencies / LatencyMon - interrupt to process latency (max), Web, Youtube, Prime95 | |
| HP EliteBoard G1a AI | |
| GMK NucBox K13 | |
| Geekom A5 Pro | |
| HP Pro Mini 400 G9-937U0EA | |
| Asus NUC 15 Pro+ | |
| MSI Cubi NUC AI+ 2MG | |
* ... Meglio usare valori piccoli
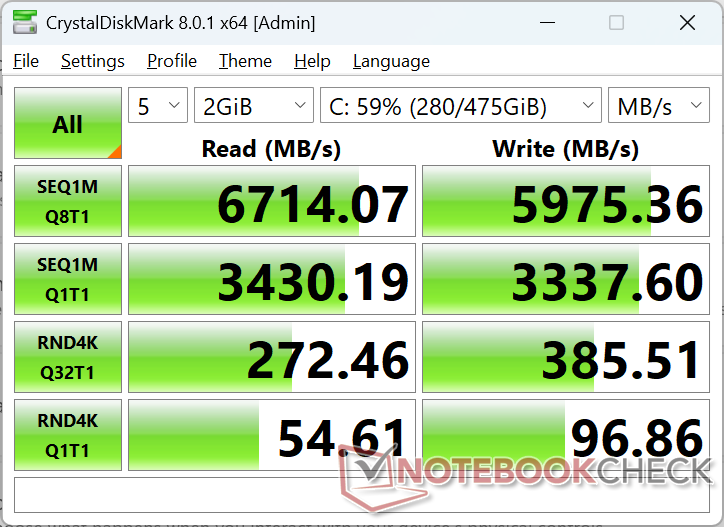
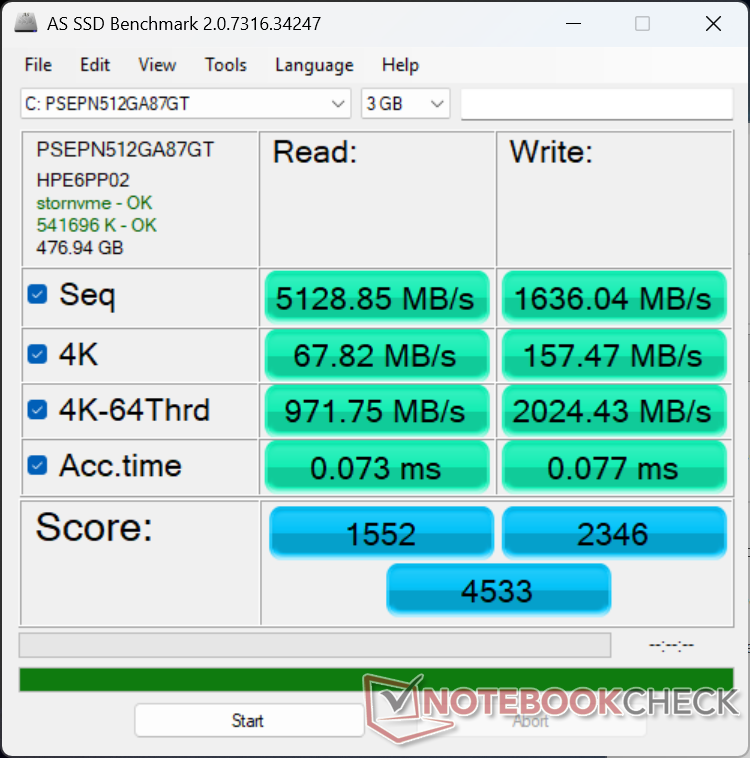
Dispositivi di archiviazione
La nostra configurazione prevede una macchina da 512 GB Phison PSEPN512GA87GT SSD PCIe4 x4 NVMe 2280 che offre velocità di trasferimento costanti fino a ~7000 MB/s, senza throttling anche quando è sotto stress. Queste velocità sono probabilmente eccessive per i tipi di carichi di lavoro per i quali EliteBoard è stata progettata, ma le prestazioni veloci sono comunque benvenute.

| Drive Performance rating - Percent | |
| HP EliteBoard G1a AI | |
| Asus NUC 15 Pro+ | |
| Geekom A5 Pro | |
| MSI Cubi NUC AI+ 2MG | |
| GMK NucBox K13 | |
| HP Pro Mini 400 G9-937U0EA | |
* ... Meglio usare valori piccoli
Strozzatura del disco: DiskSpd Lettura in loop, Profondità coda 8
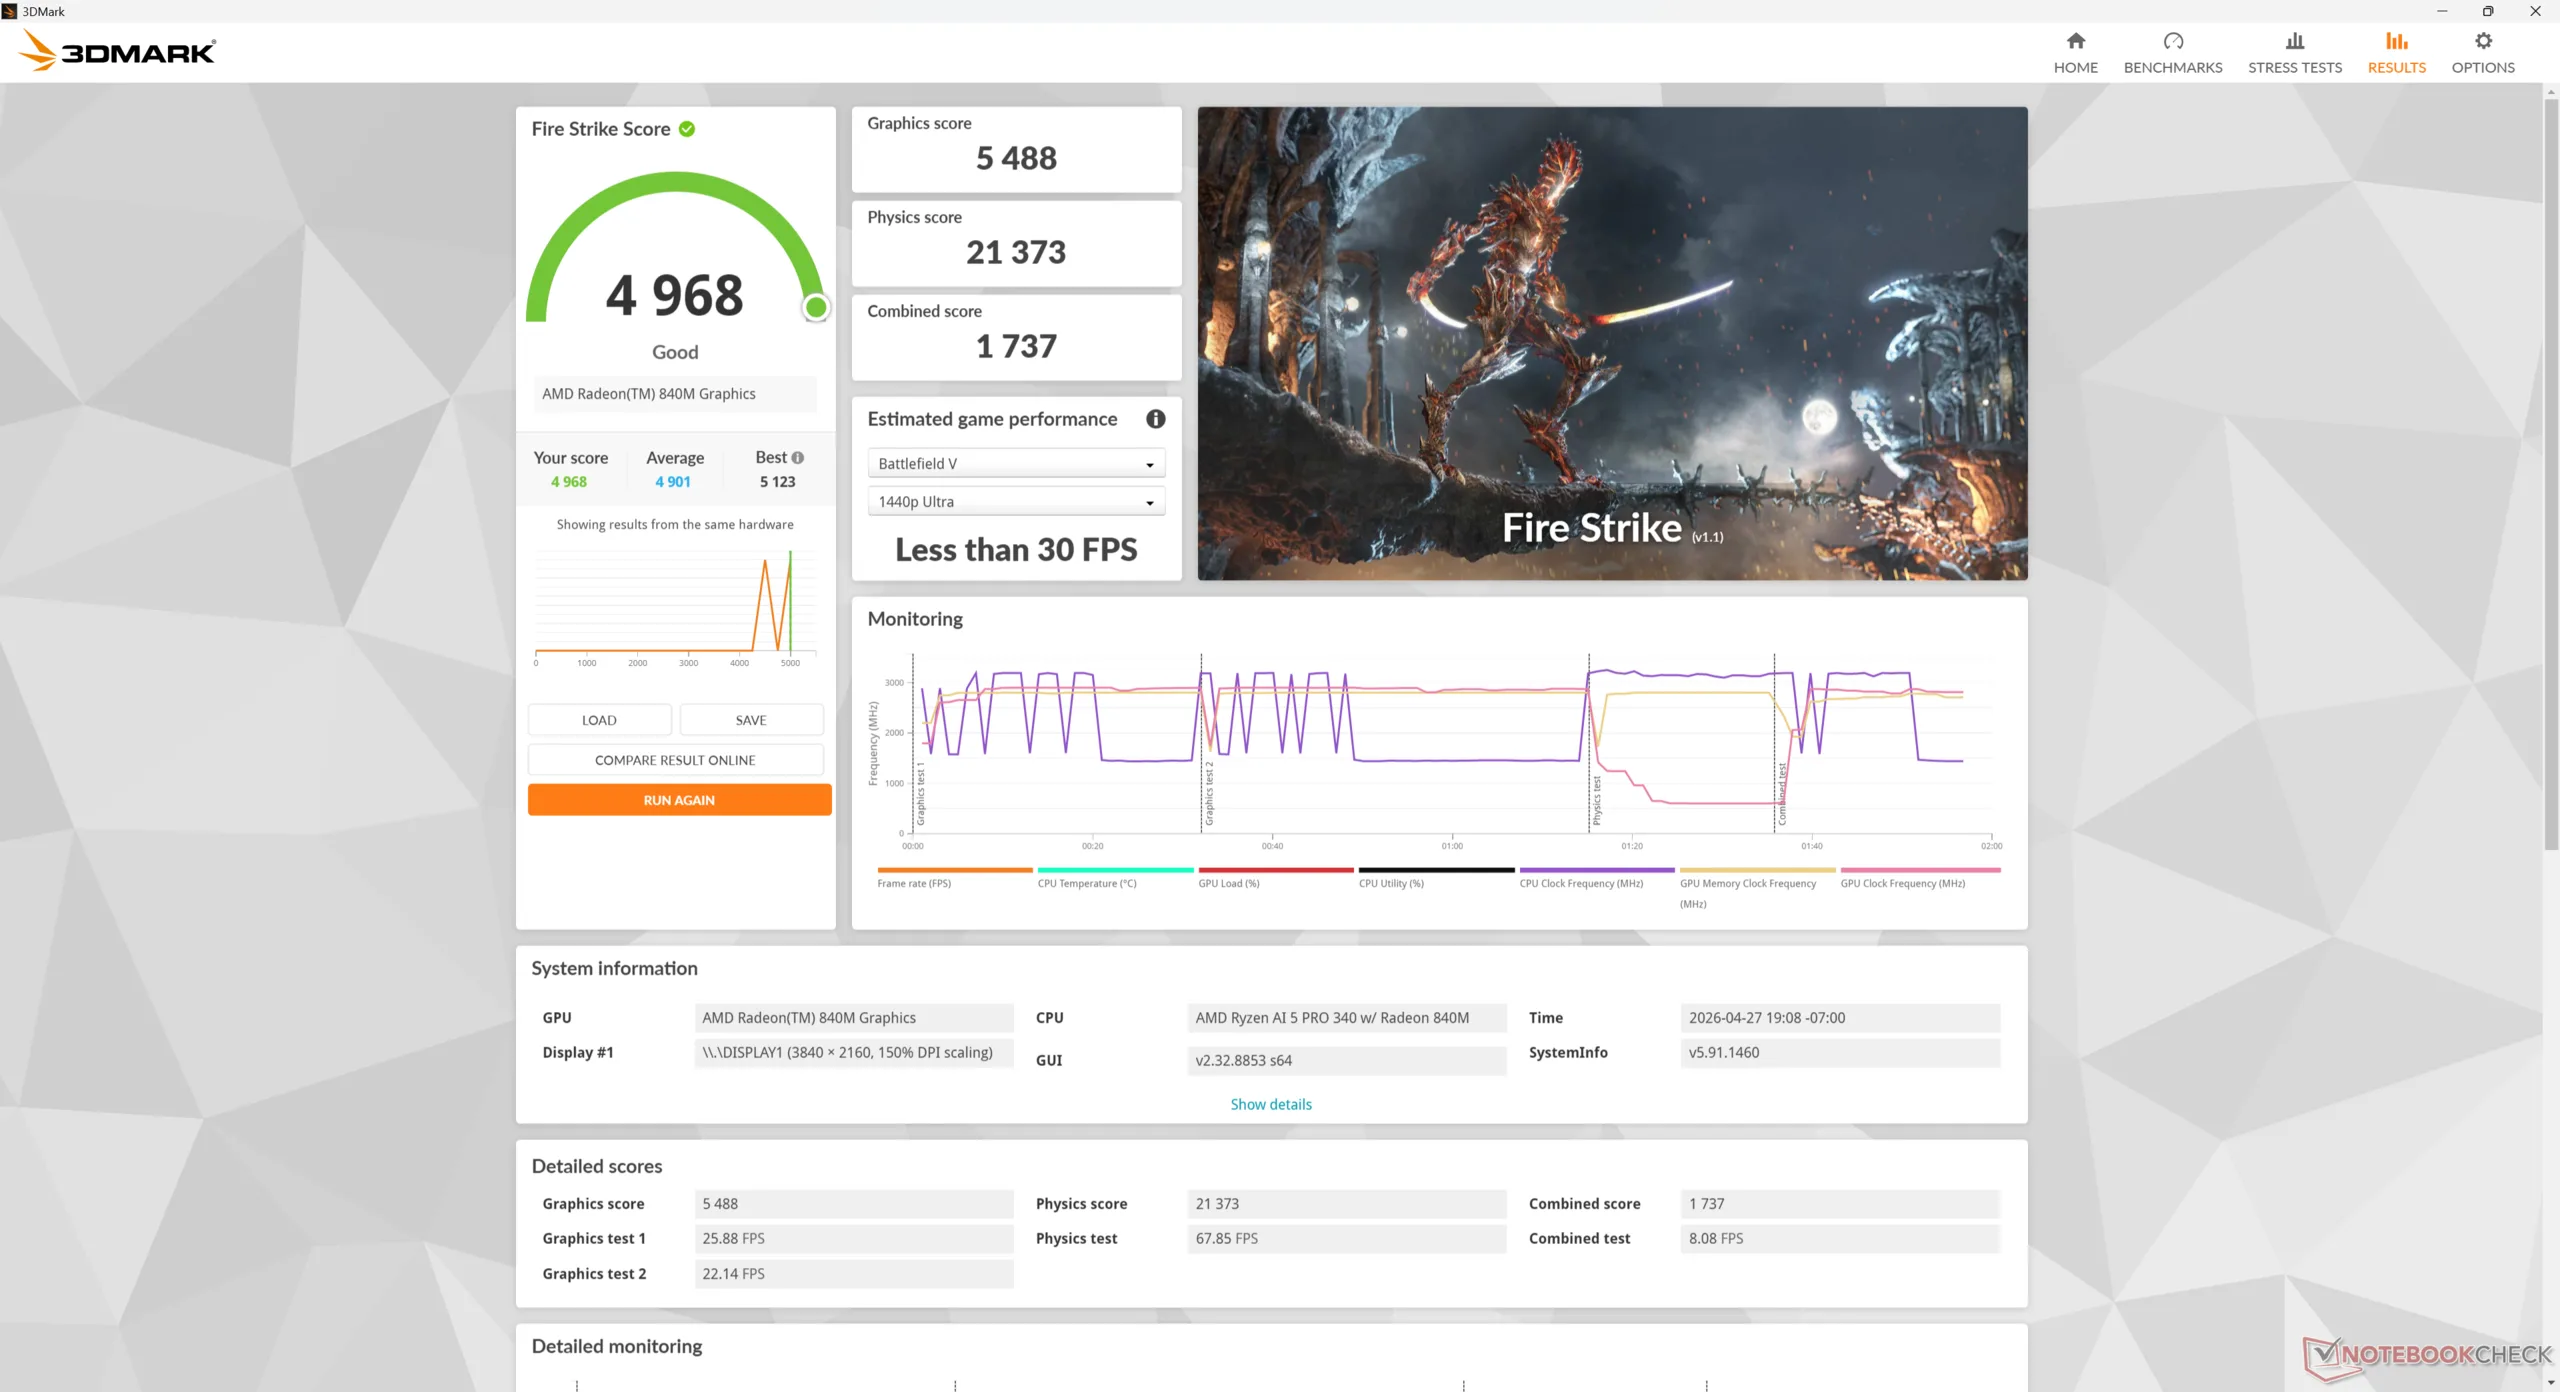
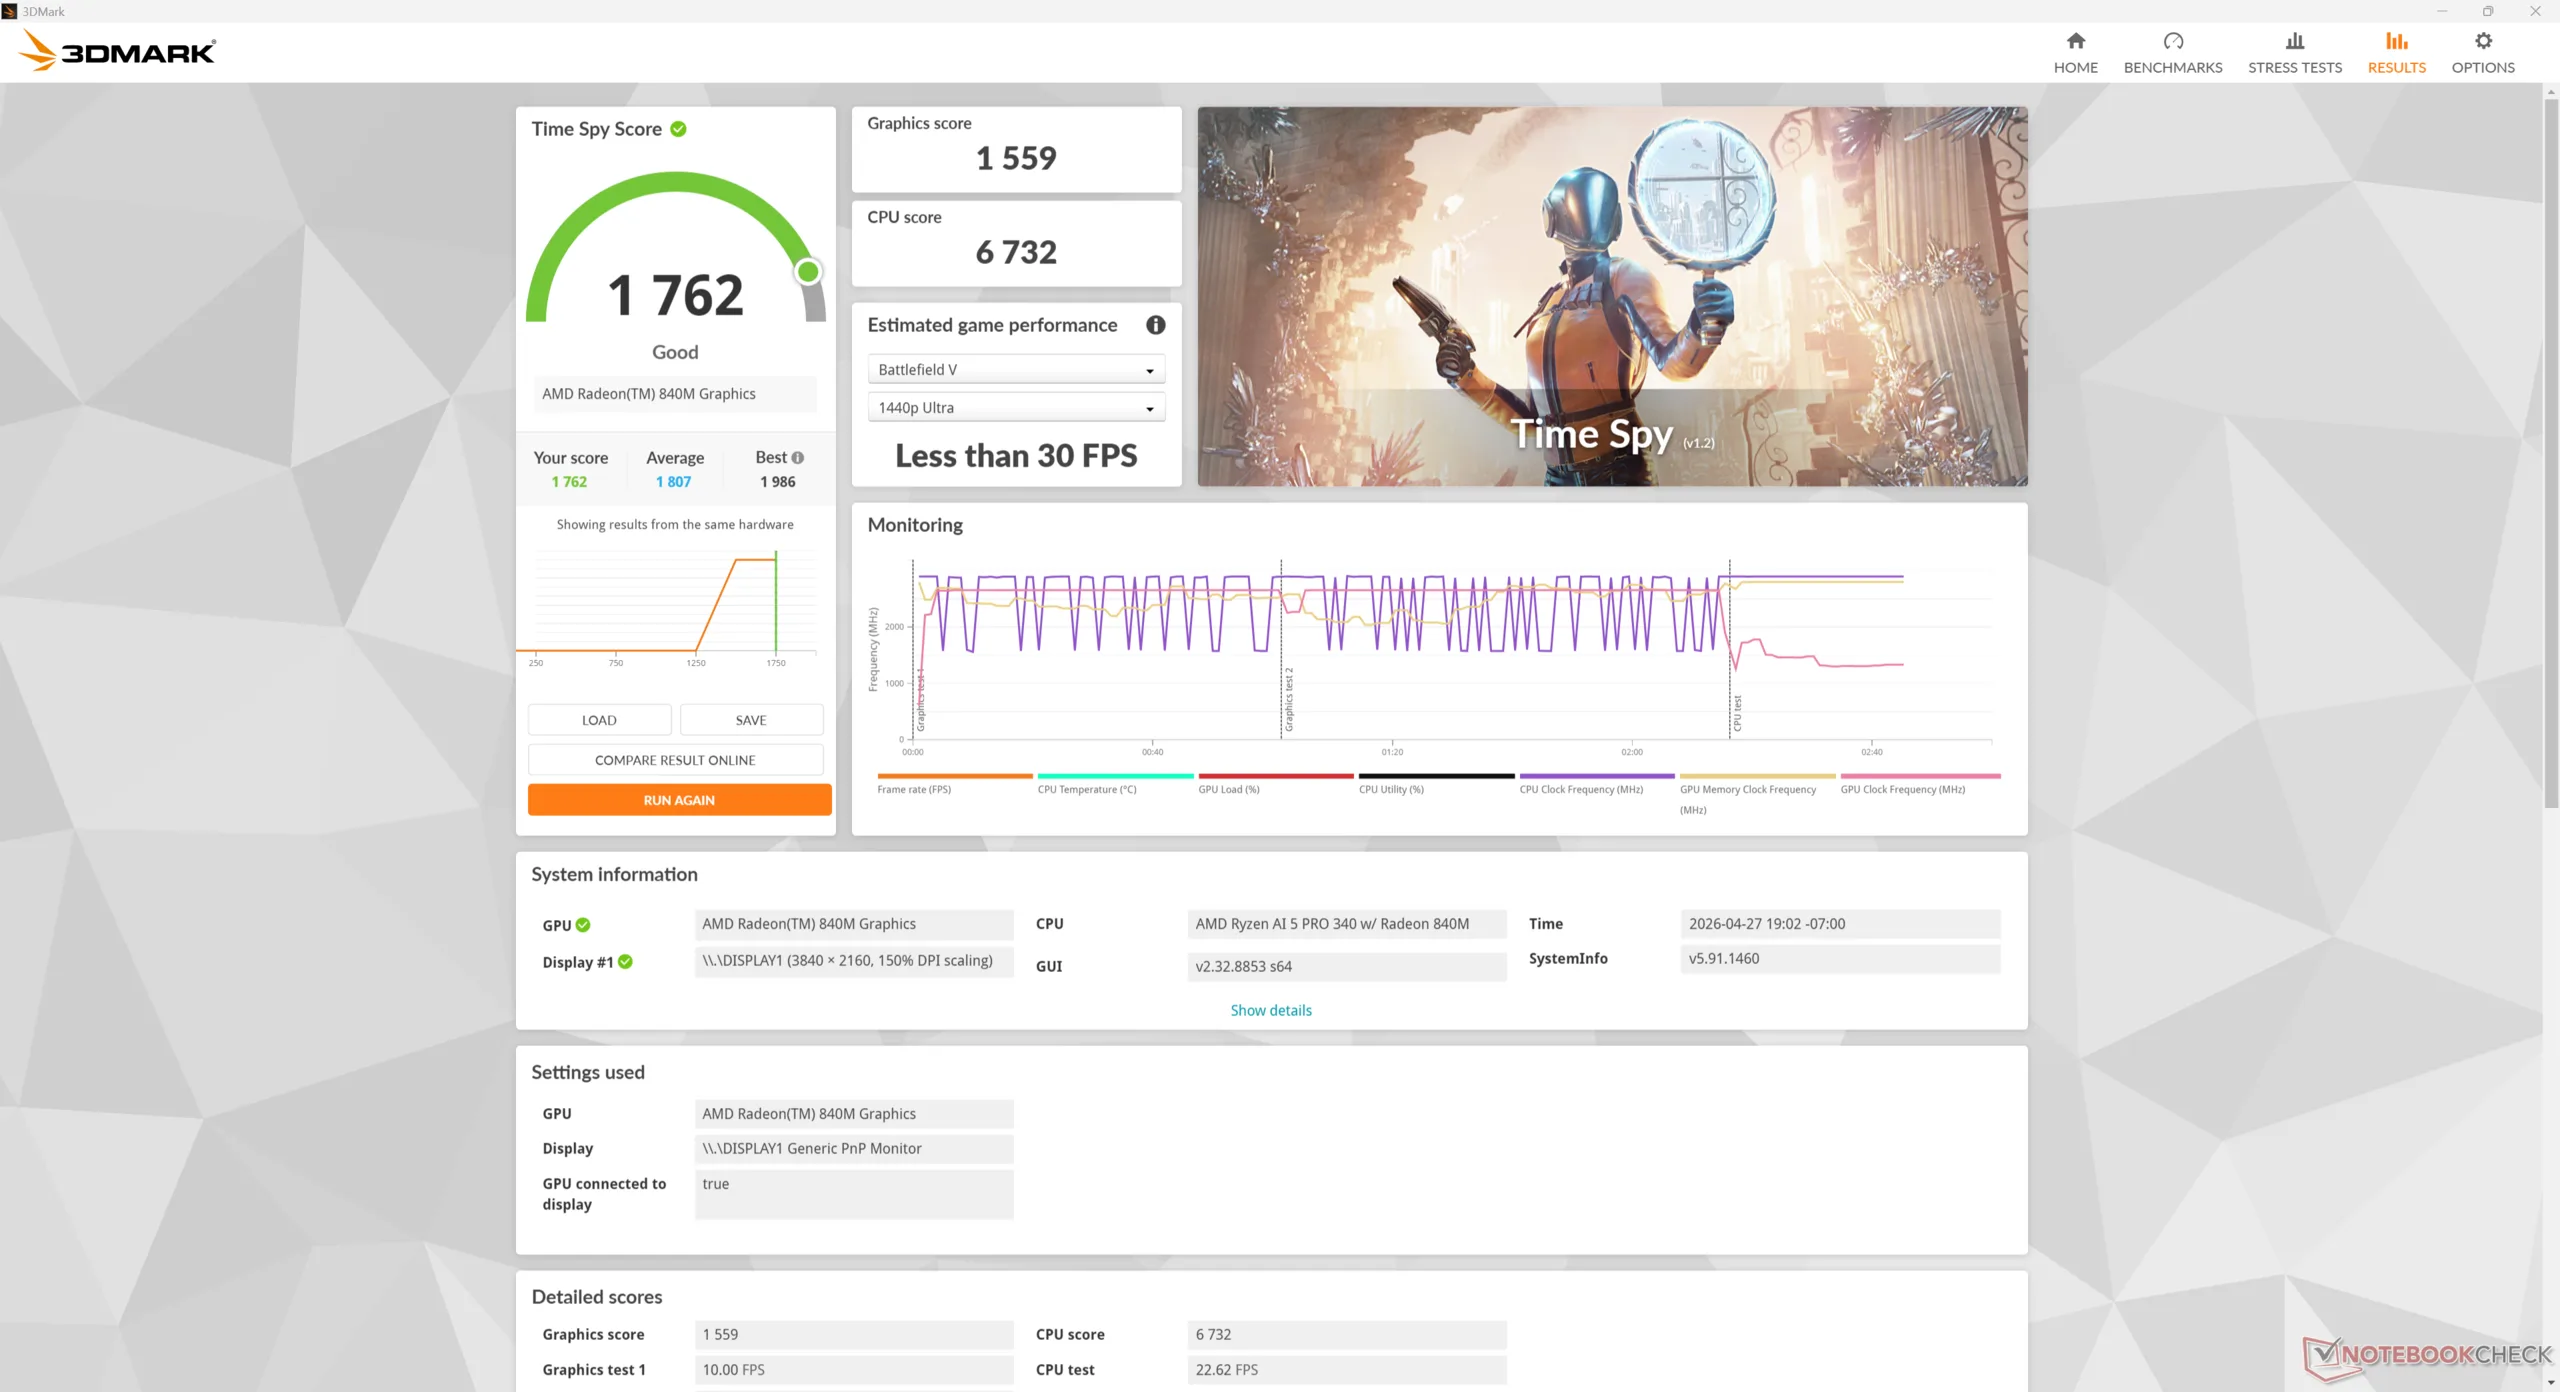
Prestazioni della GPU
Il sistema integrato Radeon 840M è un testa a testa con la vecchia Iris Xe 96EU che era popolare sui subnotebook solo qualche anno fa. Mentre l'aggiornamento alla versione Ryzen AI 7 PRO 350 Radeon 860M Migliorerebbe le prestazioni grafiche fino al 70%, ma le prestazioni complessive sarebbero comunque inadeguate per la maggior parte delle attività ad alta intensità di GPU. HP, purtroppo, non offre il modello Radeon 880M con capacità di gioco Radeon 880M o 890M.
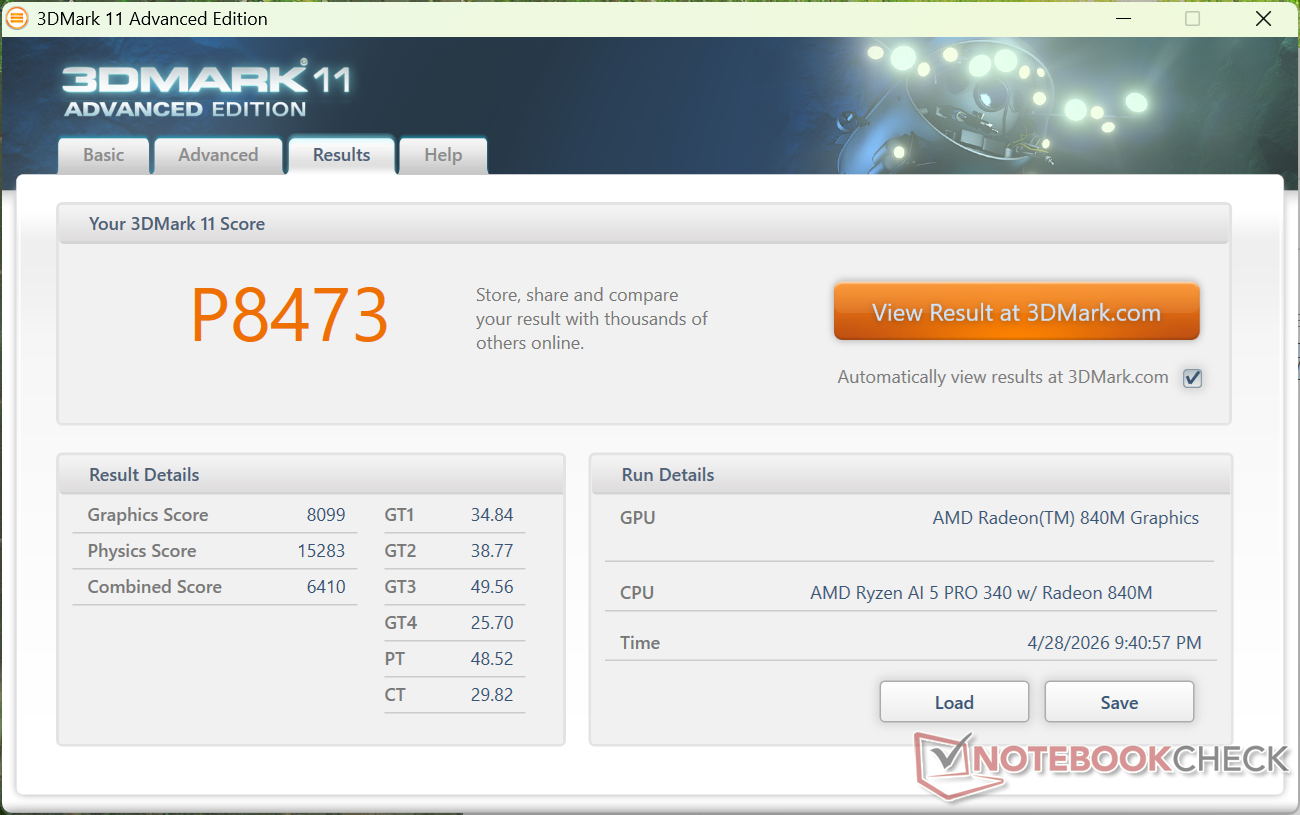
| 3DMark 11 Performance | 8473 punti | |
| 3DMark Cloud Gate Standard Score | 25064 punti | |
| 3DMark Fire Strike Score | 4968 punti | |
| 3DMark Time Spy Score | 1762 punti | |
Aiuto | ||
* ... Meglio usare valori piccoli
| Performance rating - Percent | |
| Asus NUC 15 Pro+ | |
| MSI Cubi NUC AI+ 2MG | |
| GMK NucBox K13 | |
| HP EliteBoard G1a AI | |
| Geekom A5 Pro -2! | |
| HP Pro Mini 400 G9-937U0EA -3! | |
| Cyberpunk 2077 - 1920x1080 Ultra Preset (FSR off) | |
| Asus NUC 15 Pro+ | |
| GMK NucBox K13 | |
| MSI Cubi NUC AI+ 2MG | |
| HP EliteBoard G1a AI | |
| Geekom A5 Pro | |
| HP Pro Mini 400 G9-937U0EA | |
| Baldur's Gate 3 - 1920x1080 Ultra Preset AA:T | |
| MSI Cubi NUC AI+ 2MG | |
| Asus NUC 15 Pro+ | |
| GMK NucBox K13 | |
| HP EliteBoard G1a AI | |
| GTA V - 1920x1080 Highest AA:4xMSAA + FX AF:16x | |
| MSI Cubi NUC AI+ 2MG | |
| GMK NucBox K13 | |
| HP EliteBoard G1a AI | |
| Asus NUC 15 Pro+ | |
| Geekom A5 Pro | |
| Final Fantasy XV Benchmark - 1920x1080 High Quality | |
| Asus NUC 15 Pro+ | |
| MSI Cubi NUC AI+ 2MG | |
| GMK NucBox K13 | |
| HP EliteBoard G1a AI | |
| Geekom A5 Pro | |
| HP Pro Mini 400 G9-937U0EA | |
| Strange Brigade - 1920x1080 ultra AA:ultra AF:16 | |
| MSI Cubi NUC AI+ 2MG | |
| Asus NUC 15 Pro+ | |
| GMK NucBox K13 | |
| HP EliteBoard G1a AI | |
| Dota 2 Reborn - 1920x1080 ultra (3/3) best looking | |
| Asus NUC 15 Pro+ | |
| GMK NucBox K13 | |
| HP EliteBoard G1a AI | |
| MSI Cubi NUC AI+ 2MG | |
| Geekom A5 Pro | |
| HP Pro Mini 400 G9-937U0EA | |
| X-Plane 11.11 - 1920x1080 high (fps_test=3) | |
| Asus NUC 15 Pro+ | |
| HP EliteBoard G1a AI | |
| MSI Cubi NUC AI+ 2MG | |
| Geekom A5 Pro | |
| GMK NucBox K13 | |
| HP Pro Mini 400 G9-937U0EA | |
Grafico Cyberpunk 2077 ultra FPS
| basso | medio | alto | ultra | |
|---|---|---|---|---|
| GTA V (2015) | 164.1 | 115.1 | 52.4 | 22.7 |
| Dota 2 Reborn (2015) | 160.6 | 127.2 | 80.1 | 67.7 |
| Final Fantasy XV Benchmark (2018) | 57.3 | 27 | 20.4 | |
| X-Plane 11.11 (2018) | 63.1 | 46.7 | 39.1 | |
| Strange Brigade (2018) | 128.8 | 48.1 | 40.1 | 34.5 |
| Baldur's Gate 3 (2023) | 22.7 | 18.7 | 14.3 | 14.3 |
| Cyberpunk 2077 (2023) | 26.3 | 19.7 | 15.8 | 12.6 |
| F1 24 (2024) | 48.4 | 45 | 32.4 | 6.83 |
Emissioni
Rumore del sistema
Il rumore della ventola è generalmente più evidente, dato che gli utenti siedono più vicini alle loro tastiere che ai loro desktop o mini PC. Se si eseguono carichi molto impegnativi, l'EliteBoard può essere rumoroso come alcuni computer portatili in condizioni simili. Per il resto, la ventola è discreta e non presenta grossi problemi di pulsazioni quando si naviga sul web o si sta al minimo.
Rumorosità
| Idle |
| 24.1 / 24.1 / 25.8 dB(A) |
| Sotto carico |
| 40.5 / 45.2 dB(A) |
 | ||
30 dB silenzioso 40 dB(A) udibile 50 dB(A) rumoroso |
||
min: | ||
| HP EliteBoard G1a AI Ryzen AI 5 340, Radeon 840M | Geekom A5 Pro R5 7530U, Vega 7 | GMK NucBox K13 Core Ultra 7 256V, Arc 140V | Asus NUC 15 Pro+ Ultra 9 285H, Arc 140T | MSI Cubi NUC AI+ 2MG Core Ultra 7 258V, Arc 140V | HP Pro Mini 400 G9-937U0EA i5-14500T, UHD Graphics 770 | |
|---|---|---|---|---|---|---|
| Noise | 6% | -1% | -14% | -15% | 2% | |
| off /ambiente * (dB) | 23.6 | 25 -6% | 23.3 1% | 25.3 -7% | 24.8 -5% | 24.8 -5% |
| Idle Minimum * (dB) | 24.1 | 26.6 -10% | 24.5 -2% | 25.4 -5% | 28 -16% | 26.9 -12% |
| Idle Average * (dB) | 24.1 | 26.6 -10% | 25 -4% | 25.5 -6% | 36.1 -50% | 26.9 -12% |
| Idle Maximum * (dB) | 25.8 | 26.7 -3% | 25.1 3% | 37.3 -45% | 36.1 -40% | 26.9 -4% |
| Load Average * (dB) | 40.5 | 33.5 17% | 40.1 1% | 44.4 -10% | 38.9 4% | 32.5 20% |
| Cyberpunk 2077 ultra * (dB) | 42.2 | 31.2 26% | 44.2 -5% | 46.2 -9% | 37 12% | 37.2 12% |
| Load Maximum * (dB) | 45.2 | 33.8 25% | 45.1 -0% | 52.7 -17% | 49.2 -9% | 37.2 18% |
| Witcher 3 ultra * (dB) | 31.2 | 47.7 |
* ... Meglio usare valori piccoli
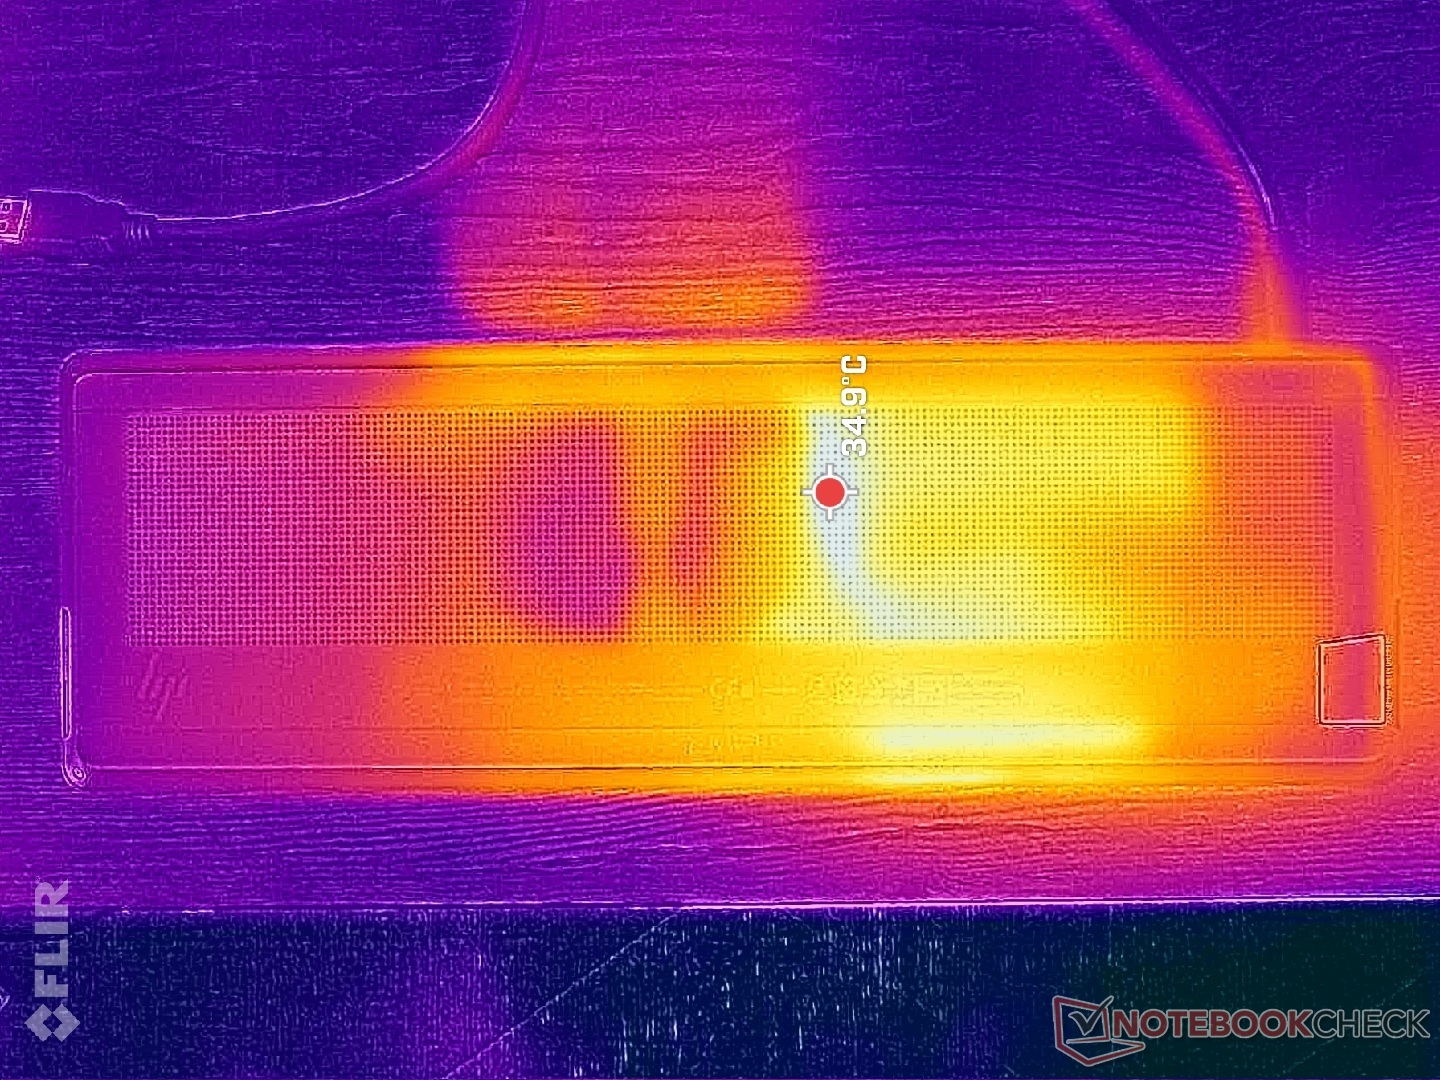
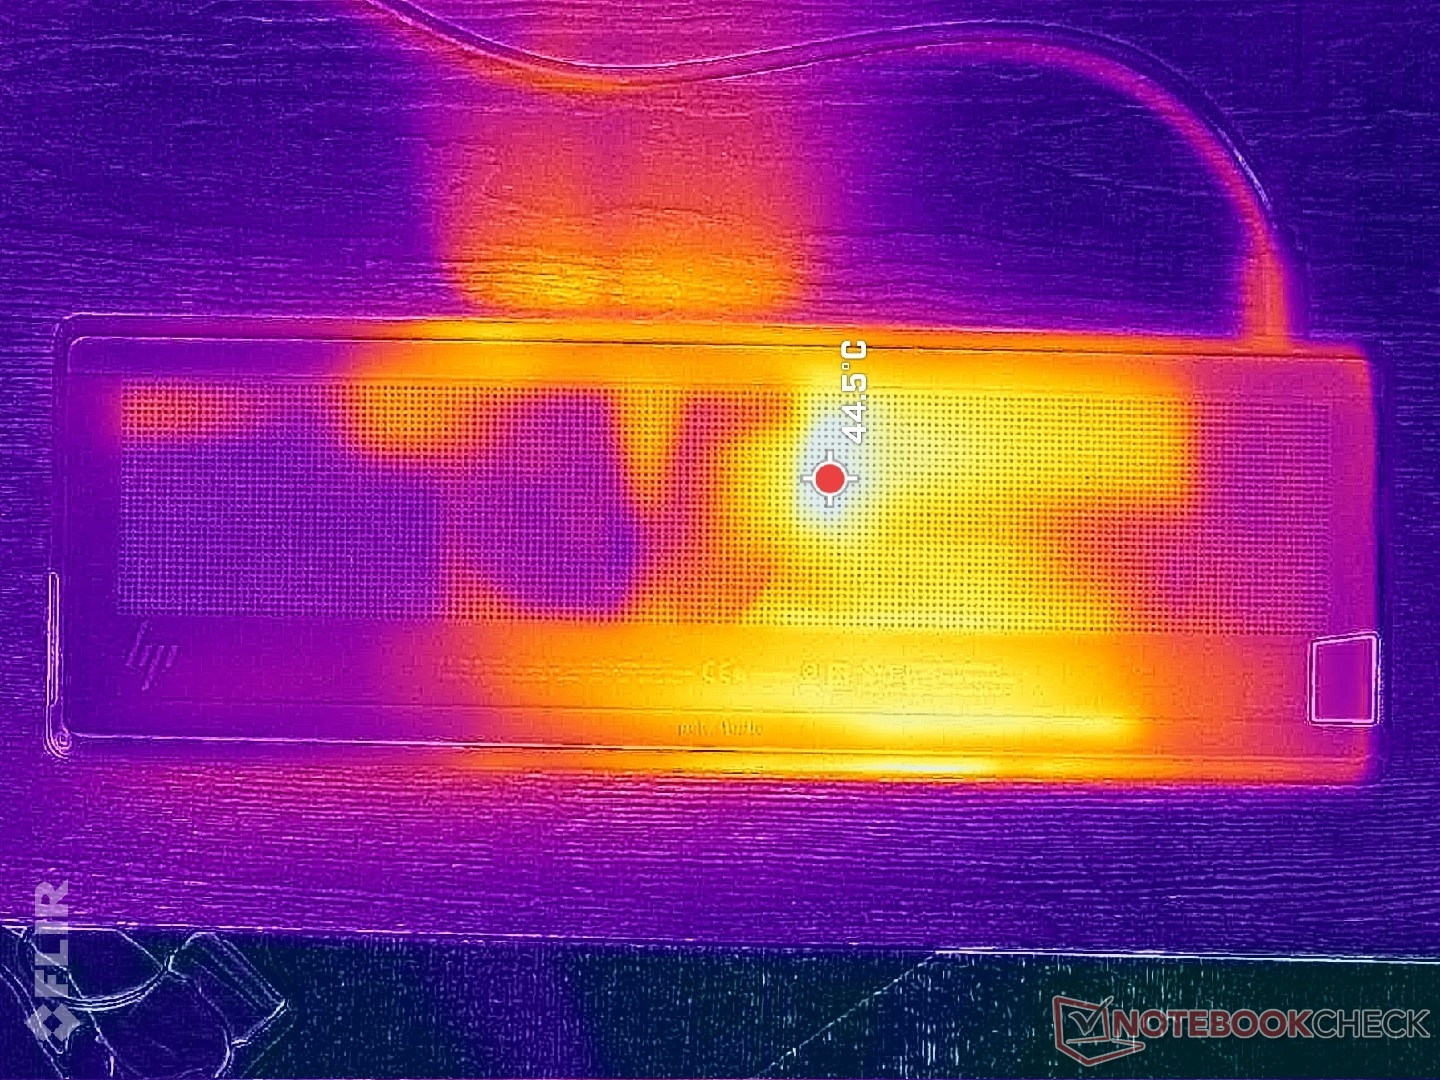
Temperatura
I punti caldi possono raggiungere i 39 C sulla parte centrale della tastiera o i 43 C sulla parte inferiore quando si eseguono carichi impegnativi per lunghi periodi. Sebbene il calore sia percepibile durante la digitazione, non abbiamo mai riscontrato un calore fastidioso, poiché il contatto con la punta delle dita è minimo durante l'uso regolare.
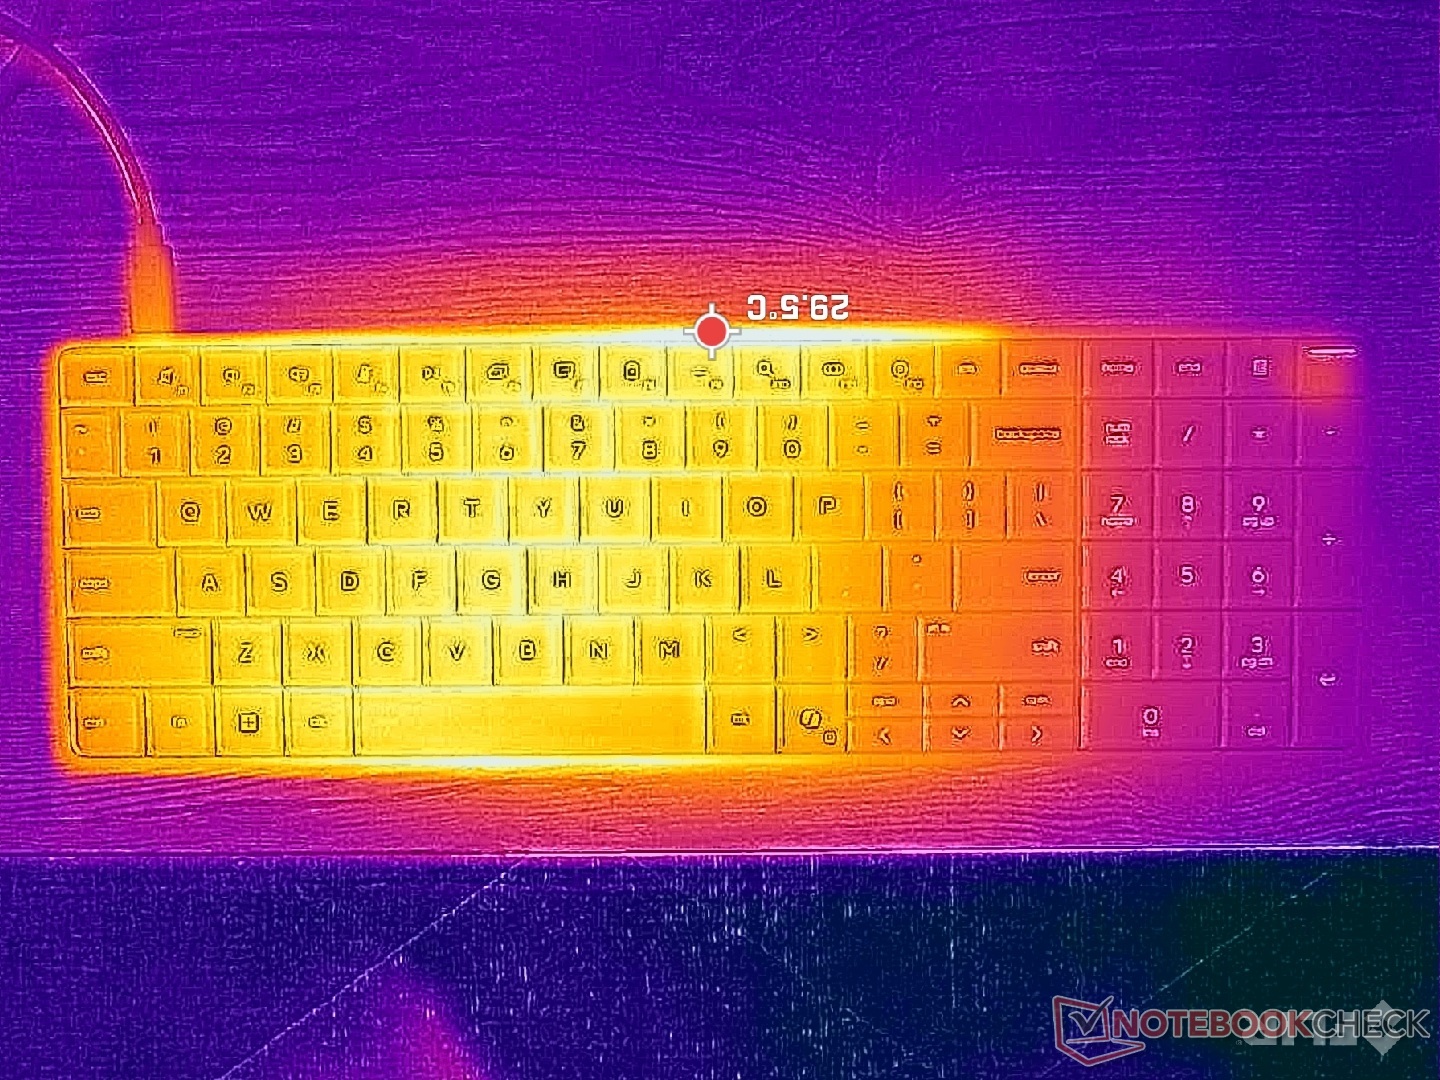
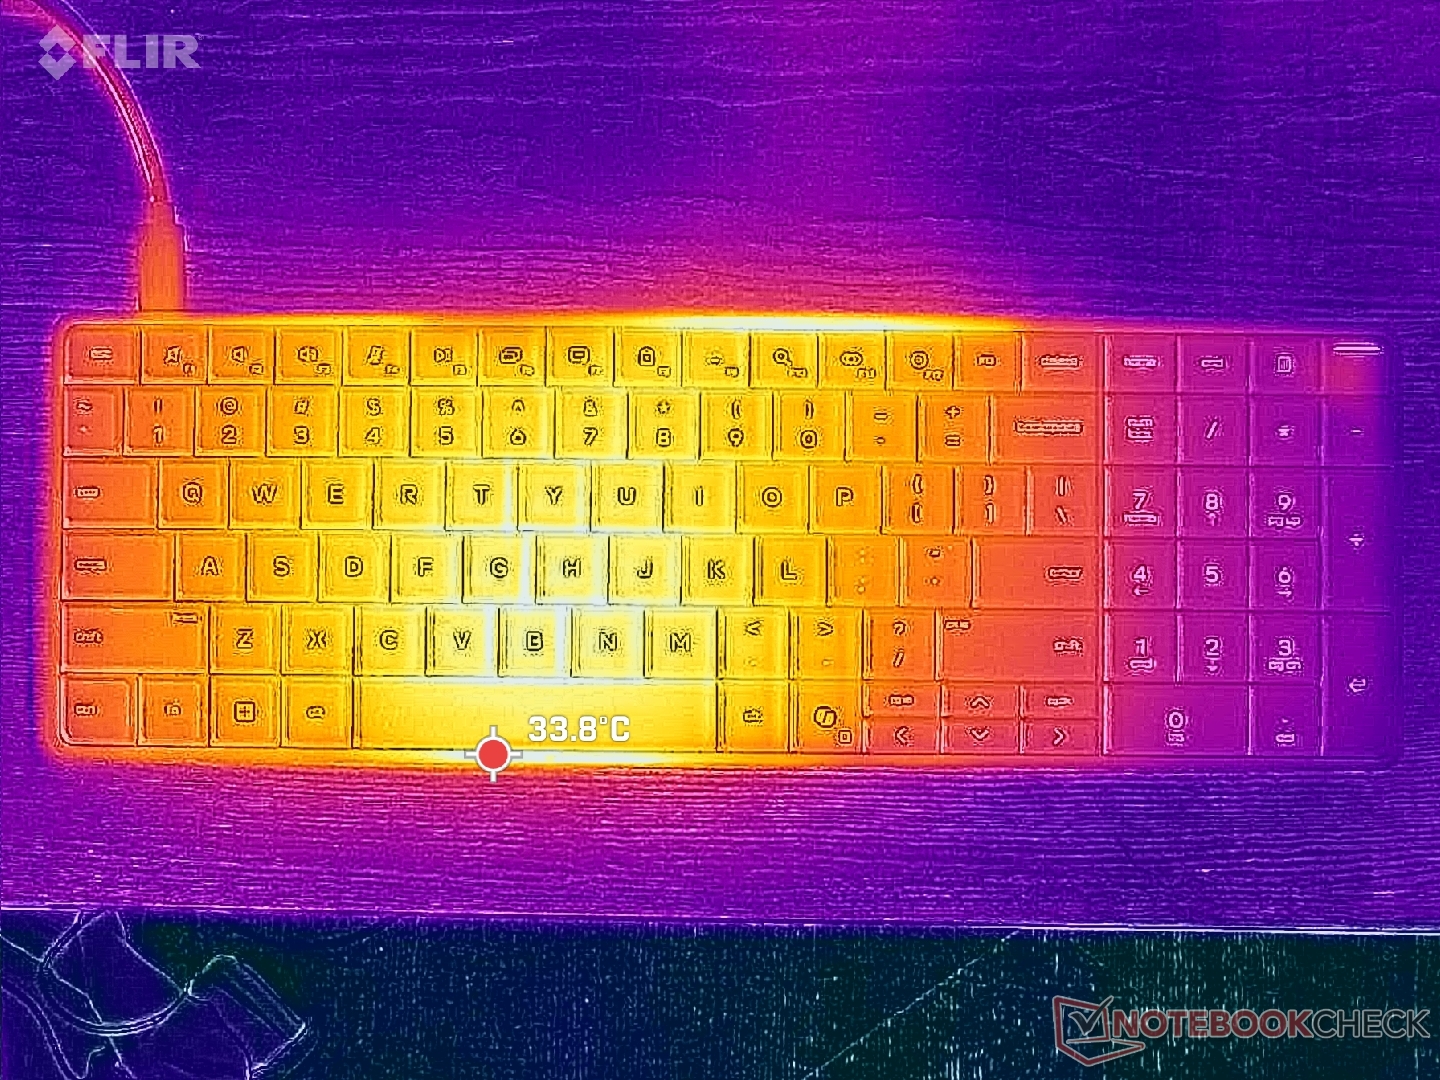
(+) La temperatura massima sul lato superiore è di 38.4 °C / 101 F, rispetto alla media di 35.5 °C / 96 F, che varia da 20.6 a 69.5 °C per questa classe Mini PC.
(±) Il lato inferiore si riscalda fino ad un massimo di 42.6 °C / 109 F, rispetto alla media di 36.2 °C / 97 F
(+) In idle, la temperatura media del lato superiore è di 30.4 °C / 87 F, rispetto alla media deld ispositivo di 32.2 °C / 90 F.
| HP EliteBoard G1a AI Ryzen AI 5 340, Radeon 840M | Geekom A5 Pro R5 7530U, Vega 7 | GMK NucBox K13 Core Ultra 7 256V, Arc 140V | Asus NUC 15 Pro+ Ultra 9 285H, Arc 140T | MSI Cubi NUC AI+ 2MG Core Ultra 7 258V, Arc 140V | HP Pro Mini 400 G9-937U0EA i5-14500T, UHD Graphics 770 | |
|---|---|---|---|---|---|---|
| Heat | 16% | 7% | 4% | 26% | 11% | |
| Maximum Upper Side * (°C) | 38.4 | 36.7 4% | 31.6 18% | 42.2 -10% | 30.8 20% | 35.7 7% |
| Maximum Bottom * (°C) | 42.6 | 40.5 5% | 50.6 -19% | 31.3 27% | 26.4 38% | 39.6 7% |
| Idle Upper Side * (°C) | 32.4 | 23.1 29% | 27 17% | 34.9 -8% | 26.4 19% | 28.6 12% |
| Idle Bottom * (°C) | 34.6 | 25.1 27% | 31.2 10% | 32.2 7% | 25.4 27% | 29 16% |
* ... Meglio usare valori piccoli
Test da sforzo
La CPU ha raggiunto i 3,7 GHz e i 54 W, prima di scendere rapidamente a 3,3 GHz e 33 W, per una temperatura costante del nucleo di 72 C. Il potenziale Turbo Boost è limitato, come ci si aspetta da un sistema che punta più sulla versatilità che sulle prestazioni grezze. La fascia media di 70 C quando si eseguono carichi impegnativi è tipica, se non leggermente più fredda della maggior parte dei subnotebook.
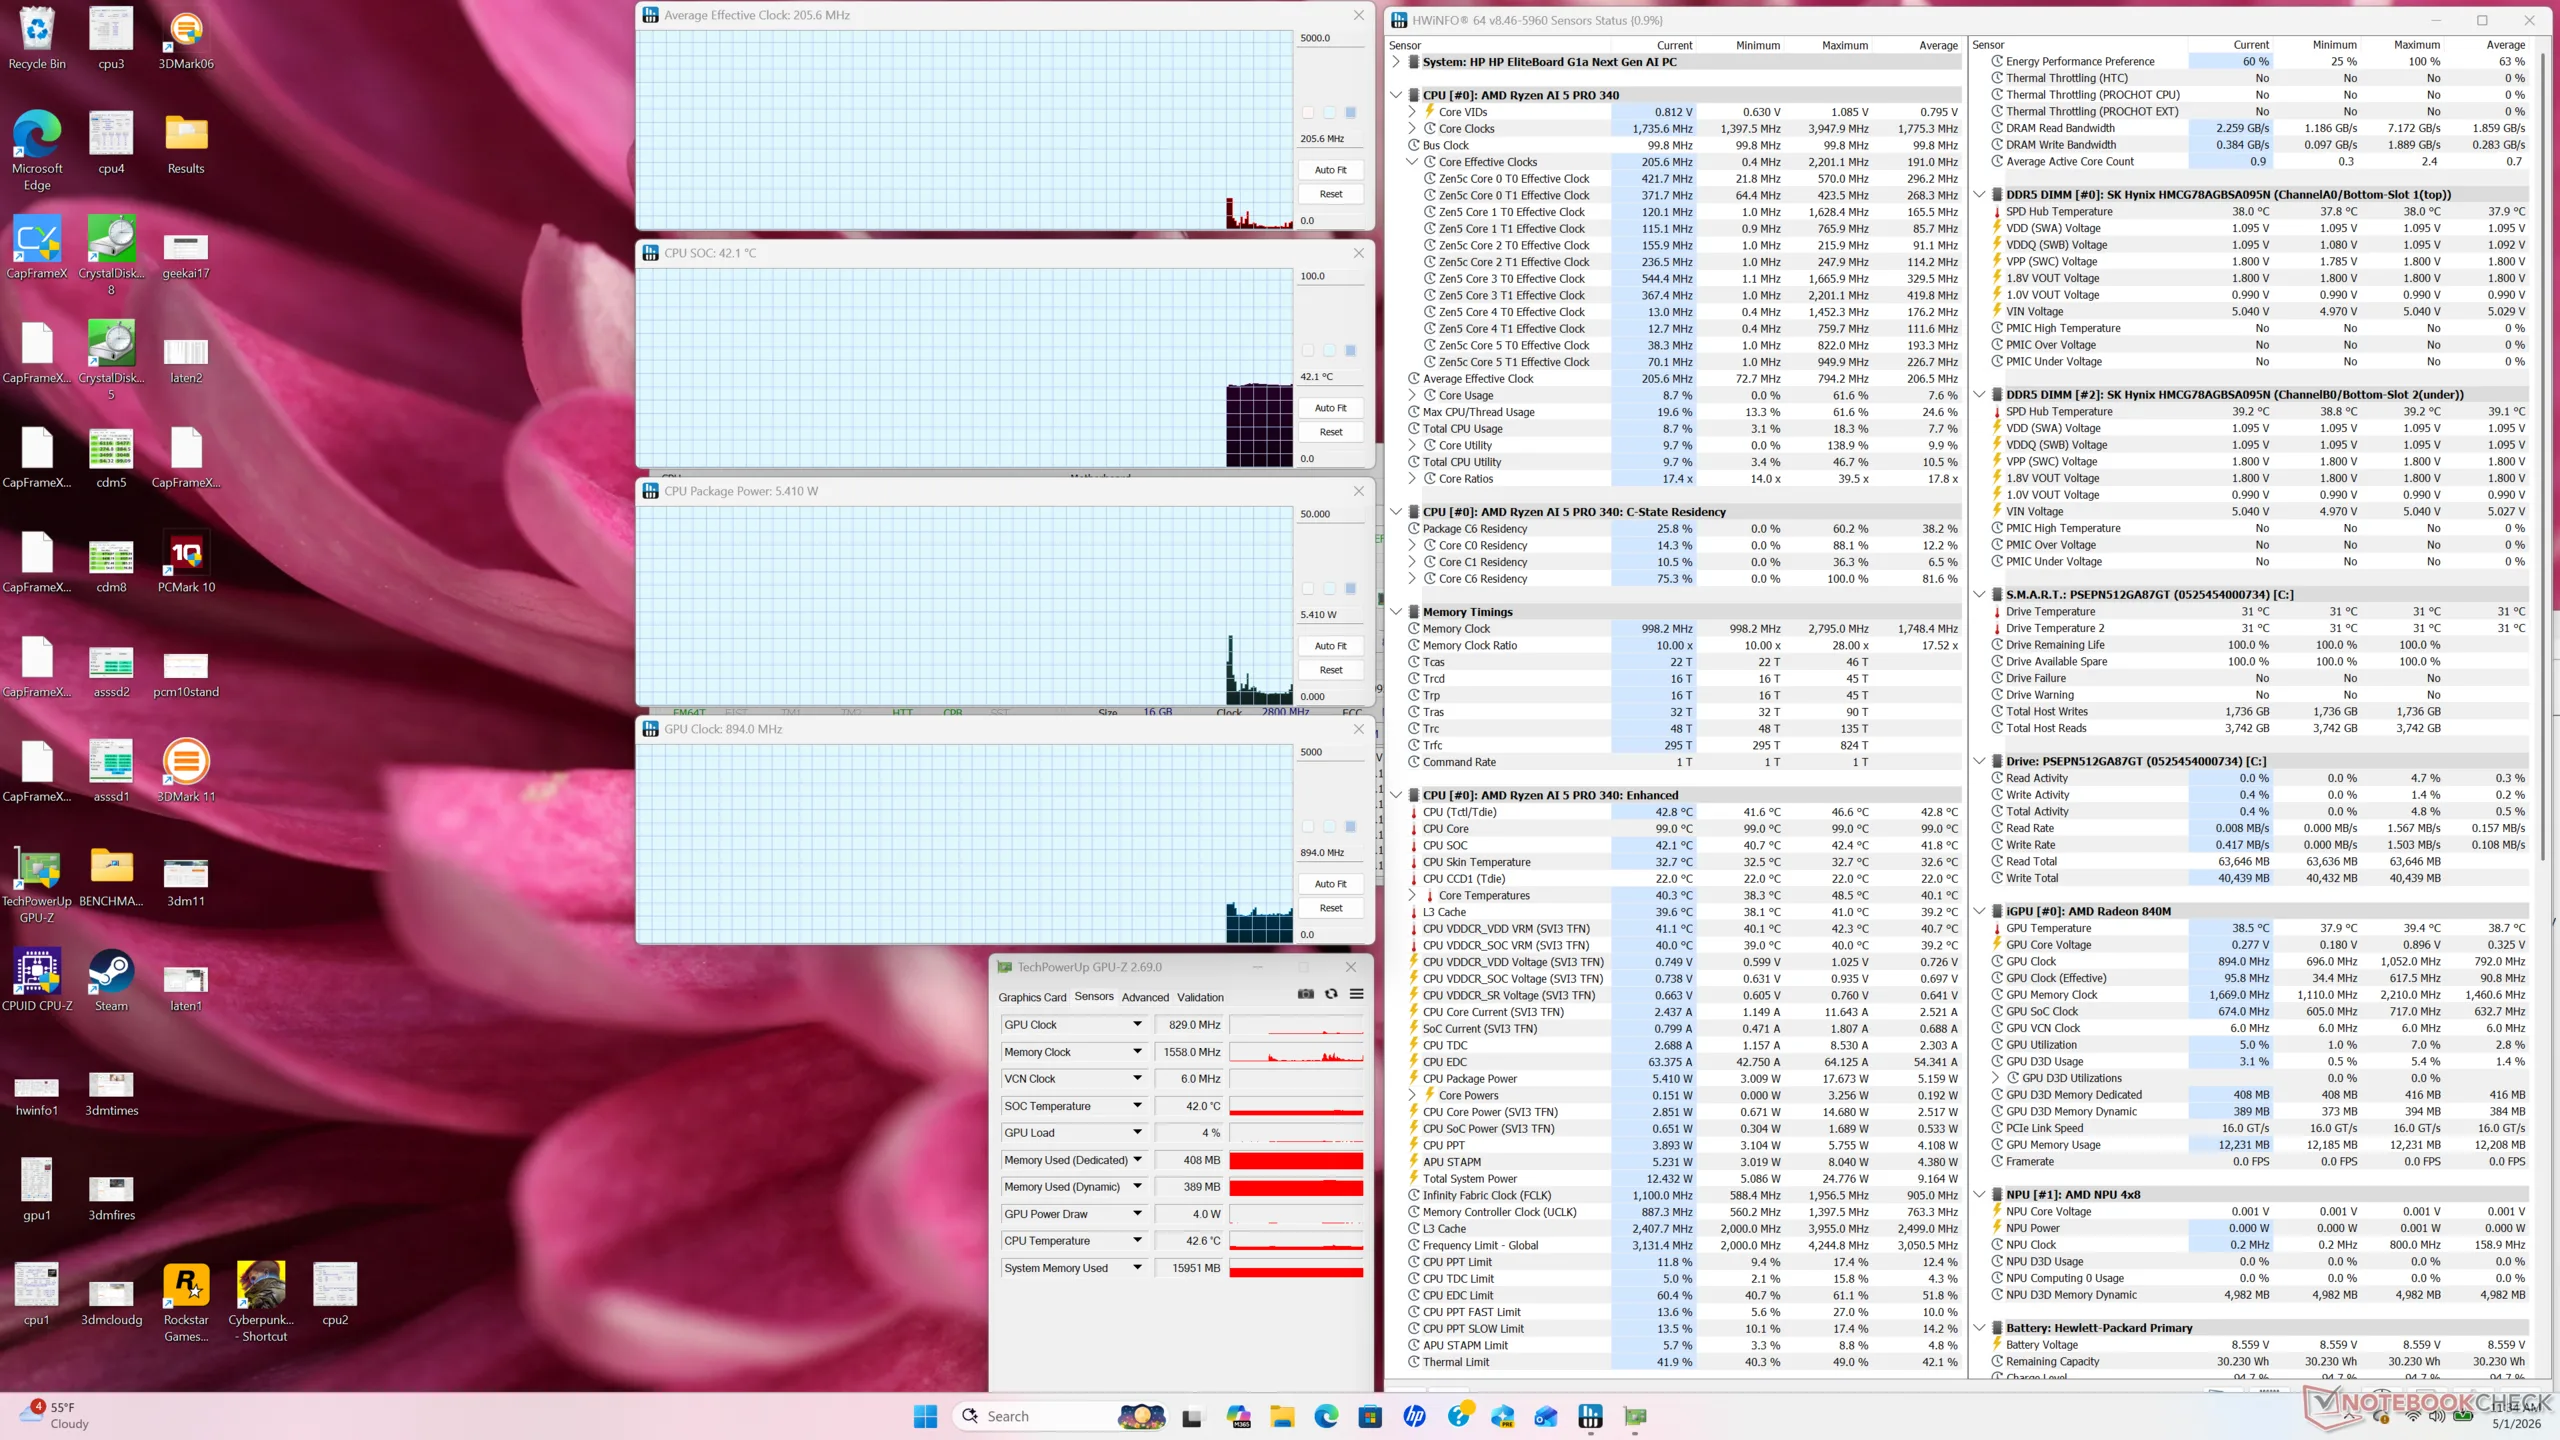
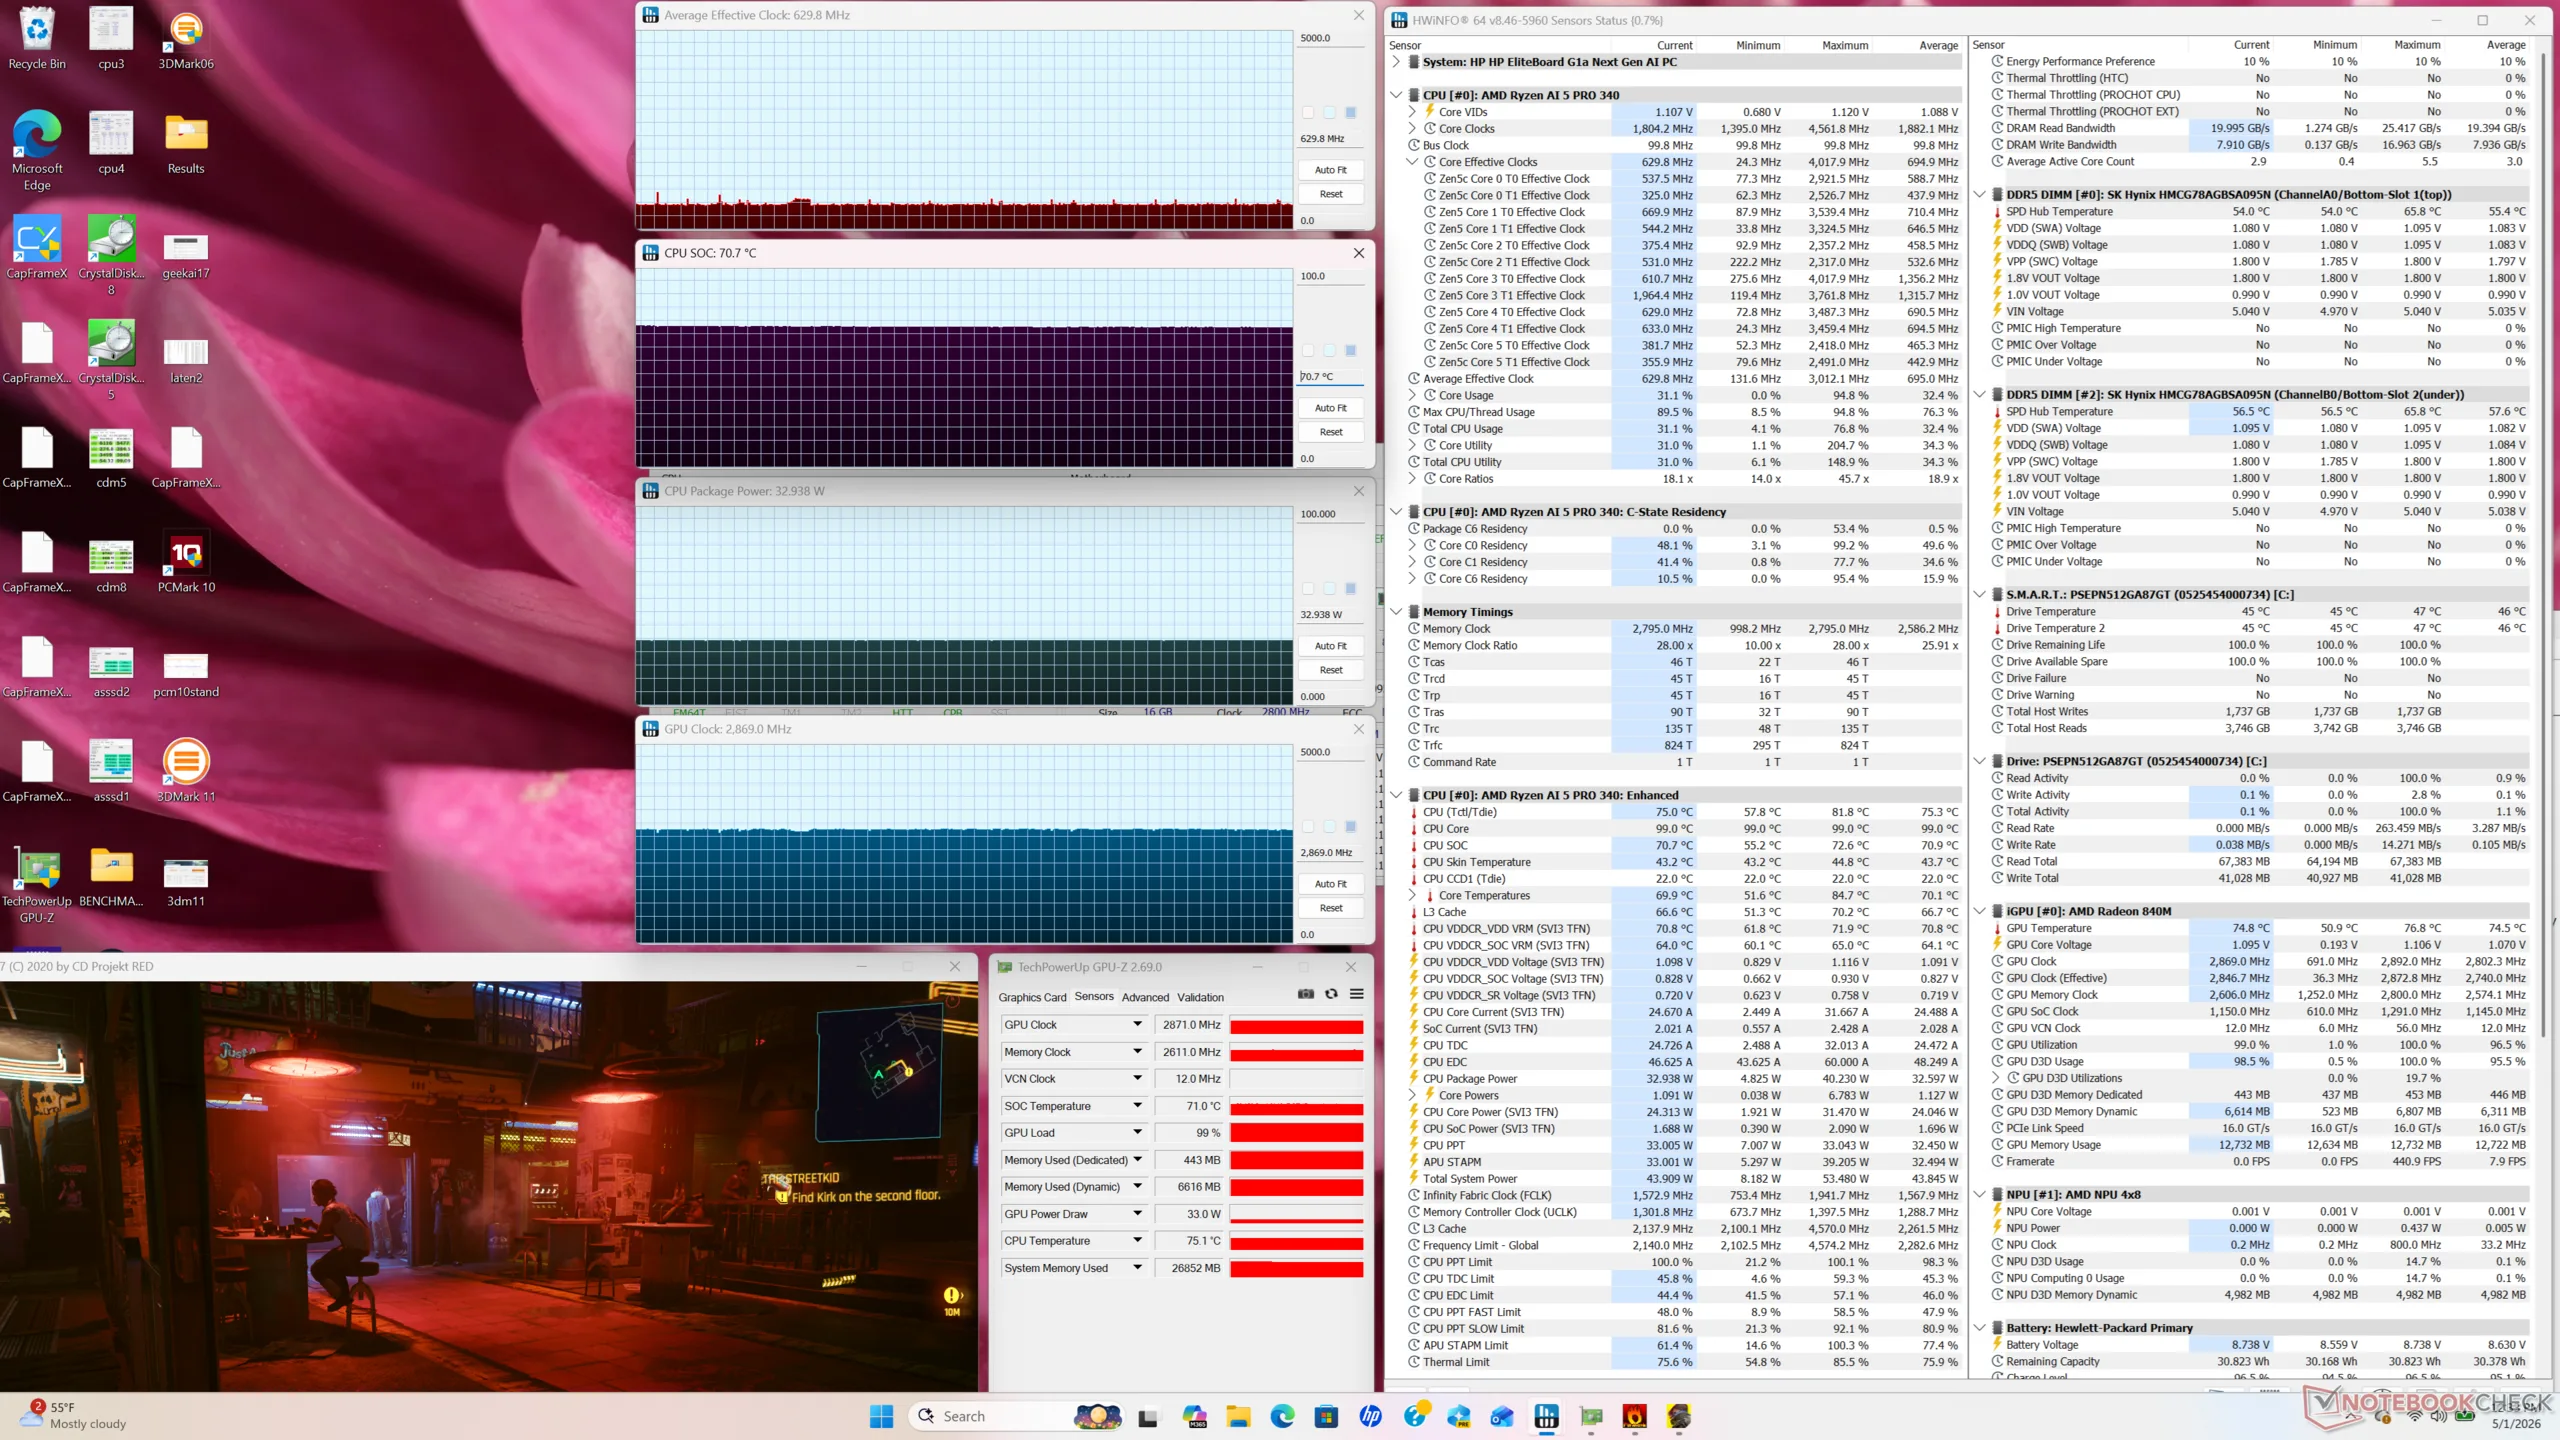
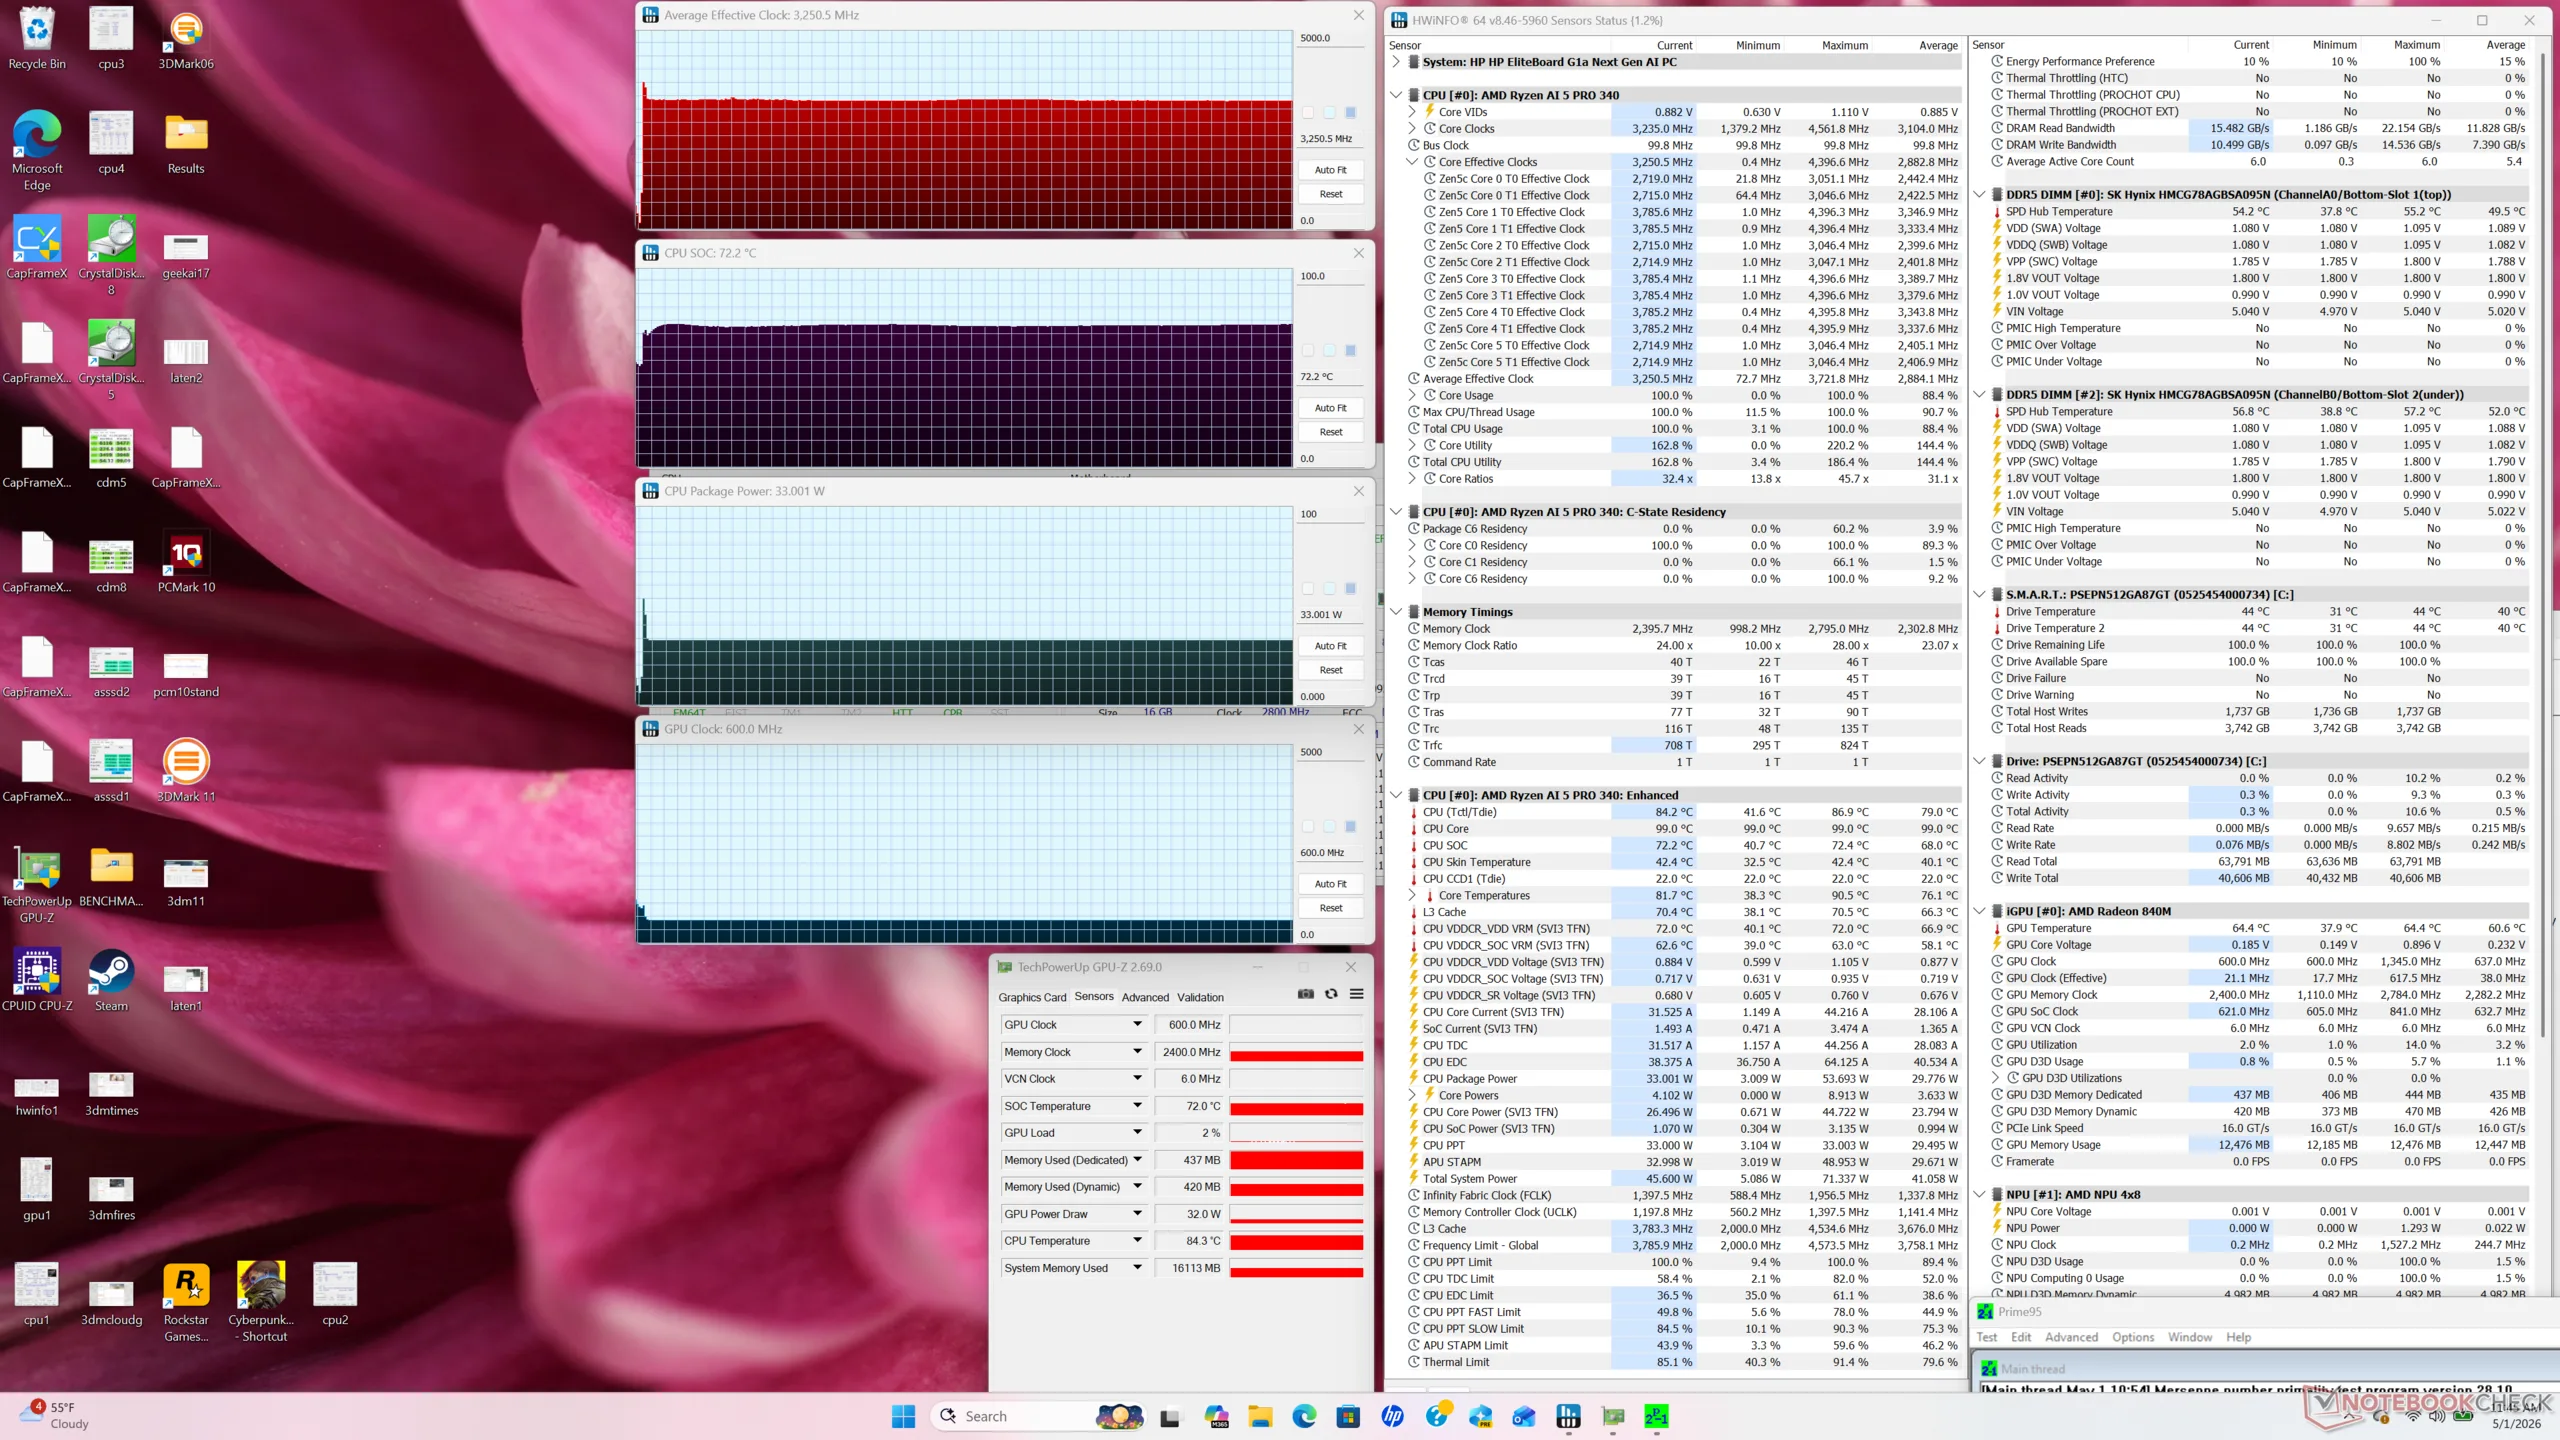
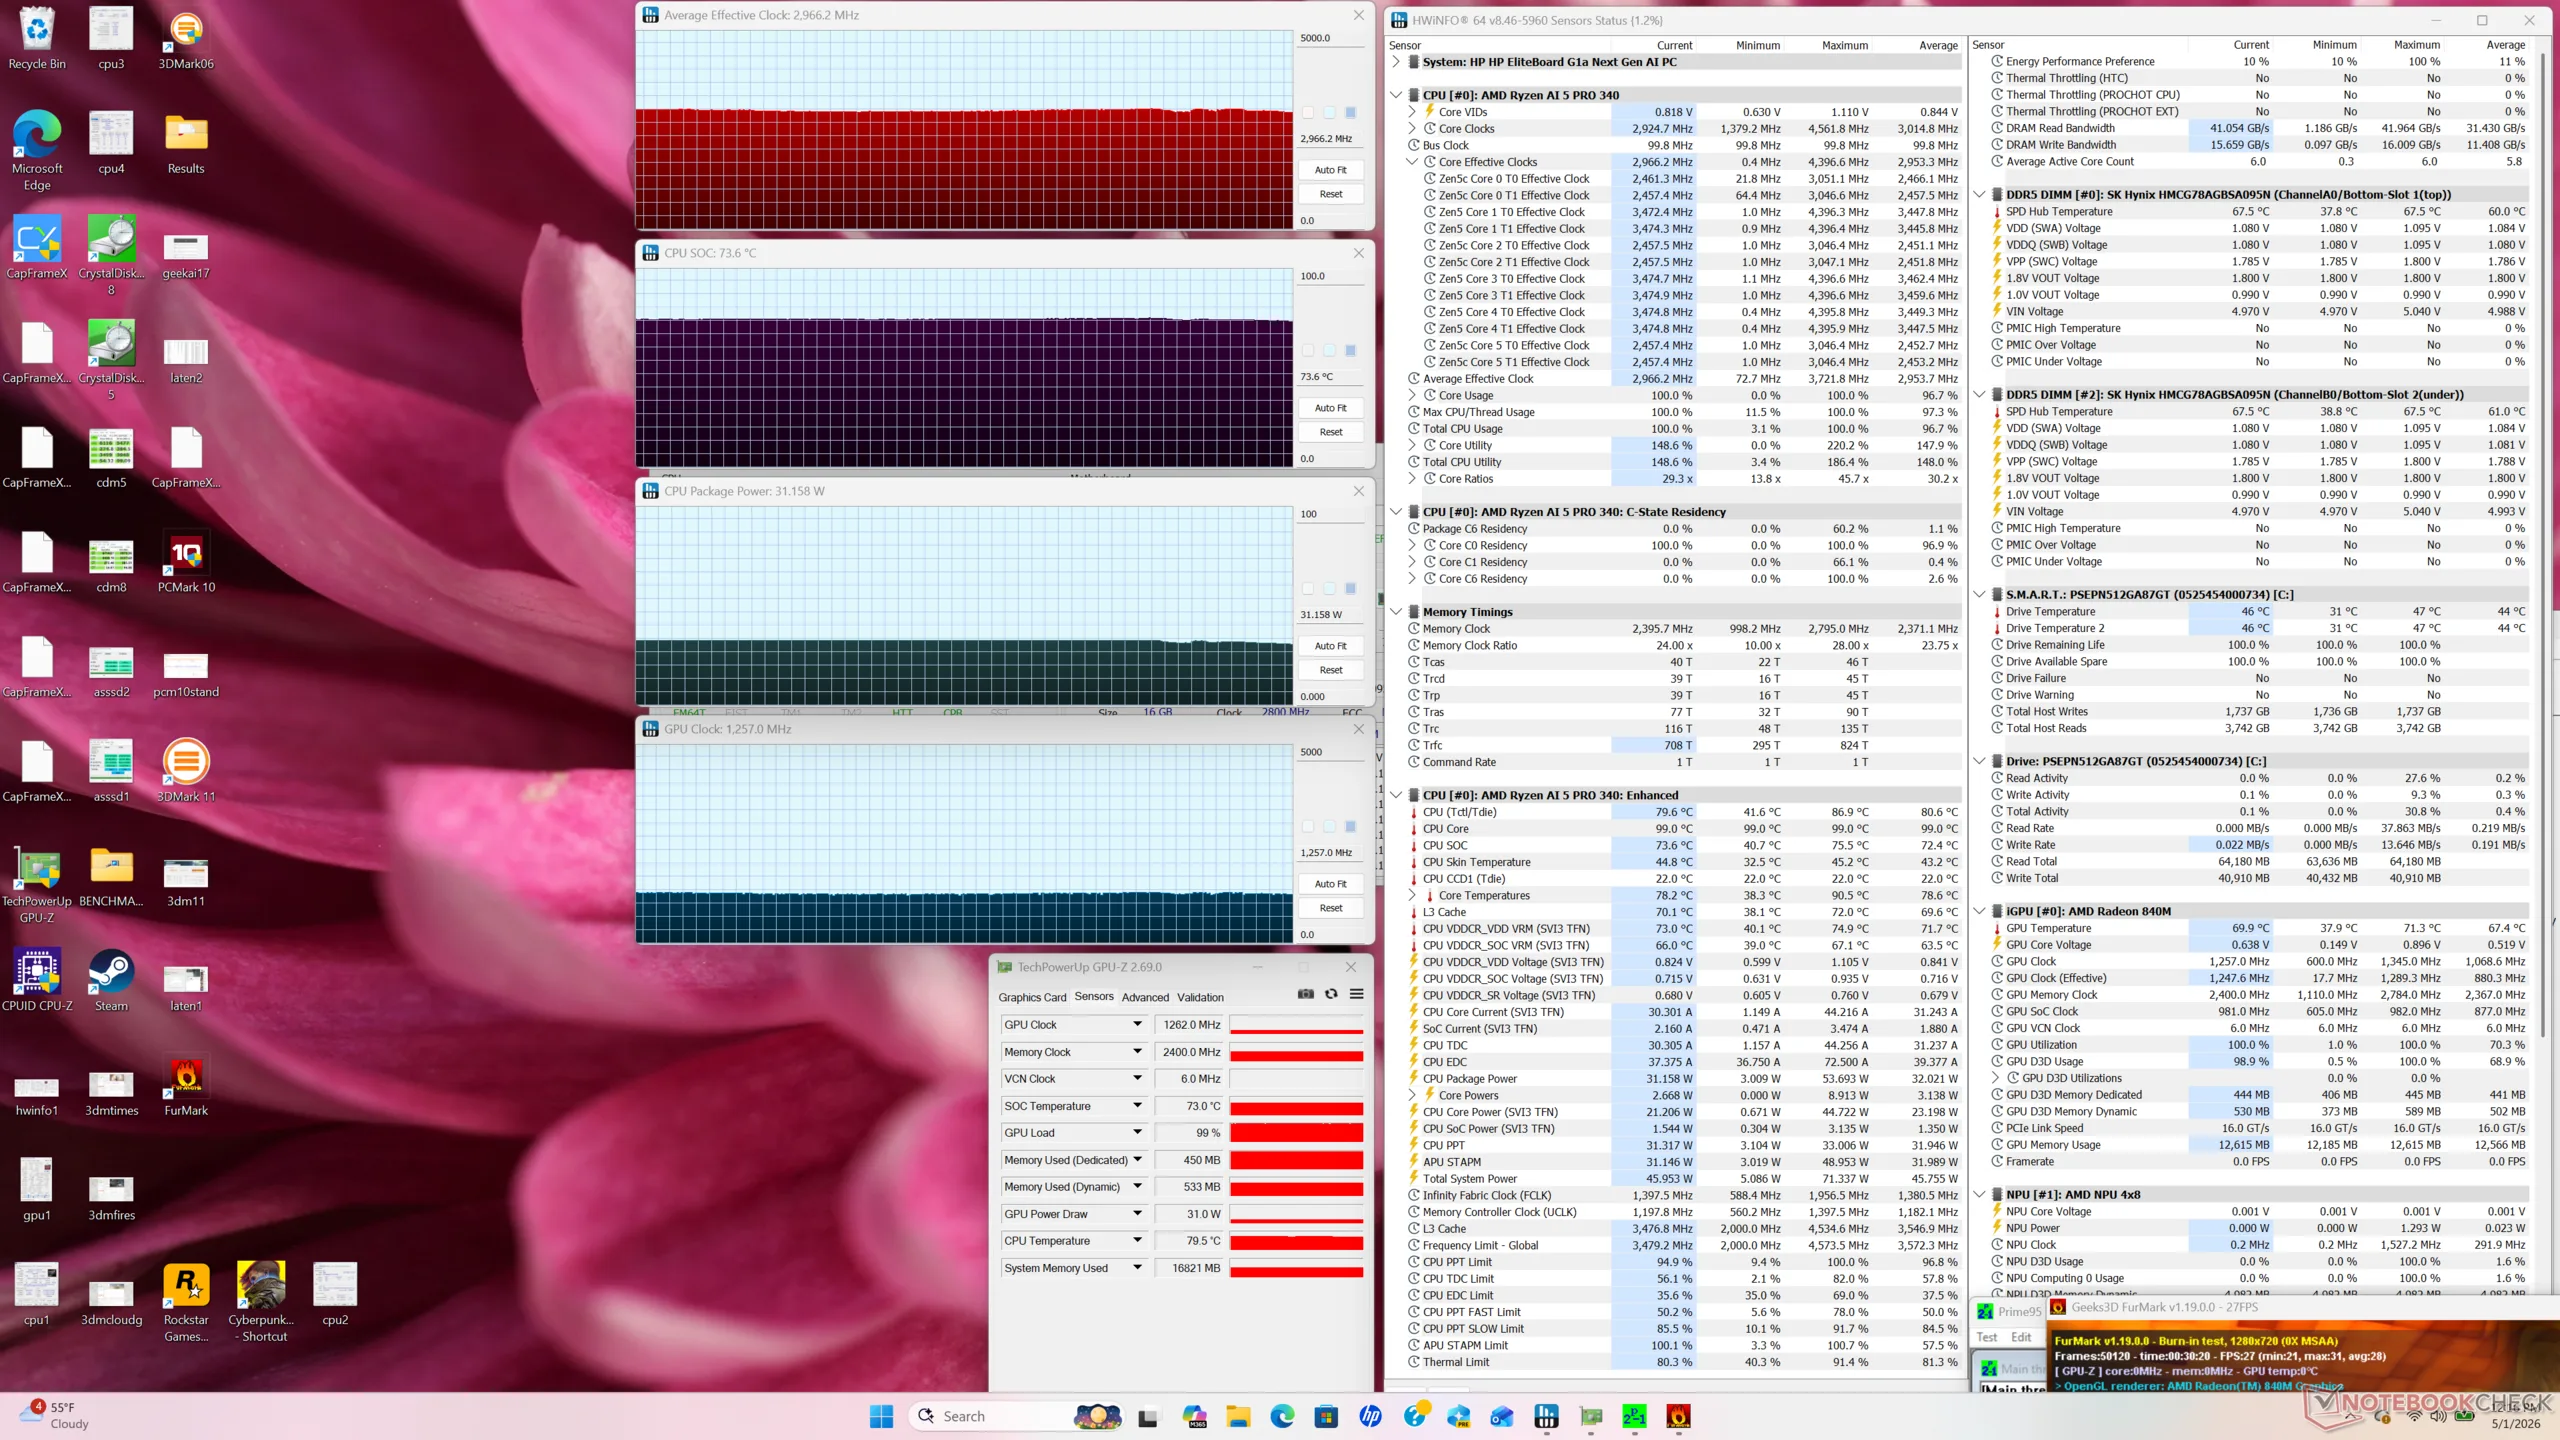
| Clock medio della CPU (GHz) | Clock della GPU (MHz) | Temperatura media della CPU (°C) | |
| Sistema inattivo | -- | 696 | 42 |
| Prime95 Stress | 3.3 | -- | 72 |
| Prime95 + FurMark Stress | 3.0 | 1257 | 74 |
| Cyberpunk 2077 Stress | 0,6 | 2869 | 71 |
Altoparlanti
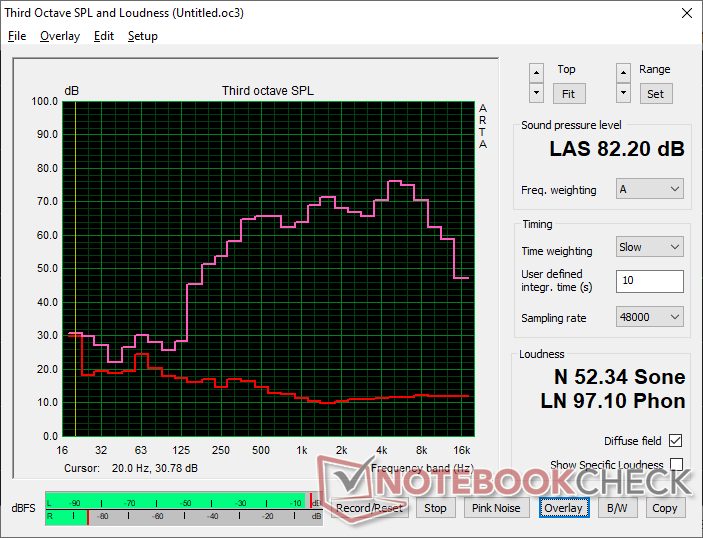
HP EliteBoard G1a AI analisi audio
(+) | gli altoparlanti sono relativamente potenti (82.2 dB)
Bassi 100 - 315 Hz
(-) | quasi nessun basso - in media 21% inferiori alla media
(±) | la linearità dei bassi è media (11% delta rispetto alla precedente frequenza)
Medi 400 - 2000 Hz
(+) | medi bilanciati - solo only 2.4% rispetto alla media
(+) | medi lineari (5.4% delta rispetto alla precedente frequenza)
Alti 2 - 16 kHz
(±) | alti elevati - circa 5.5% superiori alla media
(±) | la linearità degli alti è media (7.2% delta rispetto alla precedente frequenza)
Nel complesso 100 - 16.000 Hz
(±) | la linearità complessiva del suono è media (17.9% di differenza rispetto alla media
Rispetto alla stessa classe
» 21% di tutti i dispositivi testati in questa classe è stato migliore, 7% simile, 71% peggiore
» Il migliore ha avuto un delta di 13%, medio di 24%, peggiore di 64%
Rispetto a tutti i dispositivi testati
» 37% di tutti i dispositivi testati in questa classe è stato migliore, 8% similare, 55% peggiore
» Il migliore ha avuto un delta di 4%, medio di 24%, peggiore di 134%
Apple MacBook Pro 16 2021 M1 Pro analisi audio
(+) | gli altoparlanti sono relativamente potenti (84.7 dB)
Bassi 100 - 315 Hz
(+) | bassi buoni - solo 3.8% dalla media
(+) | bassi in lineaa (5.2% delta rispetto alla precedente frequenza)
Medi 400 - 2000 Hz
(+) | medi bilanciati - solo only 1.3% rispetto alla media
(+) | medi lineari (2.1% delta rispetto alla precedente frequenza)
Alti 2 - 16 kHz
(+) | Alti bilanciati - appena 1.9% dalla media
(+) | alti lineari (2.7% delta rispetto alla precedente frequenza)
Nel complesso 100 - 16.000 Hz
(+) | suono nel complesso lineare (4.6% differenza dalla media)
Rispetto alla stessa classe
» 0% di tutti i dispositivi testati in questa classe è stato migliore, 0% simile, 100% peggiore
» Il migliore ha avuto un delta di 5%, medio di 17%, peggiore di 45%
Rispetto a tutti i dispositivi testati
» 0% di tutti i dispositivi testati in questa classe è stato migliore, 0% similare, 100% peggiore
» Il migliore ha avuto un delta di 4%, medio di 24%, peggiore di 134%
Gestione dell'energia
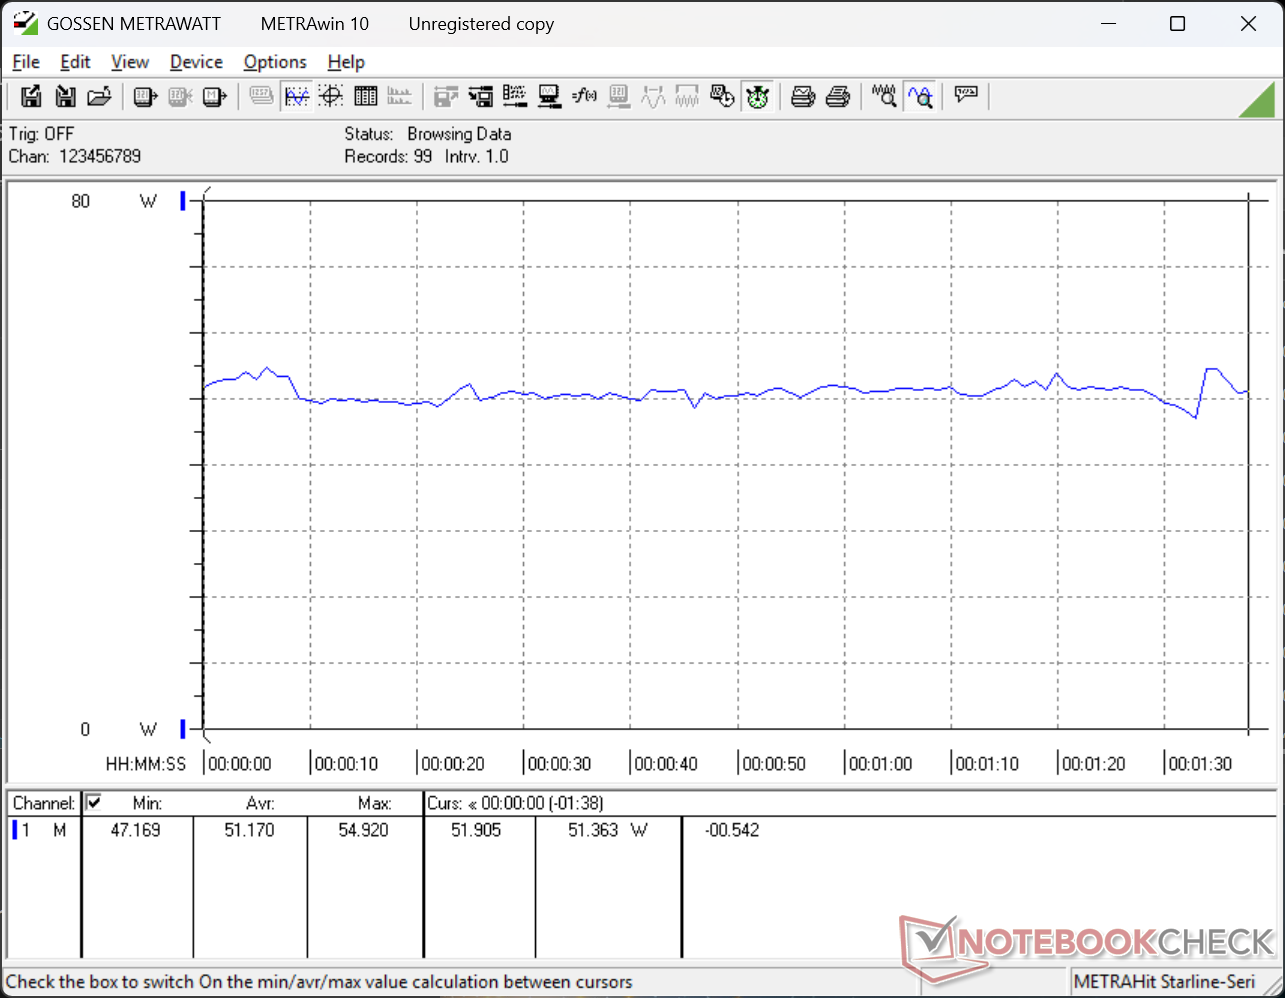
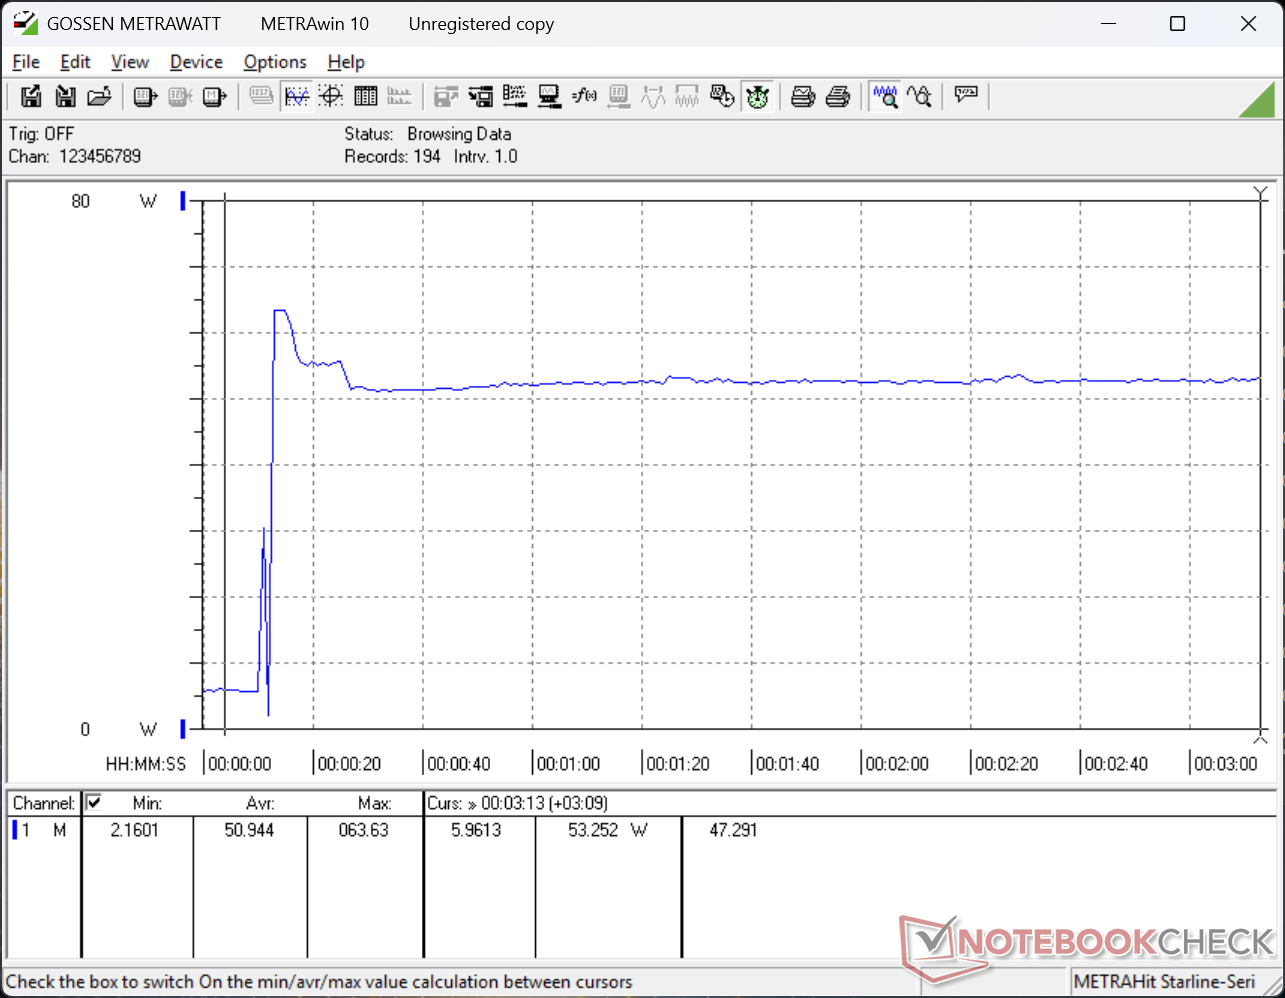
Consumo di energia
Il consumo può raggiungere i 50 W quando è sotto carico, per essere più esigente dei mini PC Lunar Lake come NucBox K13. Tuttavia, i tweens bassi sono più comuni quando si naviga semplicemente sul web o si sta al minimo.
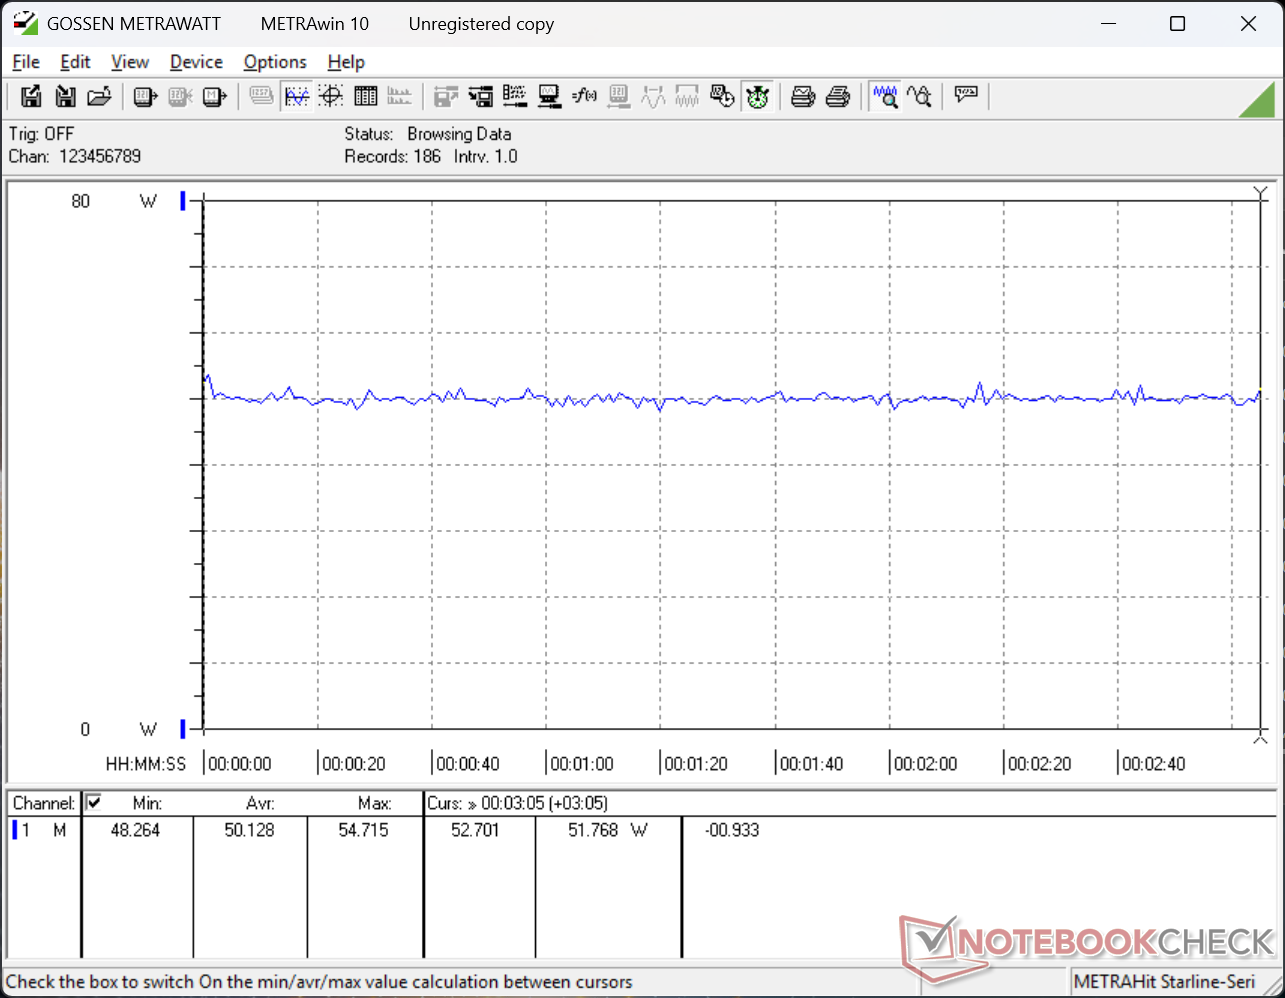
| Off / Standby | |
| Idle | |
| Sotto carico |
|
Leggenda:
min: | |
| HP EliteBoard G1a AI Ryzen AI 5 340, Radeon 840M, , , x, | Geekom A5 Pro R5 7530U, Vega 7, Wodposit WPBSN4M8-1TGP, , x, | GMK NucBox K13 Core Ultra 7 256V, Arc 140V, Huawei eKitStor Xtreme 200e 1 TB, , x, | Asus NUC 15 Pro+ Ultra 9 285H, Arc 140T, Micron 3500 1TB MTFDKBA1T0TGD, , x, | MSI Cubi NUC AI+ 2MG Core Ultra 7 258V, Arc 140V, Phison 1 TB ESR01TBTCCZ-27J, , x, | HP Pro Mini 400 G9-937U0EA i5-14500T, UHD Graphics 770, HP PSEJN512GA87EC0, , x, | |
|---|---|---|---|---|---|---|
| Power Consumption | 33% | 39% | -32% | 9% | -22% | |
| Idle Minimum * (Watt) | 4.7 | 3.2 32% | 2.3 51% | 3.9 17% | 2.9 38% | 4.9 -4% |
| Idle Average * (Watt) | 5.4 | 4.3 20% | 3.6 33% | 6.1 -13% | 5.7 -6% | 8 -48% |
| Idle Maximum * (Watt) | 7.9 | 5.1 35% | 5.8 27% | 8.2 -4% | 10.2 -29% | 13.3 -68% |
| Load Average * (Watt) | 51.2 | 32.1 37% | 27.3 47% | 56.1 -10% | 38.7 24% | 44.6 13% |
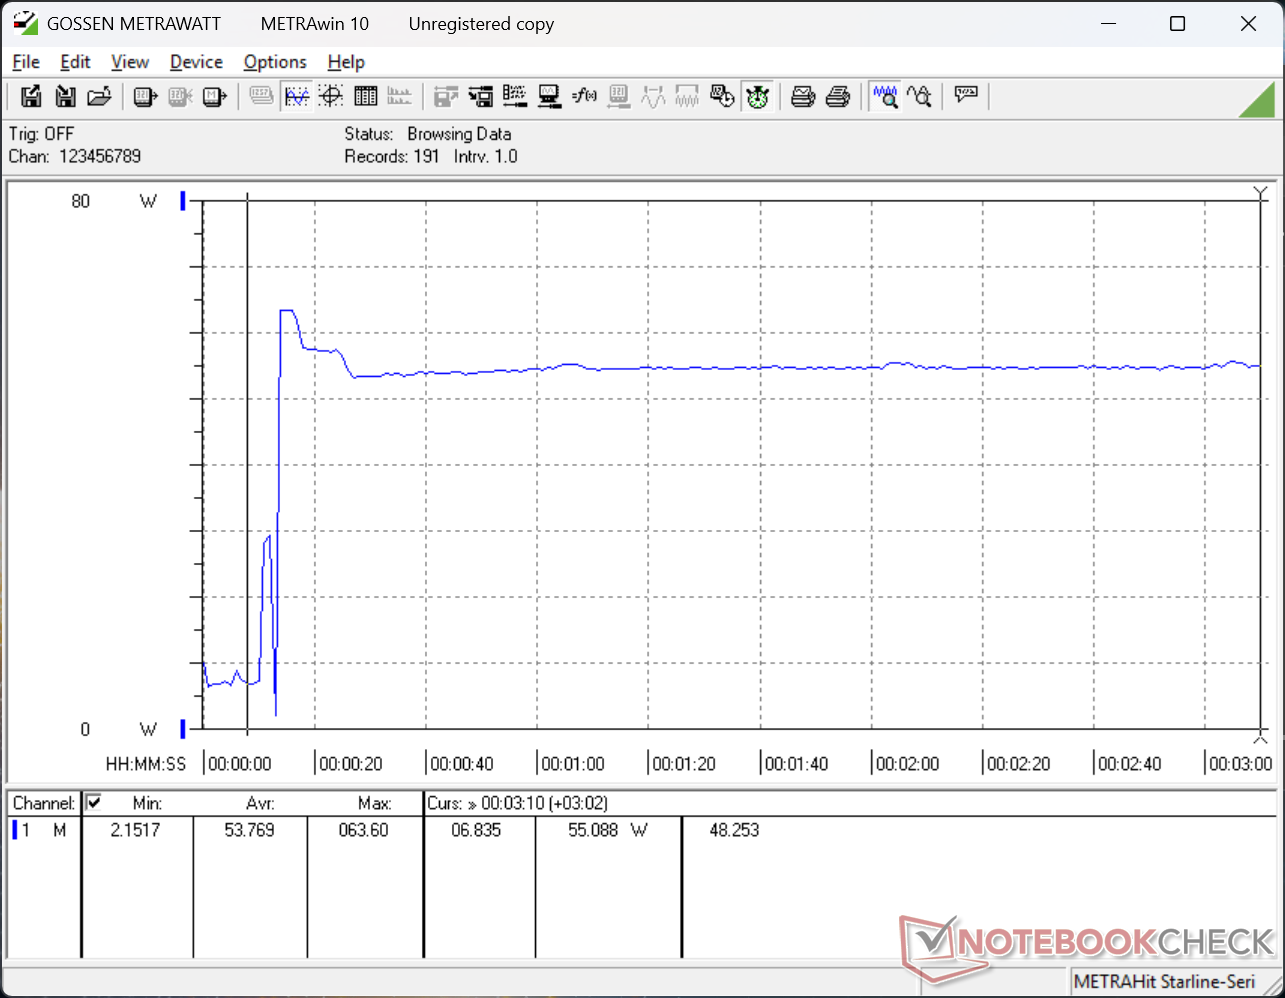
| Cyberpunk 2077 ultra external monitor * (Watt) | 50.1 | 29.4 41% | 31.6 37% | 63.9 -28% | 41.1 18% | 49 2% |
| Load Maximum * (Watt) | 63.6 | 43.5 32% | 39.6 38% | 160.6 -153% | 60 6% | 81.3 -28% |
* ... Meglio usare valori piccoli
Consumo di energia Cyberpunk / Stress Test
Consumo di energia del monitor esterno
Durata della batteria
La piccola batteria opzionale da 32 Wh può durare circa 8 ore di navigazione WLAN costante quando è collegata a un monitor HDMI. Quando è collegato via USB-C con PD, la durata della batteria diventa un non problema.
Valutazione Notebookcheck
Un PC-in-a-tastiera perfetto per gli spazi di lavoro più ristretti o per i terminali in cui un PC tower tradizionale può essere eccessivo. Tuttavia, il sistema solo USB-C si basa molto sugli adattatori.
HP EliteBoard G1a AI
- 05/05/2026 v8
Allen Ngo
 Total Sustainability Score:
 Potenziali concorrenti a confronto
Immagine | Modello | Prezzo | Peso | Altezza | Schermo |
|---|---|---|---|---|---|
1. 75.6%  | HP EliteBoard G1a AI AMD Ryzen AI 5 PRO 340 ⎘ AMD Radeon 840M ⎘ 32 GB Memoria | Amazon: 1. $1,609.93 HP EliteBoard G1a Next Gen A... 2. $4,429.43 HP ZBook 8 G1as 14" Copilot+... 3. $124.99 HP Elite x2 G8 Premium Keybo... Prezzo di listino: 1800 USD | 771 gr | 17.9 mm | x |
2. 72.6% 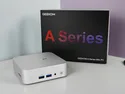 | Geekom A5 Pro AMD Ryzen 5 7530U ⎘ AMD Radeon RX Vega 7 ⎘ 16 GB Memoria, 1024 GB SSD | Amazon: Prezzo di listino: 619€ | 423 gr | 37 mm | x |
3. 77.4% 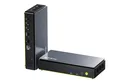 | GMK NucBox K13 Intel Core Ultra 7 256V ⎘ Intel Arc Graphics 140V ⎘ 16 GB Memoria, 1000 GB SSD | Prezzo di listino: 670 USD | 506 gr | 36.6 mm | x |
4. 77.5% 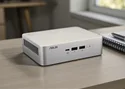 | Asus NUC 15 Pro+ Intel Core Ultra 9 285H ⎘ Intel Arc Graphics 140T ⎘ 32 GB Memoria, 1024 GB SSD | Amazon: $1,178.69 Prezzo di listino: 991€ | 690 gr | 42 mm | x |
5. 75.2% 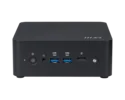 | MSI Cubi NUC AI+ 2MG Intel Core Ultra 7 258V ⎘ Intel Arc Graphics 140V ⎘ 32 GB Memoria, 1000 GB SSD | Amazon: Prezzo di listino: 900 USD | 669 gr | 50.1 mm | x |
6. 70.8%  | HP Pro Mini 400 G9-937U0EA Intel Core i5-14500T ⎘ Intel UHD Graphics 770 ⎘ 16 GB Memoria, 512 GB SSD | Prezzo di listino: 870€ | 1.2 kg | 34 mm | x |
Transparency
La selezione dei dispositivi da recensire viene effettuata dalla nostra redazione. Il campione di prova è stato fornito all'autore come prestito dal produttore o dal rivenditore ai fini di questa recensione. L'istituto di credito non ha avuto alcuna influenza su questa recensione, né il produttore ne ha ricevuto una copia prima della pubblicazione. Non vi era alcun obbligo di pubblicare questa recensione. In quanto società mediatica indipendente, Notebookcheck non è soggetta all'autorità di produttori, rivenditori o editori.
Ecco come Notebookcheck esegue i test
Ogni anno, Notebookcheck esamina in modo indipendente centinaia di laptop e smartphone utilizzando procedure standardizzate per garantire che tutti i risultati siano comparabili. Da circa 20 anni sviluppiamo continuamente i nostri metodi di prova e nel frattempo stabiliamo gli standard di settore. Nei nostri laboratori di prova, tecnici ed editori esperti utilizzano apparecchiature di misurazione di alta qualità. Questi test comportano un processo di validazione in più fasi. Il nostro complesso sistema di valutazione si basa su centinaia di misurazioni e parametri di riferimento ben fondati, che mantengono l'obiettività.
