Recensione del PC desktop Minisforum NUCXi7: gaming PC ultra sottile con GeForce RTX 3070 e Core i7-11800H

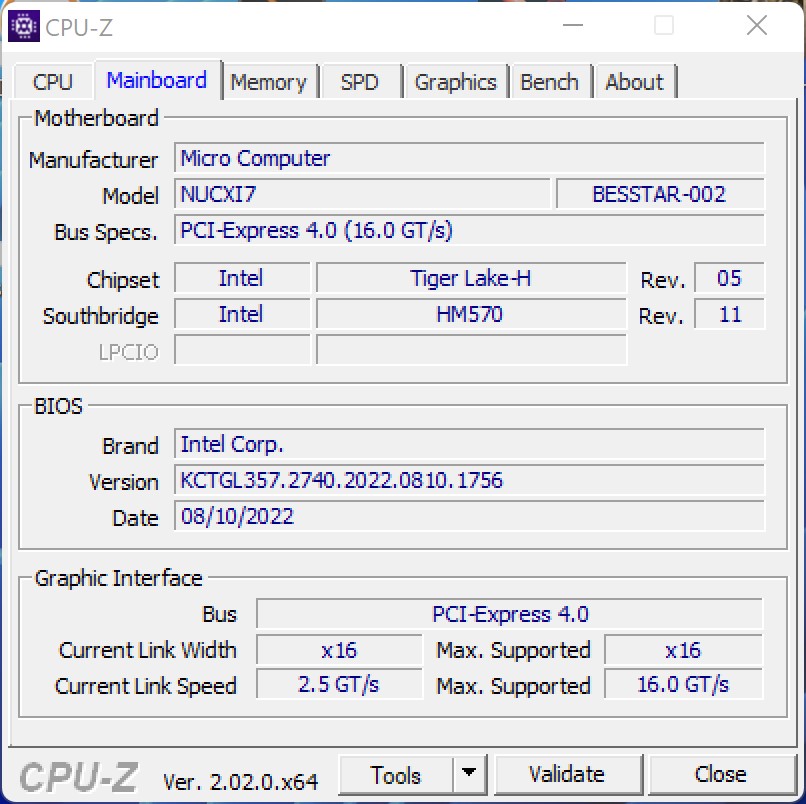
Minisforum è noto come produttore di sistemi per mini PC in questo paese (Germania). Tuttavia, con la serie NUCX, il produttore punta a un gruppo di utenti leggermente diverso, offrendo con questo modello un PC da gioco completo. Non si tratta del solito computer desktop, ma di un PC ultra sottile con una discreta potenza. È basato su una scheda madre Intel NUC-XI5, utilizzata anche nei computer portatili.
Il NUCX è attualmente disponibile in due configurazioni di base che differiscono per CPU e GPU. Da un lato, c'è il Minisforum NUCXi5, che si basa sul processore Intel Core i5-11400Hin combinazione con unaNvidia GeForce RTX 3060 Laptop GPUe, dall'altro lato, il MinisForum NUCXi7 con il processoreIntel Core i7-11800Hin combinazione con una Nvidia GeForce RTX 3070 Laptop GPU. In termini di prezzo, i modelli partono come sistemi barebone rispettivamente da 1.199 Euro (~$1.195) e 1.449 Euro (~$1.444). La nostra unità di prova, un NUCXi7 con 16 GB di RAM e un SSD da 512 GB, costa 1.629 Euro (~$1.623) con la versione Pro di Windows 11 già preinstallata.
In questa recensione, altri PC desktop compatti fungono da dispositivi di confronto. Per riflettere il confronto diretto delle prestazioni della GPU, abbiamo incluso nel campo dei nostri concorrenti di prova anche un portatile da gioco con dotazione simile.
Potenziali concorrenti a confronto
Punteggio | Data | Modello | Peso | Altezza | Prezzo |
|---|---|---|---|---|---|
v7 (old) | 09/2022 | Minisforum NUCX i7 i7-11800H, GeForce RTX 3070 Laptop GPU | 2.4 kg | 393 mm | |
v (old) | 12/2021 | Intel Beast Canyon NUC i9-11900KB, GeForce RTX 3060 | 189 mm | ||
v (old) | 06/2021 | Zotac Magnus One (ECM73070C) i7-10700, GeForce RTX 3070 | |||
v (old) | 05/2022 | Zotac ZBOX Magnus EN173070C i7-11800H, GeForce RTX 3070 Laptop GPU | 1.8 kg | 62.2 mm | |
v (old) | 04/2022 | Intel Dragon Canyon NUC - RTX 3060 i9-12900, GeForce RTX 3060 | 189 mm | ||
v (old) | 06/2020 | Zotac MEK Mini (RTX 2070 Super) i7-9700, GeForce RTX 2070 Super (Desktop) | |||
| 83.2 % v7 (old) | 10/2021 | Gigabyte A7 X1 R9 5900HX, GeForce RTX 3070 Laptop GPU | 2.5 kg | 34 mm |
Minisforum NUCXi7 in dettaglio
Caso
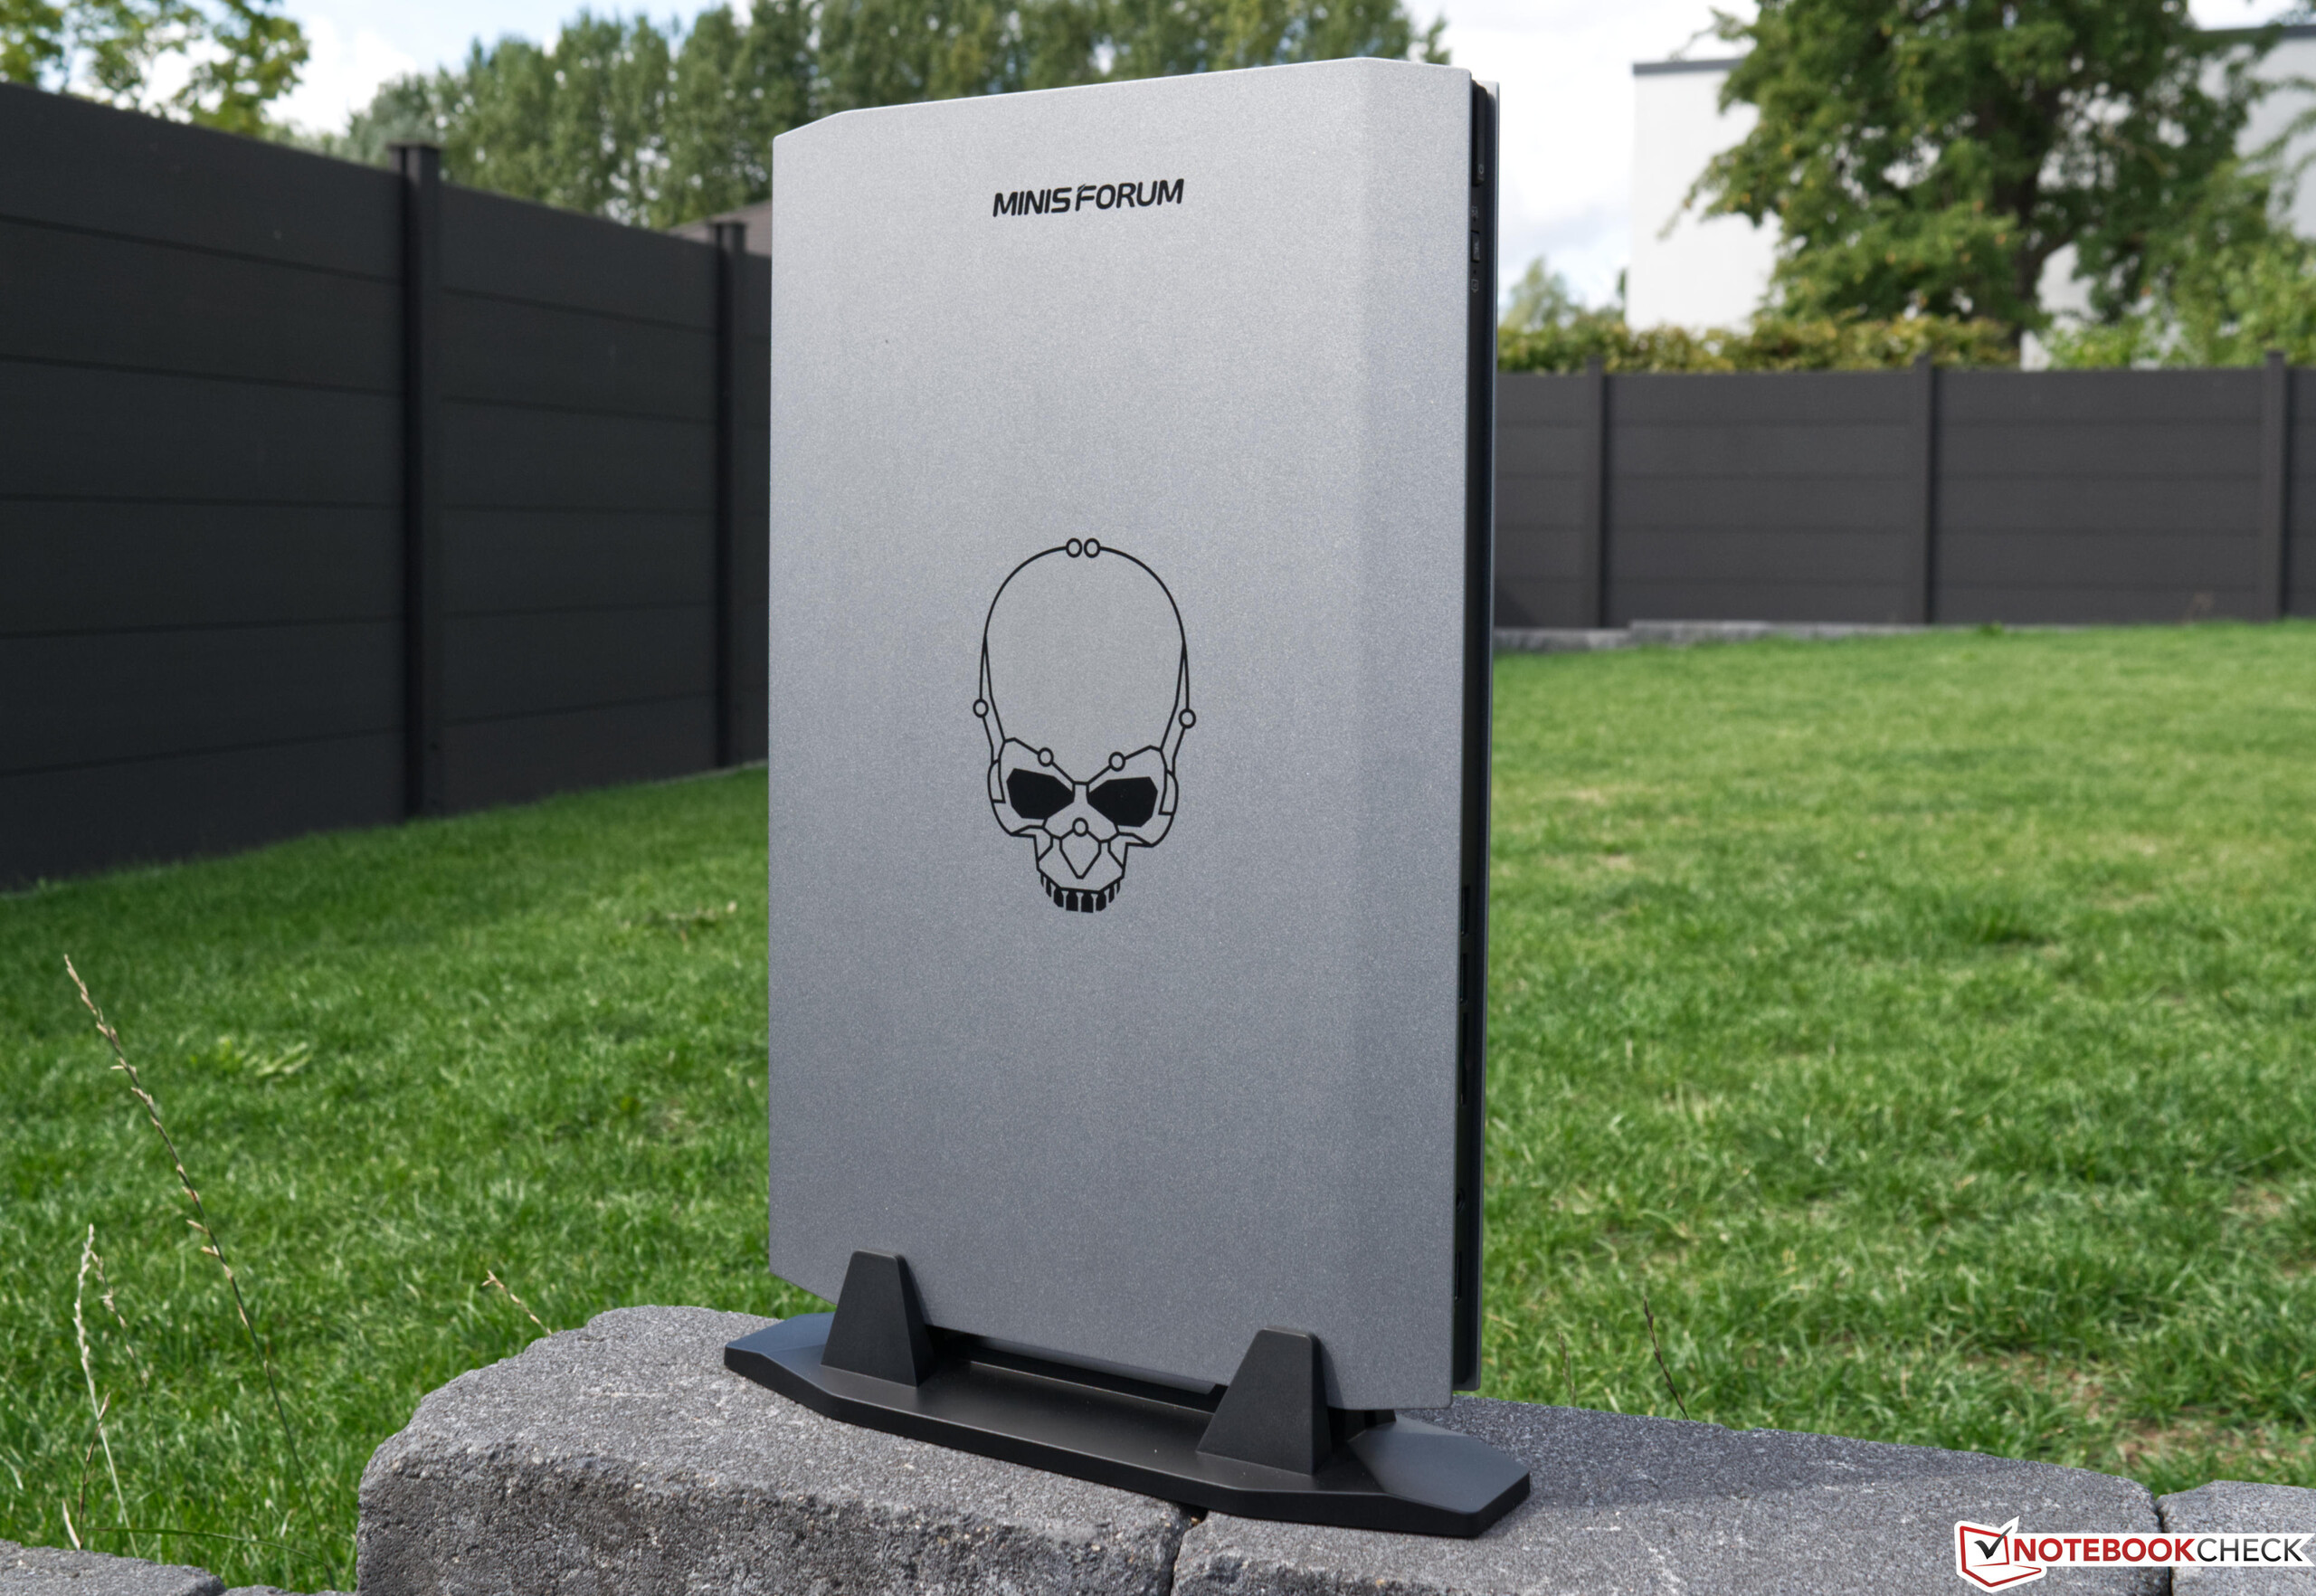
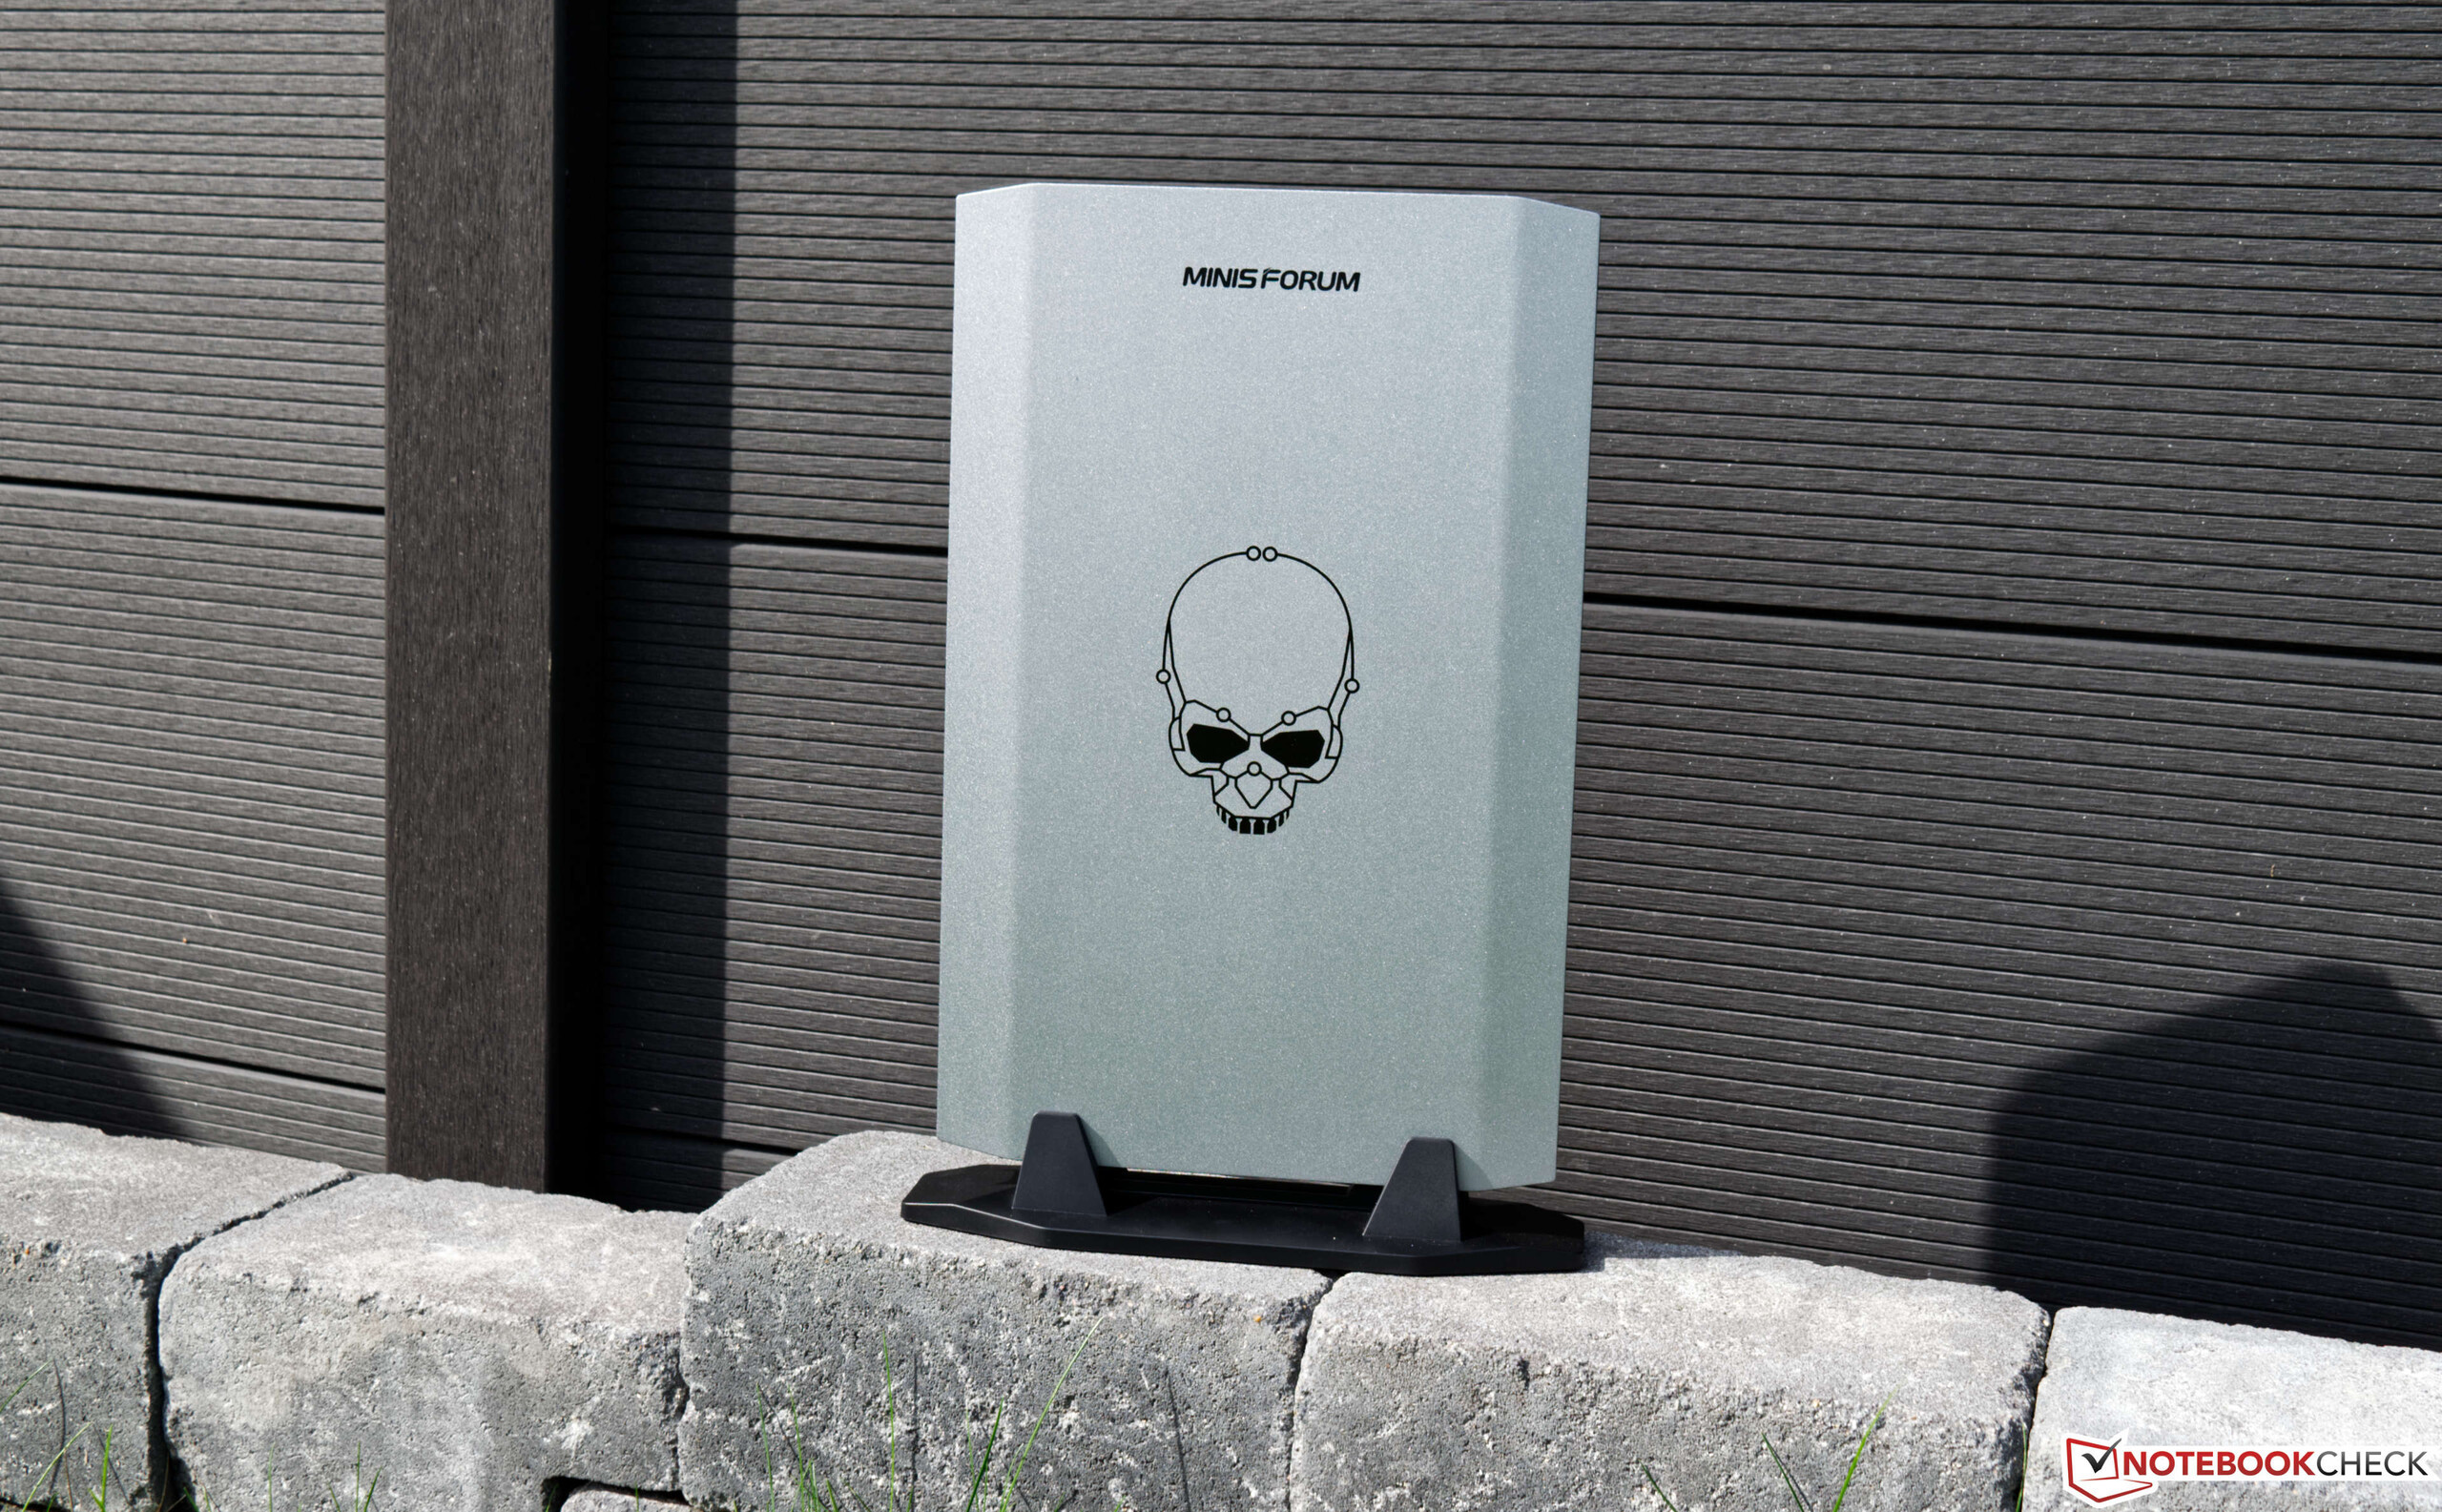
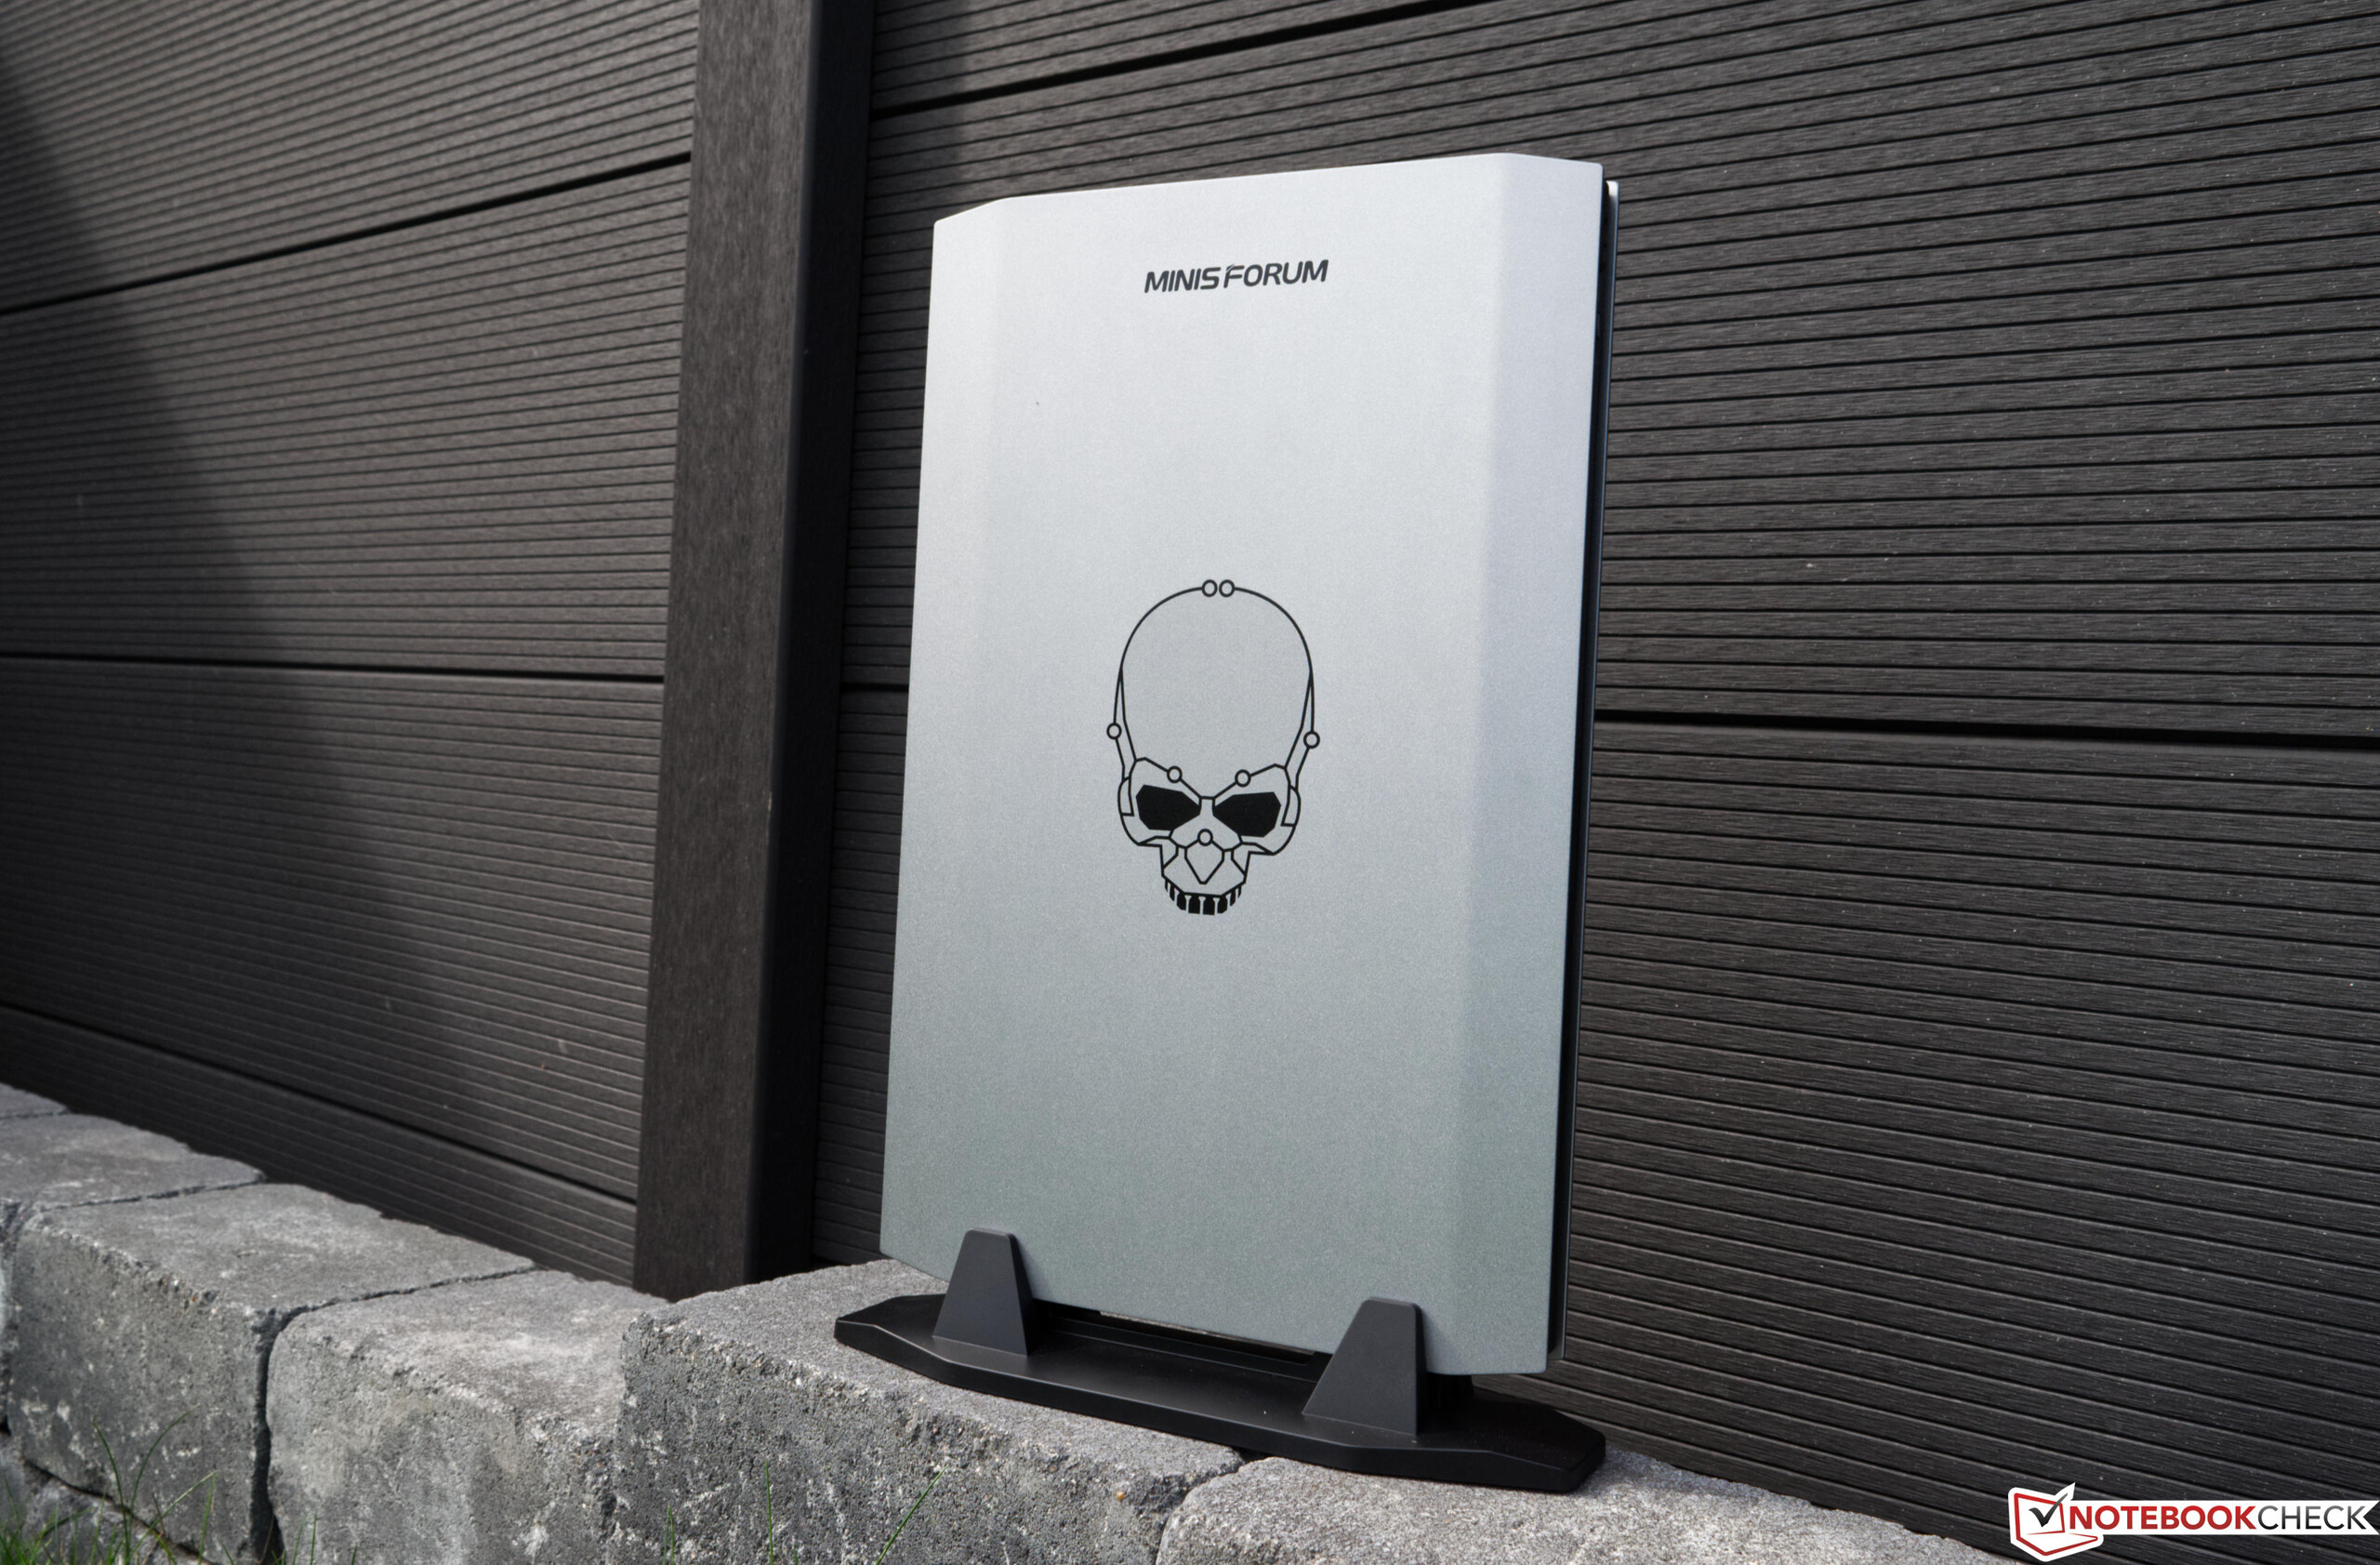
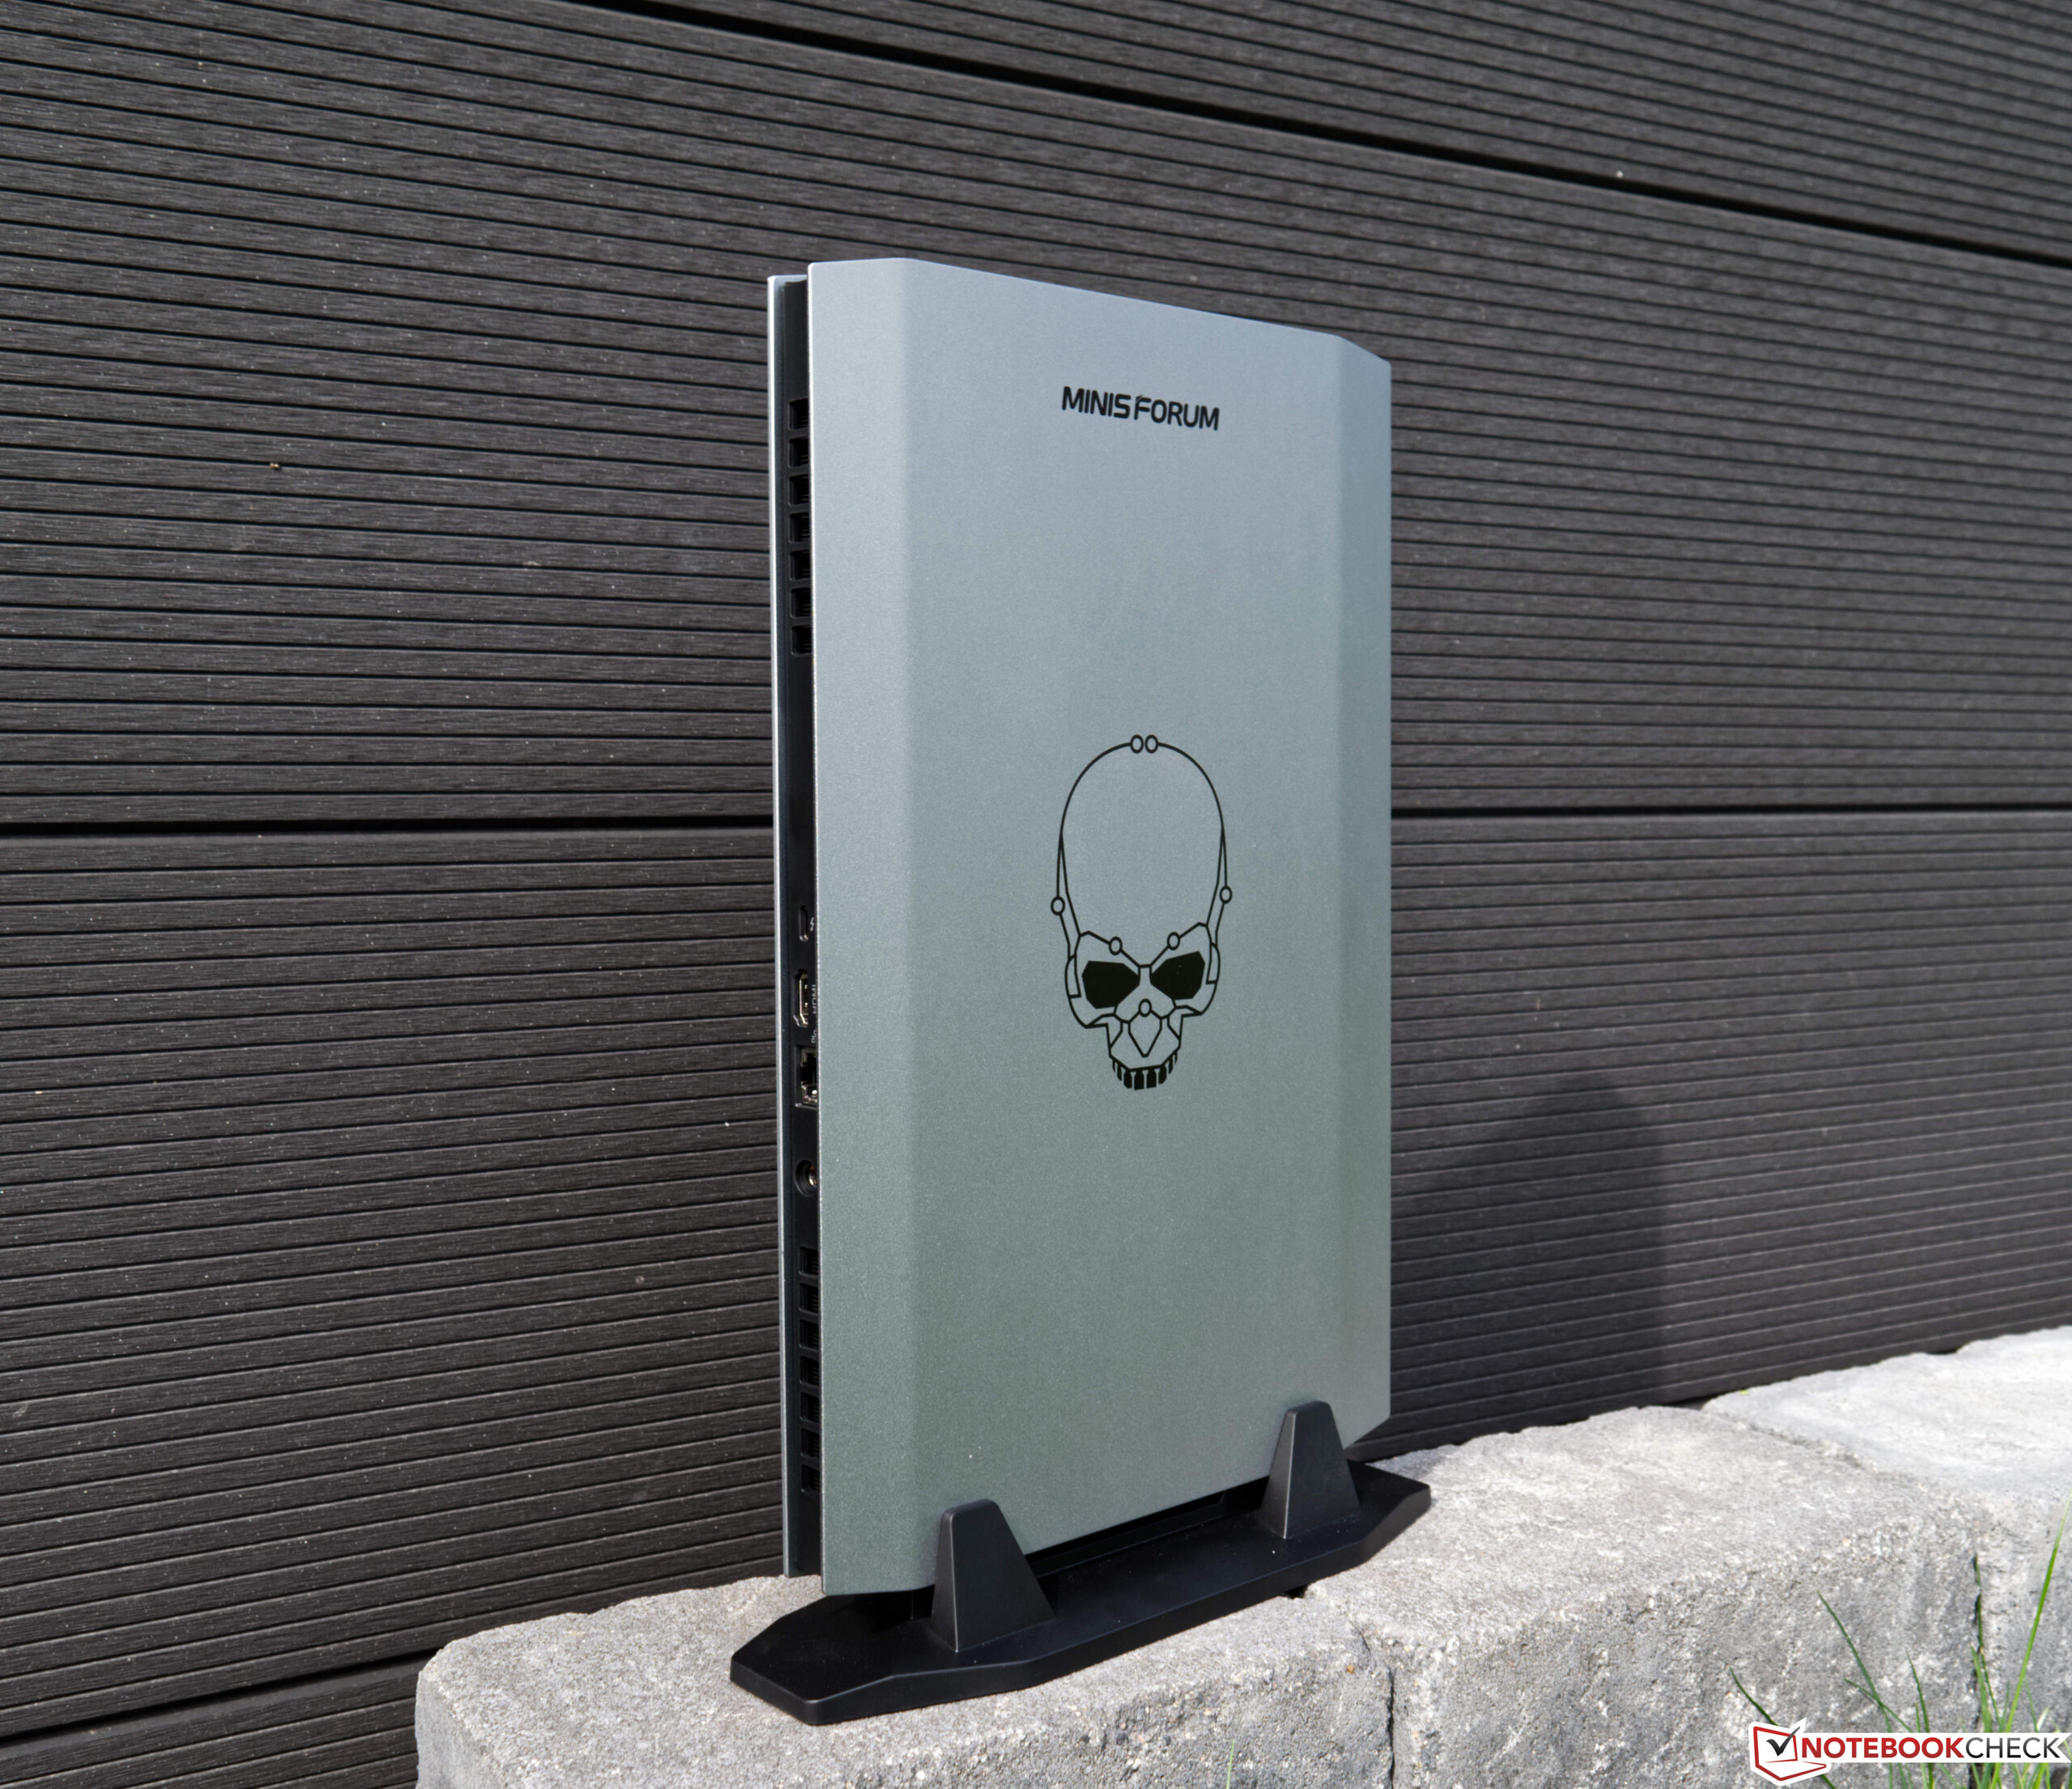
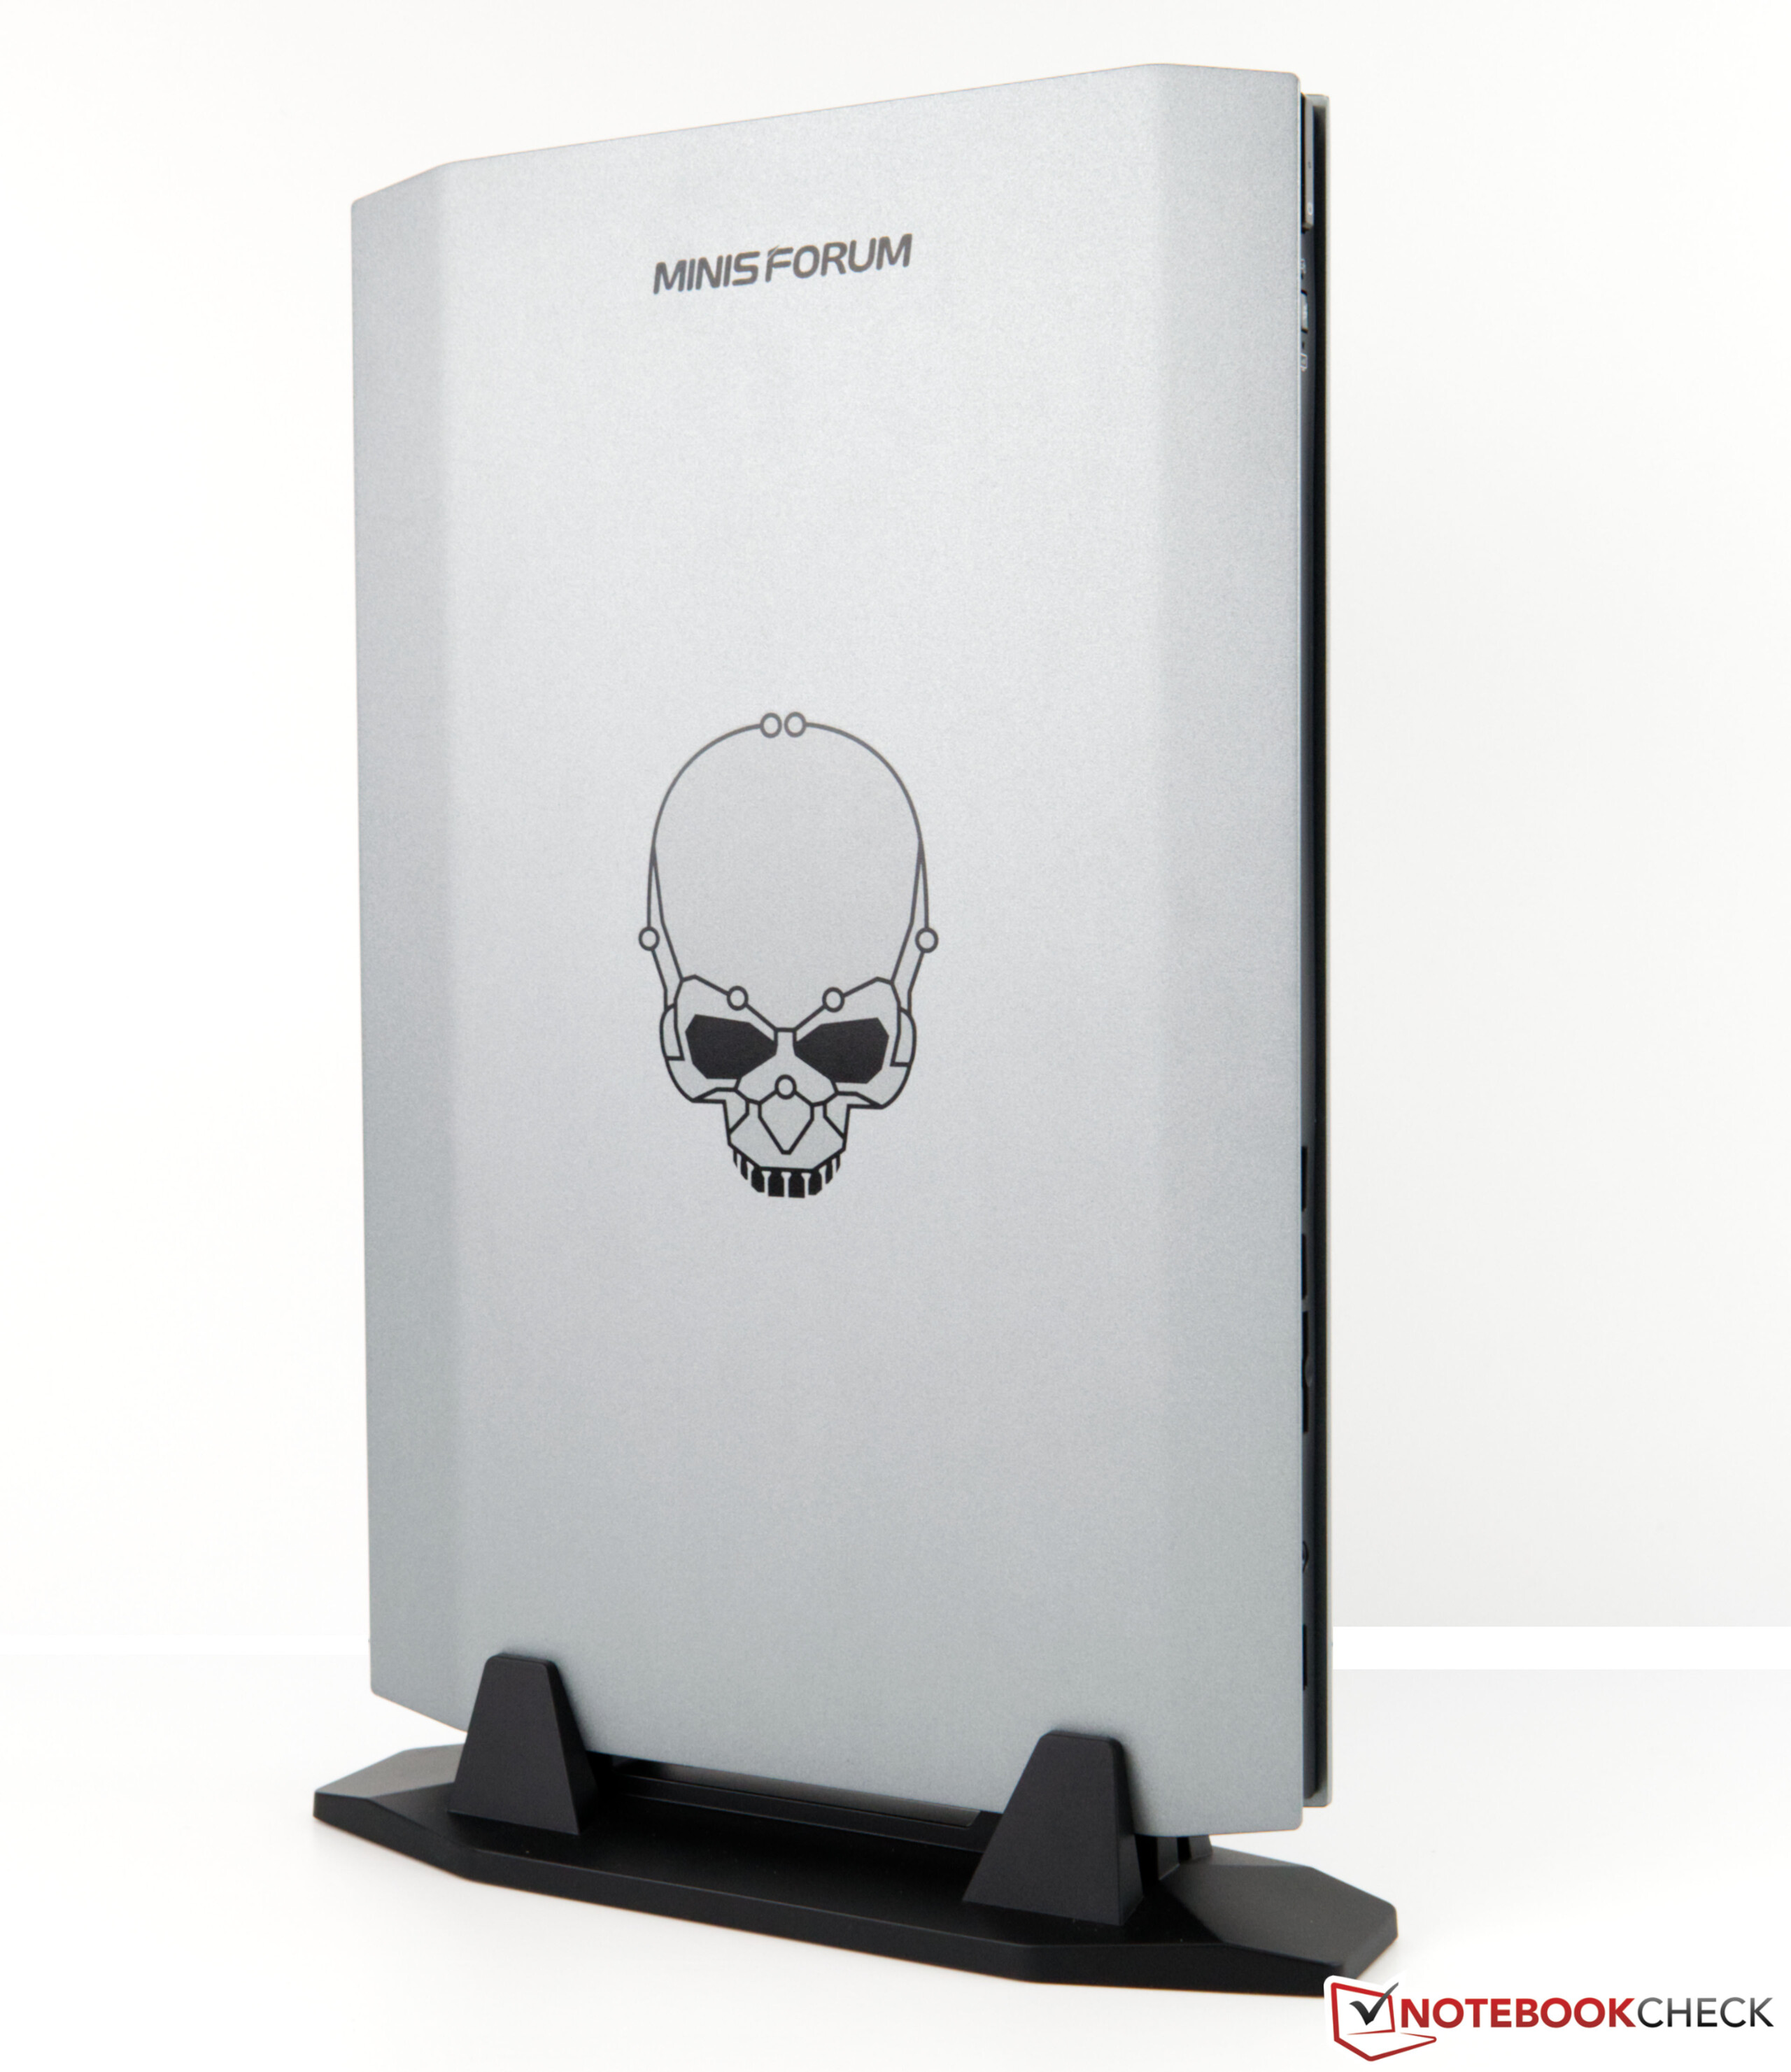
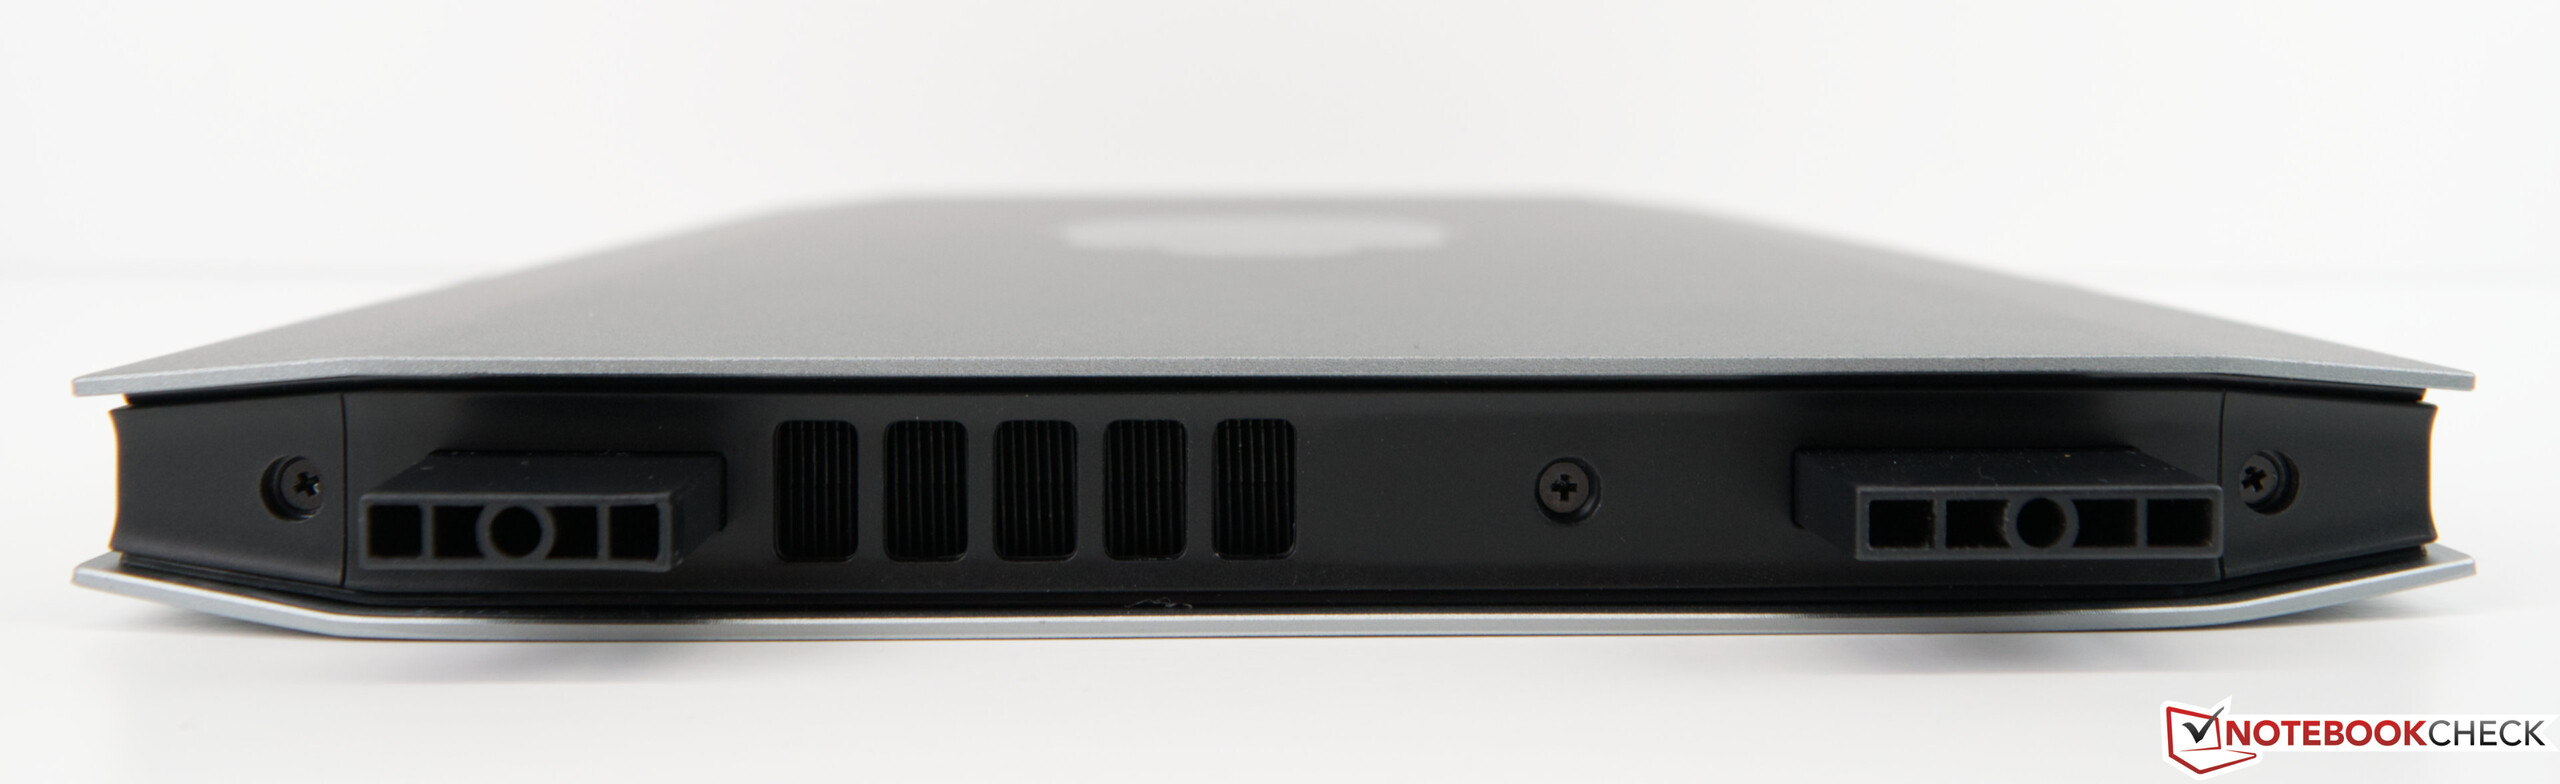
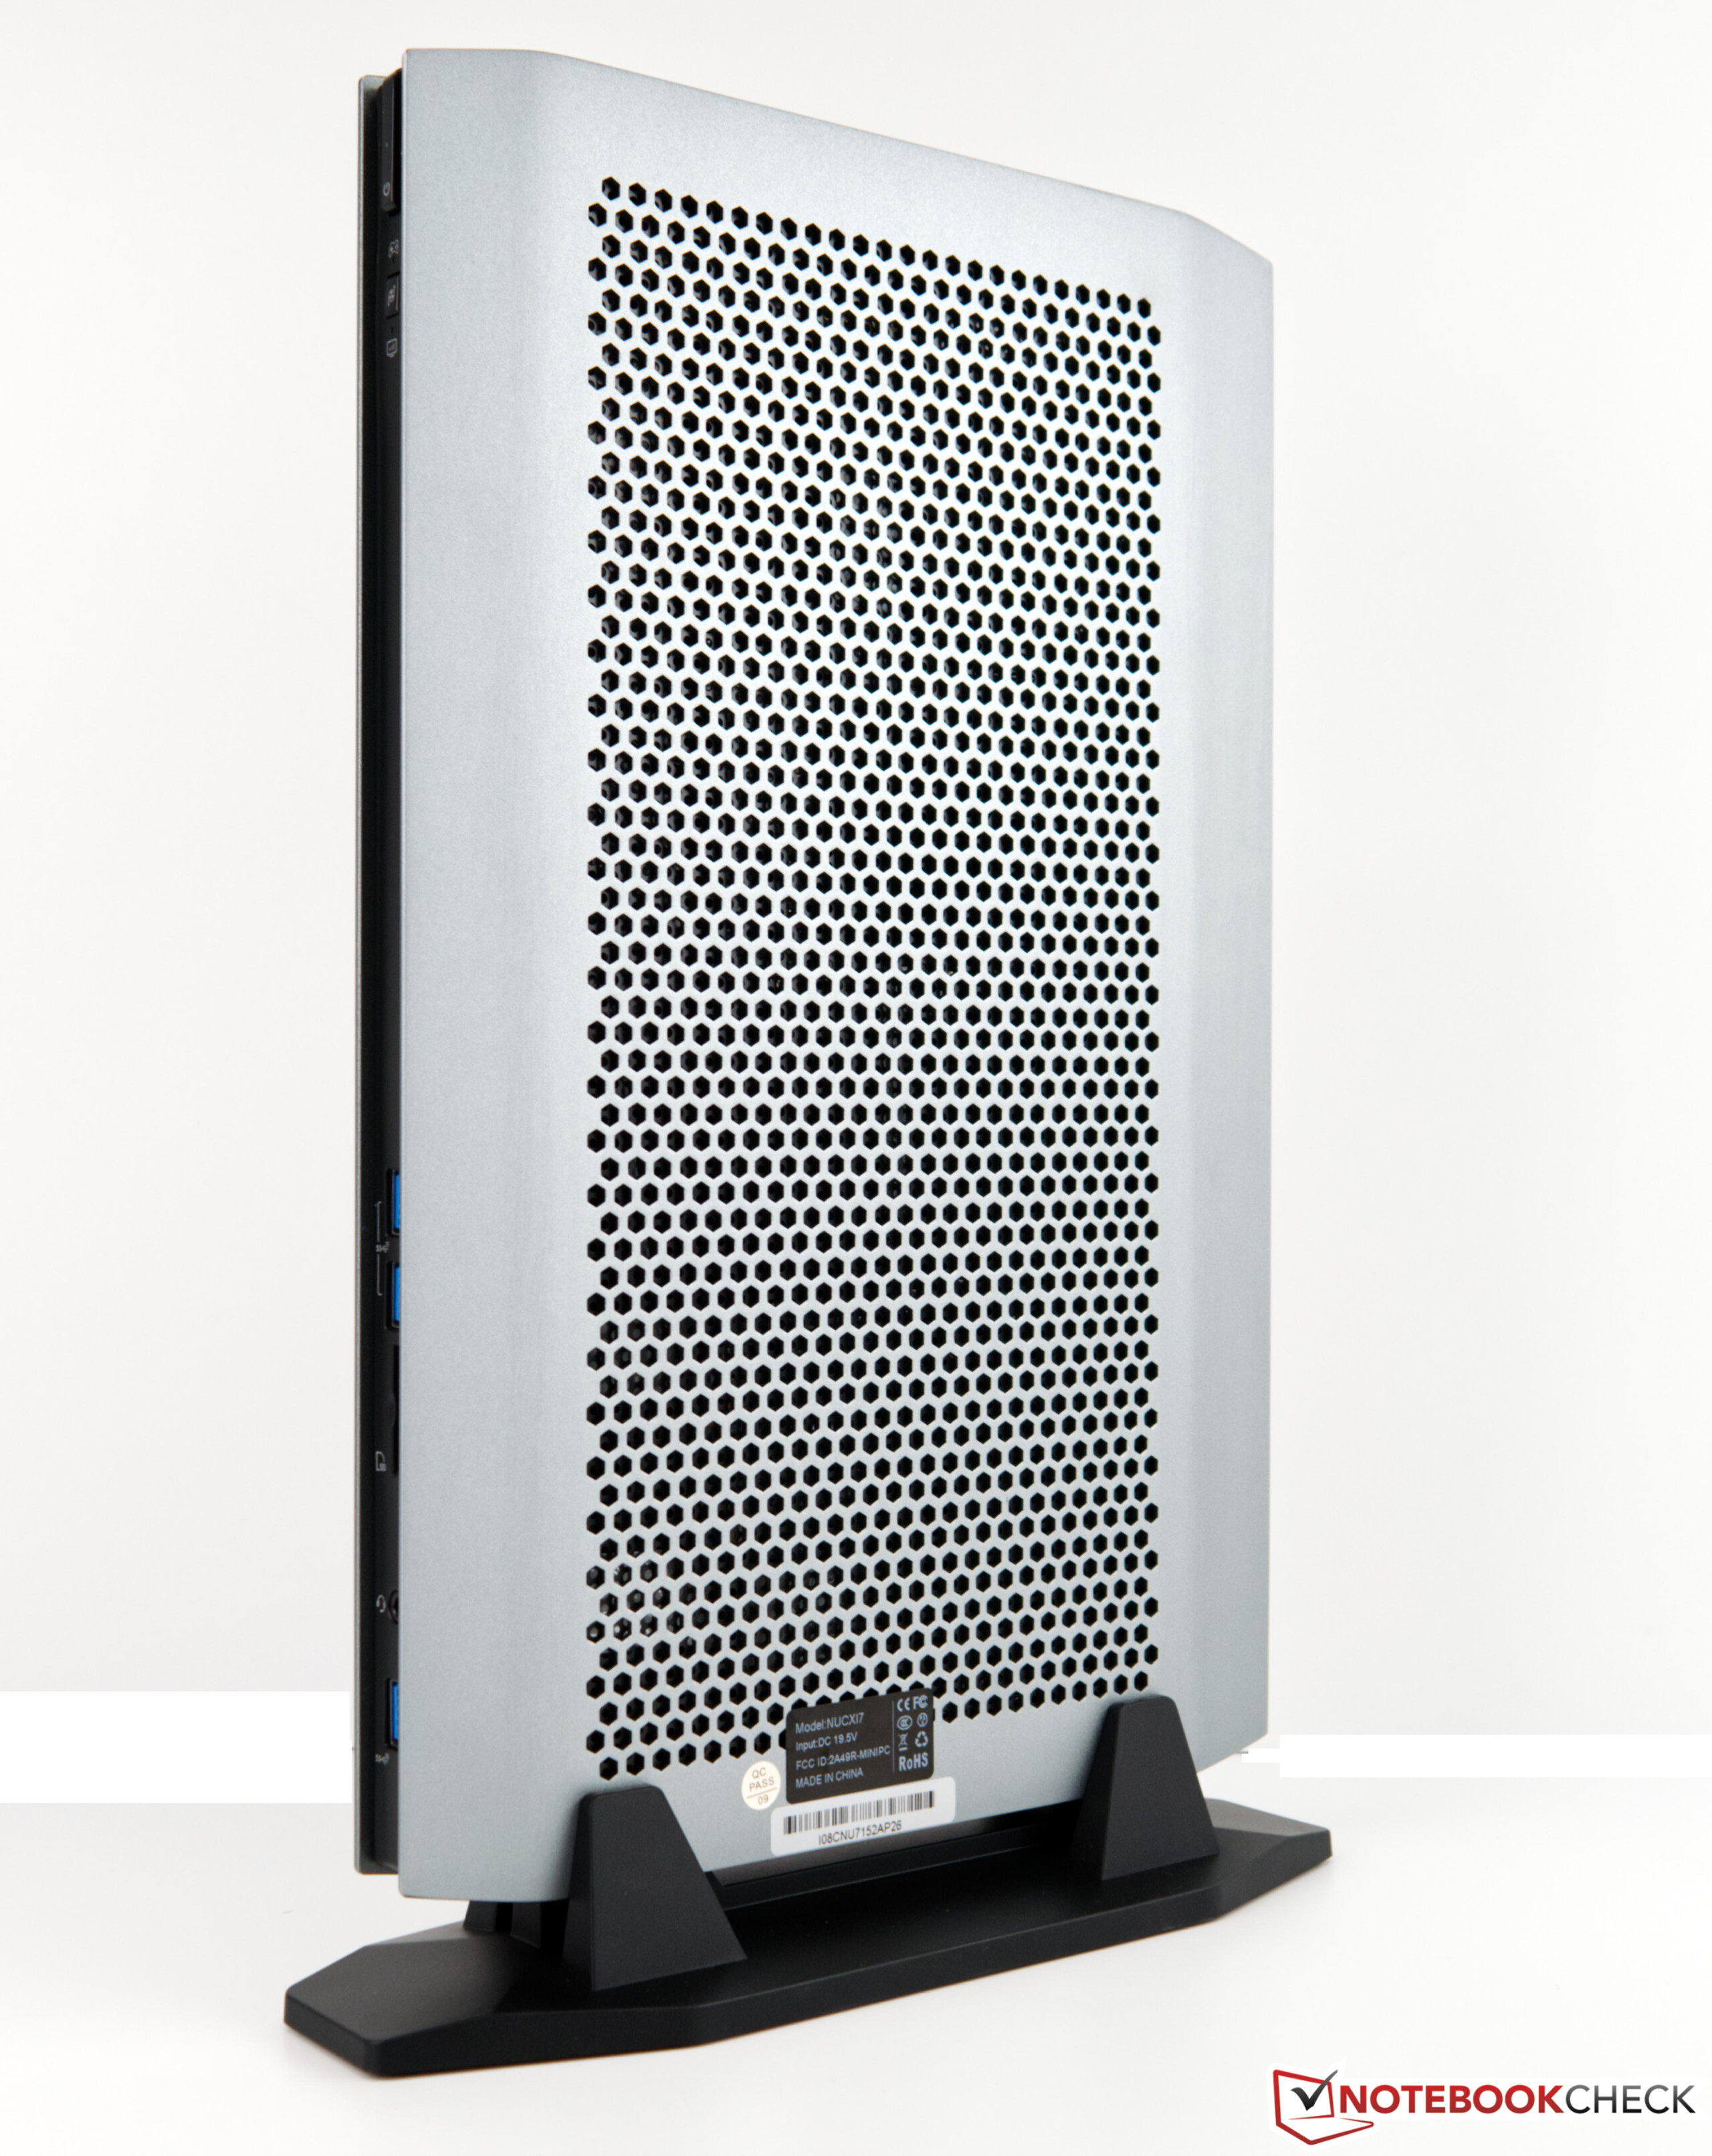
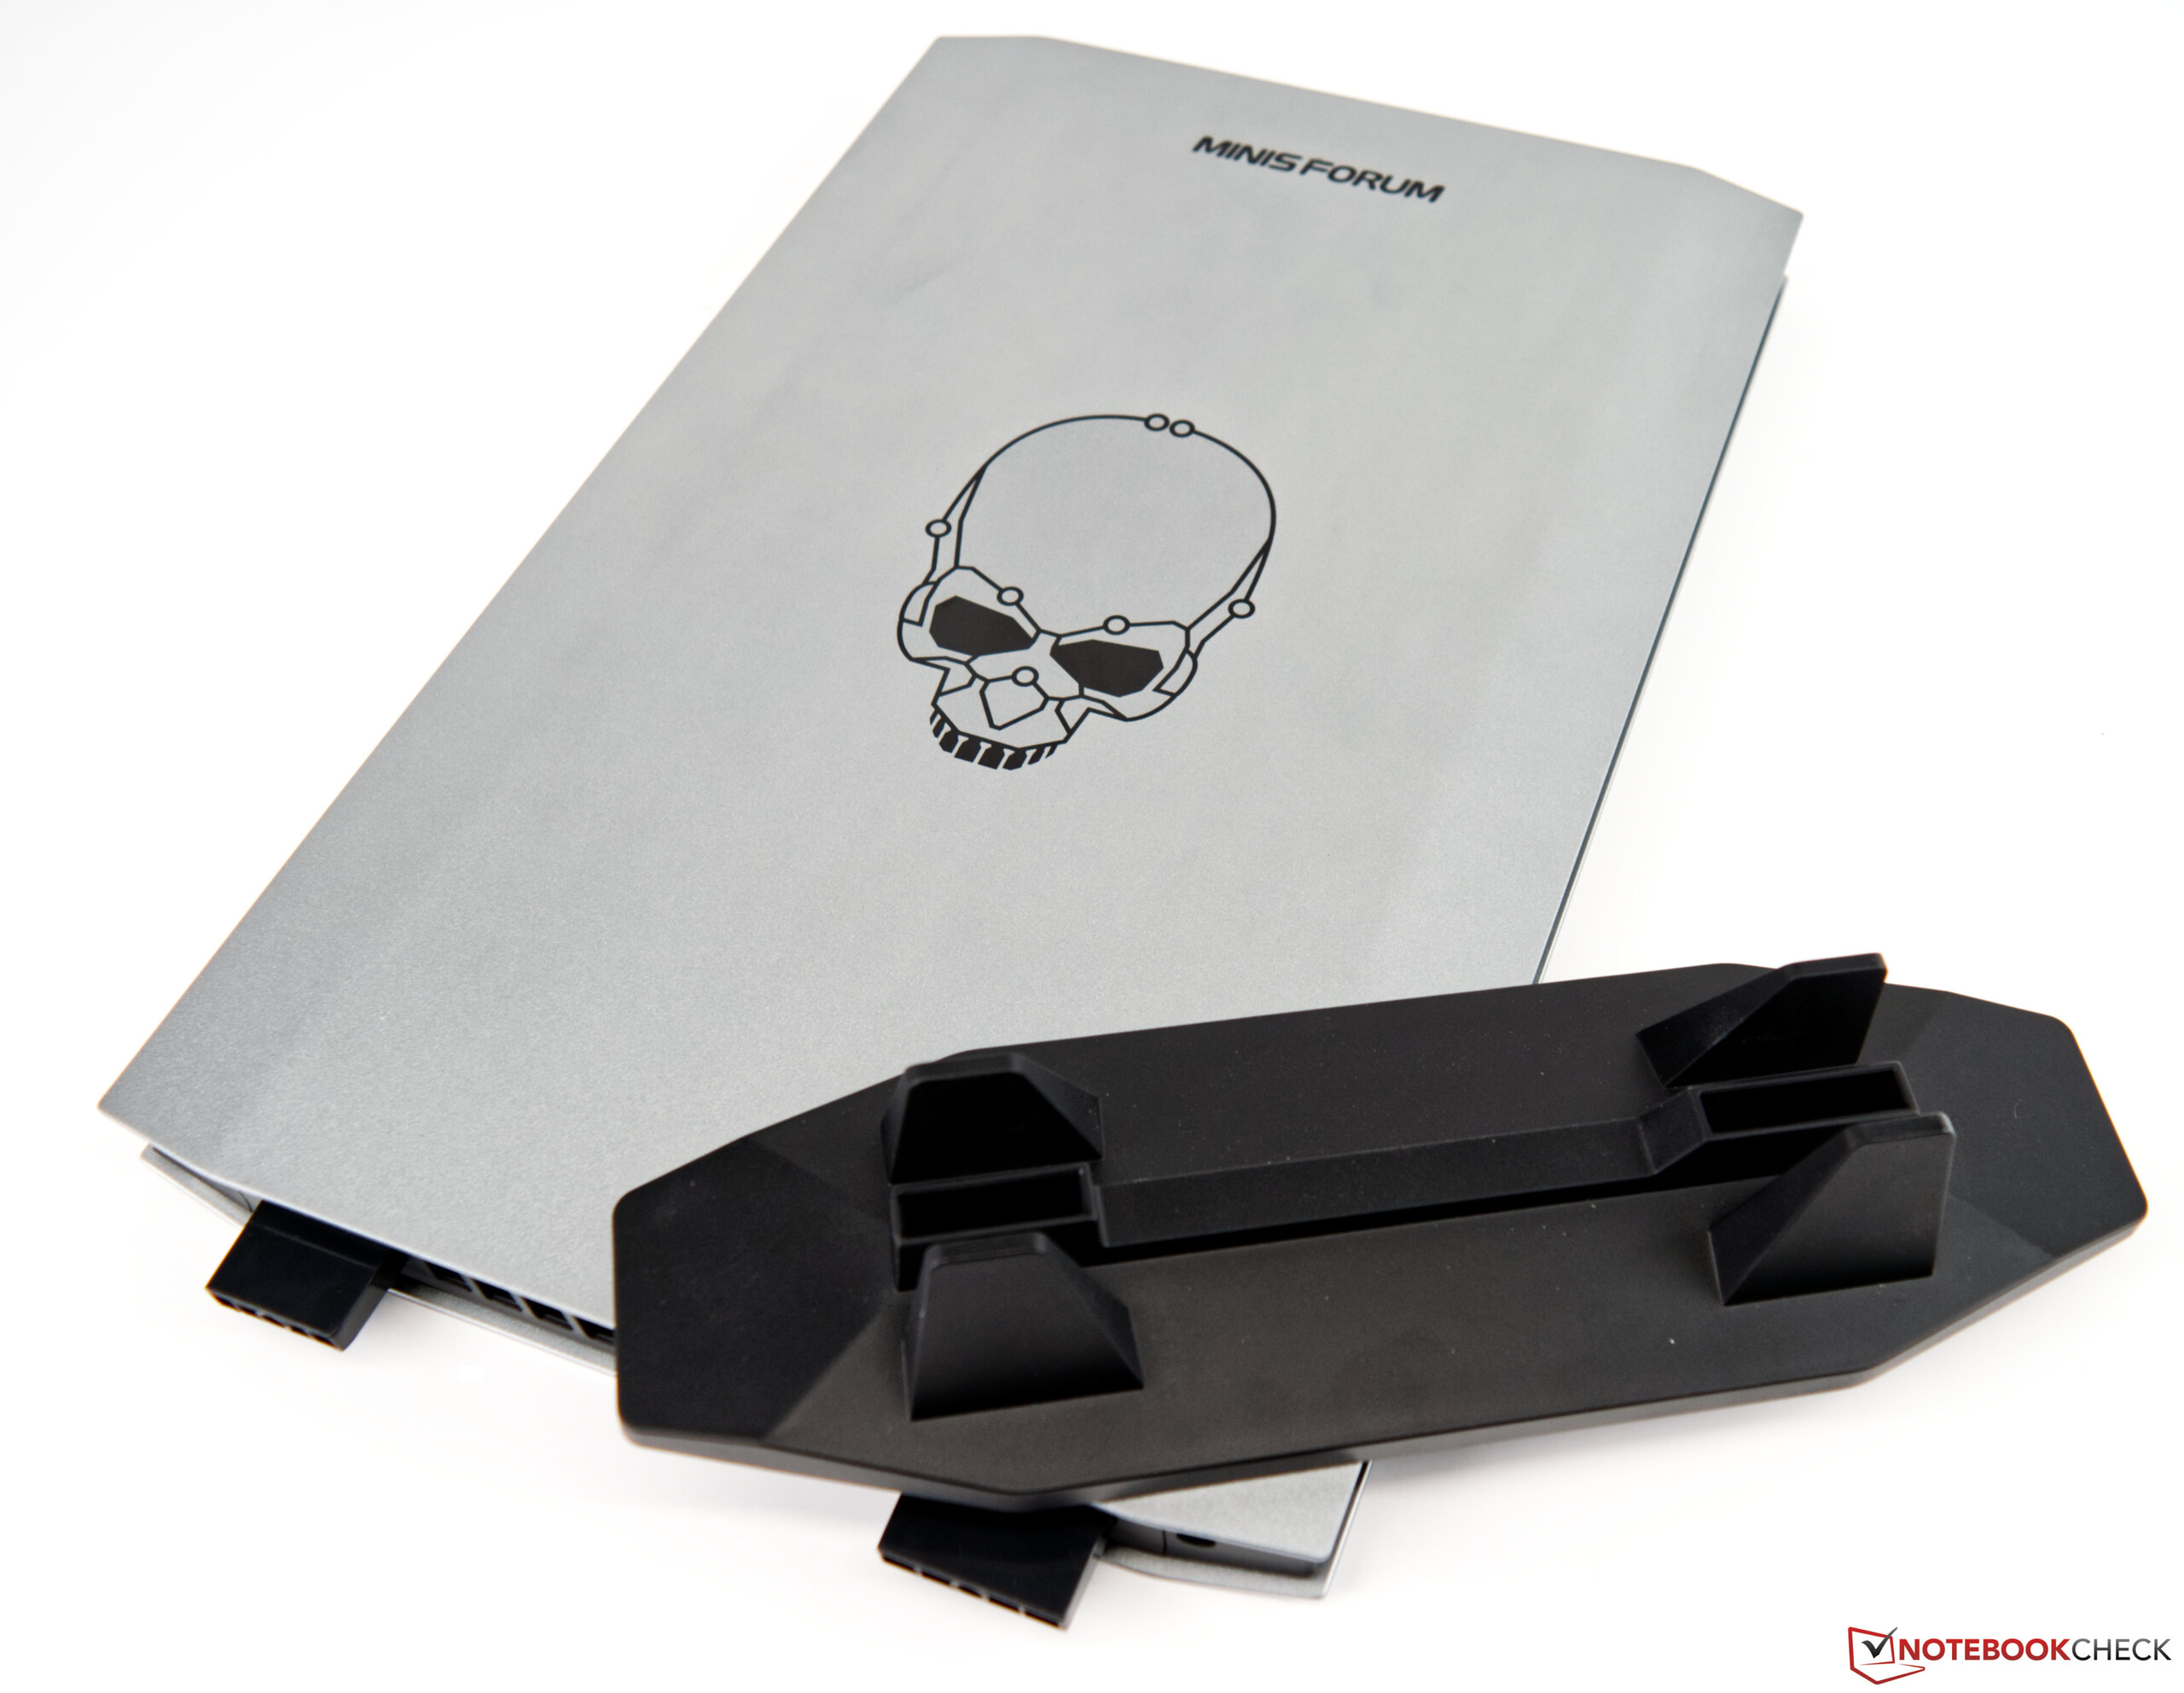
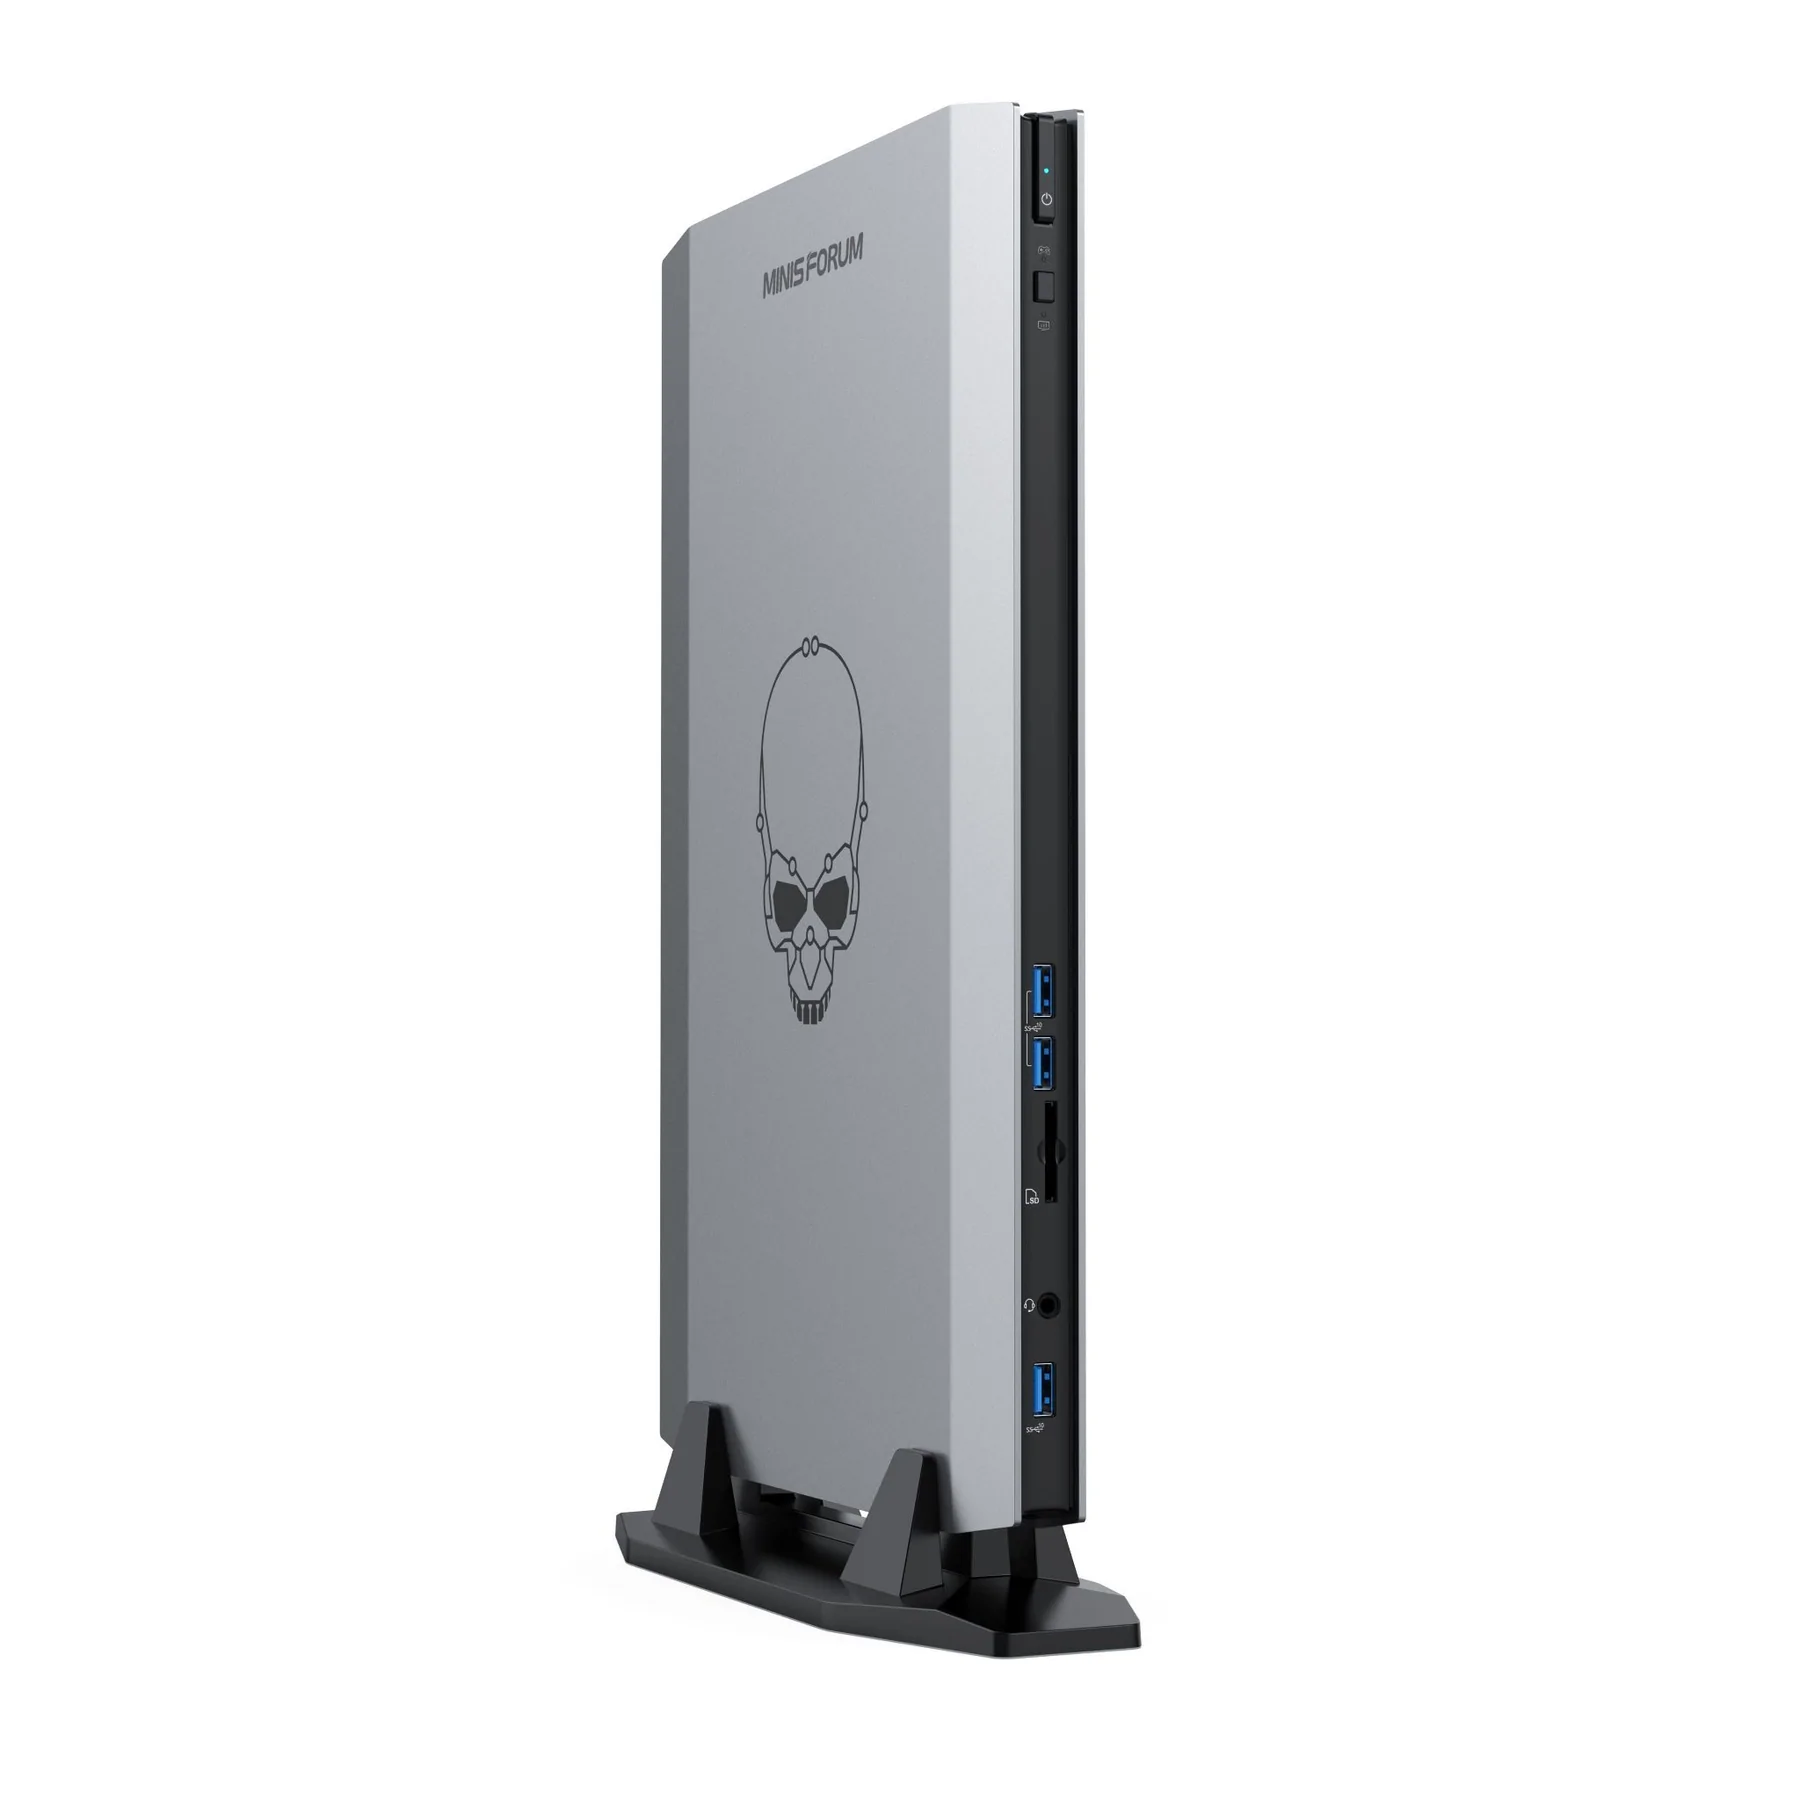
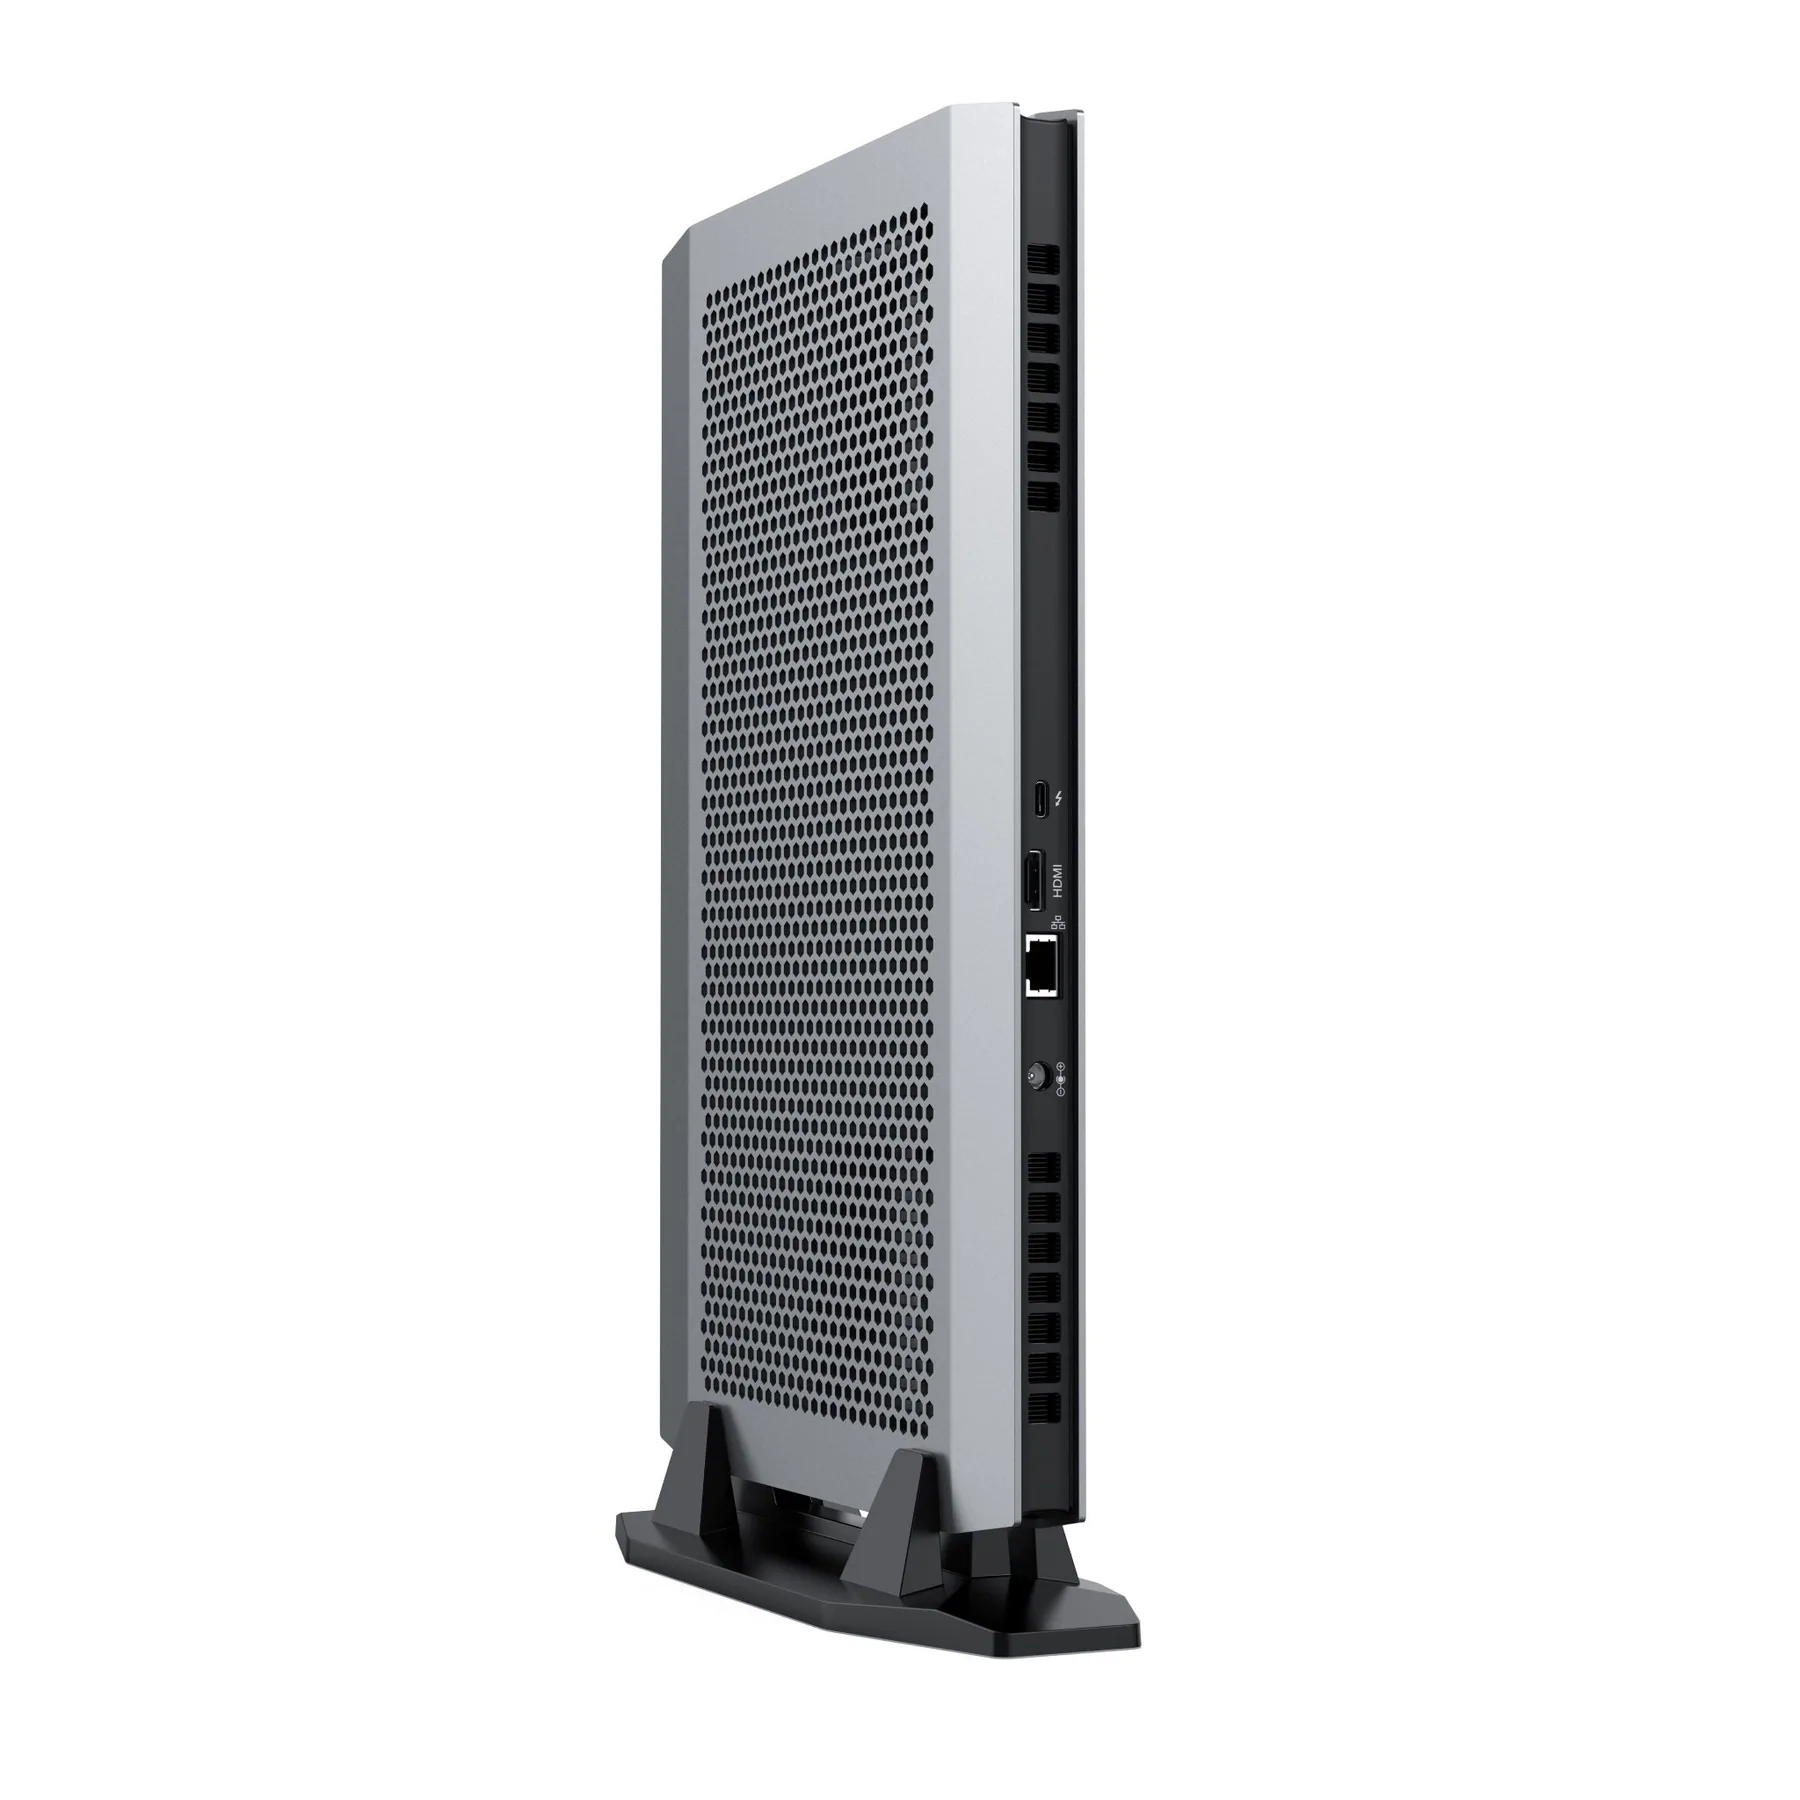
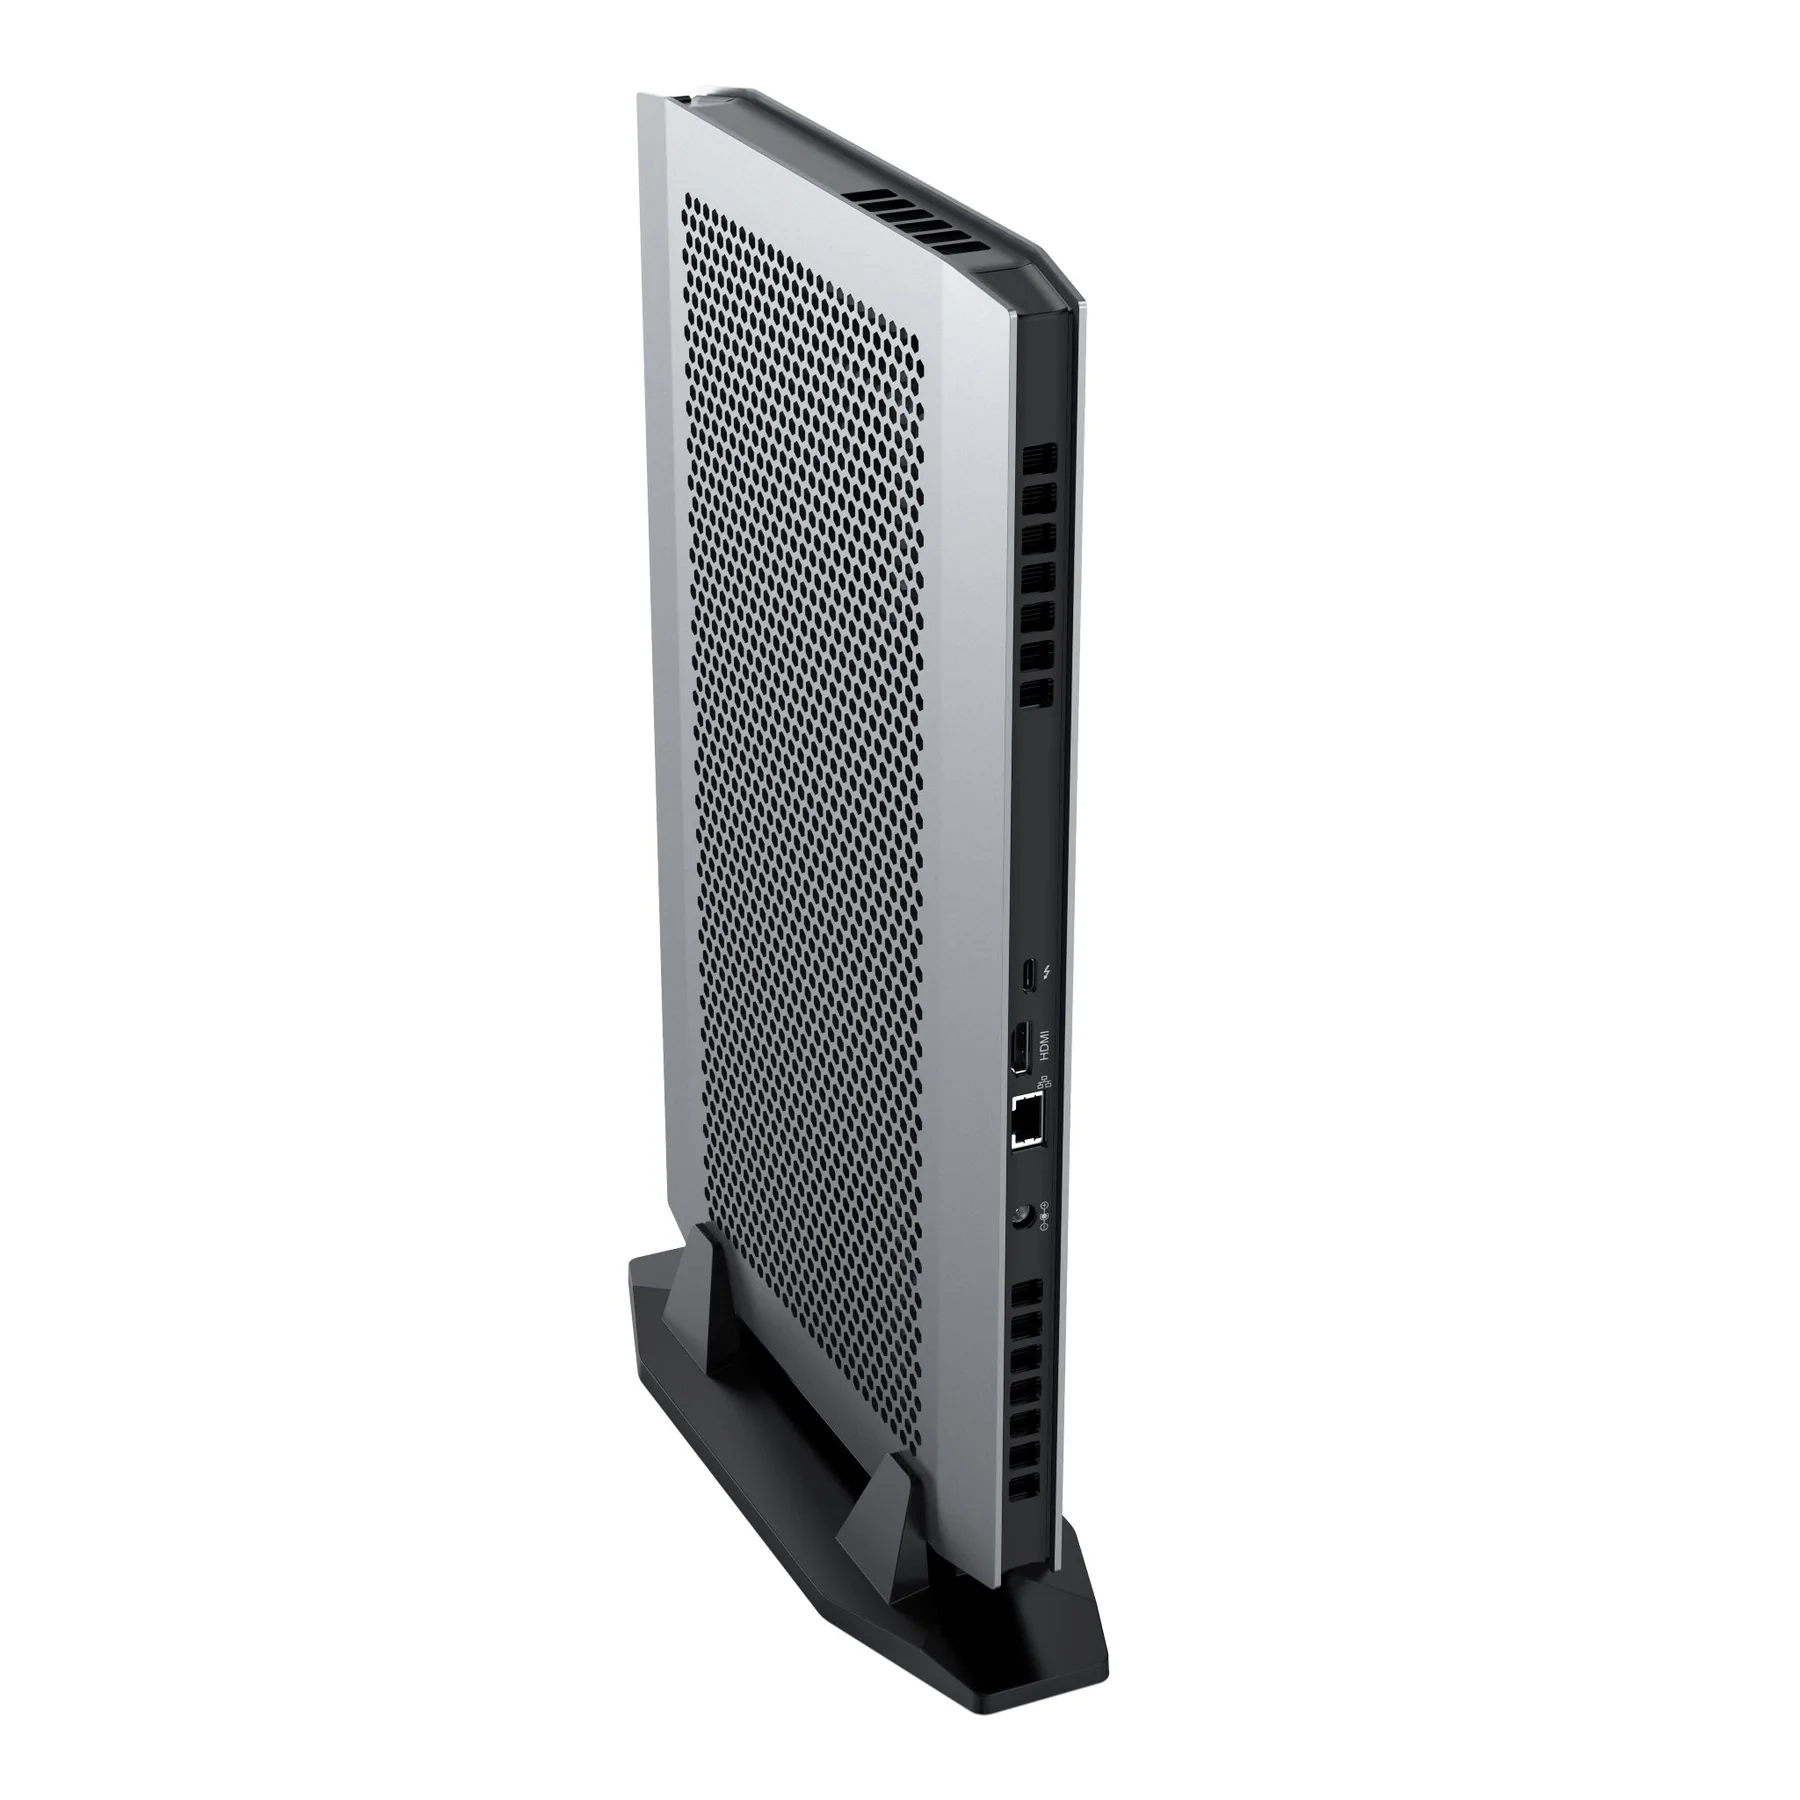
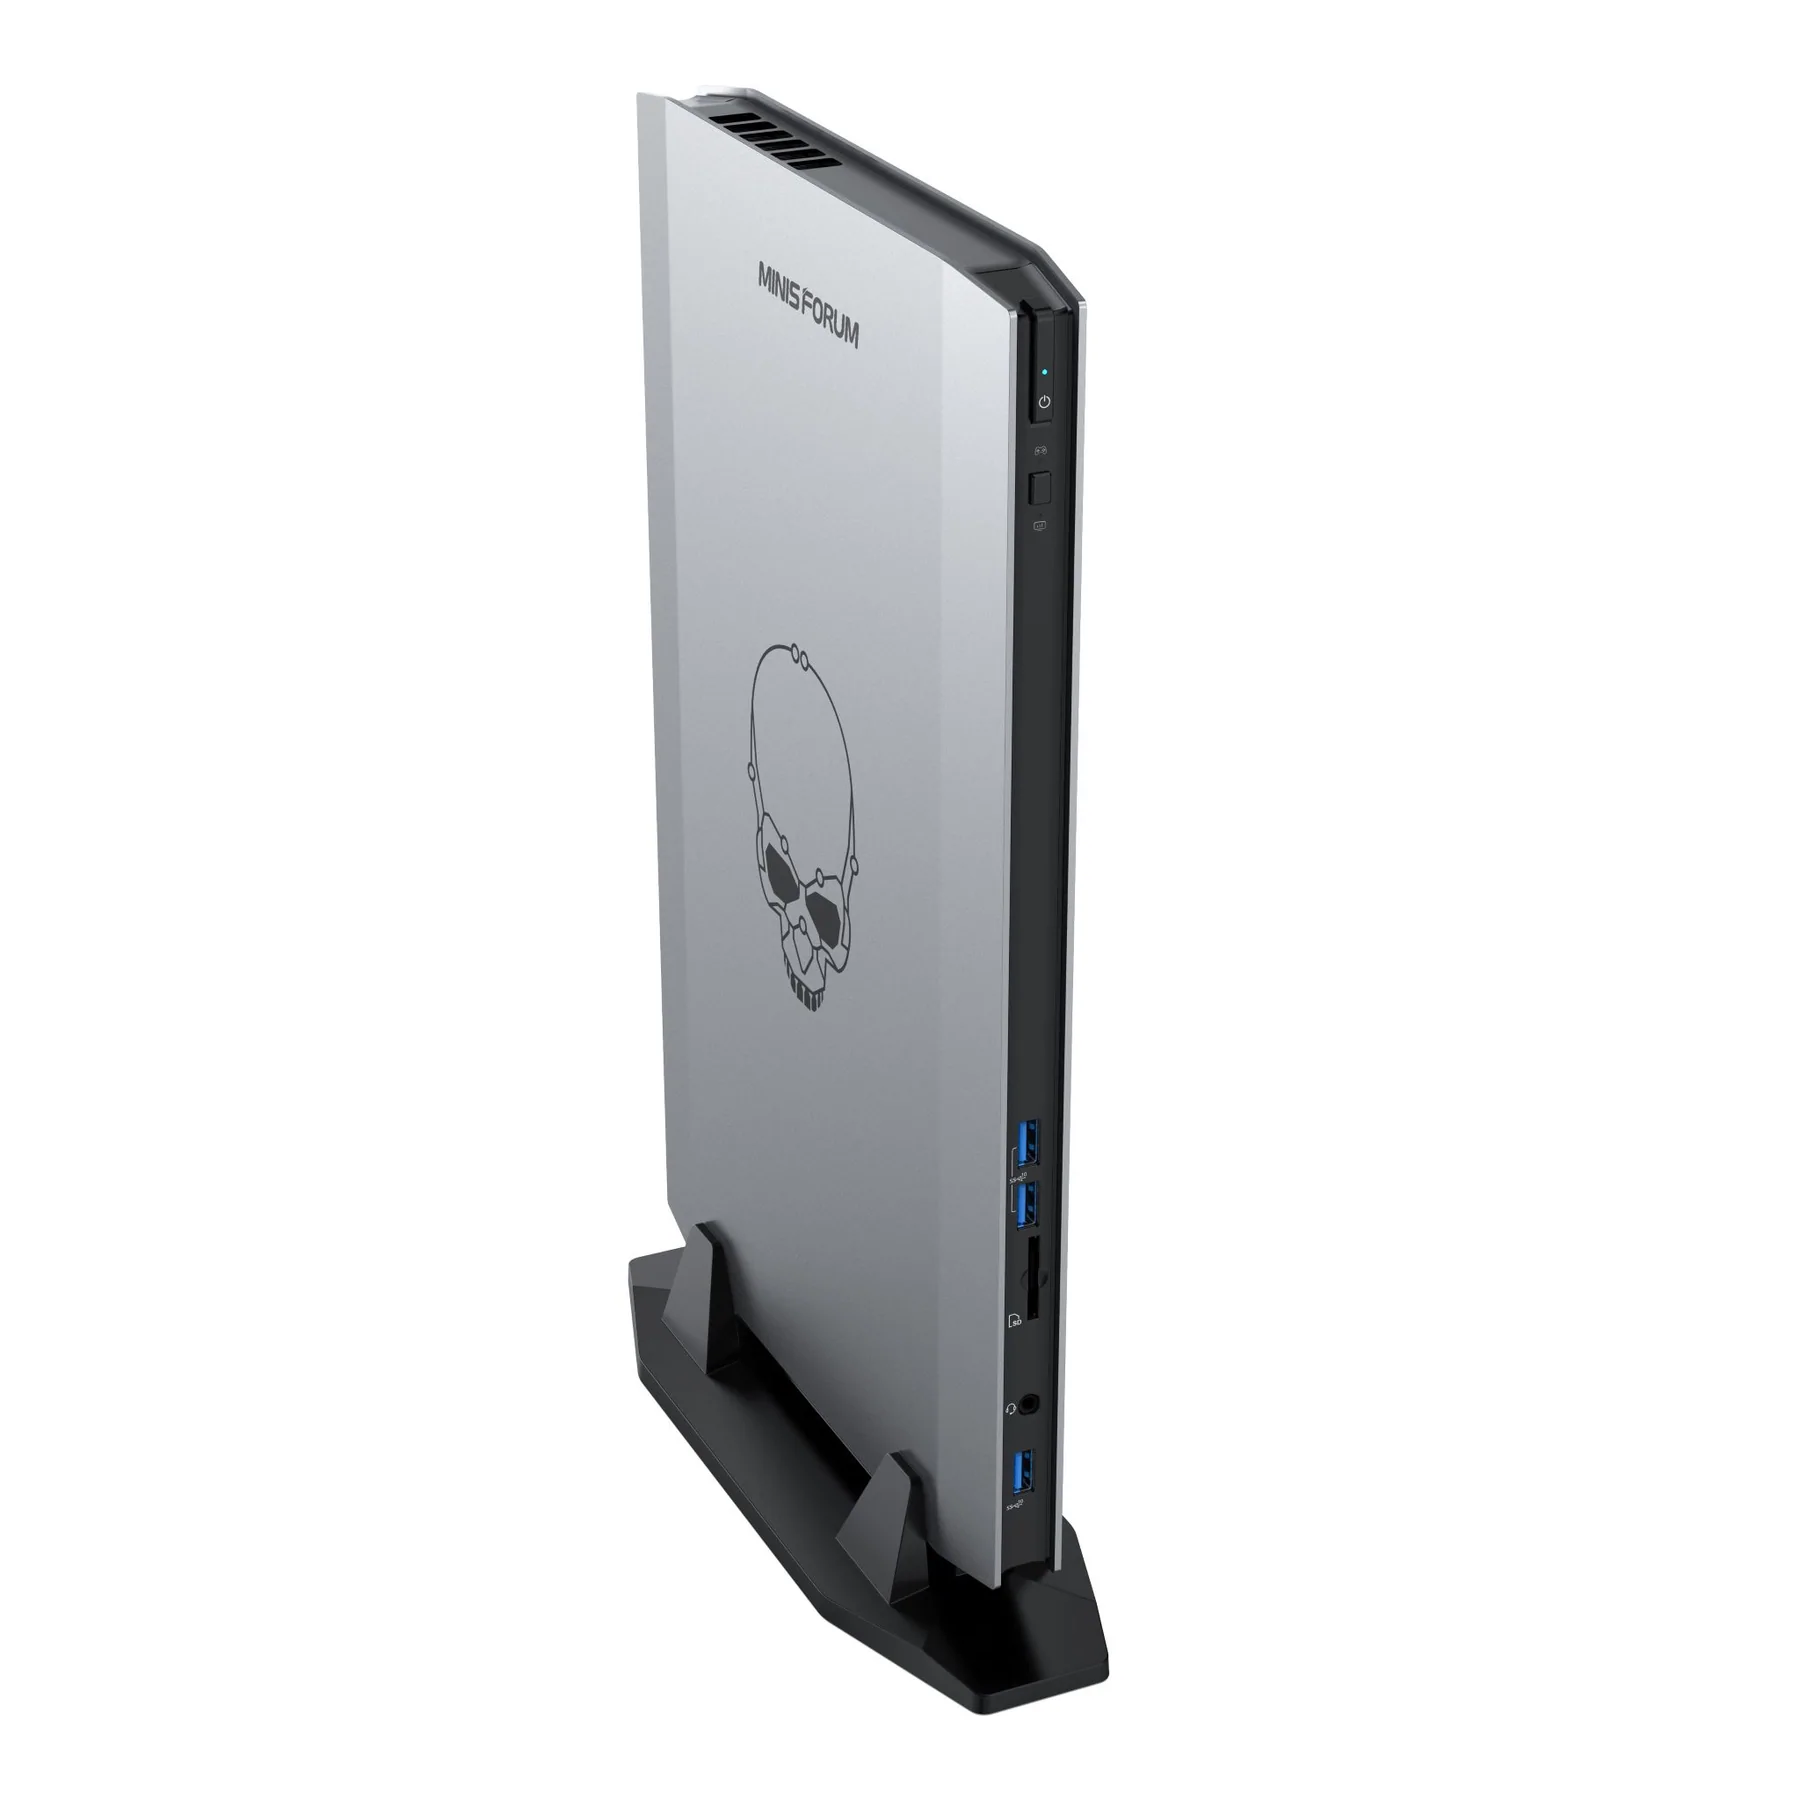
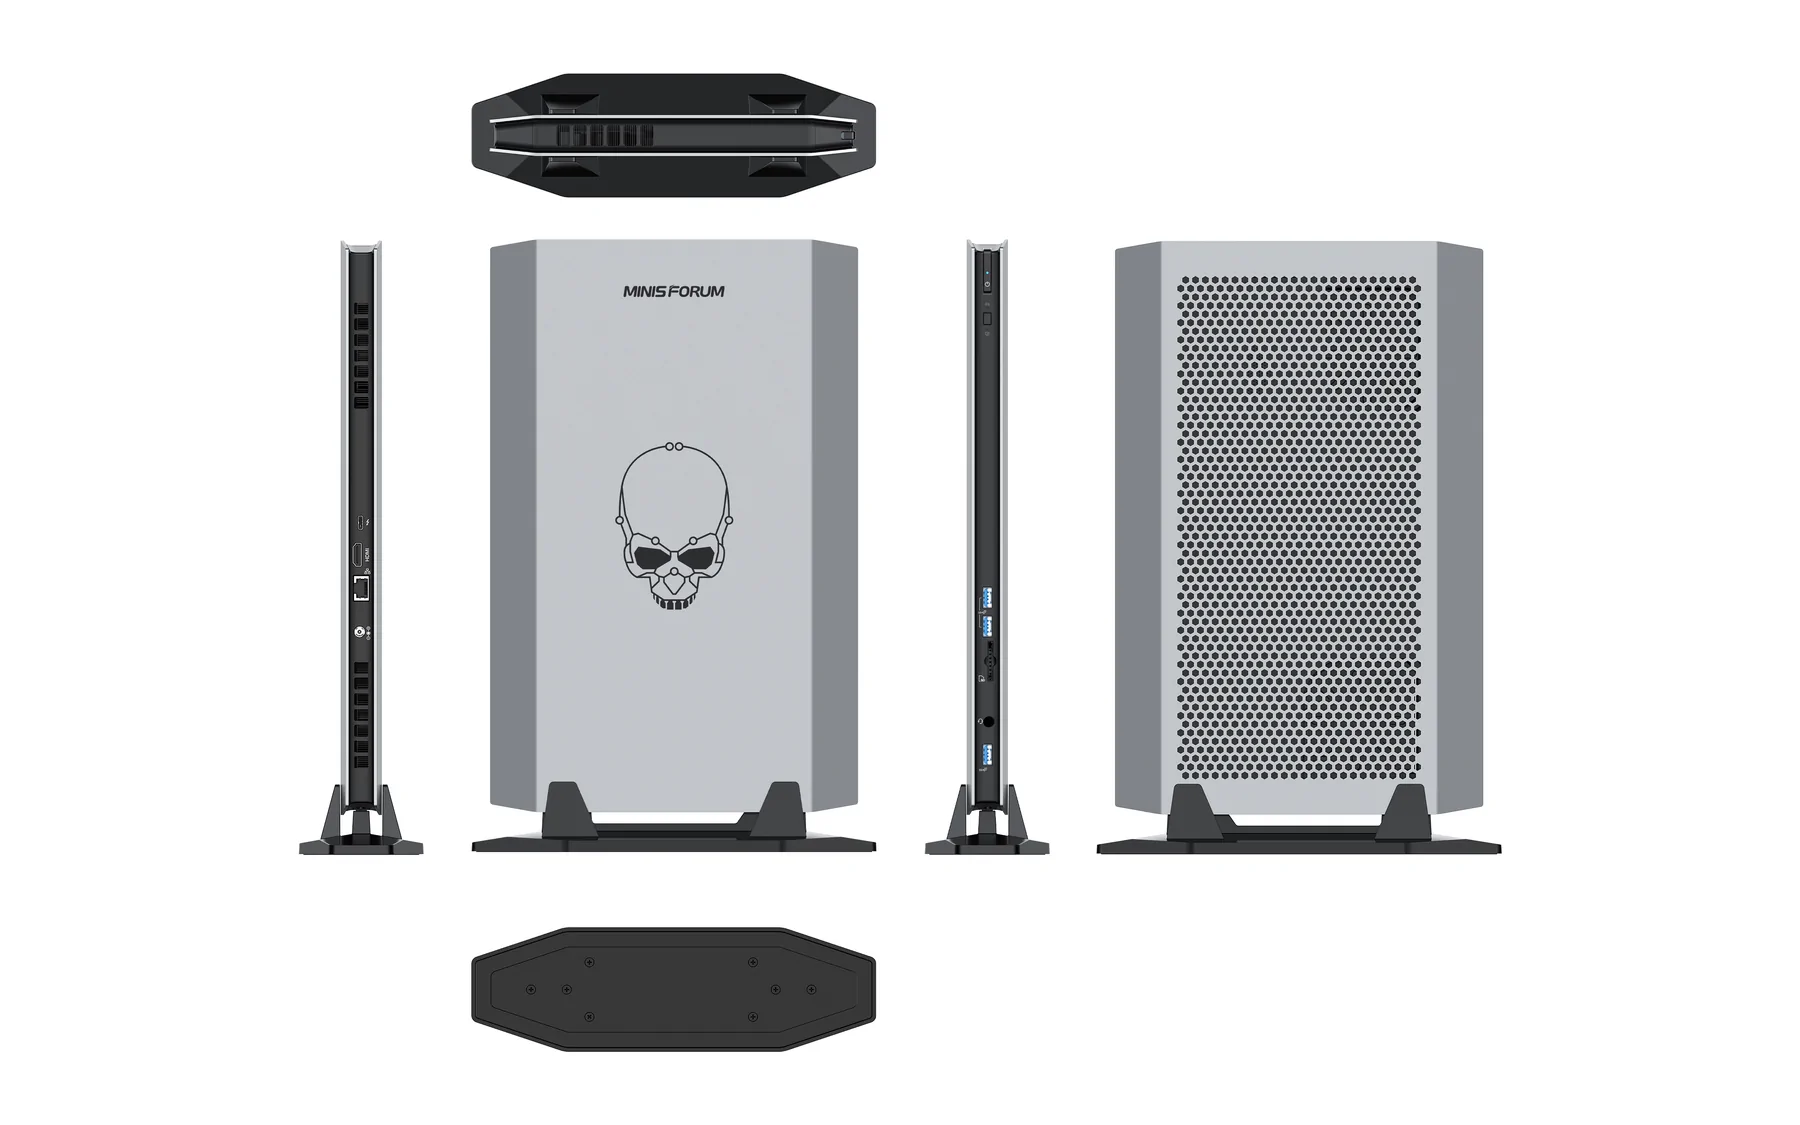
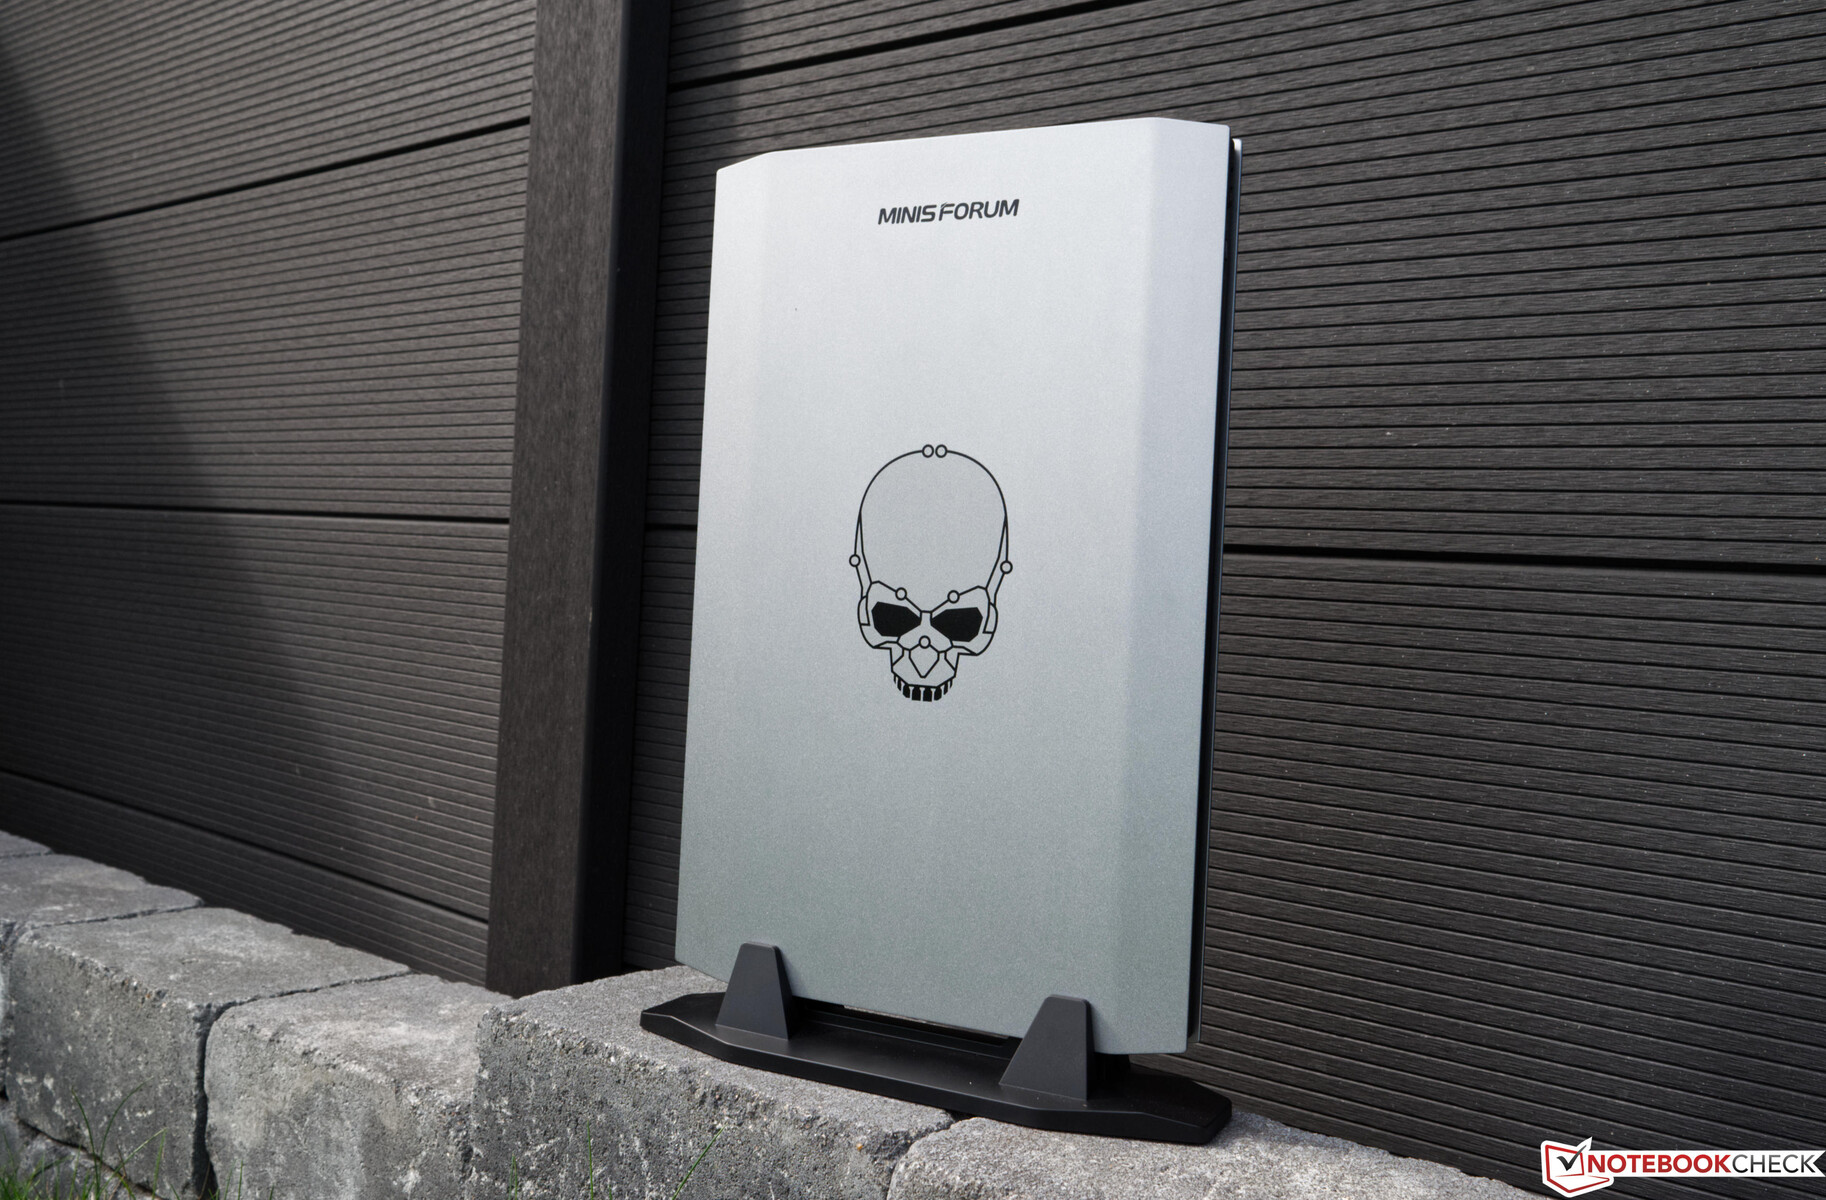
Il Minisforum NUCXi7 non è piccolo e, a nostro avviso, non è un classico mini PC. Tuttavia, il dispositivo è ancora molto sottile e ricorda un computer portatile senza display e dispositivi di input. La maggior parte del case è realizzata in plastica, pur dando un'impressione aptica di alta qualità. Una base in alluminio sarebbe probabilmente più pesante, ma il dispositivo ne guadagnerebbe in termini di qualità. Visivamente, il lato sinistro è ornato da un teschio, che vivacizza l'altrimenti semplice lato argentato. Il retro è coperto da un grande disegno a nido d'ape per garantire un buon raffreddamento. Il dispositivo è avvitato su un supporto stabile e può essere utilizzato solo in posizione verticale. Il Minisforum NUCXi7 non è stato progettato per il funzionamento in orizzontale, che probabilmente andrebbe a discapito delle caratteristiche di raffreddamento.
Compreso il supporto, il Minisforum NUCXi7 pesa solo 2,4 kg (~5,3 lb), il che è molto leggero. D'altra parte, il peso del supporto impedisce che cada facilmente. Per l'alimentatore esterno, è necessario aggiungere circa altri 0,5 kg (~1,1 lb) al peso.
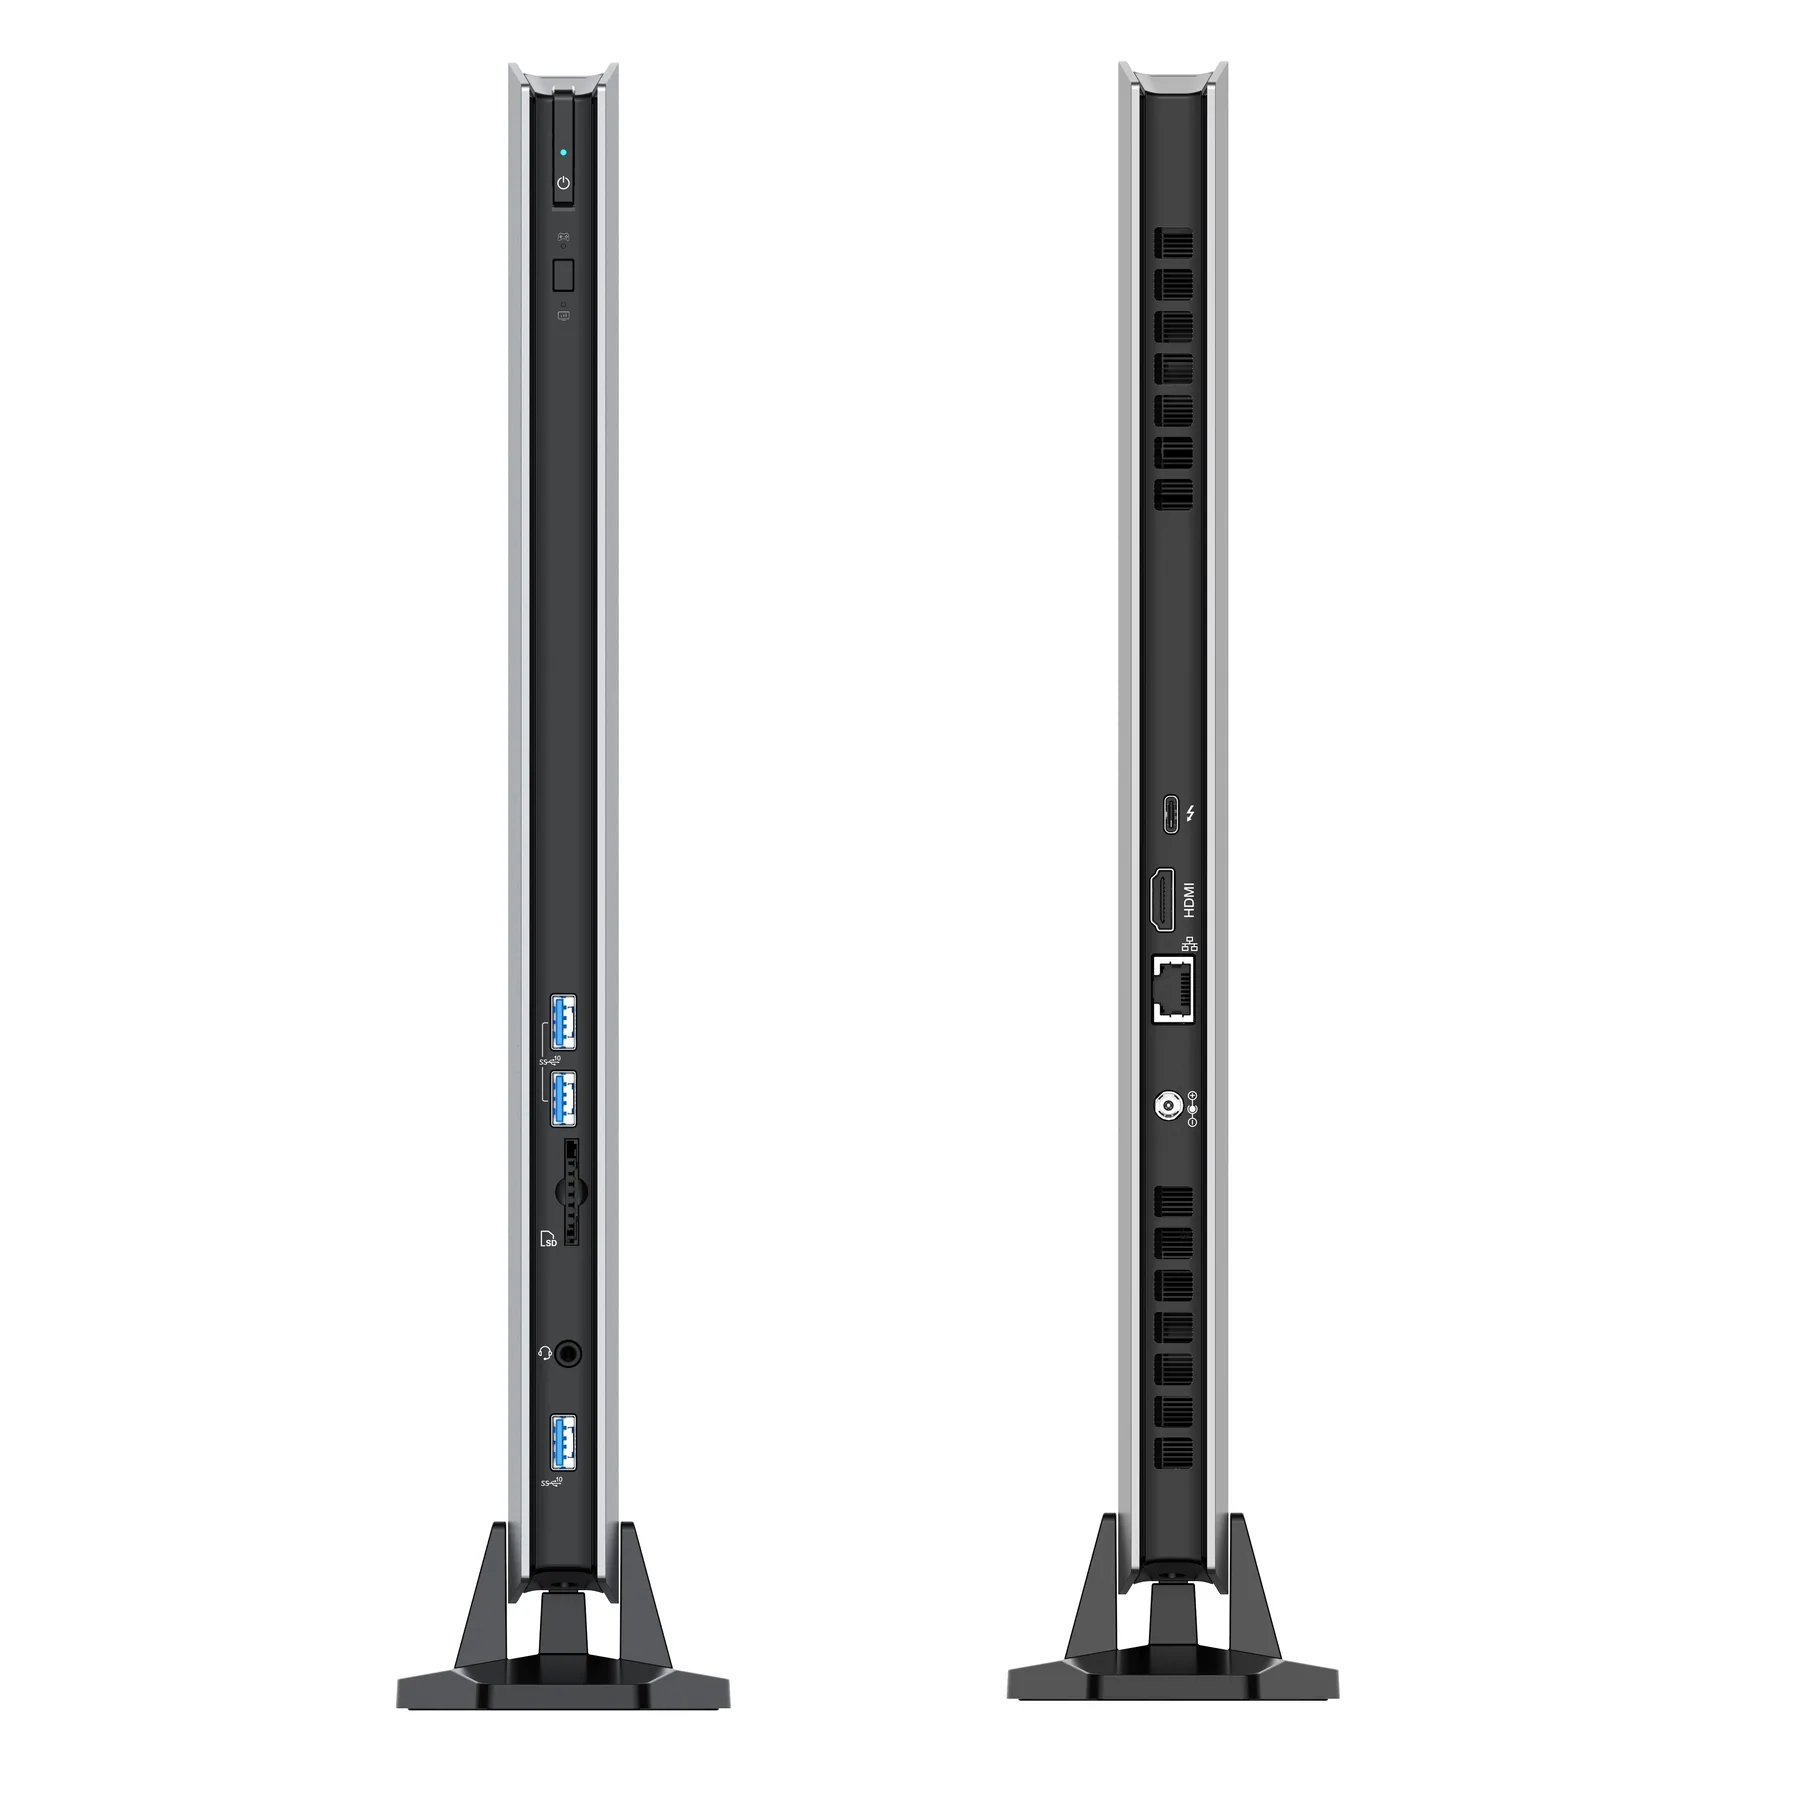
Attrezzatura
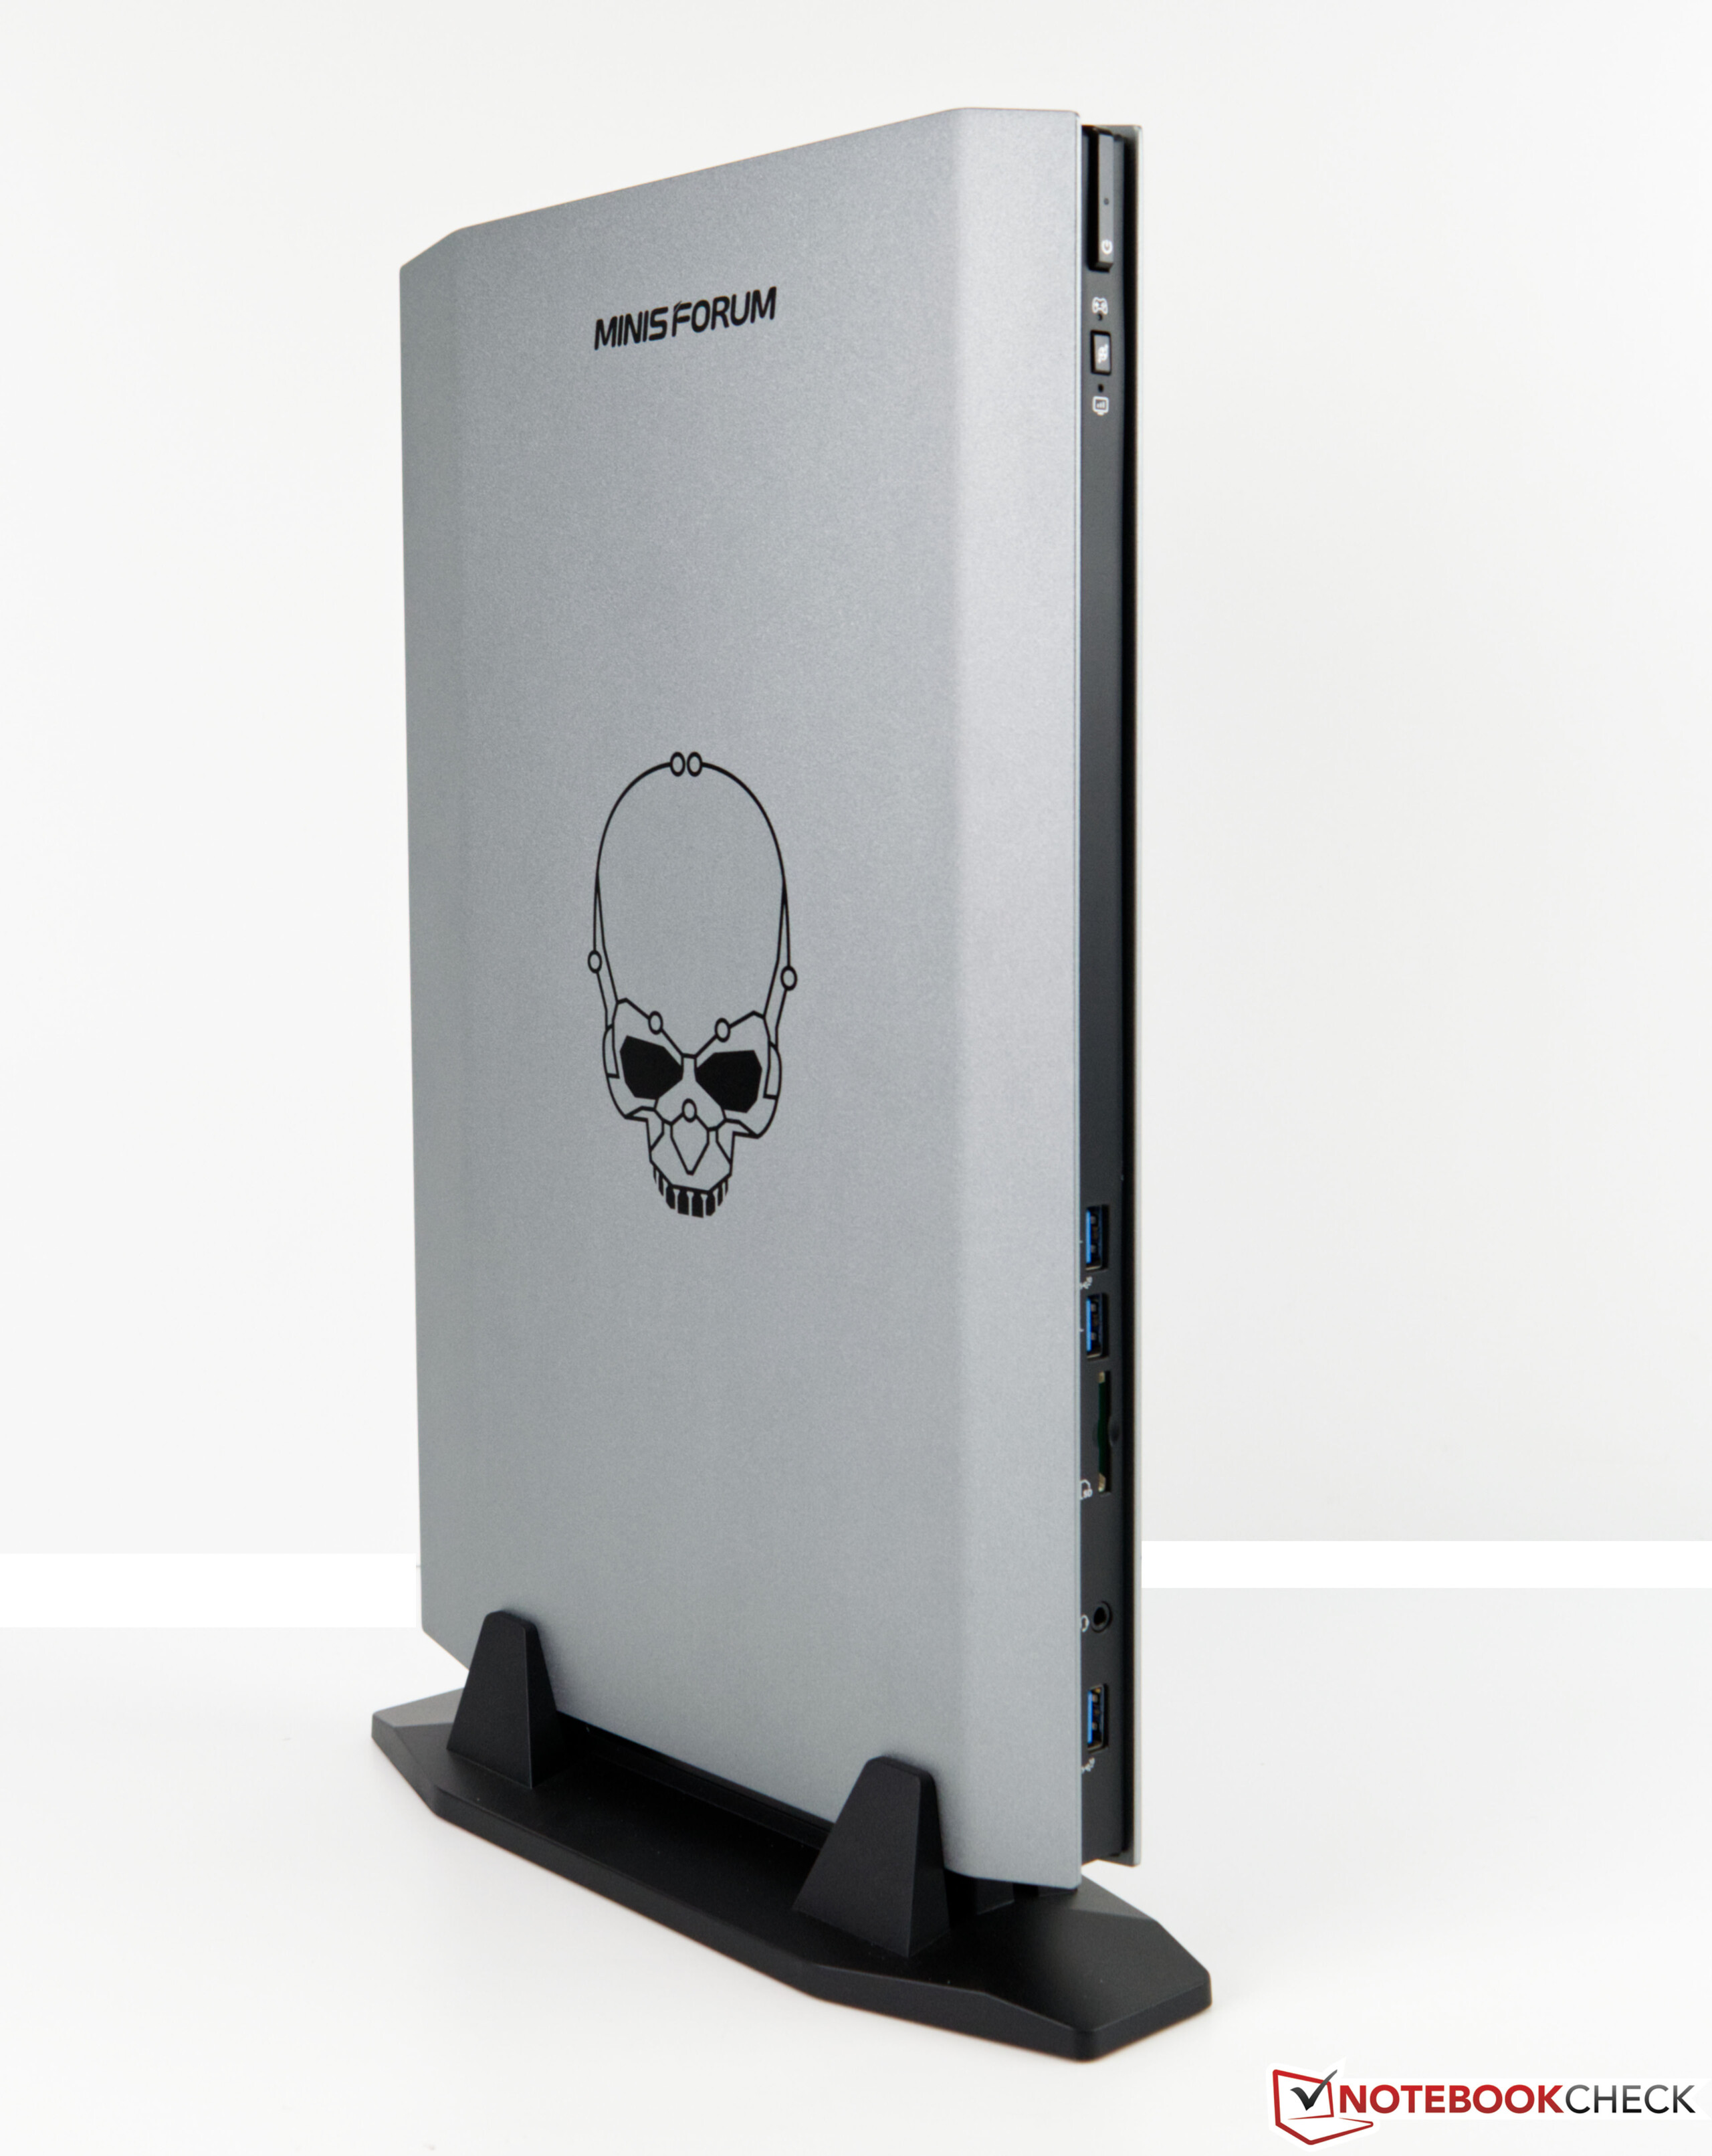
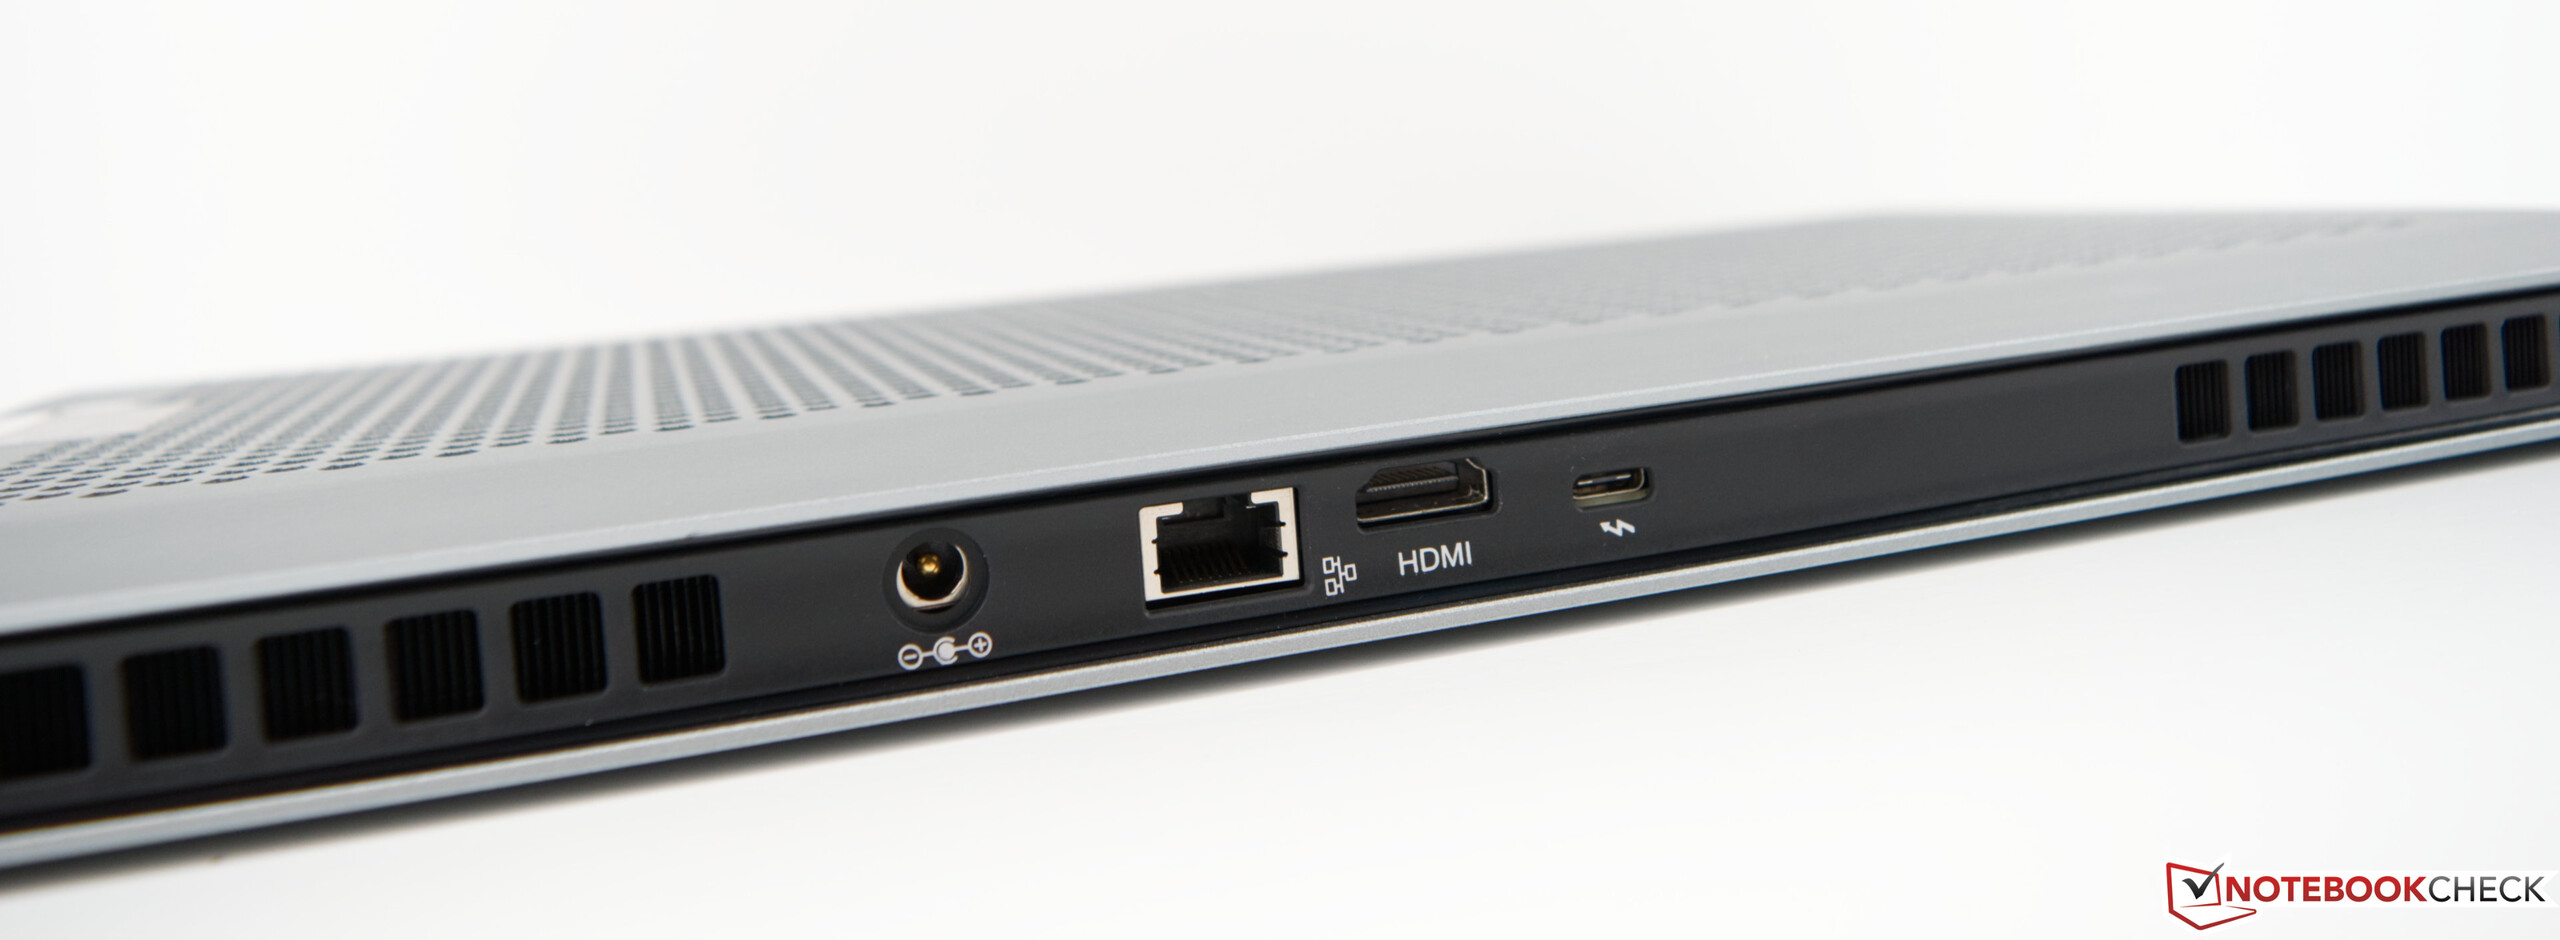
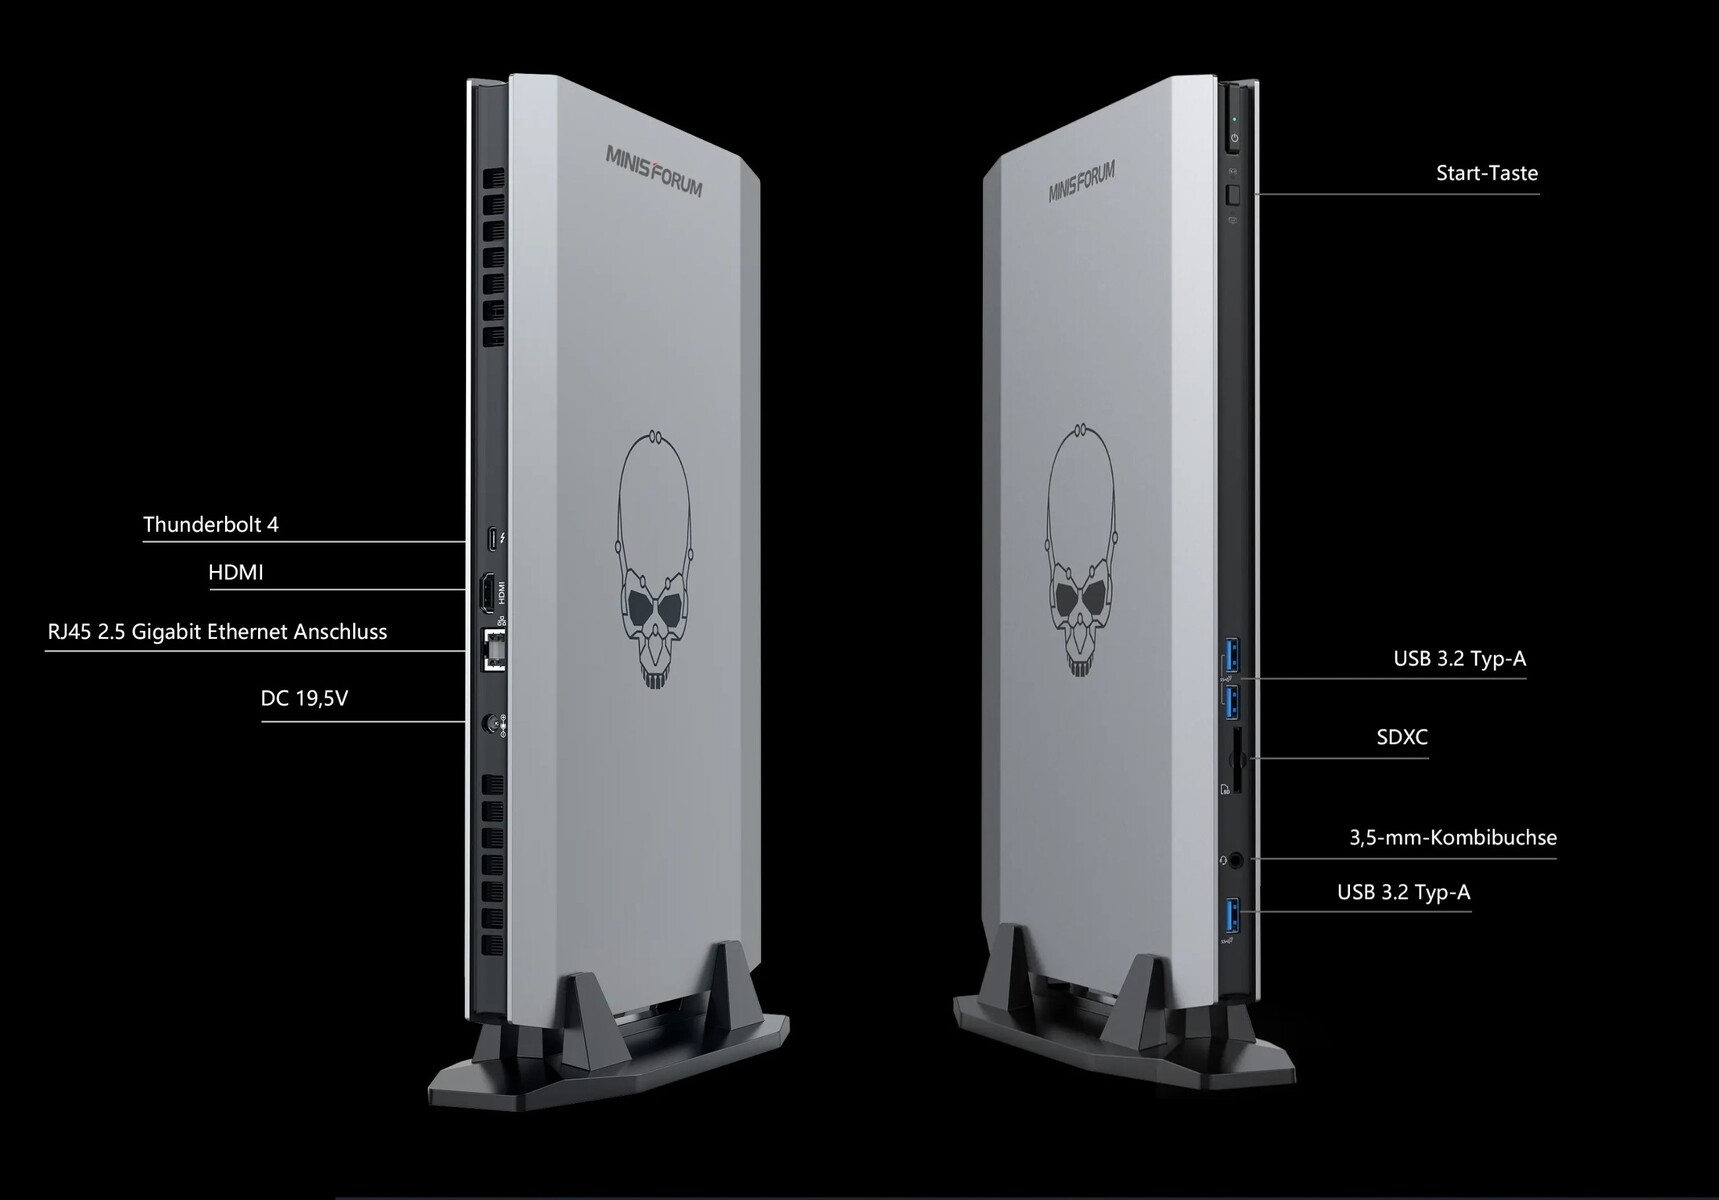
A prima vista, sono disponibili tutte le connessioni più importanti. C'è persino una moderna porta Thunderbolt. Allo stesso tempo, si possono avere opinioni diverse sul numero di porte USB 3.2 Type-A disponibili. Il dispositivo ne offre solo tre, tutte posizionate nella parte anteriore. Avremmo preferito almeno un'altra porta USB sul retro. Purtroppo, però, il produttore è vincolato al layout della scheda madre, il che renderebbe più difficile l'operazione. È possibile collegare gli schermi tramite HDMI o Thunderbolt, ed entrambe le opzioni hanno funzionato senza problemi nel nostro test. Inoltre, non si può fare a meno di un lettore di schede SD.
Lettore di schede SD
Il Minisforum NUCXi7 è dotato di un lettore di schede SD che opera a velocità USB 3. I 76 MB/s che abbiamo misurato nel nostro test utilizzando la nostra scheda di riferimento (Angelbird AV Pro V60) con connessione UHS-II confermano la velocità USB 3. Tuttavia, queste prestazioni sono ancora inferiori alla media della categoria. Tuttavia, questa prestazione è ancora peggiore della media della categoria.
| SD Card Reader - average JPG Copy Test (av. of 3 runs) | |
| Asus ROG Zephyrus Duo 16 GX650RX (AV PRO microSD 128 GB V60) | |
| Razer Blade 17 Early 2022 (AV PRO microSD 128 GB V60) | |
| Minisforum NUCX i7 (AV Pro SD microSD 128 GB V60) | |
| MSI Titan GT77 12UHS (AV PRO microSD 128 GB V60) | |
| Acer Predator Triton 500 SE PT516-52s-70KX (AV PRO microSD 128 GB V60) | |
| MSI Raider GE77 HX 12UHS (AV PRO microSD 128 GB V60) | |
Comunicazione
Minisforum utilizza un modulo Intel Wi-Fi 6E-AX210 nel NUCXi7. Nel nostro test con il router ASUS ROG Rapture GT-AXE11000, non siamo riusciti a raggiungere le buone prestazioni dei dispositivi di confronto. Il Minisforum NUCXi7 si colloca alla fine del campo di confronto, rimanendo chiaramente indietro. La porta LAN integrata offre una buona alternativa alla connessione wireless, supportando fino a 2,5 Gbit/s.
Accessori
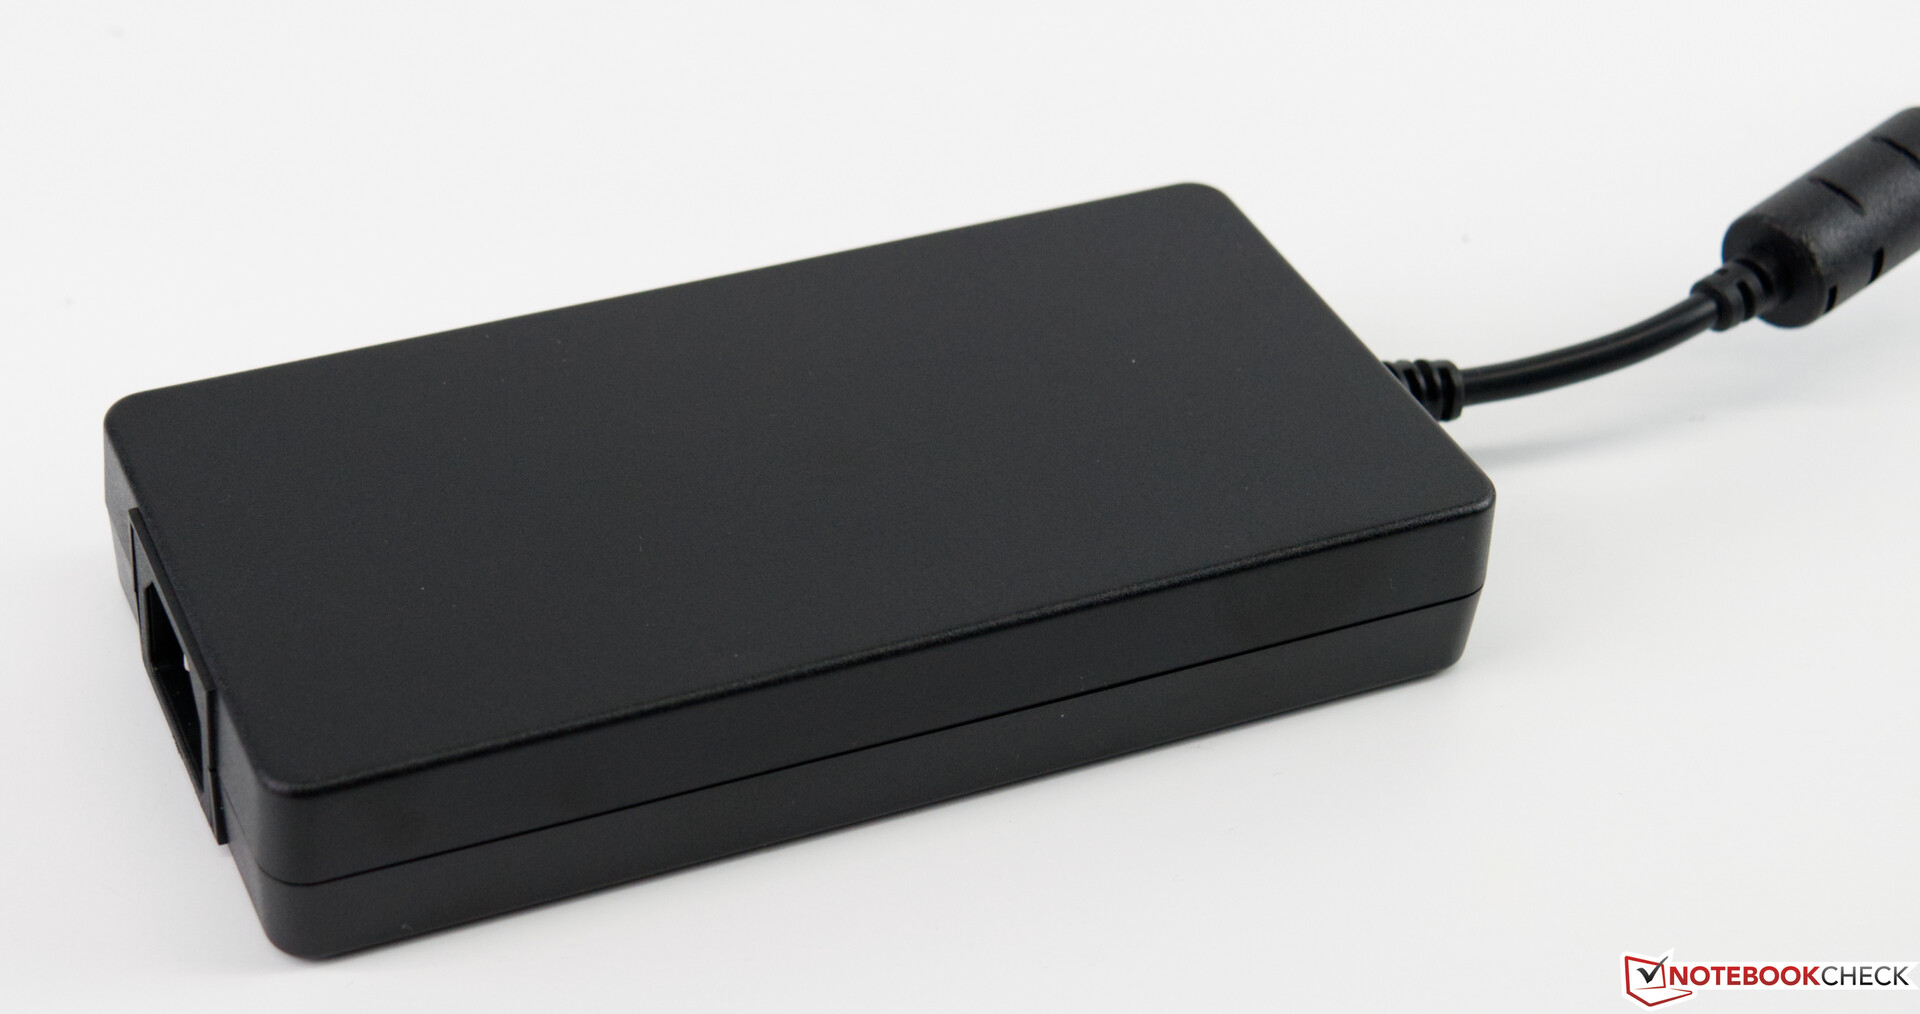
Oltre al computer stesso, la confezione include anche l'alimentatore da 230 Watt e il supporto, che consente di posizionare il dispositivo in orizzontale.
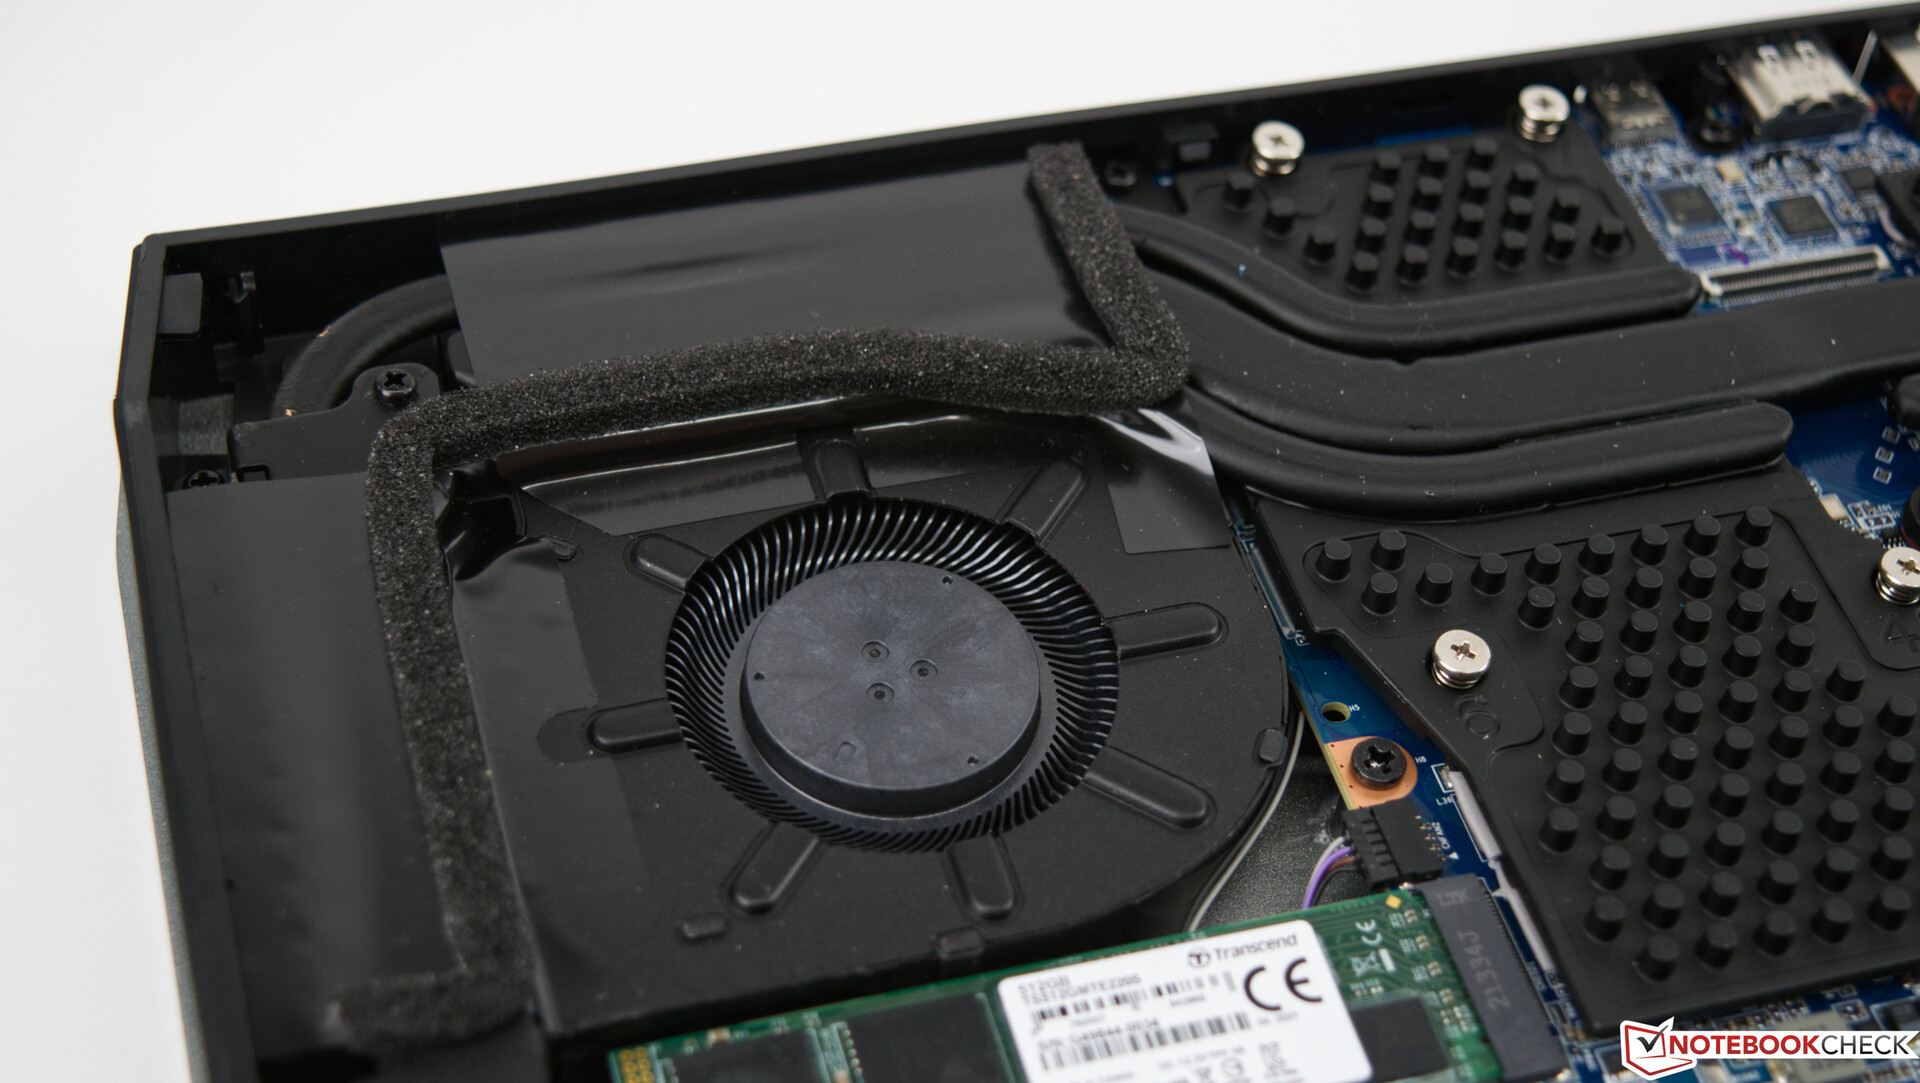
Manutenzione
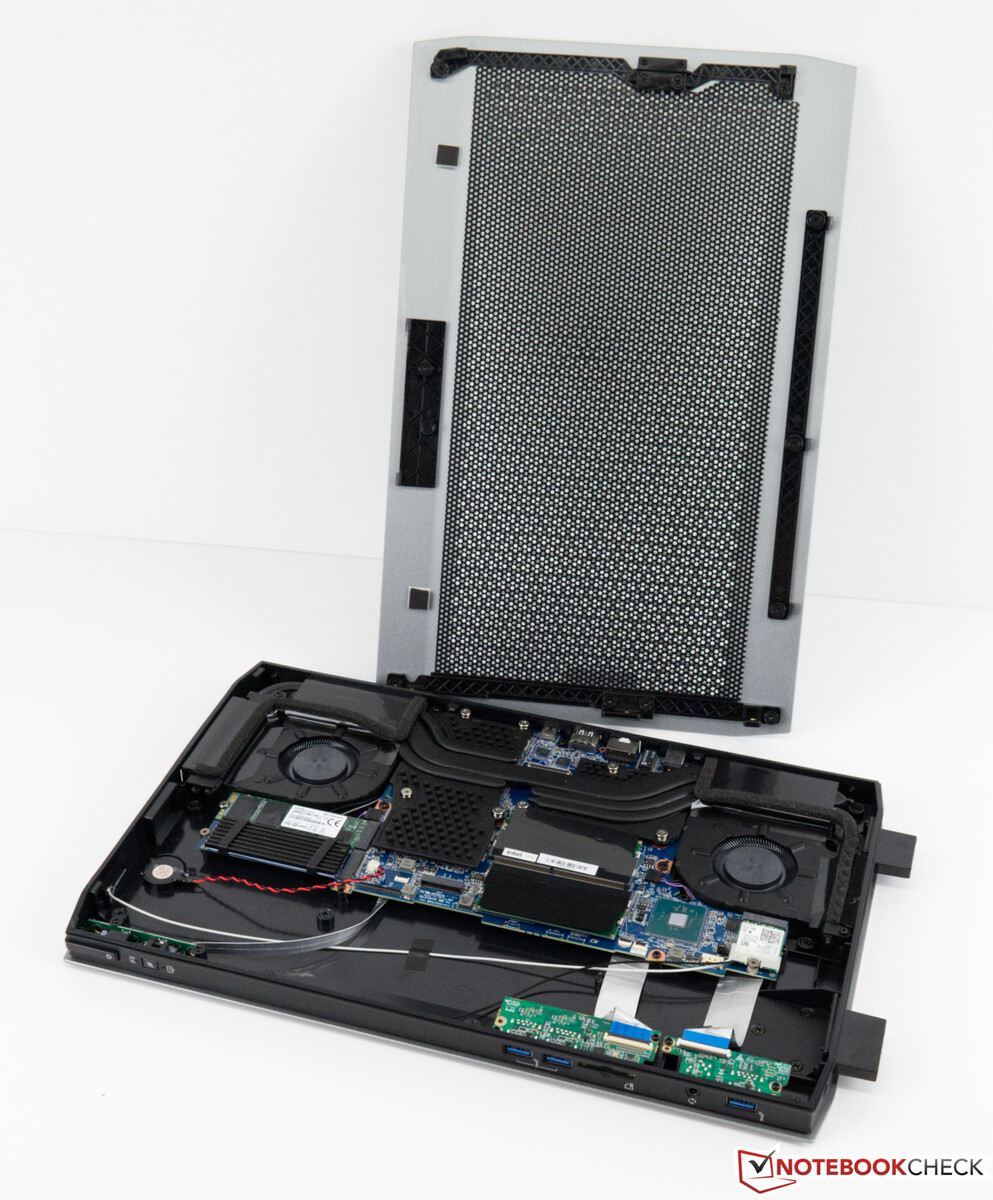
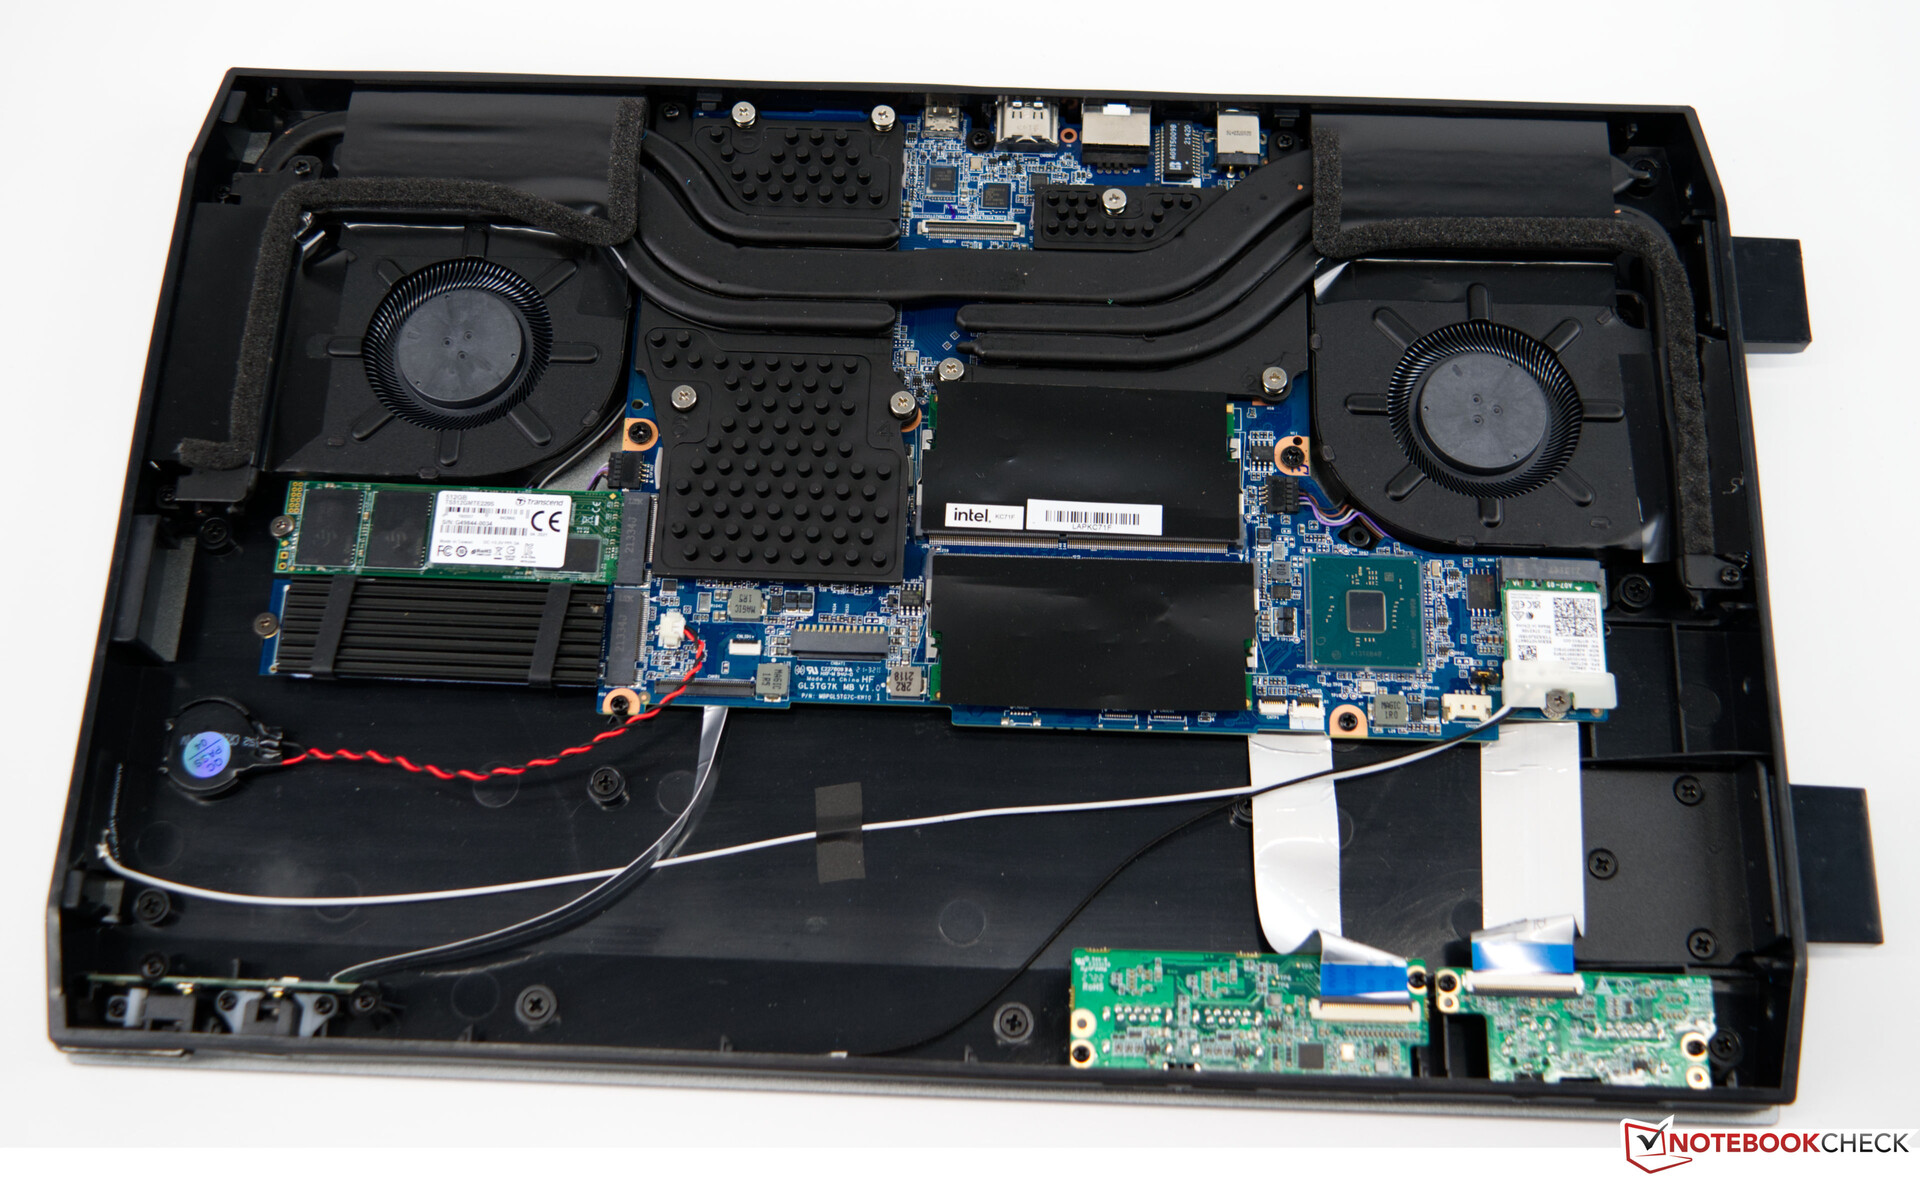
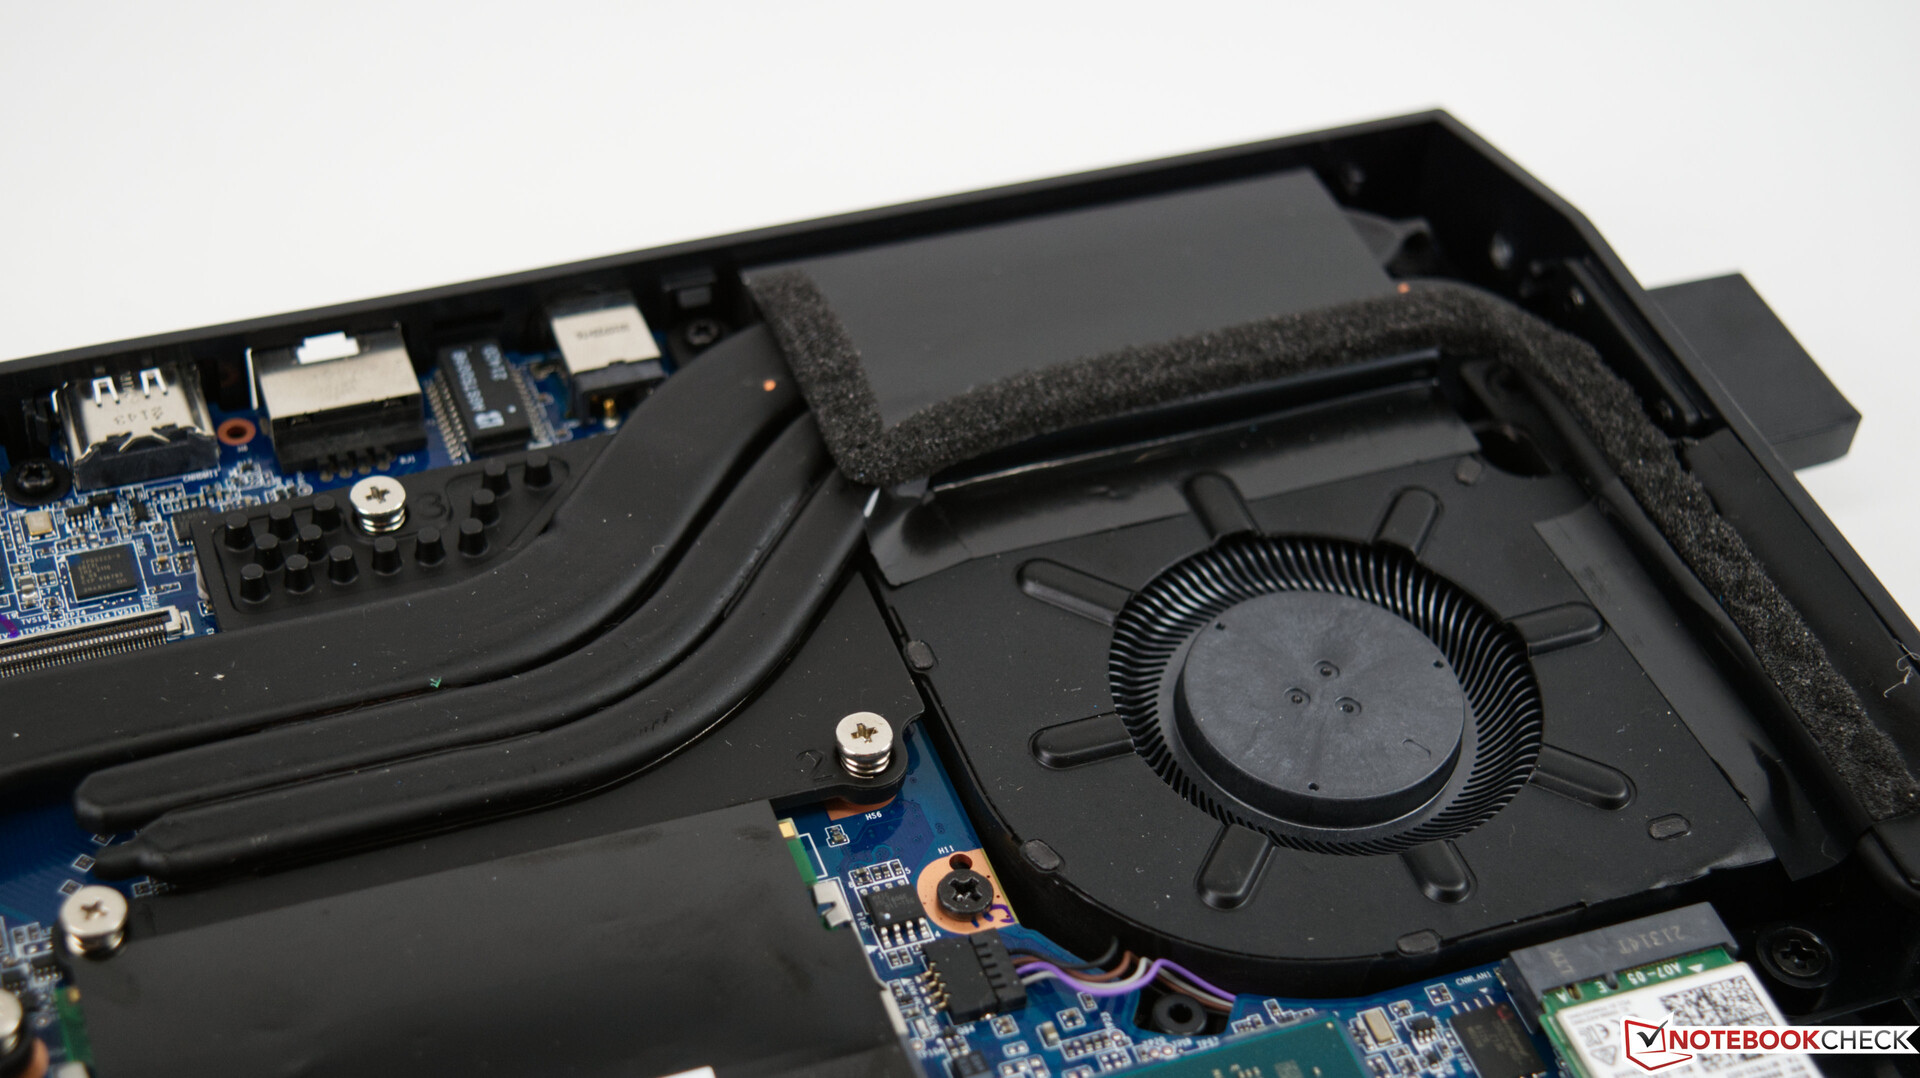
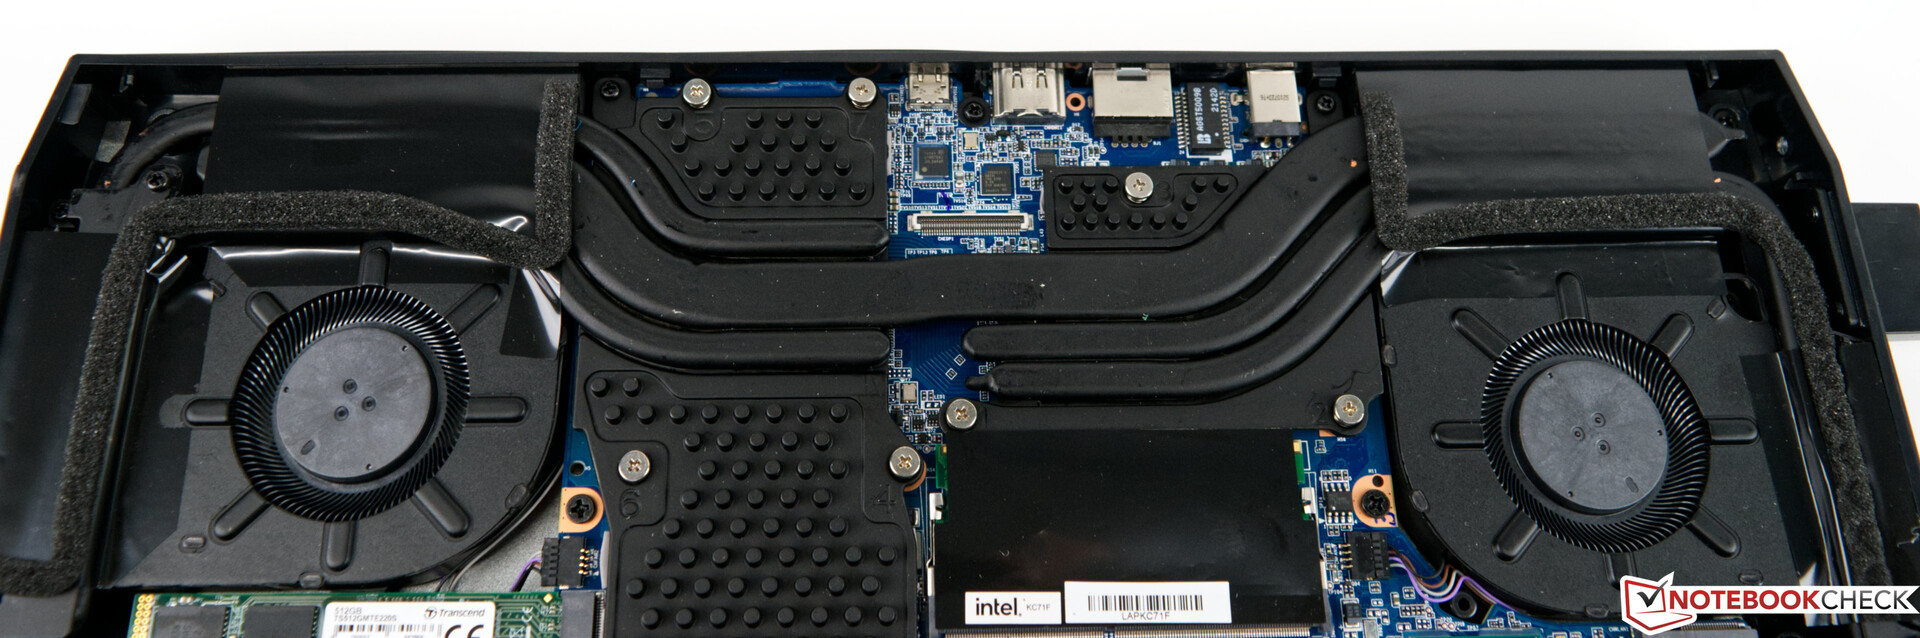
Per le operazioni di ampliamento o di manutenzione, è possibile rimuovere il coperchio laterale dell'apparecchio, fissato nella parte inferiore con tre viti; dopo averle rimosse, è possibile togliere il coperchio senza problemi. Un opuscolo in dotazione spiega anche come fare. Dopo aver rimosso il coperchio, si potrebbe essere indotti a pensare di trovarsi di fronte a un computer portatile. Ma c'è ancora molto spazio inutilizzato, che di solito è riservato alla batteria. Si capisce anche perché non sia possibile aggiungere facilmente delle porte USB sul retro. L'unico spazio per ulteriori connessioni si trova nella parte anteriore.
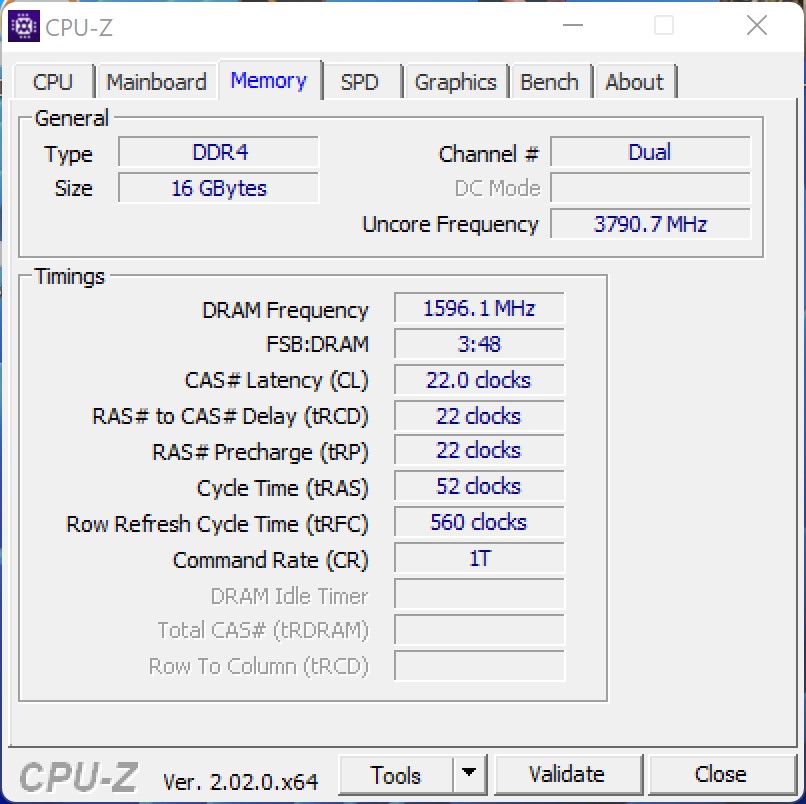
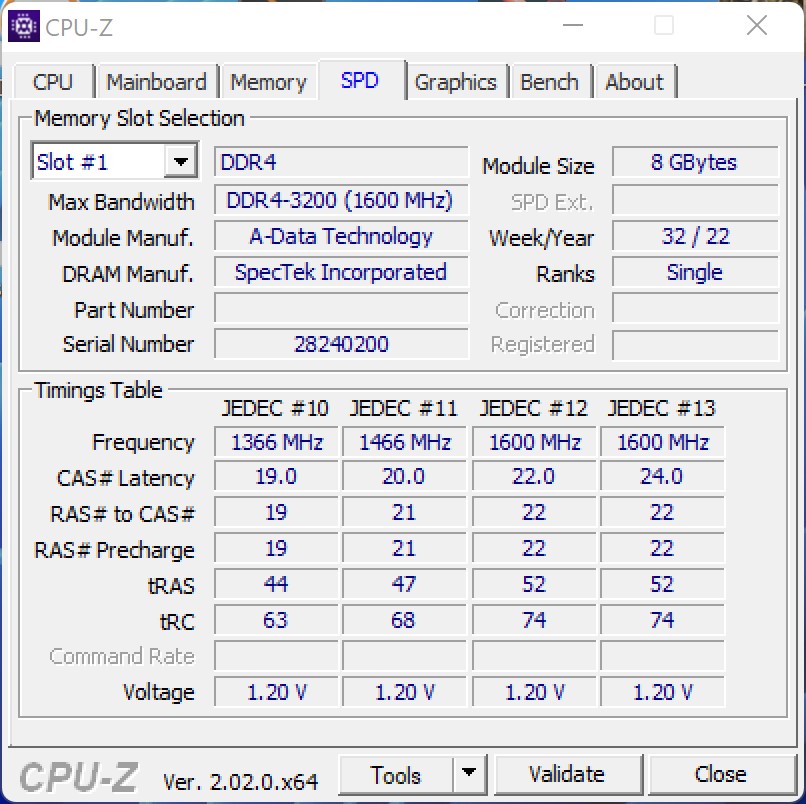
È possibile inserire un totale di due unità SSD M.2 nel dispositivo, come abbiamo fatto per questo test. Per espandere la memoria di lavoro, si ha solo la possibilità di sostituire i moduli, poiché entrambi gli slot SO-Dimm sono già occupati da moduli da 8 GB.
Prestazioni - Un veloce Core i7-11800H
Con il Intel Core i7-11800Hla nostra unità di prova offre una buona base per la gestione di applicazioni impegnative. In combinazione con la GPU Nvidia RTX 3070 Laptop GPU Nvidia GeForce RTX 3070 Laptopil Minisforum NUCXi7 si presenta come un portatile da gioco ben equipaggiato. I 16 GB di RAM sono generalmente sufficienti per tutti i giochi attuali, anche se lo spazio può diventare un po' stretto con i 512 GB dell'SSD. Con questa dotazione, è anche possibile godersi i giochi attuali a 1.440p. Chi vuole giocare solo a 1.080p dovrebbe dare un'occhiata più da vicino al NUCXi5 di Minisforum.
Condizioni di prova
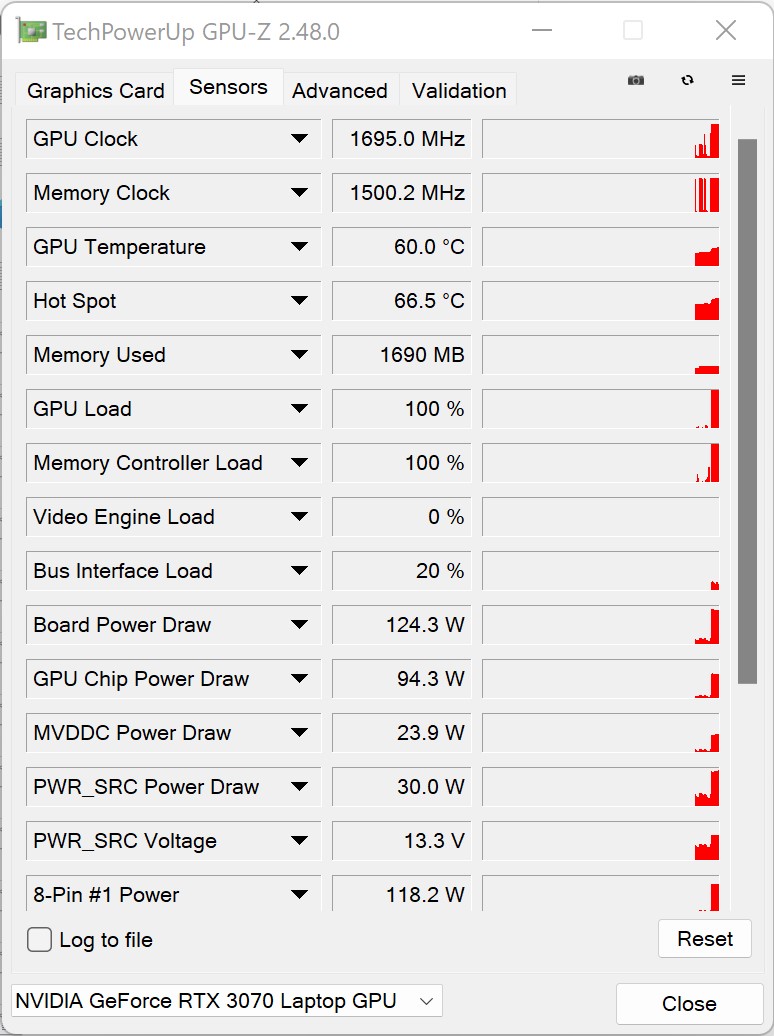
Abbiamo eseguito tutti i test sulle prestazioni in modalità Gaming. Questa modalità può essere attivata premendo un pulsante nella parte anteriore, garantendo alla GPU un consumo energetico maggiore sotto carico. Per l'esattezza, ciò corrisponde a un aumento del consumo energetico della GPU a 125 watt.
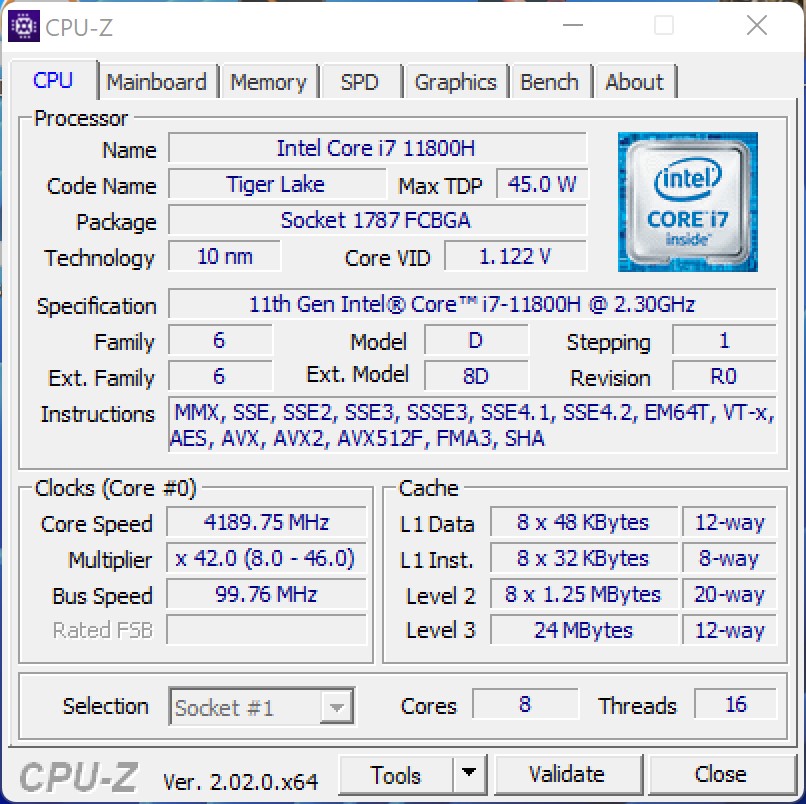
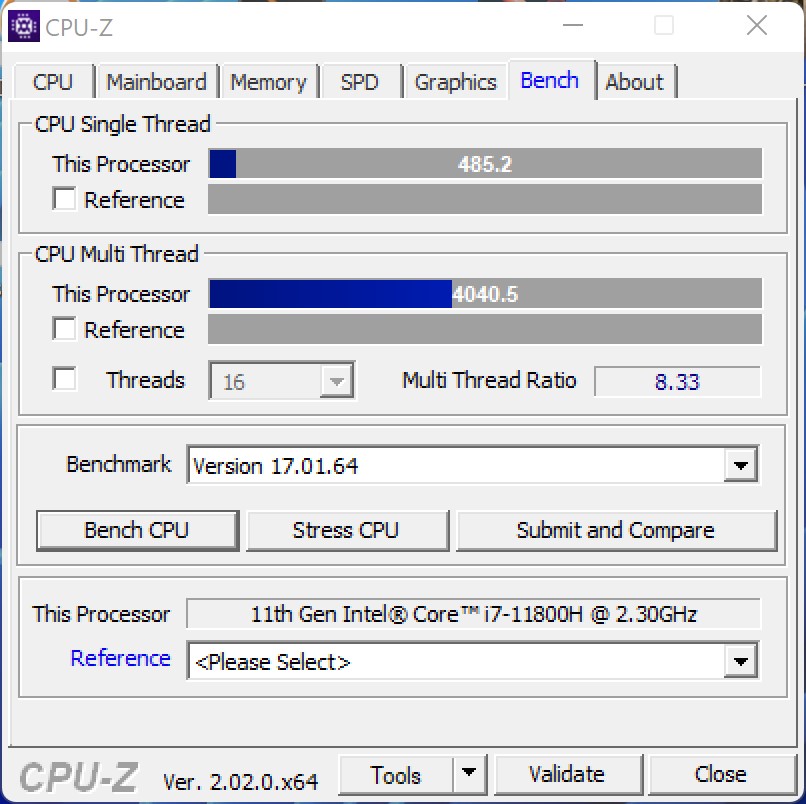
Processore
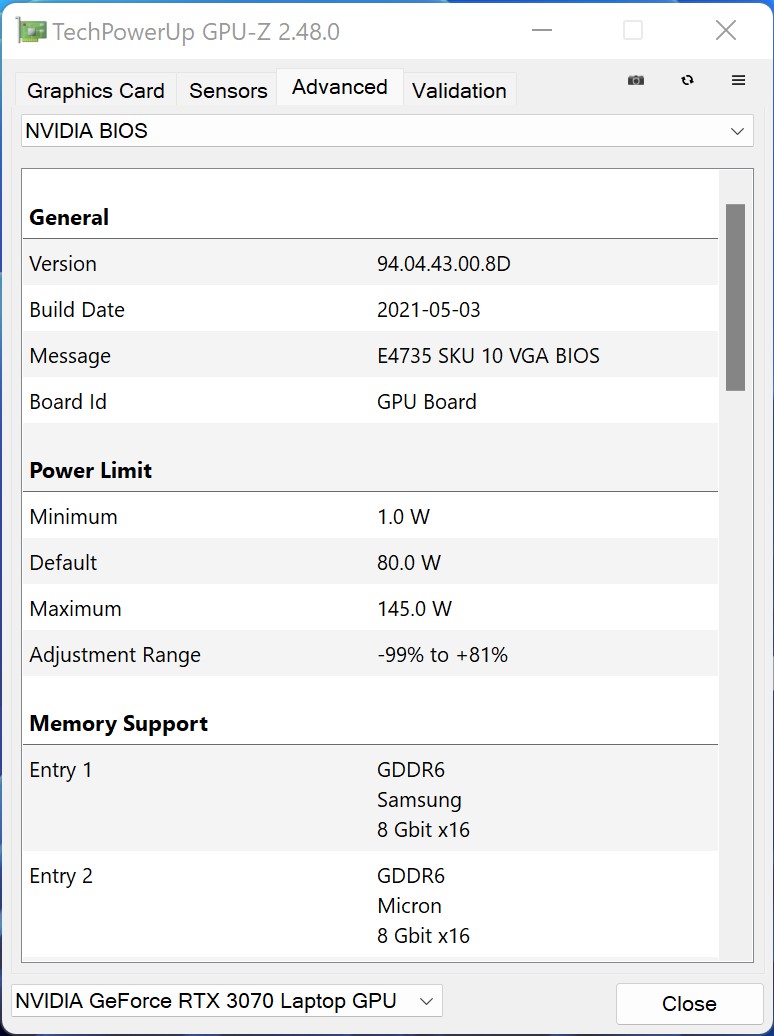
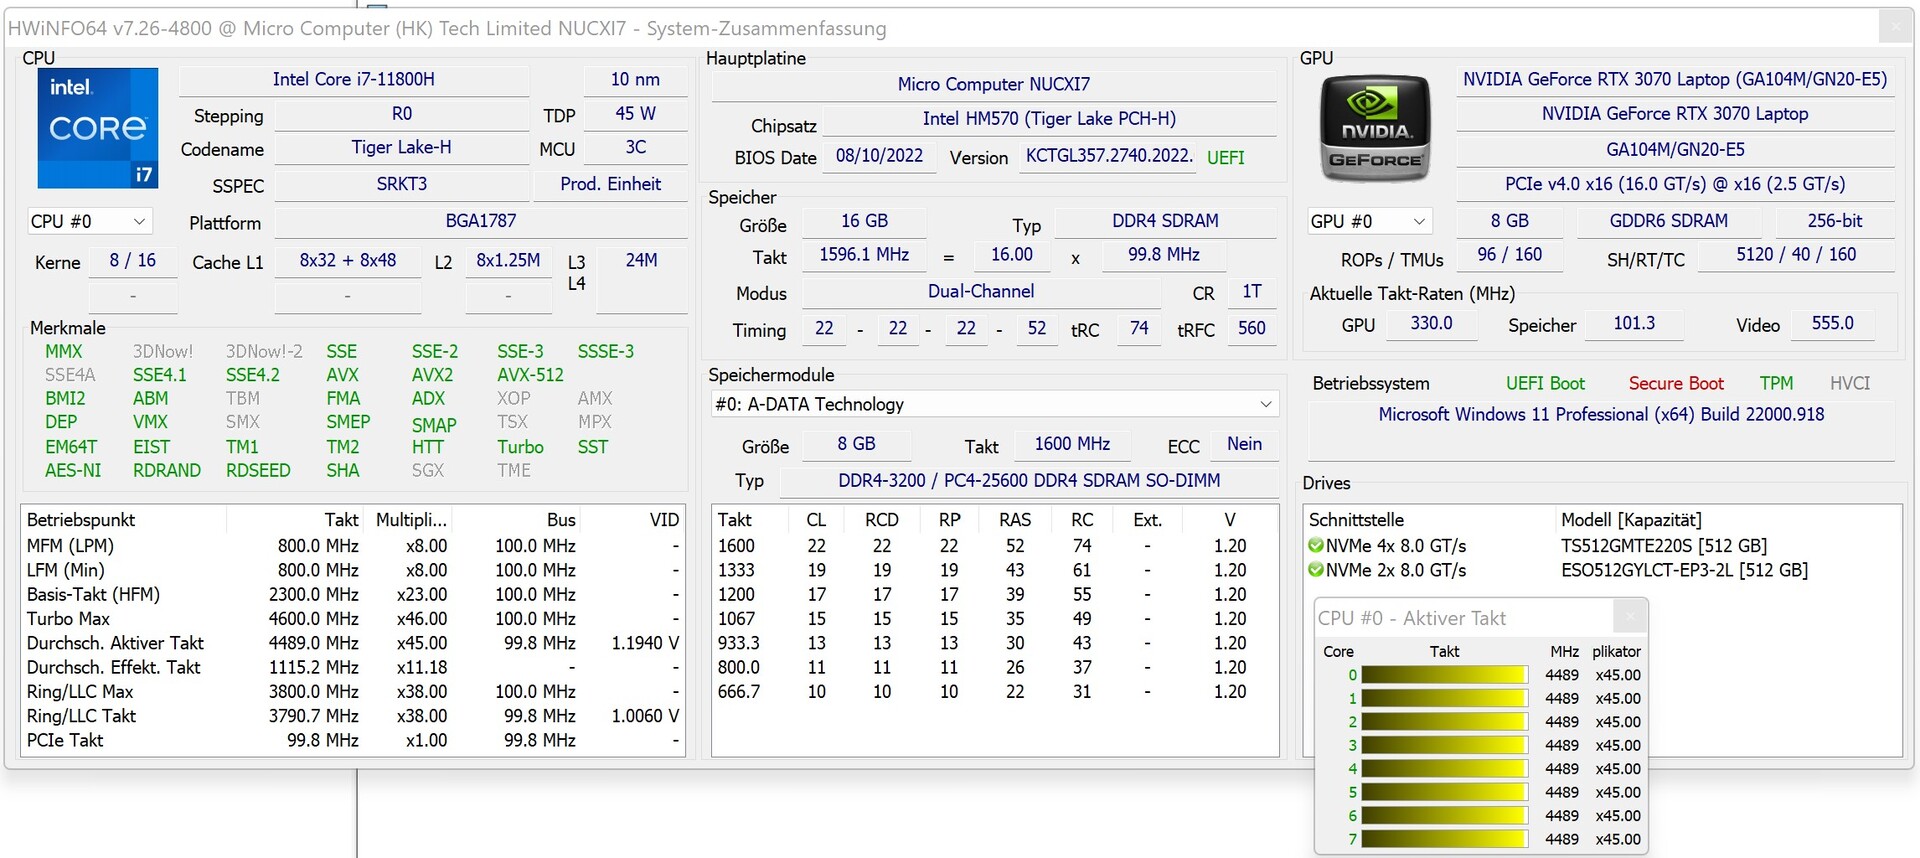
IlIntel Core i7-11800Hoffre otto core di calcolo nativi ed è basato sull'architettura Tiger Lake di Intel. Per quanto riguarda il consumo energetico, Minisforum offre uno spazio di manovra fino a 110 watt (PL2), anche se con 68 watt il PL1 è ancora un valore molto buono per ottenere prestazioni elevate. Ed è proprio questo il caso, dato che la nostra unità di prova è in grado di assicurarsi un buon posto a metà classifica con le prestazioni ottenute nel nostro test. Lo svantaggio rispetto ai dispositivi di confronto più veloci è piccolo e soggettivamente non si nota.
Potete trovare altri benchmark dei processori qui.
* ... Meglio usare valori piccoli
AIDA64: FP32 Ray-Trace | FPU Julia | CPU SHA3 | CPU Queen | FPU SinJulia | FPU Mandel | CPU AES | CPU ZLib | FP64 Ray-Trace | CPU PhotoWorxx
| Performance rating | |
| Media della classe Desktop | |
| Gigabyte A7 X1 | |
| Intel Beast Canyon NUC | |
| Intel Dragon Canyon NUC - RTX 3060 | |
| Minisforum NUCX i7 | |
| Zotac ZBOX Magnus EN173070C | |
| Zotac MEK Mini (RTX 2070 Super) | |
| AIDA64 / FP32 Ray-Trace | |
| Media della classe Desktop (12248 - 84577, n=21, ultimi 2 anni) | |
| Gigabyte A7 X1 | |
| Intel Beast Canyon NUC | |
| Intel Dragon Canyon NUC - RTX 3060 | |
| Zotac ZBOX Magnus EN173070C | |
| Minisforum NUCX i7 | |
| Zotac MEK Mini (RTX 2070 Super) | |
| AIDA64 / FPU Julia | |
| Media della classe Desktop (65152 - 246125, n=21, ultimi 2 anni) | |
| Gigabyte A7 X1 | |
| Intel Beast Canyon NUC | |
| Intel Dragon Canyon NUC - RTX 3060 | |
| Zotac ZBOX Magnus EN173070C | |
| Minisforum NUCX i7 | |
| Zotac MEK Mini (RTX 2070 Super) | |
| AIDA64 / CPU SHA3 | |
| Media della classe Desktop (2982 - 10804, n=21, ultimi 2 anni) | |
| Intel Beast Canyon NUC | |
| Intel Dragon Canyon NUC - RTX 3060 | |
| Zotac ZBOX Magnus EN173070C | |
| Minisforum NUCX i7 | |
| Gigabyte A7 X1 | |
| Zotac MEK Mini (RTX 2070 Super) | |
| AIDA64 / CPU Queen | |
| Media della classe Desktop (76512 - 187912, n=18, ultimi 2 anni) | |
| Gigabyte A7 X1 | |
| Intel Beast Canyon NUC | |
| Intel Dragon Canyon NUC - RTX 3060 | |
| Minisforum NUCX i7 | |
| Zotac ZBOX Magnus EN173070C | |
| Zotac MEK Mini (RTX 2070 Super) | |
| AIDA64 / FPU SinJulia | |
| Media della classe Desktop (6443 - 35251, n=21, ultimi 2 anni) | |
| Gigabyte A7 X1 | |
| Intel Beast Canyon NUC | |
| Intel Dragon Canyon NUC - RTX 3060 | |
| Minisforum NUCX i7 | |
| Zotac ZBOX Magnus EN173070C | |
| Zotac MEK Mini (RTX 2070 Super) | |
| AIDA64 / FPU Mandel | |
| Media della classe Desktop (31697 - 129745, n=21, ultimi 2 anni) | |
| Gigabyte A7 X1 | |
| Intel Beast Canyon NUC | |
| Intel Dragon Canyon NUC - RTX 3060 | |
| Zotac ZBOX Magnus EN173070C | |
| Minisforum NUCX i7 | |
| Zotac MEK Mini (RTX 2070 Super) | |
| AIDA64 / CPU AES | |
| Media della classe Desktop (57777 - 513073, n=21, ultimi 2 anni) | |
| Intel Beast Canyon NUC | |
| Intel Dragon Canyon NUC - RTX 3060 | |
| Minisforum NUCX i7 | |
| Zotac ZBOX Magnus EN173070C | |
| Gigabyte A7 X1 | |
| Zotac MEK Mini (RTX 2070 Super) | |
| AIDA64 / CPU ZLib | |
| Media della classe Desktop (887 - 2674, n=21, ultimi 2 anni) | |
| Gigabyte A7 X1 | |
| Minisforum NUCX i7 | |
| Intel Beast Canyon NUC | |
| Intel Dragon Canyon NUC - RTX 3060 | |
| Zotac ZBOX Magnus EN173070C | |
| Zotac MEK Mini (RTX 2070 Super) | |
| AIDA64 / FP64 Ray-Trace | |
| Media della classe Desktop (6471 - 44013, n=21, ultimi 2 anni) | |
| Gigabyte A7 X1 | |
| Intel Beast Canyon NUC | |
| Intel Dragon Canyon NUC - RTX 3060 | |
| Zotac ZBOX Magnus EN173070C | |
| Minisforum NUCX i7 | |
| Zotac MEK Mini (RTX 2070 Super) | |
| AIDA64 / CPU PhotoWorxx | |
| Media della classe Desktop (38071 - 63949, n=21, ultimi 2 anni) | |
| Zotac ZBOX Magnus EN173070C | |
| Minisforum NUCX i7 | |
| Intel Beast Canyon NUC | |
| Intel Dragon Canyon NUC - RTX 3060 | |
| Zotac MEK Mini (RTX 2070 Super) | |
| Gigabyte A7 X1 | |
Minisforum NUCXi7 nel loop multiplo di Cinebench R15
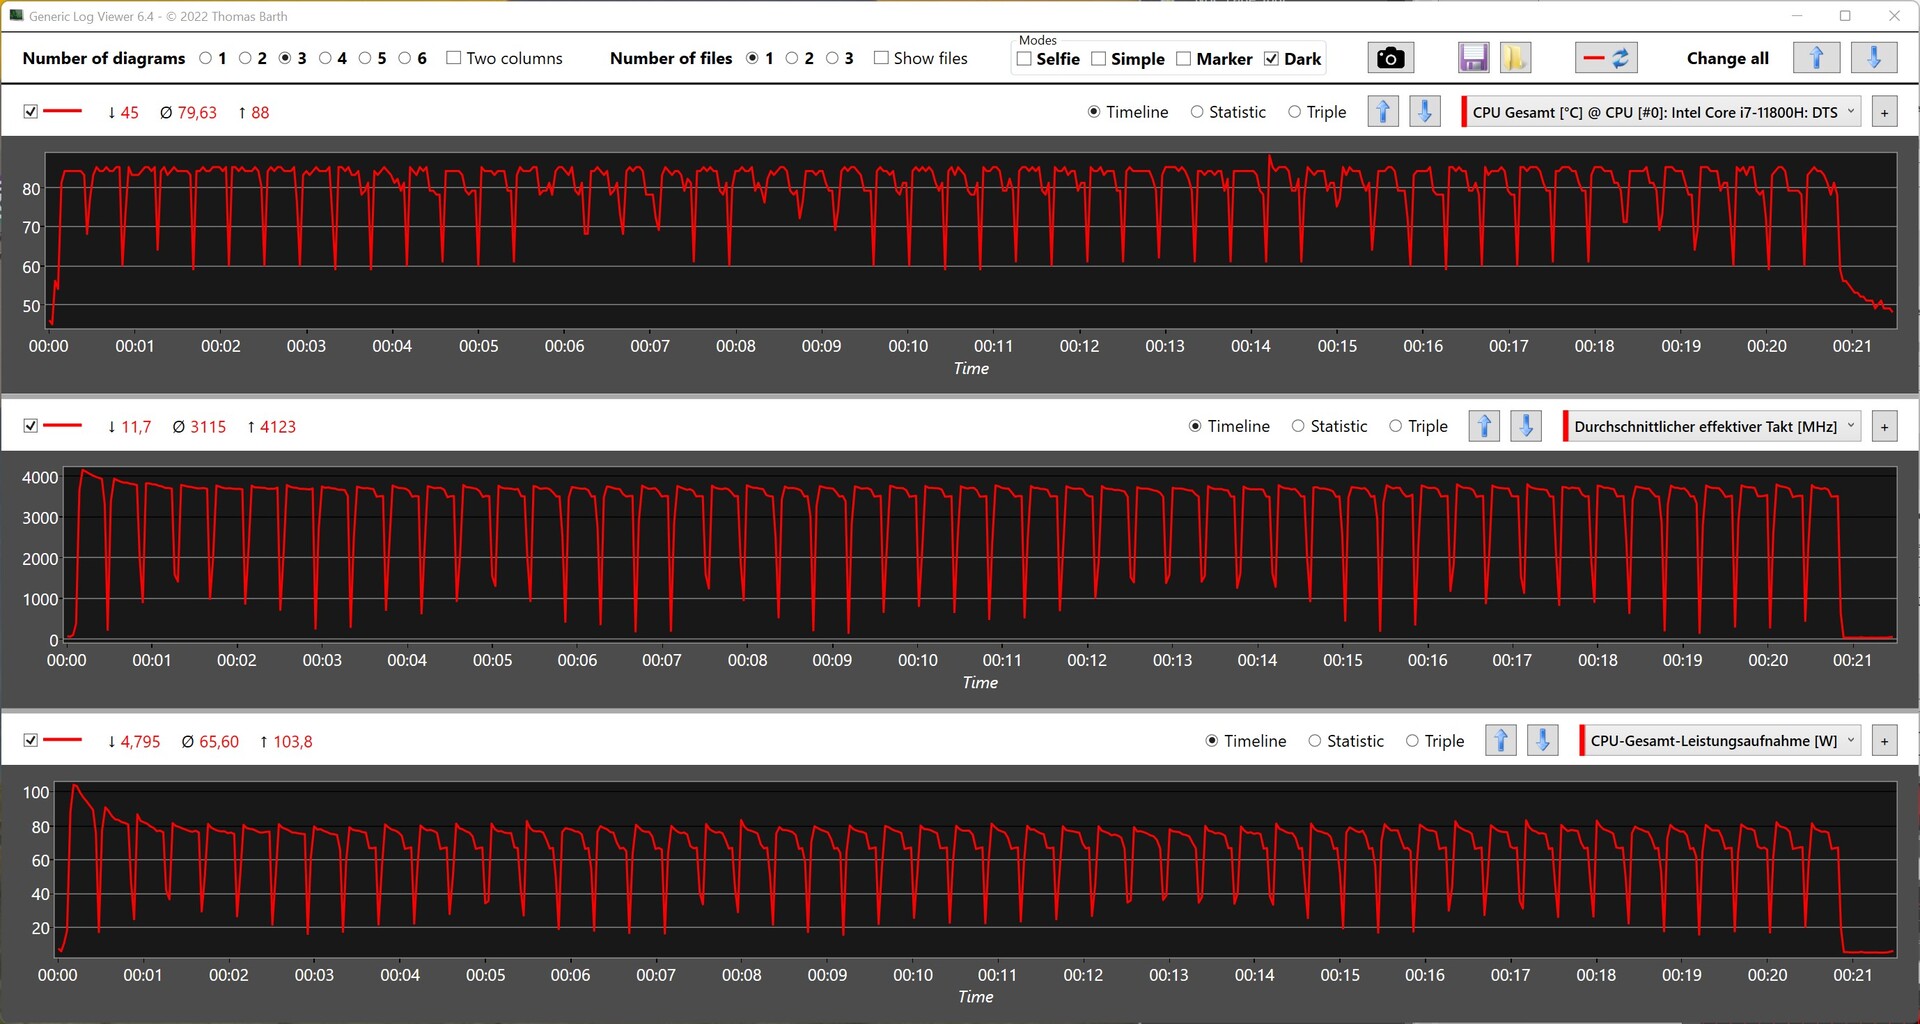
Il loop del test Cinebench R15 a carico costante dà una buona impressione dell'efficienza del sistema di raffreddamento integrato. Dopo i primi cicli, le prestazioni calano solo minimamente, prima di continuare a stabilizzarsi su una media di 1.828 punti.
Prestazioni del sistema
Il Minisforum NUCXi7 lascia una buona impressione nei benchmark di sistema. Lo svantaggio rispetto al NUC Intel Dragon Canyon con un Intel Core i9-12900 è del 17%. Allo stesso tempo, il Intel Core i7-11800Hche a questo punto ha già più di un anno di vita, dimostra di non essere destinato al macero per un bel po'. Ciononostante, il Minisforum potrebbe ottenere alcuni miglioramenti significativi con un aggiornamento ai SoC Alder Lake di Intel. Ma nella configurazione attuale, il Minisforum NUCXi7 offre prestazioni solide e convincenti anche nel funzionamento quotidiano.
| AIDA64 / Memory Copy | |
| Media della classe Desktop (54743 - 98416, n=21, ultimi 2 anni) | |
| Intel Beast Canyon NUC | |
| Intel Dragon Canyon NUC - RTX 3060 | |
| Minisforum NUCX i7 | |
| Zotac ZBOX Magnus EN173070C | |
| Media Intel Core i7-11800H (24508 - 48144, n=21) | |
| Gigabyte A7 X1 | |
| Zotac MEK Mini (RTX 2070 Super) | |
| AIDA64 / Memory Read | |
| Media della classe Desktop (58375 - 110448, n=21, ultimi 2 anni) | |
| Zotac ZBOX Magnus EN173070C | |
| Intel Beast Canyon NUC | |
| Intel Dragon Canyon NUC - RTX 3060 | |
| Minisforum NUCX i7 | |
| Media Intel Core i7-11800H (25882 - 50365, n=20) | |
| Gigabyte A7 X1 | |
| Zotac MEK Mini (RTX 2070 Super) | |
| AIDA64 / Memory Write | |
| Media della classe Desktop (60635 - 93889, n=21, ultimi 2 anni) | |
| Zotac ZBOX Magnus EN173070C | |
| Minisforum NUCX i7 | |
| Intel Beast Canyon NUC | |
| Intel Dragon Canyon NUC - RTX 3060 | |
| Media Intel Core i7-11800H (22240 - 46214, n=20) | |
| Zotac MEK Mini (RTX 2070 Super) | |
| Gigabyte A7 X1 | |
| AIDA64 / Memory Latency | |
| Minisforum NUCX i7 | |
| Media della classe Desktop (68.5 - 168, n=21, ultimi 2 anni) | |
| Intel Beast Canyon NUC | |
| Intel Dragon Canyon NUC - RTX 3060 | |
| Zotac ZBOX Magnus EN173070C | |
| Gigabyte A7 X1 | |
| Zotac MEK Mini (RTX 2070 Super) | |
| Media Intel Core i7-11800H (71.9 - 104.1, n=44) | |
* ... Meglio usare valori piccoli
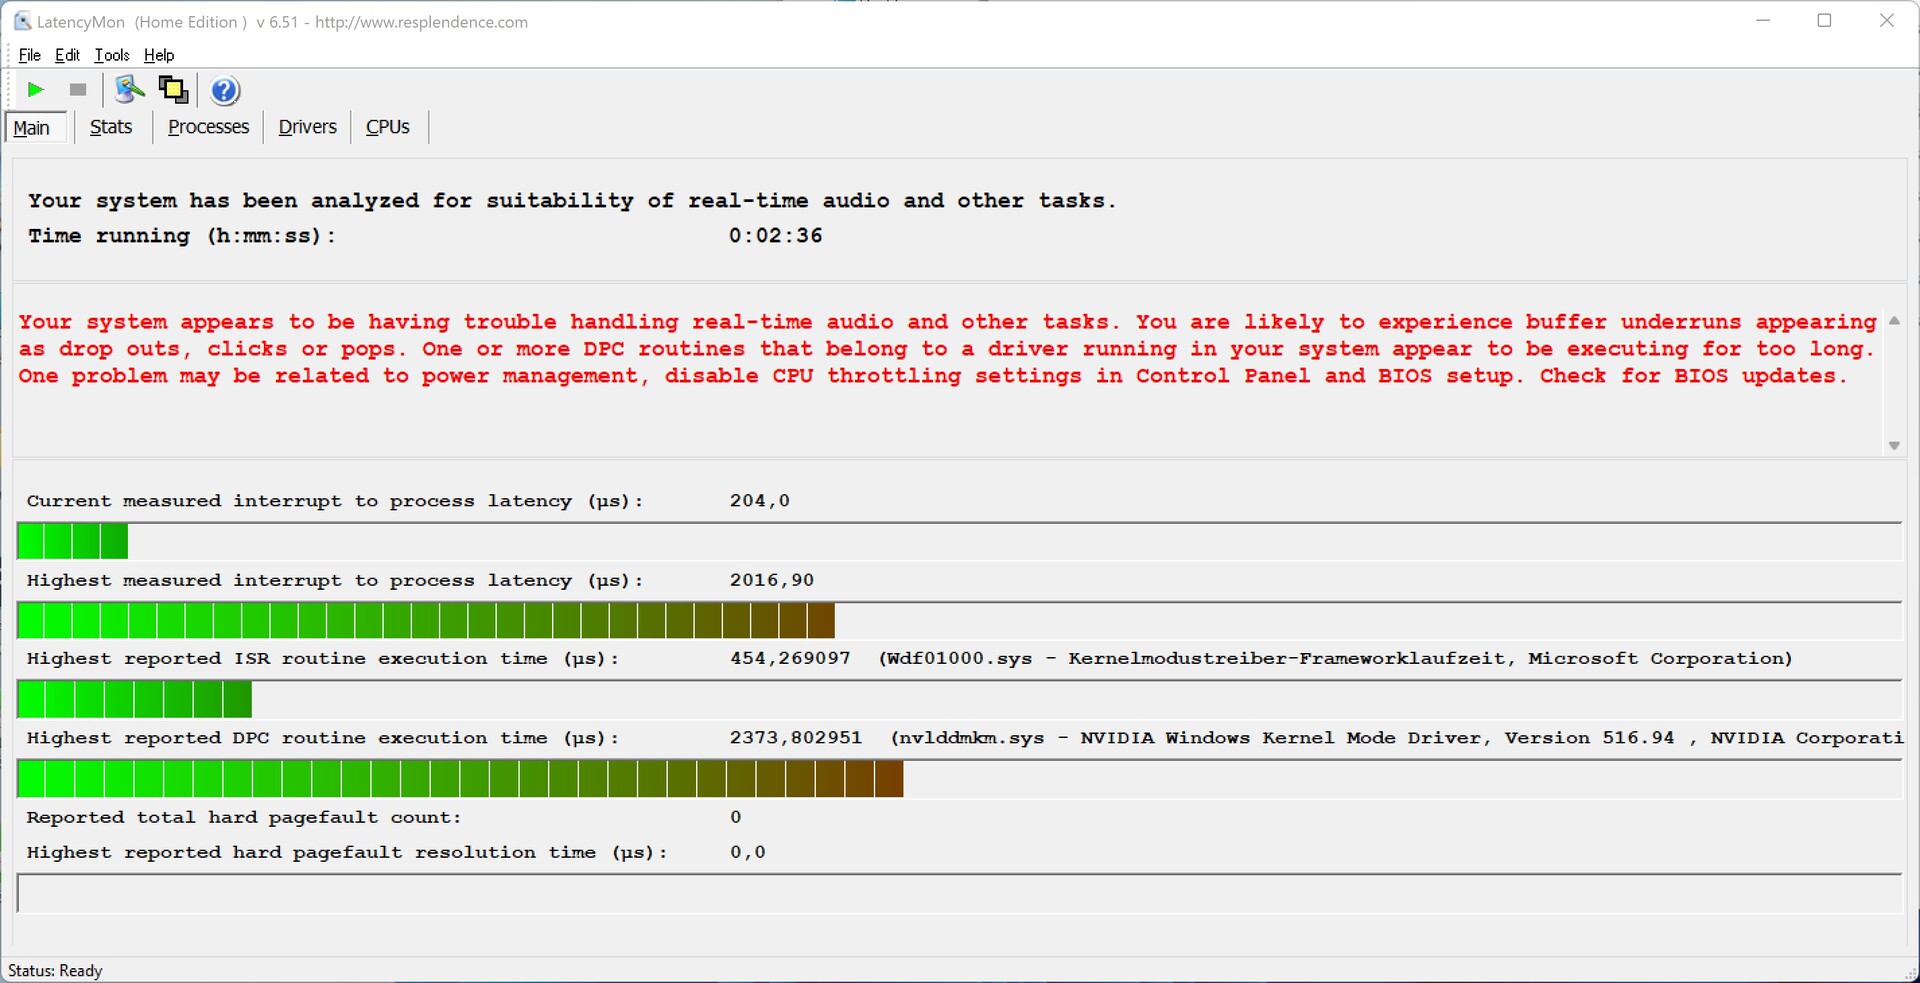
Latenze DPC
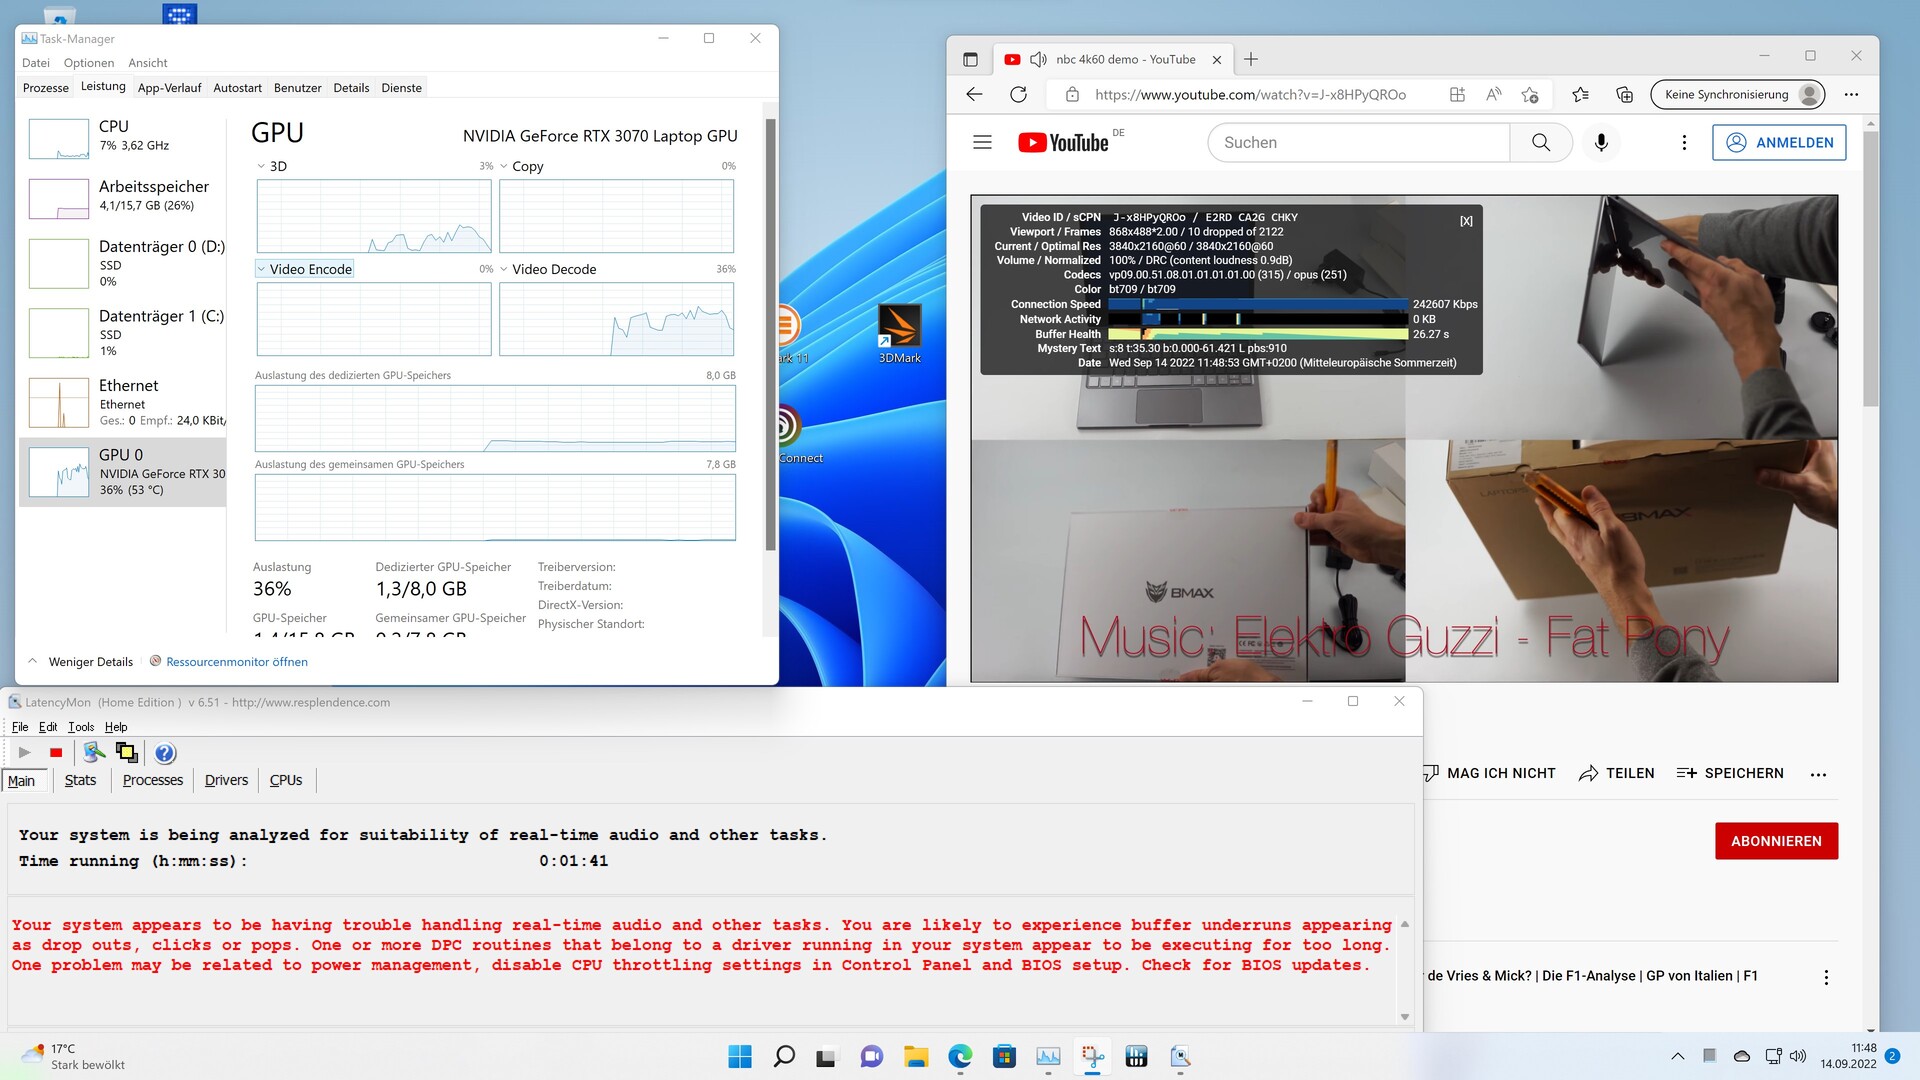
Il Minisforum NUCXi7 ha problemi di latenza già quando si aprono diverse schede nel browser Edge. Durante la riproduzione del nostro video di prova in 4K, la Nvidia GeForce RTX 3070 Laptop GPUè caricata al 36% circa.
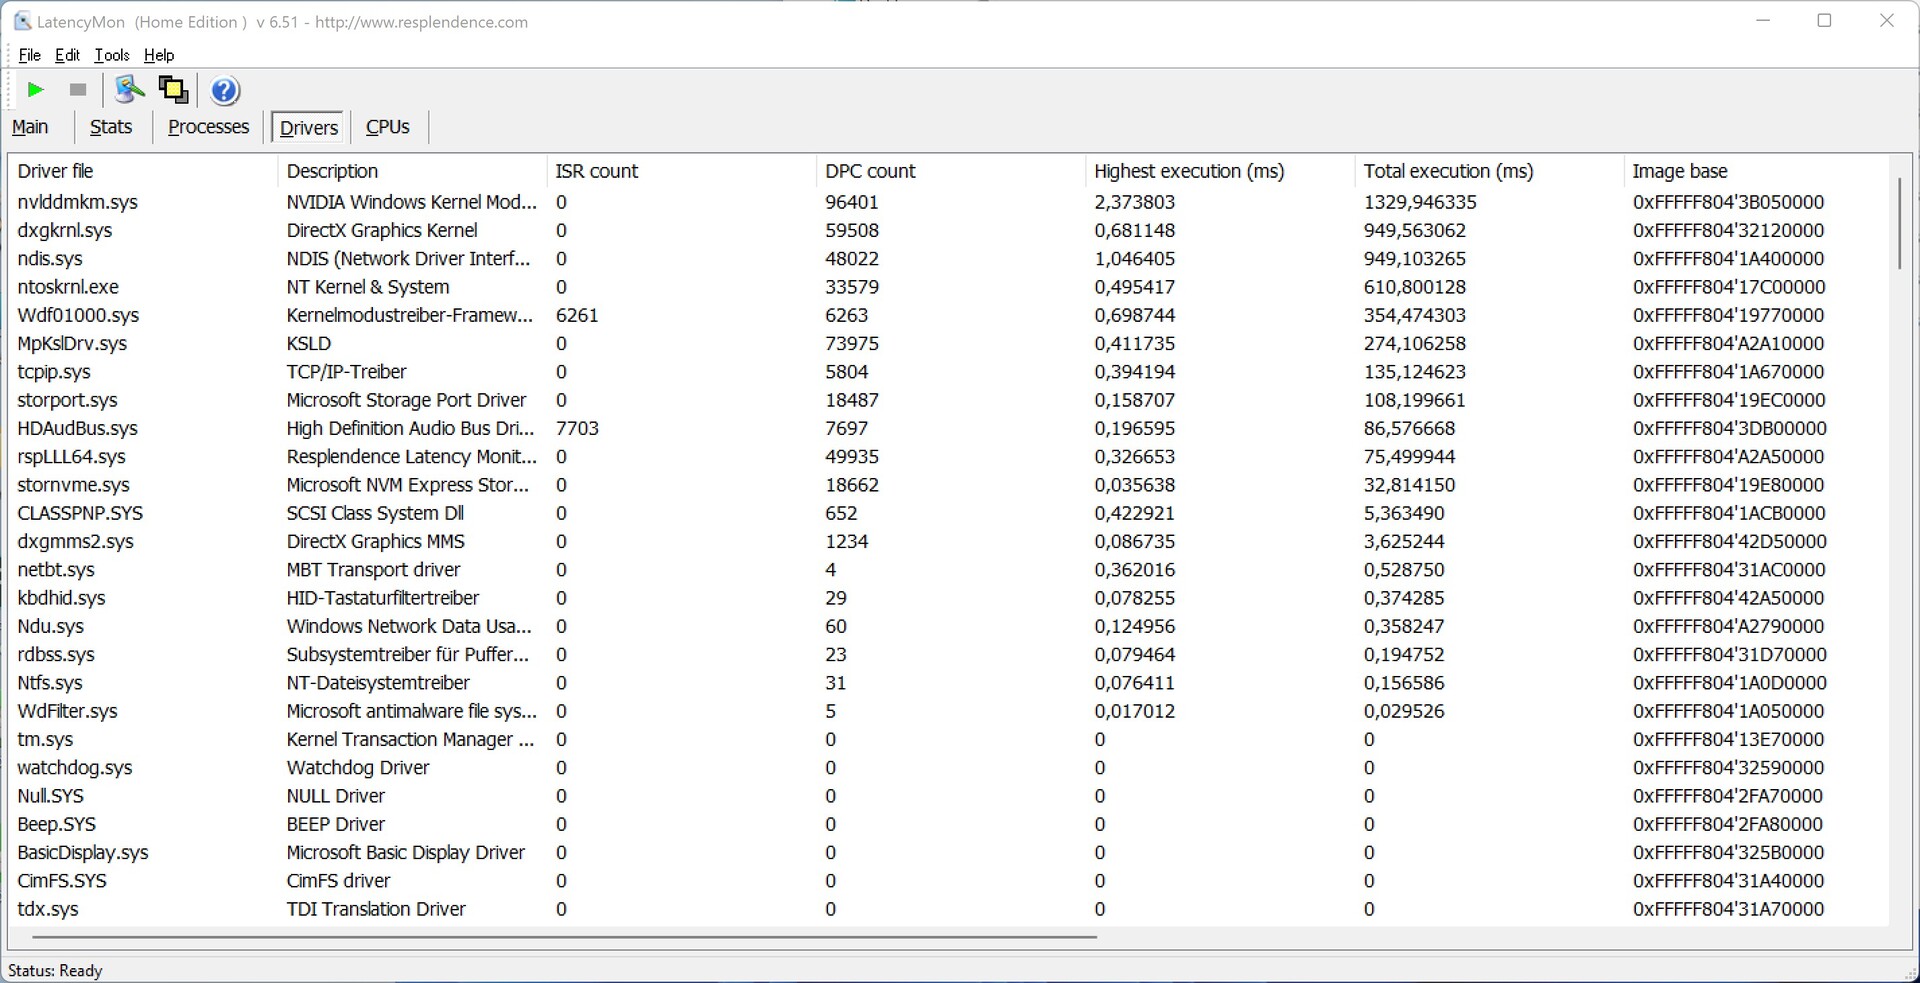
| DPC Latencies / LatencyMon - interrupt to process latency (max), Web, Youtube, Prime95 | |
| Minisforum NUCX i7, Intel Core i7-11800H | |
| Zotac ZBOX Magnus EN173070C, Intel Core i7-11800H | |
| Gigabyte A7 X1, AMD Ryzen 9 5900HX | |
* ... Meglio usare valori piccoli
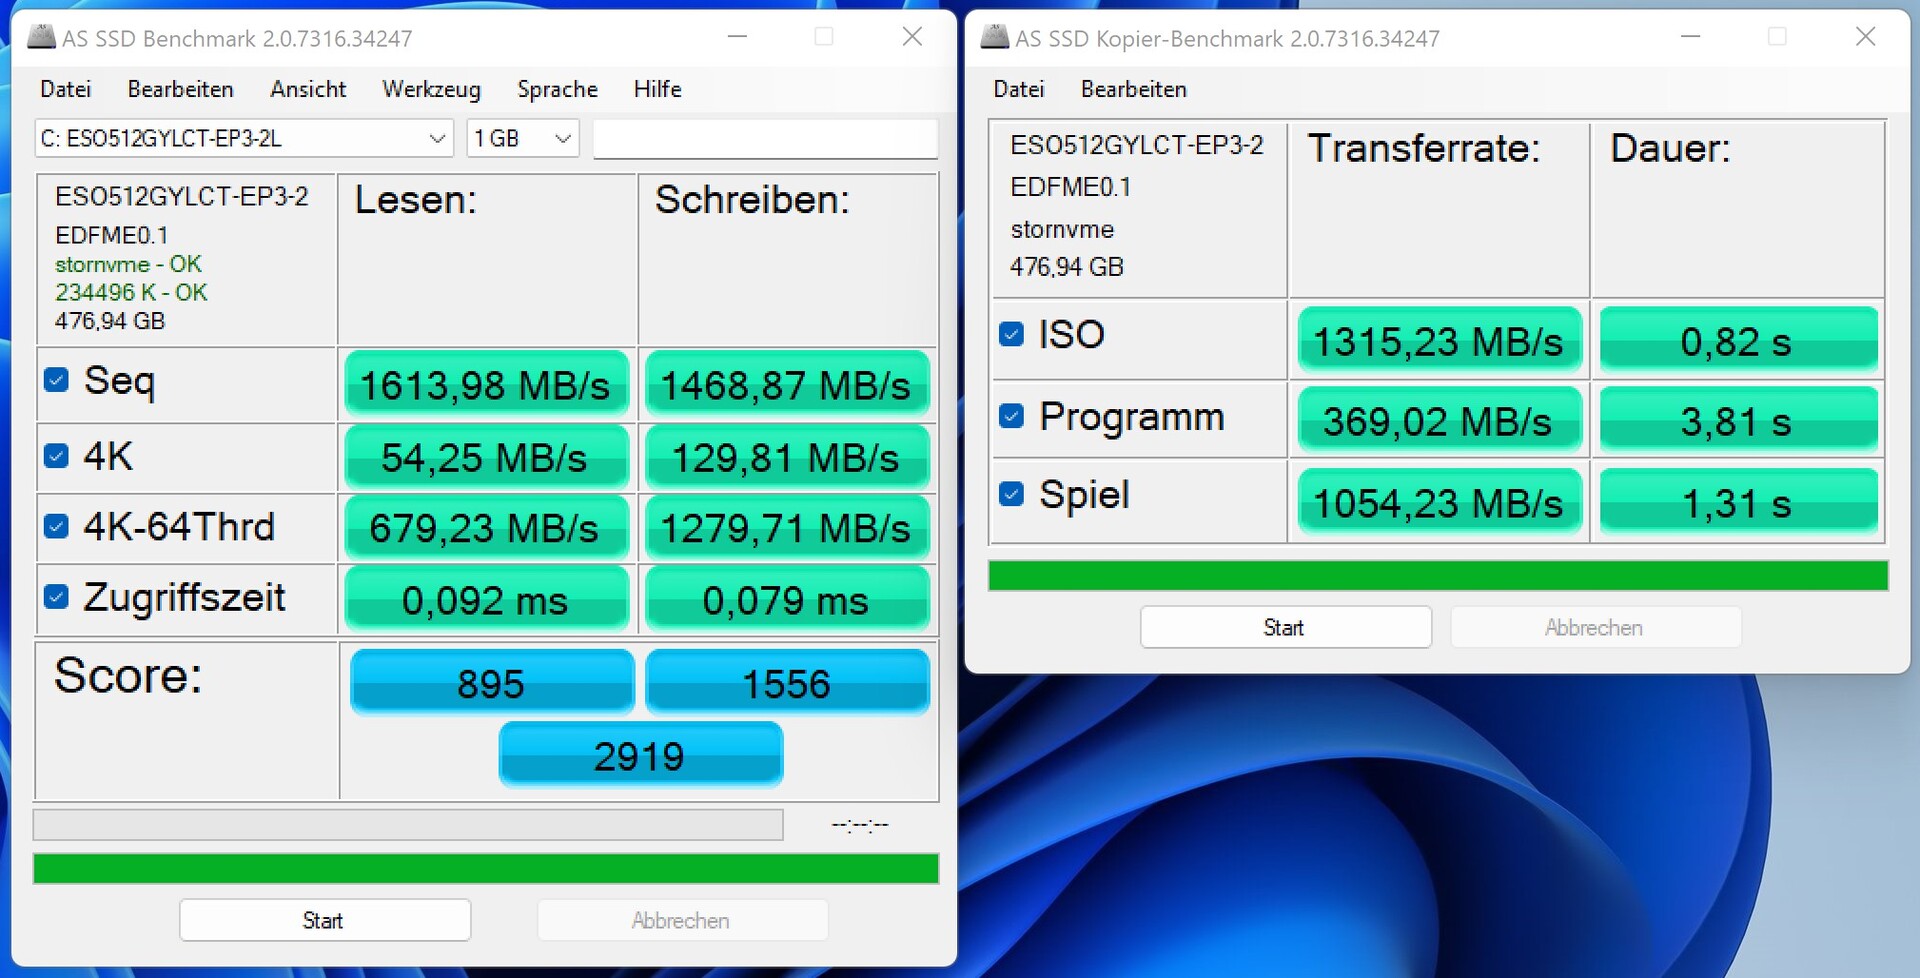
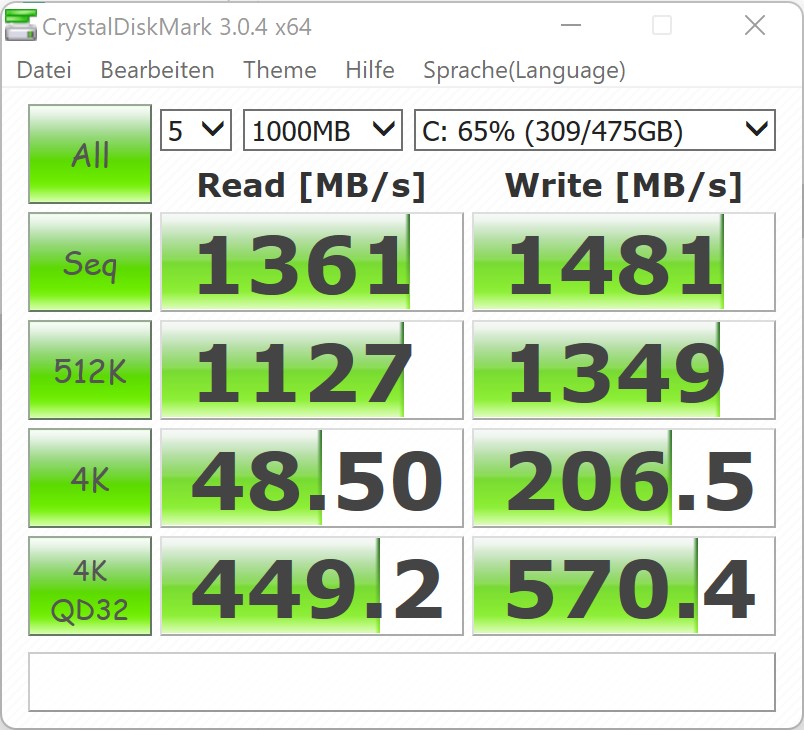
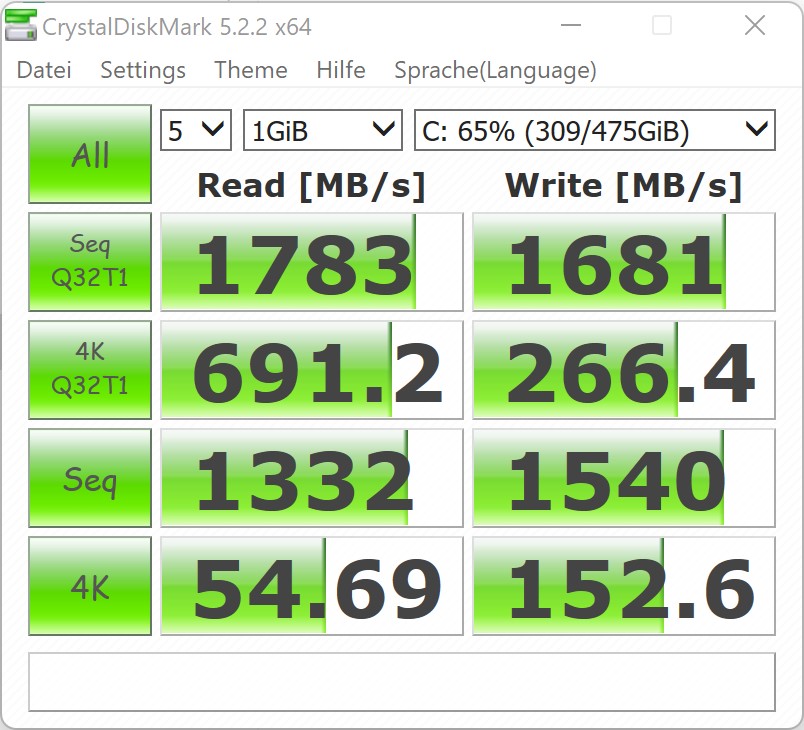
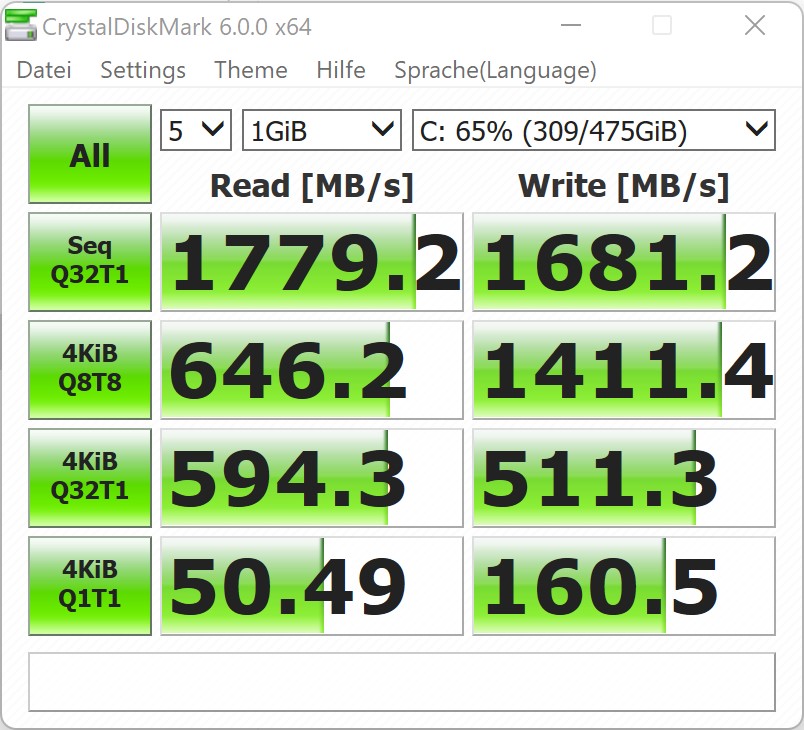
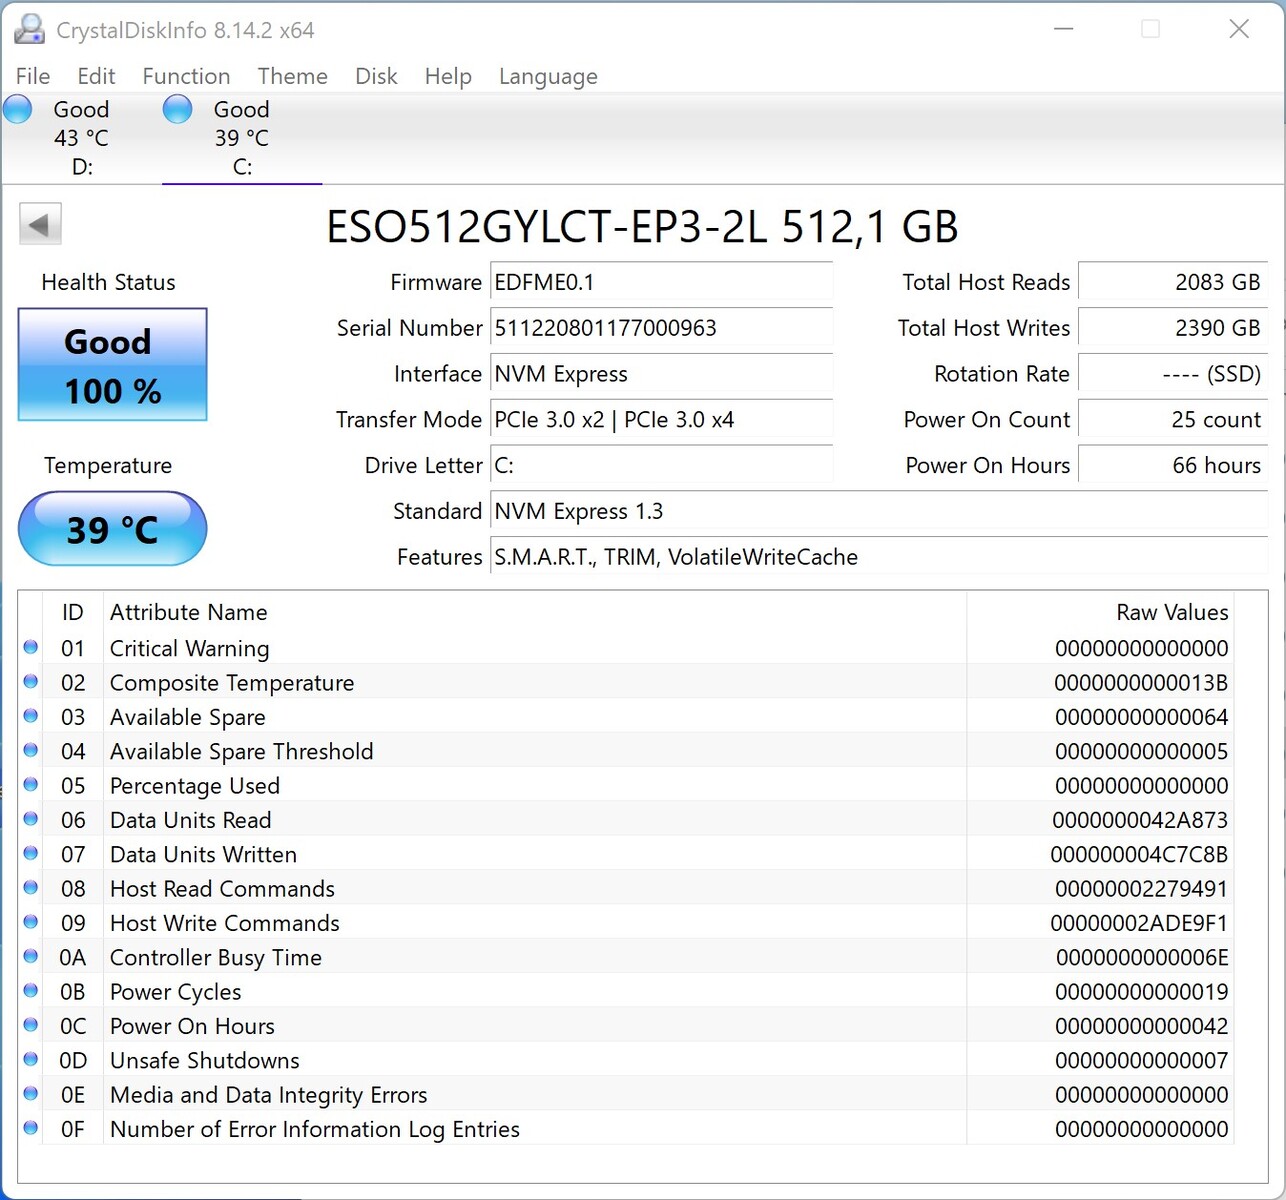
Soluzione di stoccaggio
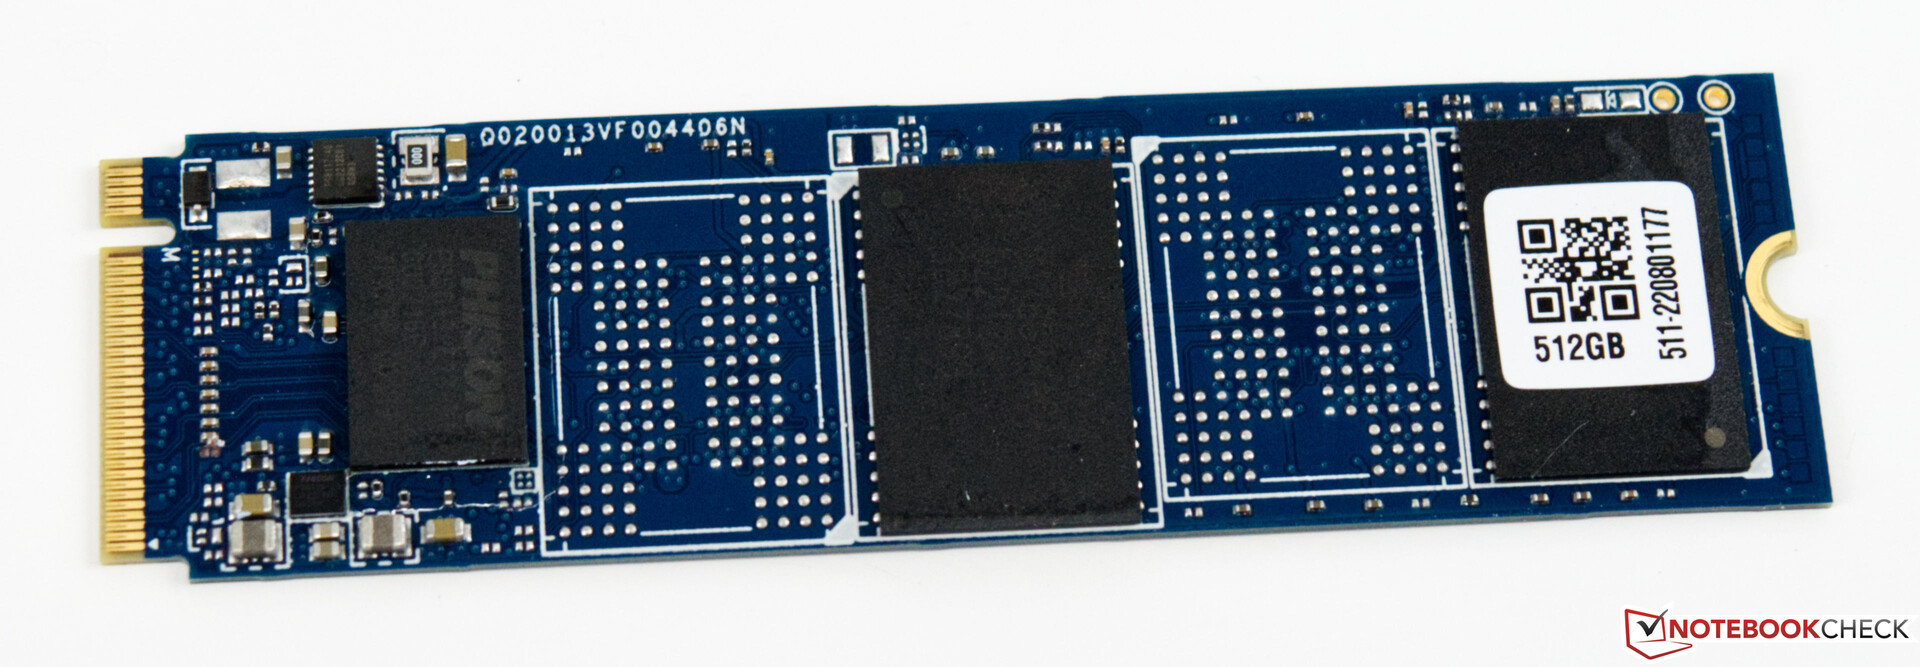
Nella nostra configurazione, la soluzione di archiviazione è un'unità SSD NVMe con 512 GB di spazio di archiviazione. Sebbene il modello utilizzato sia veloce, non è in grado di tenere il passo con le prestazioni dei dispositivi di confronto. Tuttavia, le prestazioni sono comunque sufficienti per tutte le applicazioni abituali. Inoltre, non abbiamo riscontrato latenze inutili dovute alle prestazioni dell'SSD. D'altra parte, considerando il gruppo di utenti a cui si rivolge, lo spazio di archiviazione risulta molto basso, solo 512 GB. Per un dispositivo da gioco, ci aspettiamo almeno 1 TB di spazio di archiviazione. Allo stesso tempo, è anche possibile espandere lo spazio di archiviazione in un secondo momento utilizzando il secondo slot M.2.
Potete trovare ulteriori confronti e benchmark nella nostra tabella di confronto.

* ... Meglio usare valori piccoli
Constant Performance Reading: DiskSpd Read Loop, Queue Depth 8
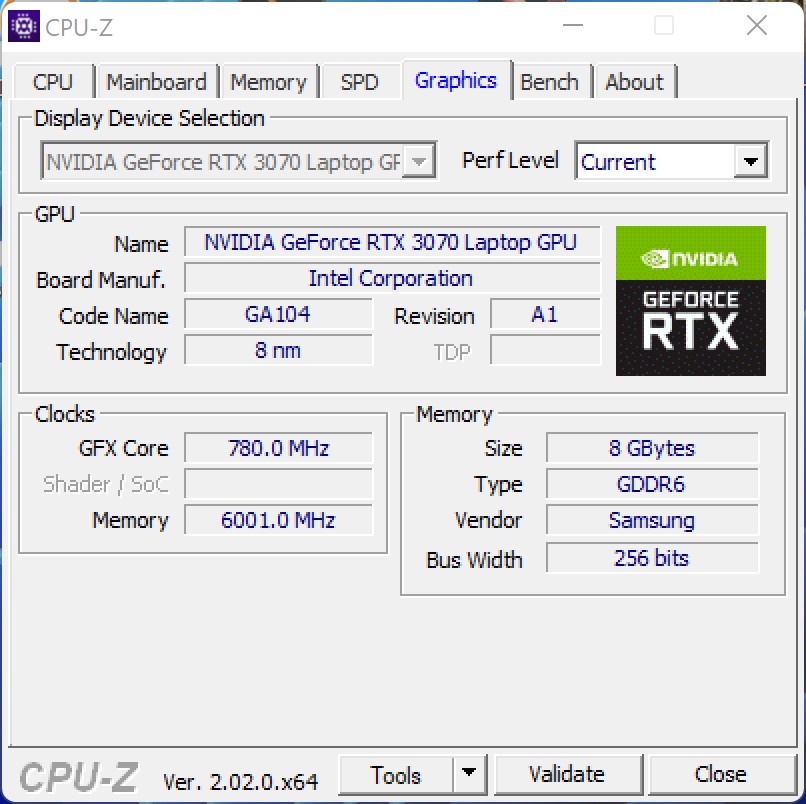
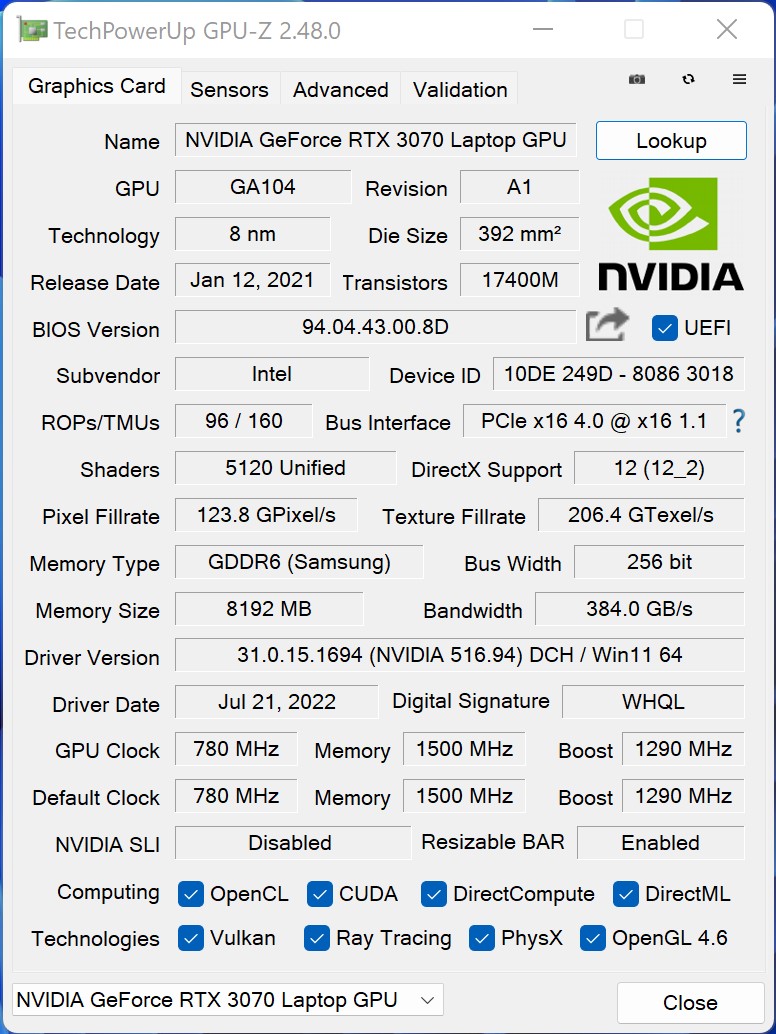
Scheda grafica
LaGPU per computer portatile Nvidia GeForce RTX 3070in esecuzione nel Minisforum NUCXi7 è in grado di sfruttare tutte le sue prestazioni di 125 watt in modalità Gaming. Tuttavia, è necessario tenere presente che si tratta della versione mobile di GeForce RTX 3070, le cui prestazioni non si avvicinano a quelle della versione desktop. La GPU Nvidia GeForce RTX 3070 per computer portatili è più lenta del 25-30% circa rispetto alla versione desktop.GPU desktop Nvidia GeForce RTX 3070. Tuttavia, la nostra unità di test tiene facilmente sotto controllo i concorrenti che si basano su una GPU Nvidia GeForce RTX 3060 Desktop. Per valutare le prestazioni approssimative del Minisforum NUCXi5, includiamo anche i valori medi delle prestazioni delle GPU Nvidia RTX 3060 Desktop GPU Nvidia GeForce RTX 3060 per computer portatilinel nostro grafico.
È possibile trovare ulteriori benchmark sulla Nvidia GeForce RTX 3070 qui.
| 3DMark 05 Standard | 46264 punti | |
| 3DMark 06 Standard Score | 47138 punti | |
| 3DMark Vantage P Result | 76594 punti | |
| 3DMark 11 Performance | 27592 punti | |
| 3DMark Ice Storm Standard Score | 218821 punti | |
| 3DMark Cloud Gate Standard Score | 53894 punti | |
| 3DMark Fire Strike Score | 21258 punti | |
| 3DMark Fire Strike Extreme Score | 11291 punti | |
| 3DMark Time Spy Score | 9337 punti | |
| 3DMark Steel Nomad Score | 2368 punti | |
| 3DMark Steel Nomad Light Score | 10548 punti | |
Aiuto | ||
Prestazioni di gioco
Il Minisforum NUCXi7 è sorprendentemente adatto come PC da gioco. Le prestazioni del sistema sono sufficienti per giocare a 1.440p nella maggior parte dei casi. Di tanto in tanto, è possibile ottenere anche 2.160p dalla GPU Nvidia GeForce RTX 3070 Laptop GPUa patto che il gioco non richieda requisiti troppo elevati all'hardware. Tuttavia, le prestazioni di gioco documentate sono sorprendenti in confronto. Spesso, la nostra unità di test è in grado di tenere il passo con i dispositivi di confronto basati sulle più veloci GPU desktop, o addirittura di superarli.
Potete trovare una panoramica delle prestazioni di tutti i nostri giochi testati rispetto ad altri modelli nel nostro Elenco dei giochi per GPU.
| GTA V | |
| 1920x1080 Highest AA:4xMSAA + FX AF:16x | |
| Minisforum NUCX i7 | |
| Zotac ZBOX Magnus EN173070C | |
| Intel Beast Canyon NUC | |
| Intel Dragon Canyon NUC - RTX 3060 | |
| Zotac Magnus One (ECM73070C) | |
| Media NVIDIA GeForce RTX 3070 Laptop GPU (21.7 - 125.8, n=50) | |
| Gigabyte A7 X1 | |
| 1920x1080 High/On (Advanced Graphics Off) AA:2xMSAA + FX AF:8x | |
| Intel Beast Canyon NUC | |
| Intel Dragon Canyon NUC - RTX 3060 | |
| Minisforum NUCX i7 | |
| Zotac ZBOX Magnus EN173070C | |
| Zotac Magnus One (ECM73070C) | |
| Media NVIDIA GeForce RTX 3070 Laptop GPU (58.2 - 181.4, n=38) | |
| Gigabyte A7 X1 | |
| The Witcher 3 | |
| 1920x1080 High Graphics & Postprocessing (Nvidia HairWorks Off) | |
| Zotac Magnus One (ECM73070C) | |
| Minisforum NUCX i7 | |
| Zotac ZBOX Magnus EN173070C | |
| Intel Dragon Canyon NUC - RTX 3060 | |
| Zotac MEK Mini (RTX 2070 Super) | |
| Media NVIDIA GeForce RTX 3070 Laptop GPU (122.1 - 207, n=34) | |
| 1920x1080 Ultra Graphics & Postprocessing (HBAO+) | |
| Zotac Magnus One (ECM73070C) | |
| Zotac ZBOX Magnus EN173070C | |
| Minisforum NUCX i7 | |
| Gigabyte A7 X1 | |
| Zotac MEK Mini (RTX 2070 Super) | |
| Media NVIDIA GeForce RTX 3070 Laptop GPU (34.9 - 109, n=52) | |
| Intel Dragon Canyon NUC - RTX 3060 | |
| F1 2020 | |
| 2560x1440 Ultra High Preset AA:T AF:16x | |
| Minisforum NUCX i7 | |
| Zotac ZBOX Magnus EN173070C | |
| Intel Beast Canyon NUC | |
| Intel Dragon Canyon NUC - RTX 3060 | |
| Media NVIDIA GeForce RTX 3070 Laptop GPU (74 - 123.7, n=4) | |
| 1920x1080 Ultra High Preset AA:T AF:16x | |
| Minisforum NUCX i7 | |
| Zotac ZBOX Magnus EN173070C | |
| Intel Beast Canyon NUC | |
| Intel Dragon Canyon NUC - RTX 3060 | |
| Media NVIDIA GeForce RTX 3070 Laptop GPU (97 - 173, n=7) | |
| basso | medio | alto | ultra | QHD DLSS | QHD | 4K DLSS | 4K FSR | 4K | |
|---|---|---|---|---|---|---|---|---|---|
| GTA V (2015) | 184.7 | 179.4 | 171.5 | 106 | 90.6 | 85.6 | |||
| The Witcher 3 (2015) | 417 | 315 | 204 | 104.1 | 71.6 | ||||
| Dota 2 Reborn (2015) | 169.9 | 151.2 | 145.8 | 135.6 | 124.3 | ||||
| Rise of the Tomb Raider (2016) | 293 | 206 | 138.7 | 122 | 56.9 | ||||
| Final Fantasy XV Benchmark (2018) | 187.3 | 135.9 | 103.3 | 76.7 | 45.6 | ||||
| X-Plane 11.11 (2018) | 143.2 | 125.9 | 94.8 | 81.5 | |||||
| Far Cry 5 (2018) | 157 | 134 | 127 | 119 | 99 | 55 | |||
| Strange Brigade (2018) | 501 | 265 | 213 | 184.7 | 137.3 | 78.6 | |||
| Shadow of the Tomb Raider (2018) | 167.7 | 143.5 | 134.3 | 123.1 | 88.6 | 48 | |||
| Forza Horizon 4 (2018) | 211 | 189 | 188 | 167 | 140 | 93 | |||
| Far Cry New Dawn (2019) | 133 | 115 | 112 | 100 | 91 | 58 | |||
| Metro Exodus (2019) | 185 | 120.8 | 93.1 | 74.6 | 59.9 | 37.6 | |||
| Anno 1800 (2019) | 143.6 | 132.6 | 109.8 | 56.7 | 48.2 | 32.1 | |||
| Control (2019) | 240 | 131.7 | 96.1 | 61 | 30.3 | ||||
| Borderlands 3 (2019) | 141.9 | 124.9 | 101 | 84.7 | 62.6 | 34.8 | |||
| F1 2020 (2020) | 333 | 273 | 230 | 166.2 | 123.7 | 69.7 | |||
| Watch Dogs Legion (2020) | 114 | 106 | 96 | 73 | 64 | 27 | |||
| Dirt 5 (2020) | 210 | 147 | 114 | 91 | 73 | 49 | |||
| F1 2021 (2021) | 381 | 303 | 244 | 123.1 | 90.2 | 51.1 | |||
| New World (2021) | 115.7 | 95.2 | 89.1 | 84.2 | 67.5 | 35.7 | |||
| Far Cry 6 (2021) | 139.1 | 120 | 106.5 | 102.3 | 78.6 | ||||
| Forza Horizon 5 (2021) | 206 | 145 | 132 | 81 | 70 | 50 | |||
| God of War (2022) | 128.1 | 111 | 91.5 | 67.7 | 57.4 | 37 | |||
| GRID Legends (2022) | 147 | 163 | 153 | 122 | 81 | 56 | |||
| Cyberpunk 2077 1.6 (2022) | 145.6 | 129.2 | 113.9 | 72.3 | 47.3 | 22.3 | |||
| Tiny Tina's Wonderlands (2022) | 194.1 | 158.8 | 111.6 | 88.3 | 62.1 | 33.6 | |||
| F1 22 (2022) | 239 | 208 | 172.1 | 61.9 | 39.7 | 19.1 | |||
| A Plague Tale Requiem (2022) | 107.9 | 84.8 | 66.2 | 50.1 | 36.3 | 20.4 | |||
| Uncharted Legacy of Thieves Collection (2022) | 83.4 | 80.6 | 76.8 | 73.7 | 56.4 | 21.9 | |||
| Call of Duty Modern Warfare 2 2022 (2022) | 129 | 117 | 90 | 87 | 62 | 58 | 37 | ||
| Spider-Man Miles Morales (2022) | 124.8 | 114.7 | 111.3 | 100.4 | 66.6 | 44.6 | |||
| The Callisto Protocol (2022) | 124.9 | 105.2 | 100.2 | 72.5 | 53.2 | 30.8 | |||
| Need for Speed Unbound (2022) | 116.8 | 108.2 | 92.7 | 89.7 | 78.1 | 44.8 | |||
| High On Life (2023) | 216 | 157 | 124.3 | 103 | 65.5 | 27.6 | |||
| The Witcher 3 v4 (2023) | 161.1 | 151.2 | 128.4 | 112.6 | 81.9 | 46.5 | |||
| Dead Space Remake (2023) | 87.7 | 83.9 | 73.3 | 73.6 | 53.8 | 27.5 | |||
| Hogwarts Legacy (2023) | 97.1 | 88.4 | 72.4 | 59.1 | 47 | 26.7 | |||
| Returnal (2023) | 104 | 101 | 93 | 79 | 59 | 34 | |||
| Atomic Heart (2023) | 186.7 | 143.9 | 88.5 | 69.8 | 53.8 | 32.5 | |||
| Company of Heroes 3 (2023) | 193.5 | 167.4 | 134.3 | 133.9 | 100.8 | 58.4 | |||
| Sons of the Forest (2023) | 80.4 | 75.8 | 72.8 | 72.5 | 57.7 | 37.8 | |||
| Resident Evil 4 Remake (2023) | 140 | 103.1 | 96.7 | 67.6 | 52.6 | 30.5 | |||
| The Last of Us (2023) | 96.6 | 82.2 | 71.6 | 56.9 | 36.6 | 31 | 16.5 | ||
| Dead Island 2 (2023) | 209 | 205 | 164.3 | 126.1 | 89.9 | 45.1 | |||
| Star Wars Jedi Survivor (2023) | 81.1 | 72.3 | 67.4 | 64.2 | 40.5 | 19.8 | |||
| Diablo 4 (2023) | 250 | 197.9 | 164.1 | 155.6 | 111.2 | 57.3 | |||
| Ratchet & Clank Rift Apart (2023) | 87.6 | 75.7 | 66.8 | 63.5 | 61.7 | 51.3 | |||
| Atlas Fallen (2023) | 144.5 | 135 | 127 | 106.8 | 42.6 | 75.9 | |||
| Immortals of Aveum (2023) | 62.4 | 51.2 | 41.7 | 28.2 | 15.9 | ||||
| Armored Core 6 (2023) | 104.3 | 102.4 | 101.1 | 96.3 | 76.6 | 44.6 | |||
| Starfield (2023) | 73.5 | 64 | 51.6 | 47.1 | 32.5 | 23.1 | |||
| Lies of P (2023) | 160.7 | 152 | 130.2 | 117.1 | 80.2 | 65 | 41.6 | ||
| Baldur's Gate 3 (2023) | 163.1 | 121.6 | 102 | 86.7 | 84.7 | 30.3 | |||
| Cyberpunk 2077 (2023) | 122.9 | 99.3 | 84.8 | 75 | 46.9 | 20.9 | |||
| Counter-Strike 2 (2023) | 241 | 230 | 193.8 | 149.5 | 105.9 | 63.3 | |||
| EA Sports FC 24 (2023) | 249 | 199.3 | 161.7 | 151.4 | 129 | 79.5 | |||
| Assassin's Creed Mirage (2023) | 114 | 106 | 101 | 79 | 64 | 52 | 41 | ||
| Total War Pharaoh (2023) | 329.3 | 205.4 | 127.1 | 99.1 | 78.3 | 42.5 | |||
| Lords of the Fallen (2023) | 68 | 68.1 | 65.2 | 53.9 | 54.6 | 26.1 | 34 | ||
| Alan Wake 2 (2023) | 67 | 61.2 | 53.2 | 33.6 | 14.1 | ||||
| EA Sports WRC (2023) | 130.8 | 98.1 | 90.7 | 83.4 | 63.2 | 52.5 | 35.5 | ||
| Call of Duty Modern Warfare 3 2023 (2023) | 146 | 129 | 101 | 83 | 67 | 46 | 43 | ||
| Avatar Frontiers of Pandora (2023) | 76 | 72 | 61 | 46 | 31 | 28 | 16 | ||
| The Finals (2023) | 222 | 181.7 | 160.6 | 127.2 | 80.2 | 37.6 | |||
| Ready or Not (2023) | 210 | 189.1 | 174.8 | 131.3 | 82 | 75.1 | 37.2 | ||
| Prince of Persia The Lost Crown (2024) | 356 | 356 | 356 | 340 | 178 | ||||
| Palworld (2024) | 116.7 | 106.1 | 103 | 102.1 | 72.9 | 54.9 | 38.7 | ||
| Enshrouded (2024) | 80.3 | 68.8 | 58.8 | 49.2 | 38 | 34 | 32.8 | 22.8 | |
| Helldivers 2 (2024) | 130 | 101 | 91.3 | 89.5 | 65.6 | 35.3 | |||
| Skull & Bones (2024) | 112 | 103 | 84 | 63 | 50 | 46 | 43 | 31 | |
| Last Epoch (2024) | 192.2 | 184.2 | 167.2 | 127.3 | 83.6 | 40.7 | |||
| Alone in the Dark (2024) | 172.9 | 156.8 | 149.9 | 102.4 | 51.5 | 36.7 | 53.1 | 16.1 | |
| Dragon's Dogma 2 (2024) | 54.2 | 52.7 | 49.3 | 38.7 | 37.5 | 33.9 | |||
| Horizon Forbidden West (2024) | 104.2 | 96.2 | 62.7 | 60.5 | 47 | 42.2 | 38.8 | 29.3 | |
| Ghost of Tsushima (2024) | 88.6 | 80.7 | 74.5 | 60.3 | 63 | 48.3 | 8.5 | 4.8 | |
| Senua's Saga Hellblade 2 (2024) | 60.9 | 52.5 | 38.4 | 39.2 | 26.1 | 24.8 | 9.4 | ||
| F1 24 (2024) | 248 | 234 | 181.7 | 60 | 61.7 | 38.1 | 33 | 18.3 | |
| The First Descendant (2024) | 151.7 | 96.9 | 78.4 | 66.1 | 43.6 | 23.3 | 23.8 | ||
| Once Human (2024) | 184.4 | 126.1 | 108.6 | 99 | 68.2 | 35.6 | |||
| Black Myth: Wukong (2024) | 80 | 60 | 46 | 24 | 27 | 18 | 19 | 10 | |
| Star Wars Outlaws (2024) | 50.2 | 44.9 | 38.1 | 30.9 | 30.8 | 22.2 | |||
| Space Marine 2 (2024) | 77.3 | 71 | 68 | 62 | 61.8 | 46.4 | 38.8 | 24.2 | |
| Final Fantasy XVI (2024) | 69.4 | 66.7 | 56.5 | 49.6 | 40.8 | 36.2 | 17.9 | ||
| God of War Ragnarök (2024) | 127.7 | 107 | 91.4 | 83.1 | 90.6 | 63.2 | 35.6 | ||
| Until Dawn (2024) | 65.3 | 51.5 | 39.1 | 28.1 | 16.1 | ||||
| Call of Duty Black Ops 6 (2024) | 111 | 99 | 72 | 69 | 50 | 31 | |||
| Stalker 2 (2024) | 77.7 | 66.7 | 53.3 | 43.9 | 36.1 | ||||
| Indiana Jones and the Great Circle (2024) | 93.5 | 63 | |||||||
| Kingdom Come Deliverance 2 (2025) | 109 | 84.3 | 69.2 | 50.2 | 49.1 | 35.9 | 23 | 20.1 | |
| Monster Hunter Wilds (2025) | 60.2 | 51.1 | 30.5 | 31.1 | 24.6 | ||||
| Civilization 7 (2025) | 292 | 174.7 | 122.3 | 79.9 | 34.9 | ||||
| Assassin's Creed Shadows (2025) | 54 | 45 | 39 | 24 | 23 | ||||
| The Elder Scrolls IV Oblivion Remastered (2025) | 80.4 | 70.4 | 47.9 | 23.7 | 25.8 | 14.2 | |||
| Doom: The Dark Ages (2025) | 68 | 60.2 | 54.7 | 52.6 | 49.9 | 33.1 | |||
| F1 25 (2025) | 185.3 | 167.5 | 138.1 | 14.9 | 15.2 | 8.48 | 6.36 | 3.44 | |
| Borderlands 4 (2025) | 56.4 | 49.4 | 40 | 26.9 | 31.1 | 18.5 | |||
| Battlefield 6 (2025) | 104.7 | 94.3 | 80.5 | 60.2 | 38.4 | 39.1 | 23 | 17.7 | |
| The Outer Worlds 2 (2025) | 86.3 | 80.4 | 64.6 | 36.5 | 31 | 23 | |||
| ARC Raiders (2025) | 181.7 | 114.9 | 92.4 | 57.5 | 58.1 | 40.2 | 36.4 | 22.7 | |
| Anno 117: Pax Romana (2025) | 95.6 | 73.5 | 55.9 | 30 | 30.6 | 21.5 | |||
| Resident Evil Requiem (2026) | 112.5 | 85.2 | 79.5 | 42.2 | 13.3 | ||||
| Death Stranding 2 (2026) | 71.4 | 61.8 | 56.8 | 44.4 | 47.9 | 33.3 | 29.6 | 20.6 | |
| Crimson Desert (2026) | 90.9 | 57.4 | 53.9 | 46.2 | 37.6 | 35.9 | 22.2 | 20.5 | |
| Pragmata (2026) | 114.4 | 86.2 | 69.2 | 67.4 | 50.6 | 42.7 | 27.7 | ||
| Forza Horizon 6 (2026) | 142 | 90 | 48 | 21 | 18 | 17 | |||
| 007 First Light (2026) | 63.7 | 52.9 | 57.8 | 49.3 | 6.93 |
Emissioni - Buon raffreddamento e silenziosità sotto carico
Emissioni sonore
Il sistema di raffreddamento del Minisforum NUCXi7 è costituito da cinque heatpipe e due ventole, che sono appena udibili o addirittura completamente silenziose durante il funzionamento a vuoto. Tuttavia, anche sotto carico, il dispositivo non diventa mai molto rumoroso e il livello di rumore massimo misurato è di 40,8 dB(A).
Rumorosità
| Idle |
| 29.5 / 29.5 / 29.5 dB(A) |
| Sotto carico |
| 32.8 / 40.8 dB(A) |
 | ||
30 dB silenzioso 40 dB(A) udibile 50 dB(A) rumoroso |
||
min: | ||
| Minisforum NUCX i7 i7-11800H, GeForce RTX 3070 Laptop GPU | Zotac Magnus One (ECM73070C) i7-10700, GeForce RTX 3070 | Zotac ZBOX Magnus EN173070C i7-11800H, GeForce RTX 3070 Laptop GPU | Intel Dragon Canyon NUC - RTX 3060 i9-12900, GeForce RTX 3060 | |
|---|---|---|---|---|
| Noise | -18% | -13% | -4% | |
| off /ambiente * (dB) | 29.5 | 30 -2% | 30.7 -4% | 30.2 -2% |
| Idle Minimum * (dB) | 29.5 | 33.58 -14% | 32.7 -11% | 30.2 -2% |
| Idle Average * (dB) | 29.5 | 32.8 -11% | 30.4 -3% | |
| Idle Maximum * (dB) | 29.5 | 32.8 -11% | 30.8 -4% | |
| Load Average * (dB) | 32.8 | 44.25 -35% | 41.7 -27% | |
| Load Maximum * (dB) | 40.8 | 48.72 -19% | 45.4 -11% | 45.1 -11% |
* ... Meglio usare valori piccoli
Temperature
A causa della costruzione, le temperature del case sono molto simili a quelle di un portatile da gioco. Durante lo stress test, abbiamo misurato 45,9 °C (114,6 °F) nel punto più caldo del lato visibile che mostra anche il logo e l'etichetta. Le temperature del case misurate durante il gioco sono leggermente inferiori.
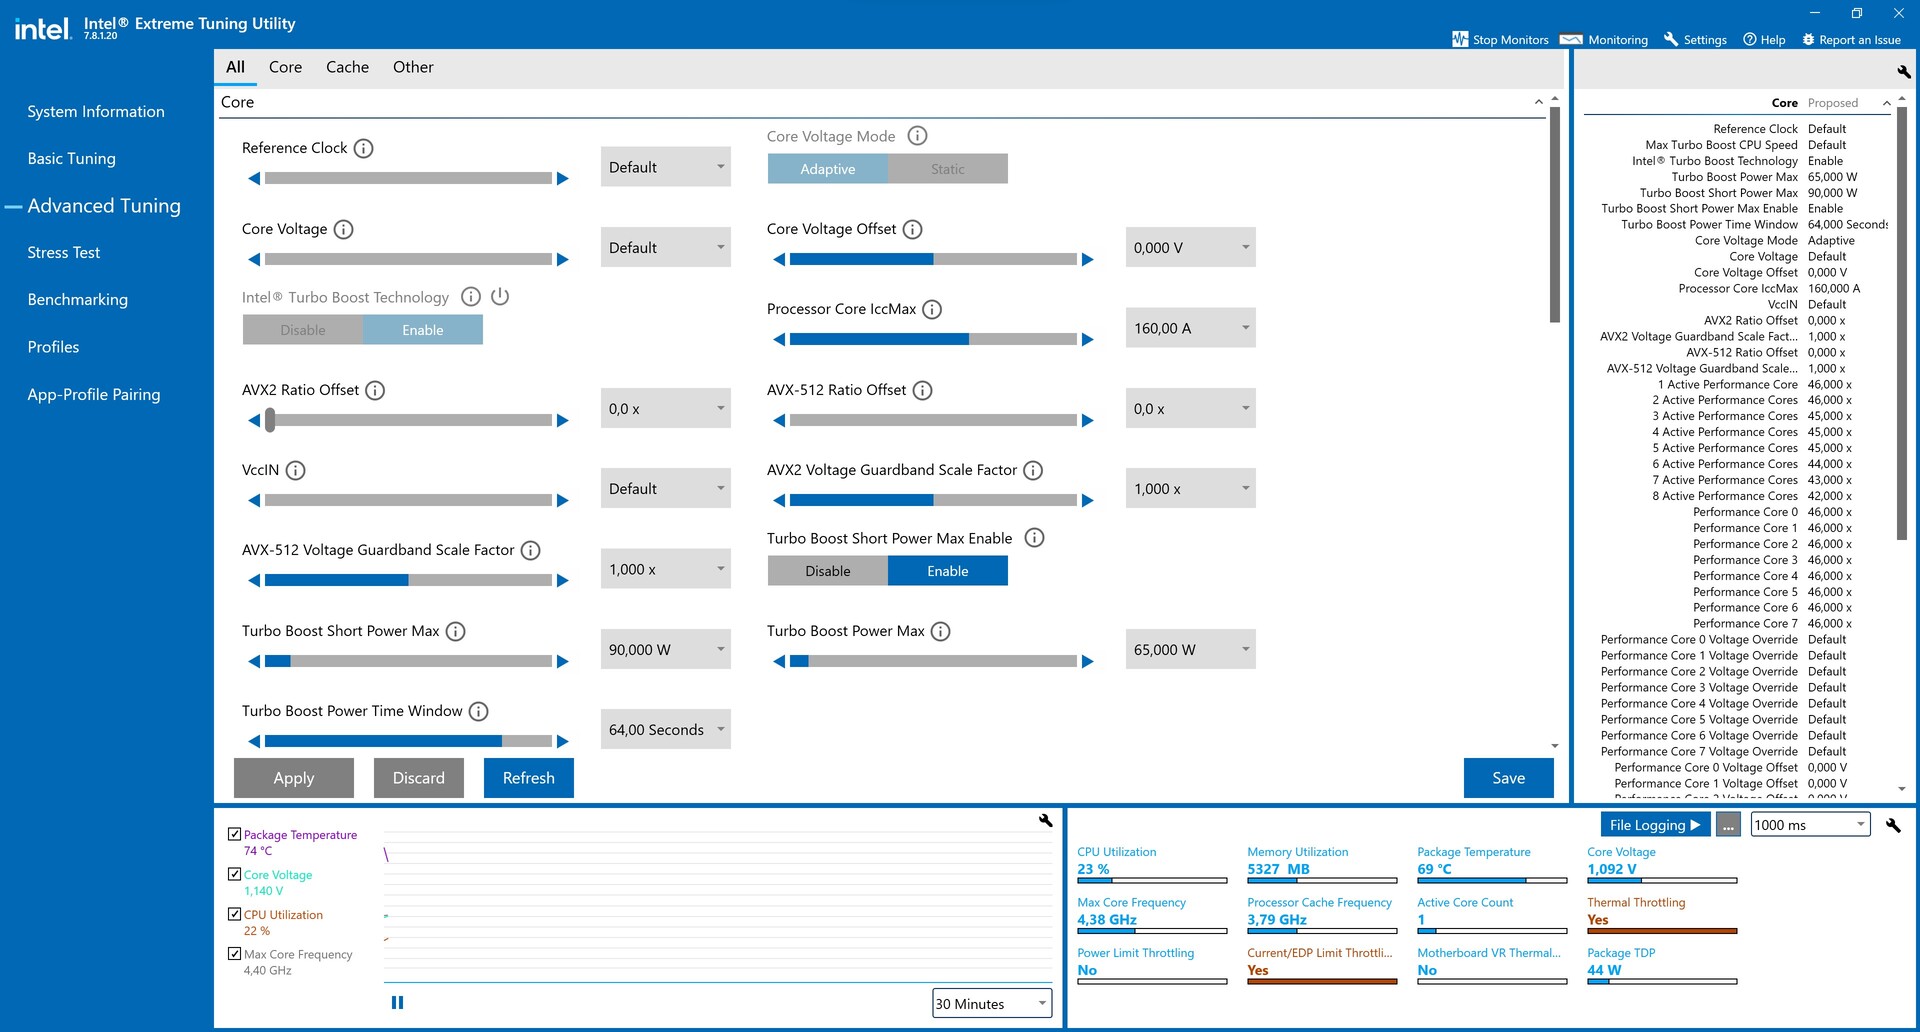
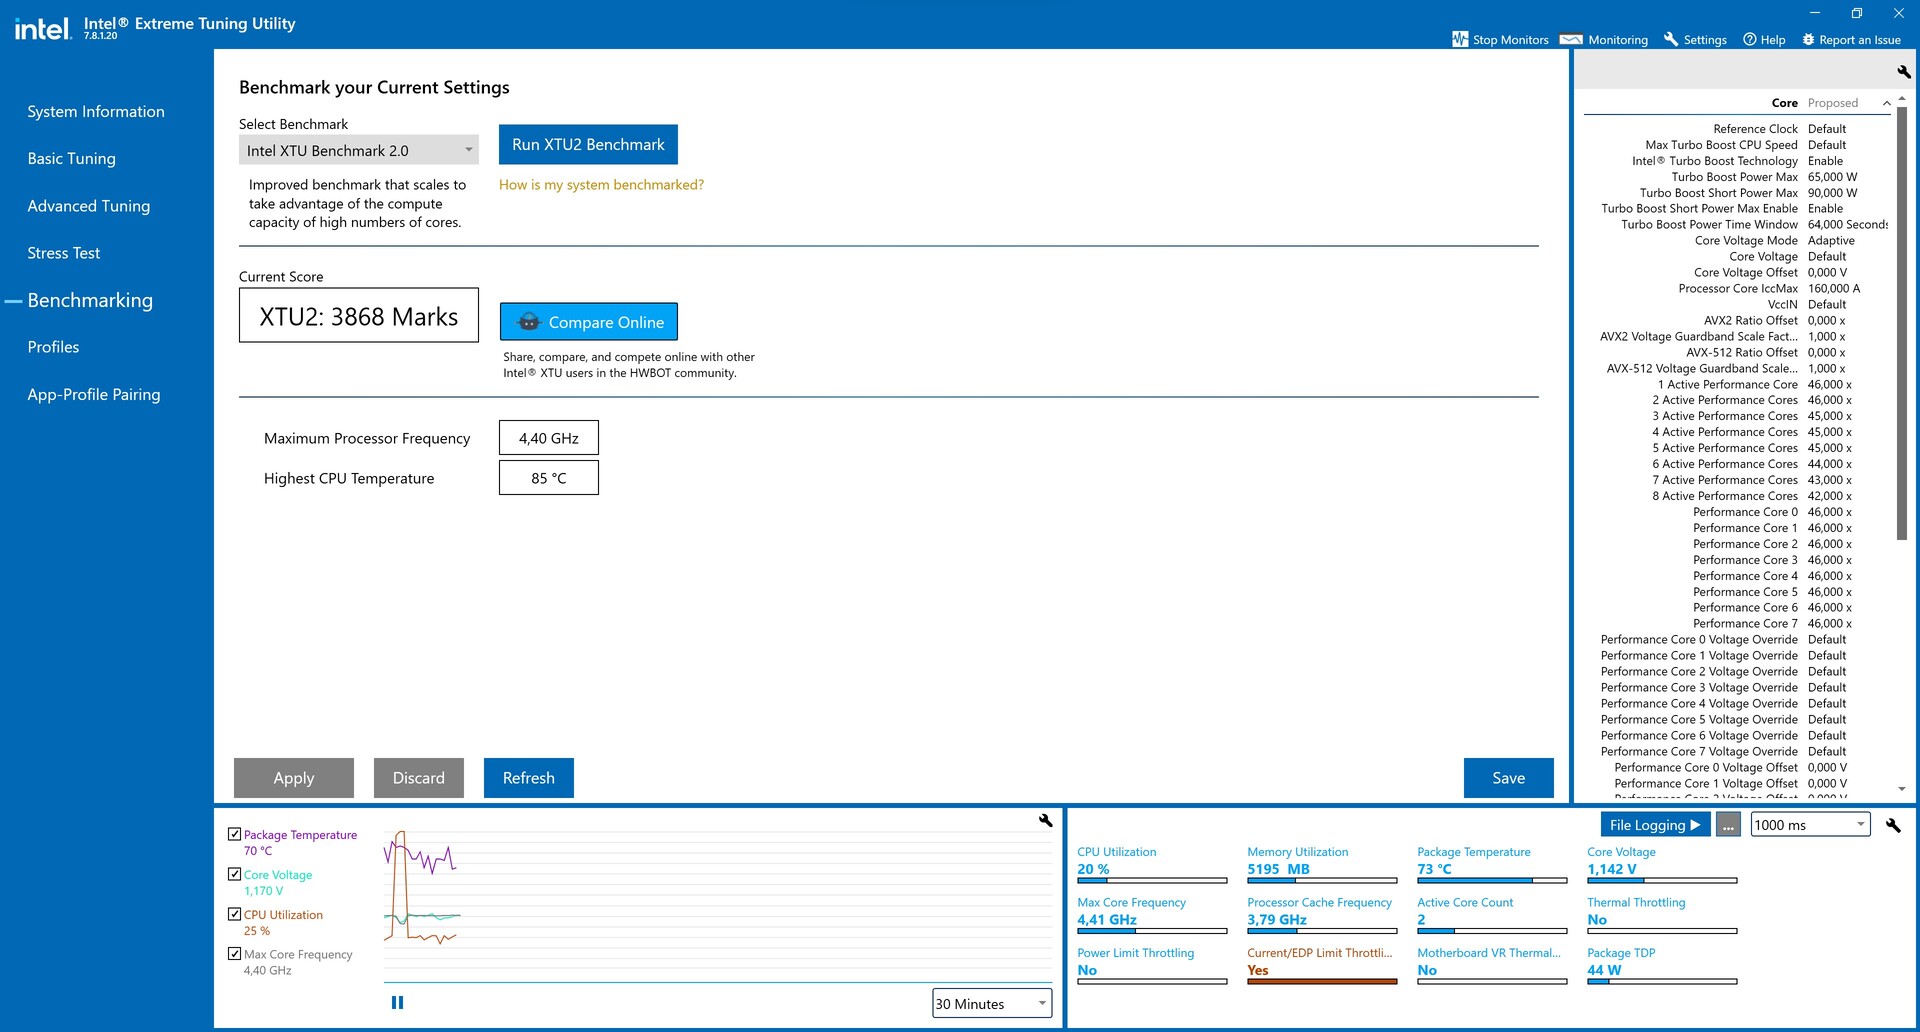
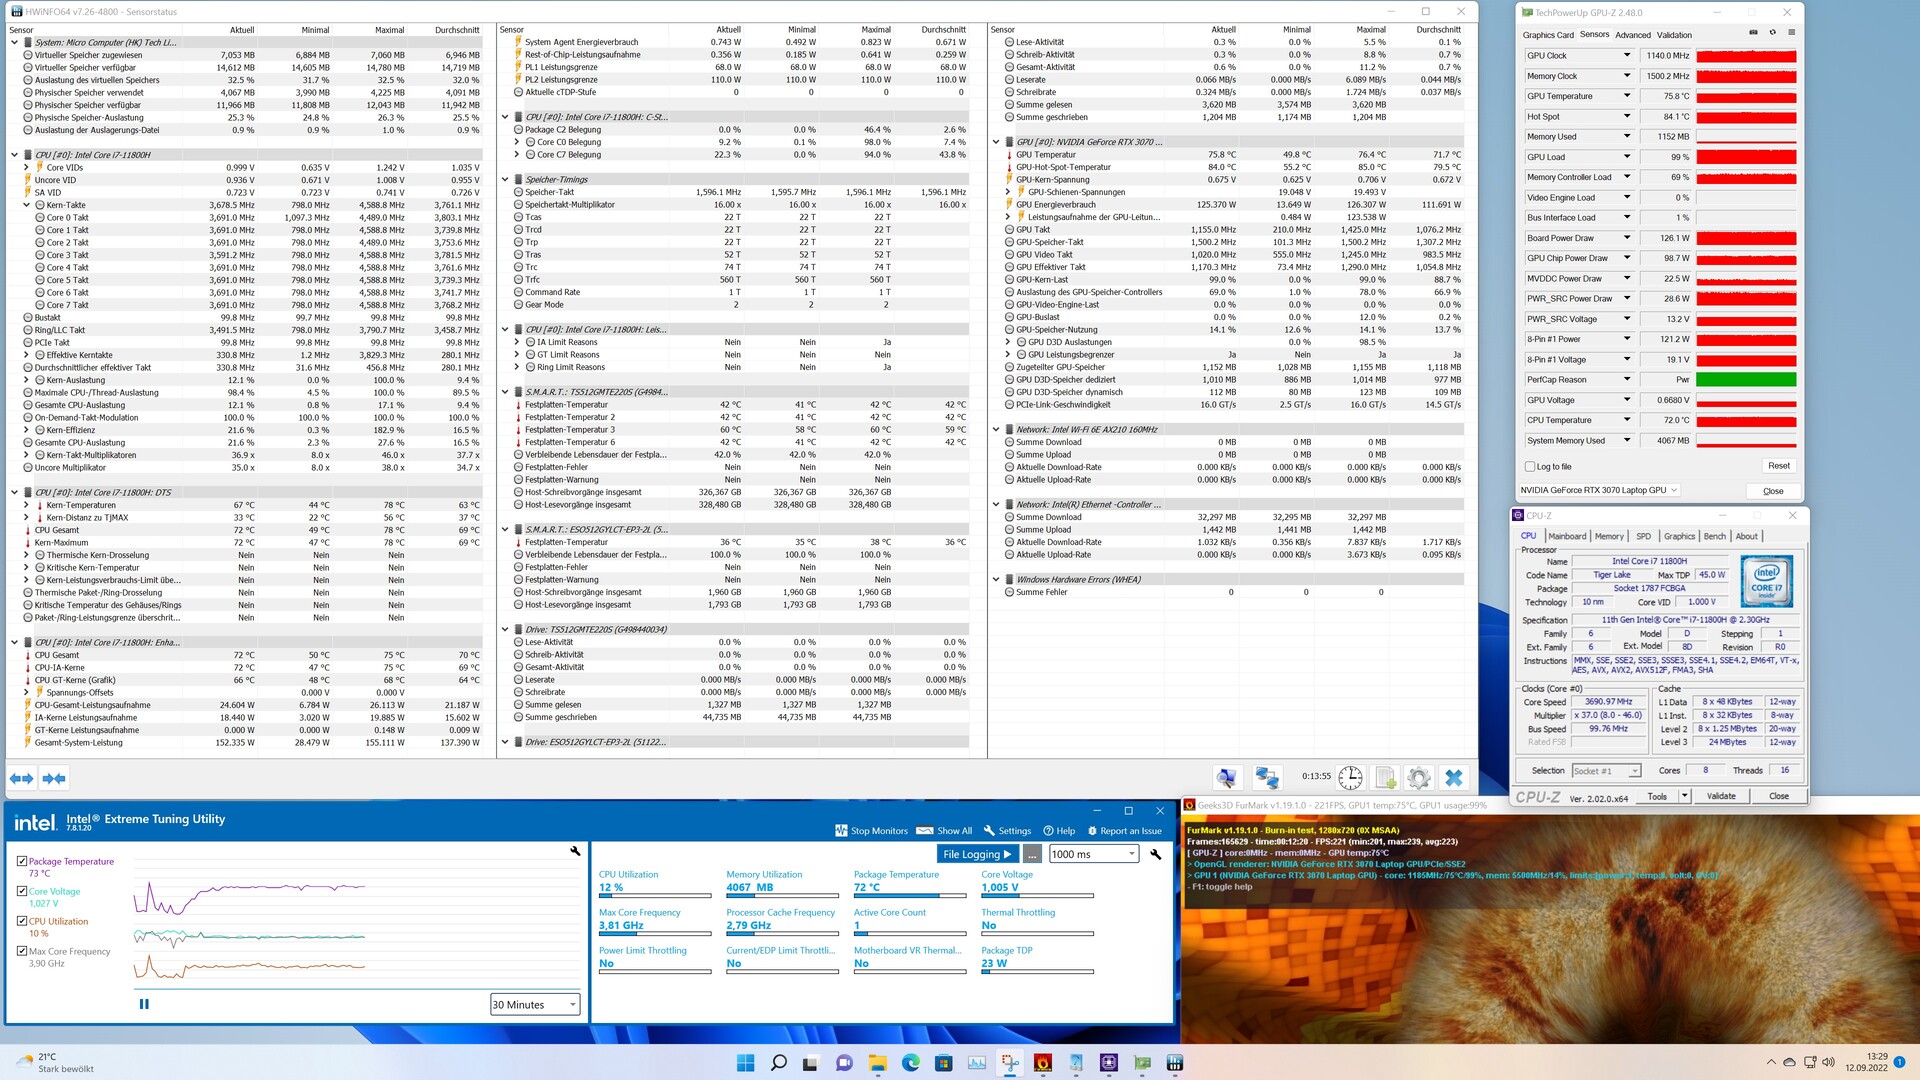
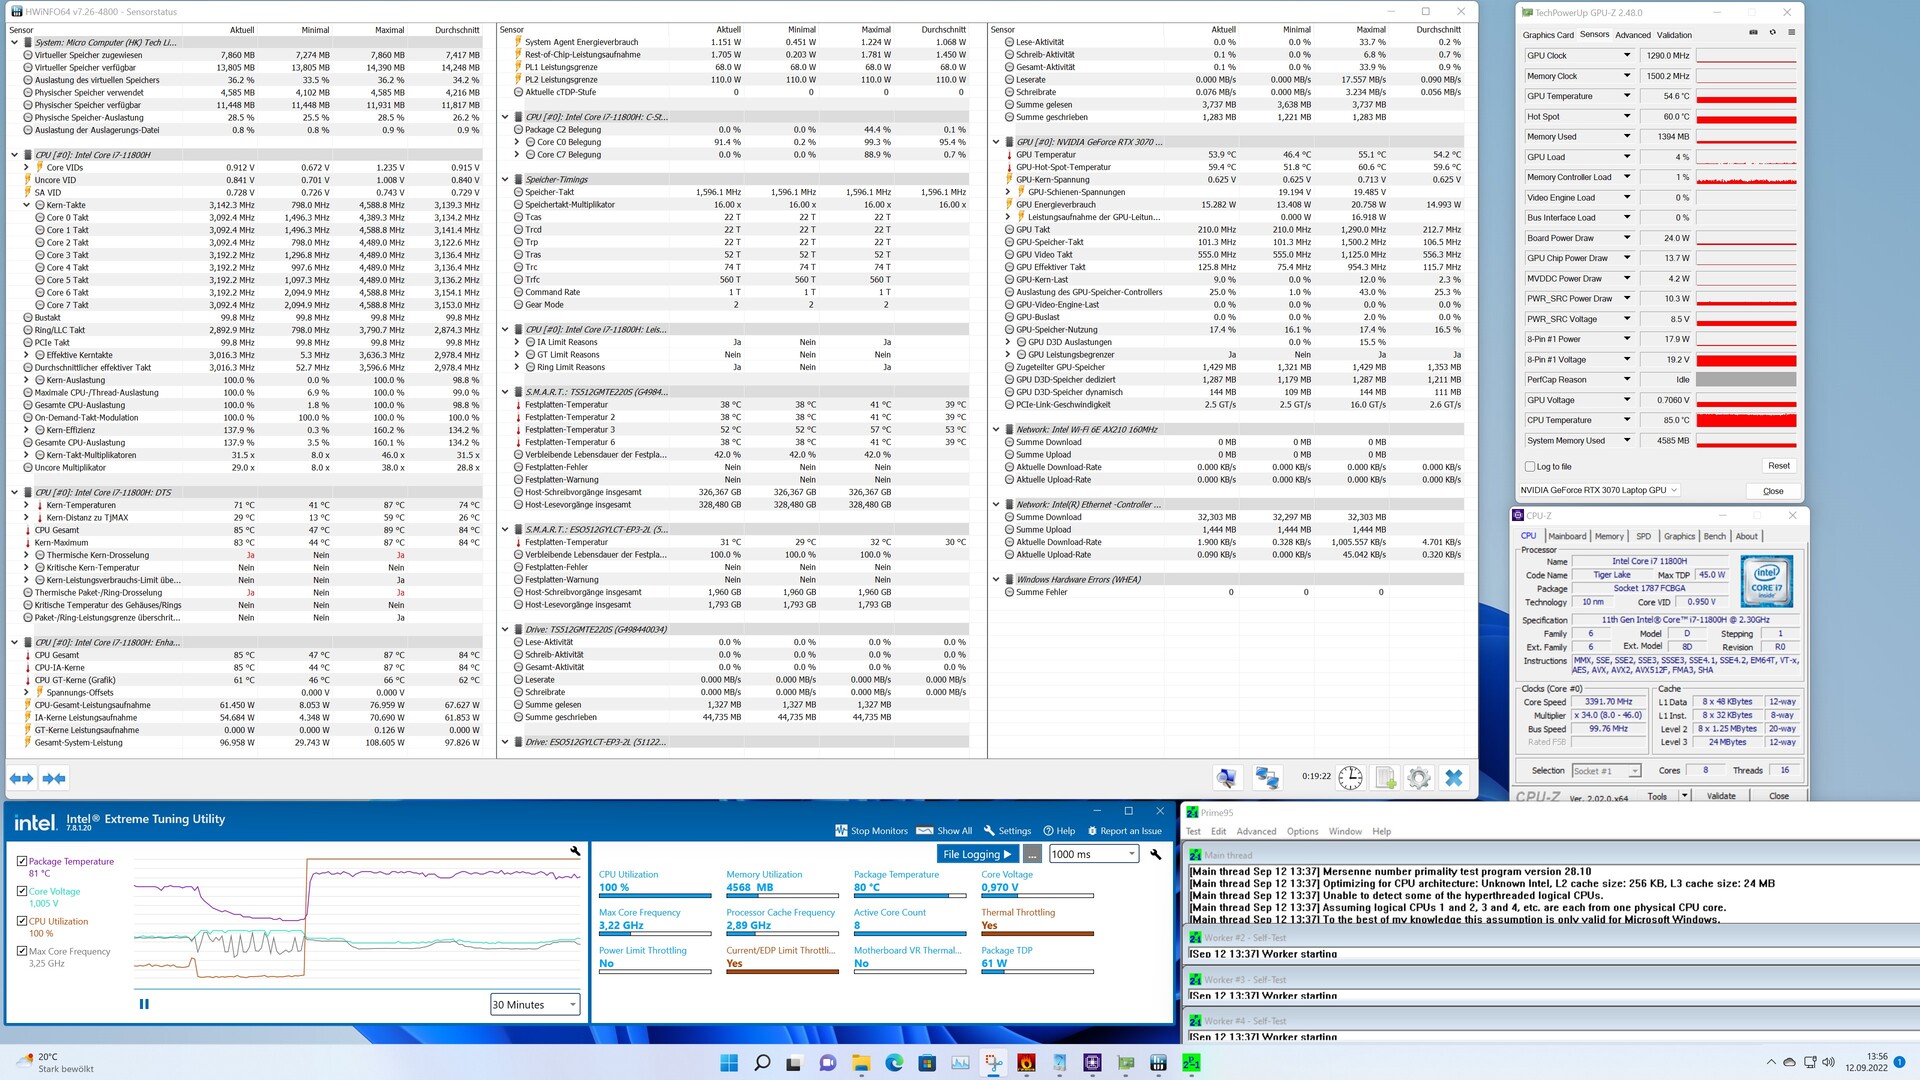
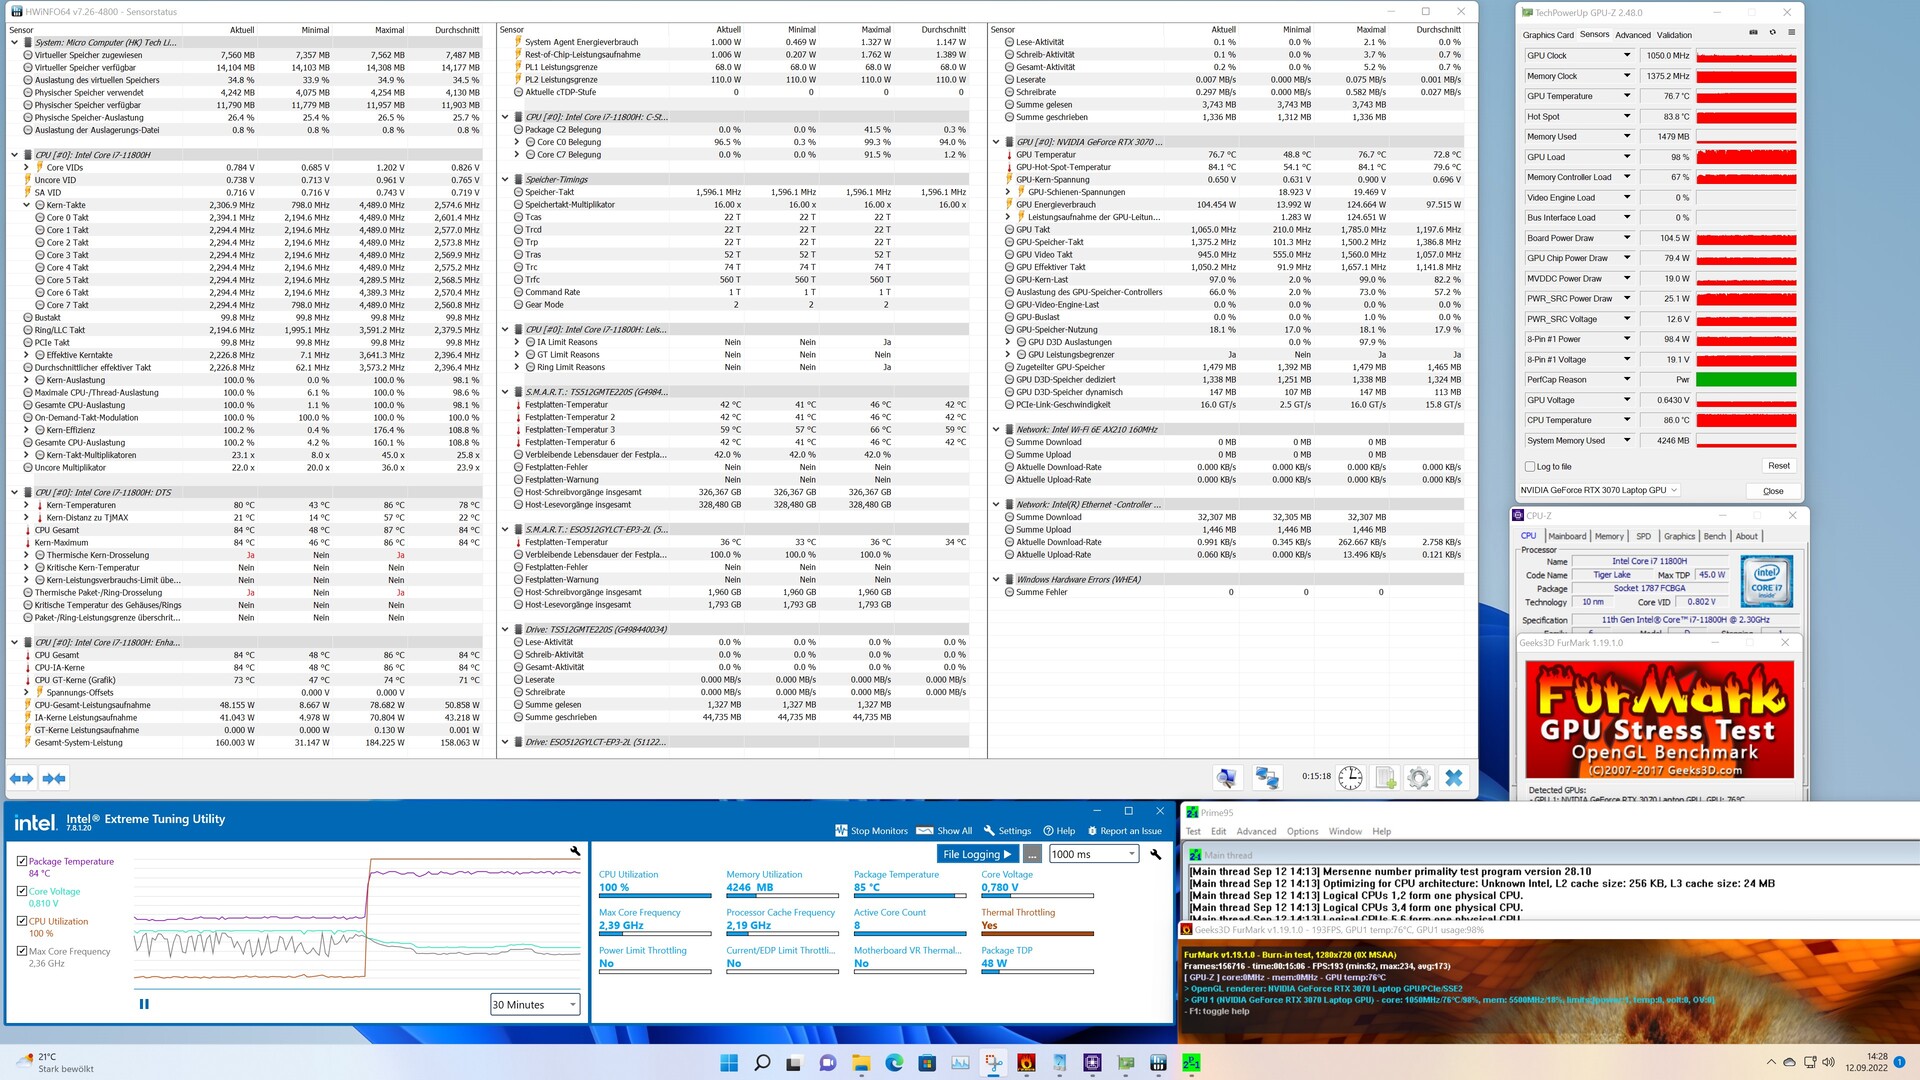
Le cose sembrano andare altrettanto bene con i componenti: Intel Core i7-11800H raggiunge 86 °C (187 °F) sotto carico, anche se la GPU Nvidia GeForce RTX 3070 Laptop rimane leggermente più fredda durante lo stress test a 77 °C (°F). Intel XTU e HWiNFO riportano un throttling termico sotto carico, il che conferma che il produttore ha definito un limite termico di 85 °C (185 °F) per il processore. È possibile aumentare questo limite del processore a 94 °C (201 °F) nel BIOS. D'altra parte, il limite di 87 °C (189 °F) rimane sempre fisso per la scheda grafica.
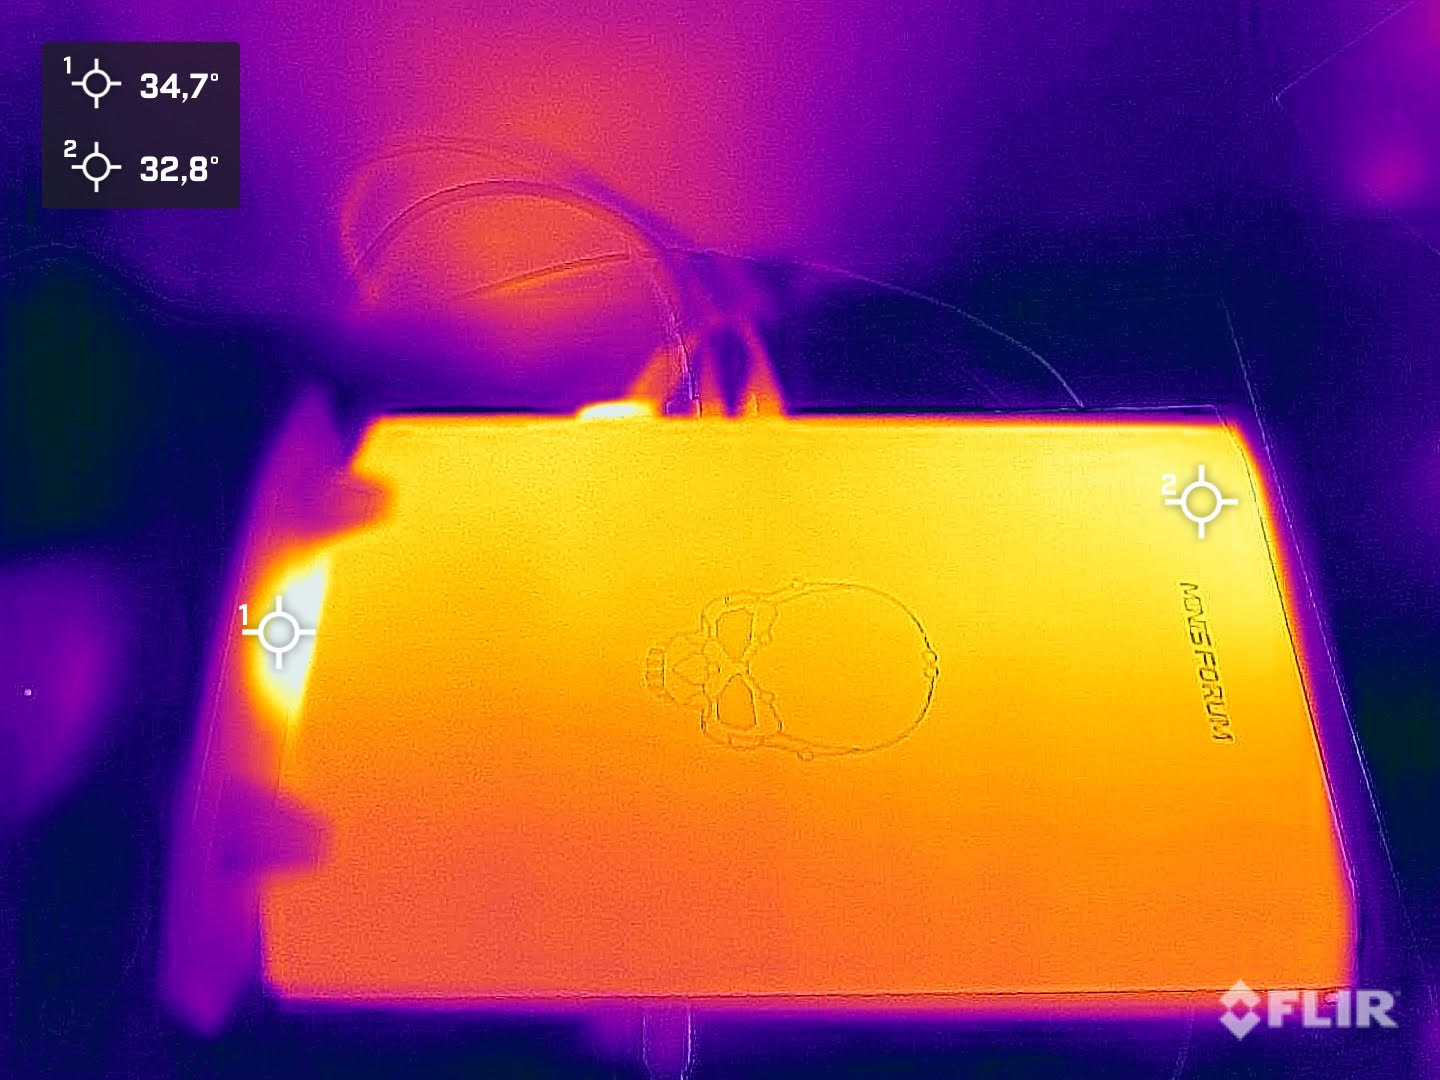
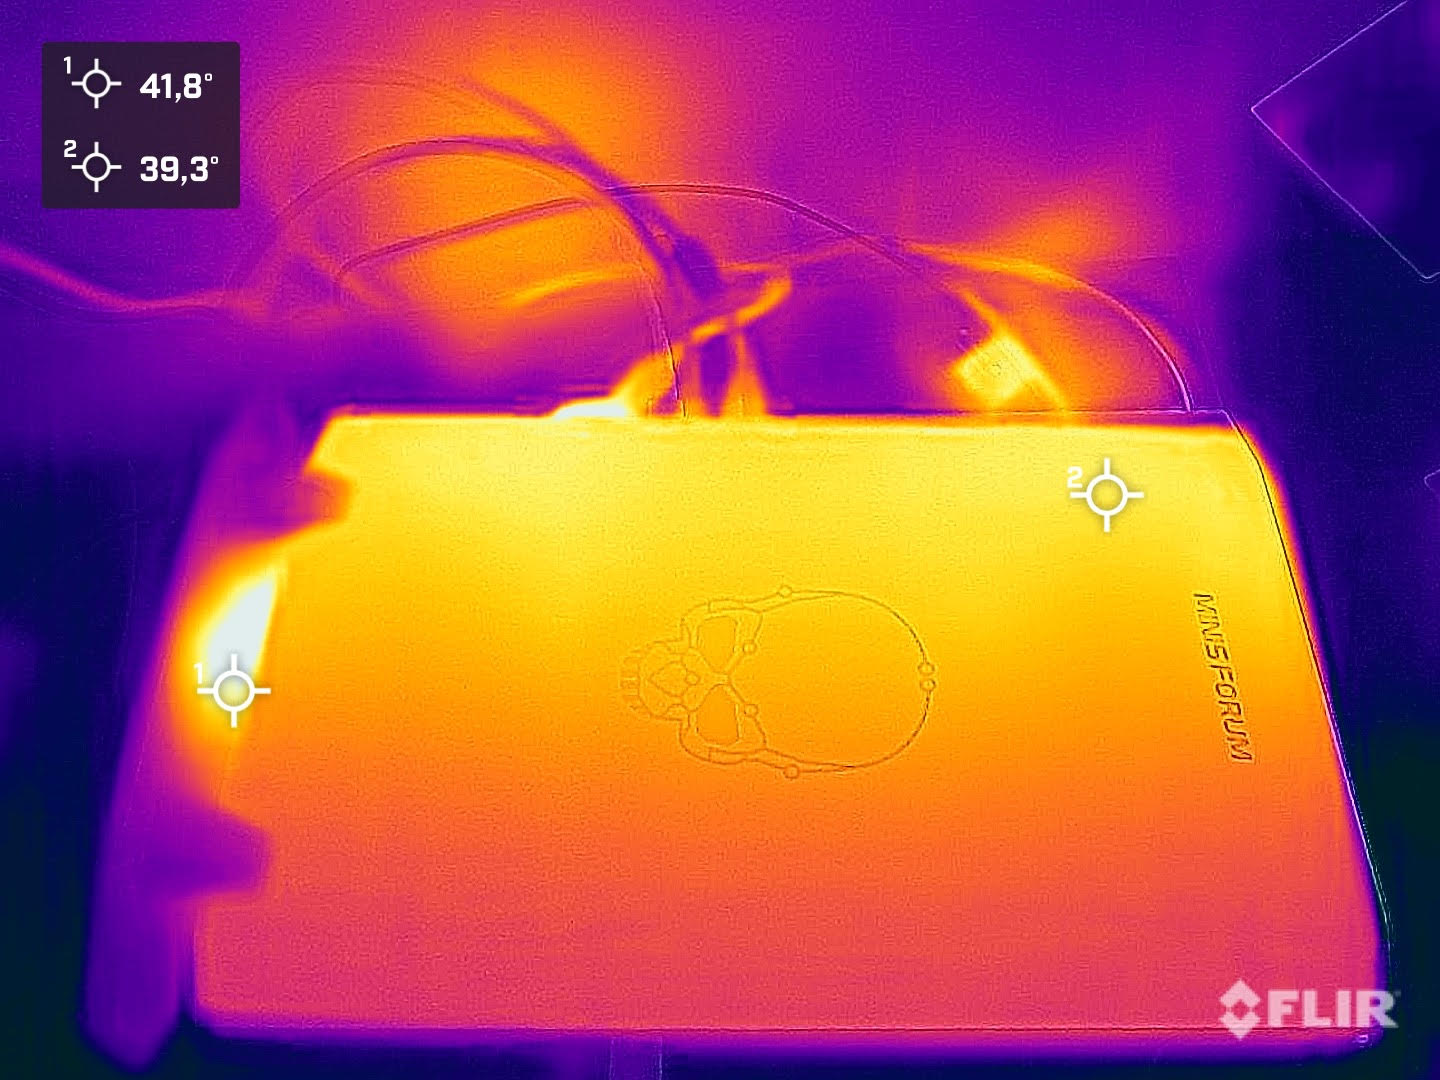
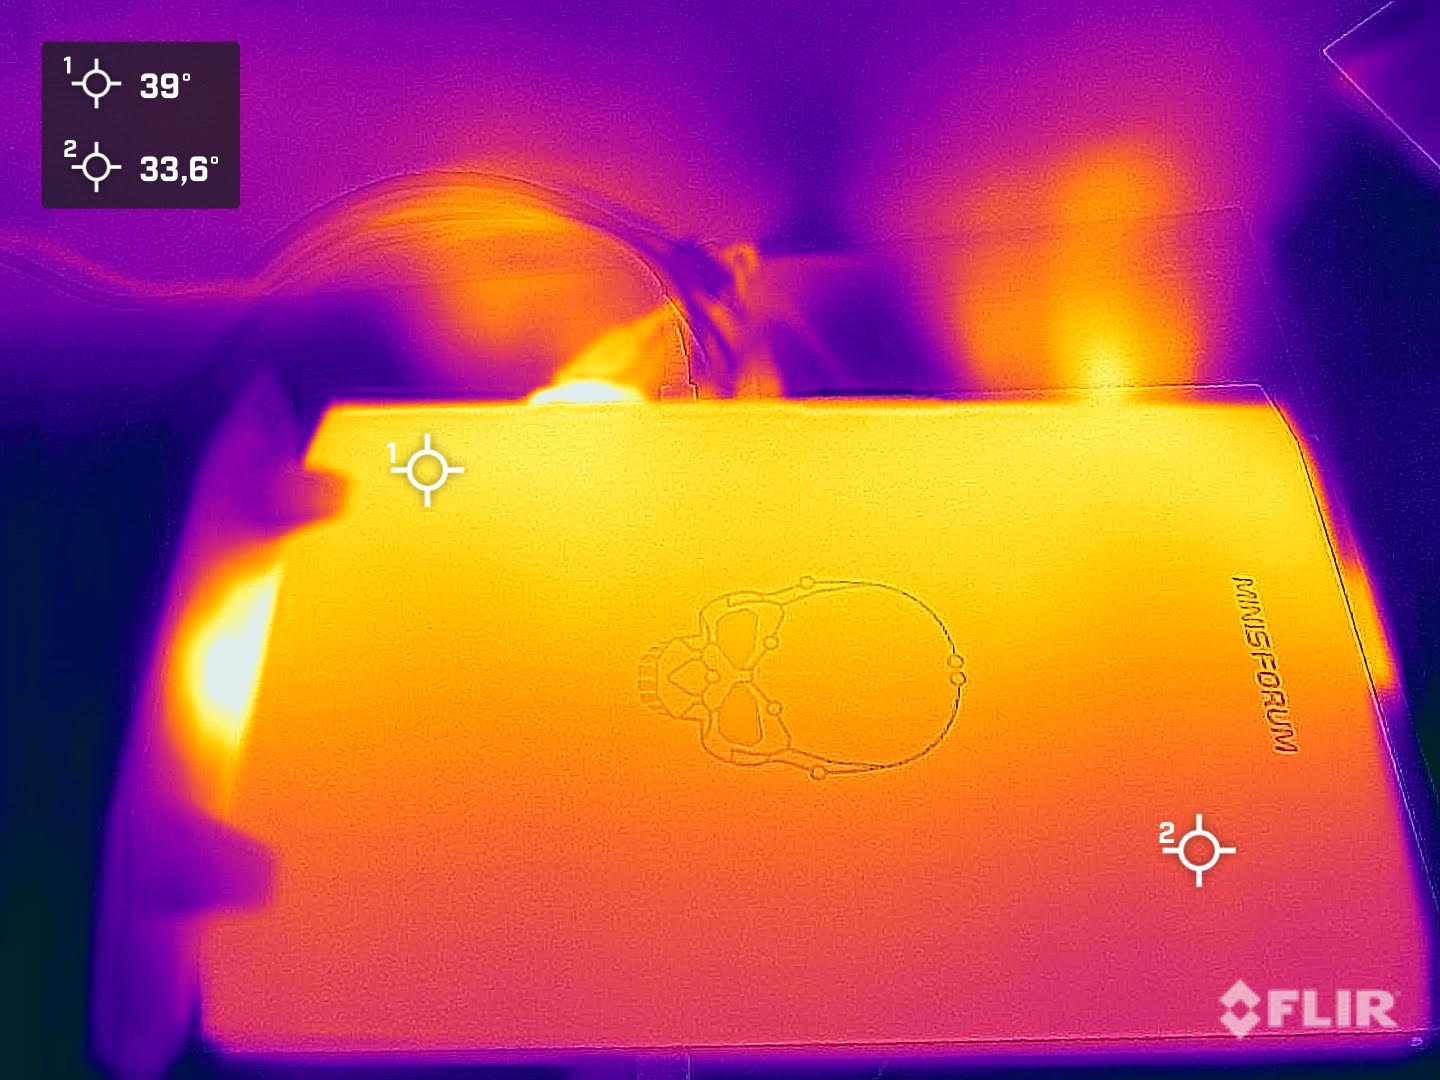
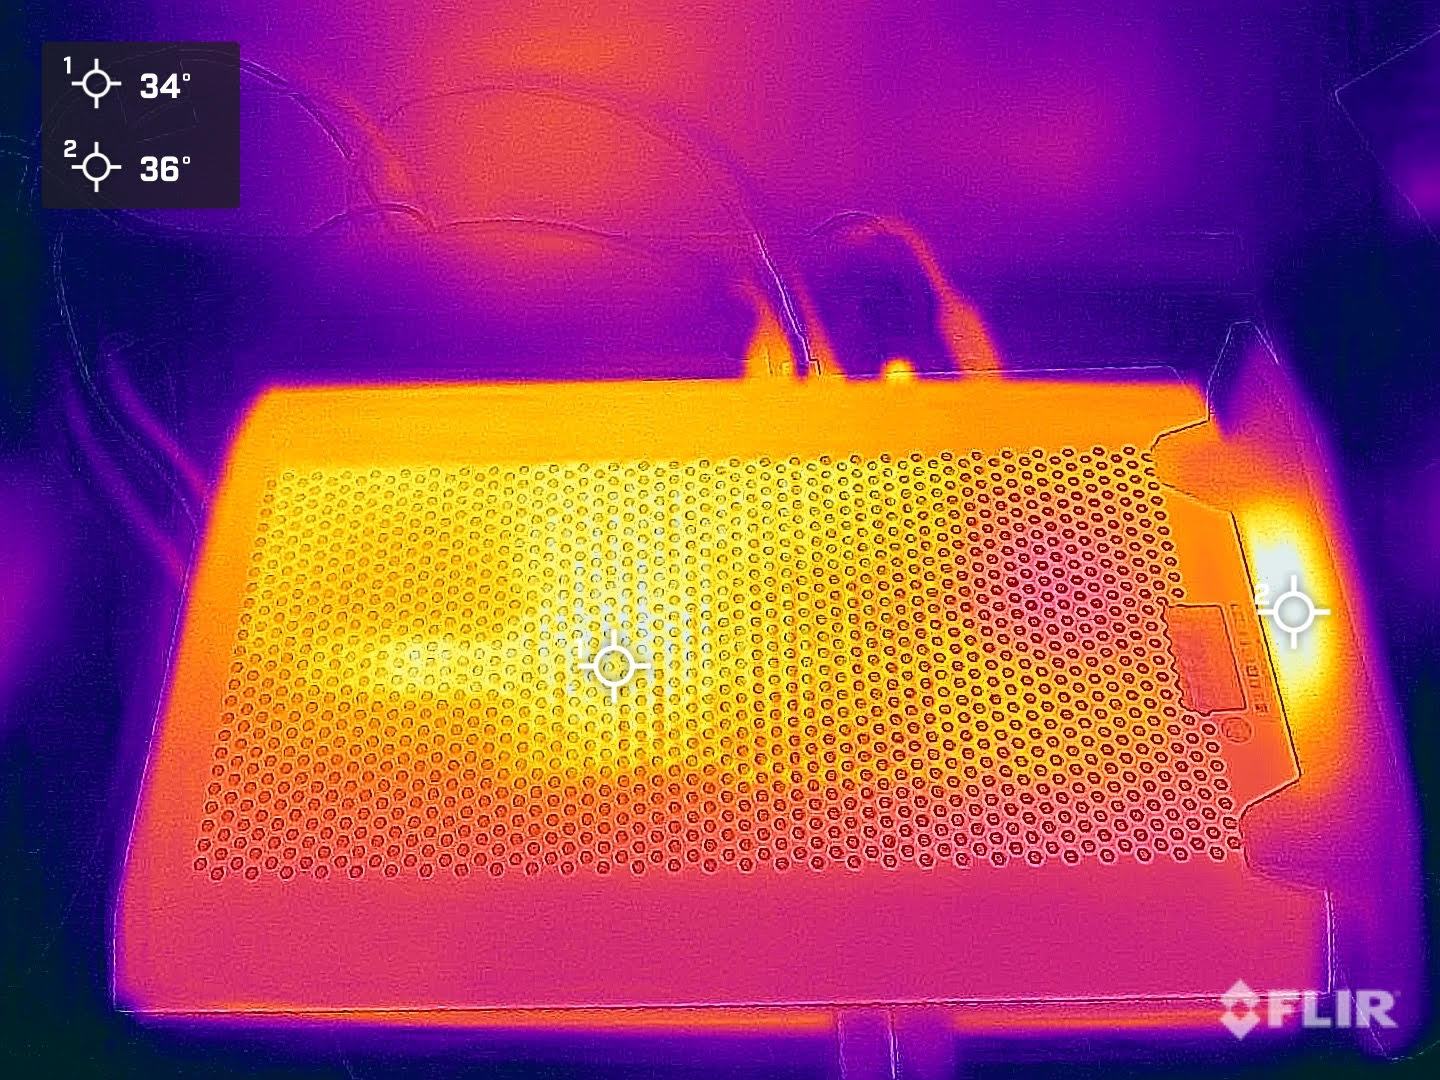
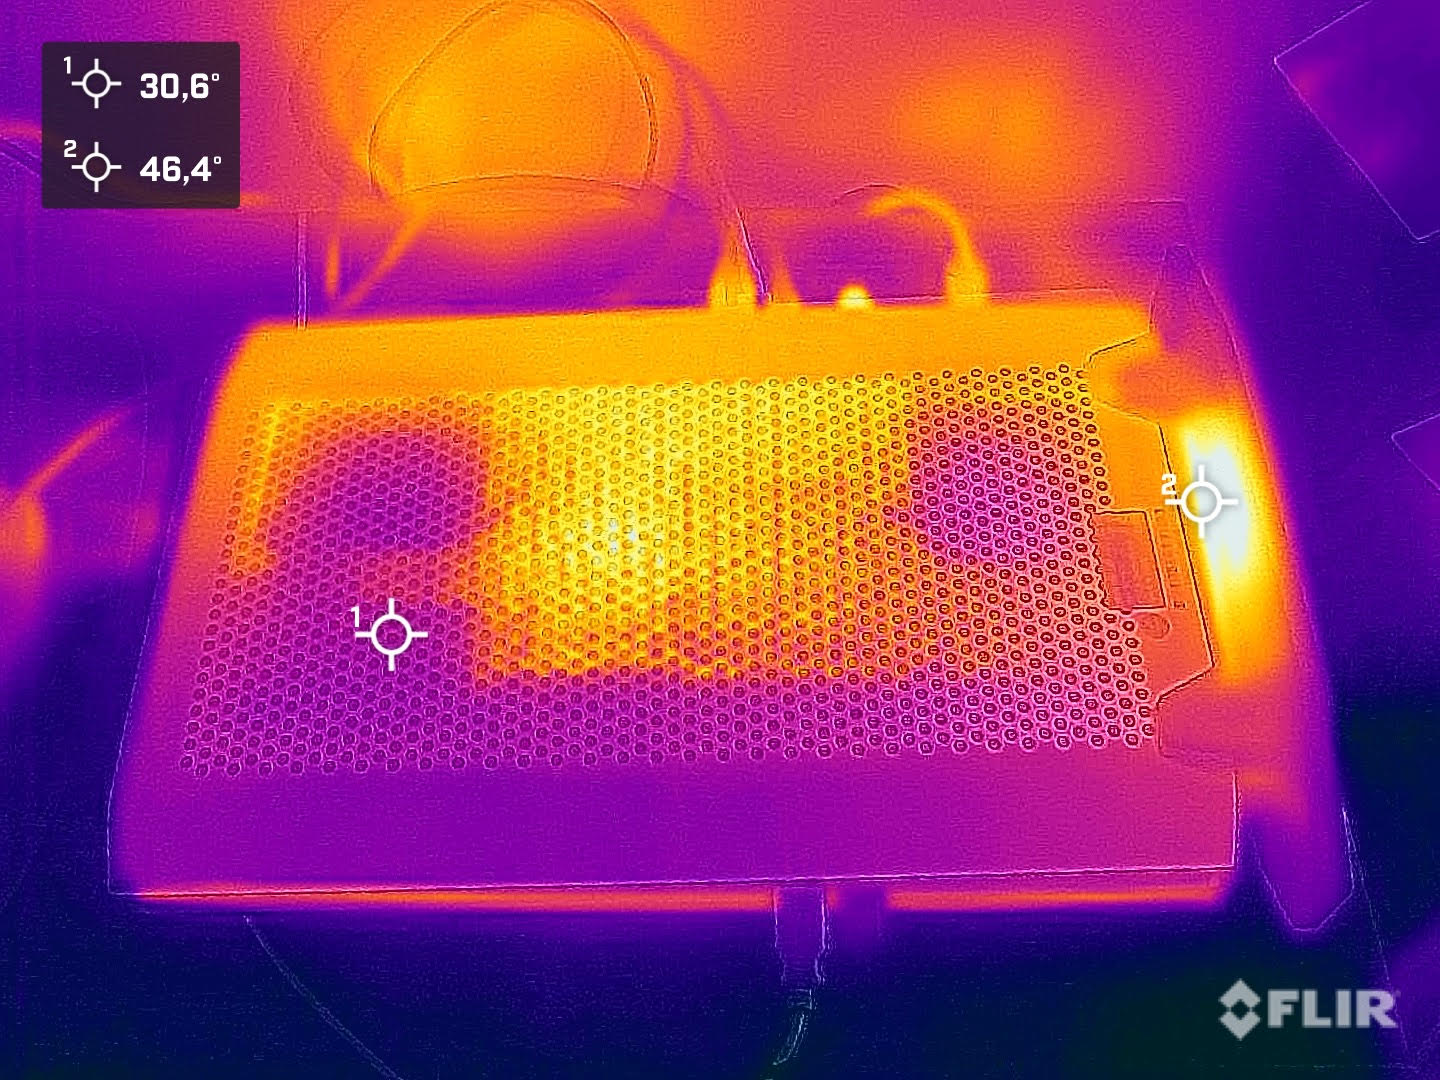
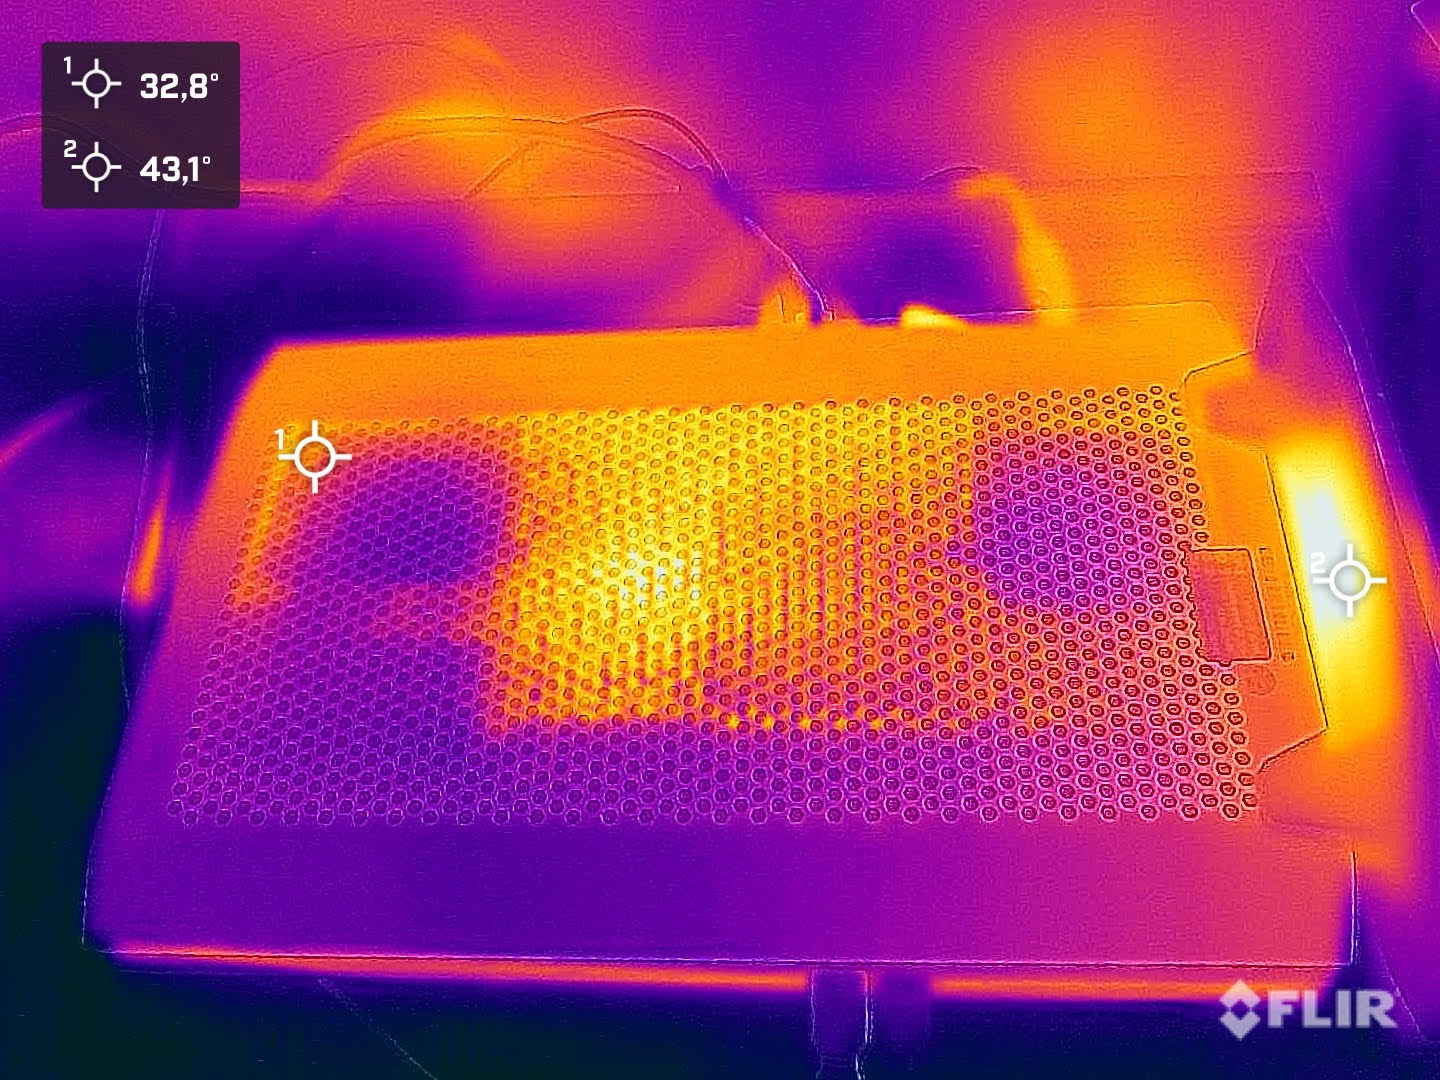
(-) La temperatura massima sul lato superiore è di 45.9 °C / 115 F, rispetto alla media di 33.9 °C / 93 F, che varia da 25 a 47 °C per questa classe Desktop.
(+) Il lato inferiore si riscalda fino ad un massimo di 39.3 °C / 103 F, rispetto alla media di 33.6 °C / 92 F
(±) In idle, la temperatura media del lato superiore è di 35.7 °C / 96 F, rispetto alla media deld ispositivo di 29.5 °C / 85 F.
(-) Riproducendo The Witcher 3, la temperatura media per il lato superiore e' di 40.2 °C / 104 F, rispetto alla media del dispositivo di 29.5 °C / 85 F.
Consumo di energia
Rispetto a un normale PC desktop, il Minisforum NUCXi7 ha un chiaro vantaggio grazie ai suoi componenti efficienti. Anche rispetto al Zotac ZBOX Magnus EN1730Cla nostra unità di prova è chiaramente in vantaggio, essendo significativamente più efficiente nonostante l'hardware quasi identico, senza perdere alcuna prestazione. Con 28-36 watt, il consumo energetico è basso senza carico, ma è comunque significativamente più alto rispetto al Gigabyte A7 X1. Sotto carico, il Minisforum NUCXi7 consuma in media 83 watt, anche se abbiamo misurato 167 watt durante il gioco. Notiamo anche brevi picchi fino a 215 watt, che non raggiungono i limiti dell'alimentatore da 230 watt.
| Off / Standby | |
| Idle | |
| Sotto carico |
|
Leggenda:
min: | |
| Minisforum NUCX i7 i7-11800H, GeForce RTX 3070 Laptop GPU | Zotac ZBOX Magnus EN173070C i7-11800H, GeForce RTX 3070 Laptop GPU | Gigabyte A7 X1 R9 5900HX, GeForce RTX 3070 Laptop GPU | Media NVIDIA GeForce RTX 3070 Laptop GPU | Media della classe Desktop | |
|---|---|---|---|---|---|
| Power Consumption | -37% | 15% | 13% | 3% | |
| Idle Minimum * (Watt) | 28.2 | 31.3 -11% | 12 57% | 15.6 ? 45% | 17.9 ? 37% |
| Idle Average * (Watt) | 29.9 | 35.1 -17% | 14 53% | 20.1 ? 33% | 37.2 ? -24% |
| Idle Maximum * (Watt) | 36.2 | 41.6 -15% | 19 48% | 29.4 ? 19% | 41.3 ? -14% |
| Load Average * (Watt) | 83.2 | 214 -157% | 118 -42% | 110.8 ? -33% | 96.7 ? -16% |
| Witcher 3 ultra * (Watt) | 167 | 193.5 -16% | 205 -23% | ||
| Cyberpunk 2077 ultra external monitor * (Watt) | 177 | ||||
| Load Maximum * (Watt) | 215.7 | 231 -7% | 229 -6% | 214 ? 1% | 141.6 ? 34% |
* ... Meglio usare valori piccoli
Power Consumption With External Monitor
Pro
Contro
Verdetto - Un PC da gioco ultra sottile
Con il Minisforum NUCXi7, il produttore offre un PC da gioco molto interessante, utilizzando la collaudata tecnologia dei computer portatili. La combinazione di Intel Core i7-11800He Nvidia GeForce RTX 3070 Laptop GPUfunziona molto bene e garantisce un sistema che funziona rapidamente. Il case molto sottile sembra essere di alta qualità e moderno allo stesso tempo. A causa del raffreddamento, il Minisforum NUCXi7 deve essere utilizzato solo in posizione verticale. Questo è un aspetto che si deve accettare quando si decide di acquistare il dispositivo. Bisogna anche accettare qualche piccolo compromesso in termini di varietà di connessioni, poiché le porte USB-A, solitamente utilizzate per il mouse e la tastiera, sono posizionate nella parte anteriore del dispositivo. Con l'unità SSD da 512 GB si è abbastanza ben equipaggiati all'inizio. Tuttavia, considerando il target di utenti, i videogiocatori potrebbero incontrare rapidamente i suoi limiti, e raccomandiamo almeno 1 TB come standard.
Il Minisforum NUCXi7 è un PC da gioco silenzioso in un case ultra sottile, progettato per i giochi a 1.440p.
Ci sono piaciuti molto i bassi valori di emissione del Minisforum NUCXi7: non solo il dispositivo è silenzioso, ma è anche efficiente, mantenendo sempre sotto controllo le temperature. Allo stesso tempo, non si deve convivere con prestazioni ridotte della CPU e della GPU. Inoltre, il nostro campione di prova non ha commesso alcun errore in nessun momento. Le prestazioni del sistema sono buone sia durante il lavoro che durante il gioco. In alcune parti, il Minisforum NUCXi7 è persino in grado di tenere il passo con i normali PC desktop.
Come possibile alternativa al Minisforum NUCXi7, si potrebbe anche prendere in considerazione un portatile da gioco. Il valore aggiunto è sicuramente maggiore, anche se con un equipaggiamento simile c'è anche un piccolo sovrapprezzo: Il Gigabyte A7 X1 di costa circa 1.800 dollari.
Prezzo e disponibilità
Il Minisforum NUCXi7è presente nel negozio di Minisforum con ordini che verranno spediti a metà ottobre. Attualmente ci sono ancora alcuni interessanti sconti di "prevendita". Ad esempio, la nostra unità di prova costa attualmente 1.169 dollari. Il prezzo normale sarebbe di 1.339 dollari senza lo sconto. Il più conveniente NUCXi5 attualmente costa $979 con lo stesso equipaggiamento di RAM e SSD (regolarmente $1129).
Minisforum NUCX i7
- 09/14/2022 v7 (old)
Sebastian Bade

