Verdetto - Non riesce a competere con Dell
HP ZBook Fury G1i 18 presenta alcuni vantaggi notevoli rispetto a Dell Pro Max 18 Plus. Funziona in modo più fresco, è leggermente più sottile e leggero, include l'illuminazione RGB per tasto e i pulsanti del mouse reali, e viene fornito con un display più veloce a 165 Hz con un ghosting meno evidente. Nel frattempo, l'hardware è costruito in modo altrettanto robusto, se non probabilmente più versatile, grazie alle cerniere più ampie e al pannello inferiore "tool-less" per una manutenzione più semplice.
Purtroppo, diversi inconvenienti impediscono ad HP di essere la workstation mobile da 18 pollici definitiva. In particolare, la CPU e la GPU funzionano in modo leggermente ma costantemente più lento rispetto a Dell, quando entrambi sono configurati con processori identici. Dell Pro Max 18 Plus funziona in modo più caldo e punta a un TGP più alto di 175 W per ottenere maggiori prestazioni. La durata della batteria e il rumore della ventola dell'HP non sono necessariamente più lunghi o più silenziosi, rispettivamente, nonostante le differenze di prestazioni tra i due modelli. La macchina Dell è anche più ottimizzata per i carichi di lavoro AI, grazie alla RAM CAMM2 di maggiore capacità e alla DGFF rimovibile che può essere sostituita con una NPU di inferenza discreta Qualcomm. I cacciatori di prestazioni potrebbero quindi trovare più valore nella macchina Dell.
Pro
Contro
Prezzo e disponibilità
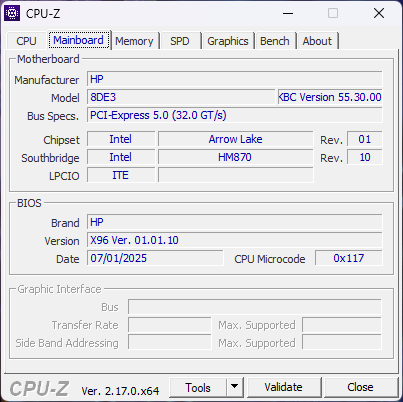
HP sta spedendo lo ZBook Fury G1i 18 a partire da 5660 dollari per la configurazione base, fino a oltre 10000 dollari se configurato con il Core Ultra 9 285HX e Nvidia RTX Pro 5000 Blackwell.
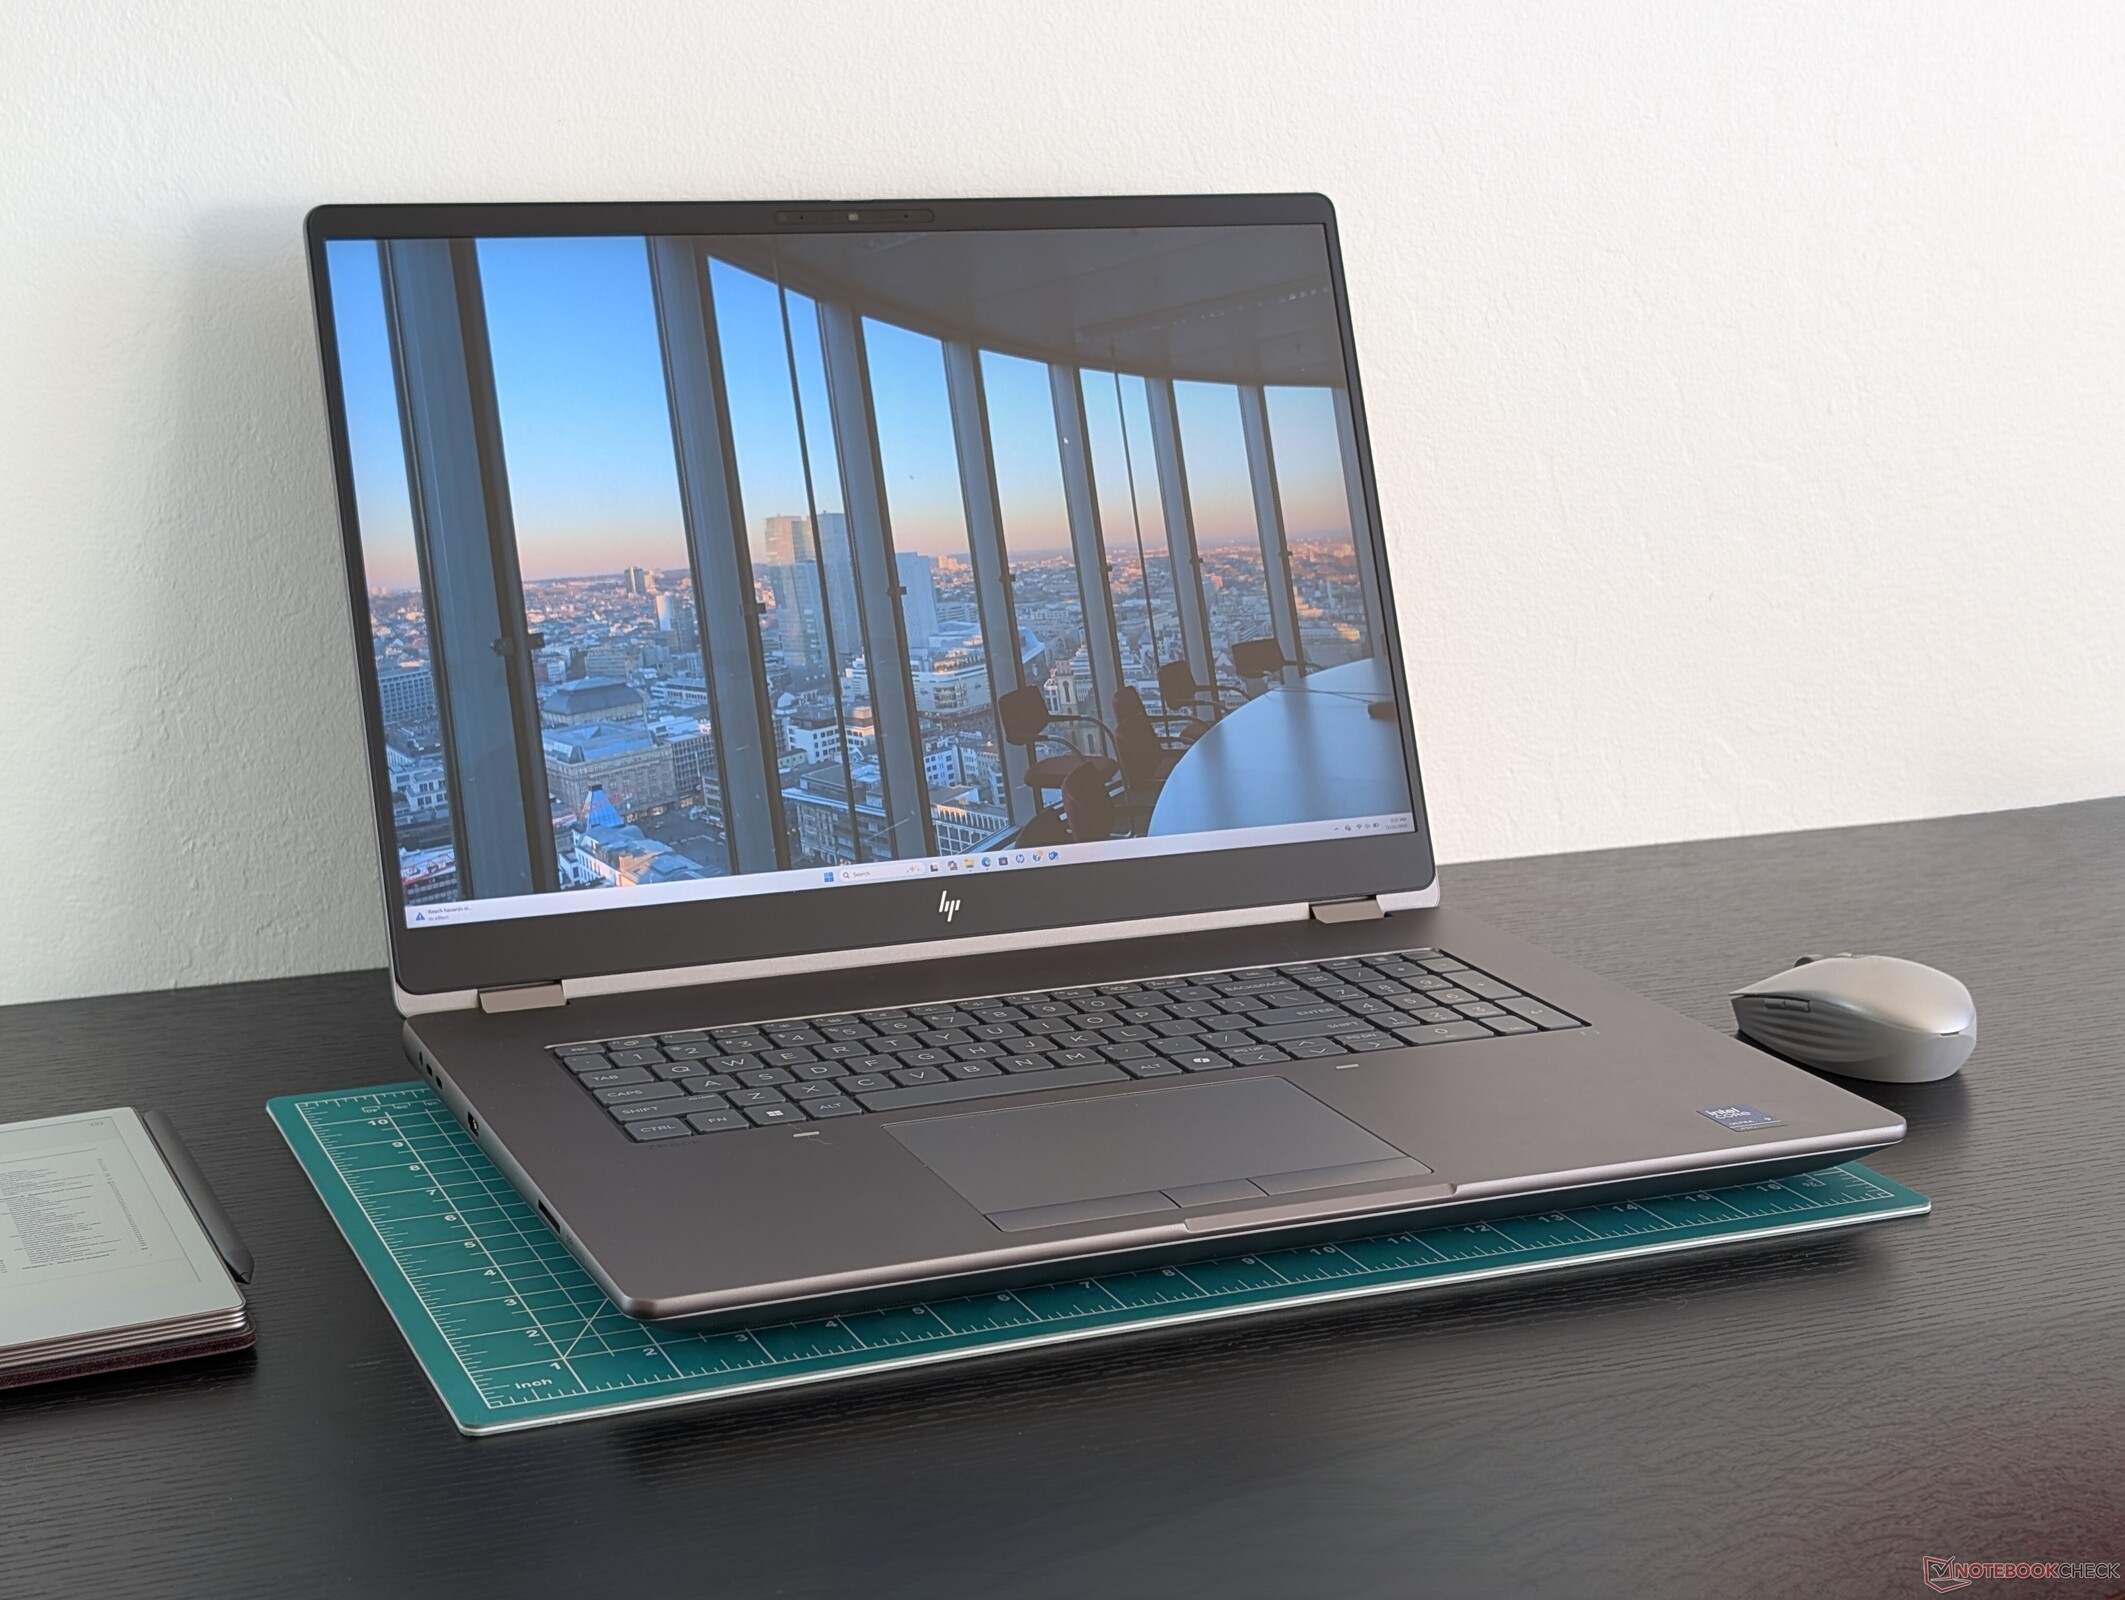
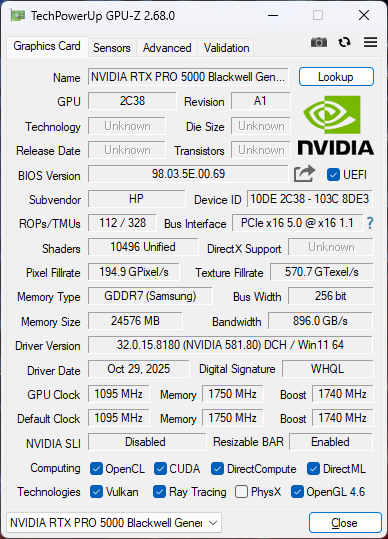
ZBook Fury G1i 18 è il primo modello da 18 pollici della famiglia Fury di workstation mobili ad alte prestazioni. Viene fornito con le ultime CPU Intel Arrow Lake-HX e le GPU Nvidia Pro Blackwell per essere uno dei più potenti della categoria.
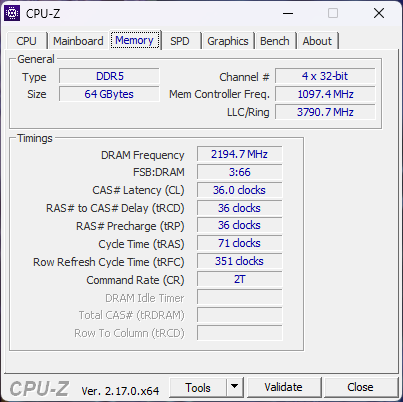
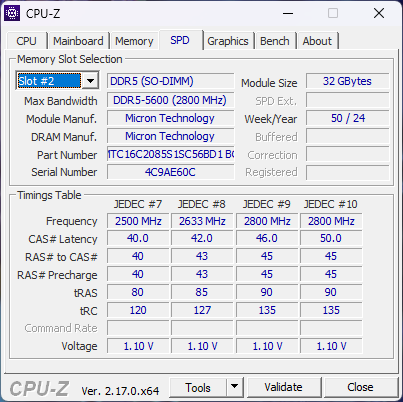
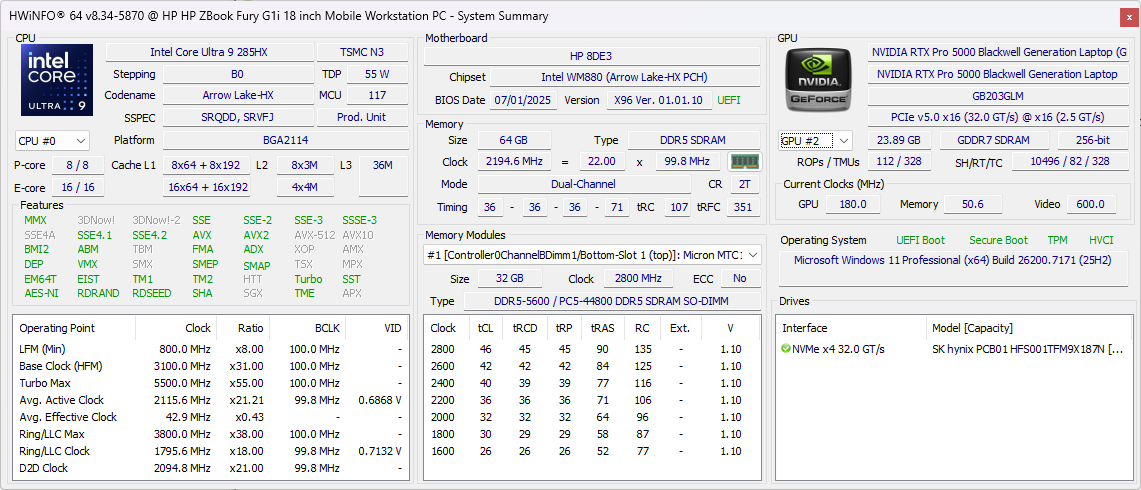
La nostra unità di prova specifica è stata configurata al massimo con la CPU Core Ultra 9 285HX, la GPU Nvidia RTX Pro 5000 Blackwell da 150 W e 64 GB di RAM DDR5-5600 per un prezzo al dettaglio di circa 9000+. Tutte le SKU al momento vengono fornite con lo stesso display IPS da 2560 x 1600p 165 Hz.
Le workstation da 18 pollici della concorrenza sono molto poche, con il modello Dell Pro Max 18 Plus è l'unico concorrente diretto al momento in cui scriviamo. Lenovo, ad esempio, non offre ancora un ThinkPad da 18 pollici con opzioni di GPU Nvidia professionali.
Altre recensioni HP:
Specifiche
Caso
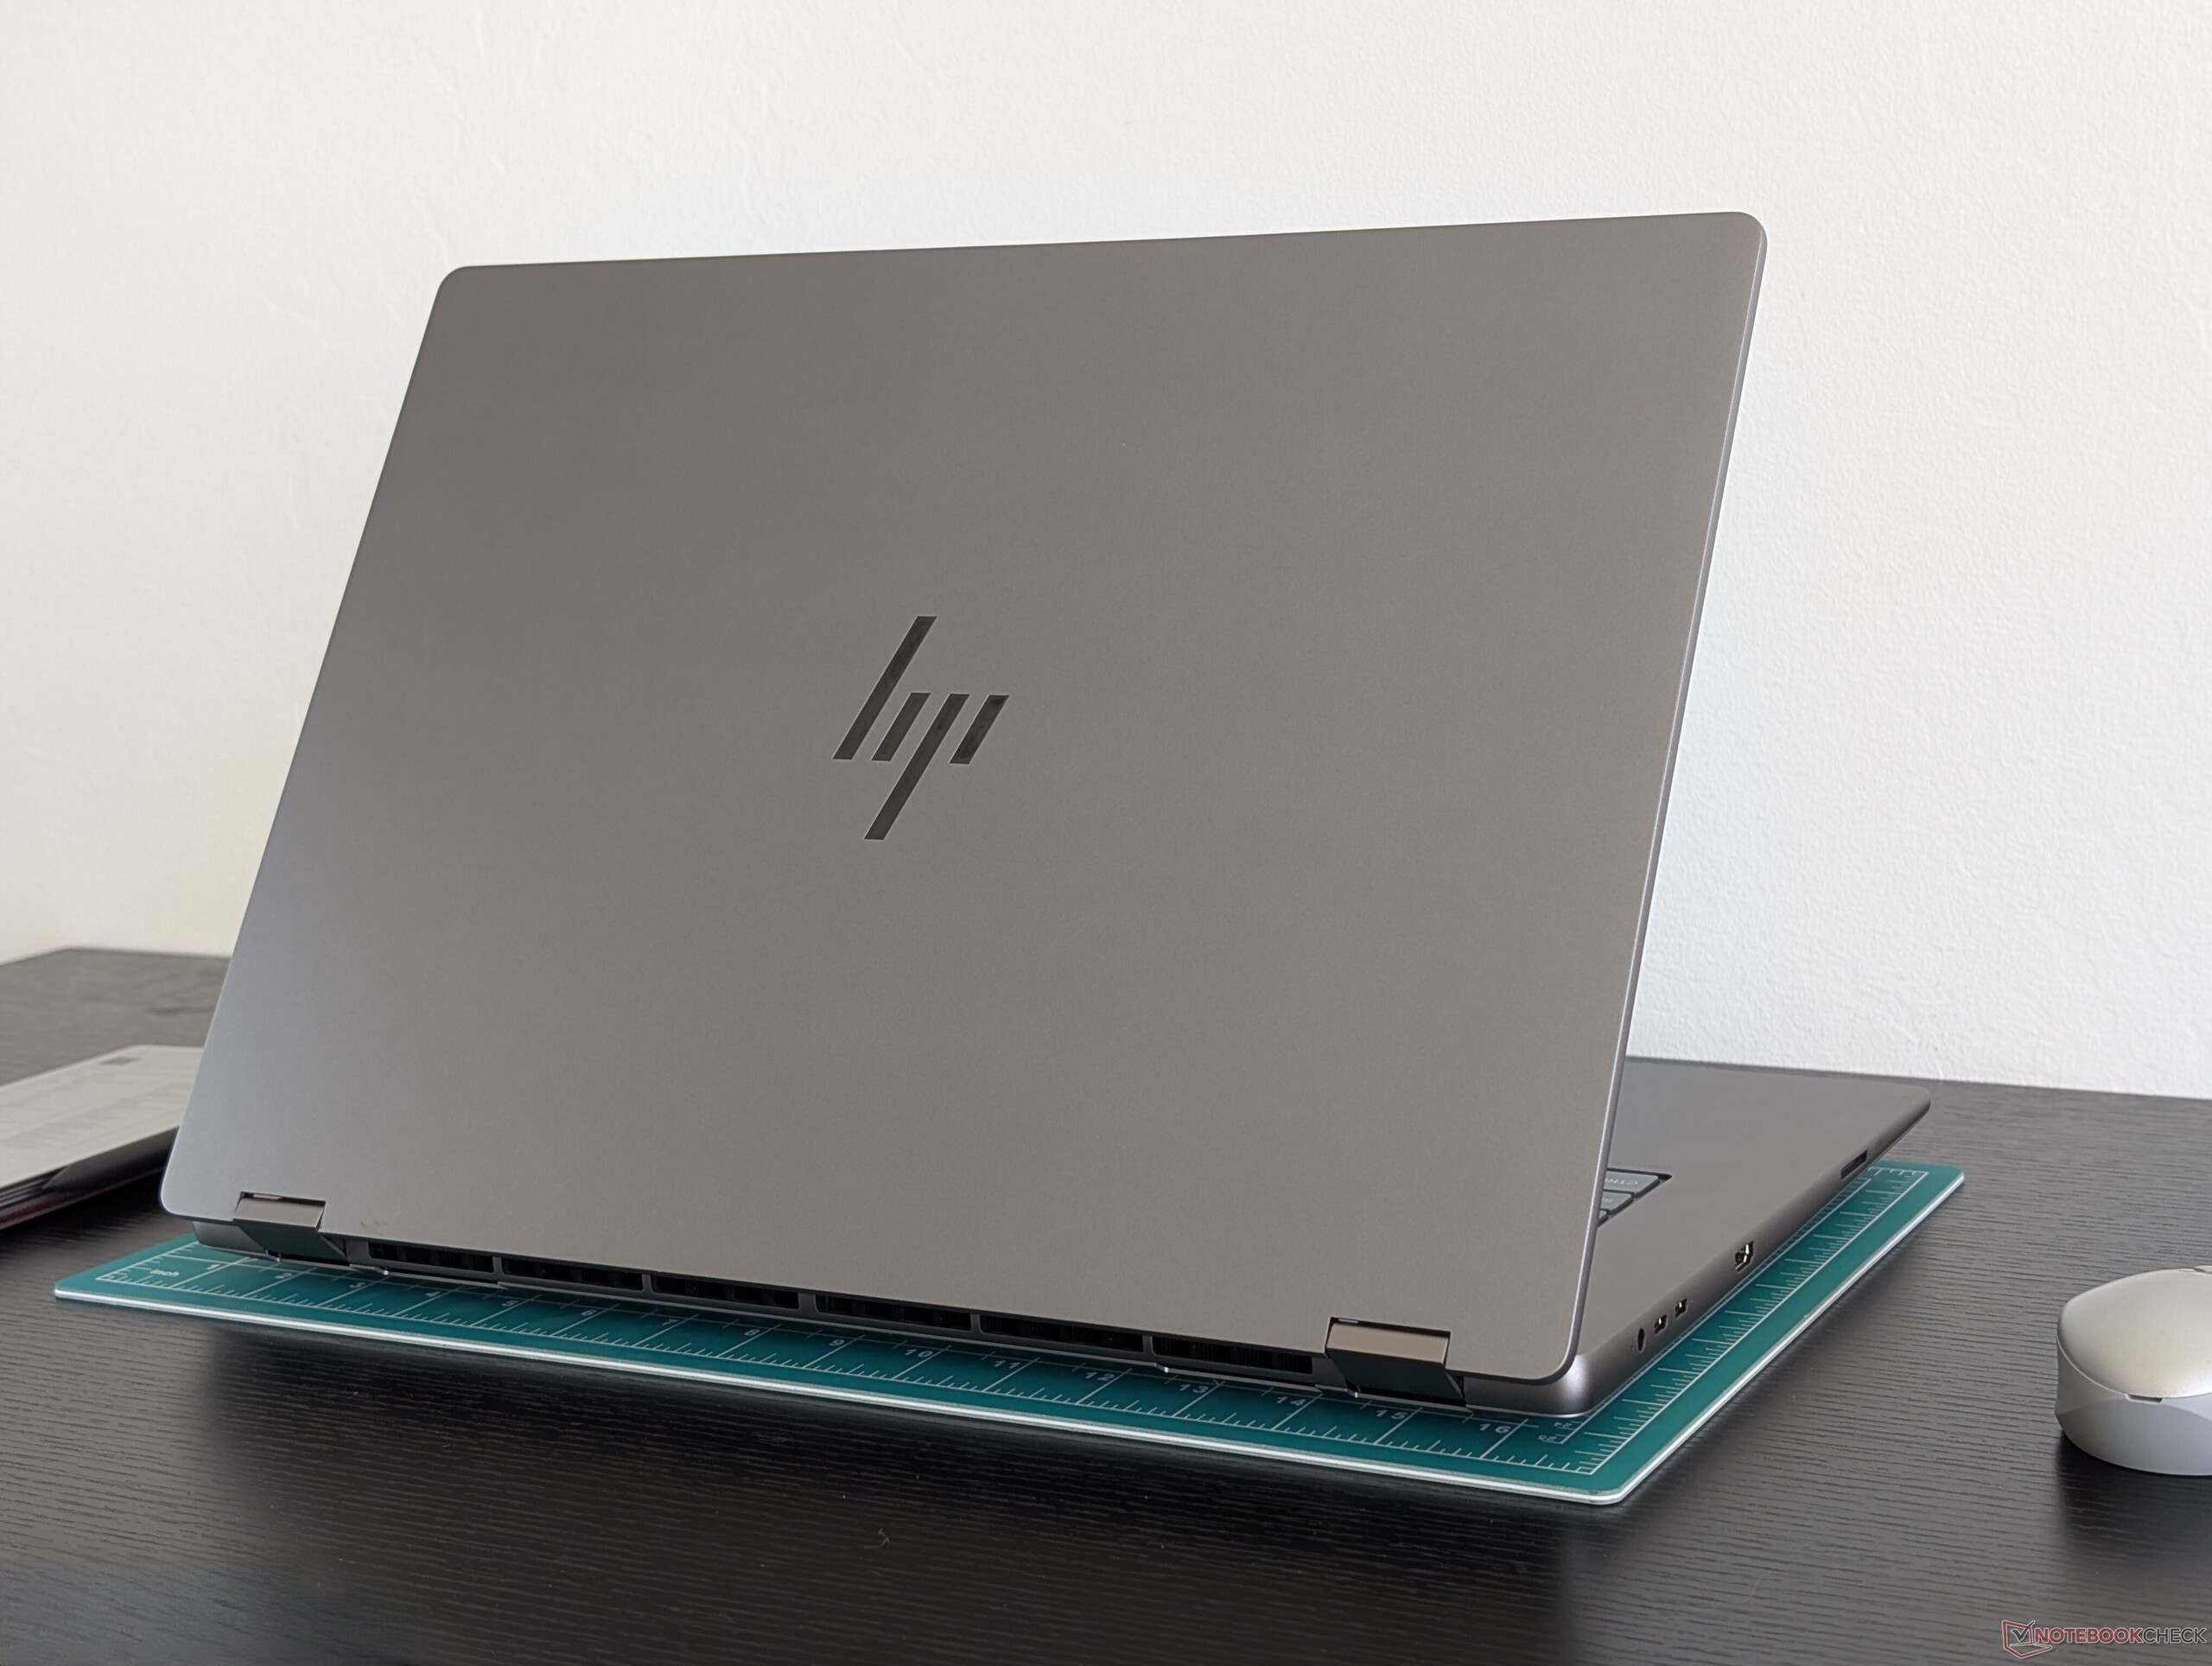
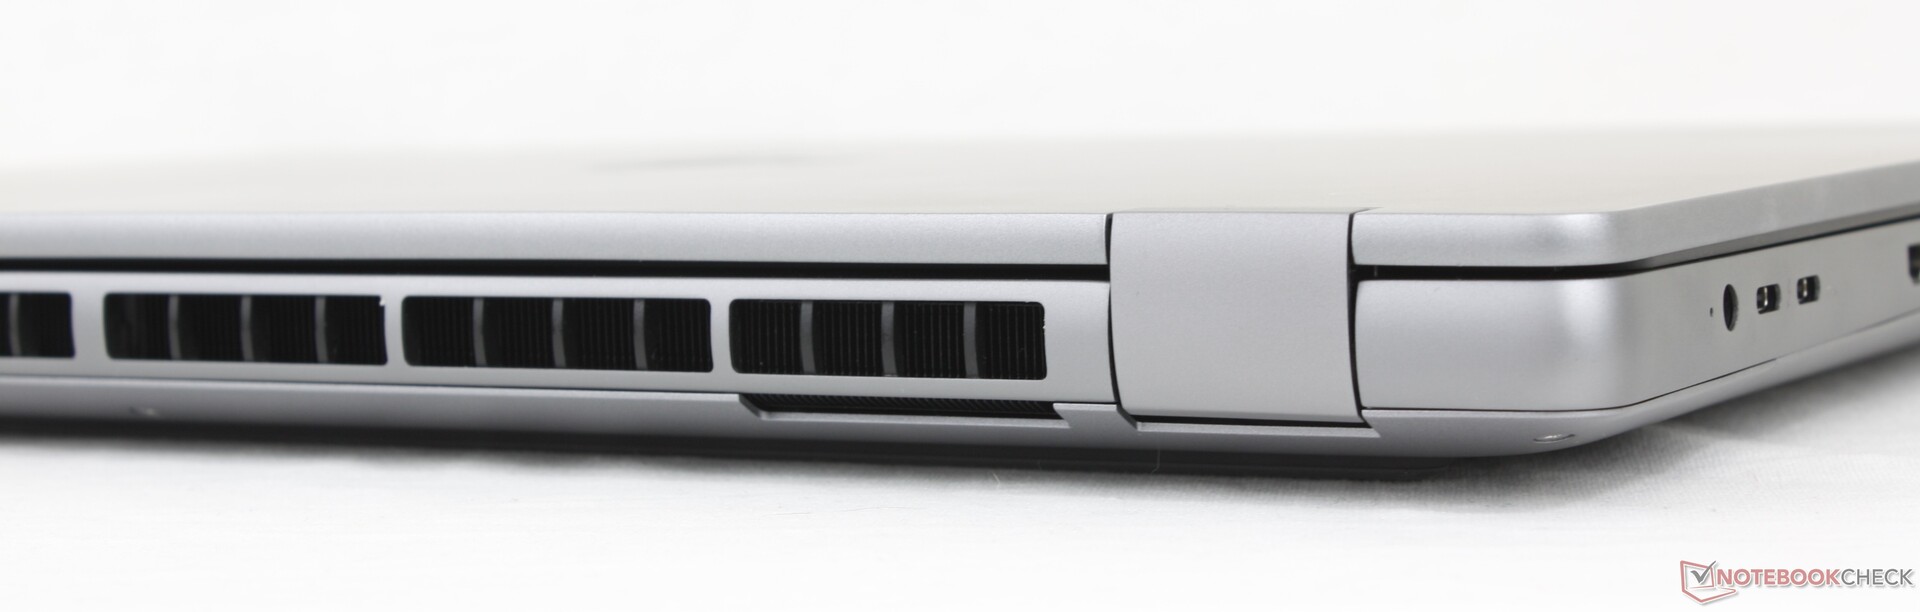
Sebbene il telaio in lega di alluminio non sia sensibilmente più debole o più forte di quello del Dell Pro Max 18 Plus, è leggermente più sottile e più leggero del Dell, pur essendo più grande in lunghezza e larghezza. Un vantaggio notevole per l'HP, tuttavia, è che il suo display può aprirsi a 180 gradi per una maggiore versatilità.
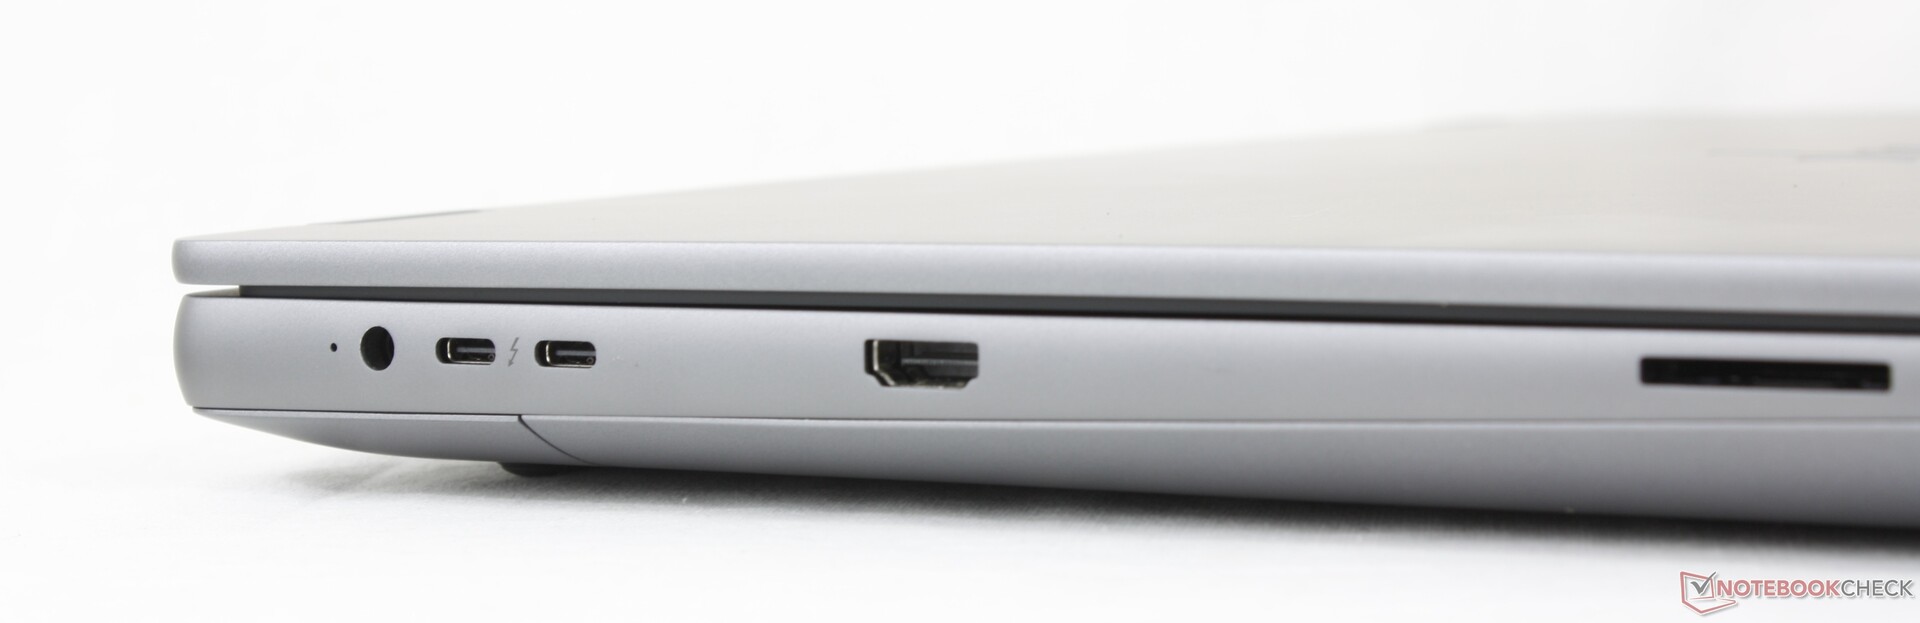
Connettività
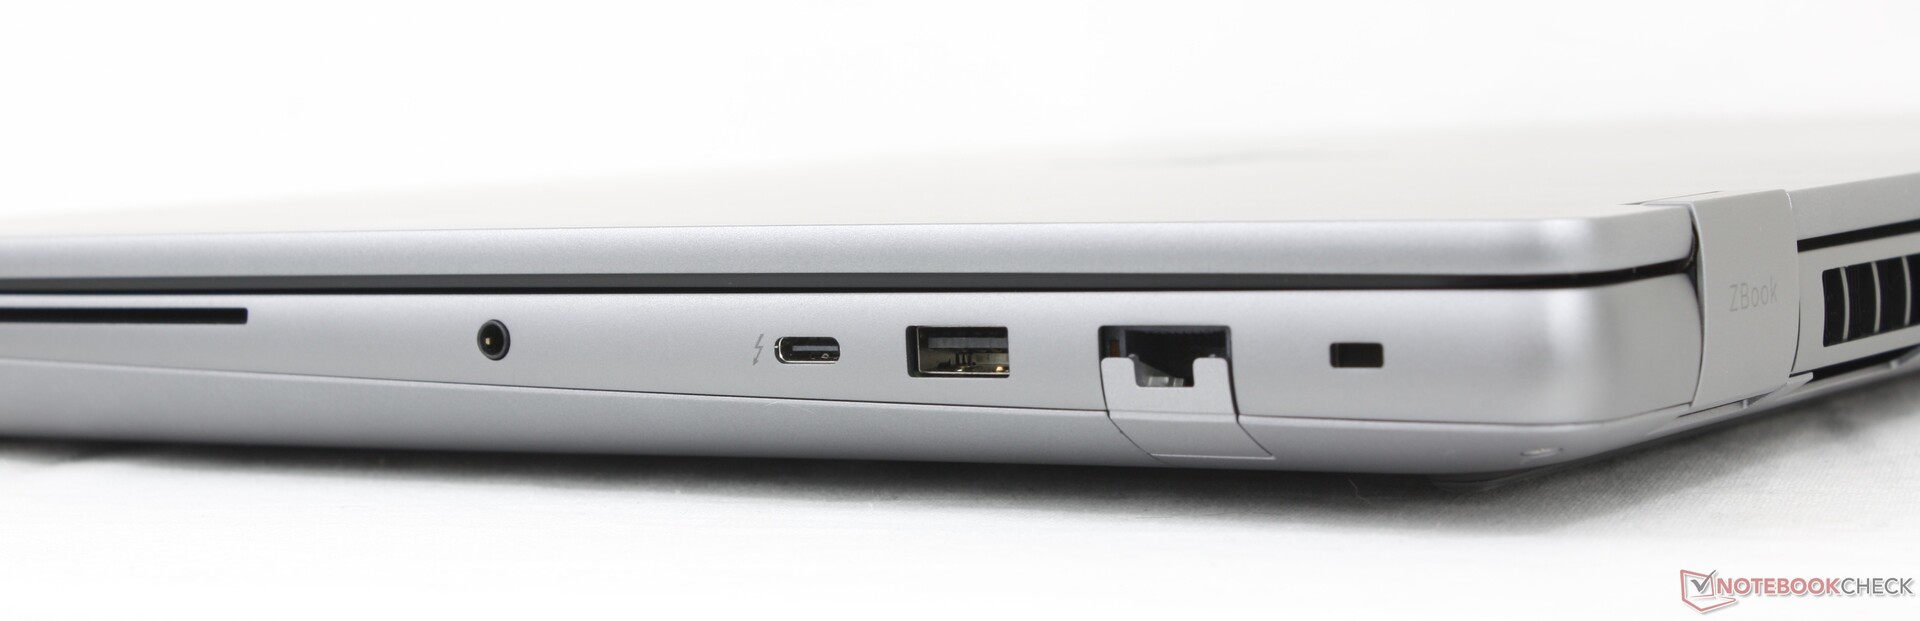
Il modello presenta tutte le porte presenti su Dell Pro Max 18 Plus, anche se con una porta USB-A in meno. La nostra principale lamentela è che le due porte USB-C lungo il bordo sinistro sono troppo vicine alla porta dell'adattatore AC. Di conseguenza, il collegamento di più cavi può risultare angusto.
Lettore di schede SD
| SD Card Reader | |
| average JPG Copy Test (av. of 3 runs) | |
| HP ZBook X G1i 16 (Toshiba Exceria Pro SDXC 64 GB UHS-II) | |
| Dell Pro Max 18 Plus MB18250 (Toshiba Exceria Pro SDXC 64 GB UHS-II) | |
| HP ZBook Fury G1i 18 (Toshiba Exceria Pro SDXC 64 GB UHS-II) | |
| Lenovo ThinkPad P16 Gen 2 (Toshiba Exceria Pro SDXC 64 GB UHS-II) | |
| Schenker Key 18 Pro M25 RTX 5090 (Angelbird AV Pro V60) | |
| maximum AS SSD Seq Read Test (1GB) | |
| HP ZBook X G1i 16 (Toshiba Exceria Pro SDXC 64 GB UHS-II) | |
| Dell Pro Max 18 Plus MB18250 (Toshiba Exceria Pro SDXC 64 GB UHS-II) | |
| HP ZBook Fury G1i 18 (Toshiba Exceria Pro SDXC 64 GB UHS-II) | |
| Schenker Key 18 Pro M25 RTX 5090 (Angelbird AV Pro V60) | |
| Lenovo ThinkPad P16 Gen 2 (Toshiba Exceria Pro SDXC 64 GB UHS-II) | |
Comunicazione
Webcam
La fotocamera da 5 MP è di serie, insieme all'IR e all'otturatore fisico. Il software Poly Camera Pro, che è incluso anche nella maggior parte degli altri computer portatili HP, è preinstallato sullo ZBook Fury per ulteriori funzioni di videoconferenza.


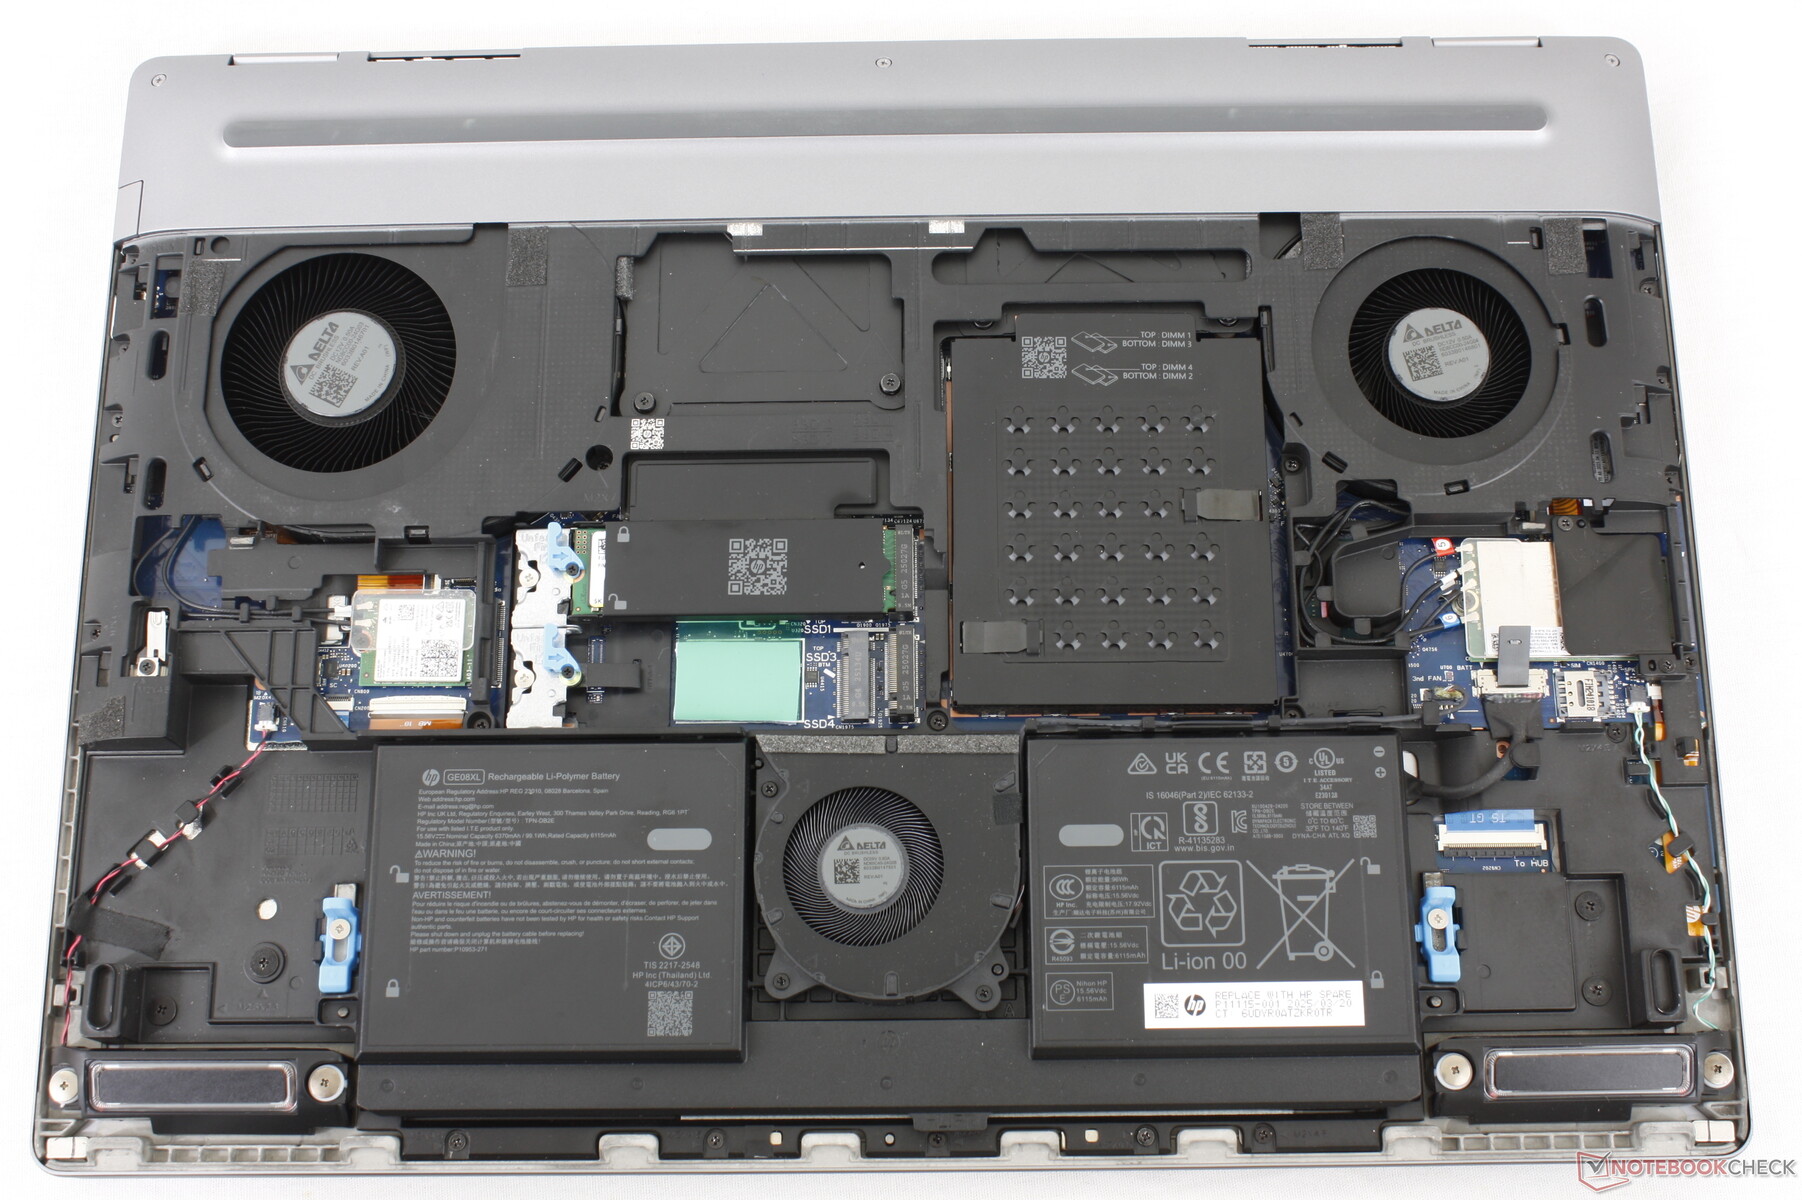
Manutenzione
Il pannello inferiore è "tool-less" e può essere rimosso senza cacciaviti. Tuttavia, la maggior parte dei componenti è avvitata sulla scheda madre e quindi è necessario un cacciavite per la manutenzione.
Sostenibilità
il 40 percento della plastica intorno allo chassis proviene dal riciclo post-consumo, mentre l'imballaggio è costituito per lo più da pasta di carta con qualche involucro di plastica per l'adattatore CA.
Accessori e garanzia
Nella confezione non ci sono altri extra oltre all'adattatore CA e alla documentazione cartacea. Deludentemente, il sistema viene fornito con una garanzia limitata del produttore di un solo anno quando si ordina dal sito ufficiale HP, invece dei soliti tre anni previsti per le workstation di fascia alta.
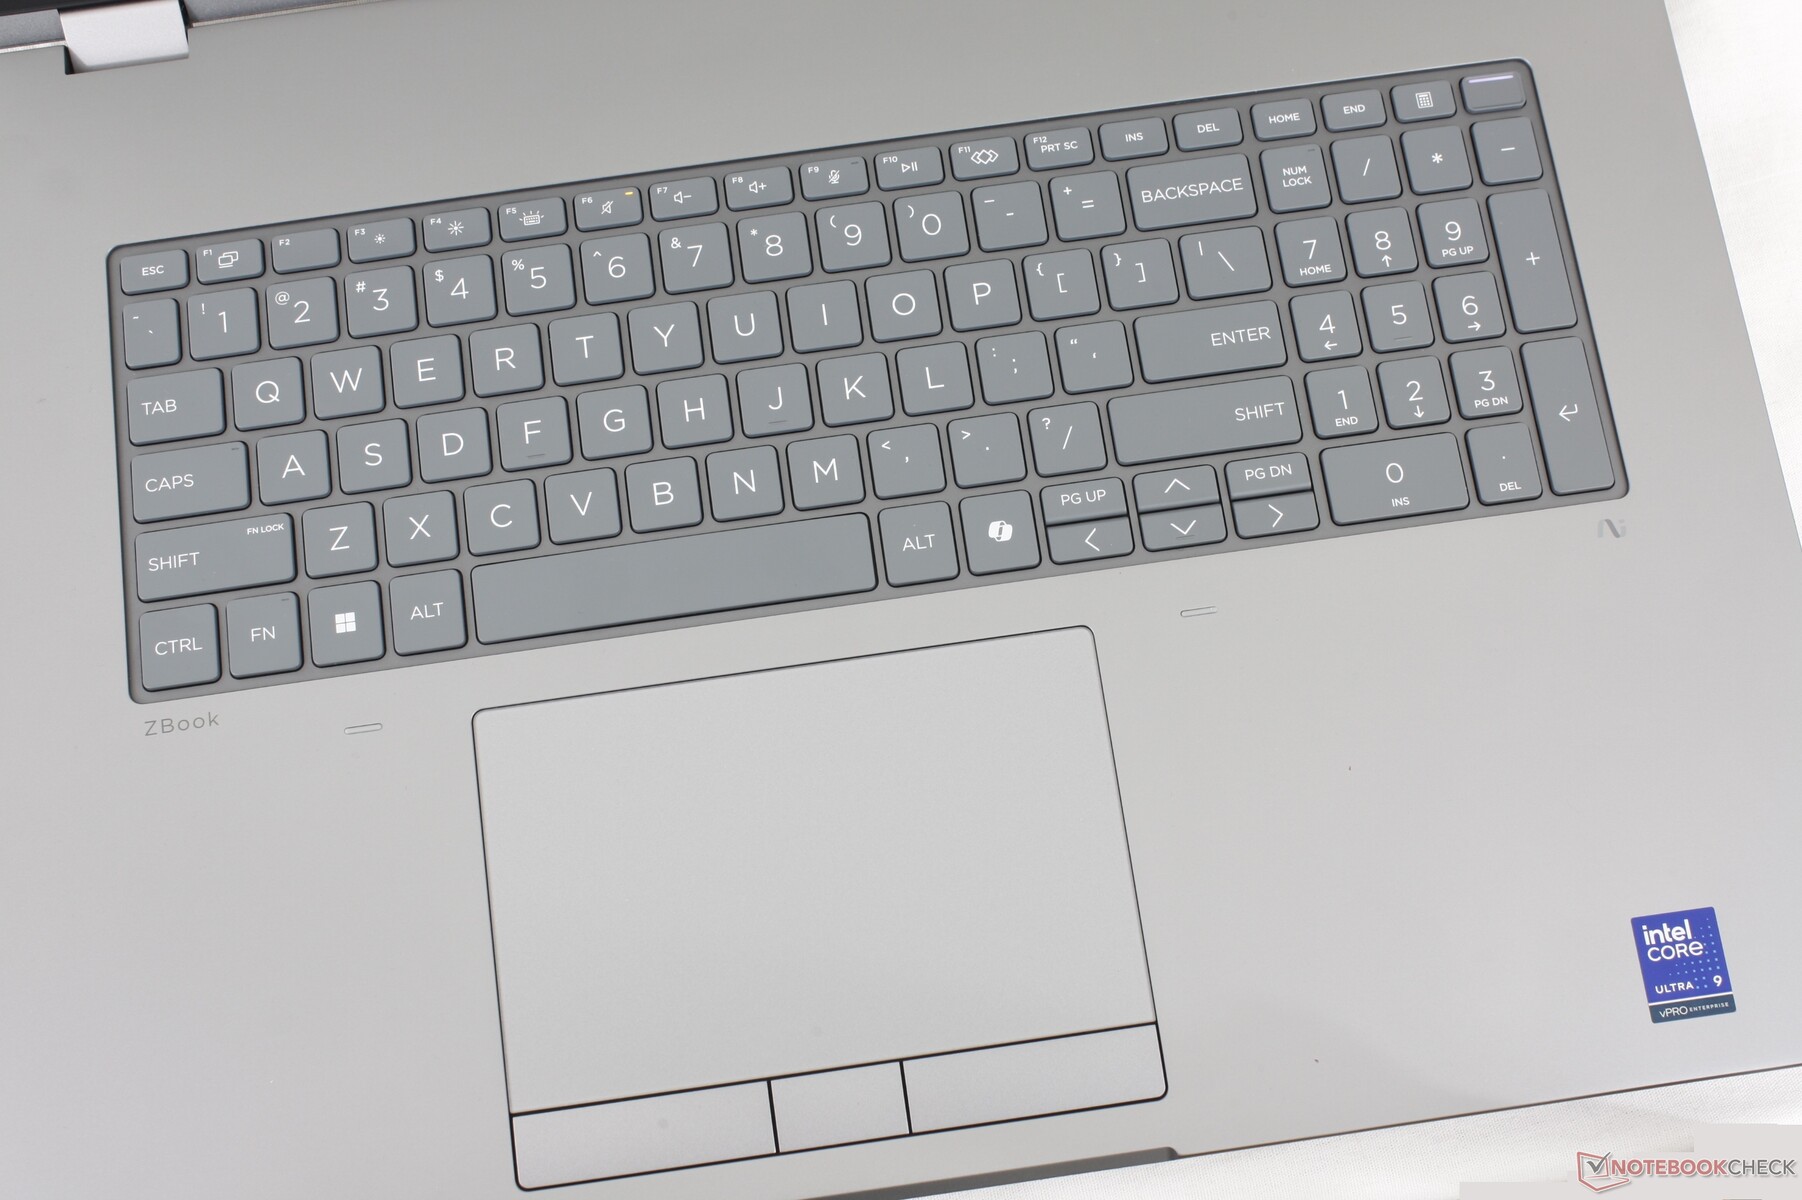
Dispositivi di ingresso
Display - Niente 4K o OLED per ora
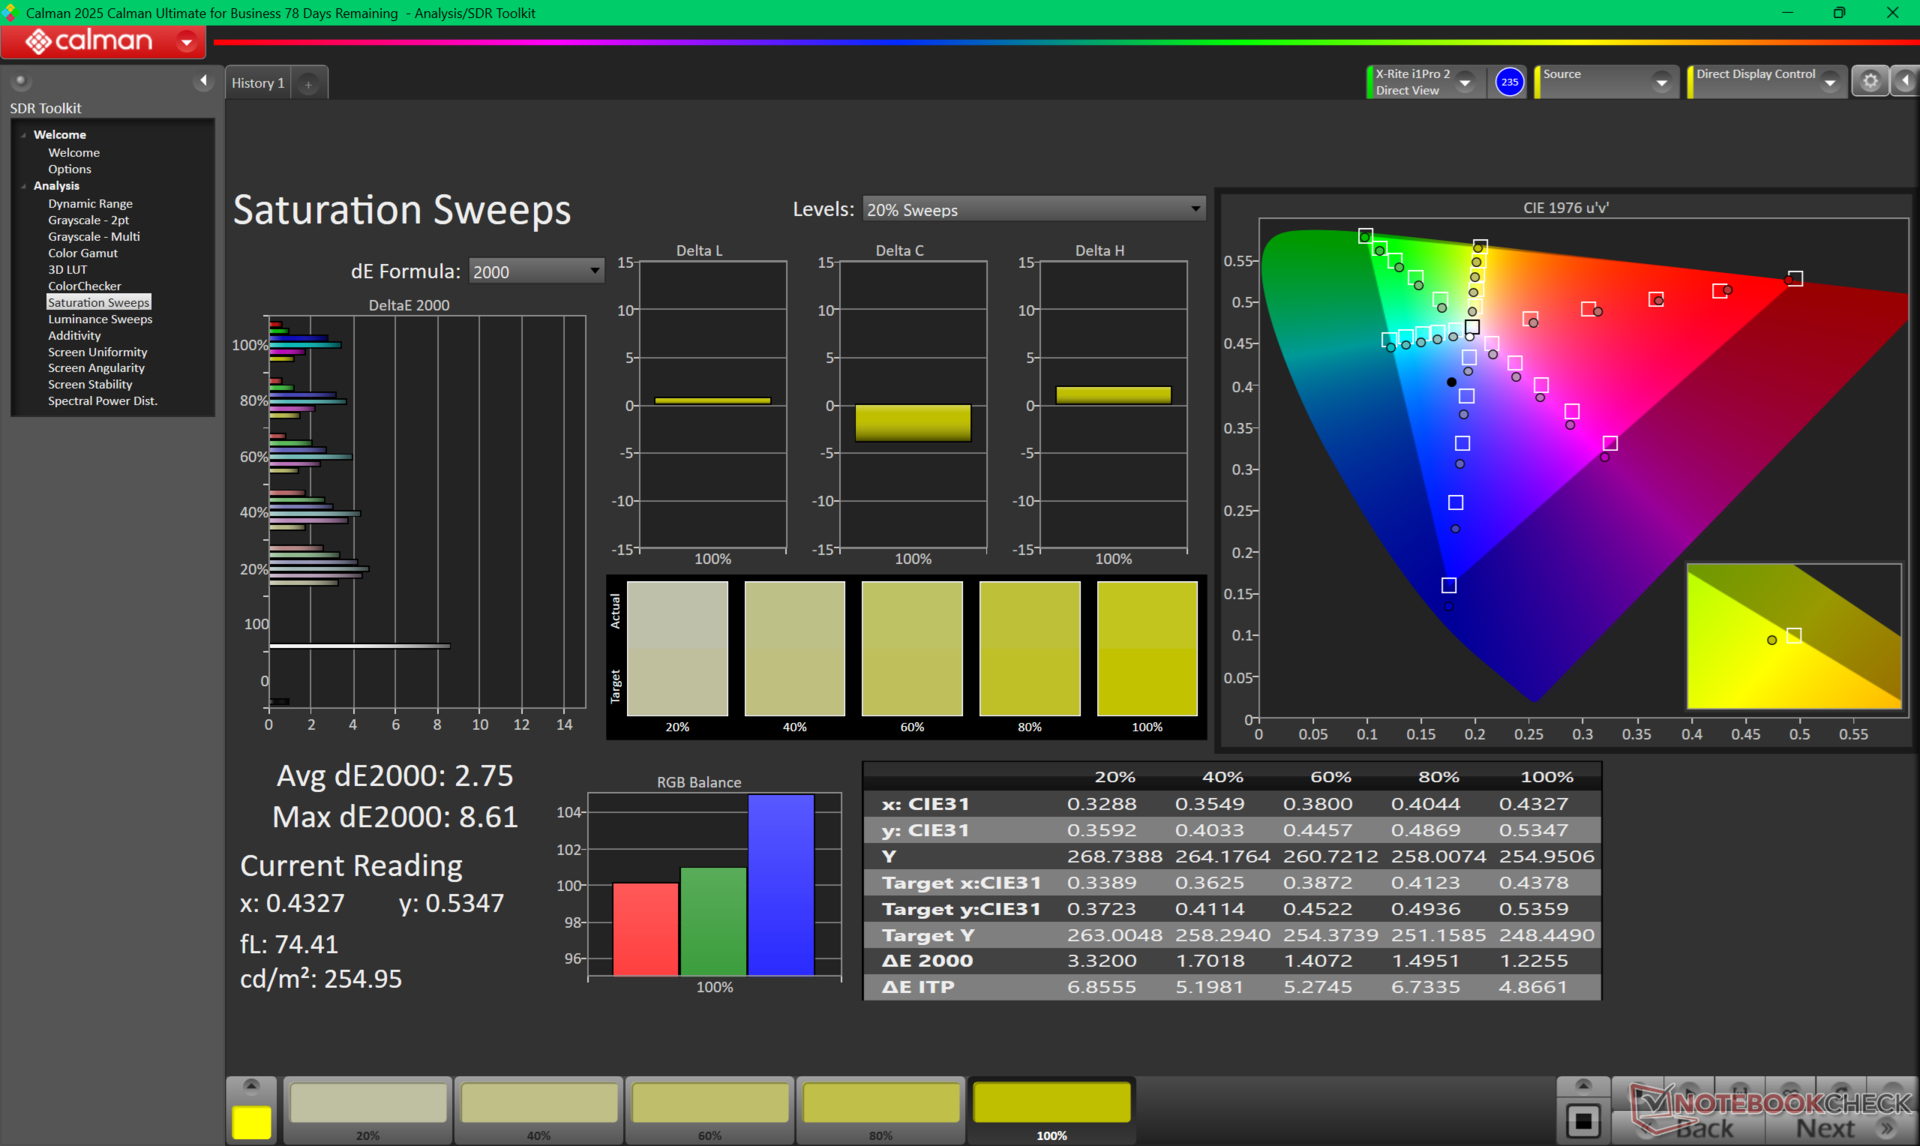
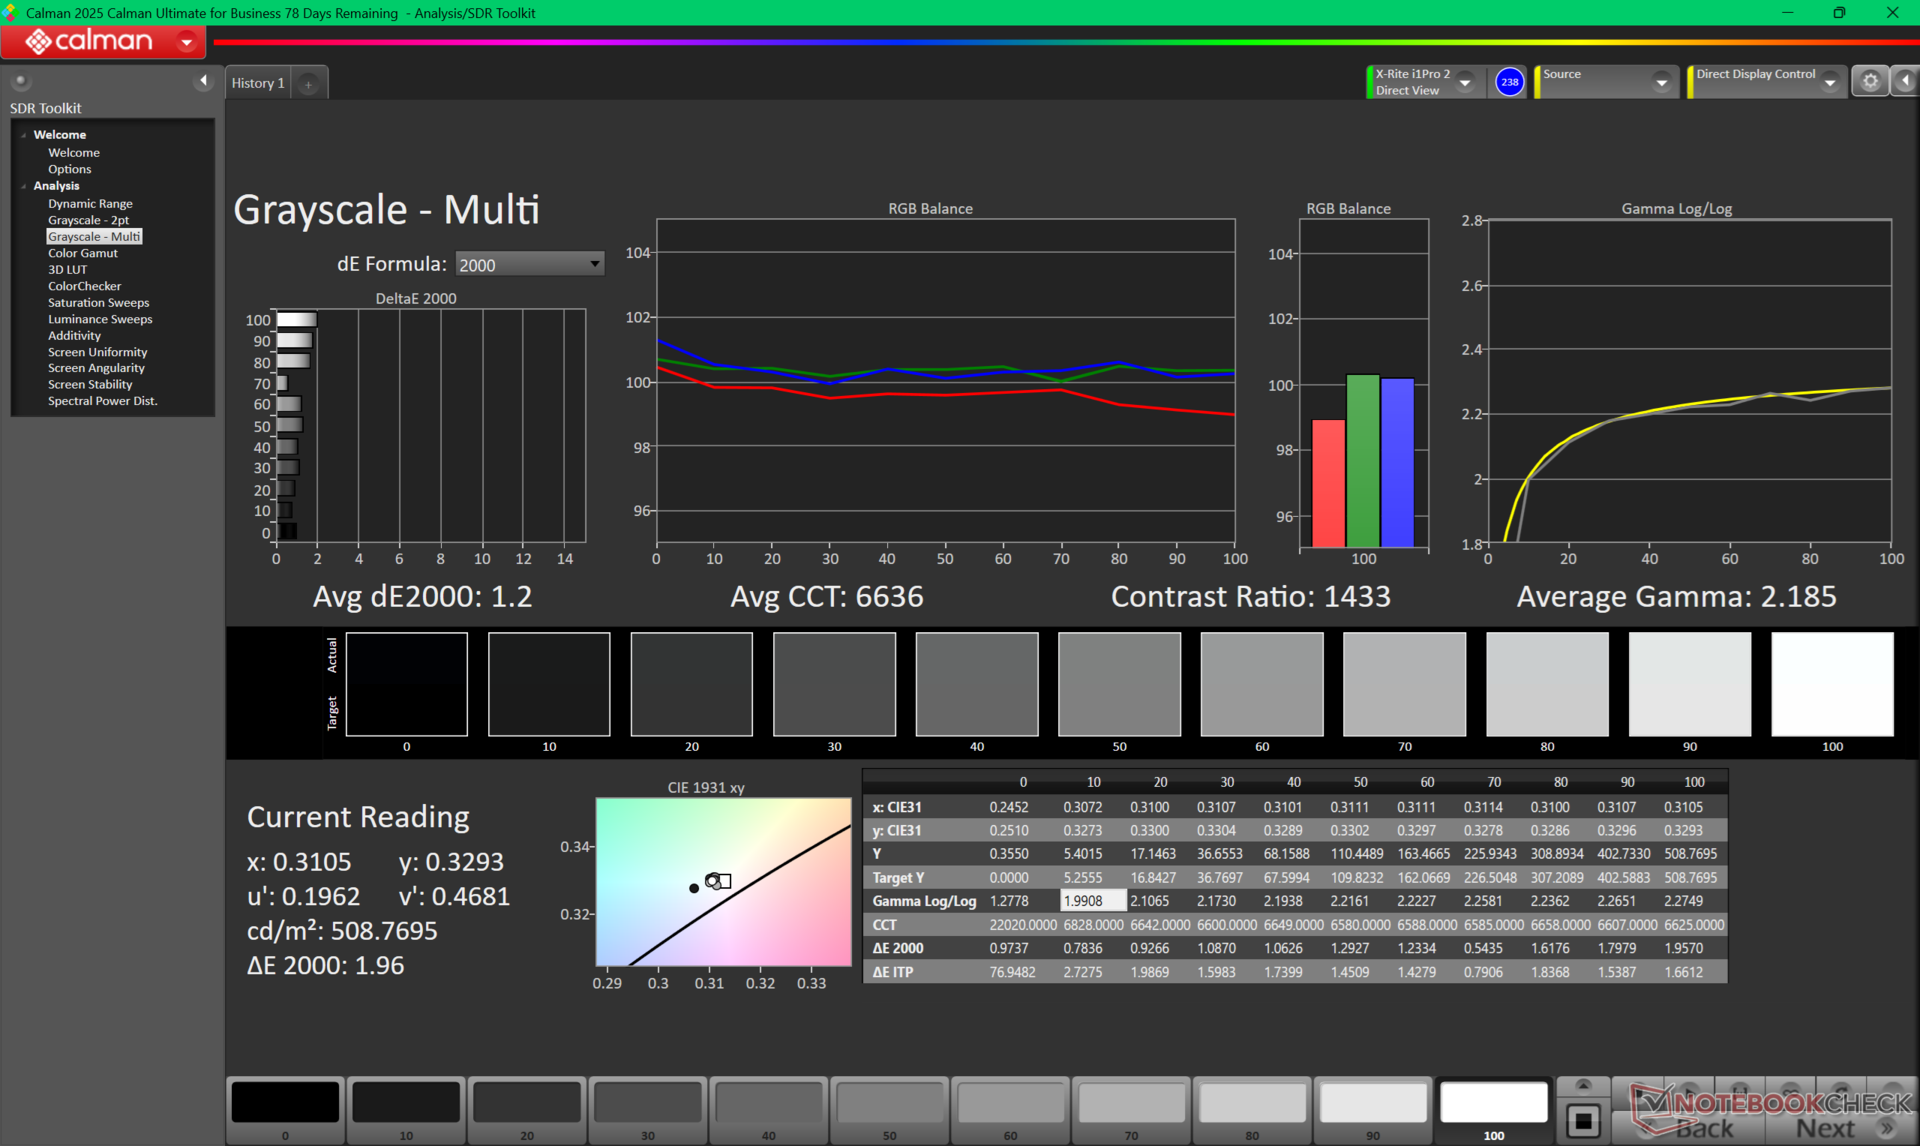
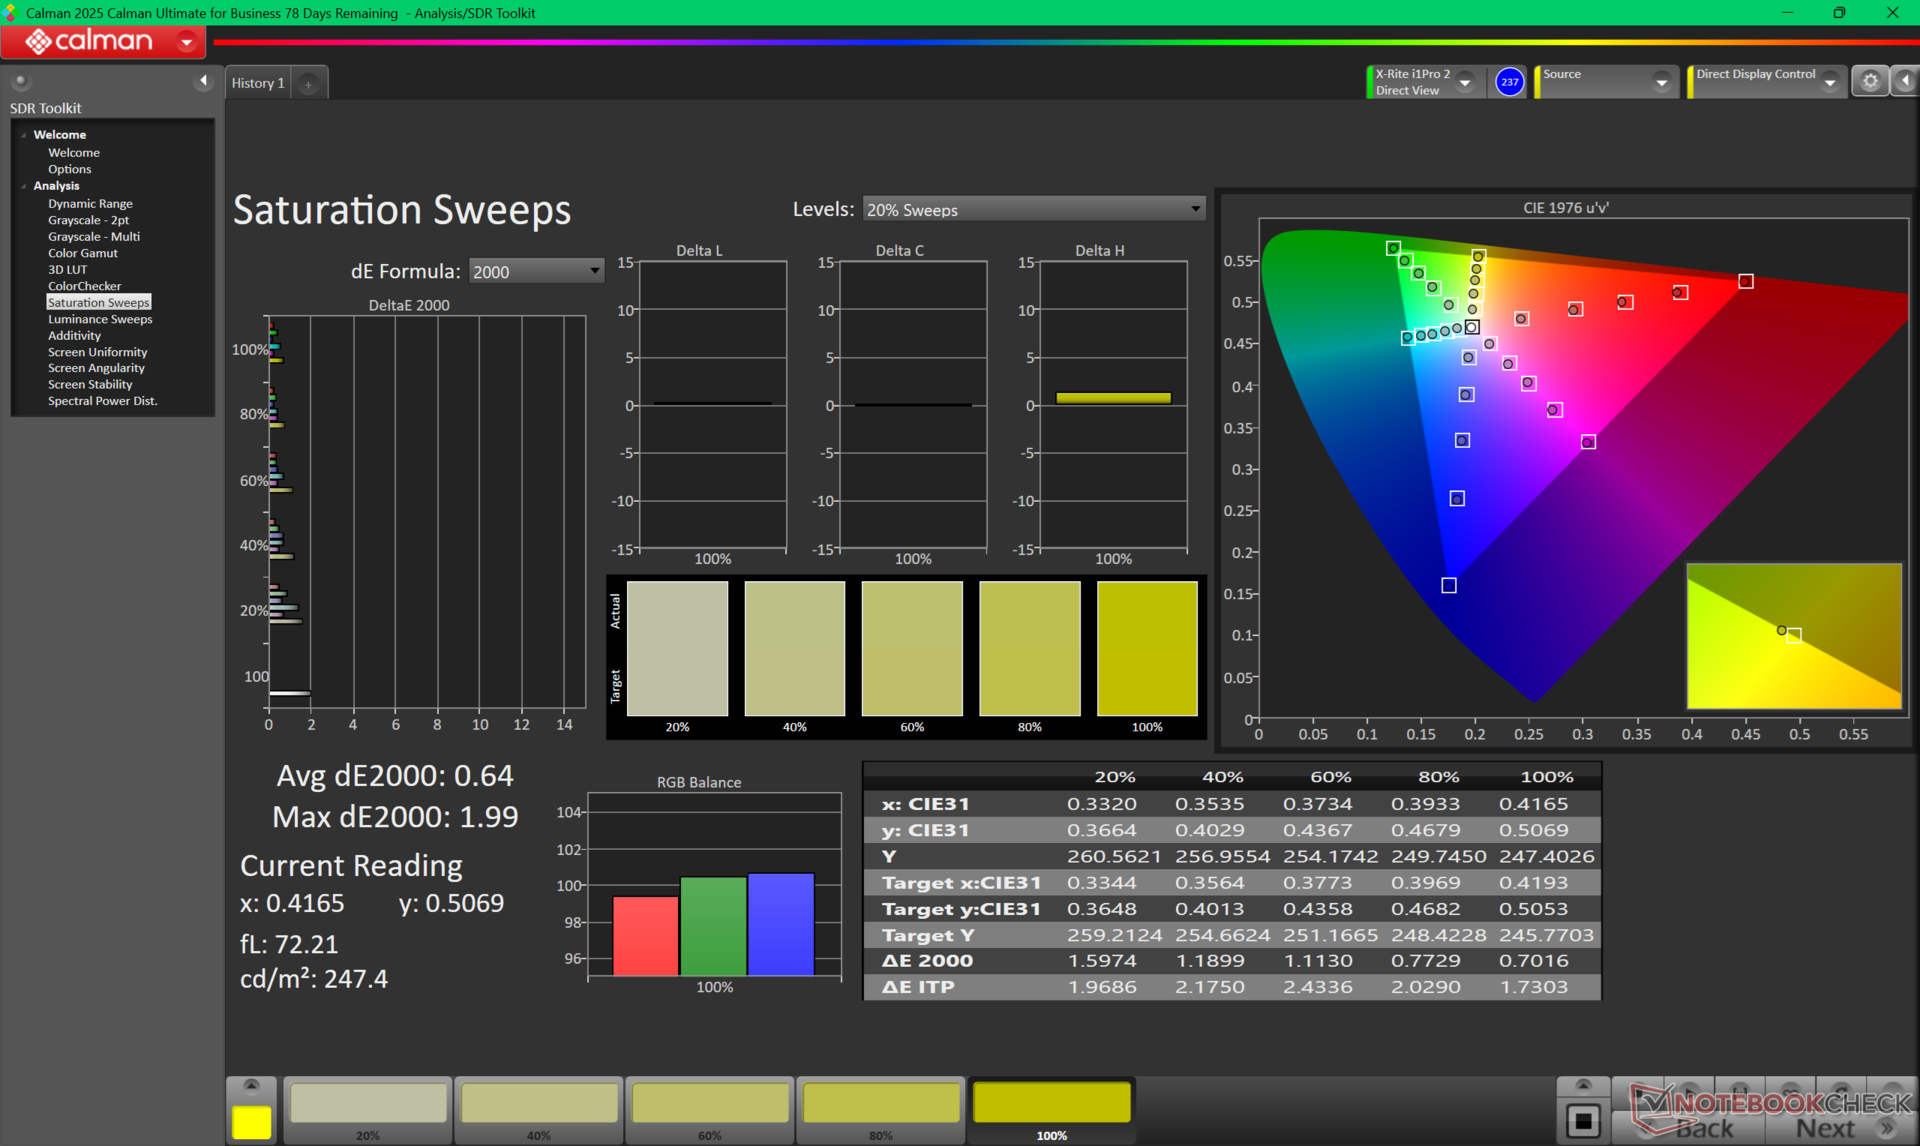
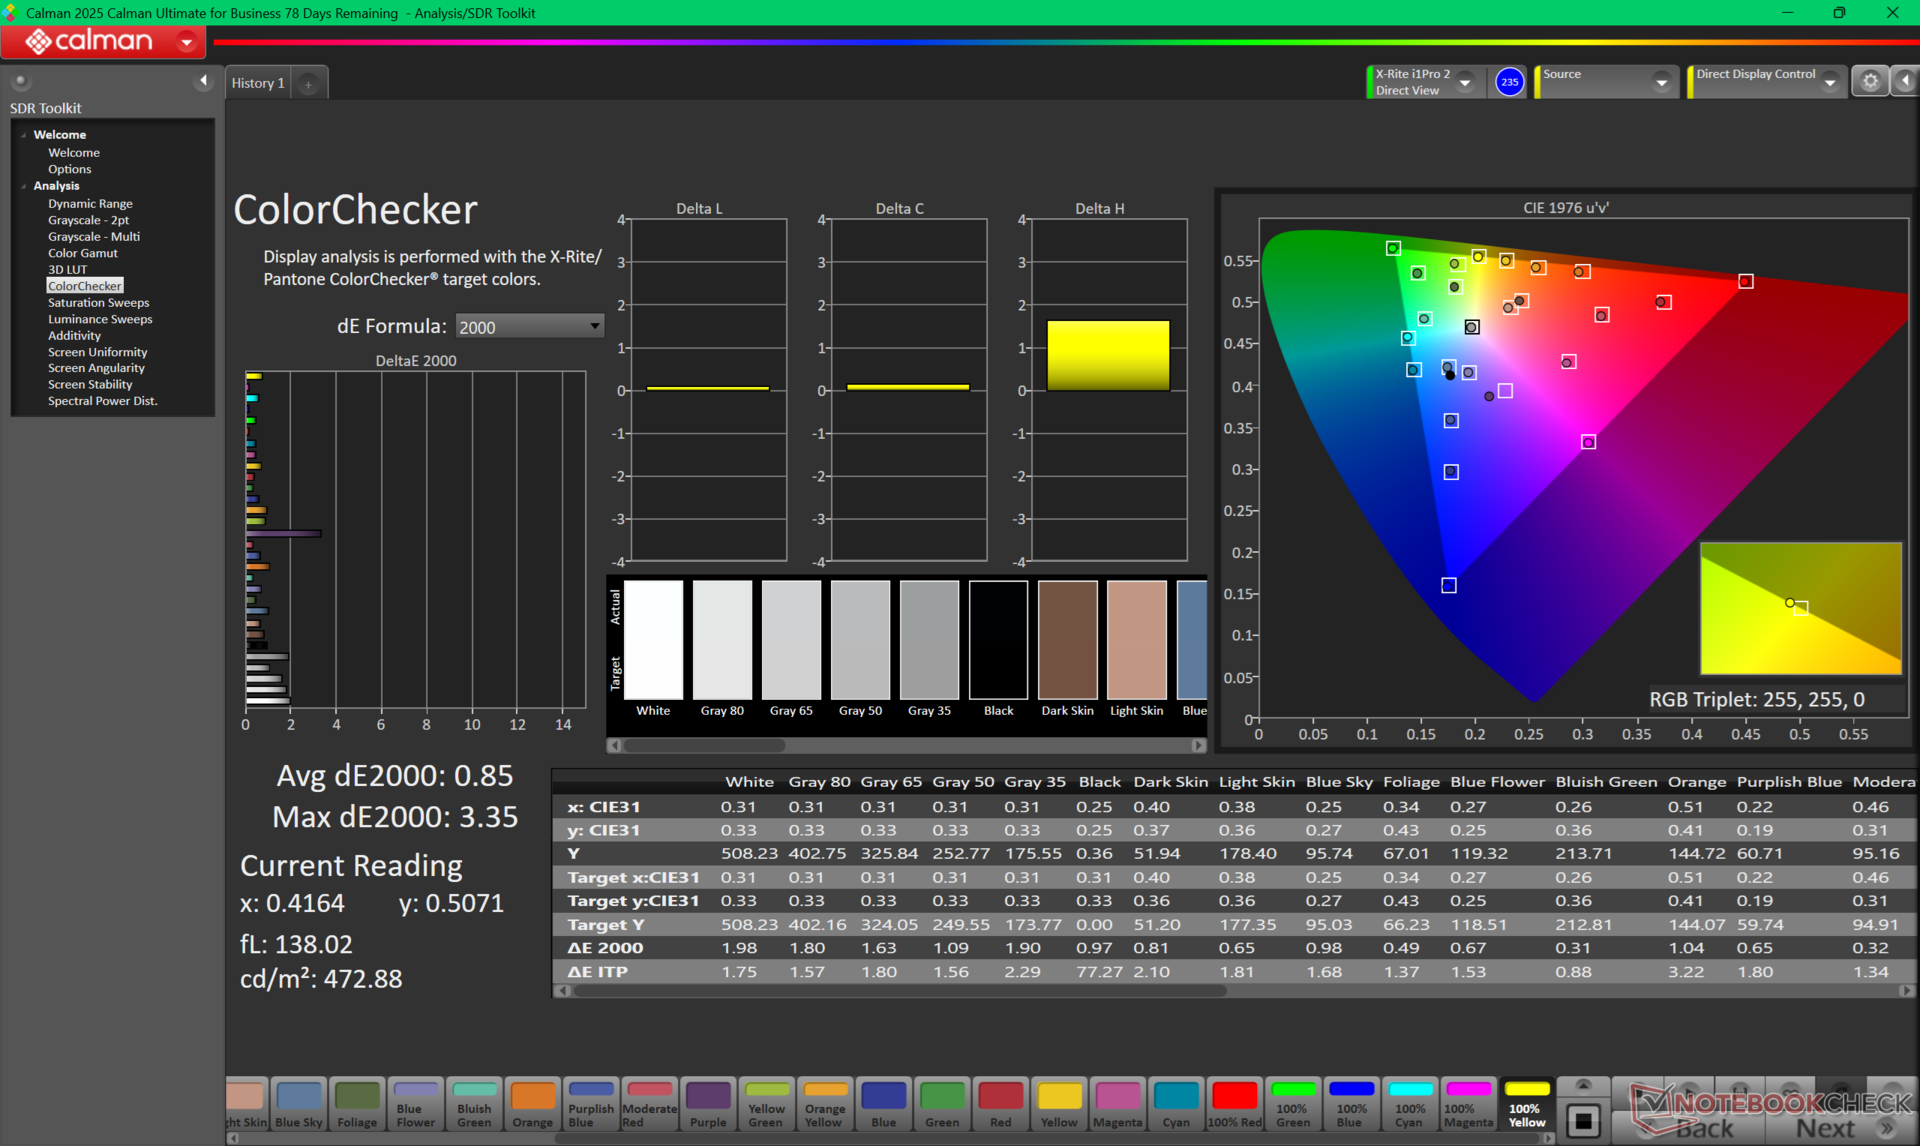
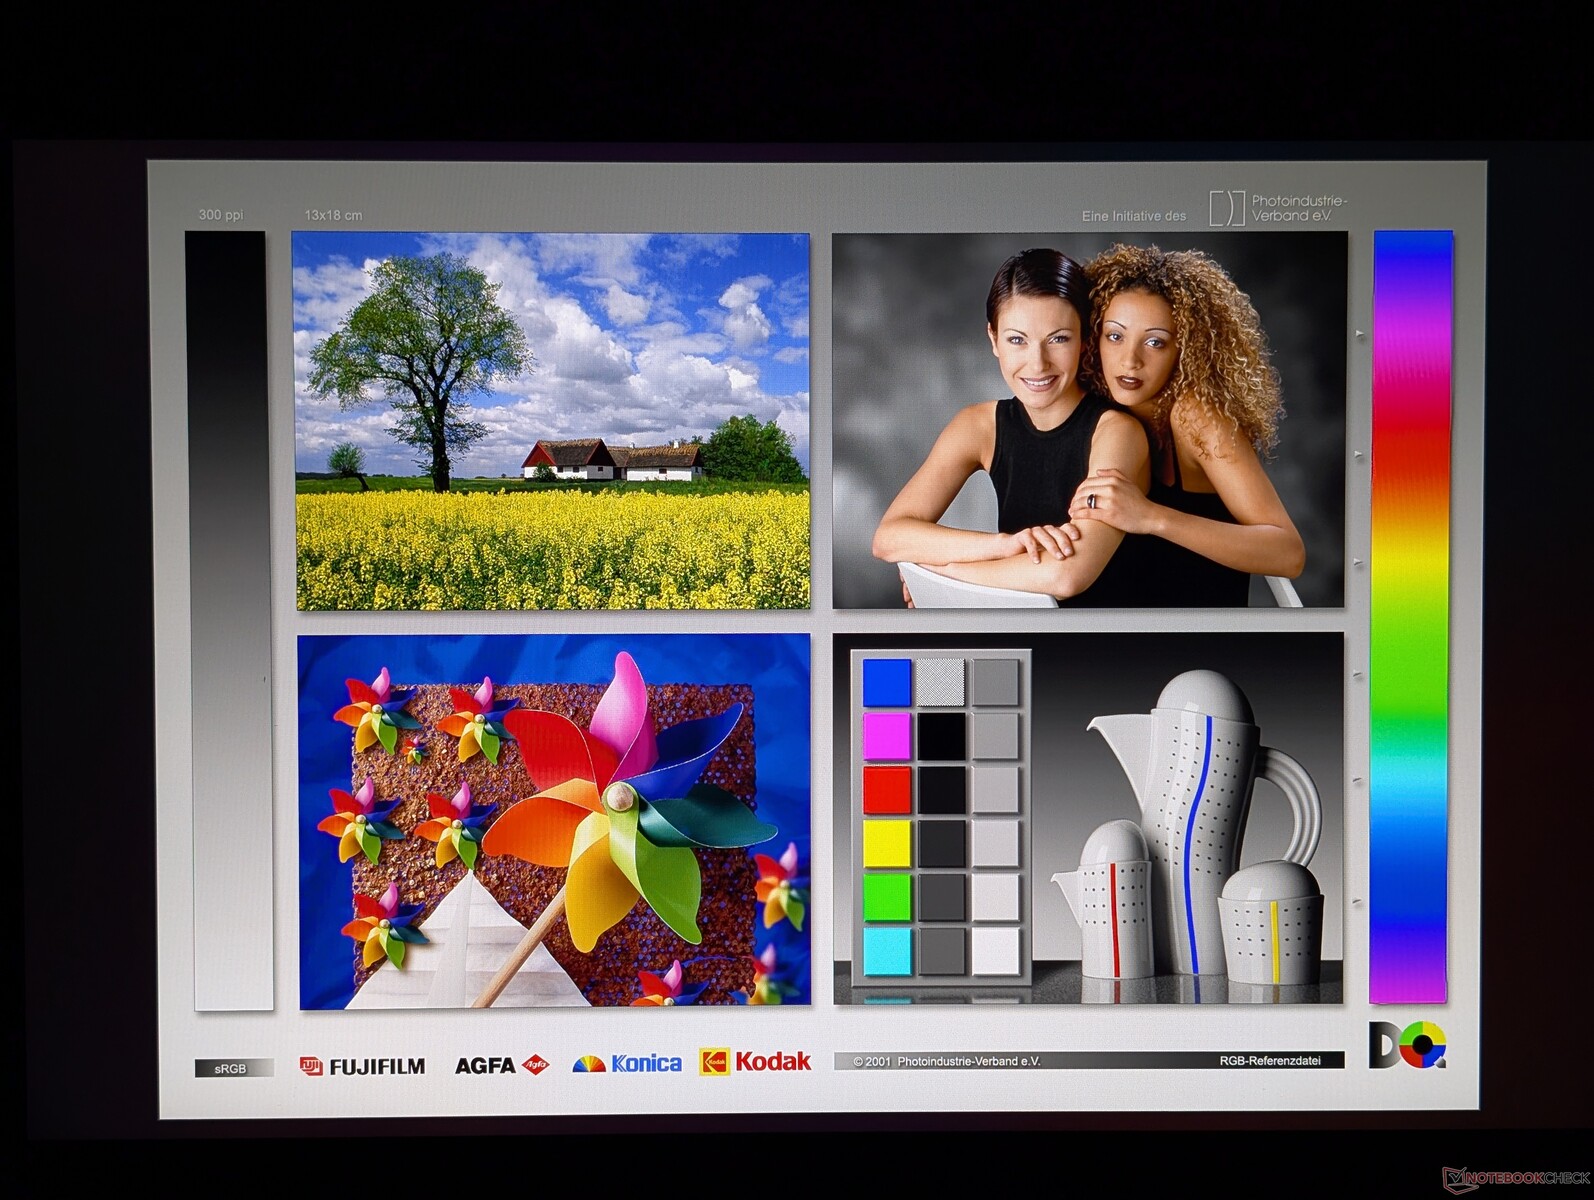
Come il Dell Pro Max 18 Plusanche il nostro HP ZBook Fury G1i 18 è limitato a un'unica opzione IPS non-touch da 2560 x 1600. Tuttavia, HP utilizza un pannello diverso di AU Optronics invece di BOE, che offre colori e livelli di luminosità P3 simili, ma con tempi di risposta in bianco e nero più rapidi, frequenza di aggiornamento nativa più veloce, supporto PSR2 e livelli di contrasto leggermente inferiori.
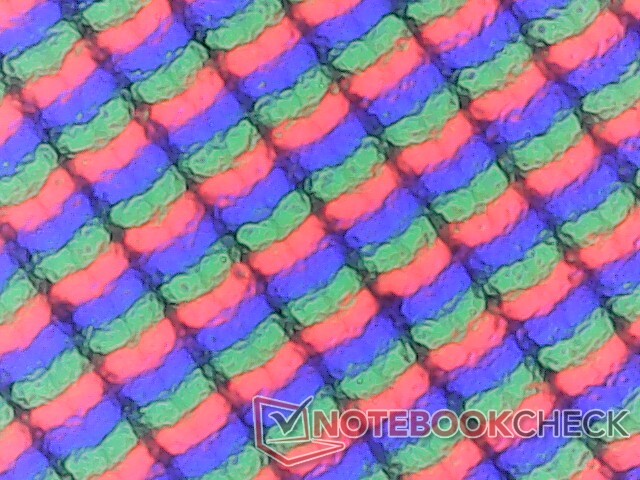
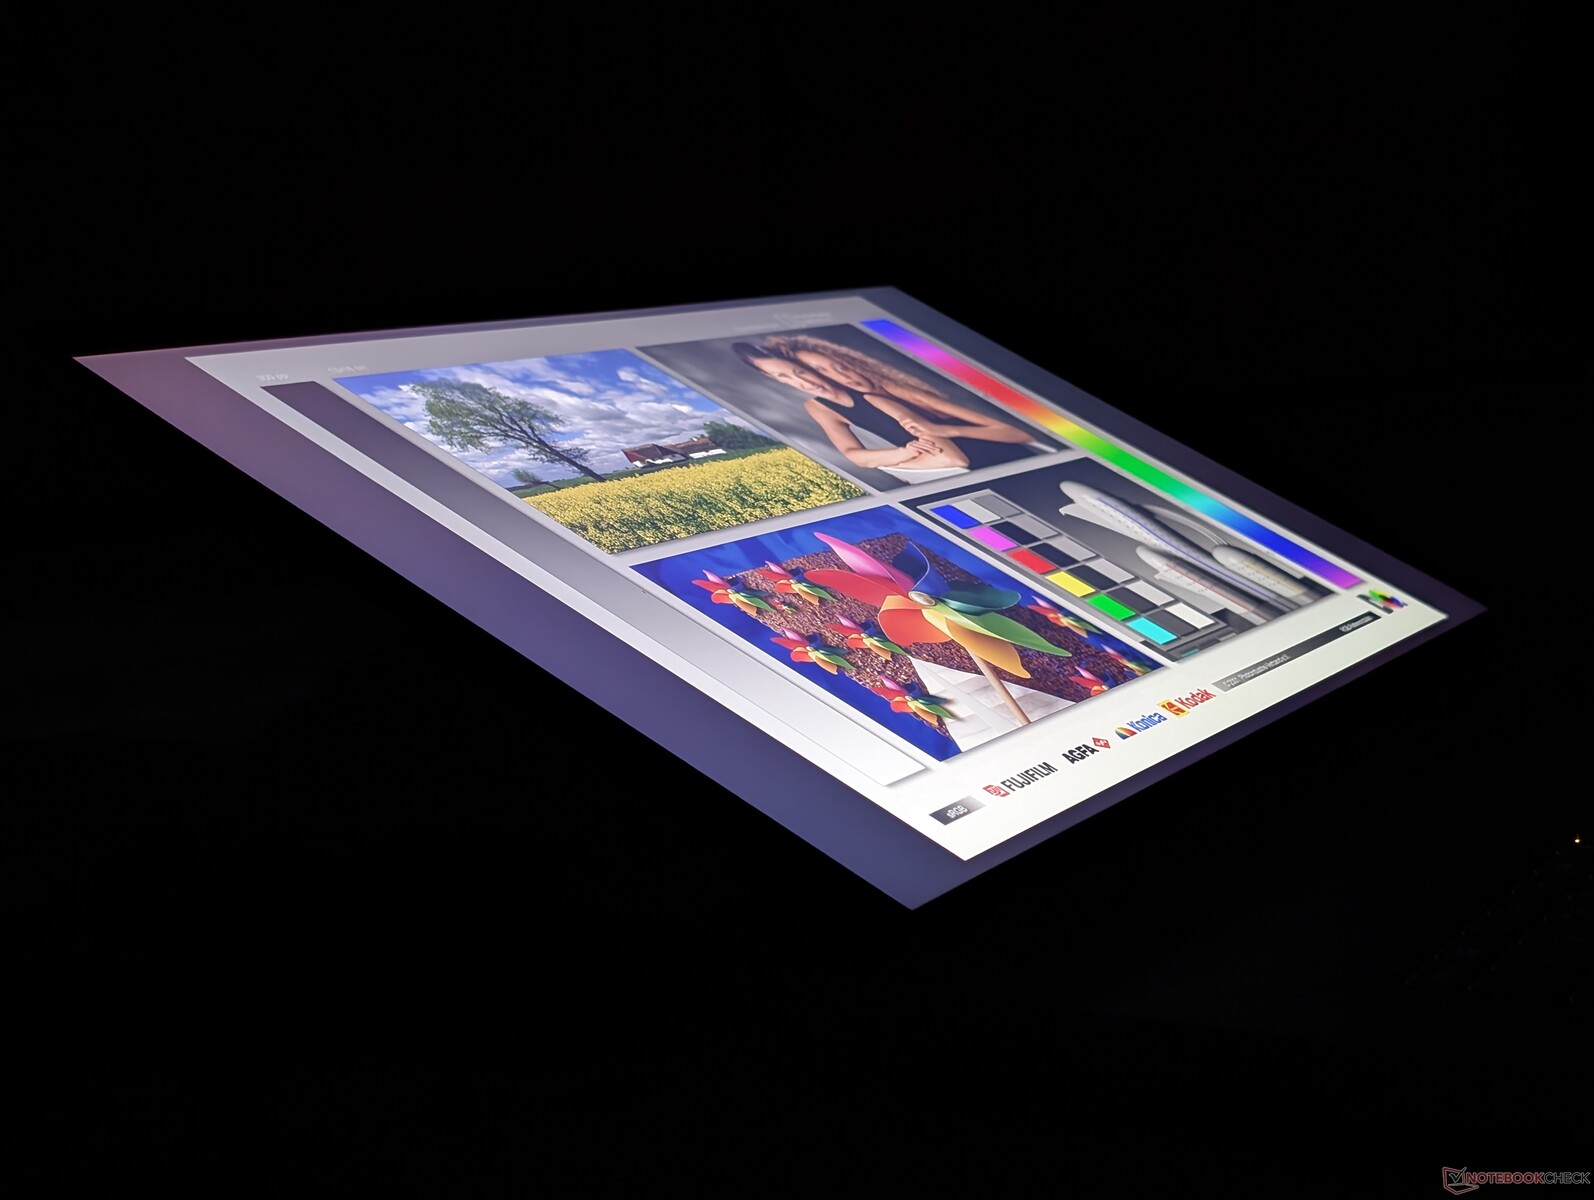
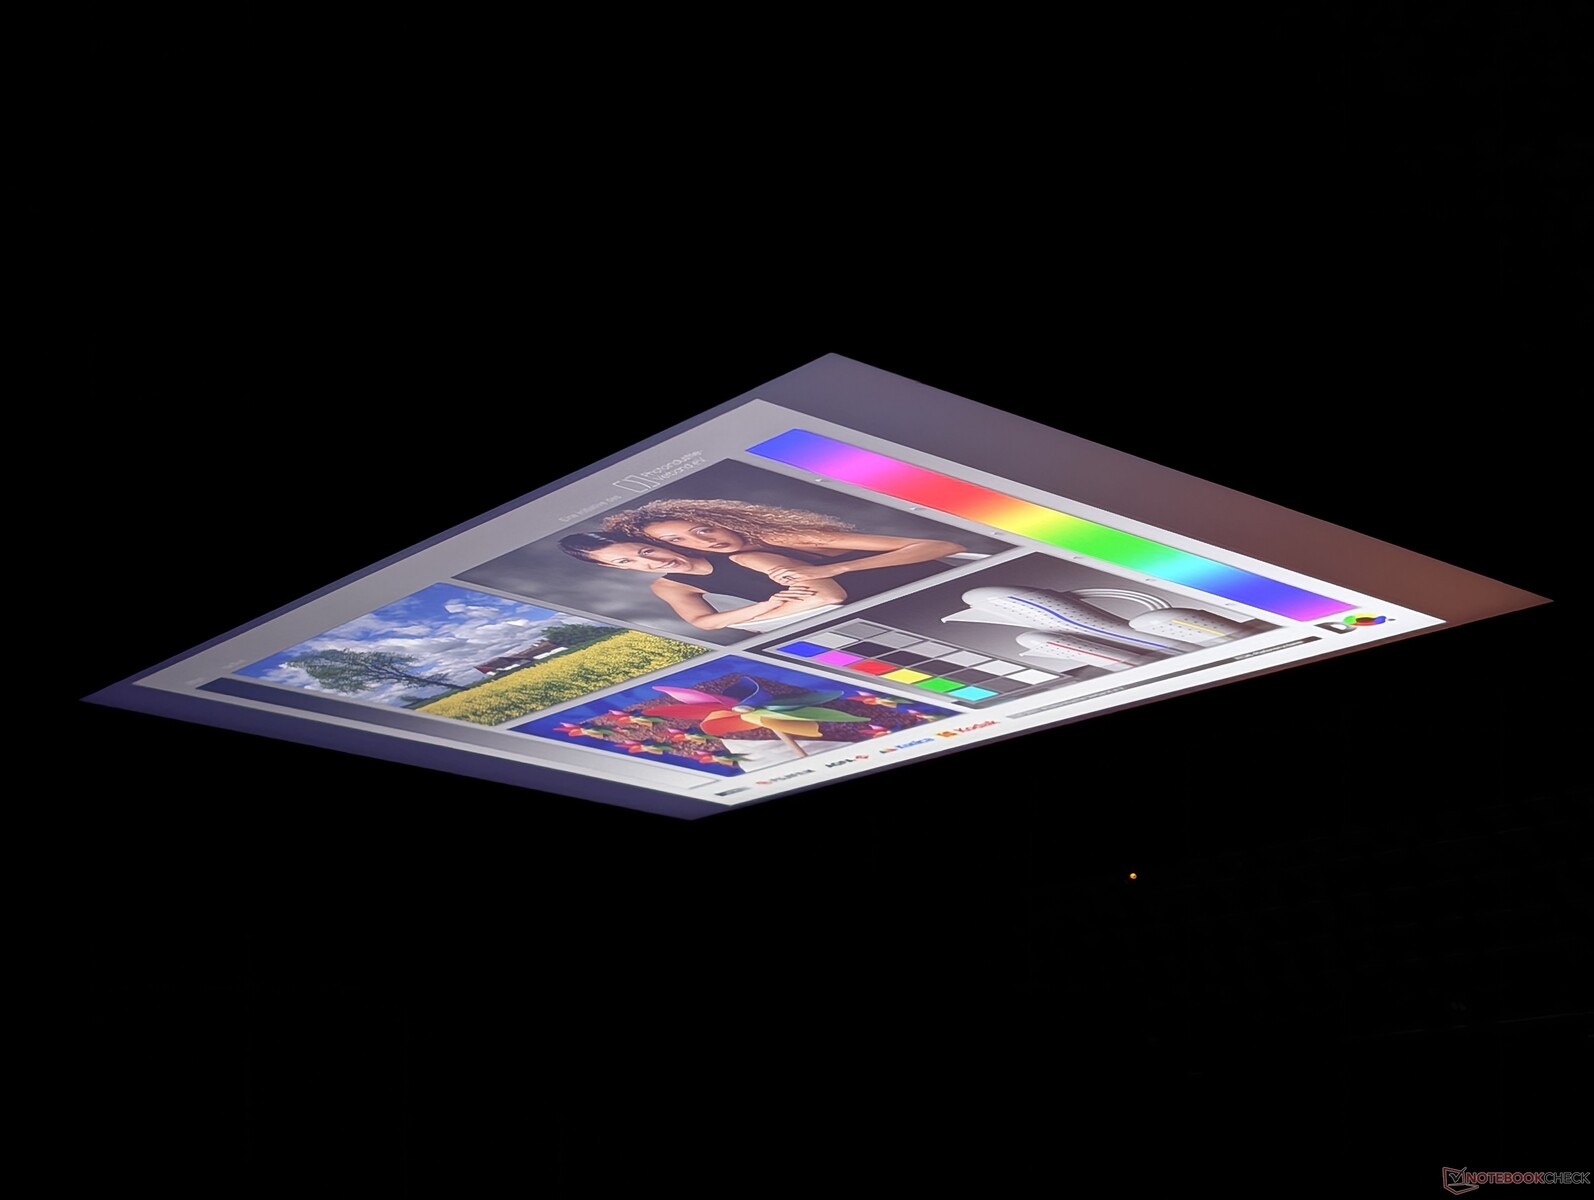
La nostra unità di prova soffre di una moderata perdita di luminosità irregolare negli angoli, come mostra l'immagine qui sotto. Sebbene sia accettabile sui computer portatili più economici, l'offuscamento è un po' deludente da vedere su una workstation di prima classe come lo ZBook.

| |||||||||||||||||||||||||
Distribuzione della luminosità: 92 %
Al centro con la batteria: 517.5 cd/m²
Contrasto: 1617:1 (Nero: 0.32 cd/m²)
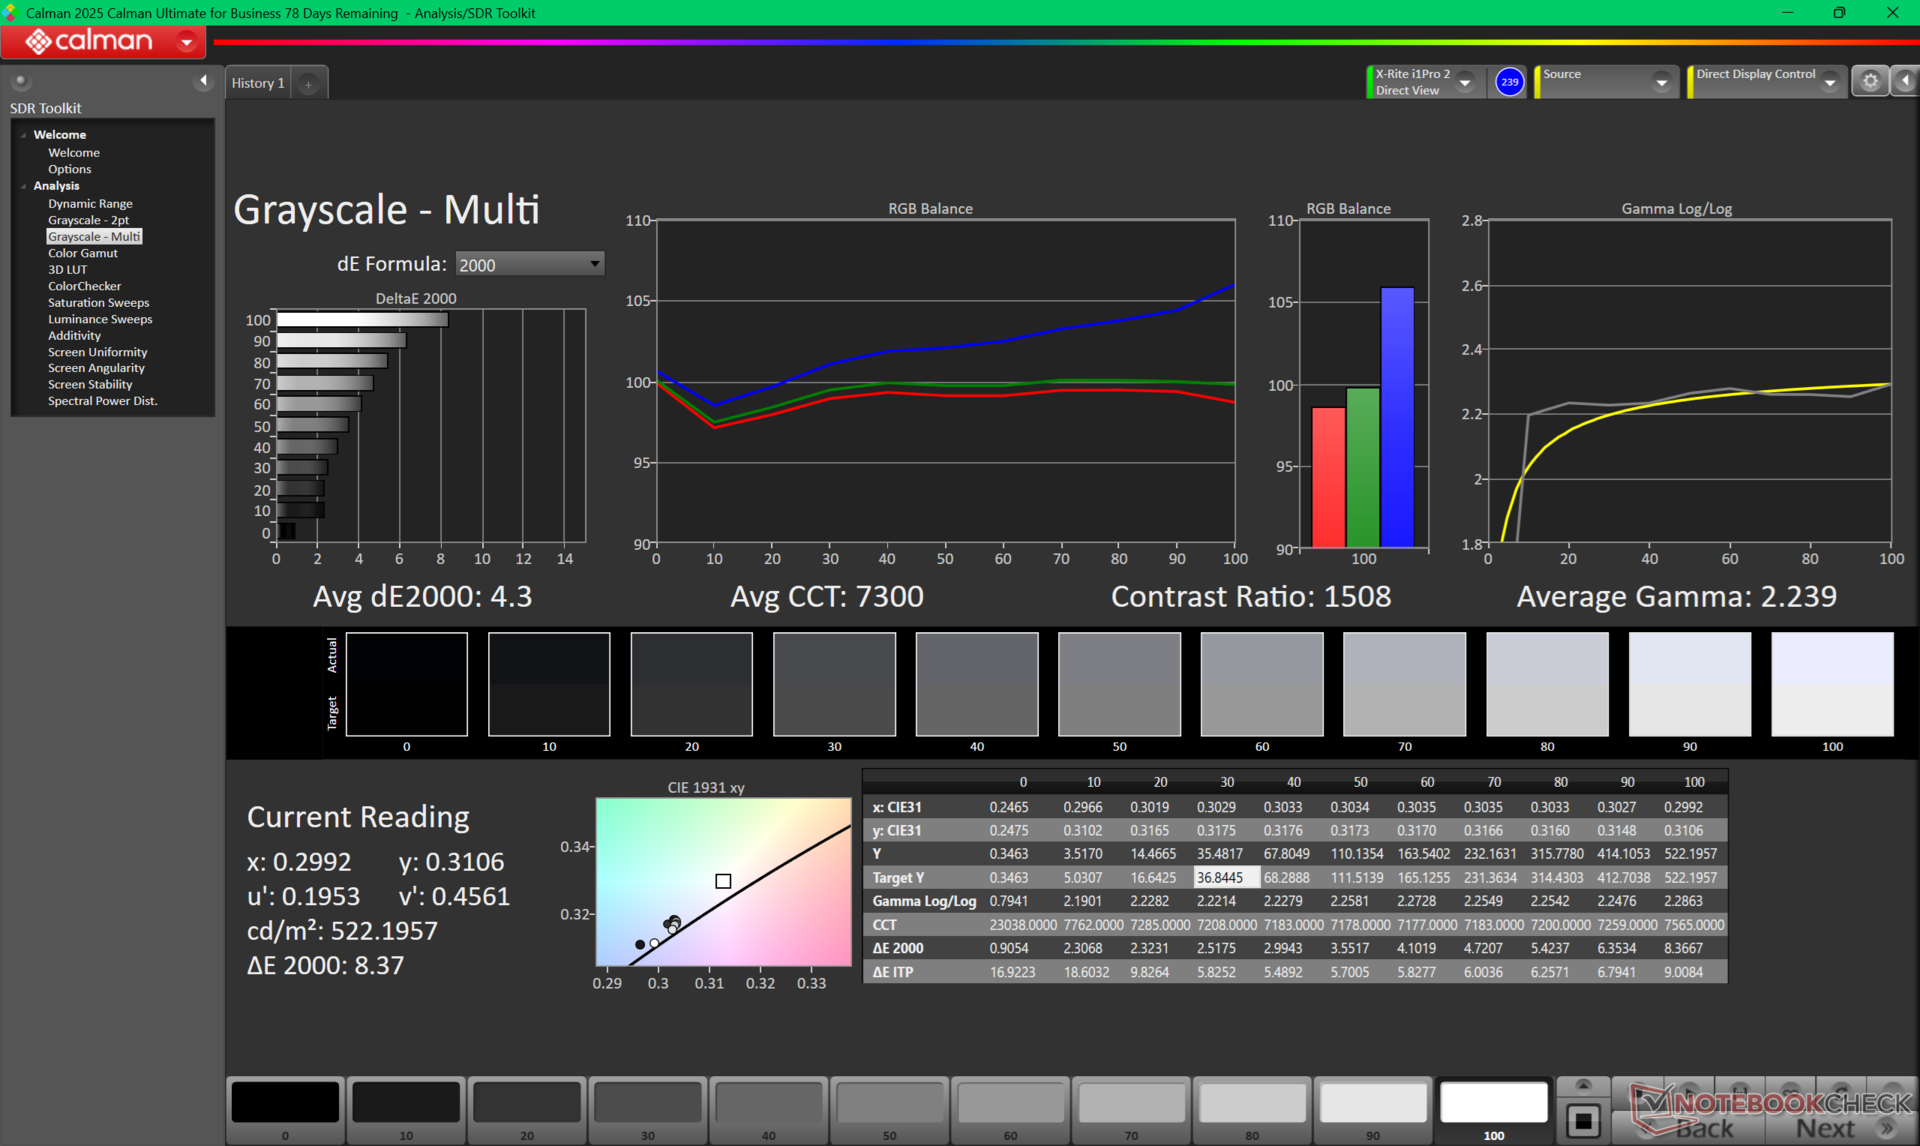
ΔE ColorChecker Calman: 3.62 | ∀{0.5-29.43 Ø4.72}
calibrated: 0.85
ΔE Greyscale Calman: 4.3 | ∀{0.09-98 Ø4.97}
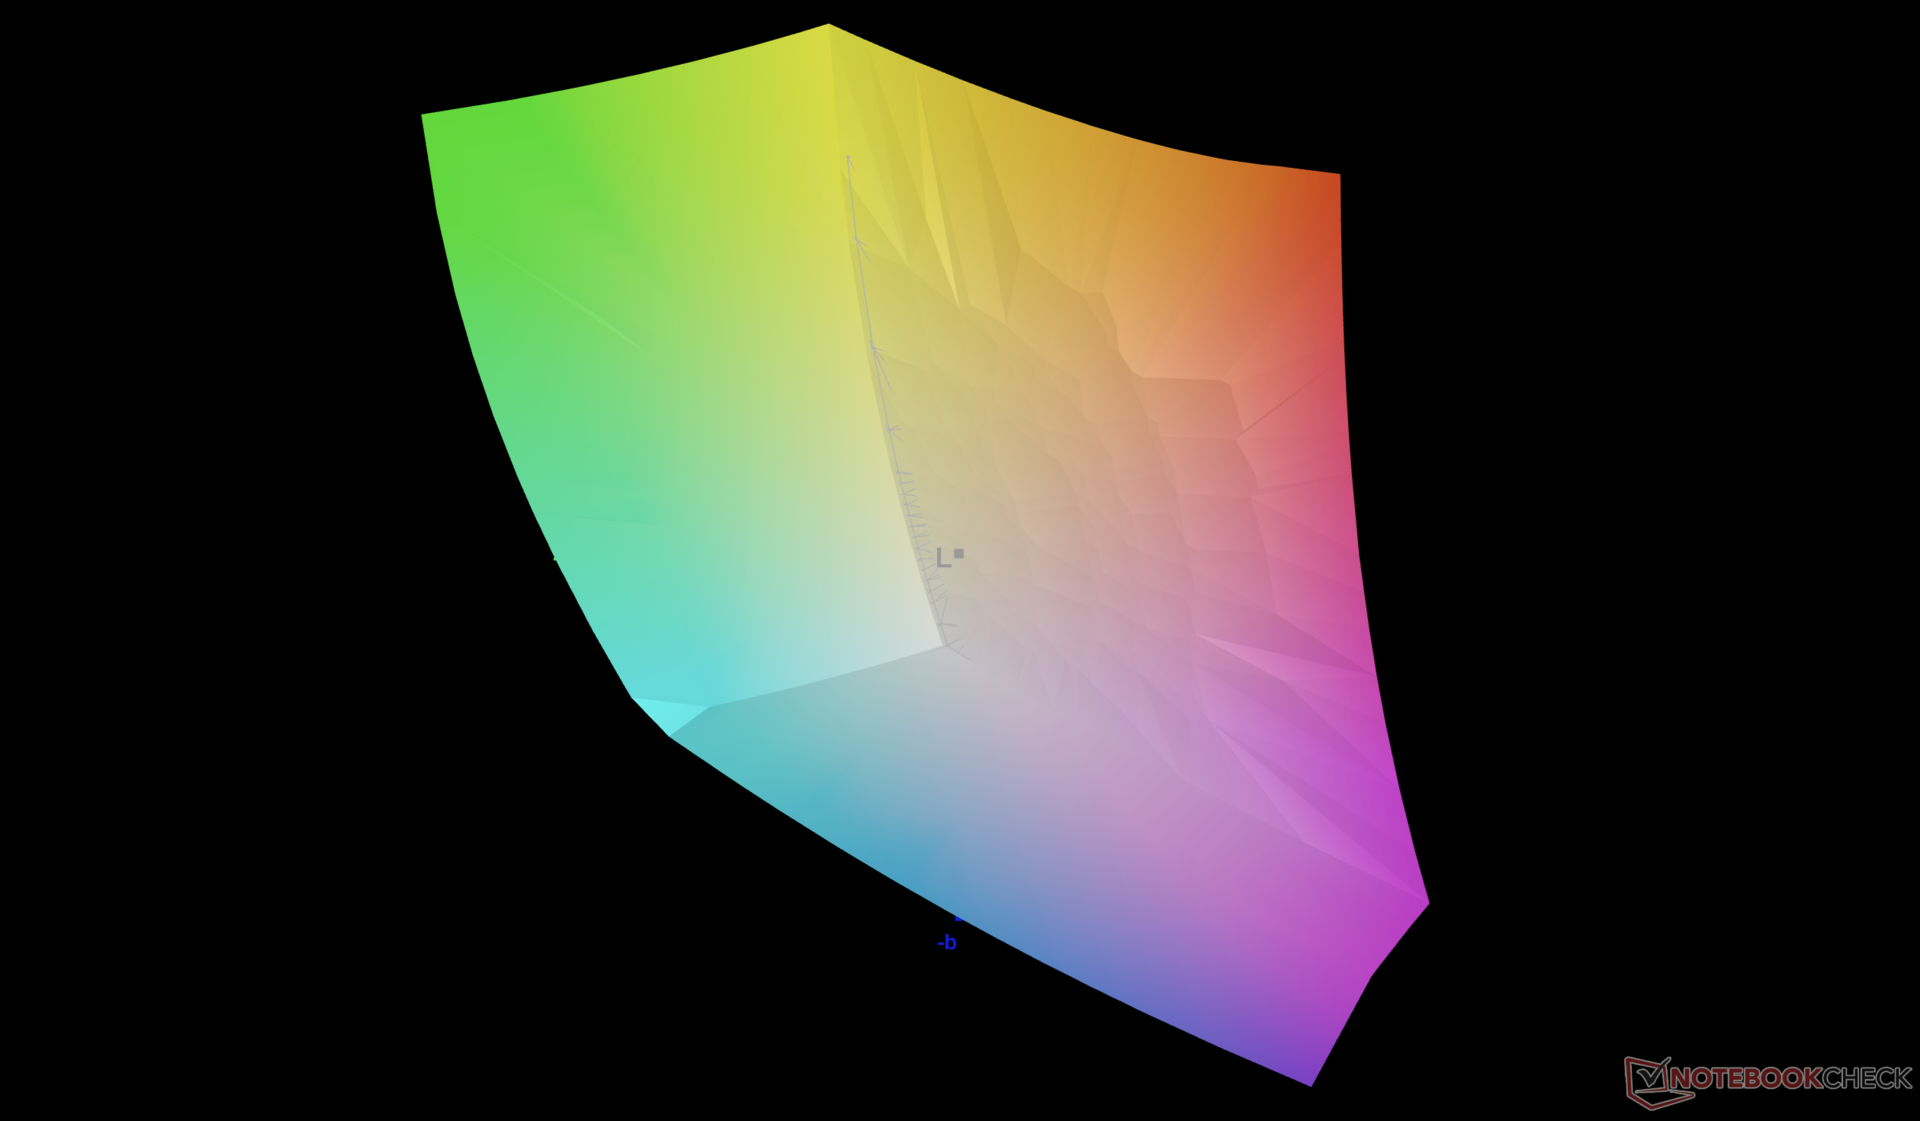
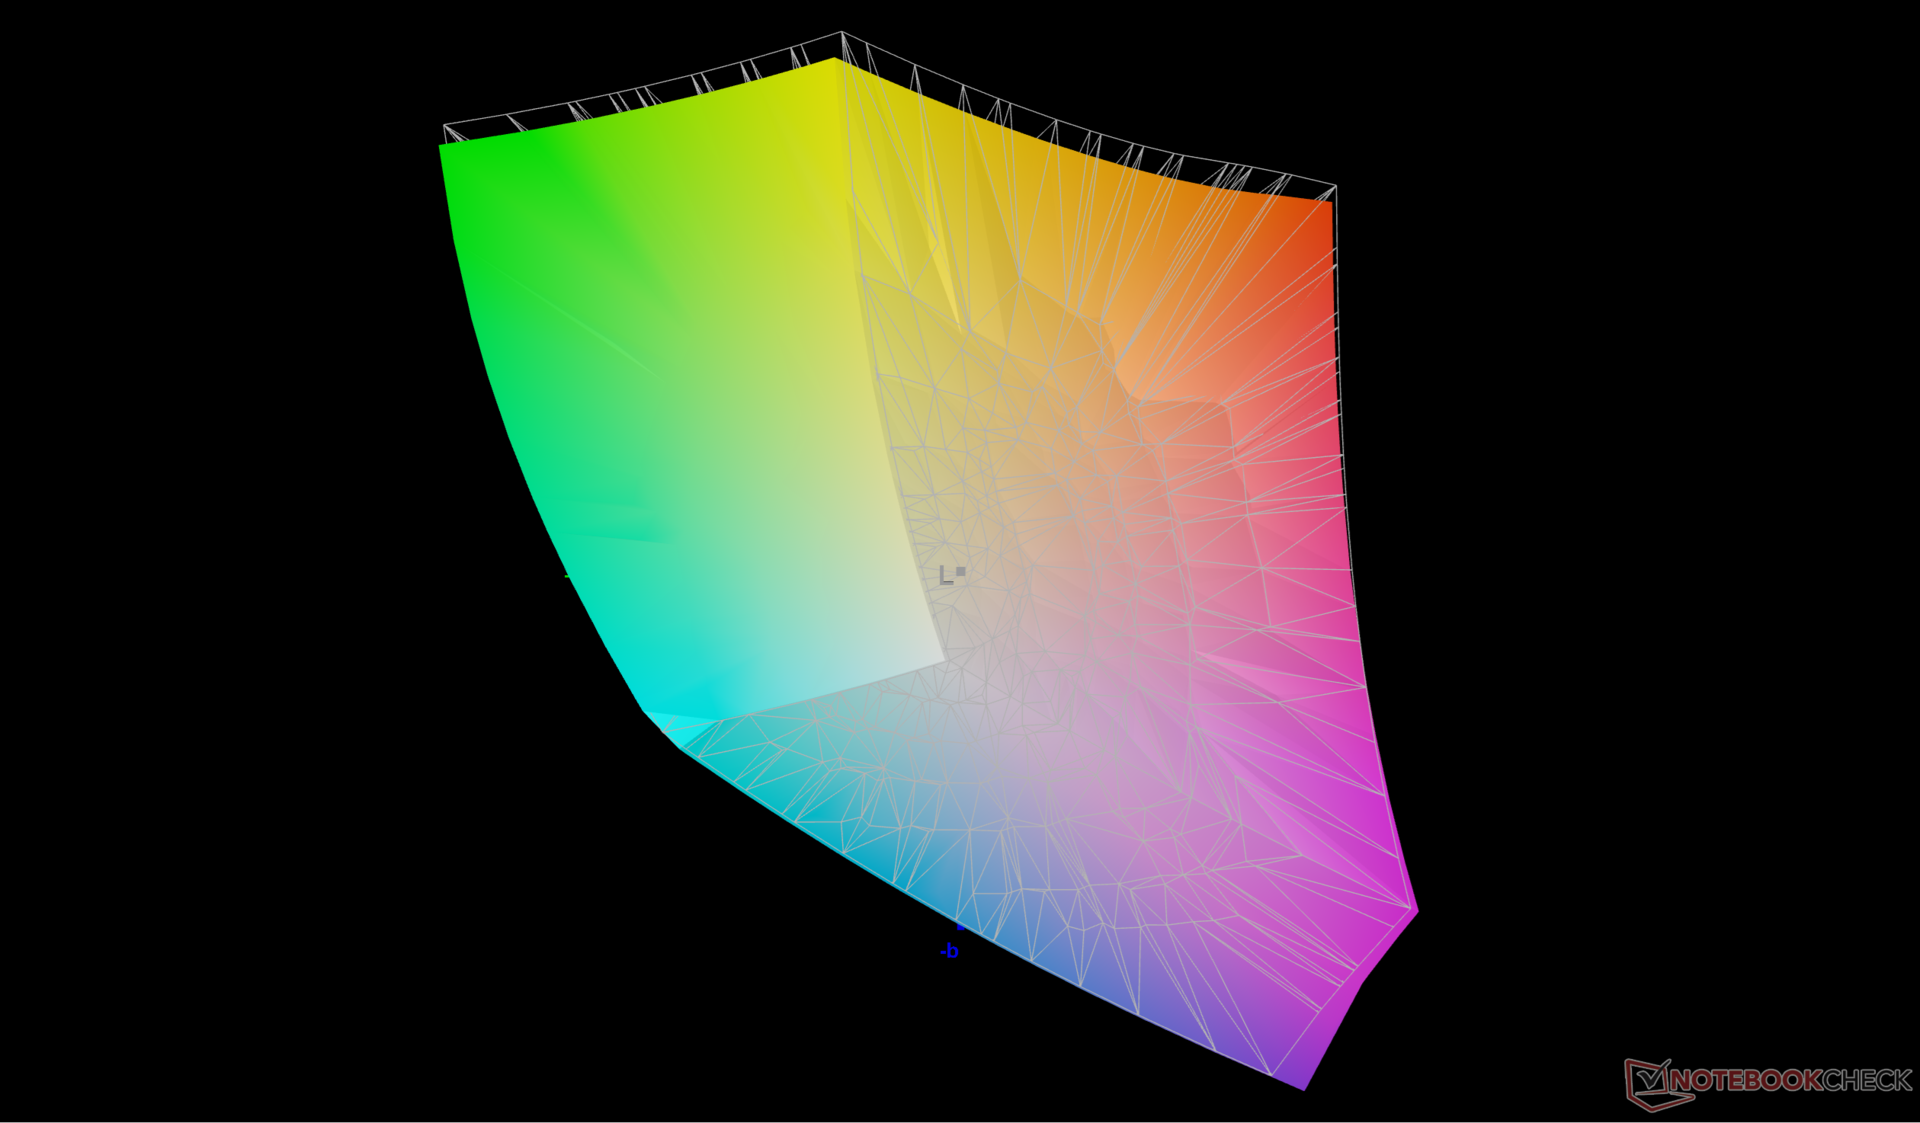
87.7% AdobeRGB 1998 (Argyll 3D)
100% sRGB (Argyll 3D)
96.6% Display P3 (Argyll 3D)
Gamma: 2.24
CCT: 7300 K
| HP ZBook Fury G1i 18 AUO12B6, IPS, 2560x1600, 18", 165 Hz | Dell Pro Max 18 Plus MB18250 BOE NE18NZ7, IPS, 2560x1600, 18", 120 Hz | Schenker Key 18 Pro M25 RTX 5090 LQ180D1JW01, IPS, 3840x2400, 18", 200 Hz | Lenovo ThinkPad P16 Gen 2 NE160QDM-NY1, IPS, 2560x1600, 16", 165 Hz | HP ZBook X G1i 16 LG Philips LGD07B3, IPS, 2560x1600, 16", 120 Hz | HP ZBook Studio 16 G11 AUO87A8, IPS, 3840x2400, 16", 120 Hz | |
|---|---|---|---|---|---|---|
| Display | -0% | -2% | -17% | 5% | -0% | |
| Display P3 Coverage (%) | 96.6 | 97.7 1% | 90.5 -6% | 68.4 -29% | 97.2 1% | 97.7 1% |
| sRGB Coverage (%) | 100 | 99.9 0% | 100 0% | 96.9 -3% | 100 0% | 99.9 0% |
| AdobeRGB 1998 Coverage (%) | 87.7 | 85.9 -2% | 87.4 0% | 70.6 -19% | 99.9 14% | 85.7 -2% |
| Response Times | -225% | 55% | -12% | -229% | -17% | |
| Response Time Grey 50% / Grey 80% * (ms) | 12.5 ? | 39.9 ? -219% | 5.2 ? 58% | 14.1 ? -13% | 45.5 ? -264% | 14.2 ? -14% |
| Response Time Black / White * (ms) | 8.9 ? | 29.4 ? -230% | 4.3 ? 52% | 9.9 ? -11% | 26.1 ? -193% | 10.6 ? -19% |
| PWM Frequency (Hz) | 26536 ? | |||||
| PWM Amplitude * (%) | 47 | |||||
| Screen | 27% | 5% | 19% | -10% | 2% | |
| Brightness middle (cd/m²) | 517.5 | 528.8 2% | 529 2% | 531.5 3% | 461.8 -11% | 404.3 -22% |
| Brightness (cd/m²) | 497 | 515 4% | 513 3% | 499 0% | 427 -14% | 405 -19% |
| Brightness Distribution (%) | 92 | 91 -1% | 95 3% | 89 -3% | 88 -4% | 92 0% |
| Black Level * (cd/m²) | 0.32 | 0.22 31% | 0.31 3% | 0.38 -19% | 0.46 -44% | 0.28 12% |
| Contrast (:1) | 1617 | 2404 49% | 1706 6% | 1399 -13% | 1004 -38% | 1444 -11% |
| Colorchecker dE 2000 * | 3.62 | 2.76 24% | 2.7 25% | 1.82 50% | 4.08 -13% | 2.63 27% |
| Colorchecker dE 2000 max. * | 8.75 | 5.38 39% | 7.8 11% | 4.1 53% | 8.1 7% | 4.48 49% |
| Colorchecker dE 2000 calibrated * | 0.85 | 0.47 45% | 0.8 6% | 0.63 26% | 0.75 12% | 1.46 -72% |
| Greyscale dE 2000 * | 4.3 | 2.2 49% | 4.9 -14% | 1.2 72% | 3.5 19% | 2.1 51% |
| Gamma | 2.24 98% | 2.14 103% | 2.23 99% | 2.15 102% | 2.15 102% | 2.3 96% |
| CCT | 7300 89% | 2584 252% | 6997 93% | 6484 100% | 6715 97% | 6810 95% |
| Media totale (Programma / Settaggio) | -66% /
-15% | 19% /
11% | -3% /
7% | -78% /
-38% | -5% /
-1% |
* ... Meglio usare valori piccoli
La temperatura del colore è sul lato freddo, a 7300. Per il resto, il display è calibrato decentemente rispetto allo standard P3.

Tempi di risposta del Display
| ↔ Tempi di risposta dal Nero al Bianco | ||
|---|---|---|
| 8.9 ms ... aumenta ↗ e diminuisce ↘ combinato | ↗ 4.5 ms Incremento | 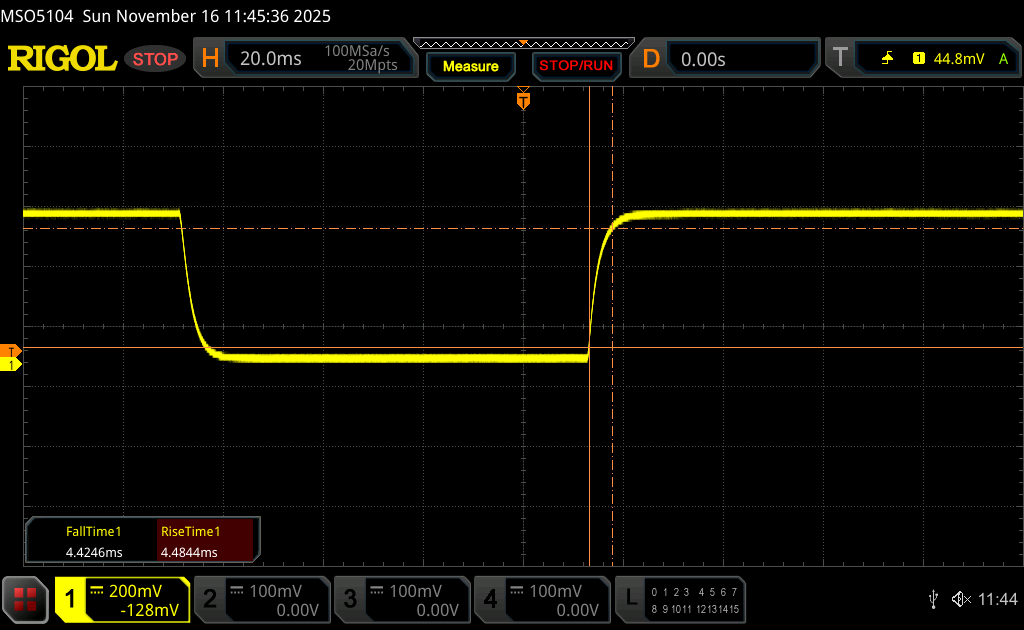 |
| ↘ 4.4 ms Calo | ||
| Lo schermo mostra veloci tempi di risposta durante i nostri tests e dovrebbe esere adatto al gaming In confronto, tutti i dispositivi di test variano da 0.1 (minimo) a 240 (massimo) ms. » 25 % di tutti i dispositivi è migliore. Questo significa che i tempi di risposta rilevati sono migliori rispettto alla media di tutti i dispositivi testati (19.8 ms). | ||
| ↔ Tempo di risposta dal 50% Grigio all'80% Grigio | ||
| 12.5 ms ... aumenta ↗ e diminuisce ↘ combinato | ↗ 6.1 ms Incremento | 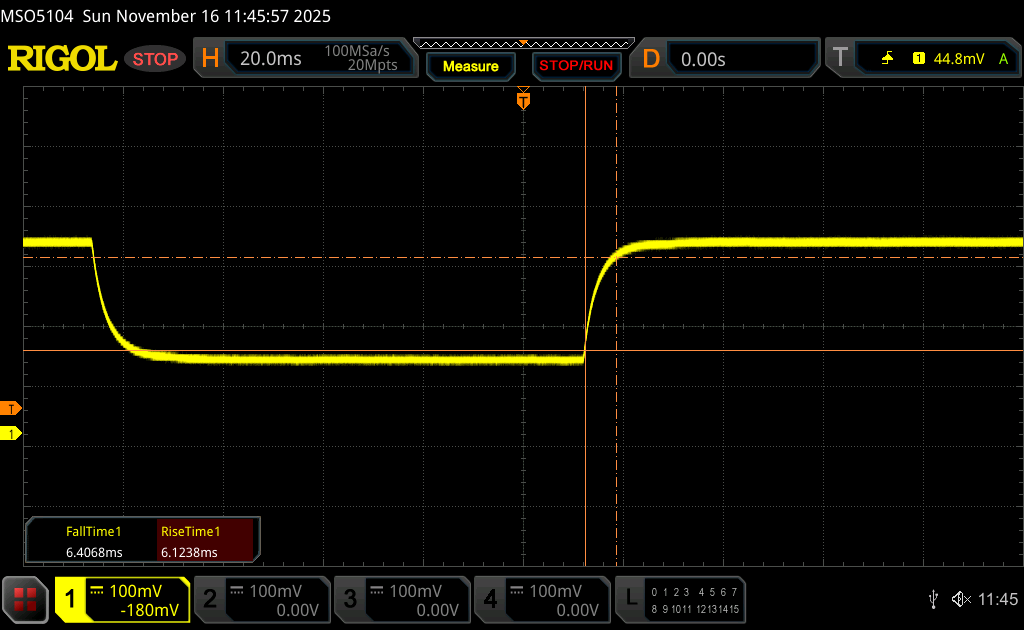 |
| ↘ 6.4 ms Calo | ||
| Lo schermo mostra buoni tempi di risposta durante i nostri tests, ma potrebbe essere troppo lento per i gamers competitivi. In confronto, tutti i dispositivi di test variano da 0.165 (minimo) a 636 (massimo) ms. » 26 % di tutti i dispositivi è migliore. Questo significa che i tempi di risposta rilevati sono migliori rispettto alla media di tutti i dispositivi testati (31 ms). | ||
Sfarfallio dello schermo / PWM (Pulse-Width Modulation)
| flickering dello schermo / PWM non rilevato | 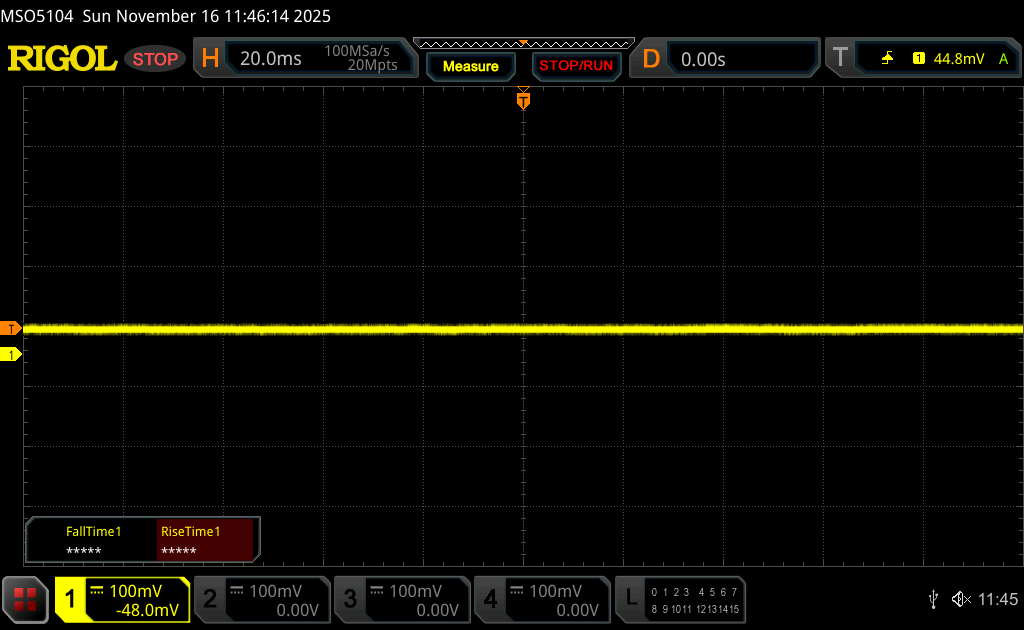 | ||
In confronto: 52 % di tutti i dispositivi testati non utilizza PWM per ridurre la luminosita' del display. Se è rilevato PWM, una media di 7763 (minimo: 5 - massimo: 343500) Hz è stata rilevata. | |||

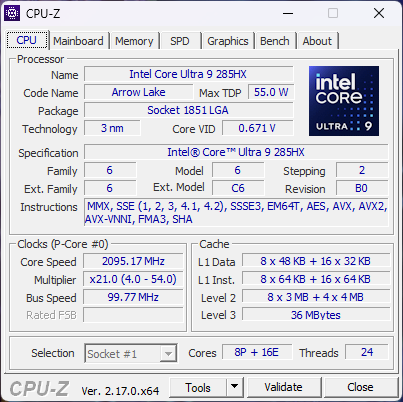
Prestazioni - Arrow Lake-HX e Nvidia Blackwell
Condizioni del test
Abbiamo impostato Windows in modalità Prestazioni con la GPU discreta attiva prima di eseguire i benchmark qui sotto. Advanced Optimus non è supportato, a differenza del concorrente Dell Pro Max 18 Plus.
Processore
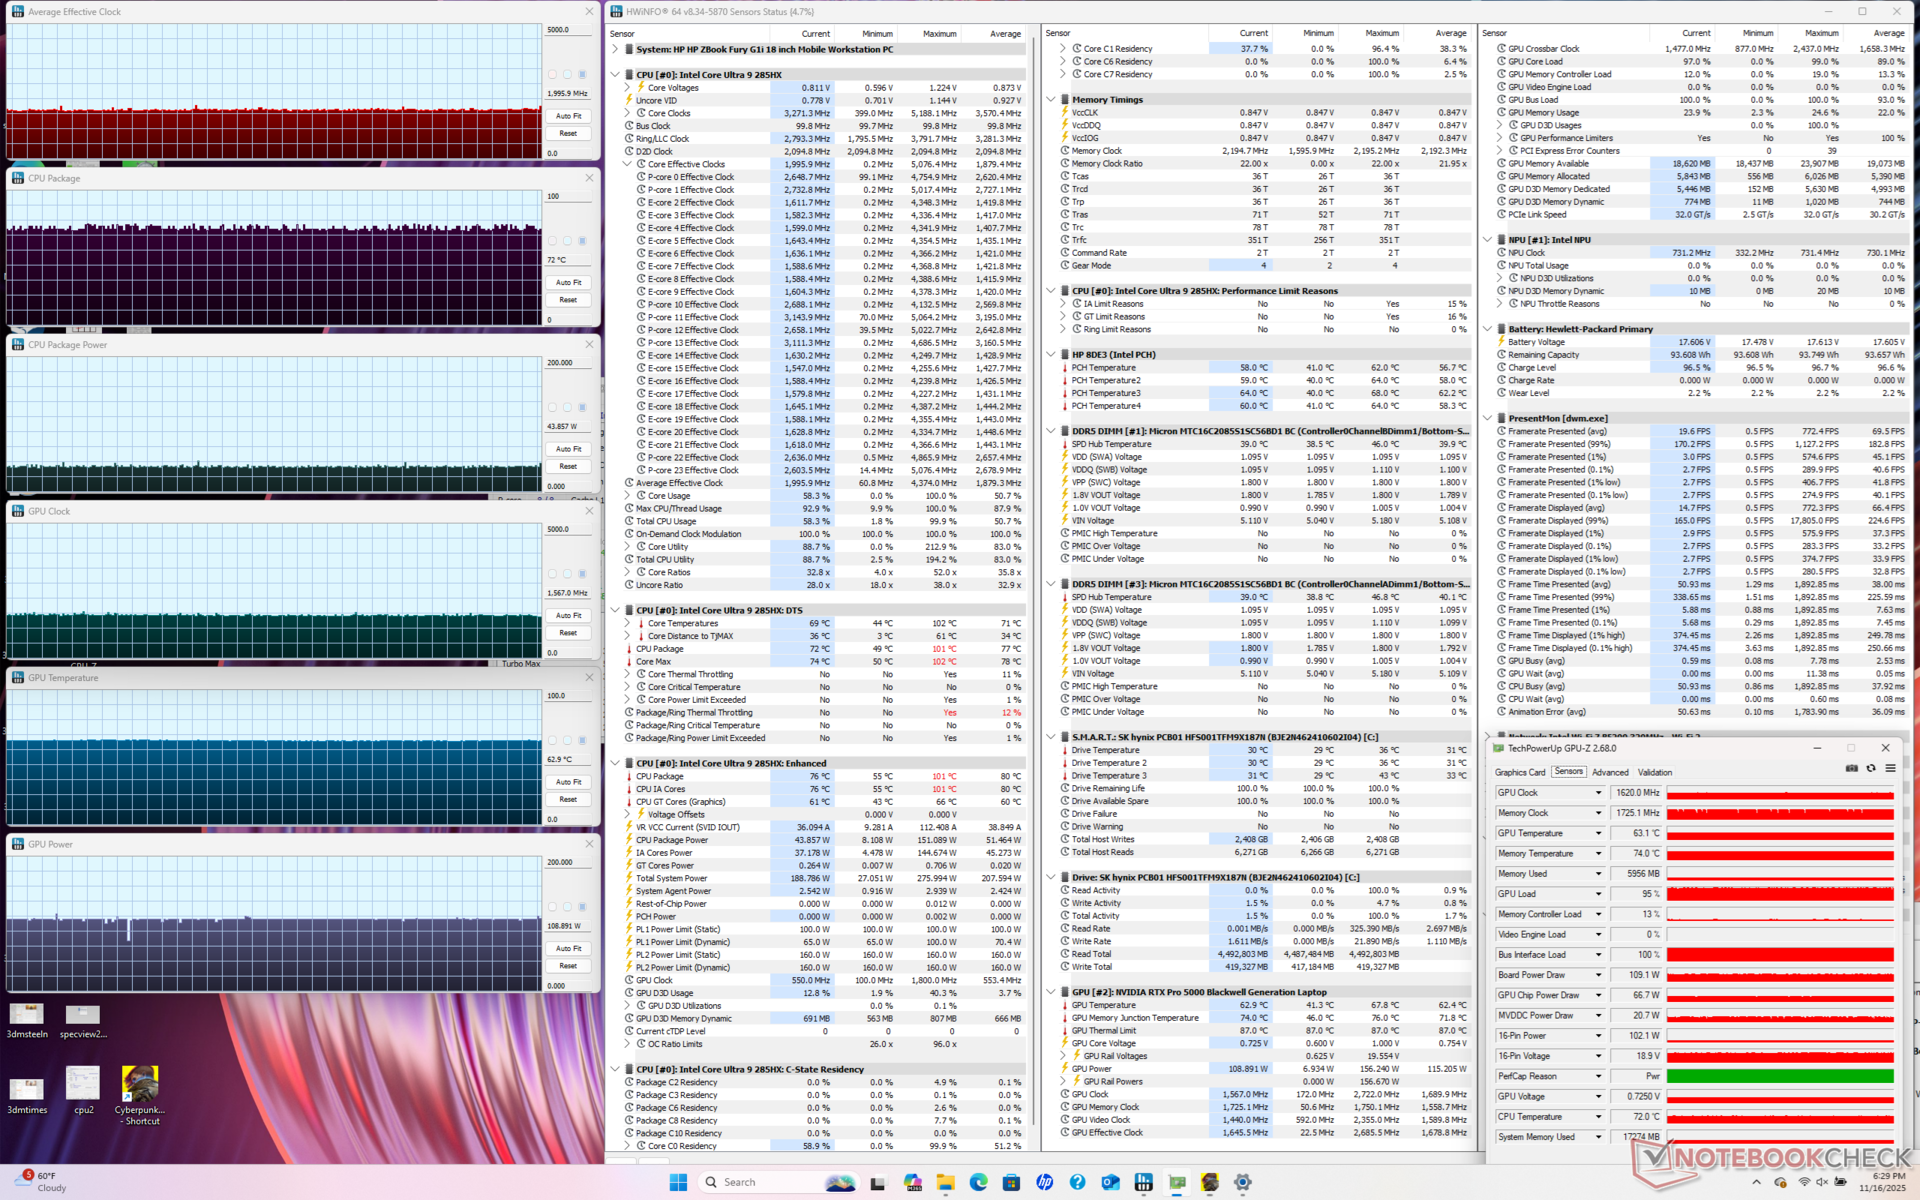
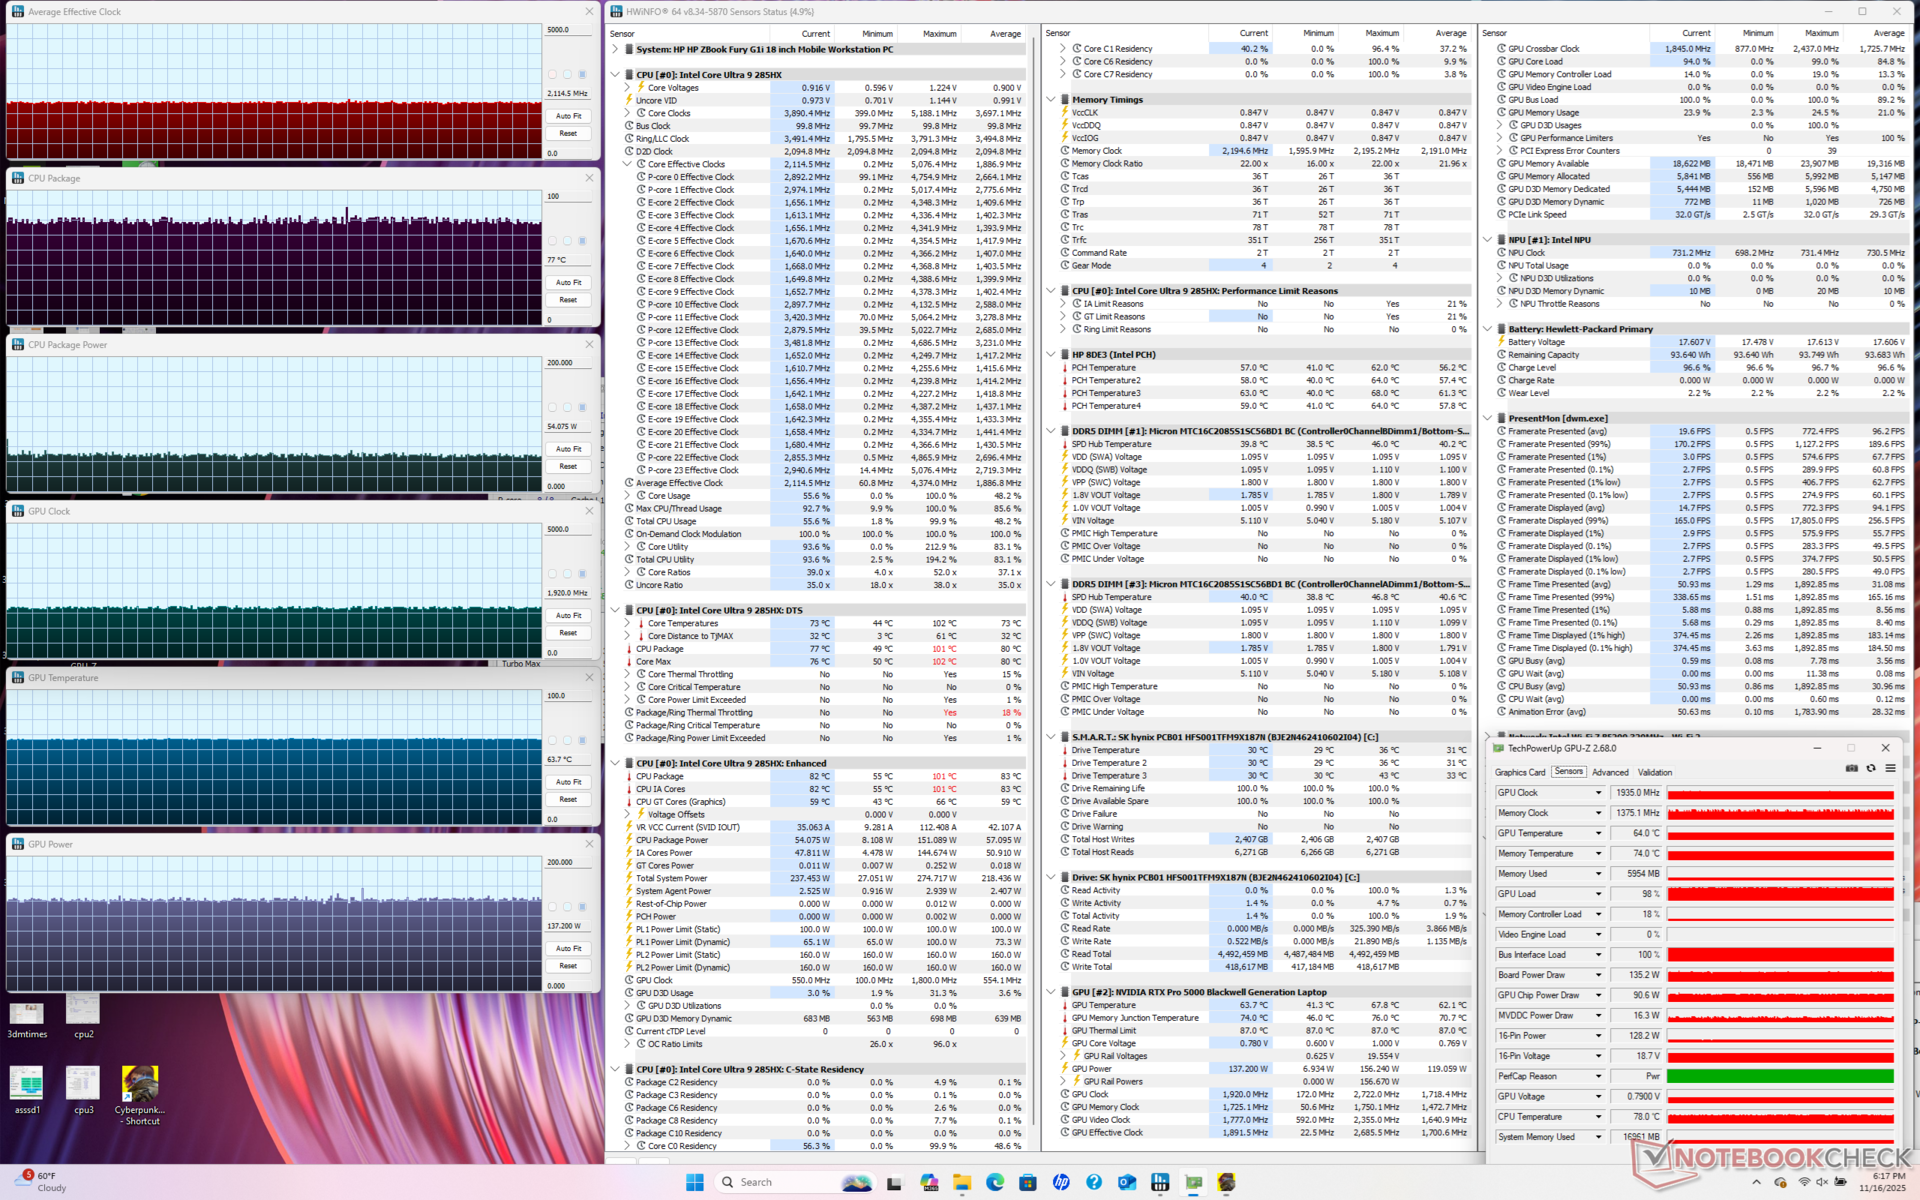
Il Core Ultra 9 285HX nel nostro HP è costantemente più lento della stessa CPU nel Dell Pro Max 18 Plus di pochi punti percentuali. Il Turbo Boost sembra essere più debole sull'HP, come dimostrano i risultati del loop CineBench R15 xT qui sotto, ma entrambe le macchine si stabilizzano quasi alle stesse velocità di clock una volta che i vantaggi del Turbo Boost si esauriscono.
Configurazione con il Core Ultra 7 255HX invece del Core Ultra 9 285HX dovrebbe avere un impatto sulle prestazioni del processore di appena il 5 percento, in base al tempo trascorso con il modello Lenovo Pro 5 1616 Lenovo Legion Pro 5 16IAX10. Gli utenti potrebbero quindi prendere in considerazione l'opzione della CPU di fascia bassa per risparmiare sui costi.
Cinebench R15 Multi Loop
Cinebench R23: Multi Core | Single Core
Cinebench R20: CPU (Multi Core) | CPU (Single Core)
Cinebench R15: CPU Multi 64Bit | CPU Single 64Bit
Blender: v2.79 BMW27 CPU
7-Zip 18.03: 7z b 4 | 7z b 4 -mmt1
Geekbench 6.7: Multi-Core | Single-Core
Geekbench 5.5: Multi-Core | Single-Core
HWBOT x265 Benchmark v2.2: 4k Preset
LibreOffice : 20 Documents To PDF
R Benchmark 2.5: Overall mean
* ... Meglio usare valori piccoli
AIDA64: FP32 Ray-Trace | FPU Julia | CPU SHA3 | CPU Queen | FPU SinJulia | FPU Mandel | CPU AES | CPU ZLib | FP64 Ray-Trace | CPU PhotoWorxx
| Performance rating | |
| Dell Pro Max 18 Plus MB18250 | |
| Schenker Key 18 Pro M25 RTX 5090 | |
| Media Intel Core Ultra 9 285HX | |
| HP ZBook Fury G1i 18 | |
| Lenovo ThinkPad P16 Gen 2 | |
| HP ZBook Studio 16 G11 | |
| AIDA64 / FP32 Ray-Trace | |
| Schenker Key 18 Pro M25 RTX 5090 | |
| Dell Pro Max 18 Plus MB18250 | |
| Media Intel Core Ultra 9 285HX (29076 - 42341, n=6) | |
| HP ZBook Fury G1i 18 | |
| Lenovo ThinkPad P16 Gen 2 | |
| HP ZBook Studio 16 G11 | |
| AIDA64 / FPU Julia | |
| Schenker Key 18 Pro M25 RTX 5090 | |
| Media Intel Core Ultra 9 285HX (161276 - 210885, n=6) | |
| Dell Pro Max 18 Plus MB18250 | |
| HP ZBook Fury G1i 18 | |
| Lenovo ThinkPad P16 Gen 2 | |
| HP ZBook Studio 16 G11 | |
| AIDA64 / CPU SHA3 | |
| Schenker Key 18 Pro M25 RTX 5090 | |
| Dell Pro Max 18 Plus MB18250 | |
| Media Intel Core Ultra 9 285HX (7757 - 9815, n=6) | |
| HP ZBook Fury G1i 18 | |
| Lenovo ThinkPad P16 Gen 2 | |
| HP ZBook Studio 16 G11 | |
| AIDA64 / CPU Queen | |
| Lenovo ThinkPad P16 Gen 2 | |
| Media Intel Core Ultra 9 285HX (134345 - 141681, n=6) | |
| Dell Pro Max 18 Plus MB18250 | |
| Schenker Key 18 Pro M25 RTX 5090 | |
| HP ZBook Fury G1i 18 | |
| HP ZBook Studio 16 G11 | |
| AIDA64 / FPU SinJulia | |
| Schenker Key 18 Pro M25 RTX 5090 | |
| Dell Pro Max 18 Plus MB18250 | |
| Lenovo ThinkPad P16 Gen 2 | |
| Media Intel Core Ultra 9 285HX (12559 - 14431, n=6) | |
| HP ZBook Fury G1i 18 | |
| HP ZBook Studio 16 G11 | |
| AIDA64 / FPU Mandel | |
| Schenker Key 18 Pro M25 RTX 5090 | |
| Media Intel Core Ultra 9 285HX (84053 - 108922, n=6) | |
| Dell Pro Max 18 Plus MB18250 | |
| HP ZBook Fury G1i 18 | |
| Lenovo ThinkPad P16 Gen 2 | |
| HP ZBook Studio 16 G11 | |
| AIDA64 / CPU AES | |
| Schenker Key 18 Pro M25 RTX 5090 | |
| Dell Pro Max 18 Plus MB18250 | |
| HP ZBook Fury G1i 18 | |
| Media Intel Core Ultra 9 285HX (119553 - 134195, n=6) | |
| Lenovo ThinkPad P16 Gen 2 | |
| HP ZBook Studio 16 G11 | |
| AIDA64 / CPU ZLib | |
| Dell Pro Max 18 Plus MB18250 | |
| Schenker Key 18 Pro M25 RTX 5090 | |
| Media Intel Core Ultra 9 285HX (1886 - 2267, n=6) | |
| HP ZBook Fury G1i 18 | |
| Lenovo ThinkPad P16 Gen 2 | |
| HP ZBook Studio 16 G11 | |
| AIDA64 / FP64 Ray-Trace | |
| Schenker Key 18 Pro M25 RTX 5090 | |
| Media Intel Core Ultra 9 285HX (15059 - 22312, n=6) | |
| Dell Pro Max 18 Plus MB18250 | |
| HP ZBook Fury G1i 18 | |
| Lenovo ThinkPad P16 Gen 2 | |
| HP ZBook Studio 16 G11 | |
| AIDA64 / CPU PhotoWorxx | |
| Dell Pro Max 18 Plus MB18250 | |
| HP ZBook Studio 16 G11 | |
| Media Intel Core Ultra 9 285HX (39232 - 62611, n=6) | |
| Lenovo ThinkPad P16 Gen 2 | |
| HP ZBook Fury G1i 18 | |
| Schenker Key 18 Pro M25 RTX 5090 | |
Test da sforzo
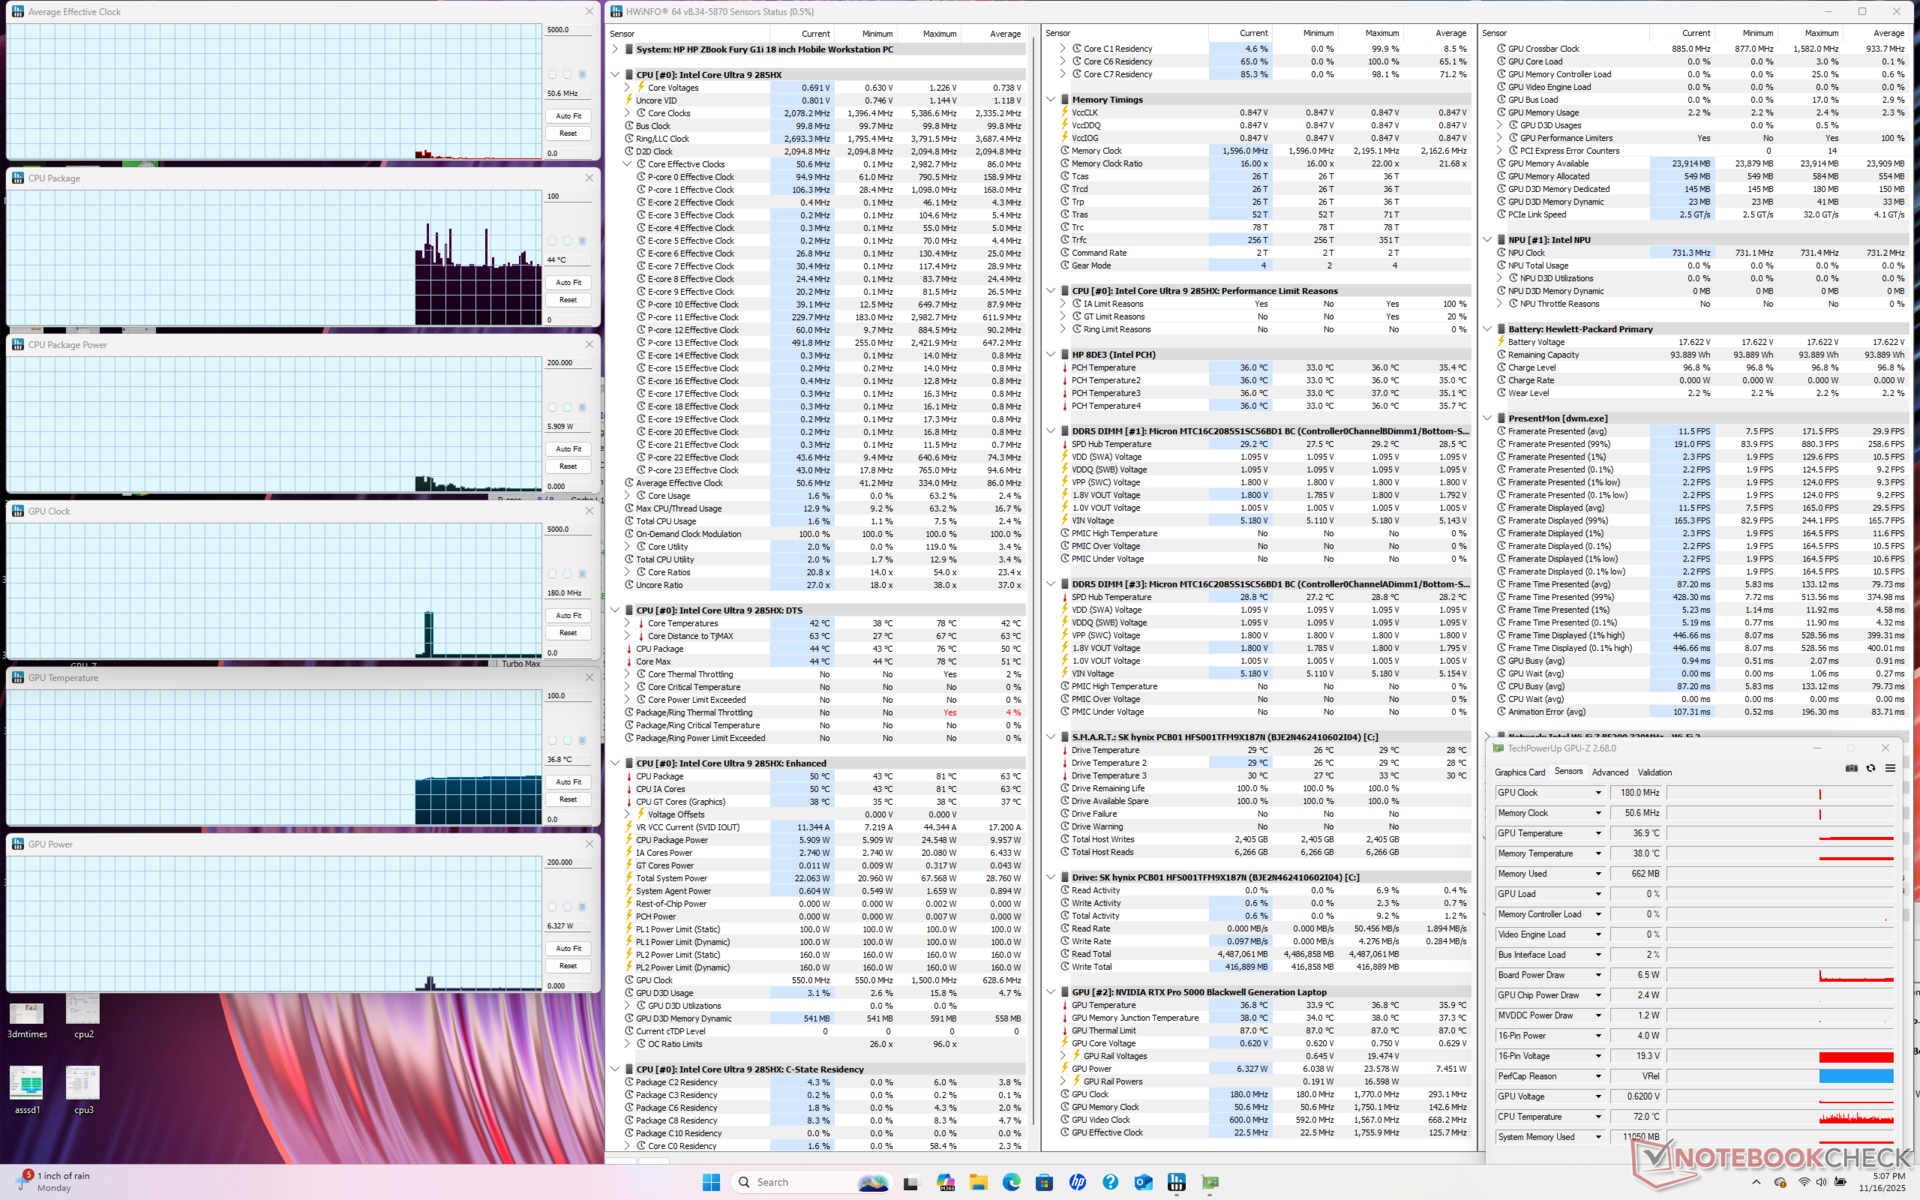
Quando si esegue Prime95 per stressare la CPU, le velocità di clock medie aumentano a 3,9 GHz, 99 C e 160 W per pochi secondi, prima di scendere e stabilizzarsi a 3,3 GHz, 91 C e 89 W. Questo comportamento è simile a quello che abbiamo osservato sul Dell Pro Max 18 Plus, anche se con velocità di clock leggermente più basse in media sull'HP.
Le temperature della CPU e della GPU durante l'esecuzione di Cyberpunk 2077 si stabilizzavano rispettivamente a 77 C e 64 C, rispetto ai 104 C e 75 C del Dell Pro Max 18 Plus. Tuttavia, le prestazioni sono leggermente più lente sull'HP, con un consumo medio di energia della GPU di soli 135 W rispetto ai 163 W del Dell, quando entrambi i sistemi sono impostati sulla modalità Performance.
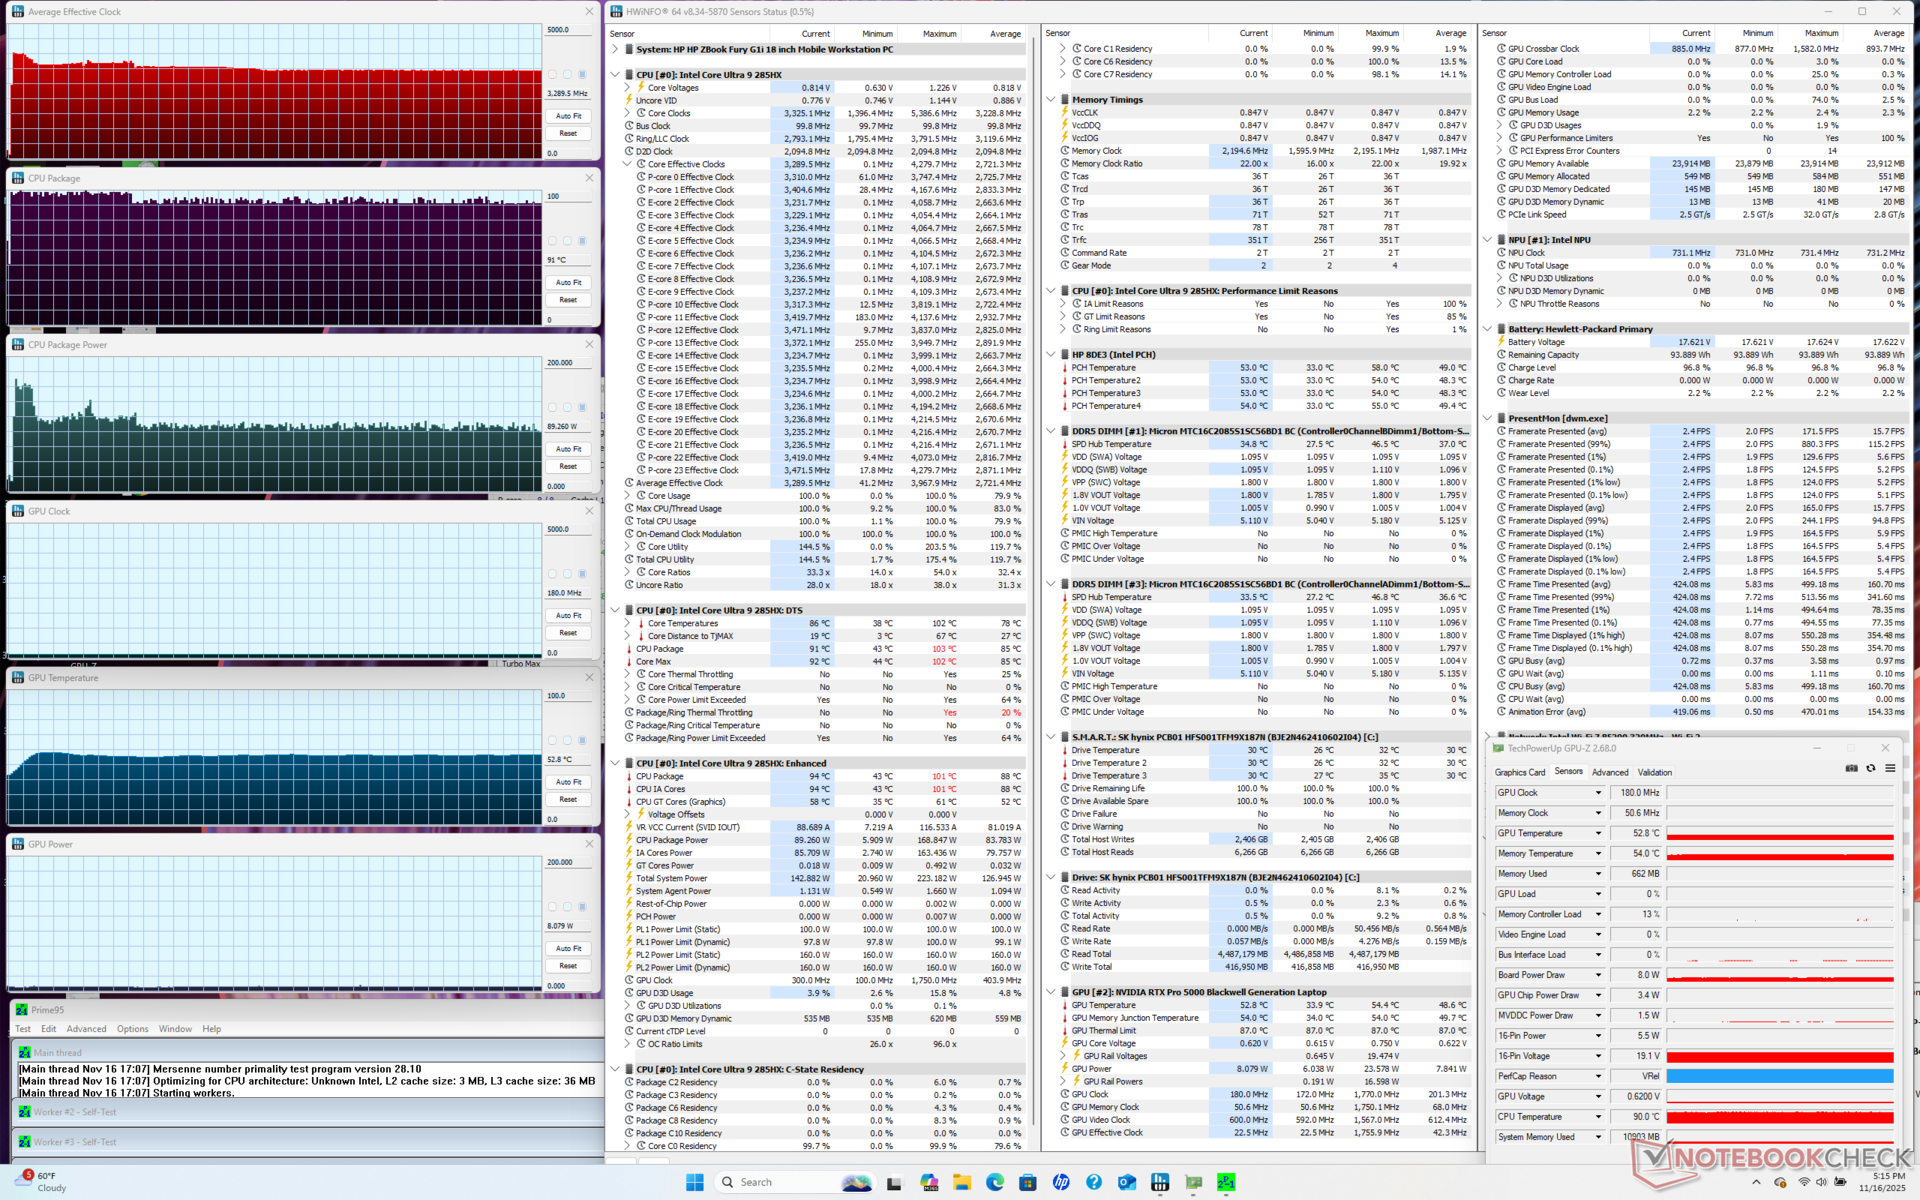

| Clock medio della CPU (GHz) | Clock della GPU (MHz) | Temperatura media della CPU (°C) | Temperatura media della GPU (°C) | |
| Sistema inattivo | -- | -- | 44 | 37 |
| Stress Prime95 | 3,3 | -- | 91 | 53 |
| Prime95 + FurMark Stress | 3.0 | 1882 | 86 | 65 |
| Cyberpunk 2077 Stress (Modalità Bilanciata) | 2.0 | 1567 | 72 | 63 |
| Cyberpunk 2077 Stress (Modalità Performance) | 2.1 | 1920 | 77 | 64 |
Prestazioni del sistema
PCMark 10 non è riuscito a completare l'esecuzione, indipendentemente dalle impostazioni della GPU, pertanto i suoi punteggi non sono inclusi di seguito. Si noti che i punteggi della memoria AIDA64 sono notevolmente più lenti rispetto a Dell Pro Max 18 Plus, in quanto la tecnologia RAM è uno dei fattori chiave di differenziazione tra i due modelli.
CrossMark: Overall | Productivity | Creativity | Responsiveness
WebXPRT 3: Overall
WebXPRT 4: Overall
Mozilla Kraken 1.1: Total
Geekbench AI: Quantized GPU 1.7 | Half Precision GPU 1.7 | Single Precision GPU 1.7
| Performance rating | |
| Dell Pro Max 18 Plus MB18250 | |
| Media Intel Core Ultra 9 285HX, NVIDIA RTX PRO 5000 Blackwell Generation Laptop | |
| HP ZBook Fury G1i 18 | |
| Schenker Key 18 Pro M25 RTX 5090 | |
| Lenovo ThinkPad P16 Gen 2 -3! | |
| HP ZBook X G1i 16 | |
| HP ZBook Studio 16 G11 -3! | |
| CrossMark / Overall | |
| Dell Pro Max 18 Plus MB18250 | |
| Media Intel Core Ultra 9 285HX, NVIDIA RTX PRO 5000 Blackwell Generation Laptop (2142 - 2267, n=3) | |
| HP ZBook Fury G1i 18 | |
| Schenker Key 18 Pro M25 RTX 5090 | |
| Lenovo ThinkPad P16 Gen 2 | |
| HP ZBook X G1i 16 | |
| HP ZBook Studio 16 G11 | |
| CrossMark / Productivity | |
| HP ZBook Fury G1i 18 | |
| Media Intel Core Ultra 9 285HX, NVIDIA RTX PRO 5000 Blackwell Generation Laptop (2016 - 2028, n=3) | |
| Dell Pro Max 18 Plus MB18250 | |
| Schenker Key 18 Pro M25 RTX 5090 | |
| HP ZBook X G1i 16 | |
| Lenovo ThinkPad P16 Gen 2 | |
| HP ZBook Studio 16 G11 | |
| CrossMark / Creativity | |
| Dell Pro Max 18 Plus MB18250 | |
| Media Intel Core Ultra 9 285HX, NVIDIA RTX PRO 5000 Blackwell Generation Laptop (2395 - 2725, n=3) | |
| HP ZBook Fury G1i 18 | |
| Lenovo ThinkPad P16 Gen 2 | |
| HP ZBook X G1i 16 | |
| Schenker Key 18 Pro M25 RTX 5090 | |
| HP ZBook Studio 16 G11 | |
| CrossMark / Responsiveness | |
| Schenker Key 18 Pro M25 RTX 5090 | |
| Dell Pro Max 18 Plus MB18250 | |
| Media Intel Core Ultra 9 285HX, NVIDIA RTX PRO 5000 Blackwell Generation Laptop (1806 - 1858, n=3) | |
| HP ZBook Fury G1i 18 | |
| Lenovo ThinkPad P16 Gen 2 | |
| HP ZBook X G1i 16 | |
| HP ZBook Studio 16 G11 | |
| WebXPRT 3 / Overall | |
| HP ZBook Fury G1i 18 | |
| Dell Pro Max 18 Plus MB18250 | |
| Media Intel Core Ultra 9 285HX, NVIDIA RTX PRO 5000 Blackwell Generation Laptop (327 - 360, n=3) | |
| Schenker Key 18 Pro M25 RTX 5090 | |
| Lenovo ThinkPad P16 Gen 2 | |
| HP ZBook X G1i 16 | |
| HP ZBook Studio 16 G11 | |
| WebXPRT 4 / Overall | |
| HP ZBook Fury G1i 18 | |
| Schenker Key 18 Pro M25 RTX 5090 | |
| Media Intel Core Ultra 9 285HX, NVIDIA RTX PRO 5000 Blackwell Generation Laptop (306 - 323, n=3) | |
| Dell Pro Max 18 Plus MB18250 | |
| Lenovo ThinkPad P16 Gen 2 | |
| HP ZBook X G1i 16 | |
| HP ZBook Studio 16 G11 | |
| Mozilla Kraken 1.1 / Total | |
| HP ZBook Studio 16 G11 | |
| HP ZBook X G1i 16 | |
| Lenovo ThinkPad P16 Gen 2 | |
| Dell Pro Max 18 Plus MB18250 | |
| Media Intel Core Ultra 9 285HX, NVIDIA RTX PRO 5000 Blackwell Generation Laptop (411 - 439, n=3) | |
| Schenker Key 18 Pro M25 RTX 5090 | |
| HP ZBook Fury G1i 18 | |
| Geekbench AI / Quantized GPU 1.7 | |
| Dell Pro Max 18 Plus MB18250 | |
| Schenker Key 18 Pro M25 RTX 5090 | |
| Media Intel Core Ultra 9 285HX, NVIDIA RTX PRO 5000 Blackwell Generation Laptop (22519 - 24656, n=3) | |
| HP ZBook Fury G1i 18 | |
| HP ZBook X G1i 16 | |
| Geekbench AI / Half Precision GPU 1.7 | |
| Dell Pro Max 18 Plus MB18250 | |
| Media Intel Core Ultra 9 285HX, NVIDIA RTX PRO 5000 Blackwell Generation Laptop (51812 - 55275, n=3) | |
| Schenker Key 18 Pro M25 RTX 5090 | |
| HP ZBook Fury G1i 18 | |
| HP ZBook X G1i 16 | |
| Geekbench AI / Single Precision GPU 1.7 | |
| Dell Pro Max 18 Plus MB18250 | |
| Schenker Key 18 Pro M25 RTX 5090 | |
| Media Intel Core Ultra 9 285HX, NVIDIA RTX PRO 5000 Blackwell Generation Laptop (28665 - 32028, n=3) | |
| HP ZBook Fury G1i 18 | |
| HP ZBook X G1i 16 | |
* ... Meglio usare valori piccoli
| AIDA64 / Memory Copy | |
| Dell Pro Max 18 Plus MB18250 | |
| Media Intel Core Ultra 9 285HX (63431 - 93933, n=6) | |
| HP ZBook Studio 16 G11 | |
| HP ZBook Fury G1i 18 | |
| Lenovo ThinkPad P16 Gen 2 | |
| Schenker Key 18 Pro M25 RTX 5090 | |
| AIDA64 / Memory Read | |
| Dell Pro Max 18 Plus MB18250 | |
| Media Intel Core Ultra 9 285HX (67084 - 97565, n=6) | |
| HP ZBook Studio 16 G11 | |
| Lenovo ThinkPad P16 Gen 2 | |
| HP ZBook Fury G1i 18 | |
| Schenker Key 18 Pro M25 RTX 5090 | |
| AIDA64 / Memory Write | |
| Dell Pro Max 18 Plus MB18250 | |
| Media Intel Core Ultra 9 285HX (64112 - 89691, n=6) | |
| HP ZBook Studio 16 G11 | |
| HP ZBook Fury G1i 18 | |
| Lenovo ThinkPad P16 Gen 2 | |
| Schenker Key 18 Pro M25 RTX 5090 | |
| AIDA64 / Memory Latency | |
| Schenker Key 18 Pro M25 RTX 5090 | |
| HP ZBook Fury G1i 18 | |
| Media Intel Core Ultra 9 285HX (104.8 - 151.7, n=6) | |
| HP ZBook Studio 16 G11 | |
| Dell Pro Max 18 Plus MB18250 | |
| Lenovo ThinkPad P16 Gen 2 | |
* ... Meglio usare valori piccoli
Latenza DPC
| DPC Latencies / LatencyMon - interrupt to process latency (max), Web, Youtube, Prime95 | |
| Schenker Key 18 Pro M25 RTX 5090 | |
| HP ZBook Fury G1i 18 | |
| HP ZBook Studio 16 G11 | |
| Dell Pro Max 18 Plus MB18250 | |
| Lenovo ThinkPad P16 Gen 2 | |
| HP ZBook X G1i 16 | |
* ... Meglio usare valori piccoli
Dispositivi di archiviazione
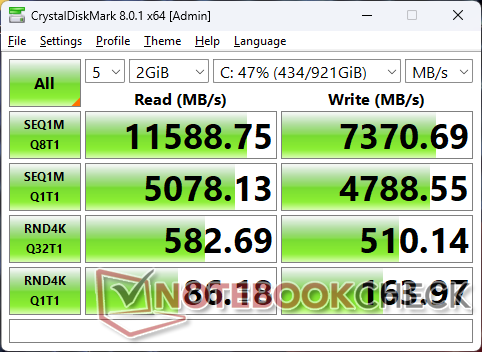
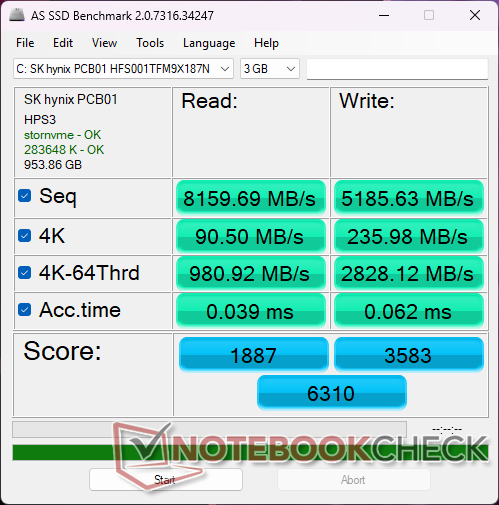
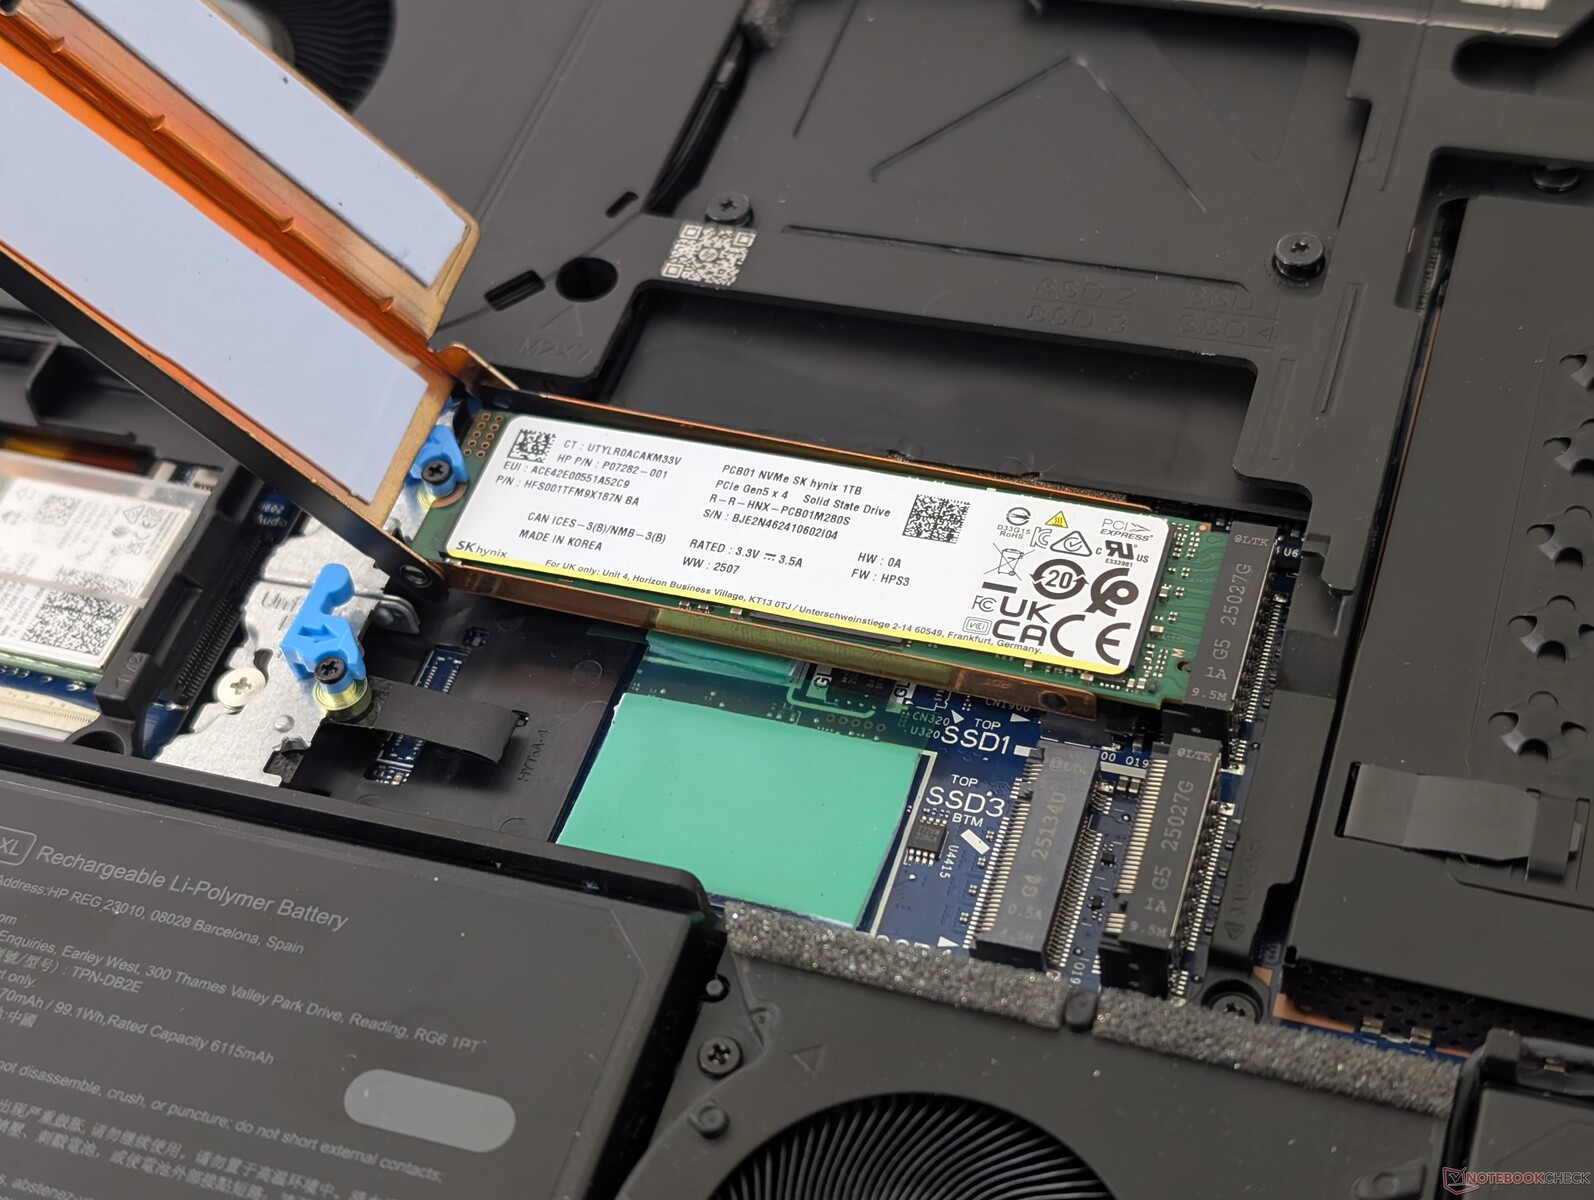
La nostra unità viene fornita con il SK Hynix PCB01 SSD PCIe5 x4 NVMe per velocità di trasferimento costanti di circa 12000 MB/s. HP supporta fino a quattro SSD M.2 2280 individuali, mentre Dell Pro Max 18 Plus ne supporta solo due.

| Drive Performance rating - Percent | |
| Schenker Key 18 Pro M25 RTX 5090 | |
| HP ZBook Fury G1i 18 | |
| HP ZBook X G1i 16 | |
| Dell Pro Max 18 Plus MB18250 | |
| Lenovo ThinkPad P16 Gen 2 | |
| HP ZBook Studio 16 G11 | |
* ... Meglio usare valori piccoli
Strozzatura del disco: DiskSpd Lettura in loop, Profondità coda 8
Prestazioni della GPU
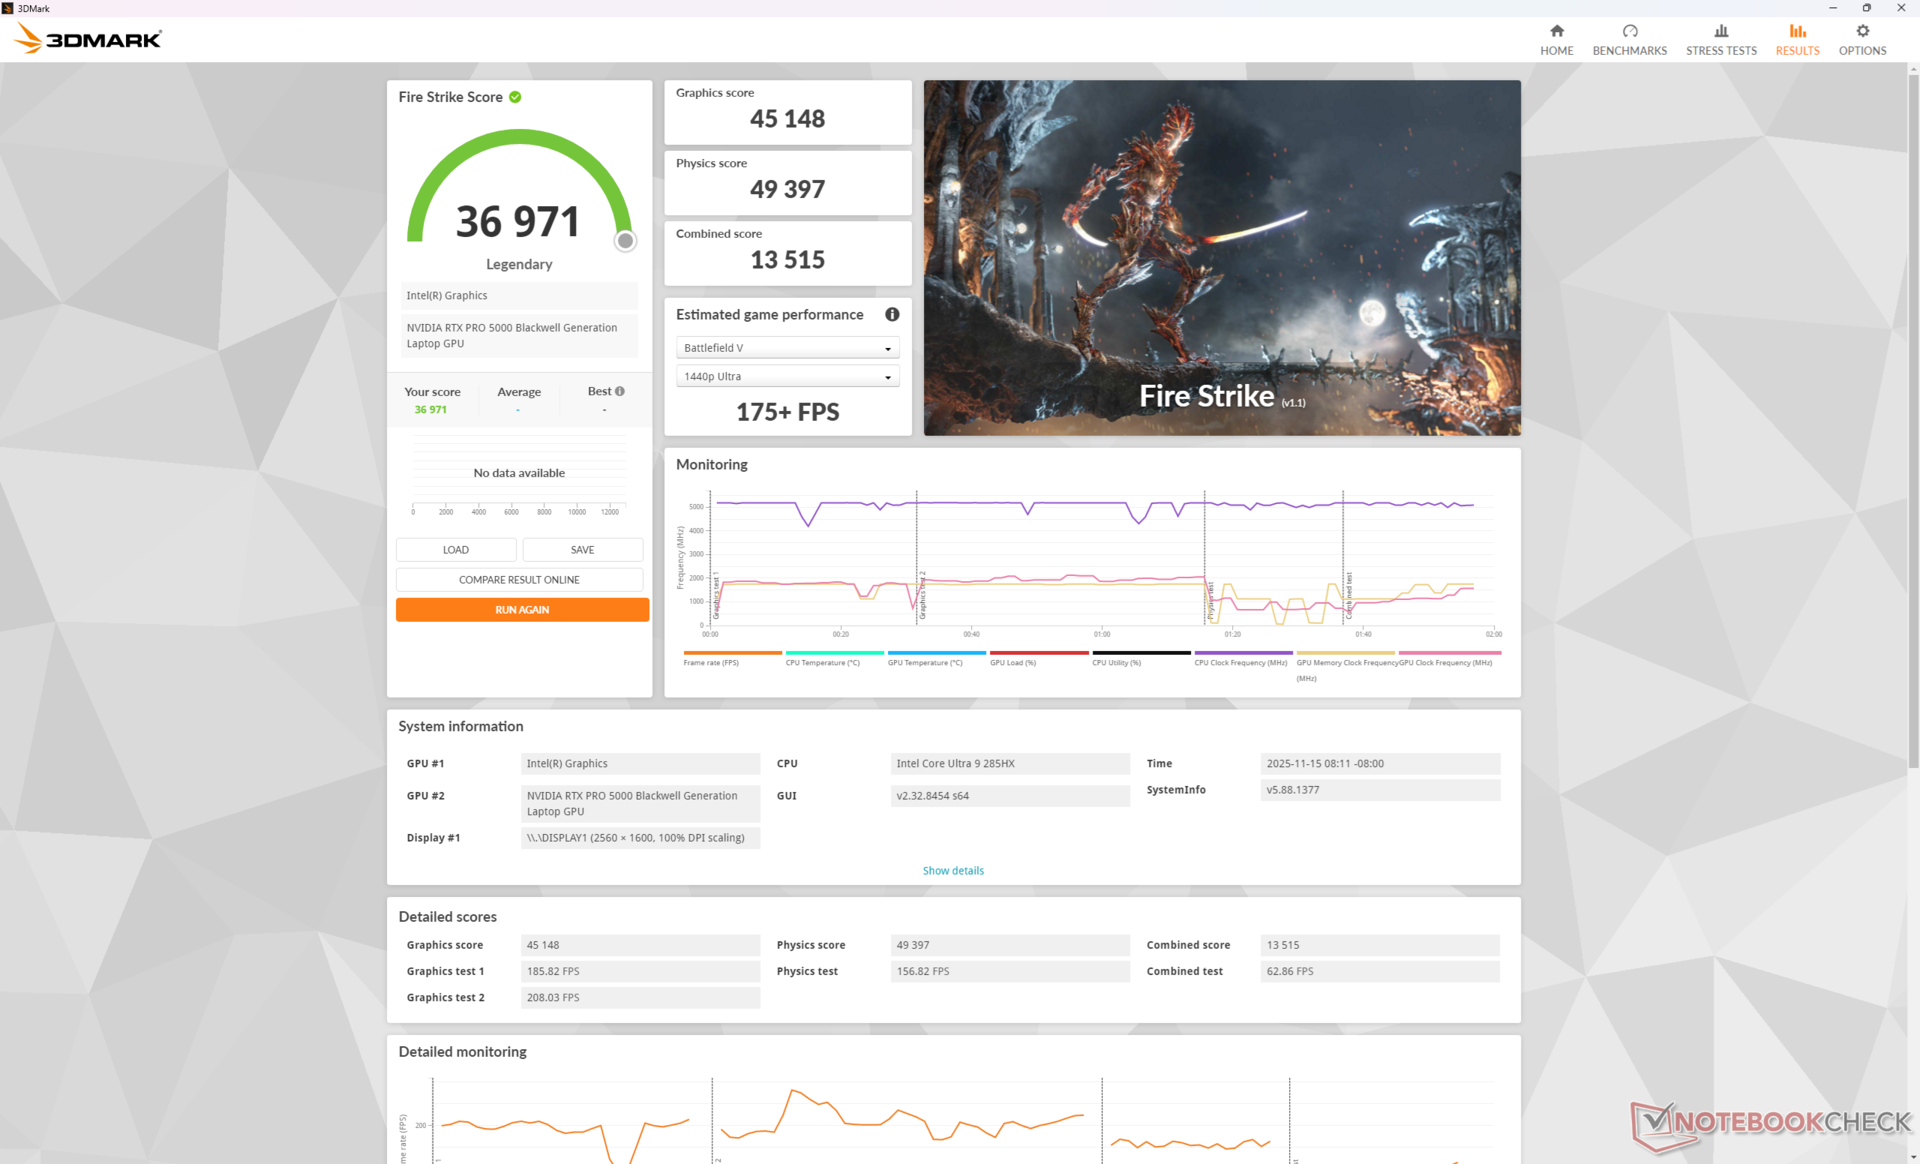
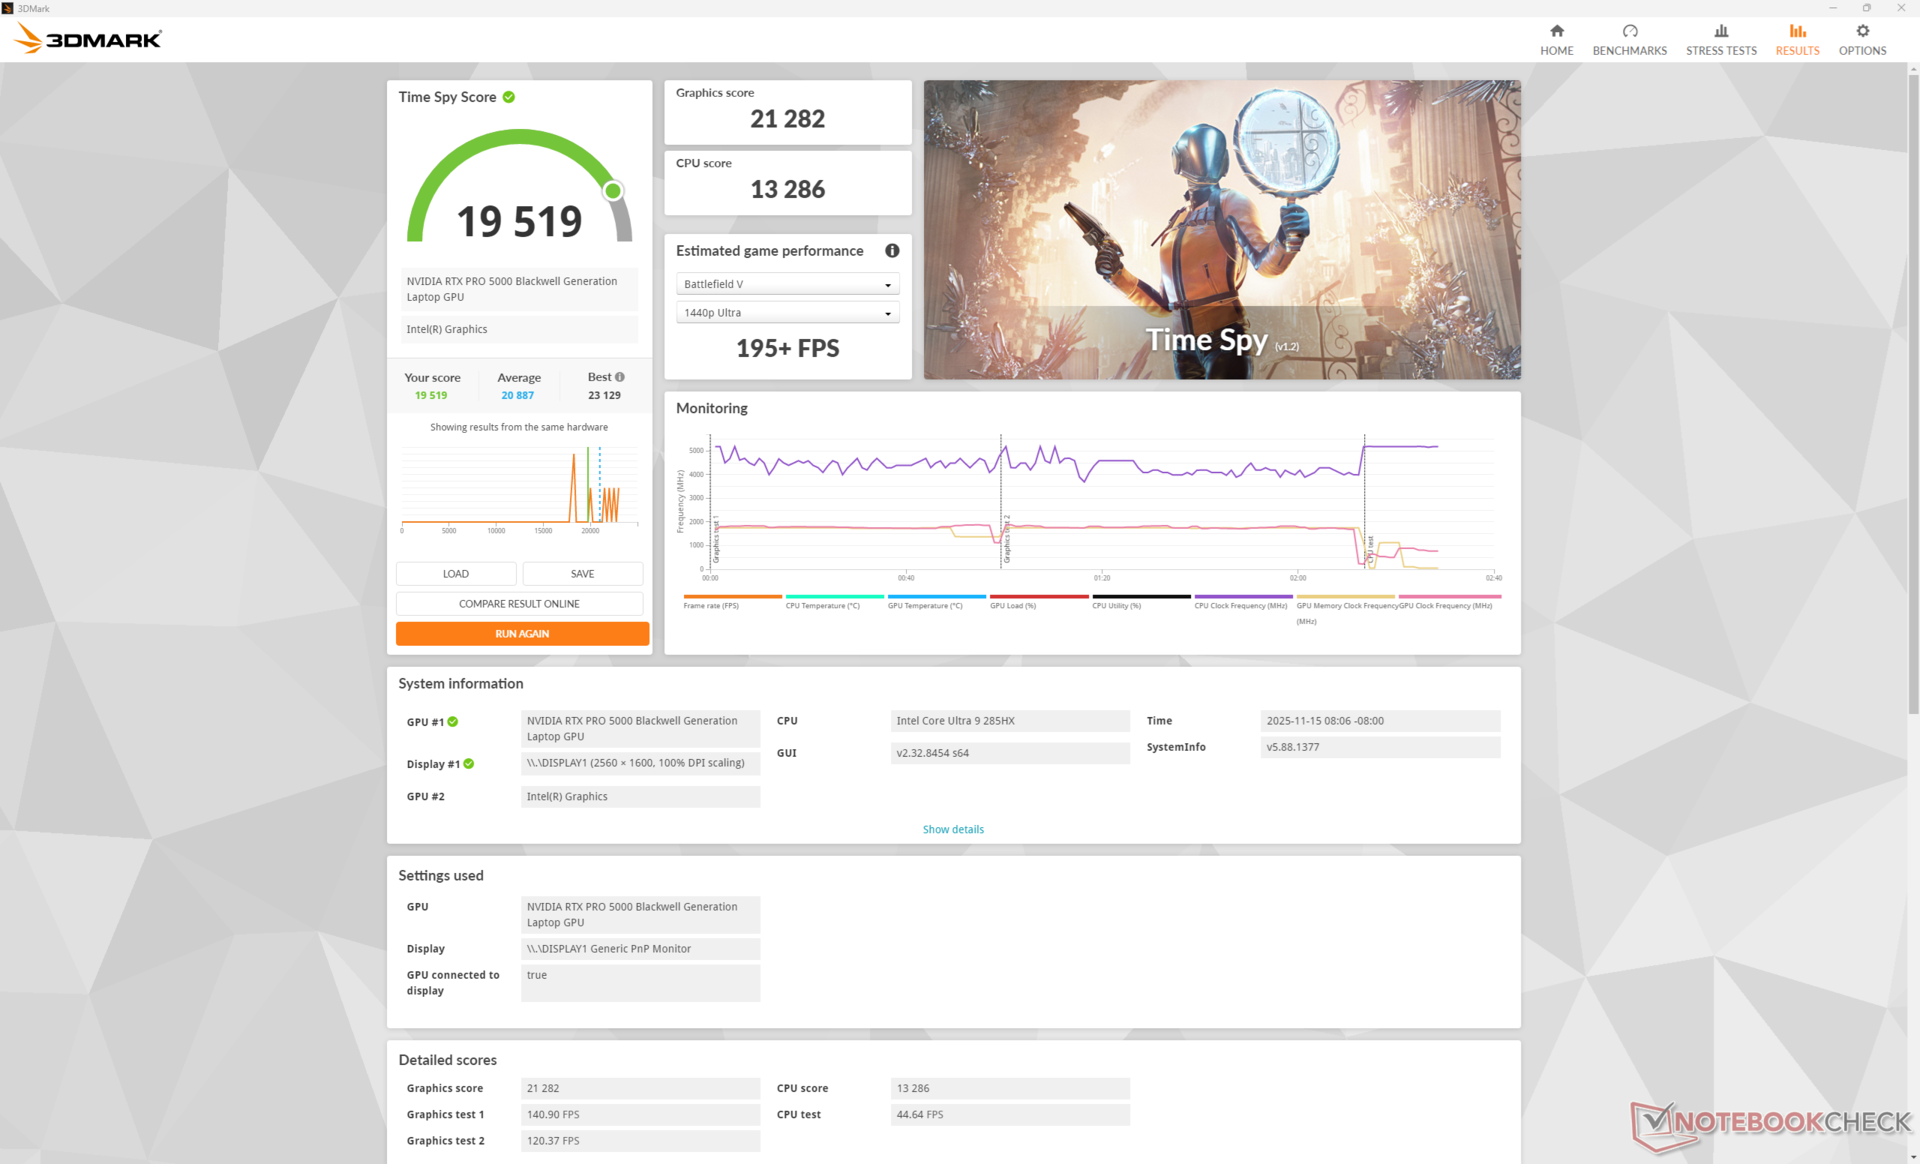
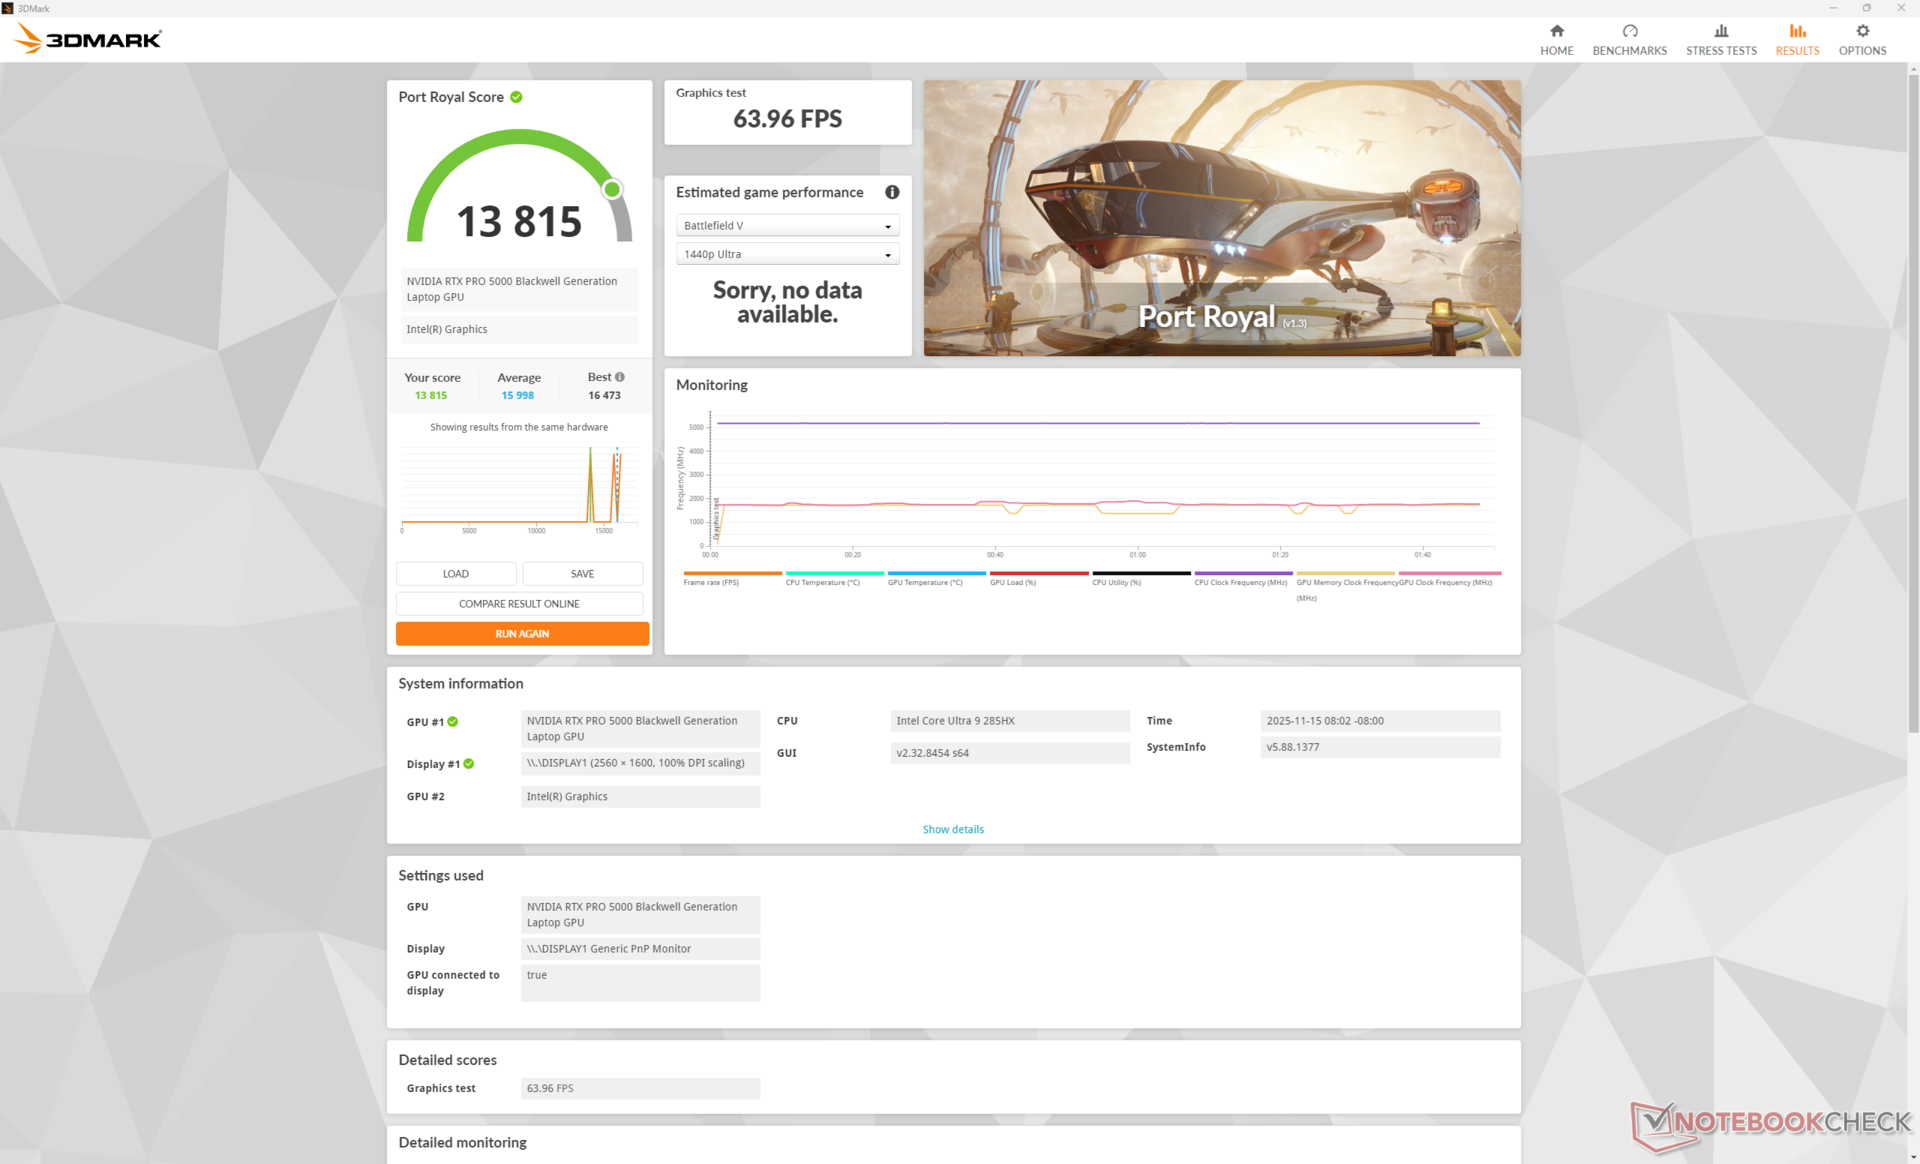
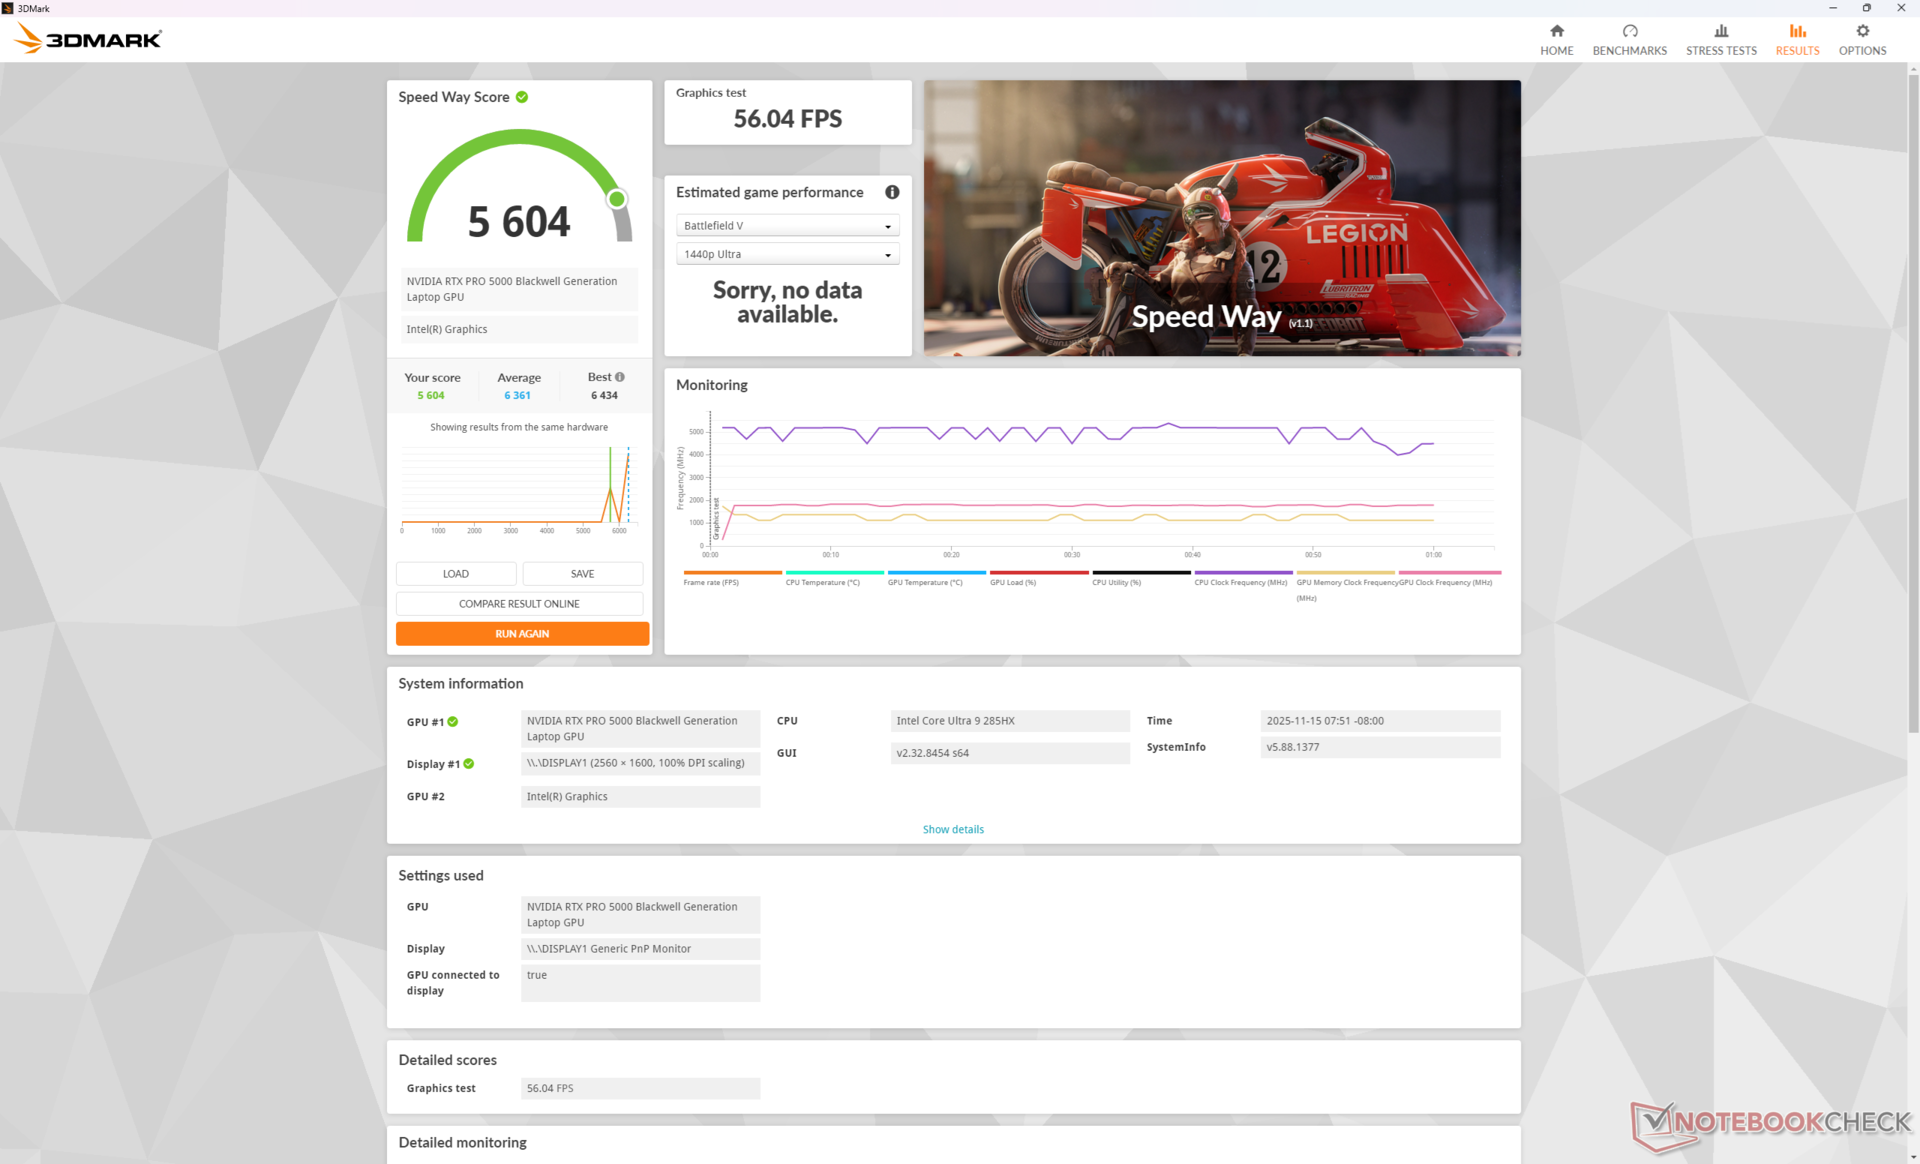
La Nvidia RTX Pro 5000 Blackwell nel nostro HP è sempre più lenta della stessa GPU nel Dell Pro Max 18 Plus. Questo è dovuto in gran parte al fatto che la GPU dell'HP punta a 150 W, mentre la GPU dell'Dell punta a 175 W per prestazioni leggermente più veloci. I vantaggi in termini di prestazioni rispetto alle opzioni Ada di ultima generazione sono comunque più significativi.
| Profilo energetico | Punteggio grafico | Punteggio Fisica | Punteggio combinato |
| Modalità Prestazioni | 45148 | 49397 | 13515 |
| Modalità equilibrata | 43709 (-3%) | 48299 (-2%) | 11177 (-17%) |
| Potenza della batteria | 28042 (-38%) | 21361 (-57%) | 7409 (-45%) |
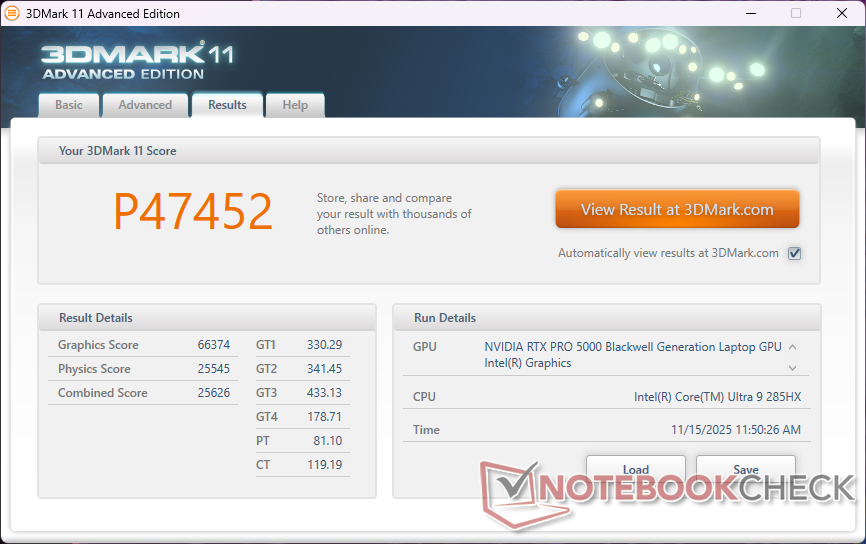
| 3DMark 11 Performance | 47452 punti | |
| 3DMark Cloud Gate Standard Score | 51342 punti | |
| 3DMark Fire Strike Score | 36971 punti | |
| 3DMark Time Spy Score | 19519 punti | |
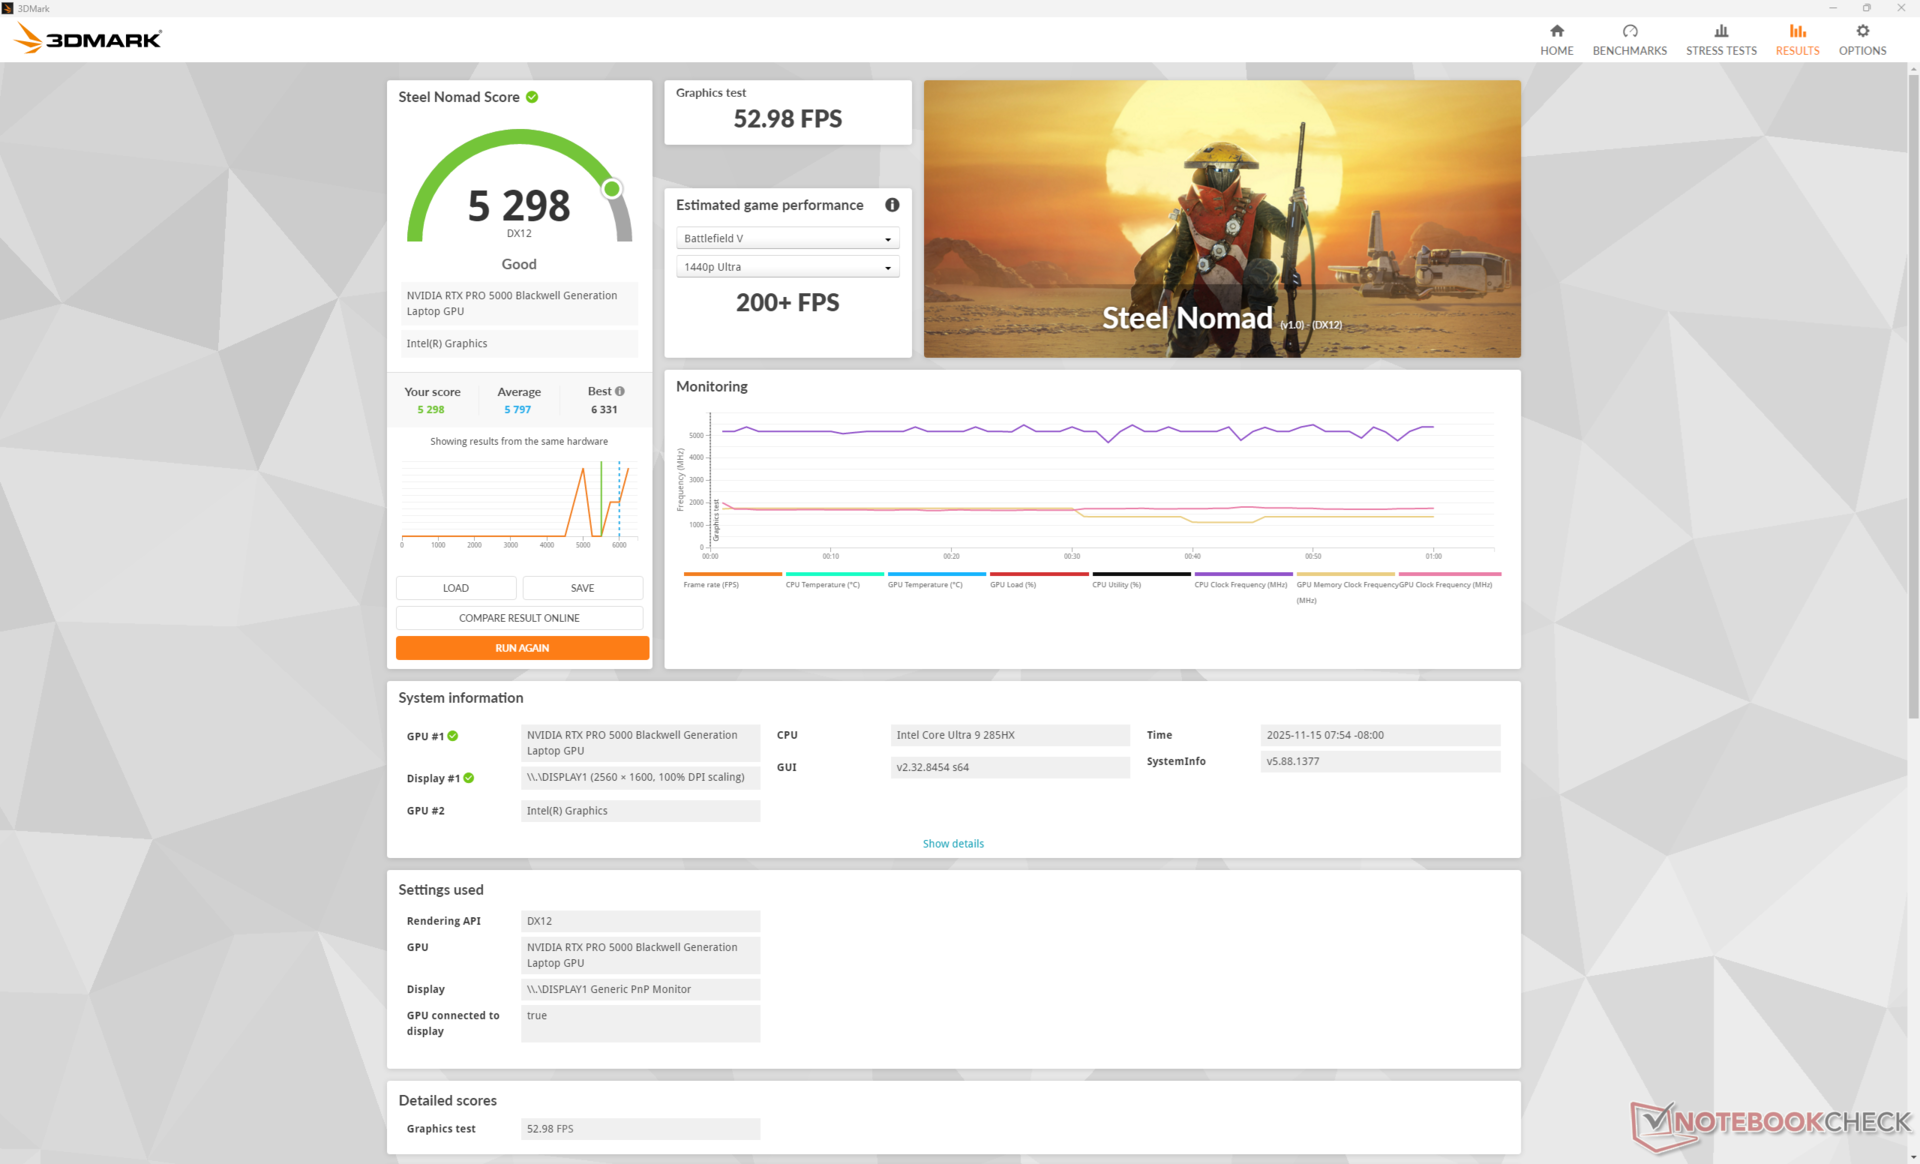
| 3DMark Steel Nomad Score | 5298 punti | |
Aiuto | ||
* ... Meglio usare valori piccoli
| Performance rating - Percent | |
| Dell Pro Max 18 Plus MB18250 | |
| Schenker Key 18 Pro M25 RTX 5090 | |
| HP ZBook Fury G1i 18 | |
| Lenovo ThinkPad P16 Gen 2 | |
| HP ZBook X G1i 16 | |
| HP ZBook Studio 16 G11 | |
| Cyberpunk 2077 - 1920x1080 Ultra Preset (FSR off) | |
| Dell Pro Max 18 Plus MB18250 | |
| Schenker Key 18 Pro M25 RTX 5090 | |
| HP ZBook Fury G1i 18 | |
| Lenovo ThinkPad P16 Gen 2 | |
| HP ZBook X G1i 16 | |
| HP ZBook Studio 16 G11 | |
| Baldur's Gate 3 - 1920x1080 Ultra Preset AA:T | |
| Dell Pro Max 18 Plus MB18250 | |
| Schenker Key 18 Pro M25 RTX 5090 | |
| HP ZBook Fury G1i 18 | |
| Lenovo ThinkPad P16 Gen 2 | |
| HP ZBook Studio 16 G11 | |
| HP ZBook X G1i 16 | |
| GTA V - 1920x1080 Highest AA:4xMSAA + FX AF:16x | |
| Dell Pro Max 18 Plus MB18250 | |
| Schenker Key 18 Pro M25 RTX 5090 | |
| HP ZBook Fury G1i 18 | |
| Lenovo ThinkPad P16 Gen 2 | |
| HP ZBook X G1i 16 | |
| HP ZBook Studio 16 G11 | |
| Final Fantasy XV Benchmark - 1920x1080 High Quality | |
| Dell Pro Max 18 Plus MB18250 | |
| HP ZBook Fury G1i 18 | |
| Schenker Key 18 Pro M25 RTX 5090 | |
| Lenovo ThinkPad P16 Gen 2 | |
| HP ZBook X G1i 16 | |
| HP ZBook Studio 16 G11 | |
| Strange Brigade - 1920x1080 ultra AA:ultra AF:16 | |
| Dell Pro Max 18 Plus MB18250 | |
| HP ZBook Fury G1i 18 | |
| Schenker Key 18 Pro M25 RTX 5090 | |
| Lenovo ThinkPad P16 Gen 2 | |
| HP ZBook Studio 16 G11 | |
| HP ZBook X G1i 16 | |
| Dota 2 Reborn - 1920x1080 ultra (3/3) best looking | |
| Lenovo ThinkPad P16 Gen 2 | |
| Dell Pro Max 18 Plus MB18250 | |
| HP ZBook Fury G1i 18 | |
| Schenker Key 18 Pro M25 RTX 5090 | |
| HP ZBook Studio 16 G11 | |
| HP ZBook X G1i 16 | |
| X-Plane 11.11 - 1920x1080 high (fps_test=3) | |
| Lenovo ThinkPad P16 Gen 2 | |
| Dell Pro Max 18 Plus MB18250 | |
| Schenker Key 18 Pro M25 RTX 5090 | |
| HP ZBook Fury G1i 18 | |
| HP ZBook Studio 16 G11 | |
| HP ZBook X G1i 16 | |
| F1 24 | |
| 3840x2160 Ultra High Preset AA:T AF:16x | |
| Dell Pro Max 18 Plus MB18250 | |
| Media NVIDIA RTX PRO 5000 Blackwell Generation Laptop (43.2 - 50.2, n=3) | |
| HP ZBook Fury G1i 18 | |
| Schenker Key 18 Pro M25 RTX 5090 | |
| 3840x2160 Ultra High Preset + Quality DLSS AF:16x | |
| Dell Pro Max 18 Plus MB18250 | |
| Media NVIDIA RTX PRO 5000 Blackwell Generation Laptop (71.8 - 85.7, n=3) | |
| HP ZBook Fury G1i 18 | |
| Schenker Key 18 Pro M25 RTX 5090 | |
| 2560x1440 Ultra High Preset + Quality DLSS AF:16x | |
| Dell Pro Max 18 Plus MB18250 | |
| Media NVIDIA RTX PRO 5000 Blackwell Generation Laptop (126.8 - 148.6, n=3) | |
| HP ZBook Fury G1i 18 | |
| Schenker Key 18 Pro M25 RTX 5090 | |
| HP ZBook X G1i 16 | |
| GTA V | |
| 3840x2160 High/On (Advanced Graphics Off) AA:FX AF:8x | |
| Media NVIDIA RTX PRO 5000 Blackwell Generation Laptop (165.3 - 170.3, n=2) | |
| HP ZBook Fury G1i 18 | |
| Lenovo Legion Pro 5 16IAX10, RTX 5070 | |
| 3840x2160 Highest AA:4xMSAA + FX AF:16x | |
| Schenker Key 18 Pro M25 RTX 5090 | |
| Media NVIDIA RTX PRO 5000 Blackwell Generation Laptop (101.6 - 105.5, n=2) | |
| HP ZBook Fury G1i 18 | |
| Lenovo Legion Pro 5 16IAX10, RTX 5070 | |
| Lenovo Legion Pro 5 16IAX10, RTX 5070 | |
| Dota 2 Reborn - 3840x2160 ultra (3/3) best looking | |
| Schenker Key 18 Pro M25 RTX 5090 | |
| Dell Pro Max 18 Plus MB18250 | |
| Media NVIDIA RTX PRO 5000 Blackwell Generation Laptop (143.9 - 149.4, n=3) | |
| HP ZBook Fury G1i 18 | |
| Lenovo ThinkPad P16 G1 RTX A5500 | |
| Lenovo Legion Pro 5 16IAX10, RTX 5070 | |
| Final Fantasy XV Benchmark - 3840x2160 High Quality | |
| Schenker Key 18 Pro M25 RTX 5090 | |
| Dell Pro Max 18 Plus MB18250 | |
| Media NVIDIA RTX PRO 5000 Blackwell Generation Laptop (88.4 - 102.2, n=3) | |
| HP ZBook Fury G1i 18 | |
| Lenovo Legion Pro 5 16IAX10, RTX 5070 | |
| Lenovo ThinkPad P16 G1 RTX A5500 | |
Grafico Cyberpunk 2077 ultra FPS
| basso | medio | alto | ultra | QHD DLSS | QHD | 4K DLSS | 4K | |
|---|---|---|---|---|---|---|---|---|
| GTA V (2015) | 186.5 | 181.3 | 175.3 | 133.6 | 130.5 | 165.3 | ||
| Dota 2 Reborn (2015) | 215 | 187.2 | 175 | 162 | 143.9 | |||
| Final Fantasy XV Benchmark (2018) | 232 | 222 | 183.8 | 145.7 | 88.4 | |||
| X-Plane 11.11 (2018) | 137.3 | 114.9 | 92 | 74.2 | ||||
| Strange Brigade (2018) | 619 | 493 | 440 | 396 | 303 | 165.7 | ||
| Baldur's Gate 3 (2023) | 245 | 208 | 182 | 177 | 179.4 | 129.5 | 114.3 | 74.1 |
| Cyberpunk 2077 (2023) | 171.8 | 173.3 | 157.7 | 143.7 | 109 | 98 | 46.1 | |
| F1 24 (2024) | 281 | 297 | 272 | 125.7 | 126.8 | 84.4 | 71.8 | 43.2 |
Emissioni
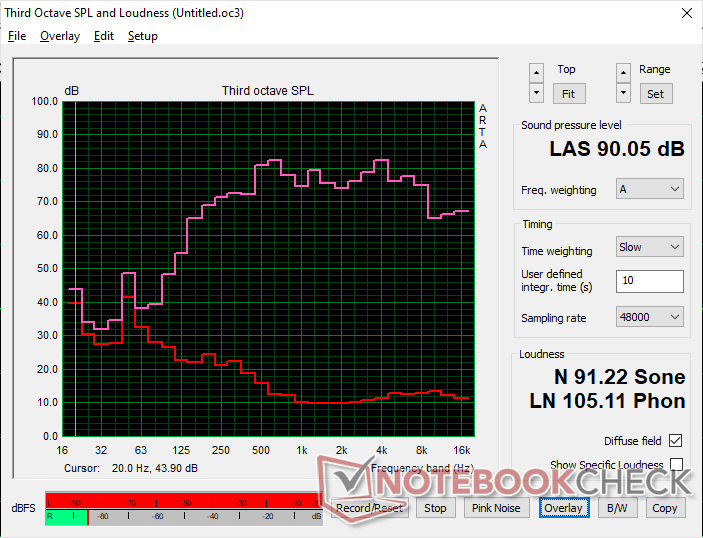
Rumore del sistema
Le ventole interne sono impercettibili quando sono al minimo o quando si eseguono attività poco impegnative come browser o Excel. Tuttavia, aumentano molto rapidamente quando si introducono carichi più elevati. In effetti, il sistema non è più silenzioso di Dell, nonostante entrambi i modelli abbiano la stessa CPU e GPU.
Rumorosità
| Idle |
| 25.7 / 25.7 / 25.7 dB(A) |
| Sotto carico |
| 48.3 / 56.5 dB(A) |
 | ||
30 dB silenzioso 40 dB(A) udibile 50 dB(A) rumoroso |
||
min: | ||
| HP ZBook Fury G1i 18 Ultra 9 285HX, RTX PRO 5000 Blackwell Generation Laptop | Dell Pro Max 18 Plus MB18250 Ultra 9 285HX, RTX PRO 5000 Blackwell Generation Laptop | Schenker Key 18 Pro M25 RTX 5090 Ultra 9 275HX, GeForce RTX 5090 Laptop | Lenovo ThinkPad P16 Gen 2 i7-14700HX, RTX 4000 Ada Generation Laptop | HP ZBook X G1i 16 Ultra 7 265H, RTX PRO 2000 Blackwell Generation Laptop | HP ZBook Studio 16 G11 Ultra 9 185H, RTX 3000 Ada Generation Laptop | |
|---|---|---|---|---|---|---|
| Noise | 4% | 2% | -1% | 13% | 9% | |
| off /ambiente * (dB) | 24.9 | 23.1 7% | 23.9 4% | 23.9 4% | 23.7 5% | 23.8 4% |
| Idle Minimum * (dB) | 25.7 | 27.1 -5% | 25.2 2% | 29.1 -13% | 23.7 8% | 23.8 7% |
| Idle Average * (dB) | 25.7 | 27.1 -5% | 25.2 2% | 29.1 -13% | 23.7 8% | 26.4 -3% |
| Idle Maximum * (dB) | 25.7 | 27.1 -5% | 25.2 2% | 29.1 -13% | 23.7 8% | 26.4 -3% |
| Load Average * (dB) | 48.3 | 38 21% | 47.8 1% | 41 15% | 32.7 32% | 33.7 30% |
| Cyberpunk 2077 ultra * (dB) | 58.2 | 53.8 8% | 54.4 7% | 52.8 9% | 50.9 13% | 46.1 21% |
| Load Maximum * (dB) | 56.5 | 53.8 5% | 58.6 -4% | 52.9 6% | 48 15% | 53.2 6% |
* ... Meglio usare valori piccoli
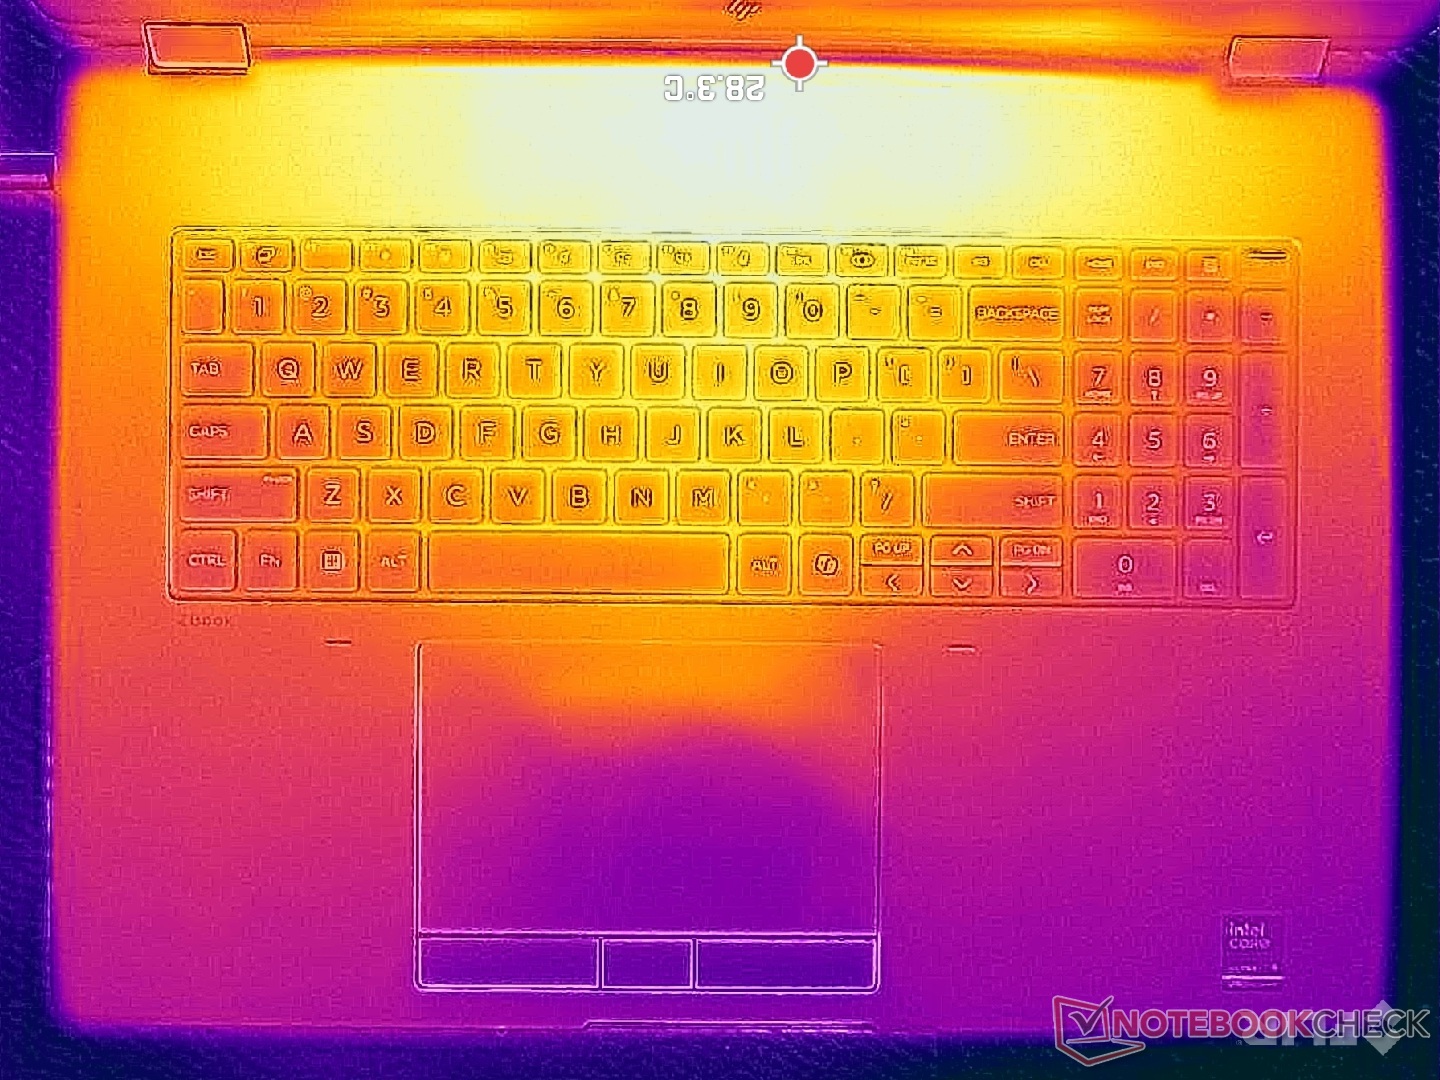
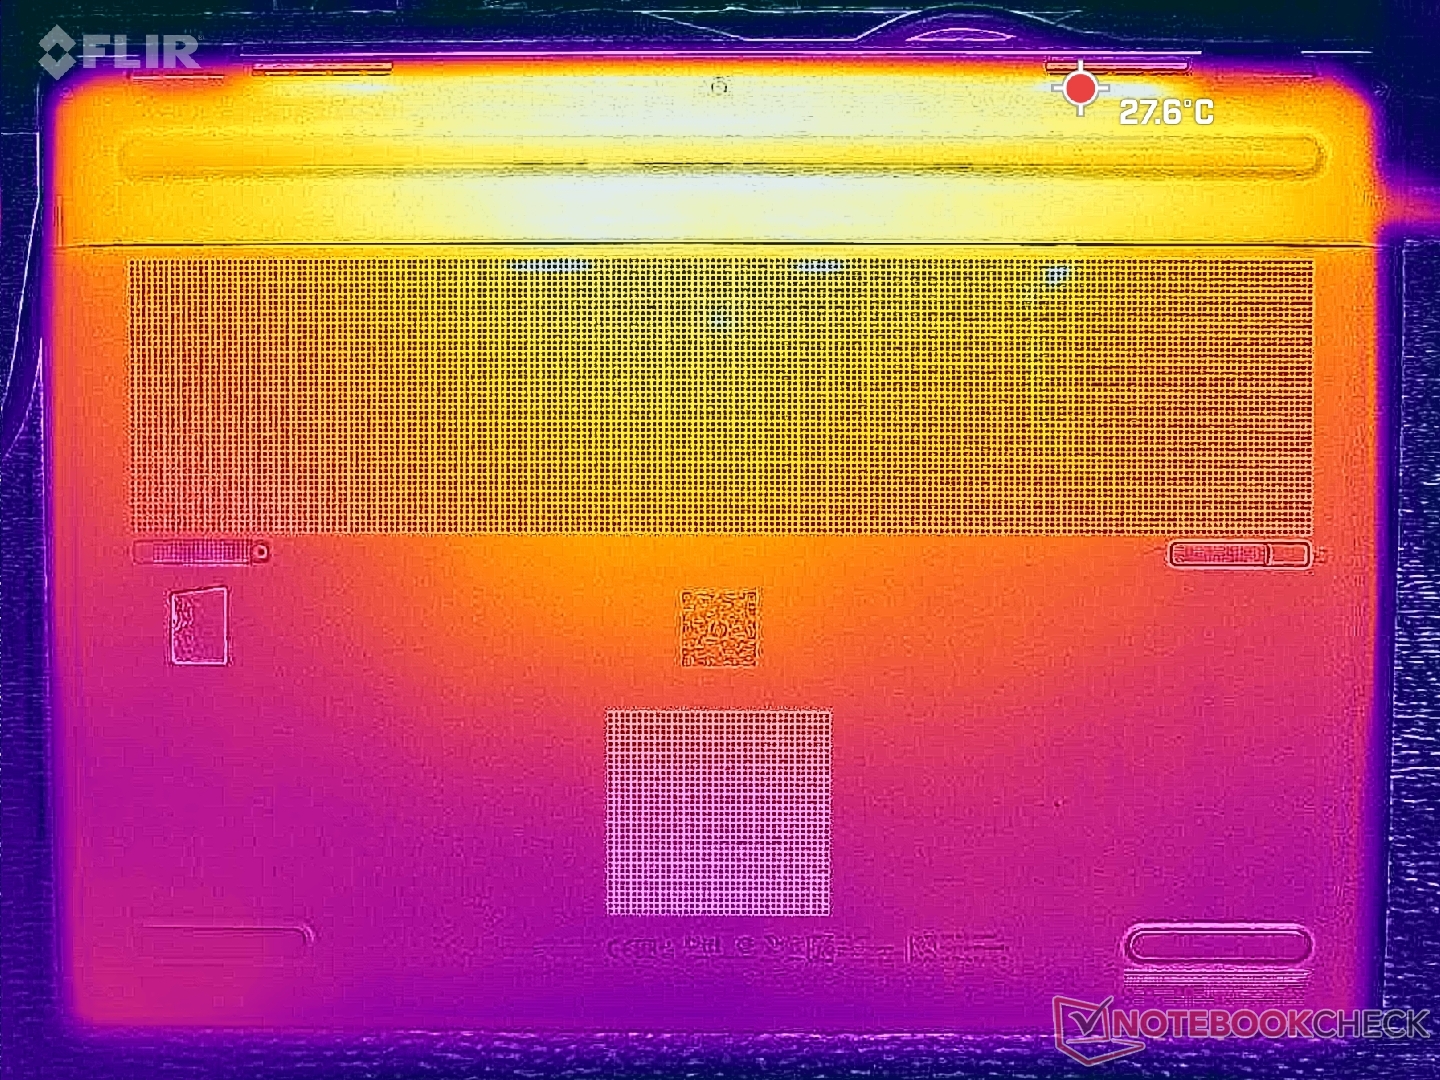
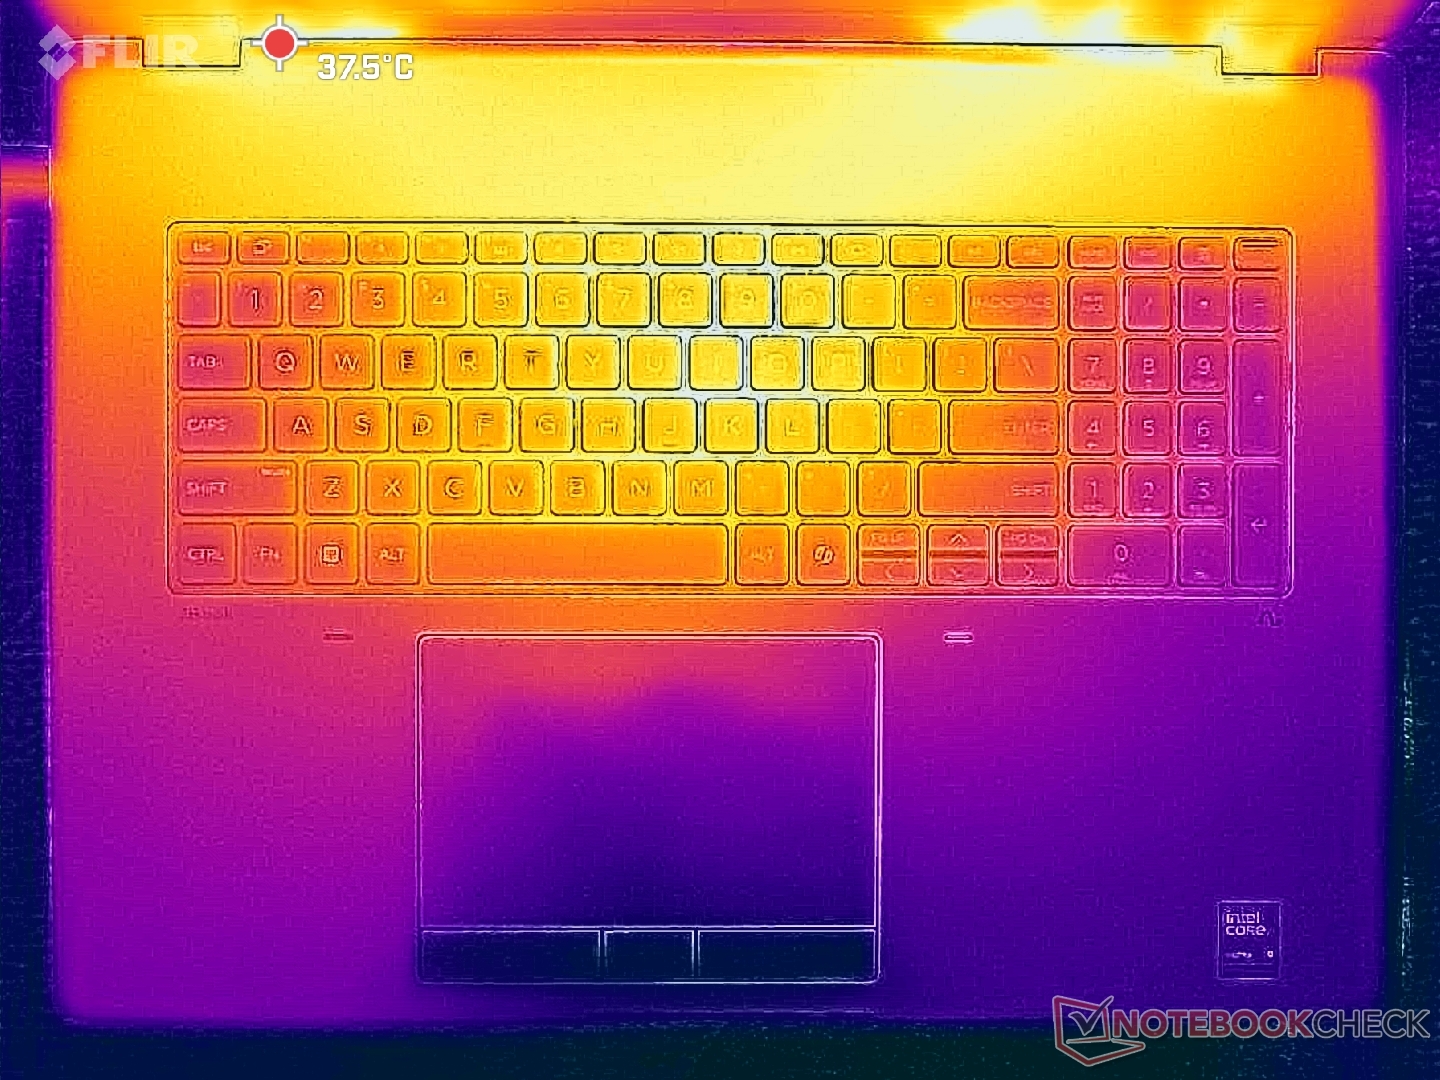
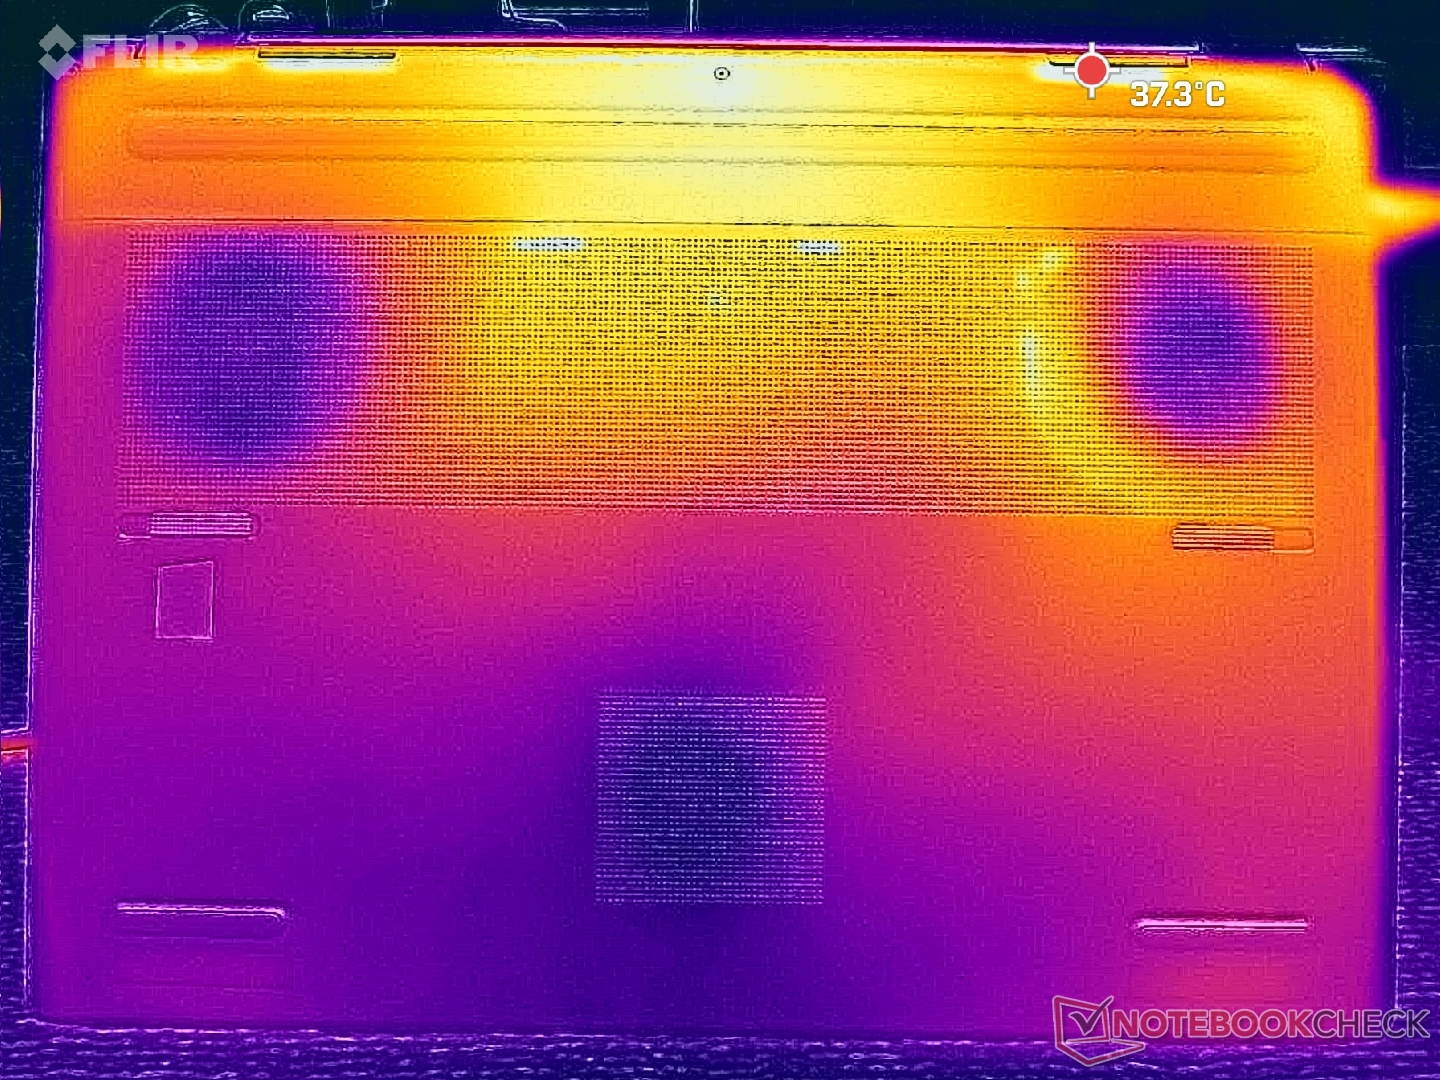
Temperatura
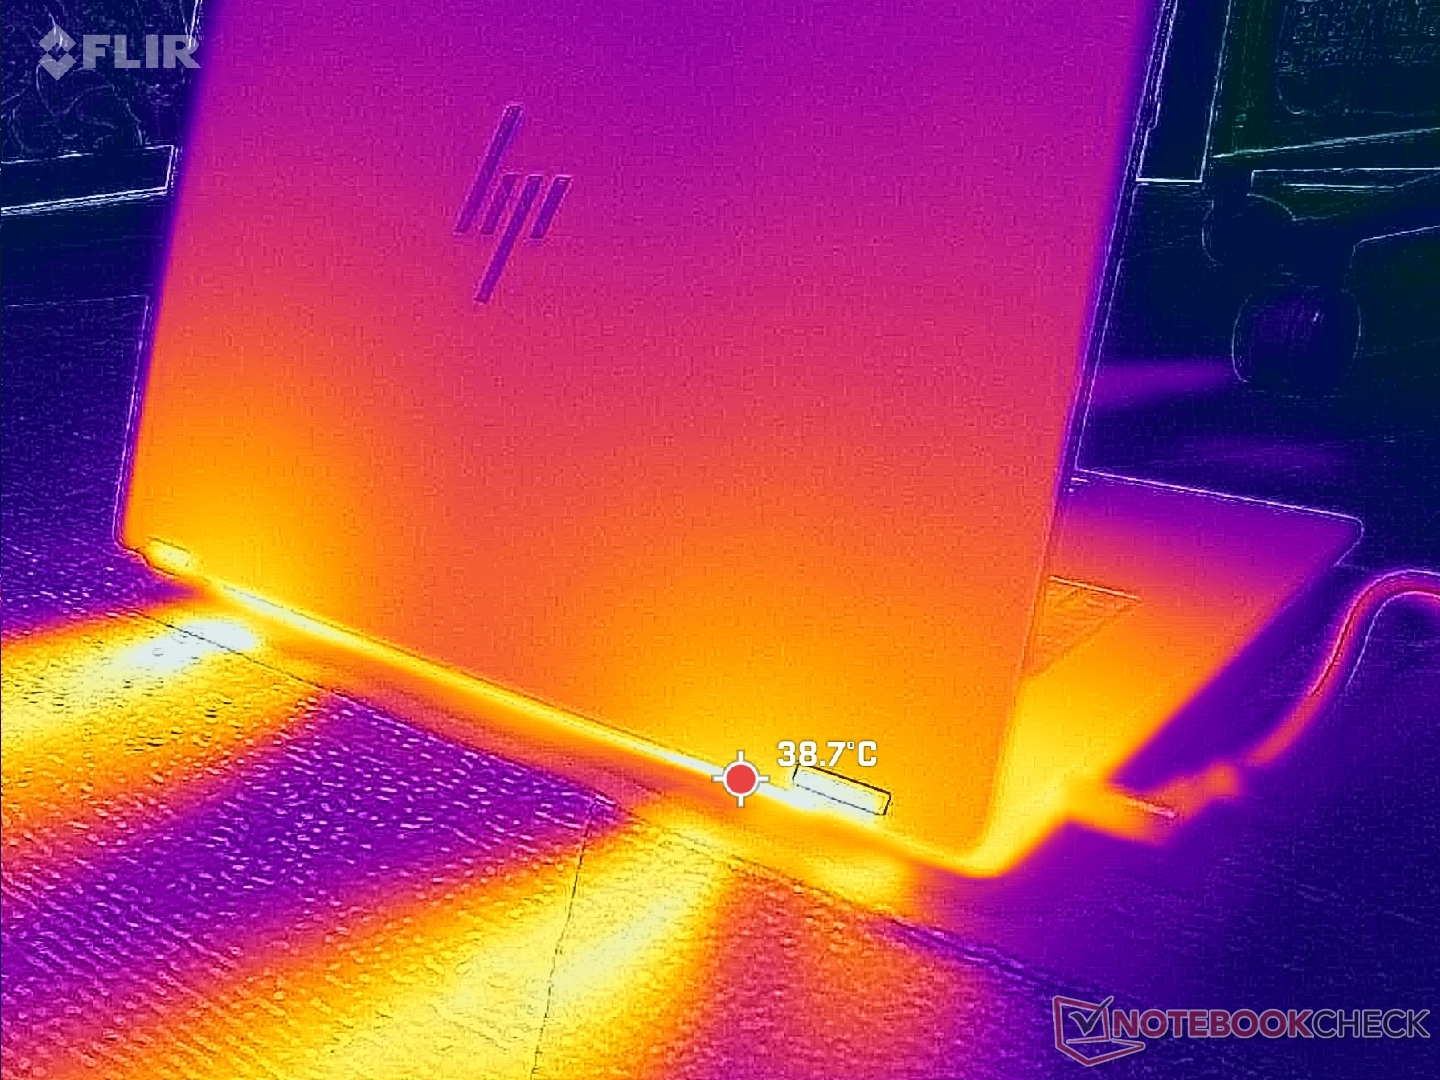
Le temperature della superficie rimangono ragionevolmente fresche anche quando si eseguono carichi impegnativi. I punti caldi sul piano della tastiera e sul coperchio inferiore raggiungerebbero rispettivamente 40 C e 36 C, rispetto ai quasi 50 C del modello Schenker Key 18 Pro.
(+) La temperatura massima sul lato superiore è di 39.6 °C / 103 F, rispetto alla media di 38.2 °C / 101 F, che varia da 22.2 a 69.8 °C per questa classe Workstation.
(+) Il lato inferiore si riscalda fino ad un massimo di 35.4 °C / 96 F, rispetto alla media di 41.1 °C / 106 F
(+) In idle, la temperatura media del lato superiore è di 28.4 °C / 83 F, rispetto alla media deld ispositivo di 32 °C / 90 F.
(+) I poggiapolsi e il touchpad sono piu' freddi della temperatura della pelle con un massimo di 26 °C / 78.8 F e sono quindi freddi al tatto.
(±) La temperatura media della zona del palmo della mano di dispositivi simili e'stata di 27.8 °C / 82 F (+1.8 °C / 3.2 F).
| HP ZBook Fury G1i 18 Ultra 9 285HX, RTX PRO 5000 Blackwell Generation Laptop | Dell Pro Max 18 Plus MB18250 Ultra 9 285HX, RTX PRO 5000 Blackwell Generation Laptop | Schenker Key 18 Pro M25 RTX 5090 Ultra 9 275HX, GeForce RTX 5090 Laptop | Lenovo ThinkPad P16 Gen 2 i7-14700HX, RTX 4000 Ada Generation Laptop | HP ZBook X G1i 16 Ultra 7 265H, RTX PRO 2000 Blackwell Generation Laptop | HP ZBook Studio 16 G11 Ultra 9 185H, RTX 3000 Ada Generation Laptop | |
|---|---|---|---|---|---|---|
| Heat | -12% | -14% | -6% | 0% | -10% | |
| Maximum Upper Side * (°C) | 39.6 | 44.8 -13% | 47.5 -20% | 46.6 -18% | 36 9% | 36.6 8% |
| Maximum Bottom * (°C) | 35.4 | 47 -33% | 52.8 -49% | 51 -44% | 39.4 -11% | 47.8 -35% |
| Idle Upper Side * (°C) | 31.6 | 31.8 -1% | 28.5 10% | 24.8 22% | 30.4 4% | 31.4 1% |
| Idle Bottom * (°C) | 31.2 | 31.4 -1% | 30.1 4% | 25.6 18% | 31.8 -2% | 35.6 -14% |
* ... Meglio usare valori piccoli
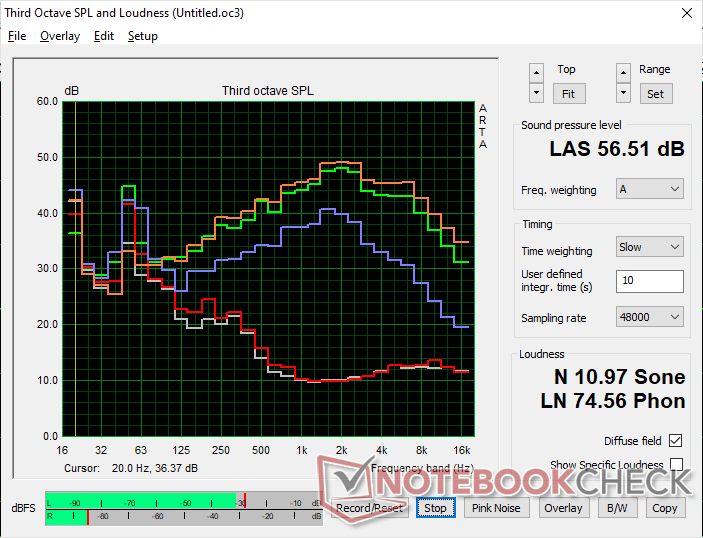
Altoparlanti
HP ZBook Fury G1i 18 analisi audio
(+) | gli altoparlanti sono relativamente potenti (90.1 dB)
Bassi 100 - 315 Hz
(±) | bassi ridotti - in media 11.4% inferiori alla media
(±) | la linearità dei bassi è media (8.9% delta rispetto alla precedente frequenza)
Medi 400 - 2000 Hz
(+) | medi bilanciati - solo only 3.2% rispetto alla media
(+) | medi lineari (5.6% delta rispetto alla precedente frequenza)
Alti 2 - 16 kHz
(+) | Alti bilanciati - appena 3.7% dalla media
(+) | alti lineari (6.5% delta rispetto alla precedente frequenza)
Nel complesso 100 - 16.000 Hz
(+) | suono nel complesso lineare (10.8% differenza dalla media)
Rispetto alla stessa classe
» 10% di tutti i dispositivi testati in questa classe è stato migliore, 4% simile, 86% peggiore
» Il migliore ha avuto un delta di 7%, medio di 17%, peggiore di 35%
Rispetto a tutti i dispositivi testati
» 6% di tutti i dispositivi testati in questa classe è stato migliore, 2% similare, 92% peggiore
» Il migliore ha avuto un delta di 4%, medio di 23%, peggiore di 134%
Apple MacBook Pro 16 2021 M1 Pro analisi audio
(+) | gli altoparlanti sono relativamente potenti (84.7 dB)
Bassi 100 - 315 Hz
(+) | bassi buoni - solo 3.8% dalla media
(+) | bassi in lineaa (5.2% delta rispetto alla precedente frequenza)
Medi 400 - 2000 Hz
(+) | medi bilanciati - solo only 1.3% rispetto alla media
(+) | medi lineari (2.1% delta rispetto alla precedente frequenza)
Alti 2 - 16 kHz
(+) | Alti bilanciati - appena 1.9% dalla media
(+) | alti lineari (2.7% delta rispetto alla precedente frequenza)
Nel complesso 100 - 16.000 Hz
(+) | suono nel complesso lineare (4.6% differenza dalla media)
Rispetto alla stessa classe
» 0% di tutti i dispositivi testati in questa classe è stato migliore, 0% simile, 100% peggiore
» Il migliore ha avuto un delta di 5%, medio di 17%, peggiore di 45%
Rispetto a tutti i dispositivi testati
» 0% di tutti i dispositivi testati in questa classe è stato migliore, 0% similare, 100% peggiore
» Il migliore ha avuto un delta di 4%, medio di 23%, peggiore di 134%
Gestione dell'energia
Consumo di energia
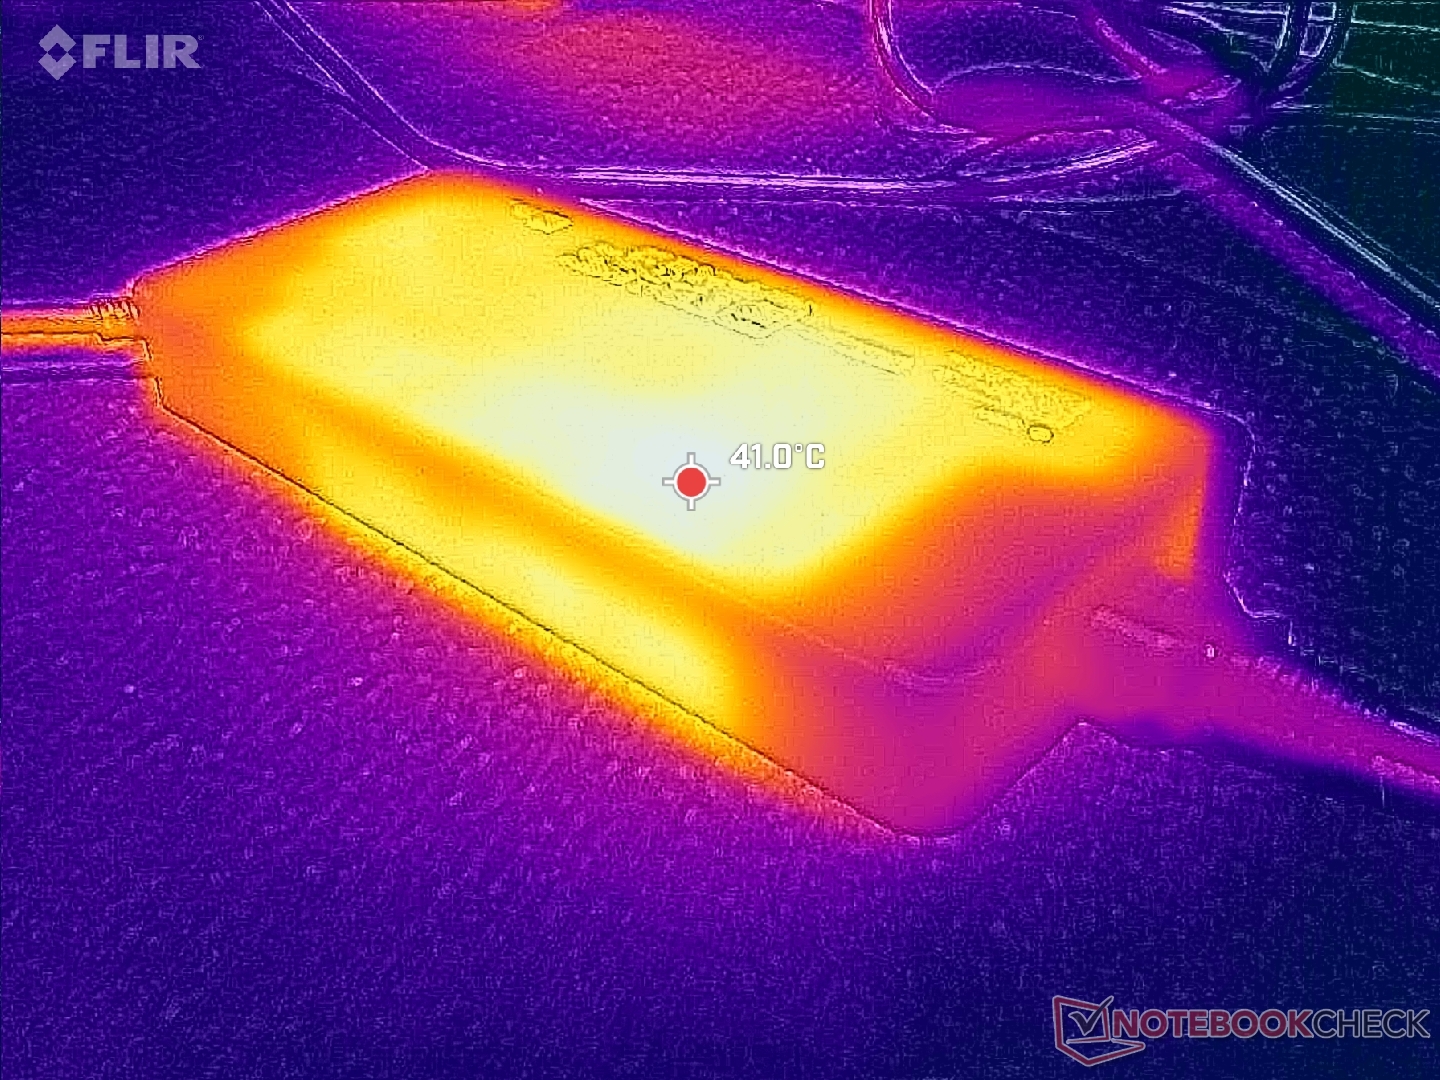
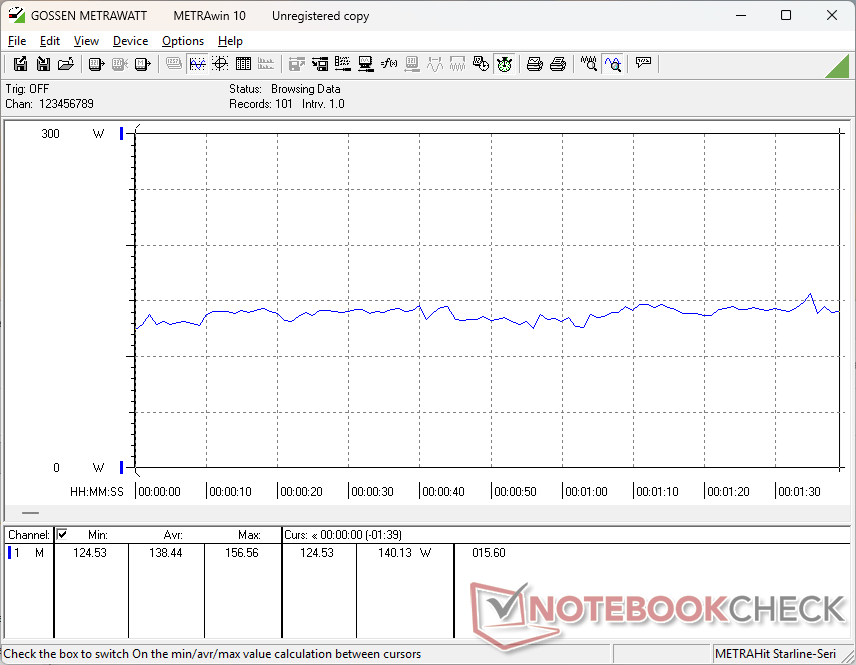
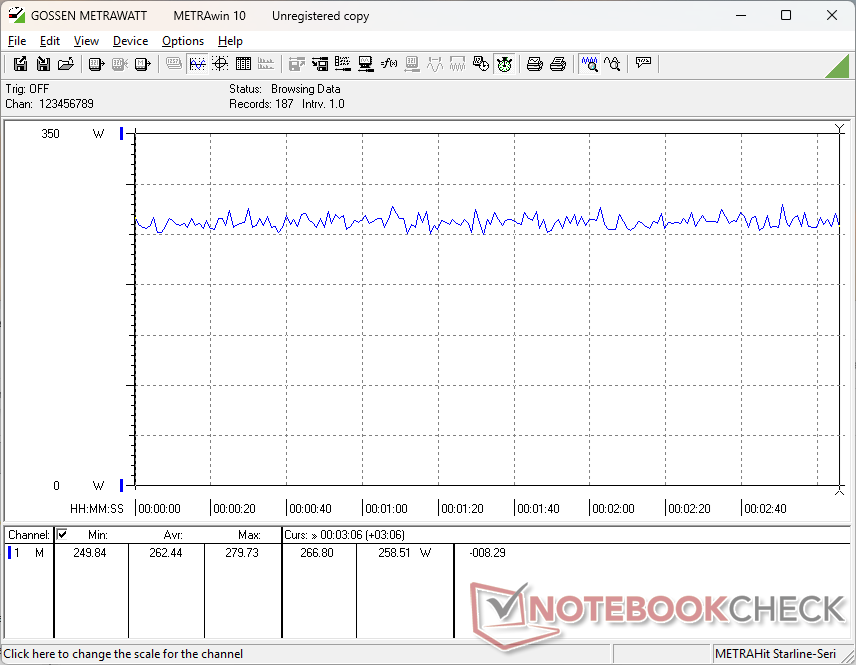
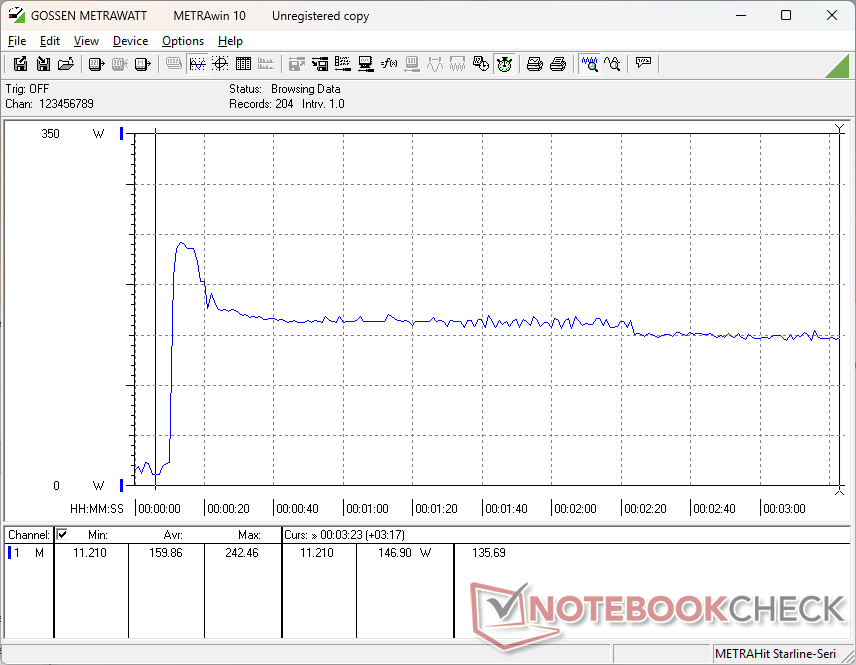
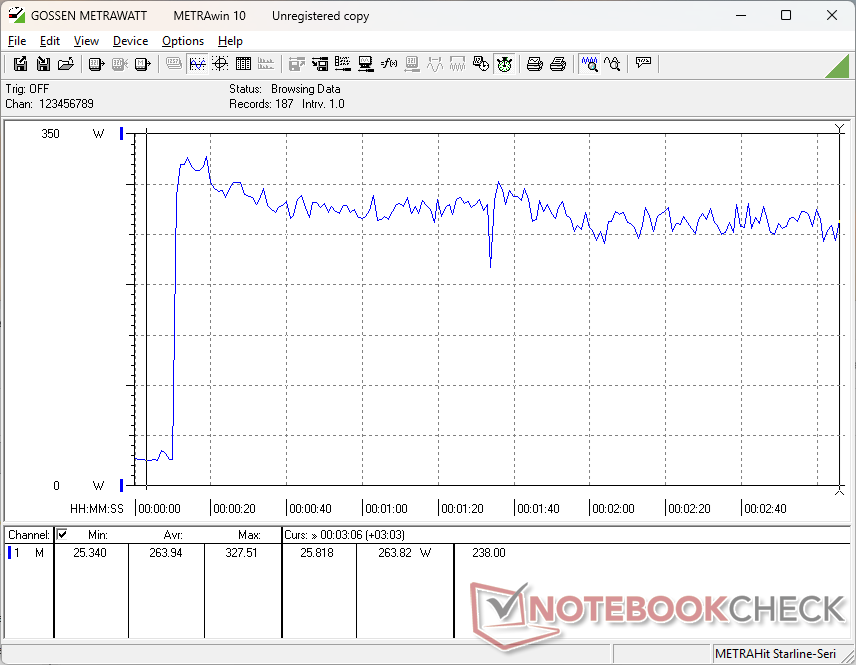
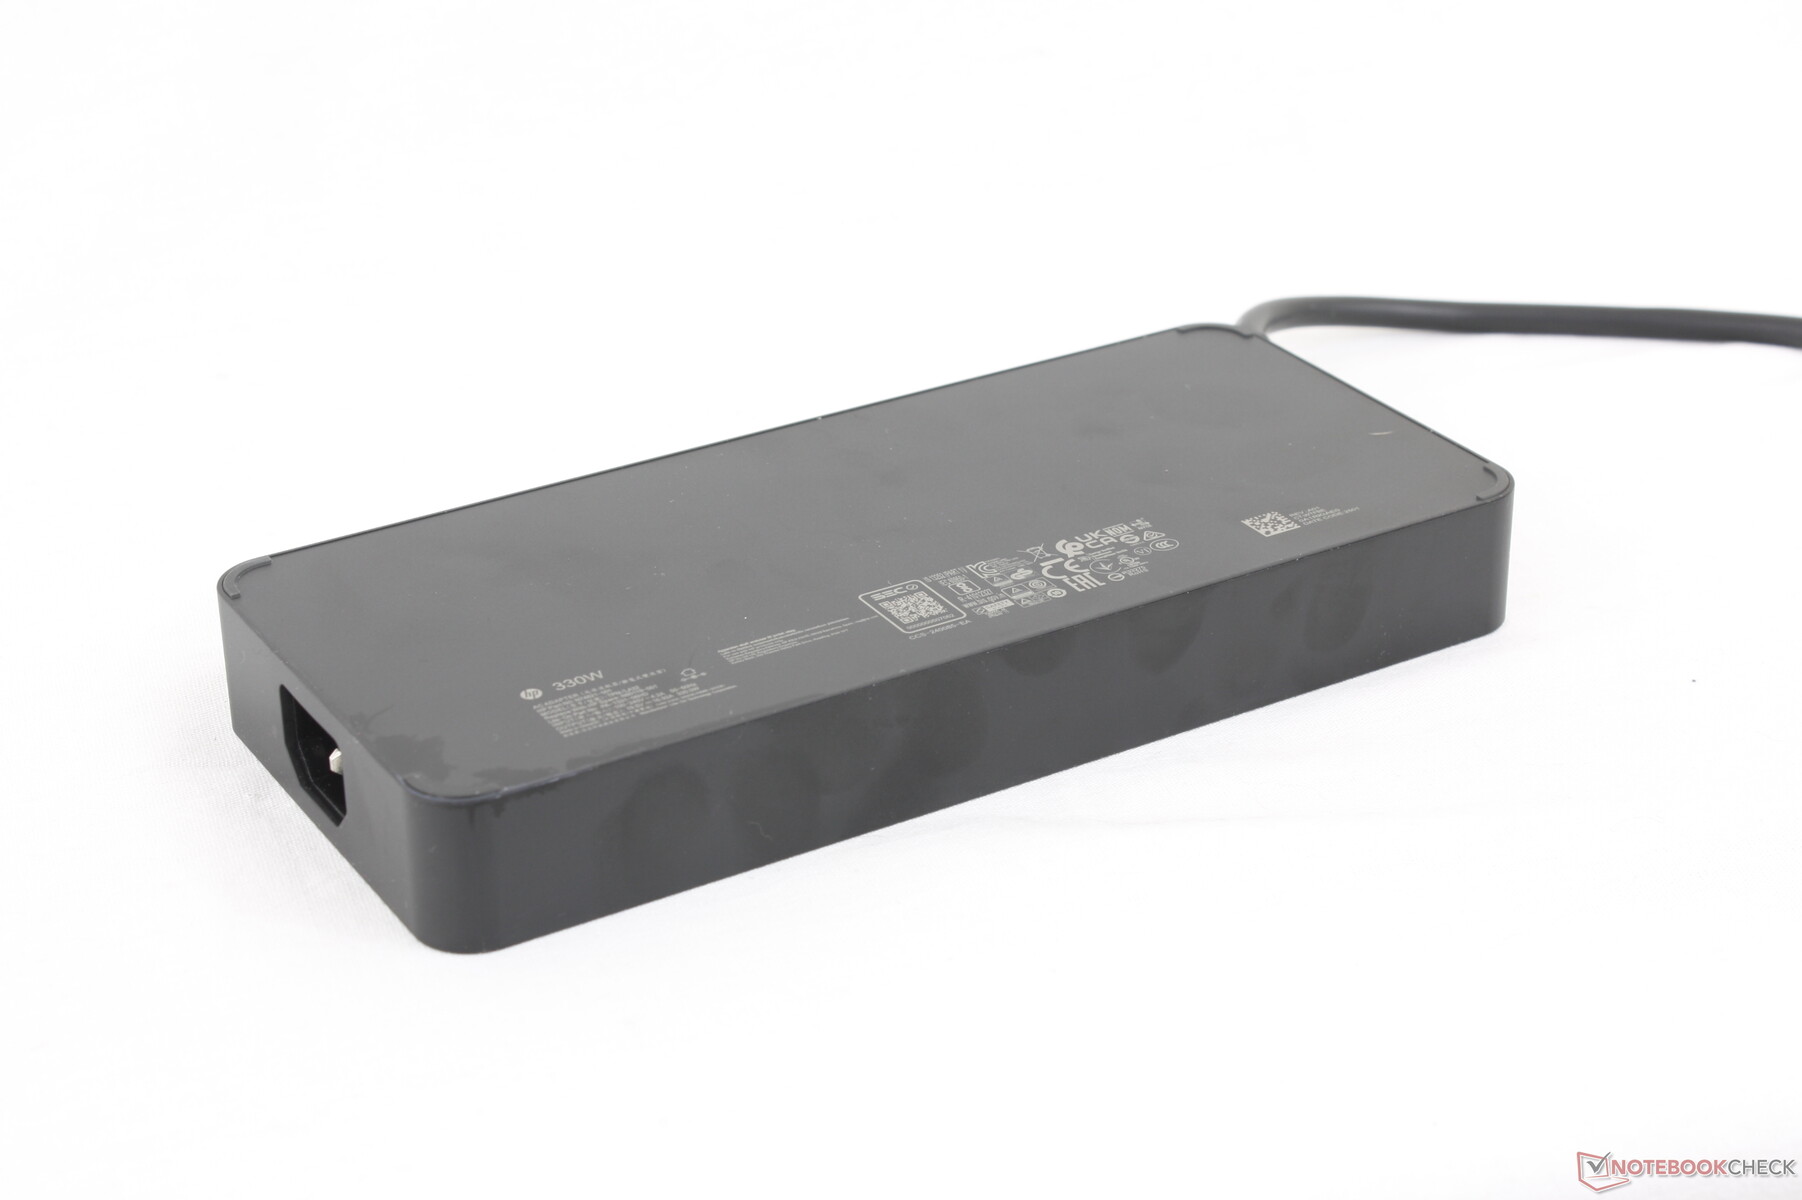
L'HP viene fornito con un adattatore CA da 330 W, mentre il Dell viene fornito con un adattatore CA USB-C da 280 W. Il consumo massimo è quindi più elevato sull'HP, dove può raggiungere i 328 W nei nostri test rispetto ai 281 W del Dell, ma questo consumo elevato è di breve durata a causa di limitazioni termiche o di tetti imposti. Quando si eseguono Prime95 e FurMark contemporaneamente, ad esempio, il consumo raggiunge un picco di 328 W prima di stabilizzarsi rapidamente a circa 265 W, come abbiamo osservato sul Dell. Pertanto, ai fini delle prestazioni, l'adattatore CA più grande da 330 W ha poca importanza.
| Off / Standby | |
| Idle | |
| Sotto carico |
|
Leggenda:
min: | |
| HP ZBook Fury G1i 18 Ultra 9 285HX, RTX PRO 5000 Blackwell Generation Laptop, , IPS, 2560x1600, 18" | Dell Pro Max 18 Plus MB18250 Ultra 9 285HX, RTX PRO 5000 Blackwell Generation Laptop, , IPS, 2560x1600, 18" | Schenker Key 18 Pro M25 RTX 5090 Ultra 9 275HX, GeForce RTX 5090 Laptop, Samsung 9100 Pro 4 TB, IPS, 3840x2400, 18" | Lenovo ThinkPad P16 Gen 2 i7-14700HX, RTX 4000 Ada Generation Laptop, SK hynix PC801 HFS001TEJ9X162N, IPS, 2560x1600, 16" | HP ZBook X G1i 16 Ultra 7 265H, RTX PRO 2000 Blackwell Generation Laptop, Samsung PM9A1 MZVL22T0HBLB, IPS, 2560x1600, 16" | HP ZBook Studio 16 G11 Ultra 9 185H, RTX 3000 Ada Generation Laptop, Kioxia XG8 KXG80ZNV1T02, IPS, 3840x2400, 16" | |
|---|---|---|---|---|---|---|
| Power Consumption | 11% | -11% | 21% | 58% | 28% | |
| Idle Minimum * (Watt) | 16.1 | 6.1 62% | 14 13% | 7.9 51% | 4.1 75% | 14 13% |
| Idle Average * (Watt) | 20.3 | 15.2 25% | 21.9 -8% | 13.1 35% | 9 56% | 22.4 -10% |
| Idle Maximum * (Watt) | 25 | 32.4 -30% | 22.3 11% | 24.2 3% | 9.4 62% | 25.7 -3% |
| Load Average * (Watt) | 138.5 | 130.1 6% | 149.5 -8% | 127.4 8% | 86.7 37% | 90.2 35% |
| Cyberpunk 2077 ultra external monitor * (Watt) | 255 | 252 1% | 336 -32% | 219 14% | 102 60% | 120.3 53% |
| Cyberpunk 2077 ultra * (Watt) | 262 | 256 2% | 333 -27% | 225 14% | 106.1 60% | 125.4 52% |
| Load Maximum * (Watt) | 327.5 | 280.9 14% | 415.4 -27% | 248.5 24% | 152.9 53% | 142 57% |
* ... Meglio usare valori piccoli
Consumo di energia Cyberpunk / Stress Test
Consumo di energia del monitor esterno
Durata della batteria
Il tempo di esecuzione della WLAN è ancora molto buono per le dimensioni, anche se leggermente inferiore a quello del Dell Pro Max 18 Plus. Il display supporta PSR2 o Panel Self Refresh 2 per il risparmio energetico al posto di Advanced Optimus.
| HP ZBook Fury G1i 18 Ultra 9 285HX, RTX PRO 5000 Blackwell Generation Laptop, 99 Wh | Dell Pro Max 18 Plus MB18250 Ultra 9 285HX, RTX PRO 5000 Blackwell Generation Laptop, 96 Wh | Schenker Key 18 Pro M25 RTX 5090 Ultra 9 275HX, GeForce RTX 5090 Laptop, 98 Wh | Lenovo ThinkPad P16 Gen 2 i7-14700HX, RTX 4000 Ada Generation Laptop, 94 Wh | HP ZBook X G1i 16 Ultra 7 265H, RTX PRO 2000 Blackwell Generation Laptop, 83 Wh | HP ZBook Studio 16 G11 Ultra 9 185H, RTX 3000 Ada Generation Laptop, 86 Wh | |
|---|---|---|---|---|---|---|
| Autonomia della batteria | ||||||
| WiFi v1.3 (h) | 8 | 9.3 16% | 5.8 -27% | 2.5 -69% | 12.5 56% | 4.8 -40% |
Valutazione Notebookcheck
L'HP ZBook Fury G1i 18 sembra eccellente sulla carta, ma le prestazioni conservative di CPU e GPU e la mancanza complessiva di innovazioni rendono il Dell Pro Max 18 Plus un'opzione probabilmente più interessante.
HP ZBook Fury G1i 18
- 11/22/2025 v8
Allen Ngo
 Total Sustainability Score:
 Potenziali concorrenti a confronto
Immagine | Modello | Prezzo | Peso | Altezza | Schermo |
|---|---|---|---|---|---|
1. 89.5%  | HP ZBook Fury G1i 18 Intel Core Ultra 9 285HX ⎘ NVIDIA RTX PRO 5000 Blackwell Generation Laptop ⎘ 64 GB Memoria | Amazon: Prezzo di listino: 11000 USD | 3.4 kg | 27 mm | 18.00" 2560x1600 168 PPI IPS |
2. 88.9%  | Dell Pro Max 18 Plus MB18250 Intel Core Ultra 9 285HX ⎘ NVIDIA RTX PRO 5000 Blackwell Generation Laptop ⎘ 128 GB Memoria | Amazon: Prezzo di listino: 6000 USD | 3.6 kg | 30.2 mm | 18.00" 2560x1600 168 PPI IPS |
3. 84.6% 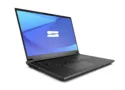 | Schenker Key 18 Pro M25 RTX 5090 Intel Core Ultra 9 275HX ⎘ NVIDIA GeForce RTX 5090 Laptop ⎘ 256 GB Memoria, 4096 GB SSD | Amazon: Prezzo di listino: 6400€ | 4.1 kg | 29.5 mm | 18.00" 3840x2400 252 PPI IPS |
4. 85.9%  | Lenovo ThinkPad P16 Gen 2 Intel Core i7-14700HX ⎘ NVIDIA RTX 4000 Ada Generation Laptop ⎘ 32 GB Memoria, 1024 GB SSD | Amazon: Prezzo di listino: 3500 USD | 3.1 kg | 30.23 mm | 16.00" 2560x1600 189 PPI IPS |
5. 87.4%  | HP ZBook X G1i 16 Intel Core Ultra 7 265H ⎘ NVIDIA RTX PRO 2000 Blackwell Generation Laptop ⎘ 64 GB Memoria, 2048 GB SSD | Amazon: Prezzo di listino: 2700 USD | 2.2 kg | 23 mm | 16.00" 2560x1600 189 PPI IPS |
6. 84.2%  | HP ZBook Studio 16 G11 Intel Core Ultra 9 185H ⎘ NVIDIA RTX 3000 Ada Generation Laptop ⎘ 64 GB Memoria, 1024 GB SSD | Amazon: Prezzo di listino: 4300 USD | 1.8 kg | 19 mm | 16.00" 3840x2400 283 PPI IPS |
Transparency
La selezione dei dispositivi da recensire viene effettuata dalla nostra redazione. Il campione di prova è stato fornito all'autore come prestito dal produttore o dal rivenditore ai fini di questa recensione. L'istituto di credito non ha avuto alcuna influenza su questa recensione, né il produttore ne ha ricevuto una copia prima della pubblicazione. Non vi era alcun obbligo di pubblicare questa recensione. In quanto società mediatica indipendente, Notebookcheck non è soggetta all'autorità di produttori, rivenditori o editori.
Ecco come Notebookcheck esegue i test
Ogni anno, Notebookcheck esamina in modo indipendente centinaia di laptop e smartphone utilizzando procedure standardizzate per garantire che tutti i risultati siano comparabili. Da circa 20 anni sviluppiamo continuamente i nostri metodi di prova e nel frattempo stabiliamo gli standard di settore. Nei nostri laboratori di prova, tecnici ed editori esperti utilizzano apparecchiature di misurazione di alta qualità. Questi test comportano un processo di validazione in più fasi. Il nostro complesso sistema di valutazione si basa su centinaia di misurazioni e parametri di riferimento ben fondati, che mantengono l'obiettività.
