Verdetto - Prestazioni di un portatile da gioco da 18 pollici con uno schermo da 16 pollici
Il Raider 16 Max HX può essere più piccolo del massiccio Raider 18 o Titan 18ma continua a dare priorità alle prestazioni prima di ogni altra cosa. La CPU Arrow Lake-HX e la GPU da 175 W sono tra le opzioni più veloci disponibili, indipendentemente dalle dimensioni del laptop, per rendere il Raider 16 Max HX una delle soluzioni più veloci per il gioco sul mercato. Il display OLED lucido è altrettanto impressionante se si riesce a mitigare l'inevitabile bagliore, mentre il pannello secondario è una caratteristica pratica che vorremmo vedere su tutti i portatili da gioco MSI in futuro.
Le prestazioni estreme hanno un costo. In particolare, il Raider 16 Max HX è più grosso e più pesante di molti altri portatili da gioco da 16 pollici, tra cui il già grande Alienware 16X Aurora. Il telaio in plastica non è così lussuoso come quello di Alienware 16 Area-51 nonostante costino circa lo stesso prezzo, mentre la mancanza di G-Sync e Advanced Optimus è difficile da perdonare in questa fascia di prezzo. Gli utenti che amano viaggiare e giocare in movimento potrebbero trovare più valore da soluzioni da 16 pollici più leggere e portatili come MSI Stealth 16 o Razer Blade 16 che dispongono di una grafica RTX 5090 simile, ma con livelli di prestazioni leggermente inferiori.
Pro
Contro
Prezzo e disponibilità
MSI Raider 16 Max HX è ora in spedizione su Amazon per un prezzo fino a $4300 USD se configurato con la GPU GeForce RTX 5090.
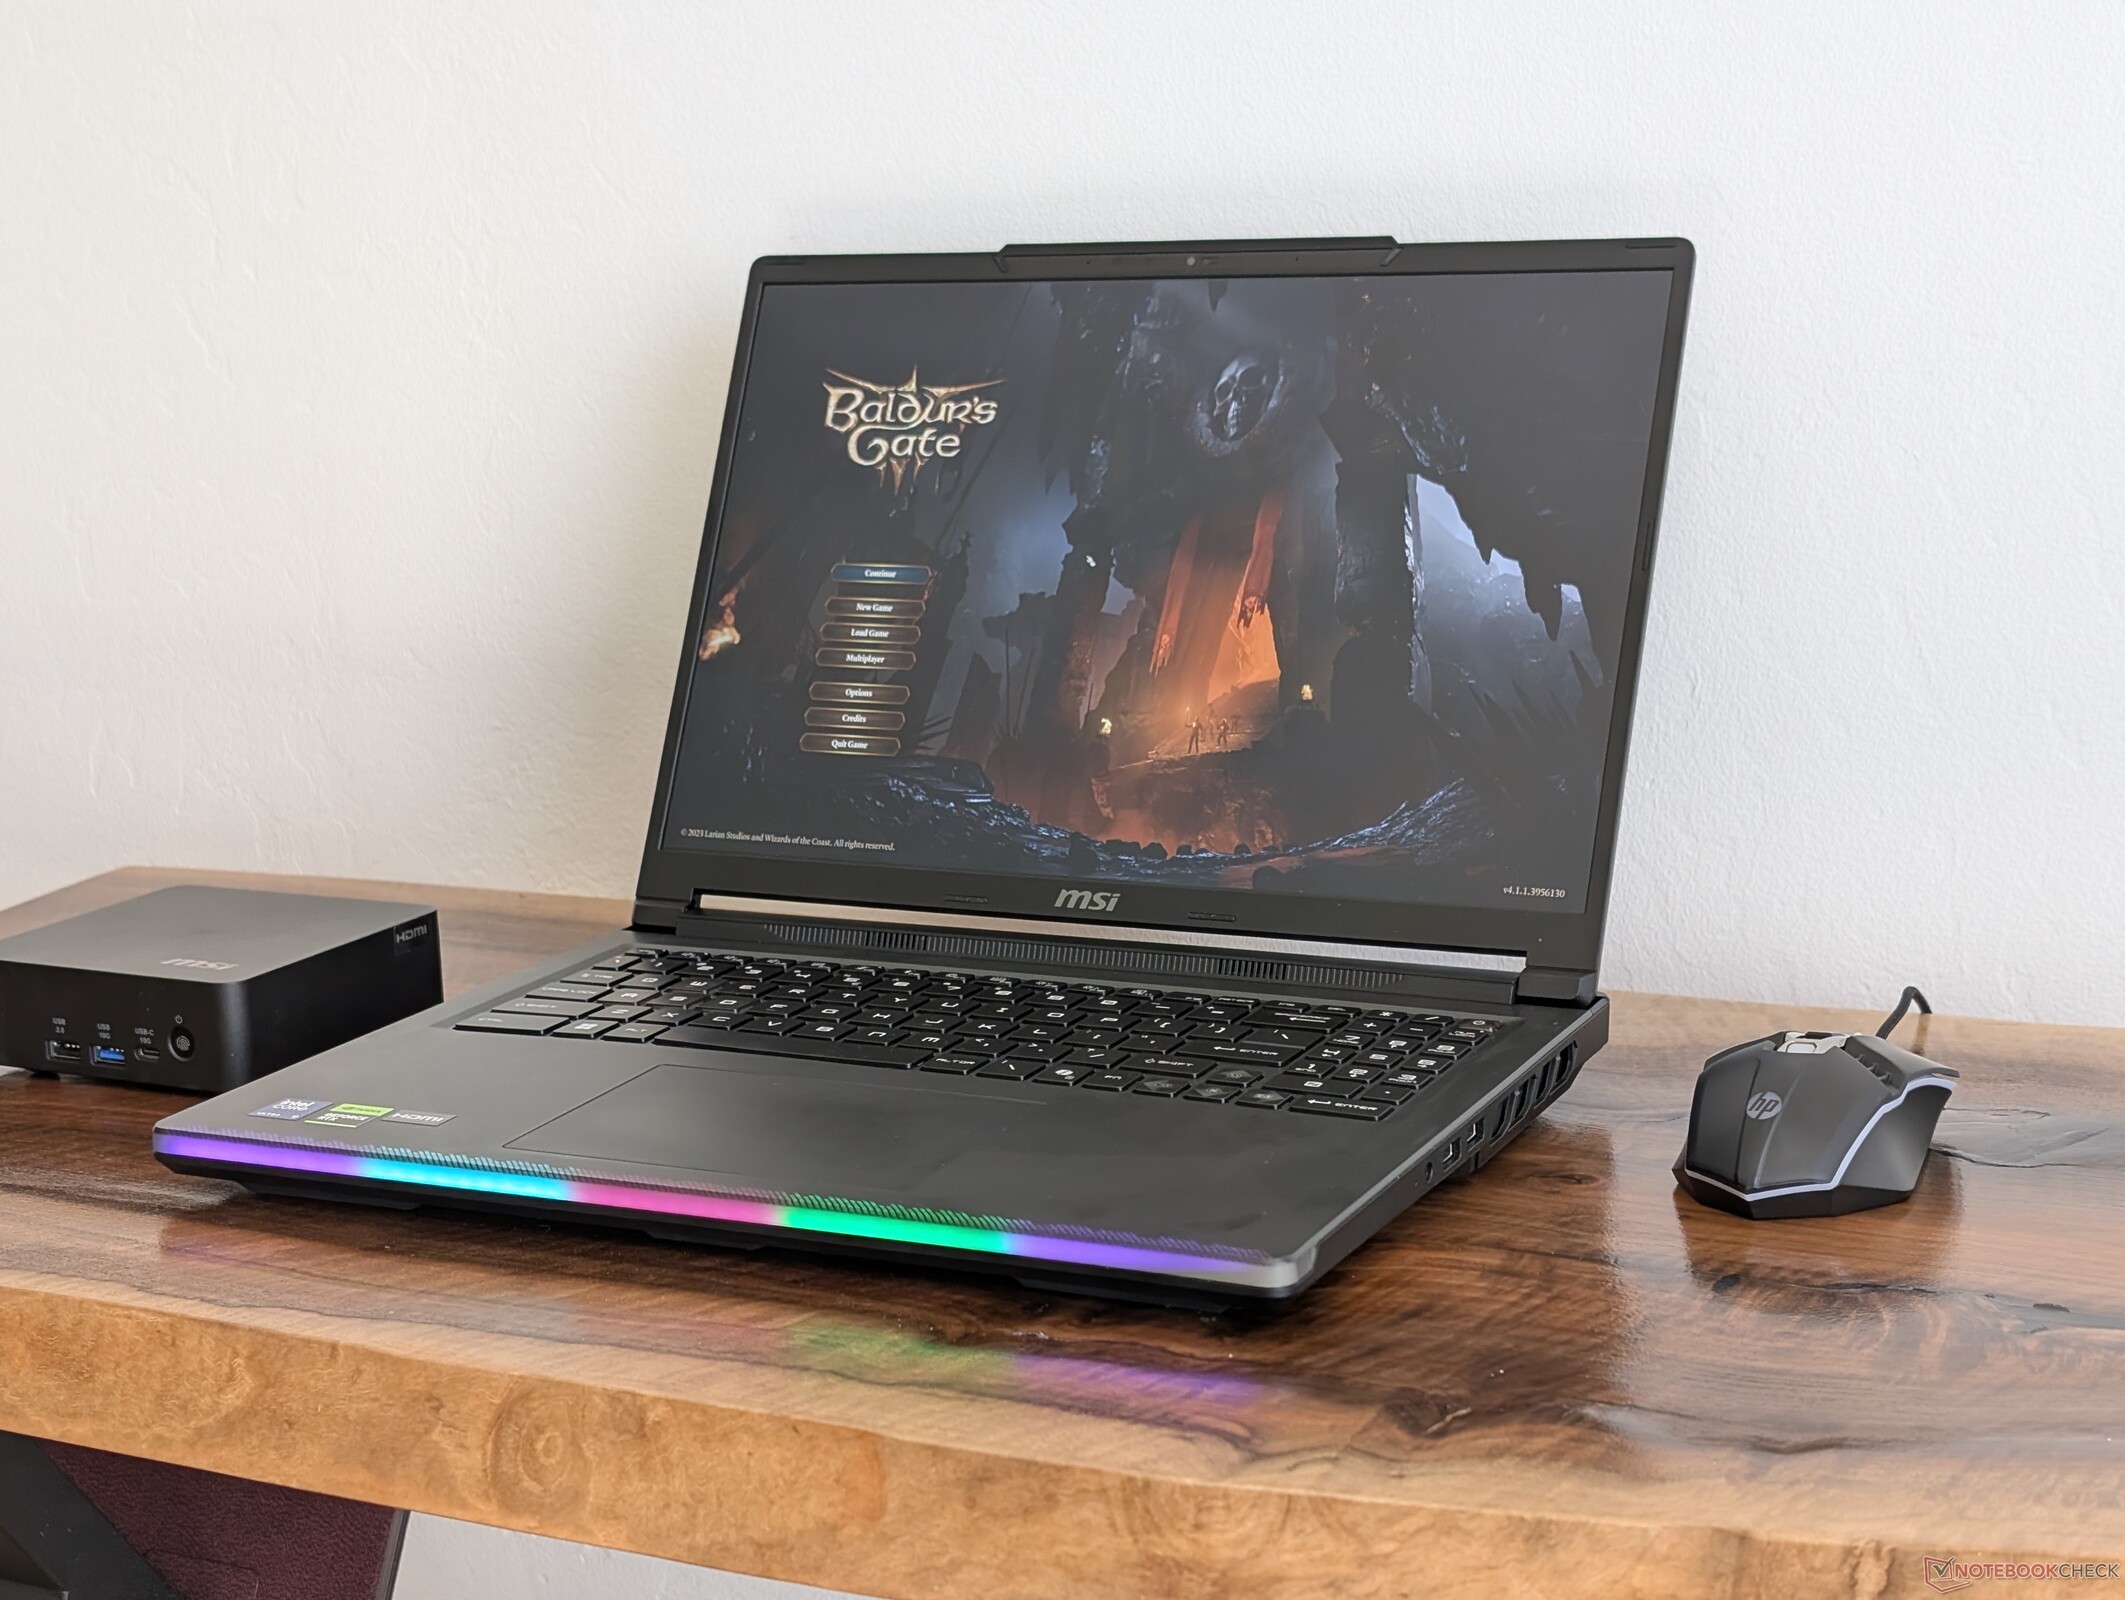
MSI Raider 16 Max HX è stato presentato al CES 2026 come primo laptop da 16 pollici della serie Raider. Si tratta anche di uno dei primi laptop da gioco MSI con un display OLED invece dei soliti IPS o Mini-LED. Come per la serie Raider 18, il Raider 16 Max HX rappresenta uno dei laptop più veloci che MSI ha da offrire.
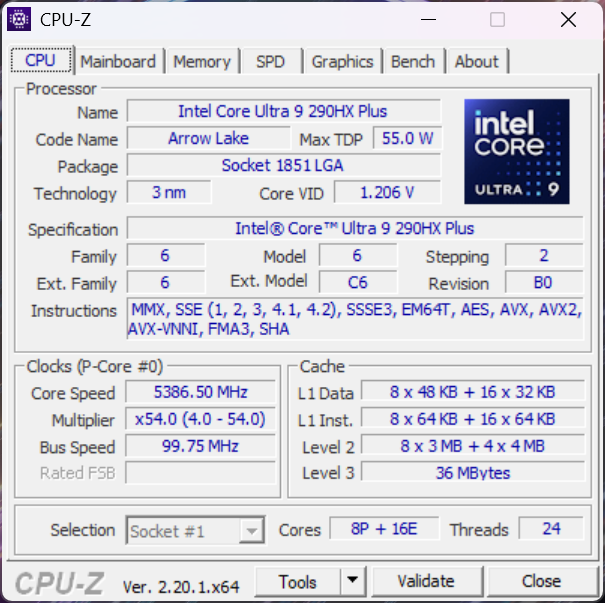
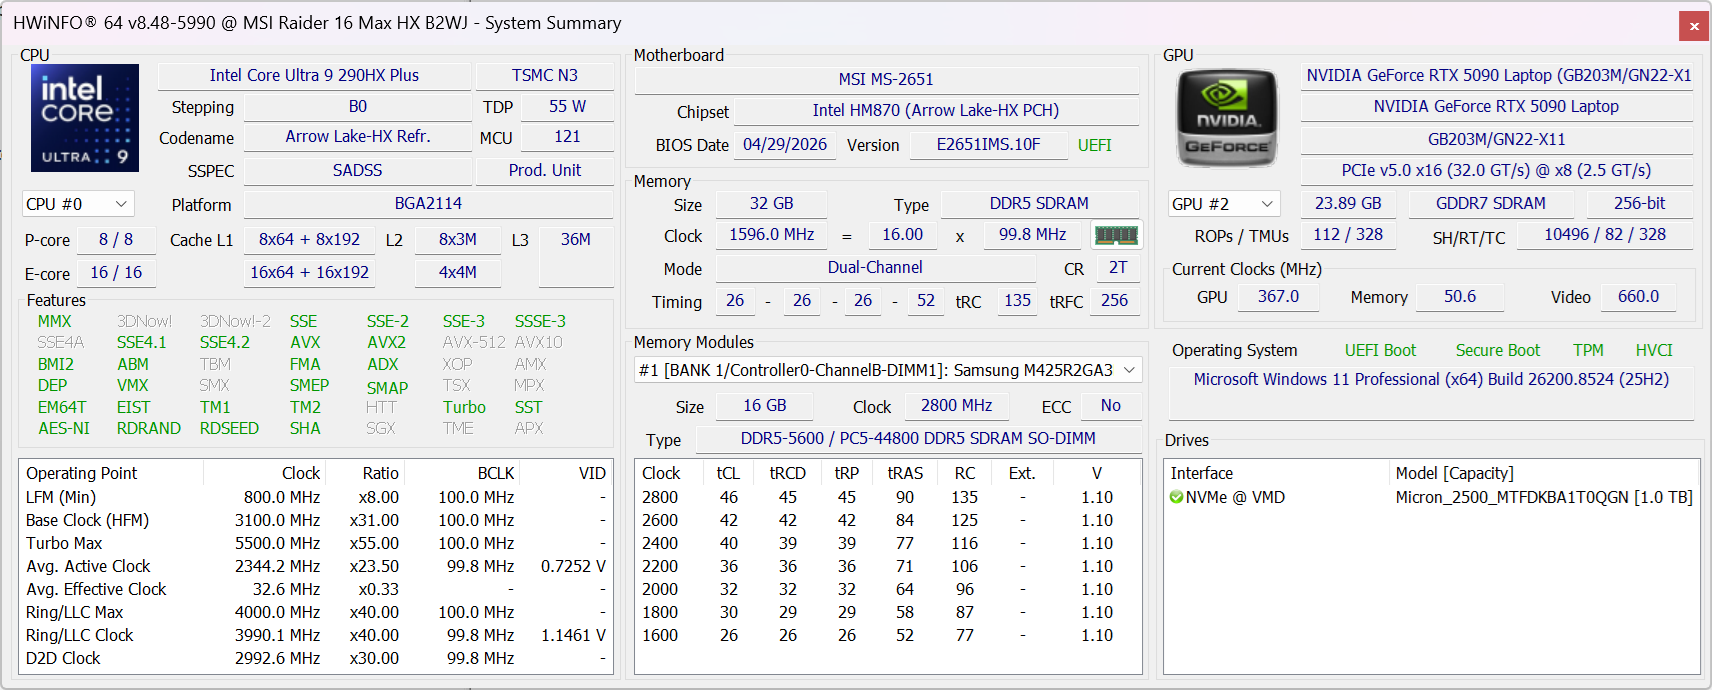
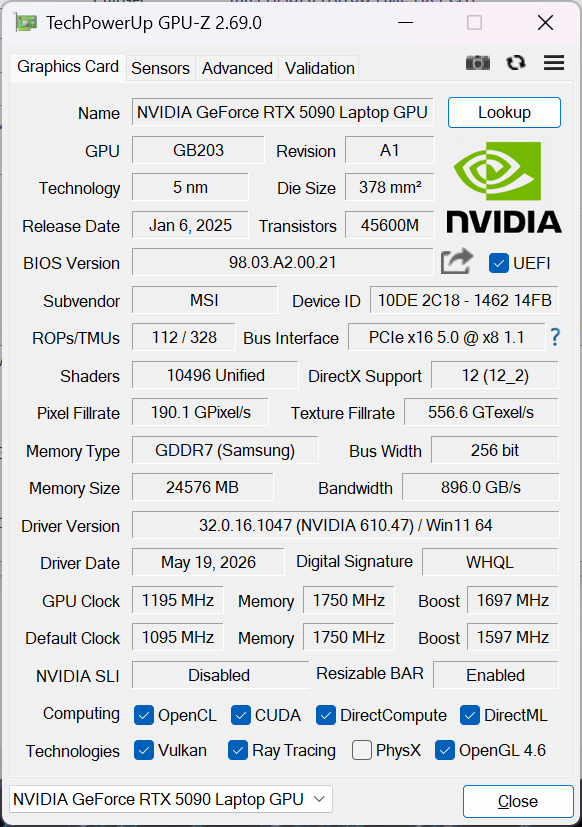
La nostra unità di prova è la configurazione di fascia più alta con la CPU Arrow Lake Core Ultra 9 290HX Plus e la GPU GeForce RTX 5090 da 175 W, al prezzo di circa 4400 dollari. Tutte le SKU al momento vengono fornite con la stessa CPU e il display OLED lucido QHD+ 240 Hz, ma potrebbero iniziare con GeForce RTX 5070 Ti.
I concorrenti includono altri computer portatili da gioco da 16 pollici di fascia alta o di punta, come il modello Dell Alienware 16 Area-51, Asus Zephyrus Duoo Razer Blade 16.
Altre recensioni di MSI:
Specifiche
Caso
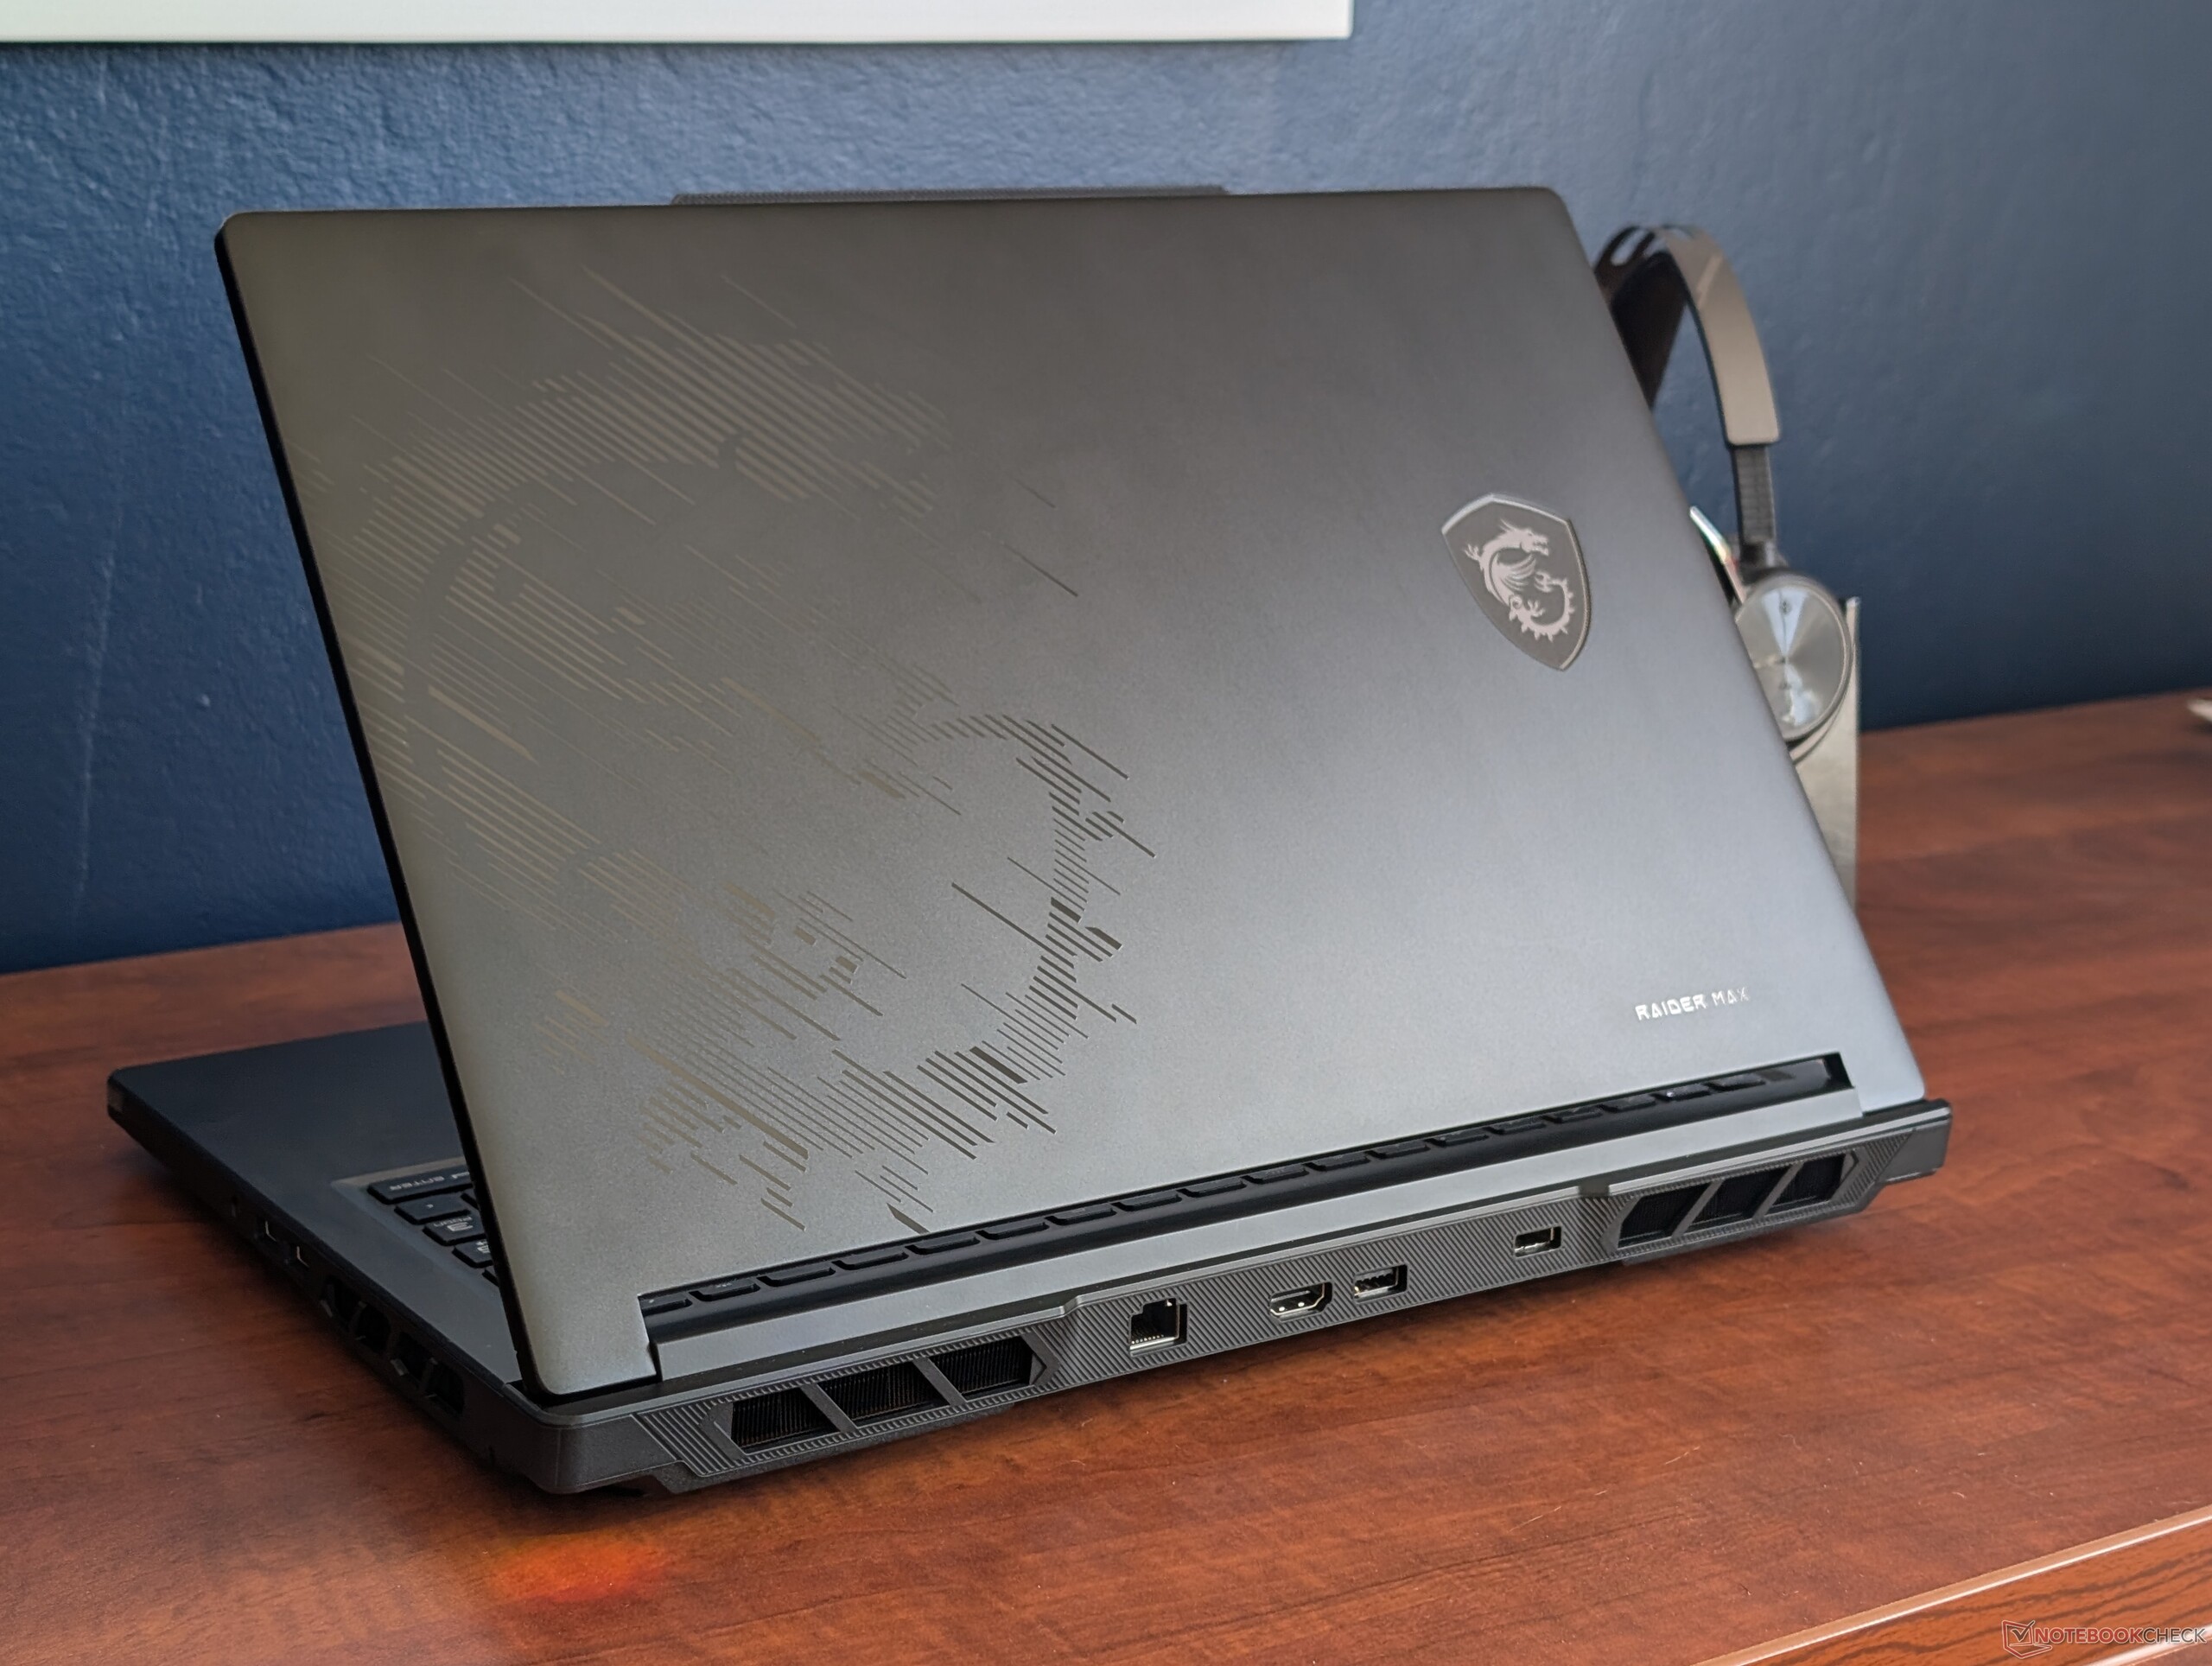
Il coperchio esterno è in metallo liscio e opaco, mentre la base è in gran parte in plastica. Sebbene non sia affatto terribile, le superfici si flettono e non si sentono rigide come i modelli concorrenti, come Alienware 16 Area-51 o Razer Blade 16. Ci saremmo aspettati un design del telaio più robusto o di qualità superiore, considerando l'elevato prezzo richiesto.
Connettività
Le opzioni delle porte sono identiche a quelle del Raider 18 HX, anche se riorganizzate.


Lettore di schede SD
| SD Card Reader | |
| average JPG Copy Test (av. of 3 runs) | |
| MSI Raider 16 Max HX B2WJ (Toshiba Exceria Pro SDXC 64 GB UHS-II) | |
| Razer Blade 16 Core Ultra 9 386H (Toshiba Exceria Pro SDXC 64 GB UHS-II) | |
| Lenovo Legion 7 16IAX10 (Toshiba Exceria Pro SDXC 64 GB UHS-II) | |
| maximum AS SSD Seq Read Test (1GB) | |
| Lenovo Legion 7 16IAX10 (Toshiba Exceria Pro SDXC 64 GB UHS-II) | |
| Razer Blade 16 Core Ultra 9 386H (Toshiba Exceria Pro SDXC 64 GB UHS-II) | |
| MSI Raider 16 Max HX B2WJ (Toshiba Exceria Pro SDXC 64 GB UHS-II) | |
Comunicazione
Webcam
la webcam da 2 MP con IR e l'otturatore fisico sono tutti di serie.


Manutenzione
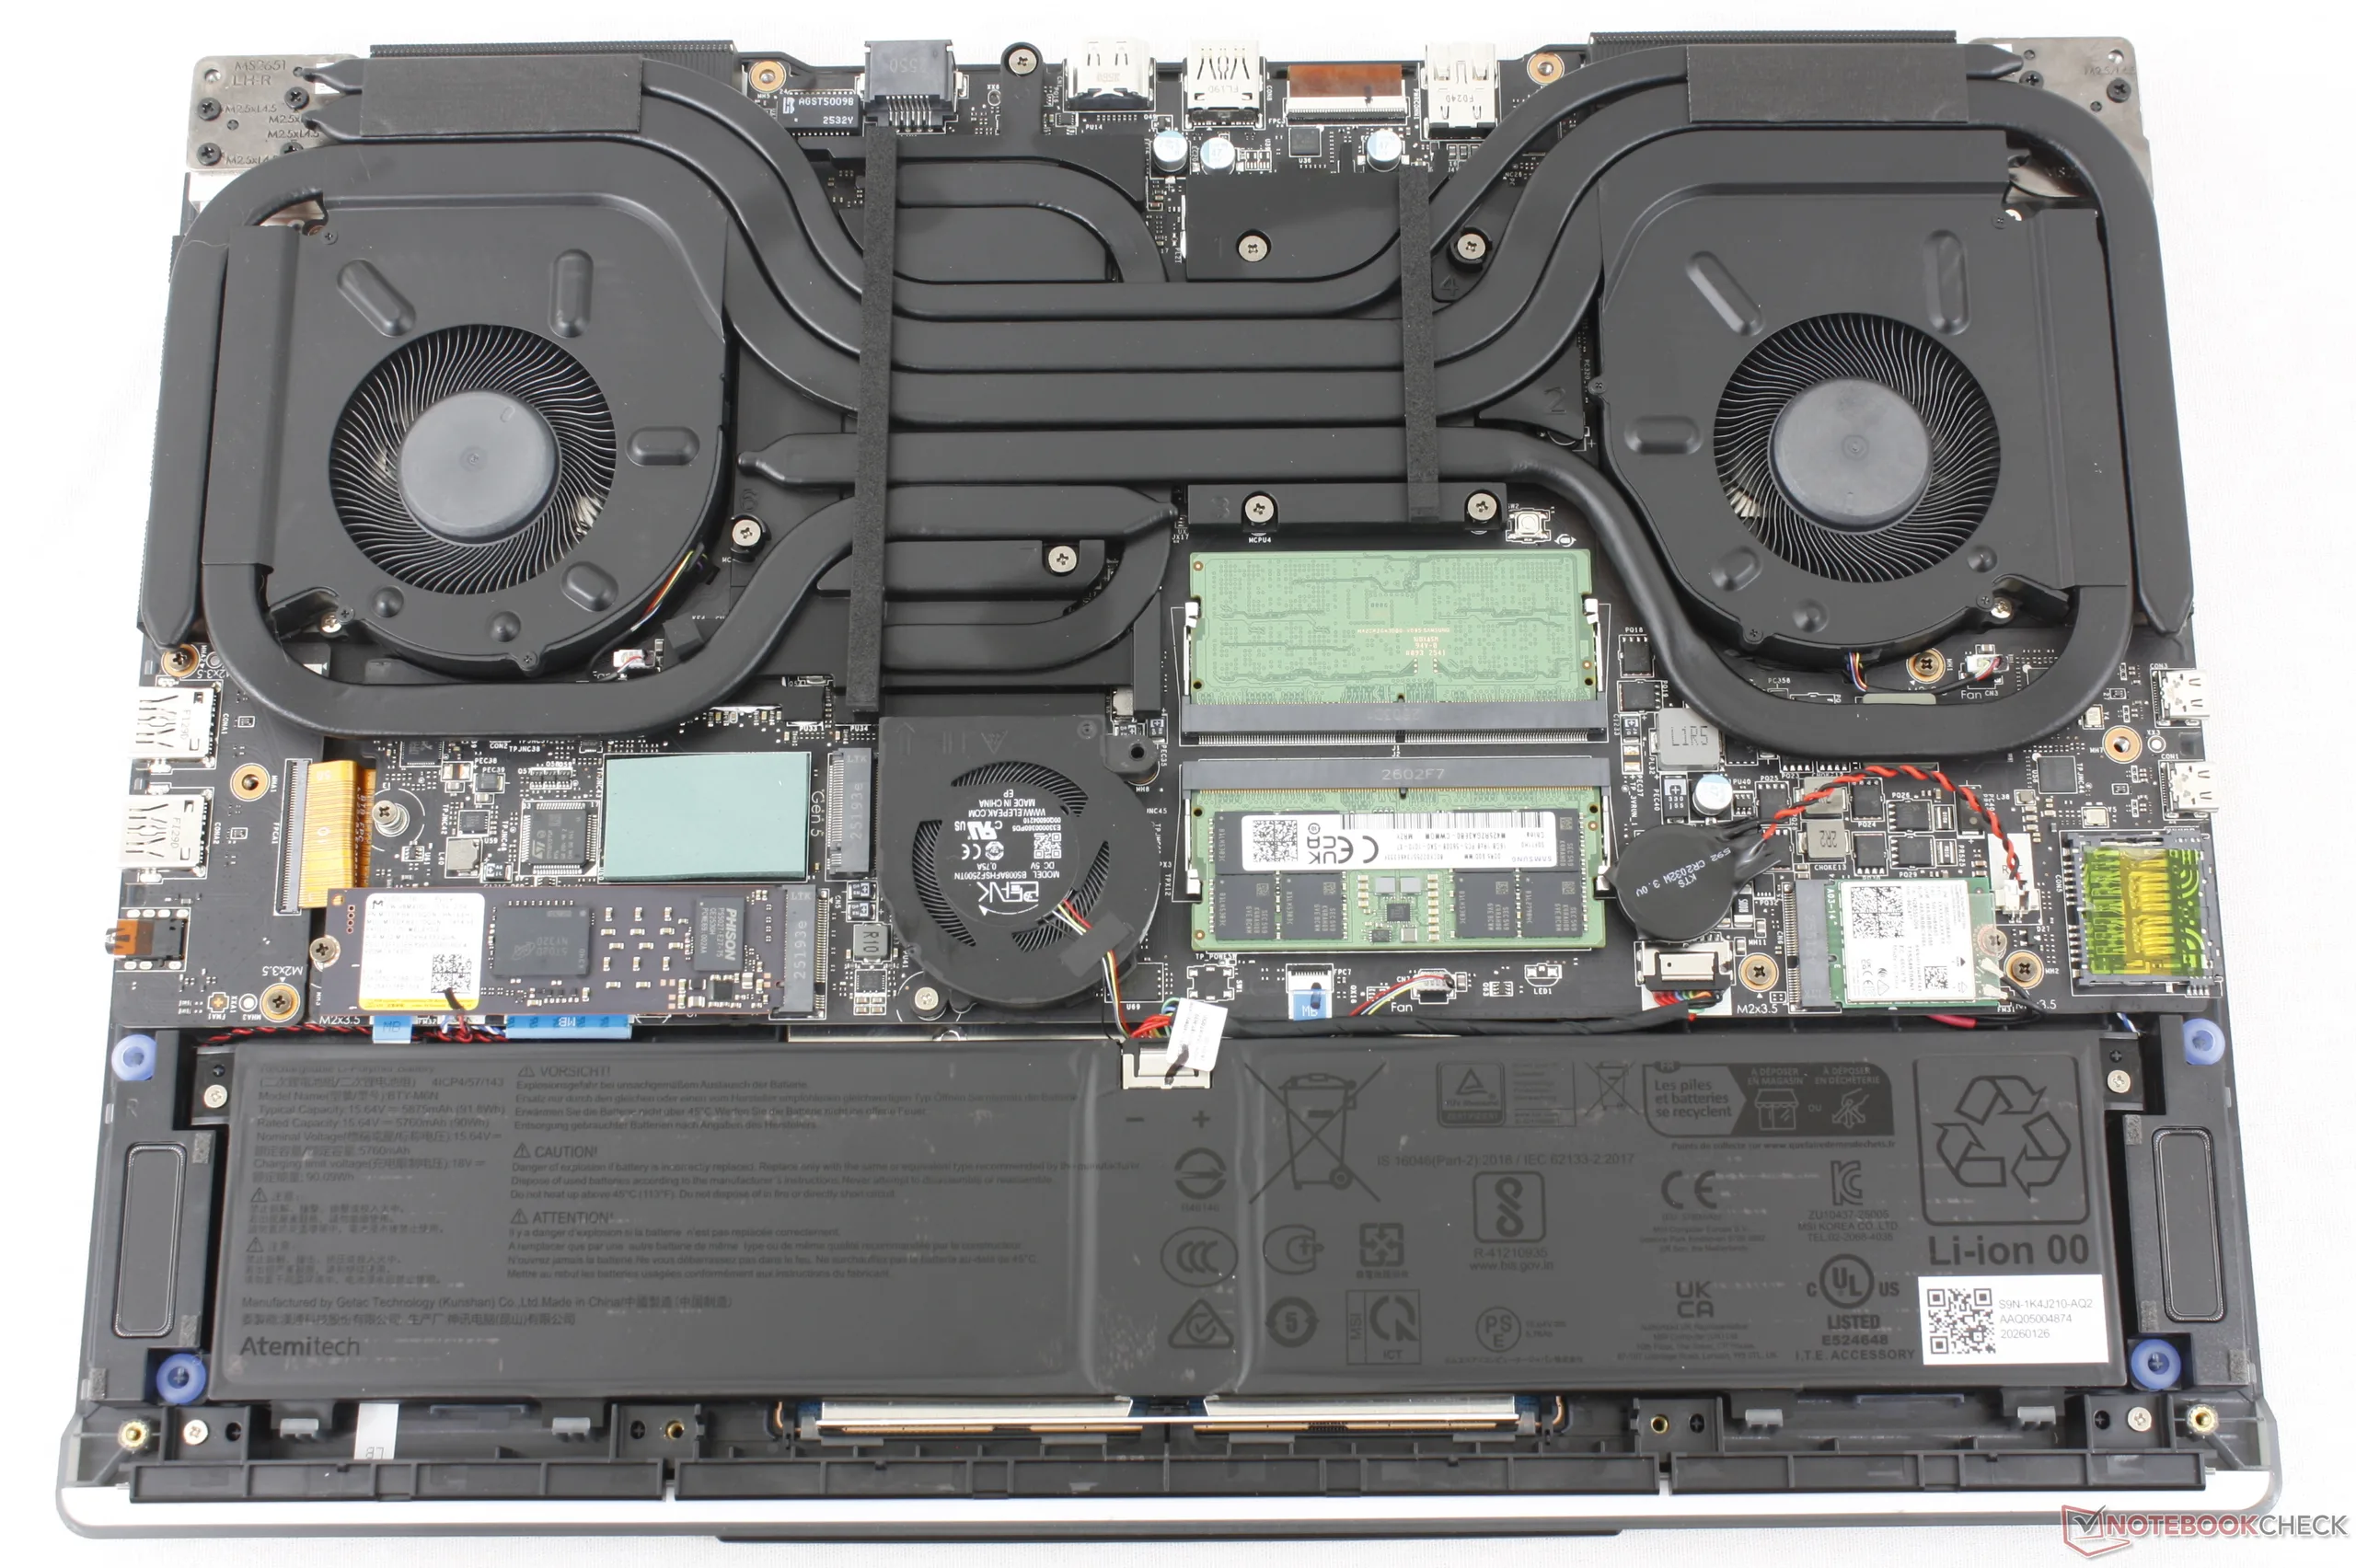
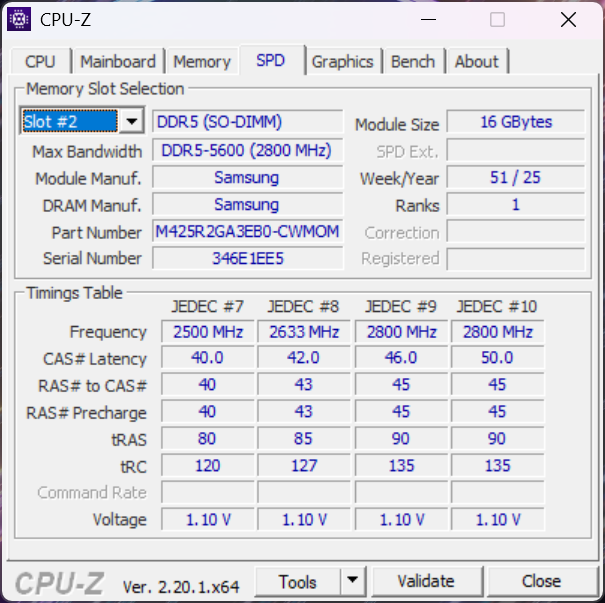
Il pannello inferiore include un sottopannello per facilitare l'accesso ai due slot SSD M.2 2280 (uno PCIe5 più uno PCIe4) e ai due slot SODIMM DDR5. Per il resto, l'intero pannello inferiore è relativamente facile da rimuovere con un cacciavite Phillips standard.
Sostenibilità
MSI non menziona i materiali riciclati utilizzati durante la produzione di Raider 16 Max HX. L'imballaggio è privo di plastica.
Accessori e garanzia
La confezione non contiene altri extra oltre all'adattatore CA e alla documentazione cartacea. Si applica la consueta garanzia limitata di un anno del produttore, se acquistata negli Stati Uniti.
Dispositivi di ingresso
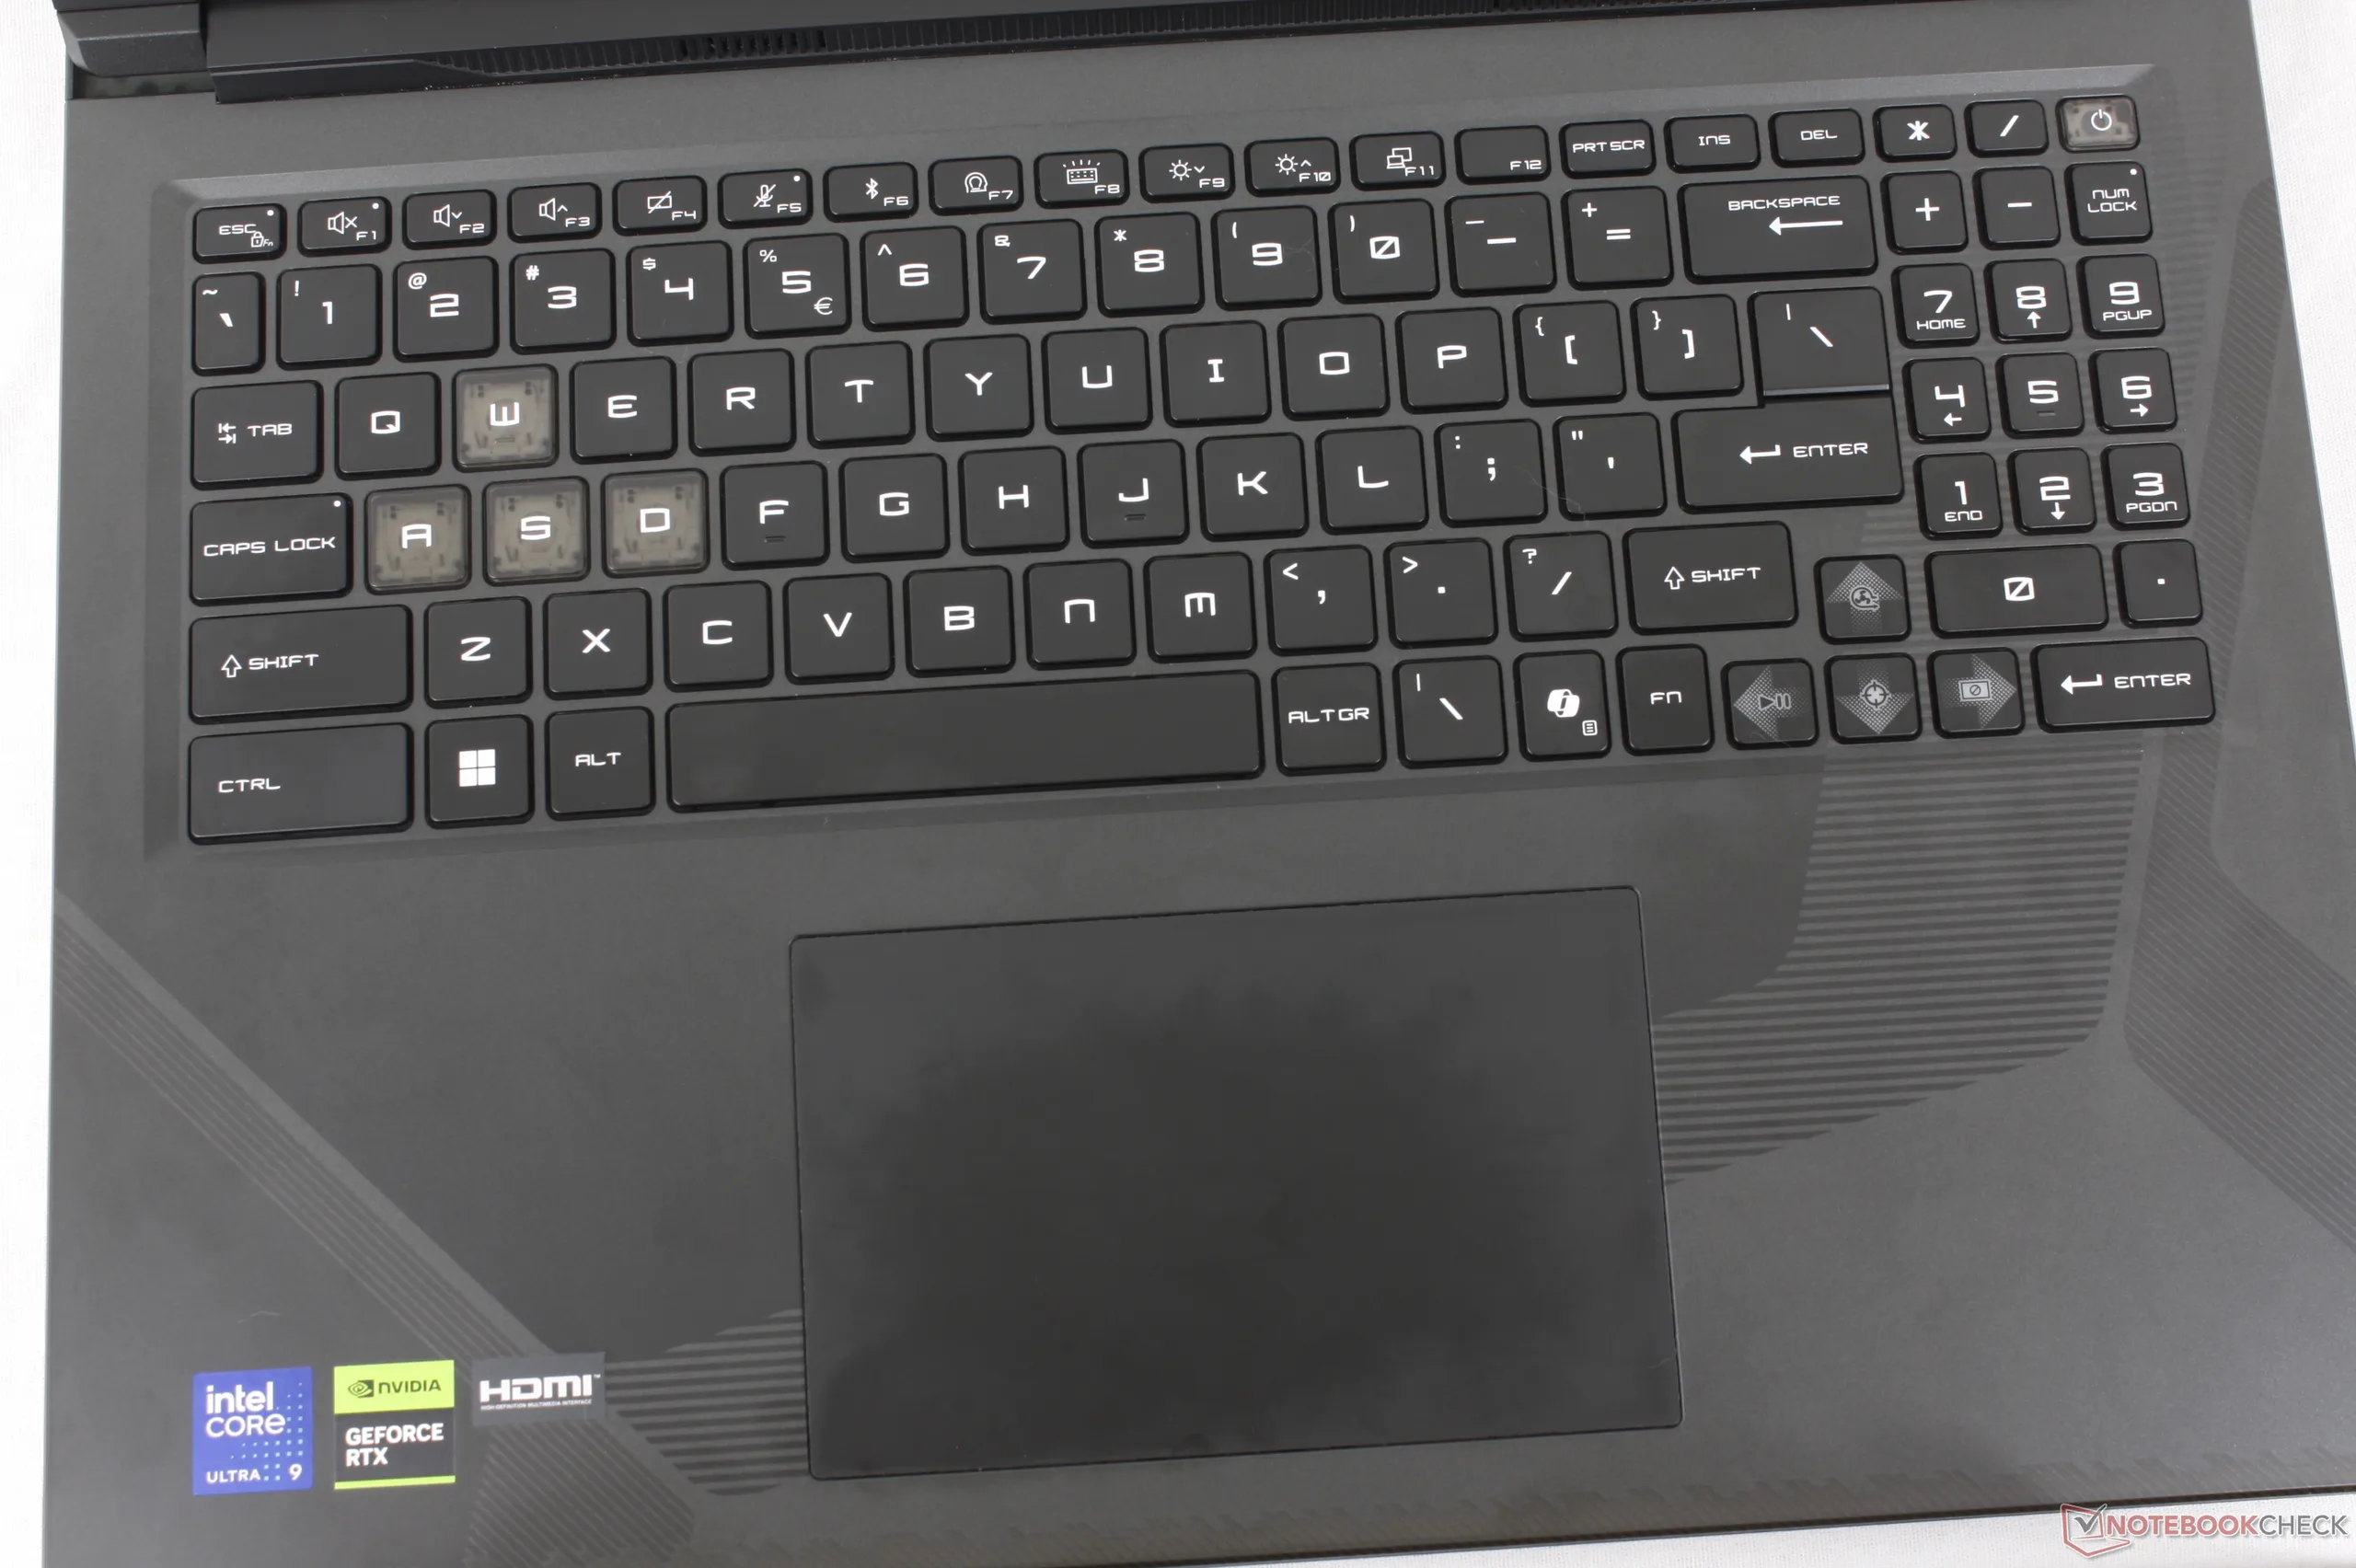
La tastiera e il clickpad di Raider 16 Max HX sono identici a quelli disponibili su Crosshair 16 HX, anche se quest'ultimo è un modello da gioco di fascia bassa di MSI. Sul Raider, tuttavia, i tasti hanno un'illuminazione RGB per tasto per una maggiore personalizzazione da parte dell'utente, mentre il Crosshair ha zone RGB più limitate.
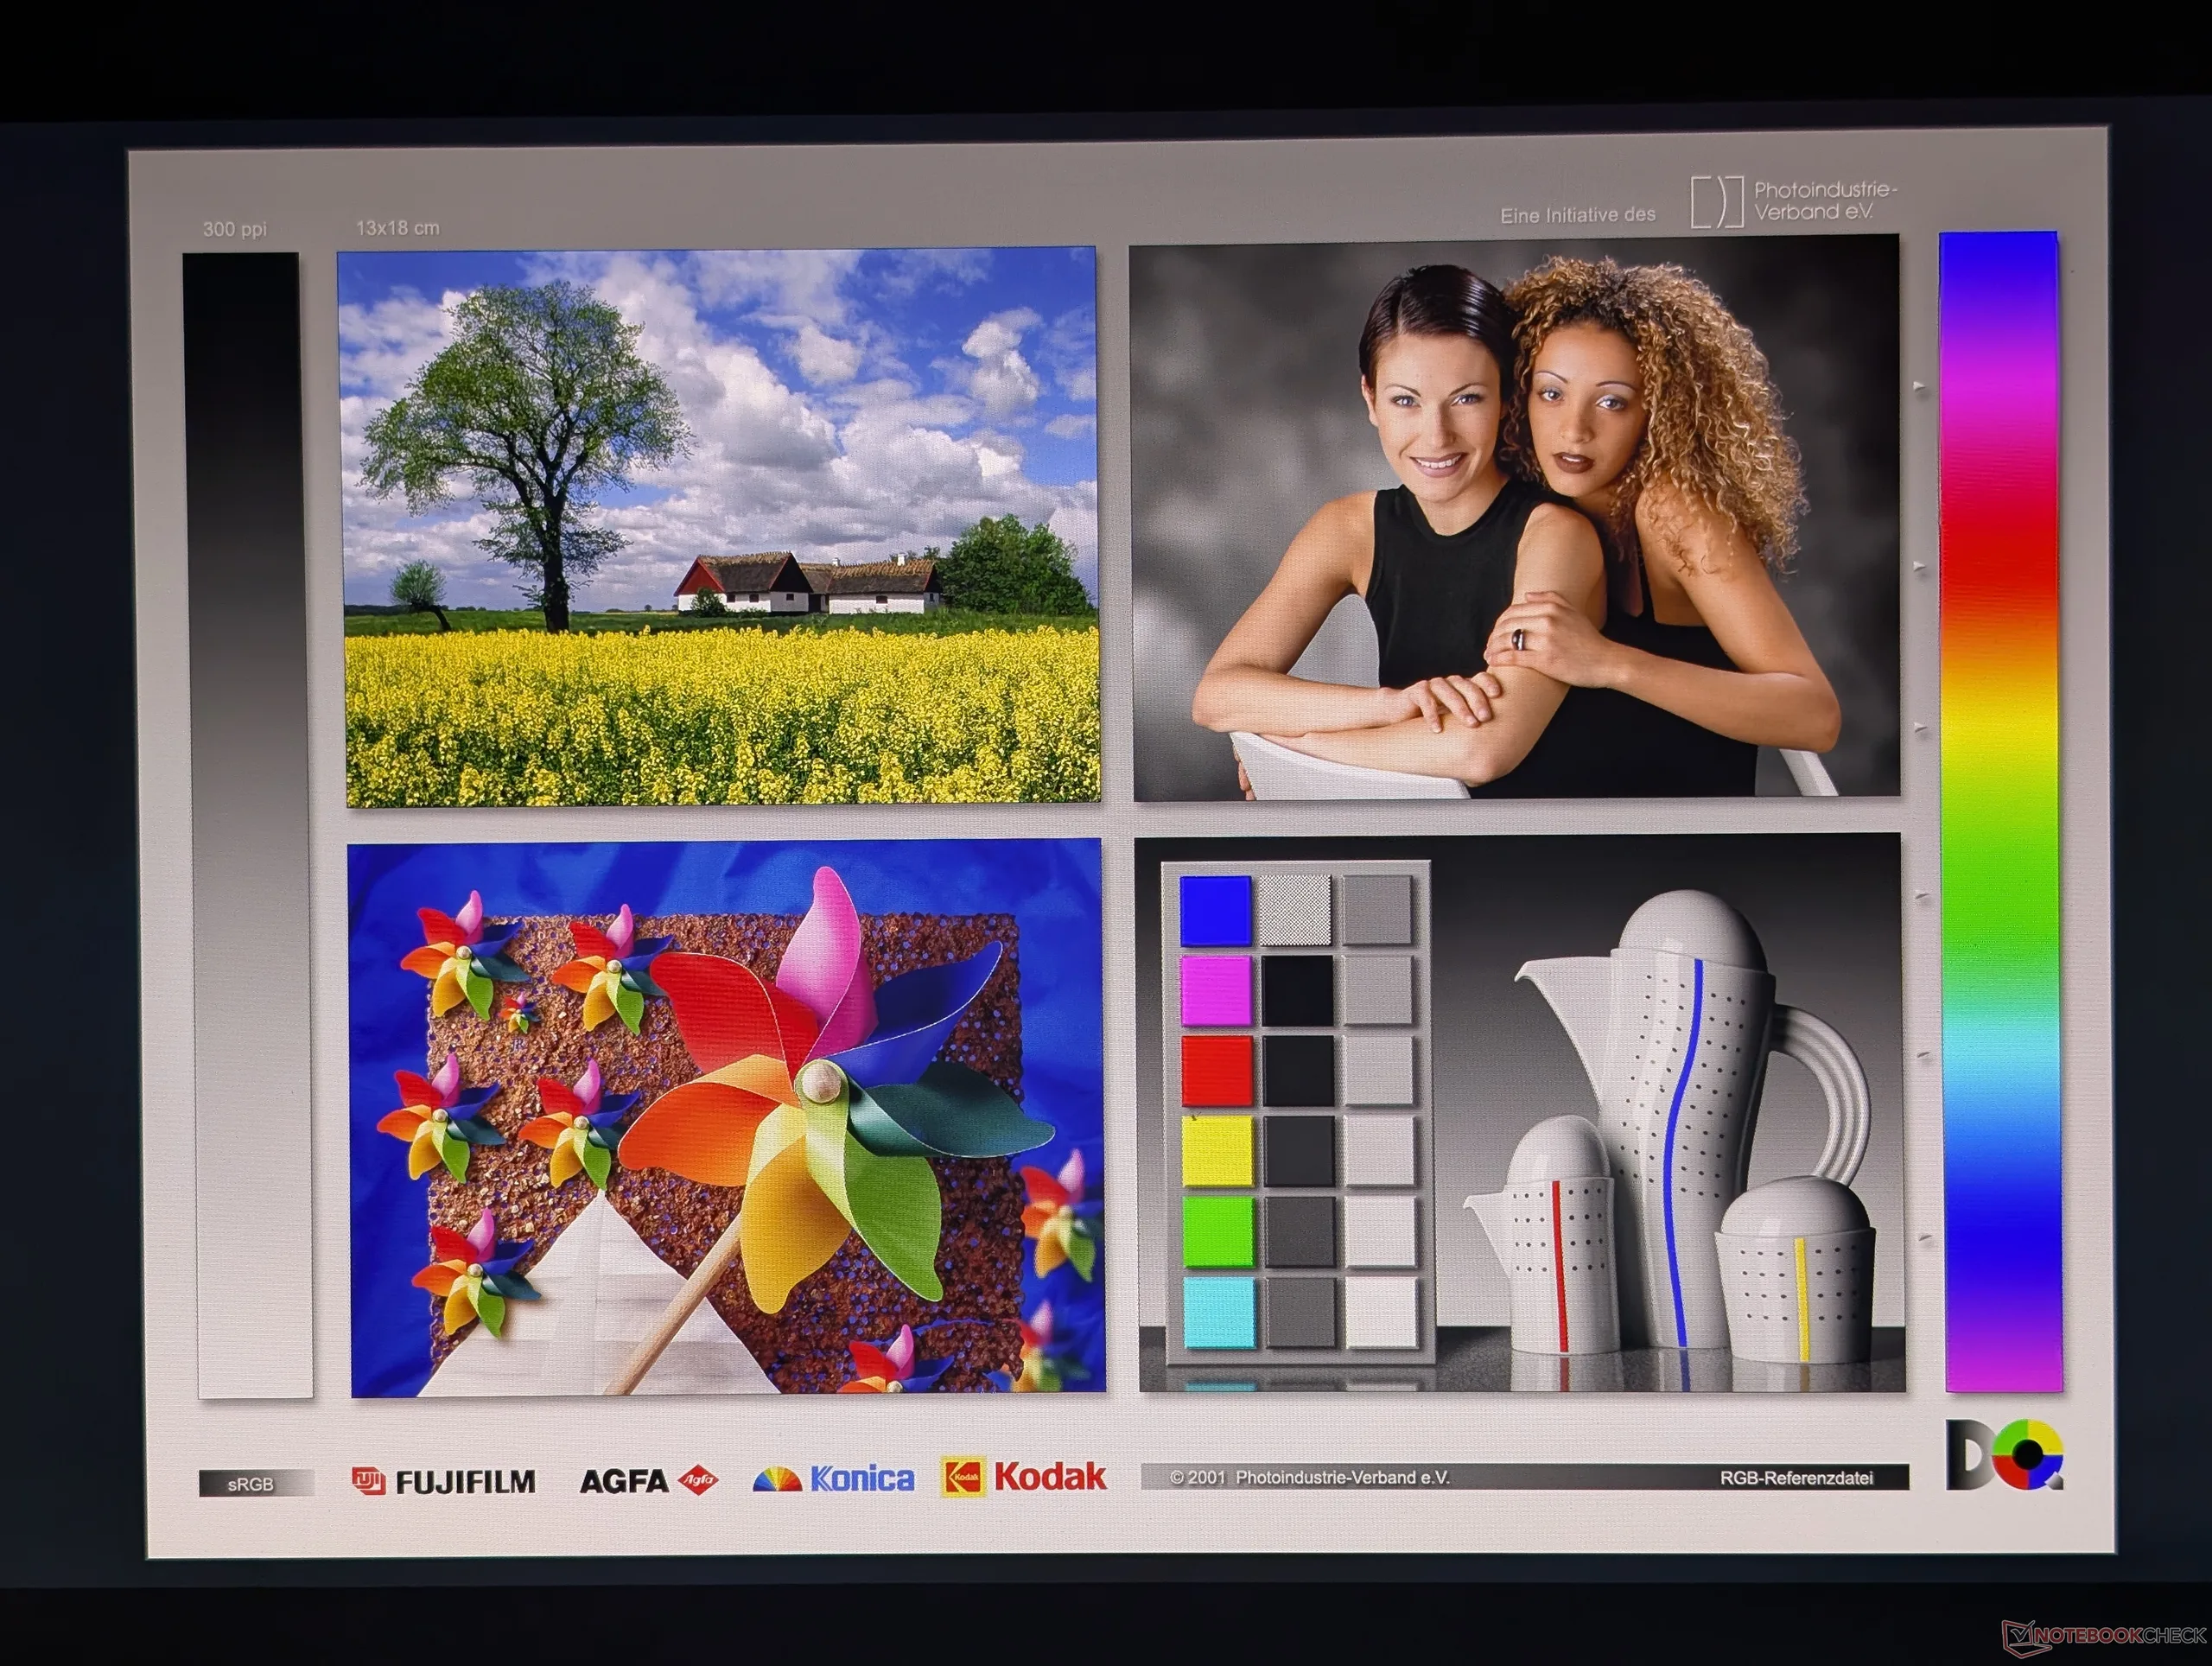
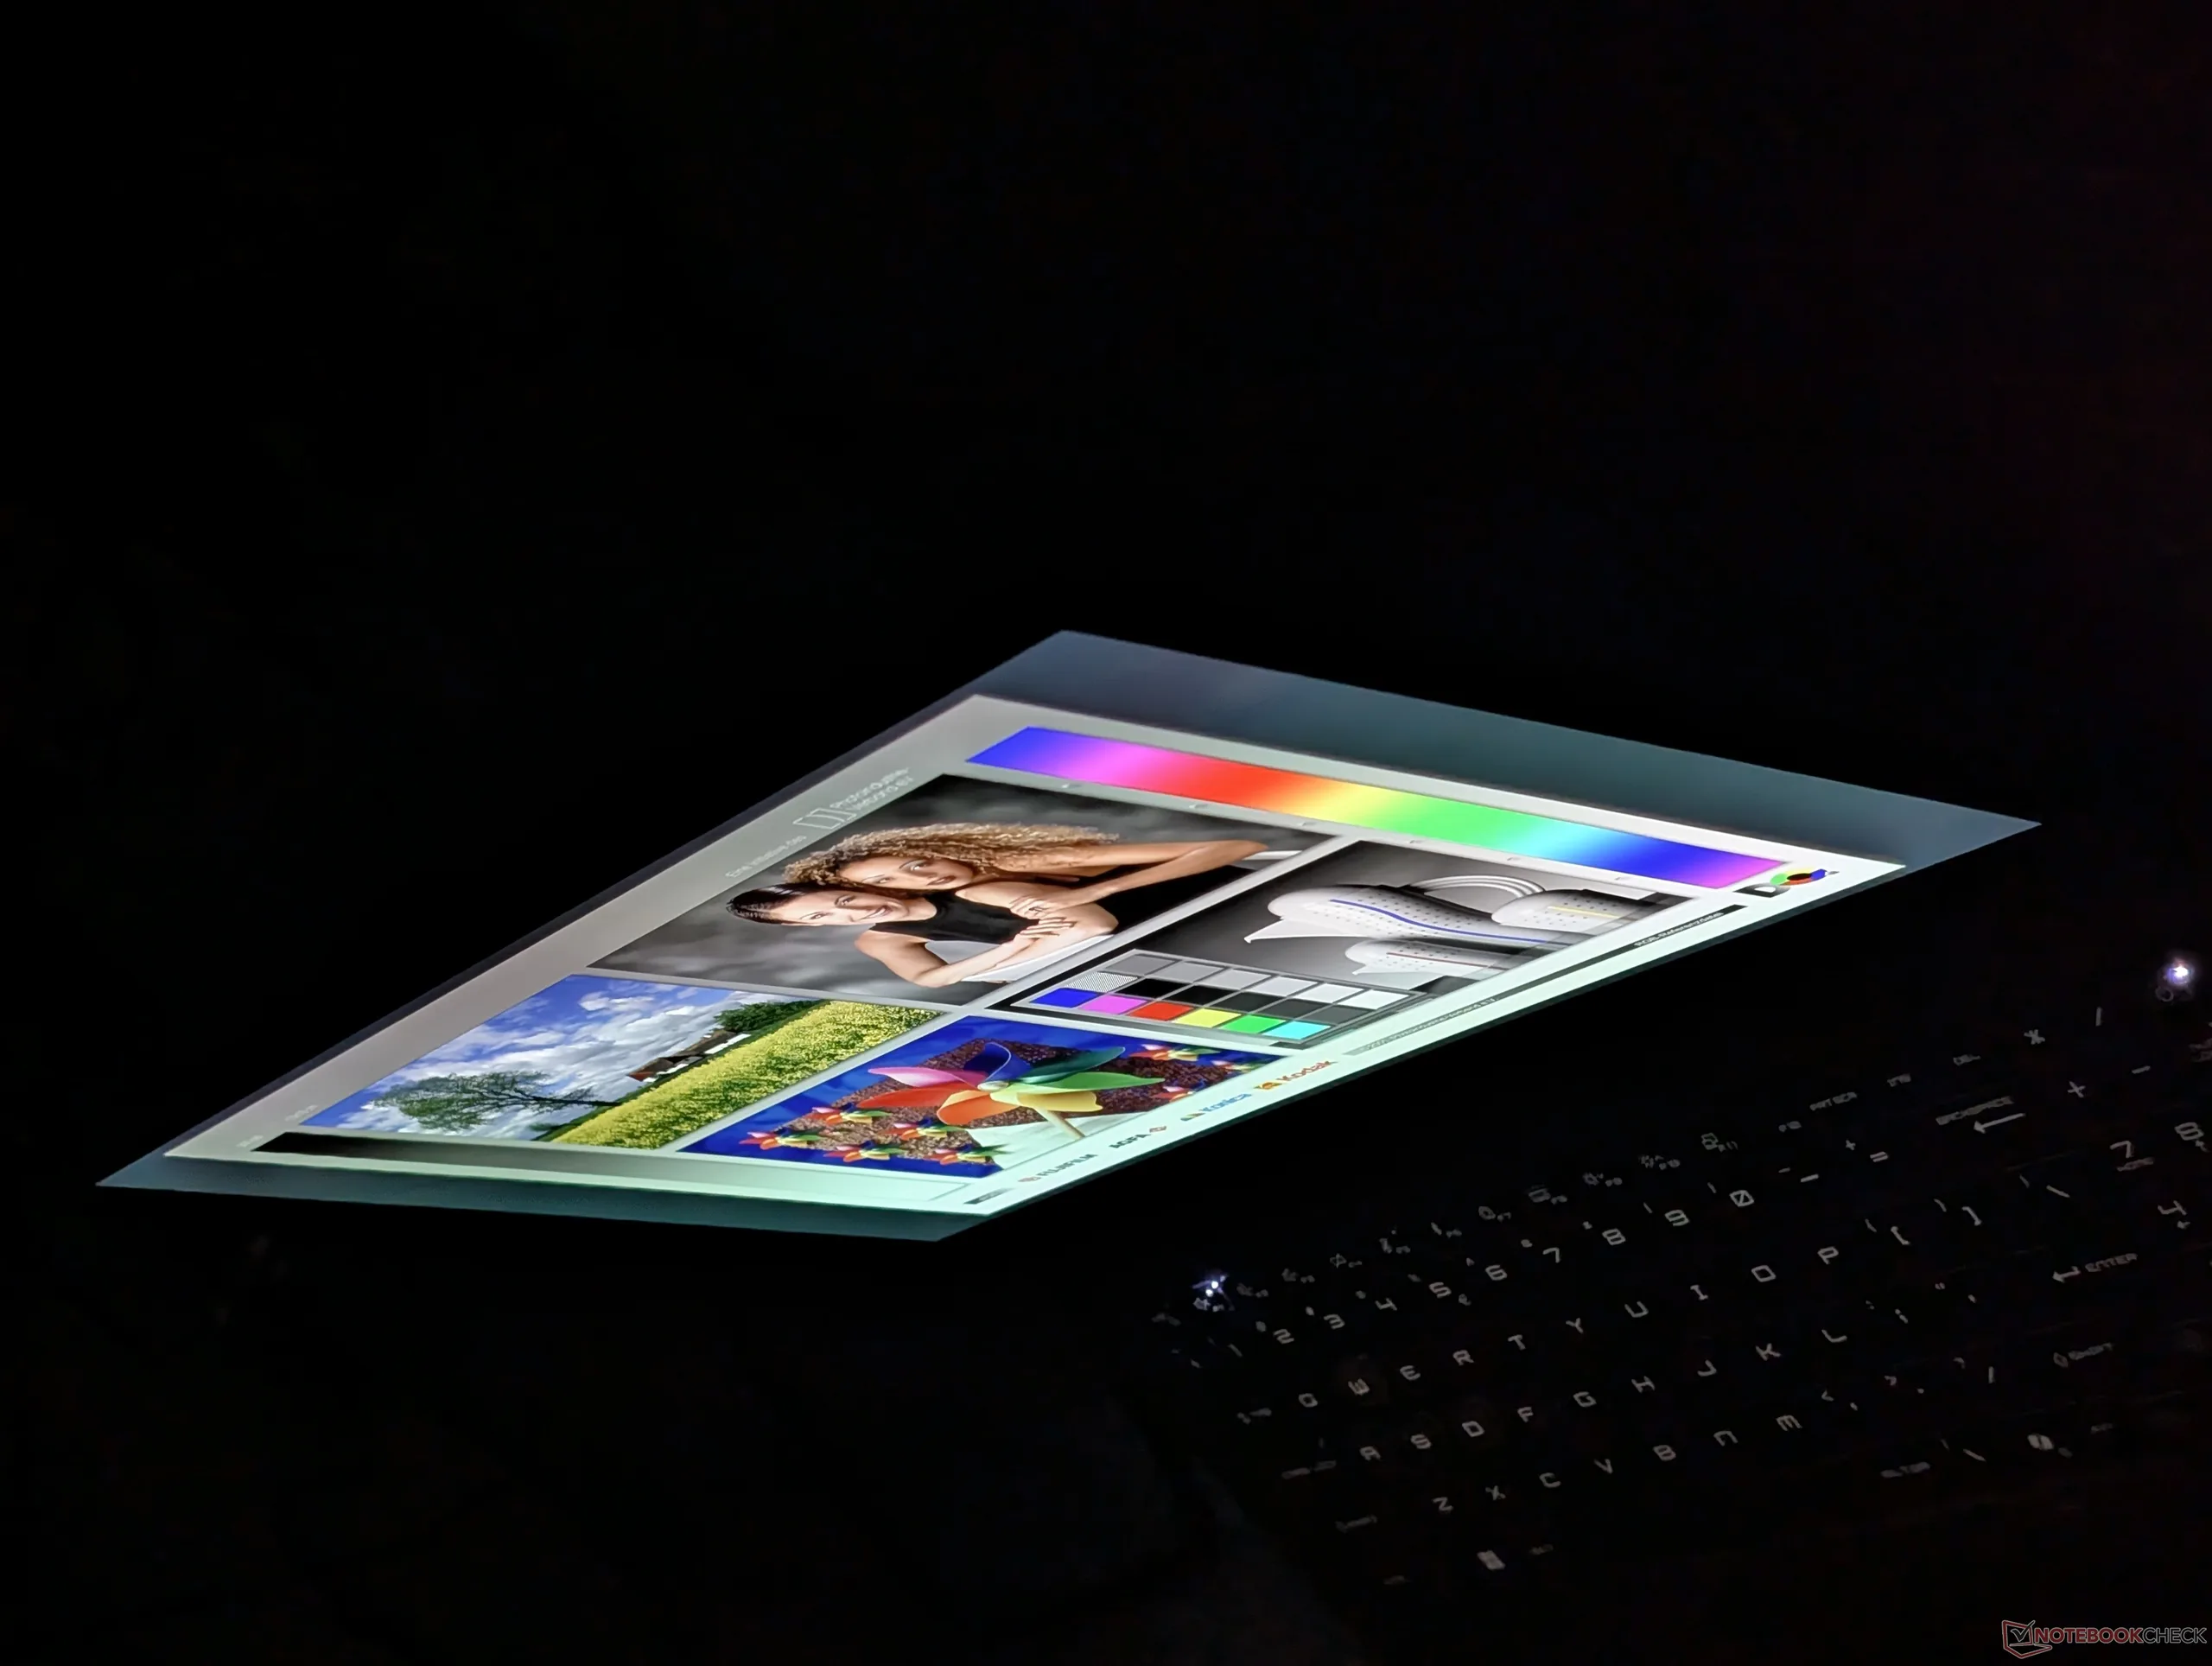
Display
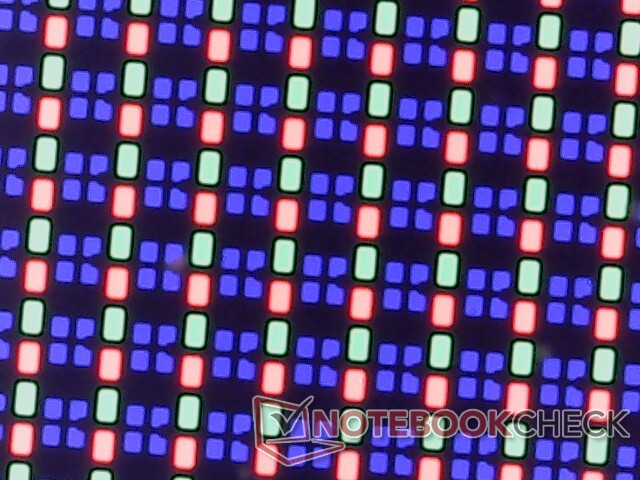
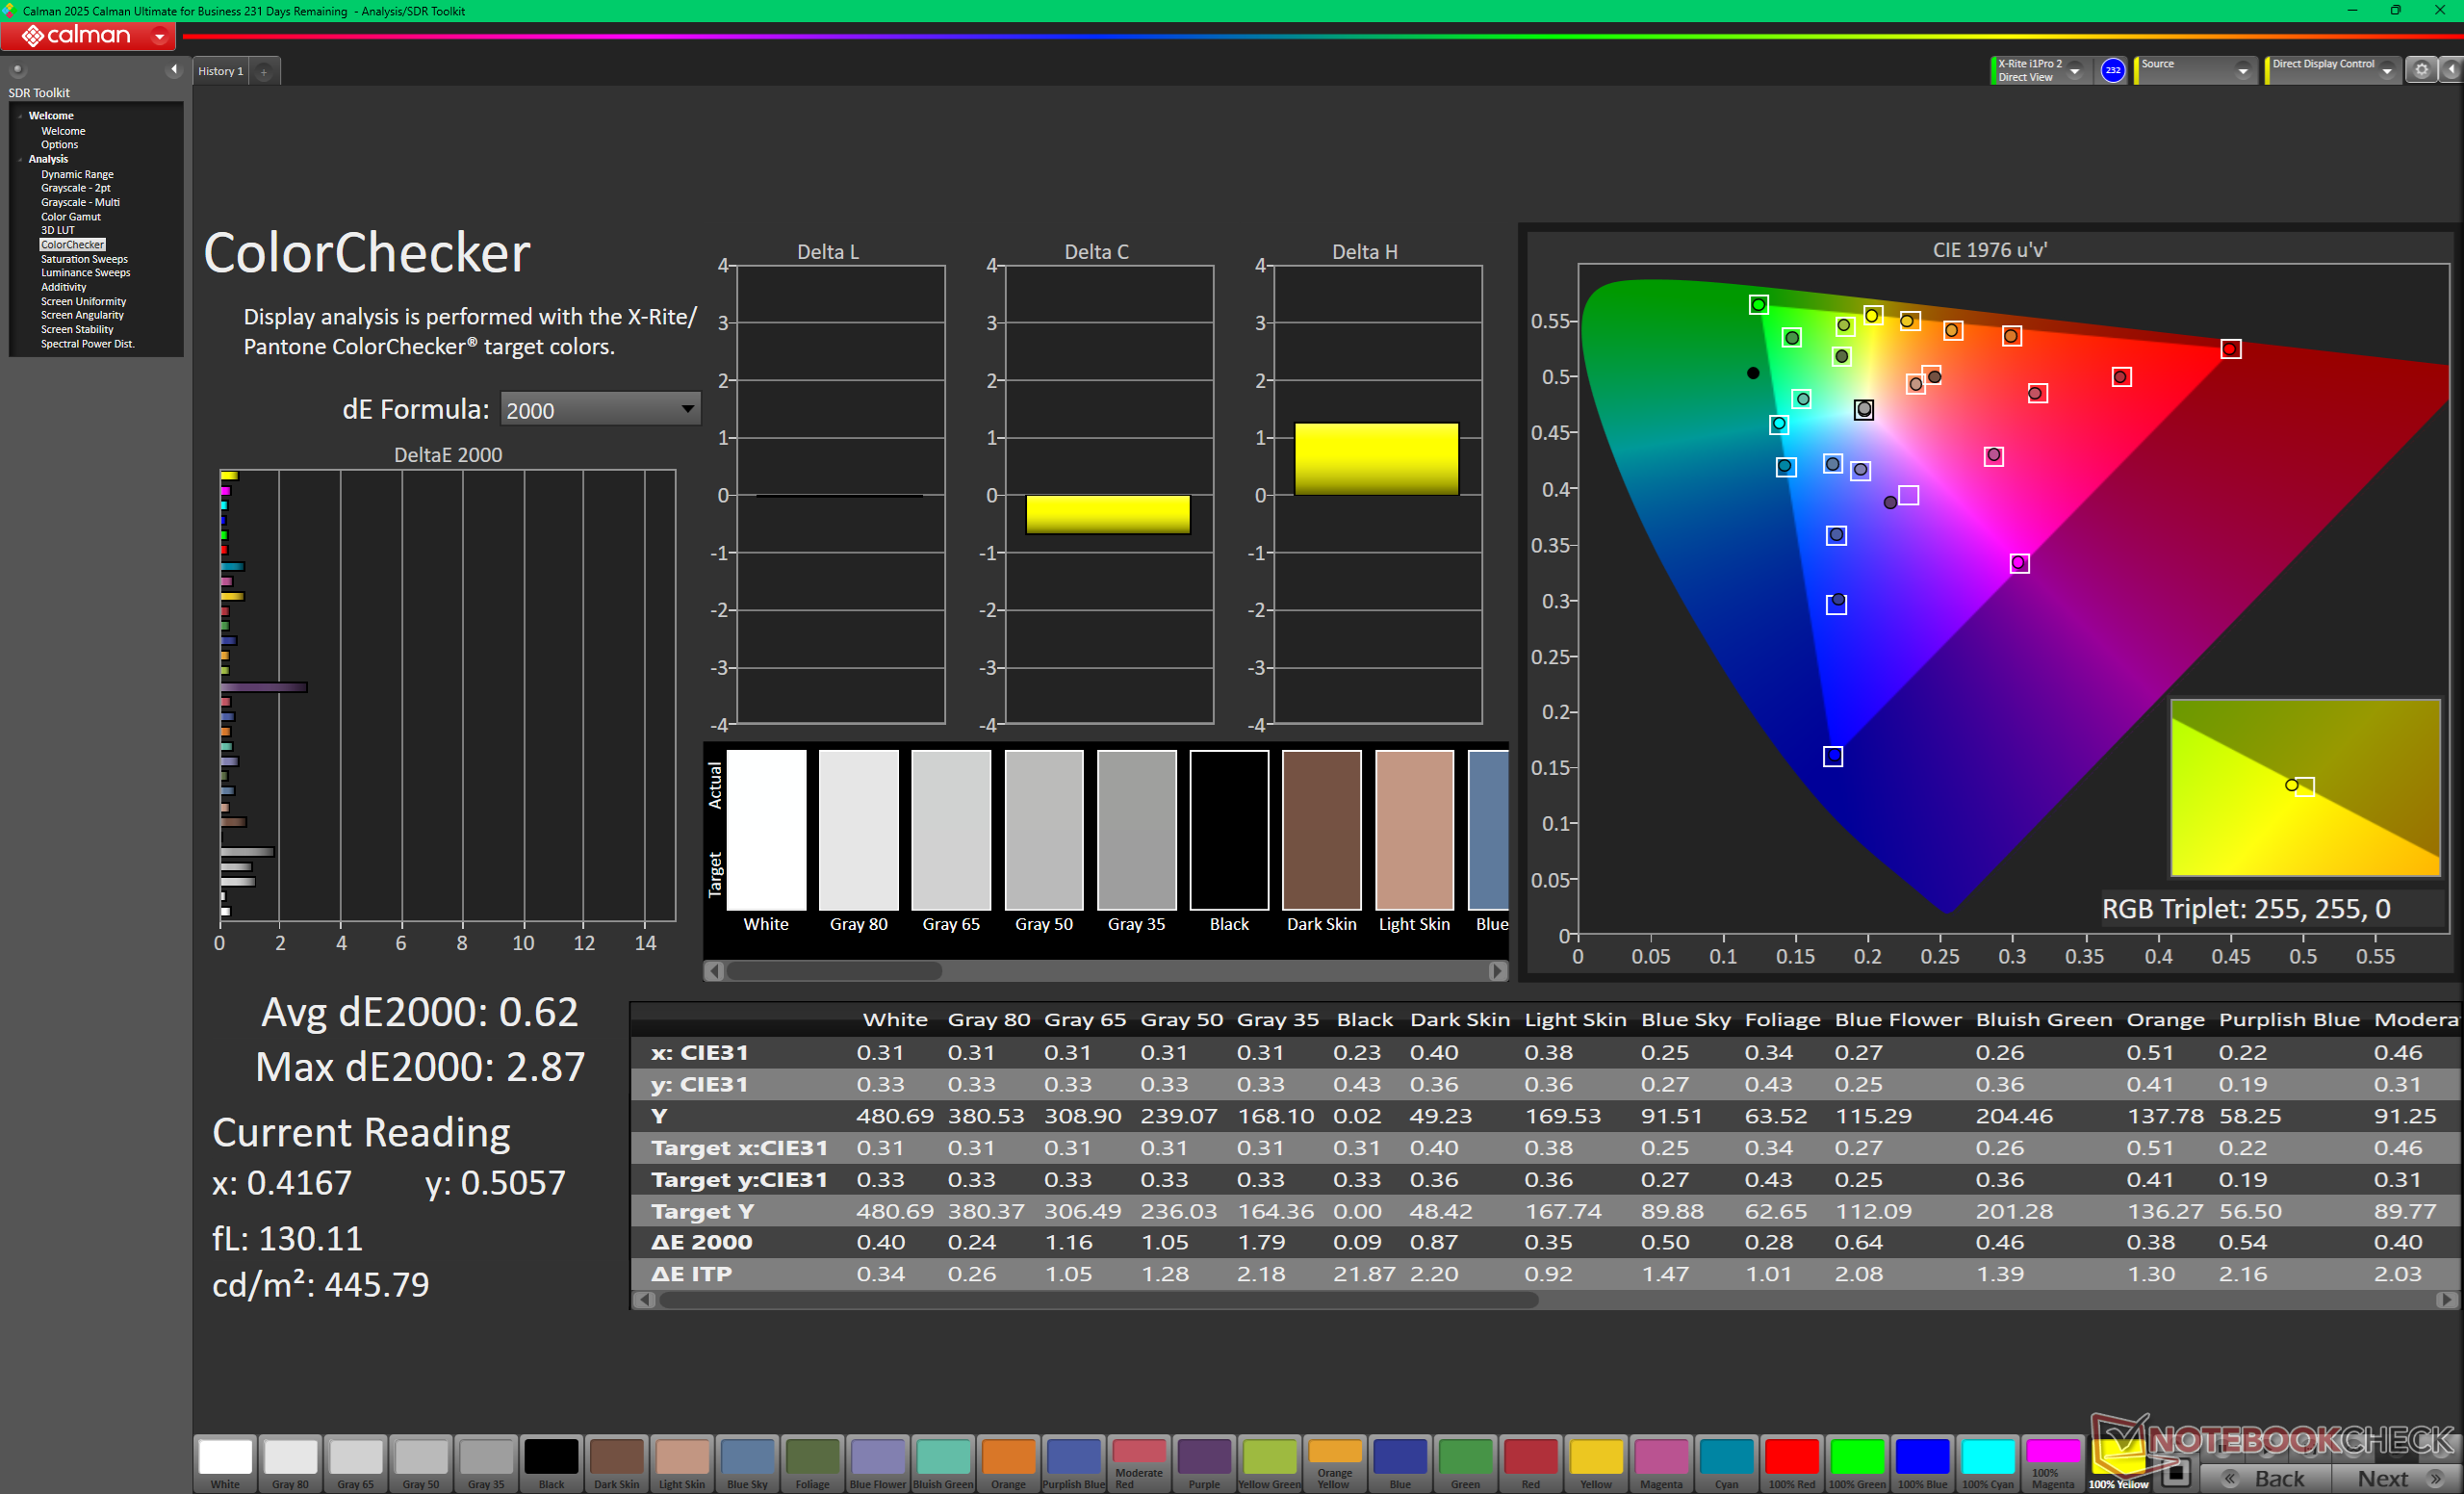
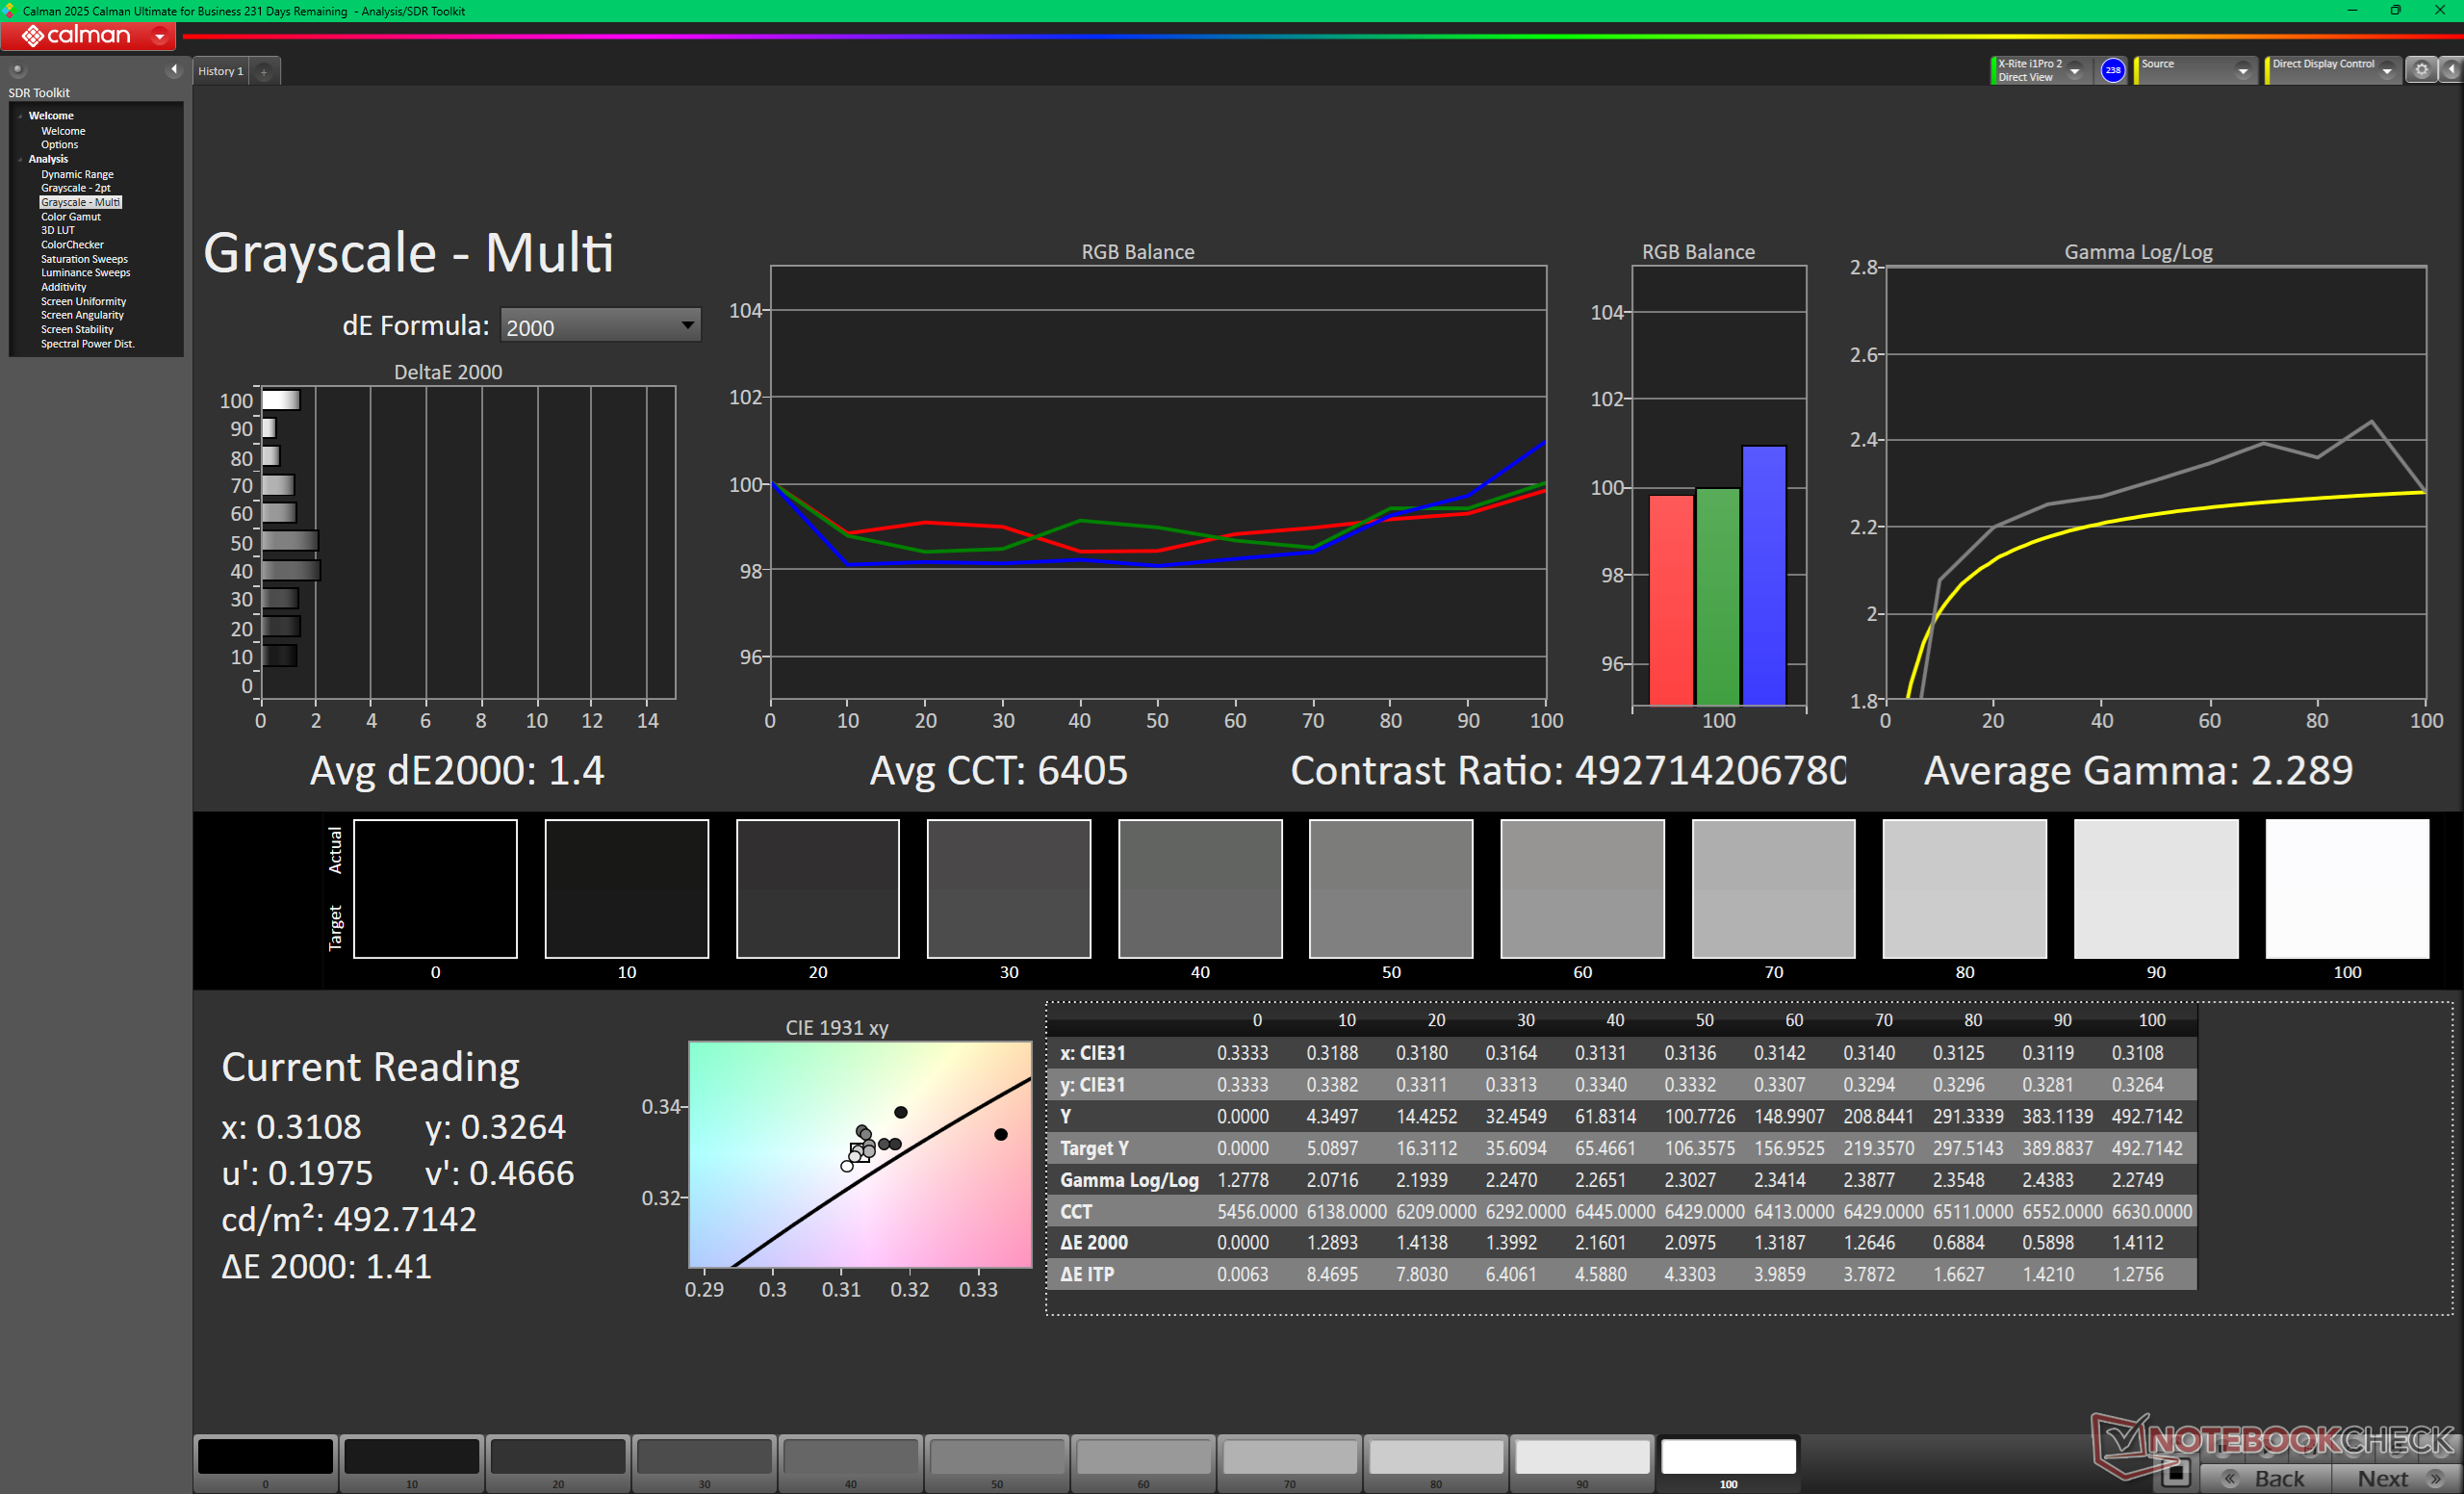
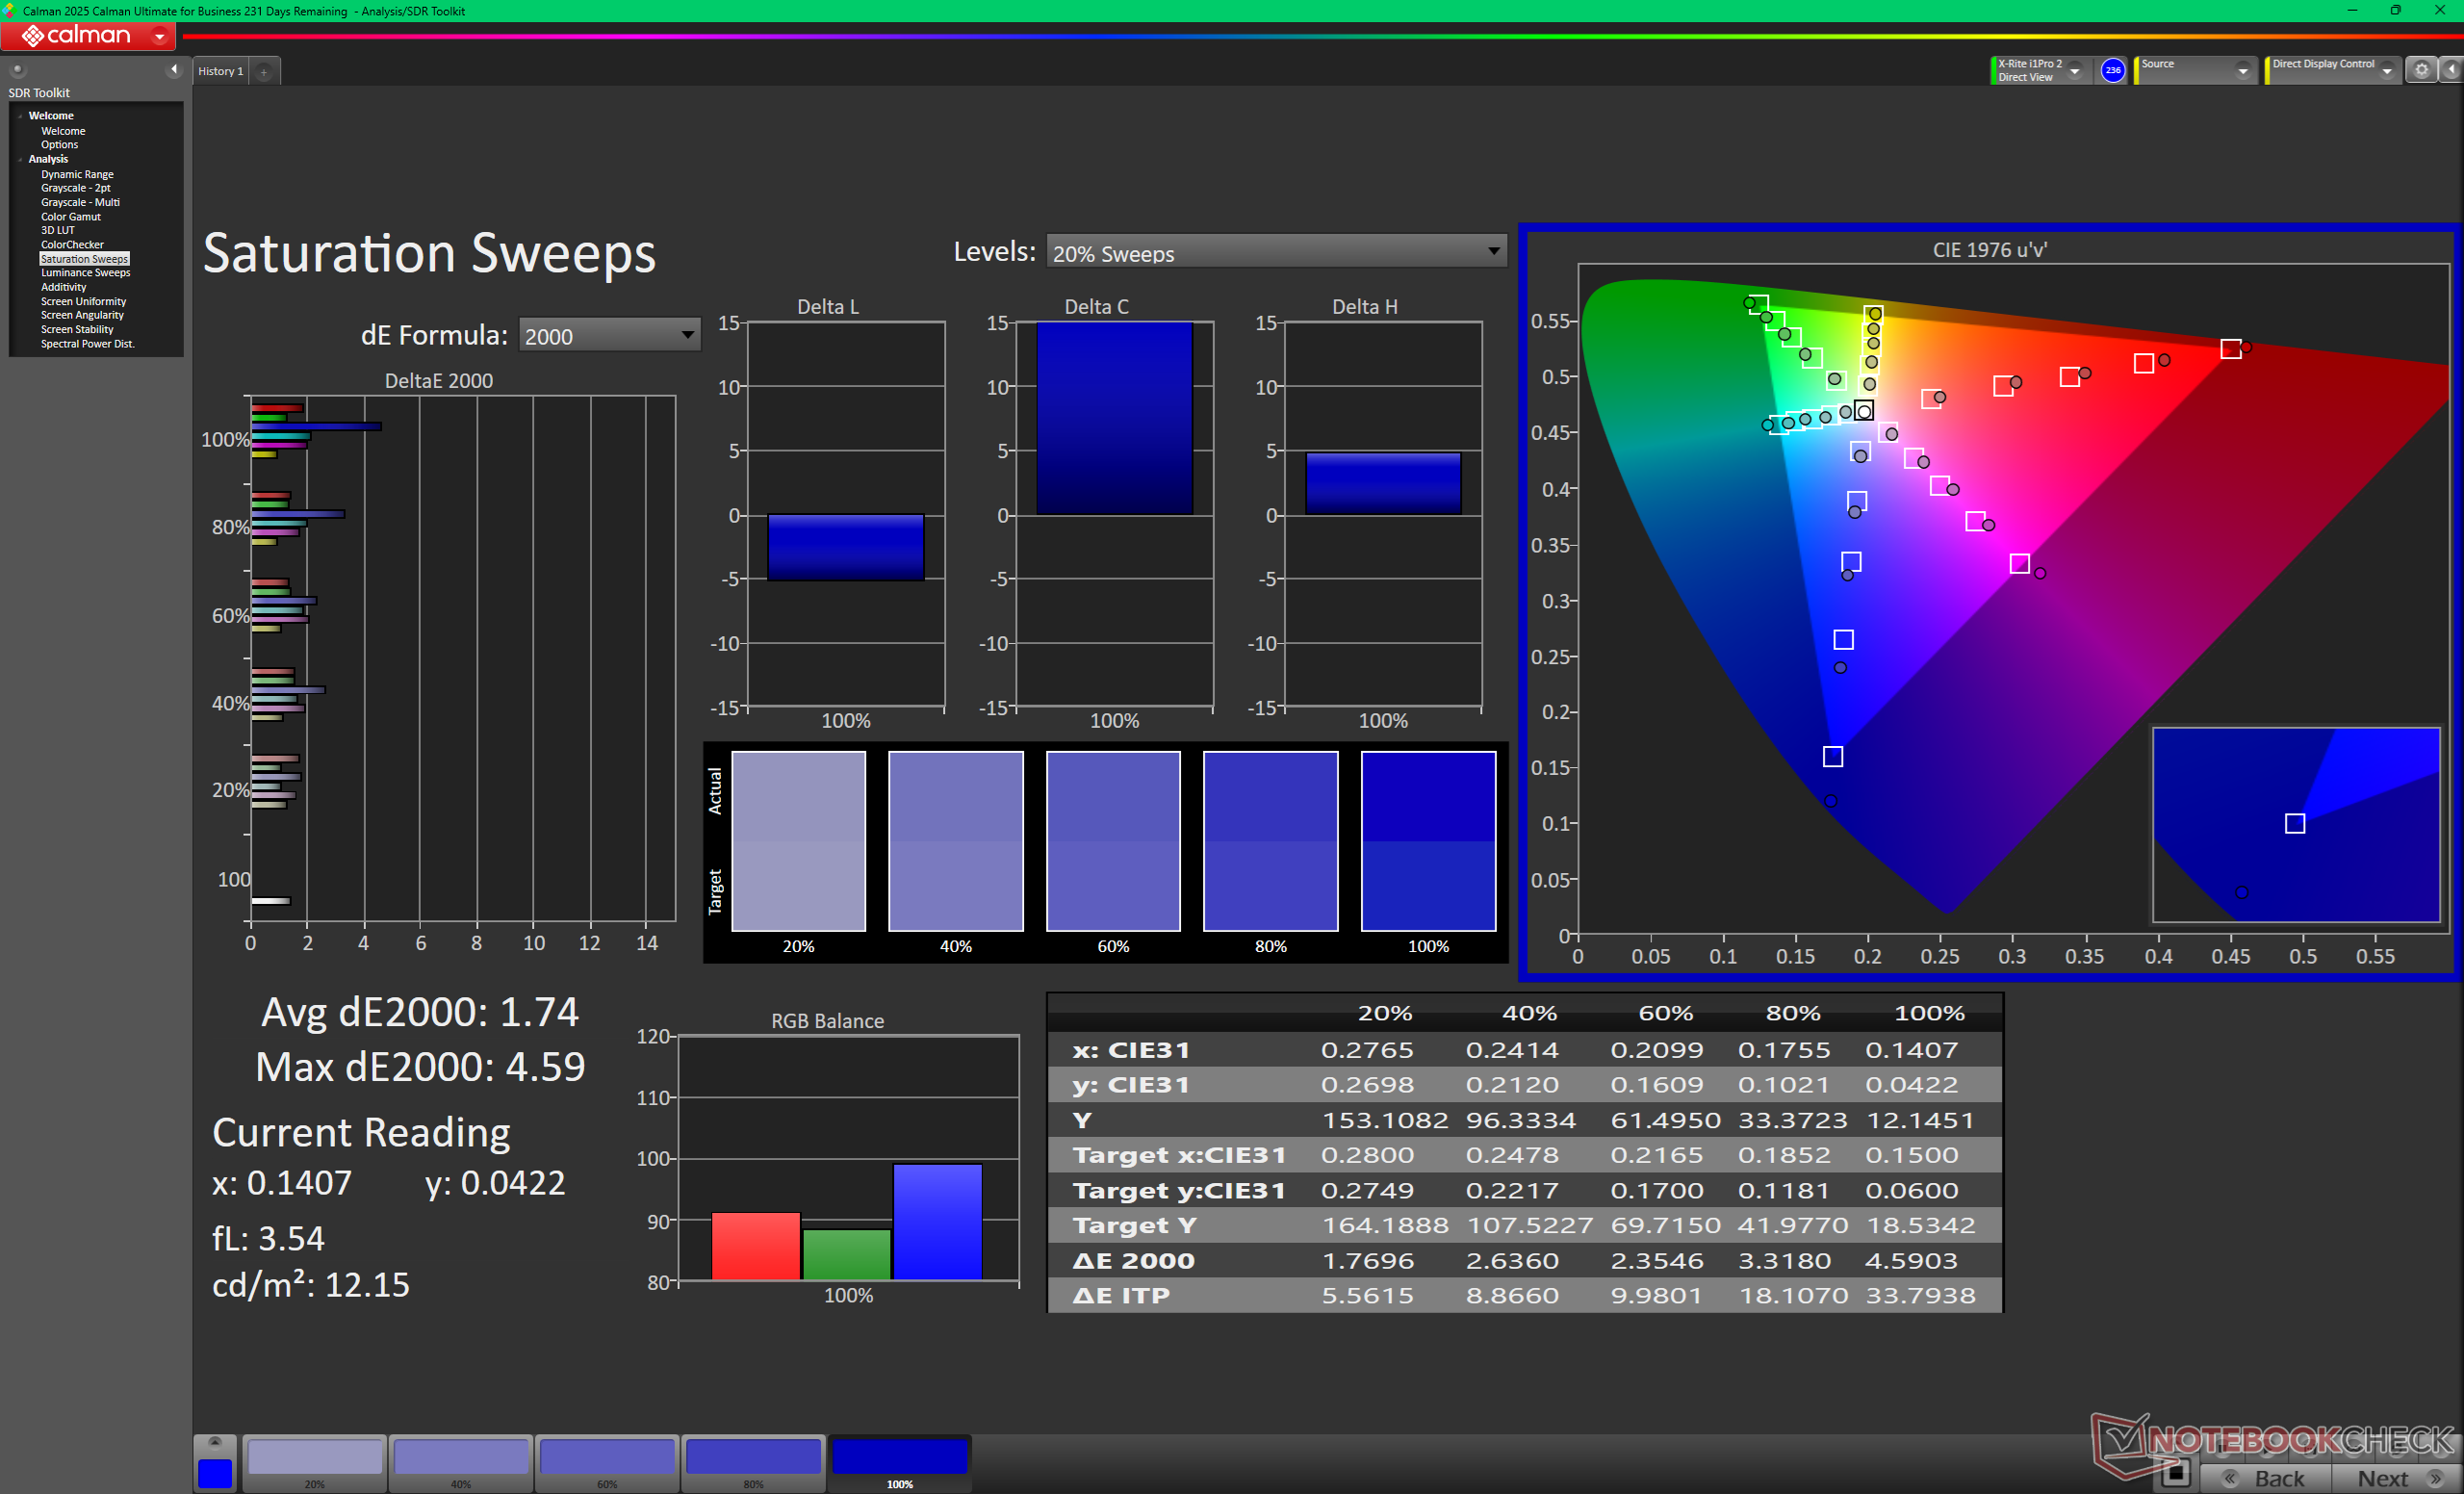
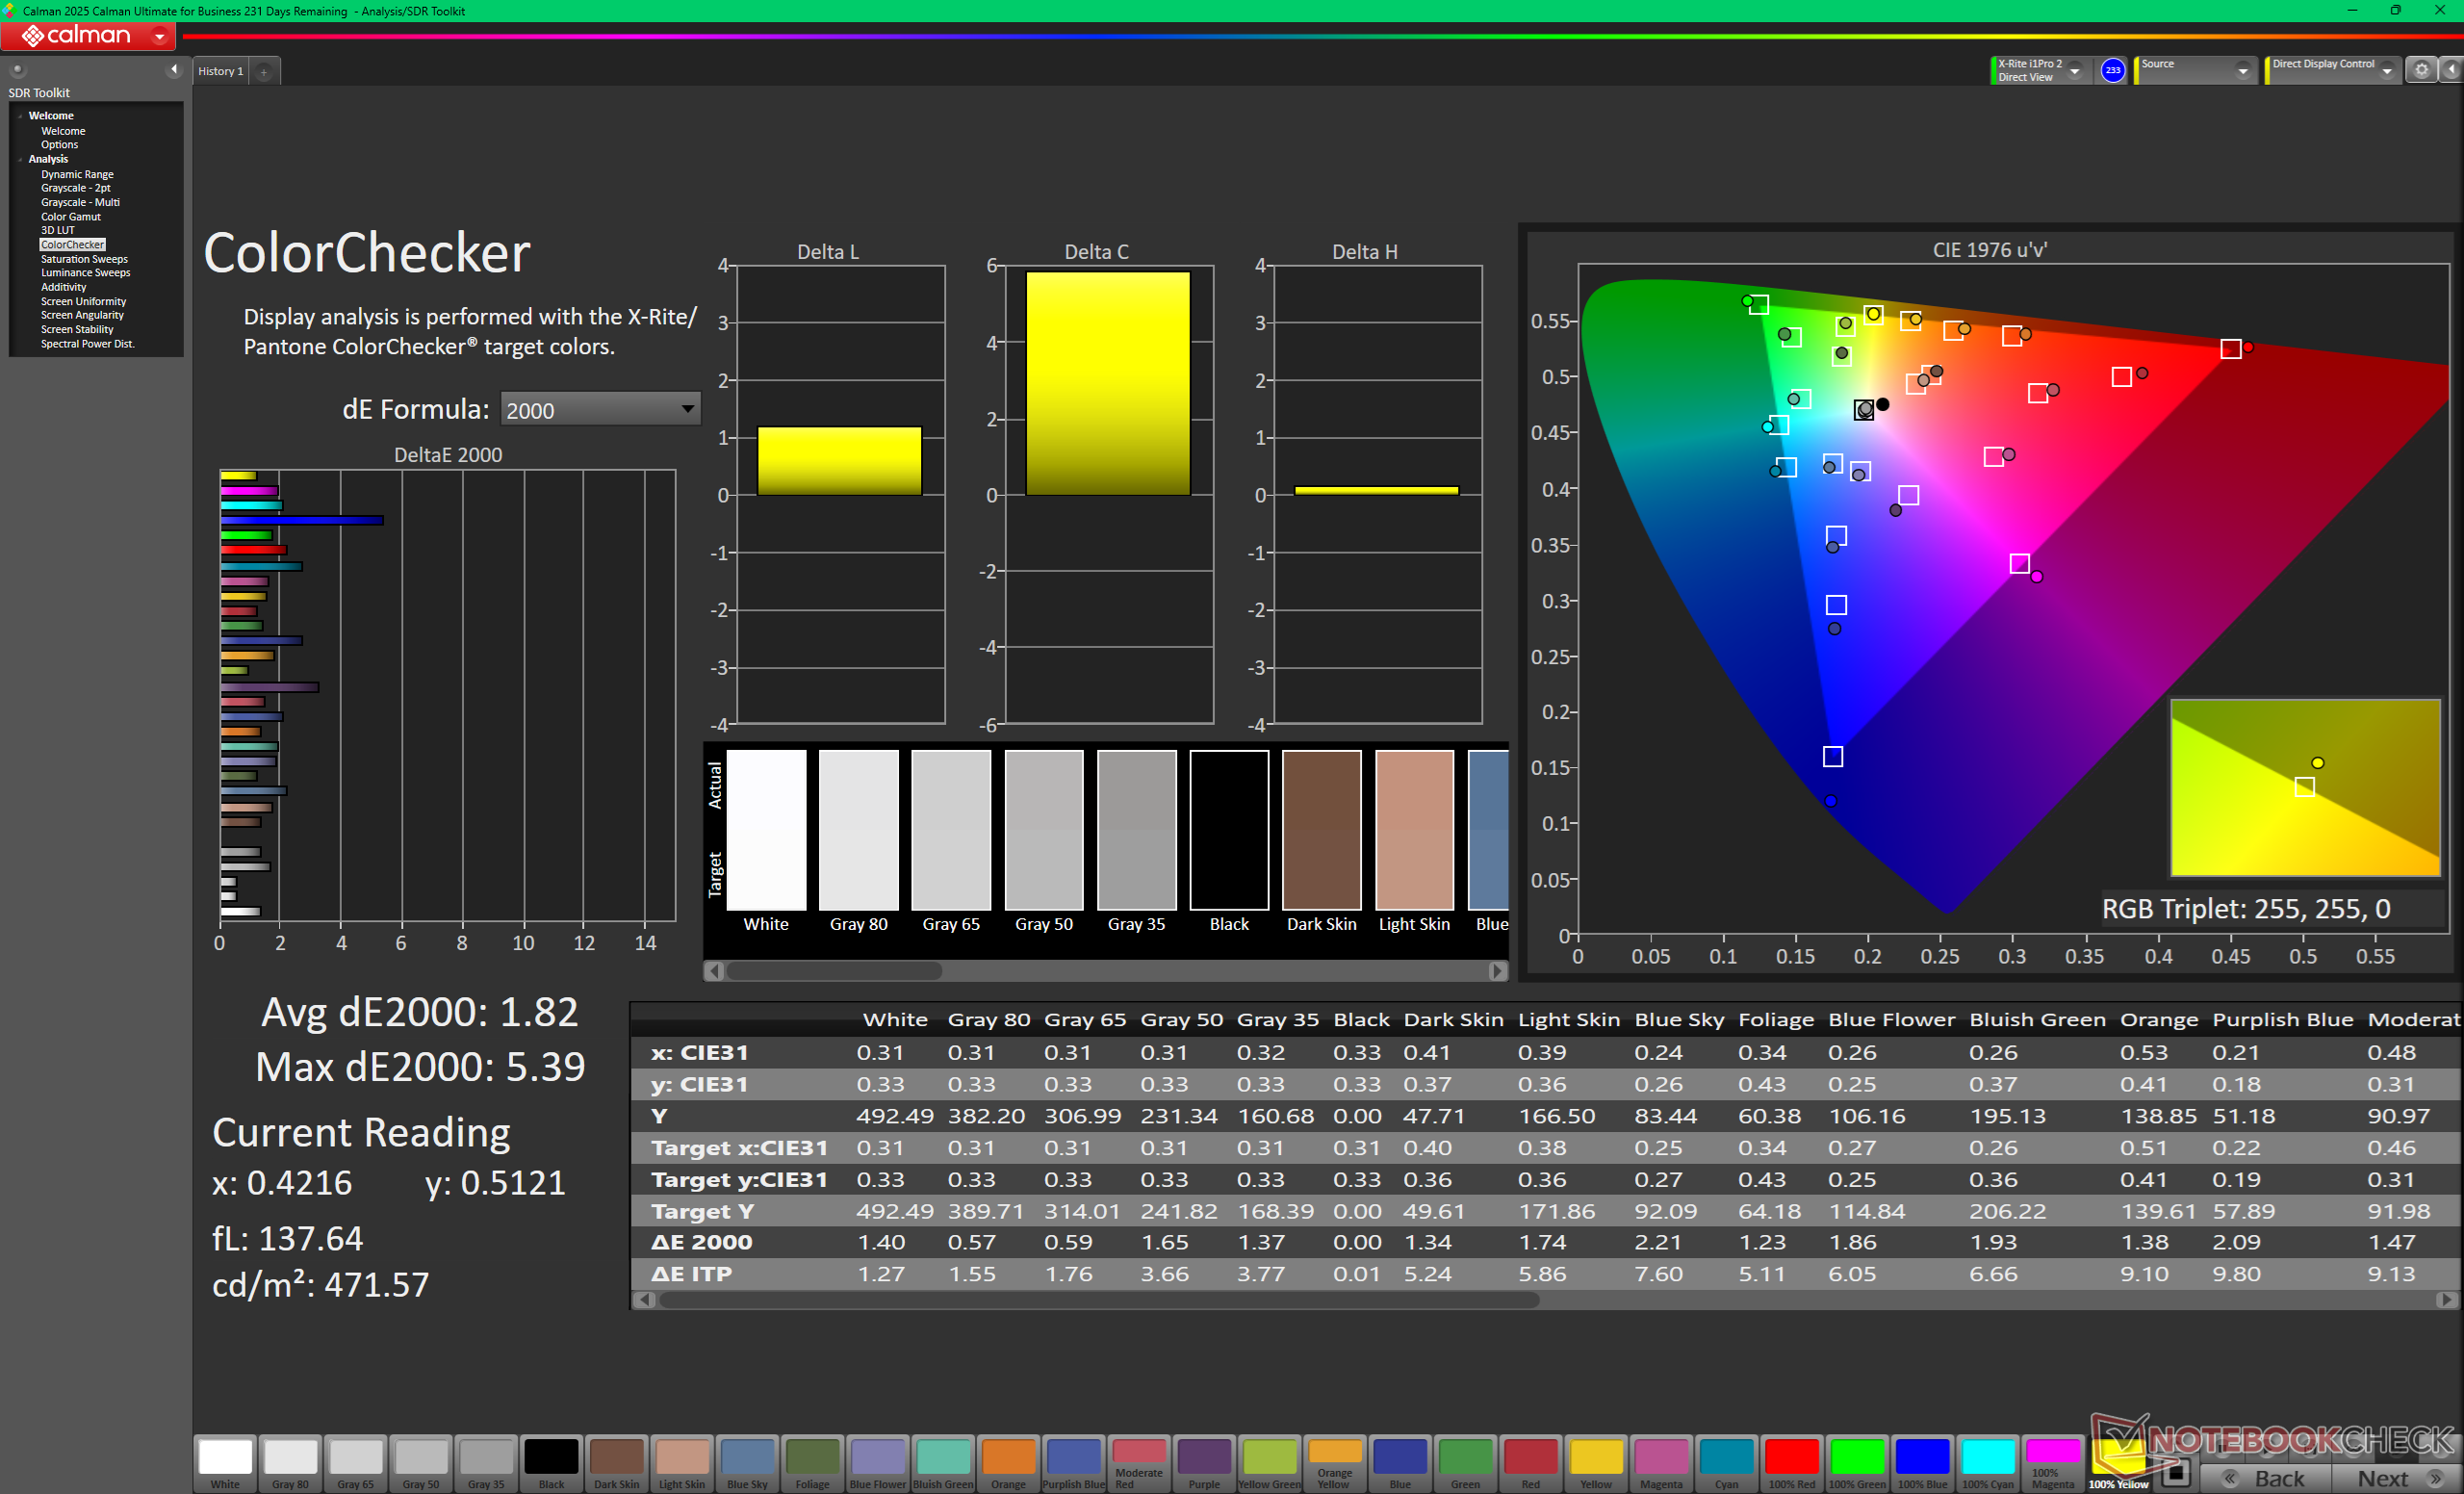
MSI sta iniziando a orientarsi maggiormente verso l'OLED invece che verso l'IPS o il Mini-LED per molti dei suoi portatili da gioco. Per Raider 16 Max HX, il pannello OLED QHD+ da 240 Hz è nitido con livelli di nero perfetti, colori P3 accurati, supporto DisplayHDR1000 e nessun effetto "alone" comunemente riscontrato nelle opzioni mini-LED della concorrenza.
I due svantaggi più evidenti del display sono la sua sovrapposizione molto lucida e la mancanza del supporto G-Sync, a differenza della maggior parte dei portatili da gioco MSI più vecchi, dove i pannelli opachi erano standard. Si prepari a combattere l'abbagliamento quando gioca in ambienti interni molto luminosi.
| |||||||||||||||||||||||||
Distribuzione della luminosità: 98 %
Al centro con la batteria: 478.6 cd/m²
Contrasto: ∞:1 (Nero: 0 cd/m²)
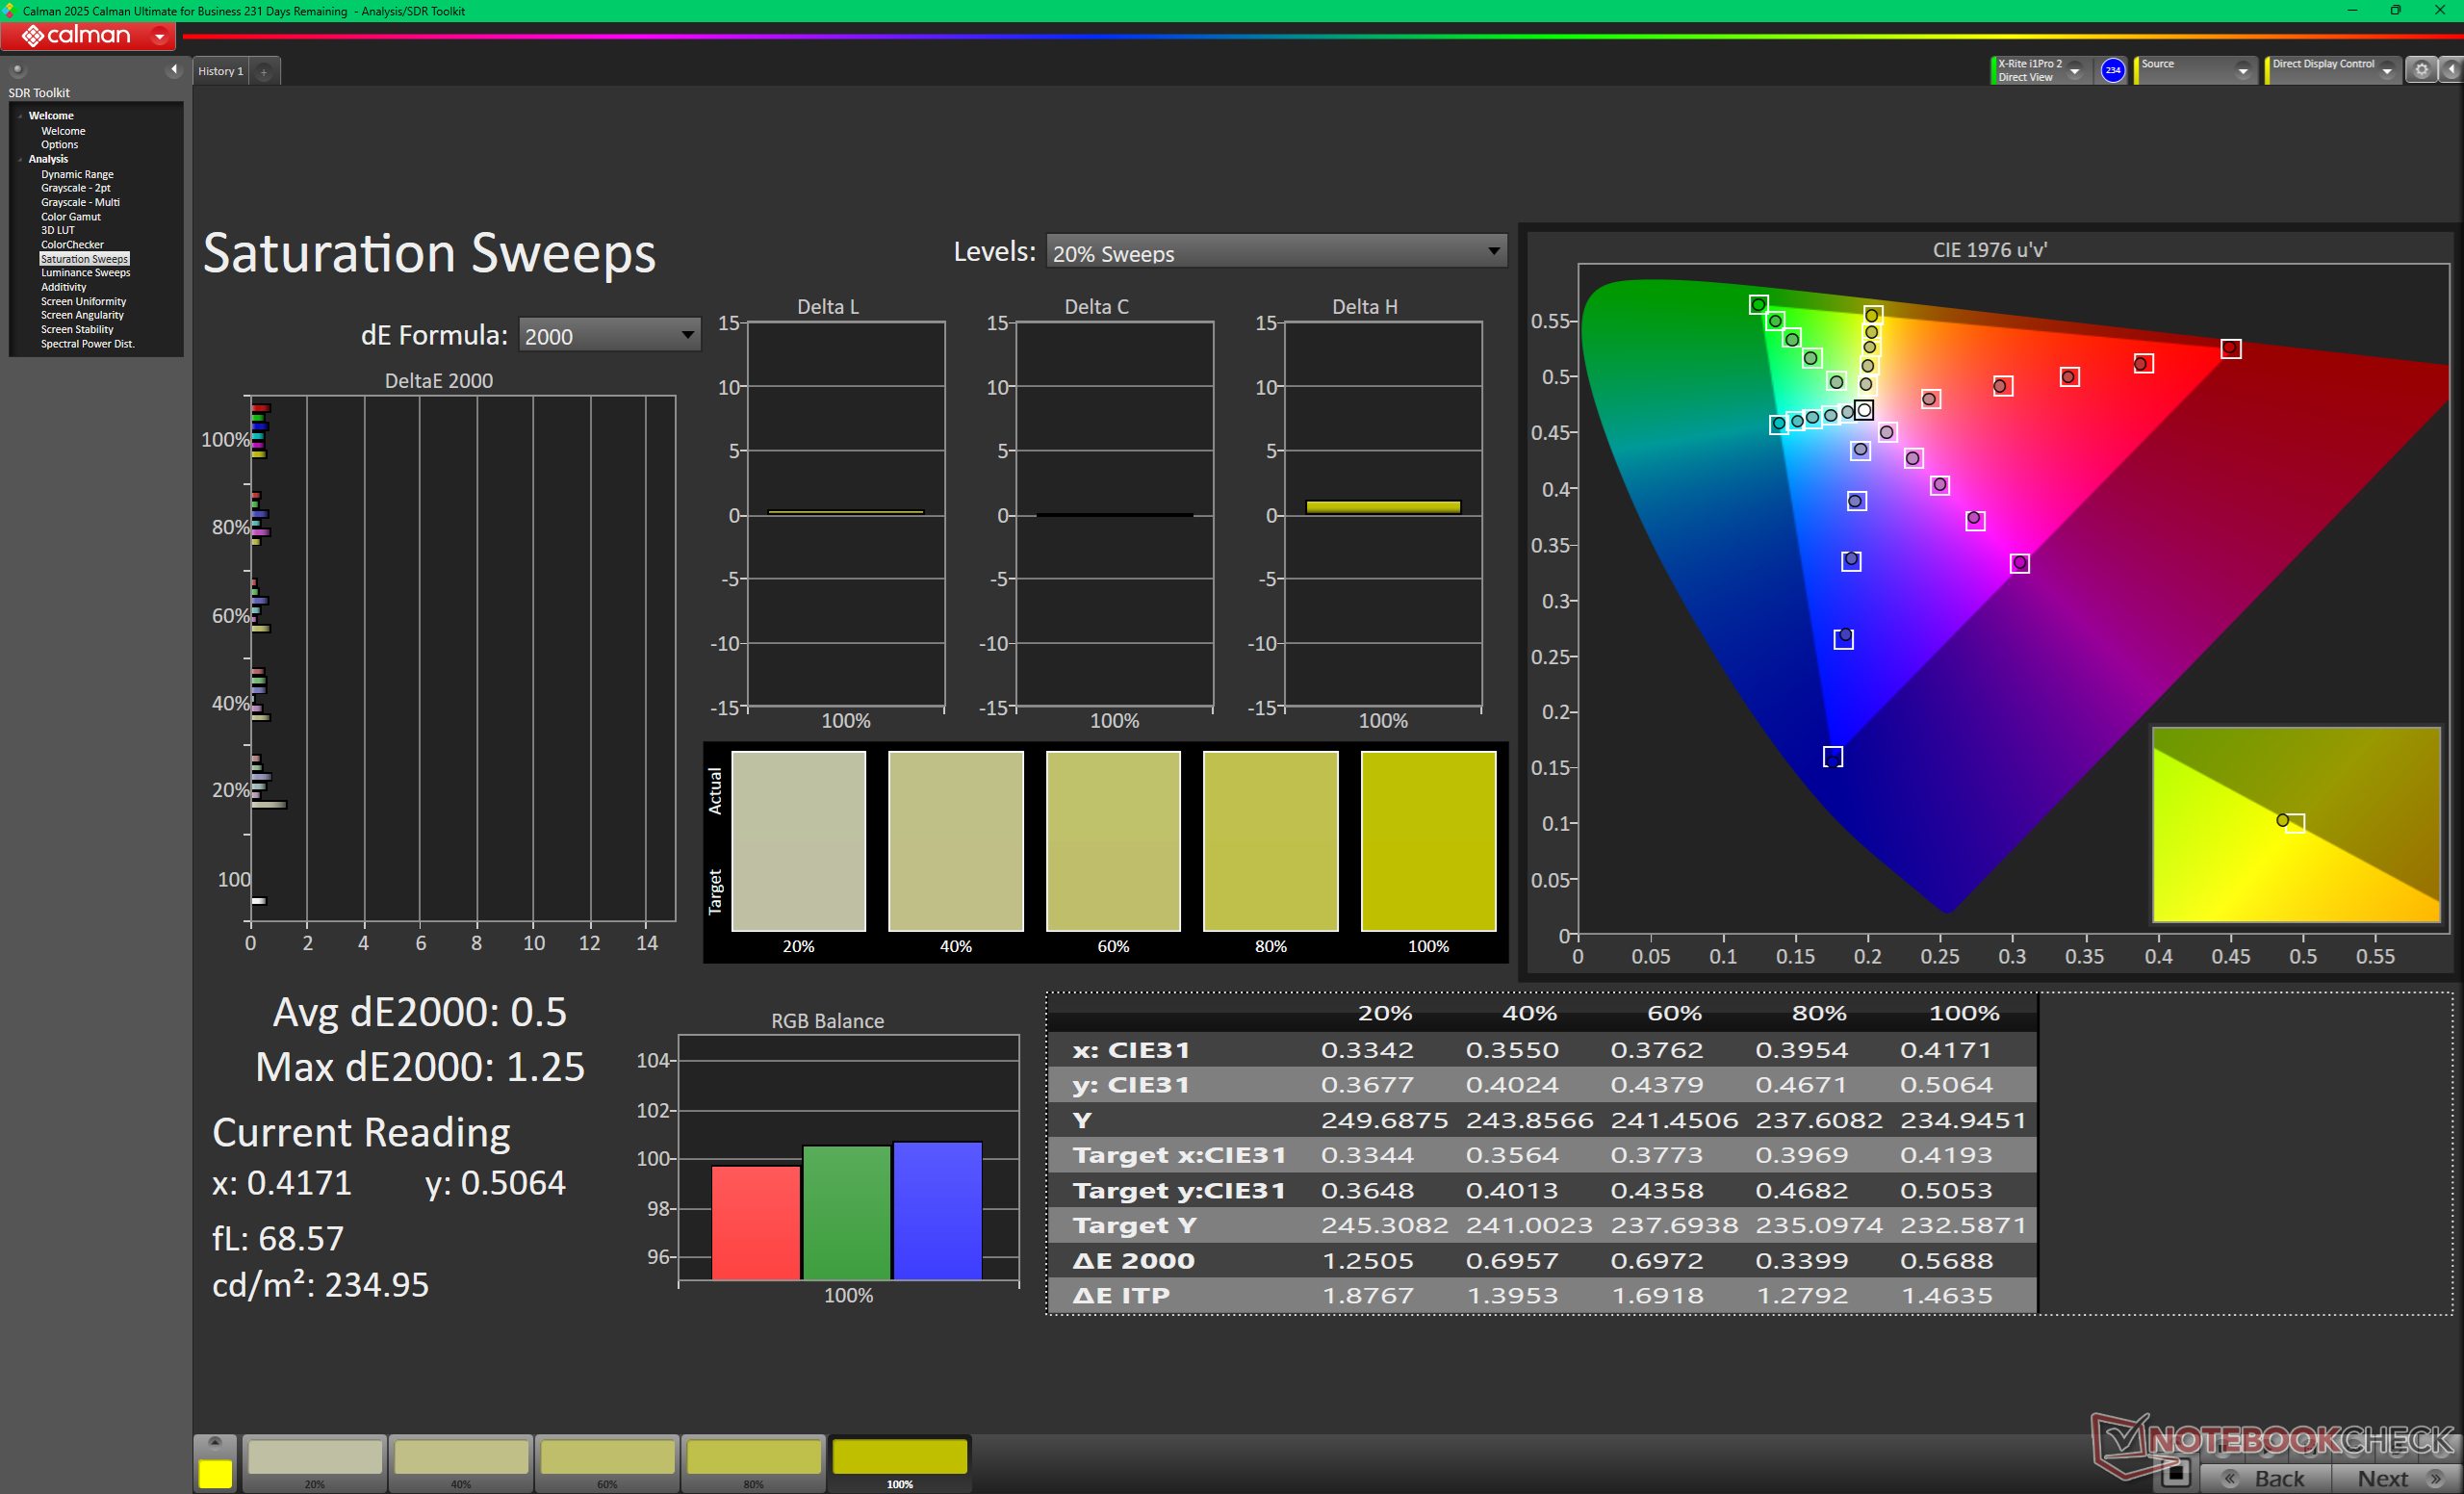
ΔE ColorChecker Calman: 0.62 | ∀{0.5-29.43 Ø4.73}
ΔE Greyscale Calman: 0.7 | ∀{0.09-98 Ø4.97}
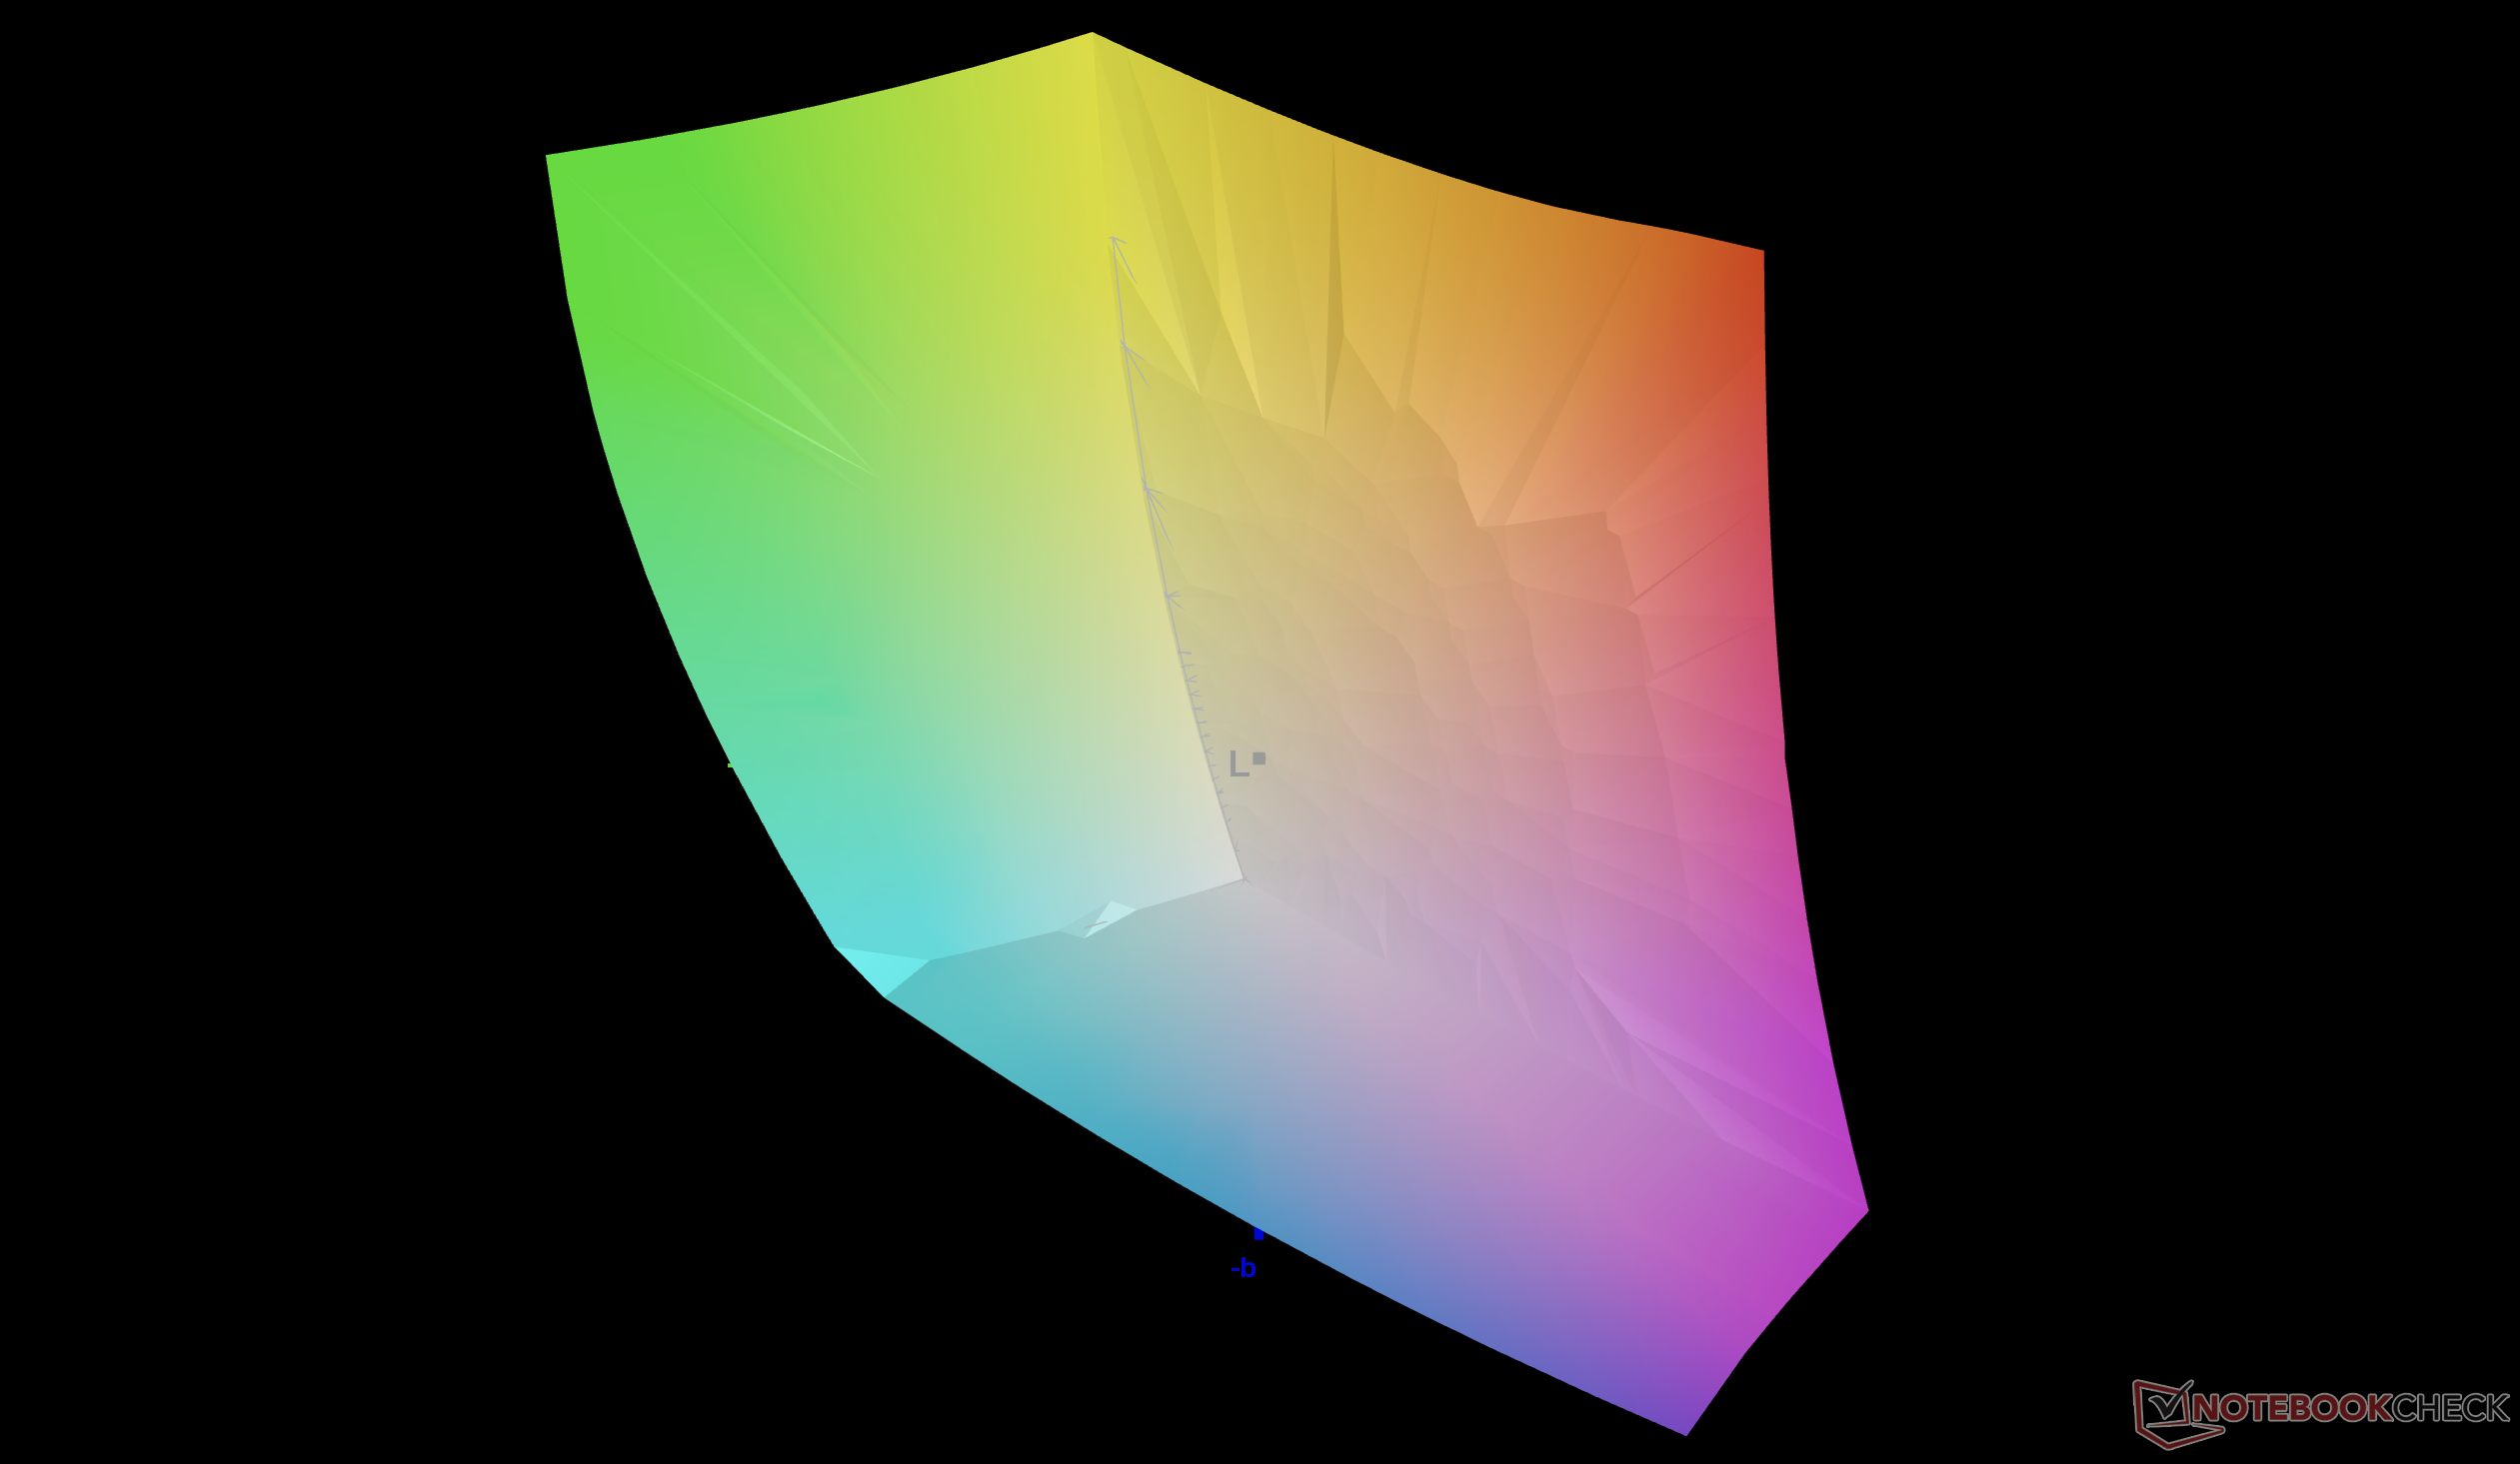
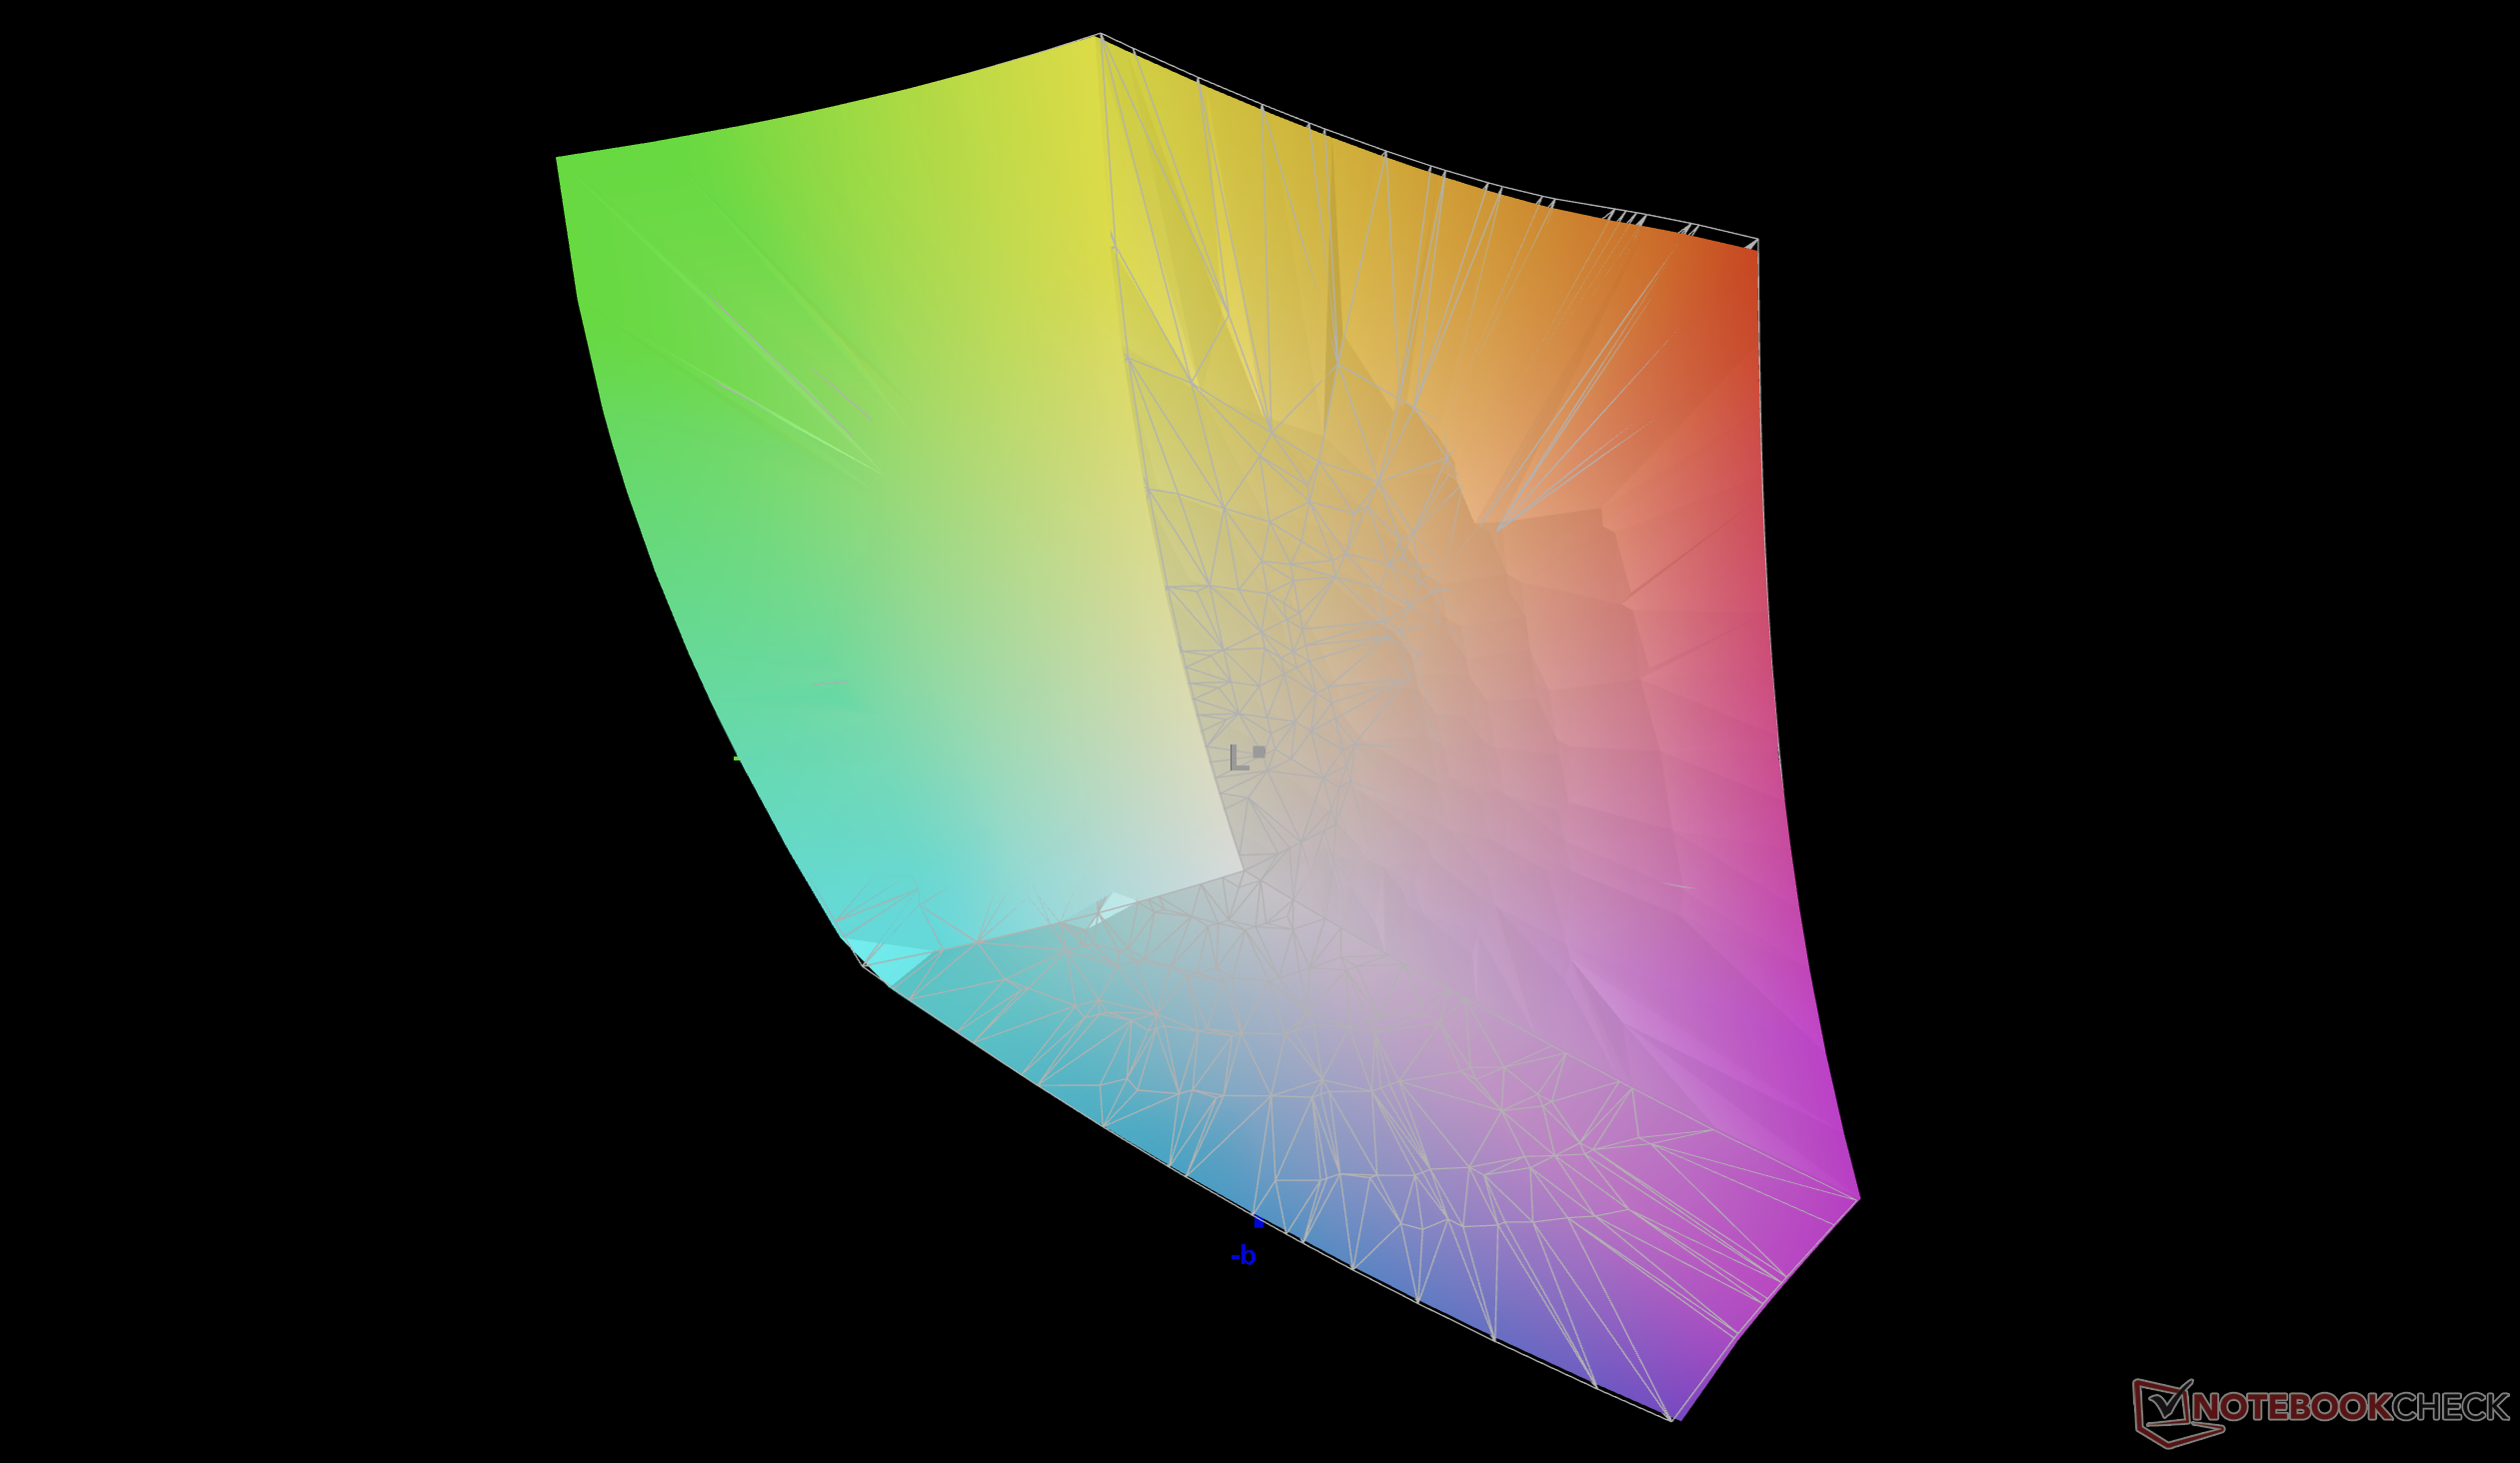
87.5% AdobeRGB 1998 (Argyll 3D)
99.9% sRGB (Argyll 3D)
99.3% Display P3 (Argyll 3D)
Gamma: 2.16
CCT: 6535 K
| MSI Raider 16 Max HX B2WJ Samsung ATNA60HU01-0, OLED, 2560x1600, 16", 240 Hz | MSI Crosshair 16 HX AI D2XWGKG AUO B160QAN02.3, IPS, 2560x1600, 16", 240 Hz | Razer Blade 16 Core Ultra 9 386H Samsung ATNA60HU06-0, OLED, 2560x1600, 16", 240 Hz | Alienware 16X Aurora Core Ultra 9 290HX Plus Samsung 160HU05, OLED, 2560x1600, 16", 240 Hz | Asus TUF Gaming A16 FA608UP MNG007DA5-3, IPS, 2560x1600, 16", 165 Hz | Lenovo Legion 7 16IAX10 Samsung ATNA60HS01-0, OLED, 2560x1600, 16", 165 Hz | |
|---|---|---|---|---|---|---|
| Display | -3% | 2% | 2% | -17% | 2% | |
| Display P3 Coverage (%) | 99.3 | 95.5 -4% | 99.7 0% | 99.6 0% | 69.4 -30% | 99.6 0% |
| sRGB Coverage (%) | 99.9 | 99.7 0% | 100 0% | 100 0% | 97.2 -3% | 100 0% |
| AdobeRGB 1998 Coverage (%) | 87.5 | 83.9 -4% | 93.5 7% | 93.9 7% | 71.9 -18% | 93.5 7% |
| Response Times | -1450% | 2% | -1% | -1641% | -62% | |
| Response Time Grey 50% / Grey 80% * (ms) | 0.28 ? | 3.59 ? -1182% | 0.28 ? -0% | 0.29 ? -4% | 6.3 ? -2150% | 0.6 ? -114% |
| Response Time Black / White * (ms) | 0.39 ? | 7.09 ? -1718% | 0.4 ? -3% | 0.45 ? -15% | 4.8 ? -1131% | 0.8 ? -105% |
| PWM Frequency (Hz) | 1440 ? | 1441 | 1439.8 ? | 1317 ? | ||
| PWM Amplitude * (%) | 35 | 32 9% | 29 17% | 23 34% | ||
| Screen | -326% | -81% | -105% | -33% | -91% | |
| Brightness middle (cd/m²) | 478.6 | 472 -1% | 462.2 -3% | 380.5 -20% | 480 0% | 477.6 0% |
| Brightness (cd/m²) | 481 | 438 -9% | 465 -3% | 384 -20% | 456 -5% | 483 0% |
| Brightness Distribution (%) | 98 | 88 -10% | 97 -1% | 98 0% | 91 -7% | 95 -3% |
| Black Level * (cd/m²) | 0.4 | 0.32 | ||||
| Colorchecker dE 2000 * | 0.62 | 6.07 -879% | 3.03 -389% | 3.27 -427% | 1.4 -126% | 3.11 -402% |
| Colorchecker dE 2000 max. * | 2.87 | 9.76 -240% | 5.84 -103% | 6.31 -120% | 2.5 13% | 5.99 -109% |
| Greyscale dE 2000 * | 0.7 | 6.4 -814% | 0.6 14% | 1 -43% | 1.2 -71% | 0.9 -29% |
| Gamma | 2.16 102% | 2.52 87% | 2.2 100% | 2.23 99% | 2.16 102% | 2.18 101% |
| CCT | 6535 99% | 7987 81% | 6452 101% | 6410 101% | 6620 98% | 6405 101% |
| Contrast (:1) | 1180 | 1500 | ||||
| Colorchecker dE 2000 calibrated * | 2.25 | 0.6 | 1.1 | 1.3 | 0.79 | |
| Media totale (Programma / Settaggio) | -593% /
-442% | -26% /
-39% | -35% /
-52% | -564% /
-321% | -50% /
-60% |
* ... Meglio usare valori piccoli

Tempi di risposta del Display
| ↔ Tempi di risposta dal Nero al Bianco | ||
|---|---|---|
| 0.39 ms ... aumenta ↗ e diminuisce ↘ combinato | ↗ 0.21 ms Incremento | 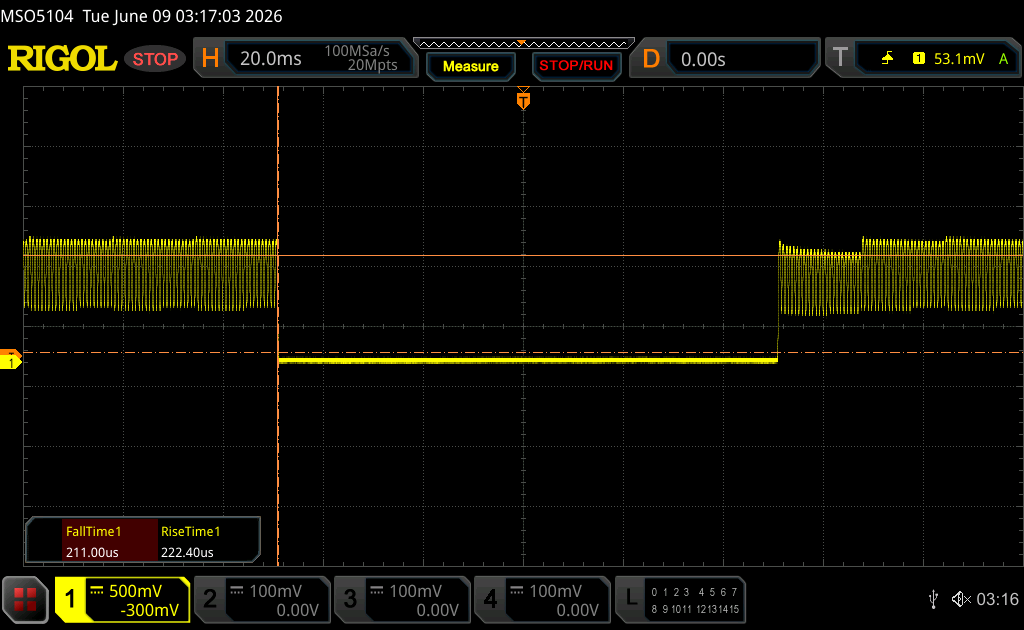 |
| ↘ 0.18 ms Calo | ||
| Lo schermo ha mostrato valori di risposta molto veloci nei nostri tests ed è molto adatto per i gaming veloce. In confronto, tutti i dispositivi di test variano da 0.1 (minimo) a 240 (massimo) ms. » 0 % di tutti i dispositivi è migliore. Questo significa che i tempi di risposta rilevati sono migliori rispettto alla media di tutti i dispositivi testati (19.9 ms). | ||
| ↔ Tempo di risposta dal 50% Grigio all'80% Grigio | ||
| 0.28 ms ... aumenta ↗ e diminuisce ↘ combinato | ↗ 0.14 ms Incremento | 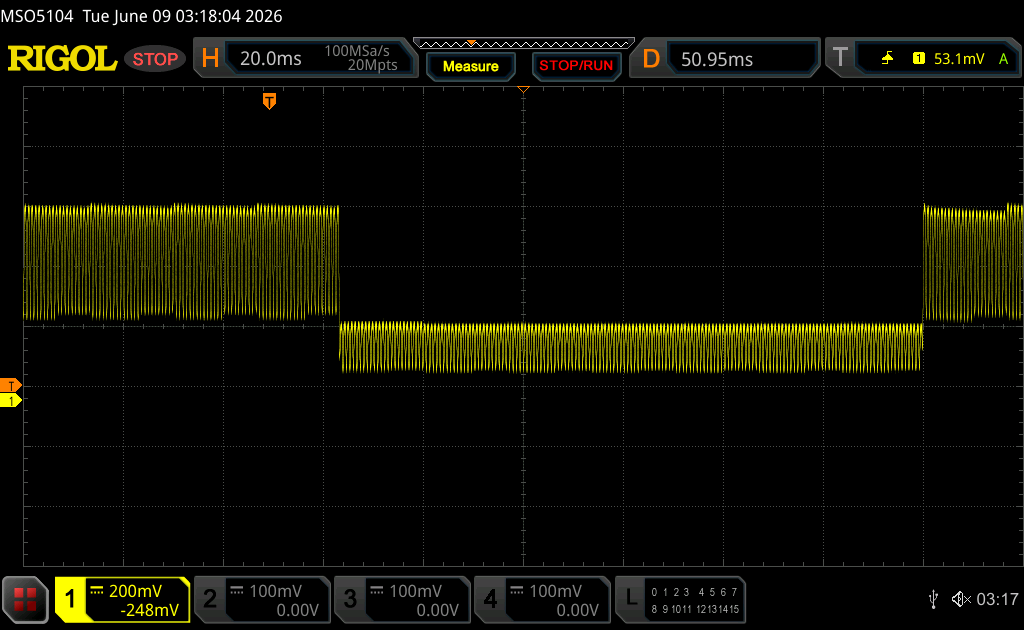 |
| ↘ 0.14 ms Calo | ||
| Lo schermo ha mostrato valori di risposta molto veloci nei nostri tests ed è molto adatto per i gaming veloce. In confronto, tutti i dispositivi di test variano da 0.165 (minimo) a 636 (massimo) ms. » 0 % di tutti i dispositivi è migliore. Questo significa che i tempi di risposta rilevati sono migliori rispettto alla media di tutti i dispositivi testati (31.1 ms). | ||
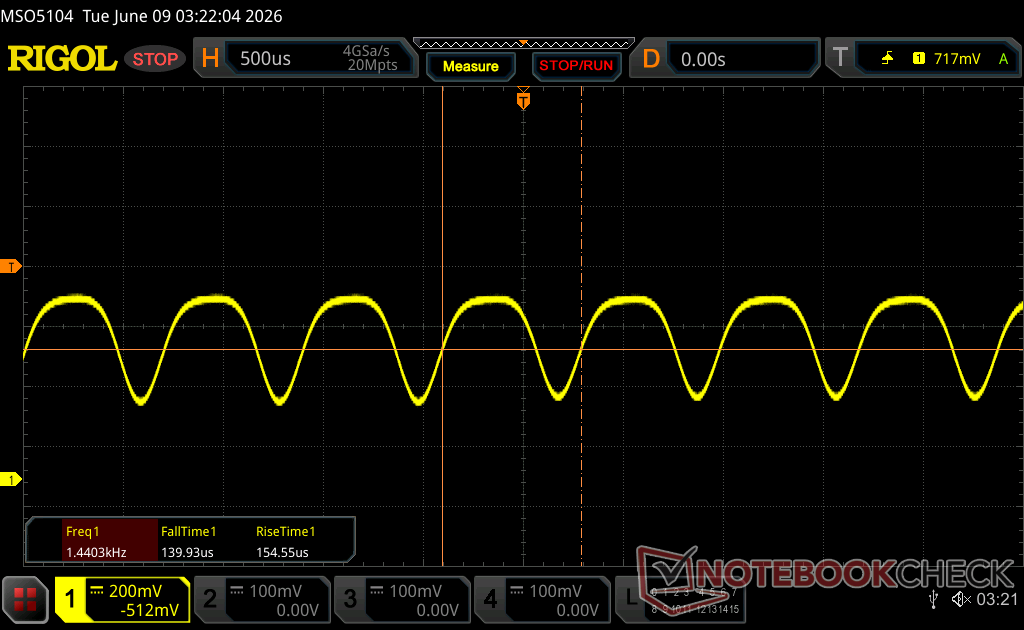
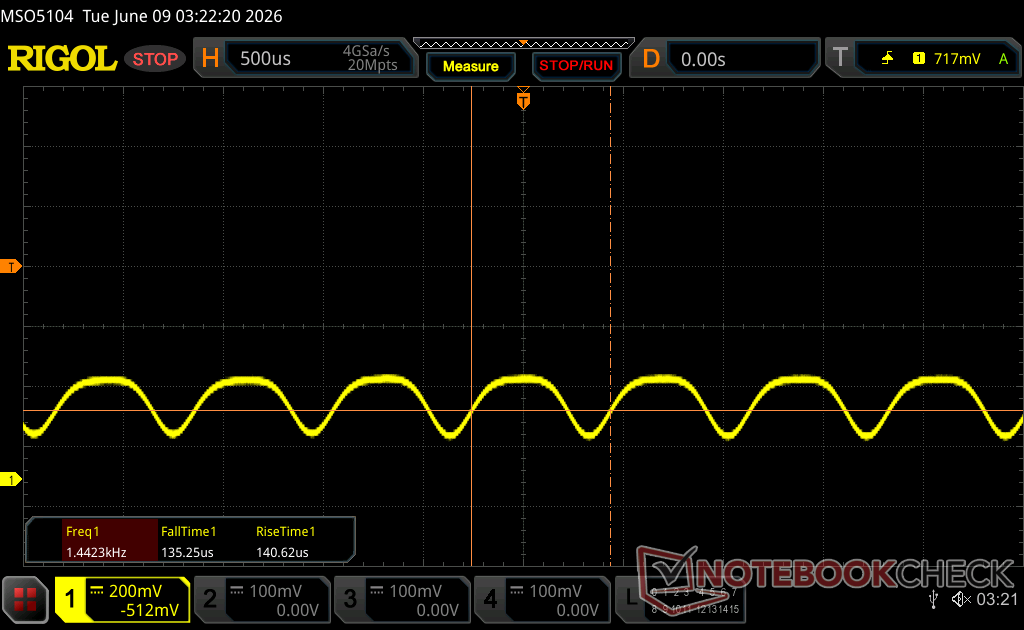
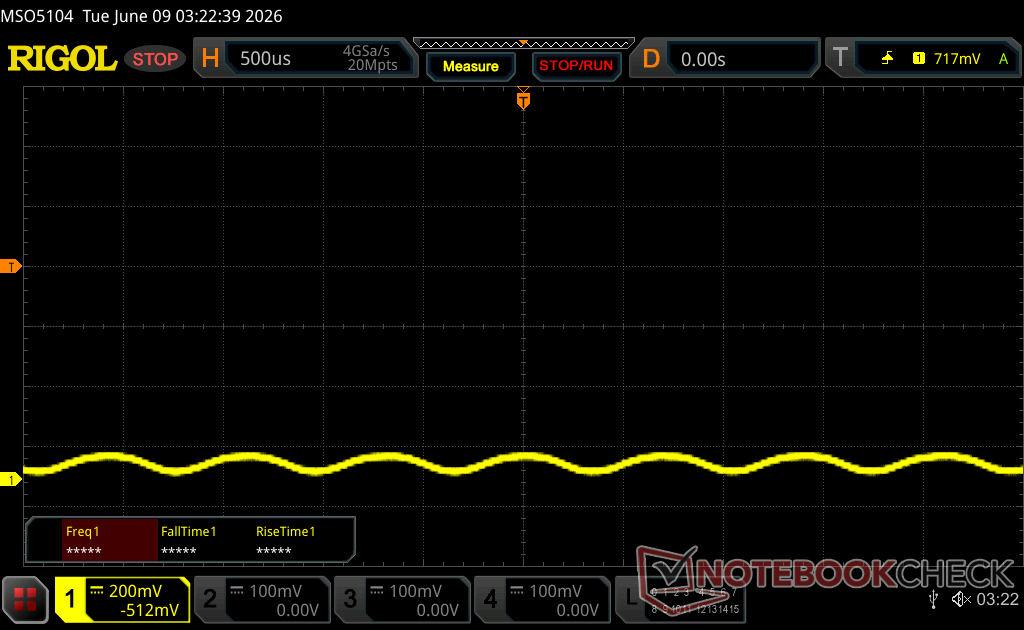
Sfarfallio dello schermo / PWM (Pulse-Width Modulation)
| flickering dello schermo / PWM rilevato | 1440 Hz Amplitude: 35 % | ≤ 100 % settaggio luminosita' | 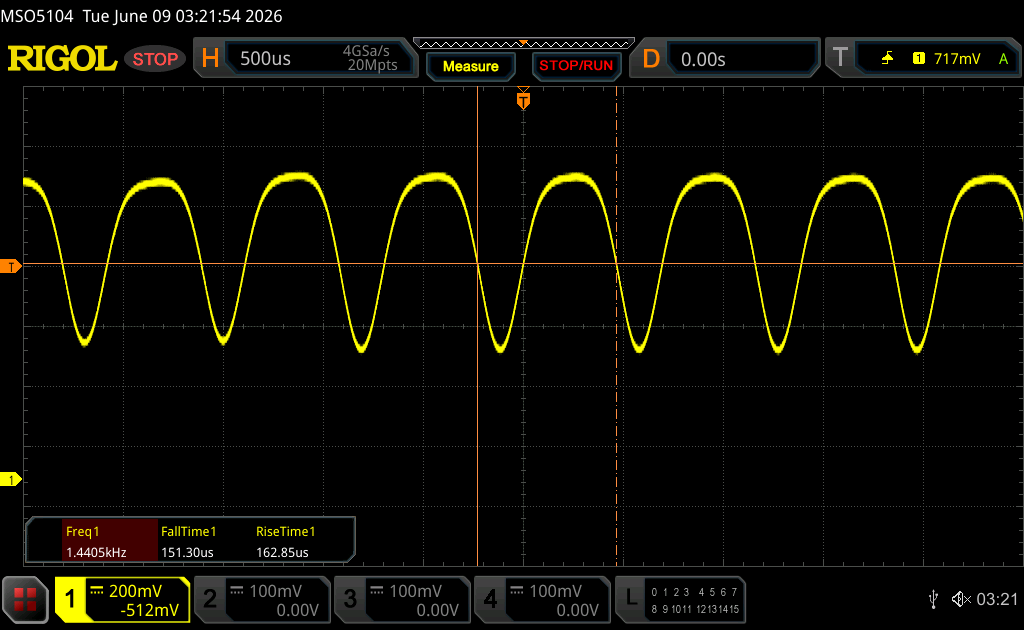 |
Il display sfarfalla a 1440 Hz (Probabilmente a causa dell'uso di PWM) Flickering rilevato ad una luminosita' di 100 % o inferiore. Non dovrebbe verificarsi flickering o PWM sopra questo valore di luminosita'. La frequenza di 1440 Hz è abbastanza alta, quindi la maggioranza degli utenti sensibili al PWM non dovrebbero notare alcun flickering. In confronto: 52 % di tutti i dispositivi testati non utilizza PWM per ridurre la luminosita' del display. Se è rilevato PWM, una media di 7816 (minimo: 5 - massimo: 343500) Hz è stata rilevata. | |||


Prestazioni
Condizioni del test
Abbiamo impostato MSI Center sulla modalità Prestazioni estreme e sulla modalità grafica discreta prima di eseguire i benchmark qui sotto.
Processore
Il Core Ultra 9 290HX Plus è essenzialmente un Core Ultra 9 275HX con le stesse dimensioni di cache e lo stesso numero di core. Gli utenti possono aspettarsi prestazioni della CPU più veloci di circa il 15 percento rispetto al modello MSI Crosshair 16 HX. Ancora più interessante è il fatto che il nostro MSI funzionerebbe fino al 10 percento più velocemente rispetto a Dell Alienware 16X Aurora con lo stesso processore Core Ultra 9 290HX Plus, come mostrano i grafici di confronto qui sotto.
Cinebench R15 Multi Loop
Cinebench R23: Multi Core | Single Core
Cinebench R20: CPU (Multi Core) | CPU (Single Core)
Cinebench R15: CPU Multi 64Bit | CPU Single 64Bit
Blender: v2.79 BMW27 CPU
7-Zip 18.03: 7z b 4 | 7z b 4 -mmt1
Geekbench 6.6: Multi-Core | Single-Core
Geekbench 5.5: Multi-Core | Single-Core
HWBOT x265 Benchmark v2.2: 4k Preset
LibreOffice : 20 Documents To PDF
R Benchmark 2.5: Overall mean
* ... Meglio usare valori piccoli
AIDA64: FP32 Ray-Trace | FPU Julia | CPU SHA3 | CPU Queen | FPU SinJulia | FPU Mandel | CPU AES | CPU ZLib | FP64 Ray-Trace | CPU PhotoWorxx | CPU CheckMate
| Performance rating | |
| MSI Raider 16 Max HX B2WJ -1! | |
| Media Intel Core Ultra 9 290HX Plus -1! | |
| Alienware 16X Aurora Core Ultra 9 290HX Plus -1! | |
| MSI Crosshair 16 HX AI D2XWGKG -1! | |
| Lenovo Legion 7 16IAX10 -1! | |
| Asus TUF Gaming A16 FA608UP -1! | |
| Razer Blade 16 Core Ultra 9 386H -1! | |
| AIDA64 / FP32 Ray-Trace | |
| MSI Raider 16 Max HX B2WJ (v8.20.8100) | |
| Media Intel Core Ultra 9 290HX Plus (34761 - 40761, n=3) | |
| MSI Crosshair 16 HX AI D2XWGKG (v6.92.6600) | |
| Alienware 16X Aurora Core Ultra 9 290HX Plus (v8.20.8100) | |
| Lenovo Legion 7 16IAX10 (v6.92.6600) | |
| Asus TUF Gaming A16 FA608UP (v6.92.6600) | |
| Razer Blade 16 Core Ultra 9 386H (v8.20.8100) | |
| AIDA64 / FPU Julia | |
| MSI Raider 16 Max HX B2WJ (v8.20.8100) | |
| Media Intel Core Ultra 9 290HX Plus (174665 - 208083, n=3) | |
| MSI Crosshair 16 HX AI D2XWGKG (v6.92.6600) | |
| Alienware 16X Aurora Core Ultra 9 290HX Plus (v8.20.8100) | |
| Lenovo Legion 7 16IAX10 (v6.92.6600) | |
| Asus TUF Gaming A16 FA608UP (v6.92.6600) | |
| Razer Blade 16 Core Ultra 9 386H (v8.20.8100) | |
| AIDA64 / CPU SHA3 | |
| MSI Raider 16 Max HX B2WJ (v8.20.8100) | |
| Media Intel Core Ultra 9 290HX Plus (8352 - 9784, n=3) | |
| MSI Crosshair 16 HX AI D2XWGKG (v6.92.6600) | |
| Alienware 16X Aurora Core Ultra 9 290HX Plus (v8.20.8100) | |
| Lenovo Legion 7 16IAX10 (v6.92.6600) | |
| Razer Blade 16 Core Ultra 9 386H (v8.20.8100) | |
| Asus TUF Gaming A16 FA608UP (v6.92.6600) | |
| AIDA64 / CPU Queen | |
| Lenovo Legion 7 16IAX10 (v6.92.6600) | |
| MSI Crosshair 16 HX AI D2XWGKG (v6.92.6600) | |
| Asus TUF Gaming A16 FA608UP (v6.92.6600) | |
| AIDA64 / FPU SinJulia | |
| Asus TUF Gaming A16 FA608UP (v6.92.6600) | |
| MSI Raider 16 Max HX B2WJ (v8.20.8100) | |
| Media Intel Core Ultra 9 290HX Plus (13612 - 14461, n=3) | |
| Alienware 16X Aurora Core Ultra 9 290HX Plus (v8.20.8100) | |
| MSI Crosshair 16 HX AI D2XWGKG (v6.92.6600) | |
| Lenovo Legion 7 16IAX10 (v6.92.6600) | |
| Razer Blade 16 Core Ultra 9 386H (v8.20.8100) | |
| AIDA64 / FPU Mandel | |
| MSI Raider 16 Max HX B2WJ (v8.20.8100) | |
| Media Intel Core Ultra 9 290HX Plus (91215 - 108275, n=3) | |
| MSI Crosshair 16 HX AI D2XWGKG (v6.92.6600) | |
| Alienware 16X Aurora Core Ultra 9 290HX Plus (v8.20.8100) | |
| Lenovo Legion 7 16IAX10 (v6.92.6600) | |
| Asus TUF Gaming A16 FA608UP (v6.92.6600) | |
| Razer Blade 16 Core Ultra 9 386H (v8.20.8100) | |
| AIDA64 / CPU AES | |
| MSI Raider 16 Max HX B2WJ (v8.20.8100) | |
| Media Intel Core Ultra 9 290HX Plus (127585 - 136781, n=3) | |
| Alienware 16X Aurora Core Ultra 9 290HX Plus (v8.20.8100) | |
| MSI Crosshair 16 HX AI D2XWGKG (v6.92.6600) | |
| Lenovo Legion 7 16IAX10 (v6.92.6600) | |
| Asus TUF Gaming A16 FA608UP (v6.92.6600) | |
| Razer Blade 16 Core Ultra 9 386H (v8.20.8100) | |
| AIDA64 / CPU ZLib | |
| MSI Raider 16 Max HX B2WJ (v8.20.8100) | |
| Media Intel Core Ultra 9 290HX Plus (1967 - 2206, n=3) | |
| MSI Crosshair 16 HX AI D2XWGKG (v6.92.6600) | |
| Alienware 16X Aurora Core Ultra 9 290HX Plus (v8.20.8100) | |
| Lenovo Legion 7 16IAX10 (v6.92.6600) | |
| Razer Blade 16 Core Ultra 9 386H (v8.20.8100) | |
| Asus TUF Gaming A16 FA608UP (v6.92.6600) | |
| AIDA64 / FP64 Ray-Trace | |
| MSI Raider 16 Max HX B2WJ (v8.20.8100) | |
| Media Intel Core Ultra 9 290HX Plus (18611 - 21949, n=3) | |
| MSI Crosshair 16 HX AI D2XWGKG (v6.92.6600) | |
| Alienware 16X Aurora Core Ultra 9 290HX Plus (v8.20.8100) | |
| Lenovo Legion 7 16IAX10 (v6.92.6600) | |
| Asus TUF Gaming A16 FA608UP (v6.92.6600) | |
| Razer Blade 16 Core Ultra 9 386H (v8.20.8100) | |
| AIDA64 / CPU PhotoWorxx | |
| Razer Blade 16 Core Ultra 9 386H (v8.20.8100) | |
| Media Intel Core Ultra 9 290HX Plus (51134 - 55731, n=3) | |
| Alienware 16X Aurora Core Ultra 9 290HX Plus (v8.20.8100) | |
| MSI Raider 16 Max HX B2WJ (v8.20.8100) | |
| Lenovo Legion 7 16IAX10 (v6.92.6600) | |
| Asus TUF Gaming A16 FA608UP (v6.92.6600) | |
| MSI Crosshair 16 HX AI D2XWGKG (v6.92.6600) | |
| AIDA64 / CPU CheckMate | |
| MSI Raider 16 Max HX B2WJ (v8.20.8100) | |
| Media Intel Core Ultra 9 290HX Plus (7624 - 8322, n=3) | |
| Alienware 16X Aurora Core Ultra 9 290HX Plus (v8.20.8100) | |
| Razer Blade 16 Core Ultra 9 386H (v8.20.8100) | |
Prestazioni del sistema
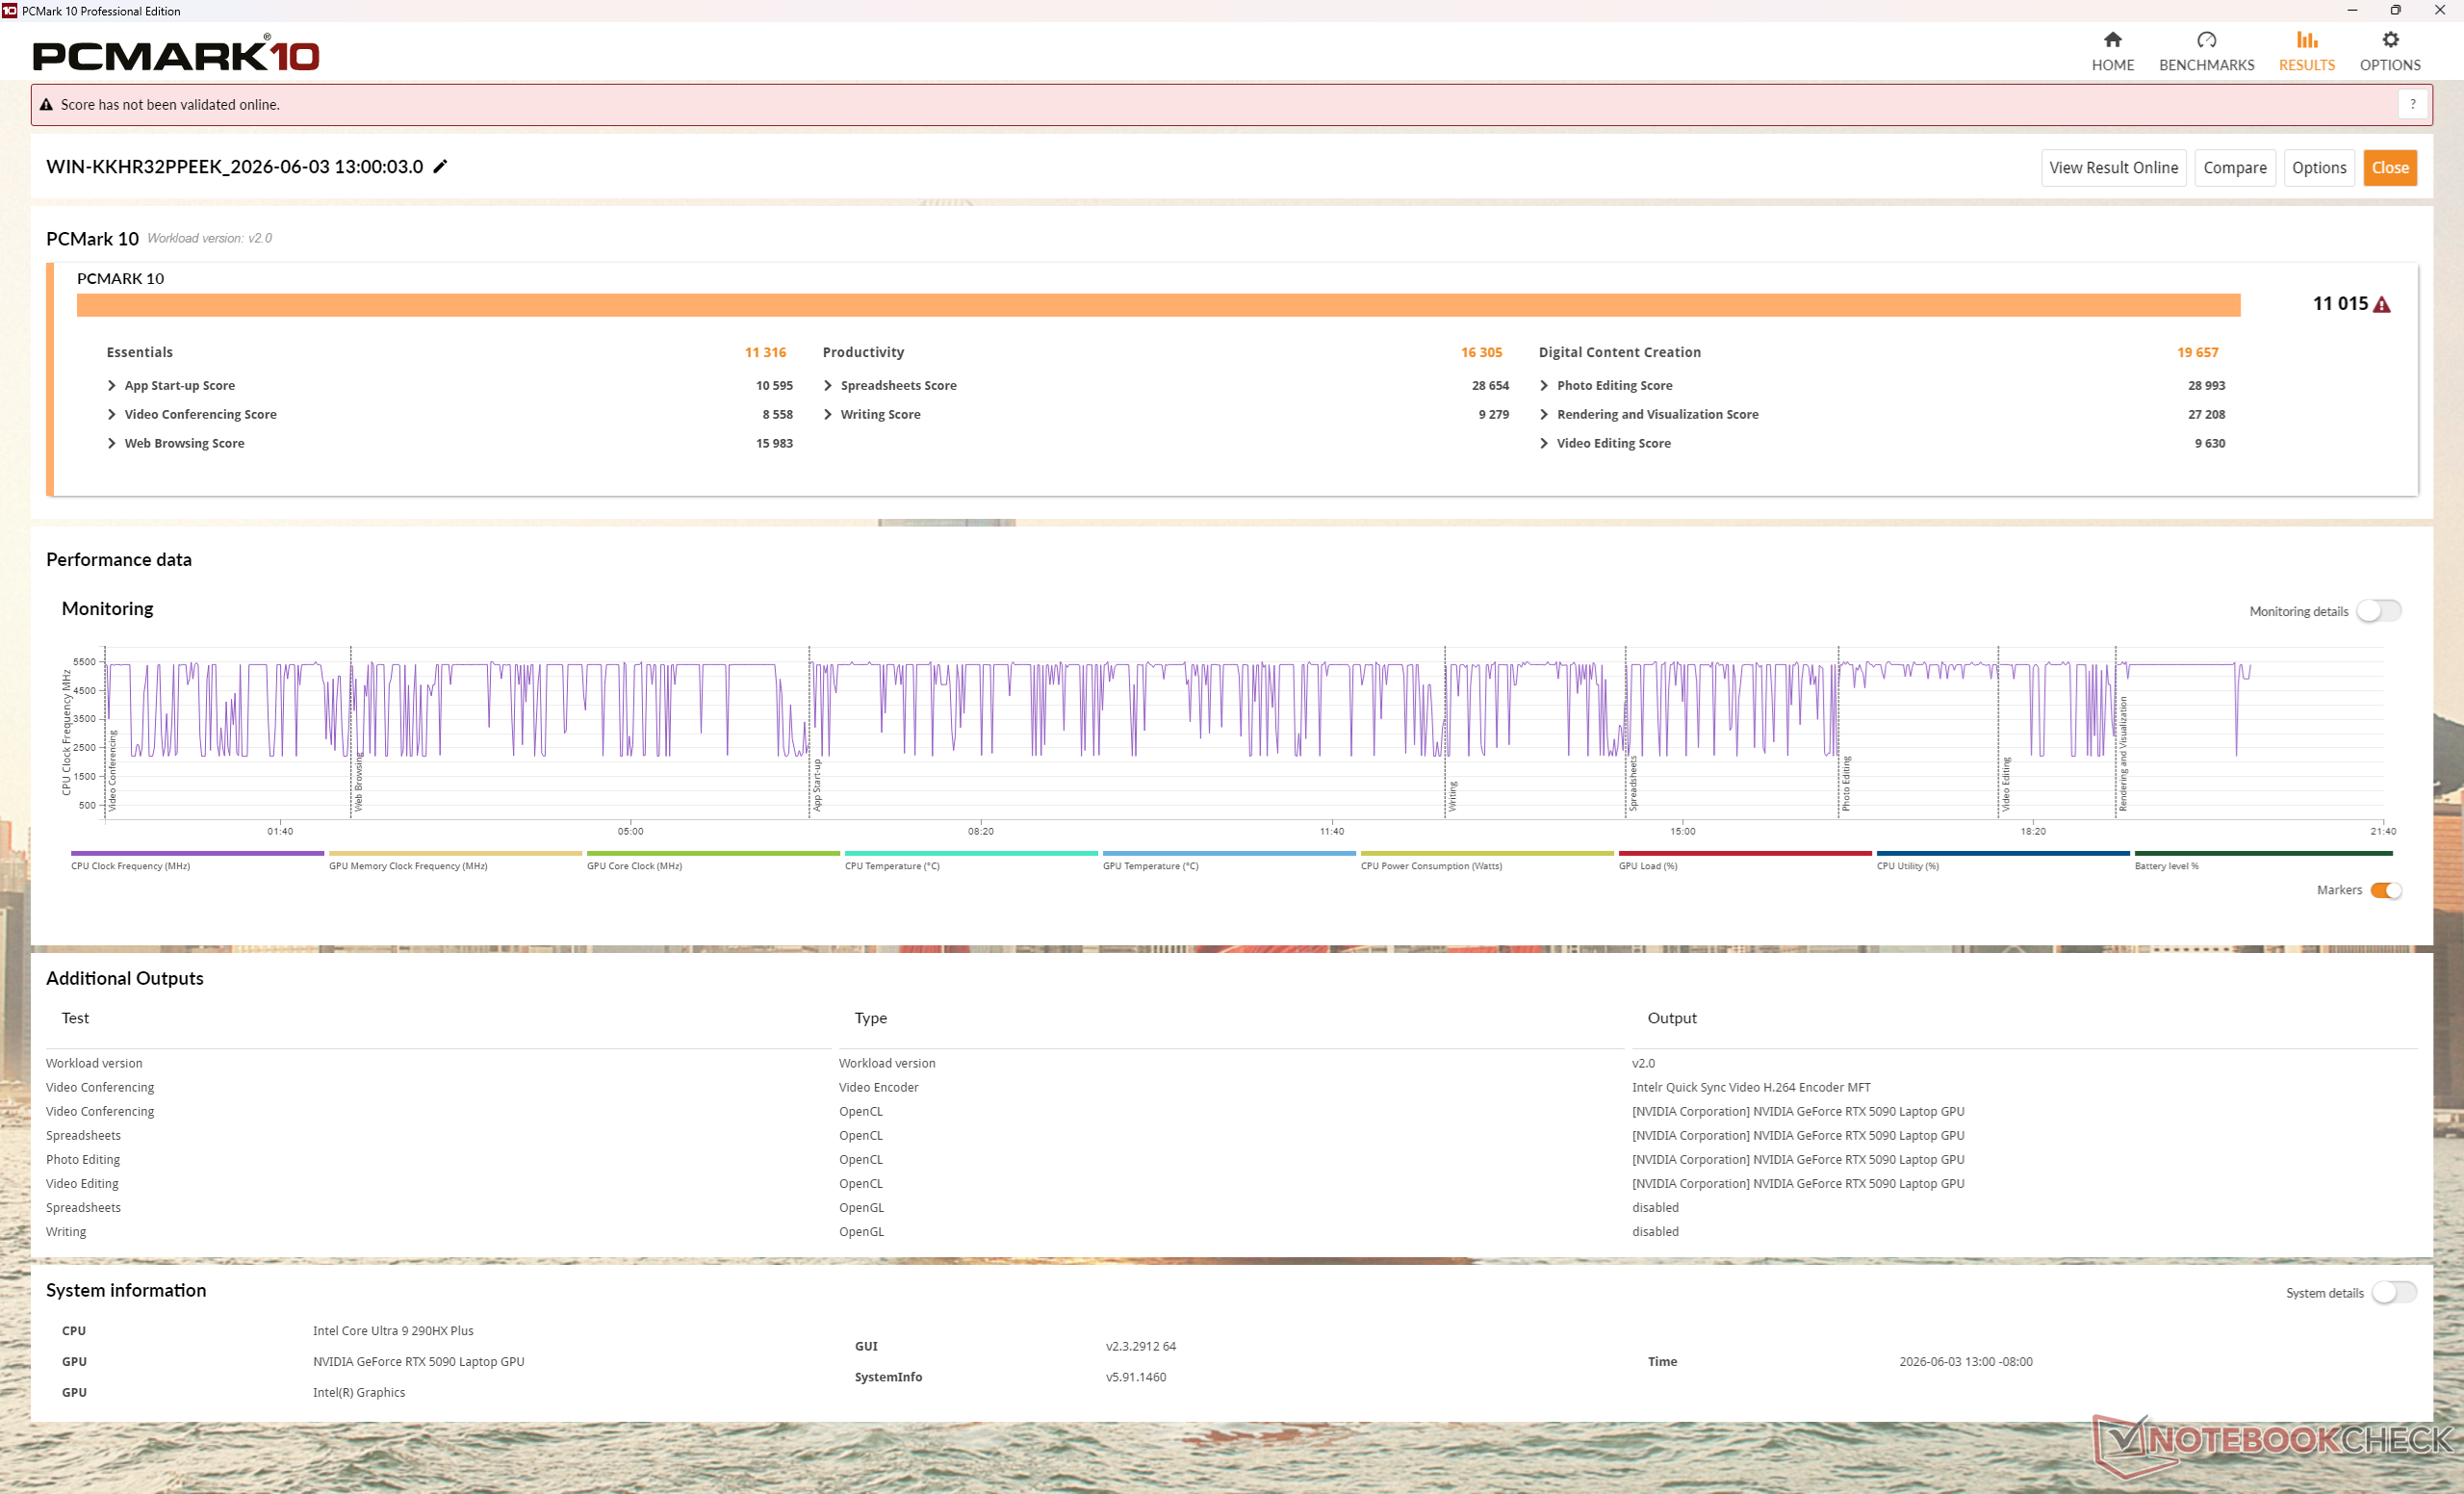
PCMark 10: Score | Essentials | Productivity | Digital Content Creation
CrossMark: Overall | Productivity | Creativity | Responsiveness
WebXPRT 3: Overall
WebXPRT 4: Overall
Mozilla Kraken 1.1: Total
Geekbench AI: Quantized GPU 1.7 | Half Precision GPU 1.7 | Single Precision GPU 1.7
| Performance rating | |
| MSI Raider 16 Max HX B2WJ | |
| Media Intel Core Ultra 9 290HX Plus, NVIDIA GeForce RTX 5090 Laptop | |
| Alienware 16X Aurora Core Ultra 9 290HX Plus | |
| Razer Blade 16 Core Ultra 9 386H | |
| MSI Crosshair 16 HX AI D2XWGKG | |
| Lenovo Legion 7 16IAX10 | |
| Asus TUF Gaming A16 FA608UP -4! | |
| PCMark 10 / Score | |
| MSI Raider 16 Max HX B2WJ | |
| Media Intel Core Ultra 9 290HX Plus, NVIDIA GeForce RTX 5090 Laptop (n=1) | |
| Alienware 16X Aurora Core Ultra 9 290HX Plus | |
| Razer Blade 16 Core Ultra 9 386H | |
| MSI Crosshair 16 HX AI D2XWGKG | |
| Lenovo Legion 7 16IAX10 | |
| PCMark 10 / Essentials | |
| Alienware 16X Aurora Core Ultra 9 290HX Plus | |
| Lenovo Legion 7 16IAX10 | |
| MSI Raider 16 Max HX B2WJ | |
| Media Intel Core Ultra 9 290HX Plus, NVIDIA GeForce RTX 5090 Laptop (n=1) | |
| Razer Blade 16 Core Ultra 9 386H | |
| MSI Crosshair 16 HX AI D2XWGKG | |
| PCMark 10 / Productivity | |
| Alienware 16X Aurora Core Ultra 9 290HX Plus | |
| MSI Raider 16 Max HX B2WJ | |
| Media Intel Core Ultra 9 290HX Plus, NVIDIA GeForce RTX 5090 Laptop (n=1) | |
| Razer Blade 16 Core Ultra 9 386H | |
| Lenovo Legion 7 16IAX10 | |
| MSI Crosshair 16 HX AI D2XWGKG | |
| PCMark 10 / Digital Content Creation | |
| MSI Raider 16 Max HX B2WJ | |
| Media Intel Core Ultra 9 290HX Plus, NVIDIA GeForce RTX 5090 Laptop (n=1) | |
| Alienware 16X Aurora Core Ultra 9 290HX Plus | |
| MSI Crosshair 16 HX AI D2XWGKG | |
| Razer Blade 16 Core Ultra 9 386H | |
| Lenovo Legion 7 16IAX10 | |
| CrossMark / Overall | |
| MSI Raider 16 Max HX B2WJ | |
| Media Intel Core Ultra 9 290HX Plus, NVIDIA GeForce RTX 5090 Laptop (n=1) | |
| Alienware 16X Aurora Core Ultra 9 290HX Plus | |
| Razer Blade 16 Core Ultra 9 386H | |
| MSI Crosshair 16 HX AI D2XWGKG | |
| Lenovo Legion 7 16IAX10 | |
| Asus TUF Gaming A16 FA608UP | |
| CrossMark / Productivity | |
| Alienware 16X Aurora Core Ultra 9 290HX Plus | |
| MSI Raider 16 Max HX B2WJ | |
| Media Intel Core Ultra 9 290HX Plus, NVIDIA GeForce RTX 5090 Laptop (n=1) | |
| Razer Blade 16 Core Ultra 9 386H | |
| MSI Crosshair 16 HX AI D2XWGKG | |
| Lenovo Legion 7 16IAX10 | |
| Asus TUF Gaming A16 FA608UP | |
| CrossMark / Creativity | |
| MSI Raider 16 Max HX B2WJ | |
| Media Intel Core Ultra 9 290HX Plus, NVIDIA GeForce RTX 5090 Laptop (n=1) | |
| Alienware 16X Aurora Core Ultra 9 290HX Plus | |
| Razer Blade 16 Core Ultra 9 386H | |
| MSI Crosshair 16 HX AI D2XWGKG | |
| Lenovo Legion 7 16IAX10 | |
| Asus TUF Gaming A16 FA608UP | |
| CrossMark / Responsiveness | |
| Alienware 16X Aurora Core Ultra 9 290HX Plus | |
| MSI Raider 16 Max HX B2WJ | |
| Media Intel Core Ultra 9 290HX Plus, NVIDIA GeForce RTX 5090 Laptop (n=1) | |
| Razer Blade 16 Core Ultra 9 386H | |
| MSI Crosshair 16 HX AI D2XWGKG | |
| Lenovo Legion 7 16IAX10 | |
| Asus TUF Gaming A16 FA608UP | |
| WebXPRT 3 / Overall | |
| Alienware 16X Aurora Core Ultra 9 290HX Plus | |
| MSI Raider 16 Max HX B2WJ | |
| Media Intel Core Ultra 9 290HX Plus, NVIDIA GeForce RTX 5090 Laptop (n=1) | |
| Lenovo Legion 7 16IAX10 | |
| MSI Crosshair 16 HX AI D2XWGKG | |
| Razer Blade 16 Core Ultra 9 386H | |
| Asus TUF Gaming A16 FA608UP | |
| WebXPRT 4 / Overall | |
| Alienware 16X Aurora Core Ultra 9 290HX Plus | |
| MSI Raider 16 Max HX B2WJ | |
| Media Intel Core Ultra 9 290HX Plus, NVIDIA GeForce RTX 5090 Laptop (n=1) | |
| Lenovo Legion 7 16IAX10 | |
| MSI Crosshair 16 HX AI D2XWGKG | |
| Razer Blade 16 Core Ultra 9 386H | |
| Asus TUF Gaming A16 FA608UP | |
| Mozilla Kraken 1.1 / Total | |
| Asus TUF Gaming A16 FA608UP | |
| Razer Blade 16 Core Ultra 9 386H | |
| Lenovo Legion 7 16IAX10 | |
| MSI Crosshair 16 HX AI D2XWGKG | |
| MSI Raider 16 Max HX B2WJ | |
| Media Intel Core Ultra 9 290HX Plus, NVIDIA GeForce RTX 5090 Laptop (n=1) | |
| Alienware 16X Aurora Core Ultra 9 290HX Plus | |
| Geekbench AI / Quantized GPU 1.7 | |
| MSI Raider 16 Max HX B2WJ | |
| Media Intel Core Ultra 9 290HX Plus, NVIDIA GeForce RTX 5090 Laptop (n=1) | |
| Razer Blade 16 Core Ultra 9 386H | |
| Alienware 16X Aurora Core Ultra 9 290HX Plus | |
| MSI Crosshair 16 HX AI D2XWGKG | |
| Asus TUF Gaming A16 FA608UP | |
| Lenovo Legion 7 16IAX10 | |
| Geekbench AI / Half Precision GPU 1.7 | |
| MSI Raider 16 Max HX B2WJ | |
| Media Intel Core Ultra 9 290HX Plus, NVIDIA GeForce RTX 5090 Laptop (n=1) | |
| Alienware 16X Aurora Core Ultra 9 290HX Plus | |
| Razer Blade 16 Core Ultra 9 386H | |
| MSI Crosshair 16 HX AI D2XWGKG | |
| Asus TUF Gaming A16 FA608UP | |
| Lenovo Legion 7 16IAX10 | |
| Geekbench AI / Single Precision GPU 1.7 | |
| MSI Raider 16 Max HX B2WJ | |
| Media Intel Core Ultra 9 290HX Plus, NVIDIA GeForce RTX 5090 Laptop (n=1) | |
| Razer Blade 16 Core Ultra 9 386H | |
| Alienware 16X Aurora Core Ultra 9 290HX Plus | |
| MSI Crosshair 16 HX AI D2XWGKG | |
| Asus TUF Gaming A16 FA608UP | |
| Lenovo Legion 7 16IAX10 | |
* ... Meglio usare valori piccoli
| PCMark 10 Score | 11015 punti | |
Aiuto | ||
| AIDA64 / Memory Copy | |
| Razer Blade 16 Core Ultra 9 386H | |
| Lenovo Legion 7 16IAX10 | |
| Media Intel Core Ultra 9 290HX Plus (76912 - 85698, n=3) | |
| MSI Raider 16 Max HX B2WJ | |
| Alienware 16X Aurora Core Ultra 9 290HX Plus | |
| MSI Crosshair 16 HX AI D2XWGKG | |
| Asus TUF Gaming A16 FA608UP | |
| AIDA64 / Memory Read | |
| Razer Blade 16 Core Ultra 9 386H | |
| Media Intel Core Ultra 9 290HX Plus (84638 - 93496, n=3) | |
| MSI Raider 16 Max HX B2WJ | |
| Lenovo Legion 7 16IAX10 | |
| Alienware 16X Aurora Core Ultra 9 290HX Plus | |
| MSI Crosshair 16 HX AI D2XWGKG | |
| Asus TUF Gaming A16 FA608UP | |
| AIDA64 / Memory Write | |
| Razer Blade 16 Core Ultra 9 386H | |
| Asus TUF Gaming A16 FA608UP | |
| Media Intel Core Ultra 9 290HX Plus (76094 - 81688, n=3) | |
| MSI Raider 16 Max HX B2WJ | |
| Lenovo Legion 7 16IAX10 | |
| Alienware 16X Aurora Core Ultra 9 290HX Plus | |
| MSI Crosshair 16 HX AI D2XWGKG | |
| AIDA64 / Memory Latency | |
| MSI Crosshair 16 HX AI D2XWGKG | |
| Alienware 16X Aurora Core Ultra 9 290HX Plus | |
| Lenovo Legion 7 16IAX10 | |
| Media Intel Core Ultra 9 290HX Plus (105.3 - 108.4, n=3) | |
| MSI Raider 16 Max HX B2WJ | |
| Asus TUF Gaming A16 FA608UP | |
| Razer Blade 16 Core Ultra 9 386H | |
* ... Meglio usare valori piccoli
Latenza DPC
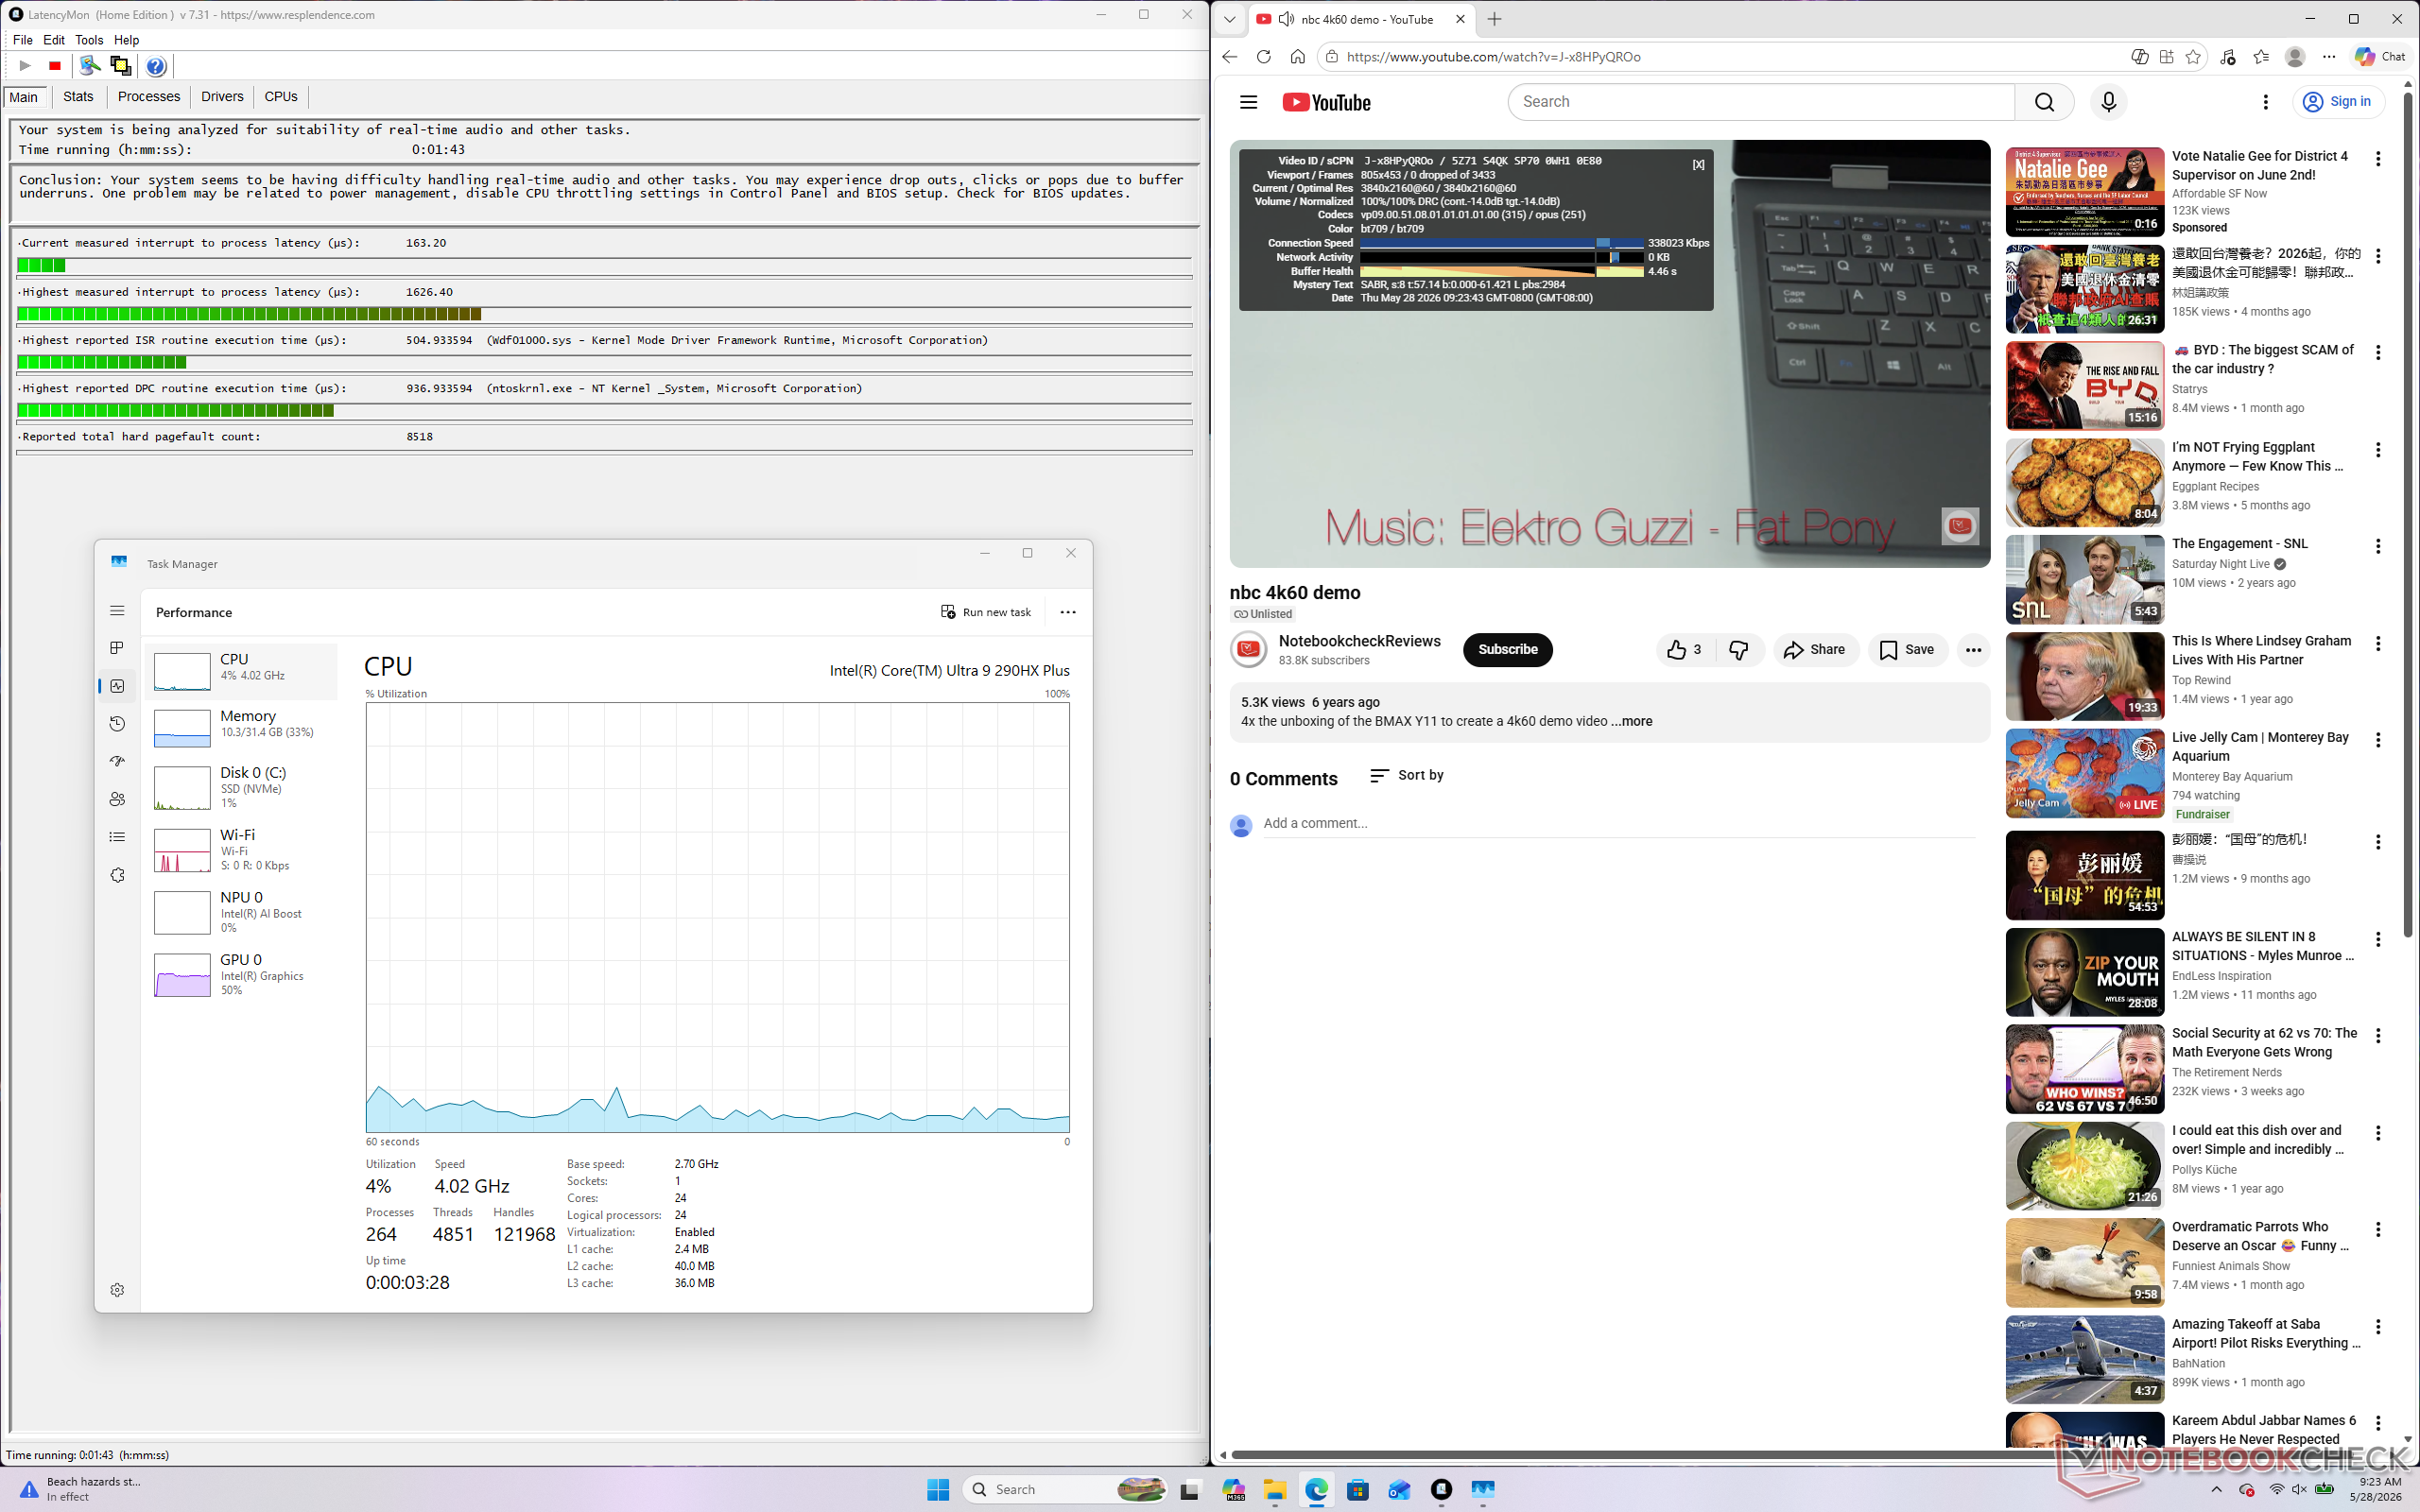
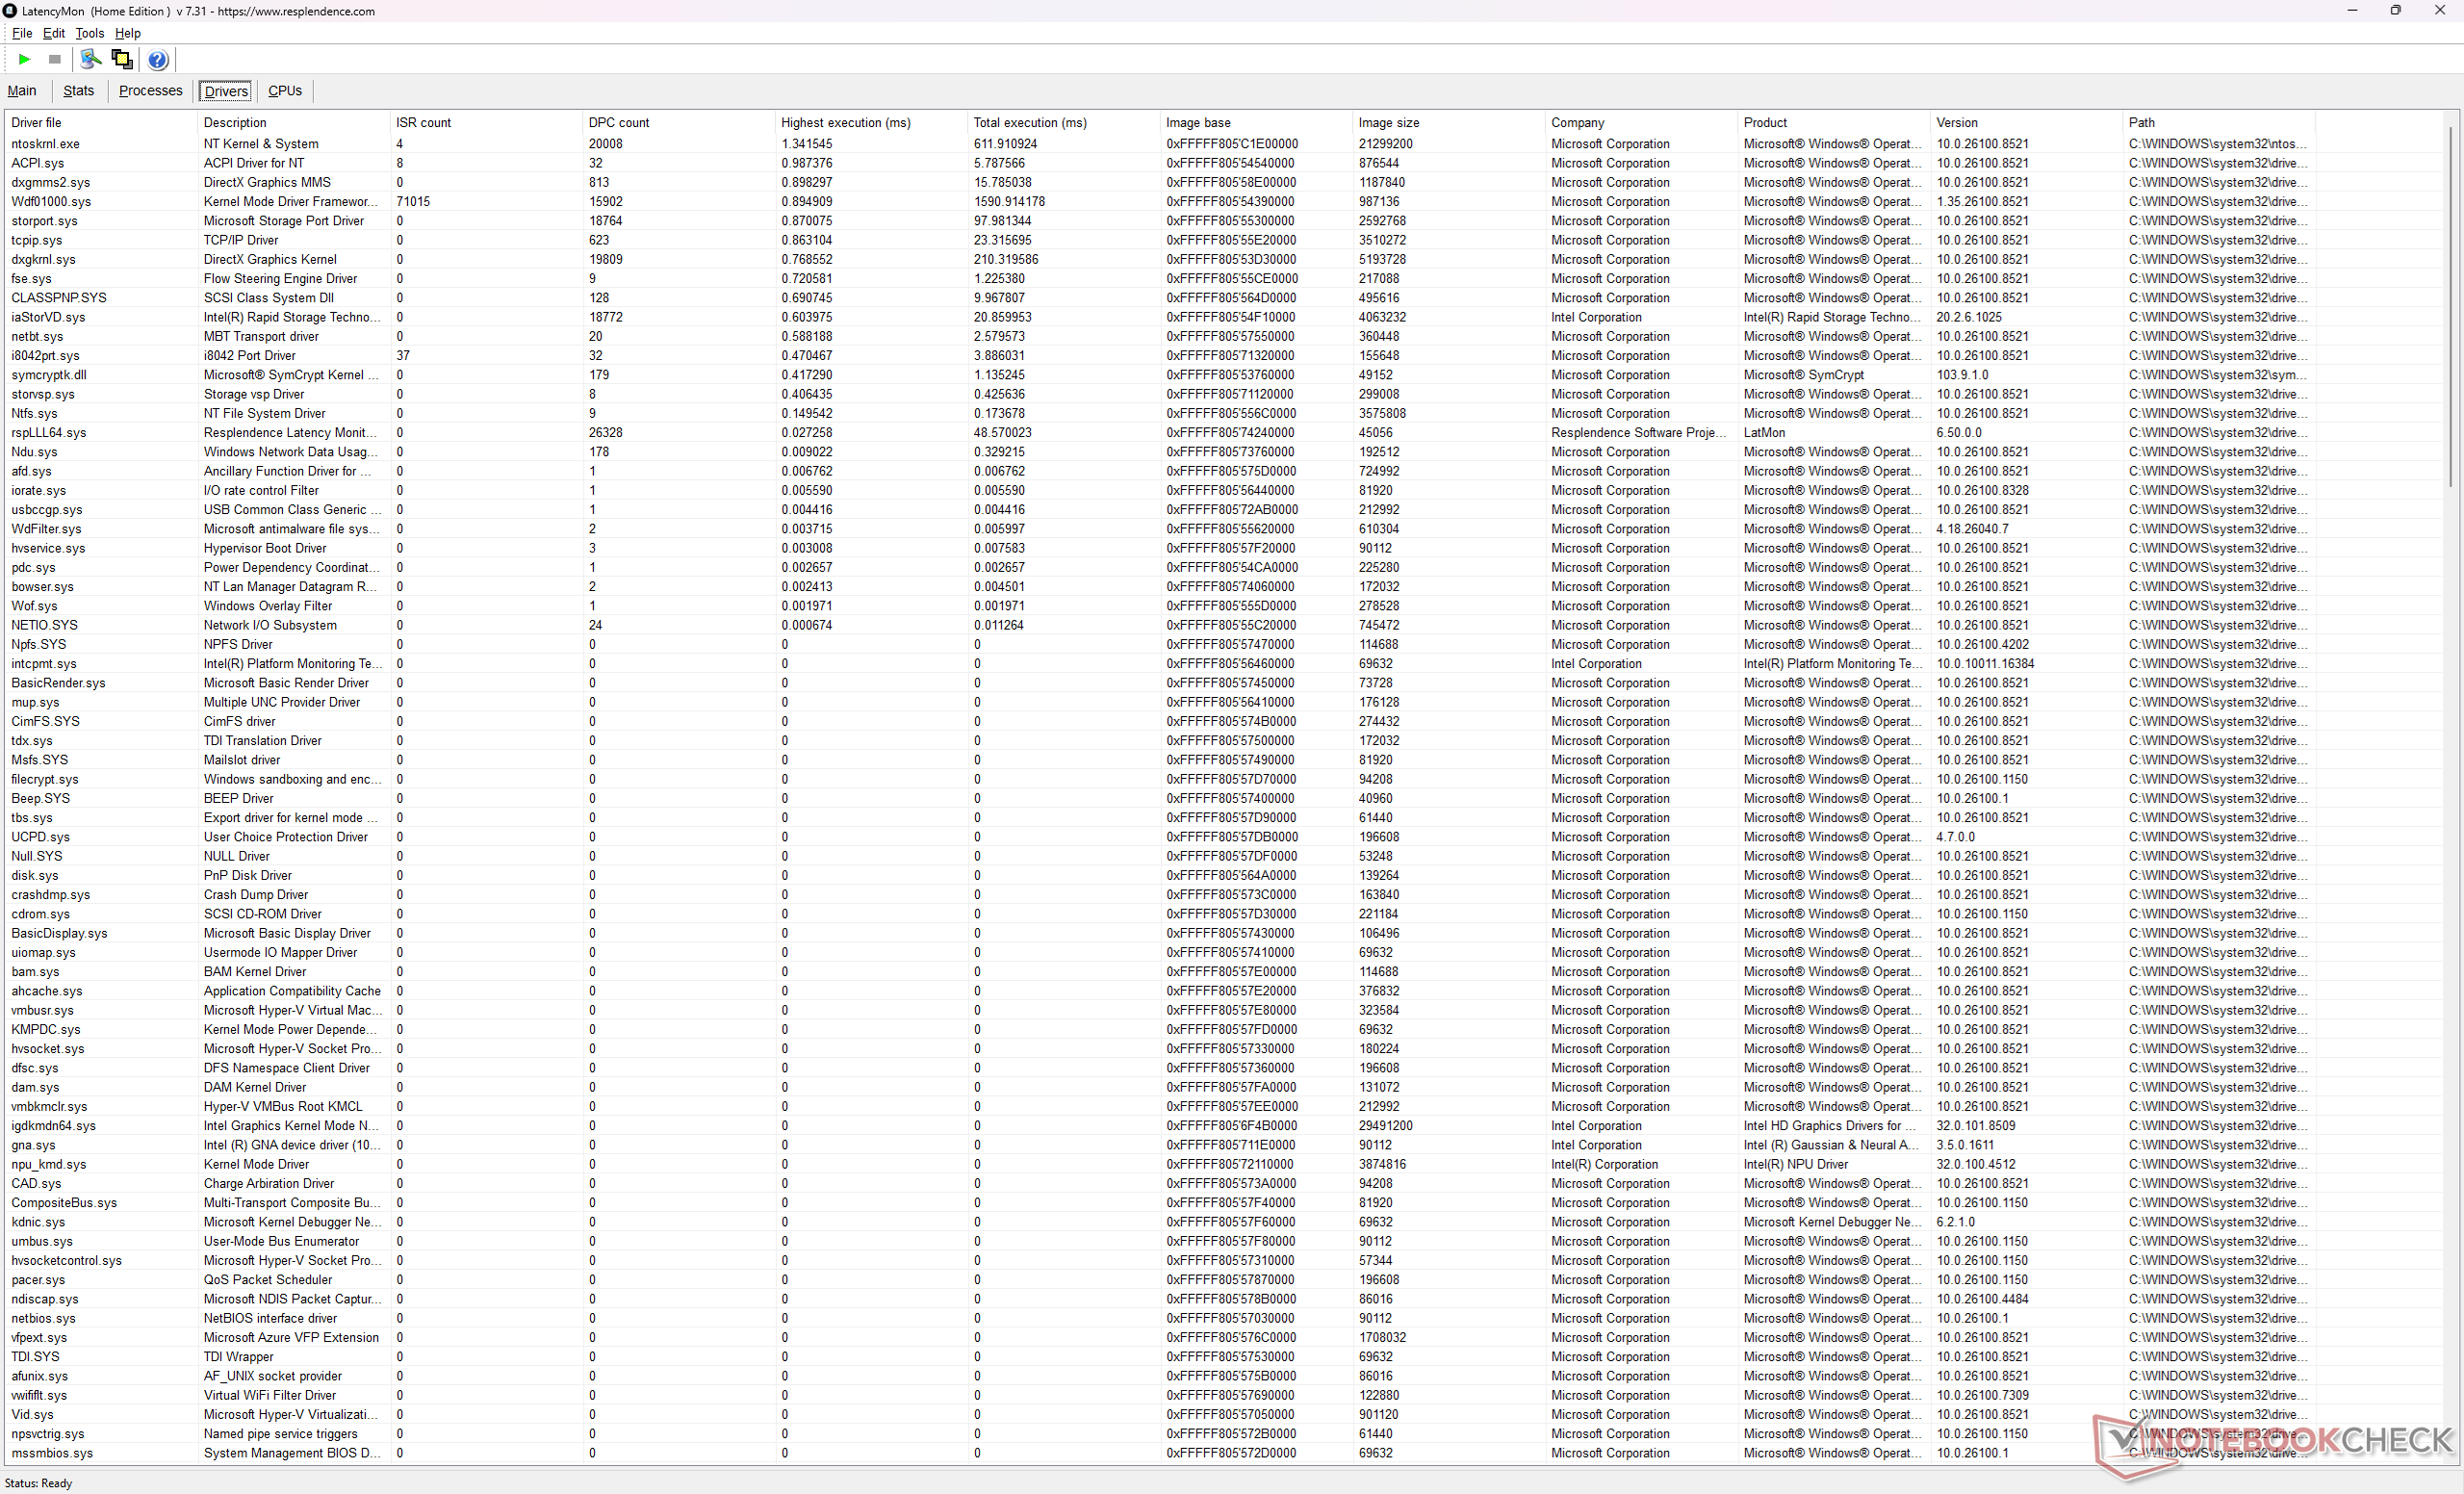
| DPC Latencies / LatencyMon - interrupt to process latency (max), Web, Youtube, Prime95 | |
| Alienware 16X Aurora Core Ultra 9 290HX Plus | |
| Razer Blade 16 Core Ultra 9 386H | |
| MSI Raider 16 Max HX B2WJ | |
| MSI Crosshair 16 HX AI D2XWGKG | |
| Lenovo Legion 7 16IAX10 | |
| Asus TUF Gaming A16 FA608UP | |
* ... Meglio usare valori piccoli
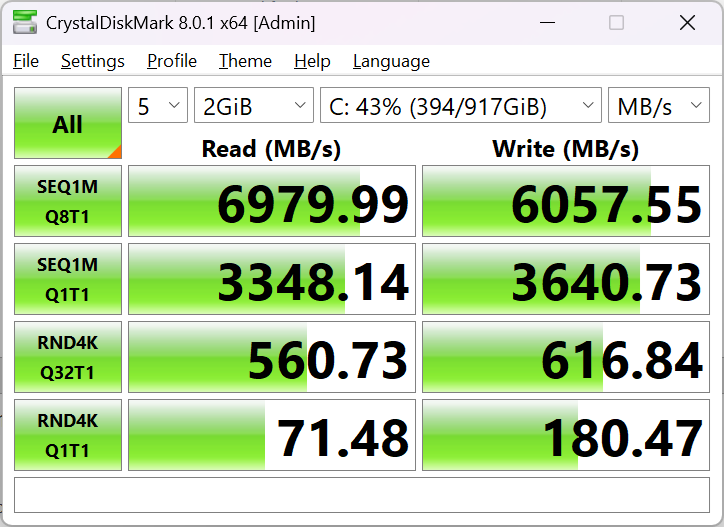
Dispositivi di archiviazione
La nostra unità di prova viene fornita con lo stesso Micron 2500 PCIe4 x4 NVMe presente sul Crosshair 16 HX.
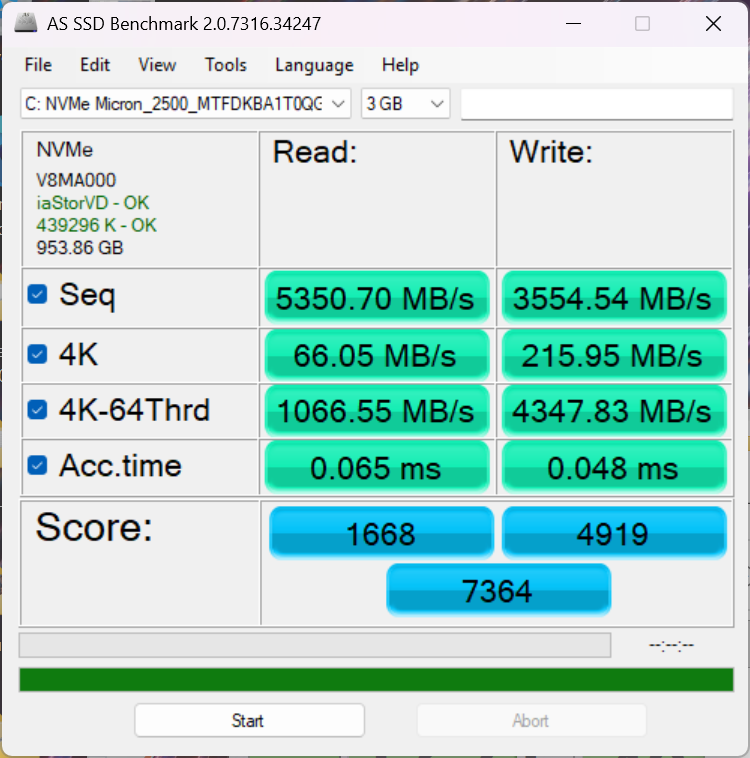

* ... Meglio usare valori piccoli
Strozzatura del disco: DiskSpd Lettura in loop, Profondità coda 8
Prestazioni della GPU
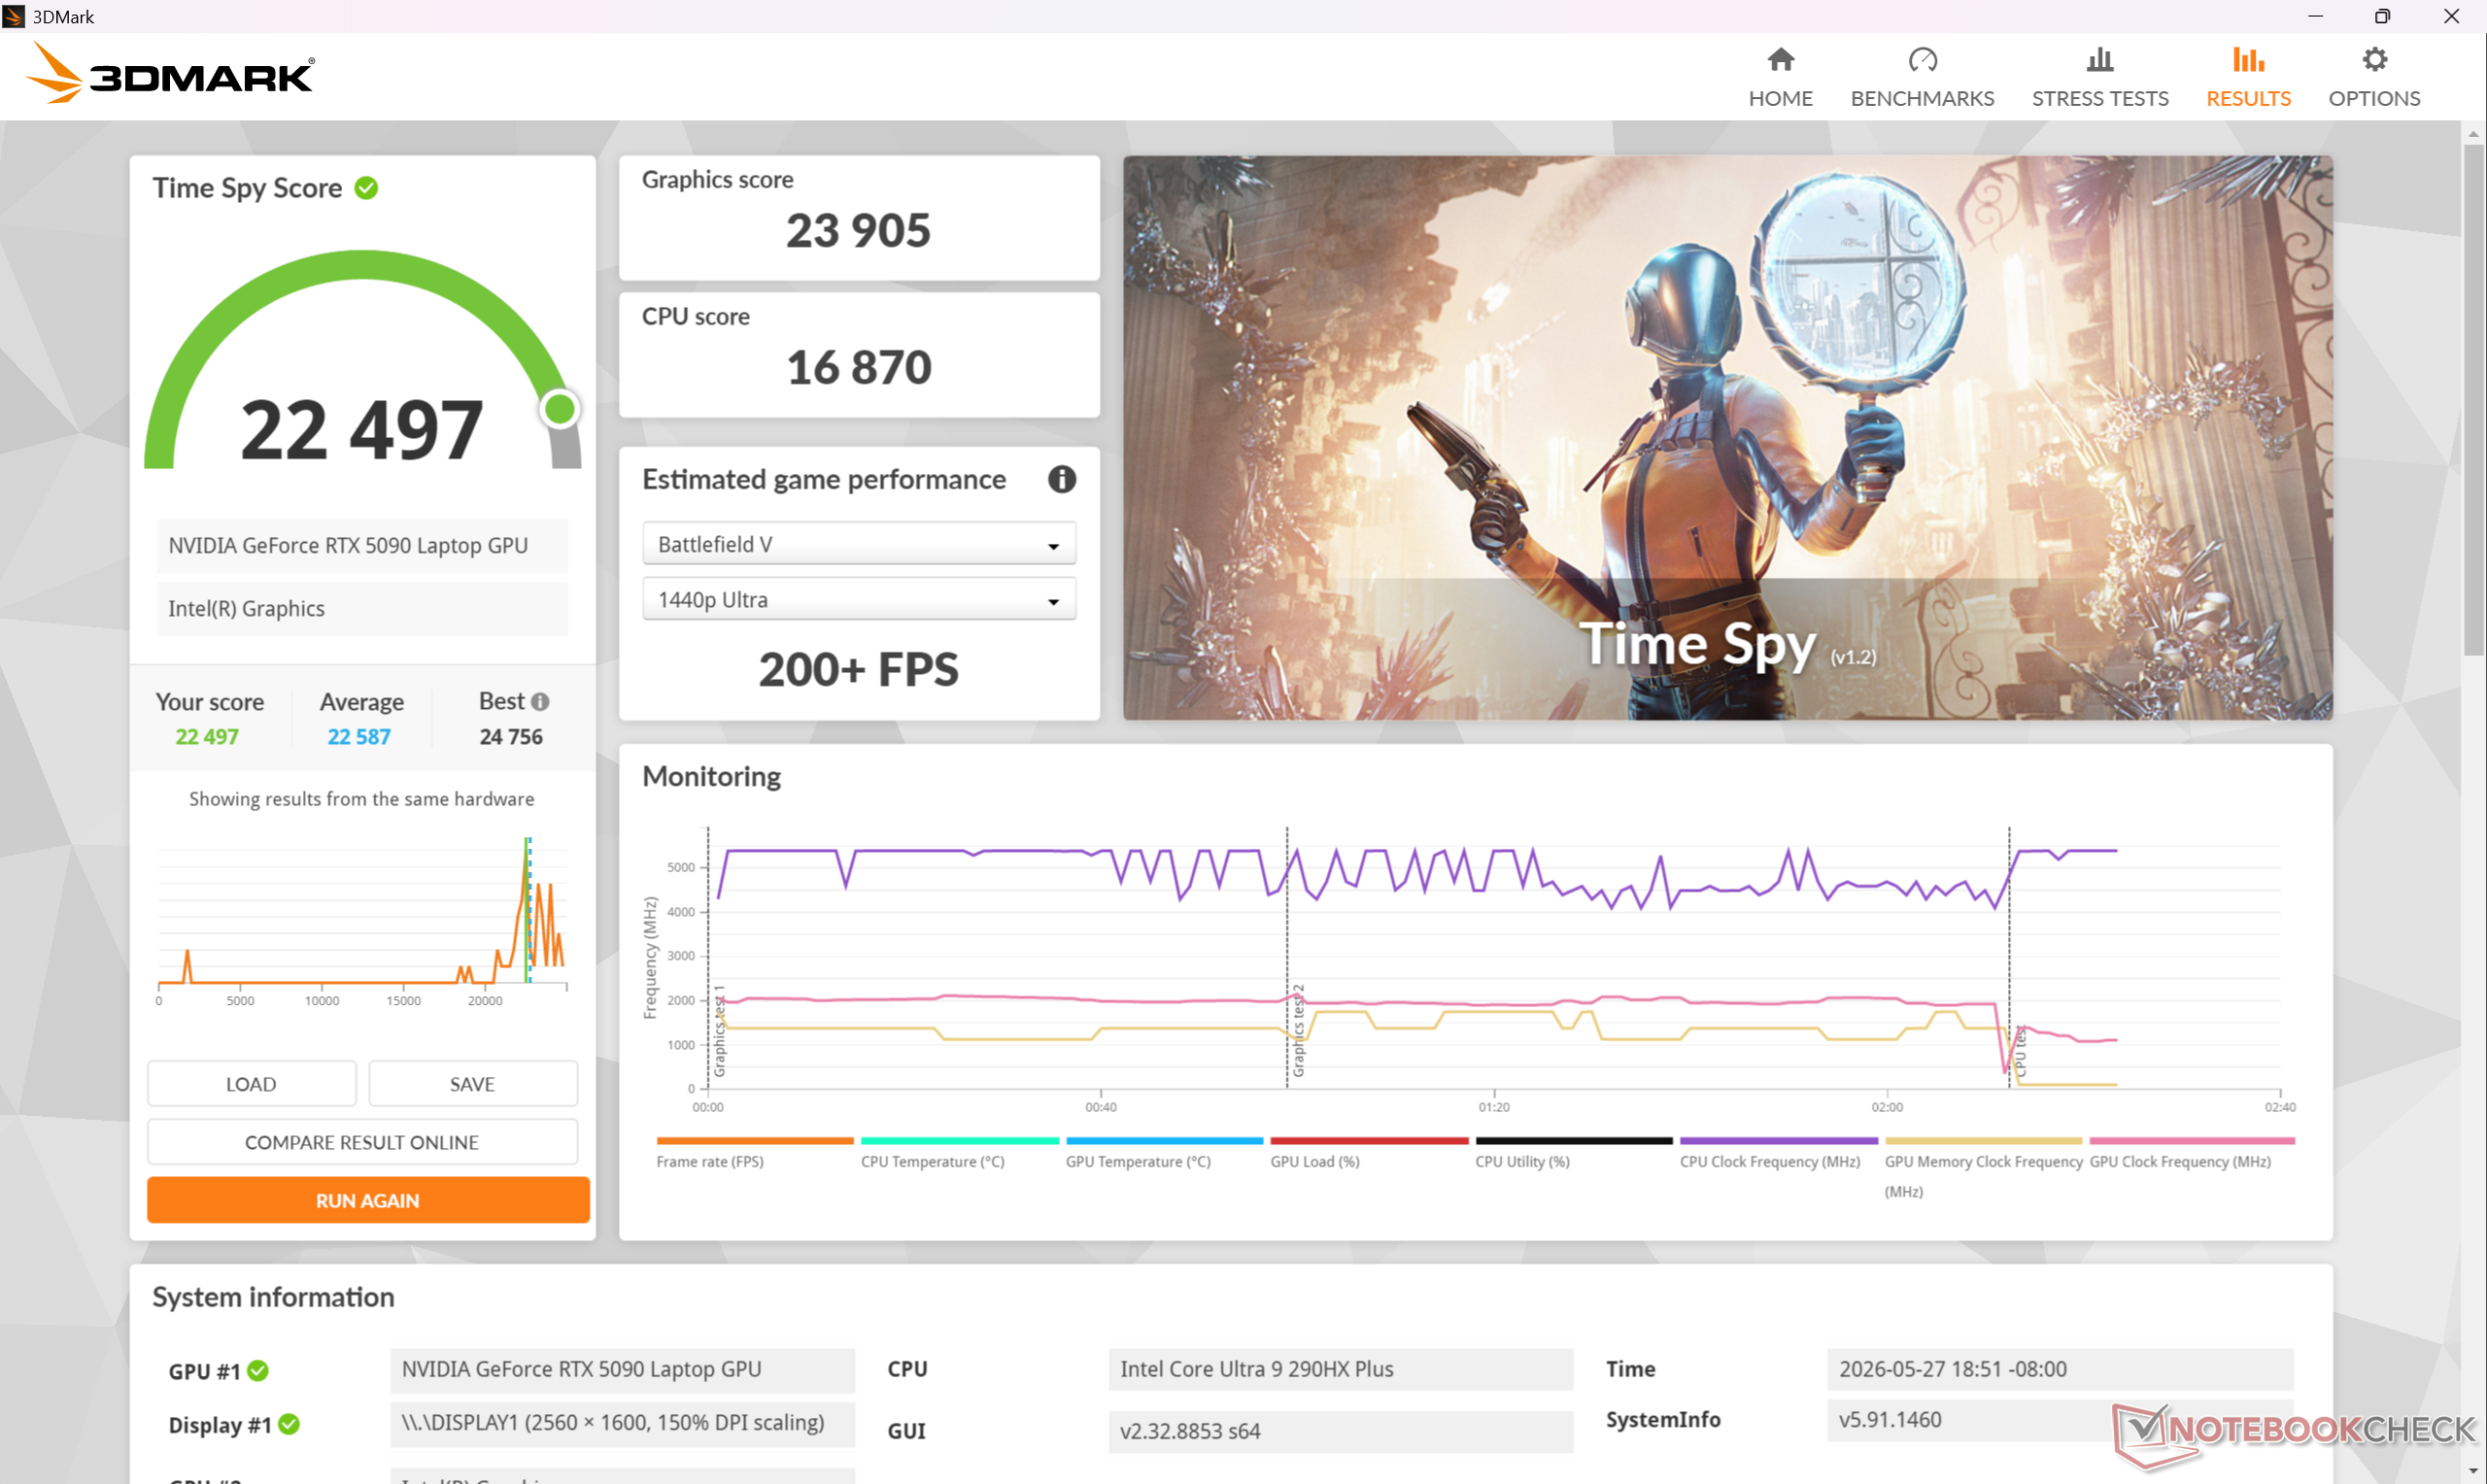
Eseguire il sistema in modalità Apex o Cooler Boost (cioè la modalità di massima rumorosità della ventola) è l'unico modo per ottenere la massima potenza di elaborazione sia dalla CPU che dalla RTX 5090 GeForce RTX 5090 GPU, come dimostra la nostra tabella dei risultati di Time Spy qui sotto. Scendere alla più silenziosa modalità Balanced riduce le prestazioni complessive di circa il 10 percento.
| Profilo di potenza | Punteggio grafico | Punteggio Fisica | Punteggio combinato |
| Modalità Cooler Boost | 26009 | 16635 | 23981 |
| Modalità Apex | 25594 (-2%) | 16938 (-2%) | 23771 (-1%) |
| Modalità Prestazioni Estreme | 23905 (-8%) | 16870 (-1%) | 22497 (-6%) |
| Modalità Bilanciata | 23572 (-9%) | 14462 (-13%) | 21536 (-10%) |
| Risparmio energetico | 18192 (-30%) | 13786 (-17%) | 17912 (-25%) |
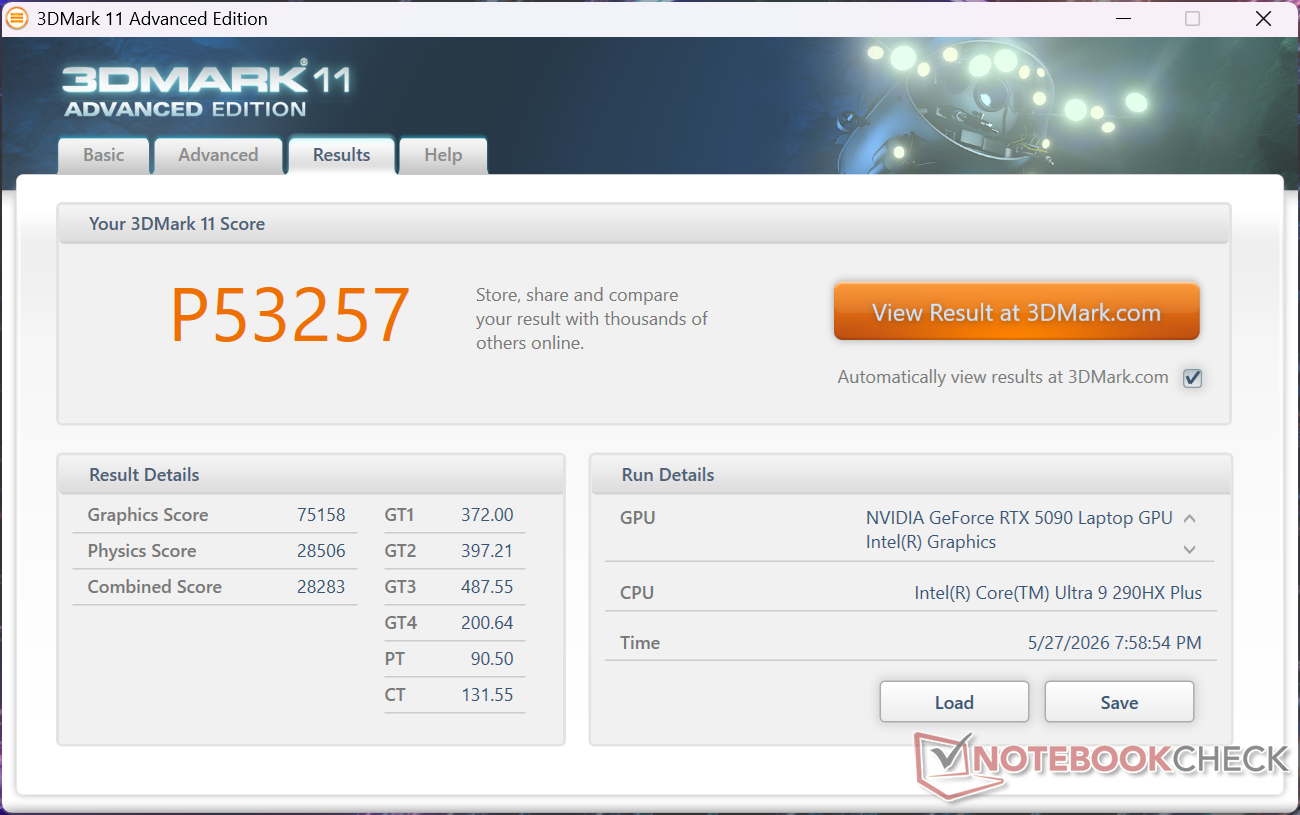
| 3DMark 11 Performance | 53257 punti | |
| 3DMark Cloud Gate Standard Score | 77700 punti | |
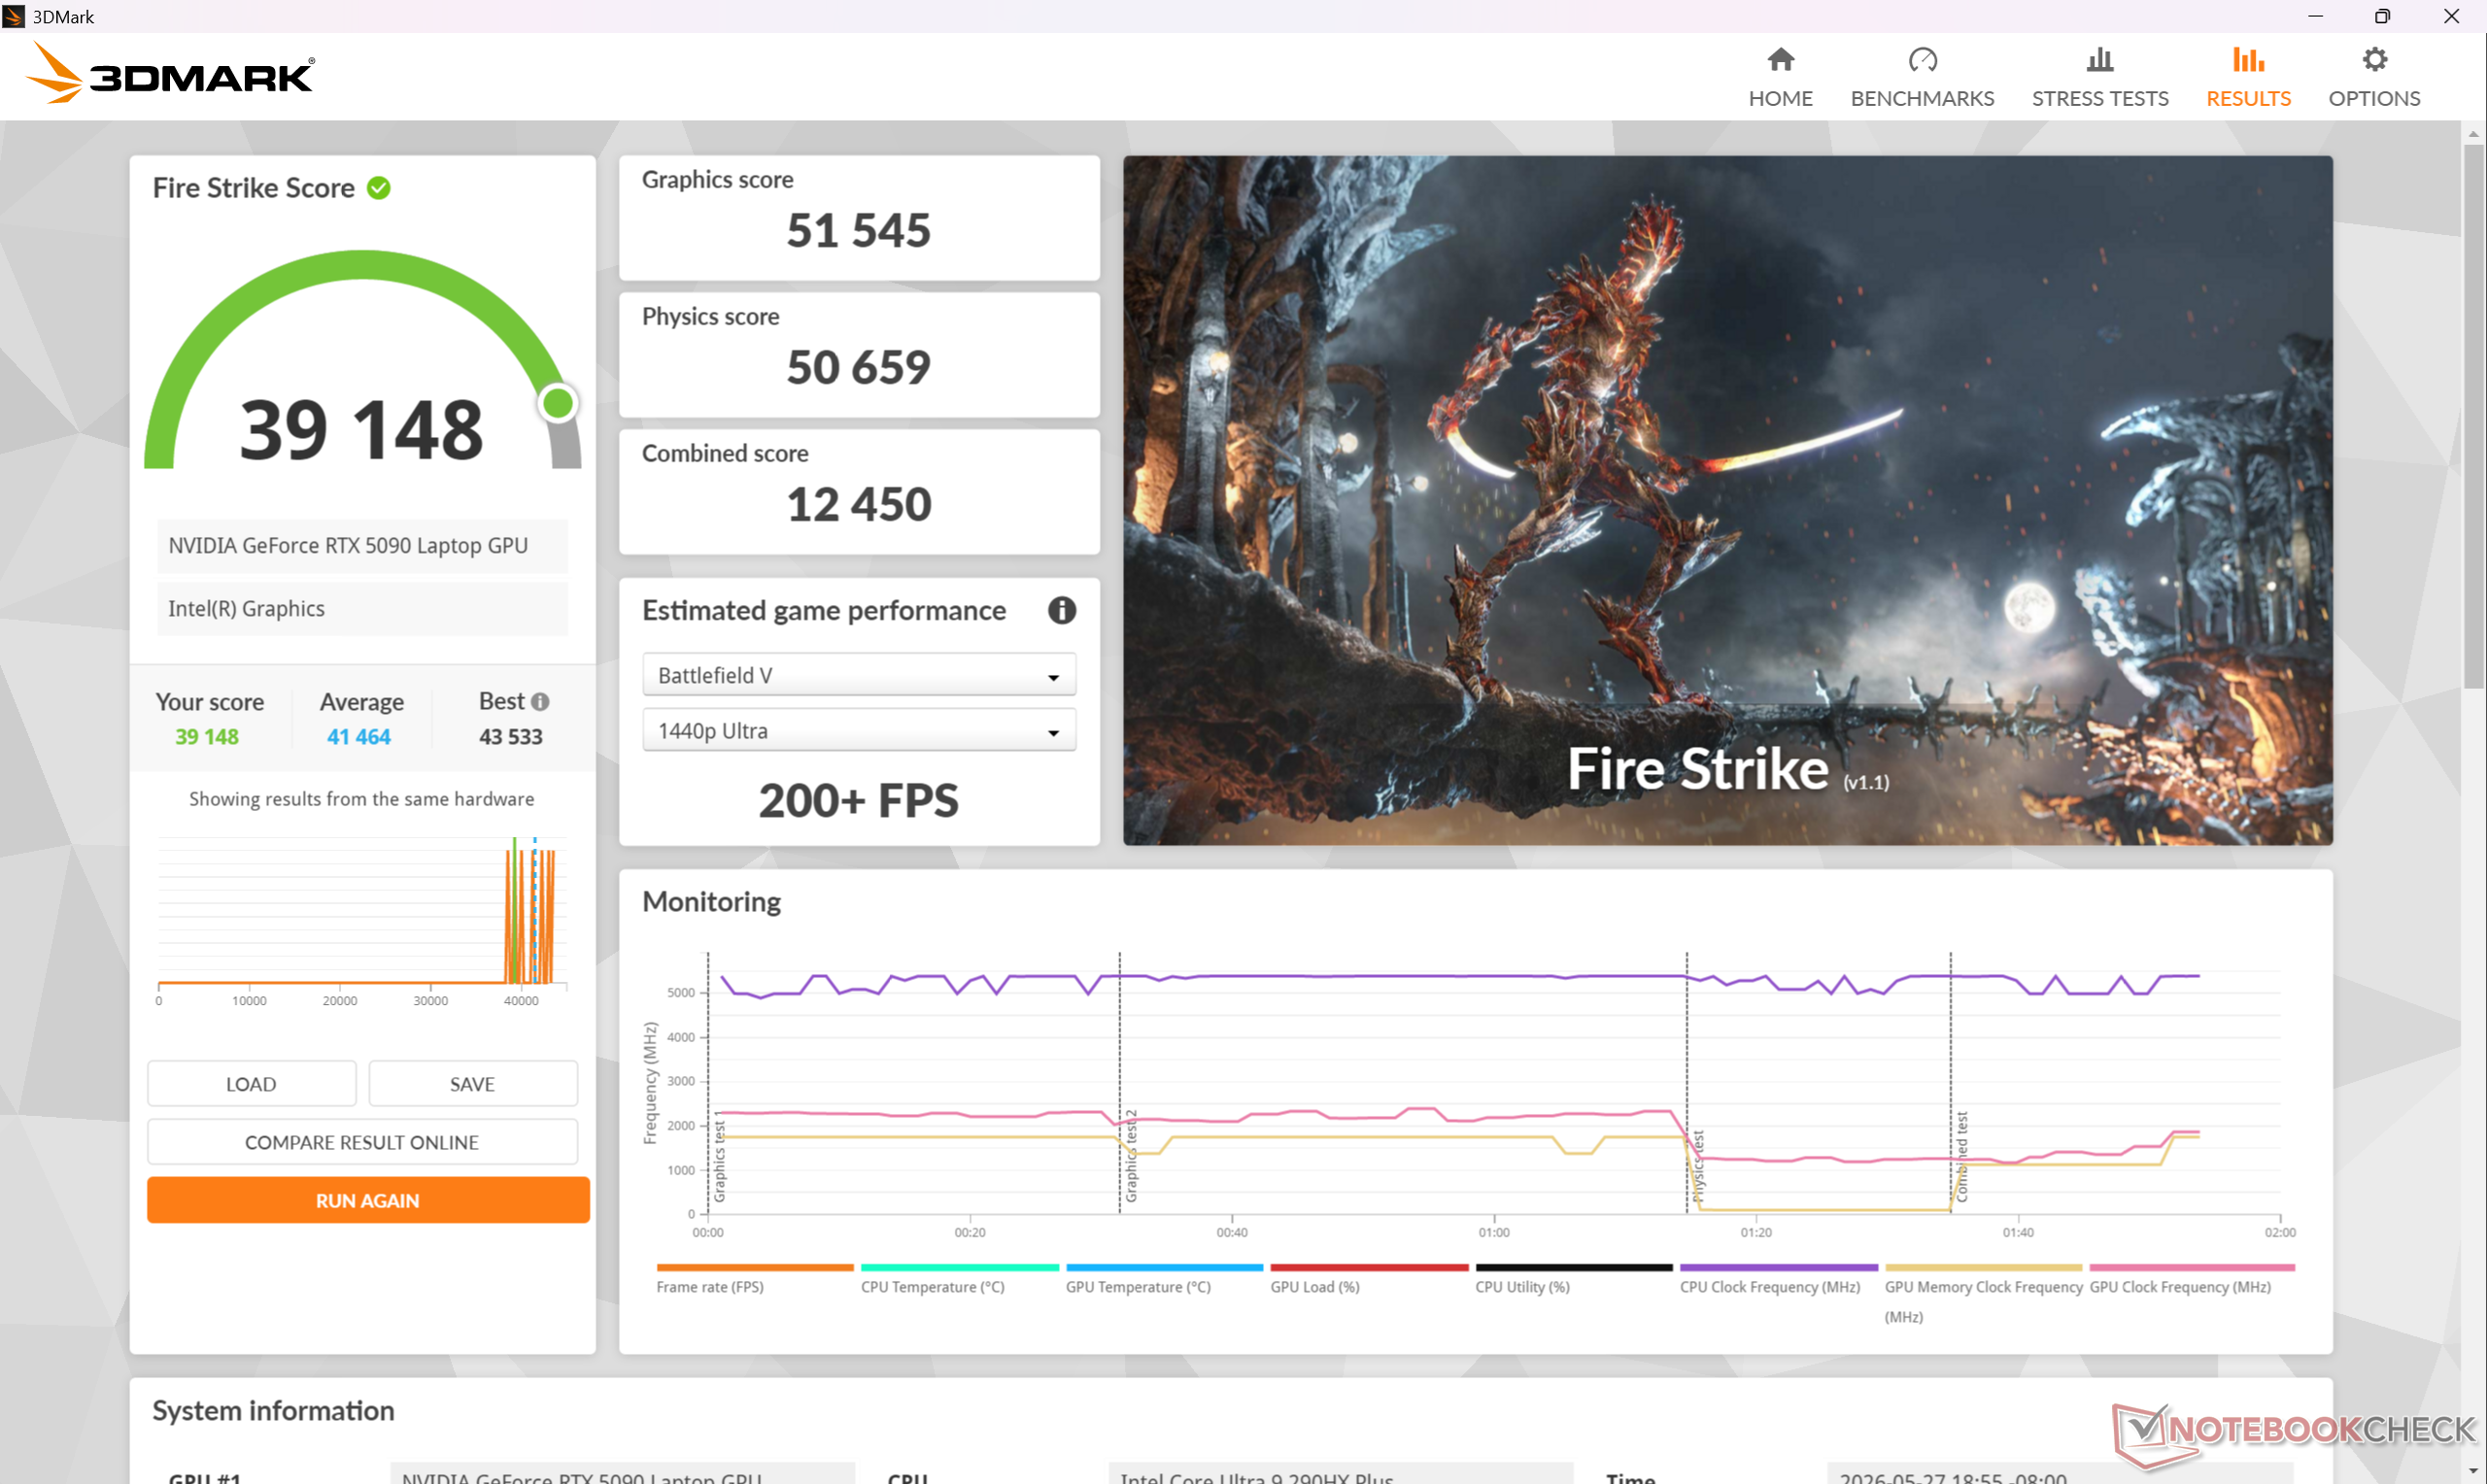
| 3DMark Fire Strike Score | 39148 punti | |
| 3DMark Time Spy Score | 22497 punti | |
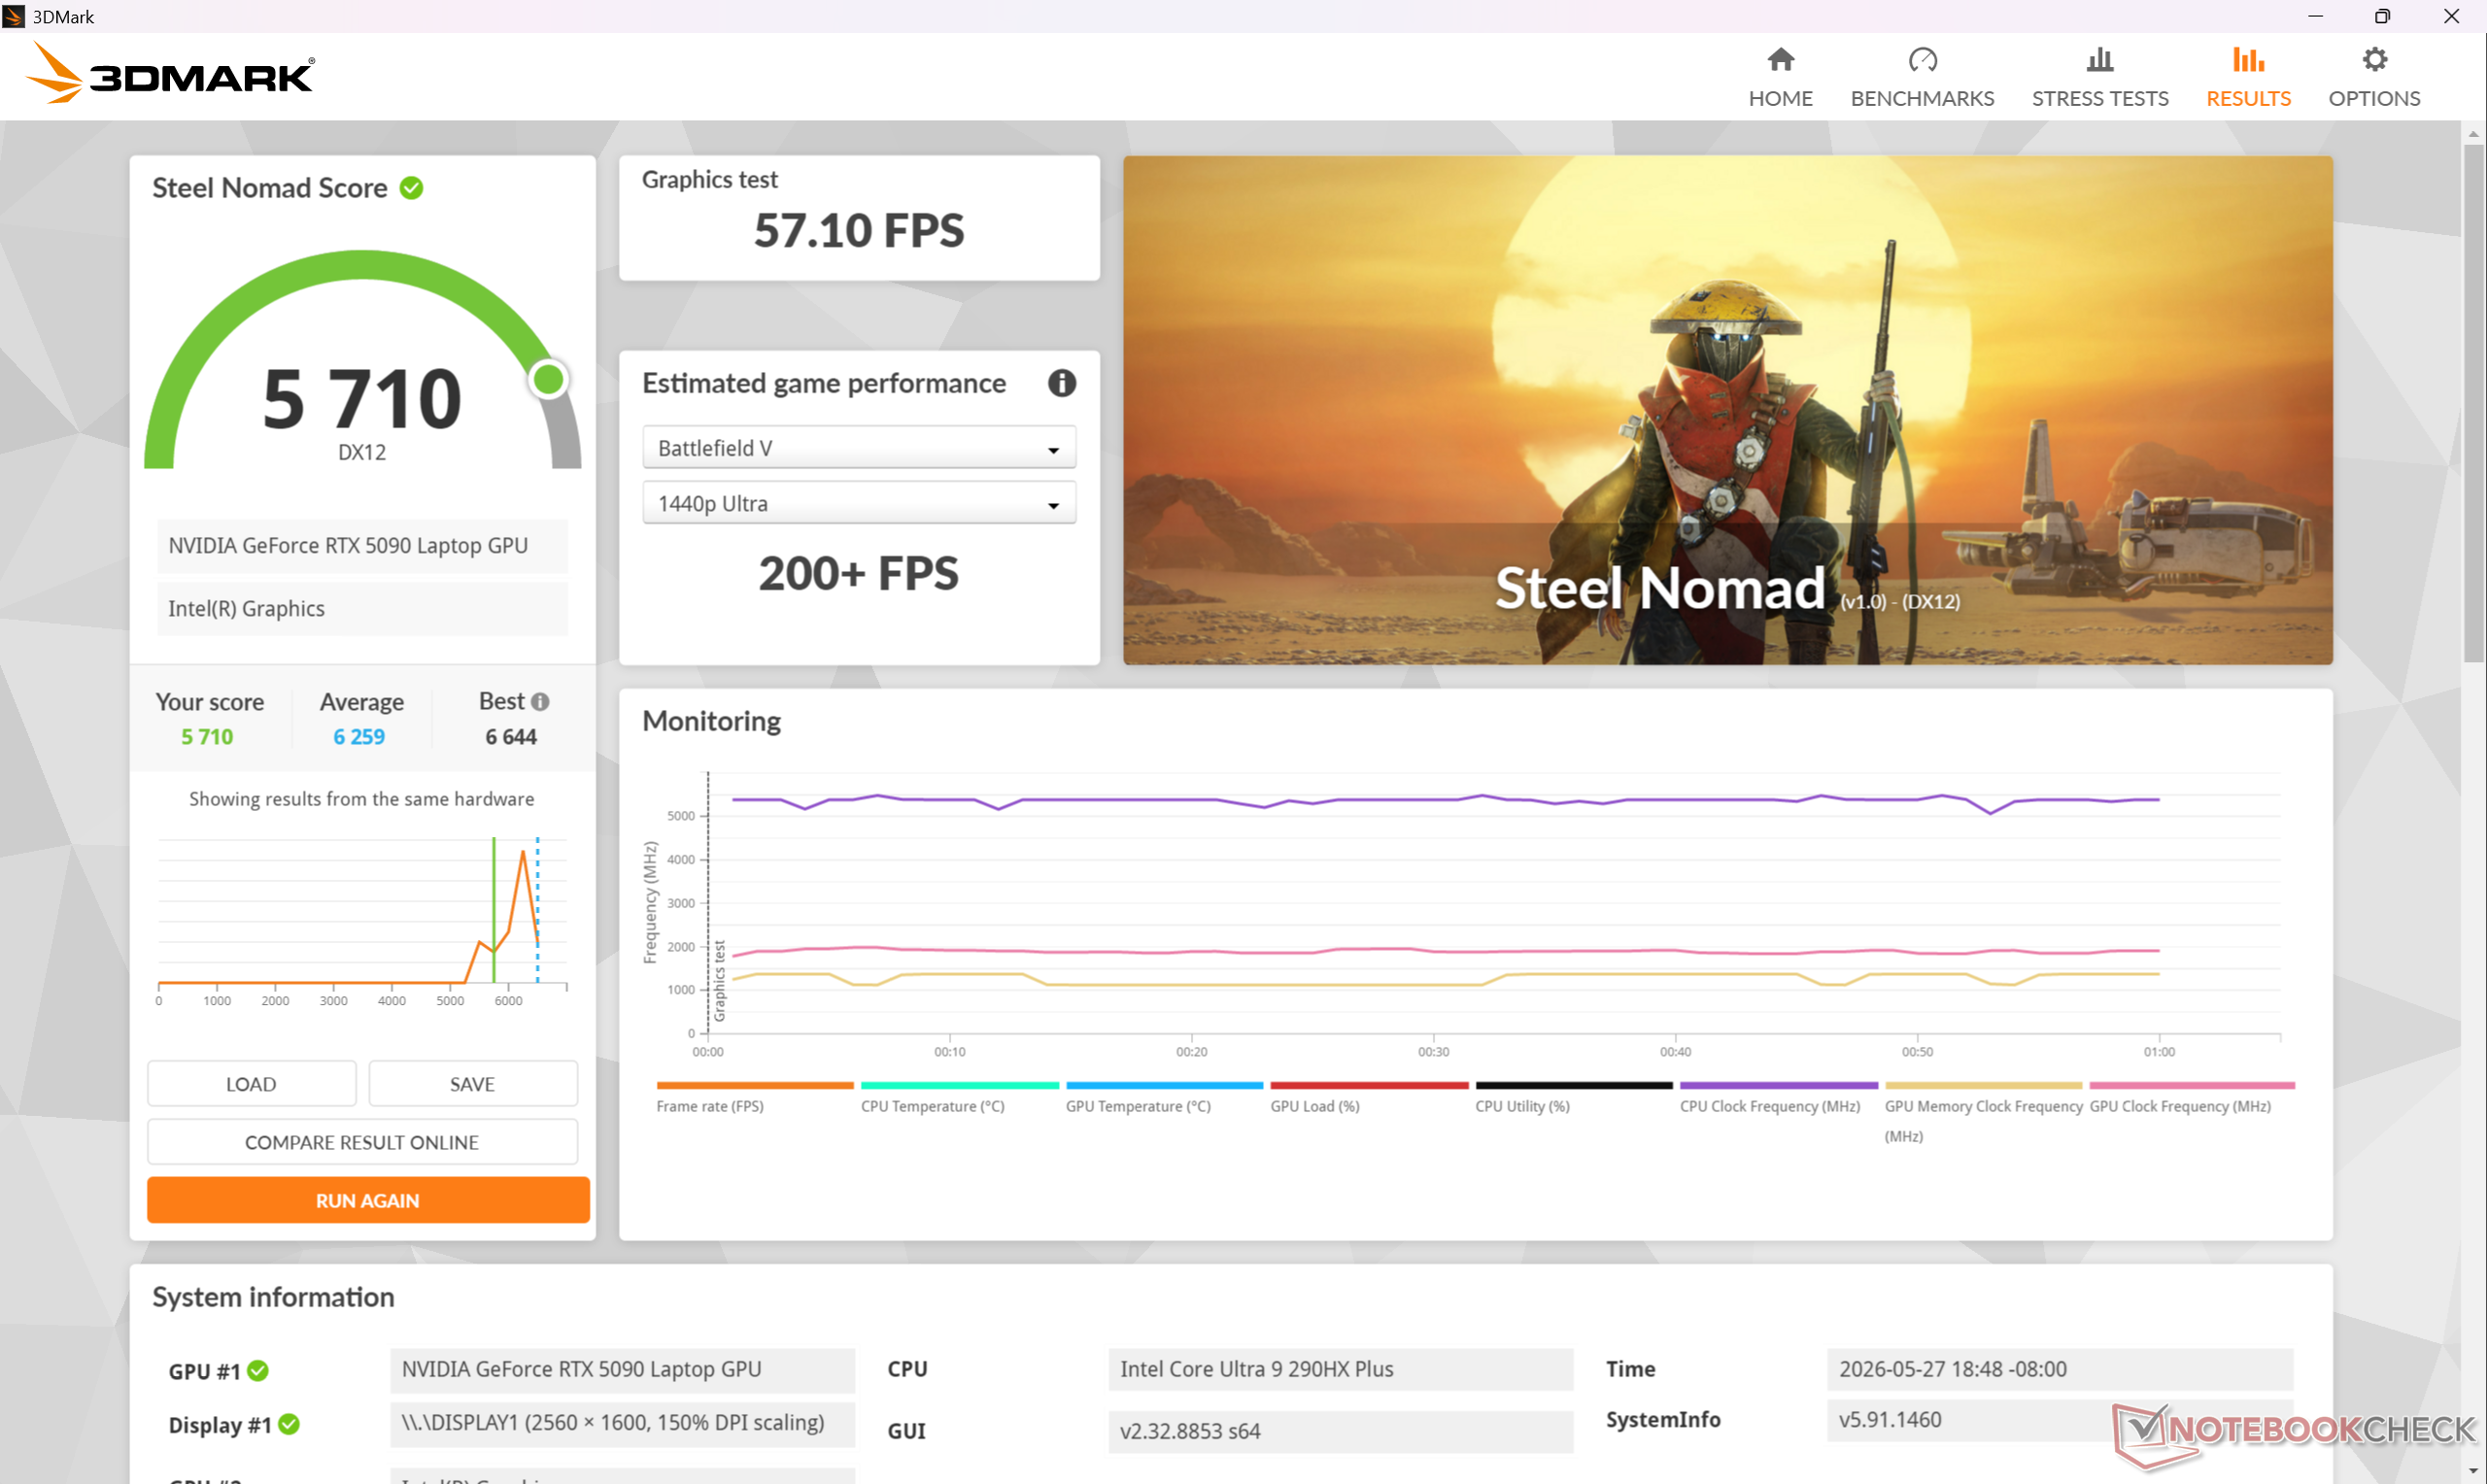
| 3DMark Steel Nomad Score | 5710 punti | |
Aiuto | ||
* ... Meglio usare valori piccoli
Prestazioni di gioco
La GeForce RTX 5090 mobile si abbina meglio con un display nativo a 1600p invece che a 4K, se si considera che la versione desktop può essere due volte più potente versione desktop può essere due volte più potente. Tenga presente che il sistema deve essere impostato sulla modalità Apex o sulla modalità Cooler Boost per sfruttare appieno i 175 W TGP pubblicizzati.
| Cyberpunk 2077 - 1920x1080 Ultra Preset (FSR off) | |
| MSI Raider 16 Max HX B2WJ | |
| Razer Blade 16 Core Ultra 9 386H | |
| Alienware 16X Aurora Core Ultra 9 290HX Plus | |
| Asus TUF Gaming A16 FA608UP | |
| MSI Crosshair 16 HX AI D2XWGKG | |
| Lenovo Legion 7 16IAX10 | |
| Baldur's Gate 3 - 1920x1080 Ultra Preset AA:T | |
| MSI Raider 16 Max HX B2WJ | |
| Razer Blade 16 Core Ultra 9 386H | |
| Alienware 16X Aurora Core Ultra 9 290HX Plus | |
| MSI Crosshair 16 HX AI D2XWGKG | |
| Asus TUF Gaming A16 FA608UP | |
| Lenovo Legion 7 16IAX10 | |
| GTA V - 1920x1080 Highest AA:4xMSAA + FX AF:16x | |
| MSI Raider 16 Max HX B2WJ | |
| Alienware 16X Aurora Core Ultra 9 290HX Plus | |
| Lenovo Legion 7 16IAX10 | |
| MSI Crosshair 16 HX AI D2XWGKG | |
| Asus TUF Gaming A16 FA608UP | |
| Razer Blade 16 Core Ultra 9 386H | |
| Final Fantasy XV Benchmark - 1920x1080 High Quality | |
| MSI Raider 16 Max HX B2WJ | |
| Razer Blade 16 Core Ultra 9 386H | |
| Alienware 16X Aurora Core Ultra 9 290HX Plus | |
| Asus TUF Gaming A16 FA608UP | |
| MSI Crosshair 16 HX AI D2XWGKG | |
| Lenovo Legion 7 16IAX10 | |
| Strange Brigade - 1920x1080 ultra AA:ultra AF:16 | |
| MSI Raider 16 Max HX B2WJ | |
| Razer Blade 16 Core Ultra 9 386H | |
| Alienware 16X Aurora Core Ultra 9 290HX Plus | |
| MSI Crosshair 16 HX AI D2XWGKG | |
| Lenovo Legion 7 16IAX10 | |
| Asus TUF Gaming A16 FA608UP | |
| Dota 2 Reborn - 1920x1080 ultra (3/3) best looking | |
| Alienware 16X Aurora Core Ultra 9 290HX Plus | |
| MSI Raider 16 Max HX B2WJ | |
| MSI Crosshair 16 HX AI D2XWGKG | |
| Lenovo Legion 7 16IAX10 | |
| Razer Blade 16 Core Ultra 9 386H | |
| Asus TUF Gaming A16 FA608UP | |
Grafico Cyberpunk 2077 ultra FPS
| basso | medio | alto | ultra | QHD DLSS | QHD | 4K DLSS | 4K | |
|---|---|---|---|---|---|---|---|---|
| GTA V (2015) | 191.4 | 190.9 | 187.5 | 165.2 | 162.3 | 181.5 | ||
| Dota 2 Reborn (2015) | 225 | 206 | 189.6 | 176.1 | 160 | |||
| Final Fantasy XV Benchmark (2018) | 234 | 236 | 205 | 171.3 | 96.3 | |||
| X-Plane 11.11 (2018) | 154.8 | 138 | 112.6 | 93.8 | ||||
| Strange Brigade (2018) | 639 | 503 | 471 | 433 | 329 | 179.6 | ||
| Baldur's Gate 3 (2023) | 287 | 242 | 211 | 207 | 202 | 147.7 | 125.9 | 83.1 |
| Cyberpunk 2077 (2023) | 199.4 | 196.6 | 177.3 | 161.7 | 122.7 | 111.2 | 61 | 50.4 |
| F1 24 (2024) | 353 | 379 | 364 | 153.8 | 154.1 | 99.8 | 85.3 | 50.5 |
| Black Myth: Wukong (2024) | 122 | 97 | 58 | 65 | 45 | 46 | 27 | |
| Assassin's Creed Shadows (2025) | 102 | 89 | 69 | 70 | 59 | 56 | 43 |
Emissioni
Rumore del sistema
Il rumore della ventola è intimamente legato alle cinque impostazioni del profilo di potenza, in ordine dal minimo al massimo delle prestazioni: Eco, Bilanciato, Prestazioni estreme, Apex e Cooler Boost. Quando si esegue Cyberpunk 2077 con questi profili, il rumore della ventola tende a stabilizzarsi a 36,2 dB(A), 47,5 dB(A), 51,1 dB(A), 57 dB(A) e 60,2 dB(A), rispettivamente. Il comportamento di pulsazione è generalmente minimo quando è impostato sulla modalità Bilanciata o inferiore. Tuttavia, 51,1 dB(A) quando gioca in modalità Prestazioni Estreme è leggermente più silenzioso rispetto a modelli concorrenti come il Lenovo 7 16IAA Lenovo Legion 7 16IAX10 o Razer Blade 16.
Rumorosità
| Idle |
| 26.6 / 26.7 / 26.9 dB(A) |
| Sotto carico |
| 36 / 60.2 dB(A) |
 | ||
30 dB silenzioso 40 dB(A) udibile 50 dB(A) rumoroso |
||
min: | ||
| MSI Raider 16 Max HX B2WJ Ultra 9 290HX Plus, GeForce RTX 5090 Laptop | MSI Crosshair 16 HX AI D2XWGKG Ultra 9 275HX, GeForce RTX 5070 Laptop | Razer Blade 16 Core Ultra 9 386H Ultra 9 386H, GeForce RTX 5090 Laptop | Alienware 16X Aurora Core Ultra 9 290HX Plus Ultra 9 290HX Plus, GeForce RTX 5070 Ti Laptop | Asus TUF Gaming A16 FA608UP R7 260, GeForce RTX 5070 Laptop | Lenovo Legion 7 16IAX10 Ultra 7 255HX, GeForce RTX 5060 Laptop | |
|---|---|---|---|---|---|---|
| Noise | -11% | -1% | -4% | -11% | 1% | |
| off /ambiente * (dB) | 23.1 | 25.56 -11% | 23.1 -0% | 23.4 -1% | 25.1 -9% | 23.9 -3% |
| Idle Minimum * (dB) | 26.6 | 28.3 -6% | 23.4 12% | 23.8 11% | 32.2 -21% | 24 10% |
| Idle Average * (dB) | 26.7 | 28.3 -6% | 25.4 5% | 23.8 11% | 32.2 -21% | 26 3% |
| Idle Maximum * (dB) | 26.9 | 28.3 -5% | 29.3 -9% | 31.4 -17% | 32.2 -20% | 29.4 -9% |
| Load Average * (dB) | 36 | 50.26 -40% | 42.6 -18% | 48.7 -35% | 38.1 -6% | 35.4 2% |
| Cyberpunk 2077 ultra * (dB) | 51.1 | 57.8 -13% | 53.6 -5% | 51.5 -1% | 53.9 -5% | 54.6 -7% |
| Load Maximum * (dB) | 60.2 | 57.95 4% | 53.7 11% | 59.8 1% | 57.1 5% | 54.7 9% |
* ... Meglio usare valori piccoli
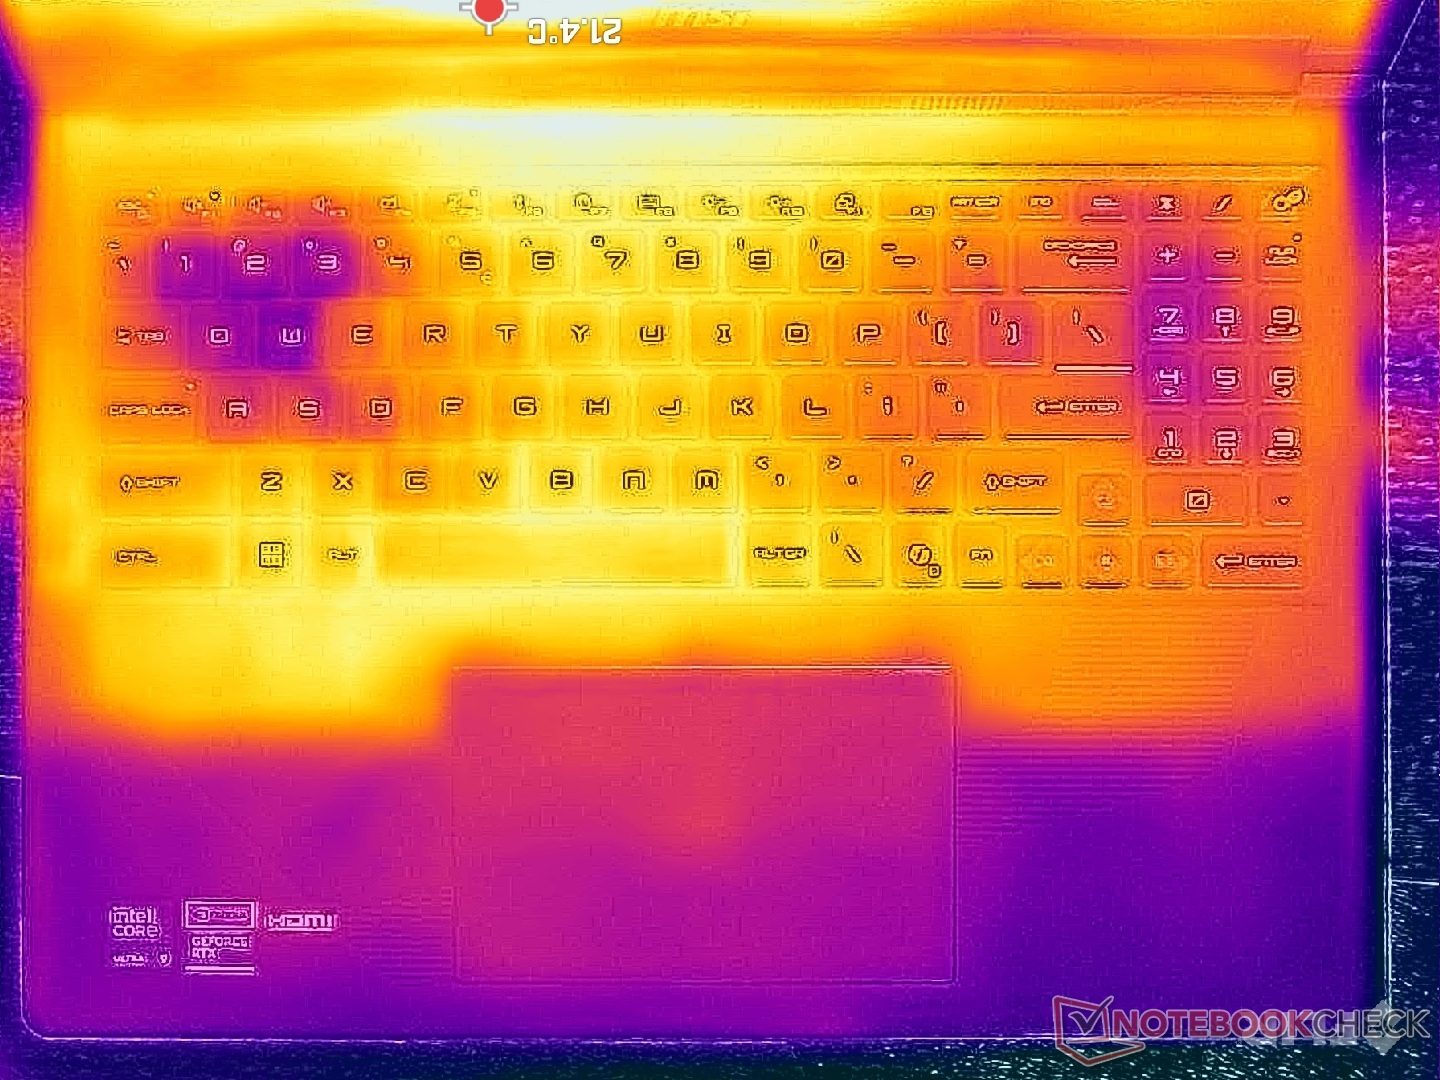
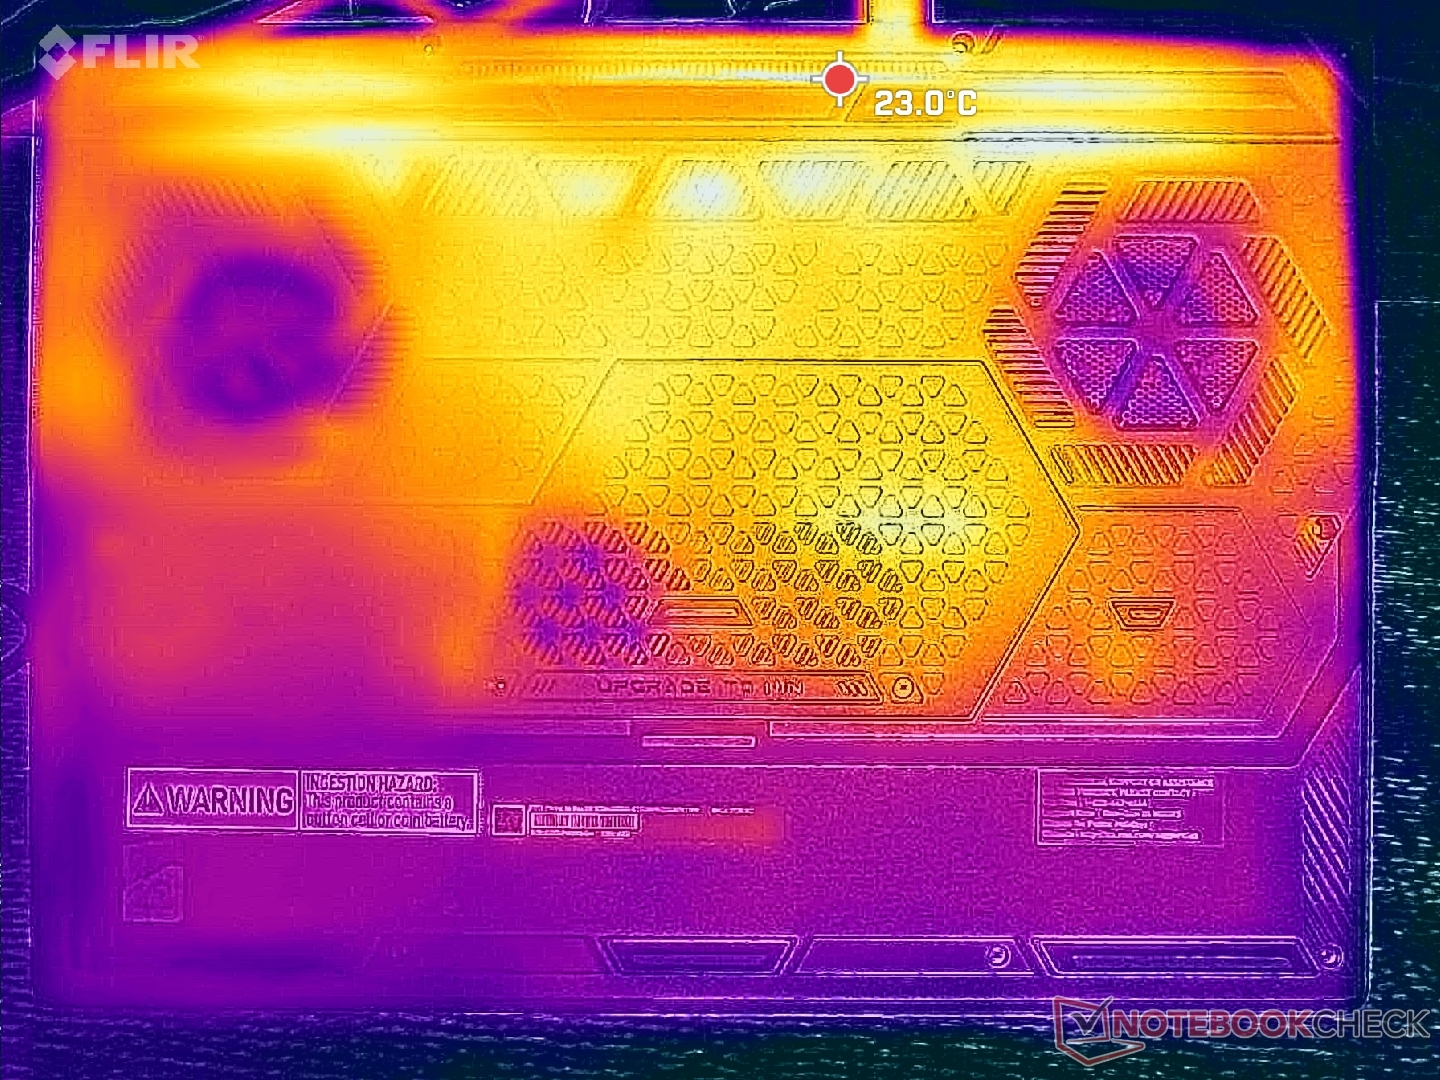
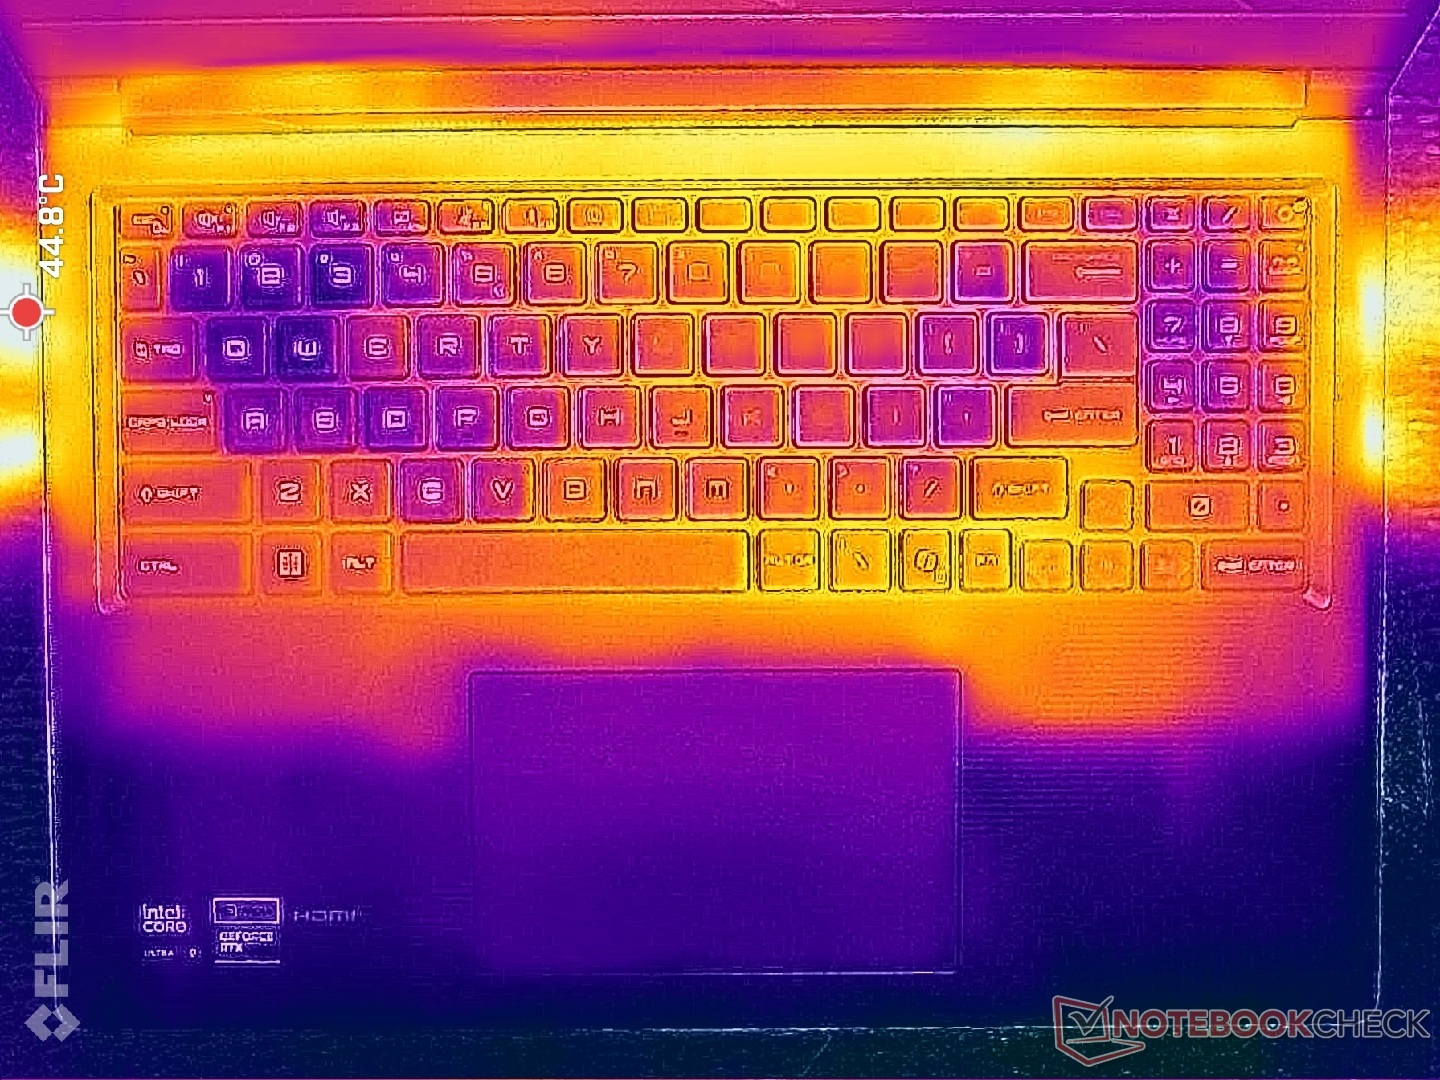
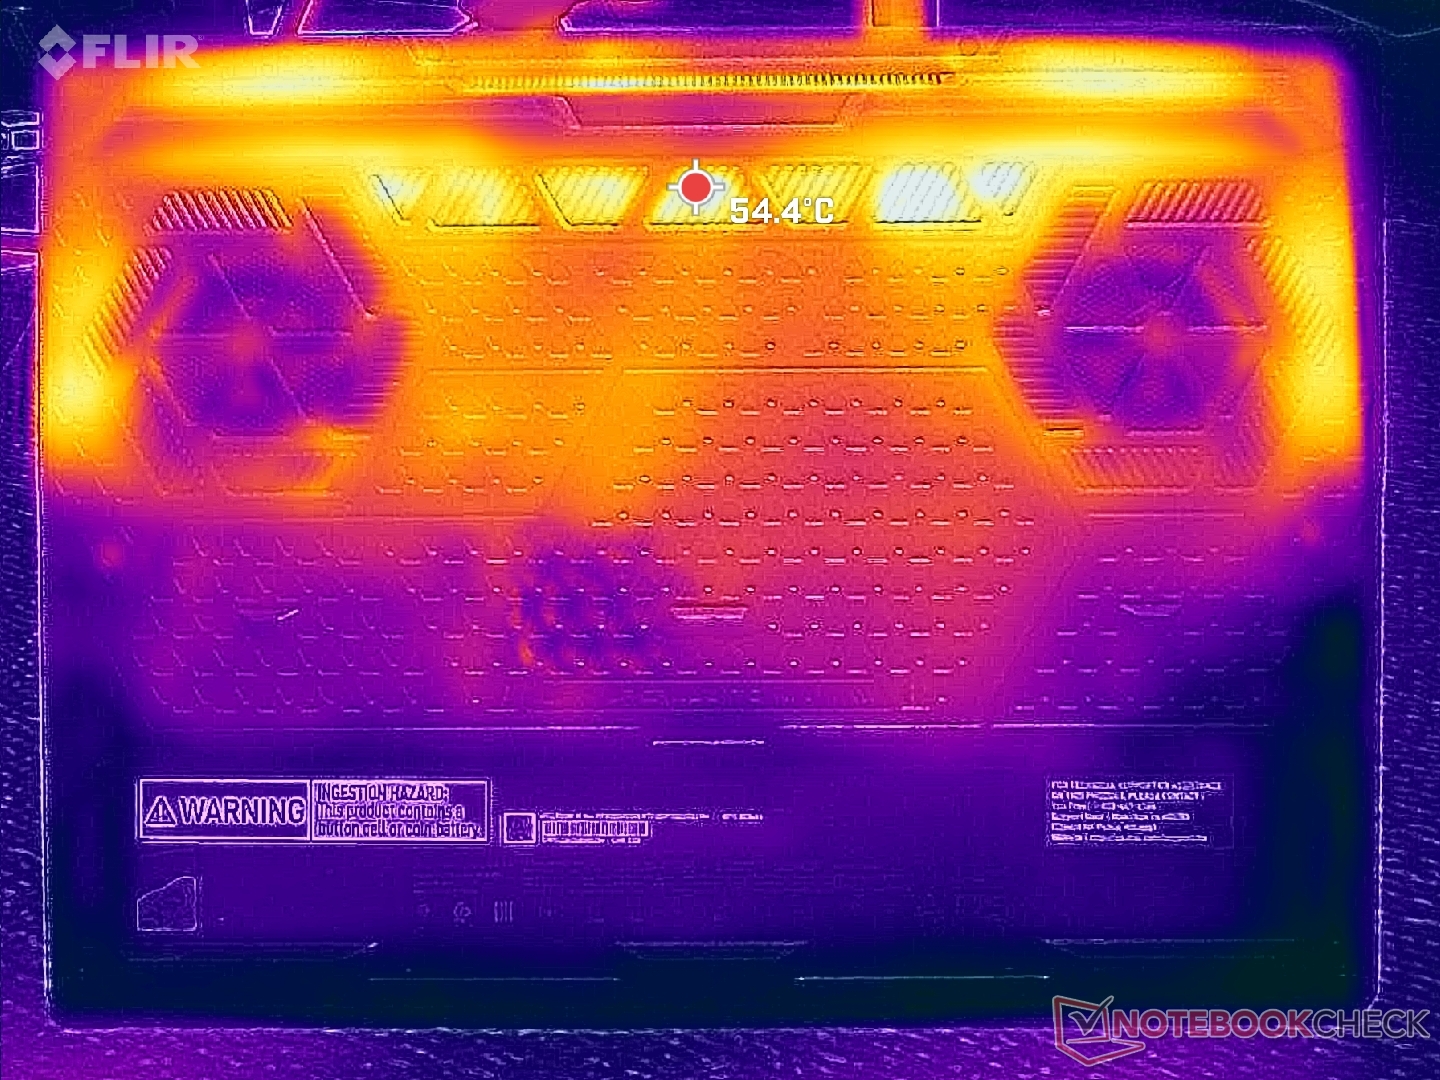
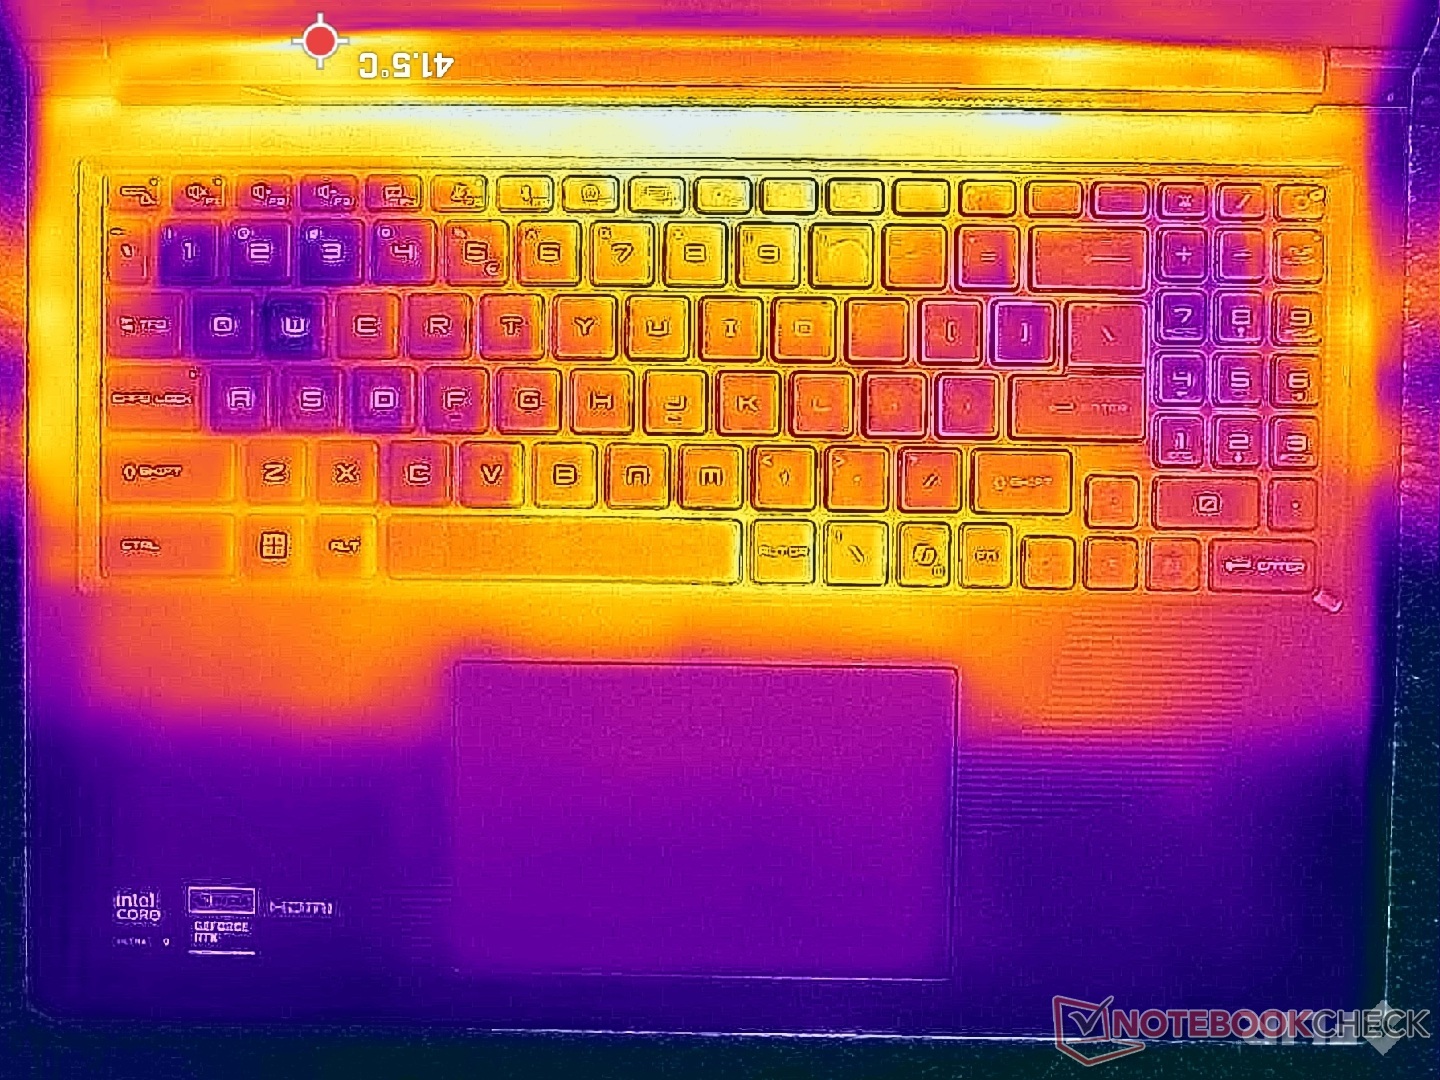
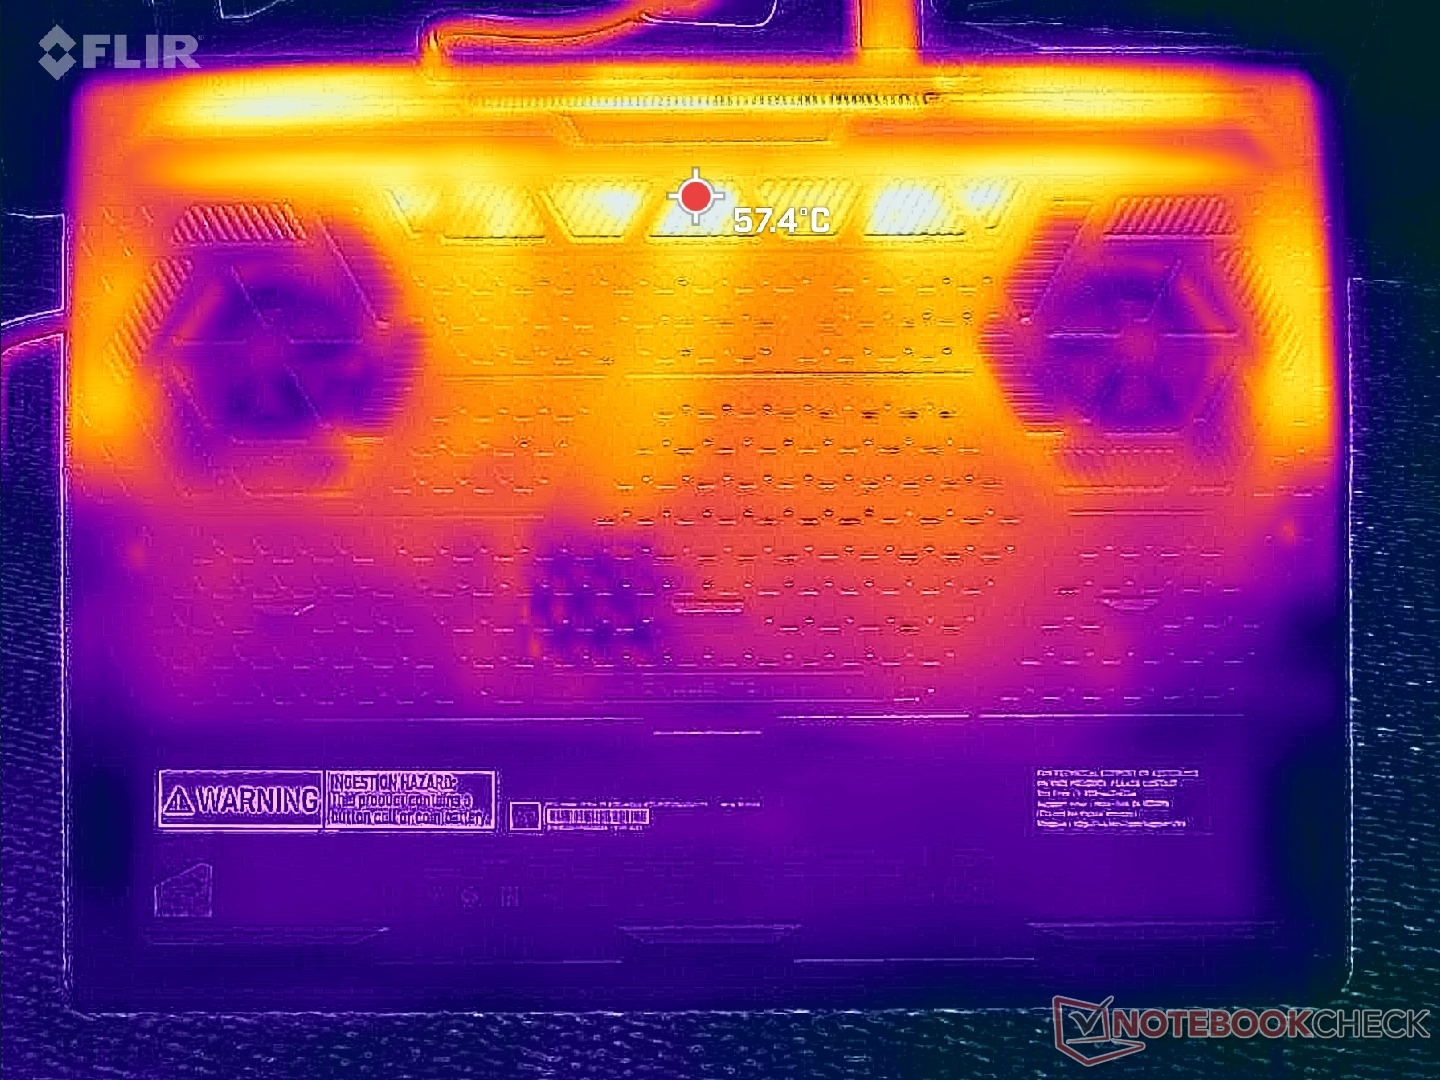
Temperatura
I punti caldi della temperatura superficiale raggiungerebbero i 44 C e i 46 C sul piano tastiera e sul coperchio inferiore, rispettivamente, il che è di qualche grado C più freddo rispetto a quanto abbiamo osservato sul più sottile Razer Blade 16.
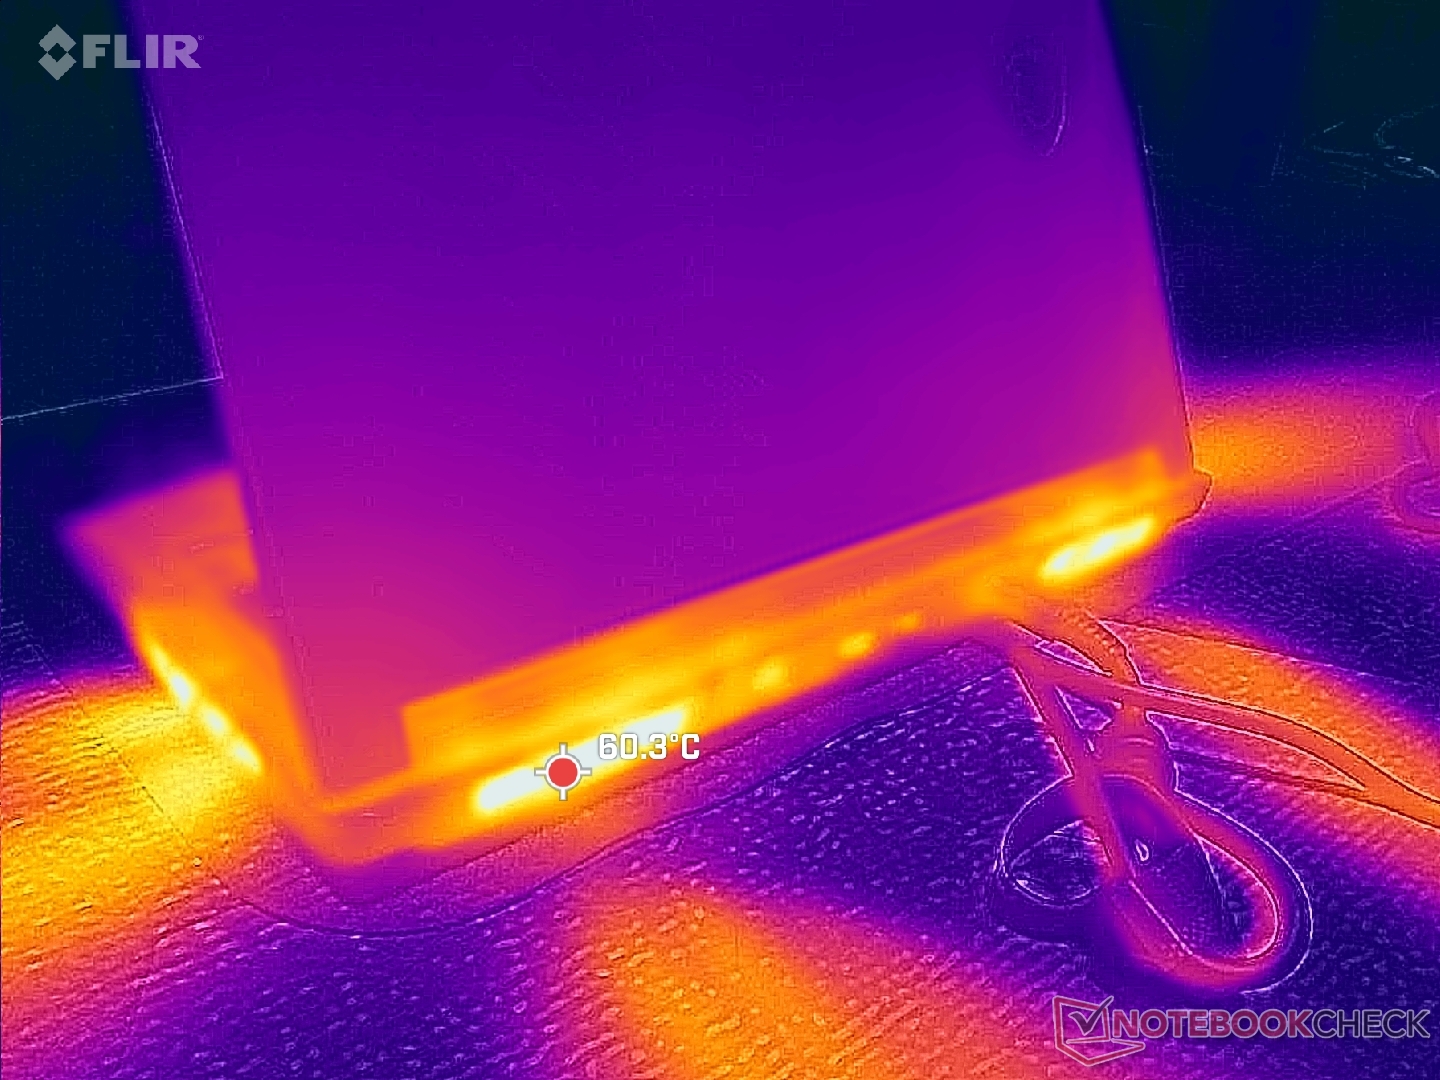
(±) La temperatura massima sul lato superiore è di 43.2 °C / 110 F, rispetto alla media di 40.4 °C / 105 F, che varia da 21.2 a 68.8 °C per questa classe Gaming.
(-) Il lato inferiore si riscalda fino ad un massimo di 45.6 °C / 114 F, rispetto alla media di 43.2 °C / 110 F
(+) In idle, la temperatura media del lato superiore è di 26.1 °C / 79 F, rispetto alla media deld ispositivo di 33.9 °C / 93 F.
(±) 3: The average temperature for the upper side is 34.1 °C / 93 F, compared to the average of 33.9 °C / 93 F for the class Gaming.
(+) I poggiapolsi e il touchpad raggiungono la temperatura massima della pelle (33.6 °C / 92.5 F) e quindi non sono caldi.
(-) La temperatura media della zona del palmo della mano di dispositivi simili e'stata di 28.8 °C / 83.8 F (-4.8 °C / -8.7 F).
| MSI Raider 16 Max HX B2WJ Ultra 9 290HX Plus, GeForce RTX 5090 Laptop | MSI Crosshair 16 HX AI D2XWGKG Ultra 9 275HX, GeForce RTX 5070 Laptop | Razer Blade 16 Core Ultra 9 386H Ultra 9 386H, GeForce RTX 5090 Laptop | Alienware 16X Aurora Core Ultra 9 290HX Plus Ultra 9 290HX Plus, GeForce RTX 5070 Ti Laptop | Asus TUF Gaming A16 FA608UP R7 260, GeForce RTX 5070 Laptop | Lenovo Legion 7 16IAX10 Ultra 7 255HX, GeForce RTX 5060 Laptop | |
|---|---|---|---|---|---|---|
| Heat | -3% | -17% | 2% | 8% | -14% | |
| Maximum Upper Side * (°C) | 43.2 | 44.8 -4% | 45.6 -6% | 48.2 -12% | 39.5 9% | 47 -9% |
| Maximum Bottom * (°C) | 45.6 | 43.4 5% | 47 -3% | 41 10% | 45.1 1% | 44 4% |
| Idle Upper Side * (°C) | 27.8 | 31.2 -12% | 35.2 -27% | 28.2 -1% | 25.7 8% | 35.6 -28% |
| Idle Bottom * (°C) | 29 | 28.8 1% | 37.6 -30% | 26.2 10% | 25.5 12% | 35.2 -21% |
* ... Meglio usare valori piccoli
Test da sforzo
La CPU ha raggiunto i 4,5 GHz, 215 W e 105 C per circa un minuto dopo l'avvio dello stress Prime95. Poi scendeva a 3,9 GHz e a ~152 W per mantenere una temperatura del nucleo più gestibile di 96 C Alienware 16 Area-51che viene fornito con la stessa CPU del nostro MSI, si stabilizzava anch'esso nella fascia alta dei 90 C in condizioni simili, suggerendo che il Core Ultra 9 290HX Plus è una delle CPU mobili più calde del mercato.
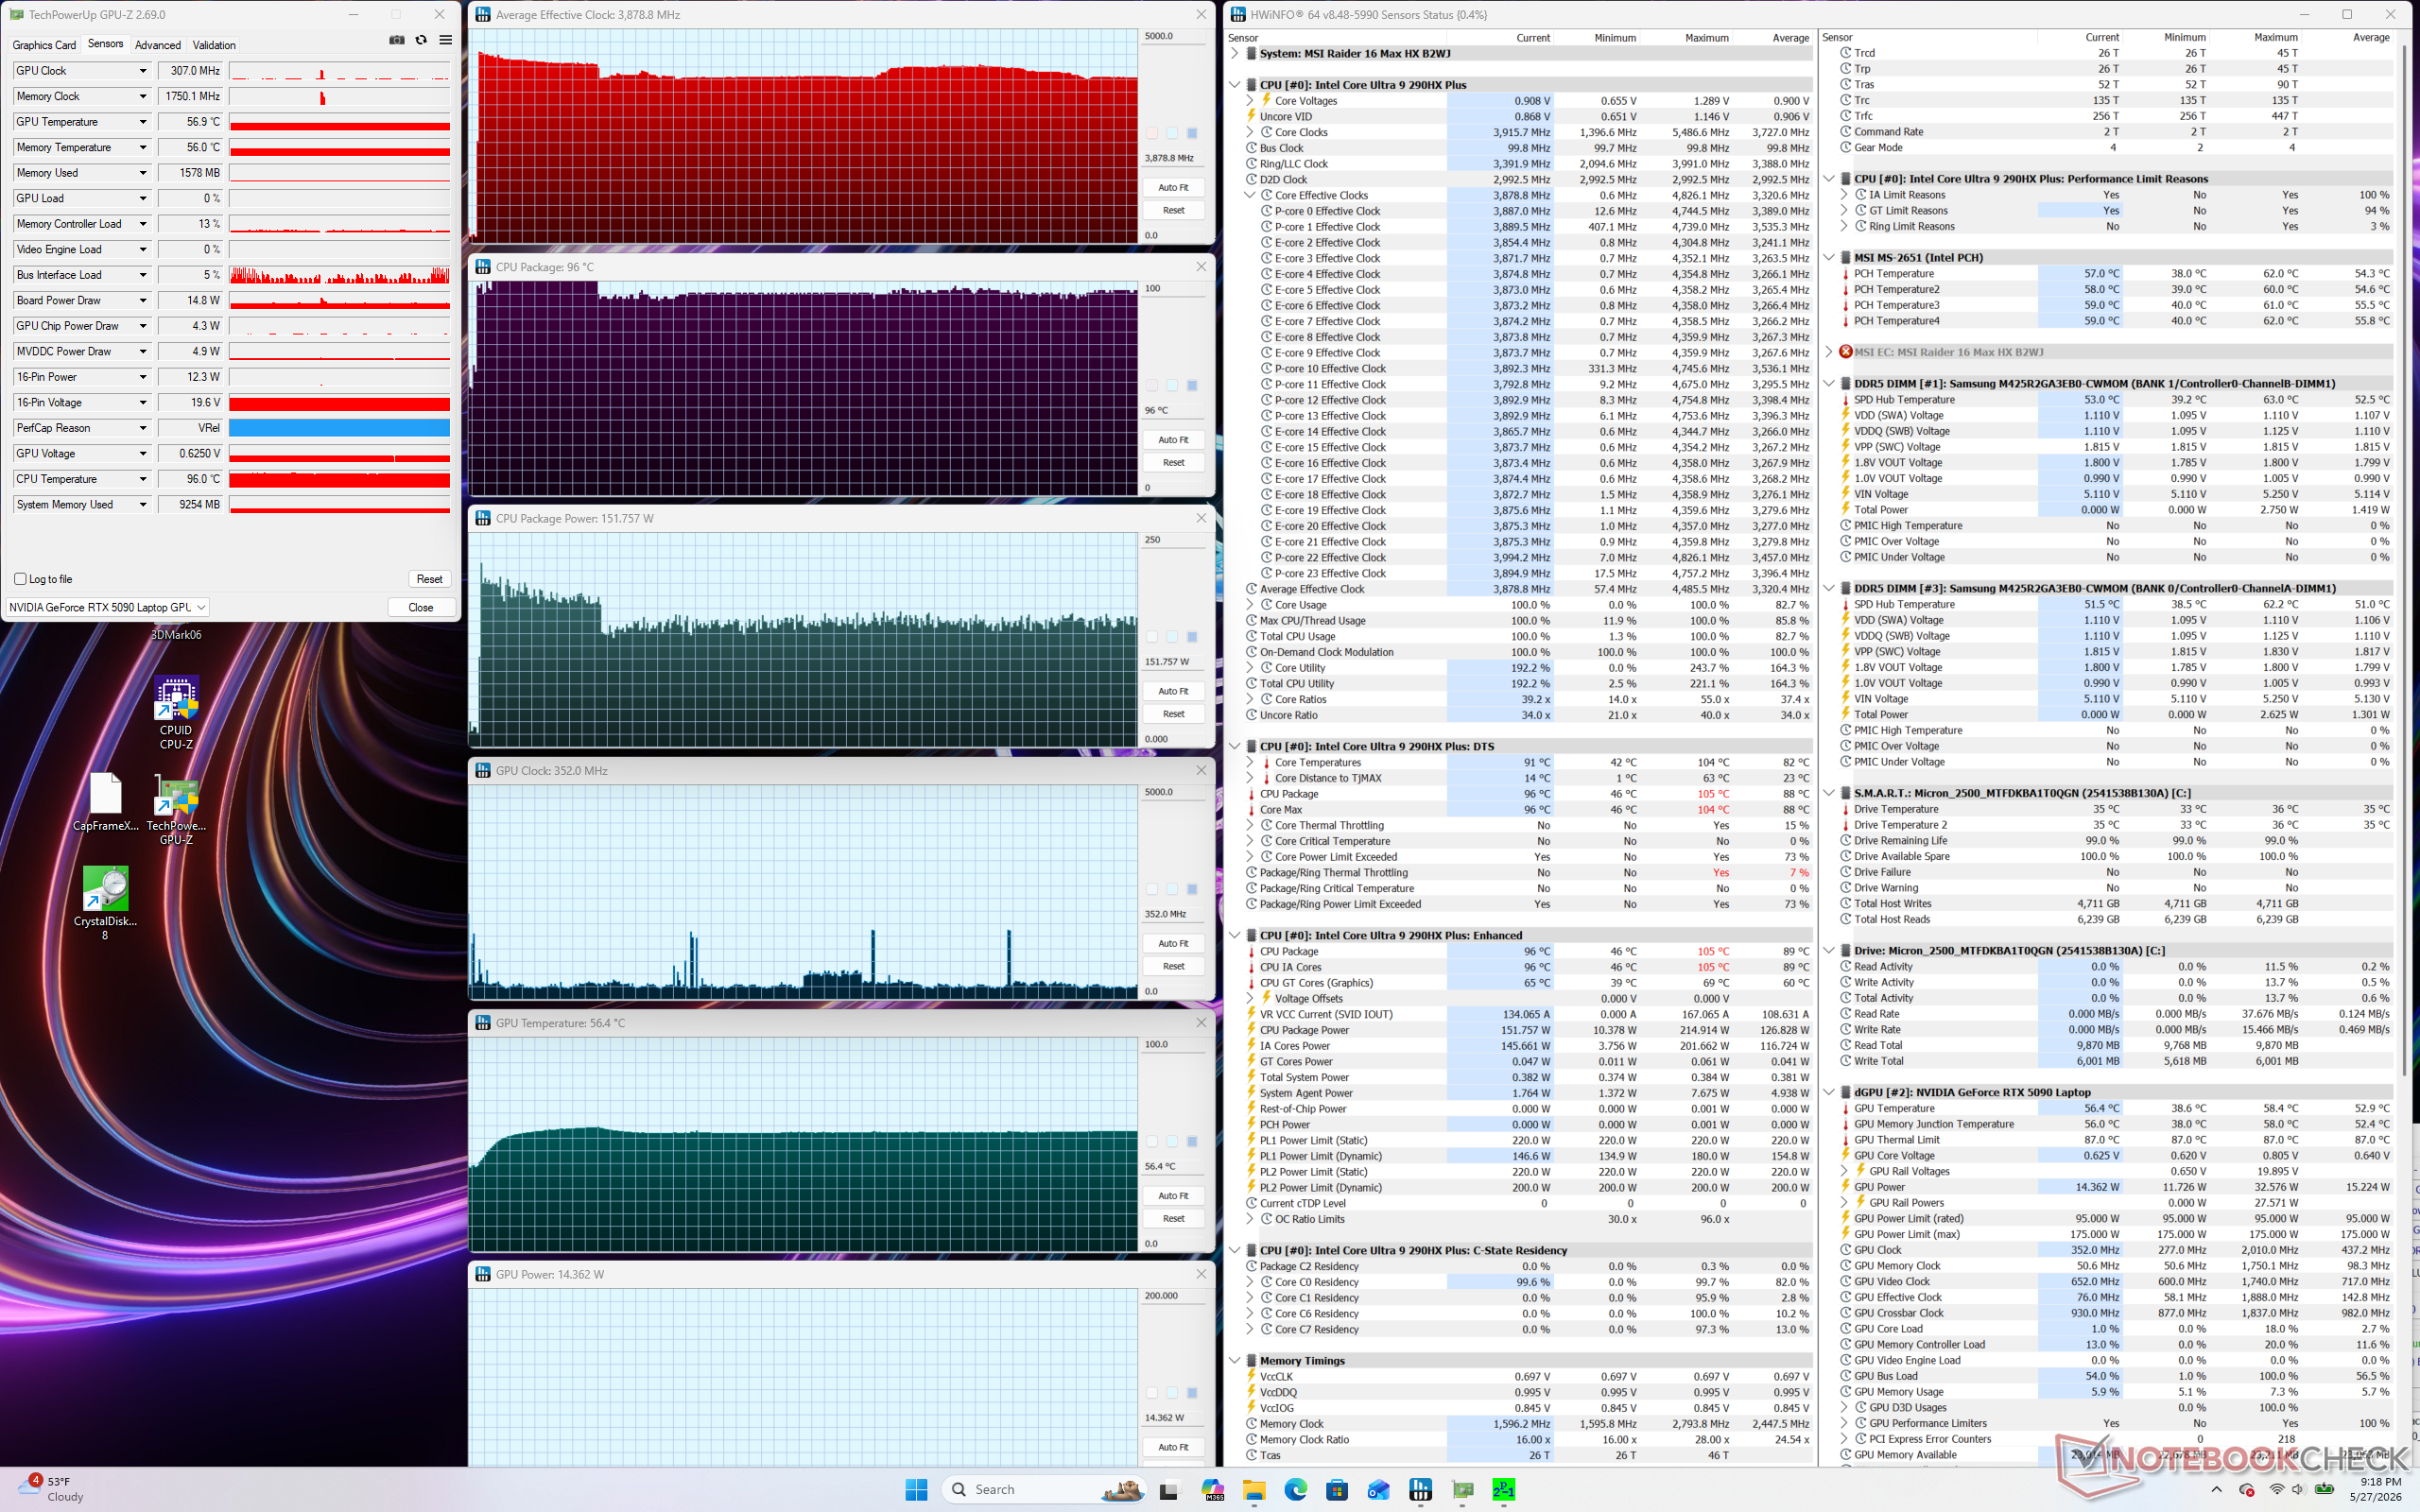
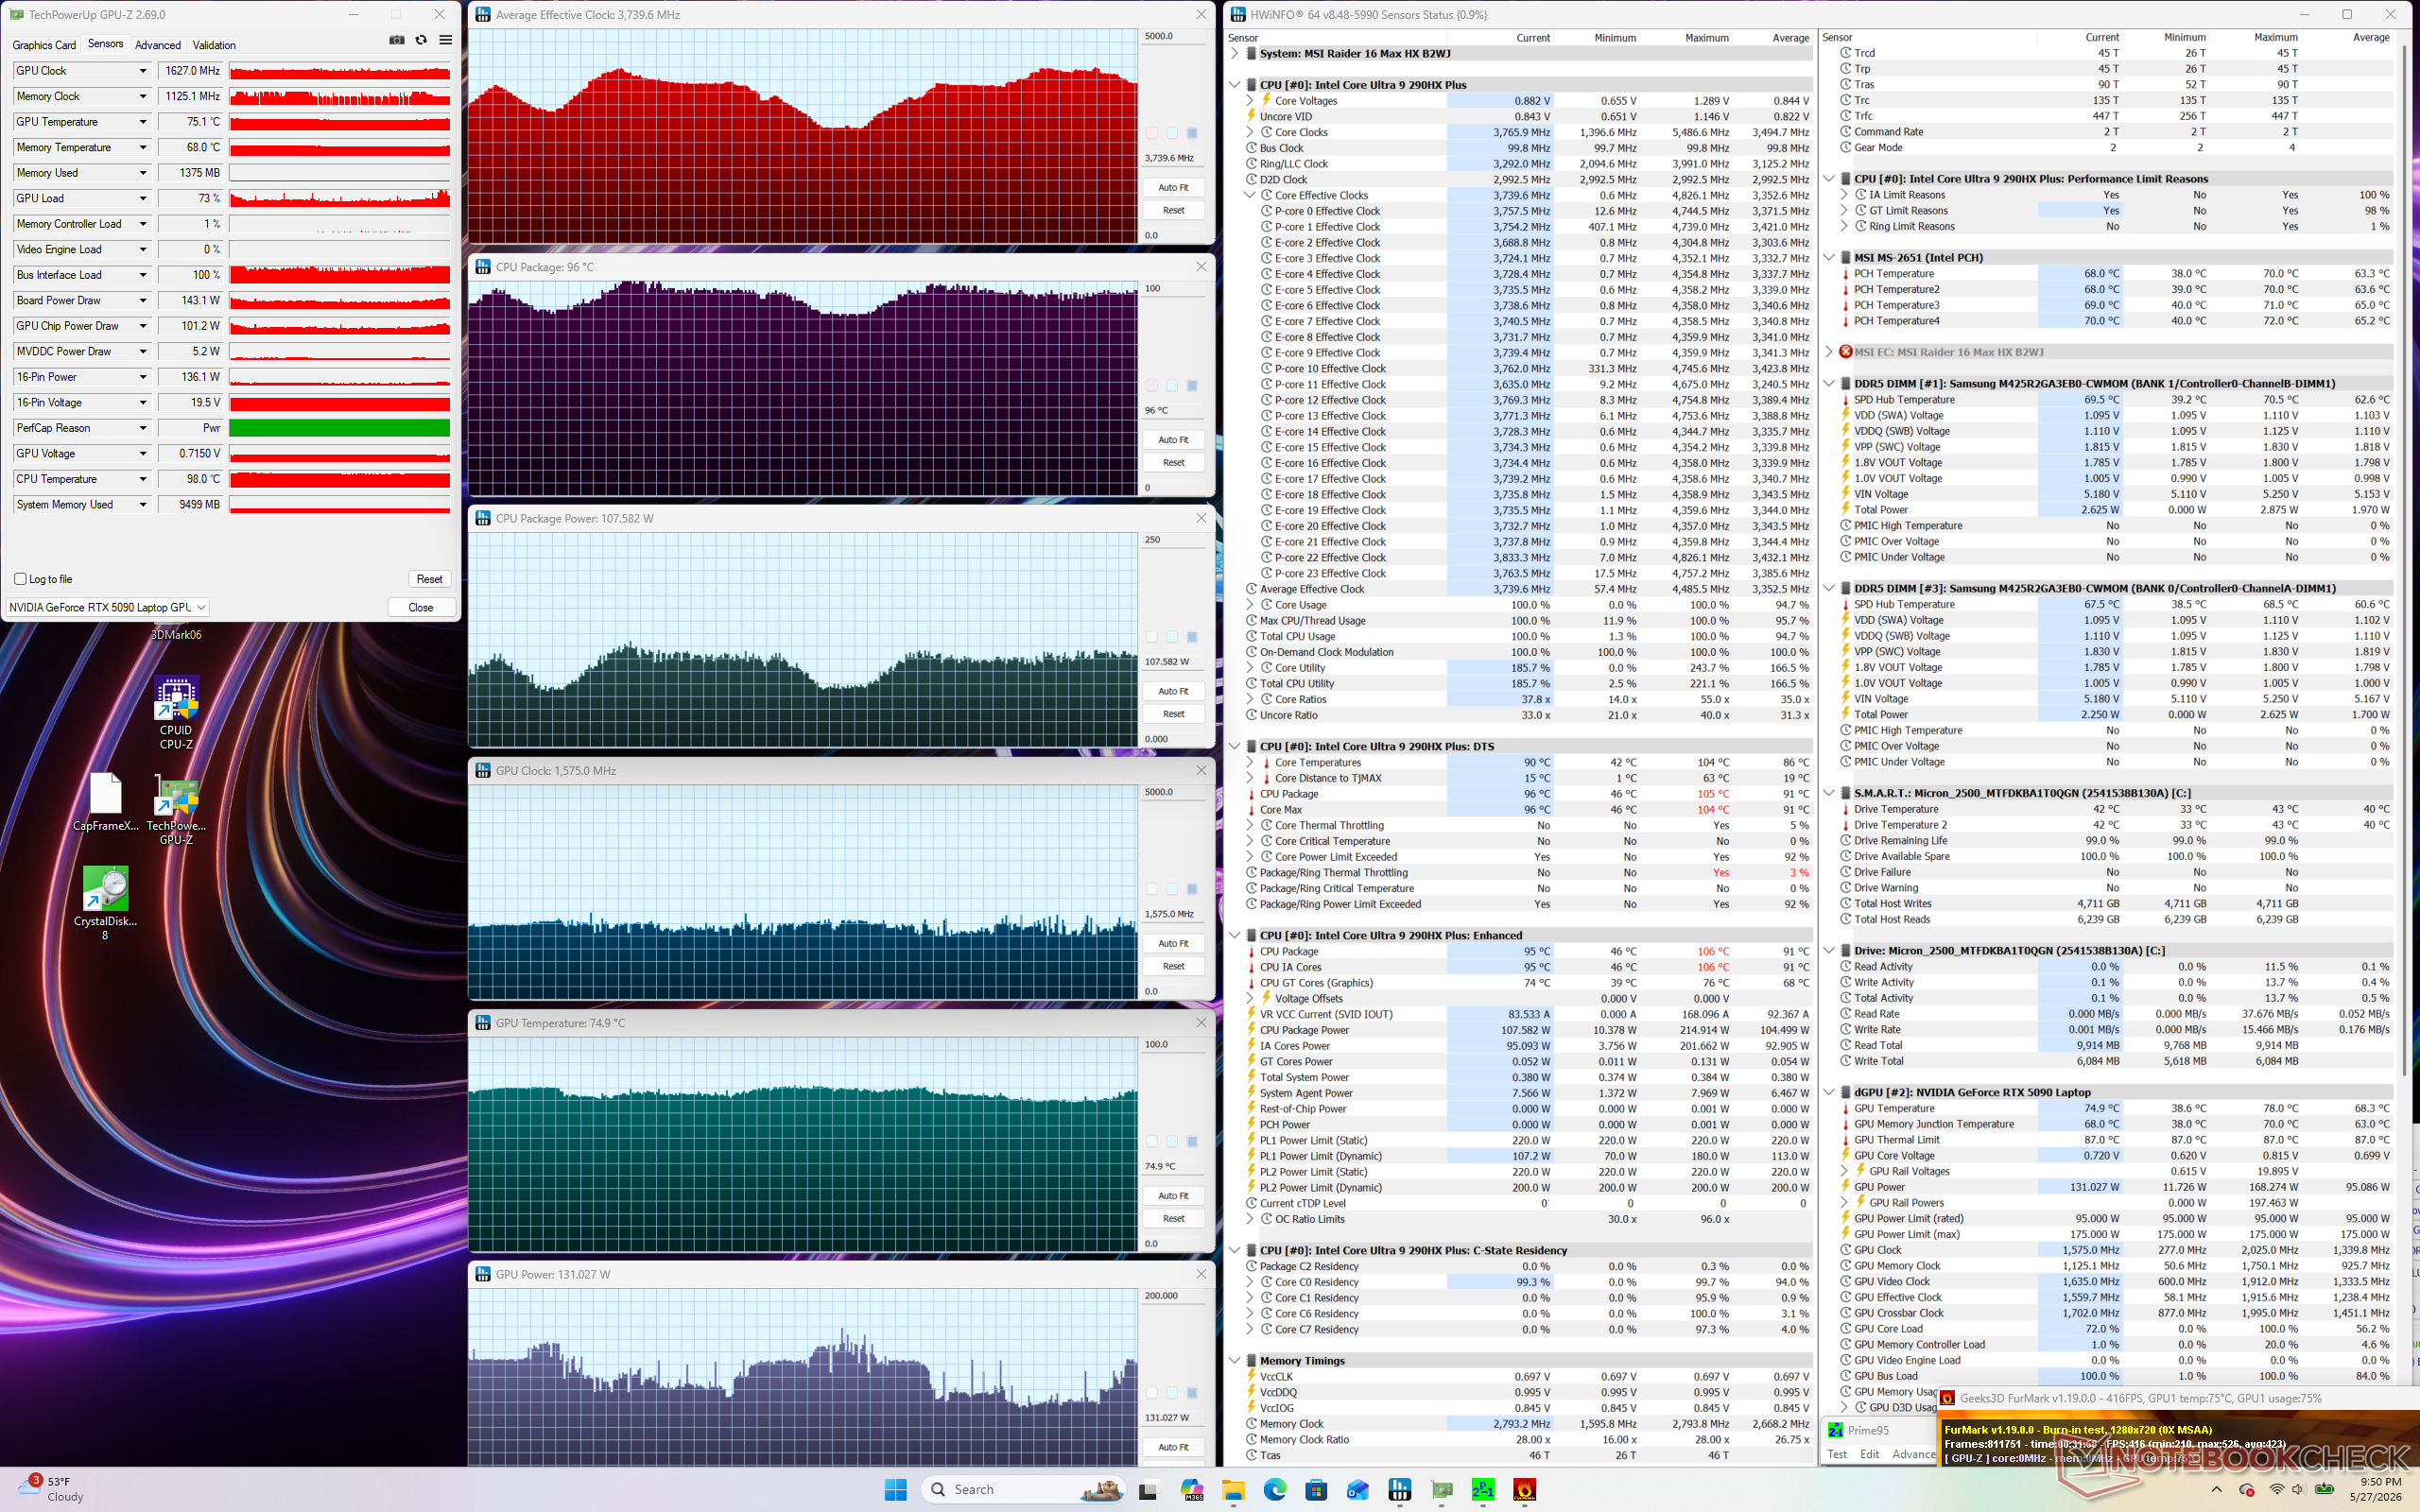
Si noti l'aumento costante delle velocità medie di clock della GPU quando si passa a profili di alimentazione più veloci, come mostrano gli screenshot e la tabella qui sotto.
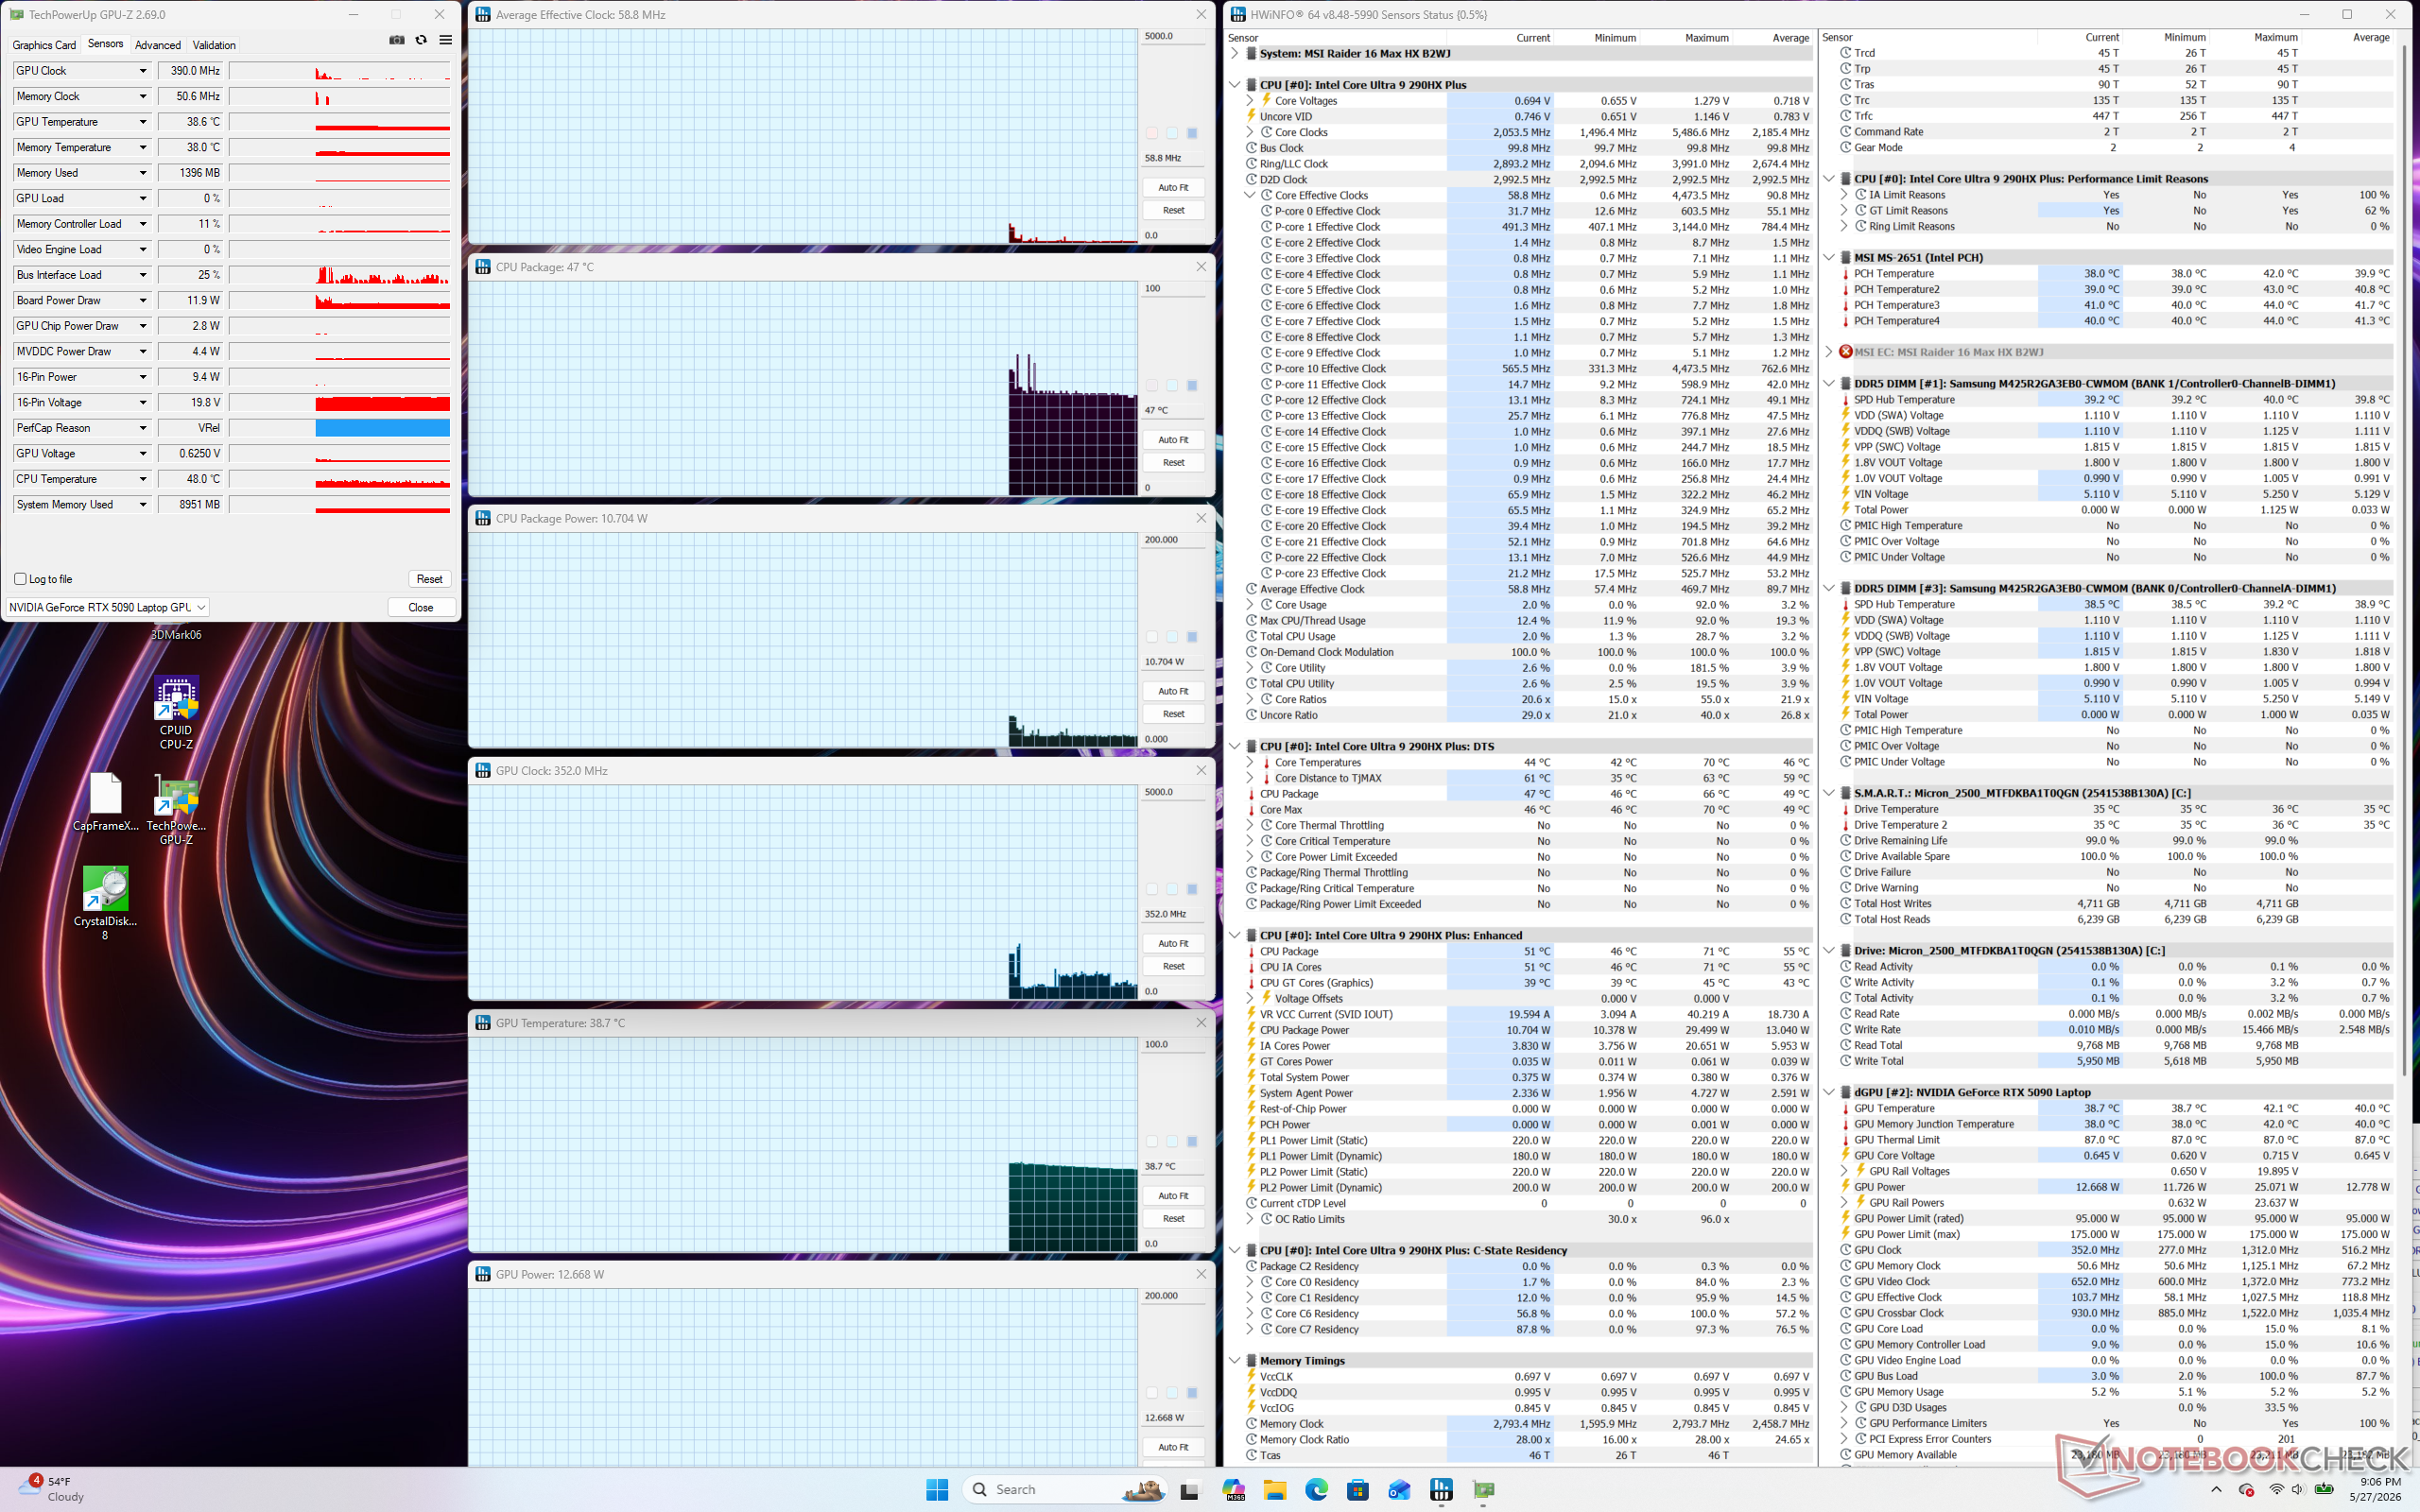
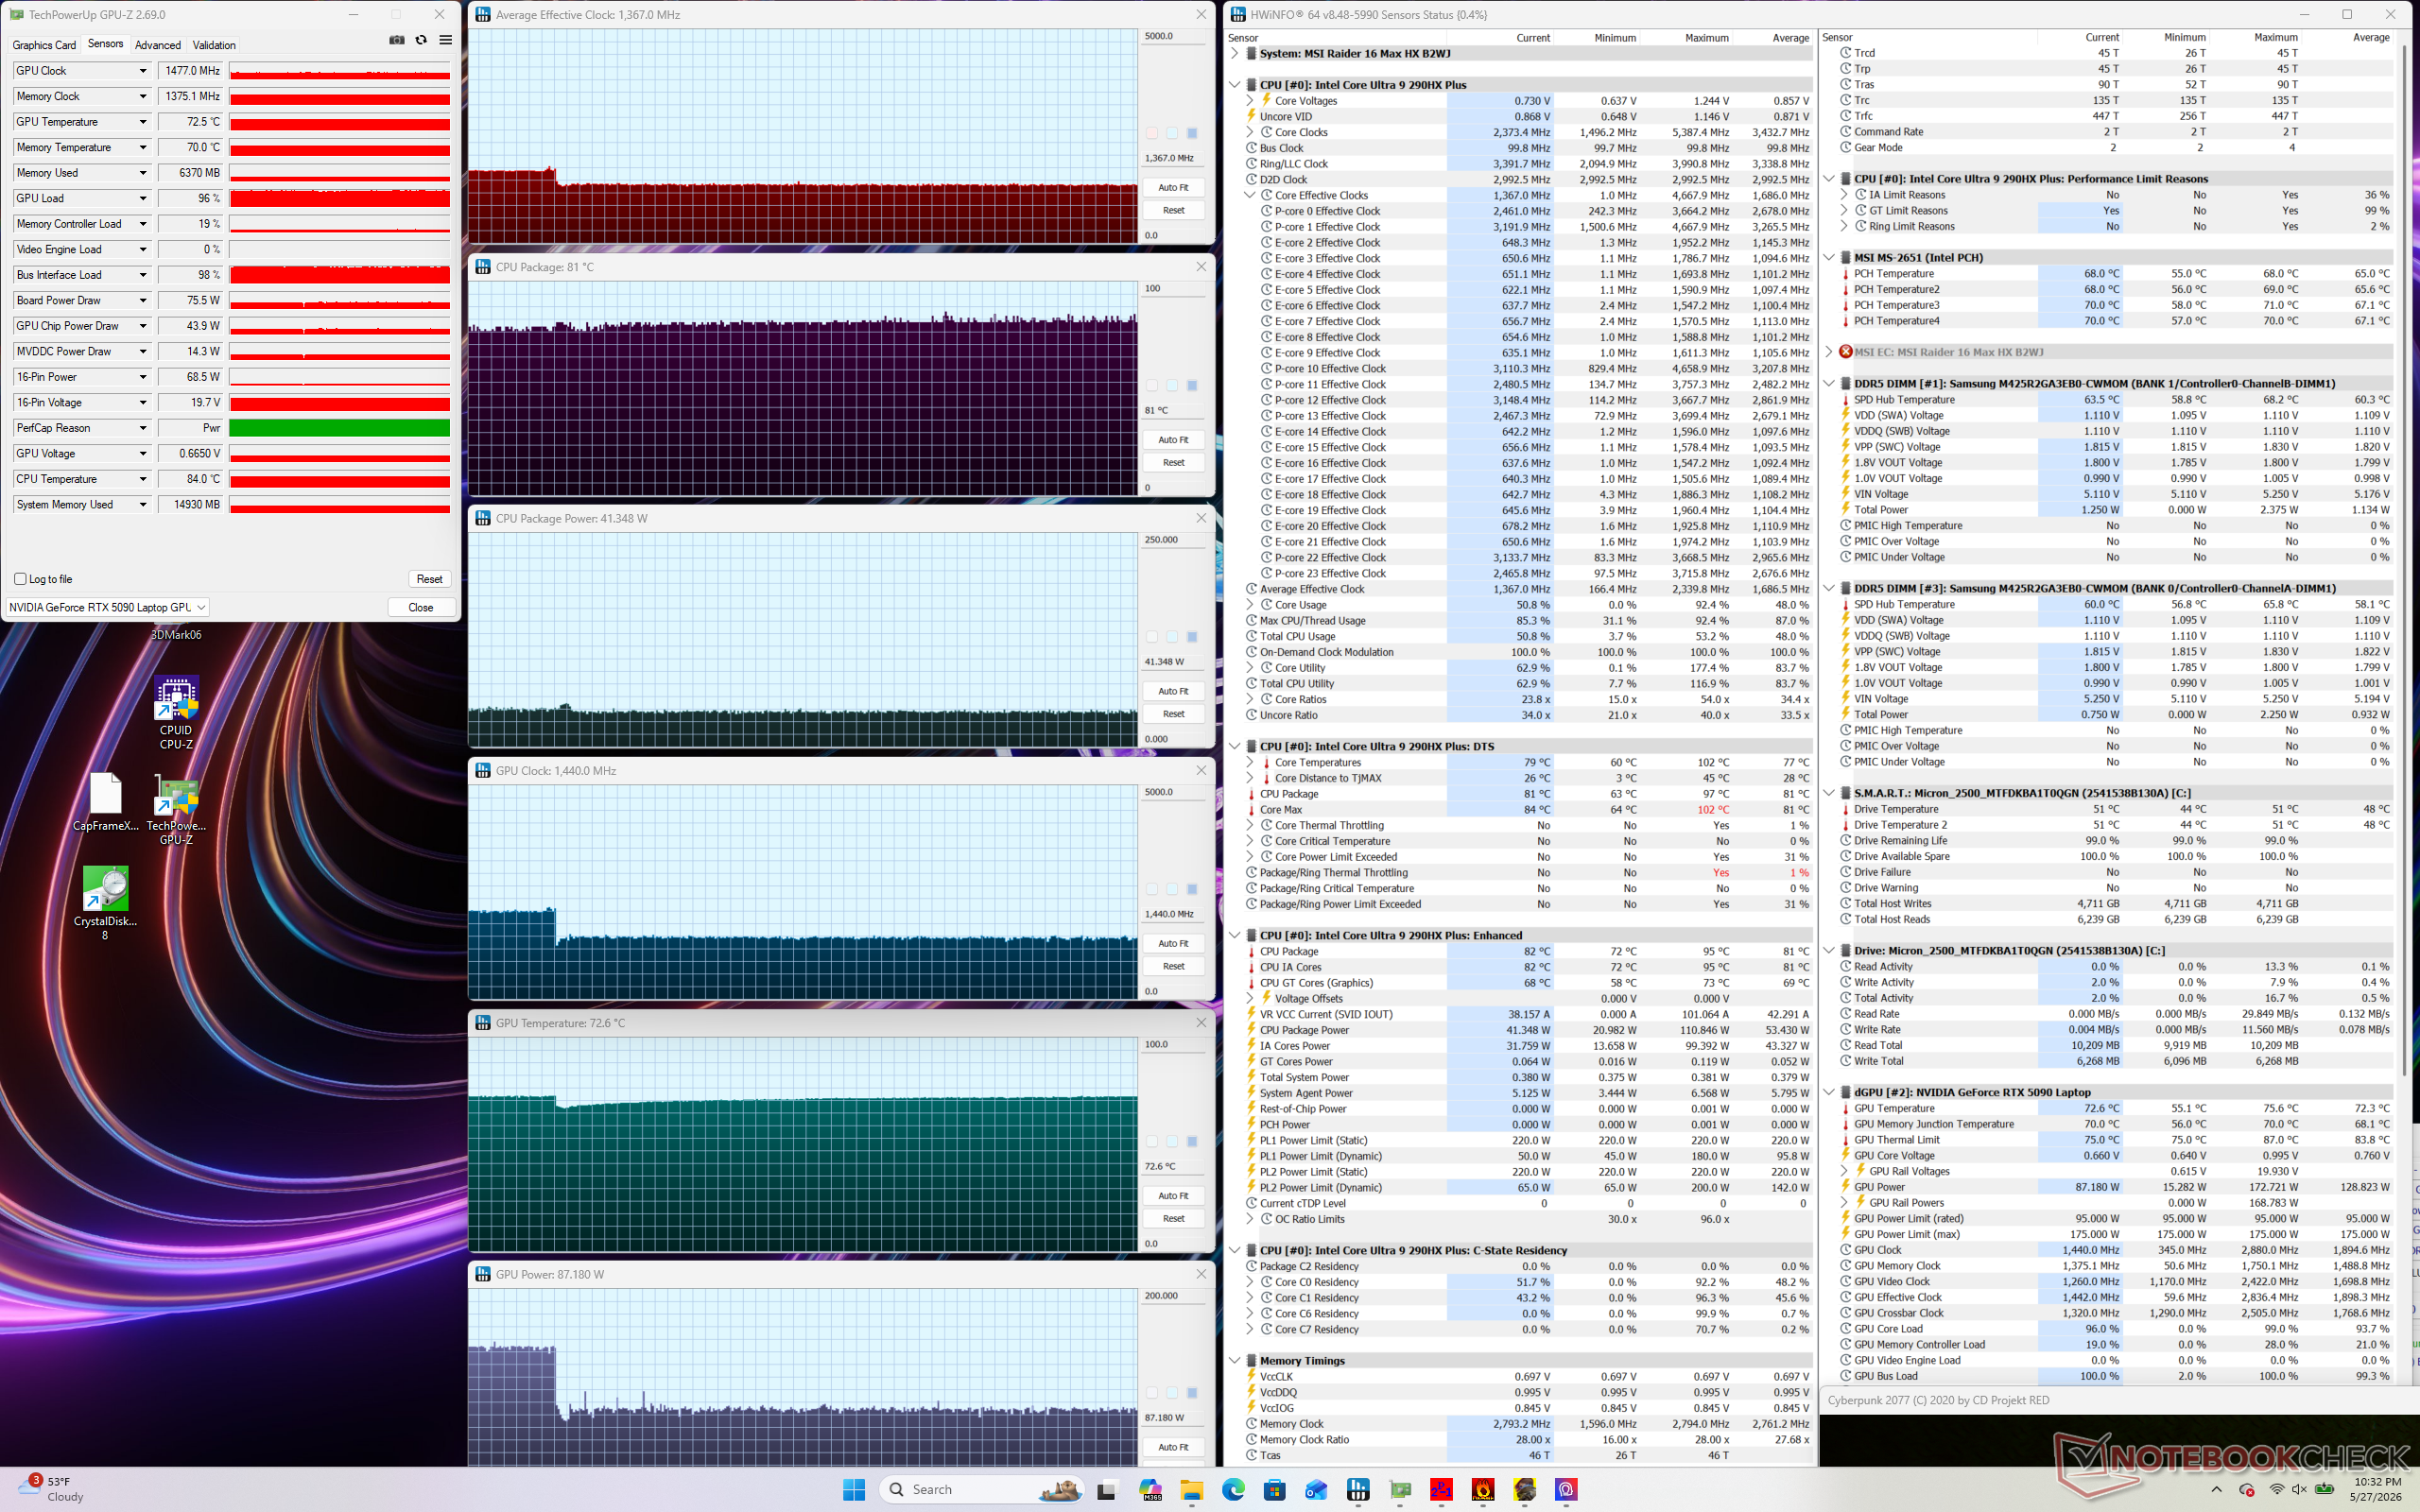
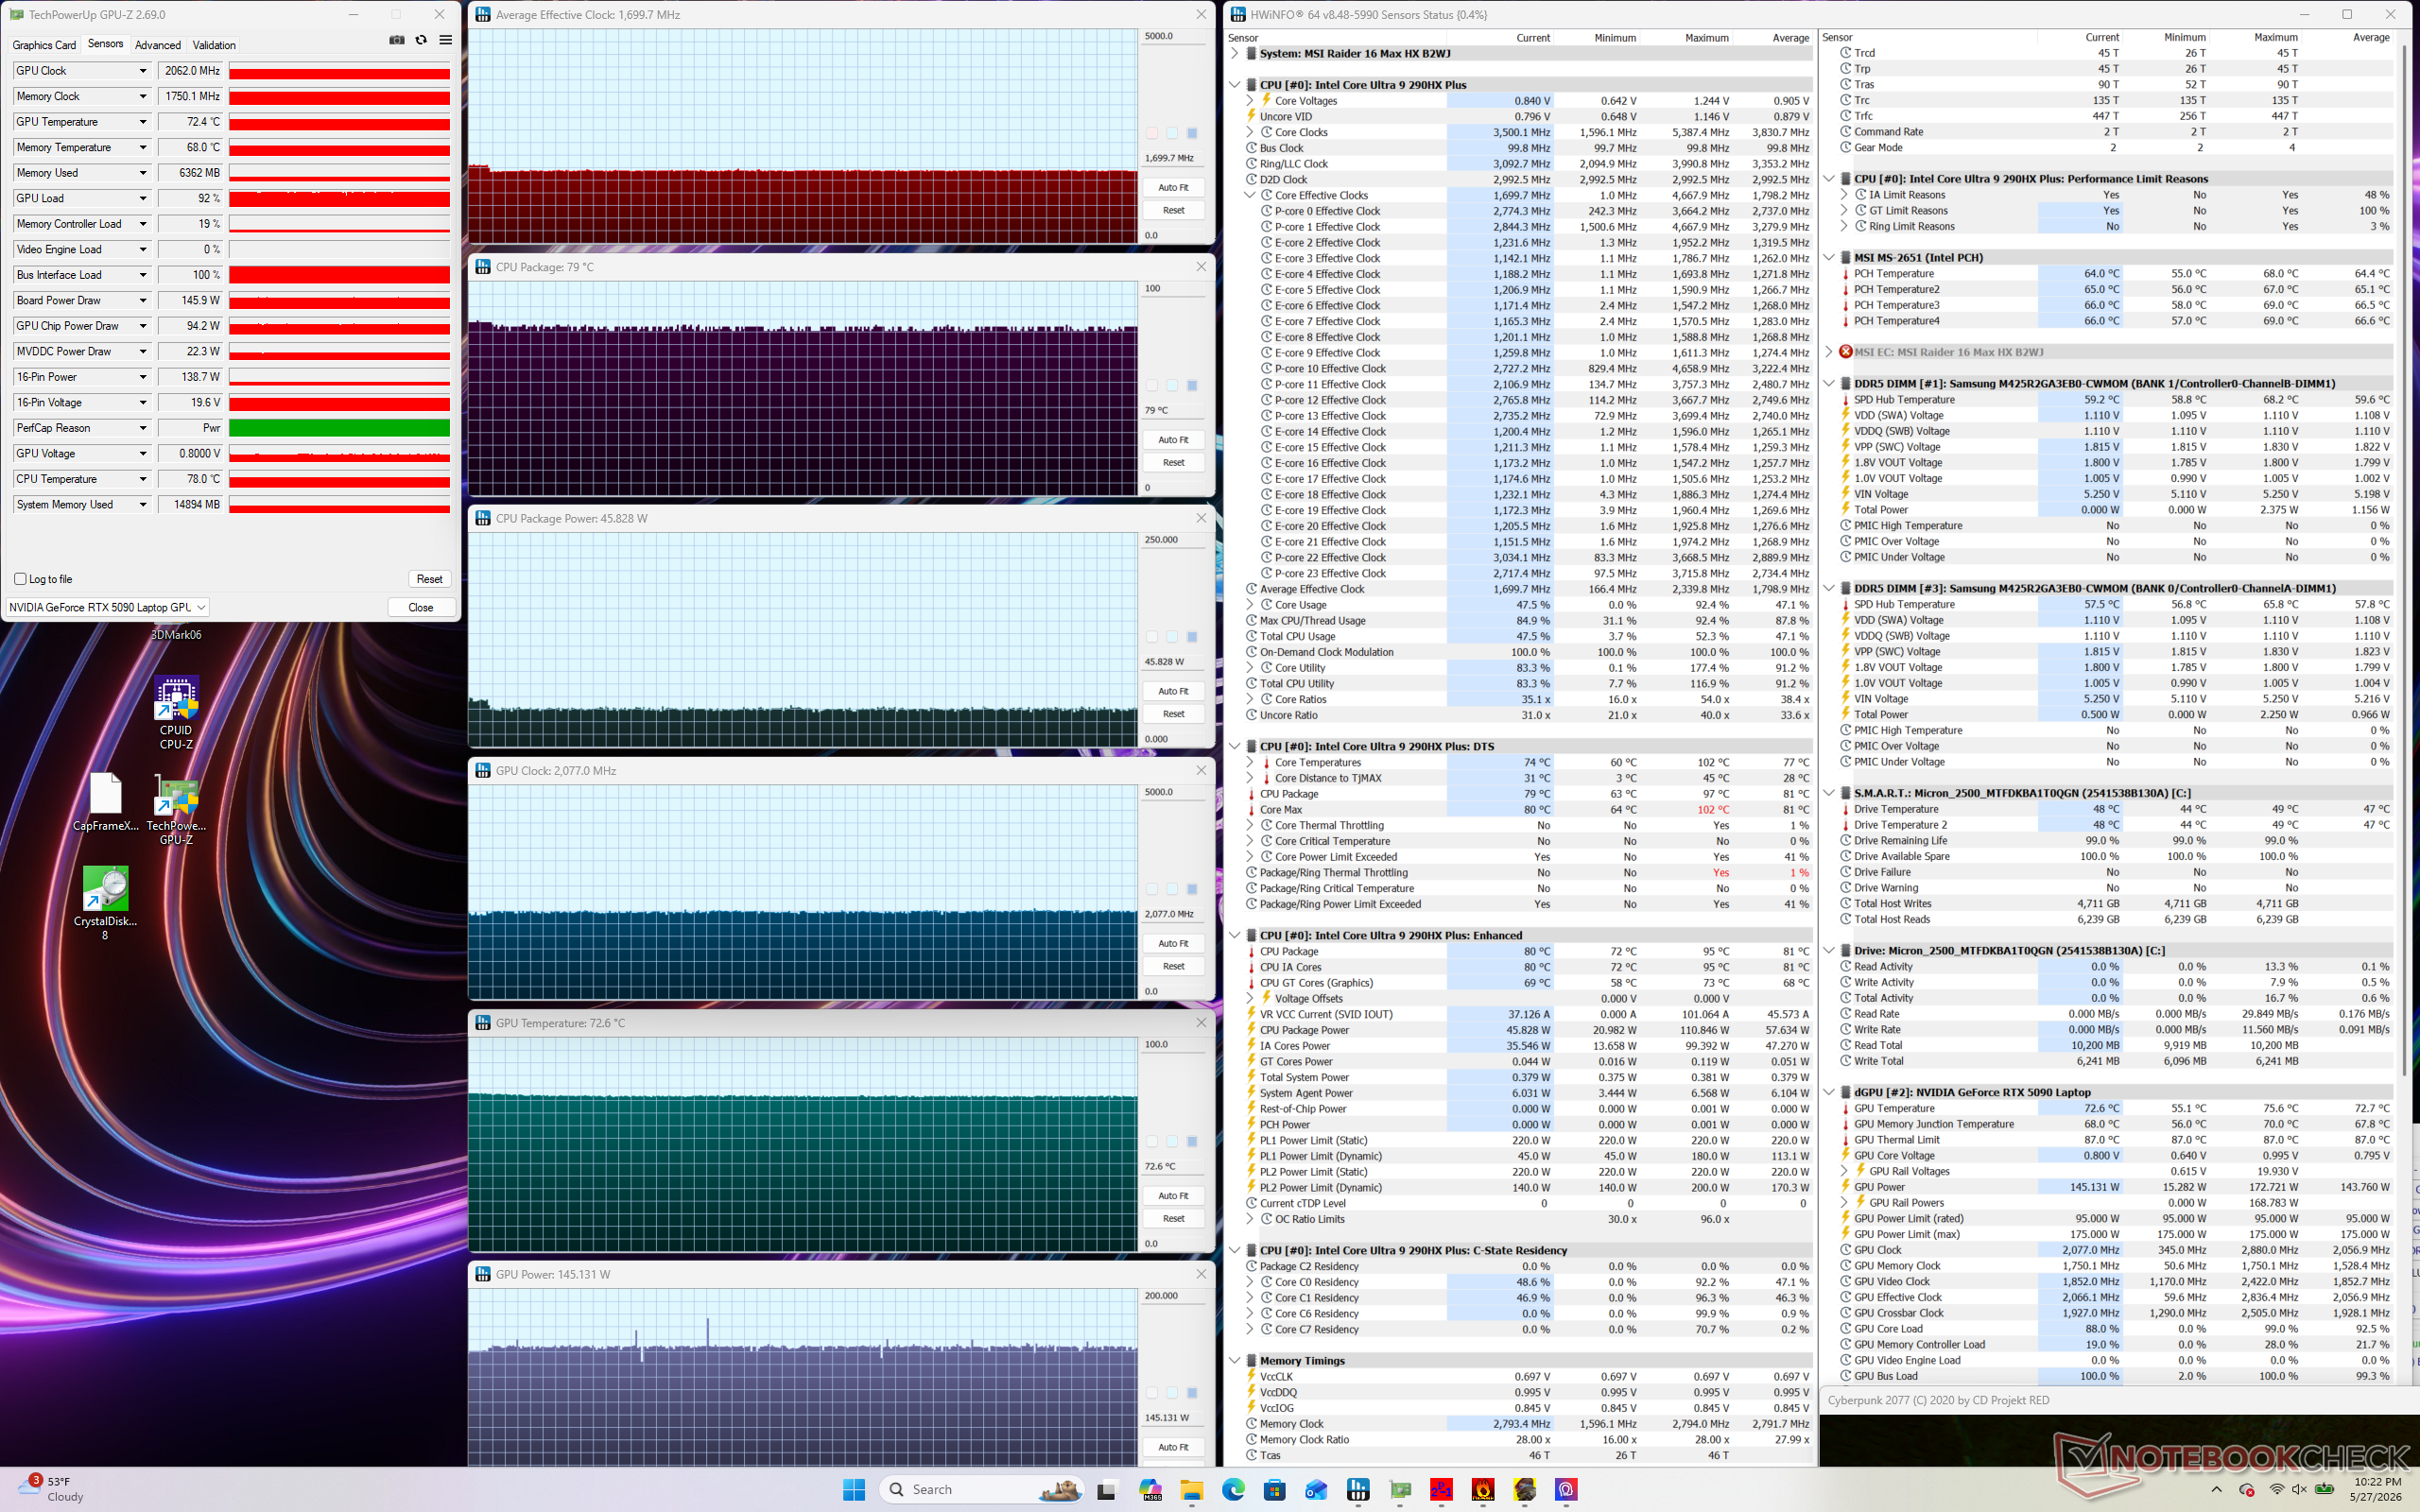
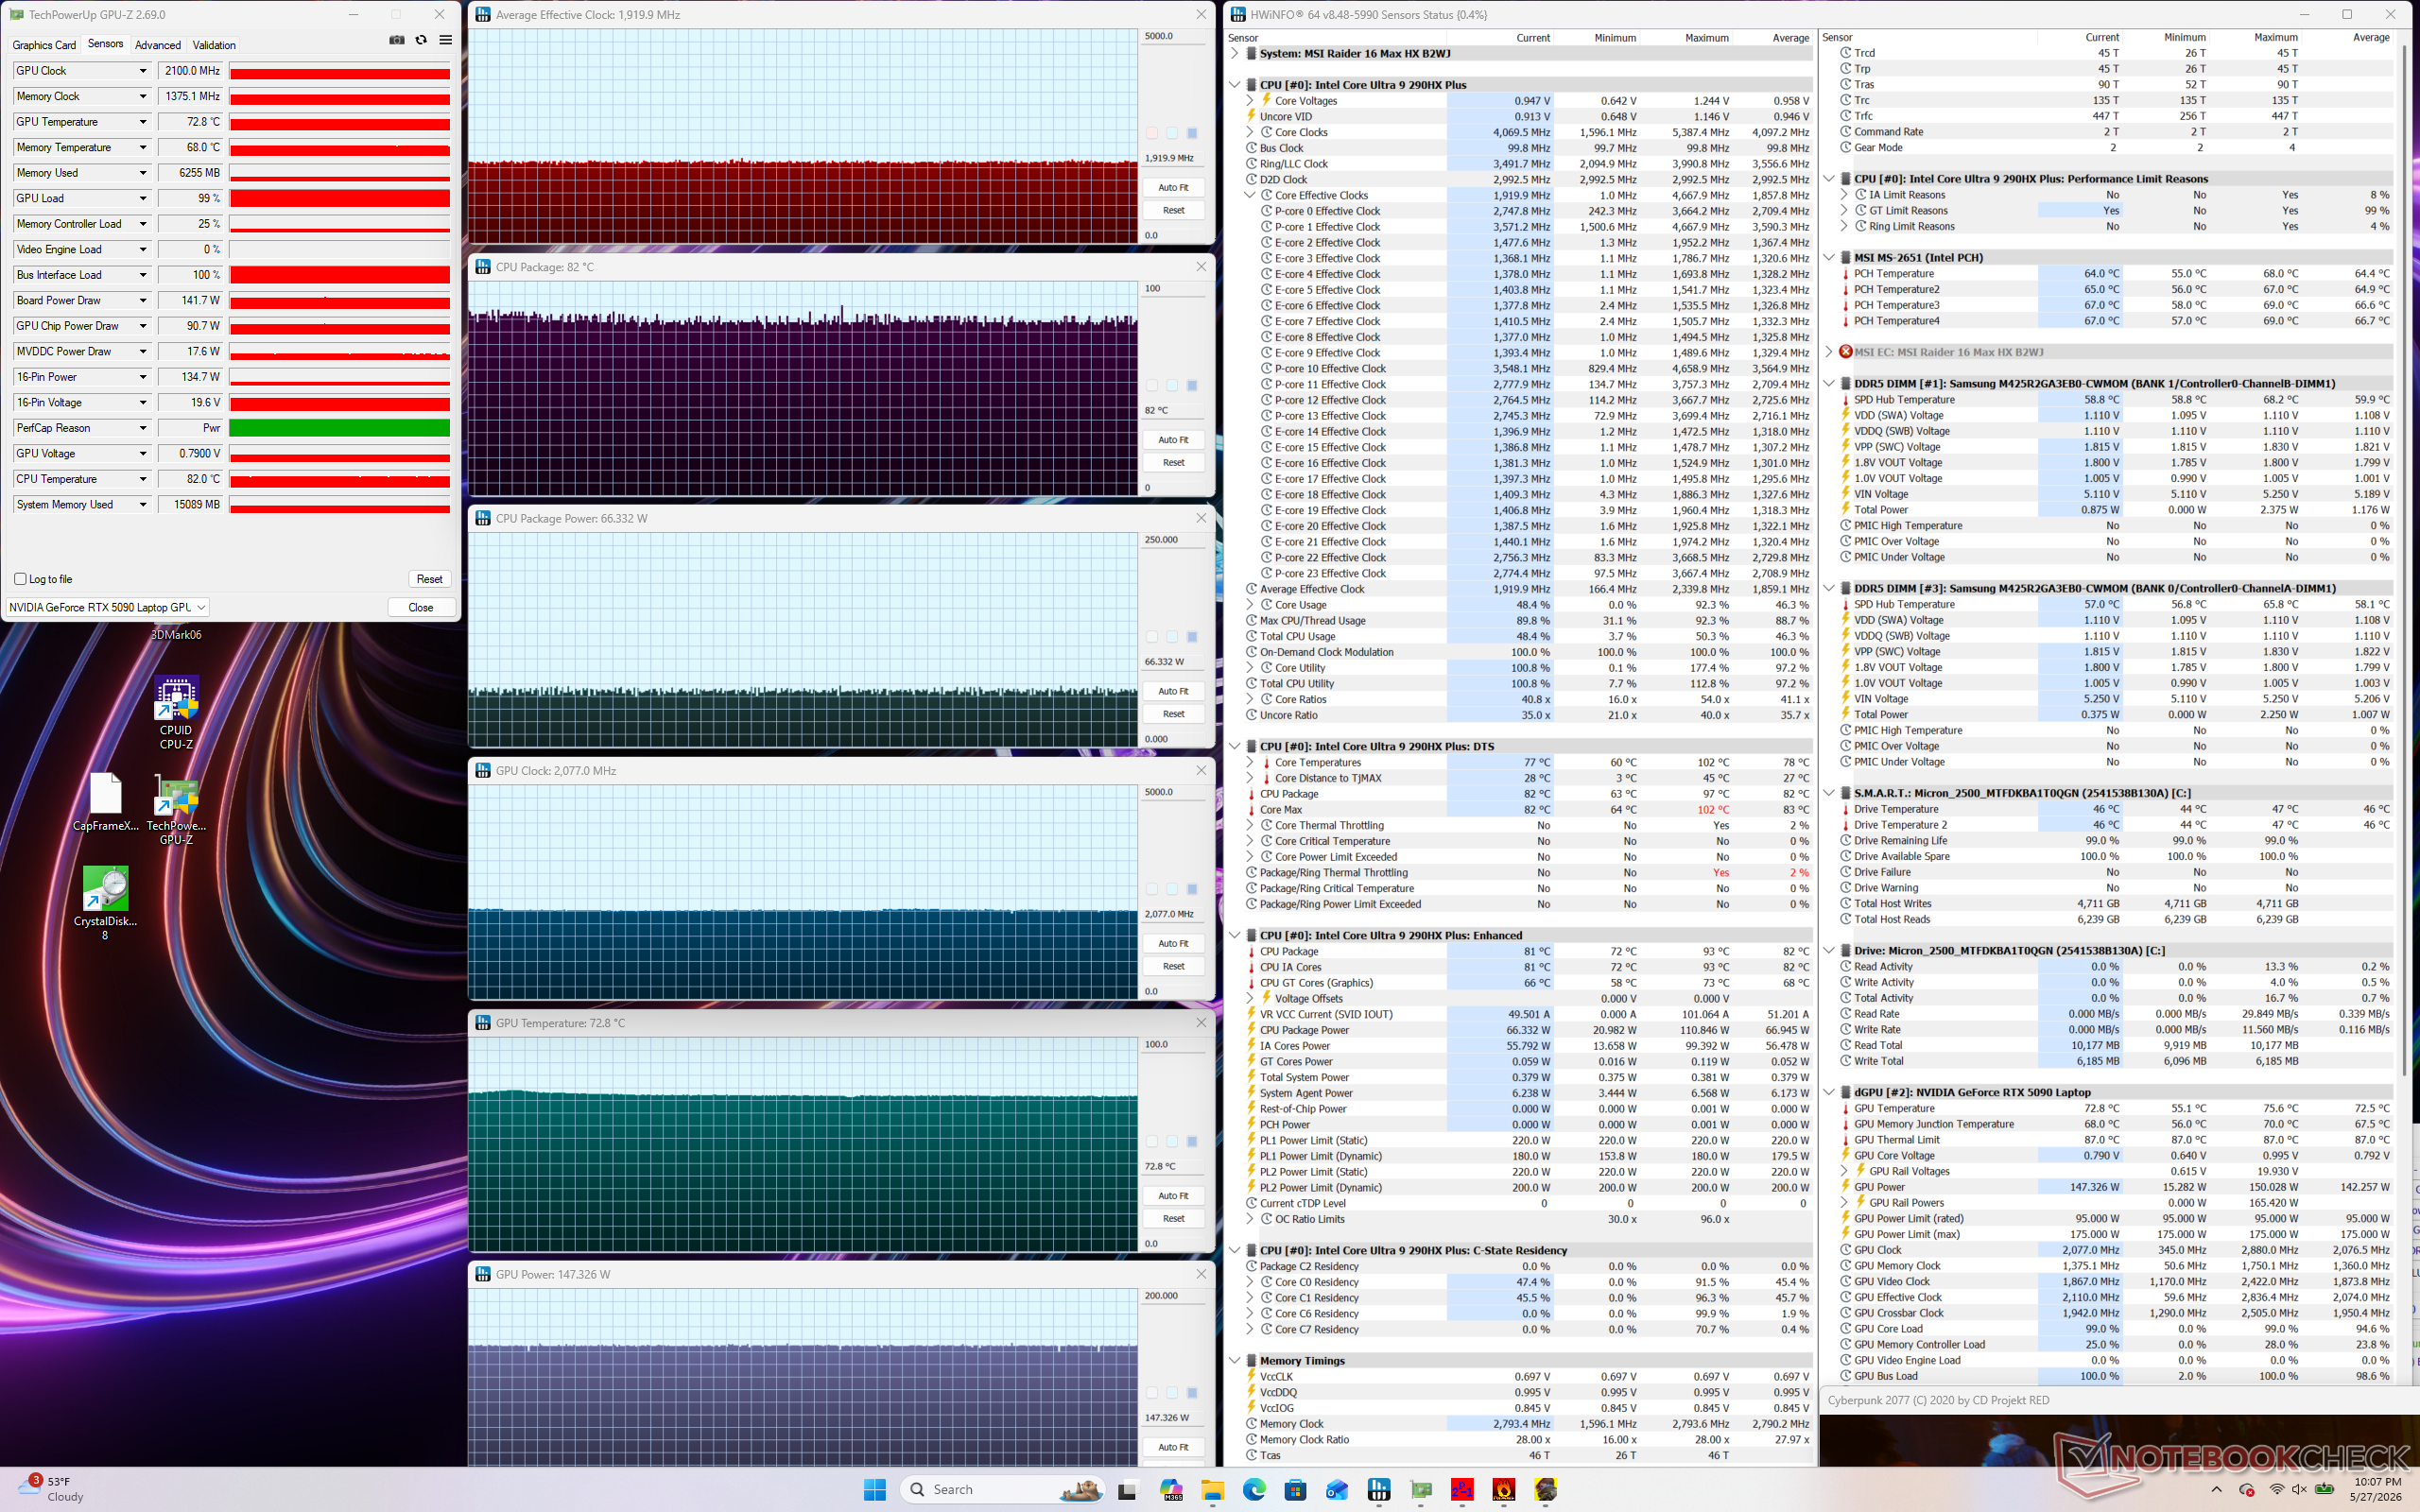

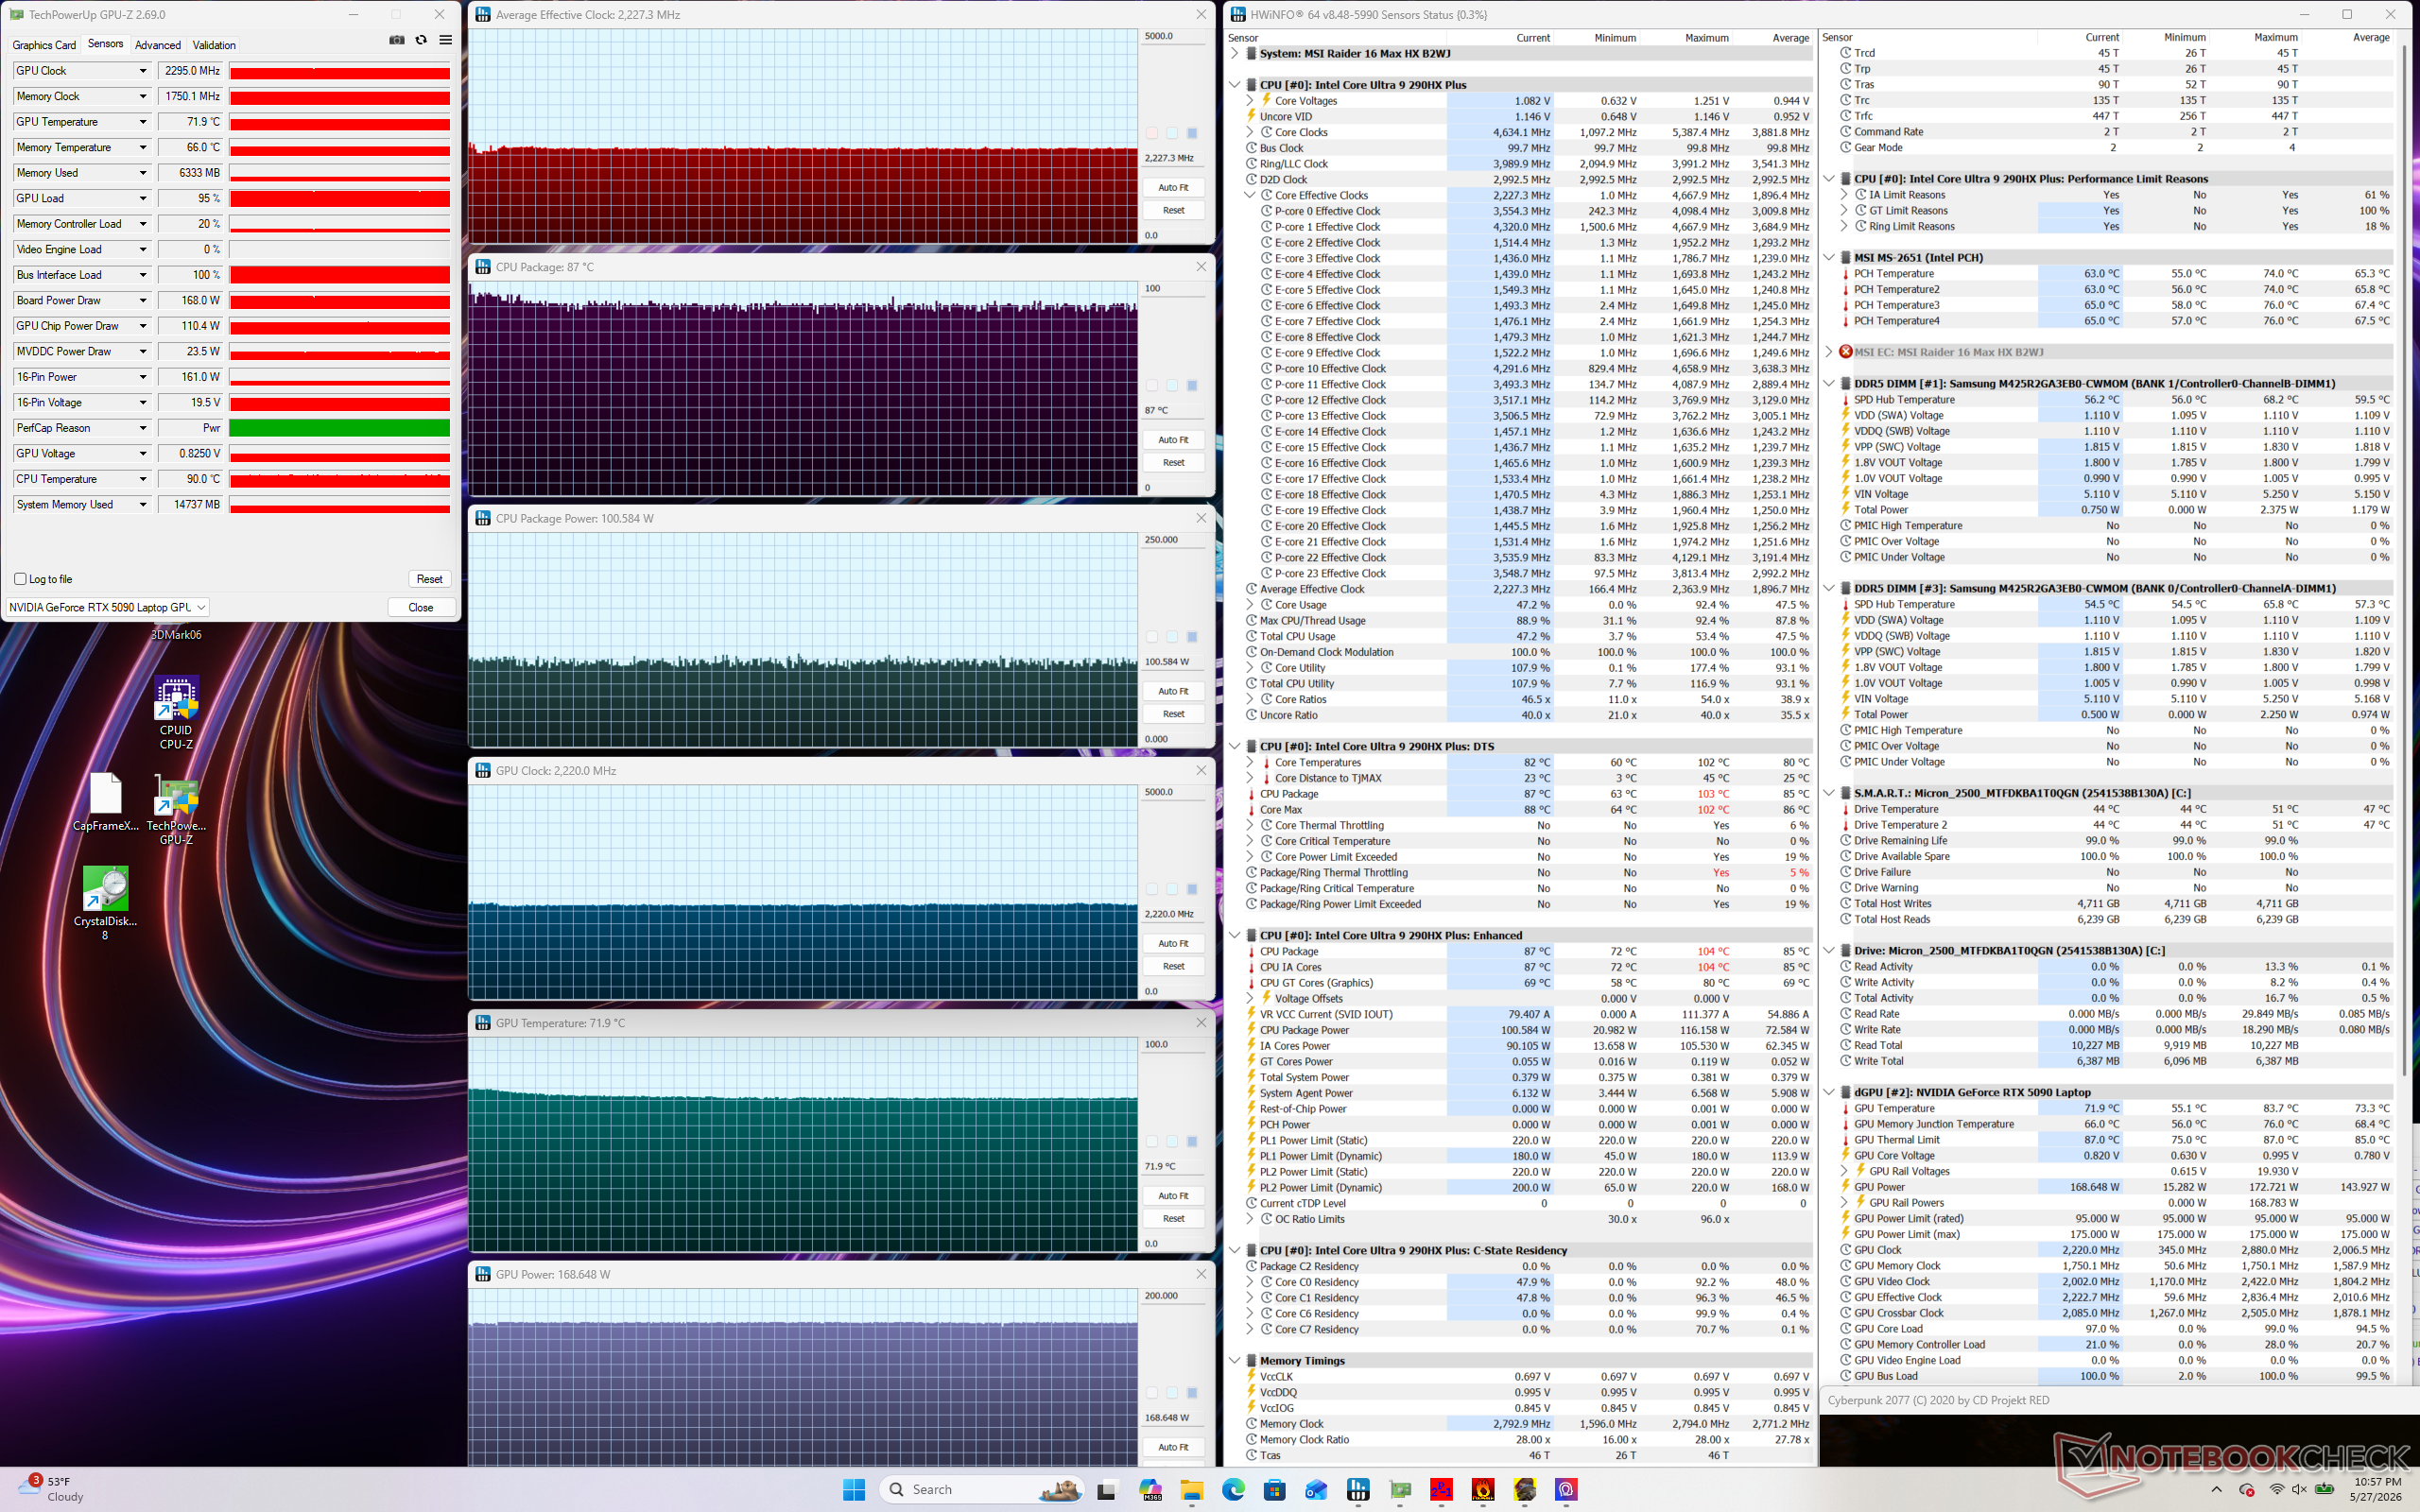
| Clock medio della CPU (GHz) | Clock della GPU (MHz) | Temperatura media della CPU (°C) | Temperatura media della GPU (°C) | |
| Sistema inattivo | -- | -- | 47 | 39 |
| Stress Prime95 | 3,9 | -- | 96 | 56 |
| Prime95 + FurMark Stress | 2,7 - 3,9 | ~1600 | 96 | 75 |
| Cyberpunk 2077 Stress (Modalità Tranquilla) | 1,4 | 1440 | 81 | 73 |
| Cyberpunk 2077 Stress (Modalità Bilanciata) | 1,7 | 2062 | 79 | 73 |
| Cyberpunk 2077 Stress (Modalità Prestazioni Estreme) | 1,9 | 2100 | 82 | 73 |
| Cyberpunk 2077 Stress (Modalità Apex) | 2,3 | 2175 | 96 | 76 |
| Cyberpunk 2077 Stress (Modalità Cooler Boost) | 2,2 | 2295 | 87 | 72 |
Altoparlanti
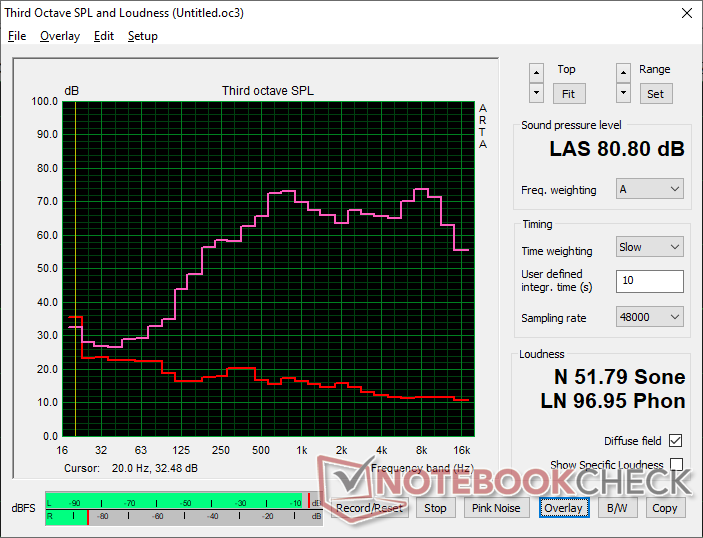
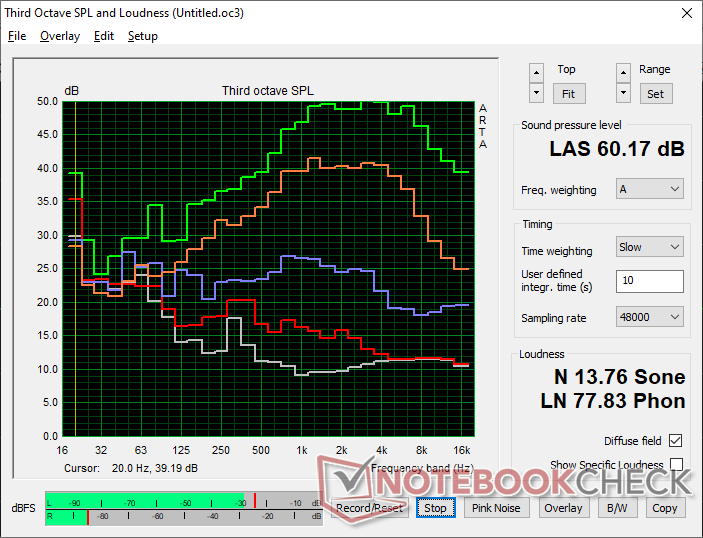
MSI Raider 16 Max HX B2WJ analisi audio
(±) | potenza degli altiparlanti media ma buona (80.8 dB)
Bassi 100 - 315 Hz
(-) | quasi nessun basso - in media 15.7% inferiori alla media
(±) | la linearità dei bassi è media (8.6% delta rispetto alla precedente frequenza)
Medi 400 - 2000 Hz
(+) | medi bilanciati - solo only 3.2% rispetto alla media
(+) | medi lineari (6.1% delta rispetto alla precedente frequenza)
Alti 2 - 16 kHz
(+) | Alti bilanciati - appena 2.9% dalla media
(+) | alti lineari (4.9% delta rispetto alla precedente frequenza)
Nel complesso 100 - 16.000 Hz
(+) | suono nel complesso lineare (14.5% differenza dalla media)
Rispetto alla stessa classe
» 27% di tutti i dispositivi testati in questa classe è stato migliore, 7% simile, 66% peggiore
» Il migliore ha avuto un delta di 6%, medio di 18%, peggiore di 132%
Rispetto a tutti i dispositivi testati
» 18% di tutti i dispositivi testati in questa classe è stato migliore, 4% similare, 78% peggiore
» Il migliore ha avuto un delta di 4%, medio di 24%, peggiore di 134%
Apple MacBook Pro 16 2021 M1 Pro analisi audio
(+) | gli altoparlanti sono relativamente potenti (84.7 dB)
Bassi 100 - 315 Hz
(+) | bassi buoni - solo 3.8% dalla media
(+) | bassi in lineaa (5.2% delta rispetto alla precedente frequenza)
Medi 400 - 2000 Hz
(+) | medi bilanciati - solo only 1.3% rispetto alla media
(+) | medi lineari (2.1% delta rispetto alla precedente frequenza)
Alti 2 - 16 kHz
(+) | Alti bilanciati - appena 1.9% dalla media
(+) | alti lineari (2.7% delta rispetto alla precedente frequenza)
Nel complesso 100 - 16.000 Hz
(+) | suono nel complesso lineare (4.6% differenza dalla media)
Rispetto alla stessa classe
» 0% di tutti i dispositivi testati in questa classe è stato migliore, 0% simile, 100% peggiore
» Il migliore ha avuto un delta di 5%, medio di 17%, peggiore di 45%
Rispetto a tutti i dispositivi testati
» 0% di tutti i dispositivi testati in questa classe è stato migliore, 0% similare, 100% peggiore
» Il migliore ha avuto un delta di 4%, medio di 24%, peggiore di 134%
Gestione dell'energia
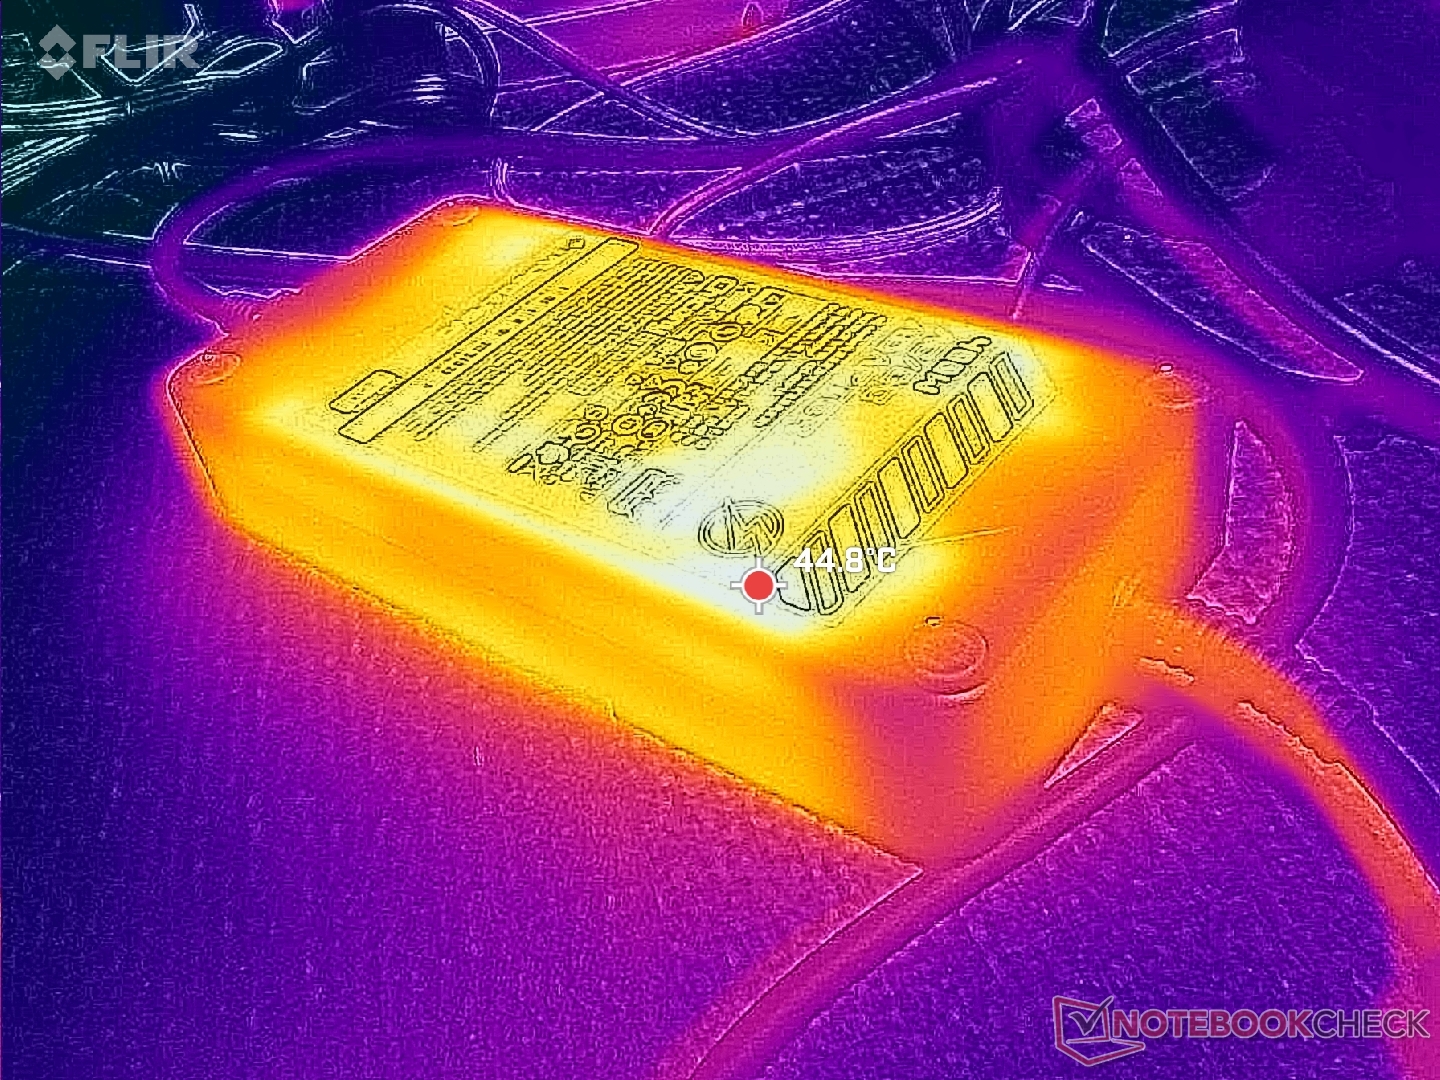
Consumo di energia
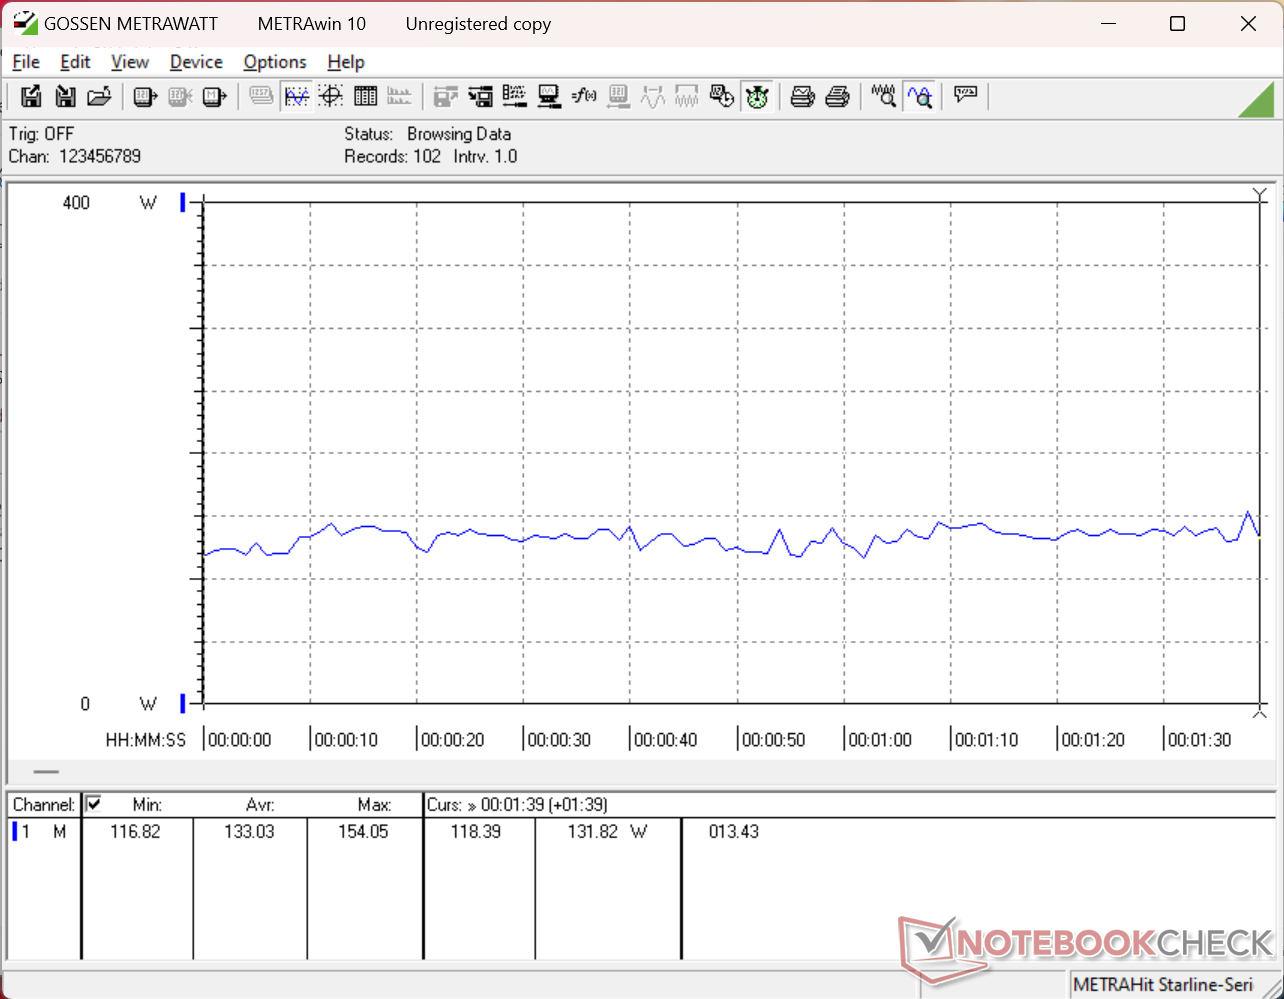
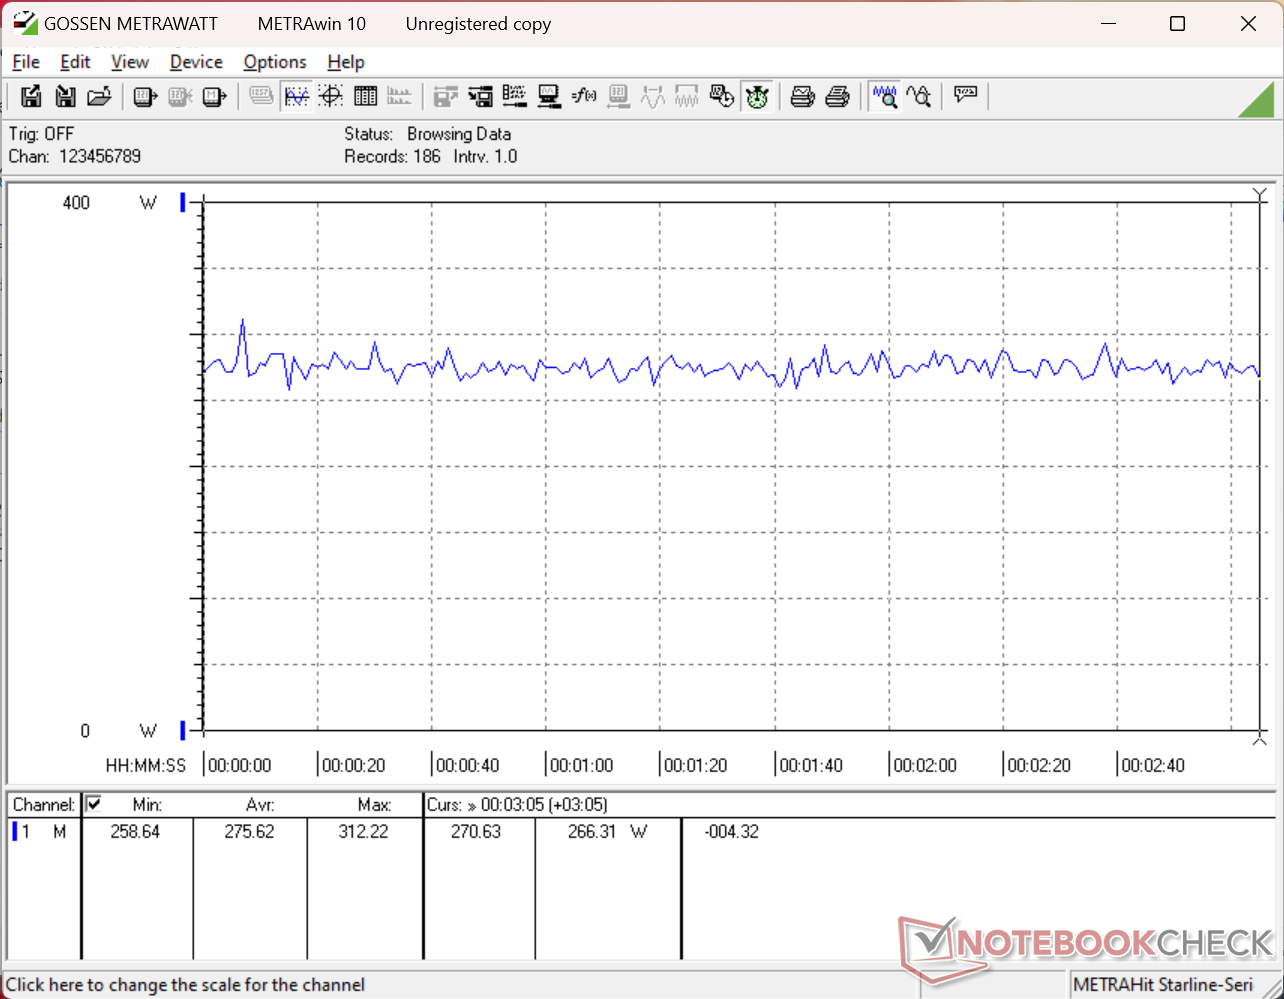
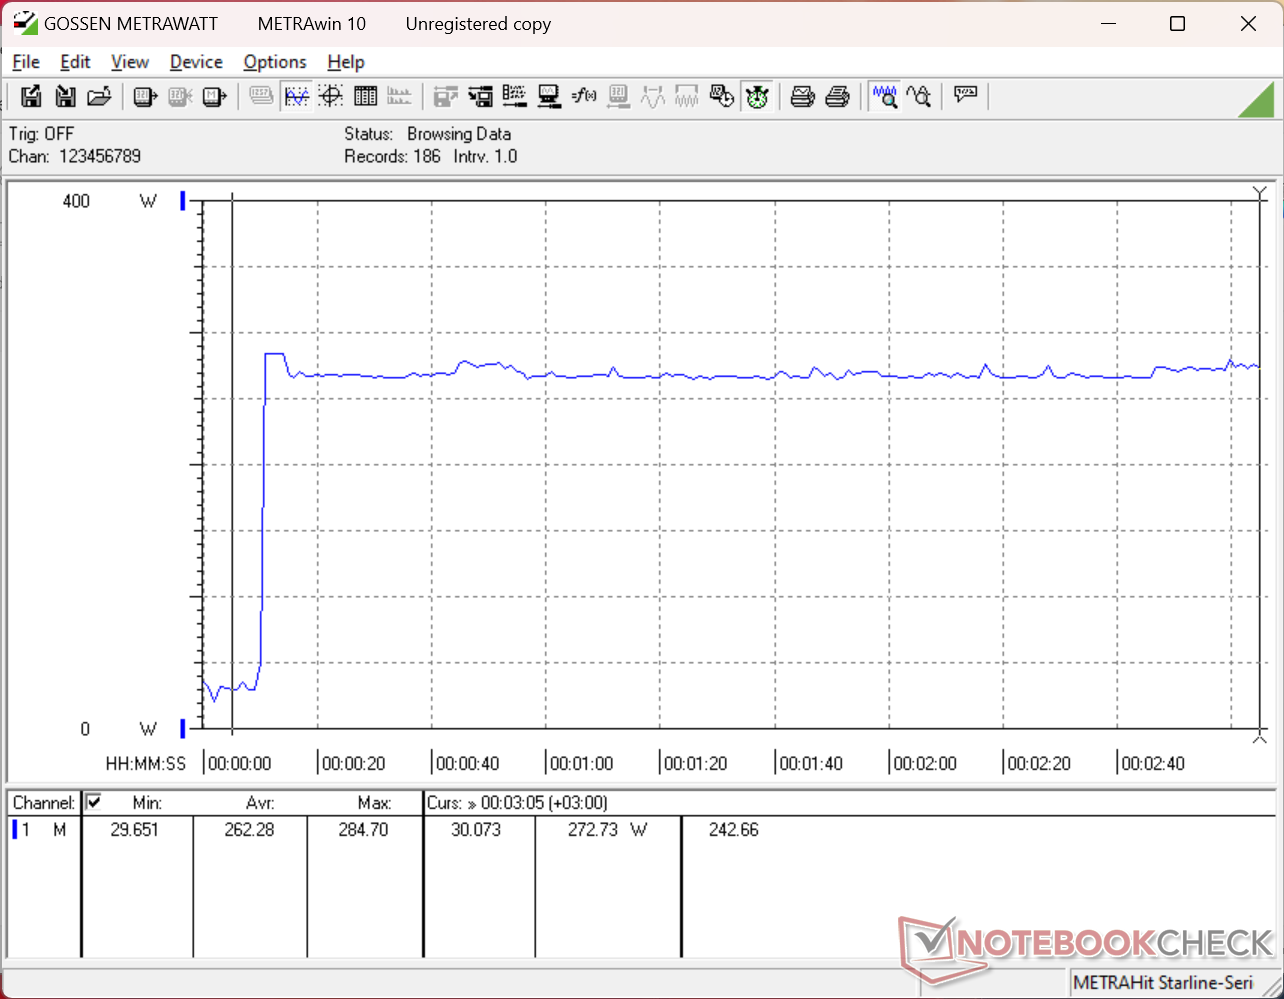
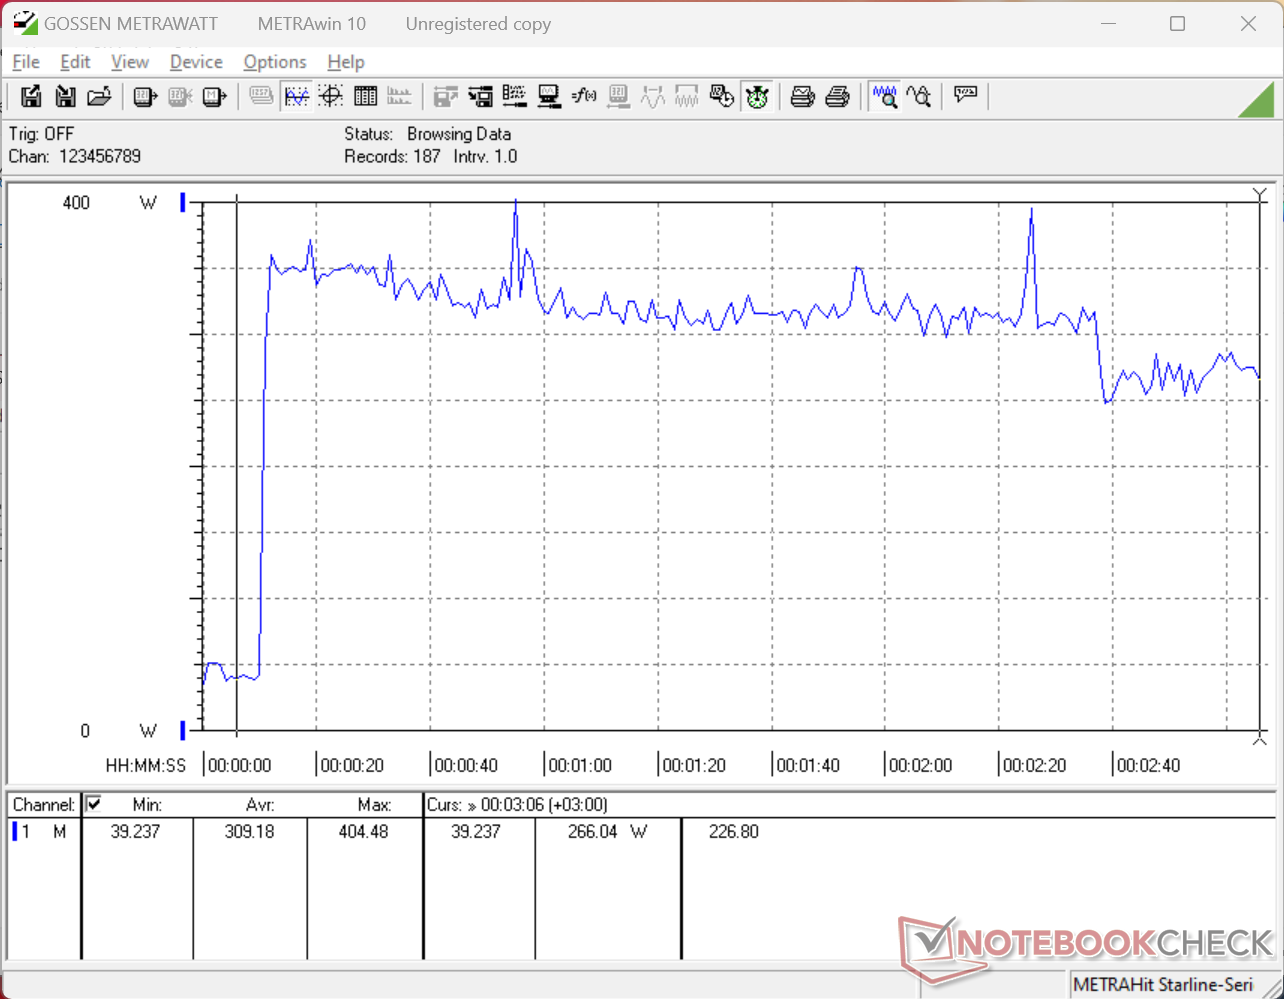
Il consumo energetico è prevedibilmente molto elevato, considerando l'hardware coinvolto. L'esecuzione di Cyberpunk 2077 in modalità Prestazioni estreme richiede circa il 28 percento in più rispetto al Razer Blade 16 anche se quest'ultimo è dotato della stessa GPU RTX 5090. La grande discrepanza può essere attribuita alla CPU Arrow Lake-HX rispetto alla serie Panther Lake-H, più lenta ma molto più efficiente.
Siamo in grado di registrare un assorbimento massimo temporaneo di 405 W quando si utilizza un adattatore CA da 400 W di grandi dimensioni (~18,8 x 8,8 x 3,4 cm).
| Off / Standby | |
| Idle | |
| Sotto carico |
|
Leggenda:
min: | |
| MSI Raider 16 Max HX B2WJ Ultra 9 290HX Plus, GeForce RTX 5090 Laptop, Micron 2500 1TB MTFDKBA1T0QGN, OLED, 2560x1600, 16" | MSI Crosshair 16 HX AI D2XWGKG Ultra 9 275HX, GeForce RTX 5070 Laptop, Micron 2500 1TB MTFDKBA1T0QGN, IPS, 2560x1600, 16" | Razer Blade 16 Core Ultra 9 386H Ultra 9 386H, GeForce RTX 5090 Laptop, Lexar NM790 2TB, OLED, 2560x1600, 16" | Alienware 16X Aurora Core Ultra 9 290HX Plus Ultra 9 290HX Plus, GeForce RTX 5070 Ti Laptop, , OLED, 2560x1600, 16" | Asus TUF Gaming A16 FA608UP R7 260, GeForce RTX 5070 Laptop, Western Digital PC SN5000S SDEQNSJ-1T00, IPS, 2560x1600, 16" | Lenovo Legion 7 16IAX10 Ultra 7 255HX, GeForce RTX 5060 Laptop, WD PC SN7100S SDFPMSL-1T00-1101, OLED, 2560x1600, 16" | |
|---|---|---|---|---|---|---|
| Power Consumption | -53% | 8% | 19% | 38% | 13% | |
| Idle Minimum * (Watt) | 7.2 | 26.2 -264% | 4.4 39% | 6.9 4% | 4.6 36% | 9.4 -31% |
| Idle Average * (Watt) | 12 | 33.8 -182% | 22.3 -86% | 8.1 32% | 9.8 18% | 10.6 12% |
| Idle Maximum * (Watt) | 32.8 | 34 -4% | 30.4 7% | 31 5% | 10.2 69% | 36.4 -11% |
| Load Average * (Watt) | 133 | 112 16% | 110.7 17% | 131.6 1% | 76.1 43% | 107.7 19% |
| Cyberpunk 2077 ultra external monitor * (Watt) | 275 | 220 20% | 216 21% | 172.1 37% | 198.1 28% | 187.5 32% |
| Cyberpunk 2077 ultra * (Watt) | 276 | 224 19% | 216 22% | 198.3 28% | 198.9 28% | 188 32% |
| Load Maximum * (Watt) | 404.5 | 315 22% | 251.3 38% | 300.1 26% | 235.2 42% | 247 39% |
* ... Meglio usare valori piccoli
Consumo di energia Cyberpunk / Stress Test
Consumo di energia del monitor esterno
Durata della batteria
L'autonomia è discreta, ma più breve rispetto a molti modelli della generazione precedente, in parte a causa del passaggio da IPS a OLED.
| MSI Raider 16 Max HX B2WJ Ultra 9 290HX Plus, GeForce RTX 5090 Laptop, 91.8 Wh | MSI Crosshair 16 HX AI D2XWGKG Ultra 9 275HX, GeForce RTX 5070 Laptop, 90 Wh | Razer Blade 16 Core Ultra 9 386H Ultra 9 386H, GeForce RTX 5090 Laptop, 90 Wh | Alienware 16X Aurora Core Ultra 9 290HX Plus Ultra 9 290HX Plus, GeForce RTX 5070 Ti Laptop, 96 Wh | Asus TUF Gaming A16 FA608UP R7 260, GeForce RTX 5070 Laptop, 90 Wh | Lenovo Legion 7 16IAX10 Ultra 7 255HX, GeForce RTX 5060 Laptop, 84 Wh | |
|---|---|---|---|---|---|---|
| Autonomia della batteria | 41% | 48% | -6% | 65% | -41% | |
| WiFi v1.3 (h) | 7.9 | 11.1 41% | 11.7 48% | 7.4 -6% | 13 65% | 4.7 -41% |
| H.264 (h) | 14.2 |
Valutazione Notebookcheck
Il Raider 16 Max HX è più pesante e più grande di molti altri portatili da gioco da 16 pollici, ma di conseguenza è in grado di spremere più prestazioni dalla CPU e dalla GPU.
MSI Raider 16 Max HX B2WJ
- 06/09/2026 v8
Allen Ngo
 Total Sustainability Score:
 Potenziali concorrenti a confronto
Immagine | Modello | Prezzo | Peso | Altezza | Schermo |
|---|---|---|---|---|---|
1. 87.7%  | MSI Raider 16 Max HX B2WJ Intel Core Ultra 9 290HX Plus ⎘ NVIDIA GeForce RTX 5090 Laptop ⎘ 32 GB Memoria, 1024 GB SSD | Amazon: Prezzo di listino: 4200 USD | 2.7 kg | 28.9 mm | 16.00" 2560x1600 189 PPI OLED |
2. 81.9%  | MSI Crosshair 16 HX AI D2XWGKG Intel Core Ultra 9 275HX ⎘ NVIDIA GeForce RTX 5070 Laptop ⎘ 16 GB Memoria, 1024 GB SSD | Amazon: Prezzo di listino: 2500 EUR | 2.5 kg | 27.9 mm | 16.00" 2560x1600 189 PPI IPS |
3. 87.7%  | Razer Blade 16 Core Ultra 9 386H Intel Core Ultra 9 386H ⎘ NVIDIA GeForce RTX 5090 Laptop ⎘ 32 GB Memoria, 2048 GB SSD | Amazon: 1. $4,349.99 Razer Blade 16 (2025) Gaming... 2. $3,999.99 Razer Blade 16 Gaming Laptop... Prezzo di listino: 4900 USD | 2.1 kg | 17.4 mm | 16.00" 2560x1600 189 PPI OLED |
4. 85.9%  | Alienware 16X Aurora Core Ultra 9 290HX Plus Intel Core Ultra 9 290HX Plus ⎘ NVIDIA GeForce RTX 5070 Ti Laptop ⎘ 32 GB Memoria | Amazon: Prezzo di listino: 3000 USD | 2.6 kg | 23.4 mm | 16.00" 2560x1600 189 PPI OLED |
5. 83.8%  | Asus TUF Gaming A16 FA608UP AMD Ryzen 7 260 ⎘ NVIDIA GeForce RTX 5070 Laptop ⎘ 32 GB Memoria, 1024 GB SSD | Amazon: Prezzo di listino: 2199€ | 2.2 kg | 25.7 mm | 16.00" 2560x1600 189 PPI IPS |
6. 86.6%  | Lenovo Legion 7 16IAX10 Intel Core Ultra 7 255HX ⎘ NVIDIA GeForce RTX 5060 Laptop ⎘ 32 GB Memoria, 1024 GB SSD | Amazon: Prezzo di listino: 1650 USD | 2 kg | 17.9 mm | 16.00" 2560x1600 189 PPI OLED |
Transparency
La selezione dei dispositivi da recensire viene effettuata dalla nostra redazione. Il campione di prova è stato fornito all'autore come prestito dal produttore o dal rivenditore ai fini di questa recensione. L'istituto di credito non ha avuto alcuna influenza su questa recensione, né il produttore ne ha ricevuto una copia prima della pubblicazione. Non vi era alcun obbligo di pubblicare questa recensione. In quanto società mediatica indipendente, Notebookcheck non è soggetta all'autorità di produttori, rivenditori o editori.
Ecco come Notebookcheck esegue i test
Ogni anno, Notebookcheck esamina in modo indipendente centinaia di laptop e smartphone utilizzando procedure standardizzate per garantire che tutti i risultati siano comparabili. Da circa 20 anni sviluppiamo continuamente i nostri metodi di prova e nel frattempo stabiliamo gli standard di settore. Nei nostri laboratori di prova, tecnici ed editori esperti utilizzano apparecchiature di misurazione di alta qualità. Questi test comportano un processo di validazione in più fasi. Il nostro complesso sistema di valutazione si basa su centinaia di misurazioni e parametri di riferimento ben fondati, che mantengono l'obiettività.
