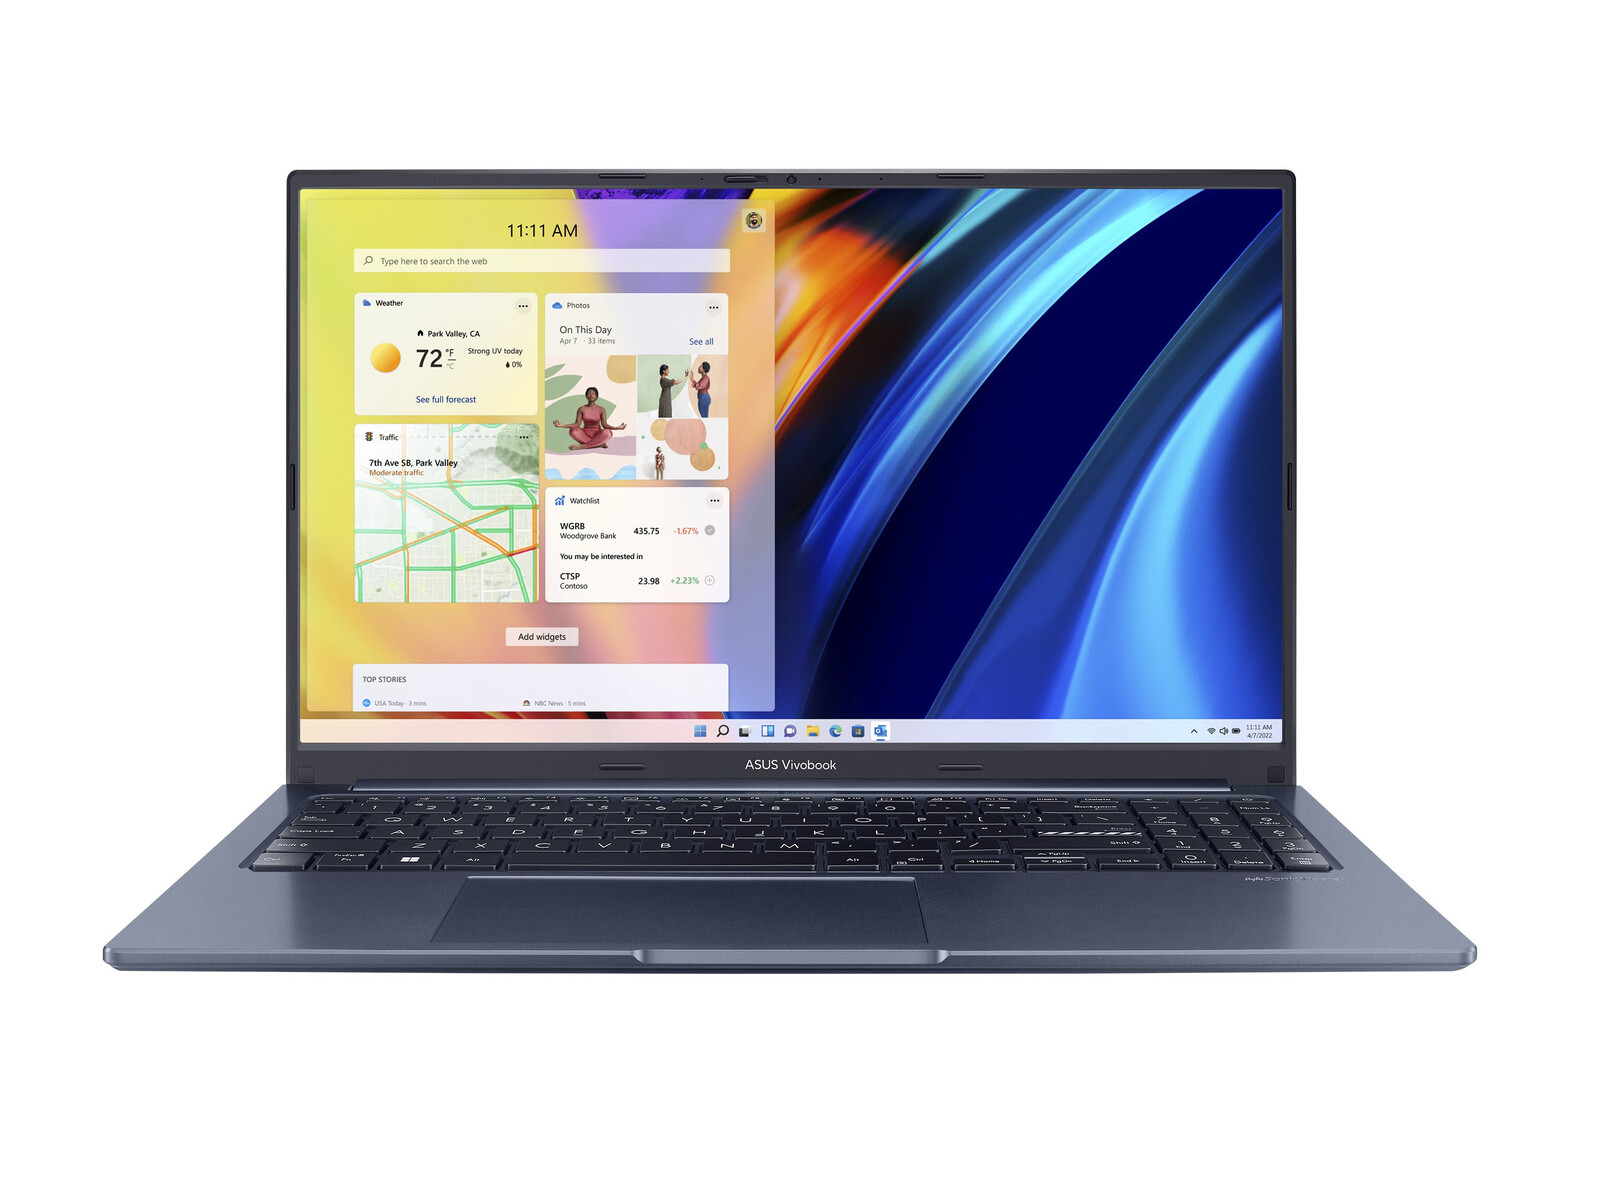
Recensione del portatile Asus VivoBook 15X M1503QA: OLED a 1080p per le masse
Da non confondere con il VivoBook 15, VivoBook 15 OLED, VivoBook 15 Pro, o VivoBook S15il VivoBook 15 X OLED è un altro modello da 15,6 pollici che fa parte della famiglia VivoBook. Presenta uno chassis diverso e un diverso set di porte rispetto ai modelli sopra citati, pur condividendo molte caratteristiche simili. I modelli VivoBook tendono ad essere più accessibili rispetto alla serie ZenBook, interamente in metallo e più lussuosa.
L'unità in esame è una configurazione di fascia bassa con CPU Ryzen 5 5600H, 8 GB di RAM, 512 GB di SSD e display OLED da 15,6 pollici 1080p per un prezzo di vendita al dettaglio di circa 700 dollari USA o meno, se in vendita. Le SKU di fascia più alta sono disponibili con il più veloce Ryzen 7 5800H e il più denso display OLED da 2,8K (1620p) per 900 dollari. Il modello standard del VivoBook 15 è dotato di CPU serie U più lente.
Tra i concorrenti del VivoBook 15 X OLED ci sono altri clamshell multimediali di fascia medio-bassa come il Dell Inspiron 15 3501, Lenovo IdeaPad 3 15, MSI Modern 15o il HP Pavilion 15.
Altre recensioni di Asus:
Potenziali concorrenti a confronto
Punteggio | Data | Modello | Peso | Altezza | Dimensione | Risoluzione | Prezzo |
|---|---|---|---|---|---|---|---|
| 83.1 % v7 (old) | 02/2023 | Asus VivoBook 15 X M1503QA R5 5600H, Vega 7 | 1.7 kg | 19.9 mm | 15.60" | 1920x1080 | |
| 80.6 % v7 (old) | 11/2021 | Asus Vivobook 15 K513EQ i7-1165G7, GeForce MX350 | 1.6 kg | 17.9 mm | 15.60" | 1920x1080 | |
| 82.1 % v7 (old) | 07/2021 | Asus VivoBook S15 D533UA R7 5700U, Vega 8 | 1.8 kg | 16.1 mm | 15.60" | 1920x1080 | |
| 87 % v7 (old) | 12/2020 | Asus ZenBook UX535-M01440 i7-10750H, GeForce GTX 1650 Ti Max-Q | 2 kg | 20 mm | 15.60" | 3840x2160 | |
| 85.1 % v7 (old) | 12/2022 | Lenovo ThinkBook 15 G3 ACL 21A400B2GE R5 5500U, Vega 7 | 1.7 kg | 18.9 mm | 15.60" | 1920x1080 | |
| 80.5 % v7 (old) | 10/2021 | Dell Inspiron 15 3501 i7-1165G7, Iris Xe G7 96EUs | 2 kg | 19.9 mm | 15.60" | 1920x1080 |
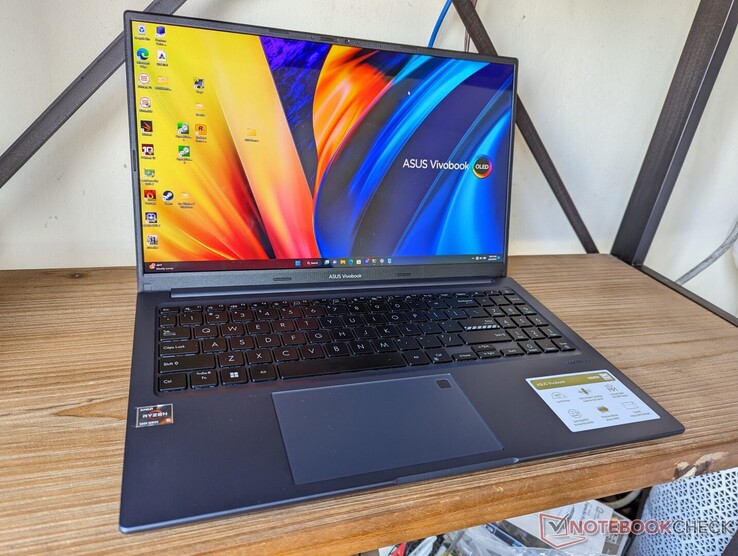
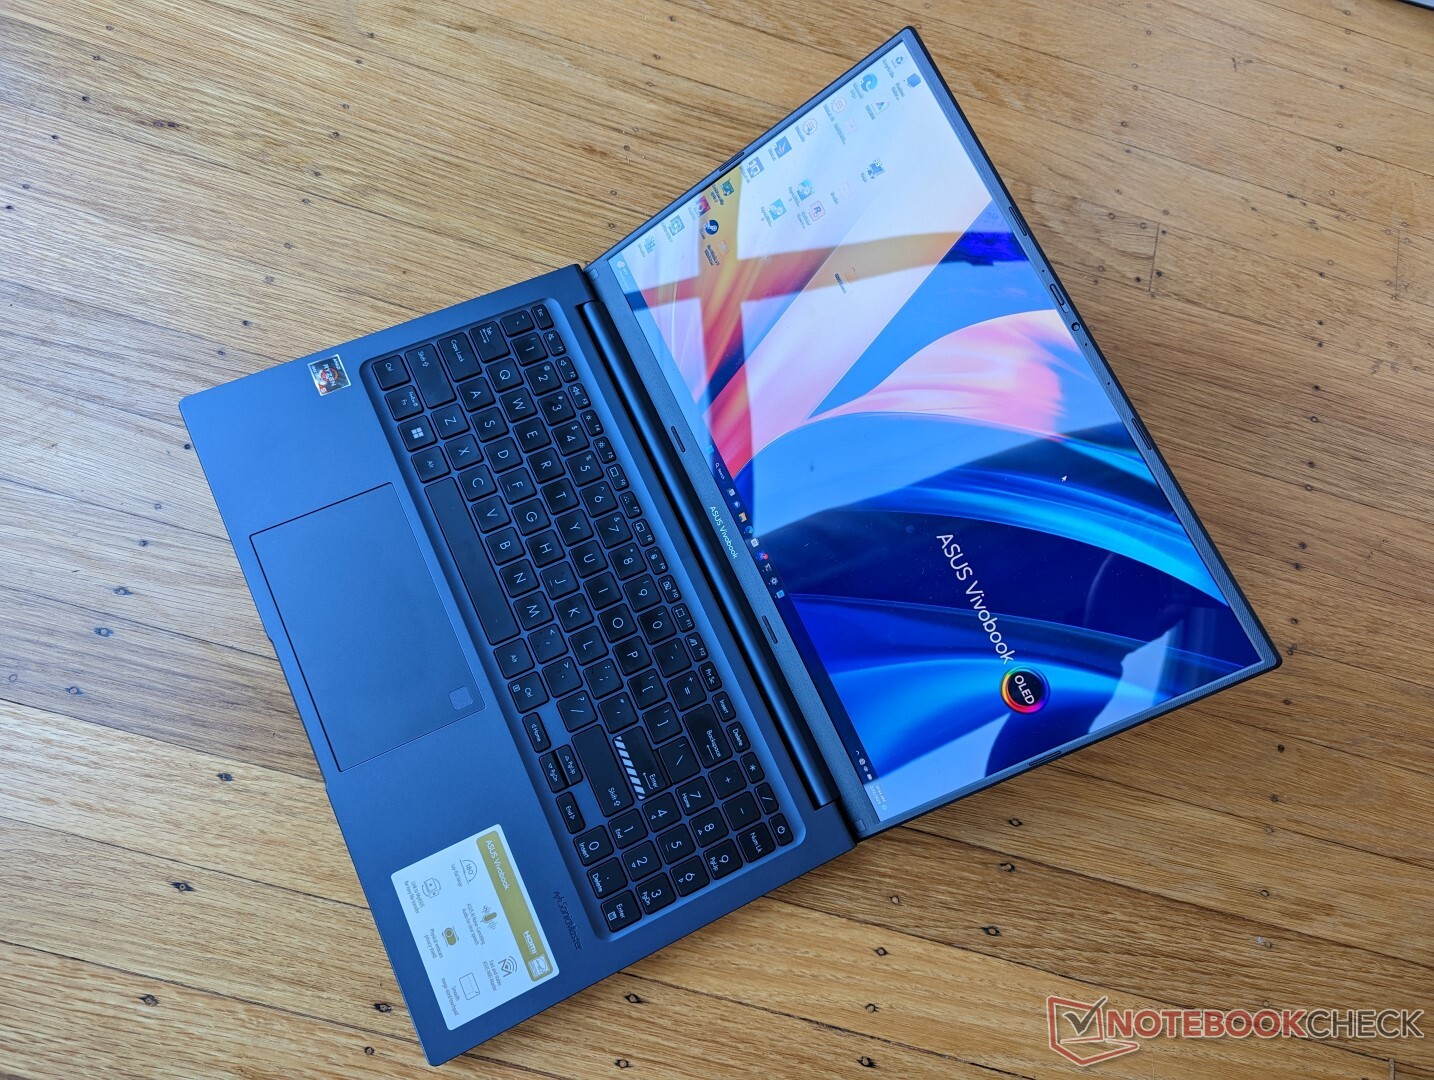
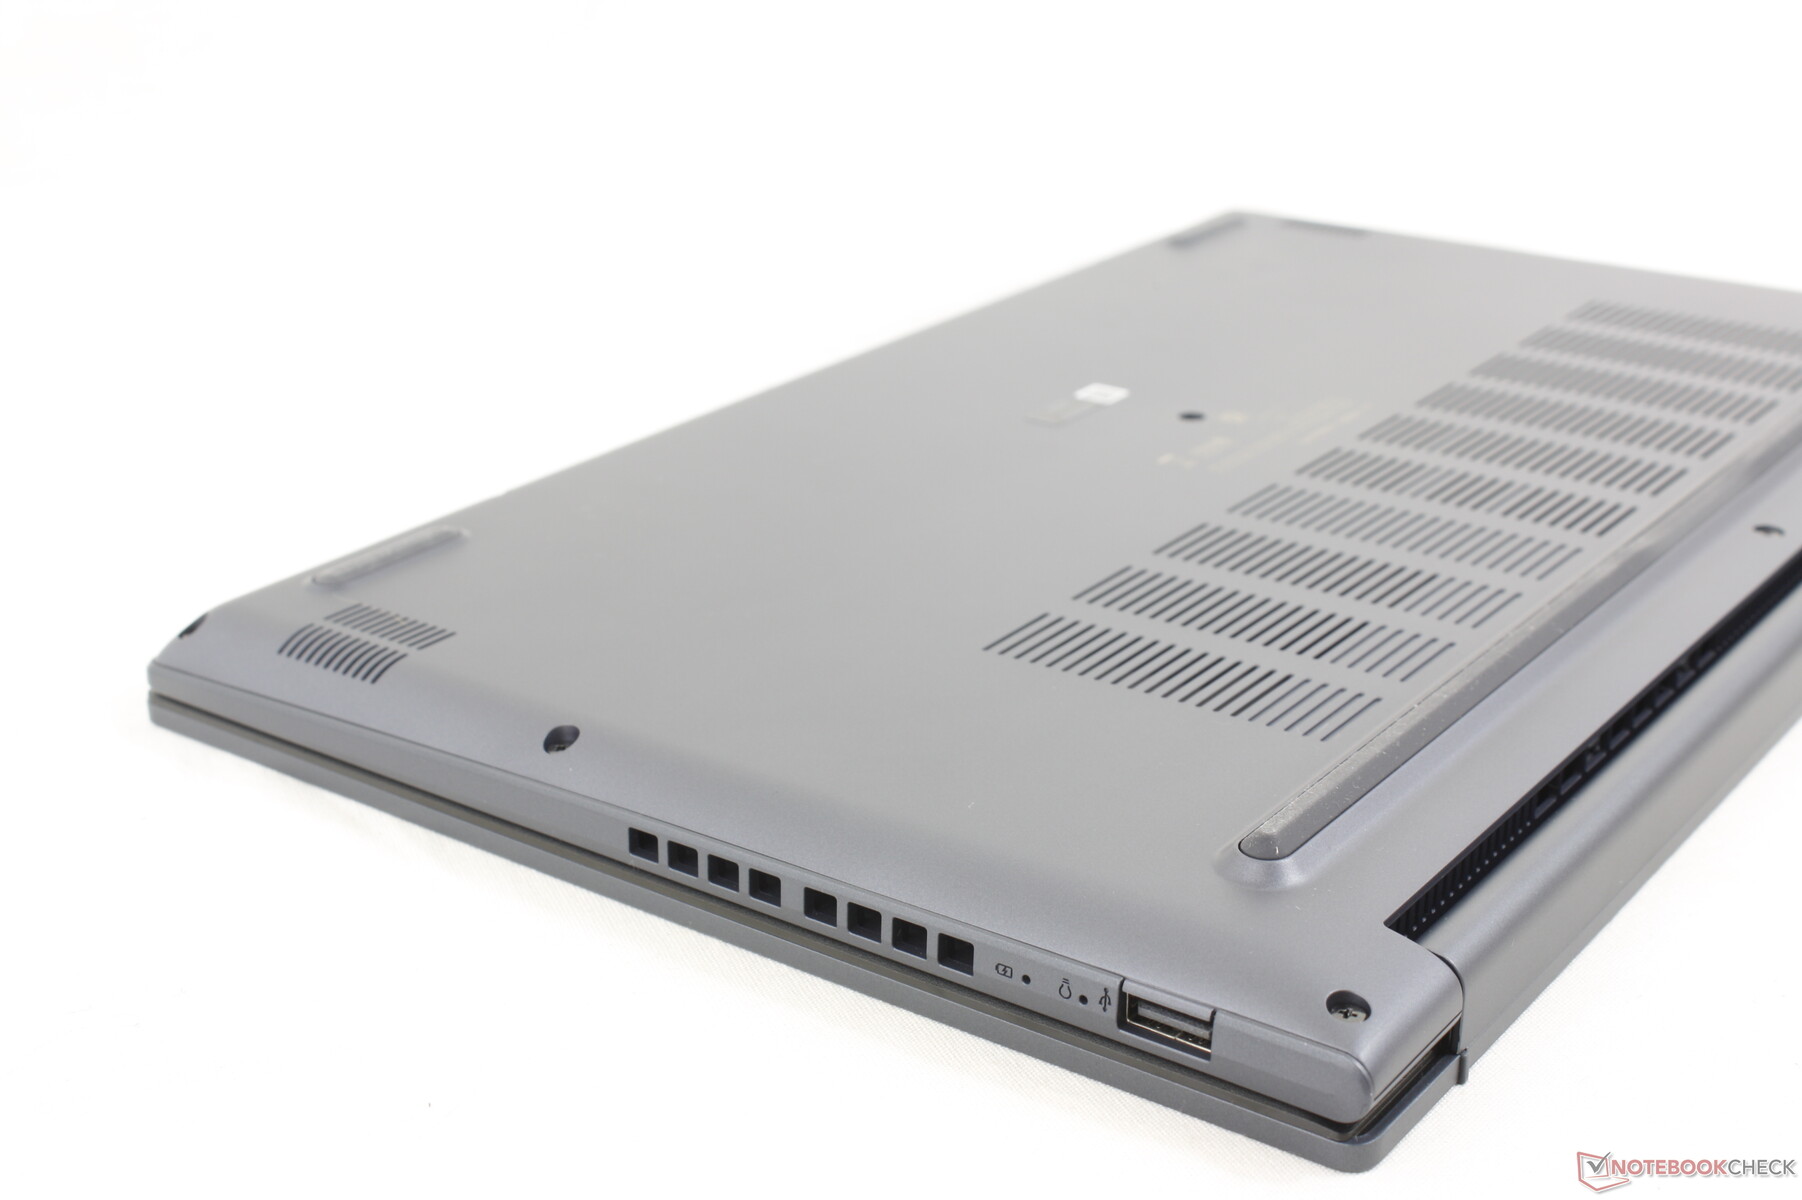
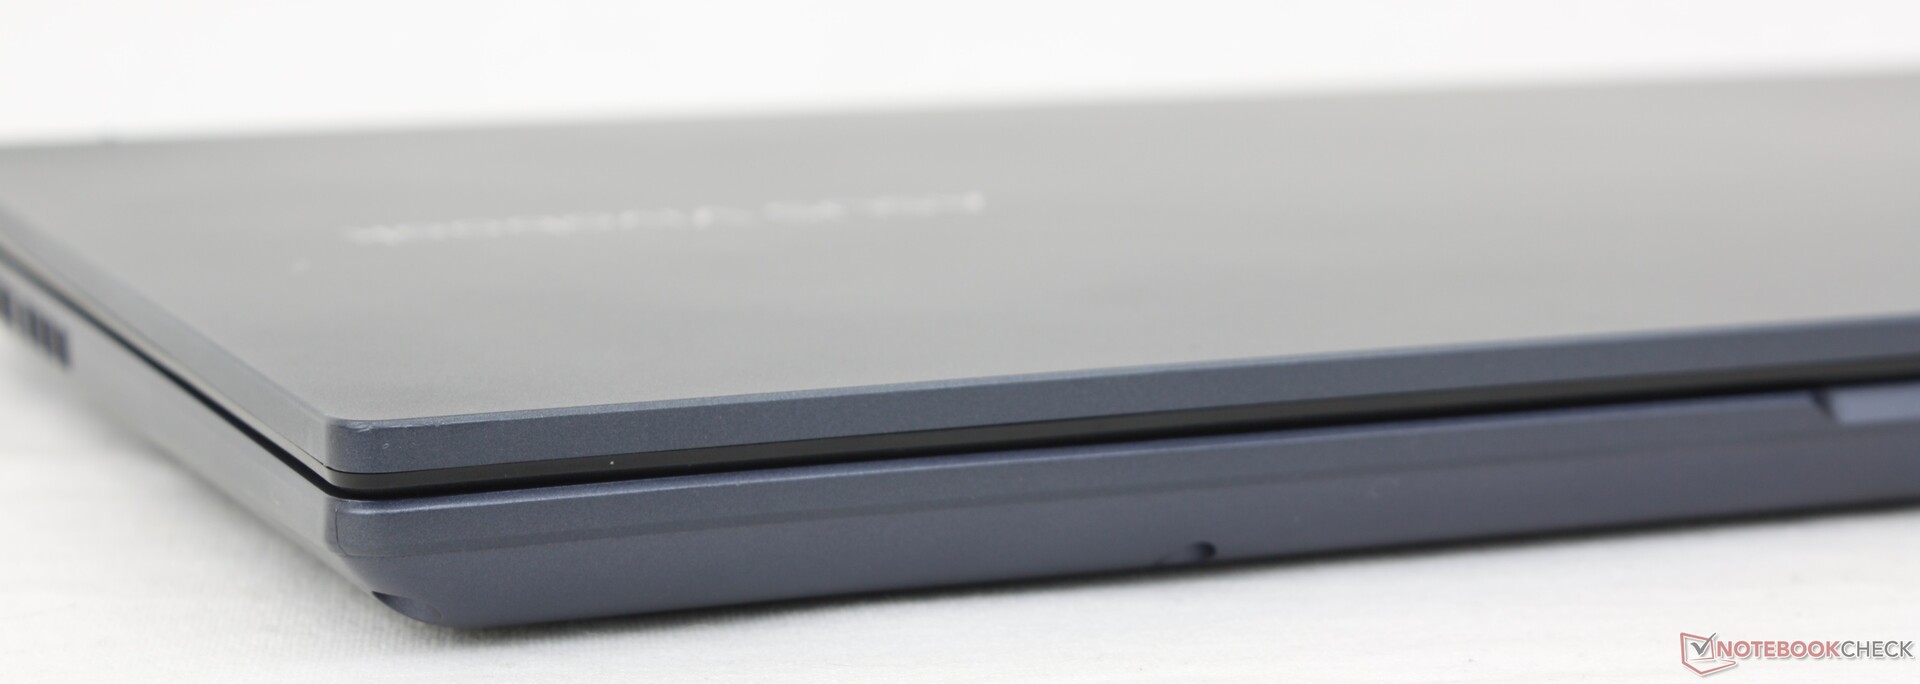
Caso - Diverse modifiche esterne
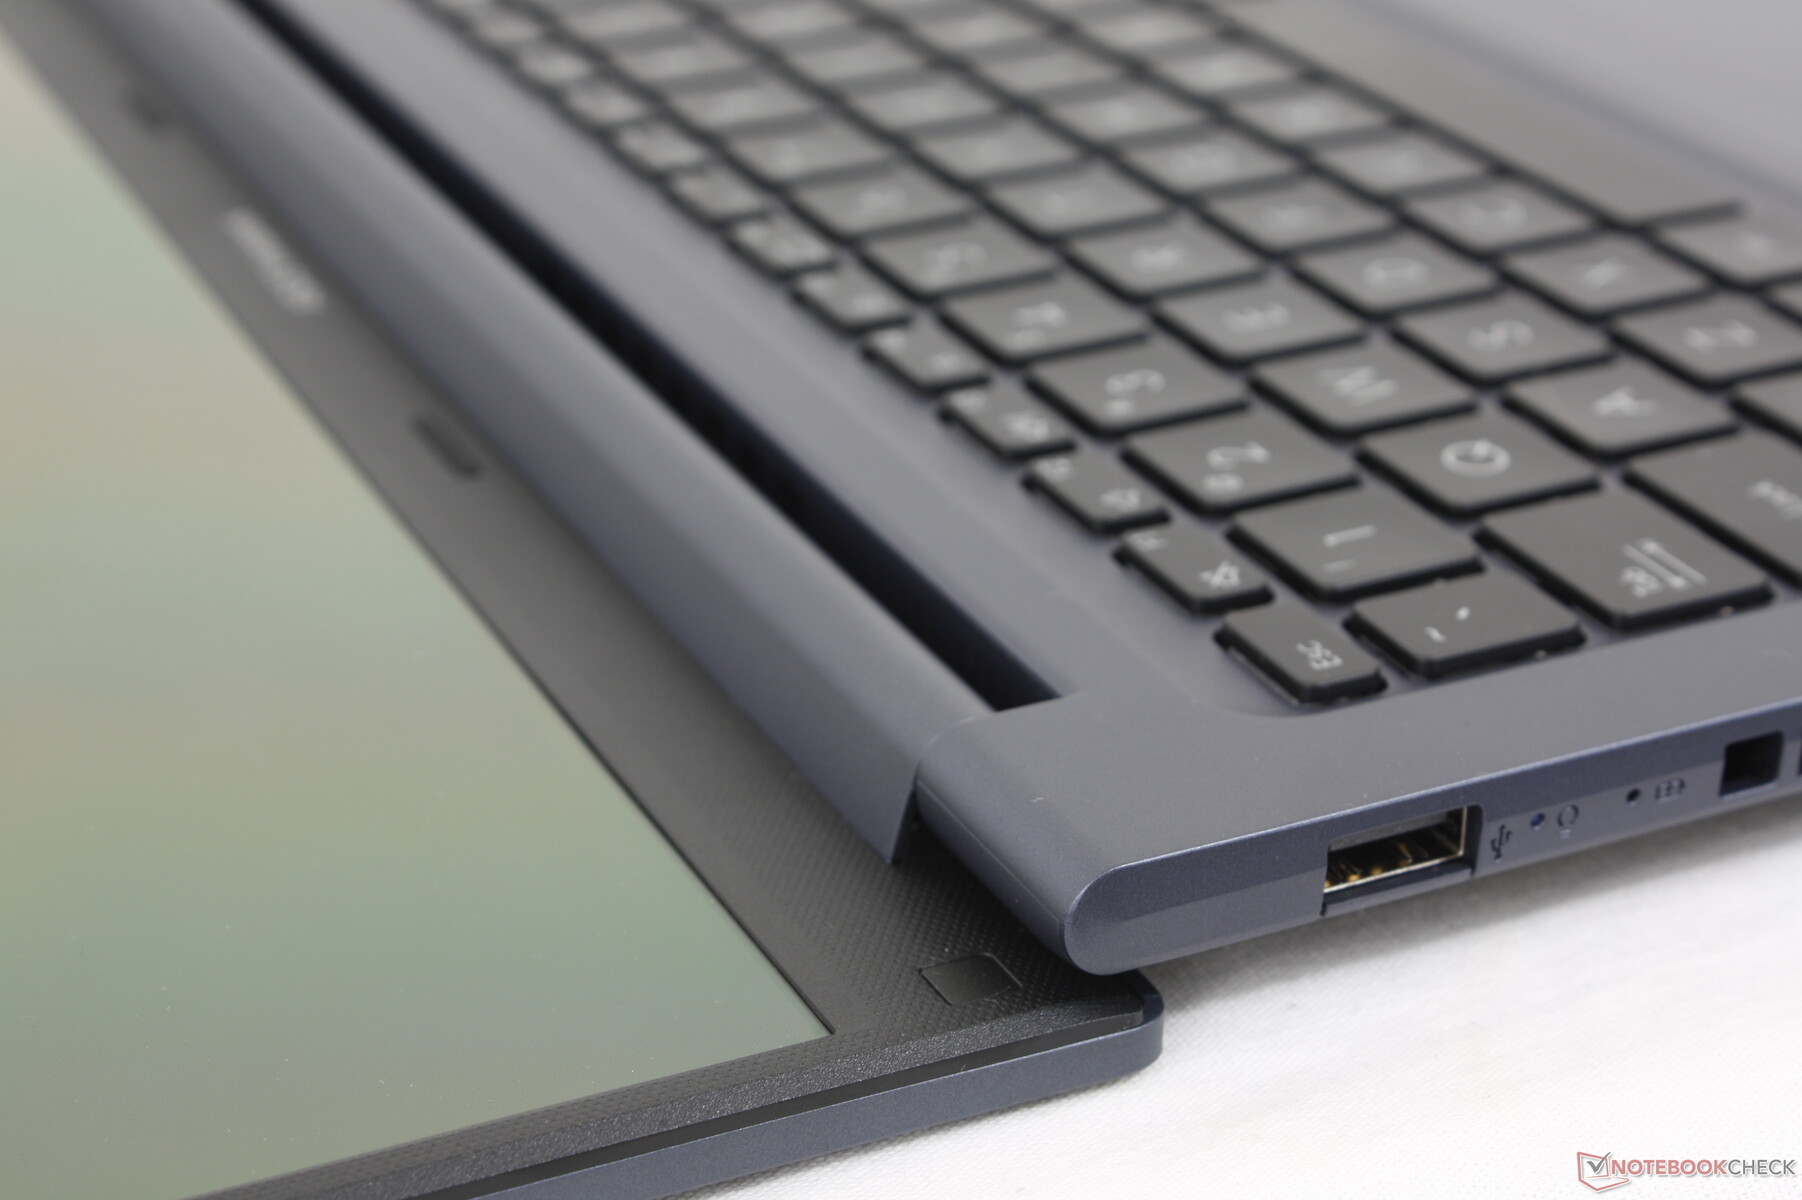
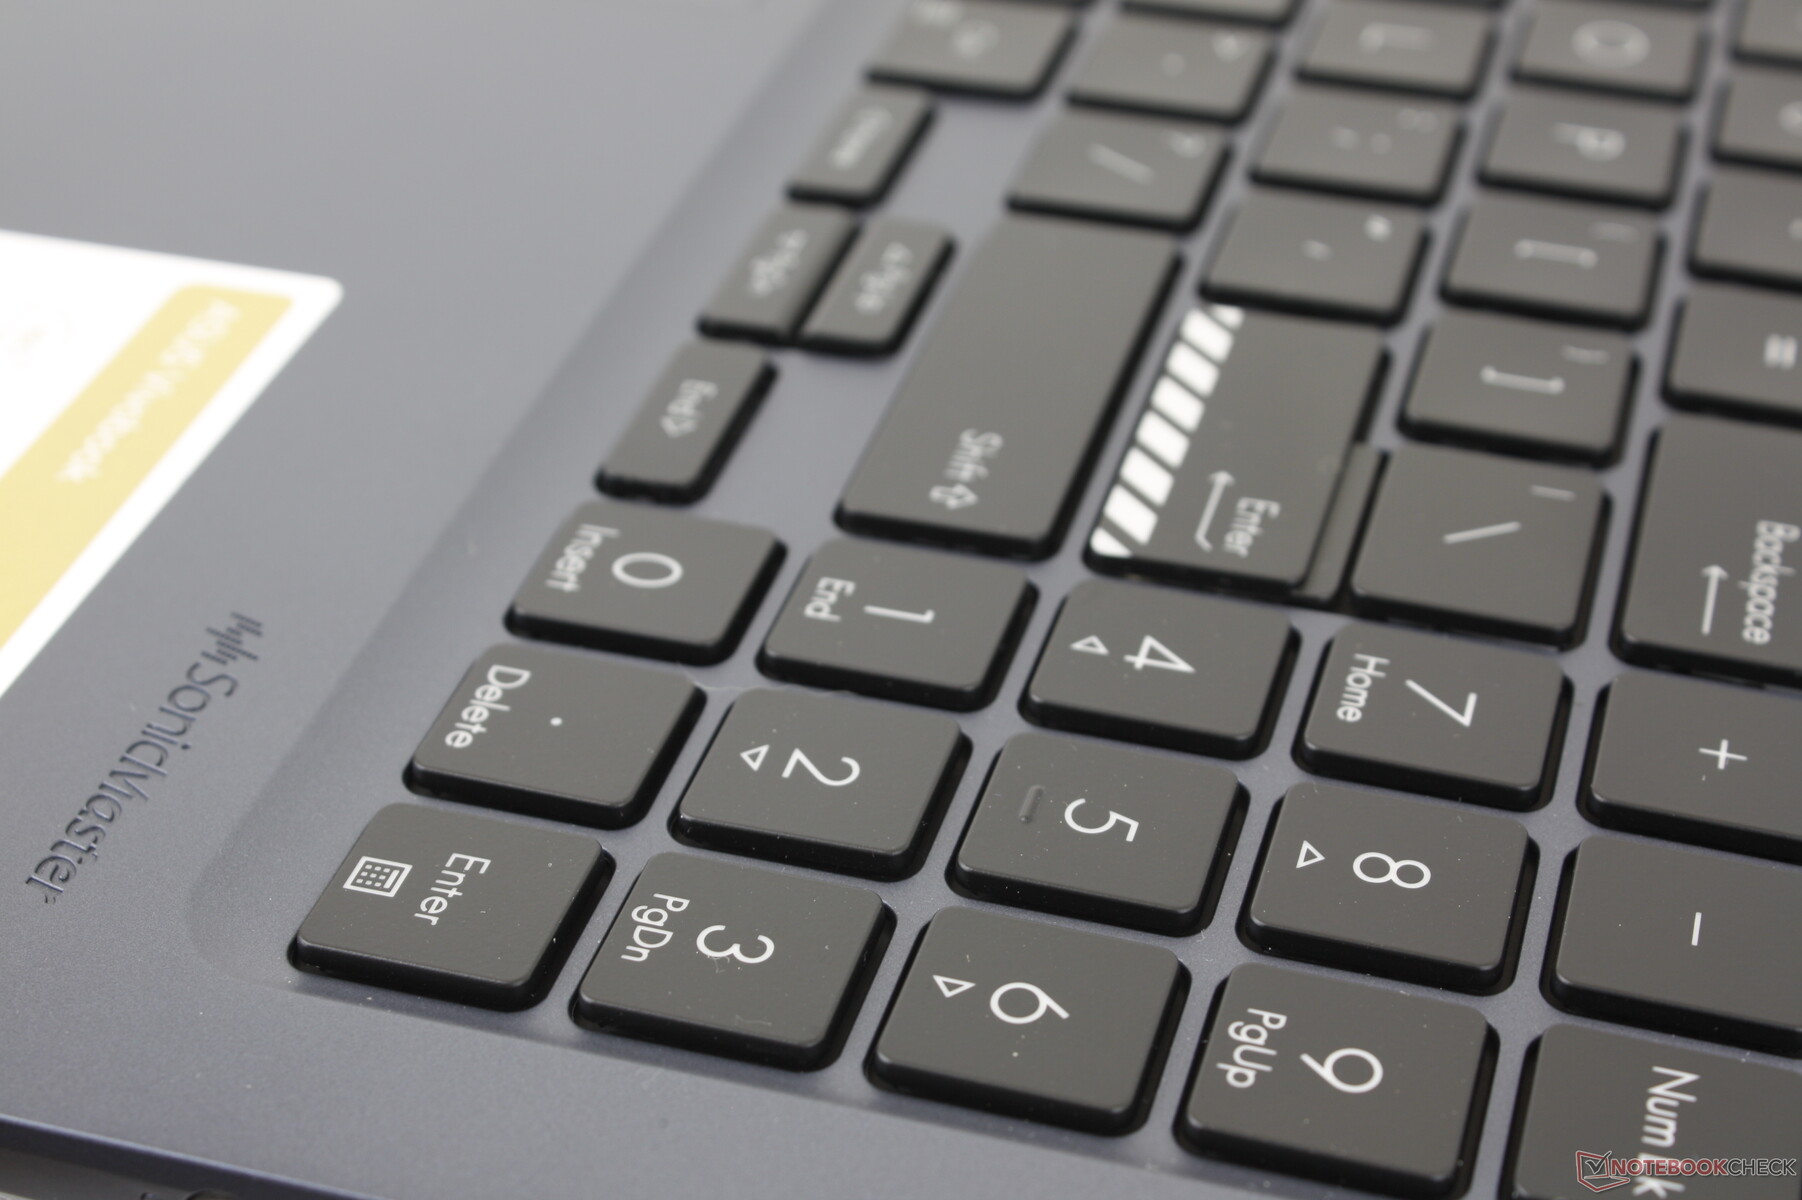
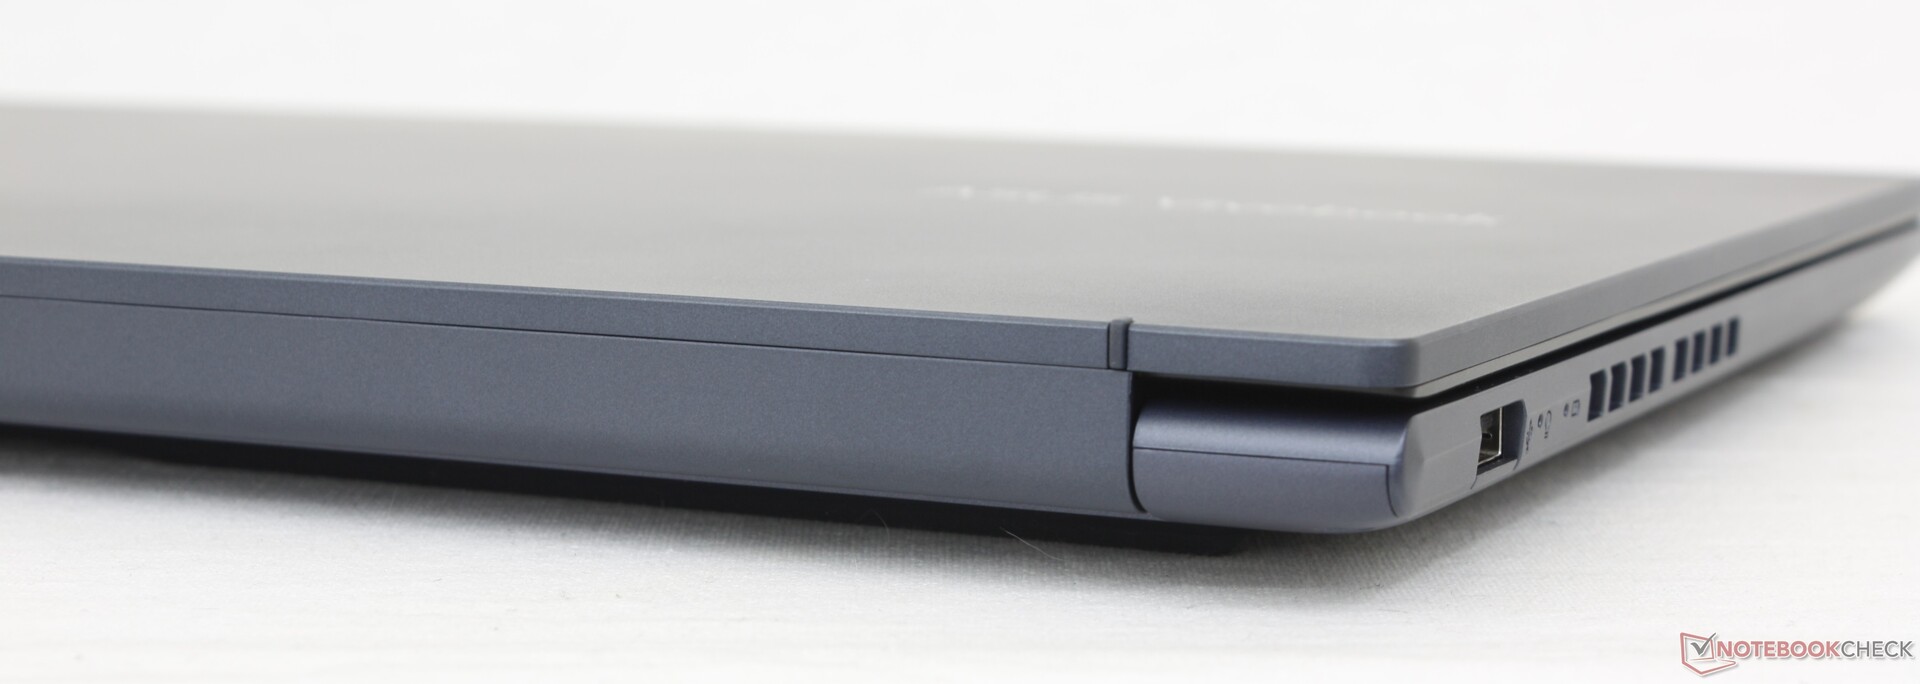
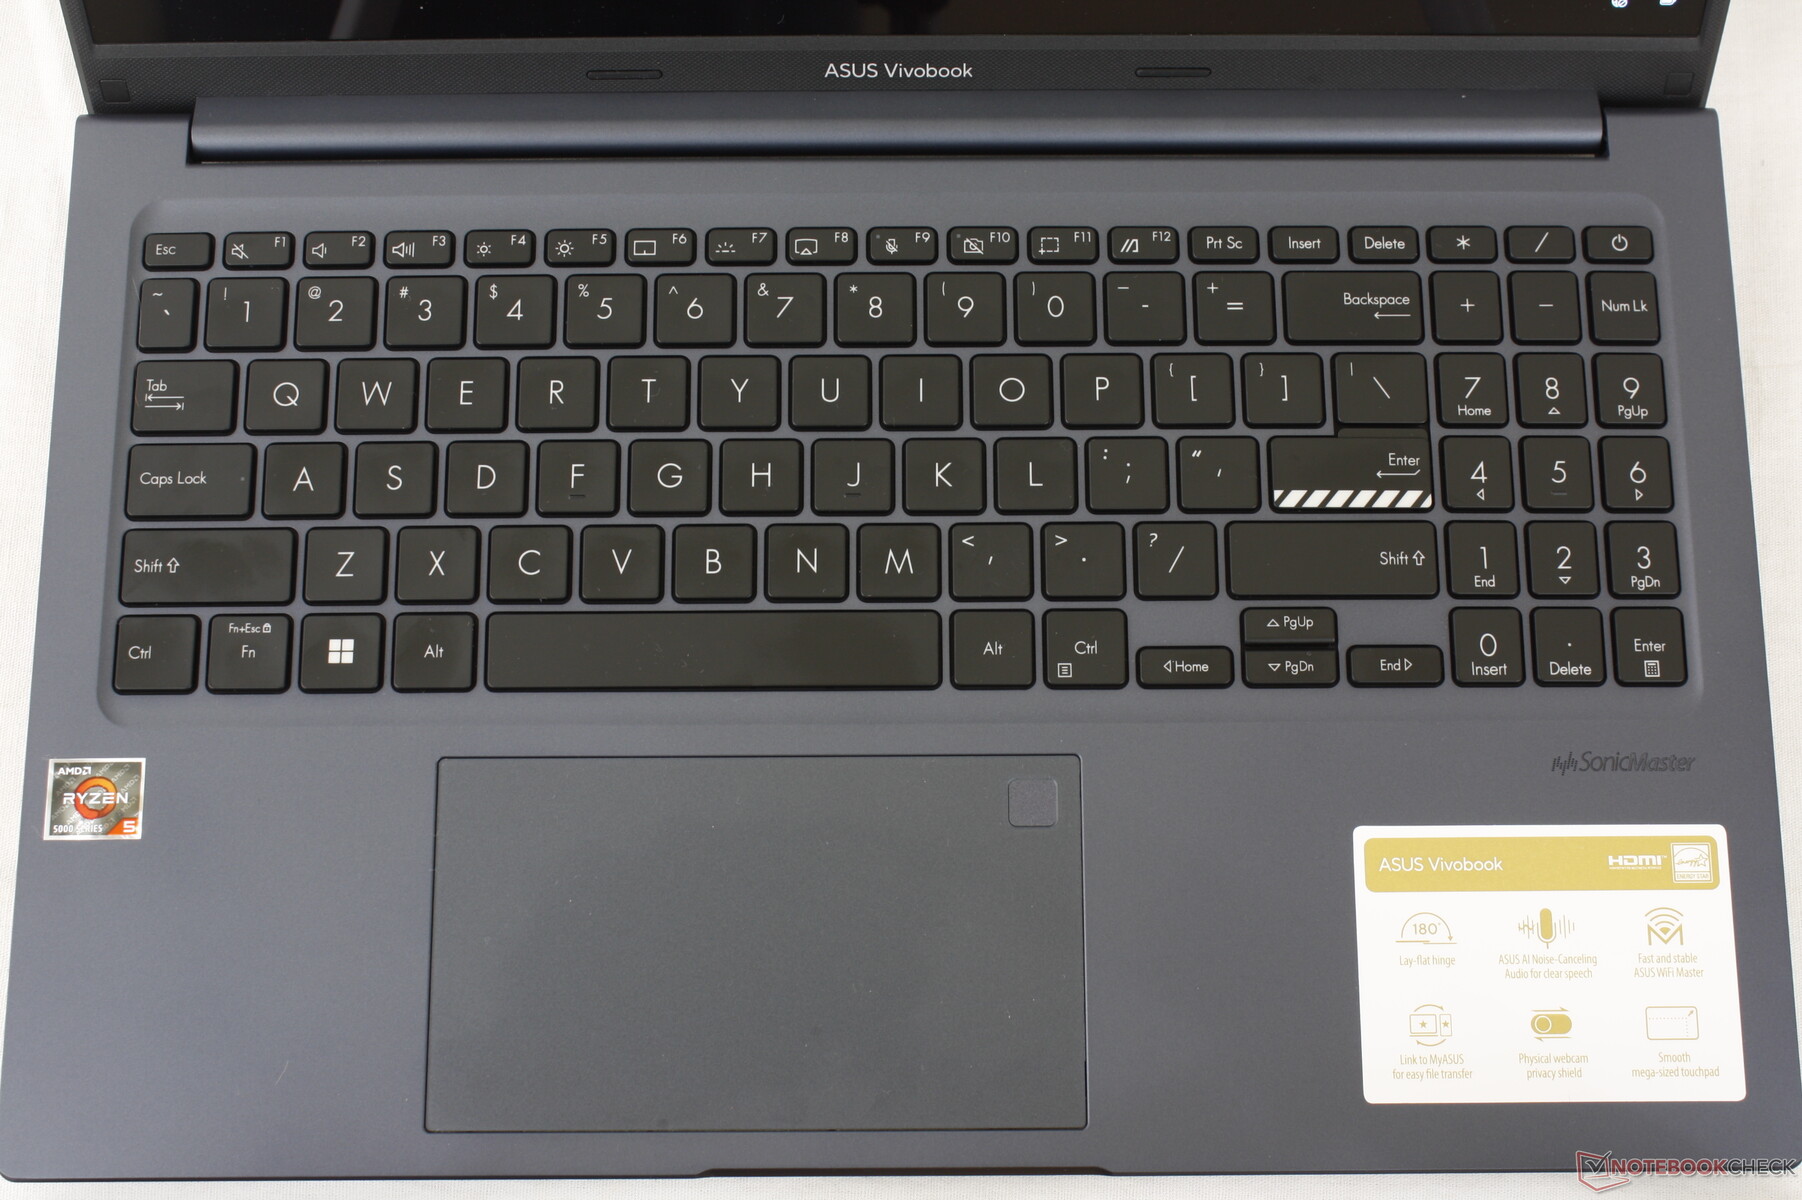
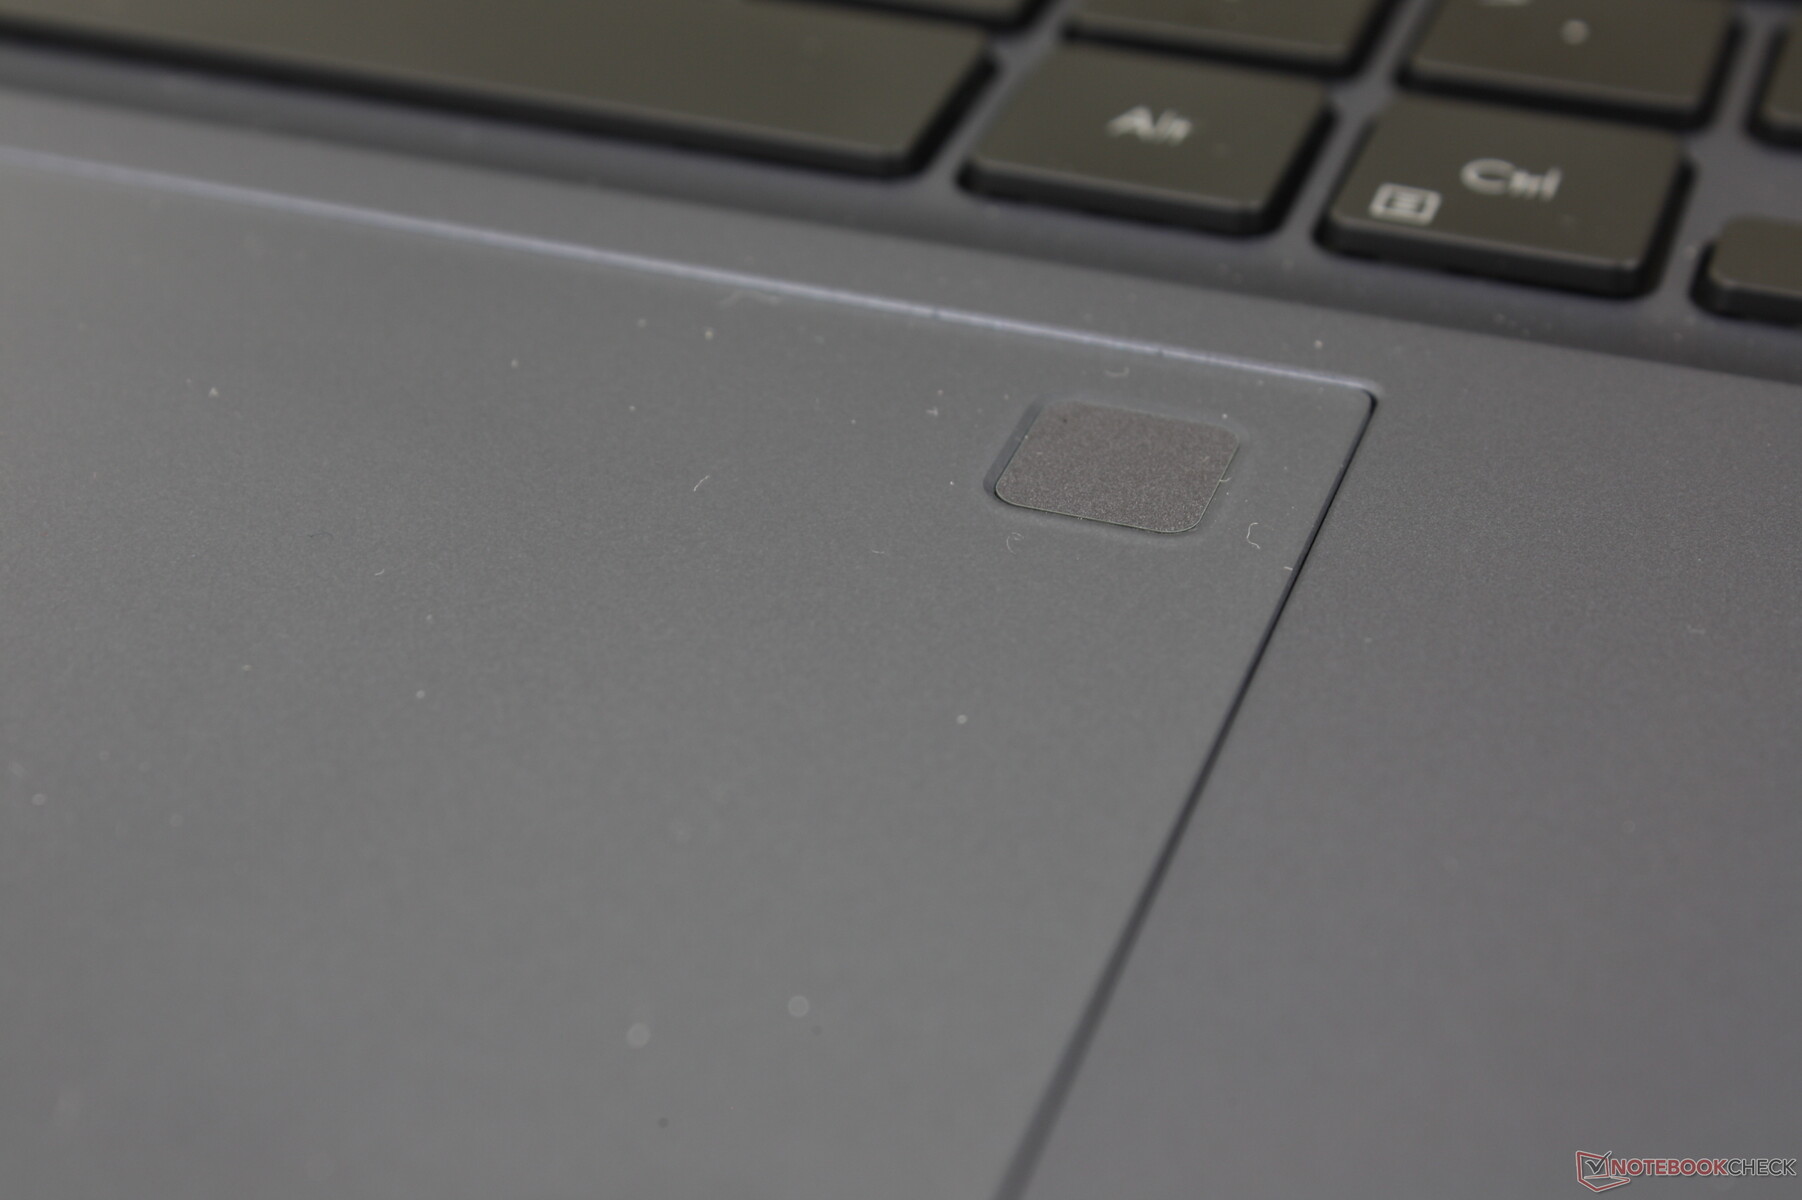
Il VivoBook 15X OLED utilizza gli stessi materiali metallici del coperchio esterno e della base in plastica del VivoBook 15 normale, ma con diversi aggiornamenti del design. In primo luogo, il logo Harman/Kardon sul poggiapolsi destro è stato sostituito da SonicMaster. In secondo luogo, il clickpad e la tastiera sono rispettivamente più grandi e più definiti. In terzo luogo, le cornici su tutti e quattro i lati sono state ridotte per ottenere un ingombro leggermente inferiore, nonostante la CPU Ryzen serie H più veloce del nostro modello. Infine, il bordo sinistro presenta nuove griglie di ventilazione e porte riorganizzate. I due modelli possono sembrare simili a prima vista, ma i cambiamenti non sono insignificanti se si guarda più da vicino.
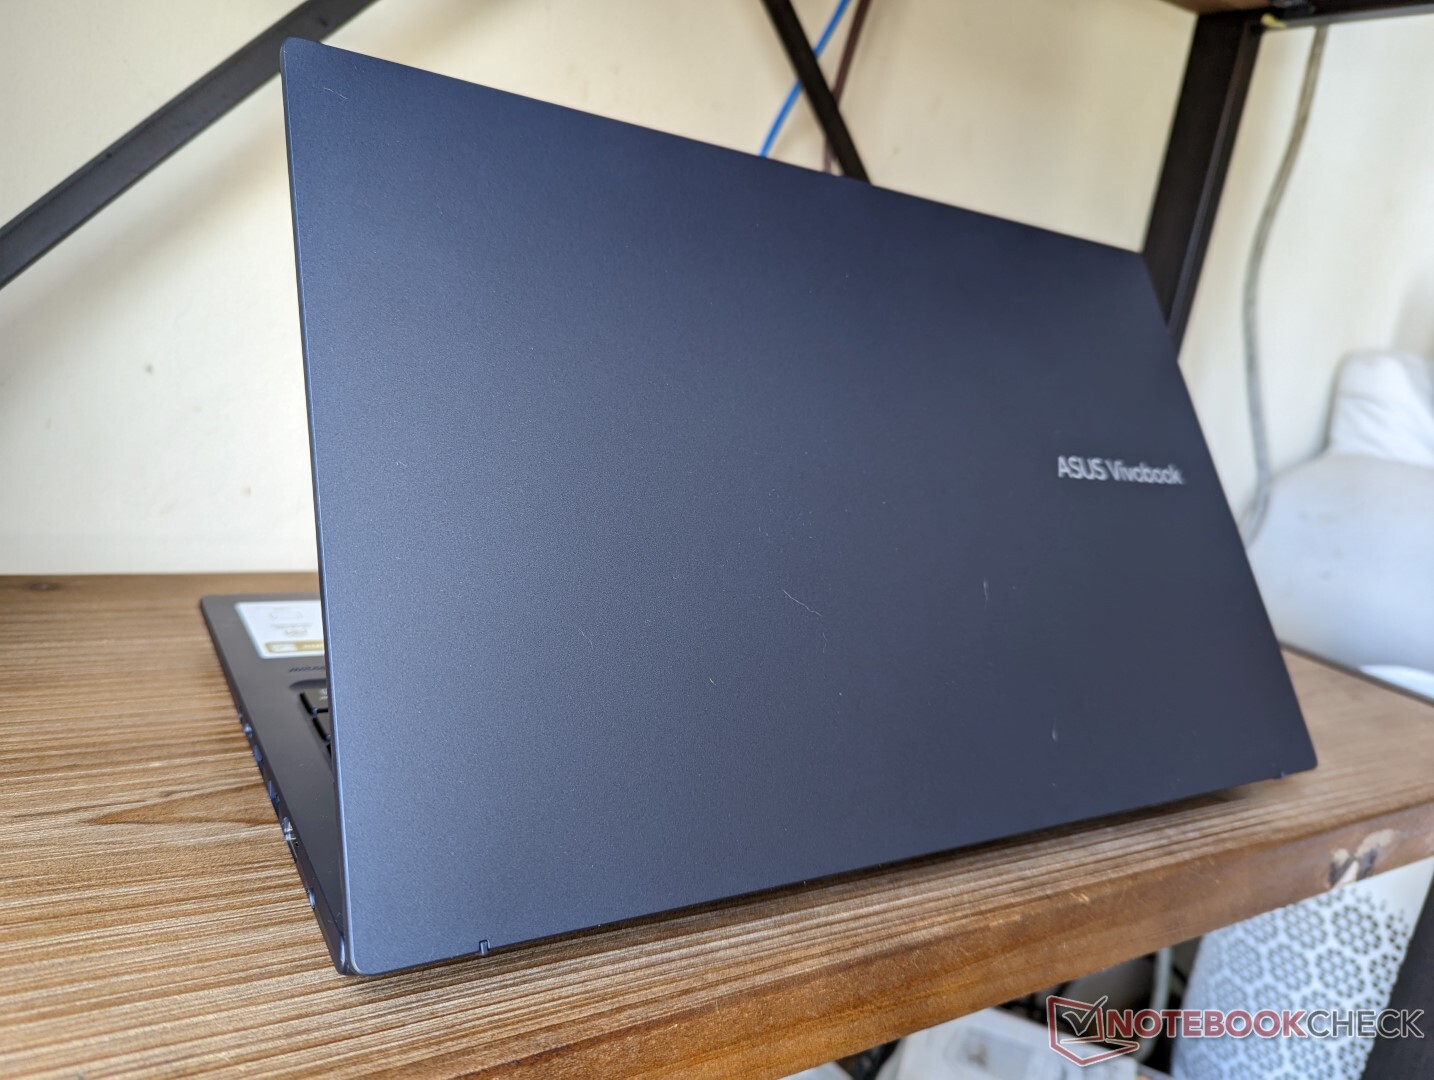
La rigidità del telaio rimane invariata rispetto al VivoBook 15 standard. La base è più suscettibile di torsioni e flessioni rispetto al più costoso ZenBook o Dell XPS serie. Lo schermo OLED e il coperchio sono particolarmente soggetti a flessioni, poiché non è presente il Gorilla Glass. Dopotutto, questo è un portatile Asus economico.
Le dimensioni e il peso complessivi non sono nulla di entusiasmante, poiché sono nella media per un Ultrabook da 15 pollici. Alcuni modelli possono essere più grandi e pesanti, come il Dell Inspiron 15 3501, mentre altri, come l'LG Gram 15, sono più pesanti LG Gram 15 sono più piccoli e leggeri. Considerando il prezzo accessibile, tuttavia, il VivoBook 15X è più leggero e portatile di quanto ci si aspetti.
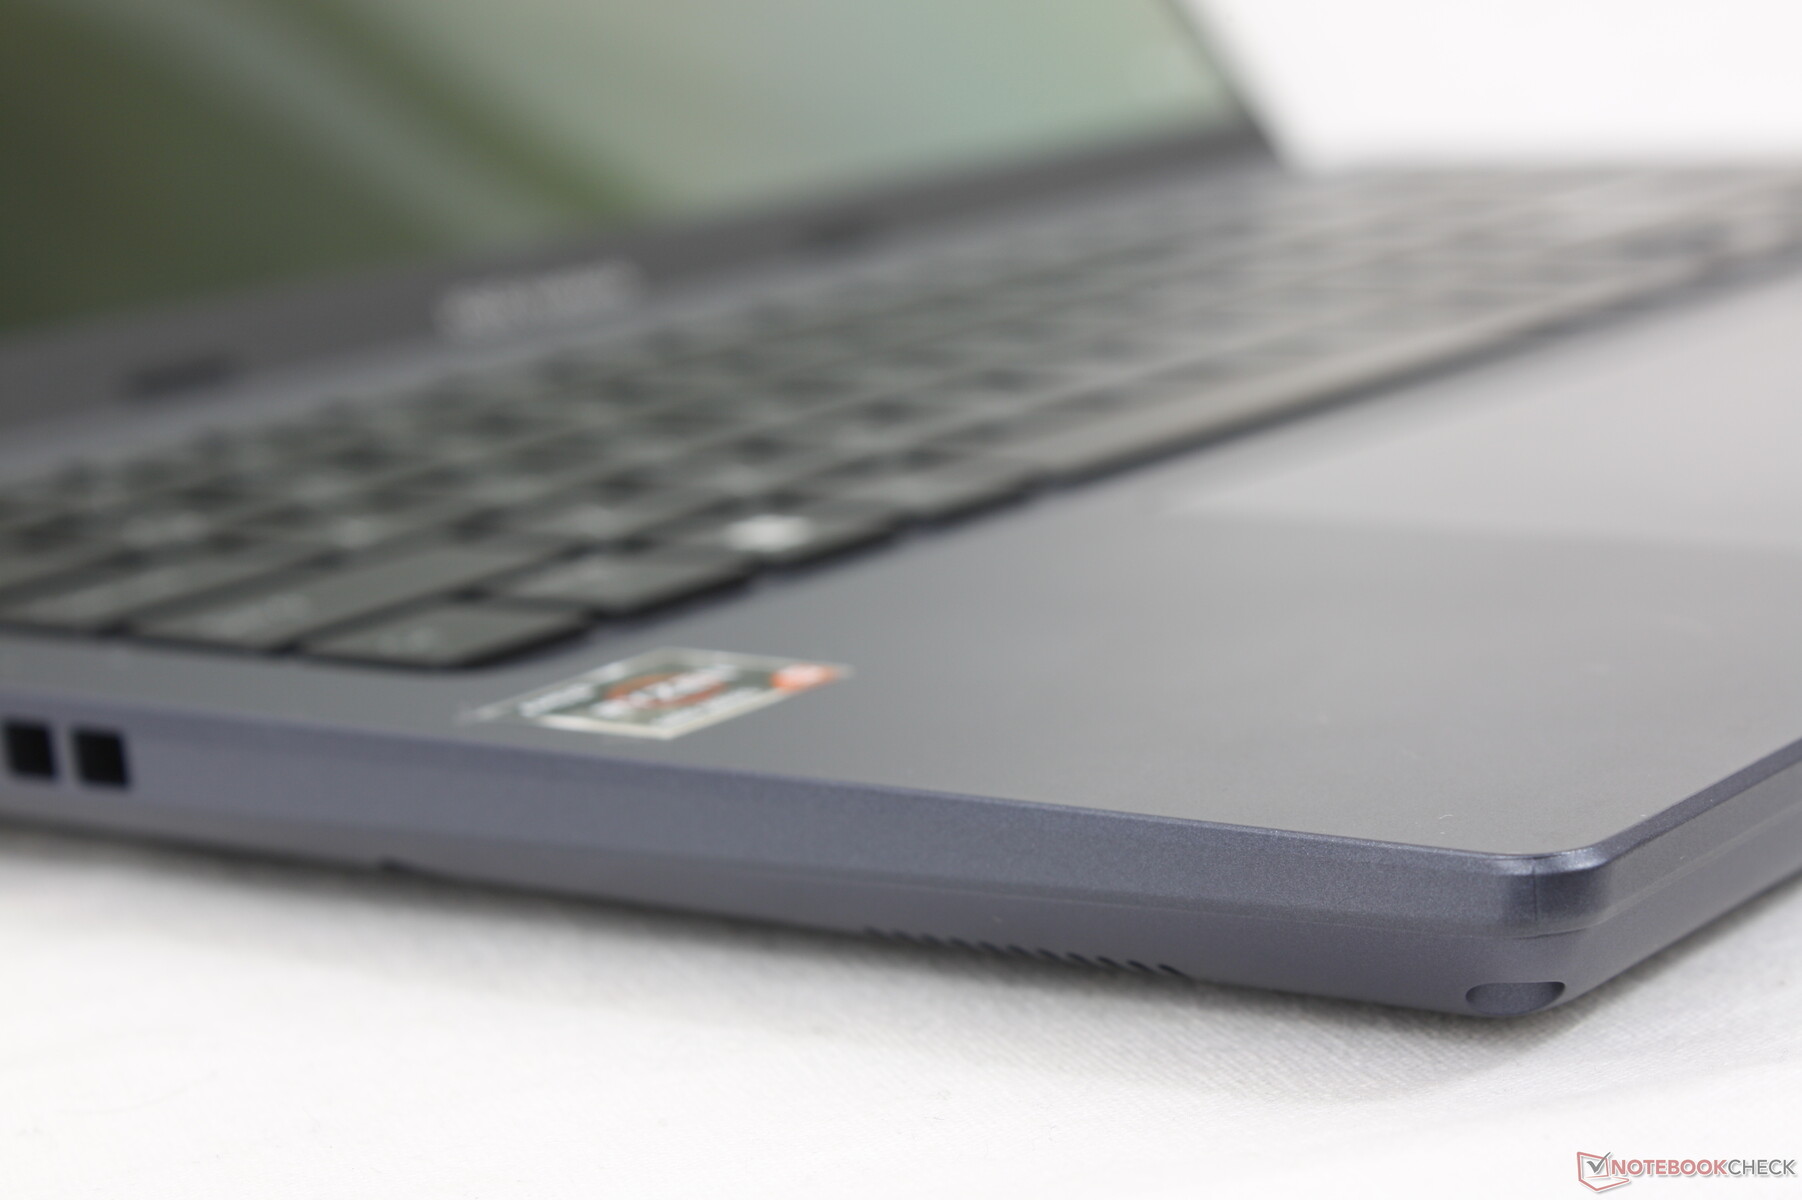
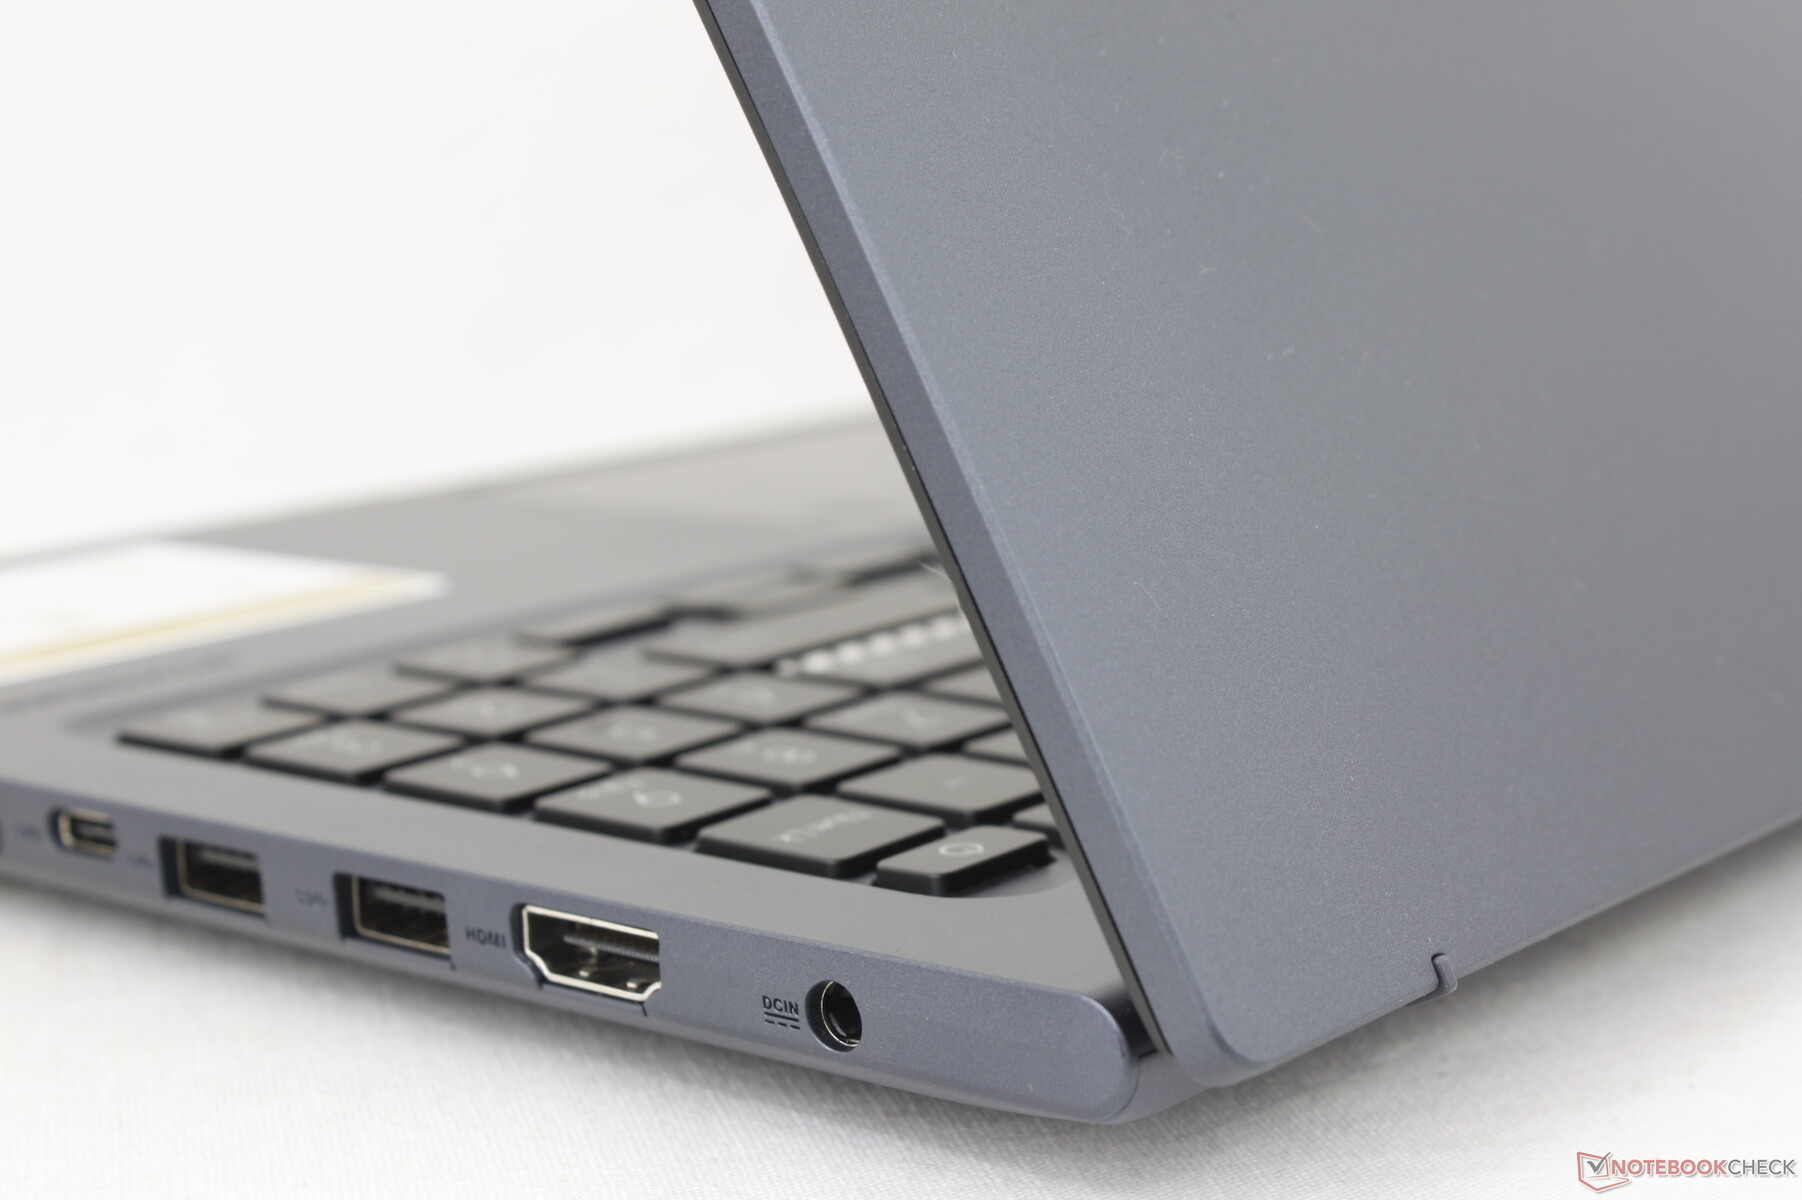
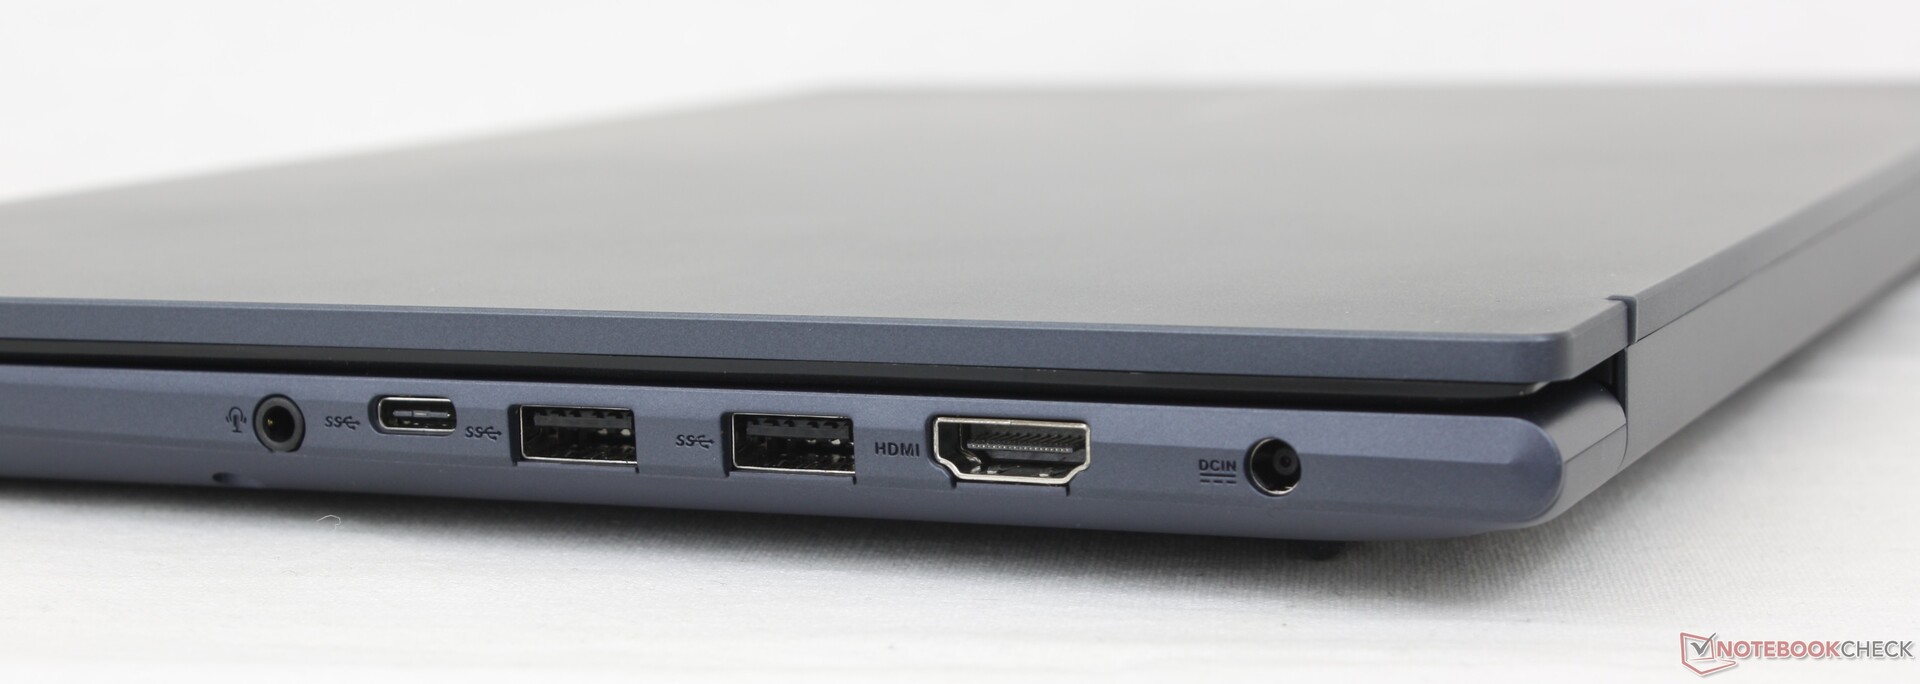
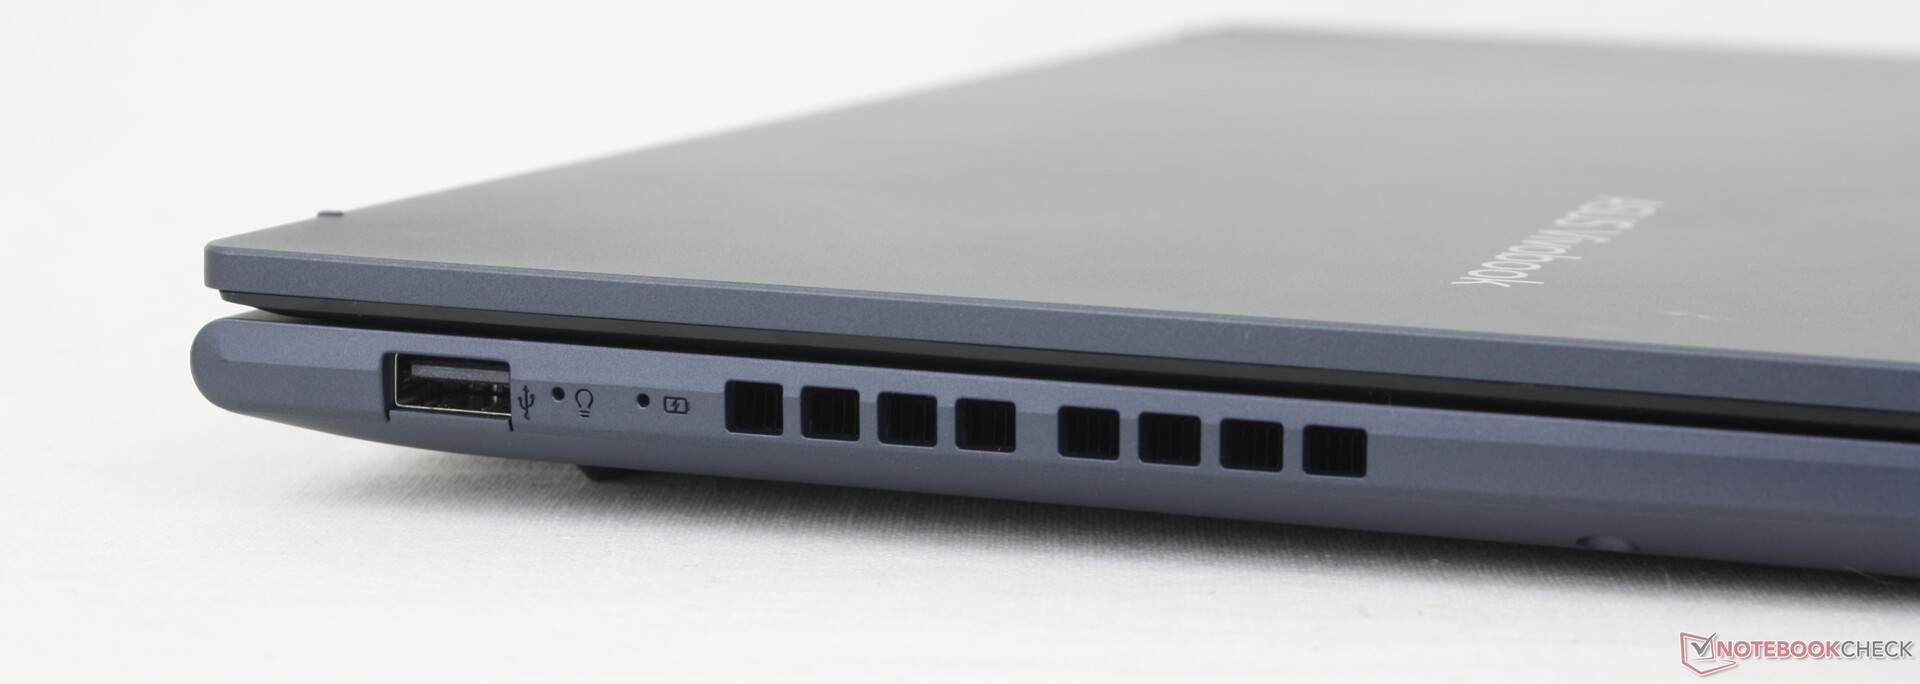
Connettività - Caratteristiche USB-C limitate
Le opzioni delle porte sono leggermente diverse tra tutti i numerosi modelli VivoBook. In questo caso, le porte del nostro VivoBook 15X M1503QA sono più simili a quelle del VivoBook S 14X S5402Z.VivoBook S 14X S5402Z ma con una porta USB-A aggiuntiva e una porta USB-C in meno. Tenete presente che la porta USB-C non supporta Thunderbolt, Power Delivery e nemmeno DisplayPort, mentre la maggior parte degli altri Ultrabook con USB-C tende a supportare almeno una delle tre.
I monitor esterni sono supportati solo fino a 4K a 30 Hz.
Comunicazione
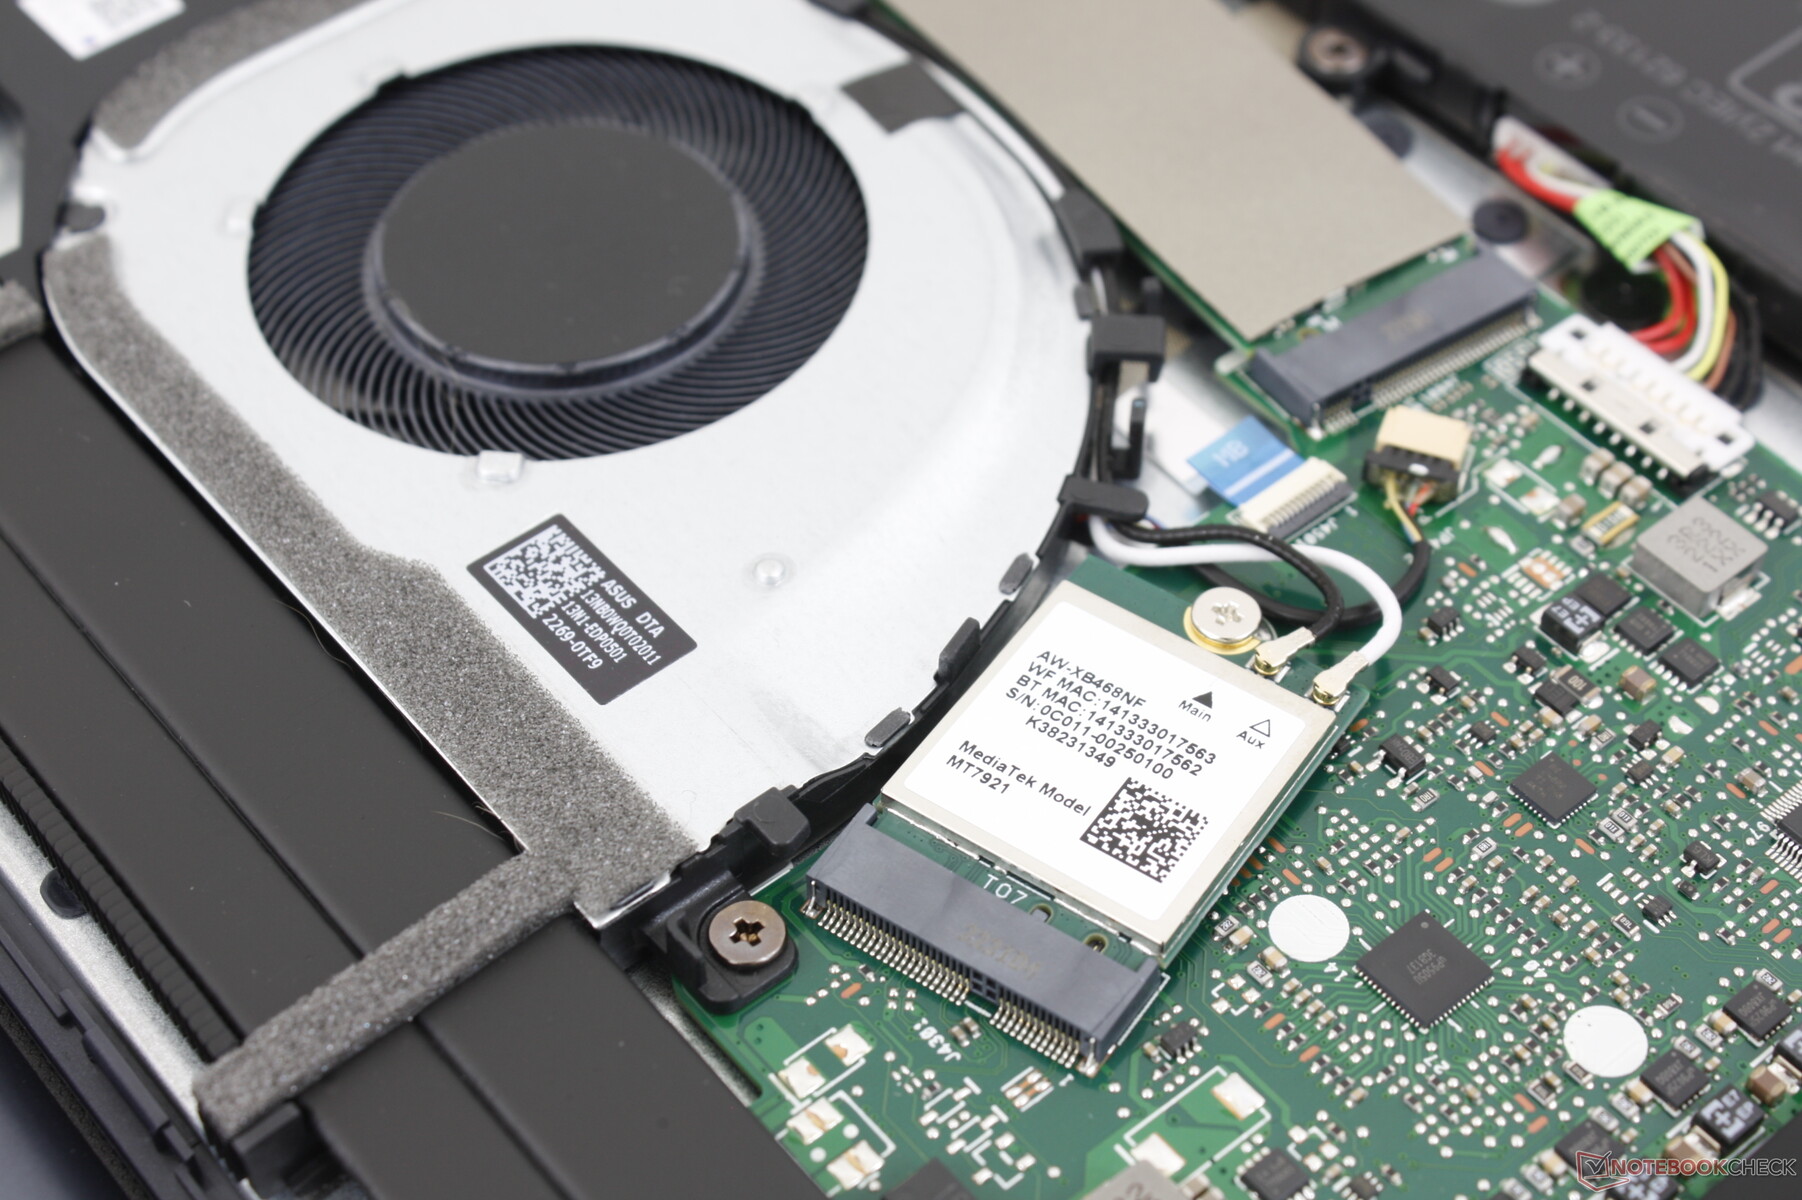
Il Wi-Fi 6 e il Bluetooth 5 sono forniti da un MediaTek MT7921. Sebbene le velocità di trasmissione siano quelle che ci aspettiamo, le velocità di ricezione tendono a fluttuare, come mostra il grafico qui sotto. Il problema non si nota durante l'uso quotidiano o lo streaming, ma è un passo indietro rispetto ai portatili della serie Intel AX, dove le prestazioni sono più costanti.
Il Wi-Fi 6E non è incluso nella configurazione, probabilmente per risparmiare sui costi.
| Networking | |
| iperf3 transmit AX12 | |
| Asus ZenBook UX535-M01440 | |
| Asus VivoBook S15 D533UA | |
| Asus Vivobook 15 K513EQ | |
| Dell Inspiron 15 3501 | |
| iperf3 receive AX12 | |
| Asus Vivobook 15 K513EQ | |
| Asus VivoBook S15 D533UA | |
| Asus ZenBook UX535-M01440 | |
| Dell Inspiron 15 3501 | |
| iperf3 receive AXE11000 | |
| Lenovo ThinkBook 15 G3 ACL 21A400B2GE | |
| Asus VivoBook 15 X M1503QA | |
| iperf3 transmit AXE11000 | |
| Lenovo ThinkBook 15 G3 ACL 21A400B2GE | |
| Asus VivoBook 15 X M1503QA | |
Webcam
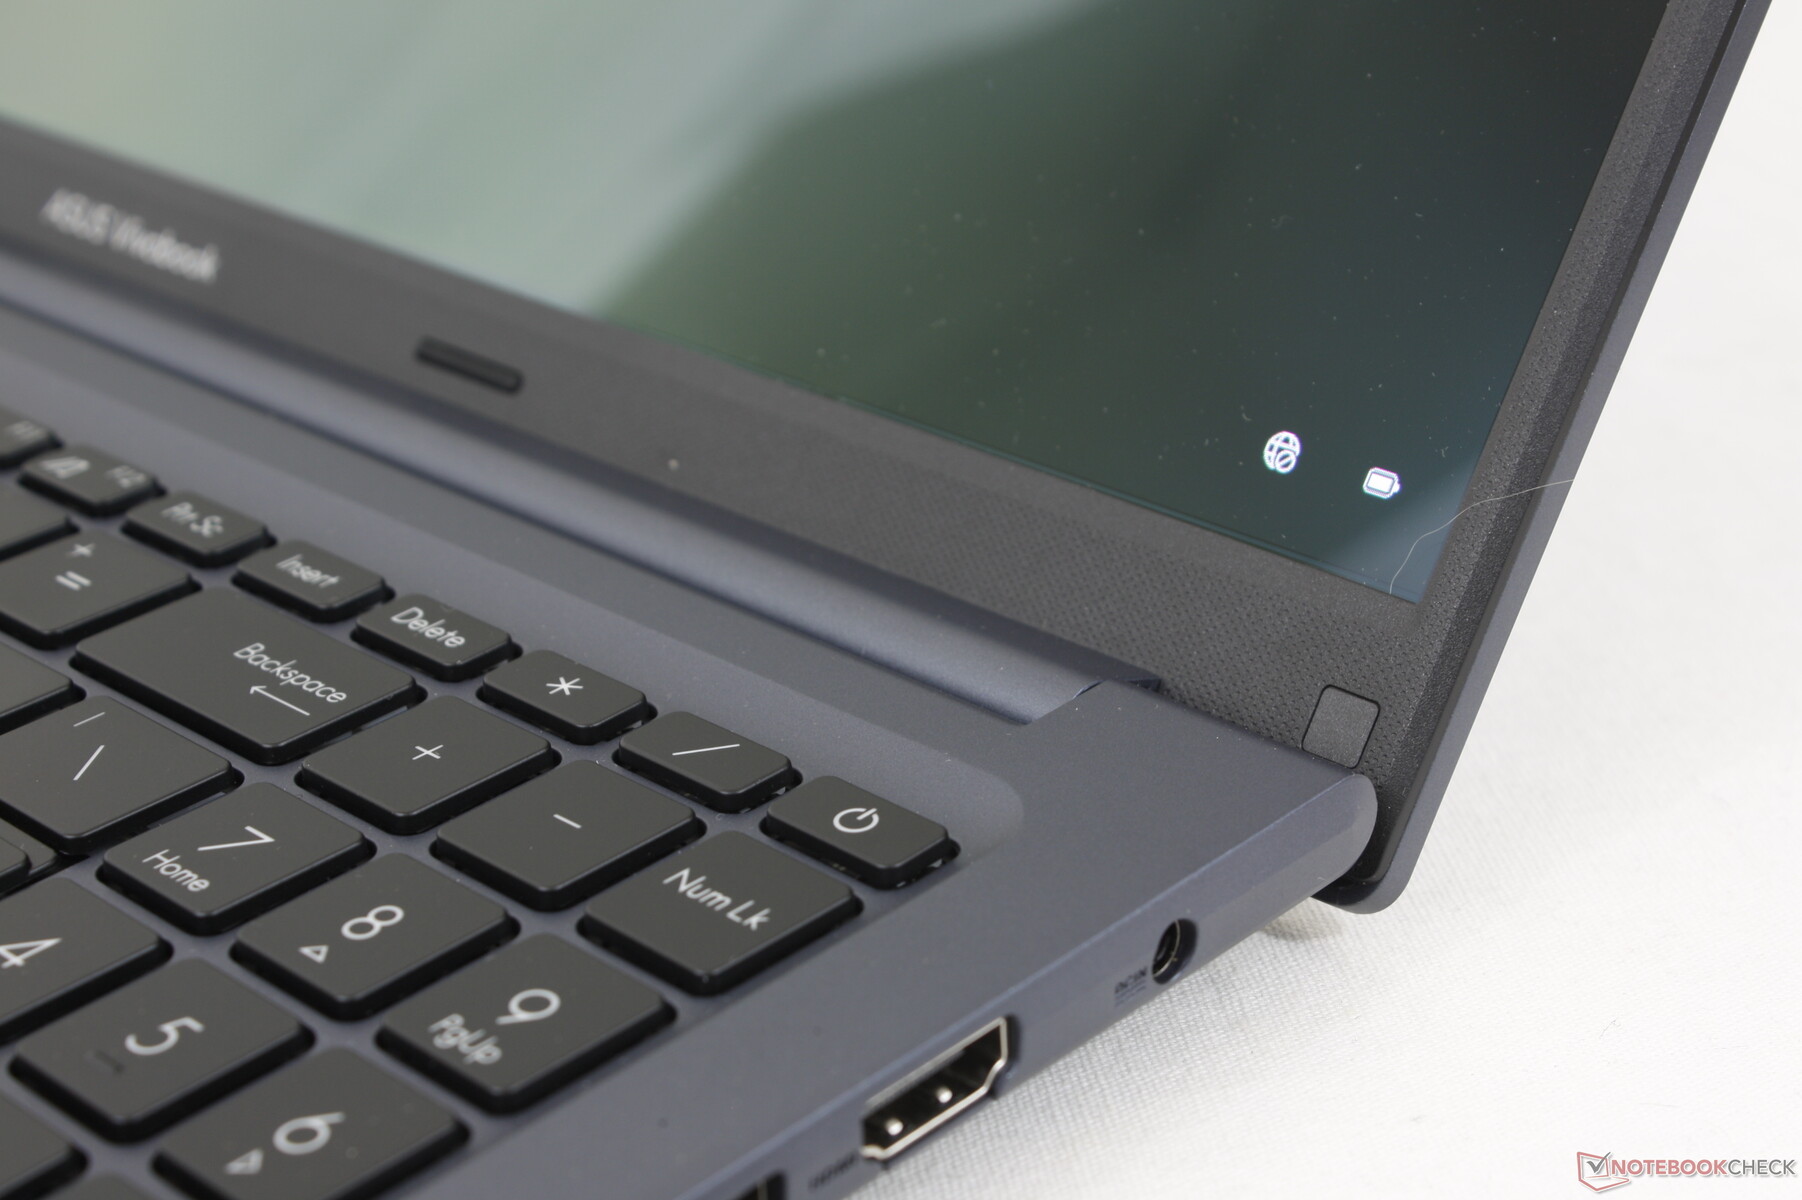
La webcam di serie è da 720p o 1 MP, probabilmente la più scadente in termini di risoluzione. Almeno c'è un otturatore fisico incorporato per la privacy, mentre il VivoBook 15 è standard VivoBook 15 era privo di otturatore.
Non c'è il sensore IR né il supporto Hello.


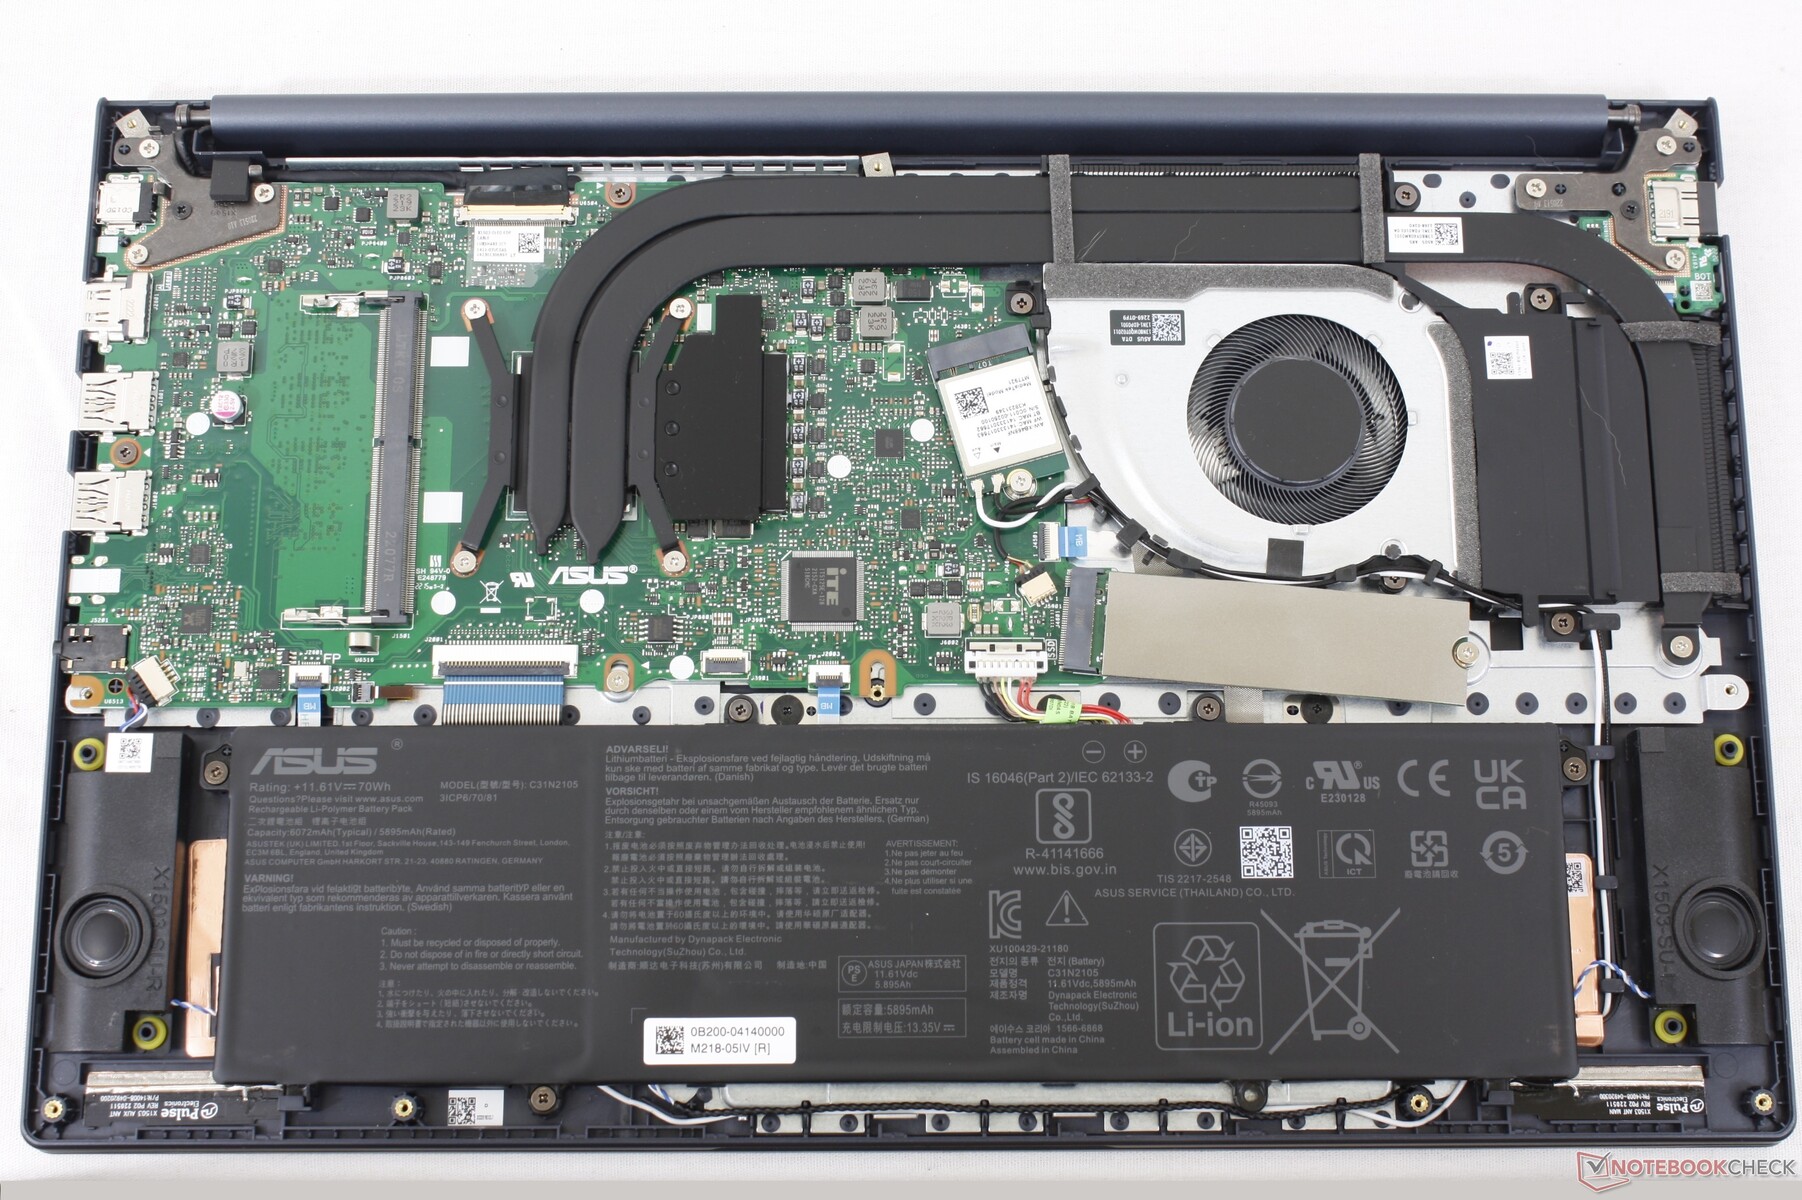
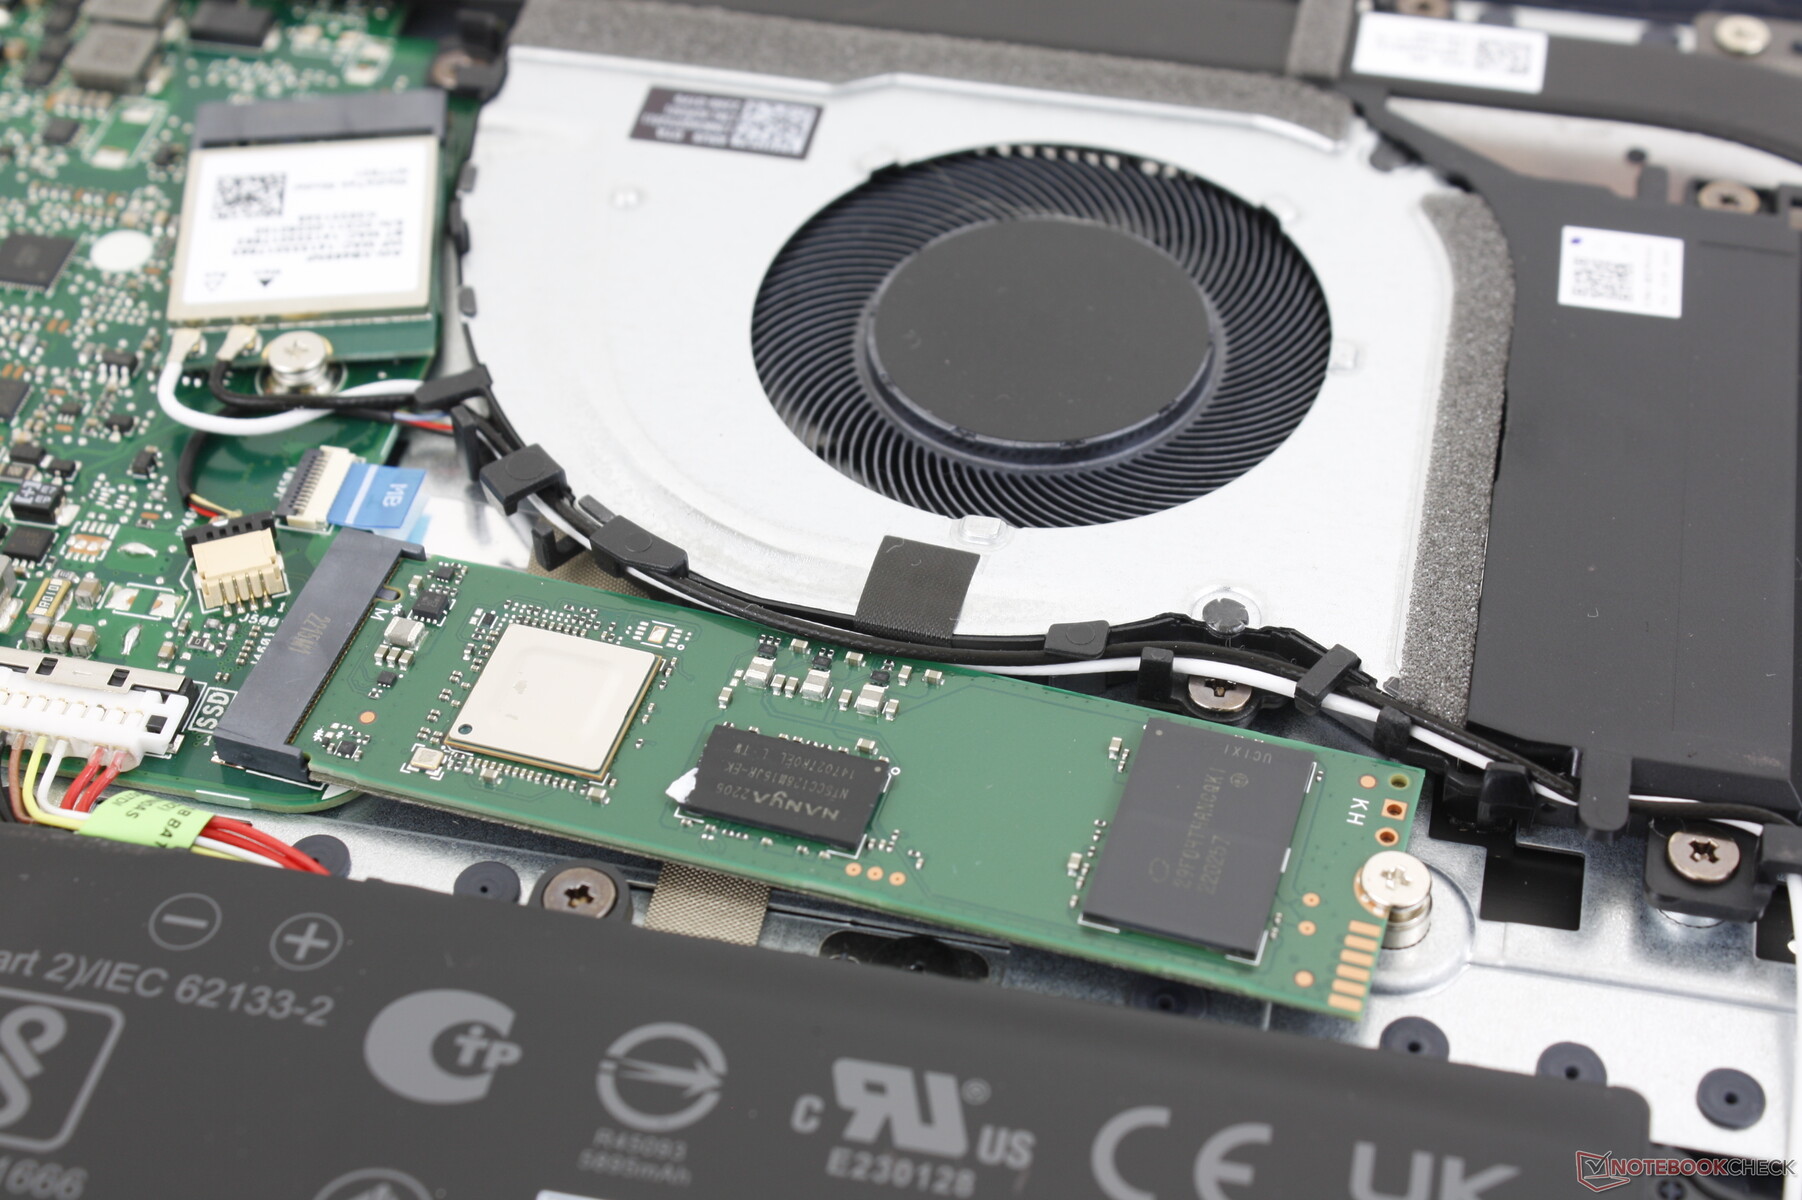
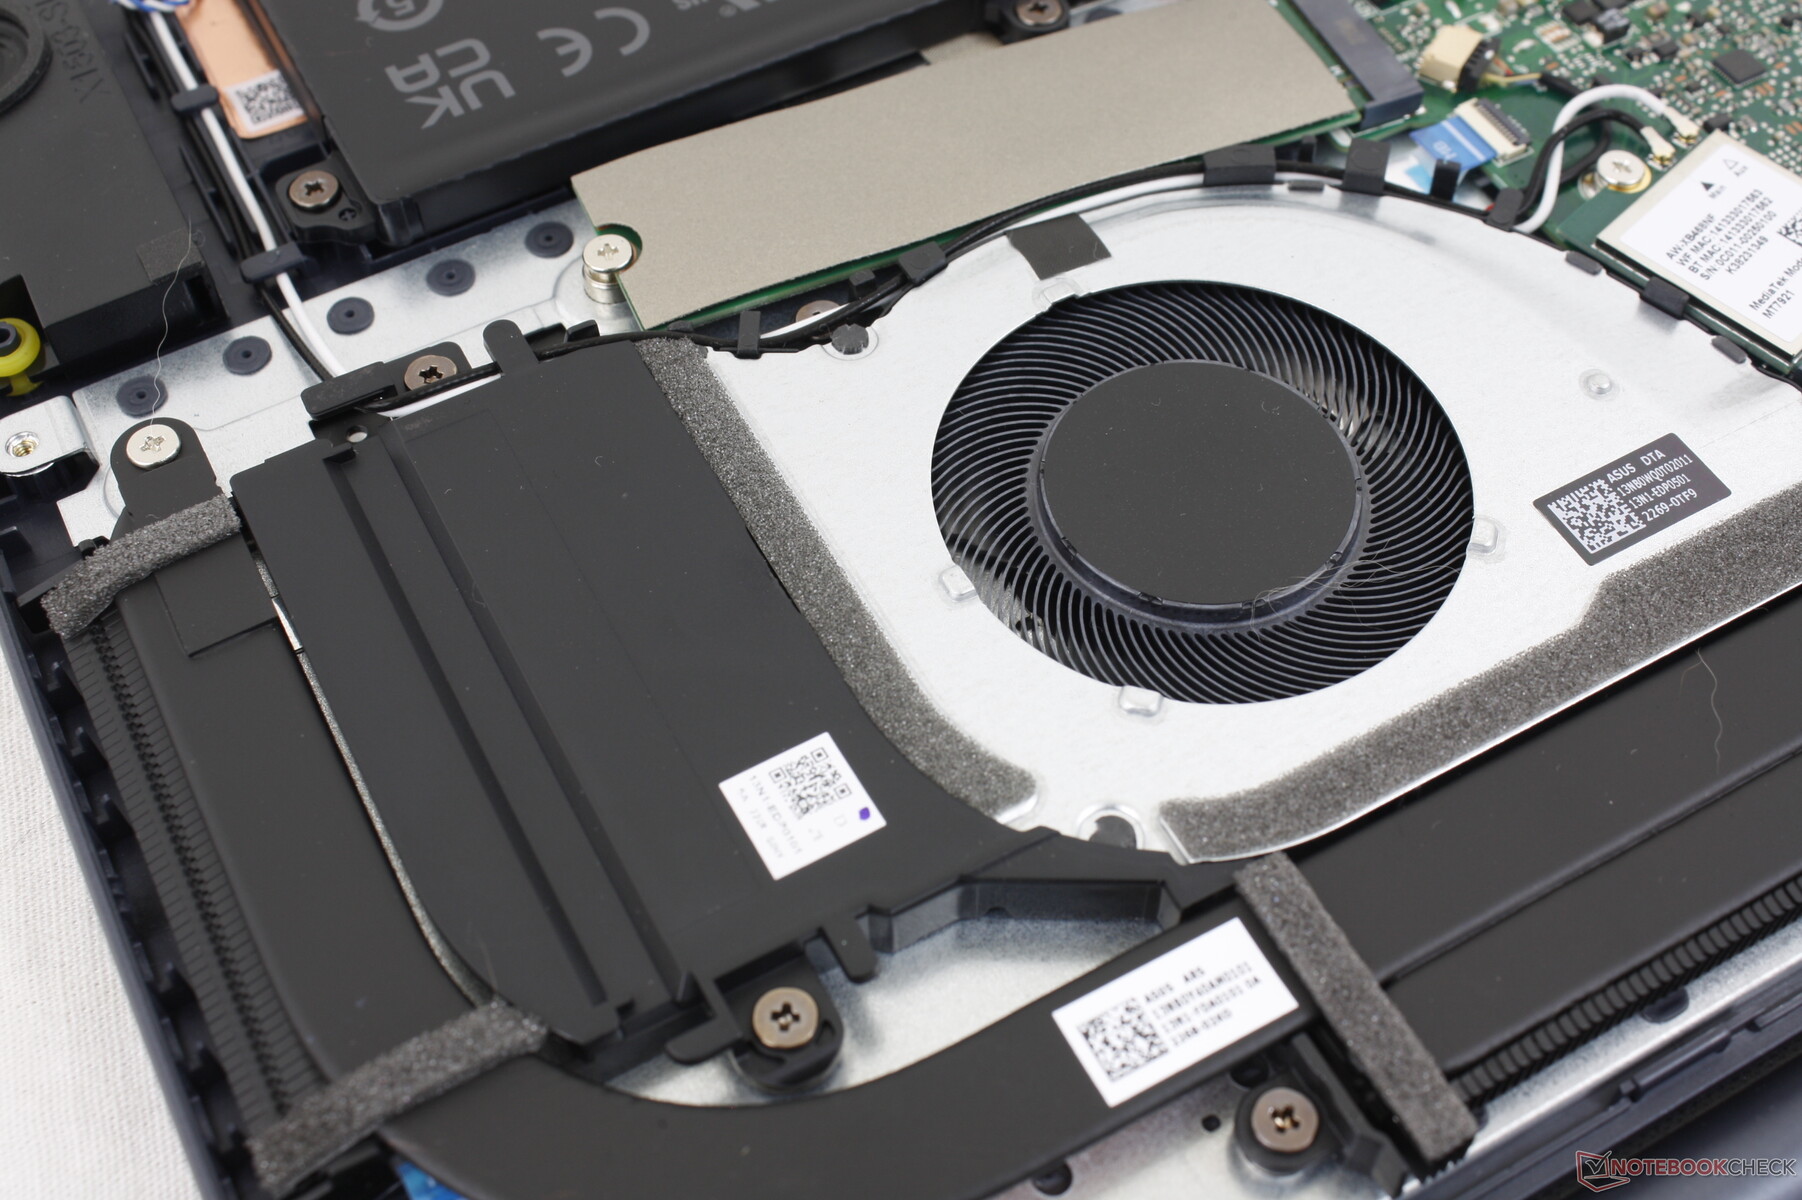
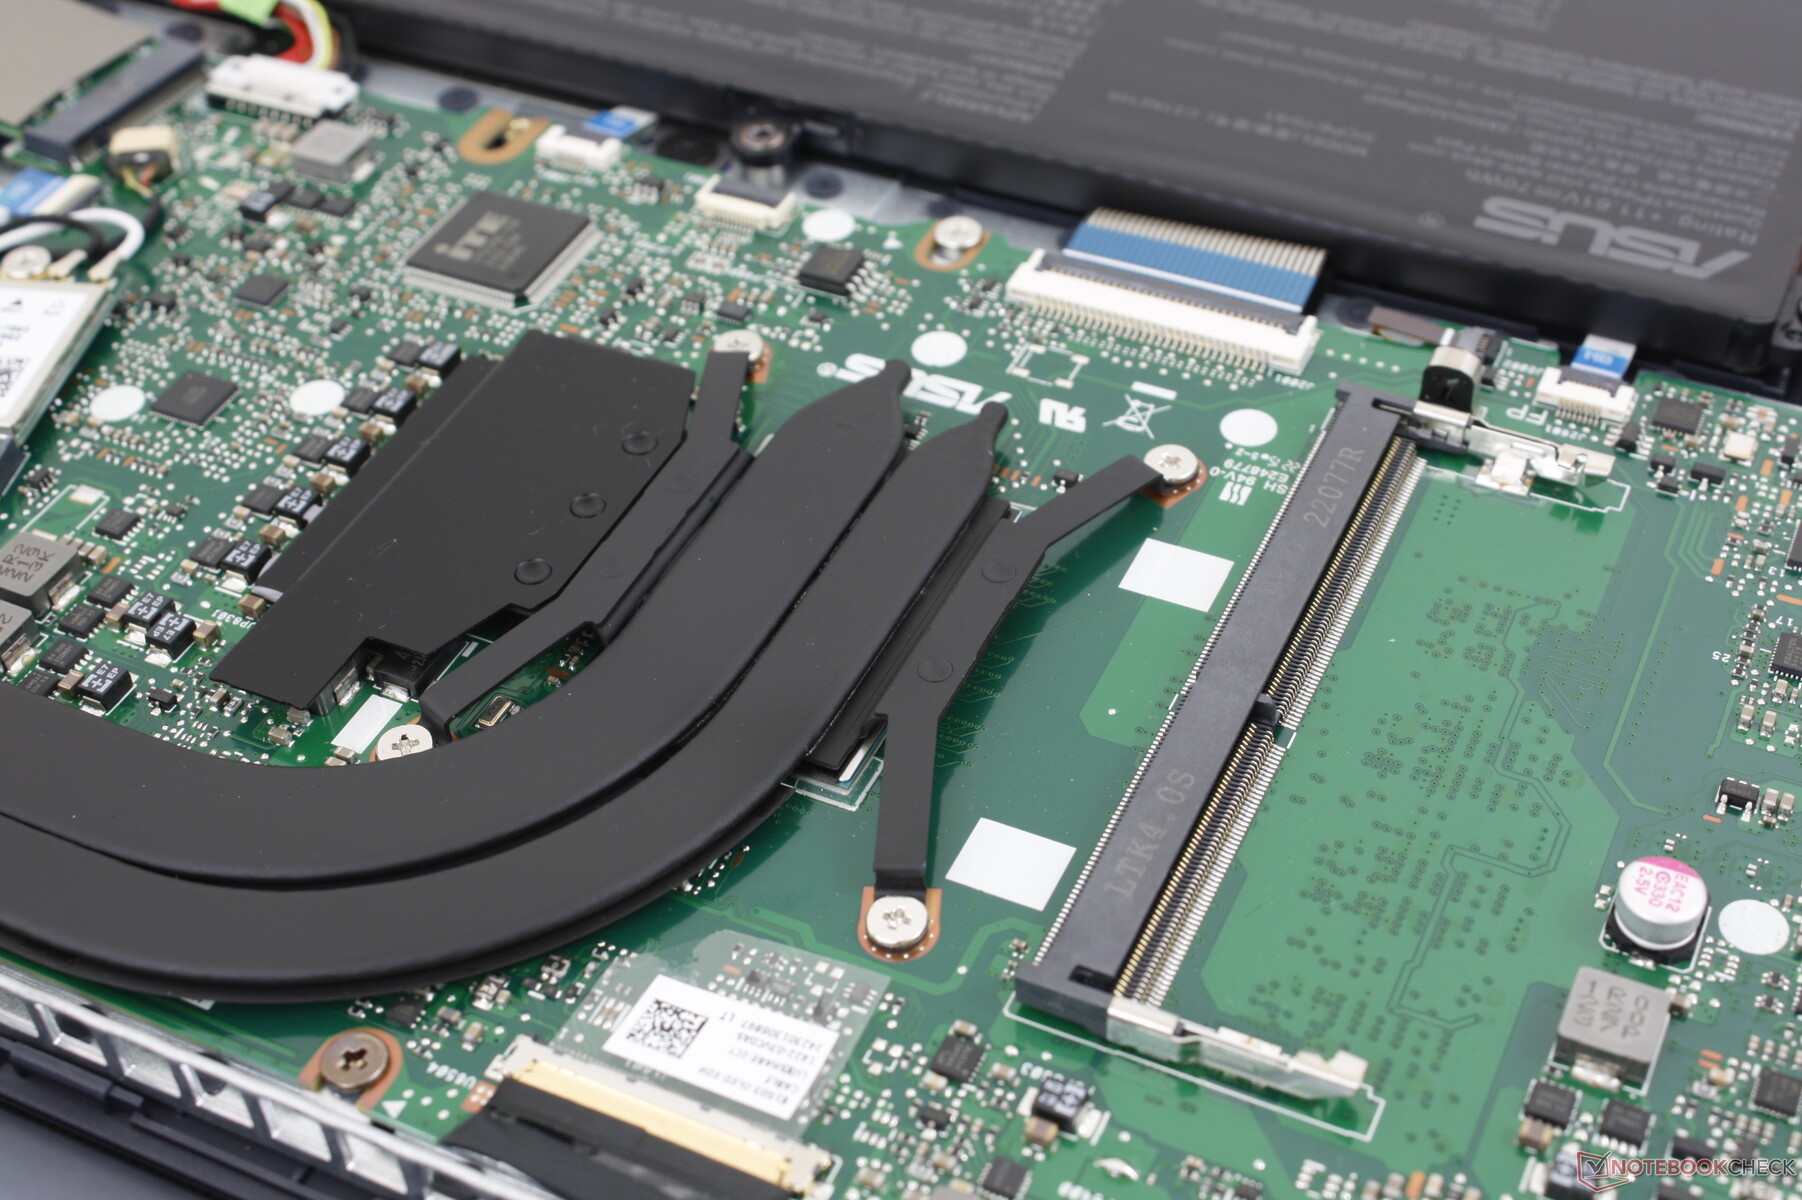
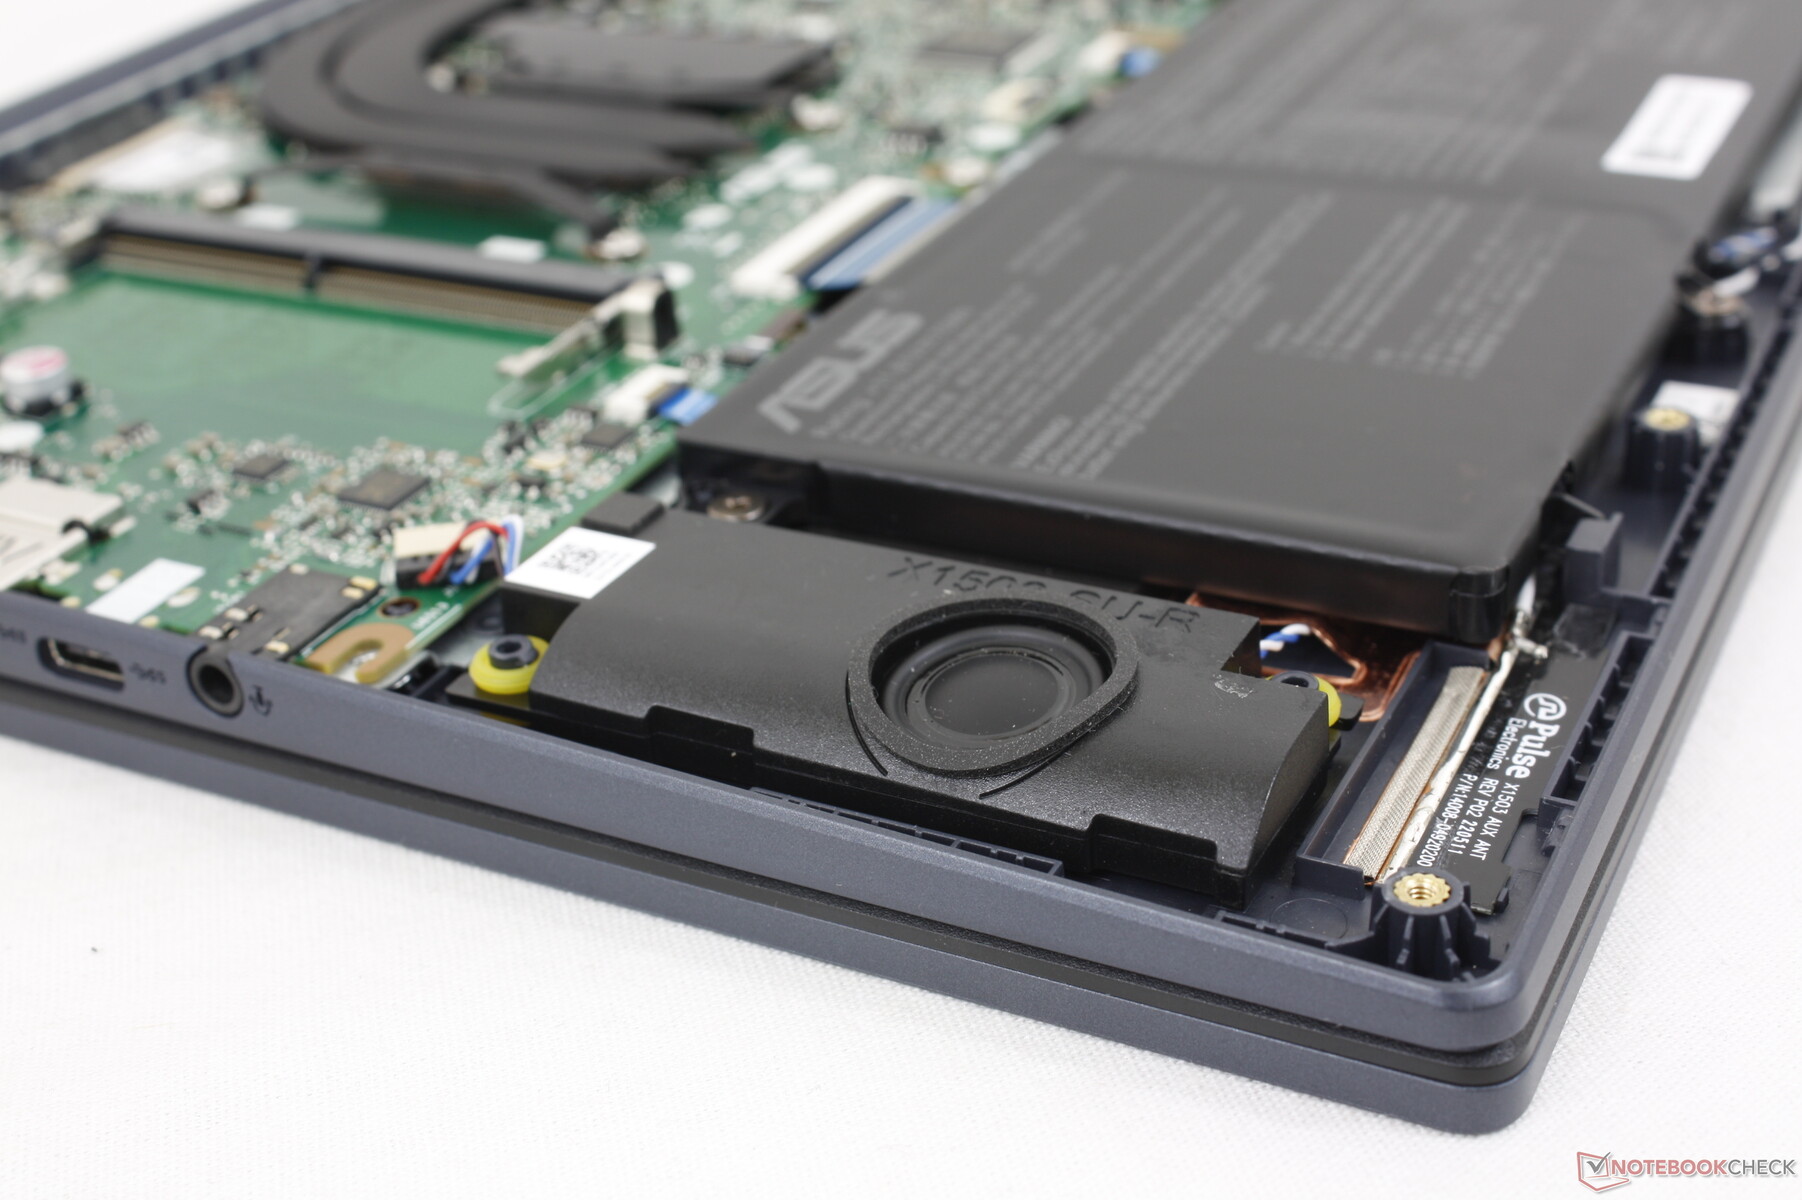
Manutenzione
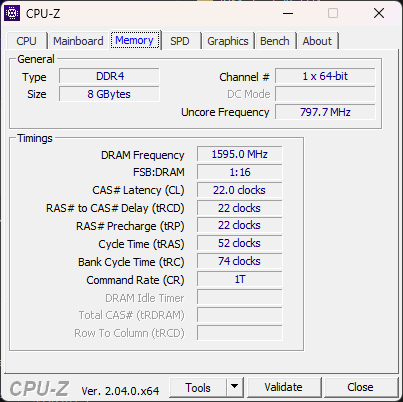
Il pannello inferiore è fissato con 10 viti Philips, nessuna delle quali è nascosta sotto la base in gomma per facilitare la manutenzione. Gli utenti hanno accesso diretto al singolo slot M.2 2280 PCIe3 x4, al singolo slot SODIMM DDR4, al modulo WLAN e alla batteria. 8 GB di RAM a canale singolo saldata sono fissi, per una capacità combinata di 16 GB se lo slot SODIMM è occupato.
Accessori e garanzia
La confezione non contiene altri extra oltre all'adattatore CA e alla documentazione. La garanzia standard limitata di un anno del produttore è valida se acquistata negli Stati Uniti.
Dispositivi di input - Cliccabili e per lo più confortevoli
Tastiera
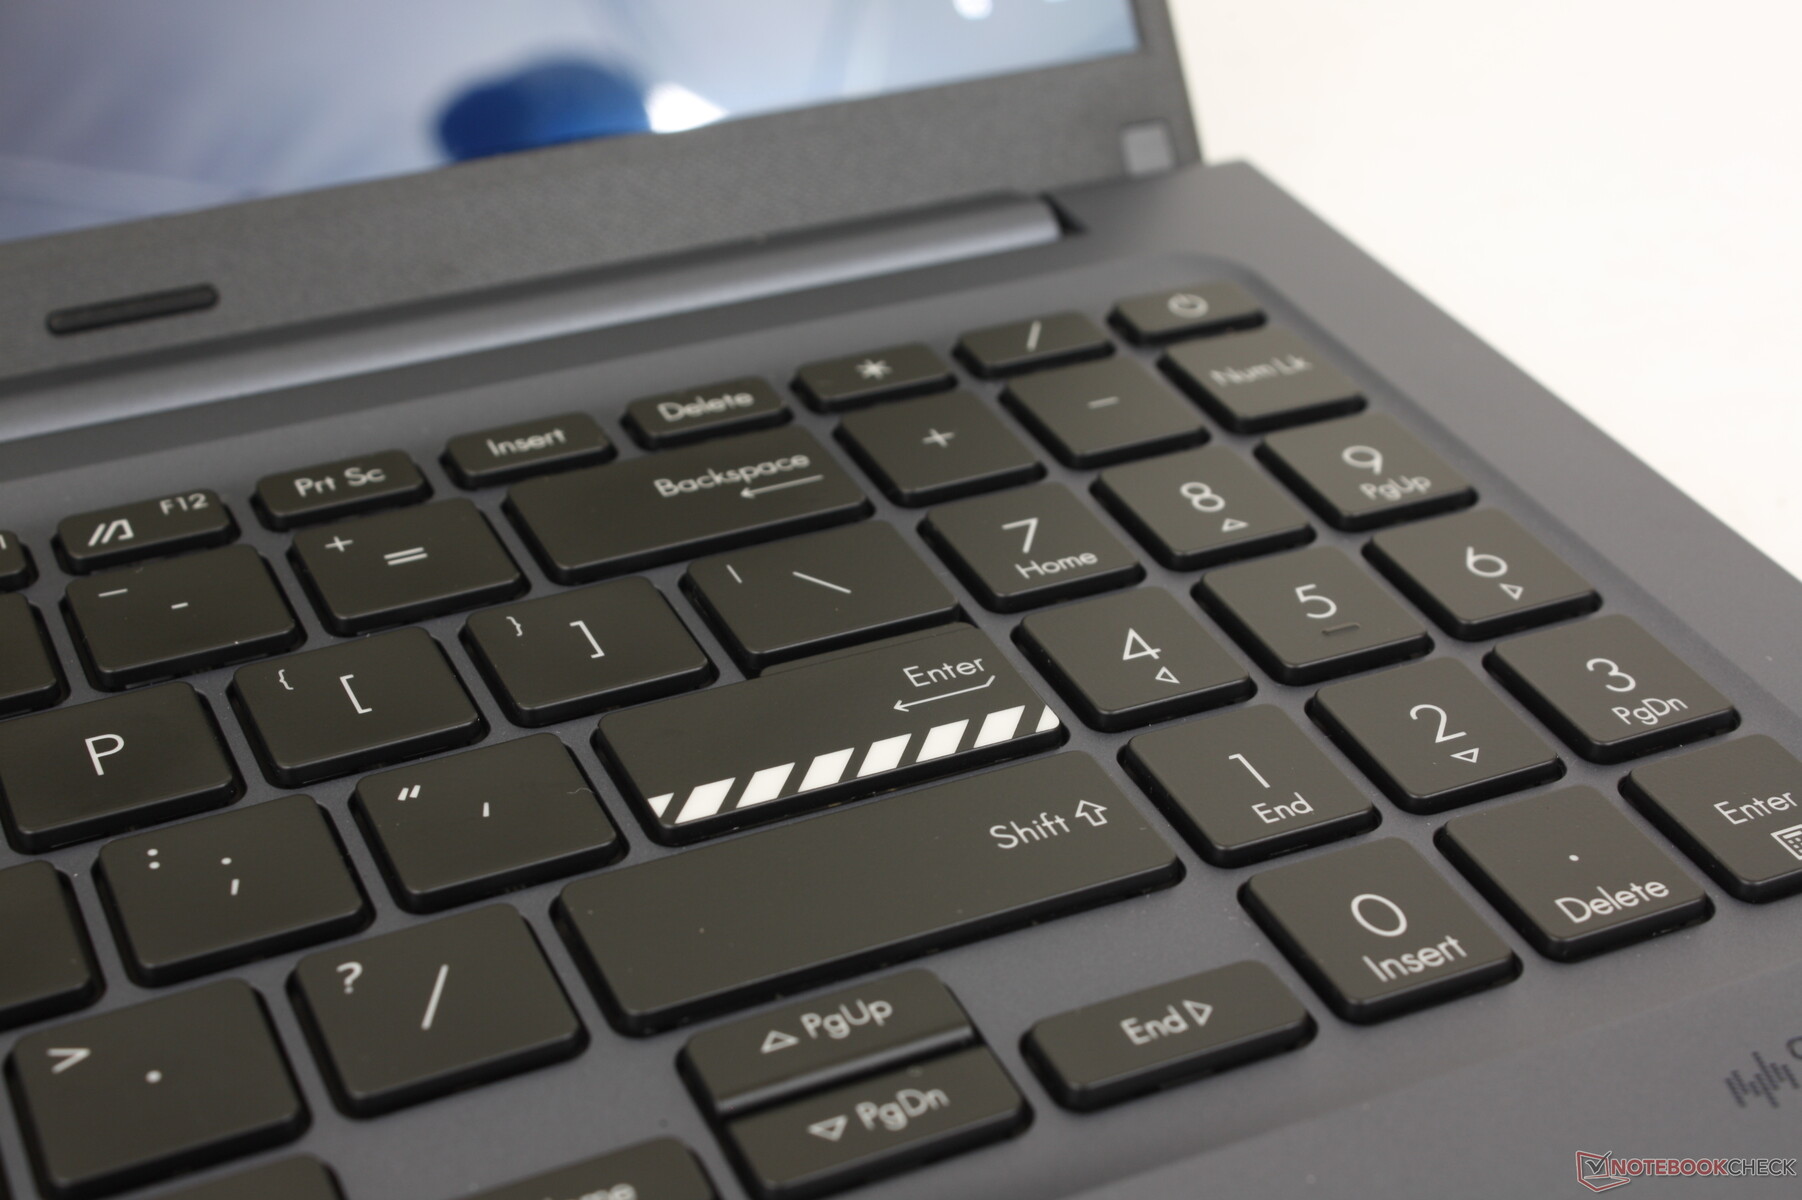
Il feedback della tastiera è solido e più nitido di quanto ci si aspettasse considerando la fascia di prezzo accessibile. I tasti Spazio e Invio, per esempio, non sono così spugnosi come su un Lenovo IdeaPad serie 3. Purtroppo, non si può dire lo stesso dei tasti freccia e del tastierino numerico, che sono più piccoli e più morbidi dei tasti QWERTY principali.
Il rumore dei tasti è leggermente più forte e acuto rispetto a quello della maggior parte degli altri Ultrabook, probabilmente a causa del feedback nitido. Non è abbastanza forte da essere fastidioso, ma vale comunque la pena di menzionarlo.
Touchpad
Il clickpad è più grande di quello del VivoBook 15 2021 (13 x 7,5 cm contro 10,5 x 7,3 cm) per facilitare il controllo del cursore e gli input multi-touch. Lo scorrimento è fluido e con un po' di aderenza alle velocità più basse per un trascinamento più preciso. Il feedback quando si fa clic è purtroppo meno profondo e più spugnoso di quanto vorremmo, per cui è sicuramente necessario un mouse per le sessioni più lunghe.

Display - Solo OLED

Asus offre due opzioni di risoluzione, entrambe OLED lucide e convalidate da Pantone:
- 1920 x 1080, 100% DCI-P3, HDR600, 60 Hz
- 2880 x 1620, 100% DCI-P3, HDR600, 120 Hz
La nostra unità di prova è dotata dell'opzione in grassetto qui sopra. In realtà, Asus utilizza lo stesso pannello OLED Samsung ATNA56YX03-0 sia per il VivoBook 15X che per il VivoBook 15 standard, il che significa che i due modelli offrono esperienze visive simili.
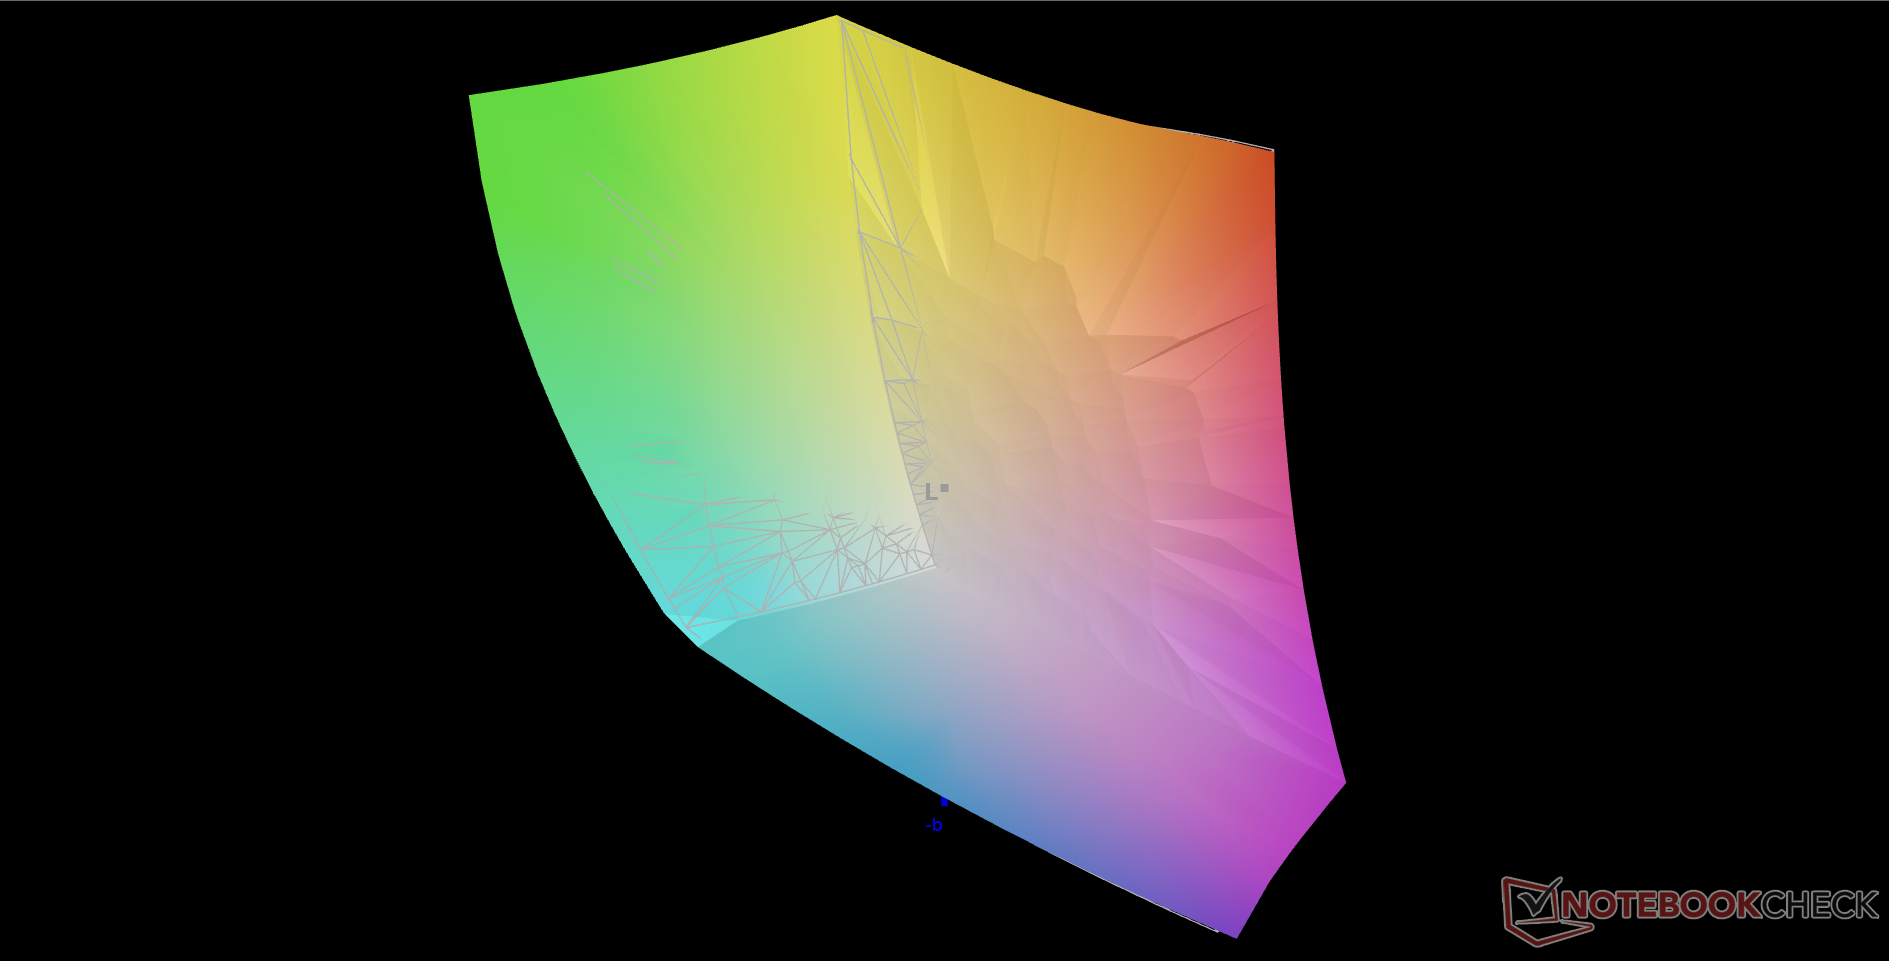
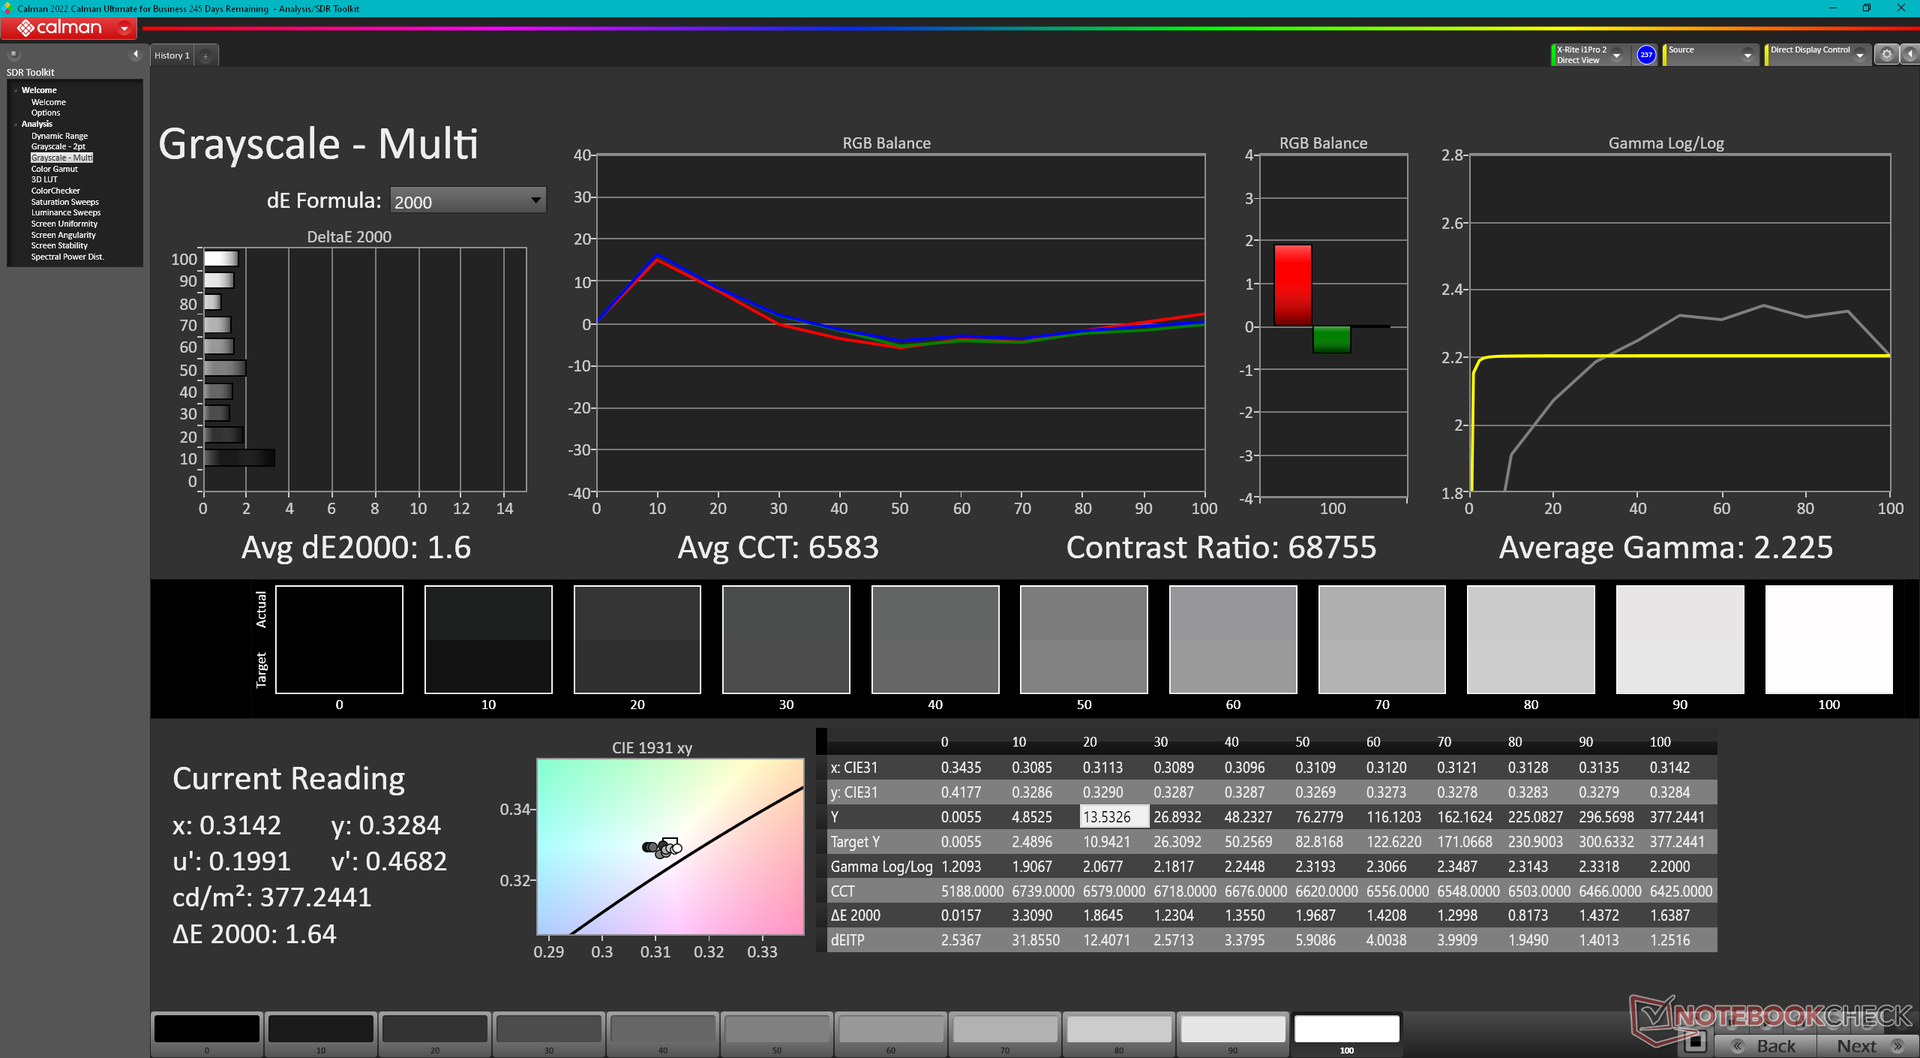
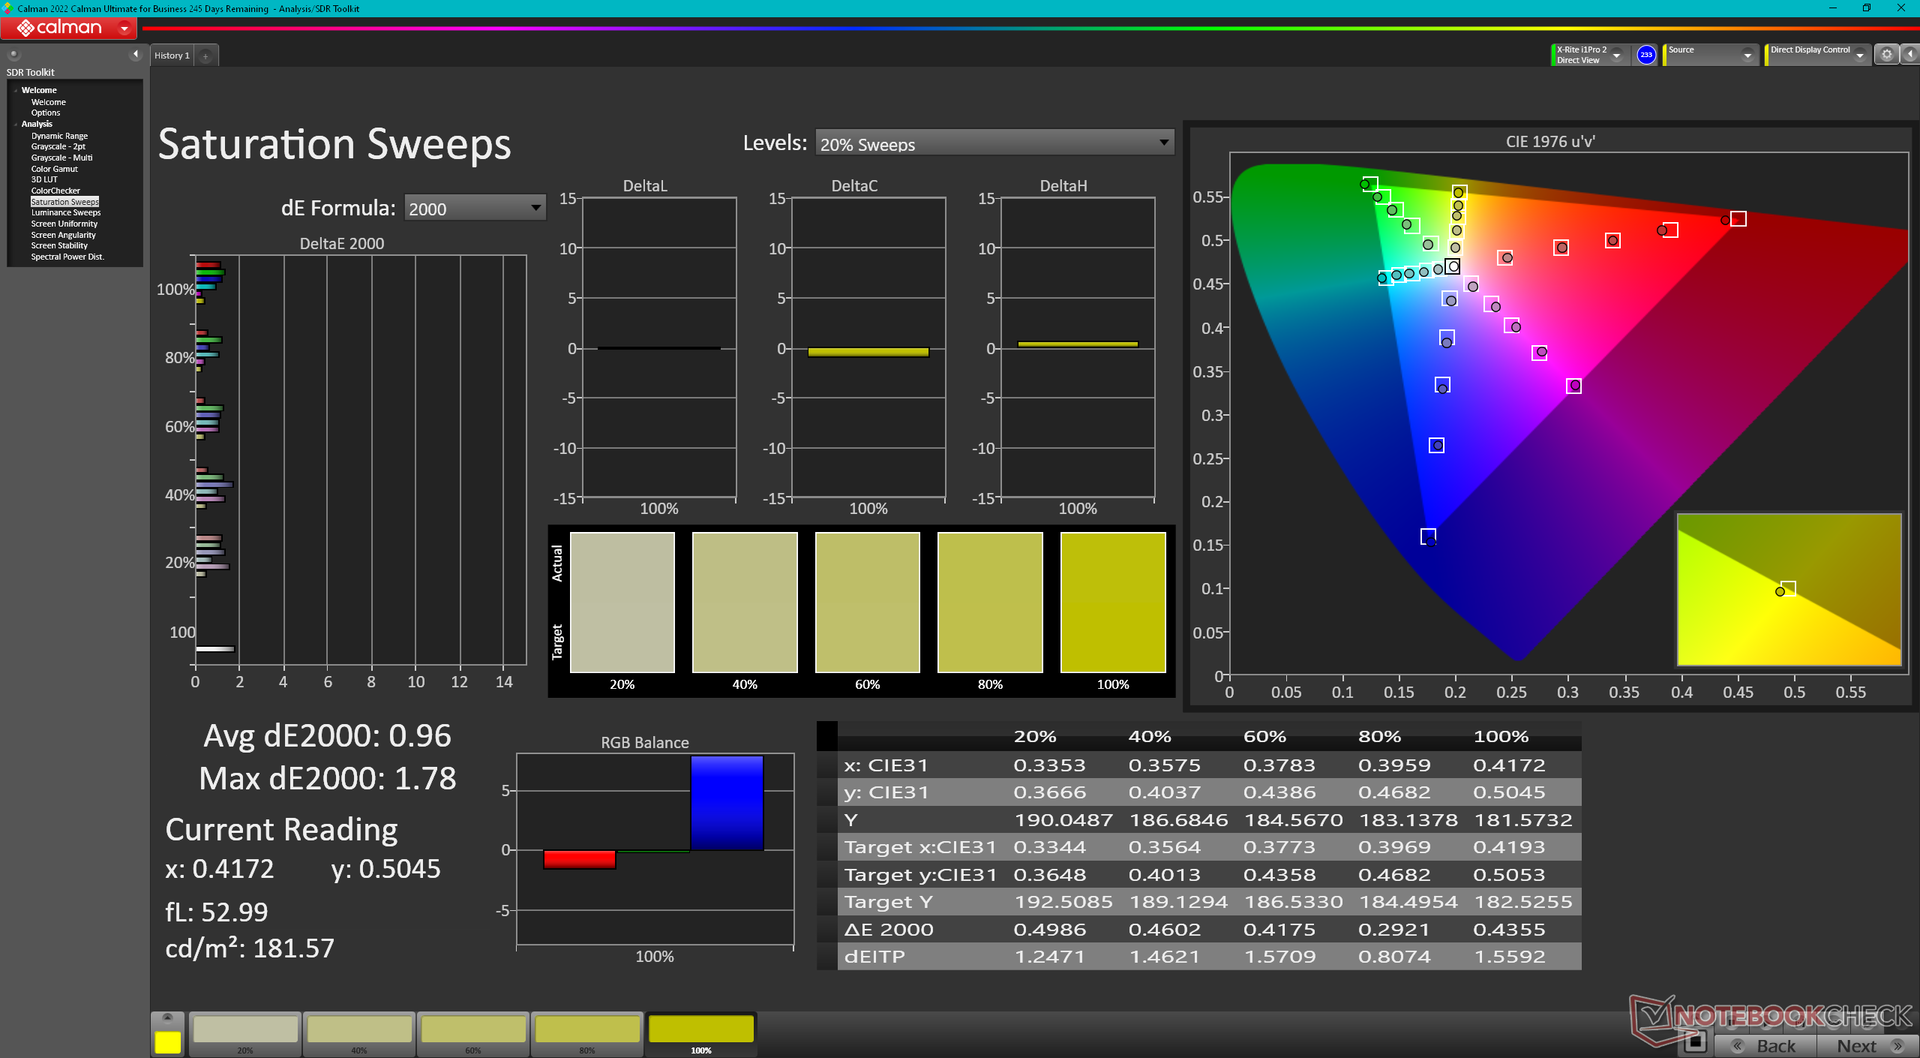
Siamo in grado di confermare la copertura completa DCI-P3, mentre il valore massimo di 600 nit è raggiungibile solo quando si riproducono contenuti HDR, come questo video di test HDR di https://www.youtube.com/watch?v=NlAsAuBtmps. Altrimenti, la luminosità massima del display raggiunge appena i 380 nit per tutti gli altri contenuti.

| |||||||||||||||||||||||||
Distribuzione della luminosità: 98 %
Al centro con la batteria: 379 cd/m²
Contrasto: ∞:1 (Nero: 0 cd/m²)
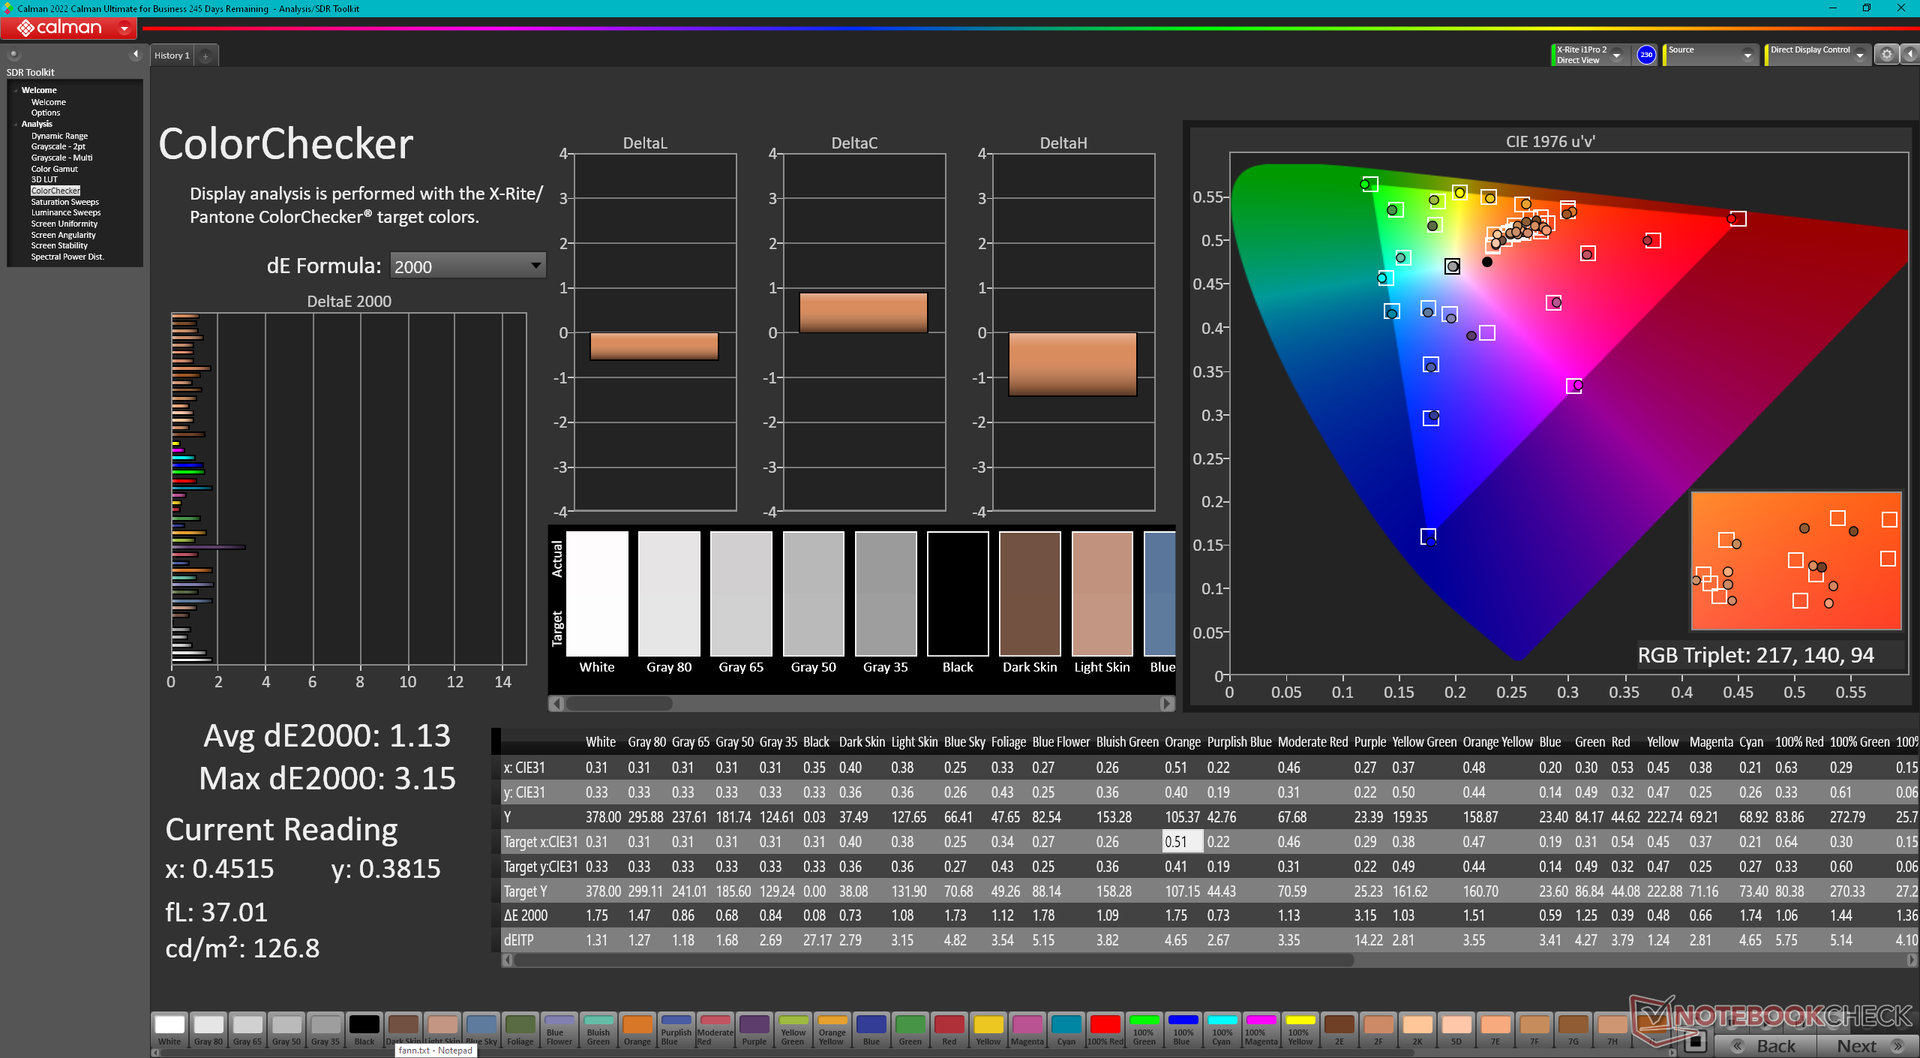
ΔE ColorChecker Calman: 1.13 | ∀{0.5-29.43 Ø4.71}
ΔE Greyscale Calman: 1.6 | ∀{0.09-98 Ø4.96}
89.7% AdobeRGB 1998 (Argyll 3D)
99.9% sRGB (Argyll 3D)
99.6% Display P3 (Argyll 3D)
Gamma: 2.23
CCT: 6583 K
| Asus VivoBook 15 X M1503QA Samsung ATNA56YX03-0, OLED, 1920x1080, 15.6" | Asus Vivobook 15 K513EQ Samsung ATNA56YX03-0, OLED, 1920x1080, 15.6" | Asus VivoBook S15 D533UA Chi Mei N156HCA-EAB, IPS, 1920x1080, 15.6" | Asus ZenBook UX535-M01440 BOE0866, IPS, 3840x2160, 15.6" | Lenovo ThinkBook 15 G3 ACL 21A400B2GE Chi Mei N156HCA-EAC, IPS, 1920x1080, 15.6" | Dell Inspiron 15 3501 BOE NV15N3D (Dell P/N: N39X1), IPS, 1920x1080, 15.6" | |
|---|---|---|---|---|---|---|
| Display | 4% | -47% | -18% | -46% | -52% | |
| Display P3 Coverage (%) | 99.6 | 99.9 0% | 43.6 -56% | 68.8 -31% | 43.8 -56% | 39.4 -60% |
| sRGB Coverage (%) | 99.9 | 100 0% | 65.2 -35% | 99.5 0% | 65.5 -34% | 58.7 -41% |
| AdobeRGB 1998 Coverage (%) | 89.7 | 99.9 11% | 45 -50% | 70.1 -22% | 45.4 -49% | 40.7 -55% |
| Response Times | -27% | -832% | -1390% | -1211% | -1822% | |
| Response Time Grey 50% / Grey 80% * (ms) | 1.8 ? | 2.2 ? -22% | 18 ? -900% | 34 ? -1789% | 30 ? -1567% | 43 ? -2289% |
| Response Time Black / White * (ms) | 2.2 ? | 2.9 ? -32% | 19 ? -764% | 24 ? -991% | 21 ? -855% | 32 ? -1355% |
| PWM Frequency (Hz) | 59.52 | 59.5 ? | 1000 ? | |||
| Screen | -36% | -91% | -34% | -95% | -104% | |
| Brightness middle (cd/m²) | 379 | 384.5 1% | 289 -24% | 402 6% | 291 -23% | 271 -28% |
| Brightness (cd/m²) | 379 | 388 2% | 267 -30% | 375 -1% | 271 -28% | 263 -31% |
| Brightness Distribution (%) | 98 | 98 0% | 85 -13% | 84 -14% | 86 -12% | 92 -6% |
| Black Level * (cd/m²) | 0.56 | 0.35 | 0.375 | 0.15 | ||
| Colorchecker dE 2000 * | 1.13 | 2.53 -124% | 3.96 -250% | 2.47 -119% | 4.17 -269% | 4.83 -327% |
| Colorchecker dE 2000 max. * | 3.15 | 6.16 -96% | 6.76 -115% | 4.32 -37% | 7.18 -128% | 7 -122% |
| Greyscale dE 2000 * | 1.6 | 1.6 -0% | 3.43 -114% | 2.26 -41% | 3.31 -107% | 3.36 -110% |
| Gamma | 2.23 99% | 2.24 98% | 2.28 96% | 2.49 88% | 2.23 99% | 2.56 86% |
| CCT | 6583 99% | 6464 101% | 7191 90% | 6285 103% | 6457 101% | 6764 96% |
| Contrast (:1) | 516 | 1149 | 776 | 1807 | ||
| Color Space (Percent of AdobeRGB 1998) (%) | 42 | 99 | ||||
| Color Space (Percent of sRGB) (%) | 65 | |||||
| Colorchecker dE 2000 calibrated * | 2.36 | |||||
| Media totale (Programma / Settaggio) | -20% /
-24% | -323% /
-214% | -481% /
-276% | -451% /
-284% | -659% /
-402% |
* ... Meglio usare valori piccoli

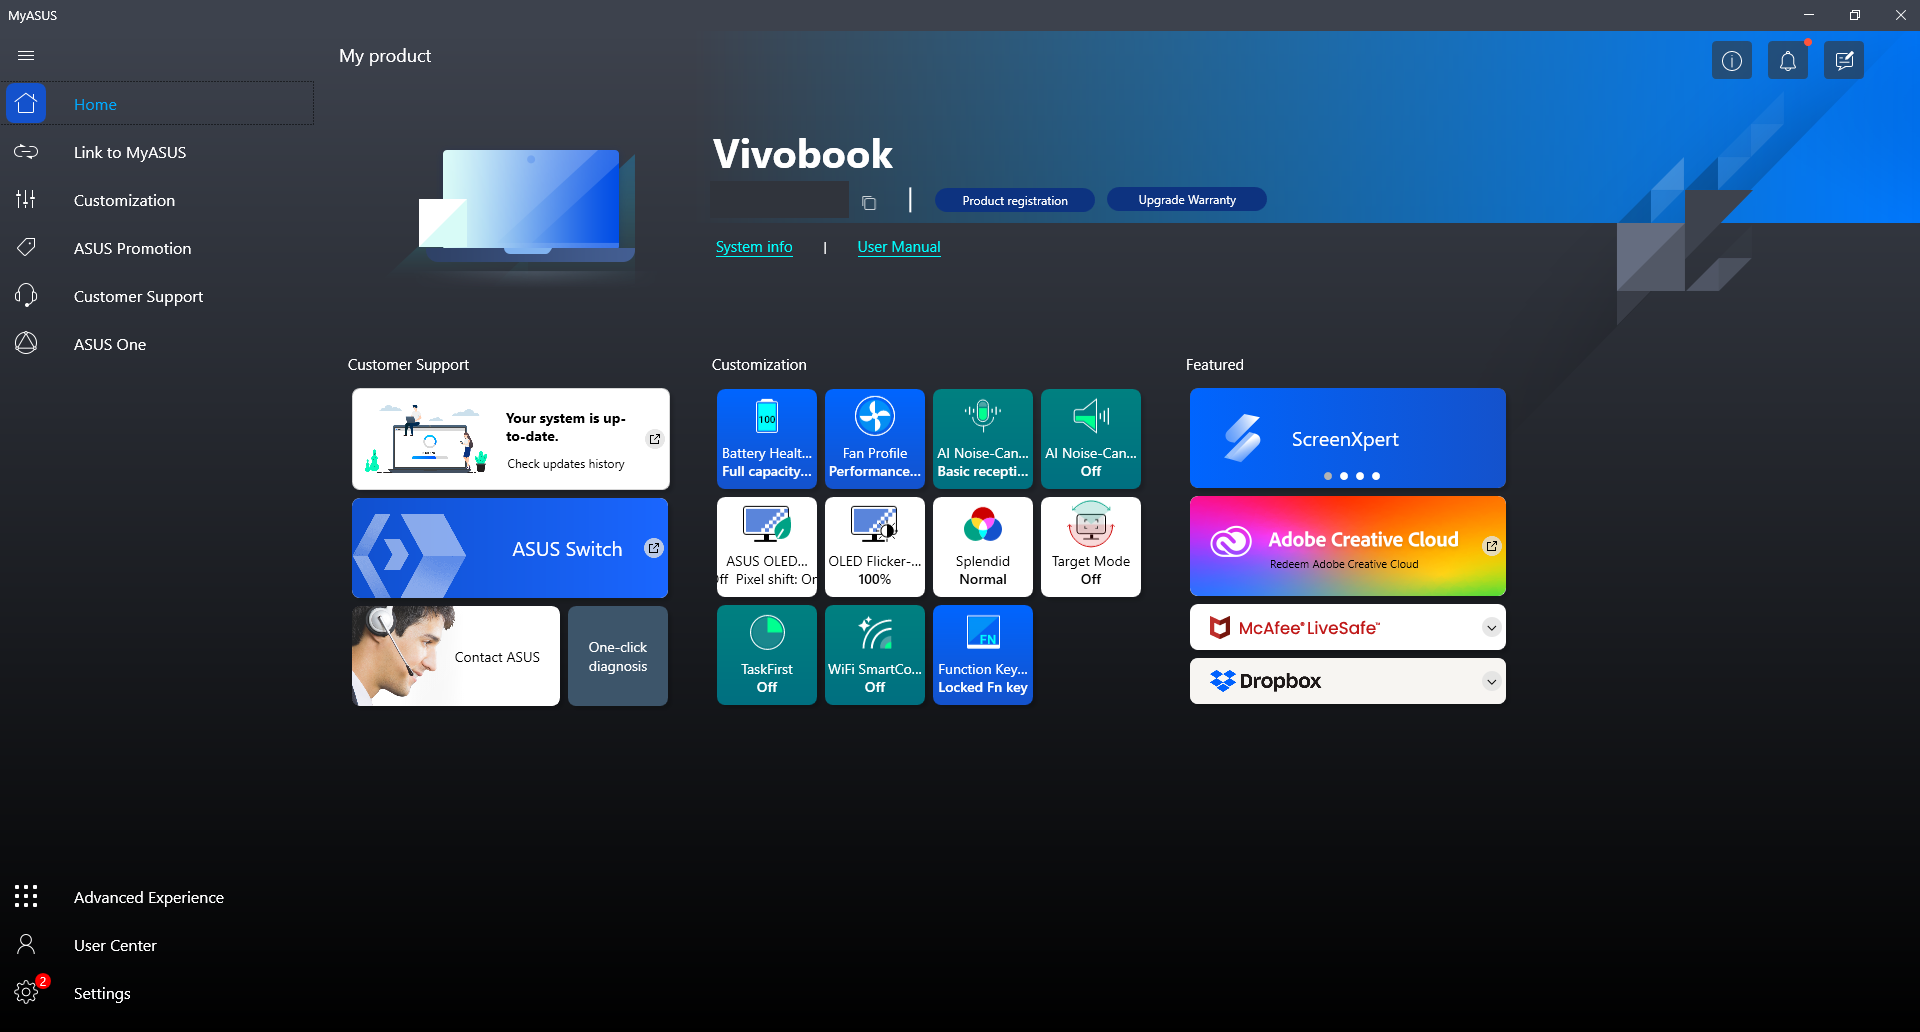
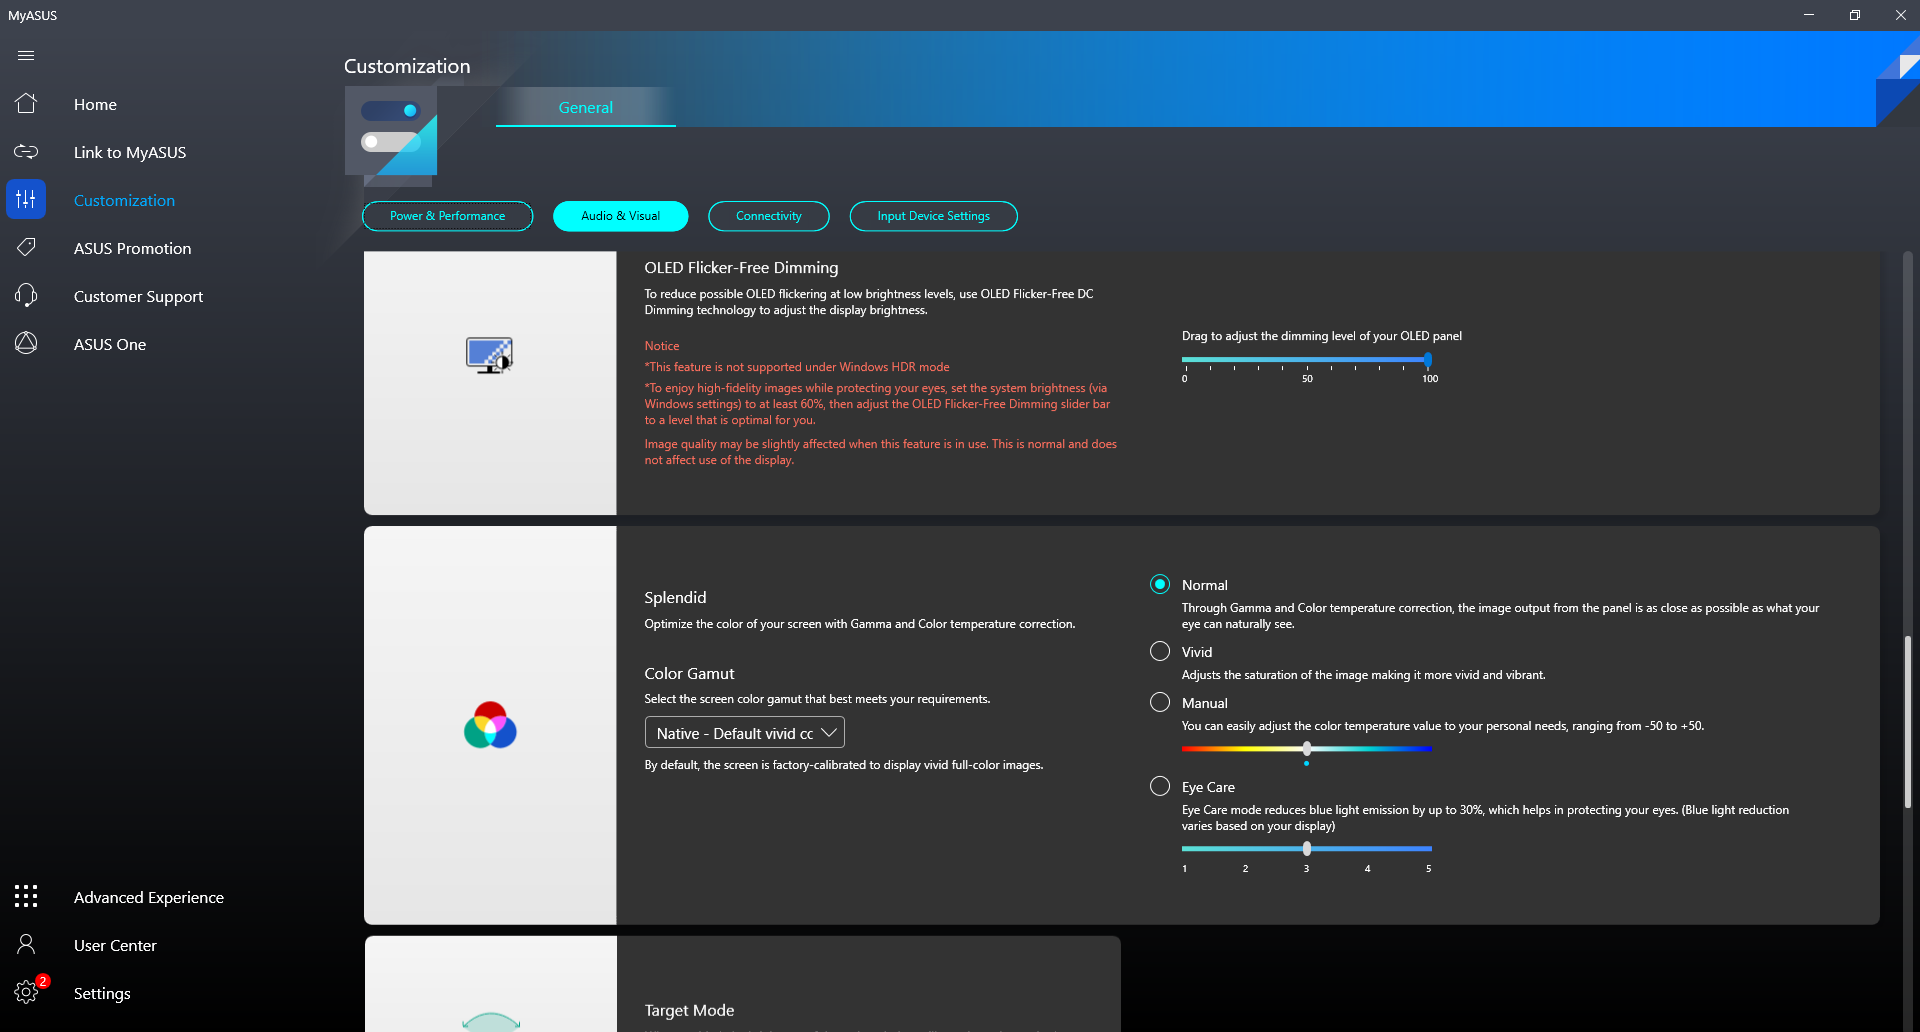
Possiamo confermare con il nostro colorimetro X-Rite che i colori sono già calibrati in partenza, come pubblicizzato dal produttore. I valori medi deltaE della scala di grigi e del colore sono rispettivamente di 1,6 e 1,13, il che significa che qualsiasi calibrazione da parte dell'utente finale non migliorerebbe di molto il display. Il passaggio da un profilo di colore all'altro con il software MyAsus preinstallato può risultare un po' problematico, in quanto le modifiche non sono correlate al profilo di colore integrato di Windows.
Tempi di risposta del Display
| ↔ Tempi di risposta dal Nero al Bianco | ||
|---|---|---|
| 2.2 ms ... aumenta ↗ e diminuisce ↘ combinato | ↗ 0.96 ms Incremento | 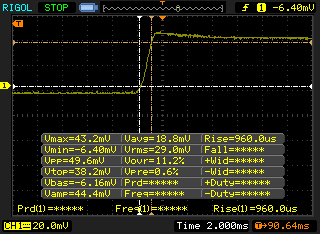 |
| ↘ 1.2 ms Calo | ||
| Lo schermo ha mostrato valori di risposta molto veloci nei nostri tests ed è molto adatto per i gaming veloce. In confronto, tutti i dispositivi di test variano da 0.1 (minimo) a 240 (massimo) ms. » 12 % di tutti i dispositivi è migliore. Questo significa che i tempi di risposta rilevati sono migliori rispettto alla media di tutti i dispositivi testati (19.8 ms). | ||
| ↔ Tempo di risposta dal 50% Grigio all'80% Grigio | ||
| 1.8 ms ... aumenta ↗ e diminuisce ↘ combinato | ↗ 0.92 ms Incremento | 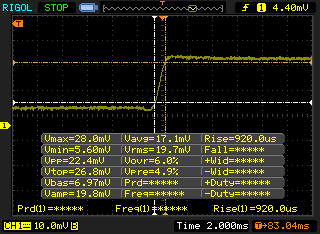 |
| ↘ 0.88 ms Calo | ||
| Lo schermo ha mostrato valori di risposta molto veloci nei nostri tests ed è molto adatto per i gaming veloce. In confronto, tutti i dispositivi di test variano da 0.165 (minimo) a 636 (massimo) ms. » 9 % di tutti i dispositivi è migliore. Questo significa che i tempi di risposta rilevati sono migliori rispettto alla media di tutti i dispositivi testati (31 ms). | ||
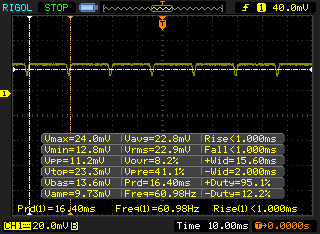
Sfarfallio dello schermo / PWM (Pulse-Width Modulation)
| flickering dello schermo / PWM rilevato | 59.52 Hz | 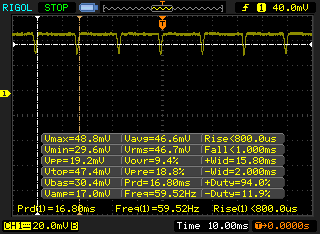 | |
Il display sfarfalla a 59.52 Hz (Probabilmente a causa dell'uso di PWM) . La frequenza di 59.52 Hz è molto bassa, quindi il flickering potrebbe causare stanchezza agli occhi e mal di testa con un utilizzo prolungato. In confronto: 52 % di tutti i dispositivi testati non utilizza PWM per ridurre la luminosita' del display. Se è rilevato PWM, una media di 7754 (minimo: 5 - massimo: 343500) Hz è stata rilevata. | |||
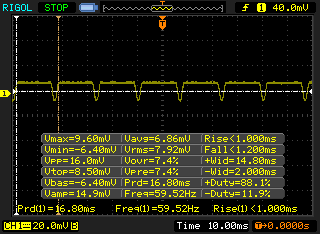
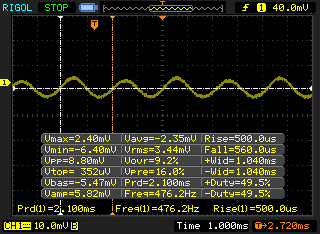
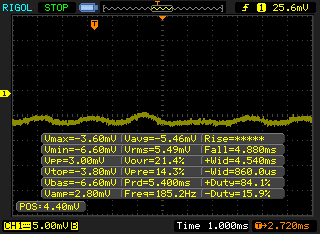
La modulazione dell'ampiezza degli impulsi è presente a tutti i livelli di luminosità, come nella maggior parte degli altri pannelli OLED per computer portatili. Siamo in grado di registrare una frequenza di 50 Hz dal 51 al 100% di luminosità e di 476 Hz dallo 0 al 49% di luminosità.

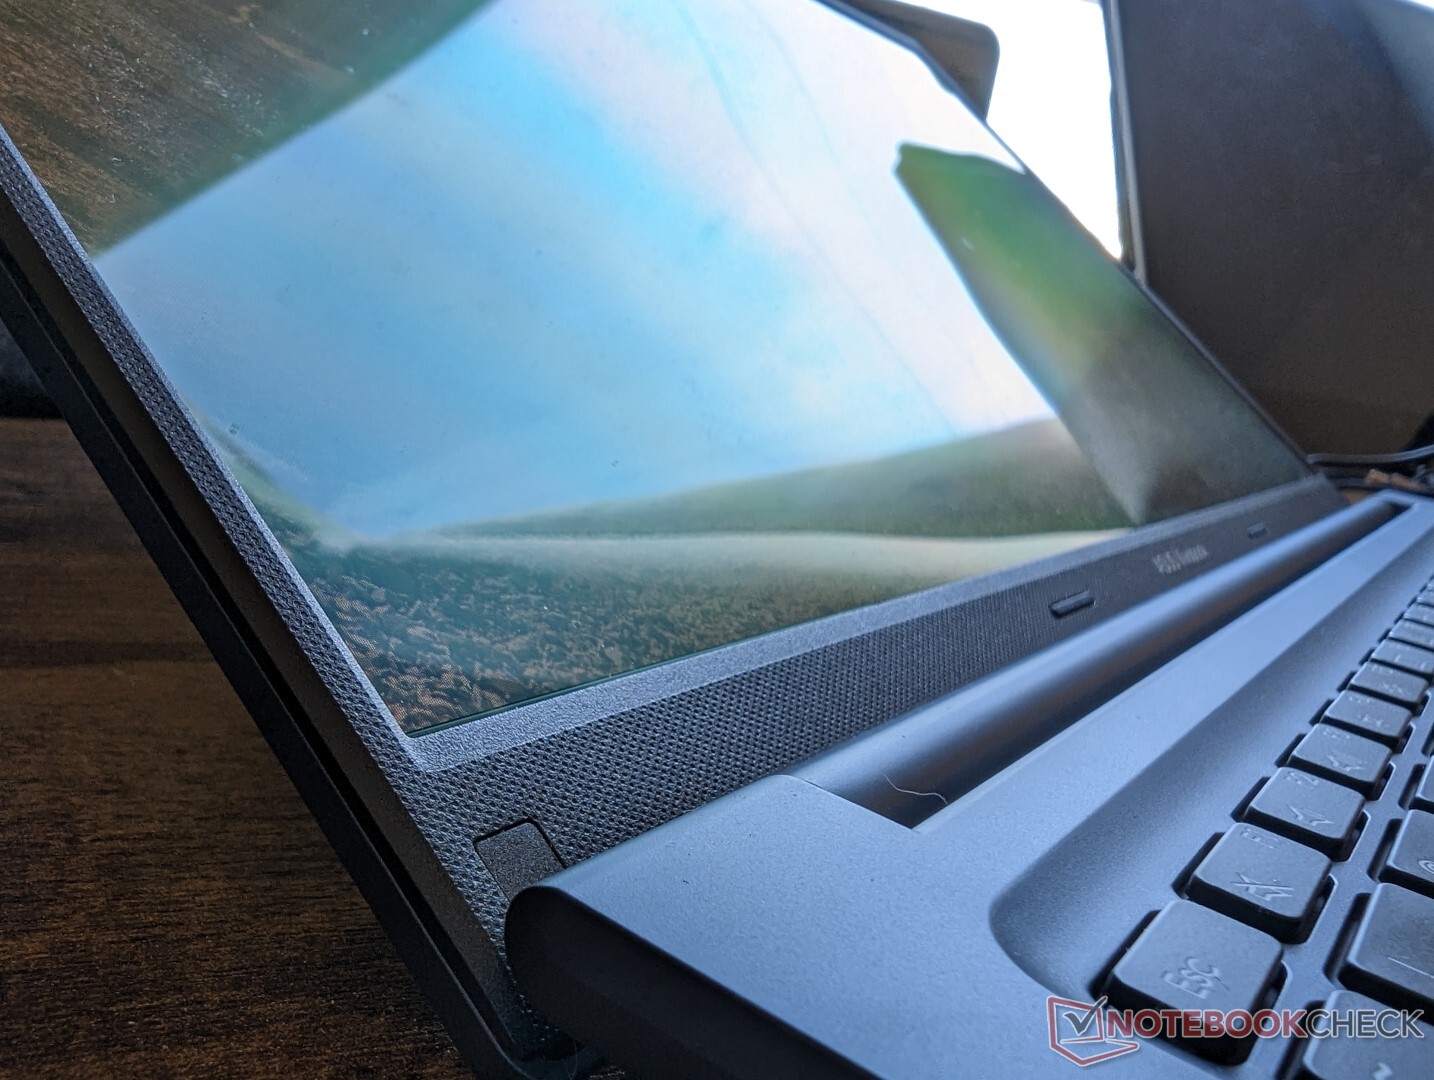
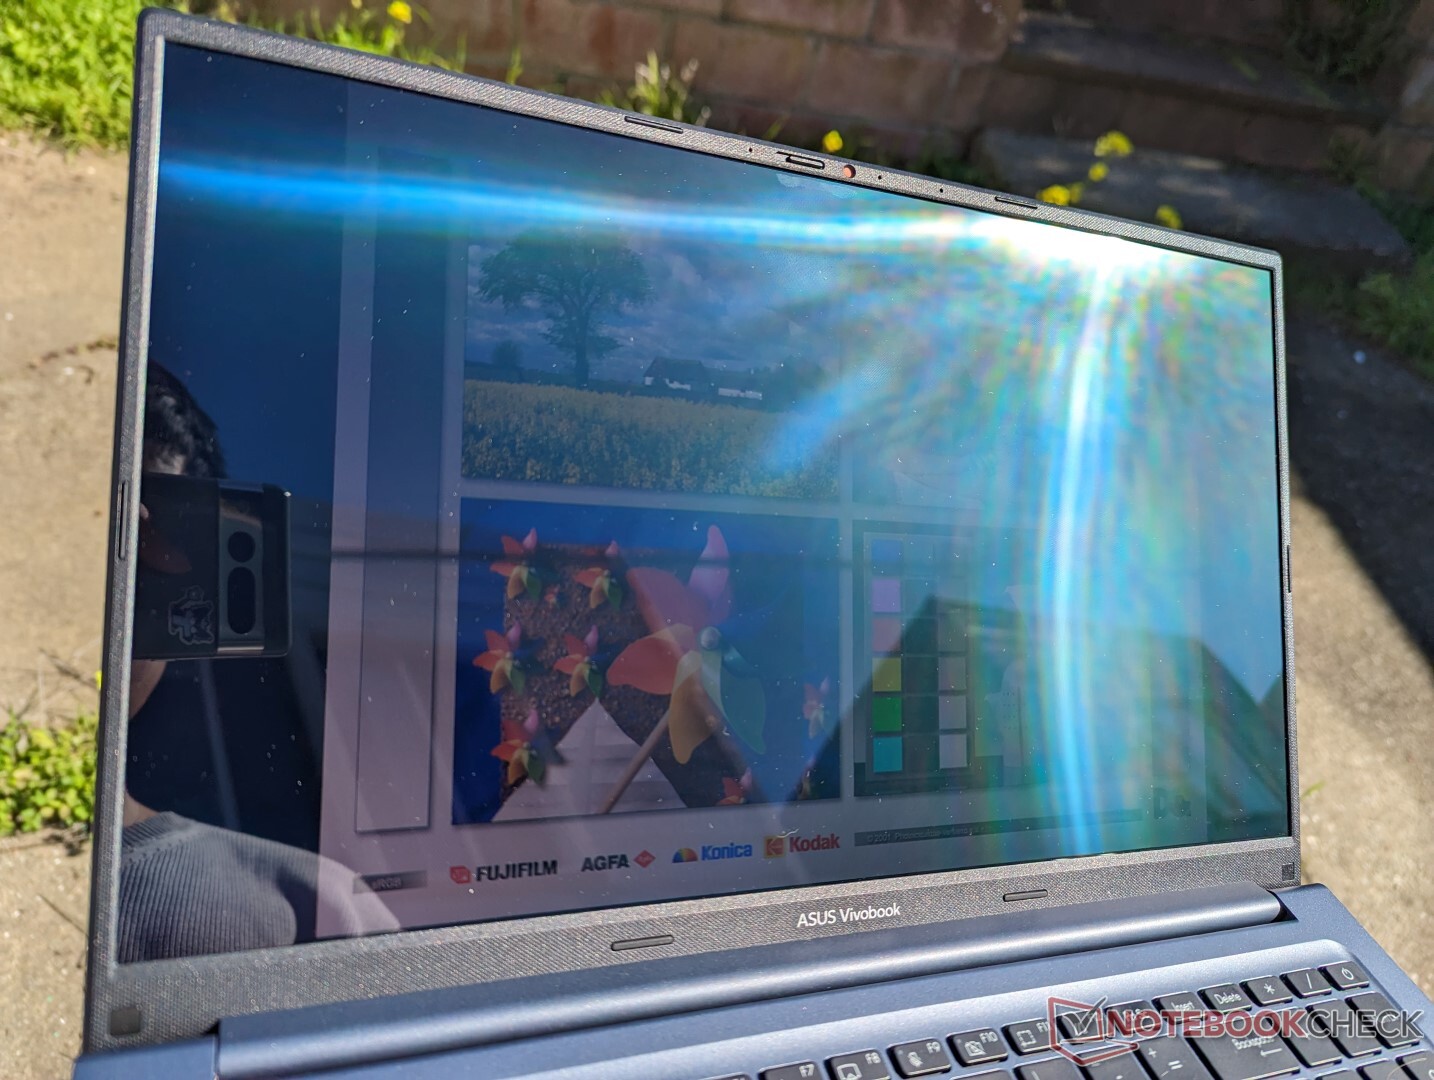
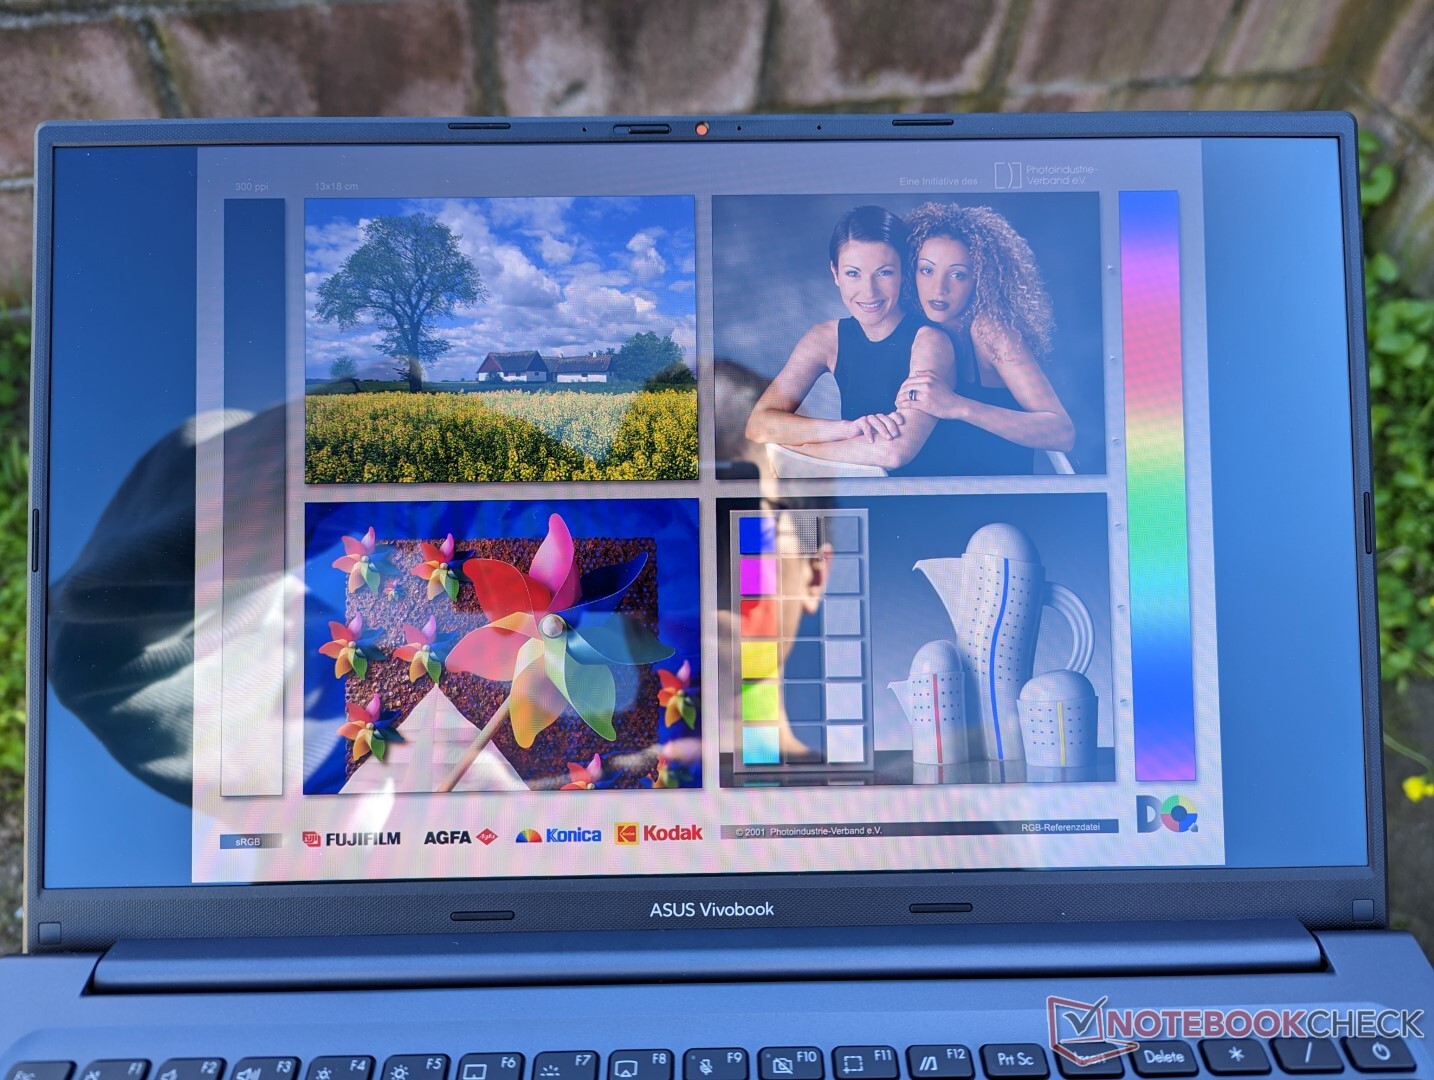
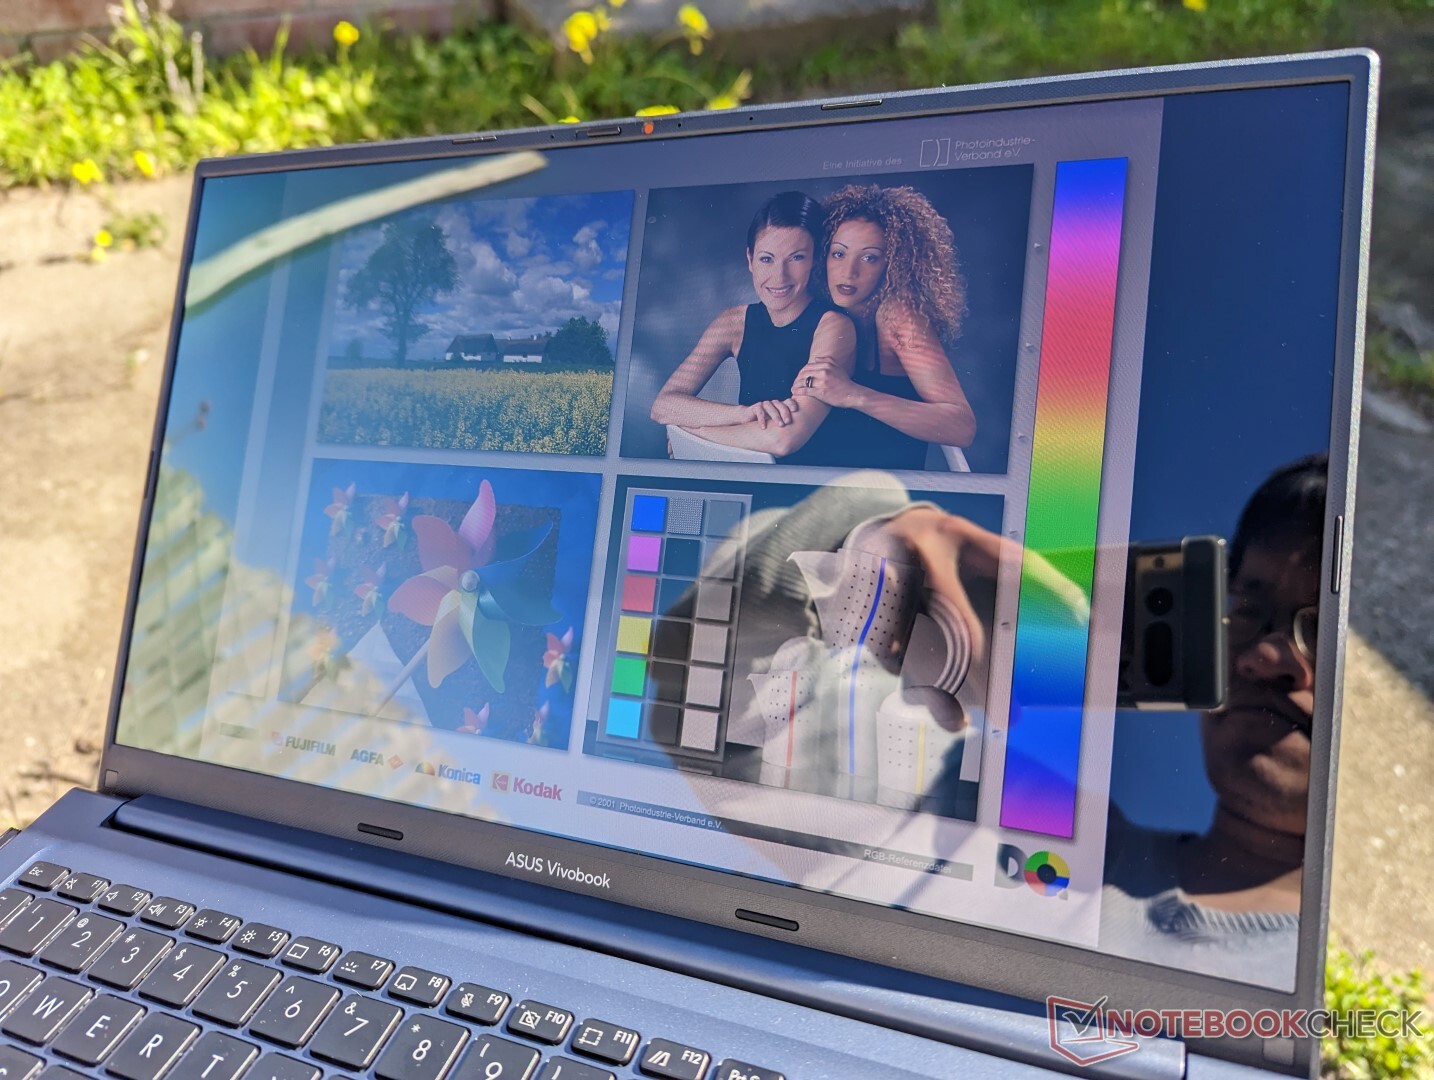
La visibilità all'aperto non è delle migliori. Sebbene l'OLED tenda ad avere prestazioni migliori rispetto all'IPS in condizioni esterne, il pannello del Vivobook non è sufficientemente luminoso per superare i riflessi del rivestimento lucido. Inoltre, il bagliore conferisce allo schermo una tonalità blu che influisce sulla visibilità e sui colori, come mostrano le immagini qui sotto.
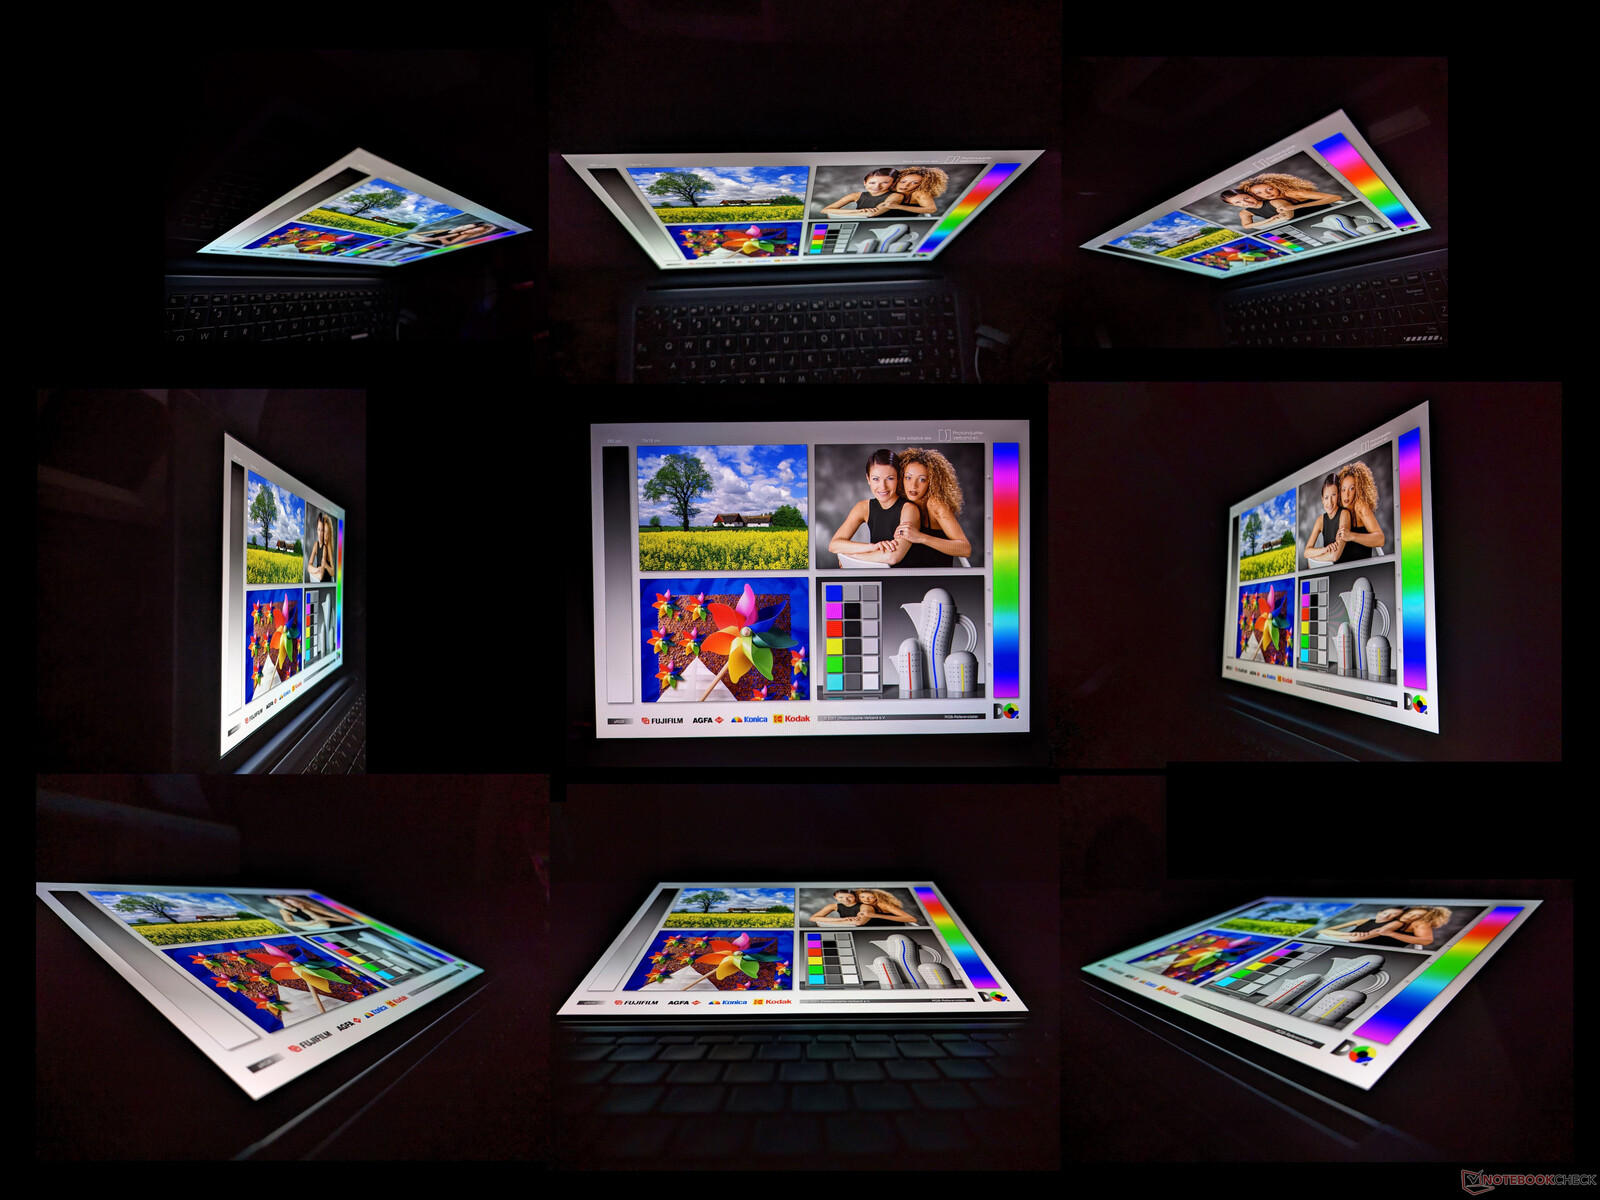
Gli angoli di visione sono eccellenti, come per qualsiasi pannello OLED. A differenza dei pannelli IPS, i pannelli OLED mostrano un effetto arcobaleno bluastro da ampi angoli, mentre i colori su un pannello IPS diventerebbero più grigi.
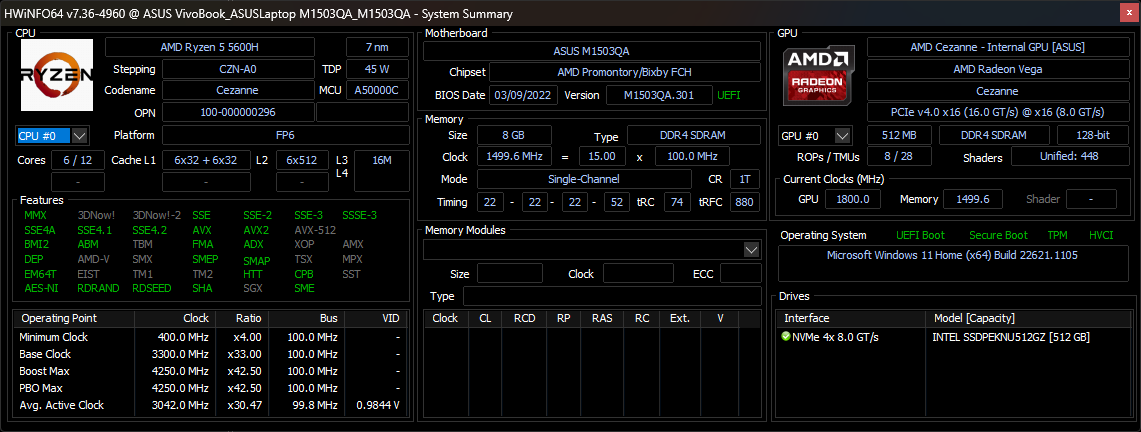
Prestazioni - Processore Ryzen serie H
Condizioni di test
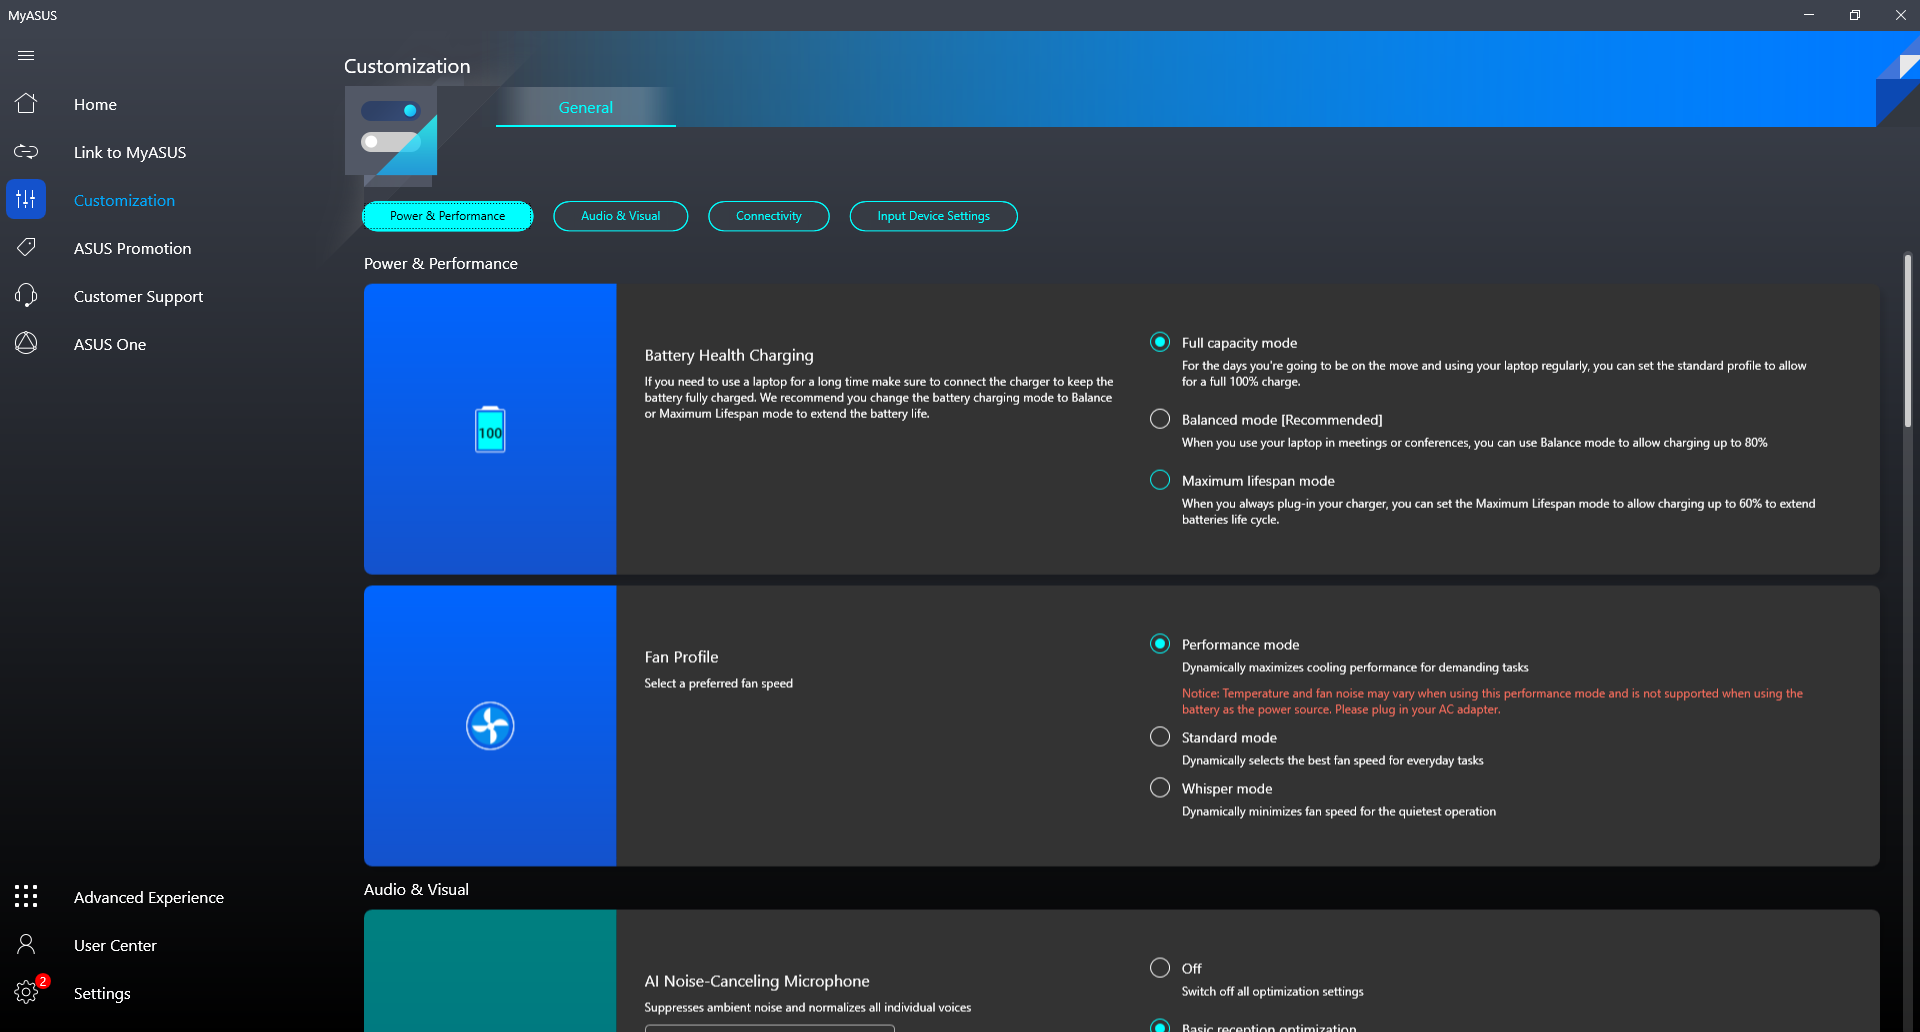
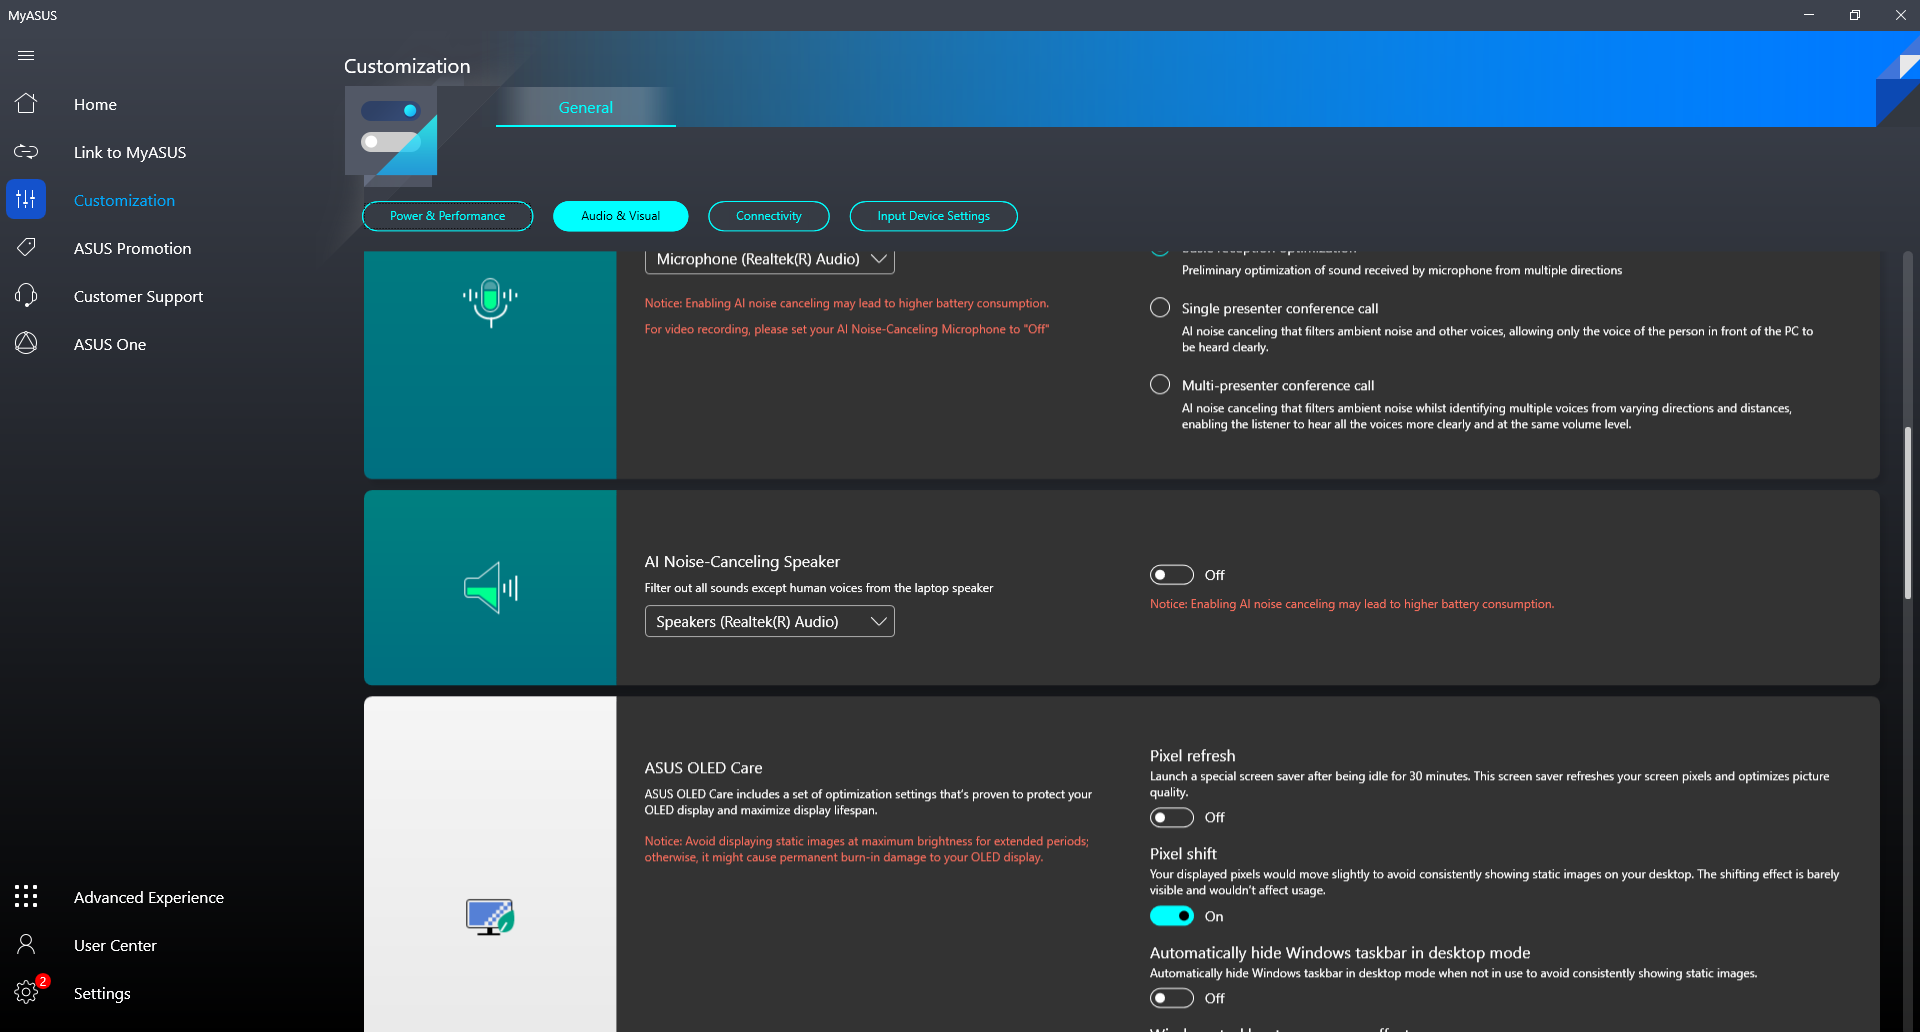
Abbiamo impostato la nostra unità in modalità Performance tramite il software MyAsus e in modalità Performance tramite Windows prima di eseguire i benchmark qui sotto. Purtroppo, la modifica del profilo di alimentazione tramite Asus non cambia automaticamente il profilo di alimentazione su Windows e viceversa. Si raccomanda agli utenti di familiarizzare con il software MyAsus, in quanto è il fulcro di tutti gli aggiornamenti critici, della modifica dei profili di colore e di altre funzioni specifiche di Asus, come mostrano gli screenshot qui sotto.
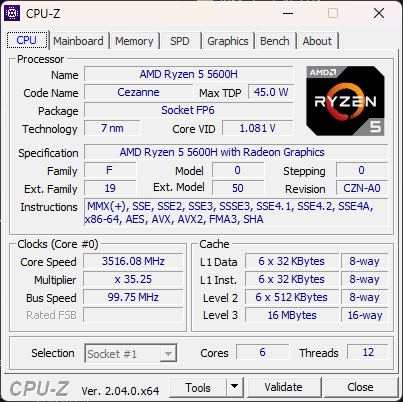
Processore
Le prestazioni della CPU sono eccellenti, con risultati che si collocano entro pochi punti percentuali rispetto alla media dei portatili del nostro database equipaggiati con lo stesso Ryzen 5 5600H RYZEN 5 5600H. Le prestazioni sono quasi identiche a quelle del modello a più bassa potenza Ryzen 7 5700U e solo dal 5 al 10% rispetto al più recente Zen 3+ Ryzen 5 6600H. La sostenibilità delle prestazioni, in particolare, è eccellente, come dimostrano i risultati costanti del loop CineBench R15 xT riportati di seguito.
Il Ryzen 5 5600H compete direttamente con l'11° generazione di Intel Core i5-11300H che supera significativamente di quasi due volte nei carichi di lavoro multi-thread. Tuttavia, un anno dopo Intel ha risposto con un 12° generazione di Core i5-12500H molto migliorato Core i5-12500H che supera la nostra CPU Ryzen di circa il 30%.
L'aggiornamento al Ryzen 7 5800H dovrebbe aumentare le prestazioni fino al 30% rispetto alla nostra configurazione Ryzen 5 5600H.
Cinebench R15 Multi Loop
Cinebench R20: CPU (Multi Core) | CPU (Single Core)
Cinebench R23: Multi Core | Single Core
Cinebench R15: CPU Multi 64Bit | CPU Single 64Bit
Blender: v2.79 BMW27 CPU
7-Zip 18.03: 7z b 4 | 7z b 4 -mmt1
Geekbench 5.5: Multi-Core | Single-Core
HWBOT x265 Benchmark v2.2: 4k Preset
LibreOffice : 20 Documents To PDF
R Benchmark 2.5: Overall mean
* ... Meglio usare valori piccoli
* ... Meglio usare valori piccoli
AIDA64: FP32 Ray-Trace | FPU Julia | CPU SHA3 | CPU Queen | FPU SinJulia | FPU Mandel | CPU AES | CPU ZLib | FP64 Ray-Trace | CPU PhotoWorxx
| Performance rating | |
| Asus VivoBook S15 D533UA | |
| Media AMD Ryzen 5 5600H | |
| Asus VivoBook 15 X M1503QA | |
| Lenovo ThinkBook 15 G3 ACL 21A400B2GE | |
| Asus Vivobook 15 K513EQ | |
| Dell Inspiron 15 3501 | |
| AIDA64 / FP32 Ray-Trace | |
| Media AMD Ryzen 5 5600H (9181 - 12636, n=14) | |
| Asus VivoBook S15 D533UA | |
| Asus VivoBook 15 X M1503QA | |
| Lenovo ThinkBook 15 G3 ACL 21A400B2GE | |
| Asus Vivobook 15 K513EQ | |
| Dell Inspiron 15 3501 | |
| AIDA64 / FPU Julia | |
| Media AMD Ryzen 5 5600H (51994 - 78250, n=14) | |
| Asus VivoBook 15 X M1503QA | |
| Asus VivoBook S15 D533UA | |
| Lenovo ThinkBook 15 G3 ACL 21A400B2GE | |
| Asus Vivobook 15 K513EQ | |
| Dell Inspiron 15 3501 | |
| AIDA64 / CPU SHA3 | |
| Media AMD Ryzen 5 5600H (1587 - 2675, n=14) | |
| Asus VivoBook 15 X M1503QA | |
| Asus Vivobook 15 K513EQ | |
| Asus VivoBook S15 D533UA | |
| Dell Inspiron 15 3501 | |
| Lenovo ThinkBook 15 G3 ACL 21A400B2GE | |
| AIDA64 / CPU Queen | |
| Asus VivoBook S15 D533UA | |
| Media AMD Ryzen 5 5600H (66699 - 77213, n=14) | |
| Asus VivoBook 15 X M1503QA | |
| Lenovo ThinkBook 15 G3 ACL 21A400B2GE | |
| Asus Vivobook 15 K513EQ | |
| Dell Inspiron 15 3501 | |
| AIDA64 / FPU SinJulia | |
| Asus VivoBook S15 D533UA | |
| Lenovo ThinkBook 15 G3 ACL 21A400B2GE | |
| Media AMD Ryzen 5 5600H (8340 - 9159, n=14) | |
| Asus VivoBook 15 X M1503QA | |
| Asus Vivobook 15 K513EQ | |
| Dell Inspiron 15 3501 | |
| AIDA64 / FPU Mandel | |
| Asus VivoBook 15 X M1503QA | |
| Media AMD Ryzen 5 5600H (28268 - 43274, n=14) | |
| Asus VivoBook S15 D533UA | |
| Lenovo ThinkBook 15 G3 ACL 21A400B2GE | |
| Asus Vivobook 15 K513EQ | |
| Dell Inspiron 15 3501 | |
| AIDA64 / CPU AES | |
| Media AMD Ryzen 5 5600H (39852 - 98939, n=14) | |
| Asus Vivobook 15 K513EQ | |
| Dell Inspiron 15 3501 | |
| Asus VivoBook S15 D533UA | |
| Lenovo ThinkBook 15 G3 ACL 21A400B2GE | |
| Asus VivoBook 15 X M1503QA | |
| AIDA64 / CPU ZLib | |
| Asus VivoBook S15 D533UA | |
| Media AMD Ryzen 5 5600H (507 - 649, n=14) | |
| Asus VivoBook 15 X M1503QA | |
| Lenovo ThinkBook 15 G3 ACL 21A400B2GE | |
| Asus Vivobook 15 K513EQ | |
| Dell Inspiron 15 3501 | |
| AIDA64 / FP64 Ray-Trace | |
| Asus VivoBook S15 D533UA | |
| Media AMD Ryzen 5 5600H (4811 - 6652, n=14) | |
| Asus VivoBook 15 X M1503QA | |
| Lenovo ThinkBook 15 G3 ACL 21A400B2GE | |
| Asus Vivobook 15 K513EQ | |
| Dell Inspiron 15 3501 | |
| AIDA64 / CPU PhotoWorxx | |
| Asus Vivobook 15 K513EQ | |
| Media AMD Ryzen 5 5600H (7419 - 24746, n=14) | |
| Dell Inspiron 15 3501 | |
| Asus VivoBook S15 D533UA | |
| Lenovo ThinkBook 15 G3 ACL 21A400B2GE | |
| Asus VivoBook 15 X M1503QA | |
Prestazioni del sistema
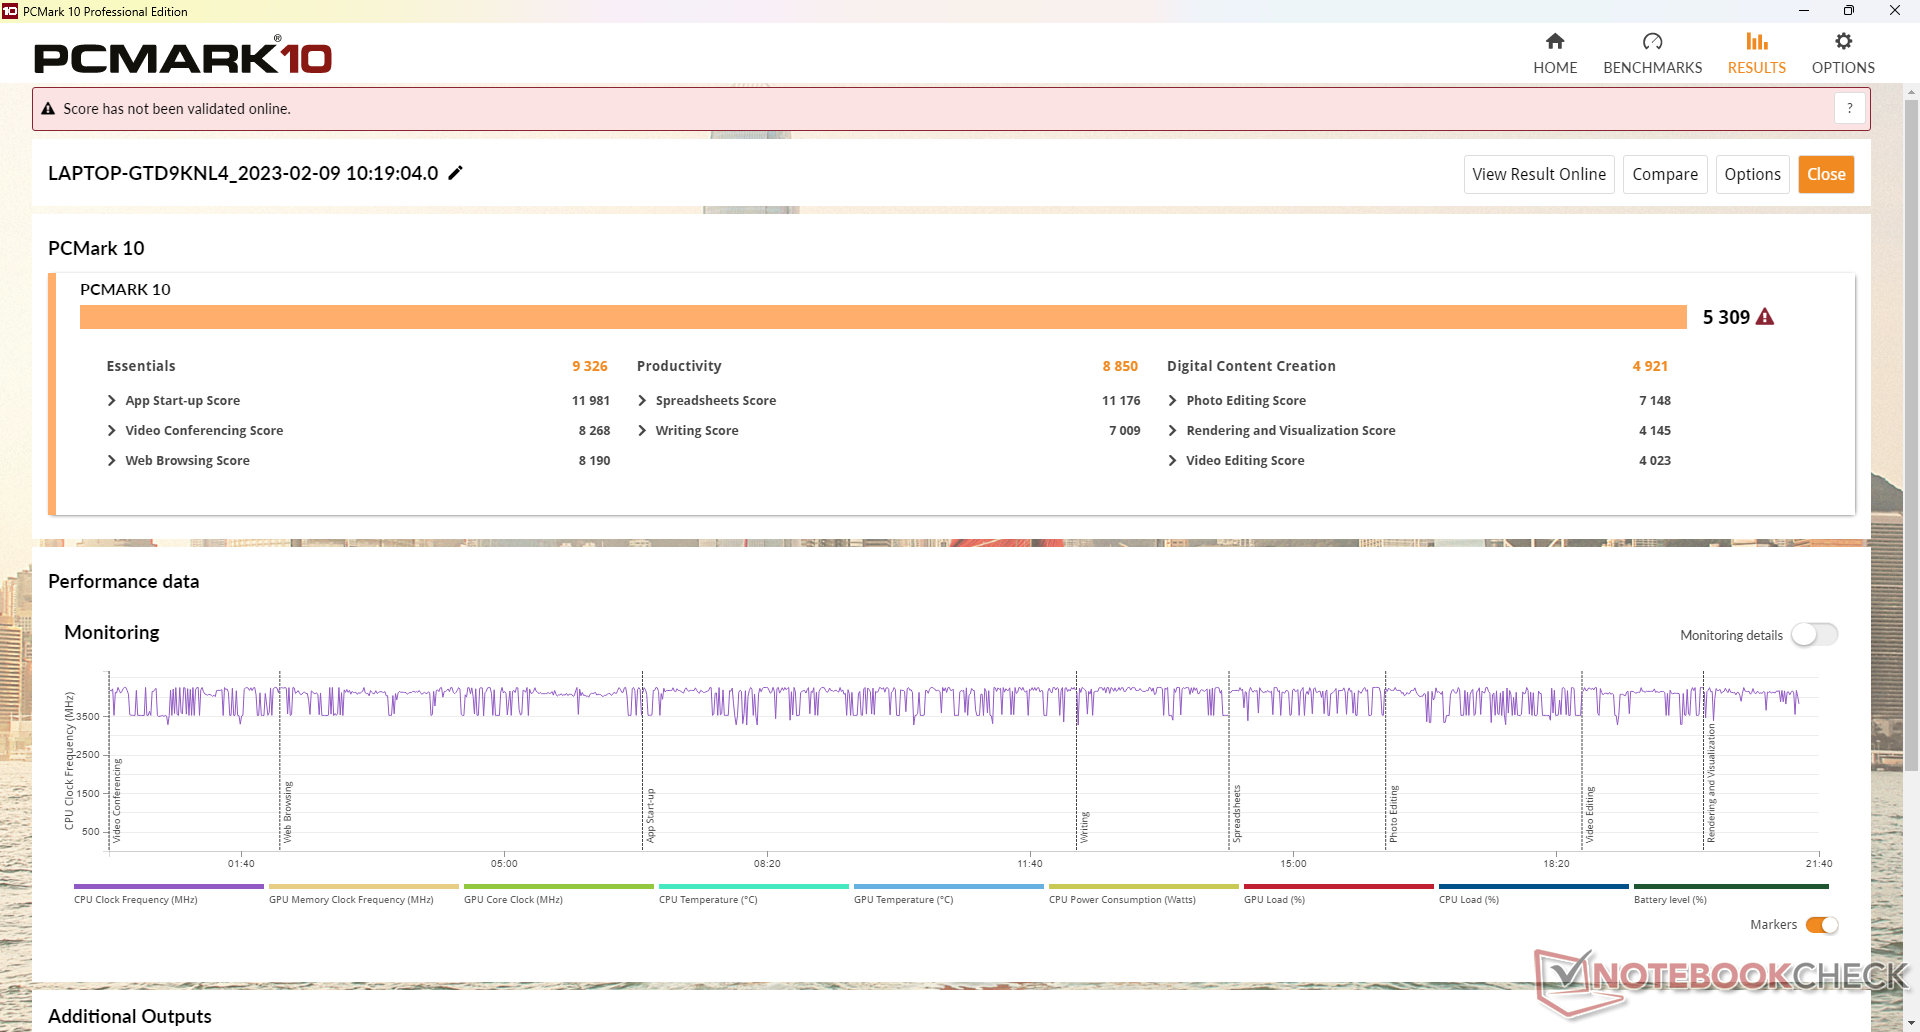
I punteggi di PCMark 10 sono paragonabili a quelli di altri Ultrabook della serie U, se non leggermente superiori grazie alla nostra CPU della serie H. Pertanto, il sistema risulta ancora scattante per i carichi quotidiani, nonostante la deludente configurazione a singola RAM.
CrossMark: Overall | Productivity | Creativity | Responsiveness
| PCMark 10 / Score | |
| Media AMD Ryzen 5 5600H, AMD Radeon RX Vega 7 (5309 - 6189, n=4) | |
| Acer Swift 3 SF314-71-56U3 | |
| Asus VivoBook S15 D533UA | |
| Asus VivoBook 15 X M1503QA | |
| Asus Vivobook 15 K513EQ | |
| Dell Inspiron 15 5518-2X3JR | |
| Dell Inspiron 15 3501 | |
| Asus ZenBook UX535-M01440 | |
| Lenovo ThinkBook 15 G3 ACL 21A400B2GE | |
| PCMark 10 / Essentials | |
| Acer Swift 3 SF314-71-56U3 | |
| Media AMD Ryzen 5 5600H, AMD Radeon RX Vega 7 (9326 - 10503, n=4) | |
| Dell Inspiron 15 3501 | |
| Asus Vivobook 15 K513EQ | |
| Asus VivoBook 15 X M1503QA | |
| Asus VivoBook S15 D533UA | |
| Asus ZenBook UX535-M01440 | |
| Lenovo ThinkBook 15 G3 ACL 21A400B2GE | |
| Dell Inspiron 15 5518-2X3JR | |
| PCMark 10 / Productivity | |
| Media AMD Ryzen 5 5600H, AMD Radeon RX Vega 7 (8850 - 9642, n=4) | |
| Asus VivoBook 15 X M1503QA | |
| Asus Vivobook 15 K513EQ | |
| Dell Inspiron 15 5518-2X3JR | |
| Asus VivoBook S15 D533UA | |
| Lenovo ThinkBook 15 G3 ACL 21A400B2GE | |
| Acer Swift 3 SF314-71-56U3 | |
| Asus ZenBook UX535-M01440 | |
| Dell Inspiron 15 3501 | |
| PCMark 10 / Digital Content Creation | |
| Acer Swift 3 SF314-71-56U3 | |
| Media AMD Ryzen 5 5600H, AMD Radeon RX Vega 7 (4921 - 6352, n=4) | |
| Asus VivoBook S15 D533UA | |
| Asus ZenBook UX535-M01440 | |
| Asus VivoBook 15 X M1503QA | |
| Dell Inspiron 15 3501 | |
| Dell Inspiron 15 5518-2X3JR | |
| Lenovo ThinkBook 15 G3 ACL 21A400B2GE | |
| Asus Vivobook 15 K513EQ | |
| CrossMark / Overall | |
| Acer Swift 3 SF314-71-56U3 | |
| Media AMD Ryzen 5 5600H, AMD Radeon RX Vega 7 (1157 - 1353, n=4) | |
| Asus VivoBook 15 X M1503QA | |
| Lenovo ThinkBook 15 G3 ACL 21A400B2GE | |
| CrossMark / Productivity | |
| Acer Swift 3 SF314-71-56U3 | |
| Media AMD Ryzen 5 5600H, AMD Radeon RX Vega 7 (1217 - 1384, n=4) | |
| Asus VivoBook 15 X M1503QA | |
| Lenovo ThinkBook 15 G3 ACL 21A400B2GE | |
| CrossMark / Creativity | |
| Acer Swift 3 SF314-71-56U3 | |
| Media AMD Ryzen 5 5600H, AMD Radeon RX Vega 7 (1184 - 1377, n=4) | |
| Asus VivoBook 15 X M1503QA | |
| Lenovo ThinkBook 15 G3 ACL 21A400B2GE | |
| CrossMark / Responsiveness | |
| Acer Swift 3 SF314-71-56U3 | |
| Media AMD Ryzen 5 5600H, AMD Radeon RX Vega 7 (926 - 1225, n=4) | |
| Asus VivoBook 15 X M1503QA | |
| Lenovo ThinkBook 15 G3 ACL 21A400B2GE | |
| PCMark 10 Score | 5309 punti | |
Aiuto | ||
| AIDA64 / Memory Copy | |
| Media AMD Ryzen 5 5600H (20549 - 42141, n=14) | |
| Asus Vivobook 15 K513EQ | |
| Asus VivoBook S15 D533UA | |
| Dell Inspiron 15 3501 | |
| Asus VivoBook 15 X M1503QA | |
| Lenovo ThinkBook 15 G3 ACL 21A400B2GE | |
| AIDA64 / Memory Read | |
| Asus Vivobook 15 K513EQ | |
| Asus VivoBook S15 D533UA | |
| Media AMD Ryzen 5 5600H (22917 - 47595, n=14) | |
| Dell Inspiron 15 3501 | |
| Lenovo ThinkBook 15 G3 ACL 21A400B2GE | |
| Asus VivoBook 15 X M1503QA | |
| AIDA64 / Memory Write | |
| Asus Vivobook 15 K513EQ | |
| Asus VivoBook S15 D533UA | |
| Media AMD Ryzen 5 5600H (20226 - 44872, n=14) | |
| Dell Inspiron 15 3501 | |
| Lenovo ThinkBook 15 G3 ACL 21A400B2GE | |
| Asus VivoBook 15 X M1503QA | |
| AIDA64 / Memory Latency | |
| Asus VivoBook S15 D533UA | |
| Dell Inspiron 15 3501 | |
| Lenovo ThinkBook 15 G3 ACL 21A400B2GE | |
| Asus Vivobook 15 K513EQ | |
| Media AMD Ryzen 5 5600H (75 - 89.1, n=14) | |
| Asus VivoBook 15 X M1503QA | |
* ... Meglio usare valori piccoli
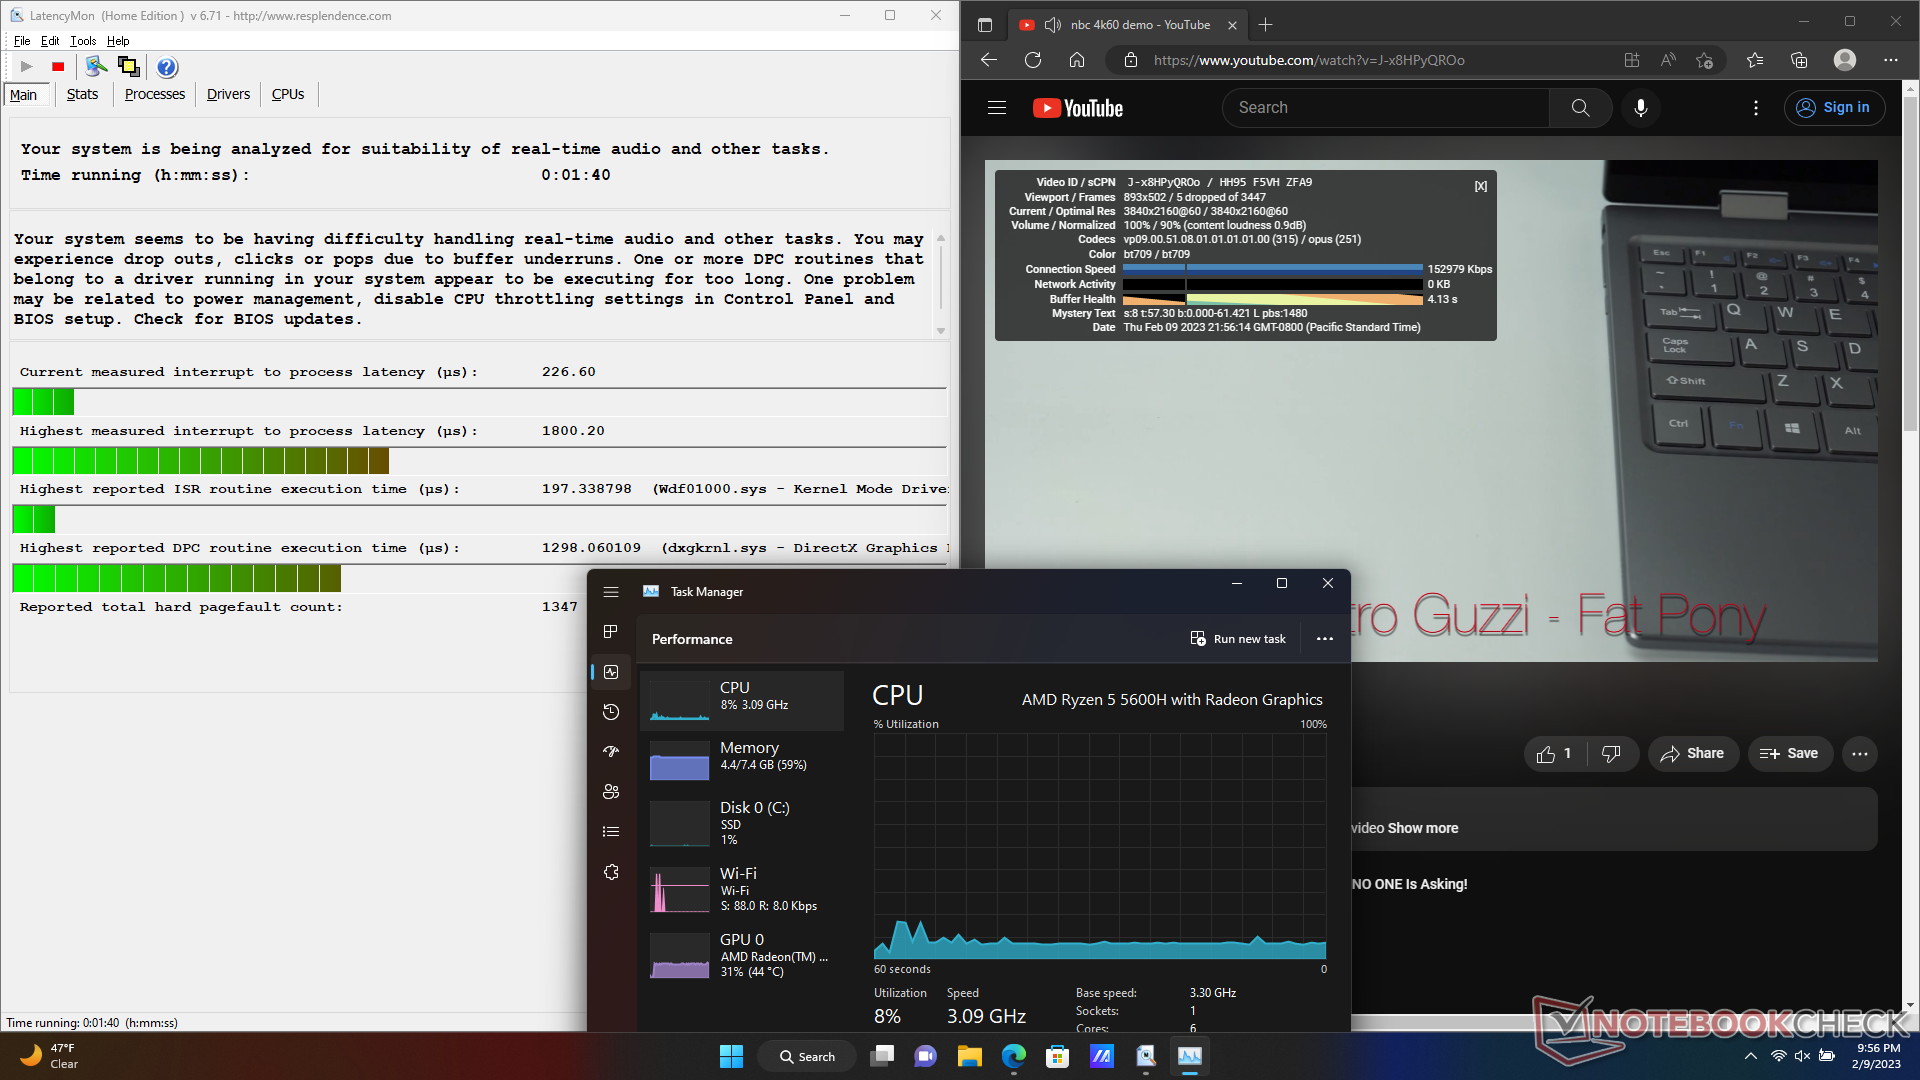
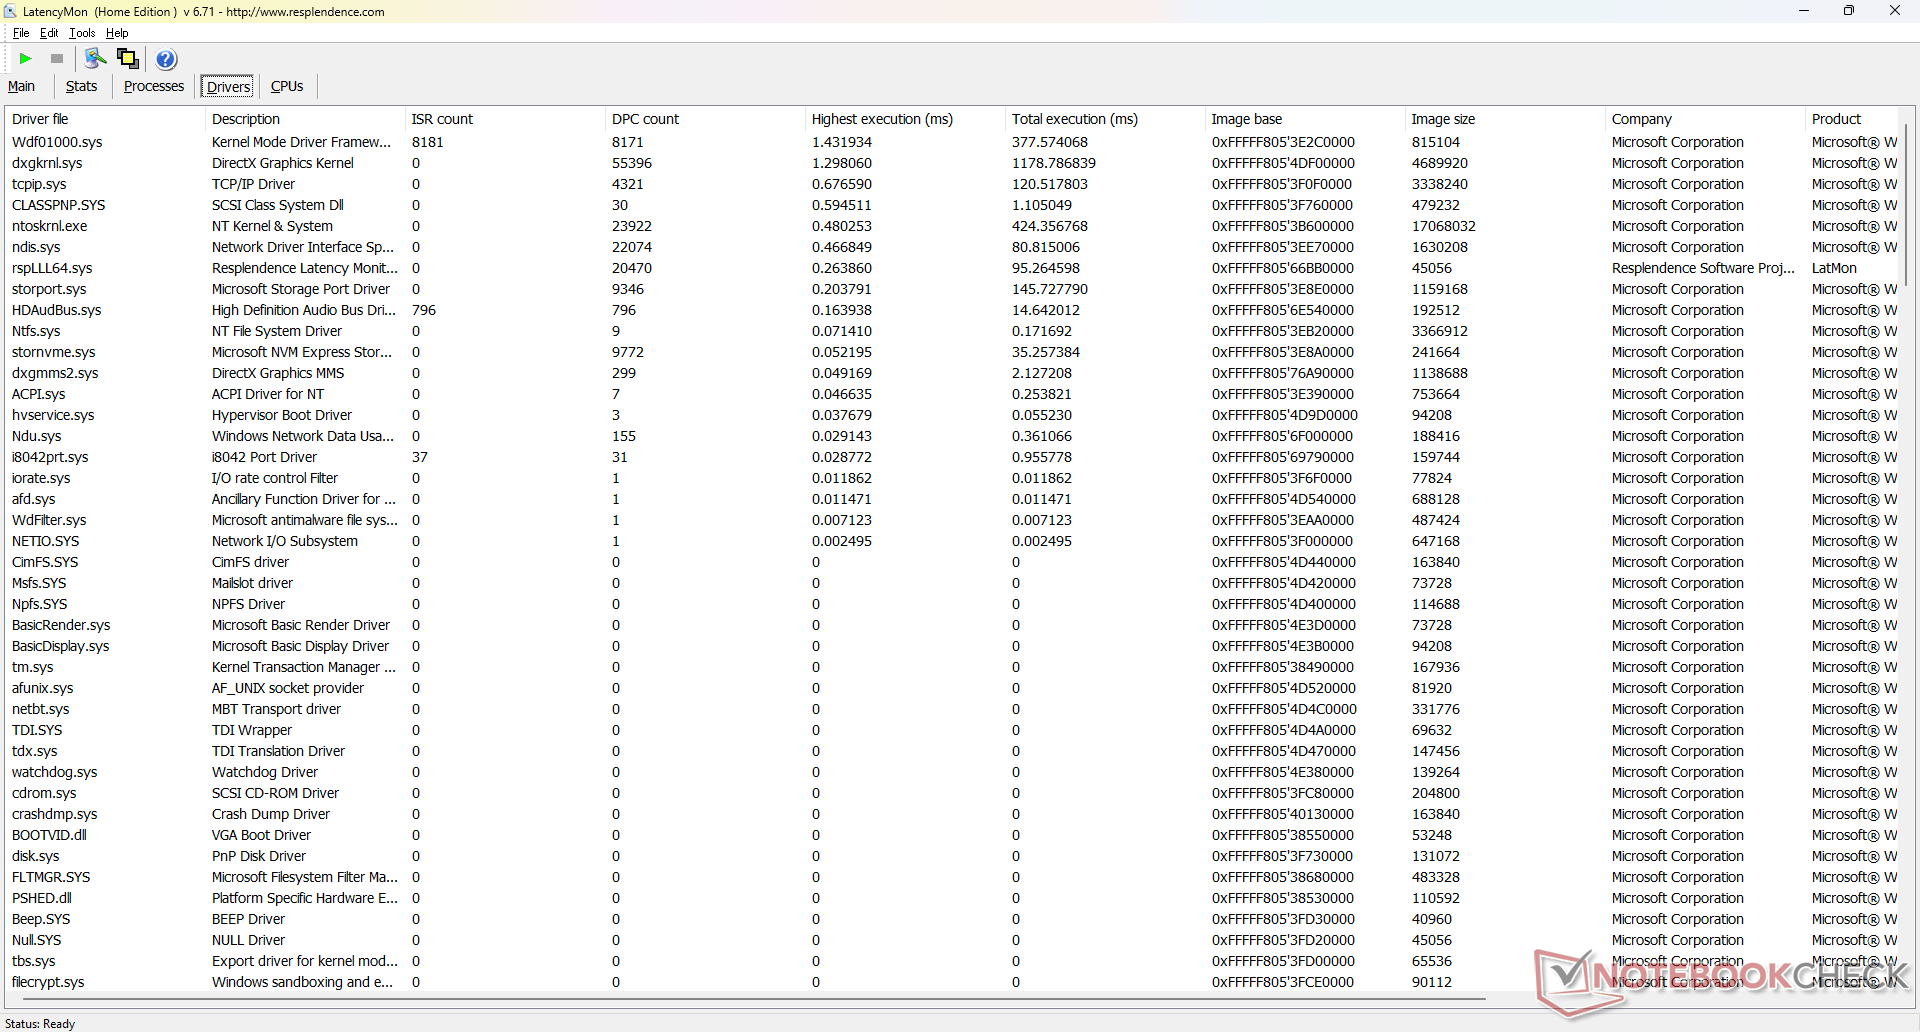
Latenza DPC
LatencyMon rivela problemi di DPC quando si aprono più schede del browser della nostra homepage. anche la riproduzione di video in 4K a 60 FPS è imperfetta, con 5 fotogrammi caduti durante il nostro video di prova di un minuto. Tuttavia, questo non dovrebbe essere un grosso problema, dato che il portatile non è in grado di riprodurre su un monitor 4K a 60 Hz.
| DPC Latencies / LatencyMon - interrupt to process latency (max), Web, Youtube, Prime95 | |
| Asus Vivobook 15 K513EQ | |
| Asus VivoBook 15 X M1503QA | |
| Lenovo ThinkBook 15 G3 ACL 21A400B2GE | |
| Dell Inspiron 15 3501 | |
| Asus ZenBook UX535-M01440 | |
| Asus VivoBook S15 D533UA | |
* ... Meglio usare valori piccoli
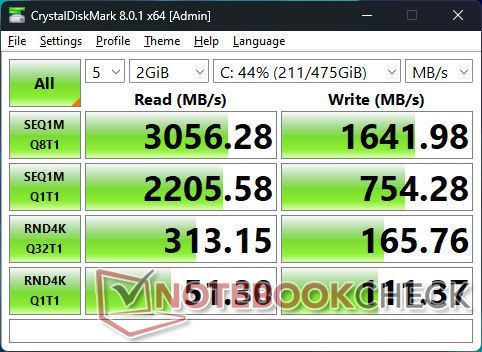
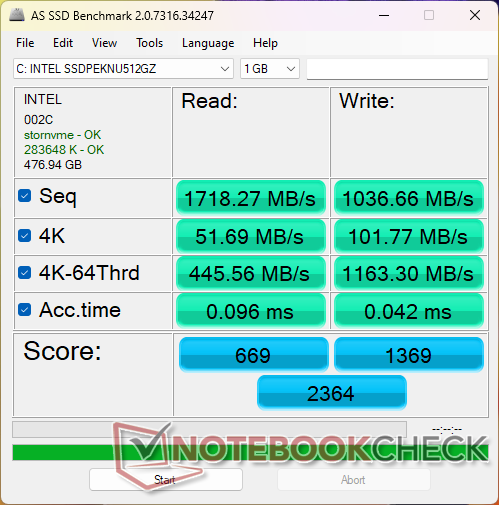
Dispositivi di archiviazione - Supporta una sola unità SSD
Il sistema supporta unità PCIe3 anziché PCIe4, probabilmente per risparmiare sui costi. I 512 GB Intel 670p nella nostra unità di test è un'unità PCIe3 x4 NVMe di fascia media con velocità di lettura e scrittura sequenziale rispettivamente di circa 3000 MB/s e 1600 MB/s. Le prestazioni sembrano fluttuare leggermente quando sono sotto stress, il che significa che può avere problemi a mantenere elevate velocità di trasferimento per lunghi periodi. Considerando la fascia di prezzo e il livello di prestazioni del portatile, tuttavia, questo aspetto non avrà molta importanza per la maggior parte dei carichi di lavoro.

| Drive Performance rating - Percent | |
| Asus VivoBook S15 D533UA | |
| Dell Inspiron 15 3501 | |
| Asus ZenBook UX535-M01440 | |
| Lenovo ThinkBook 15 G3 ACL 21A400B2GE | |
| Asus VivoBook 15 X M1503QA | |
| Asus Vivobook 15 K513EQ | |
* ... Meglio usare valori piccoli
Disk Throttling: DiskSpd Read Loop, Queue Depth 8
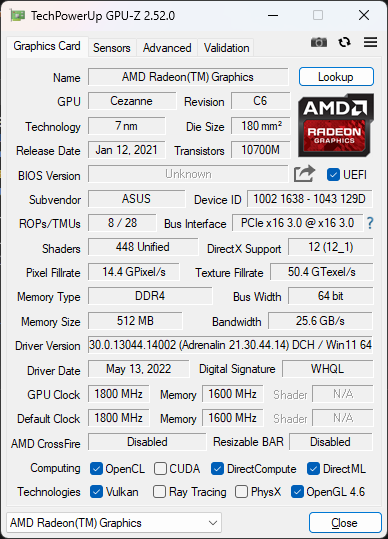
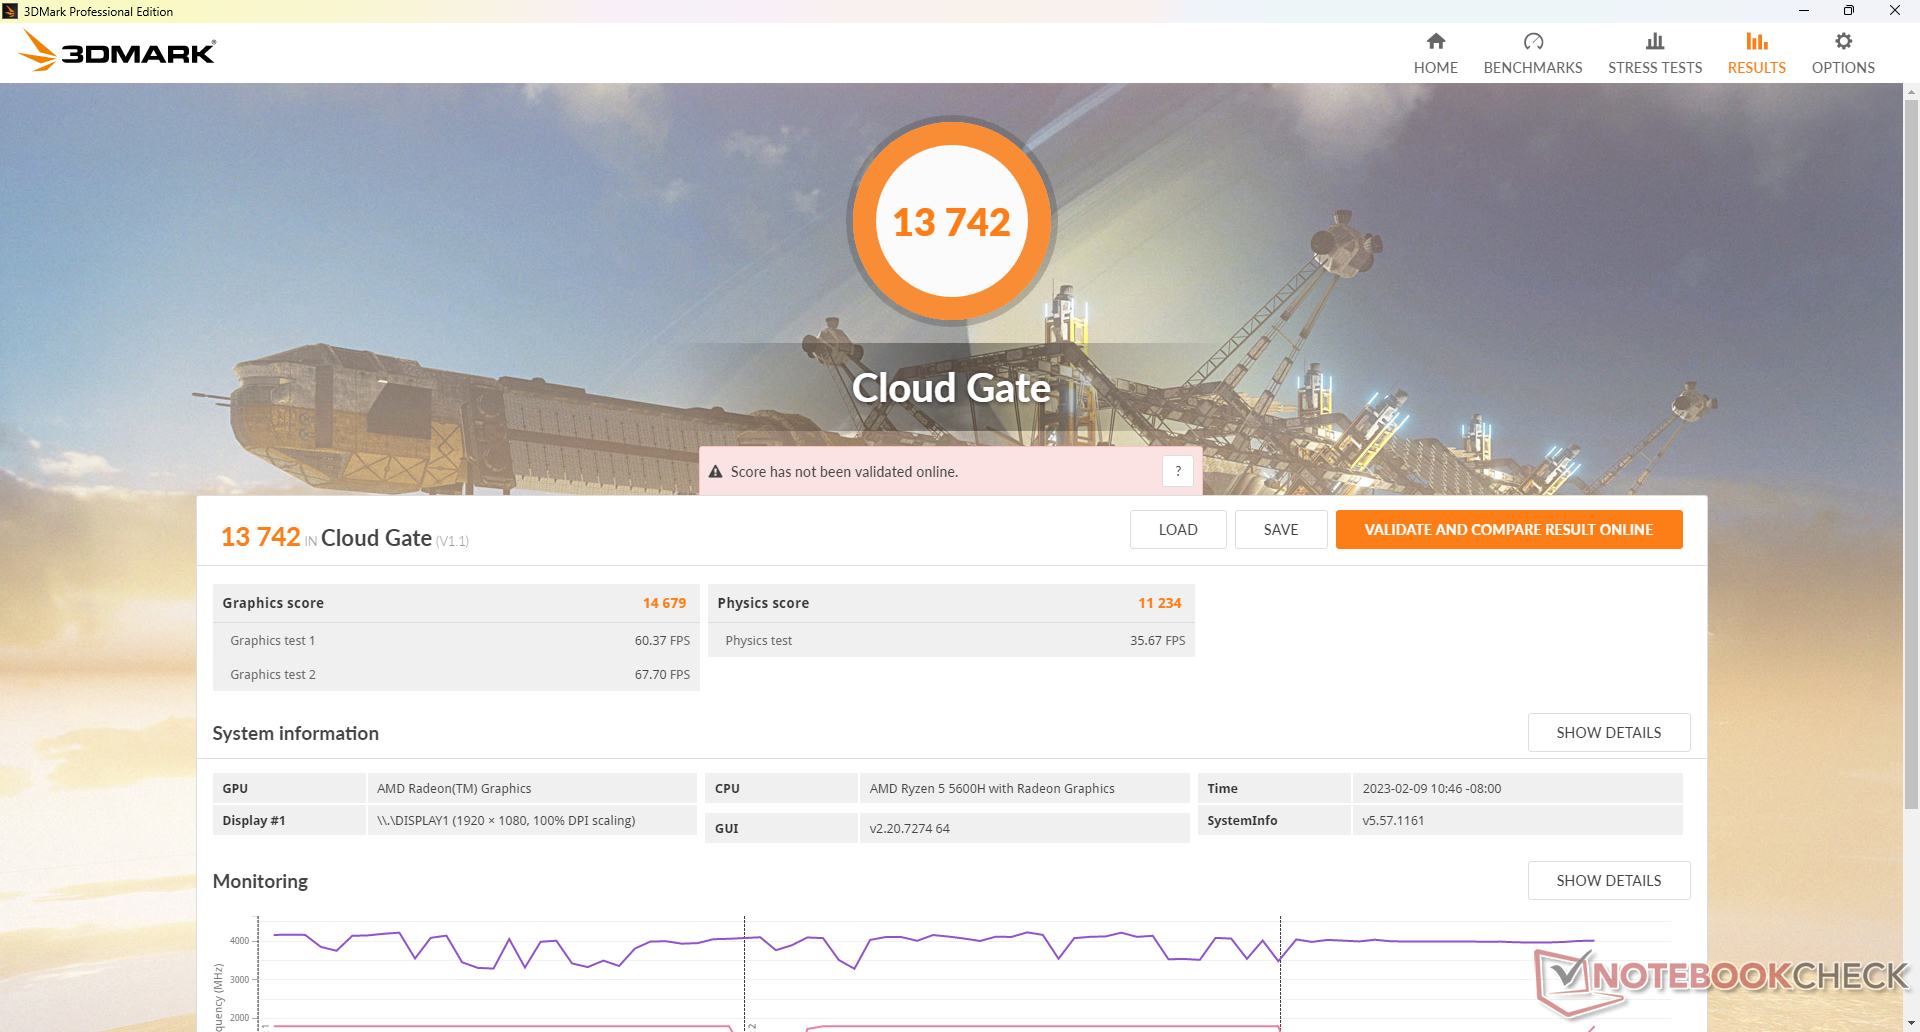
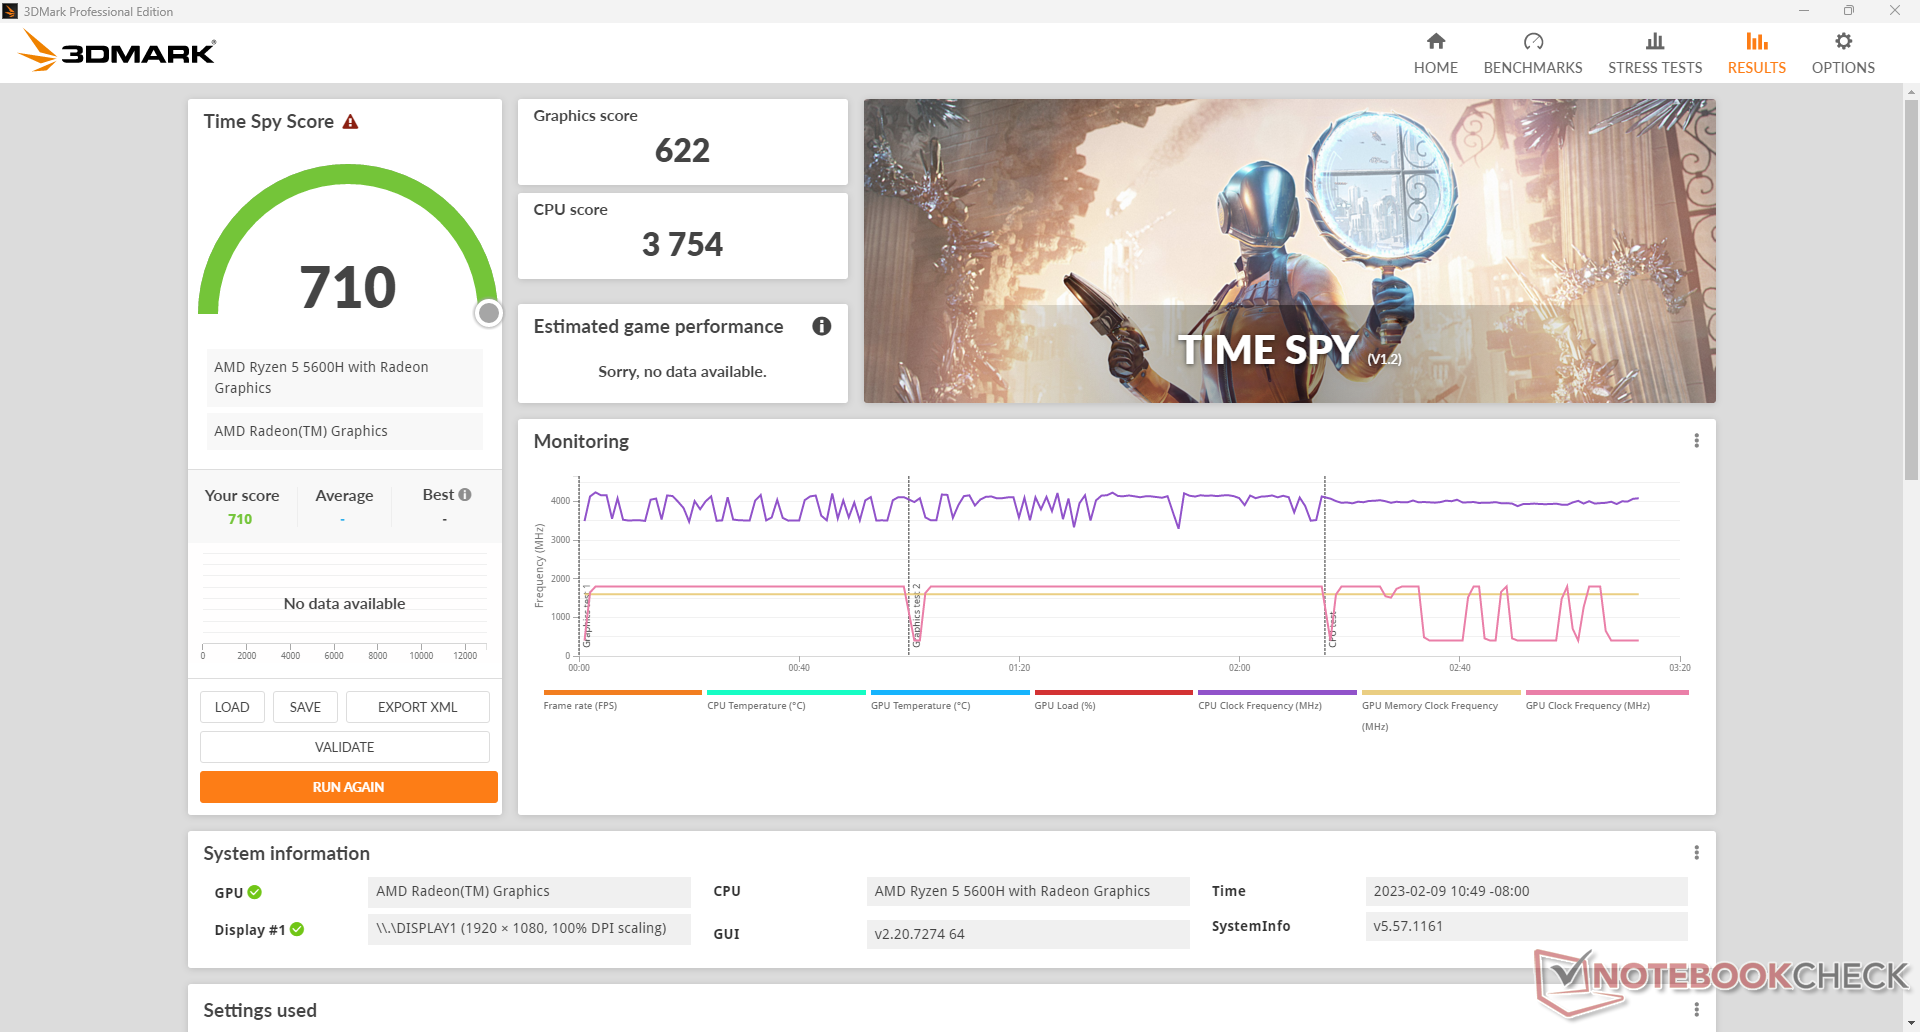
Prestazioni della GPU - Aggiornare la RAM a doppio canale quando possibile
Le prestazioni grafiche sono deludenti: circa il 35-40% in meno rispetto alla media dei laptop AMD del nostro database con la stessa Radeon RX Vega 7 integrata Radeon RX Vega 7 GPU INTEGRATA. Il deficit è così grave che la Vega 8 o le concorrenti Iris Xe 96 EU possono offrire da 1,5 a 2 volte le prestazioni grafiche del nostro Asus. Ciononostante, l'aggiornamento da un vecchio UHD Graphics 620 migliorerebbe comunque le prestazioni grafiche di circa il 50%.
Le prestazioni inferiori della nostra GPU possono essere attribuite alla configurazione della RAM a canale singolo della nostra unità di test. L'aggiunta di un altro stick di RAM per la configurazione a doppio canale dovrebbe migliorare significativamente le prestazioni grafiche, rendendole più in linea con quelle di altri portatili RX Vega 7.
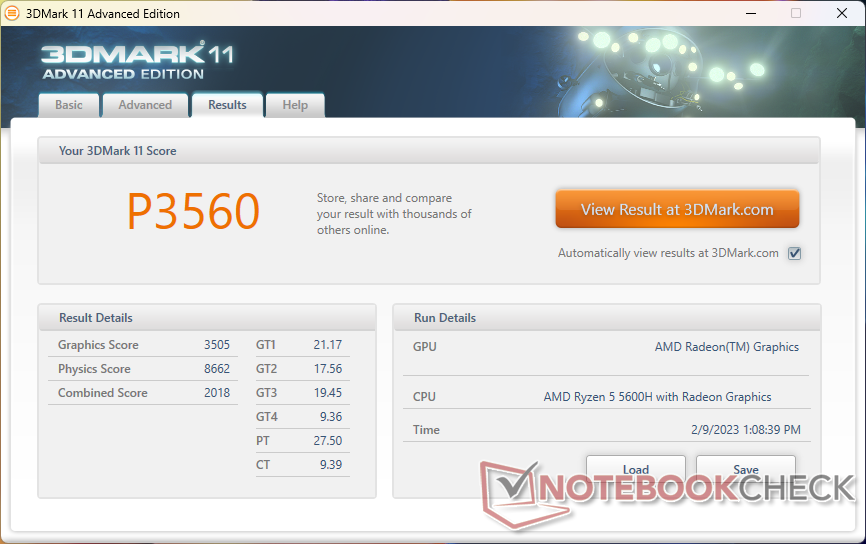
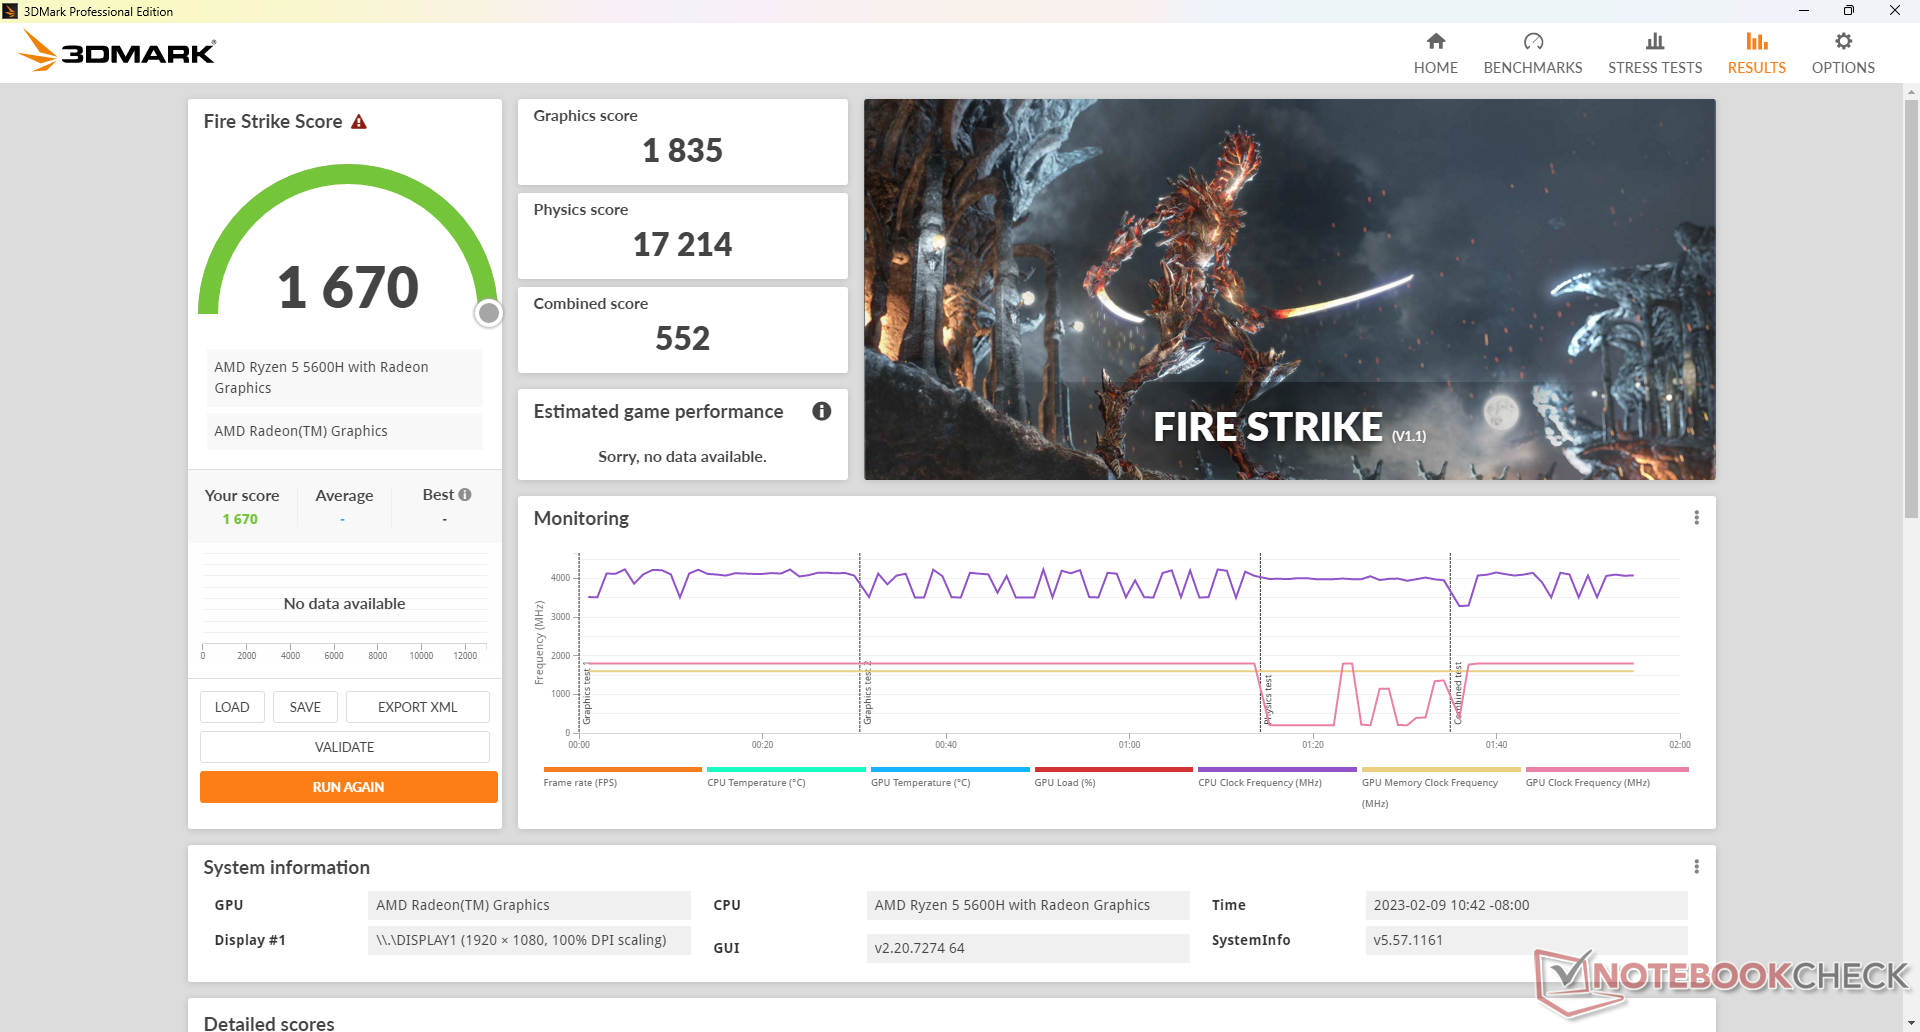
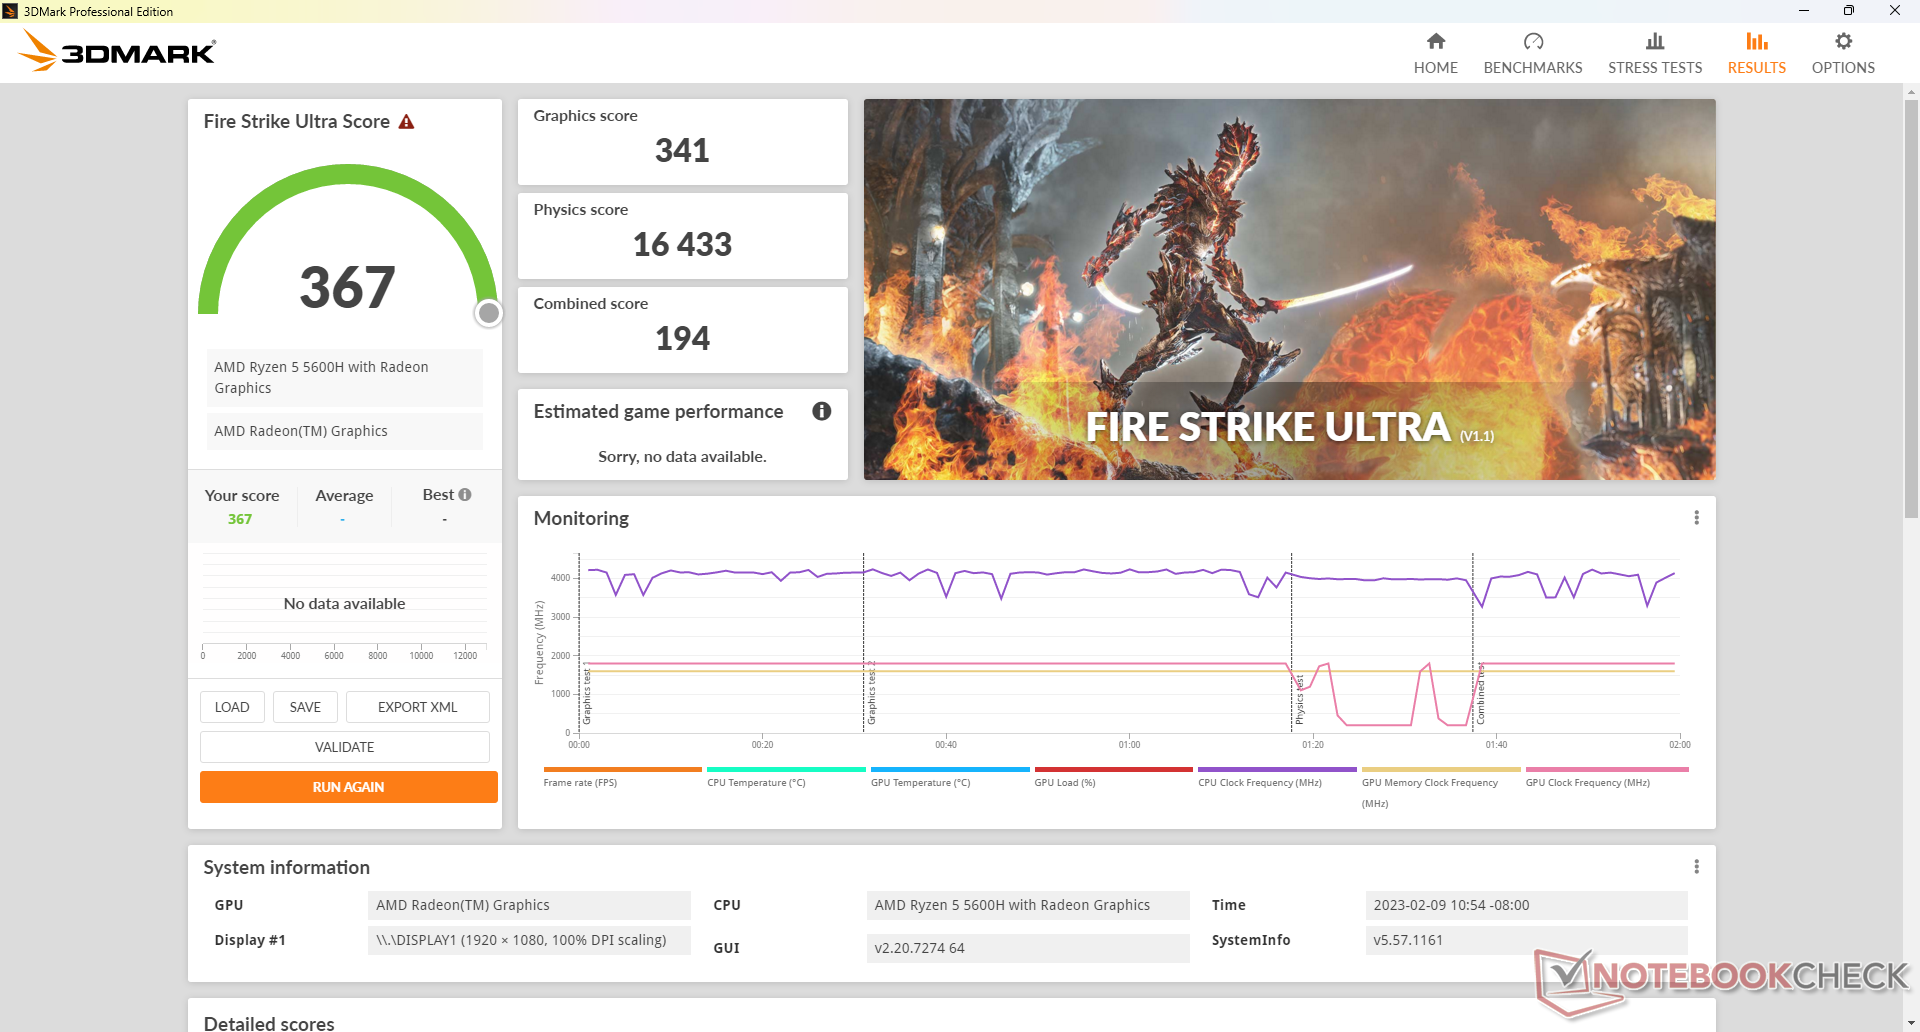
| 3DMark 11 Performance | 3560 punti | |
| 3DMark Cloud Gate Standard Score | 13742 punti | |
| 3DMark Fire Strike Score | 1670 punti | |
| 3DMark Time Spy Score | 710 punti | |
Aiuto | ||
| Cyberpunk 2077 1.6 | |
| 1280x720 Low Preset | |
| Media AMD Radeon RX Vega 7 (18.1 - 35.8, n=5) | |
| Asus VivoBook 15 X M1503QA | |
| 1920x1080 Low Preset | |
| Lenovo IdeaPad Gaming 3 15ARH7 | |
| Samsung Galaxy Book2 15 | |
| Media AMD Radeon RX Vega 7 (10 - 20.9, n=4) | |
| Asus VivoBook 15 X M1503QA | |
Il funzionamento al minimo su Witcher 3 rivela problemi di stabilità delle prestazioni, in quanto la frequenza dei fotogrammi scende periodicamente a 15 FPS prima di riprendersi immediatamente, come mostra il grafico seguente. Questo problema è solitamente attribuito a una cattiva gestione delle risorse delle applicazioni in background che possono interrompere il programma principale. I portatili economici come il Vivobook tendono ad avere più bloatware del solito.
Witcher 3 FPS Chart
| basso | medio | alto | ultra | |
|---|---|---|---|---|
| GTA V (2015) | 52.4 | 45.6 | 11.9 | 5.09 |
| The Witcher 3 (2015) | 36 | 23 | 11.2 | 8 |
| Dota 2 Reborn (2015) | 94.3 | 59 | 28 | 26.3 |
| Final Fantasy XV Benchmark (2018) | 19 | 9.75 | 6.53 | |
| X-Plane 11.11 (2018) | 32.9 | 26.1 | 23.4 | |
| Strange Brigade (2018) | 39.7 | 15.2 | 12.8 | 11 |
| Cyberpunk 2077 1.6 (2022) | 10 |
Emissioni
Rumore del sistema - Molto silenzioso per la maggior parte del tempo
Il sistema è eccellente nel rimanere silenzioso per lunghi periodi di stress. Durante l'esecuzione della prima scena di benchmark di 3DMark 06, ad esempio, è stato necessario ripetere il test tre volte prima che il rumore della ventola aumentasse in modo apprezzabile. Anche in questo caso, il rumore della ventola è appena udibile, con 27,3 dB(A) a fronte di uno sfondo silenzioso di 23,8 dB(A), rispetto ai 35 dB(A) o addirittura ai 45 dB(A) delDell Inspiron 15 3501 o VivoBook S15rispettivamente.
Sospettiamo che il rumore della ventola più silenzioso della media sia legato alle prestazioni grafiche più lente della media della nostra configurazione a canale singolo. Eseguendo Prime95 e FurMark per stressare ulteriormente il processore, ad esempio, il rumore della ventola raggiungerebbe un massimo di 41 dB(A). Per il resto, aspettatevi che il sistema funzioni in modo silenzioso per la maggior parte dei carichi di lavoro quotidiani, tra cui la navigazione o lo streaming video.
Rumorosità
| Idle |
| 24.1 / 24.1 / 24.1 dB(A) |
| Sotto carico |
| 27.3 / 41.4 dB(A) |
 | ||
30 dB silenzioso 40 dB(A) udibile 50 dB(A) rumoroso |
||
min: | ||
| Asus VivoBook 15 X M1503QA Vega 7, R5 5600H, Intel SSD 670p SSDPEKNU512GZ | Asus Vivobook 15 K513EQ GeForce MX350, i7-1165G7, Intel SSD 660p SSDPEKNW512G8 | Asus VivoBook S15 D533UA Vega 8, R7 5700U, WDC PC SN530 SDBPNPZ-1T00 | Asus ZenBook UX535-M01440 GeForce GTX 1650 Ti Max-Q, i7-10750H, WDC PC SN730 SDBPNTY-1T00 | Lenovo ThinkBook 15 G3 ACL 21A400B2GE Vega 7, R5 5500U, Samsung PM991A MZALQ256HBJD | Dell Inspiron 15 3501 Iris Xe G7 96EUs, i7-1165G7, Samsung PM991a MZ9LQ512HBLU-00BD1 | |
|---|---|---|---|---|---|---|
| Noise | -14% | -20% | -14% | -7% | -9% | |
| off /ambiente * (dB) | 23.8 | 23.4 2% | 26 -9% | 24.6 -3% | 25.5 -7% | 26 -9% |
| Idle Minimum * (dB) | 24.1 | 23.6 2% | 26 -8% | 24.6 -2% | 25.5 -6% | 26 -8% |
| Idle Average * (dB) | 24.1 | 23.6 2% | 26 -8% | 24.6 -2% | 25.5 -6% | 26 -8% |
| Idle Maximum * (dB) | 24.1 | 23.6 2% | 28.8 -20% | 24.6 -2% | 25.5 -6% | 26 -8% |
| Load Average * (dB) | 27.3 | 41 -50% | 45 -65% | 41.3 -51% | 28.5 -4% | 35.9 -32% |
| Witcher 3 ultra * (dB) | 29.7 | 42.9 -44% | 42 -41% | |||
| Load Maximum * (dB) | 41.4 | 47 -14% | 45 -9% | 41.4 -0% | 45.6 -10% | 35.8 14% |
* ... Meglio usare valori piccoli
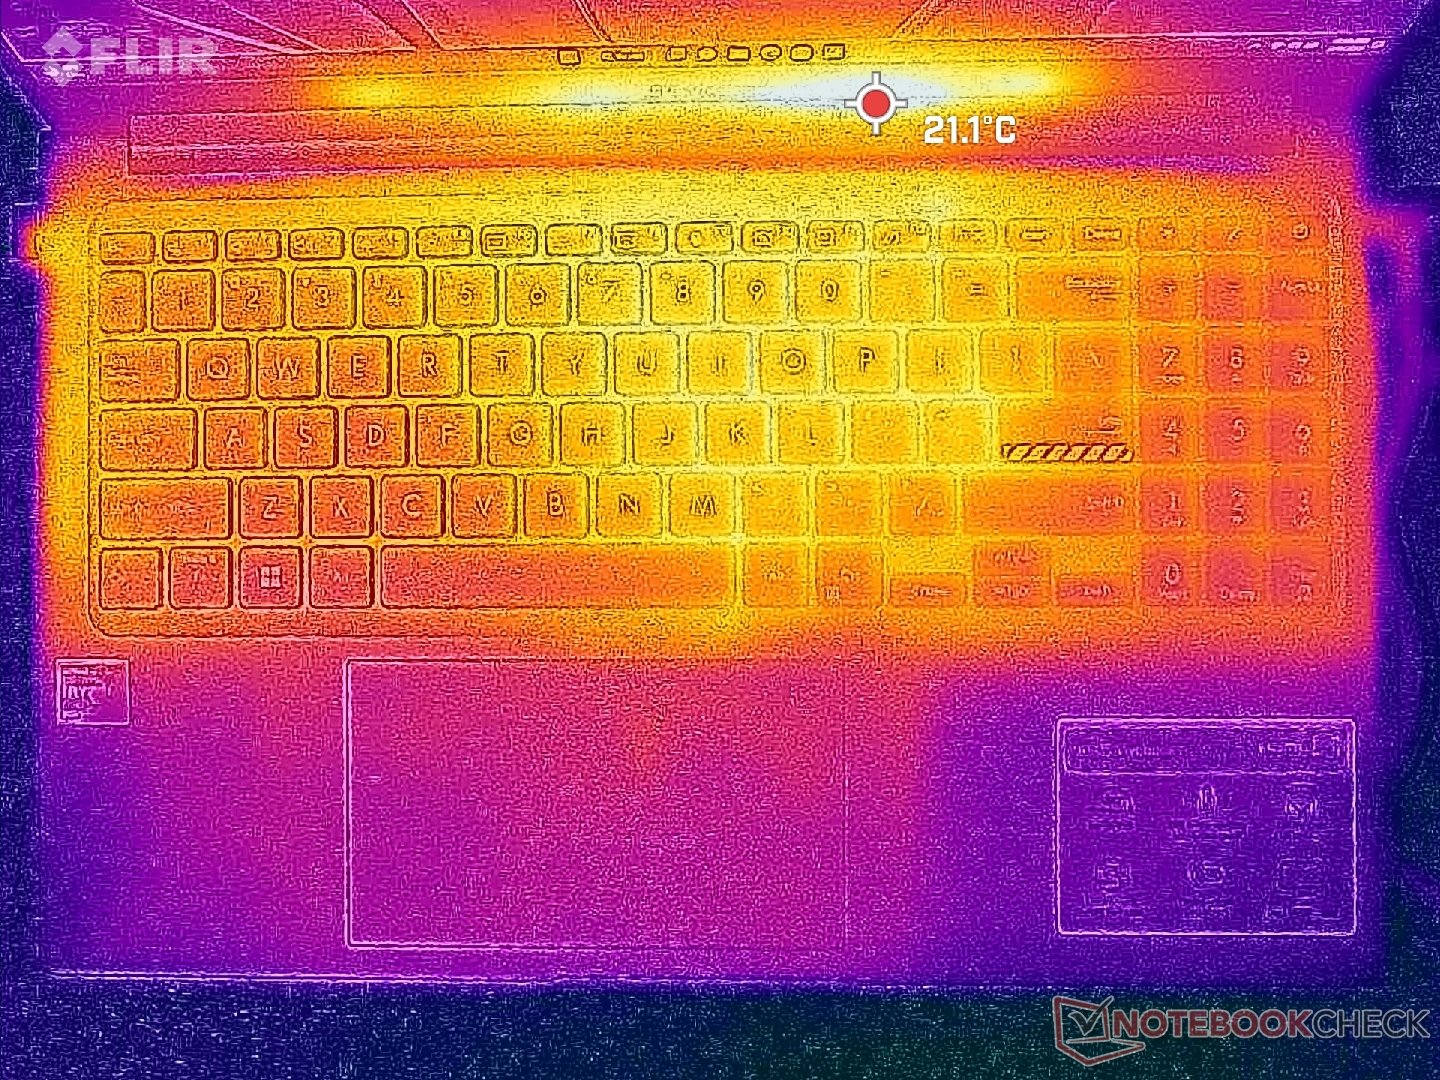
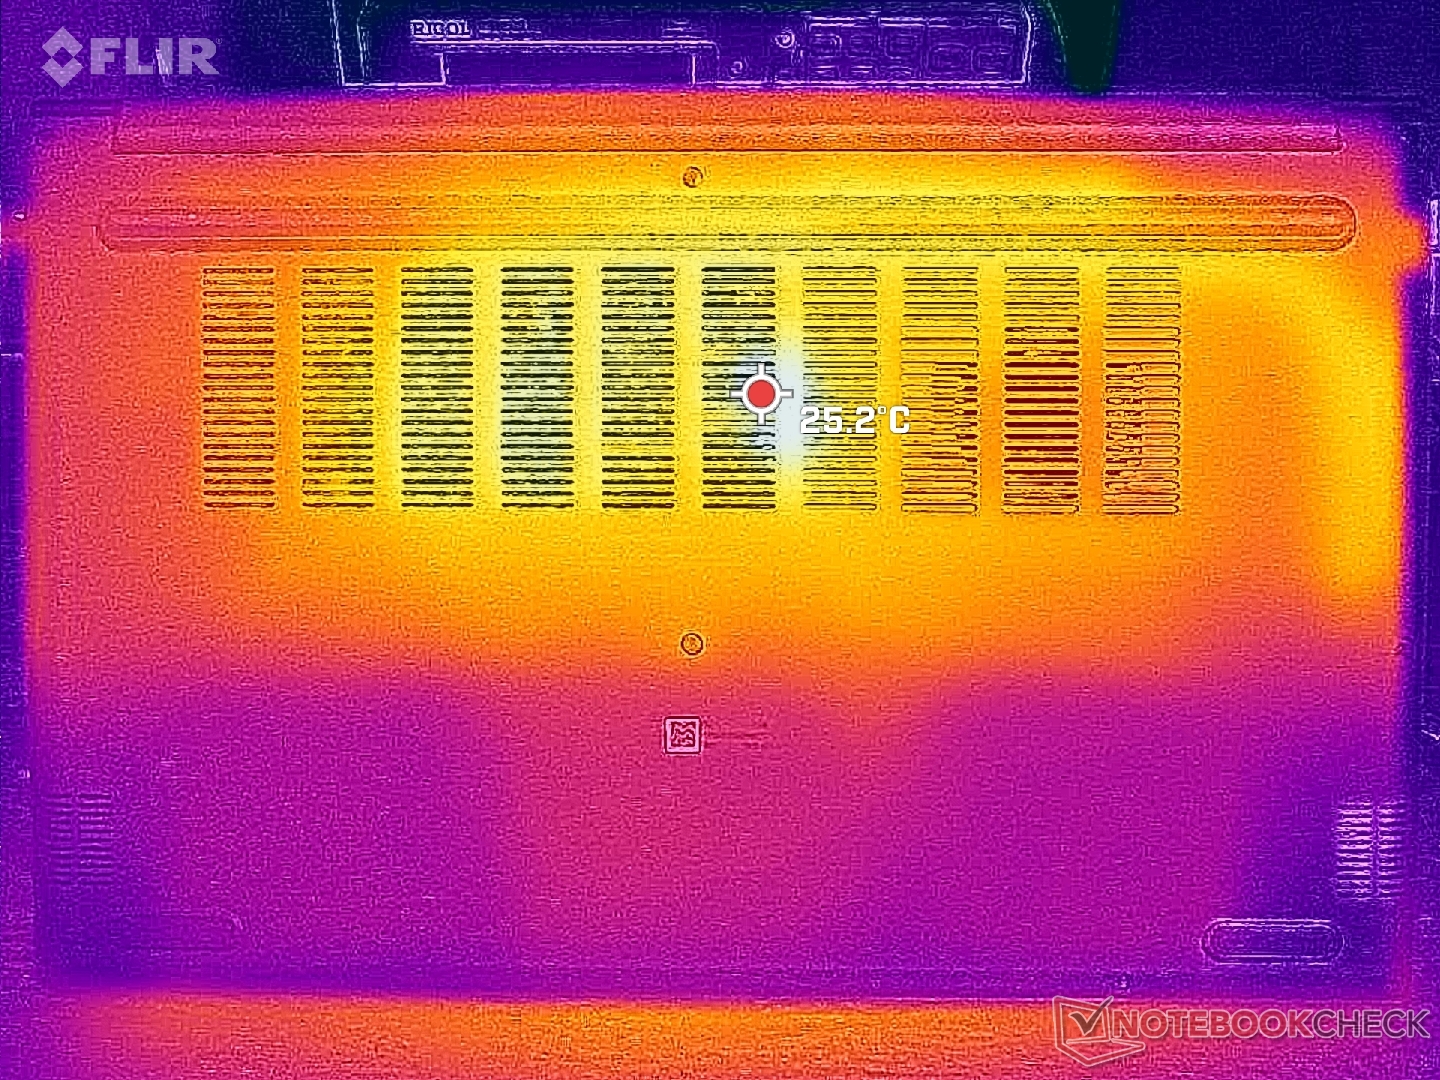
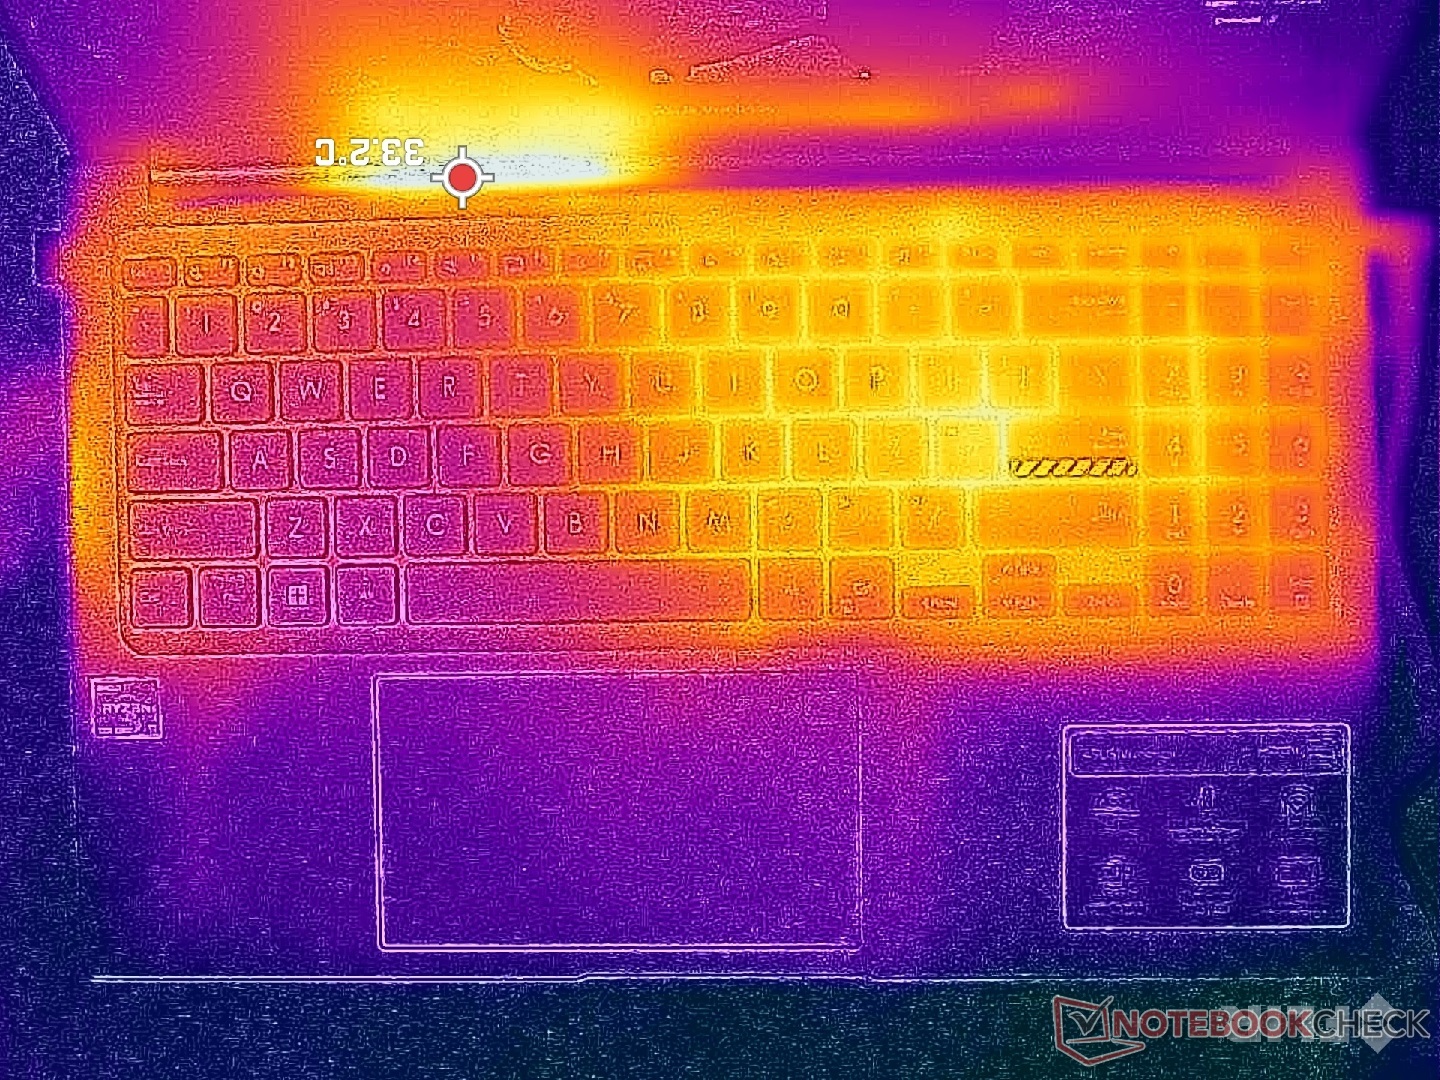
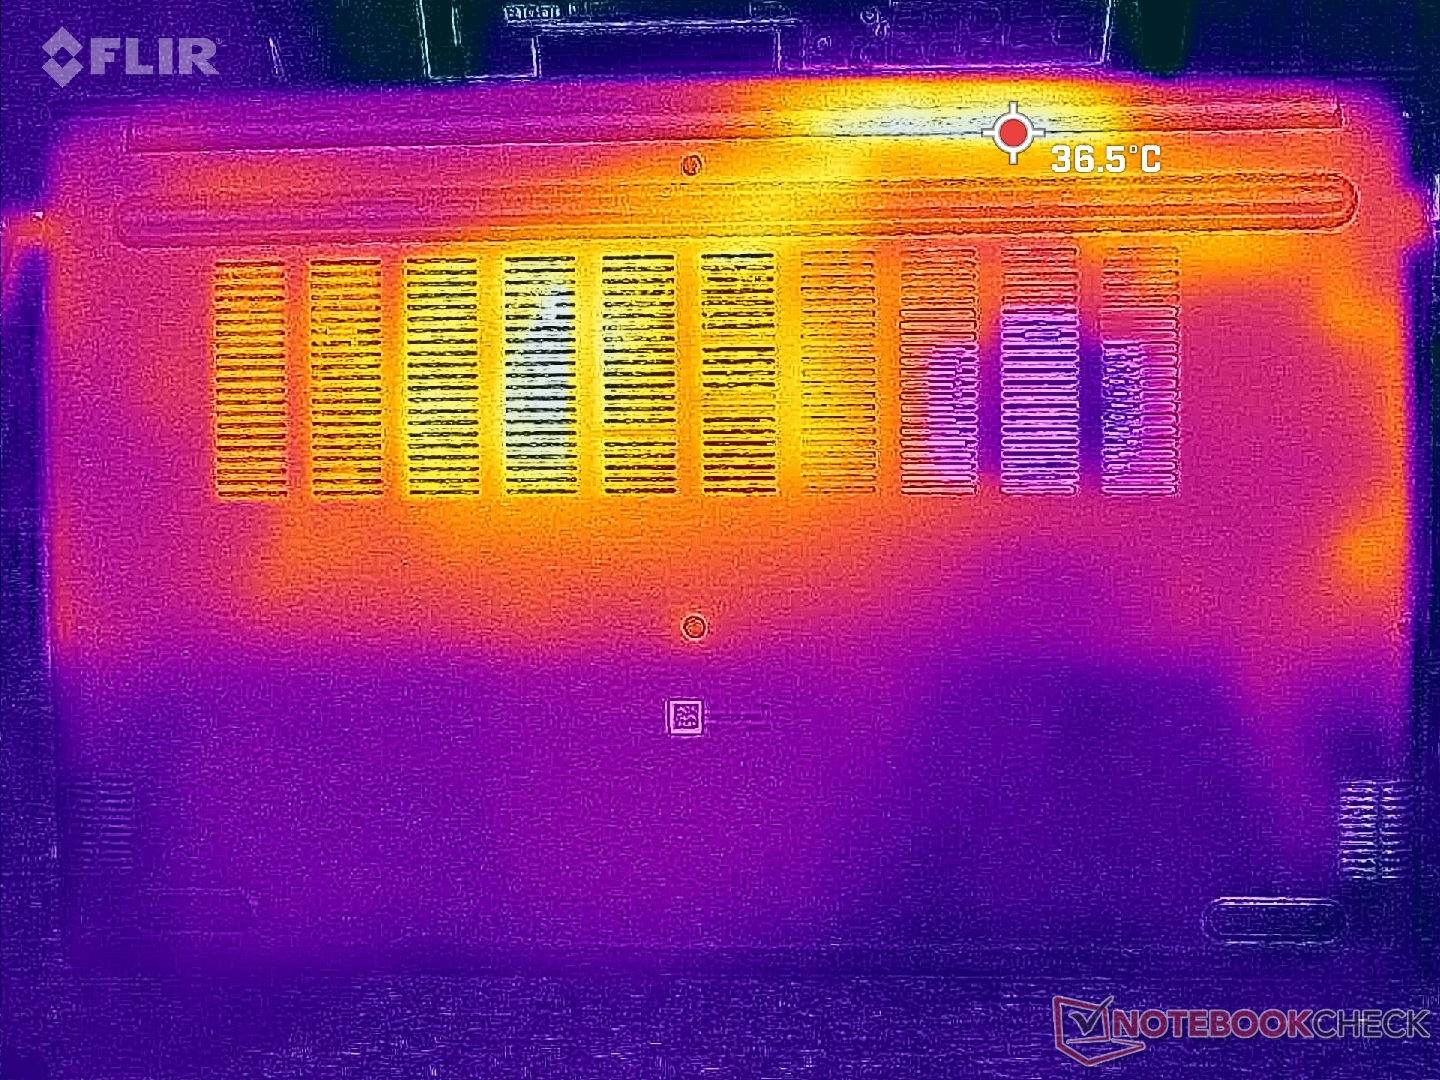
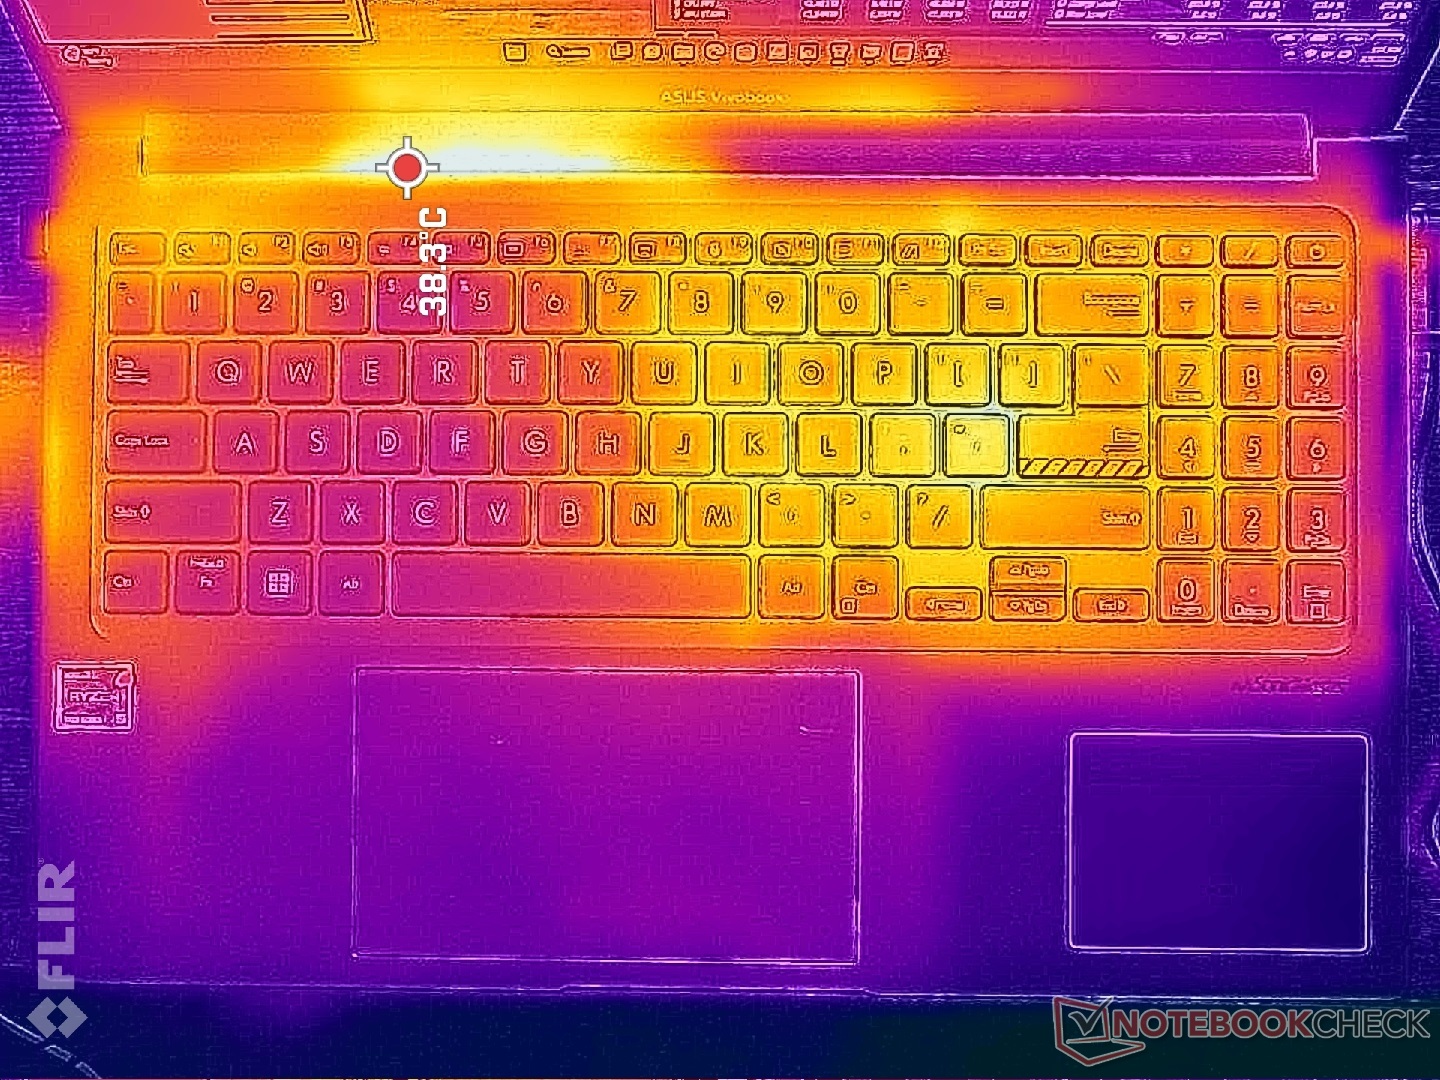
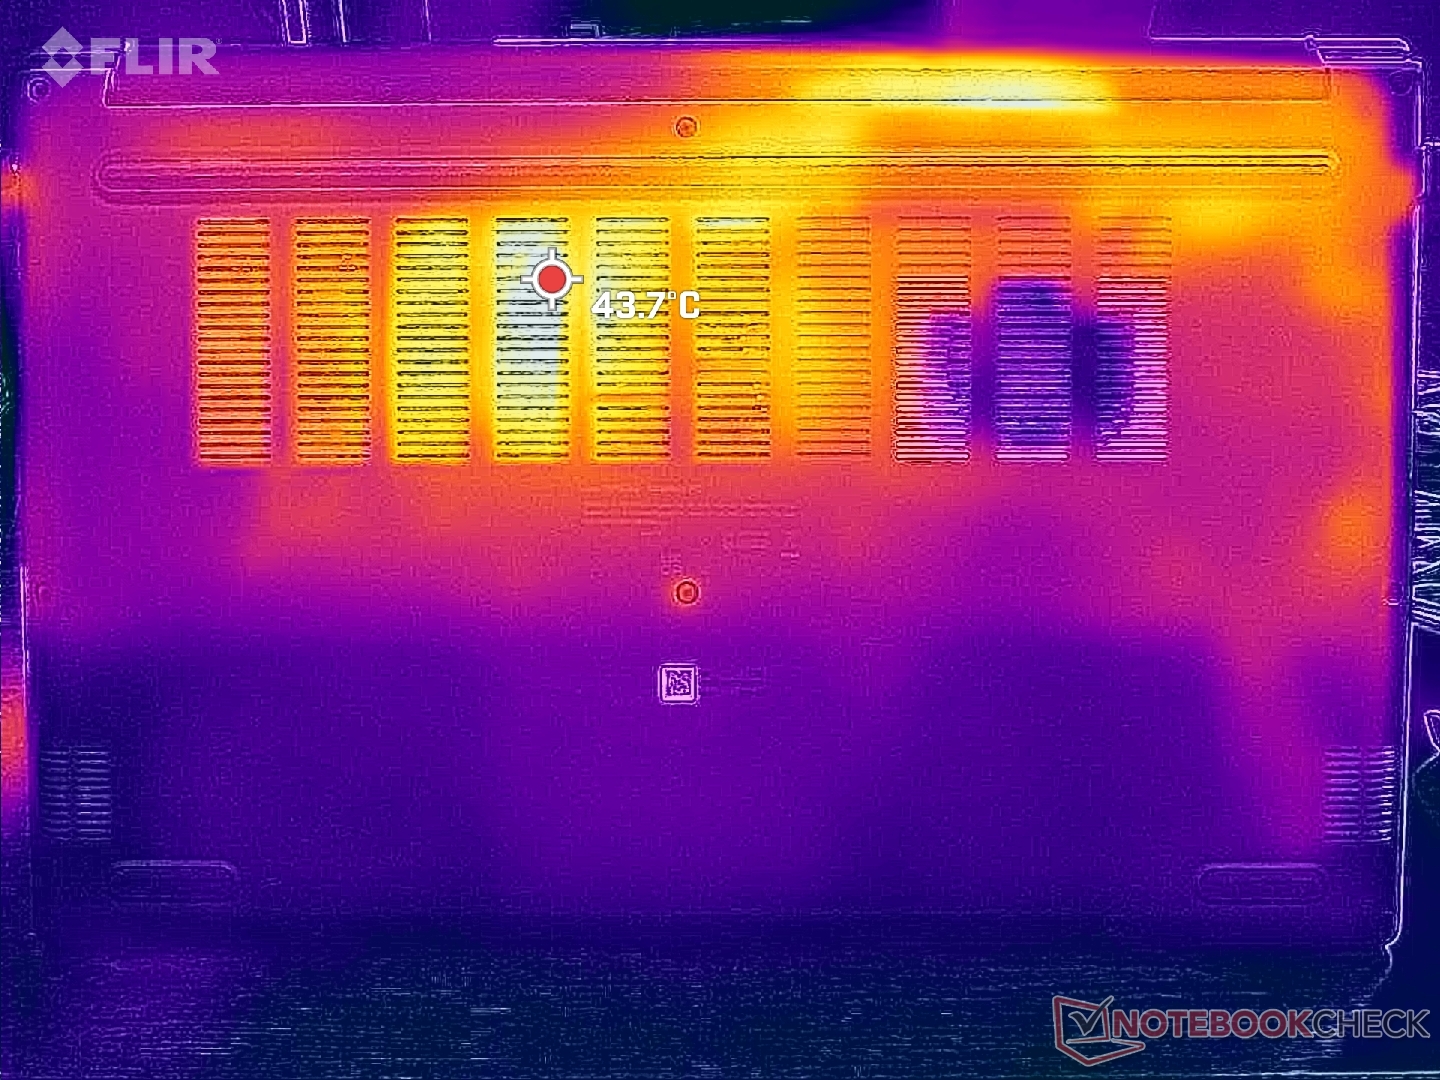
Temperatura
Le temperature di superficie sono sempre più calde nella metà destra dello chassis, a causa del posizionamento della soluzione di raffreddamento all'interno. La differenza tra il lato più freddo e quello più caldo della tastiera può raggiungere i 10 C. Le superfici non diventano mai fastidiosamente calde, indipendentemente dal carico sullo schermo.
La concorrenzaDell Inspiron 15 3501 può essere ancora più caldo, fino a 50 C sui lati superiore e inferiore, mentre il nostro Asus arriva a circa 35 C.
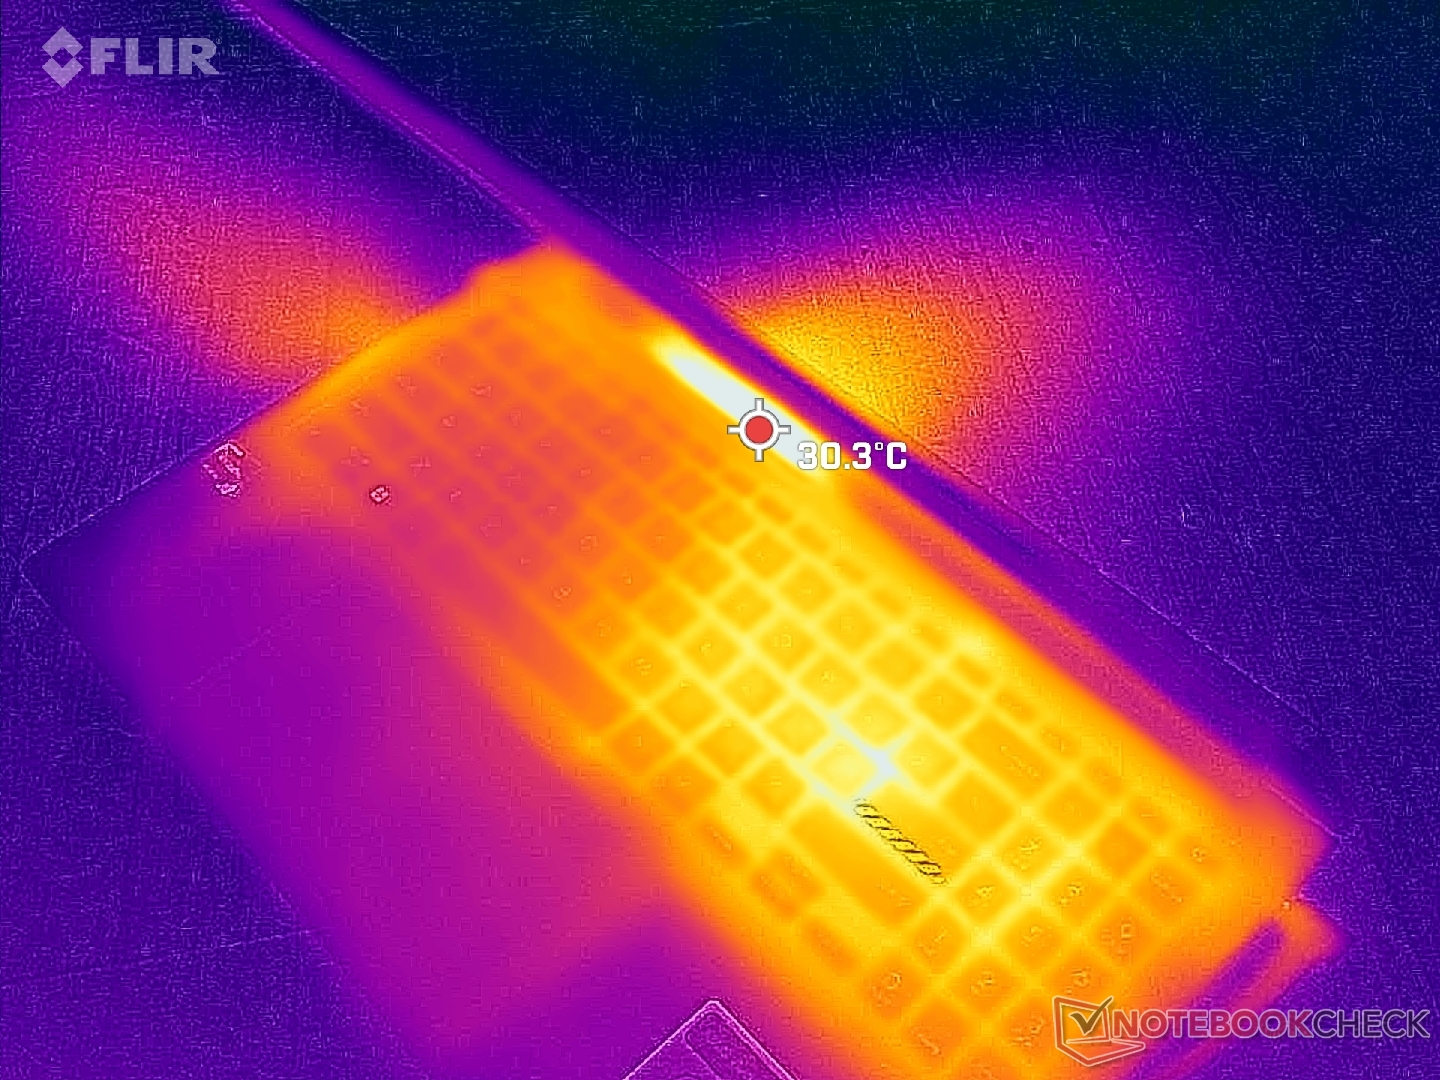
(+) La temperatura massima sul lato superiore è di 33.4 °C / 92 F, rispetto alla media di 36.8 °C / 98 F, che varia da 21 a 71 °C per questa classe Multimedia.
(+) Il lato inferiore si riscalda fino ad un massimo di 35.6 °C / 96 F, rispetto alla media di 39.1 °C / 102 F
(+) In idle, la temperatura media del lato superiore è di 22.4 °C / 72 F, rispetto alla media deld ispositivo di 31.3 °C / 88 F.
(+) Riproducendo The Witcher 3, la temperatura media per il lato superiore e' di 24.6 °C / 76 F, rispetto alla media del dispositivo di 31.3 °C / 88 F.
(+) I poggiapolsi e il touchpad sono piu' freddi della temperatura della pelle con un massimo di 20.8 °C / 69.4 F e sono quindi freddi al tatto.
(+) La temperatura media della zona del palmo della mano di dispositivi simili e'stata di 28.7 °C / 83.7 F (+7.9 °C / 14.3 F).
| Asus VivoBook 15 X M1503QA AMD Ryzen 5 5600H, AMD Radeon RX Vega 7 | Asus Vivobook 15 K513EQ Intel Core i7-1165G7, NVIDIA GeForce MX350 | Asus VivoBook S15 D533UA AMD Ryzen 7 5700U, AMD Radeon RX Vega 8 (Ryzen 4000/5000) | Asus ZenBook UX535-M01440 Intel Core i7-10750H, NVIDIA GeForce GTX 1650 Ti Max-Q | Lenovo ThinkBook 15 G3 ACL 21A400B2GE AMD Ryzen 5 5500U, AMD Radeon RX Vega 7 | Dell Inspiron 15 3501 Intel Core i7-1165G7, Intel Iris Xe Graphics G7 96EUs | |
|---|---|---|---|---|---|---|
| Heat | -30% | -22% | -15% | -25% | -20% | |
| Maximum Upper Side * (°C) | 33.4 | 48.8 -46% | 46.1 -38% | 37.8 -13% | 42.2 -26% | 45.6 -37% |
| Maximum Bottom * (°C) | 35.6 | 42 -18% | 46.6 -31% | 44.2 -24% | 48.8 -37% | 41 -15% |
| Idle Upper Side * (°C) | 24.6 | 30 -22% | 27.4 -11% | 28.1 -14% | 27.8 -13% | 28.2 -15% |
| Idle Bottom * (°C) | 26 | 35 -35% | 28.2 -8% | 27.7 -7% | 32.3 -24% | 29.1 -12% |
* ... Meglio usare valori piccoli
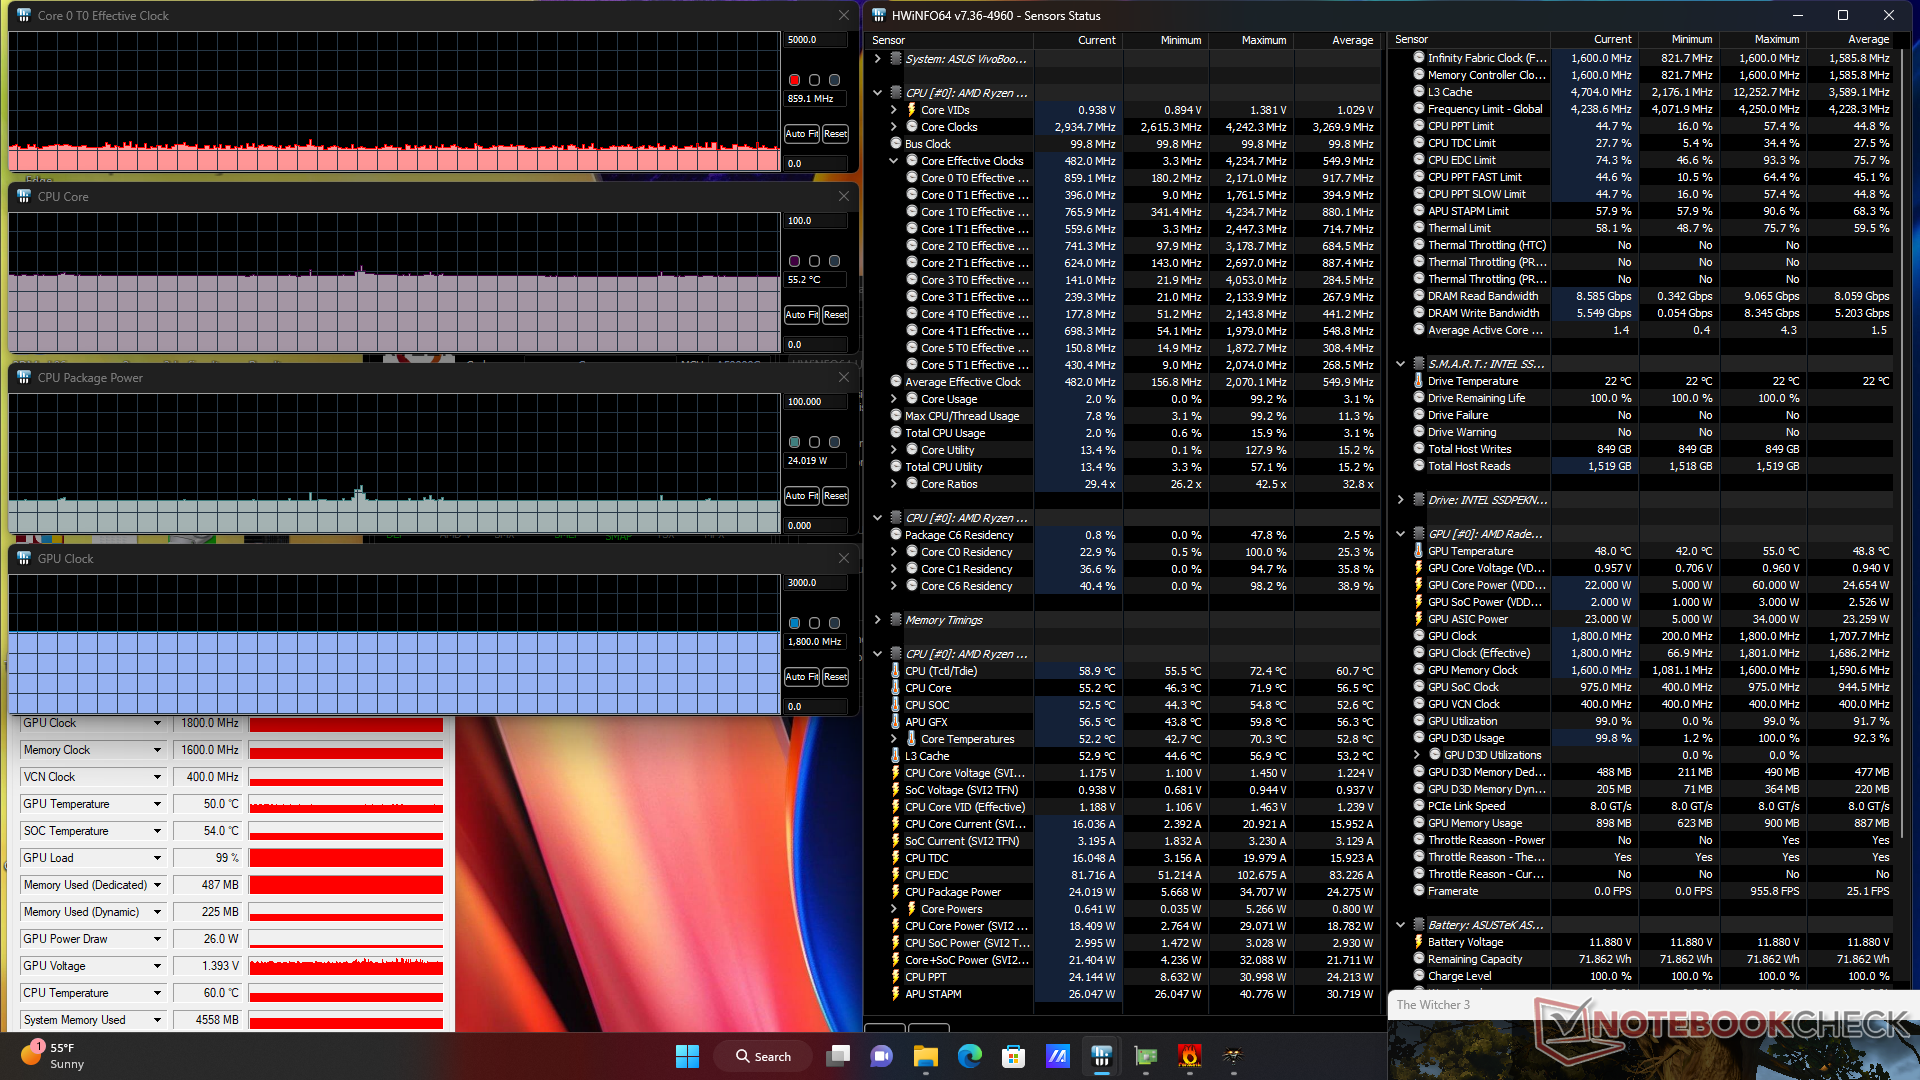
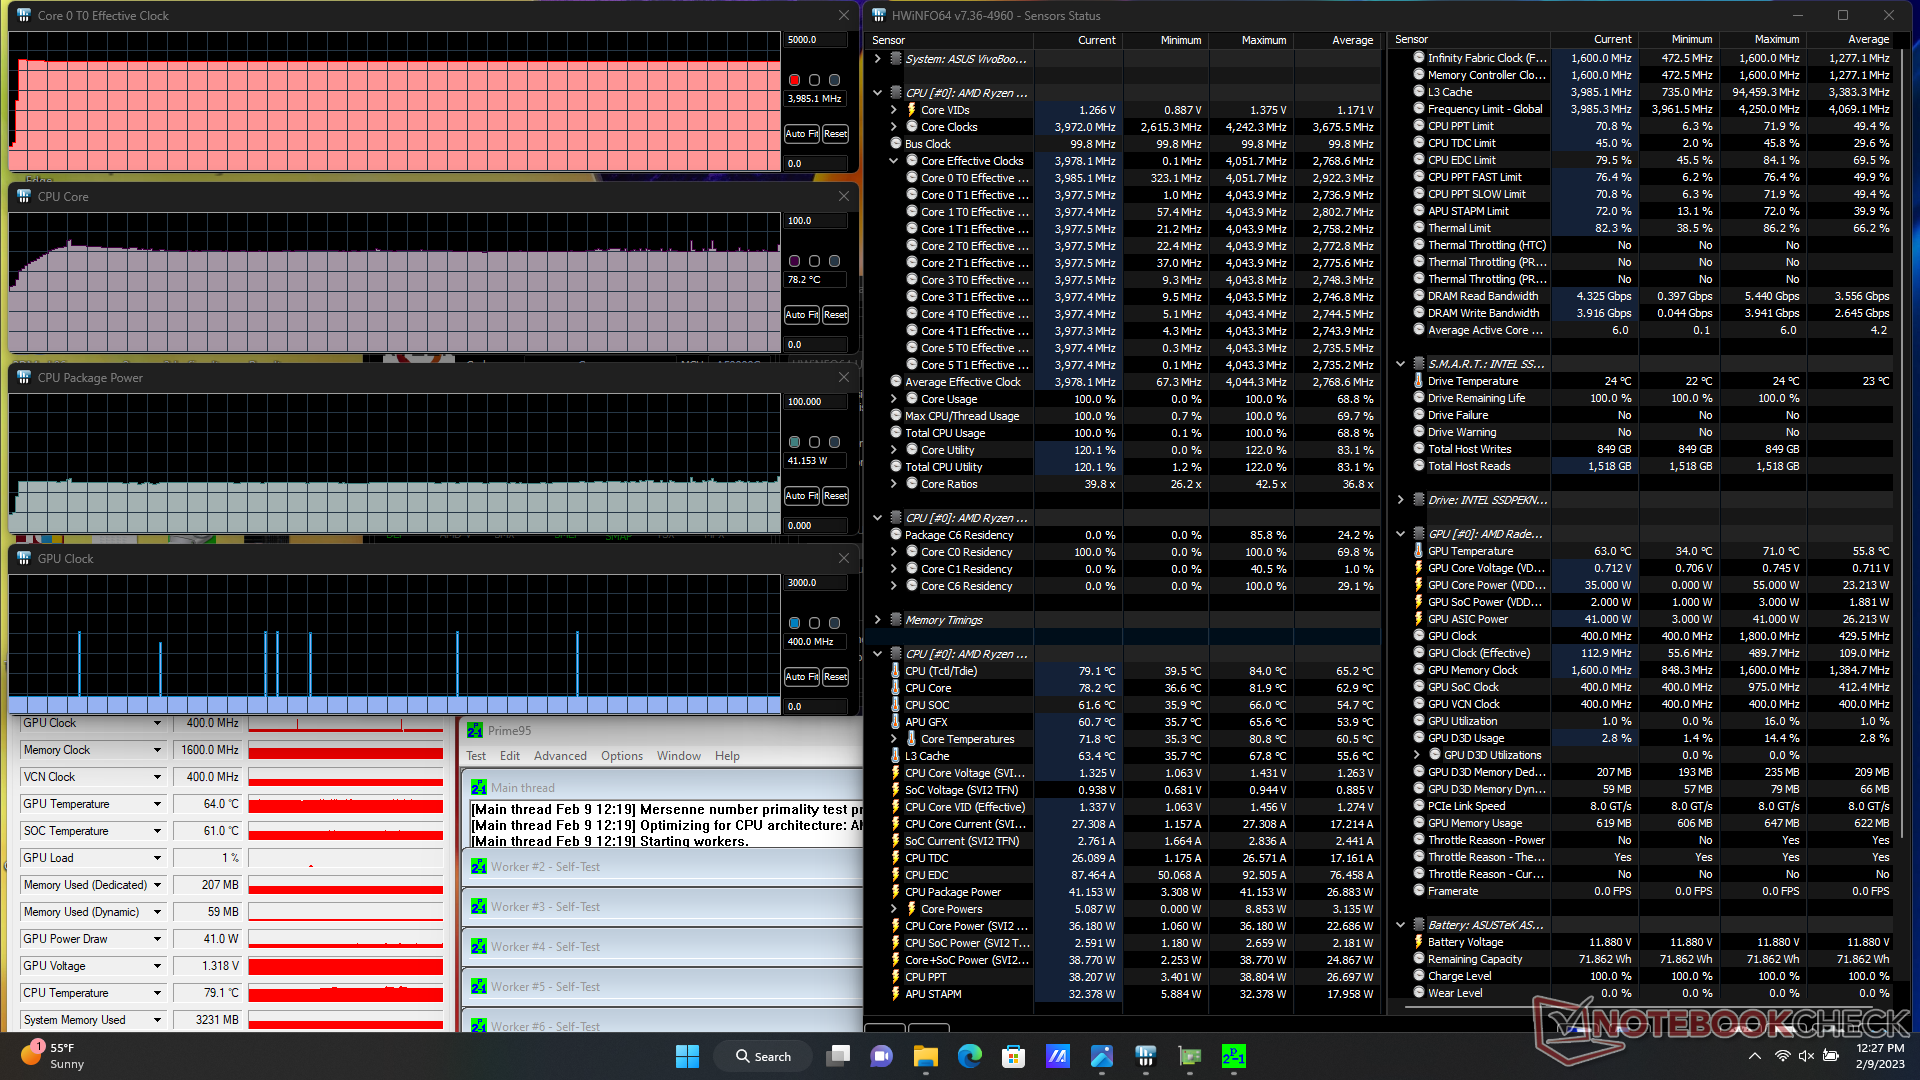
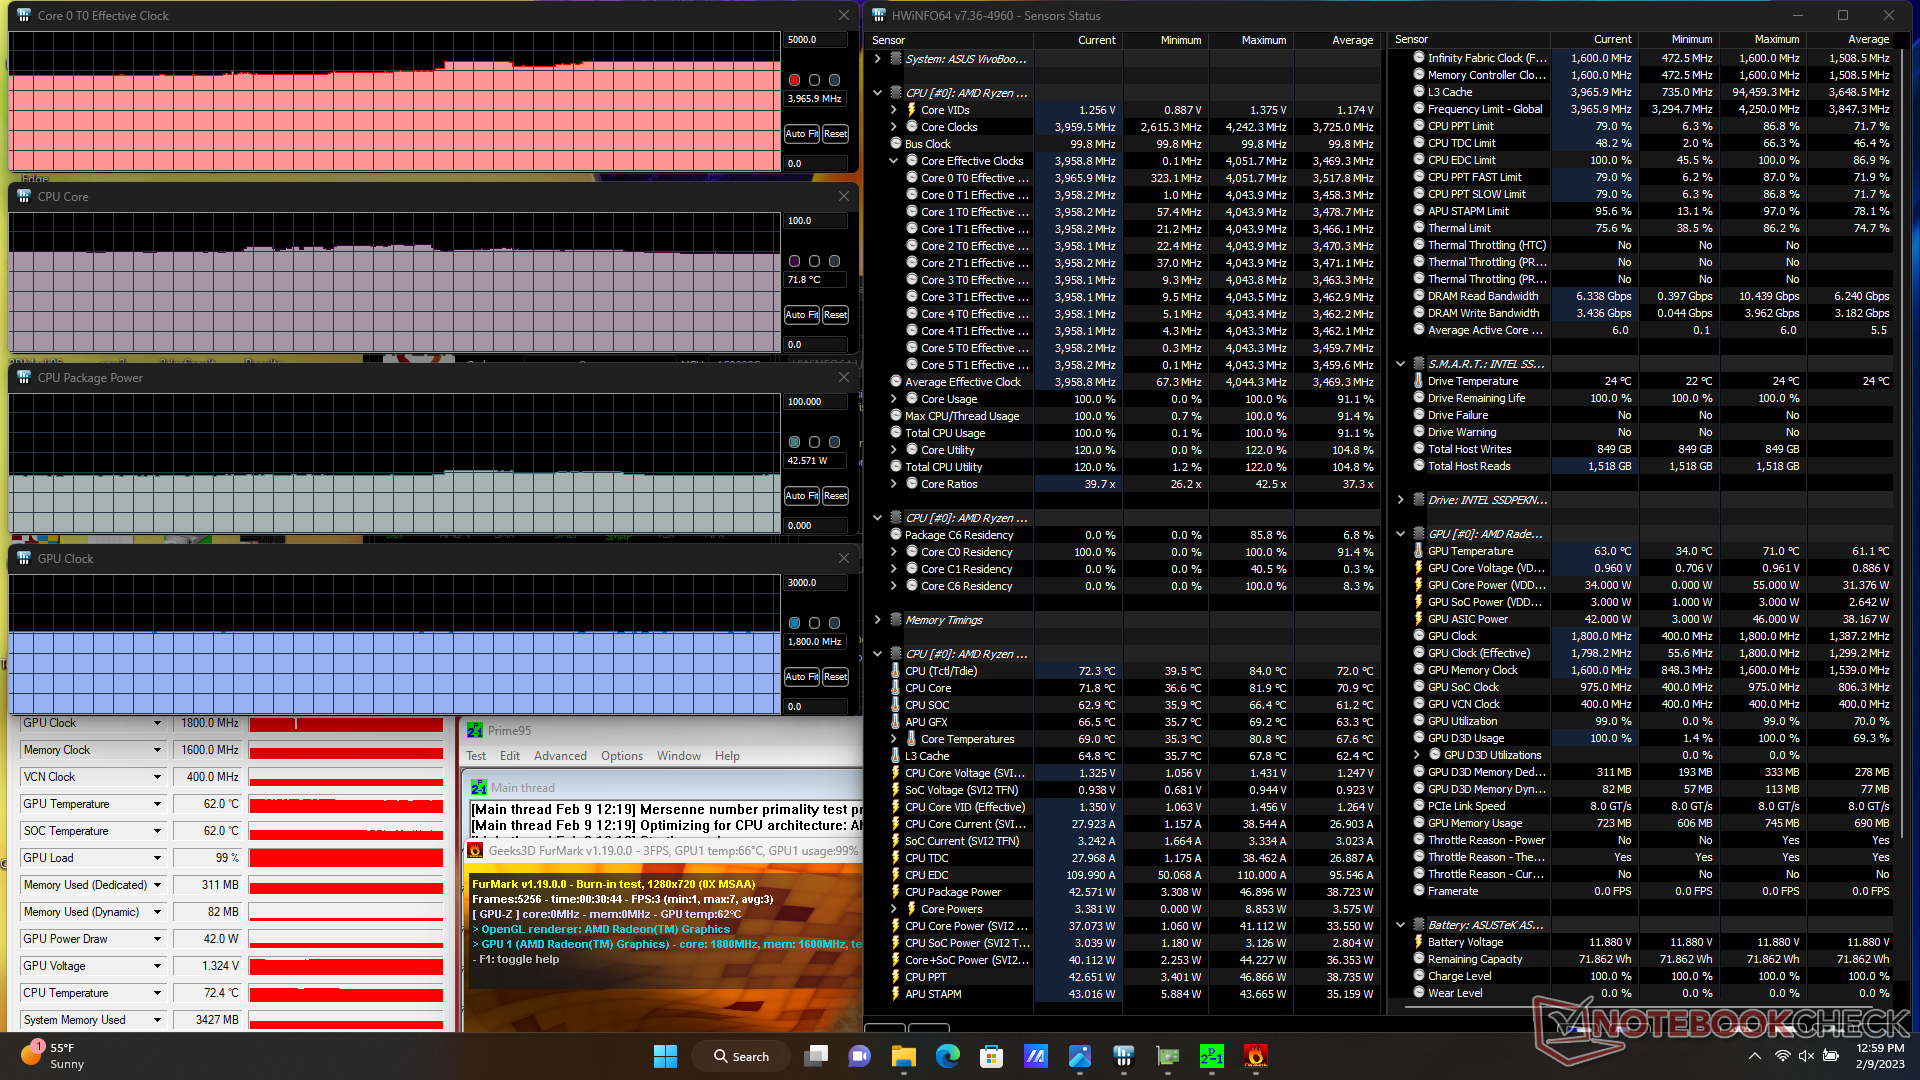
Stress test
La velocità di clock della CPU, la temperatura e l'assorbimento di potenza della scheda hanno raggiunto e si sono stabilizzati rispettivamente a 4 GHz, 78 C e 41 W, senza cali significativi o comportamenti ciclici. Al contrario, molti Ultrabook alimentati da CPU della serie U raggiungono velocità di clock elevate solo per pochi secondi prima di ridurre le prestazioni per tenere sotto controllo le temperature.
Le frequenze di clock della GPU e la temperatura si stabilizzavano a 1800 MHz e a una temperatura relativamente fresca di 55 C, rispetto ai 78 C del più piccolo VivoBook S 14X da 14 pollici.VivoBook S 14X. Tuttavia, quest'ultimo modello offre prestazioni grafiche più veloci rispetto alla nostra unità in prova.
Il funzionamento a batteria influisce sulle prestazioni. Un test 3DMark 11 a batteria restituisce i punteggi di Fisica e Grafica rispettivamente di 8132 e 3391 punti, rispetto a 8662 e 3505 punti con l'alimentazione di rete.

| Clock della CPU (GHz) | Clock della GPU (MHz) | Temperatura media della CPU (°C) | |
| Sistema inattivo | -- | -- | 37 |
| Stress Prime95 | 4,0 | -- | 78 |
| Prime95 + FurMark Stress | ~4,0 | 1800 | 72 |
| Witcher 3 Stress | ~0,9 | 1800 | 55 |
Altoparlanti
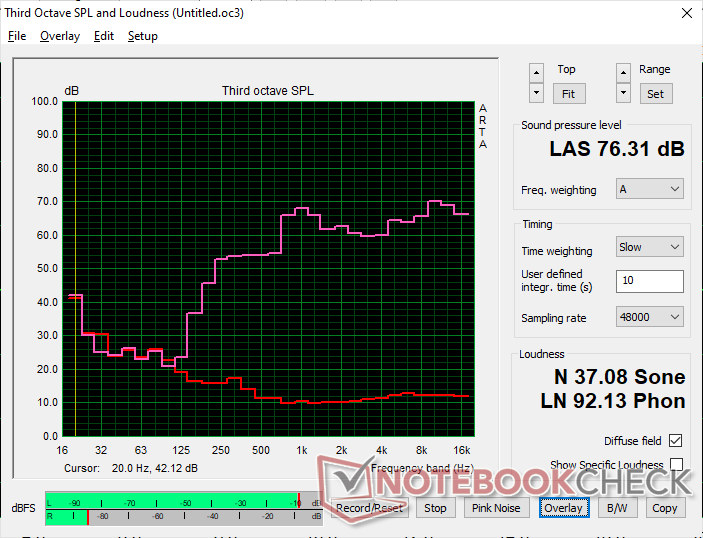
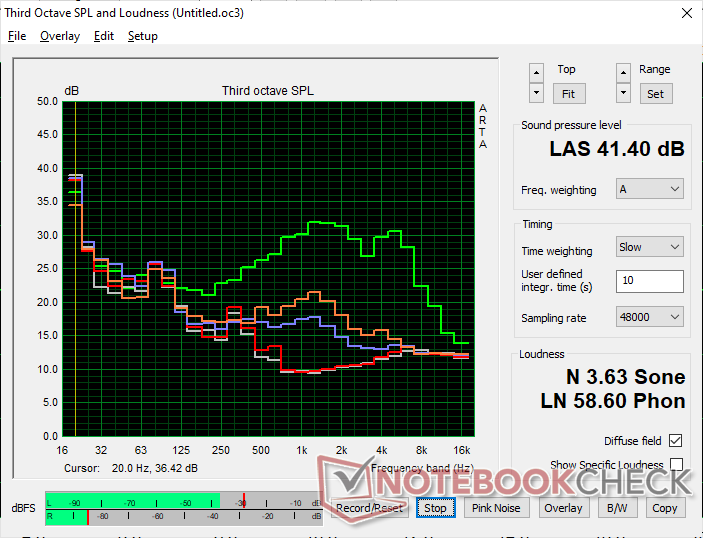
Asus VivoBook 15 X M1503QA analisi audio
(±) | potenza degli altiparlanti media ma buona (76.3 dB)
Bassi 100 - 315 Hz
(-) | quasi nessun basso - in media 21.9% inferiori alla media
(±) | la linearità dei bassi è media (12.8% delta rispetto alla precedente frequenza)
Medi 400 - 2000 Hz
(±) | medi elevati - circa 5% superiore alla media
(+) | medi lineari (5.6% delta rispetto alla precedente frequenza)
Alti 2 - 16 kHz
(+) | Alti bilanciati - appena 3.2% dalla media
(+) | alti lineari (4.1% delta rispetto alla precedente frequenza)
Nel complesso 100 - 16.000 Hz
(±) | la linearità complessiva del suono è media (20.3% di differenza rispetto alla media
Rispetto alla stessa classe
» 68% di tutti i dispositivi testati in questa classe è stato migliore, 9% simile, 24% peggiore
» Il migliore ha avuto un delta di 5%, medio di 17%, peggiore di 45%
Rispetto a tutti i dispositivi testati
» 53% di tutti i dispositivi testati in questa classe è stato migliore, 8% similare, 39% peggiore
» Il migliore ha avuto un delta di 4%, medio di 23%, peggiore di 134%
Apple MacBook Pro 16 2021 M1 Pro analisi audio
(+) | gli altoparlanti sono relativamente potenti (84.7 dB)
Bassi 100 - 315 Hz
(+) | bassi buoni - solo 3.8% dalla media
(+) | bassi in lineaa (5.2% delta rispetto alla precedente frequenza)
Medi 400 - 2000 Hz
(+) | medi bilanciati - solo only 1.3% rispetto alla media
(+) | medi lineari (2.1% delta rispetto alla precedente frequenza)
Alti 2 - 16 kHz
(+) | Alti bilanciati - appena 1.9% dalla media
(+) | alti lineari (2.7% delta rispetto alla precedente frequenza)
Nel complesso 100 - 16.000 Hz
(+) | suono nel complesso lineare (4.6% differenza dalla media)
Rispetto alla stessa classe
» 0% di tutti i dispositivi testati in questa classe è stato migliore, 0% simile, 100% peggiore
» Il migliore ha avuto un delta di 5%, medio di 17%, peggiore di 45%
Rispetto a tutti i dispositivi testati
» 0% di tutti i dispositivi testati in questa classe è stato migliore, 0% similare, 100% peggiore
» Il migliore ha avuto un delta di 4%, medio di 23%, peggiore di 134%
Gestione dell'energia
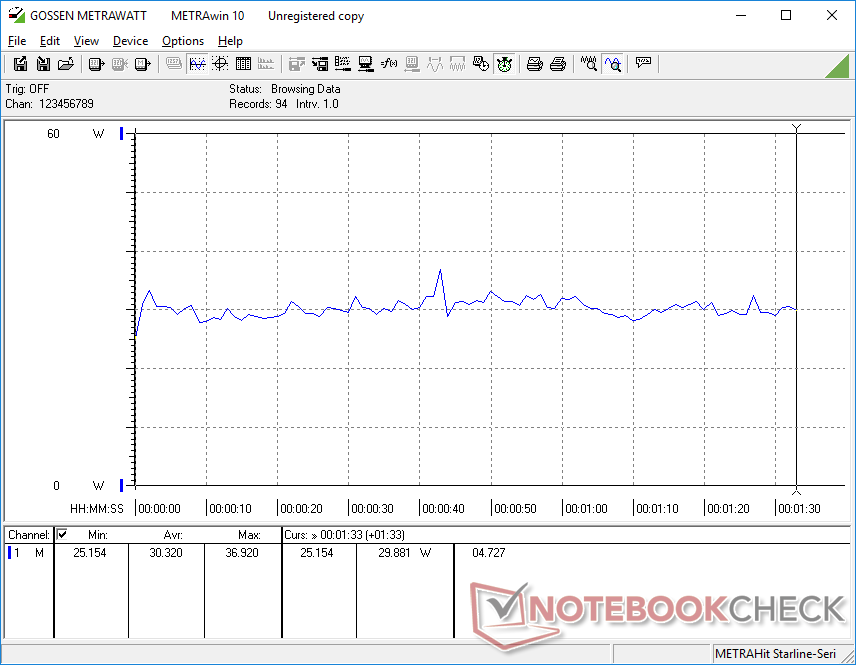
Consumo di energia
Il funzionamento al minimo sul desktop richiede tra i 5 W e i 14 W a seconda dell'impostazione della luminosità e del profilo energetico, ovvero qualche watt in più rispetto alla maggior parte delle alternative basate su IPS come il Dell Inspiron 15 3501 o il Lenovo ThinkBook 15 G Lenovo ThinkBook 15 G3. Poiché l'OLED consuma più energia quando visualizza il bianco, si consiglia di utilizzare sfondi o wallpaper più scuri per prolungare la durata della batteria.
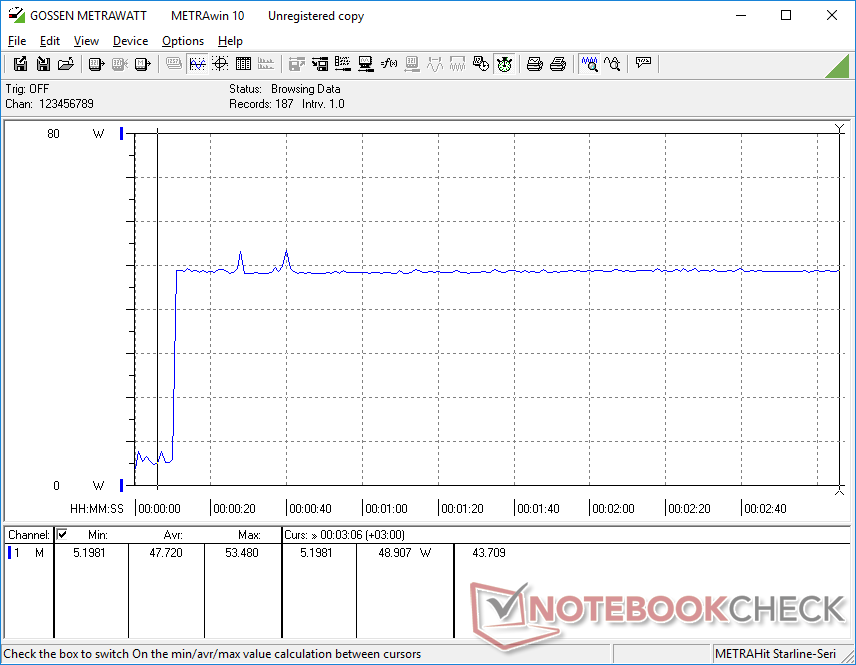
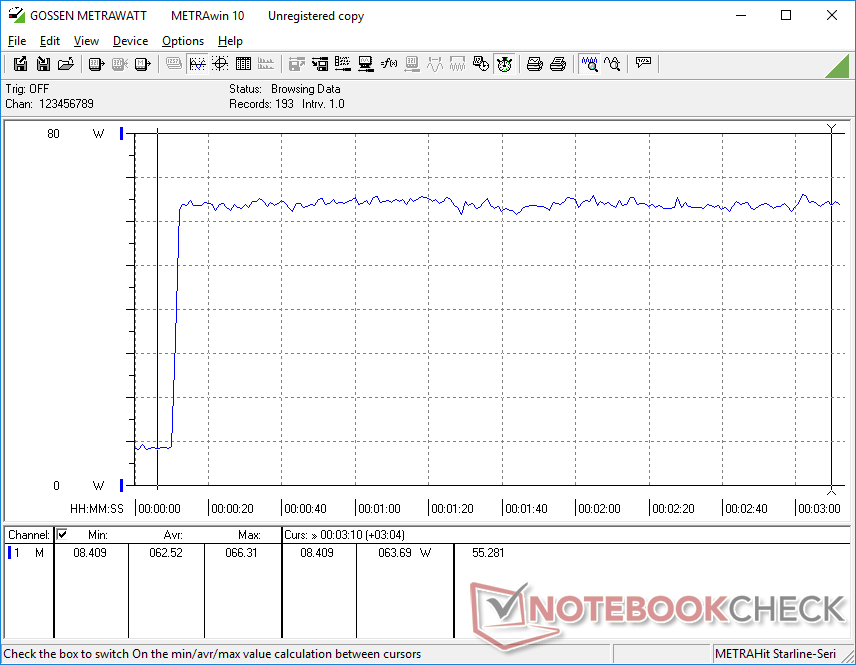
L'esecuzione di carichi elevati come 3DMark o Witcher 3 consuma in media circa 33 W rispetto ai 40 W o più del VivoBook S15 D533.VivoBook S15 D533UA o del Lenovo ThinkBook 15 G3. Le prestazioni grafiche dell'unità in esame sono più deboli, tuttavia, a causa della memoria a canale singolo, come già detto. L'aggiornamento dell'unità a un doppio canale aumenterebbe di conseguenza le prestazioni e il consumo energetico.
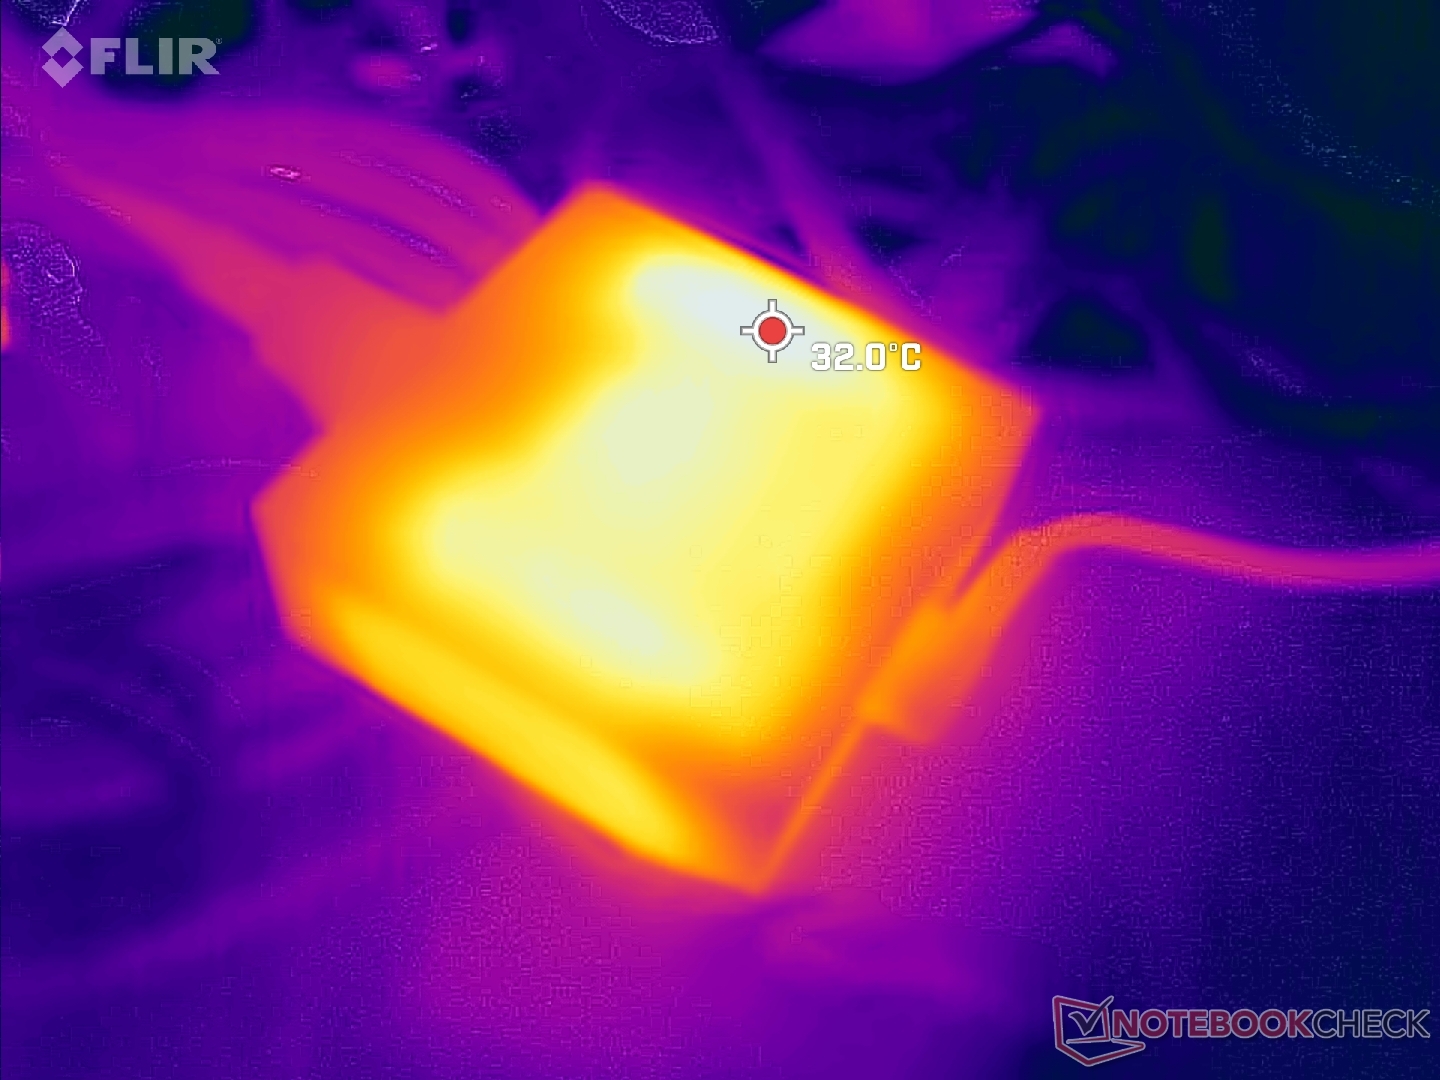
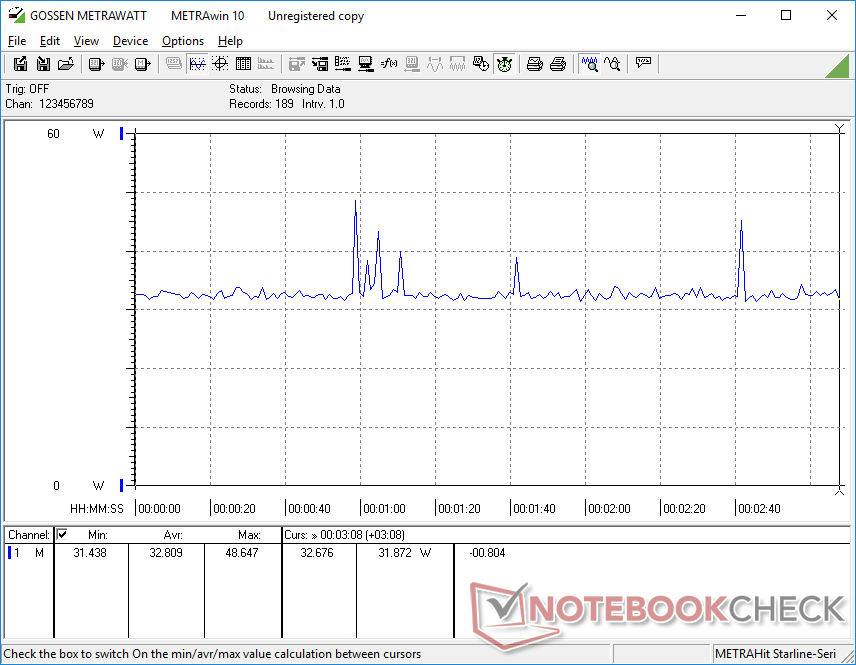
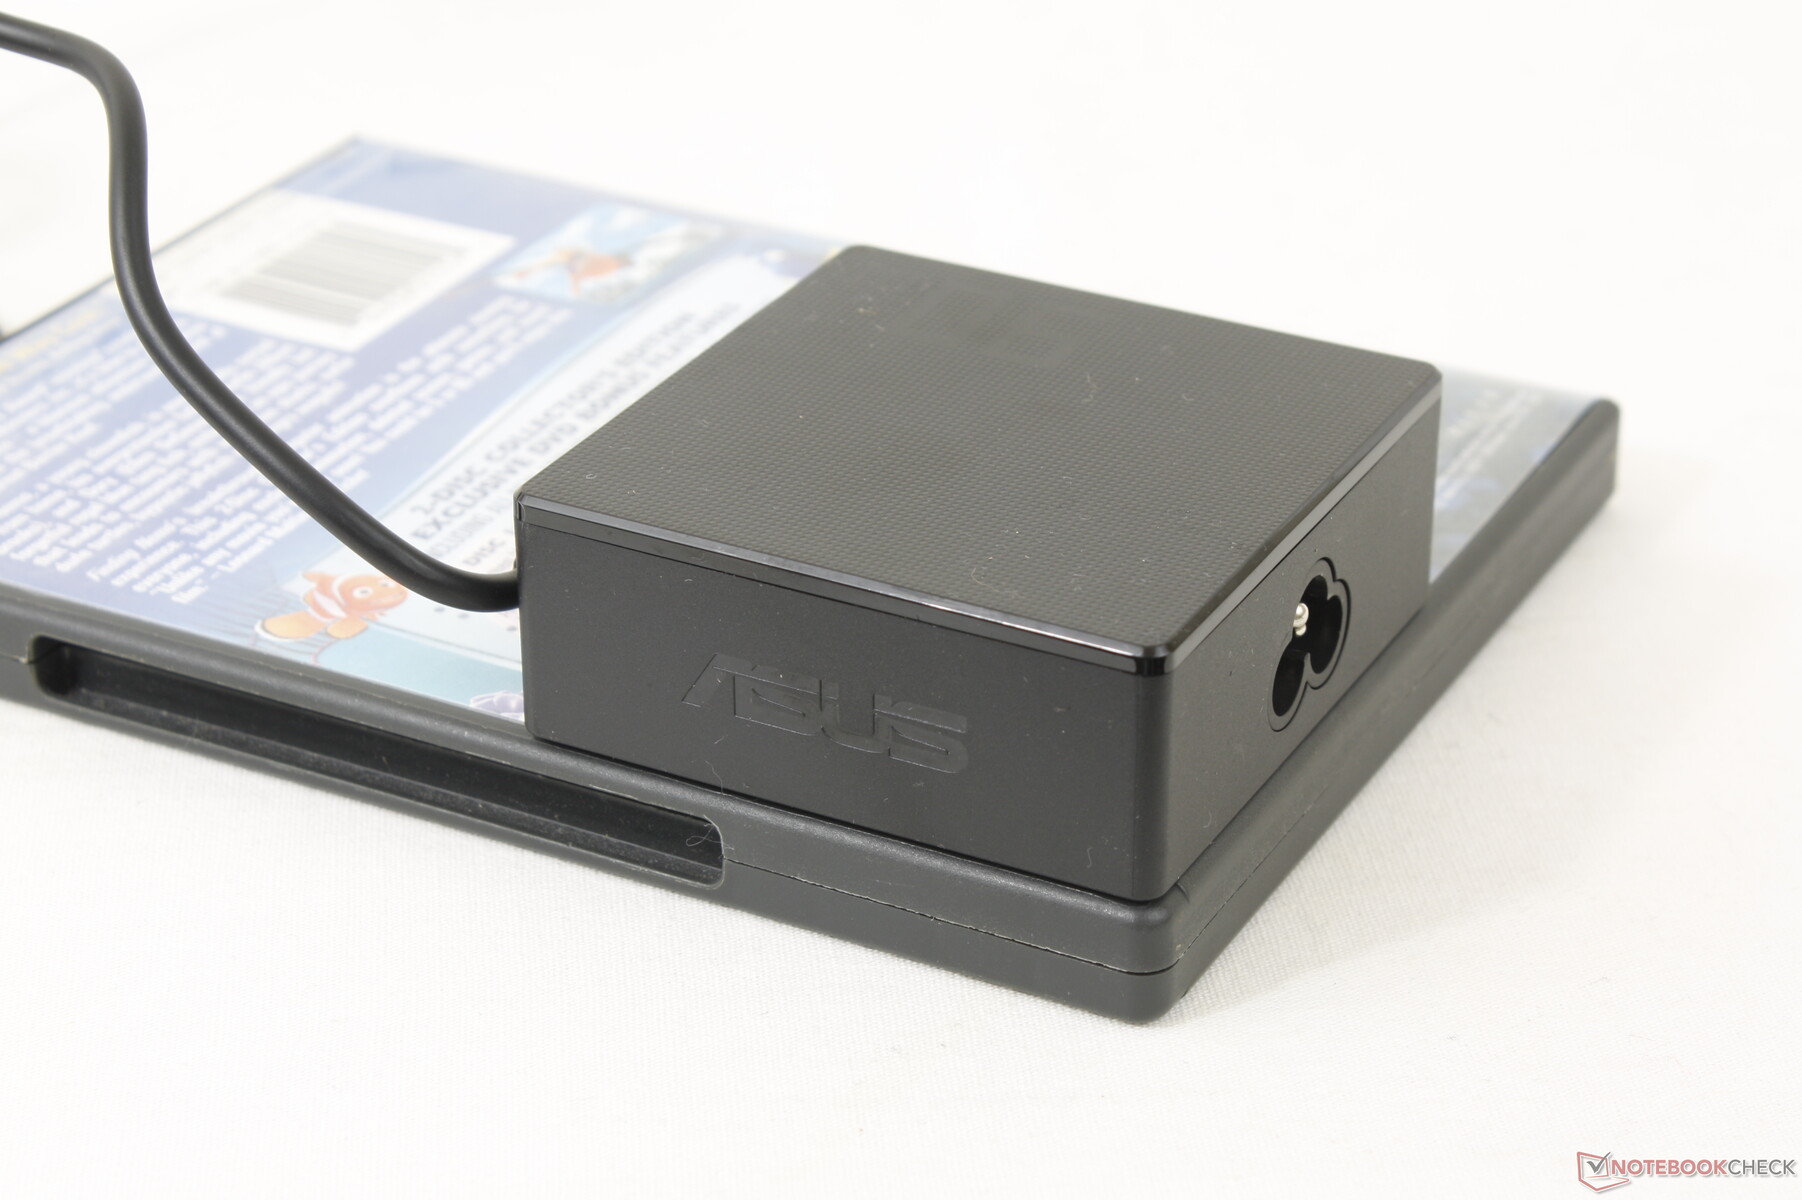
Siamo riusciti a registrare un consumo massimo di 63 W dal piccolo (7,5 x 7,5 x 2,9 cm) adattatore CA da 90 W quando si eseguono contemporaneamente Prime95 e FurMark. L'adattatore è più che sufficiente per alimentare il sistema e ricaricare la batteria a una velocità ragionevole.
| Off / Standby | |
| Idle | |
| Sotto carico |
|
Leggenda:
min: | |
| Asus VivoBook 15 X M1503QA R5 5600H, Vega 7, Intel SSD 670p SSDPEKNU512GZ, OLED, 1920x1080, 15.6" | Asus Vivobook 15 K513EQ i7-1165G7, GeForce MX350, Intel SSD 660p SSDPEKNW512G8, OLED, 1920x1080, 15.6" | Asus VivoBook S15 D533UA R7 5700U, Vega 8, WDC PC SN530 SDBPNPZ-1T00, IPS, 1920x1080, 15.6" | Asus ZenBook UX535-M01440 i7-10750H, GeForce GTX 1650 Ti Max-Q, WDC PC SN730 SDBPNTY-1T00, IPS, 3840x2160, 15.6" | Lenovo ThinkBook 15 G3 ACL 21A400B2GE R5 5500U, Vega 7, Samsung PM991A MZALQ256HBJD, IPS, 1920x1080, 15.6" | Dell Inspiron 15 3501 i7-1165G7, Iris Xe G7 96EUs, Samsung PM991a MZ9LQ512HBLU-00BD1, IPS, 1920x1080, 15.6" | |
|---|---|---|---|---|---|---|
| Power Consumption | -14% | -9% | -65% | -4% | 13% | |
| Idle Minimum * (Watt) | 5.4 | 3.7 31% | 5 7% | 4.4 19% | 4.2 22% | 3.6 33% |
| Idle Average * (Watt) | 7.4 | 6.3 15% | 7.7 -4% | 9.8 -32% | 8.3 -12% | 6.4 14% |
| Idle Maximum * (Watt) | 13.8 | 9.7 30% | 12.2 12% | 14.5 -5% | 10.4 25% | 7.9 43% |
| Load Average * (Watt) | 30.3 | 59 -95% | 41 -35% | 83 -174% | 49 -62% | 39 -29% |
| Witcher 3 ultra * (Watt) | 32.8 | 51.4 -57% | 43 -31% | 67 -104% | 39.7 -21% | 37.6 -15% |
| Load Maximum * (Watt) | 63 | 67.7 -7% | 65 -3% | 123 -95% | 49.3 22% | 41.8 34% |
* ... Meglio usare valori piccoli
Power Consumption Witcher 3 / Stresstest
Power Consumption external Monitor
Durata della batteria - Macchina di lunga durata
La capacità della batteria è elevata, pari a 70 Wh, rispetto ad altri modelli Vivobook in cui è tipica una capacità di circa 40 Wh. L'aumento è più che sufficiente per compensare la maggiore richiesta di energia del pannello OLED e della CPU della serie H. Siamo riusciti a registrare un'autonomia di navigazione reale di oltre 11 ore rispetto alle 9 ore del VivoBook S15.
La ricarica da vuoto a pieno regime è relativamente veloce, circa 90 minuti. Purtroppo, il sistema non può essere ricaricato tramite USB-C.
| Asus VivoBook 15 X M1503QA R5 5600H, Vega 7, 70 Wh | Asus Vivobook 15 K513EQ i7-1165G7, GeForce MX350, 42 Wh | Asus VivoBook S15 D533UA R7 5700U, Vega 8, 50 Wh | Asus ZenBook UX535-M01440 i7-10750H, GeForce GTX 1650 Ti Max-Q, 96 Wh | Lenovo ThinkBook 15 G3 ACL 21A400B2GE R5 5500U, Vega 7, 45 Wh | Dell Inspiron 15 3501 i7-1165G7, Iris Xe G7 96EUs, 42 Wh | |
|---|---|---|---|---|---|---|
| Autonomia della batteria | -35% | -20% | -1% | -28% | -39% | |
| Reader / Idle (h) | 18.9 | 13.3 -30% | 18.3 -3% | |||
| WiFi v1.3 (h) | 11.2 | 6 -46% | 9 -20% | 10.1 -10% | 8.1 -28% | 6.8 -39% |
| Load (h) | 1.8 | 1.3 -28% | 2 11% | |||
| H.264 (h) | 11.9 |
Pro
Contro
Verdetto - Display e processore ottimi per il prezzo
Il VivoBook 15X OLED eccelle per la lunga durata della batteria, la velocità del processore e il display OLED con calibrazione Pantone, il tutto a un prezzo ragionevole. La maggior parte degli altri Ultrabook della stessa fascia di prezzo offre in genere processori della serie U più lenti e/o un display IPS con colori inferiori. Il VivoBook 15X OLED è quindi più adatto per l'editing grafico occasionale in movimento di quanto ci si potrebbe aspettare da un portatile economico da 15,6 pollici.
Un notevole svantaggio del modello è rappresentato dai limitati 8 GB di RAM a canale singolo saldati, che incidono significativamente sulle prestazioni grafiche. Fortunatamente, il pannello inferiore si stacca con relativa facilità per consentire agli utenti di aggiungere ulteriore RAM, cosa che consigliamo vivamente. L'aggiornamento a 16 GB di RAM a doppio canale sblocca essenzialmente le prestazioni della GPU e aumenta le capacità multitasking del portatile nel suo complesso.
Un'altra limitazione da tenere a mente è la mancanza del supporto DisplayPort o HDMI 2.0. i monitor 4K a 60 Hz non sono assolutamente compatibili. Gli utenti potrebbero voler dare un'occhiata alla serie VivoBook Pro 16X o a qualsiasi altra alternativa alimentata da Intel che dovrebbe offrire migliori capacità di docking rispetto alla nostra unità AMD. Ma se vi spostate costantemente da un punto A a un punto B e nel frattempo modificate le foto, il conveniente VivoBook 15X OLED soddisfa questa nicchia.
Il VivoBook 15X OLED supera il suo peso e la sua categoria di prezzo per quanto riguarda la durata della batteria, le prestazioni del processore e i colori del display.
Prezzo e disponibilità
Asus VivoBook 15 X M1503QA
- 02/13/2023 v7 (old)
Allen Ngo
Transparency
La selezione dei dispositivi da recensire viene effettuata dalla nostra redazione. Il campione di prova è stato fornito all'autore come prestito dal produttore o dal rivenditore ai fini di questa recensione. L'istituto di credito non ha avuto alcuna influenza su questa recensione, né il produttore ne ha ricevuto una copia prima della pubblicazione. Non vi era alcun obbligo di pubblicare questa recensione. In quanto società mediatica indipendente, Notebookcheck non è soggetta all'autorità di produttori, rivenditori o editori.
Ecco come Notebookcheck esegue i test
Ogni anno, Notebookcheck esamina in modo indipendente centinaia di laptop e smartphone utilizzando procedure standardizzate per garantire che tutti i risultati siano comparabili. Da circa 20 anni sviluppiamo continuamente i nostri metodi di prova e nel frattempo stabiliamo gli standard di settore. Nei nostri laboratori di prova, tecnici ed editori esperti utilizzano apparecchiature di misurazione di alta qualità. Questi test comportano un processo di validazione in più fasi. Il nostro complesso sistema di valutazione si basa su centinaia di misurazioni e parametri di riferimento ben fondati, che mantengono l'obiettività.Price comparison

