

Notebookcheck Logo
Teaser

Recensione Dell Pro 7 14 P714260: rimanere fedeli a Intel presenta dei vantaggi

Core Ultra 7 366H vs. Ryzen AI 9 HX 470.

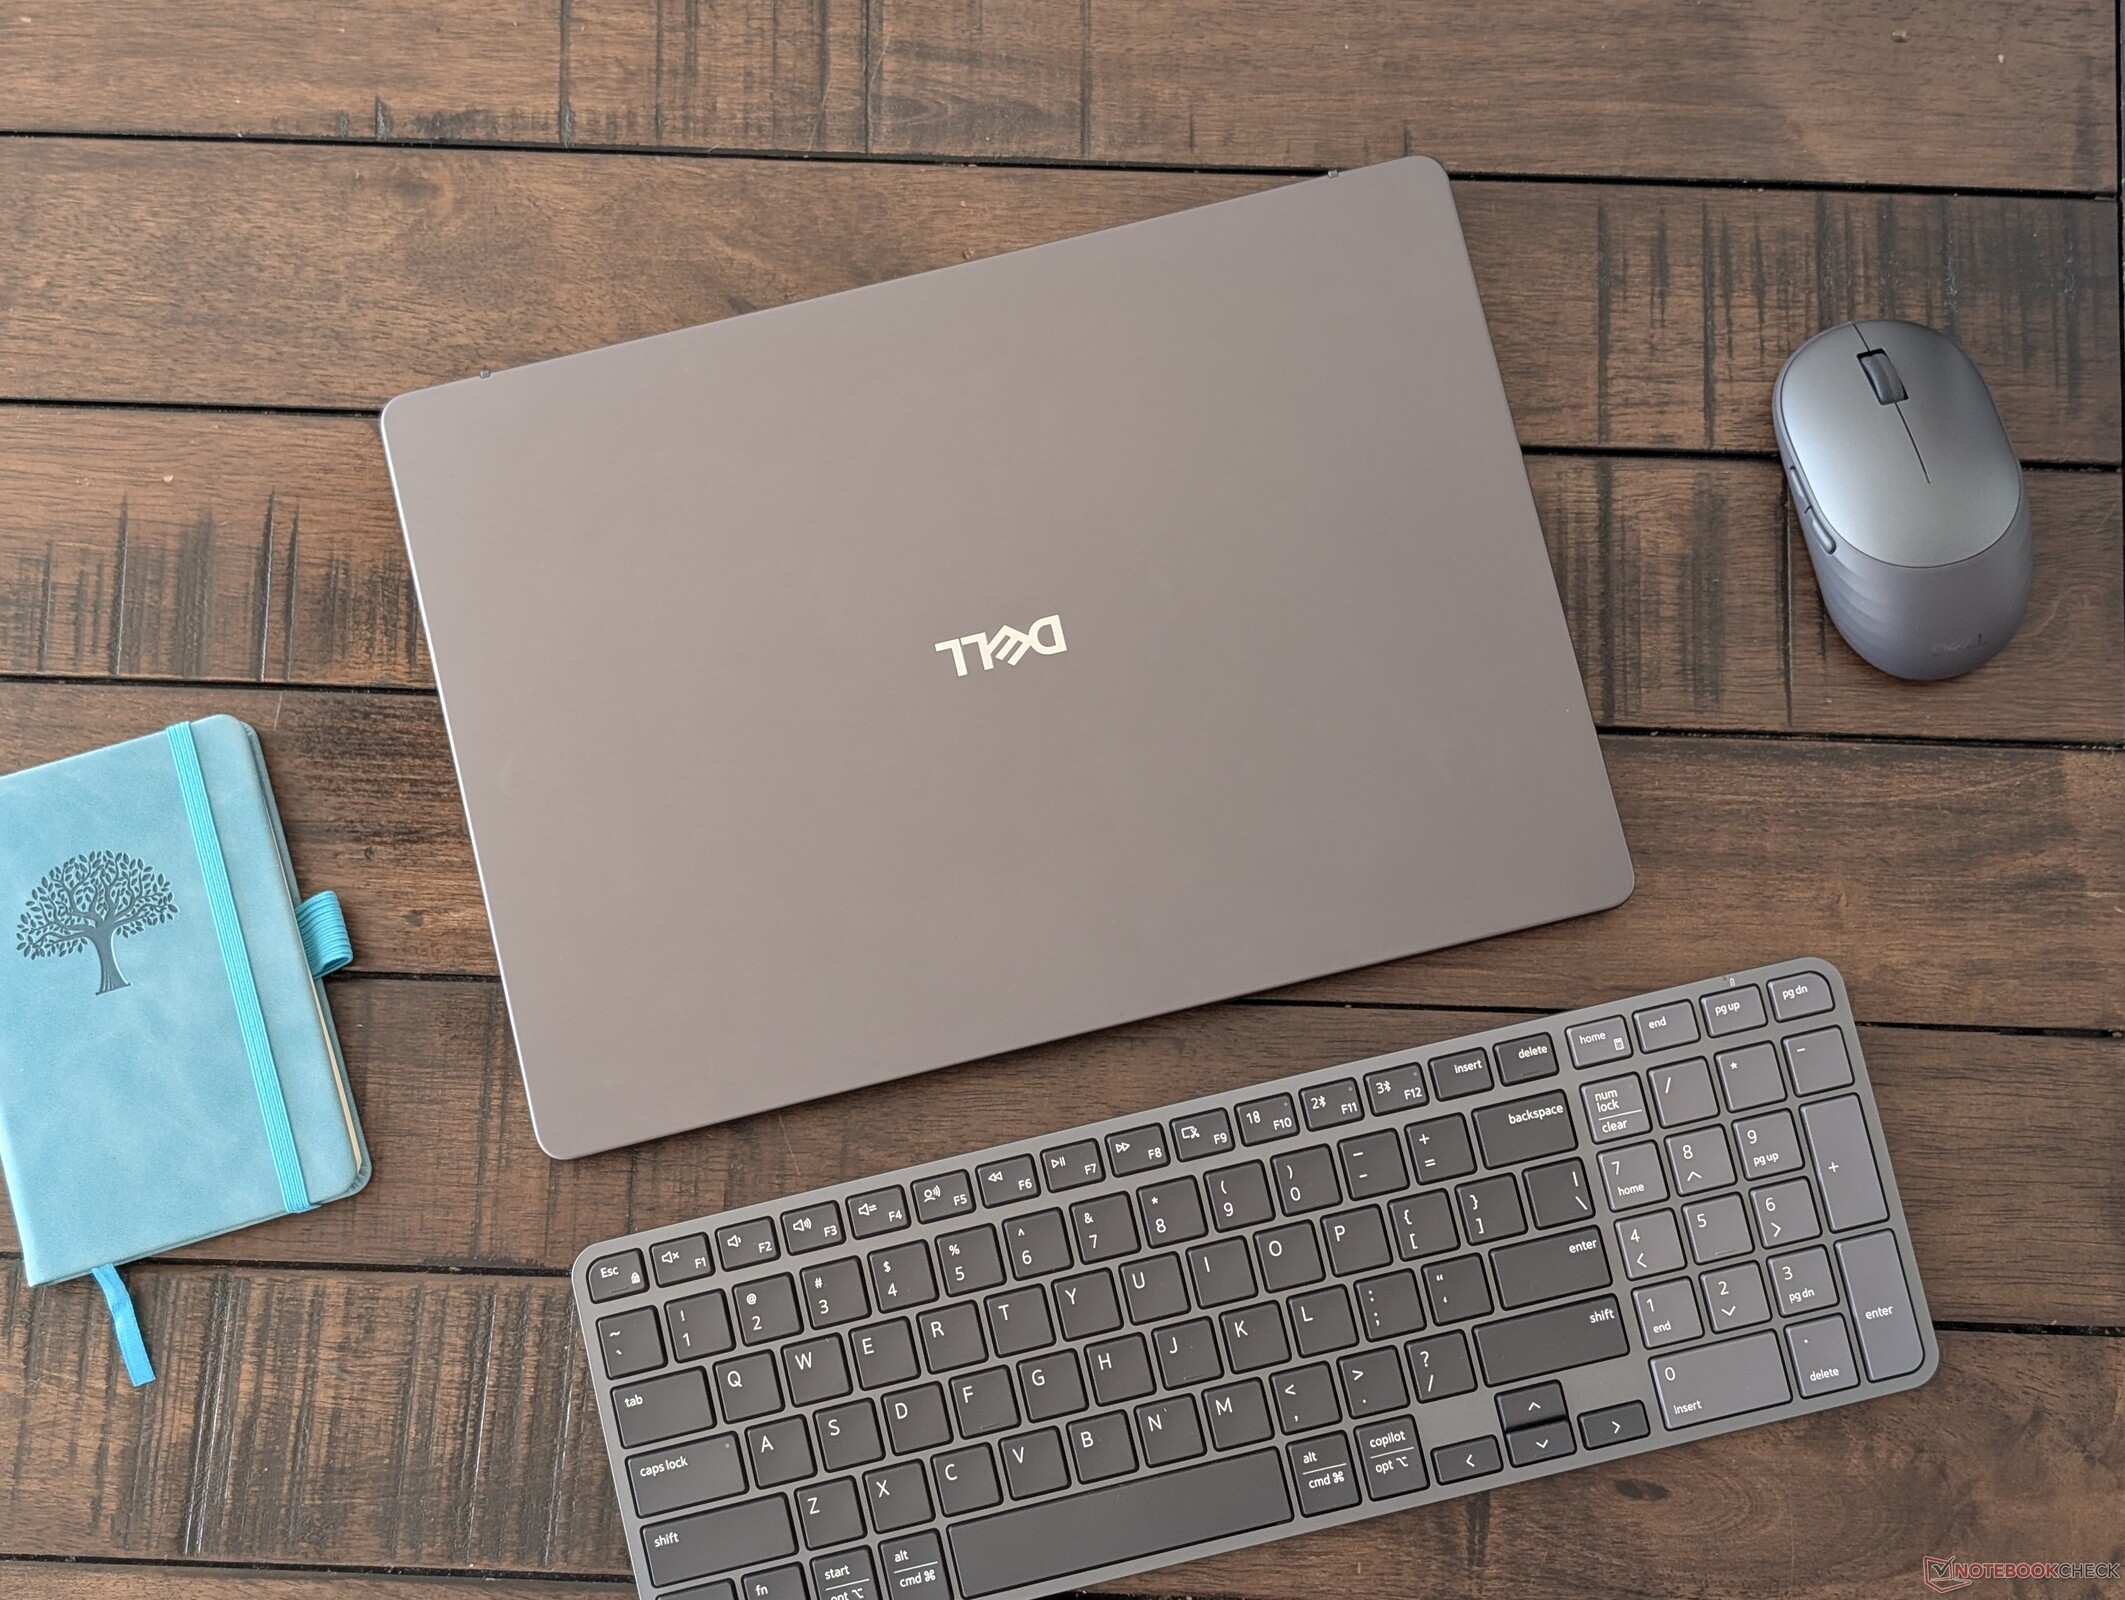
Il portatile aziendale di punta della serie Pro 7 14 di Dell è disponibile sia nella versione con processore AMD che in quella con processore Intel, con prezzi molto simili tra loro. Dopo aver testato entrambe le versioni, tuttavia, non esiste una scelta sbagliata per la maggior parte degli utenti, a meno che non si preferiscano determinate caratteristiche specifiche.
Allen Ngo, 👁 Allen Ngo (traduzione a cura di DeepL / Ninh Duy) Pubblicato 🇺🇸 🇳🇱 ...
Laptop / Notebook Panther Lake Business

Verdetto — Maggiore versatilità a un prezzo sostanzialmente identico

Per la maggior parte degli utenti, le differenze tra le versioni AMD e Intel del Dell Pro 7 14 sono relativamente minori. Entrambe sono sistemi potenti per le loro dimensioni, dotati di sicurezza vPro/PRO, ottima autonomia della batteria, opzioni di display e prezzi quasi identici, nonché la stessa esperienza di digitazione. Per quella ristretta cerchia di utenti per cui i minimi dettagli potrebbero avere importanza, tuttavia, le versioni Intel presenteranno un leggero vantaggio.

Rispetto alle configurazioni AMD, la versione Intel offre prestazioni grafiche leggermente più veloci, supporto per SSD PCIe 5, una durata della batteria ancora maggiore e funzionalità di docking migliorate grazie a Thunderbolt 4. Questi vantaggi rendono le opzioni Intel più versatili in termini di spostamenti e collegamento al dock, in particolare per gli utenti che si spostano costantemente tra diverse postazioni di lavoro, monitor esterni o configurazioni eGPU.

Le prestazioni di elaborazione grezze risultano leggermente inferiori con il chip Intel, ma i vantaggi in altri ambiti, come menzionato sopra, potrebbero rendere questo compromesso vantaggioso per specifici scenari d’uso.

Per le future revisioni, ci piacerebbe vedere un maggior numero di opzioni di display a 1600p con tecnologia OLED o touchscreen, poiché tali caratteristiche sono attualmente limitate alla risoluzione di 1200p. Anche un peso complessivo più leggero potrebbe essere d’aiuto, dato che alcuni concorrenti, come l’Asus ExpertBook Ultra o il Lenovo ThinkPad T14s, pesano ciascuno alcune centinaia di grammi in meno.

Pro

+ ottimo supporto per docking station con Thunderbolt 4
+ struttura robusta con buona riparabilità
+ nessun rallentamento delle prestazioni dell’SSD PCIe 5
+ piccolo alimentatore USB-C da 65 W
+ durata della batteria molto lunga

Contro

- RAM non espandibile; nessun supporto per SSD M.2 secondario
- Le prestazioni del Turbo Boost della CPU potrebbero essere migliori
- Opzioni touchscreen limitate esclusivamente alla risoluzione 1200p
- Nessuna opzione con processori Panther Lake X7/X9
- Un po’ pesante

Prezzo e disponibilità

Dell sta ora commercializzando il Pro 7 14 a partire da 2.200 dollari per la configurazione base fino a oltre 5.000 dollari, come configurato per la presente recensione.

Amazon Logo
$2,990.00
Dell Pro 14 Premium PA14250 Laptop - 14 inch FHD+ 400 Nits Display -Intel Core Ultra 7 268V vPro 8-Core - 32GB RAM - 256GB SSD - Win11 pro

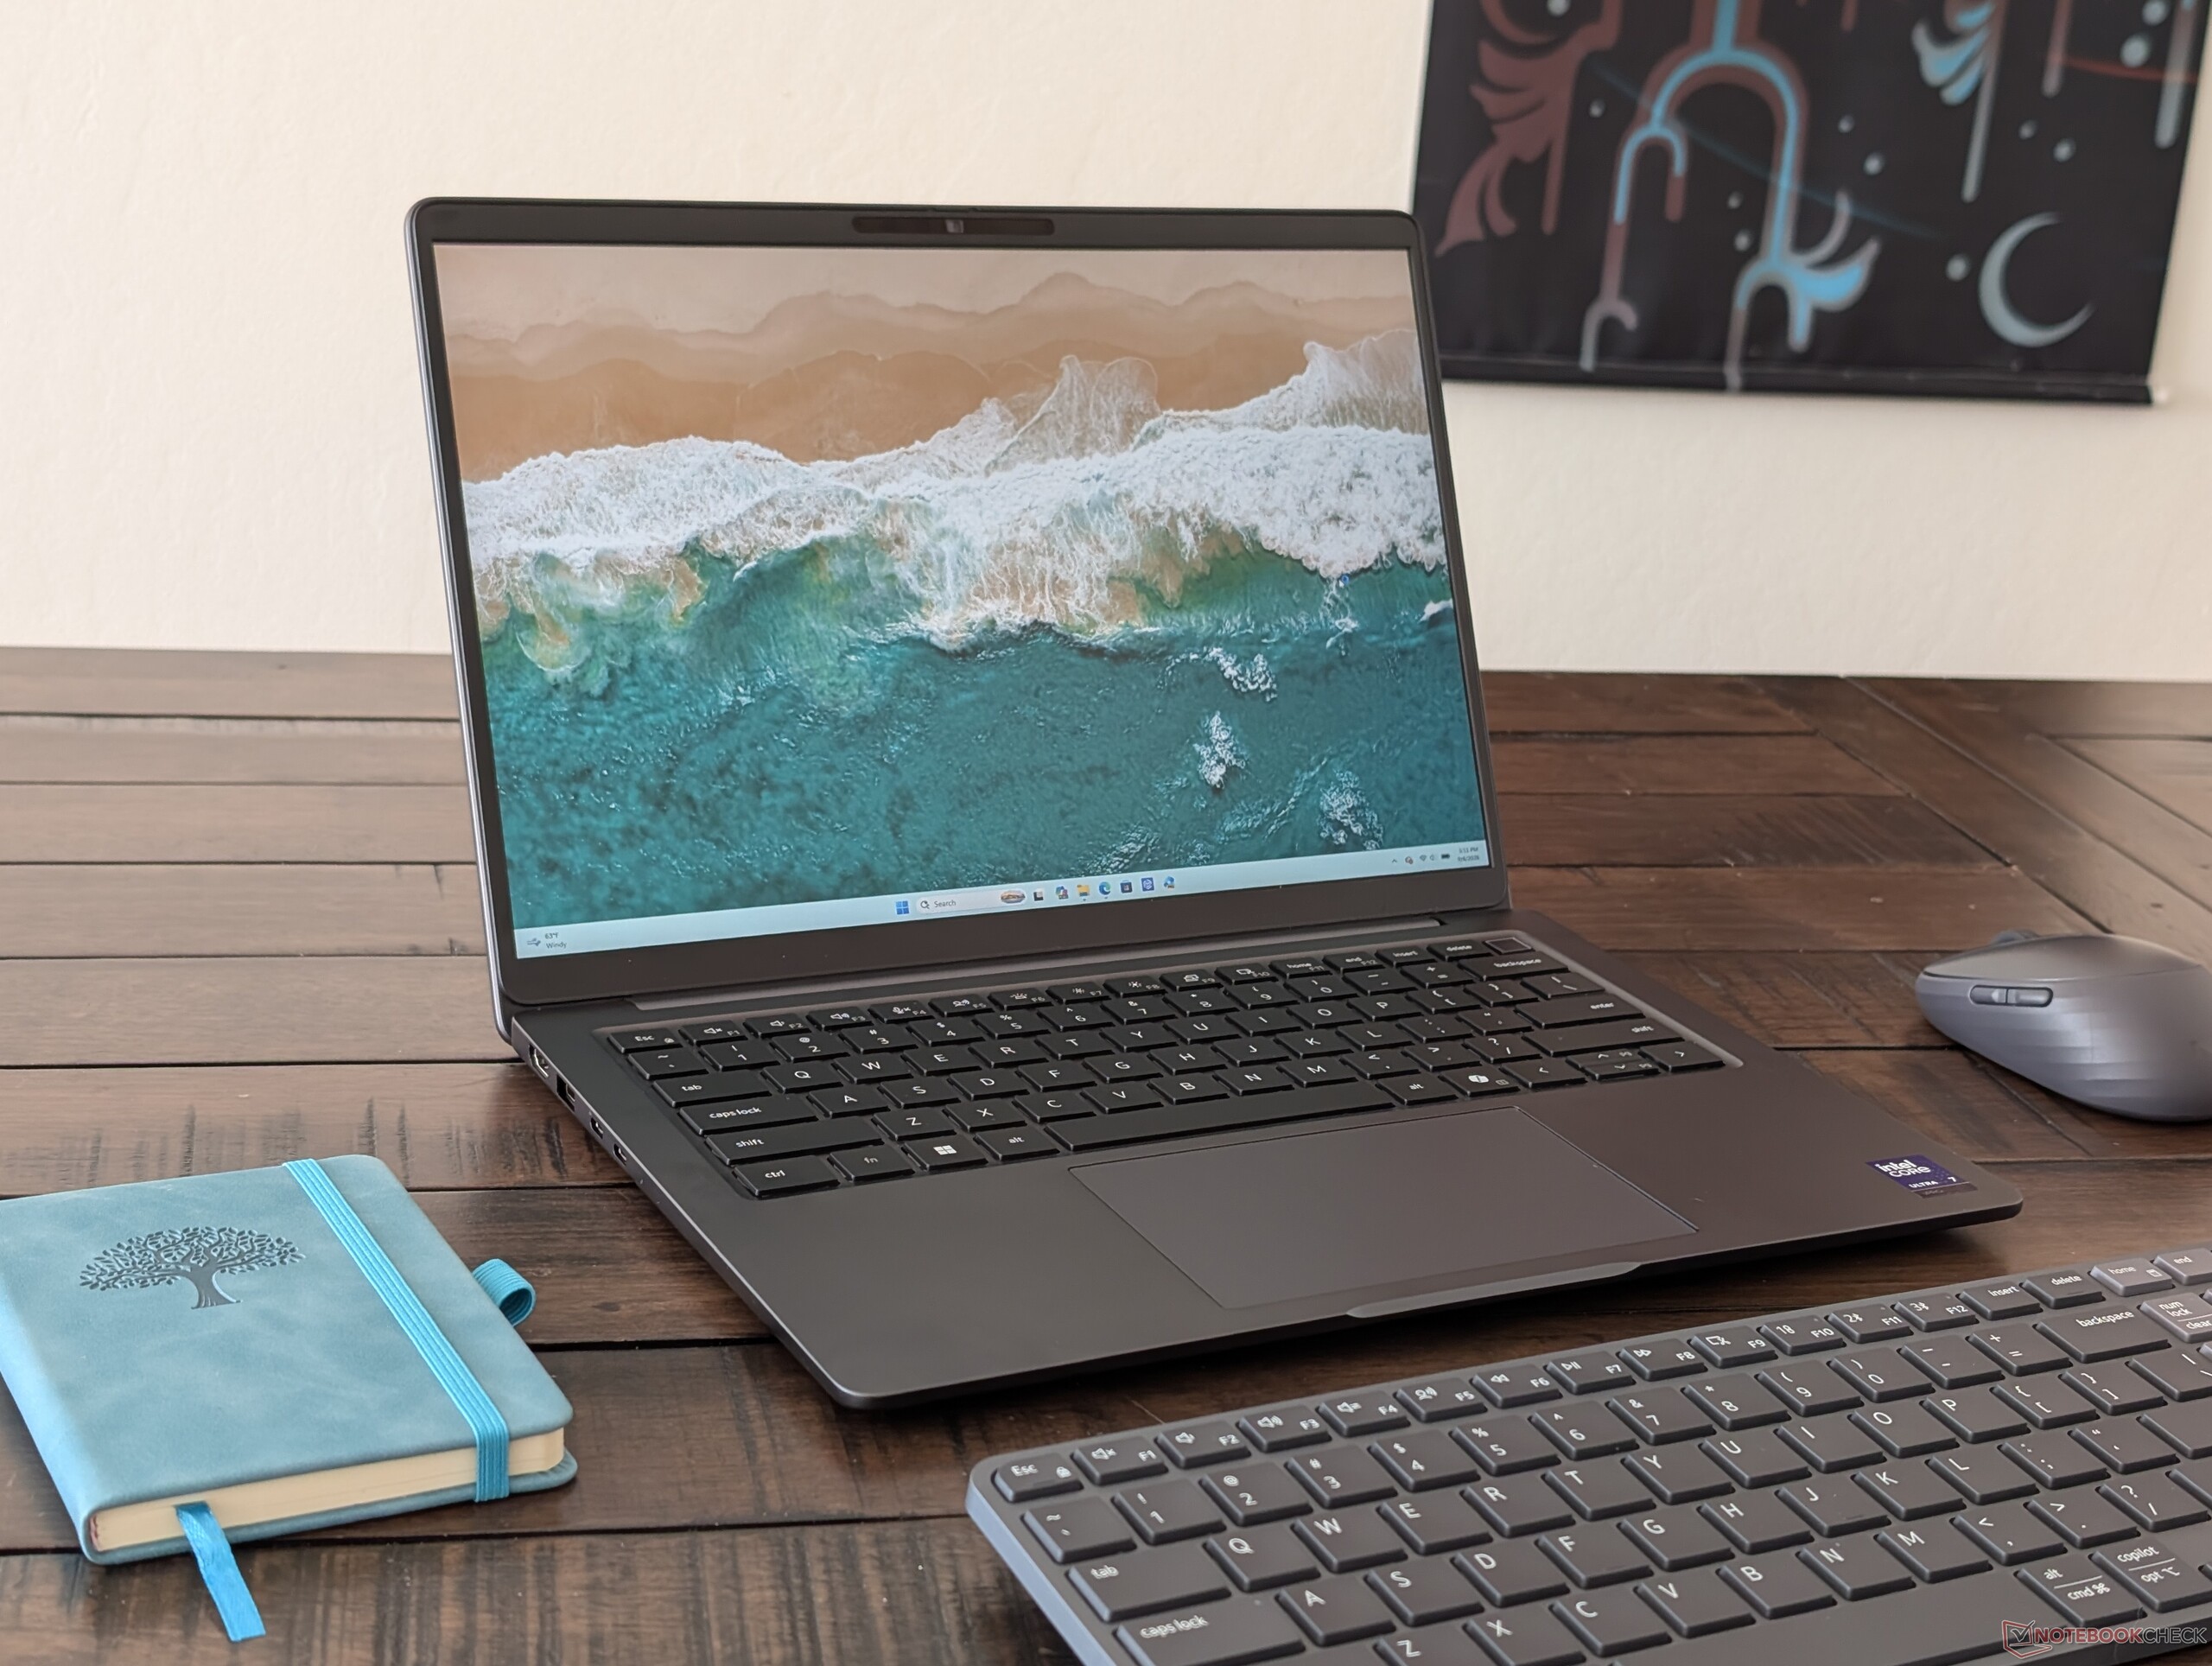
Il Dell Pro 7 14 P714260 è la versione Intel del Dell Pro 7 14 P714265 basato su AMD. Entrambe le versioni condividono per il resto lo stesso design hardware; pertanto, vi consigliamo di consultare la nostra recensione sulla versione AMD per saperne di più sulle caratteristiche fisiche.

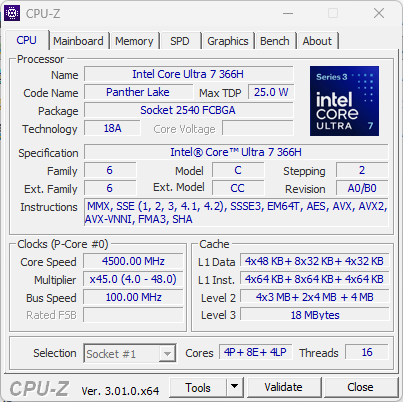
Il nostro modello di prova è una configurazione di fascia alta con processore Panther Lake Core Ultra 7 366H vPro, 64 GB di RAM LPDDR5x e display IPS da 1200p a 120 Hz, per un prezzo di circa 4.900 dollari. Le configurazioni di livello inferiore partono da poco più di 2.000 dollari.

Tra le alternative in questo segmento figurano altri subnotebook da 14 pollici orientati al mondo aziendale, come la serie HP EliteBook X, il Lenovo ThinkPad T14s o la serie Asus ExpertBook.

Altre recensioni Dell:

Specifiche

Dell Pro 7 14 P714260
Processore
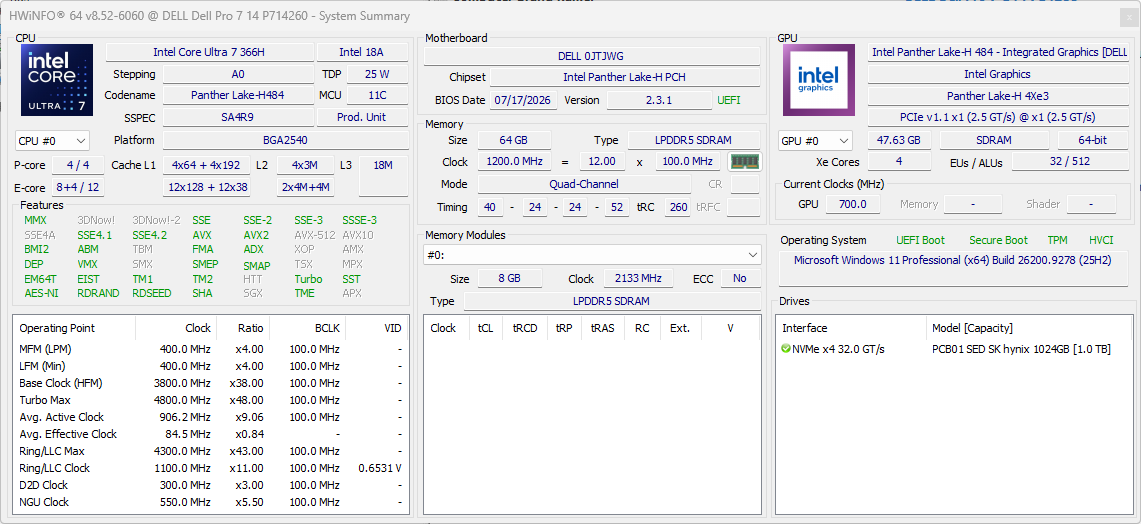
Intel Core Ultra 7 366H 16c/16t, 4 x 4.8 GHz Intel Cougar Cove P-Core, 8 x 3.8 GHz Intel Darkmont E-Core, 4 x 3.4 GHz Intel Darkmont LP E-Core, 59 W PL2 / Short Burst, 31 W PL1 / Sustained, Panther Lake
Scheda grafica
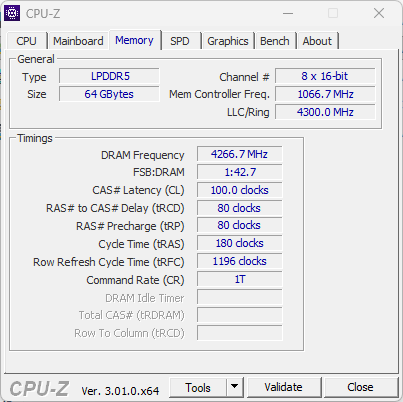
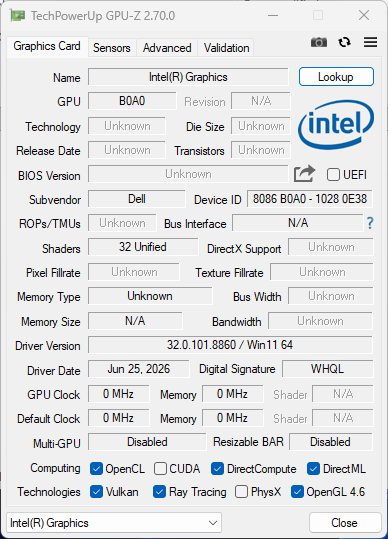
Intel Graphics 4 Xe3 Panther Lake iGPU, Core: 2400 MHz, LPDDR5x, 32.0.101.8860
Memoria
64 GB 
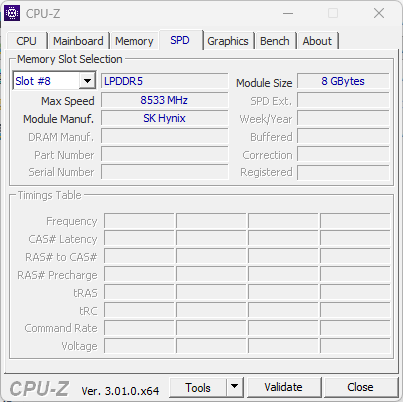
, LPDDR5x, 8533 MT/s, Soldered, Dual-Channel
Schermo
14.00 pollici 16:10, 1920 x 1200 pixel 162 PPI, LG Philips LP140WU, IPS, lucido: no, 120 Hz
Scheda madre
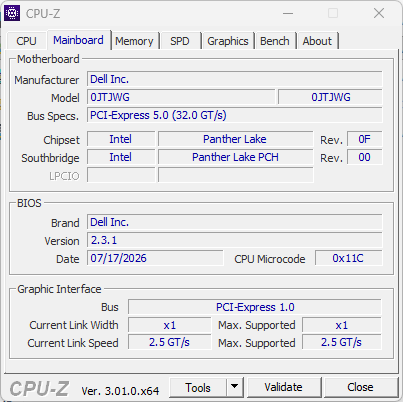
Intel Panther Lake-H PCH
Harddisk
SK hynix PCB01 HFS001TFM9X186N
Scheda audio
Intel Panther Lake-H PCH - High Definition Audio - AVS (Audio, Voice, Speech)
Porte di connessione
1 USB 3.0 / 3.1, 1 USB 3.2 Gen 2x2 20Gbps, 2 USB4 40 Gbps, 2 Thunderbolt 4, USB-C Power Delivery (PD), 1 HDMI, 3 DisplayPort, 1 Kensington Lock, Connessioni Audio: 3.5 mm combo, 1 Lettore impronte digitali
Rete
Intel Wi-Fi 7 BE211 320MHz (a/b/g/n = Wi-Fi 4/ac = Wi-Fi 5/ax = Wi-Fi 6/ Wi-Fi 6E 6 GHz be = Wi-Fi 7), Bluetooth 6.0
Dimensioni
altezza x larghezza x profondità (in mm): 14.73 x 315.5 x 226
Batteria
70 Wh polimeri di litio
Sistema Operativo
Microsoft Windows 11 Pro
Camera
Webcam: 1440p30 w/ Physical shutter + IR
Fotocamera Principale: 8.3 MPix
Altre caratteristiche
Casse: Stereo, 2 x 2 W, Tastiera: Chiclet, Illuminazione Tastiera: si, Dell Command, Optimizer, SupportAssist, 36 Mesi Garanzia
Peso
1.355 kg, Alimentazione: 265 gr
Prezzo
4900 USD
Nota: il produttore potrebbe usare componenti di fornitori diversi pannelli dei diplay, drive o banchi di memoria con specifiche simili.


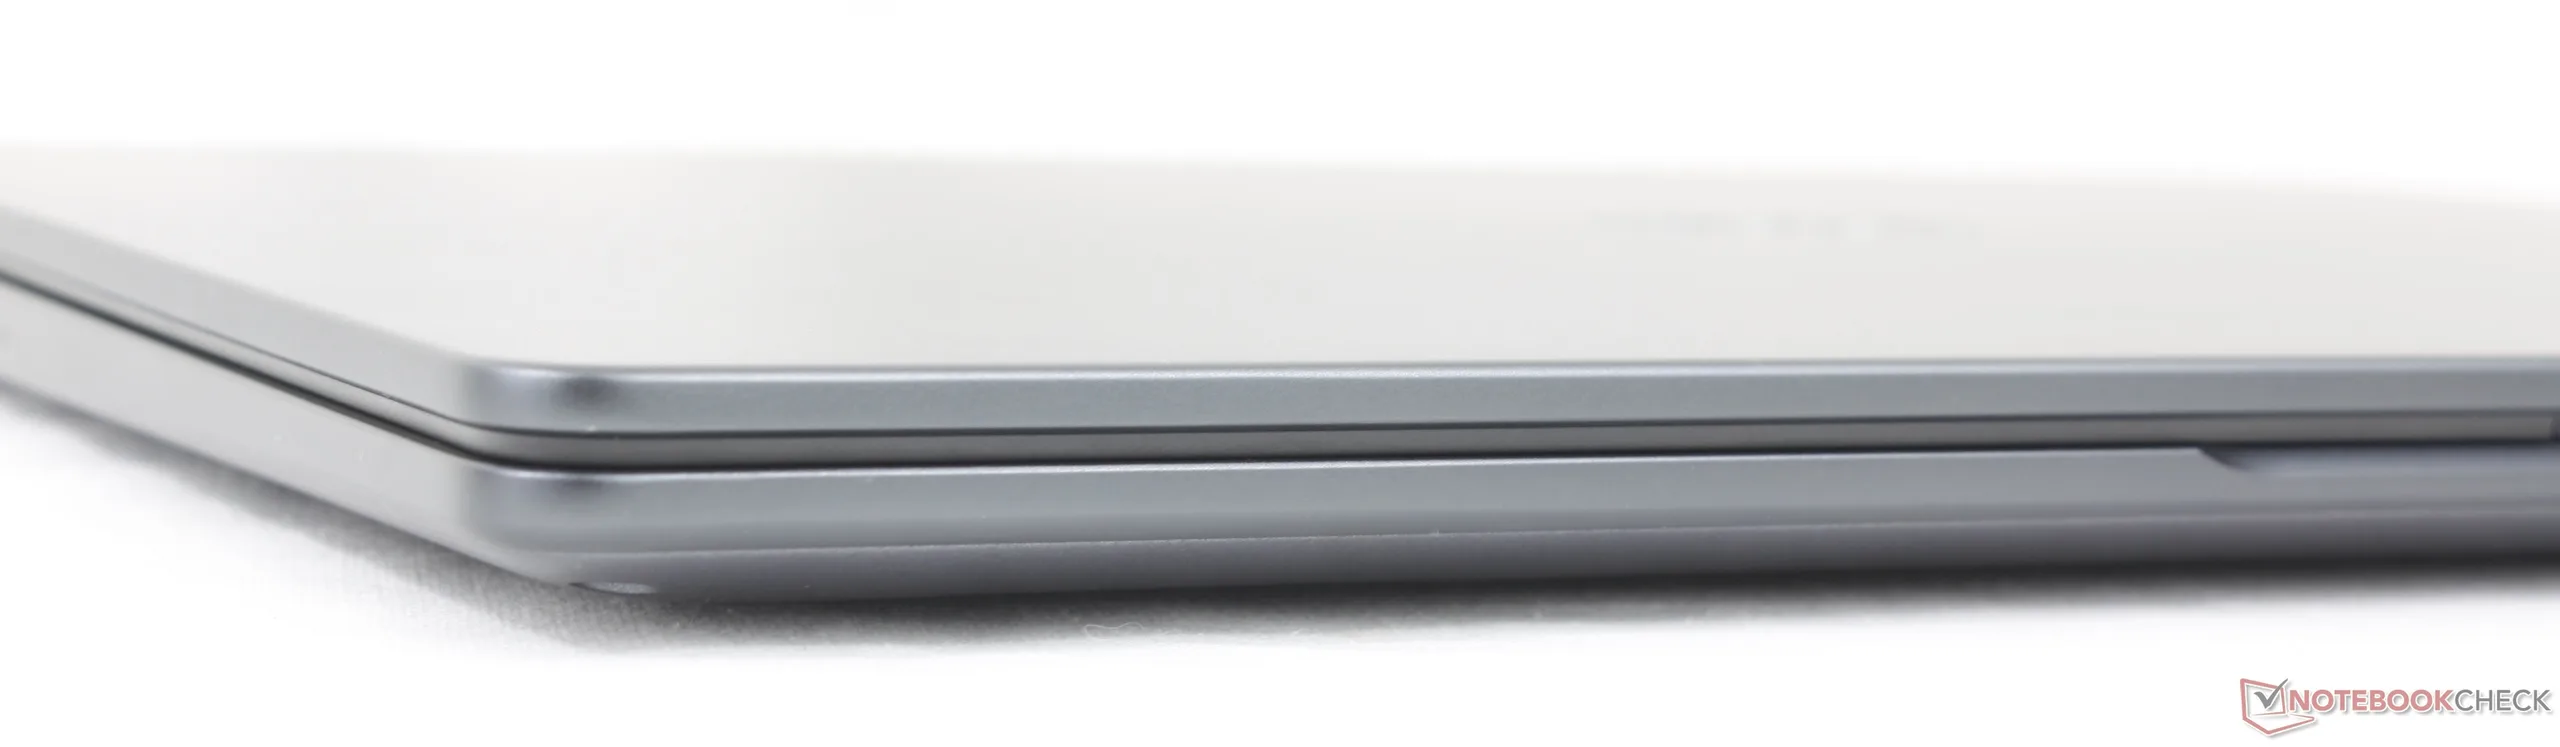
Maiuscole e minuscole

Confronto delle dimensioni

315.5 mm 226 mm 16.45 mm 1.3 kg315.6 mm 222 mm 15.5 mm 1.5 kg315.5 mm 226 mm 14.73 mm 1.4 kg312 mm 230 mm 17 mm 1 kg313 mm 219.4 mm 15.9 mm 1.2 kg310.9 mm 212.8 mm 15.9 mm 1.1 kg297 mm 210 mm 1 mm 5.7 g

Connettività

Parte anteriore: Nessuna porta
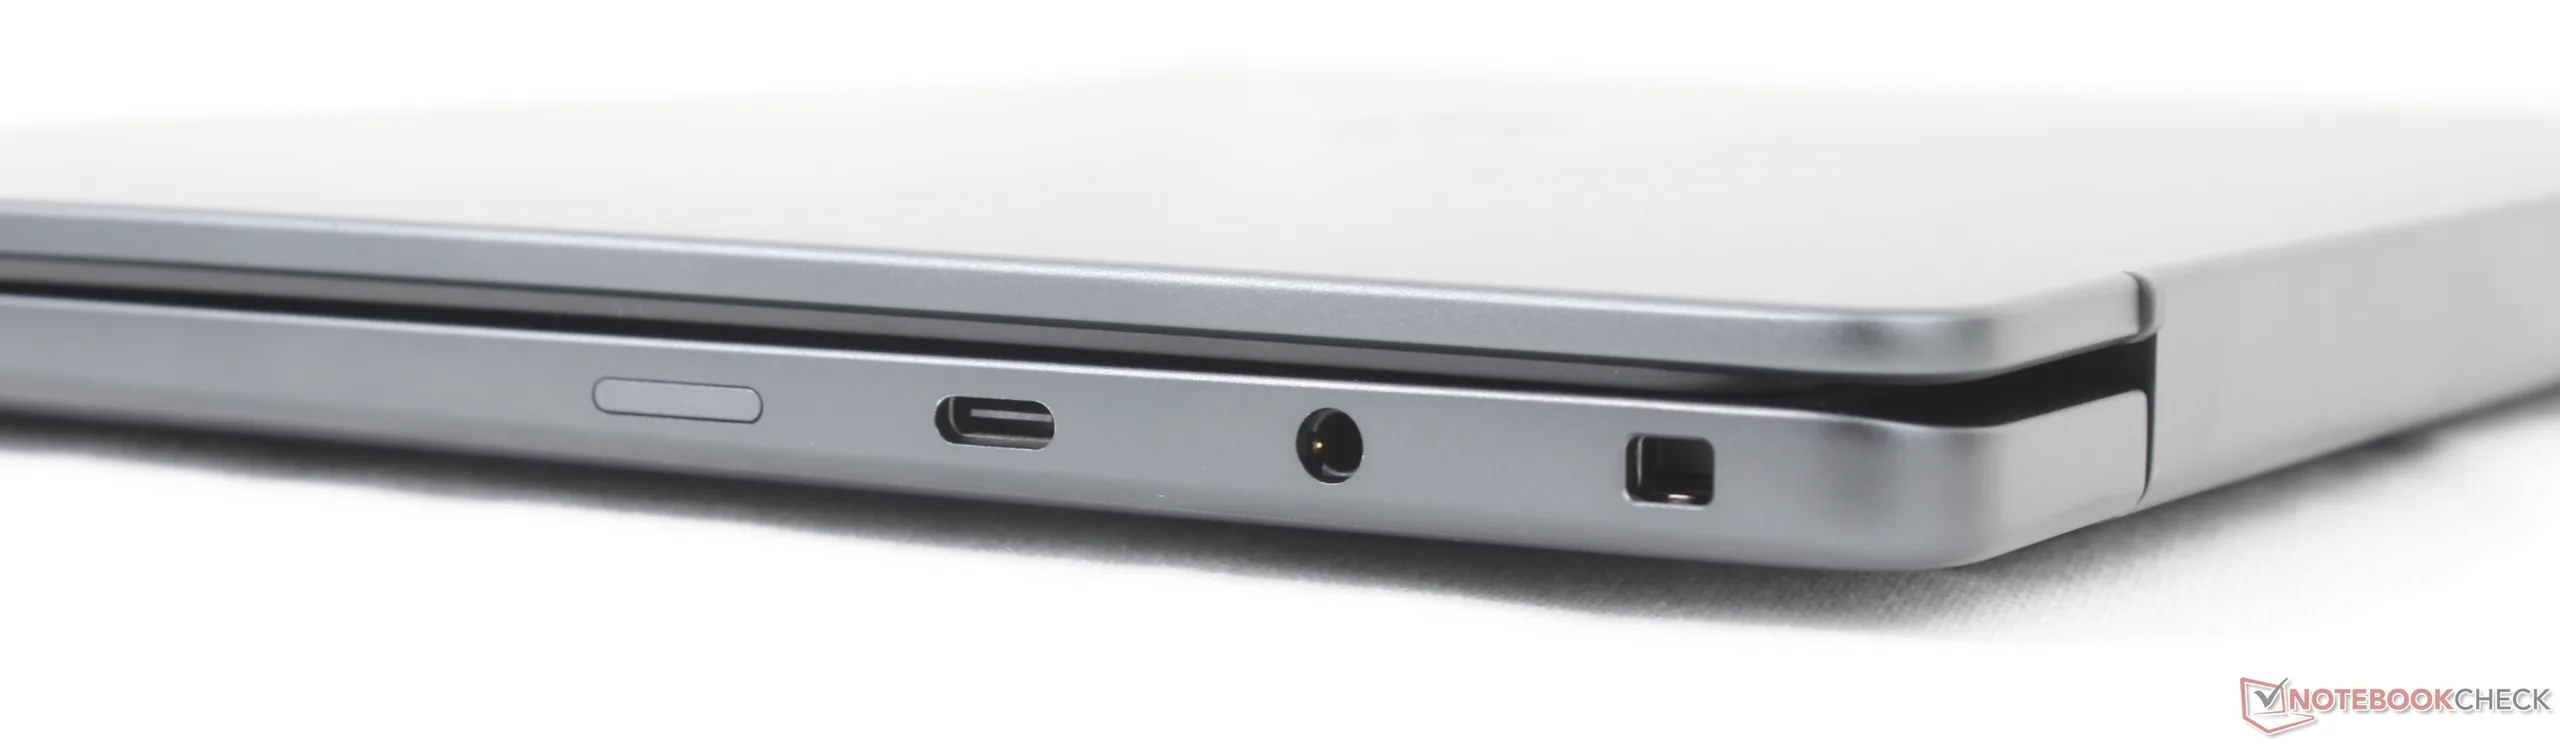
Corretto: Slot SIM (opzionale), USB-C 3.2 Gen. 2 (20 Gbos) con DisplayPort 1.4 + Power Delivery, jack per cuffie da 3,5 mm, Noble lock
Retro: Nessuna porta
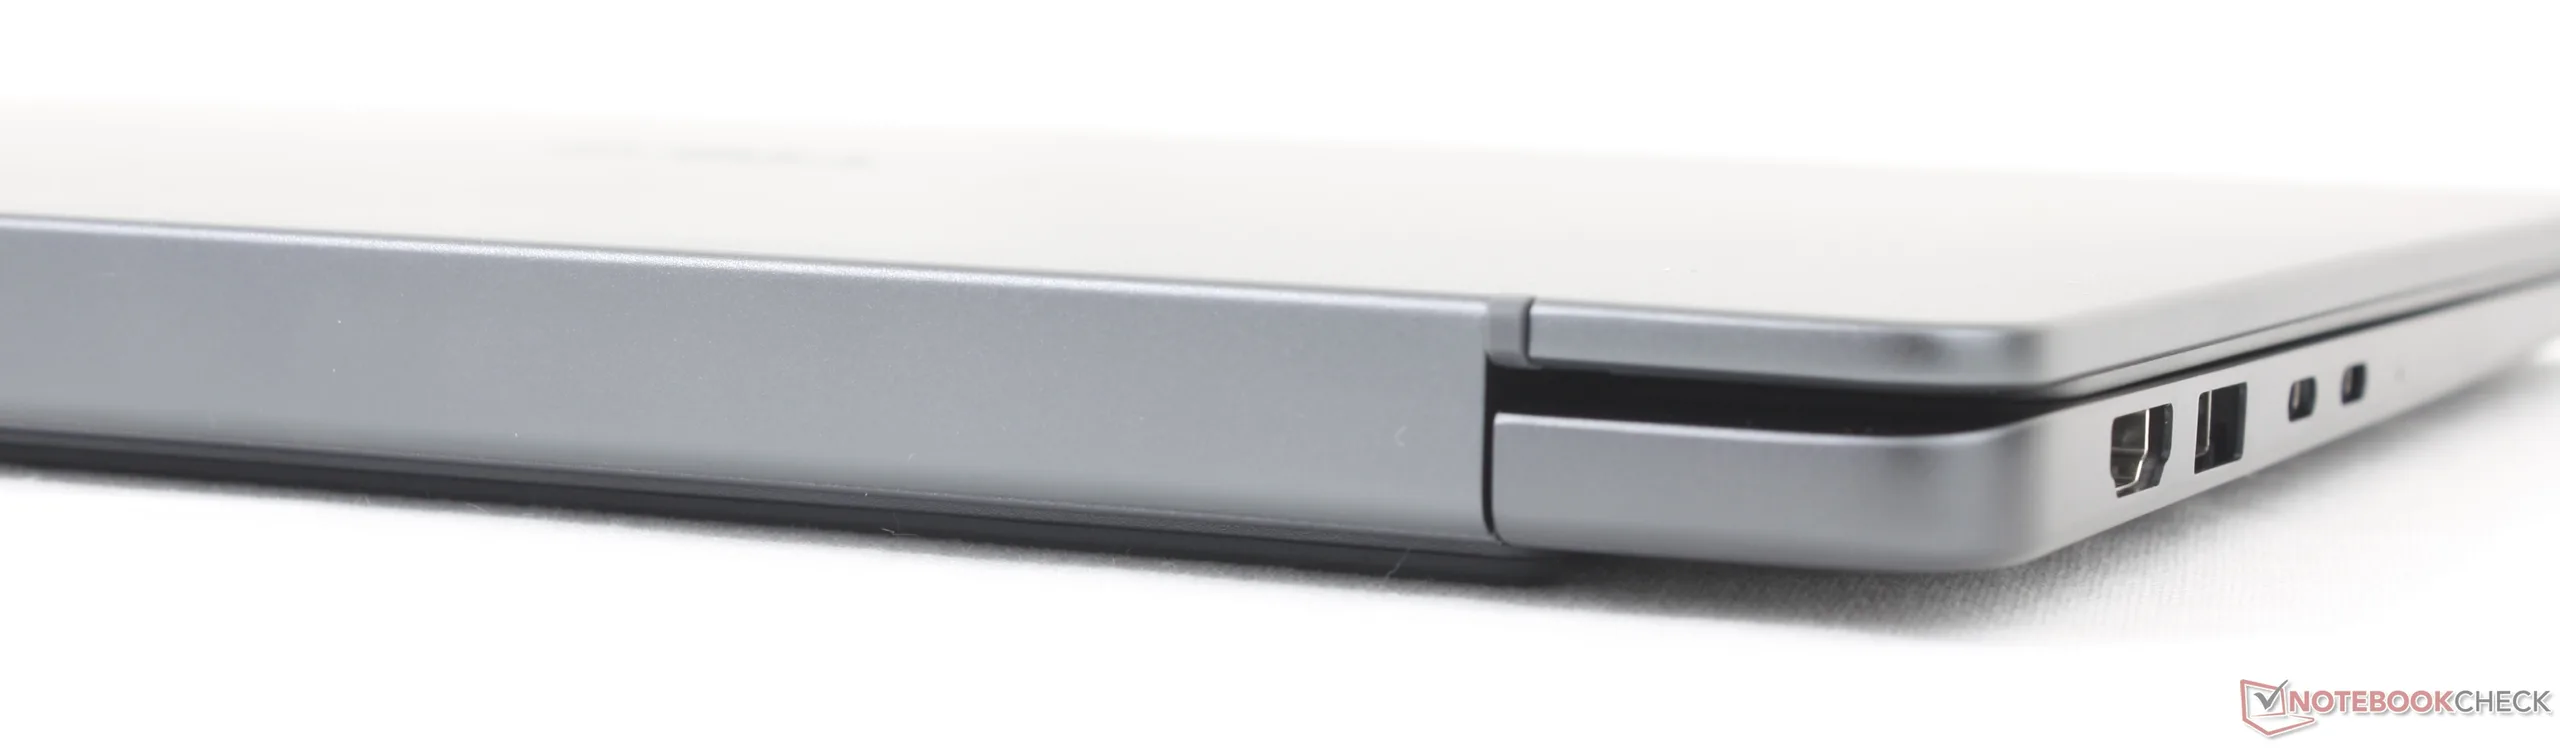
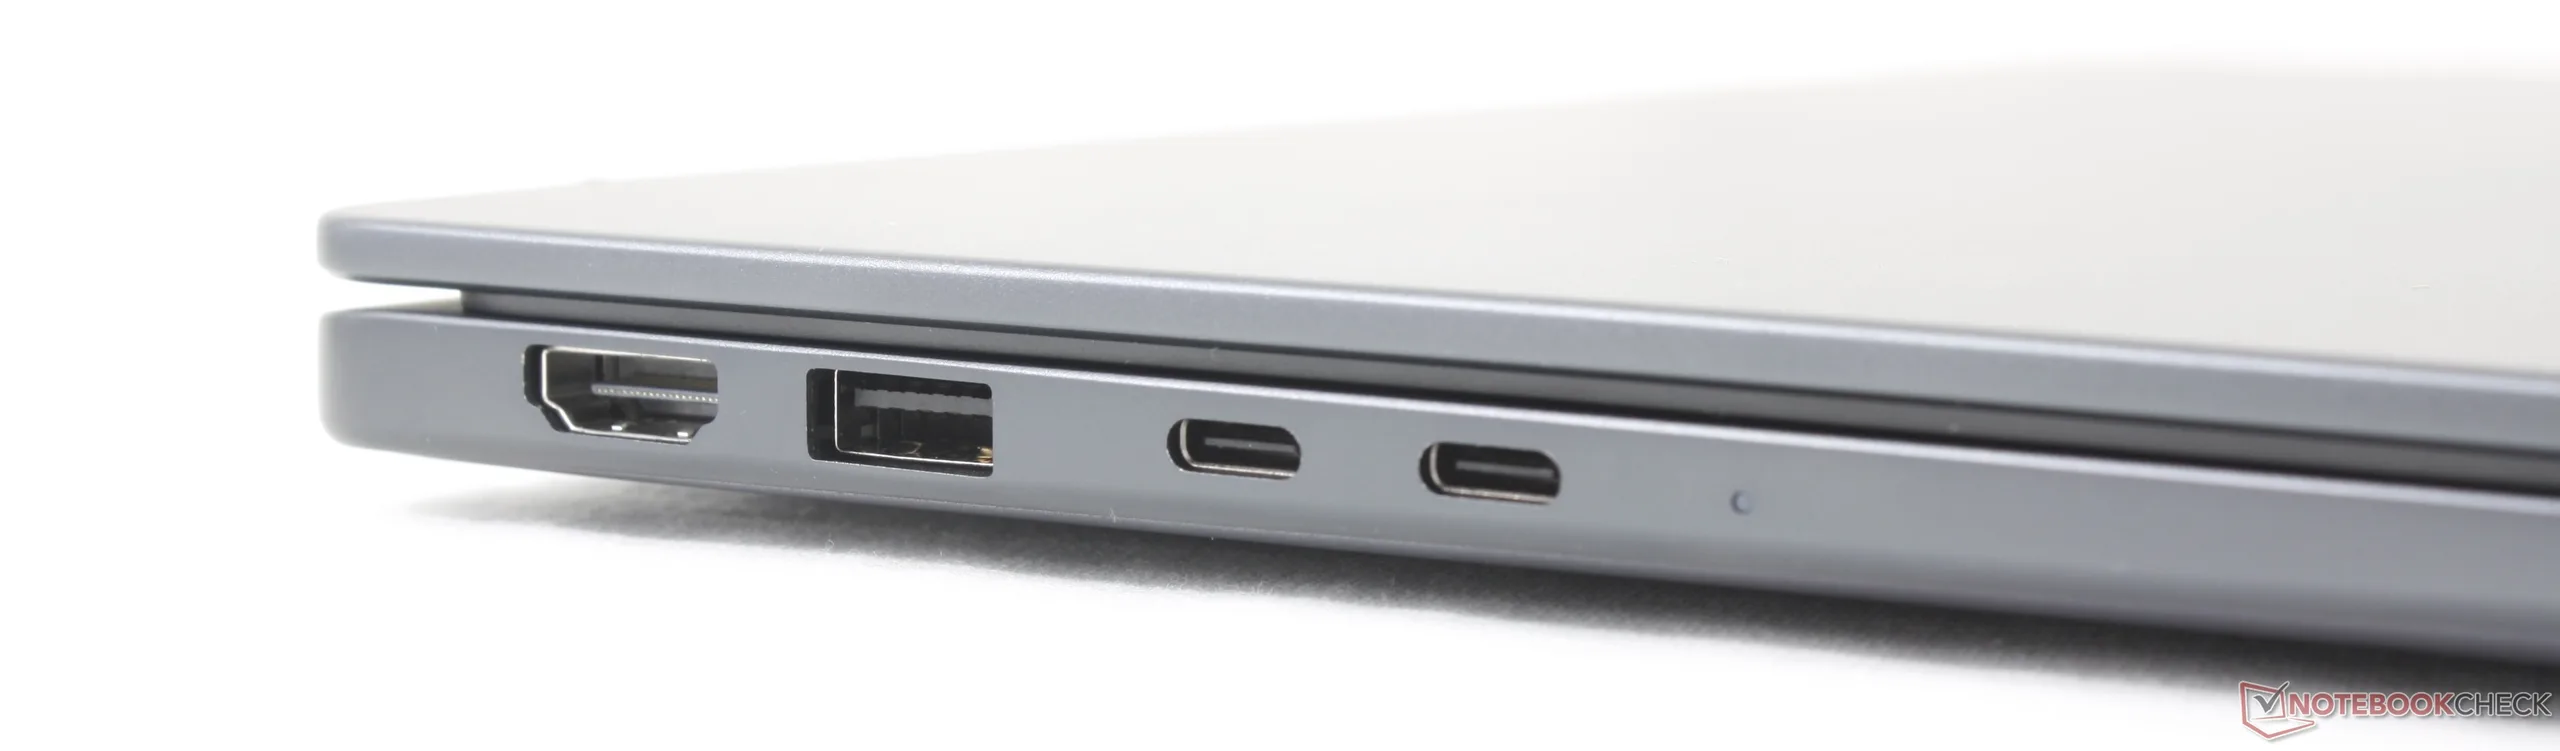
A sinistra: HDMI 2.1, USB-A 3.2 Gen. 1 (1 Gbps), 2 porte USB-C Thunderbolt 4 con DisplayPort 2.1 + Power Delivery, lettore di smart card (opzionale)

Comunicazione

Networking
iperf3 transmit Wi-Fi6/7 RT-BE96U
HP EliteBook 8 G2a 14
Mediatek Wi-Fi 7 MT7925 Wireless LAN Card
2033 (1893min - 2155max) MBit/s
Lenovo ThinkPad T14s Gen 7 21YW0022GE
Mediatek Wi-Fi 7 MT7925 Wireless LAN Card
1723 (1533min - 1812max) MBit/s
iperf3 receive Wi-Fi6/7 RT-BE96U
HP EliteBook 8 G2a 14
Mediatek Wi-Fi 7 MT7925 Wireless LAN Card
2059 (2026min - 2100max) MBit/s
Lenovo ThinkPad T14s Gen 7 21YW0022GE
Mediatek Wi-Fi 7 MT7925 Wireless LAN Card
1957 (1880min - 2007max) MBit/s
iperf3 receive AXE11000 6GHz
Acer TravelMate P6 TMP614-54-TCO-553Z
Intel BE201 320MHz
2270 (1742min - 2389max) MBit/s +48%
Dell Pro 7 14 P714265
Mediatek Wi-Fi 7 MT7925 Wireless LAN Card
1673 (1472min - 1801max) MBit/s +9%
Asus ExpertBook Ultra B9406CAA
Intel Wi-Fi 7 BE211 320MHz
1621 (1600min - 1650max) MBit/s +6%
Dell Pro 7 14 P714260
Intel Wi-Fi 7 BE211 320MHz
1534 (1508min - 1572max) MBit/s
iperf3 transmit AXE11000 6GHz
Acer TravelMate P6 TMP614-54-TCO-553Z
Intel BE201 320MHz
2157 (1961min - 2391max) MBit/s +30%
Dell Pro 7 14 P714260
Intel Wi-Fi 7 BE211 320MHz
1657 (1413min - 1902max) MBit/s
Asus ExpertBook Ultra B9406CAA
Intel Wi-Fi 7 BE211 320MHz
1625 (848min - 1675max) MBit/s -2%
Dell Pro 7 14 P714265
Mediatek Wi-Fi 7 MT7925 Wireless LAN Card
1555 (1268min - 1670max) MBit/s -6%
01002003004005006007008009001000110012001300140015001600170018001900Tooltip
Dell Pro 7 14 P714260; iperf3 receive AXE11000 6GHz; iperf 3.1.3: Ø1534 (1508-1572) MBit/s
Dell Pro 7 14 P714260; iperf3 transmit AXE11000 6GHz; iperf 3.1.3: Ø1657 (1413-1902) MBit/s

Webcam

ColorChecker
16.5 ∆E
14.6 ∆E
20.3 ∆E
21.6 ∆E
18.9 ∆E
17 ∆E
10 ∆E
20.4 ∆E
19.2 ∆E
20.1 ∆E
16.7 ∆E
16 ∆E
13.2 ∆E
15 ∆E
18.9 ∆E
15.5 ∆E
17.5 ∆E
17.6 ∆E
7.8 ∆E
13.1 ∆E
18.3 ∆E
15.7 ∆E
18.8 ∆E
7.7 ∆E
ColorChecker Dell Pro 7 14 P714260: 16.27 ∆E min: 7.67 - max: 21.59 ∆E

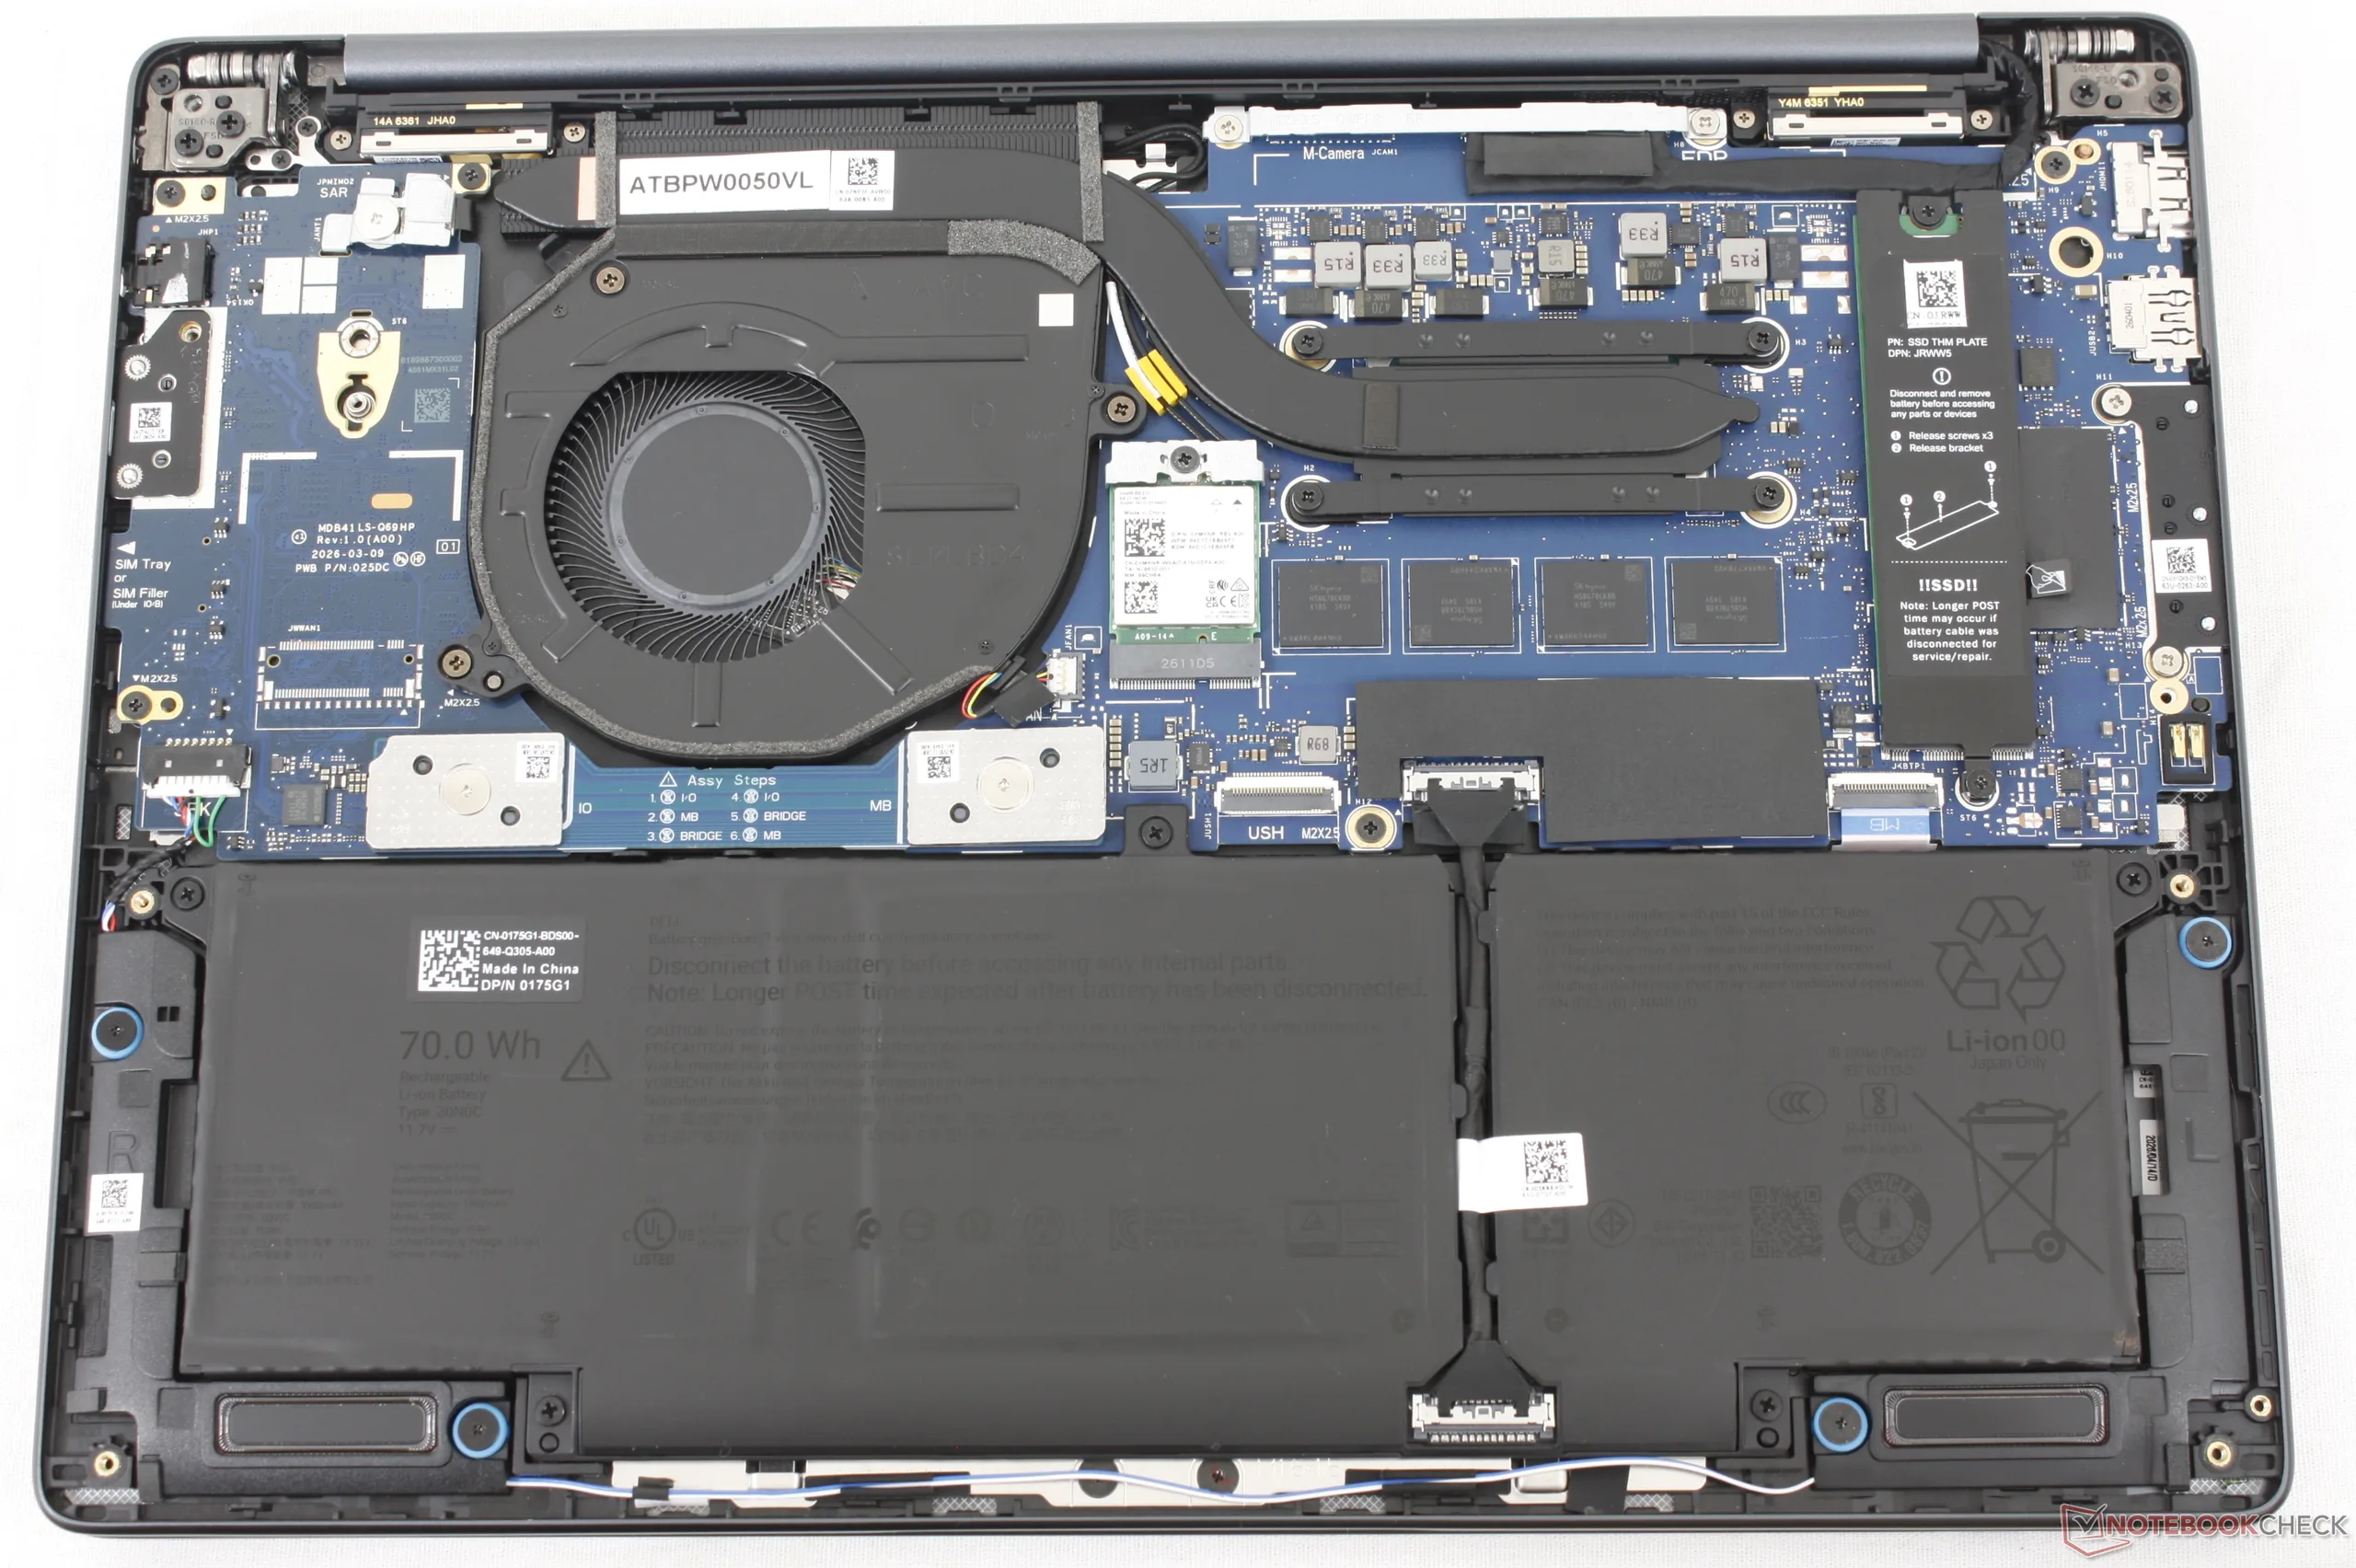
Manutenzione

Scheda madre Dell Pro 7 14 P714260

Sostenibilità

Il telaio e la batteria sono costituiti da plastica riciclata, alluminio, acciaio, vetro e cobalto in percentuali variabili. L’imballaggio è privo di plastica e interamente riciclabile.

Dispositivi di input
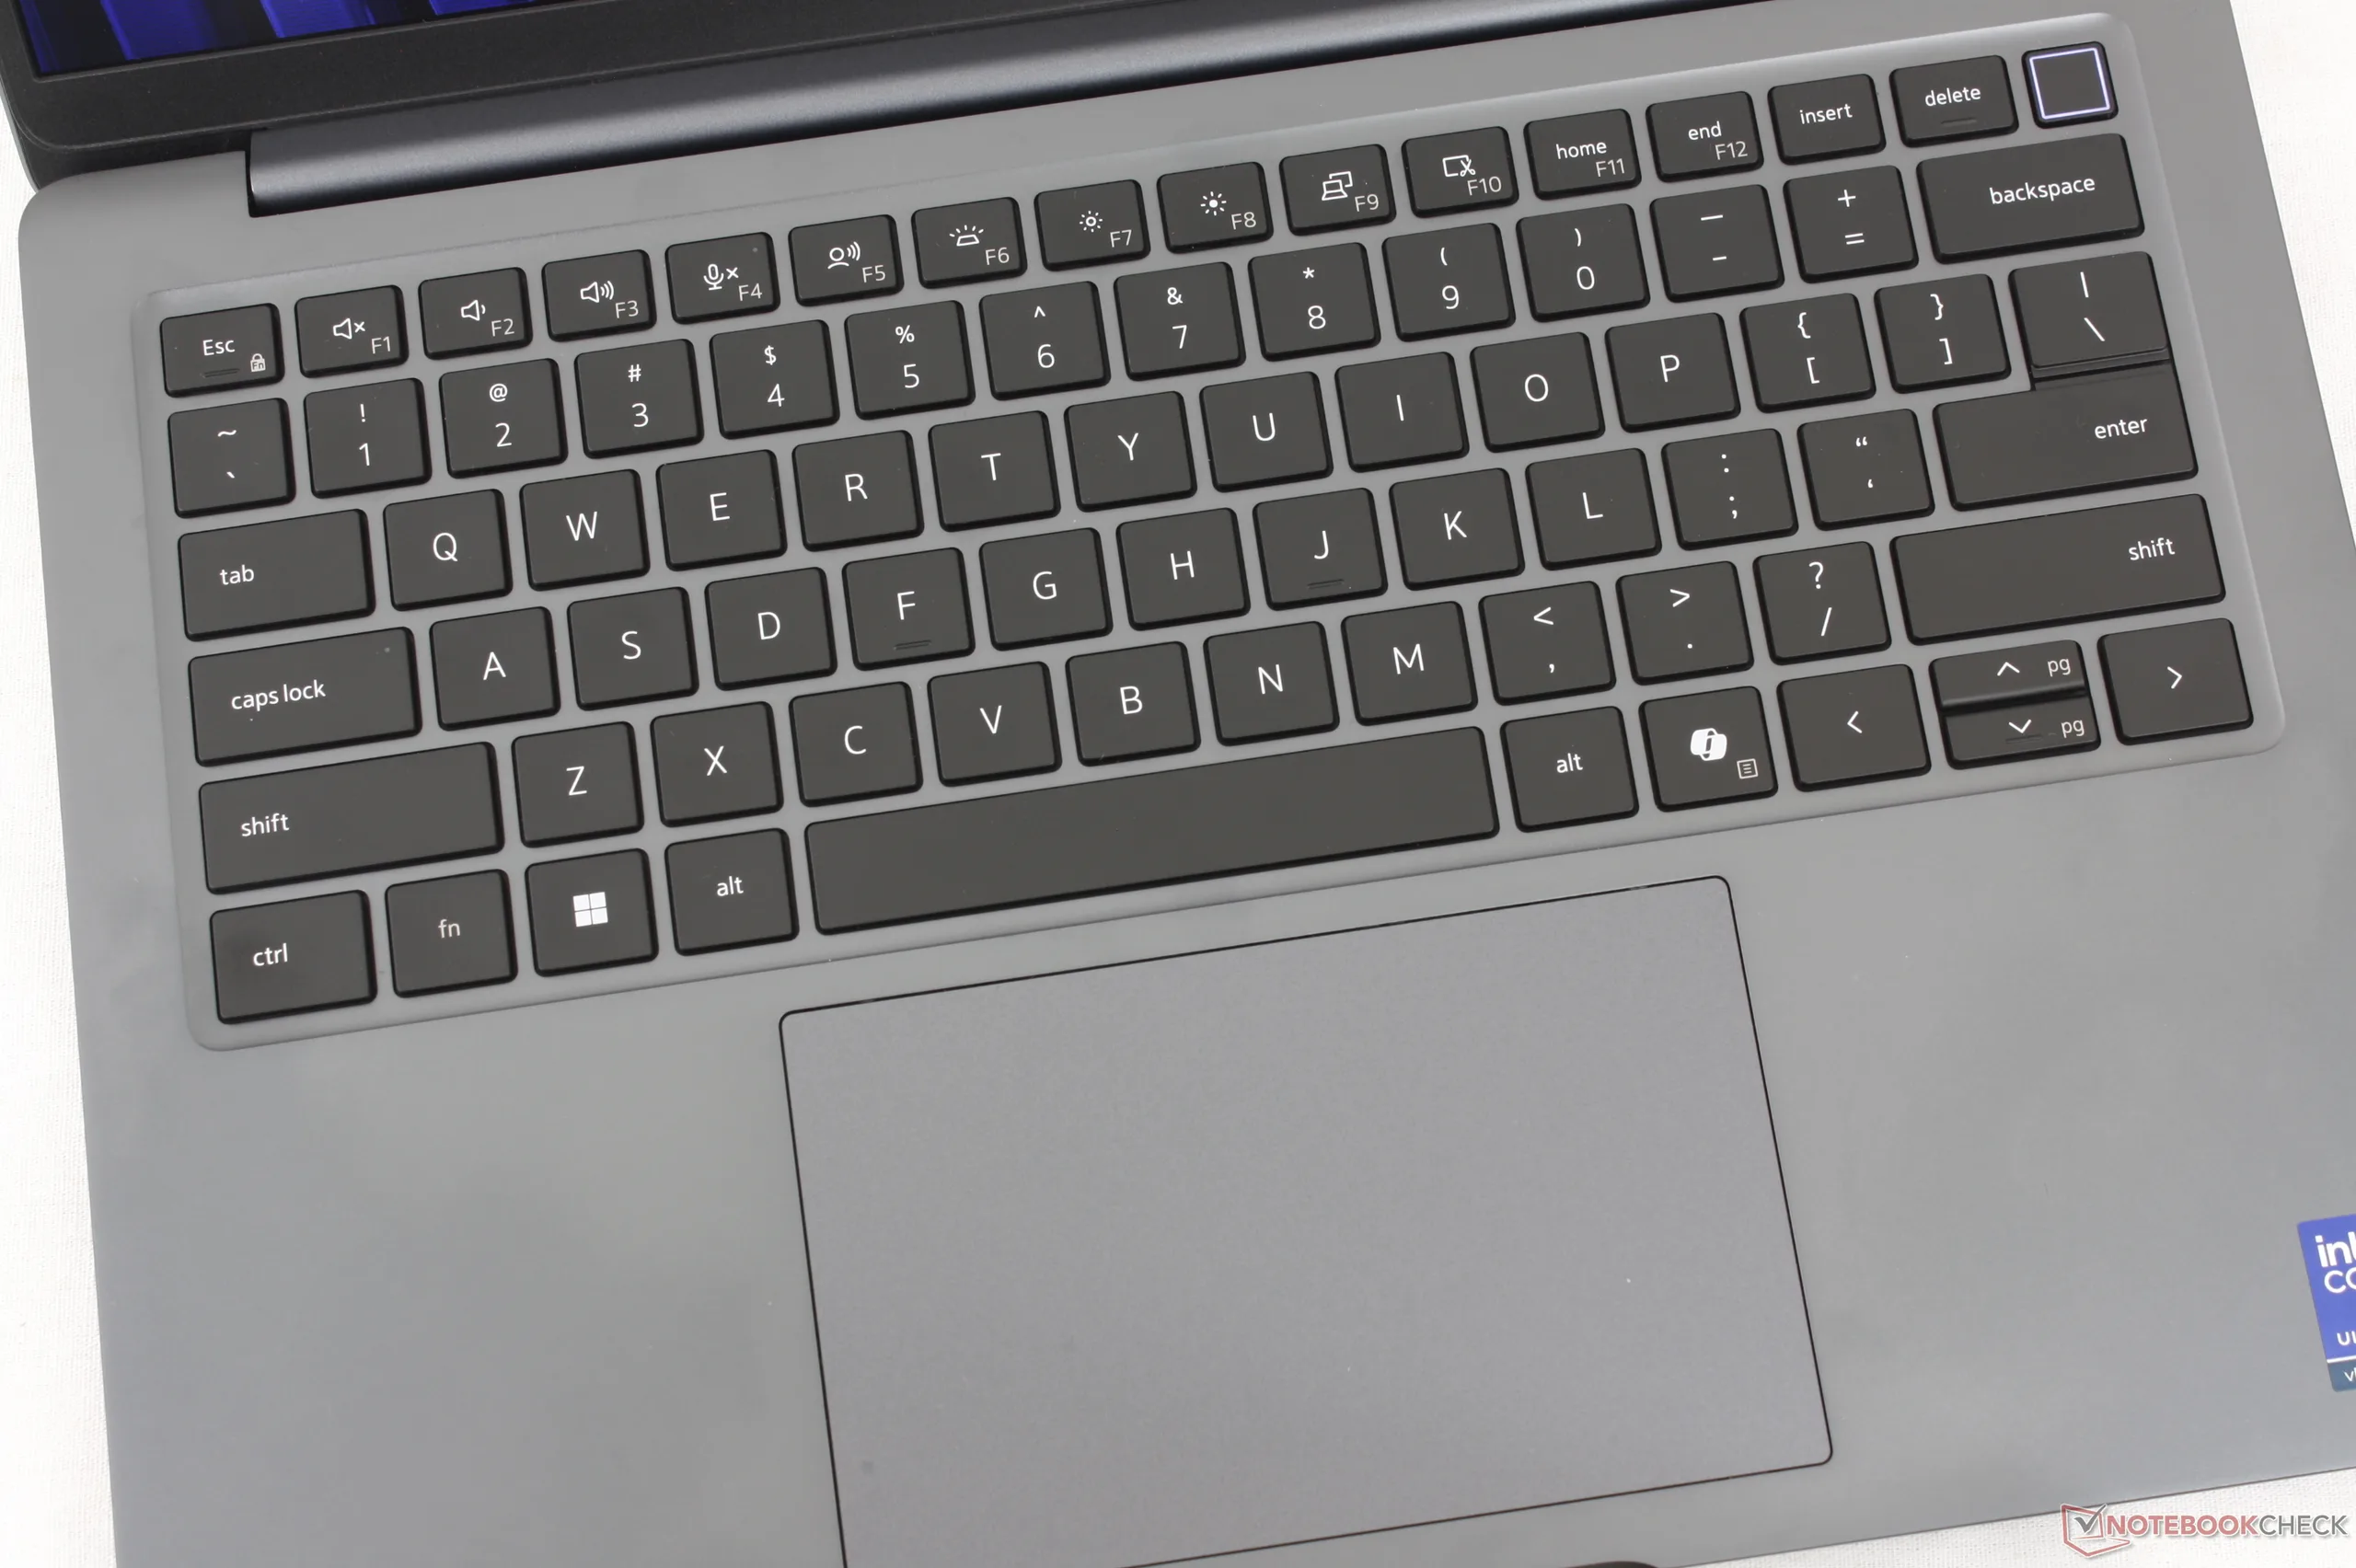
Esperienza di digitazione e utilizzo del clickpad identica a quella del Dell Pro 7 13 2-in-1

Visualizzazione

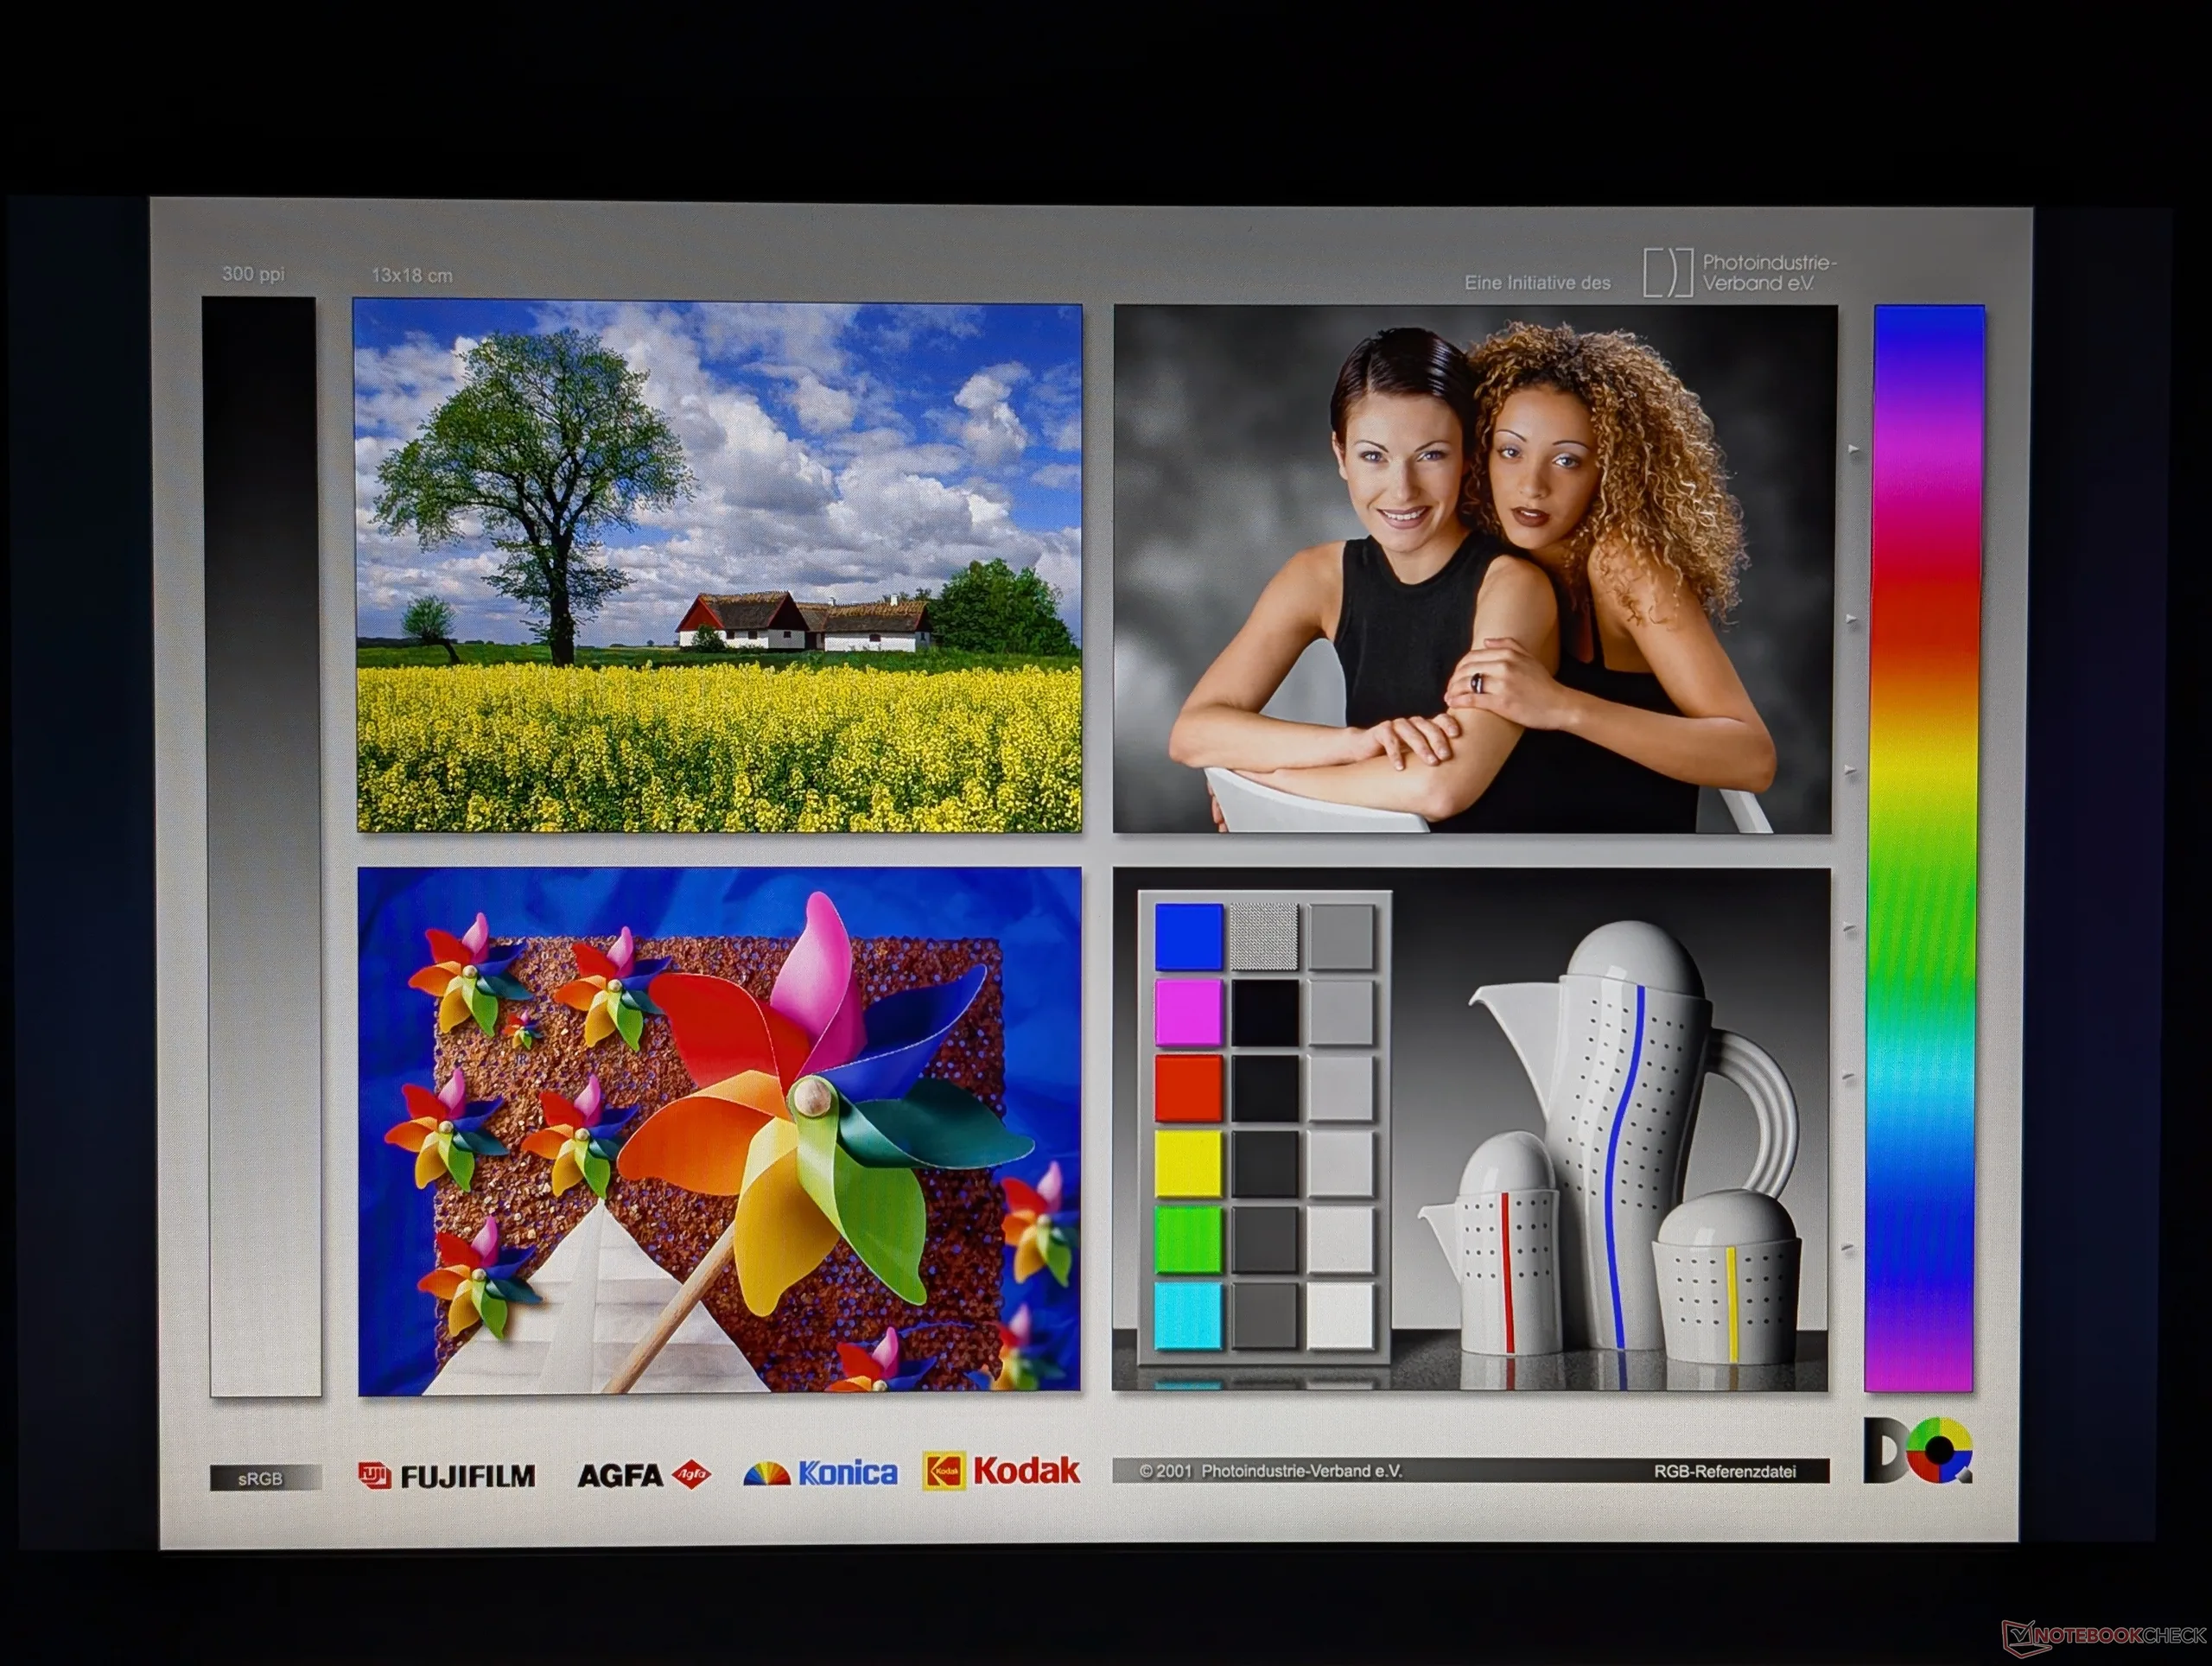
Sono disponibili cinque opzioni di visualizzazione che vanno dalla risoluzione FHD alla QHD. Tuttavia, le opzioni OLED sono limitate esclusivamente alla risoluzione FHD e offrono, nella migliore delle ipotesi, un supporto HDR insufficiente.


Granulosità minima nonostante la finitura opaca
Si osserva una leggera difusione irregolare della retroilluminazione lungo gli angoli inferiori
501.4
cd/m²
474.8
cd/m²
533
cd/m²
514.2
cd/m²
575.7
cd/m²
527.3
cd/m²
561.3
cd/m²
550.4
cd/m²
547.8
cd/m²
Distribuzione della luminosità
LG Philips LP140WU testato con X-Rite i1Pro 3
Massima: 575.7 cd/m² (Nits) Media: 531.8 cd/m² Minimum: 33.2 cd/m²
Distribuzione della luminosità: 82 %
Al centro con la batteria: 575.7 cd/m²
Contrasto: 1799:1 (Nero: 0.32 cd/m²)
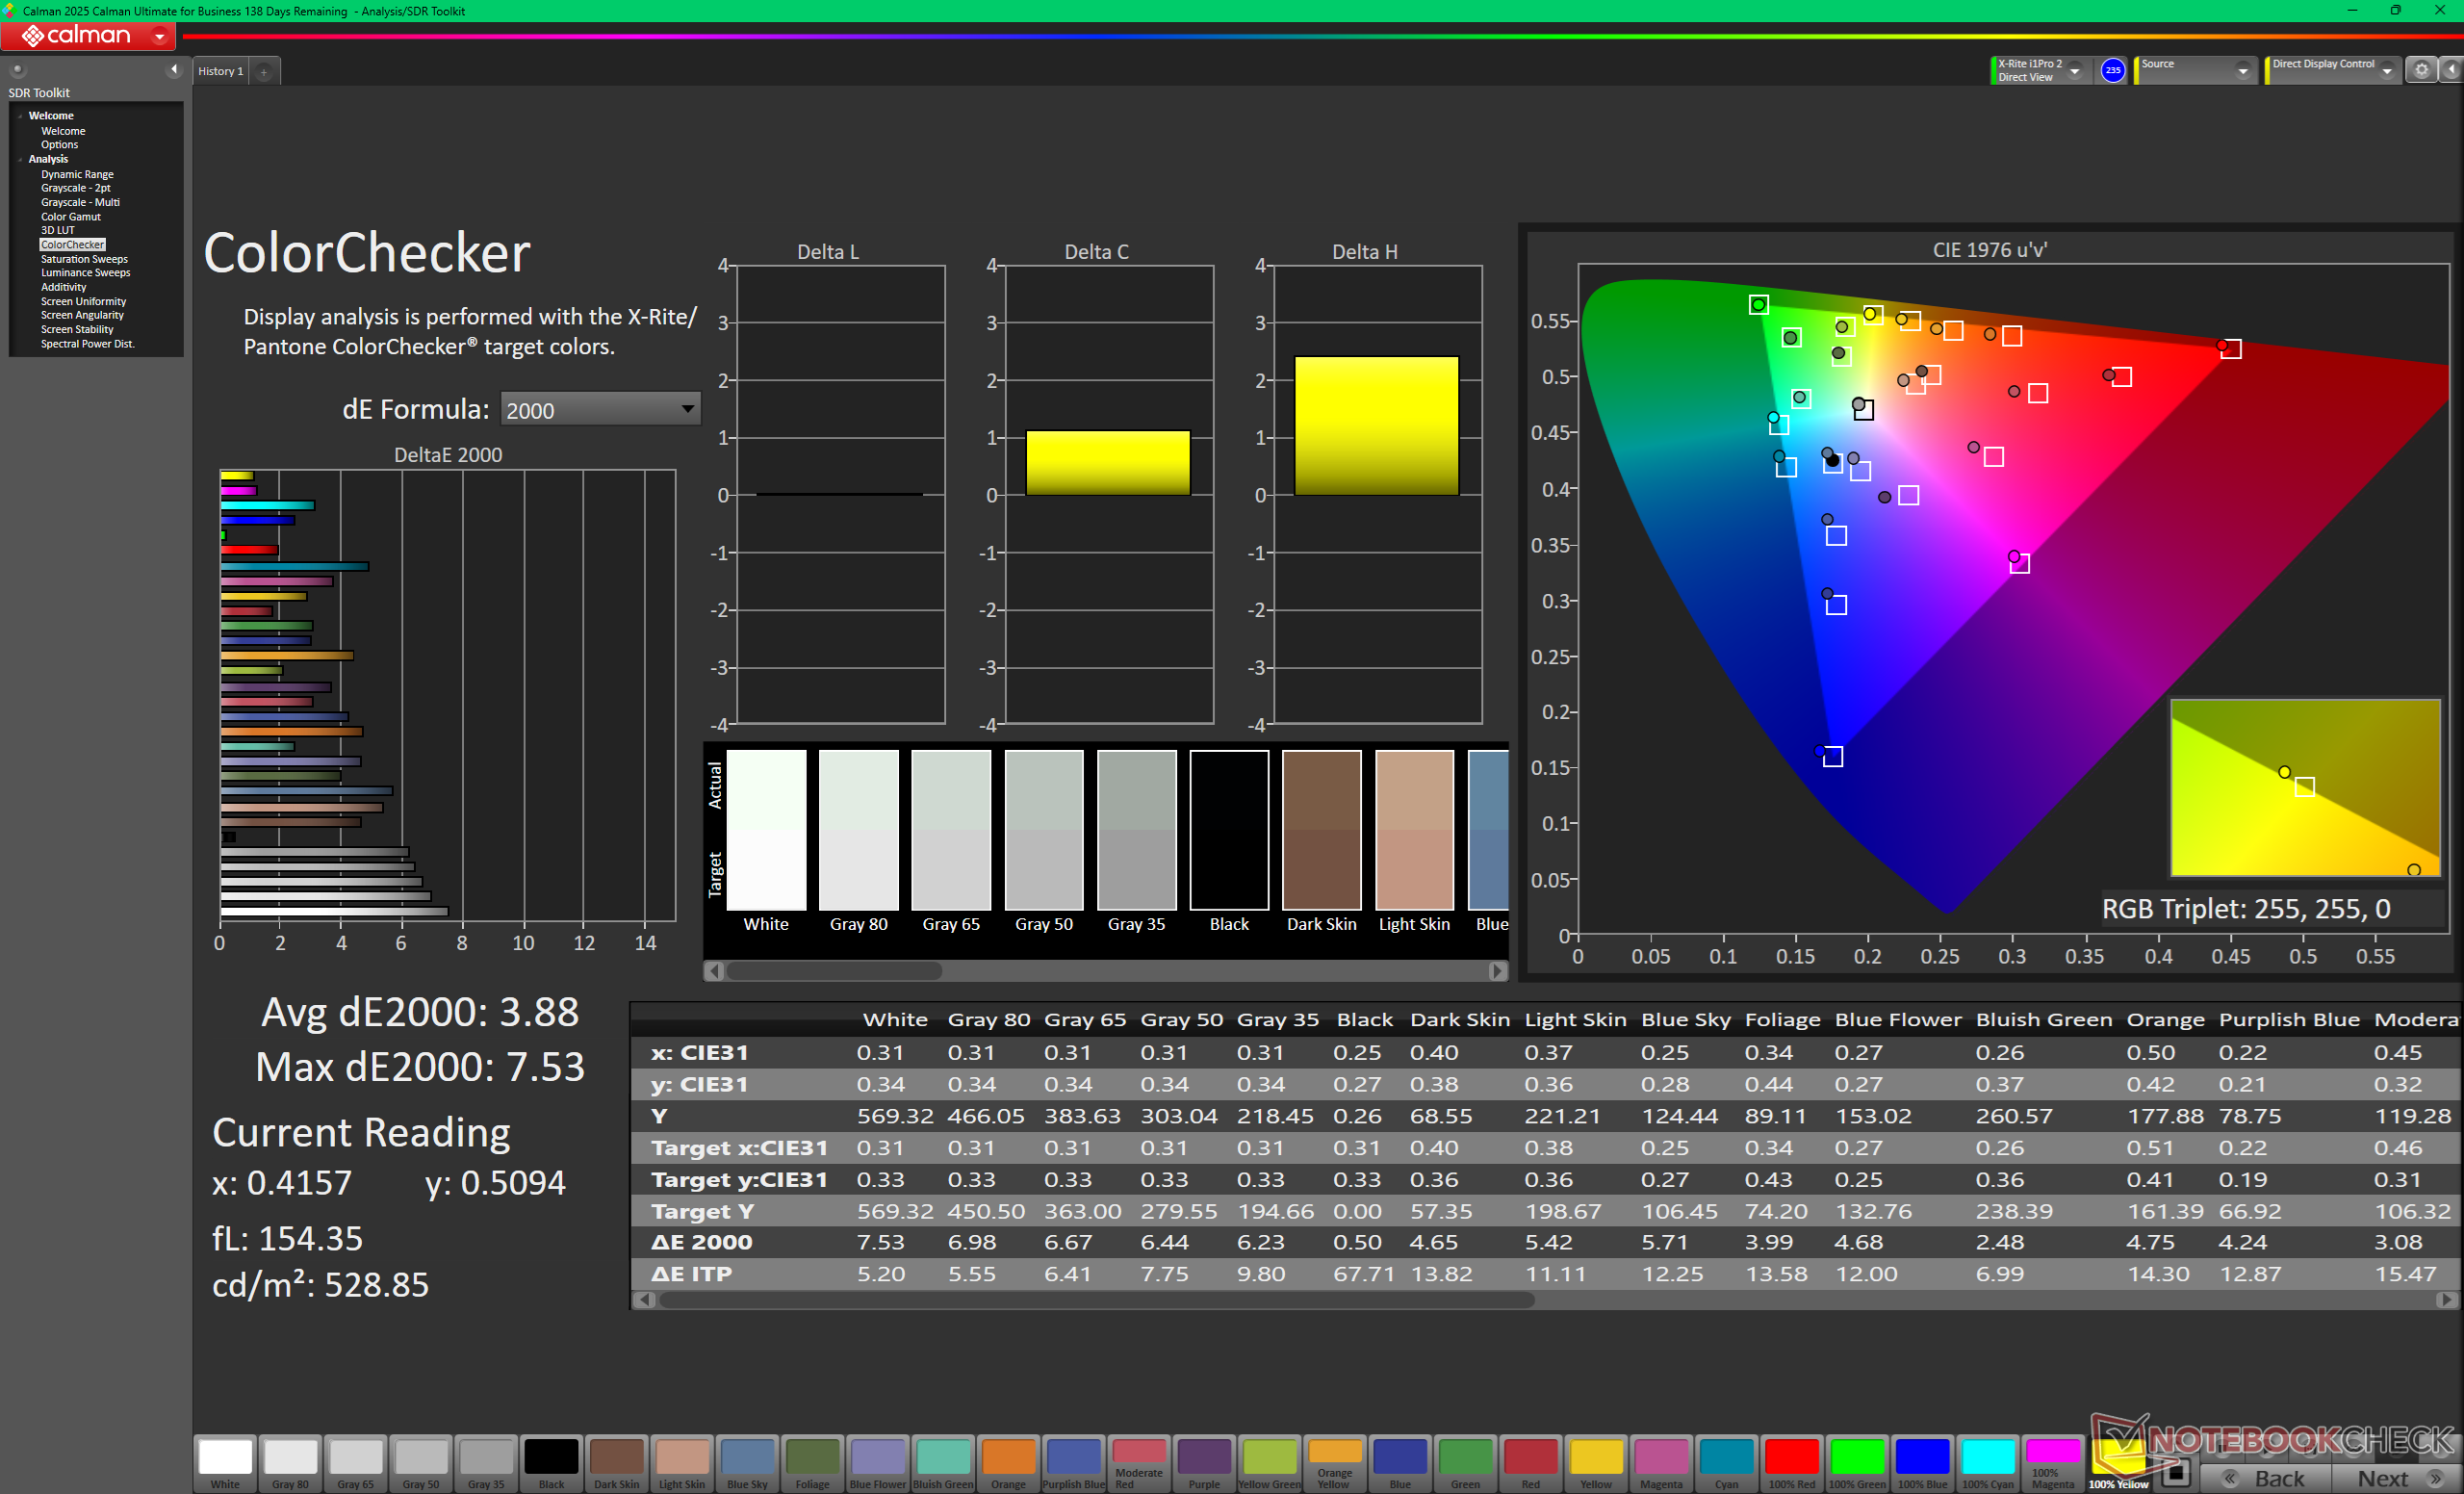
ΔE ColorChecker Calman: 3.88 | ∀{0.5-29.43 Ø4.7}
calibrated: 0.96
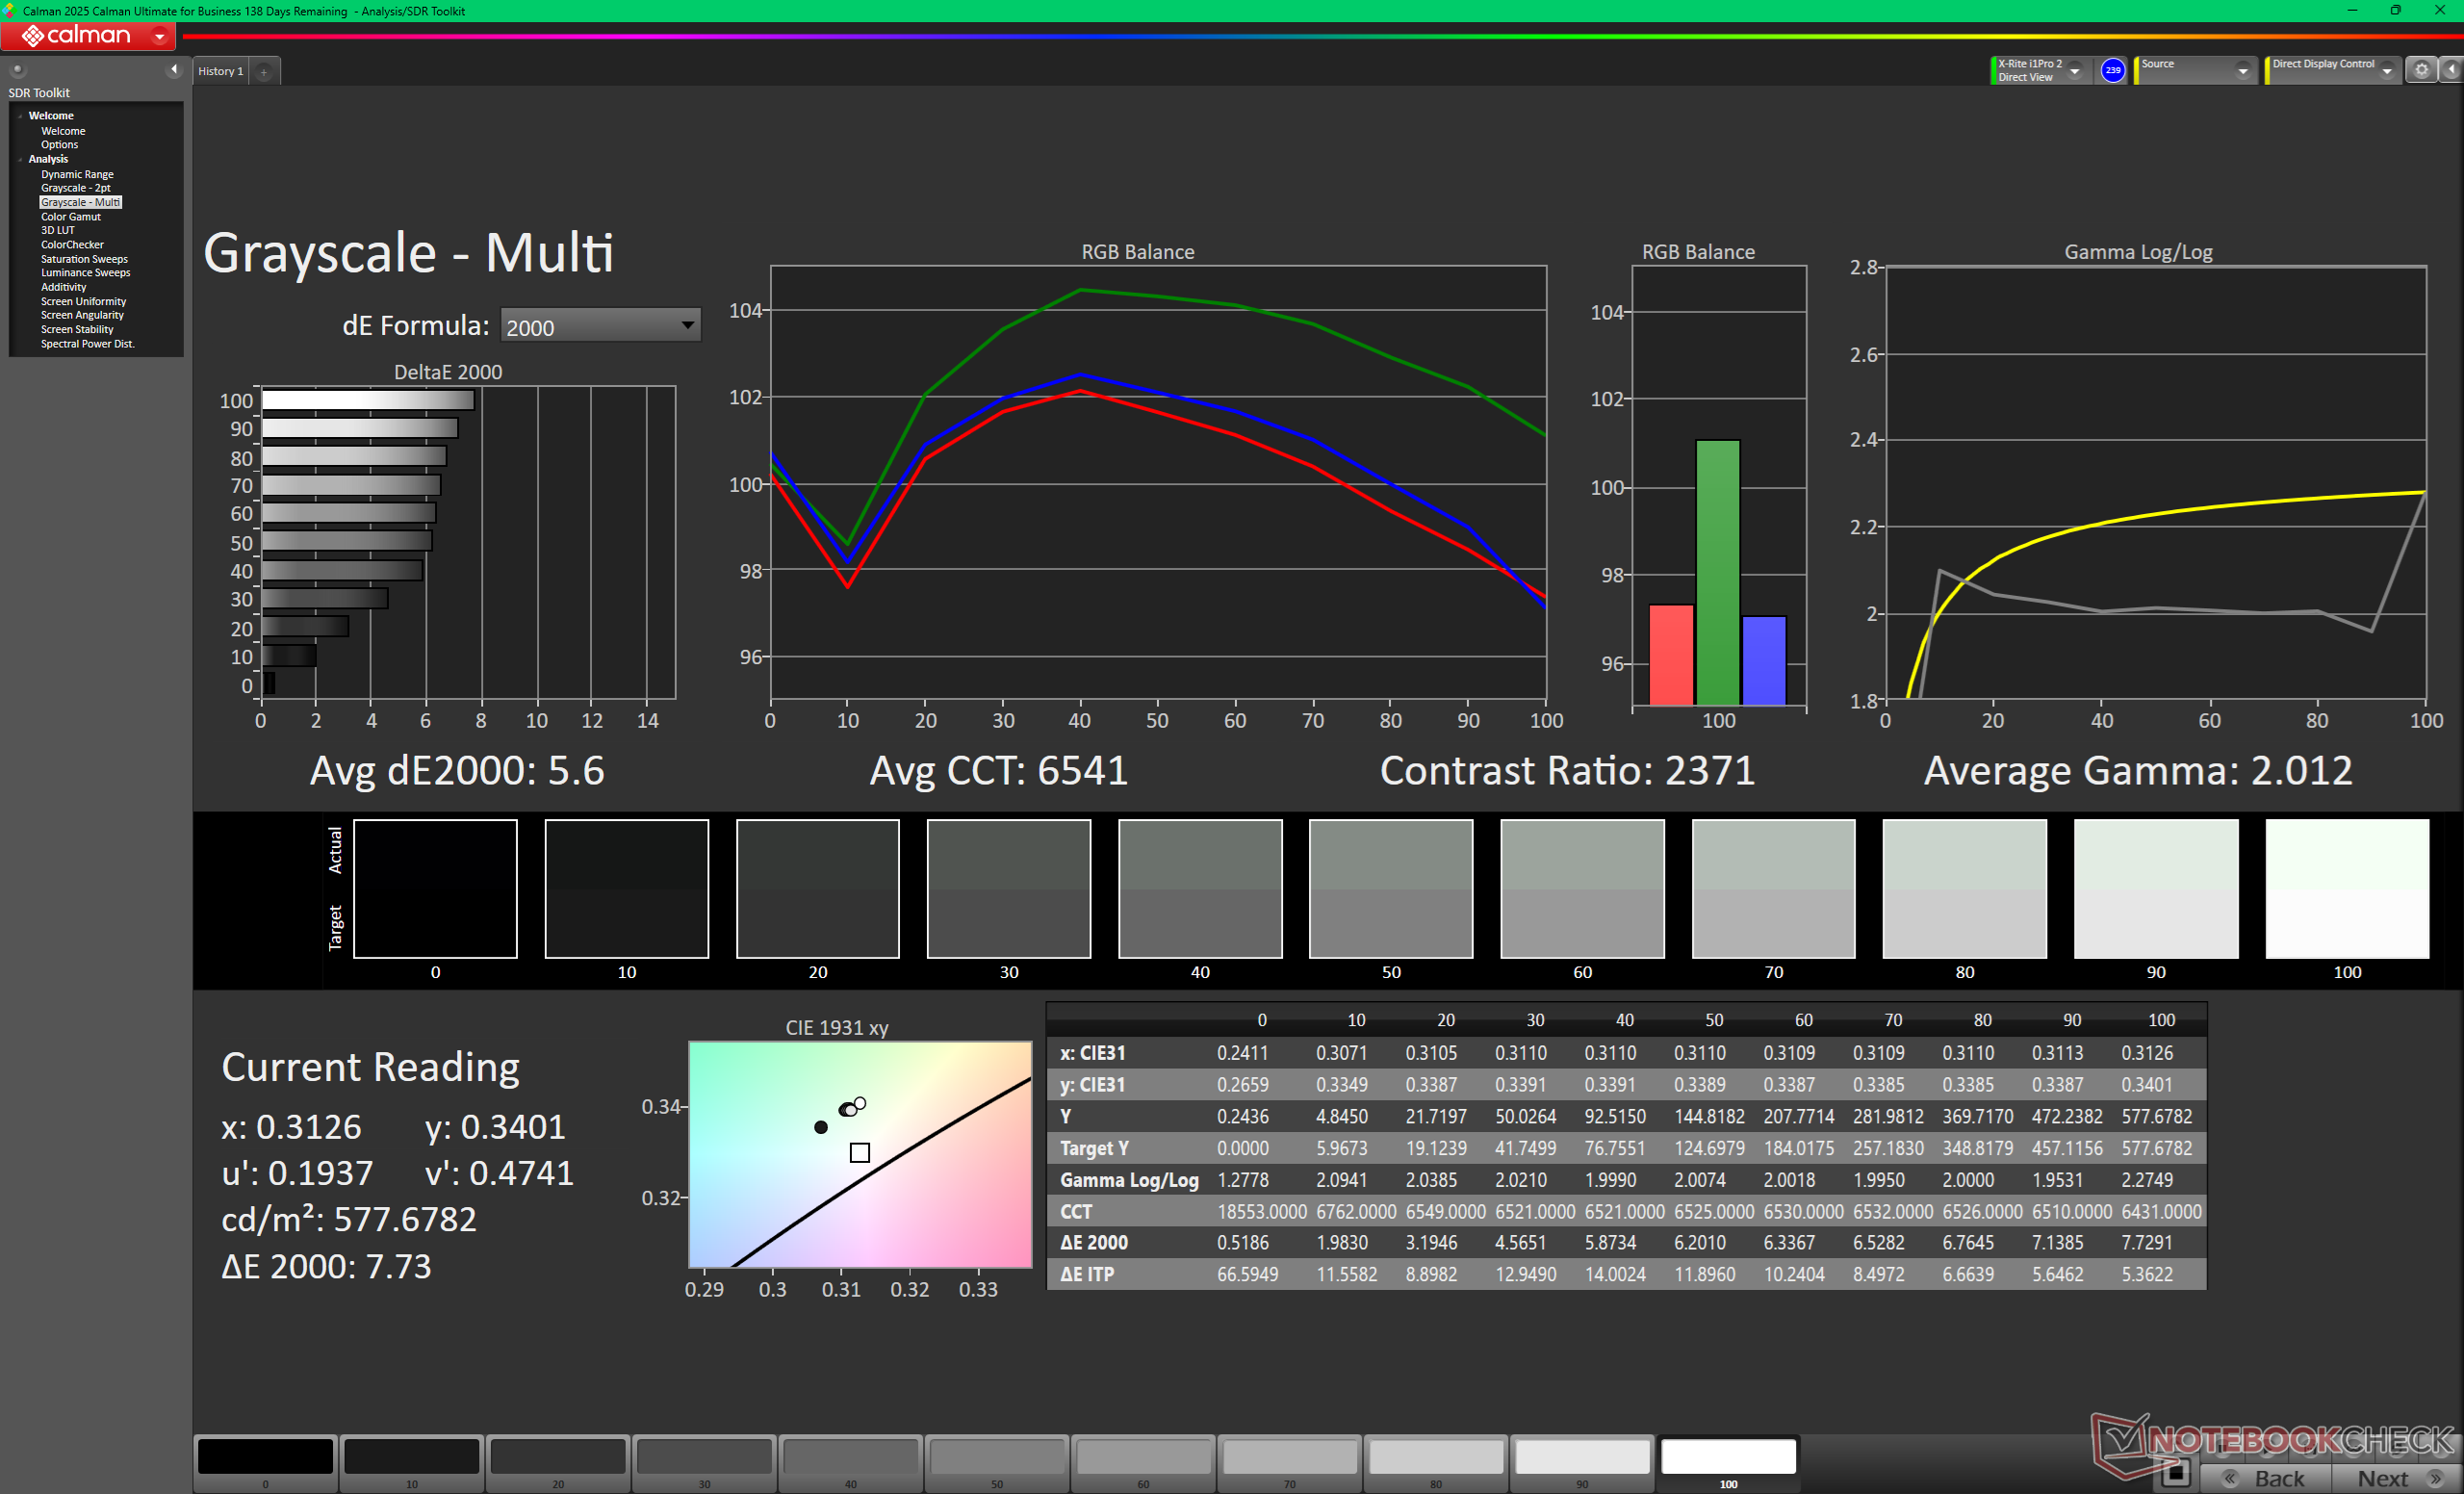
ΔE Greyscale Calman: 5.6 | ∀{0.09-98 Ø4.95}
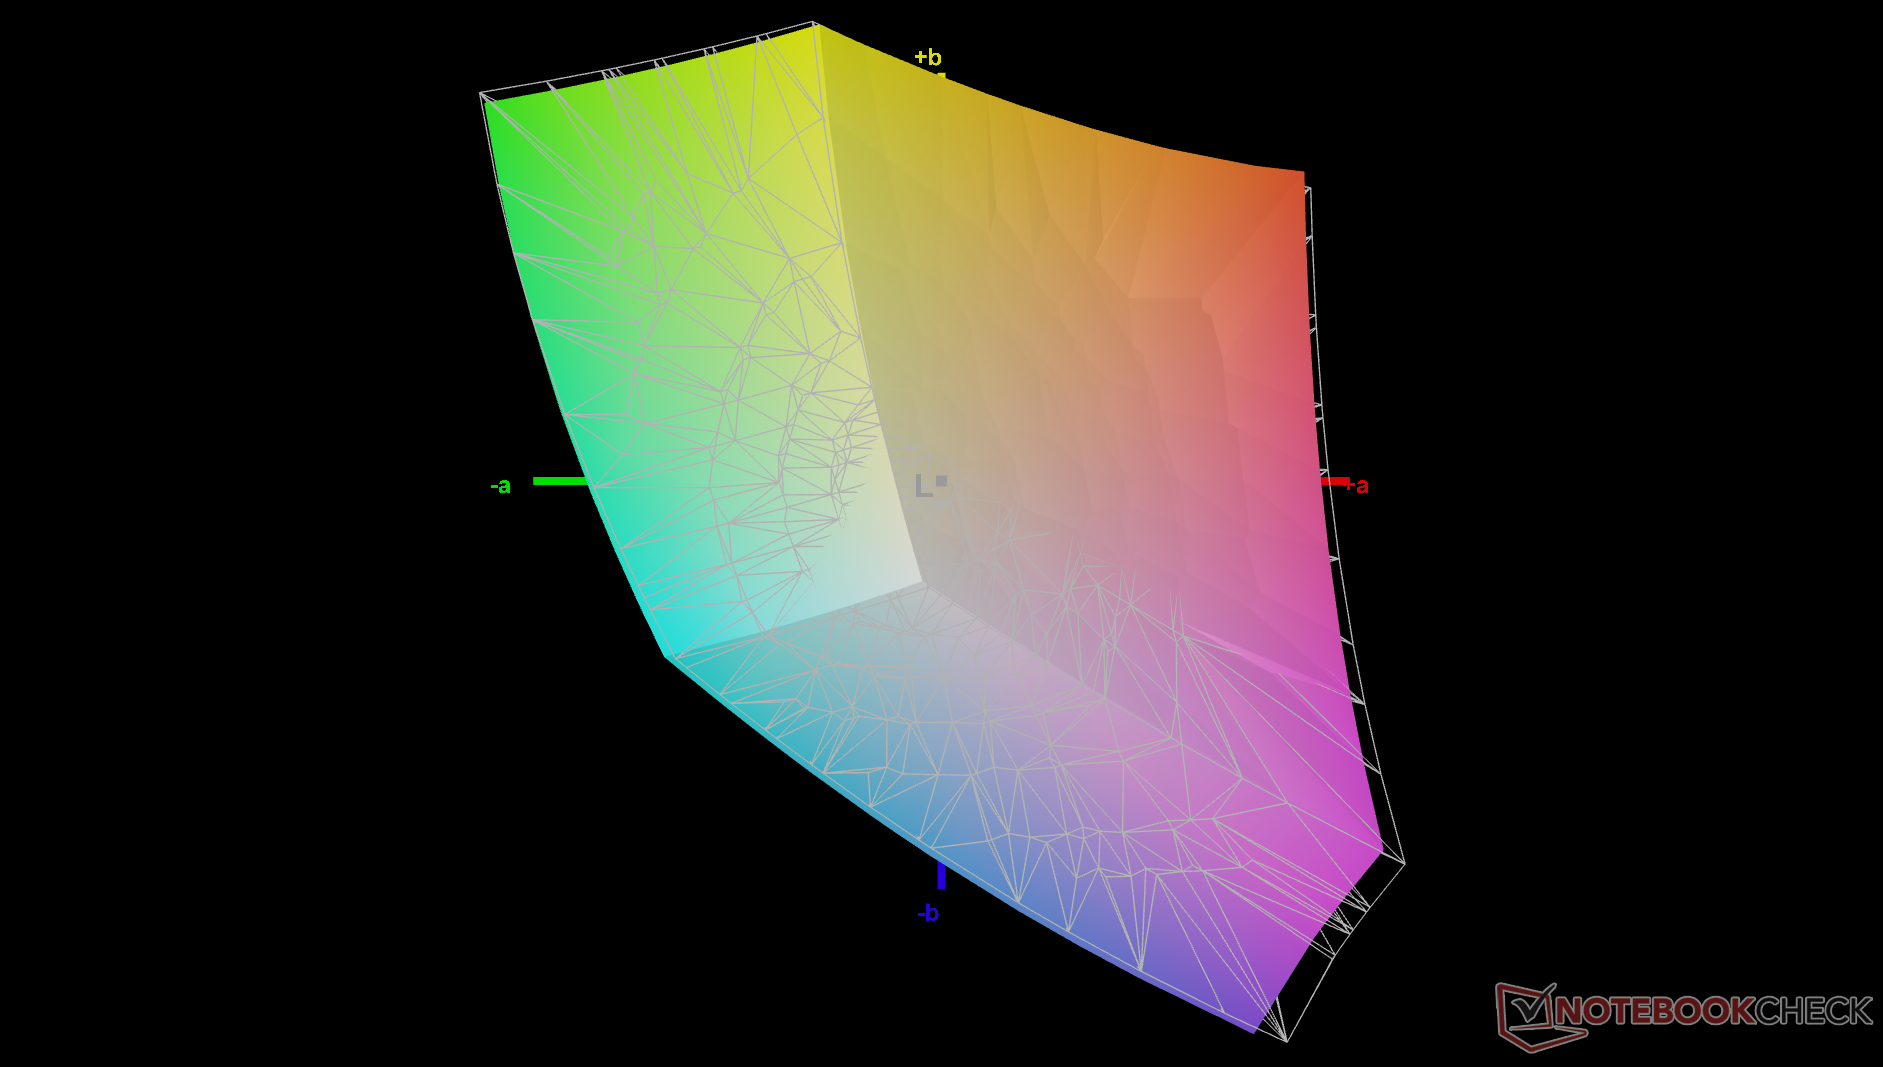
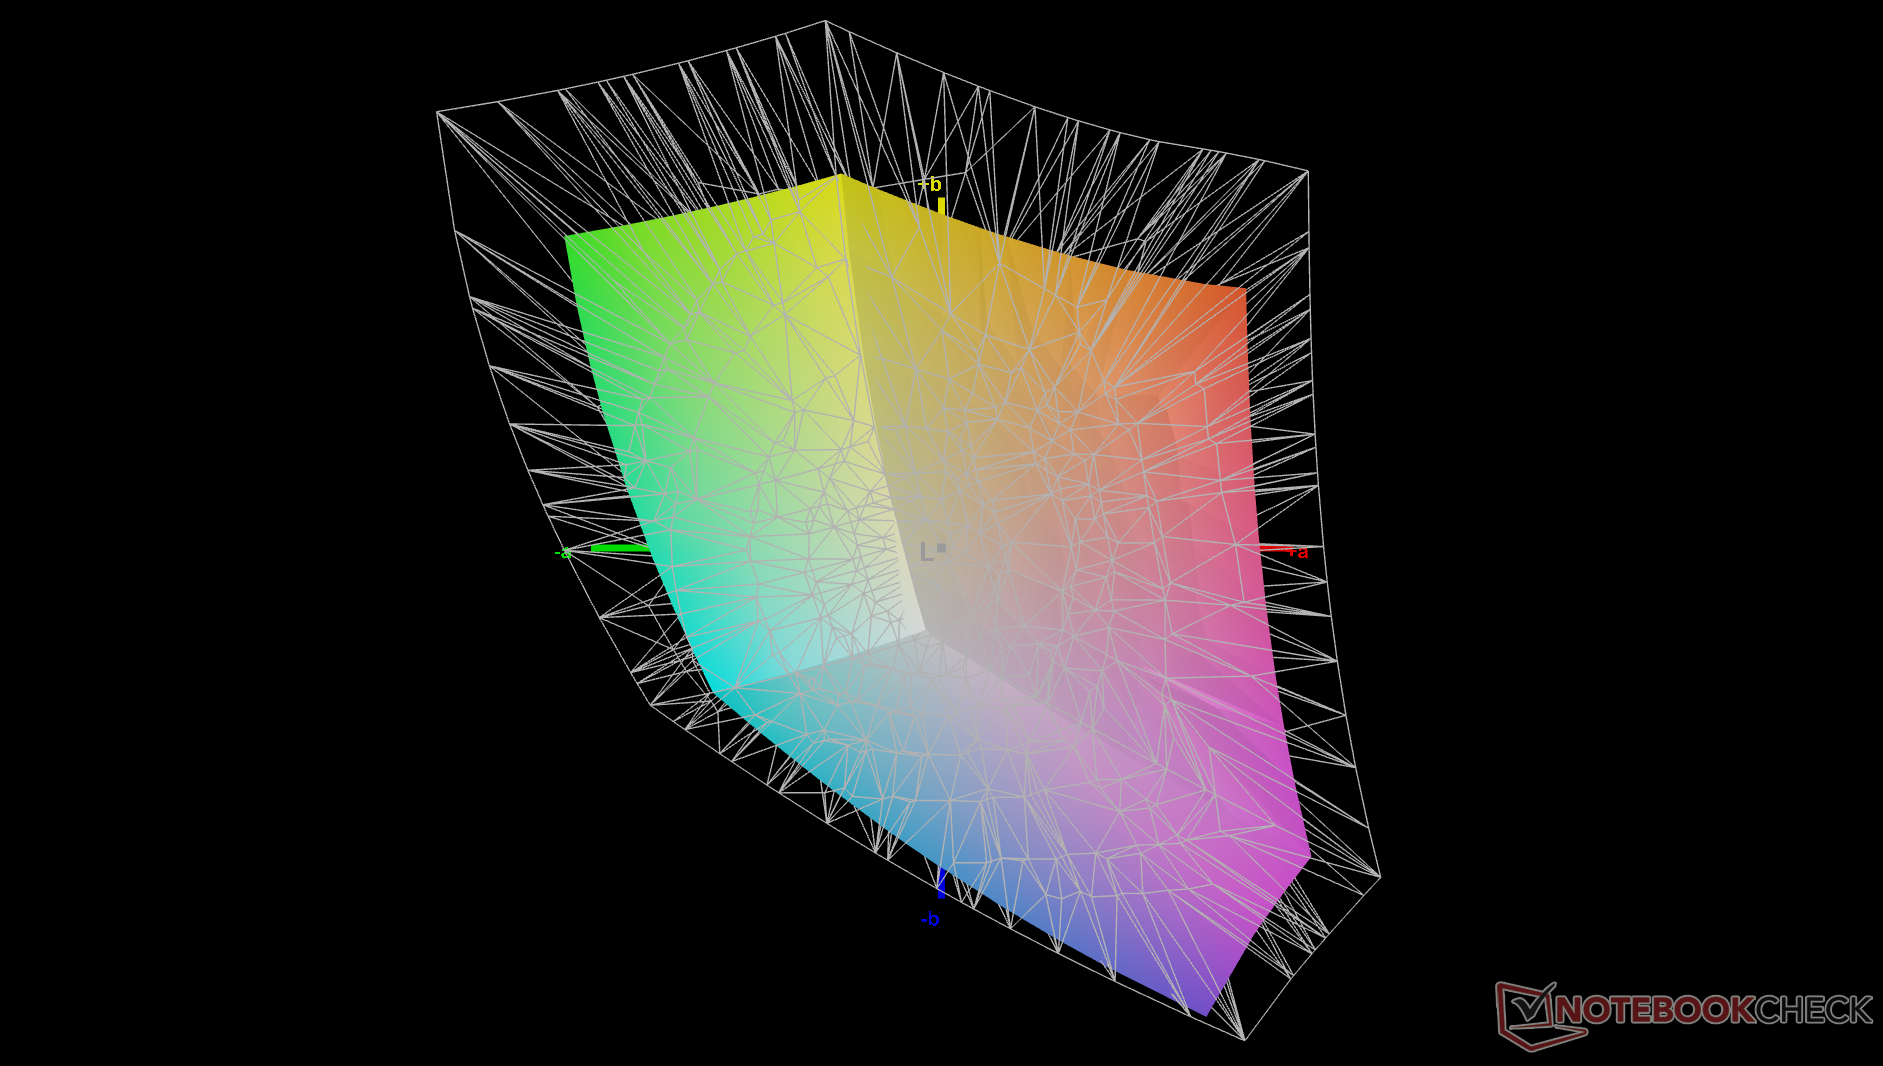
67.6% AdobeRGB 1998 (Argyll 3D)
96.2% sRGB (Argyll 3D)
65.4% Display P3 (Argyll 3D)
Gamma: 2.01
CCT: 6541 K
Dell Pro 7 14 P714260
LG Philips LP140WU, IPS, 1920x1200, 14", 120 Hz
Dell Pro 7 14 P714265
LG Philips LP140WU, IPS, 1920x1200, 14", 120 Hz
HP EliteBook 8 G2a 14
IPS, 1920x1200, 14", 60 Hz
Lenovo ThinkPad T14s Gen 7 21YW0022GE
MNE007QB1-1, IPS, 1920x1200, 14", 60 Hz
Asus ExpertBook Ultra B9406CAA
Samsung ATNA40LE01-0, OLED, 2880x1800, 14", 120 Hz
Acer TravelMate P6 TMP614-54-TCO-553Z
AUO77B2, IPS, 1920x1200, 14", 60 Hz
Display
1%
3%
5%
26%
7%
Display P3 Coverage (%)
65.4
65.9
1%
67.5
3%
71.6
9%
96.2
47%
73.49
12%
sRGB Coverage (%)
96.2
96.4
0%
99
3%
97.4
1%
100
4%
97.5
1%
AdobeRGB 1998 Coverage (%)
67.6
68.1
1%
69.6
3%
70.4
4%
86.7
28%
72.95
8%
Response Times
-14%
27%
46%
98%
-13%
Response Time Grey 50% / Grey 80% * (ms)
43.8 ?(20.4, 23.4)
50.5 ?(23.1, 27.4)
-15%
39.3 ?(18.6, 20.7)
10%
27.8 ?(10.2, 17.6)
37%
0.71 ?(0.38, 0.33)
98%
54.8 ?(25.8, 29)
-25%
Response Time Black / White * (ms)
31.3 ?(13, 18.3)
35.2 ?(14.4, 20.8)
-12%
17.8 ?(6.8, 11)
43%
14 ?(4.3, 9.7)
55%
0.94 ?(0.49, 0.45)
97%
31.2 ?(15.4, 15.8)
-0%
PWM Frequency (Hz)
968.8 ?(100)
PWM Amplitude * (%)
20
Screen
-3%
21%
16%
38%
-28%
Brightness middle (cd/m²)
575.7
571.5
-1%
449
-22%
574
0%
600.5
4%
465
-19%
Brightness (cd/m²)
532
513
-4%
434
-18%
530
0%
612
15%
449
-16%
Brightness Distribution (%)
82
83
1%
90
10%
87
6%
96
17%
88
7%
Black Level * (cd/m²)
0.32
0.29
9%
0.22
31%
0.32
-0%
0.2821
12%
Contrast (:1)
1799
1971
10%
2041
13%
1794
0%
1648
-8%
Colorchecker dE 2000 *
3.88
4.58
-18%
1.8
54%
2
48%
1.18
70%
3.78
3%
Colorchecker dE 2000 max. *
7.53
9.44
-25%
4.2
44%
3.7
51%
3.4
55%
7.58
-1%
Colorchecker dE 2000 calibrated *
0.96
0.72
25%
0.7
27%
1.1
-15%
0.73
24%
3.3
-244%
Greyscale dE 2000 *
5.6
6.8
-21%
2.8
50%
2.6
54%
1
82%
4.9
12%
Gamma
2.01 109%
2 110%
2.22 99%
2.27 97%
2.27 97%
2.278 97%
CCT
6541 99%
6303 103%
7061 92%
6910 94%
6567 99%
7594 86%
Media totale (Programma / Settaggio)
-5% / -4%
17% / 18%
22% / 18%
54% / 45%
-11% / -18%

* ... Meglio usare valori piccoli
vs. sRGB
vs. sRGB
vs. P3
vs. P3
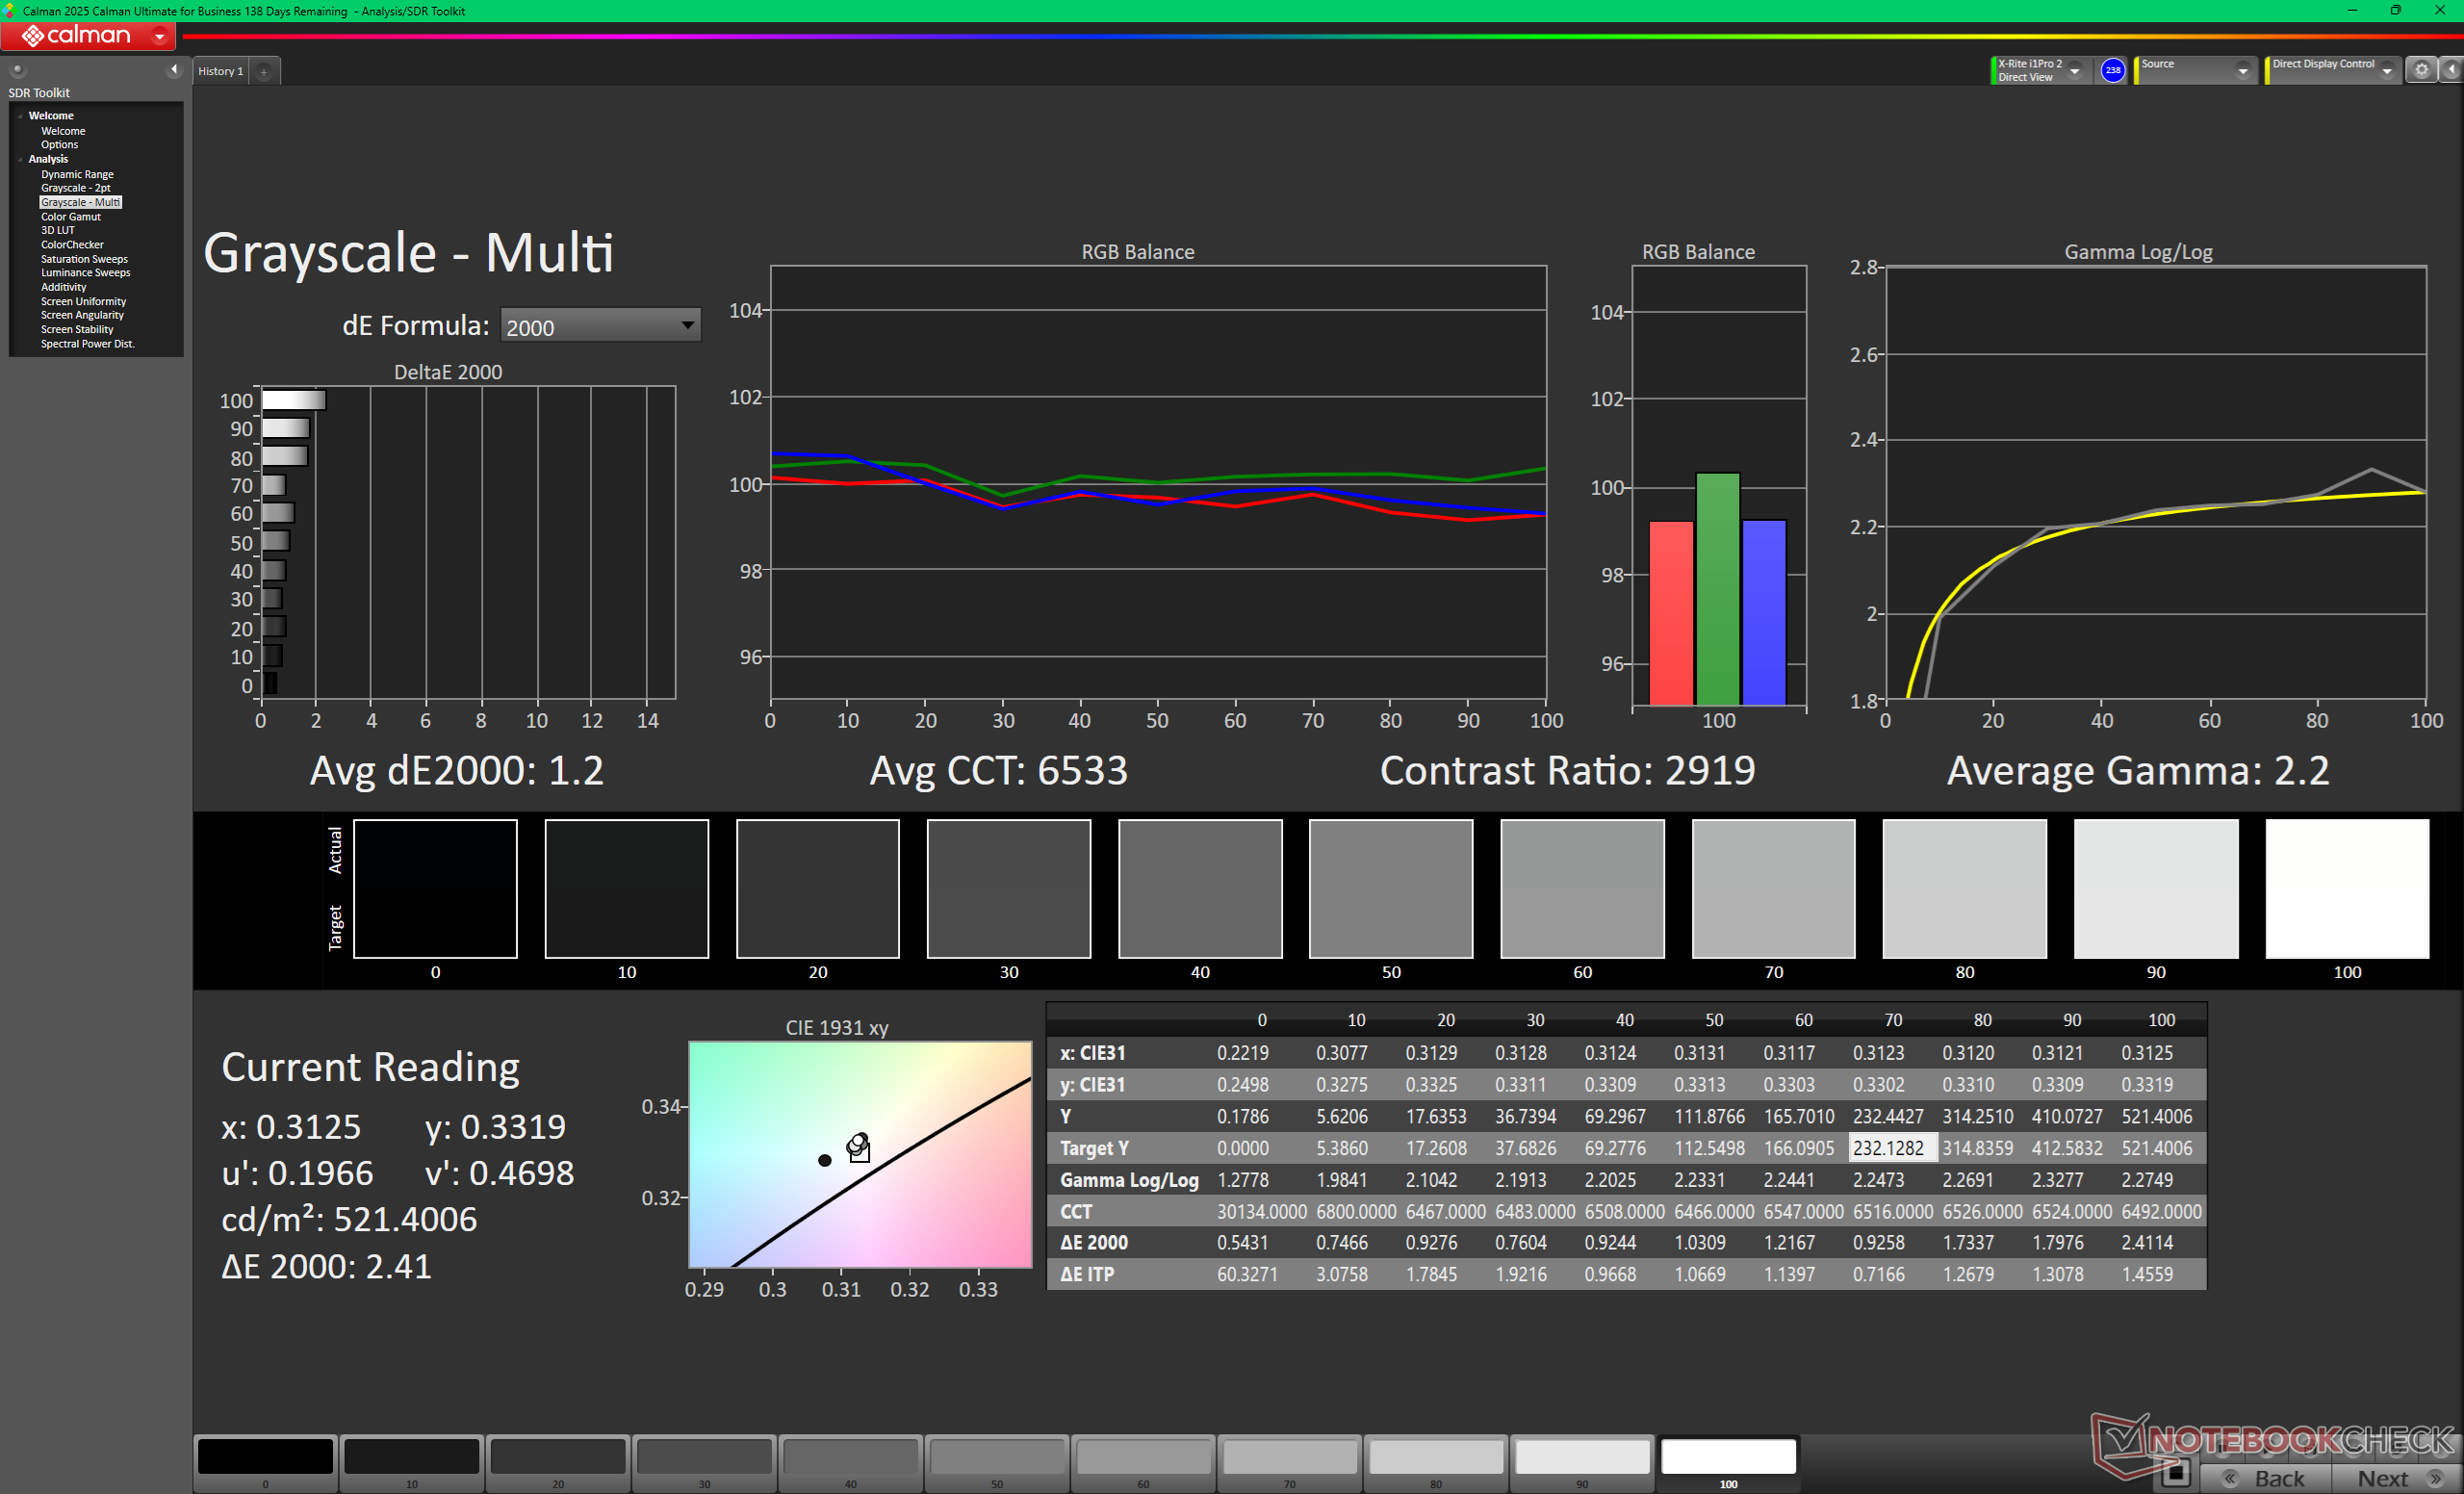
Scala di grigi prima della calibrazione (sRGB)
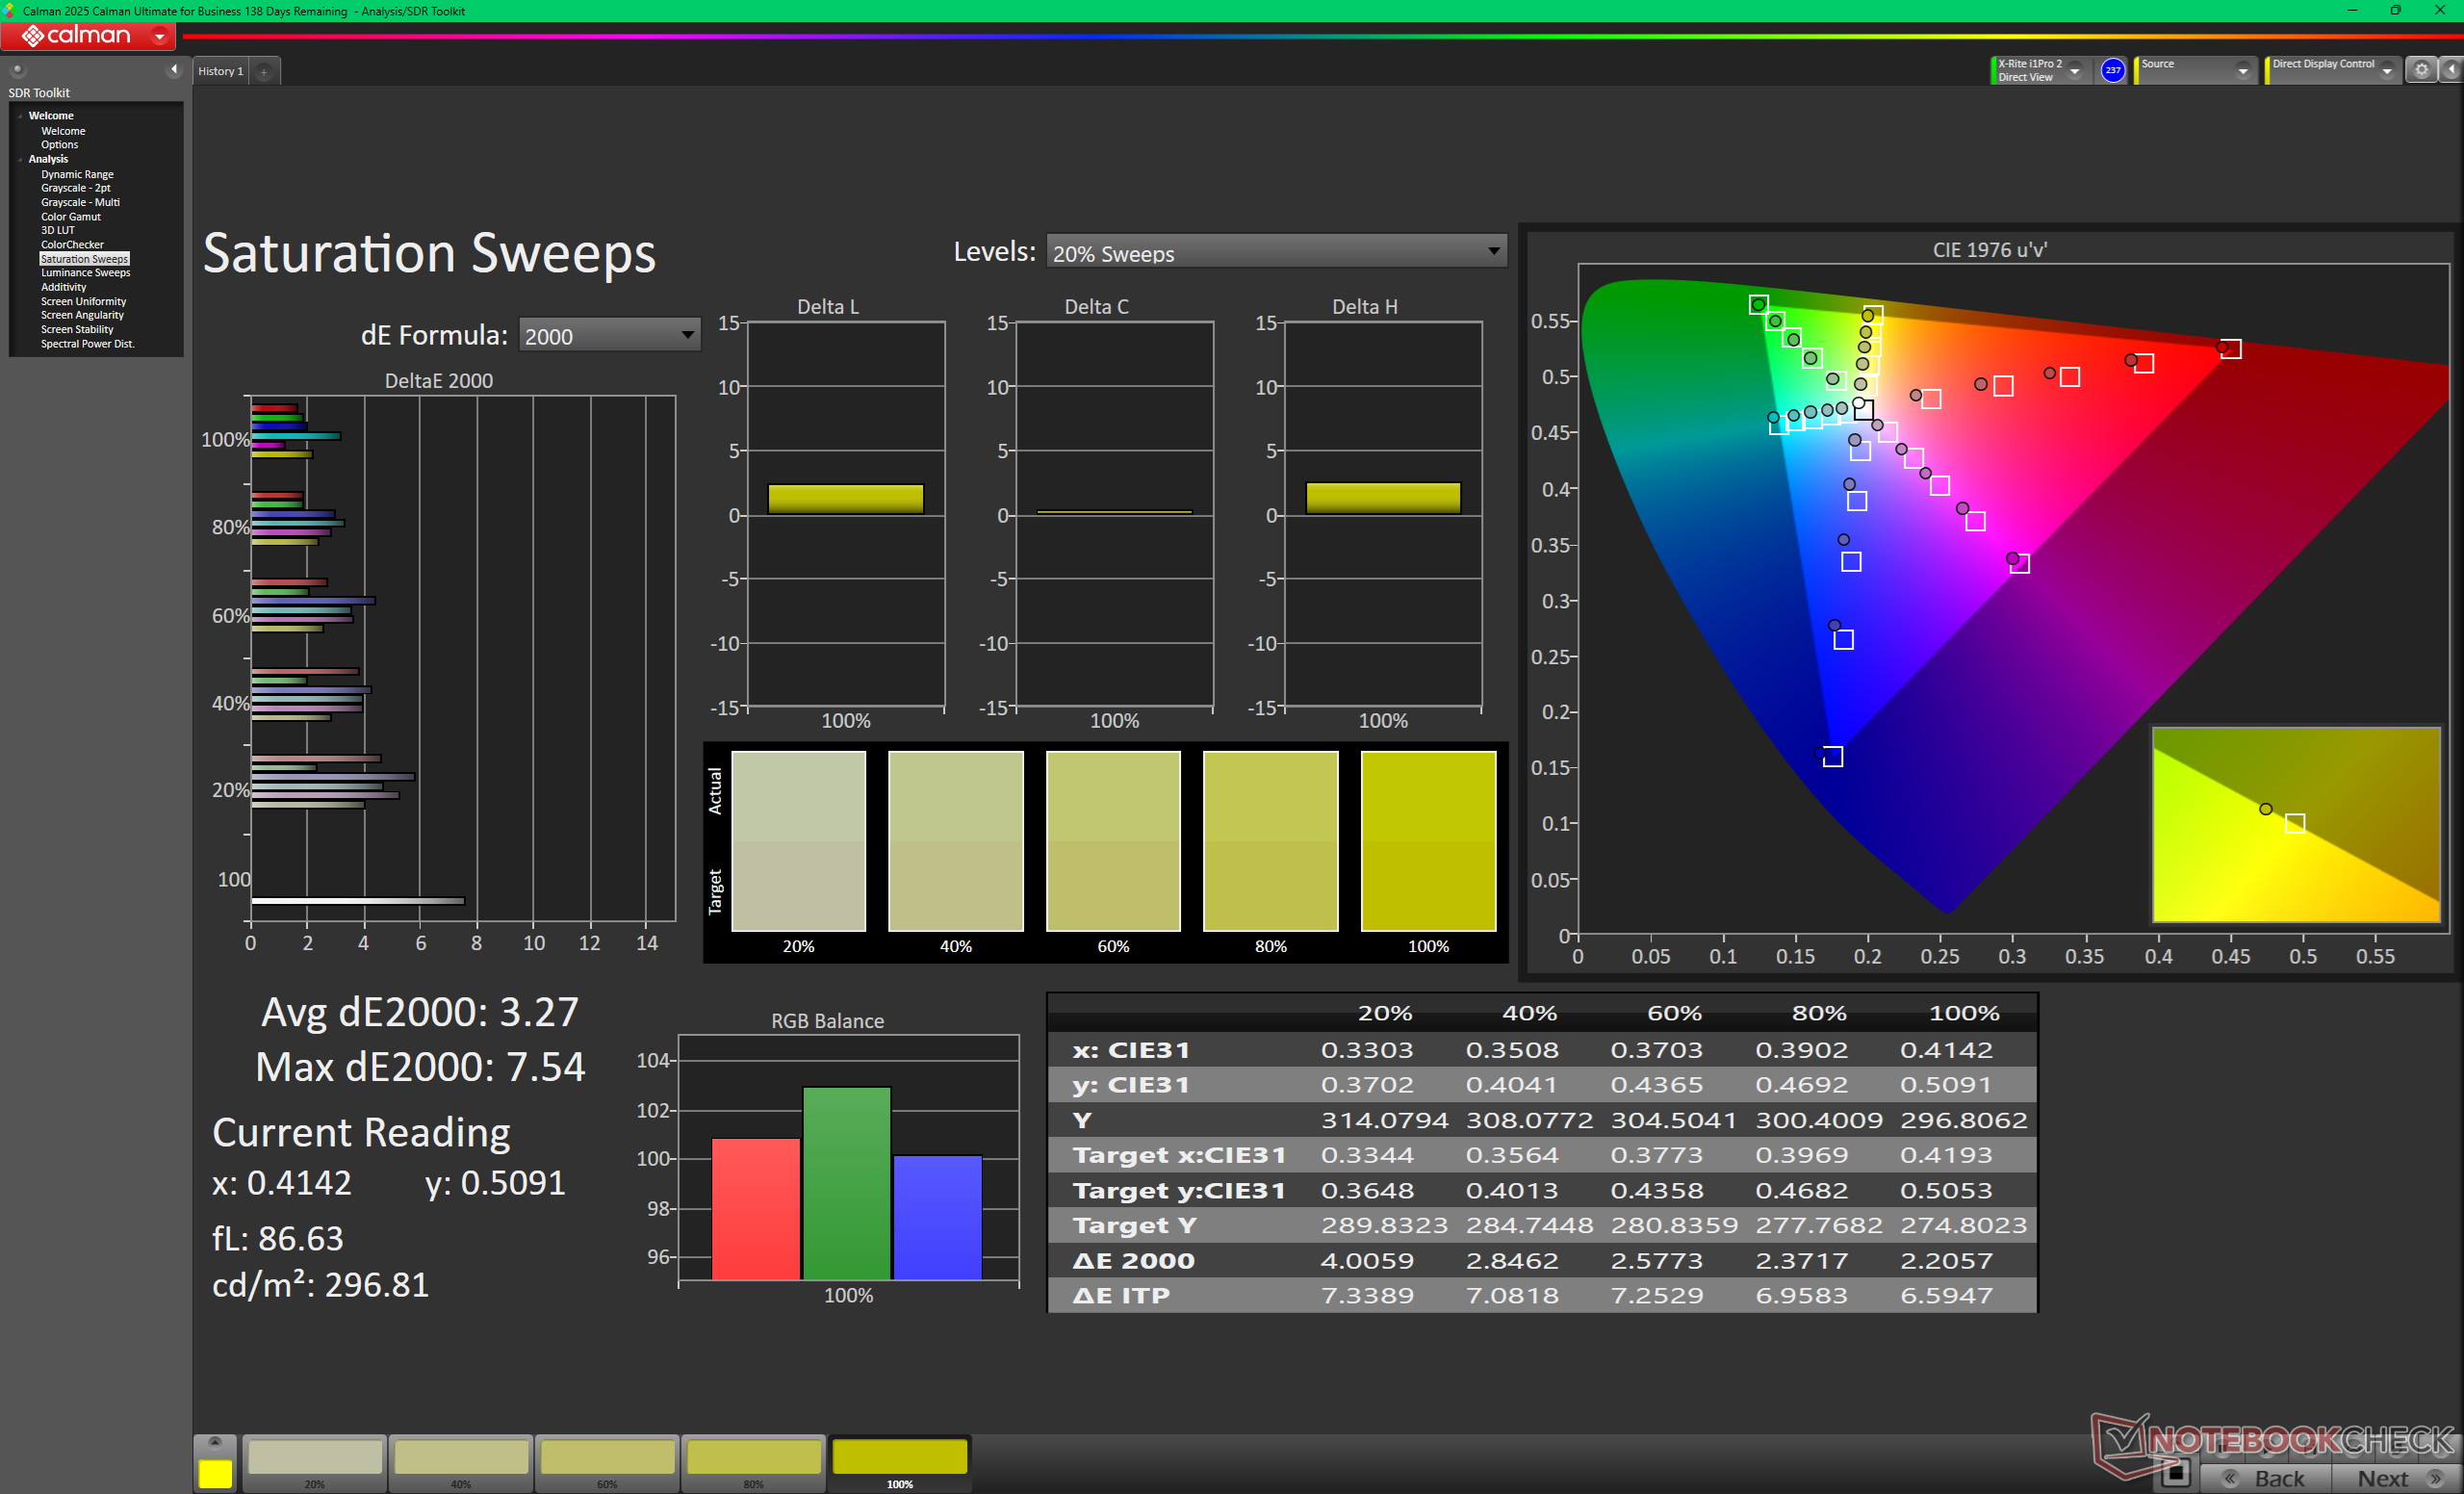
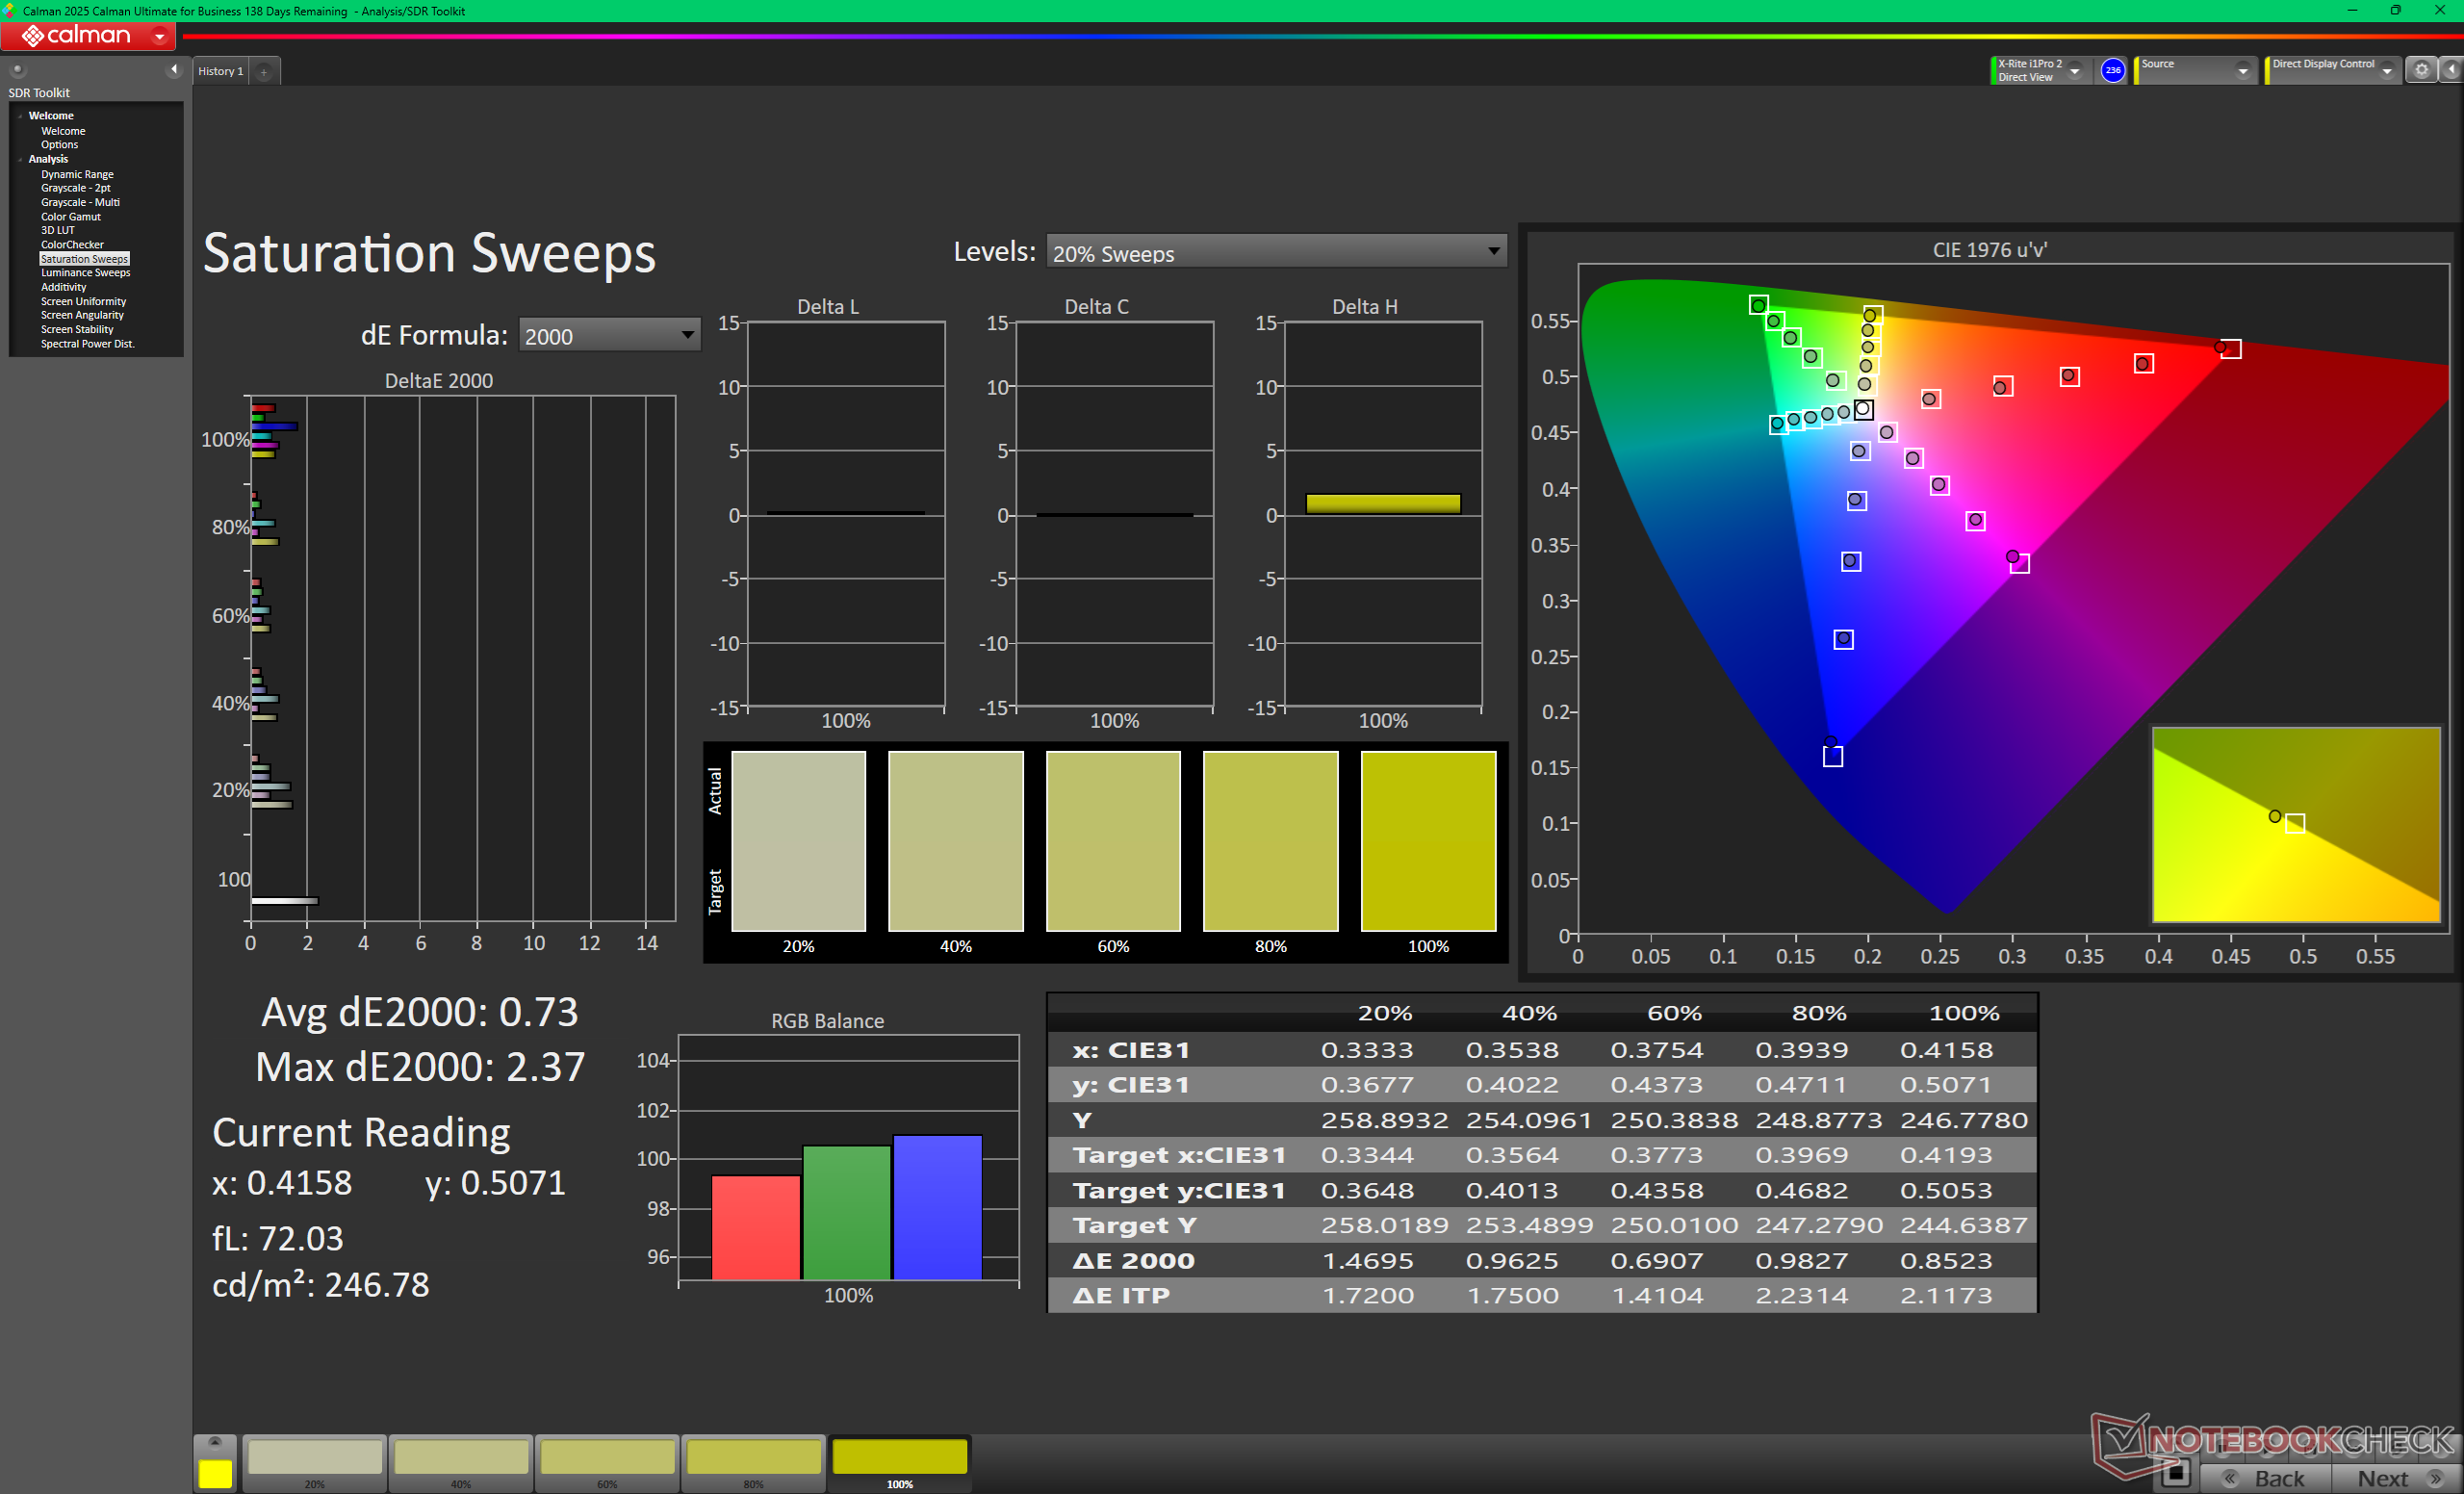
Scansioni di saturazione prima della calibrazione (sRGB)
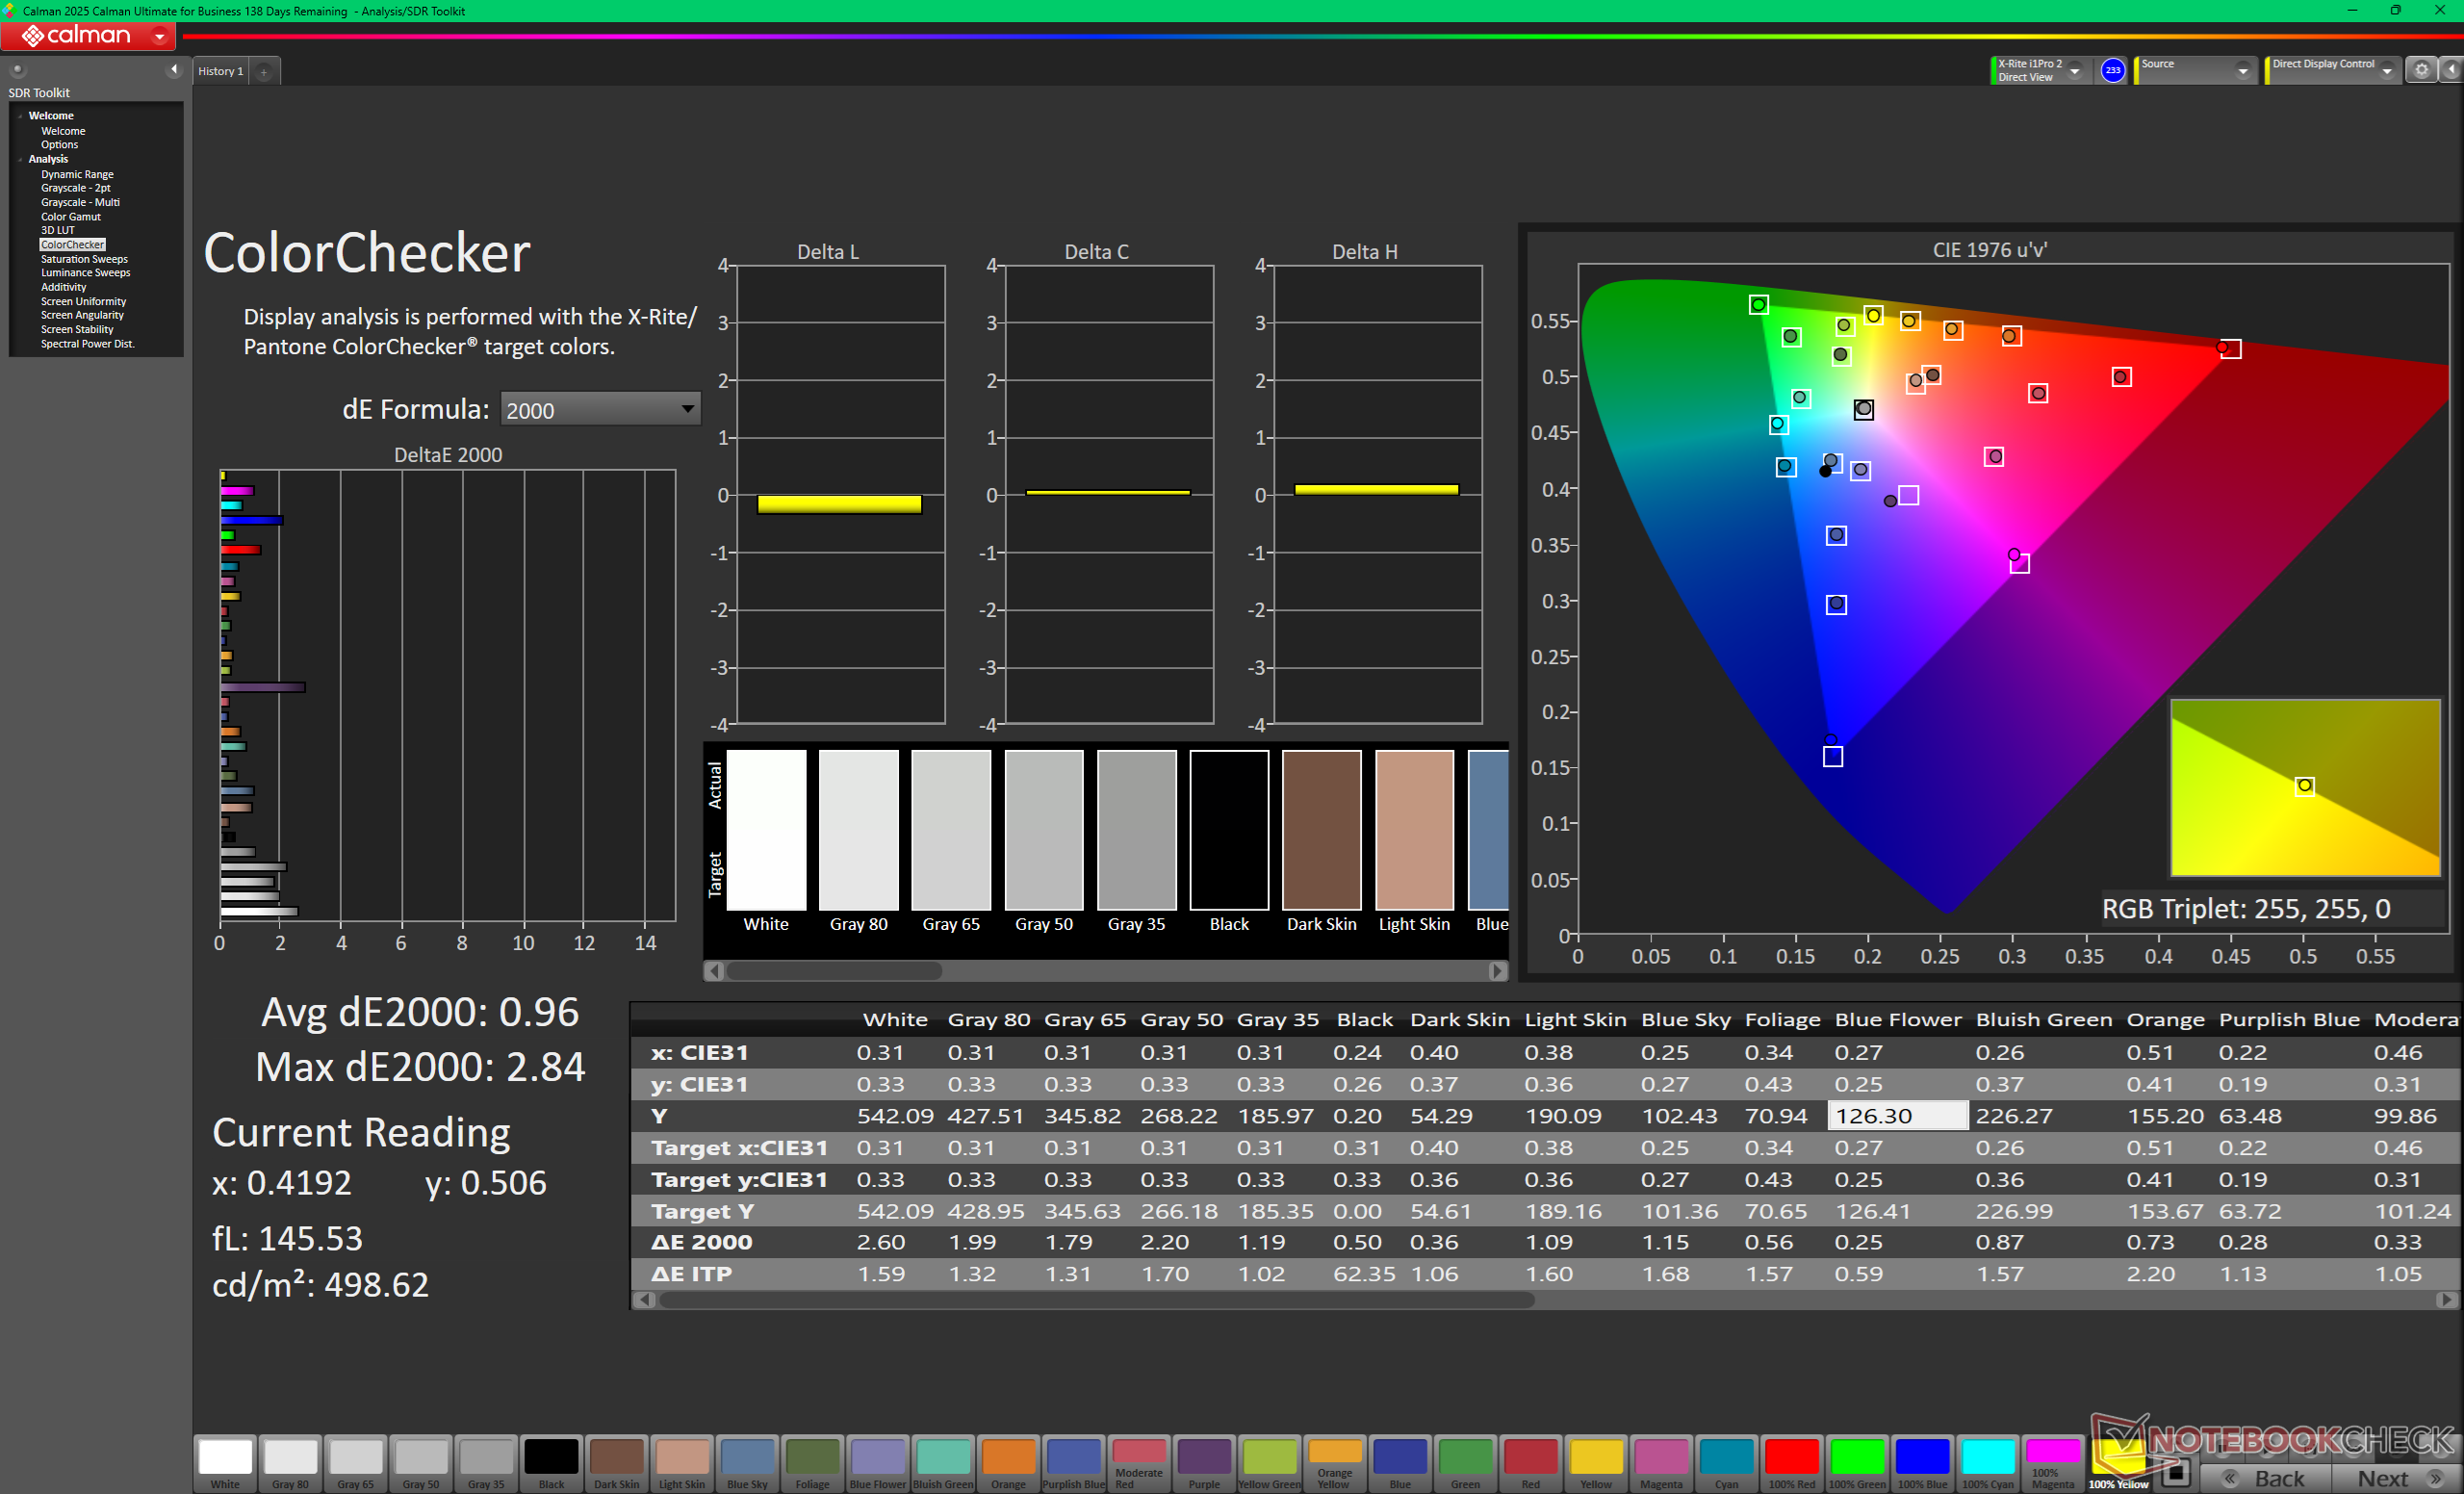
ColorChecker prima della calibrazione (sRGB)
Scala di grigi dopo la calibrazione
Scansioni di saturazione dopo la calibrazione
ColorChecker dopo la calibrazione

Tempi di risposta del Display

I tempi di risposta del display mostrano quanto sia veloce lo schermo a cambaire da un colore all'altro. Tempi di risposta lenti possono creare sovrapposizioni negloi oggetti in movimento. Specialmente i giocatori patiti del 3D dovrebbero usare uno schermo con tempi di risposta bassi.
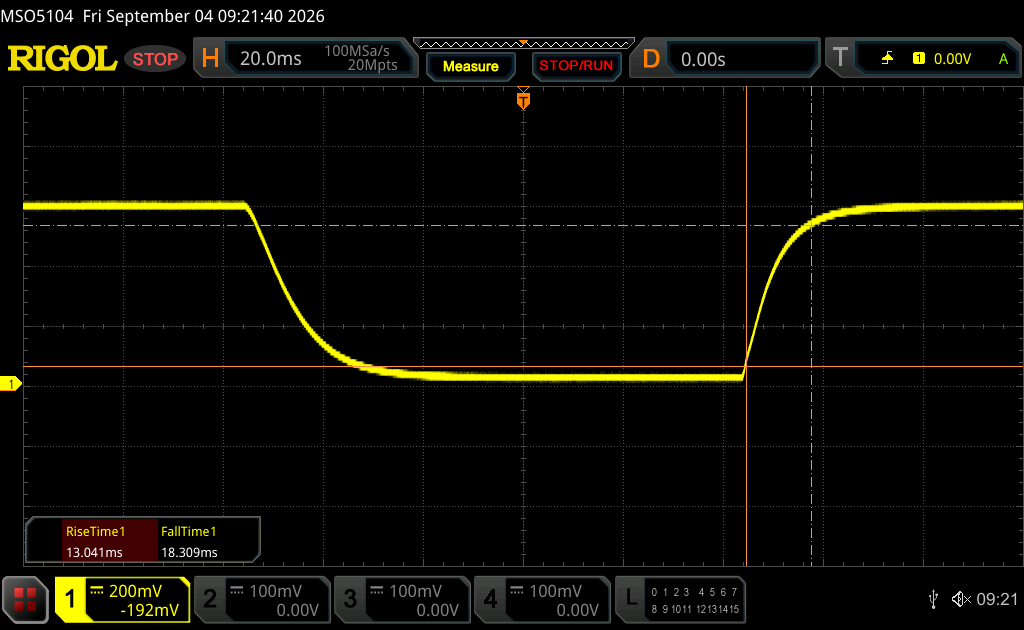
       Tempi di risposta dal Nero al Bianco
31.3 ms ... aumenta ↗ e diminuisce ↘ combinato↗ 13 ms Incremento
↘ 18.3 ms Calo
Lo schermo mostra tempi di risposta lenti nei nostri tests e sarà insoddisfacente per i gamers.
In confronto, tutti i dispositivi di test variano da 0.1 (minimo) a 240 (massimo) ms. » 85 % di tutti i dispositivi è migliore.
Questo significa che i tempi di risposta rilevati sono peggiori rispetto alla media di tutti i dispositivi testati (19.7 ms).
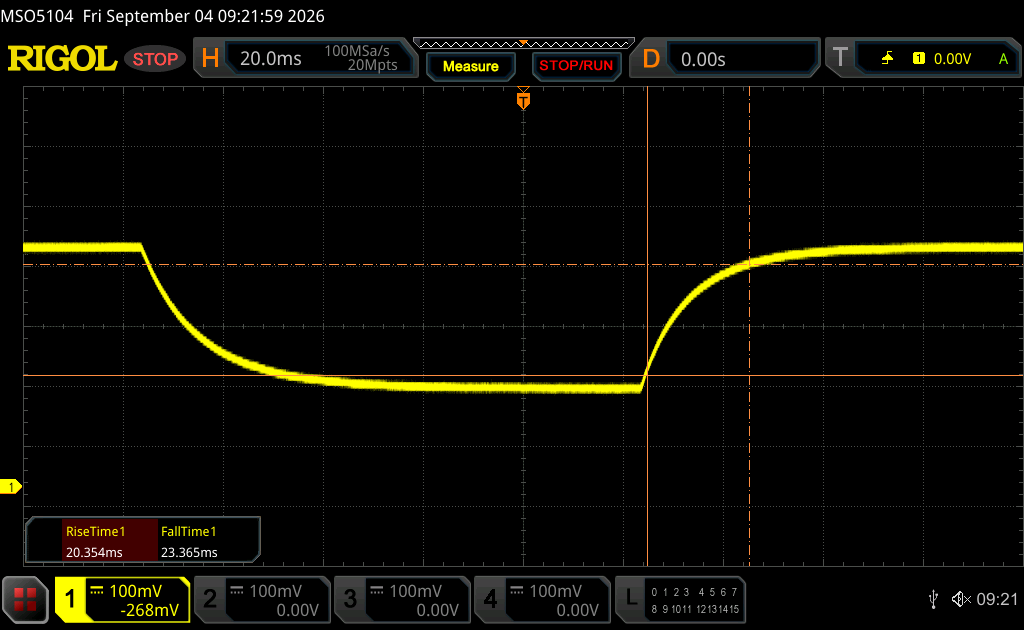
       Tempo di risposta dal 50% Grigio all'80% Grigio
43.8 ms ... aumenta ↗ e diminuisce ↘ combinato↗ 20.4 ms Incremento
↘ 23.4 ms Calo
Lo schermo mostra tempi di risposta lenti nei nostri tests e sarà insoddisfacente per i gamers.
In confronto, tutti i dispositivi di test variano da 0.13 (minimo) a 636 (massimo) ms. » 73 % di tutti i dispositivi è migliore.
Questo significa che i tempi di risposta rilevati sono peggiori rispetto alla media di tutti i dispositivi testati (30.8 ms).

Sfarfallio dello schermo / PWM (Pulse-Width Modulation)

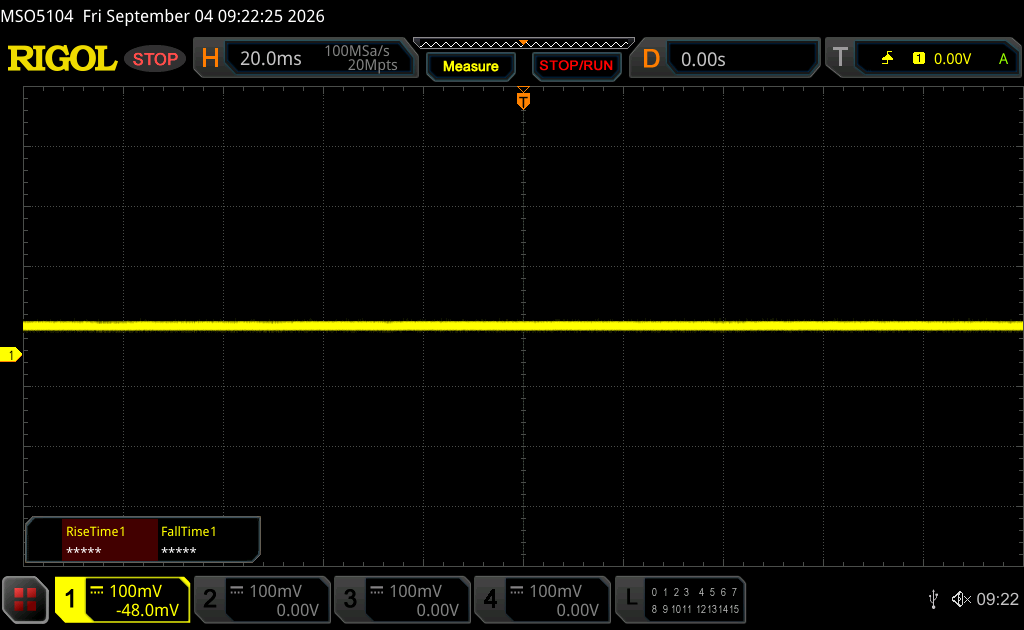
Per ridurre la luminosità dello schermo, alcuni portatili accendono e spengono la retroilluminazione in rapida successione - un metodo chiamato Pulse Width Modulation (PWM). Questa frequenza di ciclo a livello ideale non dovrebbe essere percepibile dall'occhi umano. Se tale frequenza è troppo bassa, gli utenti con occhi sensibili potrebbero stancarsi gli occhi o avere mal di testa o anche notare uno sfarfallio.
flickering dello schermo / PWM non rilevato

In confronto: 52 % di tutti i dispositivi testati non utilizza PWM per ridurre la luminosita' del display. Se è rilevato PWM, una media di 7665 (minimo: 5 - massimo: 343500) Hz è stata rilevata.

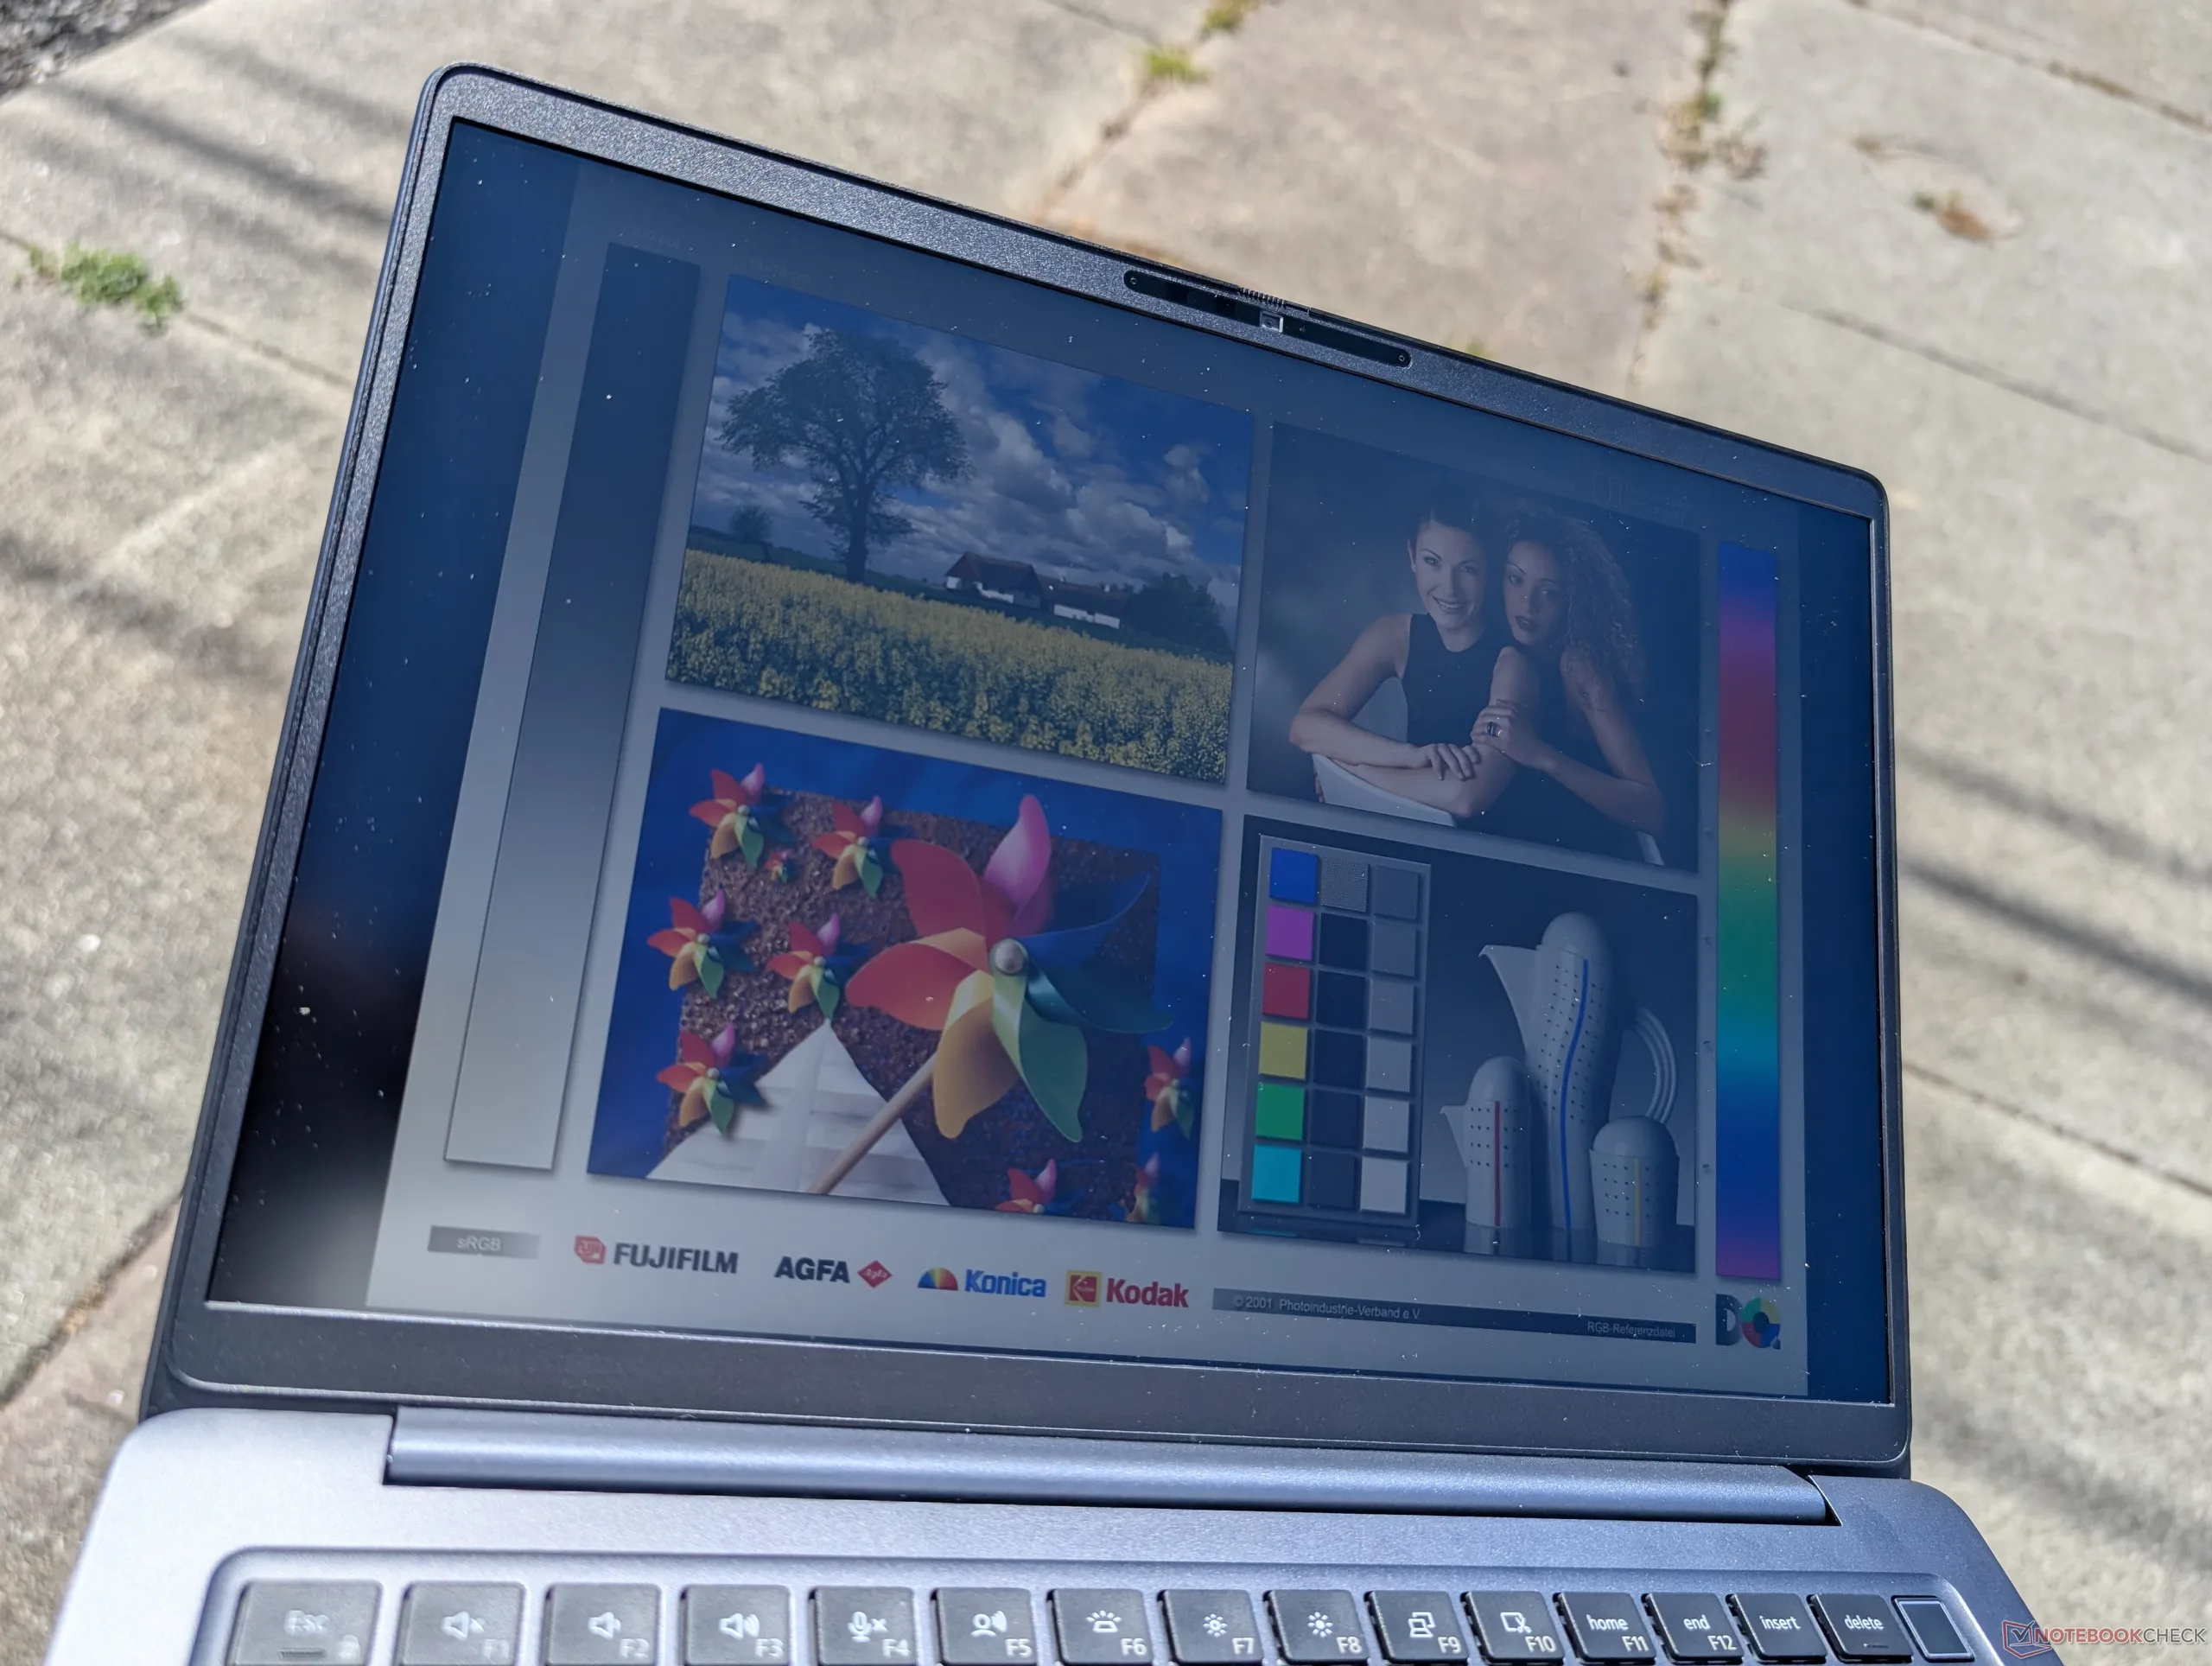
All’aperto, sotto la luce diretta del sole
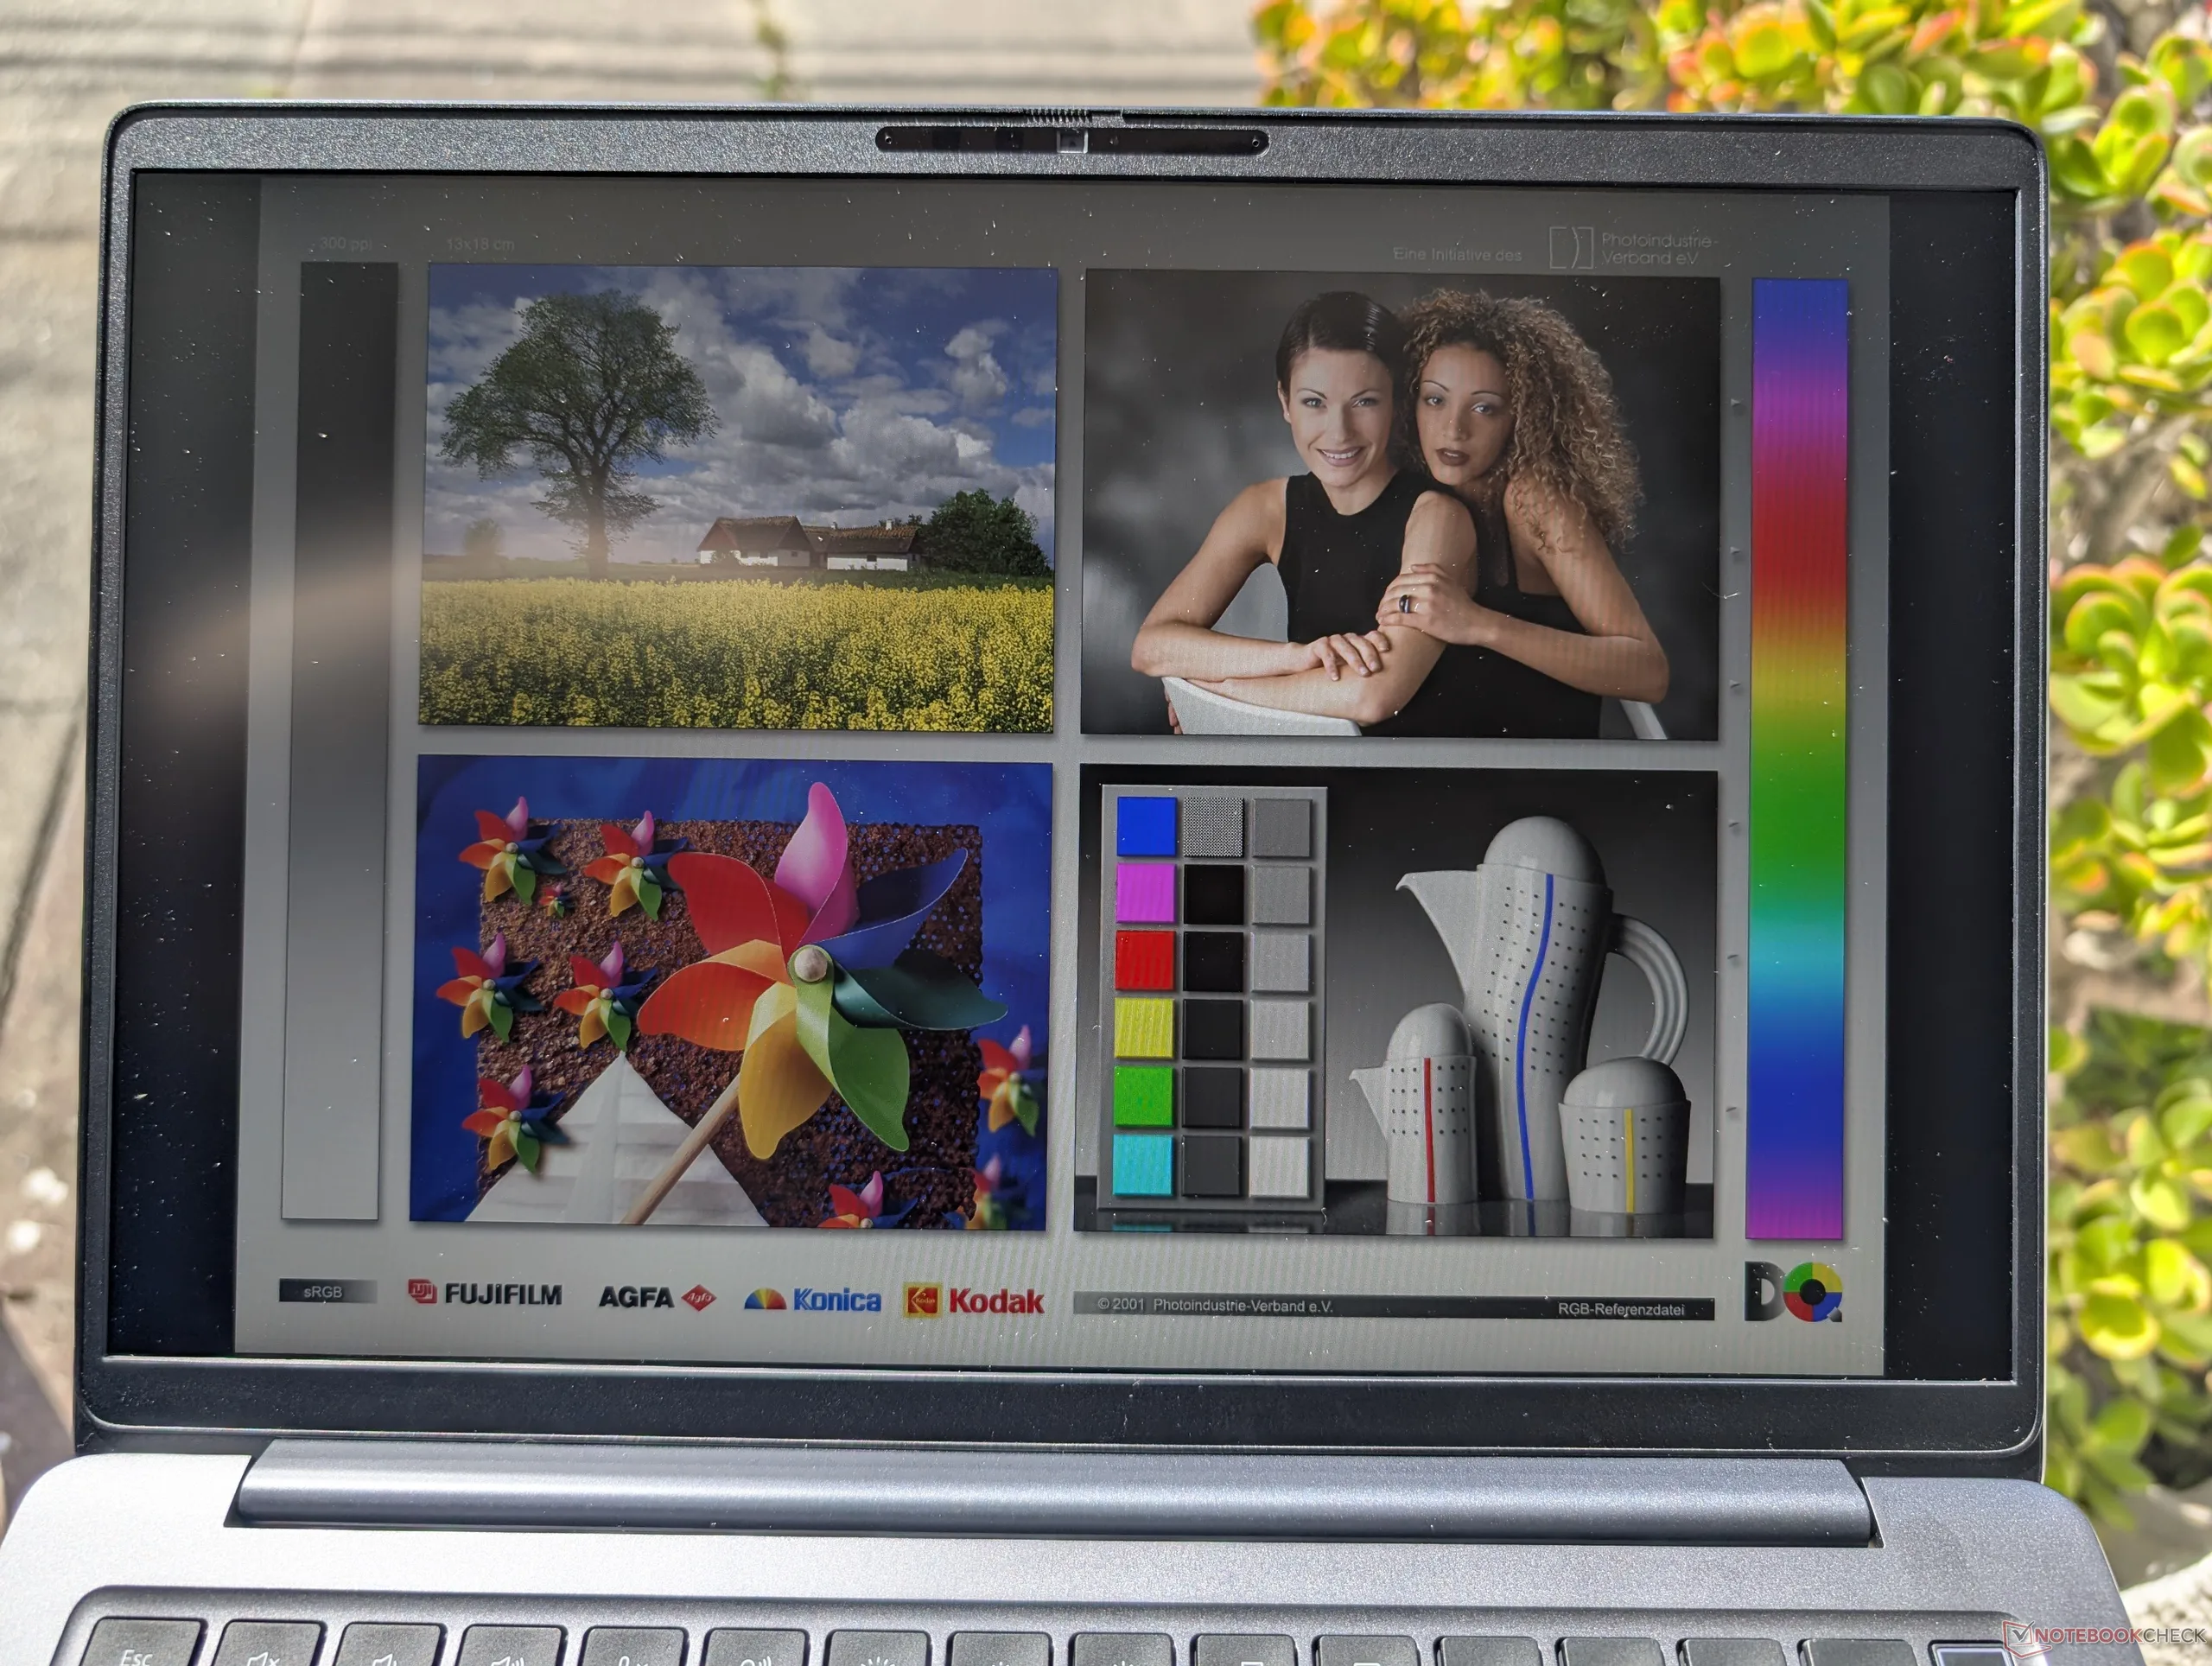
All’aperto all’ombra
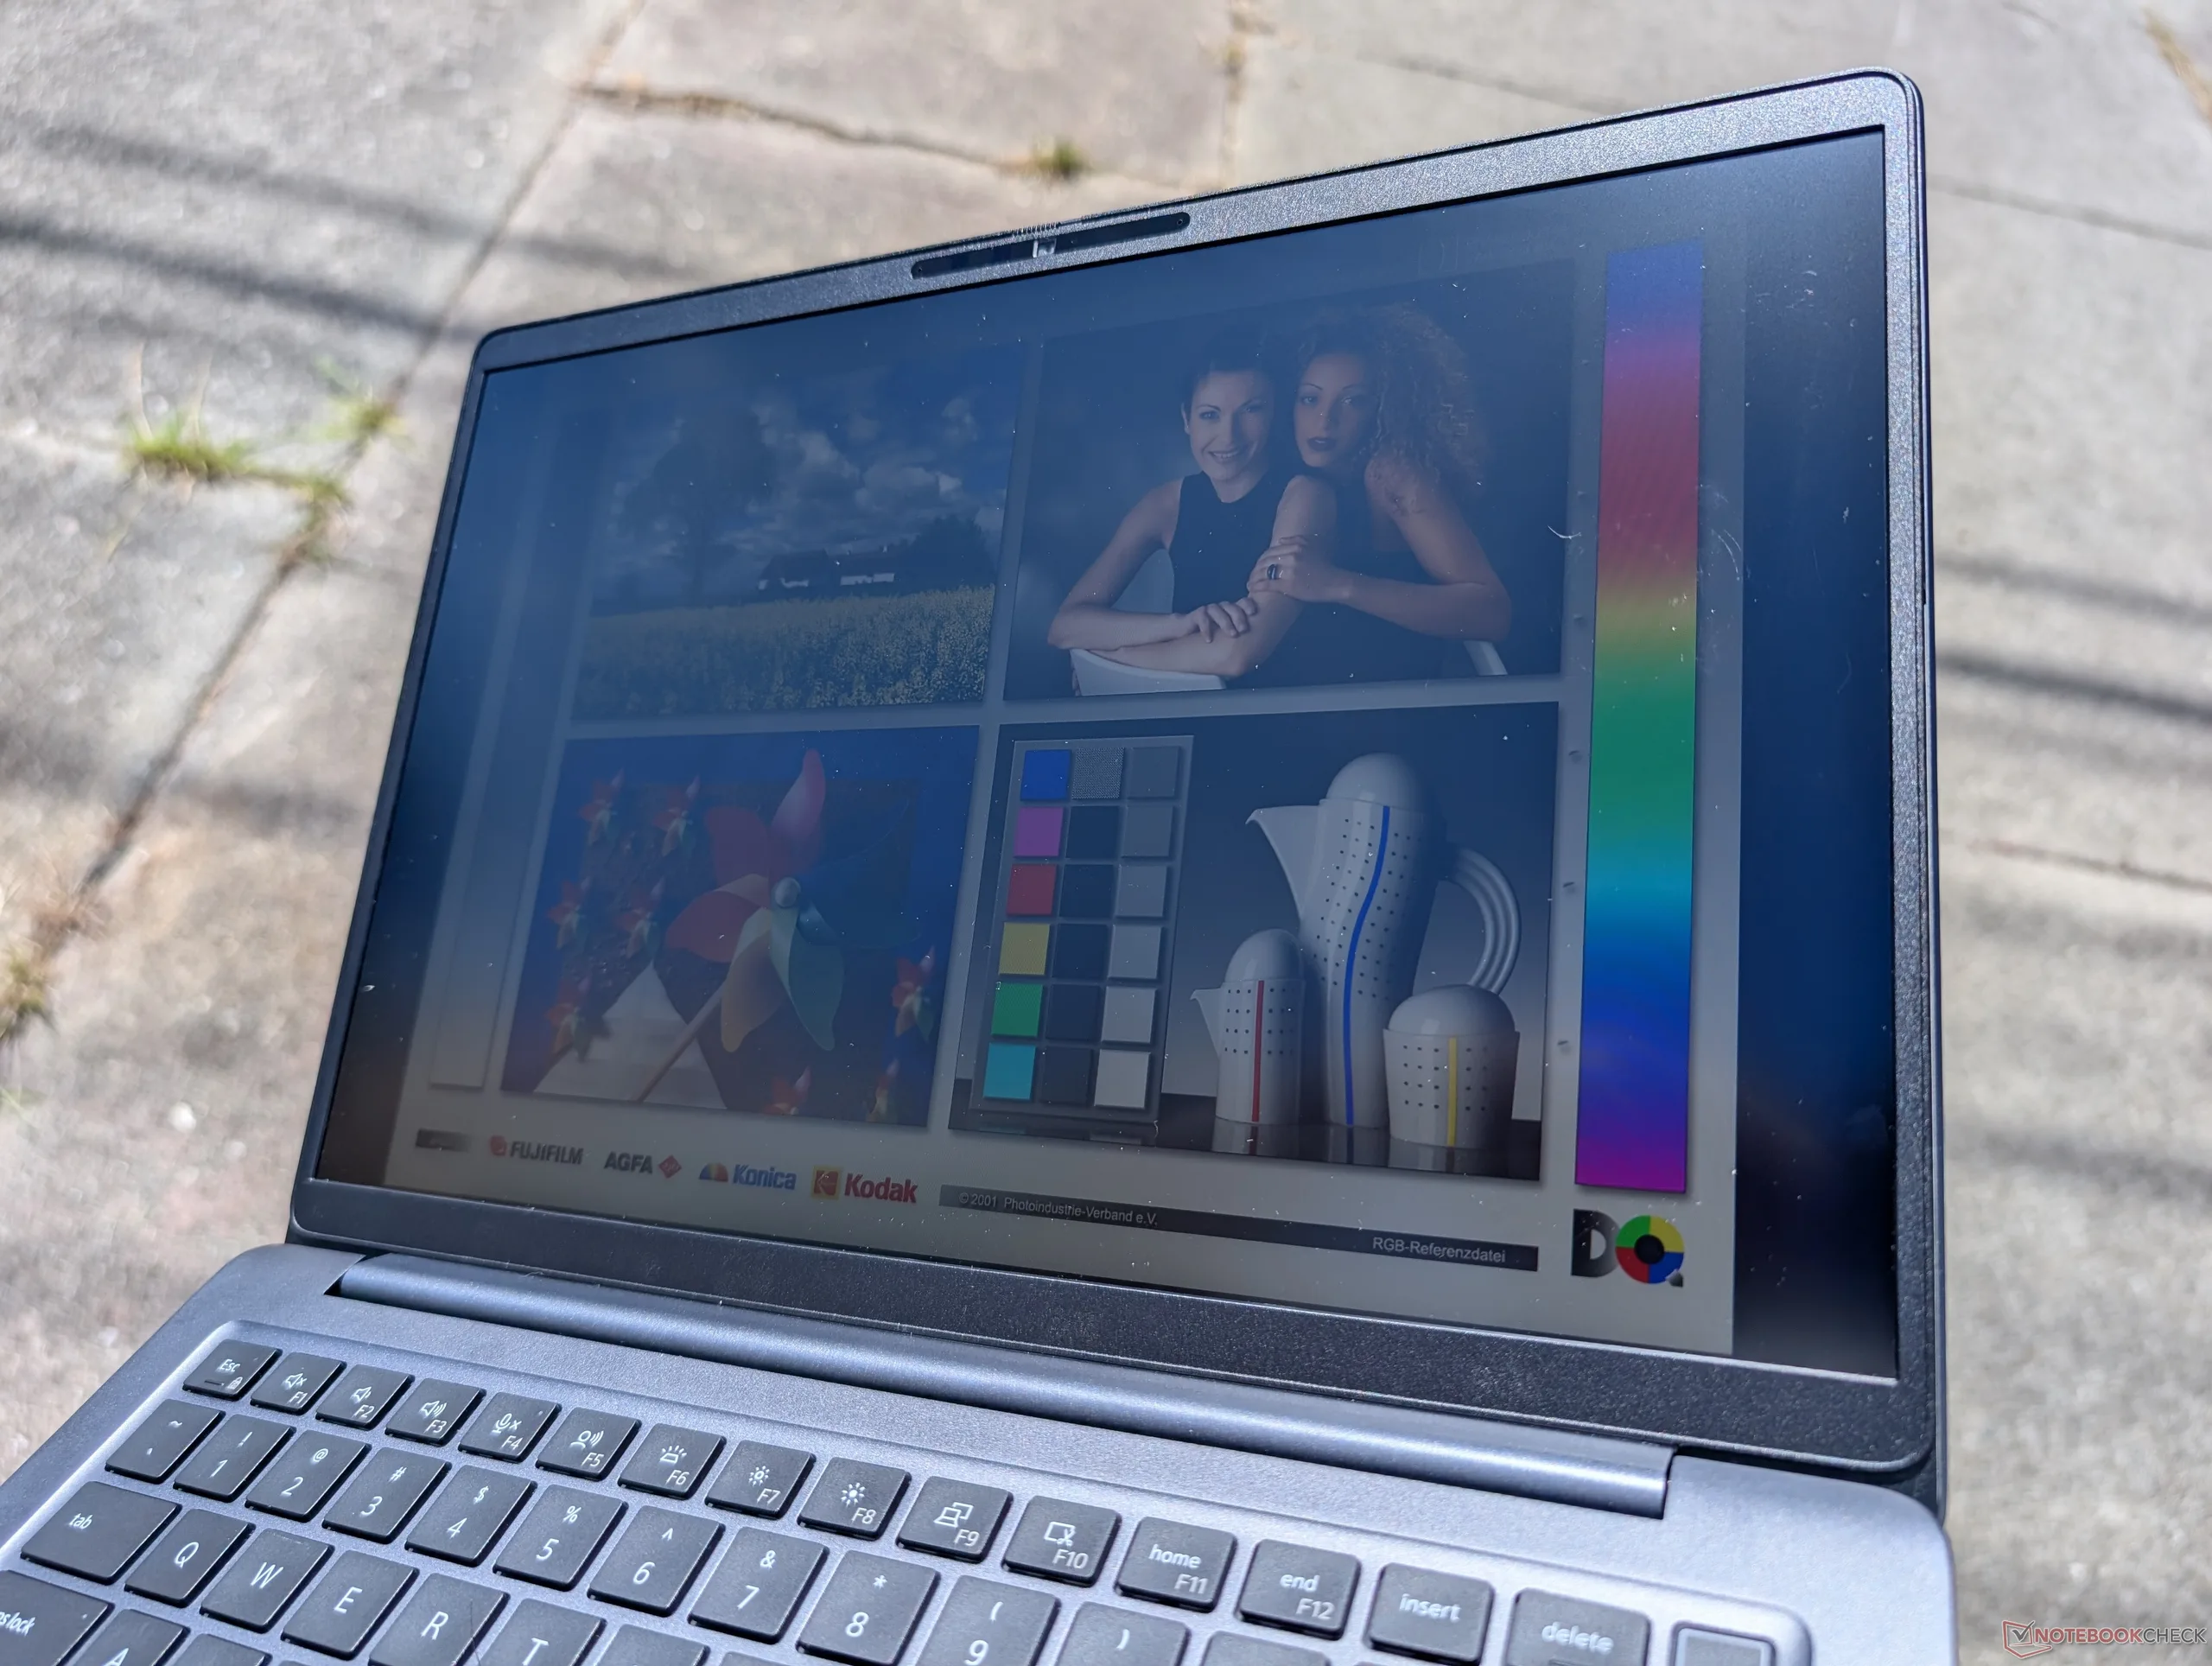
All’aperto, sotto la luce diretta del sole
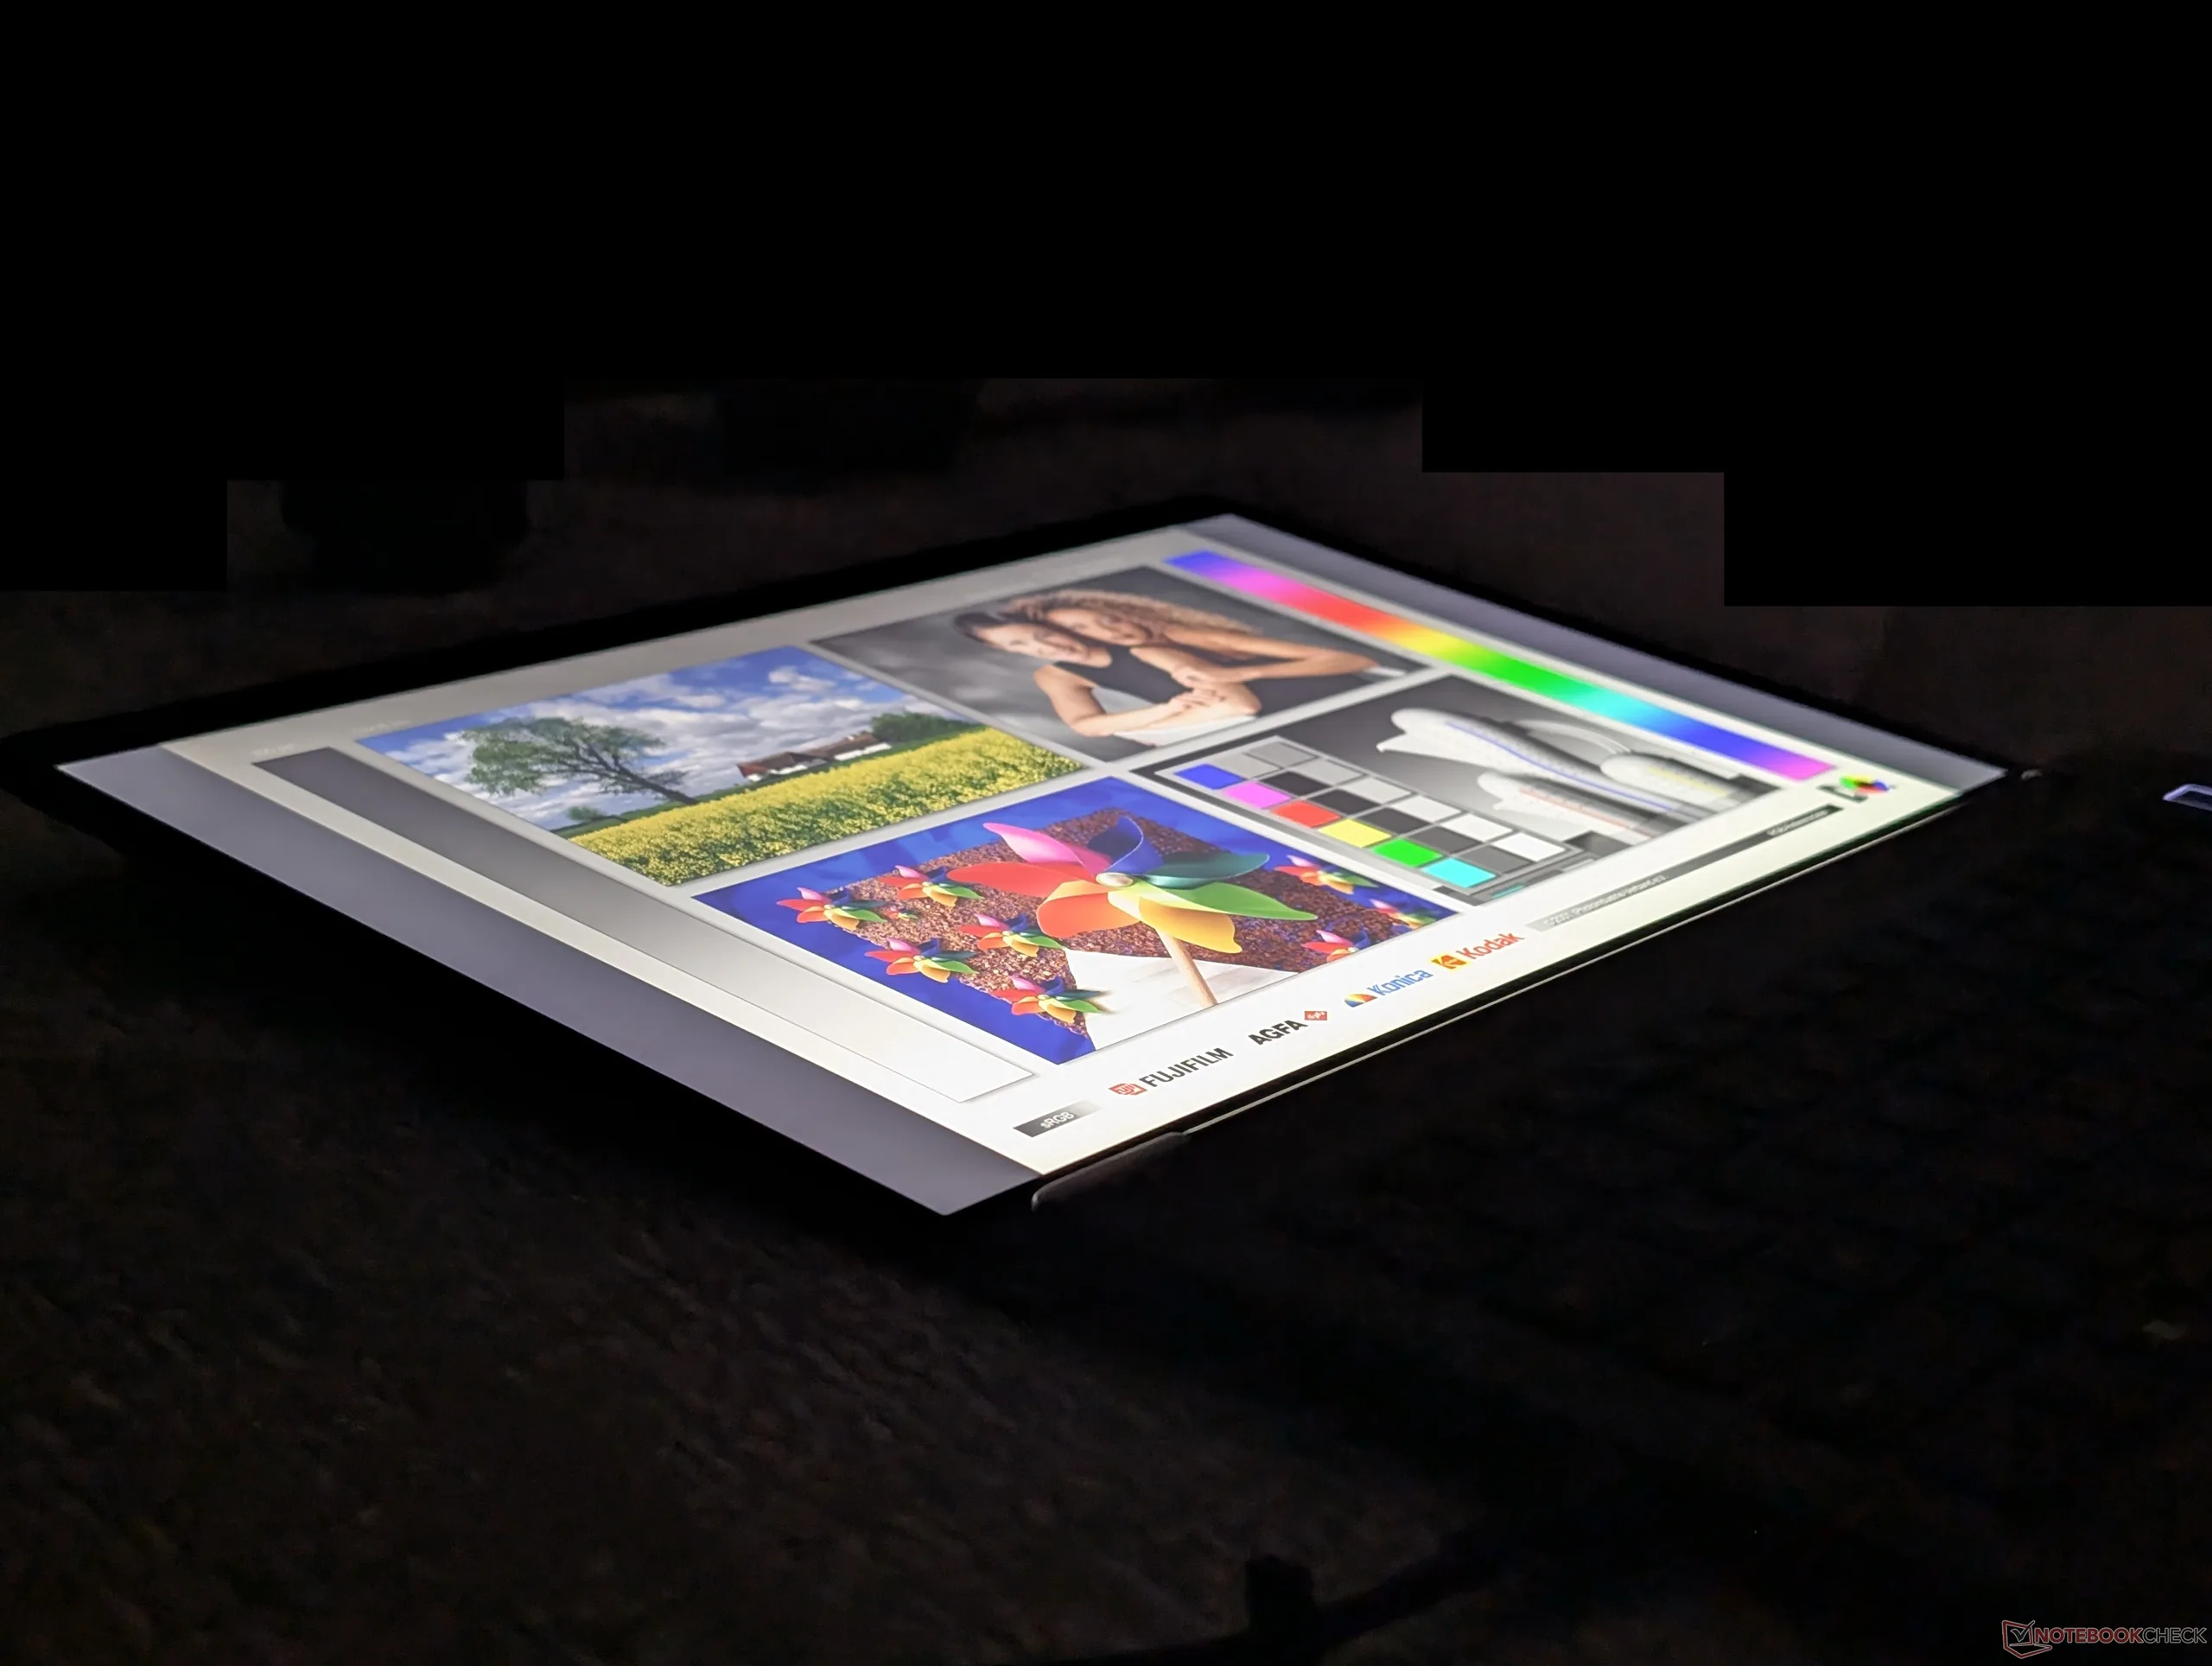
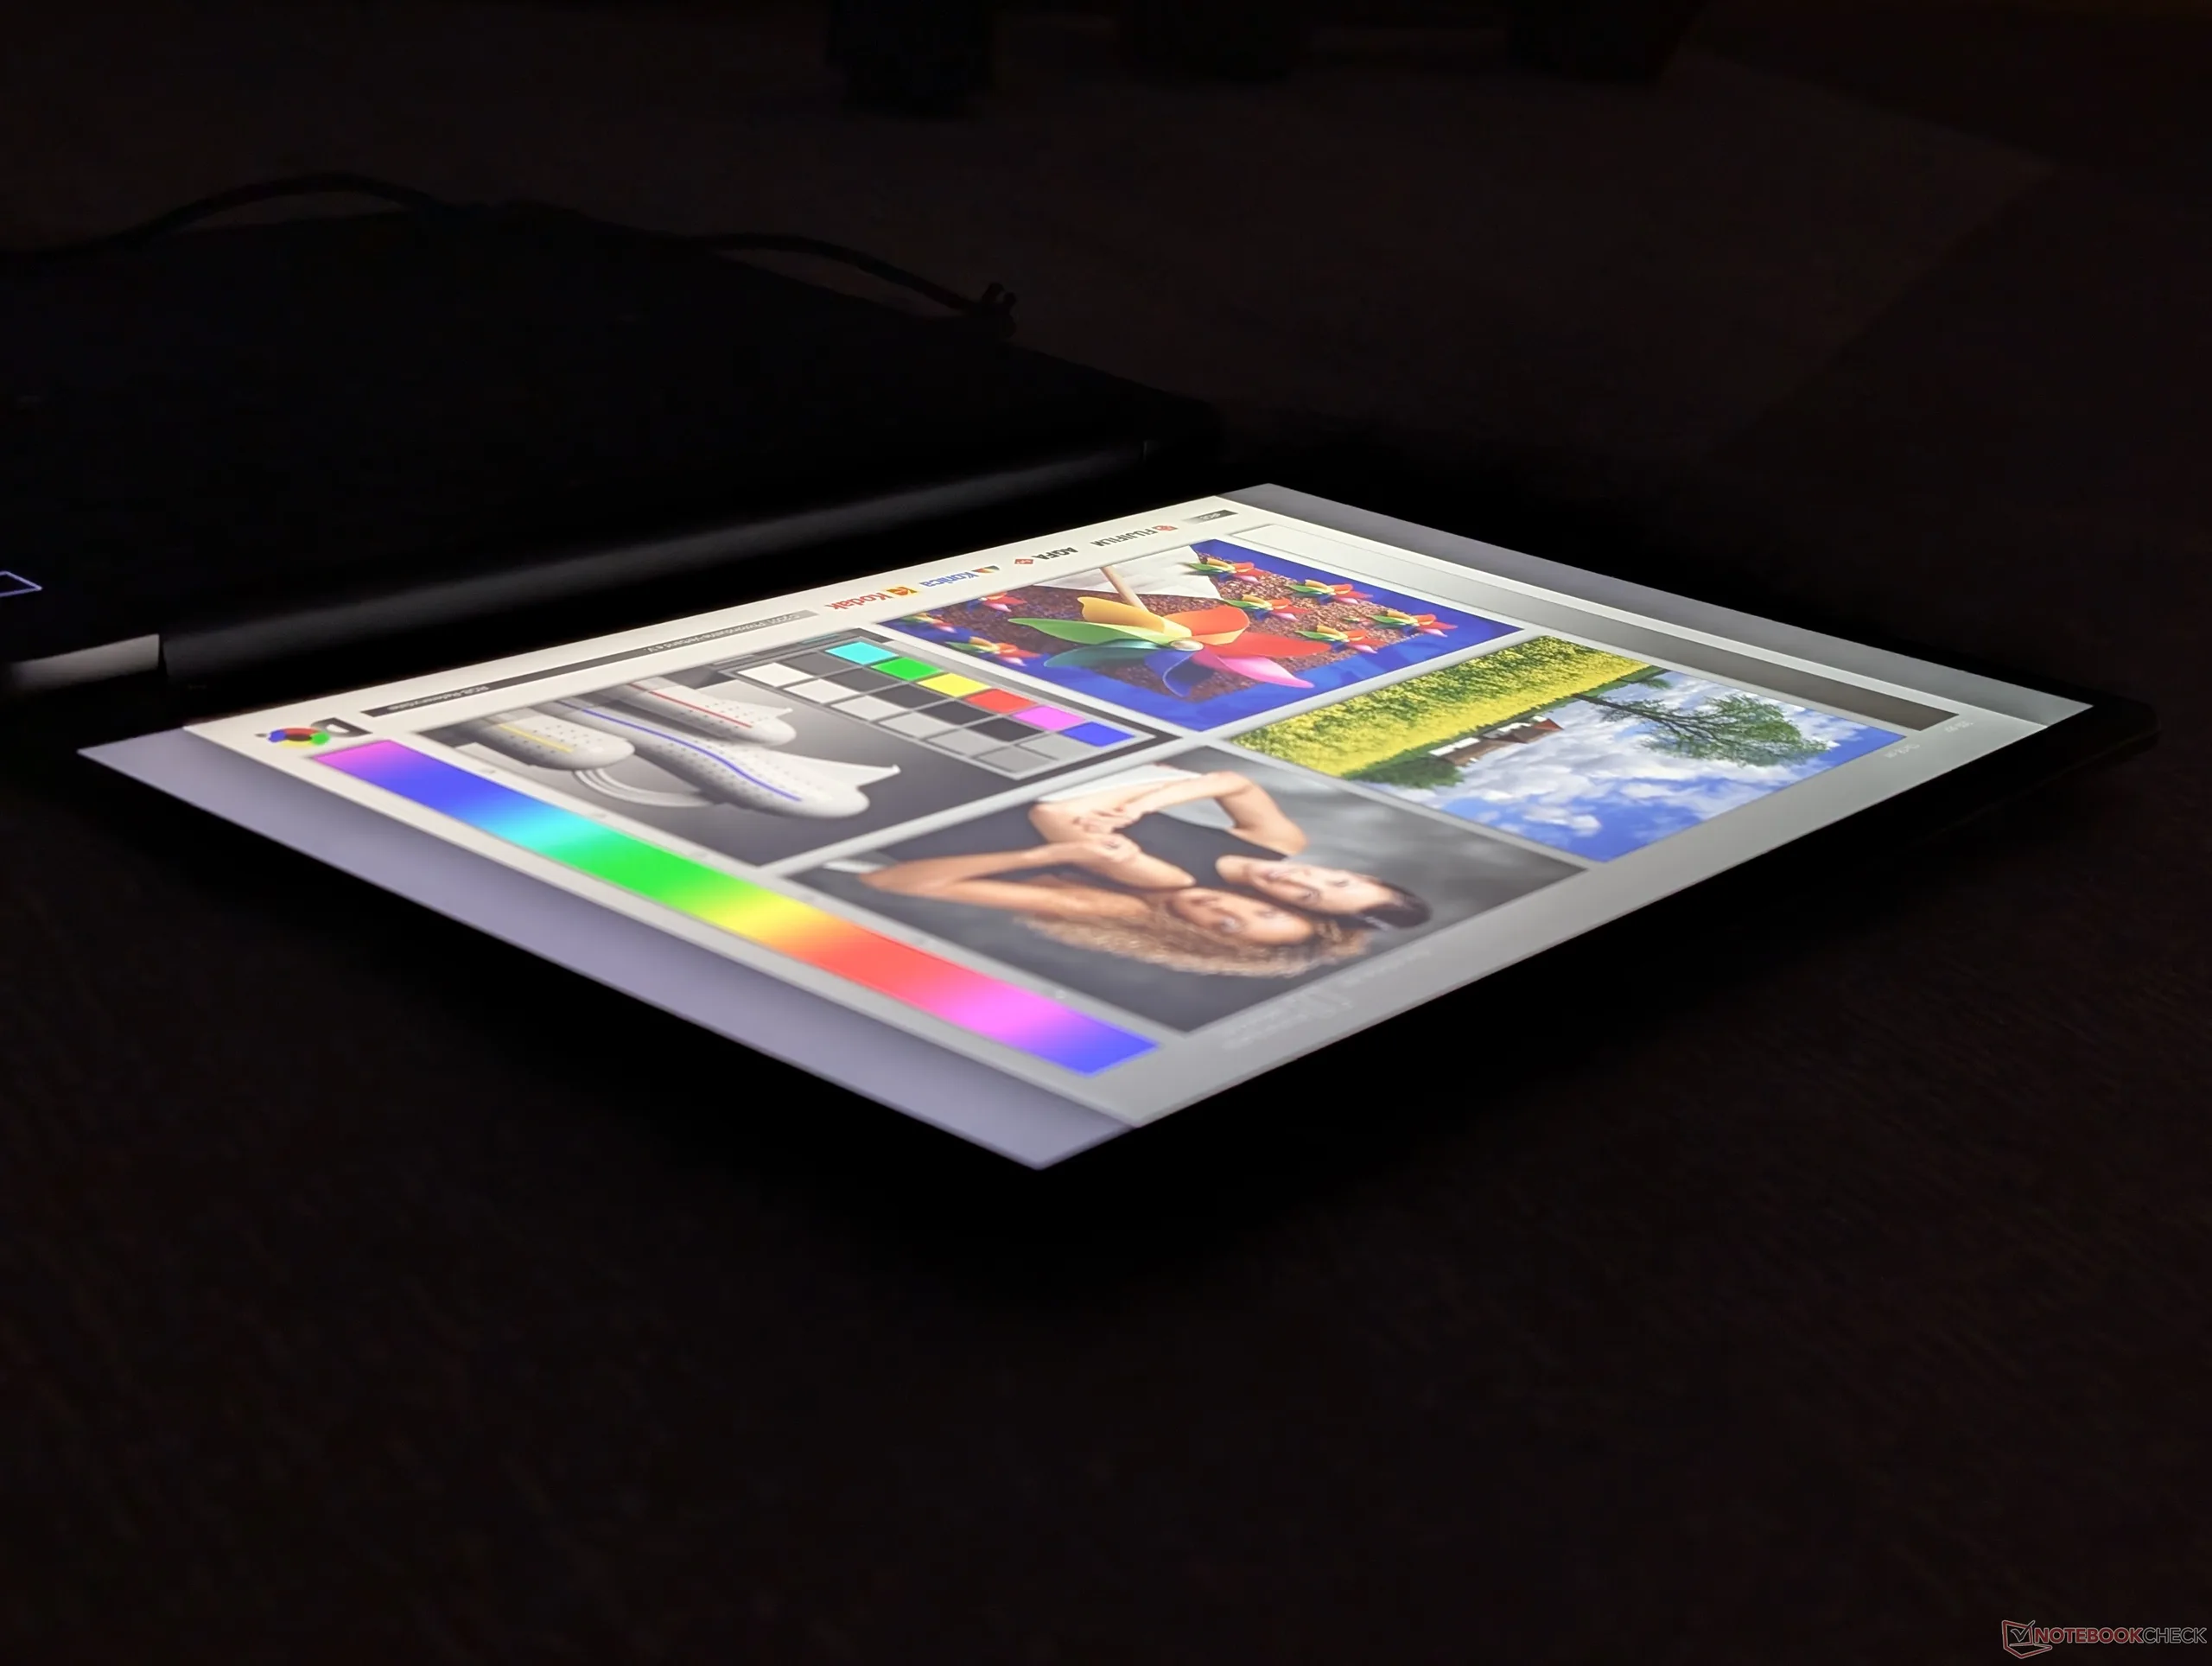
Ampi angoli di visione IPS

Prestazioni

Condizioni di prova

Prima di eseguire i benchmark riportati di seguito, abbiamo impostato Windows e Dell Optimizer in modalità Prestazioni.

Prestazioni del processore

Cinebench R15 Multi Loop

07014021028035042049056063070077084091098010501120119012601330140014701540161016801750182018901960203021002170224023102380245025202590266027302800287029403010308031503220Tooltip
Dell Pro 7 14 P714260 Intel Core Ultra 7 366H: Ø2128 (1809.55-2888.92) Points
Dell Pro 7 14 P714265 AMD Ryzen AI 9 HX PRO 470: Ø2690 (2661.34-3274.13) Points
HP EliteBook 8 G2a 14 AMD Ryzen AI 7 450: Ø2392 (2358.35-2409.49) Points
Lenovo ThinkPad T14s Gen 7 21YW0022GE AMD Ryzen AI 7 PRO 450: Ø2330 (2063.03-2456.7) Points
Asus ExpertBook Ultra B9406CAA Intel Core Ultra X7 358H: Ø2886 (2802.49-3038.82) Points
Acer TravelMate P6 TMP614-54-TCO-553Z Intel Core Ultra 5 226V: Ø1452 (1440.51-1486.82) Points
CPU Performance rating: Percent
Cinebench 2026: CPU Multi | CPU Single Thread
Cinebench R23: Multi Core | Single Core
Cinebench R20: CPU (Multi Core) | CPU (Single Core)
Cinebench R15: CPU Multi 64Bit | CPU Single 64Bit
Blender: v2.79 BMW27 CPU
7-Zip 18.03: 7z b 4 | 7z b 4 -mmt1
Geekbench 6.7: Multi-Core | Single-Core
Geekbench 5.5: Multi-Core | Single-Core
HWBOT x265 Benchmark v2.2: 4k Preset
LibreOffice : 20 Documents To PDF
R Benchmark 2.5: Overall mean
CPU Performance rating
Asus ExpertBook Ultra B9406CAA
Intel Core Ultra X7 358H
86.8 pt
Dell Pro 7 14 P714265
AMD Ryzen AI 9 HX PRO 470
84.6 pt
Dell Pro 7 14 P714260
Intel Core Ultra 7 366H
83.3 pt
Asus ZenBook S14 UX5406AA -2!
Intel Core Ultra 9 386H
83.3 pt
Media Intel Core Ultra 7 366H
 
83 pt
HP EliteBook 8 G2a 14 -4!
AMD Ryzen AI 7 450
75 pt
Lenovo ThinkPad T14s Gen 7 21YW0022GE -2!
AMD Ryzen AI 7 PRO 450
74.3 pt
Dell 14S DS14260
Intel Core Ultra 7 355
64.9 pt
Lenovo ThinkPad T14 Gen 6 21QG001VGE -2!
Intel Core Ultra 7 258V
61.9 pt
Lenovo ThinkBook 14 G9 IPL 21UX005PGE -2!
Intel Core Ultra 5 325
61.4 pt
Acer TravelMate P6 TMP614-54-TCO-553Z -2!
Intel Core Ultra 5 226V
54.1 pt
Cinebench 2026 / CPU Multi
Asus ExpertBook Ultra B9406CAA
Intel Core Ultra X7 358H
4512 Points +19%
Dell Pro 7 14 P714265
AMD Ryzen AI 9 HX PRO 470
4142 Points +9%
Media Intel Core Ultra 7 366H
  (3785 - 4305, n=3)
3963 Points +5%
Dell Pro 7 14 P714260
Intel Core Ultra 7 366H
3785 Points
Dell 14S DS14260
Intel Core Ultra 7 355
2585 Points -32%
Cinebench 2026 / CPU Single Thread
Dell Pro 7 14 P714260
Intel Core Ultra 7 366H
510 Points
Media Intel Core Ultra 7 366H
  (506 - 510, n=3)
508 Points 0%
Asus ExpertBook Ultra B9406CAA
Intel Core Ultra X7 358H
505 Points -1%
Dell Pro 7 14 P714265
AMD Ryzen AI 9 HX PRO 470
471 Points -8%
Dell 14S DS14260
Intel Core Ultra 7 355
468 Points -8%
Cinebench R23 / Multi Core
Asus ExpertBook Ultra B9406CAA
Intel Core Ultra X7 358H
19841 (17837.1min - 19840.9max) Points +16%
Dell Pro 7 14 P714265
AMD Ryzen AI 9 HX PRO 470
18834 (17418.6min - 18834.3max) Points +10%
Asus ZenBook S14 UX5406AA
Intel Core Ultra 9 386H
18553 Points +8%
Media Intel Core Ultra 7 366H
  (16974 - 19284, n=3)
17786 Points +4%
Dell Pro 7 14 P714260
Intel Core Ultra 7 366H
17100 (12200.5min - 17100max) Points
HP EliteBook 8 G2a 14
AMD Ryzen AI 7 450
16101 Points -6%
Lenovo ThinkPad T14s Gen 7 21YW0022GE
AMD Ryzen AI 7 PRO 450
16054 Points -6%
Lenovo ThinkBook 14 G9 IPL 21UX005PGE
Intel Core Ultra 5 325
11015 Points -36%
Dell 14S DS14260
Intel Core Ultra 7 355
10966 (10330.8min - 10966.4max) Points -36%
Lenovo ThinkPad T14 Gen 6 21QG001VGE
Intel Core Ultra 7 258V
10946 Points -36%
Acer TravelMate P6 TMP614-54-TCO-553Z
Intel Core Ultra 5 226V
9848 Points -42%
Cinebench R23 / Single Core
Media Intel Core Ultra 7 366H
  (2081 - 2087, n=3)
2084 Points 0%
Dell Pro 7 14 P714260
Intel Core Ultra 7 366H
2081 Points
Asus ExpertBook Ultra B9406CAA
Intel Core Ultra X7 358H
2079 Points 0%
Asus ZenBook S14 UX5406AA
Intel Core Ultra 9 386H
2066 Points -1%
Dell Pro 7 14 P714265
AMD Ryzen AI 9 HX PRO 470
2054 Points -1%
HP EliteBook 8 G2a 14
AMD Ryzen AI 7 450
2031 Points -2%
Lenovo ThinkPad T14s Gen 7 21YW0022GE
AMD Ryzen AI 7 PRO 450
2010 Points -3%
Dell 14S DS14260
Intel Core Ultra 7 355
1964 Points -6%
Lenovo ThinkBook 14 G9 IPL 21UX005PGE
Intel Core Ultra 5 325
1911 Points -8%
Lenovo ThinkPad T14 Gen 6 21QG001VGE
Intel Core Ultra 7 258V
1907 Points -8%
Acer TravelMate P6 TMP614-54-TCO-553Z
Intel Core Ultra 5 226V
1744 Points -16%
Cinebench R20 / CPU (Multi Core)
Asus ExpertBook Ultra B9406CAA
Intel Core Ultra X7 358H
7736 Points +15%
Dell Pro 7 14 P714265
AMD Ryzen AI 9 HX PRO 470
7355 Points +10%
Asus ZenBook S14 UX5406AA
Intel Core Ultra 9 386H
7175 Points +7%
Dell Pro 7 14 P714260
Intel Core Ultra 7 366H
6707 Points
Media Intel Core Ultra 7 366H
  (6517 - 6707, n=3)
6632 Points -1%
Lenovo ThinkPad T14s Gen 7 21YW0022GE
AMD Ryzen AI 7 PRO 450
6274 Points -6%
HP EliteBook 8 G2a 14
AMD Ryzen AI 7 450
6247 Points -7%
Dell 14S DS14260
Intel Core Ultra 7 355
4282 Points -36%
Lenovo ThinkPad T14 Gen 6 21QG001VGE
Intel Core Ultra 7 258V
4268 Points -36%
Lenovo ThinkBook 14 G9 IPL 21UX005PGE
Intel Core Ultra 5 325
4254 Points -37%
Acer TravelMate P6 TMP614-54-TCO-553Z
Intel Core Ultra 5 226V
3826 Points -43%
Cinebench R20 / CPU (Single Core)
Dell Pro 7 14 P714265
AMD Ryzen AI 9 HX PRO 470
806 Points +2%
Lenovo ThinkPad T14s Gen 7 21YW0022GE
AMD Ryzen AI 7 PRO 450
793 Points +1%
HP EliteBook 8 G2a 14
AMD Ryzen AI 7 450
792 Points 0%
Asus ZenBook S14 UX5406AA
Intel Core Ultra 9 386H
789 Points 0%
Dell Pro 7 14 P714260
Intel Core Ultra 7 366H
789 Points
Asus ExpertBook Ultra B9406CAA
Intel Core Ultra X7 358H
788 Points 0%
Media Intel Core Ultra 7 366H
  (760 - 789, n=3)
779 Points -1%
Dell 14S DS14260
Intel Core Ultra 7 355
749 Points -5%
Lenovo ThinkPad T14 Gen 6 21QG001VGE
Intel Core Ultra 7 258V
731 Points -7%
Lenovo ThinkBook 14 G9 IPL 21UX005PGE
Intel Core Ultra 5 325
723 Points -8%
Acer TravelMate P6 TMP614-54-TCO-553Z
Intel Core Ultra 5 226V
668 Points -15%
Cinebench R15 / CPU Multi 64Bit
Dell Pro 7 14 P714265
AMD Ryzen AI 9 HX PRO 470
3274 (2661.34min - 3274.13max) Points +13%
Asus ExpertBook Ultra B9406CAA
Intel Core Ultra X7 358H
3039 (2802.49min - 3038.82max) Points +5%
Asus ZenBook S14 UX5406AA
Intel Core Ultra 9 386H
2972 (2356.68min - 2972.43max) Points +3%
Dell Pro 7 14 P714260
Intel Core Ultra 7 366H
2889 (1809.55min - 2888.92max) Points
Media Intel Core Ultra 7 366H
  (2793 - 2986, n=3)
2889 Points 0%
Lenovo ThinkPad T14s Gen 7 21YW0022GE
AMD Ryzen AI 7 PRO 450
2457 (2063.03min - 2456.7max) Points -15%
HP EliteBook 8 G2a 14
AMD Ryzen AI 7 450
2409 (2358.35min - 2409.49max) Points -17%
Dell 14S DS14260
Intel Core Ultra 7 355
1666 (1476.23min - 1666.04max) Points -42%
Lenovo ThinkPad T14 Gen 6 21QG001VGE
Intel Core Ultra 7 258V
1618 (1324.02min - 1617.66max) Points -44%
Lenovo ThinkBook 14 G9 IPL 21UX005PGE
Intel Core Ultra 5 325
1609 (1444.41min - 1609.46max) Points -44%
Acer TravelMate P6 TMP614-54-TCO-553Z
Intel Core Ultra 5 226V
1487 (1440.51min - 1486.82max) Points -49%
Cinebench R15 / CPU Single 64Bit
Dell Pro 7 14 P714265
AMD Ryzen AI 9 HX PRO 470
313 Points +3%
Asus ExpertBook Ultra B9406CAA
Intel Core Ultra X7 358H
309 Points +1%
Dell Pro 7 14 P714260
Intel Core Ultra 7 366H
305 Points
Asus ZenBook S14 UX5406AA
Intel Core Ultra 9 386H
303 Points -1%
Media Intel Core Ultra 7 366H
  (291 - 305, n=3)
297 Points -3%
Dell 14S DS14260
Intel Core Ultra 7 355
292 Points -4%
Lenovo ThinkPad T14 Gen 6 21QG001VGE
Intel Core Ultra 7 258V
285 Points -7%
Lenovo ThinkBook 14 G9 IPL 21UX005PGE
Intel Core Ultra 5 325
280 Points -8%
Acer TravelMate P6 TMP614-54-TCO-553Z
Intel Core Ultra 5 226V
267 Points -12%
HP EliteBook 8 G2a 14
AMD Ryzen AI 7 450
235 Points -23%
Lenovo ThinkPad T14s Gen 7 21YW0022GE
AMD Ryzen AI 7 PRO 450
220 Points -28%
Blender / v2.79 BMW27 CPU
Acer TravelMate P6 TMP614-54-TCO-553Z
Intel Core Ultra 5 226V
352 Seconds * -67%
Lenovo ThinkPad T14 Gen 6 21QG001VGE
Intel Core Ultra 7 258V
333 Seconds * -58%
Lenovo ThinkBook 14 G9 IPL 21UX005PGE
Intel Core Ultra 5 325
319 Seconds * -51%
Dell 14S DS14260
Intel Core Ultra 7 355
310 Seconds * -47%
Dell Pro 7 14 P714260
Intel Core Ultra 7 366H
211 Seconds *
Lenovo ThinkPad T14s Gen 7 21YW0022GE
AMD Ryzen AI 7 PRO 450
205 Seconds * +3%
Media Intel Core Ultra 7 366H
  (194 - 211, n=3)
205 Seconds * +3%
HP EliteBook 8 G2a 14
AMD Ryzen AI 7 450
203 Seconds * +4%
Asus ZenBook S14 UX5406AA
Intel Core Ultra 9 386H
202 Seconds * +4%
Dell Pro 7 14 P714265
AMD Ryzen AI 9 HX PRO 470
178 Seconds * +16%
Asus ExpertBook Ultra B9406CAA
Intel Core Ultra X7 358H
175 Seconds * +17%
7-Zip 18.03 / 7z b 4
Dell Pro 7 14 P714265
AMD Ryzen AI 9 HX PRO 470
71554 MIPS +17%
Asus ExpertBook Ultra B9406CAA
Intel Core Ultra X7 358H
68533 MIPS +12%
Asus ZenBook S14 UX5406AA
Intel Core Ultra 9 386H
63455 MIPS +3%
Media Intel Core Ultra 7 366H
  (61043 - 65690, n=3)
62695 MIPS +2%
Dell Pro 7 14 P714260
Intel Core Ultra 7 366H
61353 MIPS
HP EliteBook 8 G2a 14
AMD Ryzen AI 7 450
59952 MIPS -2%
Lenovo ThinkPad T14s Gen 7 21YW0022GE
AMD Ryzen AI 7 PRO 450
57988 MIPS -5%
Lenovo ThinkPad T14 Gen 6 21QG001VGE
Intel Core Ultra 7 258V
36724 MIPS -40%
Dell 14S DS14260
Intel Core Ultra 7 355
36122 MIPS -41%
Lenovo ThinkBook 14 G9 IPL 21UX005PGE
Intel Core Ultra 5 325
35424 MIPS -42%
Acer TravelMate P6 TMP614-54-TCO-553Z
Intel Core Ultra 5 226V
32929 MIPS -46%
7-Zip 18.03 / 7z b 4 -mmt1
Asus ZenBook S14 UX5406AA
Intel Core Ultra 9 386H
6458 MIPS +2%
Dell Pro 7 14 P714260
Intel Core Ultra 7 366H
6359 MIPS
Media Intel Core Ultra 7 366H
  (6214 - 6404, n=3)
6326 MIPS -1%
HP EliteBook 8 G2a 14
AMD Ryzen AI 7 450
6192 MIPS -3%
Asus ExpertBook Ultra B9406CAA
Intel Core Ultra X7 358H
6170 MIPS -3%
Dell Pro 7 14 P714265
AMD Ryzen AI 9 HX PRO 470
6041 MIPS -5%
Lenovo ThinkPad T14s Gen 7 21YW0022GE
AMD Ryzen AI 7 PRO 450
5945 MIPS -7%
Dell 14S DS14260
Intel Core Ultra 7 355
5831 MIPS -8%
Lenovo ThinkPad T14 Gen 6 21QG001VGE
Intel Core Ultra 7 258V
5753 MIPS -10%
Lenovo ThinkBook 14 G9 IPL 21UX005PGE
Intel Core Ultra 5 325
5466 MIPS -14%
Acer TravelMate P6 TMP614-54-TCO-553Z
Intel Core Ultra 5 226V
5240 MIPS -18%
Geekbench 6.7 / Multi-Core
Asus ZenBook S14 UX5406AA
Intel Core Ultra 9 386H
16882 Points 0%
Dell Pro 7 14 P714260
Intel Core Ultra 7 366H
16801 Points
Asus ExpertBook Ultra B9406CAA
Intel Core Ultra X7 358H
16674 Points -1%
Media Intel Core Ultra 7 366H
  (16080 - 16948, n=5)
16569 Points -1%
Dell Pro 7 14 P714265
AMD Ryzen AI 9 HX PRO 470
14979 Points -11%
HP EliteBook 8 G2a 14
AMD Ryzen AI 7 450
13611 Points -19%
Lenovo ThinkPad T14s Gen 7 21YW0022GE
AMD Ryzen AI 7 PRO 450
13439 Points -20%
Dell 14S DS14260
Intel Core Ultra 7 355
11227 Points -33%
Lenovo ThinkPad T14 Gen 6 21QG001VGE
Intel Core Ultra 7 258V
11174 Points -33%
Lenovo ThinkBook 14 G9 IPL 21UX005PGE
Intel Core Ultra 5 325
10907 Points -35%
Acer TravelMate P6 TMP614-54-TCO-553Z
Intel Core Ultra 5 226V
9869 Points -41%
Geekbench 6.7 / Single-Core
Dell Pro 7 14 P714265
AMD Ryzen AI 9 HX PRO 470
2918 Points +2%
HP EliteBook 8 G2a 14
AMD Ryzen AI 7 450
2914 Points +2%
Asus ZenBook S14 UX5406AA
Intel Core Ultra 9 386H
2899 Points +1%
Lenovo ThinkPad T14s Gen 7 21YW0022GE
AMD Ryzen AI 7 PRO 450
2899 Points +1%
Dell Pro 7 14 P714260
Intel Core Ultra 7 366H
2866 Points
Media Intel Core Ultra 7 366H
  (2844 - 2866, n=4)
2856 Points 0%
Asus ExpertBook Ultra B9406CAA
Intel Core Ultra X7 358H
2836 Points -1%
Lenovo ThinkPad T14 Gen 6 21QG001VGE
Intel Core Ultra 7 258V
2781 Points -3%
Dell 14S DS14260
Intel Core Ultra 7 355
2716 Points -5%
Acer TravelMate P6 TMP614-54-TCO-553Z
Intel Core Ultra 5 226V
2697 Points -6%
Acer TravelMate P6 TMP614-54-TCO-553Z
Intel Core Ultra 5 226V
2551 Points -11%
Lenovo ThinkBook 14 G9 IPL 21UX005PGE
Intel Core Ultra 5 325
2571 Points -10%
Geekbench 5.5 / Multi-Core
Asus ExpertBook Ultra B9406CAA
Intel Core Ultra X7 358H
16929 Points +3%
Asus ZenBook S14 UX5406AA
Intel Core Ultra 9 386H
16599 Points +1%
Media Intel Core Ultra 7 366H
  (15891 - 16949, n=3)
16413 Points 0%
Dell Pro 7 14 P714260
Intel Core Ultra 7 366H
16399 Points
Dell Pro 7 14 P714265
AMD Ryzen AI 9 HX PRO 470
15013 Points -8%
Lenovo ThinkPad T14s Gen 7 21YW0022GE
AMD Ryzen AI 7 PRO 450
12037 Points -27%
Dell 14S DS14260
Intel Core Ultra 7 355
10000 Points -39%
Lenovo ThinkPad T14 Gen 6 21QG001VGE
Intel Core Ultra 7 258V
9918 Points -40%
Lenovo ThinkBook 14 G9 IPL 21UX005PGE
Intel Core Ultra 5 325
9514 Points -42%
Acer TravelMate P6 TMP614-54-TCO-553Z
Intel Core Ultra 5 226V
8844 Points -46%
Geekbench 5.5 / Single-Core
Lenovo ThinkPad T14s Gen 7 21YW0022GE
AMD Ryzen AI 7 PRO 450
2148 Points +1%
Dell Pro 7 14 P714265
AMD Ryzen AI 9 HX PRO 470
2129 Points 0%
Dell Pro 7 14 P714260
Intel Core Ultra 7 366H
2125 Points
Asus ExpertBook Ultra B9406CAA
Intel Core Ultra X7 358H
2116 Points 0%
Asus ZenBook S14 UX5406AA
Intel Core Ultra 9 386H
2108 Points -1%
Media Intel Core Ultra 7 366H
  (2085 - 2125, n=3)
2099 Points -1%
Lenovo ThinkPad T14 Gen 6 21QG001VGE
Intel Core Ultra 7 258V
2031 Points -4%
Dell 14S DS14260
Intel Core Ultra 7 355
2014 Points -5%
Lenovo ThinkBook 14 G9 IPL 21UX005PGE
Intel Core Ultra 5 325
1934 Points -9%
Acer TravelMate P6 TMP614-54-TCO-553Z
Intel Core Ultra 5 226V
1860 Points -12%
HWBOT x265 Benchmark v2.2 / 4k Preset
Asus ExpertBook Ultra B9406CAA
Intel Core Ultra X7 358H
23.1 fps +19%
Dell Pro 7 14 P714265
AMD Ryzen AI 9 HX PRO 470
21.9 fps +13%
Asus ZenBook S14 UX5406AA
Intel Core Ultra 9 386H
21.3 fps +10%
HP EliteBook 8 G2a 14
AMD Ryzen AI 7 450
21.2 fps +9%
Lenovo ThinkPad T14s Gen 7 21YW0022GE
AMD Ryzen AI 7 PRO 450
20.1 fps +4%
Media Intel Core Ultra 7 366H
  (19.2 - 21.5, n=3)
20 fps +3%
Dell Pro 7 14 P714260
Intel Core Ultra 7 366H
19.4 fps
Dell 14S DS14260
Intel Core Ultra 7 355
14.4 fps -26%
Lenovo ThinkPad T14 Gen 6 21QG001VGE
Intel Core Ultra 7 258V
14 fps -28%
Lenovo ThinkBook 14 G9 IPL 21UX005PGE
Intel Core Ultra 5 325
14 fps -28%
Acer TravelMate P6 TMP614-54-TCO-553Z
Intel Core Ultra 5 226V
12.6 fps -35%
LibreOffice / 20 Documents To PDF
Acer TravelMate P6 TMP614-54-TCO-553Z
Intel Core Ultra 5 226V
68.5 s * -70%
Dell Pro 7 14 P714265
AMD Ryzen AI 9 HX PRO 470
55.4 s * -37%
Lenovo ThinkPad T14s Gen 7 21YW0022GE
AMD Ryzen AI 7 PRO 450
53.1 s * -32%
Asus ExpertBook Ultra B9406CAA
Intel Core Ultra X7 358H
51.9 s * -29%
Asus ZenBook S14 UX5406AA
Intel Core Ultra 9 386H
48.2 s * -20%
Lenovo ThinkPad T14 Gen 6 21QG001VGE
Intel Core Ultra 7 258V
47.6 s * -18%
Media Intel Core Ultra 7 366H
  (40.3 - 52.7, n=3)
45.5 s * -13%
HP EliteBook 8 G2a 14
AMD Ryzen AI 7 450
44.9 s * -11%
Dell 14S DS14260
Intel Core Ultra 7 355
41.4 s * -3%
Dell Pro 7 14 P714260
Intel Core Ultra 7 366H
40.3 s *
Lenovo ThinkBook 14 G9 IPL 21UX005PGE
Intel Core Ultra 5 325
39.9 s * +1%
R Benchmark 2.5 / Overall mean
Acer TravelMate P6 TMP614-54-TCO-553Z
Intel Core Ultra 5 226V
0.4896 sec * -18%
Lenovo ThinkPad T14 Gen 6 21QG001VGE
Intel Core Ultra 7 258V
0.4586 sec * -11%
Lenovo ThinkBook 14 G9 IPL 21UX005PGE
Intel Core Ultra 5 325
0.457 sec * -10%
Dell 14S DS14260
Intel Core Ultra 7 355
0.4363 sec * -5%
Lenovo ThinkPad T14s Gen 7 21YW0022GE
AMD Ryzen AI 7 PRO 450
0.4332 sec * -5%
Asus ZenBook S14 UX5406AA
Intel Core Ultra 9 386H
0.4265 sec * -3%
Asus ExpertBook Ultra B9406CAA
Intel Core Ultra X7 358H
0.4247 sec * -2%
Media Intel Core Ultra 7 366H
  (0.4144 - 0.4313, n=3)
0.4241 sec * -2%
HP EliteBook 8 G2a 14
AMD Ryzen AI 7 450
0.4177 sec * -1%
Dell Pro 7 14 P714260
Intel Core Ultra 7 366H
0.4144 sec *
Dell Pro 7 14 P714265
AMD Ryzen AI 9 HX PRO 470
0.4047 sec * +2%

* ... Meglio usare valori piccoli
Cinebench R15 CPU Multi 64Bit
2889 Points
Cinebench R15 OpenGL 64Bit
216 fps
Cinebench R15 Ref. Match 64Bit
97.8 %
Cinebench R15 CPU Single 64Bit
305 Points
Cinebench R20 CPU (Multi Core)
6707 Points
Cinebench R20 CPU (Single Core)
789 Points
Cinebench R23 Multi Core
17100 Points
Cinebench R23 Single Core
2081 Points
Cinebench 2024 CPU Multi Core
925 Points
Cinebench 2024 CPU Single Core
123.6 Points
Cinebench 2026 CPU Multi
3785 Points
Cinebench 2026 CPU Single Thread
510 Points
Aiuto
Performance rating
Dell Pro 7 14 P714265 -1!
AMD Ryzen AI 9 HX PRO 470, Radeon 890M
96.1 pt
Lenovo ThinkPad T14s Gen 7 21YW0022GE -1!
AMD Ryzen AI 7 PRO 450, Radeon 860M
80.8 pt
HP EliteBook 8 G2a 14 -1!
AMD Ryzen AI 7 450, Radeon 860M
80.1 pt
Media Intel Core Ultra 7 366H -1!
 
67.1 pt
Dell Pro 7 14 P714260 -1!
Intel Core Ultra 7 366H, Intel Graphics 4 Xe3 PTL
64.9 pt
Asus ExpertBook Ultra B9406CAA -1!
Intel Core Ultra X7 358H, Arc B390 Panther Lake iGPU
49.9 pt
Acer TravelMate P6 TMP614-54-TCO-553Z -1!
Intel Core Ultra 5 226V, Arc 130V
48.9 pt
AIDA64 / FP32 Ray-Trace
Dell Pro 7 14 P714265
AMD Ryzen AI 9 HX PRO 470, Radeon 890M (v8.20.8100)
28416 KRay/s +99%
HP EliteBook 8 G2a 14
AMD Ryzen AI 7 450, Radeon 860M (v8.20.8100)
25044 KRay/s +76%
Lenovo ThinkPad T14s Gen 7 21YW0022GE
AMD Ryzen AI 7 PRO 450, Radeon 860M (v8.20.8100)
24488 KRay/s +72%
Media Intel Core Ultra 7 366H
  (14248 - 16737, n=3)
15126 KRay/s +6%
Dell Pro 7 14 P714260
Intel Core Ultra 7 366H, Intel Graphics 4 Xe3 PTL (v8.20.8100)
14248 KRay/s
Acer TravelMate P6 TMP614-54-TCO-553Z
Intel Core Ultra 5 226V, Arc 130V (v6.92.6600)
12299 KRay/s -14%
Asus ExpertBook Ultra B9406CAA
Intel Core Ultra X7 358H, Arc B390 Panther Lake iGPU (v6.92.6600)
12221 KRay/s -14%
AIDA64 / FPU Julia
Dell Pro 7 14 P714265
AMD Ryzen AI 9 HX PRO 470, Radeon 890M (v8.20.8100)
117109 Points +55%
HP EliteBook 8 G2a 14
AMD Ryzen AI 7 450, Radeon 860M (v8.20.8100)
102173 Points +35%
Lenovo ThinkPad T14s Gen 7 21YW0022GE
AMD Ryzen AI 7 PRO 450, Radeon 860M (v8.20.8100)
100434 Points +33%
Media Intel Core Ultra 7 366H
  (75534 - 84589, n=3)
78966 Points +5%
Dell Pro 7 14 P714260
Intel Core Ultra 7 366H, Intel Graphics 4 Xe3 PTL (v8.20.8100)
75534 Points
Acer TravelMate P6 TMP614-54-TCO-553Z
Intel Core Ultra 5 226V, Arc 130V (v6.92.6600)
60191 Points -20%
Asus ExpertBook Ultra B9406CAA
Intel Core Ultra X7 358H, Arc B390 Panther Lake iGPU (v6.92.6600)
29930 Points -60%
AIDA64 / CPU SHA3
Dell Pro 7 14 P714265
AMD Ryzen AI 9 HX PRO 470, Radeon 890M (v8.20.8100)
4824 MB/s +26%
Asus ExpertBook Ultra B9406CAA
Intel Core Ultra X7 358H, Arc B390 Panther Lake iGPU (v6.92.6600)
4549 MB/s +19%
Media Intel Core Ultra 7 366H
  (3837 - 4318, n=3)
4015 MB/s +5%
Lenovo ThinkPad T14s Gen 7 21YW0022GE
AMD Ryzen AI 7 PRO 450, Radeon 860M (v8.20.8100)
3934 MB/s +3%
Dell Pro 7 14 P714260
Intel Core Ultra 7 366H, Intel Graphics 4 Xe3 PTL (v8.20.8100)
3837 MB/s
HP EliteBook 8 G2a 14
AMD Ryzen AI 7 450, Radeon 860M (v8.20.8100)
3824 MB/s 0%
Acer TravelMate P6 TMP614-54-TCO-553Z
Intel Core Ultra 5 226V, Arc 130V (v6.92.6600)
2569 MB/s -33%
AIDA64 / CPU Queen
Asus ExpertBook Ultra B9406CAA
Intel Core Ultra X7 358H, Arc B390 Panther Lake iGPU (v6.92.6600)
63425 Points
Acer TravelMate P6 TMP614-54-TCO-553Z
Intel Core Ultra 5 226V, Arc 130V (v6.92.6600)
47071 Points
AIDA64 / FPU SinJulia
Dell Pro 7 14 P714265
AMD Ryzen AI 9 HX PRO 470, Radeon 890M (v8.20.8100)
17621 Points +154%
Lenovo ThinkPad T14s Gen 7 21YW0022GE
AMD Ryzen AI 7 PRO 450, Radeon 860M (v8.20.8100)
13684 Points +98%
HP EliteBook 8 G2a 14
AMD Ryzen AI 7 450, Radeon 860M (v8.20.8100)
12595 Points +82%
Dell Pro 7 14 P714260
Intel Core Ultra 7 366H, Intel Graphics 4 Xe3 PTL (v8.20.8100)
6925 Points
Media Intel Core Ultra 7 366H
  (6482 - 7032, n=3)
6813 Points -2%
Asus ExpertBook Ultra B9406CAA
Intel Core Ultra X7 358H, Arc B390 Panther Lake iGPU (v6.92.6600)
4735 Points -32%
Acer TravelMate P6 TMP614-54-TCO-553Z
Intel Core Ultra 5 226V, Arc 130V (v6.92.6600)
3912 Points -44%
AIDA64 / FPU Mandel
Dell Pro 7 14 P714265
AMD Ryzen AI 9 HX PRO 470, Radeon 890M (v8.20.8100)
62125 Points +55%
Lenovo ThinkPad T14s Gen 7 21YW0022GE
AMD Ryzen AI 7 PRO 450, Radeon 860M (v8.20.8100)
51669 Points +29%
HP EliteBook 8 G2a 14
AMD Ryzen AI 7 450, Radeon 860M (v8.20.8100)
51506 Points +28%
Media Intel Core Ultra 7 366H
  (40198 - 45501, n=3)
42708 Points +6%
Dell Pro 7 14 P714260
Intel Core Ultra 7 366H, Intel Graphics 4 Xe3 PTL (v8.20.8100)
40198 Points
Acer TravelMate P6 TMP614-54-TCO-553Z
Intel Core Ultra 5 226V, Arc 130V (v6.92.6600)
32488 Points -19%
Asus ExpertBook Ultra B9406CAA
Intel Core Ultra X7 358H, Arc B390 Panther Lake iGPU (v6.92.6600)
14716 Points -63%
AIDA64 / CPU AES
Dell Pro 7 14 P714265
AMD Ryzen AI 9 HX PRO 470, Radeon 890M (v8.20.8100)
98035 MB/s +63%
Lenovo ThinkPad T14s Gen 7 21YW0022GE
AMD Ryzen AI 7 PRO 450, Radeon 860M (v8.20.8100)
81704 MB/s +36%
HP EliteBook 8 G2a 14
AMD Ryzen AI 7 450, Radeon 860M (v8.20.8100)
77783 MB/s +29%
Media Intel Core Ultra 7 366H
  (57542 - 65739, n=3)
61187 MB/s +2%
Dell Pro 7 14 P714260
Intel Core Ultra 7 366H, Intel Graphics 4 Xe3 PTL (v8.20.8100)
60279 MB/s
Acer TravelMate P6 TMP614-54-TCO-553Z
Intel Core Ultra 5 226V, Arc 130V (v6.92.6600)
36108 MB/s -40%
Asus ExpertBook Ultra B9406CAA
Intel Core Ultra X7 358H, Arc B390 Panther Lake iGPU (v6.92.6600)
5127 MB/s -91%
AIDA64 / CPU ZLib
Dell Pro 7 14 P714265
AMD Ryzen AI 9 HX PRO 470, Radeon 890M (v8.20.8100)
1174 MB/s +27%
Asus ExpertBook Ultra B9406CAA
Intel Core Ultra X7 358H, Arc B390 Panther Lake iGPU (v6.92.6600)
1168 MB/s +27%
HP EliteBook 8 G2a 14
AMD Ryzen AI 7 450, Radeon 860M (v8.20.8100)
1018 MB/s +11%
Lenovo ThinkPad T14s Gen 7 21YW0022GE
AMD Ryzen AI 7 PRO 450, Radeon 860M (v8.20.8100)
1014 MB/s +10%
Media Intel Core Ultra 7 366H
  (921 - 1109, n=3)
984 MB/s +7%
Dell Pro 7 14 P714260
Intel Core Ultra 7 366H, Intel Graphics 4 Xe3 PTL (v8.20.8100)
921 MB/s
Acer TravelMate P6 TMP614-54-TCO-553Z
Intel Core Ultra 5 226V, Arc 130V (v6.92.6600)
571 MB/s -38%
AIDA64 / FP64 Ray-Trace
Dell Pro 7 14 P714265
AMD Ryzen AI 9 HX PRO 470, Radeon 890M (v8.20.8100)
14799 KRay/s +100%
HP EliteBook 8 G2a 14
AMD Ryzen AI 7 450, Radeon 860M (v8.20.8100)
13669 KRay/s +85%
Lenovo ThinkPad T14s Gen 7 21YW0022GE
AMD Ryzen AI 7 PRO 450, Radeon 860M (v8.20.8100)
13274 KRay/s +79%
Media Intel Core Ultra 7 366H
  (7395 - 8411, n=3)
7807 KRay/s +6%
Dell Pro 7 14 P714260
Intel Core Ultra 7 366H, Intel Graphics 4 Xe3 PTL (v8.20.8100)
7395 KRay/s
Acer TravelMate P6 TMP614-54-TCO-553Z
Intel Core Ultra 5 226V, Arc 130V (v6.92.6600)
6773 KRay/s -8%
Asus ExpertBook Ultra B9406CAA
Intel Core Ultra X7 358H, Arc B390 Panther Lake iGPU (v6.92.6600)
6506 KRay/s -12%
AIDA64 / CPU PhotoWorxx
Dell Pro 7 14 P714260
Intel Core Ultra 7 366H, Intel Graphics 4 Xe3 PTL (v8.20.8100)
82103 MPixel/s
Media Intel Core Ultra 7 366H
  (81156 - 82840, n=3)
82033 MPixel/s 0%
Acer TravelMate P6 TMP614-54-TCO-553Z
Intel Core Ultra 5 226V, Arc 130V (v6.92.6600)
50372 MPixel/s -39%
Dell Pro 7 14 P714265
AMD Ryzen AI 9 HX PRO 470, Radeon 890M (v8.20.8100)
50296 MPixel/s -39%
HP EliteBook 8 G2a 14
AMD Ryzen AI 7 450, Radeon 860M (v8.20.8100)
47246 MPixel/s -42%
Lenovo ThinkPad T14s Gen 7 21YW0022GE
AMD Ryzen AI 7 PRO 450, Radeon 860M (v8.20.8100)
46202 MPixel/s -44%
Asus ExpertBook Ultra B9406CAA
Intel Core Ultra X7 358H, Arc B390 Panther Lake iGPU (v6.92.6600)
30538 MPixel/s -63%
AIDA64 / CPU CheckMate
Dell Pro 7 14 P714265
AMD Ryzen AI 9 HX PRO 470, Radeon 890M (v8.20.8100)
7017 MP/s +66%
Lenovo ThinkPad T14s Gen 7 21YW0022GE
AMD Ryzen AI 7 PRO 450, Radeon 860M (v8.20.8100)
5484 MP/s +29%
HP EliteBook 8 G2a 14
AMD Ryzen AI 7 450, Radeon 860M (v8.20.8100)
5312 MP/s +25%
Media Intel Core Ultra 7 366H
  (4202 - 4310, n=3)
4250 MP/s 0%
Dell Pro 7 14 P714260
Intel Core Ultra 7 366H, Intel Graphics 4 Xe3 PTL (v8.20.8100)
4239 MP/s

Prestazioni del sistema

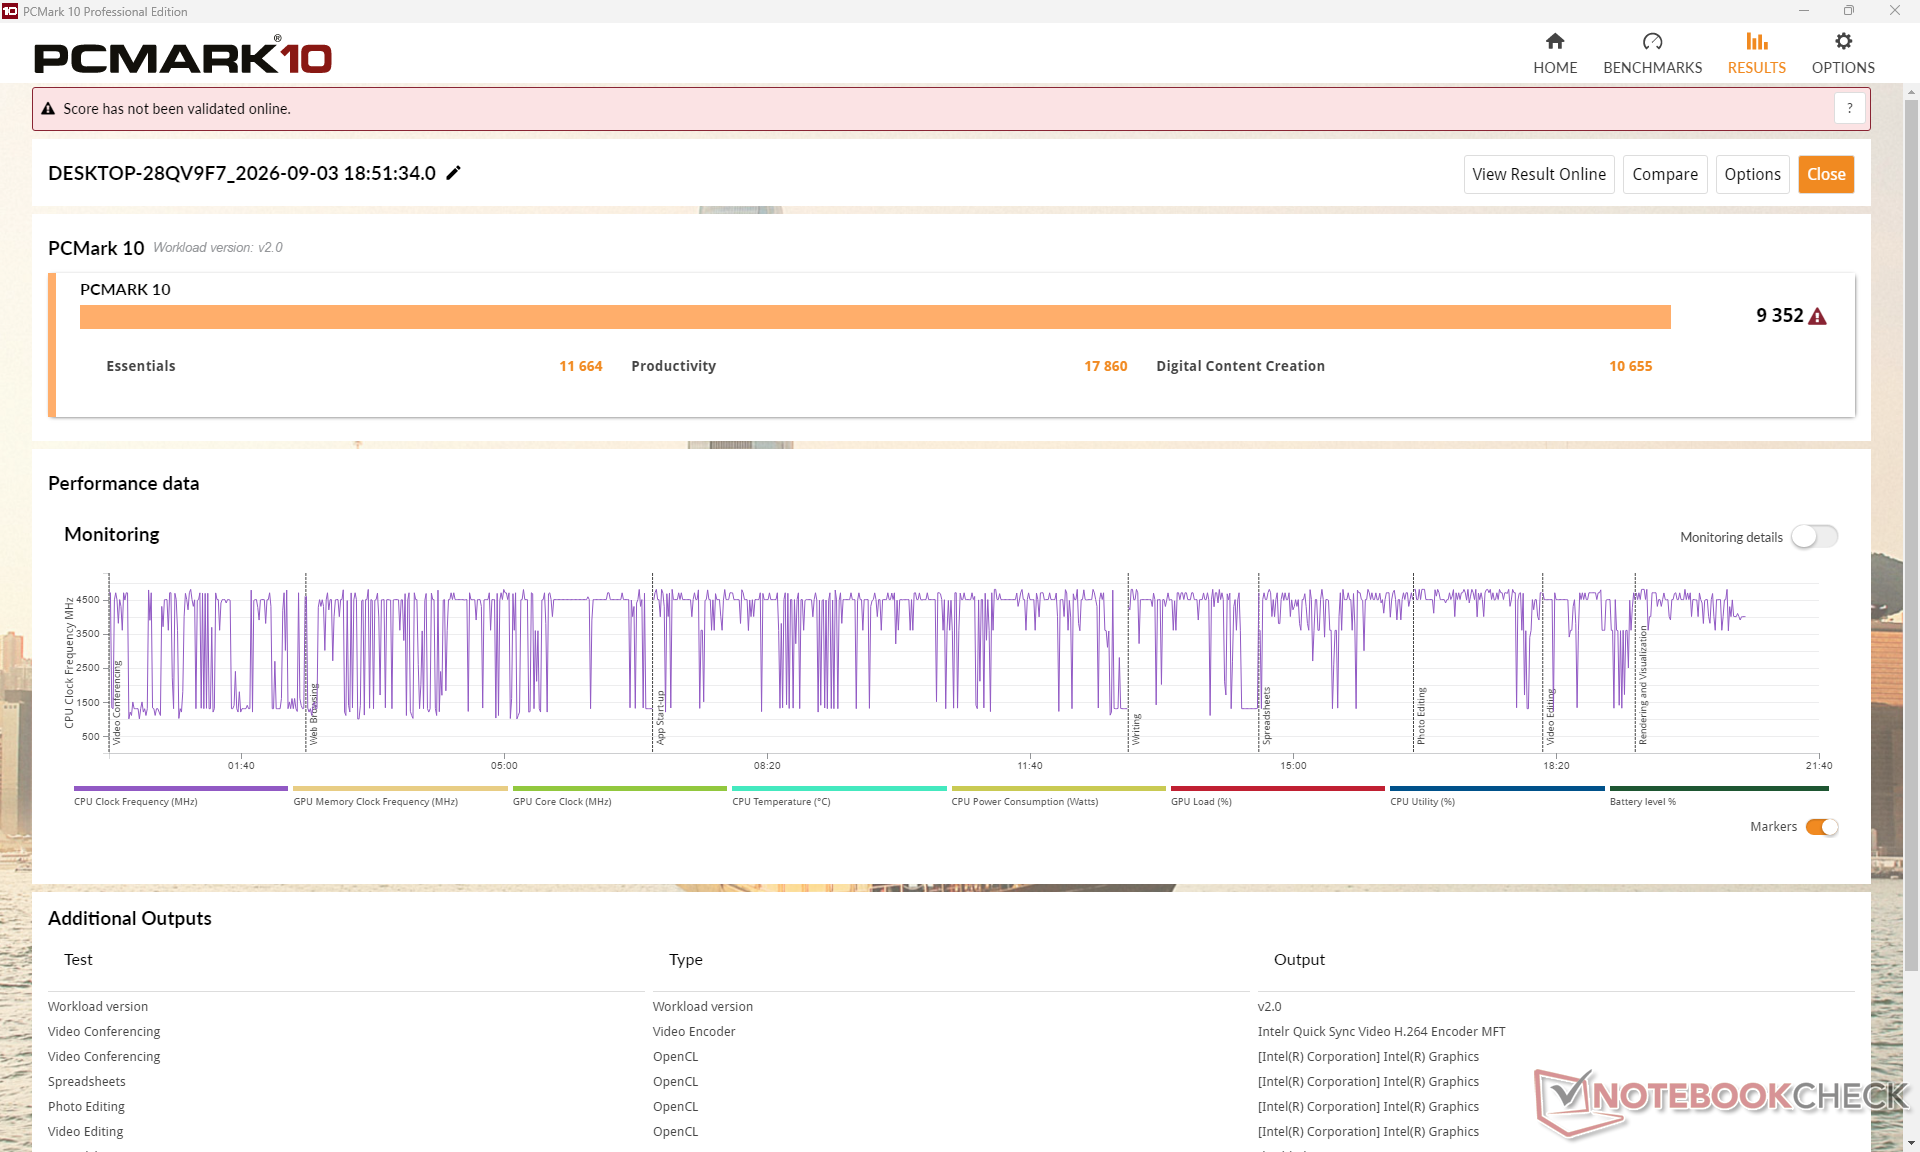
PCMark 10 Standard
PCMark 10 Standard
Performance rating
Asus ExpertBook Ultra B9406CAA
Arc B390 Panther Lake iGPU, Ultra X7 358H, Samsung PM9E1 MZVLC2T0HBLD
86.3 pt
Dell Pro 7 14 P714260
Intel Graphics 4 Xe3 PTL, Ultra 7 366H, SK hynix PCB01 HFS001TFM9X186N
82 pt
Media Intel Core Ultra 7 366H, Intel Graphics 4 Xe3 Panther Lake iGPU
 
81.2 pt
Dell Pro 7 14 P714265
Radeon 890M, Ryzen AI 9 HX PRO 470
75.5 pt
Lenovo ThinkPad T14s Gen 7 21YW0022GE
Radeon 860M, Ryzen AI 7 PRO 450, Micron 2650 MTFDKBA512TGW
73.7 pt
HP EliteBook 8 G2a 14
Radeon 860M, Ryzen AI 7 450, Western Digital PC SN5000S SDEPNSJ-1T00-1006
71.7 pt
Acer TravelMate P6 TMP614-54-TCO-553Z
Arc 130V, Core Ultra 5 226V, WDC PC SN810 512GB
62.9 pt
PCMark 10 / Score
Dell Pro 7 14 P714260
Intel Graphics 4 Xe3 PTL, Ultra 7 366H, SK hynix PCB01 HFS001TFM9X186N
9352 Points
Asus ExpertBook Ultra B9406CAA
Arc B390 Panther Lake iGPU, Ultra X7 358H, Samsung PM9E1 MZVLC2T0HBLD
9298 Points -1%
Media Intel Core Ultra 7 366H, Intel Graphics 4 Xe3 Panther Lake iGPU
  (8858 - 9352, n=3)
9097 Points -3%
Dell Pro 7 14 P714265
Radeon 890M, Ryzen AI 9 HX PRO 470
8465 Points -9%
Lenovo ThinkPad T14s Gen 7 21YW0022GE
Radeon 860M, Ryzen AI 7 PRO 450, Micron 2650 MTFDKBA512TGW
8180 Points -13%
HP EliteBook 8 G2a 14
Radeon 860M, Ryzen AI 7 450, Western Digital PC SN5000S SDEPNSJ-1T00-1006
7212 Points -23%
Acer TravelMate P6 TMP614-54-TCO-553Z
Arc 130V, Core Ultra 5 226V, WDC PC SN810 512GB
6515 Points -30%
PCMark 10 / Essentials
Dell Pro 7 14 P714260
Intel Graphics 4 Xe3 PTL, Ultra 7 366H, SK hynix PCB01 HFS001TFM9X186N
11664 Points
Media Intel Core Ultra 7 366H, Intel Graphics 4 Xe3 Panther Lake iGPU
  (10985 - 11664, n=3)
11435 Points -2%
Lenovo ThinkPad T14s Gen 7 21YW0022GE
Radeon 860M, Ryzen AI 7 PRO 450, Micron 2650 MTFDKBA512TGW
11208 Points -4%
Asus ExpertBook Ultra B9406CAA
Arc B390 Panther Lake iGPU, Ultra X7 358H, Samsung PM9E1 MZVLC2T0HBLD
10811 Points -7%
Dell Pro 7 14 P714265
Radeon 890M, Ryzen AI 9 HX PRO 470
10475 Points -10%
Acer TravelMate P6 TMP614-54-TCO-553Z
Arc 130V, Core Ultra 5 226V, WDC PC SN810 512GB
9350 Points -20%
HP EliteBook 8 G2a 14
Radeon 860M, Ryzen AI 7 450, Western Digital PC SN5000S SDEPNSJ-1T00-1006
9123 Points -22%
PCMark 10 / Productivity
Dell Pro 7 14 P714260
Intel Graphics 4 Xe3 PTL, Ultra 7 366H, SK hynix PCB01 HFS001TFM9X186N
17860 Points
Media Intel Core Ultra 7 366H, Intel Graphics 4 Xe3 Panther Lake iGPU
  (16234 - 17860, n=3)
16897 Points -5%
Dell Pro 7 14 P714265
Radeon 890M, Ryzen AI 9 HX PRO 470
15768 Points -12%
Asus ExpertBook Ultra B9406CAA
Arc B390 Panther Lake iGPU, Ultra X7 358H, Samsung PM9E1 MZVLC2T0HBLD
14899 Points -17%
Lenovo ThinkPad T14s Gen 7 21YW0022GE
Radeon 860M, Ryzen AI 7 PRO 450, Micron 2650 MTFDKBA512TGW
14067 Points -21%
HP EliteBook 8 G2a 14
Radeon 860M, Ryzen AI 7 450, Western Digital PC SN5000S SDEPNSJ-1T00-1006
12368 Points -31%
Acer TravelMate P6 TMP614-54-TCO-553Z
Arc 130V, Core Ultra 5 226V, WDC PC SN810 512GB
8652 Points -52%
PCMark 10 / Digital Content Creation
Asus ExpertBook Ultra B9406CAA
Arc B390 Panther Lake iGPU, Ultra X7 358H, Samsung PM9E1 MZVLC2T0HBLD
13541 Points +27%
Dell Pro 7 14 P714260
Intel Graphics 4 Xe3 PTL, Ultra 7 366H, SK hynix PCB01 HFS001TFM9X186N
10655 Points
Media Intel Core Ultra 7 366H, Intel Graphics 4 Xe3 Panther Lake iGPU
  (10499 - 10655, n=3)
10577 Points -1%
Dell Pro 7 14 P714265
Radeon 890M, Ryzen AI 9 HX PRO 470
9967 Points -6%
Lenovo ThinkPad T14s Gen 7 21YW0022GE
Radeon 860M, Ryzen AI 7 PRO 450, Micron 2650 MTFDKBA512TGW
9424 Points -12%
Acer TravelMate P6 TMP614-54-TCO-553Z
Arc 130V, Core Ultra 5 226V, WDC PC SN810 512GB
9276 Points -13%
HP EliteBook 8 G2a 14
Radeon 860M, Ryzen AI 7 450, Western Digital PC SN5000S SDEPNSJ-1T00-1006
9021 Points -15%
CrossMark / Overall
Media Intel Core Ultra 7 366H, Intel Graphics 4 Xe3 Panther Lake iGPU
  (2152 - 2214, n=3)
2179 Points 0%
Dell Pro 7 14 P714260
Intel Graphics 4 Xe3 PTL, Ultra 7 366H, SK hynix PCB01 HFS001TFM9X186N
2172 Points
Asus ExpertBook Ultra B9406CAA
Arc B390 Panther Lake iGPU, Ultra X7 358H, Samsung PM9E1 MZVLC2T0HBLD
1884 Points -13%
HP EliteBook 8 G2a 14
Radeon 860M, Ryzen AI 7 450, Western Digital PC SN5000S SDEPNSJ-1T00-1006
1862 Points -14%
Lenovo ThinkPad T14s Gen 7 21YW0022GE
Radeon 860M, Ryzen AI 7 PRO 450, Micron 2650 MTFDKBA512TGW
1803 Points -17%
Dell Pro 7 14 P714265
Radeon 890M, Ryzen AI 9 HX PRO 470
1783 Points -18%
Acer TravelMate P6 TMP614-54-TCO-553Z
Arc 130V, Core Ultra 5 226V, WDC PC SN810 512GB
1522 Points -30%
CrossMark / Productivity
Media Intel Core Ultra 7 366H, Intel Graphics 4 Xe3 Panther Lake iGPU
  (1957 - 1988, n=3)
1971 Points 0%
Dell Pro 7 14 P714260
Intel Graphics 4 Xe3 PTL, Ultra 7 366H, SK hynix PCB01 HFS001TFM9X186N
1968 Points
Lenovo ThinkPad T14s Gen 7 21YW0022GE
Radeon 860M, Ryzen AI 7 PRO 450, Micron 2650 MTFDKBA512TGW
1760 Points -11%
HP EliteBook 8 G2a 14
Radeon 860M, Ryzen AI 7 450, Western Digital PC SN5000S SDEPNSJ-1T00-1006
1739 Points -12%
Asus ExpertBook Ultra B9406CAA
Arc B390 Panther Lake iGPU, Ultra X7 358H, Samsung PM9E1 MZVLC2T0HBLD
1678 Points -15%
Dell Pro 7 14 P714265
Radeon 890M, Ryzen AI 9 HX PRO 470
1651 Points -16%
Acer TravelMate P6 TMP614-54-TCO-553Z
Arc 130V, Core Ultra 5 226V, WDC PC SN810 512GB
1481 Points -25%
CrossMark / Creativity
Media Intel Core Ultra 7 366H, Intel Graphics 4 Xe3 Panther Lake iGPU
  (2479 - 2556, n=3)
2505 Points +1%
Dell Pro 7 14 P714260
Intel Graphics 4 Xe3 PTL, Ultra 7 366H, SK hynix PCB01 HFS001TFM9X186N
2479 Points
Asus ExpertBook Ultra B9406CAA
Arc B390 Panther Lake iGPU, Ultra X7 358H, Samsung PM9E1 MZVLC2T0HBLD
2241 Points -10%
HP EliteBook 8 G2a 14
Radeon 860M, Ryzen AI 7 450, Western Digital PC SN5000S SDEPNSJ-1T00-1006
2127 Points -14%
Dell Pro 7 14 P714265
Radeon 890M, Ryzen AI 9 HX PRO 470
2034 Points -18%
Lenovo ThinkPad T14s Gen 7 21YW0022GE
Radeon 860M, Ryzen AI 7 PRO 450, Micron 2650 MTFDKBA512TGW
1841 Points -26%
Acer TravelMate P6 TMP614-54-TCO-553Z
Arc 130V, Core Ultra 5 226V, WDC PC SN810 512GB
1719 Points -31%
CrossMark / Responsiveness
Dell Pro 7 14 P714260
Intel Graphics 4 Xe3 PTL, Ultra 7 366H, SK hynix PCB01 HFS001TFM9X186N
1966 Points
Media Intel Core Ultra 7 366H, Intel Graphics 4 Xe3 Panther Lake iGPU
  (1864 - 1985, n=3)
1938 Points -1%
Lenovo ThinkPad T14s Gen 7 21YW0022GE
Radeon 860M, Ryzen AI 7 PRO 450, Micron 2650 MTFDKBA512TGW
1820 Points -7%
Asus ExpertBook Ultra B9406CAA
Arc B390 Panther Lake iGPU, Ultra X7 358H, Samsung PM9E1 MZVLC2T0HBLD
1585 Points -19%
HP EliteBook 8 G2a 14
Radeon 860M, Ryzen AI 7 450, Western Digital PC SN5000S SDEPNSJ-1T00-1006
1534 Points -22%
Dell Pro 7 14 P714265
Radeon 890M, Ryzen AI 9 HX PRO 470
1510 Points -23%
Acer TravelMate P6 TMP614-54-TCO-553Z
Arc 130V, Core Ultra 5 226V, WDC PC SN810 512GB
1144 Points -42%
WebXPRT 3 / Overall
Dell Pro 7 14 P714265
Radeon 890M, Ryzen AI 9 HX PRO 470
342 Points +2%
Dell Pro 7 14 P714260
Intel Graphics 4 Xe3 PTL, Ultra 7 366H, SK hynix PCB01 HFS001TFM9X186N
334 Points
HP EliteBook 8 G2a 14
Radeon 860M, Ryzen AI 7 450, Western Digital PC SN5000S SDEPNSJ-1T00-1006
332 Points -1%
Lenovo ThinkPad T14s Gen 7 21YW0022GE
Radeon 860M, Ryzen AI 7 PRO 450, Micron 2650 MTFDKBA512TGW
331 Points -1%
Media Intel Core Ultra 7 366H, Intel Graphics 4 Xe3 Panther Lake iGPU
  (321 - 334, n=3)
327 Points -2%
Asus ExpertBook Ultra B9406CAA
Arc B390 Panther Lake iGPU, Ultra X7 358H, Samsung PM9E1 MZVLC2T0HBLD
304 Points -9%
Acer TravelMate P6 TMP614-54-TCO-553Z
Arc 130V, Core Ultra 5 226V, WDC PC SN810 512GB
282 Points -16%
WebXPRT 4 / Overall
Dell Pro 7 14 P714260
Intel Graphics 4 Xe3 PTL, Ultra 7 366H, SK hynix PCB01 HFS001TFM9X186N
307 Points
Media Intel Core Ultra 7 366H, Intel Graphics 4 Xe3 Panther Lake iGPU
  (302 - 307, n=3)
305 Points -1%
HP EliteBook 8 G2a 14
Radeon 860M, Ryzen AI 7 450, Western Digital PC SN5000S SDEPNSJ-1T00-1006
281 Points -8%
Asus ExpertBook Ultra B9406CAA
Arc B390 Panther Lake iGPU, Ultra X7 358H, Samsung PM9E1 MZVLC2T0HBLD
279 Points -9%
Dell Pro 7 14 P714265
Radeon 890M, Ryzen AI 9 HX PRO 470
278 Points -9%
Lenovo ThinkPad T14s Gen 7 21YW0022GE
Radeon 860M, Ryzen AI 7 PRO 450, Micron 2650 MTFDKBA512TGW
270 Points -12%
Acer TravelMate P6 TMP614-54-TCO-553Z
Arc 130V, Core Ultra 5 226V, WDC PC SN810 512GB
251.6 Points -18%
Mozilla Kraken 1.1 / Total
Acer TravelMate P6 TMP614-54-TCO-553Z
Arc 130V, Core Ultra 5 226V, WDC PC SN810 512GB
509 ms * -13%
Media Intel Core Ultra 7 366H, Intel Graphics 4 Xe3 Panther Lake iGPU
  (449 - 451, n=3)
450 ms * -0%
Asus ExpertBook Ultra B9406CAA
Arc B390 Panther Lake iGPU, Ultra X7 358H, Samsung PM9E1 MZVLC2T0HBLD
449 ms * -0%
Dell Pro 7 14 P714260
Intel Graphics 4 Xe3 PTL, Ultra 7 366H, SK hynix PCB01 HFS001TFM9X186N
449 ms *
Lenovo ThinkPad T14s Gen 7 21YW0022GE
Radeon 860M, Ryzen AI 7 PRO 450, Micron 2650 MTFDKBA512TGW
446 ms * +1%
Dell Pro 7 14 P714265
Radeon 890M, Ryzen AI 9 HX PRO 470
426 ms * +5%
HP EliteBook 8 G2a 14
Radeon 860M, Ryzen AI 7 450, Western Digital PC SN5000S SDEPNSJ-1T00-1006
423 ms * +6%
Geekbench AI / Single Precision GPU 1.7
Asus ExpertBook Ultra B9406CAA
Arc B390 Panther Lake iGPU, Ultra X7 358H, Samsung PM9E1 MZVLC2T0HBLD
12255 Points +90%
Dell Pro 7 14 P714265
Radeon 890M, Ryzen AI 9 HX PRO 470
7225 Points +12%
HP EliteBook 8 G2a 14
Radeon 860M, Ryzen AI 7 450, Western Digital PC SN5000S SDEPNSJ-1T00-1006
6905 Points +7%
Lenovo ThinkPad T14s Gen 7 21YW0022GE
Radeon 860M, Ryzen AI 7 PRO 450, Micron 2650 MTFDKBA512TGW
6638 Points +3%
Acer TravelMate P6 TMP614-54-TCO-553Z
Arc 130V, Core Ultra 5 226V, WDC PC SN810 512GB
6602 Points +2%
Media Intel Core Ultra 7 366H, Intel Graphics 4 Xe3 Panther Lake iGPU
  (6149 - 6747, n=3)
6447 Points 0%
Dell Pro 7 14 P714260
Intel Graphics 4 Xe3 PTL, Ultra 7 366H, SK hynix PCB01 HFS001TFM9X186N
6446 Points
Geekbench AI / Half Precision GPU 1.7
Asus ExpertBook Ultra B9406CAA
Arc B390 Panther Lake iGPU, Ultra X7 358H, Samsung PM9E1 MZVLC2T0HBLD
21796 Points +81%
Acer TravelMate P6 TMP614-54-TCO-553Z
Arc 130V, Core Ultra 5 226V, WDC PC SN810 512GB
14016 Points +16%
Media Intel Core Ultra 7 366H, Intel Graphics 4 Xe3 Panther Lake iGPU
  (11904 - 12824, n=3)
12265 Points +2%
Dell Pro 7 14 P714260
Intel Graphics 4 Xe3 PTL, Ultra 7 366H, SK hynix PCB01 HFS001TFM9X186N
12067 Points
Dell Pro 7 14 P714265
Radeon 890M, Ryzen AI 9 HX PRO 470
11832 Points -2%
HP EliteBook 8 G2a 14
Radeon 860M, Ryzen AI 7 450, Western Digital PC SN5000S SDEPNSJ-1T00-1006
10647 Points -12%
Lenovo ThinkPad T14s Gen 7 21YW0022GE
Radeon 860M, Ryzen AI 7 PRO 450, Micron 2650 MTFDKBA512TGW
10131 Points -16%
Geekbench AI / Quantized GPU 1.7
Asus ExpertBook Ultra B9406CAA
Arc B390 Panther Lake iGPU, Ultra X7 358H, Samsung PM9E1 MZVLC2T0HBLD
8011 Points +87%
Dell Pro 7 14 P714265
Radeon 890M, Ryzen AI 9 HX PRO 470
5656 Points +32%
HP EliteBook 8 G2a 14
Radeon 860M, Ryzen AI 7 450, Western Digital PC SN5000S SDEPNSJ-1T00-1006
5249 Points +23%
Lenovo ThinkPad T14s Gen 7 21YW0022GE
Radeon 860M, Ryzen AI 7 PRO 450, Micron 2650 MTFDKBA512TGW
5124 Points +20%
Acer TravelMate P6 TMP614-54-TCO-553Z
Arc 130V, Core Ultra 5 226V, WDC PC SN810 512GB
4756 Points +11%
Media Intel Core Ultra 7 366H, Intel Graphics 4 Xe3 Panther Lake iGPU
  (4230 - 4509, n=3)
4337 Points +1%
Dell Pro 7 14 P714260
Intel Graphics 4 Xe3 PTL, Ultra 7 366H, SK hynix PCB01 HFS001TFM9X186N
4273 Points

* ... Meglio usare valori piccoli
PCMark 10 Score
9352 punti
Aiuto
AIDA64 / Memory Copy
Media Intel Core Ultra 7 366H
  (116863 - 120004, n=3)
118029 MB/s +1%
Dell Pro 7 14 P714260
Intel Core Ultra 7 366H, Intel Graphics 4 Xe3 PTL
116863 MB/s
Acer TravelMate P6 TMP614-54-TCO-553Z
Intel Core Ultra 5 226V, Arc 130V
99126 MB/s -15%
Lenovo ThinkPad T14s Gen 7 21YW0022GE
AMD Ryzen AI 7 PRO 450, Radeon 860M
87261 MB/s -25%
HP EliteBook 8 G2a 14
AMD Ryzen AI 7 450, Radeon 860M
85048 MB/s -27%
Dell Pro 7 14 P714265
AMD Ryzen AI 9 HX PRO 470, Radeon 890M
82931 MB/s -29%
AIDA64 / Memory Read
Asus ExpertBook Ultra B9406CAA
Intel Core Ultra X7 358H, Arc B390 Panther Lake iGPU
117245 MB/s +5%
Dell Pro 7 14 P714260
Intel Core Ultra 7 366H, Intel Graphics 4 Xe3 PTL
111878 MB/s
Media Intel Core Ultra 7 366H
  (108649 - 111878, n=3)
110025 MB/s -2%
Dell Pro 7 14 P714265
AMD Ryzen AI 9 HX PRO 470, Radeon 890M
86838 MB/s -22%
Acer TravelMate P6 TMP614-54-TCO-553Z
Intel Core Ultra 5 226V, Arc 130V
83661 MB/s -25%
HP EliteBook 8 G2a 14
AMD Ryzen AI 7 450, Radeon 860M
66728 MB/s -40%
Lenovo ThinkPad T14s Gen 7 21YW0022GE
AMD Ryzen AI 7 PRO 450, Radeon 860M
66186 MB/s -41%
AIDA64 / Memory Write
Dell Pro 7 14 P714260
Intel Core Ultra 7 366H, Intel Graphics 4 Xe3 PTL
120952 MB/s
Media Intel Core Ultra 7 366H
  (119571 - 120952, n=3)
120402 MB/s 0%
Asus ExpertBook Ultra B9406CAA
Intel Core Ultra X7 358H, Arc B390 Panther Lake iGPU
119858 MB/s -1%
Acer TravelMate P6 TMP614-54-TCO-553Z
Intel Core Ultra 5 226V, Arc 130V
111524 MB/s -8%
Lenovo ThinkPad T14s Gen 7 21YW0022GE
AMD Ryzen AI 7 PRO 450, Radeon 860M
109442 MB/s -10%
Dell Pro 7 14 P714265
AMD Ryzen AI 9 HX PRO 470, Radeon 890M
109384 MB/s -10%
HP EliteBook 8 G2a 14
AMD Ryzen AI 7 450, Radeon 860M
105796 MB/s -13%
AIDA64 / Memory Latency
Lenovo ThinkPad T14s Gen 7 21YW0022GE
AMD Ryzen AI 7 PRO 450, Radeon 860M
123.8 ns * -37%
Dell Pro 7 14 P714265
AMD Ryzen AI 9 HX PRO 470, Radeon 890M
118.5 ns * -31%
HP EliteBook 8 G2a 14
AMD Ryzen AI 7 450, Radeon 860M
109 ns * -20%
Acer TravelMate P6 TMP614-54-TCO-553Z
Intel Core Ultra 5 226V, Arc 130V
95.9 ns * -6%
Dell Pro 7 14 P714260
Intel Core Ultra 7 366H, Intel Graphics 4 Xe3 PTL
90.5 ns *
Media Intel Core Ultra 7 366H
  (89.5 - 90.5, n=3)
90.1 ns * -0%

* ... Meglio usare valori piccoli

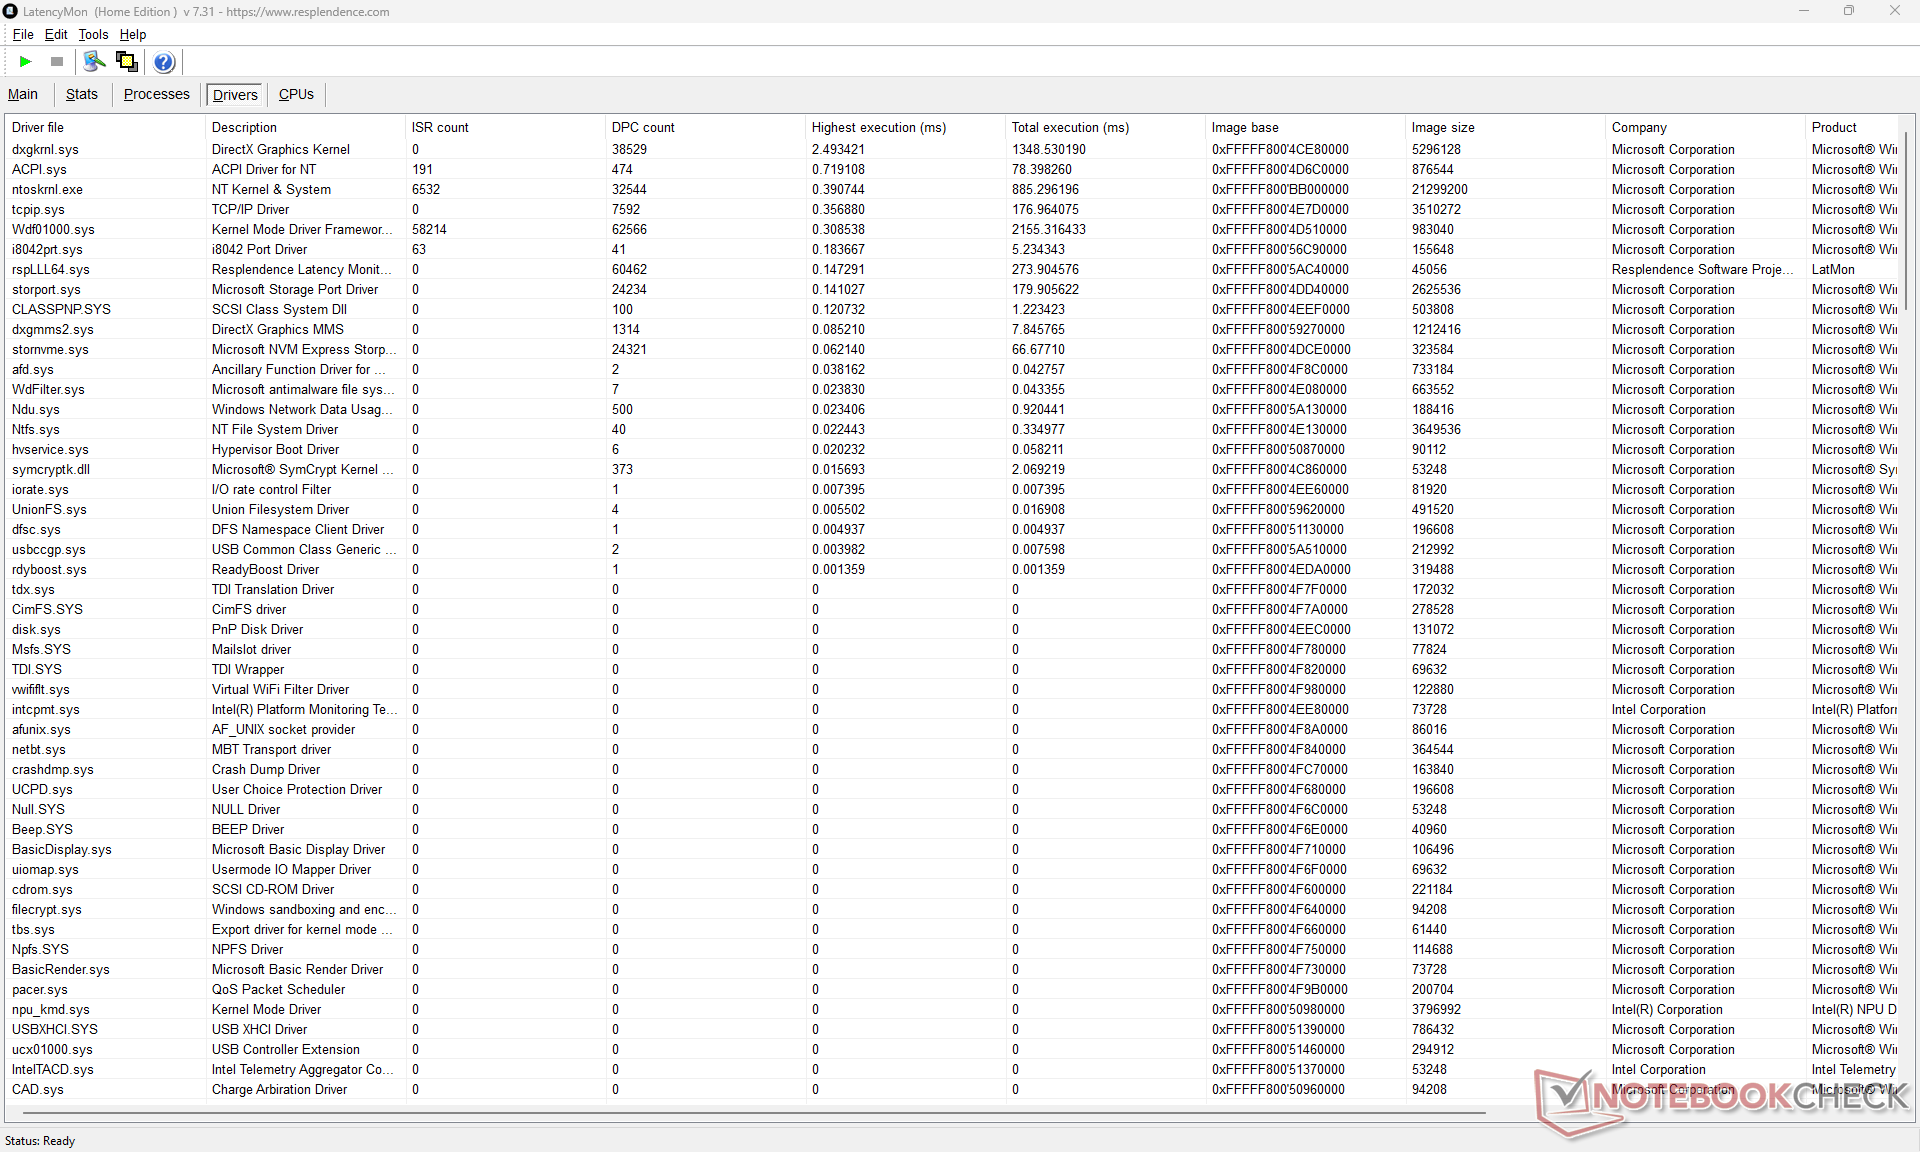
Latenza DPC
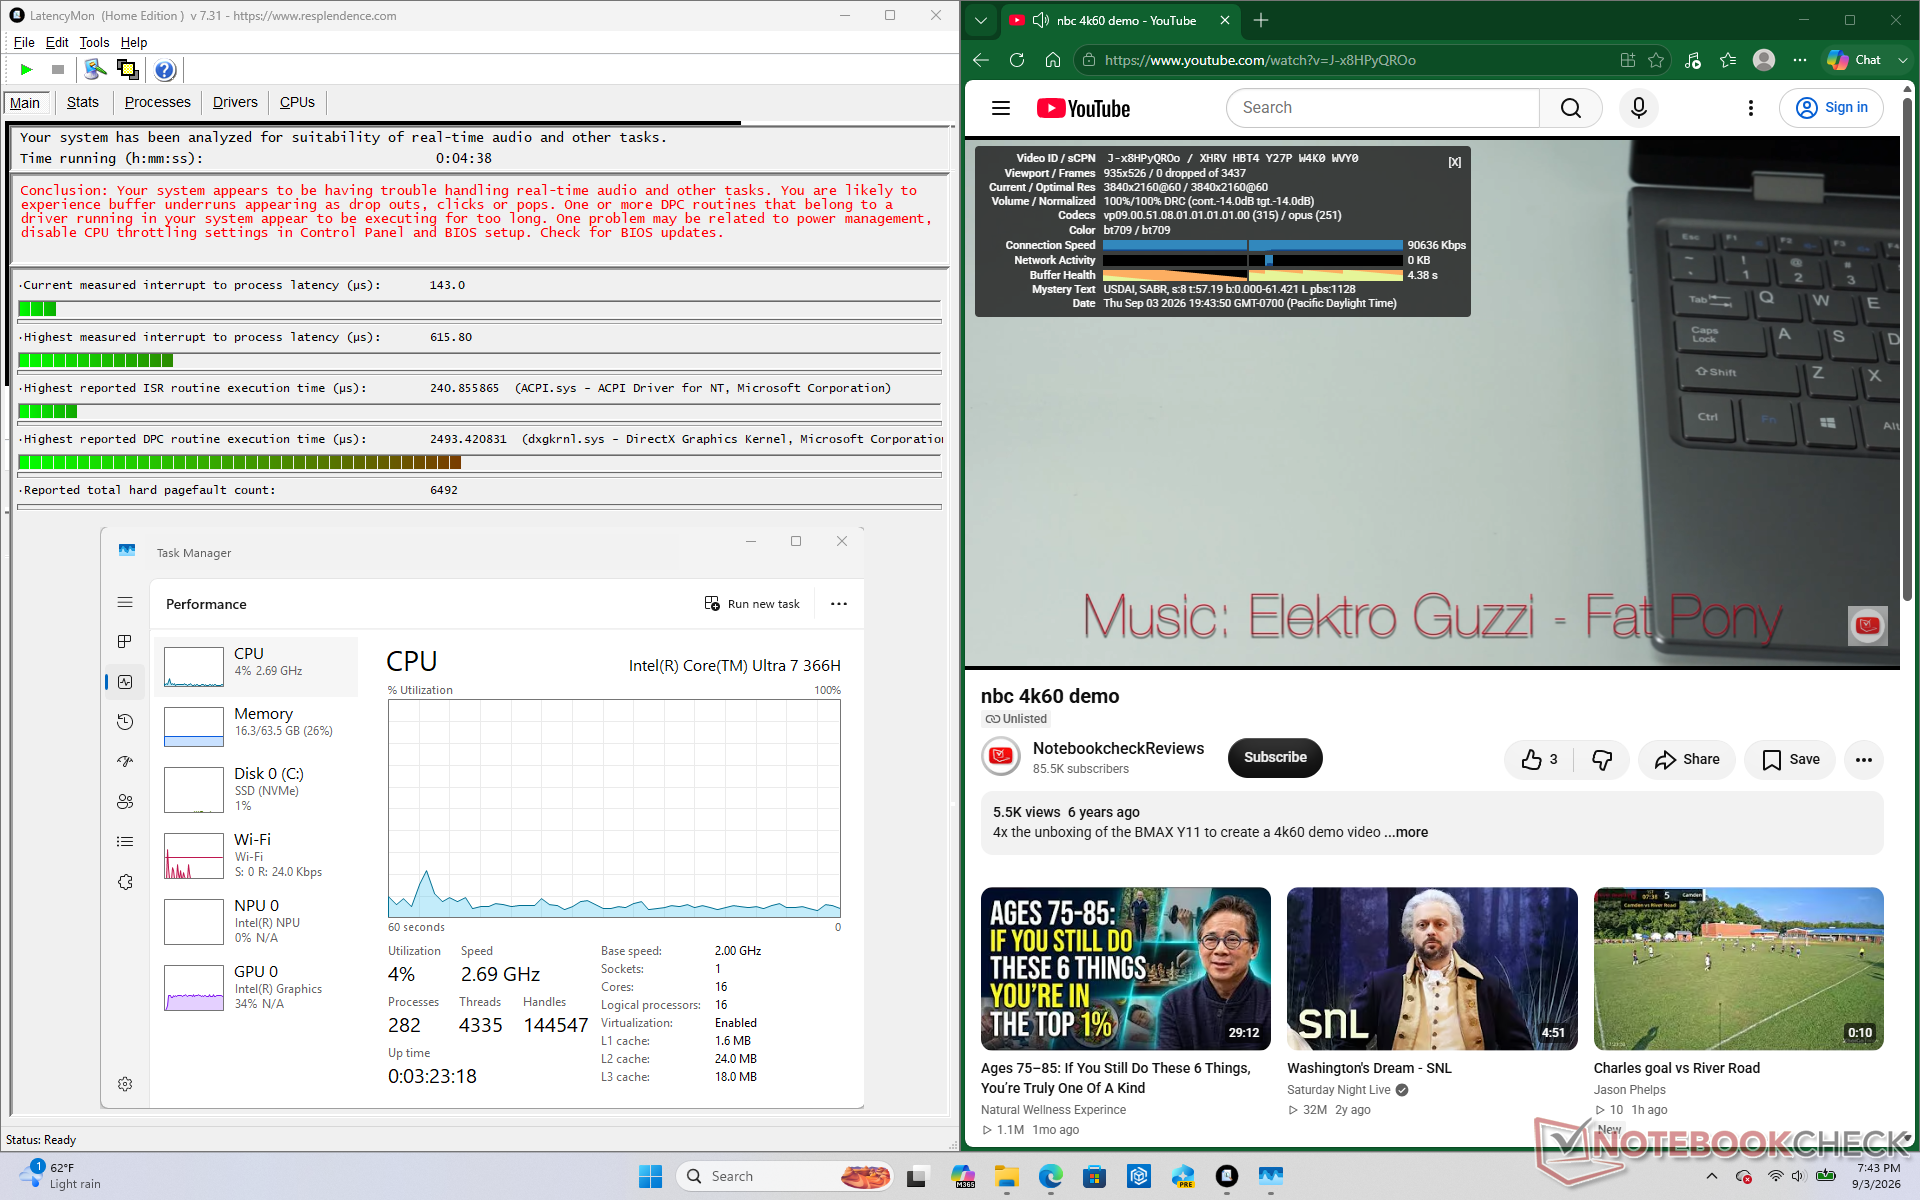
LatencyMon rileva lievi problemi di DPC, ma non si verificano frame persi durante la riproduzione di video in 4K a 60 Hz
Elenco dei driver
Elenco dei driver
DPC Latencies / LatencyMon - interrupt to process latency (max), Web, Youtube, Prime95
Dell Pro 7 14 P714265
Radeon 890M, Ryzen AI 9 HX PRO 470
5034.8 μs * -718%
Lenovo ThinkPad T14s Gen 7 21YW0022GE
Radeon 860M, Ryzen AI 7 PRO 450, Micron 2650 MTFDKBA512TGW
2926.1 μs * -375%
HP EliteBook 8 G2a 14
Radeon 860M, Ryzen AI 7 450, Western Digital PC SN5000S SDEPNSJ-1T00-1006
2089.6 μs * -239%
Acer TravelMate P6 TMP614-54-TCO-553Z
Arc 130V, Core Ultra 5 226V, WDC PC SN810 512GB
1180.9 μs * -92%
Dell Pro 7 14 P714260
Intel Graphics 4 Xe3 PTL, Ultra 7 366H, SK hynix PCB01 HFS001TFM9X186N
615.8 μs *
Asus ExpertBook Ultra B9406CAA
Arc B390 Panther Lake iGPU, Ultra X7 358H, Samsung PM9E1 MZVLC2T0HBLD
398 μs * +35%

* ... Meglio usare valori piccoli

Dispositivi di archiviazione
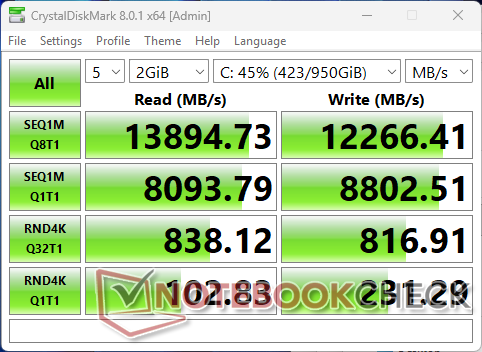
CDM 8
CDM 8

Poiché AS SSD ha presentato degli errori durante l’esecuzione sulla nostra unità, i relativi risultati non sono riportati di seguito. L’SSD SK Hynix PCB01 PCIe5 NVMe ha comunque raggiunto velocità fino a circa 14 GB/s senza problemi di throttling, anche in condizioni di carico elevato.

SK hynix PCB01 HFS001TFM9X186N
DiskSpd seq_q8t1_read: 13926MB/s
DiskSpd seq_q8t1_write: 12374MB/s
DiskSpd seq_read: 9097MB/s
DiskSpd seq_write: 7890MB/s
DiskSpd 4k_q32t16_read: 3187MB/s
DiskSpd 4k_q32t16_write: 2889MB/s
DiskSpd 4k_q1t1_read: 100.3MB/s
DiskSpd 4k_q1t1_write: 167.8MB/s
DiskSpd Loop seq_q8t1_read: 13901MB/s
Drive Performance rating - Percent
Dell Pro 7 14 P714260
SK hynix PCB01 HFS001TFM9X186N
89.9 pt
Lenovo ThinkPad T14s Gen 7 21YW0022GE
Micron 2650 MTFDKBA512TGW
74.7 pt
Asus ExpertBook Ultra B9406CAA
Samsung PM9E1 MZVLC2T0HBLD
51.5 pt
HP EliteBook 8 G2a 14
Western Digital PC SN5000S SDEPNSJ-1T00-1006
39 pt
Acer TravelMate P6 TMP614-54-TCO-553Z
WDC PC SN810 512GB
35.3 pt
Dell Pro 7 14 P714265
 
34.2 pt
DiskSpd
seq read
Dell Pro 7 14 P714260
SK hynix PCB01 HFS001TFM9X186N
9097 (8798.6min - 9097.03max) MB/s
Asus ExpertBook Ultra B9406CAA
Samsung PM9E1 MZVLC2T0HBLD
5202 (5000.31min - 5202.2max) MB/s -43%
Lenovo ThinkPad T14s Gen 7 21YW0022GE
Micron 2650 MTFDKBA512TGW
4665 (4580.04min - 4665.32max) MB/s -49%
Acer TravelMate P6 TMP614-54-TCO-553Z
WDC PC SN810 512GB
3304 (3153.49min - 3304.06max) MB/s -64%
Dell Pro 7 14 P714265
 
3090 (3051.36min - 3089.52max) MB/s -66%
HP EliteBook 8 G2a 14
Western Digital PC SN5000S SDEPNSJ-1T00-1006
2099 (2033.61min - 2099.46max) MB/s -77%
seq write
Dell Pro 7 14 P714260
SK hynix PCB01 HFS001TFM9X186N
7890 (7719.62min - 7890.27max) MB/s
Lenovo ThinkPad T14s Gen 7 21YW0022GE
Micron 2650 MTFDKBA512TGW
5223 (5088.01min - 5223.21max) MB/s -34%
HP EliteBook 8 G2a 14
Western Digital PC SN5000S SDEPNSJ-1T00-1006
3701 (2984.15min - 3701.41max) MB/s -53%
Asus ExpertBook Ultra B9406CAA
Samsung PM9E1 MZVLC2T0HBLD
2975 (2363.07min - 2974.81max) MB/s -62%
Acer TravelMate P6 TMP614-54-TCO-553Z
WDC PC SN810 512GB
2446 (2083.97min - 2445.84max) MB/s -69%
Dell Pro 7 14 P714265
 
895 (42.36min - 895.27max) MB/s -89%
seq q8 t1 read
Asus ExpertBook Ultra B9406CAA
Samsung PM9E1 MZVLC2T0HBLD
14067 (11621.3min - 14067.1max) MB/s +1%
Dell Pro 7 14 P714260
SK hynix PCB01 HFS001TFM9X186N
13926 (12290.5min - 13926.4max) MB/s
Dell Pro 7 14 P714265
 
7090 (5662.1min - 7090.34max) MB/s -49%
Lenovo ThinkPad T14s Gen 7 21YW0022GE
Micron 2650 MTFDKBA512TGW
6991 (6471.18min - 6991.07max) MB/s -50%
Acer TravelMate P6 TMP614-54-TCO-553Z
WDC PC SN810 512GB
6899 (5727.19min - 6899.46max) MB/s -50%
HP EliteBook 8 G2a 14
Western Digital PC SN5000S SDEPNSJ-1T00-1006
6335 (5674.66min - 6334.78max) MB/s -55%
seq q8 t1 write
Dell Pro 7 14 P714260
SK hynix PCB01 HFS001TFM9X186N
12374 (12340.8min - 12374max) MB/s
Asus ExpertBook Ultra B9406CAA
Samsung PM9E1 MZVLC2T0HBLD
9127 (8641.19min - 9127.43max) MB/s -26%
HP EliteBook 8 G2a 14
Western Digital PC SN5000S SDEPNSJ-1T00-1006
5652 (4366.56min - 5652.24max) MB/s -54%
Lenovo ThinkPad T14s Gen 7 21YW0022GE
Micron 2650 MTFDKBA512TGW
5333 (5268.41min - 5333.48max) MB/s -57%
Dell Pro 7 14 P714265
 
5154 (51.38min - 5154.41max) MB/s -58%
Acer TravelMate P6 TMP614-54-TCO-553Z
WDC PC SN810 512GB
4506 (4426.67min - 4506.36max) MB/s -64%
4k q1 t1 read
Dell Pro 7 14 P714260
SK hynix PCB01 HFS001TFM9X186N
100.3 (98.84min - 100.3max) MB/s
Lenovo ThinkPad T14s Gen 7 21YW0022GE
Micron 2650 MTFDKBA512TGW
87.5 (85.01min - 87.46max) MB/s -13%
Asus ExpertBook Ultra B9406CAA
Samsung PM9E1 MZVLC2T0HBLD
69.7 (68.02min - 69.67max) MB/s -31%
HP EliteBook 8 G2a 14
Western Digital PC SN5000S SDEPNSJ-1T00-1006
69.5 (61.5min - 69.54max) MB/s -31%
Acer TravelMate P6 TMP614-54-TCO-553Z
WDC PC SN810 512GB
60.2 (54.79min - 60.19max) MB/s -40%
Dell Pro 7 14 P714265
 
56.5 (55.7min - 56.49max) MB/s -44%
4k q1 t1 write
Lenovo ThinkPad T14s Gen 7 21YW0022GE
Micron 2650 MTFDKBA512TGW
273 (265.84min - 273.13max) MB/s +63%
Dell Pro 7 14 P714260
SK hynix PCB01 HFS001TFM9X186N
167.8 (165.54min - 167.83max) MB/s
Dell Pro 7 14 P714265
 
148.5 (50.42min - 148.46max) MB/s -12%
Asus ExpertBook Ultra B9406CAA
Samsung PM9E1 MZVLC2T0HBLD
125.3 (122.16min - 125.28max) MB/s -25%
HP EliteBook 8 G2a 14
Western Digital PC SN5000S SDEPNSJ-1T00-1006
124.7 (111.97min - 124.69max) MB/s -26%
Acer TravelMate P6 TMP614-54-TCO-553Z
WDC PC SN810 512GB
115.7 (110.67min - 115.69max) MB/s -31%
4k q32 t16 read
Lenovo ThinkPad T14s Gen 7 21YW0022GE
Micron 2650 MTFDKBA512TGW
3783 (3766.41min - 3783.27max) MB/s +19%
Dell Pro 7 14 P714260
SK hynix PCB01 HFS001TFM9X186N
3187 (2903.25min - 3187.22max) MB/s
HP EliteBook 8 G2a 14
Western Digital PC SN5000S SDEPNSJ-1T00-1006
943 (866.84min - 943.21max) MB/s -70%
Dell Pro 7 14 P714265
 
721 (666.51min - 720.75max) MB/s -77%
Asus ExpertBook Ultra B9406CAA
Samsung PM9E1 MZVLC2T0HBLD
690 (639.86min - 689.58max) MB/s -78%
Acer TravelMate P6 TMP614-54-TCO-553Z
WDC PC SN810 512GB
676 (653.05min - 675.77max) MB/s -79%
4k q32 t16 write
Lenovo ThinkPad T14s Gen 7 21YW0022GE
Micron 2650 MTFDKBA512TGW
3889 (3629.66min - 3889.46max) MB/s +35%
Dell Pro 7 14 P714260
SK hynix PCB01 HFS001TFM9X186N
2889 (2458.26min - 2888.79max) MB/s
HP EliteBook 8 G2a 14
Western Digital PC SN5000S SDEPNSJ-1T00-1006
434 (423.09min - 433.61max) MB/s -85%
Asus ExpertBook Ultra B9406CAA
Samsung PM9E1 MZVLC2T0HBLD
390 (355.81min - 389.58max) MB/s -87%
Acer TravelMate P6 TMP614-54-TCO-553Z
WDC PC SN810 512GB
370 (306.26min - 369.67max) MB/s -87%
Dell Pro 7 14 P714265
 
239 (39.03min - 238.53max) MB/s -92%

Limitazione della velocità del disco: ciclo di lettura DiskSpd, profondità della coda 8

0280560840112014001680196022402520280030803360364039204200448047605040532056005880616064406720700072807560784081208400868089609240952098001008010360106401092011200114801176012040123201260012880131601344013720Tooltip
Dell Pro 7 14 P714260 SK hynix PCB01 HFS001TFM9X186N; diskspd 2.0.17 f: Ø13901 (13066.89-13928.69) MB/s
Dell Pro 7 14 P714265  ; diskspd 2.0.17 f: Ø7038 (5312.37-7084.39) MB/s

Prestazioni della GPU

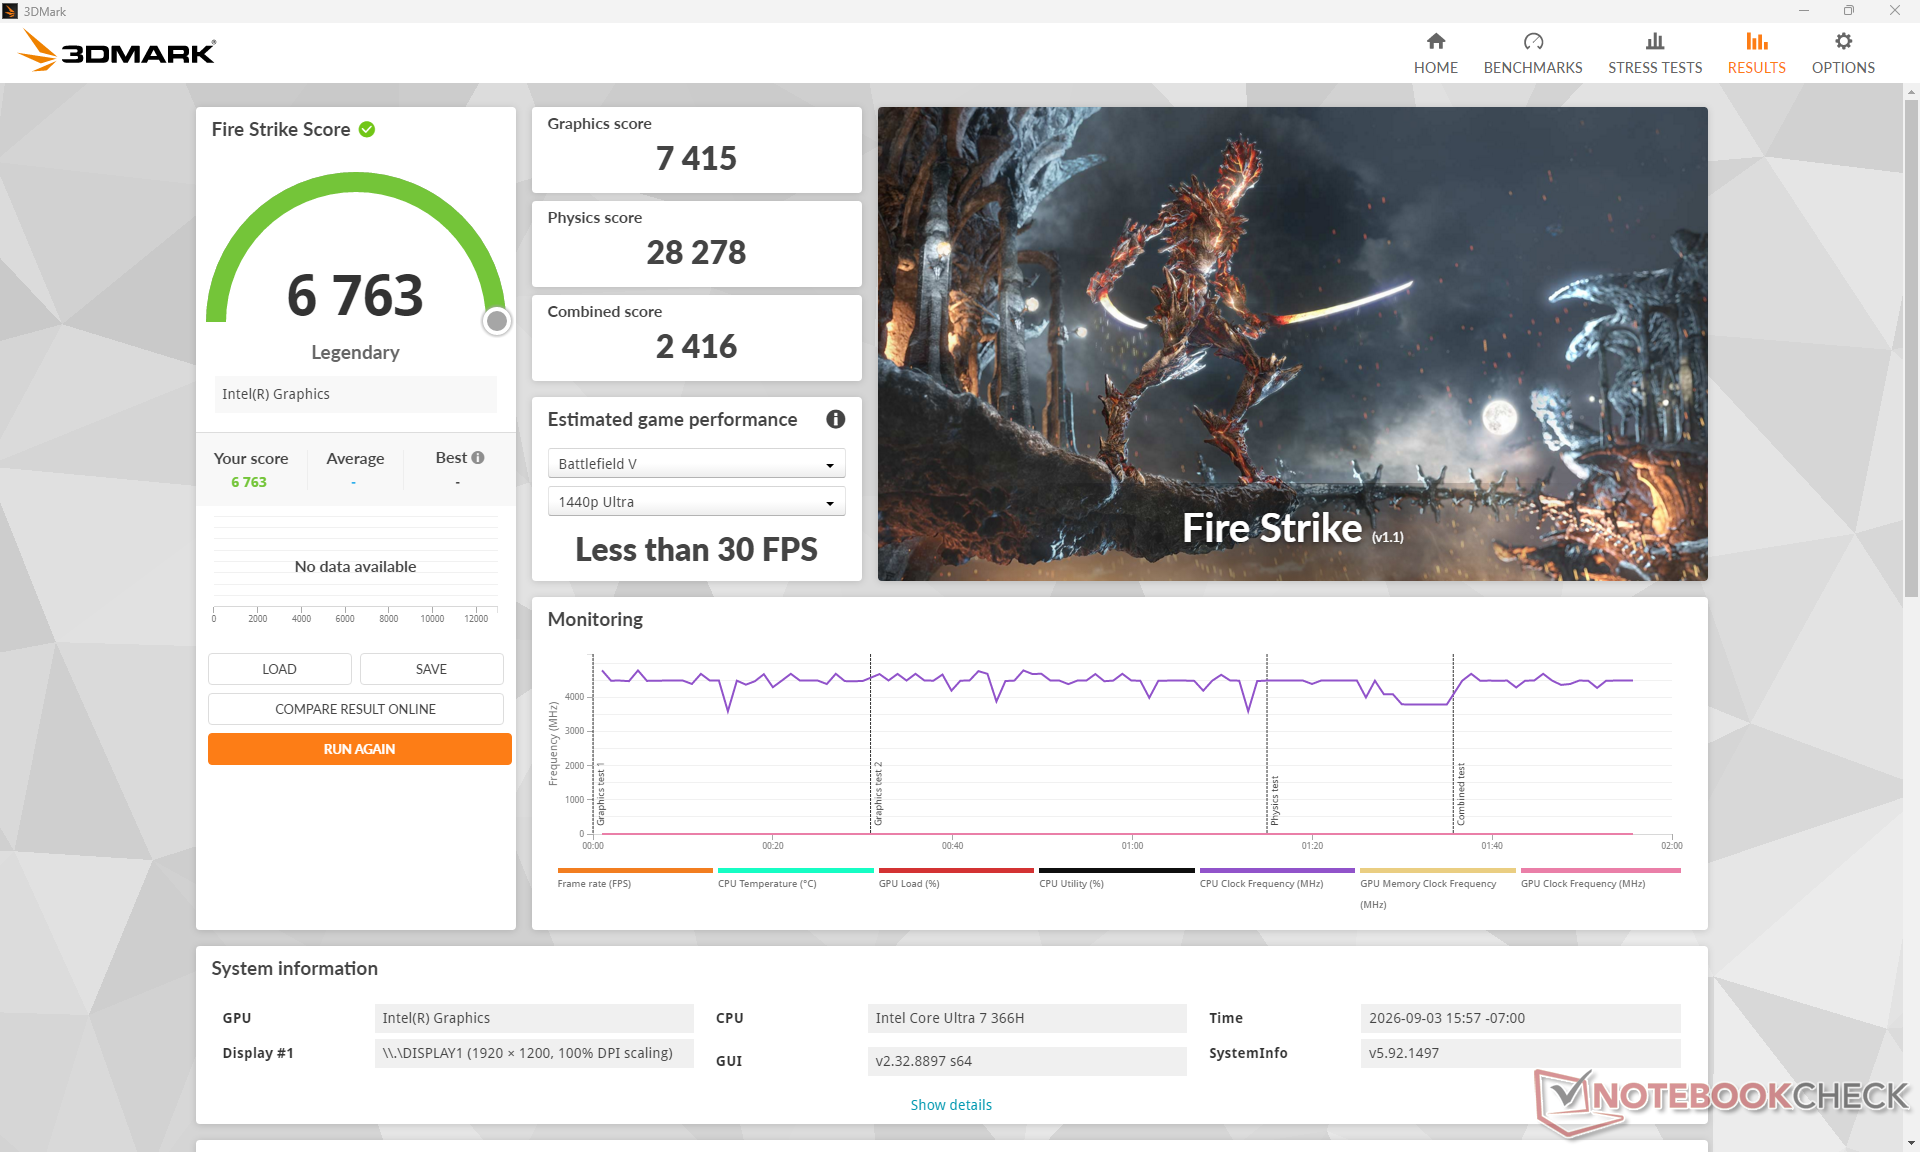
Profilo energeticoPunteggio GraficaPunteggio fisicoPunteggio combinato
Modalità prestazioni741528.2782416
Modalità bilanciata7.400 (-0 %)27.468 (-3%)2376 (-2%)
Alimentazione a batteria6.993 (-6 %)20.262 (-28%)2138 (-12%)
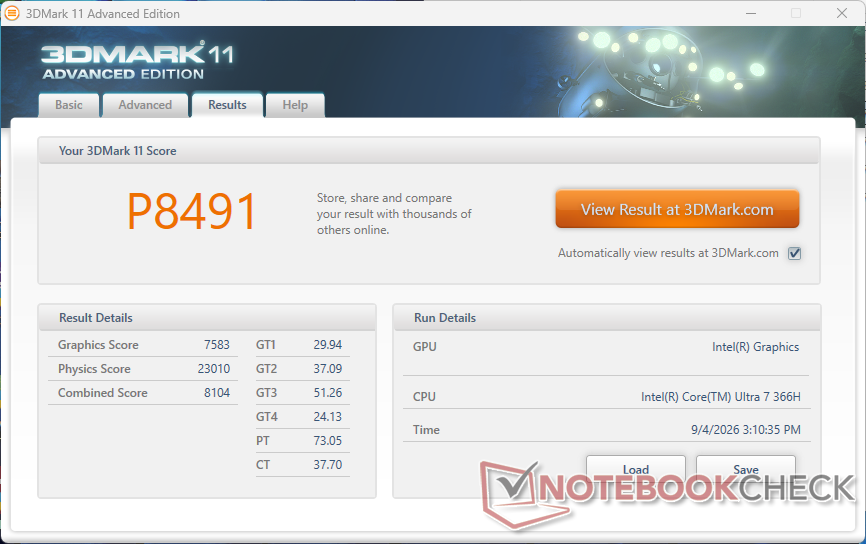
3DMark 11
3DMark 11
Fire Strike
Fire Strike
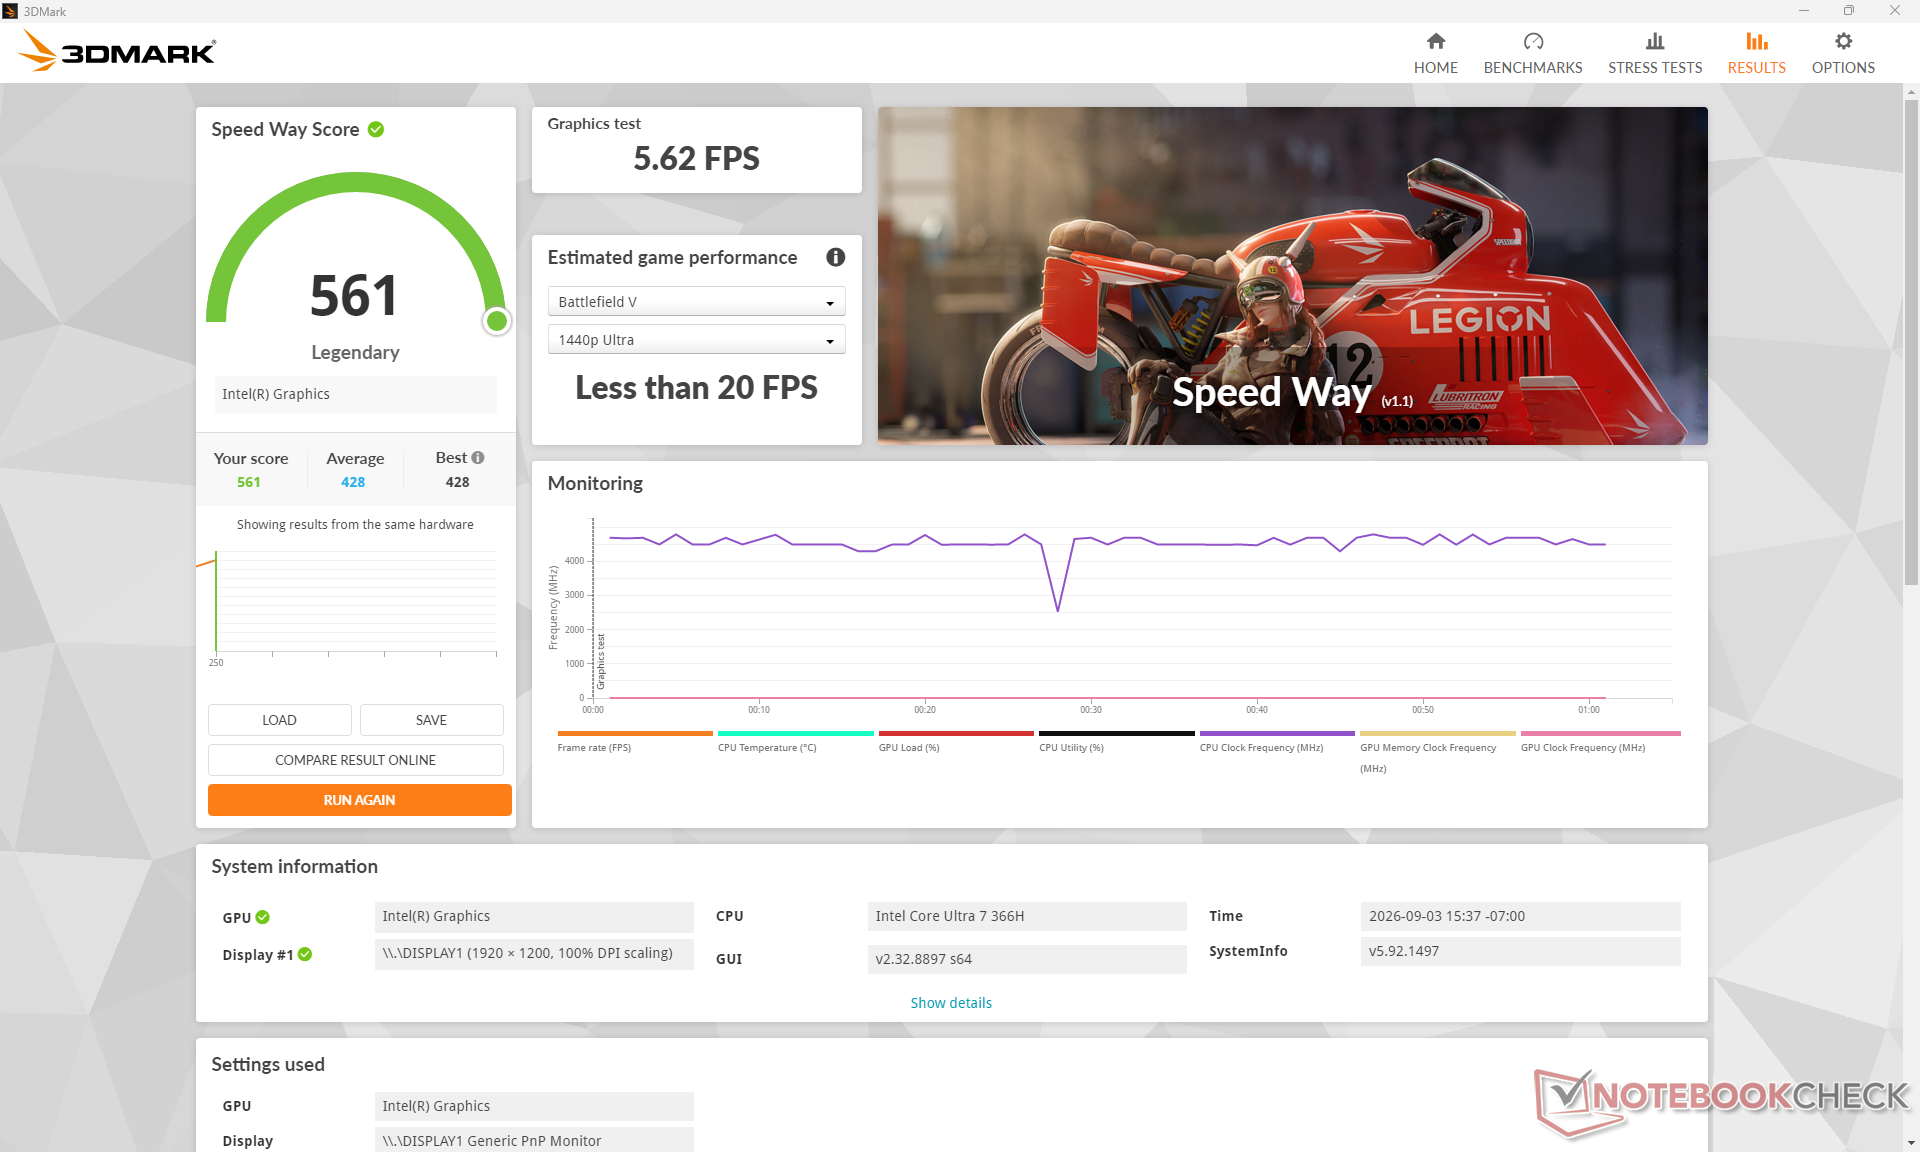
Speed Way
Speed Way
Time Spy
Time Spy
3DMark Performance rating - Percent
Asus ExpertBook Ultra B9406CAA
Intel Arc B390 12 Xe3 Panther Lake iGPU, Intel Core Ultra X7 358H
100 pt
Lenovo ThinkPad T14 Gen 6 21QG001VGE
Intel Arc Graphics 140V, Intel Core Ultra 7 258V
61.9 pt
Acer TravelMate P6 TMP614-54-TCO-553Z
Intel Arc Graphics 130V, Intel Core Ultra 5 226V
52 pt
Dell Pro 7 14 P714265
AMD Radeon 890M, AMD Ryzen AI 9 HX PRO 470
48.6 pt
Lenovo ThinkPad T14s Gen 7 21YW0022GE
AMD Radeon 860M, AMD Ryzen AI 7 PRO 450
48.4 pt
Dell Pro 7 14 P714260
Intel Graphics 4 Xe3 Panther Lake iGPU, Intel Core Ultra 7 366H
45 pt
HP EliteBook 8 G2a 14
AMD Radeon 860M, AMD Ryzen AI 7 450
44.8 pt
Asus ZenBook S14 UX5406AA
Intel Graphics 4 Xe3 Panther Lake iGPU, Intel Core Ultra 9 386H
43.5 pt
Dell 14S DS14260
Intel Graphics 4 Xe3 Panther Lake iGPU, Intel Core Ultra 7 355
41.3 pt
Media Intel Graphics 4 Xe3 Panther Lake iGPU
 
41.2 pt
Lenovo ThinkBook 14 G9 IPL 21UX005PGE
Intel Graphics 4 Xe3 Panther Lake iGPU, Intel Core Ultra 5 325
40.2 pt
3DMark 11 - 1280x720 Performance GPU
Asus ExpertBook Ultra B9406CAA
Intel Arc B390 12 Xe3 Panther Lake iGPU, Intel Core Ultra X7 358H
18313 Points +142%
Dell Pro 7 14 P714265
AMD Radeon 890M, AMD Ryzen AI 9 HX PRO 470
13767 Points +82%
Lenovo ThinkPad T14s Gen 7 21YW0022GE
AMD Radeon 860M, AMD Ryzen AI 7 PRO 450
11833 Points +56%
Lenovo ThinkPad T14 Gen 6 21QG001VGE
Intel Arc Graphics 140V, Intel Core Ultra 7 258V
11738 Points +55%
HP EliteBook 8 G2a 14
AMD Radeon 860M, AMD Ryzen AI 7 450
11677 Points +54%
Acer TravelMate P6 TMP614-54-TCO-553Z
Intel Arc Graphics 130V, Intel Core Ultra 5 226V
9765 Points +29%
Dell Pro 7 14 P714260
Intel Graphics 4 Xe3 Panther Lake iGPU, Intel Core Ultra 7 366H
7583 Points
Dell 14S DS14260
Intel Graphics 4 Xe3 Panther Lake iGPU, Intel Core Ultra 7 355
7563 Points 0%
Asus ZenBook S14 UX5406AA
Intel Graphics 4 Xe3 Panther Lake iGPU, Intel Core Ultra 9 386H
7334 Points -3%
Media Intel Graphics 4 Xe3 Panther Lake iGPU
  (5433 - 7678, n=19)
7100 Points -6%
Lenovo ThinkBook 14 G9 IPL 21UX005PGE
Intel Graphics 4 Xe3 Panther Lake iGPU, Intel Core Ultra 5 325
6519 Points -14%
3DMark
1920x1080 Fire Strike Graphics
Asus ExpertBook Ultra B9406CAA
Intel Arc B390 12 Xe3 Panther Lake iGPU, Intel Core Ultra X7 358H
17054 Points +130%
Lenovo ThinkPad T14 Gen 6 21QG001VGE
Intel Arc Graphics 140V, Intel Core Ultra 7 258V
10031 Points +35%
Acer TravelMate P6 TMP614-54-TCO-553Z
Intel Arc Graphics 130V, Intel Core Ultra 5 226V
8406 Points +13%
Lenovo ThinkPad T14s Gen 7 21YW0022GE
AMD Radeon 860M, AMD Ryzen AI 7 PRO 450
7459 Points +1%
HP EliteBook 8 G2a 14
AMD Radeon 860M, AMD Ryzen AI 7 450
7437 Points 0%
Dell Pro 7 14 P714260
Intel Graphics 4 Xe3 Panther Lake iGPU, Intel Core Ultra 7 366H
7415 Points
Dell 14S DS14260
Intel Graphics 4 Xe3 Panther Lake iGPU, Intel Core Ultra 7 355
7123 Points -4%
Asus ZenBook S14 UX5406AA
Intel Graphics 4 Xe3 Panther Lake iGPU, Intel Core Ultra 9 386H
6981 Points -6%
Media Intel Graphics 4 Xe3 Panther Lake iGPU
  (5127 - 7415, n=19)
6815 Points -8%
Dell Pro 7 14 P714265
AMD Radeon 890M, AMD Ryzen AI 9 HX PRO 470
6693 Points -10%
Lenovo ThinkBook 14 G9 IPL 21UX005PGE
Intel Graphics 4 Xe3 Panther Lake iGPU, Intel Core Ultra 5 325
6678 Points -10%
2560x1440 Time Spy Graphics
Asus ExpertBook Ultra B9406CAA
Intel Arc B390 12 Xe3 Panther Lake iGPU, Intel Core Ultra X7 358H
6679 Points +113%
Lenovo ThinkPad T14 Gen 6 21QG001VGE
Intel Arc Graphics 140V, Intel Core Ultra 7 258V
4180 Points +34%
Acer TravelMate P6 TMP614-54-TCO-553Z
Intel Arc Graphics 130V, Intel Core Ultra 5 226V
3543 Points +13%
Dell Pro 7 14 P714260
Intel Graphics 4 Xe3 Panther Lake iGPU, Intel Core Ultra 7 366H
3130 Points
Asus ZenBook S14 UX5406AA
Intel Graphics 4 Xe3 Panther Lake iGPU, Intel Core Ultra 9 386H
3044 Points -3%
Lenovo ThinkBook 14 G9 IPL 21UX005PGE
Intel Graphics 4 Xe3 Panther Lake iGPU, Intel Core Ultra 5 325
2856 Points -9%
Media Intel Graphics 4 Xe3 Panther Lake iGPU
  (2117 - 3136, n=19)
2838 Points -9%
Lenovo ThinkPad T14s Gen 7 21YW0022GE
AMD Radeon 860M, AMD Ryzen AI 7 PRO 450
2812 Points -10%
Dell 14S DS14260
Intel Graphics 4 Xe3 Panther Lake iGPU, Intel Core Ultra 7 355
2714 Points -13%
Dell Pro 7 14 P714265
AMD Radeon 890M, AMD Ryzen AI 9 HX PRO 470
2639 Points -16%
HP EliteBook 8 G2a 14
AMD Radeon 860M, AMD Ryzen AI 7 450
2355 Points -25%
2560x1440 Time Spy Score
Asus ExpertBook Ultra B9406CAA
Intel Arc B390 12 Xe3 Panther Lake iGPU, Intel Core Ultra X7 358H
7270 Points +107%
Lenovo ThinkPad T14 Gen 6 21QG001VGE
Intel Arc Graphics 140V, Intel Core Ultra 7 258V
4518 Points +29%
Acer TravelMate P6 TMP614-54-TCO-553Z
Intel Arc Graphics 130V, Intel Core Ultra 5 226V
3809 Points +8%
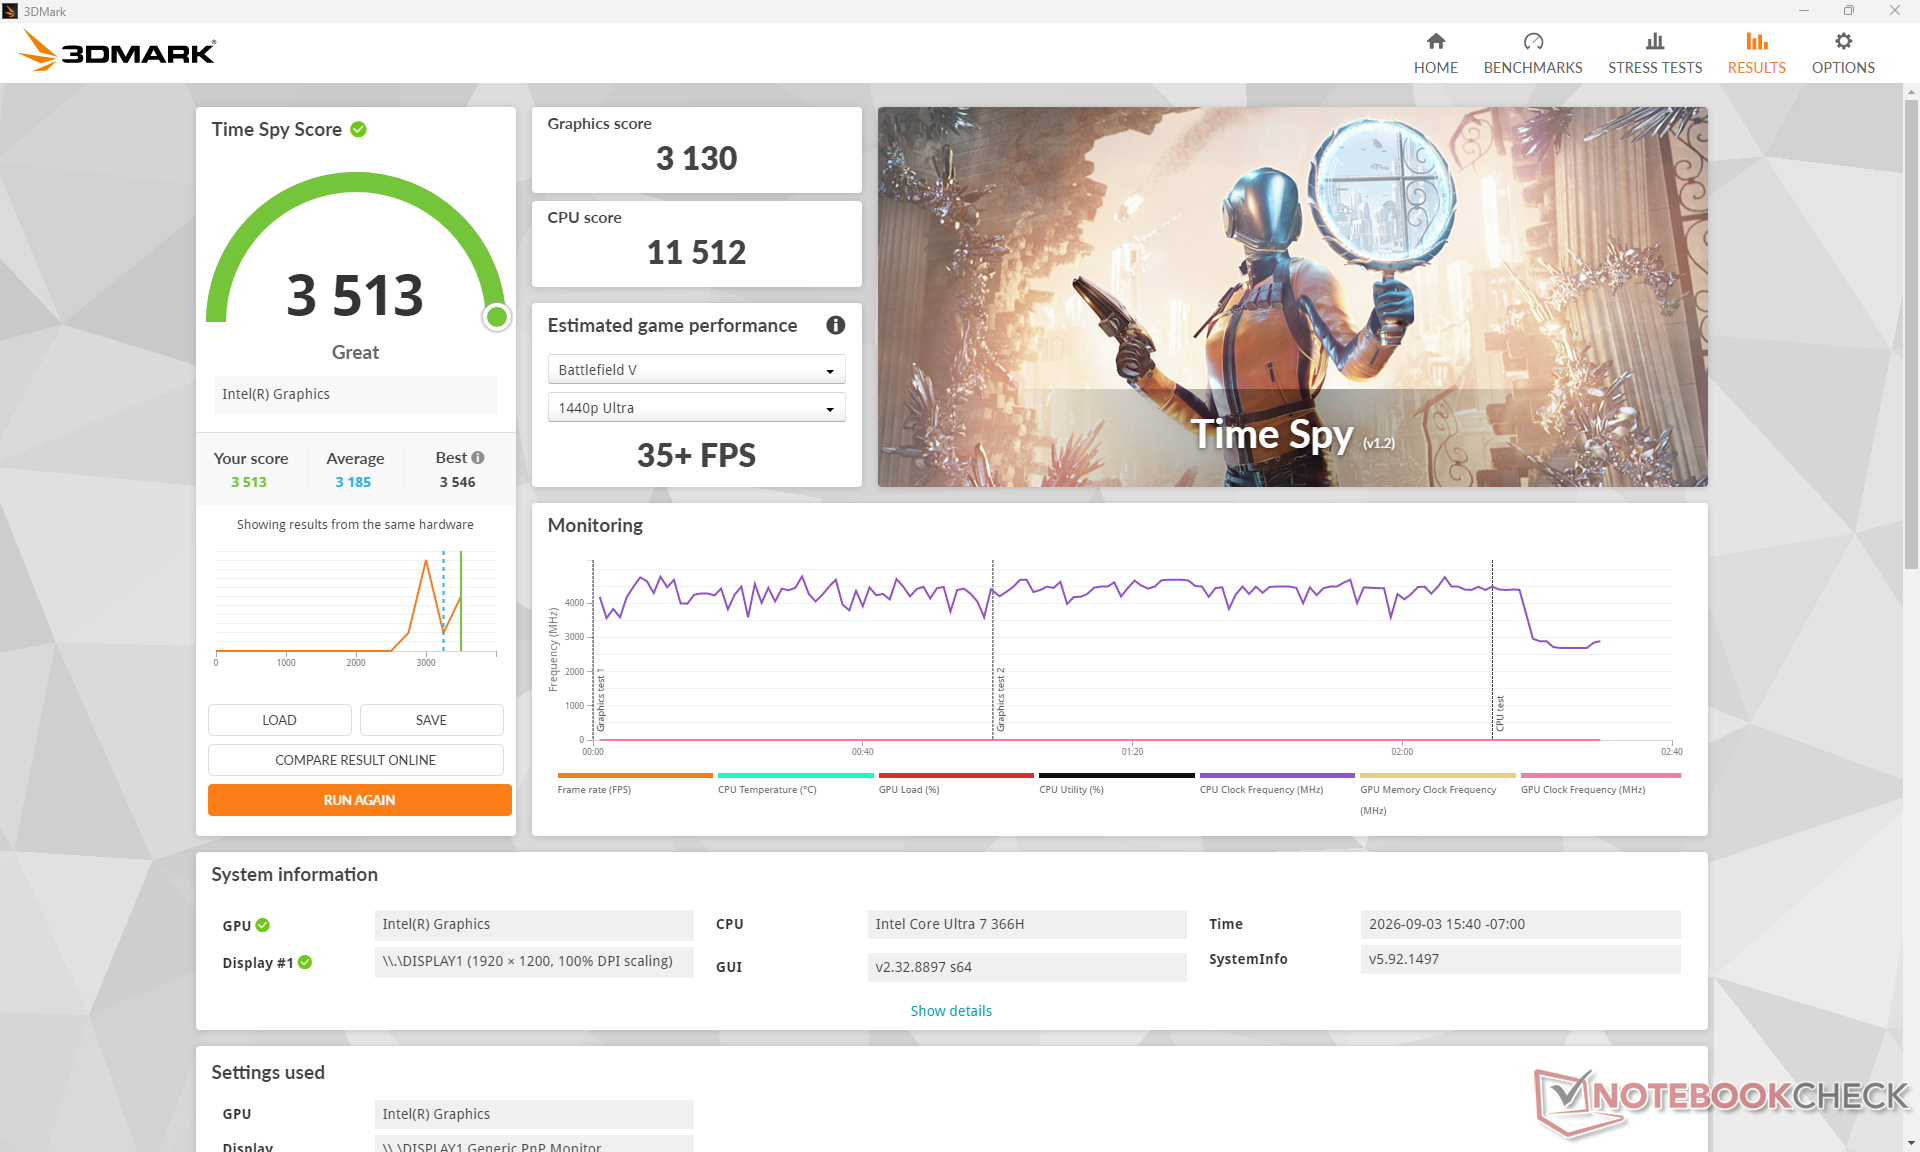
Dell Pro 7 14 P714260
Intel Graphics 4 Xe3 Panther Lake iGPU, Intel Core Ultra 7 366H
3513 Points
Asus ZenBook S14 UX5406AA
Intel Graphics 4 Xe3 Panther Lake iGPU, Intel Core Ultra 9 386H
3458 Points -2%
Media Intel Graphics 4 Xe3 Panther Lake iGPU
  (2392 - 3518, n=19)
3171 Points -10%
Lenovo ThinkBook 14 G9 IPL 21UX005PGE
Intel Graphics 4 Xe3 Panther Lake iGPU, Intel Core Ultra 5 325
3154 Points -10%
Lenovo ThinkPad T14s Gen 7 21YW0022GE
AMD Radeon 860M, AMD Ryzen AI 7 PRO 450
3148 Points -10%
Dell 14S DS14260
Intel Graphics 4 Xe3 Panther Lake iGPU, Intel Core Ultra 7 355
3012 Points -14%
Dell Pro 7 14 P714265
AMD Radeon 890M, AMD Ryzen AI 9 HX PRO 470
2954 Points -16%
HP EliteBook 8 G2a 14
AMD Radeon 860M, AMD Ryzen AI 7 450
2659 Points -24%
3DMark 11 Performance
8491 punti
3DMark Cloud Gate Standard Score
33645 punti
3DMark Fire Strike Score
6763 punti
3DMark Time Spy Score
3513 punti
Aiuto
Blender
v3.3 Classroom CPU
Acer TravelMate P6 TMP614-54-TCO-553Z
Intel Arc Graphics 130V, Intel Core Ultra 5 226V
569 Seconds * -60%
Lenovo ThinkPad T14 Gen 6 21QG001VGE
Intel Arc Graphics 140V, Intel Core Ultra 7 258V
552 Seconds * -55%
Lenovo ThinkBook 14 G9 IPL 21UX005PGE
Intel Graphics 4 Xe3 Panther Lake iGPU, Intel Core Ultra 5 325
526 Seconds * -48%
Dell 14S DS14260
Intel Graphics 4 Xe3 Panther Lake iGPU, Intel Core Ultra 7 355
503 Seconds * -42%
Media Intel Graphics 4 Xe3 Panther Lake iGPU
  (298 - 569, n=19)
428 Seconds * -21%
Dell Pro 7 14 P714260
Intel Graphics 4 Xe3 Panther Lake iGPU, Intel Core Ultra 7 366H
355 Seconds *
Lenovo ThinkPad T14s Gen 7 21YW0022GE
AMD Radeon 860M, AMD Ryzen AI 7 PRO 450
337 Seconds * +5%
Asus ZenBook S14 UX5406AA
Intel Graphics 4 Xe3 Panther Lake iGPU, Intel Core Ultra 9 386H
336 Seconds * +5%
HP EliteBook 8 G2a 14
AMD Radeon 860M, AMD Ryzen AI 7 450
316 Seconds * +11%
Asus ExpertBook Ultra B9406CAA
Intel Arc B390 12 Xe3 Panther Lake iGPU, Intel Core Ultra X7 358H
288 Seconds * +19%
Dell Pro 7 14 P714265
AMD Radeon 890M, AMD Ryzen AI 9 HX PRO 470
279 Seconds * +21%
v3.3 Classroom oneAPI/Intel
Media Intel Graphics 4 Xe3 Panther Lake iGPU
  (231 - 257, n=6)
242 Seconds *
Asus ExpertBook Ultra B9406CAA
Intel Arc B390 12 Xe3 Panther Lake iGPU, Intel Core Ultra X7 358H
110 Seconds *
v4.3 Barbershop CPU
Dell 14S DS14260
Intel Graphics 4 Xe3 Panther Lake iGPU, Intel Core Ultra 7 355
2714 Seconds * -29%
Media Intel Graphics 4 Xe3 Panther Lake iGPU
  (1505 - 2769, n=12)
2206 Seconds * -5%
Dell Pro 7 14 P714260
Intel Graphics 4 Xe3 Panther Lake iGPU, Intel Core Ultra 7 366H
2108 Seconds *
Dell Pro 7 14 P714265
AMD Radeon 890M, AMD Ryzen AI 9 HX PRO 470
1444 Seconds * +31%
Asus ExpertBook Ultra B9406CAA
Intel Arc B390 12 Xe3 Panther Lake iGPU, Intel Core Ultra X7 358H
1439 Seconds * +32%
v4.3 Barbershop oneAPI
Dell 14S DS14260
Intel Graphics 4 Xe3 Panther Lake iGPU, Intel Core Ultra 7 355
956 Seconds * -26%
Media Intel Graphics 4 Xe3 Panther Lake iGPU
  (758 - 1015, n=9)
897 Seconds * -18%
Dell Pro 7 14 P714260
Intel Graphics 4 Xe3 Panther Lake iGPU, Intel Core Ultra 7 366H
758 Seconds *
Asus ExpertBook Ultra B9406CAA
Intel Arc B390 12 Xe3 Panther Lake iGPU, Intel Core Ultra X7 358H
383 Seconds * +49%

* ... Meglio usare valori piccoli

Performance rating - Percent
Asus ExpertBook Ultra B9406CAA
Intel Core Ultra X7 358H, Intel Arc B390 12 Xe3 Panther Lake iGPU
98.6 pt
Dell Pro 7 14 P714265
AMD Ryzen AI 9 HX PRO 470, AMD Radeon 890M
64.7 pt
HP EliteBook 8 G2a 14
AMD Ryzen AI 7 450, AMD Radeon 860M
58.3 pt
Dell Pro 7 14 P714260
Intel Core Ultra 7 366H, Intel Graphics 4 Xe3 Panther Lake iGPU
57.6 pt
Lenovo ThinkPad T14s Gen 7 21YW0022GE
AMD Ryzen AI 7 PRO 450, AMD Radeon 860M
56 pt
Acer TravelMate P6 TMP614-54-TCO-553Z
Intel Core Ultra 5 226V, Intel Arc Graphics 130V
53.3 pt
Cyberpunk 2077 - 1920x1080 Ultra Preset (FSR off)
Asus ExpertBook Ultra B9406CAA
Intel Core Ultra X7 358H, Intel Arc B390 12 Xe3 Panther Lake iGPU
47.2 (39.1min, 36.3P1) fps +109%
Dell Pro 7 14 P714265
AMD Ryzen AI 9 HX PRO 470, AMD Radeon 890M
25.7 (21.4min, 20.2P1) fps +14%
Dell Pro 7 14 P714260
Intel Core Ultra 7 366H, Intel Graphics 4 Xe3 Panther Lake iGPU
22.6 (19.2min, 18.1P1) fps
HP EliteBook 8 G2a 14
AMD Ryzen AI 7 450, AMD Radeon 860M
18.6 (14.6min) fps -18%
Acer TravelMate P6 TMP614-54-TCO-553Z
Intel Core Ultra 5 226V, Intel Arc Graphics 130V
17.8 (14.6min, 13.6P1) fps -21%
Lenovo ThinkPad T14s Gen 7 21YW0022GE
AMD Ryzen AI 7 PRO 450, AMD Radeon 860M
17.7 (14.1min) fps -22%
Baldur's Gate 3 - 1920x1080 Ultra Preset AA:T
Asus ExpertBook Ultra B9406CAA
Intel Core Ultra X7 358H, Intel Arc B390 12 Xe3 Panther Lake iGPU
53.4 (45.4min, 46.4P0.1, 49.5P1) fps +127%
Dell Pro 7 14 P714265
AMD Ryzen AI 9 HX PRO 470, AMD Radeon 890M
27 (20.4min, 20.6P0.1, 24.1P1) fps +15%
Dell Pro 7 14 P714260
Intel Core Ultra 7 366H, Intel Graphics 4 Xe3 Panther Lake iGPU
23.5 (21min, 21.3P0.1, 21.8P1) fps
Acer TravelMate P6 TMP614-54-TCO-553Z
Intel Core Ultra 5 226V, Intel Arc Graphics 130V
23.3 (18.3min, 19.6P0.1, 20.9P1) fps -1%
Lenovo ThinkPad T14s Gen 7 21YW0022GE
AMD Ryzen AI 7 PRO 450, AMD Radeon 860M
17.9 (14.8min, 15.2P0.1, 16.1P1) fps -24%
HP EliteBook 8 G2a 14
AMD Ryzen AI 7 450, AMD Radeon 860M
17.9 (15.2min, 15.3P0.1, 16.4P1) fps -24%
GTA V - 1920x1080 Highest AA:4xMSAA + FX AF:16x
Asus ExpertBook Ultra B9406CAA
Intel Core Ultra X7 358H, Intel Arc B390 12 Xe3 Panther Lake iGPU
45.3 (11.1min, 34.5P1) fps +90%
Dell Pro 7 14 P714265
AMD Ryzen AI 9 HX PRO 470, AMD Radeon 890M
32.8 (4.62min, 23.8P1) fps +38%
HP EliteBook 8 G2a 14
AMD Ryzen AI 7 450, AMD Radeon 860M
29.1 (6.9min, 20.4P1) fps +22%
Lenovo ThinkPad T14s Gen 7 21YW0022GE
AMD Ryzen AI 7 PRO 450, AMD Radeon 860M
25.4 (4.78min, 18.2P1) fps +7%
Dell Pro 7 14 P714260
Intel Core Ultra 7 366H, Intel Graphics 4 Xe3 Panther Lake iGPU
23.8 (5.94min, 18.9P1) fps
Acer TravelMate P6 TMP614-54-TCO-553Z
Intel Core Ultra 5 226V, Intel Arc Graphics 130V
22 (2.37min, 10.8P1) fps -8%
Final Fantasy XV Benchmark - 1920x1080 High Quality
Asus ExpertBook Ultra B9406CAA
Intel Core Ultra X7 358H, Intel Arc B390 12 Xe3 Panther Lake iGPU
55.4 fps +102%
Dell Pro 7 14 P714265
AMD Ryzen AI 9 HX PRO 470, AMD Radeon 890M
30.4 fps +11%
Acer TravelMate P6 TMP614-54-TCO-553Z
Intel Core Ultra 5 226V, Intel Arc Graphics 130V
27.4 fps 0%
Dell Pro 7 14 P714260
Intel Core Ultra 7 366H, Intel Graphics 4 Xe3 Panther Lake iGPU
27.4 fps
Lenovo ThinkPad T14s Gen 7 21YW0022GE
AMD Ryzen AI 7 PRO 450, AMD Radeon 860M
26.8 fps -2%
HP EliteBook 8 G2a 14
AMD Ryzen AI 7 450, AMD Radeon 860M
26.1 fps -5%
Strange Brigade - 1920x1080 ultra AA:ultra AF:16
Asus ExpertBook Ultra B9406CAA
Intel Core Ultra X7 358H, Intel Arc B390 12 Xe3 Panther Lake iGPU
99.5 (24.8min, 76.1P1) fps +90%
Dell Pro 7 14 P714260
Intel Core Ultra 7 366H, Intel Graphics 4 Xe3 Panther Lake iGPU
52.4 (34.3min, 38.9P1) fps
Dell Pro 7 14 P714265
AMD Ryzen AI 9 HX PRO 470, AMD Radeon 890M
51.7 (33min, 38.9P1) fps -1%
Lenovo ThinkPad T14s Gen 7 21YW0022GE
AMD Ryzen AI 7 PRO 450, AMD Radeon 860M
44.4 (33min, 34.8P1) fps -15%
HP EliteBook 8 G2a 14
AMD Ryzen AI 7 450, AMD Radeon 860M
44.4 (29.6min, 35.2P1) fps -15%
Acer TravelMate P6 TMP614-54-TCO-553Z
Intel Core Ultra 5 226V, Intel Arc Graphics 130V
43.6 (9.9min, 15.8P1) fps -17%
Dota 2 Reborn - 1920x1080 ultra (3/3) best looking
Asus ExpertBook Ultra B9406CAA
Intel Core Ultra X7 358H, Intel Arc B390 12 Xe3 Panther Lake iGPU
102.5 (67.7min) fps +12%
Dell Pro 7 14 P714260
Intel Core Ultra 7 366H, Intel Graphics 4 Xe3 Panther Lake iGPU
91.7 (61.9min) fps
Acer TravelMate P6 TMP614-54-TCO-553Z
Intel Core Ultra 5 226V, Intel Arc Graphics 130V
84.3 (51.1min) fps -8%
HP EliteBook 8 G2a 14
AMD Ryzen AI 7 450, AMD Radeon 860M
81.4 (72.4min) fps -11%
Lenovo ThinkPad T14s Gen 7 21YW0022GE
AMD Ryzen AI 7 PRO 450, AMD Radeon 860M
81.3 (71.8min) fps -11%
Dell Pro 7 14 P714265
AMD Ryzen AI 9 HX PRO 470, AMD Radeon 890M
79.2 (63.3min) fps -14%
X-Plane 11.11 - 1920x1080 high (fps_test=3)
HP EliteBook 8 G2a 14
AMD Ryzen AI 7 450, AMD Radeon 860M
43.9 fps +49%
Lenovo ThinkPad T14s Gen 7 21YW0022GE
AMD Ryzen AI 7 PRO 450, AMD Radeon 860M
40.7 fps +38%
Dell Pro 7 14 P714265
AMD Ryzen AI 9 HX PRO 470, AMD Radeon 890M
40.2 fps +36%
Asus ExpertBook Ultra B9406CAA
Intel Core Ultra X7 358H, Intel Arc B390 12 Xe3 Panther Lake iGPU
39.7 fps +35%
Acer TravelMate P6 TMP614-54-TCO-553Z
Intel Core Ultra 5 226V, Intel Arc Graphics 130V
29.8 fps +1%
Dell Pro 7 14 P714260
Intel Core Ultra 7 366H, Intel Graphics 4 Xe3 Panther Lake iGPU
29.5 fps
GTA V - 1920x1080 Highest AA:4xMSAA + FX AF:16x
Asus ExpertBook Ultra B9406CAA
Intel Core Ultra X7 358H, Intel Arc B390 12 Xe3 Panther Lake iGPU
45.3 (11.1min, 34.5P1) fps +90%
Dell Pro 7 14 P714265
AMD Ryzen AI 9 HX PRO 470, AMD Radeon 890M
32.8 (4.62min, 23.8P1) fps +38%
HP EliteBook 8 G2a 14
AMD Ryzen AI 7 450, AMD Radeon 860M
29.1 (6.9min, 20.4P1) fps +22%
Lenovo ThinkPad T14s Gen 7 21YW0022GE
AMD Ryzen AI 7 PRO 450, AMD Radeon 860M
25.4 (4.78min, 18.2P1) fps +7%
Dell Pro 7 14 P714260
Intel Core Ultra 7 366H, Intel Graphics 4 Xe3 Panther Lake iGPU
23.8 (5.94min, 18.9P1) fps
Acer TravelMate P6 TMP614-54-TCO-553Z
Intel Core Ultra 5 226V, Intel Arc Graphics 130V
22 (2.37min, 10.8P1) fps -8%
Media Intel Graphics 4 Xe3 Panther Lake iGPU
  (15.7 - 23.8, n=18)
20.9 fps -12%
Dota 2 Reborn - 1920x1080 ultra (3/3) best looking
Asus ExpertBook Ultra B9406CAA
Intel Core Ultra X7 358H, Intel Arc B390 12 Xe3 Panther Lake iGPU
102.5 (67.7min) fps +12%
Dell Pro 7 14 P714260
Intel Core Ultra 7 366H, Intel Graphics 4 Xe3 Panther Lake iGPU
91.7 (61.9min) fps
Acer TravelMate P6 TMP614-54-TCO-553Z
Intel Core Ultra 5 226V, Intel Arc Graphics 130V
84.3 (51.1min) fps -8%
HP EliteBook 8 G2a 14
AMD Ryzen AI 7 450, AMD Radeon 860M
81.4 (72.4min) fps -11%
Lenovo ThinkPad T14s Gen 7 21YW0022GE
AMD Ryzen AI 7 PRO 450, AMD Radeon 860M
81.3 (71.8min) fps -11%
Dell Pro 7 14 P714265
AMD Ryzen AI 9 HX PRO 470, AMD Radeon 890M
79.2 (63.3min) fps -14%
Media Intel Graphics 4 Xe3 Panther Lake iGPU
  (65.7 - 91.7, n=19)
78.2 fps -15%
Final Fantasy XV Benchmark
1920x1080 Standard Quality
Asus ExpertBook Ultra B9406CAA
Intel Core Ultra X7 358H, Intel Arc B390 12 Xe3 Panther Lake iGPU
76.1 fps +105%
Dell Pro 7 14 P714265
AMD Ryzen AI 9 HX PRO 470, AMD Radeon 890M
41.3 fps +11%
Acer TravelMate P6 TMP614-54-TCO-553Z
Intel Core Ultra 5 226V, Intel Arc Graphics 130V
41.1 fps +10%
Dell Pro 7 14 P714260
Intel Core Ultra 7 366H, Intel Graphics 4 Xe3 Panther Lake iGPU
37.2 fps
Lenovo ThinkPad T14s Gen 7 21YW0022GE
AMD Ryzen AI 7 PRO 450, AMD Radeon 860M
36.4 fps -2%
HP EliteBook 8 G2a 14
AMD Ryzen AI 7 450, AMD Radeon 860M
36.1 fps -3%
Media Intel Graphics 4 Xe3 Panther Lake iGPU
  (29 - 39.5, n=18)
35.6 fps -4%
1920x1080 High Quality
Asus ExpertBook Ultra B9406CAA
Intel Core Ultra X7 358H, Intel Arc B390 12 Xe3 Panther Lake iGPU
55.4 fps +102%
Dell Pro 7 14 P714265
AMD Ryzen AI 9 HX PRO 470, AMD Radeon 890M
30.4 fps +11%
Acer TravelMate P6 TMP614-54-TCO-553Z
Intel Core Ultra 5 226V, Intel Arc Graphics 130V
27.4 fps 0%
Dell Pro 7 14 P714260
Intel Core Ultra 7 366H, Intel Graphics 4 Xe3 Panther Lake iGPU
27.4 fps
Lenovo ThinkPad T14s Gen 7 21YW0022GE
AMD Ryzen AI 7 PRO 450, AMD Radeon 860M
26.8 fps -2%
HP EliteBook 8 G2a 14
AMD Ryzen AI 7 450, AMD Radeon 860M
26.1 fps -5%
Media Intel Graphics 4 Xe3 Panther Lake iGPU
  (21.7 - 27.4, n=18)
25.6 fps -7%
X-Plane 11.11 - 1920x1080 high (fps_test=3)
HP EliteBook 8 G2a 14
AMD Ryzen AI 7 450, AMD Radeon 860M
43.9 fps +49%
Lenovo ThinkPad T14s Gen 7 21YW0022GE
AMD Ryzen AI 7 PRO 450, AMD Radeon 860M
40.7 fps +38%
Dell Pro 7 14 P714265
AMD Ryzen AI 9 HX PRO 470, AMD Radeon 890M
40.2 fps +36%
Asus ExpertBook Ultra B9406CAA
Intel Core Ultra X7 358H, Intel Arc B390 12 Xe3 Panther Lake iGPU
39.7 fps +35%
Acer TravelMate P6 TMP614-54-TCO-553Z
Intel Core Ultra 5 226V, Intel Arc Graphics 130V
29.8 fps +1%
Dell Pro 7 14 P714260
Intel Core Ultra 7 366H, Intel Graphics 4 Xe3 Panther Lake iGPU
29.5 fps
Media Intel Graphics 4 Xe3 Panther Lake iGPU
  (22.9 - 33.2, n=19)
28.8 fps -2%
Strange Brigade
1920x1080 high AA:high AF:8
Asus ExpertBook Ultra B9406CAA
Intel Core Ultra X7 358H, Intel Arc B390 12 Xe3 Panther Lake iGPU
107.6 (64.5min, 89P1) fps +74%
Dell Pro 7 14 P714260
Intel Core Ultra 7 366H, Intel Graphics 4 Xe3 Panther Lake iGPU
61.9 (39.3min, 46.7P1) fps
Dell Pro 7 14 P714265
AMD Ryzen AI 9 HX PRO 470, AMD Radeon 890M
60.8 (40.2min, 45.9P1) fps -2%
Acer TravelMate P6 TMP614-54-TCO-553Z
Intel Core Ultra 5 226V, Intel Arc Graphics 130V
55.2 (11min, 28.5P1) fps -11%
Media Intel Graphics 4 Xe3 Panther Lake iGPU
  (35.9 - 64.1, n=15)
54.4 fps -12%
Lenovo ThinkPad T14s Gen 7 21YW0022GE
AMD Ryzen AI 7 PRO 450, AMD Radeon 860M
52 (35.9min, 40.8P1) fps -16%
HP EliteBook 8 G2a 14
AMD Ryzen AI 7 450, AMD Radeon 860M
50.5 (37.4min, 40.8P1) fps -18%
1920x1080 ultra AA:ultra AF:16
Asus ExpertBook Ultra B9406CAA
Intel Core Ultra X7 358H, Intel Arc B390 12 Xe3 Panther Lake iGPU
99.5 (24.8min, 76.1P1) fps +90%
Dell Pro 7 14 P714260
Intel Core Ultra 7 366H, Intel Graphics 4 Xe3 Panther Lake iGPU
52.4 (34.3min, 38.9P1) fps
Dell Pro 7 14 P714265
AMD Ryzen AI 9 HX PRO 470, AMD Radeon 890M
51.7 (33min, 38.9P1) fps -1%
Media Intel Graphics 4 Xe3 Panther Lake iGPU
  (28.9 - 56.5, n=15)
47.6 fps -9%
Lenovo ThinkPad T14s Gen 7 21YW0022GE
AMD Ryzen AI 7 PRO 450, AMD Radeon 860M
44.4 (33min, 34.8P1) fps -15%
HP EliteBook 8 G2a 14
AMD Ryzen AI 7 450, AMD Radeon 860M
44.4 (29.6min, 35.2P1) fps -15%
Acer TravelMate P6 TMP614-54-TCO-553Z
Intel Core Ultra 5 226V, Intel Arc Graphics 130V
43.6 (9.9min, 15.8P1) fps -17%
Baldur's Gate 3
1920x1080 High Preset AA:T
Asus ExpertBook Ultra B9406CAA
Intel Core Ultra X7 358H, Intel Arc B390 12 Xe3 Panther Lake iGPU
54.3 (45.6min, 47.8P0.1, 50P1) fps +127%
Dell Pro 7 14 P714265
AMD Ryzen AI 9 HX PRO 470, AMD Radeon 890M
28 (19.9min, 20.6P0.1, 25.7P1) fps +17%
Acer TravelMate P6 TMP614-54-TCO-553Z
Intel Core Ultra 5 226V, Intel Arc Graphics 130V
24 (21.5min, 21.7P0.1, 22P1) fps 0%
Dell Pro 7 14 P714260
Intel Core Ultra 7 366H, Intel Graphics 4 Xe3 Panther Lake iGPU
23.9 (21.6min, 21.8P0.1, 22.5P1) fps
Media Intel Graphics 4 Xe3 Panther Lake iGPU
  (18 - 24.3, n=18)
21.4 fps -10%
Lenovo ThinkPad T14s Gen 7 21YW0022GE
AMD Ryzen AI 7 PRO 450, AMD Radeon 860M
18.2 (14.8min, 15P0.1, 16.7P1) fps -24%
HP EliteBook 8 G2a 14
AMD Ryzen AI 7 450, AMD Radeon 860M
18.1 (15.2min, 15.5P0.1, 16.6P1) fps -24%
1920x1080 Ultra Preset AA:T
Asus ExpertBook Ultra B9406CAA
Intel Core Ultra X7 358H, Intel Arc B390 12 Xe3 Panther Lake iGPU
53.4 (45.4min, 46.4P0.1, 49.5P1) fps +127%
Dell Pro 7 14 P714265
AMD Ryzen AI 9 HX PRO 470, AMD Radeon 890M
27 (20.4min, 20.6P0.1, 24.1P1) fps +15%
Dell Pro 7 14 P714260
Intel Core Ultra 7 366H, Intel Graphics 4 Xe3 Panther Lake iGPU
23.5 (21min, 21.3P0.1, 21.8P1) fps
Acer TravelMate P6 TMP614-54-TCO-553Z
Intel Core Ultra 5 226V, Intel Arc Graphics 130V
23.3 (18.3min, 19.6P0.1, 20.9P1) fps -1%
Media Intel Graphics 4 Xe3 Panther Lake iGPU
  (17.7 - 23.7, n=18)
21 fps -11%
Lenovo ThinkPad T14s Gen 7 21YW0022GE
AMD Ryzen AI 7 PRO 450, AMD Radeon 860M
17.9 (14.8min, 15.2P0.1, 16.1P1) fps -24%
HP EliteBook 8 G2a 14
AMD Ryzen AI 7 450, AMD Radeon 860M
17.9 (15.2min, 15.3P0.1, 16.4P1) fps -24%
Cyberpunk 2077
1920x1080 Medium Preset (FSR off)
Asus ExpertBook Ultra B9406CAA
Intel Core Ultra X7 358H, Intel Arc B390 12 Xe3 Panther Lake iGPU
63.1 (54.6min, 52.4P1) fps +104%
Dell Pro 7 14 P714265
AMD Ryzen AI 9 HX PRO 470, AMD Radeon 890M
38.6 (33.4min, 31.9P1) fps +25%
Acer TravelMate P6 TMP614-54-TCO-553Z
Intel Core Ultra 5 226V, Intel Arc Graphics 130V
33.2 (28.7min, 27.5P1) fps +7%
Dell Pro 7 14 P714260
Intel Core Ultra 7 366H, Intel Graphics 4 Xe3 Panther Lake iGPU
30.9 (27min, 26P1) fps
HP EliteBook 8 G2a 14
AMD Ryzen AI 7 450, AMD Radeon 860M
28.2 (23.4min) fps -9%
Media Intel Graphics 4 Xe3 Panther Lake iGPU
  (23.6 - 30.9, n=19)
28 fps -9%
Lenovo ThinkPad T14s Gen 7 21YW0022GE
AMD Ryzen AI 7 PRO 450, AMD Radeon 860M
27.7 (22.9min) fps -10%
1920x1080 High Preset (FSR off)
Asus ExpertBook Ultra B9406CAA
Intel Core Ultra X7 358H, Intel Arc B390 12 Xe3 Panther Lake iGPU
53.8 (46.6min, 44.7P1) fps +101%
Dell Pro 7 14 P714265
AMD Ryzen AI 9 HX PRO 470, AMD Radeon 890M
29.7 (25min, 23.6P1) fps +11%
Dell Pro 7 14 P714260
Intel Core Ultra 7 366H, Intel Graphics 4 Xe3 Panther Lake iGPU
26.8 (23.1min, 22.2P1) fps
Acer TravelMate P6 TMP614-54-TCO-553Z
Intel Core Ultra 5 226V, Intel Arc Graphics 130V
26.5 (17.8min, 12.9P1) fps -1%
Acer TravelMate P6 TMP614-54-TCO-553Z
Intel Core Ultra 5 226V, Intel Arc Graphics 130V
23.7 (20.4min, 19.6P1) fps -12%
Media Intel Graphics 4 Xe3 Panther Lake iGPU
  (20.4 - 26.8, n=19)
23.7 fps -12%
HP EliteBook 8 G2a 14
AMD Ryzen AI 7 450, AMD Radeon 860M
22.2 (18.2min) fps -17%
Lenovo ThinkPad T14s Gen 7 21YW0022GE
AMD Ryzen AI 7 PRO 450, AMD Radeon 860M
21.6 (17.5min) fps -19%
1920x1080 Ultra Preset (FSR off)
Asus ExpertBook Ultra B9406CAA
Intel Core Ultra X7 358H, Intel Arc B390 12 Xe3 Panther Lake iGPU
47.2 (39.1min, 36.3P1) fps +109%
Dell Pro 7 14 P714265
AMD Ryzen AI 9 HX PRO 470, AMD Radeon 890M
25.7 (21.4min, 20.2P1) fps +14%
Dell Pro 7 14 P714260
Intel Core Ultra 7 366H, Intel Graphics 4 Xe3 Panther Lake iGPU
22.6 (19.2min, 18.1P1) fps
Media Intel Graphics 4 Xe3 Panther Lake iGPU
  (16.8 - 22.6, n=19)
20.1 fps -11%
HP EliteBook 8 G2a 14
AMD Ryzen AI 7 450, AMD Radeon 860M
18.6 (14.6min) fps -18%
Acer TravelMate P6 TMP614-54-TCO-553Z
Intel Core Ultra 5 226V, Intel Arc Graphics 130V
17.8 (14.6min, 13.6P1) fps -21%
Lenovo ThinkPad T14s Gen 7 21YW0022GE
AMD Ryzen AI 7 PRO 450, AMD Radeon 860M
17.7 (14.1min) fps -22%
F1 24
1920x1080 High Preset AA:T AF:16x
Asus ExpertBook Ultra B9406CAA
Intel Core Ultra X7 358H, Intel Arc B390 12 Xe3 Panther Lake iGPU
104.3 (91min, 76P1) fps +107%
Dell Pro 7 14 P714265
AMD Ryzen AI 9 HX PRO 470, AMD Radeon 890M
56 (46min, 39P1) fps +11%
Dell Pro 7 14 P714260
Intel Core Ultra 7 366H, Intel Graphics 4 Xe3 Panther Lake iGPU
50.3 (42min, 40P1) fps
Lenovo ThinkPad T14s Gen 7 21YW0022GE
AMD Ryzen AI 7 PRO 450, AMD Radeon 860M
45.8 (37min, 33P1) fps -9%
Media Intel Graphics 4 Xe3 Panther Lake iGPU
  (37.7 - 50.5, n=14)
44.8 fps -11%
HP EliteBook 8 G2a 14
AMD Ryzen AI 7 450, AMD Radeon 860M
42.8 (35min, 35P1) fps -15%
1920x1080 Ultra High Preset AA:T AF:16x
Asus ExpertBook Ultra B9406CAA
Intel Core Ultra X7 358H, Intel Arc B390 12 Xe3 Panther Lake iGPU
38 (31min, 30P1) fps +166%
Dell Pro 7 14 P714265
AMD Ryzen AI 9 HX PRO 470, AMD Radeon 890M
15 (9min, 8P1) fps +5%
Dell Pro 7 14 P714260
Intel Core Ultra 7 366H, Intel Graphics 4 Xe3 Panther Lake iGPU
14.3 (12min, 10P1) fps
Media Intel Graphics 4 Xe3 Panther Lake iGPU
  (11.4 - 15.3, n=14)
14.1 fps -1%
Lenovo ThinkPad T14s Gen 7 21YW0022GE
AMD Ryzen AI 7 PRO 450, AMD Radeon 860M
10.8 (8min, 8P1) fps -24%
HP EliteBook 8 G2a 14
AMD Ryzen AI 7 450, AMD Radeon 860M
10.6 (8min, 8P1) fps -26%

Grafico degli FPS in modalità Ultra di Cyberpunk 2077

0510152025Tooltip
Dell Pro 7 14 P714260 Ultra 7 366H, Intel Graphics 4 Xe3 PTL: Ø19.9 (18-21.6) fps
Dell Pro 7 14 P714265 Ryzen AI 9 HX PRO 470, Radeon 890M: Ø24.4 (21.6-26.7) fps
bassomedioaltoultra
GTA V (2015) 177.4 168.9 51.5 23.8
Dota 2 Reborn (2015) 177 73.5 97.8 91.7
Final Fantasy XV Benchmark (2018) 74.4 37.2 27.4
X-Plane 11.11 (2018) 45.7 37 29.5
Strange Brigade (2018) 197.9 77.1 61.9 52.4
Baldur's Gate 3 (2023) 33.1 27.4 23.9 23.5
Cyberpunk 2077 (2023) 40.2 30.9 26.8 22.6
F1 24 (2024) 73.4 67.6 50.3 14.3

Emissioni

Rumore di sistema

Profilo di rumorosità della ventola (Bianco: Sfondo, Rosso: Sistema inattivo, Blu: 3DMark 11, Arancione: Cyberpunk 2077, Verde: Stress test Prime95+FurMark)

Rumorosità

Idle
23.8 / 23.8 / 23.8 dB(A)
Sotto carico
31.9 / 46.3 dB(A)
  red to green bar
 
 
30 dB
silenzioso
40 dB(A)
udibile
50 dB(A)
rumoroso
 
min: dark, med: mid, max: light   Earthworks M23R, Arta (15 cm di distanza)   Rumorosità ambientale: 23.3 dB(A)
dB(A) 0102030405060708090Deep BassMiddle BassHigh BassLower RangeMidsHigher MidsLower HighsMid HighsUpper HighsSuper Highs2038.338.135.836.435.72521.424.323.525.523.23119.222.223.122.119.1401819.719.618.8195027.233.832.132.624.66320.622.921.32222.88018.42317.719.420.510016.222.218.217.819.512515.319.214.213.417.716015.621.514.114.721.520020.522.815.114.723.725021.224.514.714.324.431518.826.118.51626.940017.828.916.314.729.250015.928.213.812.328.663016.730.313.311.230.480018.931.811.411.332100019.932.69.99.932.3125020.632.69.79.632.6160022.634.59.89.834.5200021.333.91010.333.7250021.735.210.310.435.4315021.635.310.910.935.3400020.535.811.11135.7500018.936.511.411.236.663001535.711.411.436800014.134.211.811.634.21000012.630.411.811.530.51250011.626.511.611.326.61600010.8221110.622.1SPL31.946.123.823.346.1N1.55.30.50.55.3median 18.8median 30.4median 11.6median 11.3median 30.5Delta2.75.521.65.3hearing rangehide median Fan NoiseDell Pro 7 14 P714260
Dell Pro 7 14 P714260
Ultra 7 366H, Intel Graphics 4 Xe3 PTL
Dell Pro 7 14 P714265
Ryzen AI 9 HX PRO 470, Radeon 890M
HP EliteBook 8 G2a 14
Ryzen AI 7 450, Radeon 860M
Lenovo ThinkPad T14s Gen 7 21YW0022GE
Ryzen AI 7 PRO 450, Radeon 860M
Asus ExpertBook Ultra B9406CAA
Ultra X7 358H, Arc B390 Panther Lake iGPU
Acer TravelMate P6 TMP614-54-TCO-553Z
Core Ultra 5 226V, Arc 130V
Noise
1%
3%
-2%
4%
-5%
off /ambiente * (dB)
23.3
23.2
-0%
23.9
-3%
24.8
-6%
22.9
2%
25.4
-9%
Idle Minimum * (dB)
23.8
23.2
3%
23.9
-0%
24.8
-4%
23.4
2%
25.4
-7%
Idle Average * (dB)
23.8
23.2
3%
23.9
-0%
24.8
-4%
23.4
2%
25.4
-7%
Idle Maximum * (dB)
23.8
23.2
3%
23.9
-0%
24.8
-4%
23.4
2%
25.7
-8%
Load Average * (dB)
31.9
37.5
-18%
35.3
-11%
36.7
-15%
28.6
10%
Cyberpunk 2077 ultra * (dB)
46.1
37.7
18%
38
18%
41.6
10%
42.8
7%
44.72
3%
Load Maximum * (dB)
46.3
47.1
-2%
38
18%
41.6
10%
45.2
2%
47.4
-2%

* ... Meglio usare valori piccoli

Temperatura
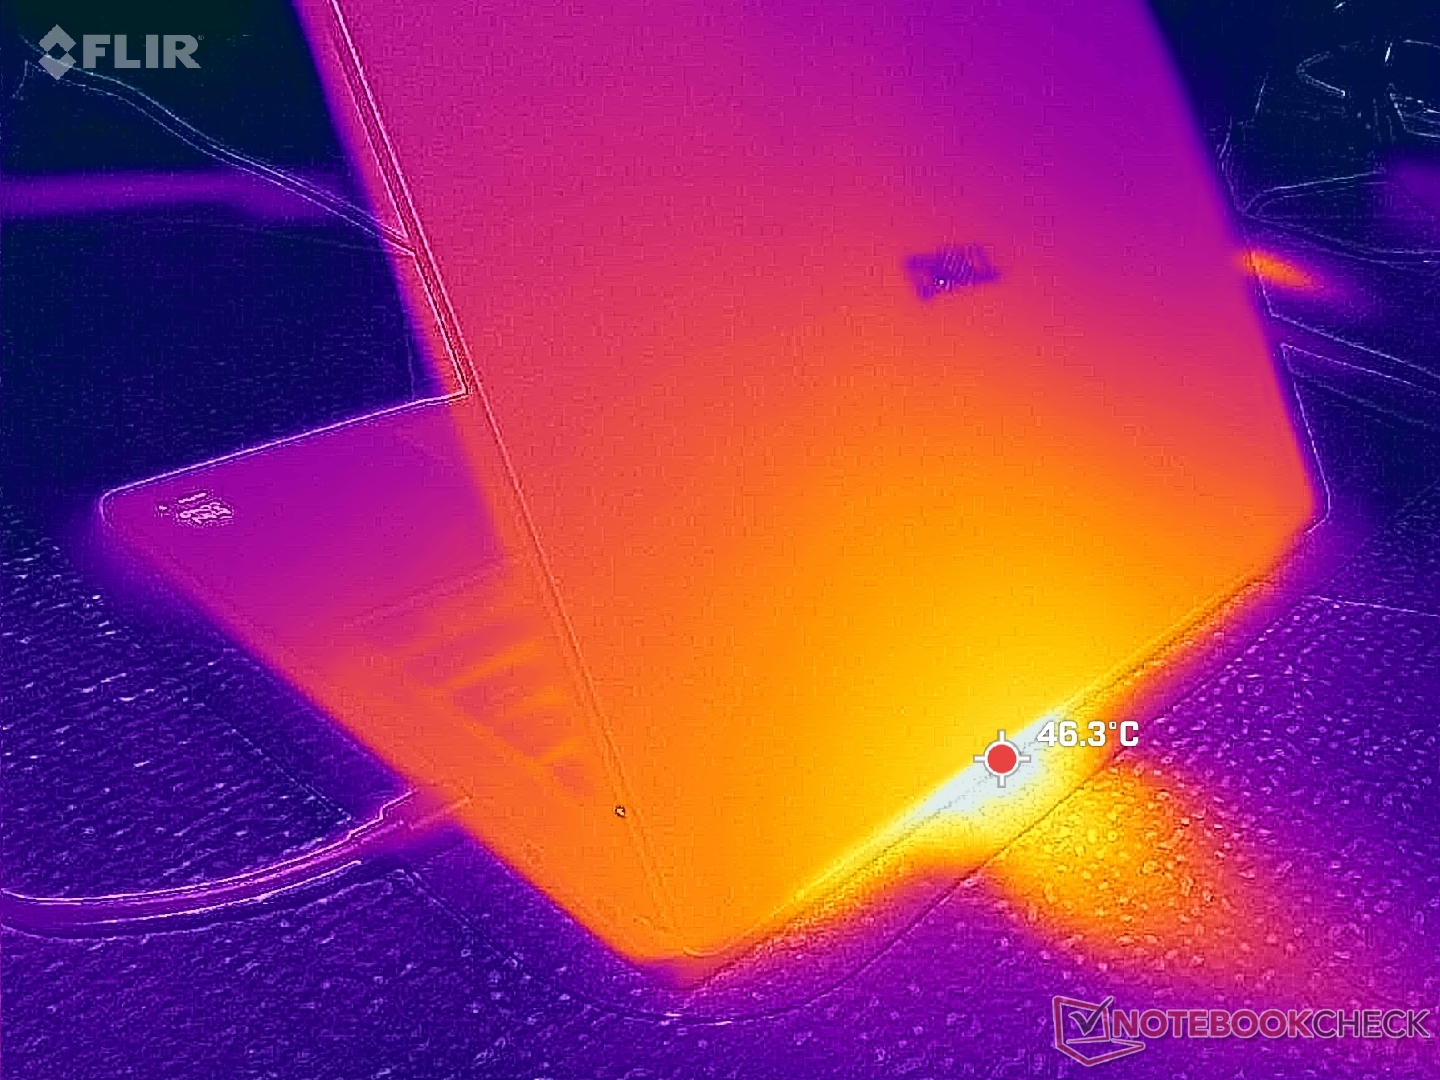
Scarico posteriore
Scarico posteriore
L’alimentatore raggiunge una temperatura superiore a 42 °C quando è sottoposto a carichi elevati
Carico massimo
43.4 °C42.4 °C37.2 °C
41.6 °C42 °C31.8 °C
33 °C29.8 °C26.8 °C
Massima: 43.4 °C
Media: 36.4 °C
31.6 °C41.6 °C43.6 °C
28.4 °C41.4 °C44.6 °C
27.4 °C33 °C35 °C
Massima: 44.6 °C
Media: 36.3 °C
Alimentazione (max)  43.4 °C | Temperatura della stanza 20 °C | Fluke 62 Mini IR Thermometer
(±) La temperatura media del lato superiore sotto carico massimo e' di 36.4 °C / 98 F, rispetto alla media di 29.5 °C / 85 F per i dispositivi di questa classe Office.
(±) La temperatura massima sul lato superiore è di 43.4 °C / 110 F, rispetto alla media di 34.4 °C / 94 F, che varia da 21.2 a 62.5 °C per questa classe Office.
(±) Il lato inferiore si riscalda fino ad un massimo di 44.6 °C / 112 F, rispetto alla media di 36.8 °C / 98 F
(+) In idle, la temperatura media del lato superiore è di 26.2 °C / 79 F, rispetto alla media deld ispositivo di 29.5 °C / 85 F.
(+) I poggiapolsi e il touchpad raggiungono la temperatura massima della pelle (33 °C / 91.4 F) e quindi non sono caldi.
(-) La temperatura media della zona del palmo della mano di dispositivi simili e'stata di 27.6 °C / 81.7 F (-5.4 °C / -9.7 F).
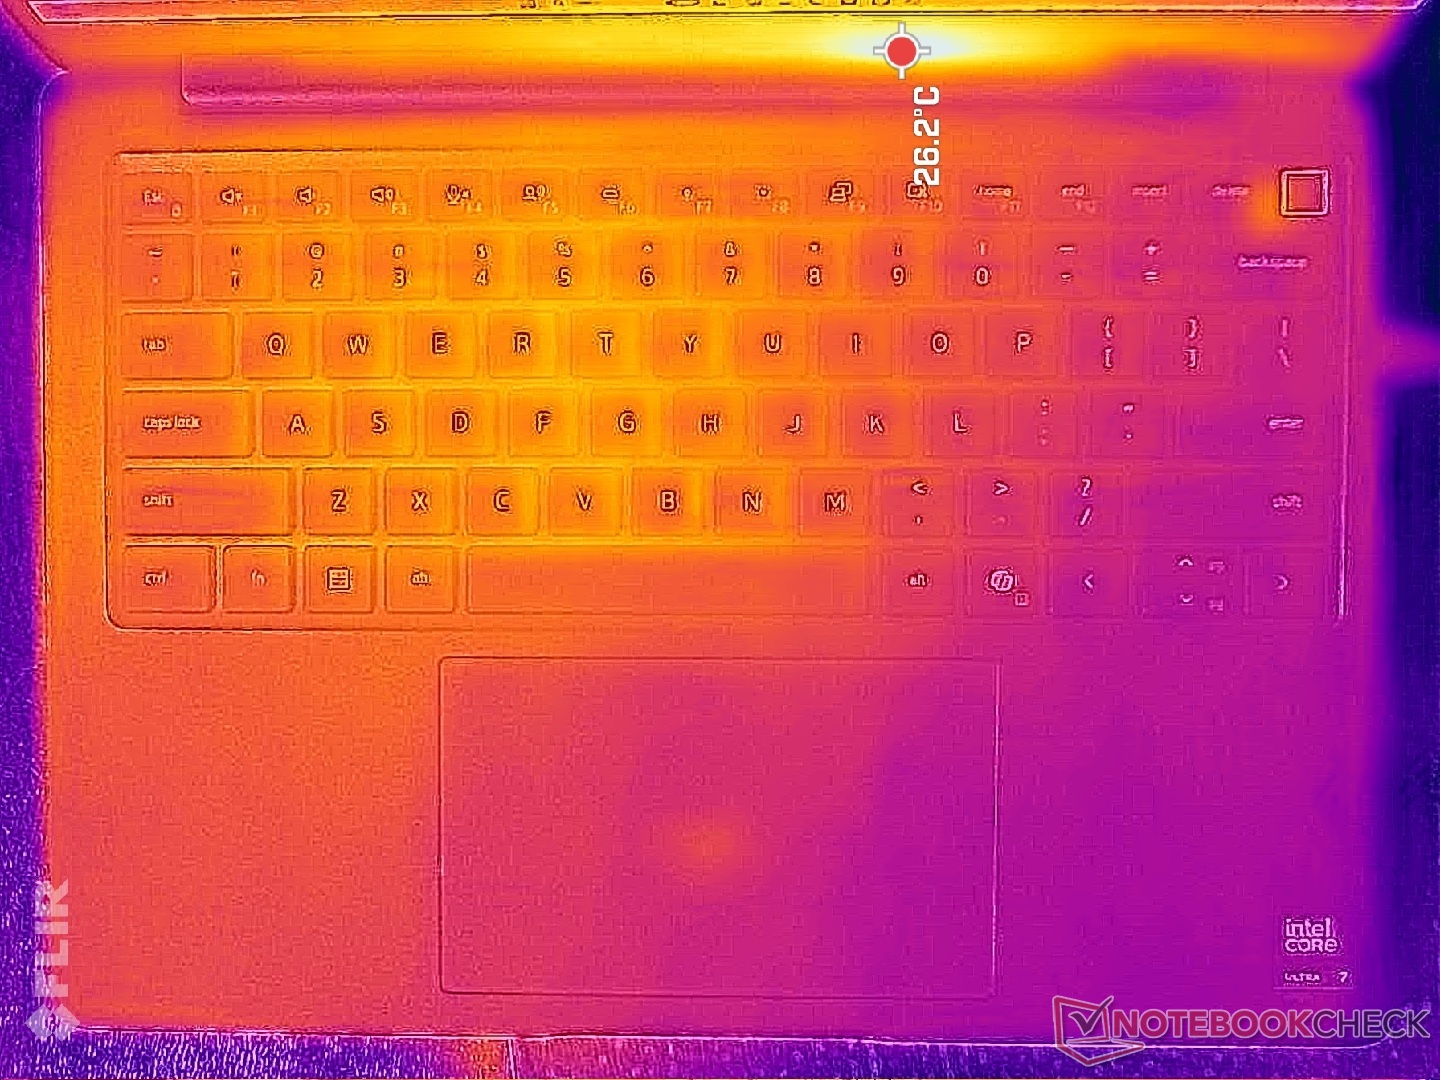
Sistema inattivo (copertina C)
Sistema inattivo (copertina D)
Test di stress con Prime95+FurMark (C cover)
Test di stress con Prime95+FurMark (livello D)
Dell Pro 7 14 P714260
Ultra 7 366H, Intel Graphics 4 Xe3 PTL
Dell Pro 7 14 P714265
Ryzen AI 9 HX PRO 470, Radeon 890M
HP EliteBook 8 G2a 14
Ryzen AI 7 450, Radeon 860M
Lenovo ThinkPad T14s Gen 7 21YW0022GE
Ryzen AI 7 PRO 450, Radeon 860M
Asus ExpertBook Ultra B9406CAA
Ultra X7 358H, Arc B390 Panther Lake iGPU
Acer TravelMate P6 TMP614-54-TCO-553Z
Core Ultra 5 226V, Arc 130V
Heat
2%
2%
5%
10%
-5%
Maximum Upper Side * (°C)
43.4
40.8
6%
41.1
5%
42.3
3%
38.6
11%
39.7
9%
Maximum Bottom * (°C)
44.6
42.6
4%
44.2
1%
43.8
2%
38.4
14%
38.9
13%
Idle Upper Side * (°C)
27.2
26
4%
26.9
1%
25.2
7%
24.6
10%
32.5
-19%
Idle Bottom * (°C)
27.6
29.2
-6%
27.6
-0%
25.5
8%
26
6%
33.5
-21%

* ... Meglio usare valori piccoli

Stress test

La CPU avrebbe raggiunto una frequenza di 2,6 GHz e una potenza di 55 W fino a quando, pochi secondi dopo, la temperatura del core avrebbe raggiunto i 96 °C. Le prestazioni sarebbero quindi scese a 1,9 GHz e 31 W per mantenere una temperatura del core più bassa, pari a 76 °C.
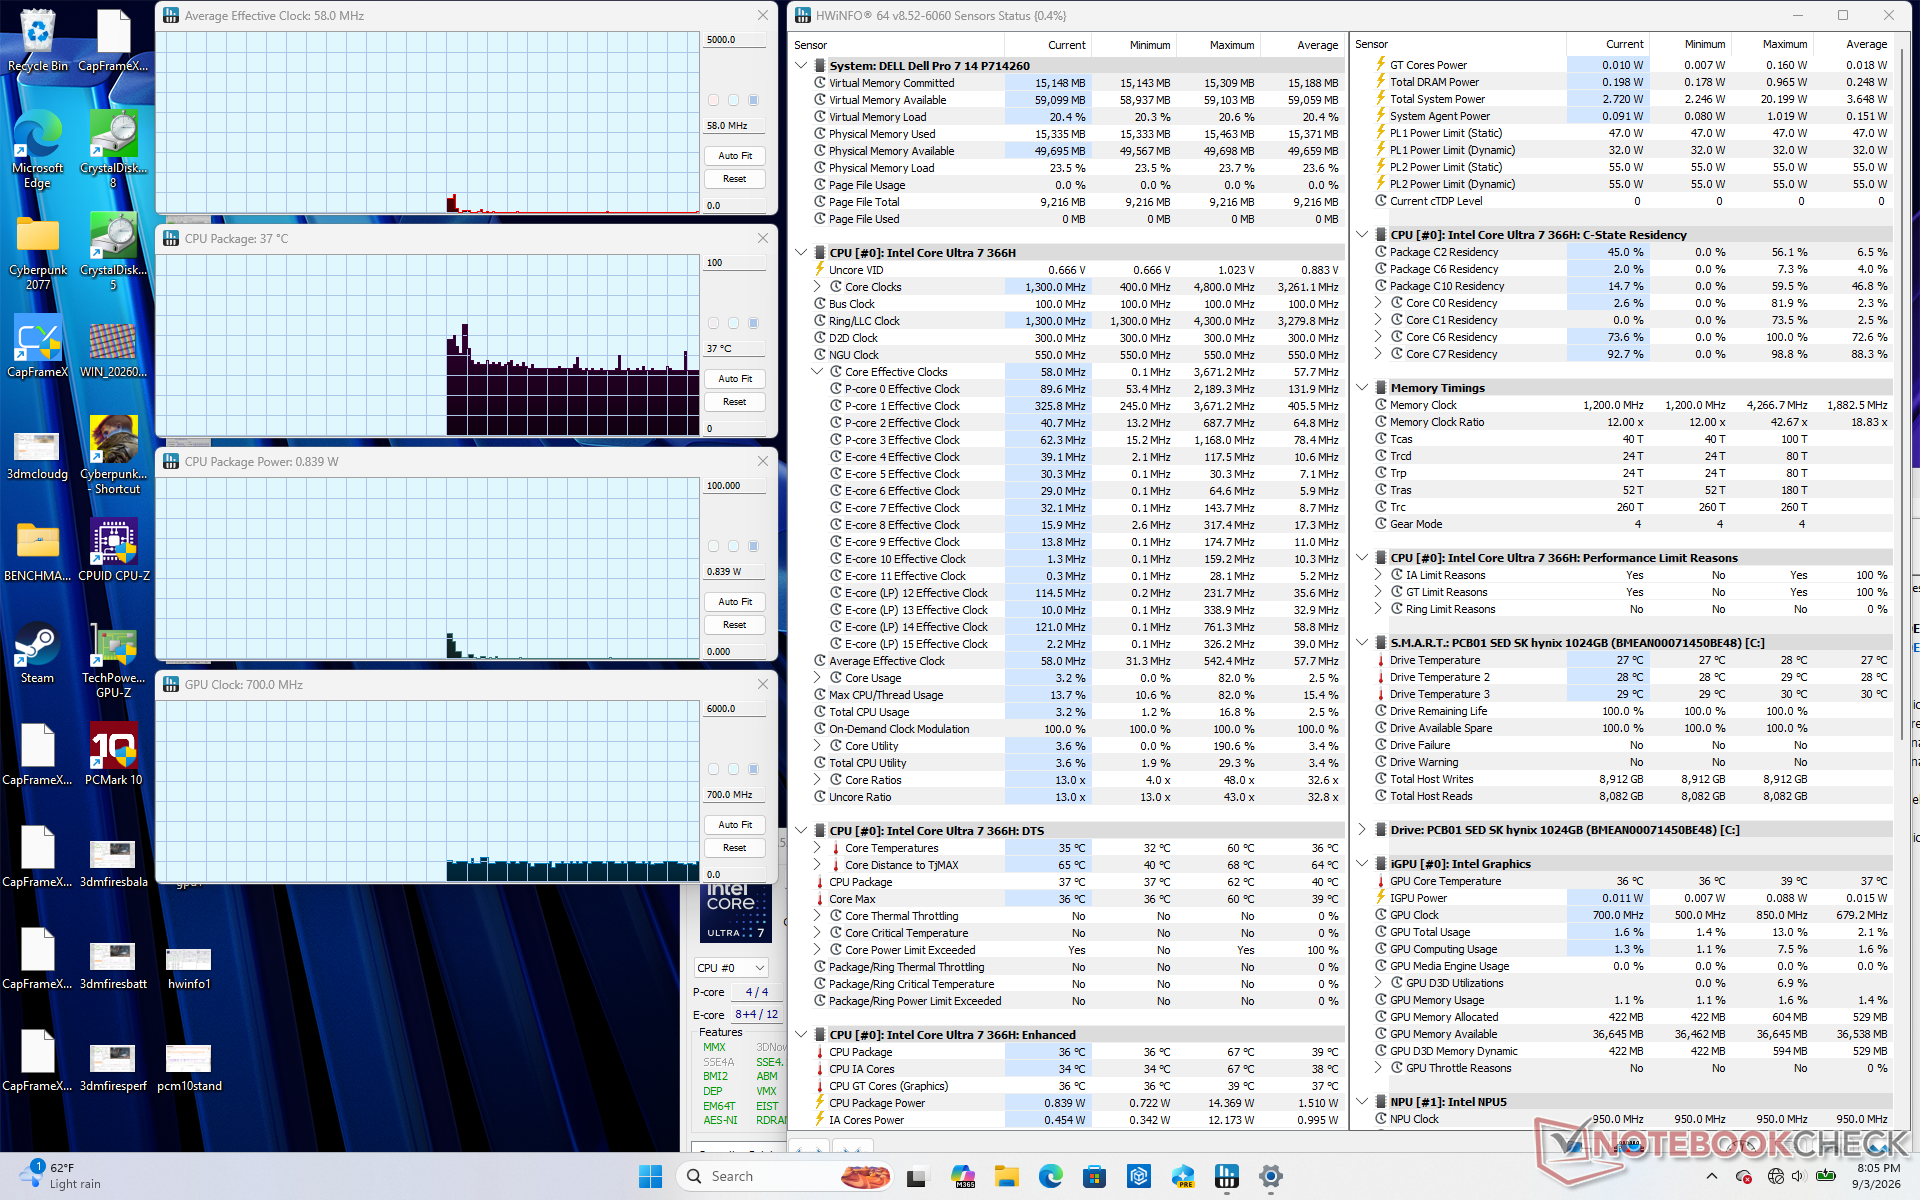
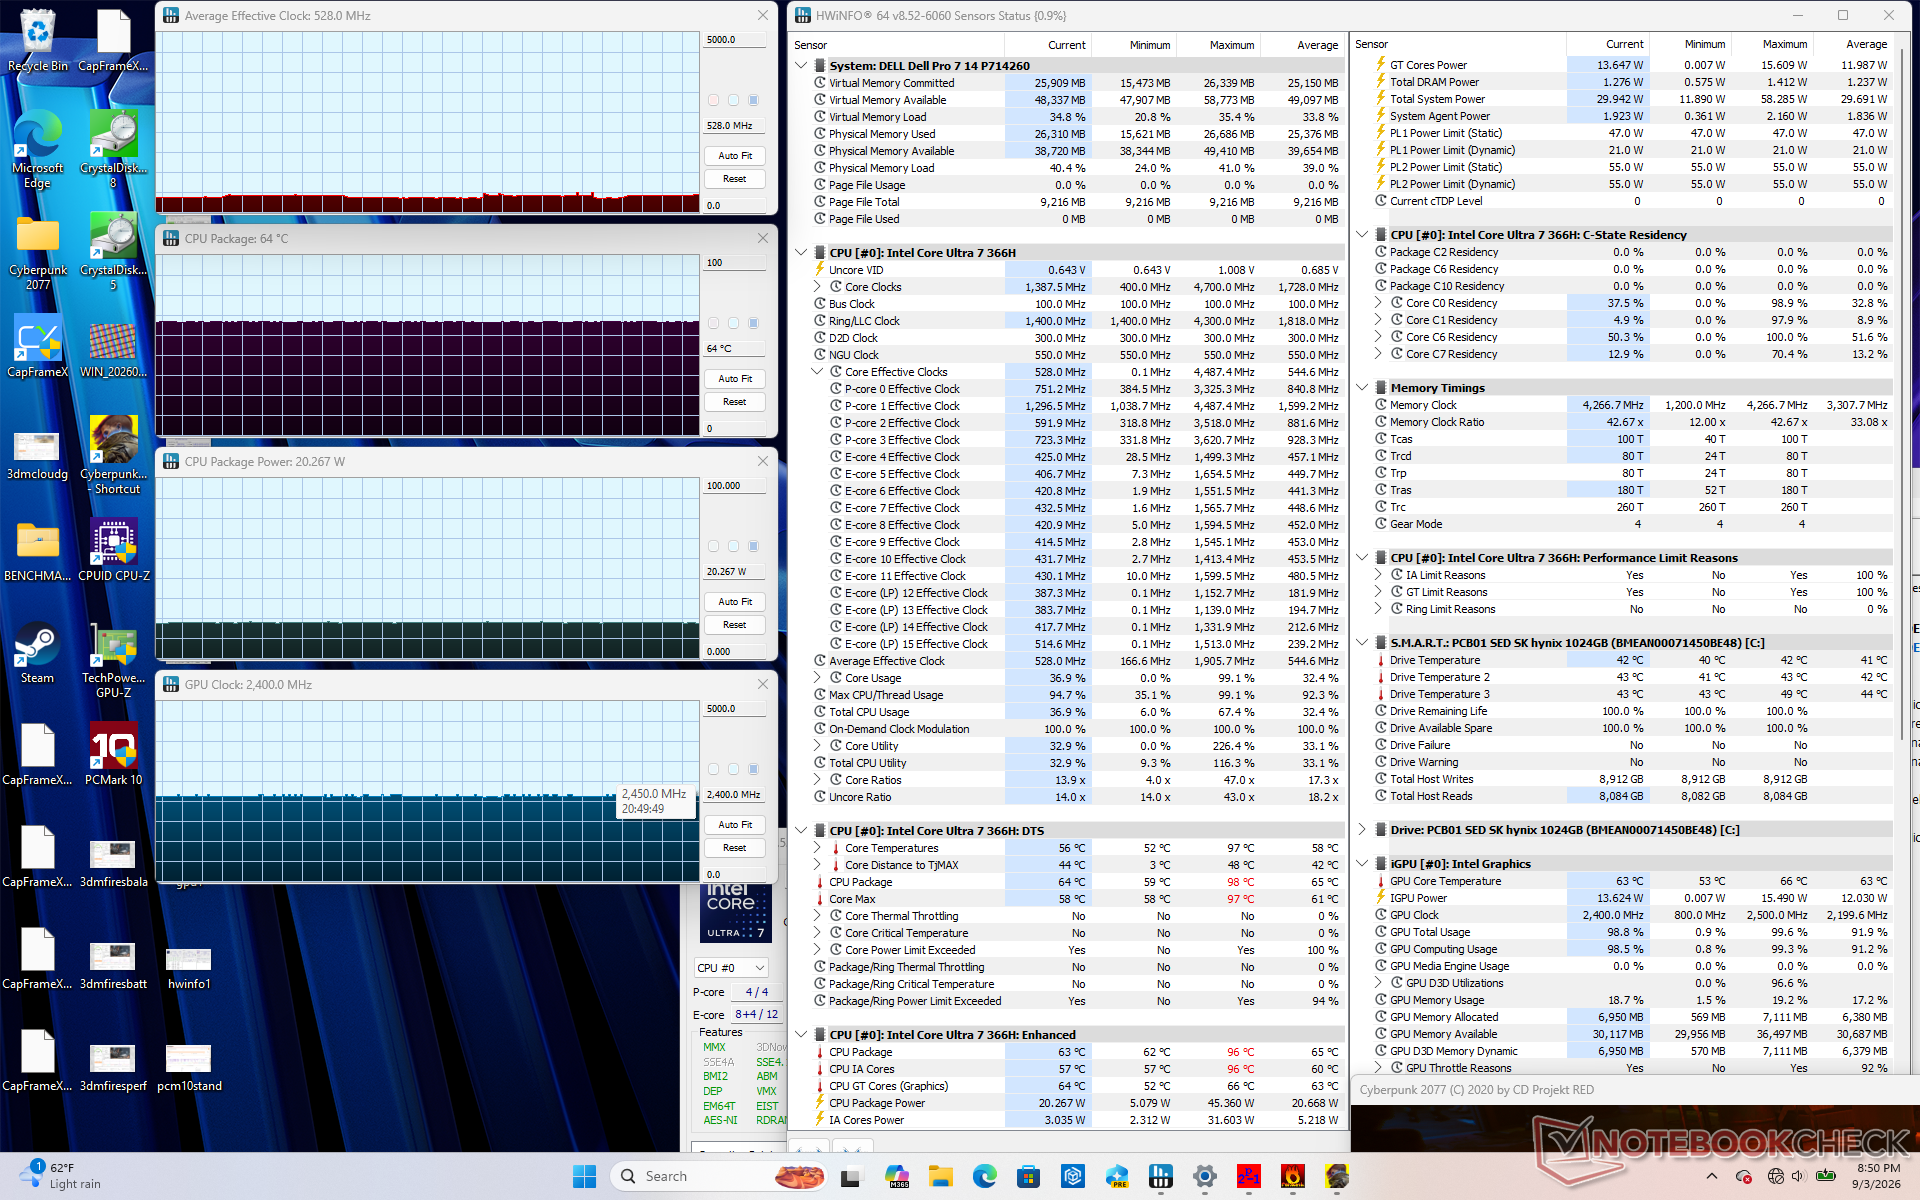
Sistema inattivo
Sistema inattivo
Cyberpunk 2077: stress
Stress test con Prime95
Test di stress con Prime95 e FurMark
Frequenza media della CPU (GHz) Frequenza di clock della GPU (MHz) Temperatura media della CPU (°C)
Sistema inattivo -- -- 37
Prime95 Stress 2.0 -- 79
Prime95 + FurMark Stress 1.1 1400 61
Cyberpunk 2077 Stress 0,5 2400 64

Relatori

Gli altoparlanti interni sono piuttosto potenti e offrono una riproduzione dei bassi soddisfacente
dB(A) 0102030405060708090Deep BassMiddle BassHigh BassLower RangeMidsHigher MidsLower HighsMid HighsUpper HighsSuper Highs2035.8352523.524.13123.120.94019.620.55032.122.56321.323.88017.740.710018.250.912514.257.116014.160.520015.161.825014.764.231518.570.140016.373.250013.871.663013.37980011.48010009.977.612509.777.616009.876.820001075.1250010.374.1315010.973.1400011.172.8500011.474.5630011.468.2800011.862.31000011.8651250011.666.3160001158.6SPL23.887.1N0.573.2median 11.6median 72.8Delta25.826.325.821.422.12624.925.127.622.532.523.448.72655.818.860.922.167.2267019.372.317.674.217.774.319.575.31571.711.871.311.27410.574.21072.710.17210.67210.97511.374.811.671.71269.71269.612.371.112.669.61270.111.269.824.784.70.666.6median 12median 71.73.42.2hearing rangehide median Pink NoiseDell Pro 7 14 P714260Apple MacBook Pro 16 2021 M1 Pro
Diagramma frequenza (le caselle possono essere selezionate/deselezionate per confrontare i dispositivi)
Dell Pro 7 14 P714260 analisi audio

(+) | gli altoparlanti sono relativamente potenti (87.1 dB)
Bassi 100 - 315 Hz
(±) | bassi ridotti - in media 12% inferiori alla media
(±) | la linearità dei bassi è media (8% delta rispetto alla precedente frequenza)
Medi 400 - 2000 Hz
(+) | medi bilanciati - solo only 3.9% rispetto alla media
(+) | medi lineari (3.7% delta rispetto alla precedente frequenza)
Alti 2 - 16 kHz
(+) | Alti bilanciati - appena 3.7% dalla media
(+) | alti lineari (4.4% delta rispetto alla precedente frequenza)
Nel complesso 100 - 16.000 Hz
(+) | suono nel complesso lineare (10.8% differenza dalla media)
Rispetto alla stessa classe
» 2% di tutti i dispositivi testati in questa classe è stato migliore, 1% simile, 96% peggiore
» Il migliore ha avuto un delta di 7%, medio di 21%, peggiore di 53%
Rispetto a tutti i dispositivi testati
» 6% di tutti i dispositivi testati in questa classe è stato migliore, 2% similare, 92% peggiore
» Il migliore ha avuto un delta di 4%, medio di 23%, peggiore di 136%

Apple MacBook Pro 16 2021 M1 Pro analisi audio

(+) | gli altoparlanti sono relativamente potenti (84.7 dB)
Bassi 100 - 315 Hz
(+) | bassi buoni - solo 3.8% dalla media
(+) | bassi in lineaa (5.2% delta rispetto alla precedente frequenza)
Medi 400 - 2000 Hz
(+) | medi bilanciati - solo only 1.3% rispetto alla media
(+) | medi lineari (2.1% delta rispetto alla precedente frequenza)
Alti 2 - 16 kHz
(+) | Alti bilanciati - appena 1.9% dalla media
(+) | alti lineari (2.7% delta rispetto alla precedente frequenza)
Nel complesso 100 - 16.000 Hz
(+) | suono nel complesso lineare (4.6% differenza dalla media)
Rispetto alla stessa classe
» 0% di tutti i dispositivi testati in questa classe è stato migliore, 0% simile, 100% peggiore
» Il migliore ha avuto un delta di 5%, medio di 17%, peggiore di 45%
Rispetto a tutti i dispositivi testati
» 0% di tutti i dispositivi testati in questa classe è stato migliore, 0% similare, 100% peggiore
» Il migliore ha avuto un delta di 4%, medio di 23%, peggiore di 136%

Gestione energetica

Consumo energetico
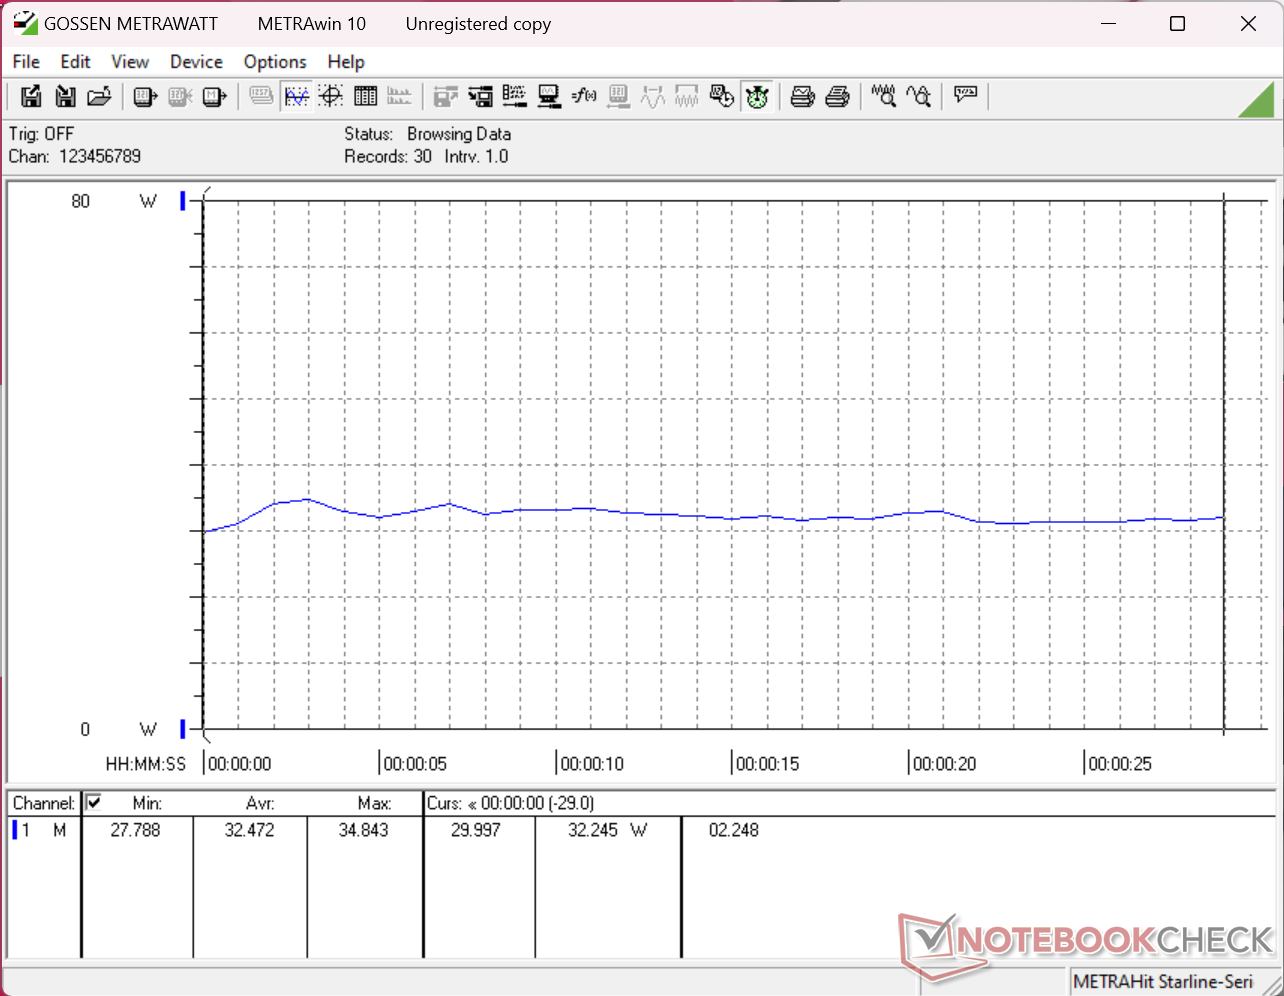
Consumo di 3DMark 11
Cyberpunk 2077: consumo in modalità Ultra a 1080p
Il consumo raggiungerebbe un picco di 69 W all’avvio dello stress test Prime95, per poi scendere rapidamente a 33 W pochi secondi dopo, il che suggerisce un potenziale limitato del Turbo Boost
Lo stress test con Prime95+FurMark è stato avviato al decimo secondo
Consumo di corrente
Off / Standbydarklight 0.12 / 0.48 Watt
Idledarkmidlight 1.4 / 4.3 / 4.6 Watt
Sotto carico midlight 32.5 / 69 Watt
 color bar
Leggenda: min: dark, med: mid, max: light        Metrahit Energy
Dell Pro 7 14 P714260
Ultra 7 366H, Intel Graphics 4 Xe3 PTL, SK hynix PCB01 HFS001TFM9X186N, IPS, 1920x1200, 14"
Dell Pro 7 14 P714265
Ryzen AI 9 HX PRO 470, Radeon 890M, , IPS, 1920x1200, 14"
HP EliteBook 8 G2a 14
Ryzen AI 7 450, Radeon 860M, Western Digital PC SN5000S SDEPNSJ-1T00-1006, IPS, 1920x1200, 14"
Lenovo ThinkPad T14s Gen 7 21YW0022GE
Ryzen AI 7 PRO 450, Radeon 860M, Micron 2650 MTFDKBA512TGW, IPS, 1920x1200, 14"
Asus ExpertBook Ultra B9406CAA
Ultra X7 358H, Arc B390 Panther Lake iGPU, Samsung PM9E1 MZVLC2T0HBLD, OLED, 2880x1800, 14"
Acer TravelMate P6 TMP614-54-TCO-553Z
Core Ultra 5 226V, Arc 130V, WDC PC SN810 512GB, IPS, 1920x1200, 14"
Power Consumption
-34%
-28%
-35%
-34%
-39%
Idle Minimum * (Watt)
1.4
2.8
-100%
2.7
-93%
2.7
-93%
3.5
-150%
4.21
-201%
Idle Average * (Watt)
4.3
6
-40%
5.8
-35%
5.5
-28%
4
7%
5.365
-25%
Idle Maximum * (Watt)
4.6
7.4
-61%
6.1
-33%
6.8
-48%
5.3
-15%
6.7
-46%
Load Average * (Watt)
32.5
47.9
-47%
48.1
-48%
60.5
-86%
43.7
-34%
Cyberpunk 2077 ultra * (Watt)
49.9
47.9
4%
55.1
-10%
49.7
-0%
61.3
-23%
40.5
19%
Cyberpunk 2077 ultra external monitor * (Watt)
47.4
45.3
4%
38.4
19%
44.1
7%
61.4
-30%
46
3%
Load Maximum * (Watt)
69
67
3%
67.2
3%
64.8
6%
63.4
8%
57
17%

* ... Meglio usare valori piccoli

Consumo energetico Cyberpunk / Test di stress

05101520253035404550556065Tooltip
Dell Pro 7 14 P714260 Ultra 7 366H, Intel Graphics 4 Xe3 PTL; 1280x720 Prime95 28.10 and Furmark 1.25: Ø52.5 (50.3-69) Watt
Dell Pro 7 14 P714265 Ryzen AI 9 HX PRO 470, Radeon 890M; 1280x720 Prime95 28.10 and Furmark 1.25: Ø53.3 (51.6-67.2) Watt
Dell Pro 7 14 P714260 Ultra 7 366H, Intel Graphics 4 Xe3 PTL; Idle 150cd/m2: Ø1.949 (1.68-4.52) Watt
Dell Pro 7 14 P714265 Ryzen AI 9 HX PRO 470, Radeon 890M; Idle 150cd/m2: Ø5.57 (4.86-9.11) Watt
Dell Pro 7 14 P714260 Ultra 7 366H, Intel Graphics 4 Xe3 PTL; Cyberpunk 2077 FHD ultra no FSR 150cd: Ø49.9 (48.6-52.7) Watt
Dell Pro 7 14 P714265 Ryzen AI 9 HX PRO 470, Radeon 890M; Cyberpunk 2077 FHD ultra no FSR 150cd: Ø47.9 (47.4-49.5) Watt

Consumo energetico del monitor esterno

05101520253035404550556065Tooltip
Dell Pro 7 14 P714260 Ultra 7 366H, Intel Graphics 4 Xe3 PTL; Prime95 V2810 Stress (external Monitor): Ø33.8 (31-69) Watt
Dell Pro 7 14 P714265 Ryzen AI 9 HX PRO 470, Radeon 890M; Prime95 V2810 Stress (external Monitor): Ø49.6 (47.7-67.8) Watt
Dell Pro 7 14 P714265 Ryzen AI 9 HX PRO 470, Radeon 890M; Cinebench R15 Multi (external Monitor): Ø61.1 (44.2-64.3) Watt
Dell Pro 7 14 P714260 Ultra 7 366H, Intel Graphics 4 Xe3 PTL; Cinebench R23 Multi (external Monitor): Ø56.5 (44.4-69.1) Watt
Dell Pro 7 14 P714265 Ryzen AI 9 HX PRO 470, Radeon 890M; Cinebench R23 Multi (external Monitor): Ø49.5 (42.2-63.7) Watt
Dell Pro 7 14 P714260 Ultra 7 366H, Intel Graphics 4 Xe3 PTL; 1280x720 FurMark 1.19 GPU Stress Test (external Monitor): Ø42.8 (32.9-50.9) Watt
Dell Pro 7 14 P714265 Ryzen AI 9 HX PRO 470, Radeon 890M; 1280x720 FurMark 1.19 GPU Stress Test (external Monitor): Ø47.7 (45.2-61.8) Watt
Dell Pro 7 14 P714260 Ultra 7 366H, Intel Graphics 4 Xe3 PTL; Idle 1min (external Monitor): Ø1.442 (1.161-3.25) Watt
Dell Pro 7 14 P714265 Ryzen AI 9 HX PRO 470, Radeon 890M; Idle 1min (external Monitor): Ø2.89 (2.38-6.56) Watt
Dell Pro 7 14 P714260 Ultra 7 366H, Intel Graphics 4 Xe3 PTL; Cyberpunk 2077 FHD ultra no FSR (external Monitor): Ø47.4 (44.6-52.5) Watt
Dell Pro 7 14 P714265 Ryzen AI 9 HX PRO 470, Radeon 890M; Cyberpunk 2077 FHD ultra no FSR (external Monitor): Ø45.3 (44.7-47.9) Watt

Durata della batteria

Autonomia della batteria
WiFi Websurfing
23ore 29minuti
Dell Pro 7 14 P714260
Ultra 7 366H, Intel Graphics 4 Xe3 PTL, 70 Wh
Dell Pro 7 14 P714265
Ryzen AI 9 HX PRO 470, Radeon 890M, 70 Wh
HP EliteBook 8 G2a 14
Ryzen AI 7 450, Radeon 860M, 68 Wh
Lenovo ThinkPad T14s Gen 7 21YW0022GE
Ryzen AI 7 PRO 450, Radeon 860M, 58 Wh
Asus ExpertBook Ultra B9406CAA
Ultra X7 358H, Arc B390 Panther Lake iGPU, 70 Wh
Acer TravelMate P6 TMP614-54-TCO-553Z
Core Ultra 5 226V, Arc 130V, 65 Wh
Autonomia della batteria
WiFi v1.3 (h)
23.5
15.7
-33%
19.3
-18%
17.4
-26%
16.1
-31%
22.1
-6%

Valutazione di Notebookcheck

Rispetto al Dell Pro 7 14 basato su AMD, la versione Intel integra Thunderbolt 4, prestazioni grafiche leggermente superiori e una maggiore efficienza che garantisce una maggiore autonomia della batteria, sebbene a costo di prestazioni del processore leggermente inferiori.

Dell Pro 7 14 P714260 - 09/07/2026 v8
Allen Ngo

Chassis
86 / 98 → 88%
Tastiera
80%
Dispositivo di puntamento
75%
Connettività
73 / 80 → 91%
Peso
71 / 20-75 → 92%
Batteria
93%
Display
81%
Prestazioni di gioco
49 / 75 → 66%
Prestazioni Applicazioni
88 / 92 → 95%
AI Performance
90%
Temperatura
90%
Rumorosità
82%
Audio
85%
Fotocamera
42 / 75 → 55%
Media
69%
85%
Office - Media ponderata
CO2 Emissions
No Data
Materials
50%
Packaging
100%
Power Use
92.5%
Repairability
50%
Software Updates
22.3%
Recycle Logo Total Sustainability Score: 52.5%

Confronto con i potenziali concorrenti

Immagine
Modello
Prezzo
Peso
Altezza
Schermo
1.
84.5%
Dell Pro 7 14 P714260
Intel Core Ultra 7 366H ⎘
Intel Graphics 4 Xe3 Panther Lake iGPU ⎘
64 GB Memoria,  SSD
Prezzo di listino: 4900 USD1.4 kg14.73 mm14.00"
1920x1200
162 PPI
IPS
2.
84.7%
Dell Pro 7 14 P714265
AMD Ryzen AI 9 HX PRO 470 ⎘
AMD Radeon 890M ⎘
64 GB Memoria
Prezzo di listino: 4900 USD1.3 kg16.45 mm14.00"
1920x1200
162 PPI
IPS
3.
87.4%
HP EliteBook 8 G2a 14
AMD Ryzen AI 7 450 ⎘
AMD Radeon 860M ⎘
32 GB Memoria, 1000 GB SSD
Amazon:
1. $2,251.28
HP EliteBook 8 G2a 14" Copil...
2. $2,143.08
HP EliteBook 8 G2i 14" Copil...
3. $1,340.01
HP EliteBook 8 G1a 14" Copil...
Prezzo di listino: 2700€
1.5 kg15.5 mm14.00"
1920x1200
162 PPI
IPS
4.
89.7%
Lenovo ThinkPad T14s Gen 7 21YW0022GE
AMD Ryzen AI 7 PRO 450 ⎘
AMD Radeon 860M ⎘
64 GB Memoria, 512 GB SSD
1.2 kg15.9 mm14.00"
1920x1200
162 PPI
IPS
5.
87.6%
Asus ExpertBook Ultra B9406CAA
Intel Core Ultra X7 358H ⎘
Intel Arc B390 12 Xe3 Panther Lake iGPU ⎘
32 GB Memoria, 2048 GB SSD
1.1 kg15.9 mm14.00"
2880x1800
243 PPI
OLED
6.
85.7%
Acer TravelMate P6 TMP614-54-TCO-553Z
Intel Core Ultra 5 226V ⎘
Intel Arc Graphics 130V ⎘
16 GB Memoria, 512 GB SSD
Prezzo di listino: 1420€1 kg17 mm14.00"
1920x1200
162 PPI
IPS

Transparency

La selezione dei dispositivi da recensire viene effettuata dalla nostra redazione. Il campione di prova è stato fornito all'autore come prestito dal produttore o dal rivenditore ai fini di questa recensione. L'istituto di credito non ha avuto alcuna influenza su questa recensione, né il produttore ne ha ricevuto una copia prima della pubblicazione. Non vi era alcun obbligo di pubblicare questa recensione. In quanto società mediatica indipendente, Notebookcheck non è soggetta all'autorità di produttori, rivenditori o editori.

Ecco come Notebookcheck esegue i test

Ogni anno, Notebookcheck esamina in modo indipendente centinaia di laptop e smartphone utilizzando procedure standardizzate per garantire che tutti i risultati siano comparabili. Da circa 20 anni sviluppiamo continuamente i nostri metodi di prova e nel frattempo stabiliamo gli standard di settore. Nei nostri laboratori di prova, tecnici ed editori esperti utilizzano apparecchiature di misurazione di alta qualità. Questi test comportano un processo di validazione in più fasi. Il nostro complesso sistema di valutazione si basa su centinaia di misurazioni e parametri di riferimento ben fondati, che mantengono l'obiettività.
Google LogoAdd as a preferred source on Google
Mail Logo
> Recensioni e prove di notebook, tablets e smartphones > Recensioni e prove > Recensioni e prove > Recensione Dell Pro 7 14 P714260: rimanere fedeli a Intel presenta dei vantaggi
Allen Ngo, 2026-09- 9 (Update: 2026-09- 9)