Conclusione
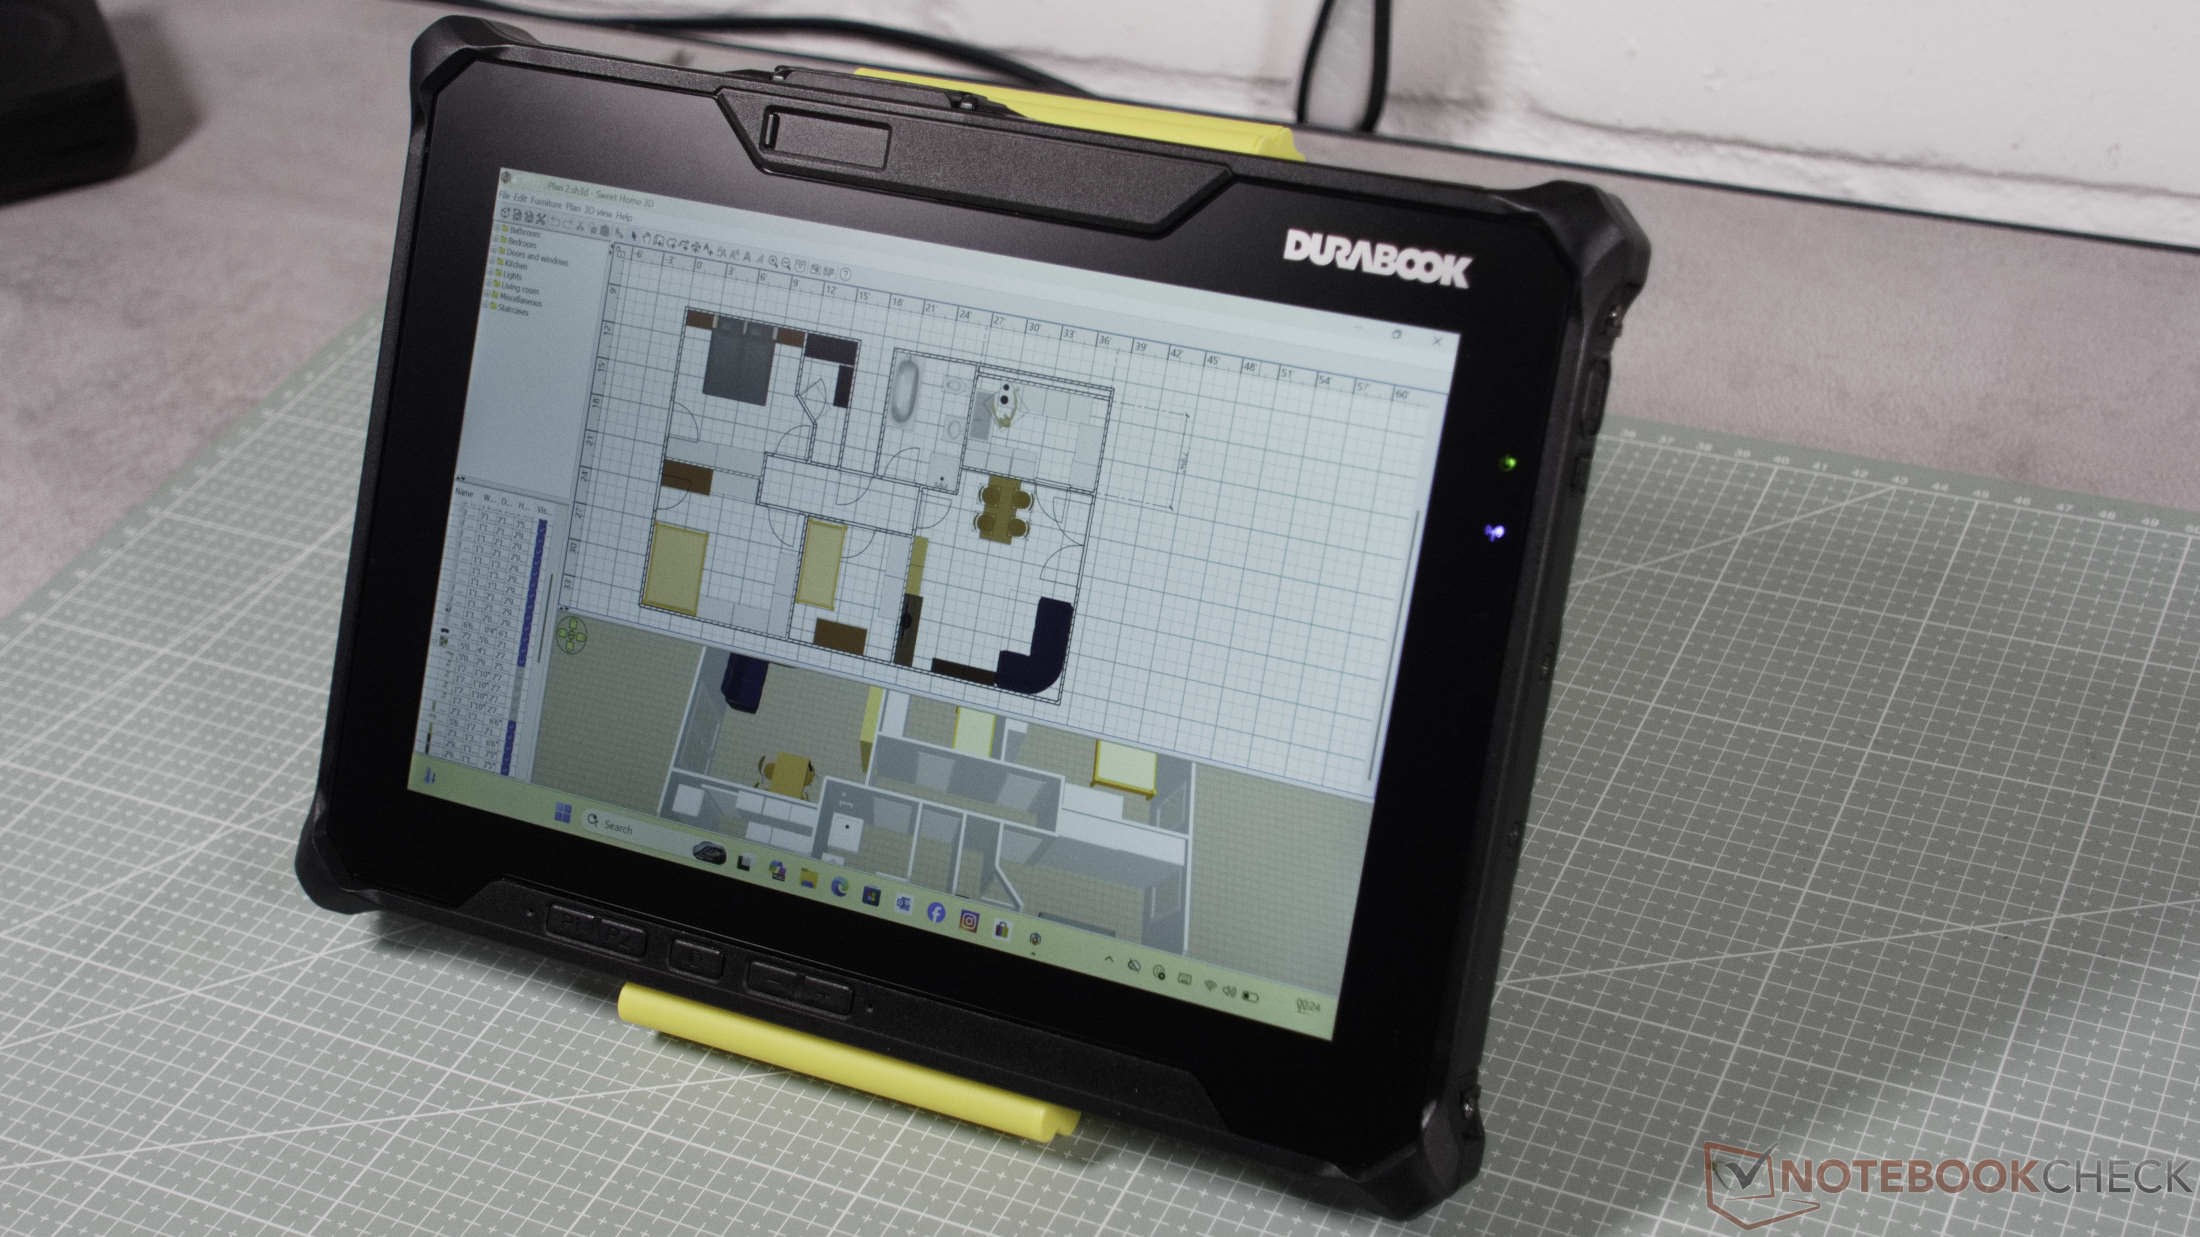
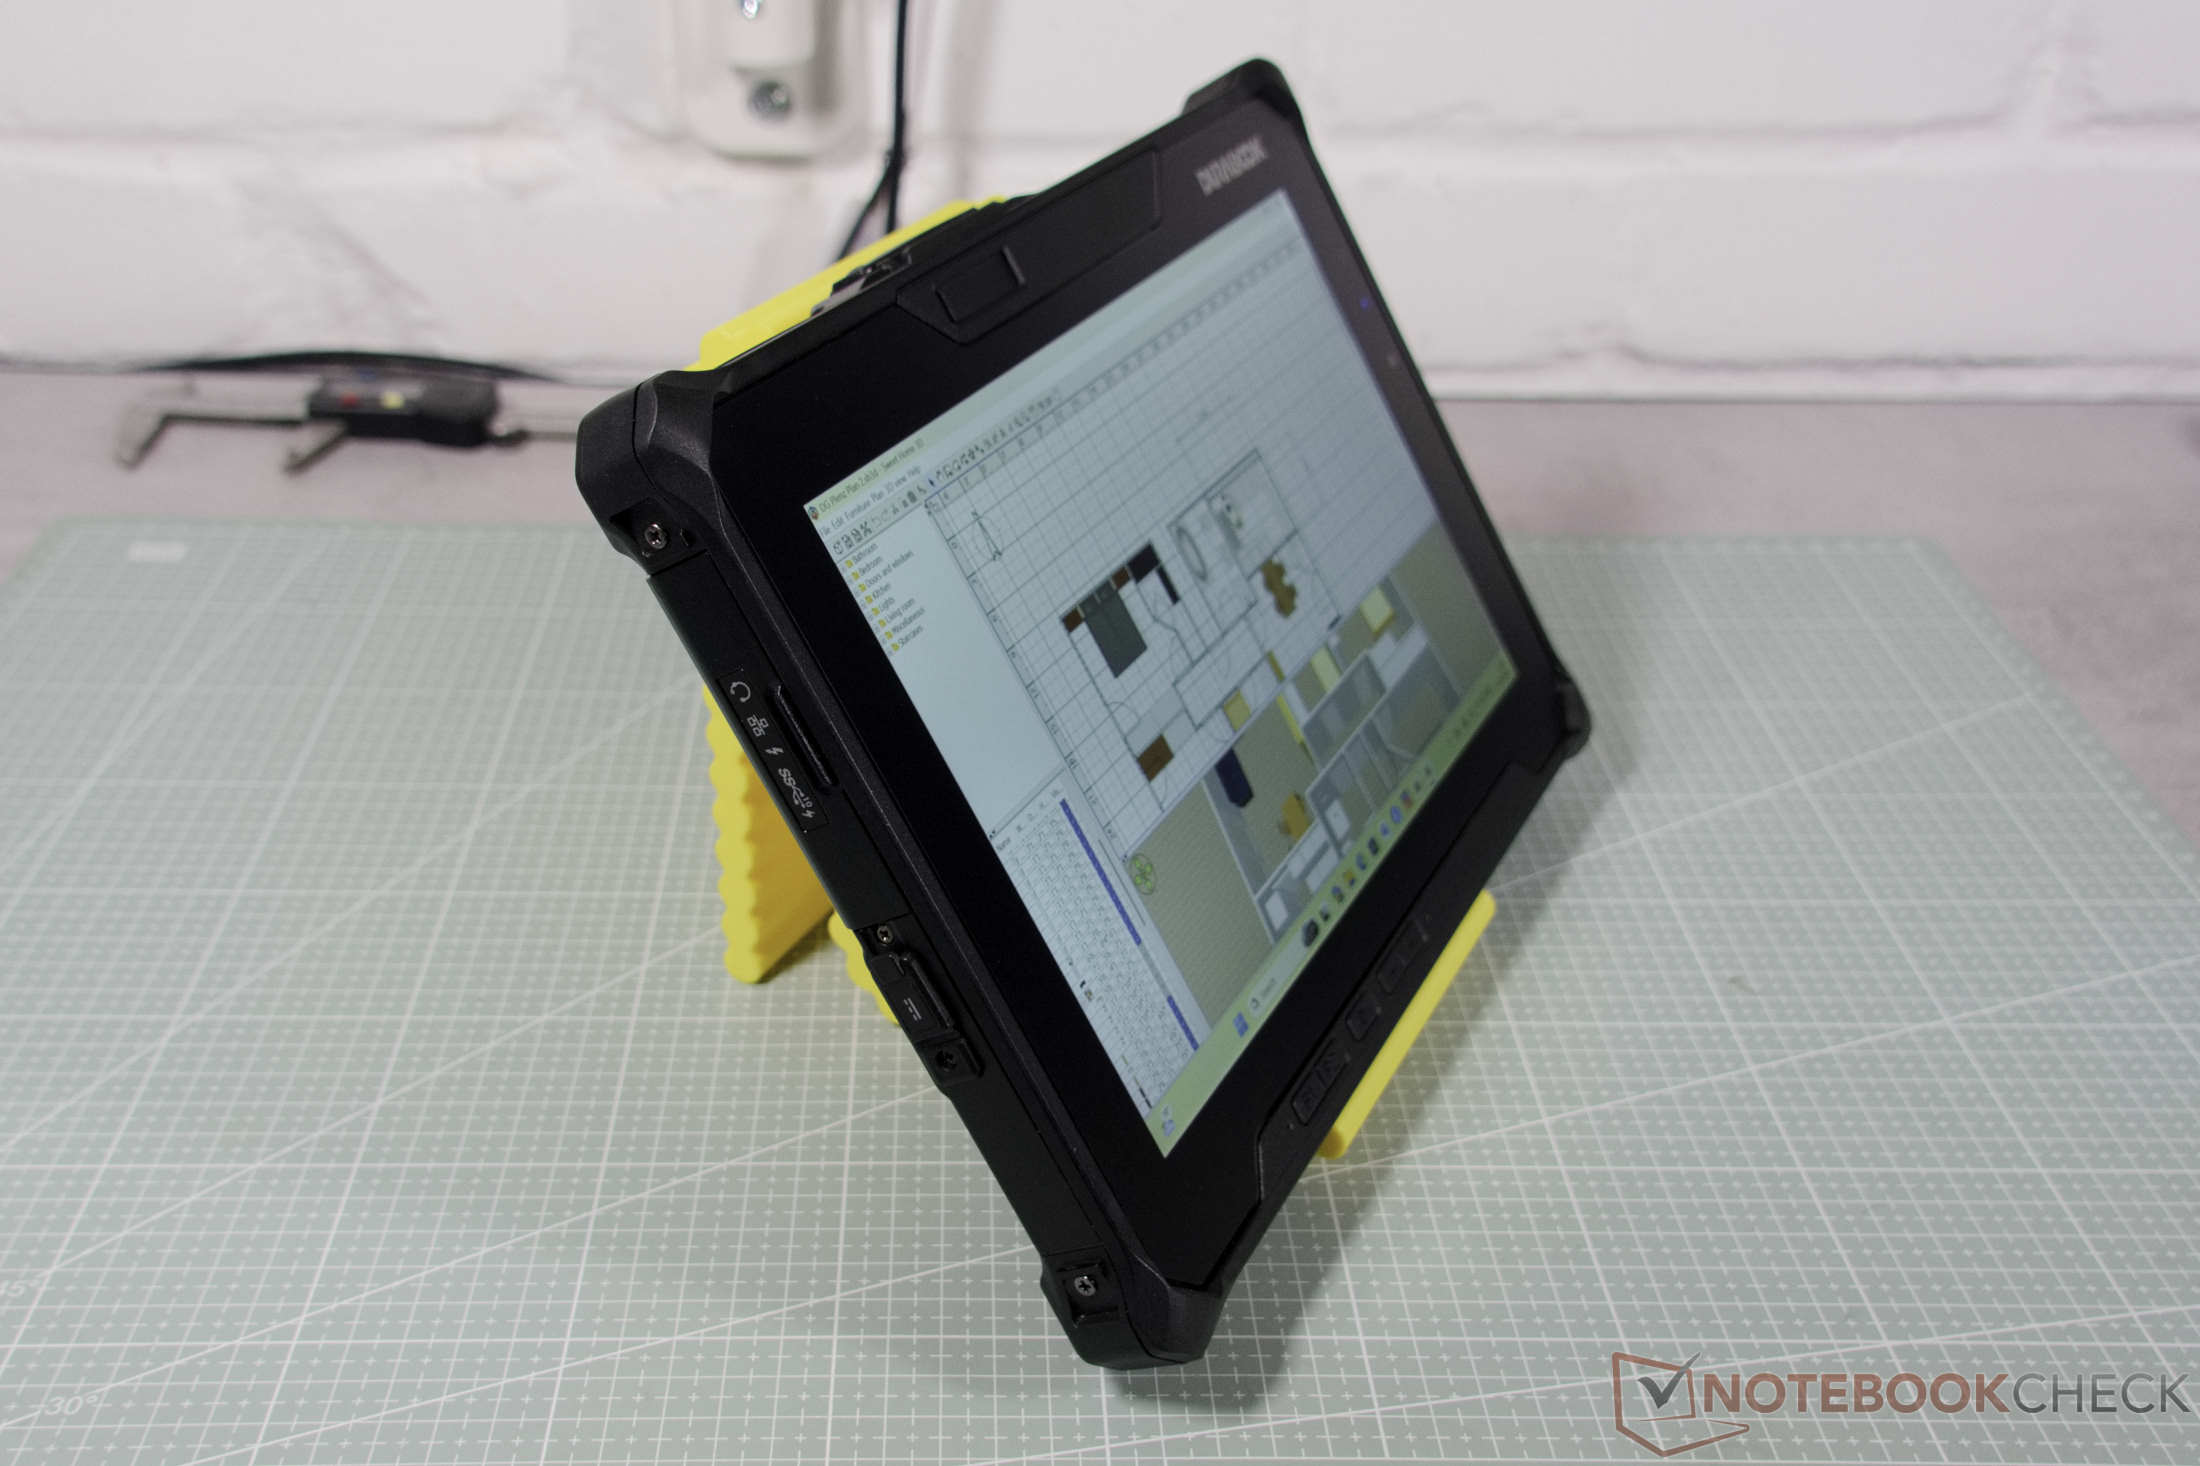
A prima vista, il Durabook R10 sembra un vero e proprio mattone rispetto ai tablet convenzionali destinati al grande pubblico. Con uno spessore di poco inferiore ai tre centimetri, cornici dello schermo spesse e un peso di oltre 1,2 chilogrammi (~2,65 libbre), questo dispositivo da 10,1 pollici risulta pesante da tenere in mano. In questo caso, la sottigliezza e la leggerezza non sono certo gli obiettivi principali. Il produttore realizza strumenti senza compromessi destinati all’uso in ambienti estremamente difficili, che si tratti di un cantiere polveroso, di uno stabilimento industriale o di un’attività sul campo.
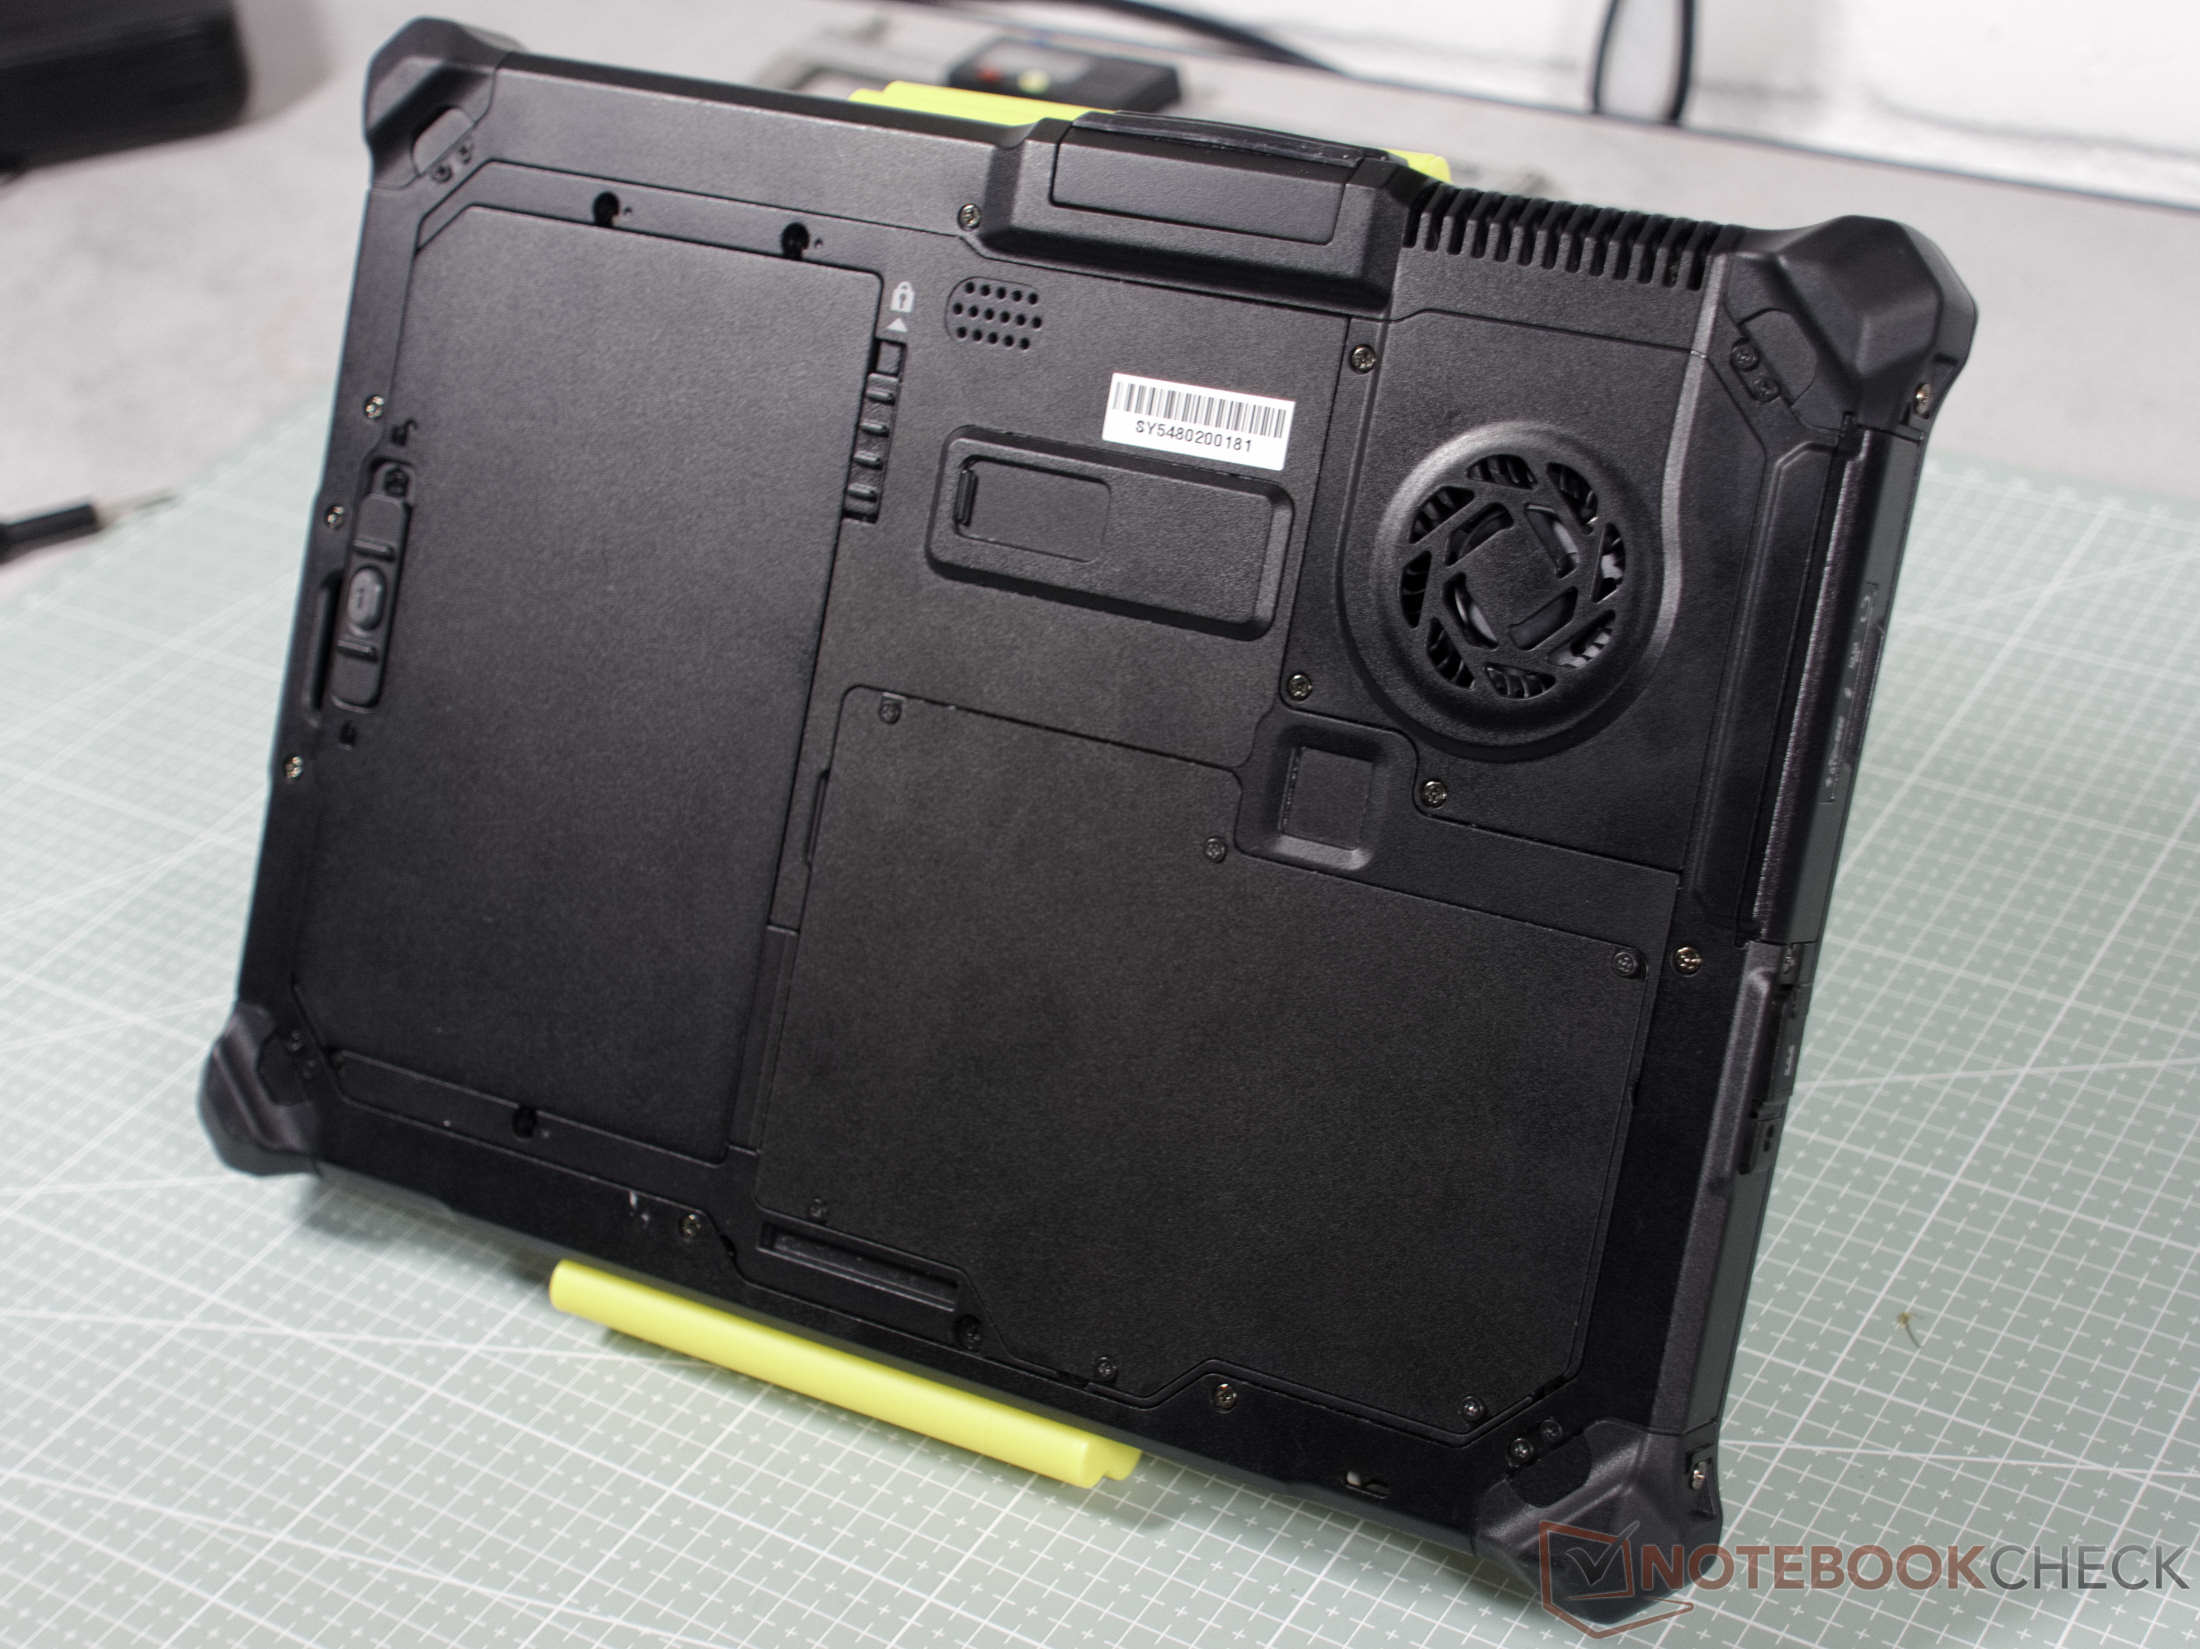
L’R10 è progettato proprio per queste condizioni estreme. L’involucro in lega di magnesio è robusto come un carro armato, resiste facilmente a cadute violente ed è rigorosamente sigillato contro acqua e sporco. Le caratteristiche che lo distinguono in modo assoluto per l’uso all’aperto, tuttavia, sono lo schermo e il sistema di alimentazione. Con una luminosità ben superiore a 1.000 cd/m² — confermata dai nostri test — questo tablet robusto resiste senza difficoltà anche alla luce solare diretta. È inoltre dotato di una batteria di riserva integrata che consente il vero hot-swapping. Ciò significa che la batteria principale può essere facilmente rimossa dal dispositivo e sostituita mentre questo è ancora in funzione.
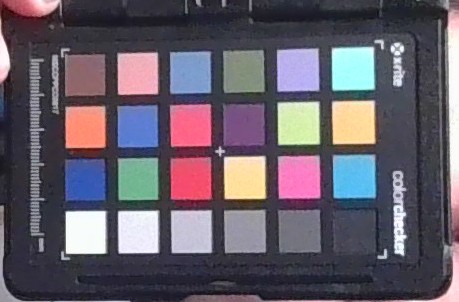
Naturalmente, questo livello di specializzazione richiede dei compromessi. Per i lavori in cui la precisione cromatica è fondamentale, il display — con la sua visibile dominante verde — risulta inutilizzabile, mentre le fotocamere e l’altoparlante mono integrato soddisfano solo le esigenze di base. Il processore Intel Core Ultra 7 258V integrato gestisce con facilità le attività quotidiane d’ufficio e di elaborazione dei documenti, ma nei test mostra difficoltà a causa delle elevate latenze DPC, il che può causare problemi durante l’acquisizione dei dati in tempo reale. Inoltre, il lettore di schede è scomodamente nascosto dietro la batteria. Tra gli aspetti positivi, l’ingombrante chassis non si surriscalda eccessivamente nemmeno sotto carico intenso, mentre la ventola interna emette un ronzio piacevolmente silenzioso in sottofondo.
Prezzo e disponibilità
I prezzi e la disponibilità del Durabook R10 sono rivolti principalmente a una clientela professionale. Il produttore non indica i prezzi sul proprio sito web; questi vengono infatti calcolati esclusivamente su richiesta individuale. Ciò è dovuto anche al fatto che molte delle configurazioni altamente specializzate — personalizzate in base alle esigenze specifiche dei singoli clienti — vengono vendute esclusivamente tramite Durabook. Il tablet rugged può essere occasionalmente reperibile presso negozi specializzati. Ad esempio, il rivenditore Ruggedbooks propone il modello base con un processore Intel Core Ultra 5 226V a circa 2.759 euro (~3.146 dollari). Su Elmark-Automation , una configurazione simile con lo stesso processore parte da circa 2.730 euro (~3.113 dollari).
Specifiche tecniche
Custodie, accessori e dispositivi di input
Il telaio del Durabook R10 è realizzato in una robusta lega di magnesio ed è perfettamente adatto agli ambienti di lavoro più difficili. Certificato secondo lo standard militare statunitense MIL-STD-810H, il tablet è progettato per resistere a cadute da altezze fino a 1,8 metri (~5,9 piedi) e a condizioni ambientali estreme. Inoltre, la certificazione IP66 garantisce protezione contro la polvere e i getti d’acqua ad alta pressione. Per le applicazioni sensibili, la certificazione MIL-STD-461F garantisce inoltre un’eccellente compatibilità elettromagnetica.
Durabook Z14I-HG: la potenza dell’intelligenza artificiale per condizioni estreme
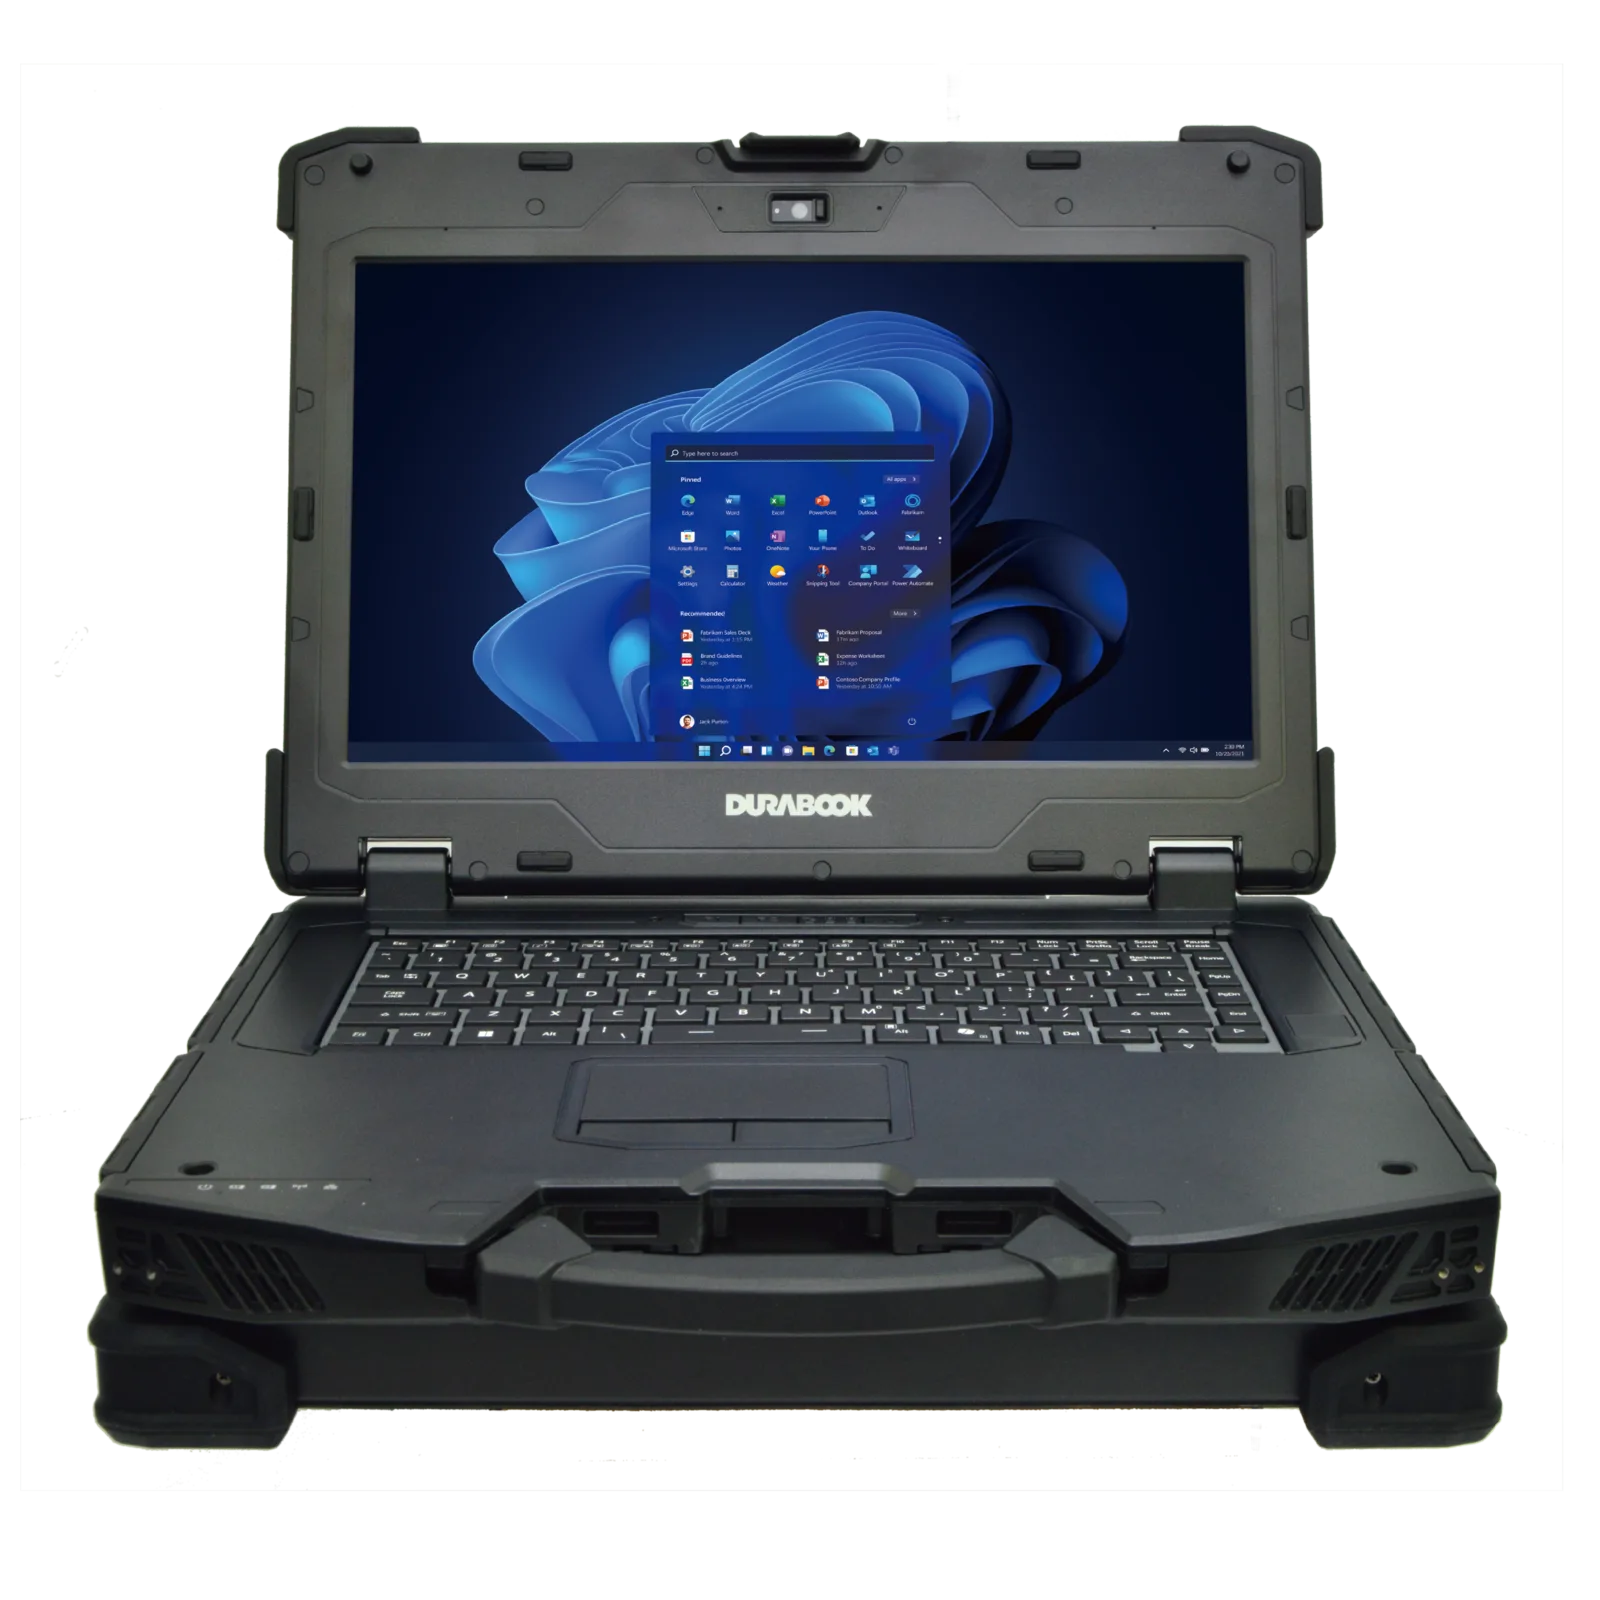
Con il modello Z14I-HG, Durabook presenta una nuova generazione di workstation portatili: completamente rinforzate, predisposte per l’intelligenza artificiale e progettate per le applicazioni più esigenti direttamente in cantiere. Il sistema da 14 pollici combina prestazioni di intelligenza artificiale edge fino a 682 TOPS con potenti processori Intel® Core™ Ultra. È inoltre dotato di un’NPU AI Boost e, come opzione, di una GPU NVIDIA® RTX™ 3500 Ada (12 GB) o RTX™ 5000 Ada (16 GB). Chiunque faccia affidamento su hardware potente e robusto — ad esempio nei settori dell’automazione industriale, dell’assistenza sul campo o della ricerca tecnica — può trarre vantaggio da analisi AI veloci e da prestazioni grafiche di livello professionale per il calcolo mobile ad alte prestazioni.
Che si tratti di rendering 3D in tempo reale, inferenza AI o simulazioni ad alta intensità di dati, lo Z14I-HG elabora localmente carichi di lavoro impegnativi. Ciò riduce la latenza. Allo stesso tempo, l’indipendenza dai fornitori di servizi cloud migliora la sicurezza dei dati, ad esempio durante ispezioni, manutenzione predittiva o applicazioni di digital twin.
Il sistema è certificato secondo gli standard MIL-STD-810H, MIL-STD-461G e IP66. Resiste a temperature estreme, umidità e interferenze elettromagnetiche. Inoltre, il display DynaVue® da 1200 nit rimane perfettamente leggibile anche alla luce diretta del sole e supporta diverse modalità di input, nonché configurazioni multischermo.
La workstation Z14I-HG è già disponibile e può essere ordinata direttamente da Durabook.
Connettività
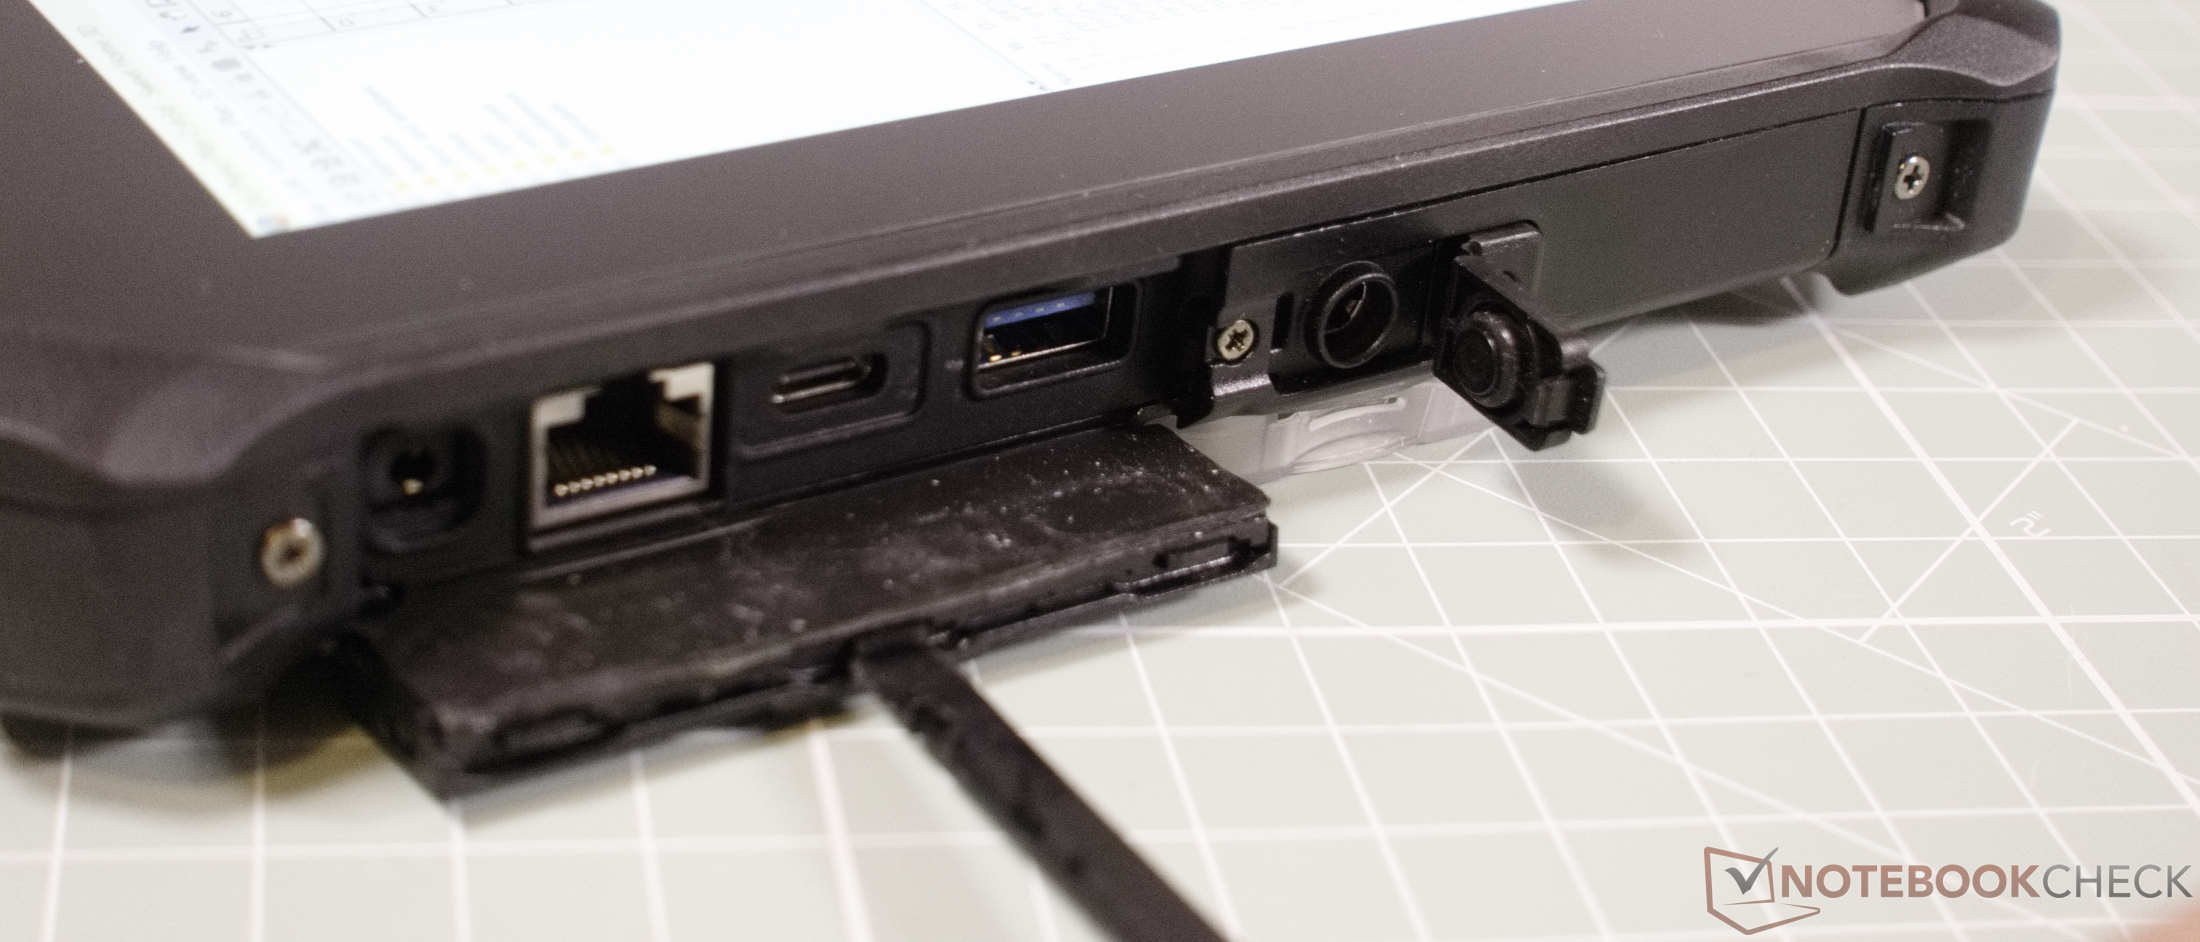
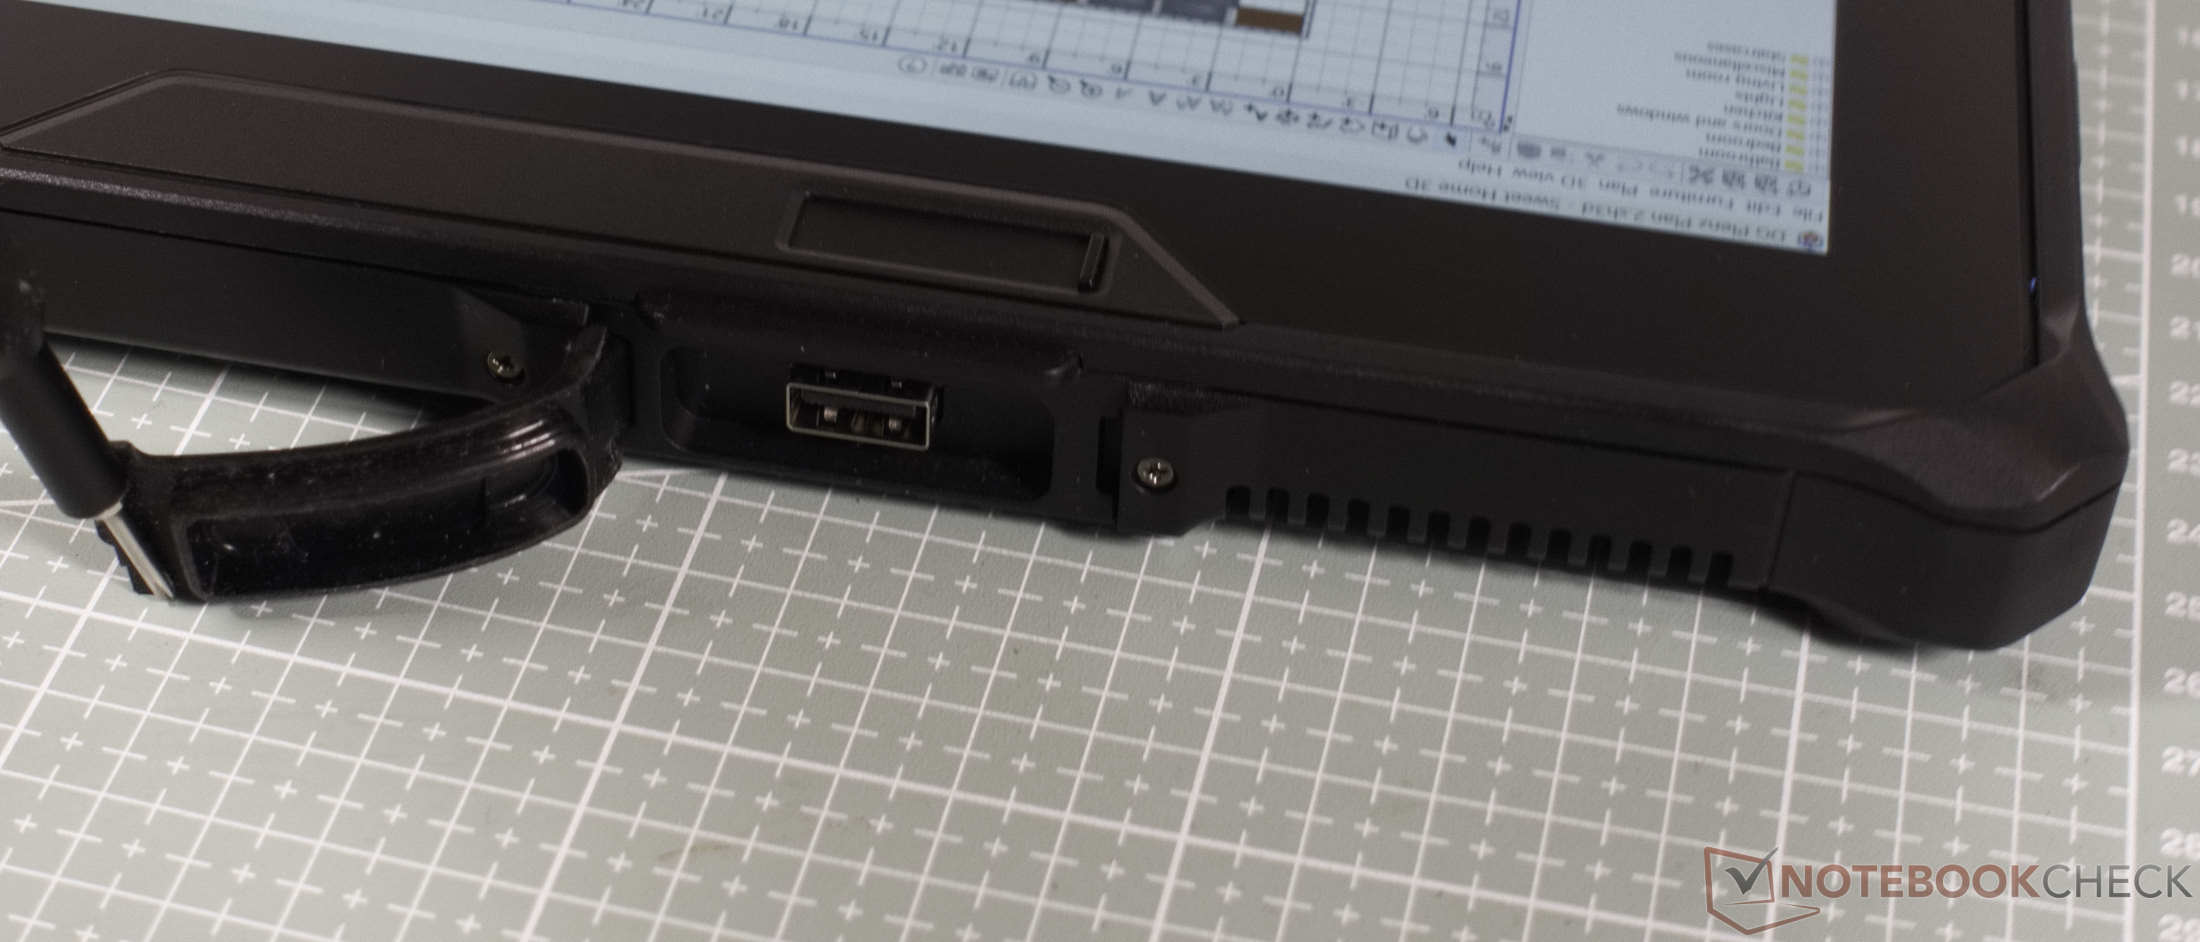
Tutte le porte sono nascoste dietro robusti cappucci protettivi. Il tablet è dotato di una moderna porta USB-C con Thunderbolt, DisplayPort e Power Delivery. Include inoltre una porta Gigabit Ethernet RJ-45, un jack per cuffie e un jack di alimentazione standard.
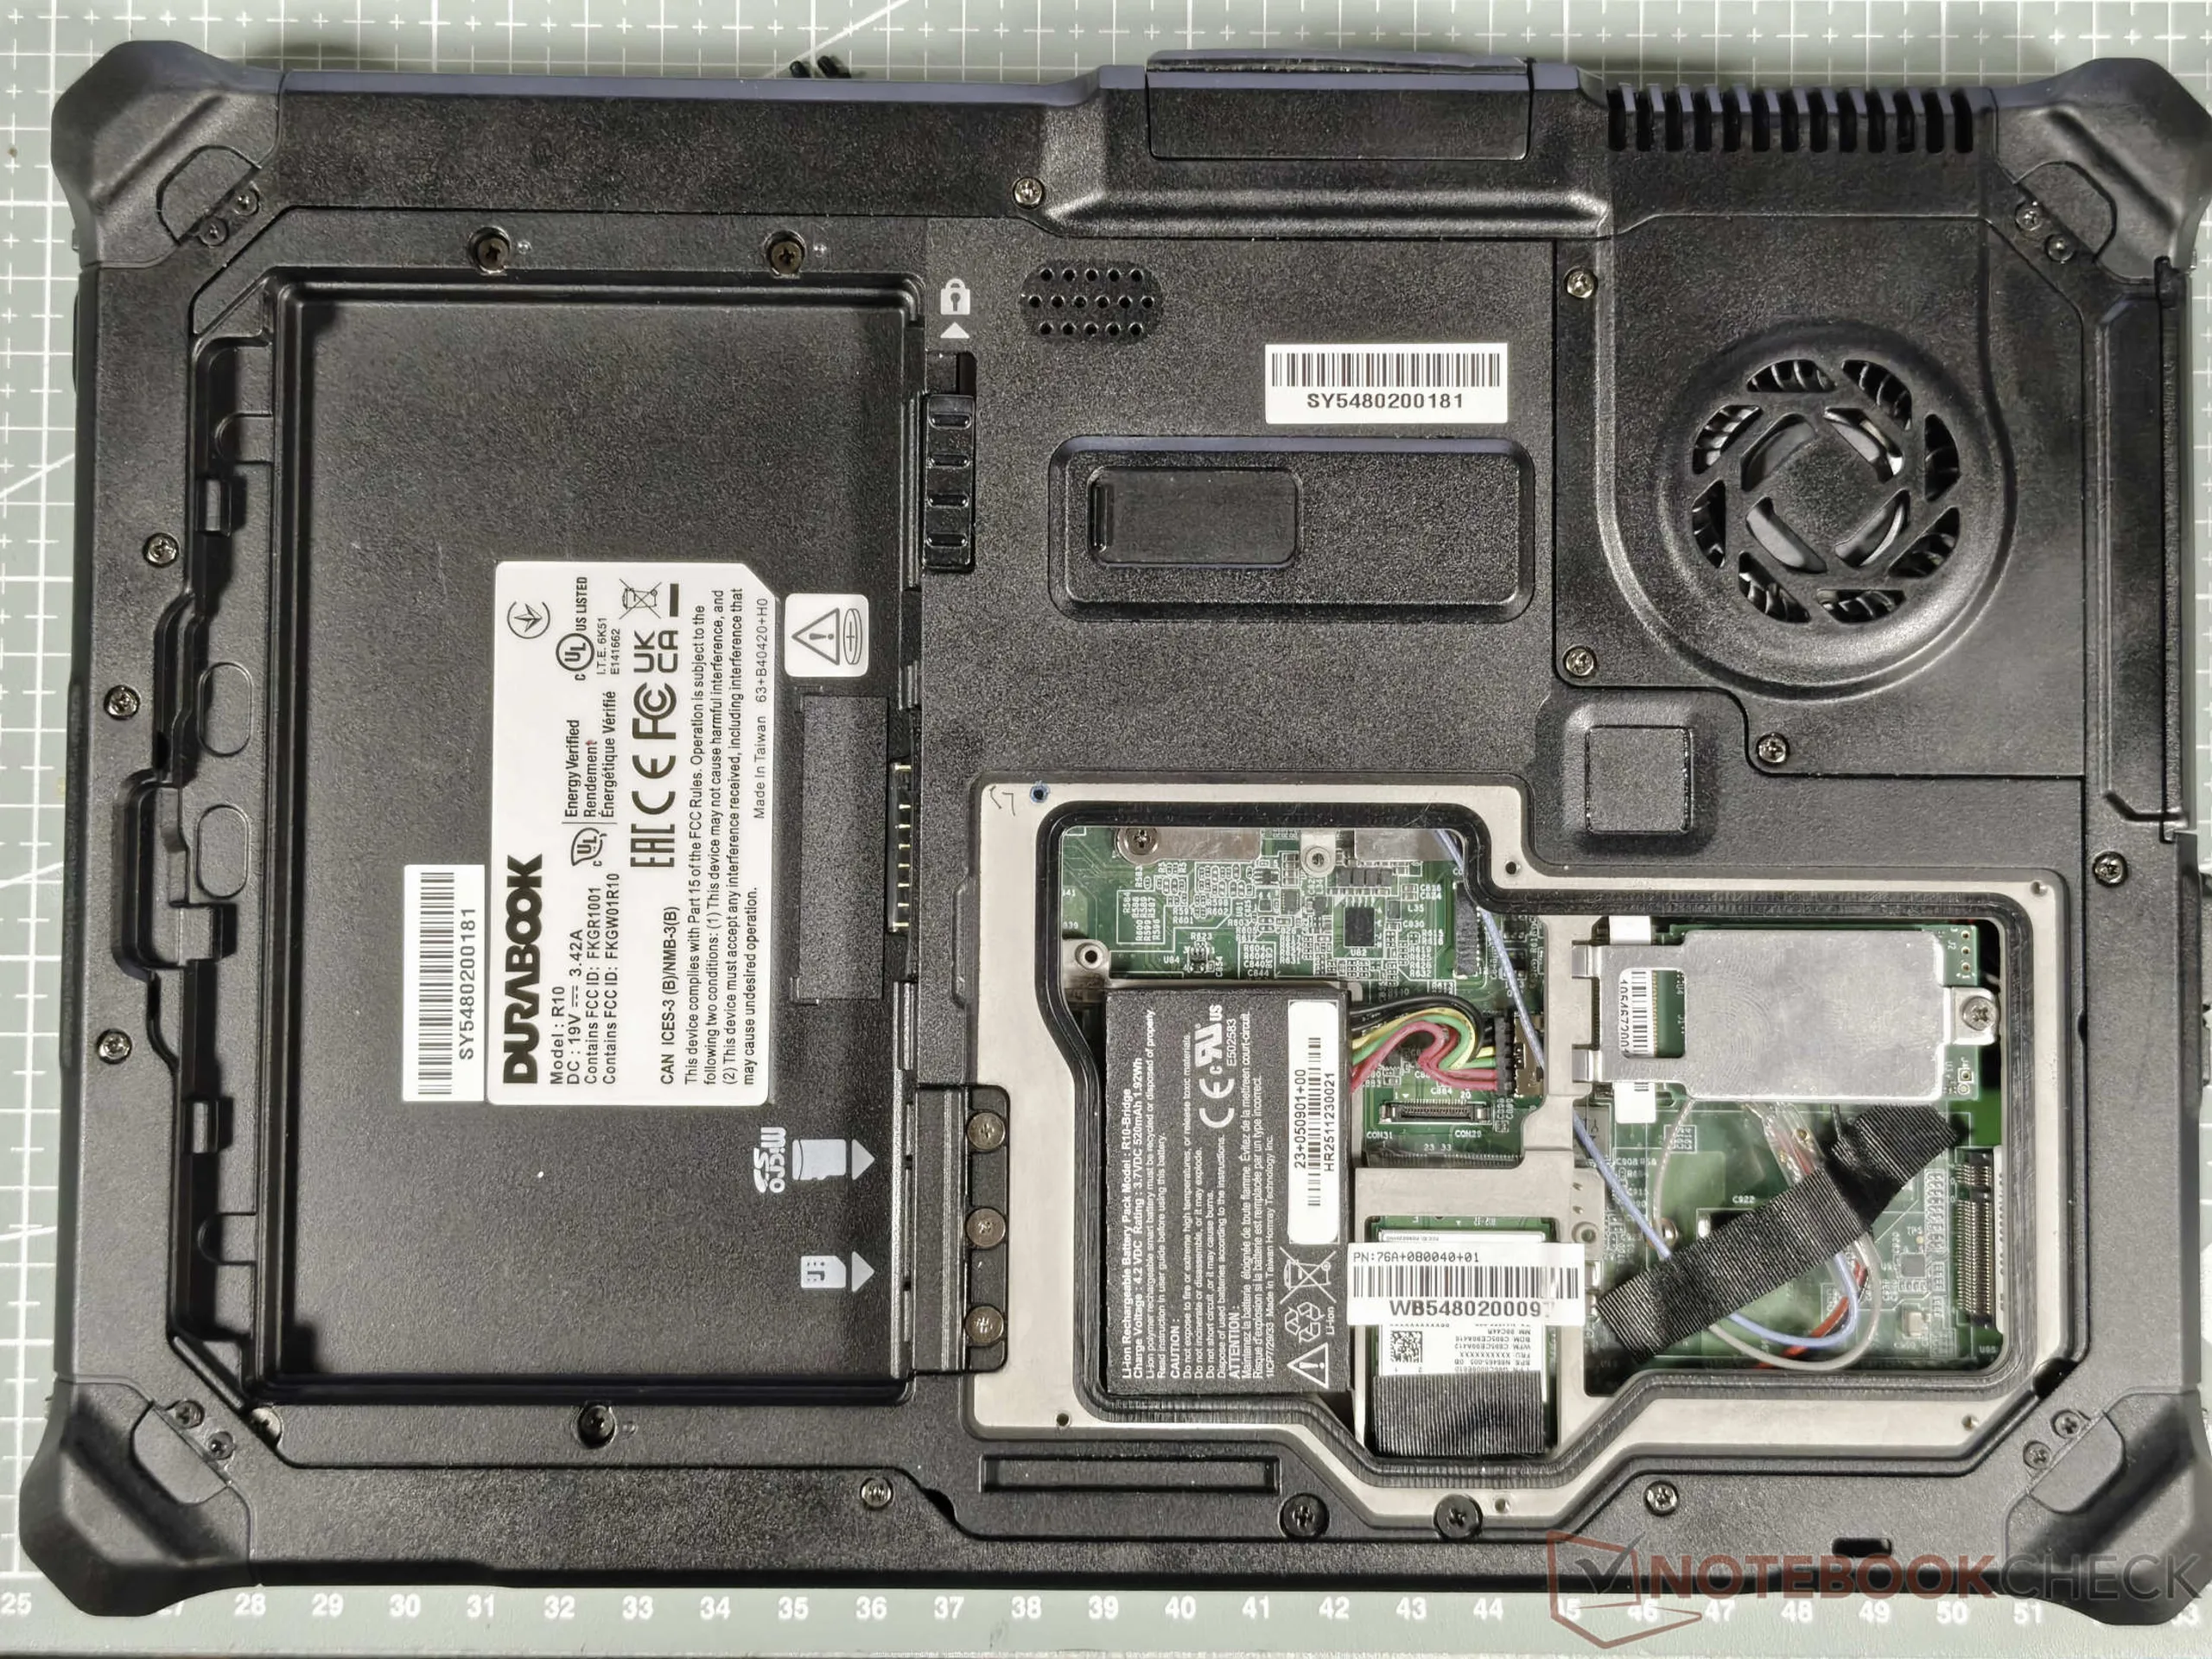
Il retro del tablet presenta anche uno scanner biometrico di impronte digitali per un accesso sicuro al sistema. Purtroppo, il lettore di schede SD integrato è piuttosto difficile da raggiungere, poiché si trova all’interno, dietro la batteria. Tuttavia, è ragionevolmente veloce. All’interno del tablet sono presenti anche slot liberi per schede di espansione. Per quanto riguarda la connettività wireless, il tablet rugged offre Wi-Fi 7 e Bluetooth 5.4.
| SD Card Reader | |
| average JPG Copy Test (av. of 3 runs) | |
| Durabook R10 | |
| Dell Latitude 7030 Rugged Extreme (AV Pro V60) | |
| Durabook R8 Tablet (AV Pro V60) | |
| Media della classe Tablet (10.2 - 79.2, n=44, ultimi 2 anni) | |
| Dynabook Portege Z40L-N (AV PRO microSD 128 GB V60) | |
| maximum AS SSD Seq Read Test (1GB) | |
| Dell Latitude 7030 Rugged Extreme (AV Pro V60) | |
| Durabook R10 | |
| Dynabook Portege Z40L-N (AV PRO microSD 128 GB V60) | |
| Media della classe Tablet (n=1ultimi 2 anni) | |
| Durabook R8 Tablet (AV Pro V60) | |
Fotocamera
La fotocamera frontale Full HD è più che adeguata per le videoconferenze. La fotocamera principale da 11 megapixel sul retro scatta foto macro di qualità davvero notevole, ma presenta qualche difficoltà con gli scatti grandangolari a causa dell’autofocus lento e di una gamma dinamica limitata. Grazie al flash integrato, la fotocamera rimane utilizzabile anche in ambienti bui.


Dispositivi di input
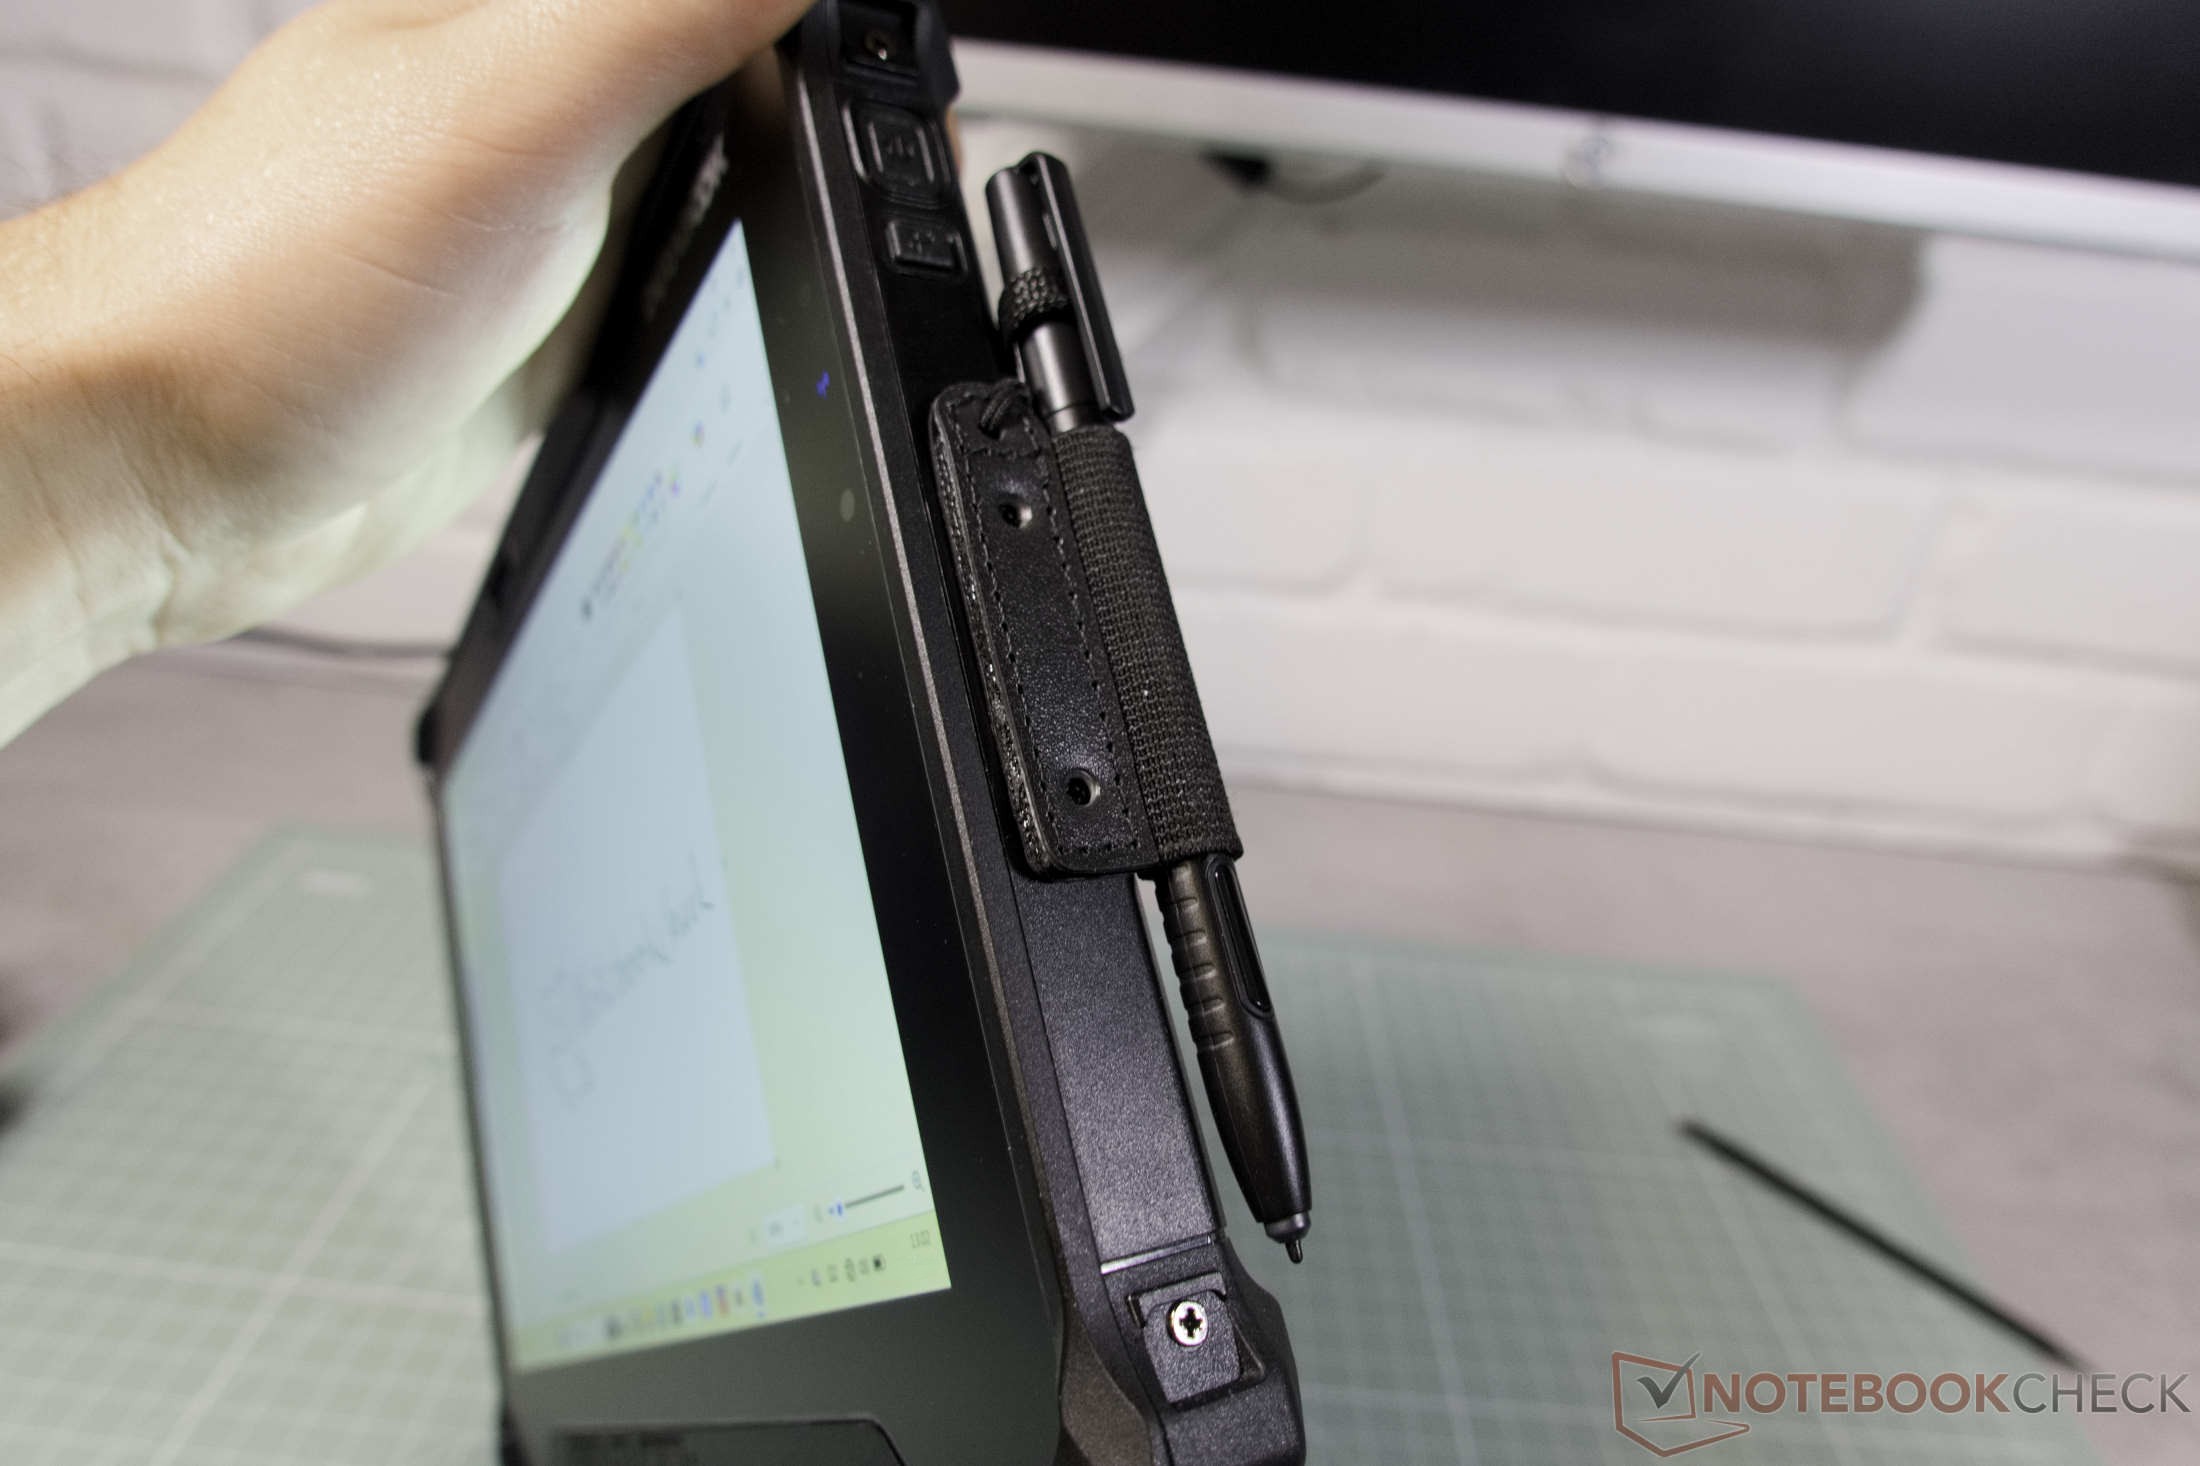
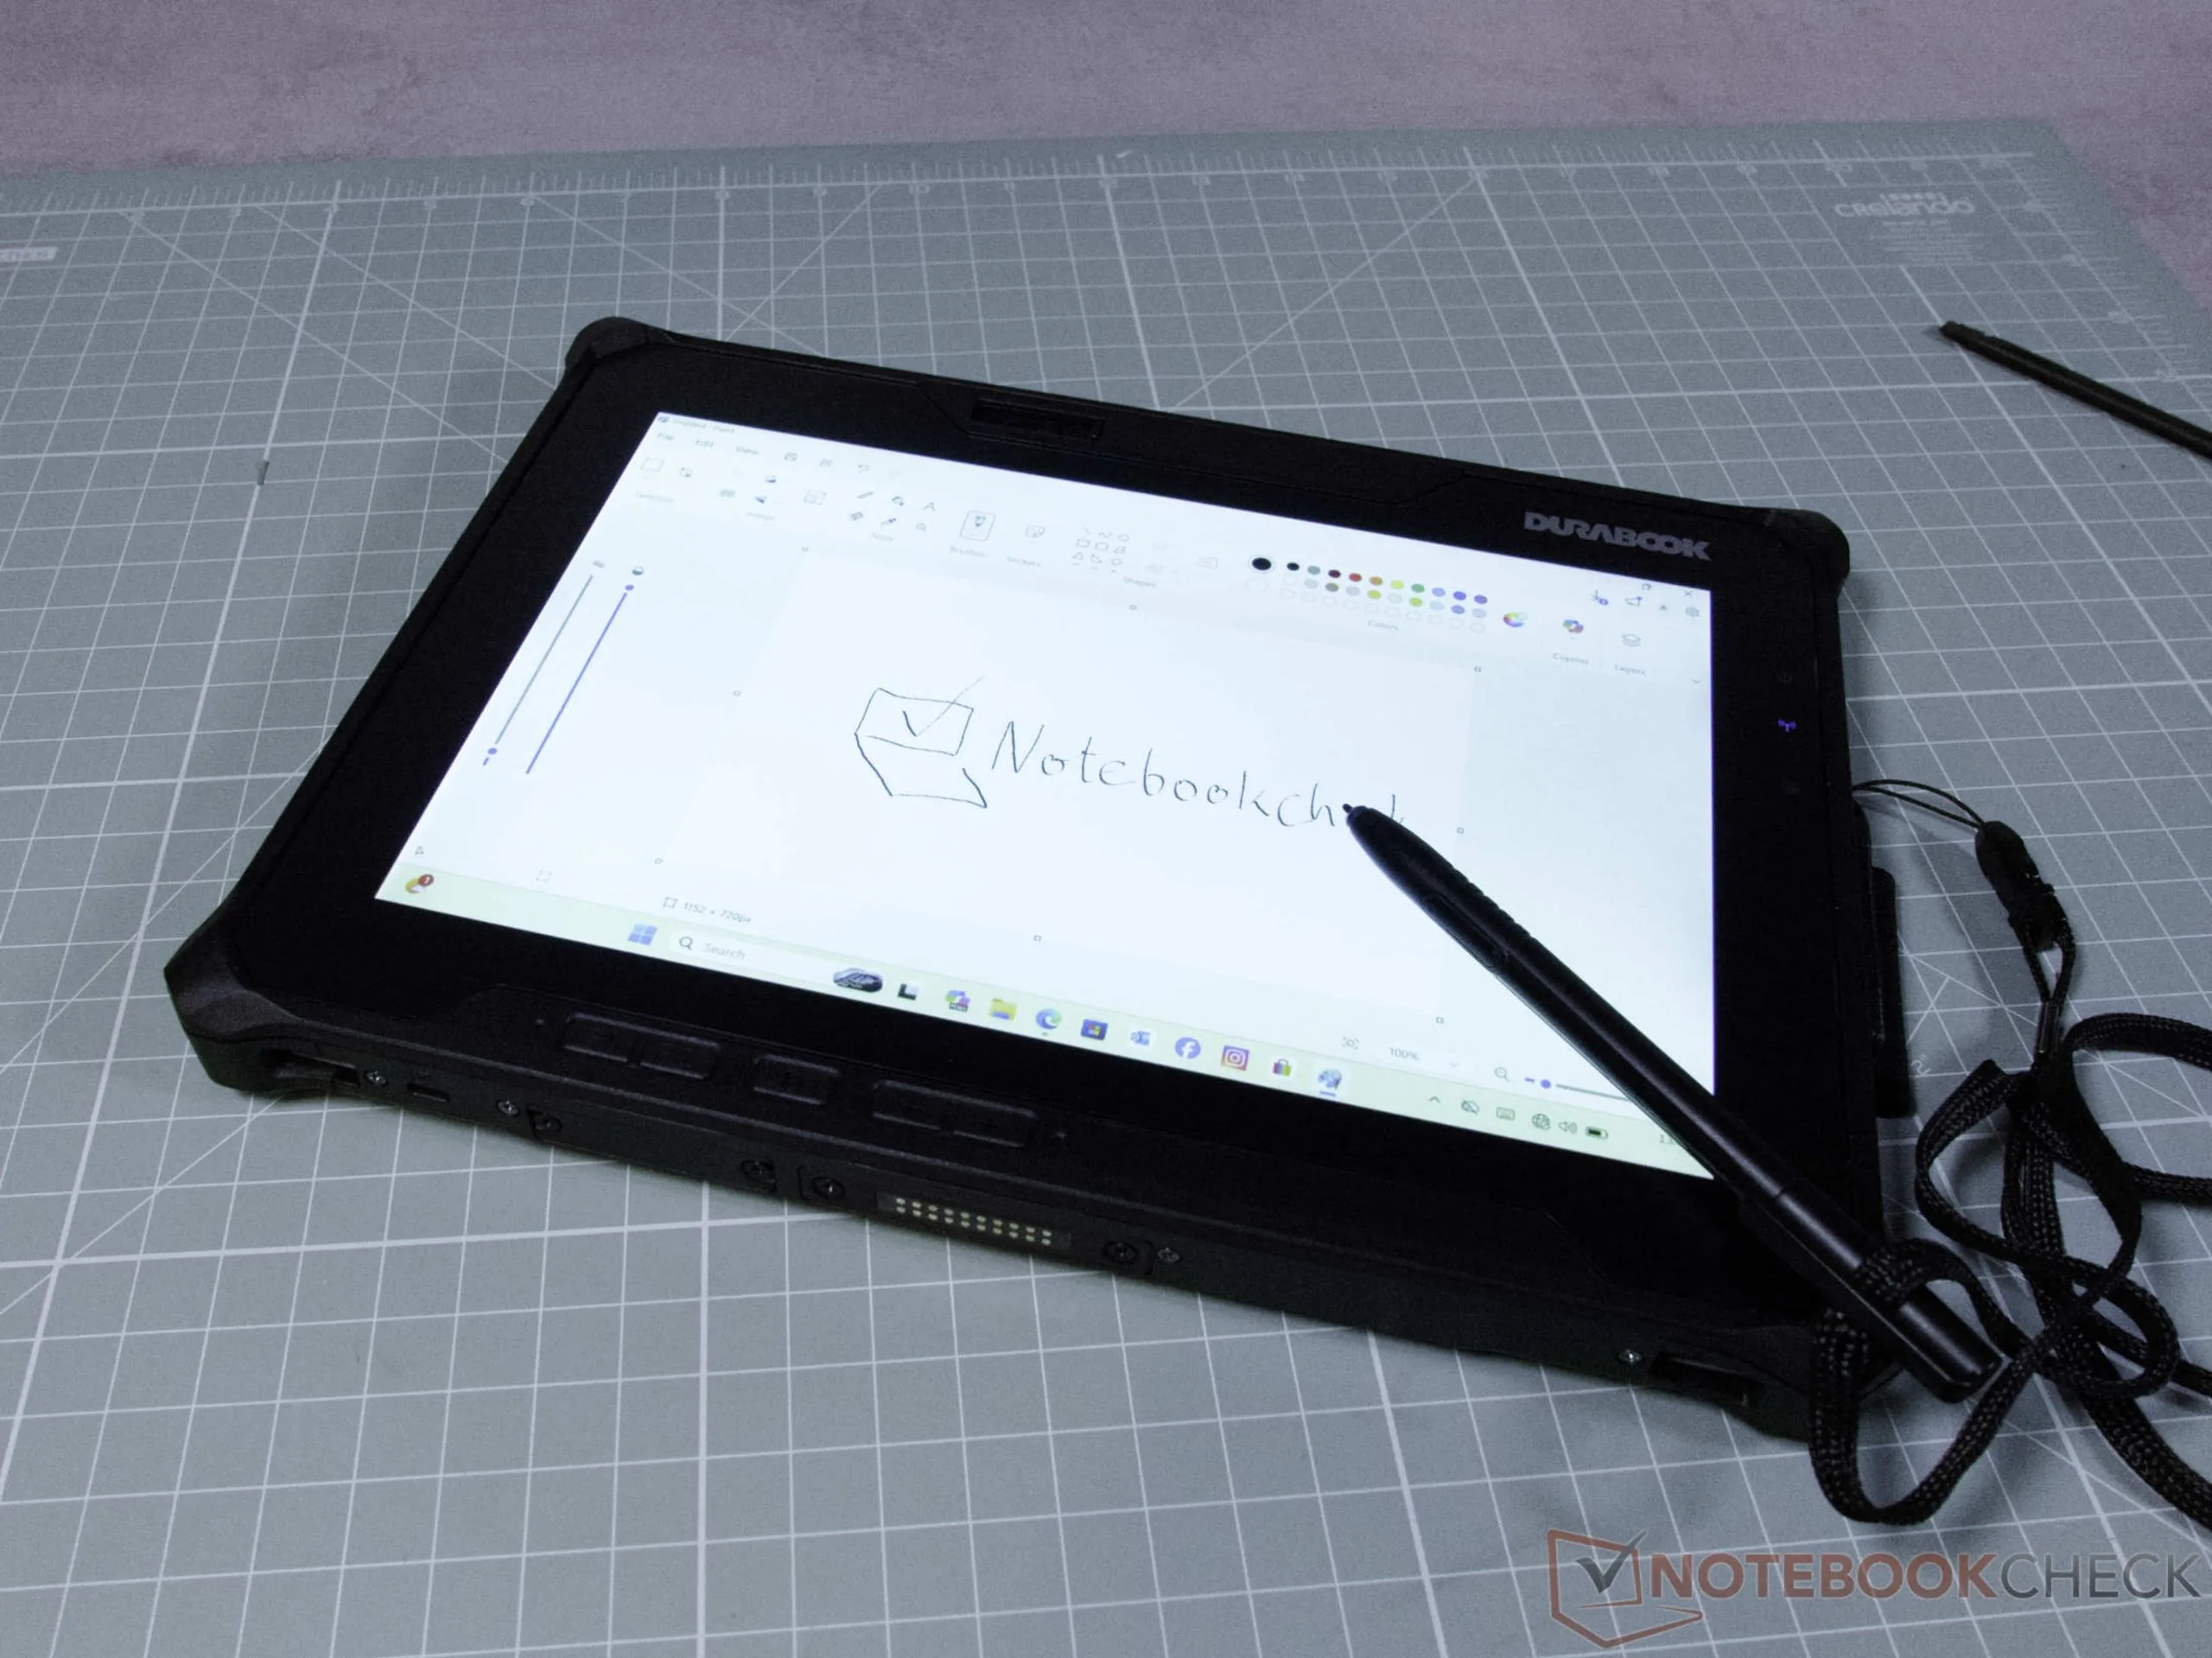
Oltre al touchscreen, il Durabook R10 è dotato di sei pulsanti le cui funzioni possono essere personalizzate. Il touchscreen rimane tuttavia l’elemento di controllo centrale e può essere ottimizzato in modo flessibile per ambienti di lavoro difficili. Ad esempio, è possibile modificare la modalità touch in modo che lo schermo riconosca in modo affidabile gli input sia indossando guanti protettivi spessi sia in condizioni di umidità. Per disegni tecnici dettagliati o schizzi, lo schermo supporta il Microsoft Pen Protocol 1.51.
Lo stilo Durabook è sorprendentemente leggero ma preciso. È possibile avvitare sul tablet un porta-penna opzionale, dotato anche di un laccio di sicurezza per la penna.
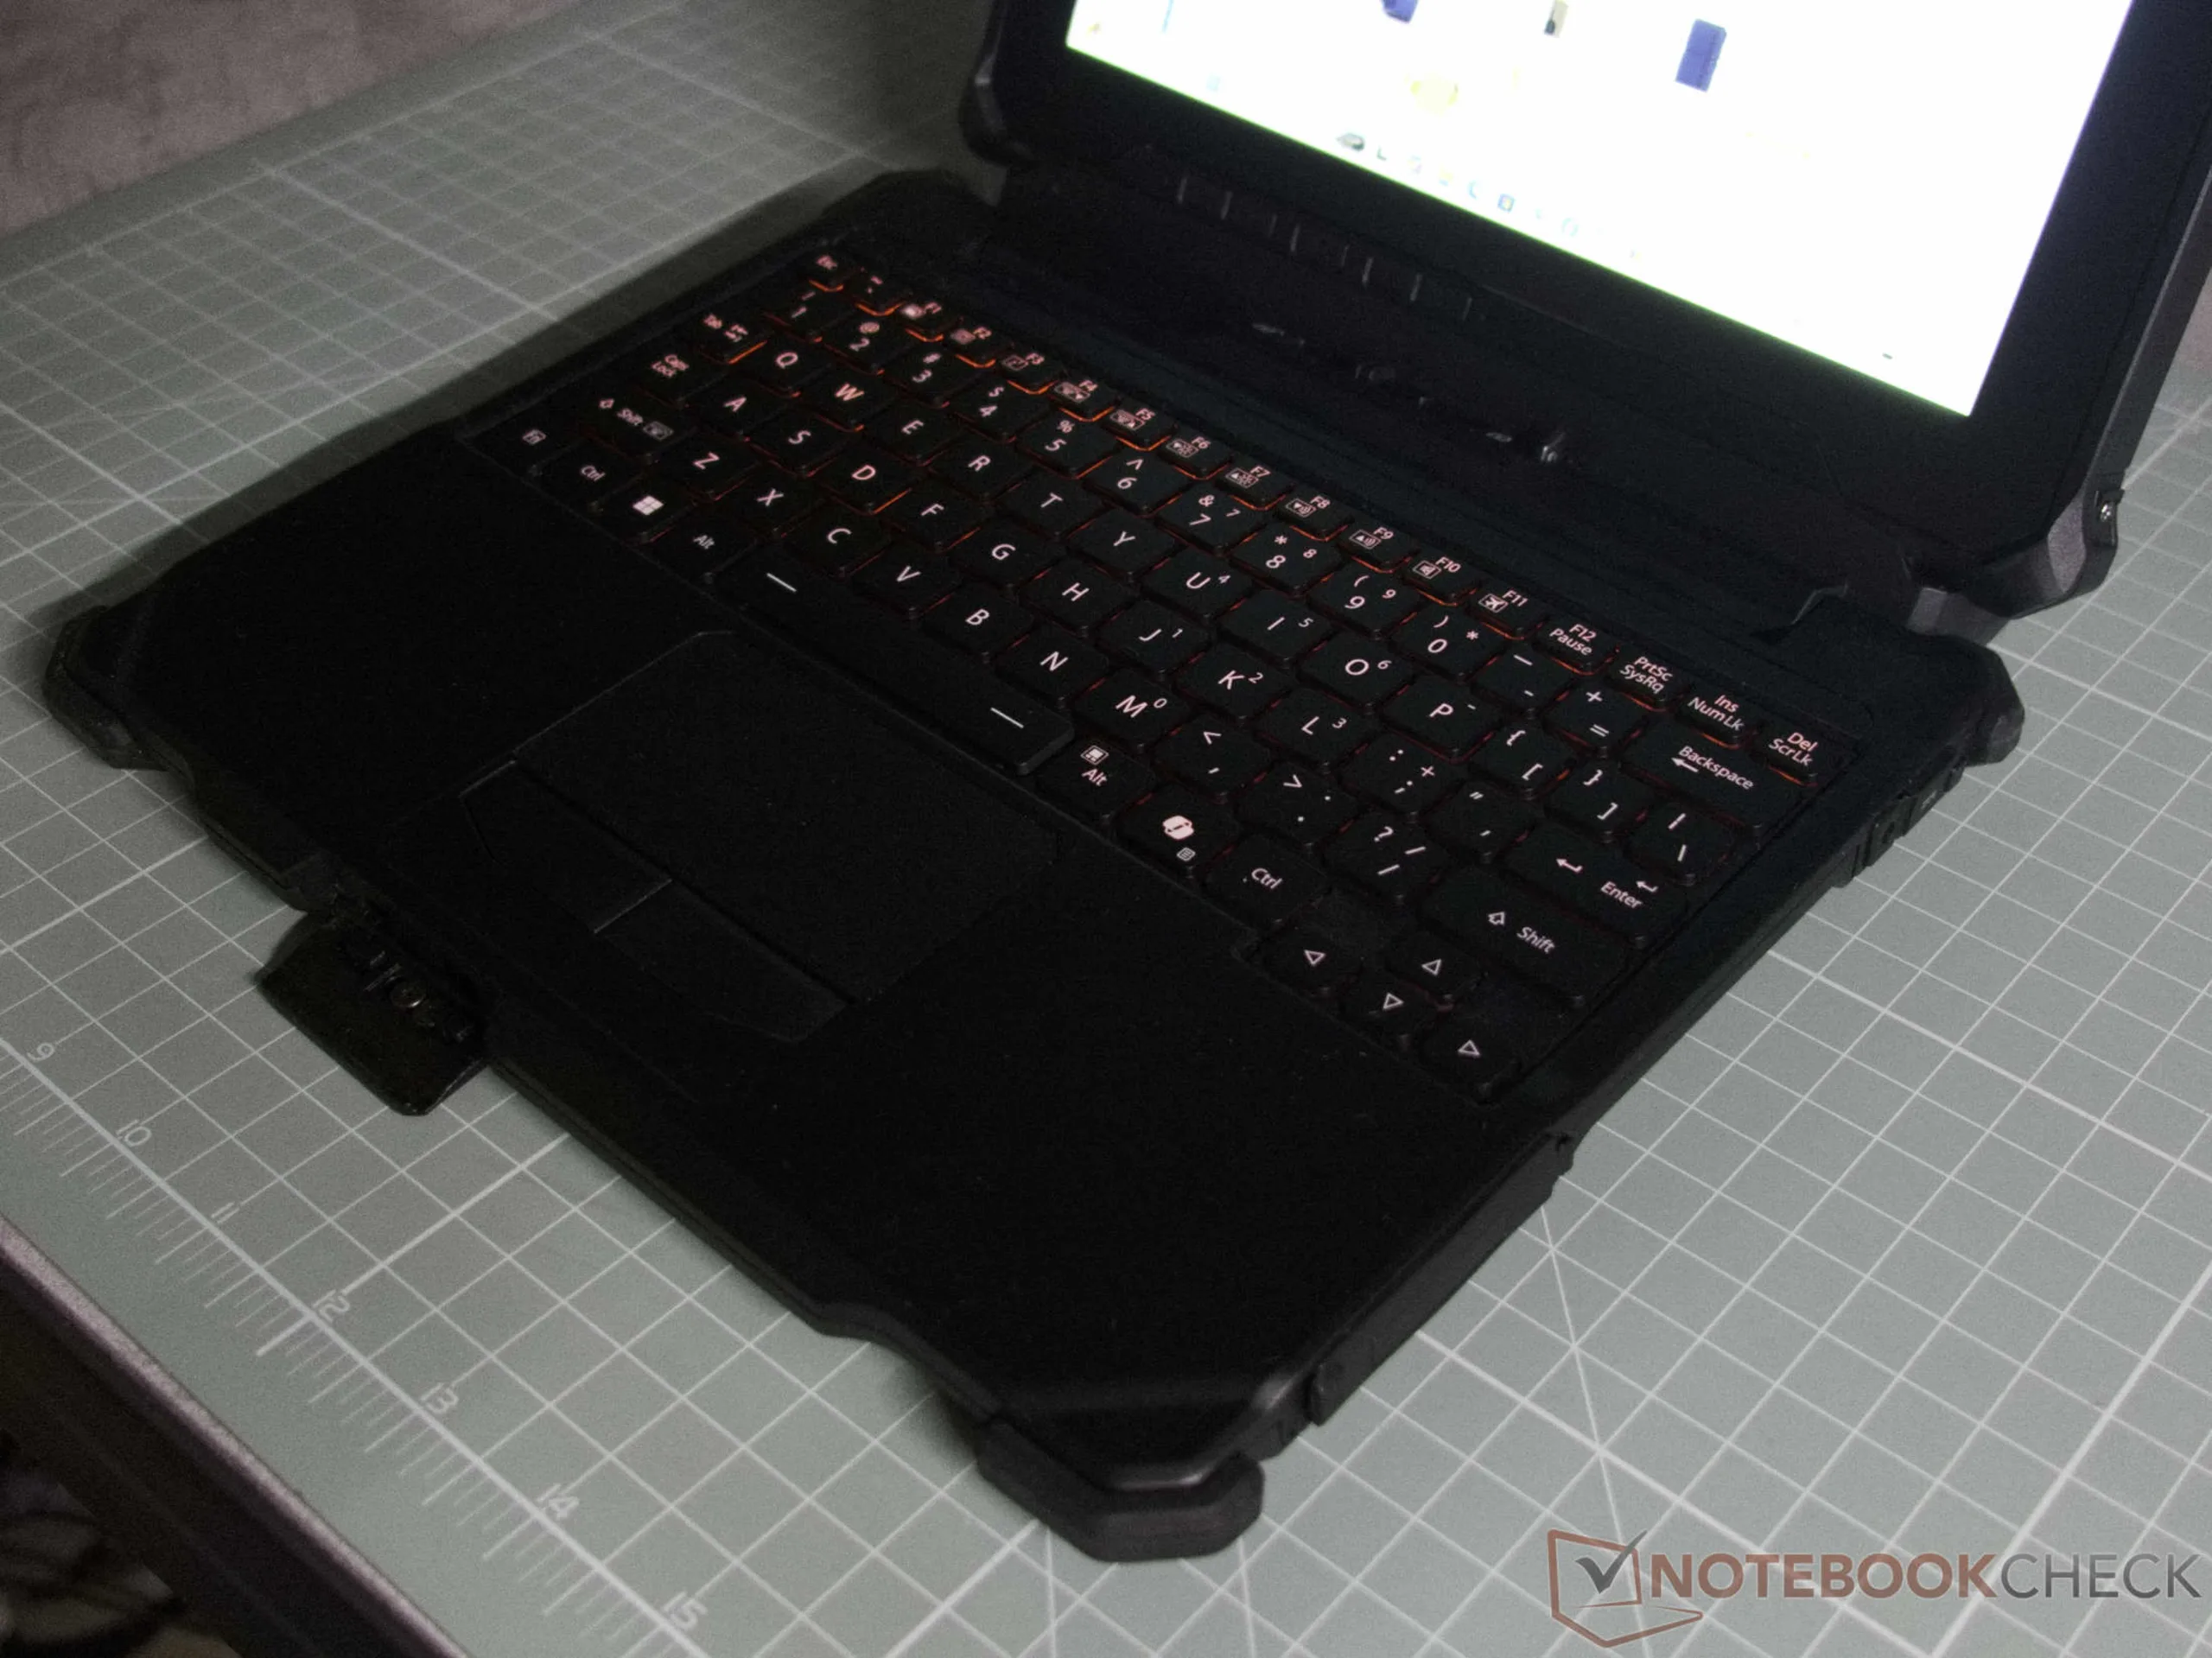
Come opzione, il tablet può essere aggiornato a un modello staccabile. Il modulo tastiera in dotazione offre una retroilluminazione rossa che non affatica la vista, oltre a diverse porte aggiuntive. Due porte USB-A 3.2 sono di serie, mentre le porte HDMI o LAN possono essere configurate in base alle esigenze. L’unità tastiera dispone inoltre di una porta di ricarica aggiuntiva.
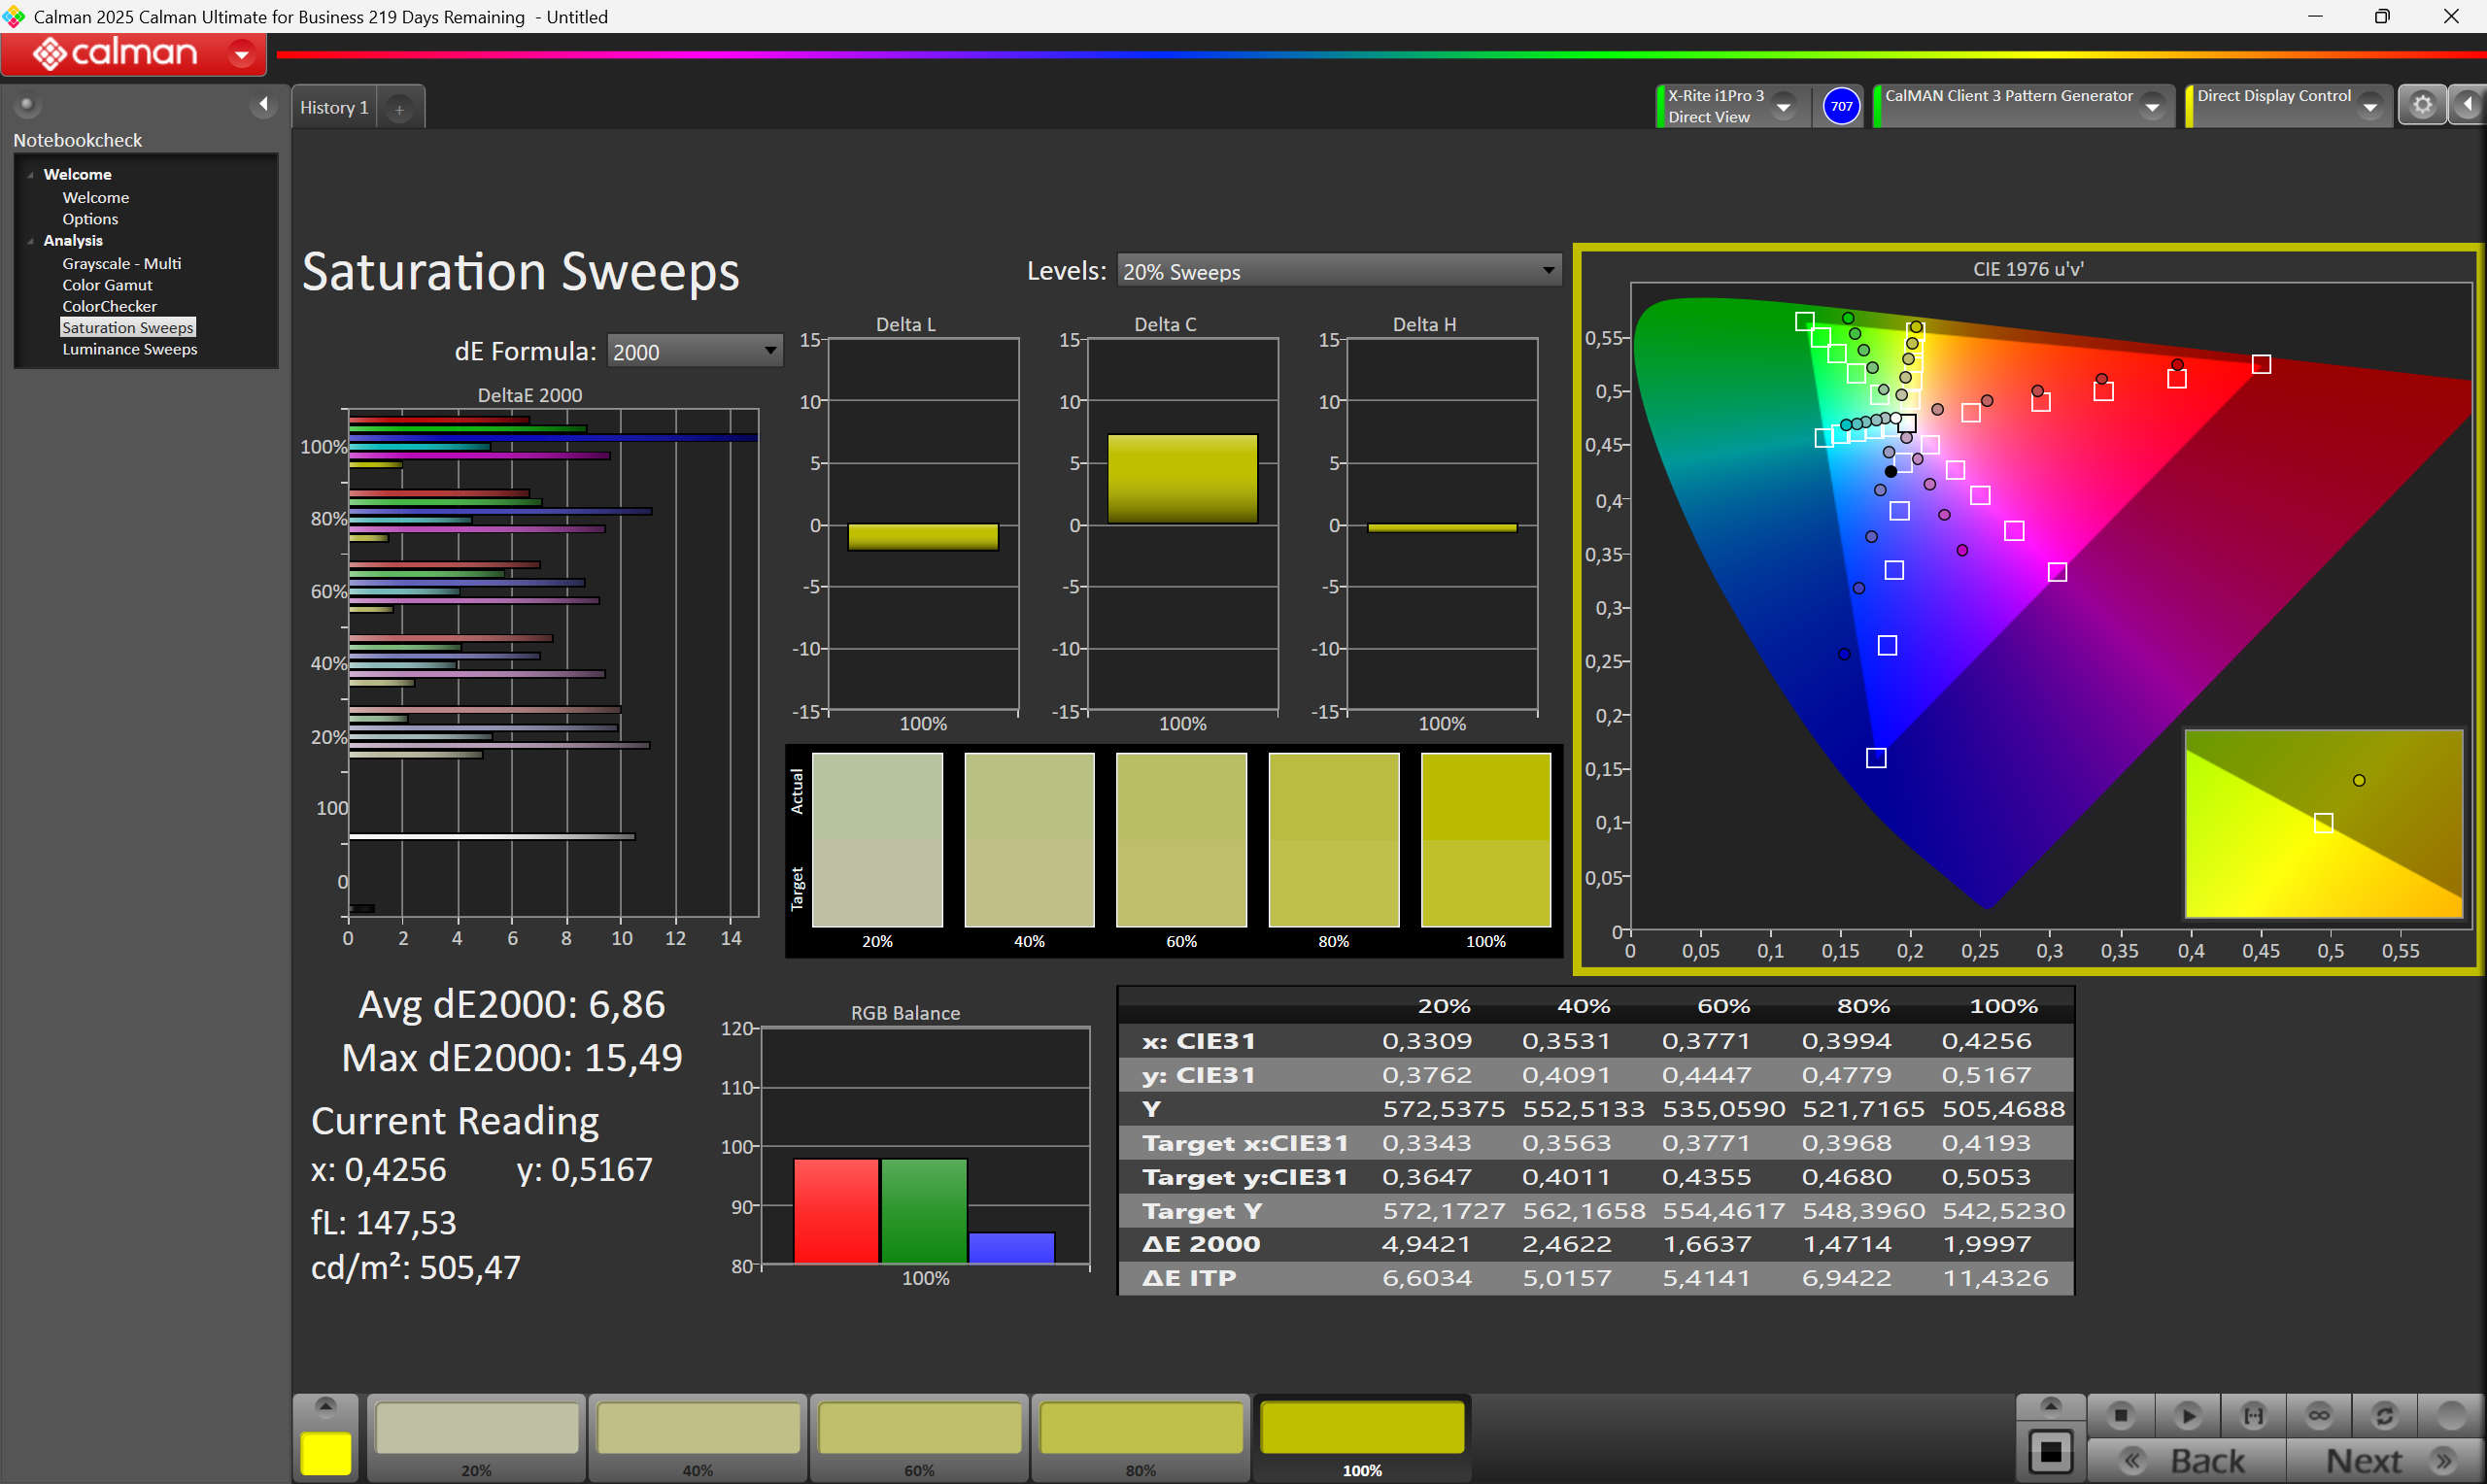
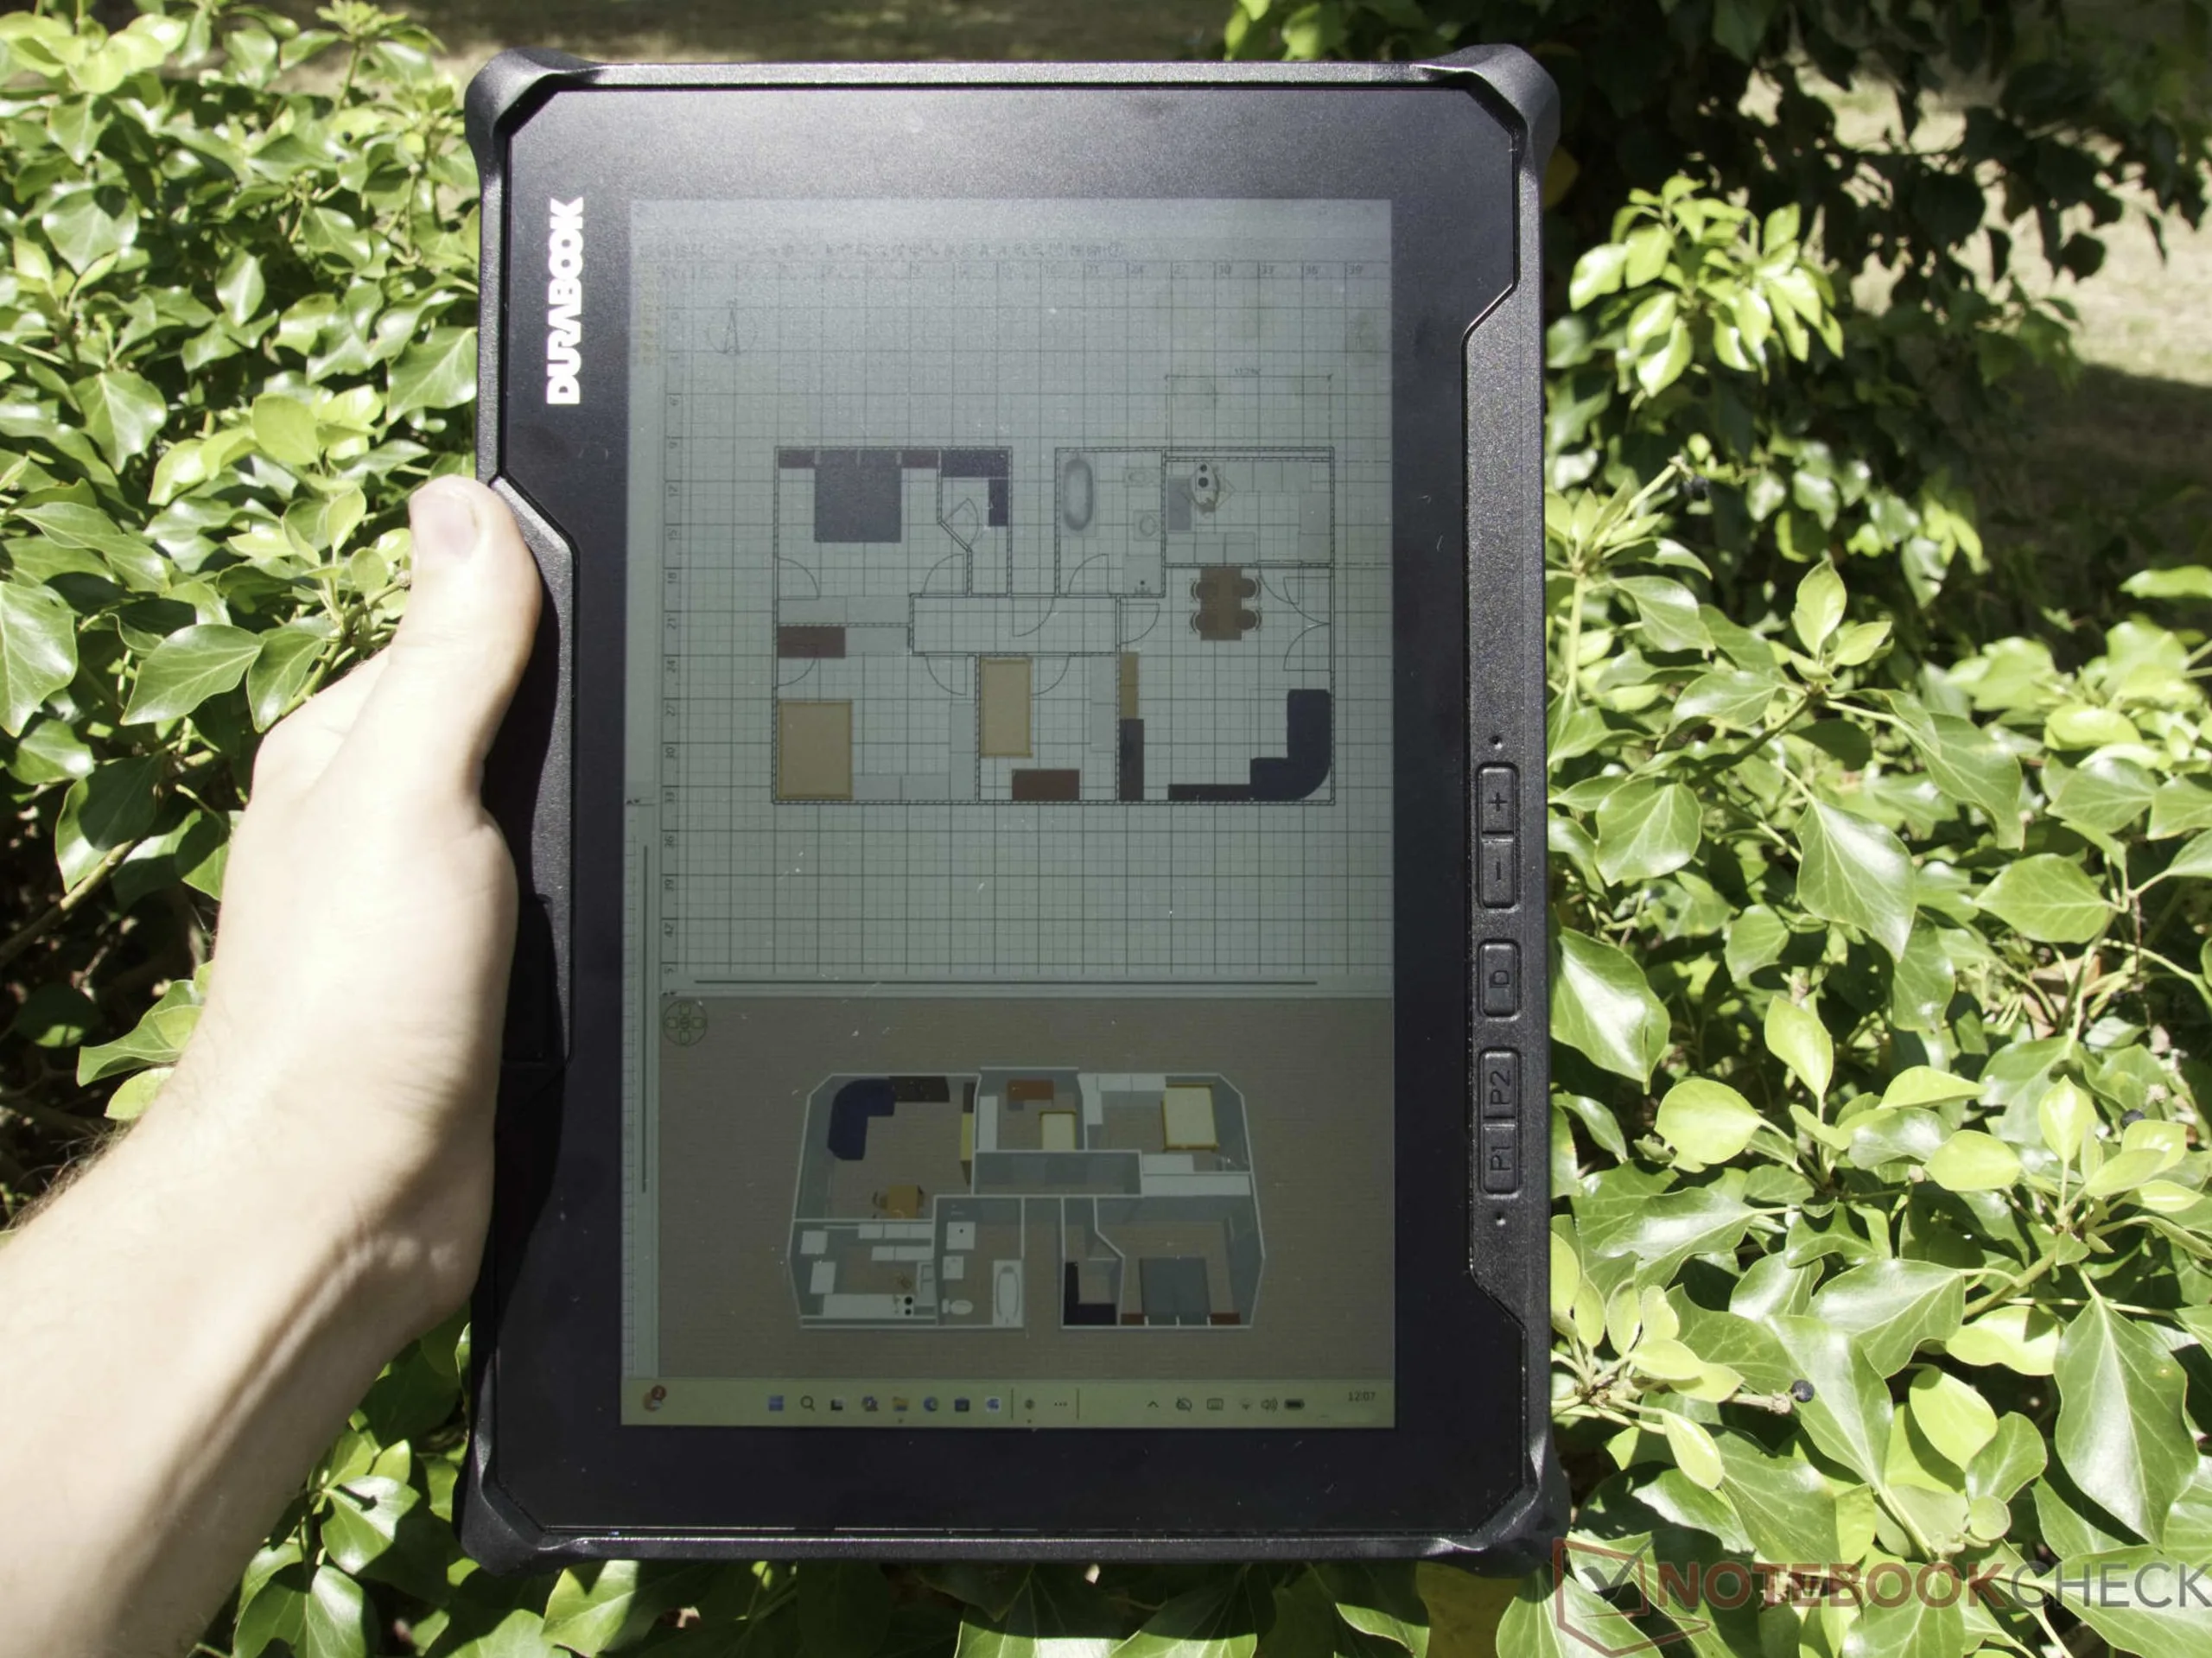
Visualizzazione
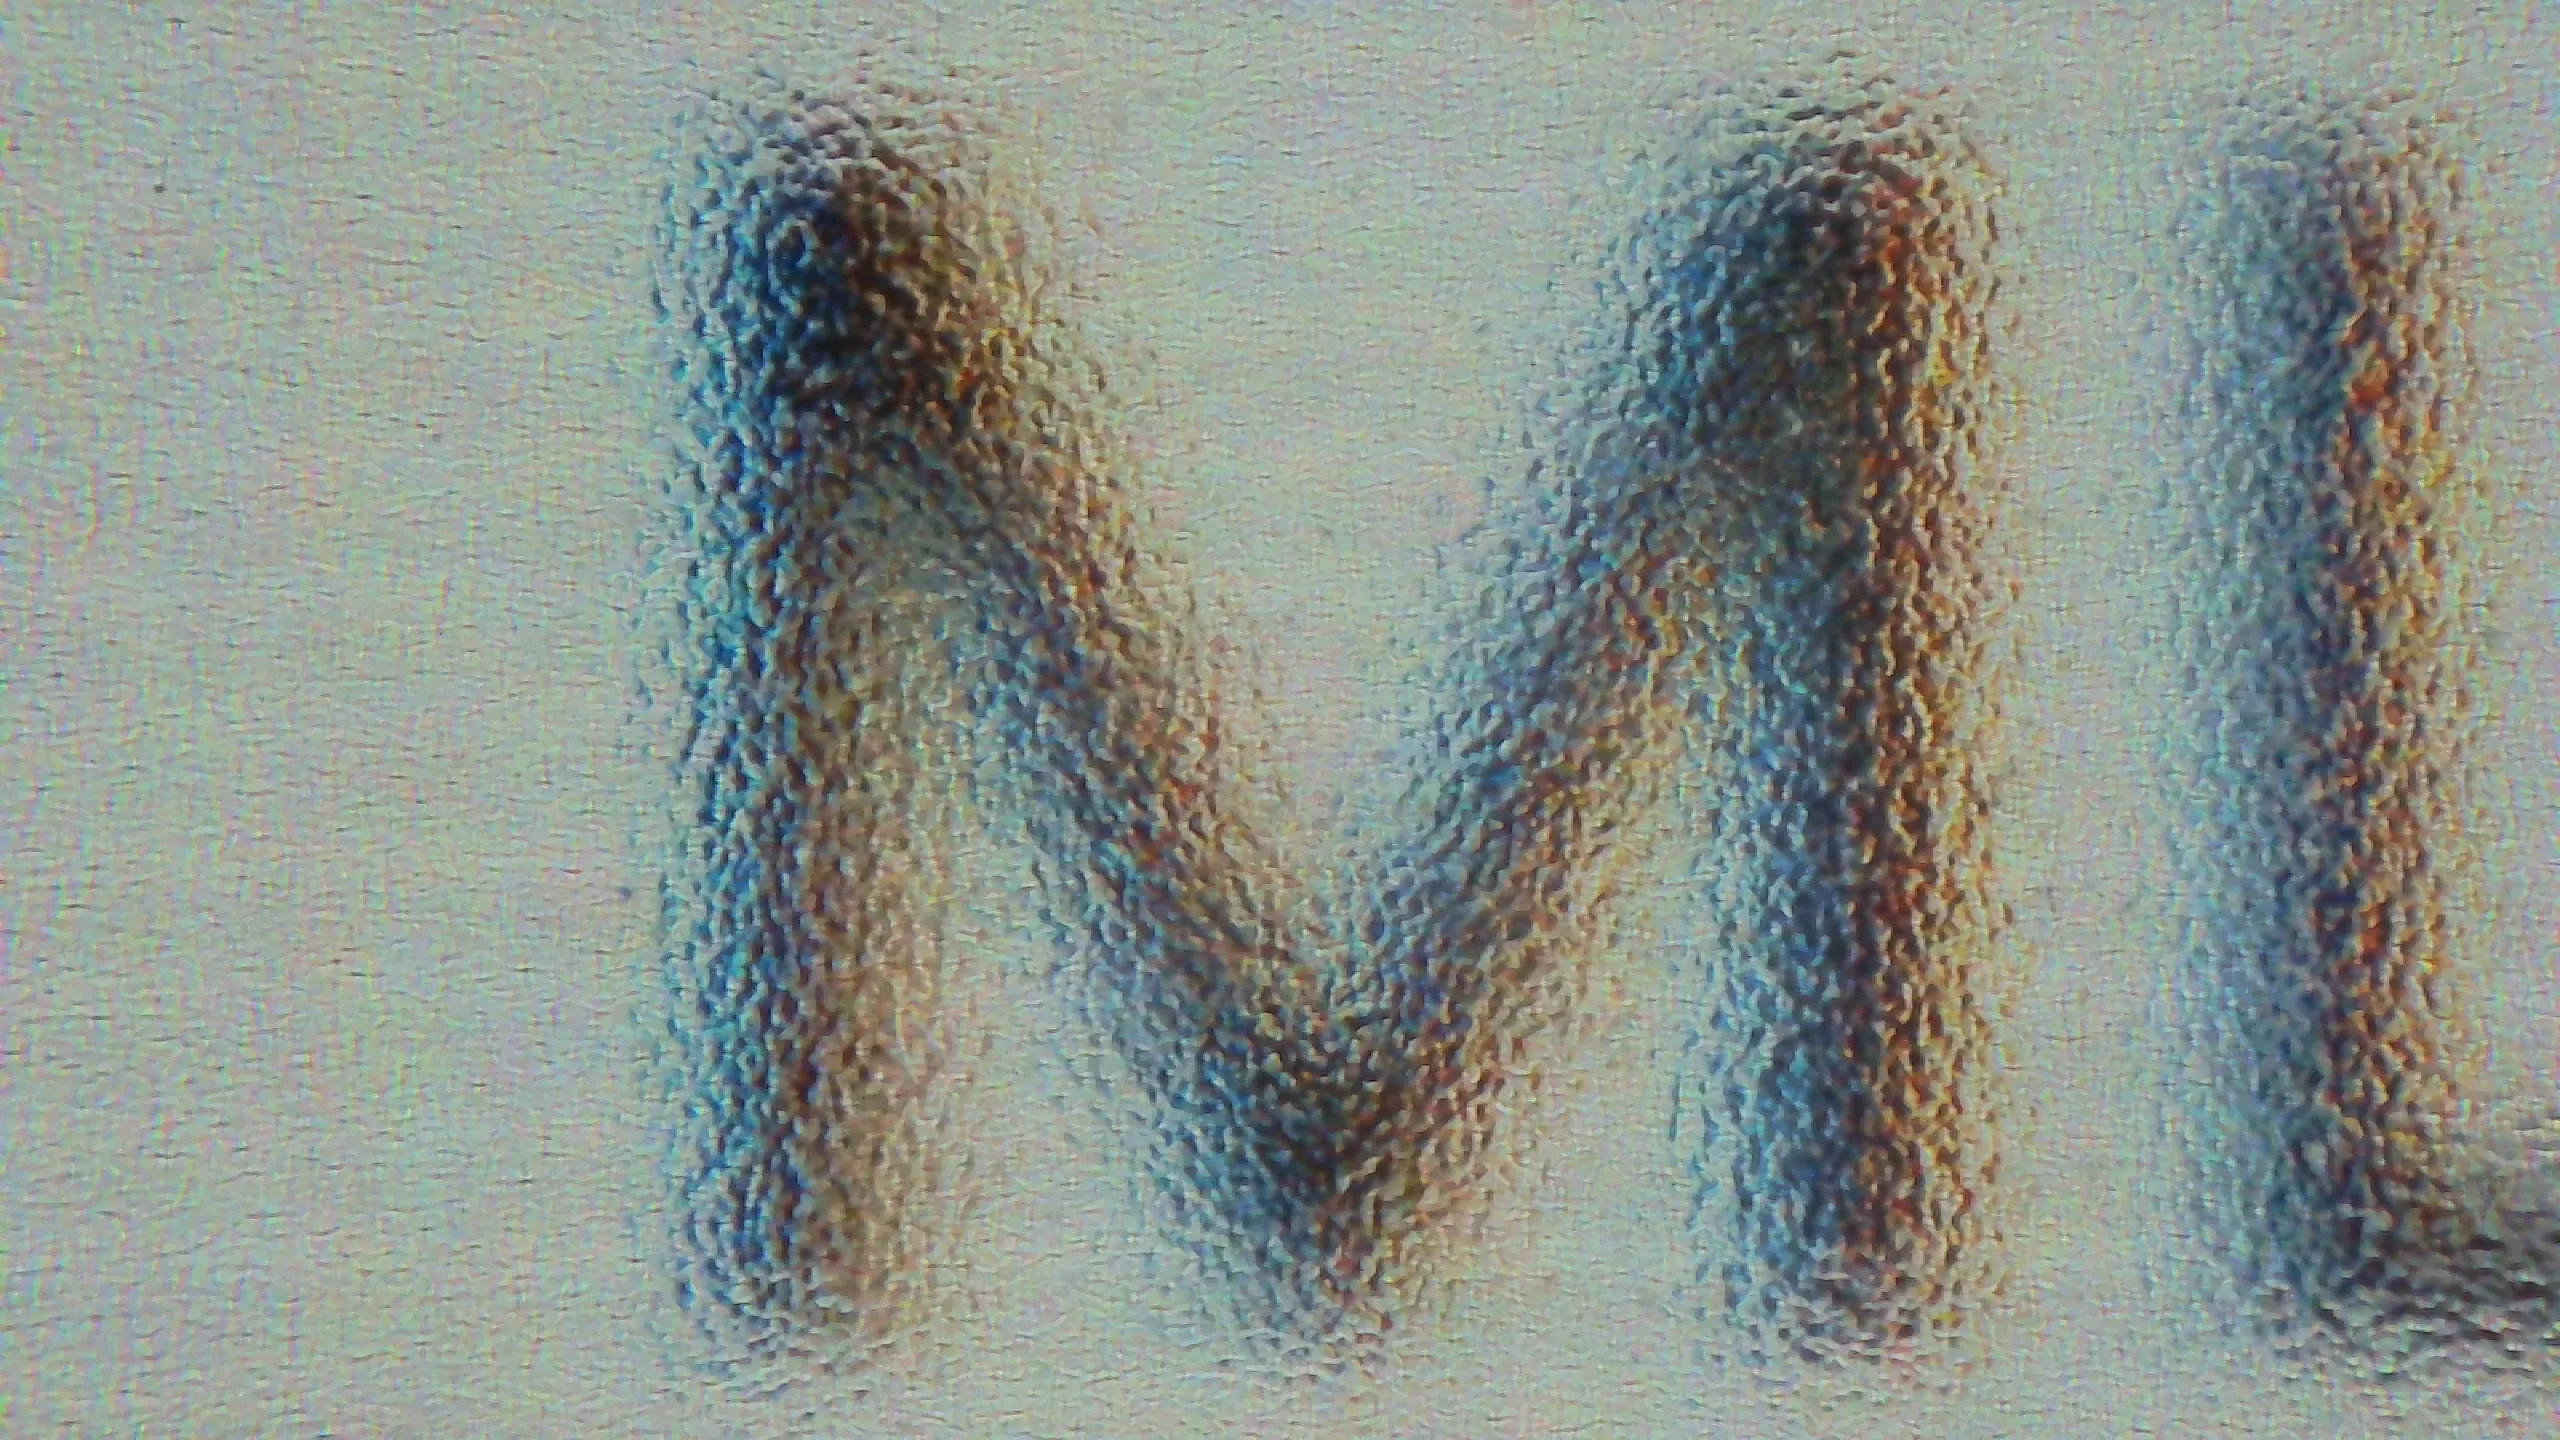
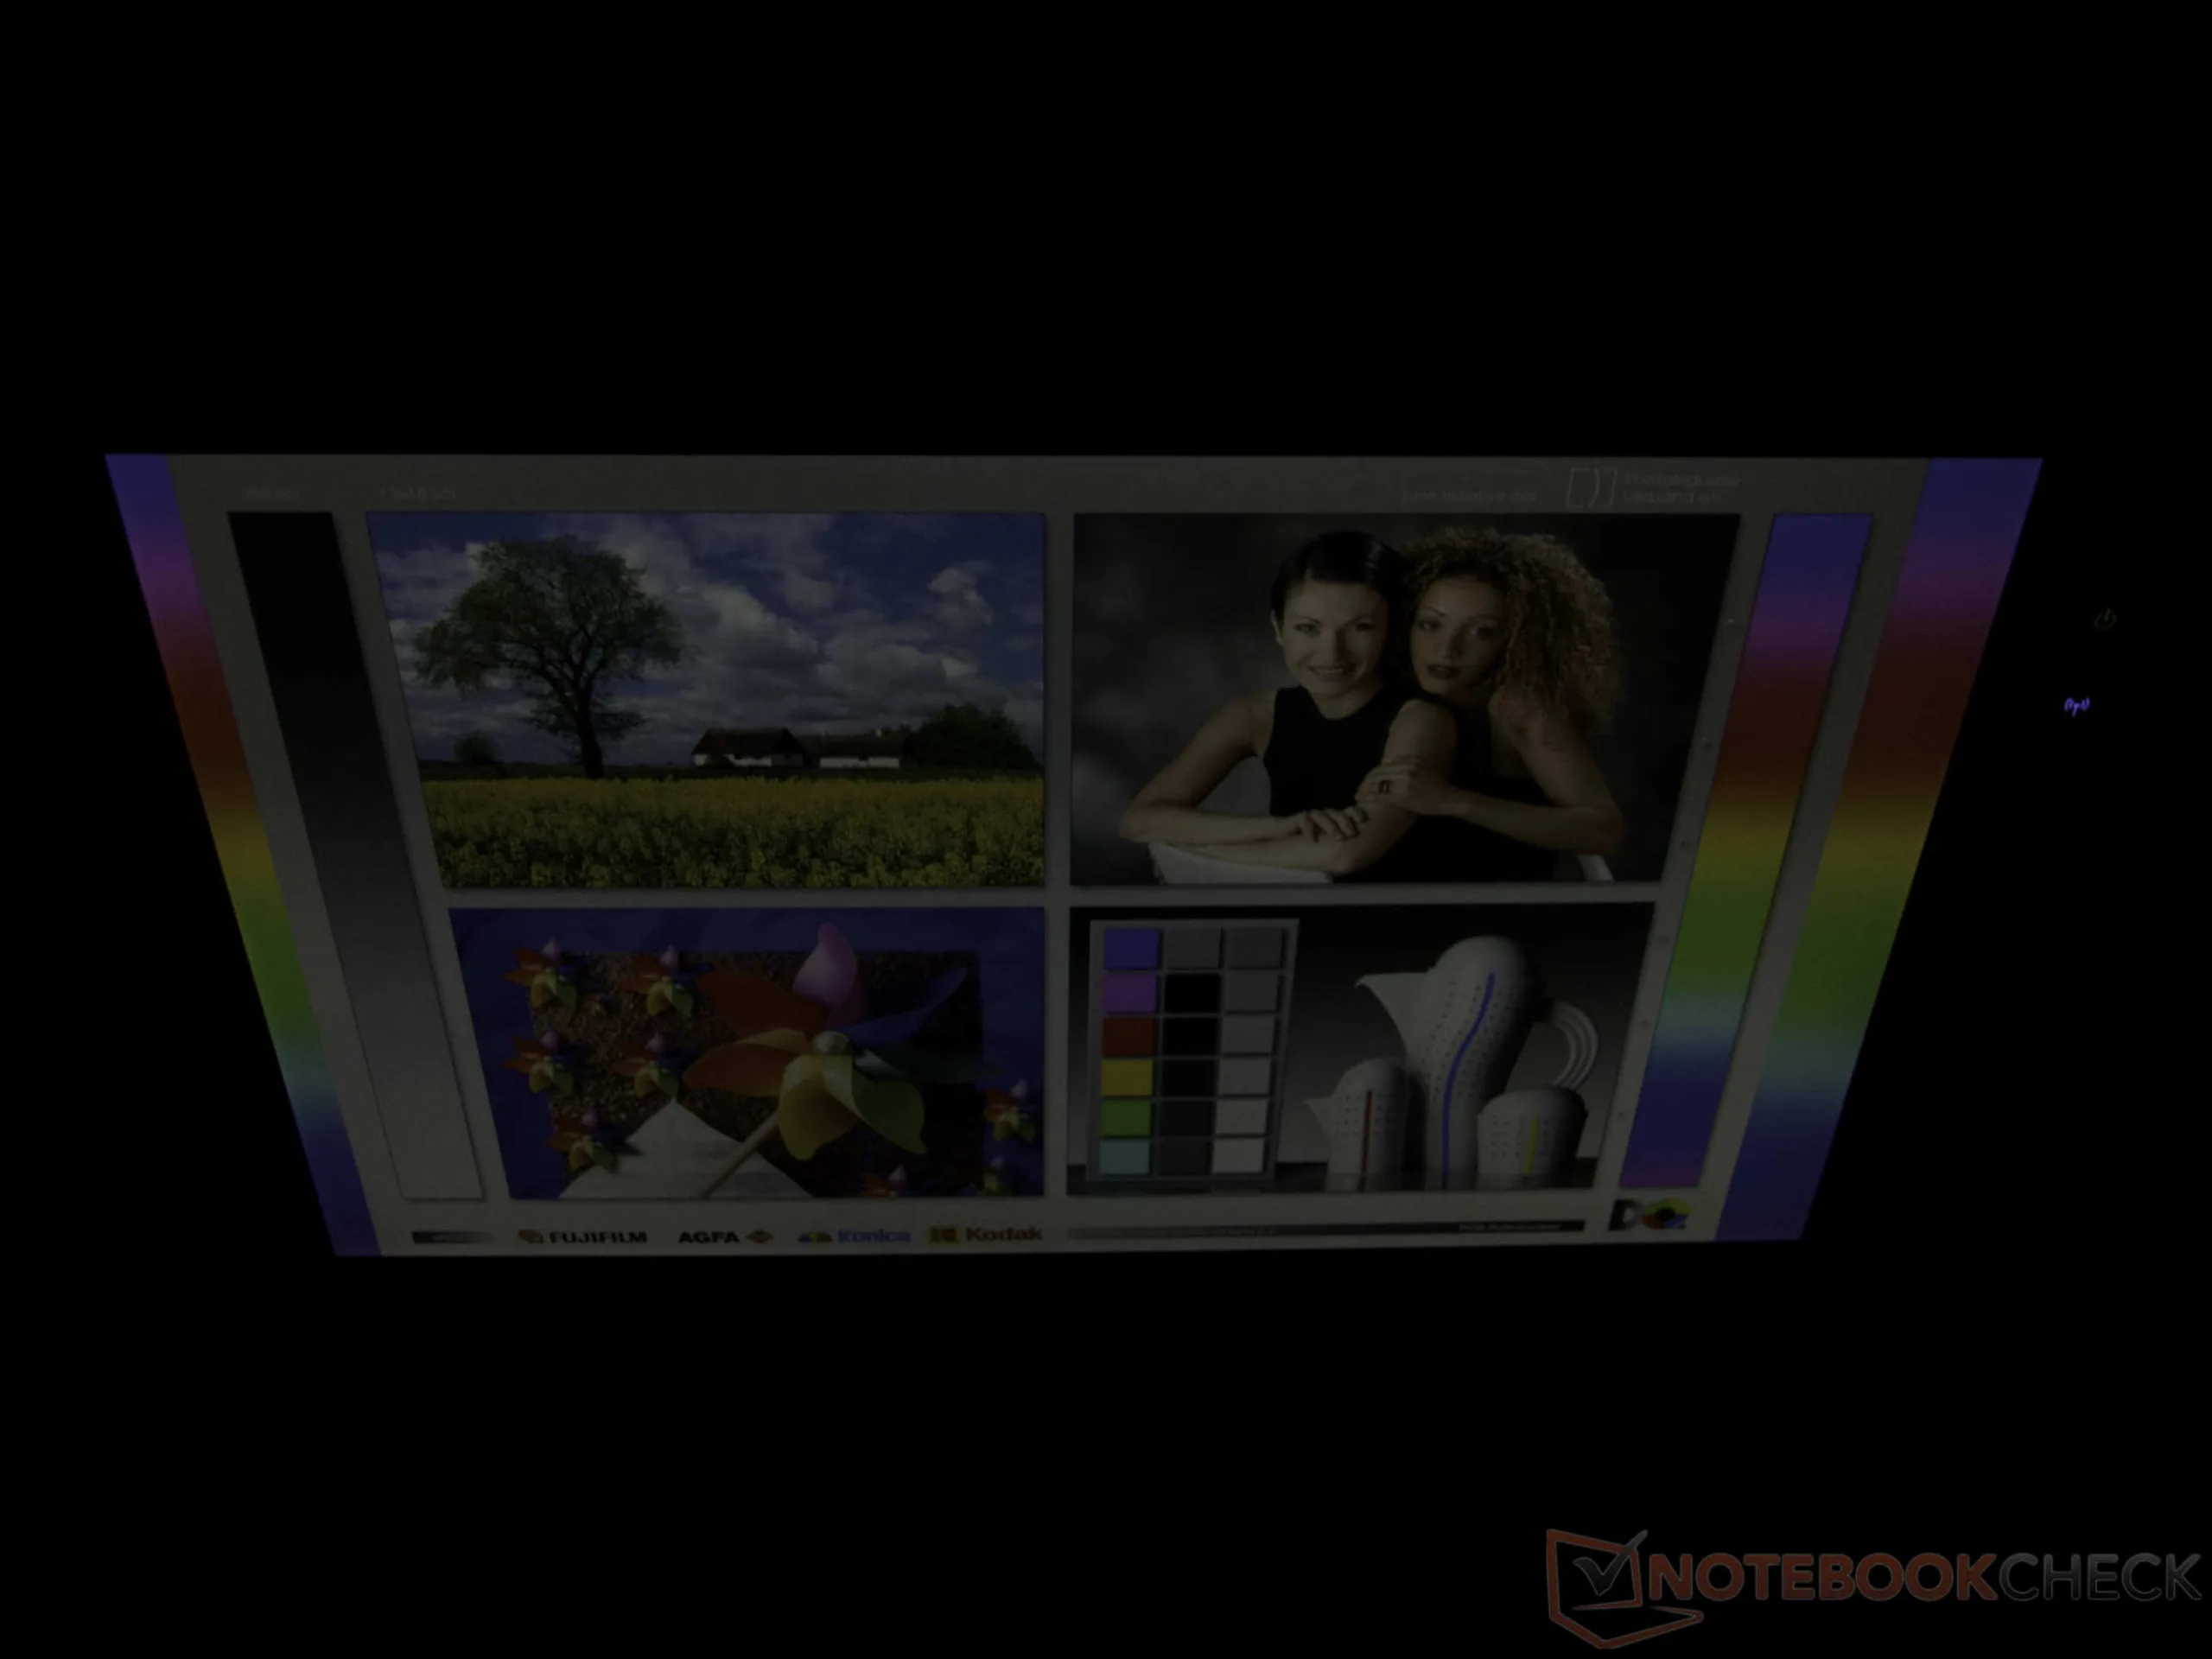
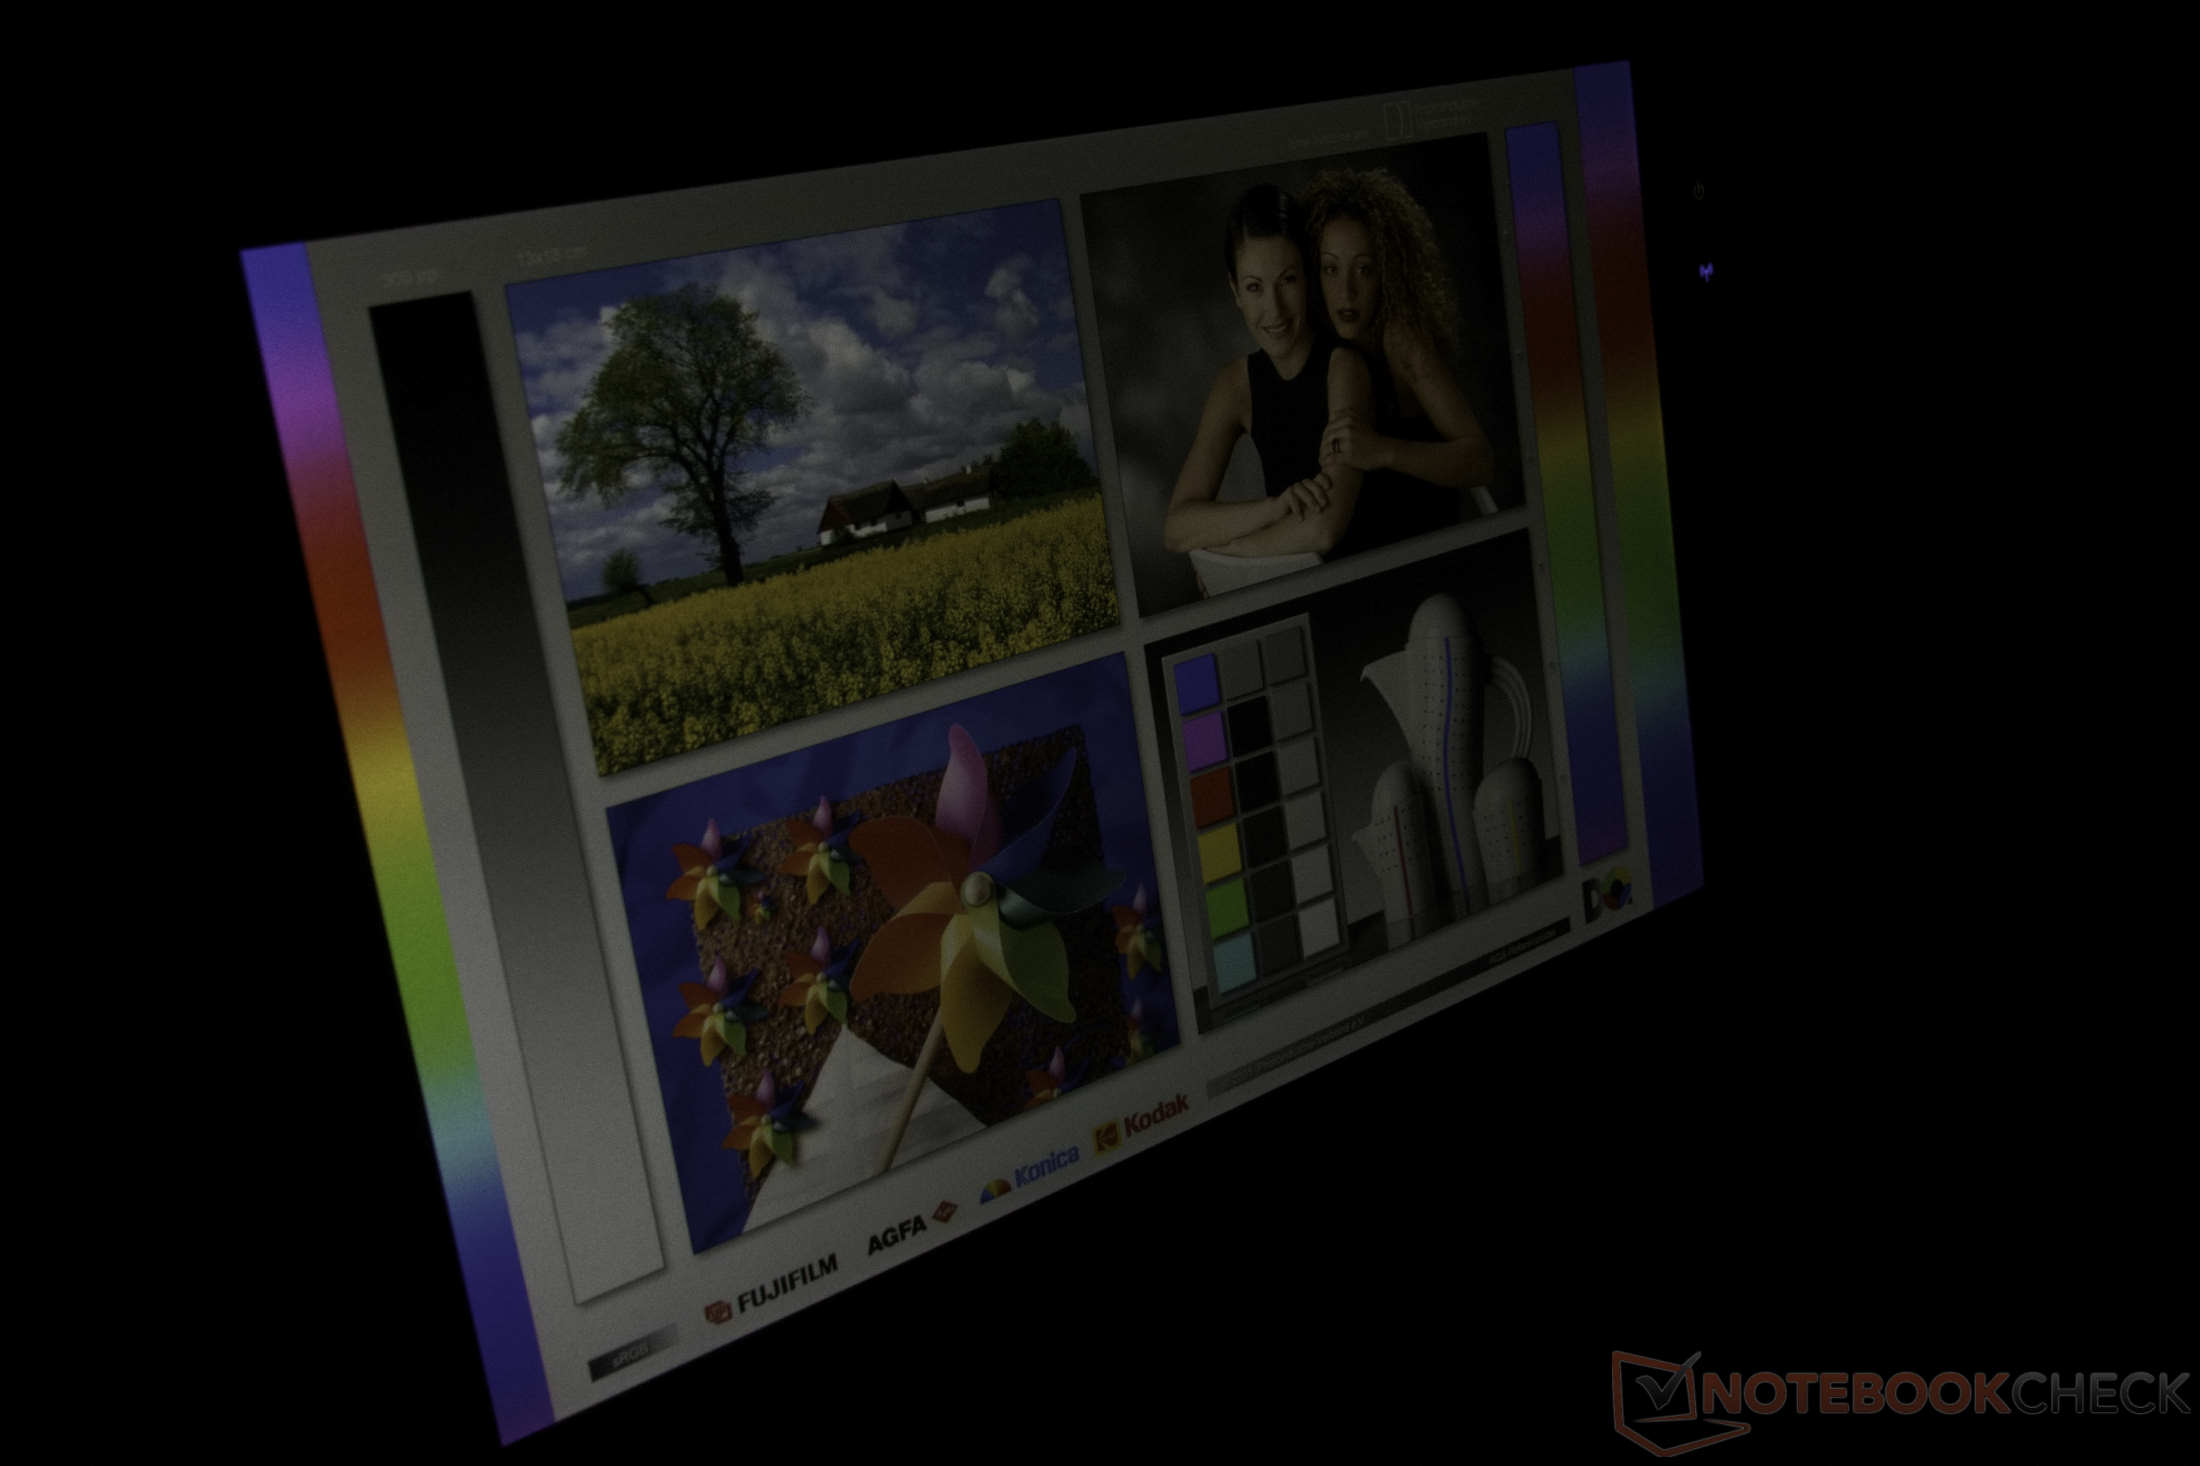
Lo schermo WUXGA da 10,1 pollici è stato progettato senza compromessi per l’uso all’aperto. Grazie a un’enorme luminosità di oltre 1.000 cd/m², il pannello è talmente luminoso che tutti i contenuti visualizzati rimangono perfettamente leggibili anche in pieno sole. Una pellicola protettiva opaca preinstallata riduce efficacemente i fastidiosi riflessi, sebbene conferisca alle aree luminose un leggero effetto arcobaleno. La regolazione adattiva della luminosità rappresenta una pratica funzione di comodità.
| |||||||||||||||||||||||||
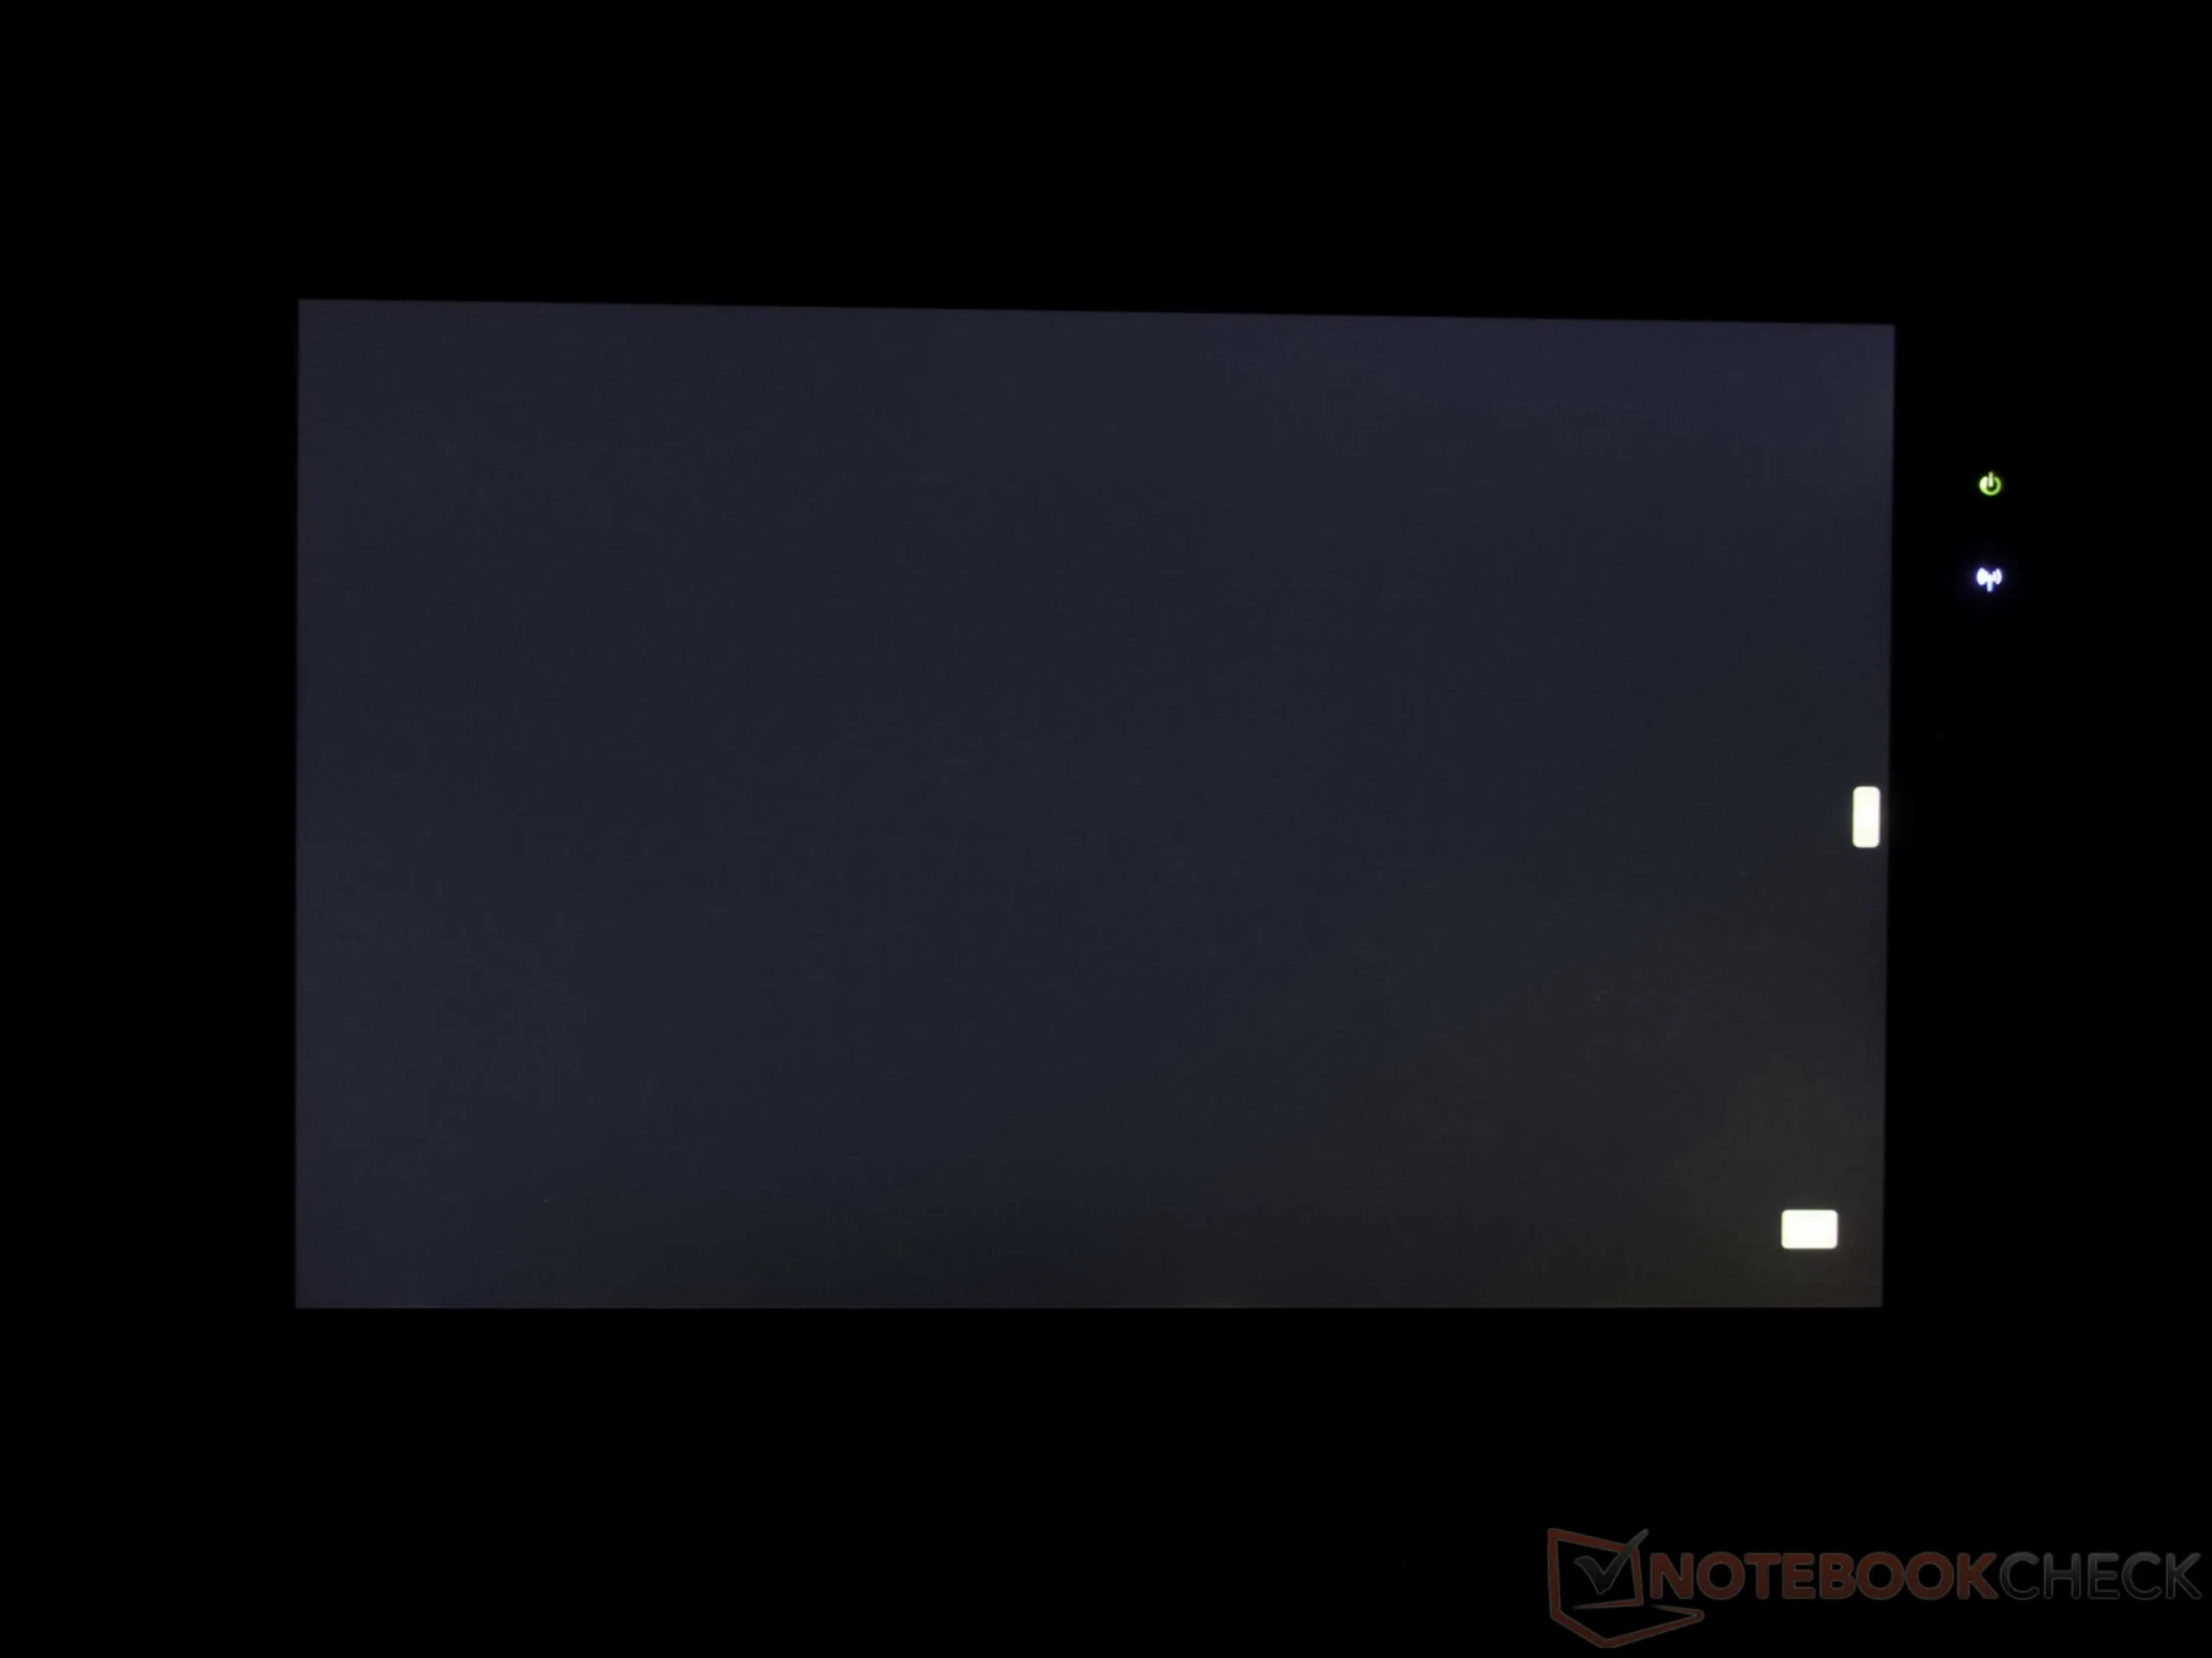
Distribuzione della luminosità: 92 %
Al centro con la batteria: 1040 cd/m²
Contrasto: 1024:1 (Nero: 1.05 cd/m²)
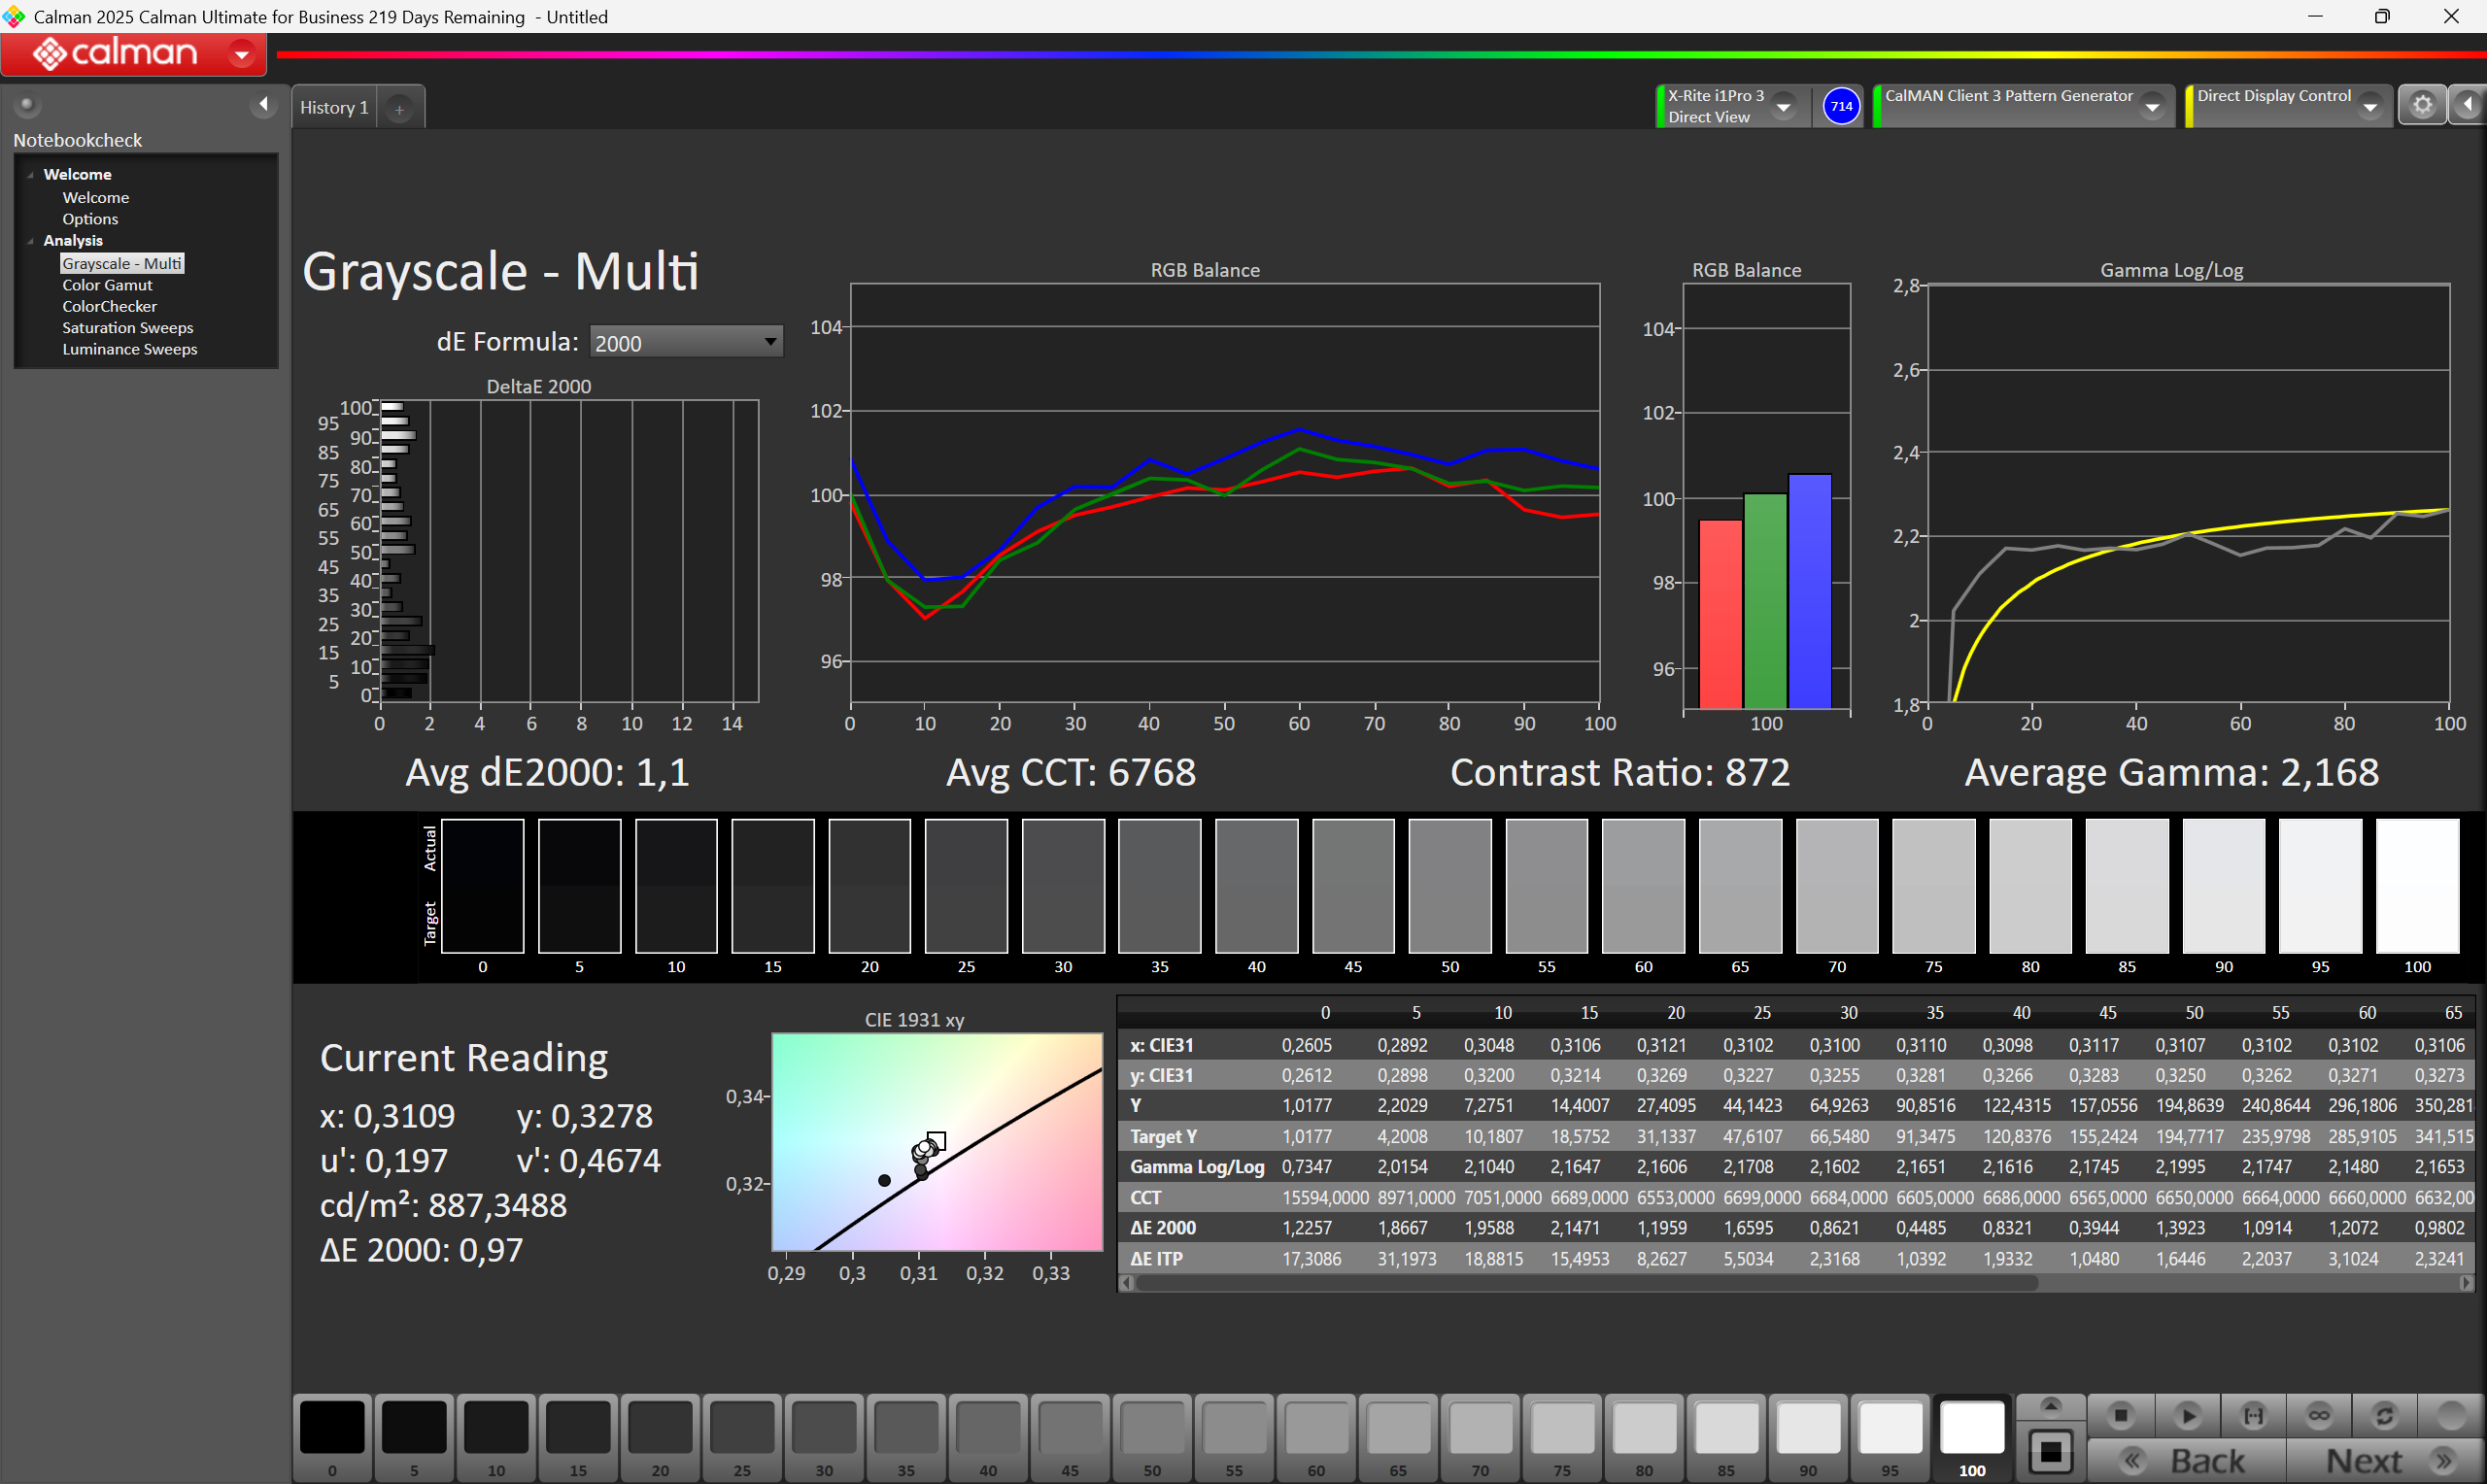
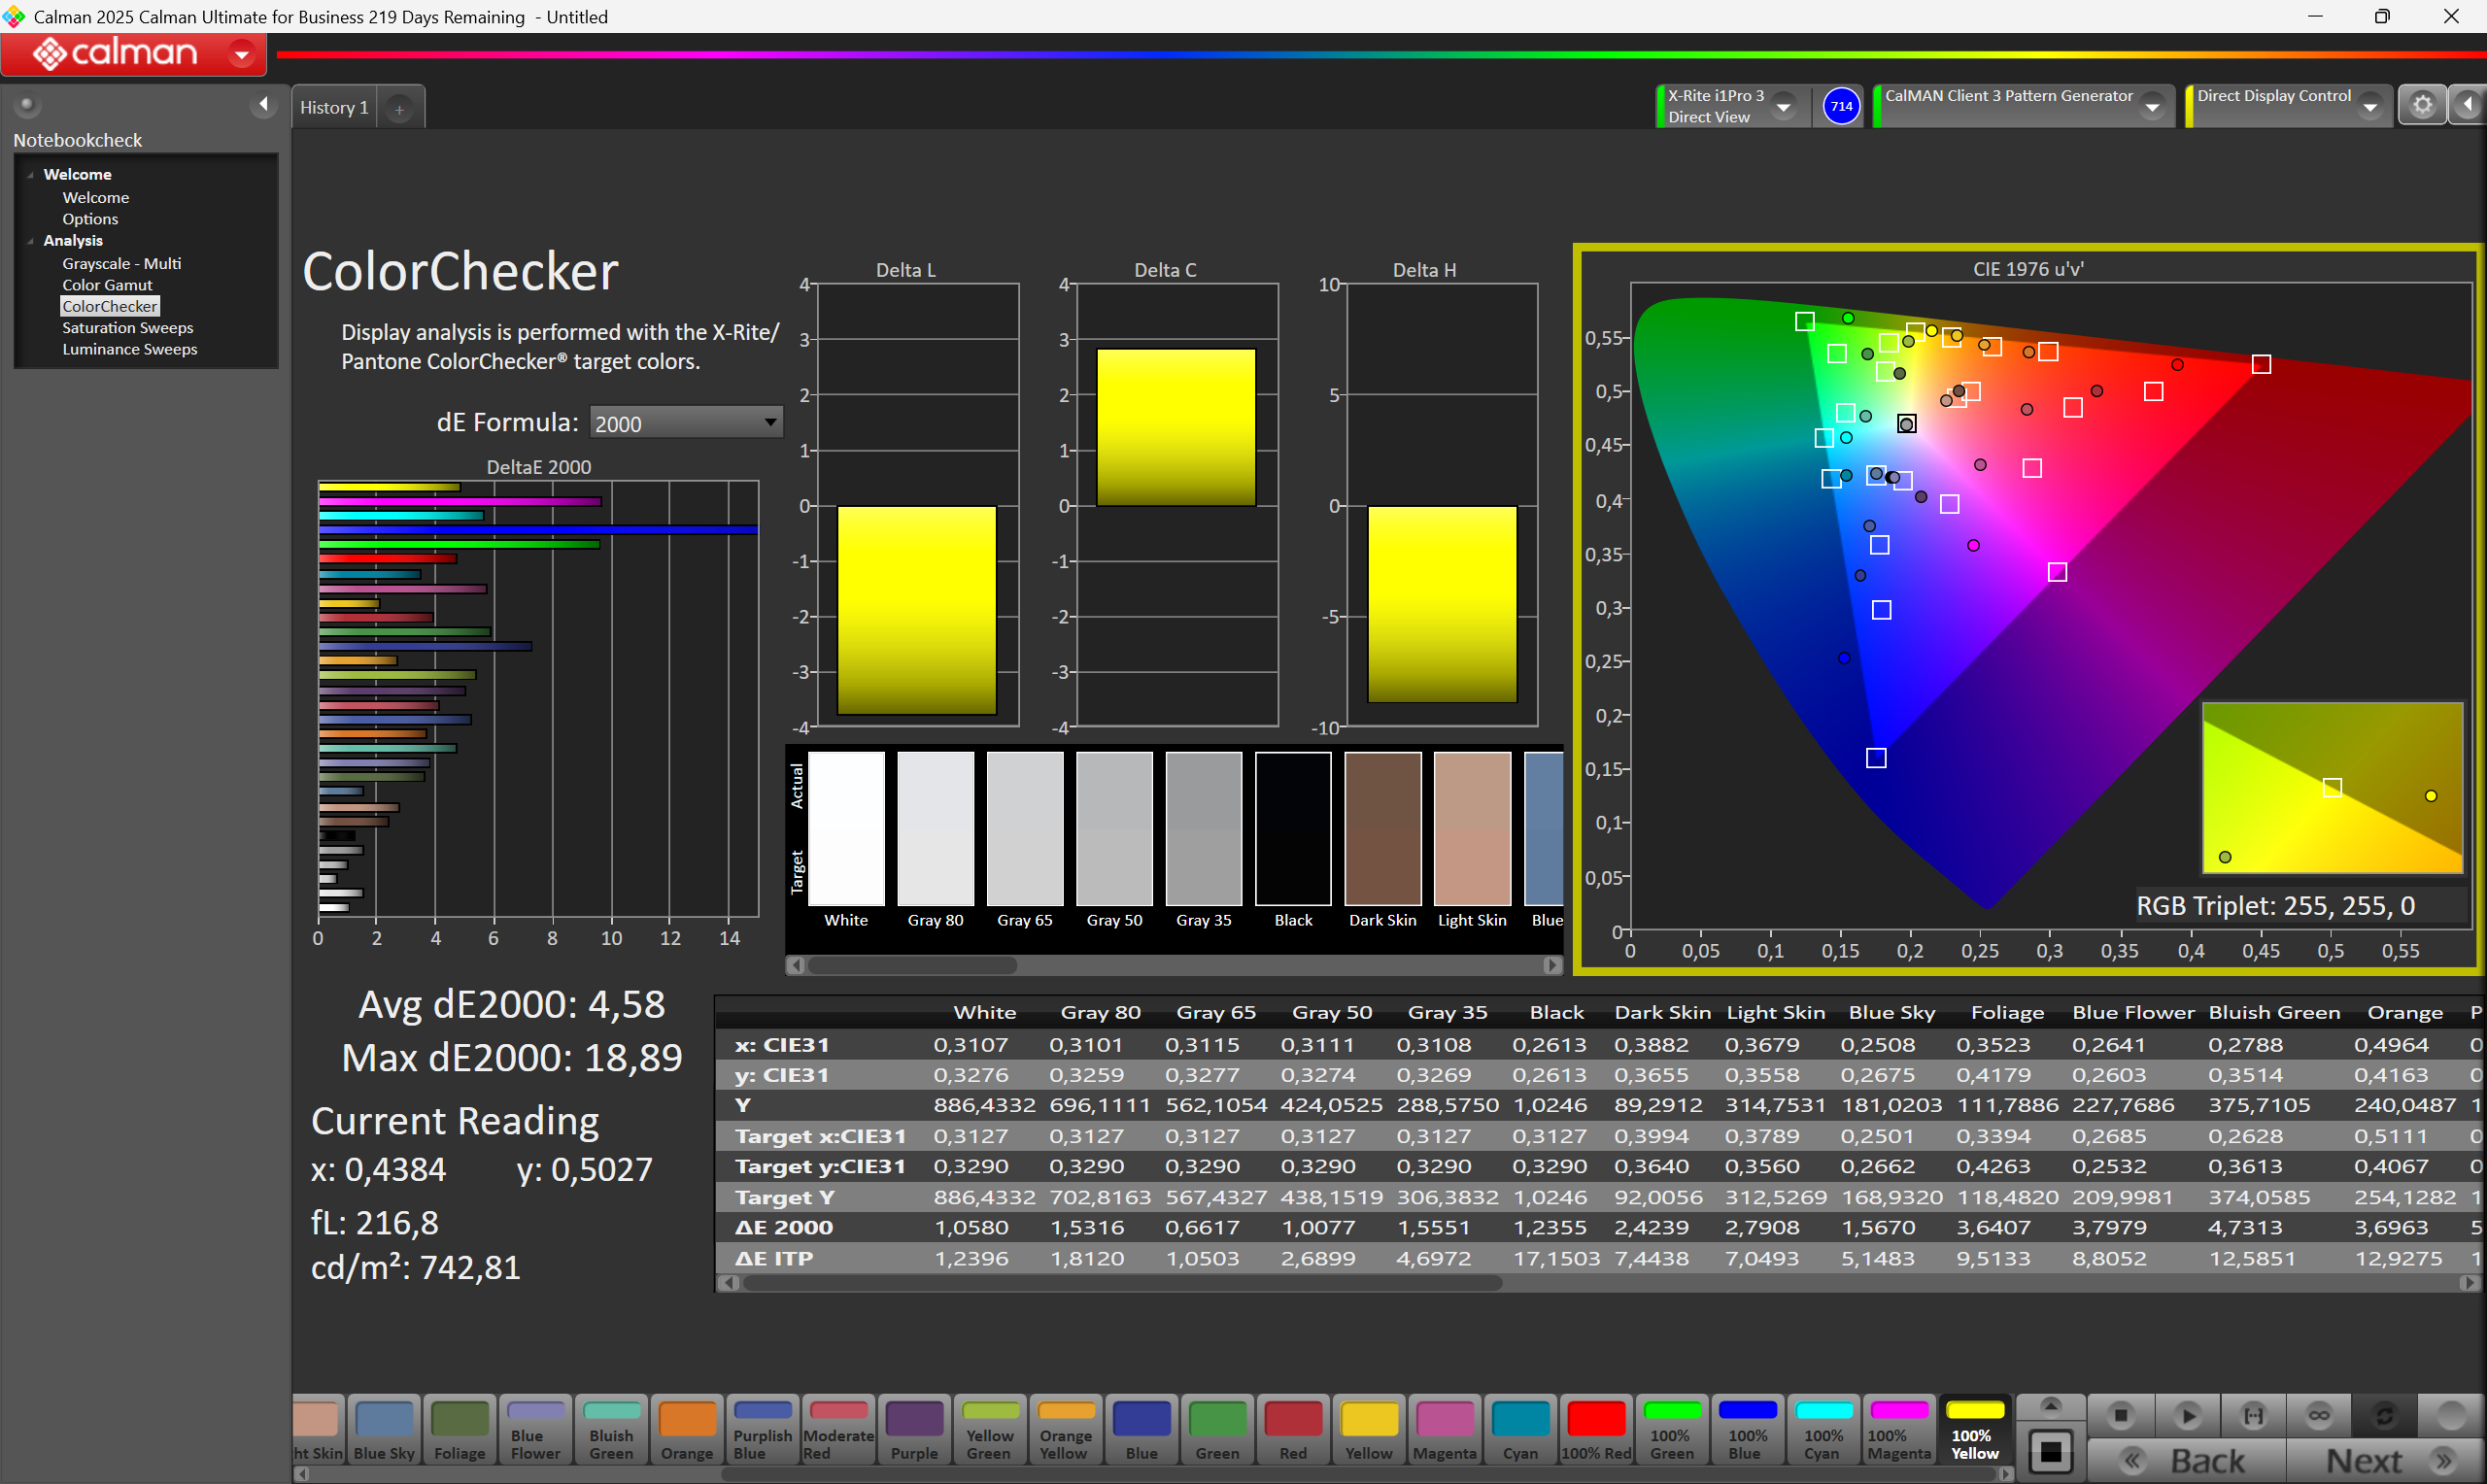
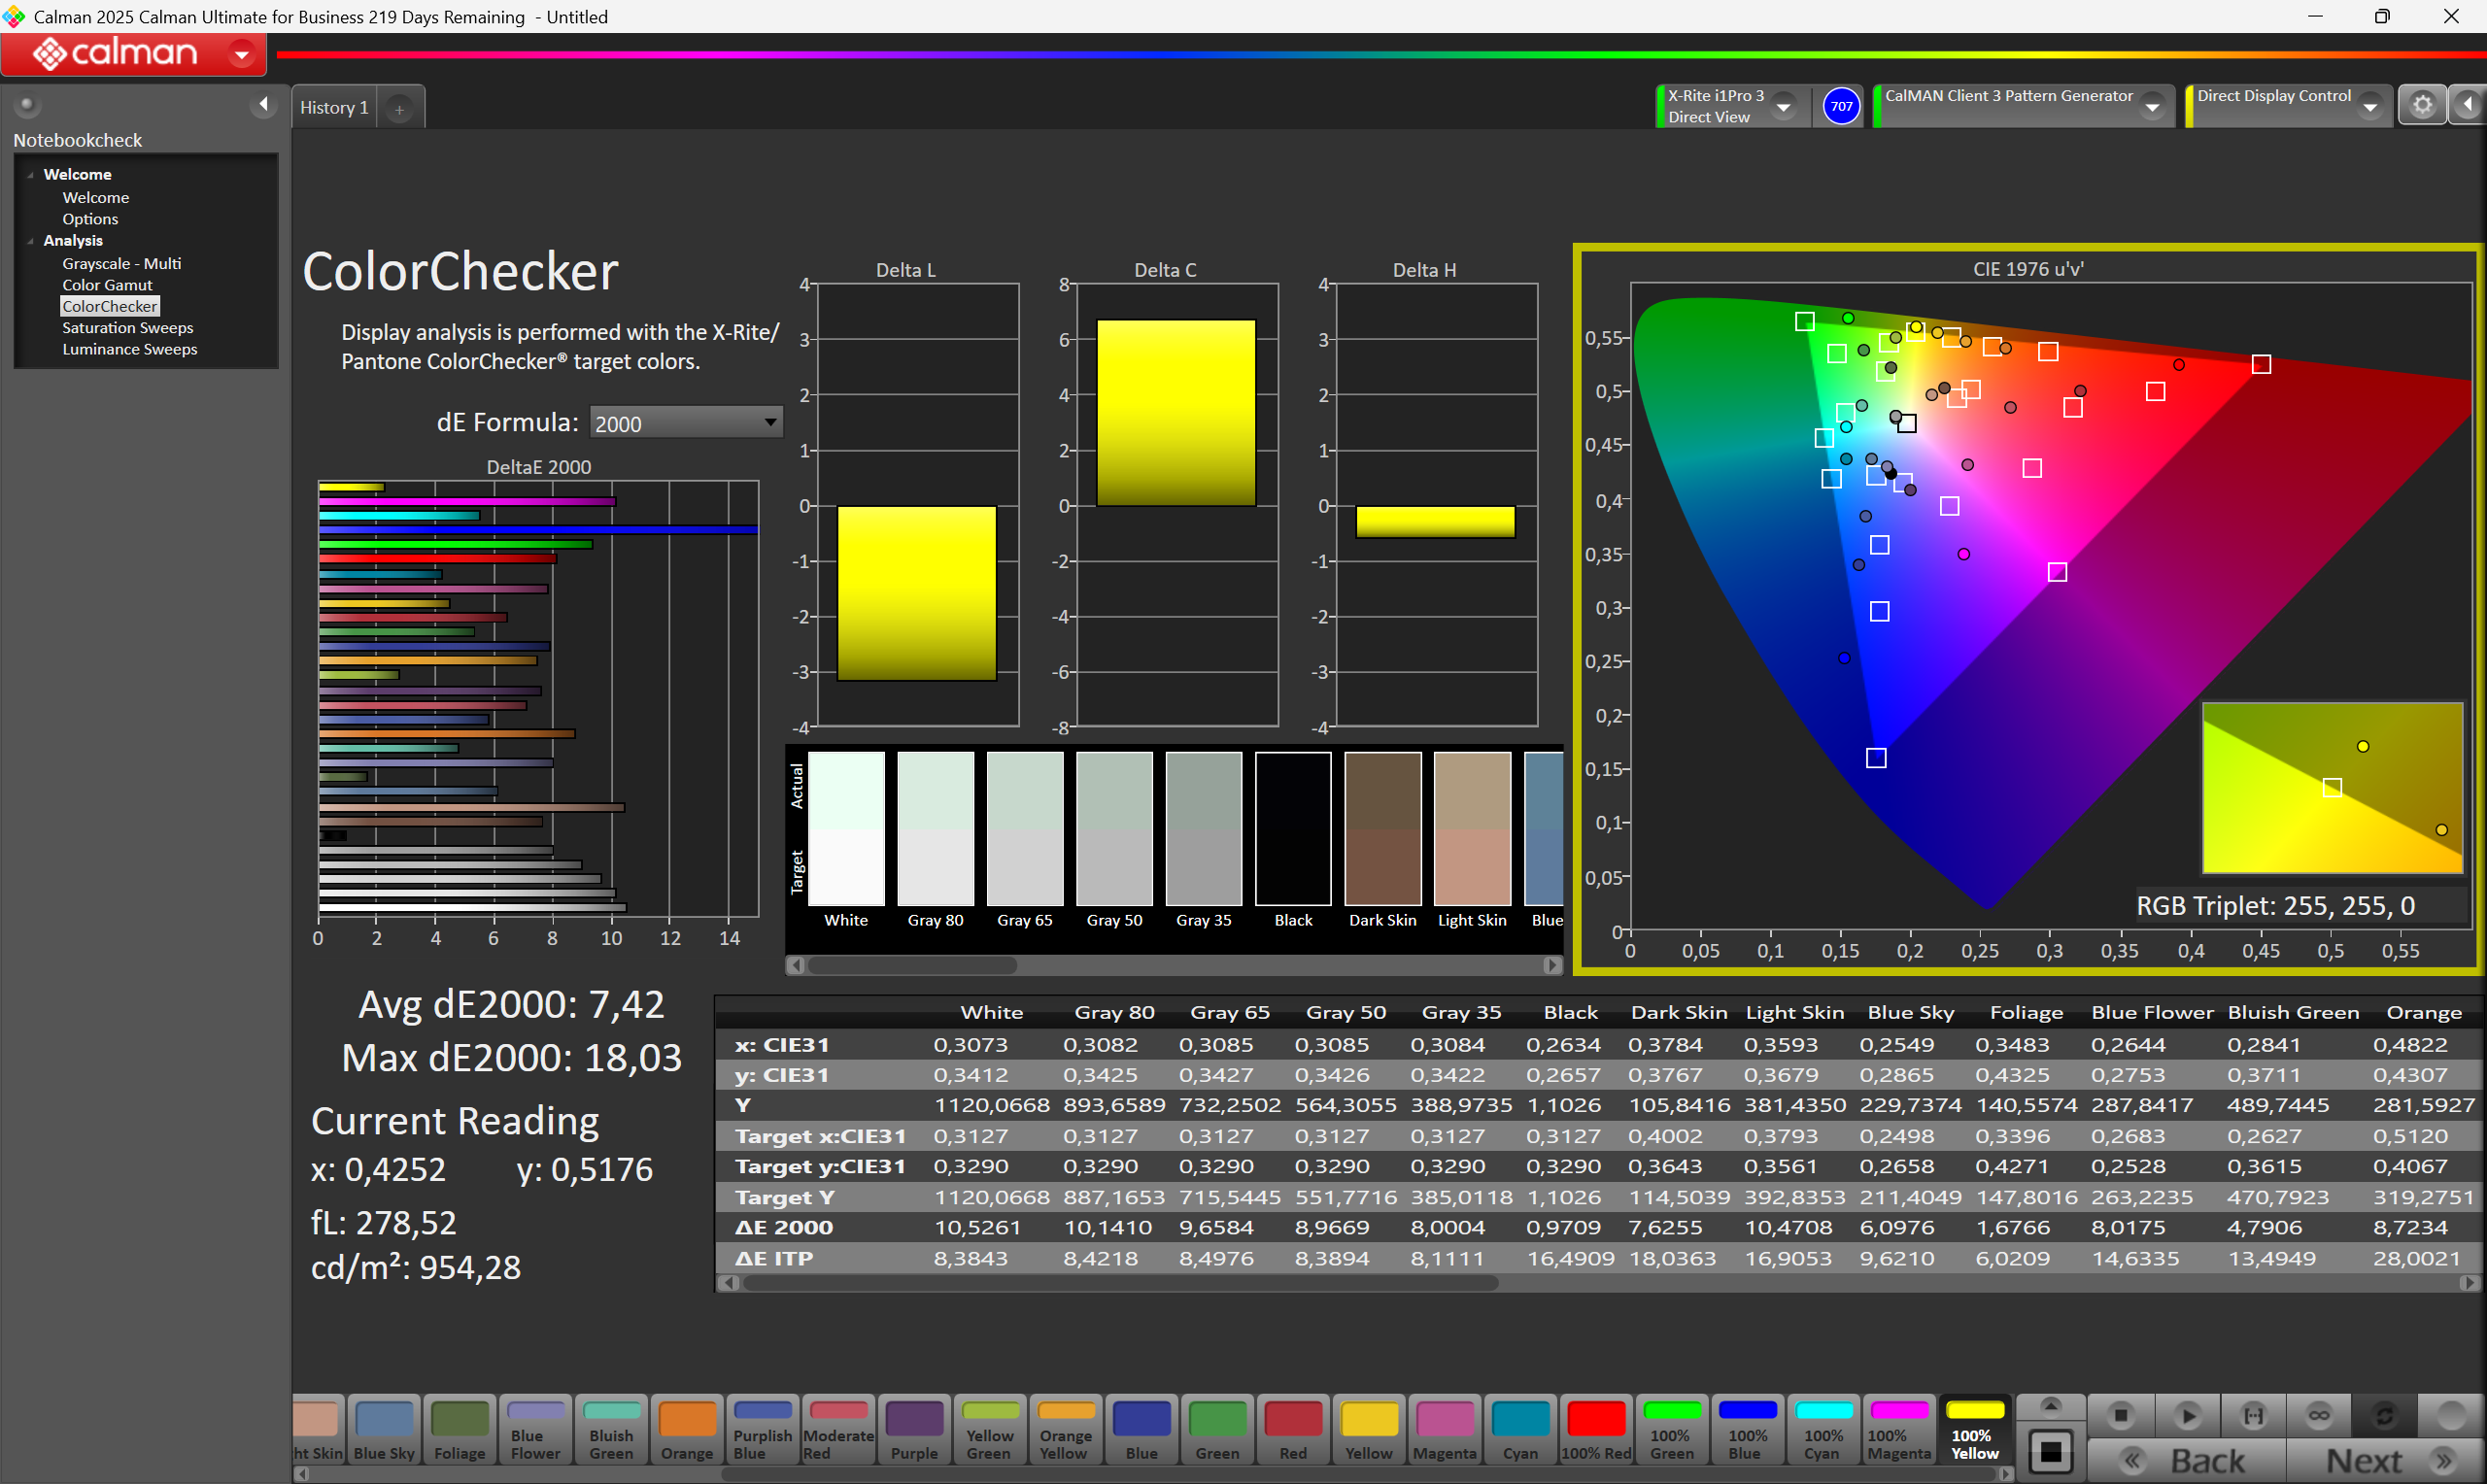
ΔE ColorChecker Calman: 7.42 | ∀{0.5-29.43 Ø4.72}
calibrated: 4.58
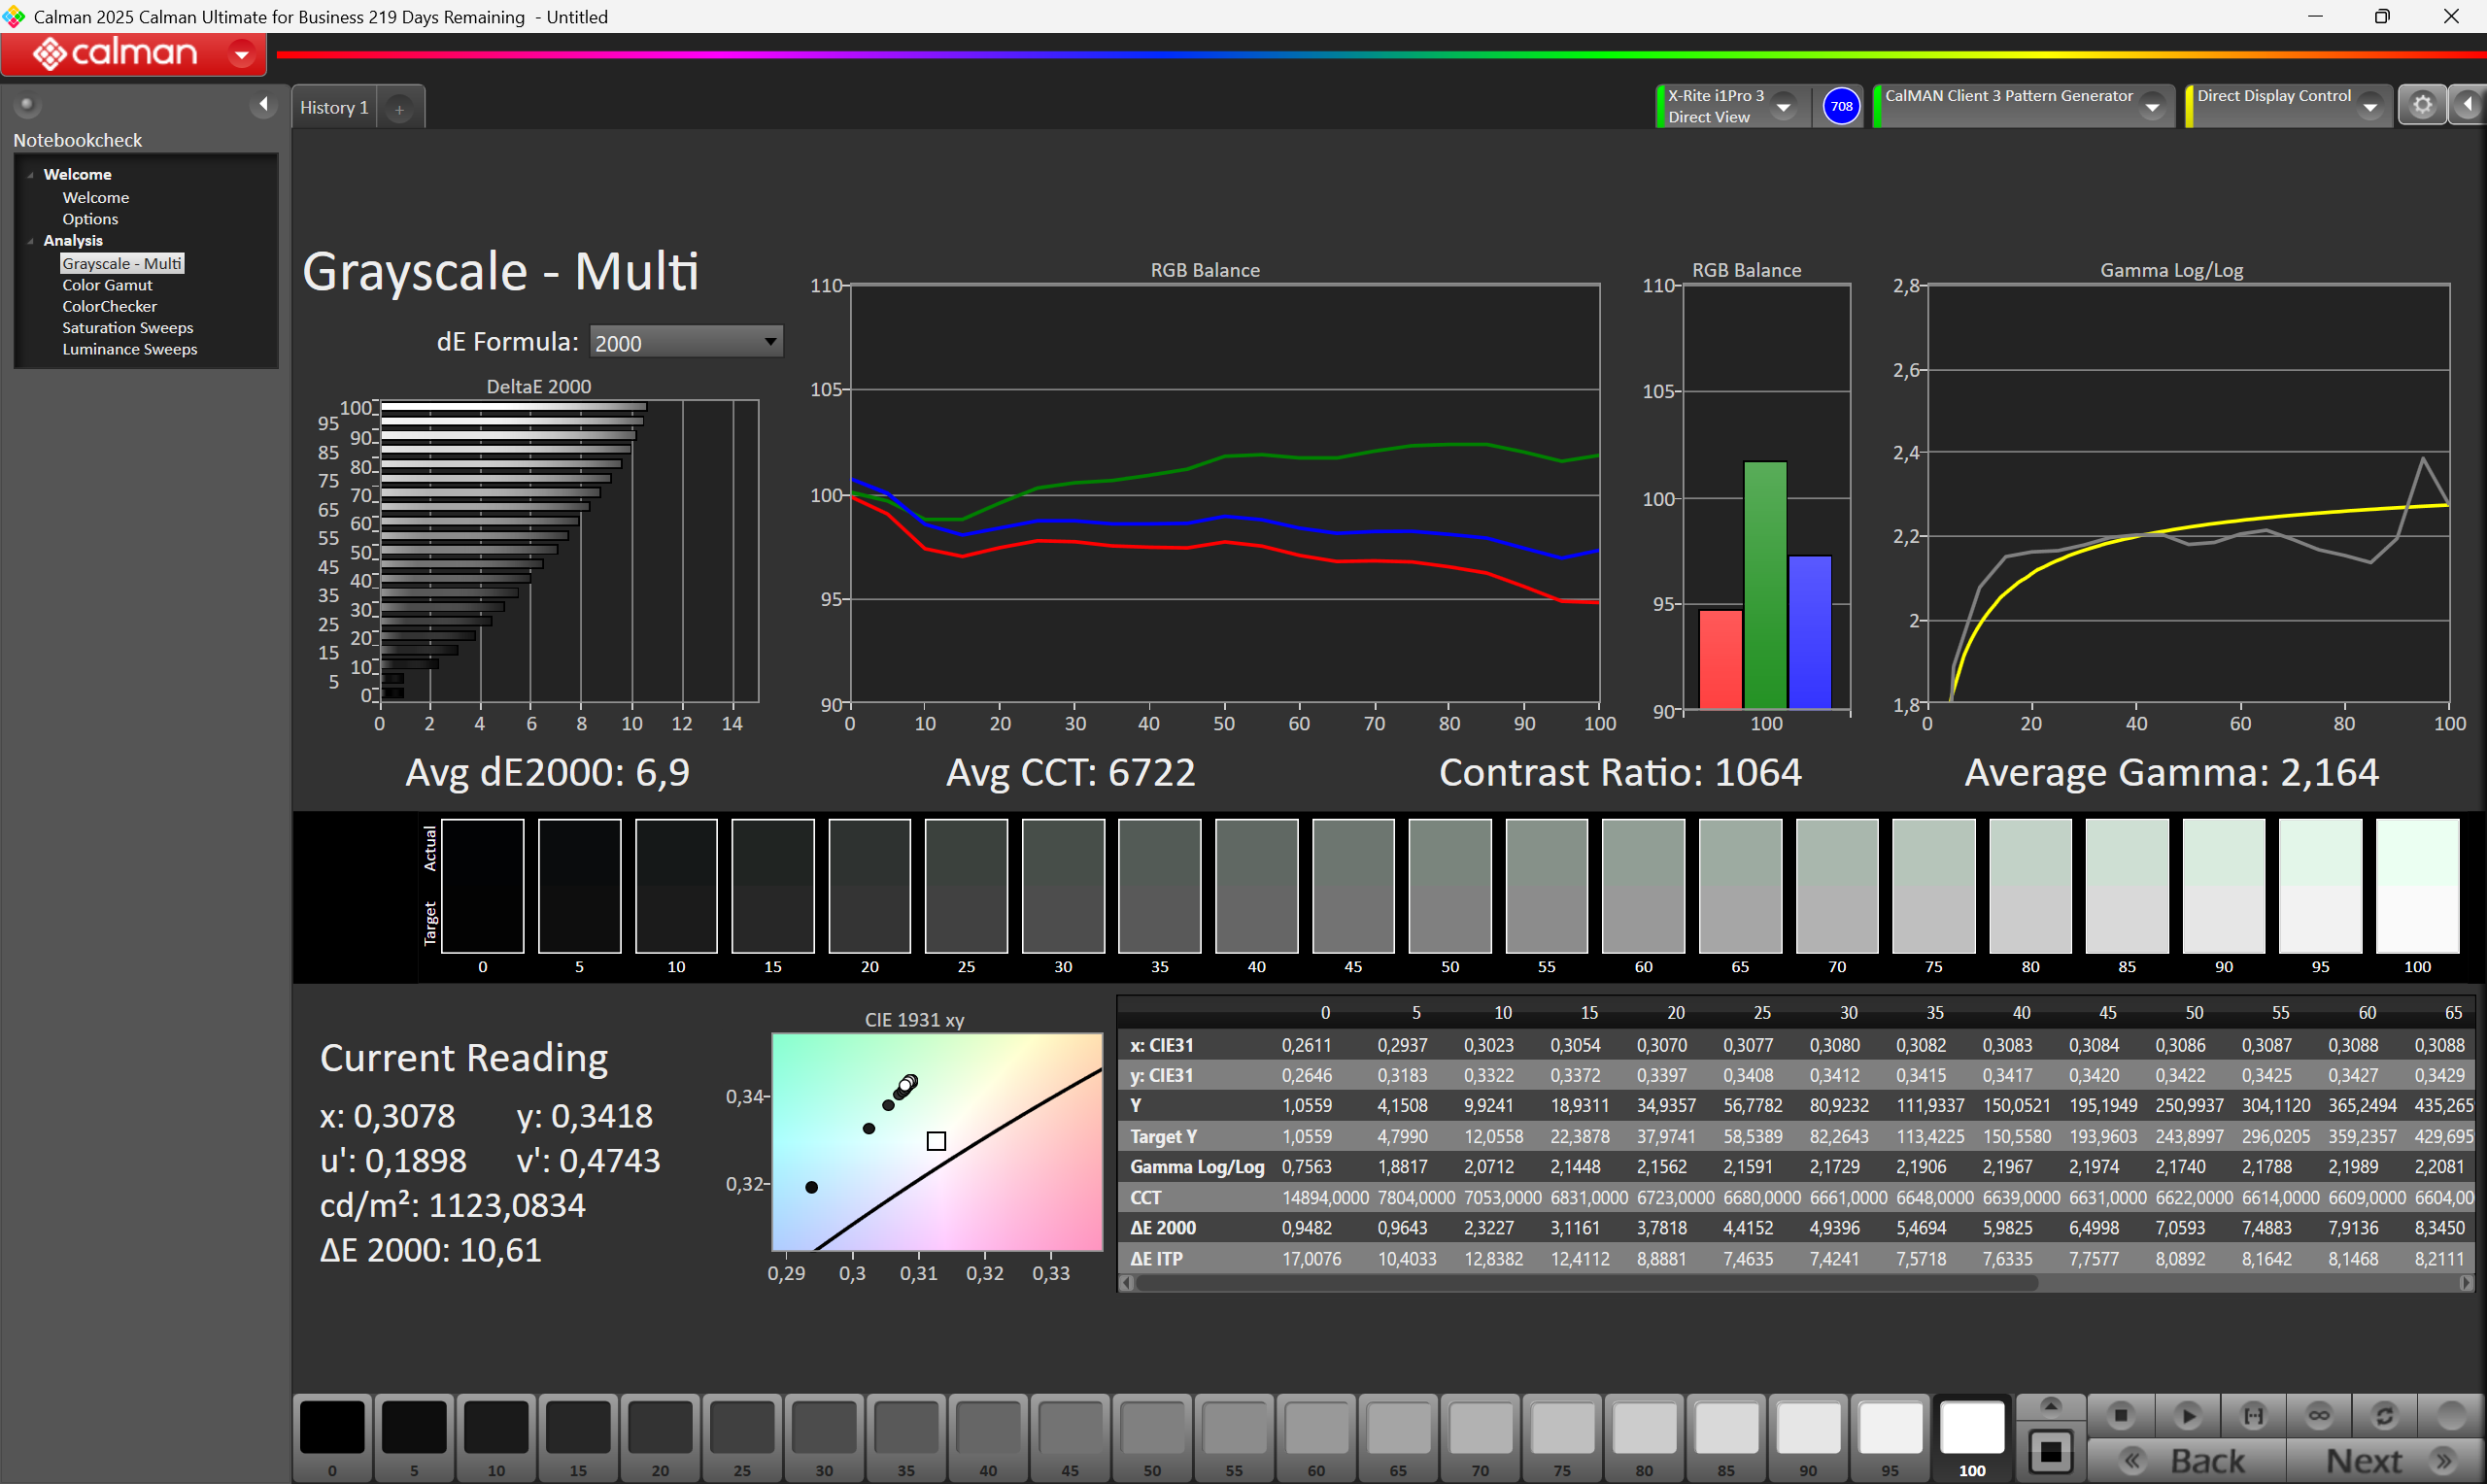
ΔE Greyscale Calman: 6.9 | ∀{0.09-98 Ø4.97}
44.17% AdobeRGB 1998 (Argyll 3D)
61.77% sRGB (Argyll 3D)
42.75% Display P3 (Argyll 3D)
Gamma: 2.164
CCT: 6722 K
| Durabook R10 HannStar 101GUW2, TFT, 1920x1200, 10.1", 60 Hz | Dell Latitude 7030 Rugged Extreme Sharp LQ101N1, IPS, 1920x1200, 10", 60 Hz | Lenovo ThinkPad T14 Gen 6 21QG001VGE MNE007JA1-3, IPS LED, 1920x1200, 14", 60 Hz | Dynabook Portege Z40L-N BOE NE140WUM-N6K, IPS, 1920x1200, 14", 60 Hz | Durabook R8 Tablet Digital Flat Panel, IPS, 1280x800, 8", 60 Hz | Lenovo ThinkPad T14 Gen 6 AMD NE140WUM-N6M, , 1920x1200, 14", 60 Hz | |
|---|---|---|---|---|---|---|
| Display | 65% | 58% | 62% | 22% | 57% | |
| Display P3 Coverage (%) | 42.75 | 72.2 69% | 67.7 58% | 70.1 64% | 51.5 20% | 66.9 56% |
| sRGB Coverage (%) | 61.77 | 99 60% | 98.3 59% | 99 60% | 77.4 25% | 98.5 59% |
| AdobeRGB 1998 Coverage (%) | 44.17 | 72.7 65% | 69.9 58% | 71.8 63% | 53.1 20% | 68.9 56% |
| Response Times | 26% | 10% | 8% | 30% | 28% | |
| Response Time Grey 50% / Grey 80% * (ms) | 53.2 ? | 35.9 ? 33% | 40.2 ? 24% | 42.1 ? 21% | 32.4 ? 39% | 31.1 ? 42% |
| Response Time Black / White * (ms) | 27.6 ? | 22.4 ? 19% | 29.1 ? -5% | 26.7 ? 3% | 21.9 ? 21% | 24.1 ? 13% |
| PWM Frequency (Hz) | 300 | 300 ? | ||||
| PWM Amplitude * (%) | 100 | 100 -0% | ||||
| Screen | 45% | 45% | 34% | 5% | 28% | |
| Brightness middle (cd/m²) | 1075 | 1183.9 10% | 554 -48% | 445.4 -59% | 943.7 -12% | 557 -48% |
| Brightness (cd/m²) | 1042 | 1140 9% | 516 -50% | 424 -59% | 870 -17% | 526 -50% |
| Brightness Distribution (%) | 92 | 88 -4% | 91 -1% | 91 -1% | 85 -8% | 84 -9% |
| Black Level * (cd/m²) | 1.05 | 0.74 30% | 0.24 77% | 0.23 78% | 0.85 19% | 0.4 62% |
| Contrast (:1) | 1024 | 1600 56% | 2308 125% | 1937 89% | 1110 8% | 1393 36% |
| Colorchecker dE 2000 * | 7.42 | 2.03 73% | 1.5 80% | 2.85 62% | 6.35 14% | 2.4 68% |
| Colorchecker dE 2000 max. * | 18.03 | 3.44 81% | 3.4 81% | 4.57 75% | 8.86 51% | 5.9 67% |
| Colorchecker dE 2000 calibrated * | 4.58 | 0.53 88% | 0.9 80% | 1.54 66% | 5.1 -11% | 0.7 85% |
| Greyscale dE 2000 * | 6.9 | 2.6 62% | 2.7 61% | 3.3 52% | 6.9 -0% | 4 42% |
| Gamma | 2.164 102% | 2.27 97% | 2.25 98% | 2.03 108% | 2.65 83% | 2.15 102% |
| CCT | 6722 97% | 6102 107% | 6882 94% | 6497 100% | 6956 93% | 7017 93% |
| Media totale (Programma / Settaggio) | 45% /
47% | 38% /
43% | 35% /
34% | 19% /
12% | 38% /
34% |
* ... Meglio usare valori piccoli
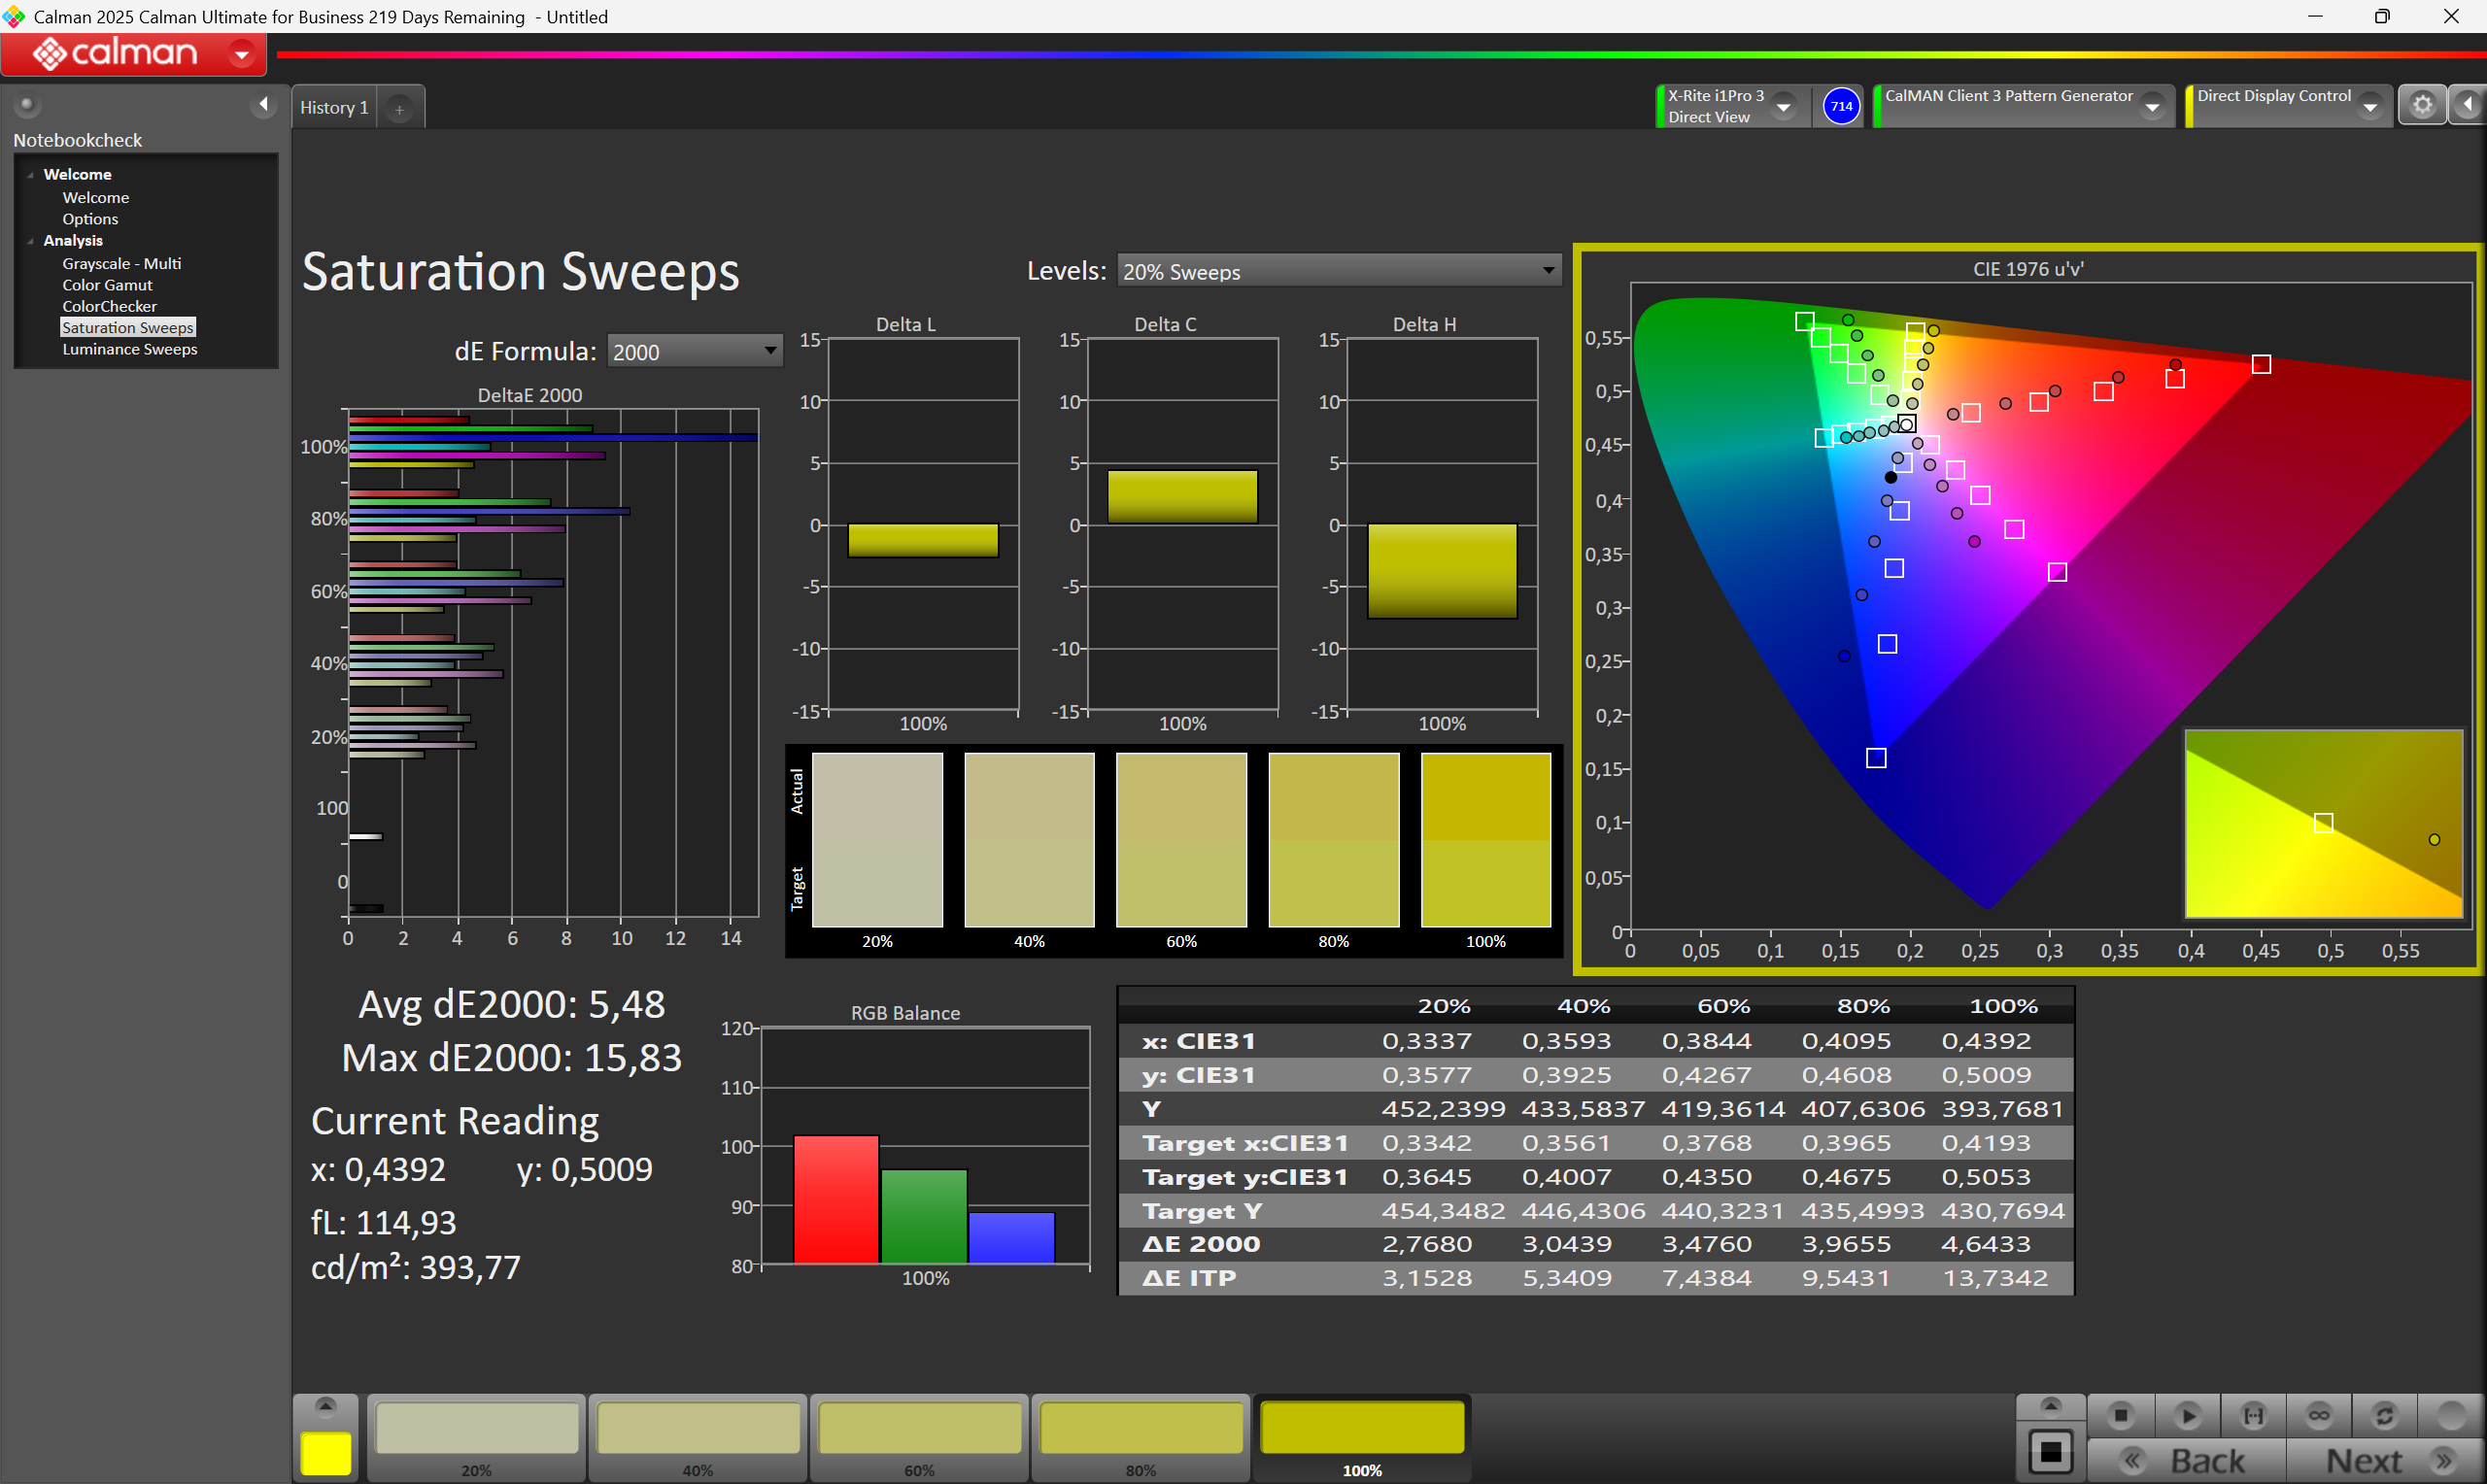
Questo tablet non è adatto a lavori in cui la precisione cromatica è fondamentale. Con una copertura della gamma cromatica sRGB pari a un esiguo 61%, i colori appaiono sbiaditi. All’acquisto, il pannello presenta una evidente dominante verde.
Tempi di risposta del Display
| ↔ Tempi di risposta dal Nero al Bianco | ||
|---|---|---|
| 27.6 ms ... aumenta ↗ e diminuisce ↘ combinato | ↗ 16 ms Incremento |   |
| ↘ 11.6 ms Calo | ||
| Lo schermo mostra tempi di risposta relativamente lenti nei nostri tests e potrebbe essere troppo lento per i gamers. In confronto, tutti i dispositivi di test variano da 0.1 (minimo) a 240 (massimo) ms. » 70 % di tutti i dispositivi è migliore. Questo significa che i tempi di risposta rilevati sono peggiori rispetto alla media di tutti i dispositivi testati (19.8 ms). | ||
| ↔ Tempo di risposta dal 50% Grigio all'80% Grigio | ||
| 53.2 ms ... aumenta ↗ e diminuisce ↘ combinato | ↗ 20 ms Incremento |   |
| ↘ 33.2 ms Calo | ||
| Lo schermo mostra tempi di risposta lenti nei nostri tests e sarà insoddisfacente per i gamers. In confronto, tutti i dispositivi di test variano da 0.165 (minimo) a 636 (massimo) ms. » 90 % di tutti i dispositivi è migliore. Questo significa che i tempi di risposta rilevati sono peggiori rispetto alla media di tutti i dispositivi testati (31 ms). | ||
Sfarfallio dello schermo / PWM (Pulse-Width Modulation)
| flickering dello schermo / PWM rilevato | 300 Hz Amplitude: 100 % |  | |
Il display sfarfalla a 300 Hz (Probabilmente a causa dell'uso di PWM) . La frequenza di 300 Hz è relativamente elevata, quindi la maggioranza degli utenti sensibili al PWM non dovrebbe notare alcun flickering. Tuttavia, è stato segnalato che alcuni utenti sono sensibili al PWM a 500 Hz ed oltre, quindi prestate attenzione. In confronto: 52 % di tutti i dispositivi testati non utilizza PWM per ridurre la luminosita' del display. Se è rilevato PWM, una media di 7781 (minimo: 5 - massimo: 343500) Hz è stata rilevata. | |||


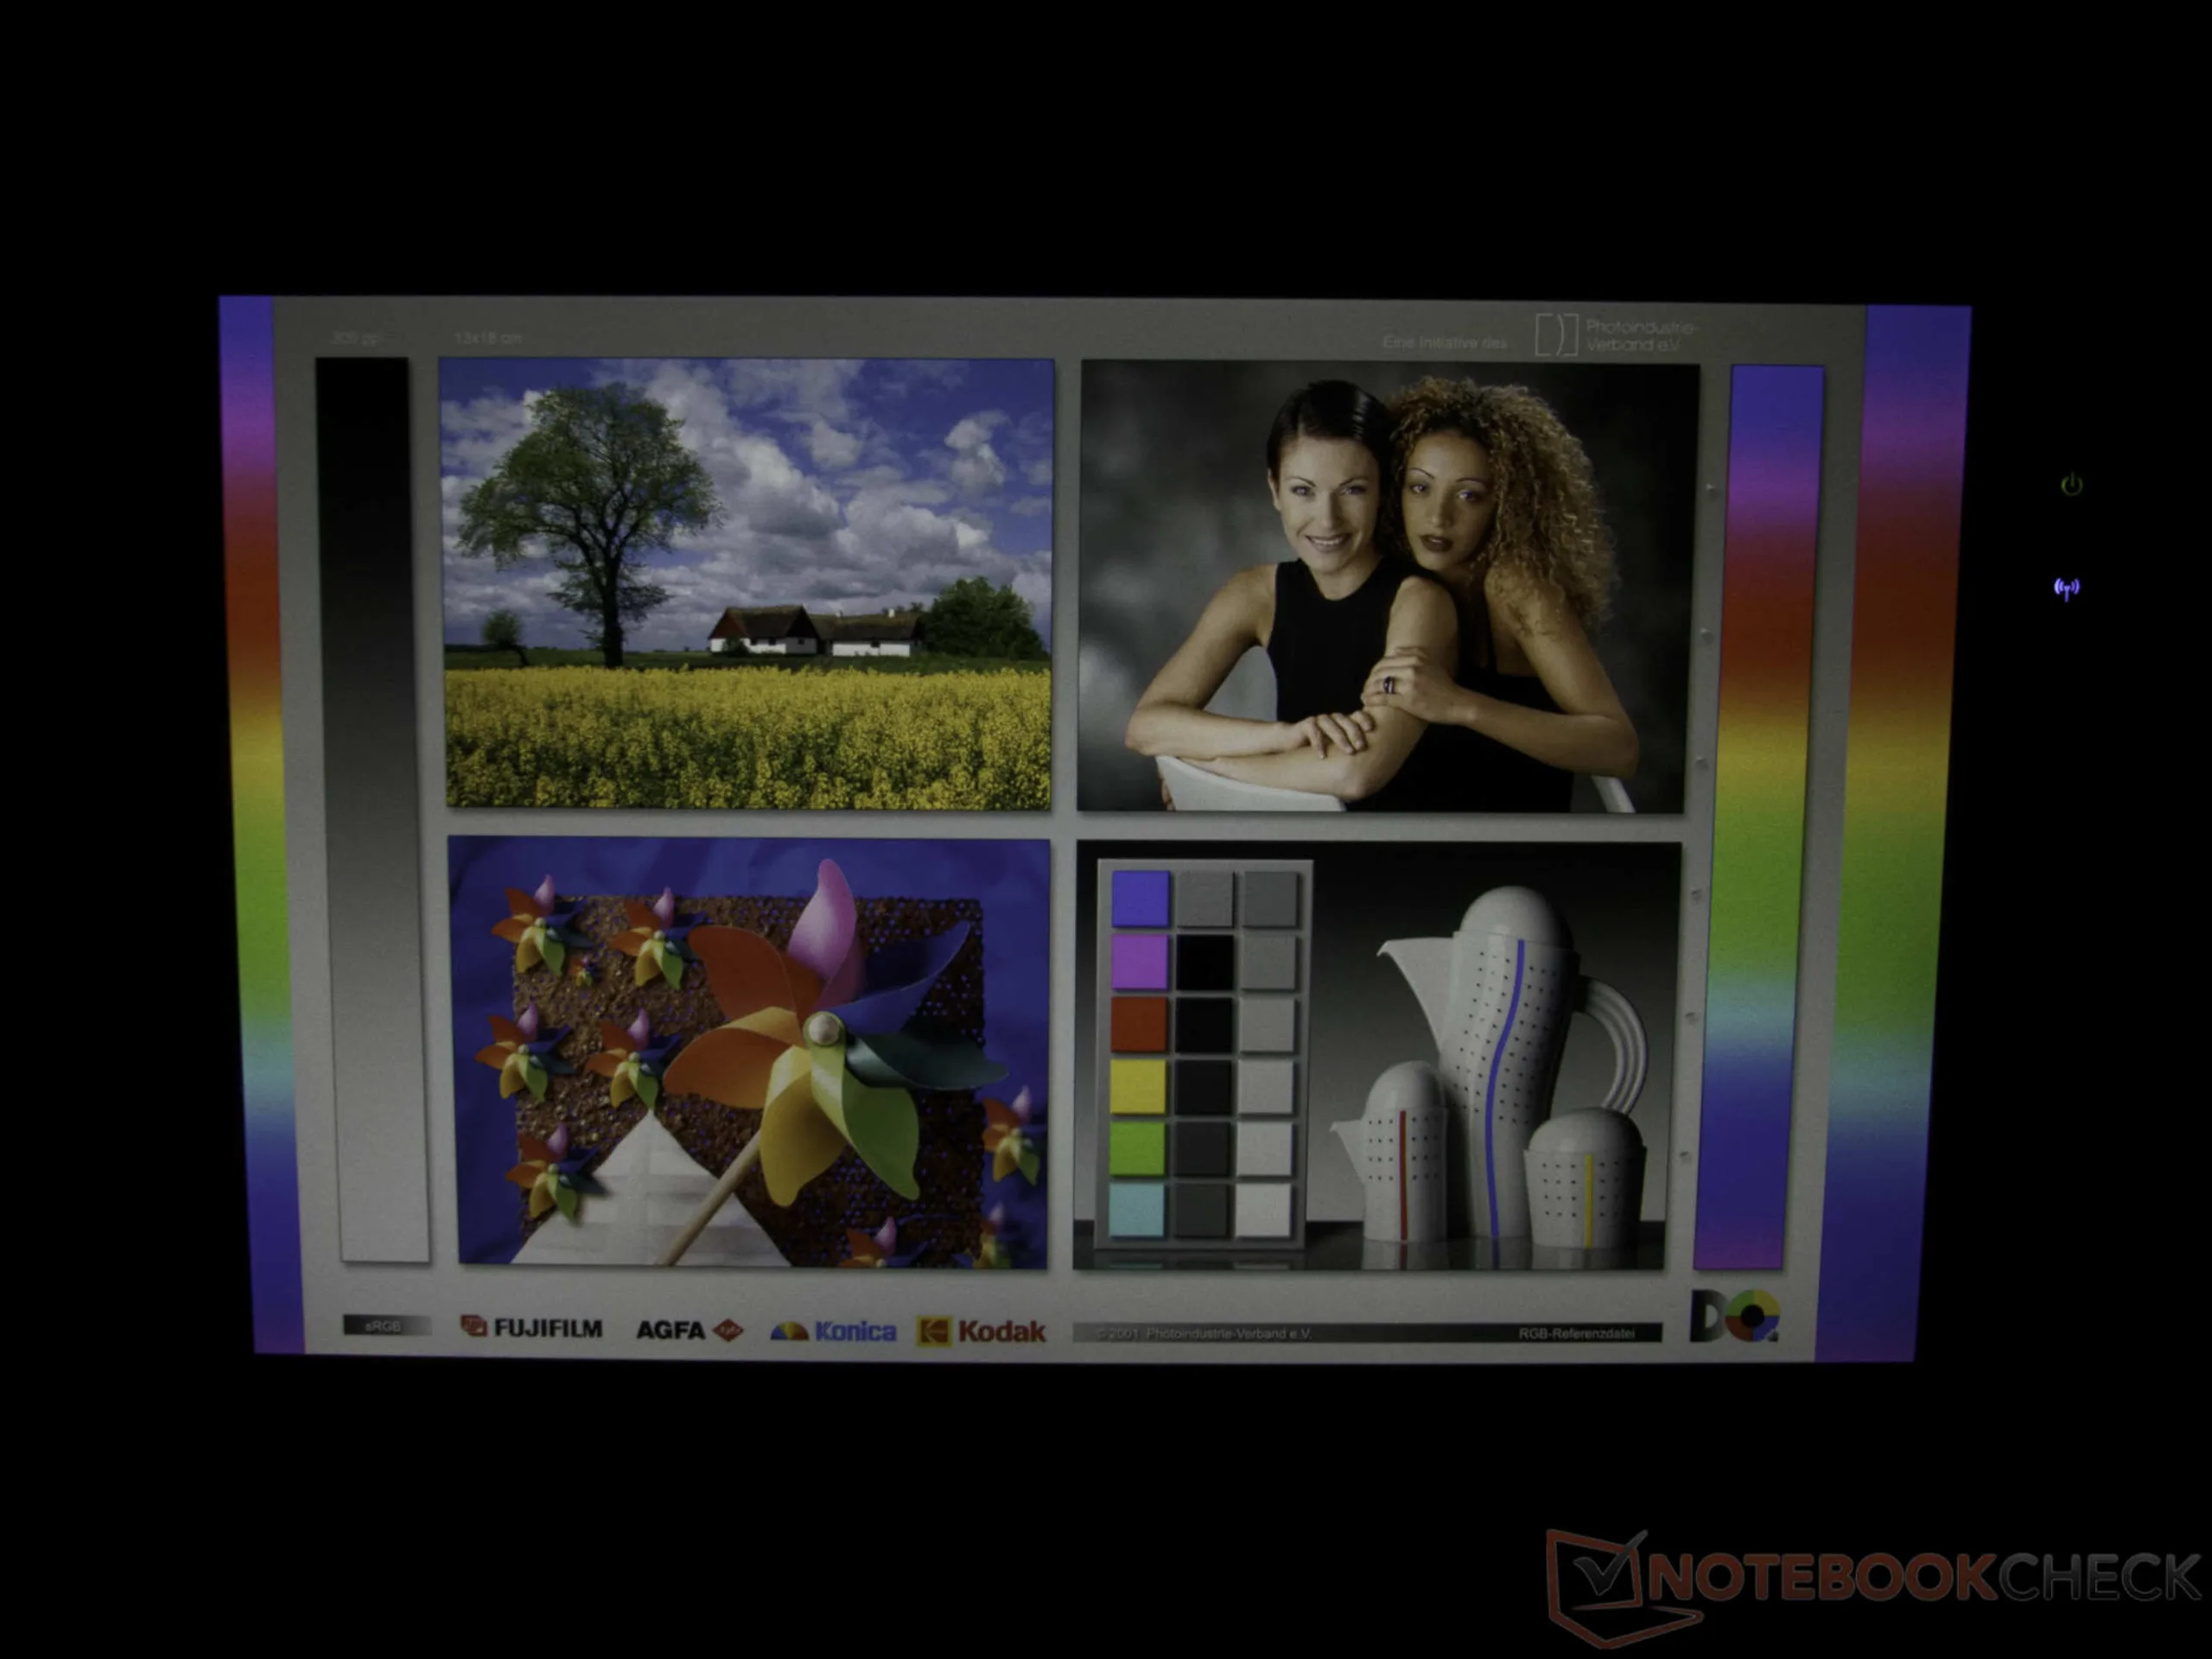
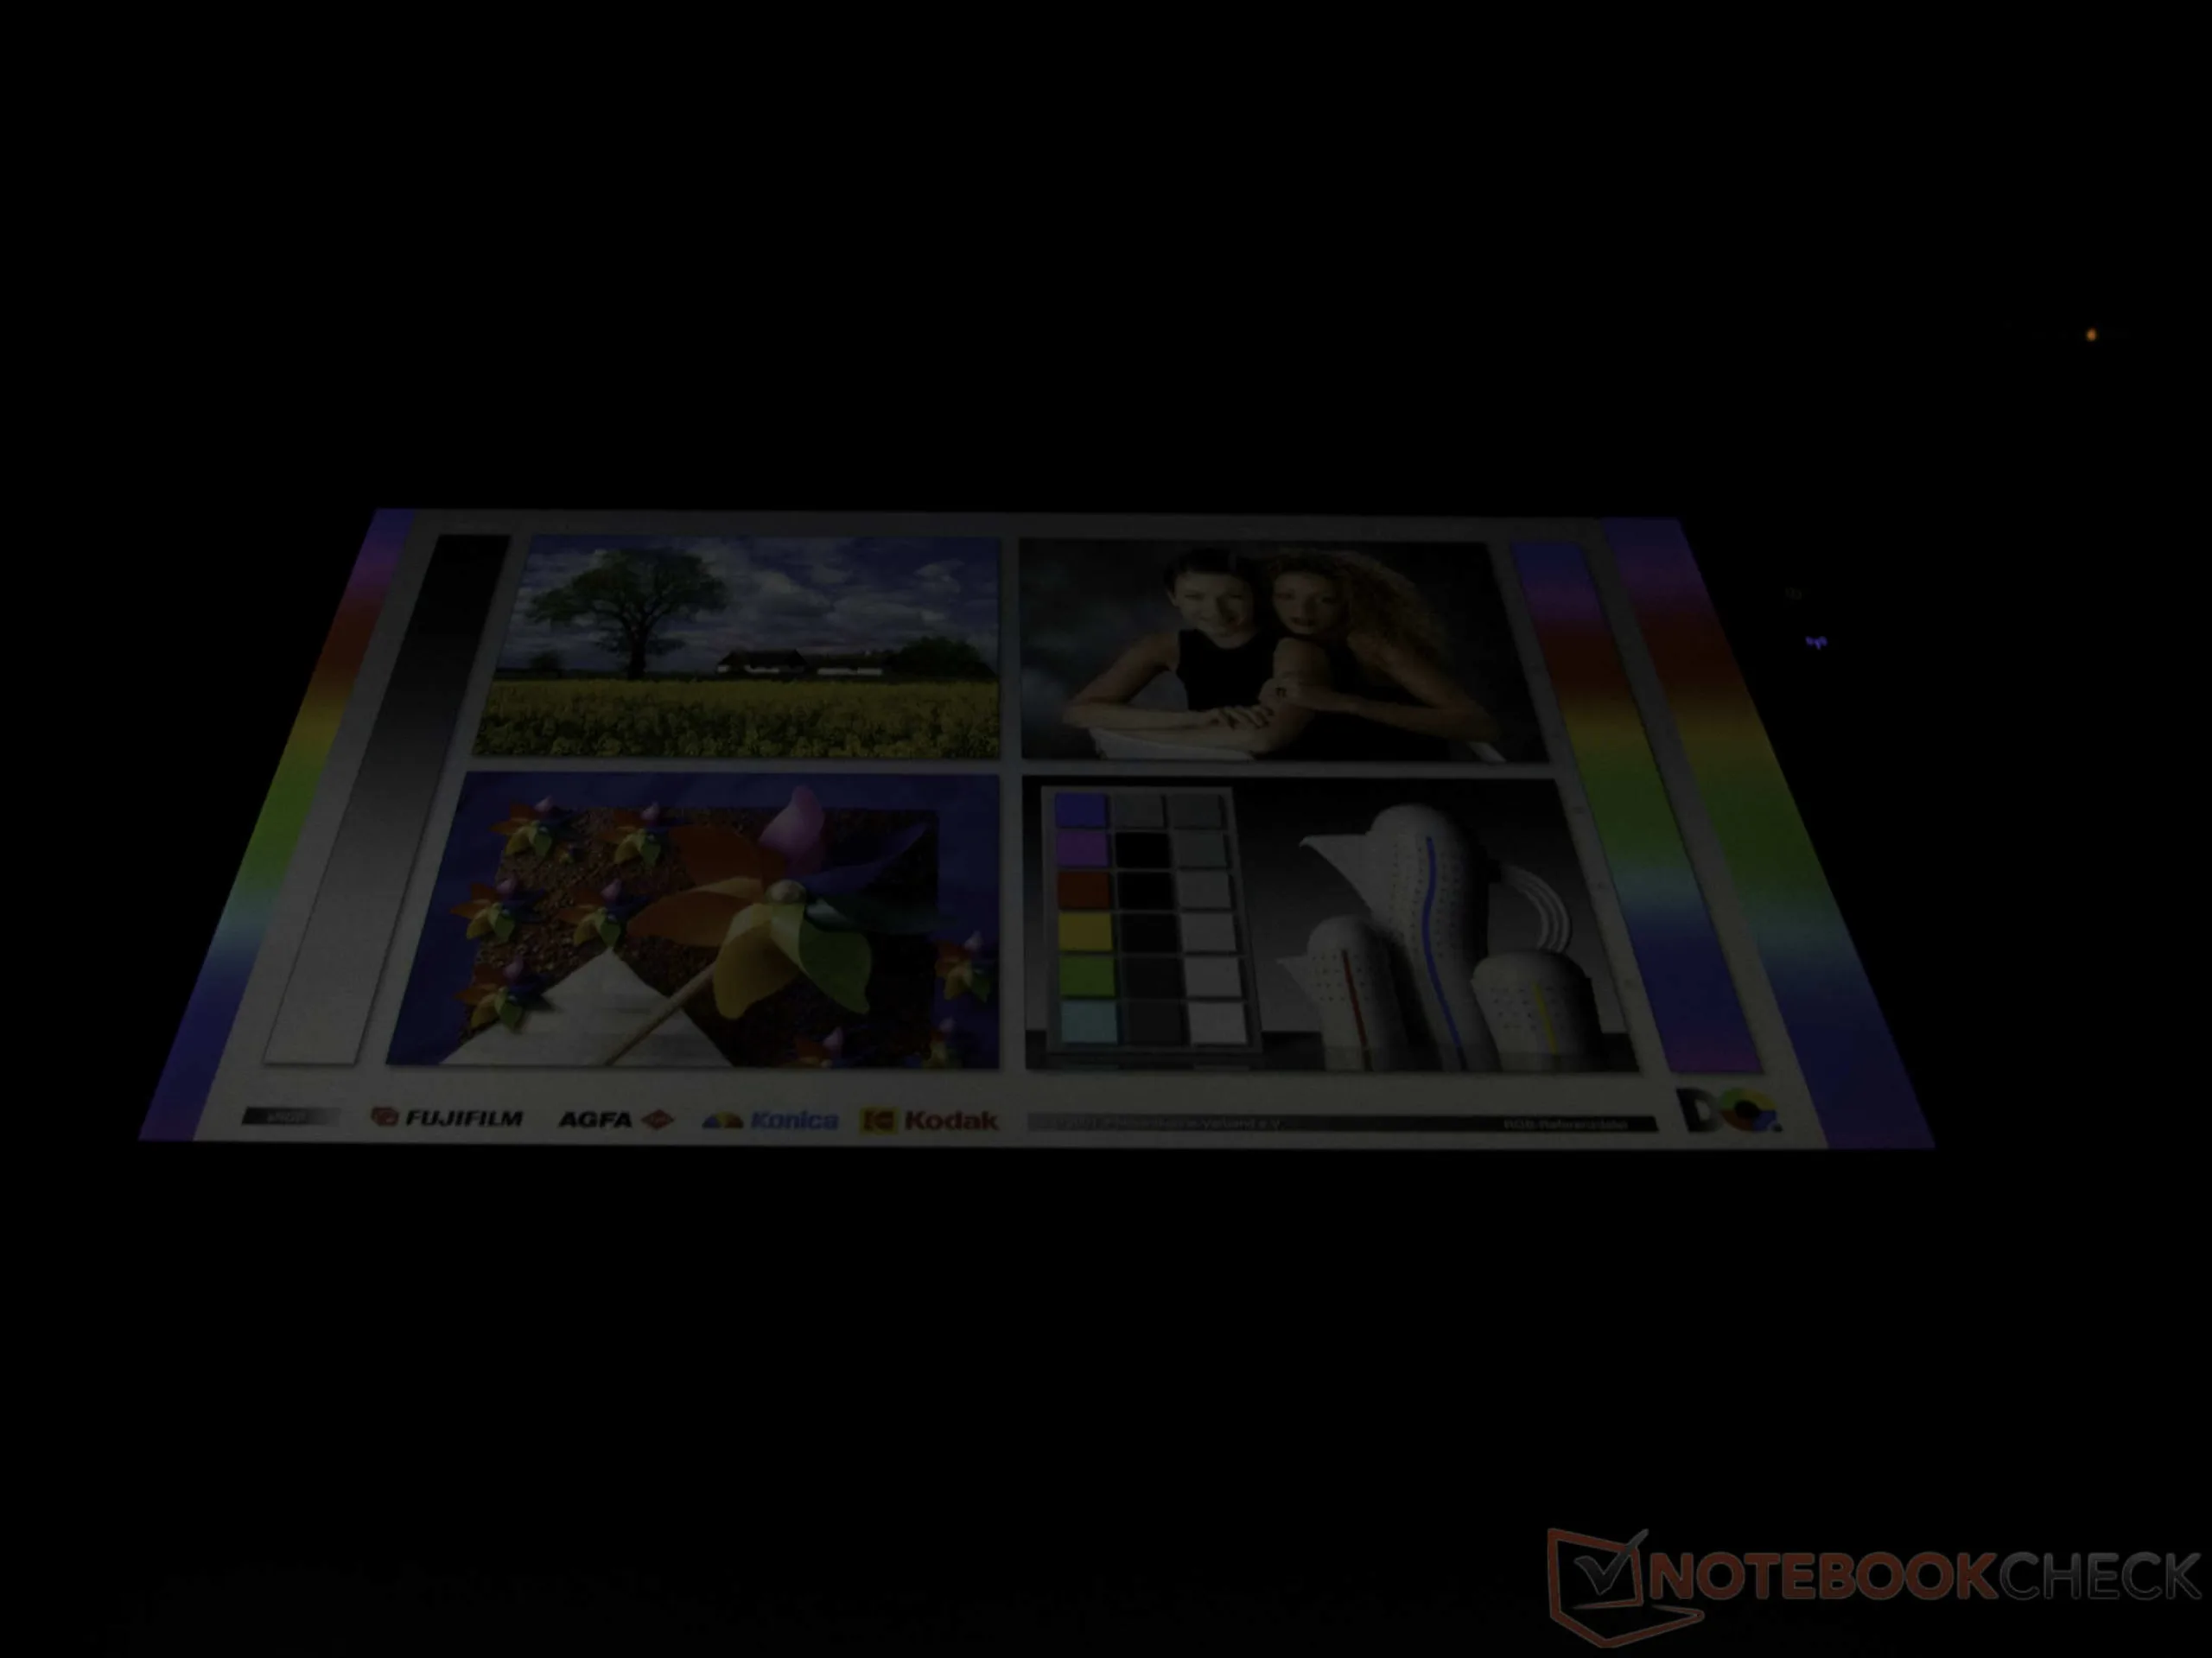
Uso all'aperto
Analisi prospettica
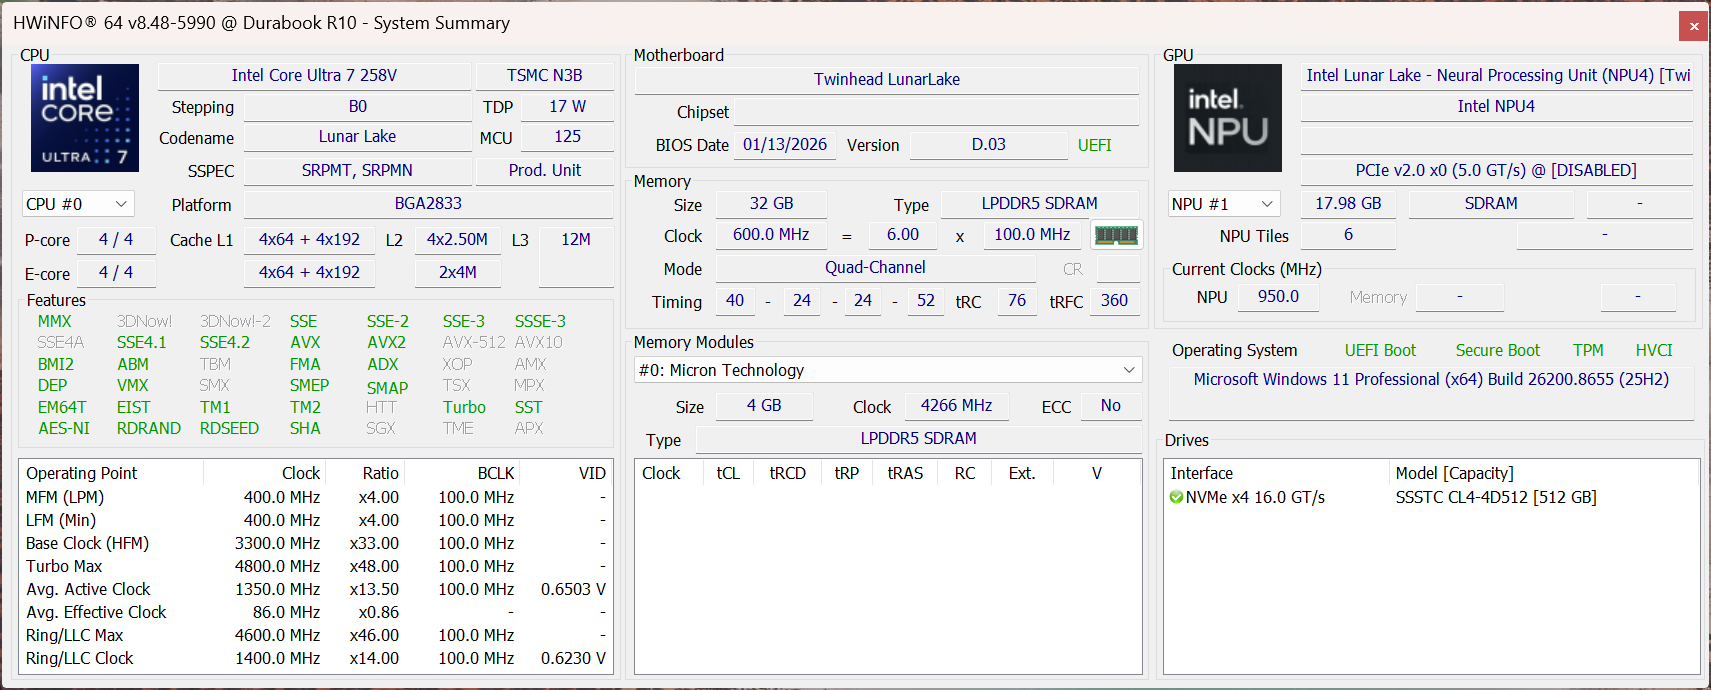
Prestazioni
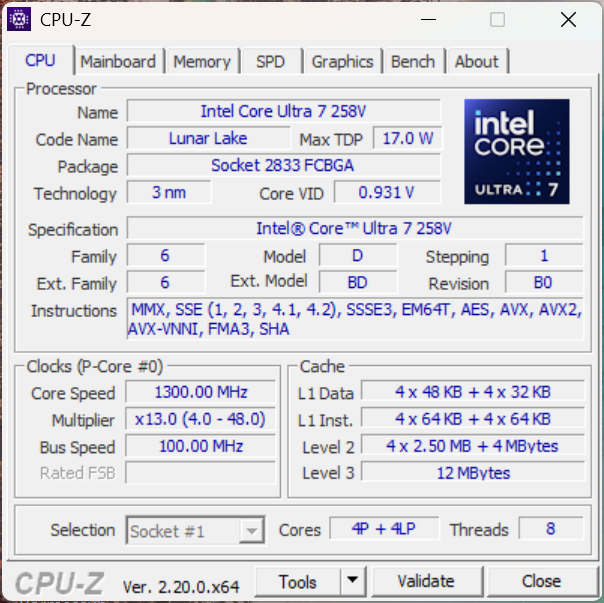
Sotto il robusto cofano, un processore Intel Core Ultra all’avanguardia lavora senza sosta. Per il modello R10 è possibile configurare quasi tutti i processori Core Ultra 5 e Core Ultra 7 della generazione Lunar Lake. A seconda della classe di processore, sono disponibili versioni vPro Enterprise.
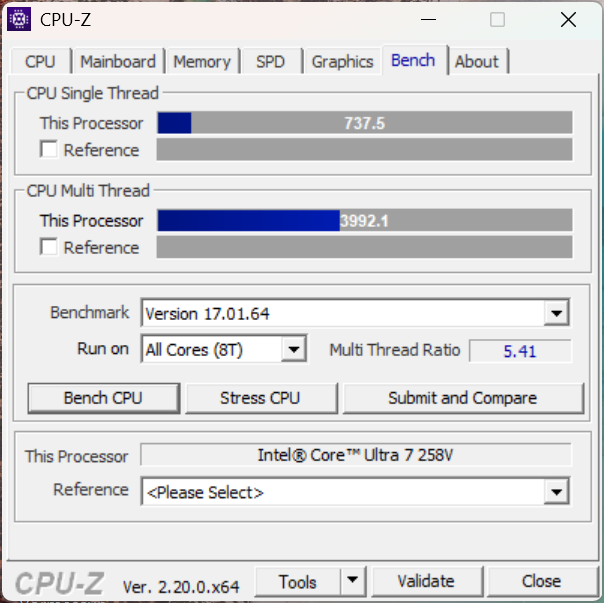
Prestazioni del processore
Il modello 258V dell’unità di prova è dotato di otto core senza multithreading. Durante brevi picchi di carico, il sistema consente un consumo massimo di 32 watt prima che la potenza venga limitata in modo permanente a circa 17 watt. Di conseguenza, le prestazioni del Core Ultra 7 rimangono al di sotto della media nel nostro confronto. In questo caso non è presente alcuna funzione di gestione dell’alimentazione con valori TDP regolabili.
Test di resistenza multi-core di Cinebench R15
Cinebench R23: Multi Core | Single Core
Cinebench R20: CPU (Multi Core) | CPU (Single Core)
Cinebench R15: CPU Multi 64Bit | CPU Single 64Bit
Blender: v2.79 BMW27 CPU
7-Zip 18.03: 7z b 4 | 7z b 4 -mmt1
Geekbench 6.7: Multi-Core | Single-Core
Geekbench 5.5: Multi-Core | Single-Core
HWBOT x265 Benchmark v2.2: 4k Preset
LibreOffice : 20 Documents To PDF
R Benchmark 2.5: Overall mean
| CPU Performance rating | |
| Lenovo ThinkPad T14 Gen 6 AMD | |
| Lenovo ThinkPad T14 Gen 6 21QG001VGE | |
| Media Intel Core Ultra 7 258V | |
| Dynabook Portege Z40L-N | |
| Durabook R10 | |
| Dell Latitude 7030 Rugged Extreme | |
| Media della classe Tablet | |
| Durabook R8 Tablet -2! | |
| Cinebench R23 / Multi Core | |
| Lenovo ThinkPad T14 Gen 6 AMD | |
| Lenovo ThinkPad T14 Gen 6 21QG001VGE | |
| Media Intel Core Ultra 7 258V (7920 - 11097, n=25) | |
| Media della classe Tablet (8043 - 10868, n=3, ultimi 2 anni) | |
| Dell Latitude 7030 Rugged Extreme | |
| Durabook R10 | |
| Durabook R10 | |
| Dynabook Portege Z40L-N | |
| Durabook R8 Tablet | |
| Cinebench R23 / Single Core | |
| Lenovo ThinkPad T14 Gen 6 AMD | |
| Lenovo ThinkPad T14 Gen 6 21QG001VGE | |
| Durabook R10 | |
| Durabook R10 | |
| Media della classe Tablet (1822 - 1921, n=3, ultimi 2 anni) | |
| Media Intel Core Ultra 7 258V (1664 - 1957, n=25) | |
| Dynabook Portege Z40L-N | |
| Dell Latitude 7030 Rugged Extreme | |
| Durabook R8 Tablet | |
| Cinebench R20 / CPU (Multi Core) | |
| Lenovo ThinkPad T14 Gen 6 AMD | |
| Lenovo ThinkPad T14 Gen 6 21QG001VGE | |
| Media Intel Core Ultra 7 258V (3130 - 4314, n=24) | |
| Media della classe Tablet (3137 - 4255, n=2, ultimi 2 anni) | |
| Dell Latitude 7030 Rugged Extreme | |
| Durabook R10 | |
| Dynabook Portege Z40L-N | |
| Durabook R8 Tablet | |
| Cinebench R20 / CPU (Single Core) | |
| Lenovo ThinkPad T14 Gen 6 AMD | |
| Lenovo ThinkPad T14 Gen 6 21QG001VGE | |
| Media della classe Tablet (705 - 739, n=2, ultimi 2 anni) | |
| Dynabook Portege Z40L-N | |
| Media Intel Core Ultra 7 258V (643 - 749, n=24) | |
| Durabook R10 | |
| Dell Latitude 7030 Rugged Extreme | |
| Durabook R8 Tablet | |
| Cinebench R15 / CPU Multi 64Bit | |
| Lenovo ThinkPad T14 Gen 6 AMD | |
| Lenovo ThinkPad T14 Gen 6 21QG001VGE | |
| Media Intel Core Ultra 7 258V (1280 - 1656, n=24) | |
| Media della classe Tablet (1285 - 1651, n=2, ultimi 2 anni) | |
| Dell Latitude 7030 Rugged Extreme | |
| Durabook R10 | |
| Dynabook Portege Z40L-N | |
| Durabook R8 Tablet | |
| Cinebench R15 / CPU Single 64Bit | |
| Media della classe Tablet (274 - 299, n=2, ultimi 2 anni) | |
| Lenovo ThinkPad T14 Gen 6 21QG001VGE | |
| Media Intel Core Ultra 7 258V (258 - 298, n=24) | |
| Dynabook Portege Z40L-N | |
| Durabook R10 | |
| Dell Latitude 7030 Rugged Extreme | |
| Lenovo ThinkPad T14 Gen 6 AMD | |
| Durabook R8 Tablet | |
| Blender / v2.79 BMW27 CPU | |
| Durabook R8 Tablet | |
| Durabook R10 | |
| Dynabook Portege Z40L-N | |
| Media della classe Tablet (337 - 484, n=2, ultimi 2 anni) | |
| Dell Latitude 7030 Rugged Extreme | |
| Media Intel Core Ultra 7 258V (315 - 484, n=24) | |
| Lenovo ThinkPad T14 Gen 6 21QG001VGE | |
| Lenovo ThinkPad T14 Gen 6 AMD | |
| 7-Zip 18.03 / 7z b 4 | |
| Lenovo ThinkPad T14 Gen 6 AMD | |
| Lenovo ThinkPad T14 Gen 6 21QG001VGE | |
| Dell Latitude 7030 Rugged Extreme | |
| Media Intel Core Ultra 7 258V (24486 - 36724, n=24) | |
| Media della classe Tablet (24486 - 36610, n=2, ultimi 2 anni) | |
| Dynabook Portege Z40L-N | |
| Durabook R10 | |
| Durabook R8 Tablet | |
| 7-Zip 18.03 / 7z b 4 -mmt1 | |
| Lenovo ThinkPad T14 Gen 6 AMD | |
| Lenovo ThinkPad T14 Gen 6 21QG001VGE | |
| Dynabook Portege Z40L-N | |
| Media Intel Core Ultra 7 258V (4769 - 5869, n=24) | |
| Media della classe Tablet (4769 - 5991, n=2, ultimi 2 anni) | |
| Dell Latitude 7030 Rugged Extreme | |
| Durabook R10 | |
| Durabook R8 Tablet | |
| Geekbench 6.7 / Multi-Core | |
| Lenovo ThinkPad T14 Gen 6 AMD | |
| Lenovo ThinkPad T14 Gen 6 21QG001VGE | |
| Media Intel Core Ultra 7 258V (8964 - 11334, n=24) | |
| Dynabook Portege Z40L-N | |
| Durabook R10 | |
| Dell Latitude 7030 Rugged Extreme | |
| Media della classe Tablet (1104 - 16544, n=86, ultimi 2 anni) | |
| Geekbench 6.7 / Single-Core | |
| Lenovo ThinkPad T14 Gen 6 AMD | |
| Lenovo ThinkPad T14 Gen 6 21QG001VGE | |
| Dynabook Portege Z40L-N | |
| Media Intel Core Ultra 7 258V (2593 - 2795, n=24) | |
| Durabook R10 | |
| Dell Latitude 7030 Rugged Extreme | |
| Media della classe Tablet (323 - 4128, n=86, ultimi 2 anni) | |
| Geekbench 5.5 / Multi-Core | |
| Lenovo ThinkPad T14 Gen 6 AMD | |
| Lenovo ThinkPad T14 Gen 6 21QG001VGE | |
| Media Intel Core Ultra 7 258V (7574 - 9918, n=24) | |
| Dynabook Portege Z40L-N | |
| Durabook R10 | |
| Dell Latitude 7030 Rugged Extreme | |
| Media della classe Tablet (303 - 10522, n=39, ultimi 2 anni) | |
| Durabook R8 Tablet | |
| Geekbench 5.5 / Single-Core | |
| Lenovo ThinkPad T14 Gen 6 AMD | |
| Lenovo ThinkPad T14 Gen 6 21QG001VGE | |
| Dynabook Portege Z40L-N | |
| Media Intel Core Ultra 7 258V (1891 - 2046, n=24) | |
| Durabook R10 | |
| Dell Latitude 7030 Rugged Extreme | |
| Durabook R8 Tablet | |
| Media della classe Tablet (103 - 2286, n=39, ultimi 2 anni) | |
| HWBOT x265 Benchmark v2.2 / 4k Preset | |
| Lenovo ThinkPad T14 Gen 6 AMD | |
| Lenovo ThinkPad T14 Gen 6 21QG001VGE | |
| Media Intel Core Ultra 7 258V (7.11 - 14.2, n=24) | |
| Media della classe Tablet (7.11 - 12.9, n=2, ultimi 2 anni) | |
| Dynabook Portege Z40L-N | |
| Dell Latitude 7030 Rugged Extreme | |
| Durabook R10 | |
| Durabook R8 Tablet | |
| LibreOffice / 20 Documents To PDF | |
| Durabook R10 | |
| Durabook R8 Tablet | |
| Media della classe Tablet (48.3 - 62.8, n=2, ultimi 2 anni) | |
| Lenovo ThinkPad T14 Gen 6 AMD | |
| Media Intel Core Ultra 7 258V (41.1 - 62.8, n=24) | |
| Lenovo ThinkPad T14 Gen 6 21QG001VGE | |
| Dell Latitude 7030 Rugged Extreme | |
| Dynabook Portege Z40L-N | |
| R Benchmark 2.5 / Overall mean | |
| Durabook R8 Tablet | |
| Durabook R10 | |
| Dell Latitude 7030 Rugged Extreme | |
| Media della classe Tablet (0.4361 - 0.542, n=2, ultimi 2 anni) | |
| Dynabook Portege Z40L-N | |
| Media Intel Core Ultra 7 258V (0.443 - 0.542, n=24) | |
| Lenovo ThinkPad T14 Gen 6 21QG001VGE | |
| Lenovo ThinkPad T14 Gen 6 AMD | |
* ... Meglio usare valori piccoli
AIDA64: FP32 Ray-Trace | FPU Julia | CPU SHA3 | FPU SinJulia | FPU Mandel | CPU AES | CPU ZLib | FP64 Ray-Trace | CPU PhotoWorxx | CPU CheckMate
| Performance rating | |
| Lenovo ThinkPad T14 Gen 6 AMD | |
| Lenovo ThinkPad T14 Gen 6 21QG001VGE -1! | |
| Media Intel Core Ultra 7 258V | |
| Media della classe Tablet | |
| Durabook R10 | |
| Dynabook Portege Z40L-N -1! | |
| Dell Latitude 7030 Rugged Extreme -1! | |
| Durabook R8 Tablet -1! | |
| AIDA64 / FP32 Ray-Trace | |
| Lenovo ThinkPad T14 Gen 6 AMD (v8.20.8100) | |
| Lenovo ThinkPad T14 Gen 6 AMD (v6.92.6600) | |
| Lenovo ThinkPad T14 Gen 6 21QG001VGE (v6.92.6600) | |
| Media Intel Core Ultra 7 258V (8454 - 12781, n=26) | |
| Media della classe Tablet (8485 - 12759, n=2, ultimi 2 anni) | |
| Dynabook Portege Z40L-N (v6.92.6600) | |
| Durabook R10 (v8.20.8100) | |
| Dell Latitude 7030 Rugged Extreme (v6.92.6600) | |
| Durabook R8 Tablet (v6.85.6300) | |
| AIDA64 / FPU Julia | |
| Lenovo ThinkPad T14 Gen 6 AMD (v8.20.8100) | |
| Lenovo ThinkPad T14 Gen 6 AMD (v6.92.6600) | |
| Lenovo ThinkPad T14 Gen 6 21QG001VGE (v6.92.6600) | |
| Media Intel Core Ultra 7 258V (40875 - 63401, n=26) | |
| Media della classe Tablet (42586 - 62102, n=2, ultimi 2 anni) | |
| Dynabook Portege Z40L-N (v6.92.6600) | |
| Durabook R10 (v8.20.8100) | |
| Dell Latitude 7030 Rugged Extreme (v6.92.6600) | |
| Durabook R8 Tablet (v6.85.6300) | |
| AIDA64 / CPU SHA3 | |
| Lenovo ThinkPad T14 Gen 6 AMD (v6.92.6600) | |
| Lenovo ThinkPad T14 Gen 6 AMD (v8.20.8100) | |
| Lenovo ThinkPad T14 Gen 6 21QG001VGE (v6.92.6600) | |
| Media Intel Core Ultra 7 258V (1930 - 2817, n=26) | |
| Media della classe Tablet (2056 - 2784, n=2, ultimi 2 anni) | |
| Durabook R10 (v8.20.8100) | |
| Dynabook Portege Z40L-N (v6.92.6600) | |
| Dell Latitude 7030 Rugged Extreme (v6.92.6600) | |
| Durabook R8 Tablet (v6.85.6300) | |
| AIDA64 / FPU SinJulia | |
| Lenovo ThinkPad T14 Gen 6 AMD (v8.20.8100) | |
| Lenovo ThinkPad T14 Gen 6 AMD (v6.92.6600) | |
| Lenovo ThinkPad T14 Gen 6 21QG001VGE (v6.92.6600) | |
| Media Intel Core Ultra 7 258V (3817 - 4440, n=26) | |
| Media della classe Tablet (4083 - 4429, n=2, ultimi 2 anni) | |
| Dell Latitude 7030 Rugged Extreme (v6.92.6600) | |
| Durabook R10 (v8.20.8100) | |
| Dynabook Portege Z40L-N (v6.92.6600) | |
| Durabook R8 Tablet (v6.85.6300) | |
| AIDA64 / FPU Mandel | |
| Lenovo ThinkPad T14 Gen 6 AMD (v8.20.8100) | |
| Lenovo ThinkPad T14 Gen 6 AMD (v6.92.6600) | |
| Lenovo ThinkPad T14 Gen 6 21QG001VGE (v6.92.6600) | |
| Media Intel Core Ultra 7 258V (21670 - 33565, n=26) | |
| Media della classe Tablet (22775 - 31836, n=2, ultimi 2 anni) | |
| Dynabook Portege Z40L-N (v6.92.6600) | |
| Durabook R10 (v8.20.8100) | |
| Dell Latitude 7030 Rugged Extreme (v6.92.6600) | |
| Durabook R8 Tablet (v6.85.6300) | |
| AIDA64 / CPU AES | |
| Lenovo ThinkPad T14 Gen 6 AMD (v6.92.6600) | |
| Lenovo ThinkPad T14 Gen 6 AMD (v8.20.8100) | |
| Lenovo ThinkPad T14 Gen 6 21QG001VGE (v6.92.6600) | |
| Media Intel Core Ultra 7 258V (30957 - 40753, n=26) | |
| Media della classe Tablet (34551 - 38941, n=2, ultimi 2 anni) | |
| Dell Latitude 7030 Rugged Extreme (v6.92.6600) | |
| Durabook R10 (v8.20.8100) | |
| Dynabook Portege Z40L-N (v6.92.6600) | |
| Durabook R8 Tablet (v6.85.6300) | |
| AIDA64 / CPU ZLib | |
| Lenovo ThinkPad T14 Gen 6 AMD (v6.92.6600) | |
| Lenovo ThinkPad T14 Gen 6 AMD (v8.20.8100) | |
| Lenovo ThinkPad T14 Gen 6 21QG001VGE (v6.92.6600) | |
| Dell Latitude 7030 Rugged Extreme (v6.92.6600) | |
| Media Intel Core Ultra 7 258V (422 - 632, n=26) | |
| Media della classe Tablet (434 - 631, n=2, ultimi 2 anni) | |
| Dynabook Portege Z40L-N (v6.92.6600) | |
| Durabook R10 (v8.20.8100) | |
| Durabook R8 Tablet (v6.85.6300) | |
| AIDA64 / FP64 Ray-Trace | |
| Lenovo ThinkPad T14 Gen 6 AMD (v6.92.6600) | |
| Lenovo ThinkPad T14 Gen 6 AMD (v8.20.8100) | |
| Lenovo ThinkPad T14 Gen 6 21QG001VGE (v6.92.6600) | |
| Media Intel Core Ultra 7 258V (4258 - 6930, n=26) | |
| Media della classe Tablet (4660 - 6803, n=2, ultimi 2 anni) | |
| Dynabook Portege Z40L-N (v6.92.6600) | |
| Durabook R10 (v8.20.8100) | |
| Dell Latitude 7030 Rugged Extreme (v6.92.6600) | |
| Durabook R8 Tablet (v6.85.6300) | |
| AIDA64 / CPU PhotoWorxx | |
| Lenovo ThinkPad T14 Gen 6 21QG001VGE (v6.92.6600) | |
| Media della classe Tablet (52755 - 54886, n=2, ultimi 2 anni) | |
| Media Intel Core Ultra 7 258V (44223 - 59245, n=26) | |
| Durabook R10 (v8.20.8100) | |
| Dynabook Portege Z40L-N (v6.92.6600) | |
| Dell Latitude 7030 Rugged Extreme (v6.92.6600) | |
| Lenovo ThinkPad T14 Gen 6 AMD (v8.20.8100) | |
| Lenovo ThinkPad T14 Gen 6 AMD (v6.92.6600) | |
| Durabook R8 Tablet (v6.85.6300) | |
| AIDA64 / CPU CheckMate | |
| Lenovo ThinkPad T14 Gen 6 AMD (v8.20.8100) | |
| Media Intel Core Ultra 7 258V (2014 - 2513, n=2) | |
| Durabook R10 (v8.20.8100) | |
| Media della classe Tablet (n=1ultimi 2 anni) | |
Prestazioni del sistema e dell'archiviazione
Nell’uso quotidiano, la piattaforma garantisce prestazioni fluide per le attività di Office. Tuttavia, se si considerano i punteggi dei benchmark, le prestazioni del tablet risultano generalmente inferiori alla media per Lunar Lake. È solo in termini di velocità di archiviazione che il tablet si distingue, offrendo le ottime prestazioni tipiche di Lunar Lake.
PCMark 10: Score | Essentials | Productivity | Digital Content Creation
CrossMark: Overall | Productivity | Creativity | Responsiveness
WebXPRT 3: Overall
WebXPRT 4: Overall
Mozilla Kraken 1.1: Total
| Performance rating | |
| Lenovo ThinkPad T14 Gen 6 AMD | |
| Lenovo ThinkPad T14 Gen 6 21QG001VGE | |
| Media Intel Core Ultra 7 258V, Intel Arc Graphics 140V | |
| Dynabook Portege Z40L-N | |
| Durabook R10 | |
| Dell Latitude 7030 Rugged Extreme | |
| Media della classe Tablet | |
| Durabook R8 Tablet | |
| PCMark 10 / Score | |
| Durabook R10 | |
| Lenovo ThinkPad T14 Gen 6 21QG001VGE | |
| Media della classe Tablet (6924 - 7420, n=2, ultimi 2 anni) | |
| Lenovo ThinkPad T14 Gen 6 AMD | |
| Media Intel Core Ultra 7 258V, Intel Arc Graphics 140V (6265 - 7420, n=23) | |
| Dynabook Portege Z40L-N | |
| Dell Latitude 7030 Rugged Extreme | |
| Durabook R8 Tablet | |
| PCMark 10 / Essentials | |
| Lenovo ThinkPad T14 Gen 6 AMD | |
| Lenovo ThinkPad T14 Gen 6 21QG001VGE | |
| Media Intel Core Ultra 7 258V, Intel Arc Graphics 140V (9295 - 11467, n=23) | |
| Dynabook Portege Z40L-N | |
| Media della classe Tablet (9991 - 10351, n=2, ultimi 2 anni) | |
| Durabook R10 | |
| Dell Latitude 7030 Rugged Extreme | |
| Durabook R8 Tablet | |
| PCMark 10 / Productivity | |
| Durabook R10 | |
| Media della classe Tablet (8823 - 13600, n=2, ultimi 2 anni) | |
| Lenovo ThinkPad T14 Gen 6 AMD | |
| Dynabook Portege Z40L-N | |
| Lenovo ThinkPad T14 Gen 6 21QG001VGE | |
| Media Intel Core Ultra 7 258V, Intel Arc Graphics 140V (7357 - 13600, n=23) | |
| Dell Latitude 7030 Rugged Extreme | |
| Durabook R8 Tablet | |
| PCMark 10 / Digital Content Creation | |
| Lenovo ThinkPad T14 Gen 6 21QG001VGE | |
| Media Intel Core Ultra 7 258V, Intel Arc Graphics 140V (8160 - 10308, n=23) | |
| Media della classe Tablet (8160 - 9863, n=2, ultimi 2 anni) | |
| Dynabook Portege Z40L-N | |
| Lenovo ThinkPad T14 Gen 6 AMD | |
| Durabook R10 | |
| Dell Latitude 7030 Rugged Extreme | |
| Durabook R8 Tablet | |
| CrossMark / Overall | |
| Lenovo ThinkPad T14 Gen 6 AMD | |
| Lenovo ThinkPad T14 Gen 6 21QG001VGE | |
| Media Intel Core Ultra 7 258V, Intel Arc Graphics 140V (1275 - 1742, n=22) | |
| Dynabook Portege Z40L-N | |
| Dell Latitude 7030 Rugged Extreme | |
| Durabook R10 | |
| Durabook R8 Tablet | |
| Media della classe Tablet (319 - 2375, n=46, ultimi 2 anni) | |
| CrossMark / Productivity | |
| Lenovo ThinkPad T14 Gen 6 AMD | |
| Lenovo ThinkPad T14 Gen 6 21QG001VGE | |
| Media Intel Core Ultra 7 258V, Intel Arc Graphics 140V (1267 - 1684, n=22) | |
| Dynabook Portege Z40L-N | |
| Dell Latitude 7030 Rugged Extreme | |
| Durabook R10 | |
| Durabook R8 Tablet | |
| Media della classe Tablet (346 - 2036, n=44, ultimi 2 anni) | |
| CrossMark / Creativity | |
| Lenovo ThinkPad T14 Gen 6 AMD | |
| Lenovo ThinkPad T14 Gen 6 21QG001VGE | |
| Media Intel Core Ultra 7 258V, Intel Arc Graphics 140V (1393 - 1977, n=22) | |
| Dynabook Portege Z40L-N | |
| Dell Latitude 7030 Rugged Extreme | |
| Durabook R10 | |
| Durabook R8 Tablet | |
| Media della classe Tablet (288 - 2620, n=44, ultimi 2 anni) | |
| CrossMark / Responsiveness | |
| Media della classe Tablet (333 - 12671, n=44, ultimi 2 anni) | |
| Lenovo ThinkPad T14 Gen 6 AMD | |
| Lenovo ThinkPad T14 Gen 6 21QG001VGE | |
| Media Intel Core Ultra 7 258V, Intel Arc Graphics 140V (999 - 1411, n=22) | |
| Dynabook Portege Z40L-N | |
| Dell Latitude 7030 Rugged Extreme | |
| Durabook R10 | |
| Durabook R8 Tablet | |
| WebXPRT 3 / Overall | |
| Lenovo ThinkPad T14 Gen 6 AMD | |
| Dynabook Portege Z40L-N | |
| Lenovo ThinkPad T14 Gen 6 21QG001VGE | |
| Media Intel Core Ultra 7 258V, Intel Arc Graphics 140V (219 - 317, n=22) | |
| Durabook R10 | |
| Dell Latitude 7030 Rugged Extreme | |
| Media della classe Tablet (108 - 480, n=10, ultimi 2 anni) | |
| Durabook R8 Tablet | |
| WebXPRT 4 / Overall | |
| Dynabook Portege Z40L-N | |
| Lenovo ThinkPad T14 Gen 6 21QG001VGE | |
| Lenovo ThinkPad T14 Gen 6 AMD | |
| Media Intel Core Ultra 7 258V, Intel Arc Graphics 140V (199.5 - 291, n=22) | |
| Durabook R10 | |
| Dell Latitude 7030 Rugged Extreme | |
| Durabook R8 Tablet | |
| Media della classe Tablet (39 - 376, n=56, ultimi 2 anni) | |
| Mozilla Kraken 1.1 / Total | |
| Media della classe Tablet (243 - 27101, n=66, ultimi 2 anni) | |
| Durabook R8 Tablet | |
| Dell Latitude 7030 Rugged Extreme | |
| Durabook R10 | |
| Media Intel Core Ultra 7 258V, Intel Arc Graphics 140V (468 - 559, n=24) | |
| Lenovo ThinkPad T14 Gen 6 21QG001VGE | |
| Dynabook Portege Z40L-N | |
| Lenovo ThinkPad T14 Gen 6 AMD | |
* ... Meglio usare valori piccoli
| PCMark 10 Score | 7420 punti | |
Aiuto | ||
| AIDA64 / Memory Copy | |
| Durabook R10 | |
| Lenovo ThinkPad T14 Gen 6 21QG001VGE | |
| Media della classe Tablet (108317 - 110050, n=2, ultimi 2 anni) | |
| Media Intel Core Ultra 7 258V (104408 - 114336, n=24) | |
| Dynabook Portege Z40L-N | |
| Dell Latitude 7030 Rugged Extreme | |
| Lenovo ThinkPad T14 Gen 6 AMD | |
| Lenovo ThinkPad T14 Gen 6 AMD | |
| Durabook R8 Tablet | |
| AIDA64 / Memory Read | |
| Lenovo ThinkPad T14 Gen 6 21QG001VGE | |
| Media Intel Core Ultra 7 258V (82846 - 89417, n=24) | |
| Dynabook Portege Z40L-N | |
| Media della classe Tablet (85395 - 87747, n=2, ultimi 2 anni) | |
| Durabook R10 | |
| Dell Latitude 7030 Rugged Extreme | |
| Lenovo ThinkPad T14 Gen 6 AMD | |
| Lenovo ThinkPad T14 Gen 6 AMD | |
| Durabook R8 Tablet | |
| AIDA64 / Memory Write | |
| Lenovo ThinkPad T14 Gen 6 21QG001VGE | |
| Media Intel Core Ultra 7 258V (108824 - 117989, n=24) | |
| Media della classe Tablet (108824 - 117859, n=2, ultimi 2 anni) | |
| Dynabook Portege Z40L-N | |
| Durabook R10 | |
| Dell Latitude 7030 Rugged Extreme | |
| Lenovo ThinkPad T14 Gen 6 AMD | |
| Lenovo ThinkPad T14 Gen 6 AMD | |
| Durabook R8 Tablet | |
| AIDA64 / Memory Latency | |
| Dell Latitude 7030 Rugged Extreme | |
| Lenovo ThinkPad T14 Gen 6 AMD | |
| Lenovo ThinkPad T14 Gen 6 AMD | |
| Durabook R8 Tablet | |
| Durabook R10 | |
| Dynabook Portege Z40L-N | |
| Lenovo ThinkPad T14 Gen 6 21QG001VGE | |
| Media della classe Tablet (94.4 - 101.7, n=2, ultimi 2 anni) | |
| Media Intel Core Ultra 7 258V (95 - 101.7, n=24) | |
* ... Meglio usare valori piccoli
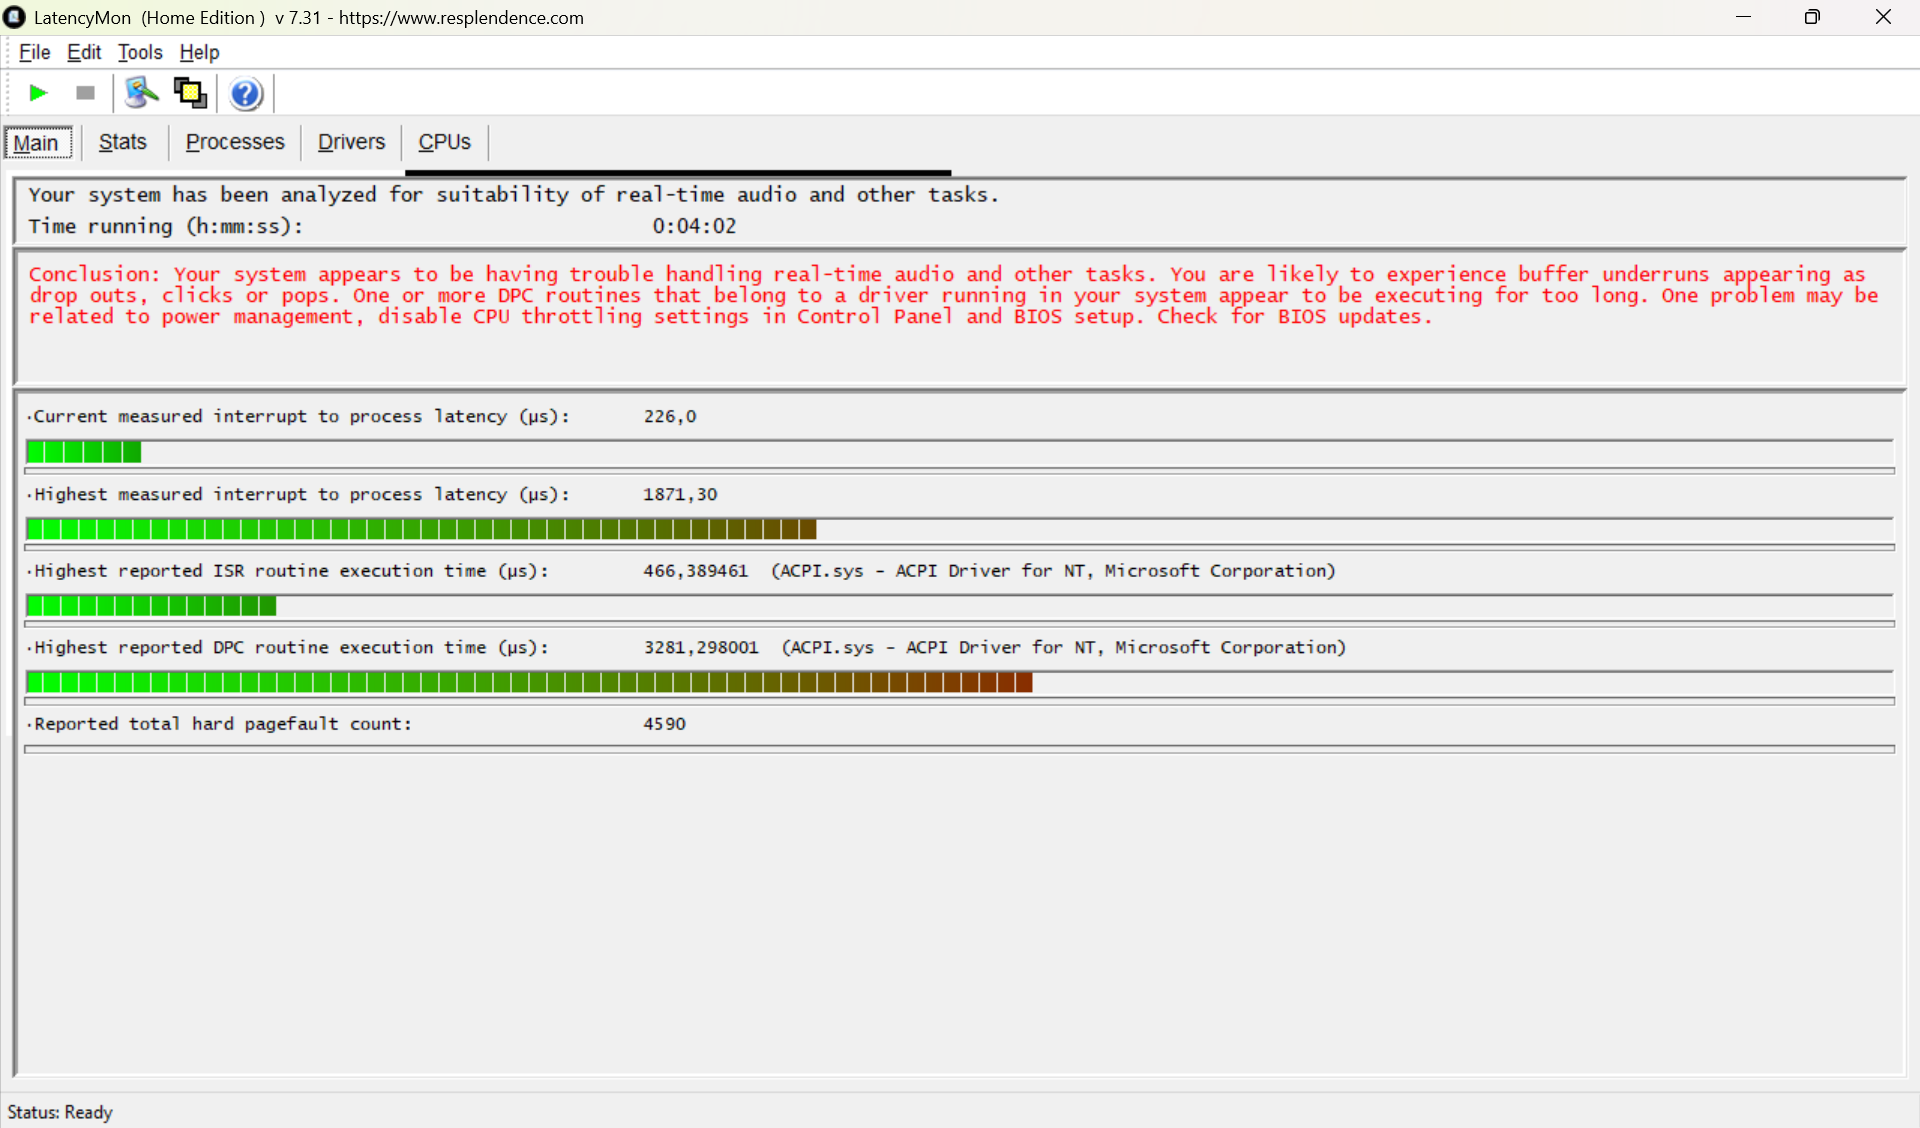
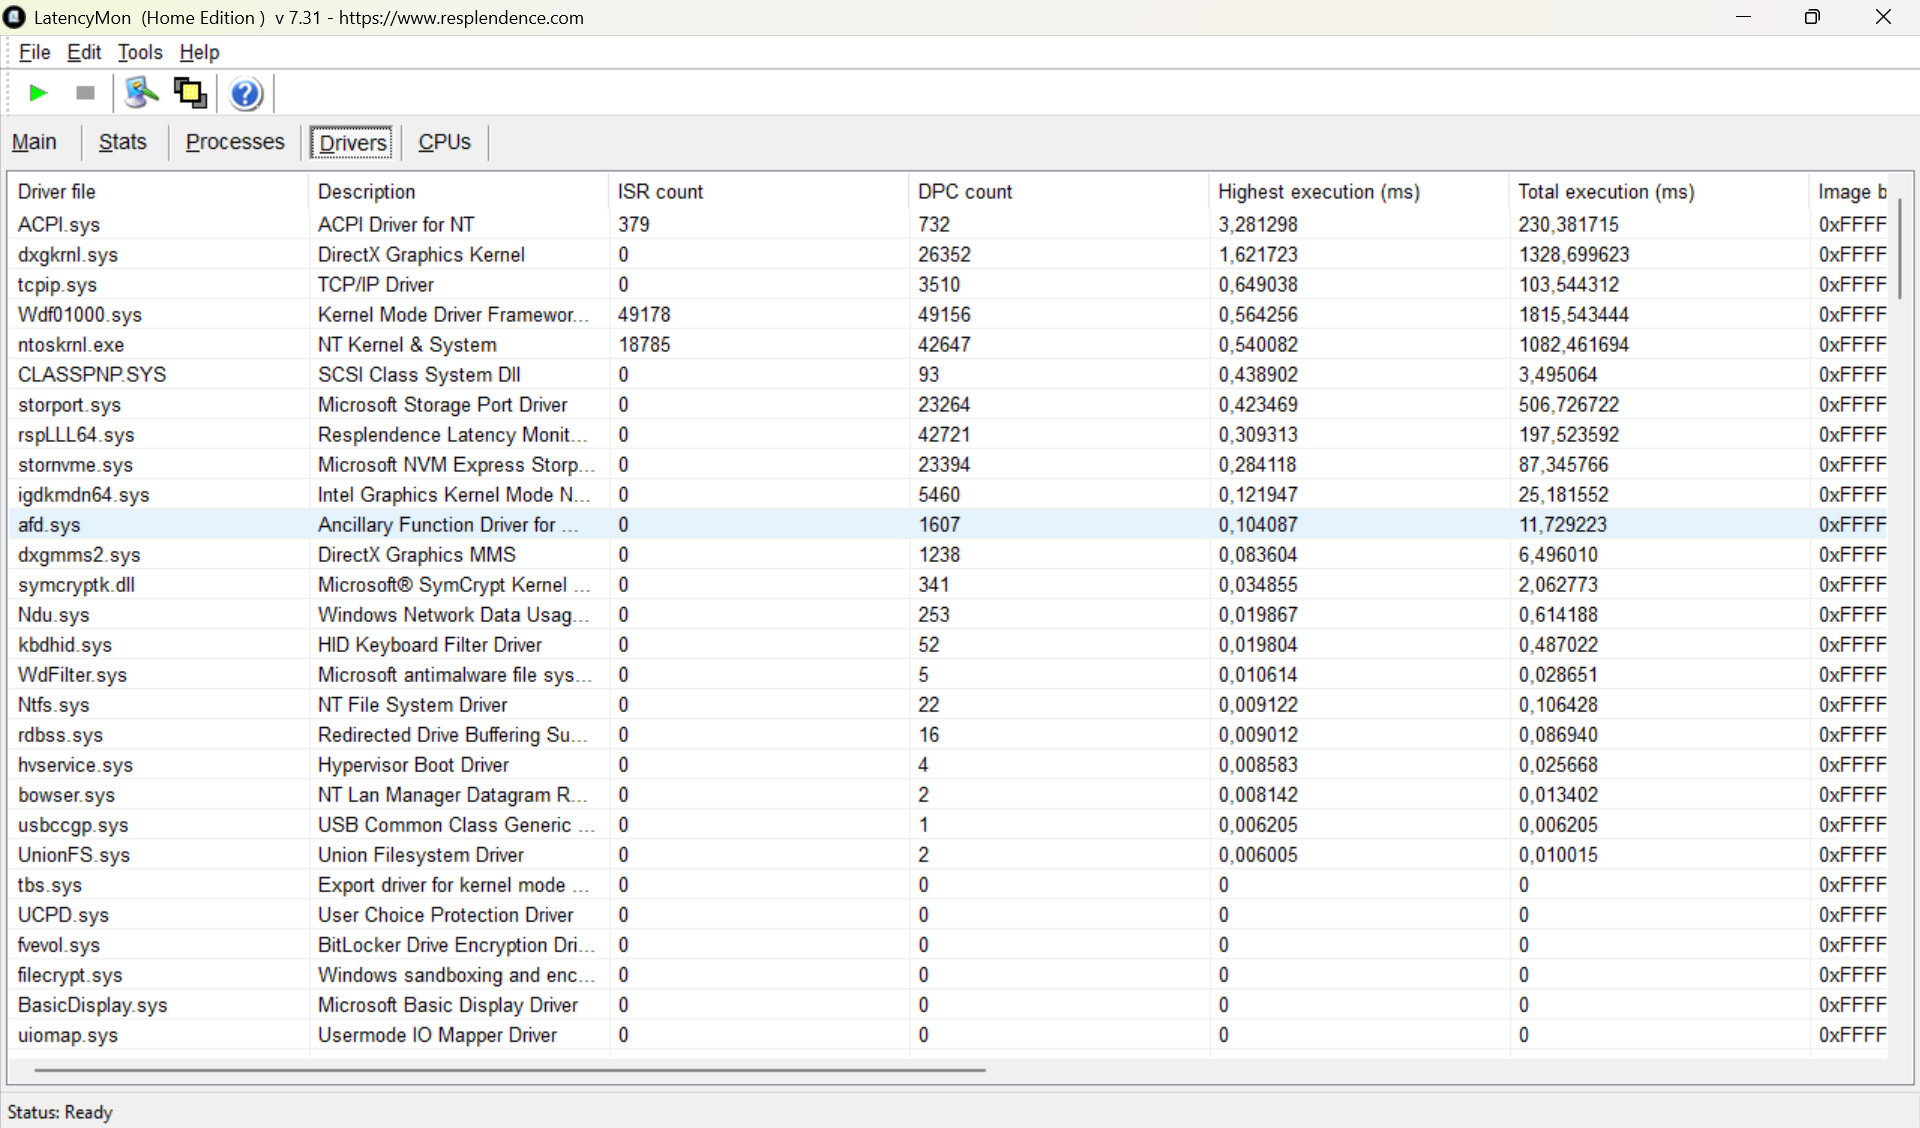
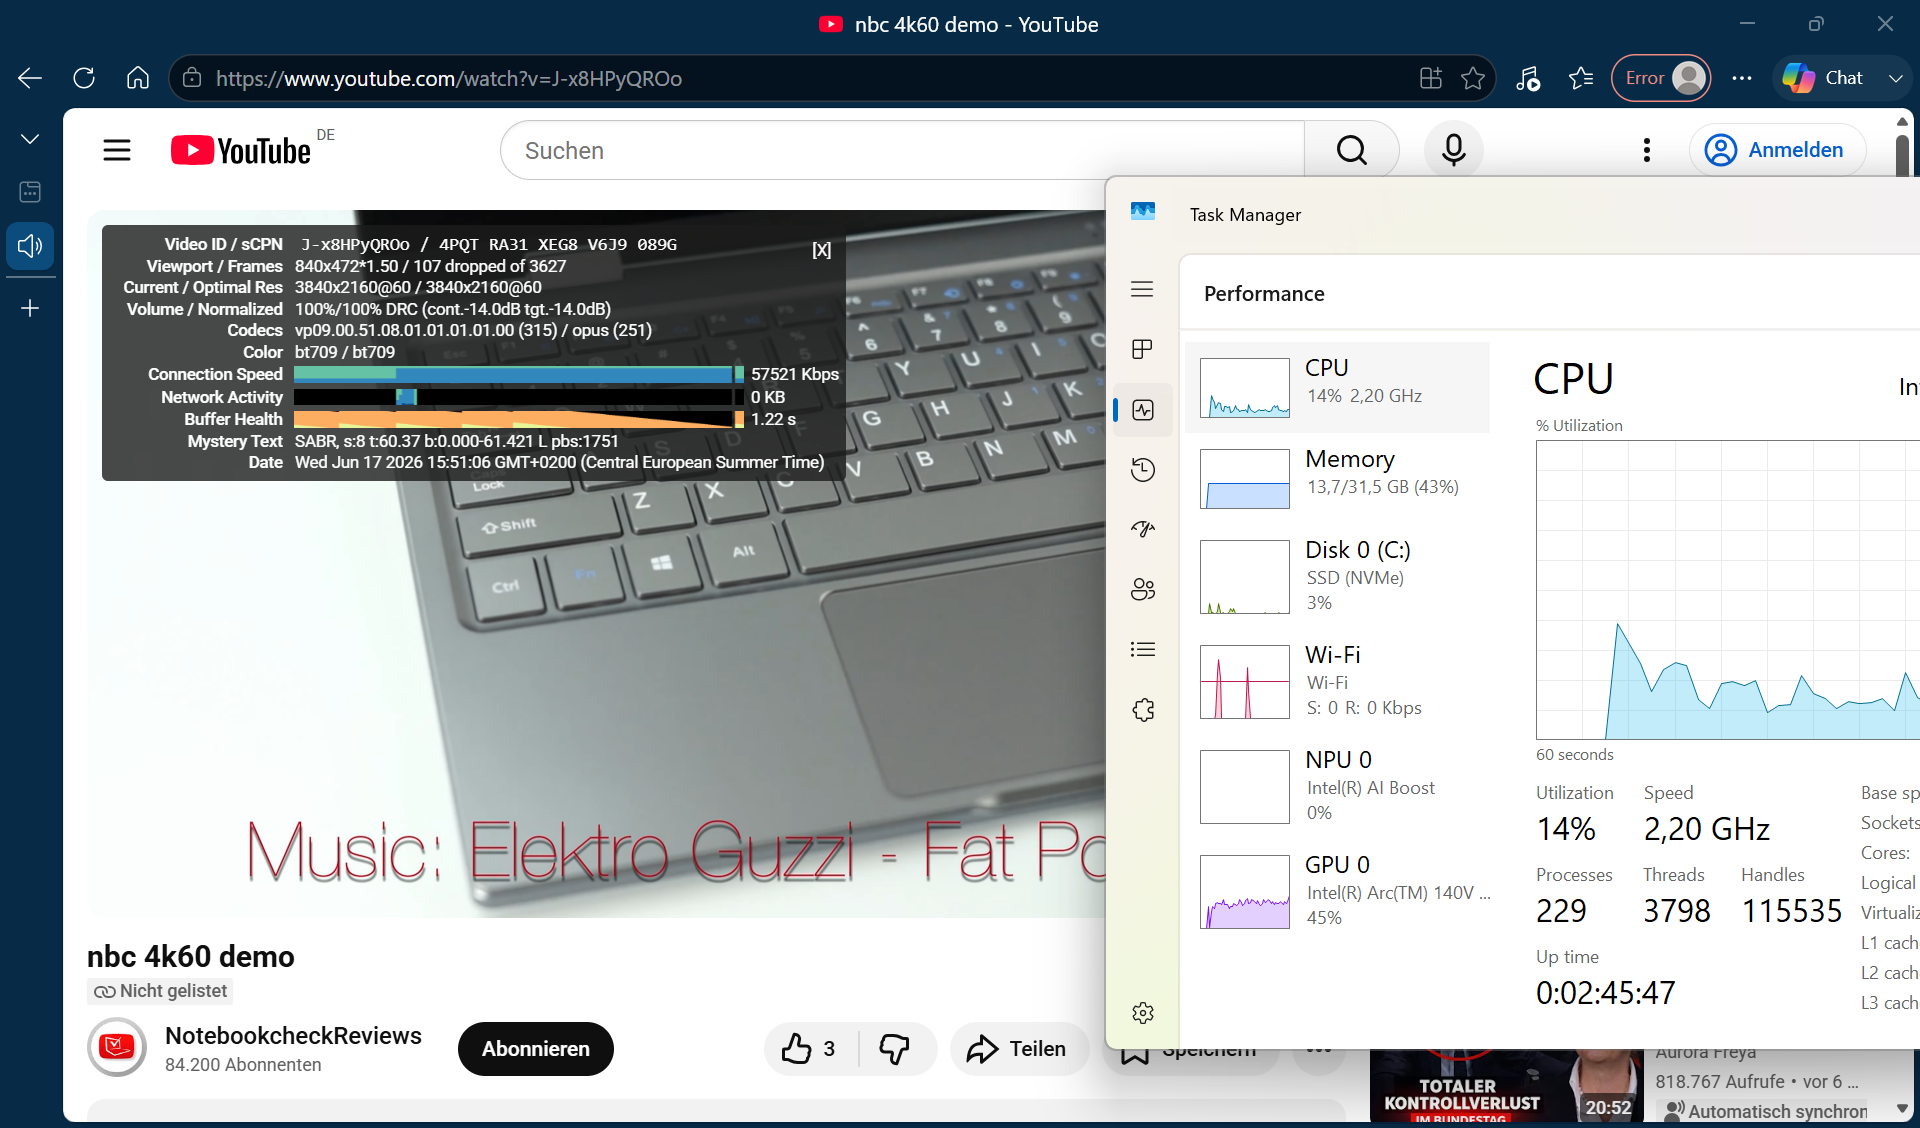
Latenze DPC
Lo strumento di analisi LatencyMon mostra che il driver ACPI causa ritardi fino a 3.281 microsecondi sul tablet. Ciò può comportare anomalie durante attività in cui la tempistica è fondamentale, quali l’editing audio o l’acquisizione di dati ad alta frequenza.
| DPC Latencies / LatencyMon - interrupt to process latency (max), Web, Youtube, Prime95 | |
| Durabook R10 | |
| Dell Latitude 7030 Rugged Extreme | |
| Durabook R8 Tablet | |
| Lenovo ThinkPad T14 Gen 6 21QG001VGE | |
| Dynabook Portege Z40L-N | |
| Media della classe Tablet (482 - 1871, n=2, ultimi 2 anni) | |
* ... Meglio usare valori piccoli
Memoria di massa

* ... Meglio usare valori piccoli
Prestazioni di lettura sostenute: ciclo di lettura DiskSpd, profondità della coda 8
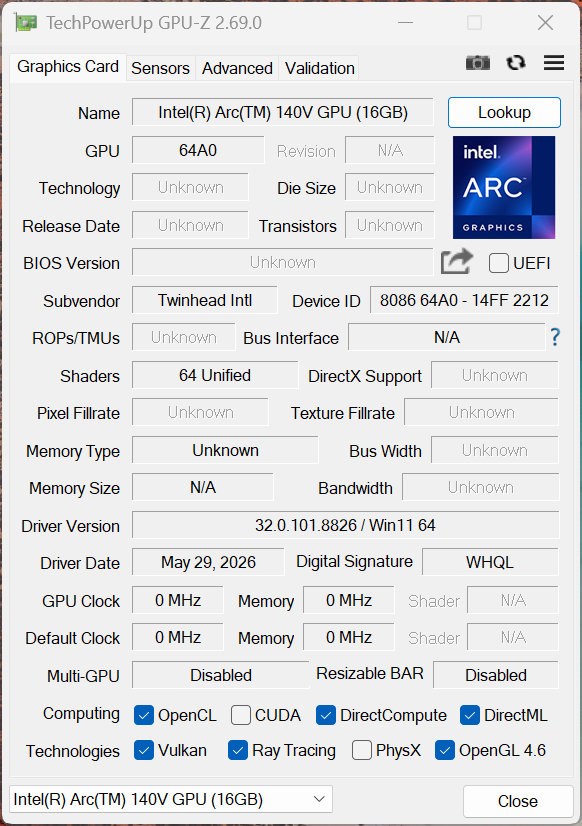
Prestazioni della GPU e dei giochi
L'elaborazione grafica è affidata alla scheda Intel Arc Graphics 140V, integrata nel processore. Questa scheda gestisce con facilità video ad alta risoluzione, attività 3D di lieve entità e configurazioni multi-monitor. Tuttavia, i file CAD di grandi dimensioni o le applicazioni graficamente impegnative possono rappresentare una sfida per la scheda grafica Intel.
| 3DMark 11 Performance | 9563 punti | |
| 3DMark Ice Storm Standard Score | 178031 punti | |
| 3DMark Cloud Gate Standard Score | 26729 punti | |
| 3DMark Fire Strike Score | 7287 punti | |
| 3DMark Time Spy Score | 3373 punti | |
| 3DMark Steel Nomad Score | 743 punti | |
| 3DMark Steel Nomad Light Score | 2843 punti | |
Aiuto | ||
* ... Meglio usare valori piccoli
| Performance rating - Percent | |
| Lenovo ThinkPad T14 Gen 6 21QG001VGE -1! | |
| Media della classe Tablet | |
| Dynabook Portege Z40L-N | |
| Durabook R10 | |
| Lenovo ThinkPad T14 Gen 6 AMD -1! | |
| Dell Latitude 7030 Rugged Extreme -1! | |
| Durabook R8 Tablet -5! | |
| Cyberpunk 2077 - 1920x1080 Ultra Preset (FSR off) | |
| Lenovo ThinkPad T14 Gen 6 21QG001VGE | |
| Media della classe Tablet (21.2 - 28.7, n=2, ultimi 2 anni) | |
| Durabook R10 | |
| Dynabook Portege Z40L-N | |
| Lenovo ThinkPad T14 Gen 6 AMD | |
| Dell Latitude 7030 Rugged Extreme | |
| Baldur's Gate 3 - 1920x1080 Ultra Preset AA:T | |
| Lenovo ThinkPad T14 Gen 6 21QG001VGE | |
| Media della classe Tablet (22.8 - 28.3, n=2, ultimi 2 anni) | |
| Dynabook Portege Z40L-N | |
| Durabook R10 | |
| Lenovo ThinkPad T14 Gen 6 AMD | |
| GTA V - 1920x1080 Highest AA:4xMSAA + FX AF:16x | |
| Lenovo ThinkPad T14 Gen 6 21QG001VGE | |
| Media della classe Tablet (21.1 - 27.8, n=2, ultimi 2 anni) | |
| Dynabook Portege Z40L-N | |
| Durabook R10 | |
| Lenovo ThinkPad T14 Gen 6 AMD | |
| Dell Latitude 7030 Rugged Extreme | |
| Final Fantasy XV Benchmark - 1920x1080 High Quality | |
| Lenovo ThinkPad T14 Gen 6 21QG001VGE | |
| Media della classe Tablet (25.4 - 34.4, n=3, ultimi 2 anni) | |
| Durabook R10 | |
| Durabook R10 | |
| Dynabook Portege Z40L-N | |
| Lenovo ThinkPad T14 Gen 6 AMD | |
| Dell Latitude 7030 Rugged Extreme | |
| Strange Brigade - 1920x1080 ultra AA:ultra AF:16 | |
| Media della classe Tablet (44.4 - 58, n=2, ultimi 2 anni) | |
| Dynabook Portege Z40L-N | |
| Durabook R10 | |
| Dell Latitude 7030 Rugged Extreme | |
| Dota 2 Reborn - 1920x1080 ultra (3/3) best looking | |
| Lenovo ThinkPad T14 Gen 6 21QG001VGE | |
| Media della classe Tablet (70.9 - 84.5, n=2, ultimi 2 anni) | |
| Durabook R10 | |
| Dynabook Portege Z40L-N | |
| Dell Latitude 7030 Rugged Extreme | |
| Lenovo ThinkPad T14 Gen 6 AMD | |
| Durabook R8 Tablet | |
Grafico dei frame al secondo (FPS) in modalità Ultra di Cyberpunk 2077
| basso | medio | alto | ultra | |
|---|---|---|---|---|
| GTA V (2015) | 128.8 | 125.6 | 50.7 | 21.1 |
| Dota 2 Reborn (2015) | 92.5 | 75 | 51.7 | 70.9 |
| Final Fantasy XV Benchmark (2018) | 63.8 | 35.9 | 25.4 | |
| X-Plane 11.11 (2018) | 34.5 | 31.4 | 30.1 | |
| Strange Brigade (2018) | 161.3 | 52.1 | 52.9 | 44.4 |
| Baldur's Gate 3 (2023) | 34.1 | 24.9 | 22.8 | |
| Cyberpunk 2077 (2023) | 37.9 | 21.2 | ||
| F1 24 (2024) | 40.4 | 14.6 | ||
| F1 25 (2025) | 55.8 | 48.6 | 34.9 |
Emissioni ed energia
Emissioni acustiche
La ventola interna funziona quasi ininterrottamente. Sebbene sia praticamente impercettibile quando il sistema è inattivo, non diventa particolarmente rumorosa nemmeno durante uno stress test, registrando un livello di 31 dB(A). Tuttavia, questo leggero ronzio viene completamente sovrastato quando il dispositivo viene utilizzato all’aperto.
Rumorosità
| Idle |
| 27.7 / 27.7 / 27.7 dB(A) |
| Sotto carico |
| / 31.6 dB(A) |
 | ||
30 dB silenzioso 40 dB(A) udibile 50 dB(A) rumoroso |
||
min: | ||
| Durabook R10 Core Ultra 7 258V, Arc 140V | Dell Latitude 7030 Rugged Extreme i7-1260U, Iris Xe G7 96EUs | Lenovo ThinkPad T14 Gen 6 21QG001VGE Core Ultra 7 258V, Arc 140V | Dynabook Portege Z40L-N Core Ultra 7 258V, Arc 140V | Durabook R8 Tablet i5-1230U, Iris Xe G7 80EUs | Lenovo ThinkPad T14 Gen 6 AMD Ryzen AI 7 PRO 350, Radeon 860M | |
|---|---|---|---|---|---|---|
| Noise | -1% | 0% | 6% | 7% | ||
| off /ambiente * (dB) | 25.9 | 23 11% | 25.1 3% | 23.5 9% | 24.5 5% | |
| Idle Minimum * (dB) | 27.7 | 23.5 15% | 25.1 9% | 23.6 15% | 24.5 12% | |
| Idle Average * (dB) | 27.7 | 23.5 15% | 25.1 9% | 23.6 15% | 24.5 12% | |
| Idle Maximum * (dB) | 27.7 | 23.5 15% | 27.1 2% | 23.6 15% | 24.5 12% | |
| Load Maximum * (dB) | 31.6 | 50.6 -60% | 38.5 -22% | 39 -23% | 33.7 -7% | |
| Load Average * (dB) | 24.1 | 34.8 | 37 | 26.8 | ||
| Cyberpunk 2077 ultra * (dB) | 50.5 | 38.3 | 37.8 | 35.3 |
* ... Meglio usare valori piccoli
Temperatura
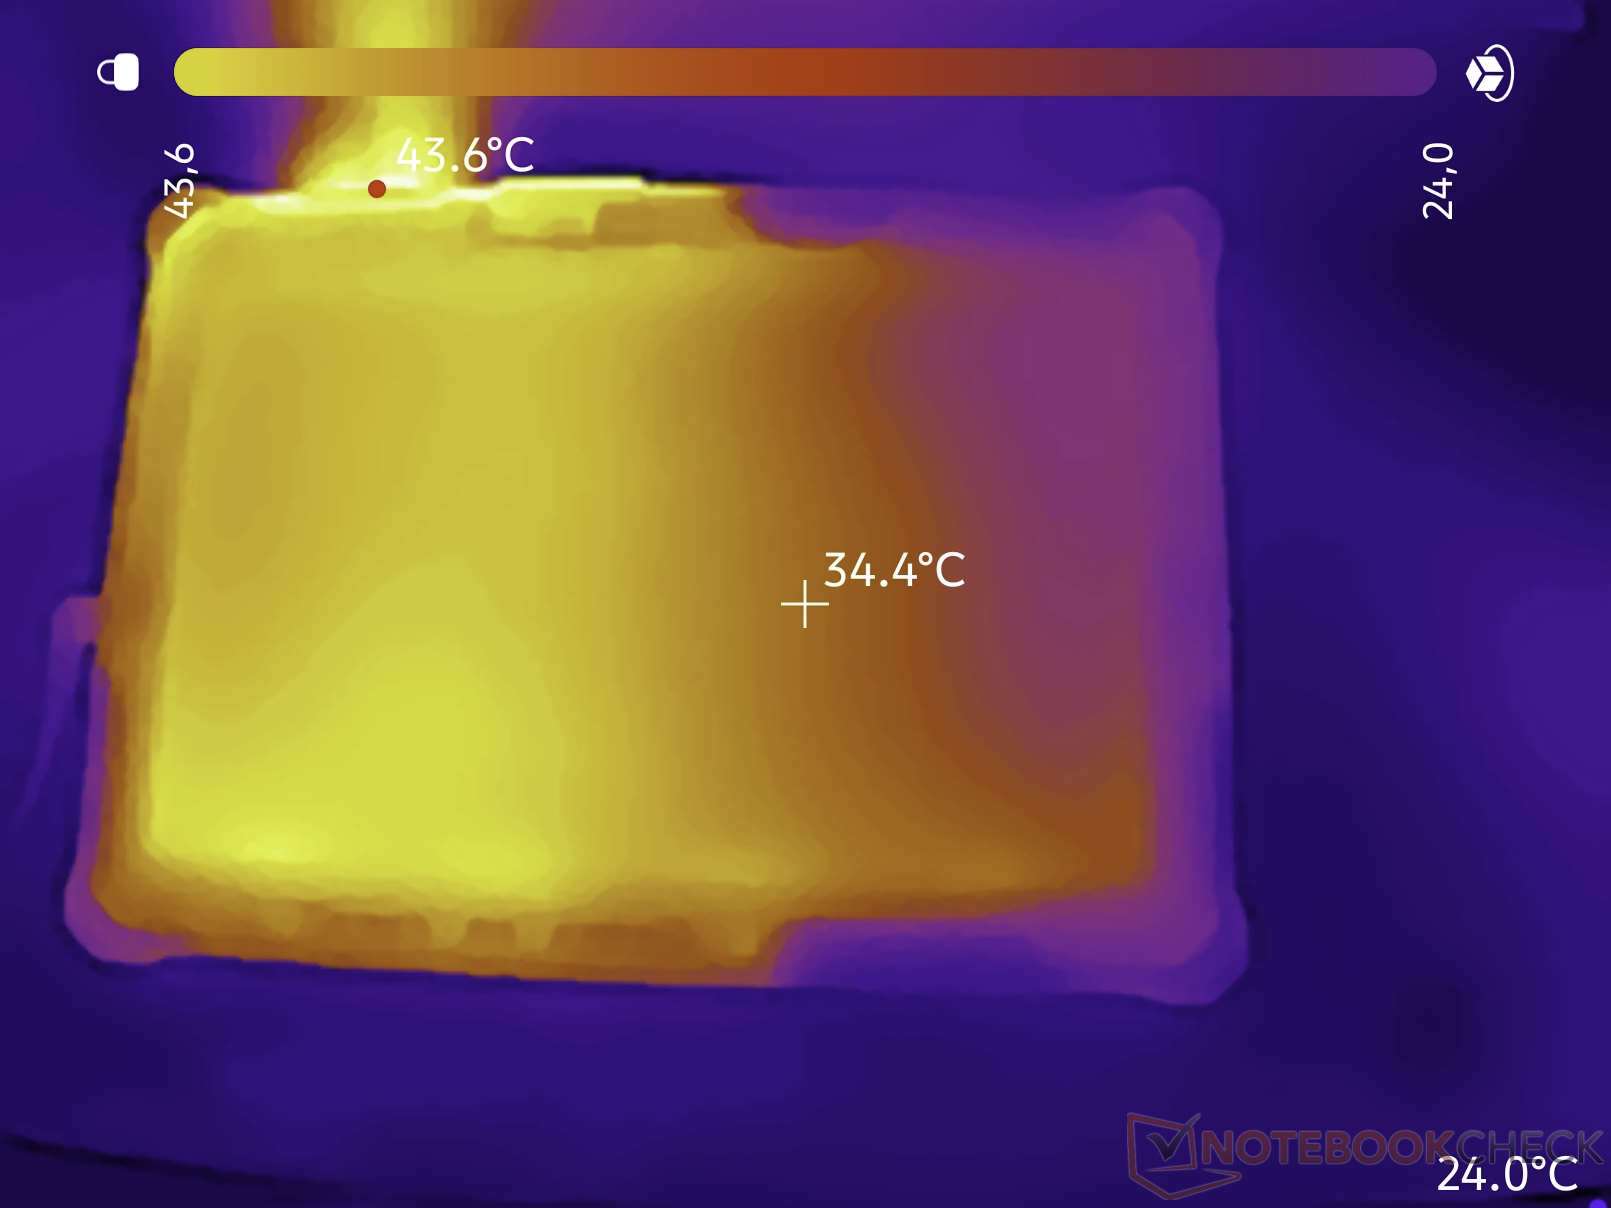
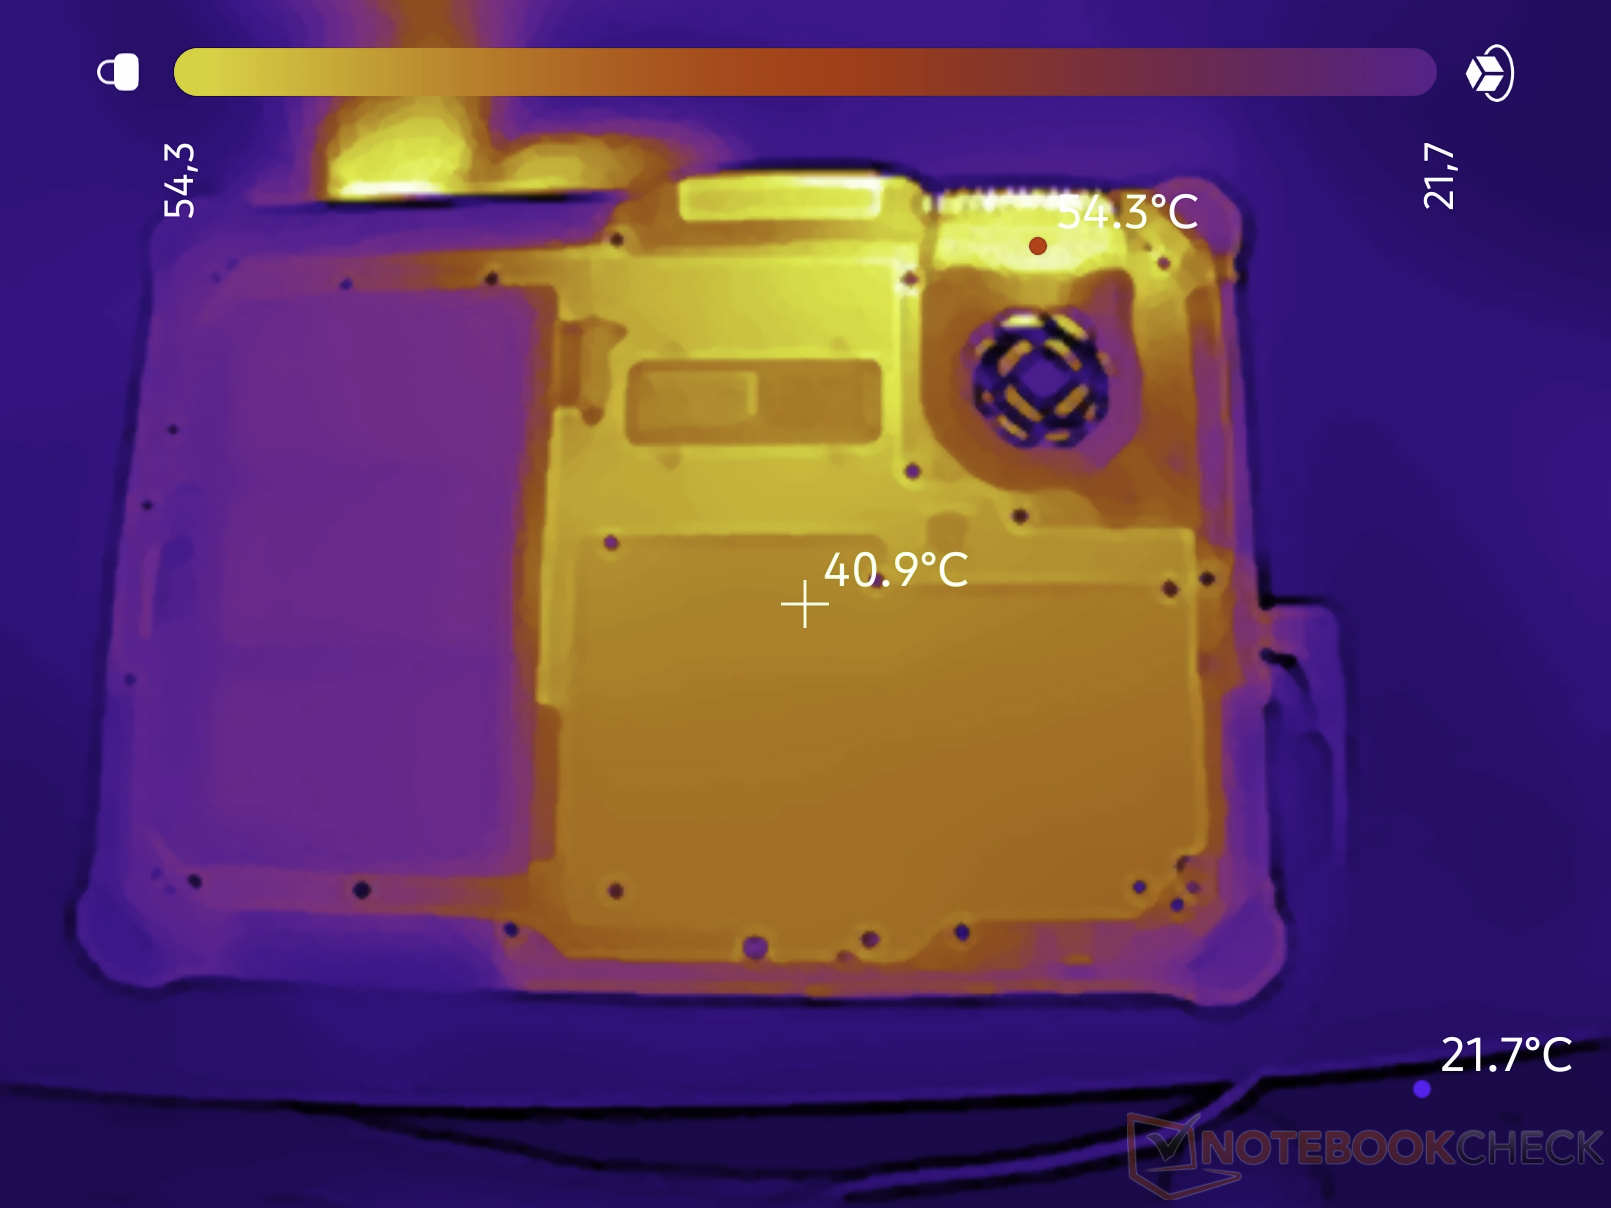
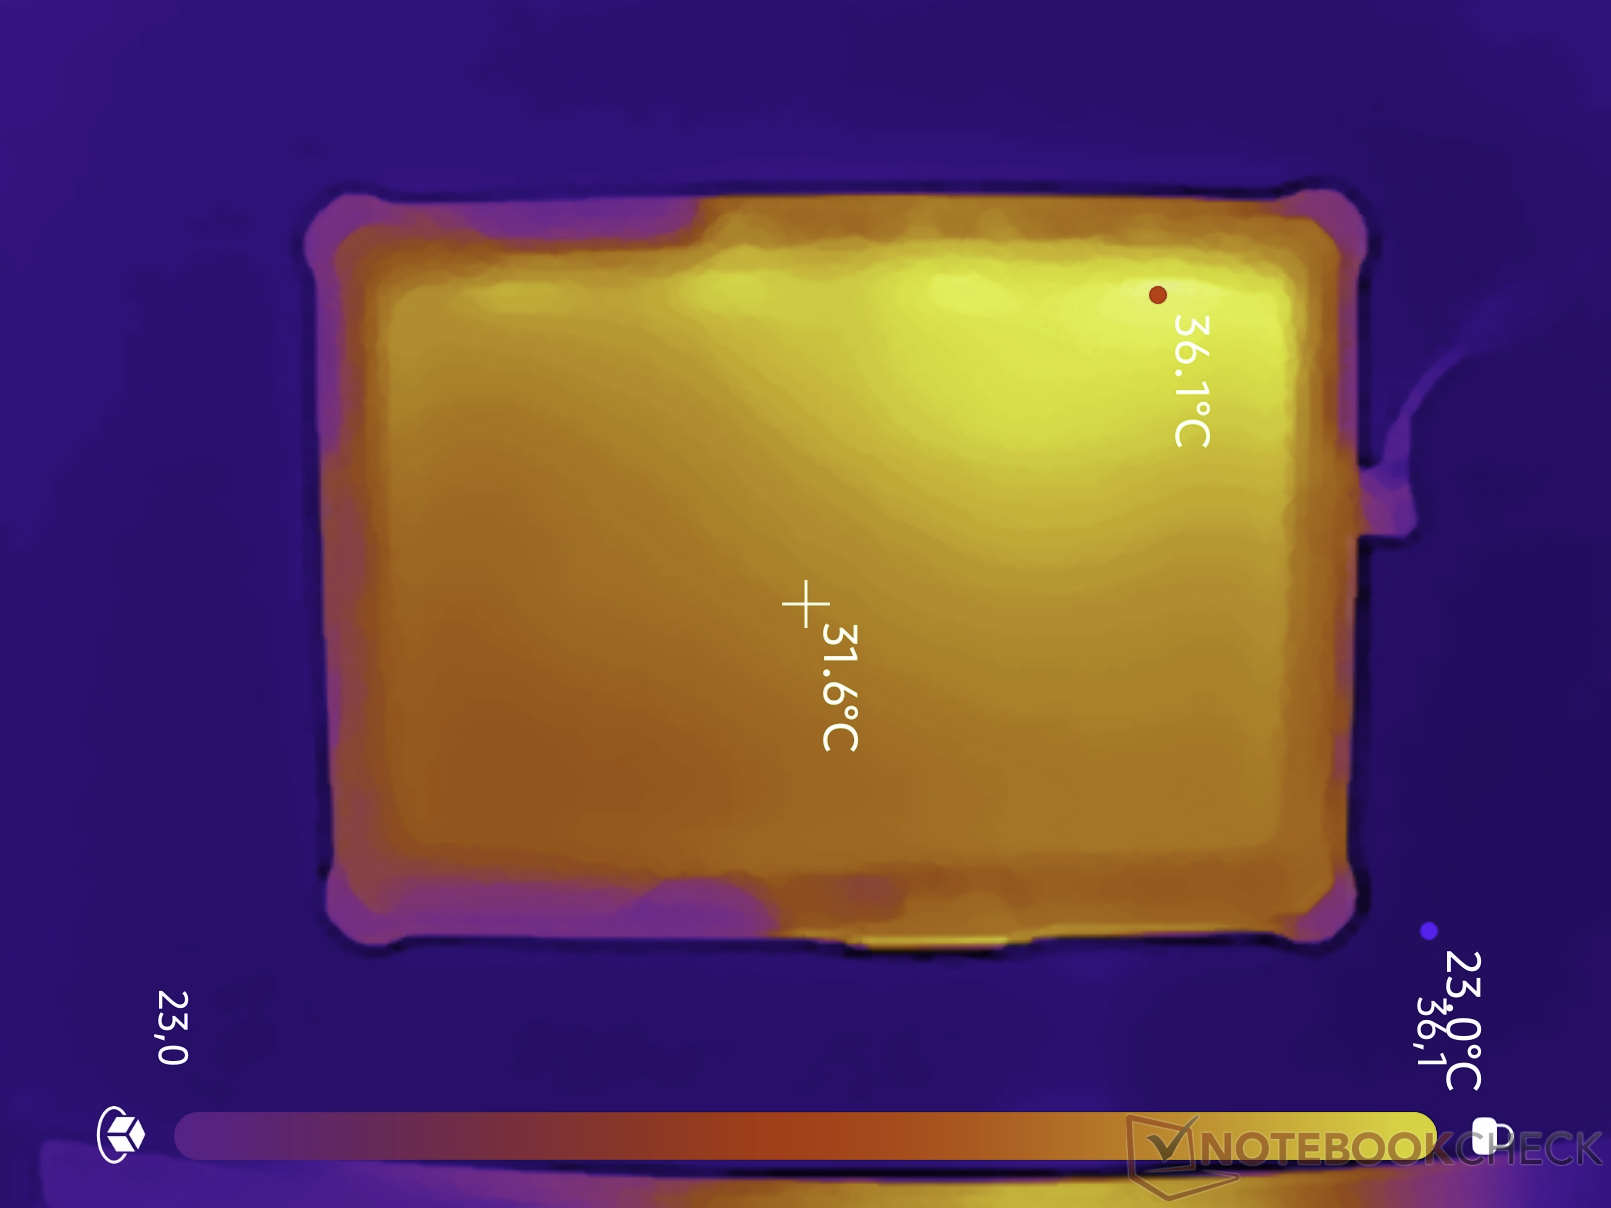
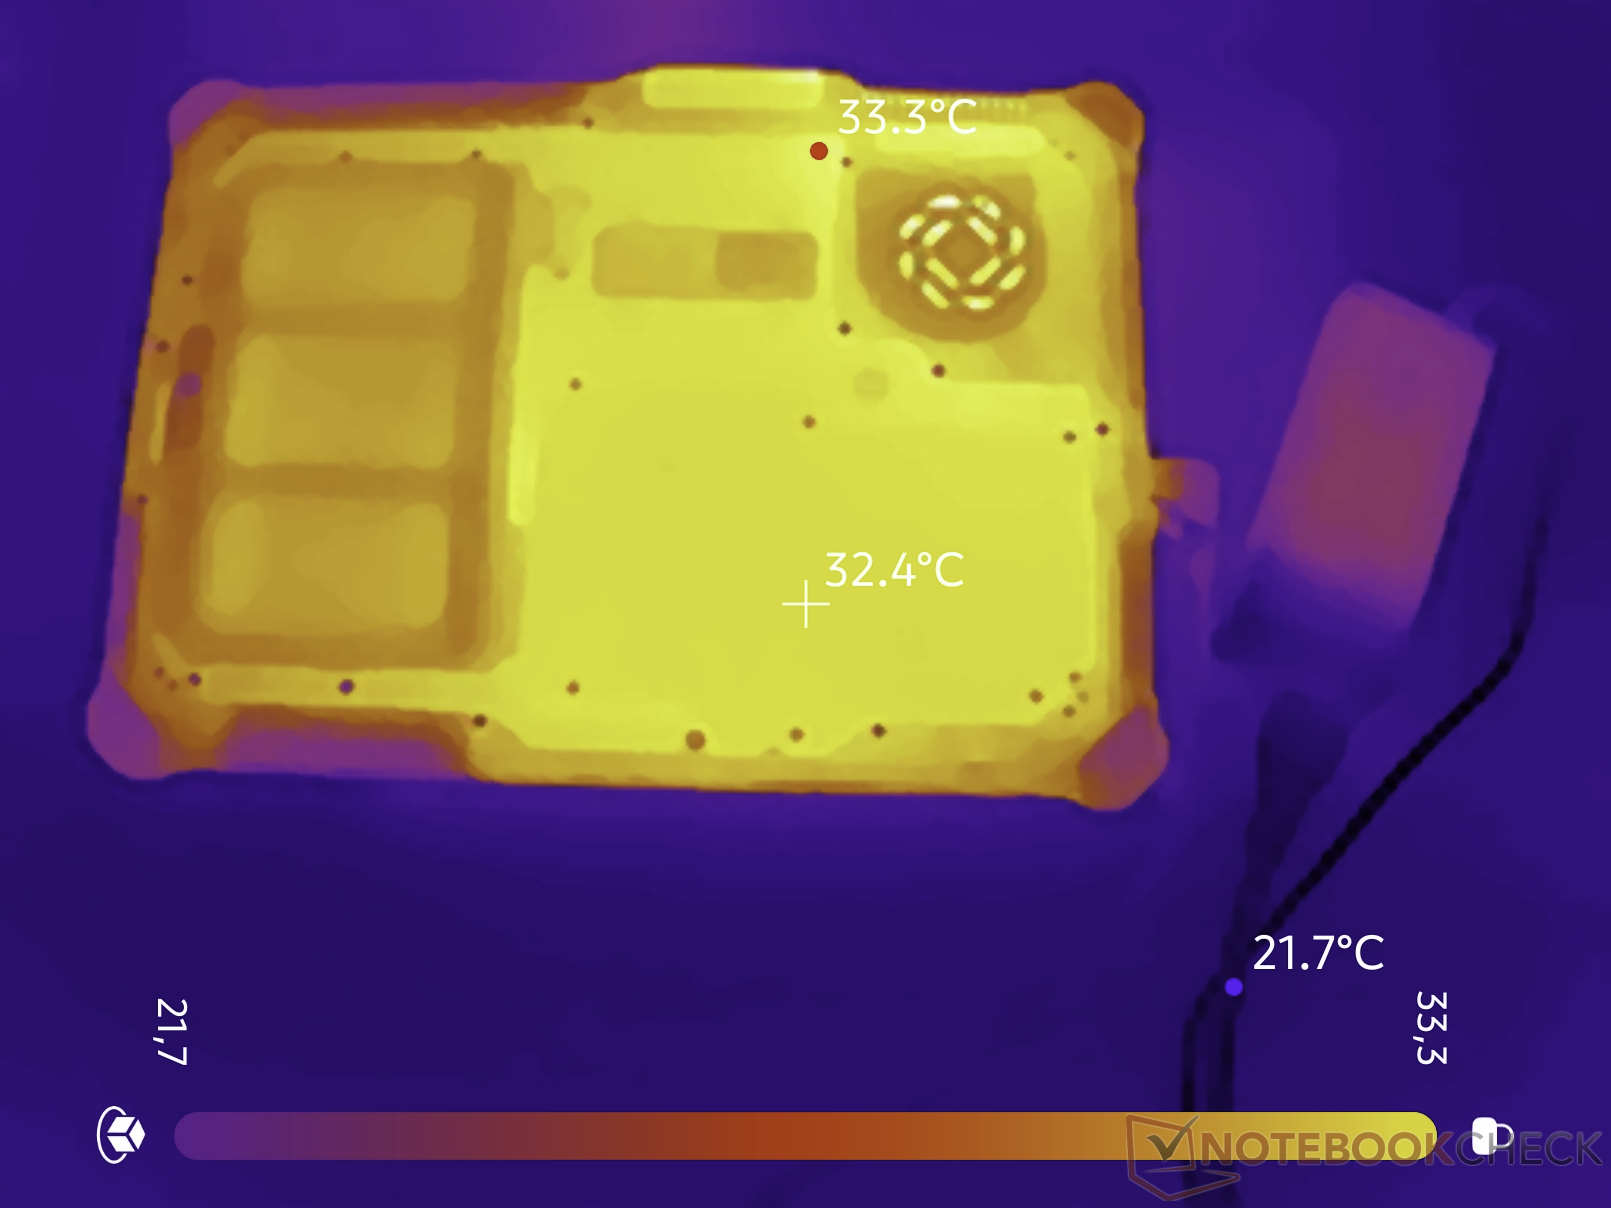
Il sistema di raffreddamento offre prestazioni eccezionali. Durante il test di stress, il tablet raggiunge temperature superiori ai 40 °C (104 °F) solo in alcuni punti. Il resto del robusto telaio rimane a una temperatura confortevole.
(±) La temperatura massima sul lato superiore è di 43.6 °C / 110 F, rispetto alla media di 33.6 °C / 92 F, che varia da 20.7 a 53.2 °C per questa classe Tablet.
(±) Il lato inferiore si riscalda fino ad un massimo di 40 °C / 104 F, rispetto alla media di 33.2 °C / 92 F
(±) In idle, la temperatura media del lato superiore è di 33.3 °C / 92 F, rispetto alla media deld ispositivo di 30 °C / 86 F.
| Durabook R10 Core Ultra 7 258V, Arc 140V | Dell Latitude 7030 Rugged Extreme i7-1260U, Iris Xe G7 96EUs | Lenovo ThinkPad T14 Gen 6 21QG001VGE Core Ultra 7 258V, Arc 140V | Dynabook Portege Z40L-N Core Ultra 7 258V, Arc 140V | Durabook R8 Tablet i5-1230U, Iris Xe G7 80EUs | Lenovo ThinkPad T14 Gen 6 AMD Ryzen AI 7 PRO 350, Radeon 860M | |
|---|---|---|---|---|---|---|
| Heat | 11% | 16% | -2% | -0% | -3% | |
| Maximum Upper Side * (°C) | 43.6 | 37.2 15% | 39.7 9% | 41.2 6% | 38.2 12% | 47.7 -9% |
| Maximum Bottom * (°C) | 40 | 43.4 -9% | 38.1 5% | 38 5% | 49.6 -24% | 49.5 -24% |
| Idle Upper Side * (°C) | 36.1 | 26.4 27% | 24.3 33% | 35.4 2% | 32.2 11% | 30.7 15% |
| Idle Bottom * (°C) | 33.3 | 29.6 11% | 27.7 17% | 39.8 -20% | 33.4 -0% | 31.6 5% |
* ... Meglio usare valori piccoli
Relatore
Le prestazioni audio del dispositivo sono modeste. L’altoparlante mono integrato sul retro del tablet raggiunge un volume massimo di 54 dB(A) e offre una qualità del suono piuttosto mediocre. Ciò è sufficiente per riprodurre i segnali acustici di avviso del sistema, almeno in ambienti silenziosi.
Durabook R10 analisi audio
(-) | altoparlanti non molto potenti (58.3 dB)
Bassi 100 - 315 Hz
(-) | quasi nessun basso - in media 17.7% inferiori alla media
(±) | la linearità dei bassi è media (7.6% delta rispetto alla precedente frequenza)
Medi 400 - 2000 Hz
(+) | medi bilanciati - solo only 2.9% rispetto alla media
(±) | linearità dei medi adeguata (13.7% delta rispetto alla precedente frequenza)
Alti 2 - 16 kHz
(+) | Alti bilanciati - appena 4.7% dalla media
(±) | la linearità degli alti è media (10.2% delta rispetto alla precedente frequenza)
Nel complesso 100 - 16.000 Hz
(-) | suono nel complesso non lineare (31.3% di differenza rispetto alla media
Rispetto alla stessa classe
» 90% di tutti i dispositivi testati in questa classe è stato migliore, 3% simile, 7% peggiore
» Il migliore ha avuto un delta di 7%, medio di 20%, peggiore di 129%
Rispetto a tutti i dispositivi testati
» 90% di tutti i dispositivi testati in questa classe è stato migliore, 2% similare, 8% peggiore
» Il migliore ha avuto un delta di 4%, medio di 24%, peggiore di 134%
Apple MacBook Pro 16 2021 M1 Pro analisi audio
(+) | gli altoparlanti sono relativamente potenti (84.7 dB)
Bassi 100 - 315 Hz
(+) | bassi buoni - solo 3.8% dalla media
(+) | bassi in lineaa (5.2% delta rispetto alla precedente frequenza)
Medi 400 - 2000 Hz
(+) | medi bilanciati - solo only 1.3% rispetto alla media
(+) | medi lineari (2.1% delta rispetto alla precedente frequenza)
Alti 2 - 16 kHz
(+) | Alti bilanciati - appena 1.9% dalla media
(+) | alti lineari (2.7% delta rispetto alla precedente frequenza)
Nel complesso 100 - 16.000 Hz
(+) | suono nel complesso lineare (4.6% differenza dalla media)
Rispetto alla stessa classe
» 0% di tutti i dispositivi testati in questa classe è stato migliore, 0% simile, 100% peggiore
» Il migliore ha avuto un delta di 5%, medio di 17%, peggiore di 45%
Rispetto a tutti i dispositivi testati
» 0% di tutti i dispositivi testati in questa classe è stato migliore, 0% similare, 100% peggiore
» Il migliore ha avuto un delta di 4%, medio di 24%, peggiore di 134%
Consumo energetico e durata della batteria
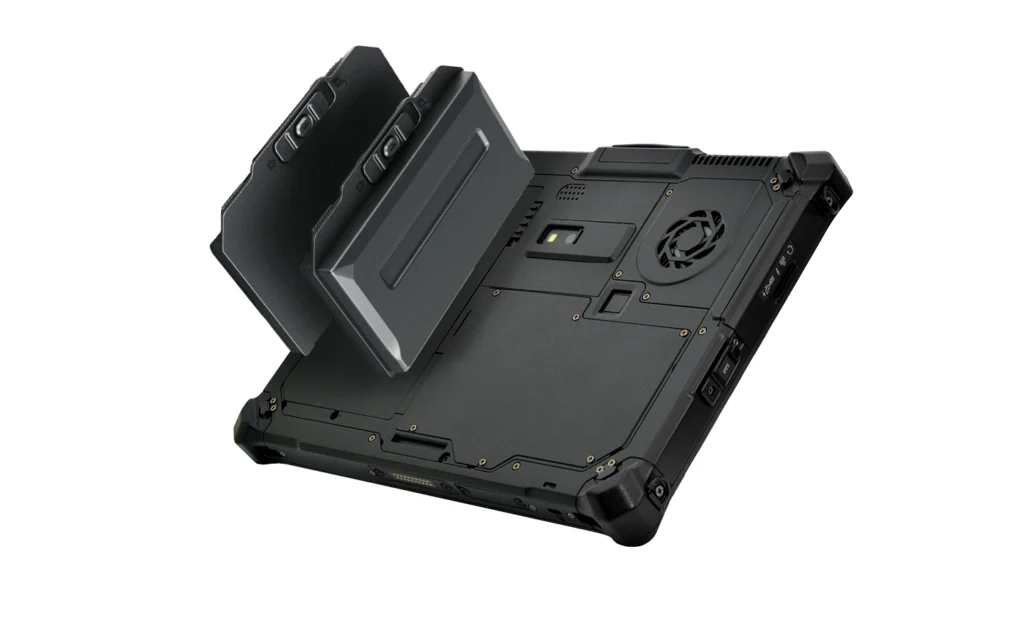
Nel nostro stress test abbiamo registrato un consumo energetico massimo di 55 watt. Il principale responsabile del consumo energetico è di gran lunga il display estremamente luminoso, che mette a dura prova la batteria o l’alimentatore. Lontano da una presa di corrente, nel nostro test la batteria ha garantito un’autonomia di otto ore durante la navigazione web continua tramite Wi-Fi. Grazie alla funzione hot-swap, la batteria può essere sostituita mentre il dispositivo è in funzione. All’interno del Durabook è presente una piccola batteria, che garantisce poco più di un minuto di autonomia e consente di sostituire la batteria senza spegnere il dispositivo. Per un utilizzo ancora più prolungato senza ricarica o sostituzione della batteria, il produttore offre anche una batteria ad alta capacità, sebbene questa sporga in modo significativo dal dispositivo.
| Off / Standby | |
| Idle | |
| Sotto carico |
|
Leggenda:
min: | |
Consumo energetico Cyberpunk / Test di stress
Consumo energetico con un monitor esterno
| Durabook R10 Core Ultra 7 258V, Arc 140V, 48 Wh | Dell Latitude 7030 Rugged Extreme i7-1260U, Iris Xe G7 96EUs, 36 Wh | Lenovo ThinkPad T14 Gen 6 21QG001VGE Core Ultra 7 258V, Arc 140V, 57 Wh | Dynabook Portege Z40L-N Core Ultra 7 258V, Arc 140V, 56 Wh | Durabook R8 Tablet i5-1230U, Iris Xe G7 80EUs, 27.4 Wh | Lenovo ThinkPad T14 Gen 6 AMD Ryzen AI 7 PRO 350, Radeon 860M, 57 Wh | Media della classe Tablet | |
|---|---|---|---|---|---|---|---|
| Battery Runtime | |||||||
| WiFi Websurfing (h) | 8.4 | 6.1 -27% | 19.4 131% | 19.1 127% | 5.3 -37% | 13.8 64% | 15.8 ? 88% |
| Autonomia della batteria | -27% | 131% | 127% | -37% | 64% | 88% | |
| WiFi v1.3 (h) | 8.4 | 6.1 -27% | 19.4 131% | 19.1 127% | 5.3 -37% | 13.8 64% | 15.8 ? 88% |
| Load (h) | 1.6 | 1.1 | 4.16 ? | ||||
| Media totale (Programma / Settaggio) | -27% /
-27% | 131% /
131% | 127% /
127% | -37% /
-37% | 64% /
64% | 88% /
88% |
| Durabook R10 Core Ultra 7 258V, Arc 140V, 48 Wh | Dell Latitude 7030 Rugged Extreme i7-1260U, Iris Xe G7 96EUs, 36 Wh | Lenovo ThinkPad T14 Gen 6 21QG001VGE Core Ultra 7 258V, Arc 140V, 57 Wh | Dynabook Portege Z40L-N Core Ultra 7 258V, Arc 140V, 56 Wh | Durabook R8 Tablet i5-1230U, Iris Xe G7 80EUs, 27.4 Wh | Lenovo ThinkPad T14 Gen 6 AMD Ryzen AI 7 PRO 350, Radeon 860M, 57 Wh | Media della classe Tablet | |
|---|---|---|---|---|---|---|---|
| Autonomia della batteria | -27% | 131% | 127% | -37% | 64% | 88% | |
| WiFi v1.3 (h) | 8.4 | 6.1 -27% | 19.4 131% | 19.1 127% | 5.3 -37% | 13.8 64% | 15.8 ? 88% |
| Load (h) | 1.6 | 1.1 | 4.16 ? |
Valutazione complessiva di Notebookcheck
Il Durabook R10 è un vero e proprio colosso progettato per ambienti di lavoro estremi. Le sue certificazioni secondo gli standard militari, il display luminoso e l’alimentazione senza interruzioni sono davvero impressionanti. Tuttavia, le prestazioni della CPU inferiori alla media, l’elevata latenza e lo schermo leggermente verdastro richiedono alcuni compromessi.
Durabook R10
- 06/18/2026 v8
Marc Herter
 Total Sustainability Score:
 Un confronto tra le possibili alternative
Immagine | Modello | Prezzo | Peso | Altezza | Schermo |
|---|---|---|---|---|---|
1. 76.5%  | Durabook R10 Intel Core Ultra 7 258V ⎘ Intel Arc Graphics 140V ⎘ 32 GB Memoria | Amazon: 1. $14.99 ZBAGUG for Durabook R10 Tabl... 2. $17.99 ZBAGUG 2-Pack for Durabook R... | 1.3 kg | 29 mm | 10.10" 1920x1200 224 PPI TFT |
2. 82.3% 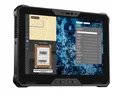 | Dell Latitude 7030 Rugged Extreme Intel Core i7-1260U ⎘ Intel Iris Xe Graphics G7 96EUs ⎘ 32 GB Memoria, 1024 GB SSD | Amazon: 1. $2,049.00 Dell Latitude Rugged Extreme... 2. $2,199.00 Dell Latitude 7330 Rugged Ex... 3. $1,850.00 Dell Latitude Rugged Extreme... Prezzo di listino: 3000 USD | 1.1 kg | 25.4 mm | 10.00" 1920x1200 226 PPI IPS |
3. 79.6% v7 (old)  | Durabook R8 Tablet Intel Core i5-1230U ⎘ Intel Iris Xe Graphics G7 80EUs ⎘ 8 GB Memoria, 128 GB SSD | Amazon: 1. $38.99 PowerHOOD DC19V AC Power Ada... 2. $39.95 BoxWave Screen Protector Com... 3. $39.95 BoxWave Screen Protector Com... | 856 gr | 20.6 mm | 8.00" 1280x800 189 PPI IPS |
Transparency
La selezione dei dispositivi da recensire viene effettuata dalla nostra redazione. Il campione di prova è stato fornito all'autore come prestito dal produttore o dal rivenditore ai fini di questa recensione. L'istituto di credito non ha avuto alcuna influenza su questa recensione, né il produttore ne ha ricevuto una copia prima della pubblicazione. Non vi era alcun obbligo di pubblicare questa recensione. In quanto società mediatica indipendente, Notebookcheck non è soggetta all'autorità di produttori, rivenditori o editori.
Ecco come Notebookcheck esegue i test
Ogni anno, Notebookcheck esamina in modo indipendente centinaia di laptop e smartphone utilizzando procedure standardizzate per garantire che tutti i risultati siano comparabili. Da circa 20 anni sviluppiamo continuamente i nostri metodi di prova e nel frattempo stabiliamo gli standard di settore. Nei nostri laboratori di prova, tecnici ed editori esperti utilizzano apparecchiature di misurazione di alta qualità. Questi test comportano un processo di validazione in più fasi. Il nostro complesso sistema di valutazione si basa su centinaia di misurazioni e parametri di riferimento ben fondati, che mantengono l'obiettività.