

Verdetto - Prestazioni elevate con caratteristiche pratiche
Dell Pro Max 16 Plus rappresenta un significativo passo in avanti rispetto alla precedente generazione Precision 7680 o 7670. A parte l'atteso aumento delle prestazioni, il modello rivisto ottiene ulteriori caratteristiche non presenti sul modello precedente, tra cui OLED a 120 Hz, porte USB-C modulari per la riparabilità, opzioni SSD PCIe5, supporto Thunderbolt 5, ricarica USB-C compatta e una webcam a risoluzione più elevata. I miglioramenti sono probabilmente superiori ai piccoli aumenti di spessore e di ingombro.
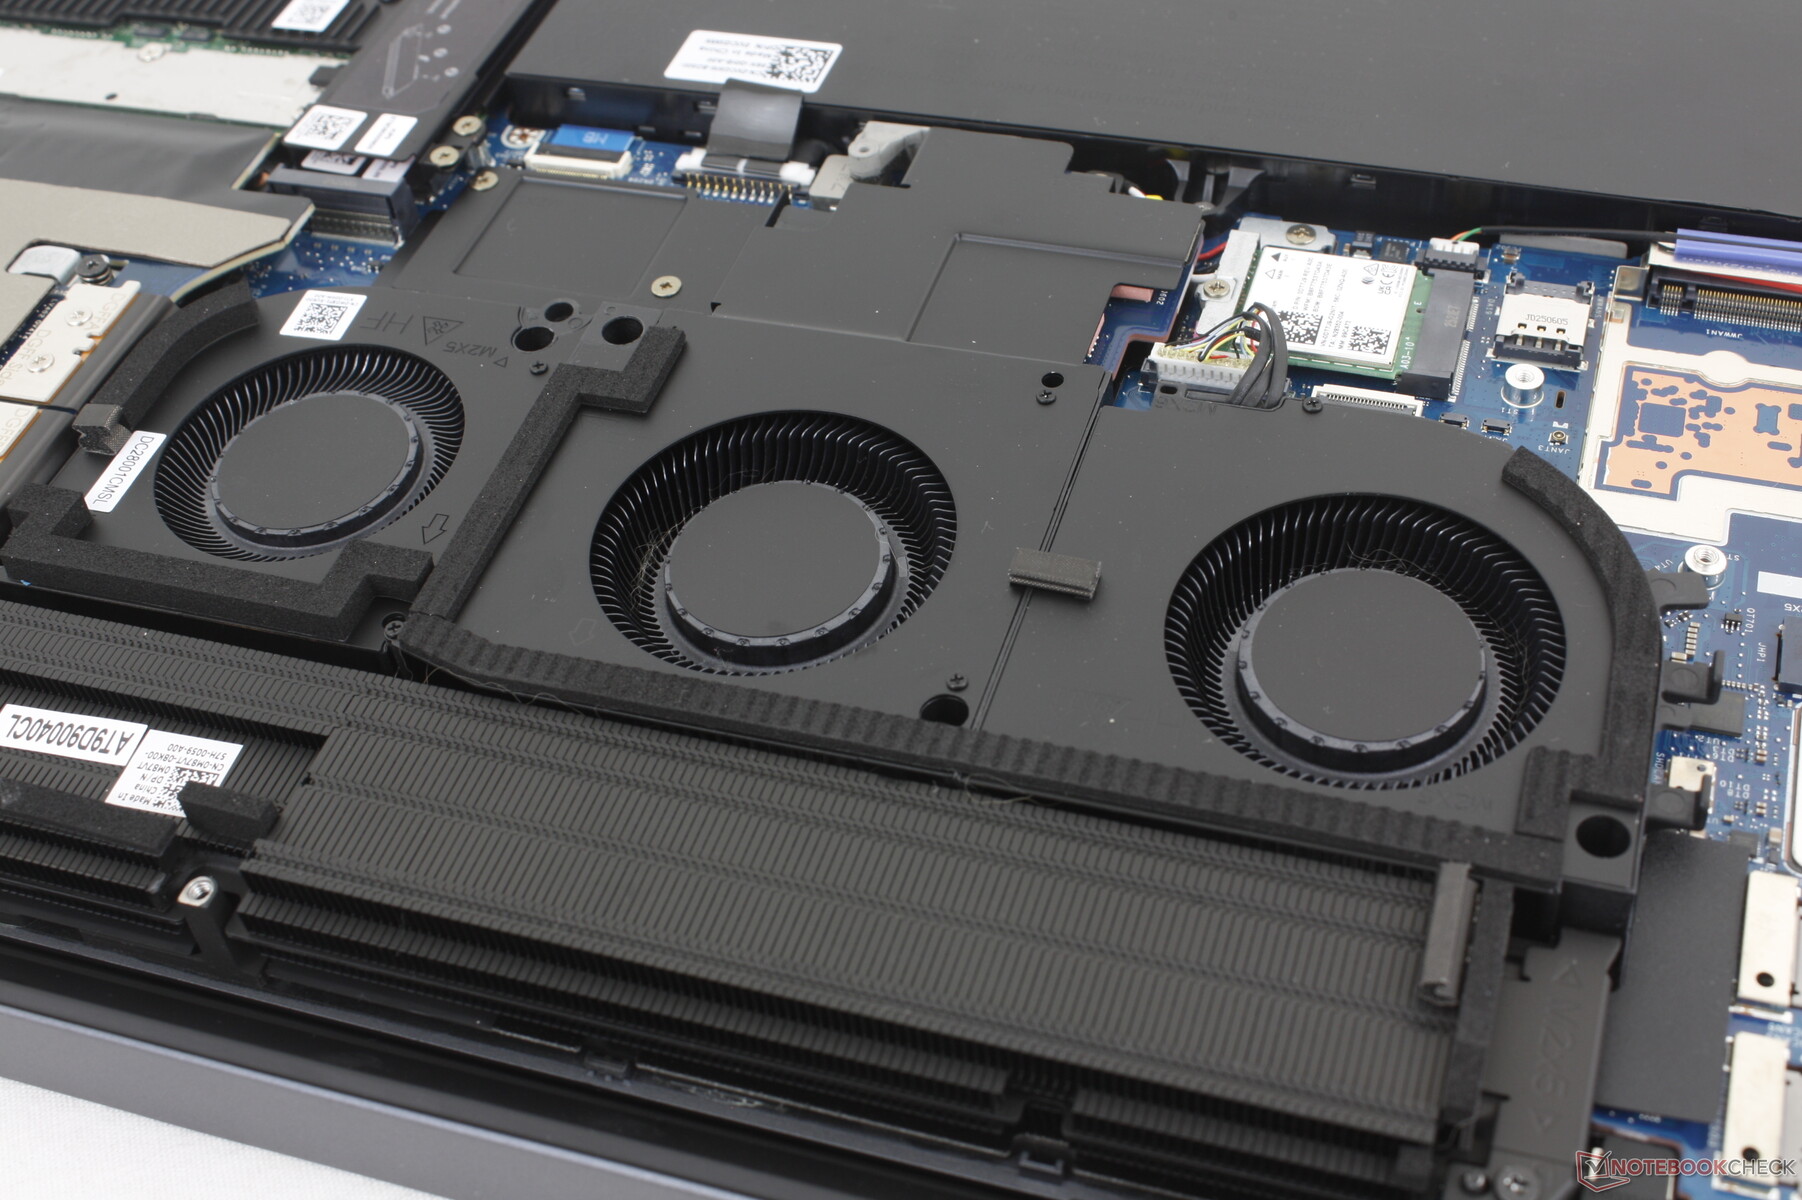
Gli svantaggi sono generalmente minori. Il consumo energetico è ora più elevato rispetto al passato, con un massimo di 280 W rispetto ai 240 W o meno di Precision 7680. Quindi, sebbene Pro Max 16 Plus sia certamente più potente, è anche più esigente nei confronti della soluzione di raffreddamento, con una durata della batteria complessivamente più breve. La temperatura della CPU, in particolare, può raggiungere i 95 C - 105 C quando è sotto sforzo, il che influisce sulle prestazioni Turbo Boost del sistema. Nel frattempo, la GPU tende a stabilizzarsi a 125 W, anche se è valutata per un massimo di 175 W. È quindi probabile che la stessa CPU e GPU possa funzionare più velocemente su fattori di forma più spessi o più grandi, come il Pro Max 18 Plus da 18 pollici. Il sistema Pro Max 16 Plus è comunque una delle workstation più veloci e pratiche disponibili, nonostante i limiti della soluzione di raffreddamento.
Pro
Contro
Prezzo e disponibilità
Dell sta distribuendo il Pro Max 16 Plus a partire da 3700 dollari per la configurazione base Core Ultra 7, RTX Pro 1000. Il nostro Core Ultra 9 con RTX Pro 5000 Blackwell non è ancora ampiamente disponibile.
- $5.90JuYuish Keyboard Skin Compatible for Dell Pro 16/16 Plus PC16250 PC16255 PB16255 PB16250, Dell Pro Max 16/16 Plus / 18 Plus MC16255 MC16250 MB16250 MB18250 Laptop with Numeric Keypad (Clear)
- $1,414.95Dell Pro 16 Plus PB16250 (Replaces Latitude 5550) Business Notebook 16" FHD+ Intel Ultra 7-265U, 32GB DDR5 RAM, 1TB NVMe, Wi-Fi 6E, BT, Backlit Keyboard, HD Webcam, RJ-45, Win 11 Pro
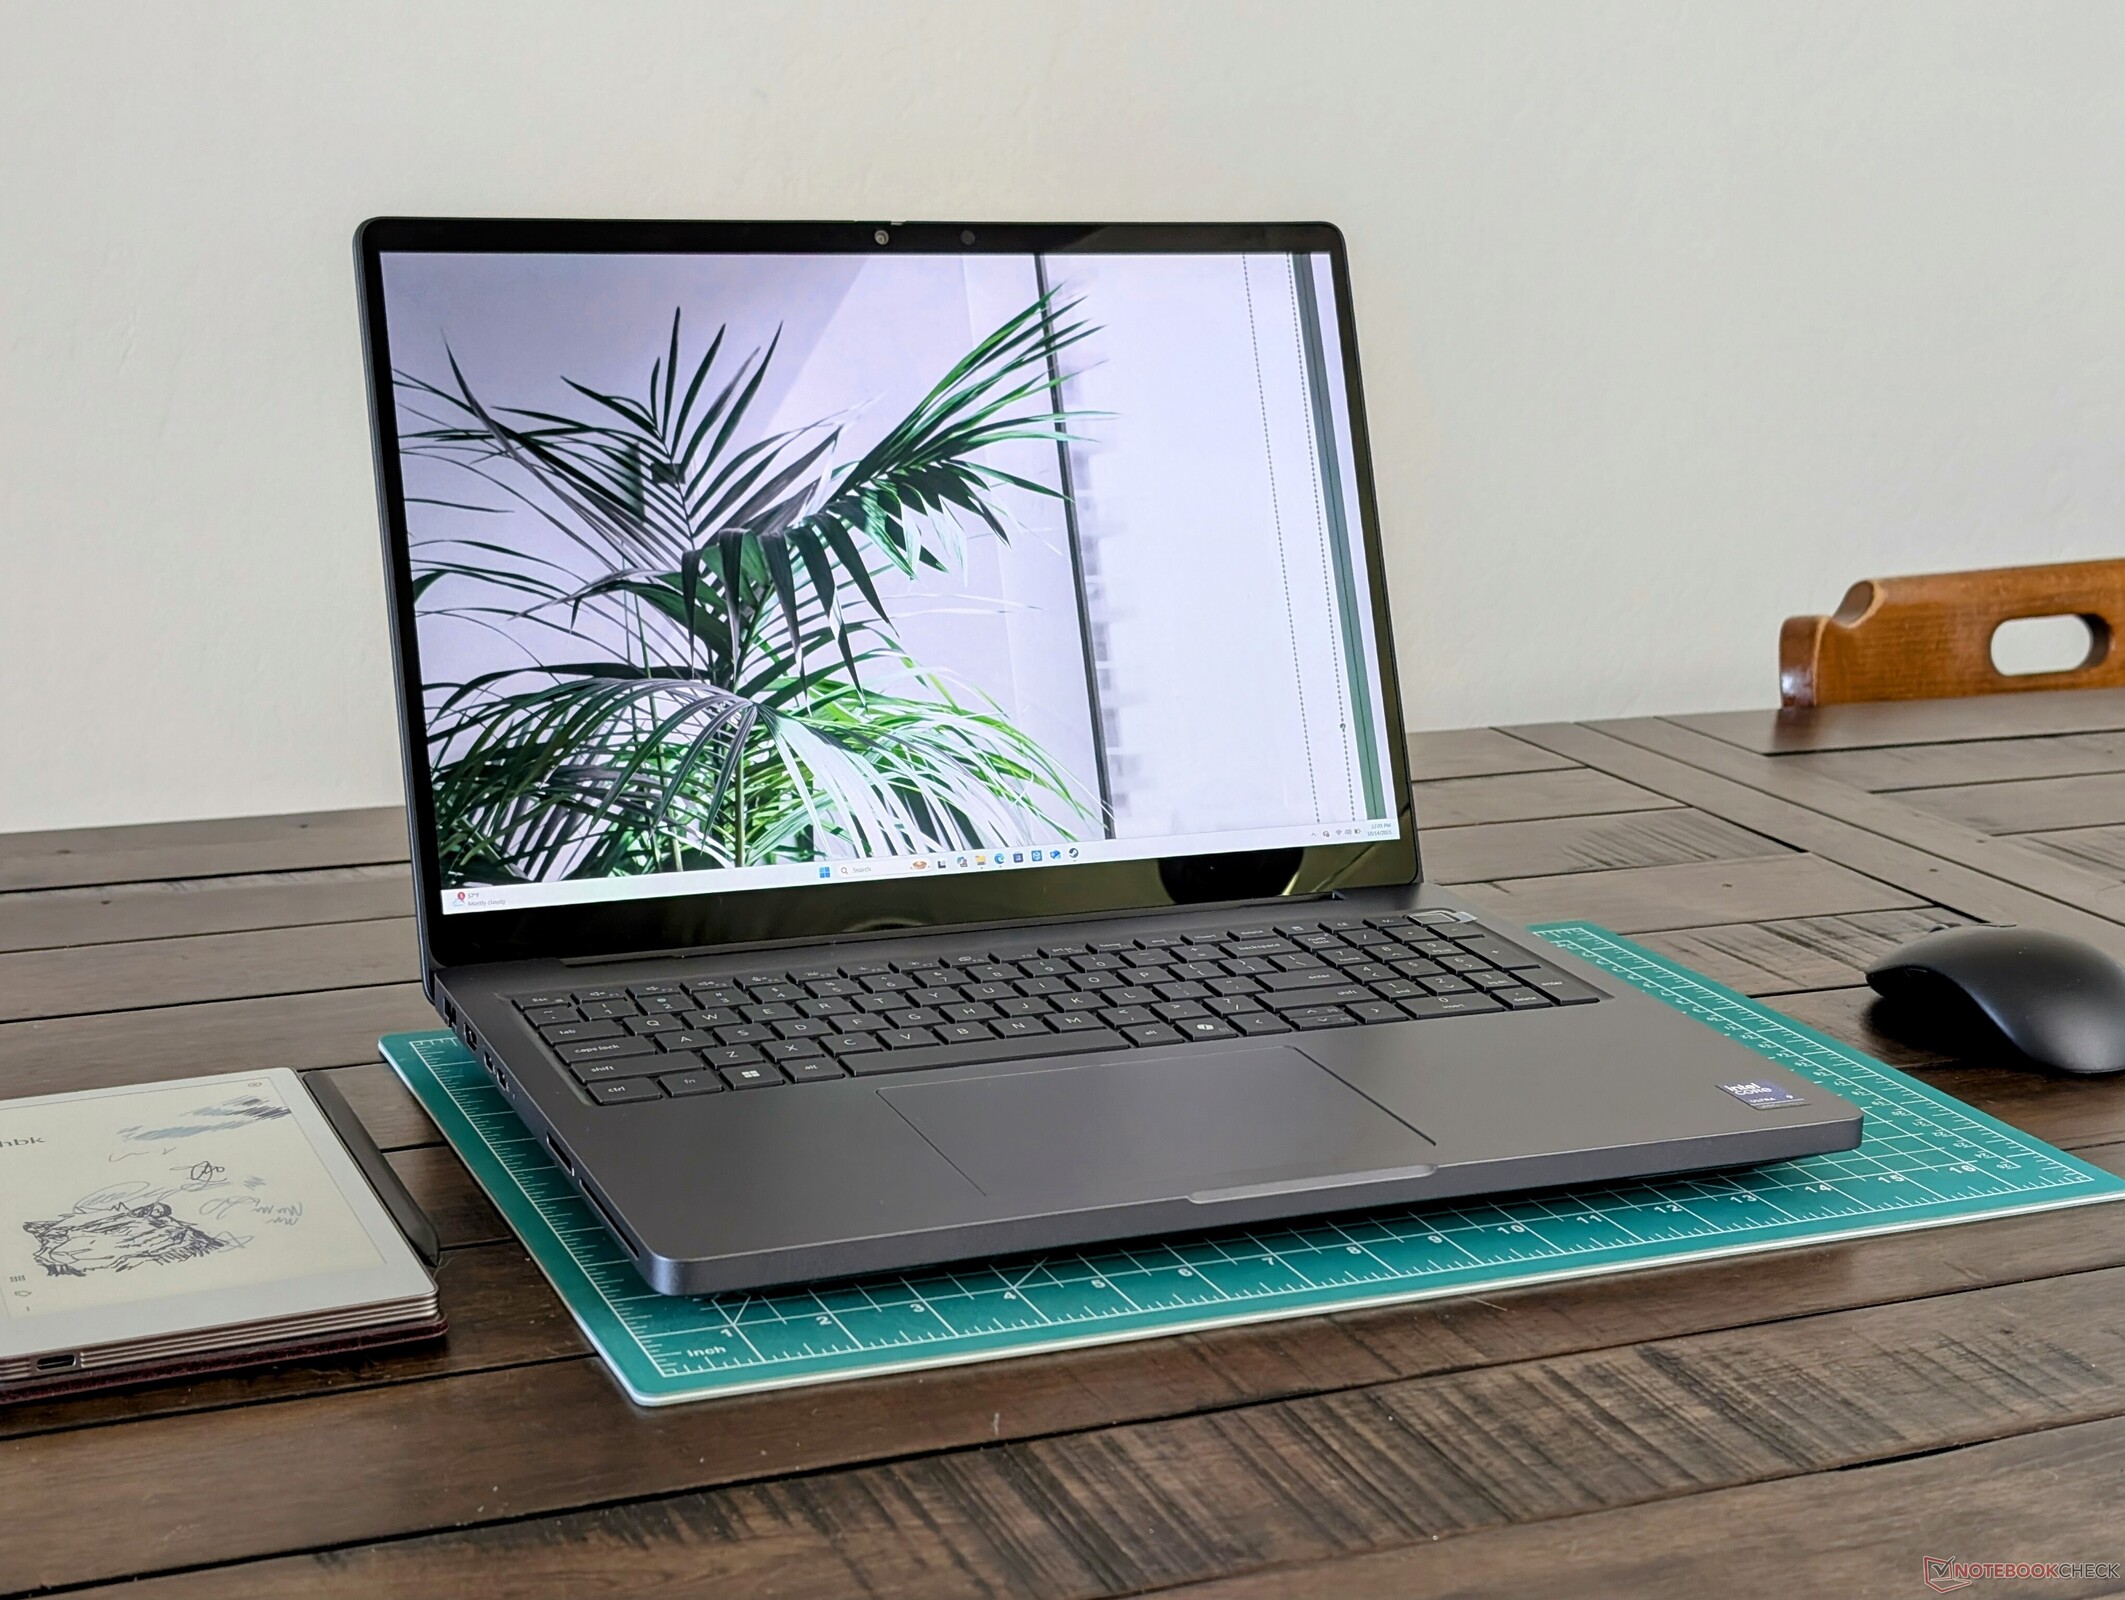
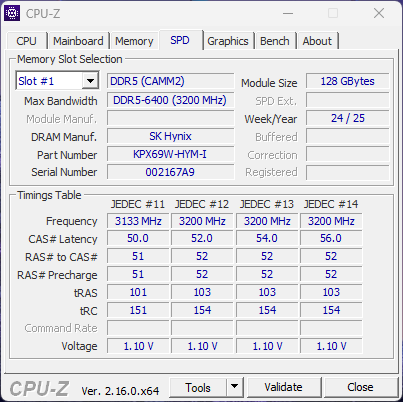
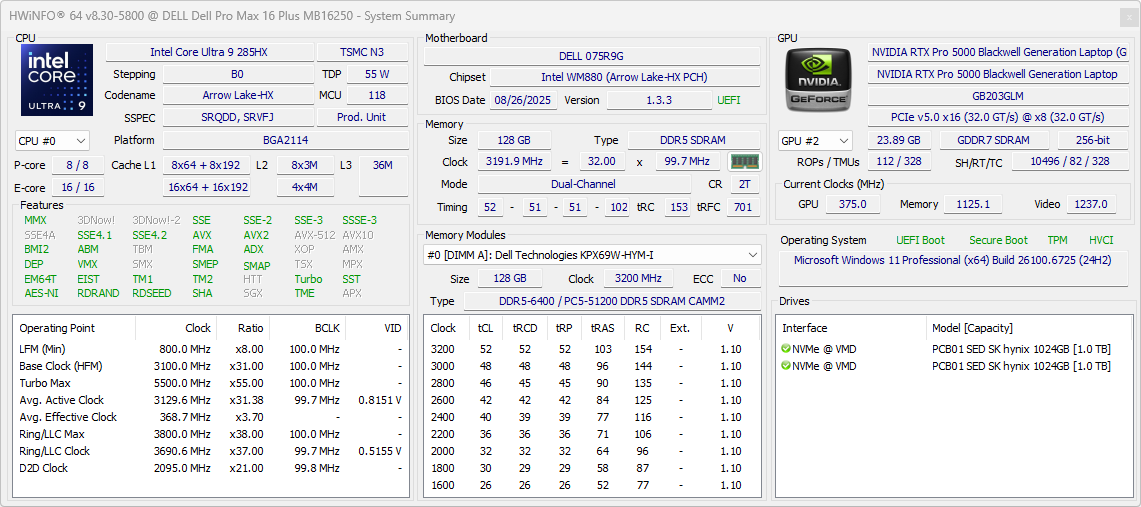
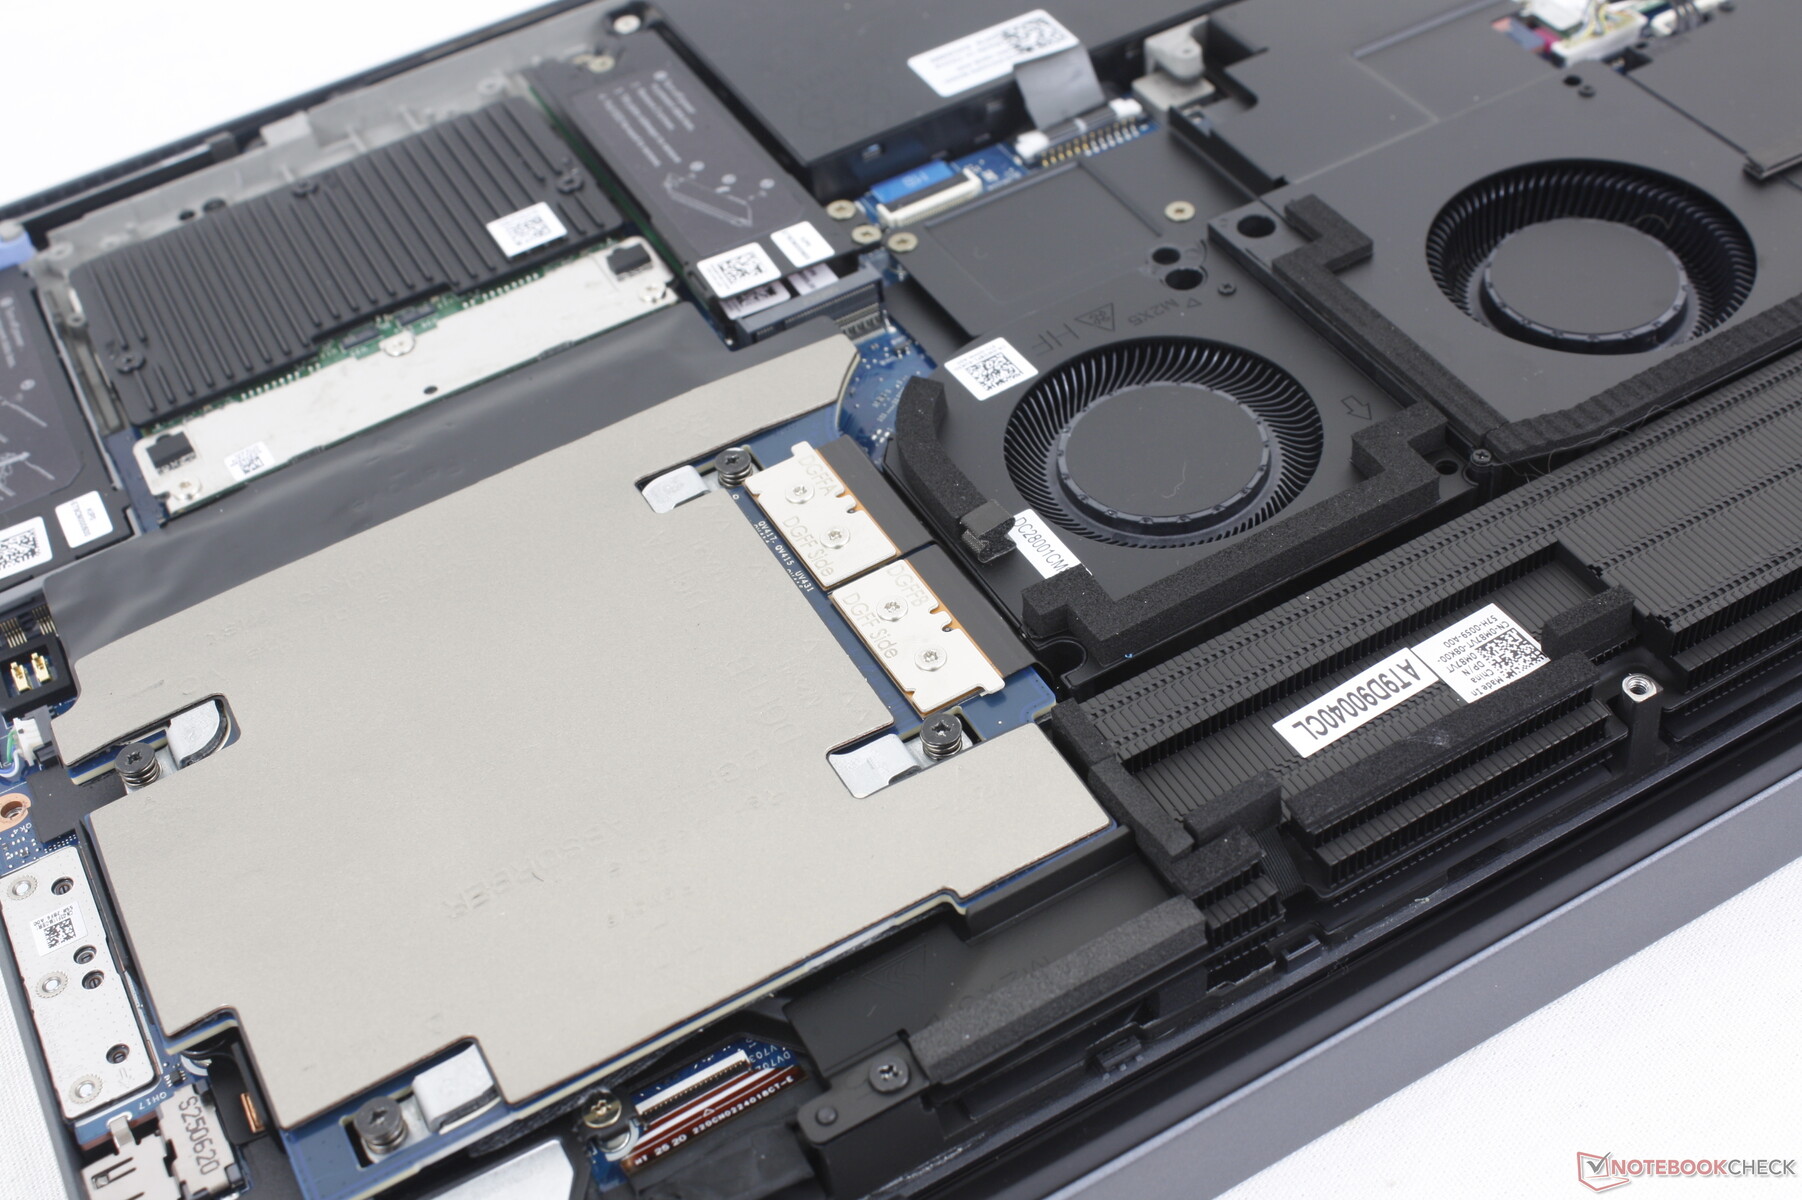
Dell Pro Max 16 Plus è l'ultima workstation mobile da 16 pollici del produttore, che succede alla serie Precision 7680 di ultima generazione. In quanto tale, è una workstation di fascia alta con processori e caratteristiche avanzate, tra cui le CPU Intel Arrow Lake-HX, le GPU Nvidia Pro Blackwell e la compatibilità con hardware specializzato come i moduli DGFF e CAMM2.
La nostra unità di prova è la configurazione di fascia più alta con Core Ultra 9 285HX, RTX Pro 5000 Blackwell, touchscreen OLED 4K UHD 120 Hz, SSD PCIe5 da 2 TB e 128 GB di RAM CAMM2 per circa 5000 dollari. Le SKU minori iniziano con il Core Ultra 5 245HX, 16 GB CSoDIMM, solo grafica integrata e un display di base FHD+ non touch per circa 3700 dollari.
Le alternative in questo spazio includono altre workstation da 16 pollici orientate alle prestazioni, come il modello MSI CreatorPro Z16P, Lenovo ThinkPad P16 Gen 2o il HP ZBook Studio 16.
Altre recensioni di Dell:
Specifiche
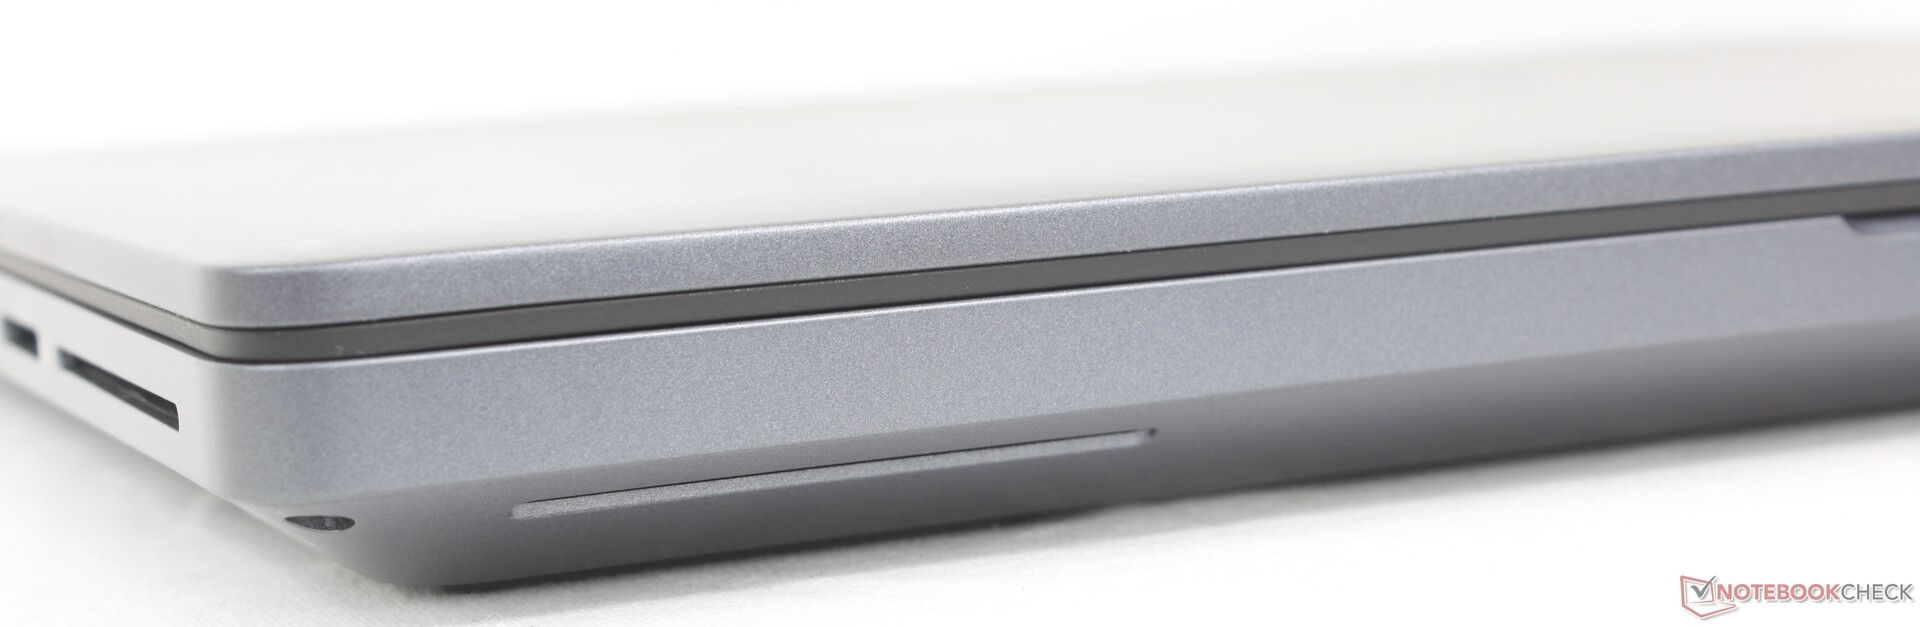
Caso
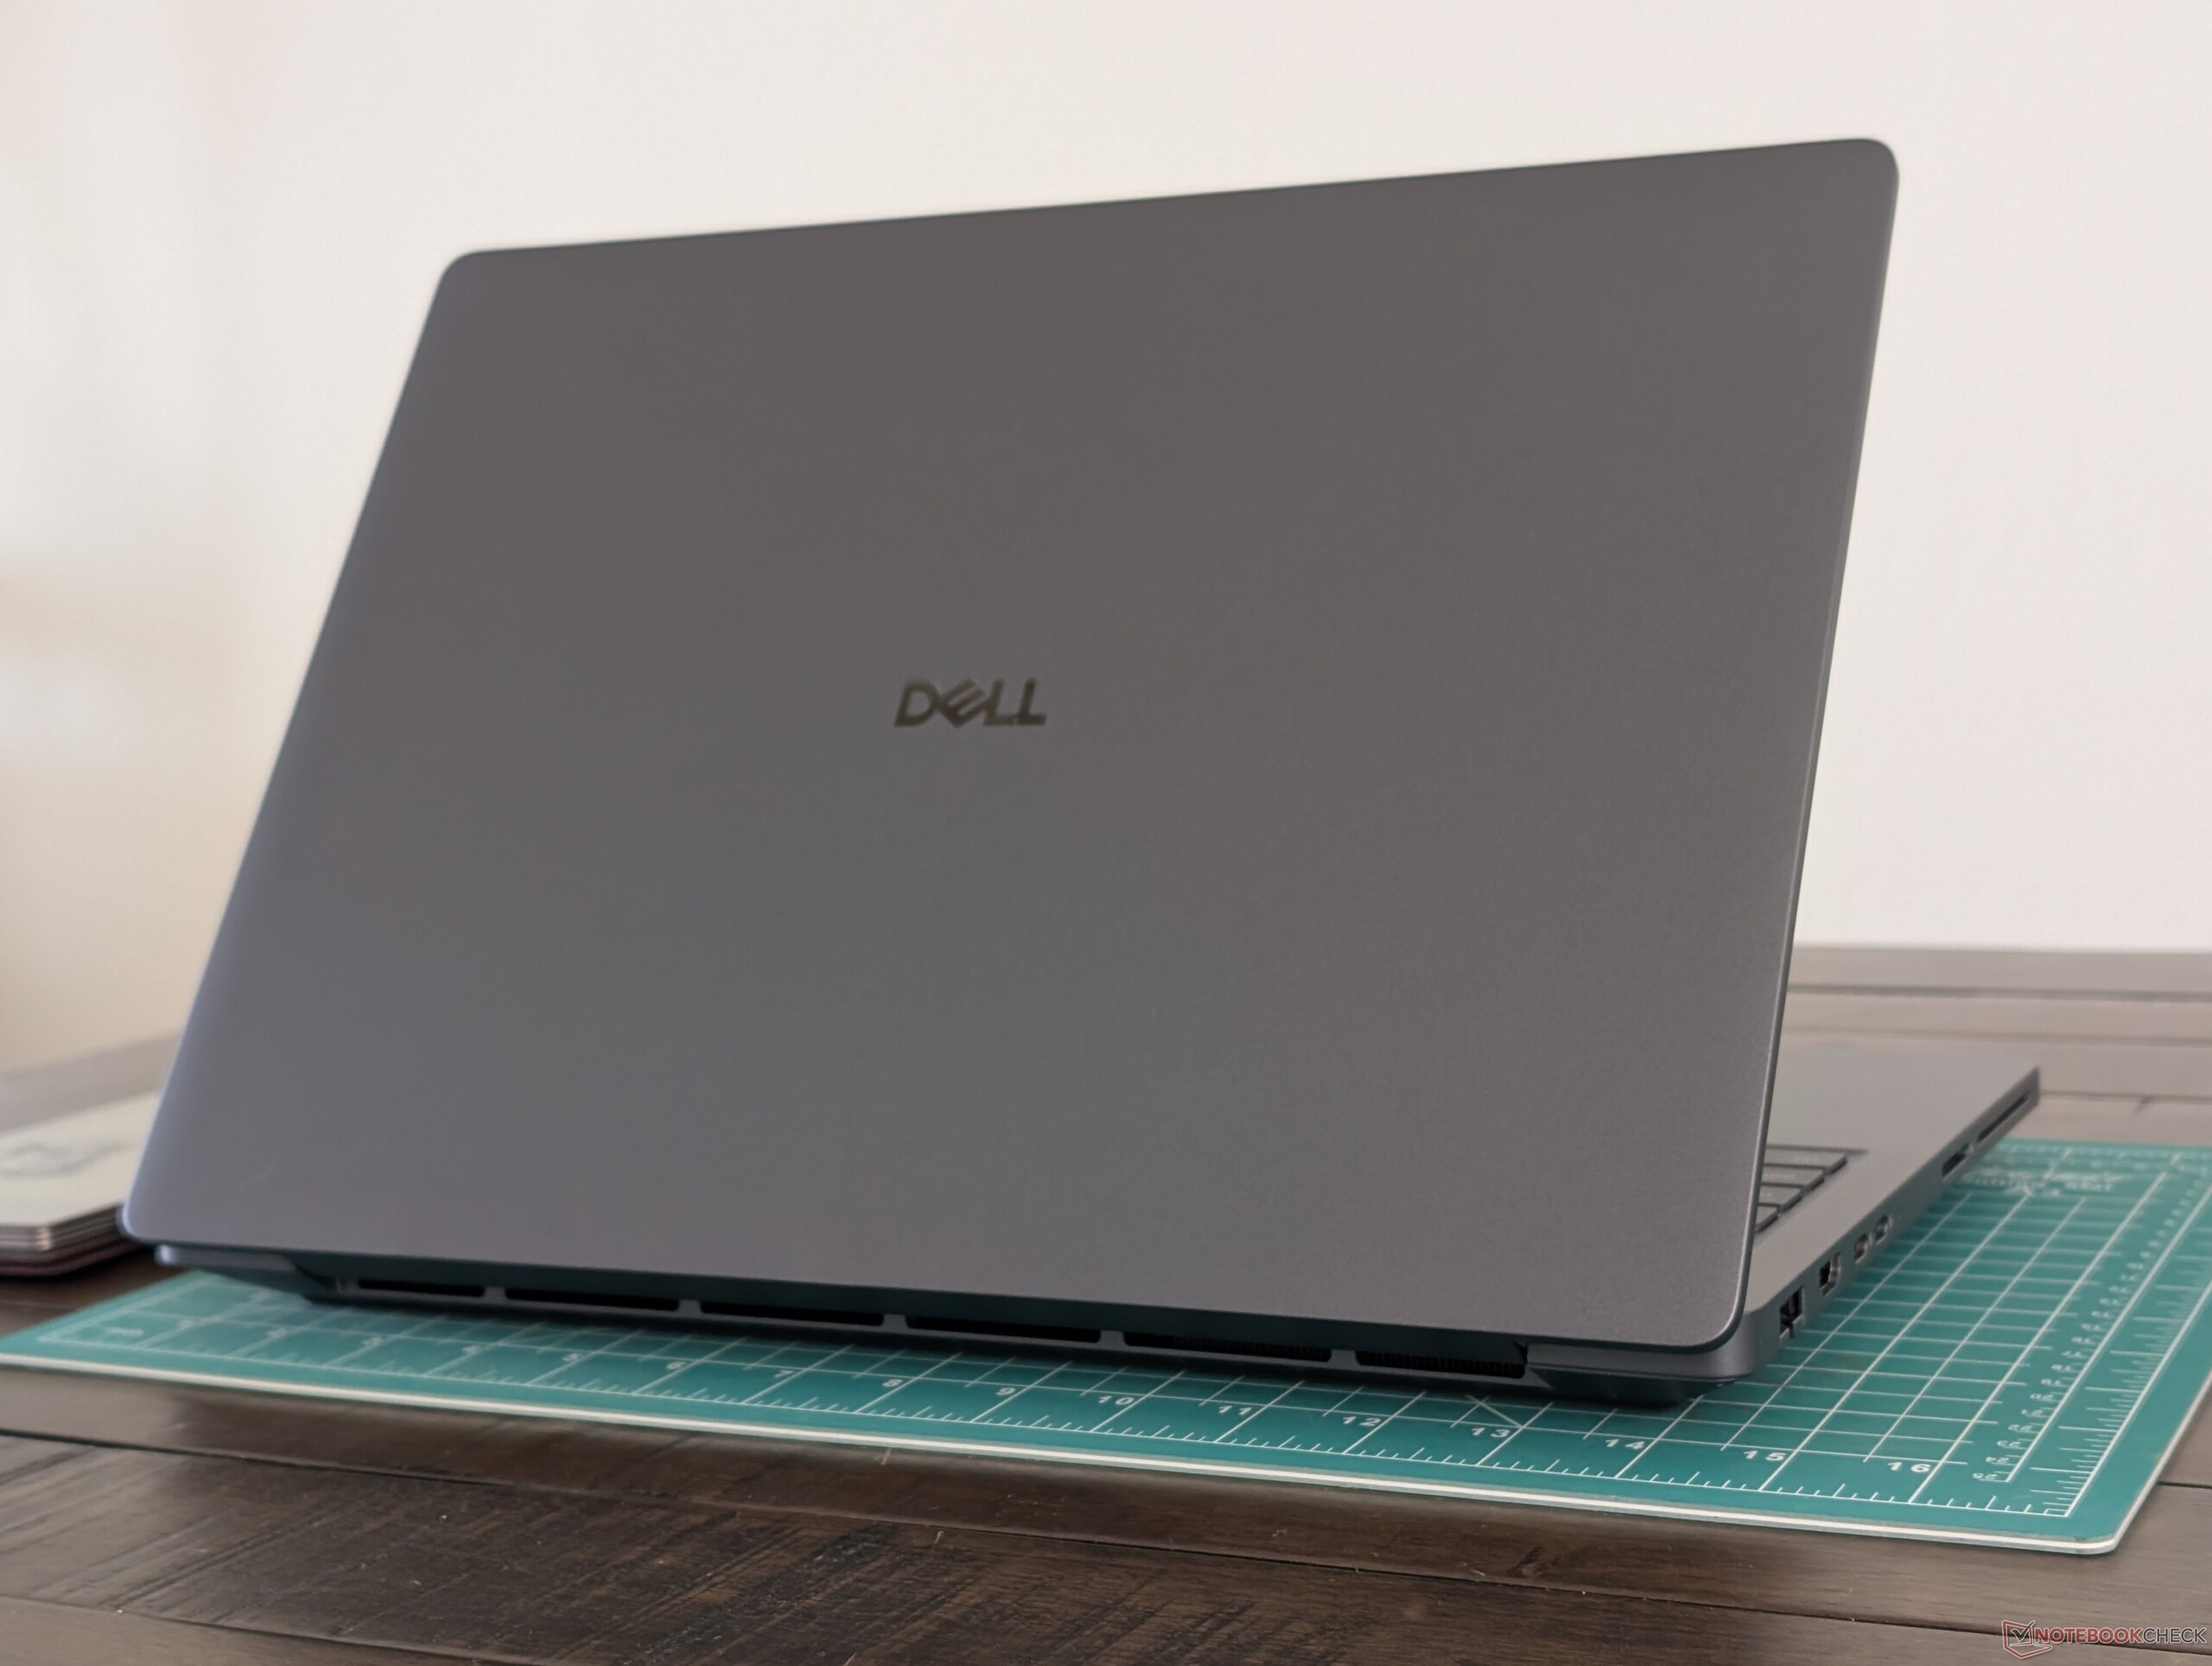
Il modello è in realtà leggermente più grande e più spesso del modello Precision 7670, che risale a 4 anni fa. Tuttavia, la solida qualità costruttiva e le caratteristiche professionali come CAMM2, DGFF e la riparabilità modulare USB-C fanno sì che le dimensioni maggiori valgano l'investimento.

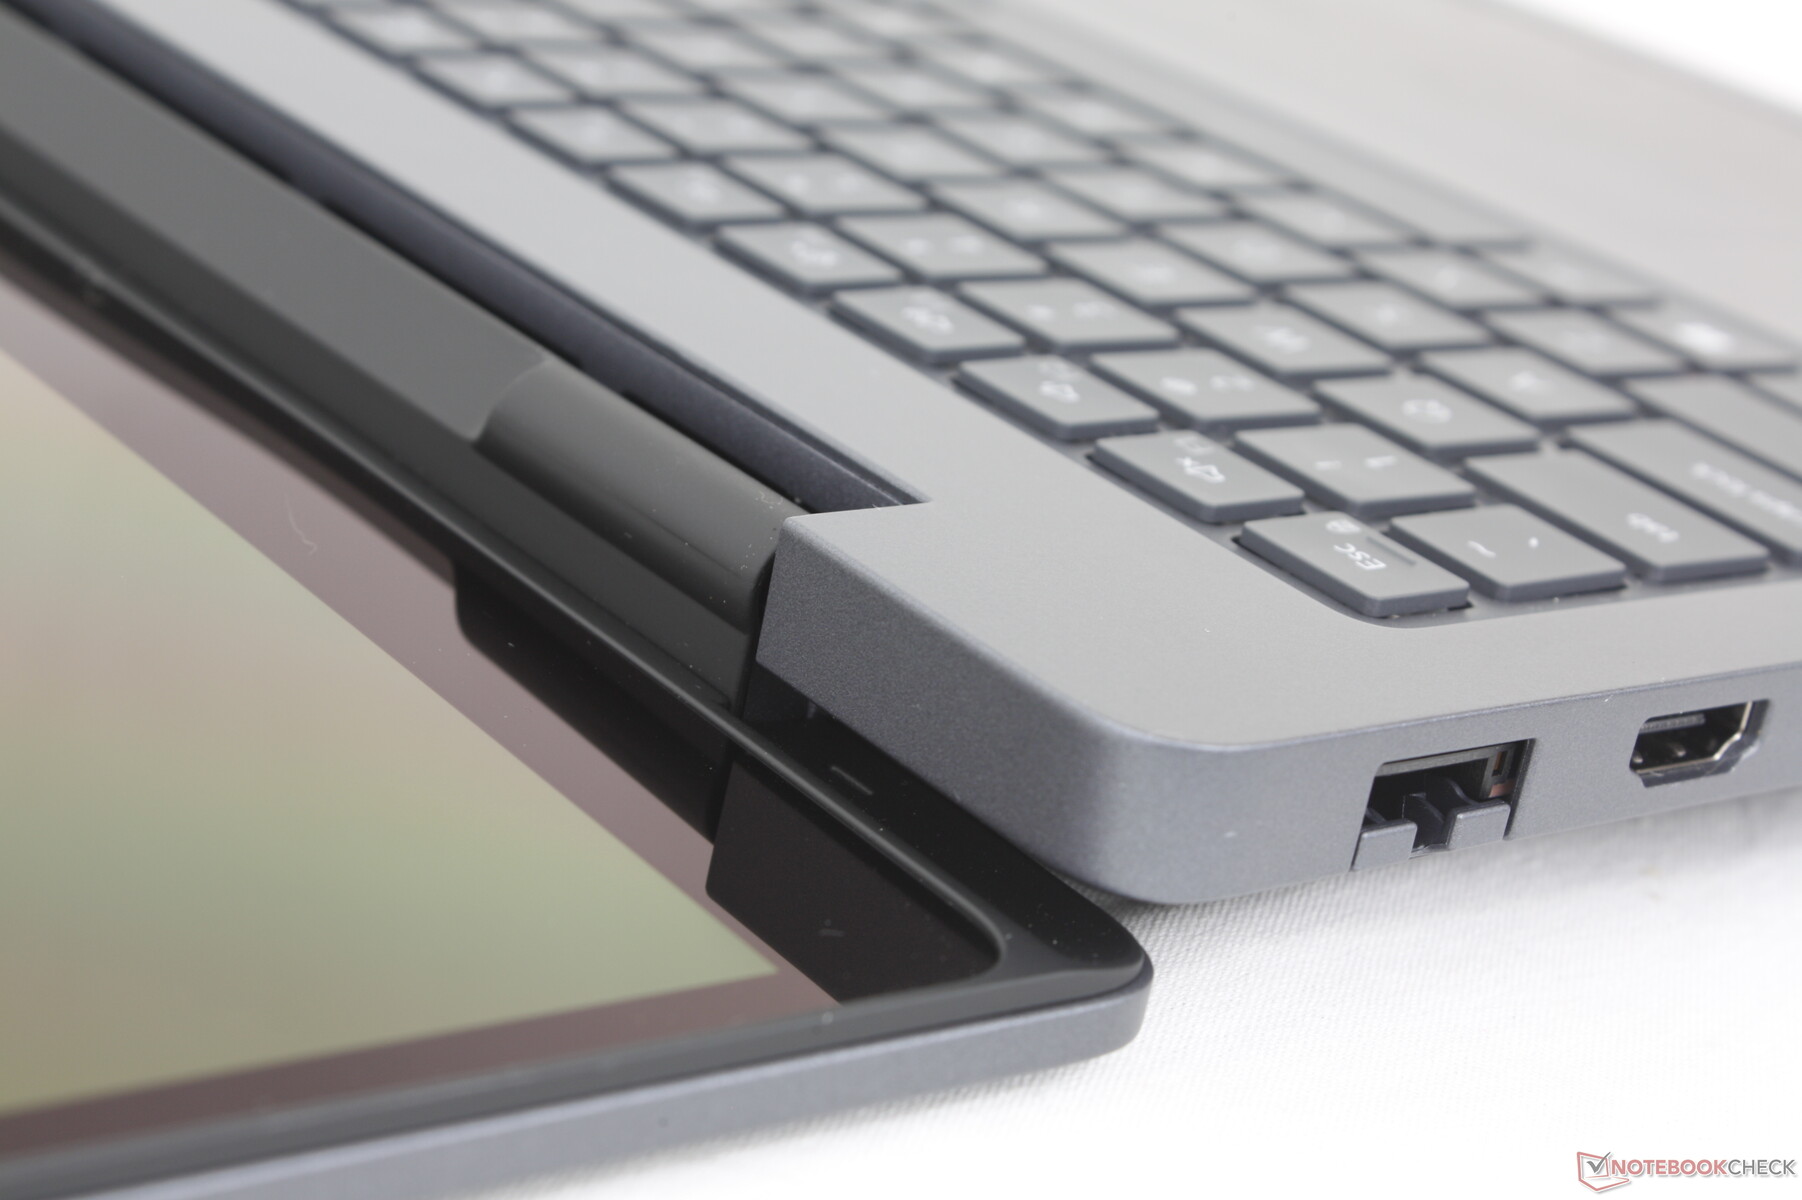
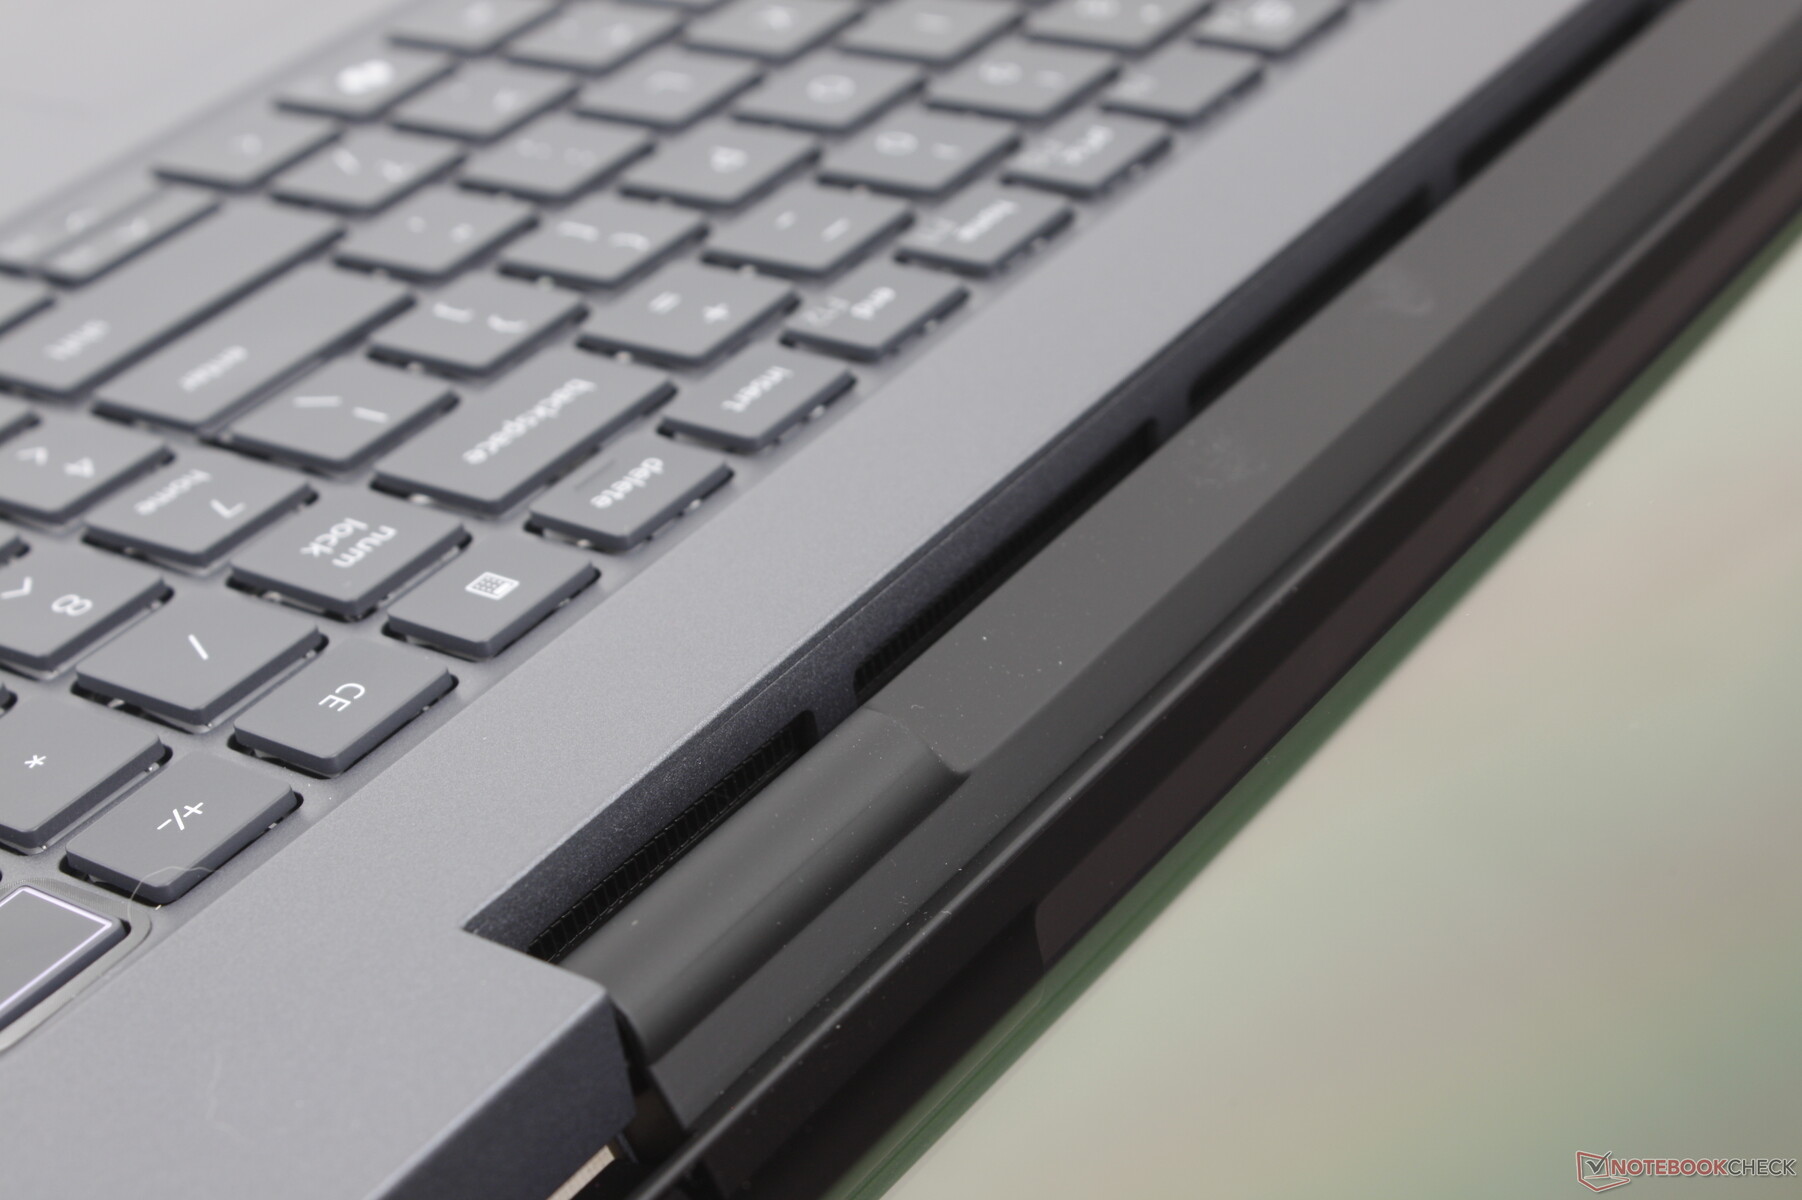
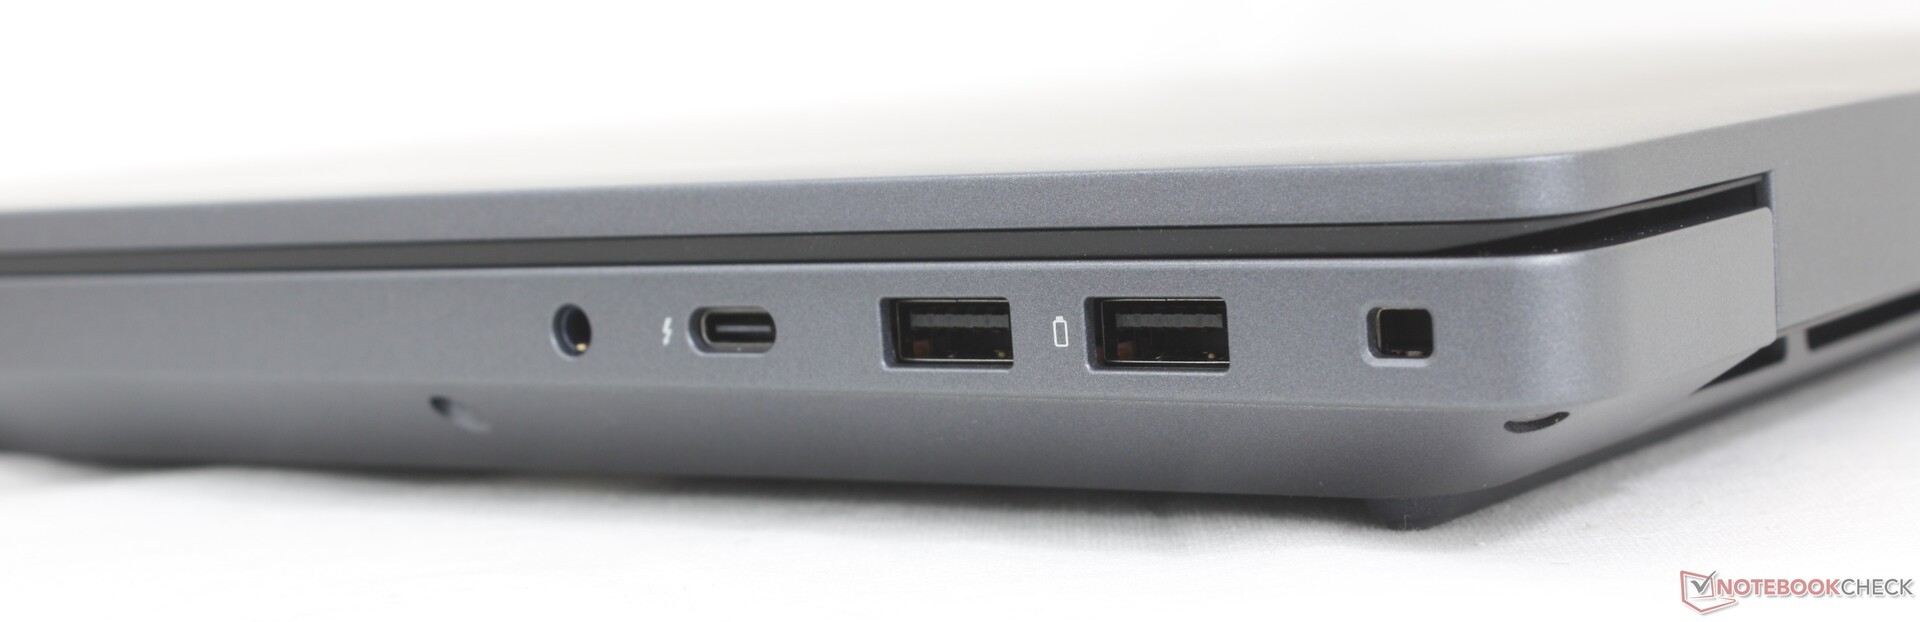
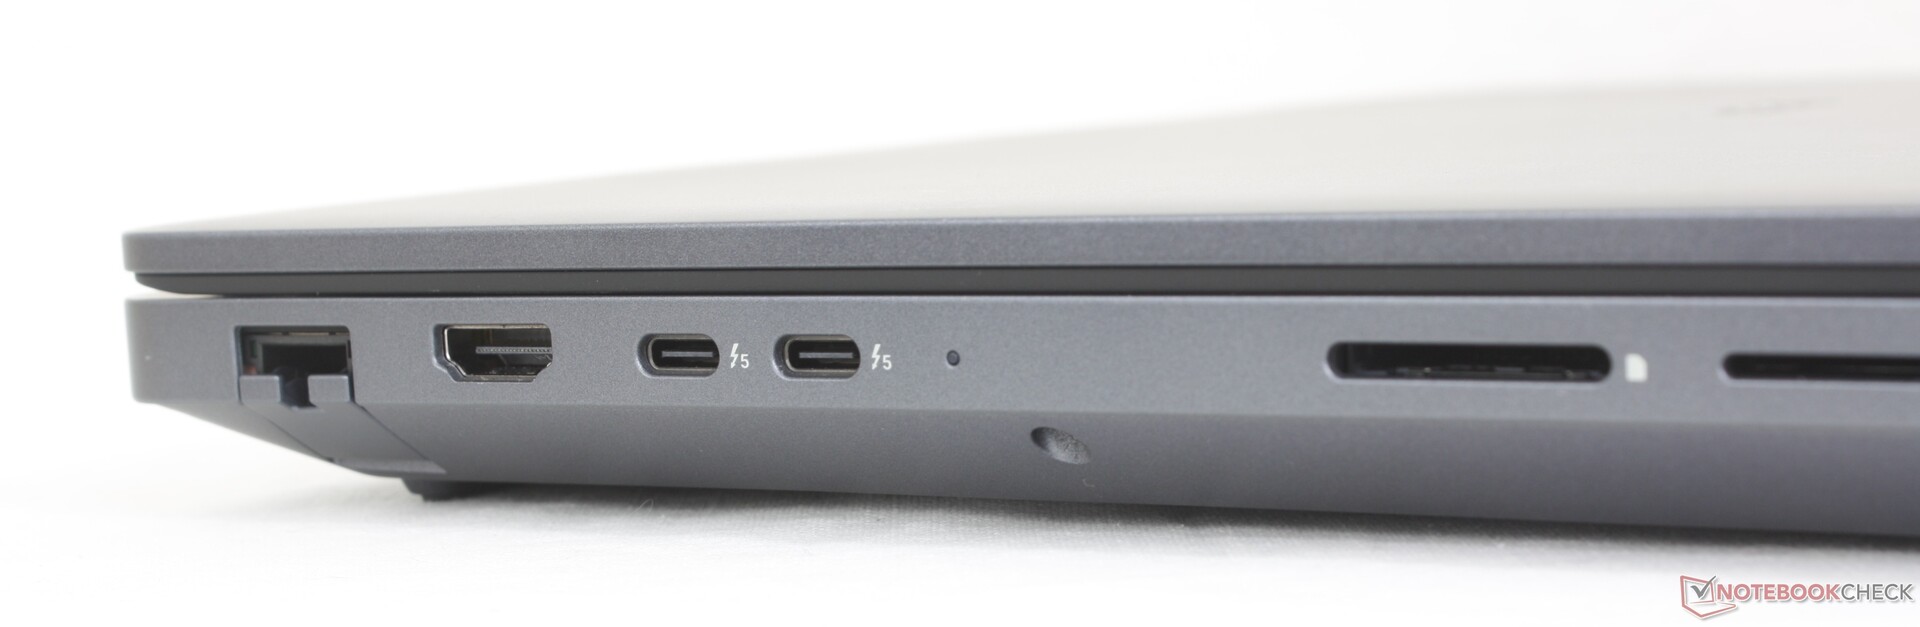
Connettività
Le opzioni delle porte sono in gran parte identiche a quelle di Precision 7680, anche se con alcune importanti modifiche. La porta dedicata per l'adattatore AC, ad esempio, è stata abbandonata sul Pro Max 16 Plus, il che significa che una delle tre porte USB-C sarà quasi sempre occupata per la ricarica. Nel frattempo, Thunderbolt 5 è ora di serie per funzionalità di docking più avanzate.
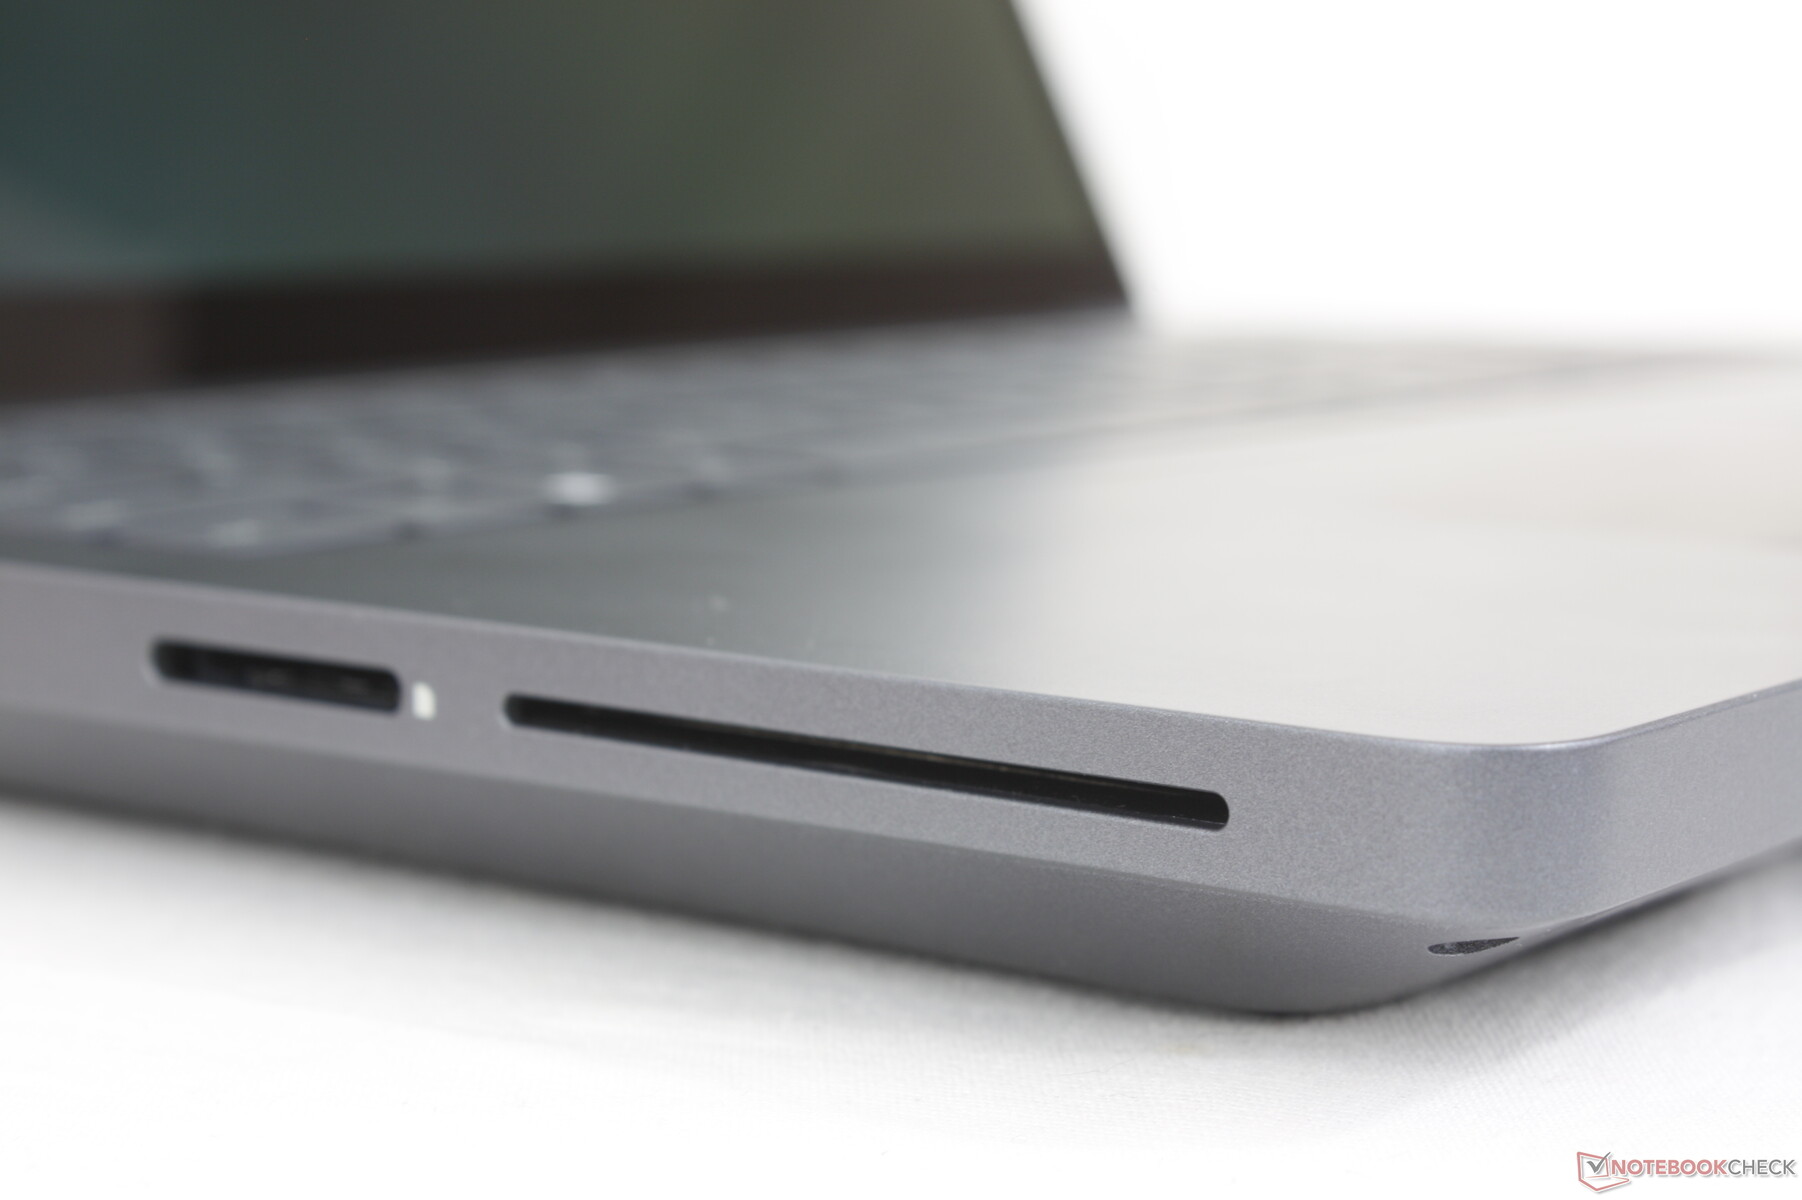
Lettore di schede SD
| SD Card Reader | |
| average JPG Copy Test (av. of 3 runs) | |
| Dell Precision 5000 5680 (Toshiba Exceria Pro SDXC 64 GB UHS-II) | |
| Lenovo ThinkPad P16 Gen 2 (Toshiba Exceria Pro SDXC 64 GB UHS-II) | |
| MSI CreatorPro Z16P B12UKST (AV Pro V60) | |
| Dell Pro Max 16 Plus (Toshiba Exceria Pro SDXC 64 GB UHS-II) | |
| Lenovo ThinkPad P1 Gen 7 21KV001SGE (AV Pro V60) | |
| maximum AS SSD Seq Read Test (1GB) | |
| Dell Precision 5000 5680 (Toshiba Exceria Pro SDXC 64 GB UHS-II) | |
| Dell Pro Max 16 Plus (Toshiba Exceria Pro SDXC 64 GB UHS-II) | |
| Lenovo ThinkPad P1 Gen 7 21KV001SGE (AV Pro V60) | |
| Lenovo ThinkPad P16 Gen 2 (Toshiba Exceria Pro SDXC 64 GB UHS-II) | |
| MSI CreatorPro Z16P B12UKST (AV Pro V60) | |
Comunicazione
Webcam
Webcam opzionale da 8 MP con IR e otturatore fisico.


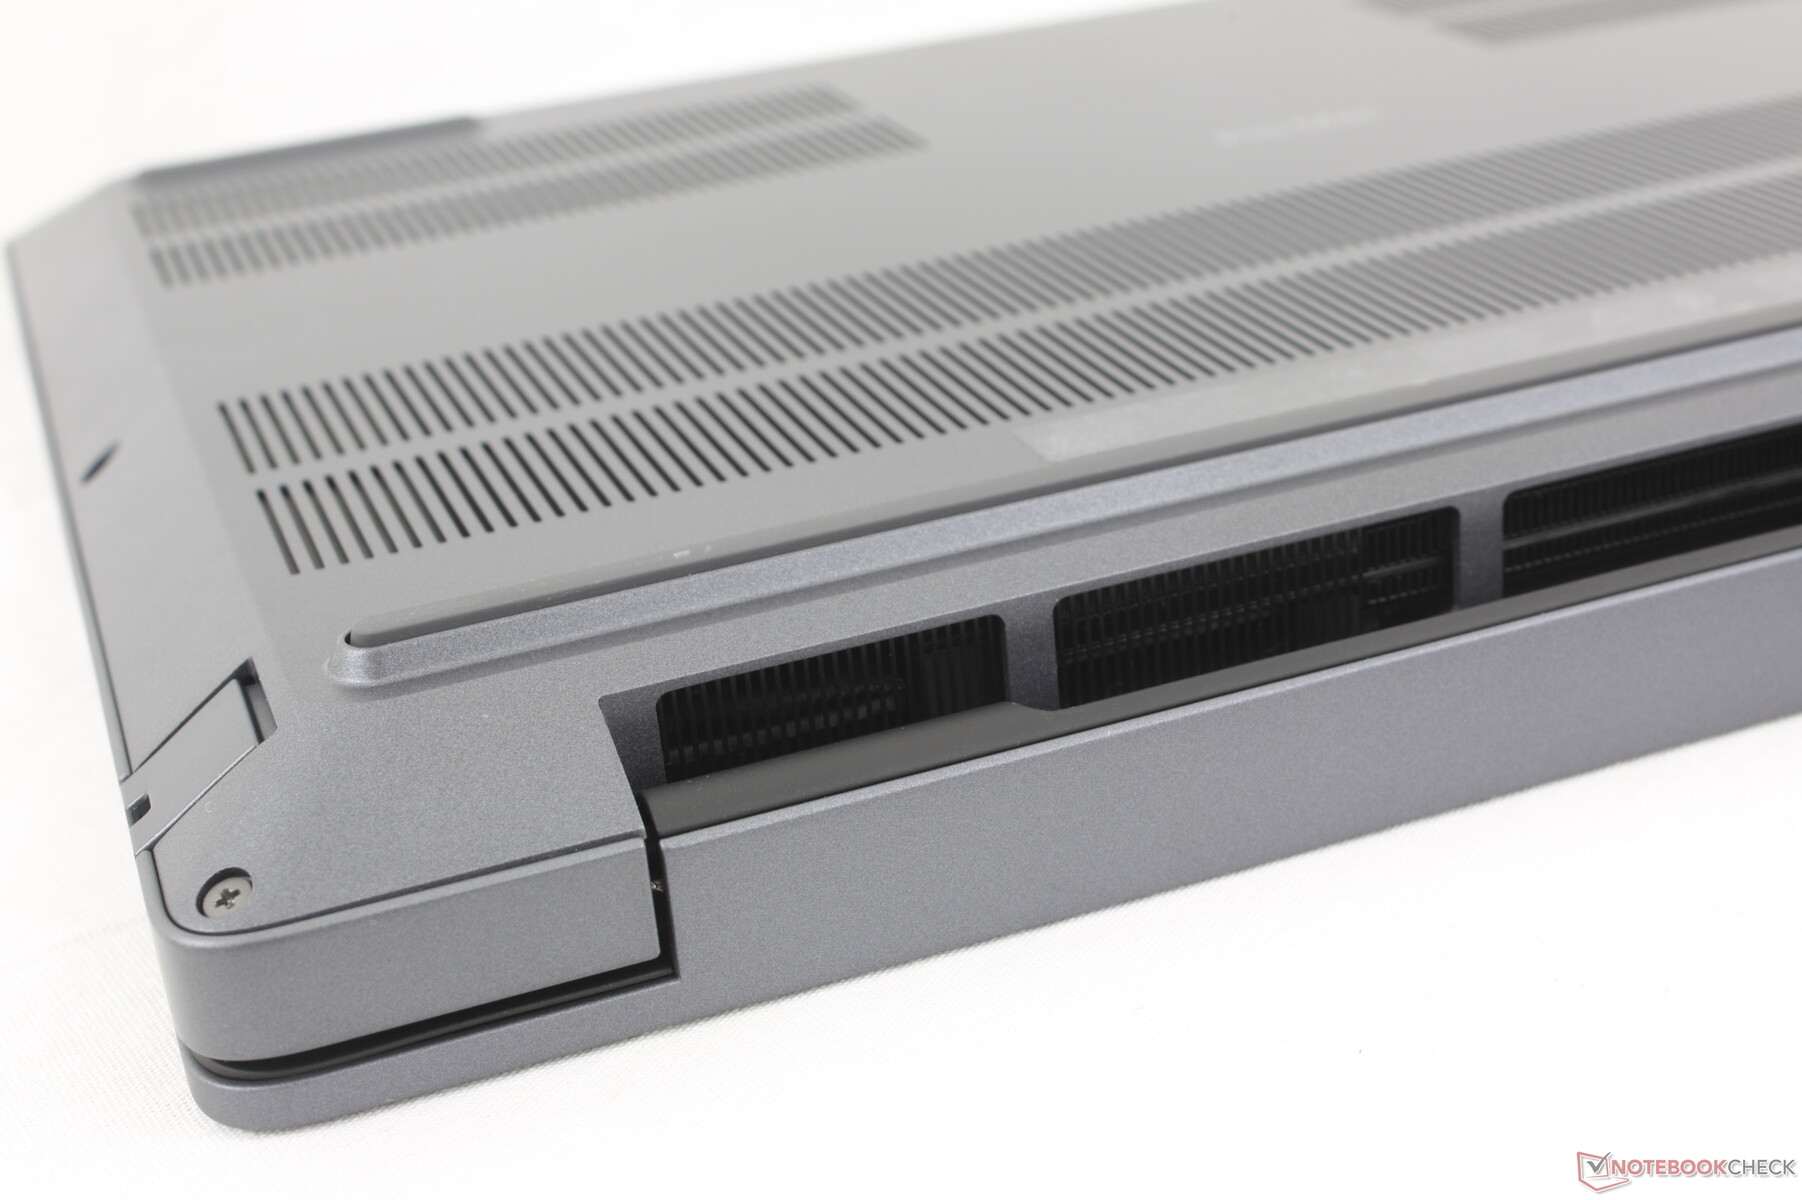
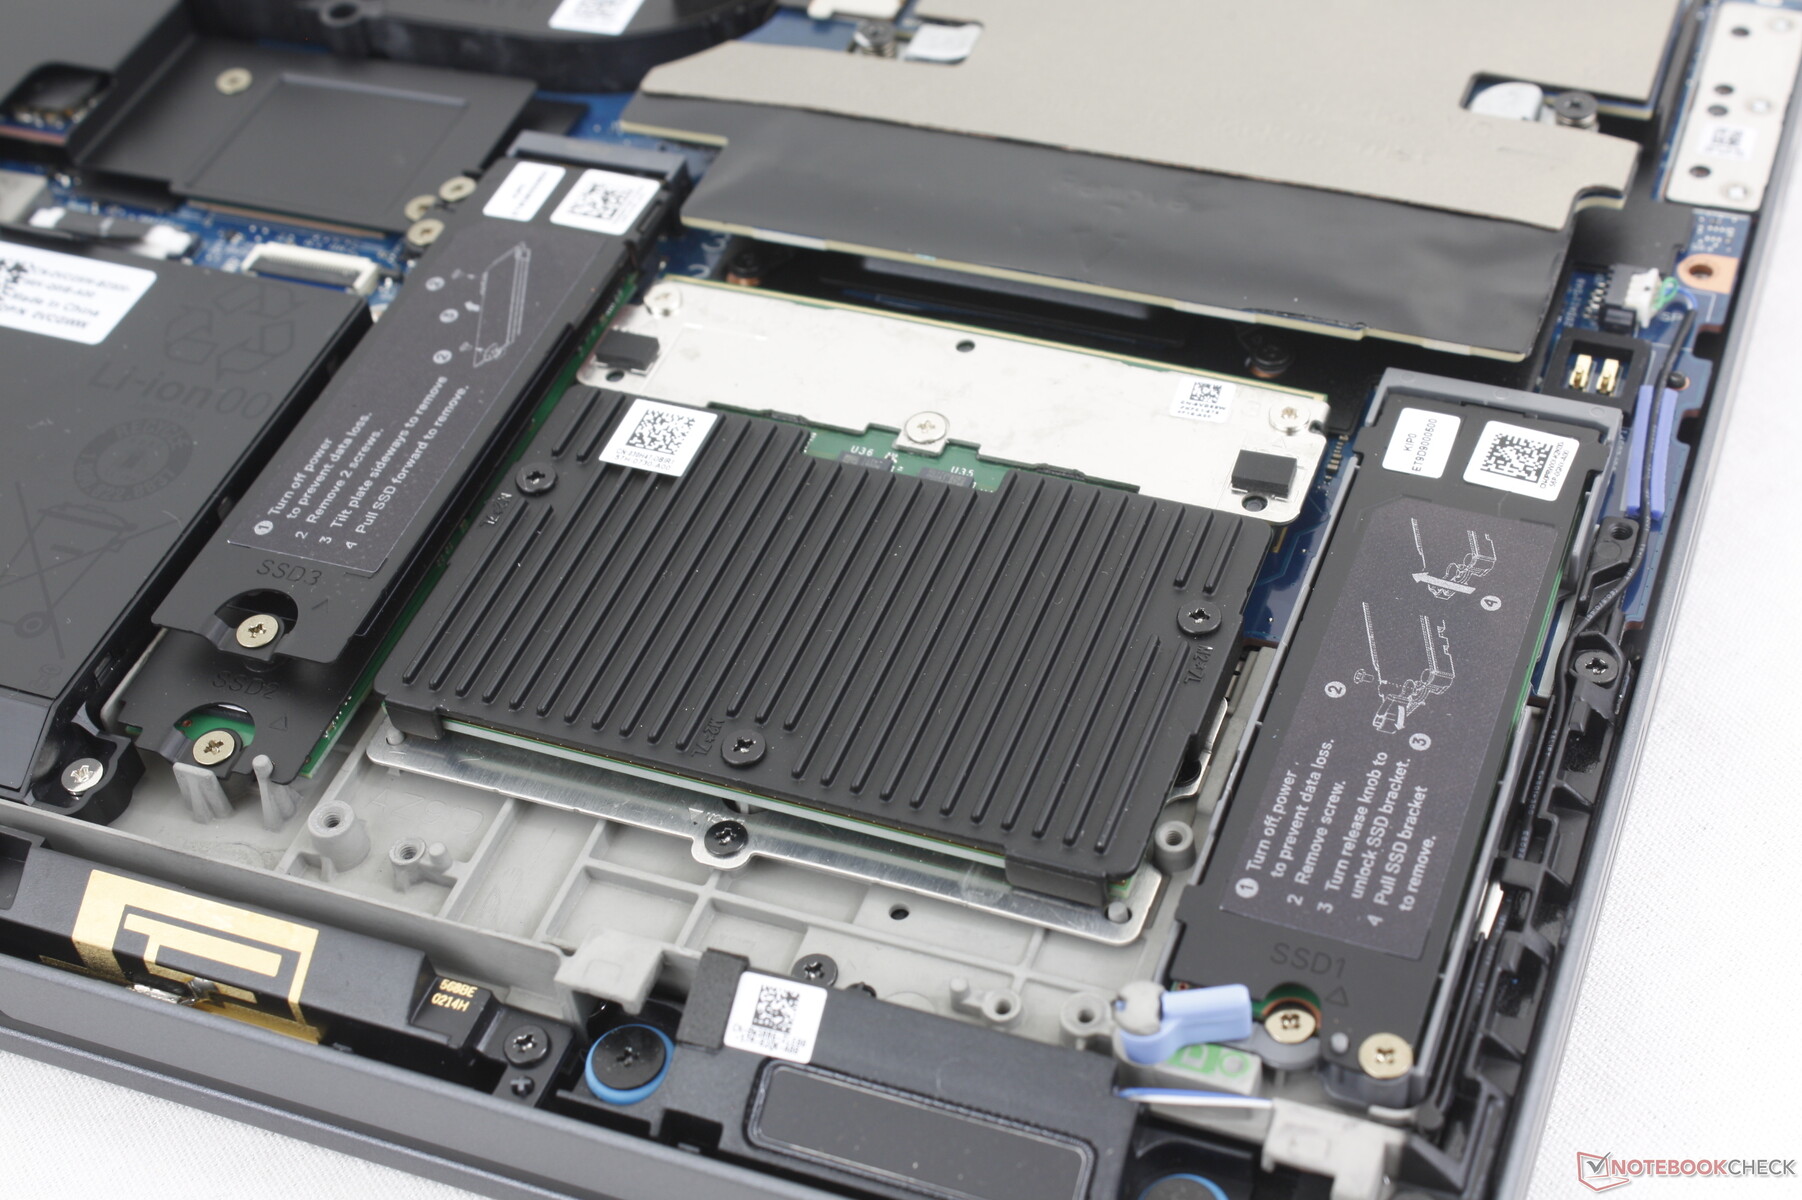
Manutenzione
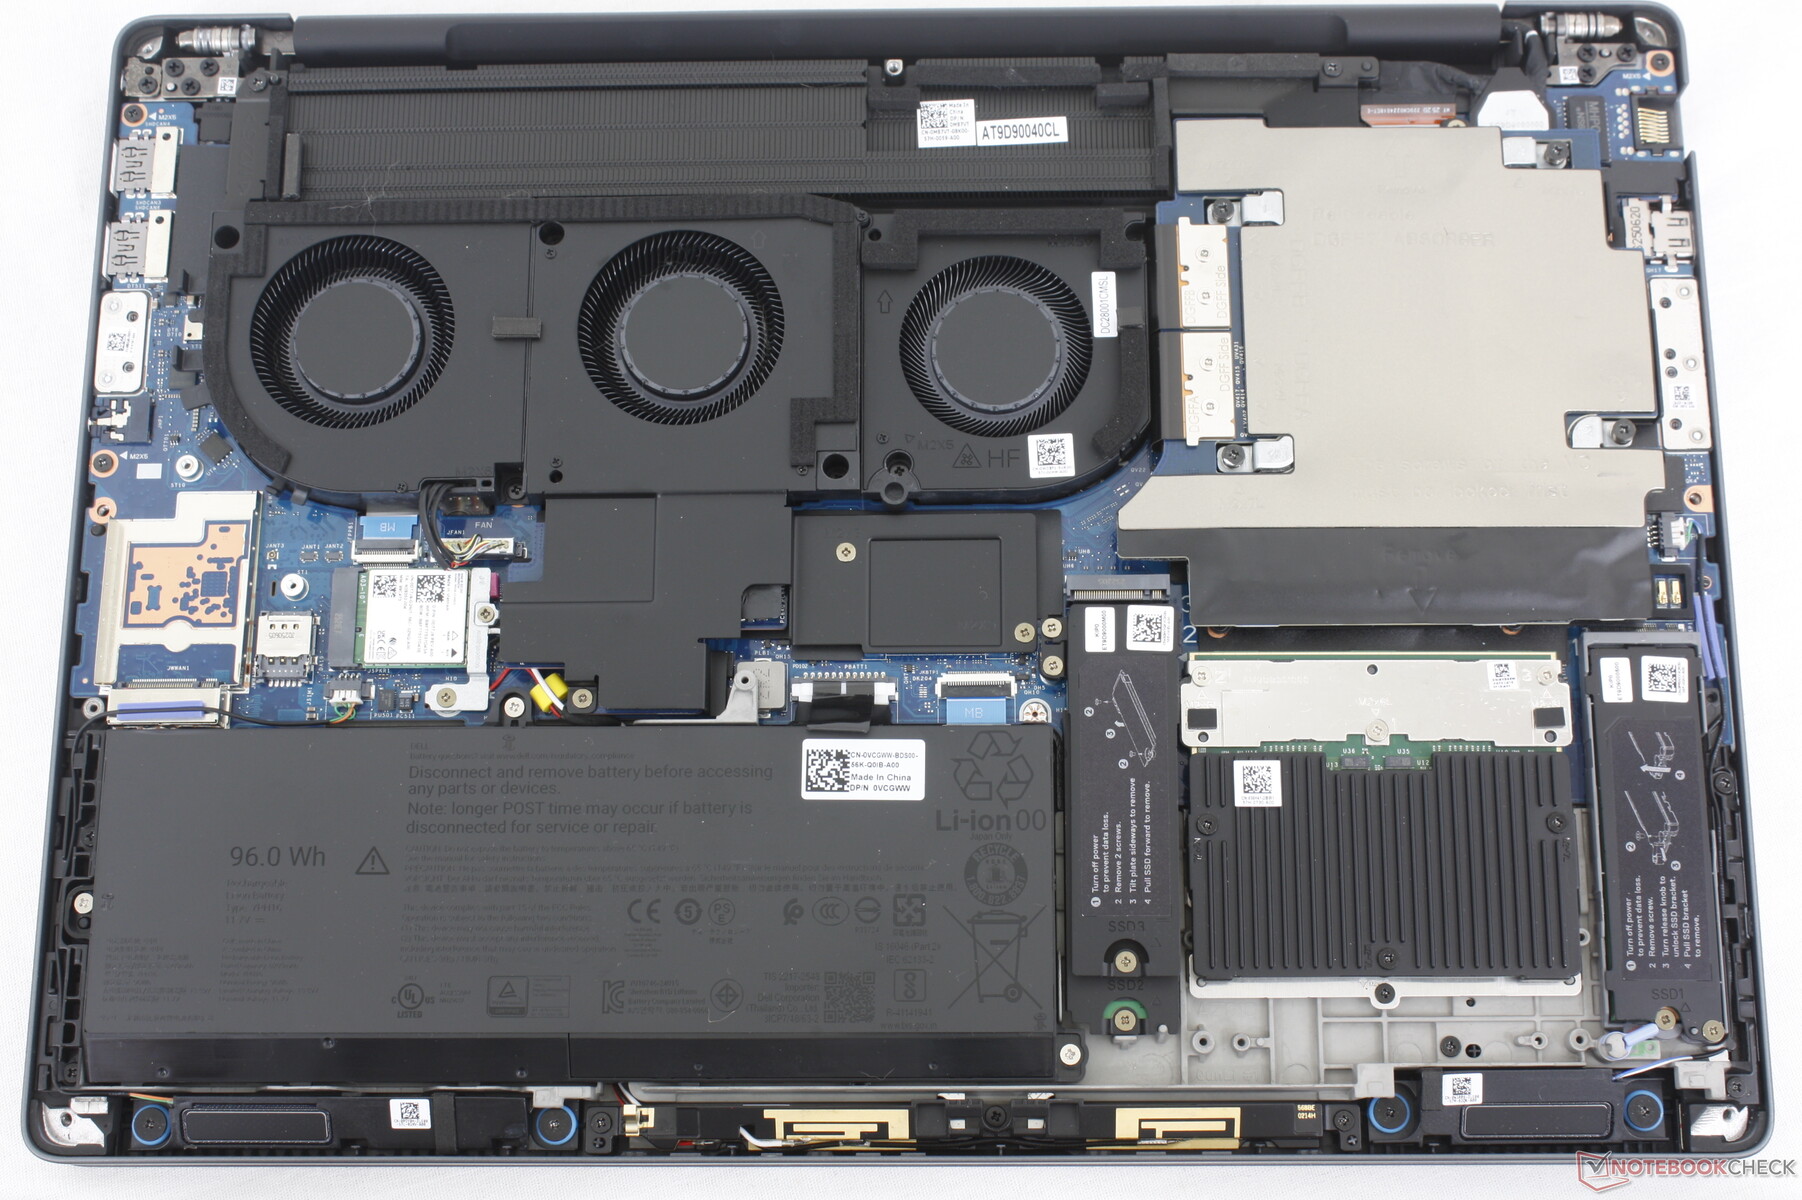
Il pannello inferiore richiede solo un cacciavite Phillips per essere rimosso per facilitare l'accesso ai componenti interni. Il modulo CAMM2, i due slot SSD M.2 2280, il modulo WLAN e la scheda grafica (DGFF) sono tutti rimovibili.
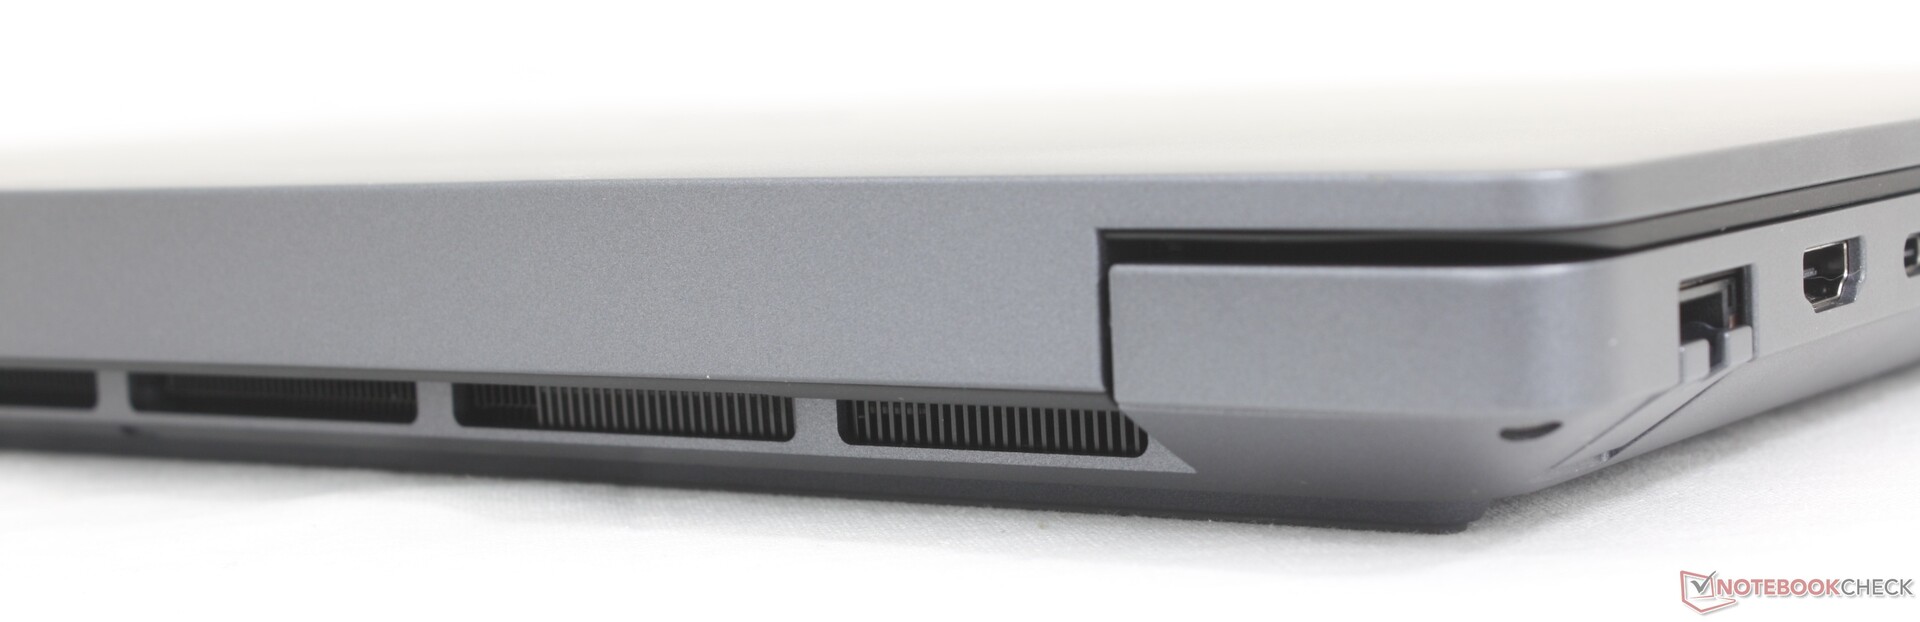
La "porta del drive" SSD che si trovava sul vecchio design Precision 7670/7680 è stata eliminata.
Sostenibilità
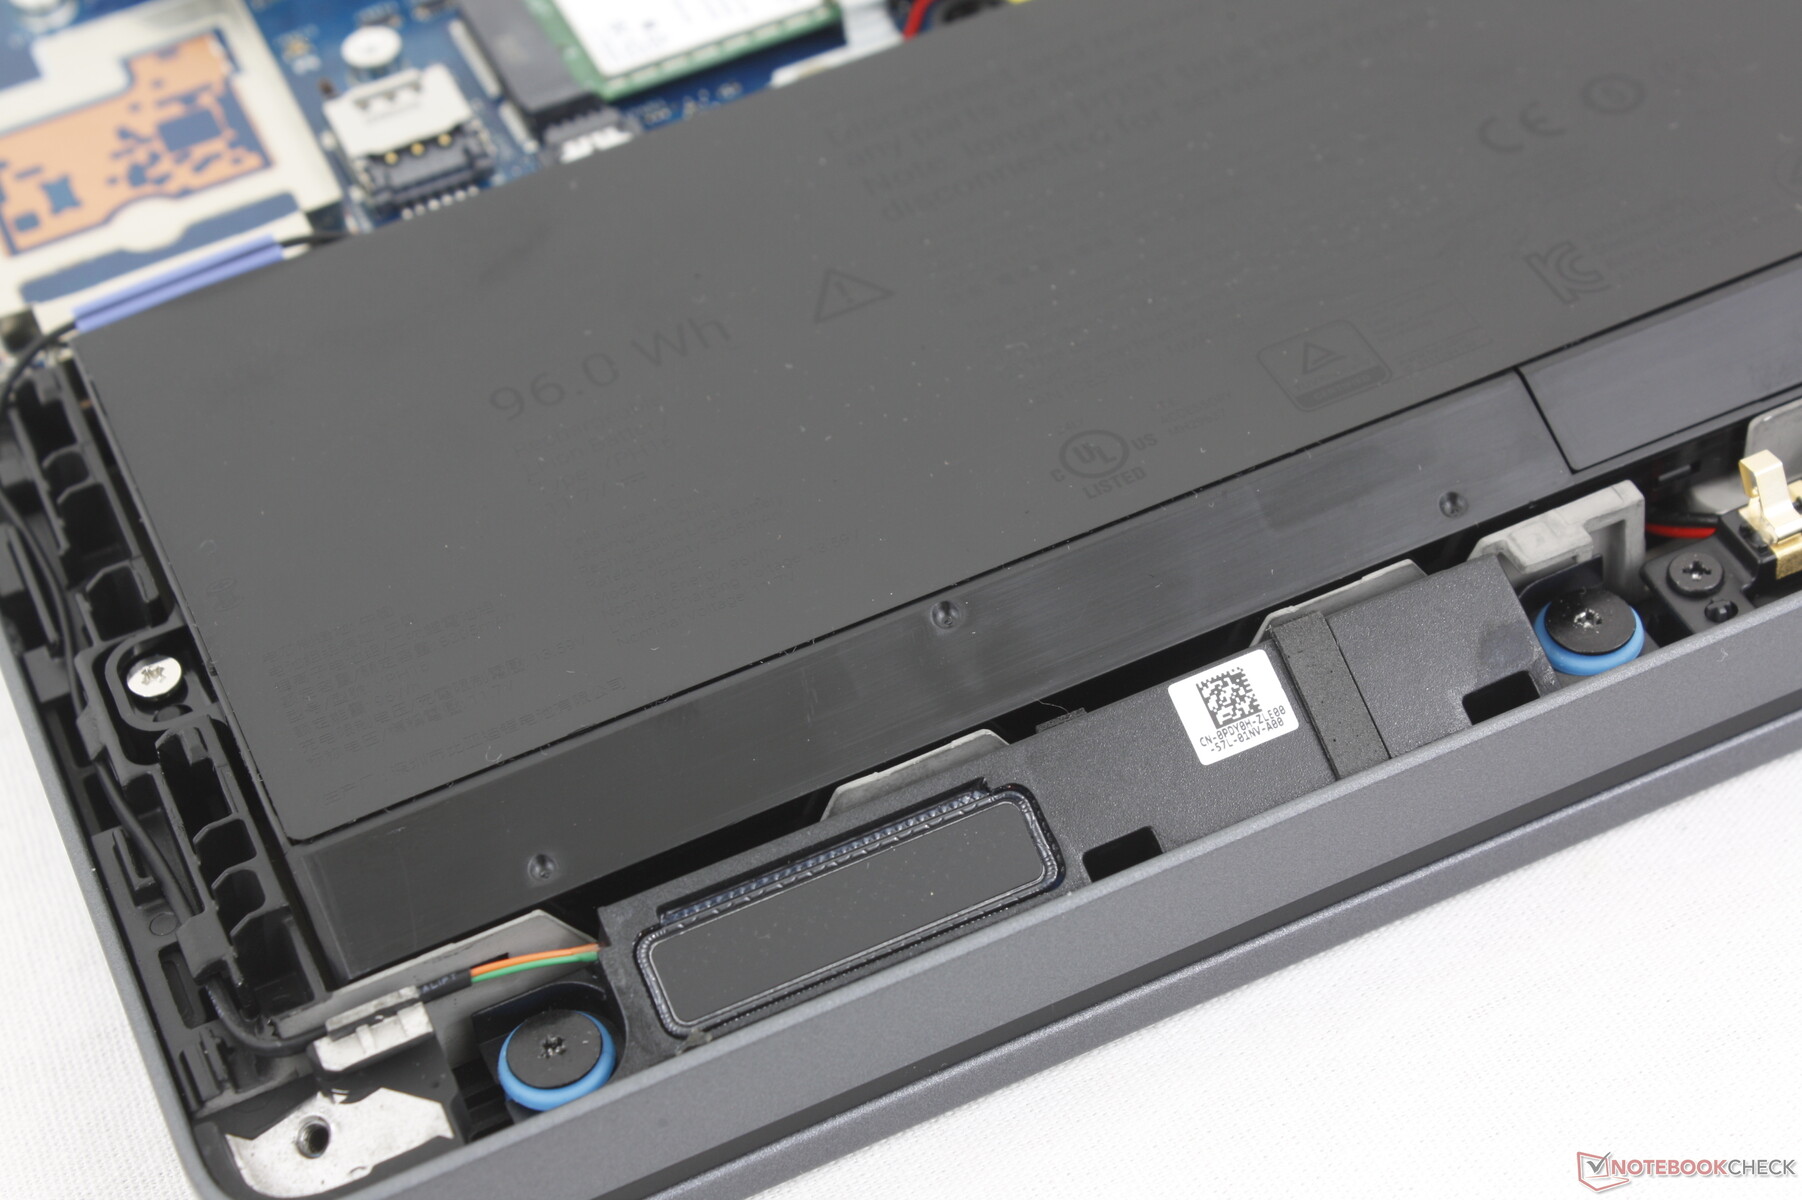
Il telaio è composto dal 90 percento di magnesio riciclato per le coperture superiori e inferiori, dal 30 percento di plastica PCC per i poggiapolsi, dal 46 percento di plastica biobased per i paraurti inferiori e dal 50 percento di cobalto riciclato per la batteria da 96 Whr. Questo modello è anche uno dei primi di Dell a incorporare porte USB-C modulari, per una facile sostituzione nel caso in cui le porte si rompano o si allentino a causa dell'uso eccessivo.
Accessori e garanzia
Nella confezione non ci sono altri extra oltre all'adattatore CA e alla documentazione. La garanzia del produttore di tre anni è standard.
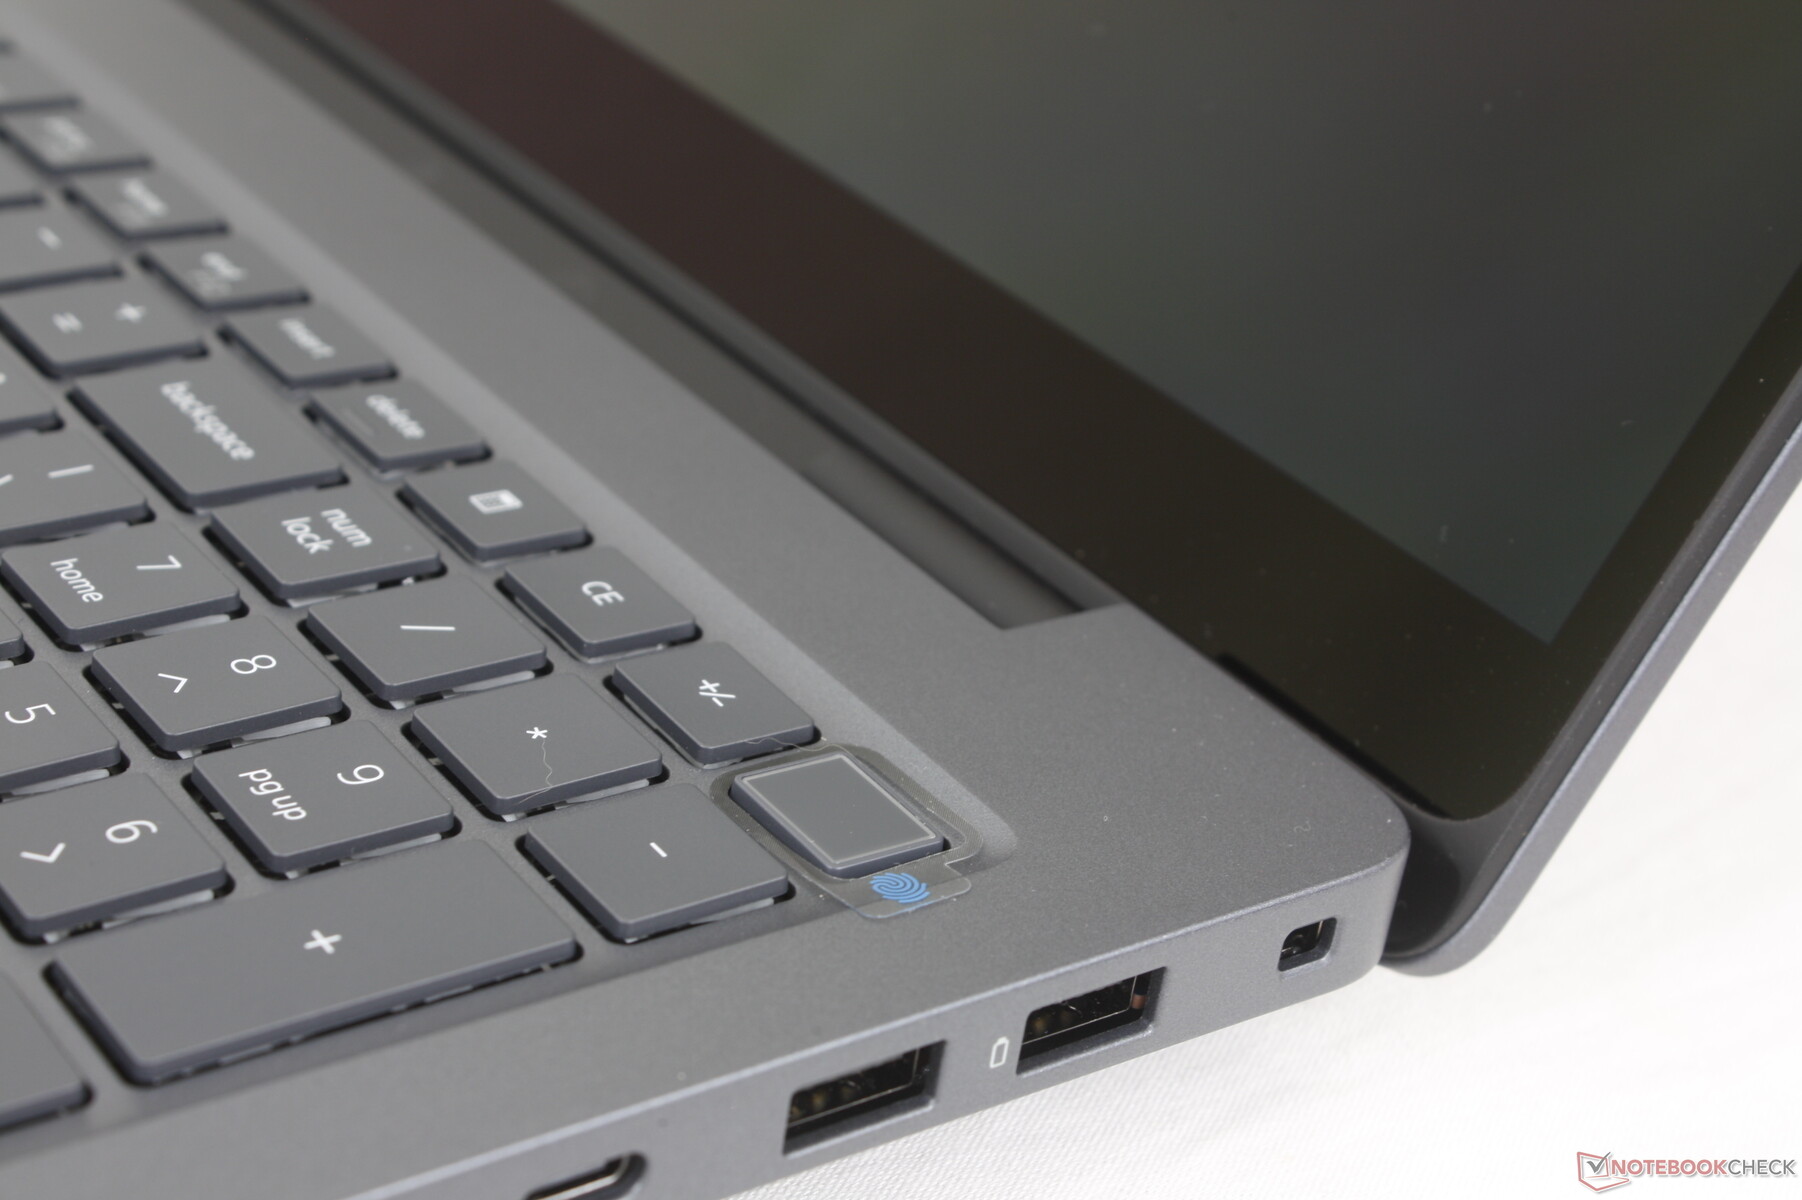
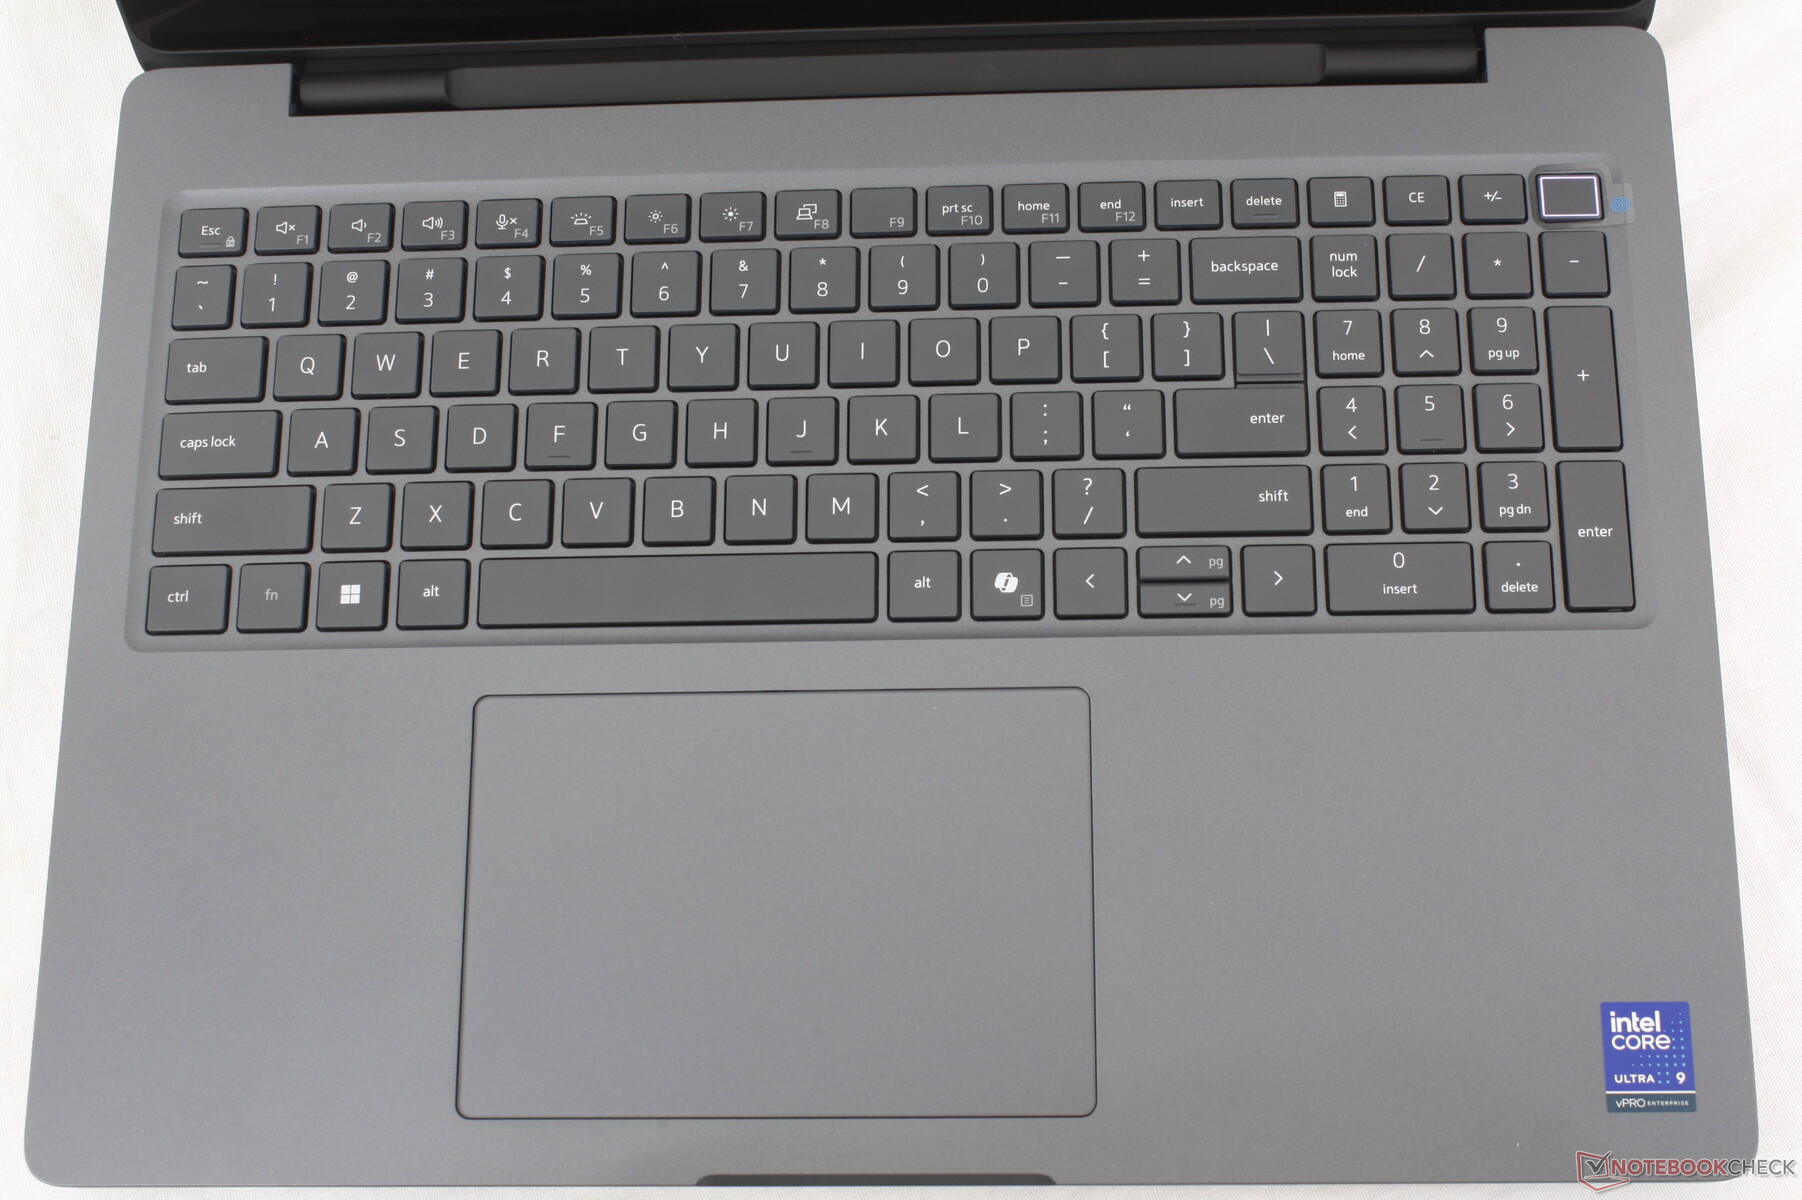
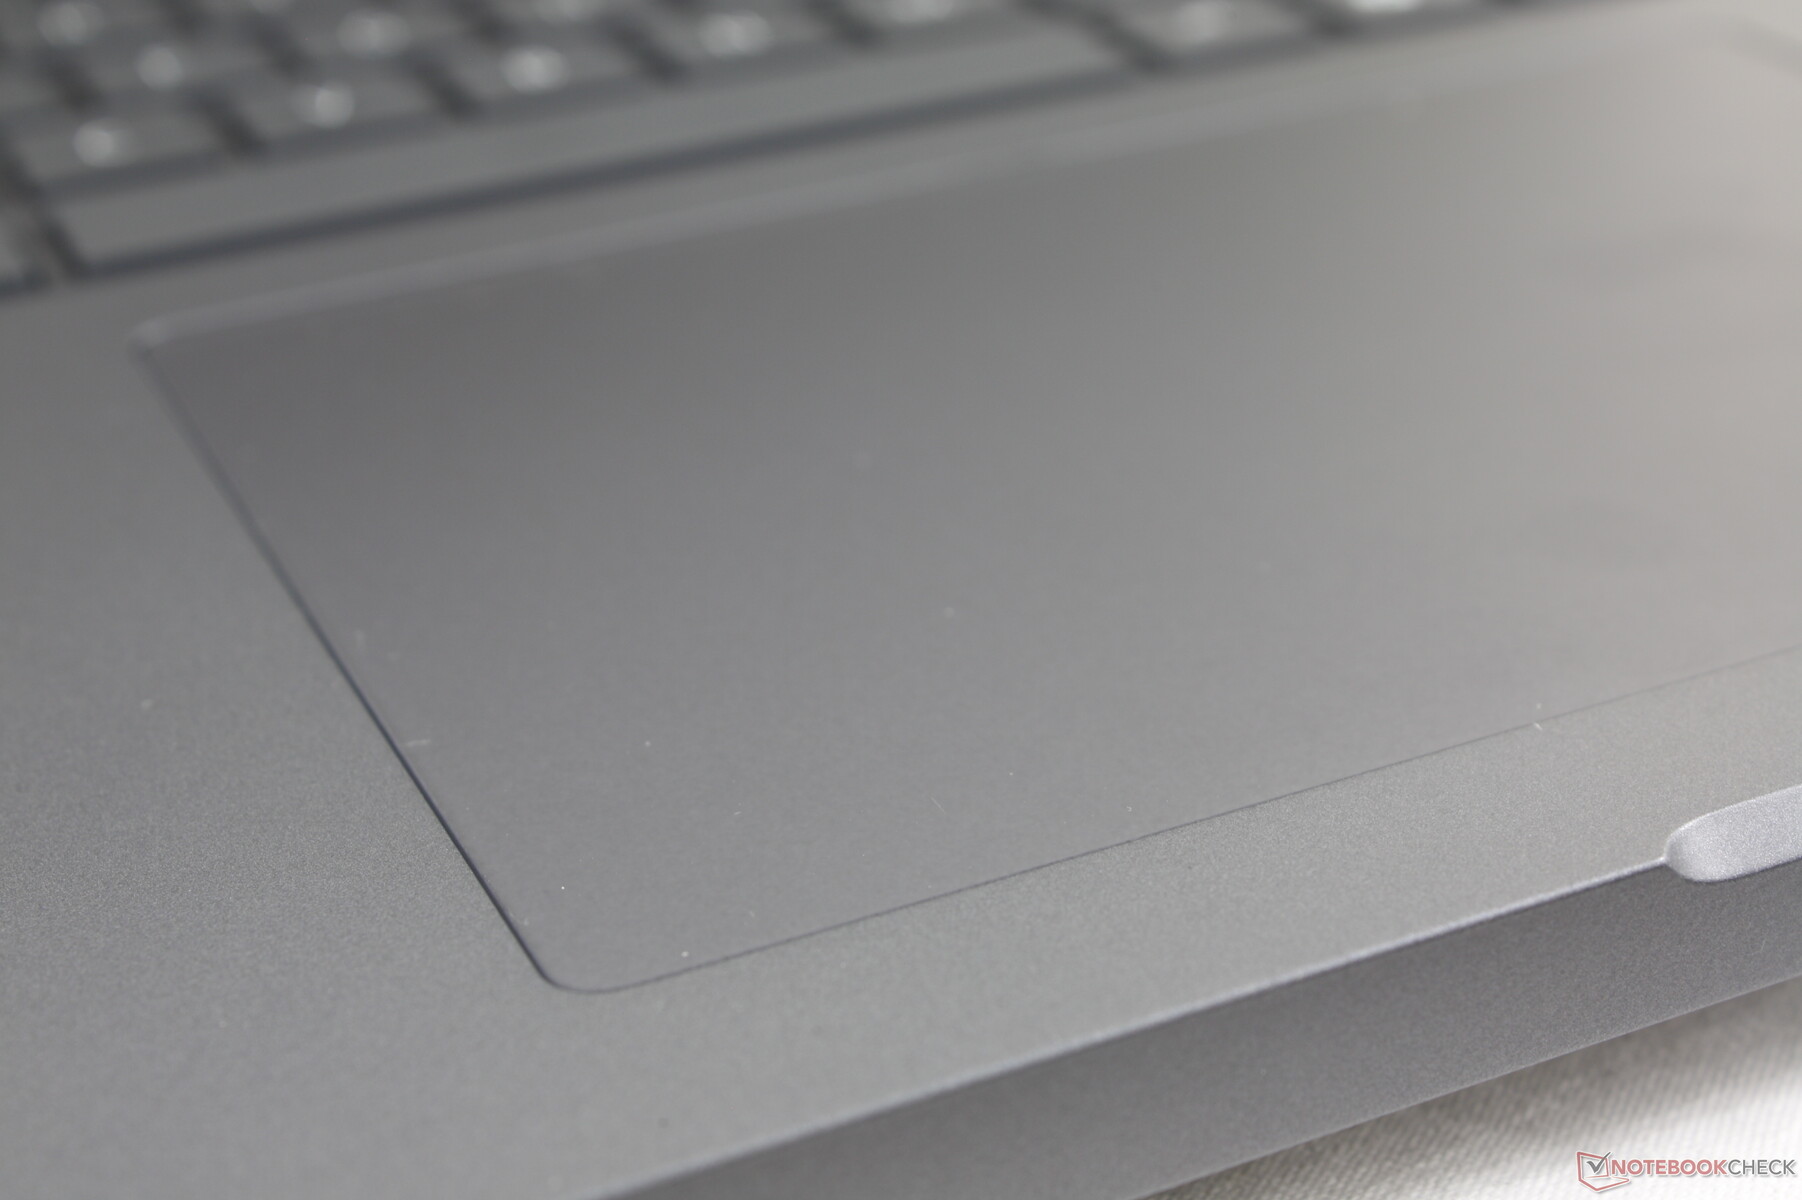
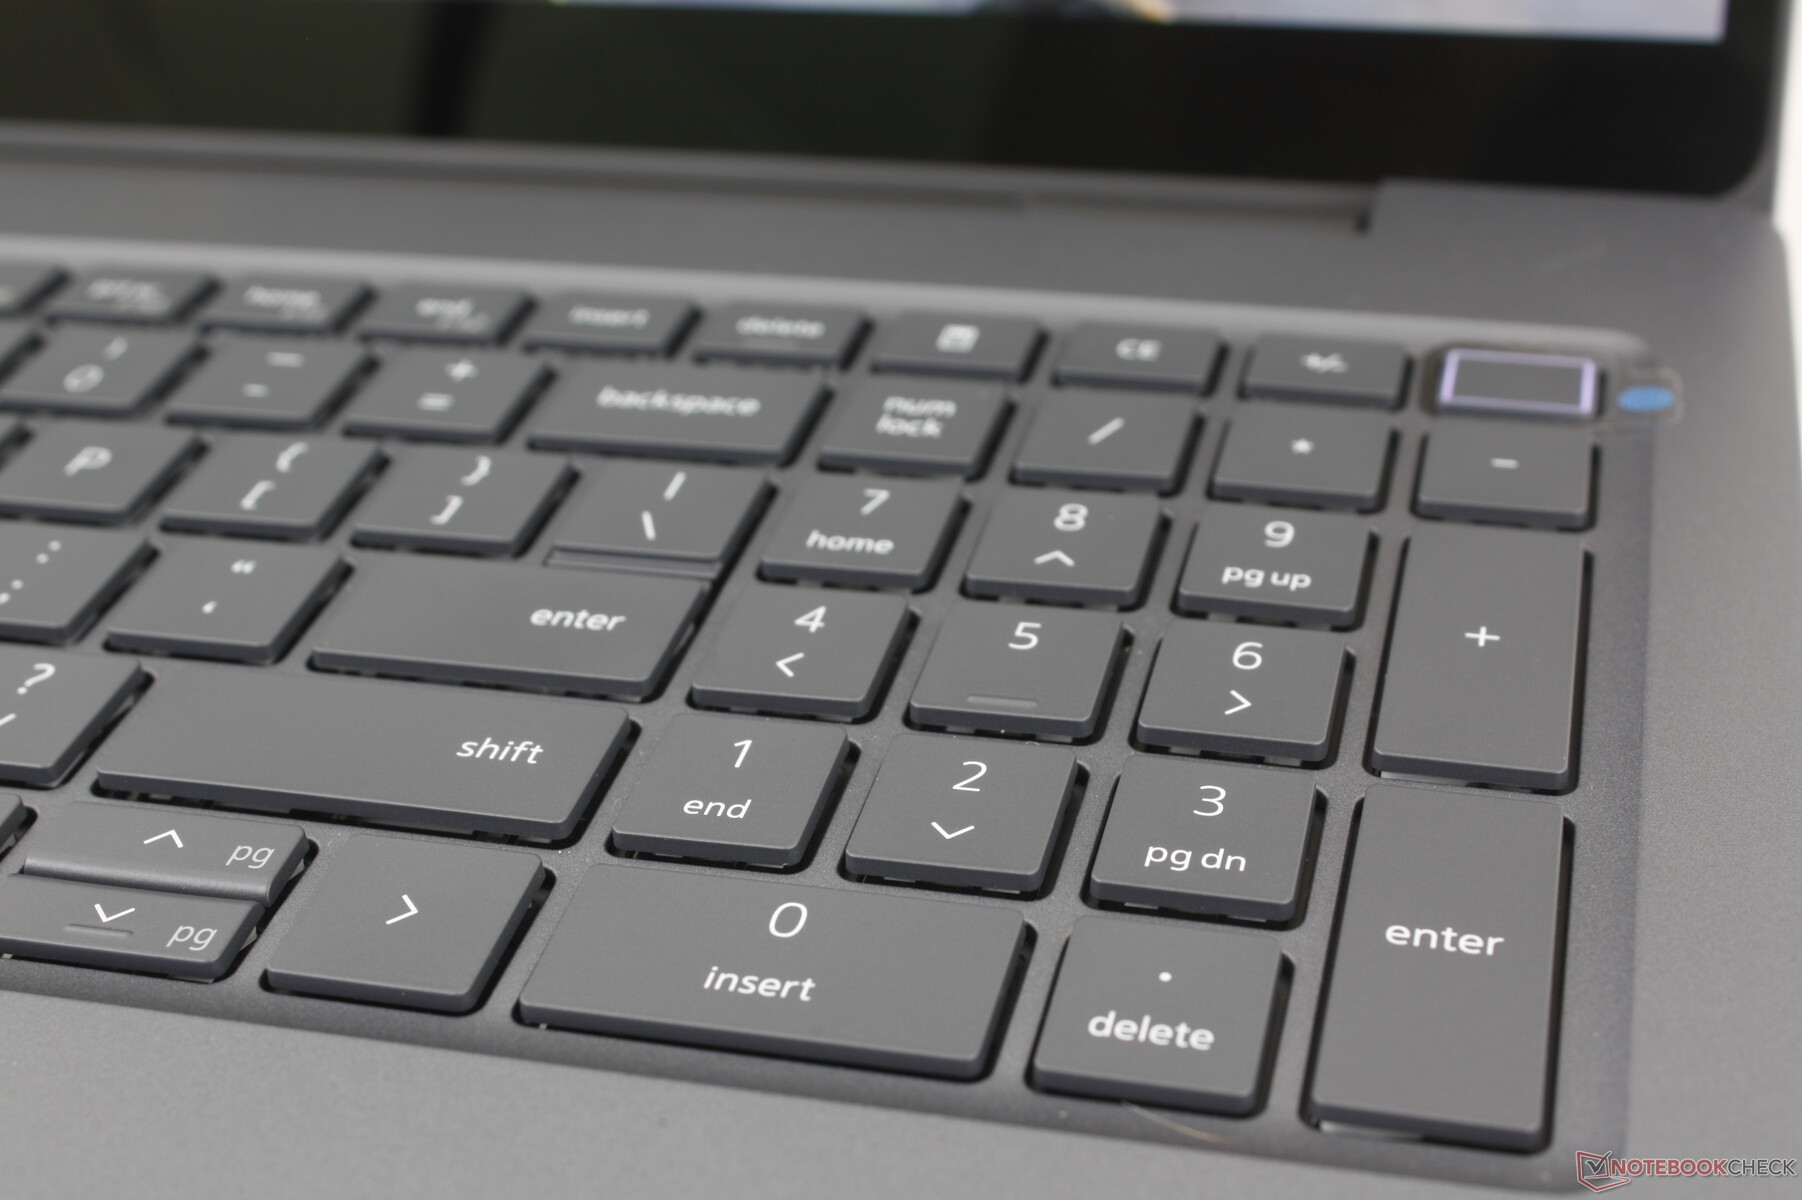
Dispositivi di ingresso
Tastiera e touchpad

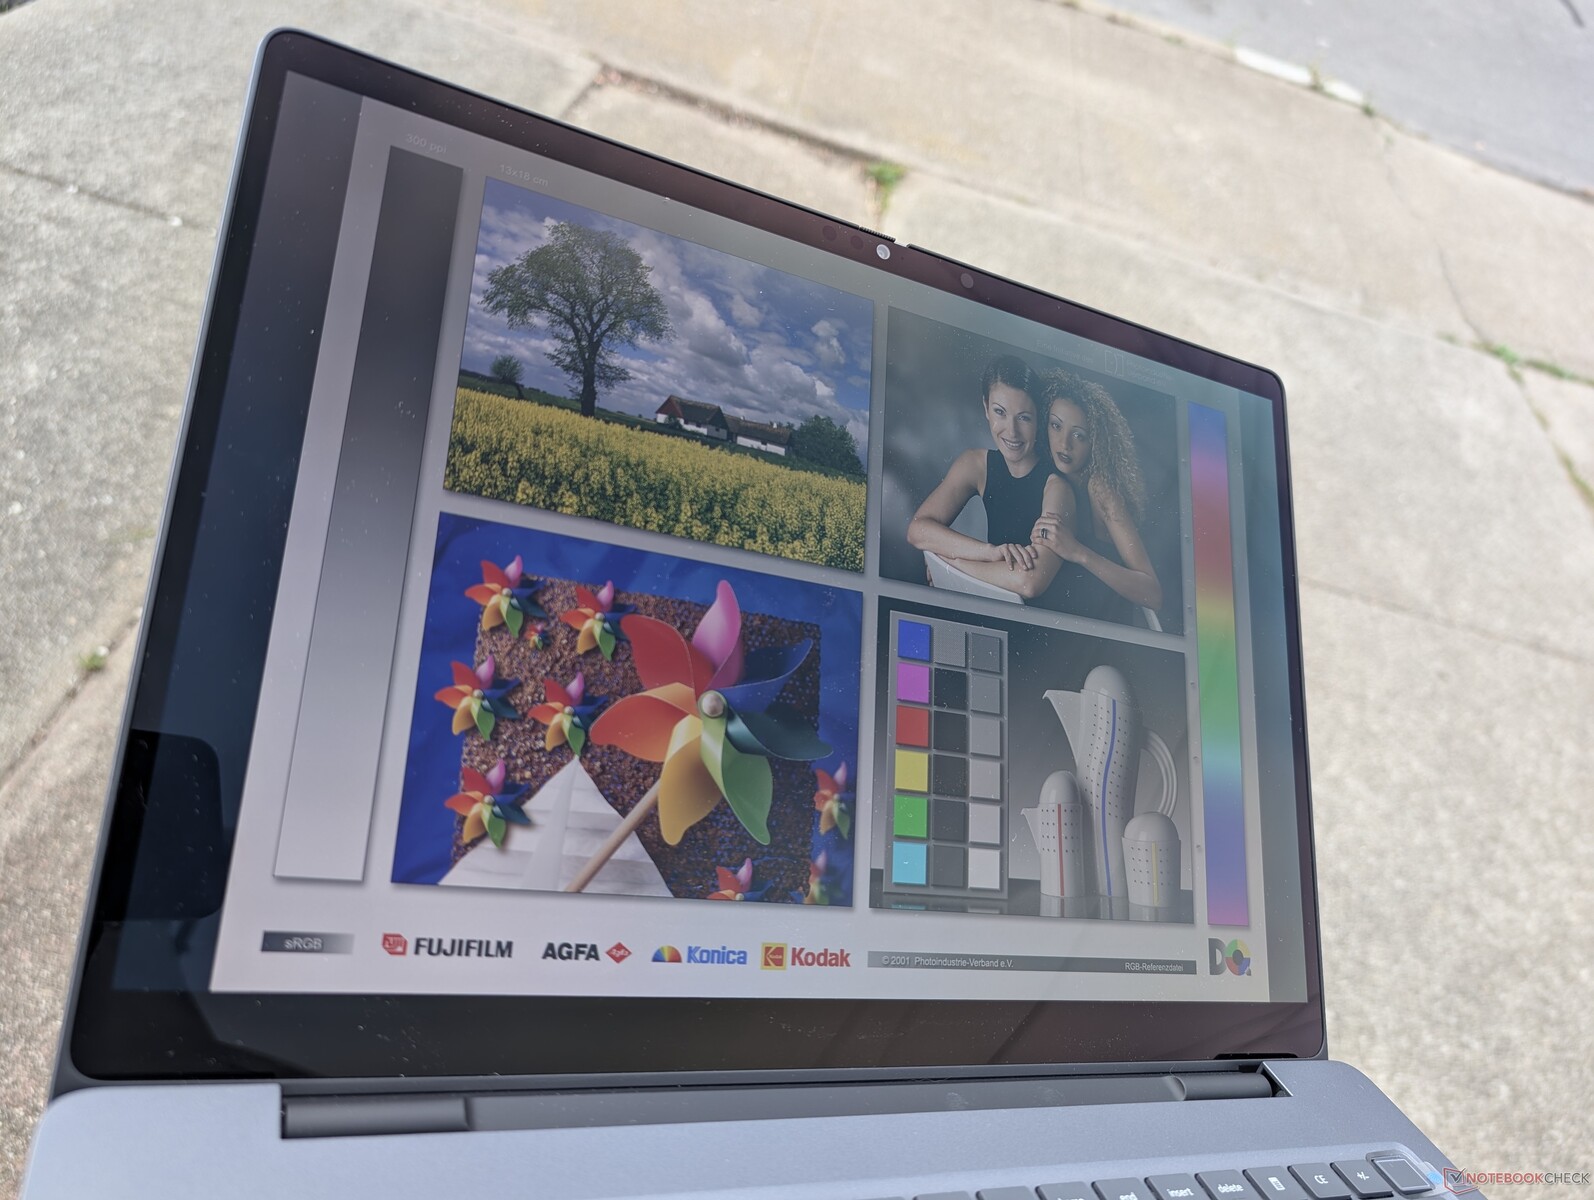
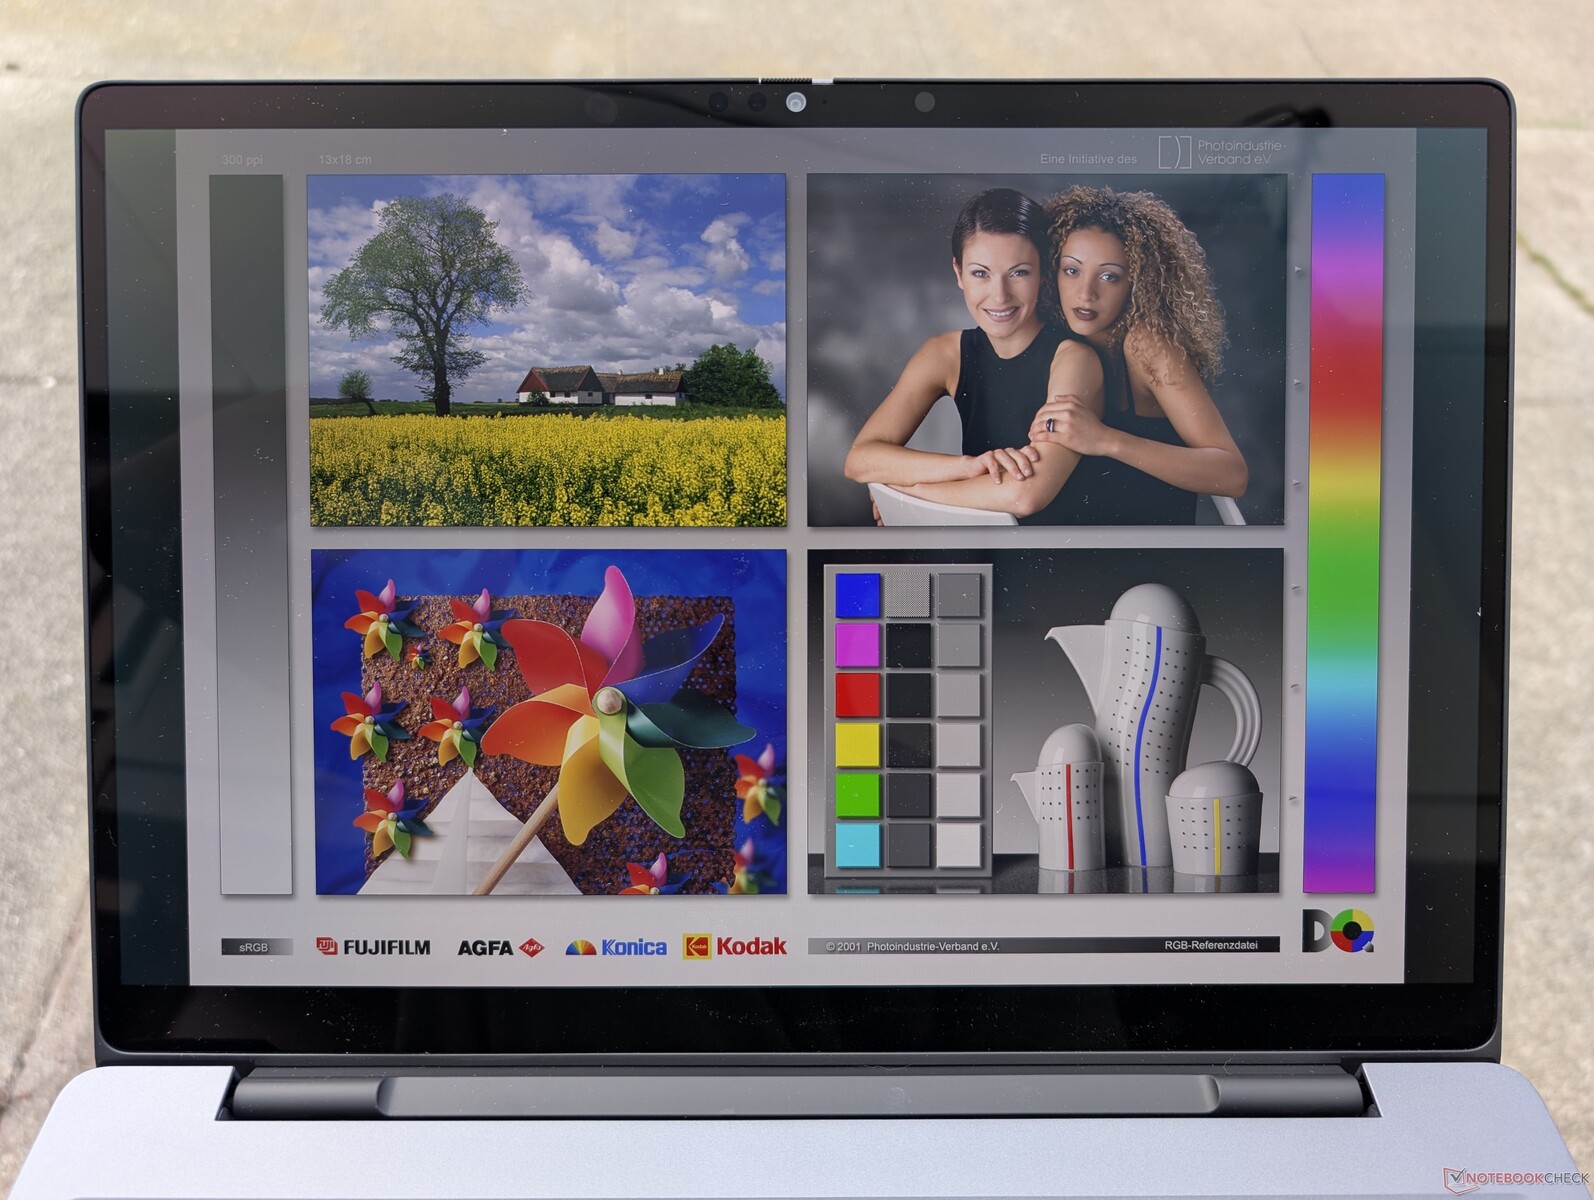
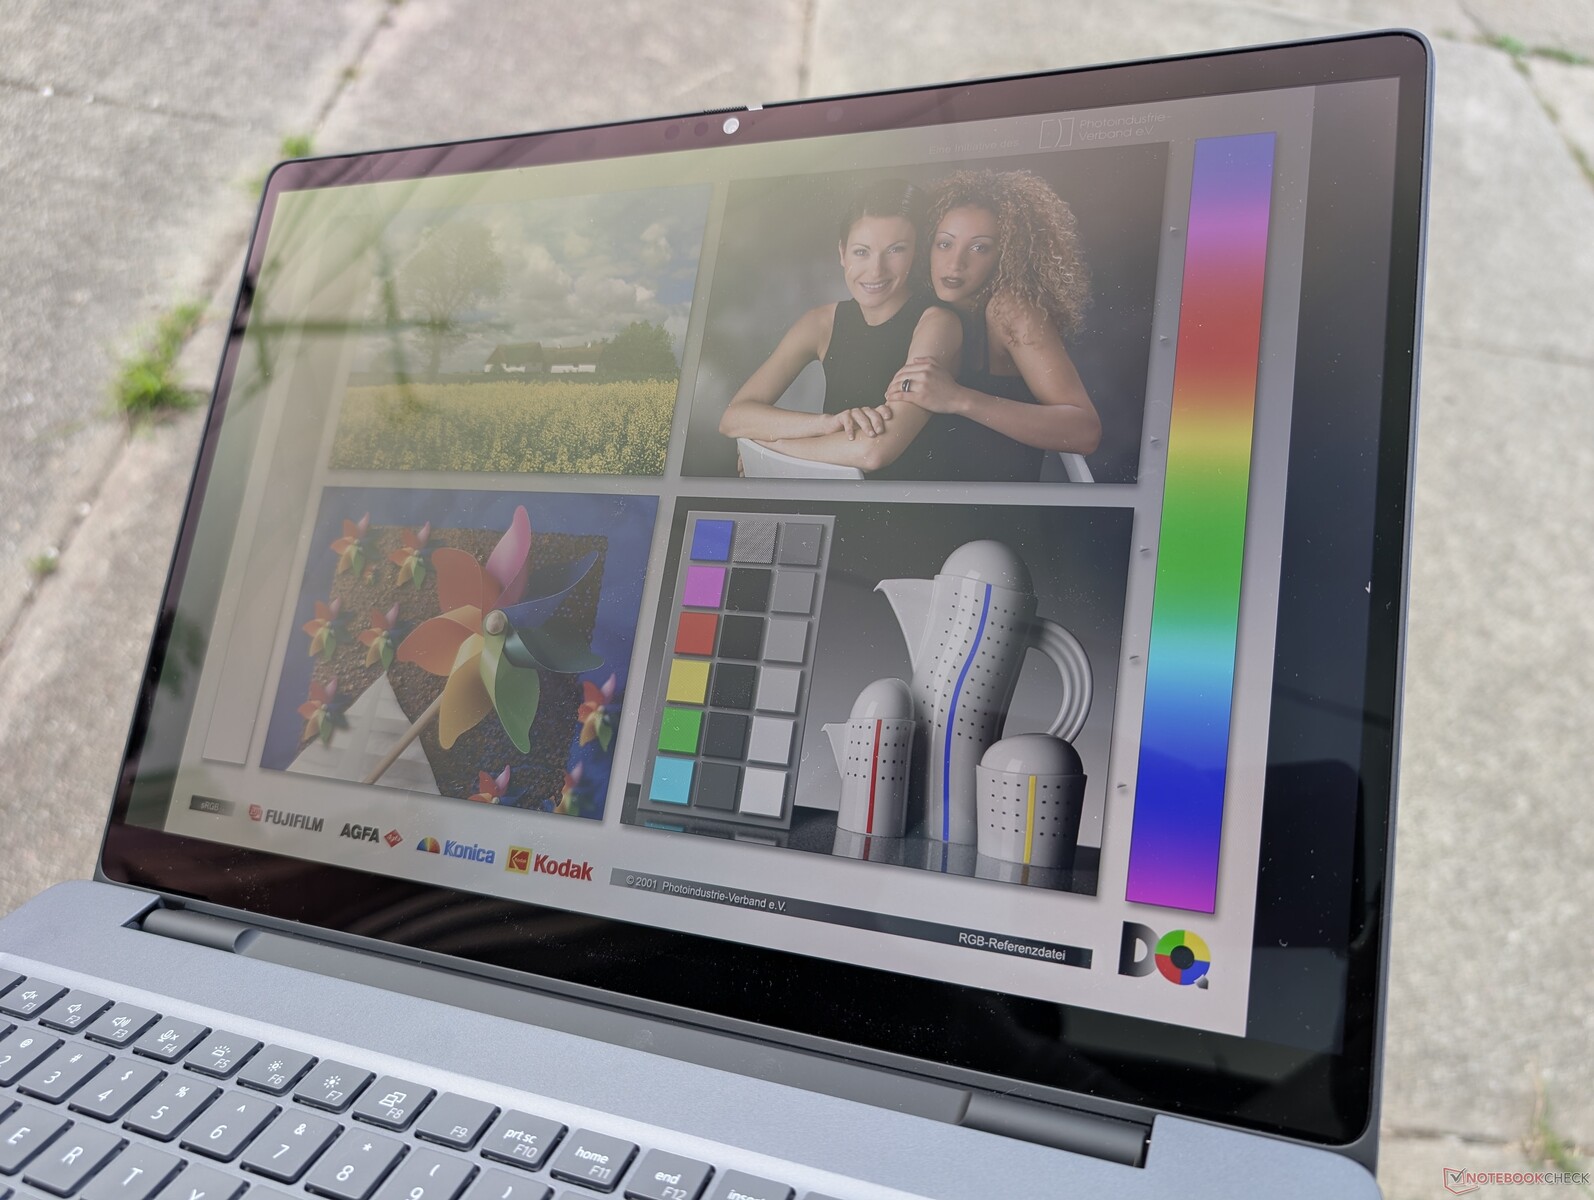
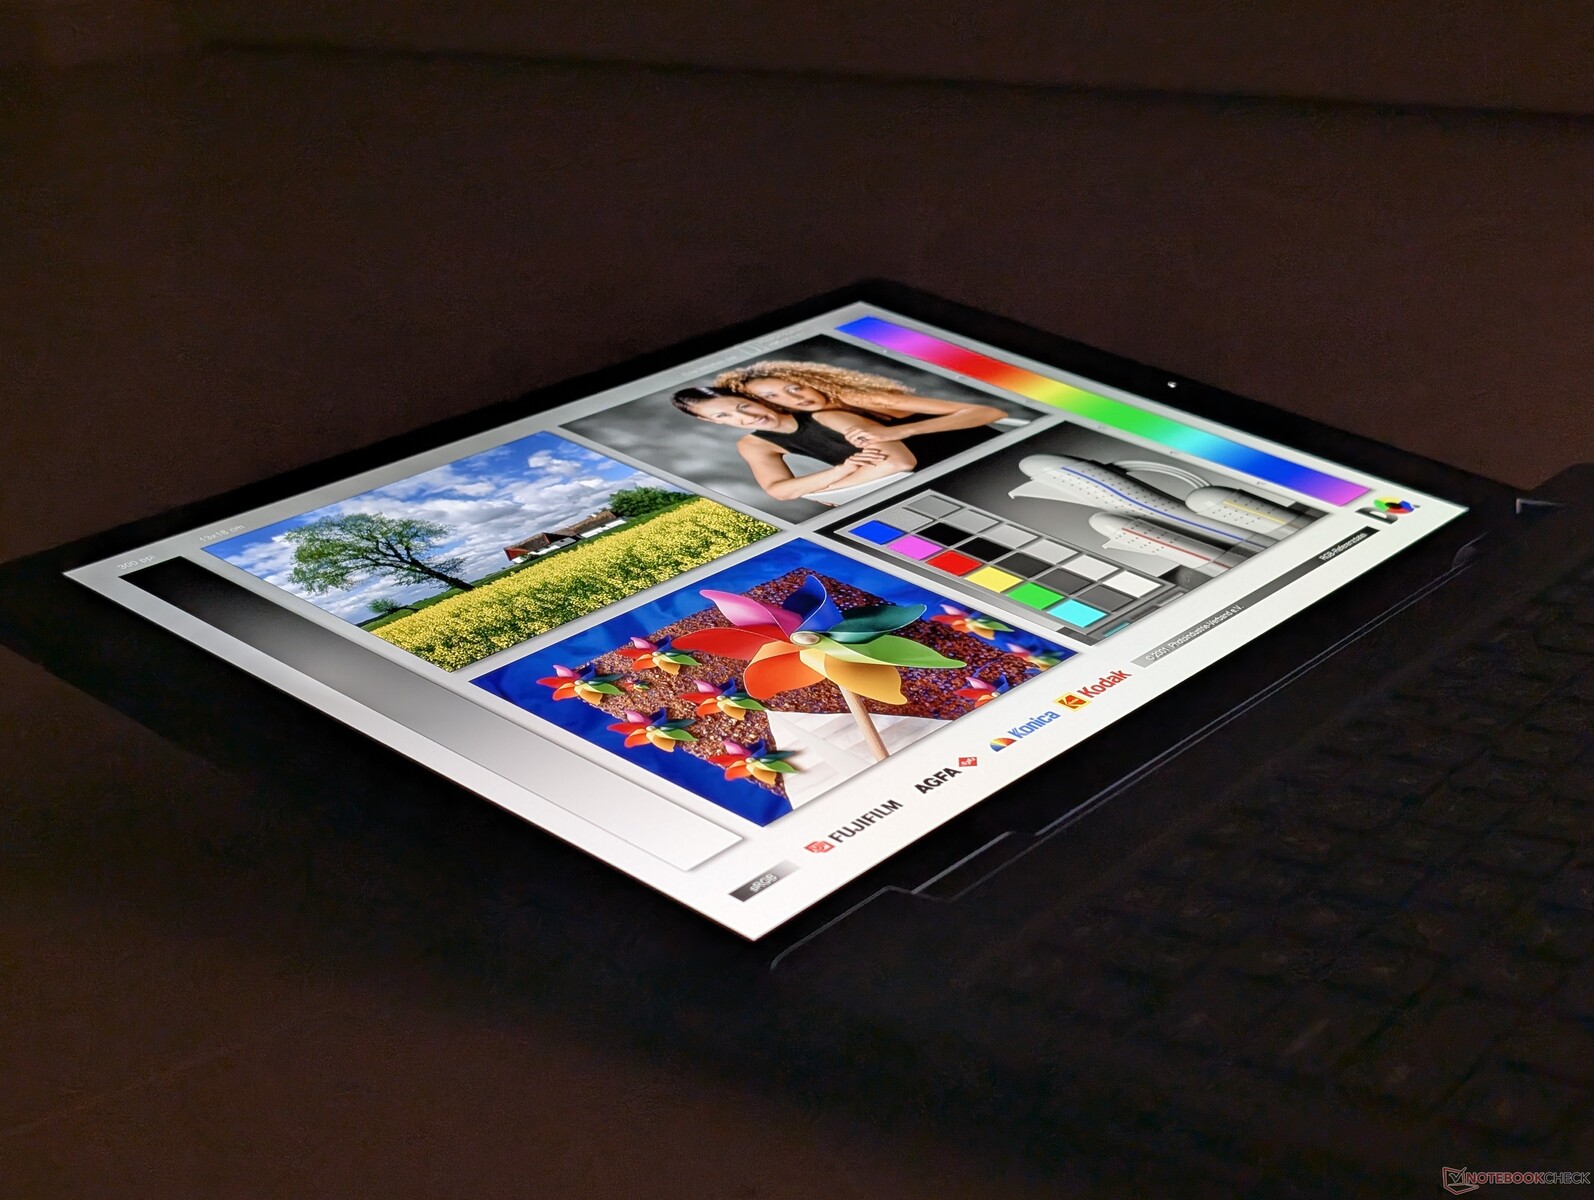
Display

Sono disponibili tre opzioni di visualizzazione, come segue:
- 1920 x 1200, 60 Hz, non touch, 300 nits, ~60% sRGB
- 1920 x 1200, 120 Hz, non touch, 500 nits, 100% DCI-P3
- 3840 x 2400, 120 Hz, OLED, touch, 500 nits, 100% DCI-P3
La nostra unità di prova è equipaggiata con l'opzione in grassetto qui sopra, per essere una delle poche workstation da 16 pollici che vengono fornite con pannelli OLED 4K 120 Hz.
La luminosità massima raggiunge ~550 nits se si attiva la modalità SDR o 1066 nits se si attiva la modalità HDR. la riproduzione 4K HDR è quindi altrettanto buona o migliore della maggior parte dei computer portatili consumer di livello enthusiast.
| |||||||||||||||||||||||||
Distribuzione della luminosità: 95 %
Al centro con la batteria: 530.9 cd/m²
Contrasto: ∞:1 (Nero: 0 cd/m²)
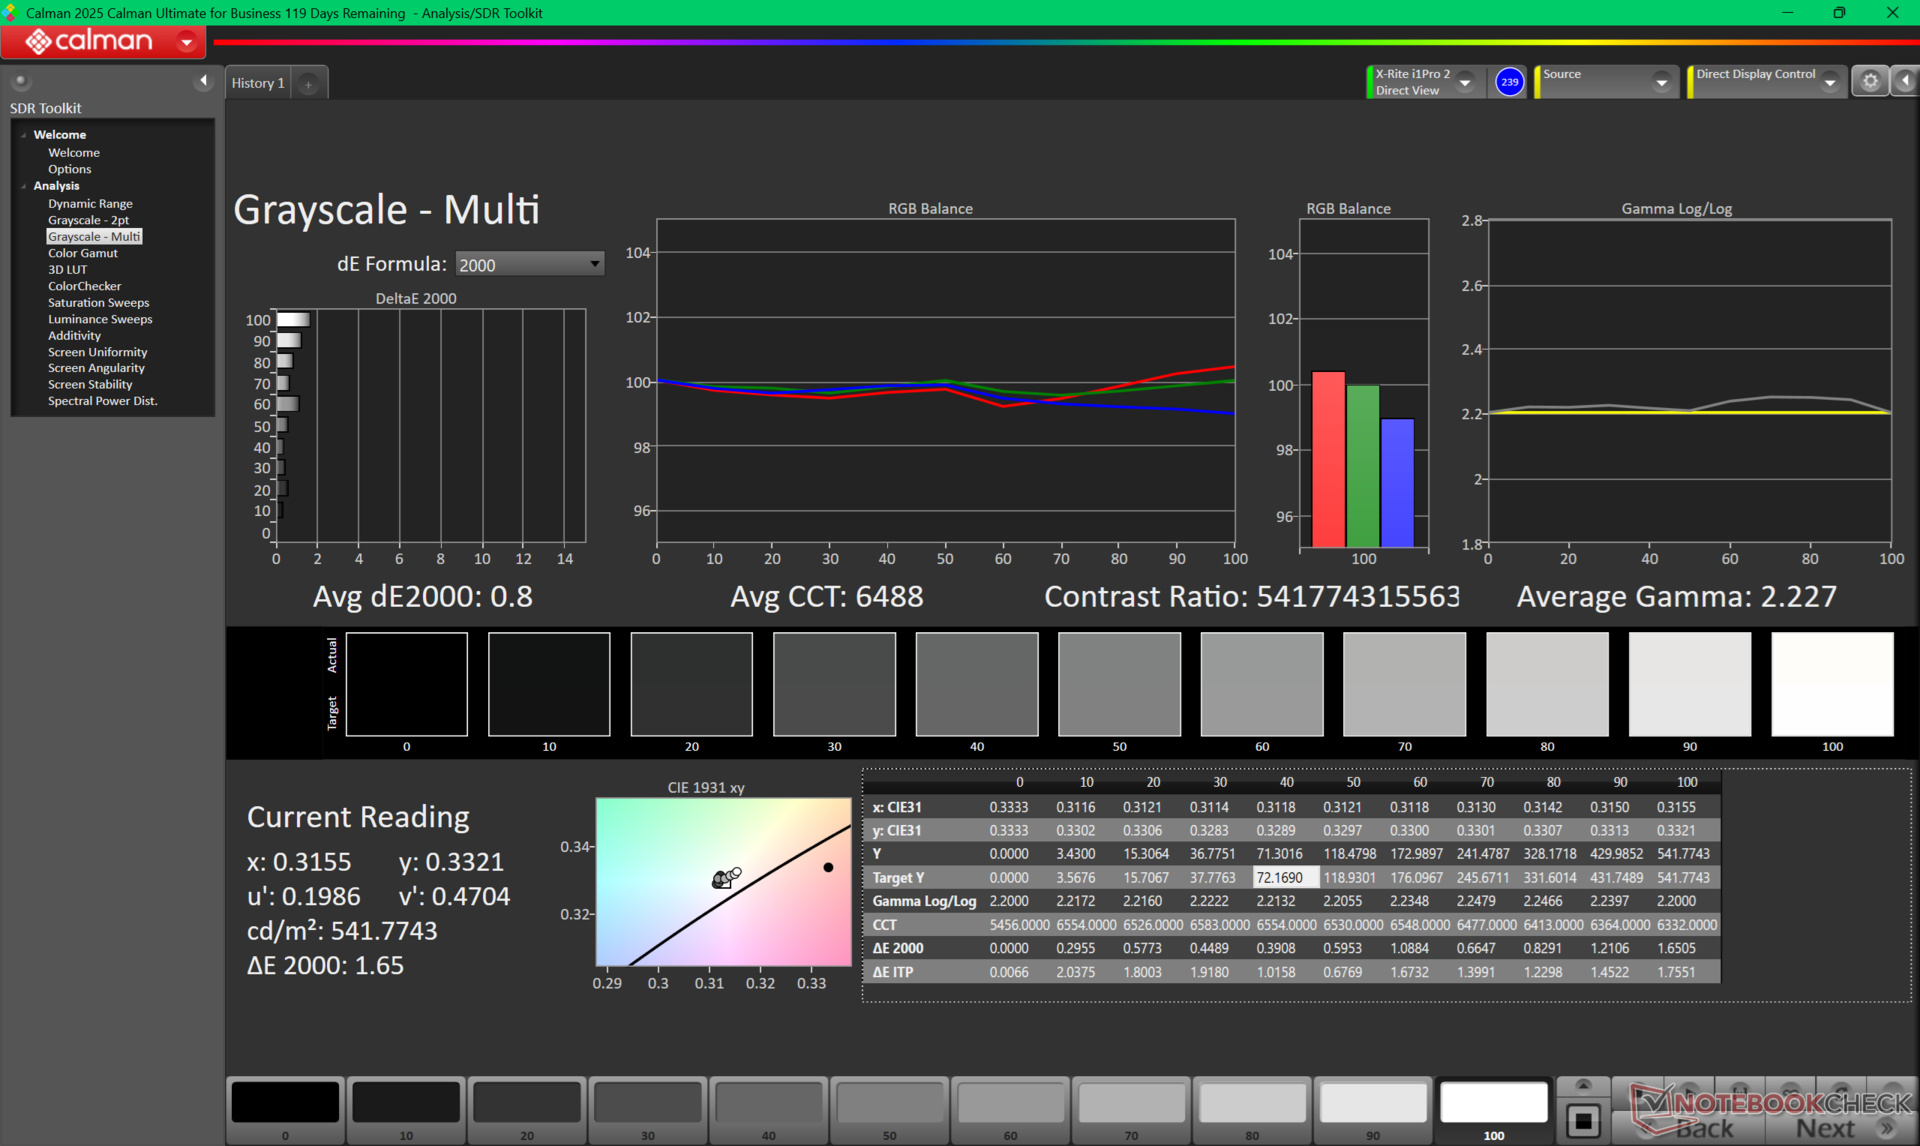
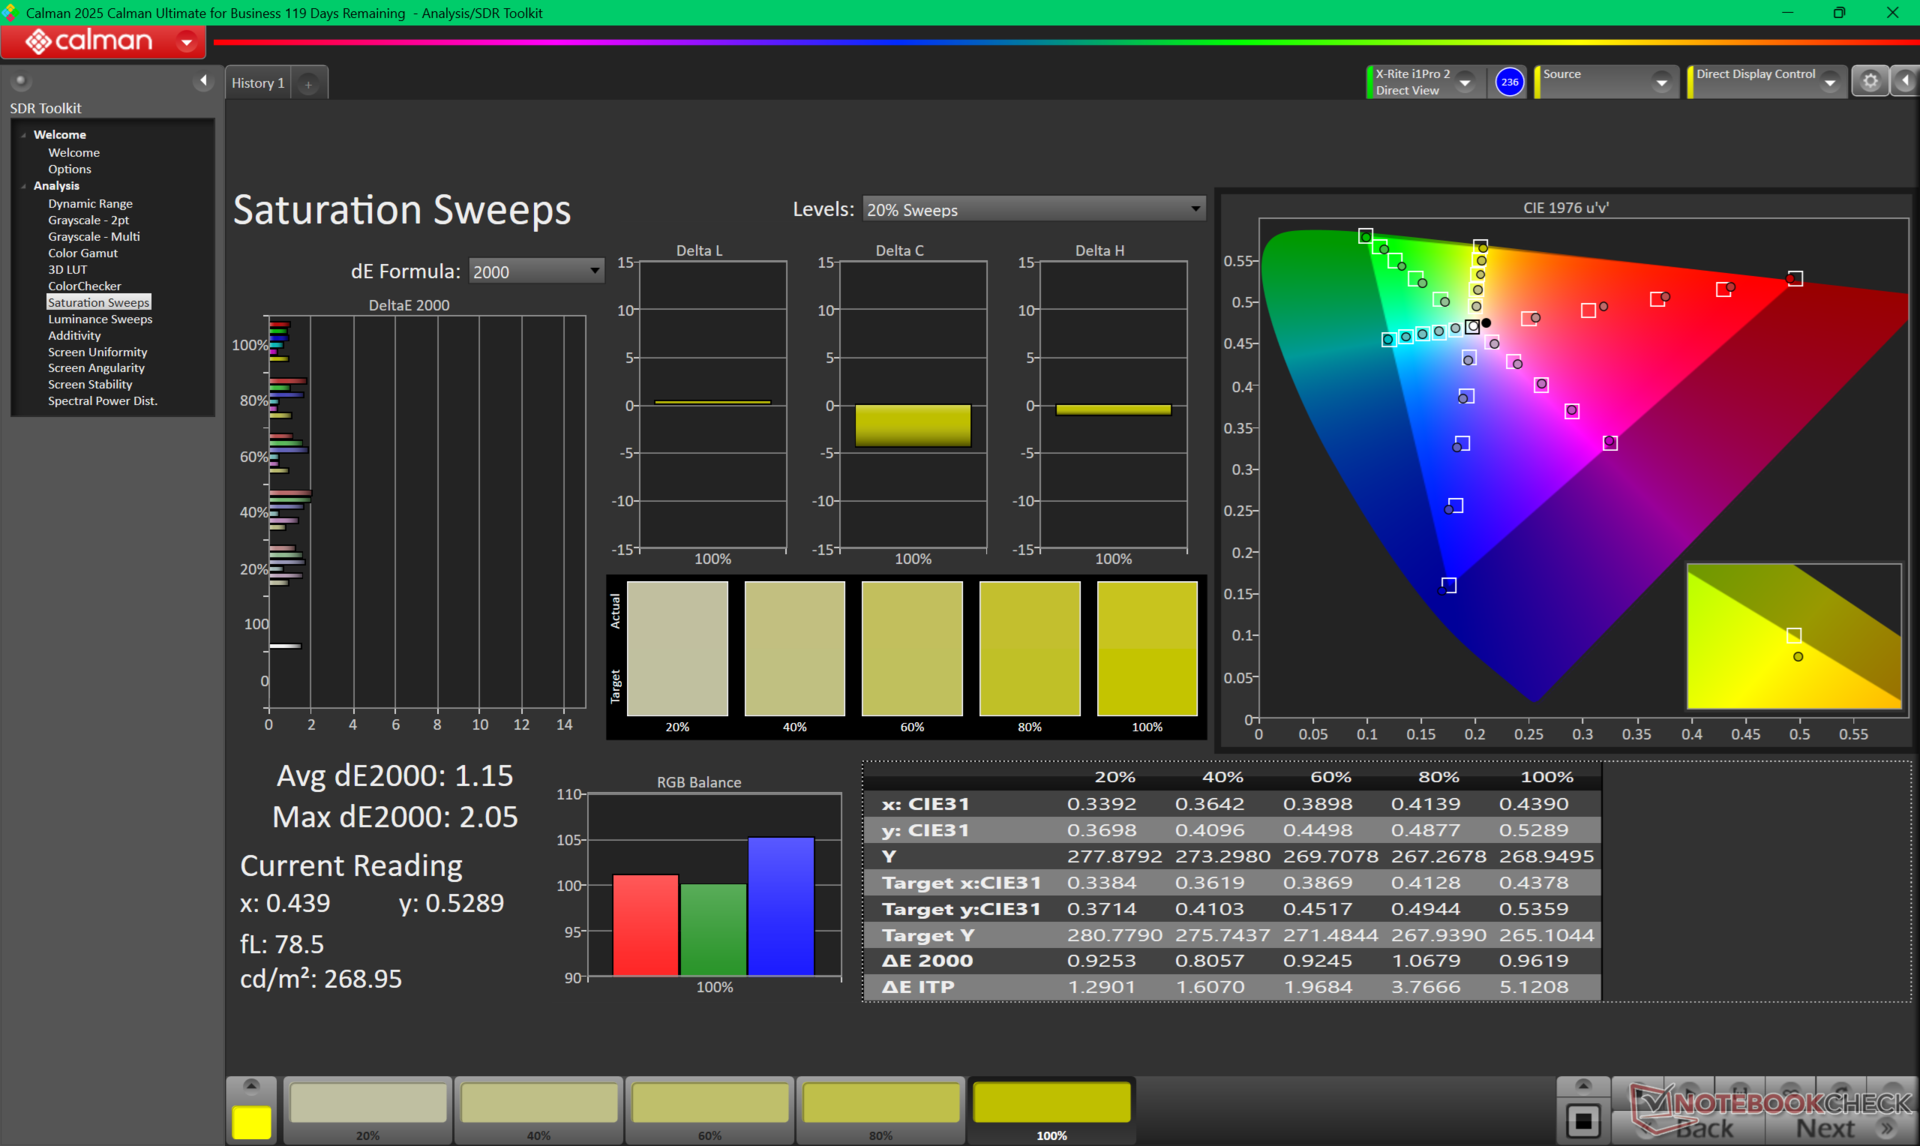
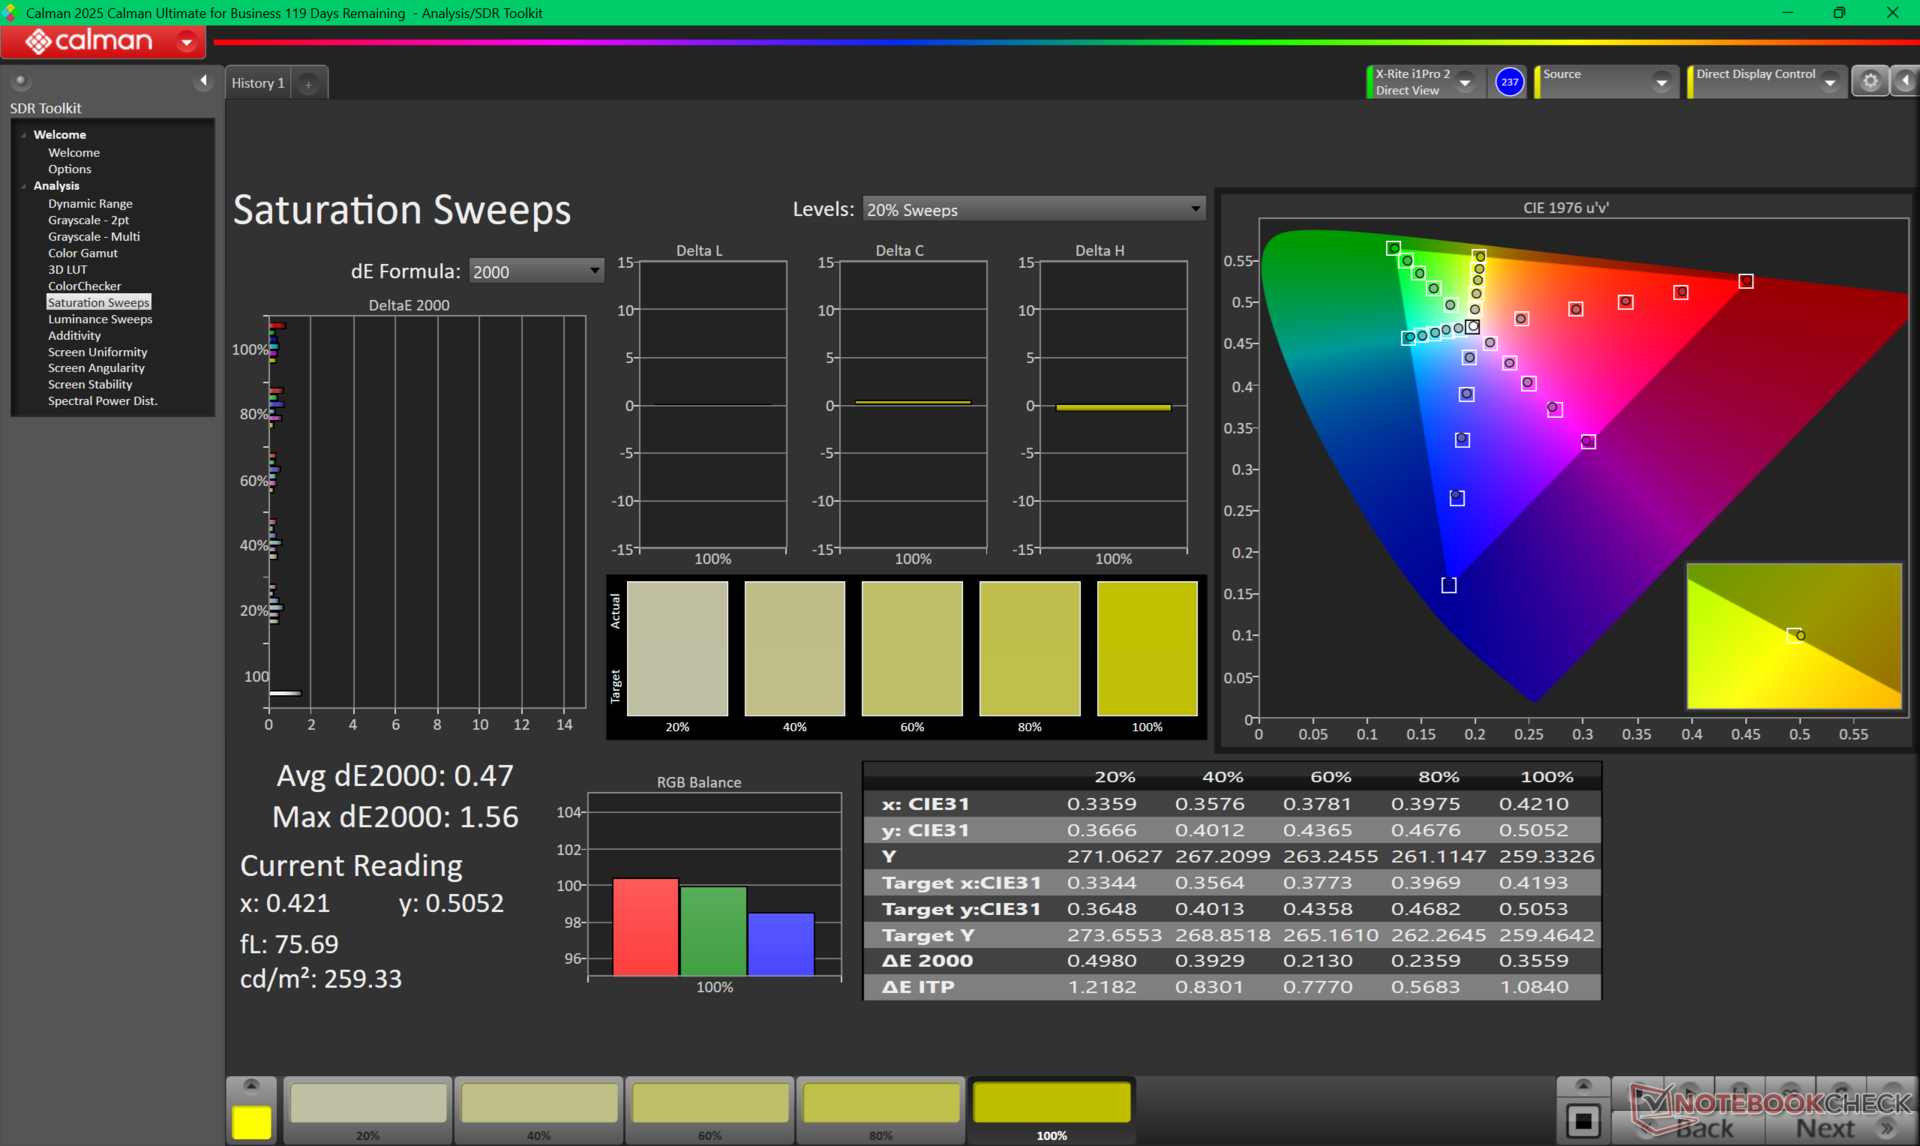
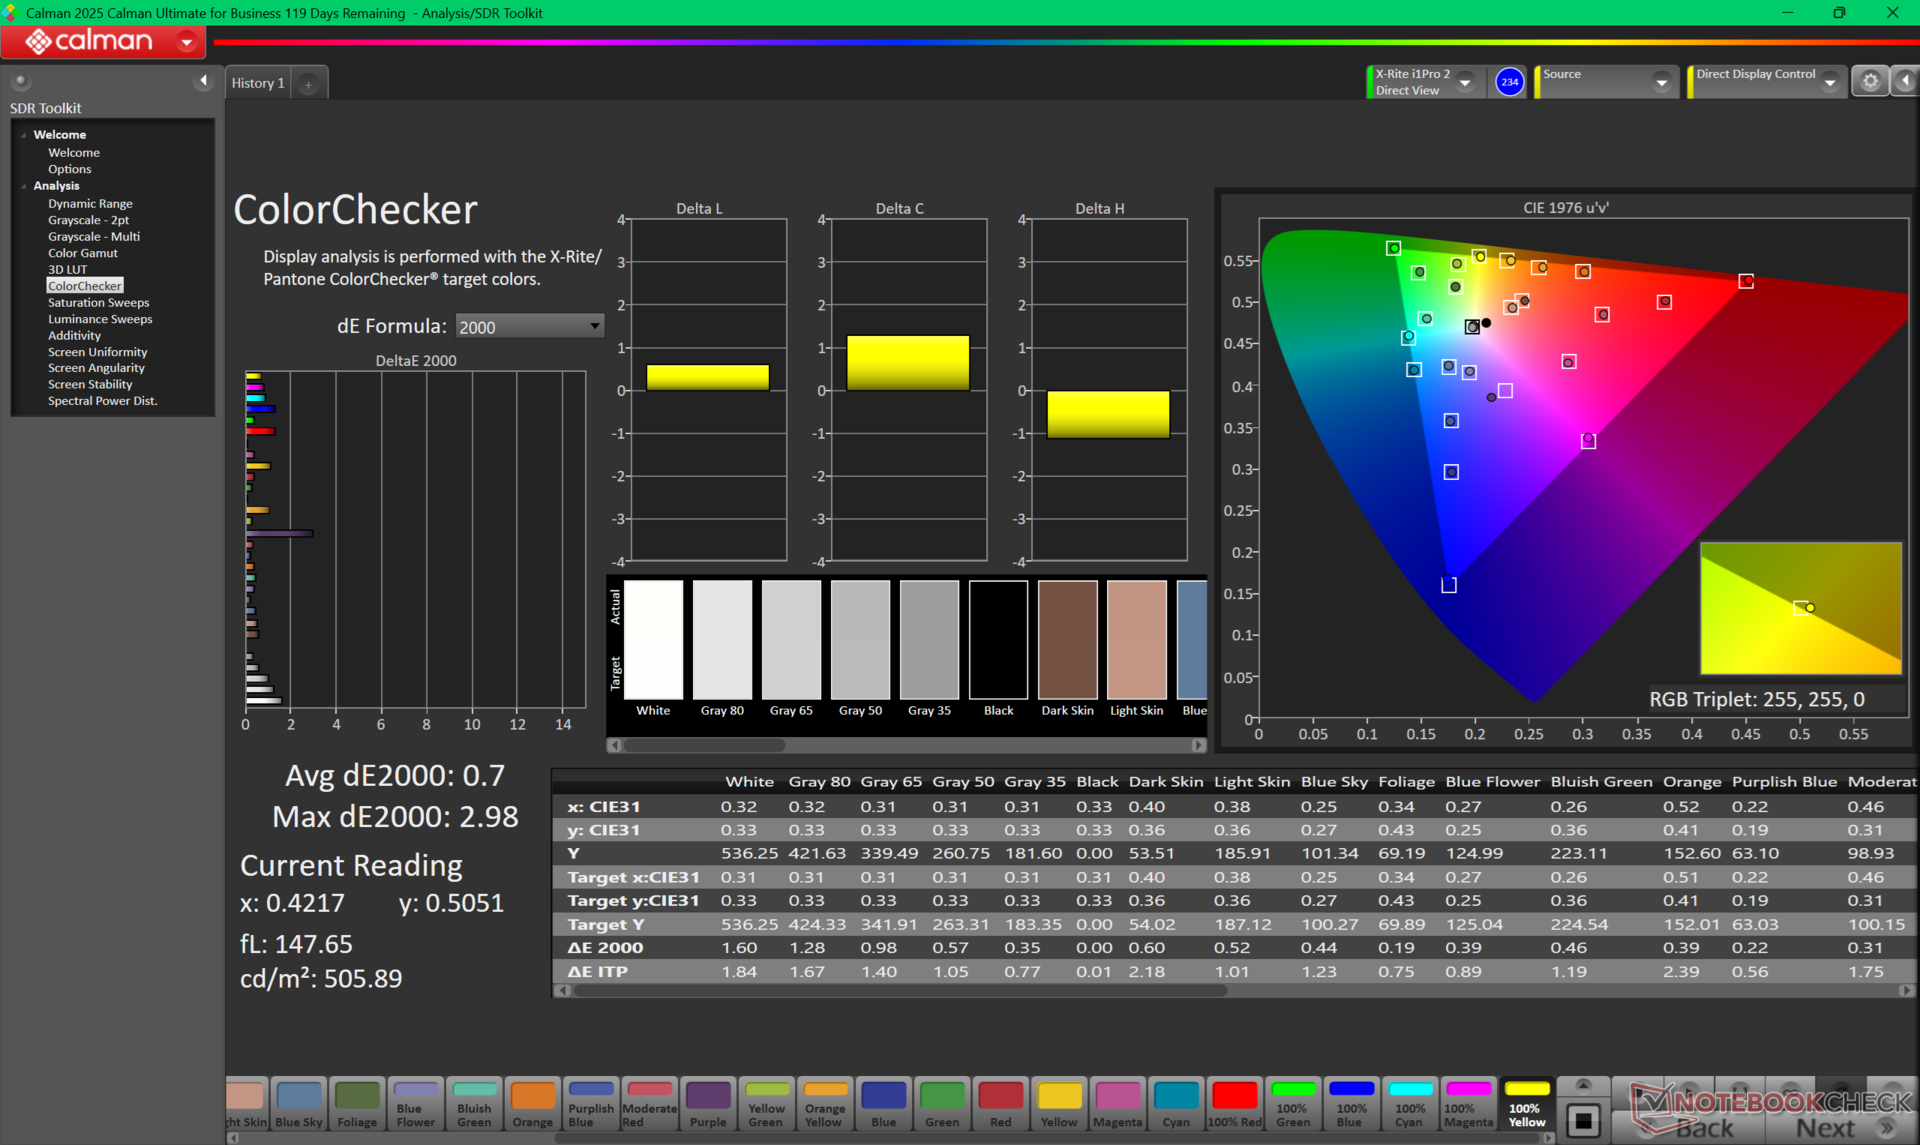
ΔE ColorChecker Calman: 2.42 | ∀{0.5-29.43 Ø4.8}
calibrated: 0.7
ΔE Greyscale Calman: 0.8 | ∀{0.09-98 Ø5}
88.8% AdobeRGB 1998 (Argyll 3D)
100% sRGB (Argyll 3D)
97.3% Display P3 (Argyll 3D)
Gamma: 2.23
CCT: 6488 K
| Dell Pro Max 16 Plus Samsung 160HC01, OLED, 3840x2400, 16", 120 Hz | Dell Precision 5690 Samsung 160YV03, OLED, 3840x2400, 16", 60 Hz | Dell Precision 5000 5680 Samsung 160YV03, OLED, 3840x2400, 16", 60 Hz | Lenovo ThinkPad P16 Gen 2 NE160QDM-NY1, IPS, 2560x1600, 16", 165 Hz | Lenovo ThinkPad P1 Gen 7 21KV001SGE MNG007DA1-9 , IPS LED, 2560x1600, 16", 165 Hz | HP ZBook Studio 16 G11 AUO87A8, IPS, 3840x2400, 16", 120 Hz | MSI CreatorPro Z16P B12UKST B160QAN02.N, IPS, 2560x1600, 16", 165 Hz | |
|---|---|---|---|---|---|---|---|
| Display | 4% | 4% | -18% | -17% | -1% | -1% | |
| Display P3 Coverage (%) | 97.3 | 99.8 3% | 99.9 3% | 68.4 -30% | 69.4 -29% | 97.7 0% | 97.6 0% |
| sRGB Coverage (%) | 100 | 100 0% | 100 0% | 96.9 -3% | 97.6 -2% | 99.9 0% | 99.9 0% |
| AdobeRGB 1998 Coverage (%) | 88.8 | 96.6 9% | 97.5 10% | 70.6 -20% | 71.8 -19% | 85.7 -3% | 87.4 -2% |
| Response Times | -131% | -133% | -1575% | -1385% | -1623% | -1332% | |
| Response Time Grey 50% / Grey 80% * (ms) | 0.63 ? | 1.7 ? -170% | 1.68 ? -167% | 14.1 ? -2138% | 11.2 ? -1678% | 14.2 ? -2154% | 12.8 ? -1932% |
| Response Time Black / White * (ms) | 0.89 ? | 1.7 ? -91% | 1.77 ? -99% | 9.9 ? -1012% | 10.6 ? -1091% | 10.6 ? -1091% | 7.4 ? -731% |
| PWM Frequency (Hz) | 479.9 ? | 60 ? | 60 ? | ||||
| PWM Amplitude * (%) | 28 | ||||||
| Screen | -44% | -67% | 0% | -112% | -44% | -17% | |
| Brightness middle (cd/m²) | 530.9 | 348.1 -34% | 345.7 -35% | 531.5 0% | 516 -3% | 404.3 -24% | 407 -23% |
| Brightness (cd/m²) | 540 | 351 -35% | 349 -35% | 499 -8% | 505 -6% | 405 -25% | 388 -28% |
| Brightness Distribution (%) | 95 | 97 2% | 98 3% | 89 -6% | 89 -6% | 92 -3% | 88 -7% |
| Black Level * (cd/m²) | 0.38 | 0.41 | 0.28 | 0.36 | |||
| Colorchecker dE 2000 * | 2.42 | 4.18 -73% | 3.59 -48% | 1.82 25% | 3.5 -45% | 2.63 -9% | 1.3 46% |
| Colorchecker dE 2000 max. * | 5.76 | 6.68 -16% | 7.02 -22% | 4.1 29% | 8.8 -53% | 4.48 22% | 2.5 57% |
| Colorchecker dE 2000 calibrated * | 0.7 | 0.97 -39% | 0.99 -41% | 0.63 10% | 1.2 -71% | 1.46 -109% | 0.7 -0% |
| Greyscale dE 2000 * | 0.8 | 1.7 -113% | 3.1 -288% | 1.2 -50% | 5.6 -600% | 2.1 -163% | 2.1 -163% |
| Gamma | 2.23 99% | 2.2 100% | 2.13 103% | 2.15 102% | 2.27 97% | 2.3 96% | 2.26 97% |
| CCT | 6488 100% | 6198 105% | 6448 101% | 6484 100% | 6071 107% | 6810 95% | 6437 101% |
| Contrast (:1) | 1399 | 1259 | 1444 | 1131 | |||
| Media totale (Programma / Settaggio) | -57% /
-46% | -65% /
-60% | -531% /
-267% | -505% /
-300% | -556% /
-297% | -450% /
-232% |
* ... Meglio usare valori piccoli
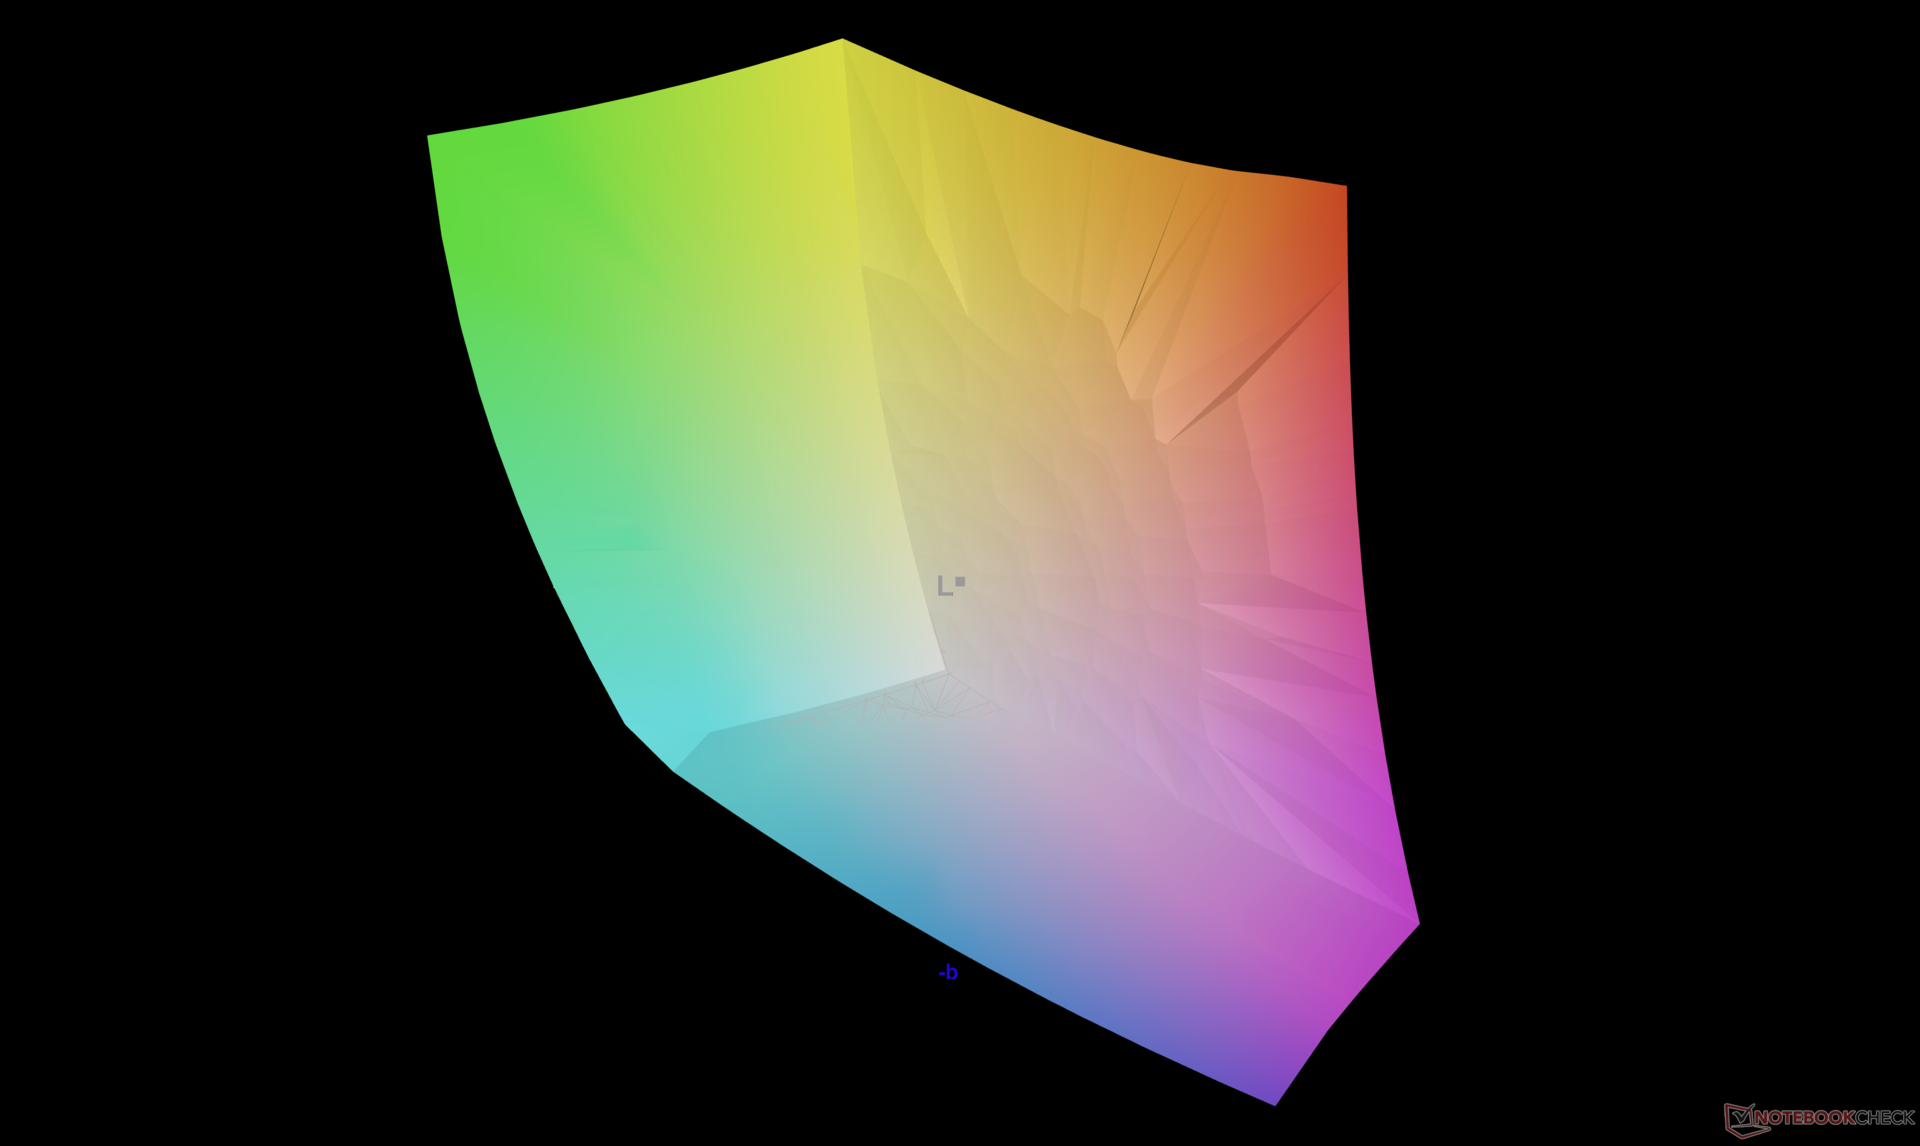
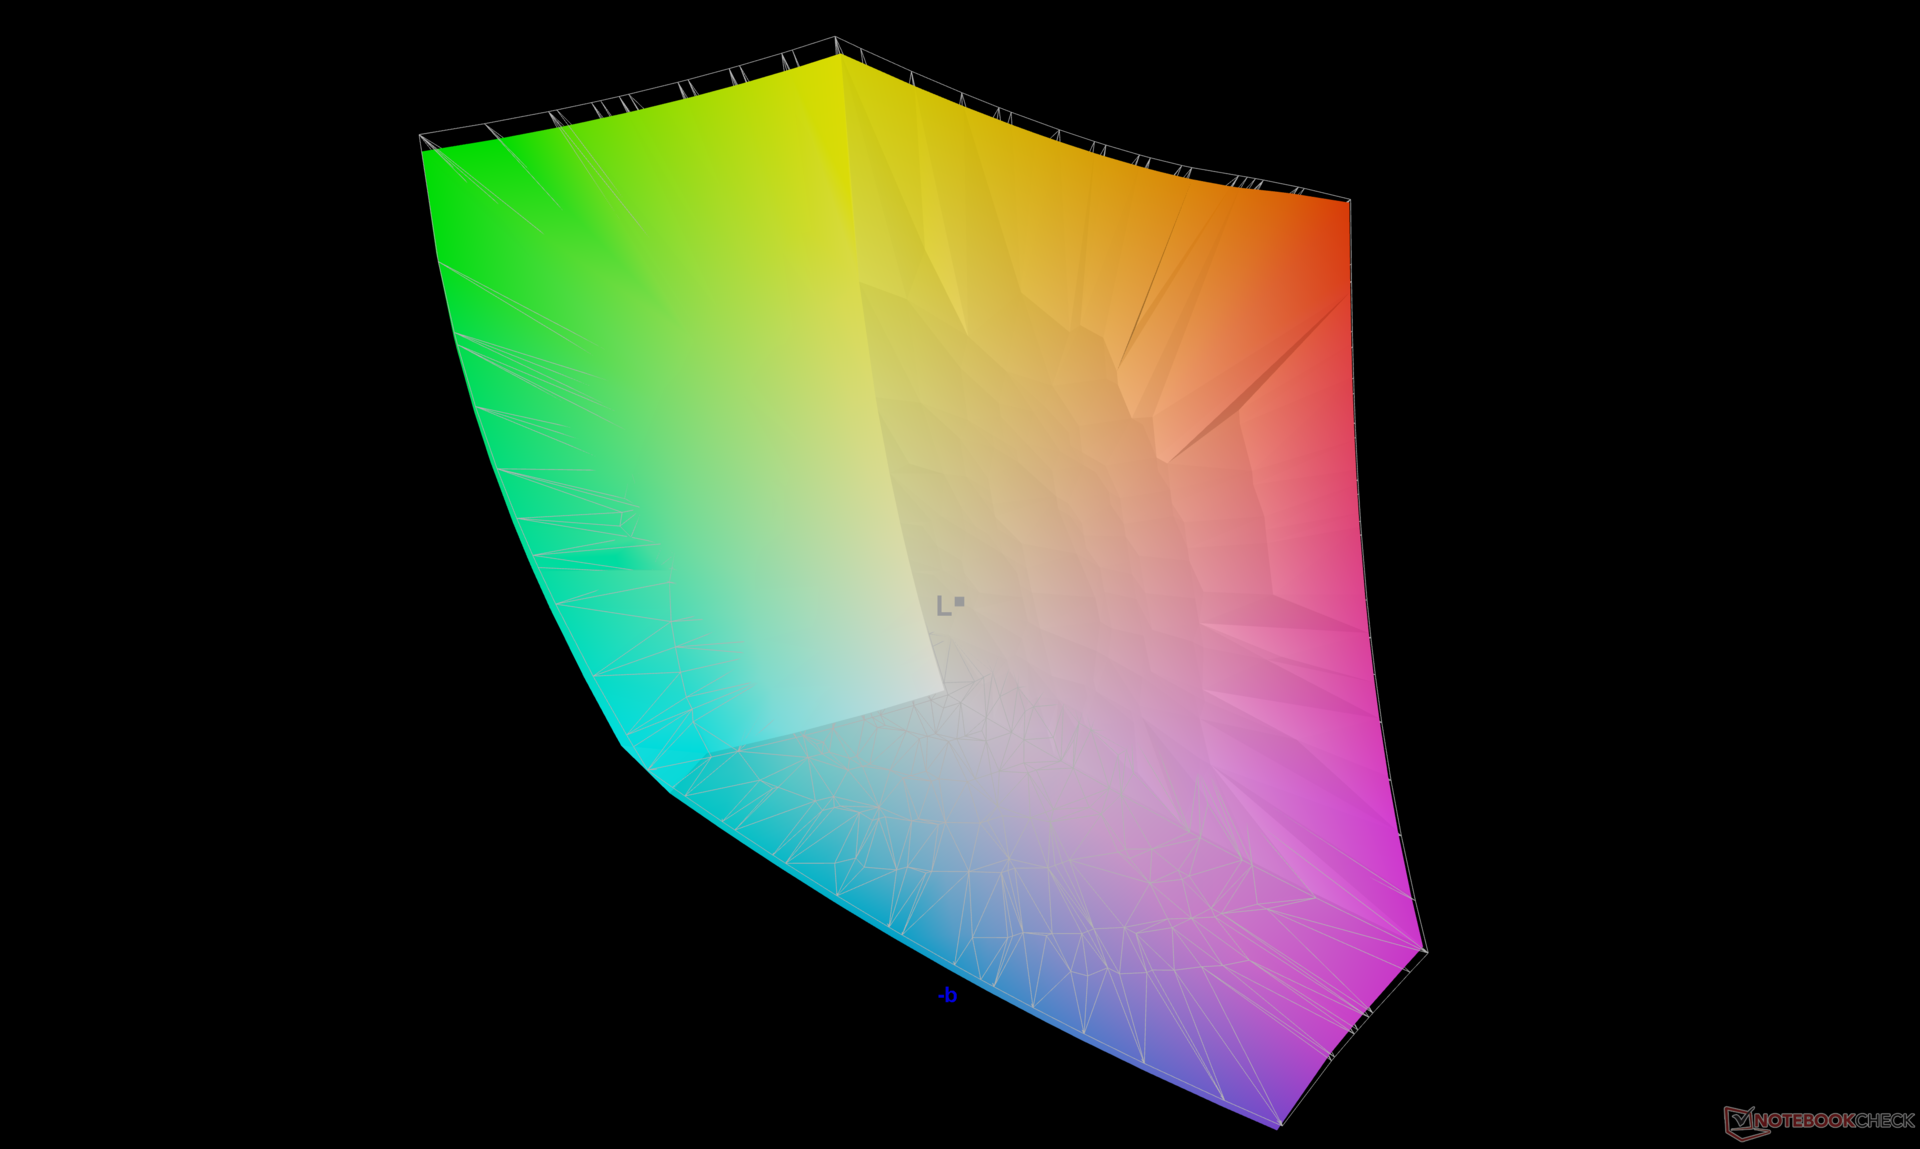
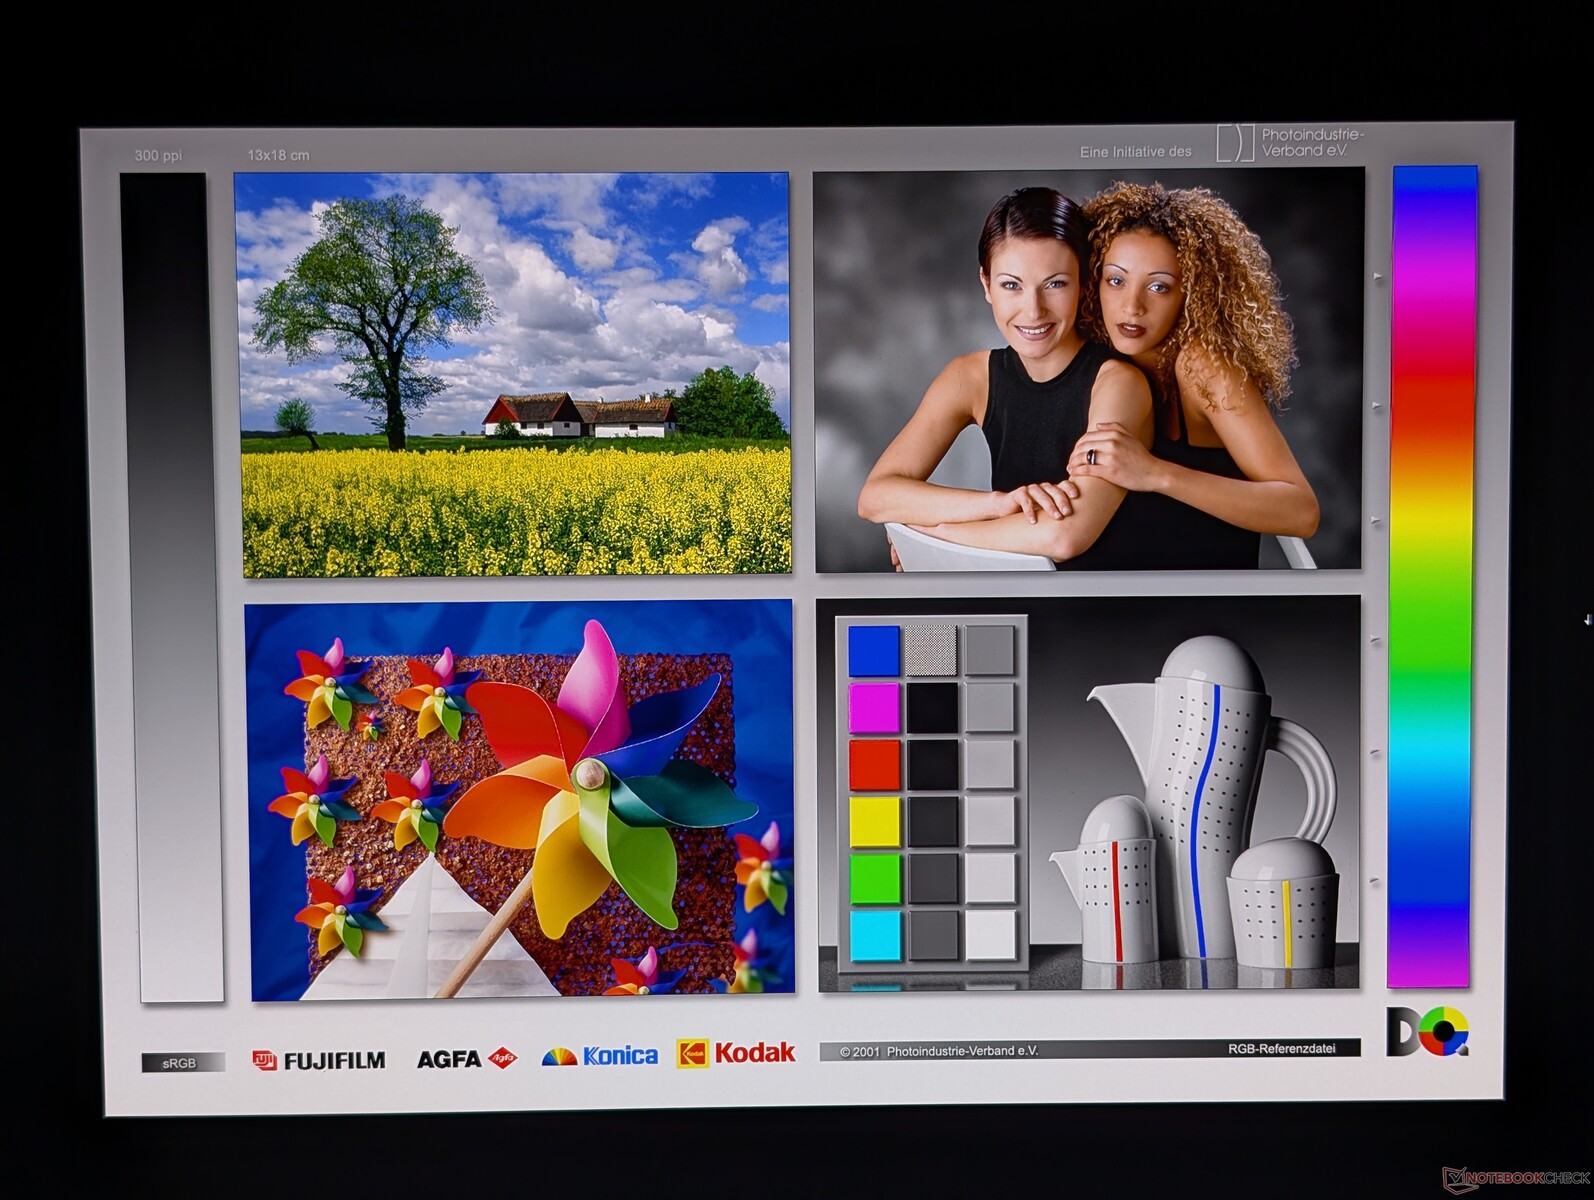
Il display viene fornito ben calibrato rispetto allo standard P3, con valori medi di deltaE della scala di grigi e del colore di appena 0,8 e 2,42, rispettivamente.


Tempi di risposta del Display
| ↔ Tempi di risposta dal Nero al Bianco | ||
|---|---|---|
| 0.89 ms ... aumenta ↗ e diminuisce ↘ combinato | ↗ 0.42 ms Incremento | 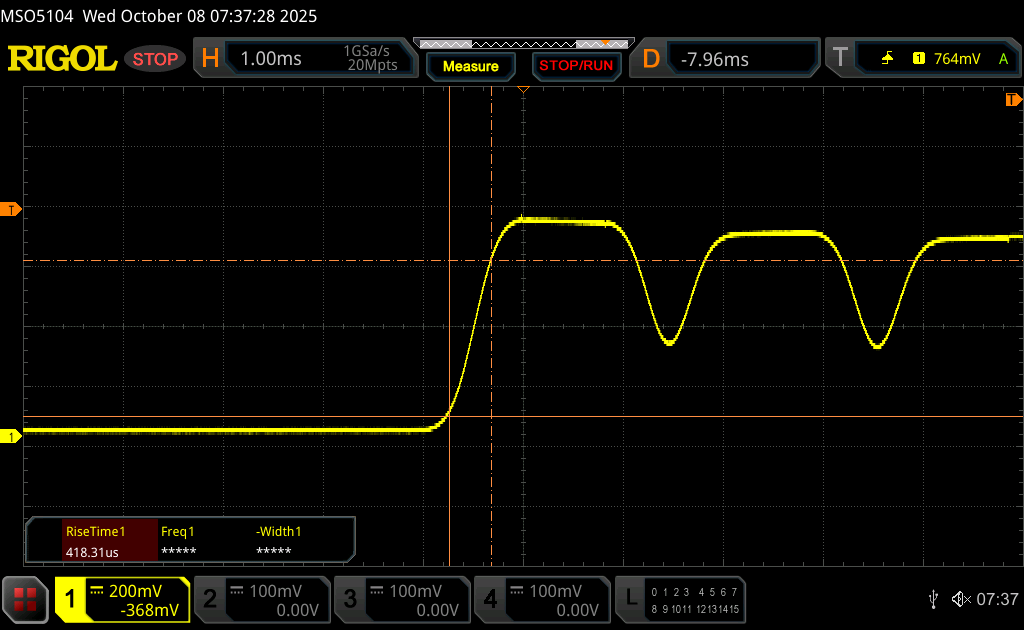 |
| ↘ 0.47 ms Calo | ||
| Lo schermo ha mostrato valori di risposta molto veloci nei nostri tests ed è molto adatto per i gaming veloce. In confronto, tutti i dispositivi di test variano da 0.1 (minimo) a 240 (massimo) ms. » 2 % di tutti i dispositivi è migliore. Questo significa che i tempi di risposta rilevati sono migliori rispettto alla media di tutti i dispositivi testati (20.3 ms). | ||
| ↔ Tempo di risposta dal 50% Grigio all'80% Grigio | ||
| 0.63 ms ... aumenta ↗ e diminuisce ↘ combinato | ↗ 0.34 ms Incremento | 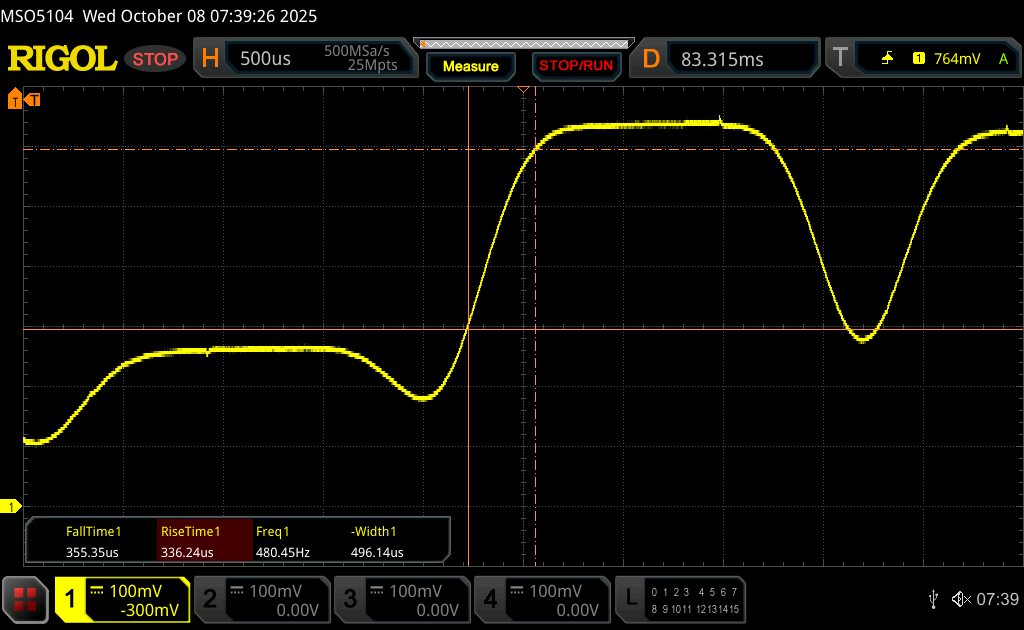 |
| ↘ 0.29 ms Calo | ||
| Lo schermo ha mostrato valori di risposta molto veloci nei nostri tests ed è molto adatto per i gaming veloce. In confronto, tutti i dispositivi di test variano da 0.165 (minimo) a 636 (massimo) ms. » 1 % di tutti i dispositivi è migliore. Questo significa che i tempi di risposta rilevati sono migliori rispettto alla media di tutti i dispositivi testati (31.7 ms). | ||
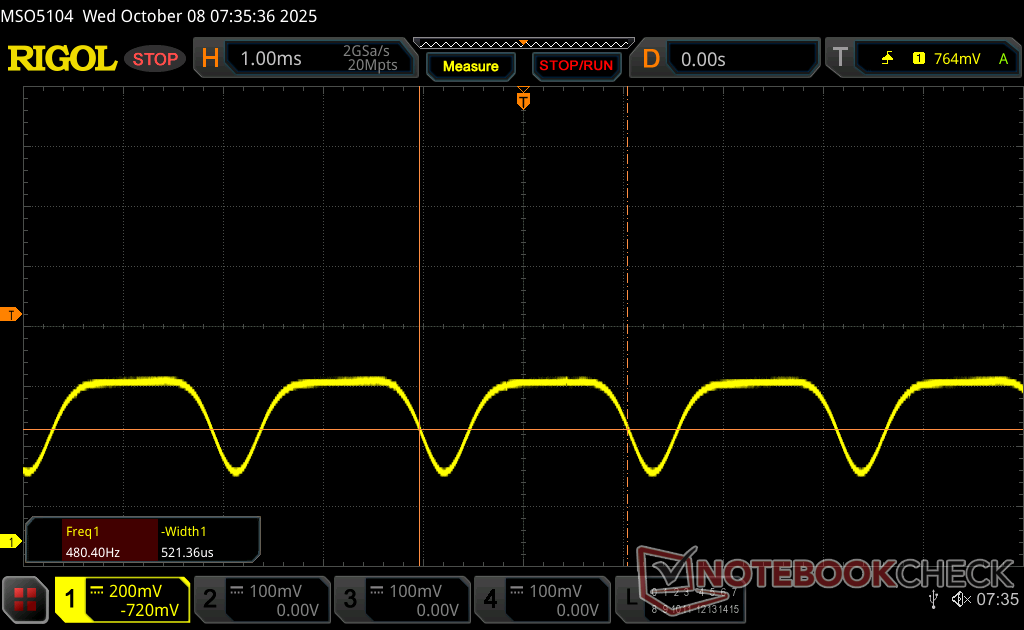
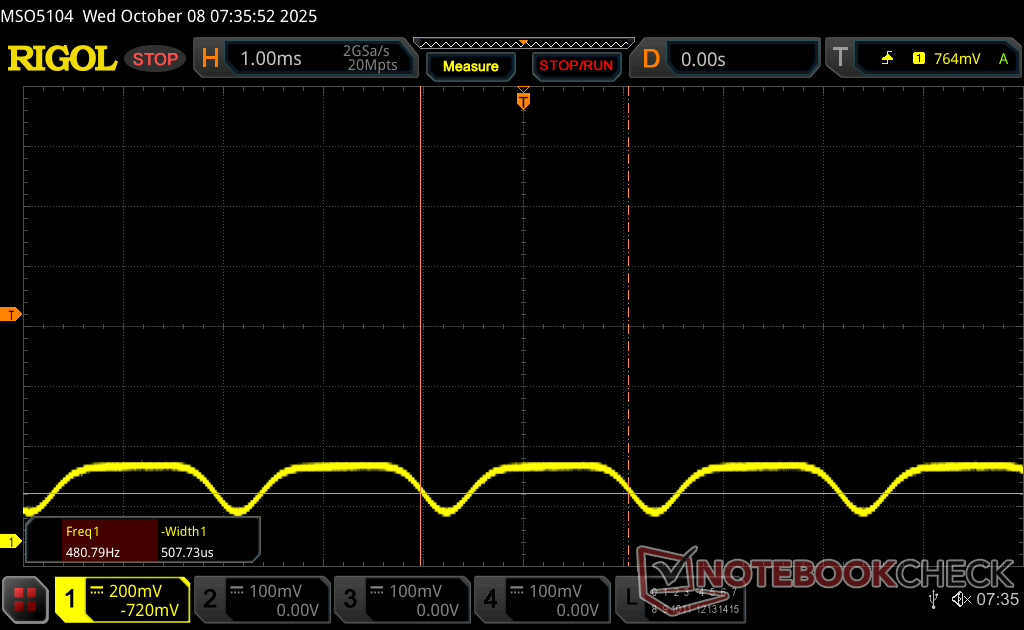
Sfarfallio dello schermo / PWM (Pulse-Width Modulation)
| flickering dello schermo / PWM rilevato | 479.9 Hz Amplitude: 28 % | ≤ 100 % settaggio luminosita' | 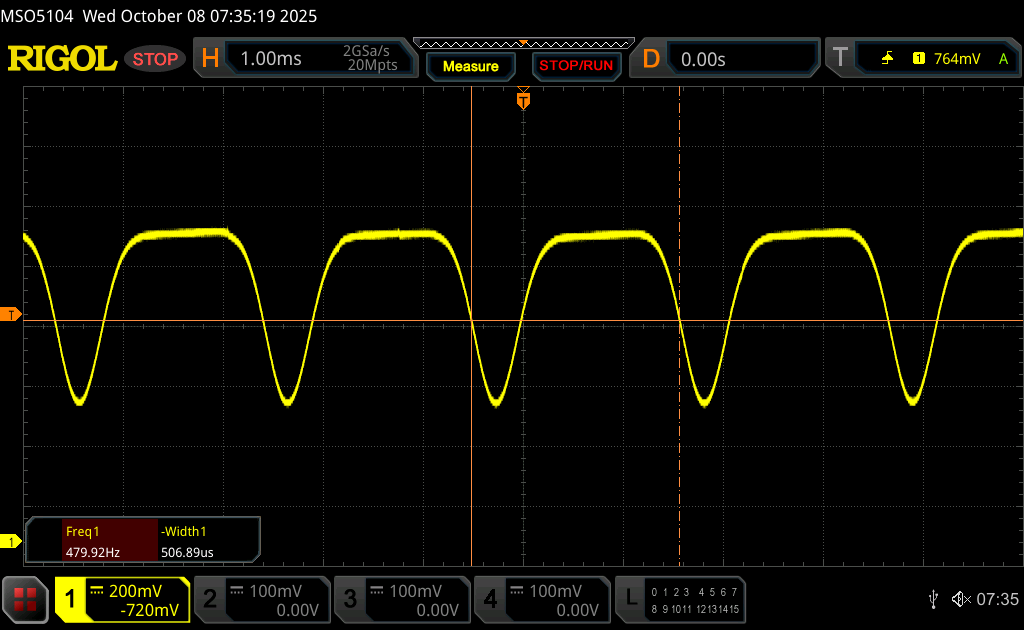 |
Il display sfarfalla a 479.9 Hz (Probabilmente a causa dell'uso di PWM) Flickering rilevato ad una luminosita' di 100 % o inferiore. Non dovrebbe verificarsi flickering o PWM sopra questo valore di luminosita'. La frequenza di 479.9 Hz è relativamente elevata, quindi la maggioranza degli utenti sensibili al PWM non dovrebbe notare alcun flickering. Tuttavia, è stato segnalato che alcuni utenti sono sensibili al PWM a 500 Hz ed oltre, quindi prestate attenzione. In confronto: 53 % di tutti i dispositivi testati non utilizza PWM per ridurre la luminosita' del display. Se è rilevato PWM, una media di 8169 (minimo: 5 - massimo: 343500) Hz è stata rilevata. | |||

Prestazioni
Condizioni del test
Abbiamo impostato Dell Optimizer sulla modalità Performance e Nvidia Control Panel sulla modalità grafica discreta prima di eseguire i benchmark qui sotto. Il passaggio tra le modalità Optimus e dGPU non richiede il riavvio.
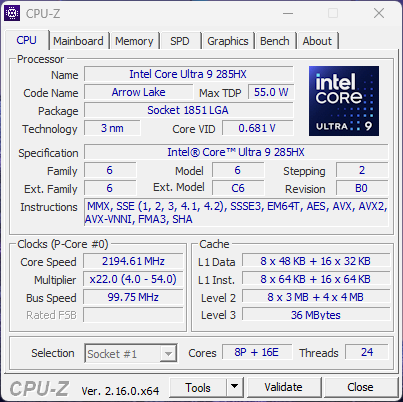
Processore
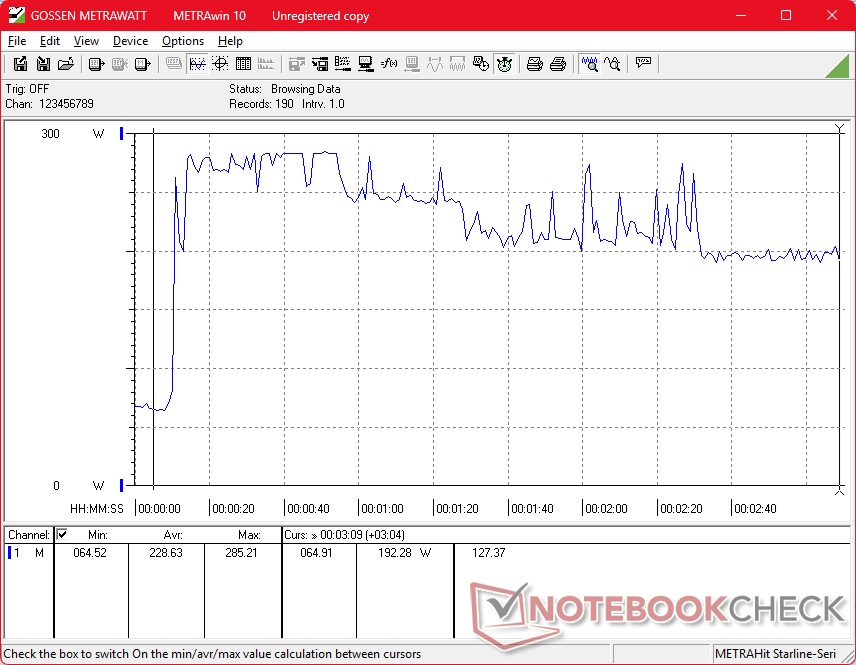
Il Core Ultra 9 285HX è uno dei processori più veloci disponibili su qualsiasi workstation mobile, con un aumento delle prestazioni di quasi due volte rispetto al Core Ultra 9 185H nella versione dello scorso anno Precision 5690. La sostenibilità delle prestazioni è tuttavia imperfetta; quando si esegue CineBench R15 xT in un ciclo, ad esempio, le prestazioni diminuiscono di circa il 10% nel tempo, come mostra il grafico di confronto qui sotto.
Cinebench R15 Multi Loop
Cinebench R23: Multi Core | Single Core
Cinebench R20: CPU (Multi Core) | CPU (Single Core)
Cinebench R15: CPU Multi 64Bit | CPU Single 64Bit
Blender: v2.79 BMW27 CPU
7-Zip 18.03: 7z b 4 | 7z b 4 -mmt1
Geekbench 6.5: Multi-Core | Single-Core
Geekbench 5.5: Multi-Core | Single-Core
HWBOT x265 Benchmark v2.2: 4k Preset
LibreOffice : 20 Documents To PDF
R Benchmark 2.5: Overall mean
| Geekbench 6.5 / Multi-Core | |
| Media Intel Core Ultra 9 285HX (20630 - 22104, n=2) | |
| Dell Pro Max 16 Plus | |
| Lenovo ThinkPad P16 Gen 2 | |
| HP ZBook Fury 16 G10 | |
| Dell Precision 5000 5680 | |
| Dell Precision 5690 | |
| HP ZBook Studio 16 G11 | |
| Lenovo ThinkPad P1 Gen 7 21KV001SGE | |
| Lenovo ThinkPad P16s G2 21K9000CGE | |
| Geekbench 6.5 / Single-Core | |
| Media Intel Core Ultra 9 285HX (2907 - 3088, n=2) | |
| HP ZBook Fury 16 G10 | |
| Dell Pro Max 16 Plus | |
| Lenovo ThinkPad P16 Gen 2 | |
| Dell Precision 5000 5680 | |
| Dell Precision 5690 | |
| HP ZBook Studio 16 G11 | |
| Lenovo ThinkPad P16s G2 21K9000CGE | |
| Lenovo ThinkPad P1 Gen 7 21KV001SGE | |
* ... Meglio usare valori piccoli
AIDA64: FP32 Ray-Trace | FPU Julia | CPU SHA3 | CPU Queen | FPU SinJulia | FPU Mandel | CPU AES | CPU ZLib | FP64 Ray-Trace | CPU PhotoWorxx
| Performance rating | |
| Media Intel Core Ultra 9 285HX | |
| Dell Pro Max 16 Plus | |
| Lenovo ThinkPad P16 Gen 2 | |
| Dell Precision 5690 | |
| HP ZBook Studio 16 G11 | |
| Lenovo ThinkPad P1 Gen 7 21KV001SGE | |
| MSI CreatorPro Z16P B12UKST | |
| Dell Precision 5000 5680 | |
| AIDA64 / FP32 Ray-Trace | |
| Media Intel Core Ultra 9 285HX (31893 - 42341, n=2) | |
| Dell Pro Max 16 Plus | |
| Lenovo ThinkPad P16 Gen 2 | |
| Dell Precision 5690 | |
| Lenovo ThinkPad P1 Gen 7 21KV001SGE | |
| HP ZBook Studio 16 G11 | |
| Dell Precision 5000 5680 | |
| MSI CreatorPro Z16P B12UKST | |
| AIDA64 / FPU Julia | |
| Media Intel Core Ultra 9 285HX (161276 - 210885, n=2) | |
| Dell Pro Max 16 Plus | |
| Lenovo ThinkPad P16 Gen 2 | |
| Dell Precision 5690 | |
| HP ZBook Studio 16 G11 | |
| Lenovo ThinkPad P1 Gen 7 21KV001SGE | |
| Dell Precision 5000 5680 | |
| MSI CreatorPro Z16P B12UKST | |
| AIDA64 / CPU SHA3 | |
| Media Intel Core Ultra 9 285HX (7921 - 9815, n=2) | |
| Dell Pro Max 16 Plus | |
| Lenovo ThinkPad P16 Gen 2 | |
| Dell Precision 5690 | |
| HP ZBook Studio 16 G11 | |
| Lenovo ThinkPad P1 Gen 7 21KV001SGE | |
| MSI CreatorPro Z16P B12UKST | |
| Dell Precision 5000 5680 | |
| AIDA64 / CPU Queen | |
| Lenovo ThinkPad P16 Gen 2 | |
| Media Intel Core Ultra 9 285HX (135057 - 141681, n=2) | |
| Dell Pro Max 16 Plus | |
| Dell Precision 5000 5680 | |
| MSI CreatorPro Z16P B12UKST | |
| Dell Precision 5690 | |
| HP ZBook Studio 16 G11 | |
| Lenovo ThinkPad P1 Gen 7 21KV001SGE | |
| AIDA64 / FPU SinJulia | |
| Media Intel Core Ultra 9 285HX (13080 - 14431, n=2) | |
| Lenovo ThinkPad P16 Gen 2 | |
| Dell Pro Max 16 Plus | |
| Dell Precision 5690 | |
| HP ZBook Studio 16 G11 | |
| Lenovo ThinkPad P1 Gen 7 21KV001SGE | |
| Dell Precision 5000 5680 | |
| MSI CreatorPro Z16P B12UKST | |
| AIDA64 / FPU Mandel | |
| Media Intel Core Ultra 9 285HX (84053 - 108922, n=2) | |
| Dell Pro Max 16 Plus | |
| Lenovo ThinkPad P16 Gen 2 | |
| Dell Precision 5690 | |
| Lenovo ThinkPad P1 Gen 7 21KV001SGE | |
| HP ZBook Studio 16 G11 | |
| Dell Precision 5000 5680 | |
| MSI CreatorPro Z16P B12UKST | |
| AIDA64 / CPU AES | |
| MSI CreatorPro Z16P B12UKST | |
| Media Intel Core Ultra 9 285HX (119553 - 134195, n=2) | |
| Dell Pro Max 16 Plus | |
| Lenovo ThinkPad P16 Gen 2 | |
| Dell Precision 5690 | |
| HP ZBook Studio 16 G11 | |
| Lenovo ThinkPad P1 Gen 7 21KV001SGE | |
| Dell Precision 5000 5680 | |
| AIDA64 / CPU ZLib | |
| Media Intel Core Ultra 9 285HX (1886 - 2267, n=2) | |
| Dell Pro Max 16 Plus | |
| Lenovo ThinkPad P16 Gen 2 | |
| Dell Precision 5690 | |
| HP ZBook Studio 16 G11 | |
| Lenovo ThinkPad P1 Gen 7 21KV001SGE | |
| MSI CreatorPro Z16P B12UKST | |
| Dell Precision 5000 5680 | |
| AIDA64 / FP64 Ray-Trace | |
| Media Intel Core Ultra 9 285HX (17357 - 22312, n=2) | |
| Dell Pro Max 16 Plus | |
| Lenovo ThinkPad P16 Gen 2 | |
| Dell Precision 5690 | |
| Lenovo ThinkPad P1 Gen 7 21KV001SGE | |
| HP ZBook Studio 16 G11 | |
| Dell Precision 5000 5680 | |
| MSI CreatorPro Z16P B12UKST | |
| AIDA64 / CPU PhotoWorxx | |
| Dell Pro Max 16 Plus | |
| Media Intel Core Ultra 9 285HX (62274 - 62611, n=2) | |
| HP ZBook Studio 16 G11 | |
| Dell Precision 5690 | |
| Dell Precision 5000 5680 | |
| MSI CreatorPro Z16P B12UKST | |
| Lenovo ThinkPad P1 Gen 7 21KV001SGE | |
| Lenovo ThinkPad P16 Gen 2 | |
Prestazioni del sistema
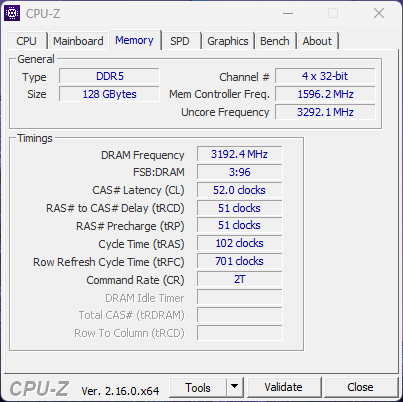
I punteggi di PCMark 10 non sono inclusi, poiché il benchmark si blocca costantemente anche quando viene aggiornato all'ultima versione e si provano diverse configurazioni di GPU. Detto questo, i punteggi della memoria AIDA64 sono tra i più alti di qualsiasi workstation mobile, grazie ai vantaggi prestazionali della RAM CAMM2.
CrossMark: Overall | Productivity | Creativity | Responsiveness
WebXPRT 3: Overall
WebXPRT 4: Overall
Mozilla Kraken 1.1: Total
| Performance rating | |
| Dell Pro Max 16 Plus | |
| Media Intel Core Ultra 9 285HX, Nvidia RTX PRO 5000 Blackwell Generation Laptop | |
| Lenovo ThinkPad P16 Gen 2 | |
| Dell Precision 5000 5680 | |
| MSI CreatorPro Z16P B12UKST | |
| Dell Precision 5690 | |
| HP ZBook Studio 16 G11 | |
| Lenovo ThinkPad P1 Gen 7 21KV001SGE | |
| CrossMark / Overall | |
| Dell Pro Max 16 Plus | |
| Media Intel Core Ultra 9 285HX, Nvidia RTX PRO 5000 Blackwell Generation Laptop (n=1) | |
| Lenovo ThinkPad P16 Gen 2 | |
| MSI CreatorPro Z16P B12UKST | |
| Dell Precision 5000 5680 | |
| Dell Precision 5690 | |
| HP ZBook Studio 16 G11 | |
| Lenovo ThinkPad P1 Gen 7 21KV001SGE | |
| CrossMark / Productivity | |
| Dell Pro Max 16 Plus | |
| Media Intel Core Ultra 9 285HX, Nvidia RTX PRO 5000 Blackwell Generation Laptop (n=1) | |
| Lenovo ThinkPad P16 Gen 2 | |
| MSI CreatorPro Z16P B12UKST | |
| Dell Precision 5000 5680 | |
| Dell Precision 5690 | |
| HP ZBook Studio 16 G11 | |
| Lenovo ThinkPad P1 Gen 7 21KV001SGE | |
| CrossMark / Creativity | |
| Dell Pro Max 16 Plus | |
| Media Intel Core Ultra 9 285HX, Nvidia RTX PRO 5000 Blackwell Generation Laptop (n=1) | |
| Lenovo ThinkPad P16 Gen 2 | |
| Dell Precision 5000 5680 | |
| MSI CreatorPro Z16P B12UKST | |
| Dell Precision 5690 | |
| HP ZBook Studio 16 G11 | |
| Lenovo ThinkPad P1 Gen 7 21KV001SGE | |
| CrossMark / Responsiveness | |
| MSI CreatorPro Z16P B12UKST | |
| Dell Pro Max 16 Plus | |
| Media Intel Core Ultra 9 285HX, Nvidia RTX PRO 5000 Blackwell Generation Laptop (n=1) | |
| Lenovo ThinkPad P16 Gen 2 | |
| Dell Precision 5000 5680 | |
| Dell Precision 5690 | |
| HP ZBook Studio 16 G11 | |
| Lenovo ThinkPad P1 Gen 7 21KV001SGE | |
| WebXPRT 3 / Overall | |
| Dell Precision 5000 5680 | |
| Lenovo ThinkPad P16 Gen 2 | |
| Dell Pro Max 16 Plus | |
| Media Intel Core Ultra 9 285HX, Nvidia RTX PRO 5000 Blackwell Generation Laptop (n=1) | |
| MSI CreatorPro Z16P B12UKST | |
| HP ZBook Studio 16 G11 | |
| Dell Precision 5690 | |
| Lenovo ThinkPad P1 Gen 7 21KV001SGE | |
| WebXPRT 4 / Overall | |
| Dell Pro Max 16 Plus | |
| Media Intel Core Ultra 9 285HX, Nvidia RTX PRO 5000 Blackwell Generation Laptop (n=1) | |
| Lenovo ThinkPad P16 Gen 2 | |
| Dell Precision 5000 5680 | |
| Dell Precision 5690 | |
| MSI CreatorPro Z16P B12UKST | |
| HP ZBook Studio 16 G11 | |
| Lenovo ThinkPad P1 Gen 7 21KV001SGE | |
| Mozilla Kraken 1.1 / Total | |
| Lenovo ThinkPad P1 Gen 7 21KV001SGE | |
| MSI CreatorPro Z16P B12UKST | |
| HP ZBook Studio 16 G11 | |
| Dell Precision 5690 | |
| Dell Precision 5000 5680 | |
| Lenovo ThinkPad P16 Gen 2 | |
| Dell Pro Max 16 Plus | |
| Media Intel Core Ultra 9 285HX, Nvidia RTX PRO 5000 Blackwell Generation Laptop (n=1) | |
* ... Meglio usare valori piccoli
| AIDA64 / Memory Copy | |
| Media Intel Core Ultra 9 285HX (93381 - 93933, n=2) | |
| Dell Pro Max 16 Plus | |
| Dell Precision 5690 | |
| HP ZBook Studio 16 G11 | |
| Dell Precision 5000 5680 | |
| Lenovo ThinkPad P1 Gen 7 21KV001SGE | |
| Lenovo ThinkPad P16 Gen 2 | |
| MSI CreatorPro Z16P B12UKST | |
| AIDA64 / Memory Read | |
| Dell Pro Max 16 Plus | |
| Media Intel Core Ultra 9 285HX (97209 - 97565, n=2) | |
| Dell Precision 5690 | |
| HP ZBook Studio 16 G11 | |
| Lenovo ThinkPad P16 Gen 2 | |
| Dell Precision 5000 5680 | |
| MSI CreatorPro Z16P B12UKST | |
| Lenovo ThinkPad P1 Gen 7 21KV001SGE | |
| AIDA64 / Memory Write | |
| Dell Pro Max 16 Plus | |
| Media Intel Core Ultra 9 285HX (89392 - 89630, n=2) | |
| Dell Precision 5000 5680 | |
| HP ZBook Studio 16 G11 | |
| Dell Precision 5690 | |
| MSI CreatorPro Z16P B12UKST | |
| Lenovo ThinkPad P16 Gen 2 | |
| Lenovo ThinkPad P1 Gen 7 21KV001SGE | |
| AIDA64 / Memory Latency | |
| Dell Precision 5690 | |
| Lenovo ThinkPad P1 Gen 7 21KV001SGE | |
| HP ZBook Studio 16 G11 | |
| Dell Pro Max 16 Plus | |
| Media Intel Core Ultra 9 285HX (104.8 - 115.1, n=2) | |
| MSI CreatorPro Z16P B12UKST | |
| Lenovo ThinkPad P16 Gen 2 | |
| Dell Precision 5000 5680 | |
* ... Meglio usare valori piccoli
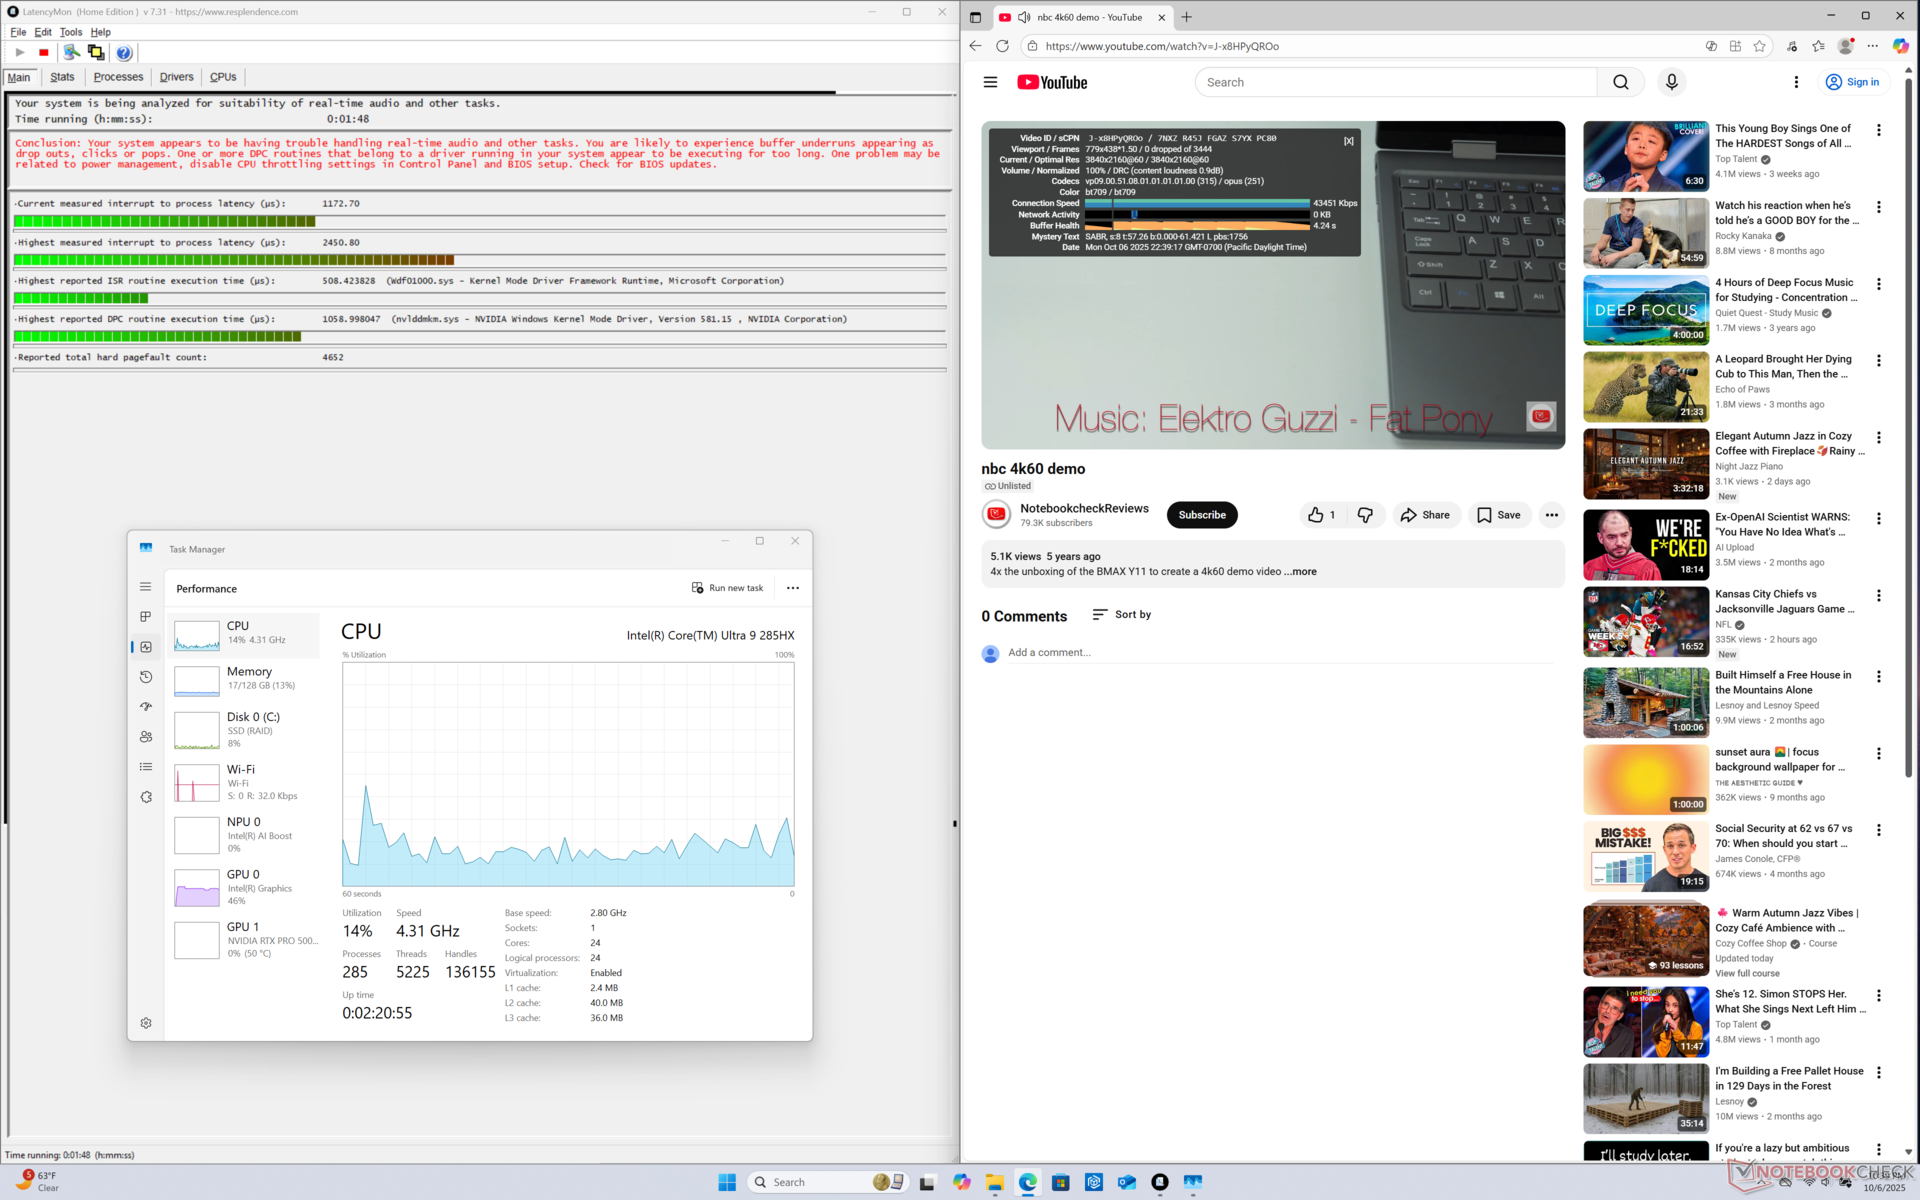
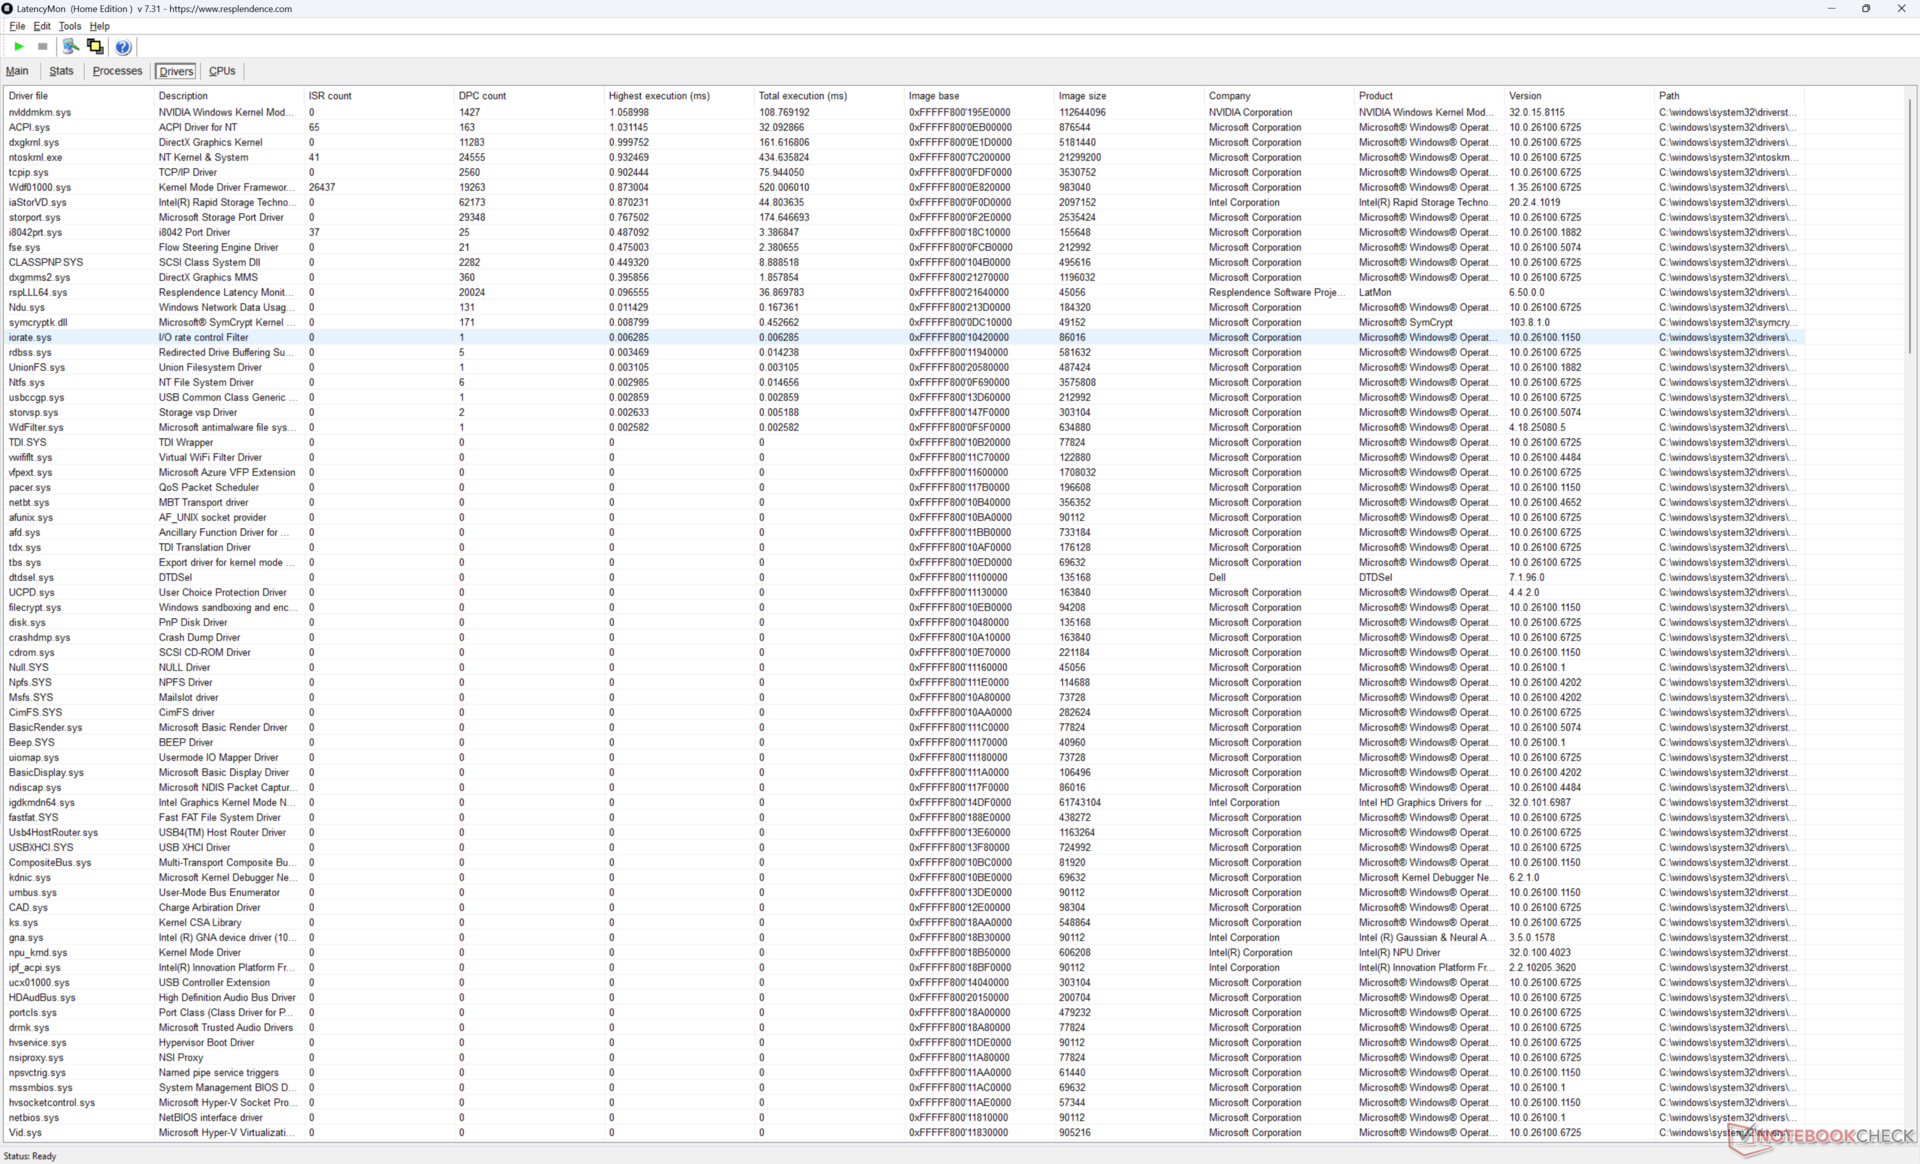
Latenza DPC
LatencyMon mostra lievi problemi di DPC, ma non ci sono cadute di fotogrammi durante il nostro test di riproduzione video 4K60.
| DPC Latencies / LatencyMon - interrupt to process latency (max), Web, Youtube, Prime95 | |
| Dell Pro Max 16 Plus | |
| Dell Precision 5000 5680 | |
| Lenovo ThinkPad P1 Gen 7 21KV001SGE | |
| HP ZBook Studio 16 G11 | |
| Lenovo ThinkPad P16 Gen 2 | |
| MSI CreatorPro Z16P B12UKST | |
| Dell Precision 5690 | |
* ... Meglio usare valori piccoli
Dispositivi di archiviazione
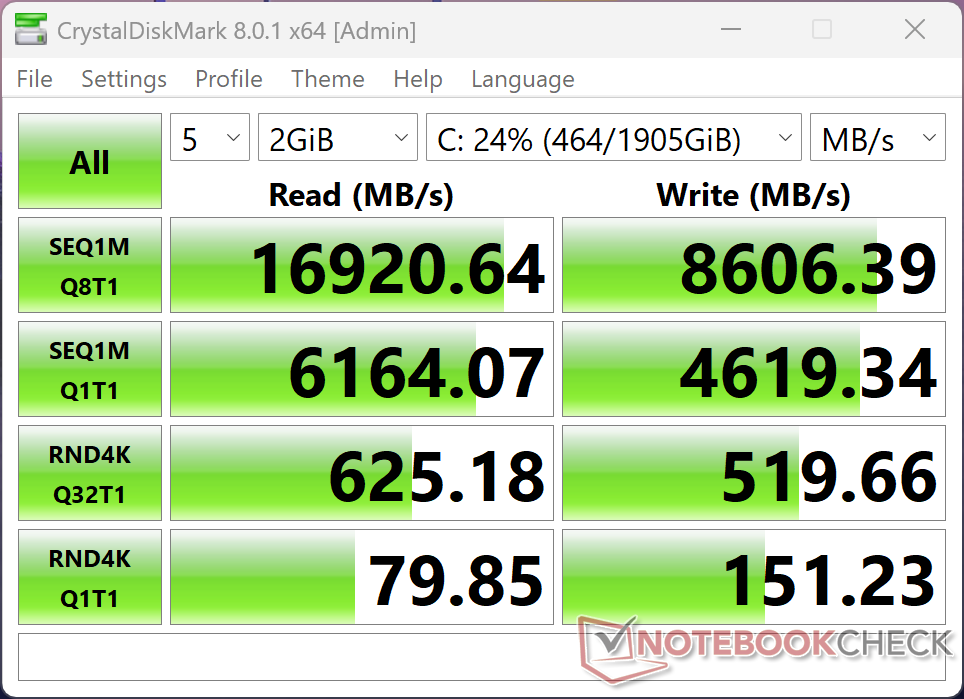
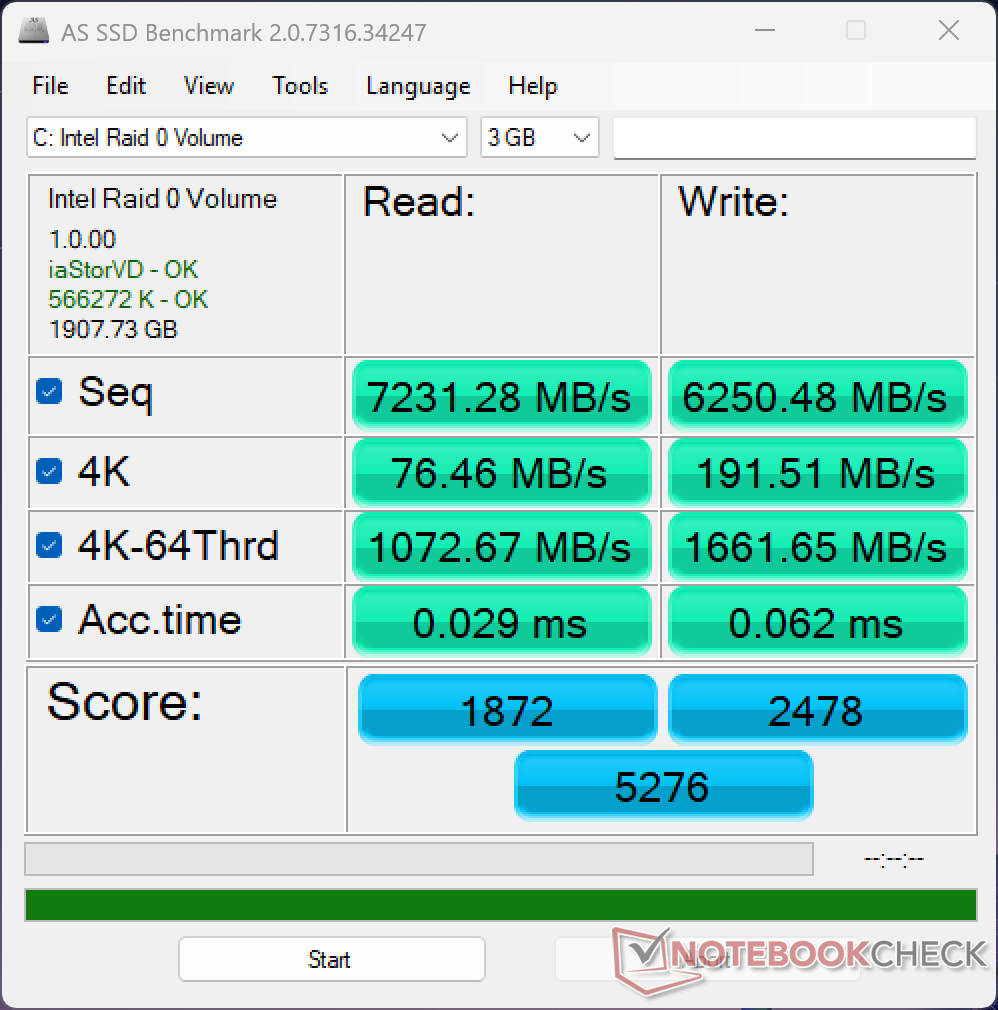
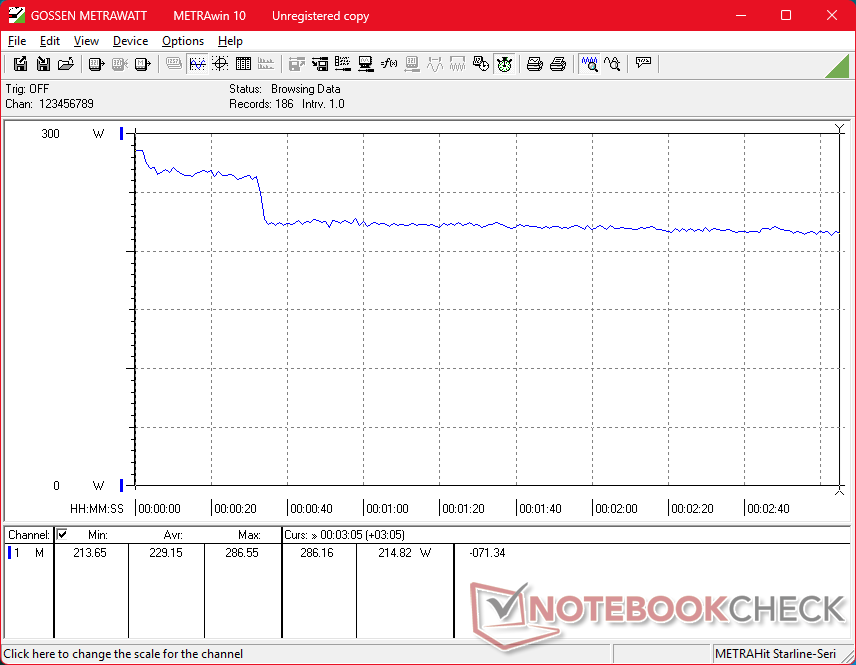
La nostra unità di prova viene fornita con il SK Hynix PCB01 SSD PCIe5 x4 NVMe per velocità di lettura fino a ~16 GB/s. Le prestazioni sono scese leggermente a ~13 GB/s dopo alcuni minuti del nostro stress test DisKSpd, come mostra il grafico sottostante.

* ... Meglio usare valori piccoli
Strozzatura del disco: DiskSpd Lettura in loop, Profondità coda 8
Prestazioni della GPU
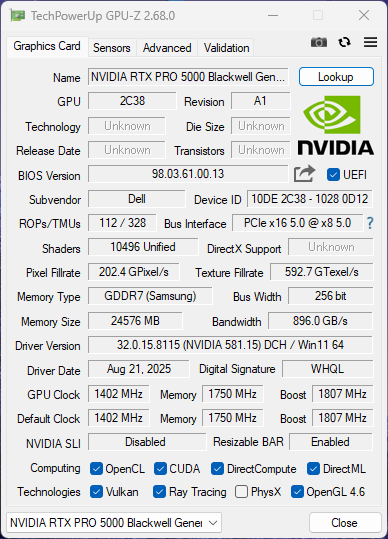
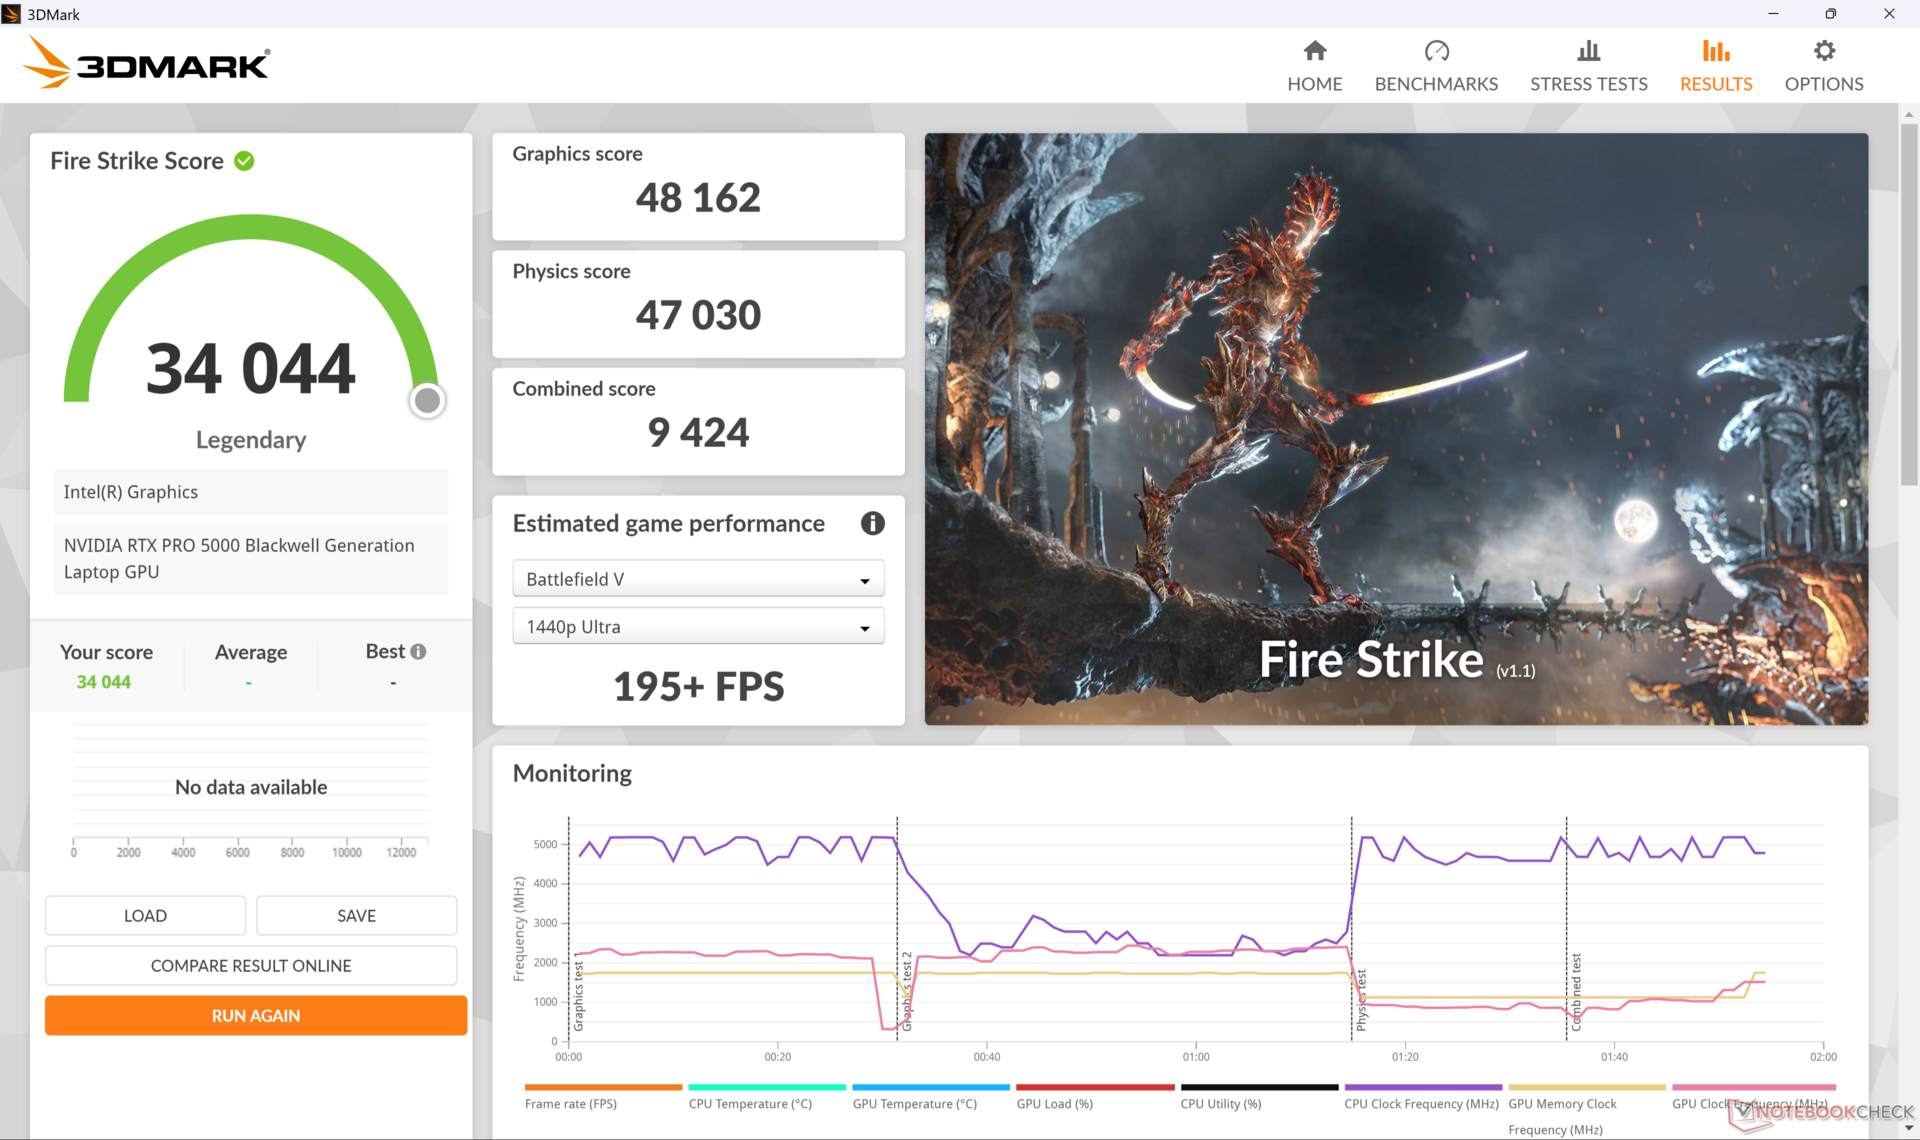
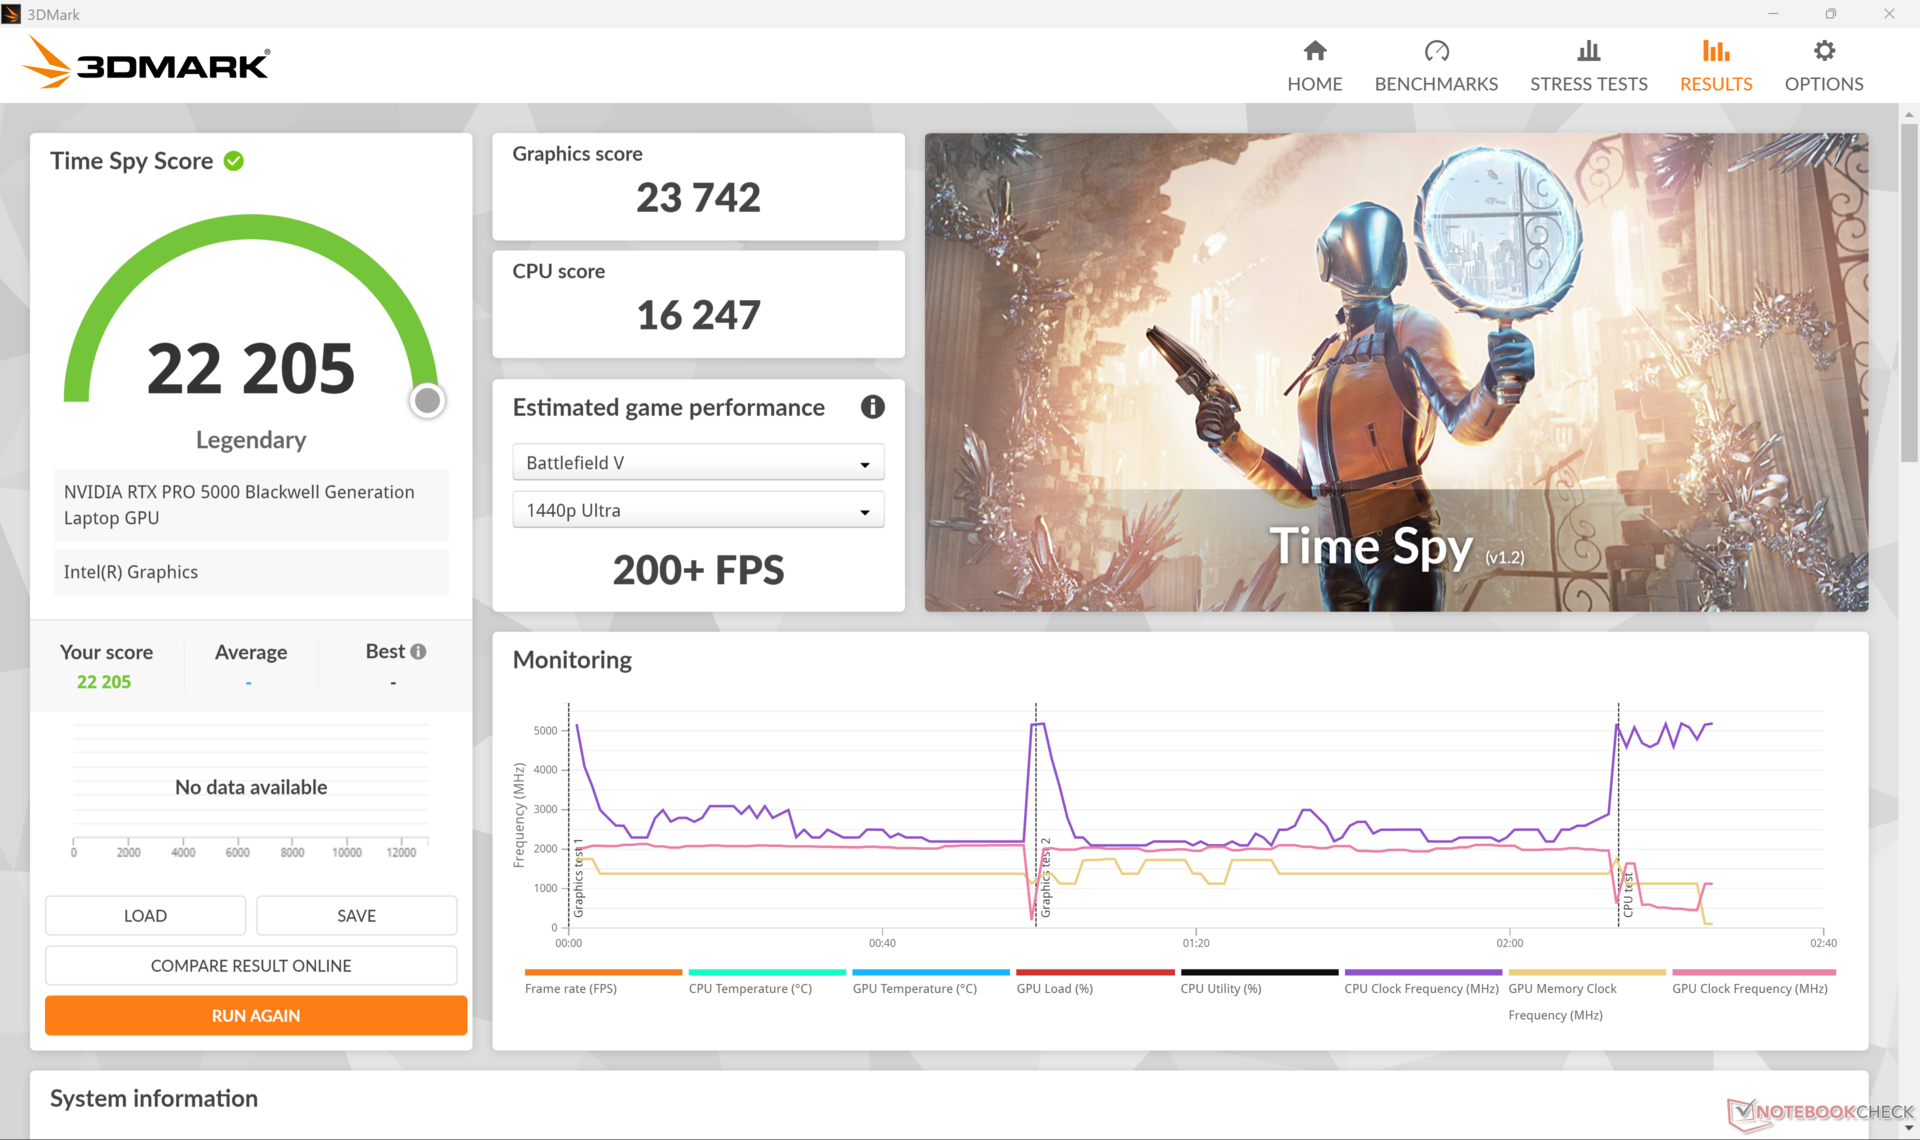
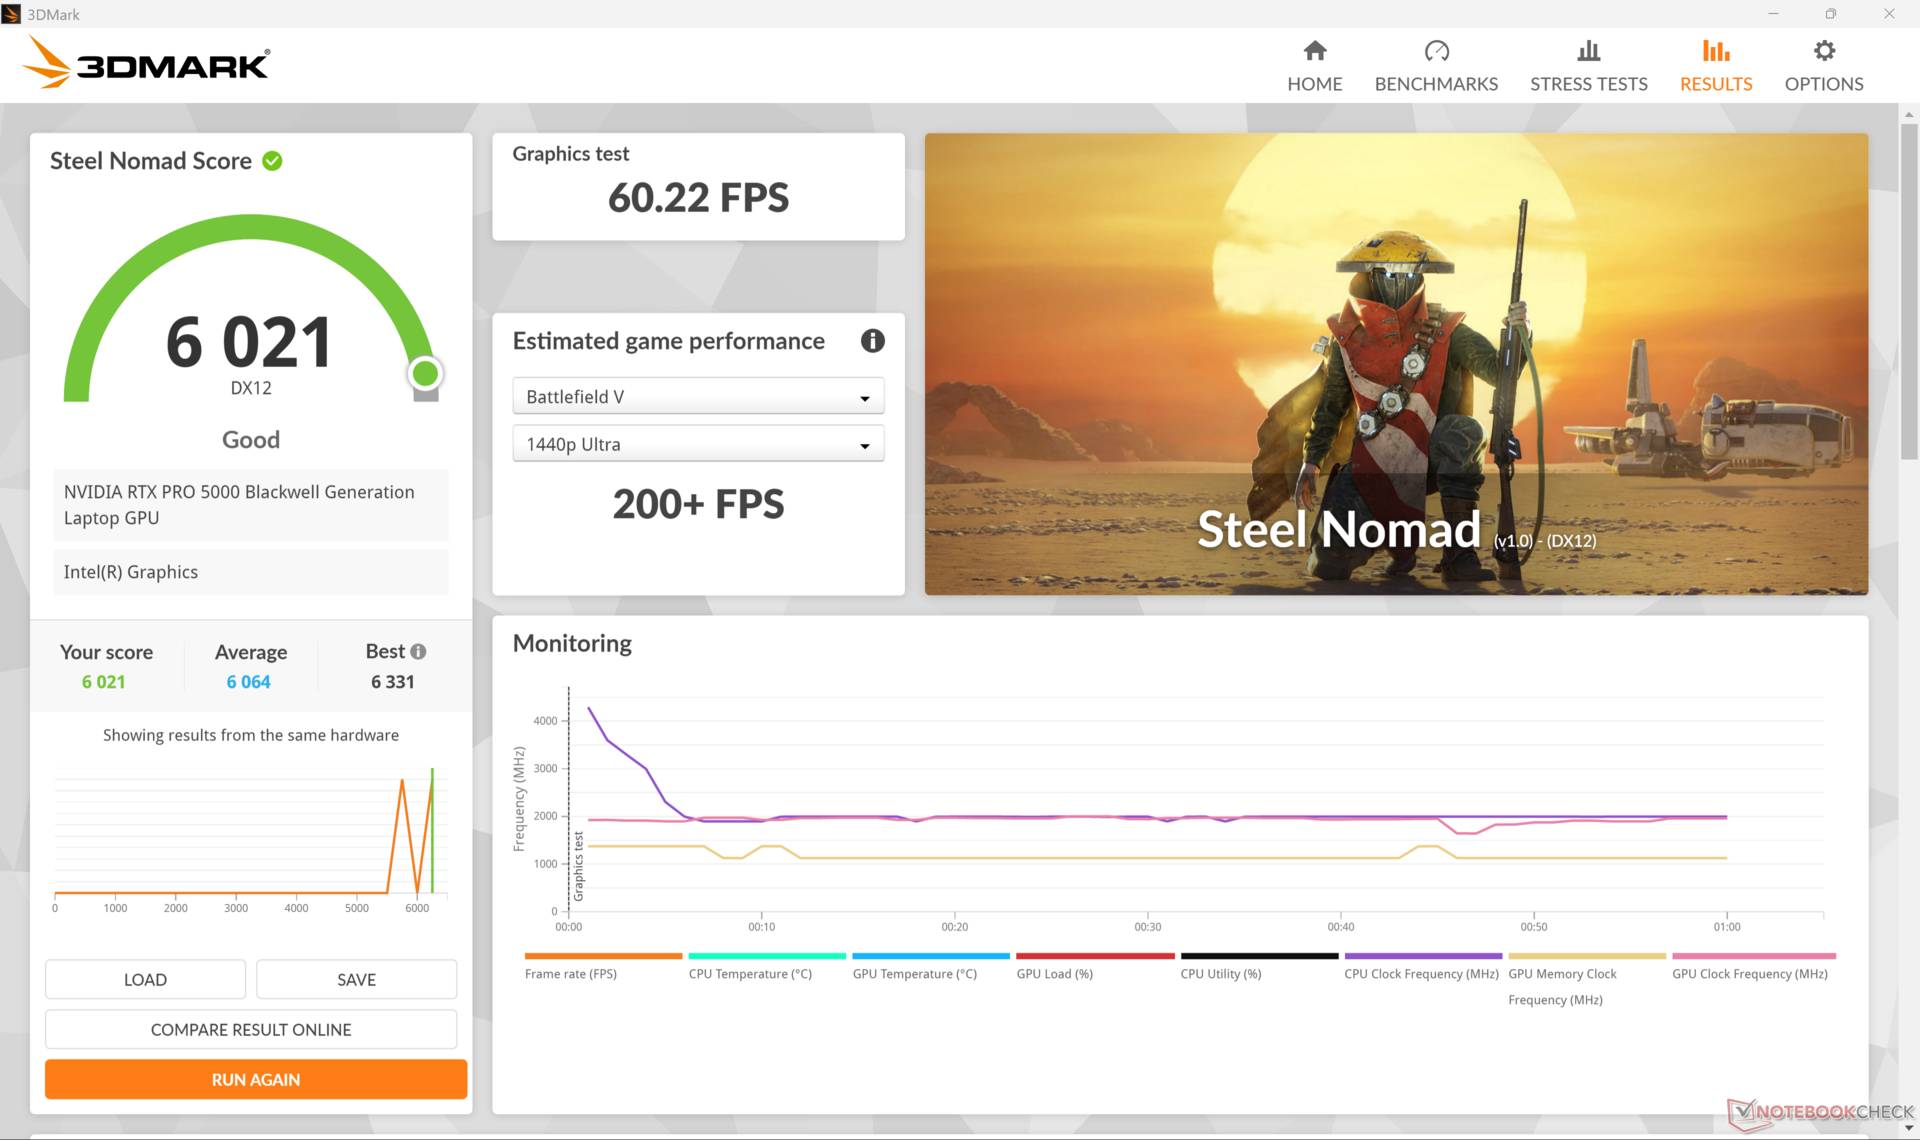
È la prima workstation del nostro database con il modello RTX Pro 5000 Blackwellla GPU supera di gran lunga le prestazioni della RTX 5000 Ada che era prevalente sulle workstation di punta della generazione precedente, come il modello HP ZBook Fury 16 G10 di circa il 35-50%. I vantaggi possono essere ancora maggiori se si tiene conto dei risultati di Specviewperf. L'esecuzione del sistema in modalità Bilanciata o Ottimizzata invece che in modalità Prestazioni avrebbe un impatto minimo sulle prestazioni, secondo i benchmark 3DMark Fire Strike.
| Profilo energetico | Punteggio grafico | Punteggio Fisica | Punteggio combinato |
| Modalità Prestazioni (~121 W) | 48162 | 47030 | 9424 |
| Modalità Bilanciata (~108 W) | 47134 (-2%) | 45150 (-4%) | 12212 (+30%) |
| Potenza della batteria | 25838 (-46%) | 34253 (-27%) | 6186 (-34%) |
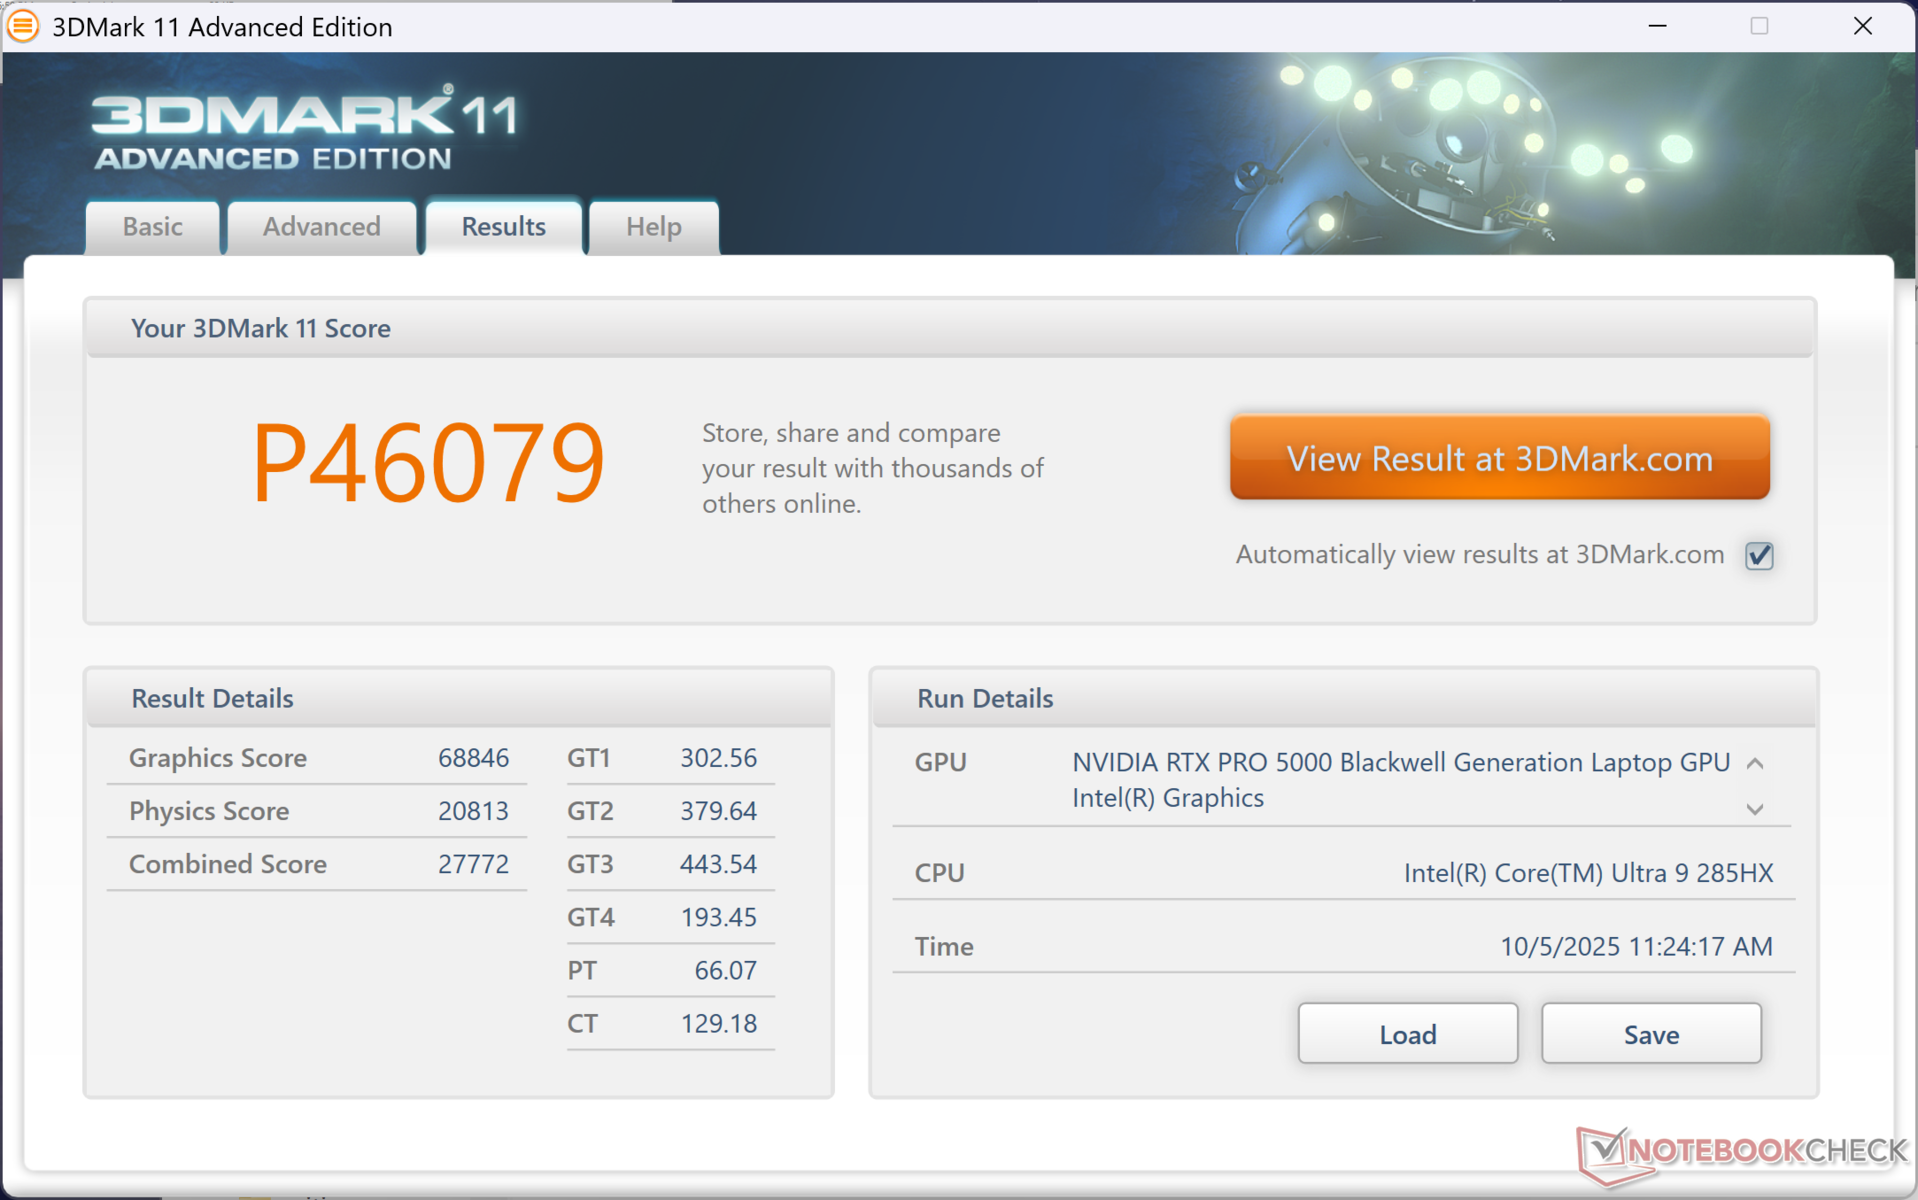

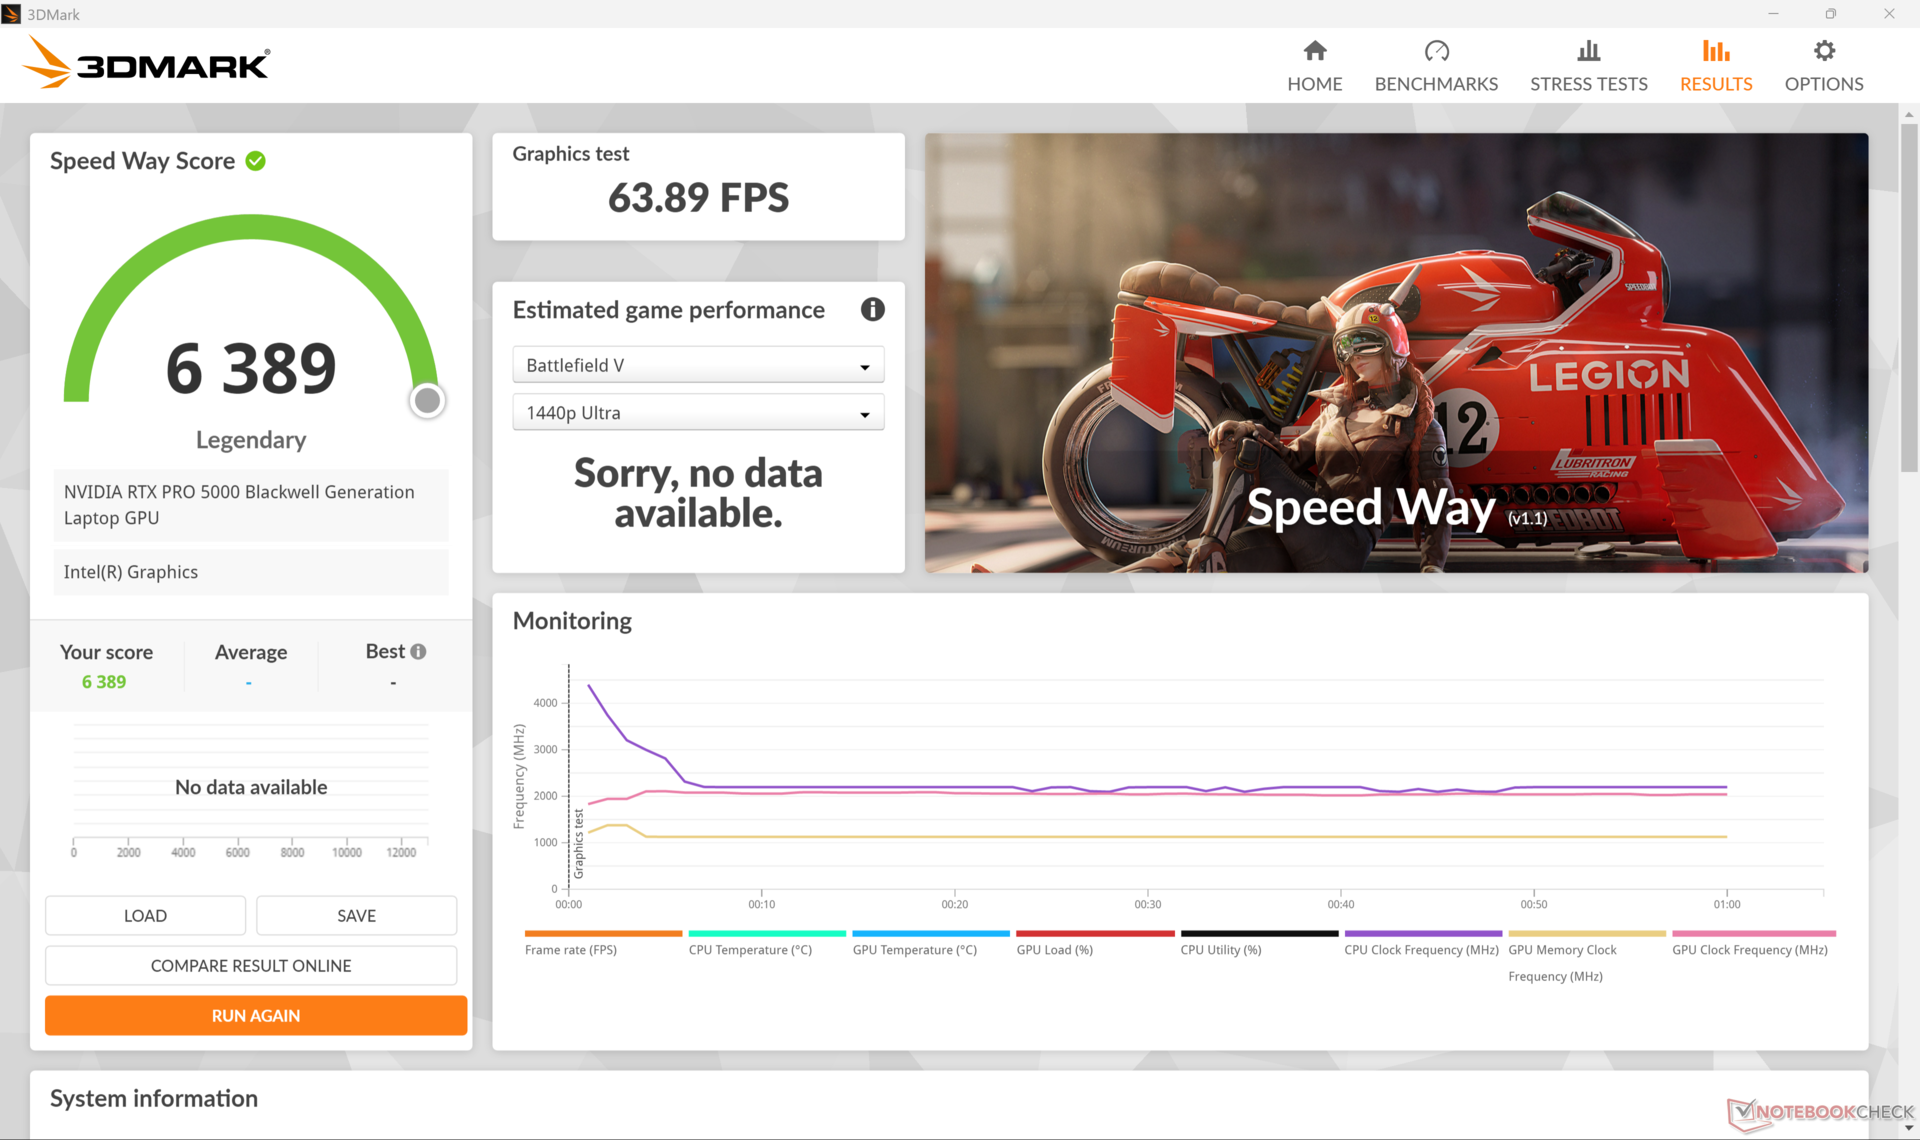
| 3DMark 11 Performance | 46079 punti | |
| 3DMark Cloud Gate Standard Score | 67837 punti | |
| 3DMark Fire Strike Score | 34044 punti | |
| 3DMark Time Spy Score | 22205 punti | |
| 3DMark Steel Nomad Score | 6021 punti | |
Aiuto | ||
* ... Meglio usare valori piccoli
Prestazioni di gioco
Le prestazioni di gioco sono in gran parte simili a quelle della GeForce RTX 5080 mobile che è prevedibile, dato che la RTX Pro 5000 Blackwell è basata sulla RTX 5080 mobile rTX 5090 mobile ma senza le ottimizzazioni di gioco. Alcuni titoli funzionano peggio o in modo incoerente su RTX Pro 5000 Blackwell, tra cui Monster Hunter Wilds.
| Performance rating - Percent | |
| Dell Pro Max 16 Plus | |
| Lenovo ThinkPad P16 Gen 2 | |
| Dell Precision 5000 5680 -3! | |
| Dell Precision 5690 -1! | |
| HP ZBook Studio 16 G11 | |
| MSI CreatorPro Z16P B12UKST -2! | |
| Lenovo ThinkPad P1 Gen 7 21KV001SGE -1! | |
| Cyberpunk 2077 2.2 Phantom Liberty - 1920x1080 Ultra Preset (FSR off) | |
| Dell Pro Max 16 Plus | |
| Dell Precision 5690 | |
| Lenovo ThinkPad P16 Gen 2 | |
| Lenovo ThinkPad P1 Gen 7 21KV001SGE | |
| HP ZBook Studio 16 G11 | |
| Baldur's Gate 3 - 1920x1080 Ultra Preset AA:T | |
| Dell Pro Max 16 Plus | |
| Lenovo ThinkPad P16 Gen 2 | |
| Dell Precision 5690 | |
| HP ZBook Studio 16 G11 | |
| Lenovo ThinkPad P1 Gen 7 21KV001SGE | |
| GTA V - 1920x1080 Highest Settings possible AA:4xMSAA + FX AF:16x | |
| Dell Pro Max 16 Plus | |
| Lenovo ThinkPad P16 Gen 2 | |
| Dell Precision 5000 5680 | |
| Lenovo ThinkPad P1 Gen 7 21KV001SGE | |
| HP ZBook Studio 16 G11 | |
| MSI CreatorPro Z16P B12UKST | |
| Final Fantasy XV Benchmark - 1920x1080 High Quality | |
| Dell Pro Max 16 Plus | |
| Lenovo ThinkPad P16 Gen 2 | |
| Dell Precision 5690 | |
| Dell Precision 5000 5680 | |
| HP ZBook Studio 16 G11 | |
| Lenovo ThinkPad P1 Gen 7 21KV001SGE | |
| MSI CreatorPro Z16P B12UKST | |
| Strange Brigade - 1920x1080 ultra AA:ultra AF:16 | |
| Lenovo ThinkPad P16 Gen 2 | |
| Dell Pro Max 16 Plus | |
| Dell Precision 5690 | |
| HP ZBook Studio 16 G11 | |
| MSI CreatorPro Z16P B12UKST | |
| Dota 2 Reborn - 1920x1080 ultra (3/3) best looking | |
| Dell Pro Max 16 Plus | |
| Lenovo ThinkPad P16 Gen 2 | |
| MSI CreatorPro Z16P B12UKST | |
| Dell Precision 5000 5680 | |
| HP ZBook Studio 16 G11 | |
| Dell Precision 5690 | |
| Lenovo ThinkPad P1 Gen 7 21KV001SGE | |
| X-Plane 11.11 - 1920x1080 high (fps_test=3) | |
| Lenovo ThinkPad P16 Gen 2 | |
| Dell Pro Max 16 Plus | |
| Dell Precision 5000 5680 | |
| MSI CreatorPro Z16P B12UKST | |
| Dell Precision 5690 | |
| HP ZBook Studio 16 G11 | |
| Lenovo ThinkPad P1 Gen 7 21KV001SGE | |
Grafico Cyberpunk 2077 ultra FPS
| basso | medio | alto | ultra | QHD DLSS | QHD | 4K DLSS | 4K | |
|---|---|---|---|---|---|---|---|---|
| GTA V (2015) | 184.7 | 183.5 | 178.1 | 142.5 | 138 | 170.3 | ||
| Dota 2 Reborn (2015) | 212 | 181 | 184.8 | 166 | 146.4 | |||
| Final Fantasy XV Benchmark (2018) | 233 | 220 | 184.2 | 162.8 | 102.2 | |||
| X-Plane 11.11 (2018) | 144.4 | 125.7 | 103.2 | 82.6 | ||||
| Strange Brigade (2018) | 382 | 285 | 261 | 288 | 300 | 177.3 | ||
| Baldur's Gate 3 (2023) | 204 | 201.8 | 155.2 | 128.1 | 80.1 | |||
| Cyberpunk 2077 2.2 Phantom Liberty (2023) | 133.9 | 121.6 | 120.6 | 119.8 | 116.3 | 105.1 | 65.3 | 51 |
| F1 24 (2024) | 251 | 243 | 231 | 131.2 | 128.1 | 94.9 | 82 | 47.2 |
| Black Myth: Wukong (2024) | 142 | 72 | 54 | 42 | 36 | 37 | 32 | 26 |
| Monster Hunter Wilds (2025) | 25.4 | 27 | 27.8 | 43.3 | 39 | 33.9 | 35.3 | |
| Assassin's Creed Shadows (2025) | 103 | 98 | 86 | 68 | 67 | 57 | 56 | 42 |
Emissioni
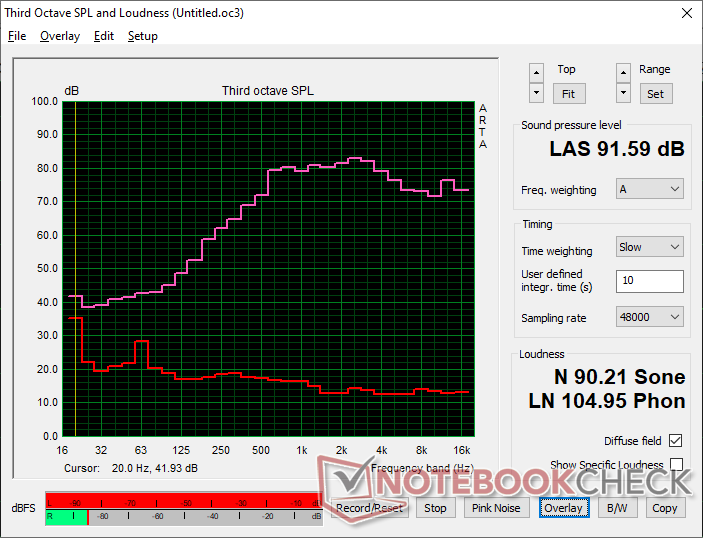
Rumore del sistema
Mentre le ventole sono quasi sempre attive, il comportamento pulsante è generalmente ridotto al minimo per ridurre gli aumenti di rumore. Detto questo, il sistema può essere piuttosto rumoroso, con quasi 55 dB(A) quando si eseguono carichi impegnativi, che è simile a quello che abbiamo registrato sul Lenovo ThinkPad P1 o HP ZBook Studio 16 G11.
Il rumore della ventola raggiunge i 49 dB(A) e i 54,3 dB(A) quando si imposta la modalità Bilanciata e la modalità Prestazioni, rispettivamente.
Rumorosità
| Idle |
| 26.7 / 30.5 / 34 dB(A) |
| Sotto carico |
| 39.8 / 54.3 dB(A) |
 | ||
30 dB silenzioso 40 dB(A) udibile 50 dB(A) rumoroso |
||
min: | ||
| Dell Pro Max 16 Plus RTX PRO 5000 Blackwell Generation Laptop, Ultra 9 285HX, SK hynix PCB01 HFS001TFM9X186N | Dell Precision 5690 NVIDIA RTX 5000 Ada Generation Laptop GPU, Ultra 9 185H, 2x Samsung PM9A1 1TB (RAID 0) | Dell Precision 5000 5680 NVIDIA RTX 5000 Ada Generation Laptop GPU, i9-13900H, 2x SK hynix PC801 HFS512GEJ9X101N RAID 0 | Lenovo ThinkPad P16 Gen 2 NVIDIA RTX 4000 Ada Generation Laptop GPU, i7-14700HX, SK hynix PC801 HFS001TEJ9X162N | Lenovo ThinkPad P1 Gen 7 21KV001SGE NVIDIA GeForce RTX 4060 Laptop GPU, Ultra 7 155H, Kioxia XG8 KXG8AZNV1T02 | HP ZBook Studio 16 G11 NVIDIA RTX 3000 Ada Generation Laptop GPU, Ultra 9 185H, Kioxia XG8 KXG80ZNV1T02 | MSI CreatorPro Z16P B12UKST RTX A3000 Laptop GPU, i7-12700H, Samsung PM9A1 MZVL21T0HCLR | |
|---|---|---|---|---|---|---|---|
| Noise | 7% | 14% | 1% | 6% | 11% | 5% | |
| off /ambiente * (dB) | 23.2 | 23.4 -1% | 22.8 2% | 23.9 -3% | 24.7 -6% | 23.8 -3% | 24.1 -4% |
| Idle Minimum * (dB) | 26.7 | 23.6 12% | 23 14% | 29.1 -9% | 24.7 7% | 23.8 11% | 27.1 -1% |
| Idle Average * (dB) | 30.5 | 24.9 18% | 23 25% | 29.1 5% | 24.7 19% | 26.4 13% | 27.1 11% |
| Idle Maximum * (dB) | 34 | 30.9 9% | 23 32% | 29.1 14% | 24.7 27% | 26.4 22% | 27.1 20% |
| Load Average * (dB) | 39.8 | 40.4 -2% | 37.2 7% | 41 -3% | 43.7 -10% | 33.7 15% | 42.9 -8% |
| Cyberpunk 2077 ultra * (dB) | 54.3 | 52.8 3% | 53.2 2% | 46.1 15% | |||
| Load Maximum * (dB) | 54.3 | 51.9 4% | 51 6% | 52.9 3% | 53.3 2% | 53.2 2% | 47 13% |
| Witcher 3 ultra * (dB) | 48.3 | 51 | 44 |
* ... Meglio usare valori piccoli
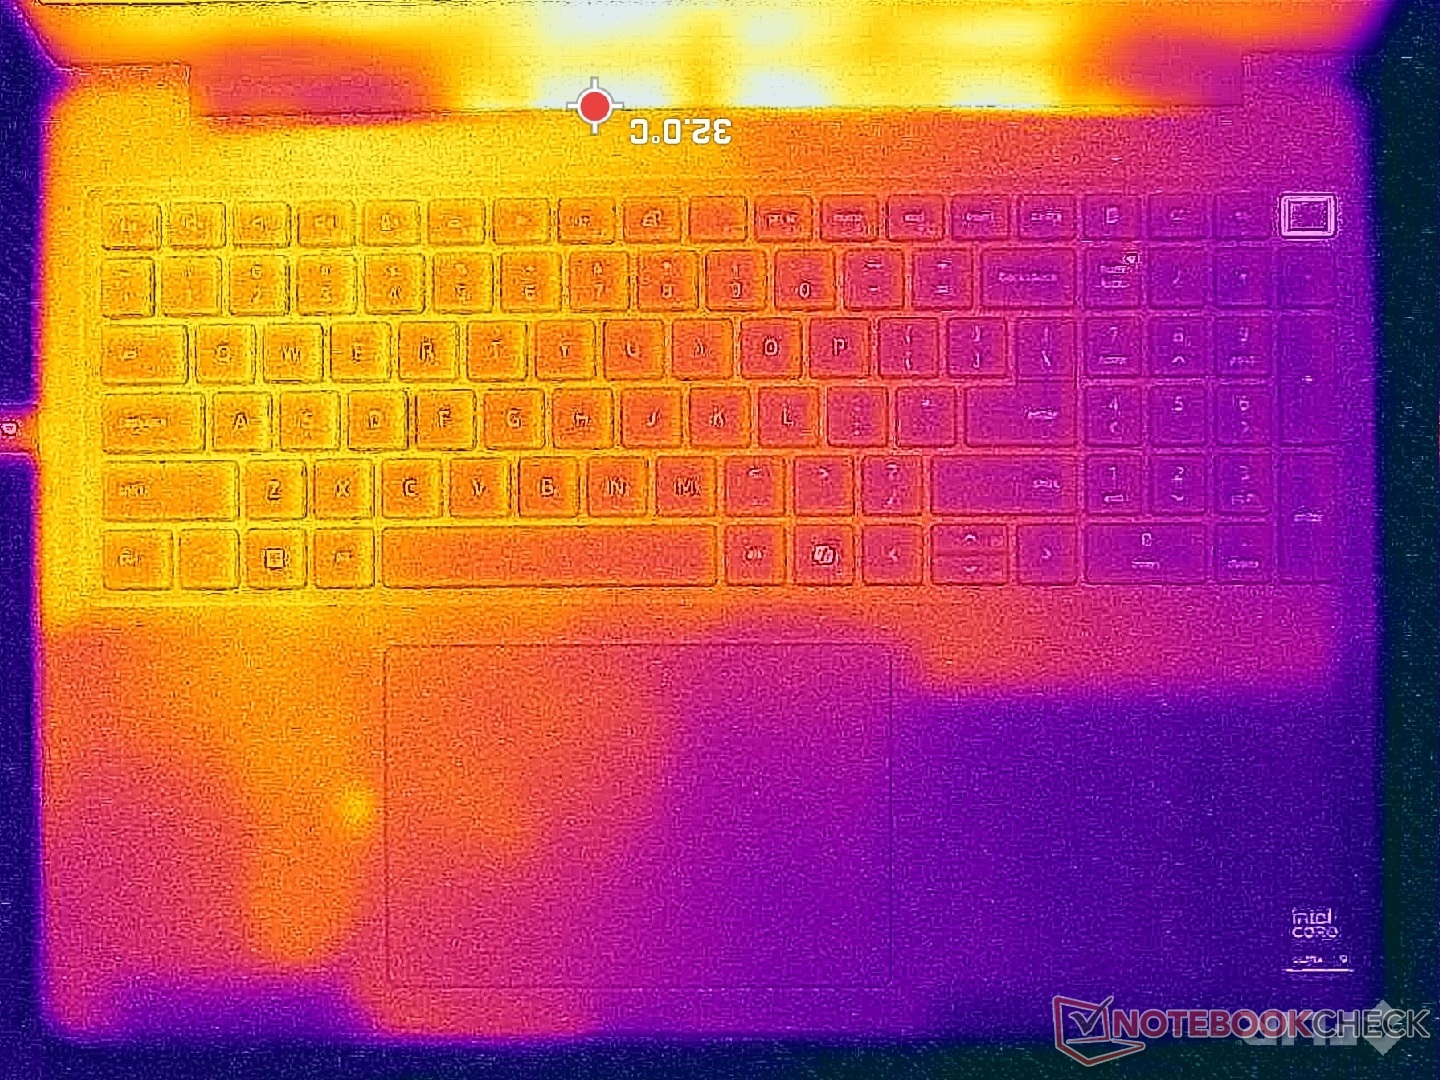
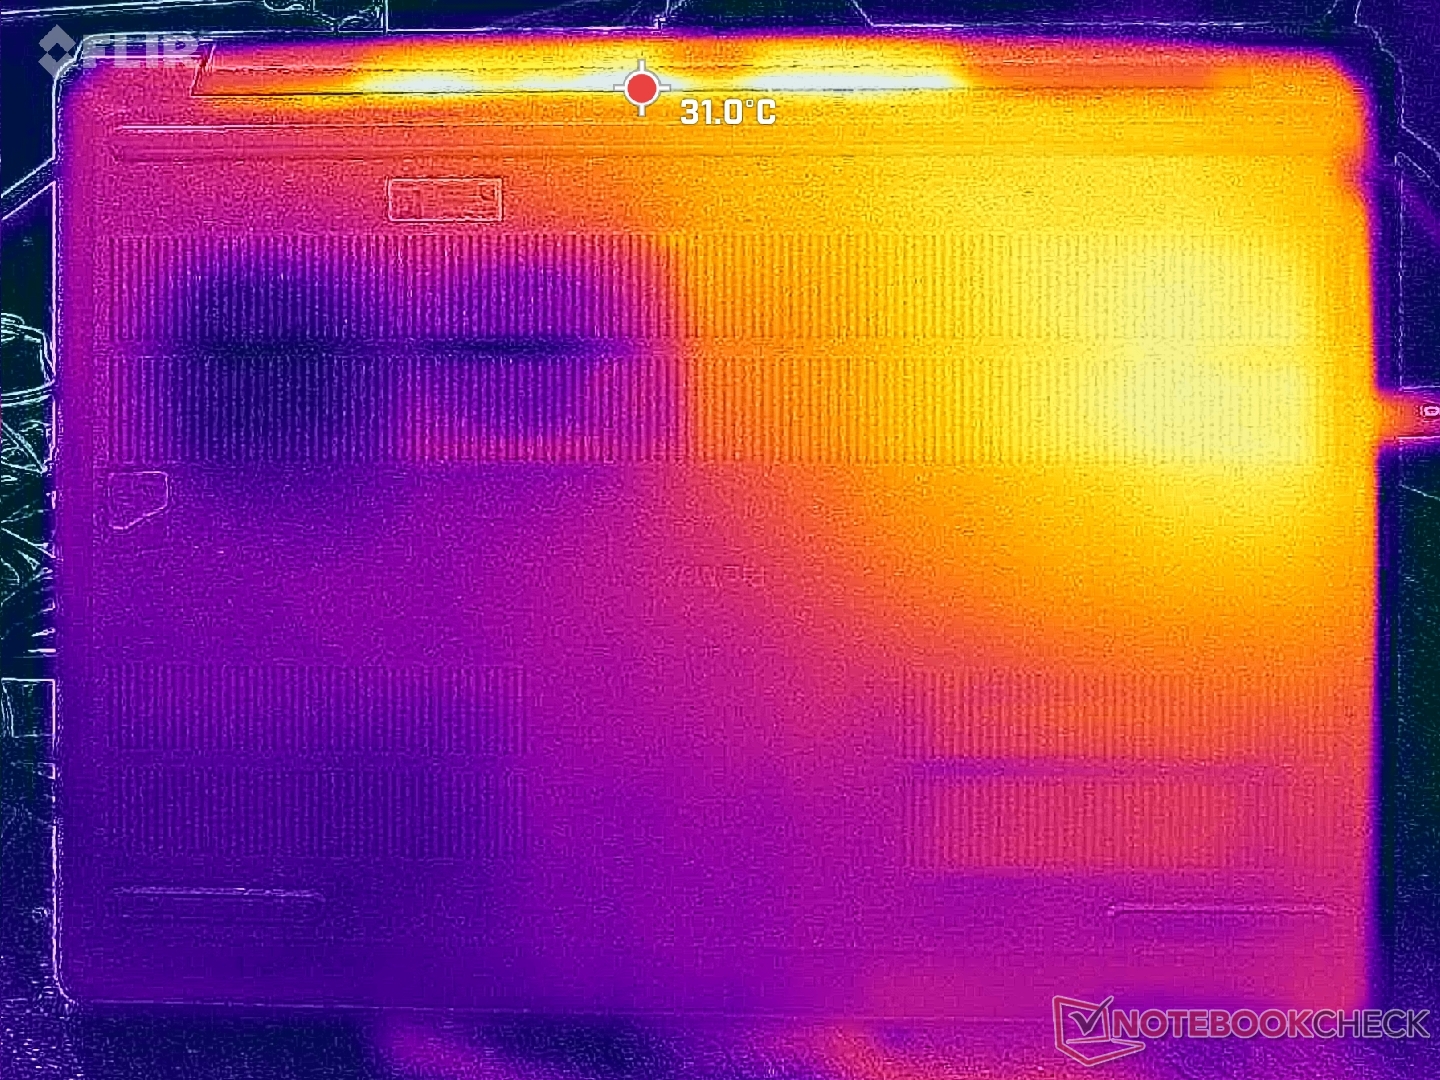
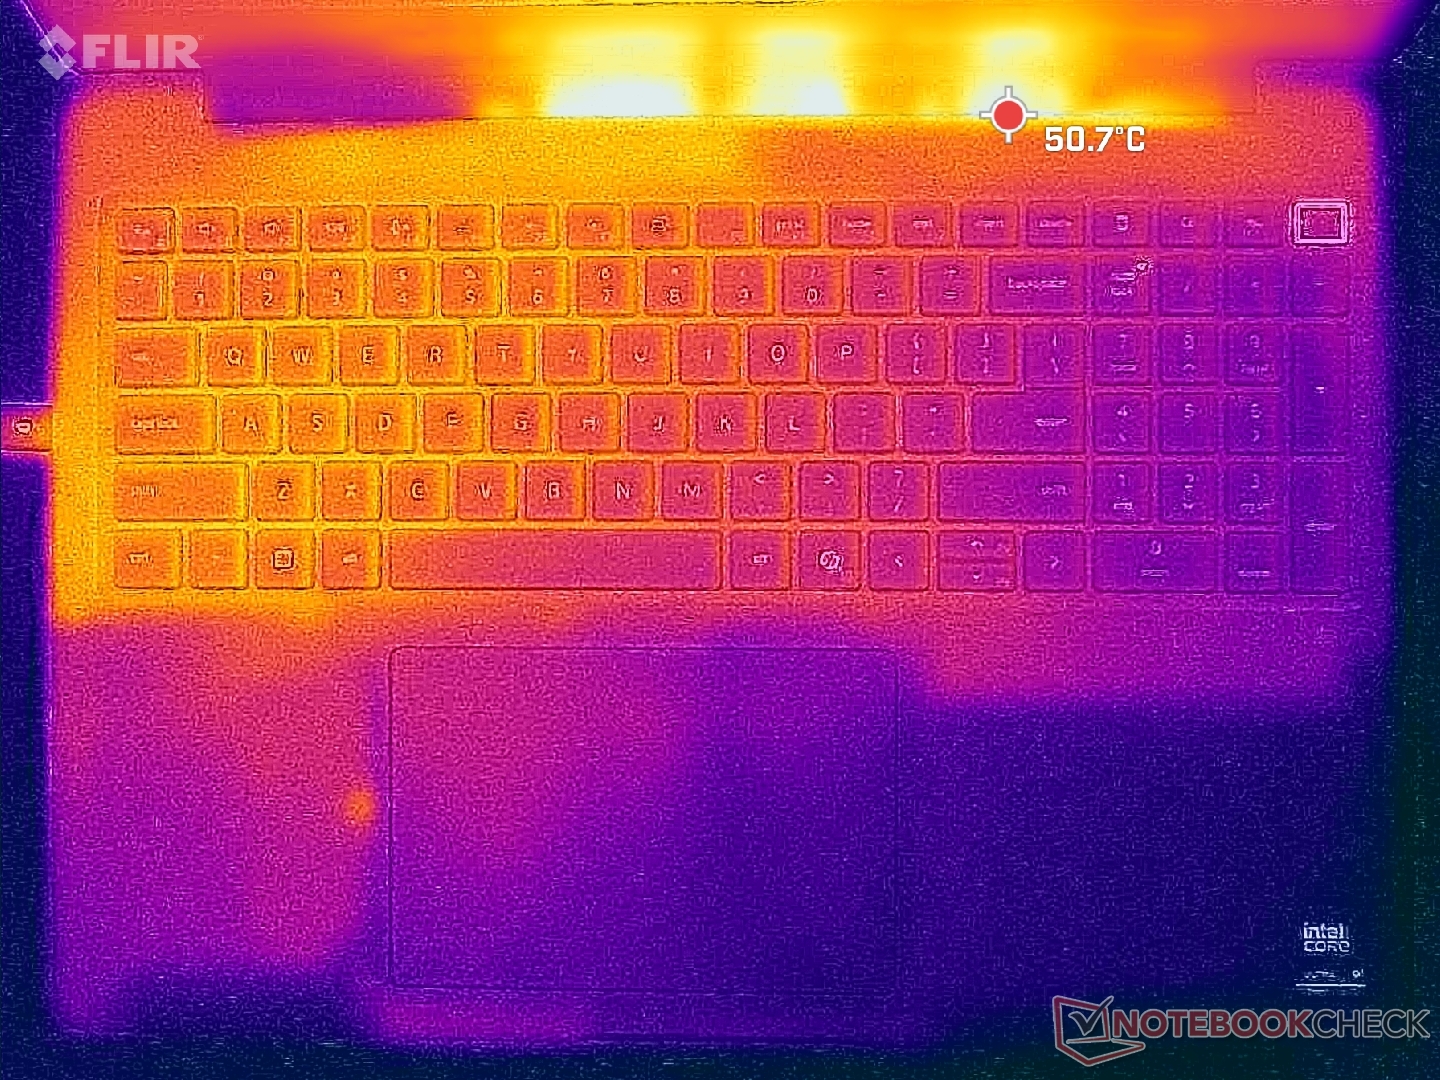
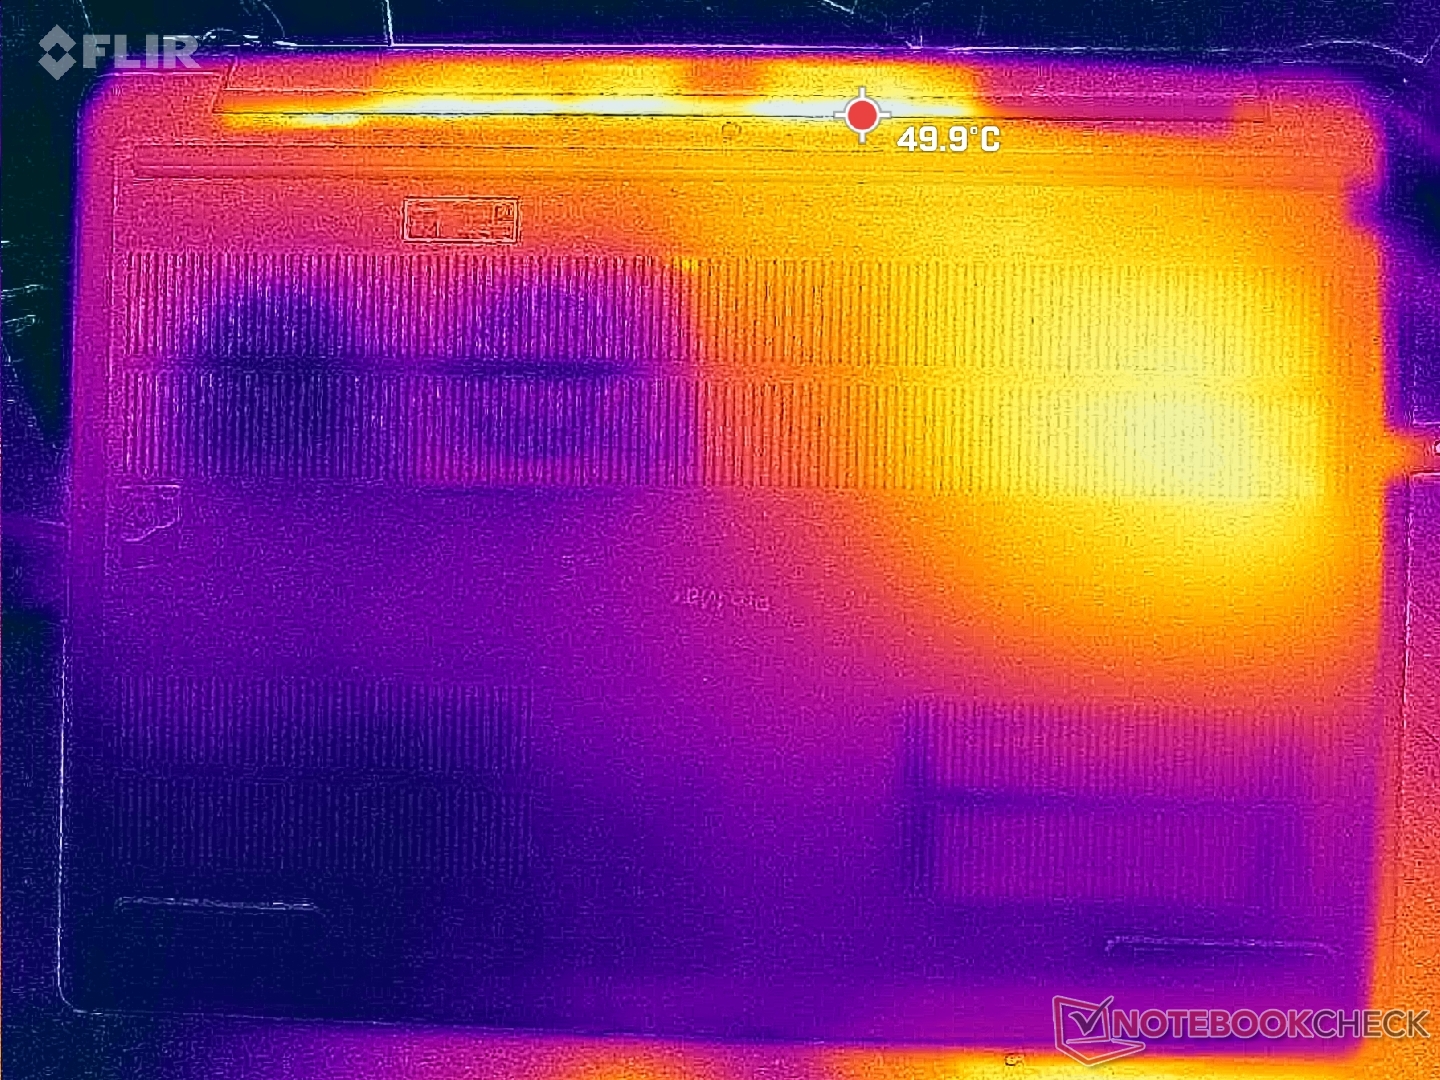
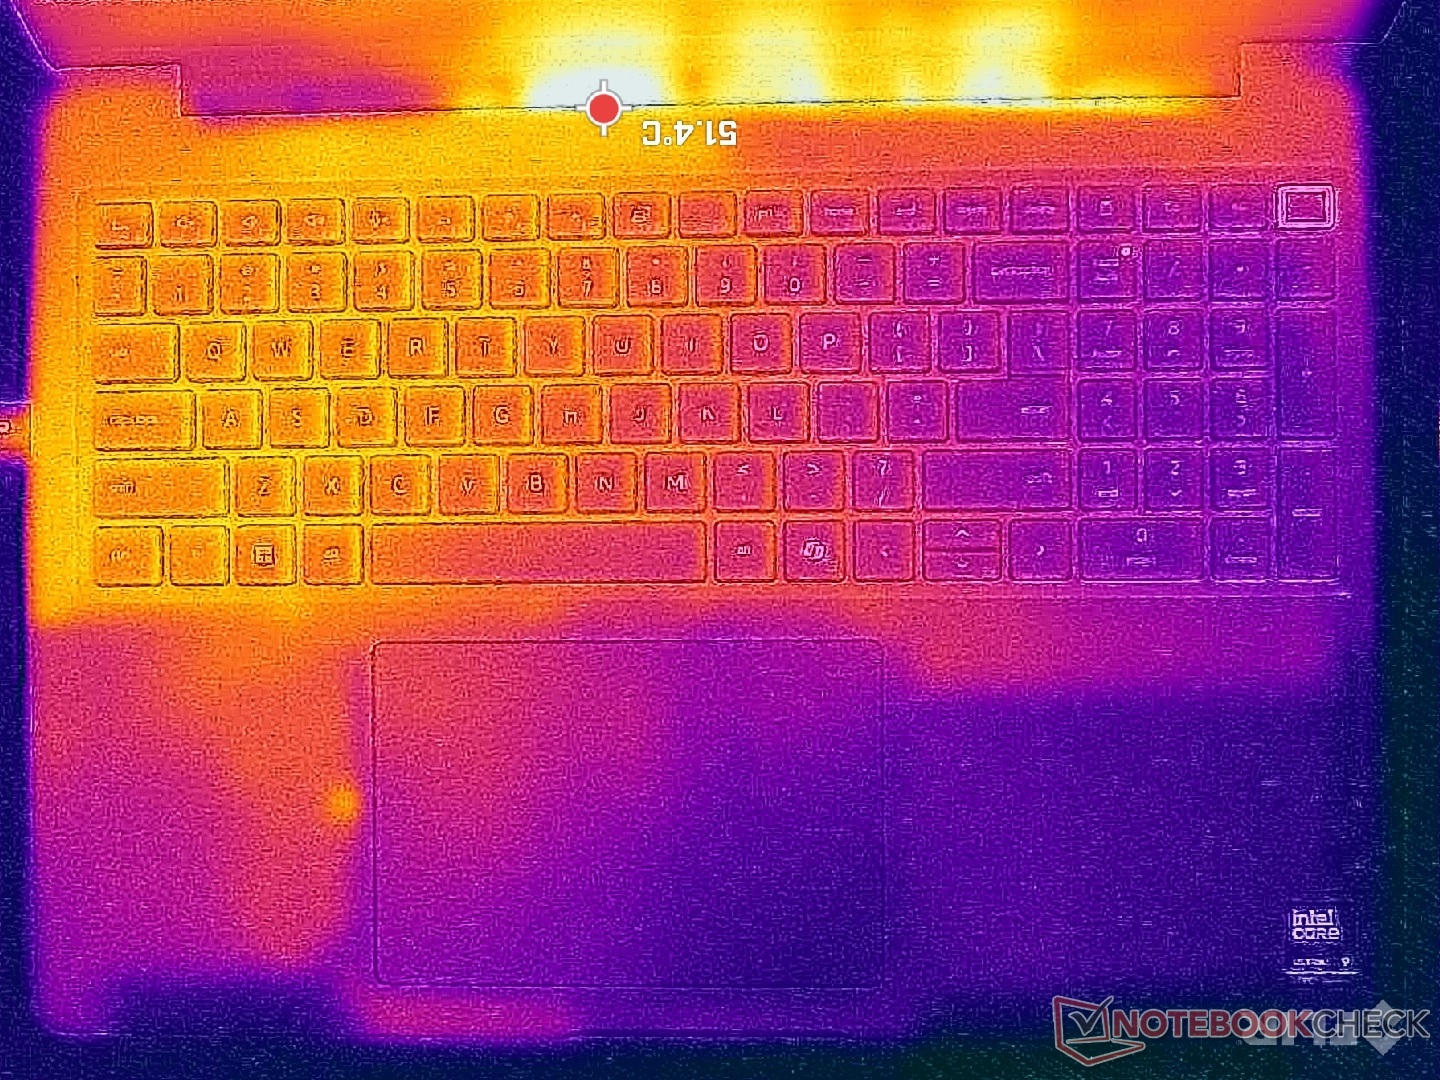
Temperatura
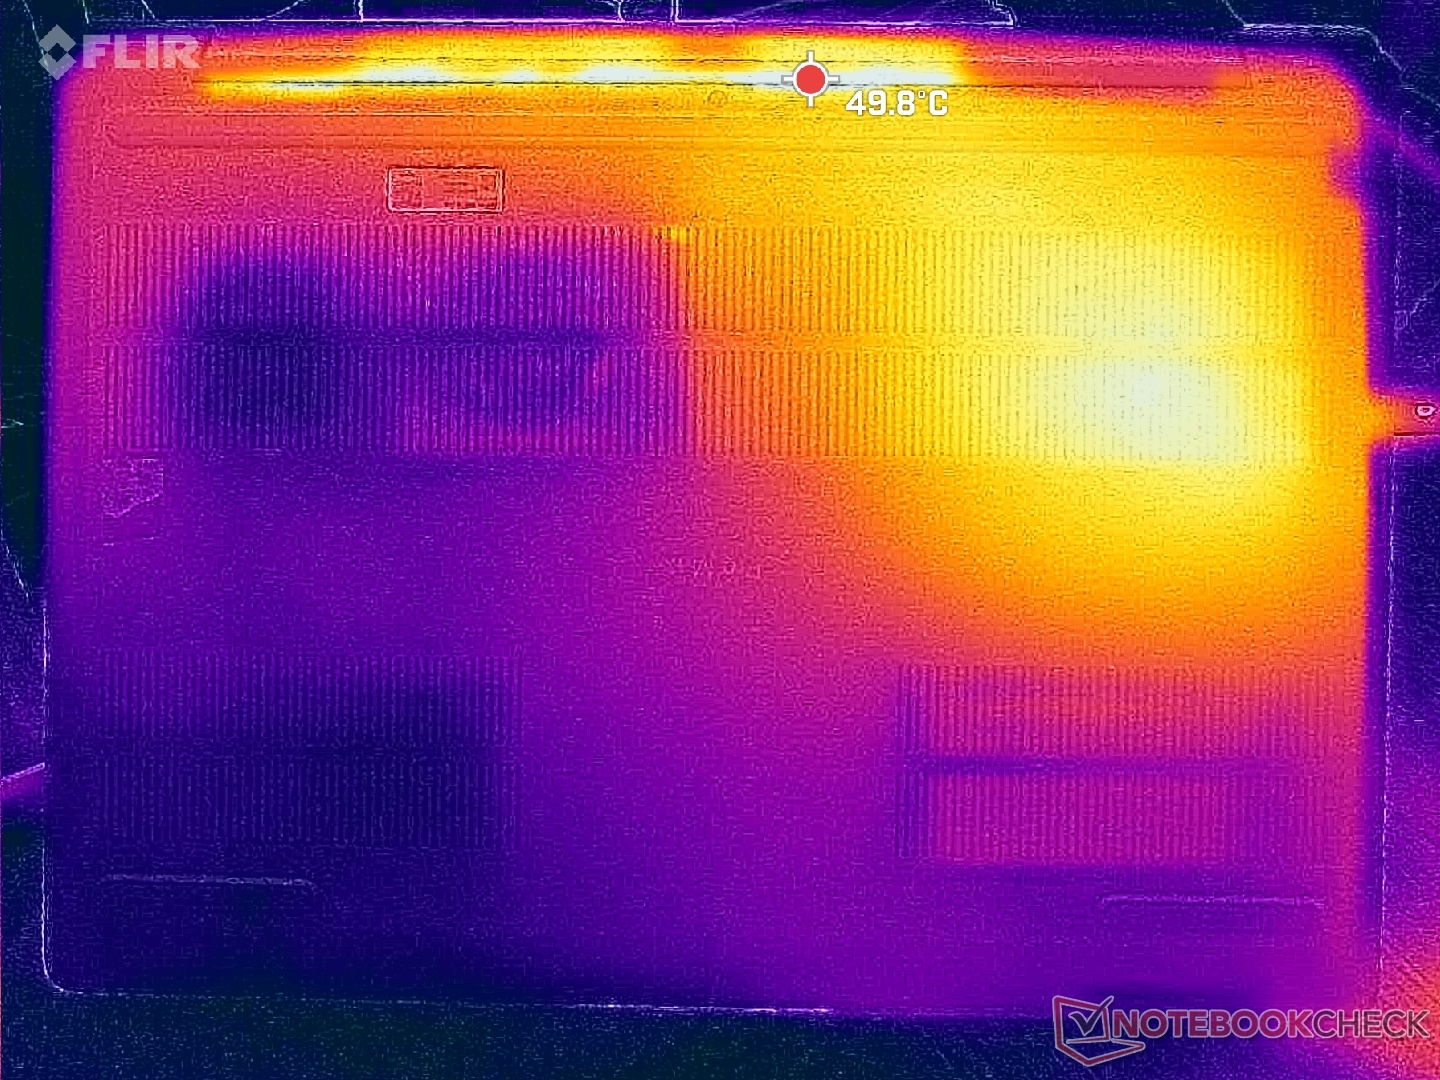
Le temperature di superficie sono quasi sempre calde, indipendentemente dal carico sullo schermo, probabilmente a causa delle ventole letargiche e delle parti ad alte prestazioni. La metà sinistra dello chassis diventa sensibilmente più calda di quella destra a causa della soluzione di raffreddamento asimmetrica.
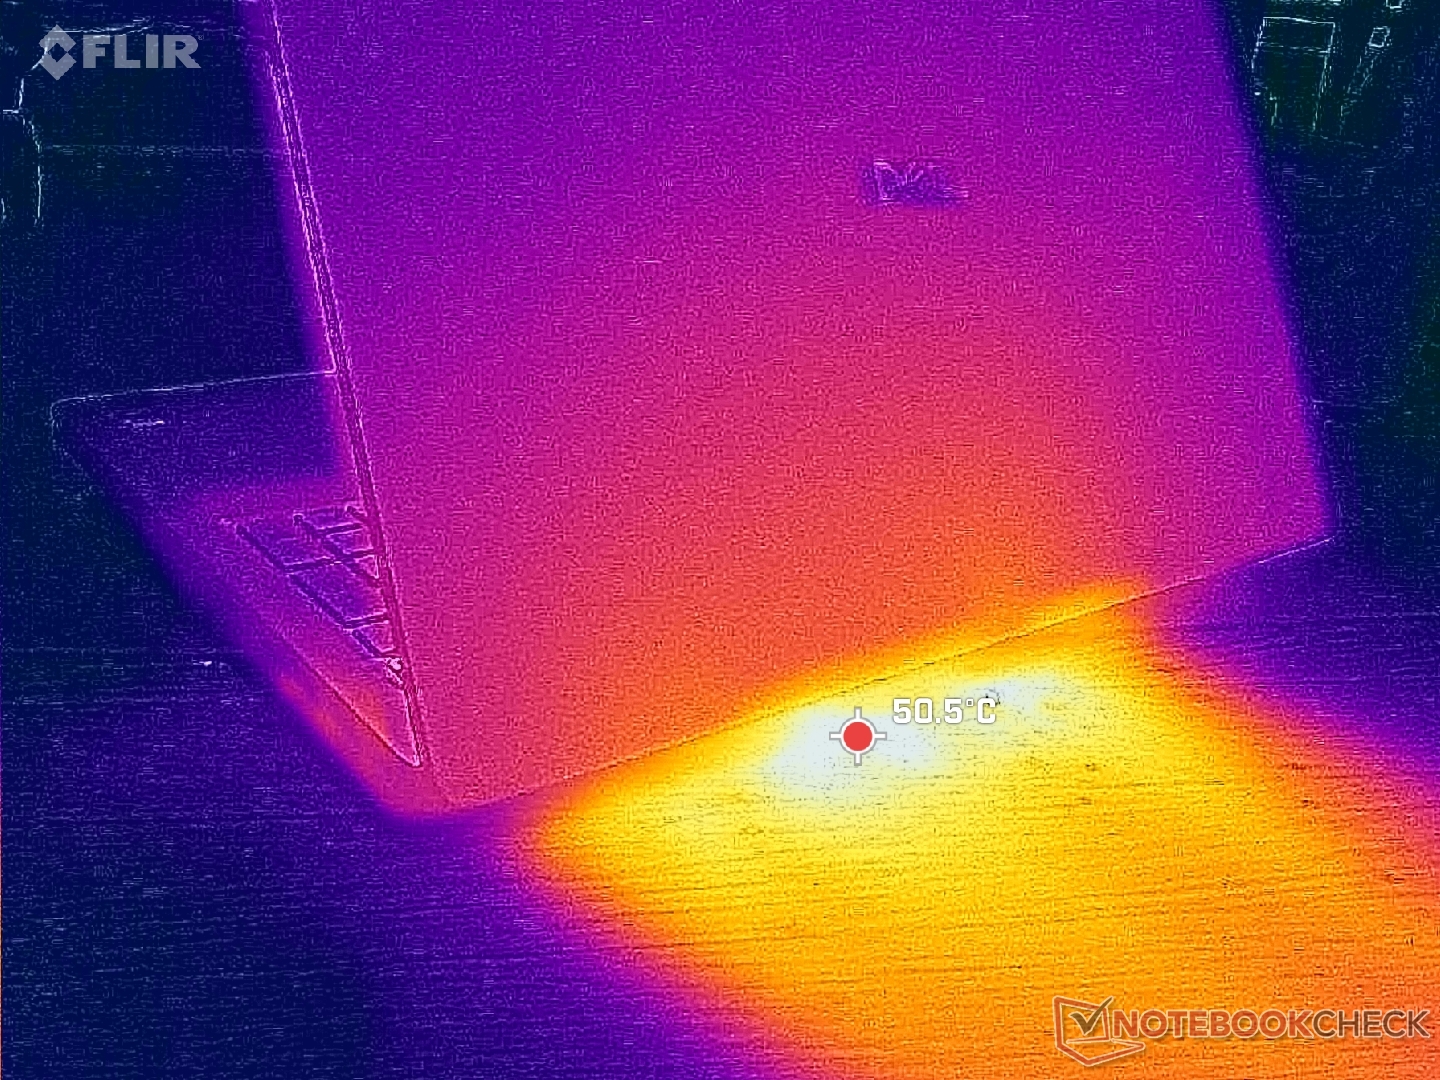
(±) La temperatura massima sul lato superiore è di 40.4 °C / 105 F, rispetto alla media di 38.3 °C / 101 F, che varia da 22.2 a 69.8 °C per questa classe Workstation.
(-) Il lato inferiore si riscalda fino ad un massimo di 45.6 °C / 114 F, rispetto alla media di 41.3 °C / 106 F
(+) In idle, la temperatura media del lato superiore è di 29.5 °C / 85 F, rispetto alla media deld ispositivo di 32 °C / 90 F.
(±) 3: The average temperature for the upper side is 34.2 °C / 94 F, compared to the average of 32 °C / 90 F for the class Workstation.
(+) I poggiapolsi e il touchpad raggiungono la temperatura massima della pelle (33.2 °C / 91.8 F) e quindi non sono caldi.
(-) La temperatura media della zona del palmo della mano di dispositivi simili e'stata di 27.9 °C / 82.2 F (-5.3 °C / -9.6 F).
| Dell Pro Max 16 Plus Intel Core Ultra 9 285HX, Nvidia RTX PRO 5000 Blackwell Generation Laptop | Dell Precision 5690 Intel Core Ultra 9 185H, Nvidia RTX 5000 Ada Generation Laptop GPU | Dell Precision 5000 5680 Intel Core i9-13900H, Nvidia RTX 5000 Ada Generation Laptop GPU | Lenovo ThinkPad P16 Gen 2 Intel Core i7-14700HX, NVIDIA RTX 4000 Ada Generation Laptop GPU | Lenovo ThinkPad P1 Gen 7 21KV001SGE Intel Core Ultra 7 155H, NVIDIA GeForce RTX 4060 Laptop GPU | HP ZBook Studio 16 G11 Intel Core Ultra 9 185H, NVIDIA RTX 3000 Ada Generation Laptop GPU | MSI CreatorPro Z16P B12UKST Intel Core i7-12700H, NVIDIA RTX A3000 Laptop GPU | |
|---|---|---|---|---|---|---|---|
| Heat | 6% | -1% | 5% | 6% | 0% | -11% | |
| Maximum Upper Side * (°C) | 40.4 | 46.6 -15% | 50.2 -24% | 46.6 -15% | 50.3 -25% | 36.6 9% | 56.3 -39% |
| Maximum Bottom * (°C) | 45.6 | 33 28% | 32 30% | 51 -12% | 38 17% | 47.8 -5% | 68.3 -50% |
| Idle Upper Side * (°C) | 32.8 | 32.4 1% | 37.4 -14% | 24.8 24% | 28.3 14% | 31.4 4% | 25.2 23% |
| Idle Bottom * (°C) | 33 | 29.4 11% | 31.2 5% | 25.6 22% | 27.3 17% | 35.6 -8% | 25.9 22% |
* ... Meglio usare valori piccoli
Test da sforzo
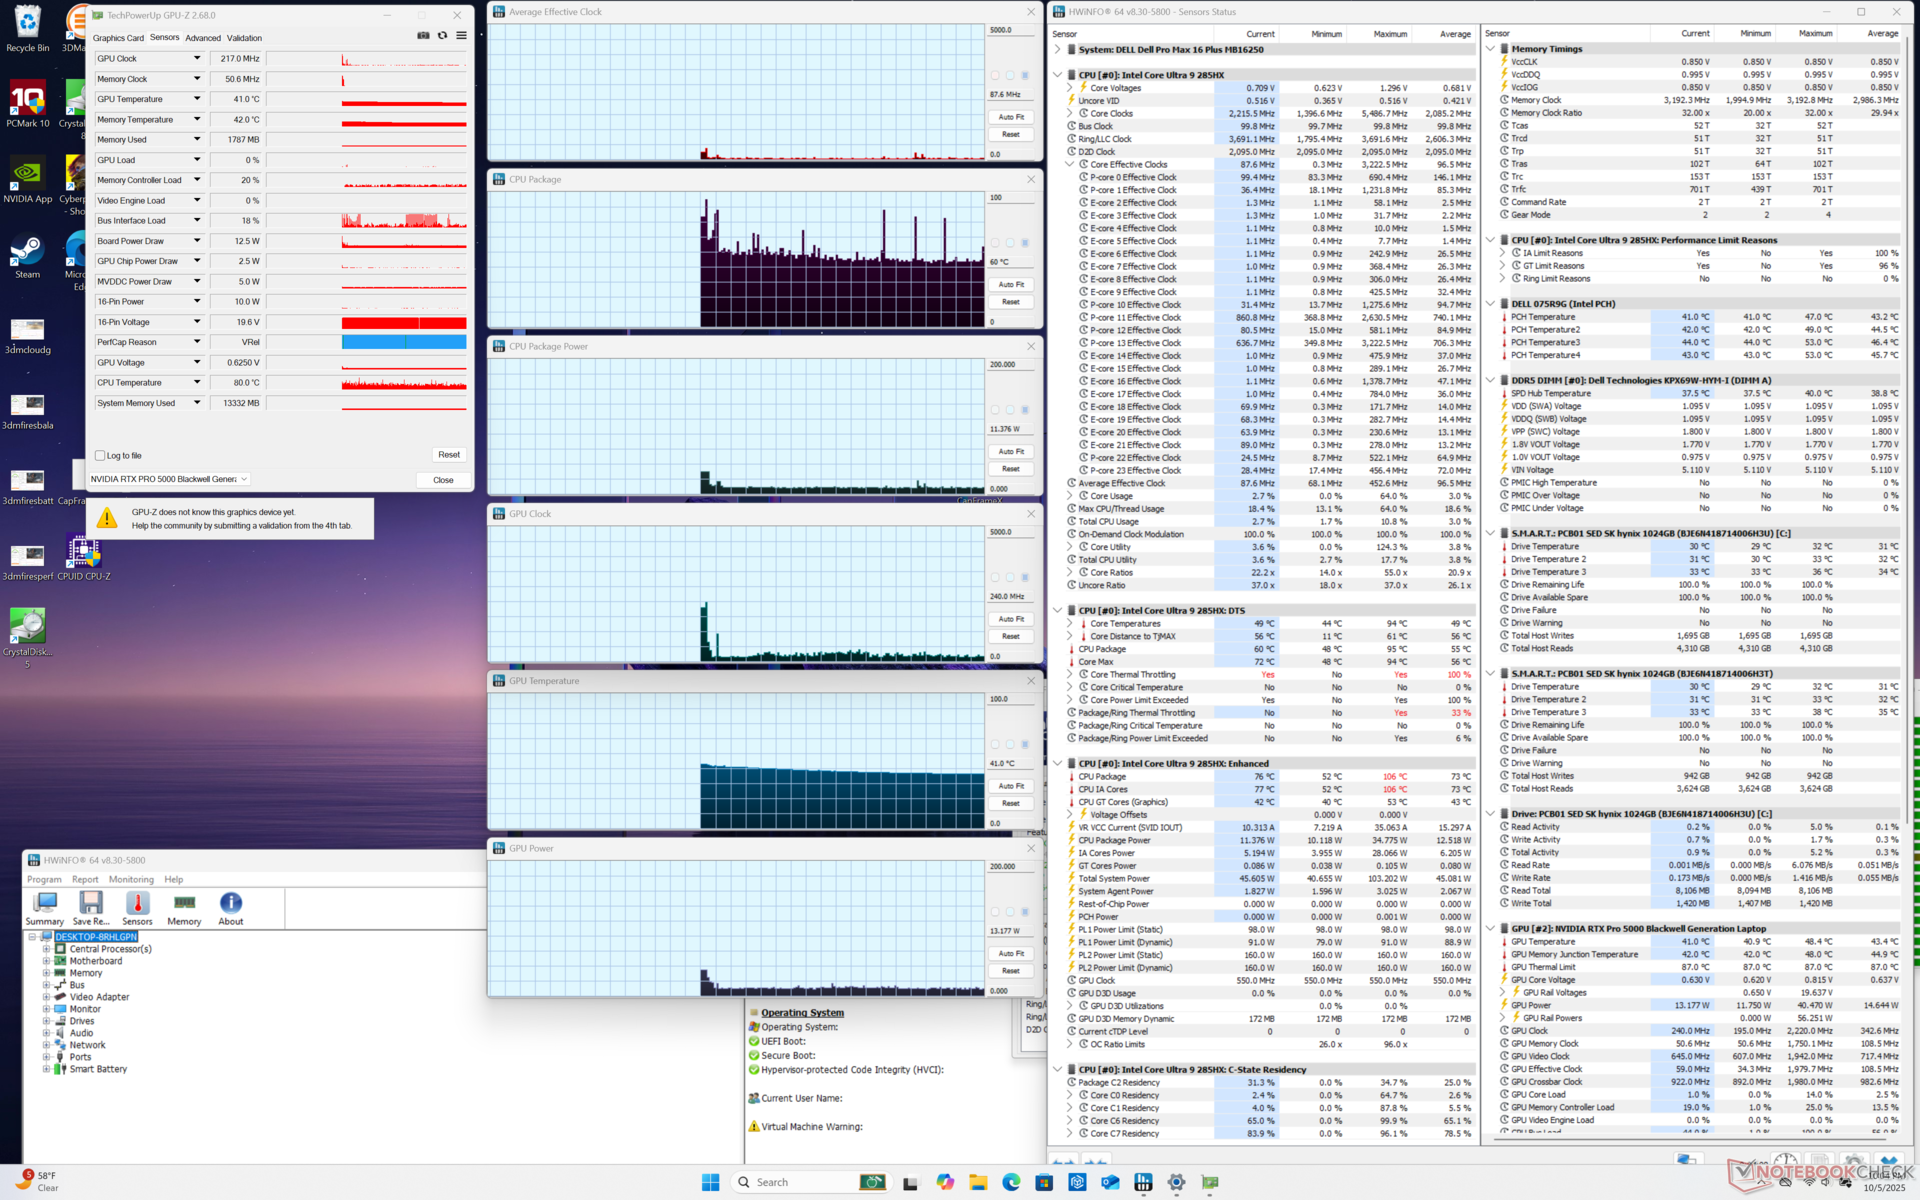
La CPU aumenterebbe a 3,8 GHz, 159 W e 105 C quando inizia lo stress Prime95, prima di scendere rapidamente e stabilizzarsi a 3,1 GHz, 90 W e 96 C. La temperatura del core diventerebbe più calda di quanto vorremmo quando è completamente stressato.
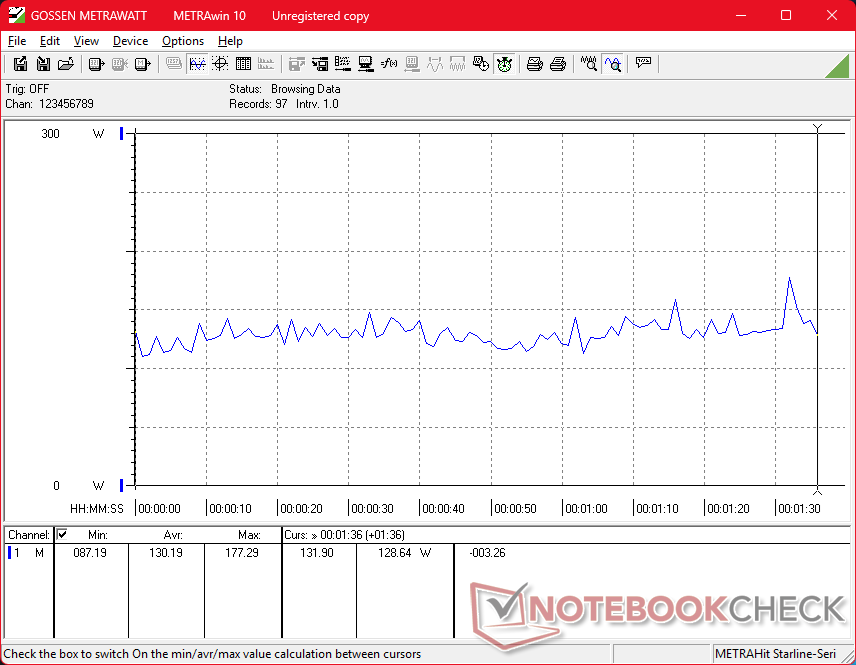
Eseguendo Cyberpunk 2077 in modalità Prestazioni per rappresentare condizioni di stress più tipiche, la GPU si stabilizzerebbe a ~121 W. Scendendo alla modalità Bilanciata, il limite massimo di assorbimento di energia della GPU si ridurrebbe a ~108 W.
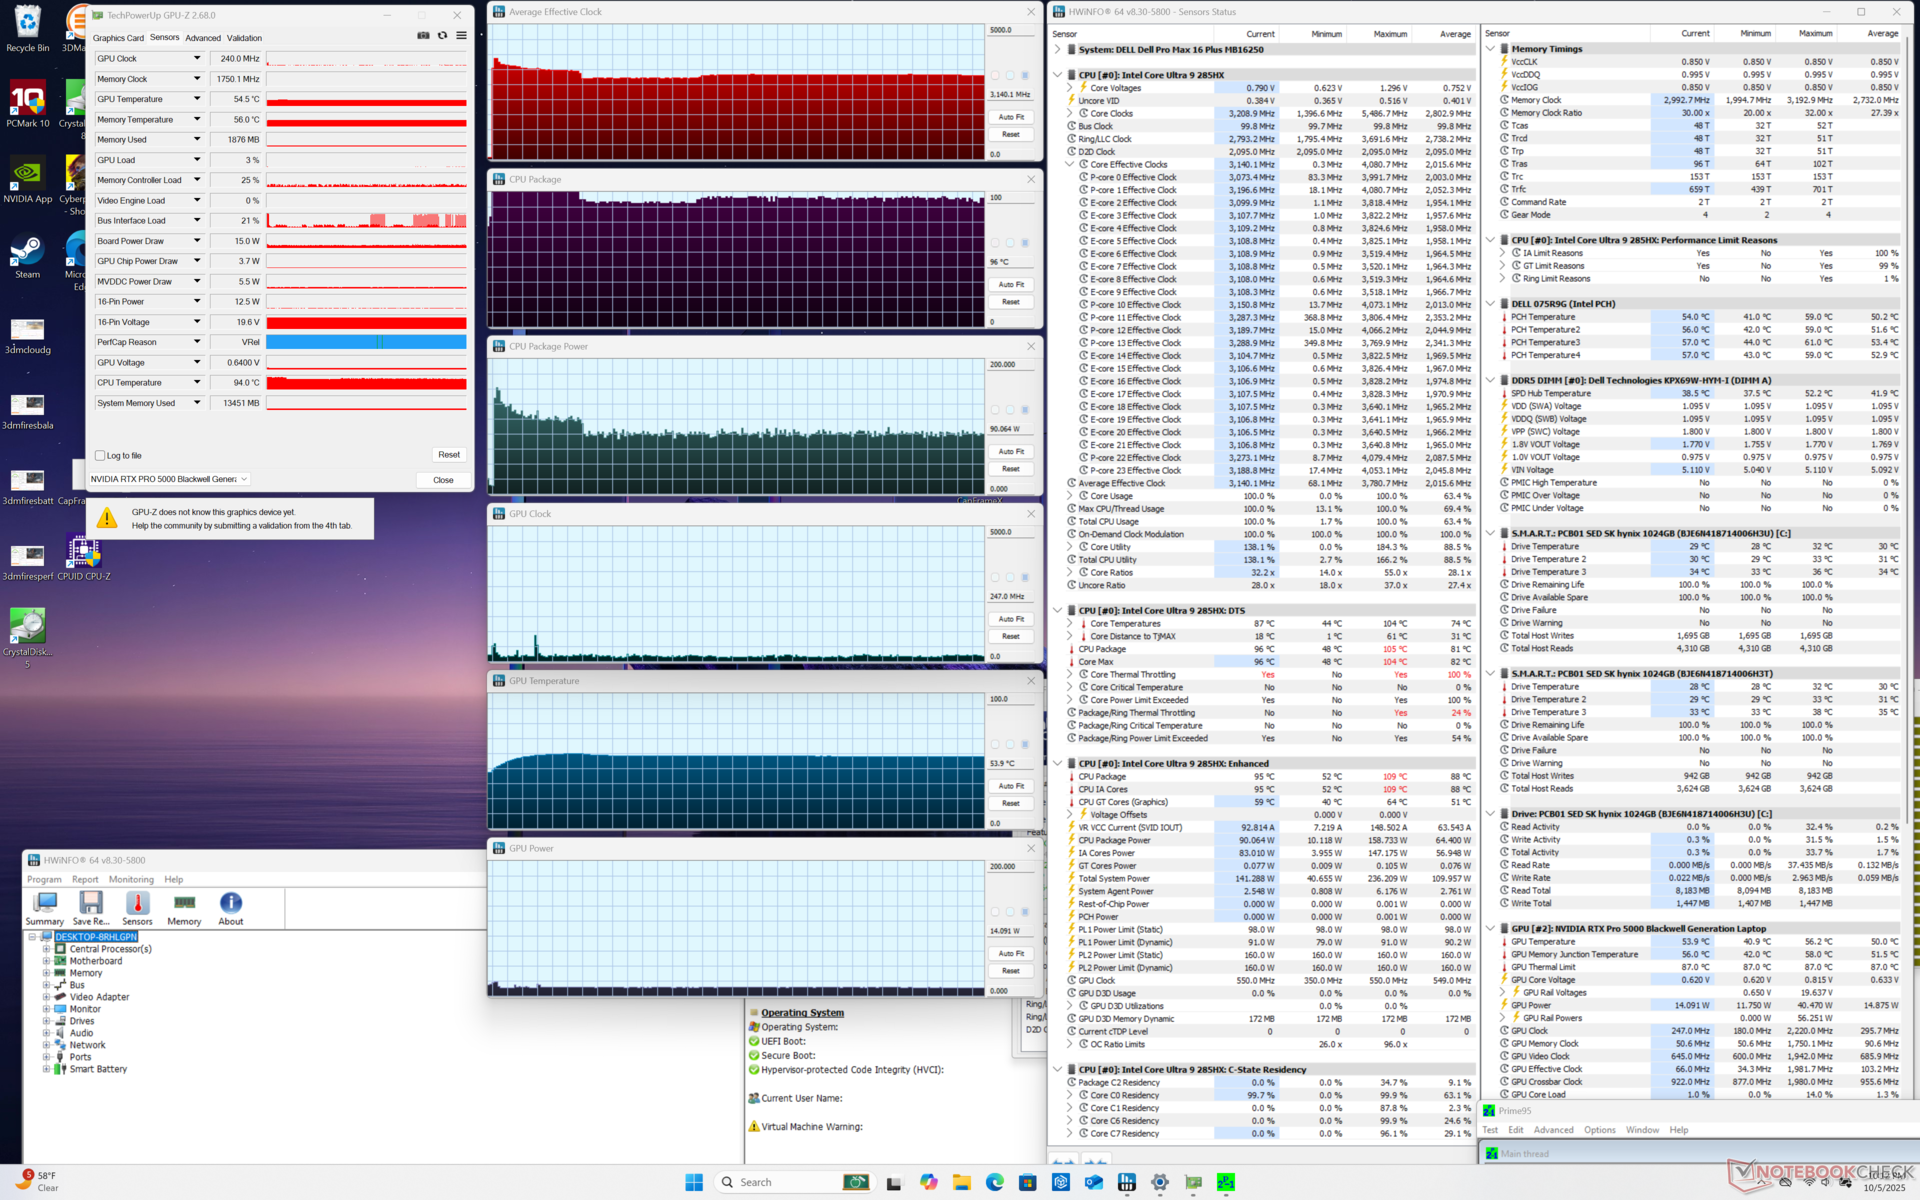
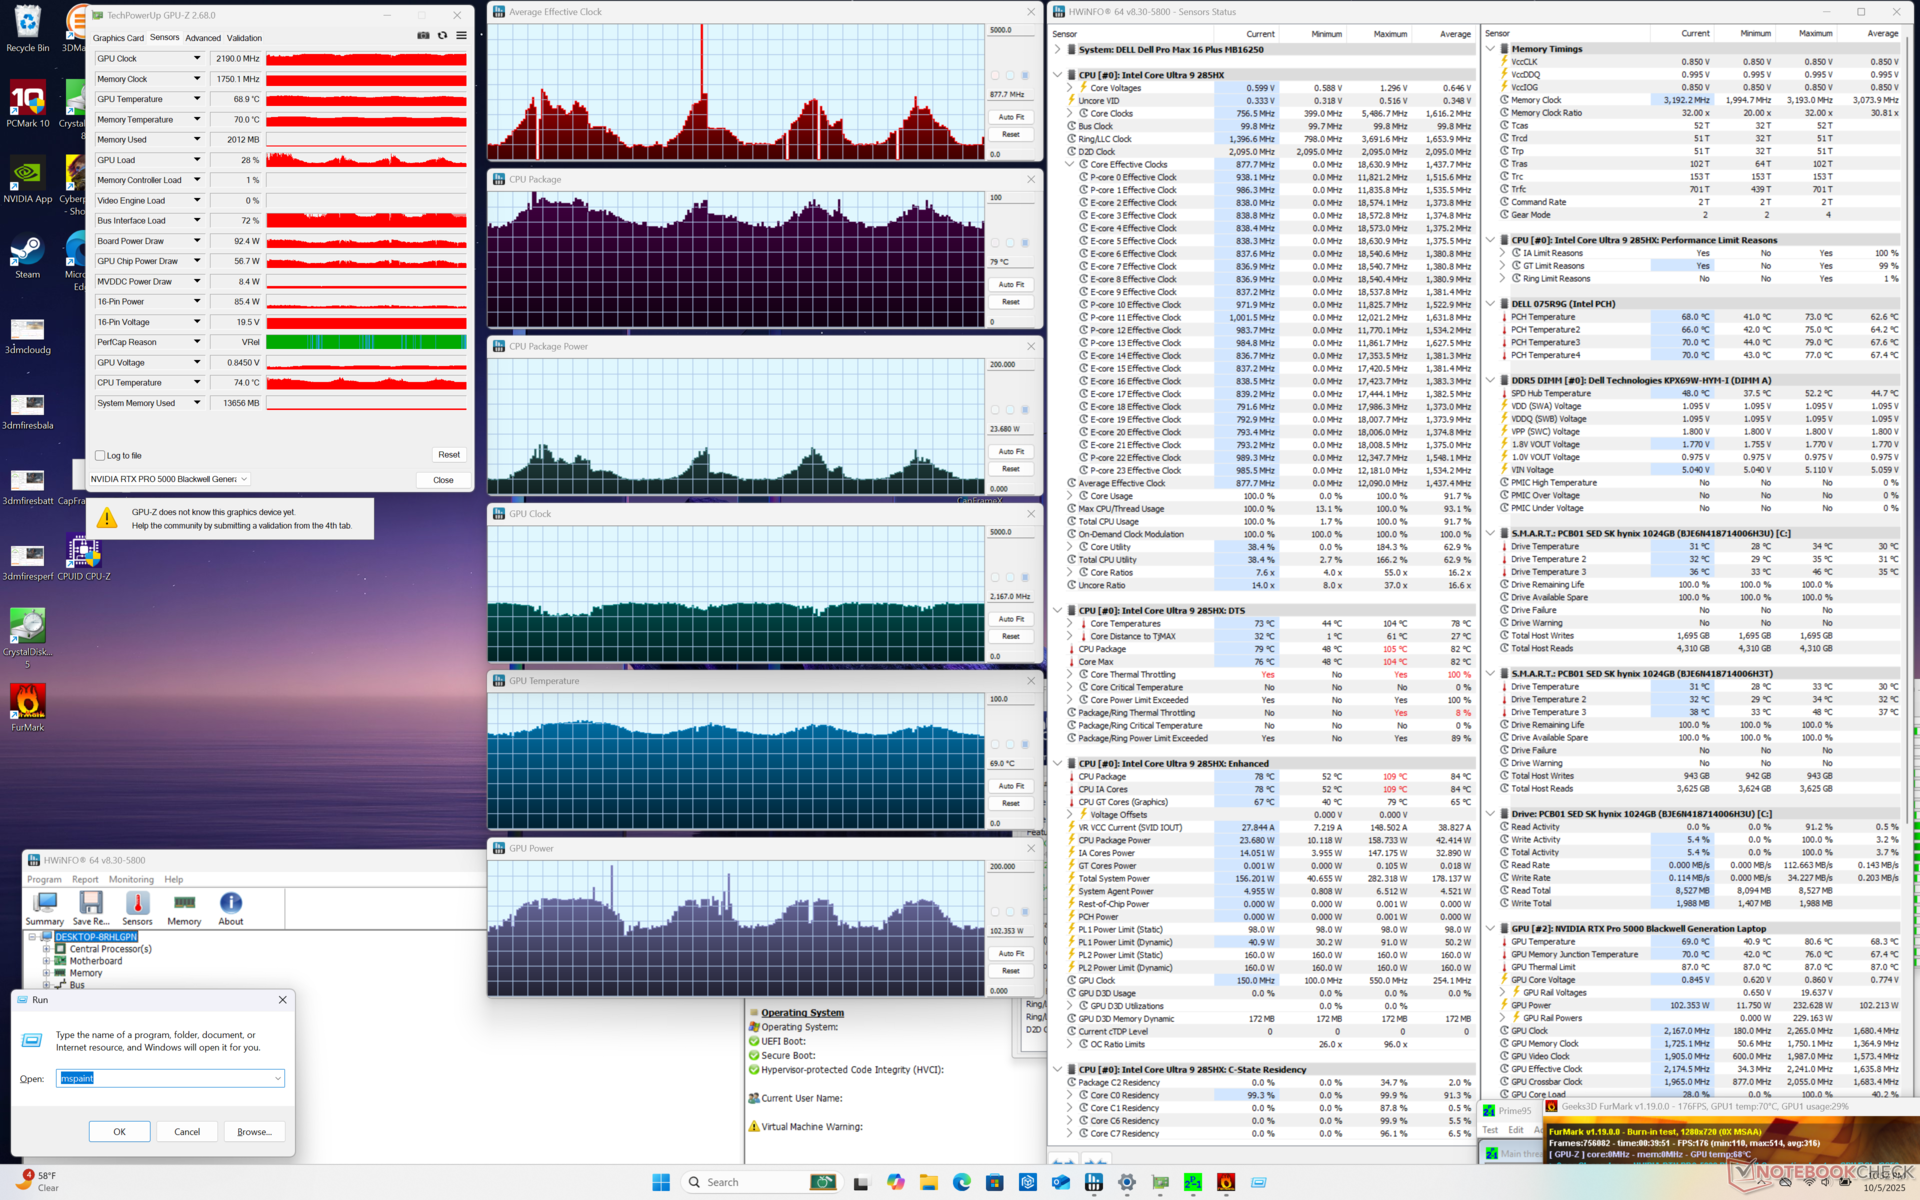
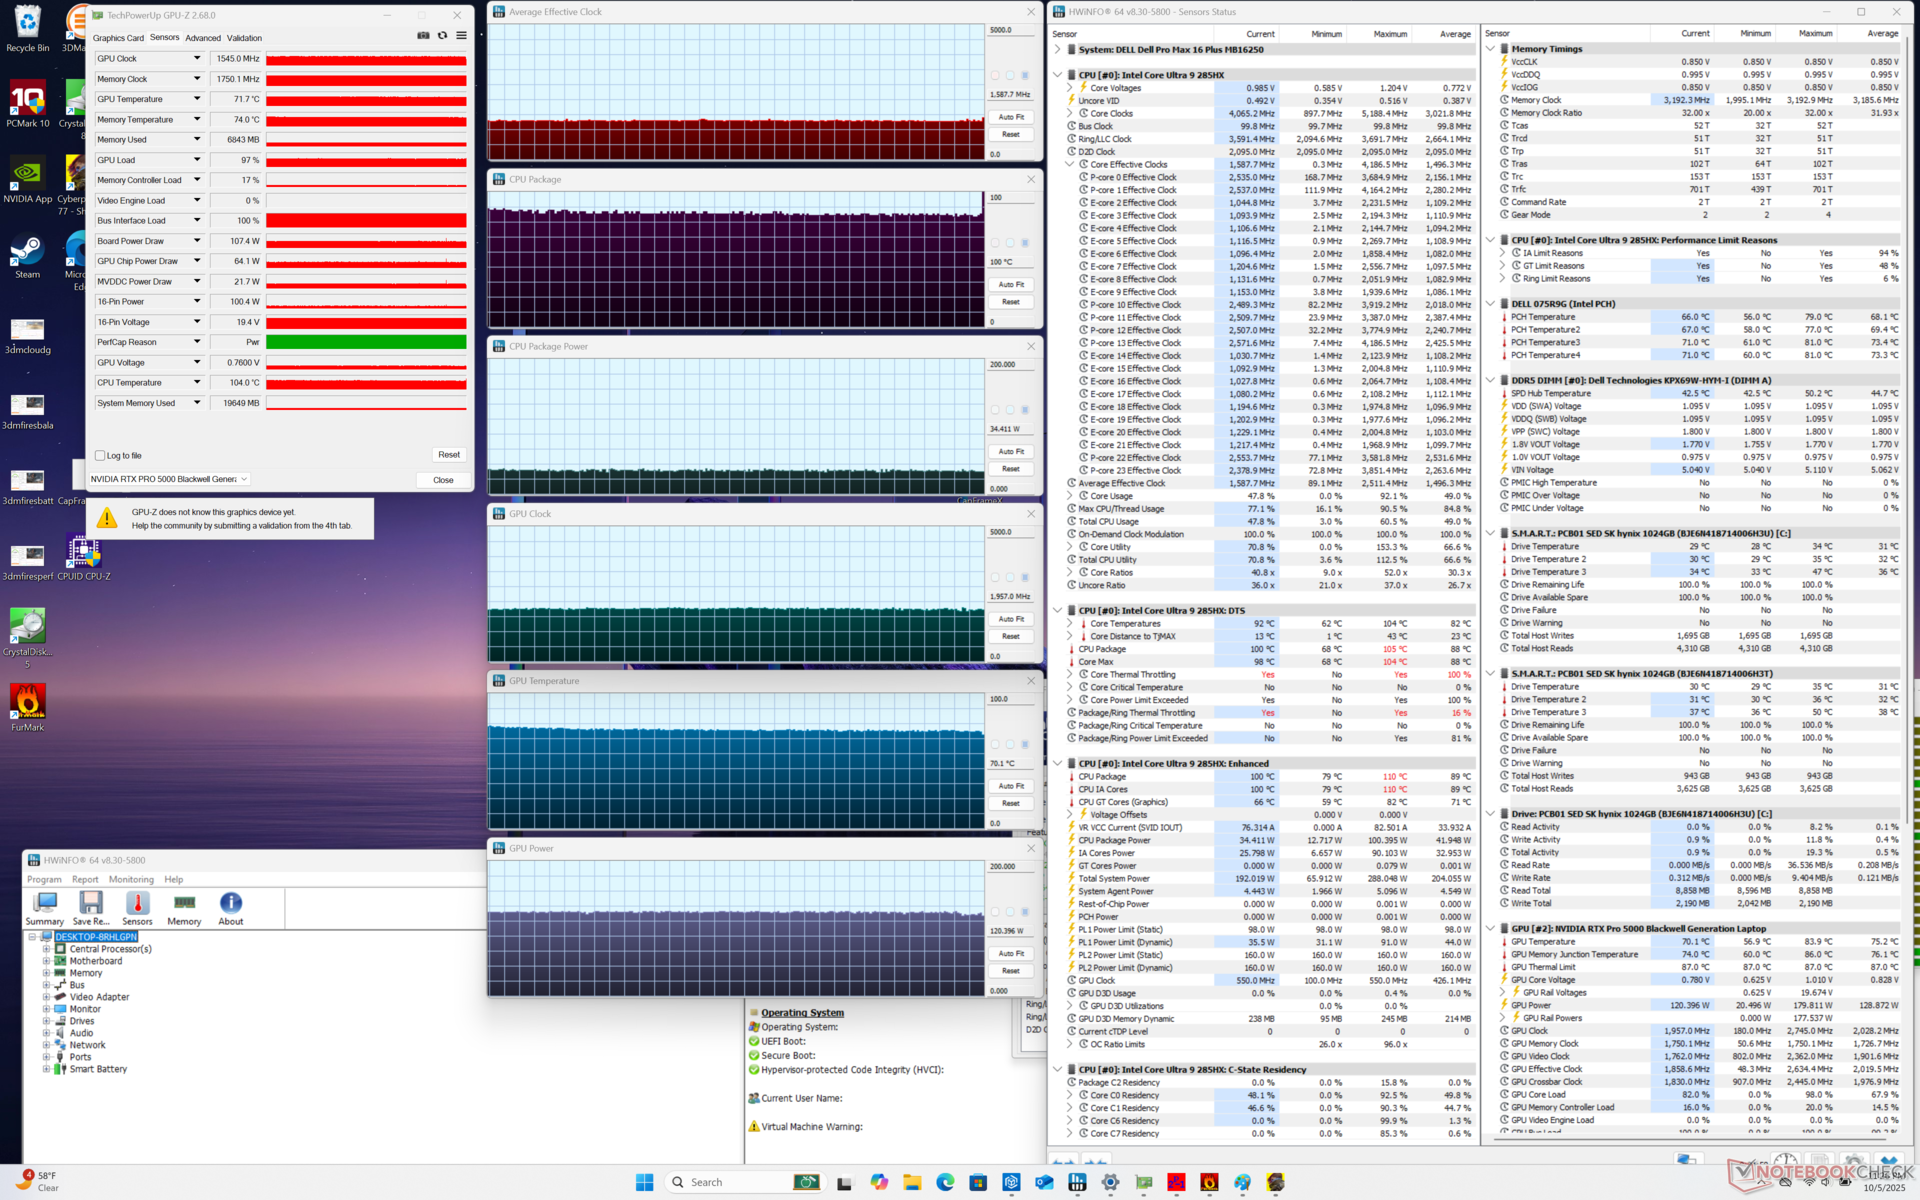
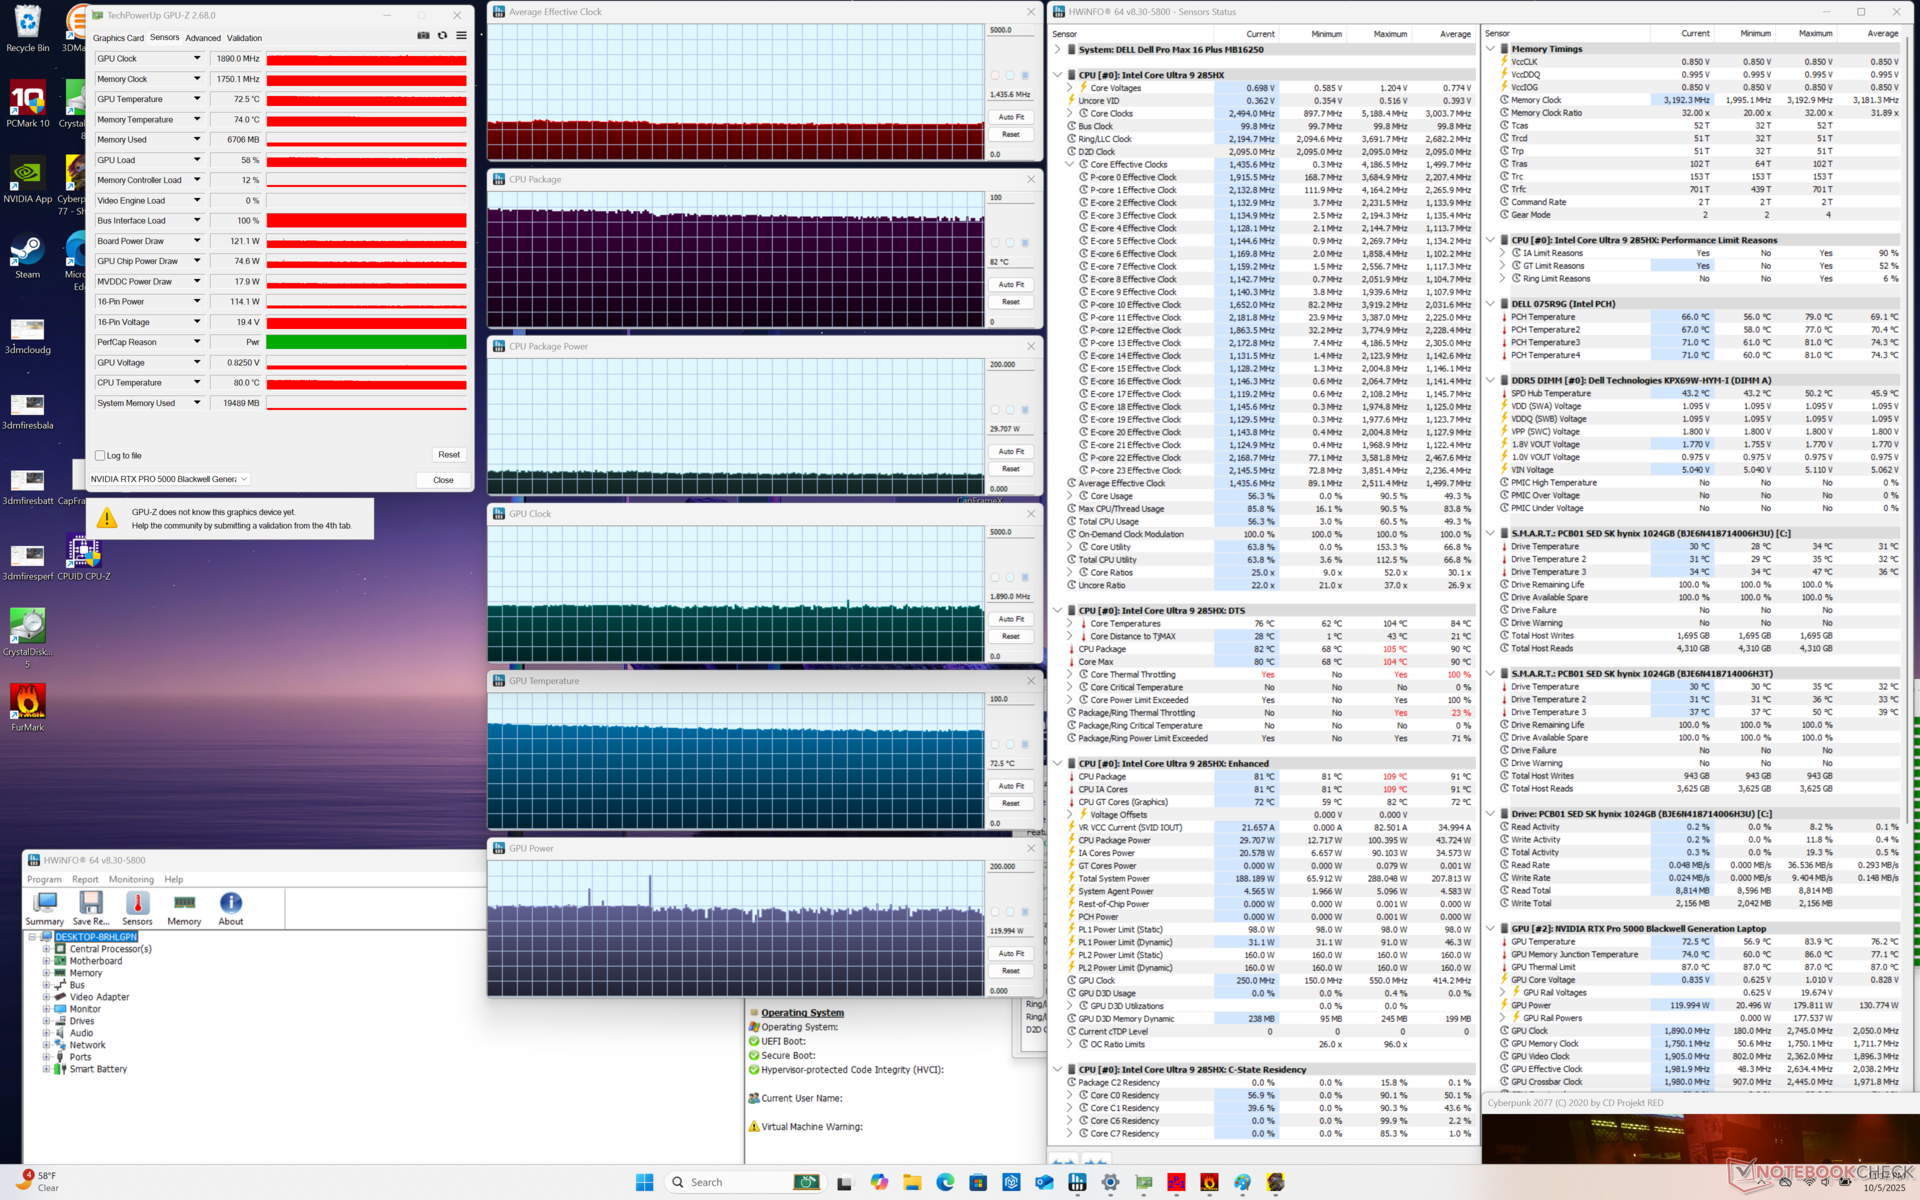
| Clock medio della CPU (GHz) | Clock della GPU (MHz) | Temperatura media della CPU (°C) | Temperatura media della GPU (°C) | |
| Sistema inattivo | -- | -- | 55 | 41 |
| Stress Prime95 | 3,1 | -- | 96 | 55 |
| Stress Prime95 + FurMark | 0,5 - 2,8 | 1,7 - 2,2 | 75 - 105 | 70 - 78 |
| Cyberpunk 2077 Stress (modalità Bilanciata) | ~1,6 | 1545 | 82 | 71 |
| Cyberpunk 2077 Stress (modalità Performance) | ~1,4 | 1890 | 82 | 73 |
Altoparlanti
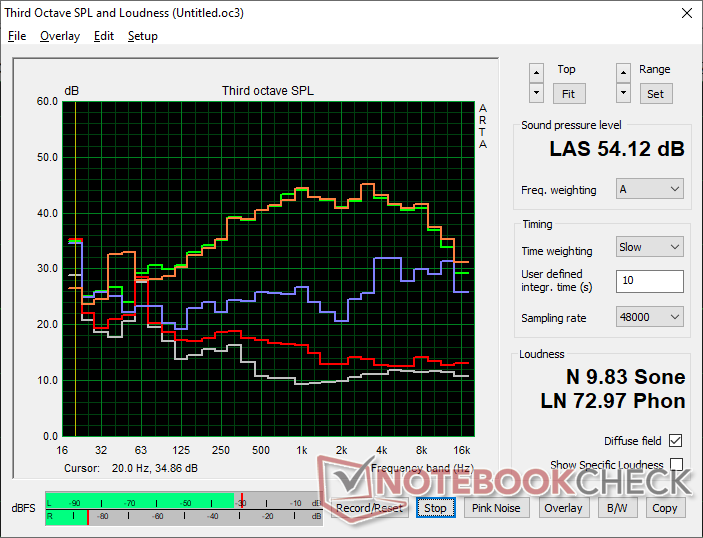
Dell Pro Max 16 Plus analisi audio
(+) | gli altoparlanti sono relativamente potenti (91.6 dB)
Bassi 100 - 315 Hz
(-) | quasi nessun basso - in media 20.9% inferiori alla media
(+) | bassi in lineaa (5.9% delta rispetto alla precedente frequenza)
Medi 400 - 2000 Hz
(+) | medi bilanciati - solo only 4.5% rispetto alla media
(+) | medi lineari (4% delta rispetto alla precedente frequenza)
Alti 2 - 16 kHz
(+) | Alti bilanciati - appena 3.7% dalla media
(+) | alti lineari (2.9% delta rispetto alla precedente frequenza)
Nel complesso 100 - 16.000 Hz
(+) | suono nel complesso lineare (14.3% differenza dalla media)
Rispetto alla stessa classe
» 27% di tutti i dispositivi testati in questa classe è stato migliore, 4% simile, 69% peggiore
» Il migliore ha avuto un delta di 7%, medio di 18%, peggiore di 35%
Rispetto a tutti i dispositivi testati
» 17% di tutti i dispositivi testati in questa classe è stato migliore, 4% similare, 79% peggiore
» Il migliore ha avuto un delta di 4%, medio di 24%, peggiore di 134%
Apple MacBook Pro 16 2021 M1 Pro analisi audio
(+) | gli altoparlanti sono relativamente potenti (84.7 dB)
Bassi 100 - 315 Hz
(+) | bassi buoni - solo 3.8% dalla media
(+) | bassi in lineaa (5.2% delta rispetto alla precedente frequenza)
Medi 400 - 2000 Hz
(+) | medi bilanciati - solo only 1.3% rispetto alla media
(+) | medi lineari (2.1% delta rispetto alla precedente frequenza)
Alti 2 - 16 kHz
(+) | Alti bilanciati - appena 1.9% dalla media
(+) | alti lineari (2.7% delta rispetto alla precedente frequenza)
Nel complesso 100 - 16.000 Hz
(+) | suono nel complesso lineare (4.6% differenza dalla media)
Rispetto alla stessa classe
» 0% di tutti i dispositivi testati in questa classe è stato migliore, 0% simile, 100% peggiore
» Il migliore ha avuto un delta di 5%, medio di 18%, peggiore di 45%
Rispetto a tutti i dispositivi testati
» 0% di tutti i dispositivi testati in questa classe è stato migliore, 0% similare, 100% peggiore
» Il migliore ha avuto un delta di 4%, medio di 24%, peggiore di 134%
Gestione dell'energia
Consumo di energia
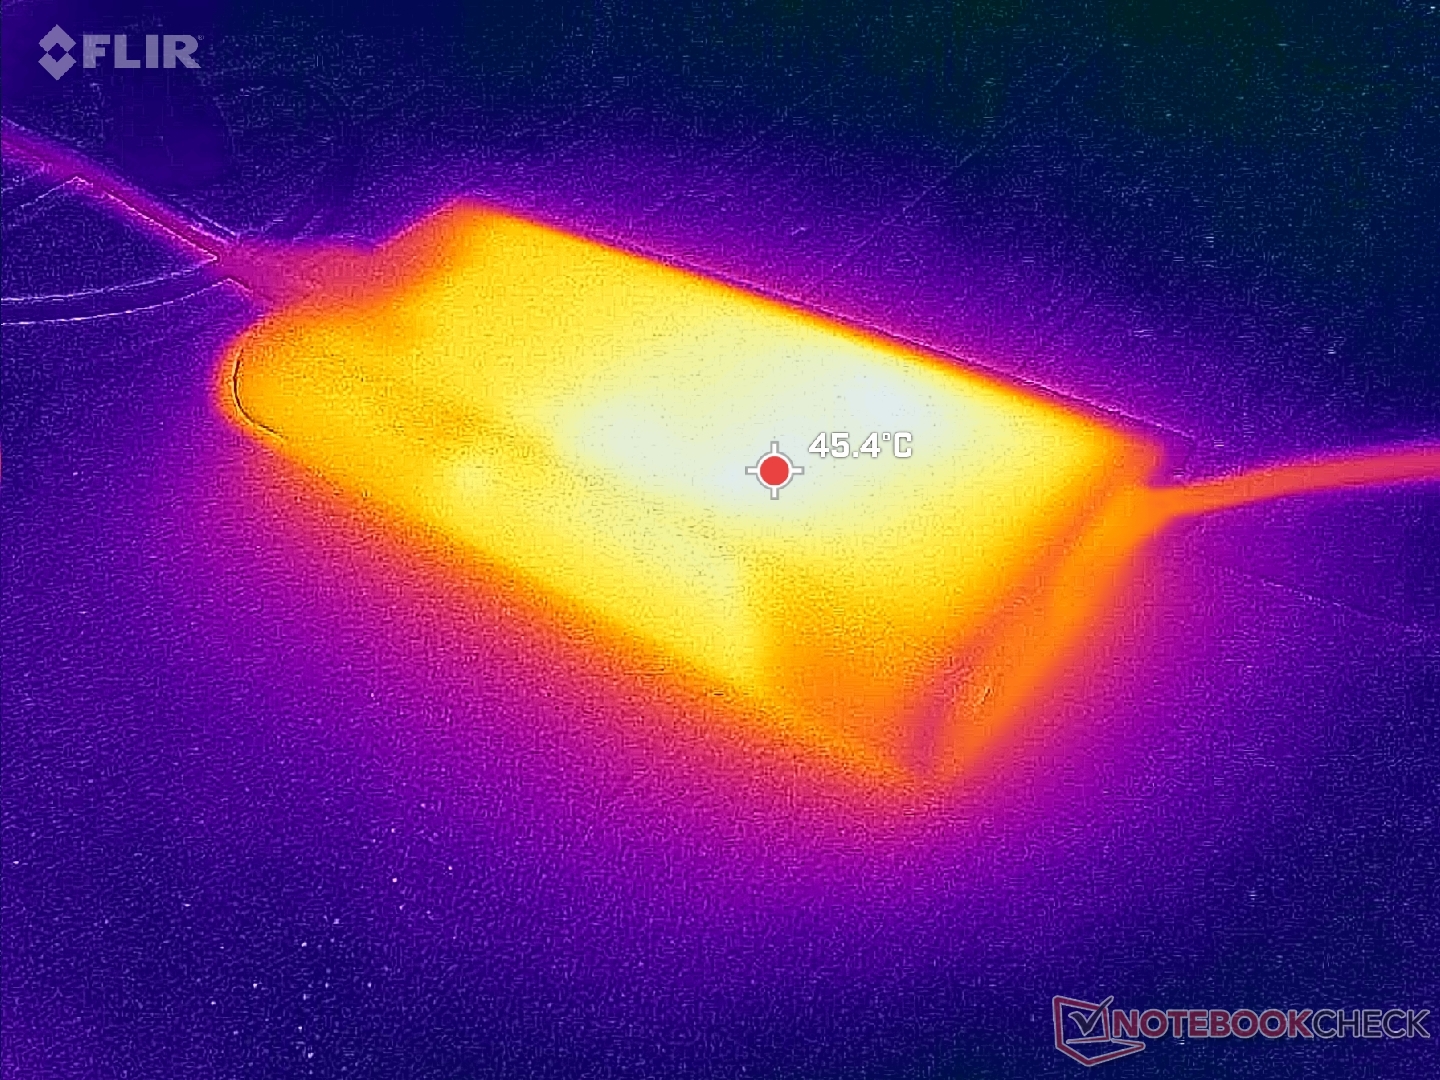
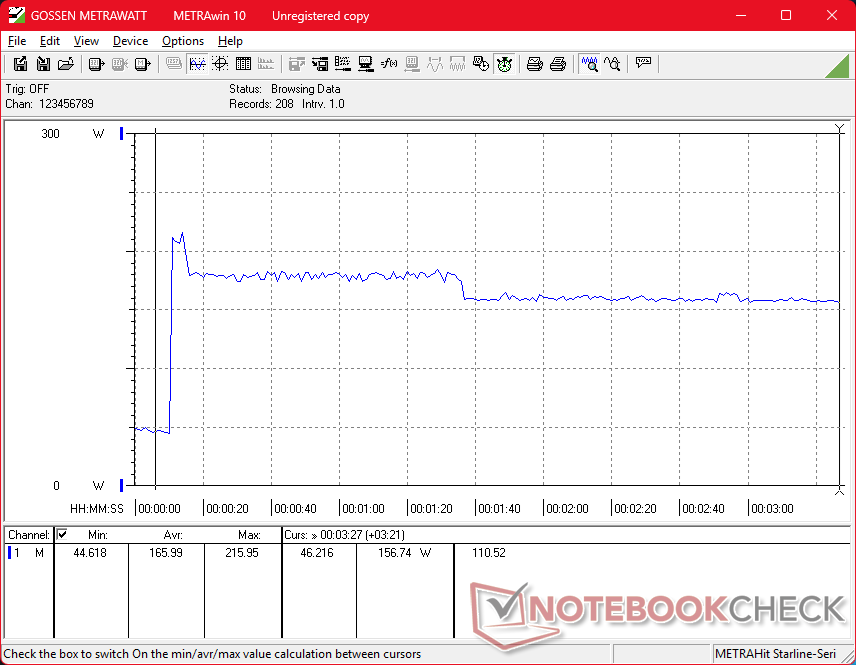
I tassi di consumo sono prevedibilmente molto elevati anche quando il computer è al minimo, il che contribuisce alla minore durata della batteria e alle superfici sempre calde. Il sistema è notevolmente più esigente rispetto all'uscente Precision 5690, ma le prestazioni sono sia più veloci che più costanti per essere un giusto compromesso.
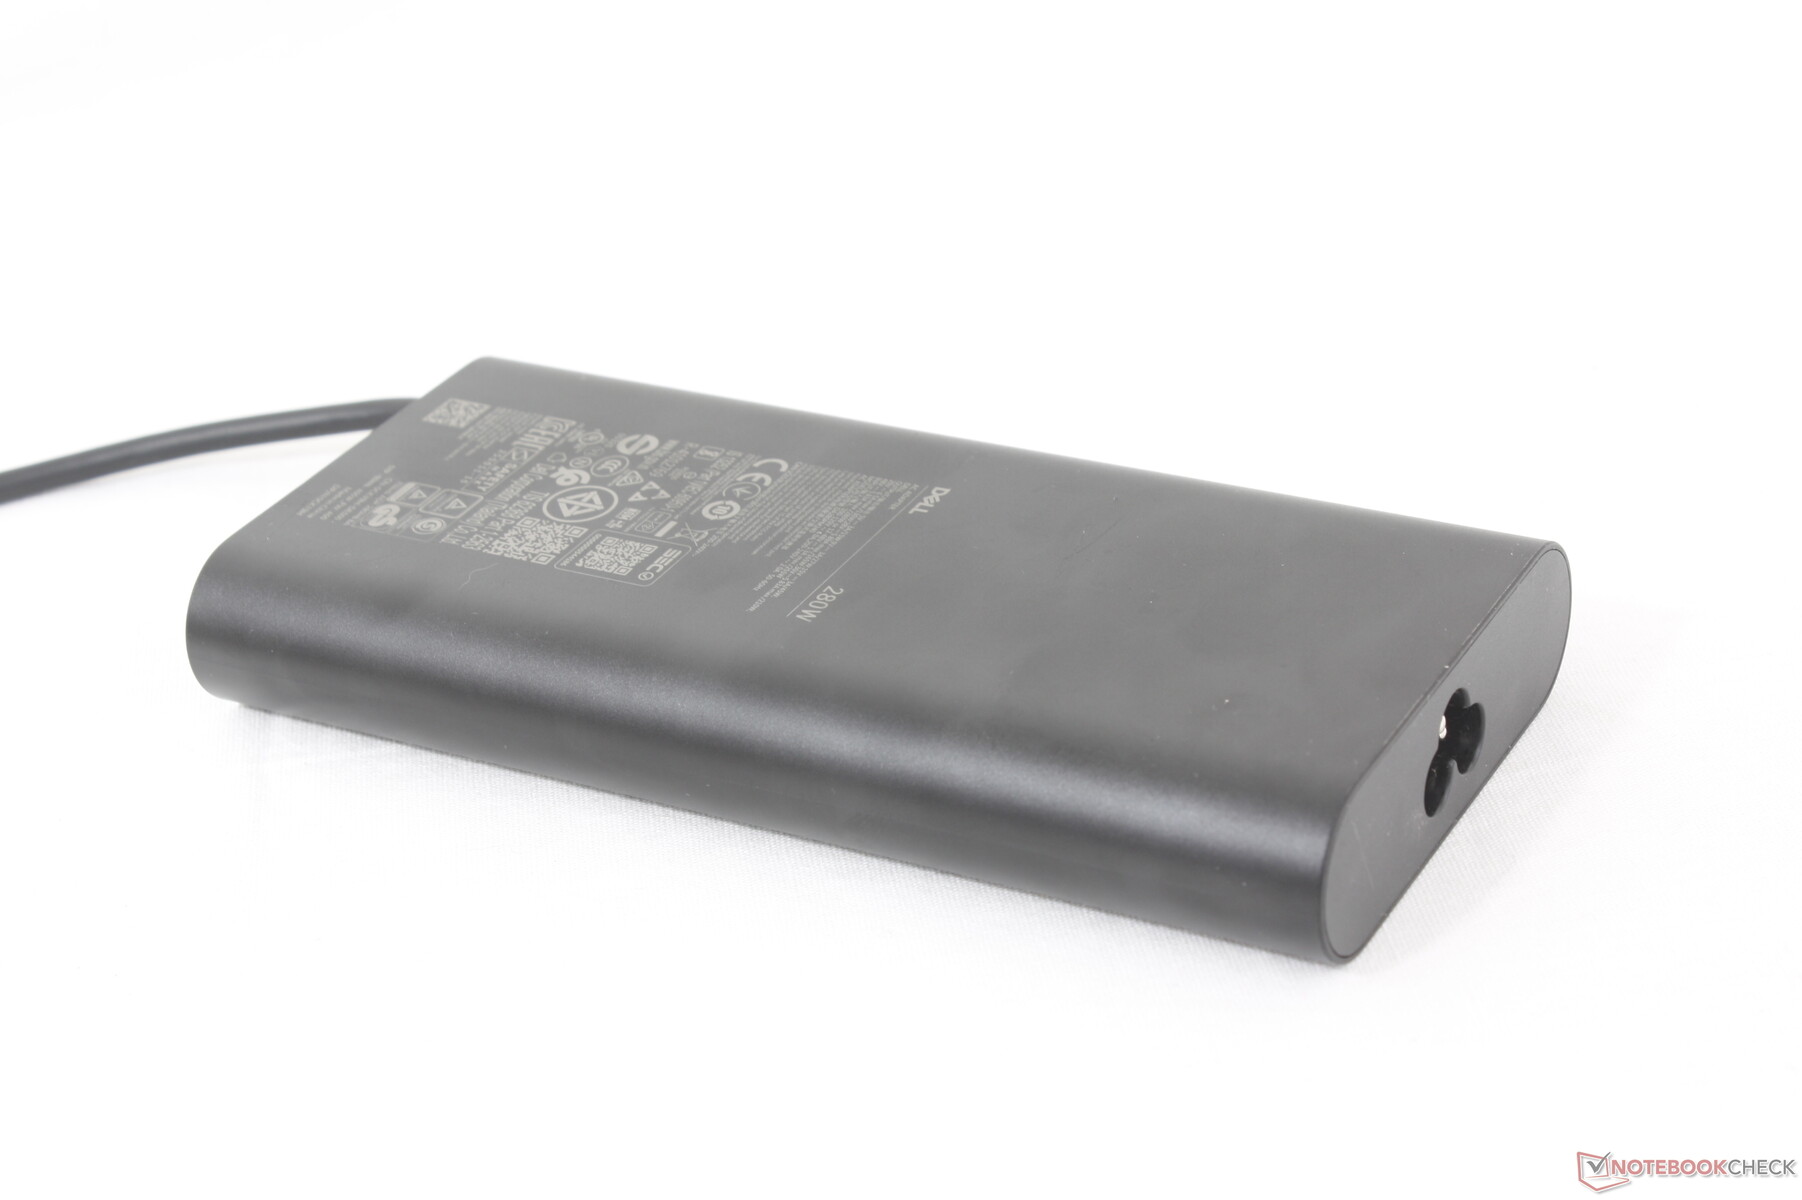
Vale la pena notare che questo è uno degli unici computer portatili ad essere fornito con un adattatore CA USB-C sottile (~16 x 7,8 x 2,4 cm) da 280 W, dato che la maggior parte degli altri adattatori USB-C si attesta su valori compresi tra i 150 W e i 240 W.
| Off / Standby | |
| Idle | |
| Sotto carico |
|
Leggenda:
min: | |
| Dell Pro Max 16 Plus Ultra 9 285HX, RTX PRO 5000 Blackwell Generation Laptop, SK hynix PCB01 HFS001TFM9X186N, OLED, 3840x2400, 16" | Dell Precision 5690 Ultra 9 185H, NVIDIA RTX 5000 Ada Generation Laptop GPU, 2x Samsung PM9A1 1TB (RAID 0), OLED, 3840x2400, 16" | Dell Precision 5000 5680 i9-13900H, NVIDIA RTX 5000 Ada Generation Laptop GPU, 2x SK hynix PC801 HFS512GEJ9X101N RAID 0, OLED, 3840x2400, 16" | Lenovo ThinkPad P16 Gen 2 i7-14700HX, NVIDIA RTX 4000 Ada Generation Laptop GPU, SK hynix PC801 HFS001TEJ9X162N, IPS, 2560x1600, 16" | Lenovo ThinkPad P1 Gen 7 21KV001SGE Ultra 7 155H, NVIDIA GeForce RTX 4060 Laptop GPU, Kioxia XG8 KXG8AZNV1T02, IPS LED, 2560x1600, 16" | HP ZBook Studio 16 G11 Ultra 9 185H, NVIDIA RTX 3000 Ada Generation Laptop GPU, Kioxia XG8 KXG80ZNV1T02, IPS, 3840x2400, 16" | MSI CreatorPro Z16P B12UKST i7-12700H, RTX A3000 Laptop GPU, Samsung PM9A1 MZVL21T0HCLR, IPS, 2560x1600, 16" | |
|---|---|---|---|---|---|---|---|
| Power Consumption | 52% | 55% | 31% | 55% | 47% | 50% | |
| Idle Minimum * (Watt) | 35.1 | 7.9 77% | 8 77% | 7.9 77% | 7.3 79% | 14 60% | 10.8 69% |
| Idle Average * (Watt) | 39.2 | 12 69% | 10.4 73% | 13.1 67% | 12.3 69% | 22.4 43% | 16.3 58% |
| Idle Maximum * (Watt) | 56 | 28.6 49% | 30.5 46% | 24.2 57% | 17.9 68% | 25.7 54% | 16.9 70% |
| Load Average * (Watt) | 130.2 | 98.8 24% | 75.4 42% | 127.4 2% | 78.2 40% | 90.2 31% | 111.7 14% |
| Cyberpunk 2077 ultra external monitor * (Watt) | 213 | 219 -3% | 117.7 45% | 120.3 44% | |||
| Cyberpunk 2077 ultra * (Watt) | 229 | 225 2% | 123.5 46% | 125.4 45% | |||
| Load Maximum * (Watt) | 285.2 | 174.8 39% | 175 39% | 248.5 13% | 167.5 41% | 142 50% | 177.4 38% |
| Witcher 3 ultra * (Watt) | 144.5 | 134 | 152.1 |
* ... Meglio usare valori piccoli
Consumo di energia Cyberpunk / Stress Test
Consumo di energia del monitor esterno
Durata della batteria
L'autonomia WLAN è breve, solo 3,5 ore, nonostante la batteria di grande capacità. La velocità di ricarica è comunque molto rapida, soprattutto per un adattatore CA USB-C, con poco più di un'ora da vuoto a pieno regime.
| Dell Pro Max 16 Plus Ultra 9 285HX, RTX PRO 5000 Blackwell Generation Laptop, 96 Wh | Dell Precision 5690 Ultra 9 185H, NVIDIA RTX 5000 Ada Generation Laptop GPU, 98 Wh | Dell Precision 5000 5680 i9-13900H, NVIDIA RTX 5000 Ada Generation Laptop GPU, 98 Wh | Lenovo ThinkPad P16 Gen 2 i7-14700HX, NVIDIA RTX 4000 Ada Generation Laptop GPU, 94 Wh | Lenovo ThinkPad P1 Gen 7 21KV001SGE Ultra 7 155H, NVIDIA GeForce RTX 4060 Laptop GPU, 90 Wh | HP ZBook Studio 16 G11 Ultra 9 185H, NVIDIA RTX 3000 Ada Generation Laptop GPU, 86 Wh | MSI CreatorPro Z16P B12UKST i7-12700H, RTX A3000 Laptop GPU, 90 Wh | |
|---|---|---|---|---|---|---|---|
| Autonomia della batteria | 156% | 175% | -31% | 175% | 33% | 61% | |
| WiFi v1.3 (h) | 3.6 | 9.2 156% | 9.9 175% | 2.5 -31% | 9.9 175% | 4.8 33% | 5.8 61% |
| Reader / Idle (h) | 17.9 | ||||||
| Load (h) | 1.7 | 1.9 |
Valutazione Notebookcheck
Workstation Dell di punta con specifiche uniche, tra cui memoria CAMM2, OLED 4K 120 Hz, processori Arrow Lake-HX e grafica RTX 5000 Blackwell.
Dell Pro Max 16 Plus
- 10/14/2025 v8
Allen Ngo
 Total Sustainability Score:
 Potenziali concorrenti a confronto
Immagine | Modello | Prezzo | Peso | Altezza | Schermo |
|---|---|---|---|---|---|
1. 88.4%  | Dell Pro Max 16 Plus Intel Core Ultra 9 285HX ⎘ Nvidia RTX PRO 5000 Blackwell Generation Laptop ⎘ 128 GB Memoria, SSD | Amazon: 1. $1,699.99 Dell Inspiron 16 Plus Laptop... 2. $5.90 JuYuish Keyboard Skin Compat... 3. $1,414.95 Dell Pro 16 Plus PB16250 (Re... Prezzo di listino: 5000 USD | 2.8 kg | 30.9 mm | 16.00" 3840x2400 283 PPI OLED |
2. 88.3% v7 (old)  | Dell Precision 5690 Intel Core Ultra 9 185H ⎘ Nvidia RTX 5000 Ada Generation Laptop GPU ⎘ 32 GB Memoria, 2048 GB SSD | Amazon: $1,799.99 Prezzo di listino: 5900 USD | 2.3 kg | 22.17 mm | 16.00" 3840x2400 283 PPI OLED |
3. 89% v7 (old)  | Dell Precision 5000 5680 Intel Core i9-13900H ⎘ Nvidia RTX 5000 Ada Generation Laptop GPU ⎘ 32 GB Memoria, 1024 GB SSD | Amazon: 1. $26.59 100W USB C Laptop Charger fo... 2. $27.99 100W USB-C AC Adapter Compat... 3. $1,998.77 Dell Precision 5000 5680 16"... Prezzo di listino: 6500 USD | 2.3 kg | 22.17 mm | 16.00" 3840x2400 283 PPI OLED |
4. 85.9%  | Lenovo ThinkPad P16 Gen 2 Intel Core i7-14700HX ⎘ NVIDIA RTX 4000 Ada Generation Laptop GPU ⎘ 32 GB Memoria, 1024 GB SSD | Amazon: Prezzo di listino: 3500 USD | 3.1 kg | 30.23 mm | 16.00" 2560x1600 189 PPI IPS |
5. 83.5%  | Lenovo ThinkPad P1 Gen 7 21KV001SGE Intel Core Ultra 7 155H ⎘ NVIDIA GeForce RTX 4060 Laptop GPU ⎘ 32 GB Memoria, 1024 GB SSD | Amazon: $2,250.00 Prezzo di listino: 3239 Euro | 2 kg | 20.5 mm | 16.00" 2560x1600 189 PPI IPS LED |
6. 84.2%  | HP ZBook Studio 16 G11 Intel Core Ultra 9 185H ⎘ NVIDIA RTX 3000 Ada Generation Laptop GPU ⎘ 64 GB Memoria, 1024 GB SSD | Amazon: $4,148.32 Prezzo di listino: 4300 USD | 1.8 kg | 19 mm | 16.00" 3840x2400 283 PPI IPS |
7. 84.3% v7 (old)  | MSI CreatorPro Z16P B12UKST Intel Core i7-12700H ⎘ NVIDIA RTX A3000 Laptop GPU ⎘ 32 GB Memoria, 1024 GB SSD | Amazon: 1. $42.99 240W USB Tip Charger Fit for... 2. $86.39 240W 230W USB Tip Charger Co... 3. $106.50 Adamanta 16GB (1x16GB) Compa... Prezzo di listino: 3500€ | 2.4 kg | 19 mm | 16.00" 2560x1600 189 PPI IPS |
Transparency
La selezione dei dispositivi da recensire viene effettuata dalla nostra redazione. Il campione di prova è stato fornito all'autore come prestito dal produttore o dal rivenditore ai fini di questa recensione. L'istituto di credito non ha avuto alcuna influenza su questa recensione, né il produttore ne ha ricevuto una copia prima della pubblicazione. Non vi era alcun obbligo di pubblicare questa recensione. In quanto società mediatica indipendente, Notebookcheck non è soggetta all'autorità di produttori, rivenditori o editori.
Ecco come Notebookcheck esegue i test
Ogni anno, Notebookcheck esamina in modo indipendente centinaia di laptop e smartphone utilizzando procedure standardizzate per garantire che tutti i risultati siano comparabili. Da circa 20 anni sviluppiamo continuamente i nostri metodi di prova e nel frattempo stabiliamo gli standard di settore. Nei nostri laboratori di prova, tecnici ed editori esperti utilizzano apparecchiature di misurazione di alta qualità. Questi test comportano un processo di validazione in più fasi. Il nostro complesso sistema di valutazione si basa su centinaia di misurazioni e parametri di riferimento ben fondati, che mantengono l'obiettività.
