

Notebookcheck Logo
Teaser

Recensione dell’HP HyperX Omen 16: una delle CPU AMD più veloci per i giocatori mainstream

Nuovi inizi per HyperX.

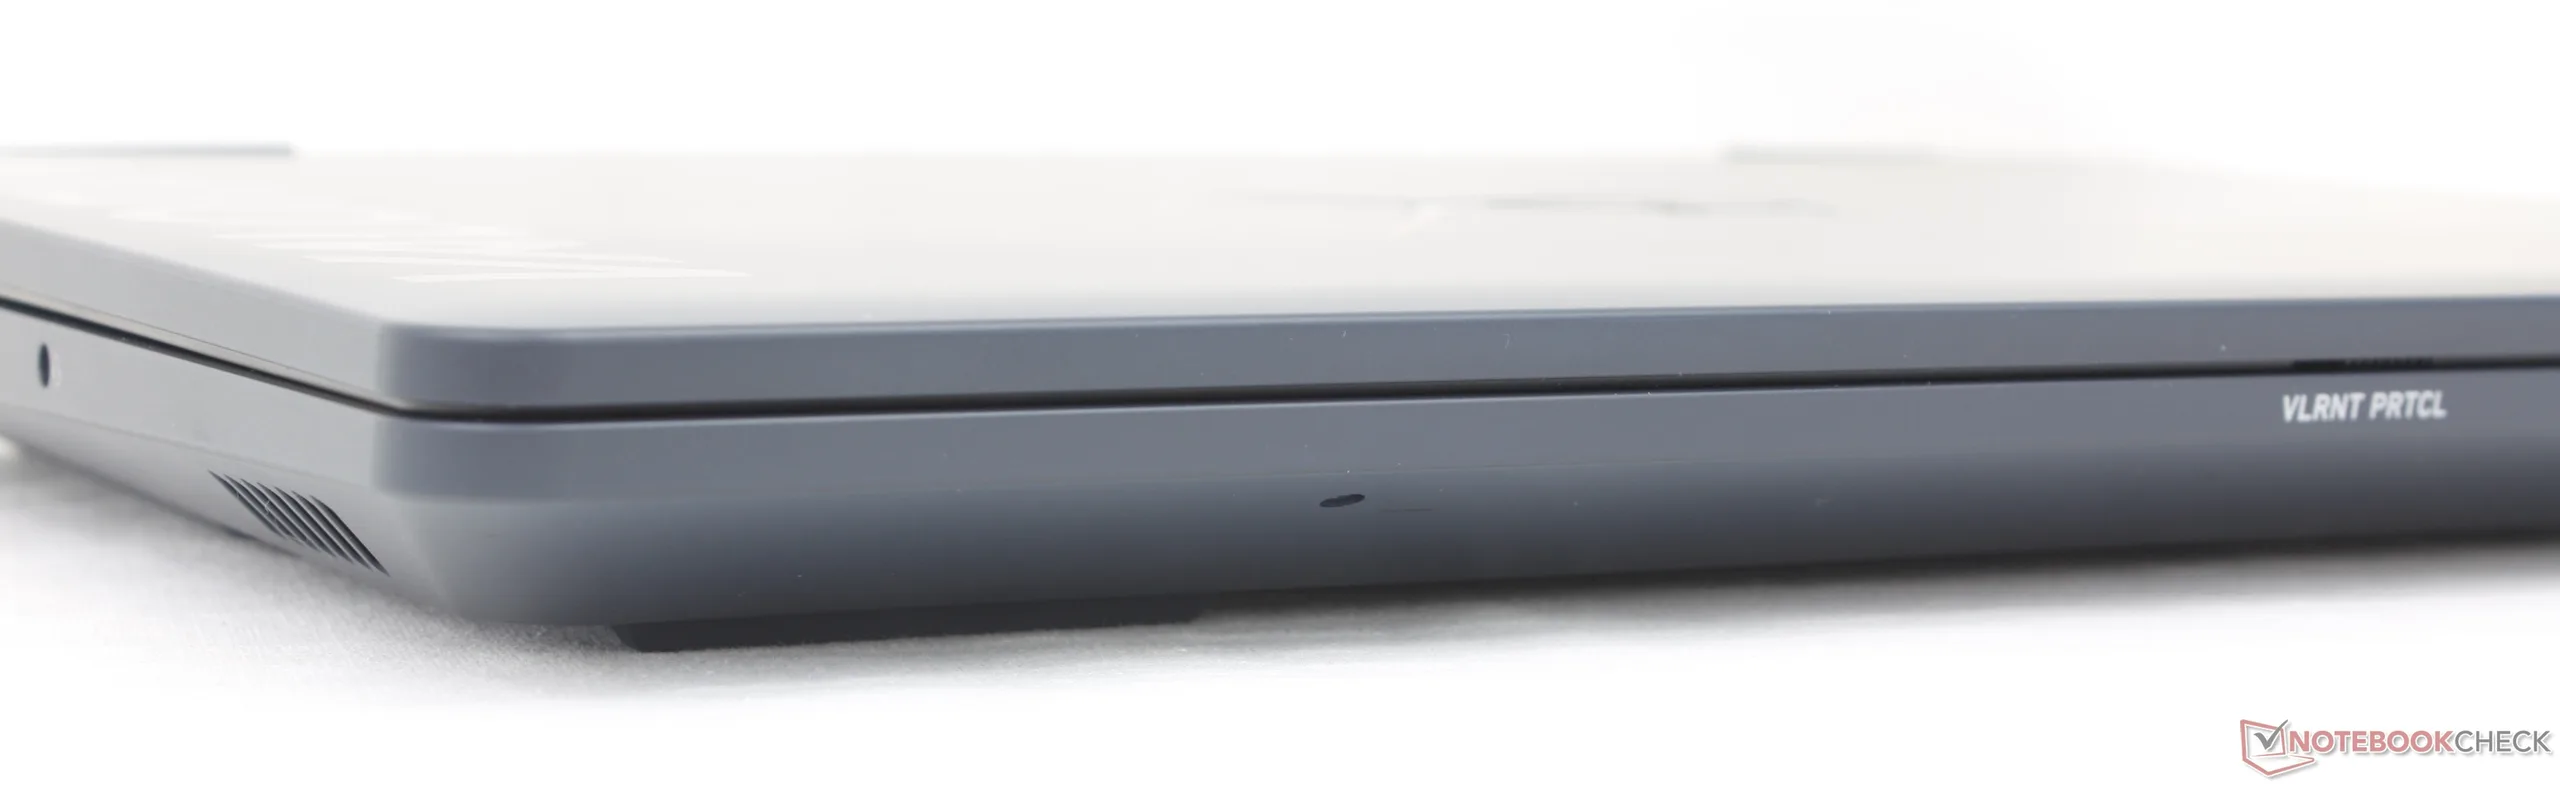
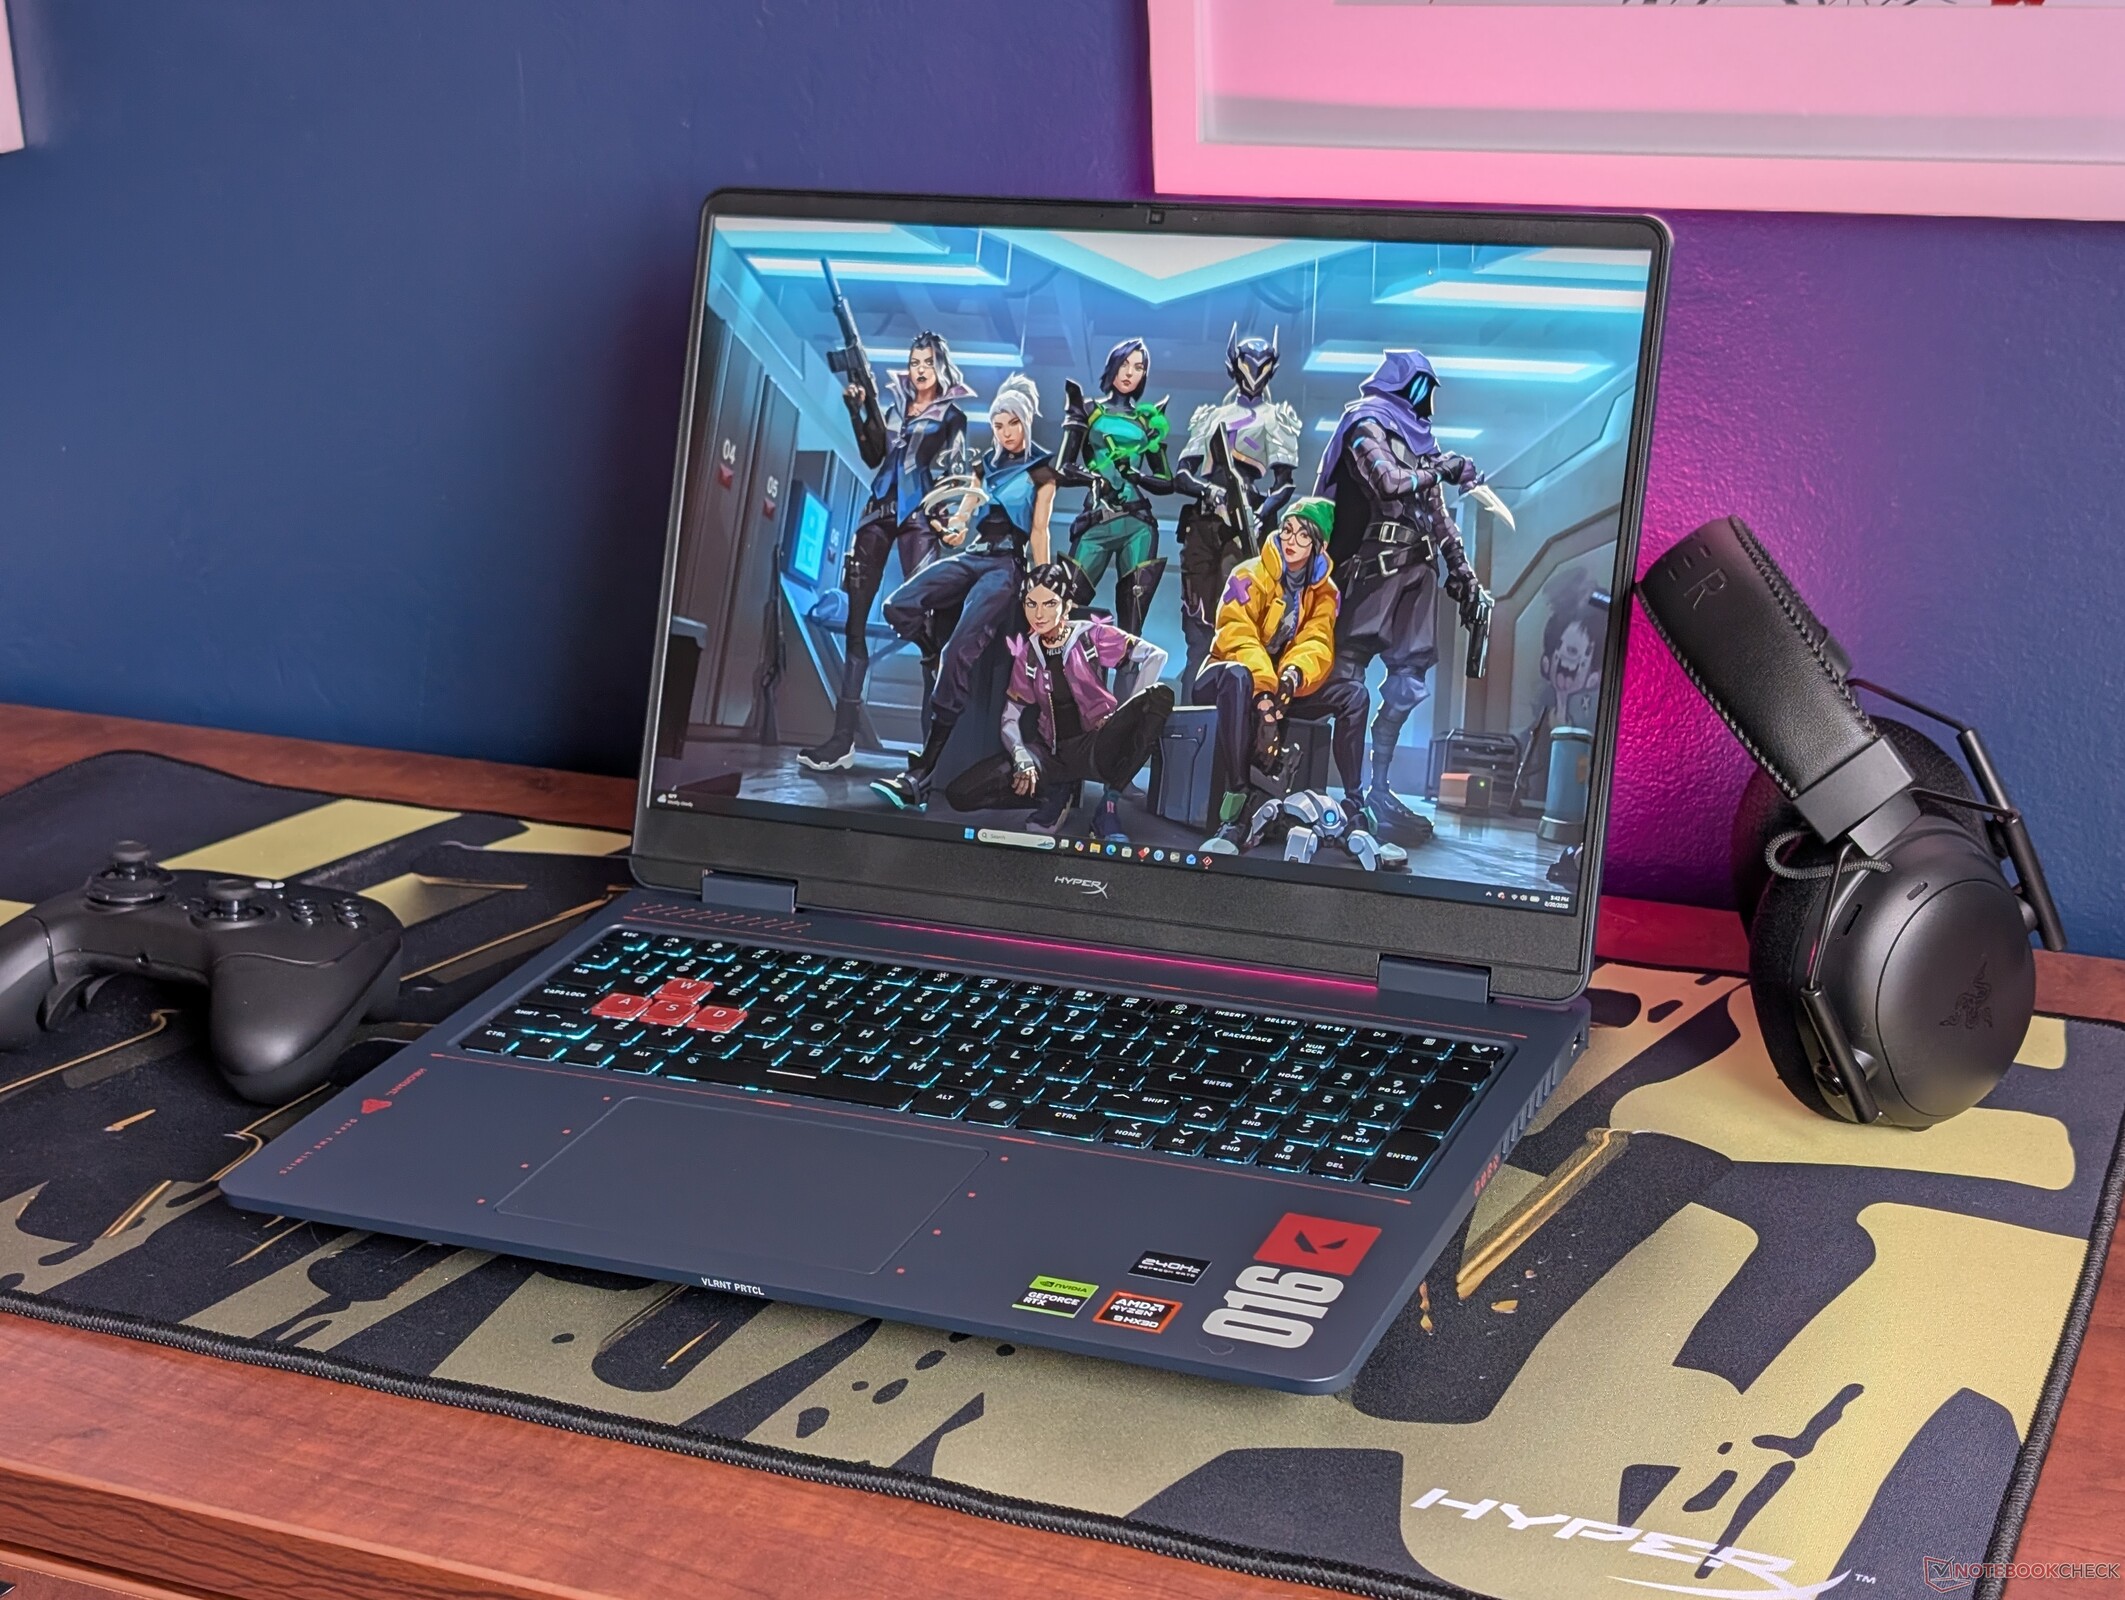
Pur riutilizzando lo stesso design del telaio e le stesse porte del modello Omen 16 del 2025, il modello del 2026 introduce una CPU più potente, un display più veloce e con una risoluzione più elevata, nonché una disposizione della tastiera più intuitiva che anche i giocatori occasionali potranno apprezzare. Inoltre, la skin della Valorant Edition risulta sorprendentemente accattivante su un modello che, per il resto, si colloca nella fascia media.
Allen Ngo, 👁 Allen Ngo (traduzione a cura di DeepL / Ninh Duy) Pubblicato 🇺🇸 🇳🇱 ...
AMD Geforce Gaming Laptop / Notebook

Verdetto — Equilibrato per gli sparatutto in prima persona (FPS)

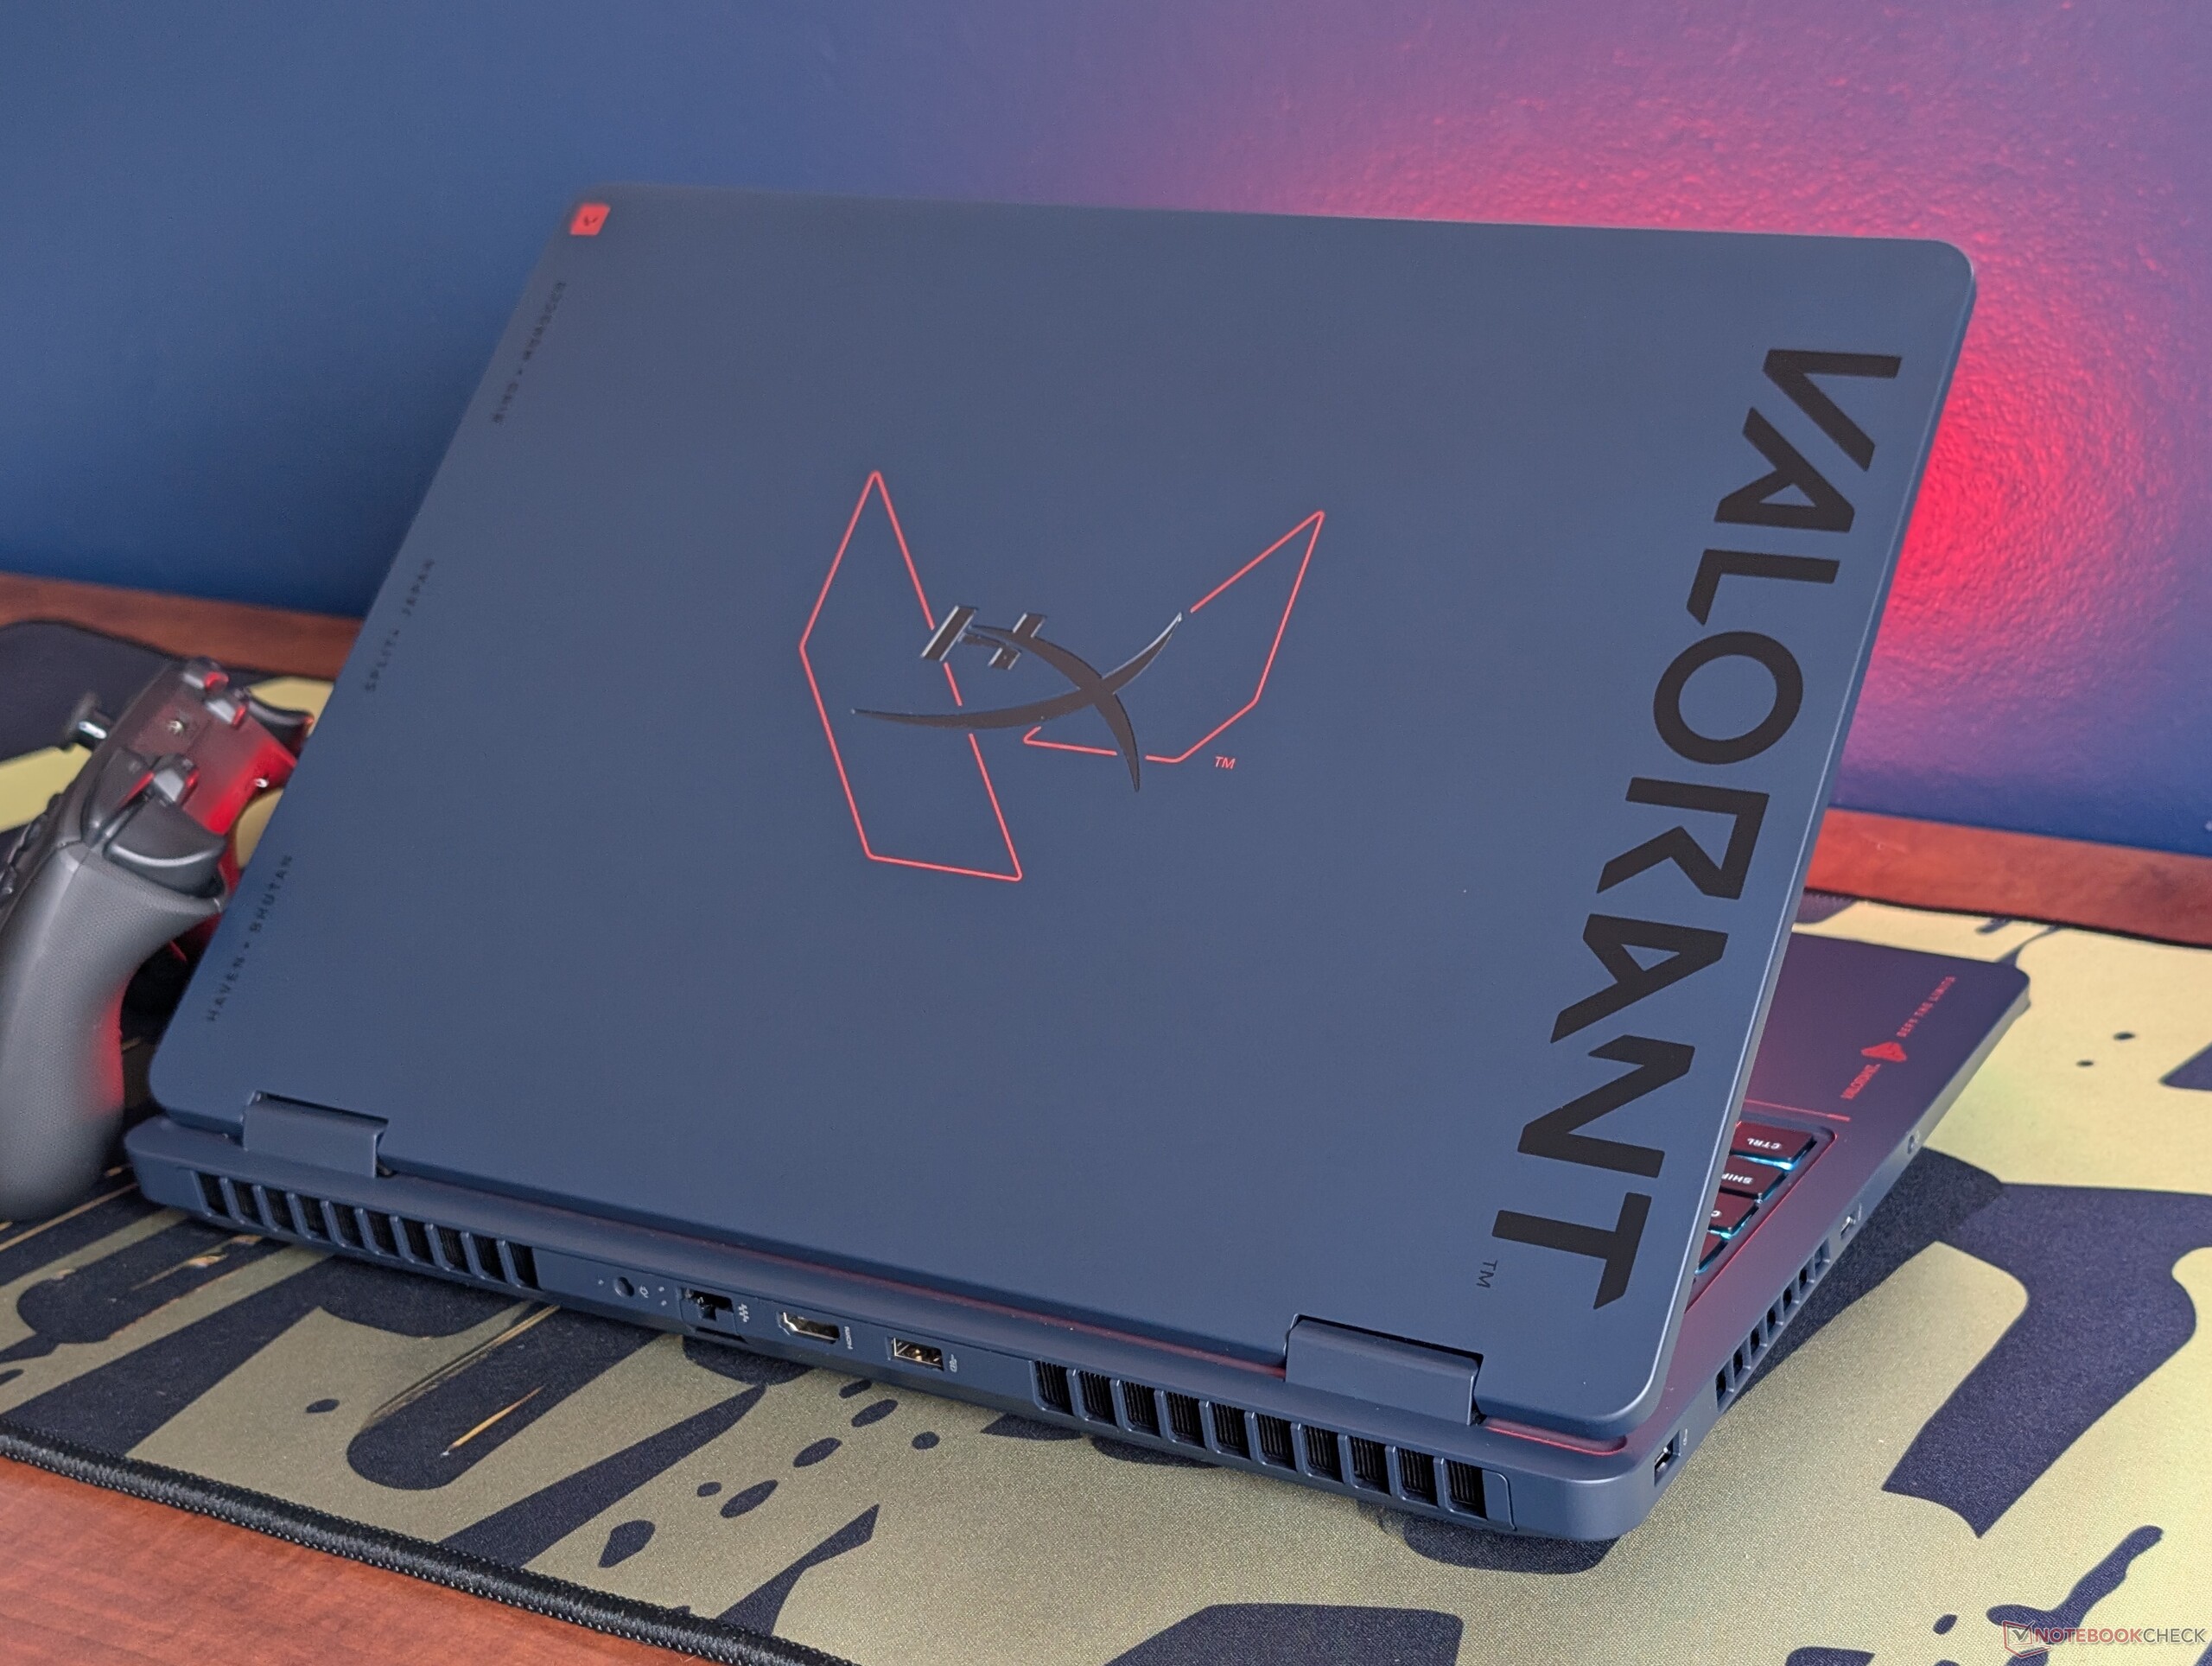
Innanzitutto, dobbiamo elogiare HP per aver progettato un portatile da gaming a tema che risulti effettivamente piacevole alla vista. Molto spesso, le skin in edizione limitata tendono ad essere eccessivamente ornate o appariscenti e, di conseguenza, possono risultare poco attuali nel tempo. L’HyperX Omen 16 Valorant Edition presenta una decorazione minimalista, affidandosi maggiormente a un’iconografia semplice e a colori sobri per rappresentare il gioco, piuttosto che a personaggi complessi o a una grafica sgargiante. Il risultato estetico è senza dubbio migliore rispetto all’Omen 16 base, a condizione che i proprietari siano in grado di tollerare le inevitabili impronte digitali.

Anche Valorant stesso si abbina bene alle specifiche tecniche del dispositivo. Poiché il gioco può risultare piuttosto esigente nei confronti della CPU quando si punta a frame rate elevati, il Ryzen 9 9955HX3D è uno dei migliori processori AMD per dispositivi mobili adatti a questo scopo. Rinunciare al G-Sync e all’illuminazione RGB per singolo tasto è probabilmente più accettabile rispetto a uno schermo di qualità inferiore.

Al di là dei miglioramenti superficiali, l’HyperX Omen 16 del 2026 rappresenta comunque solo un aggiornamento minore rispetto all’Omen 16 del 2025, poiché la struttura di base e la scheda madre sono rimaste sostanzialmente invariate. Sono invece la CPU Zen 5 più veloce, il display IPS migliorato e la tastiera modificata a contribuire a distinguere il modello del 2026 da quello dell’anno precedente. Si tenga presente che molte di queste modifiche comportano livelli di consumo energetico più elevati rispetto al passato, con una durata complessiva della batteria più breve. Si raccomanda inoltre l’uso delle cuffie, poiché il rumore delle ventole può rappresentare un problema se non si gioca in modalità «Balanced».

Pro

+ facile manutenzione; supporta 2 moduli SODIMM + 2 SSD M.2
+ display IPS QHD da 240 Hz di alta qualità con gamma cromatica sRGB completa
+ tasti comodi con tastierino numerico integrato
+ prestazioni della CPU molto elevate in termini di potenza lorda
+ skin di Valorant visivamente accattivante

Contro

- autonomia della batteria ridotta; elevato consumo energetico
- ventola molto rumorosa in modalità Unleashed
- gli altoparlanti potrebbero essere più potenti
- illuminazione dei tasti solo a tre zone
- tende a raccogliere le impronte digitali
- assenza di G-Sync

Prezzo e disponibilità

HP sta attualmente commercializzando l’HyperX Omen 16 Valorant Edition al prezzo di 2.250 dollari.

Amazon Logo
$1,590.89
HP OMEN MAX 16-ak0047nr 16" WQXGA 240Hz Gaming Laptop, AMD Ryzen AI 7 H 3

L’HyperX Omen 16 del 2026 è un portatile da gaming di fascia media destinato a sostituire l’Omen 16 del 2025. HP sta gradualmente ridenominando molti dei propri modelli Omen con il marchio HyperX, come rivelato durante il CES 2026, e pertanto il nuovo HyperX Omen 16 è uno dei primi a sfoggiare il nome aggiornato.

Il nostro modello di prova è la Valorant Edition dell’HyperX Omen 16, caratterizzata da dettagli rossi a tema. Al di là delle differenze estetiche, tuttavia, lo chassis è per il resto identico a quello dell’Omen 16 del 2025. L’unica configurazione disponibile nella Valorant Edition è dotata della CPU AMD Ryzen 9 9955HX3D, relativamente poco diffusa, della GPU GeForce RTX 5070 da 115 W e di un display IPS da 240 Hz e 1600p, per un prezzo di circa 2.250 dollari.

Tra i concorrenti in questo segmento figurano altri portatili da gioco da 16 pollici di fascia media, quali l’MSI Crosshair A16, il Lenovo Legion Pro 5 16 o l’Alienware 16X Aurora.

Altre recensioni HP:

Specifiche

HP HyperX Omen 16 16-ap1931nr
Processore
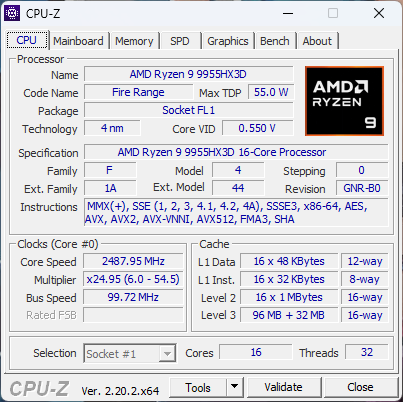
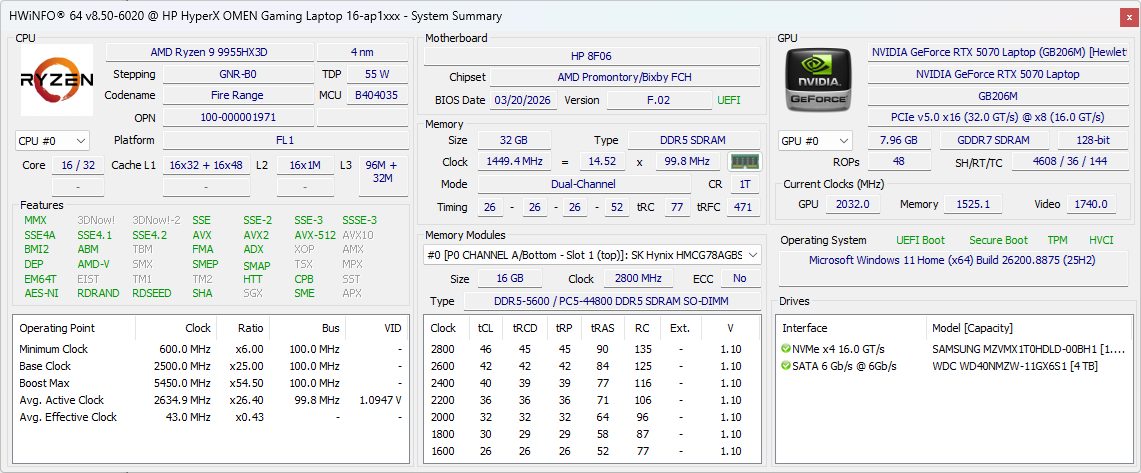
AMD Ryzen 9 9955HX3D 16c/32t, 16 x 5.4 GHz AMD Zen 5, 117 W PL2 / Short Burst, 105 W PL1 / Sustained, Fire Range-HX (Zen 5)
Scheda grafica
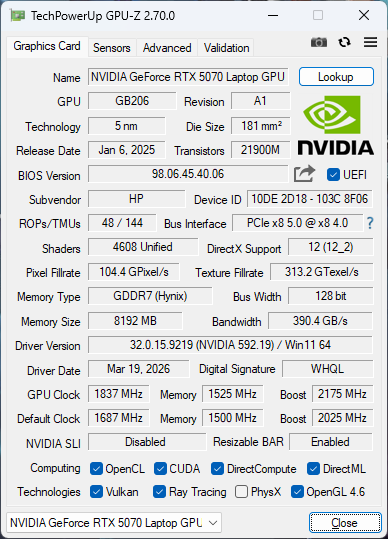
NVIDIA GeForce RTX 5070 Laptop - 8 GB VRAM, Core: 2175 MHz, RAM: 1525 MHz, 115 W TDP, GDDR7, 592.19, Advanced Optimus
Memoria
32 GB 
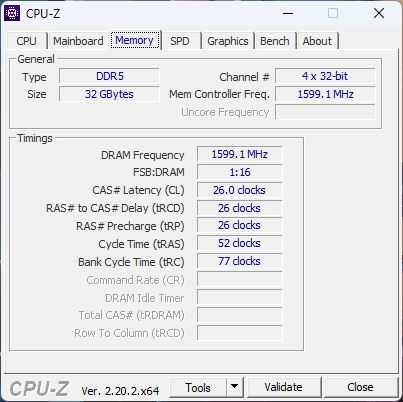
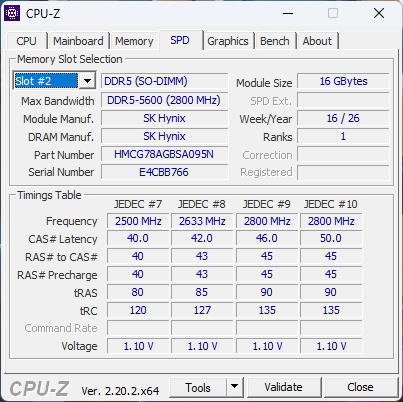
, SK Hynix, DDR5-5600, Dual-Channel, 2x SODIMM
Schermo
16.00 pollici 16:10, 2560 x 1600 pixel 189 PPI, BOE0CD1, IPS, lucido: no, 240 Hz
Scheda madre
AMD Promontory/Bixby FCH
Scheda audio
AMD Zen - Audio Processor - HD Audio Controller
Porte di connessione
2 USB 3.0 / 3.1, 2 USB 3.1 Gen 2, USB-C Power Delivery (PD), 1 HDMI, 1 DisplayPort, Connessioni Audio: 3.5 mm combo
Rete
Realtek RTL8168/8111 Gigabit-LAN (10/100/1000MBit/s), Mediatek Wi-Fi 7 MT7925 Wireless LAN Card (a/b/g/ac = Wi-Fi 5/ax = Wi-Fi 6/ Wi-Fi 6E 6 GHz be = Wi-Fi 7), Bluetooth 6.0
Dimensioni
altezza x larghezza x profondità (in mm): 30 x 357 x 269
Batteria
83 Wh polimeri di litio, 8-cell
Sistema Operativo
Microsoft Windows 11 Home
Camera
Webcam: 1080p30
Fotocamera Principale: 2 MPix
Altre caratteristiche
Casse: Stereo, Tastiera: Chiclet, Illuminazione Tastiera: si, HP Smart, Omen Gaming Hub, 12 Mesi Garanzia
Peso
2.439 kg, Alimentazione: 866 gr
Prezzo
2250 USD
Amazon
Nota: il produttore potrebbe usare componenti di fornitori diversi pannelli dei diplay, drive o banchi di memoria con specifiche simili.


Caso

Il telaio è identico a quello del modello 2025, ma presenta due importanti modifiche. In primo luogo, la tastiera è stata rivisitata con tasti freccia più grandi e una disposizione più ordinata. In secondo luogo, i loghi Omen presenti sulla cornice interna e sul coperchio esterno sono stati sostituiti con quelli HyperX. Per il resto, il design di base rimane invariato, comprese le porte.
Confronto delle dimensioni

364.38 mm 268.06 mm 25.95 mm 2.3 kg363 mm 269.7 mm 25.55 mm 2.3 kg357 mm 269 mm 30 mm 2.4 kg357.5 mm 269 mm 23.7 mm 2.4 kg356.98 mm 265.43 mm 23.4 mm 2.6 kg354 mm 269 mm 25.7 mm 2.2 kg297 mm 210 mm 1 mm 5.7 g

Connettività

Parte anteriore: Nessuna porta
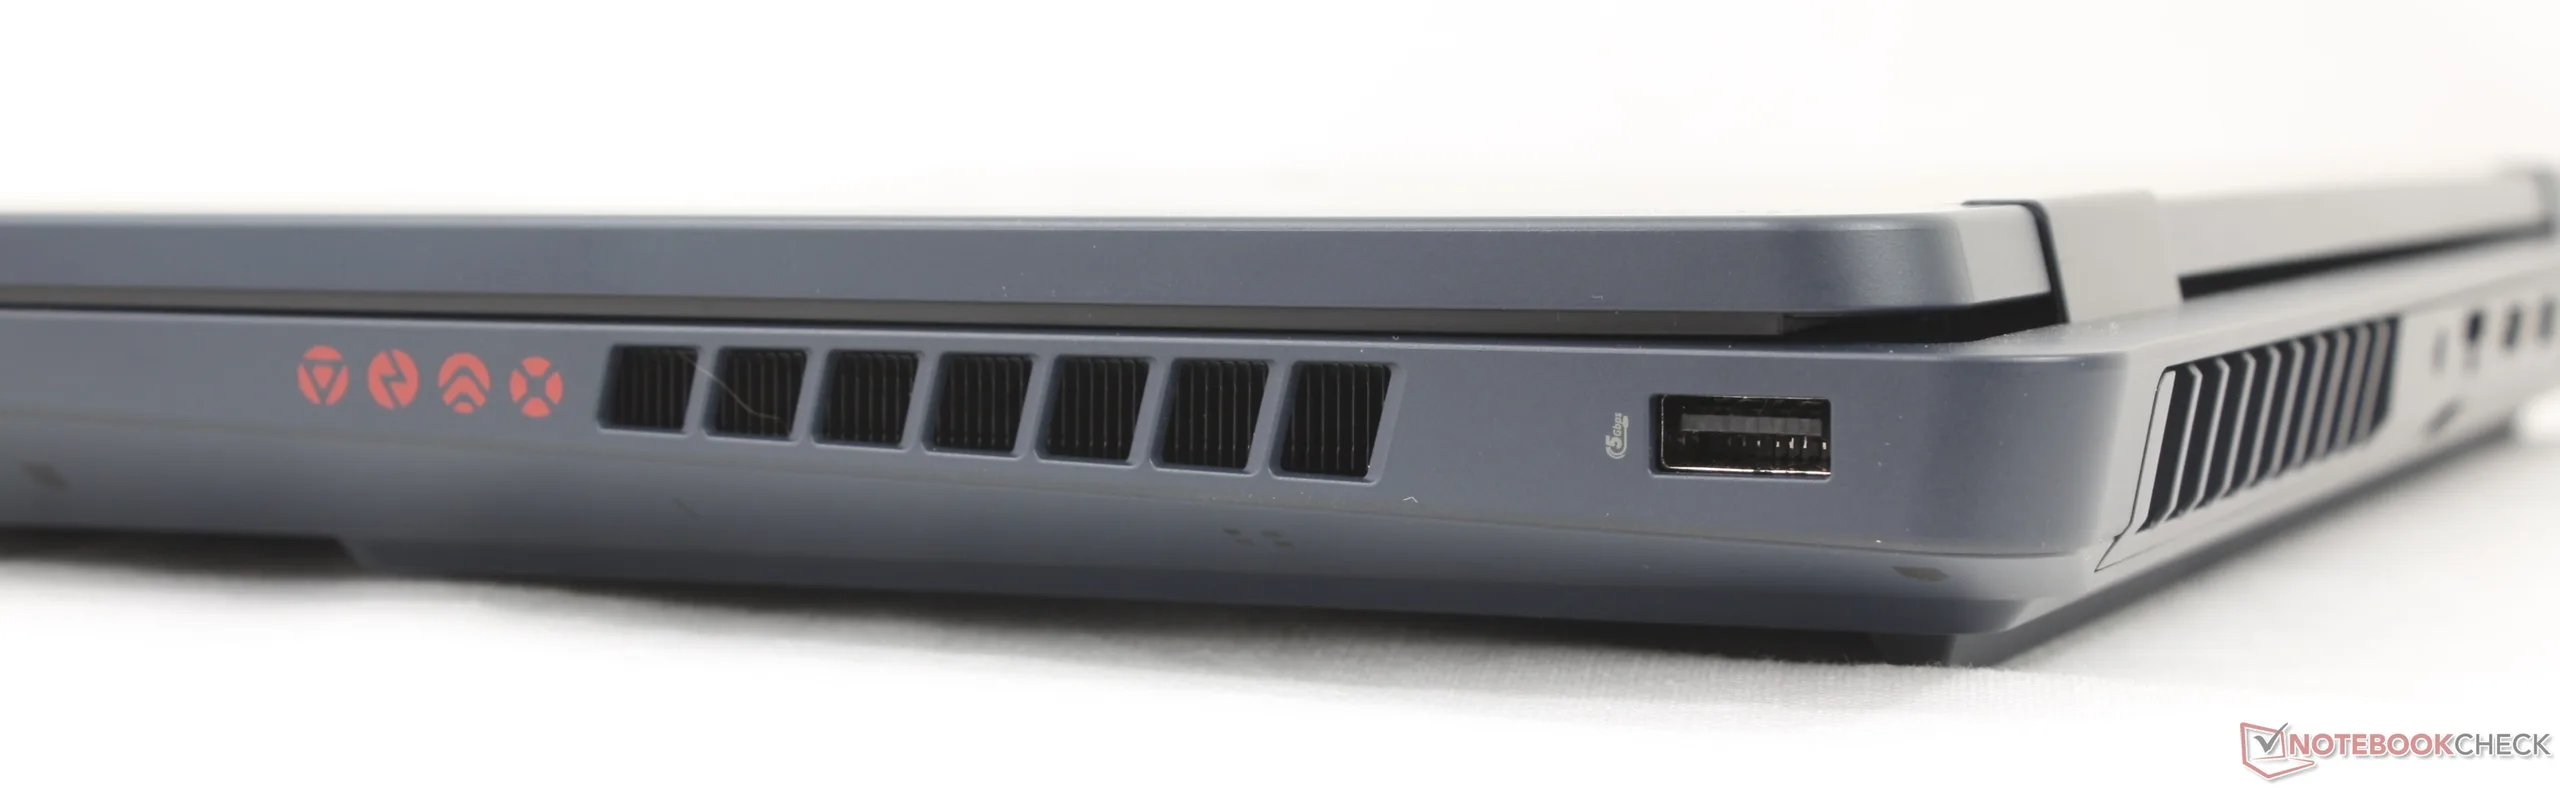
Esempio corretto: USB-A (5 Gbit/s)
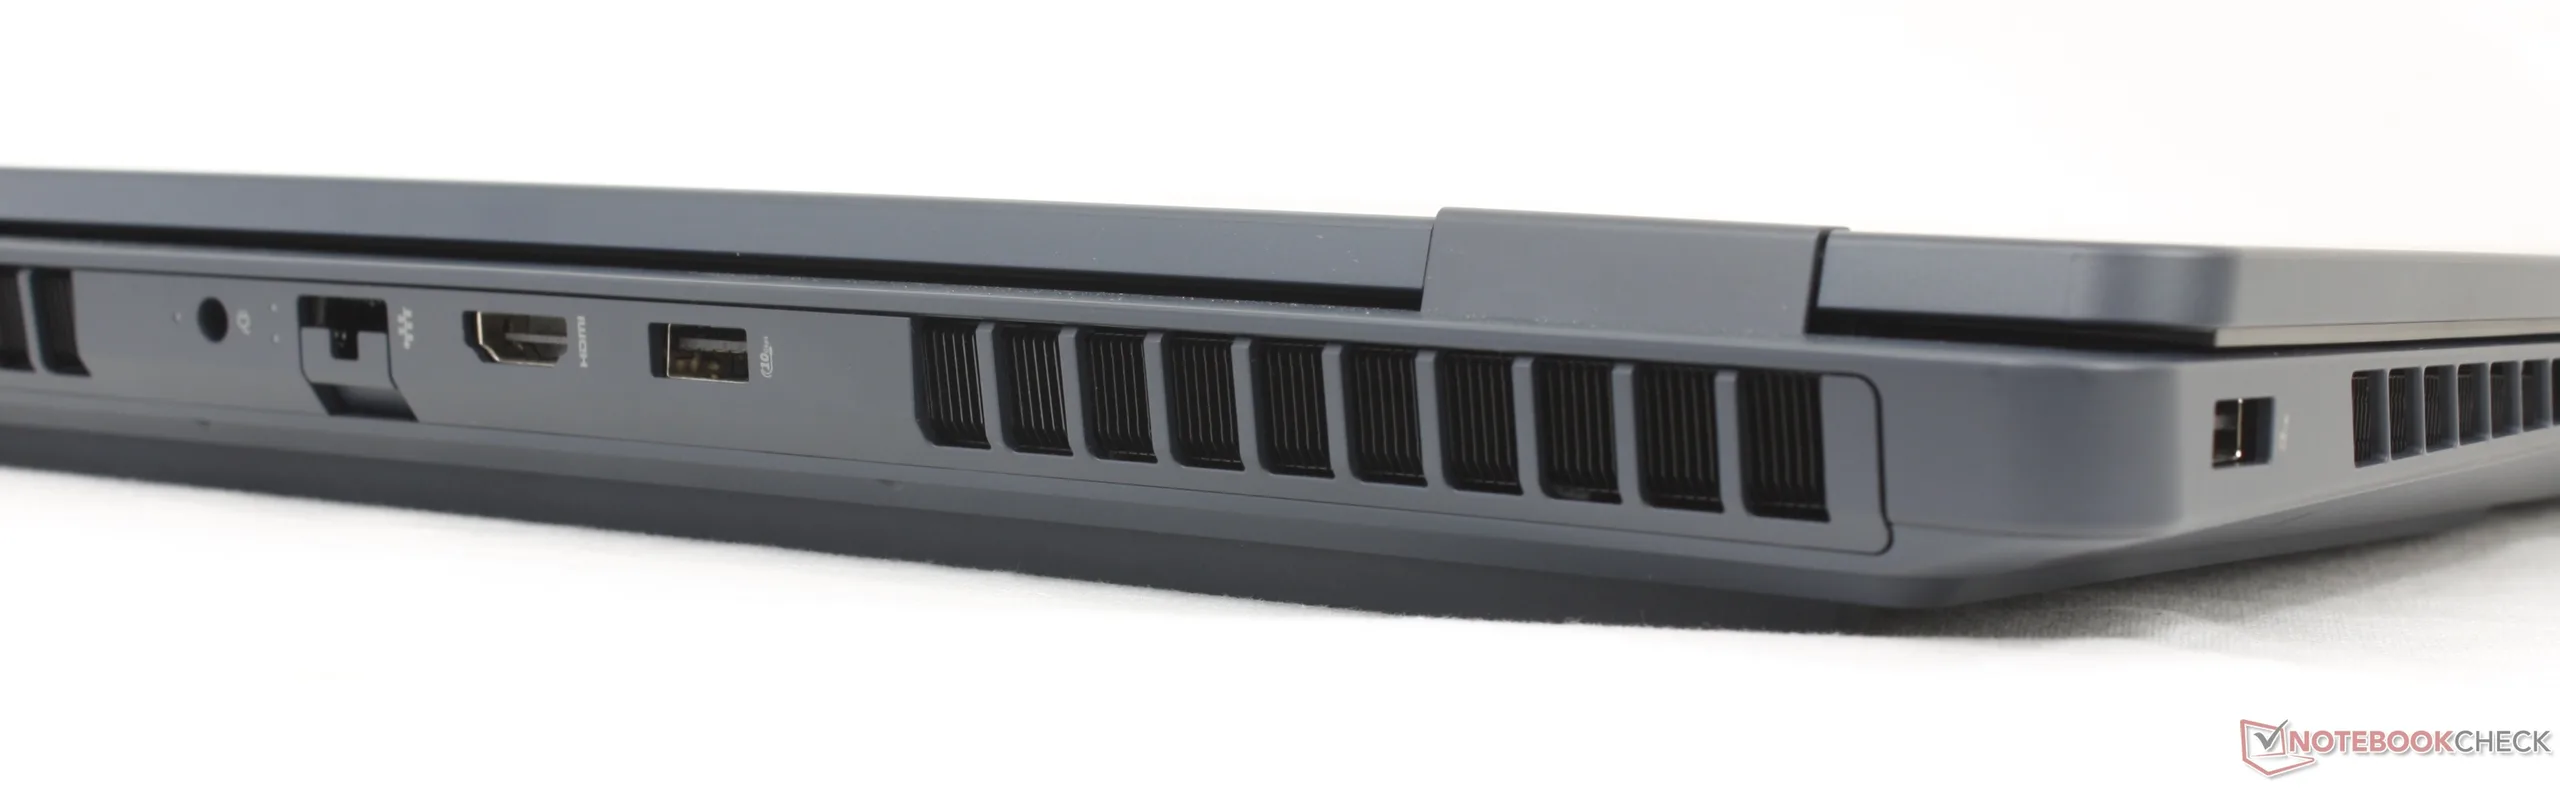
Pannello posteriore: alimentatore CA, RJ-45 (1 Gbps), HDMI 2.1, USB-A (10 Gbitps)
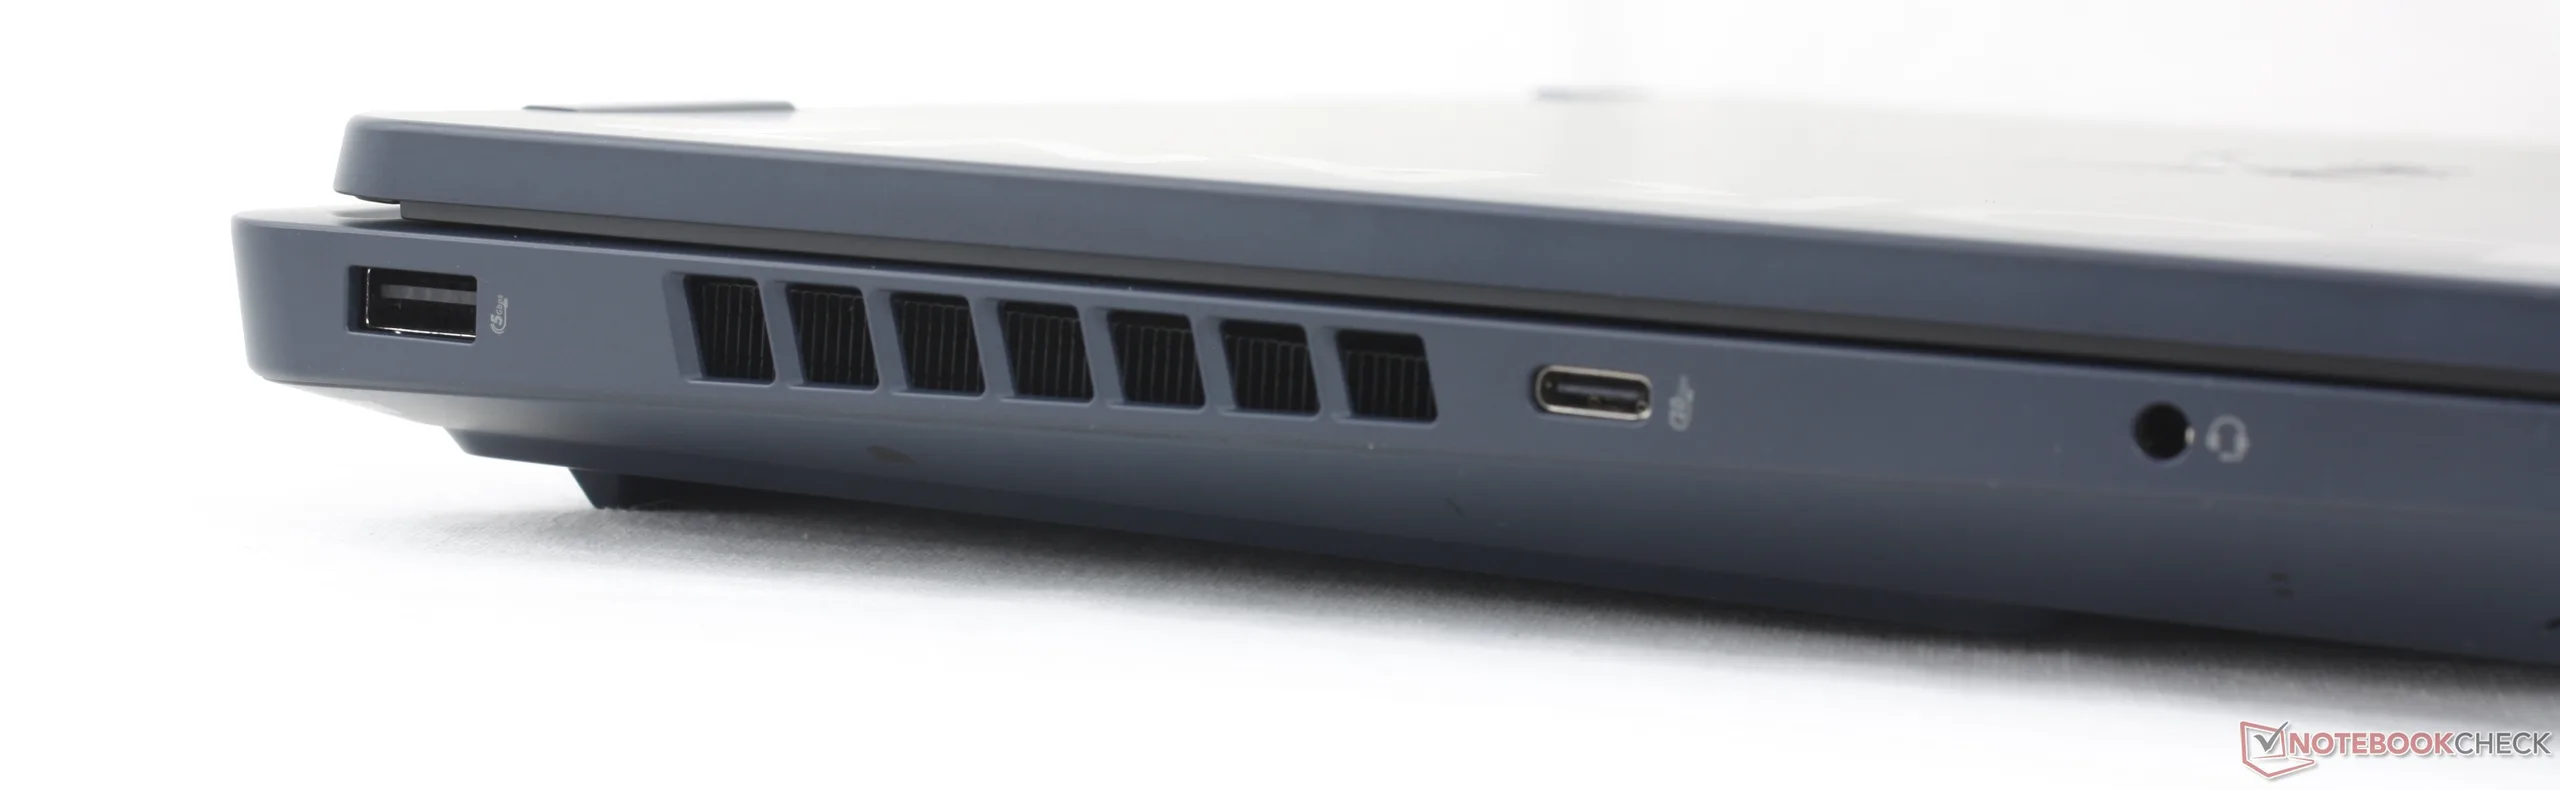
A sinistra: USB-A (5 Gbit/s), USB-C (10 Gbit/s), auricolari da 3,5 mm

Comunicazione

Networking
iperf3 receive AXE11000 6GHz
HP HyperX Omen 16 16-ap1931nr
Mediatek Wi-Fi 7 MT7925 Wireless LAN Card
1744 (1715min - 1767max) MBit/s
MSI Crosshair A16 HX E8WGK
MediaTek Wi-Fi 6E MT7922 160MHz Wireless LAN Card
1693 (1555min - 1755max) MBit/s -3%
Alienware 16X Aurora Core Ultra 9 290HX Plus
Mediatek Wi-Fi 7 MT7925 Wireless LAN Card
1506 (1352min - 1594max) MBit/s -14%
iperf3 transmit AXE11000 6GHz
Lenovo Legion Pro 5 16IAX10, RTX 5070
Mediatek Wi-Fi 7 MT7925 Wireless LAN Card
1868 (897min - 1974max) MBit/s +18%
MSI Crosshair A16 HX E8WGK
MediaTek Wi-Fi 6E MT7922 160MHz Wireless LAN Card
1781 (1713min - 1841max) MBit/s +13%
Alienware 16X Aurora Core Ultra 9 290HX Plus
Mediatek Wi-Fi 7 MT7925 Wireless LAN Card
1611 (1515min - 1687max) MBit/s +2%
HP HyperX Omen 16 16-ap1931nr
Mediatek Wi-Fi 7 MT7925 Wireless LAN Card
1581 (1434min - 1686max) MBit/s
010020030040050060070080090010001100120013001400150016001700Tooltip
HP HyperX Omen 16 16-ap1931nr; iperf3 receive AXE11000 6GHz; iperf 3.1.3: Ø1744 (1715-1767) MBit/s
HP HyperX Omen 16 16-ap1931nr; iperf3 receive AXE11000; iperf 3.1.3: Ø1436 (1250-1633) MBit/s

Webcam

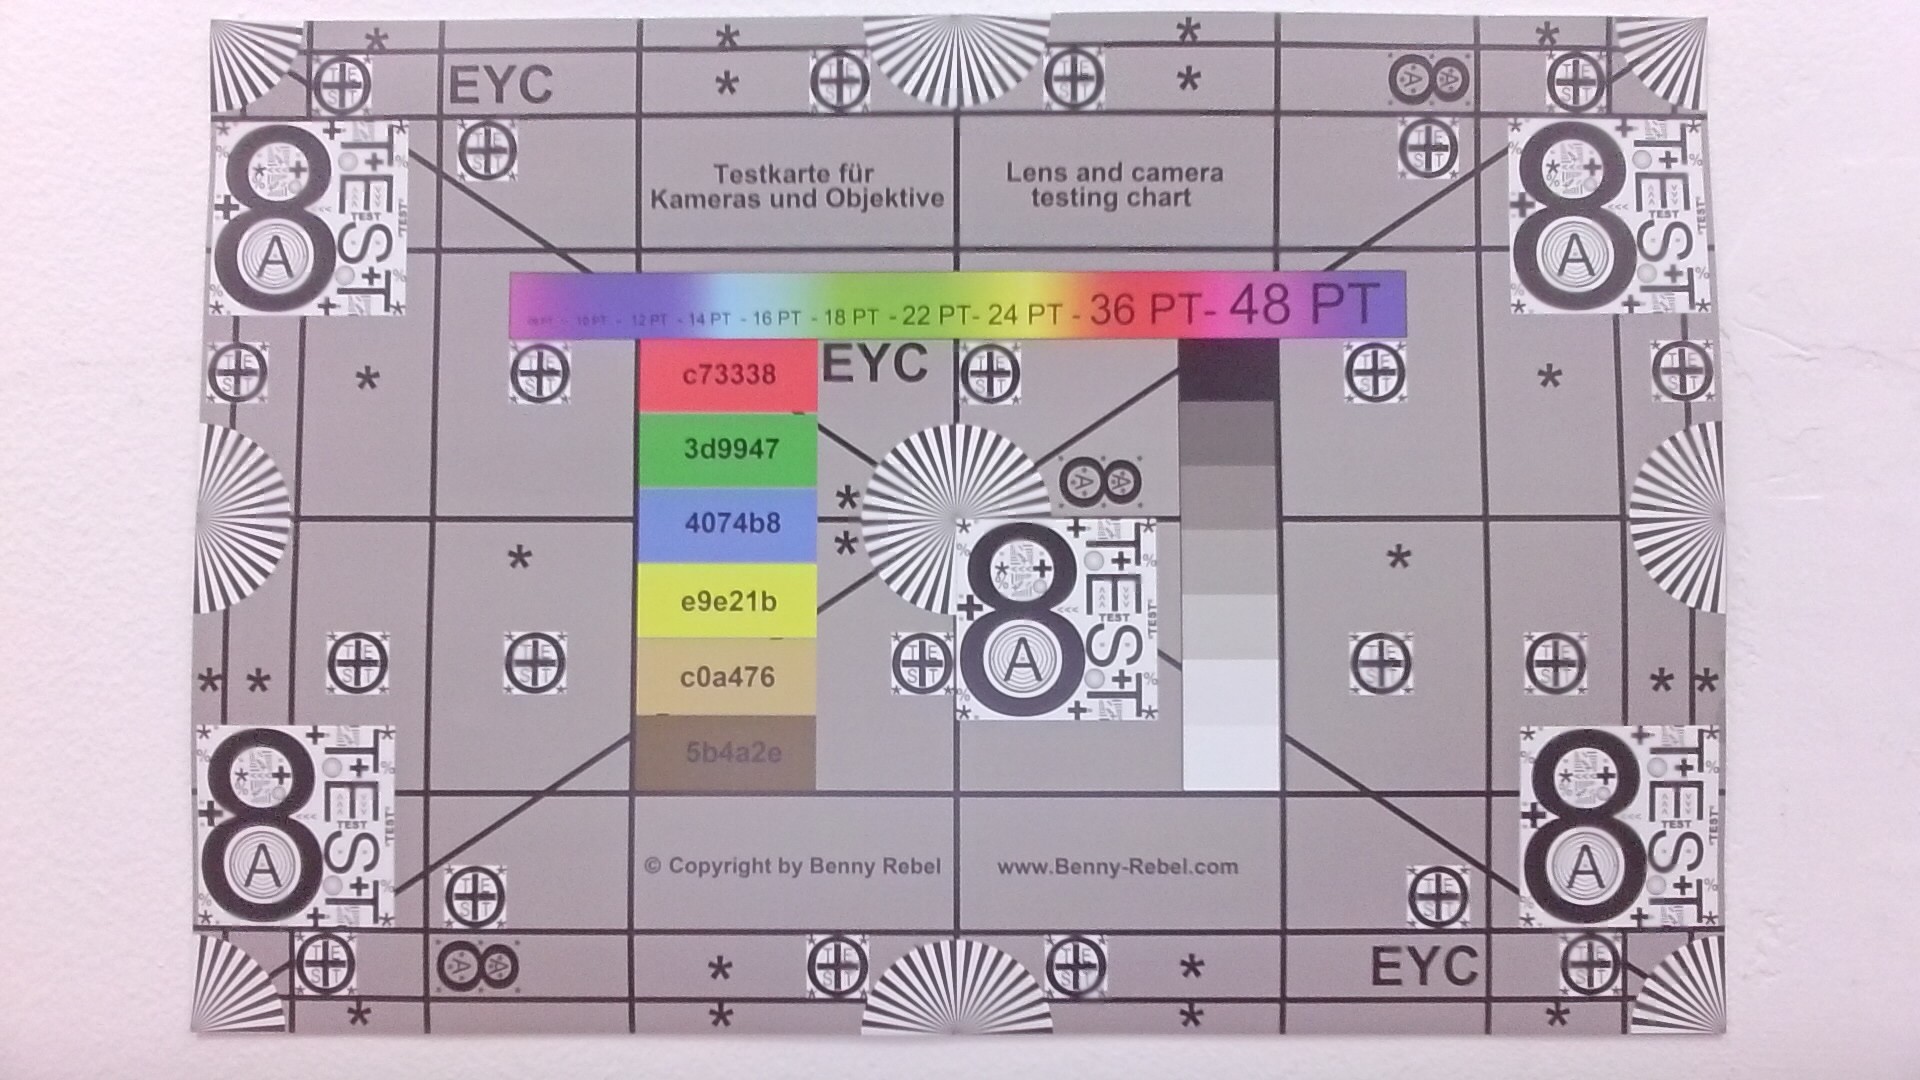
La telecamera da 1080p è dotata di un obturatore per la privacy integrato, ma non dispone di IR.

ColorChecker
9.1 ∆E
12.1 ∆E
11.1 ∆E
16.4 ∆E
15.3 ∆E
16.6 ∆E
12.8 ∆E
13.2 ∆E
13.2 ∆E
11.2 ∆E
15.2 ∆E
22.5 ∆E
11.7 ∆E
17.8 ∆E
18.4 ∆E
15.5 ∆E
18.2 ∆E
24.1 ∆E
1.6 ∆E
10.2 ∆E
19.2 ∆E
20.7 ∆E
19.3 ∆E
10.8 ∆E
ColorChecker HP HyperX Omen 16 16-ap1931nr: 14.84 ∆E min: 1.57 - max: 24.1 ∆E

Manutenzione

Proprio come per gli aggiornamenti esterni minori, l’Omen 16 del 2026 è internamente molto simile al modello dell’anno scorso, con caratteristiche di espansione simili, quali 2 SSD M.2 e 2 slot SODIMM.
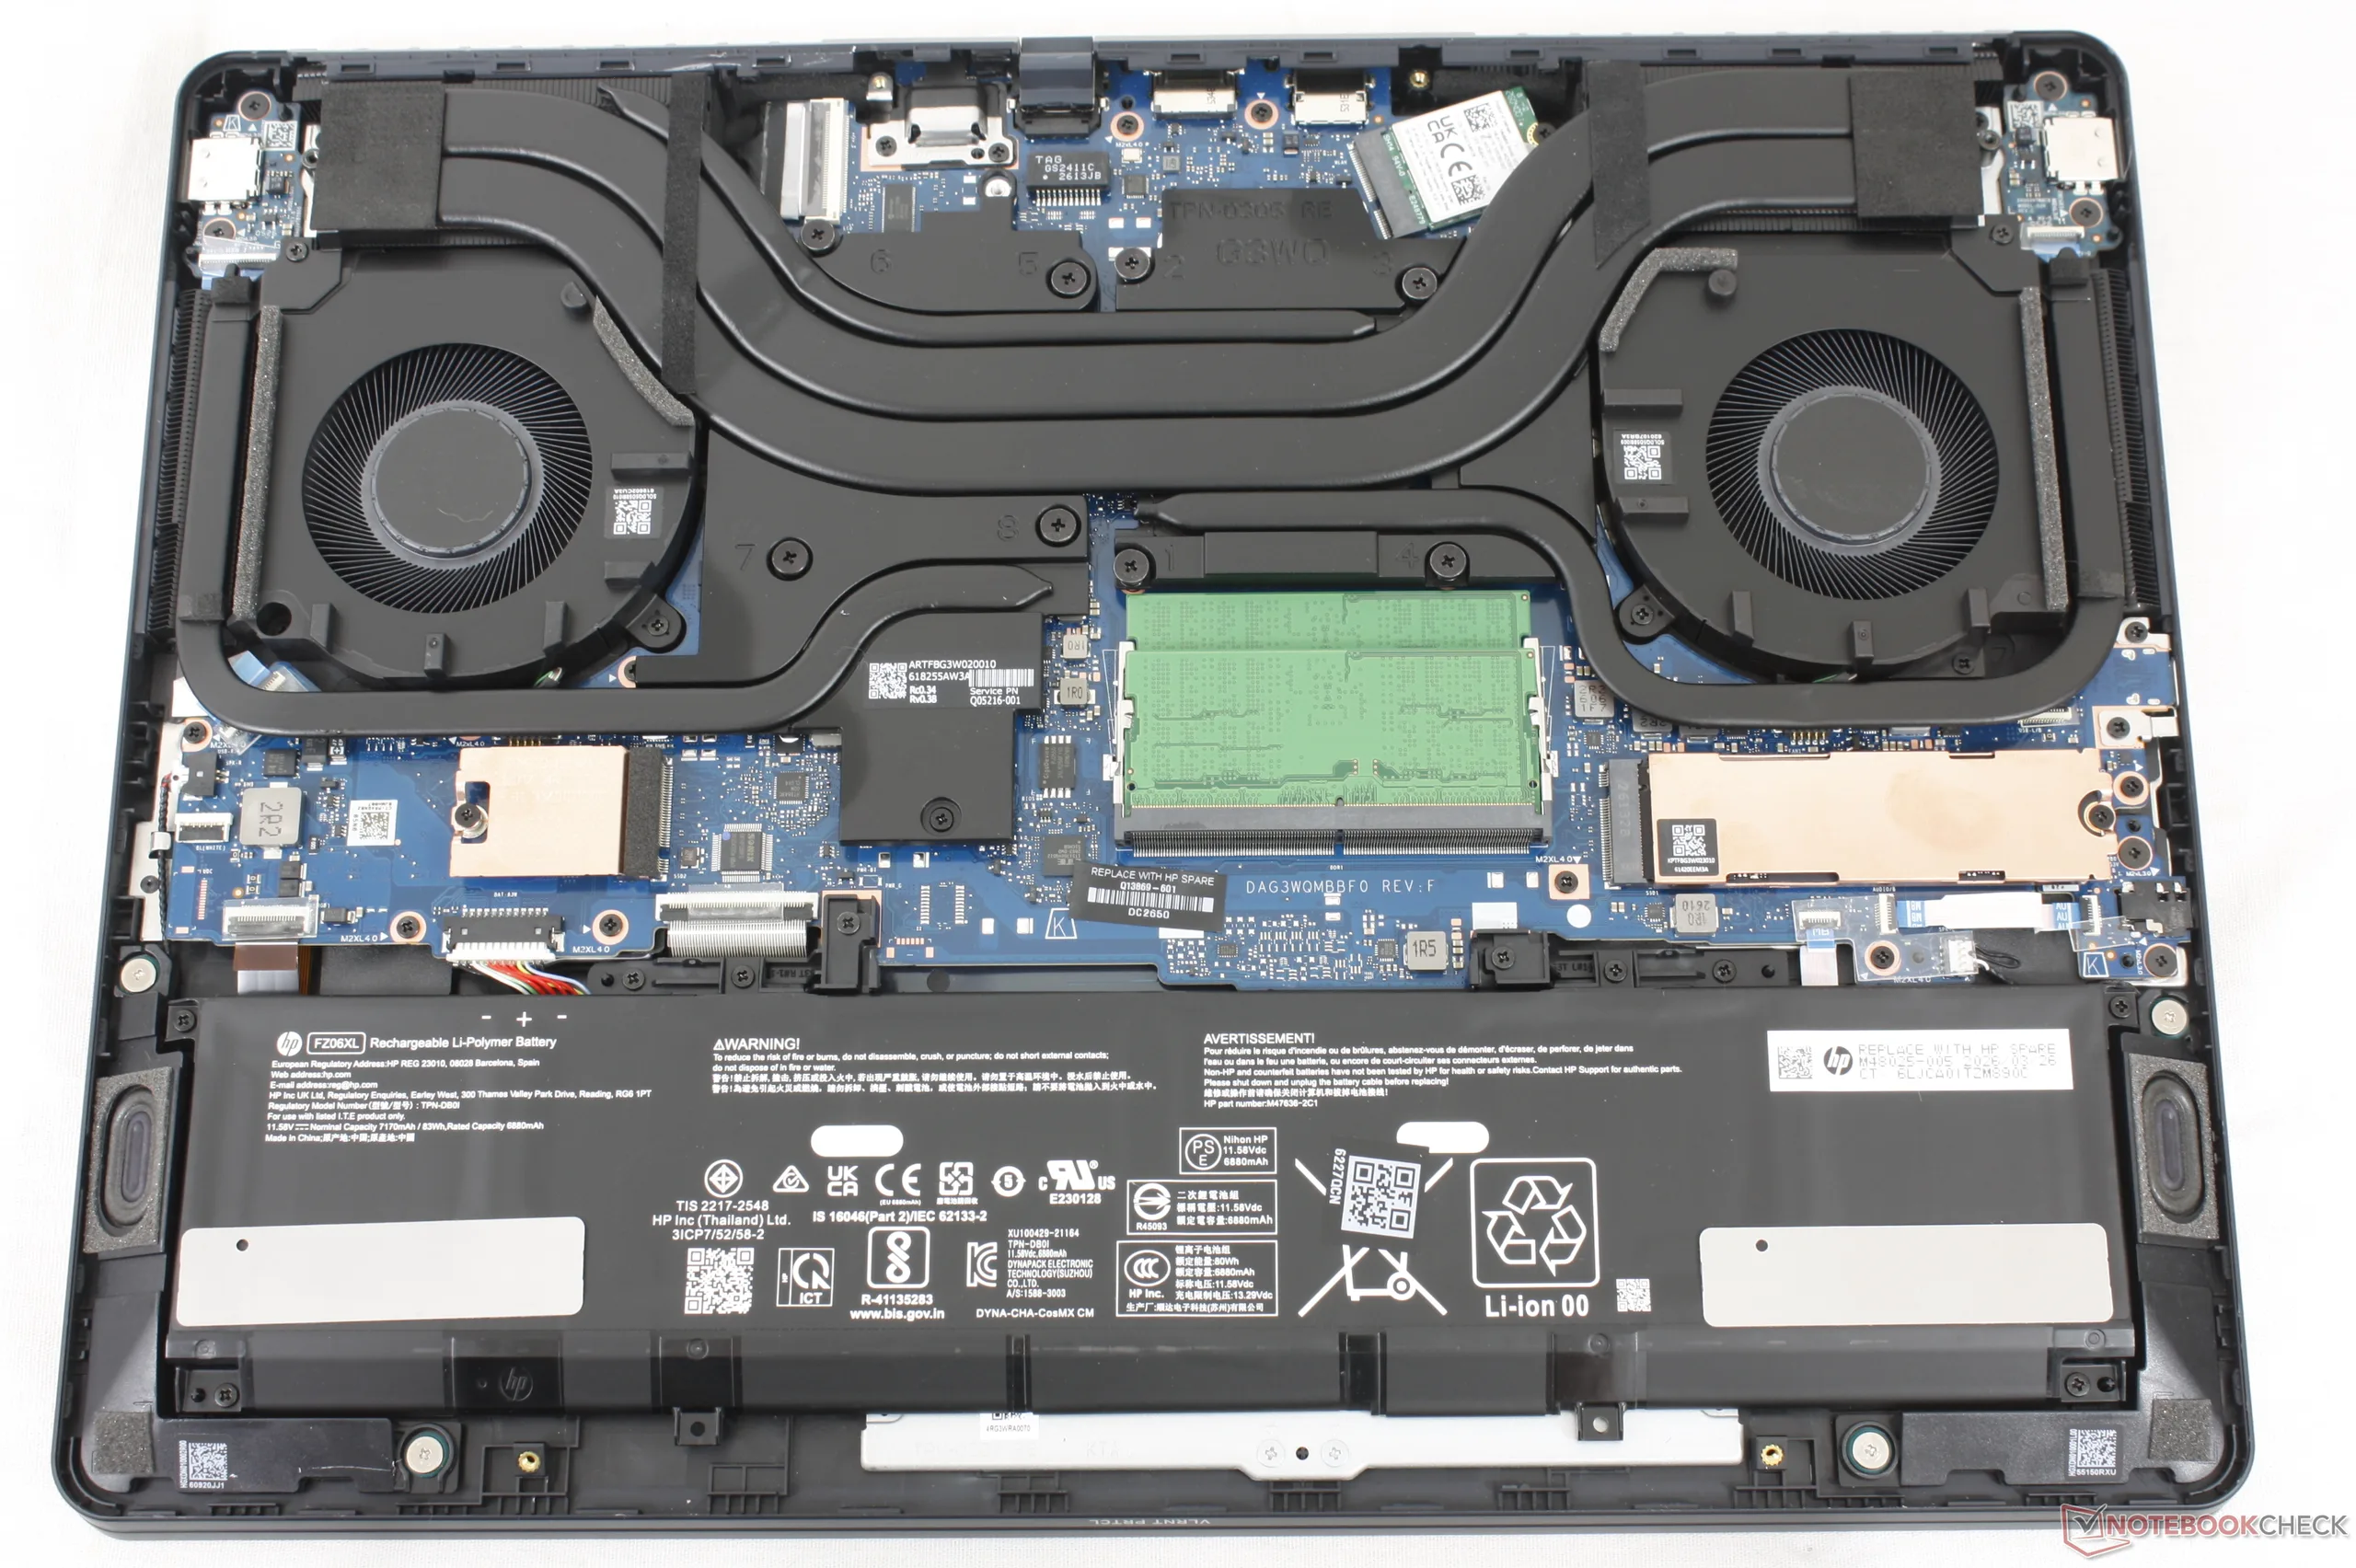
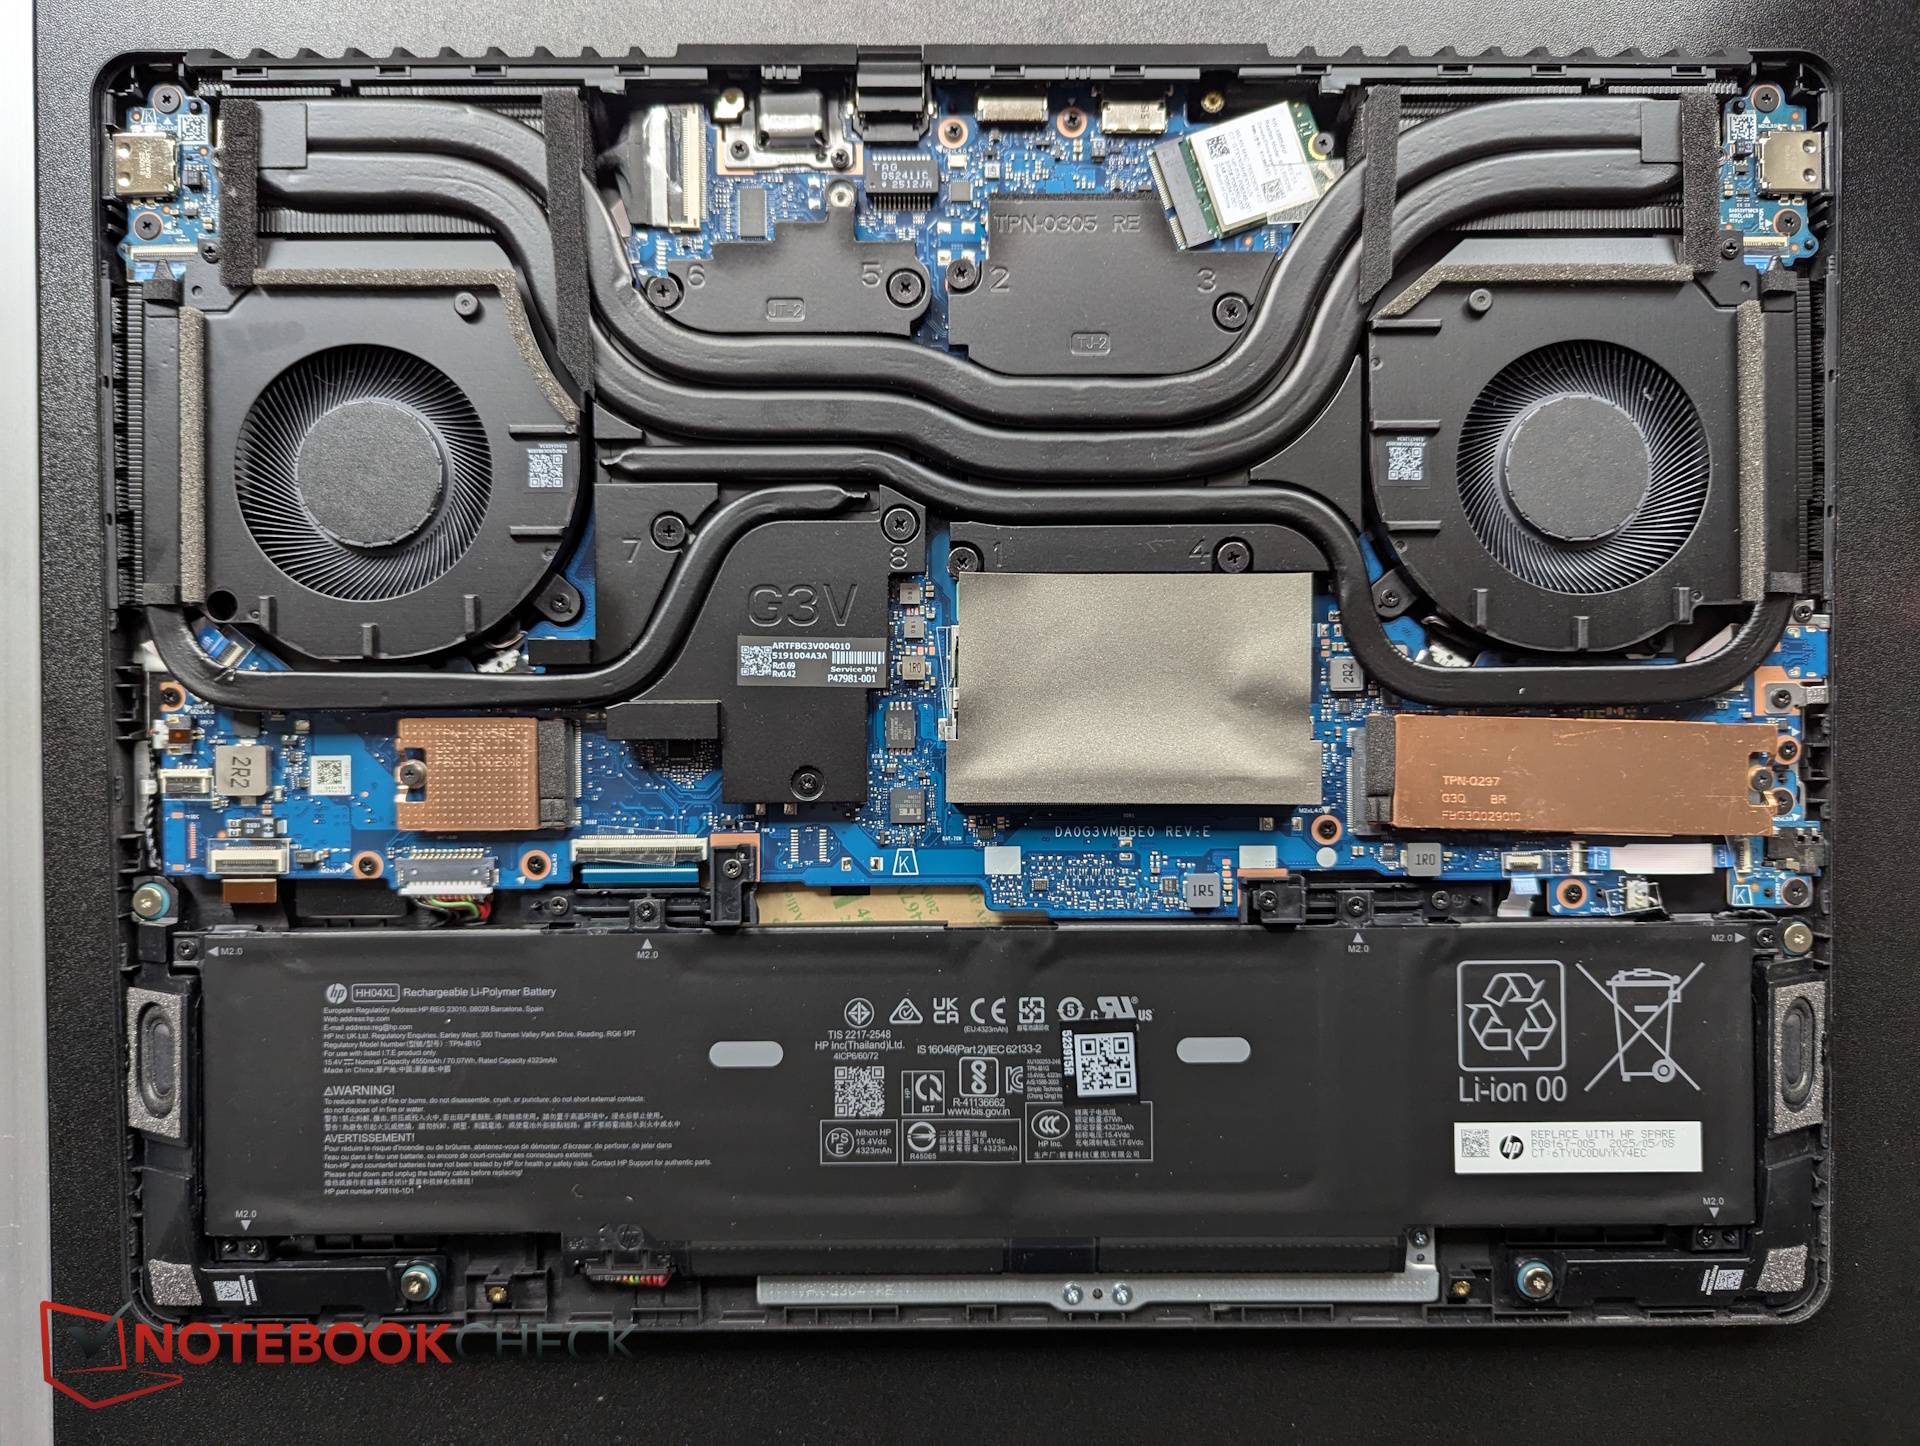
2026 Omen 16
2026 Omen 16
2025 Omen 16 a titolo di confronto

Sostenibilità

I tasti della tastiera sono realizzati in plastica riciclata post-consumo, senza alcuna indicazione relativa ad altre parti o alle quantità riciclate. L’imballaggio prevede un leggero utilizzo di plastica per il rivestimento dell’adattatore di corrente.

Accessori e garanzia

Nella confezione non sono presenti accessori oltre all’adattatore di corrente e alla documentazione. Se acquistato negli Stati Uniti, il prodotto è coperto da una garanzia limitata del produttore della durata di un anno.

Dispositivi di input

La tastiera è stata rinnovata rispetto al modello Omen 16 del 2025 per includere tasti freccia più grandi e una disposizione dei caratteri più ordinata. Il clickpad, tuttavia, rimane invariato con le dimensioni di 12,5 x 8 cm.
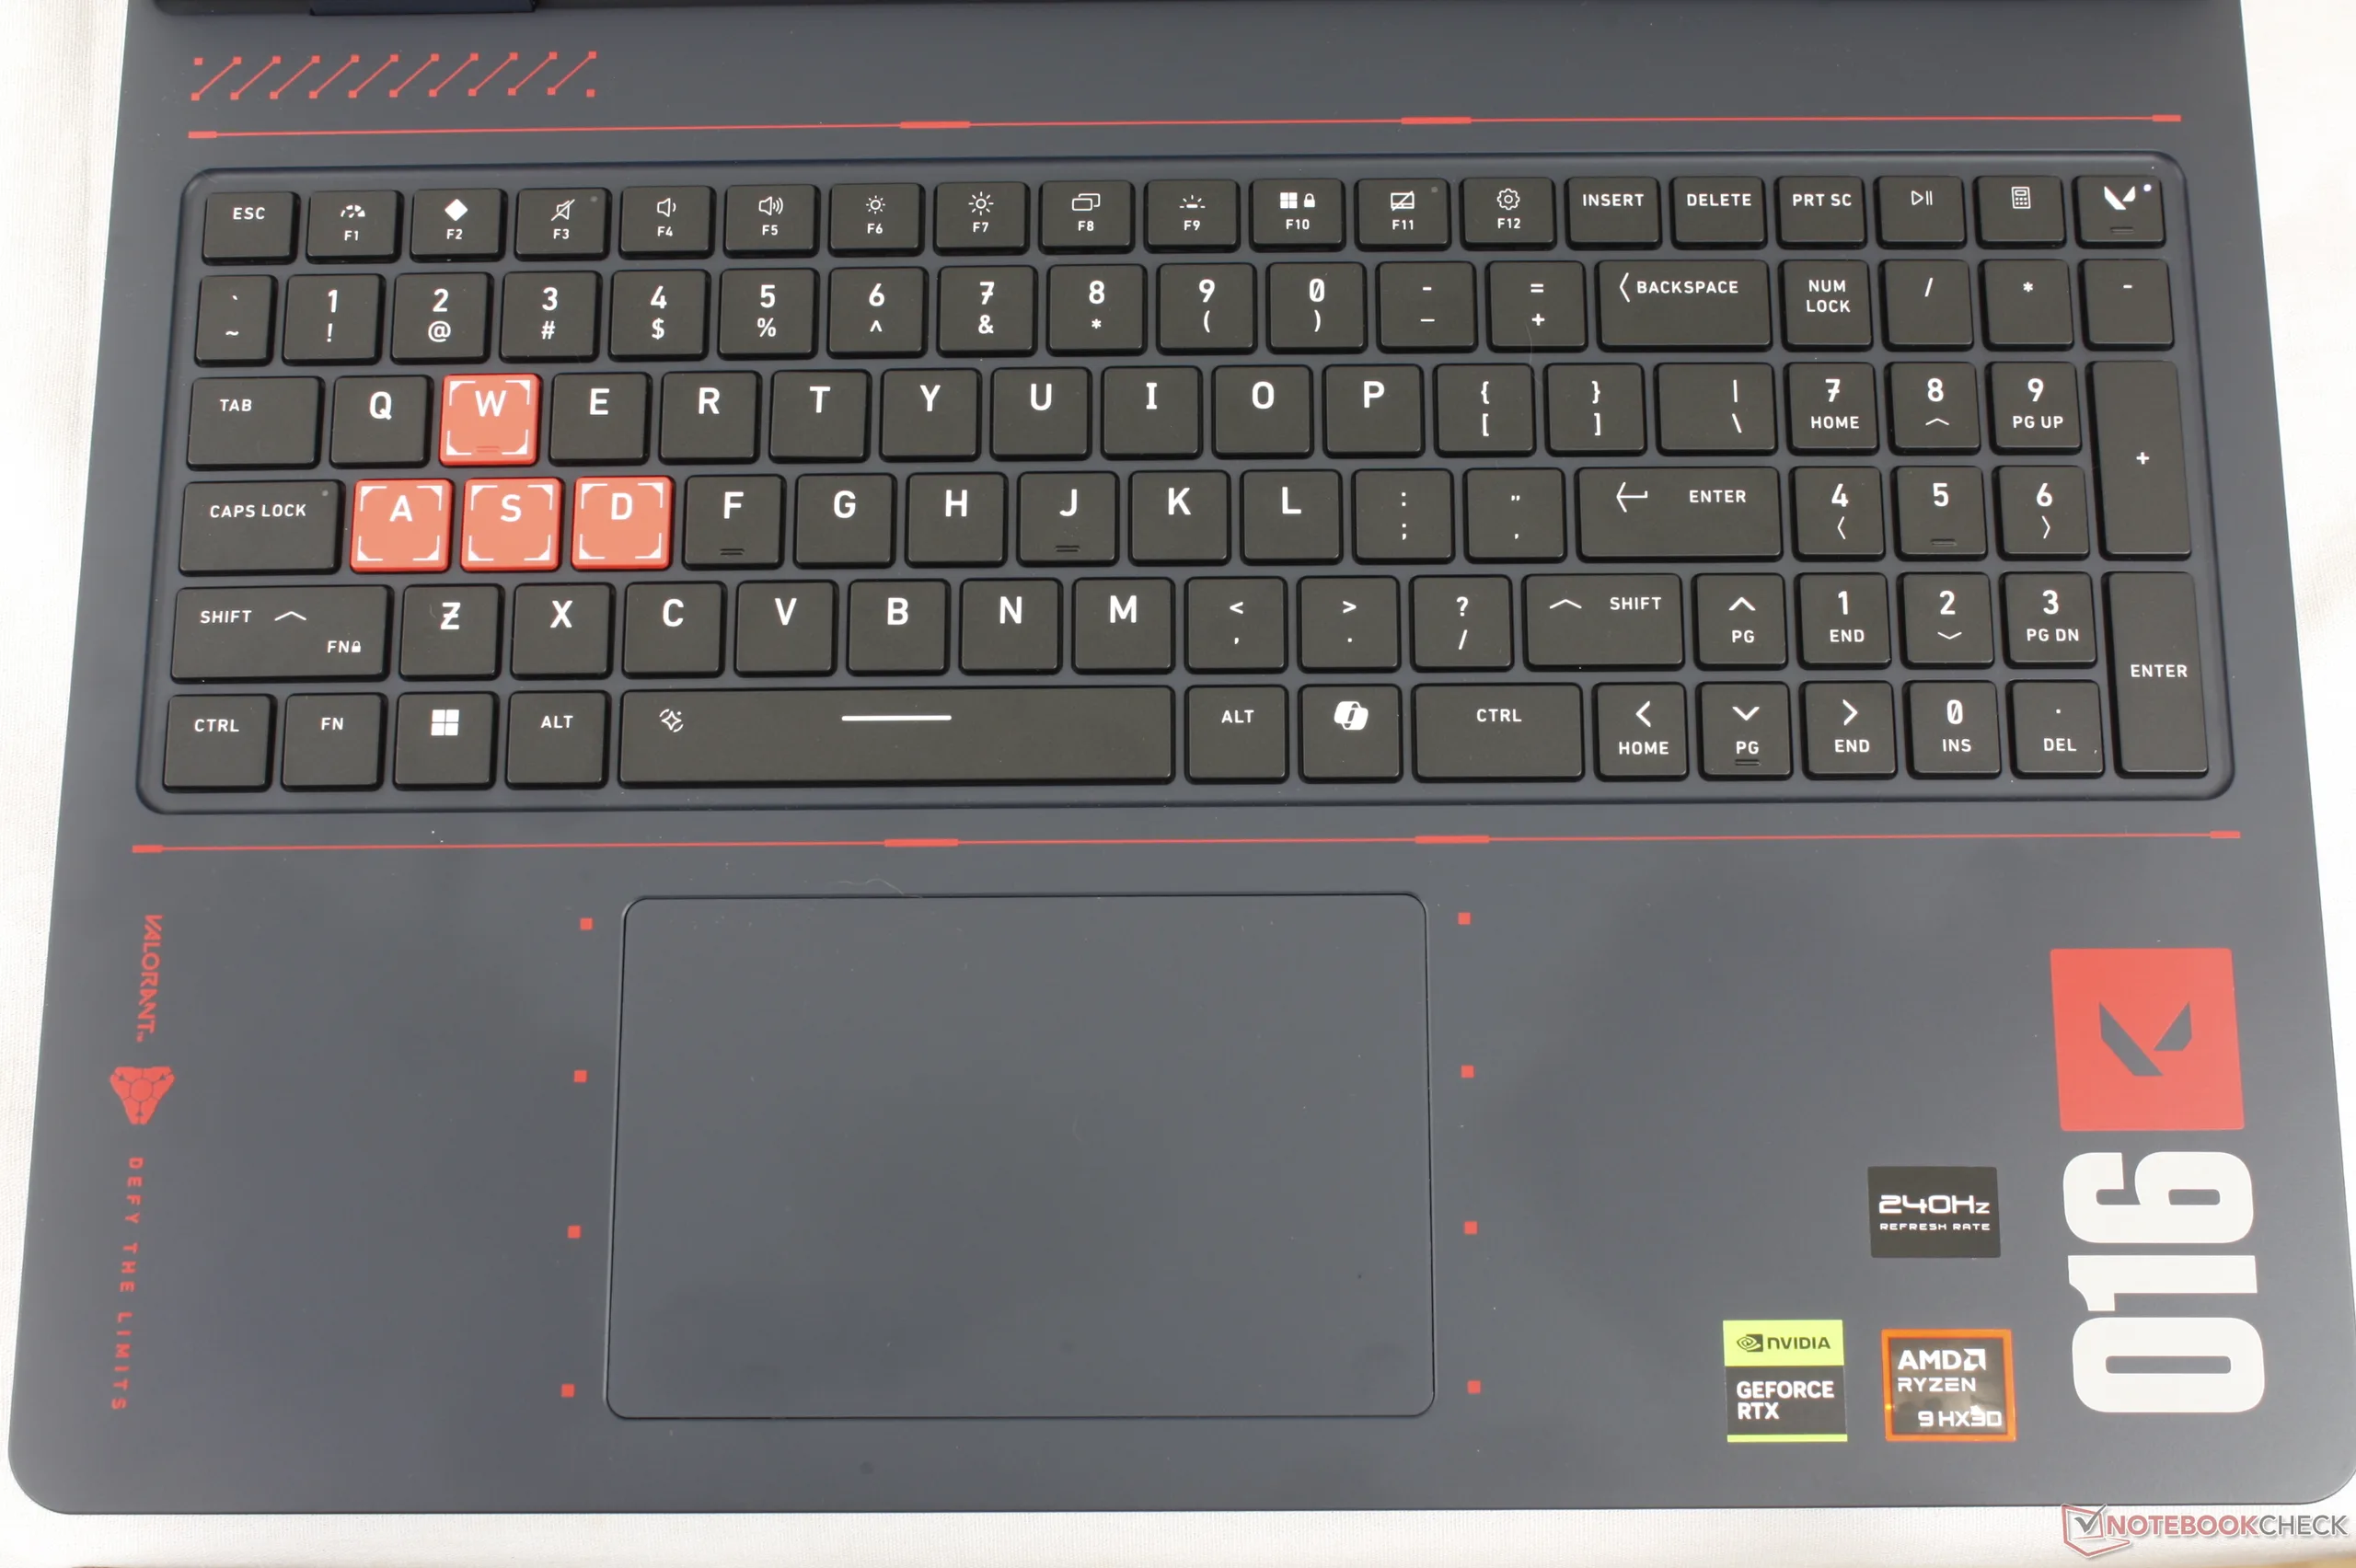
L'illuminazione RGB è limitata a tre zone anziché essere individuale per ogni tasto

Visualizza

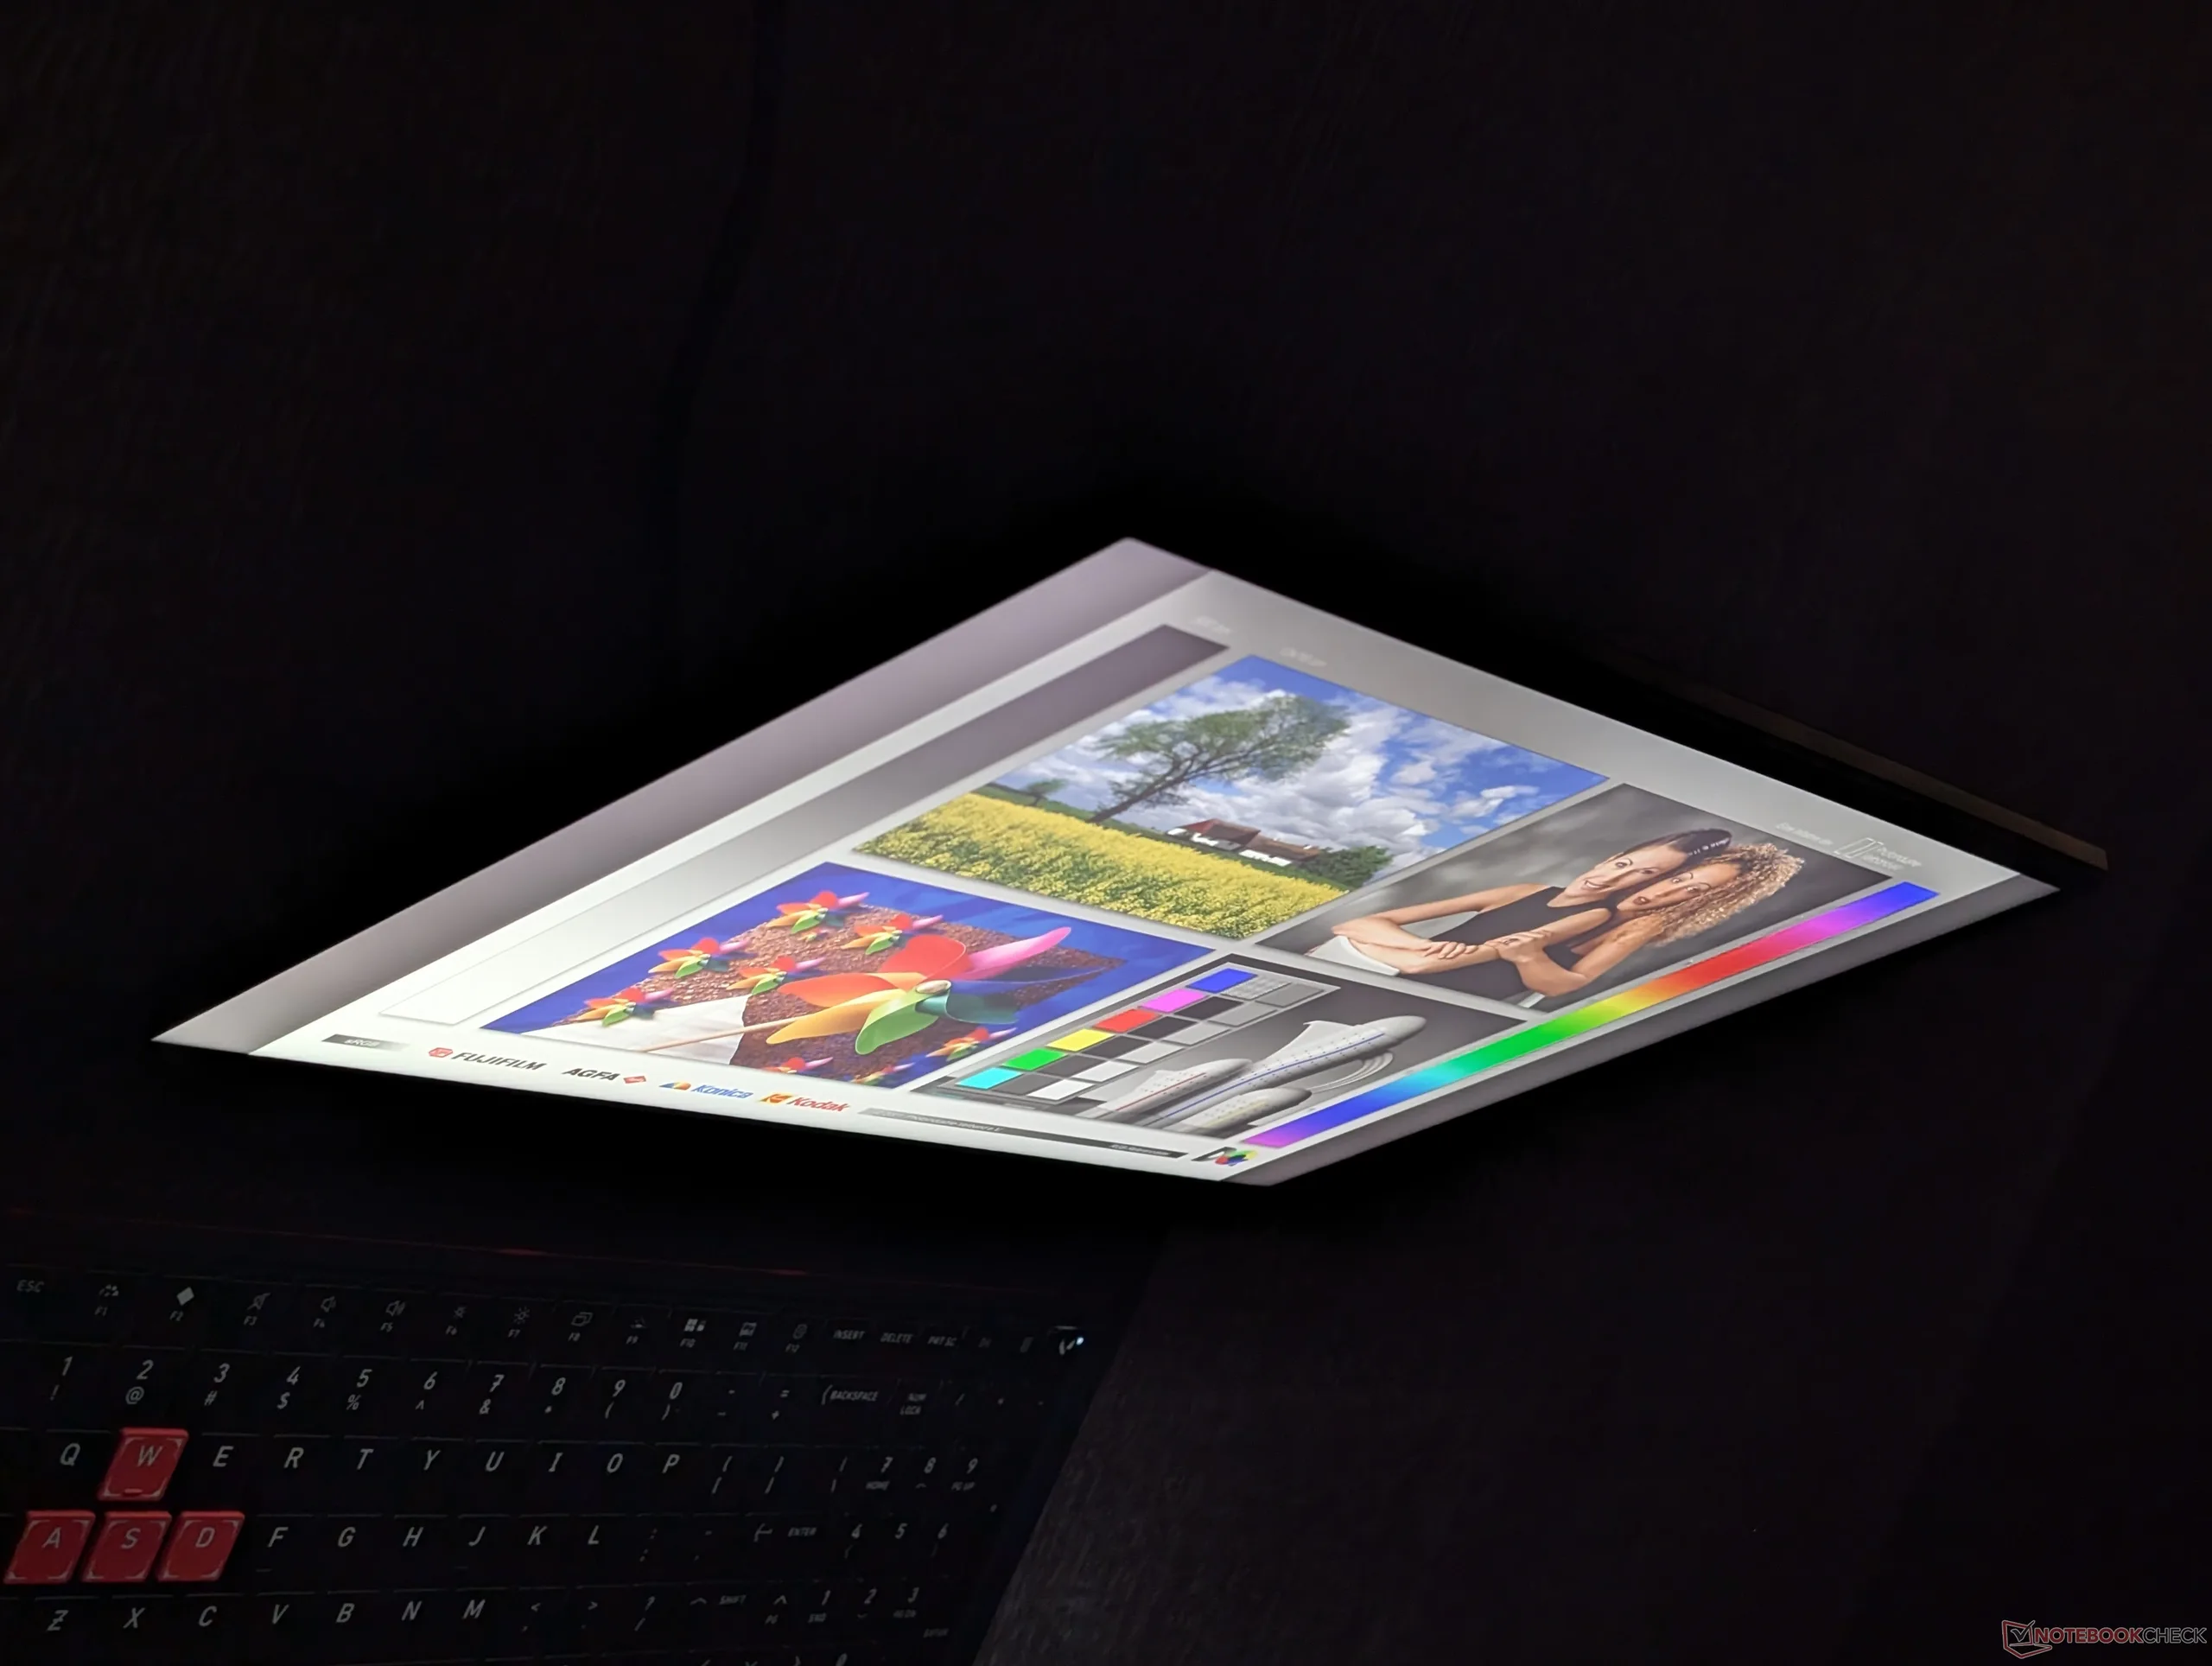
Pur non essendo un display OLED, lo schermo IPS è comunque ottimizzato per i giochi dal ritmo serrato, grazie alla sua elevata frequenza di aggiornamento di 240 Hz, ai tempi di risposta rapidi tra bianco e nero per ridurre l’effetto ghosting, ai colori sRGB calibrati e a una retroilluminazione luminosa da 500 nit. Purtroppo non supporta né G-Sync né HDR; quest’ultima limitazione è dovuta ai livelli di nero mediocri.


Il pannello opaco presenta una grana leggermente più marcata rispetto alla versione lucida
Si osserva un leggero bleeding della retroilluminazione lungo gli angoli
512.1
cd/m²
549.4
cd/m²
552.5
cd/m²
546.6
cd/m²
569.7
cd/m²
557.7
cd/m²
539.3
cd/m²
532.8
cd/m²
546.6
cd/m²
Distribuzione della luminosità
BOE0CD1 testato con X-Rite i1Pro 3
Massima: 569.7 cd/m² (Nits) Media: 545.2 cd/m² Minimum: 29.7 cd/m²
Distribuzione della luminosità: 90 %
Al centro con la batteria: 569.7 cd/m²
Contrasto: 1212:1 (Nero: 0.47 cd/m²)
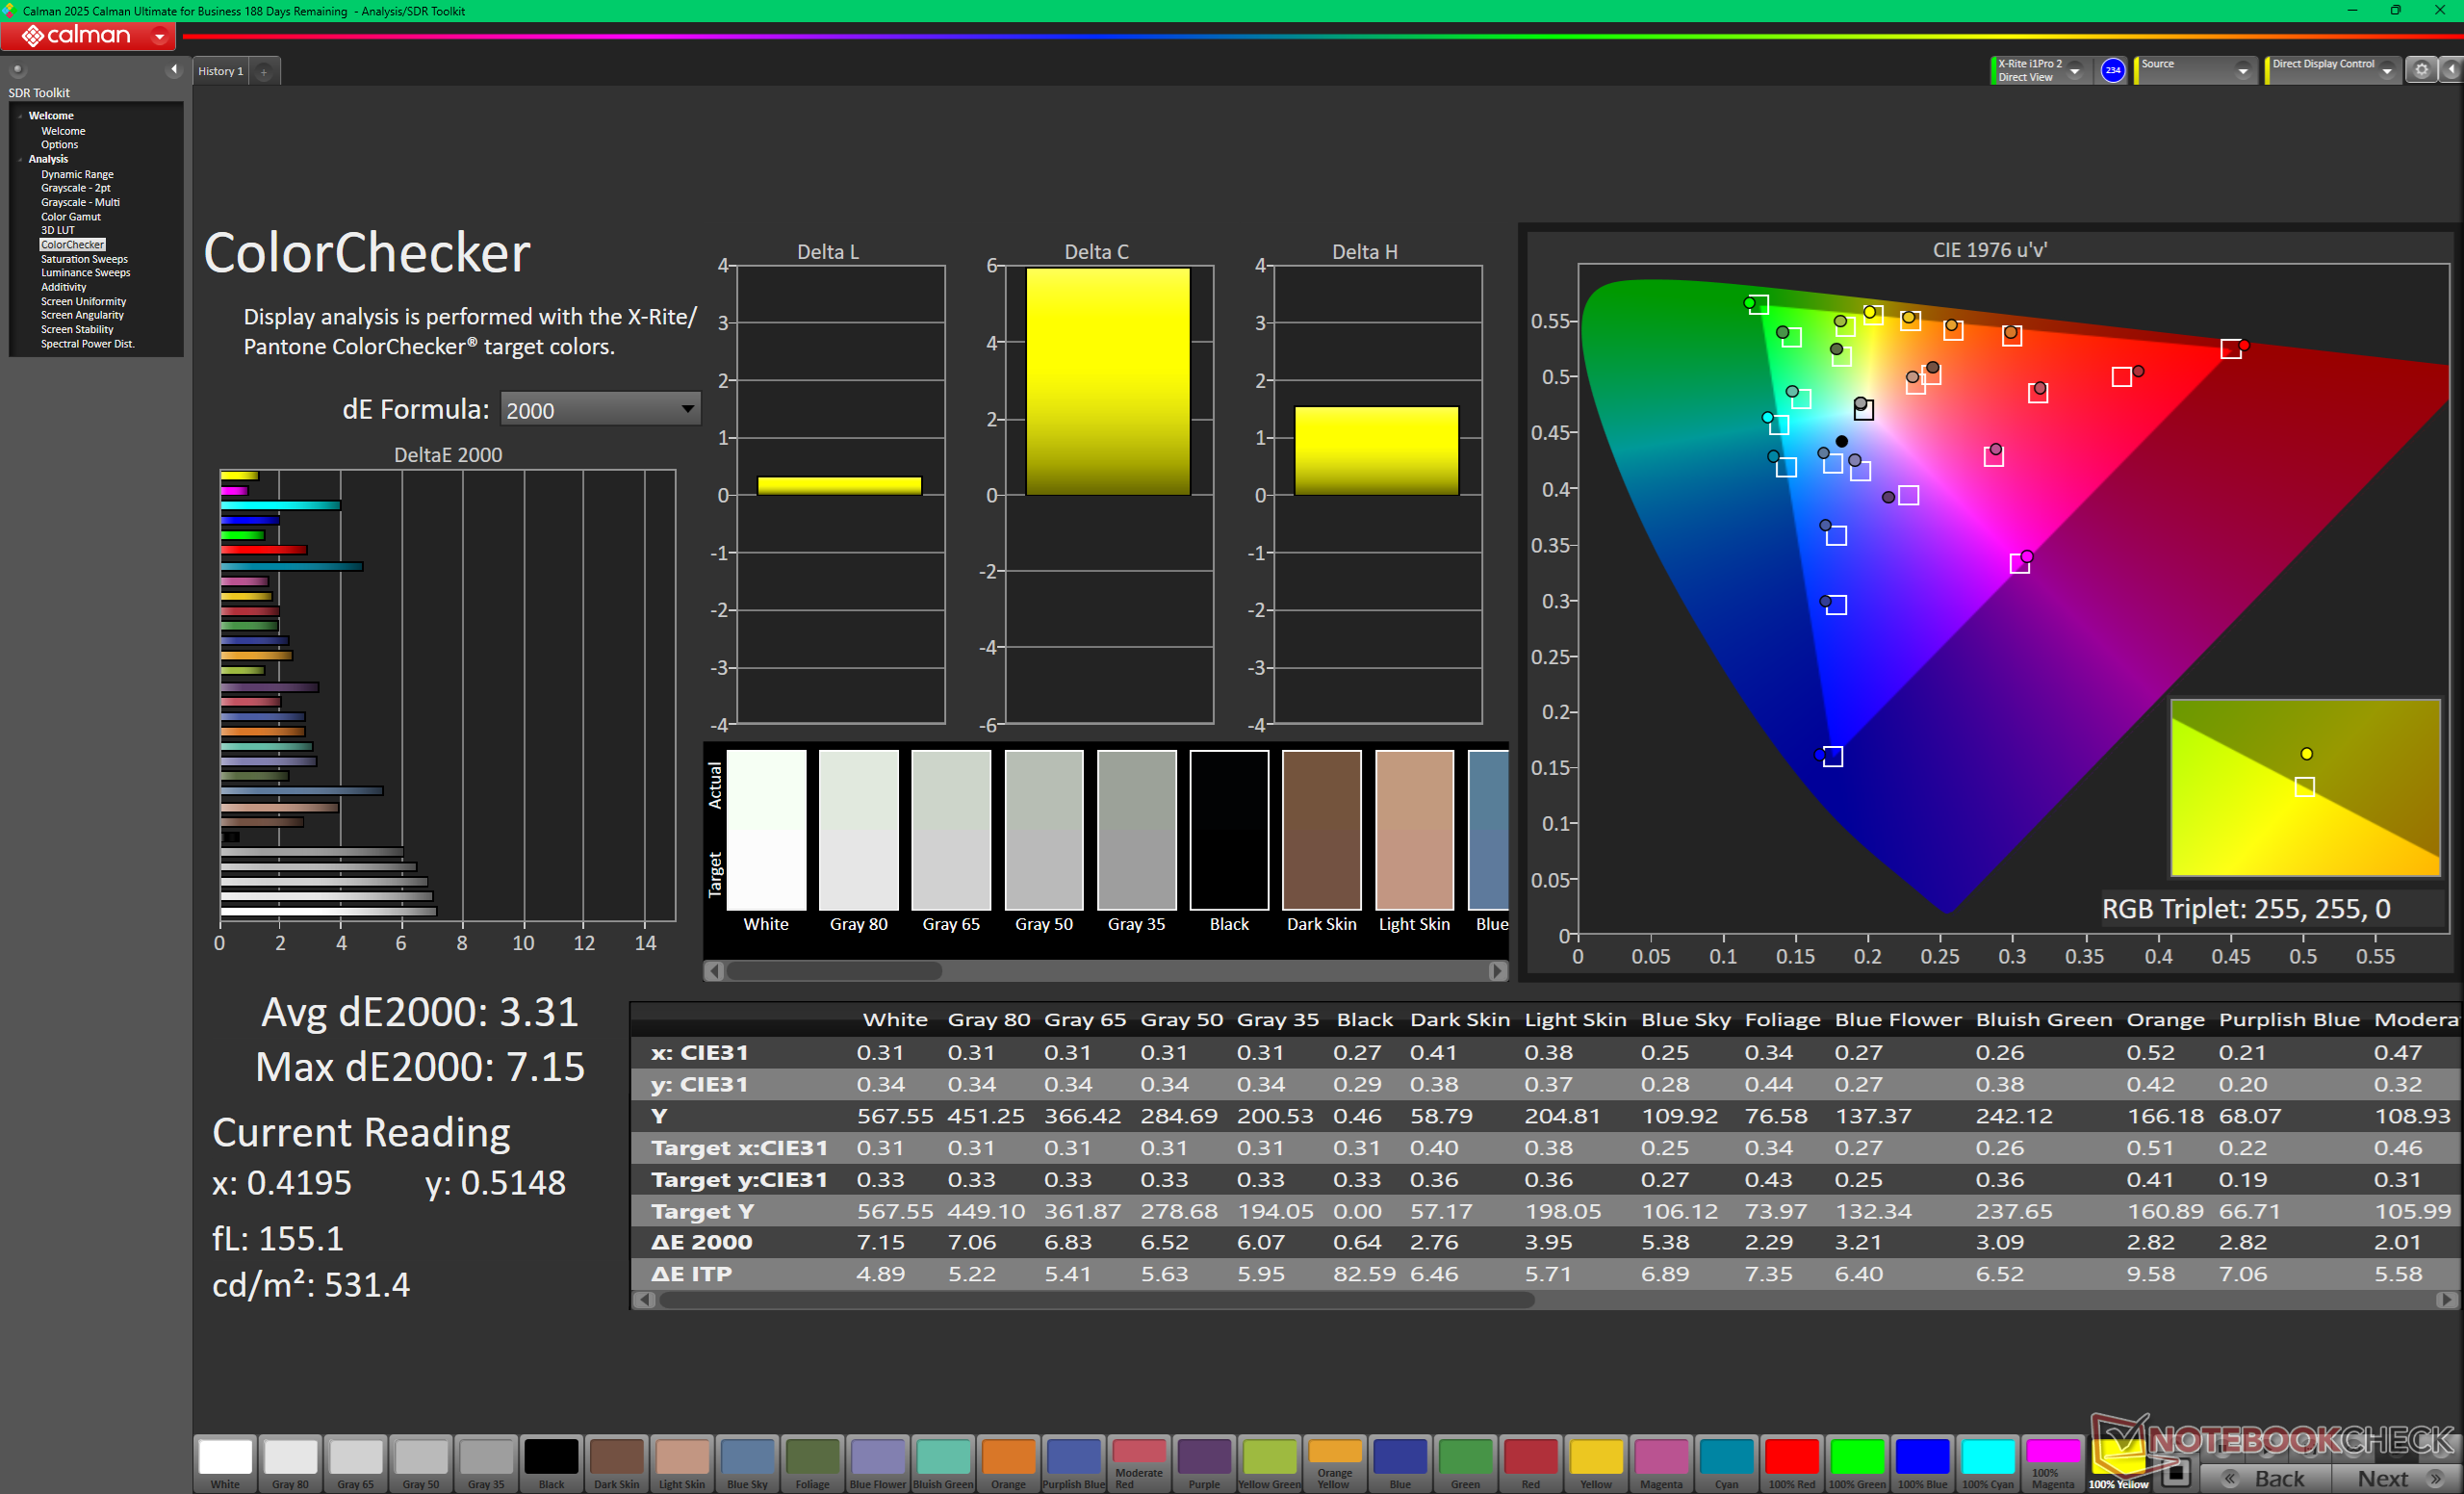
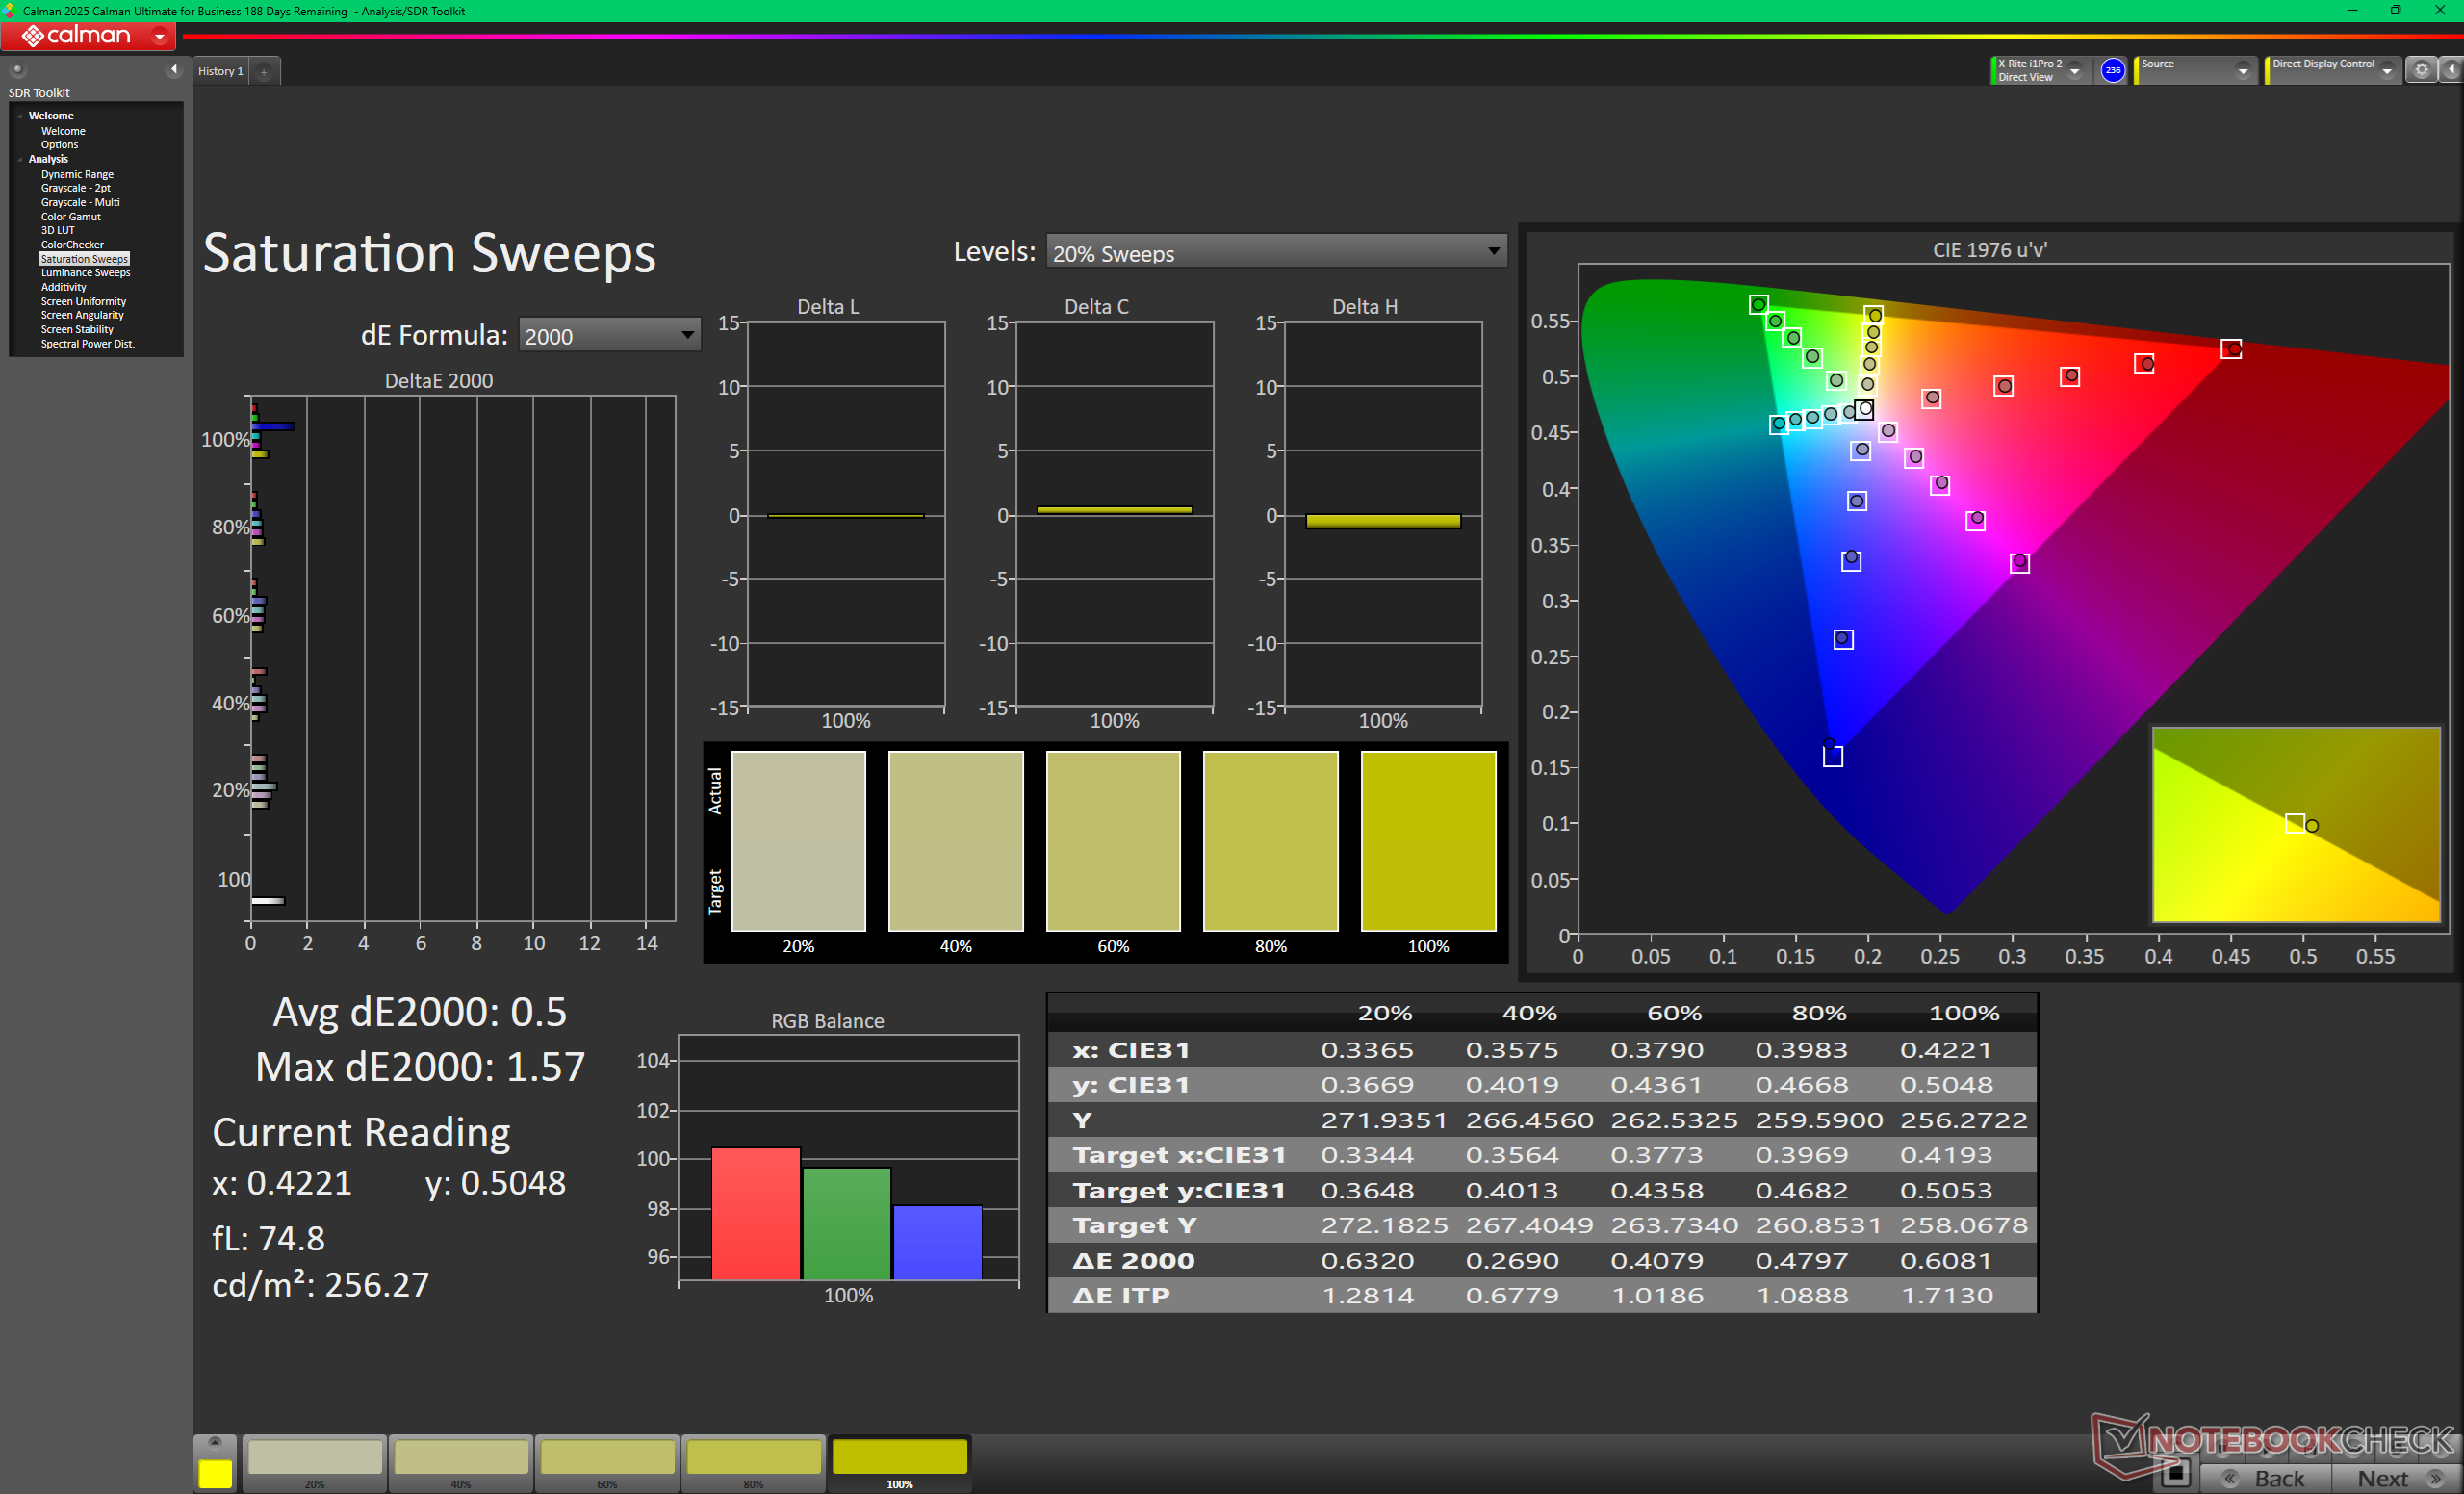
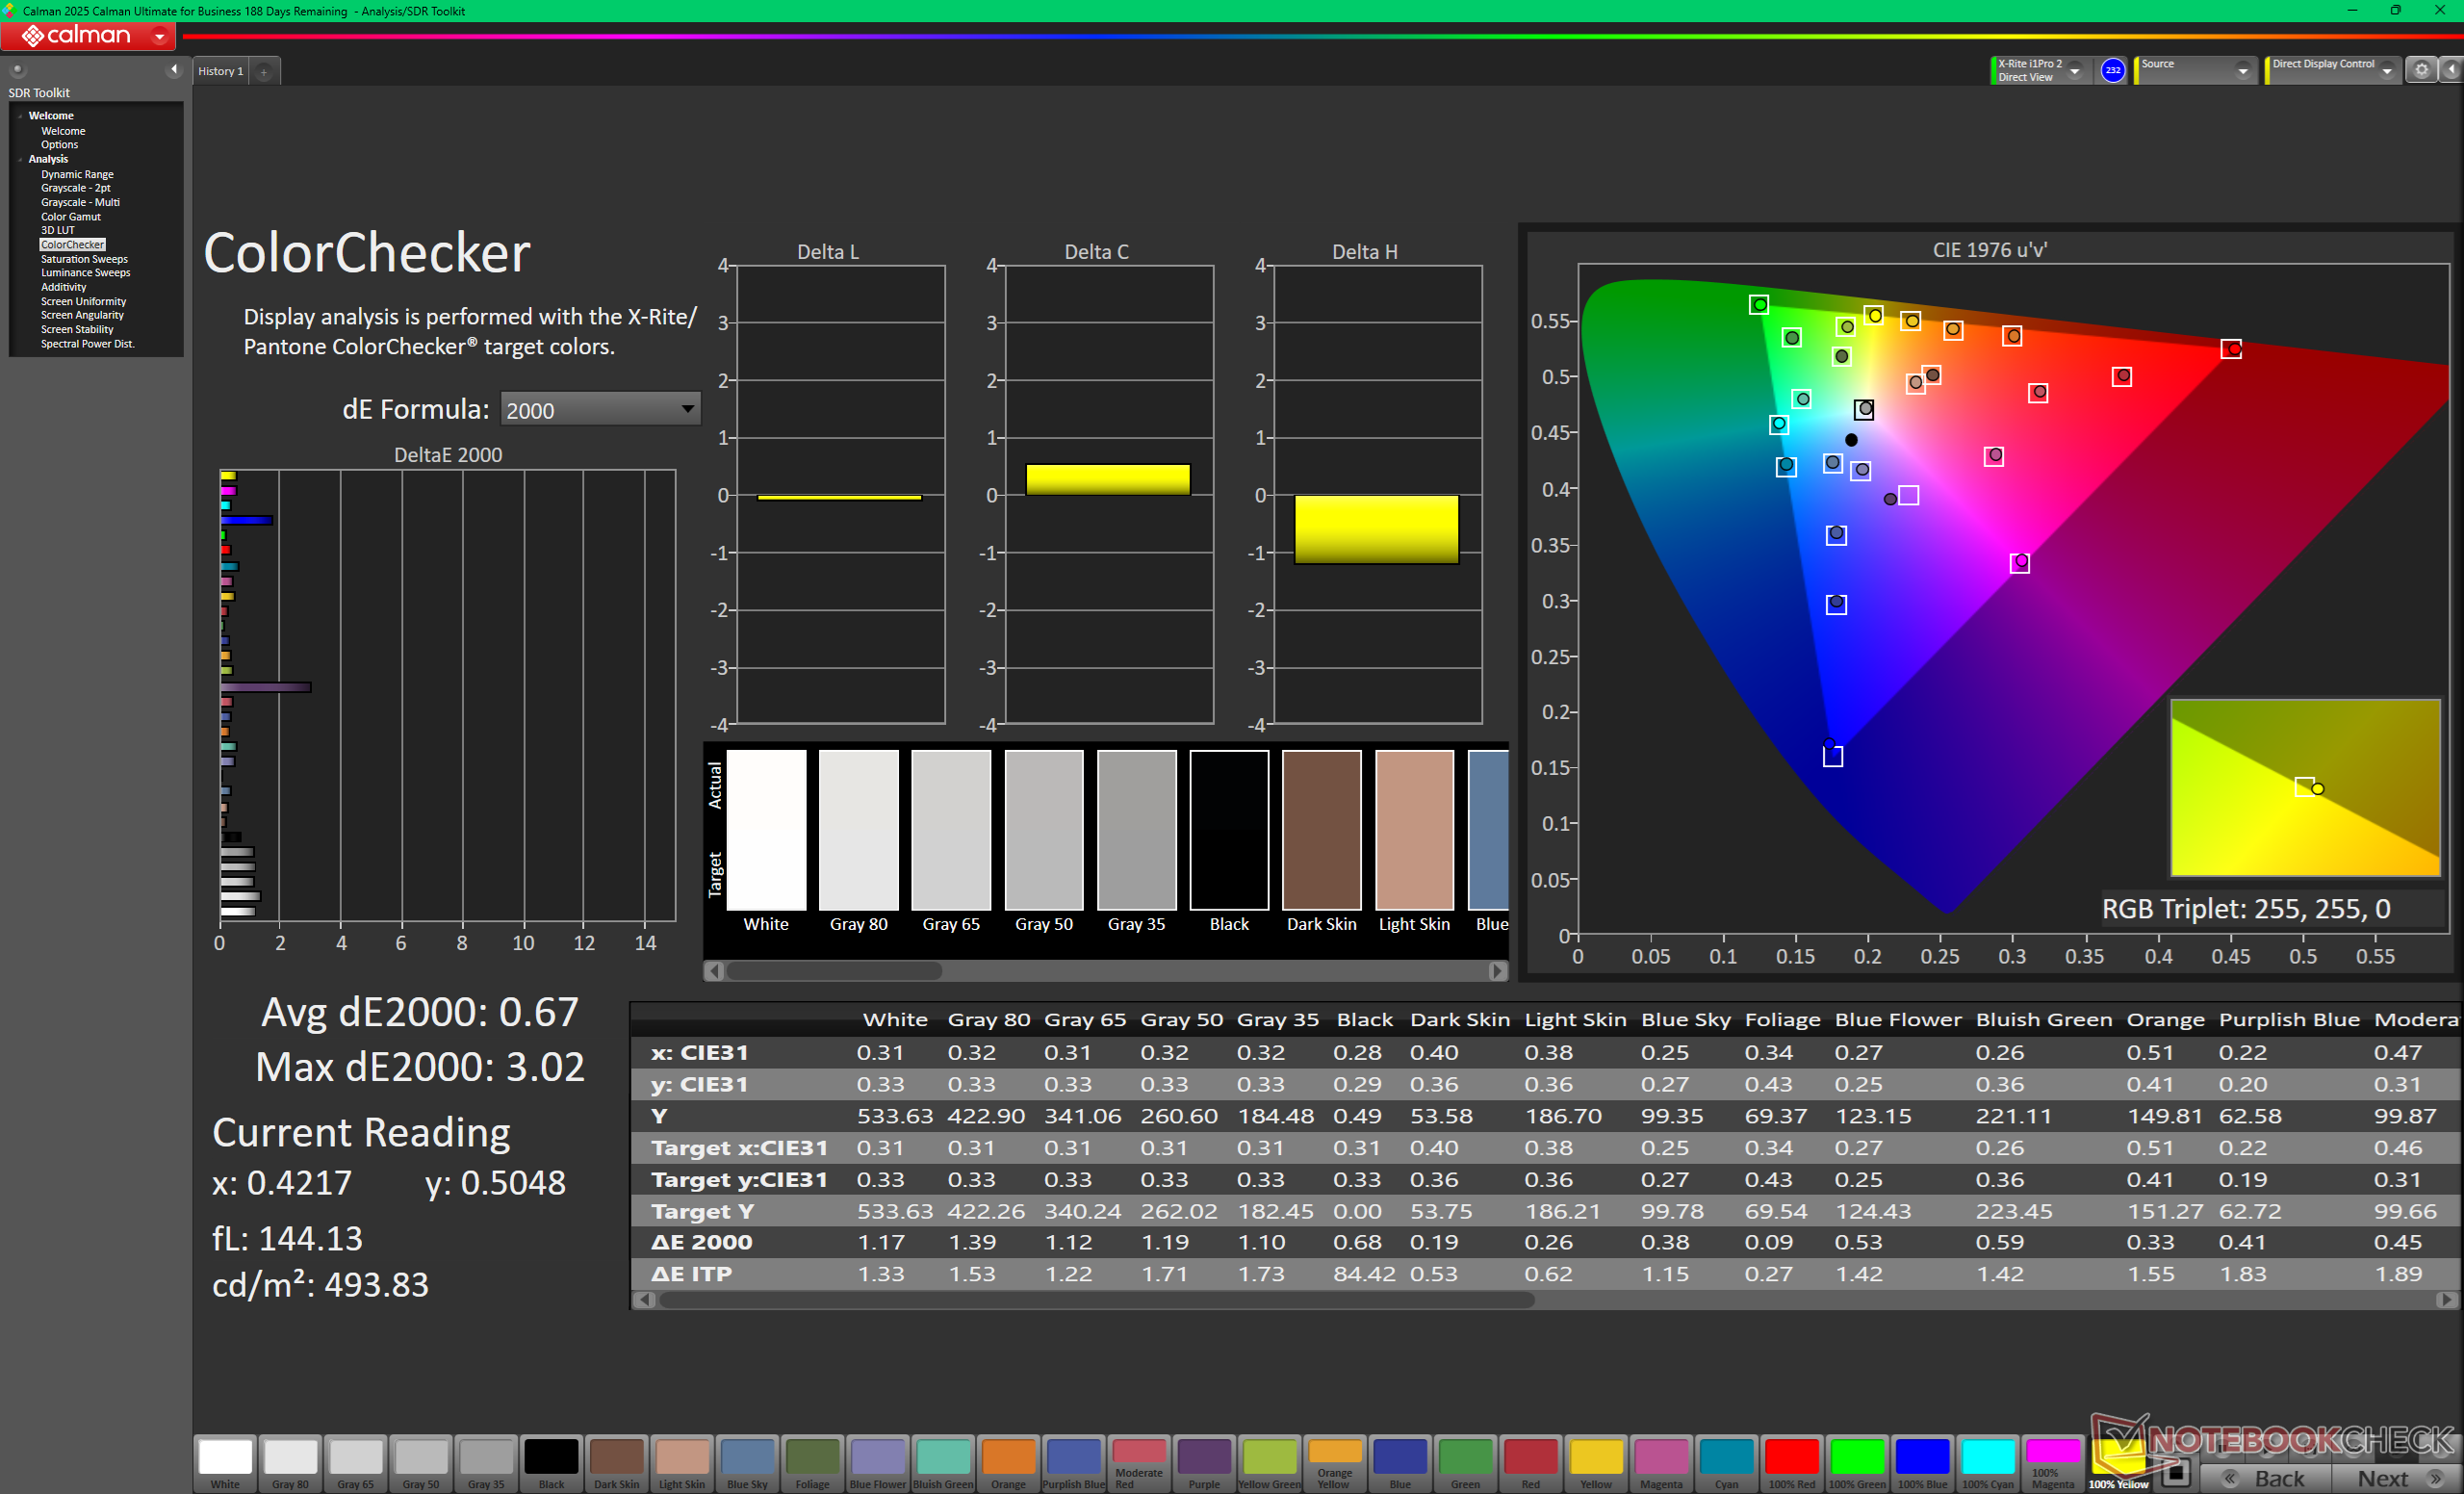
ΔE ColorChecker Calman: 3.31 | ∀{0.5-29.43 Ø4.7}
calibrated: 0.67
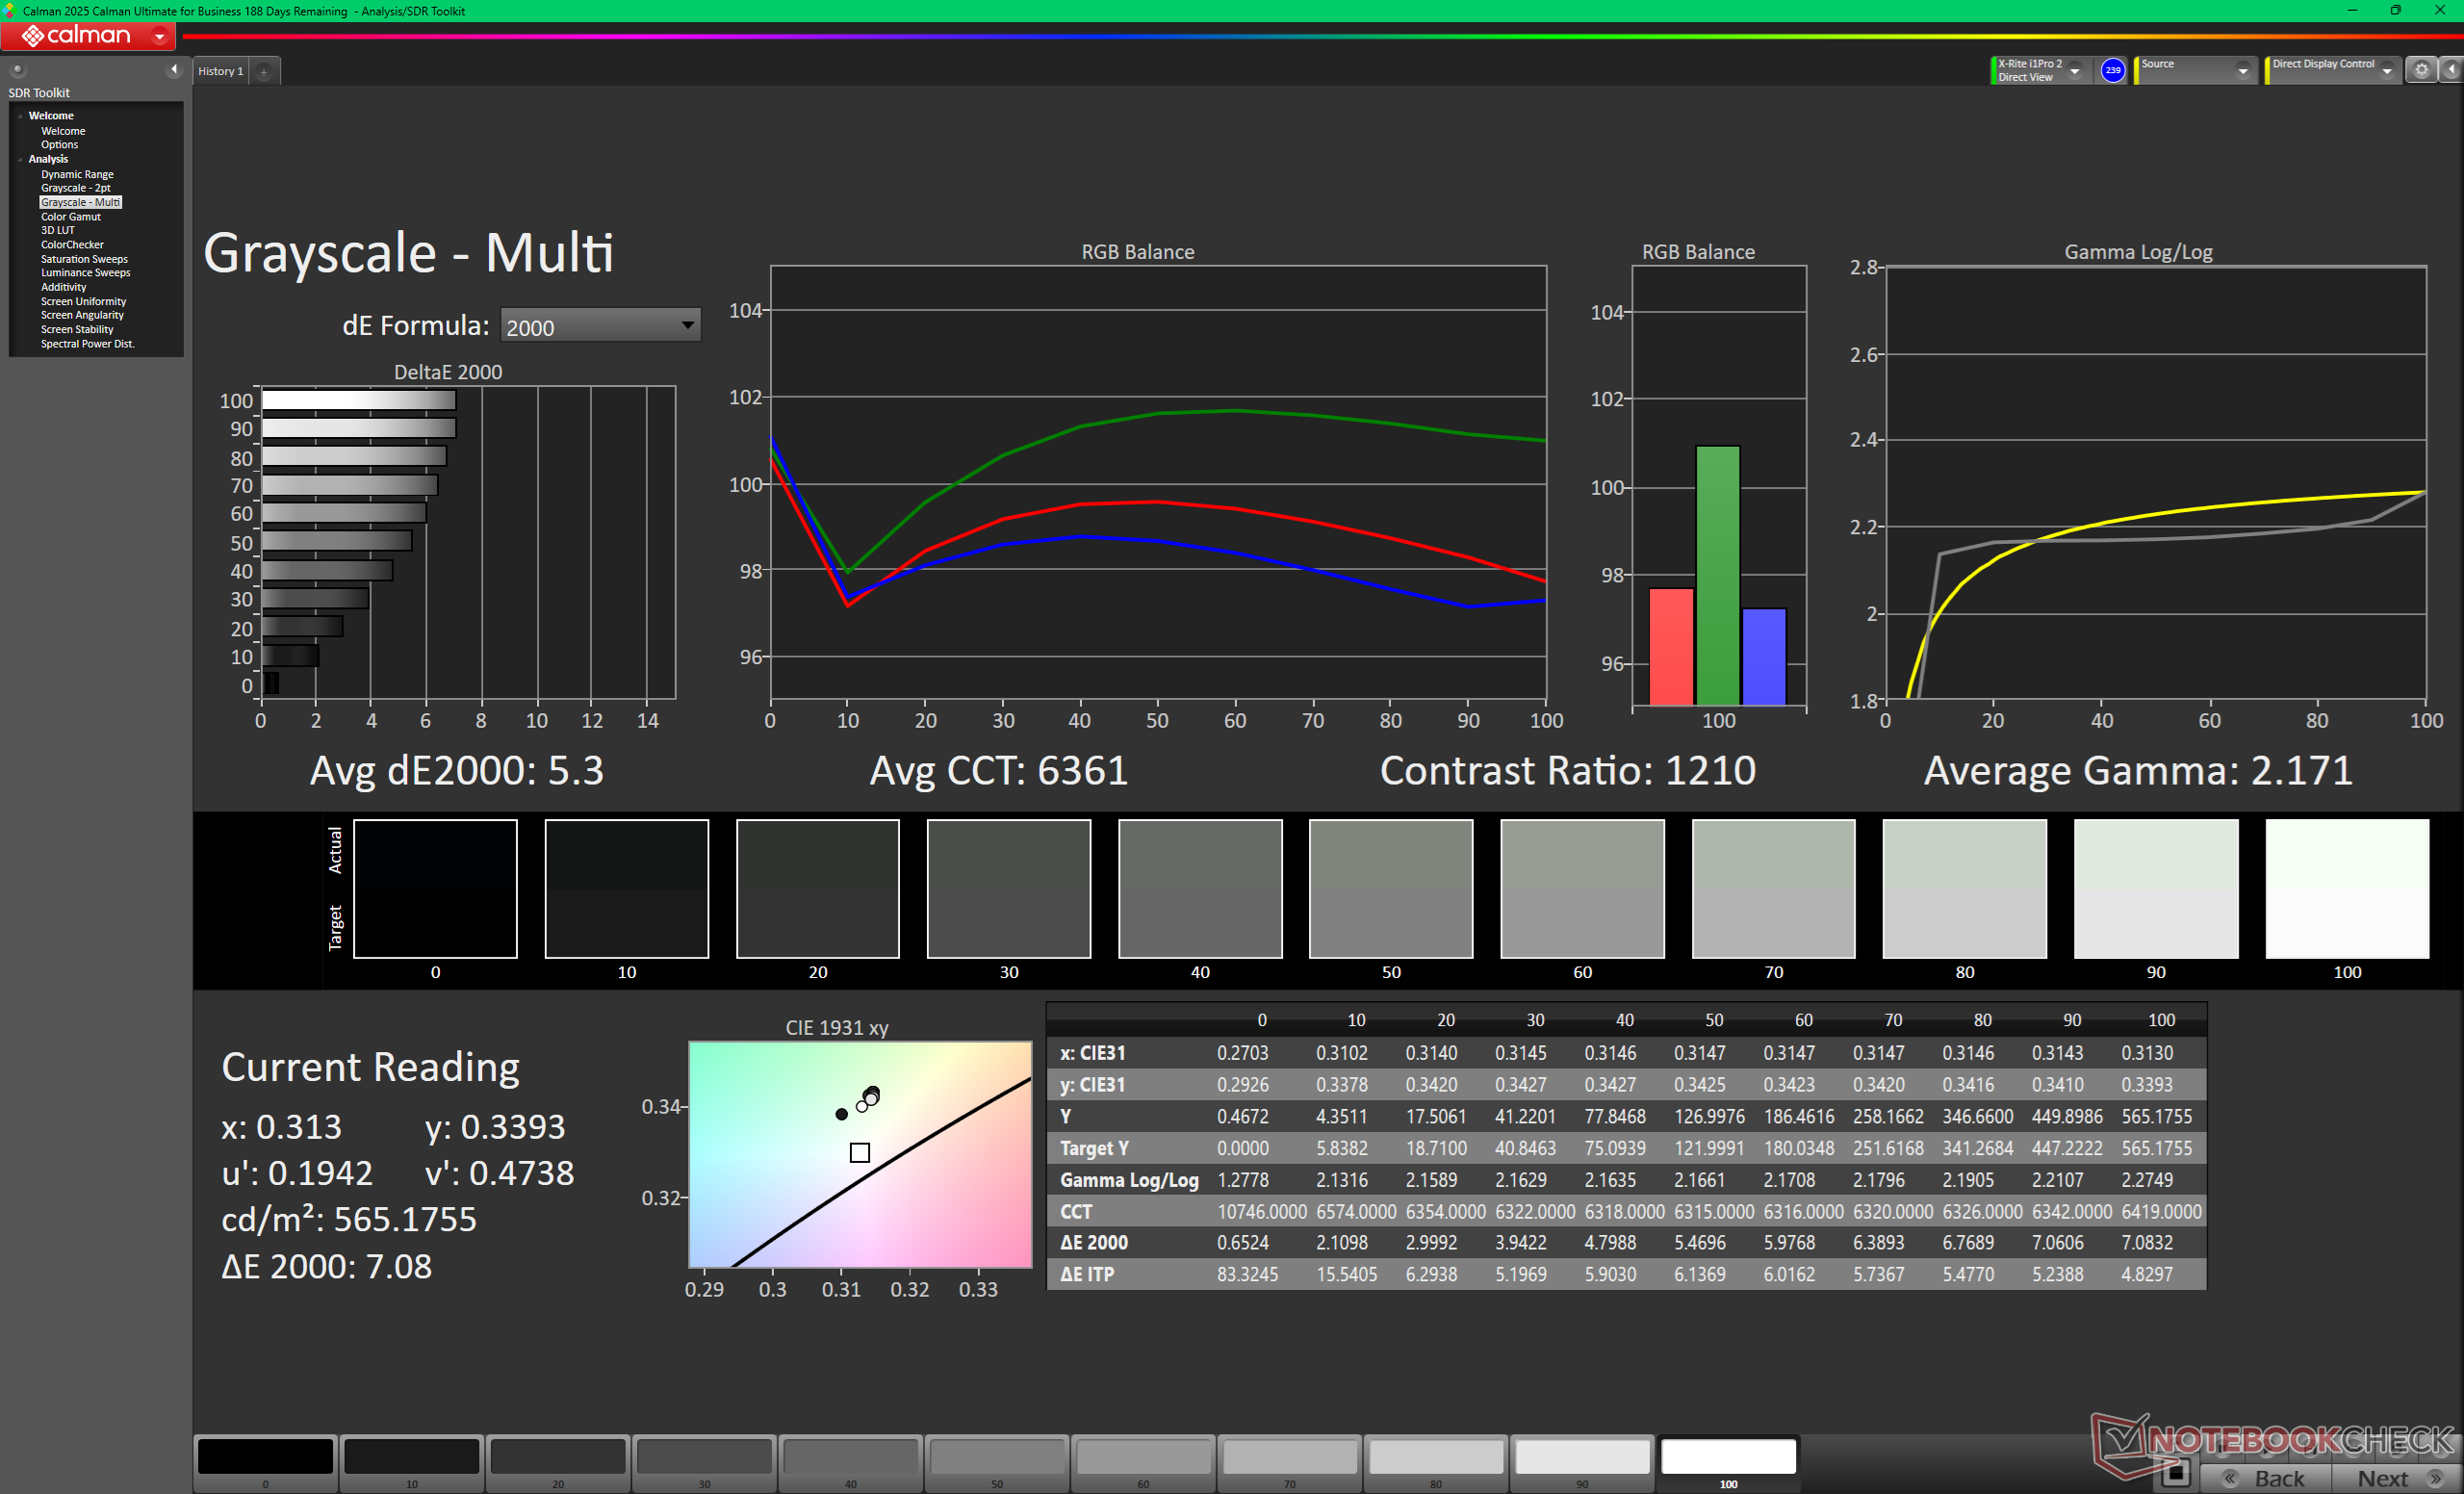
ΔE Greyscale Calman: 5.3 | ∀{0.09-98 Ø4.95}
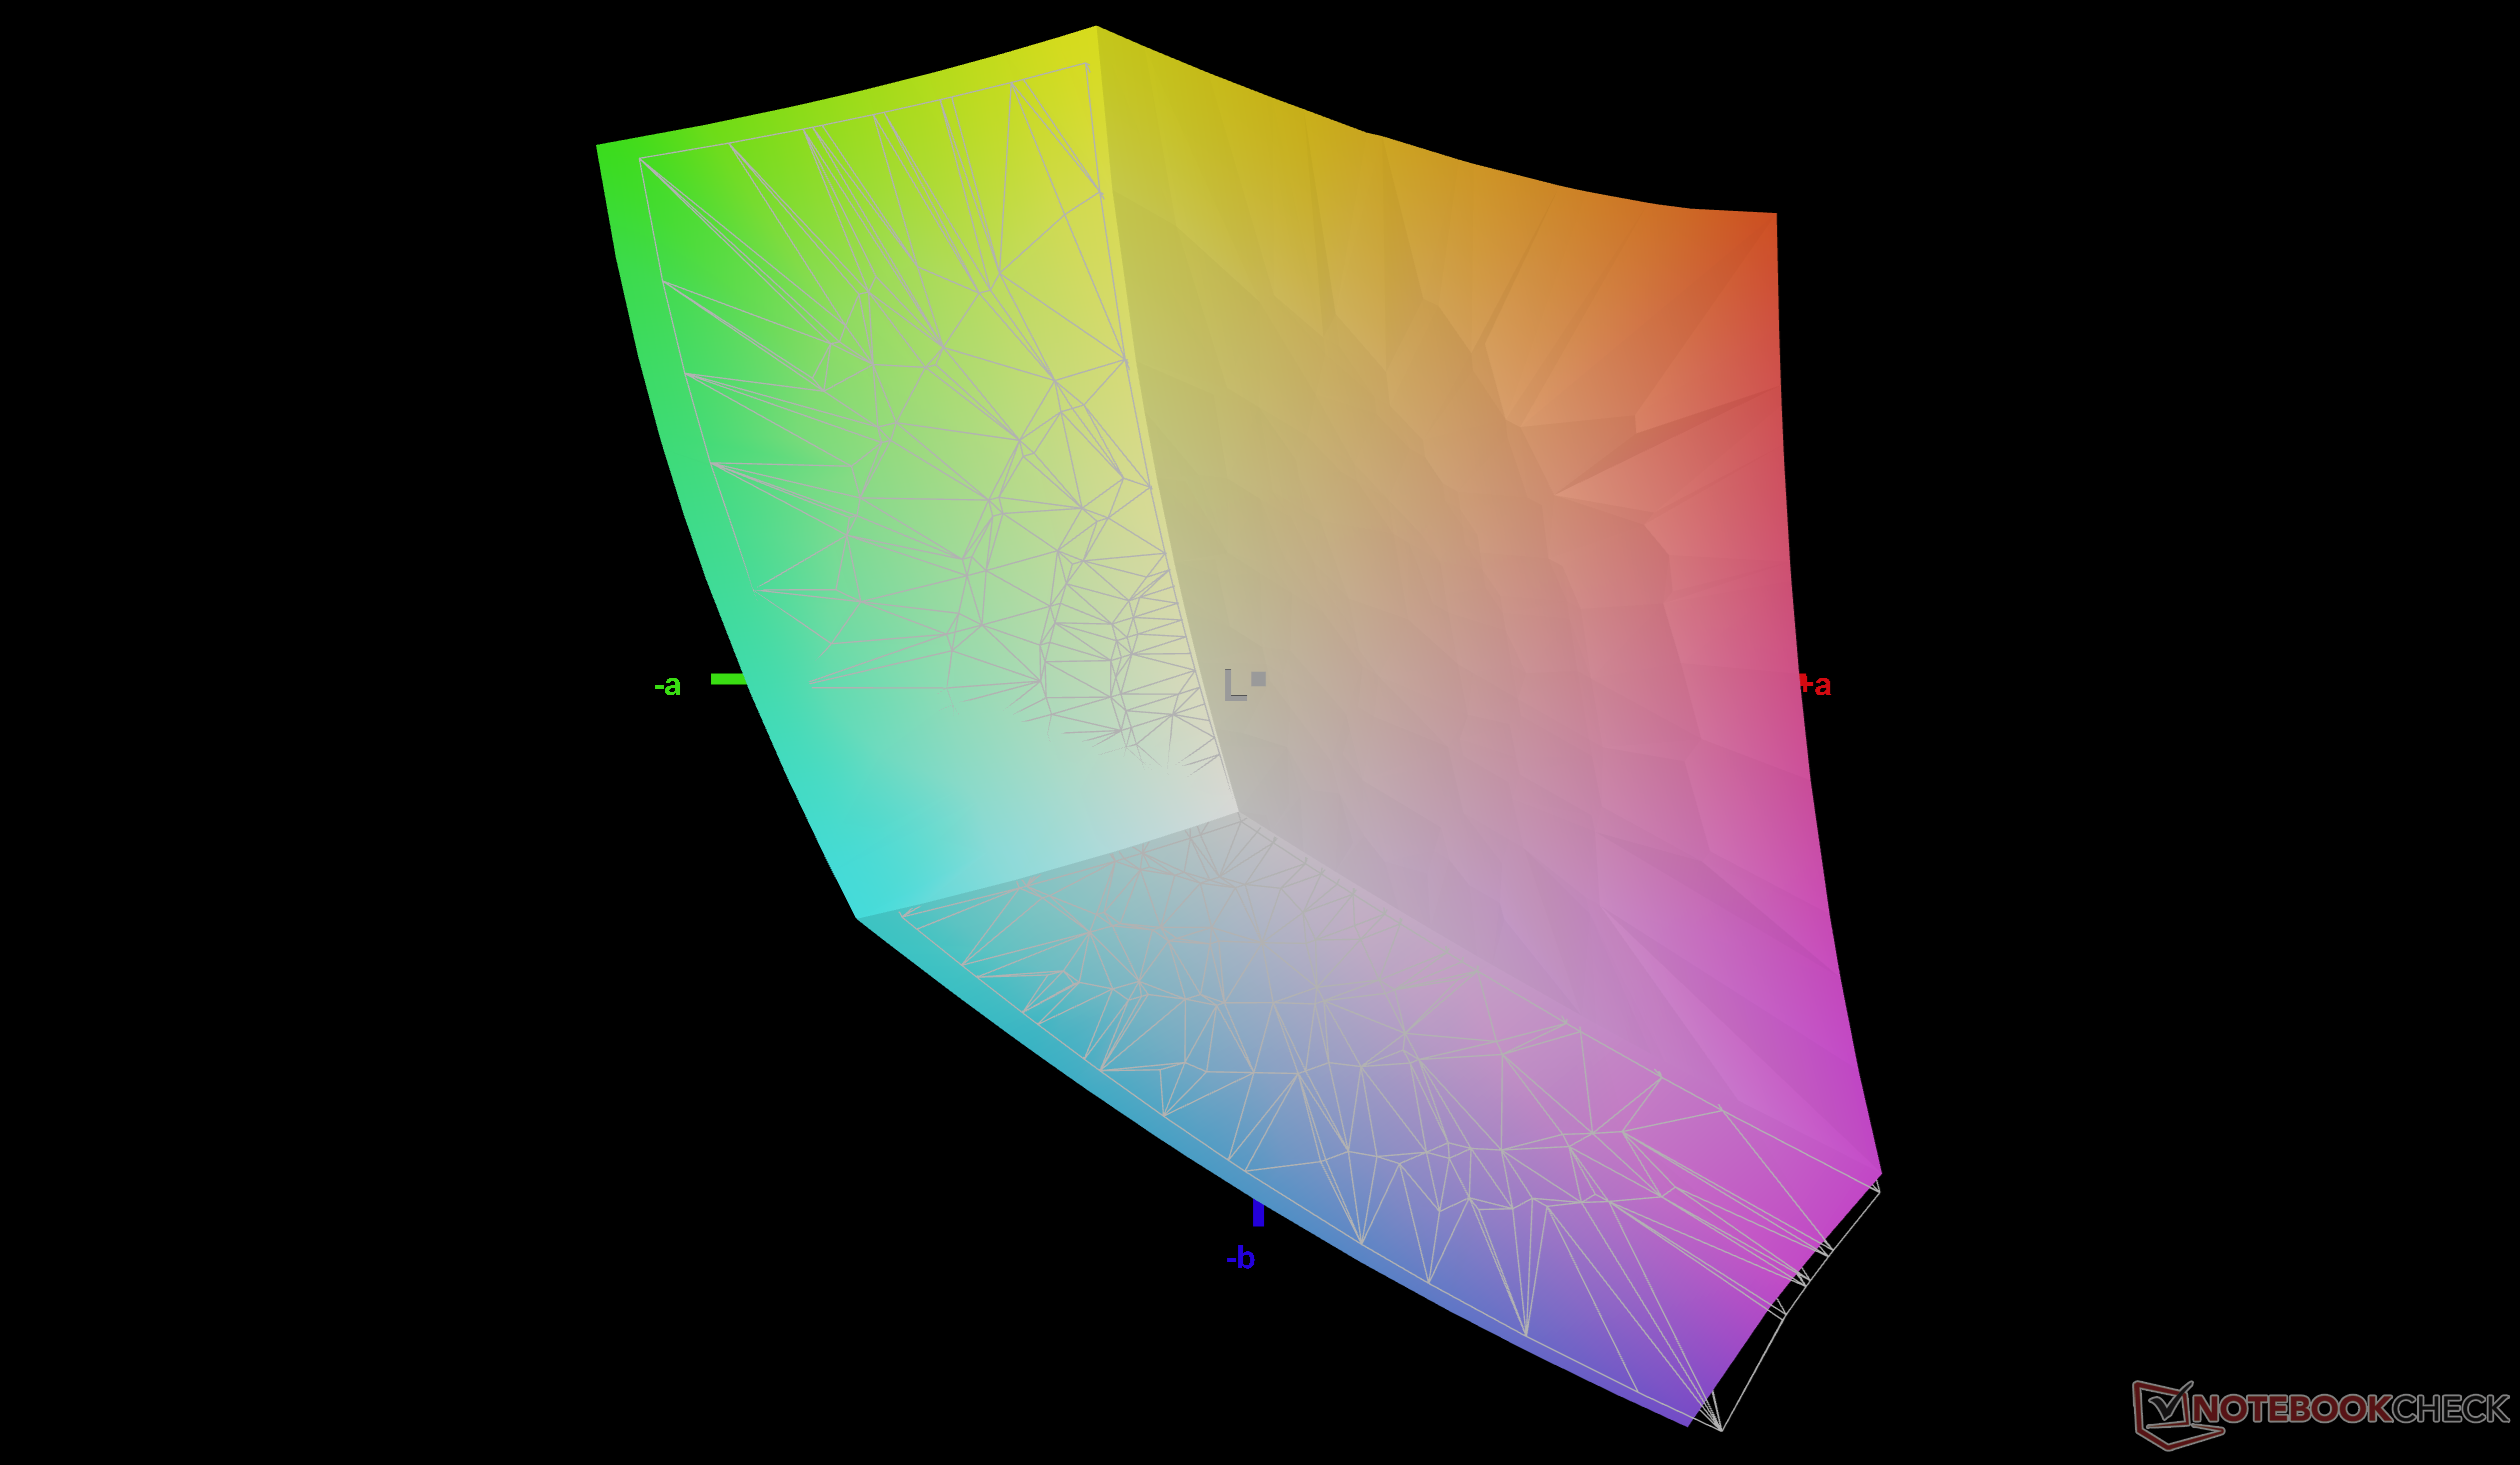
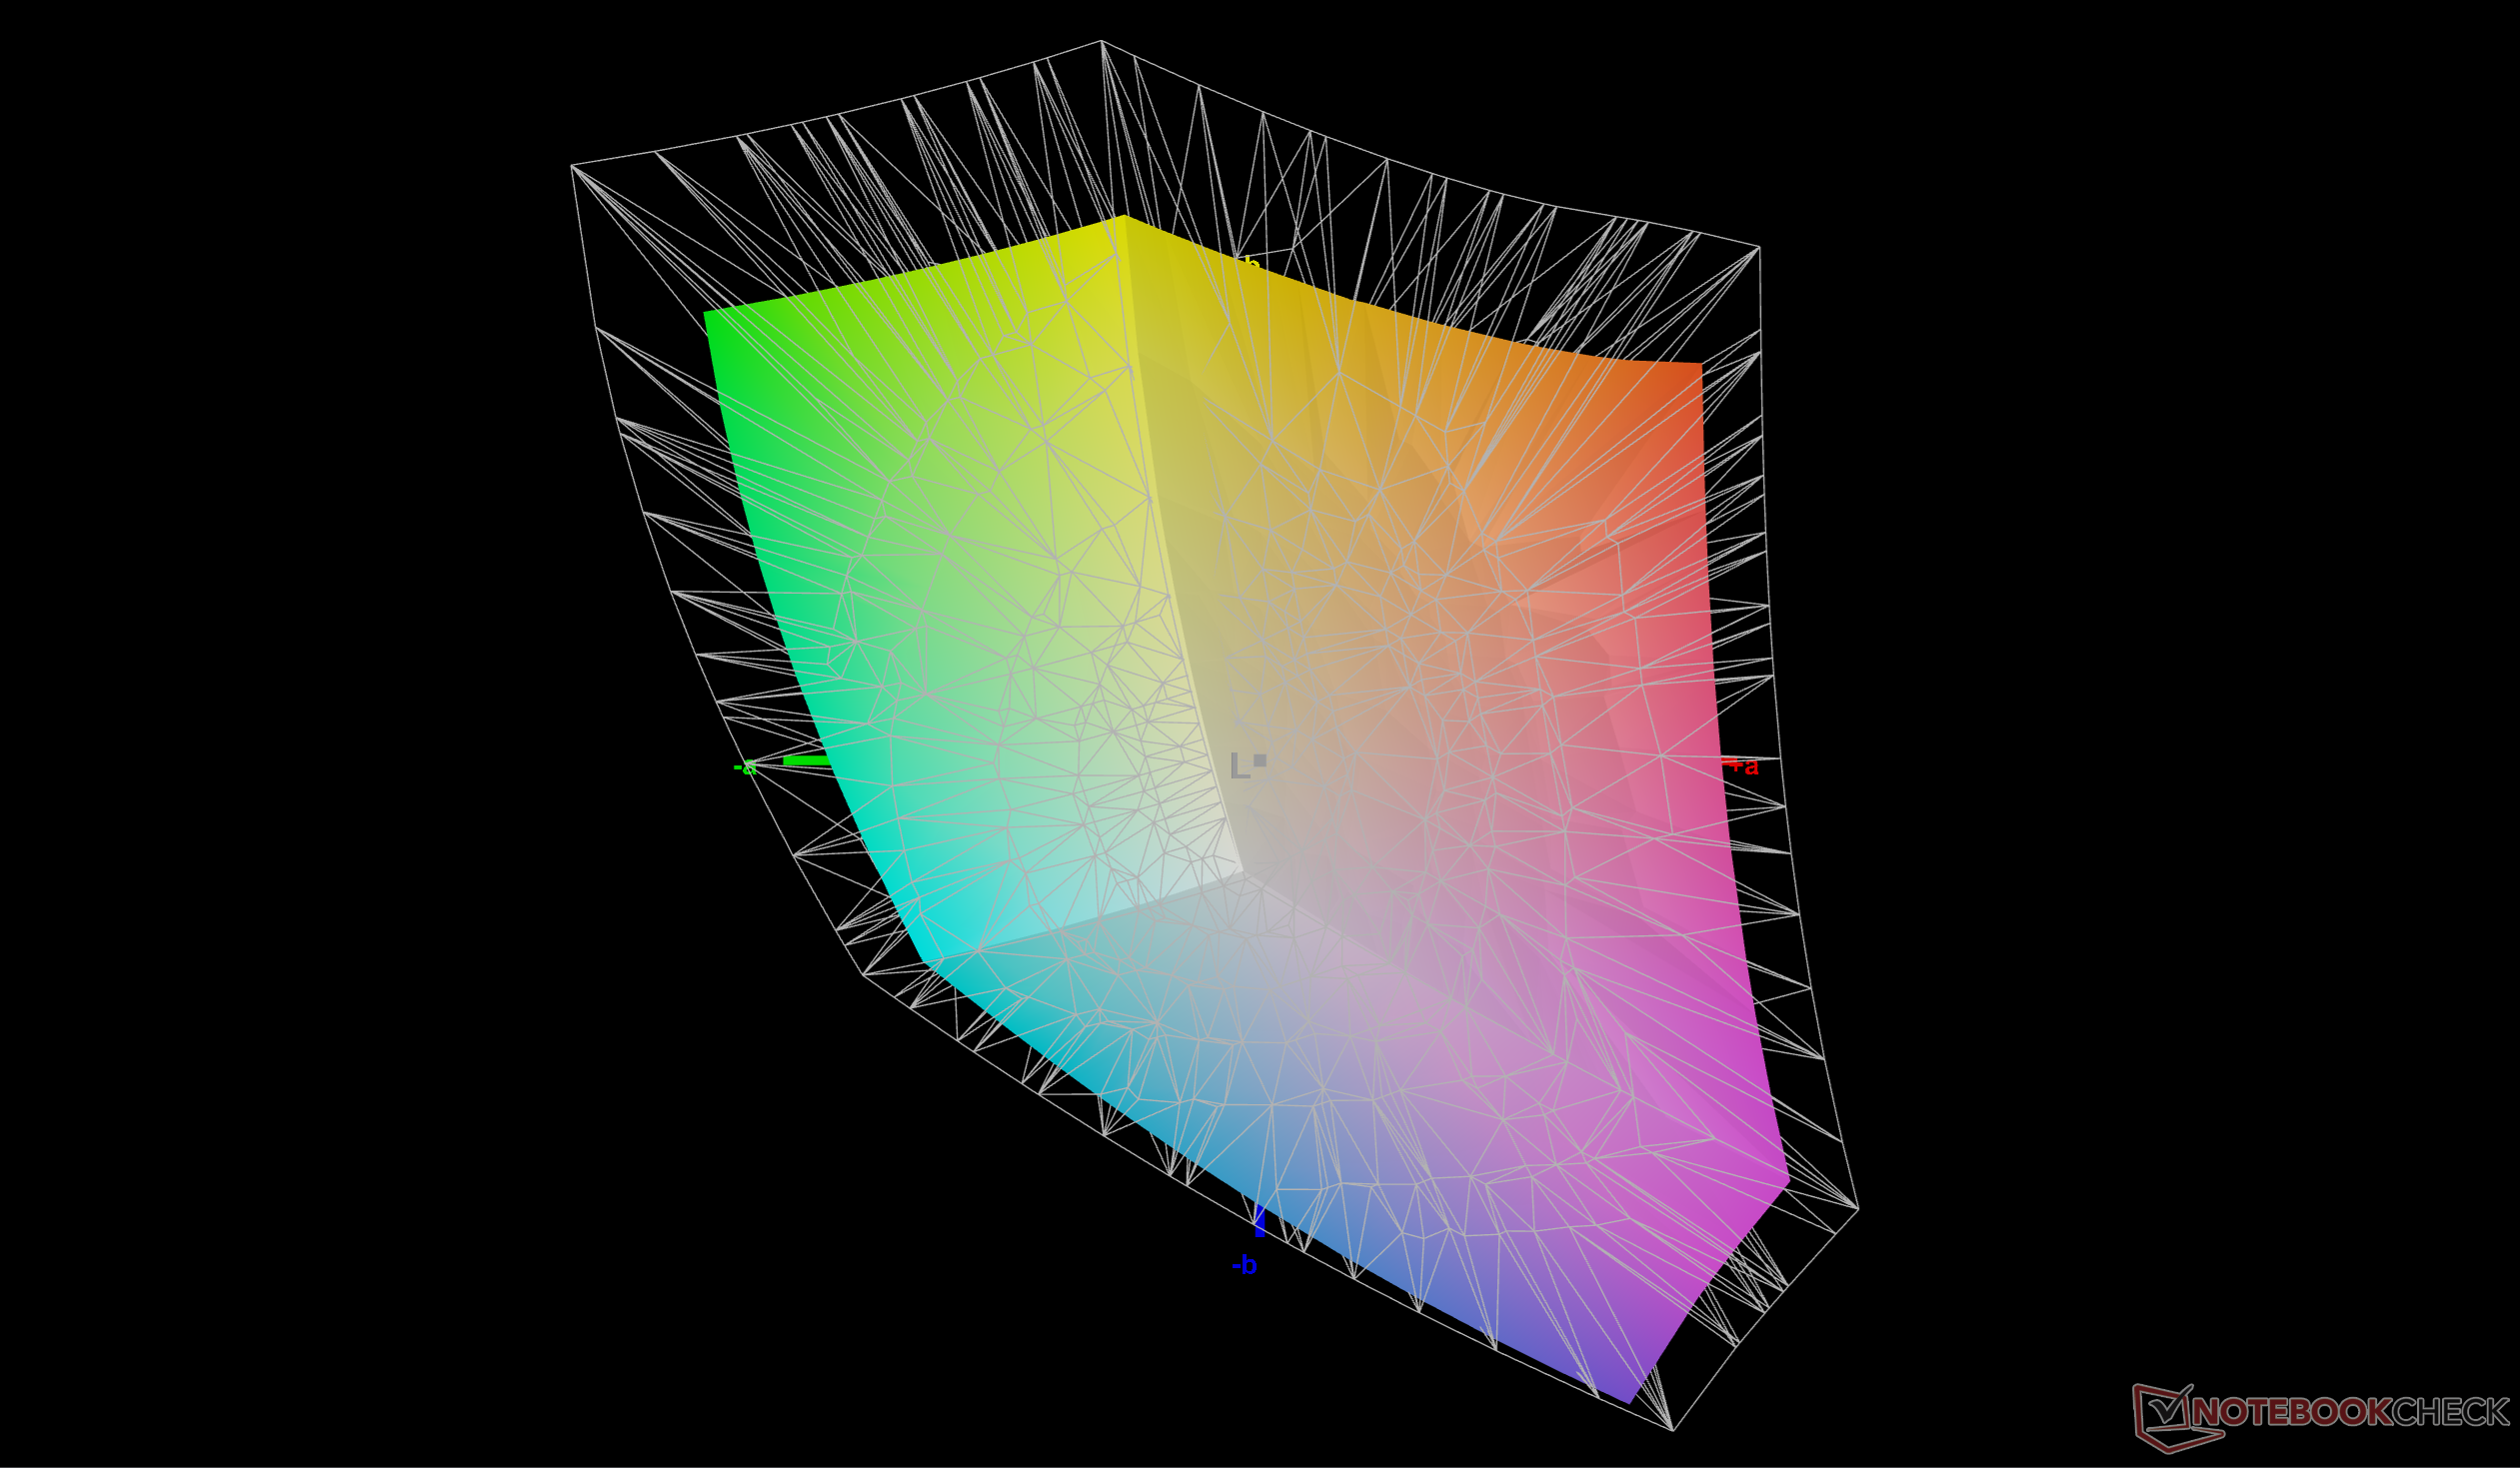
75% AdobeRGB 1998 (Argyll 3D)
98.8% sRGB (Argyll 3D)
73% Display P3 (Argyll 3D)
Gamma: 2.17
CCT: 6361 K
HP HyperX Omen 16 16-ap1931nr
BOE0CD1, IPS, 2560x1600, 16", 240 Hz
HP Omen 16-ap0091ng
AUODBB2, IPS, 1920x1200, 16", 144 Hz
MSI Crosshair A16 HX E8WGK
AU Optronics B160QAN02.3, IPS, 2560x1600, 16", 240 Hz
Alienware 16X Aurora Core Ultra 9 290HX Plus
Samsung 160HU05, OLED, 2560x1600, 16", 240 Hz
Lenovo Legion Pro 5 16IAX10, RTX 5070
ATNA60HS01-0 (Samsung SDC420A), OLED, 2650x1600, 16", 165 Hz
Asus TUF Gaming A16 FA608UP
MNG007DA5-3, IPS, 2560x1600, 16", 165 Hz
Display
-45%
14%
21%
21%
-4%
Display P3 Coverage (%)
73
40
-45%
94.9
30%
99.6
36%
99.3
36%
69.4
-5%
sRGB Coverage (%)
98.8
58.1
-41%
99.6
1%
100
1%
100
1%
97.2
-2%
AdobeRGB 1998 Coverage (%)
75
38.7
-48%
83.1
11%
93.9
25%
93.9
25%
71.9
-4%
Response Times
-237%
20%
96%
76%
21%
Response Time Grey 50% / Grey 80% * (ms)
5.6 ?(2.8, 2.8)
27.6 ?(12.9, 14.7)
-393%
4.2 ?(1.8, 2.4)
25%
0.29 ?(0.15, 0.14)
95%
2 ?(1, 1)
64%
6.3 ?(2.8, 3.5)
-13%
Response Time Black / White * (ms)
10.7 ?(5.5, 5.2)
19.4 ?(9.6, 9.8)
-81%
9.2 ?(4.9, 4.3)
14%
0.45 ?(0.23, 0.22)
96%
1.4 ?(0.8, 0.6)
87%
4.8 ?(1.7, 3.1)
55%
PWM Frequency (Hz)
1439.8 ?(100)
1300
PWM Amplitude * (%)
29
16.7
Screen
-77%
-14%
-3%
42%
15%
Brightness middle (cd/m²)
569.7
328
-42%
512.4
-10%
380.5
-33%
521
-9%
480
-16%
Brightness (cd/m²)
545
313
-43%
476
-13%
384
-30%
519
-5%
456
-16%
Brightness Distribution (%)
90
91
1%
89
-1%
98
9%
98
9%
91
1%
Black Level * (cd/m²)
0.47
0.26
45%
0.39
17%
0.075
84%
0.32
32%
Contrast (:1)
1212
1262
4%
1314
8%
6947
473%
1500
24%
Colorchecker dE 2000 *
3.31
4.73
-43%
4.65
-40%
3.27
1%
2.5
24%
1.4
58%
Colorchecker dE 2000 max. *
7.15
17.47
-144%
8.33
-17%
6.31
12%
4.85
32%
2.5
65%
Colorchecker dE 2000 calibrated *
0.67
4.22
-530%
1.3
-94%
1.1
-64%
2.5
-273%
1.3
-94%
Greyscale dE 2000 *
5.3
2.05
61%
3.9
26%
1
81%
3.17
40%
1.2
77%
Gamma
2.17 101%
2.63 84%
2.57 86%
2.23 99%
2.35 94%
2.16 102%
CCT
6361 102%
6718 97%
6813 95%
6410 101%
6454 101%
6620 98%
Media totale (Programma / Settaggio)
-120% / -93%
7% / -3%
38% / 19%
46% / 42%
11% / 12%

* ... Meglio usare valori piccoli
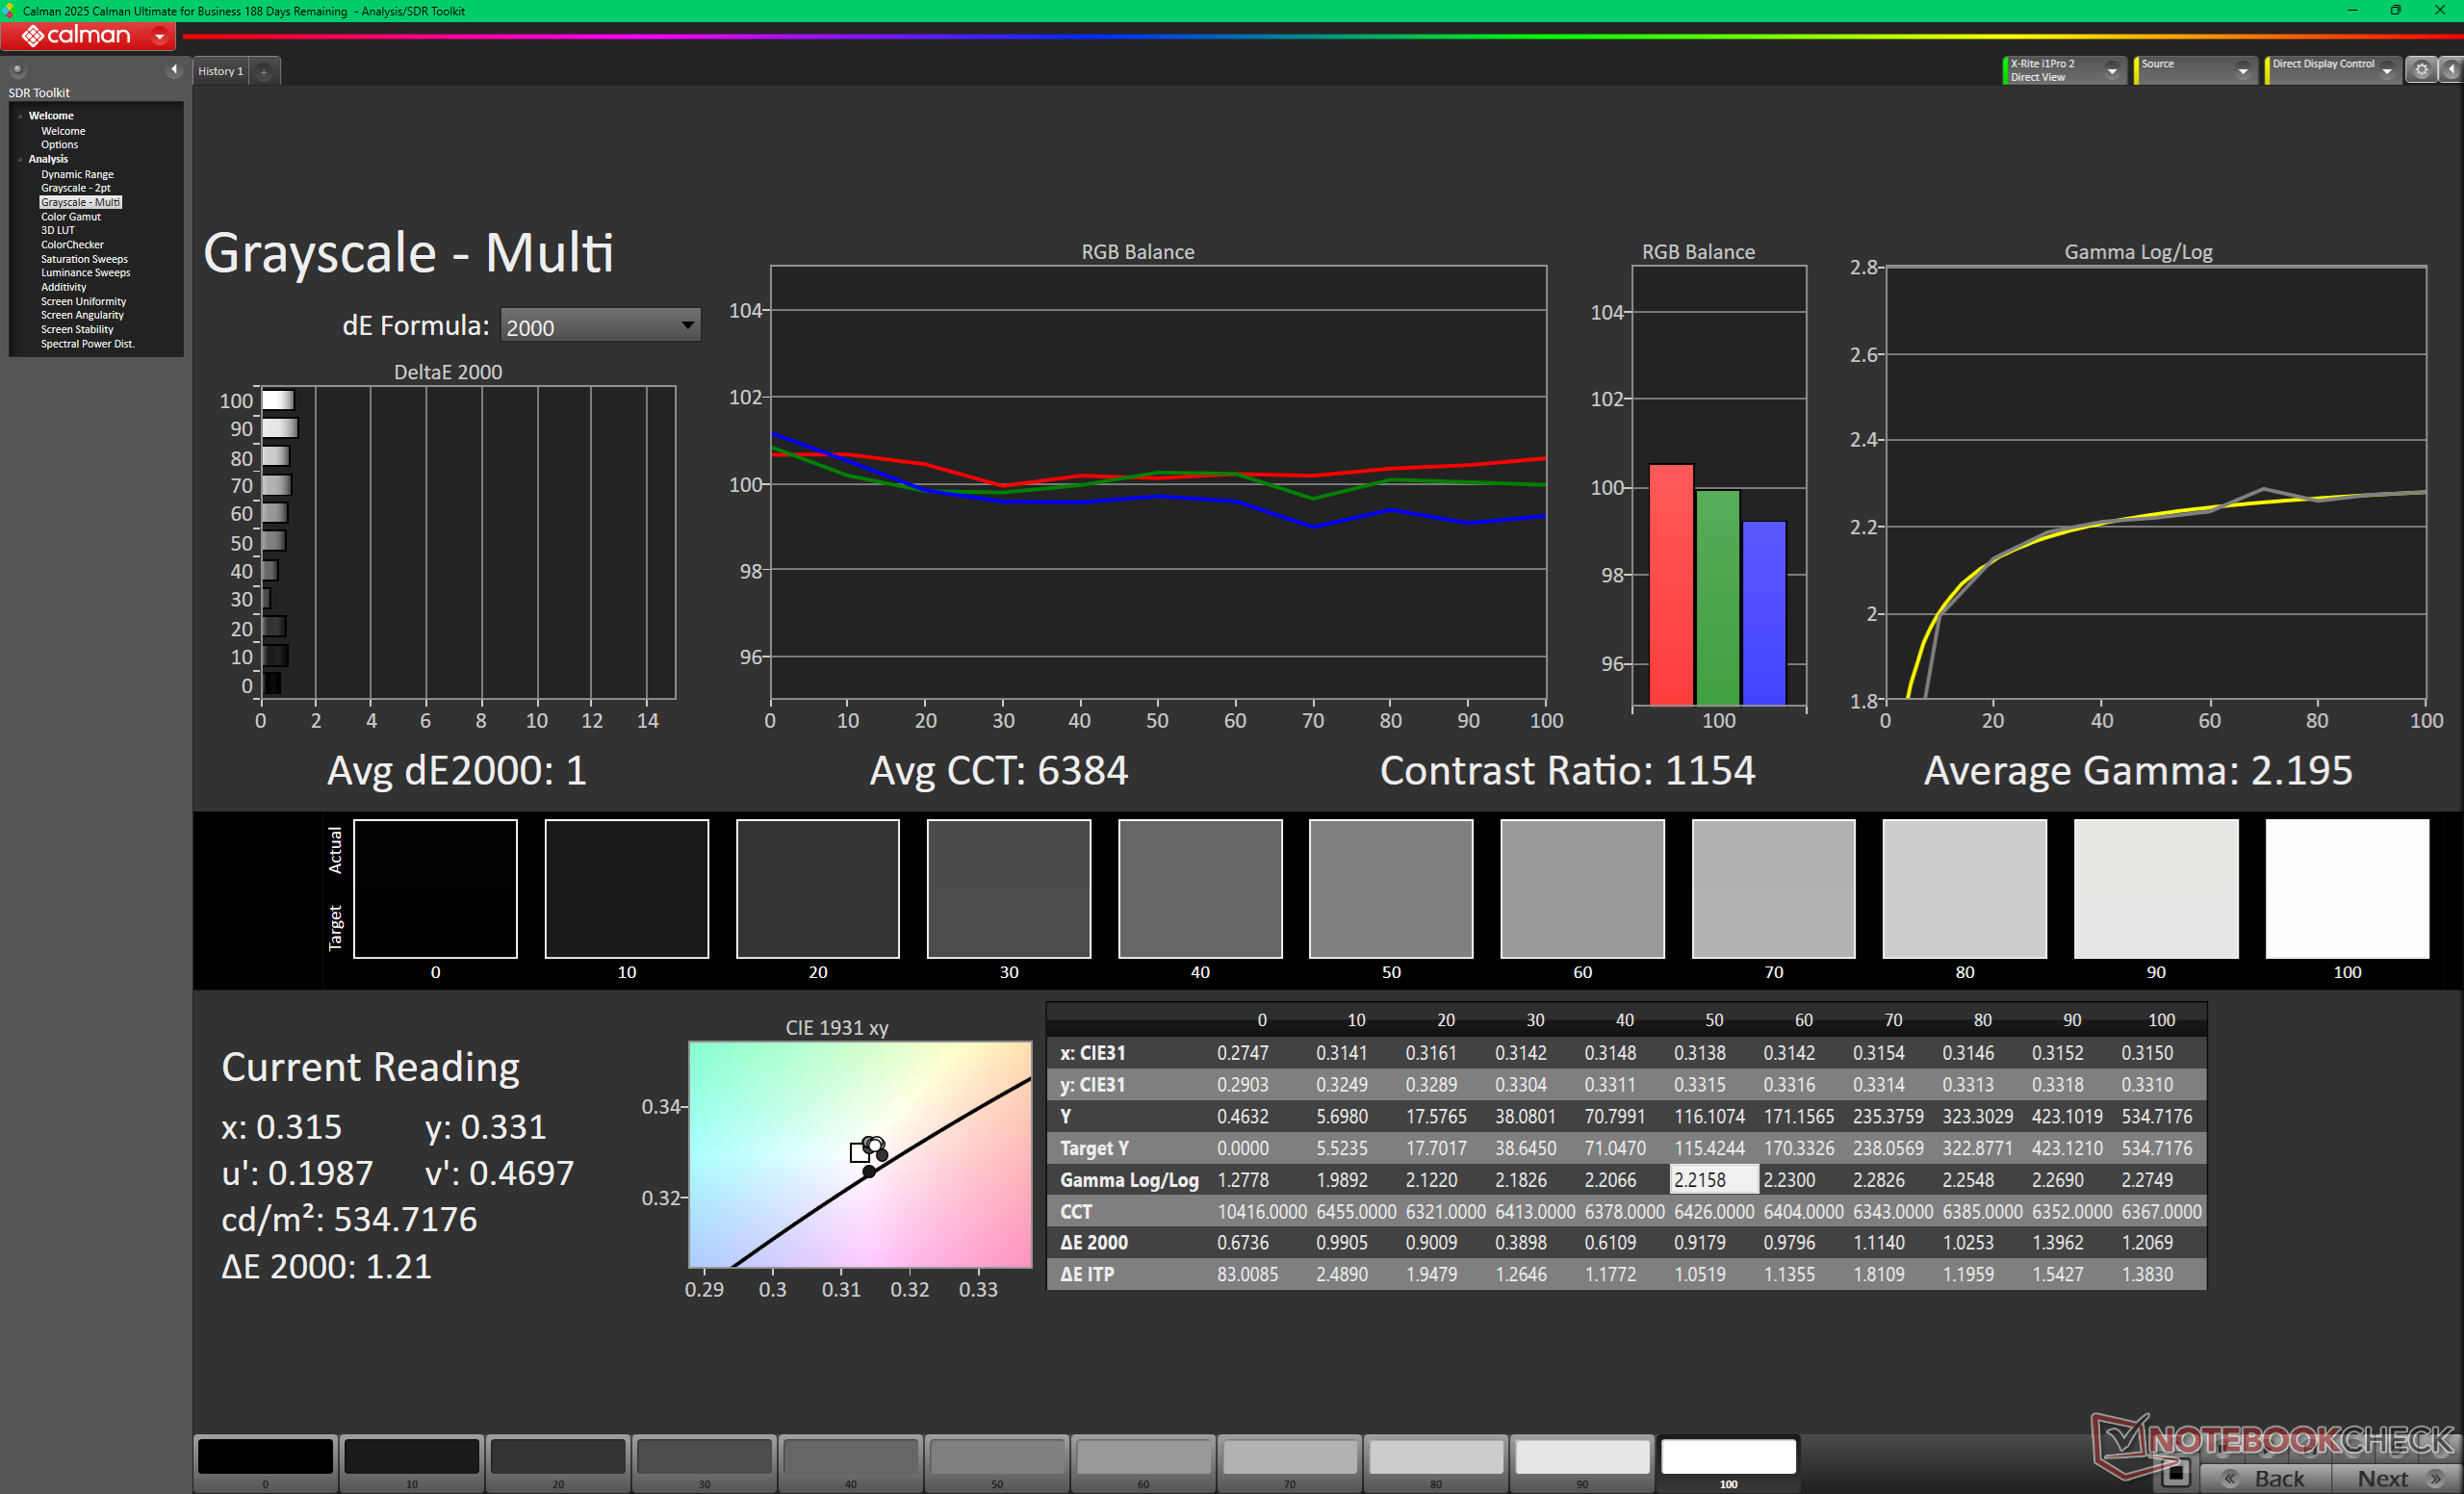
vs. sRGB
vs. sRGB
vs. P3
vs. P3
Scala di grigi prima della calibrazione (sRGB)
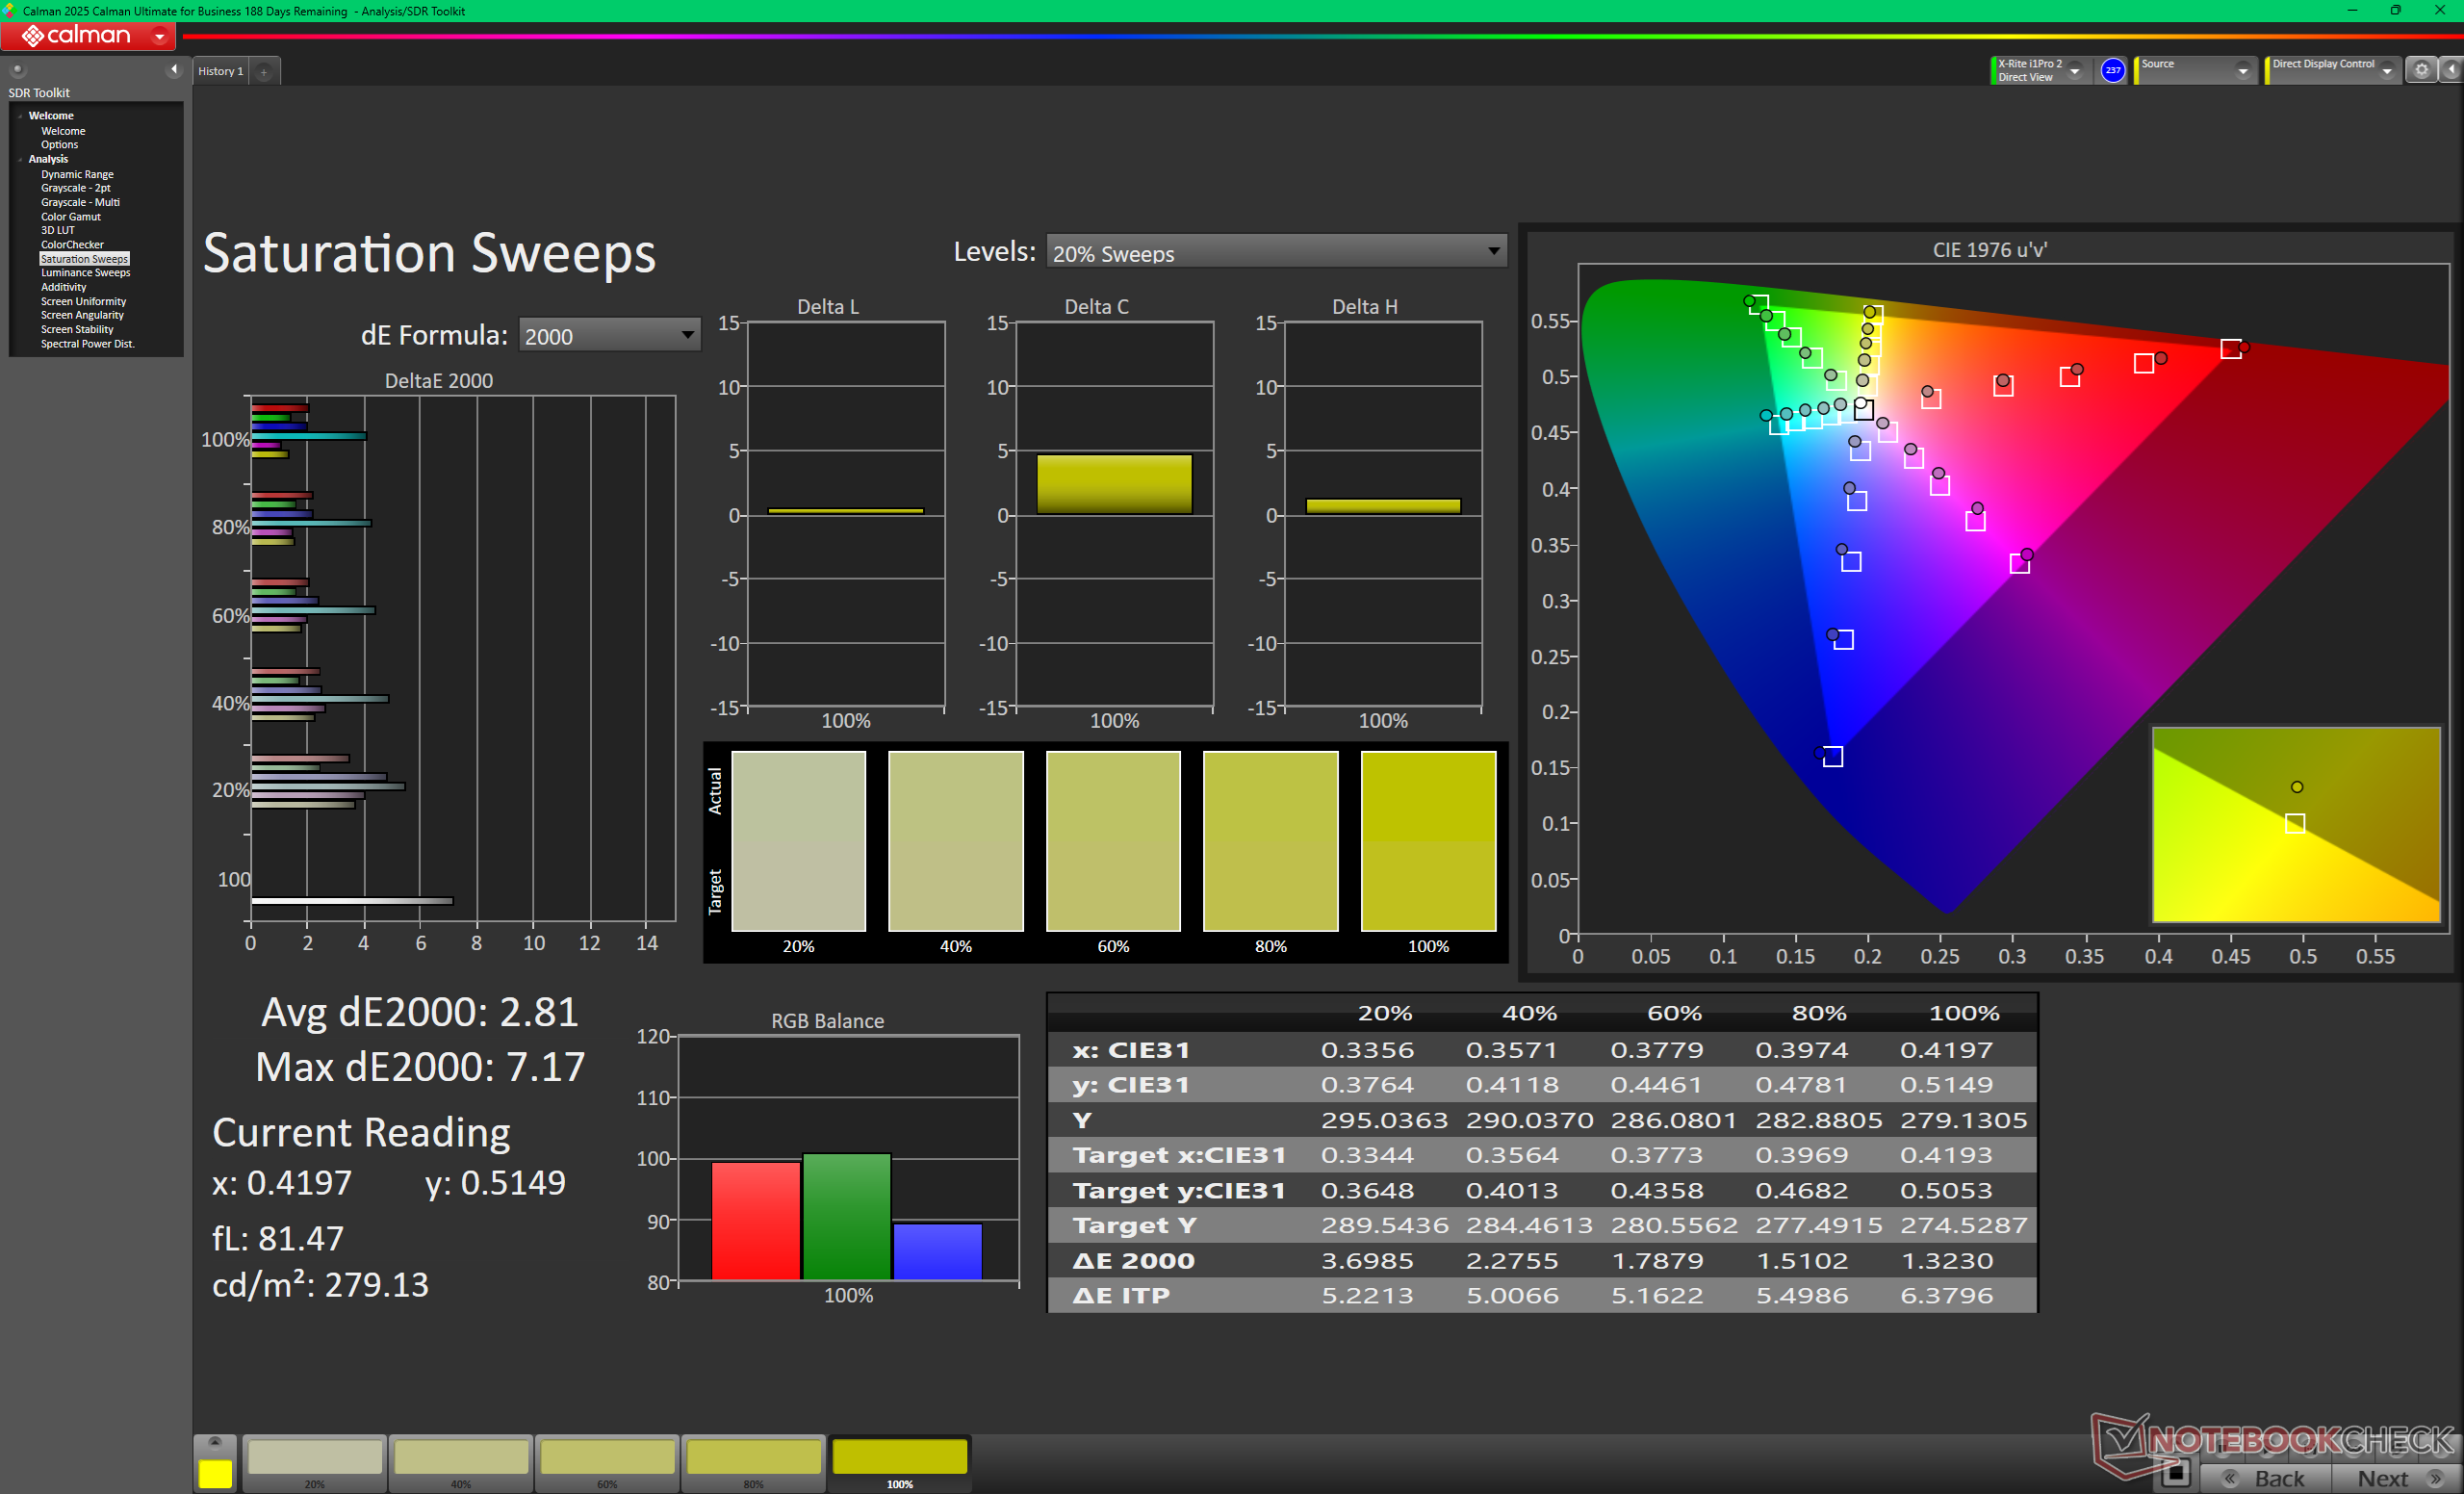
Scansioni di saturazione prima della calibrazione (sRGB)
ColorChecker prima della calibrazione (sRGB)
Scala di grigi dopo la calibrazione (sRGB)
Scansioni di saturazione dopo la calibrazione (sRGB)
ColorChecker dopo la calibrazione (sRGB)

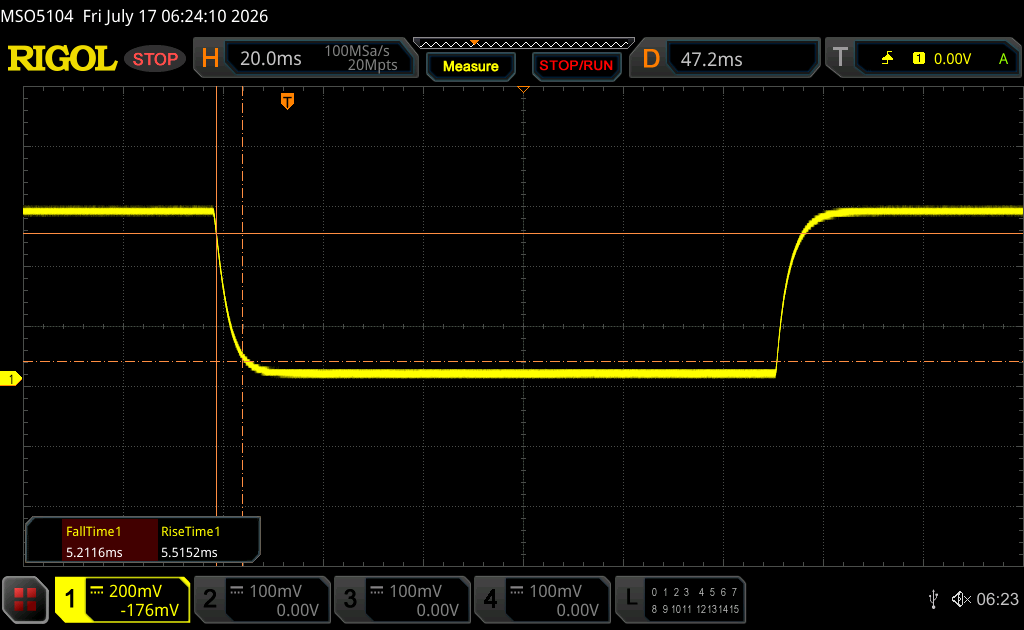
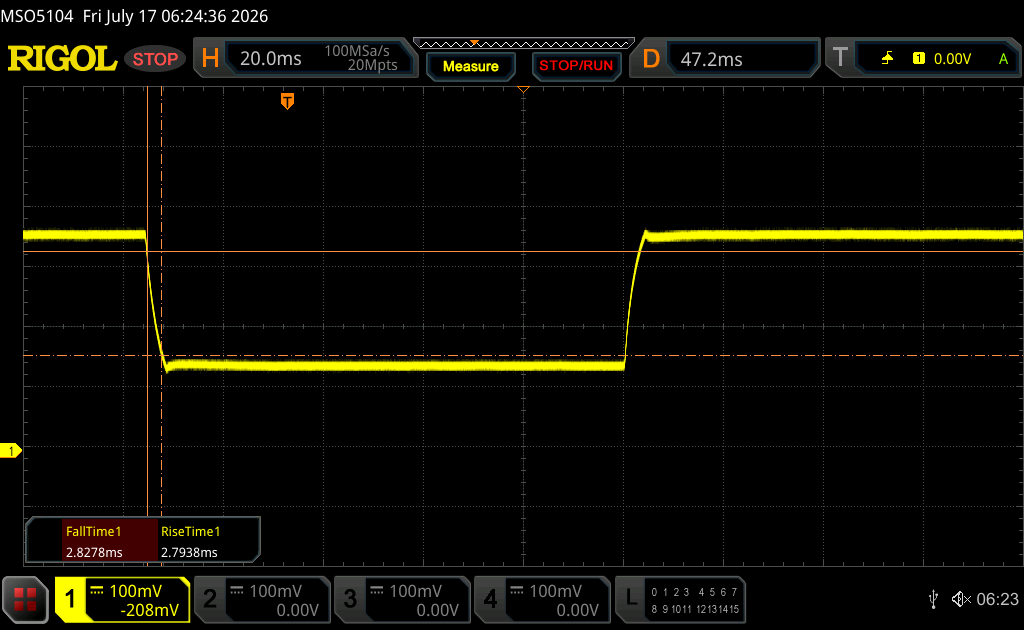
Tempi di risposta del Display

I tempi di risposta del display mostrano quanto sia veloce lo schermo a cambaire da un colore all'altro. Tempi di risposta lenti possono creare sovrapposizioni negloi oggetti in movimento. Specialmente i giocatori patiti del 3D dovrebbero usare uno schermo con tempi di risposta bassi.
       Tempi di risposta dal Nero al Bianco
10.7 ms ... aumenta ↗ e diminuisce ↘ combinato↗ 5.5 ms Incremento
↘ 5.2 ms Calo
Lo schermo mostra buoni tempi di risposta durante i nostri tests, ma potrebbe essere troppo lento per i gamers competitivi.
In confronto, tutti i dispositivi di test variano da 0.1 (minimo) a 240 (massimo) ms. » 29 % di tutti i dispositivi è migliore.
Questo significa che i tempi di risposta rilevati sono migliori rispettto alla media di tutti i dispositivi testati (19.7 ms).
       Tempo di risposta dal 50% Grigio all'80% Grigio
5.6 ms ... aumenta ↗ e diminuisce ↘ combinato↗ 2.8 ms Incremento
↘ 2.8 ms Calo
Lo schermo ha mostrato valori di risposta molto veloci nei nostri tests ed è molto adatto per i gaming veloce.
In confronto, tutti i dispositivi di test variano da 0.13 (minimo) a 636 (massimo) ms. » 18 % di tutti i dispositivi è migliore.
Questo significa che i tempi di risposta rilevati sono migliori rispettto alla media di tutti i dispositivi testati (30.8 ms).

Sfarfallio dello schermo / PWM (Pulse-Width Modulation)

Per ridurre la luminosità dello schermo, alcuni portatili accendono e spengono la retroilluminazione in rapida successione - un metodo chiamato Pulse Width Modulation (PWM). Questa frequenza di ciclo a livello ideale non dovrebbe essere percepibile dall'occhi umano. Se tale frequenza è troppo bassa, gli utenti con occhi sensibili potrebbero stancarsi gli occhi o avere mal di testa o anche notare uno sfarfallio.
flickering dello schermo / PWM non rilevato

In confronto: 52 % di tutti i dispositivi testati non utilizza PWM per ridurre la luminosita' del display. Se è rilevato PWM, una media di 7686 (minimo: 5 - massimo: 343500) Hz è stata rilevata.

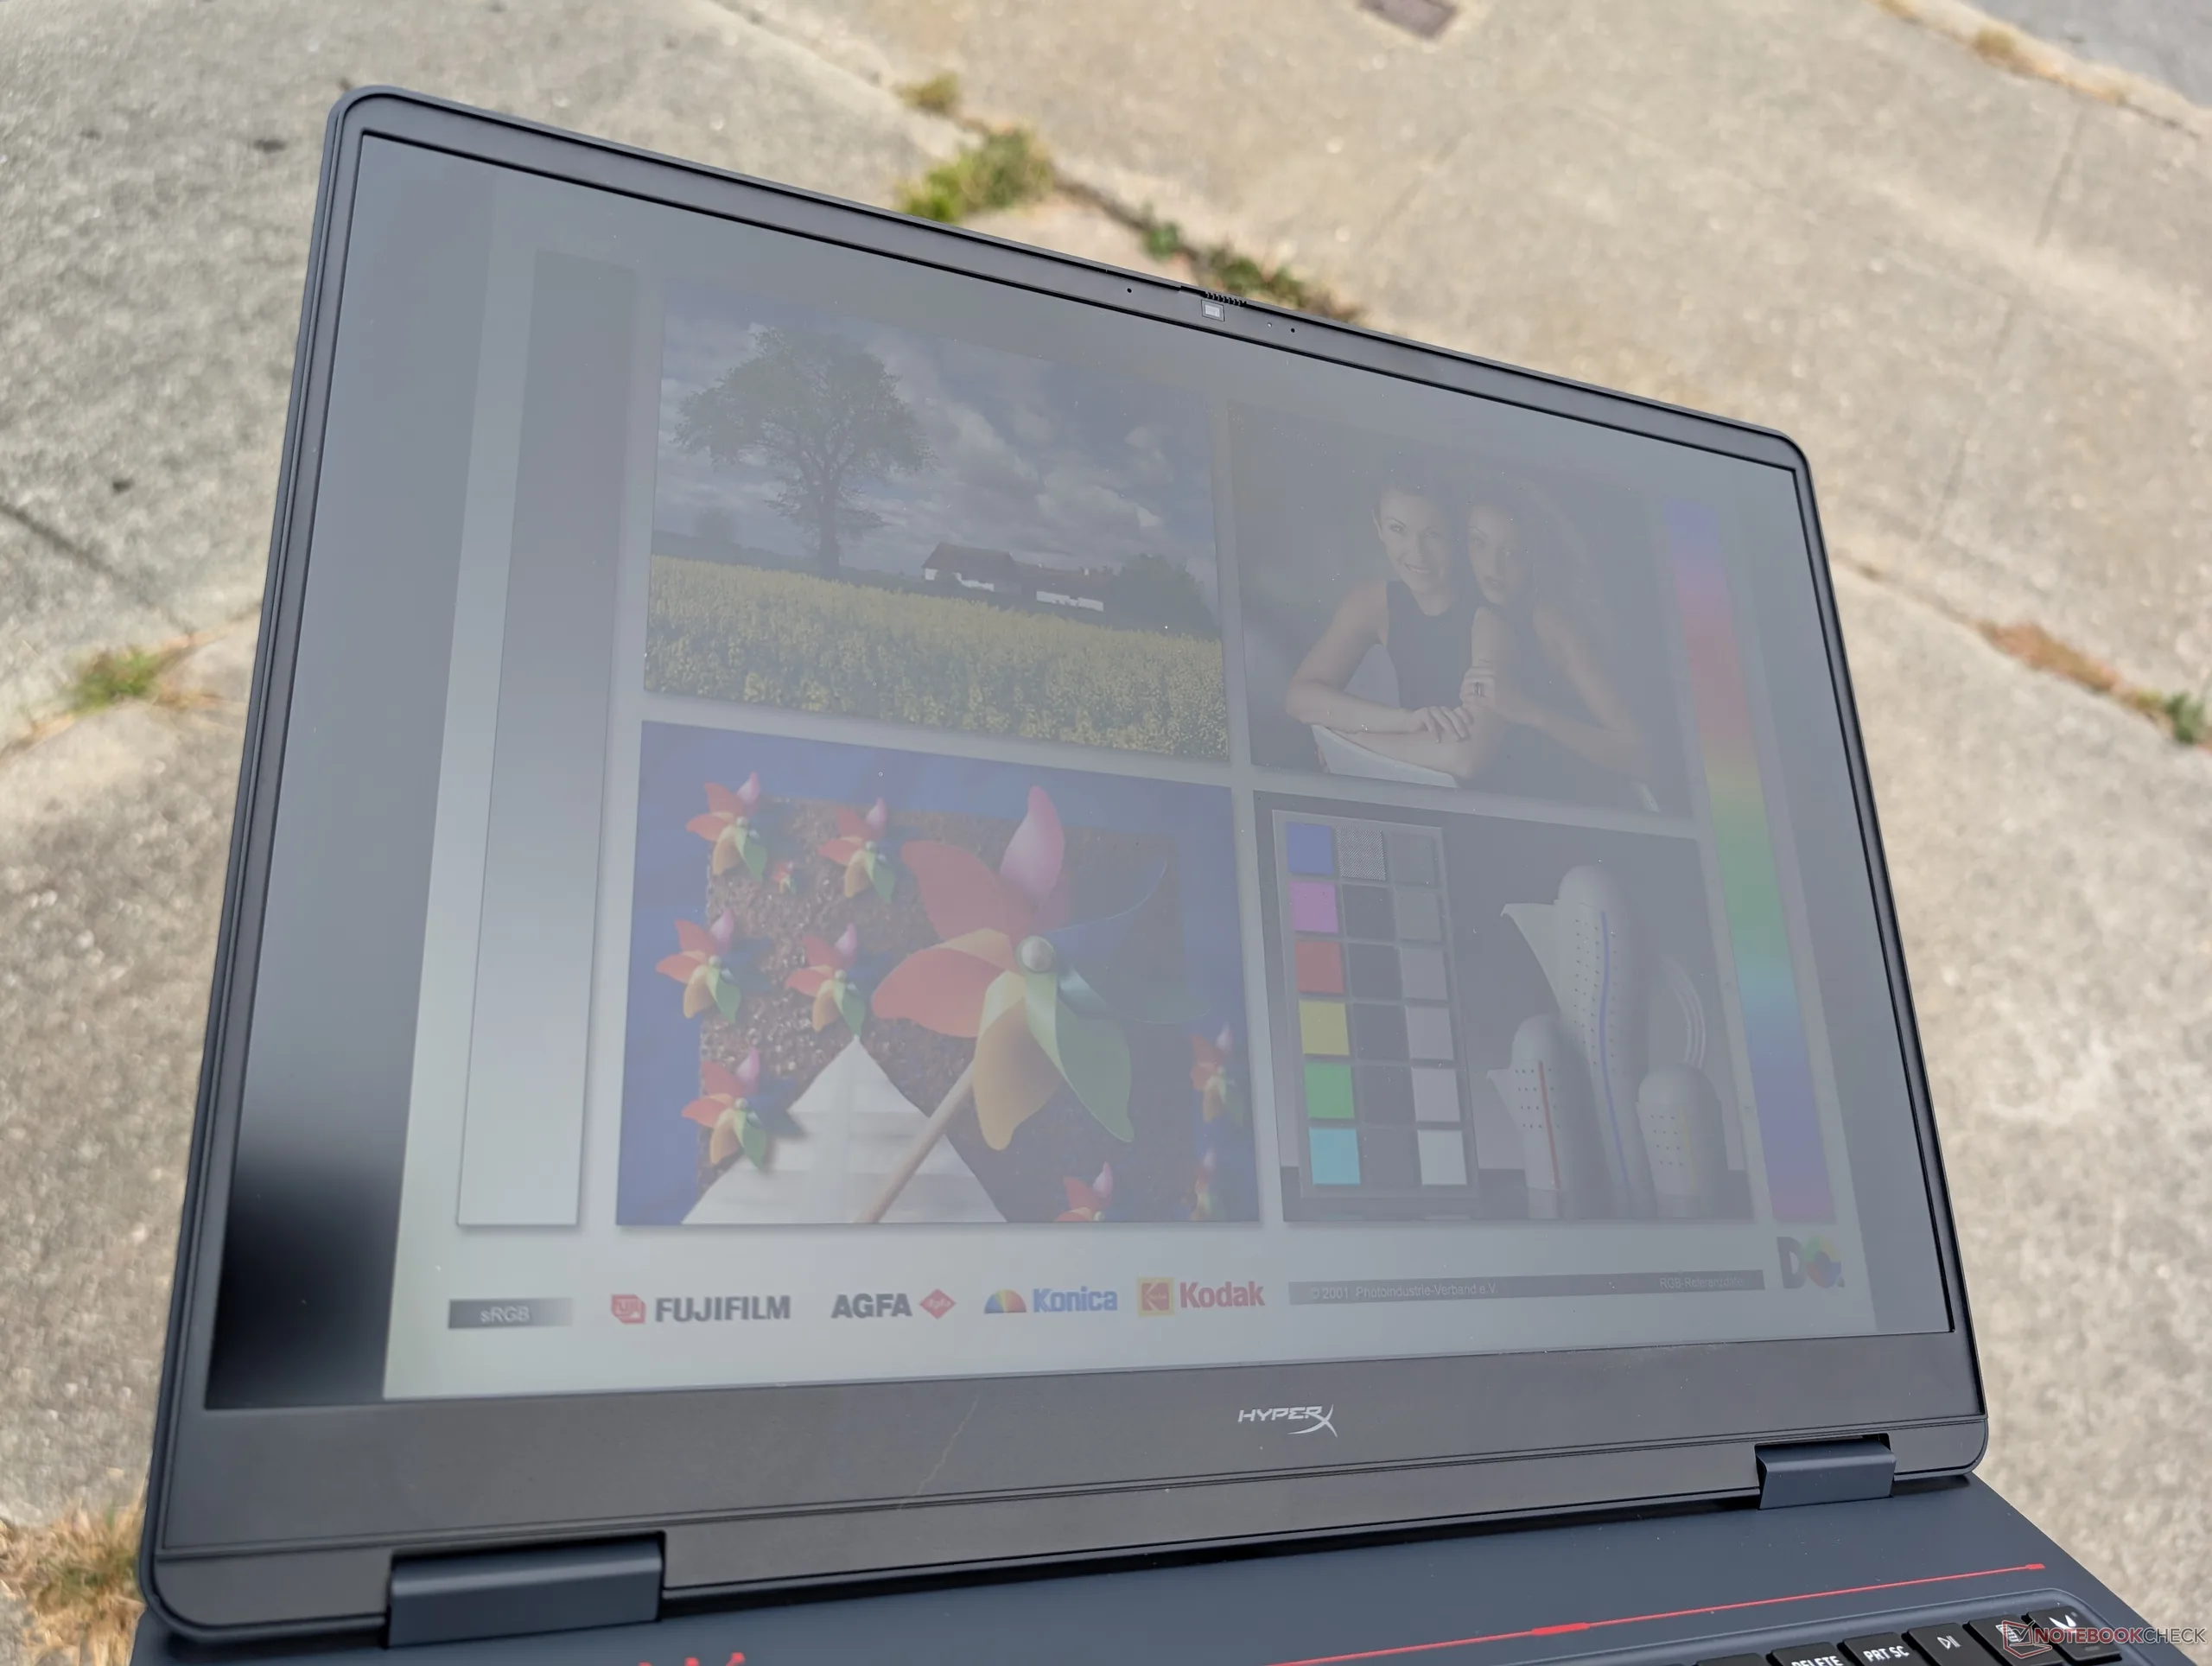
All’aperto, sotto un cielo nuvoloso ma luminoso
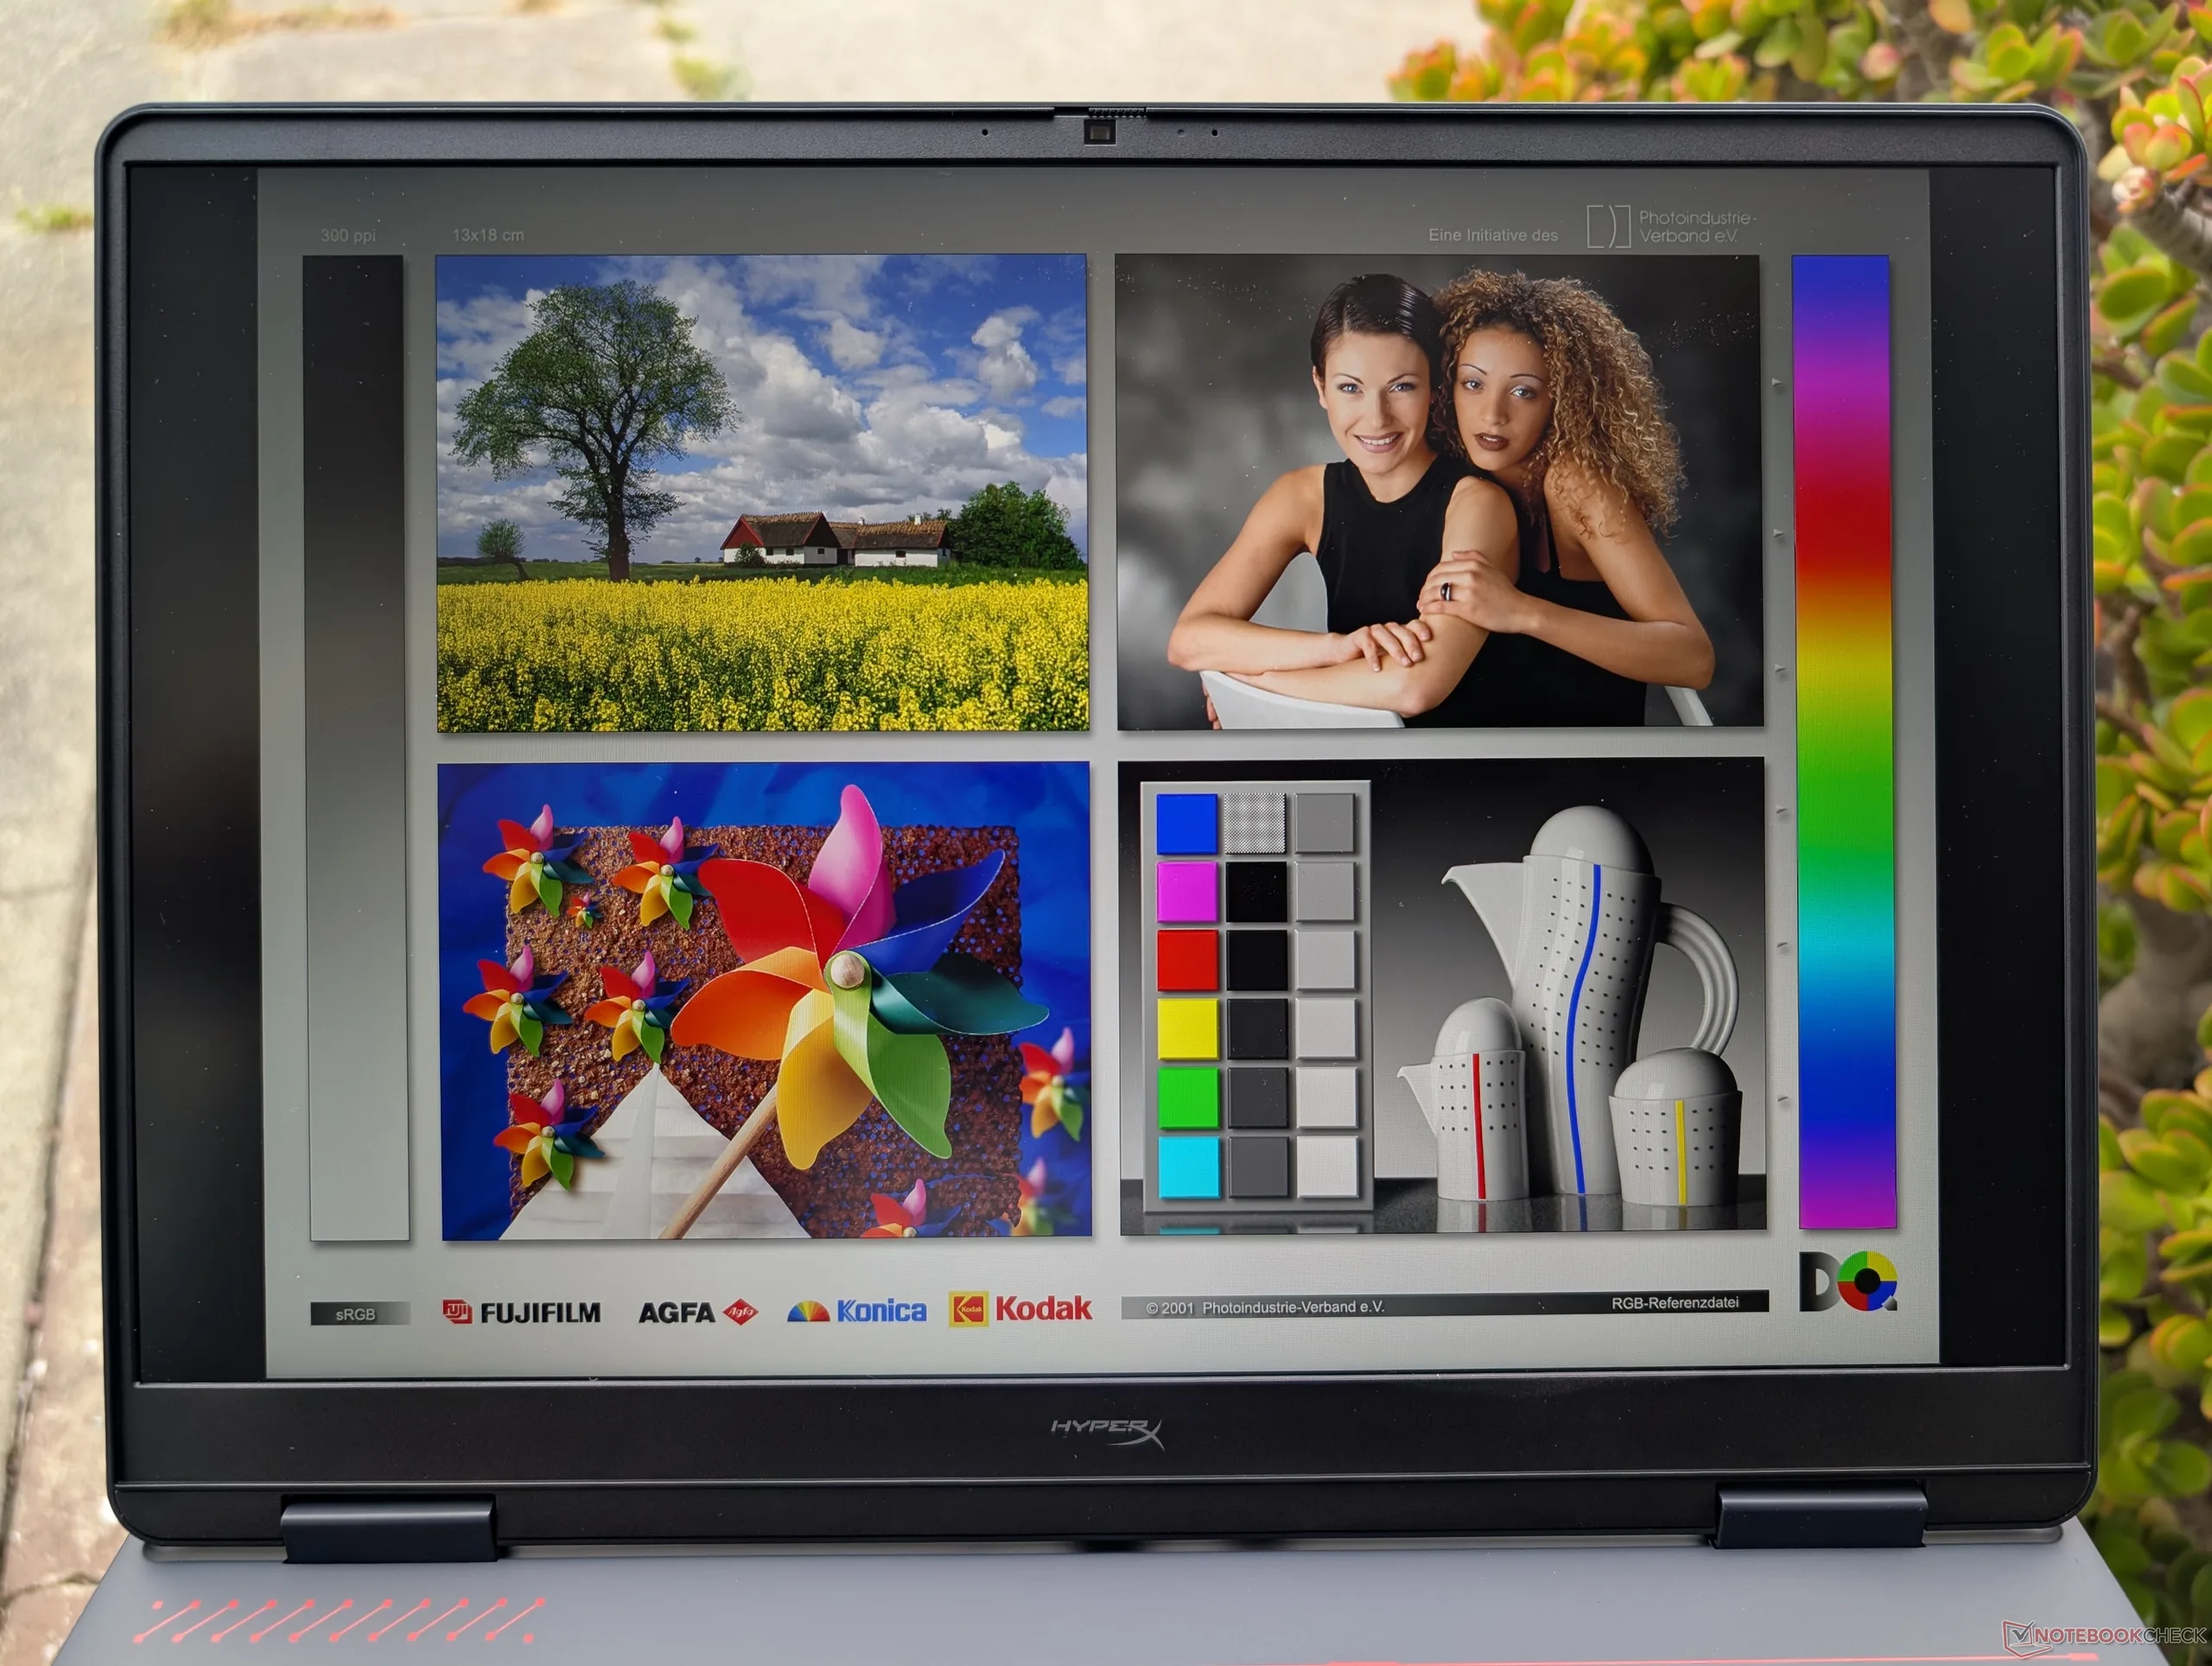
All’aperto all’ombra
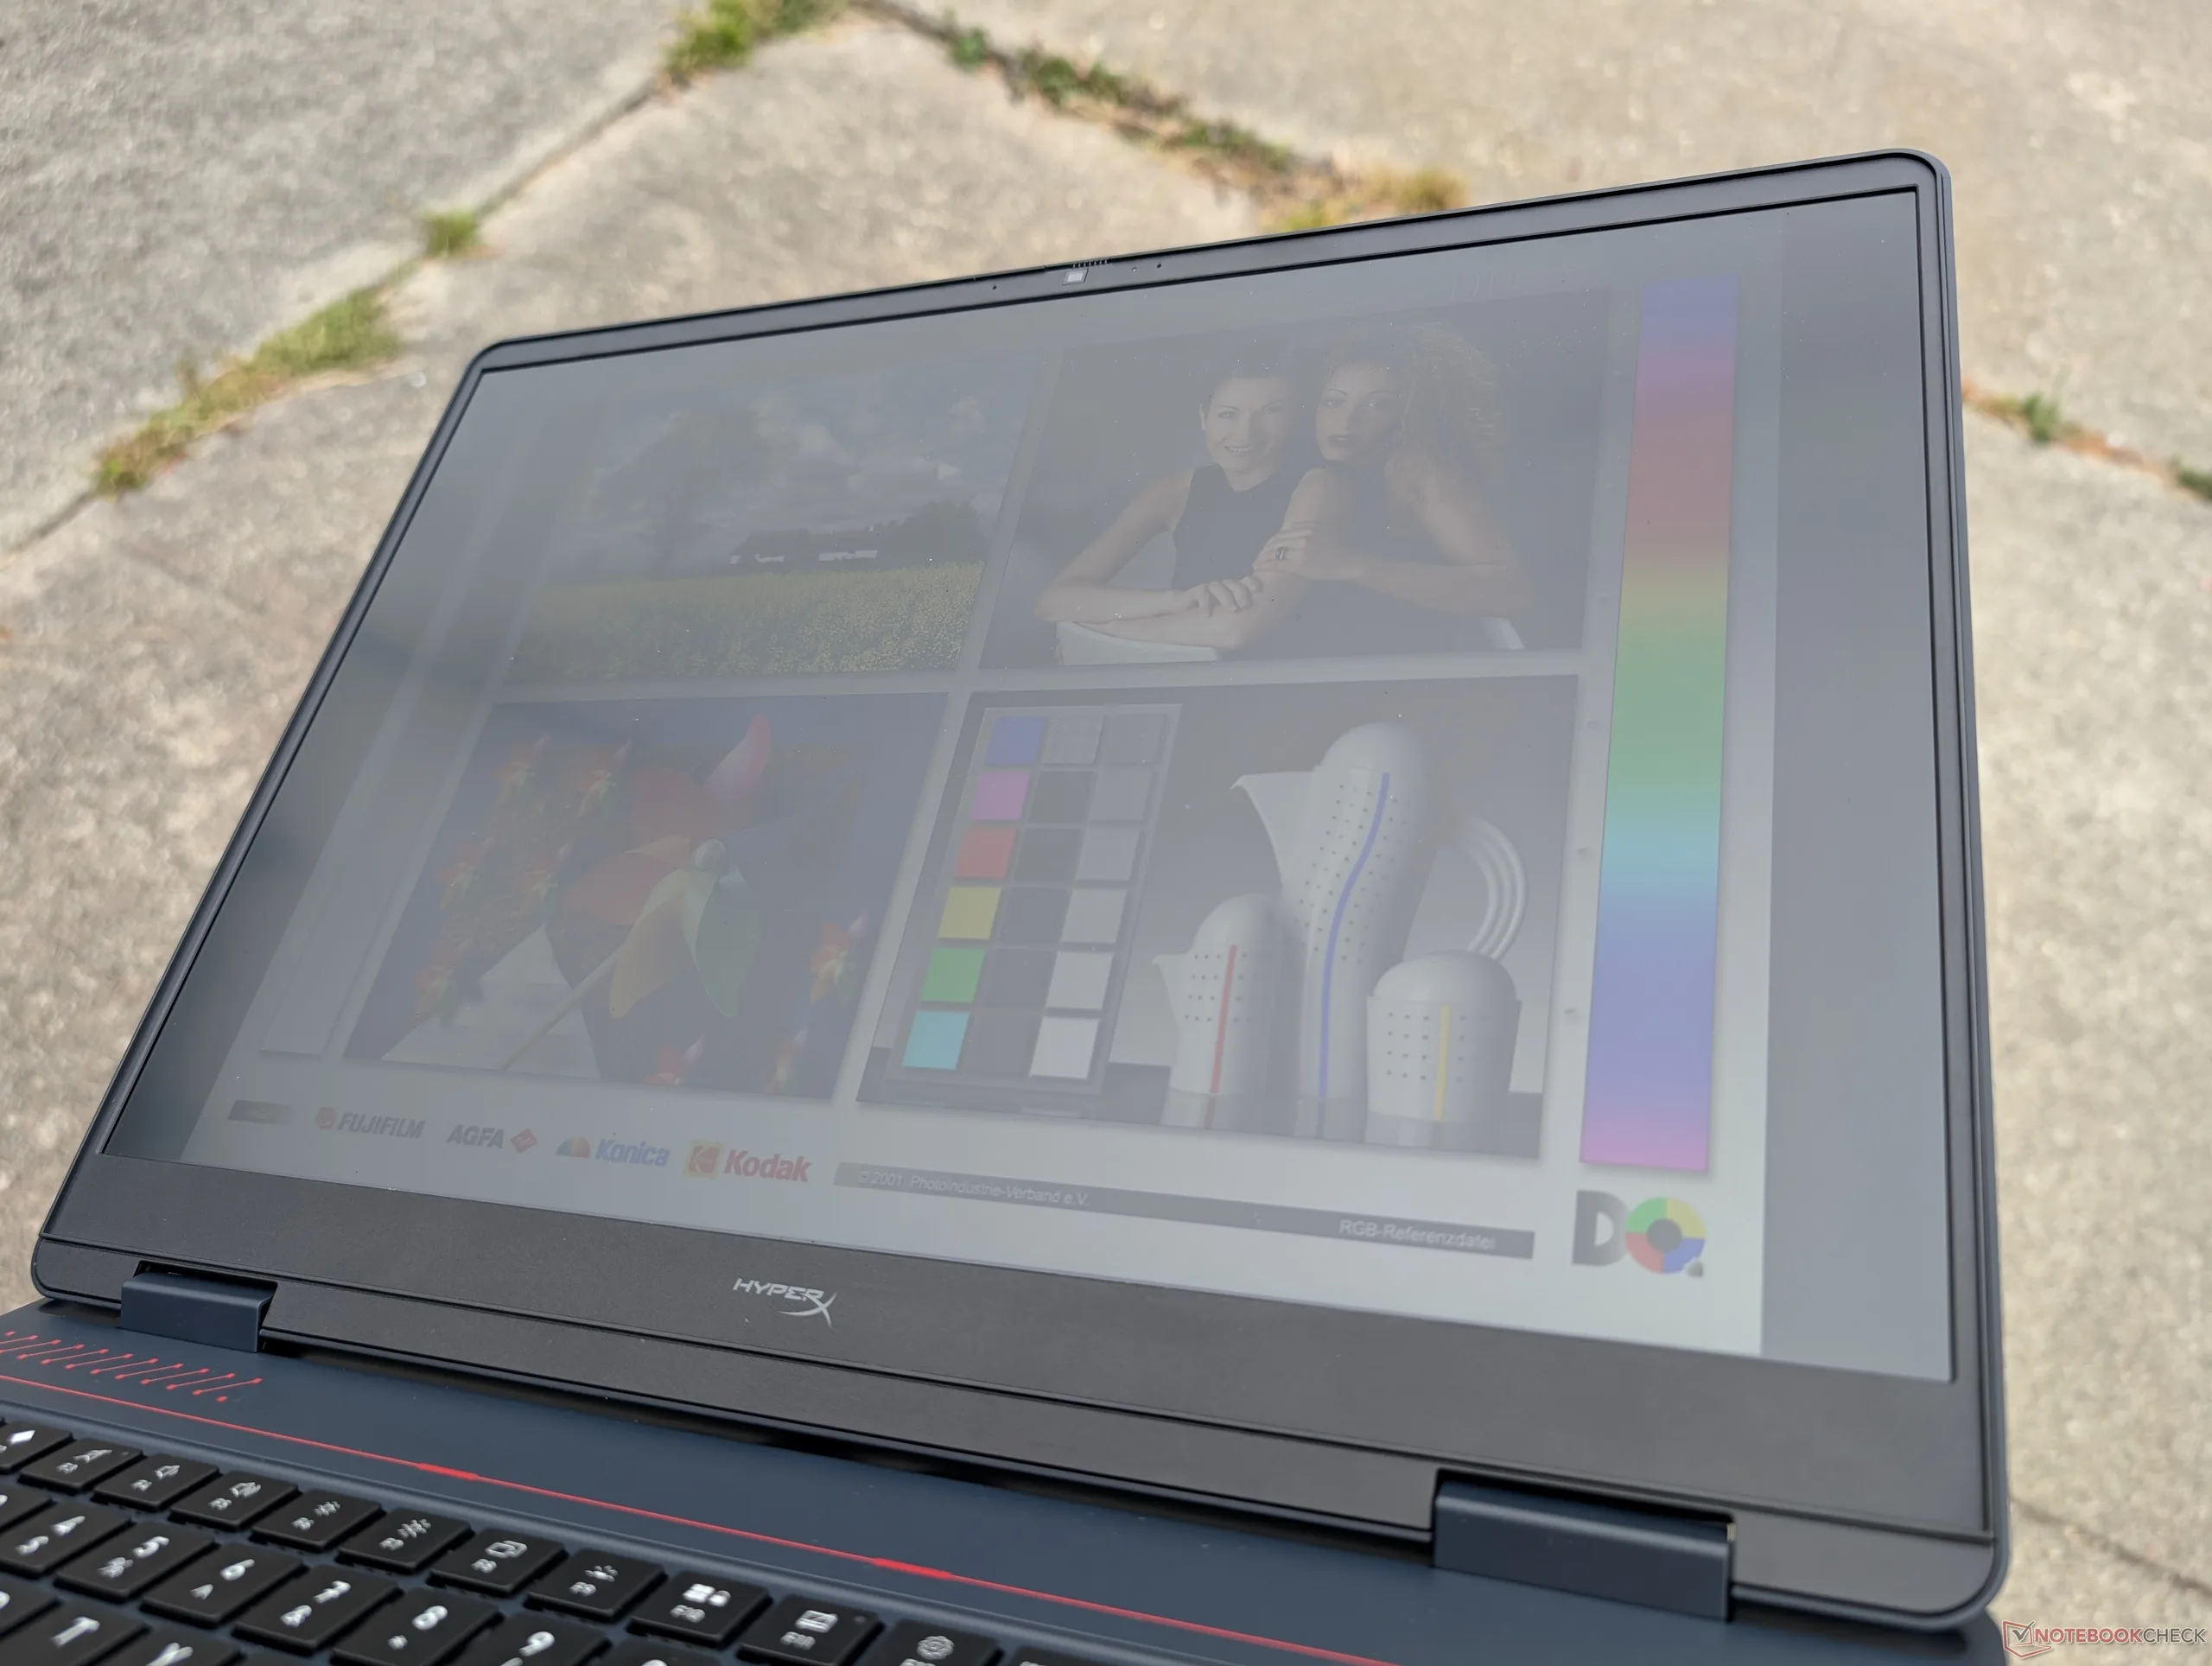
All’aperto, sotto un cielo nuvoloso ma luminoso
Ampi angoli di visione IPS

Prestazioni

Condizioni di prova

Prima di eseguire i benchmark riportati di seguito, abbiamo impostato il sistema in modalità «Unleashed» e in modalità grafica discreta.

Prestazioni del processore

Le prestazioni complessive del processore sono solo leggermente inferiori rispetto a quelle dei portatili dotati di Core Ultra 9 290HX Plus, come l’Alienware 16X Aurora. Il Ryzen 9 9955HXD è per il resto quasi identico al Ryzen 9 9955HX, ad eccezione delle dimensioni della cache L3.

Cinebench R15 Multi Loop

01202403604806007208409601080120013201440156016801800192020402160228024002520264027602880300031203240336034803600372038403960408042004320444045604680480049205040516052805400552056405760Tooltip
HP HyperX Omen 16 16-ap1931nr AMD Ryzen 9 9955HX3D: Ø5663 (5471.21-5839.42) Points
HP Omen 16-ap0091ng AMD Ryzen 9 8940HX: Ø4084 (4037.14-4295.53) Points
MSI Crosshair A16 HX E8WGK AMD Ryzen 9 8940HX: Ø5290 (5233.55-5355.47) Points
Alienware 16X Aurora Core Ultra 9 290HX Plus Intel Core Ultra 9 290HX Plus: Ø5102 (4340.28-5617.19) Points
Lenovo Legion Pro 5 16IAX10, RTX 5070 Intel Core Ultra 7 255HX: Ø4910 (4795.01-5190.09) Points
Asus TUF Gaming A16 FA608UP AMD Ryzen 7 260: Ø2740 (2520.16-2768.93) Points
CPU Performance rating: Percent
Cinebench R23: Multi Core | Single Core
Cinebench R20: CPU (Multi Core) | CPU (Single Core)
Cinebench R15: CPU Multi 64Bit | CPU Single 64Bit
Blender: v2.79 BMW27 CPU
7-Zip 18.03: 7z b 4 | 7z b 4 -mmt1
Geekbench 6.7: Multi-Core | Single-Core
Geekbench 5.5: Multi-Core | Single-Core
HWBOT x265 Benchmark v2.2: 4k Preset
LibreOffice : 20 Documents To PDF
R Benchmark 2.5: Overall mean
CPU Performance rating
Media AMD Ryzen 9 9955HX3D
 
85 pt
Schenker XMG APEX 16 MAX
AMD Ryzen 9 9955HX
84.8 pt
Alienware 16X Aurora Core Ultra 9 290HX Plus
Intel Core Ultra 9 290HX Plus
83 pt
HP HyperX Omen 16 16-ap1931nr
AMD Ryzen 9 9955HX3D
82.4 pt
Acer Predator Helios Neo 16S AI PHN16S-71-94L9
Intel Core Ultra 9 275HX
77.6 pt
Lenovo Legion Pro 5 16IAX10, RTX 5070
Intel Core Ultra 7 255HX
77.5 pt
MSI Crosshair A16 HX E8WGK
AMD Ryzen 9 8940HX
75.6 pt
Lenovo Legion 9 16IRX9, RTX 4090
Intel Core i9-14900HX
67.1 pt
HP Omen 16-ap0091ng
AMD Ryzen 9 8940HX
65.6 pt
Alienware m16 R1 Intel
Intel Core i7-13700HX
59 pt
Asus TUF Gaming A16 FA608UP
AMD Ryzen 7 260
52.7 pt
Cinebench R23 / Multi Core
Media AMD Ryzen 9 9955HX3D
  (36580 - 39266, n=4)
38042 Points +4%
Alienware 16X Aurora Core Ultra 9 290HX Plus
Intel Core Ultra 9 290HX Plus
37038 (32828min - 37037.5max) Points +1%
HP HyperX Omen 16 16-ap1931nr
AMD Ryzen 9 9955HX3D
36580 (35337.4min - 36580.1max) Points
Schenker XMG APEX 16 MAX
AMD Ryzen 9 9955HX
35960 Points -2%
Lenovo Legion Pro 5 16IAX10, RTX 5070
Intel Core Ultra 7 255HX
34005 Points -7%
MSI Crosshair A16 HX E8WGK
AMD Ryzen 9 8940HX
32745 (32277.9min - 32745.3max) Points -10%
Lenovo Legion 9 16IRX9, RTX 4090
Intel Core i9-14900HX
31889 Points -13%
Acer Predator Helios Neo 16S AI PHN16S-71-94L9
Intel Core Ultra 9 275HX
31727 Points -13%
HP Omen 16-ap0091ng
AMD Ryzen 9 8940HX
27145 Points -26%
Alienware m16 R1 Intel
Intel Core i7-13700HX
21889 Points -40%
Asus TUF Gaming A16 FA608UP
AMD Ryzen 7 260
17277 Points -53%
Cinebench R23 / Single Core
Alienware 16X Aurora Core Ultra 9 290HX Plus
Intel Core Ultra 9 290HX Plus
2330 Points +8%
Acer Predator Helios Neo 16S AI PHN16S-71-94L9
Intel Core Ultra 9 275HX
2250 Points +4%
Schenker XMG APEX 16 MAX
AMD Ryzen 9 9955HX
2172 Points +1%
Lenovo Legion Pro 5 16IAX10, RTX 5070
Intel Core Ultra 7 255HX
2163 Points 0%
Media AMD Ryzen 9 9955HX3D
  (2150 - 2179, n=4)
2162 Points 0%
HP HyperX Omen 16 16-ap1931nr
AMD Ryzen 9 9955HX3D
2154 Points
Alienware m16 R1 Intel
Intel Core i7-13700HX
1933 Points -10%
HP Omen 16-ap0091ng
AMD Ryzen 9 8940HX
1917 Points -11%
MSI Crosshair A16 HX E8WGK
AMD Ryzen 9 8940HX
1886 Points -12%
Asus TUF Gaming A16 FA608UP
AMD Ryzen 7 260
1760 Points -18%
Lenovo Legion 9 16IRX9, RTX 4090
Intel Core i9-14900HX
1720 Points -20%
Cinebench R20 / CPU (Multi Core)
Media AMD Ryzen 9 9955HX3D
  (14209 - 15177, n=4)
14831 Points +4%
Alienware 16X Aurora Core Ultra 9 290HX Plus
Intel Core Ultra 9 290HX Plus
14397 Points +1%
HP HyperX Omen 16 16-ap1931nr
AMD Ryzen 9 9955HX3D
14209 Points
Schenker XMG APEX 16 MAX
AMD Ryzen 9 9955HX
13963 Points -2%
Lenovo Legion Pro 5 16IAX10, RTX 5070
Intel Core Ultra 7 255HX
13056 Points -8%
MSI Crosshair A16 HX E8WGK
AMD Ryzen 9 8940HX
12785 Points -10%
Acer Predator Helios Neo 16S AI PHN16S-71-94L9
Intel Core Ultra 9 275HX
12542 Points -12%
Lenovo Legion 9 16IRX9, RTX 4090
Intel Core i9-14900HX
11960 Points -16%
HP Omen 16-ap0091ng
AMD Ryzen 9 8940HX
10439 Points -27%
Alienware m16 R1 Intel
Intel Core i7-13700HX
8062 Points -43%
Asus TUF Gaming A16 FA608UP
AMD Ryzen 7 260
6770 Points -52%
Cinebench R20 / CPU (Single Core)
Acer Predator Helios Neo 16S AI PHN16S-71-94L9
Intel Core Ultra 9 275HX
865 Points +2%
Alienware 16X Aurora Core Ultra 9 290HX Plus
Intel Core Ultra 9 290HX Plus
864 Points +2%
Schenker XMG APEX 16 MAX
AMD Ryzen 9 9955HX
856 Points +1%
HP HyperX Omen 16 16-ap1931nr
AMD Ryzen 9 9955HX3D
845 Points
Media AMD Ryzen 9 9955HX3D
  (790 - 851, n=4)
833 Points -1%
Lenovo Legion Pro 5 16IAX10, RTX 5070
Intel Core Ultra 7 255HX
831 Points -2%
HP Omen 16-ap0091ng
AMD Ryzen 9 8940HX
745 Points -12%
Alienware m16 R1 Intel
Intel Core i7-13700HX
738 Points -13%
MSI Crosshair A16 HX E8WGK
AMD Ryzen 9 8940HX
736 Points -13%
Asus TUF Gaming A16 FA608UP
AMD Ryzen 7 260
679 Points -20%
Lenovo Legion 9 16IRX9, RTX 4090
Intel Core i9-14900HX
657 Points -22%
Cinebench R15 / CPU Multi 64Bit
Media AMD Ryzen 9 9955HX3D
  (5839 - 6068, n=4)
5998 Points +3%
HP HyperX Omen 16 16-ap1931nr
AMD Ryzen 9 9955HX3D
5839 (5471.21min - 5839.42max) Points
Schenker XMG APEX 16 MAX
AMD Ryzen 9 9955HX
5624 (5340.45min - 5623.51max) Points -4%
Alienware 16X Aurora Core Ultra 9 290HX Plus
Intel Core Ultra 9 290HX Plus
5617 (4340.28min - 5617.19max) Points -4%
MSI Crosshair A16 HX E8WGK
AMD Ryzen 9 8940HX
5355 (5233.55min - 5355.47max) Points -8%
Lenovo Legion Pro 5 16IAX10, RTX 5070
Intel Core Ultra 7 255HX
5190 (4795.01min - 5190.09max) Points -11%
Lenovo Legion 9 16IRX9, RTX 4090
Intel Core i9-14900HX
4879 (4505.52min - 4878.64max) Points -16%
Acer Predator Helios Neo 16S AI PHN16S-71-94L9
Intel Core Ultra 9 275HX
4737 (4180.6min - 4737.09max) Points -19%
HP Omen 16-ap0091ng
AMD Ryzen 9 8940HX
4296 (4037.14min - 4295.53max) Points -26%
Alienware m16 R1 Intel
Intel Core i7-13700HX
3183 Points -45%
Asus TUF Gaming A16 FA608UP
AMD Ryzen 7 260
2769 (2520.16min - 2768.93max) Points -53%
Cinebench R15 / CPU Single 64Bit
Alienware 16X Aurora Core Ultra 9 290HX Plus
Intel Core Ultra 9 290HX Plus
340 Points +1%
Schenker XMG APEX 16 MAX
AMD Ryzen 9 9955HX
336 Points 0%
Acer Predator Helios Neo 16S AI PHN16S-71-94L9
Intel Core Ultra 9 275HX
335 Points 0%
HP HyperX Omen 16 16-ap1931nr
AMD Ryzen 9 9955HX3D
335 Points
Media AMD Ryzen 9 9955HX3D
  (321 - 335, n=4)
330 Points -1%
Lenovo Legion Pro 5 16IAX10, RTX 5070
Intel Core Ultra 7 255HX
328 Points -2%
MSI Crosshair A16 HX E8WGK
AMD Ryzen 9 8940HX
301 Points -10%
HP Omen 16-ap0091ng
AMD Ryzen 9 8940HX
292 Points -13%
Alienware m16 R1 Intel
Intel Core i7-13700HX
277 Points -17%
Asus TUF Gaming A16 FA608UP
AMD Ryzen 7 260
275 Points -18%
Lenovo Legion 9 16IRX9, RTX 4090
Intel Core i9-14900HX
247 Points -26%
Blender / v2.79 BMW27 CPU
Asus TUF Gaming A16 FA608UP
AMD Ryzen 7 260
182 Seconds * -100%
Alienware m16 R1 Intel
Intel Core i7-13700HX
159 Seconds * -75%
HP Omen 16-ap0091ng
AMD Ryzen 9 8940HX
116 Seconds * -27%
Acer Predator Helios Neo 16S AI PHN16S-71-94L9
Intel Core Ultra 9 275HX
112 Seconds * -23%
Lenovo Legion 9 16IRX9, RTX 4090
Intel Core i9-14900HX
106 Seconds * -16%
Lenovo Legion Pro 5 16IAX10, RTX 5070
Intel Core Ultra 7 255HX
104 Seconds * -14%
MSI Crosshair A16 HX E8WGK
AMD Ryzen 9 8940HX
96 Seconds * -5%
Alienware 16X Aurora Core Ultra 9 290HX Plus
Intel Core Ultra 9 290HX Plus
94 Seconds * -3%
HP HyperX Omen 16 16-ap1931nr
AMD Ryzen 9 9955HX3D
91 Seconds *
Schenker XMG APEX 16 MAX
AMD Ryzen 9 9955HX
85 Seconds * +7%
Media AMD Ryzen 9 9955HX3D
  (80 - 91, n=4)
83.3 Seconds * +8%
7-Zip 18.03 / 7z b 4
Media AMD Ryzen 9 9955HX3D
  (130158 - 148086, n=4)
142262 MIPS +9%
Schenker XMG APEX 16 MAX
AMD Ryzen 9 9955HX
139824 MIPS +7%
MSI Crosshair A16 HX E8WGK
AMD Ryzen 9 8940HX
137645 MIPS +6%
HP HyperX Omen 16 16-ap1931nr
AMD Ryzen 9 9955HX3D
130158 MIPS
Lenovo Legion 9 16IRX9, RTX 4090
Intel Core i9-14900HX
125676 MIPS -3%
Lenovo Legion Pro 5 16IAX10, RTX 5070
Intel Core Ultra 7 255HX
104055 MIPS -20%
Alienware 16X Aurora Core Ultra 9 290HX Plus
Intel Core Ultra 9 290HX Plus
103986 MIPS -20%
HP Omen 16-ap0091ng
AMD Ryzen 9 8940HX
103455 MIPS -21%
Acer Predator Helios Neo 16S AI PHN16S-71-94L9
Intel Core Ultra 9 275HX
102844 MIPS -21%
Alienware m16 R1 Intel
Intel Core i7-13700HX
83449 MIPS -36%
Asus TUF Gaming A16 FA608UP
AMD Ryzen 7 260
72400 MIPS -44%
7-Zip 18.03 / 7z b 4 -mmt1
HP Omen 16-ap0091ng
AMD Ryzen 9 8940HX
7407 MIPS +6%
Schenker XMG APEX 16 MAX
AMD Ryzen 9 9955HX
7374 MIPS +6%
MSI Crosshair A16 HX E8WGK
AMD Ryzen 9 8940HX
7220 MIPS +4%
Media AMD Ryzen 9 9955HX3D
  (6960 - 7382, n=4)
7198 MIPS +3%
Acer Predator Helios Neo 16S AI PHN16S-71-94L9
Intel Core Ultra 9 275HX
6981 MIPS 0%
HP HyperX Omen 16 16-ap1931nr
AMD Ryzen 9 9955HX3D
6960 MIPS
Lenovo Legion Pro 5 16IAX10, RTX 5070
Intel Core Ultra 7 255HX
6576 MIPS -6%
Alienware 16X Aurora Core Ultra 9 290HX Plus
Intel Core Ultra 9 290HX Plus
6562 MIPS -6%
Alienware m16 R1 Intel
Intel Core i7-13700HX
6409 MIPS -8%
Asus TUF Gaming A16 FA608UP
AMD Ryzen 7 260
6101 MIPS -12%
Lenovo Legion 9 16IRX9, RTX 4090
Intel Core i9-14900HX
5452 MIPS -22%
Geekbench 6.7 / Multi-Core
Media AMD Ryzen 9 9955HX3D
  (19418 - 20551, n=6)
20040 Points +3%
Alienware 16X Aurora Core Ultra 9 290HX Plus
Intel Core Ultra 9 290HX Plus
19855 Points +2%
Schenker XMG APEX 16 MAX
AMD Ryzen 9 9955HX
19725 Points +2%
Acer Predator Helios Neo 16S AI PHN16S-71-94L9
Intel Core Ultra 9 275HX
19675 Points +1%
Lenovo Legion Pro 5 16IAX10, RTX 5070
Intel Core Ultra 7 255HX
19623 Points +1%
HP HyperX Omen 16 16-ap1931nr
AMD Ryzen 9 9955HX3D
19418 Points
Lenovo Legion 9 16IRX9, RTX 4090
Intel Core i9-14900HX
17499 Points -10%
MSI Crosshair A16 HX E8WGK
AMD Ryzen 9 8940HX
16483 Points -15%
Alienware m16 R1 Intel
Intel Core i7-13700HX
14402 Points -26%
Asus TUF Gaming A16 FA608UP
AMD Ryzen 7 260
13299 Points -32%
HP Omen 16-ap0091ng
AMD Ryzen 9 8940HX
11447 Points -41%
Geekbench 6.7 / Single-Core
Schenker XMG APEX 16 MAX
AMD Ryzen 9 9955HX
3259 Points +3%
Media AMD Ryzen 9 9955HX3D
  (3146 - 3237, n=6)
3186 Points +1%
HP HyperX Omen 16 16-ap1931nr
AMD Ryzen 9 9955HX3D
3159 Points
Alienware 16X Aurora Core Ultra 9 290HX Plus
Intel Core Ultra 9 290HX Plus
3147 Points 0%
Acer Predator Helios Neo 16S AI PHN16S-71-94L9
Intel Core Ultra 9 275HX
3113 Points -1%
Lenovo Legion Pro 5 16IAX10, RTX 5070
Intel Core Ultra 7 255HX
3028 Points -4%
MSI Crosshair A16 HX E8WGK
AMD Ryzen 9 8940HX
2839 Points -10%
HP Omen 16-ap0091ng
AMD Ryzen 9 8940HX
2816 Points -11%
Asus TUF Gaming A16 FA608UP
AMD Ryzen 7 260
2673 Points -15%
Alienware m16 R1 Intel
Intel Core i7-13700HX
2638 Points -16%
Lenovo Legion 9 16IRX9, RTX 4090
Intel Core i9-14900HX
2419 Points -23%
Geekbench 5.5 / Multi-Core
Alienware 16X Aurora Core Ultra 9 290HX Plus
Intel Core Ultra 9 290HX Plus
23839 Points +12%
Media AMD Ryzen 9 9955HX3D
  (21223 - 23669, n=4)
23005 Points +8%
Schenker XMG APEX 16 MAX
AMD Ryzen 9 9955HX
22716 Points +7%
Acer Predator Helios Neo 16S AI PHN16S-71-94L9
Intel Core Ultra 9 275HX
22082 Points +4%
Lenovo Legion 9 16IRX9, RTX 4090
Intel Core i9-14900HX
21642 Points +2%
HP HyperX Omen 16 16-ap1931nr
AMD Ryzen 9 9955HX3D
21223 Points
Lenovo Legion Pro 5 16IAX10, RTX 5070
Intel Core Ultra 7 255HX
20532 Points -3%
MSI Crosshair A16 HX E8WGK
AMD Ryzen 9 8940HX
19054 Points -10%
Alienware m16 R1 Intel
Intel Core i7-13700HX
14448 Points -32%
HP Omen 16-ap0091ng
AMD Ryzen 9 8940HX
13357 Points -37%
Asus TUF Gaming A16 FA608UP
AMD Ryzen 7 260
12239 Points -42%
Geekbench 5.5 / Single-Core
Schenker XMG APEX 16 MAX
AMD Ryzen 9 9955HX
2474 Points +6%
Media AMD Ryzen 9 9955HX3D
  (2326 - 2406, n=4)
2379 Points +2%
HP HyperX Omen 16 16-ap1931nr
AMD Ryzen 9 9955HX3D
2326 Points
Alienware 16X Aurora Core Ultra 9 290HX Plus
Intel Core Ultra 9 290HX Plus
2282 Points -2%
Lenovo Legion Pro 5 16IAX10, RTX 5070
Intel Core Ultra 7 255HX
2211 Points -5%
Acer Predator Helios Neo 16S AI PHN16S-71-94L9
Intel Core Ultra 9 275HX
2196 Points -6%
MSI Crosshair A16 HX E8WGK
AMD Ryzen 9 8940HX
2025 Points -13%
HP Omen 16-ap0091ng
AMD Ryzen 9 8940HX
1961 Points -16%
Asus TUF Gaming A16 FA608UP
AMD Ryzen 7 260
1954 Points -16%
Alienware m16 R1 Intel
Intel Core i7-13700HX
1845 Points -21%
Lenovo Legion 9 16IRX9, RTX 4090
Intel Core i9-14900HX
1729 Points -26%
HWBOT x265 Benchmark v2.2 / 4k Preset
Media AMD Ryzen 9 9955HX3D
  (39 - 43, n=4)
41.8 fps +7%
Schenker XMG APEX 16 MAX
AMD Ryzen 9 9955HX
39.7 fps +2%
HP HyperX Omen 16 16-ap1931nr
AMD Ryzen 9 9955HX3D
39 fps
Alienware 16X Aurora Core Ultra 9 290HX Plus
Intel Core Ultra 9 290HX Plus
38.2 fps -2%
Lenovo Legion Pro 5 16IAX10, RTX 5070
Intel Core Ultra 7 255HX
36.9 fps -5%
MSI Crosshair A16 HX E8WGK
AMD Ryzen 9 8940HX
35.7 fps -8%
Acer Predator Helios Neo 16S AI PHN16S-71-94L9
Intel Core Ultra 9 275HX
33.4 fps -14%
Lenovo Legion 9 16IRX9, RTX 4090
Intel Core i9-14900HX
30.7 fps -21%
HP Omen 16-ap0091ng
AMD Ryzen 9 8940HX
25.7 fps -34%
Alienware m16 R1 Intel
Intel Core i7-13700HX
22.4 fps -43%
Asus TUF Gaming A16 FA608UP
AMD Ryzen 7 260
21.4 fps -45%
LibreOffice / 20 Documents To PDF
Asus TUF Gaming A16 FA608UP
AMD Ryzen 7 260
57.1 s * -10%
Lenovo Legion 9 16IRX9, RTX 4090
Intel Core i9-14900HX
53.6 s * -3%
Media AMD Ryzen 9 9955HX3D
  (44.9 - 71.8, n=5)
53.4 s * -3%
HP HyperX Omen 16 16-ap1931nr
AMD Ryzen 9 9955HX3D
51.9 s *
HP HyperX Omen 16 16-ap1931nr
AMD Ryzen 9 9955HX3D
51.9 s * -0%
Schenker XMG APEX 16 MAX
AMD Ryzen 9 9955HX
48.7 s * +6%
HP Omen 16-ap0091ng
AMD Ryzen 9 8940HX
45.9 s * +12%
Lenovo Legion Pro 5 16IAX10, RTX 5070
Intel Core Ultra 7 255HX
45.9 s * +12%
Alienware m16 R1 Intel
Intel Core i7-13700HX
45.4 s * +13%
Acer Predator Helios Neo 16S AI PHN16S-71-94L9
Intel Core Ultra 9 275HX
44.6 s * +14%
MSI Crosshair A16 HX E8WGK
AMD Ryzen 9 8940HX
43.6 s * +16%
Alienware 16X Aurora Core Ultra 9 290HX Plus
Intel Core Ultra 9 290HX Plus
39.4 s * +24%
R Benchmark 2.5 / Overall mean
Lenovo Legion 9 16IRX9, RTX 4090
Intel Core i9-14900HX
0.4859 sec * -35%
Asus TUF Gaming A16 FA608UP
AMD Ryzen 7 260
0.4479 sec * -24%
Alienware m16 R1 Intel
Intel Core i7-13700HX
0.4422 sec * -22%
MSI Crosshair A16 HX E8WGK
AMD Ryzen 9 8940HX
0.4286 sec * -19%
Lenovo Legion Pro 5 16IAX10, RTX 5070
Intel Core Ultra 7 255HX
0.4269 sec * -18%
HP Omen 16-ap0091ng
AMD Ryzen 9 8940HX
0.4215 sec * -17%
Acer Predator Helios Neo 16S AI PHN16S-71-94L9
Intel Core Ultra 9 275HX
0.401 sec * -11%
Alienware 16X Aurora Core Ultra 9 290HX Plus
Intel Core Ultra 9 290HX Plus
0.391 sec * -8%
HP HyperX Omen 16 16-ap1931nr
AMD Ryzen 9 9955HX3D
0.3611 sec *
Media AMD Ryzen 9 9955HX3D
  (0.3552 - 0.3677, n=4)
0.3602 sec * -0%
Schenker XMG APEX 16 MAX
AMD Ryzen 9 9955HX
0.3439 sec * +5%

* ... Meglio usare valori piccoli
Cinebench R15 CPU Multi 64Bit
5839 Points
Cinebench R15 OpenGL 64Bit
337 fps
Cinebench R15 Ref. Match 64Bit
99.6 %
Cinebench R15 CPU Single 64Bit
335 Points
Cinebench R20 CPU (Multi Core)
14209 Points
Cinebench R20 CPU (Single Core)
845 Points
Cinebench R23 Multi Core
36580 Points
Cinebench R23 Single Core
2154 Points
Cinebench 2024 CPU Multi Core
2015 Points
Cinebench 2024 CPU Single Core
128.2 Points
Cinebench 2026 CPU Multi
8296 Points
Cinebench 2026 CPU Single Thread
522 Points
Aiuto
Performance rating
HP HyperX Omen 16 16-ap1931nr -1!
AMD Ryzen 9 9955HX3D, GeForce RTX 5070 Laptop
94.5 pt
Media AMD Ryzen 9 9955HX3D
 
94.3 pt
MSI Crosshair A16 HX E8WGK -1!
AMD Ryzen 9 8940HX, GeForce RTX 5070 Laptop
75.7 pt
HP Omen 16-ap0091ng -1!
AMD Ryzen 9 8940HX, GeForce RTX 5060 Laptop
66 pt
Lenovo Legion Pro 5 16IAX10, RTX 5070 -1!
Intel Core Ultra 7 255HX, GeForce RTX 5070 Laptop
61.6 pt
Alienware 16X Aurora Core Ultra 9 290HX Plus -1!
Intel Core Ultra 9 290HX Plus, GeForce RTX 5070 Ti Laptop
59.8 pt
Asus TUF Gaming A16 FA608UP -1!
AMD Ryzen 7 260, GeForce RTX 5070 Laptop
47.3 pt
AIDA64 / FP32 Ray-Trace
Media AMD Ryzen 9 9955HX3D
  (76012 - 84943, n=4)
80661 KRay/s +6%
HP HyperX Omen 16 16-ap1931nr
AMD Ryzen 9 9955HX3D, GeForce RTX 5070 Laptop (v8.20.8100)
76012 KRay/s
MSI Crosshair A16 HX E8WGK
AMD Ryzen 9 8940HX, GeForce RTX 5070 Laptop (v8.20.8100)
53747 KRay/s -29%
HP Omen 16-ap0091ng
AMD Ryzen 9 8940HX, GeForce RTX 5060 Laptop (v6.92.6600)
43311 KRay/s -43%
Alienware 16X Aurora Core Ultra 9 290HX Plus
Intel Core Ultra 9 290HX Plus, GeForce RTX 5070 Ti Laptop (v8.20.8100)
34761 KRay/s -54%
Lenovo Legion Pro 5 16IAX10, RTX 5070
Intel Core Ultra 7 255HX, GeForce RTX 5070 Laptop (v6.92.6600)
34250 KRay/s -55%
Asus TUF Gaming A16 FA608UP
AMD Ryzen 7 260, GeForce RTX 5070 Laptop (v6.92.6600)
28399 KRay/s -63%
AIDA64 / FPU Julia
HP HyperX Omen 16 16-ap1931nr
AMD Ryzen 9 9955HX3D, GeForce RTX 5070 Laptop (v8.20.8100)
358092 Points
Media AMD Ryzen 9 9955HX3D
  (230738 - 372155, n=4)
299853 Points -16%
MSI Crosshair A16 HX E8WGK
AMD Ryzen 9 8940HX, GeForce RTX 5070 Laptop (v8.20.8100)
218716 Points -39%
Alienware 16X Aurora Core Ultra 9 290HX Plus
Intel Core Ultra 9 290HX Plus, GeForce RTX 5070 Ti Laptop (v8.20.8100)
174665 Points -51%
HP Omen 16-ap0091ng
AMD Ryzen 9 8940HX, GeForce RTX 5060 Laptop (v6.92.6600)
171374 Points -52%
Lenovo Legion Pro 5 16IAX10, RTX 5070
Intel Core Ultra 7 255HX, GeForce RTX 5070 Laptop (v6.92.6600)
167758 Points -53%
Asus TUF Gaming A16 FA608UP
AMD Ryzen 7 260, GeForce RTX 5070 Laptop (v6.92.6600)
117226 Points -67%
AIDA64 / CPU SHA3
Media AMD Ryzen 9 9955HX3D
  (9393 - 9750, n=4)
9607 MB/s +2%
MSI Crosshair A16 HX E8WGK
AMD Ryzen 9 8940HX, GeForce RTX 5070 Laptop (v8.20.8100)
9427 MB/s 0%
HP HyperX Omen 16 16-ap1931nr
AMD Ryzen 9 9955HX3D, GeForce RTX 5070 Laptop (v8.20.8100)
9393 MB/s
Alienware 16X Aurora Core Ultra 9 290HX Plus
Intel Core Ultra 9 290HX Plus, GeForce RTX 5070 Ti Laptop (v8.20.8100)
8352 MB/s -11%
HP Omen 16-ap0091ng
AMD Ryzen 9 8940HX, GeForce RTX 5060 Laptop (v6.92.6600)
7988 MB/s -15%
Lenovo Legion Pro 5 16IAX10, RTX 5070
Intel Core Ultra 7 255HX, GeForce RTX 5070 Laptop (v6.92.6600)
7694 MB/s -18%
Asus TUF Gaming A16 FA608UP
AMD Ryzen 7 260, GeForce RTX 5070 Laptop (v6.92.6600)
5002 MB/s -47%
AIDA64 / CPU Queen
Media AMD Ryzen 9 9955HX3D
  (171718 - 173351, n=2)
172535 Points
HP Omen 16-ap0091ng
AMD Ryzen 9 8940HX, GeForce RTX 5060 Laptop (v6.92.6600)
169334 Points
Lenovo Legion Pro 5 16IAX10, RTX 5070
Intel Core Ultra 7 255HX, GeForce RTX 5070 Laptop (v6.92.6600)
135237 Points
Asus TUF Gaming A16 FA608UP
AMD Ryzen 7 260, GeForce RTX 5070 Laptop (v6.92.6600)
119010 Points
AIDA64 / FPU SinJulia
Media AMD Ryzen 9 9955HX3D
  (31654 - 33636, n=4)
32633 Points +3%
HP HyperX Omen 16 16-ap1931nr
AMD Ryzen 9 9955HX3D, GeForce RTX 5070 Laptop (v8.20.8100)
31654 Points
MSI Crosshair A16 HX E8WGK
AMD Ryzen 9 8940HX, GeForce RTX 5070 Laptop (v8.20.8100)
29886 Points -6%
HP Omen 16-ap0091ng
AMD Ryzen 9 8940HX, GeForce RTX 5060 Laptop (v6.92.6600)
26855 Points -15%
Asus TUF Gaming A16 FA608UP
AMD Ryzen 7 260, GeForce RTX 5070 Laptop (v6.92.6600)
15283 Points -52%
Alienware 16X Aurora Core Ultra 9 290HX Plus
Intel Core Ultra 9 290HX Plus, GeForce RTX 5070 Ti Laptop (v8.20.8100)
13687 Points -57%
Lenovo Legion Pro 5 16IAX10, RTX 5070
Intel Core Ultra 7 255HX, GeForce RTX 5070 Laptop (v6.92.6600)
12286 Points -61%
AIDA64 / FPU Mandel
HP HyperX Omen 16 16-ap1931nr
AMD Ryzen 9 9955HX3D, GeForce RTX 5070 Laptop (v8.20.8100)
189485 Points
Media AMD Ryzen 9 9955HX3D
  (122088 - 196829, n=4)
158765 Points -16%
MSI Crosshair A16 HX E8WGK
AMD Ryzen 9 8940HX, GeForce RTX 5070 Laptop (v8.20.8100)
117231 Points -38%
Alienware 16X Aurora Core Ultra 9 290HX Plus
Intel Core Ultra 9 290HX Plus, GeForce RTX 5070 Ti Laptop (v8.20.8100)
91215 Points -52%
HP Omen 16-ap0091ng
AMD Ryzen 9 8940HX, GeForce RTX 5060 Laptop (v6.92.6600)
90684 Points -52%
Lenovo Legion Pro 5 16IAX10, RTX 5070
Intel Core Ultra 7 255HX, GeForce RTX 5070 Laptop (v6.92.6600)
87947 Points -54%
Asus TUF Gaming A16 FA608UP
AMD Ryzen 7 260, GeForce RTX 5070 Laptop (v6.92.6600)
63212 Points -67%
AIDA64 / CPU AES
MSI Crosshair A16 HX E8WGK
AMD Ryzen 9 8940HX, GeForce RTX 5070 Laptop (v8.20.8100)
175214 MB/s +15%
Media AMD Ryzen 9 9955HX3D
  (152883 - 163423, n=4)
159710 MB/s +4%
HP HyperX Omen 16 16-ap1931nr
AMD Ryzen 9 9955HX3D, GeForce RTX 5070 Laptop (v8.20.8100)
152883 MB/s
HP Omen 16-ap0091ng
AMD Ryzen 9 8940HX, GeForce RTX 5060 Laptop (v6.92.6600)
150768 MB/s -1%
Alienware 16X Aurora Core Ultra 9 290HX Plus
Intel Core Ultra 9 290HX Plus, GeForce RTX 5070 Ti Laptop (v8.20.8100)
127585 MB/s -17%
Lenovo Legion Pro 5 16IAX10, RTX 5070
Intel Core Ultra 7 255HX, GeForce RTX 5070 Laptop (v6.92.6600)
115838 MB/s -24%
Asus TUF Gaming A16 FA608UP
AMD Ryzen 7 260, GeForce RTX 5070 Laptop (v6.92.6600)
90394 MB/s -41%
AIDA64 / CPU ZLib
Media AMD Ryzen 9 9955HX3D
  (2324 - 2517, n=4)
2444 MB/s +5%
HP HyperX Omen 16 16-ap1931nr
AMD Ryzen 9 9955HX3D, GeForce RTX 5070 Laptop (v8.20.8100)
2324 MB/s
MSI Crosshair A16 HX E8WGK
AMD Ryzen 9 8940HX, GeForce RTX 5070 Laptop (v8.20.8100)
2122 MB/s -9%
Alienware 16X Aurora Core Ultra 9 290HX Plus
Intel Core Ultra 9 290HX Plus, GeForce RTX 5070 Ti Laptop (v8.20.8100)
1967 MB/s -15%
Lenovo Legion Pro 5 16IAX10, RTX 5070
Intel Core Ultra 7 255HX, GeForce RTX 5070 Laptop (v6.92.6600)
1850 MB/s -20%
HP Omen 16-ap0091ng
AMD Ryzen 9 8940HX, GeForce RTX 5060 Laptop (v6.92.6600)
1784 MB/s -23%
Asus TUF Gaming A16 FA608UP
AMD Ryzen 7 260, GeForce RTX 5070 Laptop (v6.92.6600)
1039 MB/s -55%
AIDA64 / FP64 Ray-Trace
Media AMD Ryzen 9 9955HX3D
  (40864 - 45384, n=4)
43001 KRay/s +5%
HP HyperX Omen 16 16-ap1931nr
AMD Ryzen 9 9955HX3D, GeForce RTX 5070 Laptop (v8.20.8100)
40864 KRay/s
MSI Crosshair A16 HX E8WGK
AMD Ryzen 9 8940HX, GeForce RTX 5070 Laptop (v8.20.8100)
28773 KRay/s -30%
HP Omen 16-ap0091ng
AMD Ryzen 9 8940HX, GeForce RTX 5060 Laptop (v6.92.6600)
23193 KRay/s -43%
Alienware 16X Aurora Core Ultra 9 290HX Plus
Intel Core Ultra 9 290HX Plus, GeForce RTX 5070 Ti Laptop (v8.20.8100)
18611 KRay/s -54%
Lenovo Legion Pro 5 16IAX10, RTX 5070
Intel Core Ultra 7 255HX, GeForce RTX 5070 Laptop (v6.92.6600)
18315 KRay/s -55%
Asus TUF Gaming A16 FA608UP
AMD Ryzen 7 260, GeForce RTX 5070 Laptop (v6.92.6600)
15351 KRay/s -62%
AIDA64 / CPU PhotoWorxx
Lenovo Legion Pro 5 16IAX10, RTX 5070
Intel Core Ultra 7 255HX, GeForce RTX 5070 Laptop (v6.92.6600)
54070 MPixel/s +23%
Alienware 16X Aurora Core Ultra 9 290HX Plus
Intel Core Ultra 9 290HX Plus, GeForce RTX 5070 Ti Laptop (v8.20.8100)
51199 MPixel/s +16%
HP HyperX Omen 16 16-ap1931nr
AMD Ryzen 9 9955HX3D, GeForce RTX 5070 Laptop (v8.20.8100)
43964 MPixel/s
Media AMD Ryzen 9 9955HX3D
  (38765 - 44266, n=4)
42507 MPixel/s -3%
Asus TUF Gaming A16 FA608UP
AMD Ryzen 7 260, GeForce RTX 5070 Laptop (v6.92.6600)
39936 MPixel/s -9%
MSI Crosshair A16 HX E8WGK
AMD Ryzen 9 8940HX, GeForce RTX 5070 Laptop (v8.20.8100)
35274 MPixel/s -20%
HP Omen 16-ap0091ng
AMD Ryzen 9 8940HX, GeForce RTX 5060 Laptop (v6.92.6600)
18283 MPixel/s -58%
AIDA64 / CPU CheckMate
Media AMD Ryzen 9 9955HX3D
  (19603 - 20751, n=2)
20177 MP/s +3%
HP HyperX Omen 16 16-ap1931nr
AMD Ryzen 9 9955HX3D, GeForce RTX 5070 Laptop (v8.20.8100)
19603 MP/s
MSI Crosshair A16 HX E8WGK
AMD Ryzen 9 8940HX, GeForce RTX 5070 Laptop (v8.20.8100)
11788 MP/s -40%
Alienware 16X Aurora Core Ultra 9 290HX Plus
Intel Core Ultra 9 290HX Plus, GeForce RTX 5070 Ti Laptop (v8.20.8100)
7624 MP/s -61%

Prestazioni del sistema

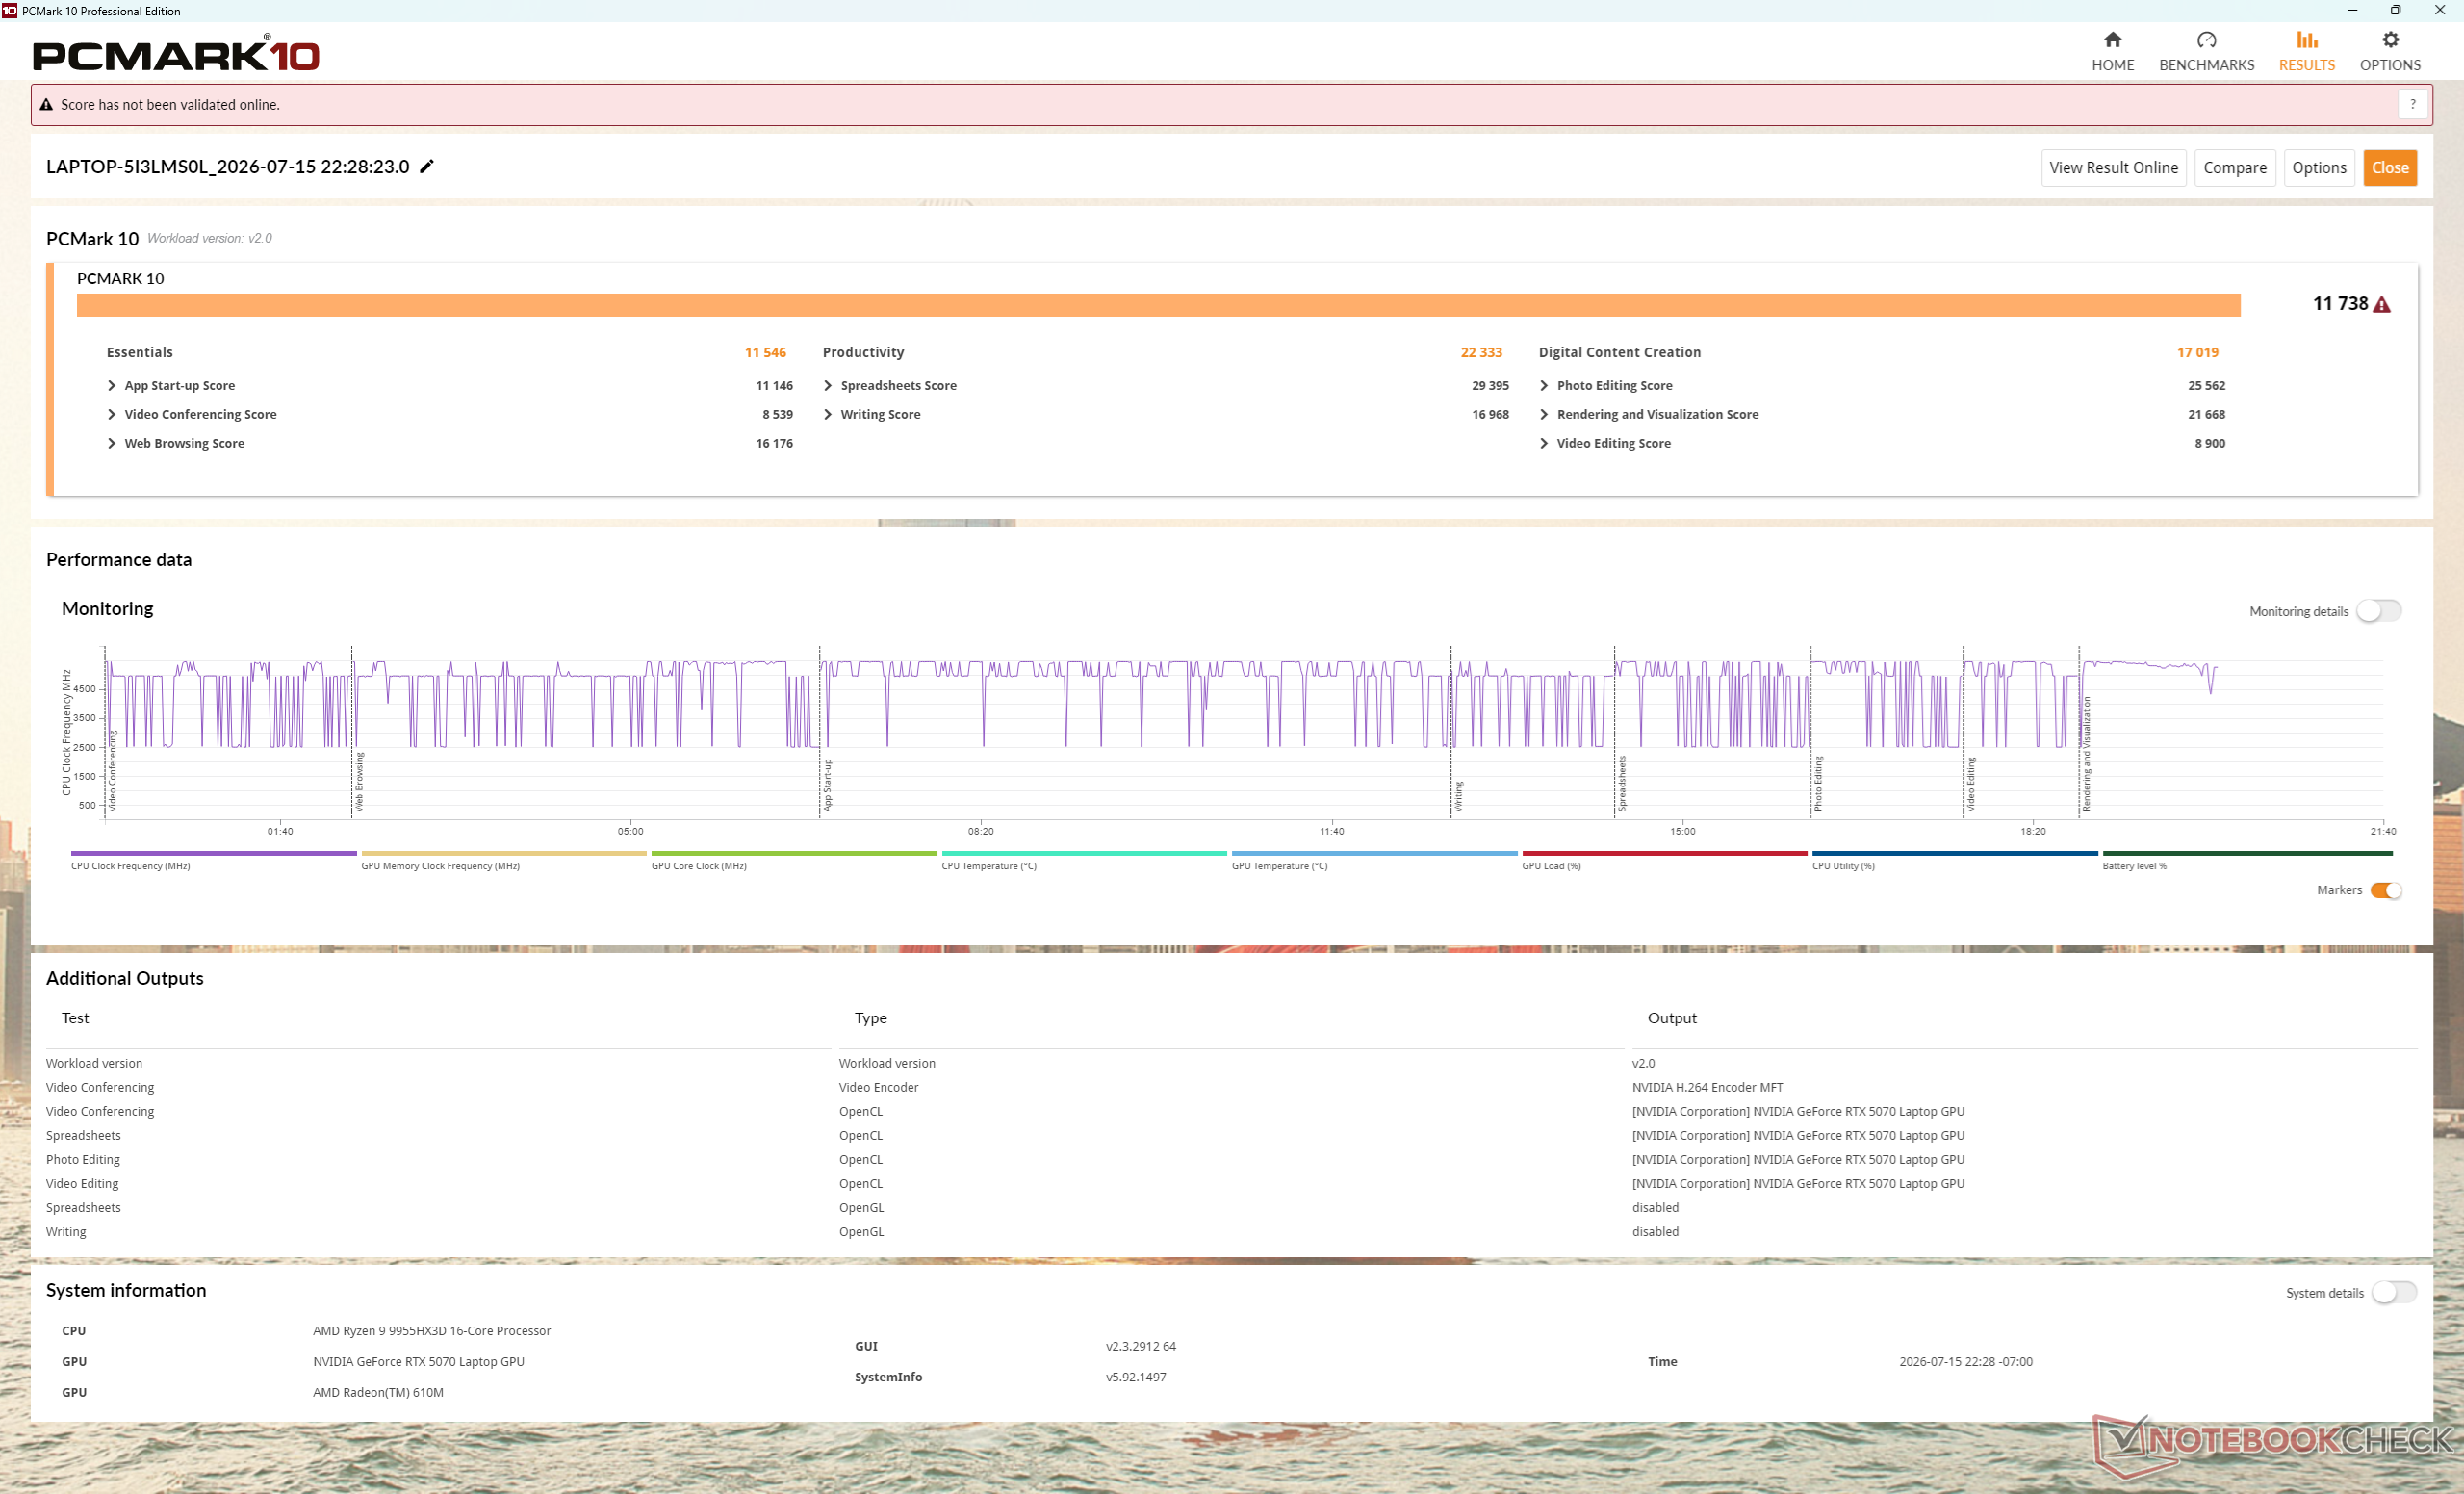
Eccellente punteggio PCMark 10, sostenuto dall’elevatissimo punteggio parziale nella categoria “Produttività” ottenuto grazie alla CPU a 16 core
Performance rating
Alienware 16X Aurora Core Ultra 9 290HX Plus
GeForce RTX 5070 Ti Laptop, Ultra 9 290HX Plus
92.6 pt
HP HyperX Omen 16 16-ap1931nr
GeForce RTX 5070 Laptop, R9 9955HX3D
85 pt
MSI Crosshair A16 HX E8WGK
GeForce RTX 5070 Laptop, R9 8940HX, Micron 2500 1TB MTFDKBA1T0QGN
84.5 pt
Lenovo Legion Pro 5 16IAX10, RTX 5070
GeForce RTX 5070 Laptop, Ultra 7 255HX, SK Hynix HFS001TEJ9X115N
80.7 pt
Asus TUF Gaming A16 FA608UP -4!
GeForce RTX 5070 Laptop, R7 260, Western Digital PC SN5000S SDEQNSJ-1T00
68.5 pt
HP Omen 16-ap0091ng
GeForce RTX 5060 Laptop, R9 8940HX, Samsung PM9C1b MZVL81T0HFLB-00BH1
68.1 pt
PCMark 10 / Score
HP HyperX Omen 16 16-ap1931nr
GeForce RTX 5070 Laptop, R9 9955HX3D
11738 Points
MSI Crosshair A16 HX E8WGK
GeForce RTX 5070 Laptop, R9 8940HX, Micron 2500 1TB MTFDKBA1T0QGN
11334 Points -3%
Alienware 16X Aurora Core Ultra 9 290HX Plus
GeForce RTX 5070 Ti Laptop, Ultra 9 290HX Plus
10891 Points -7%
Lenovo Legion Pro 5 16IAX10, RTX 5070
GeForce RTX 5070 Laptop, Ultra 7 255HX, SK Hynix HFS001TEJ9X115N
8910 Points -24%
HP Omen 16-ap0091ng
GeForce RTX 5060 Laptop, R9 8940HX, Samsung PM9C1b MZVL81T0HFLB-00BH1
8054 Points -31%
PCMark 10 / Essentials
Alienware 16X Aurora Core Ultra 9 290HX Plus
GeForce RTX 5070 Ti Laptop, Ultra 9 290HX Plus
11935 Points +3%
HP HyperX Omen 16 16-ap1931nr
GeForce RTX 5070 Laptop, R9 9955HX3D
11546 Points
MSI Crosshair A16 HX E8WGK
GeForce RTX 5070 Laptop, R9 8940HX, Micron 2500 1TB MTFDKBA1T0QGN
11393 Points -1%
Lenovo Legion Pro 5 16IAX10, RTX 5070
GeForce RTX 5070 Laptop, Ultra 7 255HX, SK Hynix HFS001TEJ9X115N
11229 Points -3%
HP Omen 16-ap0091ng
GeForce RTX 5060 Laptop, R9 8940HX, Samsung PM9C1b MZVL81T0HFLB-00BH1
10709 Points -7%
PCMark 10 / Productivity
HP HyperX Omen 16 16-ap1931nr
GeForce RTX 5070 Laptop, R9 9955HX3D
22333 Points
MSI Crosshair A16 HX E8WGK
GeForce RTX 5070 Laptop, R9 8940HX, Micron 2500 1TB MTFDKBA1T0QGN
21327 Points -5%
Alienware 16X Aurora Core Ultra 9 290HX Plus
GeForce RTX 5070 Ti Laptop, Ultra 9 290HX Plus
16565 Points -26%
Lenovo Legion Pro 5 16IAX10, RTX 5070
GeForce RTX 5070 Laptop, Ultra 7 255HX, SK Hynix HFS001TEJ9X115N
9938 Points -56%
HP Omen 16-ap0091ng
GeForce RTX 5060 Laptop, R9 8940HX, Samsung PM9C1b MZVL81T0HFLB-00BH1
9831 Points -56%
PCMark 10 / Digital Content Creation
Alienware 16X Aurora Core Ultra 9 290HX Plus
GeForce RTX 5070 Ti Laptop, Ultra 9 290HX Plus
17730 Points +4%
Lenovo Legion Pro 5 16IAX10, RTX 5070
GeForce RTX 5070 Laptop, Ultra 7 255HX, SK Hynix HFS001TEJ9X115N
17200 Points +1%
HP HyperX Omen 16 16-ap1931nr
GeForce RTX 5070 Laptop, R9 9955HX3D
17019 Points
MSI Crosshair A16 HX E8WGK
GeForce RTX 5070 Laptop, R9 8940HX, Micron 2500 1TB MTFDKBA1T0QGN
16259 Points -4%
HP Omen 16-ap0091ng
GeForce RTX 5060 Laptop, R9 8940HX, Samsung PM9C1b MZVL81T0HFLB-00BH1
13465 Points -21%
CrossMark / Overall
Alienware 16X Aurora Core Ultra 9 290HX Plus
GeForce RTX 5070 Ti Laptop, Ultra 9 290HX Plus
2390 Points +20%
Lenovo Legion Pro 5 16IAX10, RTX 5070
GeForce RTX 5070 Laptop, Ultra 7 255HX, SK Hynix HFS001TEJ9X115N
2056 Points +3%
MSI Crosshair A16 HX E8WGK
GeForce RTX 5070 Laptop, R9 8940HX, Micron 2500 1TB MTFDKBA1T0QGN
2011 Points +1%
HP HyperX Omen 16 16-ap1931nr
GeForce RTX 5070 Laptop, R9 9955HX3D
1990 Points
HP Omen 16-ap0091ng
GeForce RTX 5060 Laptop, R9 8940HX, Samsung PM9C1b MZVL81T0HFLB-00BH1
1903 Points -4%
Asus TUF Gaming A16 FA608UP
GeForce RTX 5070 Laptop, R7 260, Western Digital PC SN5000S SDEQNSJ-1T00
1712 Points -14%
CrossMark / Productivity
Alienware 16X Aurora Core Ultra 9 290HX Plus
GeForce RTX 5070 Ti Laptop, Ultra 9 290HX Plus
2254 Points +22%
Lenovo Legion Pro 5 16IAX10, RTX 5070
GeForce RTX 5070 Laptop, Ultra 7 255HX, SK Hynix HFS001TEJ9X115N
1926 Points +5%
MSI Crosshair A16 HX E8WGK
GeForce RTX 5070 Laptop, R9 8940HX, Micron 2500 1TB MTFDKBA1T0QGN
1869 Points +1%
HP HyperX Omen 16 16-ap1931nr
GeForce RTX 5070 Laptop, R9 9955HX3D
1843 Points
HP Omen 16-ap0091ng
GeForce RTX 5060 Laptop, R9 8940HX, Samsung PM9C1b MZVL81T0HFLB-00BH1
1831 Points -1%
Asus TUF Gaming A16 FA608UP
GeForce RTX 5070 Laptop, R7 260, Western Digital PC SN5000S SDEQNSJ-1T00
1648 Points -11%
CrossMark / Creativity
Alienware 16X Aurora Core Ultra 9 290HX Plus
GeForce RTX 5070 Ti Laptop, Ultra 9 290HX Plus
2571 Points +13%
Lenovo Legion Pro 5 16IAX10, RTX 5070
GeForce RTX 5070 Laptop, Ultra 7 255HX, SK Hynix HFS001TEJ9X115N
2317 Points +2%
MSI Crosshair A16 HX E8WGK
GeForce RTX 5070 Laptop, R9 8940HX, Micron 2500 1TB MTFDKBA1T0QGN
2298 Points +1%
HP HyperX Omen 16 16-ap1931nr
GeForce RTX 5070 Laptop, R9 9955HX3D
2267 Points
HP Omen 16-ap0091ng
GeForce RTX 5060 Laptop, R9 8940HX, Samsung PM9C1b MZVL81T0HFLB-00BH1
2112 Points -7%
Asus TUF Gaming A16 FA608UP
GeForce RTX 5070 Laptop, R7 260, Western Digital PC SN5000S SDEQNSJ-1T00
1879 Points -17%
CrossMark / Responsiveness
Alienware 16X Aurora Core Ultra 9 290HX Plus
GeForce RTX 5070 Ti Laptop, Ultra 9 290HX Plus
2289 Points +35%
Lenovo Legion Pro 5 16IAX10, RTX 5070
GeForce RTX 5070 Laptop, Ultra 7 255HX, SK Hynix HFS001TEJ9X115N
1748 Points +3%
HP HyperX Omen 16 16-ap1931nr
GeForce RTX 5070 Laptop, R9 9955HX3D
1691 Points
MSI Crosshair A16 HX E8WGK
GeForce RTX 5070 Laptop, R9 8940HX, Micron 2500 1TB MTFDKBA1T0QGN
1680 Points -1%
HP Omen 16-ap0091ng
GeForce RTX 5060 Laptop, R9 8940HX, Samsung PM9C1b MZVL81T0HFLB-00BH1
1562 Points -8%
Asus TUF Gaming A16 FA608UP
GeForce RTX 5070 Laptop, R7 260, Western Digital PC SN5000S SDEQNSJ-1T00
1454 Points -14%
WebXPRT 3 / Overall
Alienware 16X Aurora Core Ultra 9 290HX Plus
GeForce RTX 5070 Ti Laptop, Ultra 9 290HX Plus
375 Points +11%
HP HyperX Omen 16 16-ap1931nr
GeForce RTX 5070 Laptop, R9 9955HX3D
339 Points
Lenovo Legion Pro 5 16IAX10, RTX 5070
GeForce RTX 5070 Laptop, Ultra 7 255HX, SK Hynix HFS001TEJ9X115N
335 Points -1%
HP Omen 16-ap0091ng
GeForce RTX 5060 Laptop, R9 8940HX, Samsung PM9C1b MZVL81T0HFLB-00BH1
322 Points -5%
MSI Crosshair A16 HX E8WGK
GeForce RTX 5070 Laptop, R9 8940HX, Micron 2500 1TB MTFDKBA1T0QGN
322 Points -5%
Asus TUF Gaming A16 FA608UP
GeForce RTX 5070 Laptop, R7 260, Western Digital PC SN5000S SDEQNSJ-1T00
297 Points -12%
WebXPRT 4 / Overall
Alienware 16X Aurora Core Ultra 9 290HX Plus
GeForce RTX 5070 Ti Laptop, Ultra 9 290HX Plus
345 Points +8%
Lenovo Legion Pro 5 16IAX10, RTX 5070
GeForce RTX 5070 Laptop, Ultra 7 255HX, SK Hynix HFS001TEJ9X115N
326 Points +3%
HP HyperX Omen 16 16-ap1931nr
GeForce RTX 5070 Laptop, R9 9955HX3D
318 Points
MSI Crosshair A16 HX E8WGK
GeForce RTX 5070 Laptop, R9 8940HX, Micron 2500 1TB MTFDKBA1T0QGN
283 Points -11%
HP Omen 16-ap0091ng
GeForce RTX 5060 Laptop, R9 8940HX, Samsung PM9C1b MZVL81T0HFLB-00BH1
253 Points -20%
Asus TUF Gaming A16 FA608UP
GeForce RTX 5070 Laptop, R7 260, Western Digital PC SN5000S SDEQNSJ-1T00
239 Points -25%
Mozilla Kraken 1.1 / Total
Asus TUF Gaming A16 FA608UP
GeForce RTX 5070 Laptop, R7 260, Western Digital PC SN5000S SDEQNSJ-1T00
562 ms * -40%
HP Omen 16-ap0091ng
GeForce RTX 5060 Laptop, R9 8940HX, Samsung PM9C1b MZVL81T0HFLB-00BH1
509 ms * -27%
MSI Crosshair A16 HX E8WGK
GeForce RTX 5070 Laptop, R9 8940HX, Micron 2500 1TB MTFDKBA1T0QGN
474 ms * -18%
Lenovo Legion Pro 5 16IAX10, RTX 5070
GeForce RTX 5070 Laptop, Ultra 7 255HX, SK Hynix HFS001TEJ9X115N
429 ms * -7%
HP HyperX Omen 16 16-ap1931nr
GeForce RTX 5070 Laptop, R9 9955HX3D
402 ms *
Alienware 16X Aurora Core Ultra 9 290HX Plus
GeForce RTX 5070 Ti Laptop, Ultra 9 290HX Plus
394 ms * +2%
Geekbench AI / Quantized GPU 1.7
Alienware 16X Aurora Core Ultra 9 290HX Plus
GeForce RTX 5070 Ti Laptop, Ultra 9 290HX Plus
19163 Points +14%
MSI Crosshair A16 HX E8WGK
GeForce RTX 5070 Laptop, R9 8940HX, Micron 2500 1TB MTFDKBA1T0QGN
18147 Points +8%
Lenovo Legion Pro 5 16IAX10, RTX 5070
GeForce RTX 5070 Laptop, Ultra 7 255HX, SK Hynix HFS001TEJ9X115N
17210 Points +2%
HP HyperX Omen 16 16-ap1931nr
GeForce RTX 5070 Laptop, R9 9955HX3D
16797 Points
Asus TUF Gaming A16 FA608UP
GeForce RTX 5070 Laptop, R7 260, Western Digital PC SN5000S SDEQNSJ-1T00
16466 Points -2%
HP Omen 16-ap0091ng
GeForce RTX 5060 Laptop, R9 8940HX, Samsung PM9C1b MZVL81T0HFLB-00BH1
13288 Points -21%
Geekbench AI / Half Precision GPU 1.7
MSI Crosshair A16 HX E8WGK
GeForce RTX 5070 Laptop, R9 8940HX, Micron 2500 1TB MTFDKBA1T0QGN
45382 Points +17%
Alienware 16X Aurora Core Ultra 9 290HX Plus
GeForce RTX 5070 Ti Laptop, Ultra 9 290HX Plus
45324 Points +17%
Lenovo Legion Pro 5 16IAX10, RTX 5070
GeForce RTX 5070 Laptop, Ultra 7 255HX, SK Hynix HFS001TEJ9X115N
41962 Points +8%
HP HyperX Omen 16 16-ap1931nr
GeForce RTX 5070 Laptop, R9 9955HX3D
38675 Points
Asus TUF Gaming A16 FA608UP
GeForce RTX 5070 Laptop, R7 260, Western Digital PC SN5000S SDEQNSJ-1T00
38118 Points -1%
HP Omen 16-ap0091ng
GeForce RTX 5060 Laptop, R9 8940HX, Samsung PM9C1b MZVL81T0HFLB-00BH1
27029 Points -30%
Geekbench AI / Single Precision GPU 1.7
Alienware 16X Aurora Core Ultra 9 290HX Plus
GeForce RTX 5070 Ti Laptop, Ultra 9 290HX Plus
24661 Points +16%
MSI Crosshair A16 HX E8WGK
GeForce RTX 5070 Laptop, R9 8940HX, Micron 2500 1TB MTFDKBA1T0QGN
23474 Points +10%
Lenovo Legion Pro 5 16IAX10, RTX 5070
GeForce RTX 5070 Laptop, Ultra 7 255HX, SK Hynix HFS001TEJ9X115N
22431 Points +6%
HP HyperX Omen 16 16-ap1931nr
GeForce RTX 5070 Laptop, R9 9955HX3D
21259 Points
Asus TUF Gaming A16 FA608UP
GeForce RTX 5070 Laptop, R7 260, Western Digital PC SN5000S SDEQNSJ-1T00
21012 Points -1%
HP Omen 16-ap0091ng
GeForce RTX 5060 Laptop, R9 8940HX, Samsung PM9C1b MZVL81T0HFLB-00BH1
16368 Points -23%

* ... Meglio usare valori piccoli
PCMark 10 Score
11738 punti
Aiuto
AIDA64 / Memory Copy
Lenovo Legion Pro 5 16IAX10, RTX 5070
Intel Core Ultra 7 255HX, GeForce RTX 5070 Laptop
85286 MB/s +35%
Alienware 16X Aurora Core Ultra 9 290HX Plus
Intel Core Ultra 9 290HX Plus, GeForce RTX 5070 Ti Laptop
76912 MB/s +22%
Asus TUF Gaming A16 FA608UP
AMD Ryzen 7 260, GeForce RTX 5070 Laptop
67750 MB/s +7%
HP HyperX Omen 16 16-ap1931nr
AMD Ryzen 9 9955HX3D, GeForce RTX 5070 Laptop
63072 MB/s
Media AMD Ryzen 9 9955HX3D
  (56383 - 63173, n=4)
61040 MB/s -3%
MSI Crosshair A16 HX E8WGK
AMD Ryzen 9 8940HX, GeForce RTX 5070 Laptop
55263 MB/s -12%
HP Omen 16-ap0091ng
AMD Ryzen 9 8940HX, GeForce RTX 5060 Laptop
29102 MB/s -54%
AIDA64 / Memory Read
Lenovo Legion Pro 5 16IAX10, RTX 5070
Intel Core Ultra 7 255HX, GeForce RTX 5070 Laptop
95821 MB/s +44%
Alienware 16X Aurora Core Ultra 9 290HX Plus
Intel Core Ultra 9 290HX Plus, GeForce RTX 5070 Ti Laptop
84638 MB/s +28%
HP HyperX Omen 16 16-ap1931nr
AMD Ryzen 9 9955HX3D, GeForce RTX 5070 Laptop
66378 MB/s
MSI Crosshair A16 HX E8WGK
AMD Ryzen 9 8940HX, GeForce RTX 5070 Laptop
66207 MB/s 0%
Media AMD Ryzen 9 9955HX3D
  (59750 - 66539, n=4)
64509 MB/s -3%
Asus TUF Gaming A16 FA608UP
AMD Ryzen 7 260, GeForce RTX 5070 Laptop
61170 MB/s -8%
HP Omen 16-ap0091ng
AMD Ryzen 9 8940HX, GeForce RTX 5060 Laptop
35634 MB/s -46%
AIDA64 / Memory Write
Asus TUF Gaming A16 FA608UP
AMD Ryzen 7 260, GeForce RTX 5070 Laptop
86401 MB/s +25%
Lenovo Legion Pro 5 16IAX10, RTX 5070
Intel Core Ultra 7 255HX, GeForce RTX 5070 Laptop
84882 MB/s +23%
Alienware 16X Aurora Core Ultra 9 290HX Plus
Intel Core Ultra 9 290HX Plus, GeForce RTX 5070 Ti Laptop
76094 MB/s +10%
HP HyperX Omen 16 16-ap1931nr
AMD Ryzen 9 9955HX3D, GeForce RTX 5070 Laptop
69285 MB/s
Media AMD Ryzen 9 9955HX3D
  (59506 - 72898, n=4)
67780 MB/s -2%
MSI Crosshair A16 HX E8WGK
AMD Ryzen 9 8940HX, GeForce RTX 5070 Laptop
61853 MB/s -11%
HP Omen 16-ap0091ng
AMD Ryzen 9 8940HX, GeForce RTX 5060 Laptop
32239 MB/s -53%
AIDA64 / Memory Latency
Alienware 16X Aurora Core Ultra 9 290HX Plus
Intel Core Ultra 9 290HX Plus, GeForce RTX 5070 Ti Laptop
108.4 ns * -11%
Lenovo Legion Pro 5 16IAX10, RTX 5070
Intel Core Ultra 7 255HX, GeForce RTX 5070 Laptop
104.2 ns * -6%
Media AMD Ryzen 9 9955HX3D
  (96.1 - 103.6, n=4)
99.5 ns * -2%
HP HyperX Omen 16 16-ap1931nr
AMD Ryzen 9 9955HX3D, GeForce RTX 5070 Laptop
98 ns *
Asus TUF Gaming A16 FA608UP
AMD Ryzen 7 260, GeForce RTX 5070 Laptop
93.8 ns * +4%
MSI Crosshair A16 HX E8WGK
AMD Ryzen 9 8940HX, GeForce RTX 5070 Laptop
87.1 ns * +11%
HP Omen 16-ap0091ng
AMD Ryzen 9 8940HX, GeForce RTX 5060 Laptop
83.5 ns * +15%

* ... Meglio usare valori piccoli

Latenza DPC
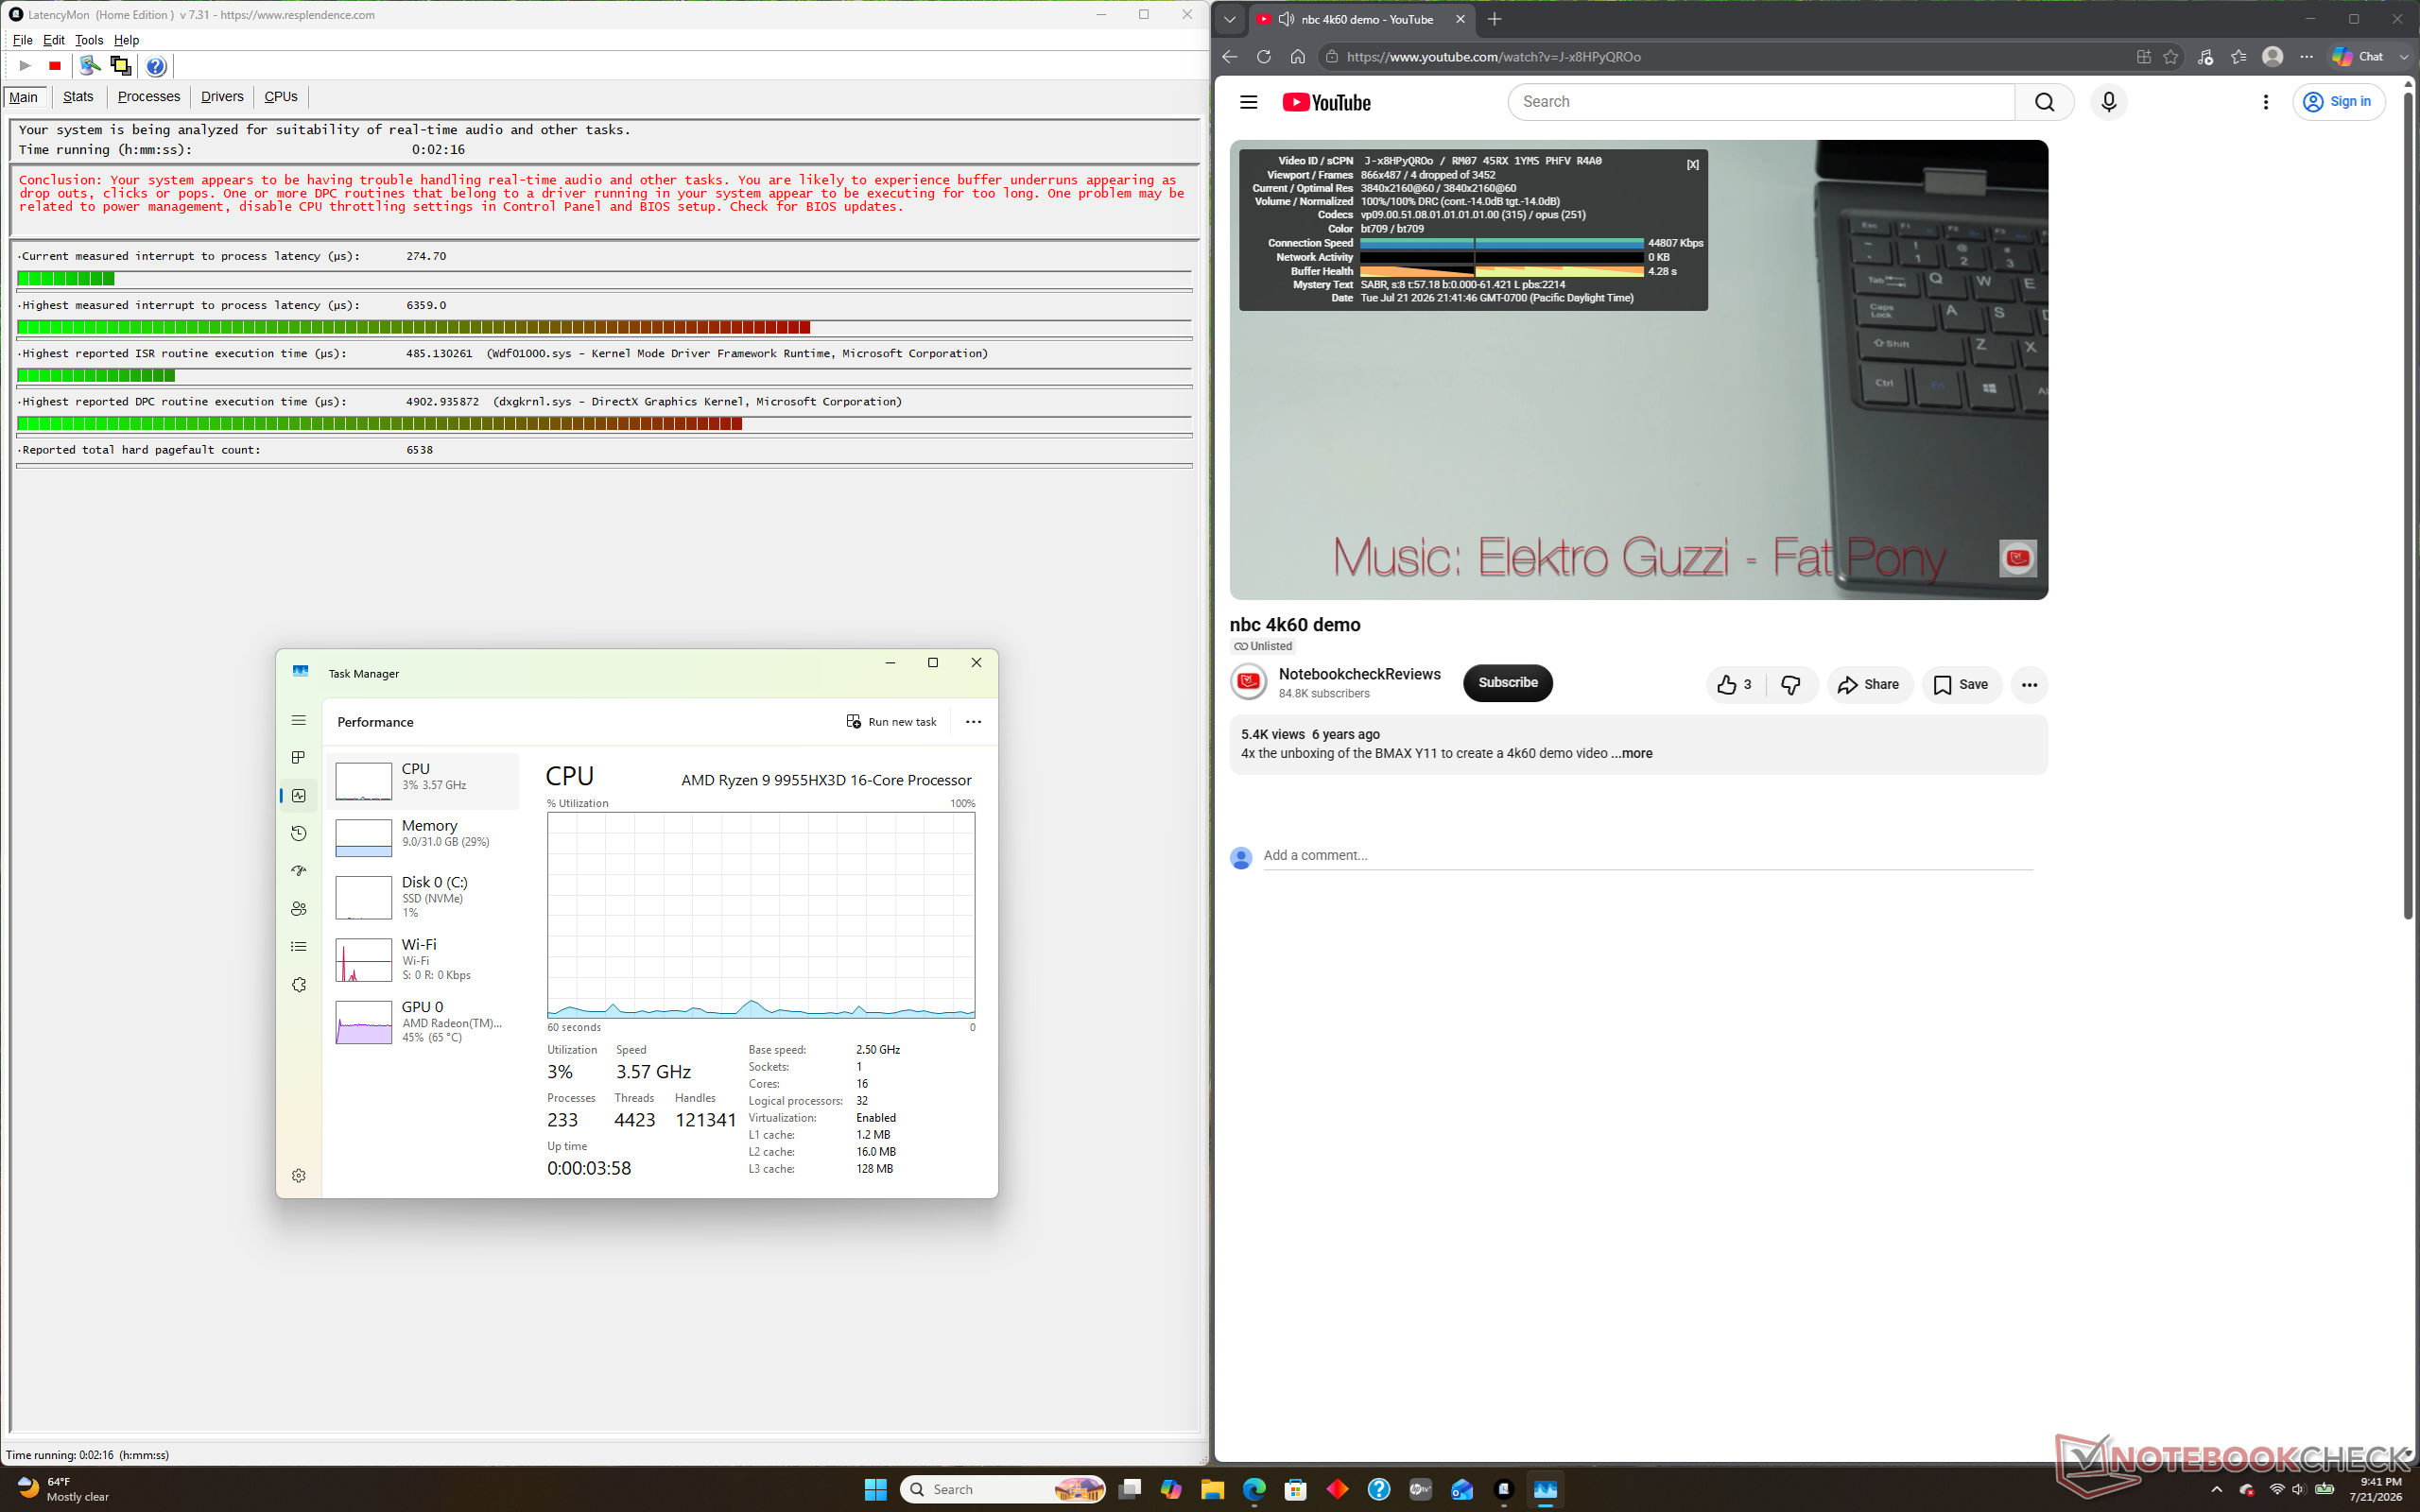
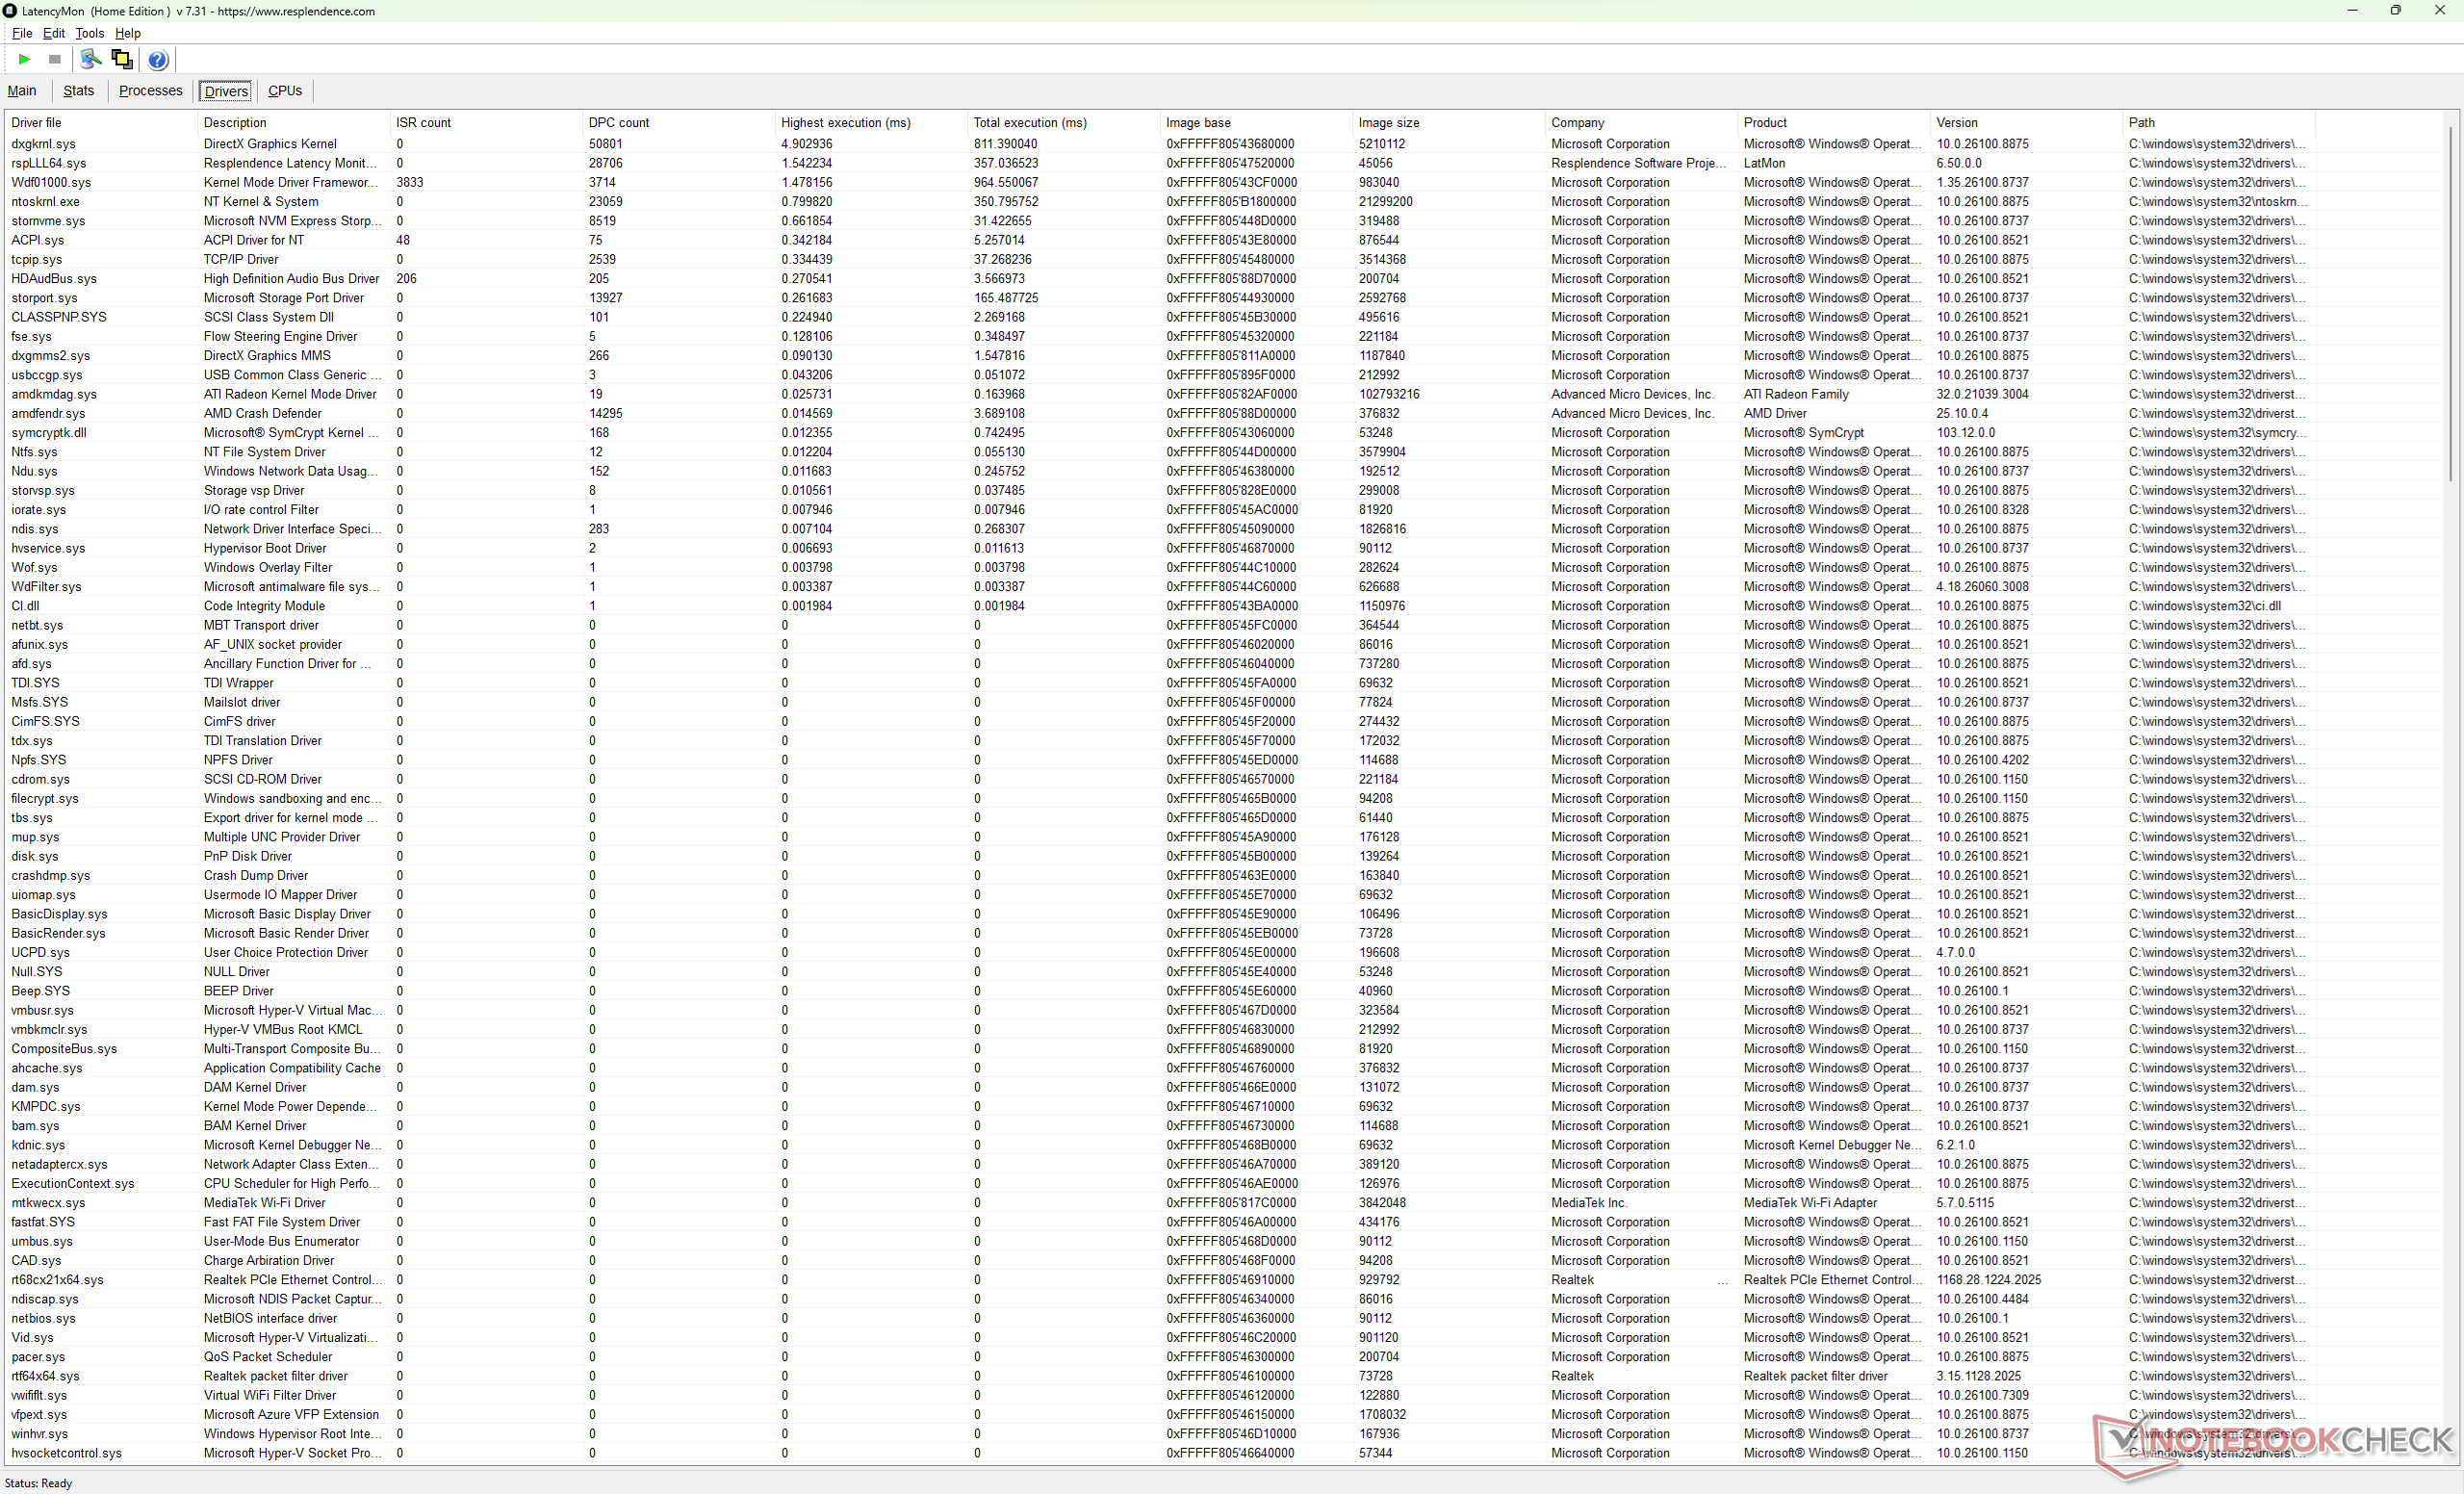
LatencyMon rileva problemi di DPC e 4 fotogrammi persi durante la riproduzione di contenuti video 4K60, anche dopo ripetuti tentativi
Elenco dei driver
Elenco dei driver
DPC Latencies / LatencyMon - interrupt to process latency (max), Web, Youtube, Prime95
HP HyperX Omen 16 16-ap1931nr
GeForce RTX 5070 Laptop, R9 9955HX3D
6359 μs *
Alienware 16X Aurora Core Ultra 9 290HX Plus
GeForce RTX 5070 Ti Laptop, Ultra 9 290HX Plus
4122.5 μs * +35%
MSI Crosshair A16 HX E8WGK
GeForce RTX 5070 Laptop, R9 8940HX, Micron 2500 1TB MTFDKBA1T0QGN
1690 μs * +73%
HP Omen 16-ap0091ng
GeForce RTX 5060 Laptop, R9 8940HX, Samsung PM9C1b MZVL81T0HFLB-00BH1
1425.3 μs * +78%
Lenovo Legion Pro 5 16IAX10, RTX 5070
GeForce RTX 5070 Laptop, Ultra 7 255HX, SK Hynix HFS001TEJ9X115N
810.5 μs * +87%
Asus TUF Gaming A16 FA608UP
GeForce RTX 5070 Laptop, R7 260, Western Digital PC SN5000S SDEQNSJ-1T00
563.8 μs * +91%

* ... Meglio usare valori piccoli

Dispositivi di archiviazione
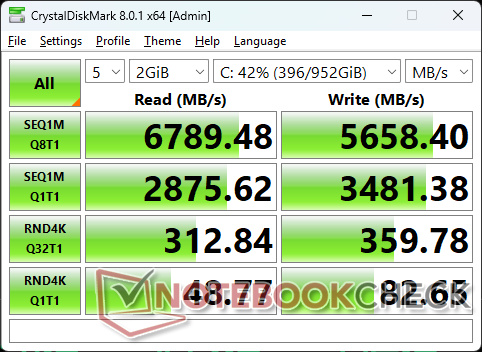
CDM 8
CDM 8
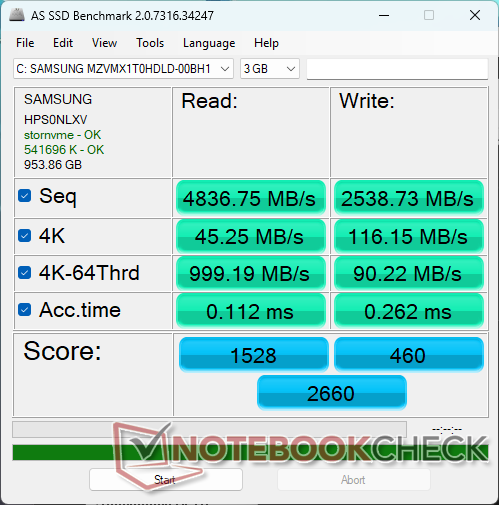
AS SSD
AS SSD
Sequential Read: 4836.75MB/s
Sequential Write: 2538.73MB/s
4K Read: 45.25MB/s
4K Write: 116.15MB/s
4K-64 Read: 999.19MB/s
4K-64 Write: 90.22MB/s
Access Time Read: 0.112ms
Access Time Write: 0.262ms
Copy ISO: 3127.57MB/s
Copy Program: 958.69MB/s
Copy Game: 287.74MB/s
Score Read: 1528Points
Score Write: 460Points
Score Total: 2660Points
Drive Performance rating - Percent
Alienware 16X Aurora Core Ultra 9 290HX Plus
 
95.5 pt
Lenovo Legion Pro 5 16IAX10, RTX 5070
SK Hynix HFS001TEJ9X115N
78.8 pt
MSI Crosshair A16 HX E8WGK
Micron 2500 1TB MTFDKBA1T0QGN
62.6 pt
HP Omen 16-ap0091ng
Samsung PM9C1b MZVL81T0HFLB-00BH1
55.5 pt
Asus TUF Gaming A16 FA608UP
Western Digital PC SN5000S SDEQNSJ-1T00
55.2 pt
HP HyperX Omen 16 16-ap1931nr
 
38.1 pt
DiskSpd
seq read
Lenovo Legion Pro 5 16IAX10, RTX 5070
SK Hynix HFS001TEJ9X115N
4778 (4600.31min - 4777.52max) MB/s +45%
Alienware 16X Aurora Core Ultra 9 290HX Plus
 
4669 (4086.52min - 4669.2max) MB/s +42%
HP HyperX Omen 16 16-ap1931nr
 
3291 (3274.91min - 3291.27max) MB/s
MSI Crosshair A16 HX E8WGK
Micron 2500 1TB MTFDKBA1T0QGN
3253 (3214.59min - 3253.1max) MB/s -1%
HP Omen 16-ap0091ng
Samsung PM9C1b MZVL81T0HFLB-00BH1
3031 (2761.74min - 3031.45max) MB/s -8%
Asus TUF Gaming A16 FA608UP
Western Digital PC SN5000S SDEQNSJ-1T00
1717 (1605.72min - 1717.49max) MB/s -48%
seq write
Alienware 16X Aurora Core Ultra 9 290HX Plus
 
5645 (1502.75min - 5644.73max) MB/s +258%
MSI Crosshair A16 HX E8WGK
Micron 2500 1TB MTFDKBA1T0QGN
4062 (3914.68min - 4062.45max) MB/s +157%
Asus TUF Gaming A16 FA608UP
Western Digital PC SN5000S SDEQNSJ-1T00
3830 (3464.7min - 3830.45max) MB/s +143%
HP Omen 16-ap0091ng
Samsung PM9C1b MZVL81T0HFLB-00BH1
3704 (3259.18min - 3704.34max) MB/s +135%
Lenovo Legion Pro 5 16IAX10, RTX 5070
SK Hynix HFS001TEJ9X115N
1793 (1679.19min - 1792.86max) MB/s +14%
HP HyperX Omen 16 16-ap1931nr
 
1578 (1318.06min - 1577.89max) MB/s
seq q8 t1 read
MSI Crosshair A16 HX E8WGK
Micron 2500 1TB MTFDKBA1T0QGN
7324 (6376.43min - 7324.33max) MB/s +2%
HP Omen 16-ap0091ng
Samsung PM9C1b MZVL81T0HFLB-00BH1
7258 (6649.77min - 7257.61max) MB/s +1%
HP HyperX Omen 16 16-ap1931nr
 
7169 (3534.12min - 7168.9max) MB/s
Lenovo Legion Pro 5 16IAX10, RTX 5070
SK Hynix HFS001TEJ9X115N
7146 (5921.52min - 7145.87max) MB/s 0%
Alienware 16X Aurora Core Ultra 9 290HX Plus
 
7035 (6225.19min - 7034.67max) MB/s -2%
Asus TUF Gaming A16 FA608UP
Western Digital PC SN5000S SDEQNSJ-1T00
6365 (5802.54min - 6364.58max) MB/s -11%
seq q8 t1 write
Alienware 16X Aurora Core Ultra 9 290HX Plus
 
6525 (6509.96min - 6524.66max) MB/s +80%
MSI Crosshair A16 HX E8WGK
Micron 2500 1TB MTFDKBA1T0QGN
6109 (6054.95min - 6109.42max) MB/s +68%
Lenovo Legion Pro 5 16IAX10, RTX 5070
SK Hynix HFS001TEJ9X115N
6086 (6054.06min - 6085.94max) MB/s +68%
HP Omen 16-ap0091ng
Samsung PM9C1b MZVL81T0HFLB-00BH1
5750 (5600.99min - 5749.76max) MB/s +59%
Asus TUF Gaming A16 FA608UP
Western Digital PC SN5000S SDEQNSJ-1T00
5576 (5054.3min - 5575.91max) MB/s +54%
HP HyperX Omen 16 16-ap1931nr
 
3626 (170.08min - 3625.89max) MB/s
4k q1 t1 read
Alienware 16X Aurora Core Ultra 9 290HX Plus
 
79.5 (77.33min - 79.48max) MB/s +61%
Asus TUF Gaming A16 FA608UP
Western Digital PC SN5000S SDEQNSJ-1T00
71.9 (71.68min - 71.87max) MB/s +45%
MSI Crosshair A16 HX E8WGK
Micron 2500 1TB MTFDKBA1T0QGN
63.4 (63.17min - 63.39max) MB/s +28%
Lenovo Legion Pro 5 16IAX10, RTX 5070
SK Hynix HFS001TEJ9X115N
61.5 (61.03min - 61.51max) MB/s +24%
HP Omen 16-ap0091ng
Samsung PM9C1b MZVL81T0HFLB-00BH1
51.7 (50.4min - 51.66max) MB/s +4%
HP HyperX Omen 16 16-ap1931nr
 
49.5 (48.58min - 49.45max) MB/s
4k q1 t1 write
Alienware 16X Aurora Core Ultra 9 290HX Plus
 
338 (317.84min - 337.66max) MB/s +188%
MSI Crosshair A16 HX E8WGK
Micron 2500 1TB MTFDKBA1T0QGN
165.1 (163.36min - 165.14max) MB/s +41%
Lenovo Legion Pro 5 16IAX10, RTX 5070
SK Hynix HFS001TEJ9X115N
154 (87.61min - 154.04max) MB/s +31%
Asus TUF Gaming A16 FA608UP
Western Digital PC SN5000S SDEQNSJ-1T00
143.8 (140.01min - 143.77max) MB/s +22%
HP HyperX Omen 16 16-ap1931nr
 
117.4 (92.53min - 117.43max) MB/s
HP Omen 16-ap0091ng
Samsung PM9C1b MZVL81T0HFLB-00BH1
96.7 (95.77min - 96.65max) MB/s -18%
4k q32 t16 read
Alienware 16X Aurora Core Ultra 9 290HX Plus
 
4999 (4701.95min - 4999.05max) MB/s +398%
Lenovo Legion Pro 5 16IAX10, RTX 5070
SK Hynix HFS001TEJ9X115N
4691 (4642.12min - 4690.75max) MB/s +368%
Asus TUF Gaming A16 FA608UP
Western Digital PC SN5000S SDEQNSJ-1T00
1036 (949.61min - 1035.55max) MB/s +3%
HP HyperX Omen 16 16-ap1931nr
 
1003 (969.75min - 1003.25max) MB/s
MSI Crosshair A16 HX E8WGK
Micron 2500 1TB MTFDKBA1T0QGN
994 (979.79min - 994.26max) MB/s -1%
HP Omen 16-ap0091ng
Samsung PM9C1b MZVL81T0HFLB-00BH1
889 (844.18min - 889.18max) MB/s -11%
4k q32 t16 write
Alienware 16X Aurora Core Ultra 9 290HX Plus
 
4388 (1358.14min - 4387.65max) MB/s +810%
Lenovo Legion Pro 5 16IAX10, RTX 5070
SK Hynix HFS001TEJ9X115N
4001 (3124.4min - 4001.37max) MB/s +730%
HP HyperX Omen 16 16-ap1931nr
 
482 (286.45min - 482.02max) MB/s
Asus TUF Gaming A16 FA608UP
Western Digital PC SN5000S SDEQNSJ-1T00
455 (405.09min - 455.15max) MB/s -6%
MSI Crosshair A16 HX E8WGK
Micron 2500 1TB MTFDKBA1T0QGN
436 (430.48min - 436.24max) MB/s -10%
HP Omen 16-ap0091ng
Samsung PM9C1b MZVL81T0HFLB-00BH1
356 (352.83min - 355.66max) MB/s -26%
AS SSD
Score Total
Alienware 16X Aurora Core Ultra 9 290HX Plus
 
9593 Points +261%
Lenovo Legion Pro 5 16IAX10, RTX 5070
SK Hynix HFS001TEJ9X115N
8115 Points +205%
MSI Crosshair A16 HX E8WGK
Micron 2500 1TB MTFDKBA1T0QGN
6234 Points +134%
HP Omen 16-ap0091ng
Samsung PM9C1b MZVL81T0HFLB-00BH1
5084 Points +91%
Asus TUF Gaming A16 FA608UP
Western Digital PC SN5000S SDEQNSJ-1T00
4498 Points +69%
HP HyperX Omen 16 16-ap1931nr
 
2660 Points
Score Read
Lenovo Legion Pro 5 16IAX10, RTX 5070
SK Hynix HFS001TEJ9X115N
3166 Points +107%
Alienware 16X Aurora Core Ultra 9 290HX Plus
 
2811 Points +84%
MSI Crosshair A16 HX E8WGK
Micron 2500 1TB MTFDKBA1T0QGN
1629 Points +7%
HP HyperX Omen 16 16-ap1931nr
 
1528 Points
HP Omen 16-ap0091ng
Samsung PM9C1b MZVL81T0HFLB-00BH1
1384 Points -9%
Asus TUF Gaming A16 FA608UP
Western Digital PC SN5000S SDEQNSJ-1T00
1333 Points -13%
Score Write
Alienware 16X Aurora Core Ultra 9 290HX Plus
 
5340 Points +1061%
MSI Crosshair A16 HX E8WGK
Micron 2500 1TB MTFDKBA1T0QGN
3890 Points +746%
Lenovo Legion Pro 5 16IAX10, RTX 5070
SK Hynix HFS001TEJ9X115N
3493 Points +659%
HP Omen 16-ap0091ng
Samsung PM9C1b MZVL81T0HFLB-00BH1
3046 Points +562%
Asus TUF Gaming A16 FA608UP
Western Digital PC SN5000S SDEQNSJ-1T00
2553 Points +455%
HP HyperX Omen 16 16-ap1931nr
 
460 Points
Seq Read
Alienware 16X Aurora Core Ultra 9 290HX Plus
 
5862.72 MB/s +21%
Lenovo Legion Pro 5 16IAX10, RTX 5070
SK Hynix HFS001TEJ9X115N
5856 MB/s +21%
MSI Crosshair A16 HX E8WGK
Micron 2500 1TB MTFDKBA1T0QGN
5611.82 MB/s +16%
HP HyperX Omen 16 16-ap1931nr
 
4836.75 MB/s
HP Omen 16-ap0091ng
Samsung PM9C1b MZVL81T0HFLB-00BH1
4595 MB/s -5%
Asus TUF Gaming A16 FA608UP
Western Digital PC SN5000S SDEQNSJ-1T00
4346 MB/s -10%
Seq Write
Alienware 16X Aurora Core Ultra 9 290HX Plus
 
5723.88 MB/s +125%
HP Omen 16-ap0091ng
Samsung PM9C1b MZVL81T0HFLB-00BH1
3249 MB/s +28%
MSI Crosshair A16 HX E8WGK
Micron 2500 1TB MTFDKBA1T0QGN
3051.42 MB/s +20%
Lenovo Legion Pro 5 16IAX10, RTX 5070
SK Hynix HFS001TEJ9X115N
2720 MB/s +7%
Asus TUF Gaming A16 FA608UP
Western Digital PC SN5000S SDEQNSJ-1T00
2619 MB/s +3%
HP HyperX Omen 16 16-ap1931nr
 
2538.73 MB/s
4K Read
Alienware 16X Aurora Core Ultra 9 290HX Plus
 
87.34 MB/s +93%
Asus TUF Gaming A16 FA608UP
Western Digital PC SN5000S SDEQNSJ-1T00
66.2 MB/s +46%
Lenovo Legion Pro 5 16IAX10, RTX 5070
SK Hynix HFS001TEJ9X115N
60 MB/s +33%
HP Omen 16-ap0091ng
Samsung PM9C1b MZVL81T0HFLB-00BH1
58.8 MB/s +30%
MSI Crosshair A16 HX E8WGK
Micron 2500 1TB MTFDKBA1T0QGN
58.74 MB/s +30%
HP HyperX Omen 16 16-ap1931nr
 
45.25 MB/s
4K Write
Alienware 16X Aurora Core Ultra 9 290HX Plus
 
284.01 MB/s +145%
Lenovo Legion Pro 5 16IAX10, RTX 5070
SK Hynix HFS001TEJ9X115N
250 MB/s +115%
MSI Crosshair A16 HX E8WGK
Micron 2500 1TB MTFDKBA1T0QGN
192.85 MB/s +66%
HP Omen 16-ap0091ng
Samsung PM9C1b MZVL81T0HFLB-00BH1
189.4 MB/s +63%
Asus TUF Gaming A16 FA608UP
Western Digital PC SN5000S SDEQNSJ-1T00
156.3 MB/s +35%
HP HyperX Omen 16 16-ap1931nr
 
116.15 MB/s
4K-64 Read
Lenovo Legion Pro 5 16IAX10, RTX 5070
SK Hynix HFS001TEJ9X115N
2520 MB/s +152%
Alienware 16X Aurora Core Ultra 9 290HX Plus
 
2137.32 MB/s +114%
MSI Crosshair A16 HX E8WGK
Micron 2500 1TB MTFDKBA1T0QGN
1008.8 MB/s +1%
HP HyperX Omen 16 16-ap1931nr
 
999.19 MB/s
HP Omen 16-ap0091ng
Samsung PM9C1b MZVL81T0HFLB-00BH1
866 MB/s -13%
Asus TUF Gaming A16 FA608UP
Western Digital PC SN5000S SDEQNSJ-1T00
832 MB/s -17%
4K-64 Write
Alienware 16X Aurora Core Ultra 9 290HX Plus
 
4483.37 MB/s +4869%
MSI Crosshair A16 HX E8WGK
Micron 2500 1TB MTFDKBA1T0QGN
3391.95 MB/s +3660%
Lenovo Legion Pro 5 16IAX10, RTX 5070
SK Hynix HFS001TEJ9X115N
2970 MB/s +3192%
HP Omen 16-ap0091ng
Samsung PM9C1b MZVL81T0HFLB-00BH1
2532 MB/s +2706%
Asus TUF Gaming A16 FA608UP
Western Digital PC SN5000S SDEQNSJ-1T00
2134 MB/s +2265%
HP HyperX Omen 16 16-ap1931nr
 
90.22 MB/s
Access Time Read
HP HyperX Omen 16 16-ap1931nr
 
0.112 ms *
HP Omen 16-ap0091ng
Samsung PM9C1b MZVL81T0HFLB-00BH1
0.098 ms * +12%
MSI Crosshair A16 HX E8WGK
Micron 2500 1TB MTFDKBA1T0QGN
0.078 ms * +30%
Asus TUF Gaming A16 FA608UP
Western Digital PC SN5000S SDEQNSJ-1T00
0.054 ms * +52%
Lenovo Legion Pro 5 16IAX10, RTX 5070
SK Hynix HFS001TEJ9X115N
0.052 ms * +54%
Alienware 16X Aurora Core Ultra 9 290HX Plus
 
0.042 ms * +62%
Access Time Write
HP HyperX Omen 16 16-ap1931nr
 
0.262 ms *
MSI Crosshair A16 HX E8WGK
Micron 2500 1TB MTFDKBA1T0QGN
0.06 ms * +77%
Alienware 16X Aurora Core Ultra 9 290HX Plus
 
0.041 ms * +84%
Asus TUF Gaming A16 FA608UP
Western Digital PC SN5000S SDEQNSJ-1T00
0.03 ms * +89%
HP Omen 16-ap0091ng
Samsung PM9C1b MZVL81T0HFLB-00BH1
0.022 ms * +92%
Lenovo Legion Pro 5 16IAX10, RTX 5070
SK Hynix HFS001TEJ9X115N
0.018 ms * +93%

* ... Meglio usare valori piccoli

Limitazione della velocità del disco: ciclo di lettura DiskSpd, profondità della coda 8

0150300450600750900105012001350150016501800195021002250240025502700285030003150330034503600375039004050420043504500465048004950510052505400555057005850600061506300645066006750690070507200Tooltip
HP HyperX Omen 16 16-ap1931nr  ; diskspd 2.0.17 f: Ø6849 (4957.67-6914.73) MB/s
HP Omen 16-ap0091ng Samsung PM9C1b MZVL81T0HFLB-00BH1; diskspd 2.0.17 f: Ø7228 (5964.95-7269.15) MB/s

Prestazioni della GPU

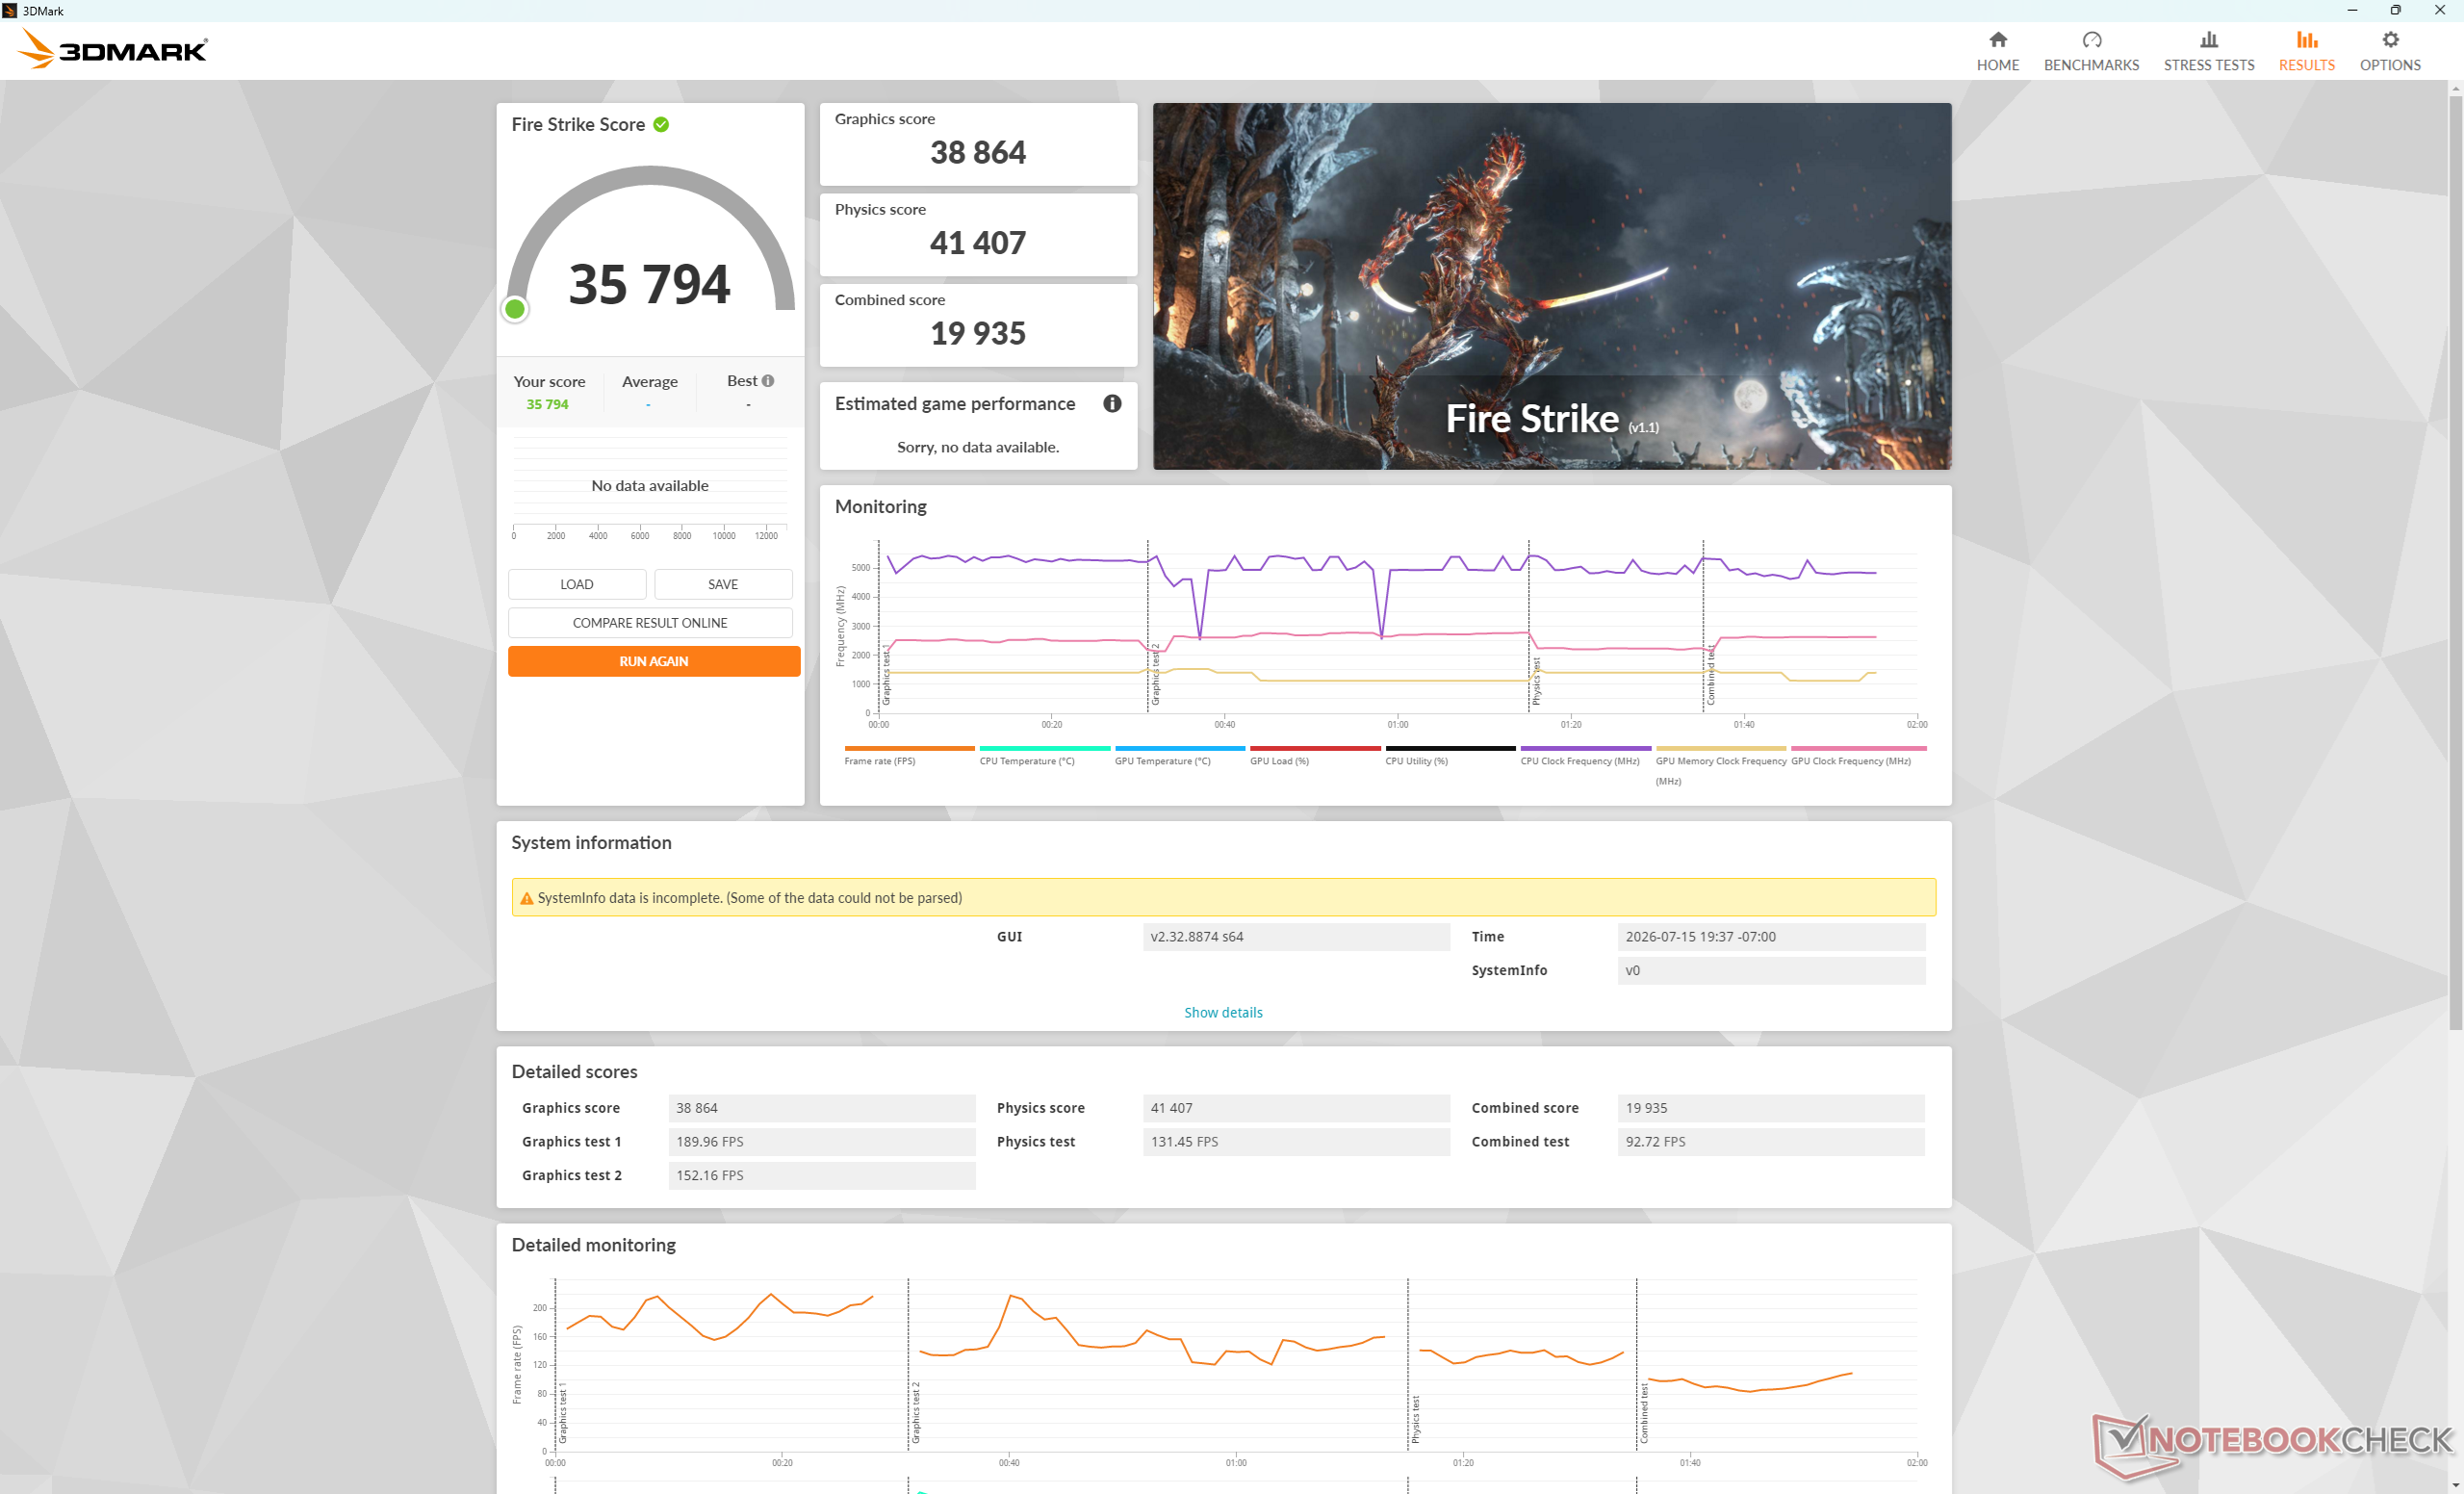
La GeForce RTX 5070 da 115 W funziona dal 5 al 10% più velocemente rispetto al laptop medio presente nel nostro database dotato della stessa opzione GPU. Si consiglia di utilizzare la modalità Prestazioni o una modalità superiore durante il gioco, poiché l’utilizzo della modalità Bilanciata influirebbe sulle prestazioni grafiche fino al 13%, come dimostrato dai nostri risultati Fire Strike riportati di seguito.

Profilo di alimentazionePunteggio graficoPunteggio fisicoPunteggio combinato
Modalità “Unleashed”3886441.40719.935
Modalità Prestazioni38.484 (-1 %)39.567 (-4%)18.485 (-7%)
Modalità bilanciata33.847 (-13%)33.778 (-18%)16.119 (-19%)
Alimentazione a batteria14.105 (-64%)24.832 (-40 %)4.124 (-79%)
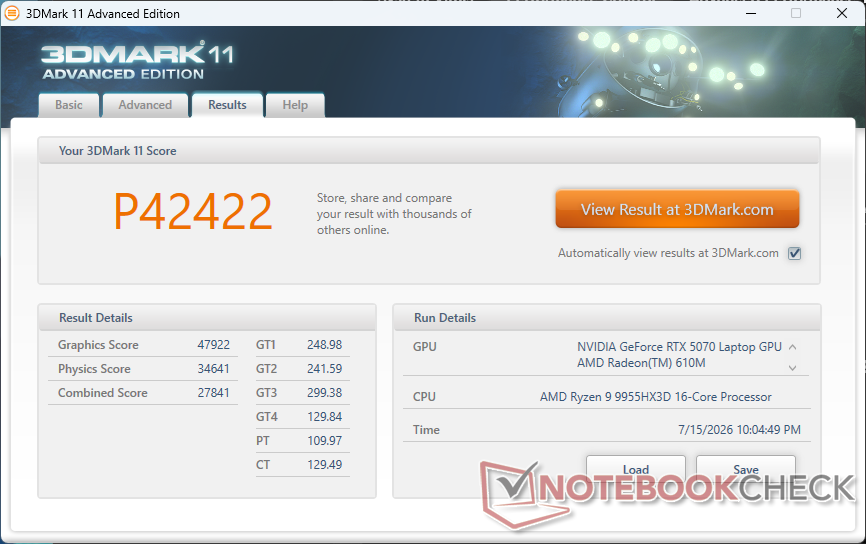
3DMark 11
3DMark 11
Fire Strike
Fire Strike
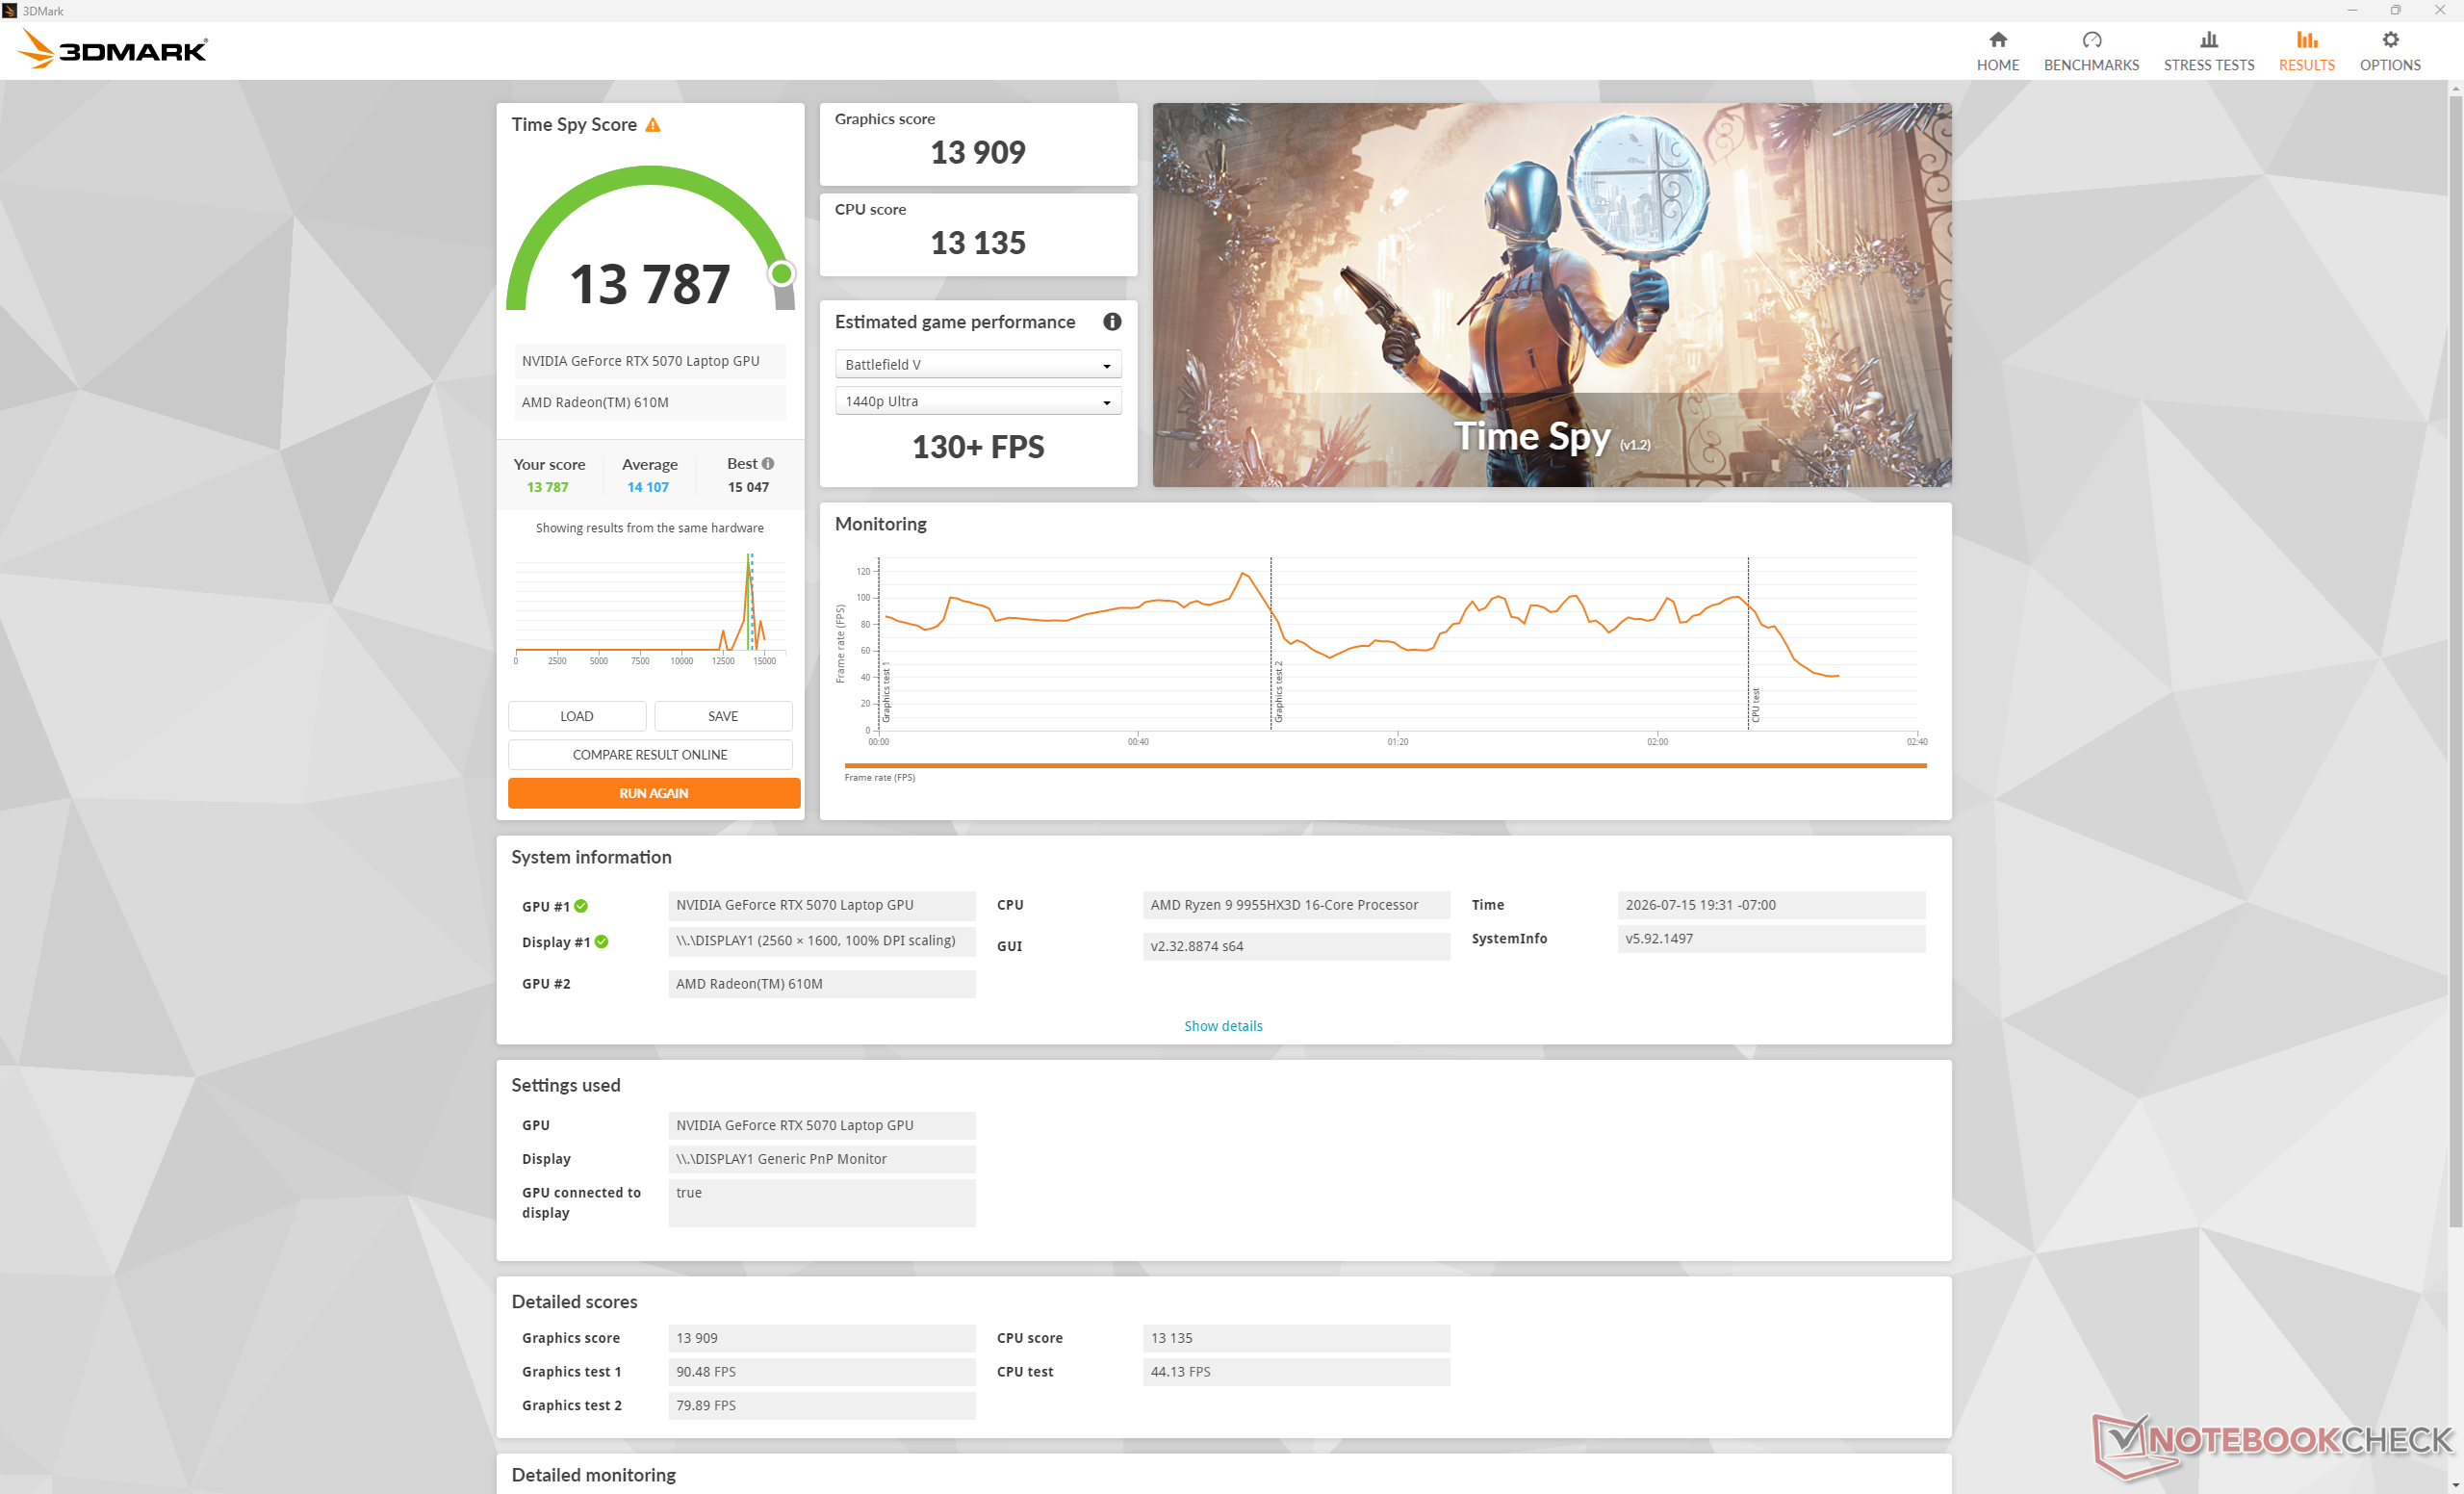
Time Spy
Time Spy
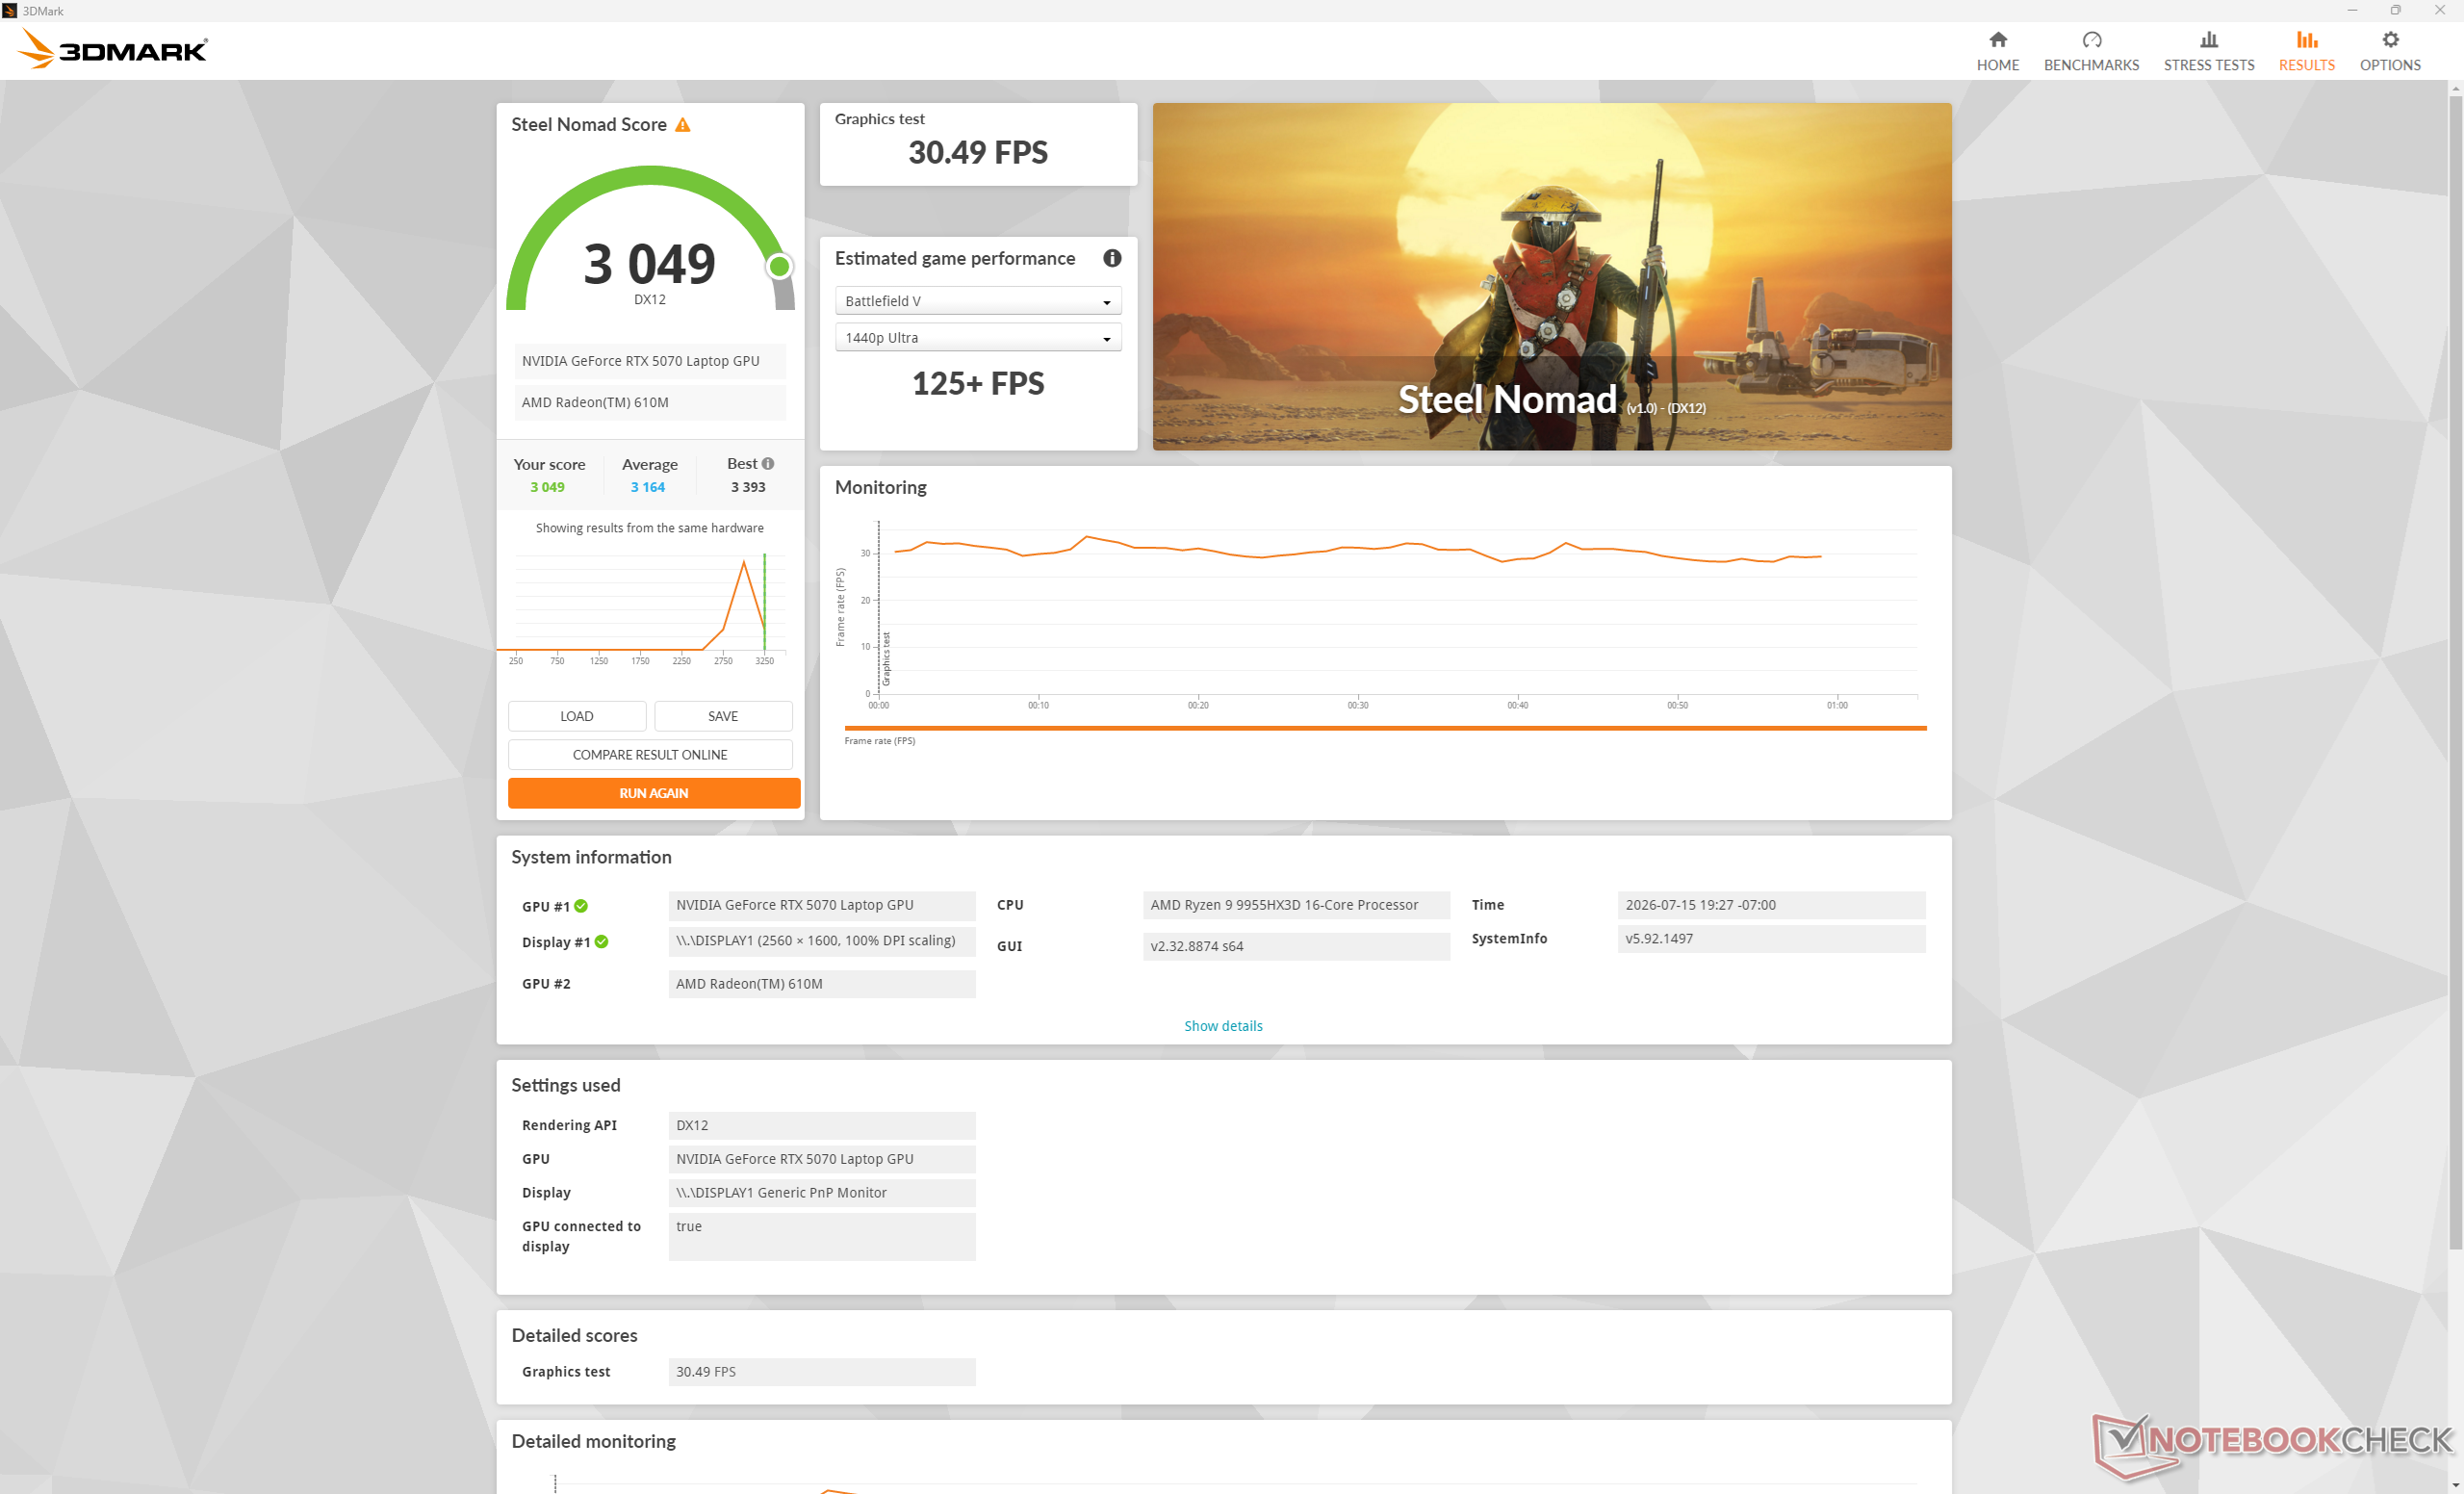
Steel Nomad
Steel Nomad
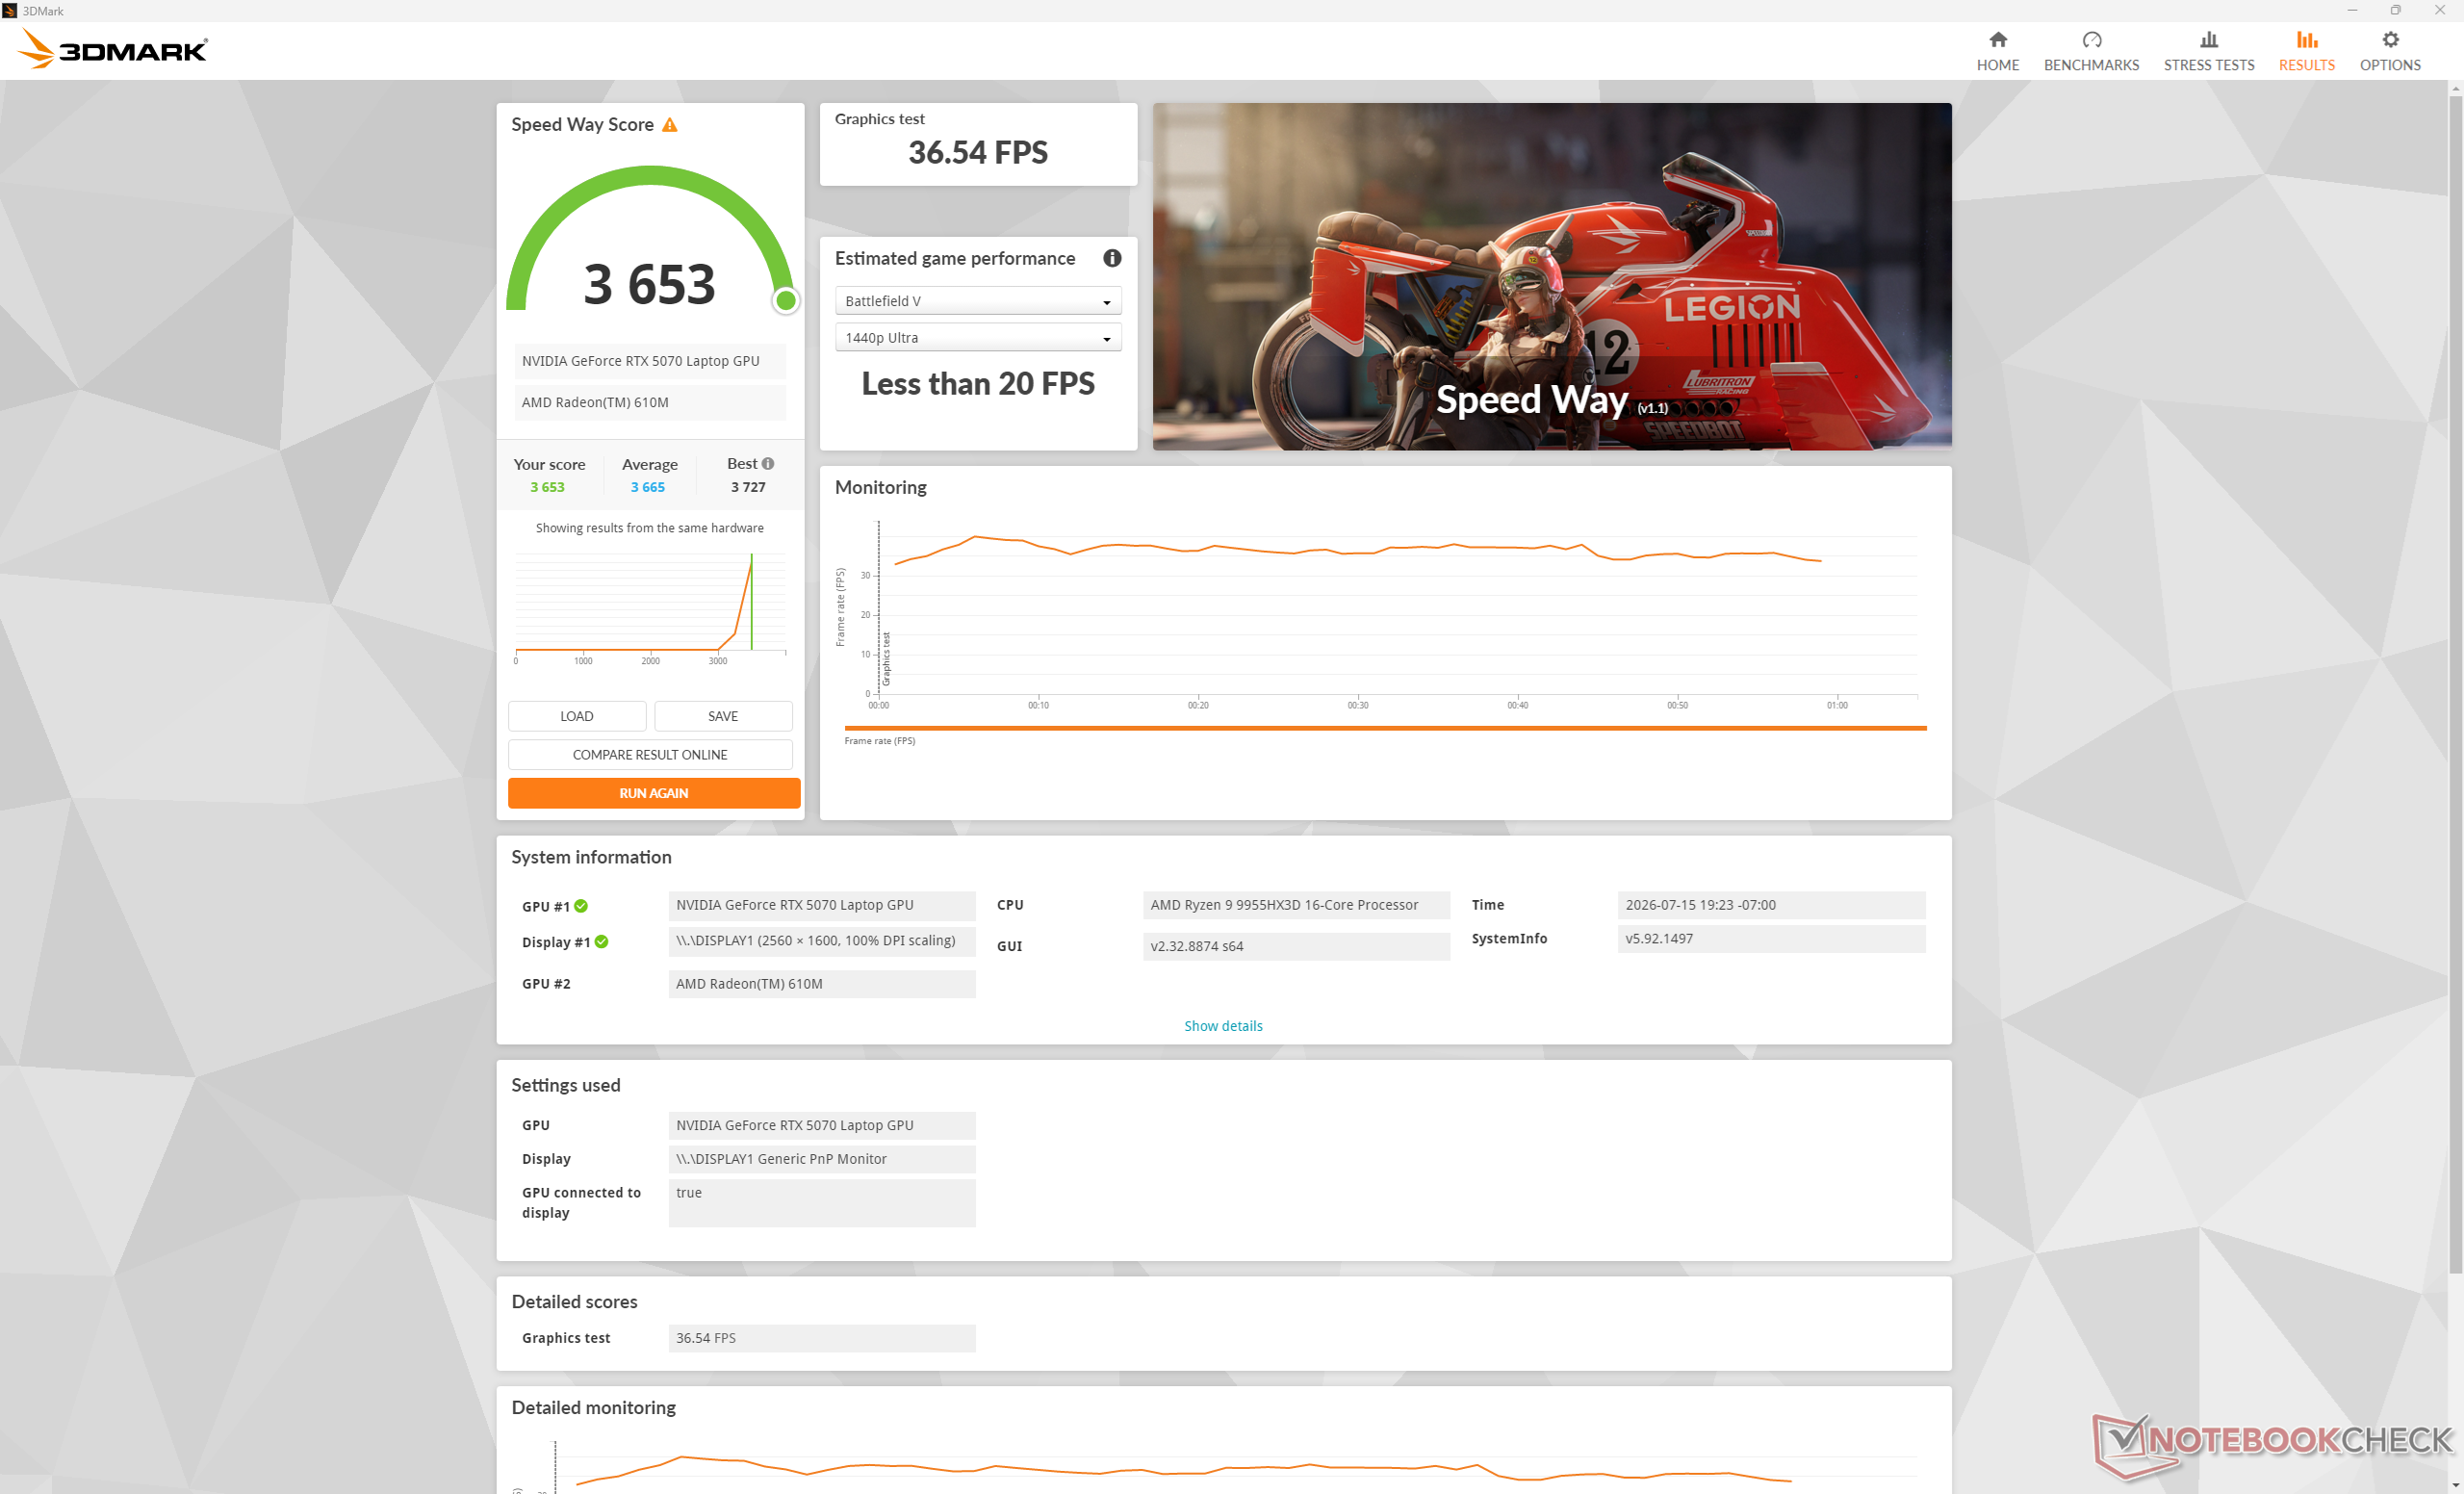
Speed Way
Speed Way
3DMark Performance rating - Percent
NVIDIA KFA2 GeForce RTX 5070 1-Click OC
NVIDIA GeForce RTX 5070, AMD Ryzen 7 9800X3D
99 pt
Lenovo Legion 9 16IRX9, RTX 4090 -2!
NVIDIA GeForce RTX 4090 Laptop GPU, Intel Core i9-14900HX
87.6 pt
Aorus Master 16 AM6J -2!
NVIDIA GeForce RTX 5080 Laptop, AMD Ryzen 9 9955HX3D
85.3 pt
Schenker XMG APEX 16 MAX -1!
NVIDIA GeForce RTX 5070 Ti Laptop, AMD Ryzen 9 9955HX
77.6 pt
Alienware 16X Aurora Core Ultra 9 290HX Plus
NVIDIA GeForce RTX 5070 Ti Laptop, Intel Core Ultra 9 290HX Plus
74 pt
Acer Predator Helios Neo 16S AI PHN16S-71-94L9 -2!
NVIDIA GeForce RTX 5070 Ti Laptop, Intel Core Ultra 9 275HX
66.5 pt
Lenovo Legion Pro 5 16IAX10, RTX 5070 -2!
NVIDIA GeForce RTX 5070 Laptop, Intel Core Ultra 7 255HX
64.7 pt
HP HyperX Omen 16 16-ap1931nr
NVIDIA GeForce RTX 5070 Laptop, AMD Ryzen 9 9955HX3D
63 pt
MSI Crosshair A16 HX E8WGK
NVIDIA GeForce RTX 5070 Laptop, AMD Ryzen 9 8940HX
63 pt
Media NVIDIA GeForce RTX 5070 Laptop
 
59.2 pt
HP Omen 16-ap0091ng -2!
NVIDIA GeForce RTX 5060 Laptop, AMD Ryzen 9 8940HX
52.6 pt
Alienware m16 R1 Intel -1!
NVIDIA GeForce RTX 4060 Laptop GPU, Intel Core i7-13700HX
48.6 pt
3DMark 11 - 1280x720 Performance GPU
NVIDIA KFA2 GeForce RTX 5070 1-Click OC
NVIDIA GeForce RTX 5070, AMD Ryzen 7 9800X3D
71642 Points +49%
Lenovo Legion 9 16IRX9, RTX 4090
NVIDIA GeForce RTX 4090 Laptop GPU, Intel Core i9-14900HX
64341 Points +34%
Aorus Master 16 AM6J
NVIDIA GeForce RTX 5080 Laptop, AMD Ryzen 9 9955HX3D
61571 Points +28%
Schenker XMG APEX 16 MAX
NVIDIA GeForce RTX 5070 Ti Laptop, AMD Ryzen 9 9955HX
57140 Points +19%
Alienware 16X Aurora Core Ultra 9 290HX Plus
NVIDIA GeForce RTX 5070 Ti Laptop, Intel Core Ultra 9 290HX Plus
54767 Points +14%
Acer Predator Helios Neo 16S AI PHN16S-71-94L9
NVIDIA GeForce RTX 5070 Ti Laptop, Intel Core Ultra 9 275HX
49092 Points +2%
Lenovo Legion Pro 5 16IAX10, RTX 5070
NVIDIA GeForce RTX 5070 Laptop, Intel Core Ultra 7 255HX
48777 Points +2%
HP HyperX Omen 16 16-ap1931nr
NVIDIA GeForce RTX 5070 Laptop, AMD Ryzen 9 9955HX3D
47922 Points
MSI Crosshair A16 HX E8WGK
NVIDIA GeForce RTX 5070 Laptop, AMD Ryzen 9 8940HX
45691 Points -5%
Media NVIDIA GeForce RTX 5070 Laptop
  (36721 - 49568, n=29)
44394 Points -7%
Alienware m16 R1 Intel
NVIDIA GeForce RTX 4060 Laptop GPU, Intel Core i7-13700HX
37496 Points -22%
HP Omen 16-ap0091ng
NVIDIA GeForce RTX 5060 Laptop, AMD Ryzen 9 8940HX
36563 Points -24%
3DMark
1920x1080 Fire Strike Graphics
NVIDIA KFA2 GeForce RTX 5070 1-Click OC
NVIDIA GeForce RTX 5070, AMD Ryzen 7 9800X3D
58426 Points +50%
Aorus Master 16 AM6J
NVIDIA GeForce RTX 5080 Laptop, AMD Ryzen 9 9955HX3D
46816 Points +20%
Schenker XMG APEX 16 MAX
NVIDIA GeForce RTX 5070 Ti Laptop, AMD Ryzen 9 9955HX
44206 Points +14%
Alienware 16X Aurora Core Ultra 9 290HX Plus
NVIDIA GeForce RTX 5070 Ti Laptop, Intel Core Ultra 9 290HX Plus
43581 Points +12%
Lenovo Legion 9 16IRX9, RTX 4090
NVIDIA GeForce RTX 4090 Laptop GPU, Intel Core i9-14900HX
43518 Points +12%
MSI Crosshair A16 HX E8WGK
NVIDIA GeForce RTX 5070 Laptop, AMD Ryzen 9 8940HX
38954 Points 0%
HP HyperX Omen 16 16-ap1931nr
NVIDIA GeForce RTX 5070 Laptop, AMD Ryzen 9 9955HX3D
38864 Points
Lenovo Legion Pro 5 16IAX10, RTX 5070
NVIDIA GeForce RTX 5070 Laptop, Intel Core Ultra 7 255HX
37831 Points -3%
Acer Predator Helios Neo 16S AI PHN16S-71-94L9
NVIDIA GeForce RTX 5070 Ti Laptop, Intel Core Ultra 9 275HX
36184 Points -7%
Media NVIDIA GeForce RTX 5070 Laptop
  (28759 - 38954, n=34)
35449 Points -9%
HP Omen 16-ap0091ng
NVIDIA GeForce RTX 5060 Laptop, AMD Ryzen 9 8940HX
30913 Points -20%
Alienware m16 R1 Intel
NVIDIA GeForce RTX 4060 Laptop GPU, Intel Core i7-13700HX
27506 Points -29%
2560x1440 Time Spy Graphics
NVIDIA KFA2 GeForce RTX 5070 1-Click OC
NVIDIA GeForce RTX 5070, AMD Ryzen 7 9800X3D
22423 Points +61%
Lenovo Legion 9 16IRX9, RTX 4090
NVIDIA GeForce RTX 4090 Laptop GPU, Intel Core i9-14900HX
20416 Points +47%
Aorus Master 16 AM6J
NVIDIA GeForce RTX 5080 Laptop, AMD Ryzen 9 9955HX3D
19673 Points +41%
Schenker XMG APEX 16 MAX
NVIDIA GeForce RTX 5070 Ti Laptop, AMD Ryzen 9 9955HX
17914 Points +29%
Alienware 16X Aurora Core Ultra 9 290HX Plus
NVIDIA GeForce RTX 5070 Ti Laptop, Intel Core Ultra 9 290HX Plus
16458 Points +18%
Acer Predator Helios Neo 16S AI PHN16S-71-94L9
NVIDIA GeForce RTX 5070 Ti Laptop, Intel Core Ultra 9 275HX
14615 Points +5%
MSI Crosshair A16 HX E8WGK
NVIDIA GeForce RTX 5070 Laptop, AMD Ryzen 9 8940HX
14118 Points +2%
HP HyperX Omen 16 16-ap1931nr
NVIDIA GeForce RTX 5070 Laptop, AMD Ryzen 9 9955HX3D
13909 Points
Lenovo Legion Pro 5 16IAX10, RTX 5070
NVIDIA GeForce RTX 5070 Laptop, Intel Core Ultra 7 255HX
13510 Points -3%
Media NVIDIA GeForce RTX 5070 Laptop
  (10851 - 14771, n=34)
13264 Points -5%
HP Omen 16-ap0091ng
NVIDIA GeForce RTX 5060 Laptop, AMD Ryzen 9 8940HX
11655 Points -16%
Alienware m16 R1 Intel
NVIDIA GeForce RTX 4060 Laptop GPU, Intel Core i7-13700HX
10591 Points -24%
2560x1440 Time Spy Score
NVIDIA KFA2 GeForce RTX 5070 1-Click OC
NVIDIA GeForce RTX 5070, AMD Ryzen 7 9800X3D
21110 Points +53%
Lenovo Legion 9 16IRX9, RTX 4090
NVIDIA GeForce RTX 4090 Laptop GPU, Intel Core i9-14900HX
20099 Points +46%
Aorus Master 16 AM6J
NVIDIA GeForce RTX 5080 Laptop, AMD Ryzen 9 9955HX3D
18453 Points +34%
Schenker XMG APEX 16 MAX
NVIDIA GeForce RTX 5070 Ti Laptop, AMD Ryzen 9 9955HX
17095 Points +24%
Alienware 16X Aurora Core Ultra 9 290HX Plus
NVIDIA GeForce RTX 5070 Ti Laptop, Intel Core Ultra 9 290HX Plus
16581 Points +20%
Acer Predator Helios Neo 16S AI PHN16S-71-94L9
NVIDIA GeForce RTX 5070 Ti Laptop, Intel Core Ultra 9 275HX
14888 Points +8%
MSI Crosshair A16 HX E8WGK
NVIDIA GeForce RTX 5070 Laptop, AMD Ryzen 9 8940HX
13964 Points +1%
Lenovo Legion Pro 5 16IAX10, RTX 5070
NVIDIA GeForce RTX 5070 Laptop, Intel Core Ultra 7 255HX
13880 Points +1%
HP HyperX Omen 16 16-ap1931nr
NVIDIA GeForce RTX 5070 Laptop, AMD Ryzen 9 9955HX3D
13787 Points
Media NVIDIA GeForce RTX 5070 Laptop
  (11192 - 14448, n=34)
13120 Points -5%
HP Omen 16-ap0091ng
NVIDIA GeForce RTX 5060 Laptop, AMD Ryzen 9 8940HX
11484 Points -17%
Alienware m16 R1 Intel
NVIDIA GeForce RTX 4060 Laptop GPU, Intel Core i7-13700HX
11090 Points -20%
2560x1440 Speed Way Score
NVIDIA KFA2 GeForce RTX 5070 1-Click OC
NVIDIA GeForce RTX 5070, AMD Ryzen 7 9800X3D
5895 Points +61%
Alienware 16X Aurora Core Ultra 9 290HX Plus
NVIDIA GeForce RTX 5070 Ti Laptop, Intel Core Ultra 9 290HX Plus
4313 Points +18%
MSI Crosshair A16 HX E8WGK
NVIDIA GeForce RTX 5070 Laptop, AMD Ryzen 9 8940HX
3682 Points +1%
HP HyperX Omen 16 16-ap1931nr
NVIDIA GeForce RTX 5070 Laptop, AMD Ryzen 9 9955HX3D
3653 Points
Media NVIDIA GeForce RTX 5070 Laptop
  (2796 - 3682, n=10)
3418 Points -6%
Alienware m16 R1 Intel
NVIDIA GeForce RTX 4060 Laptop GPU, Intel Core i7-13700HX
2591 Points -29%
Steel Nomad Score
NVIDIA KFA2 GeForce RTX 5070 1-Click OC
NVIDIA GeForce RTX 5070, AMD Ryzen 7 9800X3D
5521 Points +81%
NVIDIA KFA2 GeForce RTX 5070 1-Click OC
NVIDIA GeForce RTX 5070, AMD Ryzen 7 9800X3D
4866 Points +60%
Schenker XMG APEX 16 MAX
NVIDIA GeForce RTX 5070 Ti Laptop, AMD Ryzen 9 9955HX
3953 Points +30%
Alienware 16X Aurora Core Ultra 9 290HX Plus
NVIDIA GeForce RTX 5070 Ti Laptop, Intel Core Ultra 9 290HX Plus
3741 Points +23%
MSI Crosshair A16 HX E8WGK
NVIDIA GeForce RTX 5070 Laptop, AMD Ryzen 9 8940HX
3087 Points +1%
HP HyperX Omen 16 16-ap1931nr
NVIDIA GeForce RTX 5070 Laptop, AMD Ryzen 9 9955HX3D
3049 Points
Media NVIDIA GeForce RTX 5070 Laptop
  (2441 - 3195, n=21)
2952 Points -3%
3DMark 11 Performance
42422 punti
3DMark Cloud Gate Standard Score
77325 punti
3DMark Fire Strike Score
35794 punti
3DMark Time Spy Score
13787 punti
3DMark Steel Nomad Score
3049 punti
Aiuto
Blender
v3.3 Classroom OPTIX/RTX
HP Omen 16-ap0091ng
NVIDIA GeForce RTX 5060 Laptop, AMD Ryzen 9 8940HX
21 Seconds * -24%
Asus TUF Gaming A16 FA608UP
NVIDIA GeForce RTX 5070 Laptop, AMD Ryzen 7 260
20 Seconds * -18%
Lenovo Legion Pro 5 16IAX10, RTX 5070
NVIDIA GeForce RTX 5070 Laptop, Intel Core Ultra 7 255HX
18 Seconds * -6%
MSI Crosshair A16 HX E8WGK
NVIDIA GeForce RTX 5070 Laptop, AMD Ryzen 9 8940HX
17 Seconds * -0%
HP HyperX Omen 16 16-ap1931nr
NVIDIA GeForce RTX 5070 Laptop, AMD Ryzen 9 9955HX3D
17 Seconds *
Alienware 16X Aurora Core Ultra 9 290HX Plus
NVIDIA GeForce RTX 5070 Ti Laptop, Intel Core Ultra 9 290HX Plus
14 Seconds * +18%
v3.3 Classroom CUDA
HP Omen 16-ap0091ng
NVIDIA GeForce RTX 5060 Laptop, AMD Ryzen 9 8940HX
38 Seconds * -27%
Asus TUF Gaming A16 FA608UP
NVIDIA GeForce RTX 5070 Laptop, AMD Ryzen 7 260
33.1 Seconds * -10%
MSI Crosshair A16 HX E8WGK
NVIDIA GeForce RTX 5070 Laptop, AMD Ryzen 9 8940HX
30 Seconds * -0%
HP HyperX Omen 16 16-ap1931nr
NVIDIA GeForce RTX 5070 Laptop, AMD Ryzen 9 9955HX3D
30 Seconds *
Lenovo Legion Pro 5 16IAX10, RTX 5070
NVIDIA GeForce RTX 5070 Laptop, Intel Core Ultra 7 255HX
29 Seconds * +3%
Alienware 16X Aurora Core Ultra 9 290HX Plus
NVIDIA GeForce RTX 5070 Ti Laptop, Intel Core Ultra 9 290HX Plus
25 Seconds * +17%
v3.3 Classroom CPU
Asus TUF Gaming A16 FA608UP
NVIDIA GeForce RTX 5070 Laptop, AMD Ryzen 7 260
292 Seconds * -112%
HP Omen 16-ap0091ng
NVIDIA GeForce RTX 5060 Laptop, AMD Ryzen 9 8940HX
195 Seconds * -41%
Lenovo Legion Pro 5 16IAX10, RTX 5070
NVIDIA GeForce RTX 5070 Laptop, Intel Core Ultra 7 255HX
171 Seconds * -24%
Alienware 16X Aurora Core Ultra 9 290HX Plus
NVIDIA GeForce RTX 5070 Ti Laptop, Intel Core Ultra 9 290HX Plus
155 Seconds * -12%
MSI Crosshair A16 HX E8WGK
NVIDIA GeForce RTX 5070 Laptop, AMD Ryzen 9 8940HX
150 Seconds * -9%
HP HyperX Omen 16 16-ap1931nr
NVIDIA GeForce RTX 5070 Laptop, AMD Ryzen 9 9955HX3D
138 Seconds *
v4.3 Barbershop CPU
Alienware 16X Aurora Core Ultra 9 290HX Plus
NVIDIA GeForce RTX 5070 Ti Laptop, Intel Core Ultra 9 290HX Plus
766 Seconds * -10%
MSI Crosshair A16 HX E8WGK
NVIDIA GeForce RTX 5070 Laptop, AMD Ryzen 9 8940HX
716 Seconds * -3%
HP HyperX Omen 16 16-ap1931nr
NVIDIA GeForce RTX 5070 Laptop, AMD Ryzen 9 9955HX3D
694 Seconds *
v4.3 Barbershop OPTIX
MSI Crosshair A16 HX E8WGK
NVIDIA GeForce RTX 5070 Laptop, AMD Ryzen 9 8940HX
86 Seconds * -1%
HP HyperX Omen 16 16-ap1931nr
NVIDIA GeForce RTX 5070 Laptop, AMD Ryzen 9 9955HX3D
85 Seconds *
Alienware 16X Aurora Core Ultra 9 290HX Plus
NVIDIA GeForce RTX 5070 Ti Laptop, Intel Core Ultra 9 290HX Plus
73 Seconds * +14%

* ... Meglio usare valori piccoli

Performance rating - Percent
Alienware 16X Aurora Core Ultra 9 290HX Plus
Intel Core Ultra 9 290HX Plus, NVIDIA GeForce RTX 5070 Ti Laptop
97.7 pt
HP HyperX Omen 16 16-ap1931nr
AMD Ryzen 9 9955HX3D, NVIDIA GeForce RTX 5070 Laptop
92.3 pt
MSI Crosshair A16 HX E8WGK
AMD Ryzen 9 8940HX, NVIDIA GeForce RTX 5070 Laptop
89.2 pt
Lenovo Legion Pro 5 16IAX10, RTX 5070
Intel Core Ultra 7 255HX, NVIDIA GeForce RTX 5070 Laptop
86.4 pt
Asus TUF Gaming A16 FA608UP
AMD Ryzen 7 260, NVIDIA GeForce RTX 5070 Laptop
77.1 pt
HP Omen 16-ap0091ng
AMD Ryzen 9 8940HX, NVIDIA GeForce RTX 5060 Laptop
74.5 pt
Cyberpunk 2077 - 1920x1080 Ultra Preset (FSR off)
Alienware 16X Aurora Core Ultra 9 290HX Plus
Intel Core Ultra 9 290HX Plus, NVIDIA GeForce RTX 5070 Ti Laptop
114.9 (92.5min, 83.6P1) fps +6%
MSI Crosshair A16 HX E8WGK
AMD Ryzen 9 8940HX, NVIDIA GeForce RTX 5070 Laptop
112.1 (90.9min, 85.1P1) fps +3%
Asus TUF Gaming A16 FA608UP
AMD Ryzen 7 260, NVIDIA GeForce RTX 5070 Laptop
109.4 (88.6min) fps +1%
HP HyperX Omen 16 16-ap1931nr
AMD Ryzen 9 9955HX3D, NVIDIA GeForce RTX 5070 Laptop
108.8 (88.3min, 83.2P1) fps
Lenovo Legion Pro 5 16IAX10, RTX 5070
Intel Core Ultra 7 255HX, NVIDIA GeForce RTX 5070 Laptop
107 (88.7min) fps -2%
HP Omen 16-ap0091ng
AMD Ryzen 9 8940HX, NVIDIA GeForce RTX 5060 Laptop
86.6 (59min) fps -20%
Baldur's Gate 3 - 1920x1080 Ultra Preset AA:T
Alienware 16X Aurora Core Ultra 9 290HX Plus
Intel Core Ultra 9 290HX Plus, NVIDIA GeForce RTX 5070 Ti Laptop
159.3 (127.7min, 136P0.1, 144.7P1) fps +18%
HP HyperX Omen 16 16-ap1931nr
AMD Ryzen 9 9955HX3D, NVIDIA GeForce RTX 5070 Laptop
134.5 (79.5min, 79.7P0.1, 80P1) fps
MSI Crosshair A16 HX E8WGK
AMD Ryzen 9 8940HX, NVIDIA GeForce RTX 5070 Laptop
133.2 (79.7min, 79.7P0.1, 79.9P1) fps -1%
Lenovo Legion Pro 5 16IAX10, RTX 5070
Intel Core Ultra 7 255HX, NVIDIA GeForce RTX 5070 Laptop
130.6 fps -3%
Asus TUF Gaming A16 FA608UP
AMD Ryzen 7 260, NVIDIA GeForce RTX 5070 Laptop
127.5 fps -5%
HP Omen 16-ap0091ng
AMD Ryzen 9 8940HX, NVIDIA GeForce RTX 5060 Laptop
109.1 fps -19%
GTA V - 1920x1080 Highest AA:4xMSAA + FX AF:16x
HP HyperX Omen 16 16-ap1931nr
AMD Ryzen 9 9955HX3D, NVIDIA GeForce RTX 5070 Laptop
171.5 (1.578min, 111.1P1) fps
Alienware 16X Aurora Core Ultra 9 290HX Plus
Intel Core Ultra 9 290HX Plus, NVIDIA GeForce RTX 5070 Ti Laptop
159.2 (5.59min, 111.1P1) fps -7%
Lenovo Legion Pro 5 16IAX10, RTX 5070
Intel Core Ultra 7 255HX, NVIDIA GeForce RTX 5070 Laptop
153.2 (2.31min, 111.1P1) fps -11%
MSI Crosshair A16 HX E8WGK
AMD Ryzen 9 8940HX, NVIDIA GeForce RTX 5070 Laptop
152.6 (3.83min, 100P1) fps -11%
HP Omen 16-ap0091ng
AMD Ryzen 9 8940HX, NVIDIA GeForce RTX 5060 Laptop
127.5 (2.93min, 83.3P1) fps -26%
Asus TUF Gaming A16 FA608UP
AMD Ryzen 7 260, NVIDIA GeForce RTX 5070 Laptop
124.8 (4.67min, 90.9P1) fps -27%
Final Fantasy XV Benchmark - 1920x1080 High Quality
Alienware 16X Aurora Core Ultra 9 290HX Plus
Intel Core Ultra 9 290HX Plus, NVIDIA GeForce RTX 5070 Ti Laptop
161.1 fps +19%
Lenovo Legion Pro 5 16IAX10, RTX 5070
Intel Core Ultra 7 255HX, NVIDIA GeForce RTX 5070 Laptop
144.5 fps +7%
Asus TUF Gaming A16 FA608UP
AMD Ryzen 7 260, NVIDIA GeForce RTX 5070 Laptop
142.3 fps +5%
MSI Crosshair A16 HX E8WGK
AMD Ryzen 9 8940HX, NVIDIA GeForce RTX 5070 Laptop
140 fps +4%
HP HyperX Omen 16 16-ap1931nr
AMD Ryzen 9 9955HX3D, NVIDIA GeForce RTX 5070 Laptop
135.2 fps
HP Omen 16-ap0091ng
AMD Ryzen 9 8940HX, NVIDIA GeForce RTX 5060 Laptop
111 fps -18%
Strange Brigade - 1920x1080 ultra AA:ultra AF:16
Alienware 16X Aurora Core Ultra 9 290HX Plus
Intel Core Ultra 9 290HX Plus, NVIDIA GeForce RTX 5070 Ti Laptop
314 (155.9min, 229P1) fps +21%
HP HyperX Omen 16 16-ap1931nr
AMD Ryzen 9 9955HX3D, NVIDIA GeForce RTX 5070 Laptop
260 (56.4min, 196P1) fps
MSI Crosshair A16 HX E8WGK
AMD Ryzen 9 8940HX, NVIDIA GeForce RTX 5070 Laptop
258 (159.7min, 195.8P1) fps -1%
Lenovo Legion Pro 5 16IAX10, RTX 5070
Intel Core Ultra 7 255HX, NVIDIA GeForce RTX 5070 Laptop
246 (9min, 185.2P1) fps -5%
Asus TUF Gaming A16 FA608UP
AMD Ryzen 7 260, NVIDIA GeForce RTX 5070 Laptop
219 (128min, 164.3P1) fps -16%
HP Omen 16-ap0091ng
AMD Ryzen 9 8940HX, NVIDIA GeForce RTX 5060 Laptop
217.8 (86.3min, 152.5P1) fps -16%
Dota 2 Reborn - 1920x1080 ultra (3/3) best looking
HP HyperX Omen 16 16-ap1931nr
AMD Ryzen 9 9955HX3D, NVIDIA GeForce RTX 5070 Laptop
200 (161.1min) fps
Alienware 16X Aurora Core Ultra 9 290HX Plus
Intel Core Ultra 9 290HX Plus, NVIDIA GeForce RTX 5070 Ti Laptop
184.7 (155.7min) fps -8%
MSI Crosshair A16 HX E8WGK
AMD Ryzen 9 8940HX, NVIDIA GeForce RTX 5070 Laptop
183.3 (152.5min) fps -8%
Lenovo Legion Pro 5 16IAX10, RTX 5070
Intel Core Ultra 7 255HX, NVIDIA GeForce RTX 5070 Laptop
162.4 (136.4min) fps -19%
HP Omen 16-ap0091ng
AMD Ryzen 9 8940HX, NVIDIA GeForce RTX 5060 Laptop
161.6 (132.4min) fps -19%
Asus TUF Gaming A16 FA608UP
AMD Ryzen 7 260, NVIDIA GeForce RTX 5070 Laptop
123.2 (104.7min) fps -38%
X-Plane 11.11 - 1920x1080 high (fps_test=3)
HP HyperX Omen 16 16-ap1931nr
AMD Ryzen 9 9955HX3D, NVIDIA GeForce RTX 5070 Laptop
111.9 fps
Alienware 16X Aurora Core Ultra 9 290HX Plus
Intel Core Ultra 9 290HX Plus, NVIDIA GeForce RTX 5070 Ti Laptop
110.4 fps -1%
MSI Crosshair A16 HX E8WGK
AMD Ryzen 9 8940HX, NVIDIA GeForce RTX 5070 Laptop
104.8 fps -6%
Lenovo Legion Pro 5 16IAX10, RTX 5070
Intel Core Ultra 7 255HX, NVIDIA GeForce RTX 5070 Laptop
101.6 fps -9%
HP Omen 16-ap0091ng
AMD Ryzen 9 8940HX, NVIDIA GeForce RTX 5060 Laptop
93.9 fps -16%
Asus TUF Gaming A16 FA608UP
AMD Ryzen 7 260, NVIDIA GeForce RTX 5070 Laptop
80.7 fps -28%
GTA V - 2560x1440 Highest AA:4xMSAA + FX AF:16x
Schenker XMG APEX 16 MAX
AMD Ryzen 9 9955HX, NVIDIA GeForce RTX 5070 Ti Laptop
157.3 (3.68min, 111.1P1) fps +18%
Lenovo Legion 9 16IRX9, RTX 4090
Intel Core i9-14900HX, NVIDIA GeForce RTX 4090 Laptop GPU
138.9 (0.96min, 100P1) fps +4%
Alienware 16X Aurora Core Ultra 9 290HX Plus
Intel Core Ultra 9 290HX Plus, NVIDIA GeForce RTX 5070 Ti Laptop
134.4 (26.2min, 90.9P1) fps +1%
HP HyperX Omen 16 16-ap1931nr
AMD Ryzen 9 9955HX3D, NVIDIA GeForce RTX 5070 Laptop
133.2 (6.74min, 83.3P1) fps
MSI Crosshair A16 HX E8WGK
AMD Ryzen 9 8940HX, NVIDIA GeForce RTX 5070 Laptop
129.7 (6.57min, 83.3P1) fps -3%
Lenovo Legion Pro 5 16IAX10, RTX 5070
Intel Core Ultra 7 255HX, NVIDIA GeForce RTX 5070 Laptop
126 (4.91min, 90.9P1) fps -5%
Media NVIDIA GeForce RTX 5070 Laptop
  (96 - 133.2, n=25)
116.4 fps -13%
Final Fantasy XV Benchmark
1920x1080 High Quality
NVIDIA KFA2 GeForce RTX 5070 1-Click OC
AMD Ryzen 7 9800X3D, NVIDIA GeForce RTX 5070
206 fps +52%
Lenovo Legion 9 16IRX9, RTX 4090
Intel Core i9-14900HX, NVIDIA GeForce RTX 4090 Laptop GPU
165.1 fps +22%
Alienware 16X Aurora Core Ultra 9 290HX Plus
Intel Core Ultra 9 290HX Plus, NVIDIA GeForce RTX 5070 Ti Laptop
161.1 fps +19%
Schenker XMG APEX 16 MAX
AMD Ryzen 9 9955HX, NVIDIA GeForce RTX 5070 Ti Laptop
158.2 fps +17%
Lenovo Legion Pro 5 16IAX10, RTX 5070
Intel Core Ultra 7 255HX, NVIDIA GeForce RTX 5070 Laptop
144.5 fps +7%
MSI Crosshair A16 HX E8WGK
AMD Ryzen 9 8940HX, NVIDIA GeForce RTX 5070 Laptop
140 fps +4%
HP HyperX Omen 16 16-ap1931nr
AMD Ryzen 9 9955HX3D, NVIDIA GeForce RTX 5070 Laptop
135.2 fps
Media NVIDIA GeForce RTX 5070 Laptop
  (96 - 150.7, n=27)
133.7 fps -1%
HP Omen 16-ap0091ng
AMD Ryzen 9 8940HX, NVIDIA GeForce RTX 5060 Laptop
111 fps -18%
Alienware m16 R1 Intel
Intel Core i7-13700HX, NVIDIA GeForce RTX 4060 Laptop GPU
104.7 fps -23%
2560x1440 High Quality
NVIDIA KFA2 GeForce RTX 5070 1-Click OC
AMD Ryzen 7 9800X3D, NVIDIA GeForce RTX 5070
162.4 fps +62%
Lenovo Legion 9 16IRX9, RTX 4090
Intel Core i9-14900HX, NVIDIA GeForce RTX 4090 Laptop GPU
142 fps +42%
Schenker XMG APEX 16 MAX
AMD Ryzen 9 9955HX, NVIDIA GeForce RTX 5070 Ti Laptop
121.8 fps +22%
Alienware 16X Aurora Core Ultra 9 290HX Plus
Intel Core Ultra 9 290HX Plus, NVIDIA GeForce RTX 5070 Ti Laptop
120.3 fps +20%
Lenovo Legion Pro 5 16IAX10, RTX 5070
Intel Core Ultra 7 255HX, NVIDIA GeForce RTX 5070 Laptop
106.8 fps +7%
MSI Crosshair A16 HX E8WGK
AMD Ryzen 9 8940HX, NVIDIA GeForce RTX 5070 Laptop
102 fps +2%
HP HyperX Omen 16 16-ap1931nr
AMD Ryzen 9 9955HX3D, NVIDIA GeForce RTX 5070 Laptop
100.2 fps
Media NVIDIA GeForce RTX 5070 Laptop
  (82.5 - 110, n=26)
99.2 fps -1%
Alienware m16 R1 Intel
Intel Core i7-13700HX, NVIDIA GeForce RTX 4060 Laptop GPU
77.1 fps -23%
X-Plane 11.11 - 1920x1080 high (fps_test=3)
NVIDIA KFA2 GeForce RTX 5070 1-Click OC
AMD Ryzen 7 9800X3D, NVIDIA GeForce RTX 5070
183.9 fps +64%
Aorus Master 16 AM6J
AMD Ryzen 9 9955HX3D, NVIDIA GeForce RTX 5080 Laptop
148.5 fps +33%
Lenovo Legion 9 16IRX9, RTX 4090
Intel Core i9-14900HX, NVIDIA GeForce RTX 4090 Laptop GPU
125.6 fps +12%
Alienware m16 R1 Intel
Intel Core i7-13700HX, NVIDIA GeForce RTX 4060 Laptop GPU
120.4 fps +8%
HP HyperX Omen 16 16-ap1931nr
AMD Ryzen 9 9955HX3D, NVIDIA GeForce RTX 5070 Laptop
111.9 fps
Alienware 16X Aurora Core Ultra 9 290HX Plus
Intel Core Ultra 9 290HX Plus, NVIDIA GeForce RTX 5070 Ti Laptop
110.4 fps -1%
Acer Predator Helios Neo 16S AI PHN16S-71-94L9
Intel Core Ultra 9 275HX, NVIDIA GeForce RTX 5070 Ti Laptop
109.4 fps -2%
Schenker XMG APEX 16 MAX
AMD Ryzen 9 9955HX, NVIDIA GeForce RTX 5070 Ti Laptop
105.6 fps -6%
MSI Crosshair A16 HX E8WGK
AMD Ryzen 9 8940HX, NVIDIA GeForce RTX 5070 Laptop
104.8 fps -6%
Lenovo Legion Pro 5 16IAX10, RTX 5070
Intel Core Ultra 7 255HX, NVIDIA GeForce RTX 5070 Laptop
101.6 fps -9%
Media NVIDIA GeForce RTX 5070 Laptop
  (73.5 - 116.3, n=29)
94.7 fps -15%
HP Omen 16-ap0091ng
AMD Ryzen 9 8940HX, NVIDIA GeForce RTX 5060 Laptop
93.9 fps -16%
Strange Brigade
1920x1080 ultra AA:ultra AF:16
NVIDIA KFA2 GeForce RTX 5070 1-Click OC
AMD Ryzen 7 9800X3D, NVIDIA GeForce RTX 5070
437 (139min, 310P1) fps +68%
Lenovo Legion 9 16IRX9, RTX 4090
Intel Core i9-14900HX, NVIDIA GeForce RTX 4090 Laptop GPU
369 (5min, 269P1) fps +42%
Schenker XMG APEX 16 MAX
AMD Ryzen 9 9955HX, NVIDIA GeForce RTX 5070 Ti Laptop
340 (59.4min, 243P1) fps +31%
Alienware 16X Aurora Core Ultra 9 290HX Plus
Intel Core Ultra 9 290HX Plus, NVIDIA GeForce RTX 5070 Ti Laptop
314 (155.9min, 229P1) fps +21%
HP HyperX Omen 16 16-ap1931nr
AMD Ryzen 9 9955HX3D, NVIDIA GeForce RTX 5070 Laptop
260 (56.4min, 196P1) fps
MSI Crosshair A16 HX E8WGK
AMD Ryzen 9 8940HX, NVIDIA GeForce RTX 5070 Laptop
258 (159.7min, 195.8P1) fps -1%
Lenovo Legion Pro 5 16IAX10, RTX 5070
Intel Core Ultra 7 255HX, NVIDIA GeForce RTX 5070 Laptop
246 (9min, 185.2P1) fps -5%
Media NVIDIA GeForce RTX 5070 Laptop
  (203 - 261, n=25)
240 fps -8%
HP Omen 16-ap0091ng
AMD Ryzen 9 8940HX, NVIDIA GeForce RTX 5060 Laptop
217.8 (86.3min, 152.5P1) fps -16%
Alienware m16 R1 Intel
Intel Core i7-13700HX, NVIDIA GeForce RTX 4060 Laptop GPU
190.3 (52.8min, 139.4P1) fps -27%
2560x1440 ultra AA:ultra AF:16
NVIDIA KFA2 GeForce RTX 5070 1-Click OC
AMD Ryzen 7 9800X3D, NVIDIA GeForce RTX 5070
318 (147.4min, 246P1) fps +86%
Lenovo Legion 9 16IRX9, RTX 4090
Intel Core i9-14900HX, NVIDIA GeForce RTX 4090 Laptop GPU
290 (38.6min, 219P1) fps +70%
Schenker XMG APEX 16 MAX
AMD Ryzen 9 9955HX, NVIDIA GeForce RTX 5070 Ti Laptop
236 (150.4min, 187.7P1) fps +38%
Alienware 16X Aurora Core Ultra 9 290HX Plus
Intel Core Ultra 9 290HX Plus, NVIDIA GeForce RTX 5070 Ti Laptop
210 (99.1min, 166.2P1) fps +23%
Lenovo Legion Pro 5 16IAX10, RTX 5070
Intel Core Ultra 7 255HX, NVIDIA GeForce RTX 5070 Laptop
177.4 (31.7min, 147.8P1) fps +4%
HP HyperX Omen 16 16-ap1931nr
AMD Ryzen 9 9955HX3D, NVIDIA GeForce RTX 5070 Laptop
170.6 (115.5min, 139.3P1) fps
MSI Crosshair A16 HX E8WGK
AMD Ryzen 9 8940HX, NVIDIA GeForce RTX 5070 Laptop
170.4 (127.2min, 139P1) fps 0%
Media NVIDIA GeForce RTX 5070 Laptop
  (137 - 230, n=23)
166.6 fps -2%
HP Omen 16-ap0091ng
AMD Ryzen 9 8940HX, NVIDIA GeForce RTX 5060 Laptop
155.7 fps -9%
Alienware m16 R1 Intel
Intel Core i7-13700HX, NVIDIA GeForce RTX 4060 Laptop GPU
128.5 (88.2min, 103.1P1) fps -25%
Baldur's Gate 3
1920x1080 Ultra Preset AA:T
NVIDIA KFA2 GeForce RTX 5070 1-Click OC
AMD Ryzen 7 9800X3D, NVIDIA GeForce RTX 5070
190.6 (164.5min, 170.2P0.1, 175.4P1) fps +42%
Aorus Master 16 AM6J
AMD Ryzen 9 9955HX3D, NVIDIA GeForce RTX 5080 Laptop
175 (65min) fps +30%
Alienware 16X Aurora Core Ultra 9 290HX Plus
Intel Core Ultra 9 290HX Plus, NVIDIA GeForce RTX 5070 Ti Laptop
159.3 (127.7min, 136P0.1, 144.7P1) fps +18%
Schenker XMG APEX 16 MAX
AMD Ryzen 9 9955HX, NVIDIA GeForce RTX 5070 Ti Laptop
155.6 (107.2min, 130P0.1, 140P1) fps +16%
HP HyperX Omen 16 16-ap1931nr
AMD Ryzen 9 9955HX3D, NVIDIA GeForce RTX 5070 Laptop
134.5 (79.5min, 79.7P0.1, 80P1) fps
MSI Crosshair A16 HX E8WGK
AMD Ryzen 9 8940HX, NVIDIA GeForce RTX 5070 Laptop
133.2 (79.7min, 79.7P0.1, 79.9P1) fps -1%
Lenovo Legion Pro 5 16IAX10, RTX 5070
Intel Core Ultra 7 255HX, NVIDIA GeForce RTX 5070 Laptop
130.6 fps -3%
Acer Predator Helios Neo 16S AI PHN16S-71-94L9
Intel Core Ultra 9 275HX, NVIDIA GeForce RTX 5070 Ti Laptop
122.8 (52.2min, 71.3P0.1, 104.9P1) fps -9%
Media NVIDIA GeForce RTX 5070 Laptop
  (87.3 - 141.4, n=34)
121.6 fps -10%
HP Omen 16-ap0091ng
AMD Ryzen 9 8940HX, NVIDIA GeForce RTX 5060 Laptop
109.1 fps -19%
2560x1440 Ultra Preset AA:T
NVIDIA KFA2 GeForce RTX 5070 1-Click OC
AMD Ryzen 7 9800X3D, NVIDIA GeForce RTX 5070
138.3 (120.1min, 122.3P0.1, 125.1P1) fps +48%
Aorus Master 16 AM6J
AMD Ryzen 9 9955HX3D, NVIDIA GeForce RTX 5080 Laptop
123 (79min) fps +32%
Schenker XMG APEX 16 MAX
AMD Ryzen 9 9955HX, NVIDIA GeForce RTX 5070 Ti Laptop
110.5 (92.1min, 95.8P0.1, 99P1) fps +18%
Alienware 16X Aurora Core Ultra 9 290HX Plus
Intel Core Ultra 9 290HX Plus, NVIDIA GeForce RTX 5070 Ti Laptop
109.5 (15.7min, 54.3P0.1, 93.4P1) fps +17%
HP HyperX Omen 16 16-ap1931nr
AMD Ryzen 9 9955HX3D, NVIDIA GeForce RTX 5070 Laptop
93.4 (60min, 72.2P0.1, 79.6P1) fps
MSI Crosshair A16 HX E8WGK
AMD Ryzen 9 8940HX, NVIDIA GeForce RTX 5070 Laptop
90.3 (60min, 60P0.1, 79.6P1) fps -3%
Lenovo Legion Pro 5 16IAX10, RTX 5070
Intel Core Ultra 7 255HX, NVIDIA GeForce RTX 5070 Laptop
90 fps -4%
Media NVIDIA GeForce RTX 5070 Laptop
  (61 - 96.4, n=31)
83.9 fps -10%
HP Omen 16-ap0091ng
AMD Ryzen 9 8940HX, NVIDIA GeForce RTX 5060 Laptop
75.5 fps -19%
2560x1440 Ultra Preset + Quality DLSS
Alienware 16X Aurora Core Ultra 9 290HX Plus
Intel Core Ultra 9 290HX Plus, NVIDIA GeForce RTX 5070 Ti Laptop
157.7 (17.7min, 106.2P0.1, 144.9P1) fps +16%
HP HyperX Omen 16 16-ap1931nr
AMD Ryzen 9 9955HX3D, NVIDIA GeForce RTX 5070 Laptop
136.3 (79.7min, 79.8P0.1, 80P1) fps
Lenovo Legion Pro 5 16IAX10, RTX 5070
Intel Core Ultra 7 255HX, NVIDIA GeForce RTX 5070 Laptop
135.8 fps 0%
MSI Crosshair A16 HX E8WGK
AMD Ryzen 9 8940HX, NVIDIA GeForce RTX 5070 Laptop
129.6 (79.7min, 79.7P0.1, 79.9P1) fps -5%
Media NVIDIA GeForce RTX 5070 Laptop
  (97.7 - 140, n=10)
127.5 fps -6%
HP Omen 16-ap0091ng
AMD Ryzen 9 8940HX, NVIDIA GeForce RTX 5060 Laptop
114.3 fps -16%
Cyberpunk 2077
1920x1080 High Preset (FSR off)
NVIDIA KFA2 GeForce RTX 5070 1-Click OC
AMD Ryzen 7 9800X3D, NVIDIA GeForce RTX 5070
187.6 (156.6min) fps +52%
Aorus Master 16 AM6J
AMD Ryzen 9 9955HX3D, NVIDIA GeForce RTX 5080 Laptop
169.3 (139min) fps +37%
Schenker XMG APEX 16 MAX
AMD Ryzen 9 9955HX, NVIDIA GeForce RTX 5070 Ti Laptop
140.6 (116.9min) fps +14%
Alienware 16X Aurora Core Ultra 9 290HX Plus
Intel Core Ultra 9 290HX Plus, NVIDIA GeForce RTX 5070 Ti Laptop
126.1 (103min, 95.3P1) fps +2%
MSI Crosshair A16 HX E8WGK
AMD Ryzen 9 8940HX, NVIDIA GeForce RTX 5070 Laptop
124.8 (103.1min, 96.5P1) fps +1%
HP HyperX Omen 16 16-ap1931nr
AMD Ryzen 9 9955HX3D, NVIDIA GeForce RTX 5070 Laptop
123.7 (103.3min, 97.1P1) fps
Lenovo Legion Pro 5 16IAX10, RTX 5070
Intel Core Ultra 7 255HX, NVIDIA GeForce RTX 5070 Laptop
122 (103.1min) fps -1%
Acer Predator Helios Neo 16S AI PHN16S-71-94L9
Intel Core Ultra 9 275HX, NVIDIA GeForce RTX 5070 Ti Laptop
112 (94min) fps -9%
Media NVIDIA GeForce RTX 5070 Laptop
  (84.5 - 124.8, n=27)
111.1 fps -10%
HP Omen 16-ap0091ng
AMD Ryzen 9 8940HX, NVIDIA GeForce RTX 5060 Laptop
95.3 fps -23%
1920x1080 Ultra Preset (FSR off)
NVIDIA KFA2 GeForce RTX 5070 1-Click OC
AMD Ryzen 7 9800X3D, NVIDIA GeForce RTX 5070
170.3 (140.8min) fps +57%
Aorus Master 16 AM6J
AMD Ryzen 9 9955HX3D, NVIDIA GeForce RTX 5080 Laptop
144.5 (116min) fps +33%
Schenker XMG APEX 16 MAX
AMD Ryzen 9 9955HX, NVIDIA GeForce RTX 5070 Ti Laptop
128 (103min) fps +18%
Lenovo Legion 9 16IRX9, RTX 4090
Intel Core i9-14900HX, NVIDIA GeForce RTX 4090 Laptop GPU
127 (70.6min) fps +17%
Alienware 16X Aurora Core Ultra 9 290HX Plus
Intel Core Ultra 9 290HX Plus, NVIDIA GeForce RTX 5070 Ti Laptop
114.9 (92.5min, 83.6P1) fps +6%
MSI Crosshair A16 HX E8WGK
AMD Ryzen 9 8940HX, NVIDIA GeForce RTX 5070 Laptop
112.1 (90.9min, 85.1P1) fps +3%
HP HyperX Omen 16 16-ap1931nr
AMD Ryzen 9 9955HX3D, NVIDIA GeForce RTX 5070 Laptop
108.8 (88.3min, 83.2P1) fps
Lenovo Legion Pro 5 16IAX10, RTX 5070
Intel Core Ultra 7 255HX, NVIDIA GeForce RTX 5070 Laptop
107 (88.7min) fps -2%
Acer Predator Helios Neo 16S AI PHN16S-71-94L9
Intel Core Ultra 9 275HX, NVIDIA GeForce RTX 5070 Ti Laptop
100.8 (80min) fps -7%
Media NVIDIA GeForce RTX 5070 Laptop
  (81.5 - 112.1, n=34)
99.4 fps -9%
HP Omen 16-ap0091ng
AMD Ryzen 9 8940HX, NVIDIA GeForce RTX 5060 Laptop
86.6 (59min) fps -20%
1920x1080 Ray Tracing Ultra Preset (DLSS off)
NVIDIA KFA2 GeForce RTX 5070 1-Click OC
AMD Ryzen 7 9800X3D, NVIDIA GeForce RTX 5070
75 (65.9min) fps +56%
Alienware 16X Aurora Core Ultra 9 290HX Plus
Intel Core Ultra 9 290HX Plus, NVIDIA GeForce RTX 5070 Ti Laptop
52.5 (45min, 42.4P1) fps +9%
MSI Crosshair A16 HX E8WGK
AMD Ryzen 9 8940HX, NVIDIA GeForce RTX 5070 Laptop
48.5 (42.4min, 40.5P1) fps +1%
HP HyperX Omen 16 16-ap1931nr
AMD Ryzen 9 9955HX3D, NVIDIA GeForce RTX 5070 Laptop
48 (41.9min, 40P1) fps
Media NVIDIA GeForce RTX 5070 Laptop
  (35.3 - 48.5, n=7)
44.6 fps -7%
2560x1440 Ultra Preset (FSR off)
NVIDIA KFA2 GeForce RTX 5070 1-Click OC
AMD Ryzen 7 9800X3D, NVIDIA GeForce RTX 5070
111.8 (94.3min) fps +63%
Aorus Master 16 AM6J
AMD Ryzen 9 9955HX3D, NVIDIA GeForce RTX 5080 Laptop
99.8 (84min) fps +46%
Lenovo Legion 9 16IRX9, RTX 4090
Intel Core i9-14900HX, NVIDIA GeForce RTX 4090 Laptop GPU
86 (70.4min) fps +26%
Schenker XMG APEX 16 MAX
AMD Ryzen 9 9955HX, NVIDIA GeForce RTX 5070 Ti Laptop
82.9 (69.5min) fps +21%
Alienware 16X Aurora Core Ultra 9 290HX Plus
Intel Core Ultra 9 290HX Plus, NVIDIA GeForce RTX 5070 Ti Laptop
75.1 (61.7min, 58.1P1) fps +10%
MSI Crosshair A16 HX E8WGK
AMD Ryzen 9 8940HX, NVIDIA GeForce RTX 5070 Laptop
68.8 (58.4min, 56.1P1) fps +1%
HP HyperX Omen 16 16-ap1931nr
AMD Ryzen 9 9955HX3D, NVIDIA GeForce RTX 5070 Laptop
68.4 (58min, 55.5P1) fps
Lenovo Legion Pro 5 16IAX10, RTX 5070
Intel Core Ultra 7 255HX, NVIDIA GeForce RTX 5070 Laptop
68.3 (58.1min) fps 0%
Media NVIDIA GeForce RTX 5070 Laptop
  (51.9 - 68.8, n=31)
63.3 fps -7%
HP Omen 16-ap0091ng
AMD Ryzen 9 8940HX, NVIDIA GeForce RTX 5060 Laptop
56.1 fps -18%
2560x1440 Ultra Preset DLSS4 quality no FG
NVIDIA KFA2 GeForce RTX 5070 1-Click OC
AMD Ryzen 7 9800X3D, NVIDIA GeForce RTX 5070
128.7 (111.7min) fps +61%
Schenker XMG APEX 16 MAX
AMD Ryzen 9 9955HX, NVIDIA GeForce RTX 5070 Ti Laptop
96.1 (82.8min) fps +20%
Alienware 16X Aurora Core Ultra 9 290HX Plus
Intel Core Ultra 9 290HX Plus, NVIDIA GeForce RTX 5070 Ti Laptop
86.9 (74.9min, 70.5P1) fps +9%
MSI Crosshair A16 HX E8WGK
AMD Ryzen 9 8940HX, NVIDIA GeForce RTX 5070 Laptop
81.9 (71.5min, 67.2P1) fps +3%
Lenovo Legion Pro 5 16IAX10, RTX 5070
Intel Core Ultra 7 255HX, NVIDIA GeForce RTX 5070 Laptop
80.7 (70.5min) fps +1%
HP HyperX Omen 16 16-ap1931nr
AMD Ryzen 9 9955HX3D, NVIDIA GeForce RTX 5070 Laptop
79.9 (69.7min, 66.3P1) fps
Media NVIDIA GeForce RTX 5070 Laptop
  (61.4 - 81.9, n=18)
74.3 fps -7%
HP Omen 16-ap0091ng
AMD Ryzen 9 8940HX, NVIDIA GeForce RTX 5060 Laptop
65.2 fps -18%
F1 24
1920x1080 Ultra High Preset AA:T AF:16x
NVIDIA KFA2 GeForce RTX 5070 1-Click OC
AMD Ryzen 7 9800X3D, NVIDIA GeForce RTX 5070
138.2 (96min, 107P1) fps +56%
Lenovo Legion 9 16IRX9, RTX 4090
Intel Core i9-14900HX, NVIDIA GeForce RTX 4090 Laptop GPU
113.6 (14min, 69P1) fps +28%
Schenker XMG APEX 16 MAX
AMD Ryzen 9 9955HX, NVIDIA GeForce RTX 5070 Ti Laptop
110.6 (70min, 84P1) fps +25%
Alienware 16X Aurora Core Ultra 9 290HX Plus
Intel Core Ultra 9 290HX Plus, NVIDIA GeForce RTX 5070 Ti Laptop
97.7 (64min, 74P1) fps +10%
MSI Crosshair A16 HX E8WGK
AMD Ryzen 9 8940HX, NVIDIA GeForce RTX 5070 Laptop
94.7 (68min, 75P1) fps +7%
HP HyperX Omen 16 16-ap1931nr
AMD Ryzen 9 9955HX3D, NVIDIA GeForce RTX 5070 Laptop
88.6 (68min, 70P1) fps
Media NVIDIA GeForce RTX 5070 Laptop
  (63.8 - 94.7, n=19)
83.5 fps -6%
2560x1440 Ultra High Preset AA:T AF:16x
NVIDIA KFA2 GeForce RTX 5070 1-Click OC
AMD Ryzen 7 9800X3D, NVIDIA GeForce RTX 5070
88.3 (71min, 72P1) fps +58%
Lenovo Legion 9 16IRX9, RTX 4090
Intel Core i9-14900HX, NVIDIA GeForce RTX 4090 Laptop GPU
72.1 (2min, 56P1) fps +29%
Schenker XMG APEX 16 MAX
AMD Ryzen 9 9955HX, NVIDIA GeForce RTX 5070 Ti Laptop
72 (58min, 58P1) fps +29%
Alienware 16X Aurora Core Ultra 9 290HX Plus
Intel Core Ultra 9 290HX Plus, NVIDIA GeForce RTX 5070 Ti Laptop
62.8 (49min, 50P1) fps +12%
MSI Crosshair A16 HX E8WGK
AMD Ryzen 9 8940HX, NVIDIA GeForce RTX 5070 Laptop
59.3 (47min, 47P1) fps +6%
HP HyperX Omen 16 16-ap1931nr
AMD Ryzen 9 9955HX3D, NVIDIA GeForce RTX 5070 Laptop
56 (45min, 44P1) fps
Media NVIDIA GeForce RTX 5070 Laptop
  (40.3 - 59.3, n=19)
52.3 fps -7%
2560x1440 Ultra High Preset + Quality DLSS AF:16x
NVIDIA KFA2 GeForce RTX 5070 1-Click OC
AMD Ryzen 7 9800X3D, NVIDIA GeForce RTX 5070
138.7 (103min, 109P1) fps +61%
Schenker XMG APEX 16 MAX
AMD Ryzen 9 9955HX, NVIDIA GeForce RTX 5070 Ti Laptop
112.4 (67min, 80P1) fps +31%
Alienware 16X Aurora Core Ultra 9 290HX Plus
Intel Core Ultra 9 290HX Plus, NVIDIA GeForce RTX 5070 Ti Laptop
99 (58min, 72P1) fps +15%
MSI Crosshair A16 HX E8WGK
AMD Ryzen 9 8940HX, NVIDIA GeForce RTX 5070 Laptop
93.1 (65min, 71P1) fps +8%
HP HyperX Omen 16 16-ap1931nr
AMD Ryzen 9 9955HX3D, NVIDIA GeForce RTX 5070 Laptop
86.1 (66min, 65P1) fps
Media NVIDIA GeForce RTX 5070 Laptop
  (62.9 - 93.1, n=16)
80.9 fps -6%

Grafico dei FPS in modalità Ultra di Cyberpunk 2077

05101520253035404550556065707580859095100105110Tooltip
HP HyperX Omen 16 16-ap1931nr R9 9955HX3D, GeForce RTX 5070 Laptop: Ø110.6 (102.1-113.7) fps
HP Omen 16-ap0091ng R9 8940HX, GeForce RTX 5060 Laptop: Ø78.2 (74.1-78.9) fps
bassomedioaltoultraQHD DLSSQHD
GTA V (2015) 188.1 187.9 188 171.5 133.2
Dota 2 Reborn (2015) 260 225 214 200
Final Fantasy XV Benchmark (2018) 229 182.2 135.2 100.2
X-Plane 11.11 (2018) 157.6 144 111.9
Strange Brigade (2018) 593 376 301 260 170.6
Valorant (2020) 641.5 397.2
Baldur's Gate 3 (2023) 134.5 136.3 93.4
Cyberpunk 2077 (2023) 177.6 148.7 123.7 108.8 79.9 68.4
F1 24 (2024) 383 327 250 88.6 86.1 56
Black Myth: Wukong (2024) 60 36 38 26

Emissioni

Rumore di sistema

Il rumore della ventola tende a aumentare frequentemente e in modo significativo nelle modalità «Performance» o «Unleashed», anche durante la semplice navigazione o lo streaming video. Si raccomanda pertanto di utilizzare la modalità «Balanced» o una modalità inferiore quando non si sta giocando.

Il rumore della ventola è in media di 43,4 dB(A), 49,7 dB(A) e 54,7 dB(A) durante il gioco nelle modalità "Balanced", "Performance" e "Unleashed", rispettivamente. 
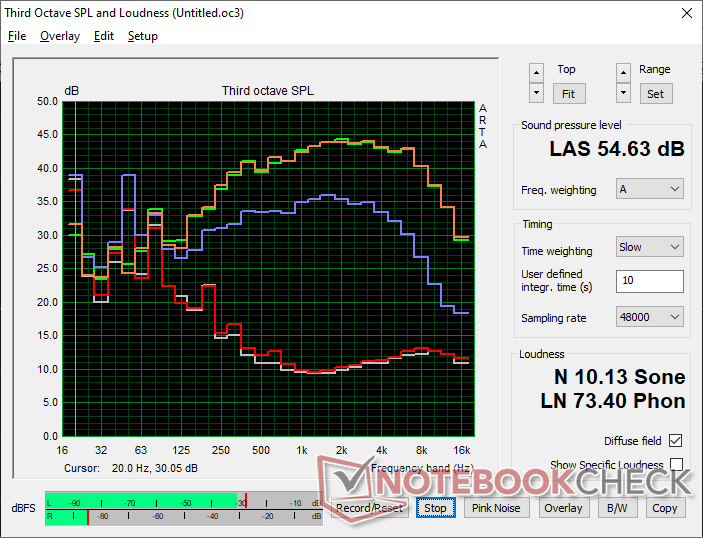
Profilo di rumorosità della ventola (Bianco: rumore di fondo, Rosso: sistema inattivo, Blu: 3DMark 06, Arancione: Cyberpunk 2077, Verde: stress test Prime95+FurMark)

Rumorosità

Idle
24.2 / 24.2 / 25.3 dB(A)
Sotto carico
45.7 / 54.7 dB(A)
  red to green bar
 
 
30 dB
silenzioso
40 dB(A)
udibile
50 dB(A)
rumoroso
 
min: dark, med: mid, max: light   Earthworks M23R, Arta (15 cm di distanza)   Rumorosità ambientale: 23.8 dB(A)
dB(A) 0102030405060708090Deep BassMiddle BassHigh BassLower RangeMidsHigher MidsLower HighsMid HighsUpper HighsSuper Highs2031.63936.838.430.1252426.72423.927.23123.725.3212023.44028.228.927.325.927.95024.43933.933.825.76328.13023.624.227.68033.233.13131.533.910028.527.922.422.429.212528.126.619.92129.21603327.819.118.832.820034.130.722.422.633.925037.53115.314.636.931539.431.716.7153940040.933.613.11241.150039.733.412.110.939.463041.633.612.710.840.88004133.310.79.841100042.434.99.89.542.7125043.235.49.59.443.3160043.935.99.99.443.9200043.935.410.39.844.4250043.834.610.510.343.631504434.911.210.943.9400043.133.411.410.943500042.532.111.811.642.4630042.930.212.712.142.9800040.326.713.212.340.41000037.422.712.812.637.41250034.219.412.212.334.21600029.718.411.710.829.2SPL54.745.724.223.754.6N10.25.40.60.510.1median 40.9median 32.1median 12.2median 11.6median 40.8Delta4.93.62.32.24.9hearing rangehide median Fan NoiseHP HyperX Omen 16 16-ap1931nr
HP HyperX Omen 16 16-ap1931nr
R9 9955HX3D, GeForce RTX 5070 Laptop
HP Omen 16-ap0091ng
R9 8940HX, GeForce RTX 5060 Laptop
MSI Crosshair A16 HX E8WGK
R9 8940HX, GeForce RTX 5070 Laptop
Alienware 16X Aurora Core Ultra 9 290HX Plus
Ultra 9 290HX Plus, GeForce RTX 5070 Ti Laptop
Lenovo Legion Pro 5 16IAX10, RTX 5070
Ultra 7 255HX, GeForce RTX 5070 Laptop
Asus TUF Gaming A16 FA608UP
R7 260, GeForce RTX 5070 Laptop
Noise
1%
-8%
-4%
5%
-12%
off /ambiente * (dB)
23.8
23
3%
23.4
2%
23.4
2%
23
3%
25.1
-5%
Idle Minimum * (dB)
24.2
23
5%
29.1
-20%
23.8
2%
23
5%
32.2
-33%
Idle Average * (dB)
24.2
23
5%
29.1
-20%
23.8
2%
23
5%
32.2
-33%
Idle Maximum * (dB)
25.3
27.64
-9%
29.1
-15%
31.4
-24%
23
9%
32.2
-27%
Load Average * (dB)
45.7
49.5
-8%
41.7
9%
48.7
-7%
43.85
4%
38.1
17%
Cyberpunk 2077 ultra * (dB)
54.7
49.5
10%
58.7
-7%
51.5
6%
50.27
8%
53.9
1%
Load Maximum * (dB)
54.7
52.73
4%
59
-8%
59.8
-9%
52.9
3%
57.1
-4%

* ... Meglio usare valori piccoli

Temperatura
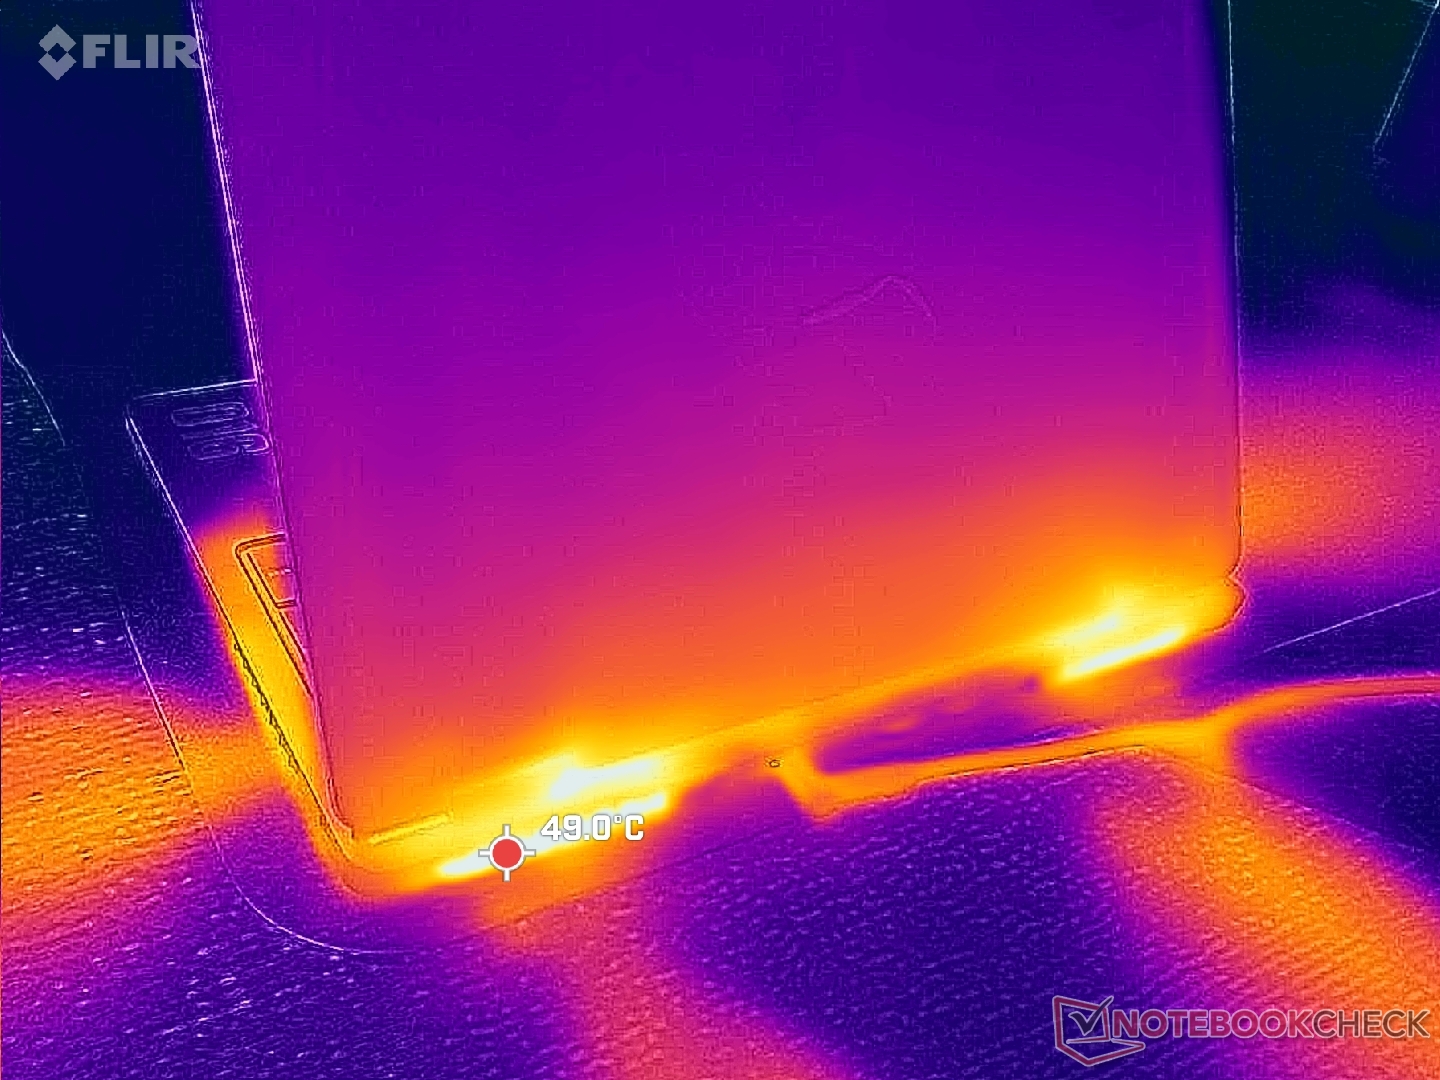
Quattro serie di bocchette di scarico lungo la parte posteriore e i lati
L'alimentatore raggiunge una temperatura superiore a 47 °C quando è sottoposto a carichi elevati
Carico massimo
 39 °C39.4 °C36.8 °C 
 39 °C38.8 °C40.2 °C 
 27.8 °C29.2 °C27.8 °C 
Massima: 40.2 °C
Media: 35.3 °C
43 °C41 °C42.4 °C
37.4 °C39.4 °C39.4 °C
27.6 °C28.2 °C29 °C
Massima: 43 °C
Media: 36.4 °C
Alimentazione (max)  52 °C | Temperatura della stanza 23 °C | Fluke 62 Mini IR Thermometer
(±) La temperatura media del lato superiore sotto carico massimo e' di 35.3 °C / 96 F, rispetto alla media di 33.9 °C / 93 F per i dispositivi di questa classe Gaming.
(±) La temperatura massima sul lato superiore è di 40.2 °C / 104 F, rispetto alla media di 40.4 °C / 105 F, che varia da 21.2 a 68.8 °C per questa classe Gaming.
(±) Il lato inferiore si riscalda fino ad un massimo di 43 °C / 109 F, rispetto alla media di 43.2 °C / 110 F
(+) In idle, la temperatura media del lato superiore è di 27.1 °C / 81 F, rispetto alla media deld ispositivo di 33.9 °C / 93 F.
(+) 3: The average temperature for the upper side is 31.8 °C / 89 F, compared to the average of 33.9 °C / 93 F for the class Gaming.
(+) I poggiapolsi e il touchpad sono piu' freddi della temperatura della pelle con un massimo di 29.2 °C / 84.6 F e sono quindi freddi al tatto.
(±) La temperatura media della zona del palmo della mano di dispositivi simili e'stata di 28.8 °C / 83.8 F (-0.4 °C / -0.8 F).
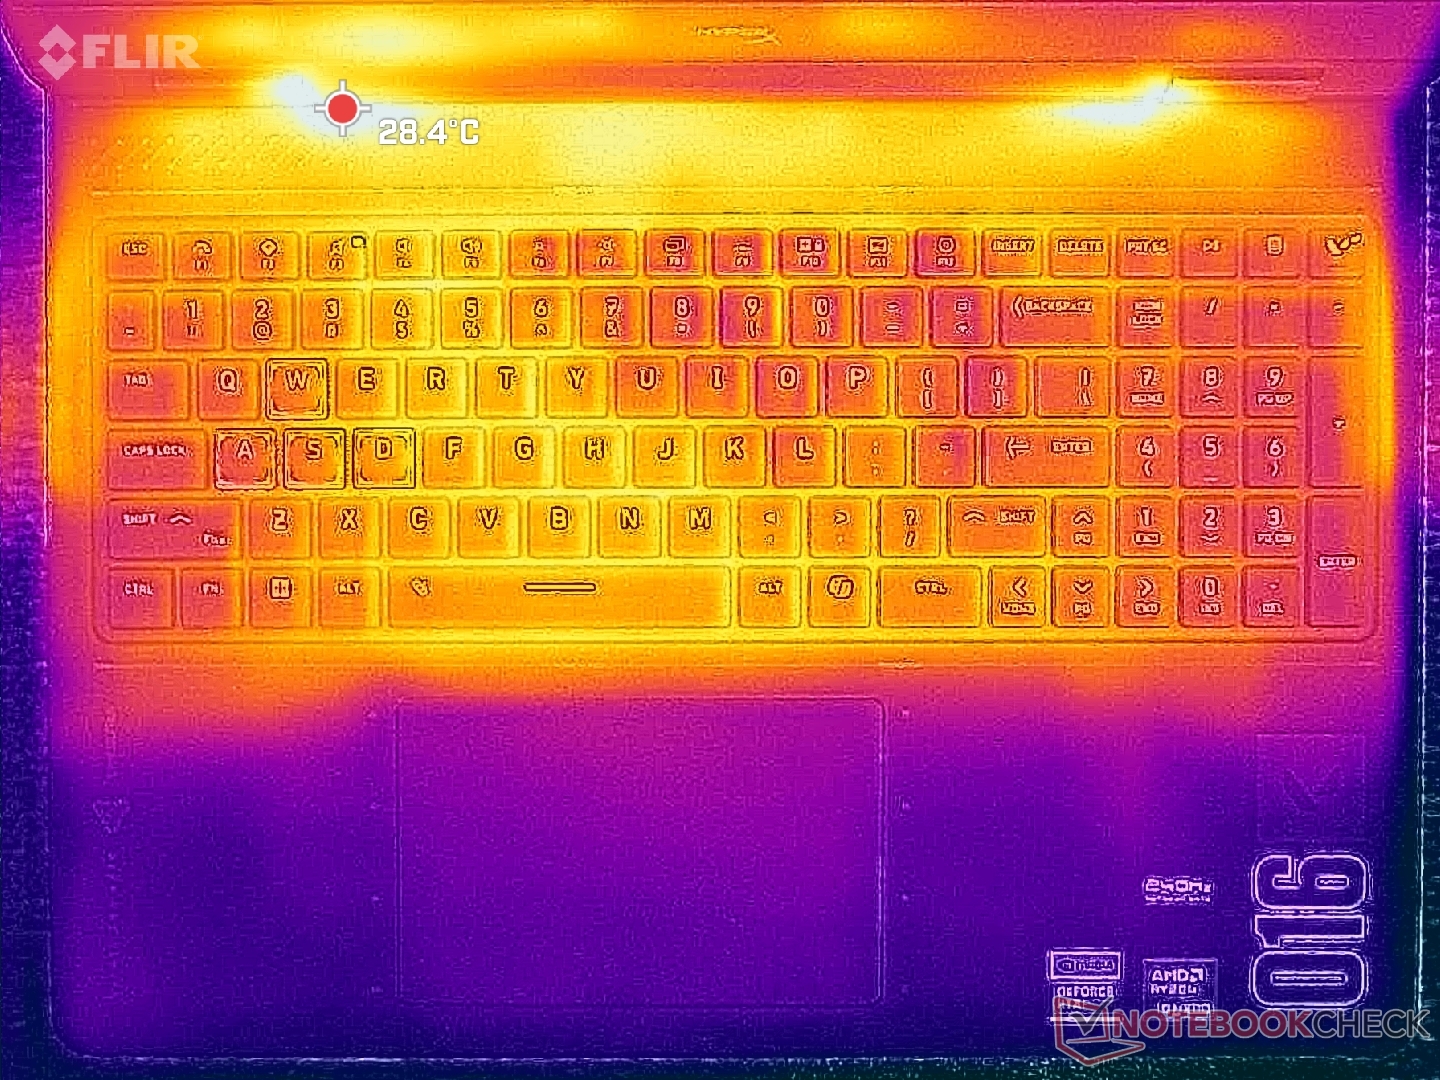
Sistema inattivo (copertina C)
Sistema inattivo (copertina D)
Cyberpunk 2077: lo stress (copertina C)
Cyberpunk 2077: lo stress (copertina D)
Test di stress con Prime95+FurMark (livello C)
Test di stress con Prime95+FurMark (livello D)
HP HyperX Omen 16 16-ap1931nr
R9 9955HX3D, GeForce RTX 5070 Laptop
HP Omen 16-ap0091ng
R9 8940HX, GeForce RTX 5060 Laptop
MSI Crosshair A16 HX E8WGK
R9 8940HX, GeForce RTX 5070 Laptop
Alienware 16X Aurora Core Ultra 9 290HX Plus
Ultra 9 290HX Plus, GeForce RTX 5070 Ti Laptop
Lenovo Legion Pro 5 16IAX10, RTX 5070
Ultra 7 255HX, GeForce RTX 5070 Laptop
Asus TUF Gaming A16 FA608UP
R7 260, GeForce RTX 5070 Laptop
Heat
7%
-9%
3%
-5%
9%
Maximum Upper Side * (°C)
40.2
36
10%
41.8
-4%
48.2
-20%
42
-4%
39.5
2%
Maximum Bottom * (°C)
43
37
14%
50.6
-18%
41
5%
44
-2%
45.1
-5%
Idle Upper Side * (°C)
30
30
-0%
30.8
-3%
28.2
6%
33
-10%
25.7
14%
Idle Bottom * (°C)
33
32
3%
36
-9%
26.2
21%
34
-3%
25.5
23%

* ... Meglio usare valori piccoli

Stress test

La CPU raggiungeva i 4,1 GHz e i 118 W durante l’esecuzione dello stress test Prime95, per poi scendere leggermente a 3,8 GHz, 105 W e 76 °C poco dopo. Il TGP si attestava in media a 93 W, 111 W e 111 W durante l’esecuzione di Cyberpunk 2077 rispettivamente nelle modalità «Balanced», «Performance» e «Unleashed», il che significa che le ventole più silenziose della modalità «Balanced» comportano lievi perdite di prestazioni durante il gioco.
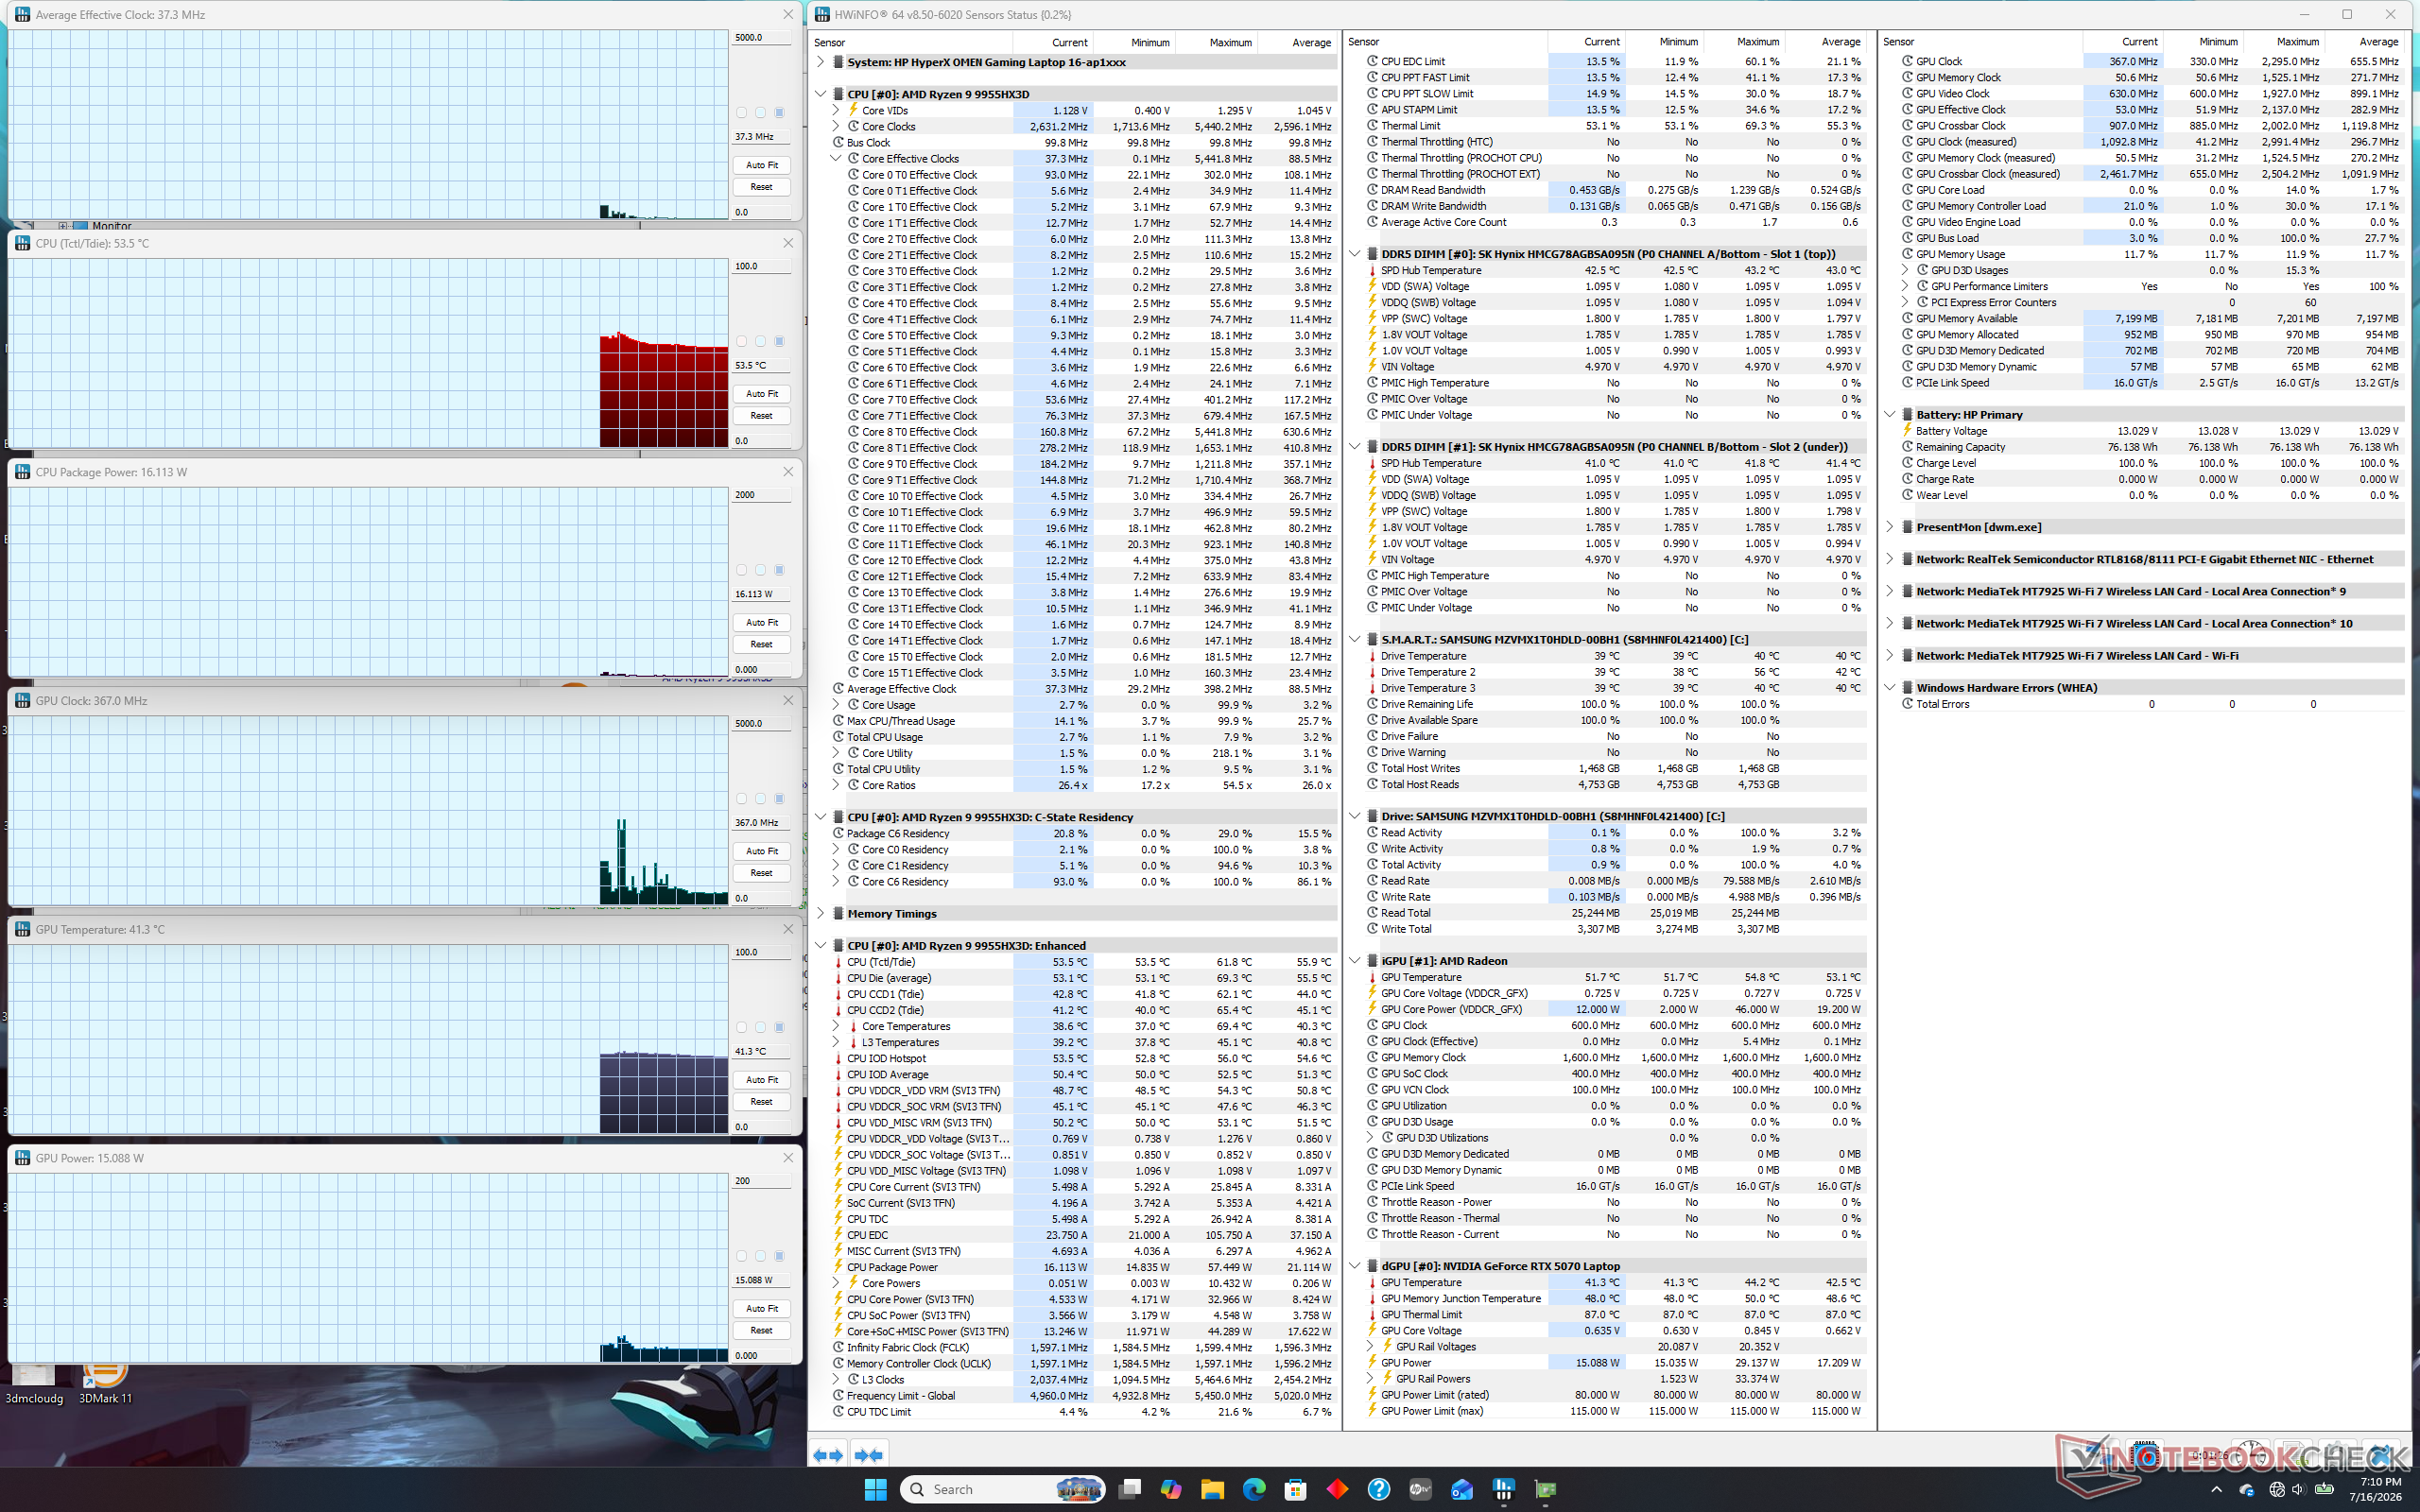
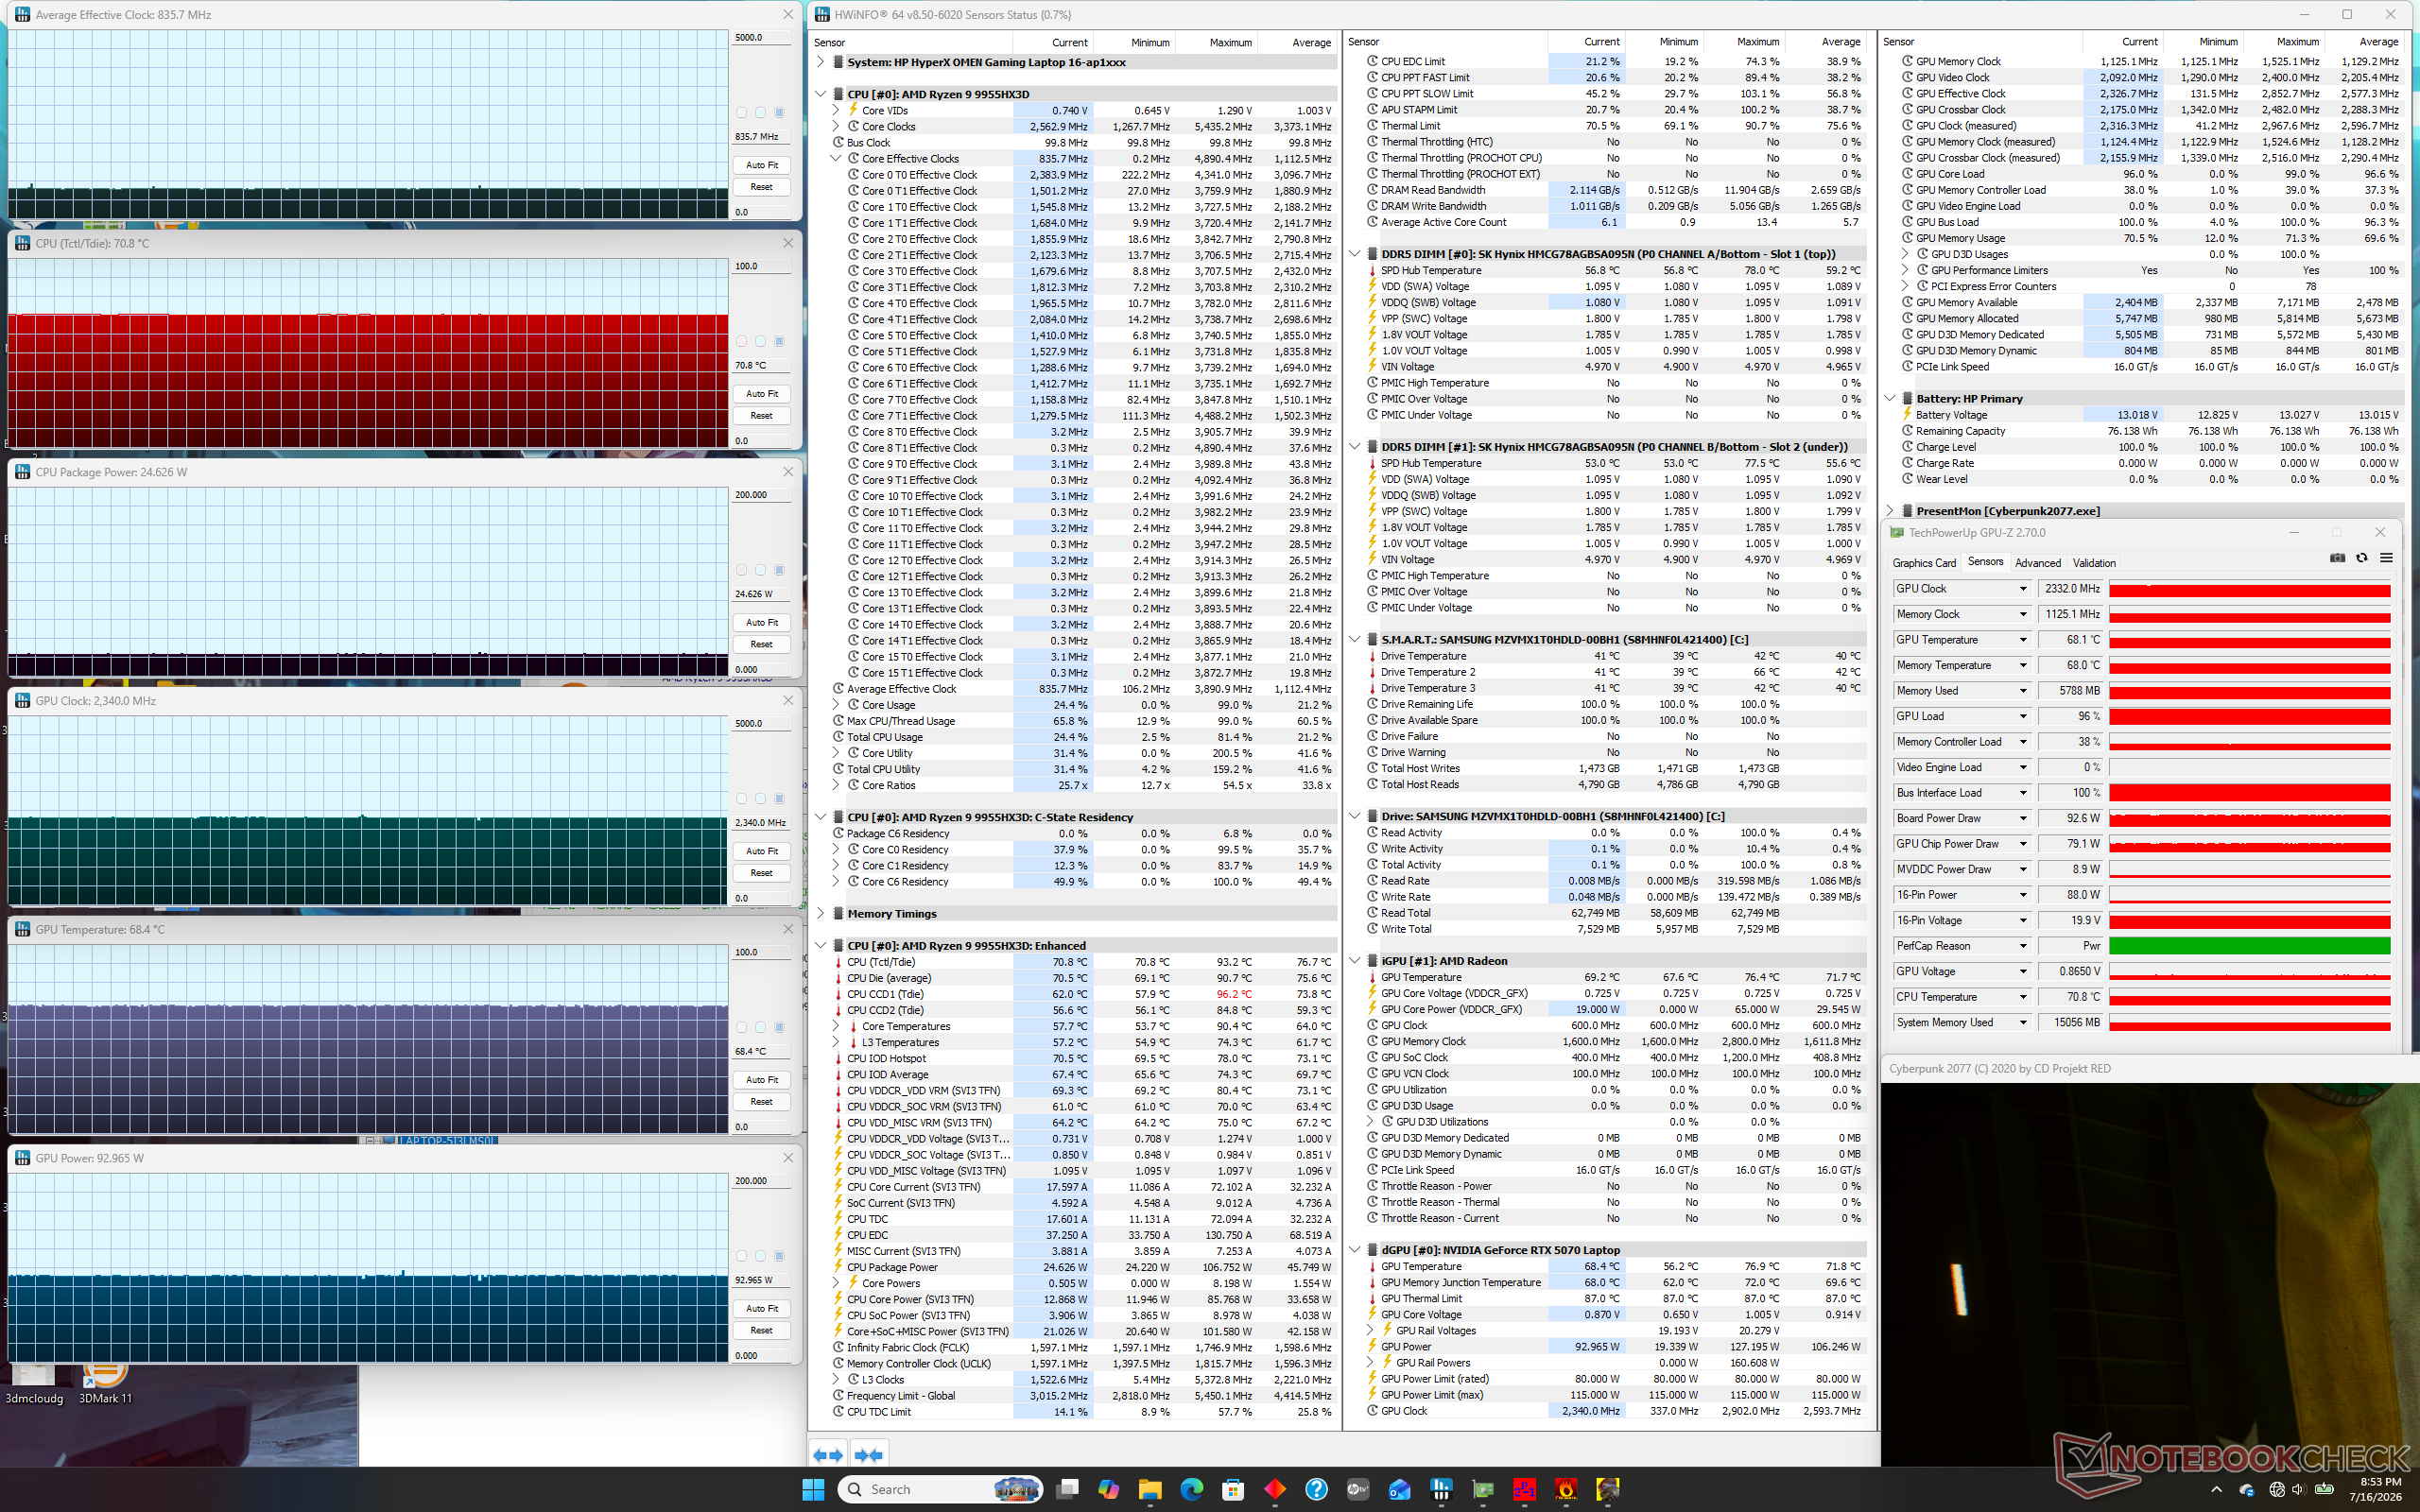
Sistema inattivo
Sistema inattivo
Cyberpunk 2077 (modalità bilanciata)
Test di stress con Prime95
Cyberpunk 2077 (Modalità Prestazioni)
Test di stress con Prime95+FurMark
Cyberpunk 2077 (modalità Unleashed)
Frequenza di clock della CPU (GHz) Frequenza di clock della GPU (MHz) Temperatura media della CPU (°C) Temperatura media della GPU (°C) Sistema inattivo
--
367
54
41
Stress
con Prime95
Prime95 + FurMark Stress
3,3
2250
81
79
Stress test Cyberpunk 2077 (modalità bilanciata)
0,8
2340
71
68
Cyberpunk 2077 Stress (modalità Performance)
1,2
2685
75
72
Cyberpunk 2077 Stress (modalità Unleashed)
1,2
2455
89
74

Relatori

Il rumore rosa presenta un volume massimo relativamente basso, pari a 78 dB(A), mentre la maggior parte dei portatili multimediali da 16 pollici registra un valore medio leggermente superiore a 80 dB(A)
dB(A) 0102030405060708090Deep BassMiddle BassHigh BassLower RangeMidsHigher MidsLower HighsMid HighsUpper HighsSuper Highs2036.832.1252424.9312121.54027.3275033.924.96323.624.5803131.310022.428.612519.936.916019.146.620022.454.825015.359.731516.762.540013.165.950012.163.663012.766.780010.771.810009.870.312509.567.716009.968.2200010.368.4250010.563.8315011.264.6400011.466.3500011.863.7630012.762.3800013.263.31000012.8671250012.266.21600011.761.9SPL24.278.9N0.646.3median 12.2median 63.8Delta2.35.726.325.821.422.12624.925.127.622.532.523.448.72655.818.860.922.167.2267019.372.317.674.217.774.319.575.31571.711.871.311.27410.574.21072.710.17210.67210.97511.374.811.671.71269.71269.612.371.112.669.61270.111.269.824.784.70.666.6median 12median 71.73.42.2hearing rangehide median Pink NoiseHP HyperX Omen 16 16-ap1931nrApple MacBook Pro 16 2021 M1 Pro
Diagramma frequenza (le caselle possono essere selezionate/deselezionate per confrontare i dispositivi)
HP HyperX Omen 16 16-ap1931nr analisi audio

(±) | potenza degli altiparlanti media ma buona (78.9 dB)
Bassi 100 - 315 Hz
(-) | quasi nessun basso - in media 15.6% inferiori alla media
(±) | la linearità dei bassi è media (11.8% delta rispetto alla precedente frequenza)
Medi 400 - 2000 Hz
(+) | medi bilanciati - solo only 4.1% rispetto alla media
(+) | medi lineari (4.5% delta rispetto alla precedente frequenza)
Alti 2 - 16 kHz
(+) | Alti bilanciati - appena 1.2% dalla media
(+) | alti lineari (4.4% delta rispetto alla precedente frequenza)
Nel complesso 100 - 16.000 Hz
(+) | suono nel complesso lineare (13.3% differenza dalla media)
Rispetto alla stessa classe
» 19% di tutti i dispositivi testati in questa classe è stato migliore, 5% simile, 76% peggiore
» Il migliore ha avuto un delta di 6%, medio di 18%, peggiore di 132%
Rispetto a tutti i dispositivi testati
» 14% di tutti i dispositivi testati in questa classe è stato migliore, 3% similare, 83% peggiore
» Il migliore ha avuto un delta di 4%, medio di 23%, peggiore di 134%

Apple MacBook Pro 16 2021 M1 Pro analisi audio

(+) | gli altoparlanti sono relativamente potenti (84.7 dB)
Bassi 100 - 315 Hz
(+) | bassi buoni - solo 3.8% dalla media
(+) | bassi in lineaa (5.2% delta rispetto alla precedente frequenza)
Medi 400 - 2000 Hz
(+) | medi bilanciati - solo only 1.3% rispetto alla media
(+) | medi lineari (2.1% delta rispetto alla precedente frequenza)
Alti 2 - 16 kHz
(+) | Alti bilanciati - appena 1.9% dalla media
(+) | alti lineari (2.7% delta rispetto alla precedente frequenza)
Nel complesso 100 - 16.000 Hz
(+) | suono nel complesso lineare (4.6% differenza dalla media)
Rispetto alla stessa classe
» 0% di tutti i dispositivi testati in questa classe è stato migliore, 0% simile, 100% peggiore
» Il migliore ha avuto un delta di 5%, medio di 17%, peggiore di 45%
Rispetto a tutti i dispositivi testati
» 0% di tutti i dispositivi testati in questa classe è stato migliore, 0% similare, 100% peggiore
» Il migliore ha avuto un delta di 4%, medio di 23%, peggiore di 134%

Gestione energetica

Consumo energetico

Il consumo complessivo è molto elevato, in gran parte a causa della CPU Ryzen 9 9955HX3D. L’esecuzione di Prime95, ad esempio, richiederebbe già 180 W, un valore superiore a quello della maggior parte degli altri portatili da gioco in condizioni simili. La durata relativamente breve della batteria, di cui si parlerà nella sezione seguente, non è quindi una sorpresa.
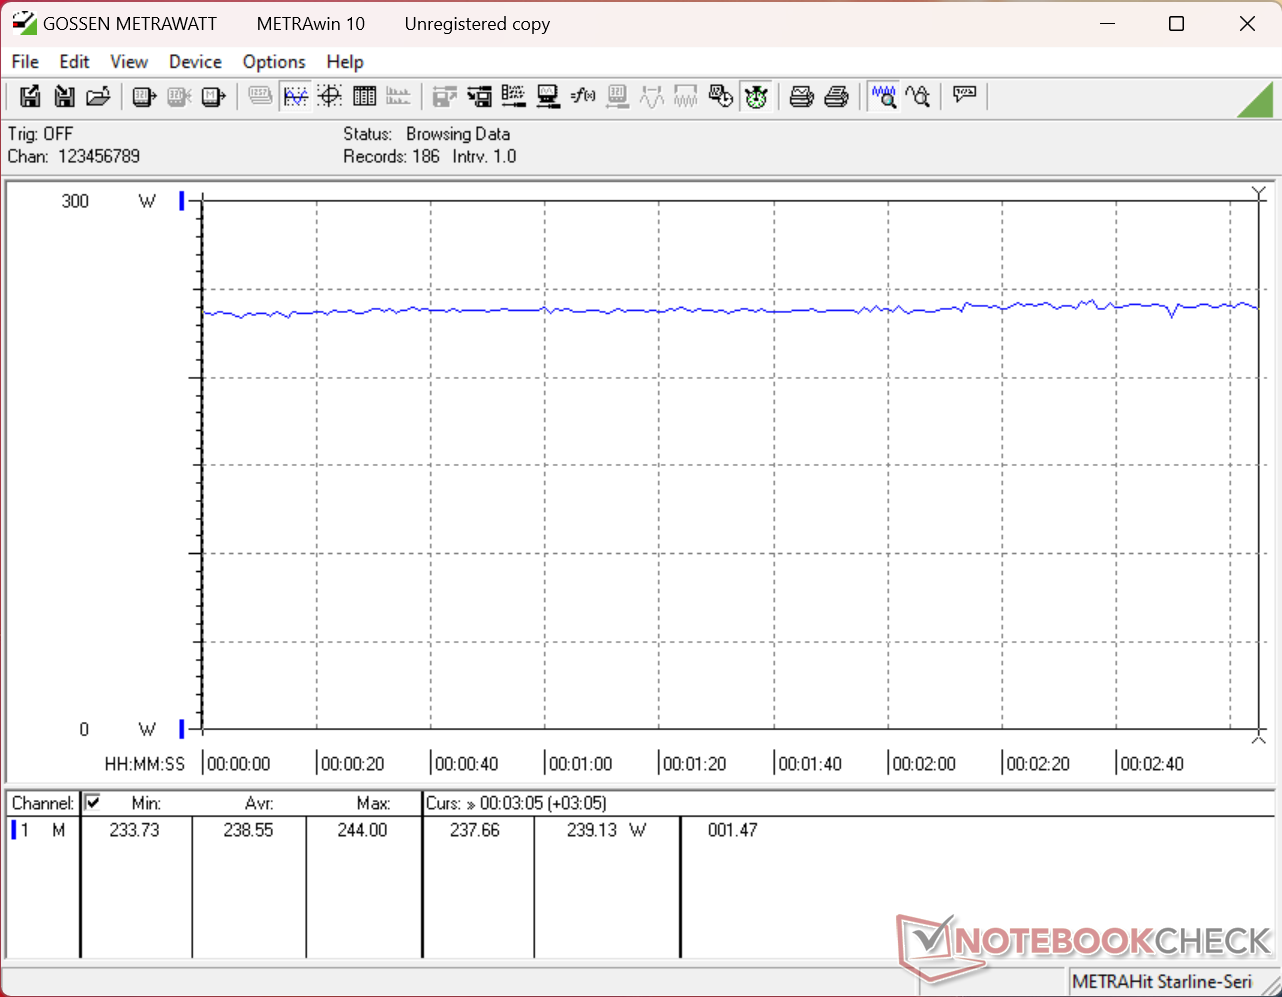
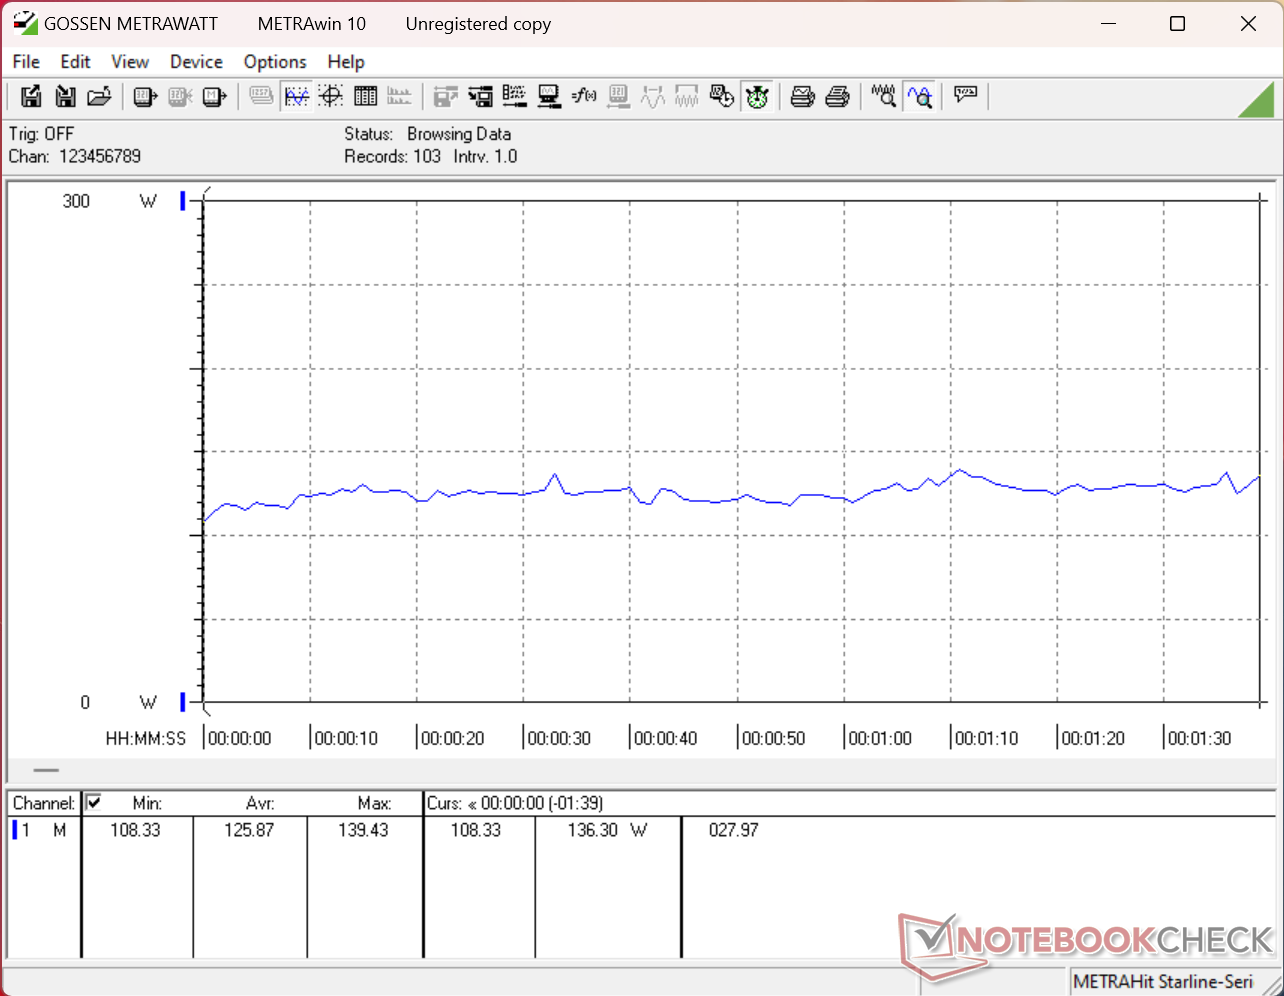
Cyberpunk 2077: consumo a 1080p in modalità Ultra
Consumo di 3DMark06
Consumo di 3DMark06
Il consumo raggiungeva un picco di 198 W all’avvio dello stress test Prime95, per poi scendere rapidamente a 181 W
Lo stress test con Prime95+FurMark è stato avviato al decimo secondo. Il sistema assorbe fino a 260 W dall’alimentatore CA da 280 W, di dimensioni relativamente grandi (~18 x 9 x 2,5 cm).
Consumo di corrente
Off / Standbydarklight 0.02 / 0.3 Watt
Idledarkmidlight 10.7 / 15.4 / 44.1 Watt
Sotto carico midlight 125.9 / 269.2 Watt
 color bar
Leggenda: min: dark, med: mid, max: light        Metrahit Energy
HP HyperX Omen 16 16-ap1931nr
R9 9955HX3D, GeForce RTX 5070 Laptop, , IPS, 2560x1600, 16"
HP Omen 16-ap0091ng
R9 8940HX, GeForce RTX 5060 Laptop, Samsung PM9C1b MZVL81T0HFLB-00BH1, IPS, 1920x1200, 16"
MSI Crosshair A16 HX E8WGK
R9 8940HX, GeForce RTX 5070 Laptop, Micron 2500 1TB MTFDKBA1T0QGN, IPS, 2560x1600, 16"
Alienware 16X Aurora Core Ultra 9 290HX Plus
Ultra 9 290HX Plus, GeForce RTX 5070 Ti Laptop, , OLED, 2560x1600, 16"
Lenovo Legion Pro 5 16IAX10, RTX 5070
Ultra 7 255HX, GeForce RTX 5070 Laptop, SK Hynix HFS001TEJ9X115N, OLED, 2650x1600, 16"
Asus TUF Gaming A16 FA608UP
R7 260, GeForce RTX 5070 Laptop, Western Digital PC SN5000S SDEQNSJ-1T00, IPS, 2560x1600, 16"
Power Consumption
28%
-4%
20%
16%
37%
Idle Minimum * (Watt)
10.7
7.8
27%
12.3
-15%
6.9
36%
10.6
1%
4.6
57%
Idle Average * (Watt)
15.4
8.8
43%
17.1
-11%
8.1
47%
12.3
20%
9.8
36%
Idle Maximum * (Watt)
44.1
21.5
51%
42.4
4%
31
30%
18.6
58%
10.2
77%
Load Average * (Watt)
125.9
119
5%
130.2
-3%
131.6
-5%
104
17%
76.1
40%
Cyberpunk 2077 ultra external monitor * (Watt)
236
164.5
30%
242
-3%
172.1
27%
227
4%
198.1
16%
Cyberpunk 2077 ultra * (Watt)
239
192
20%
246
-3%
198.3
17%
231
3%
198.9
17%
Load Maximum * (Watt)
269.2
208
23%
264.3
2%
300.1
-11%
248
8%
235.2
13%

* ... Meglio usare valori piccoli

Consumo energetico Cyberpunk / Stress test

0102030405060708090100110120130140150160170180190200210220230240250260Tooltip
HP HyperX Omen 16 16-ap1931nr R9 9955HX3D, GeForce RTX 5070 Laptop; 1280x720 Prime95 28.10 and Furmark 1.25: Ø258 (248-269) Watt
Lenovo Pro 9 16IPH11 Ultra 9 386H, GeForce RTX 5060 Laptop; 1280x720 Prime95 28.10 and Furmark 1.25: Ø186.7 (163.6-231) Watt
HP HyperX Omen 16 16-ap1931nr R9 9955HX3D, GeForce RTX 5070 Laptop; Idle 150cd/m2: Ø11.4 (9.29-17.2) Watt
Lenovo Pro 9 16IPH11 Ultra 9 386H, GeForce RTX 5060 Laptop; Idle 150cd/m2: Ø15.4 (14.7-17.6) Watt
HP HyperX Omen 16 16-ap1931nr R9 9955HX3D, GeForce RTX 5070 Laptop; Cyberpunk 2077 FHD ultra no FSR 150cd: Ø239 (234-244) Watt
Lenovo Pro 9 16IPH11 Ultra 9 386H, GeForce RTX 5060 Laptop; Cyberpunk 2077 FHD ultra no FSR 150cd: Ø161.2 (155-171.2) Watt

Consumo energetico del monitor esterno

05101520253035404550556065707580859095100105110115120125130135140145150155160165170175180185190195200205210215220225230235240245250Tooltip
HP HyperX Omen 16 16-ap1931nr R9 9955HX3D, GeForce RTX 5070 Laptop; Prime95 V2810 Stress (external Monitor): Ø179.6 (174.2-198.2) Watt
HP Omen 16-ap0091ng R9 8940HX, GeForce RTX 5060 Laptop; Prime95 V2810 Stress (external Monitor): Ø94.9 (92.08-120.03) Watt
HP Omen 16-ap0091ng R9 8940HX, GeForce RTX 5060 Laptop; Cinebench R15 Multi (external Monitor): Ø103.5 (94.29-121.45) Watt
HP HyperX Omen 16 16-ap1931nr R9 9955HX3D, GeForce RTX 5070 Laptop; Cinebench R23 Multi (external Monitor): Ø182.5 (172.2-202) Watt
HP Omen 16-ap0091ng R9 8940HX, GeForce RTX 5060 Laptop; Cinebench R23 Multi (external Monitor): Ø95.1 (82.09-122.09) Watt
HP HyperX Omen 16 16-ap1931nr R9 9955HX3D, GeForce RTX 5070 Laptop; 1280x720 FurMark 1.19 GPU Stress Test (external Monitor): Ø156.6 (146.9-164.1) Watt
HP Omen 16-ap0091ng R9 8940HX, GeForce RTX 5060 Laptop; 1280x720 FurMark 1.19 GPU Stress Test (external Monitor): Ø161.3 (147.46-176.63) Watt
HP HyperX Omen 16 16-ap1931nr R9 9955HX3D, GeForce RTX 5070 Laptop; Idle 1min (external Monitor): Ø10.7 (8.18-16.7) Watt
HP Omen 16-ap0091ng R9 8940HX, GeForce RTX 5060 Laptop; Idle 1min (external Monitor): Ø26.4 (17.347-34.44) Watt
HP HyperX Omen 16 16-ap1931nr R9 9955HX3D, GeForce RTX 5070 Laptop; Cyberpunk 2077 FHD ultra no FSR (external Monitor): Ø236 (223-250) Watt
HP Omen 16-ap0091ng R9 8940HX, GeForce RTX 5060 Laptop; Cyberpunk 2077 FHD ultra no FSR (external Monitor): Ø164.5 (161.25-168.08) Watt

Durata della batteria

Autonomia della batteria
WiFi Websurfing
3ore 54minuti
HP HyperX Omen 16 16-ap1931nr
R9 9955HX3D, GeForce RTX 5070 Laptop, 83 Wh
HP Omen 16-ap0091ng
R9 8940HX, GeForce RTX 5060 Laptop, 70 Wh
MSI Crosshair A16 HX E8WGK
R9 8940HX, GeForce RTX 5070 Laptop, 80 Wh
Alienware 16X Aurora Core Ultra 9 290HX Plus
Ultra 9 290HX Plus, GeForce RTX 5070 Ti Laptop, 96 Wh
Lenovo Legion Pro 5 16IAX10, RTX 5070
Ultra 7 255HX, GeForce RTX 5070 Laptop, 80 Wh
Asus TUF Gaming A16 FA608UP
R7 260, GeForce RTX 5070 Laptop, 90 Wh
Autonomia della batteria
28%
41%
90%
59%
233%
WiFi v1.3 (h)
3.9
5
28%
5.5
41%
7.4
90%
6.2
59%
13
233%
H.264 (h)
5.1
6.1
Load (h)
1.3
1.8

Valutazione di Notebookcheck

L’HyperX Omen 16 presenta solo lievi modifiche esterne, ma include aggiornamenti più significativi a livello di CPU e display, in particolare per quanto riguarda la sua potentissima CPU Ryzen 9 9955HX3D.

HP HyperX Omen 16 16-ap1931nr - 08/21/2026 v8
Allen Ngo

Chassis
86 / 98 → 88%
Tastiera
91%
Dispositivo di puntamento
88%
Connettività
62 / 80 → 77%
Peso
60 / 10-68 → 86%
Batteria
57 / 95 → 60%
Display
83%
Prestazioni di gioco
92%
Prestazioni Applicazioni
93%
AI Performance
96%
Temperatura
92 / 95 → 97%
Rumorosità
70 / 90 → 78%
Audio
74%
Fotocamera
38 / 75 → 51%
Media
68%
85%
Gaming - Media ponderata
CO2 Emissions
50%
Materials
40%
Packaging
50%
Power Use
88.3%
Repairability
42%
Software Updates
22.3%
Recycle Logo Total Sustainability Score: 48.8%

Confronto con i potenziali concorrenti

Immagine
Modello
Prezzo
Peso
Altezza
Schermo
1.
84.9%
HP HyperX Omen 16 16-ap1931nr
AMD Ryzen 9 9955HX3D ⎘
NVIDIA GeForce RTX 5070 Laptop ⎘
32 GB Memoria
Amazon:
1. $1,909.00
HP Omen 16 Gaming AI Laptop ...
2. $1,099.99
HP Omen 16 Slim Gaming Lapto...
3. $1,590.89
HP OMEN MAX 16-ak0047nr 16" ...
Prezzo di listino: 2250 USD
2.4 kg30 mm16.00"
2560x1600
189 PPI
IPS
2.
82.5%
HP Omen 16-ap0091ng
HP Omen 16-ap0091ng
AMD Ryzen 9 8940HX ⎘
NVIDIA GeForce RTX 5060 Laptop ⎘
16 GB Memoria, 1000 GB SSD
Amazon: Prezzo di listino: 1500 Euro2.4 kg23.7 mm16.00"
1920x1200
162 PPI
IPS
3.
82.5%
MSI Crosshair A16 HX E8WGK
AMD Ryzen 9 8940HX ⎘
NVIDIA GeForce RTX 5070 Laptop ⎘
32 GB Memoria, 1024 GB SSD
Amazon: $2,699.00
Prezzo di listino: 2700 USD
2.3 kg25.55 mm16.00"
2560x1600
189 PPI
IPS
4.
86.1%
Alienware 16X Aurora Core Ultra 9 290HX Plus
Intel Core Ultra 9 290HX Plus ⎘
NVIDIA GeForce RTX 5070 Ti Laptop ⎘
32 GB Memoria
Amazon: Prezzo di listino: 3000 USD2.6 kg23.4 mm16.00"
2560x1600
189 PPI
OLED
5.
86.4%
Lenovo Legion Pro 5 16IAX10, RTX 5070
Intel Core Ultra 7 255HX ⎘
NVIDIA GeForce RTX 5070 Laptop ⎘
32 GB Memoria, 1024 GB SSD
Amazon: Prezzo di listino: 1800 Euro2.3 kg25.95 mm16.00"
2650x1600
189 PPI
OLED
6.
83.8%
Asus TUF Gaming A16 FA608UP
AMD Ryzen 7 260 ⎘
NVIDIA GeForce RTX 5070 Laptop ⎘
32 GB Memoria, 1024 GB SSD
Amazon: Prezzo di listino: 2199€2.2 kg25.7 mm16.00"
2560x1600
189 PPI
IPS

Transparency

La selezione dei dispositivi da recensire viene effettuata dalla nostra redazione. Il campione di prova è stato fornito all'autore come prestito dal produttore o dal rivenditore ai fini di questa recensione. L'istituto di credito non ha avuto alcuna influenza su questa recensione, né il produttore ne ha ricevuto una copia prima della pubblicazione. Non vi era alcun obbligo di pubblicare questa recensione. In quanto società mediatica indipendente, Notebookcheck non è soggetta all'autorità di produttori, rivenditori o editori.

Ecco come Notebookcheck esegue i test

Ogni anno, Notebookcheck esamina in modo indipendente centinaia di laptop e smartphone utilizzando procedure standardizzate per garantire che tutti i risultati siano comparabili. Da circa 20 anni sviluppiamo continuamente i nostri metodi di prova e nel frattempo stabiliamo gli standard di settore. Nei nostri laboratori di prova, tecnici ed editori esperti utilizzano apparecchiature di misurazione di alta qualità. Questi test comportano un processo di validazione in più fasi. Il nostro complesso sistema di valutazione si basa su centinaia di misurazioni e parametri di riferimento ben fondati, che mantengono l'obiettività.
Google LogoAdd as a preferred source on Google
Mail Logo
> Recensioni e prove di notebook, tablets e smartphones > Recensioni e prove > Recensioni e prove > Recensione dell’HP HyperX Omen 16: una delle CPU AMD più veloci per i giocatori mainstream
Allen Ngo, 2026-08-22 (Update: 2026-08-22)