Recensione del notebook Asus ROG Strix Scar 16 (2024): Prestazioni infuocate e brillantezza dei mini LED con un prezzo all'altezza
 in recensione")
Asus ha aggiornato l'intera linea di computer portatili al CES 2024. Tra le varianti gaming 2024, abbiamo recensito il ROG Zephyrus G14, ROG Zephyrus G16e ROG Strix Scar 18 finora. Oggi, diamo un'occhiata alla nuova ROG Strix Scar 16.
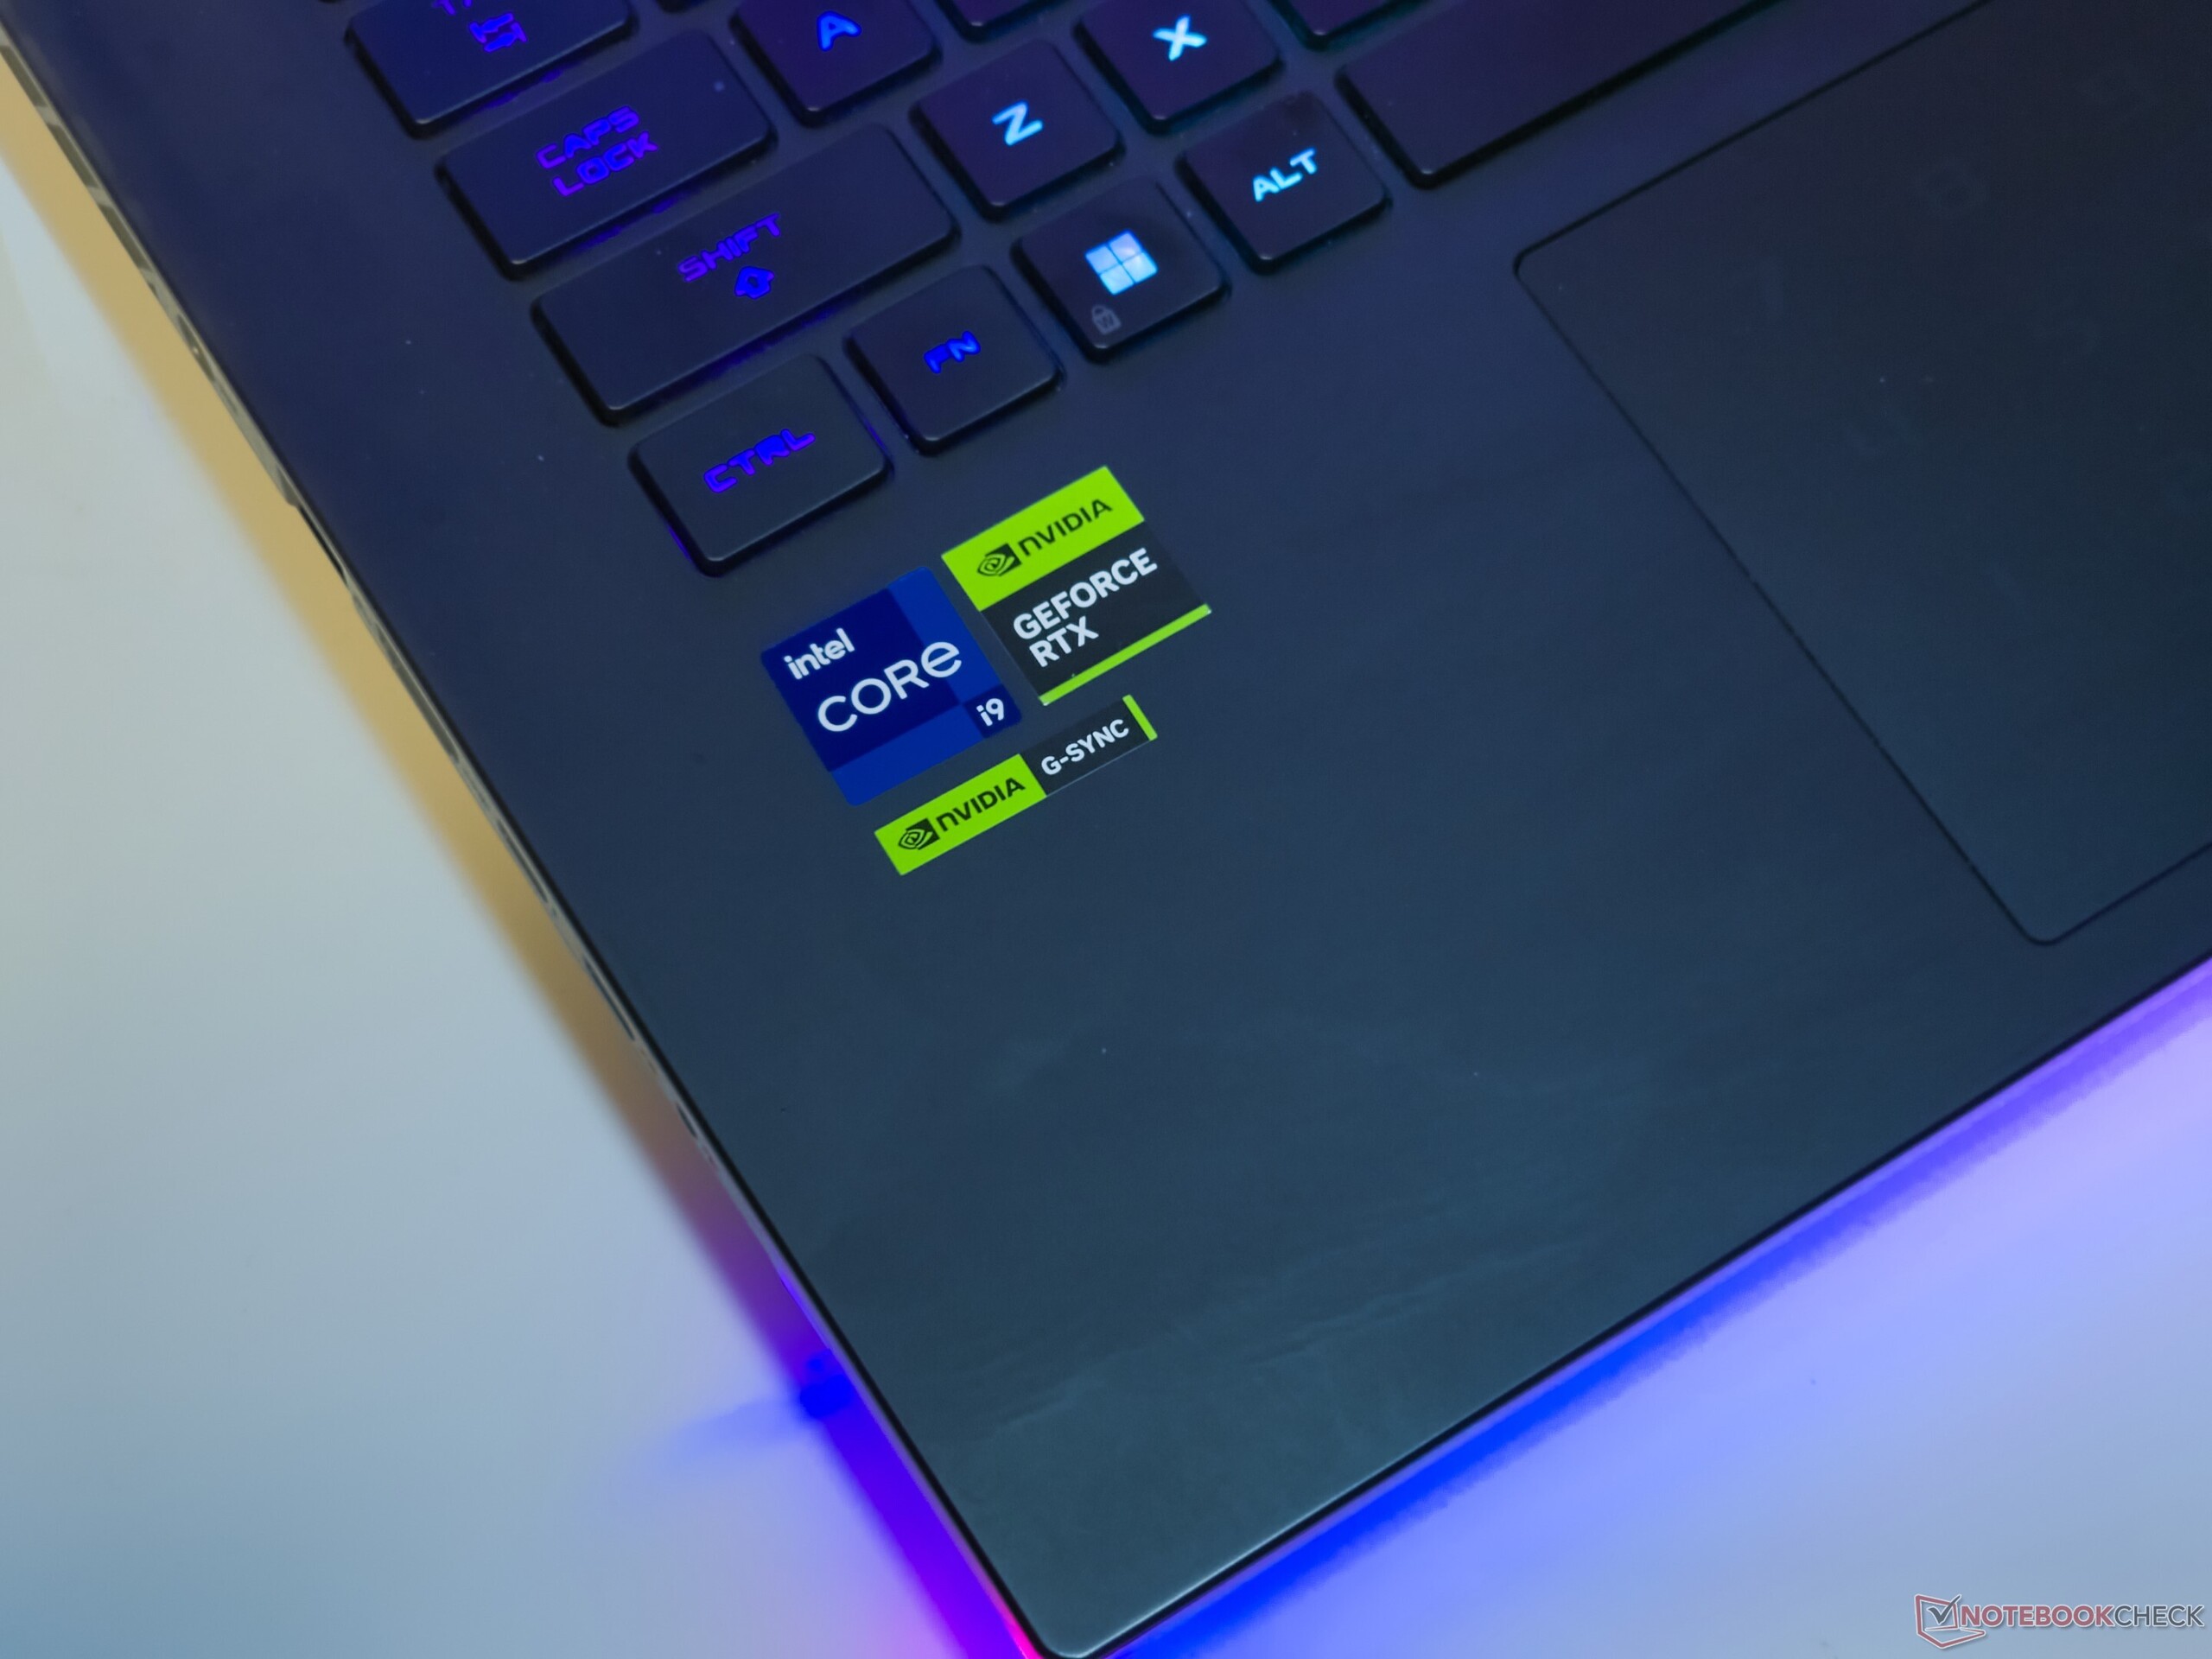
ROG Strix Scar 16 si rivolge ai giocatori di alto livello e dispone dell'hardware necessario. Il nostro dispositivo di prova si basa sul Intel Core i9-14900HX Raptor Lake-HX, completato da un processore da 175 W GPU Nvidia GeForce RTX 4080 Laptop.
Altre specifiche degne di nota includono 32 GB di RAM DDR5-5600, un'unità SSD NVMe da 2 TB e un display QHD+ 240 Hz mini-LED G-Sync che insieme non si fanno scrupoli a fare un buco nel portafoglio di ₹2.89.990 (~US$3.473).
Potenziali concorrenti a confrontos
Punteggio | Data | Modello | Peso | Altezza | Dimensione | Risoluzione | Prezzo |
|---|---|---|---|---|---|---|---|
| 87.6 % v7 (old) | 04/2024 | Asus ROG Strix Scar 16 G634JZR i9-14900HX, GeForce RTX 4080 Laptop GPU | 2.7 kg | 30.4 mm | 16.00" | 2560x1600 | |
| 87.2 % v7 (old) | 08/2023 | Asus ROG Strix Scar 17 G733PYV-LL053X R9 7945HX3D, GeForce RTX 4090 Laptop GPU | 2.9 kg | 28.3 mm | 17.30" | 2560x1440 | |
| 88.4 % v7 (old) | 03/2023 | Asus ROG Strix G16 G614JZ i9-13980HX, GeForce RTX 4080 Laptop GPU | 2.4 kg | 30.4 mm | 16.00" | 2560x1600 | |
| 89.5 % v7 (old) | 03/2024 | Lenovo Legion Pro 7 16IRX9H i9-14900HX, GeForce RTX 4080 Laptop GPU | 2.7 kg | 21.95 mm | 16.00" | 2560x1600 | |
| 86.7 % v7 (old) | 02/2024 | HP Omen 16 (2024) i9-14900HX, GeForce RTX 4080 Laptop GPU | 2.4 kg | 23.5 mm | 16.10" | 2560x1440 | |
| 88 % v7 (old) | 02/2024 | MSI Vector 16 HX A14V i9-14900HX, GeForce RTX 4080 Laptop GPU | 2.7 kg | 28.55 mm | 16.00" | 2560x1600 | |
| 90.2 % v7 (old) | 03/2024 | Alienware m16 R2 Ultra 7 155H, GeForce RTX 4070 Laptop GPU | 2.5 kg | 23.5 mm | 16.00" | 2560x1600 |
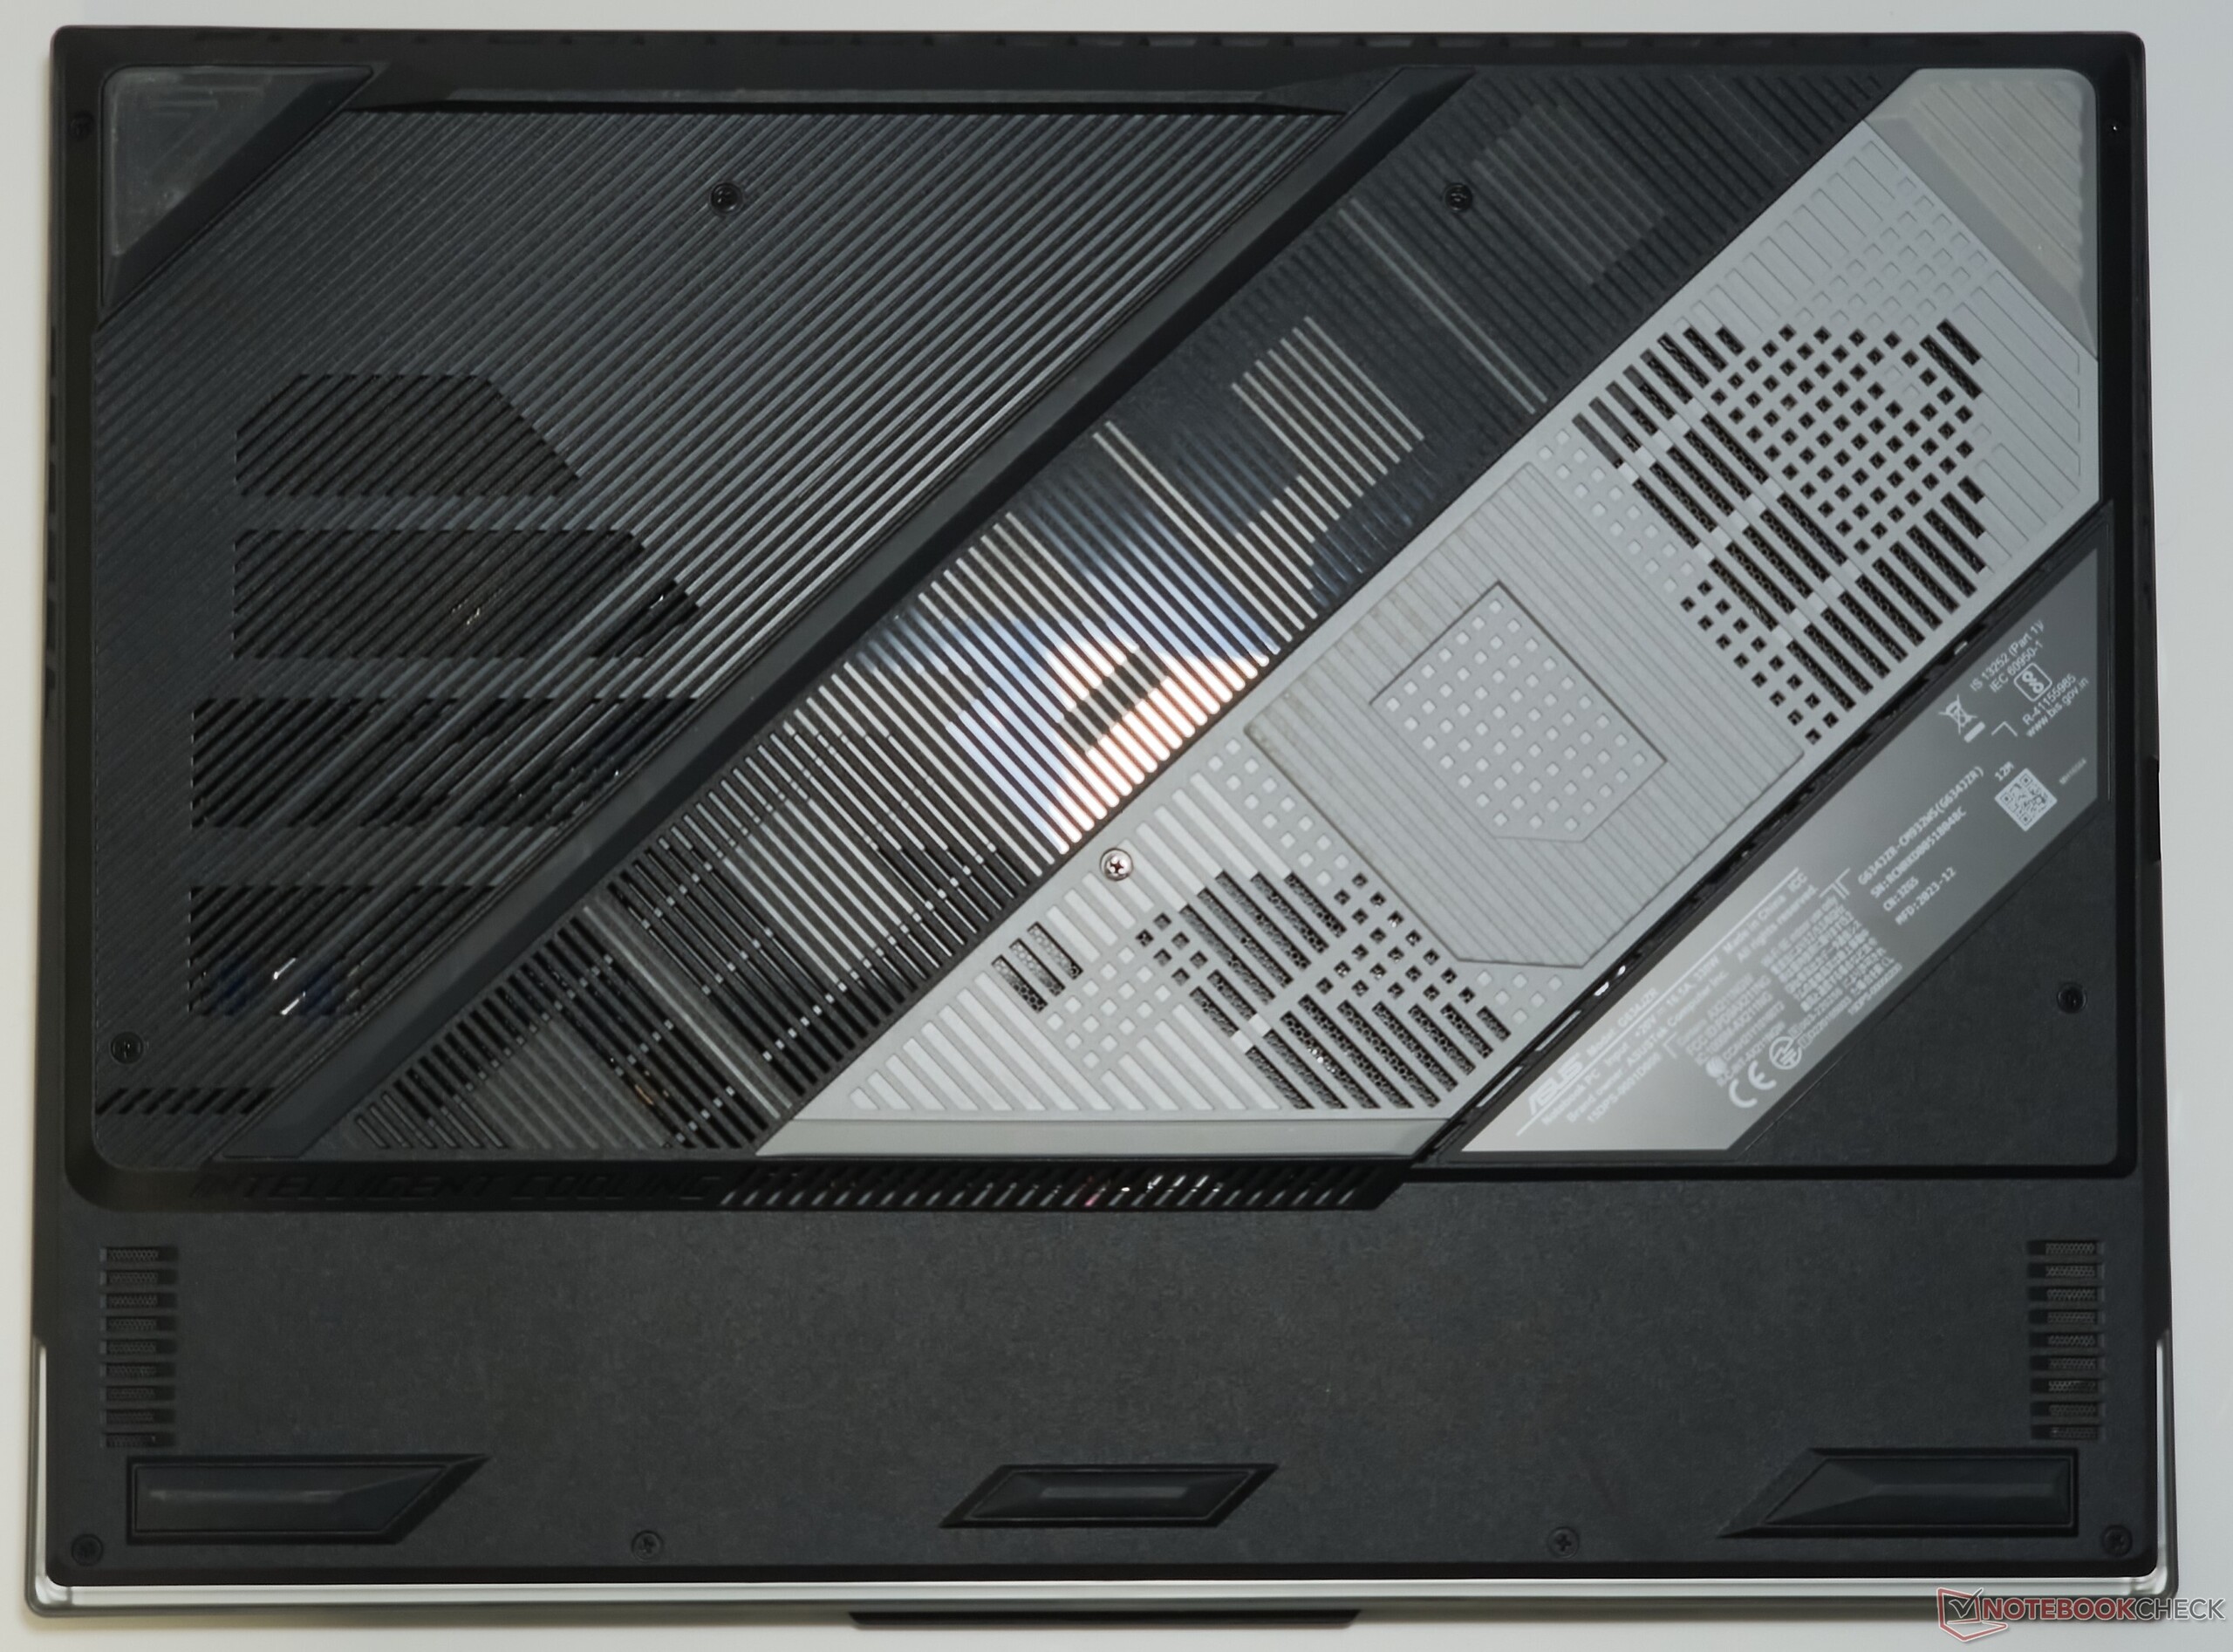
Telaio: Principalmente in plastica, con un peek-a-boo traslucido
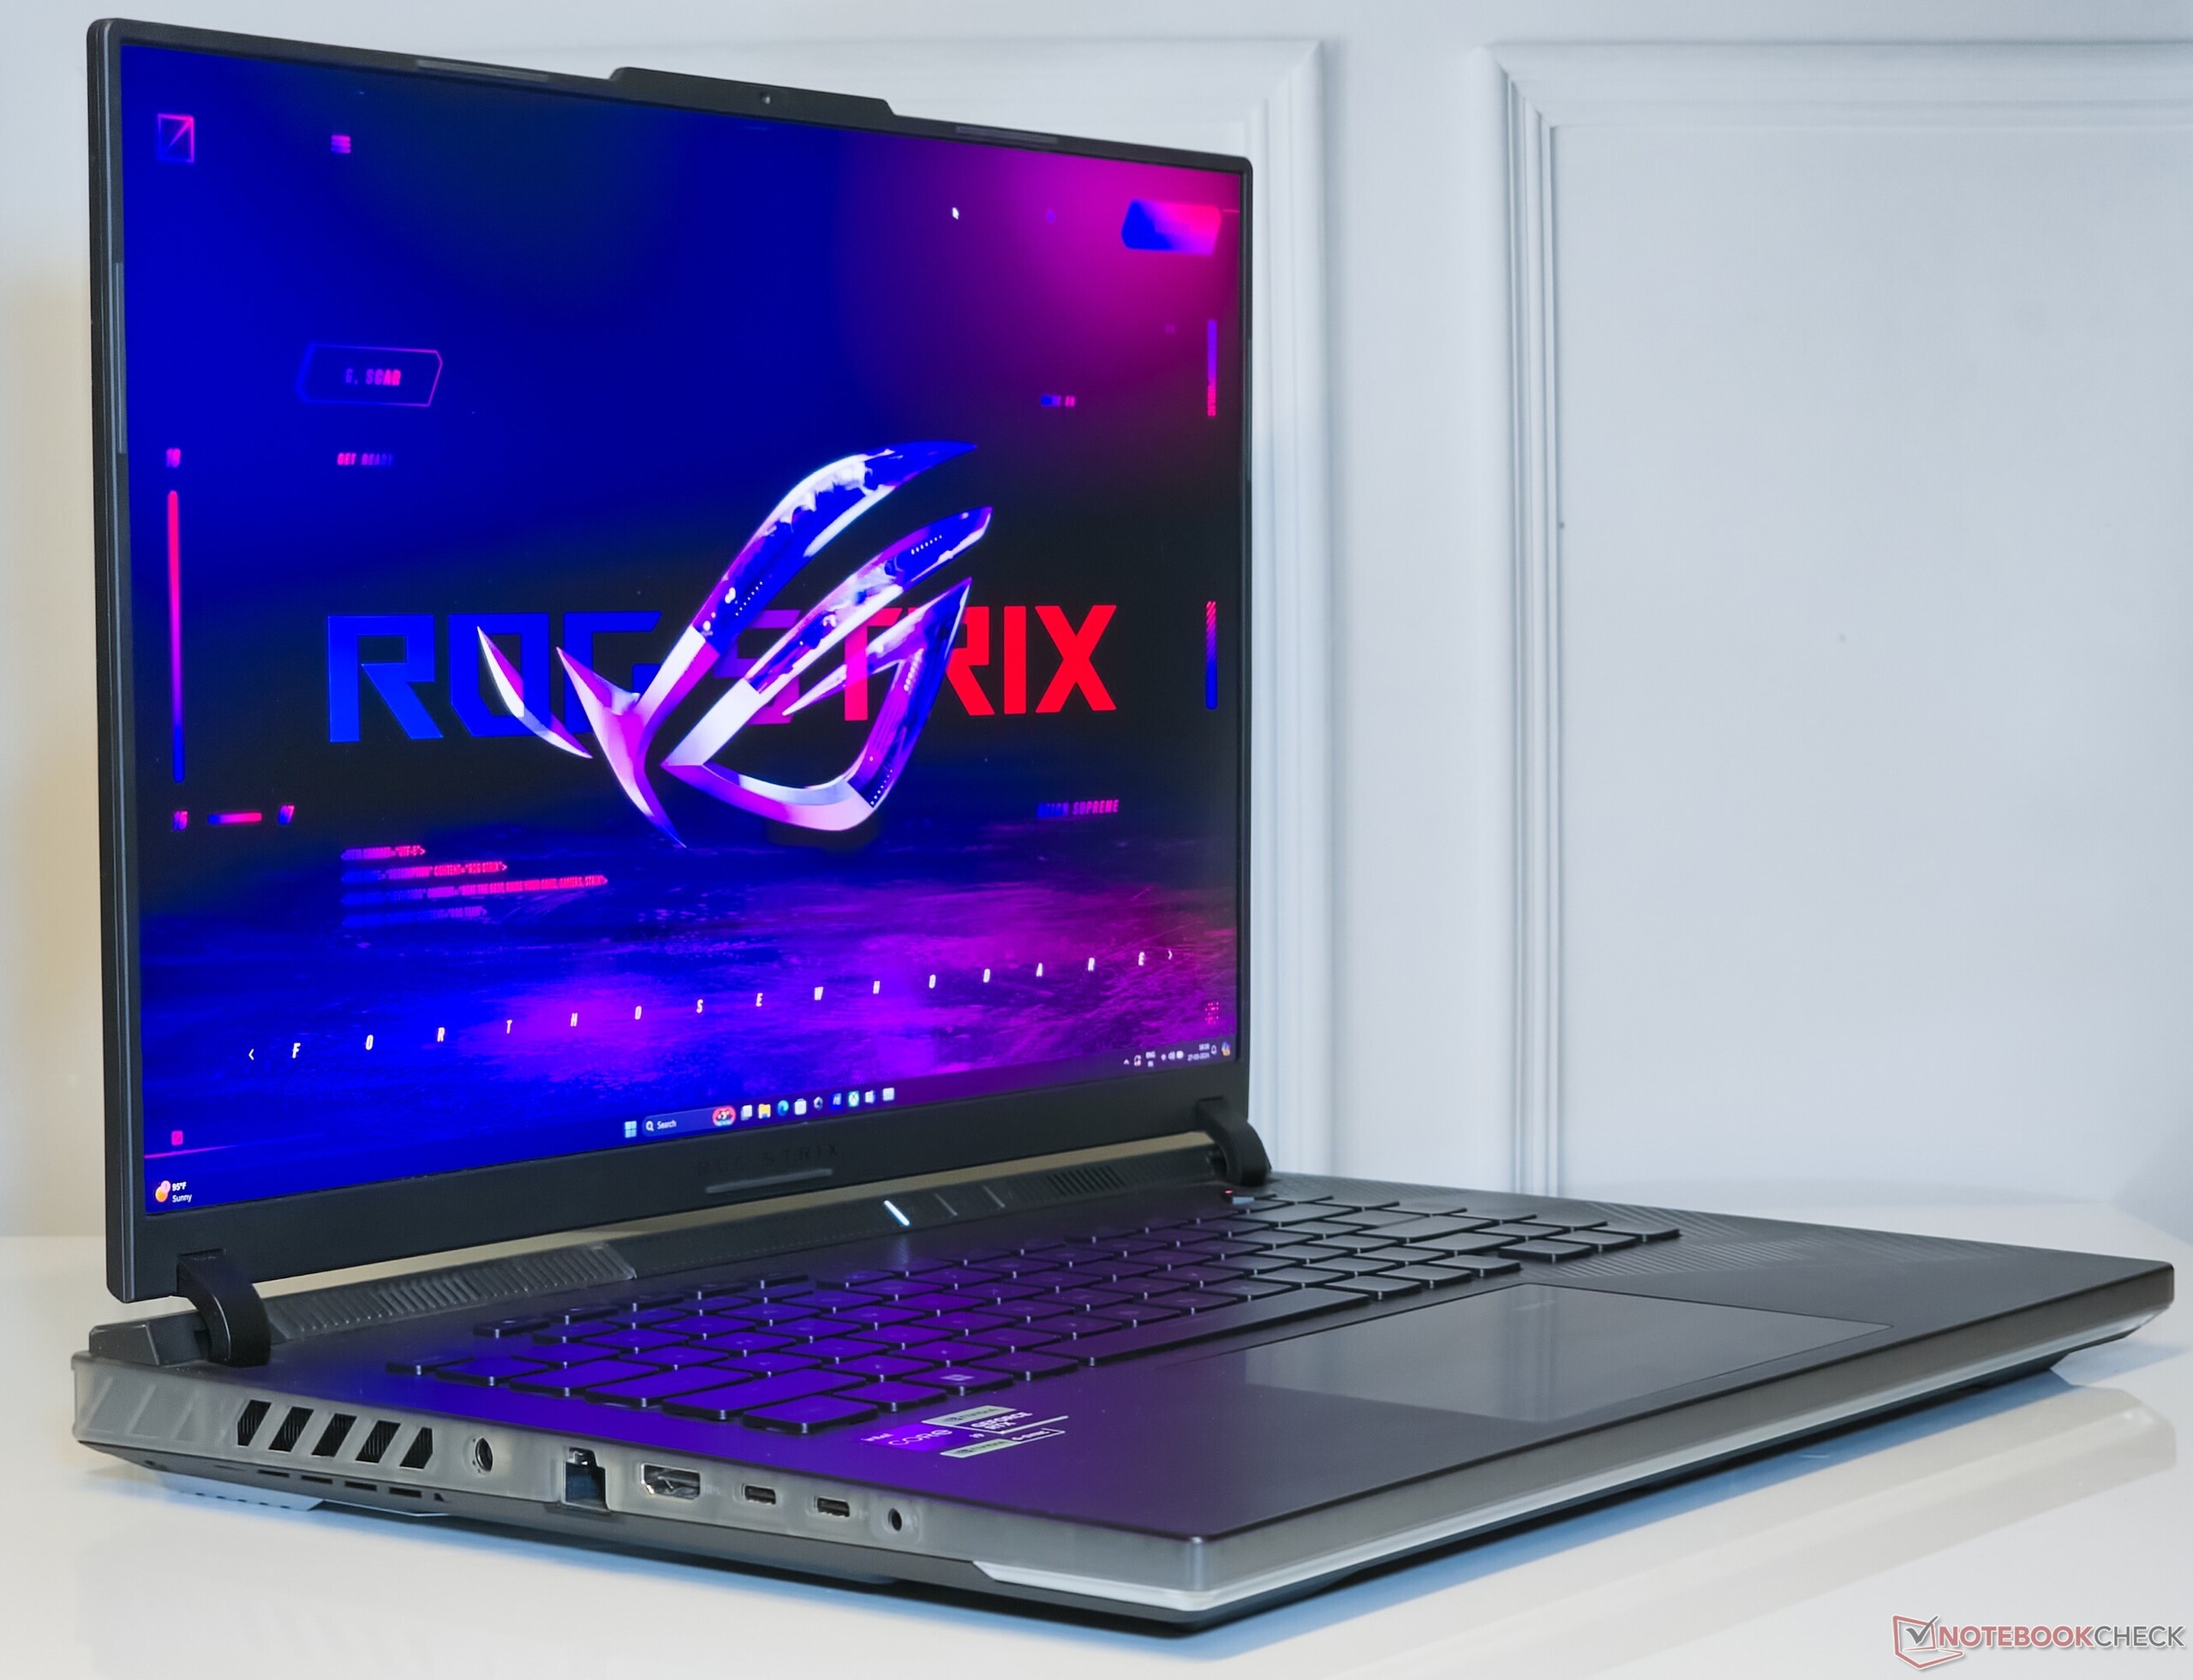
Il ROG Strix Scar 16 di quest'anno sfoggia un linguaggio di design familiare, come abbiamo visto in precedenza con il modello 2022 Scar 15 ma ora è più pesante di 350 g, con un peso di 2,65 kg.
Il telaio non si flette, nonostante la costruzione in plastica. Anche il coperchio in alluminio con finitura opaca sembra abbastanza robusto, con cerniere stabili.
Il coperchio può essere aperto con un solo dito senza che il portatile scivoli sulla scrivania, cosa che viene ulteriormente impedita dalla base gommata.
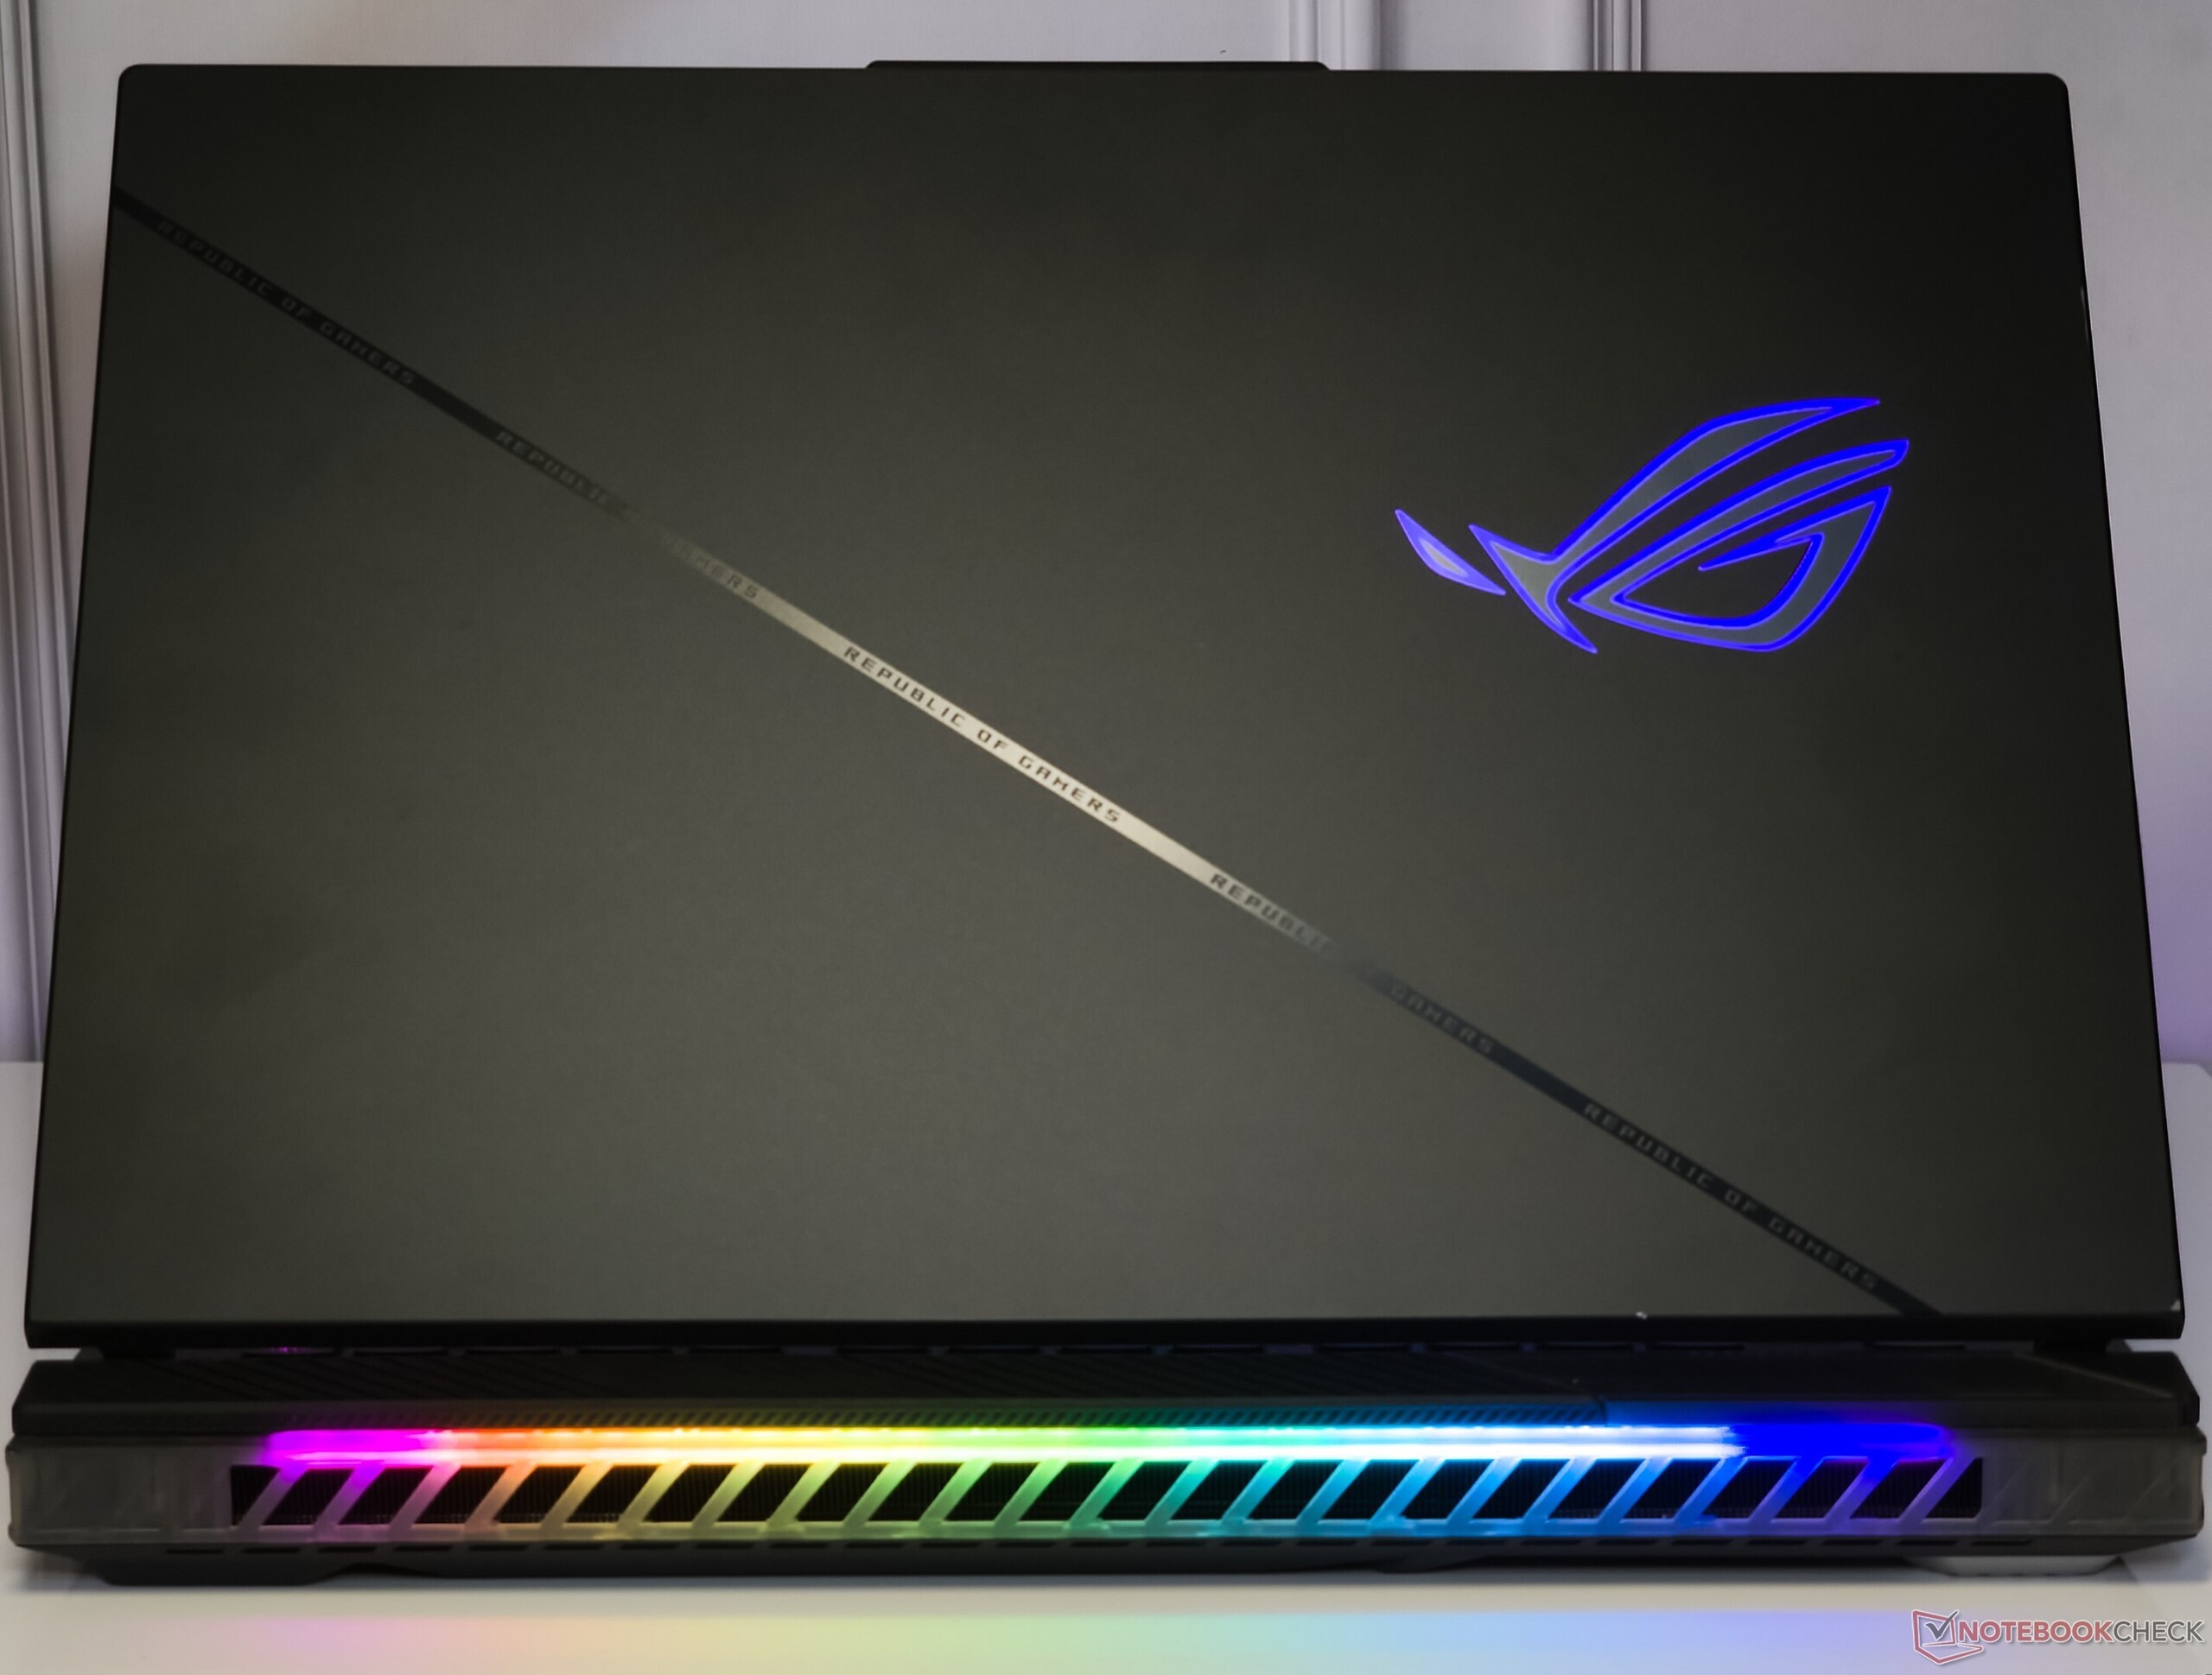
Gli appassionati della serie Scar noteranno che il piano tastiera non presenta più la striscia diagonale bianca con il logo ROG.
La parte superiore del piano tastiera rimane traslucida come prima, offrendo una sbirciatina agli interni sottostanti. Tuttavia, Asus ha fatto poco per rendere il piano resistente alle impronte digitali e al grasso.
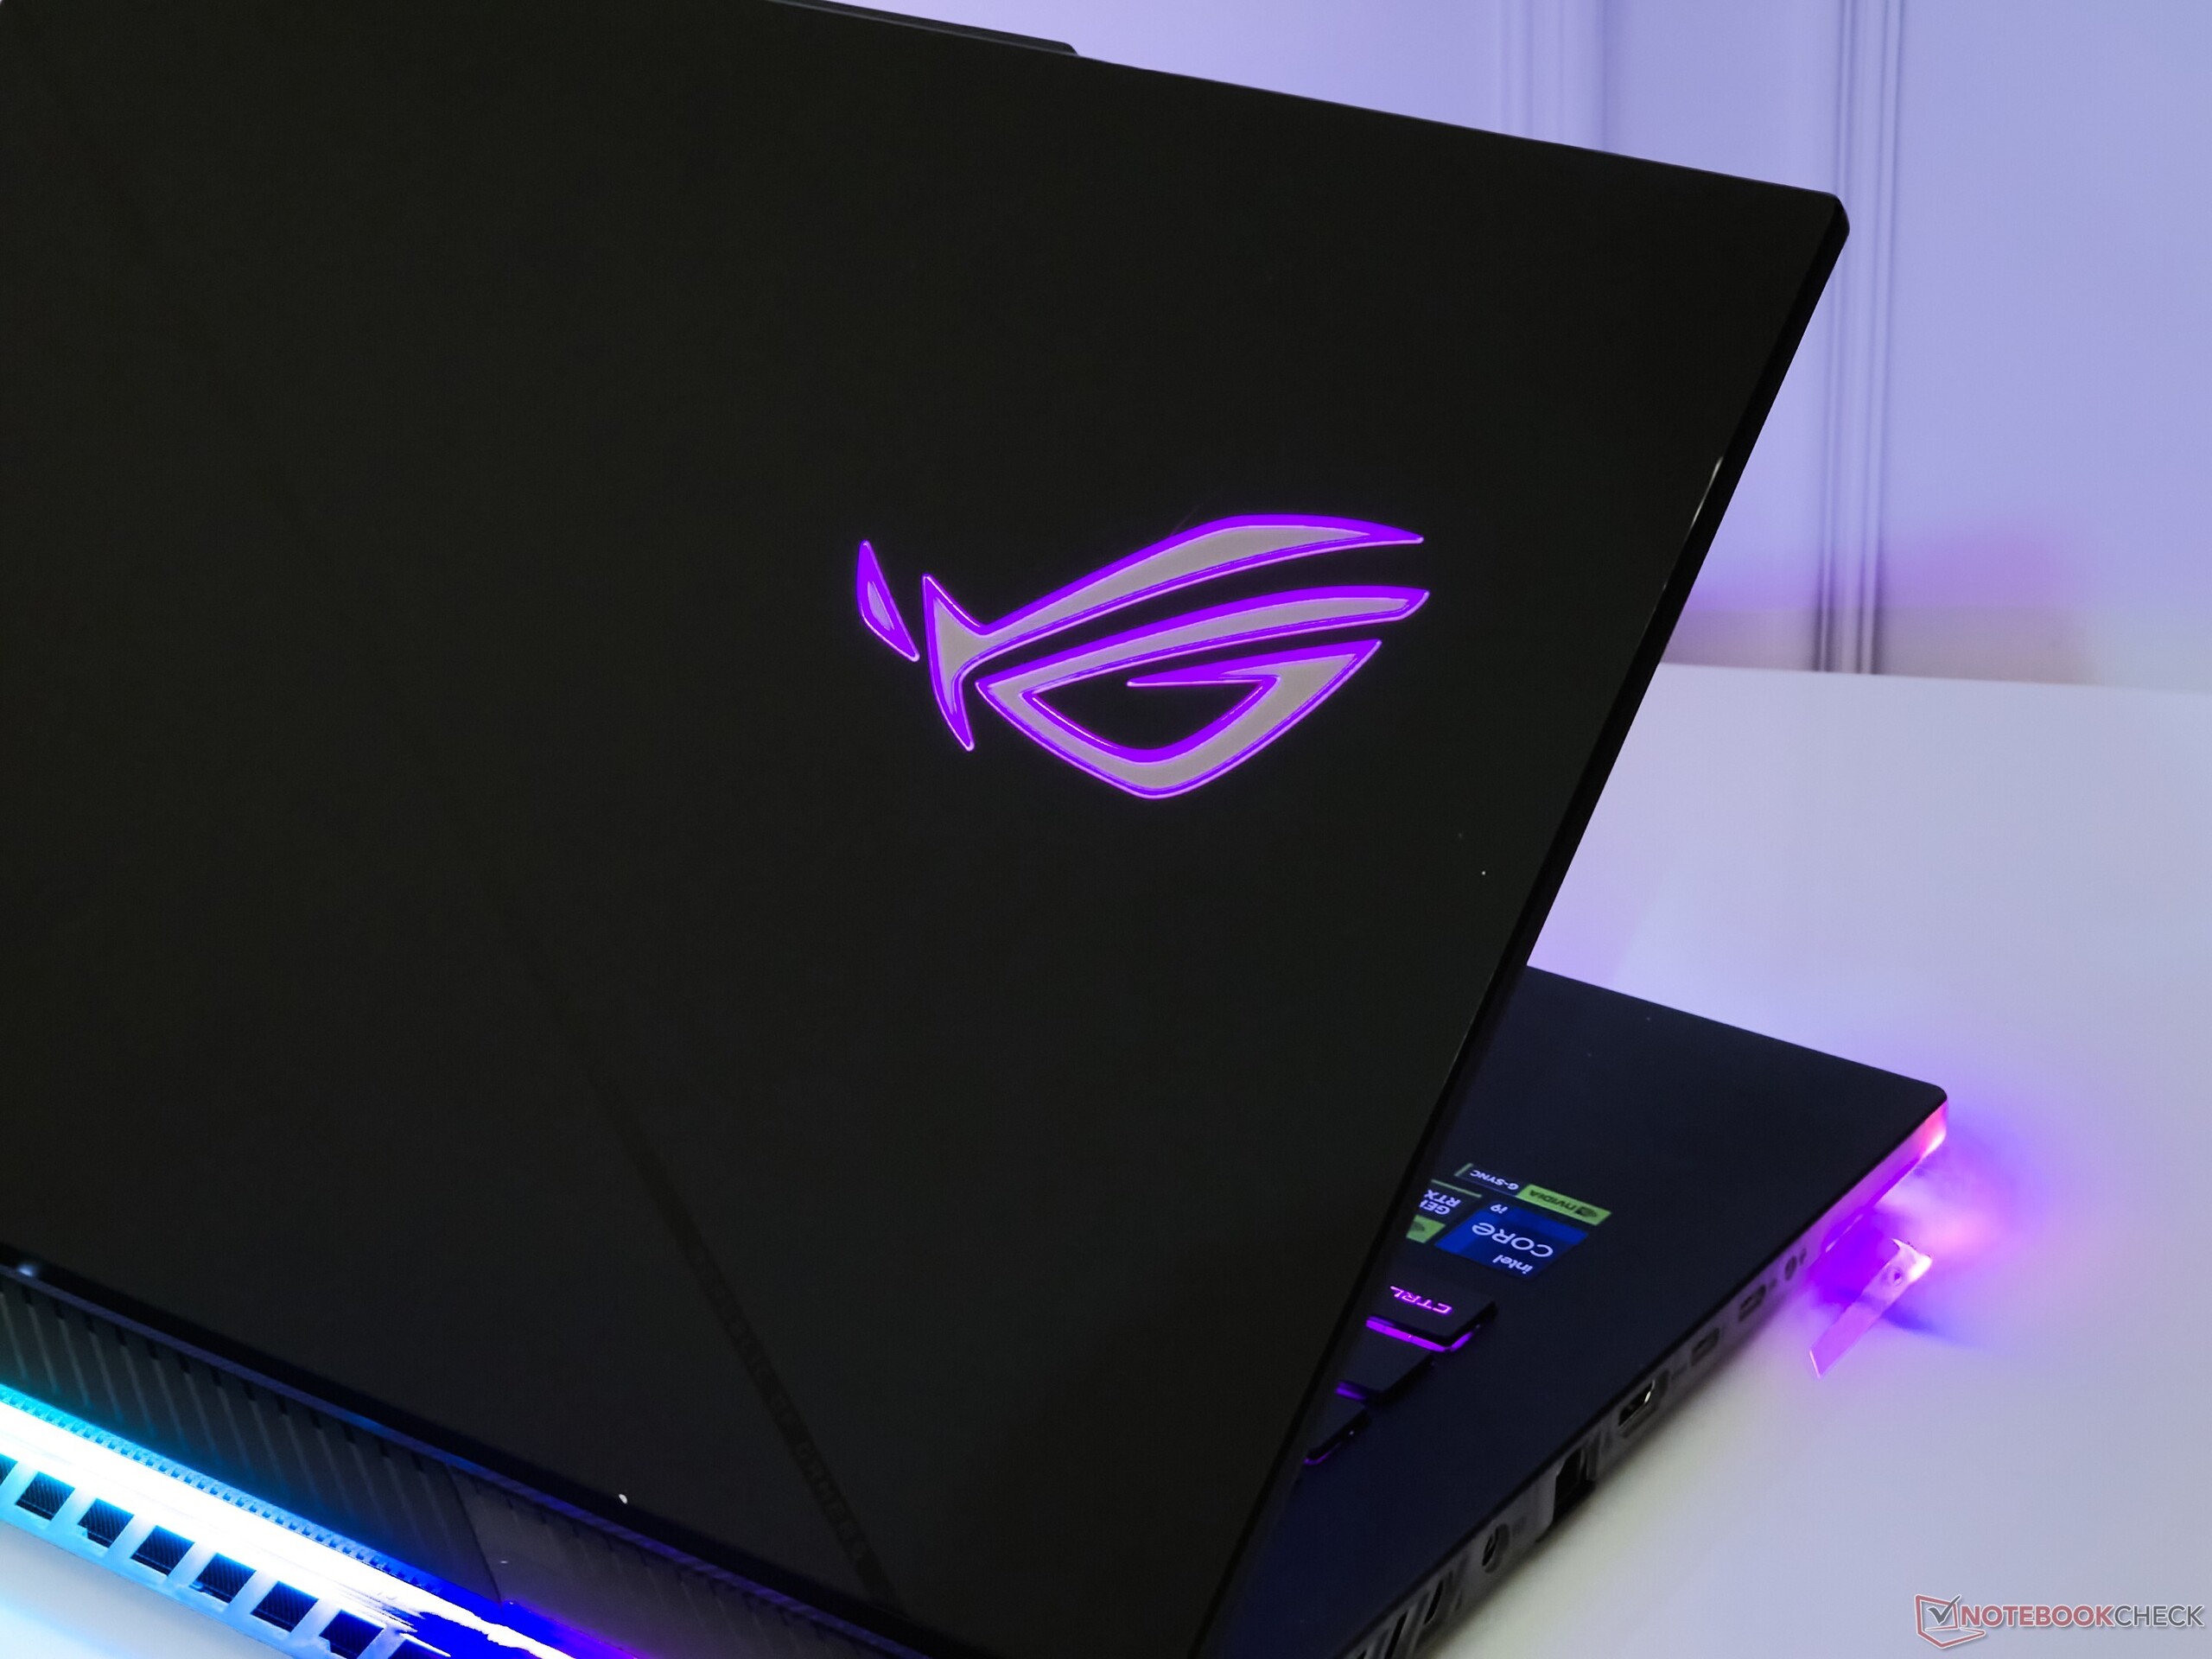
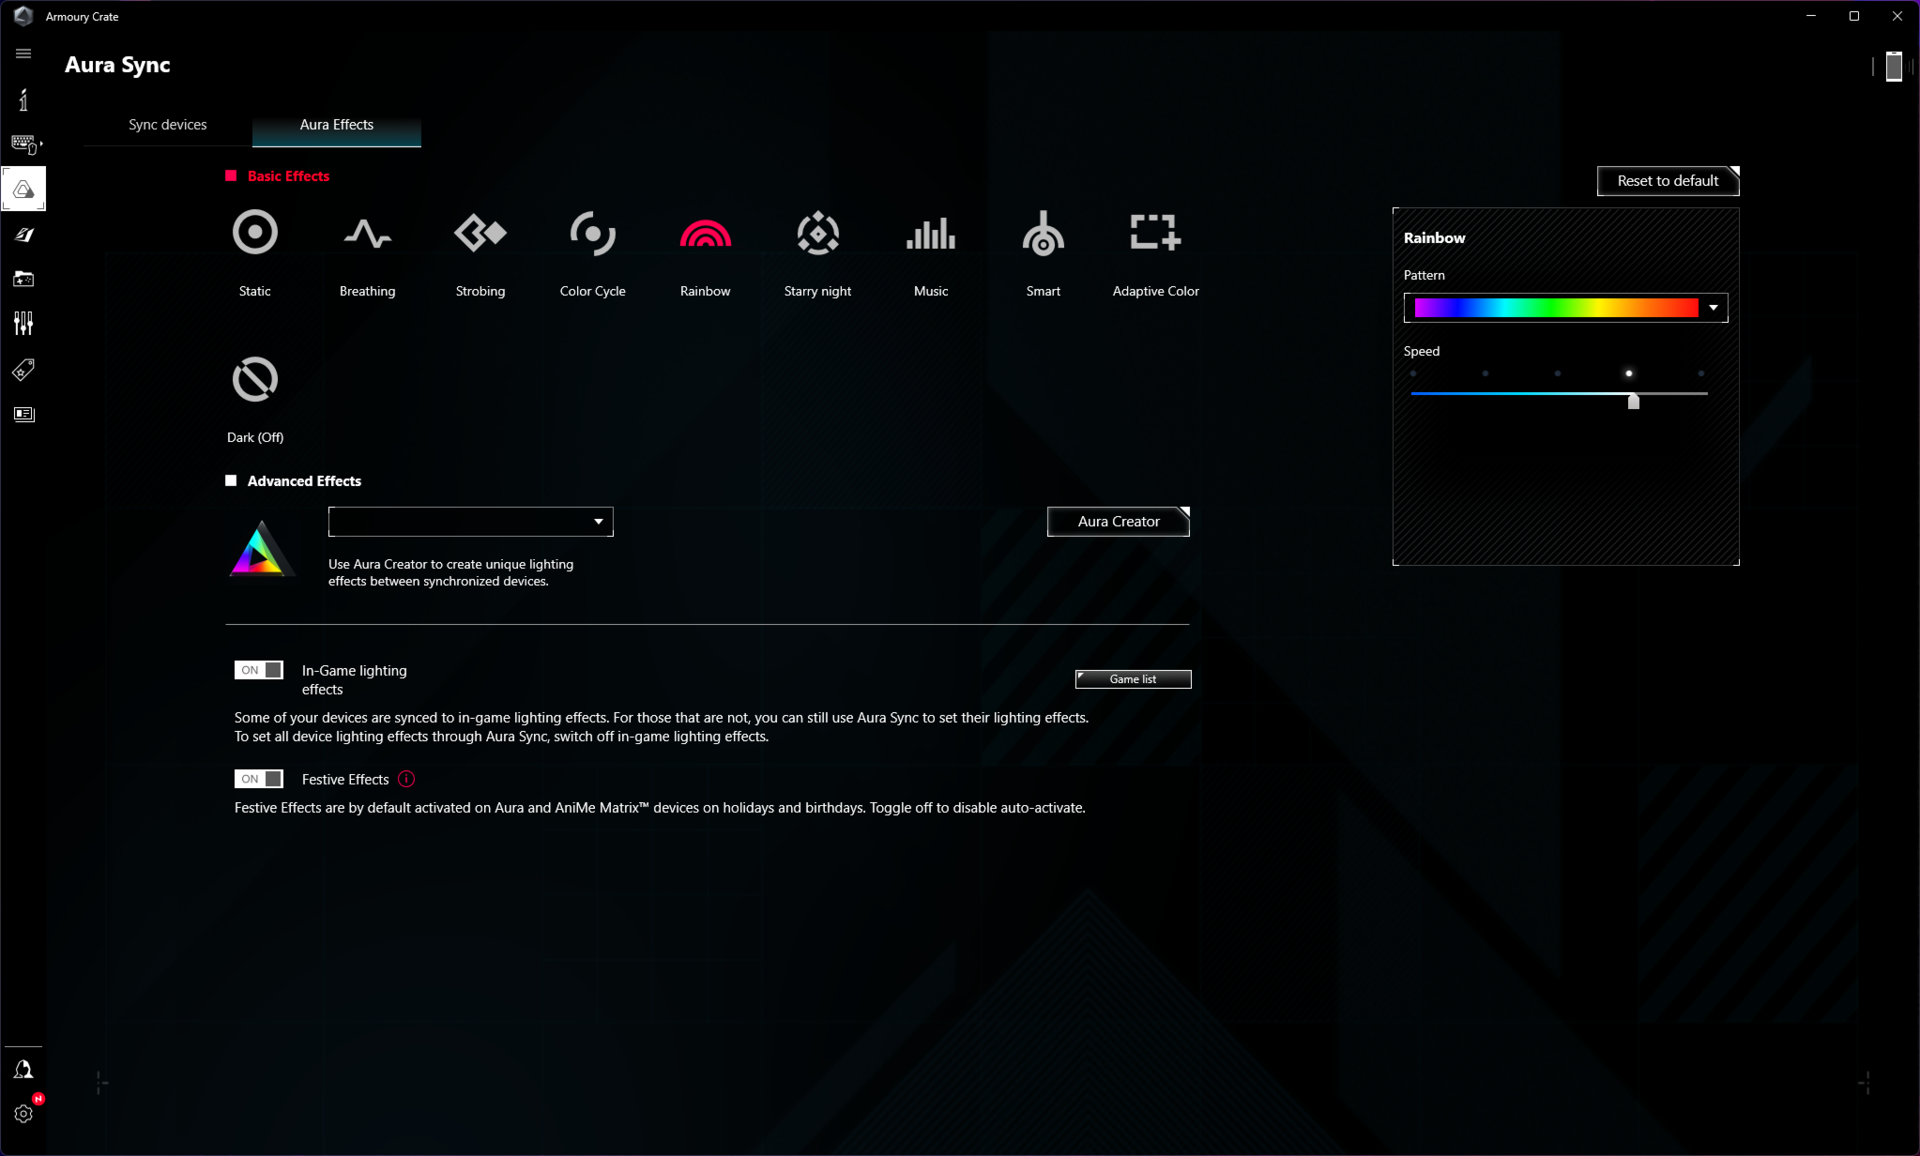
La tastiera, la base, la parte posteriore e il logo ROG dello Scar 16 si crogiolano nella bontà RGB che può essere controllata e personalizzata tramite Armory Crate. Tuttavia, non c'è un modo apparente per illuminare individualmente queste aree: o tutto RGB o niente.
Fedele all'etica di Scar, Asus consente di progettare e stampare in 3D i cappucci ROG Armor per un tocco di personalizzazione.
Connettività: Mediocre Wi-Fi 5 e 100 W di potenza USB
La ROG Strix Scar 16 utilizza lo stesso layout di porte e la stessa funzionalità della versione dello scorso anno. Asus non offre più la ROG Keystone, che è stata a lungo una caratteristica distintiva della serie Scar, nonostante la sua dubbia utilità.
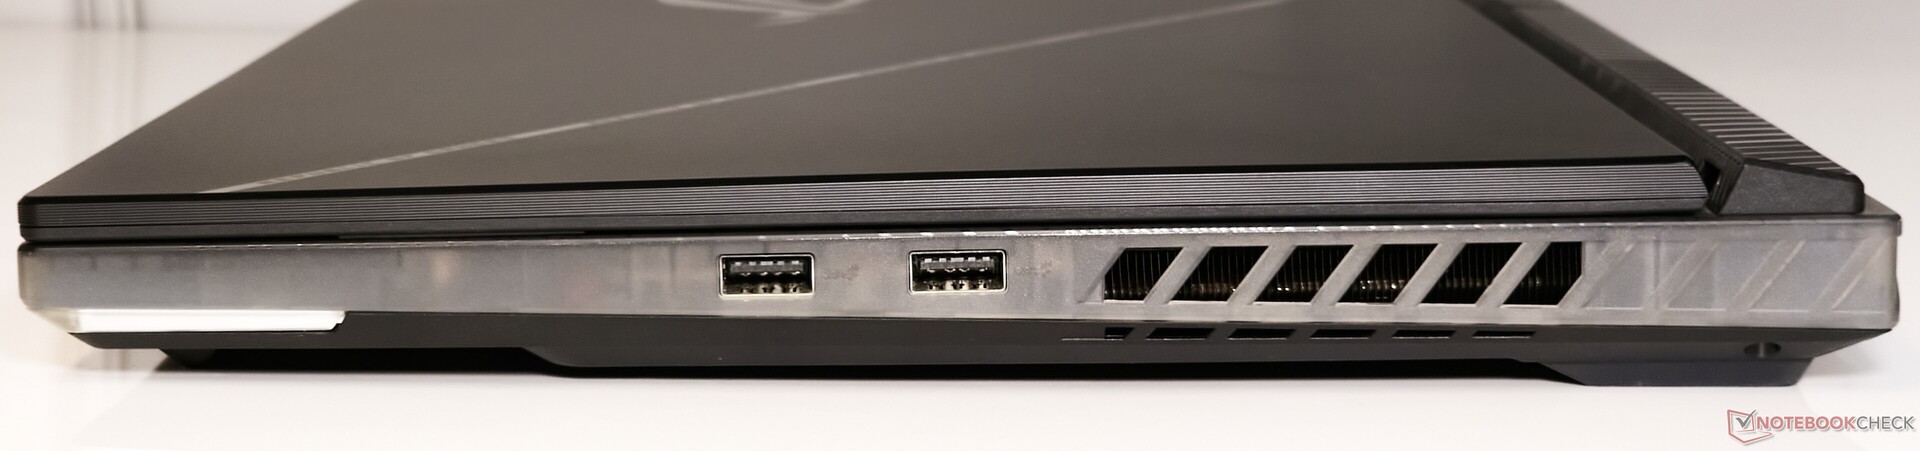
La distribuzione delle porte non è uniforme. Ad eccezione di due porte USB 3.2 Gen2 Type-A sul lato destro, tutte le porte aggiuntive si trovano a sinistra. Tuttavia, le porte sono comodamente distanziate e non rappresentano un ostacolo per il collegamento di più periferiche.
Ci sono due porte USB Type-C, una delle quali è Thunderbolt 4. La porta Thunderbolt 4 consente l'uscita DisplayPort 1.4, ma non la ricarica. La porta USB 3.2 Gen2 Type-C, invece, non solo offre l'uscita DisplayPort, ma anche un'erogazione di energia da 100 W.
La parte posteriore è completamente riservata ad ospitare l'apparato di raffreddamento e quindi è priva di porte.

Comunicazione
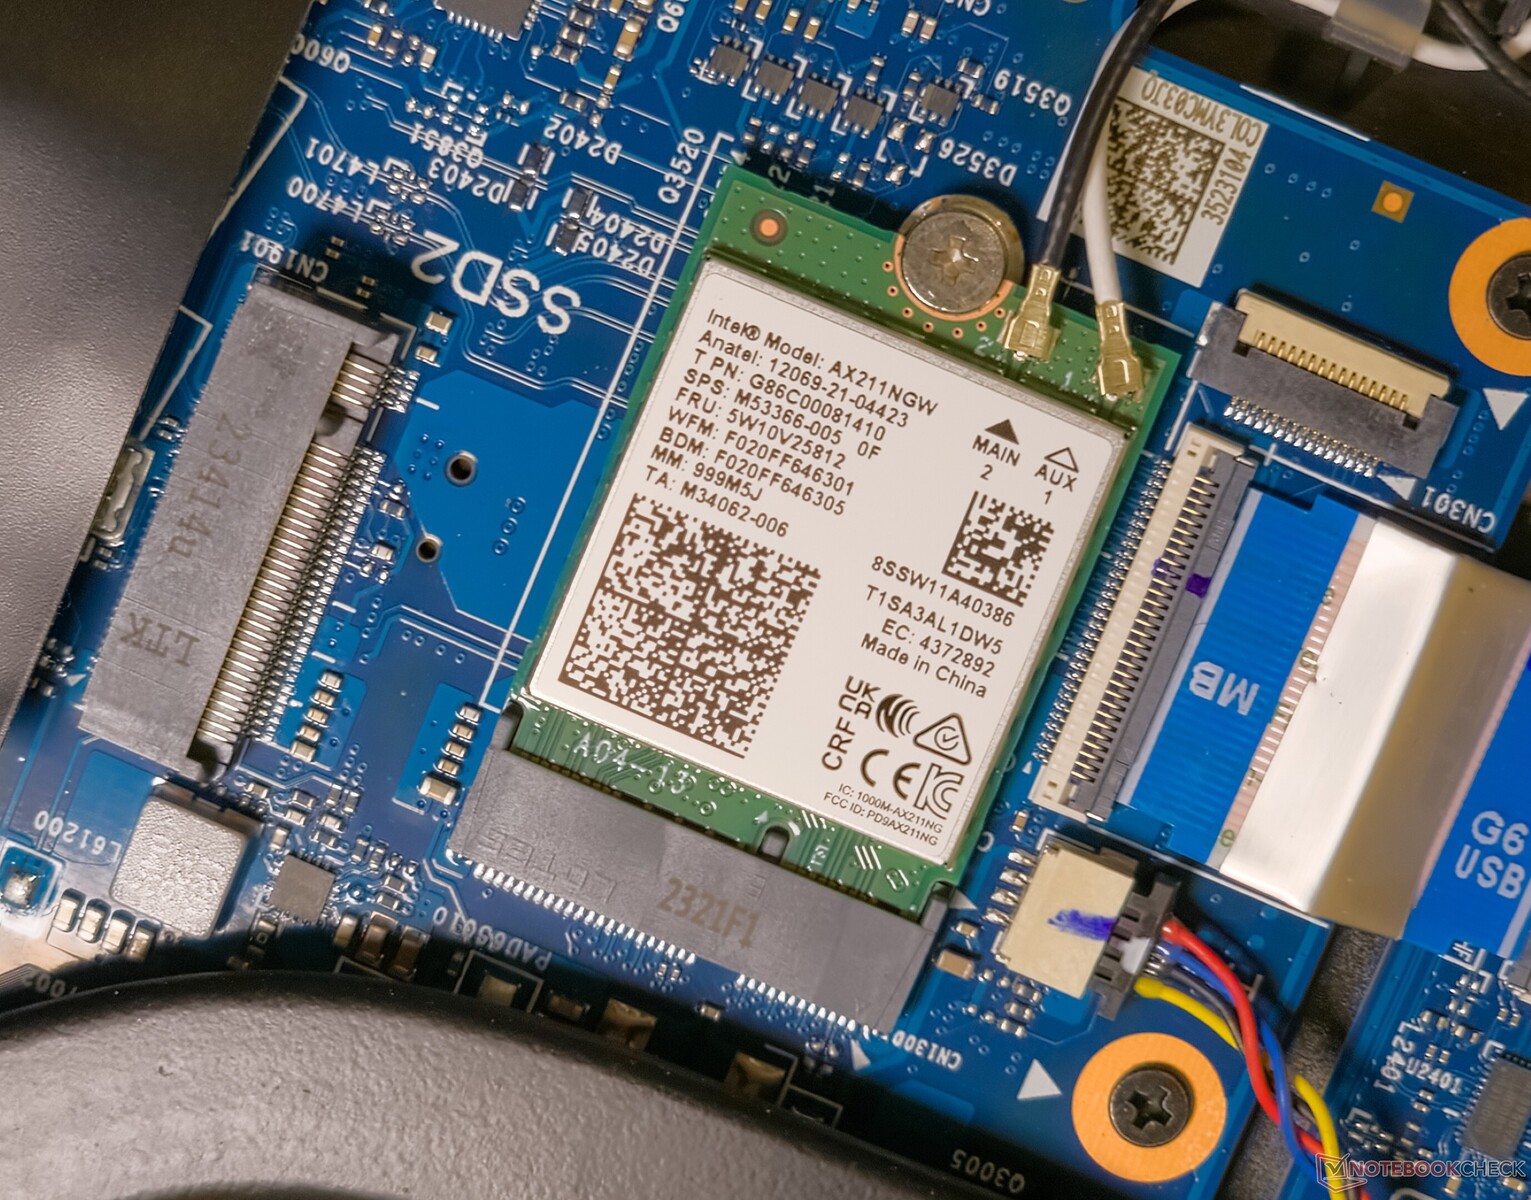
I computer portatili del 2024 stanno lentamente aderendo alla tendenza del Wi-Fi 7, anche se il supporto per lo standard è previsto solo quando Windows 11 24H2 inizierà ad essere distribuito nel corso dell'anno. Lo Scar 16, quindi, si accontenta del normale chip Intel Wi-Fi AX211.
Il test dello Scar 16 con il nostro router di riferimento Asus ROG Rapture GT-AXE11000 ha rivelato un throughput relativamente inferiore nella banda Wi-Fi 5 rispetto alla concorrenza. Tuttavia, le prestazioni sono abbastanza stabili, senza grossi cali di velocità.
Le prestazioni in Wi-Fi 6E sono state nettamente migliori, con velocità di trasmissione e ricezione fino a 1,5 Gbps e 1,74 Gbps, rispettivamente, ma abbiamo osservato un momentaneo throttling durante il test di trasmissione.
| Networking / iperf3 transmit AXE11000 | |
| Asus ROG Strix G16 G614JZ | |
| HP Omen 16 (2024) | |
| Lenovo Legion Pro 7 16IRX9H | |
| Media della classe Gaming (560 - 1862, n=88, ultimi 2 anni) | |
| Media Intel Wi-Fi 6E AX211 (64 - 1921, n=276) | |
| Alienware m16 R2 | |
| MSI Vector 16 HX A14V | |
| Asus ROG Strix Scar 16 G634JZR | |
| Networking / iperf3 receive AXE11000 | |
| HP Omen 16 (2024) | |
| Lenovo Legion Pro 7 16IRX9H | |
| Asus ROG Strix G16 G614JZ | |
| Media della classe Gaming (680 - 1745, n=88, ultimi 2 anni) | |
| Media Intel Wi-Fi 6E AX211 (582 - 1890, n=276) | |
| MSI Vector 16 HX A14V | |
| Alienware m16 R2 | |
| Asus ROG Strix Scar 16 G634JZR | |
| Networking / iperf3 transmit AXE11000 6GHz | |
| Asus ROG Strix Scar 16 G634JZR | |
| Media della classe Gaming (723 - 1868, n=36, ultimi 2 anni) | |
| MSI Vector 16 HX A14V | |
| Alienware m16 R2 | |
| Media Intel Wi-Fi 6E AX211 (385 - 1851, n=226) | |
| Networking / iperf3 receive AXE11000 6GHz | |
| Asus ROG Strix Scar 16 G634JZR | |
| Media della classe Gaming (975 - 1775, n=35, ultimi 2 anni) | |
| Media Intel Wi-Fi 6E AX211 (700 - 1857, n=226) | |
| Alienware m16 R2 | |
| MSI Vector 16 HX A14V | |
Webcam
A differenza dello Scar 15, che includeva una webcam esterna ROG Eye 1080p come accessorio inbox, lo Scar 16 si accontenta di un sensore integrato convenzionale a 720p.
La qualità dell'immagine non è eccezionale in nessun caso, ma riesce a superare una o due videochiamate occasionali. Osserviamo grandi deviazioni di colore nelle tonalità del blu e la nitidezza generale non sembra adeguata.


Sicurezza
Lo Scar 16 non dispone di alcuna forma di autenticazione biometrica. È presente un modulo TPM 2.0 per soddisfare i requisiti di Windows 11.
Accessori e garanzia
Nella confezione è incluso un cappuccio dell'armatura personalizzabile. Non ci sono altri accessori oltre a questo.
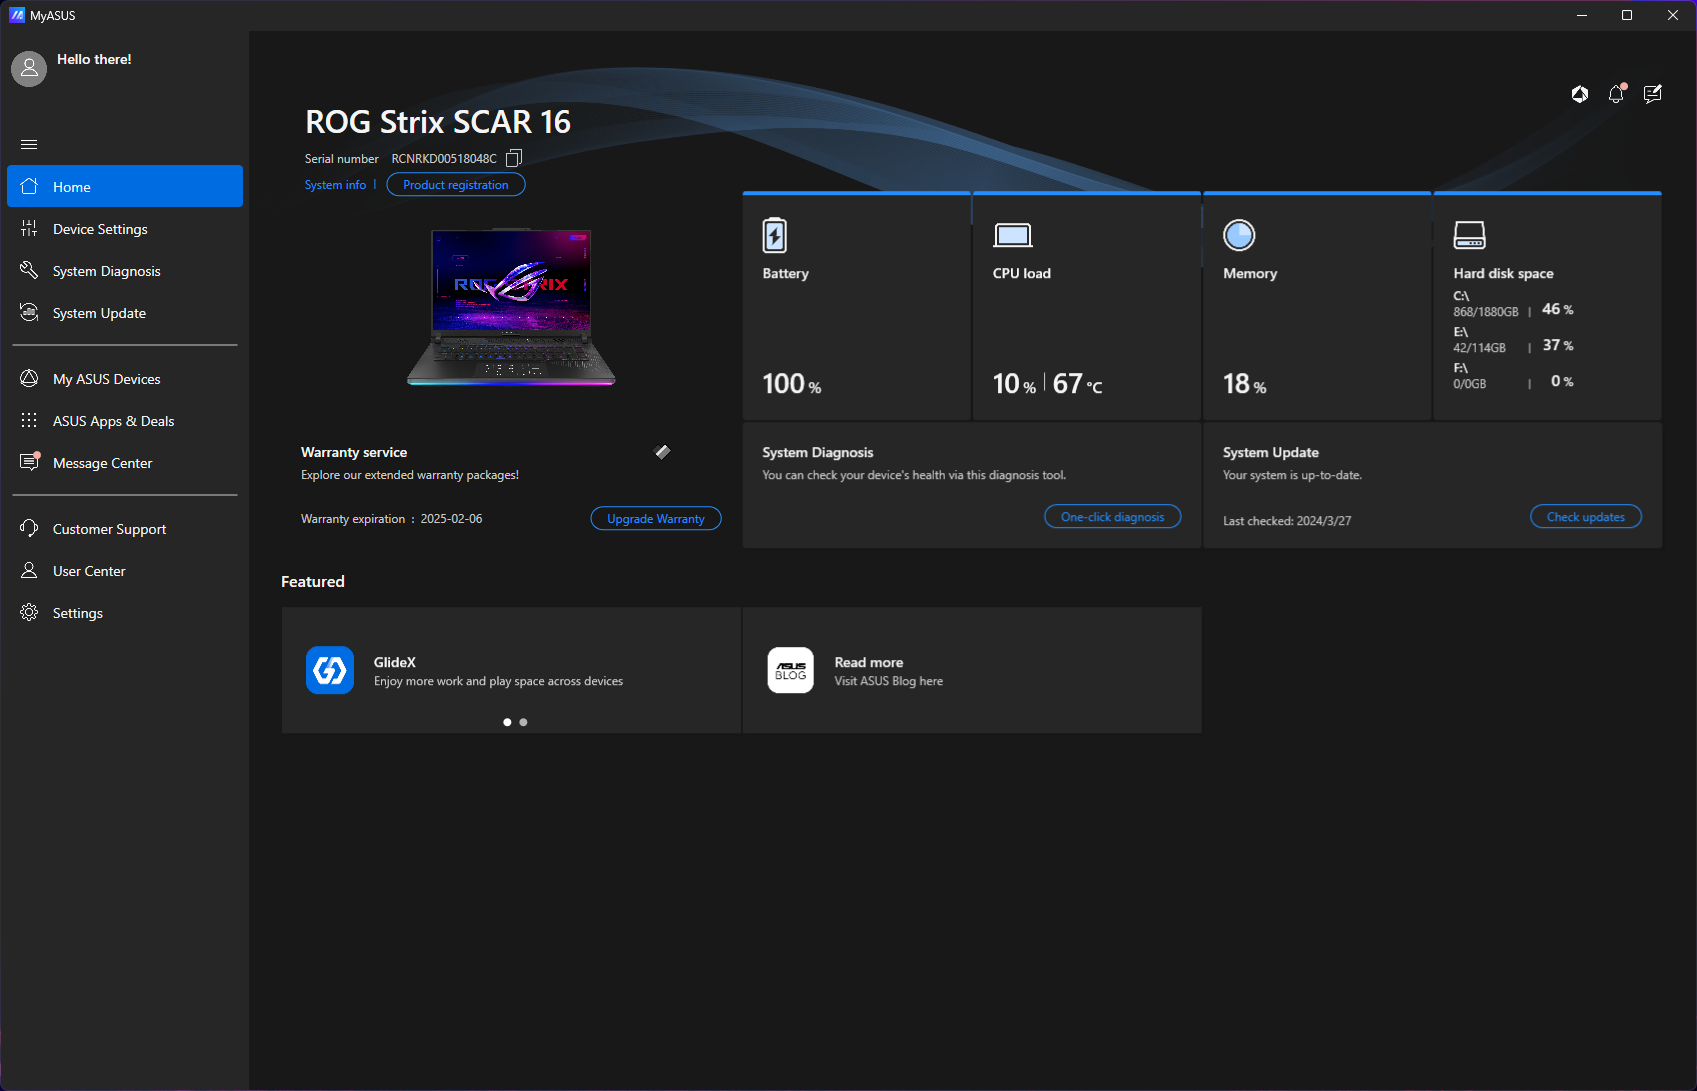
Asus offre una garanzia standard di un anno per lo Scar 16 in India. Le estensioni della garanzia possono essere acquistate tramite l'applicazione MyAsus preinstallata entro 180 giorni dall'acquisto.
Gli acquirenti possono anche scegliere tra diverse opzioni di garanzia https://asuspromo.in/terms che vanno da ₹999 (U$12) per un'estensione di un anno a ₹4.999 (US$60) che include un'estensione di due anni e tre anni di protezione contro i danni accidentali.
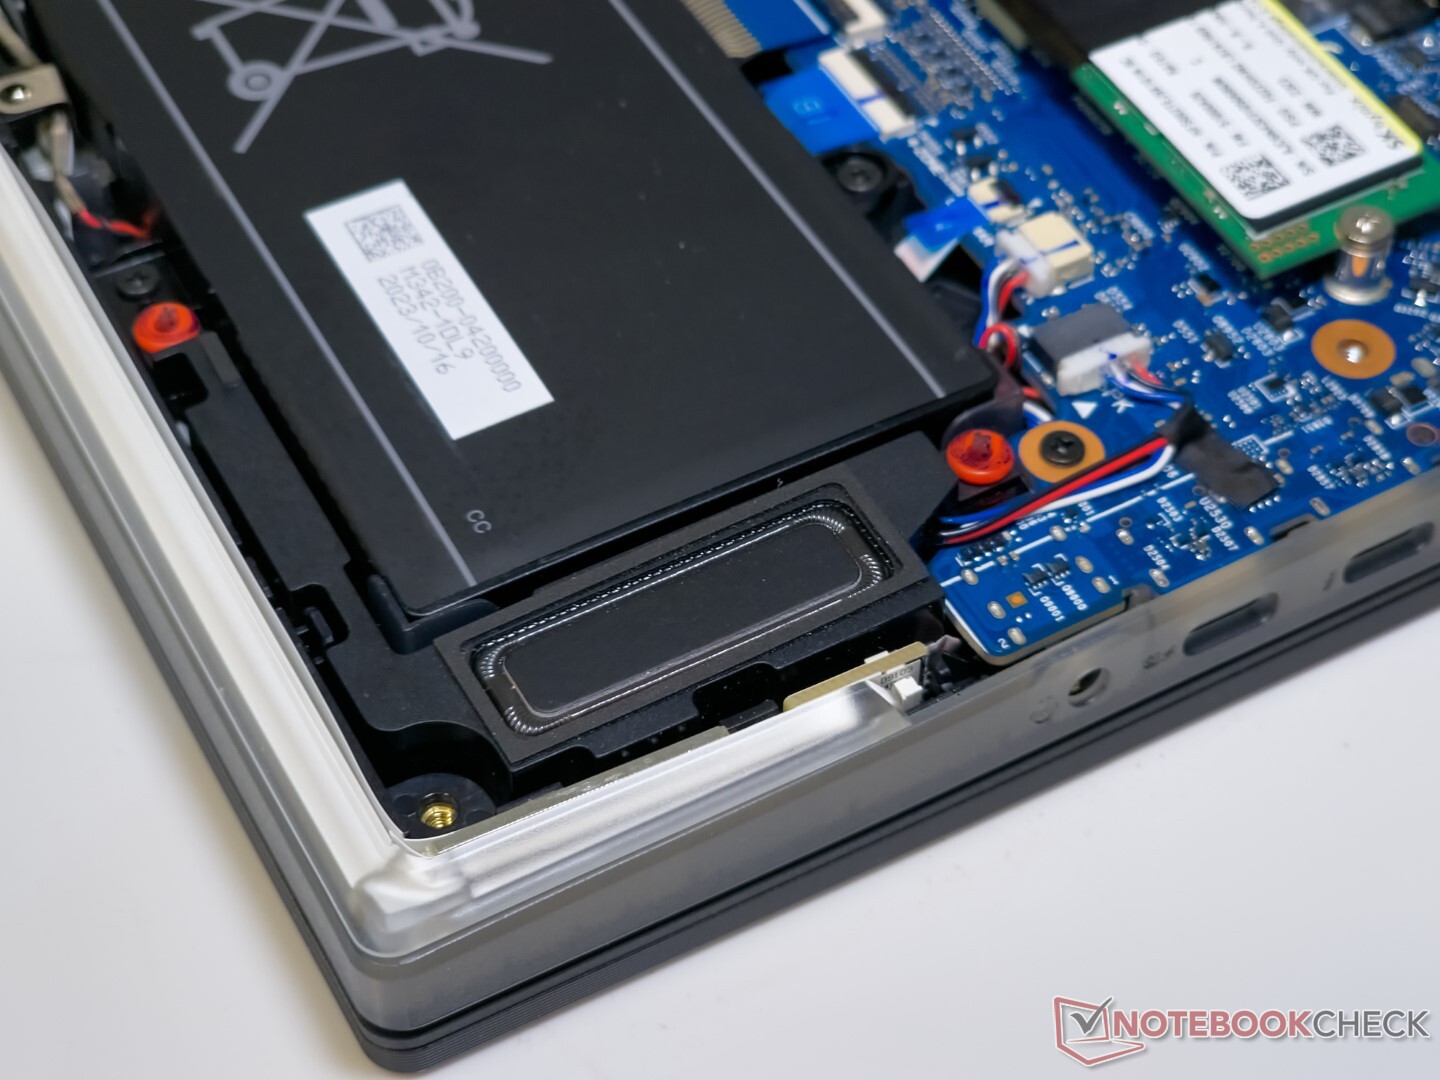
Manutenzione
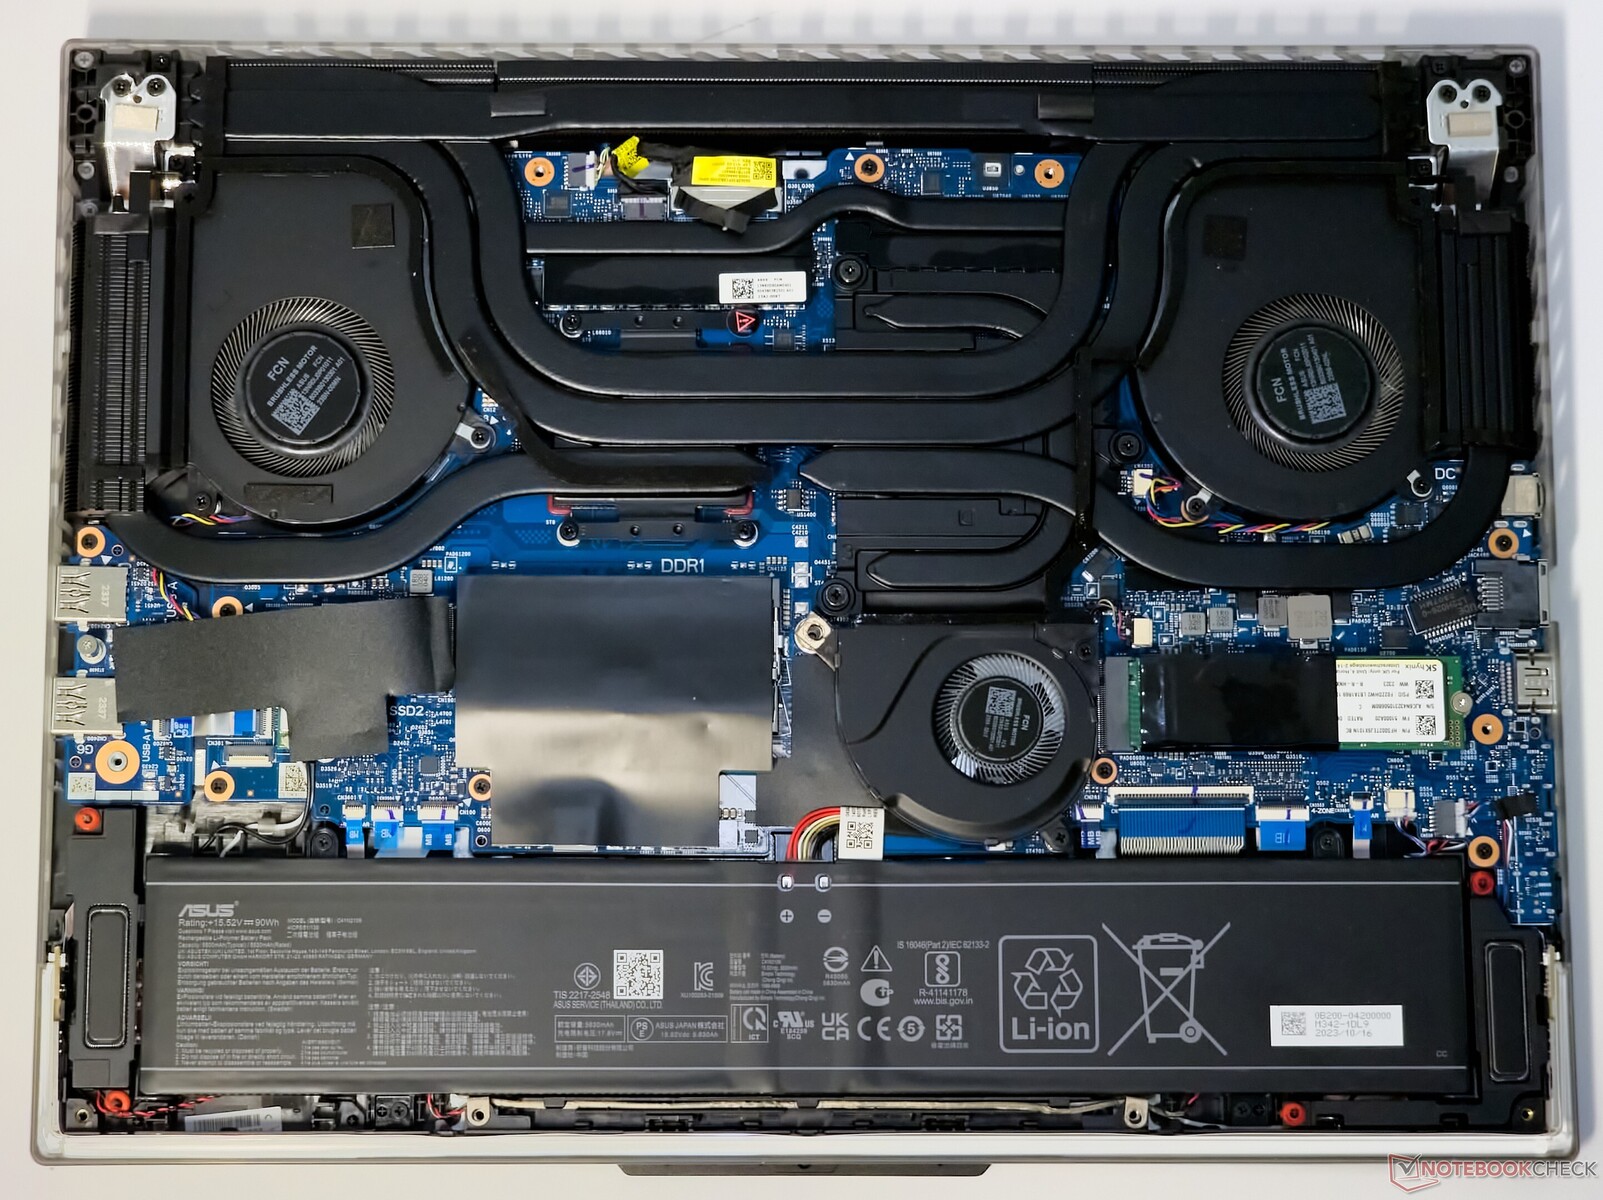
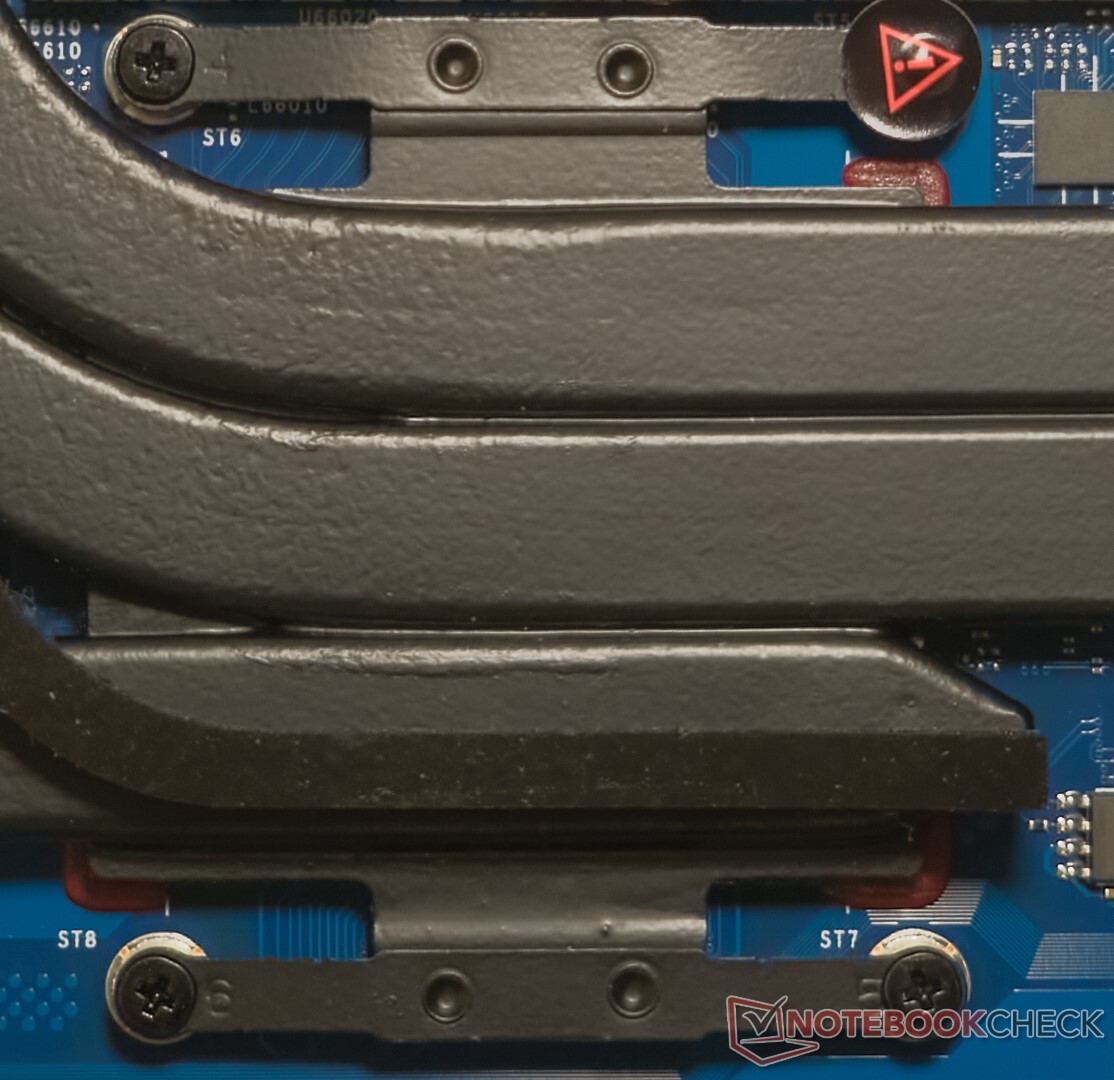
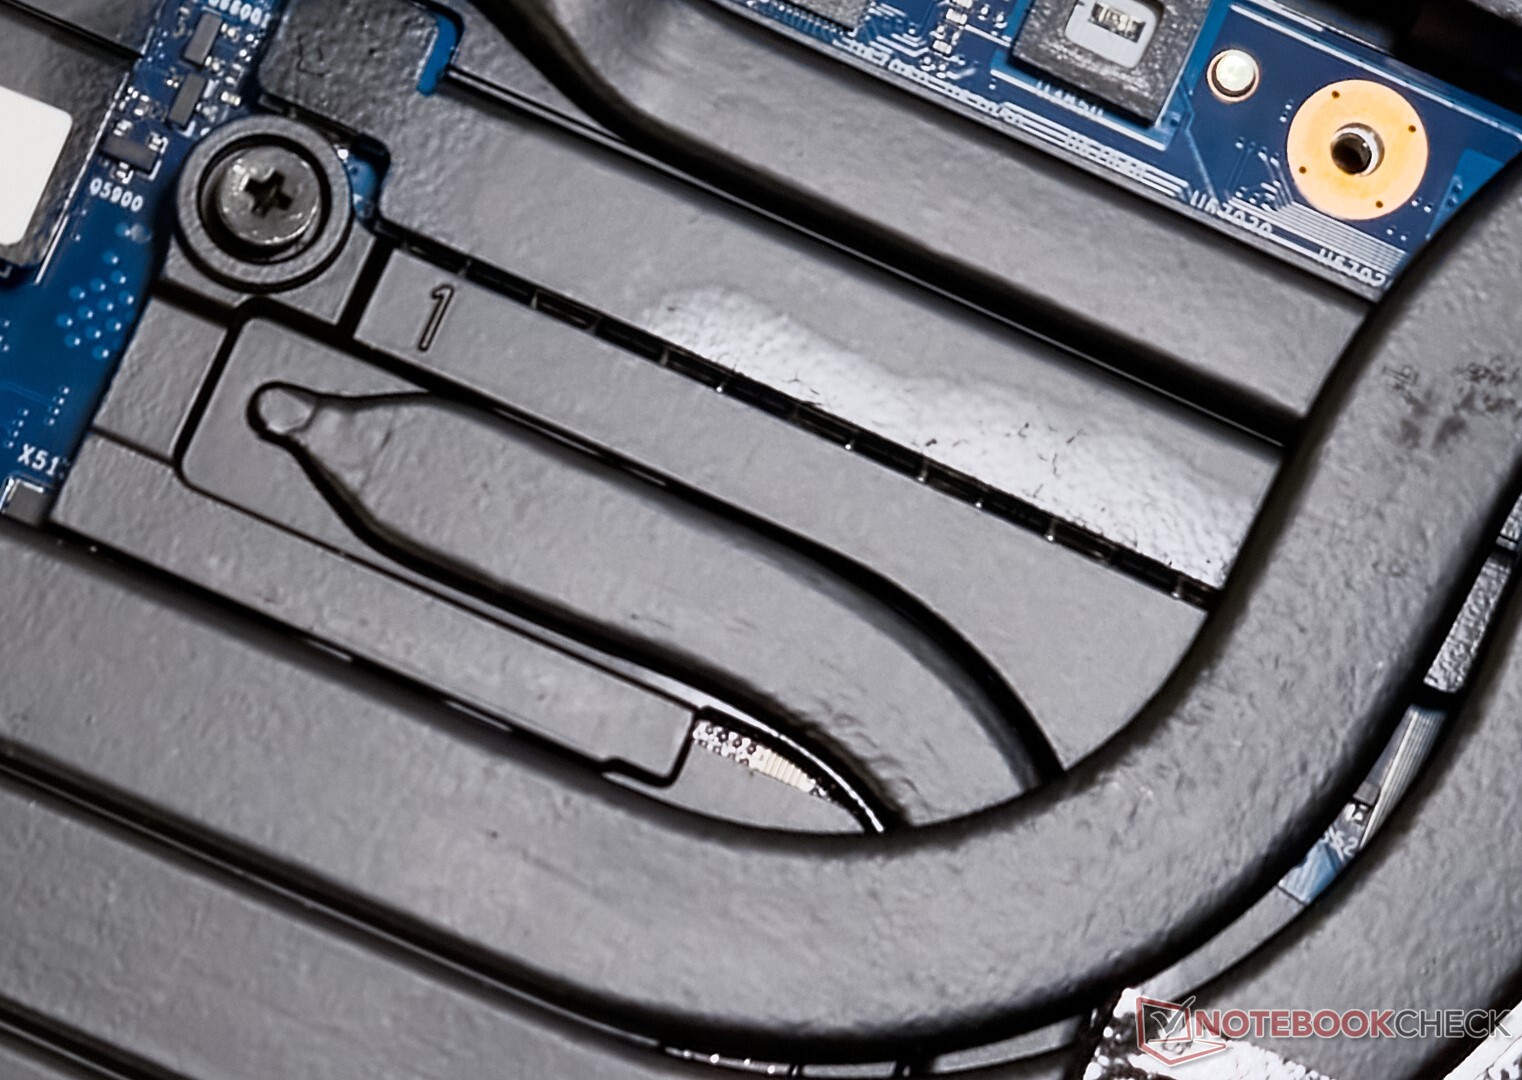
Rimuovendo le 11 viti PH0 e facendo leva sul pannello posteriore, si scopre l'intenso layout interno dello Scar 16. Un sensore ottico sulla scheda madre agisce come una funzione di sicurezza, impedendo al portatile di accendersi o spegnersi se è già acceso quando si rimuove il pannello inferiore. Per riavviarsi, il pannello inferiore deve essere rimesso a posto e il portatile deve essere collegato all'adattatore di alimentazione.
La striscia LED RGB non fa più parte del pannello posteriore, quindi addio alla preoccupazione che i fragili cavi a nastro si spezzino mentre apre il coperchio.
La RAM, l'SSD e la scheda WLAN possono essere sostituiti per un aggiornamento, se necessario. Anche la batteria può essere svitata e sostituita.
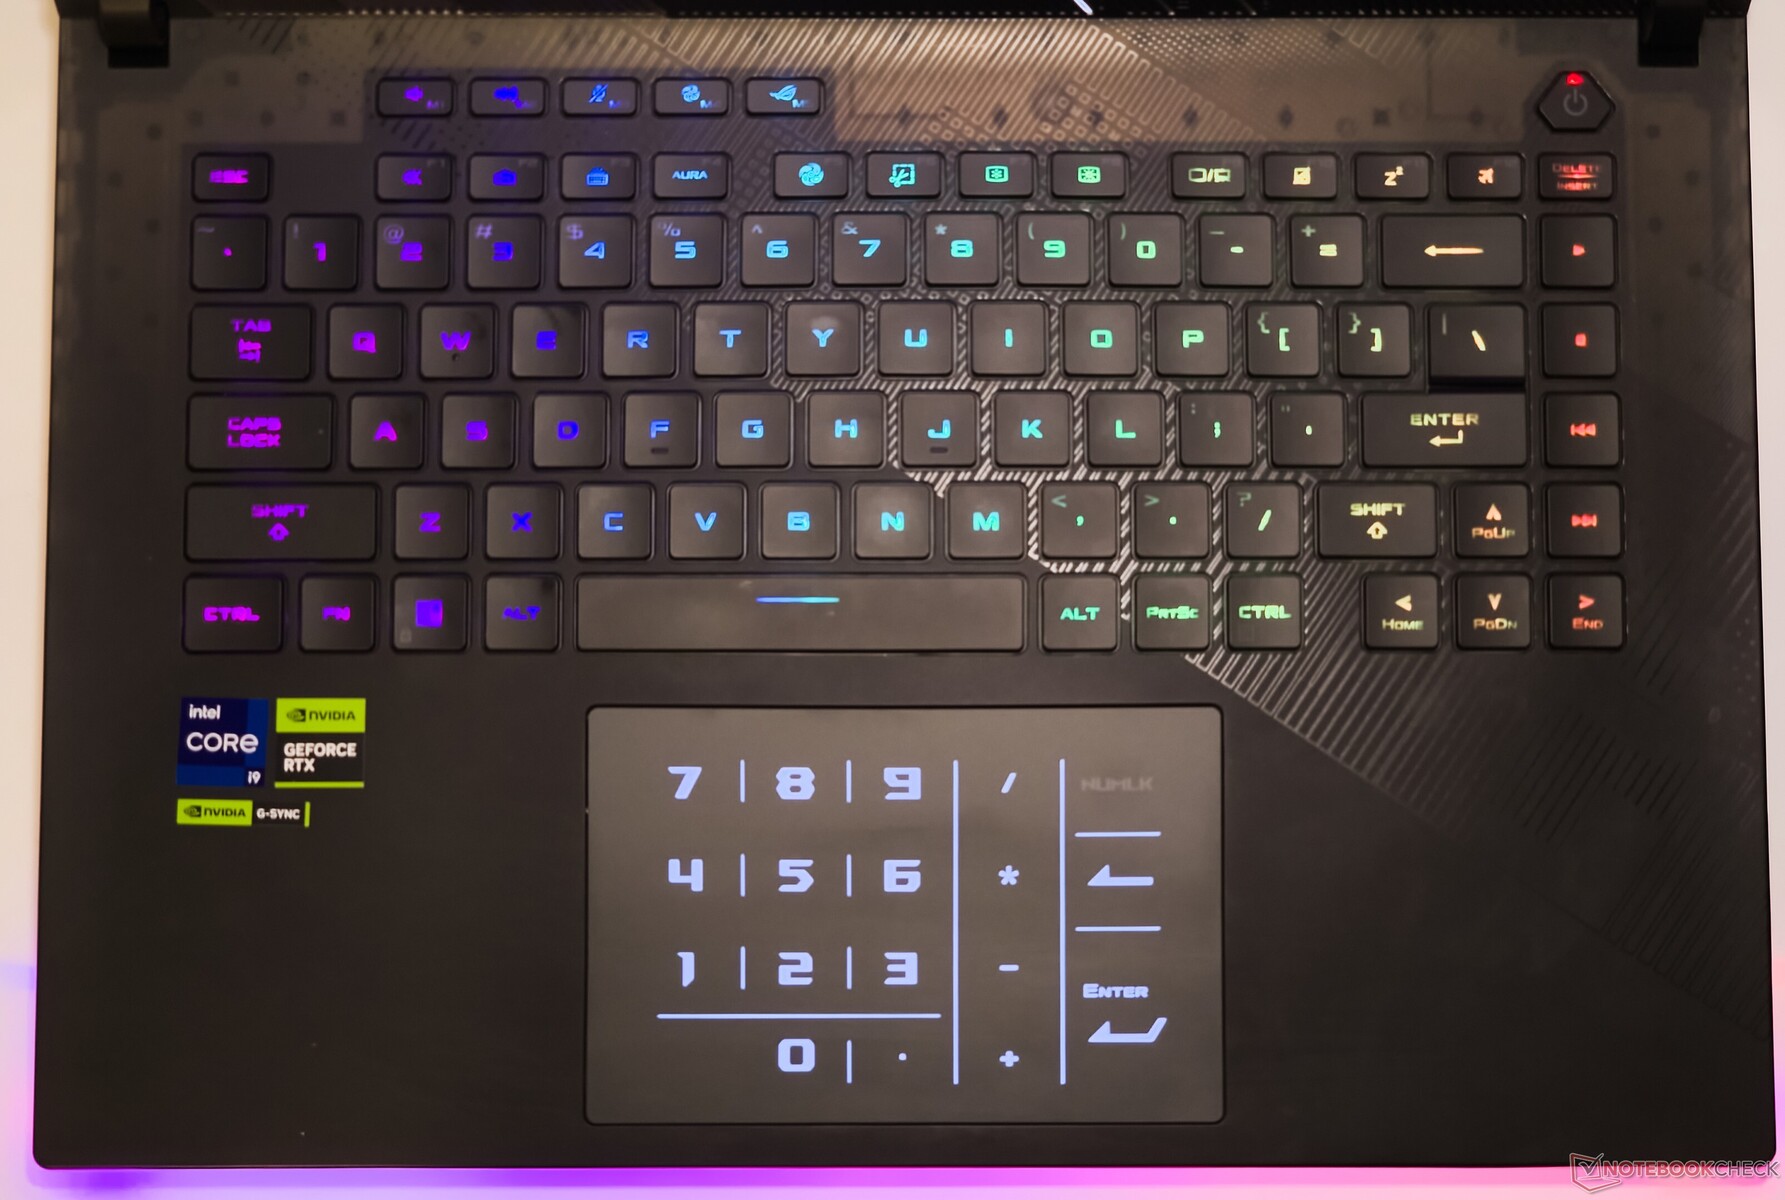
Dispositivi di input: Pratico tastierino numerico virtuale, ma F1-F12 rimane non illuminato
Tastiera
La tastiera dello Scar 16 offre una buona esperienza di digitazione nel complesso, ma il feedback avrebbe potuto essere più nitido. Chi proviene da un notebook ROG non-Asus potrebbe impiegare un po' di tempo per adattarsi al tasto Shift corto a destra e alla disposizione verticale dei tasti multimediali verso destra.
Come è standard per i portatili ROG, la fila superiore consente di programmare funzioni macro tramite Armory Crate. È lodevole che Asus fornisca tasti freccia a grandezza naturale. Ci sono tasti dedicati per passare tra i preset di illuminazione RGB e i profili di prestazioni.
L'RGB per ogni tasto può essere personalizzato tramite Armory Crate. Tuttavia, le lettere F1-F12 continuano a rimanere al buio.
Touchpad
Il touchpad da 8,5 cm x 13 cm offre un'esperienza di scorrimento fluida con il supporto dei gesti di Windows Precision. Il touchpad offre una buona tattilità e i clic sono reattivi agli angoli.
Un toggle di blocco numerico morbido in alto a destra del touchpad offre un tastierino numerico virtuale per chi ha bisogno di snocciolare numeri. Può essere attivato accidentalmente durante lo scorrimento, ma in genere non ostacola il normale utilizzo.
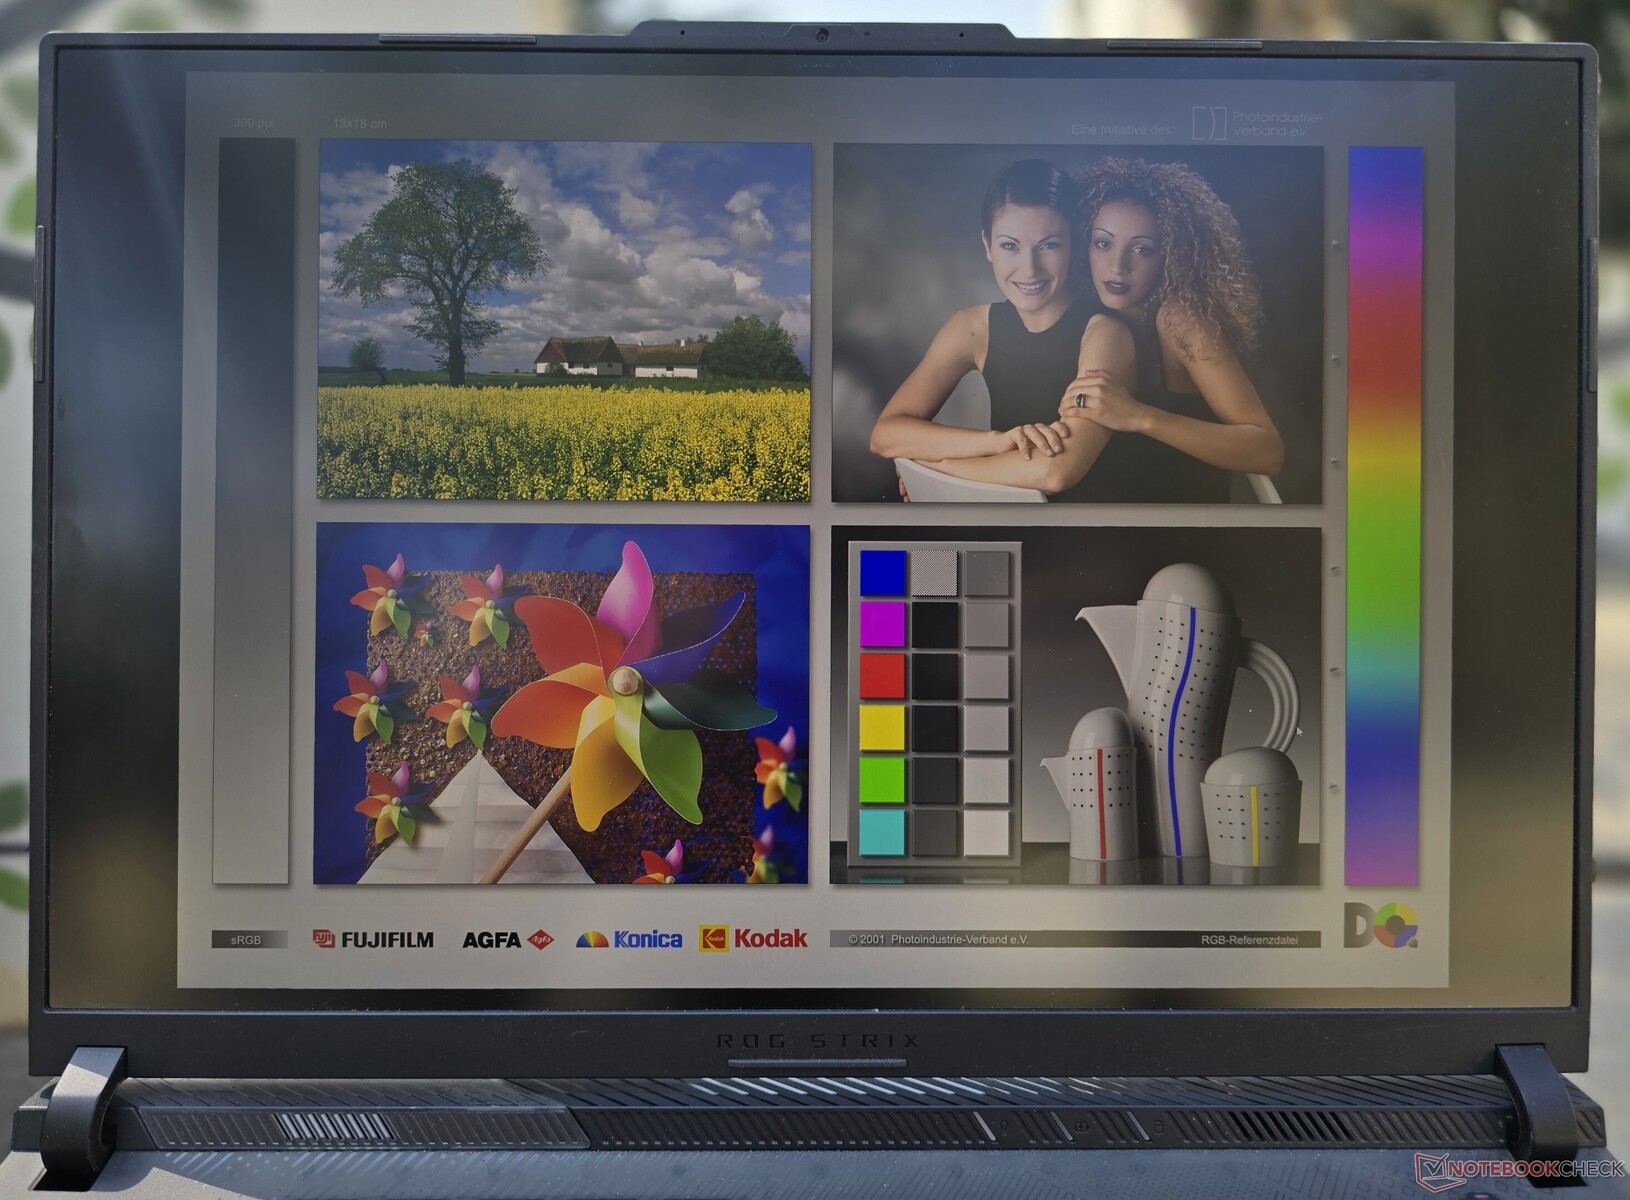
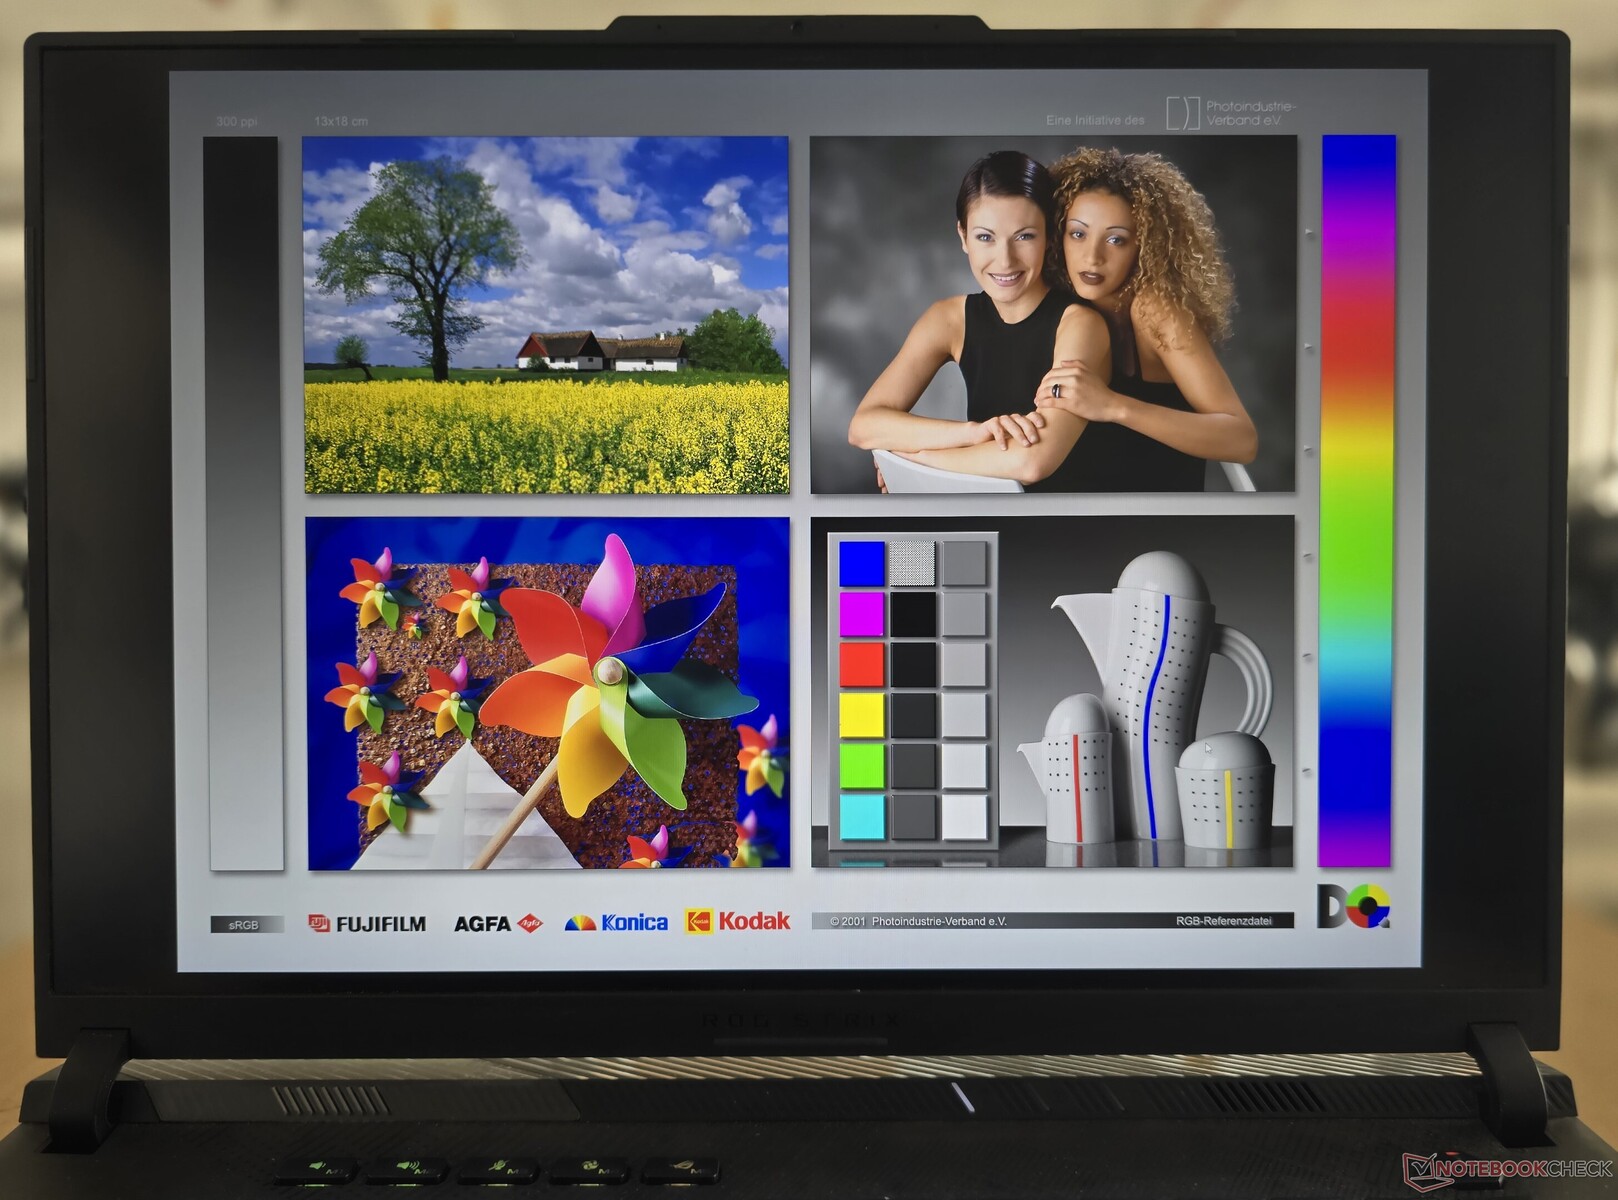
Display: pannello QHD+ G-Sync HDR da 240 Hz con PWM elevato
ROG Strix Scar 16 è dotato di un pannello mini LED "Nebula HDR" 2560 x 1600 16:10, che Asus dichiara avere 2.048 zone di oscuramento. Il display da 240 Hz supporta HDR10, Dolby Vision, Nvidia G-Sync ed è anche convalidato da Pantone.
Armory Crate consente di passare dalla retroilluminazione a zona singola a quella a zona multipla. La prima è la modalità operativa predefinita e consente un'illuminazione più uniforme per flussi di lavoro accurati dal punto di vista cromatico.
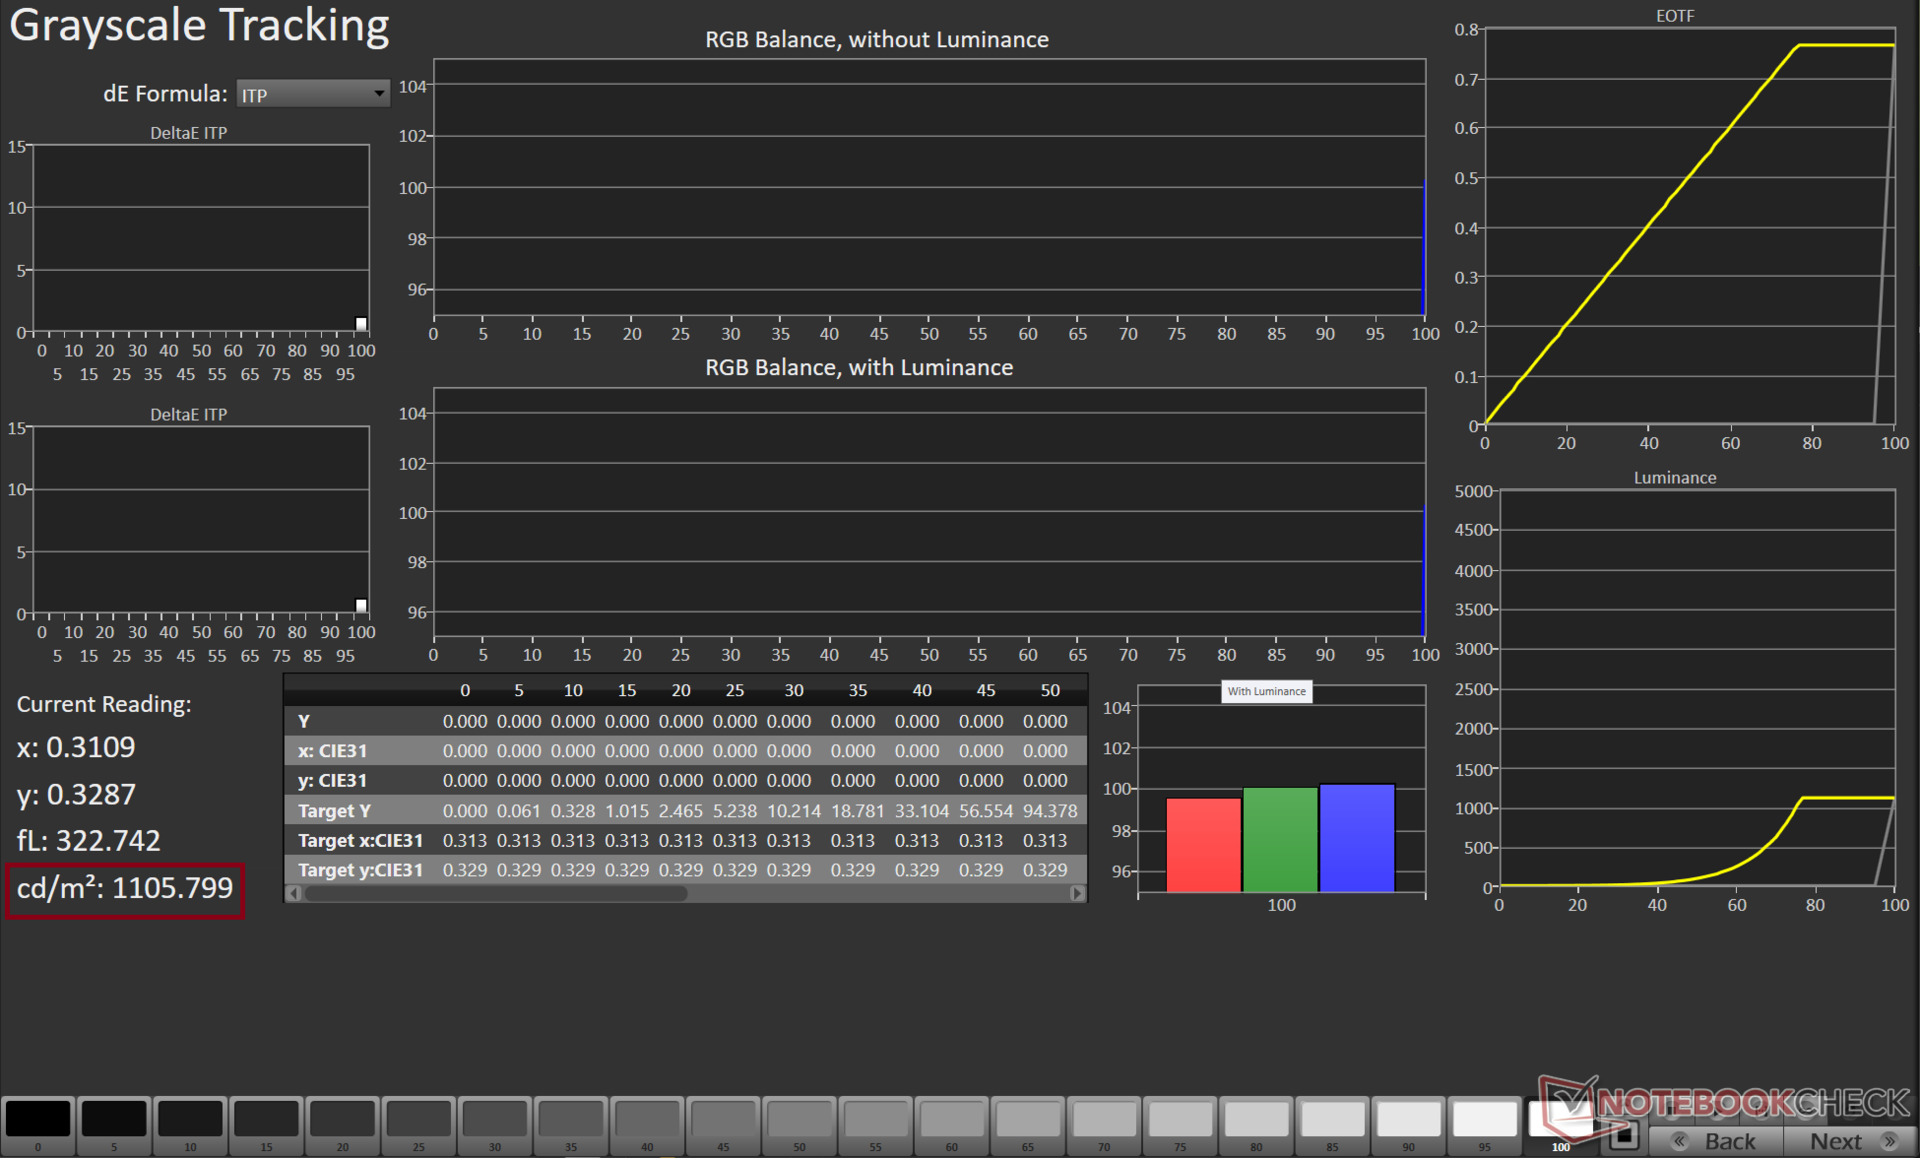
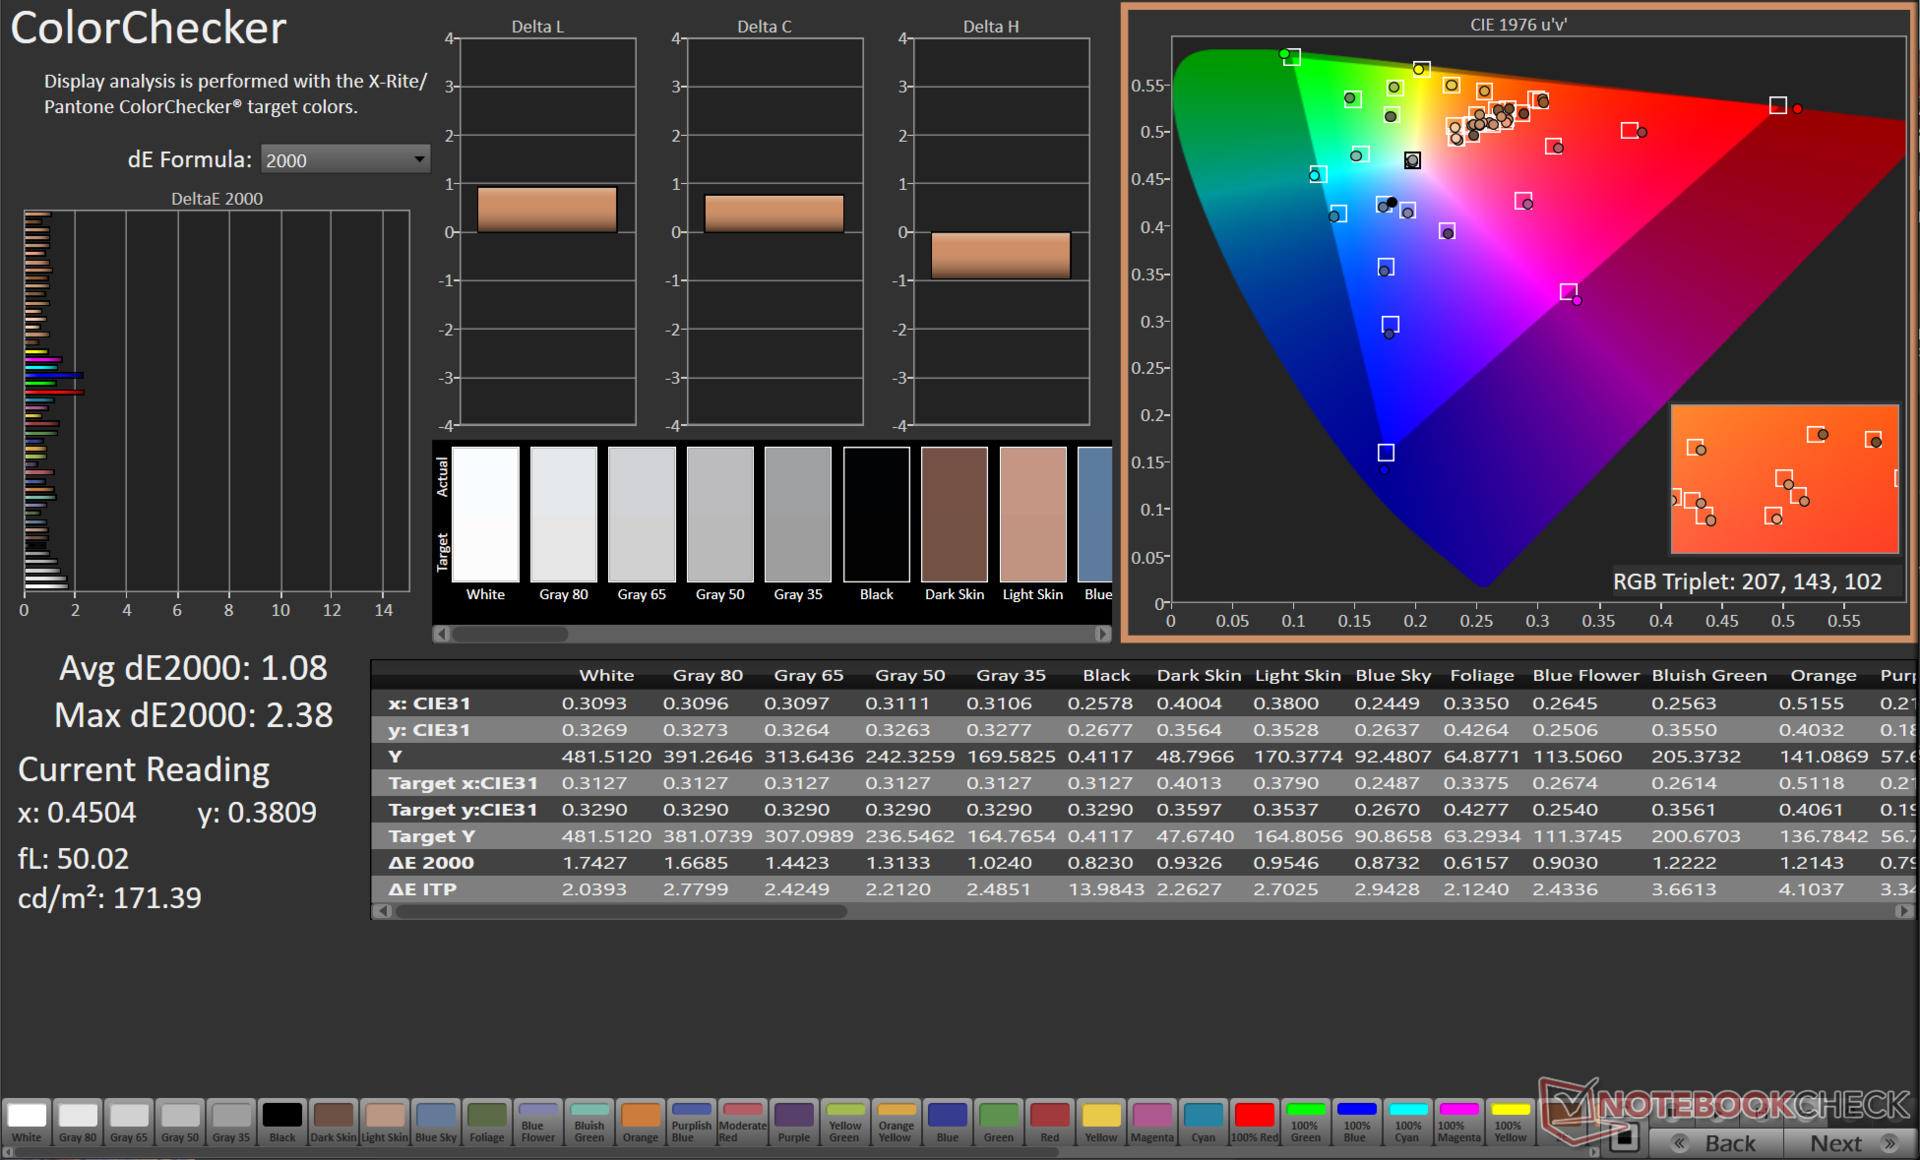
In questa modalità, il display di Scar 16 ha mostrato una buona distribuzione della luminosità del 94% nelle nostre misurazioni SDR, con un picco di luminosità di 503 nit. Abbiamo misurato un rapporto di contrasto di 1.225:1, che è buono, ma è necessario attivare l'interruttore multizona se si desiderano neri ancora più profondi.
Faccia riferimento al nostro Recensione di ROG Scar 18 (2024) che monta un pannello Nebula HDR mini LED simile per il tipo di valori che ci si può aspettare con la retroilluminazione multizona.
Asus pubblicizza 1.100 nit di luminosità di picco HDR e abbiamo riscontrato che questa affermazione è vera quando viene misurata con una finestra del 49%.
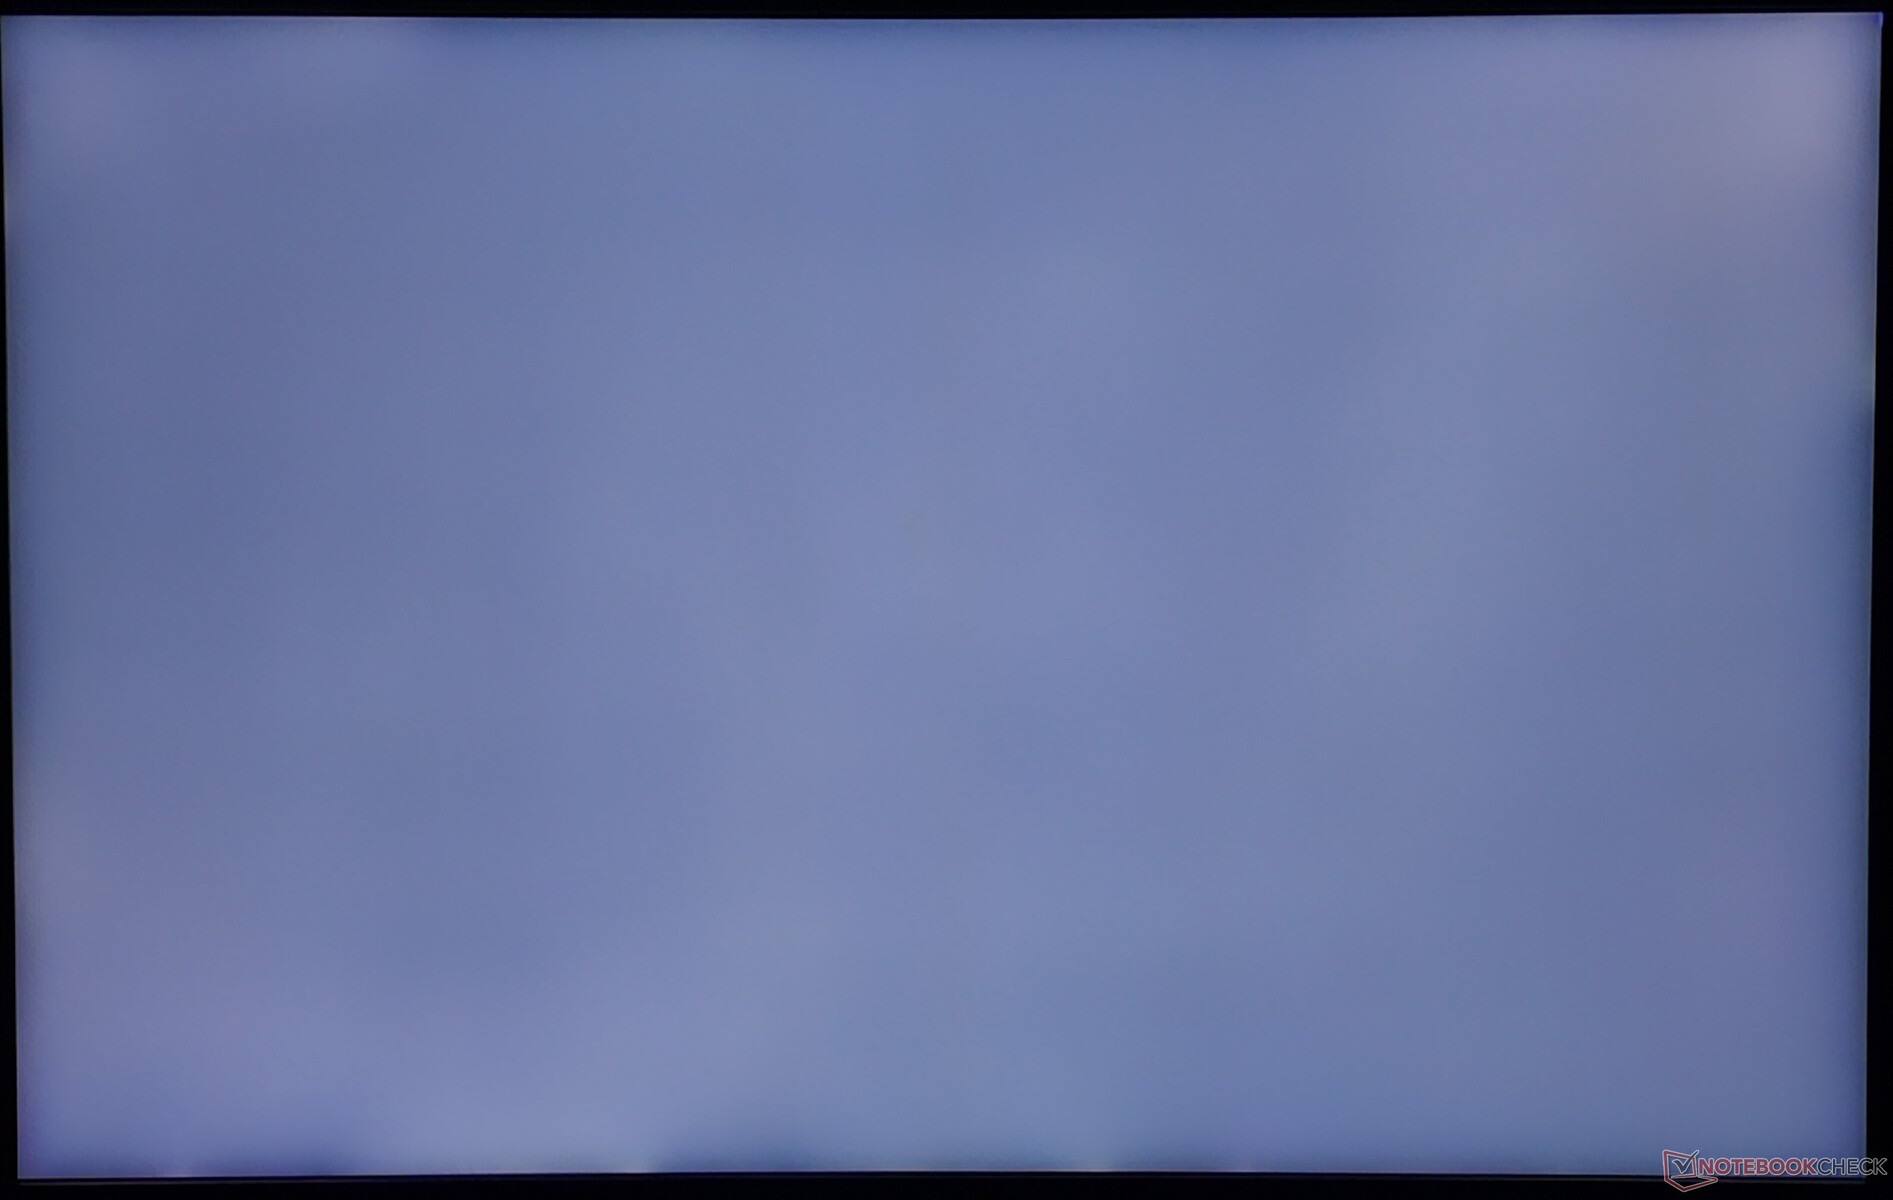
Il backlight bleeding è visibile solo in minima parte lungo la cornice inferiore del display.
| |||||||||||||||||||||||||
Distribuzione della luminosità: 94 %
Al centro con la batteria: 291 cd/m²
Contrasto: 1225:1 (Nero: 0.4 cd/m²)
ΔE ColorChecker Calman: 1.08 | ∀{0.5-29.43 Ø4.72}
calibrated: 0.9
ΔE Greyscale Calman: 1.1 | ∀{0.09-98 Ø4.97}
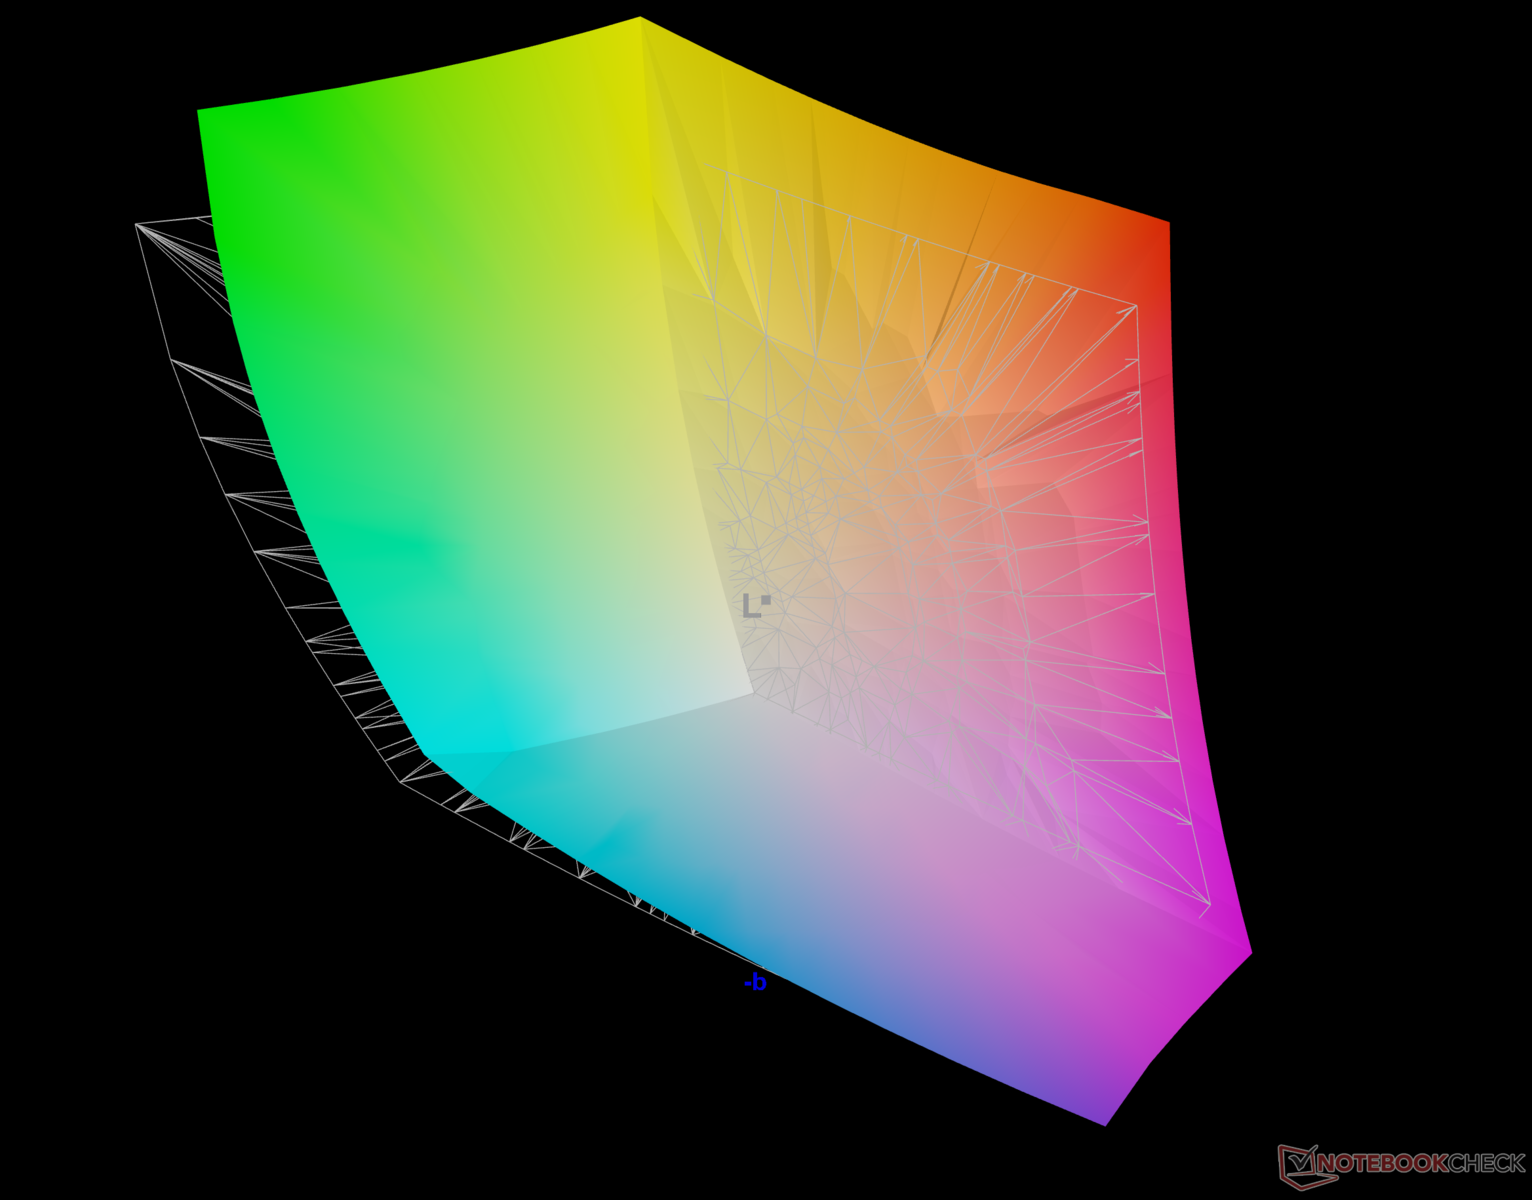
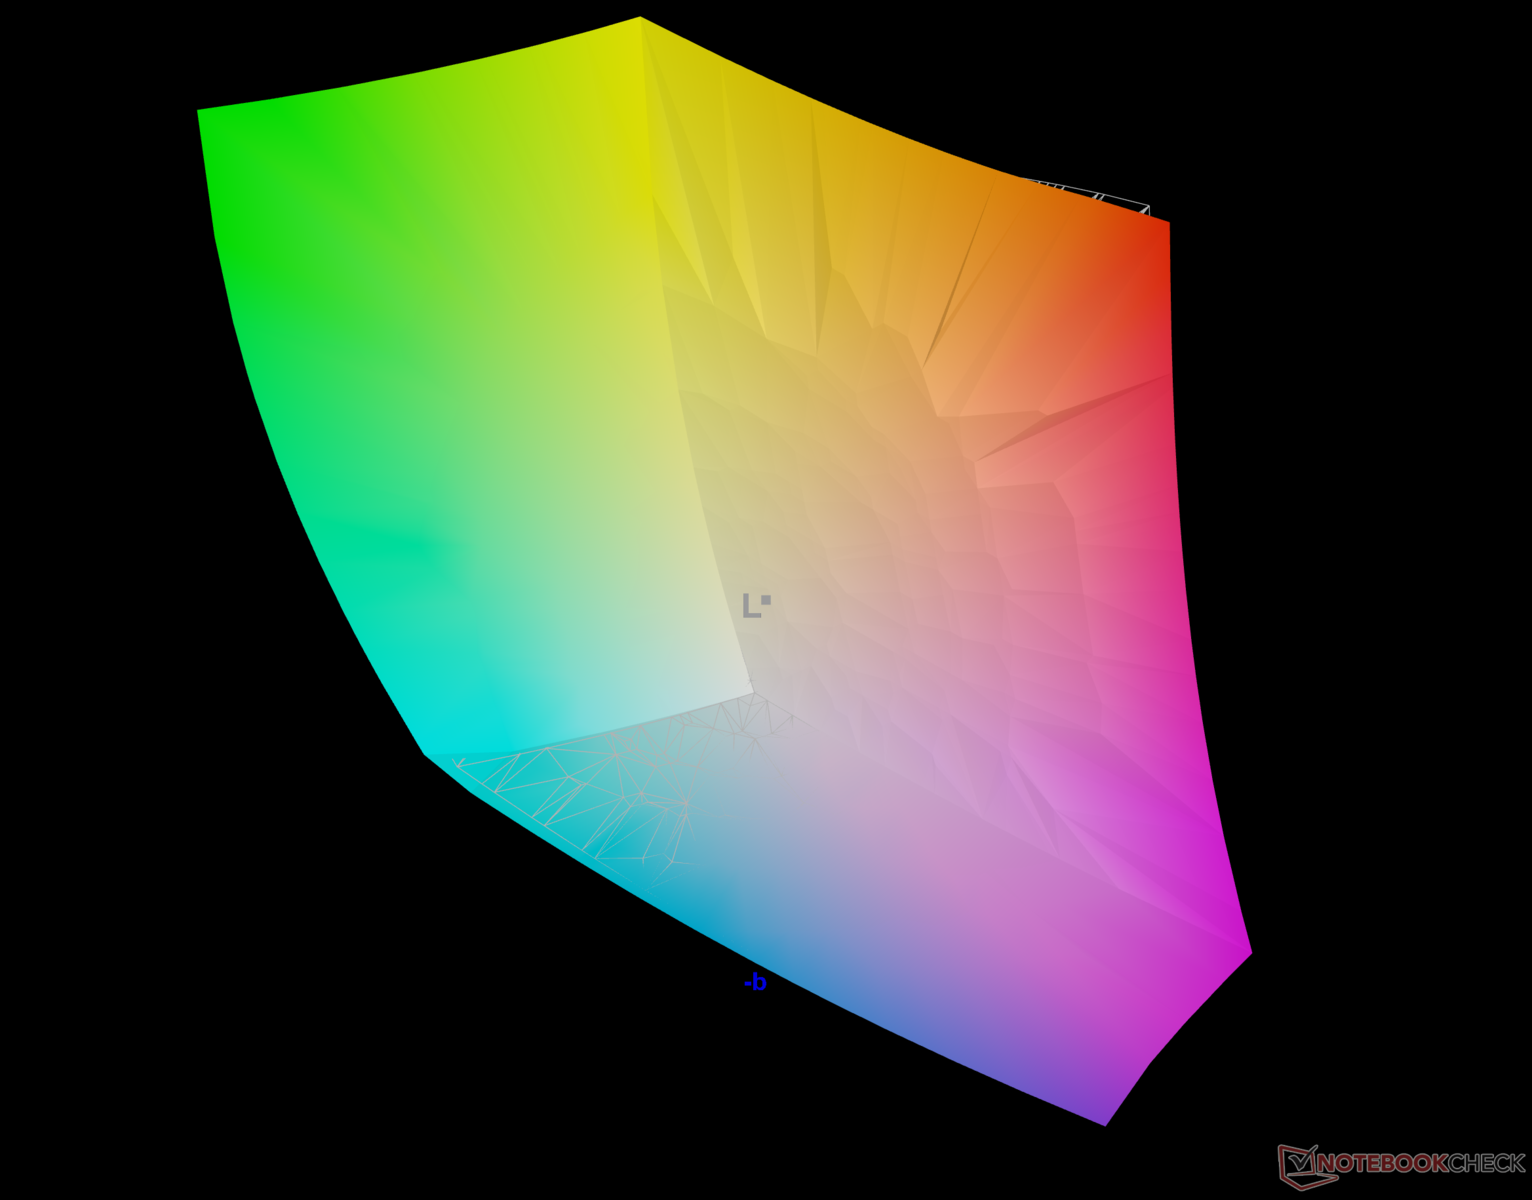
90.8% AdobeRGB 1998 (Argyll 3D)
100% sRGB (Argyll 3D)
99.8% Display P3 (Argyll 3D)
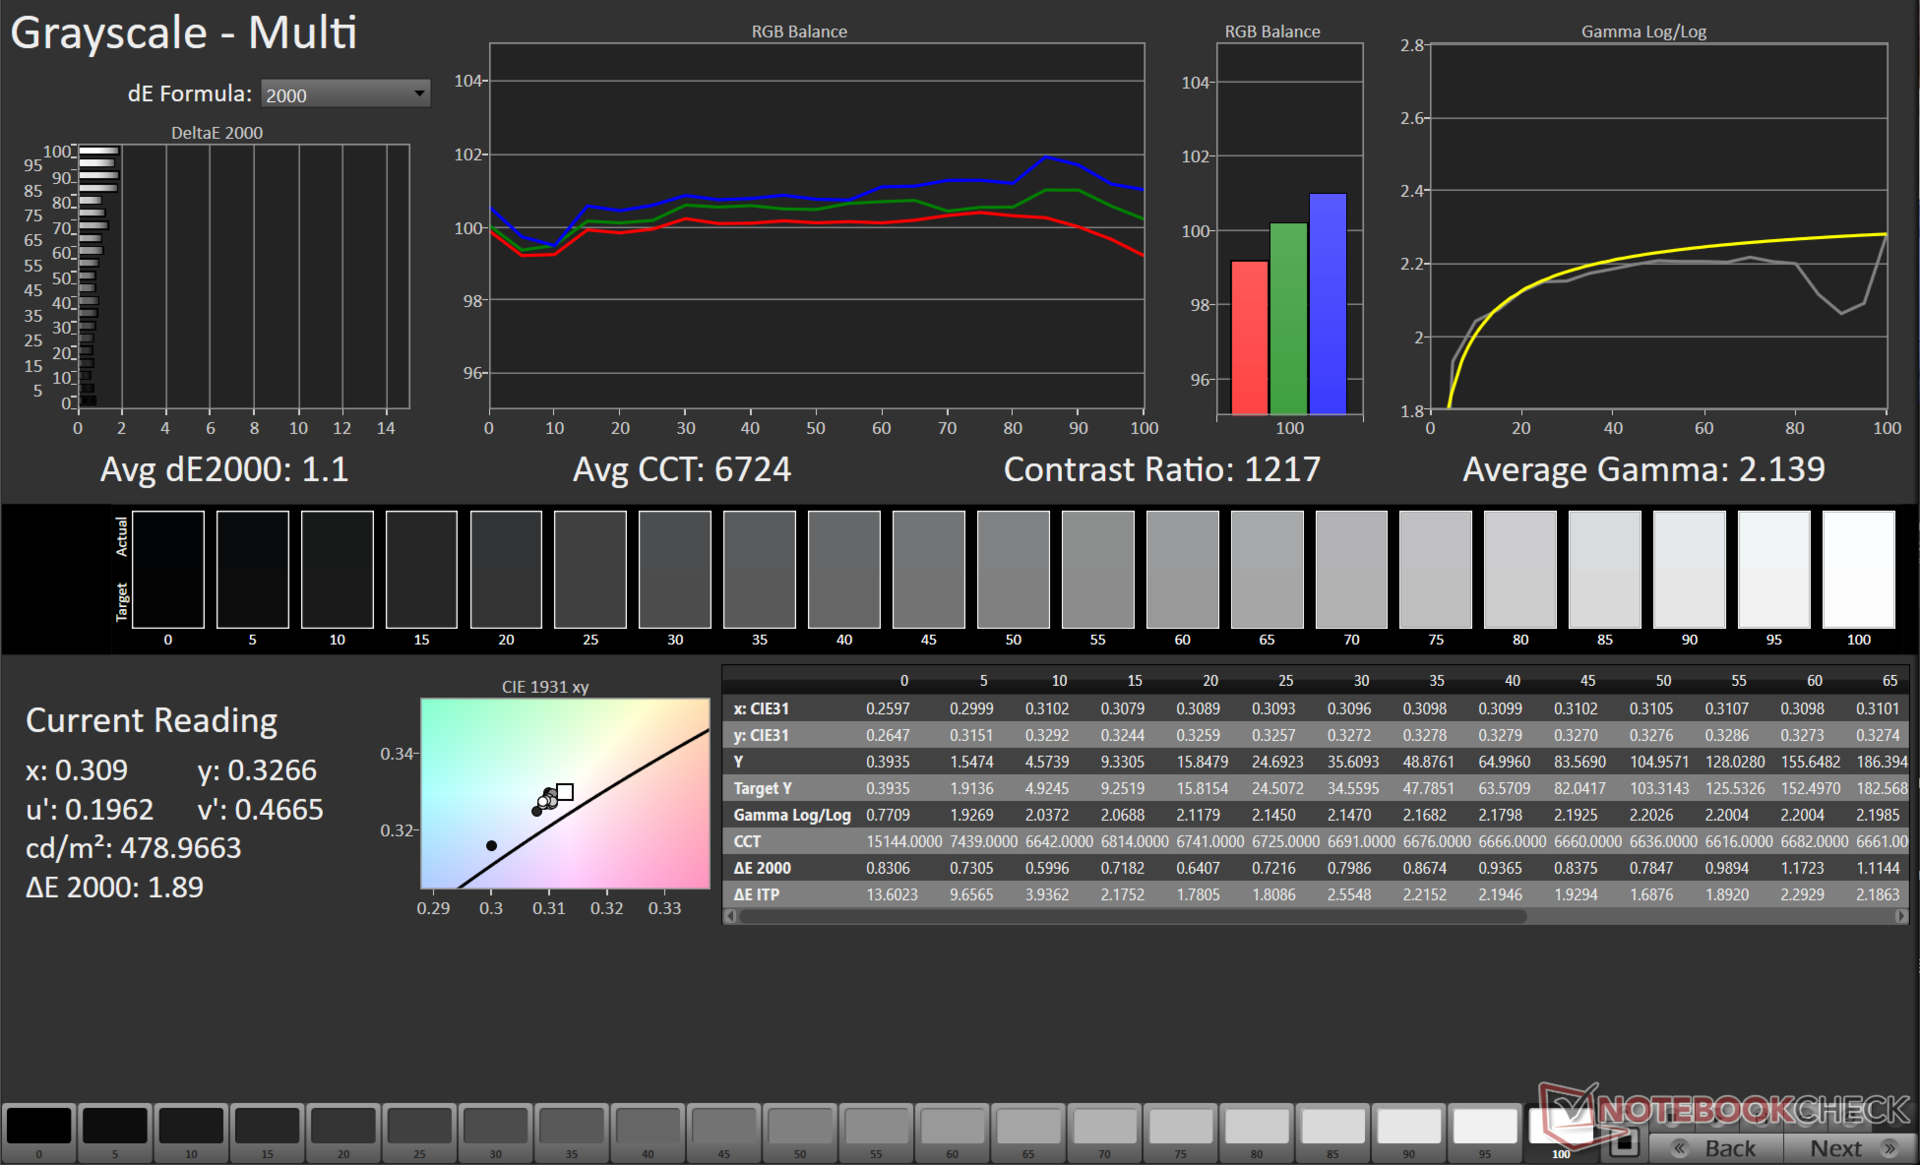
Gamma: 2.13
CCT: 6724 K
| Asus ROG Strix Scar 16 G634JZR BOE NE160QDM-NM7, Mini LED, 2560x1600, 16" | Asus ROG Strix G16 G614JZ TL160ADMP03-0, IPS, 2560x1600, 16" | Lenovo Legion Pro 7 16IRX9H BOE CQ NE16QDM-NZB, IPS, 2560x1600, 16" | HP Omen 16 (2024) BOE BOE0B7D, IPS, 2560x1440, 16.1" | MSI Vector 16 HX A14V Chi Mei N160GME-GTB, IPS, 2560x1600, 16" | Alienware m16 R2 BOE NE16NYH, IPS, 2560x1600, 16" | |
|---|---|---|---|---|---|---|
| Display | -3% | -2% | -18% | -3% | -17% | |
| Display P3 Coverage (%) | 99.8 | 97 -3% | 98.5 -1% | 68.6 -31% | 95.4 -4% | 71 -29% |
| sRGB Coverage (%) | 100 | 99.9 0% | 99.9 0% | 98.6 -1% | 99.7 0% | 100 0% |
| AdobeRGB 1998 Coverage (%) | 90.8 | 84.9 -6% | 86.7 -5% | 70.6 -22% | 85.4 -6% | 71.4 -21% |
| Response Times | 18% | -54% | -86% | -12% | 1% | |
| Response Time Grey 50% / Grey 80% * (ms) | 5 ? | 5.1 ? -2% | 12.6 ? -152% | 14.1 ? -182% | 5.7 ? -14% | 5.7 ? -14% |
| Response Time Black / White * (ms) | 10.4 ? | 6.6 ? 37% | 5.8 ? 44% | 9.3 ? 11% | 11.4 ? -10% | 8.7 ? 16% |
| PWM Frequency (Hz) | 2040 ? | |||||
| Screen | -34% | -1% | -46% | -70% | -27% | |
| Brightness middle (cd/m²) | 490 | 470 -4% | 487 -1% | 292 -40% | 557.2 14% | 345.8 -29% |
| Brightness (cd/m²) | 487 | 459 -6% | 460 -6% | 291 -40% | 506 4% | 337 -31% |
| Brightness Distribution (%) | 94 | 93 -1% | 88 -6% | 85 -10% | 83 -12% | 87 -7% |
| Black Level * (cd/m²) | 0.4 | 0.42 -5% | 0.42 -5% | 0.24 40% | 0.41 -2% | 0.3 25% |
| Contrast (:1) | 1225 | 1119 -9% | 1160 -5% | 1217 -1% | 1359 11% | 1153 -6% |
| Colorchecker dE 2000 * | 1.08 | 1.86 -72% | 1.12 -4% | 2.36 -119% | 2.91 -169% | 1.99 -84% |
| Colorchecker dE 2000 max. * | 2.38 | 3.87 -63% | 2.26 5% | 4.08 -71% | 5.94 -150% | 3.52 -48% |
| Colorchecker dE 2000 calibrated * | 0.9 | 0.93 -3% | 0.54 40% | 0.93 -3% | 1.63 -81% | 0.62 31% |
| Greyscale dE 2000 * | 1.1 | 2.7 -145% | 1.4 -27% | 3 -173% | 3.8 -245% | 2.1 -91% |
| Gamma | 2.13 103% | 2.246 98% | 2.242 98% | 2.101 105% | 2.23 99% | 2.32 95% |
| CCT | 6724 97% | 6711 97% | 6809 95% | 5976 109% | 6408 101% | 6369 102% |
| Media totale (Programma / Settaggio) | -6% /
-20% | -19% /
-9% | -50% /
-46% | -28% /
-47% | -14% /
-21% |
* ... Meglio usare valori piccoli
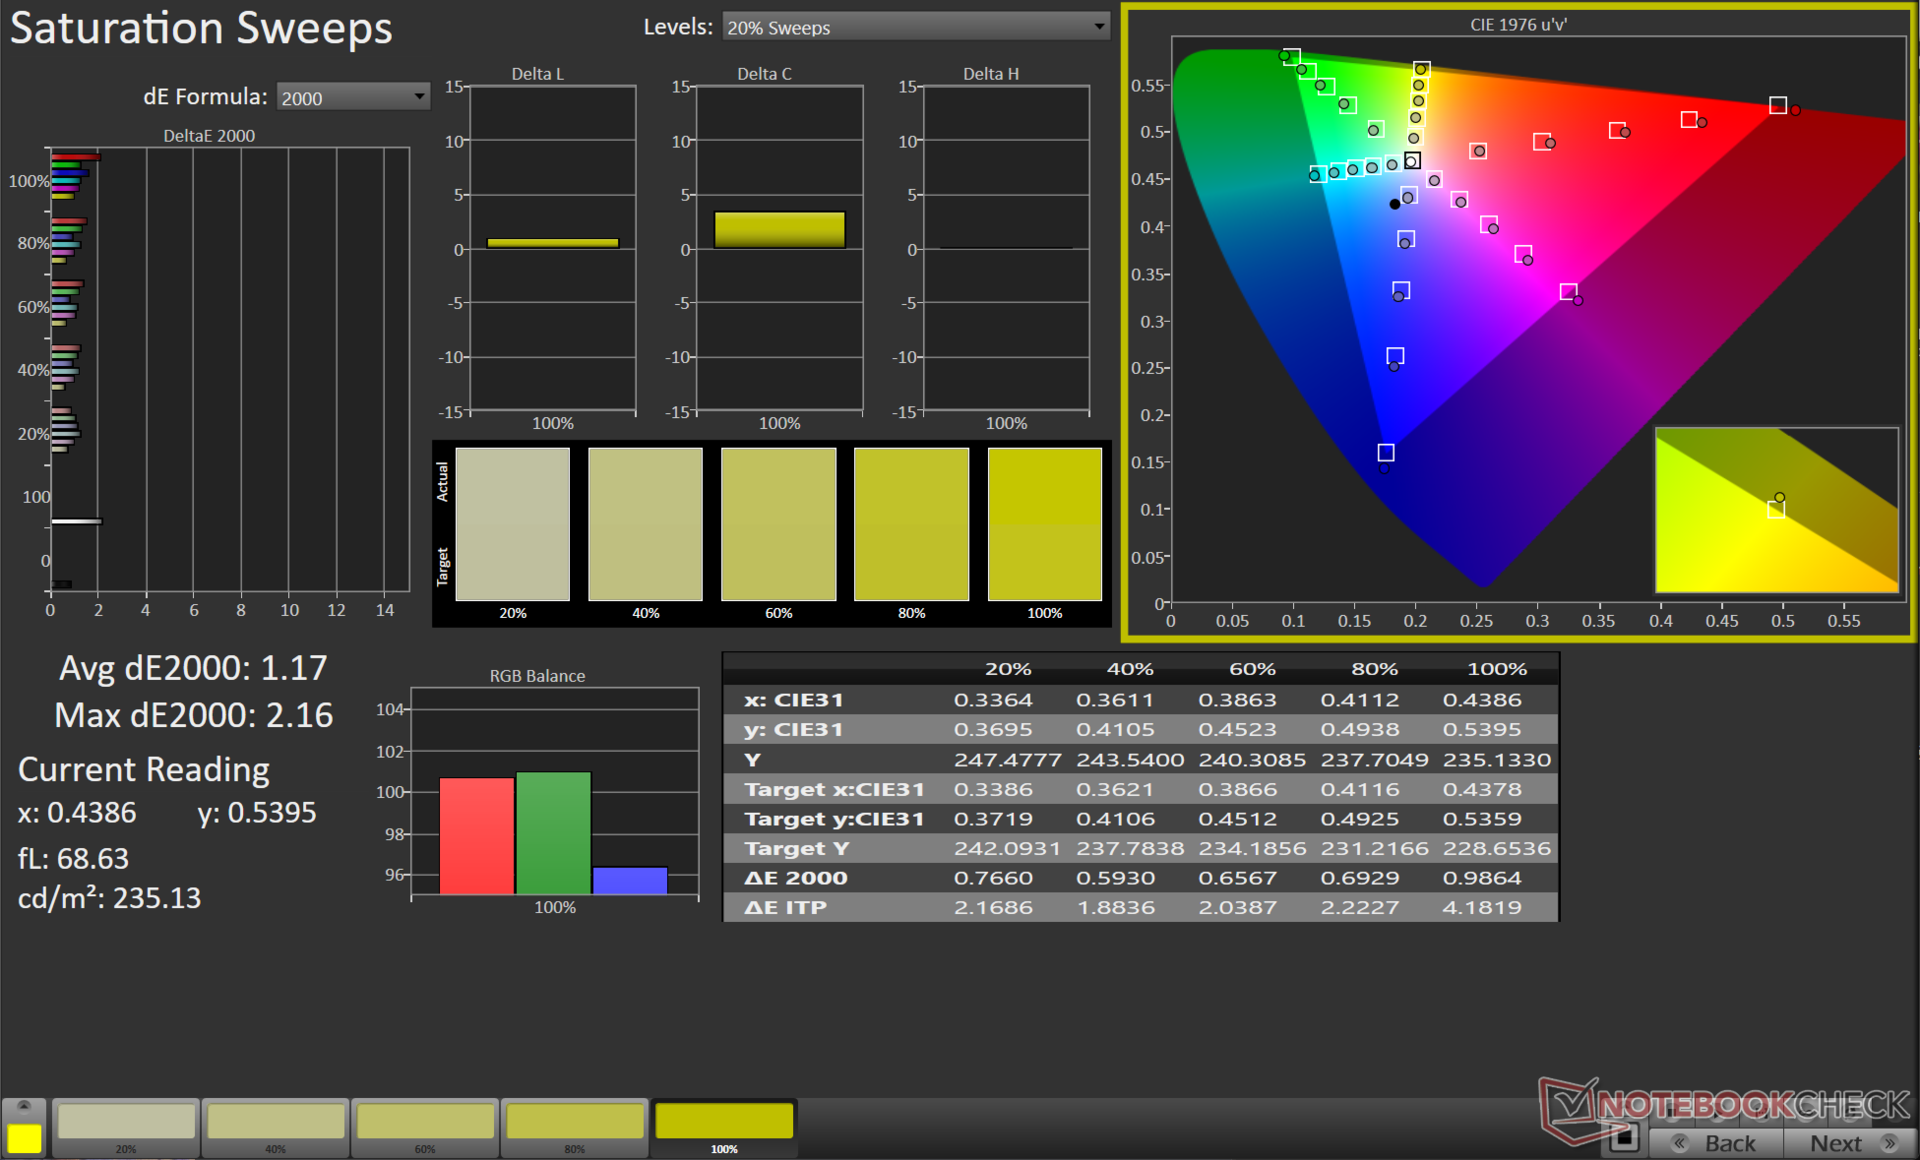
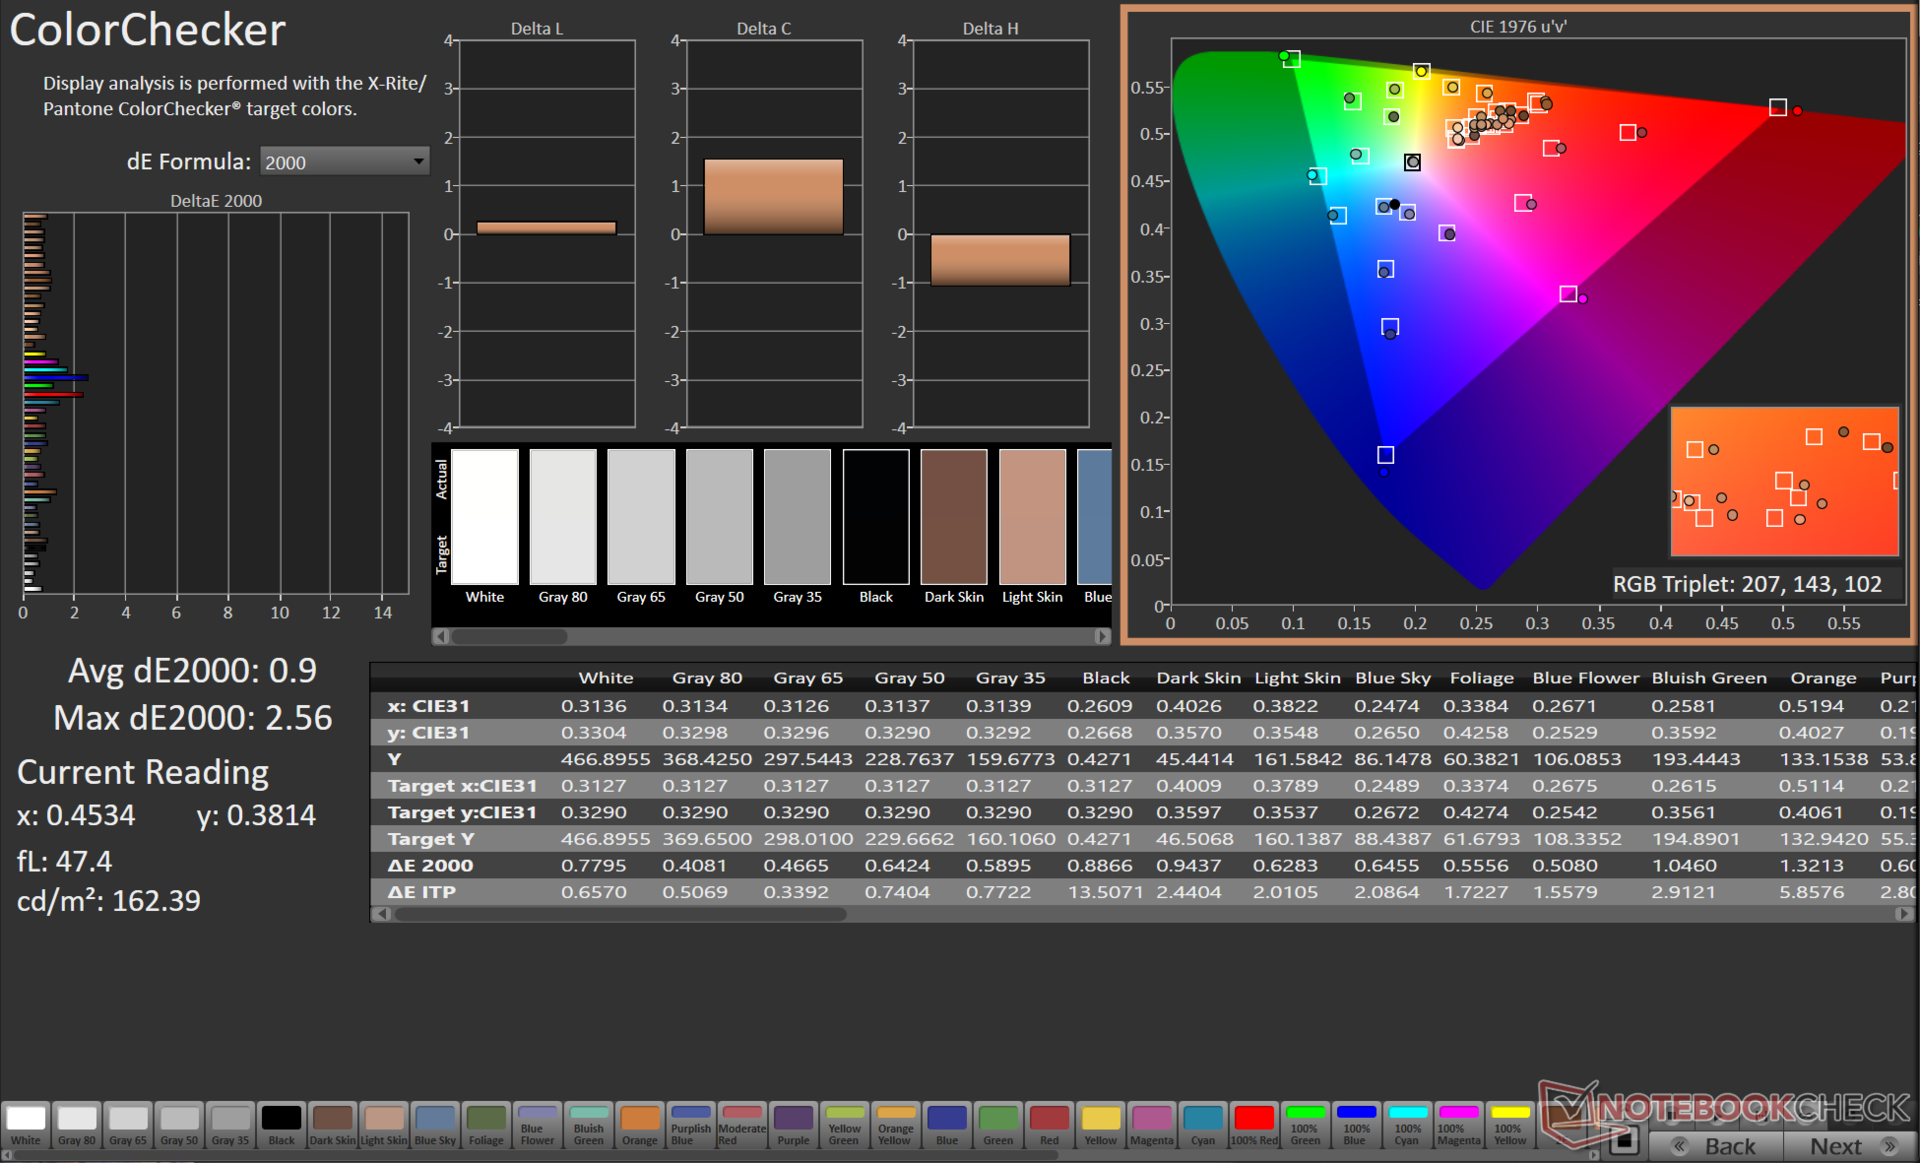
Il display di Scar 16 copre completamente gli spazi colore sRGB e Display P3. Anche la copertura Adobe RGB è buona, con quasi il 91%, rendendo lo Scar 16 molto adatto sia al consumo di media che ai flussi di lavoro per la creazione di contenuti.

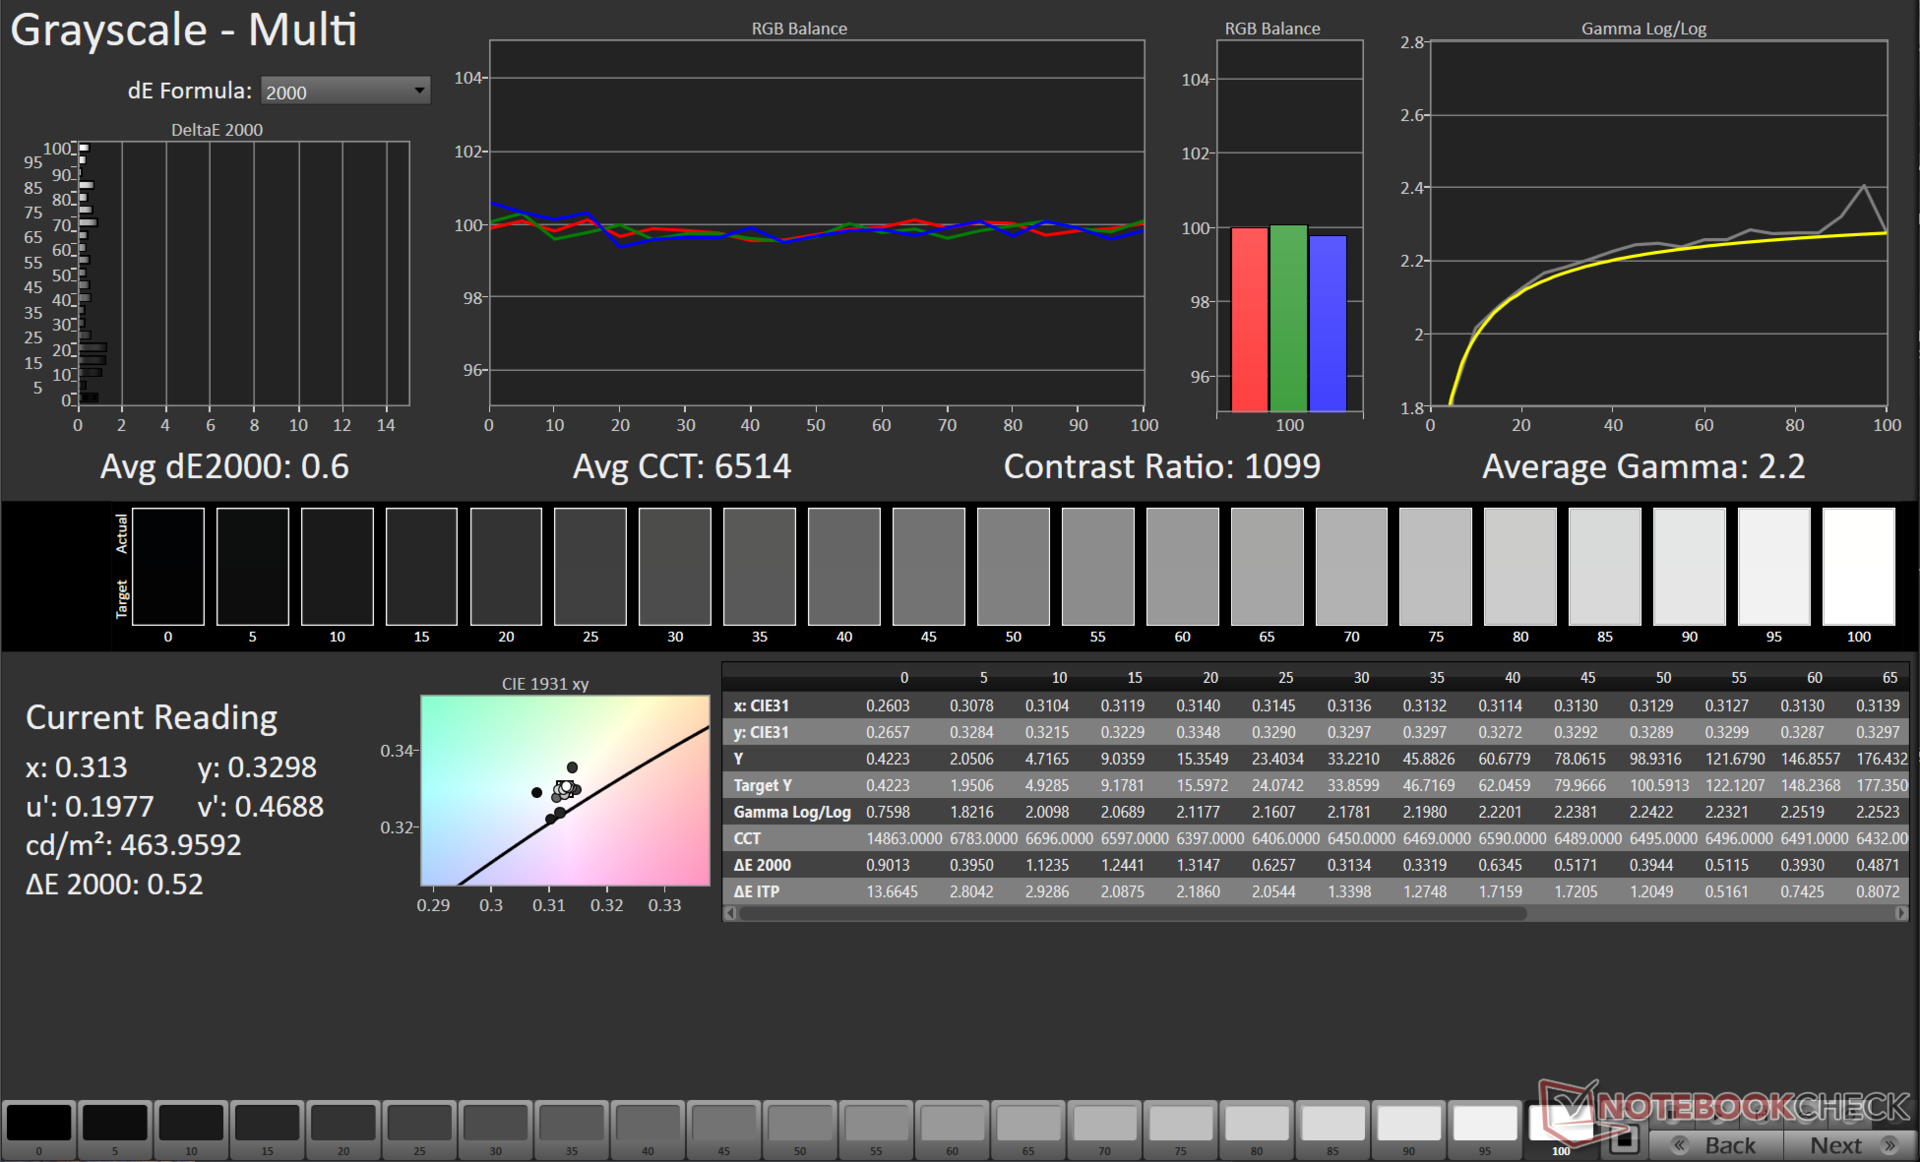
Il display di Scar 16 è ben calibrato fuori dalla confezione, con valori medi di Scala di grigi e ColorChecker Delta E 2000 di 1,1 e 1,08, rispettivamente.
La nostra routine di calibrazione nello spazio colore Display P3 con lo spettrofotometro X-Rite i1Basic Pro 3 e il software Calman Ultimate di Portrait Displays restringe ulteriormente questi valori corrispondenti a 0,6 e 0,9.

Tempi di risposta del Display
| ↔ Tempi di risposta dal Nero al Bianco | ||
|---|---|---|
| 10.4 ms ... aumenta ↗ e diminuisce ↘ combinato | ↗ 3 ms Incremento |  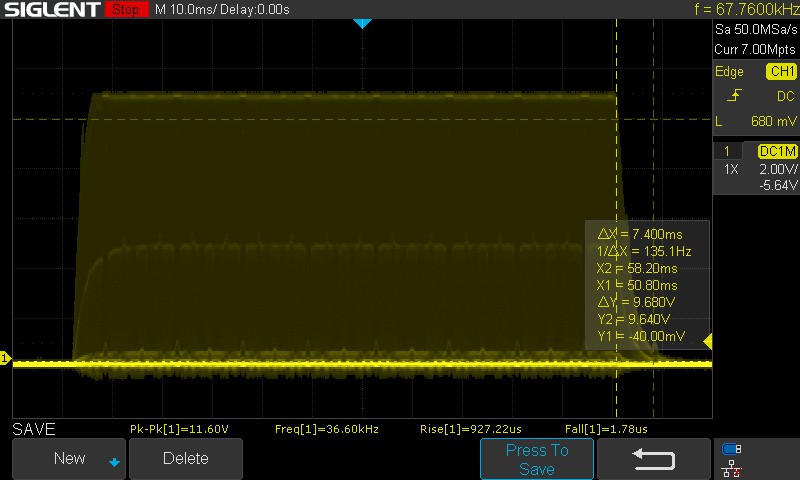 |
| ↘ 7.4 ms Calo | ||
| Lo schermo mostra buoni tempi di risposta durante i nostri tests, ma potrebbe essere troppo lento per i gamers competitivi. In confronto, tutti i dispositivi di test variano da 0.1 (minimo) a 240 (massimo) ms. » 28 % di tutti i dispositivi è migliore. Questo significa che i tempi di risposta rilevati sono migliori rispettto alla media di tutti i dispositivi testati (19.8 ms). | ||
| ↔ Tempo di risposta dal 50% Grigio all'80% Grigio | ||
| 5 ms ... aumenta ↗ e diminuisce ↘ combinato | ↗ 2 ms Incremento | 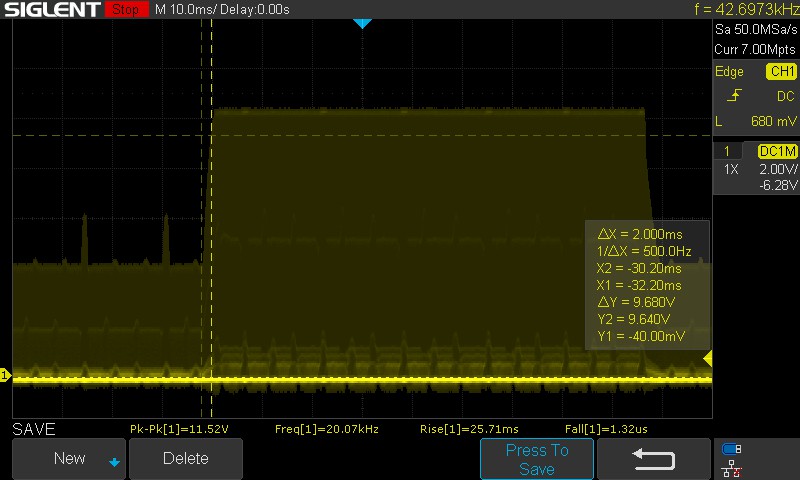 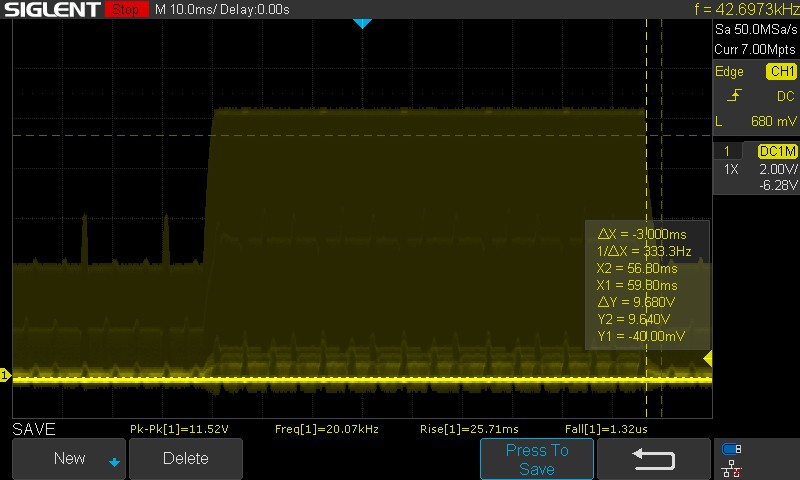 |
| ↘ 3 ms Calo | ||
| Lo schermo ha mostrato valori di risposta molto veloci nei nostri tests ed è molto adatto per i gaming veloce. In confronto, tutti i dispositivi di test variano da 0.165 (minimo) a 636 (massimo) ms. » 17 % di tutti i dispositivi è migliore. Questo significa che i tempi di risposta rilevati sono migliori rispettto alla media di tutti i dispositivi testati (31 ms). | ||
Abbiamo dovuto stimare manualmente i tempi di risposta a causa del PWM in background con il pannello mini LED. I tempi di risposta stimati sembrano decenti per un portatile da gioco.
Asus pubblicizza un tempo di risposta di 3 ms, ma abbiamo misurato 5 ms con transizioni dal 50% di grigio all'80% di grigio. Non viene offerta un'opzione di overdrive del pannello.
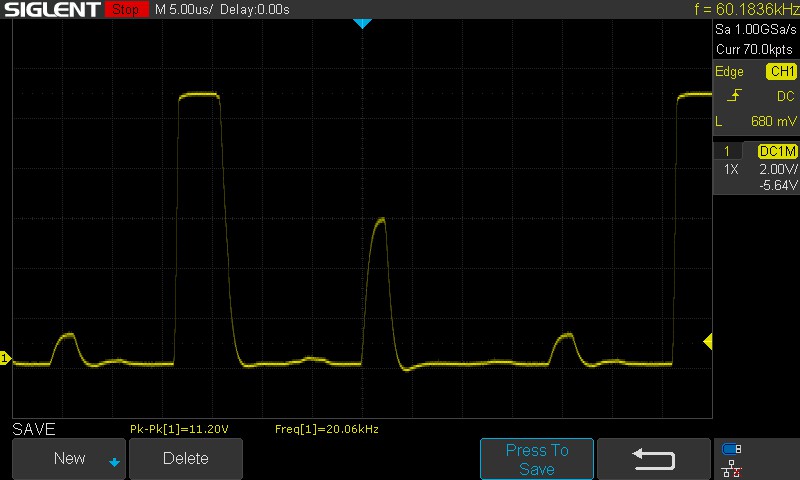
Sfarfallio dello schermo / PWM (Pulse-Width Modulation)
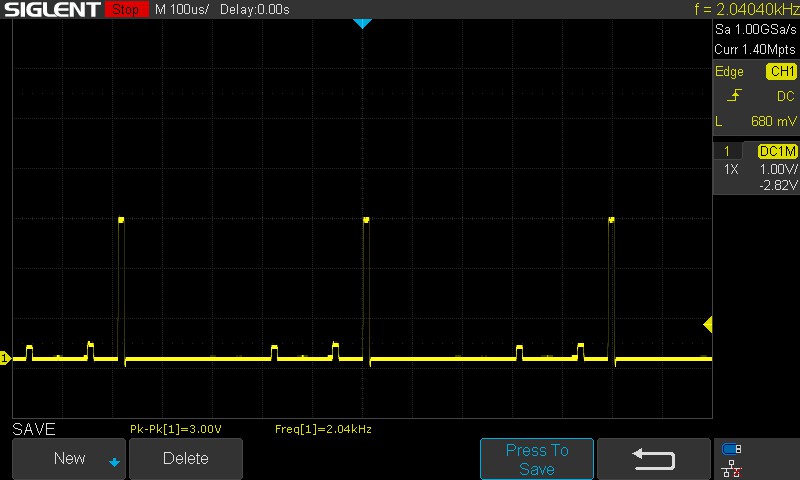
| flickering dello schermo / PWM rilevato | 2040 Hz | ≤ 10 % settaggio luminosita' | 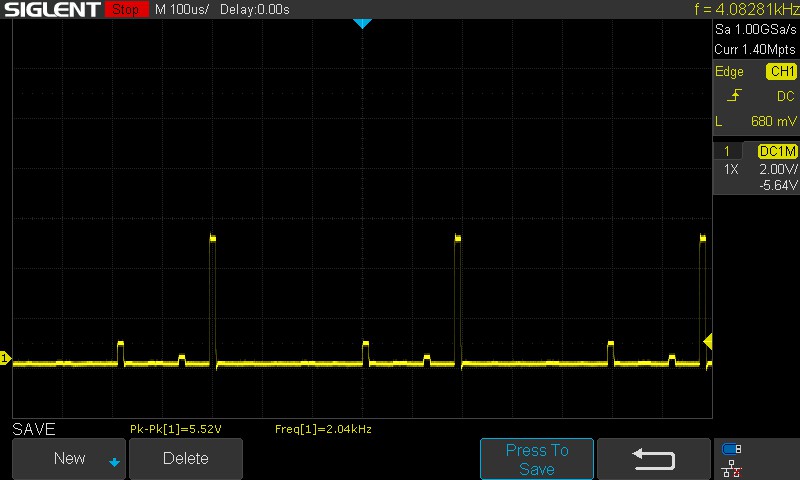 |
Il display sfarfalla a 2040 Hz (Probabilmente a causa dell'uso di PWM) Flickering rilevato ad una luminosita' di 10 % o inferiore. Non dovrebbe verificarsi flickering o PWM sopra questo valore di luminosita'. La frequenza di 2040 Hz è abbastanza alta, quindi la maggioranza degli utenti sensibili al PWM non dovrebbero notare alcun flickering. In confronto: 52 % di tutti i dispositivi testati non utilizza PWM per ridurre la luminosita' del display. Se è rilevato PWM, una media di 7747 (minimo: 5 - massimo: 343500) Hz è stata rilevata. | |||
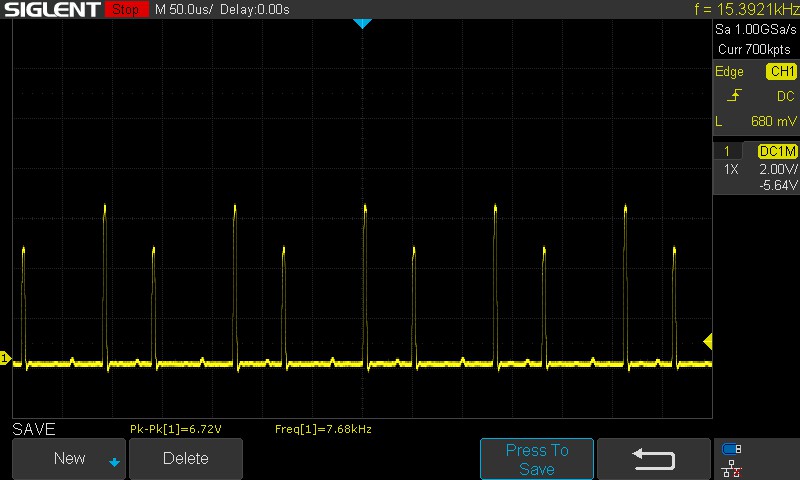
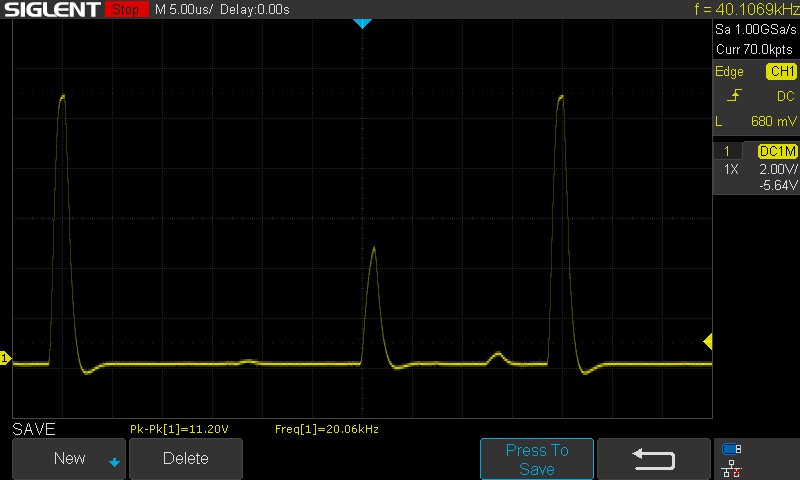
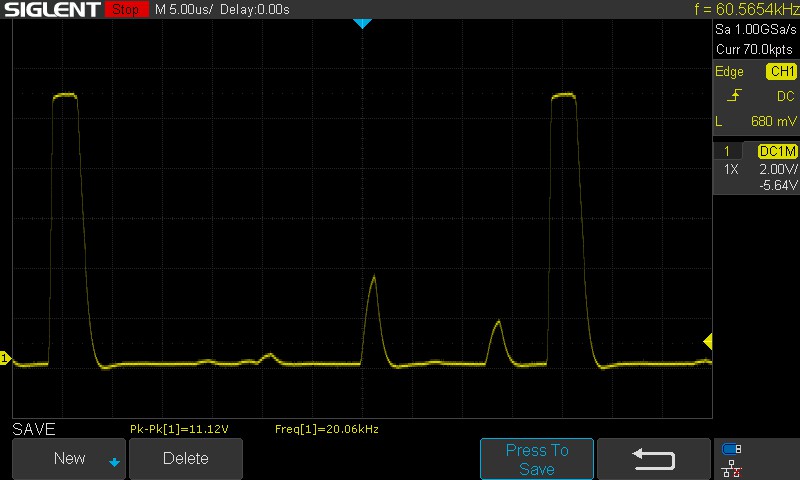
Abbiamo registrato una frequenza PWM di 2,04 kHZ con il cursore della luminosità di Windows impostato al 10%. Dal 50% al 100% di luminosità, questo valore aumenta a 20,06 kHz. I valori misurati sono abbastanza elevati e quindi non dovrebbero creare problemi di affaticamento degli occhi, anche a livelli di luminosità inferiori.
Faccia riferimento al nostro articolo, "Perché il PWM è un problema"per maggiori informazioni. Abbiamo anche una Pagina della classifica PWM che elenca le misurazioni di frequenza di tutti i dispositivi recensiti.

La visione all'aperto è generalmente buona, ma un sole abbagliante può presentare problemi di leggibilità dei contenuti sullo schermo. Gli angoli di visione sono abbastanza stabili, senza alcuna perdita percepibile di luminosità o di informazioni cromatiche agli estremi.

Prestazioni: Il Core i9-14900HX mostra guadagni modesti rispetto al Core i9-13980HX
Asus offre il ROG Strix Scar 16 in due configurazioni, entrambe con Intel Core i9-14900HX con processori Intel Core i9-14900HX. Le SKU si differenziano solo per la GPU, con possibilità di scelta tra la Nvidia GeForce RTX 4080 e la GPU RTX 4090 per computer portatilis.
Condizioni del test
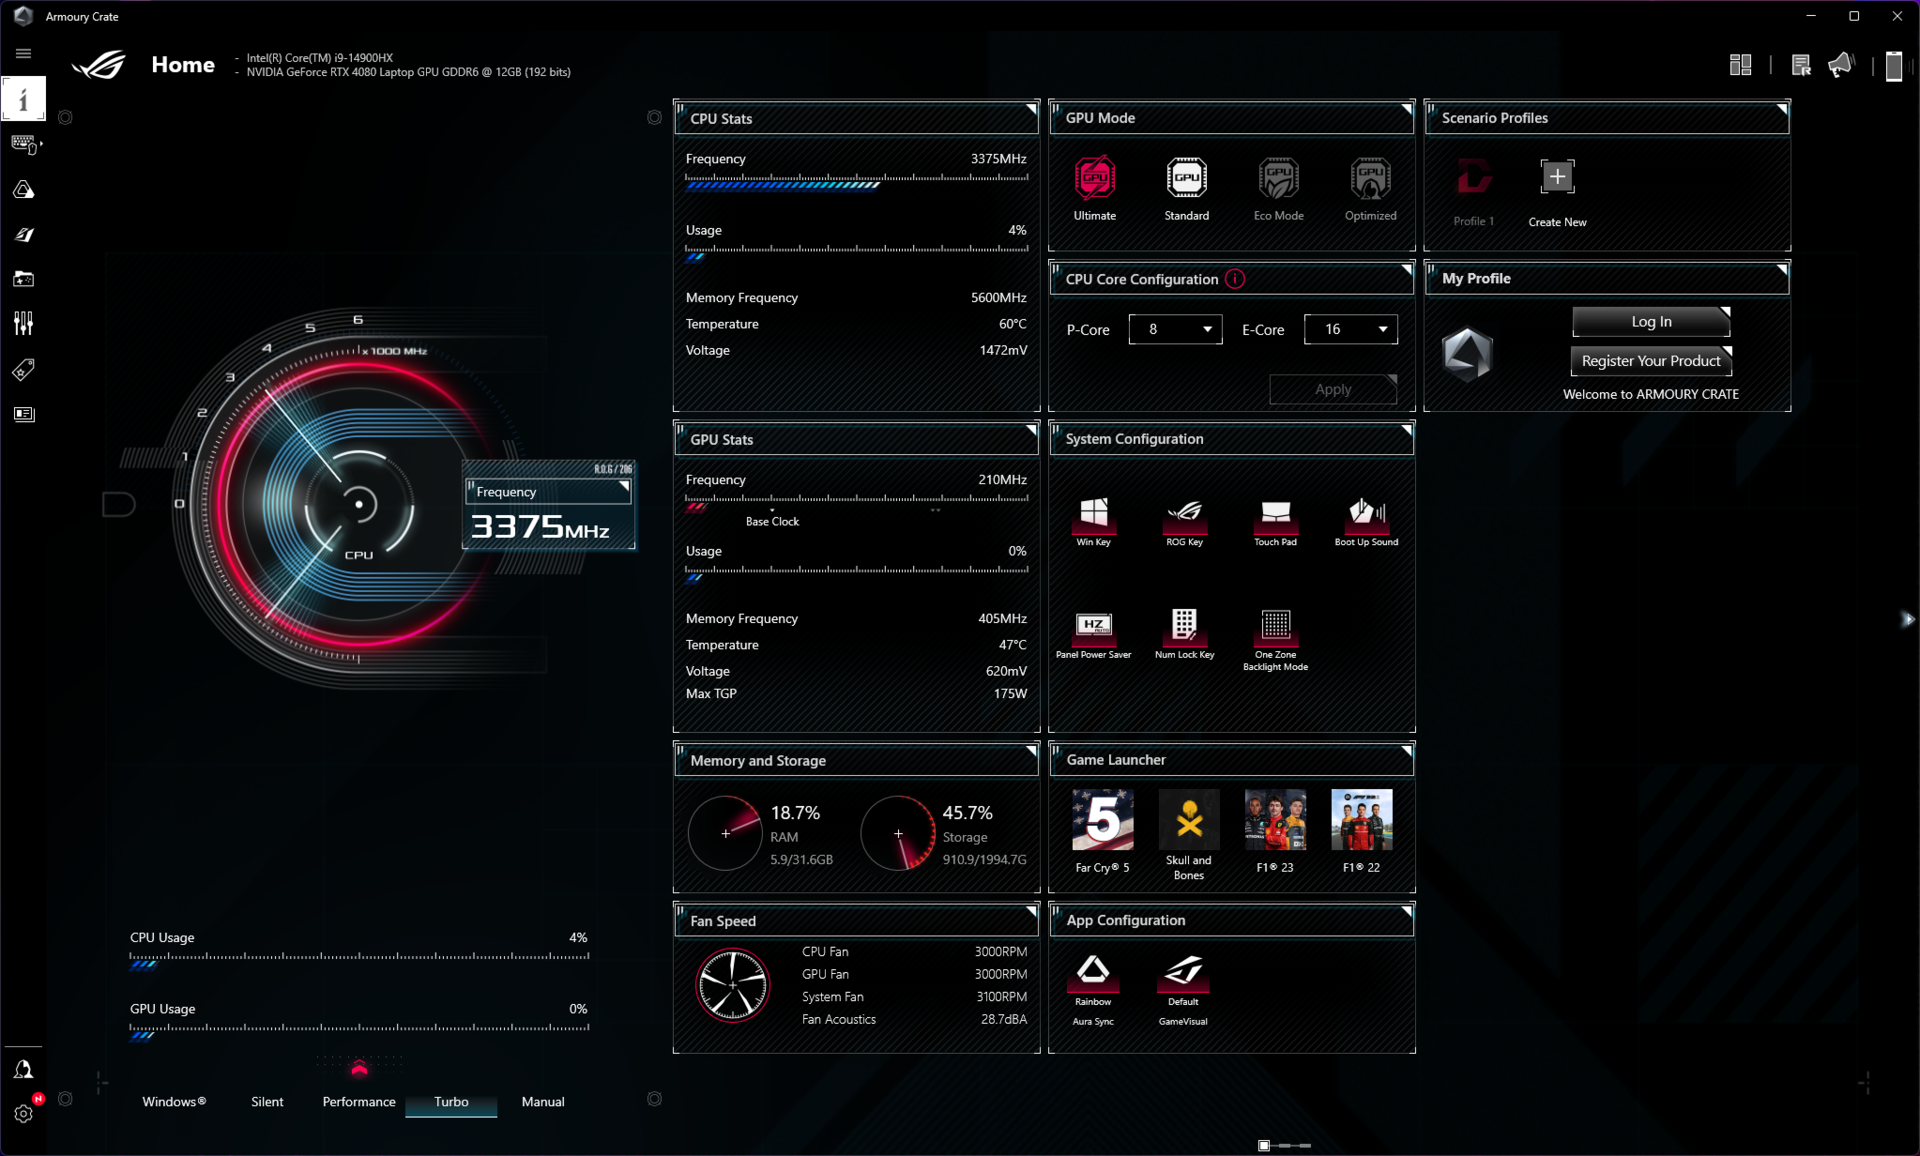
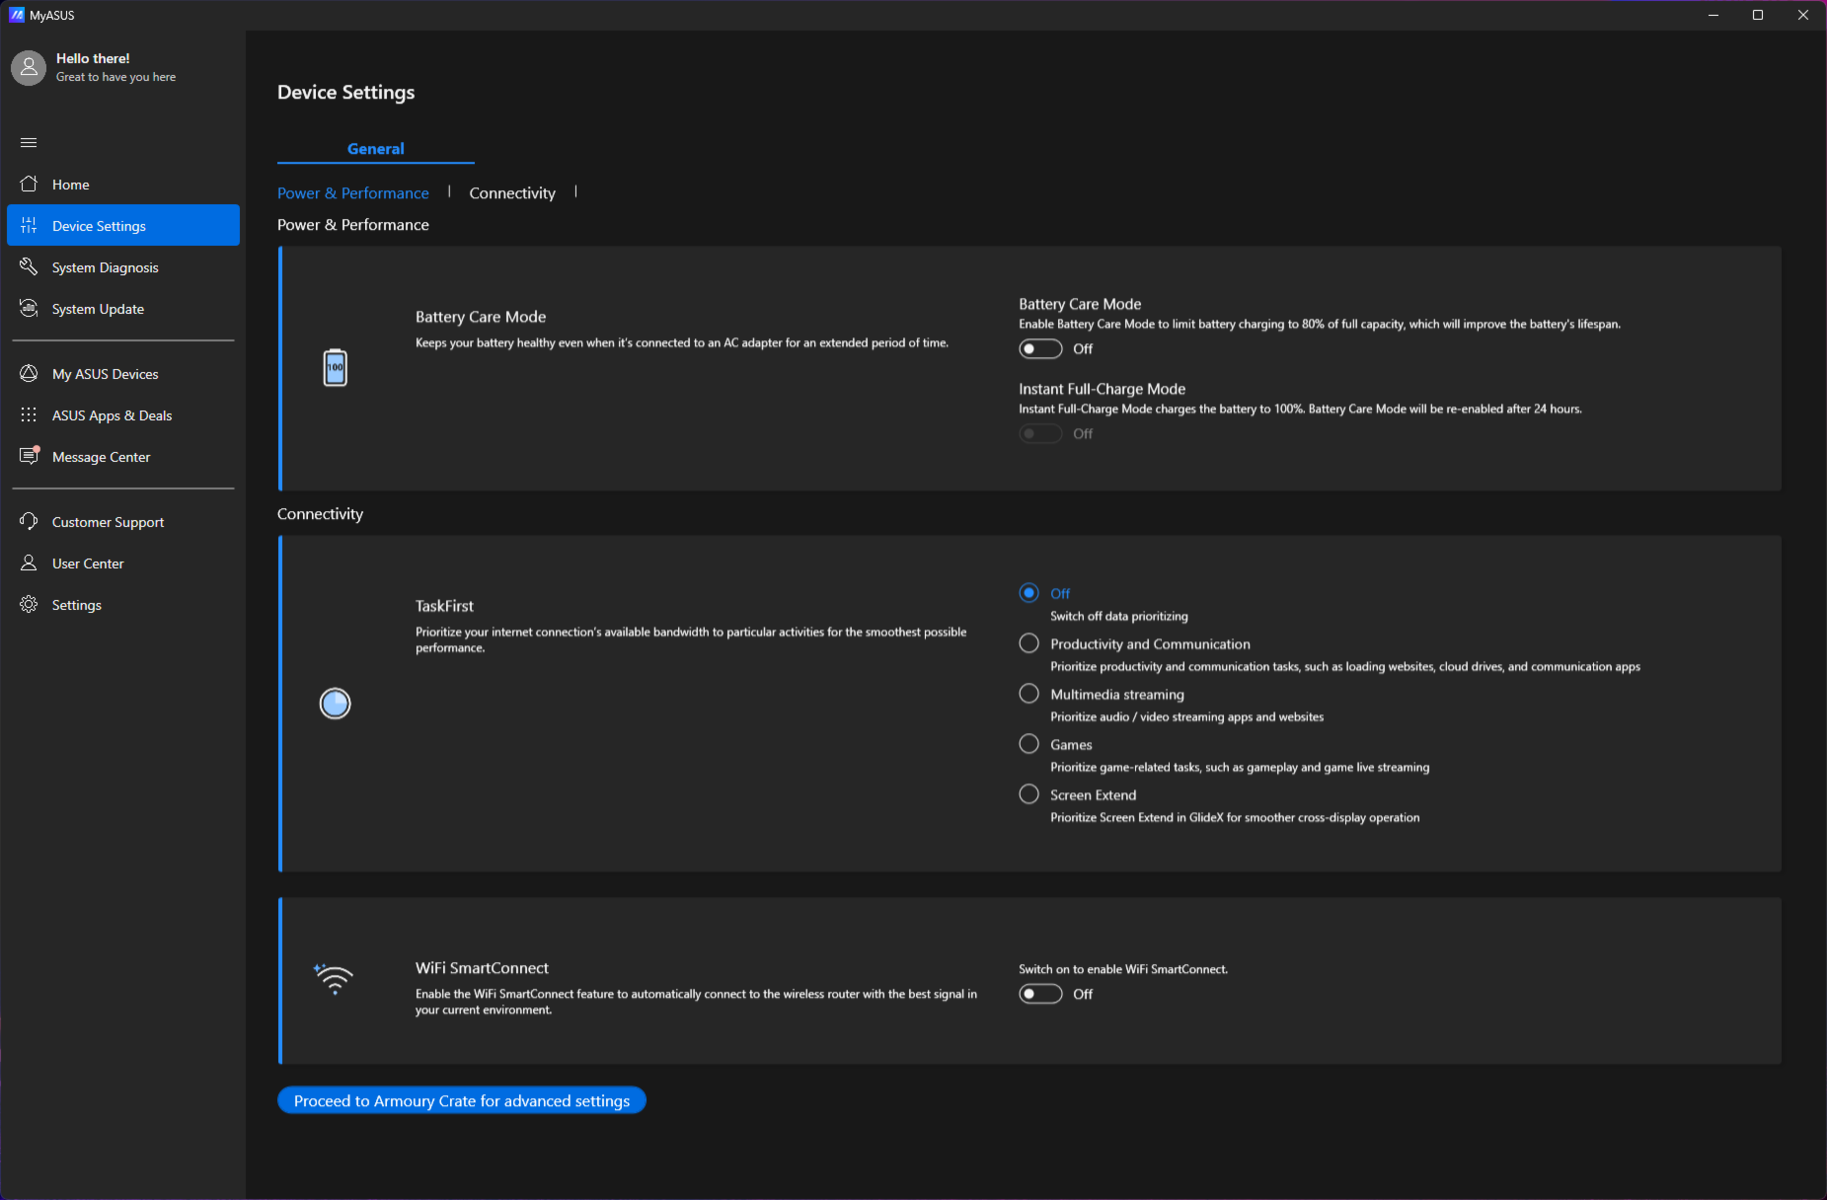
La messa a punto delle prestazioni può essere eseguita tramite Armory Crate. Asus offre anche l'applicazione MyAsus, che offre funzioni accessorie come gli aggiornamenti del sistema, la diagnostica, ecc.
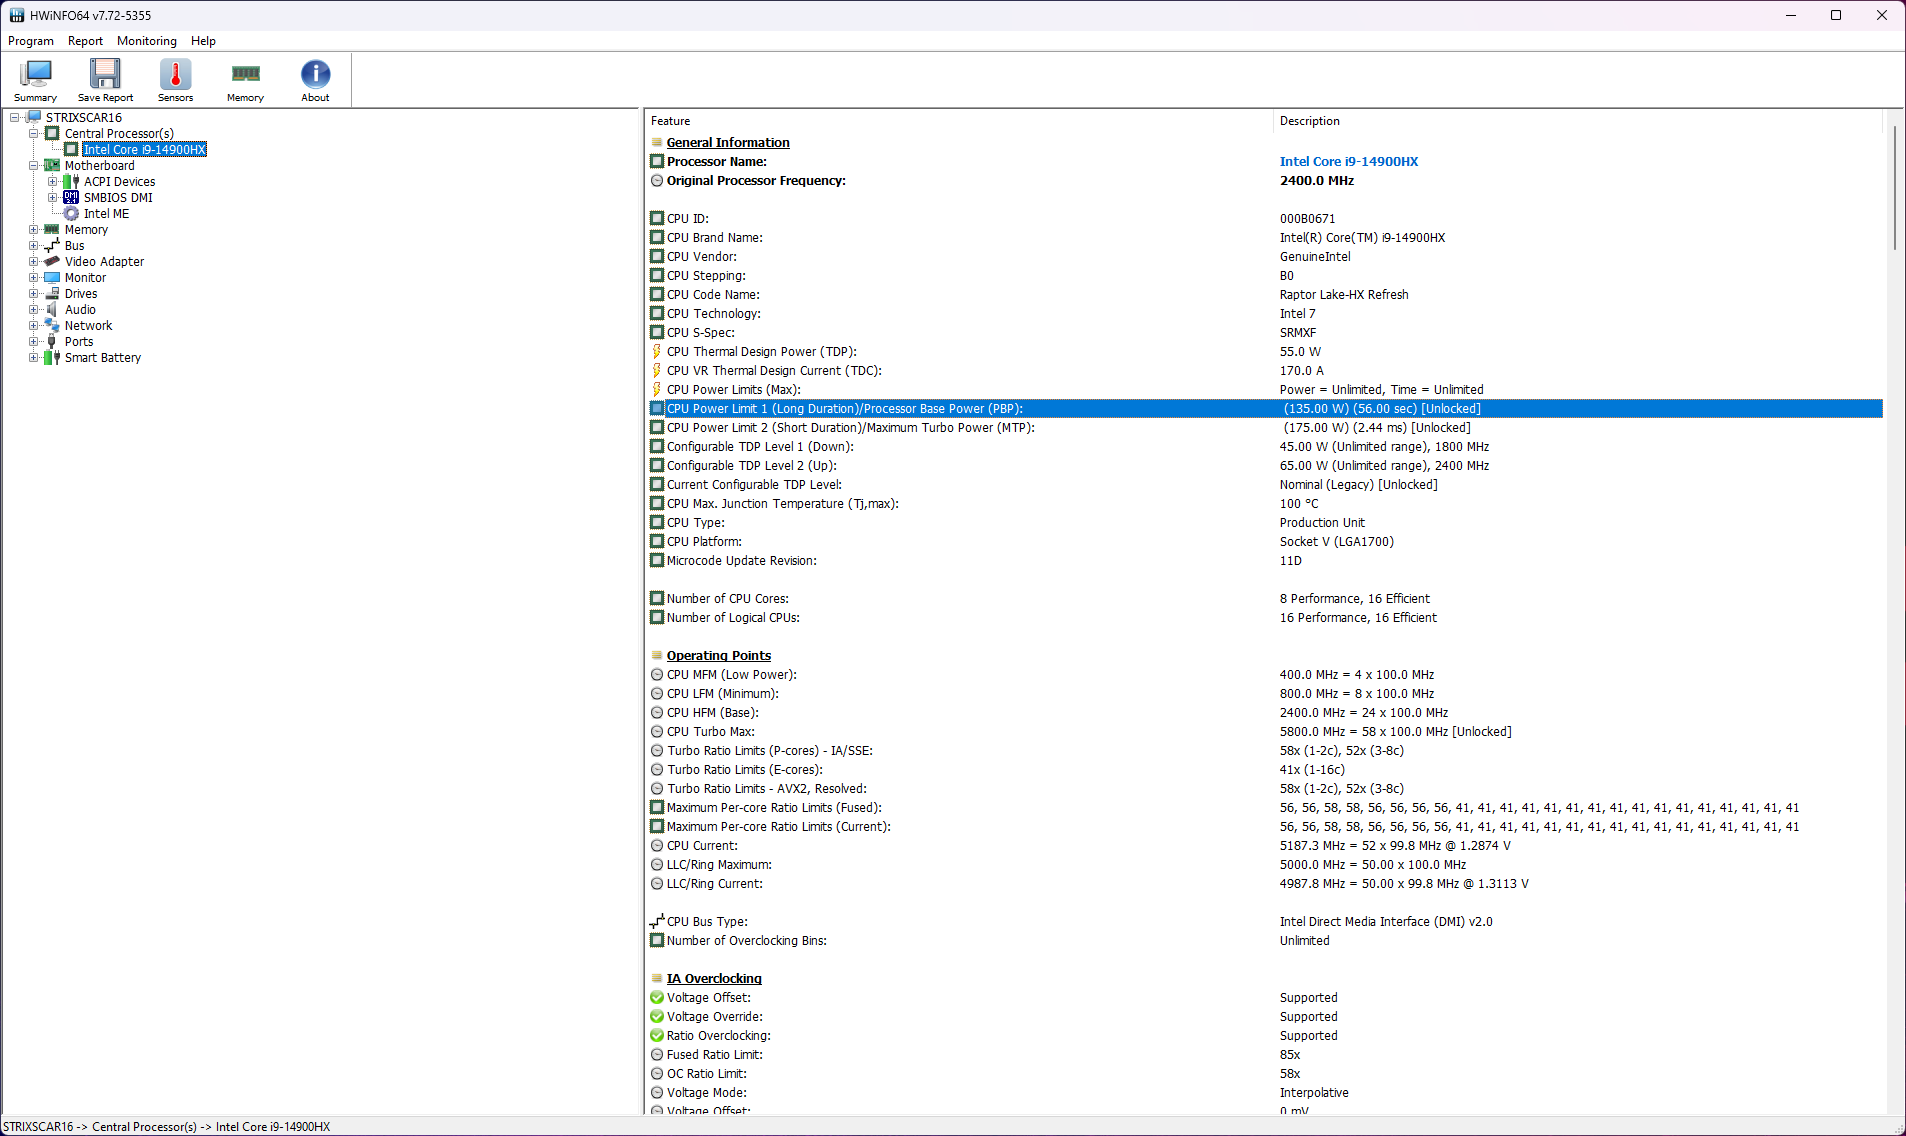
Lo Scar 16 offre tre profili energetici principali tra cui scegliere: Silenzioso, Prestazioni e Turbo. È anche possibile utilizzare i piani energetici di Windows al posto di quelli disponibili in Armory Crate. Inoltre, esiste una modalità Manuale che consente di configurare fino a un PL1 da 140 W.
| Modalità prestazioni | PL1 (PBP) / Tau | PL2 (MTP) / Tau | Cinebench R15 Multi score | Cinebench R15 Multi score (30 loop) |
|---|---|---|---|---|
| Silenzioso | 70 W / 56 s | 100 W / 2,44 ms | 3904 (-15,14%) | 3435 (-20,98%) |
| Prestazioni | 107 W / 56 s | 120 W / 2,44 ms | 4208 (-8,54%) | 4182 (-3,79%) |
| Turbo | 135 W / 56 s | 175 W / 2,44 ms | 4601 (100%) | 4347 (100%) |
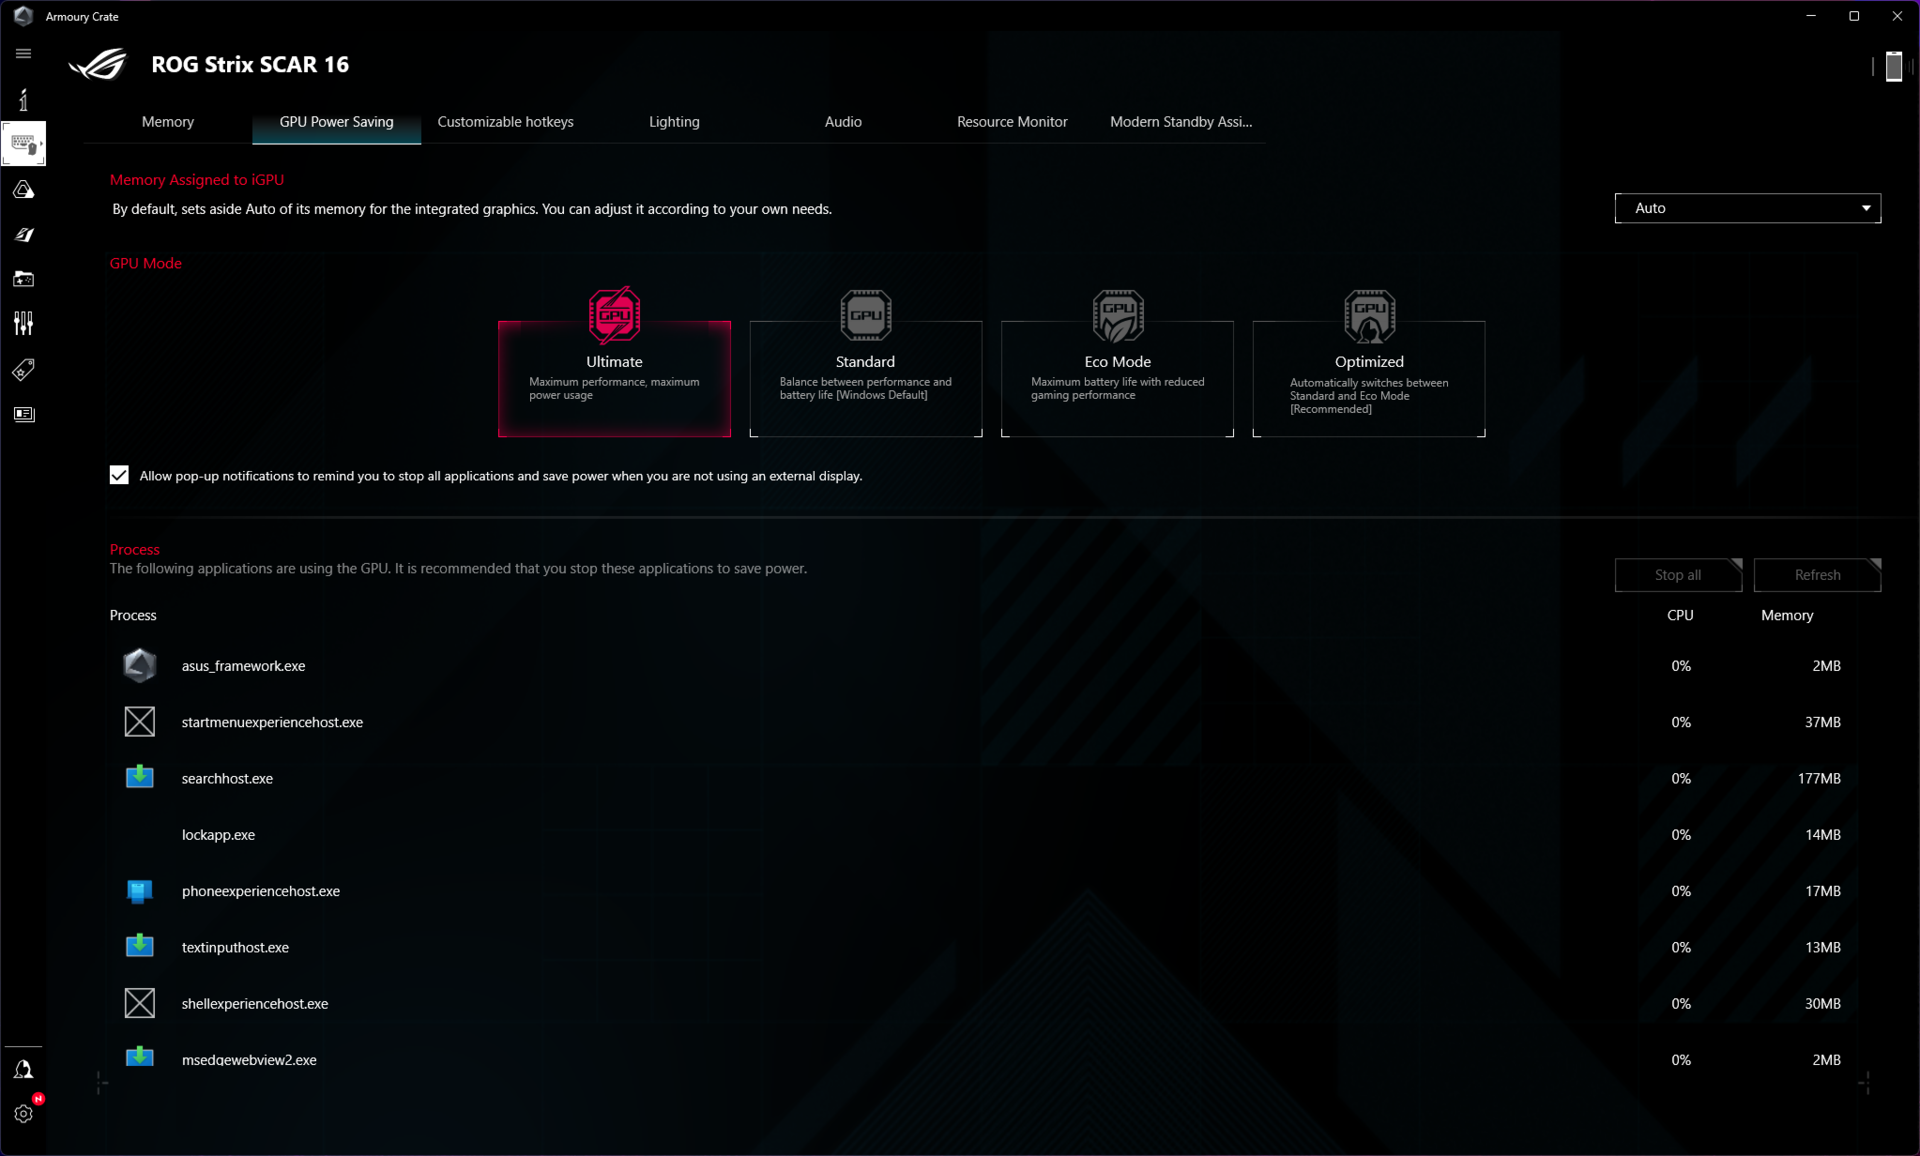
Nvidia Advanced Optimus è supportato, ma Asus include anche una modalità MUX hardware. Abbiamo eseguito tutti i benchmark in modalità Turbo con MUX impostato sulla dGPU RTX 4080.
I test della batteria sono stati eseguiti in modalità Silenziosa con MSHybrid abilitato.
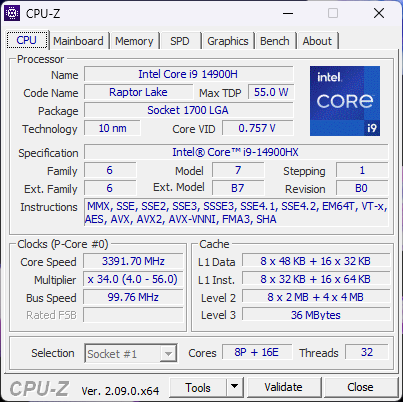
Processore
Il Core i9-14900HX è molto simile al Core i9-13980HX con 24 core (8P + 16E) e 32 thread, ma con un boost di 5,8 GHz.
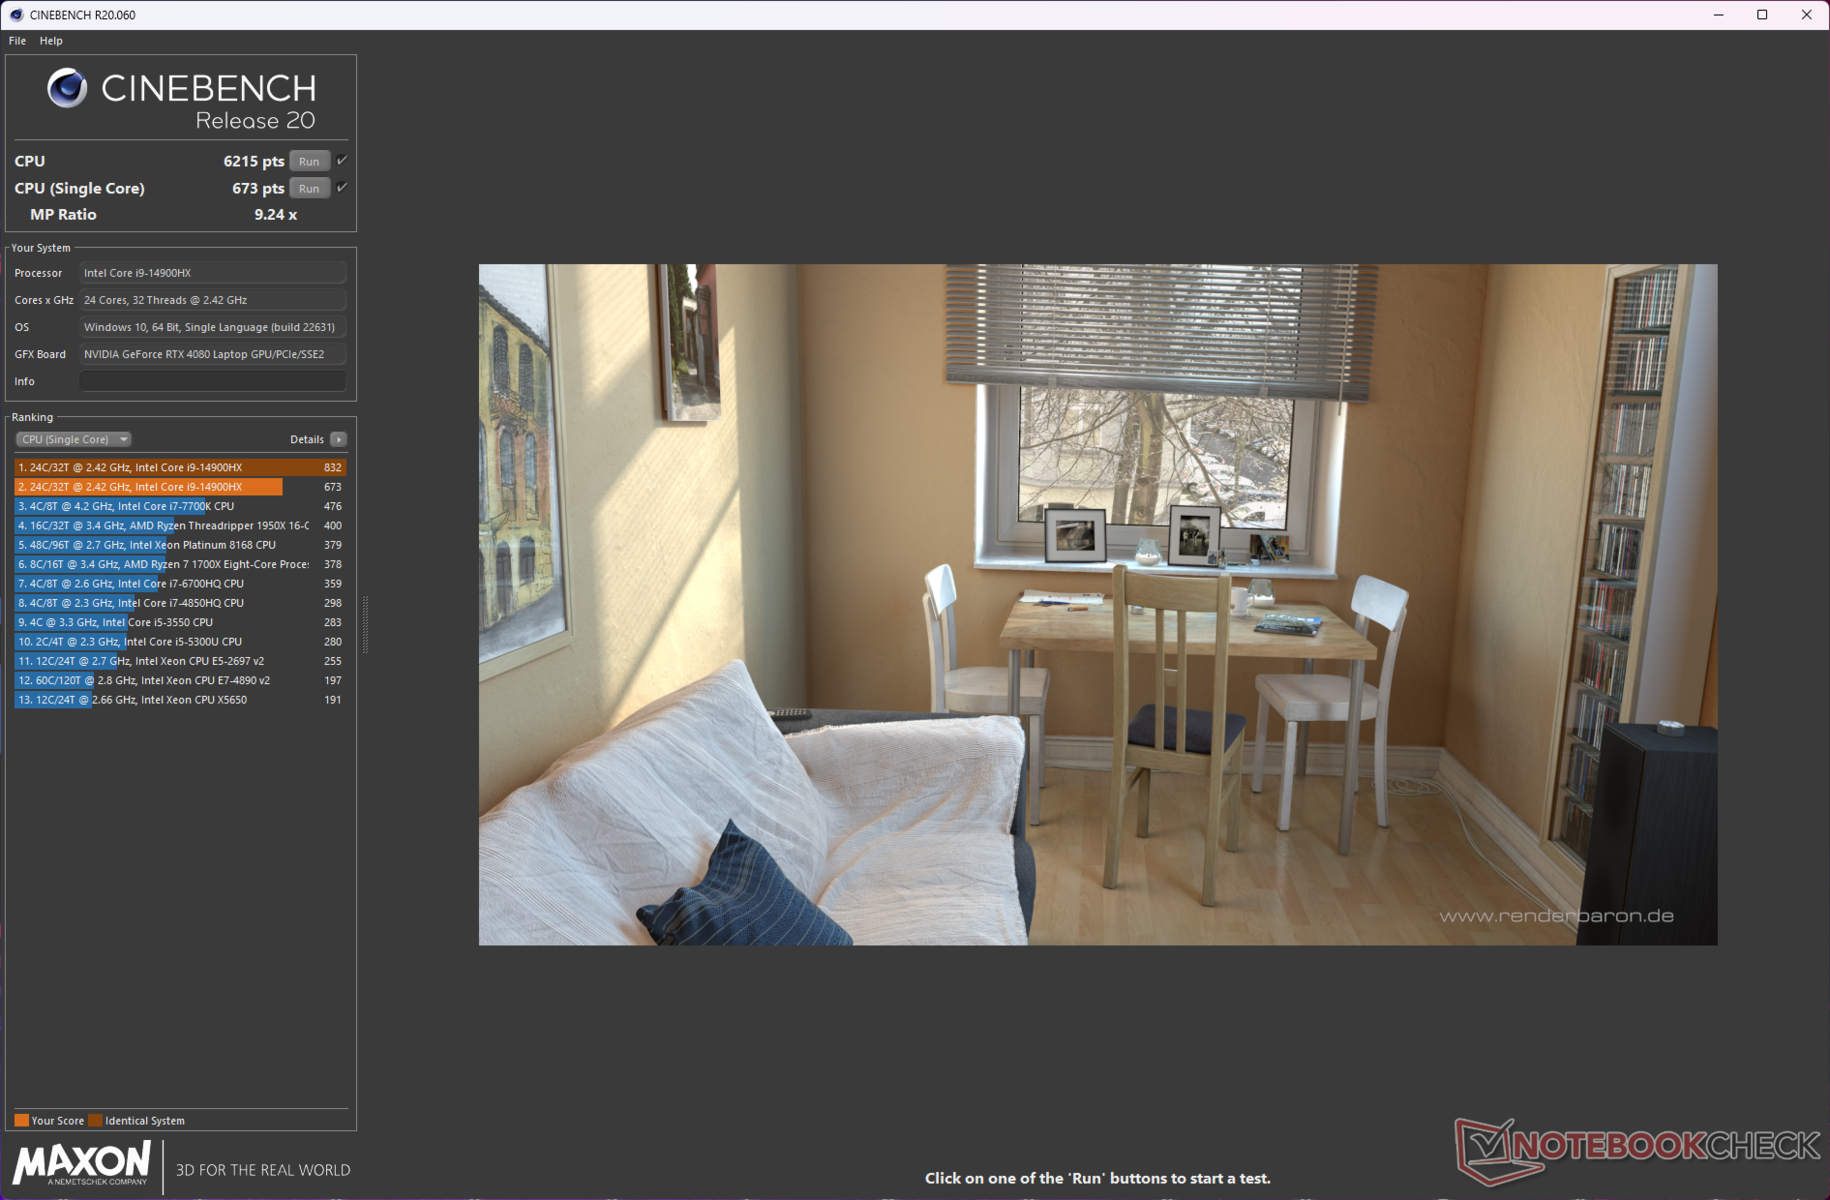
Il Raptor Lake-HX di 14esima generazione non è un aggiornamento importante e l'aumento delle prestazioni rispetto a un Core i9-13980HX rientra nel margine di errore. Le prestazioni single-core dello Scar 16 sono alla pari con quelle di altri laptop Core i9-14900HX.
Tuttavia, il MSI Vector 16 HX con la stessa CPU ha un vantaggio percepibile in multi-core, grazie al PL2 da 184 W più elevato. Al contrario, il HP Omen 16con un Core i9-14900HX da 130 W PL2 si colloca dietro lo Scar 16 in questi test.
Cinebench R15 Multi Loop
Cinebench R23: Multi Core | Single Core
Cinebench R20: CPU (Multi Core) | CPU (Single Core)
Cinebench R15: CPU Multi 64Bit | CPU Single 64Bit
Blender: v2.79 BMW27 CPU
7-Zip 18.03: 7z b 4 | 7z b 4 -mmt1
Geekbench 6.7: Multi-Core | Single-Core
Geekbench 5.5: Multi-Core | Single-Core
HWBOT x265 Benchmark v2.2: 4k Preset
LibreOffice : 20 Documents To PDF
R Benchmark 2.5: Overall mean
| CPU Performance rating | |
| Lenovo Legion Pro 7 16IRX9H | |
| Asus ROG Strix Scar 17 G733PYV-LL053X | |
| Asus ROG Strix Scar 16 G634JZR | |
| MSI Vector 16 HX A14V | |
| Media Intel Core i9-14900HX | |
| Asus ROG Strix G16 G614JZ -2! | |
| HP Omen 16 (2024) | |
| Media della classe Gaming | |
| Alienware m16 R2 -1! | |
| Cinebench R23 / Multi Core | |
| MSI Vector 16 HX A14V | |
| Asus ROG Strix Scar 17 G733PYV-LL053X | |
| Lenovo Legion Pro 7 16IRX9H | |
| Asus ROG Strix Scar 16 G634JZR | |
| Asus ROG Strix G16 G614JZ | |
| Media Intel Core i9-14900HX (17078 - 36249, n=37) | |
| HP Omen 16 (2024) | |
| Media della classe Gaming (10488 - 40970, n=106, ultimi 2 anni) | |
| Alienware m16 R2 | |
| Cinebench R23 / Single Core | |
| Lenovo Legion Pro 7 16IRX9H | |
| HP Omen 16 (2024) | |
| MSI Vector 16 HX A14V | |
| Asus ROG Strix Scar 16 G634JZR | |
| Media Intel Core i9-14900HX (1720 - 2245, n=37) | |
| Asus ROG Strix G16 G614JZ | |
| Media della classe Gaming (1166 - 2387, n=106, ultimi 2 anni) | |
| Asus ROG Strix Scar 17 G733PYV-LL053X | |
| Alienware m16 R2 | |
| Cinebench R20 / CPU (Multi Core) | |
| Asus ROG Strix Scar 17 G733PYV-LL053X | |
| Lenovo Legion Pro 7 16IRX9H | |
| MSI Vector 16 HX A14V | |
| Asus ROG Strix Scar 16 G634JZR | |
| Asus ROG Strix G16 G614JZ | |
| Media Intel Core i9-14900HX (6579 - 13832, n=37) | |
| Media della classe Gaming (4029 - 16108, n=105, ultimi 2 anni) | |
| HP Omen 16 (2024) | |
| Alienware m16 R2 | |
| Cinebench R20 / CPU (Single Core) | |
| HP Omen 16 (2024) | |
| Asus ROG Strix Scar 16 G634JZR | |
| MSI Vector 16 HX A14V | |
| Lenovo Legion Pro 7 16IRX9H | |
| Media Intel Core i9-14900HX (657 - 859, n=37) | |
| Asus ROG Strix G16 G614JZ | |
| Media della classe Gaming (442 - 904, n=105, ultimi 2 anni) | |
| Asus ROG Strix Scar 17 G733PYV-LL053X | |
| Alienware m16 R2 | |
| Cinebench R15 / CPU Multi 64Bit | |
| Asus ROG Strix Scar 17 G733PYV-LL053X | |
| Asus ROG Strix Scar 16 G634JZR | |
| Asus ROG Strix G16 G614JZ | |
| Asus ROG Strix G16 G614JZ | |
| Lenovo Legion Pro 7 16IRX9H | |
| MSI Vector 16 HX A14V | |
| Media Intel Core i9-14900HX (3263 - 5589, n=38) | |
| Media della classe Gaming (1578 - 6271, n=104, ultimi 2 anni) | |
| HP Omen 16 (2024) | |
| Alienware m16 R2 | |
| Cinebench R15 / CPU Single 64Bit | |
| Asus ROG Strix Scar 16 G634JZR | |
| Lenovo Legion Pro 7 16IRX9H | |
| Asus ROG Strix Scar 17 G733PYV-LL053X | |
| HP Omen 16 (2024) | |
| MSI Vector 16 HX A14V | |
| Asus ROG Strix G16 G614JZ | |
| Asus ROG Strix G16 G614JZ | |
| Media Intel Core i9-14900HX (247 - 323, n=37) | |
| Media della classe Gaming (188.8 - 344, n=105, ultimi 2 anni) | |
| Alienware m16 R2 | |
| Blender / v2.79 BMW27 CPU | |
| HP Omen 16 (2024) | |
| Media della classe Gaming (80 - 330, n=103, ultimi 2 anni) | |
| Media Intel Core i9-14900HX (91 - 206, n=37) | |
| Asus ROG Strix Scar 16 G634JZR | |
| Asus ROG Strix G16 G614JZ | |
| Lenovo Legion Pro 7 16IRX9H | |
| MSI Vector 16 HX A14V | |
| Asus ROG Strix Scar 17 G733PYV-LL053X | |
| 7-Zip 18.03 / 7z b 4 | |
| Asus ROG Strix Scar 17 G733PYV-LL053X | |
| Lenovo Legion Pro 7 16IRX9H | |
| MSI Vector 16 HX A14V | |
| Asus ROG Strix Scar 16 G634JZR | |
| Asus ROG Strix G16 G614JZ | |
| Media Intel Core i9-14900HX (66769 - 136645, n=37) | |
| Media della classe Gaming (33491 - 148086, n=104, ultimi 2 anni) | |
| HP Omen 16 (2024) | |
| Alienware m16 R2 | |
| 7-Zip 18.03 / 7z b 4 -mmt1 | |
| Asus ROG Strix Scar 17 G733PYV-LL053X | |
| Asus ROG Strix Scar 16 G634JZR | |
| Lenovo Legion Pro 7 16IRX9H | |
| HP Omen 16 (2024) | |
| MSI Vector 16 HX A14V | |
| Media Intel Core i9-14900HX (5452 - 7545, n=37) | |
| Asus ROG Strix G16 G614JZ | |
| Media della classe Gaming (4199 - 7436, n=104, ultimi 2 anni) | |
| Alienware m16 R2 | |
| Geekbench 6.7 / Multi-Core | |
| Asus ROG Strix Scar 16 G634JZR | |
| Lenovo Legion Pro 7 16IRX9H | |
| MSI Vector 16 HX A14V | |
| Media Intel Core i9-14900HX (13158 - 19665, n=37) | |
| Asus ROG Strix Scar 17 G733PYV-LL053X | |
| HP Omen 16 (2024) | |
| Media della classe Gaming (6625 - 22104, n=105, ultimi 2 anni) | |
| Alienware m16 R2 | |
| Geekbench 6.7 / Single-Core | |
| HP Omen 16 (2024) | |
| Lenovo Legion Pro 7 16IRX9H | |
| Asus ROG Strix Scar 16 G634JZR | |
| MSI Vector 16 HX A14V | |
| Media Intel Core i9-14900HX (2419 - 3129, n=37) | |
| Asus ROG Strix Scar 17 G733PYV-LL053X | |
| Media della classe Gaming (1490 - 3259, n=105, ultimi 2 anni) | |
| Alienware m16 R2 | |
| Geekbench 5.5 / Multi-Core | |
| Asus ROG Strix Scar 16 G634JZR | |
| MSI Vector 16 HX A14V | |
| Lenovo Legion Pro 7 16IRX9H | |
| Asus ROG Strix Scar 17 G733PYV-LL053X | |
| Media Intel Core i9-14900HX (8618 - 23194, n=37) | |
| Asus ROG Strix G16 G614JZ | |
| HP Omen 16 (2024) | |
| Media della classe Gaming (6460 - 27010, n=104, ultimi 2 anni) | |
| Alienware m16 R2 | |
| Geekbench 5.5 / Single-Core | |
| Asus ROG Strix Scar 16 G634JZR | |
| HP Omen 16 (2024) | |
| Asus ROG Strix Scar 17 G733PYV-LL053X | |
| MSI Vector 16 HX A14V | |
| Lenovo Legion Pro 7 16IRX9H | |
| Media Intel Core i9-14900HX (1669 - 2210, n=37) | |
| Media della classe Gaming (986 - 2474, n=104, ultimi 2 anni) | |
| Asus ROG Strix G16 G614JZ | |
| Alienware m16 R2 | |
| HWBOT x265 Benchmark v2.2 / 4k Preset | |
| Asus ROG Strix Scar 17 G733PYV-LL053X | |
| Lenovo Legion Pro 7 16IRX9H | |
| MSI Vector 16 HX A14V | |
| Asus ROG Strix Scar 16 G634JZR | |
| Asus ROG Strix G16 G614JZ | |
| Media Intel Core i9-14900HX (16.8 - 38.9, n=37) | |
| Media della classe Gaming (11.5 - 44.3, n=104, ultimi 2 anni) | |
| HP Omen 16 (2024) | |
| Alienware m16 R2 | |
| LibreOffice / 20 Documents To PDF | |
| Alienware m16 R2 | |
| Media della classe Gaming (33.2 - 88.8, n=104, ultimi 2 anni) | |
| Asus ROG Strix Scar 16 G634JZR | |
| Asus ROG Strix G16 G614JZ | |
| MSI Vector 16 HX A14V | |
| HP Omen 16 (2024) | |
| Media Intel Core i9-14900HX (19 - 85.1, n=37) | |
| Asus ROG Strix Scar 17 G733PYV-LL053X | |
| Lenovo Legion Pro 7 16IRX9H | |
| R Benchmark 2.5 / Overall mean | |
| Alienware m16 R2 | |
| Media della classe Gaming (0.3439 - 0.759, n=105, ultimi 2 anni) | |
| Asus ROG Strix Scar 17 G733PYV-LL053X | |
| Asus ROG Strix G16 G614JZ | |
| Lenovo Legion Pro 7 16IRX9H | |
| Media Intel Core i9-14900HX (0.3604 - 0.4859, n=37) | |
| MSI Vector 16 HX A14V | |
| HP Omen 16 (2024) | |
| Asus ROG Strix Scar 16 G634JZR | |
* ... Meglio usare valori piccoli
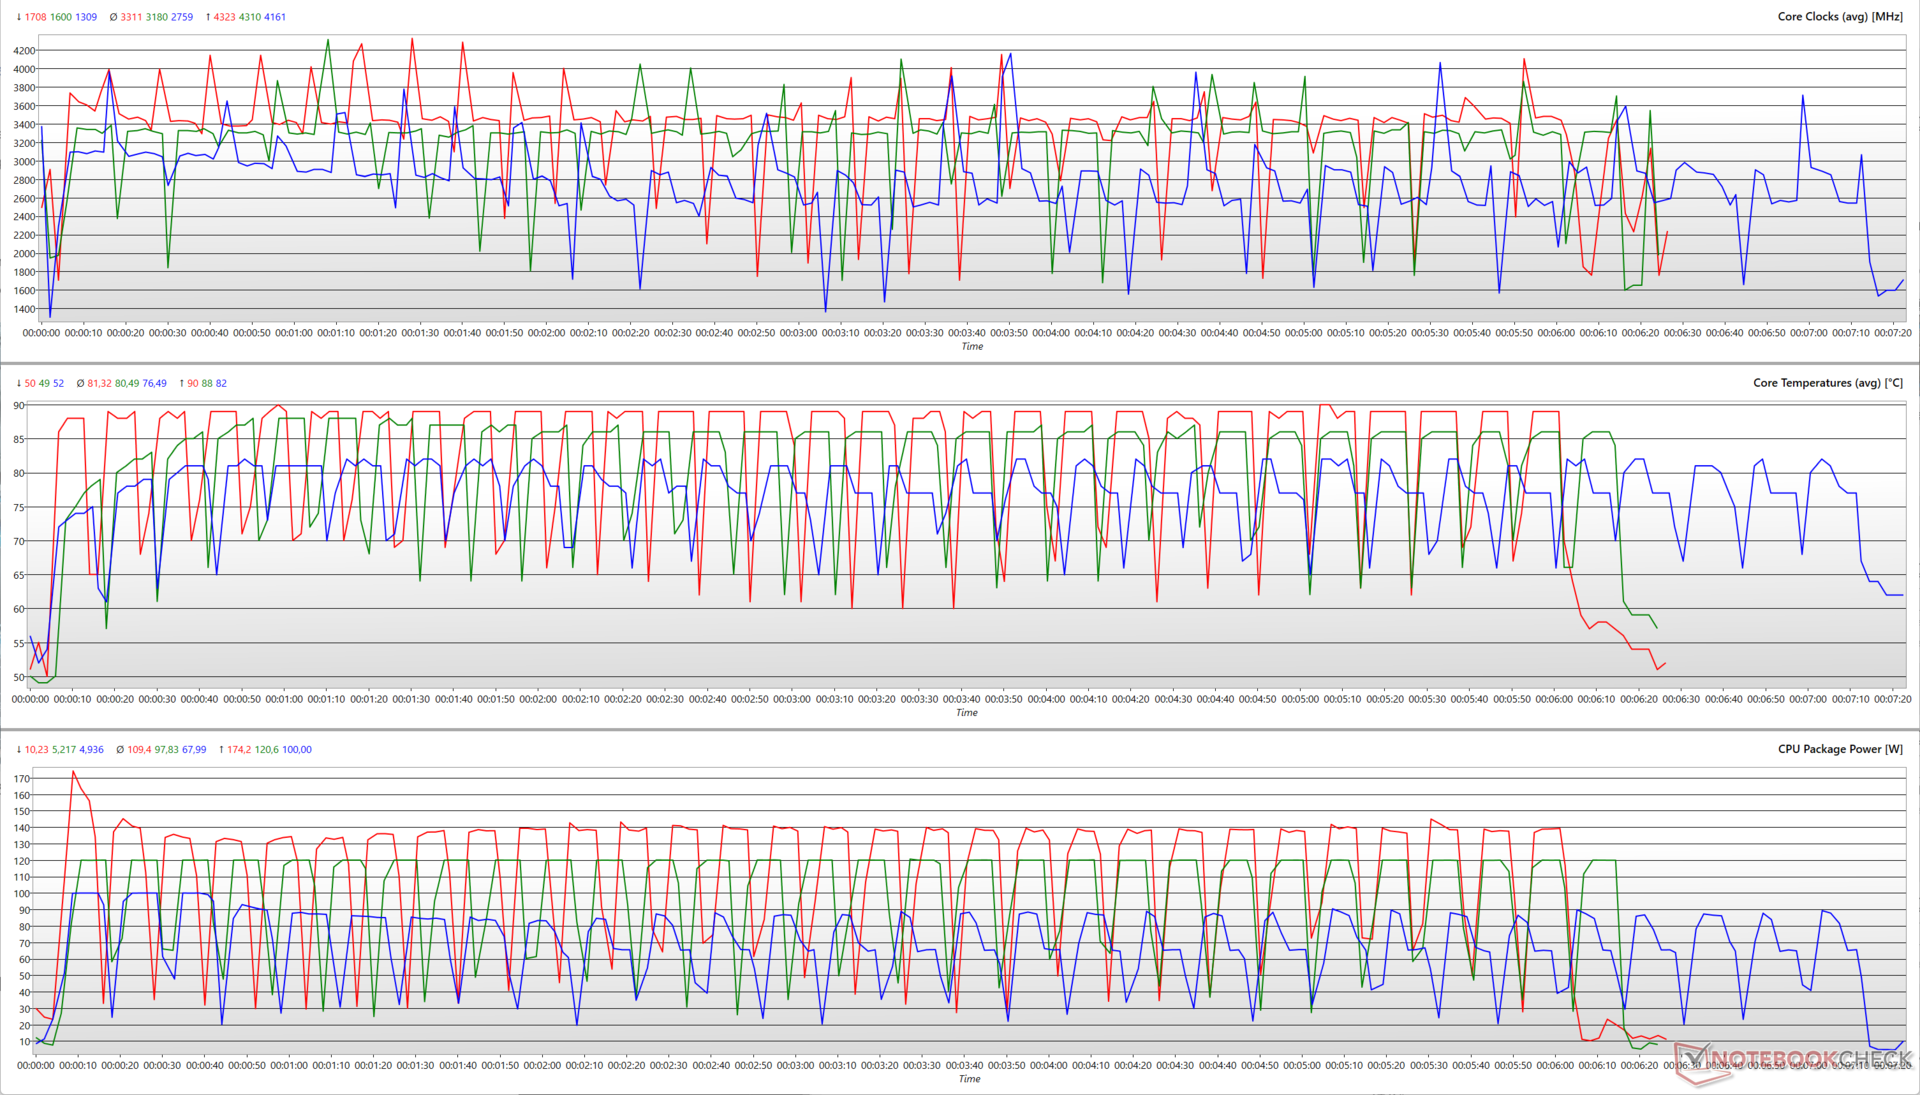
L'esecuzione di Cinebench R15 multi-core per 30 loop mostra che il Core i9-14900HX è in grado di utilizzare l'intero limite PL2 consentito in ogni modalità. Nel profilo Turbo, il Core i9-14900HX è in grado di raggiungere un boost di 4,3 GHz a 174 W, prima di assestarsi su un clock medio di 3,3 GHz a 109 W di media.
Tuttavia, la CPU è in grado di raggiungere un clock simile a 120 W anche in modalità Performance, mentre i clock medi si attestano a 3,18 GHz con una potenza media del pacchetto di 97,8 W.
La modalità Silent vede un consumo medio del pacchetto di 68 W per clock medi di 2,76 GHz. La CPU è in grado di raggiungere un boost massimo di 4,16 GHz a 100 W in questa modalità.
I punteggi di Cinebench R20 sull'alimentazione della batteria diminuiscono del 19,78% e del 46,44% rispettivamente in single-core e multi-core.
AIDA64: FP32 Ray-Trace | FPU Julia | CPU SHA3 | CPU Queen | FPU SinJulia | FPU Mandel | CPU AES | CPU ZLib | FP64 Ray-Trace | CPU PhotoWorxx
| Performance rating | |
| Asus ROG Strix Scar 17 G733PYV-LL053X | |
| MSI Vector 16 HX A14V | |
| Lenovo Legion Pro 7 16IRX9H | |
| Asus ROG Strix Scar 16 G634JZR | |
| Asus ROG Strix G16 G614JZ | |
| Media della classe Gaming | |
| Media Intel Core i9-14900HX | |
| HP Omen 16 (2024) | |
| Alienware m16 R2 | |
| AIDA64 / FP32 Ray-Trace | |
| Asus ROG Strix Scar 17 G733PYV-LL053X | |
| Media della classe Gaming (10227 - 85542, n=103, ultimi 2 anni) | |
| MSI Vector 16 HX A14V | |
| Lenovo Legion Pro 7 16IRX9H | |
| Asus ROG Strix G16 G614JZ | |
| Asus ROG Strix Scar 16 G634JZR | |
| Media Intel Core i9-14900HX (13098 - 33474, n=36) | |
| Alienware m16 R2 | |
| HP Omen 16 (2024) | |
| AIDA64 / FPU Julia | |
| Asus ROG Strix Scar 17 G733PYV-LL053X | |
| MSI Vector 16 HX A14V | |
| Lenovo Legion Pro 7 16IRX9H | |
| Media della classe Gaming (51376 - 238426, n=103, ultimi 2 anni) | |
| Asus ROG Strix G16 G614JZ | |
| Asus ROG Strix Scar 16 G634JZR | |
| Media Intel Core i9-14900HX (67573 - 166040, n=36) | |
| Alienware m16 R2 | |
| HP Omen 16 (2024) | |
| AIDA64 / CPU SHA3 | |
| Asus ROG Strix Scar 17 G733PYV-LL053X | |
| Lenovo Legion Pro 7 16IRX9H | |
| MSI Vector 16 HX A14V | |
| Asus ROG Strix Scar 16 G634JZR | |
| Asus ROG Strix G16 G614JZ | |
| Media della classe Gaming (2180 - 9817, n=103, ultimi 2 anni) | |
| Media Intel Core i9-14900HX (3589 - 7979, n=36) | |
| HP Omen 16 (2024) | |
| Alienware m16 R2 | |
| AIDA64 / CPU Queen | |
| Asus ROG Strix Scar 17 G733PYV-LL053X | |
| Asus ROG Strix Scar 16 G634JZR | |
| Lenovo Legion Pro 7 16IRX9H | |
| Asus ROG Strix G16 G614JZ | |
| MSI Vector 16 HX A14V | |
| Media Intel Core i9-14900HX (118405 - 148966, n=36) | |
| HP Omen 16 (2024) | |
| Media della classe Gaming (49785 - 173351, n=89, ultimi 2 anni) | |
| Alienware m16 R2 | |
| AIDA64 / FPU SinJulia | |
| Asus ROG Strix Scar 17 G733PYV-LL053X | |
| Asus ROG Strix G16 G614JZ | |
| Lenovo Legion Pro 7 16IRX9H | |
| MSI Vector 16 HX A14V | |
| Asus ROG Strix Scar 16 G634JZR | |
| Media Intel Core i9-14900HX (10475 - 18517, n=36) | |
| Media della classe Gaming (4424 - 33636, n=103, ultimi 2 anni) | |
| HP Omen 16 (2024) | |
| Alienware m16 R2 | |
| AIDA64 / FPU Mandel | |
| Asus ROG Strix Scar 17 G733PYV-LL053X | |
| Media della classe Gaming (25115 - 128721, n=103, ultimi 2 anni) | |
| MSI Vector 16 HX A14V | |
| Lenovo Legion Pro 7 16IRX9H | |
| Asus ROG Strix G16 G614JZ | |
| Asus ROG Strix Scar 16 G634JZR | |
| Media Intel Core i9-14900HX (32543 - 83662, n=36) | |
| Alienware m16 R2 | |
| HP Omen 16 (2024) | |
| AIDA64 / CPU AES | |
| Asus ROG Strix Scar 17 G733PYV-LL053X | |
| Asus ROG Strix Scar 16 G634JZR | |
| Media Intel Core i9-14900HX (86964 - 241777, n=36) | |
| Lenovo Legion Pro 7 16IRX9H | |
| MSI Vector 16 HX A14V | |
| Asus ROG Strix G16 G614JZ | |
| Media della classe Gaming (39258 - 247074, n=103, ultimi 2 anni) | |
| HP Omen 16 (2024) | |
| Alienware m16 R2 | |
| AIDA64 / CPU ZLib | |
| Lenovo Legion Pro 7 16IRX9H | |
| MSI Vector 16 HX A14V | |
| Asus ROG Strix Scar 17 G733PYV-LL053X | |
| Asus ROG Strix G16 G614JZ | |
| Asus ROG Strix Scar 16 G634JZR | |
| Media Intel Core i9-14900HX (1054 - 2292, n=36) | |
| Media della classe Gaming (574 - 2531, n=103, ultimi 2 anni) | |
| HP Omen 16 (2024) | |
| Alienware m16 R2 | |
| AIDA64 / FP64 Ray-Trace | |
| Asus ROG Strix Scar 17 G733PYV-LL053X | |
| Media della classe Gaming (5509 - 45446, n=103, ultimi 2 anni) | |
| MSI Vector 16 HX A14V | |
| Lenovo Legion Pro 7 16IRX9H | |
| Asus ROG Strix G16 G614JZ | |
| Asus ROG Strix Scar 16 G634JZR | |
| Media Intel Core i9-14900HX (6809 - 18349, n=36) | |
| Alienware m16 R2 | |
| HP Omen 16 (2024) | |
| AIDA64 / CPU PhotoWorxx | |
| Asus ROG Strix Scar 16 G634JZR | |
| HP Omen 16 (2024) | |
| MSI Vector 16 HX A14V | |
| Lenovo Legion Pro 7 16IRX9H | |
| Media Intel Core i9-14900HX (23903 - 54702, n=36) | |
| Media della classe Gaming (12271 - 89891, n=103, ultimi 2 anni) | |
| Alienware m16 R2 | |
| Asus ROG Strix G16 G614JZ | |
| Asus ROG Strix Scar 17 G733PYV-LL053X | |
Maggiori informazioni e confronti delle prestazioni sono disponibili nel nostro sito dedicato Intel Core i9-14900HX pagina dedicata.
Prestazioni del sistema
Lo Scar 16 rimane un po' indietro rispetto al Lenovo Legion Pro 7 nei test PCMark 10 e CrossMark. Detto questo, il portatile è abbastanza reattivo per le attività di tutti i giorni e non ci sono troppi carichi di lavoro che possono bloccare le sue prestazioni.
CrossMark: Overall | Productivity | Creativity | Responsiveness
AIDA64: Memory Copy | Memory Read | Memory Write | Memory Latency
WebXPRT 3: Overall
WebXPRT 4: Overall
Mozilla Kraken 1.1: Total
| PCMark 10 / Score | |
| Asus ROG Strix Scar 17 G733PYV-LL053X | |
| Lenovo Legion Pro 7 16IRX9H | |
| HP Omen 16 (2024) | |
| Media Intel Core i9-14900HX, NVIDIA GeForce RTX 4080 Laptop GPU (7703 - 9223, n=7) | |
| MSI Vector 16 HX A14V | |
| Media della classe Gaming (5828 - 11730, n=92, ultimi 2 anni) | |
| Alienware m16 R2 | |
| Asus ROG Strix Scar 16 G634JZR | |
| Asus ROG Strix G16 G614JZ | |
| PCMark 10 / Essentials | |
| Asus ROG Strix G16 G614JZ | |
| Lenovo Legion Pro 7 16IRX9H | |
| Media Intel Core i9-14900HX, NVIDIA GeForce RTX 4080 Laptop GPU (11255 - 12600, n=7) | |
| Asus ROG Strix Scar 16 G634JZR | |
| Asus ROG Strix Scar 17 G733PYV-LL053X | |
| MSI Vector 16 HX A14V | |
| HP Omen 16 (2024) | |
| Media della classe Gaming (8810 - 11935, n=96, ultimi 2 anni) | |
| Alienware m16 R2 | |
| PCMark 10 / Productivity | |
| HP Omen 16 (2024) | |
| Lenovo Legion Pro 7 16IRX9H | |
| Media della classe Gaming (6845 - 21327, n=94, ultimi 2 anni) | |
| Asus ROG Strix Scar 17 G733PYV-LL053X | |
| Media Intel Core i9-14900HX, NVIDIA GeForce RTX 4080 Laptop GPU (6662 - 11410, n=7) | |
| MSI Vector 16 HX A14V | |
| Alienware m16 R2 | |
| Asus ROG Strix G16 G614JZ | |
| Asus ROG Strix Scar 16 G634JZR | |
| PCMark 10 / Digital Content Creation | |
| Asus ROG Strix Scar 17 G733PYV-LL053X | |
| Asus ROG Strix Scar 16 G634JZR | |
| MSI Vector 16 HX A14V | |
| Media Intel Core i9-14900HX, NVIDIA GeForce RTX 4080 Laptop GPU (14211 - 16246, n=7) | |
| HP Omen 16 (2024) | |
| Lenovo Legion Pro 7 16IRX9H | |
| Media della classe Gaming (7602 - 19954, n=94, ultimi 2 anni) | |
| Alienware m16 R2 | |
| Asus ROG Strix G16 G614JZ | |
| CrossMark / Overall | |
| Lenovo Legion Pro 7 16IRX9H | |
| HP Omen 16 (2024) | |
| MSI Vector 16 HX A14V | |
| Asus ROG Strix G16 G614JZ | |
| Media Intel Core i9-14900HX, NVIDIA GeForce RTX 4080 Laptop GPU (1992 - 2334, n=7) | |
| Asus ROG Strix Scar 17 G733PYV-LL053X | |
| Asus ROG Strix Scar 16 G634JZR | |
| Media della classe Gaming (1366 - 2409, n=93, ultimi 2 anni) | |
| Alienware m16 R2 | |
| CrossMark / Productivity | |
| Lenovo Legion Pro 7 16IRX9H | |
| HP Omen 16 (2024) | |
| Asus ROG Strix G16 G614JZ | |
| MSI Vector 16 HX A14V | |
| Media Intel Core i9-14900HX, NVIDIA GeForce RTX 4080 Laptop GPU (1812 - 2204, n=7) | |
| Asus ROG Strix Scar 17 G733PYV-LL053X | |
| Asus ROG Strix Scar 16 G634JZR | |
| Media della classe Gaming (1386 - 2254, n=93, ultimi 2 anni) | |
| Alienware m16 R2 | |
| CrossMark / Creativity | |
| Lenovo Legion Pro 7 16IRX9H | |
| MSI Vector 16 HX A14V | |
| Asus ROG Strix Scar 17 G733PYV-LL053X | |
| Media Intel Core i9-14900HX, NVIDIA GeForce RTX 4080 Laptop GPU (2327 - 2500, n=7) | |
| Asus ROG Strix G16 G614JZ | |
| HP Omen 16 (2024) | |
| Asus ROG Strix Scar 16 G634JZR | |
| Media della classe Gaming (1343 - 2729, n=93, ultimi 2 anni) | |
| Alienware m16 R2 | |
| CrossMark / Responsiveness | |
| Lenovo Legion Pro 7 16IRX9H | |
| HP Omen 16 (2024) | |
| Asus ROG Strix G16 G614JZ | |
| MSI Vector 16 HX A14V | |
| Media Intel Core i9-14900HX, NVIDIA GeForce RTX 4080 Laptop GPU (1520 - 2254, n=7) | |
| Asus ROG Strix Scar 16 G634JZR | |
| Media della classe Gaming (1226 - 2334, n=93, ultimi 2 anni) | |
| Asus ROG Strix Scar 17 G733PYV-LL053X | |
| Alienware m16 R2 | |
| AIDA64 / Memory Copy | |
| HP Omen 16 (2024) | |
| Asus ROG Strix Scar 16 G634JZR | |
| Lenovo Legion Pro 7 16IRX9H | |
| MSI Vector 16 HX A14V | |
| Media Intel Core i9-14900HX, NVIDIA GeForce RTX 4080 Laptop GPU (64612 - 79244, n=8) | |
| Media della classe Gaming (21750 - 129946, n=103, ultimi 2 anni) | |
| Alienware m16 R2 | |
| Asus ROG Strix G16 G614JZ | |
| Asus ROG Strix Scar 17 G733PYV-LL053X | |
| AIDA64 / Memory Read | |
| Asus ROG Strix Scar 16 G634JZR | |
| HP Omen 16 (2024) | |
| Lenovo Legion Pro 7 16IRX9H | |
| MSI Vector 16 HX A14V | |
| Media Intel Core i9-14900HX, NVIDIA GeForce RTX 4080 Laptop GPU (62535 - 87507, n=8) | |
| Alienware m16 R2 | |
| Media della classe Gaming (22956 - 118858, n=103, ultimi 2 anni) | |
| Asus ROG Strix G16 G614JZ | |
| Asus ROG Strix Scar 17 G733PYV-LL053X | |
| AIDA64 / Memory Write | |
| HP Omen 16 (2024) | |
| Asus ROG Strix Scar 16 G634JZR | |
| MSI Vector 16 HX A14V | |
| Media della classe Gaming (22297 - 135096, n=103, ultimi 2 anni) | |
| Media Intel Core i9-14900HX, NVIDIA GeForce RTX 4080 Laptop GPU (60645 - 77715, n=8) | |
| Lenovo Legion Pro 7 16IRX9H | |
| Alienware m16 R2 | |
| Asus ROG Strix G16 G614JZ | |
| Asus ROG Strix Scar 17 G733PYV-LL053X | |
| AIDA64 / Memory Latency | |
| Alienware m16 R2 | |
| Media della classe Gaming (75.3 - 259, n=103, ultimi 2 anni) | |
| Asus ROG Strix Scar 17 G733PYV-LL053X | |
| Asus ROG Strix G16 G614JZ | |
| HP Omen 16 (2024) | |
| Media Intel Core i9-14900HX, NVIDIA GeForce RTX 4080 Laptop GPU (79.7 - 97.7, n=8) | |
| MSI Vector 16 HX A14V | |
| Asus ROG Strix Scar 16 G634JZR | |
| Lenovo Legion Pro 7 16IRX9H | |
| WebXPRT 3 / Overall | |
| Asus ROG Strix Scar 17 G733PYV-LL053X | |
| Lenovo Legion Pro 7 16IRX9H | |
| Asus ROG Strix G16 G614JZ | |
| Media Intel Core i9-14900HX, NVIDIA GeForce RTX 4080 Laptop GPU (310 - 345, n=7) | |
| HP Omen 16 (2024) | |
| MSI Vector 16 HX A14V | |
| Media della classe Gaming (220 - 532, n=97, ultimi 2 anni) | |
| Asus ROG Strix Scar 16 G634JZR | |
| Alienware m16 R2 | |
| WebXPRT 4 / Overall | |
| Asus ROG Strix Scar 17 G733PYV-LL053X | |
| Lenovo Legion Pro 7 16IRX9H | |
| Media Intel Core i9-14900HX, NVIDIA GeForce RTX 4080 Laptop GPU (300 - 321, n=7) | |
| Asus ROG Strix G16 G614JZ | |
| HP Omen 16 (2024) | |
| Asus ROG Strix Scar 16 G634JZR | |
| MSI Vector 16 HX A14V | |
| Media della classe Gaming (165 - 354, n=97, ultimi 2 anni) | |
| Alienware m16 R2 | |
| Mozilla Kraken 1.1 / Total | |
| Alienware m16 R2 | |
| Media della classe Gaming (391 - 590, n=99, ultimi 2 anni) | |
| Asus ROG Strix G16 G614JZ | |
| MSI Vector 16 HX A14V | |
| Asus ROG Strix Scar 16 G634JZR | |
| Media Intel Core i9-14900HX, NVIDIA GeForce RTX 4080 Laptop GPU (437 - 446, n=7) | |
| Lenovo Legion Pro 7 16IRX9H | |
| HP Omen 16 (2024) | |
| Asus ROG Strix Scar 17 G733PYV-LL053X | |
* ... Meglio usare valori piccoli
| PCMark 8 Home Score Accelerated v2 | 5883 punti | |
| PCMark 10 Score | 7703 punti | |
Aiuto | ||
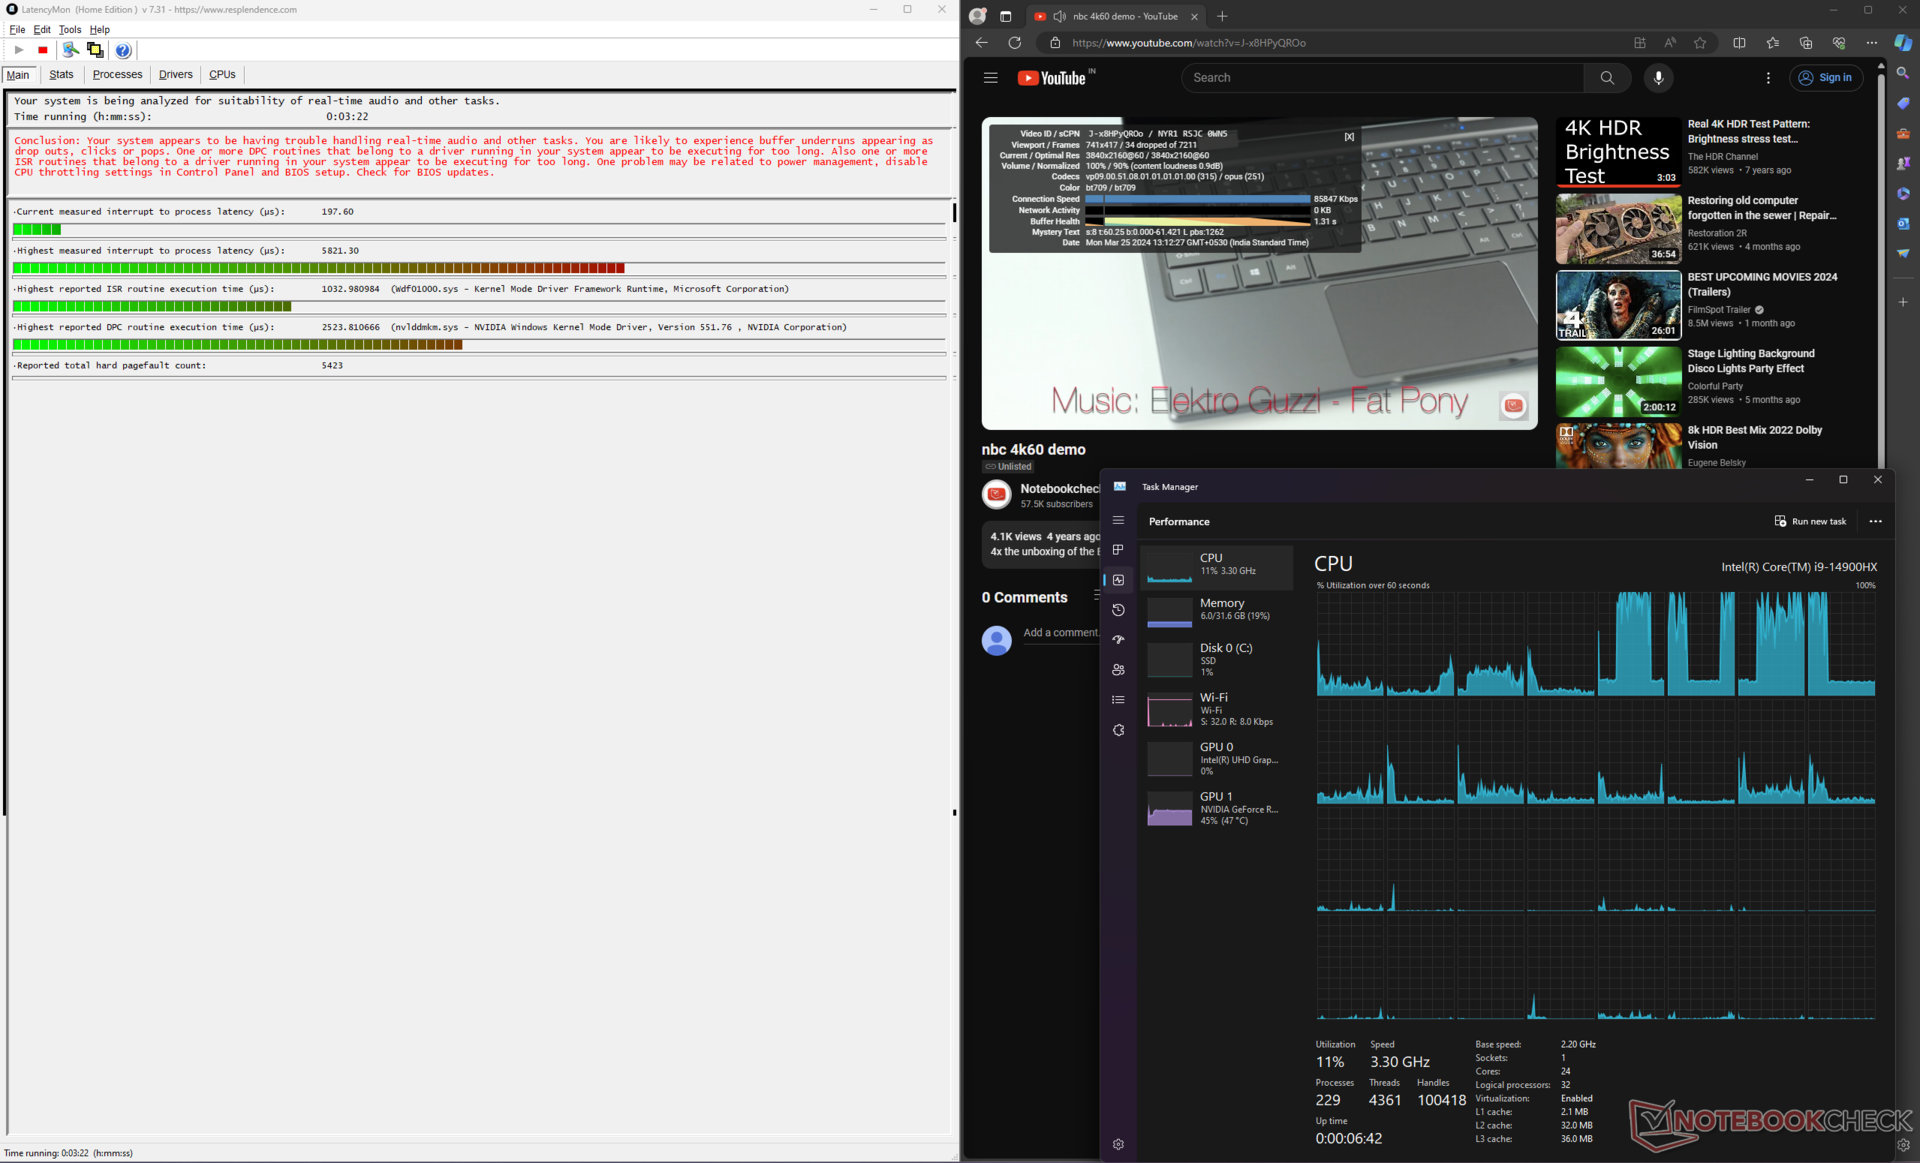
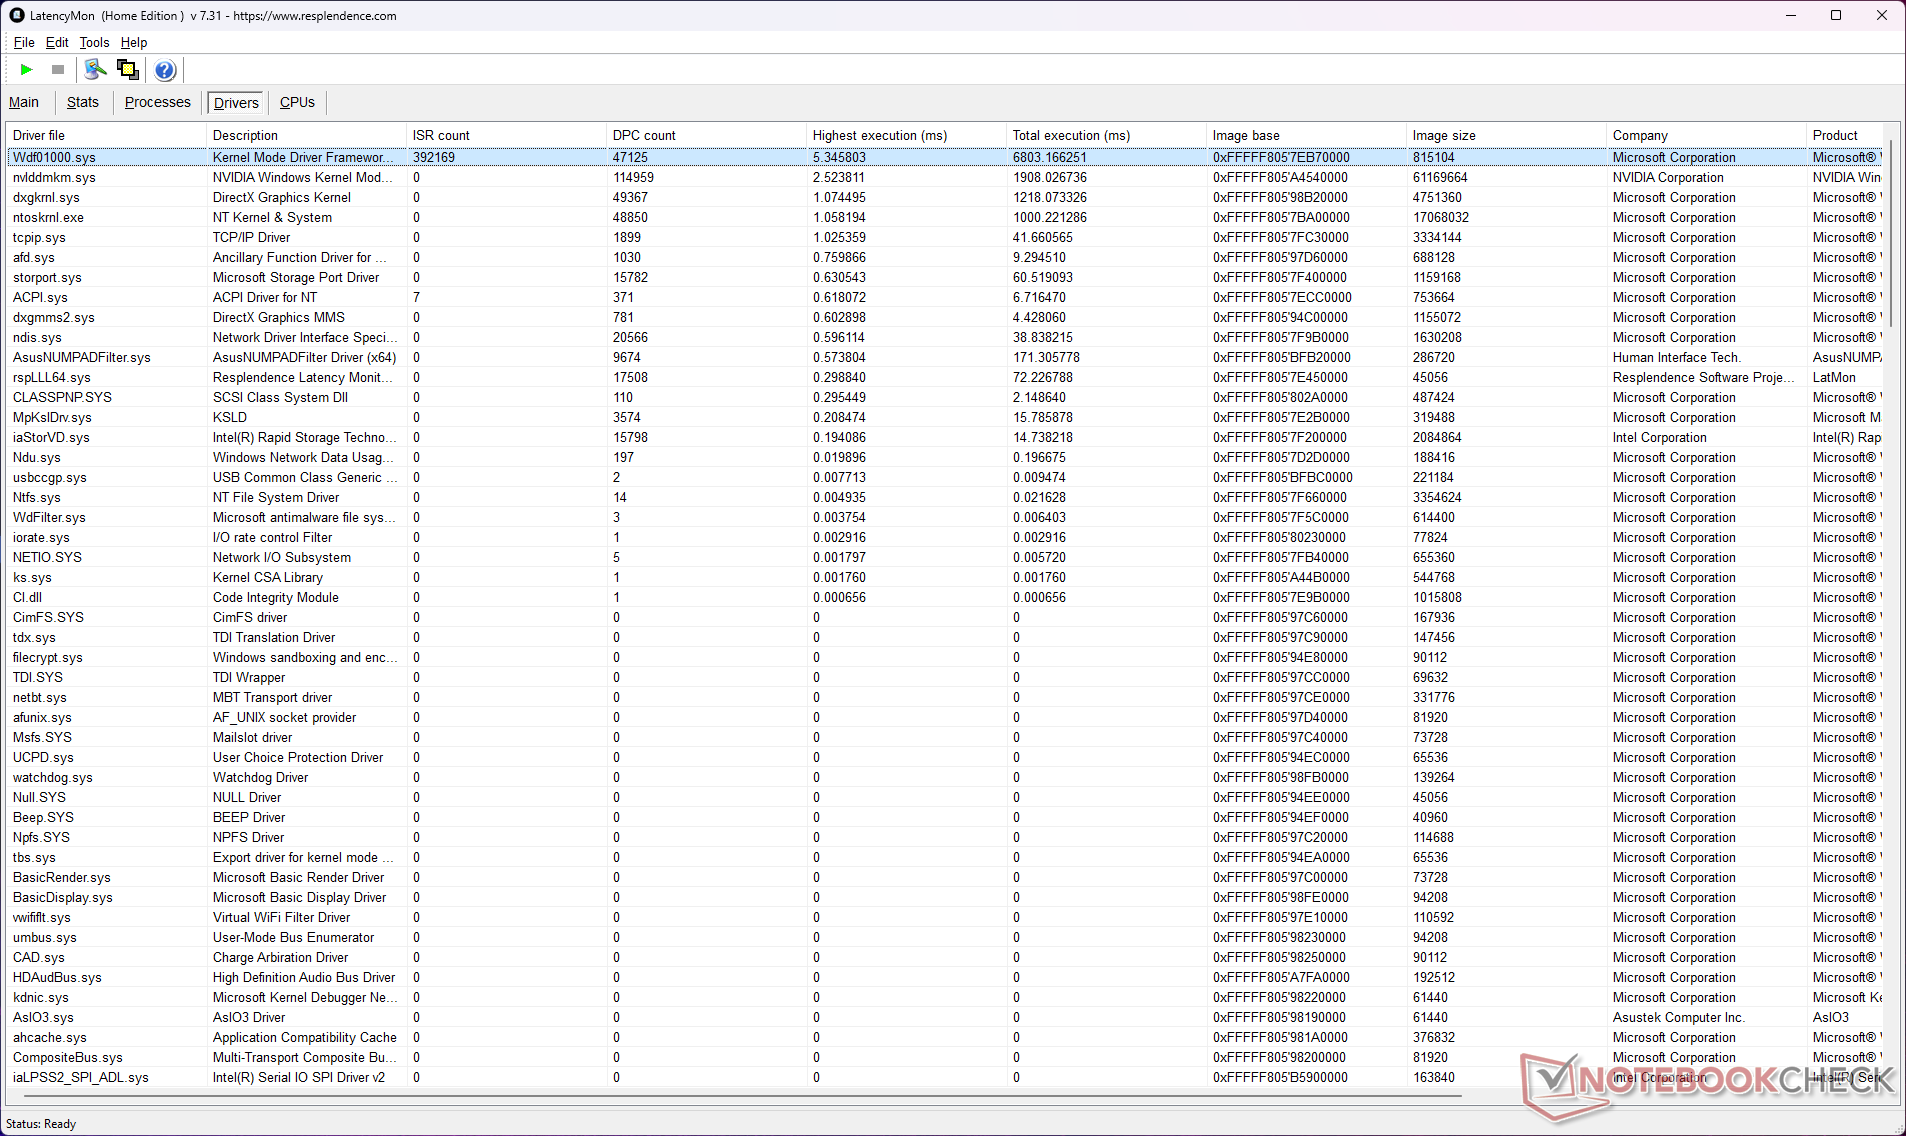
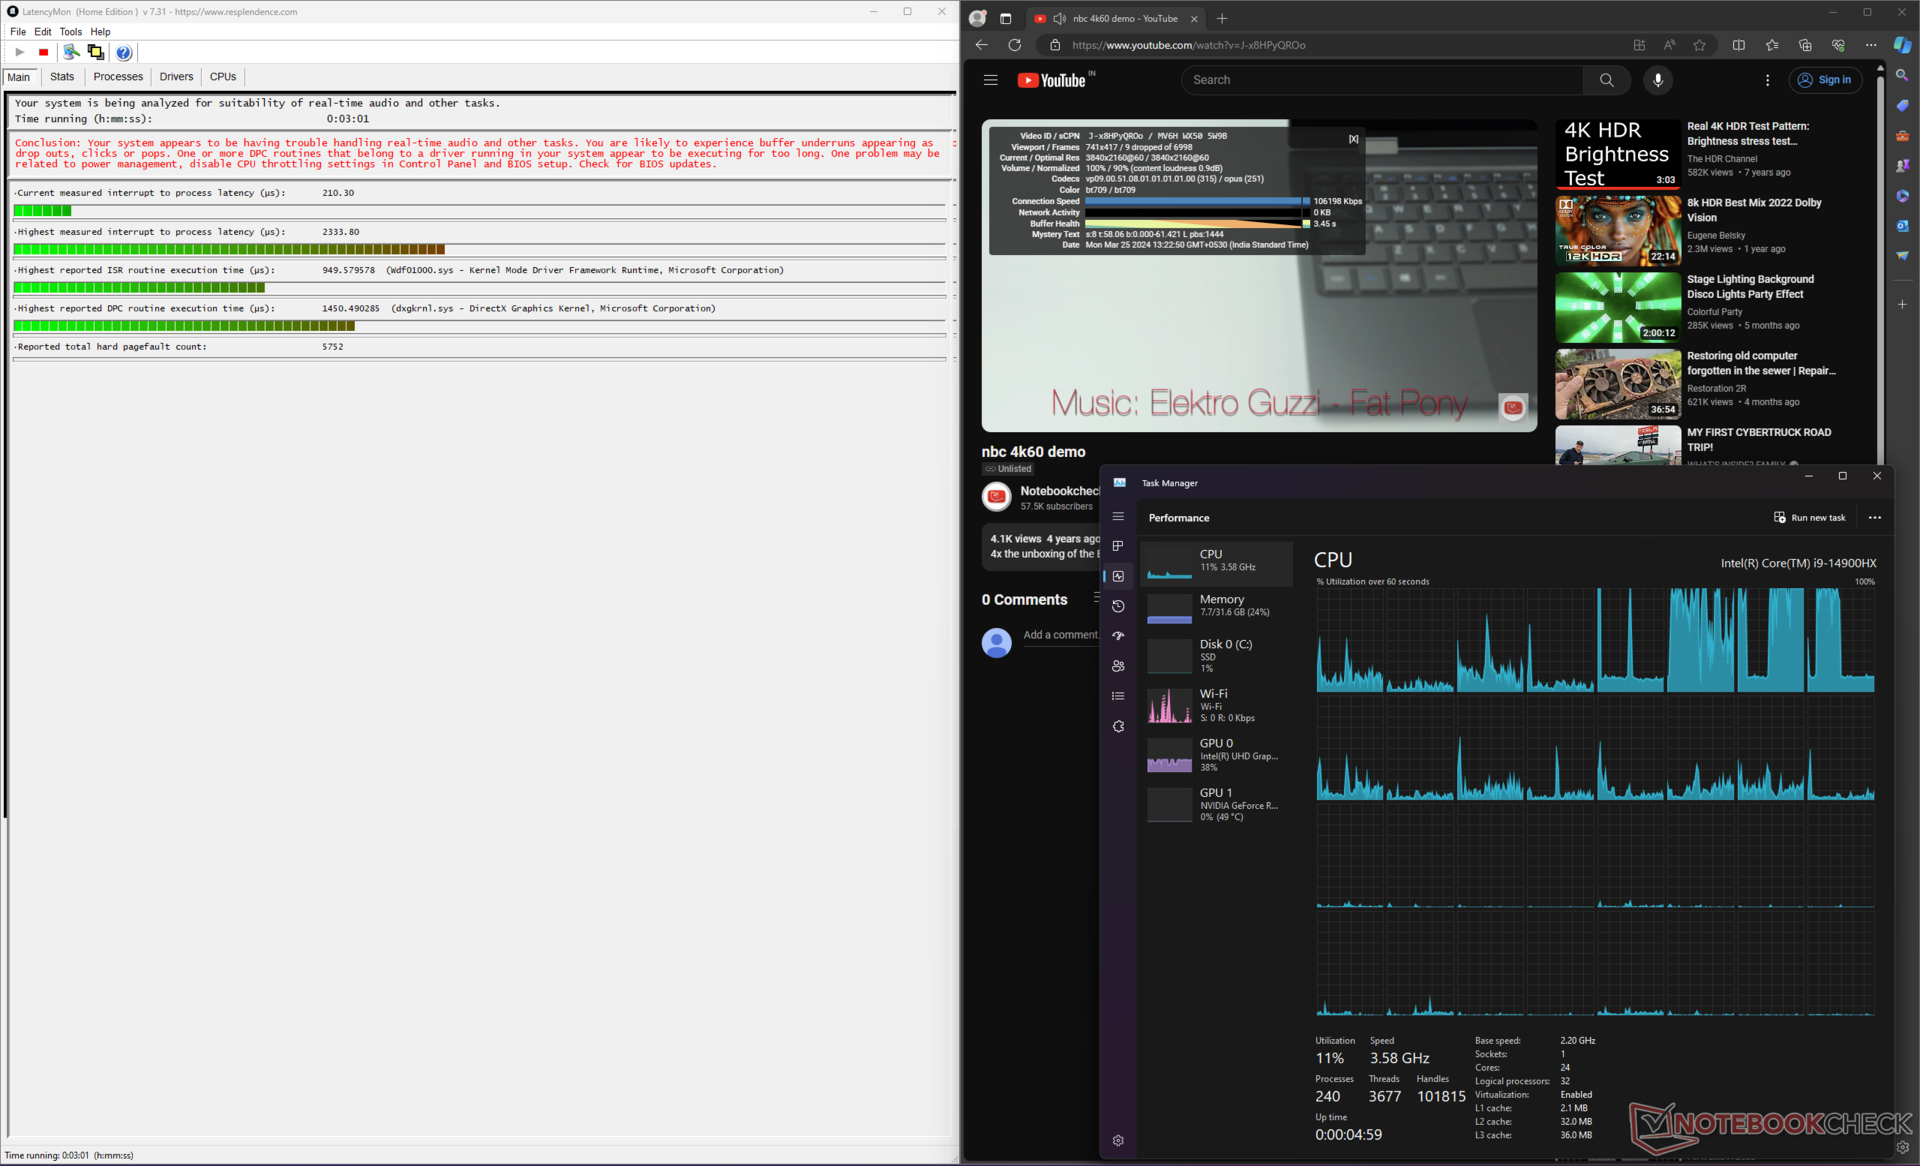
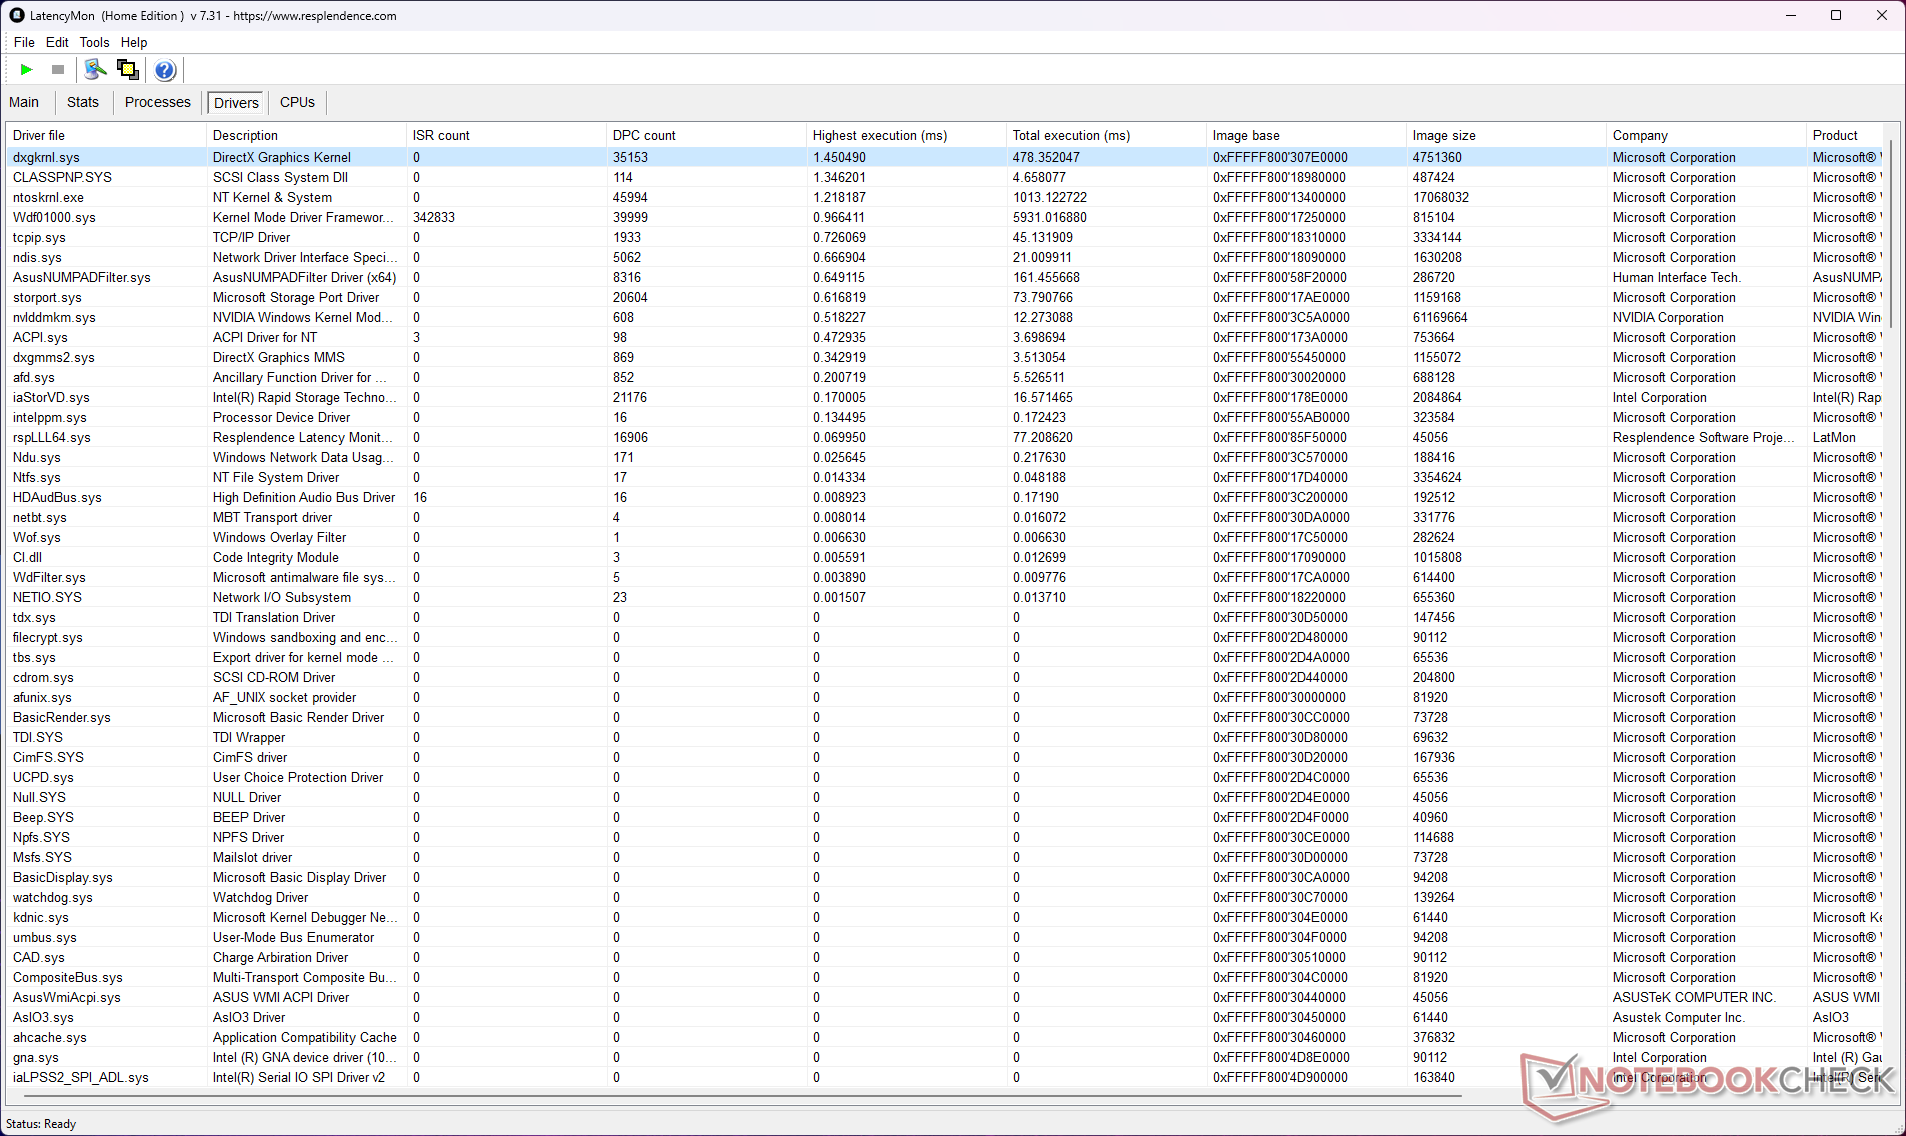
Latenza DPC
La latenza DPC è più alta con il MUX della dGPU abilitato. Il passaggio all'iGPU riduce la latenza da 5821,30 µs a 2333,80 µs, che è comunque un valore elevato. Questo può creare problemi se si tratta di flussi di lavoro di editing audio o video in tempo reale.
| DPC Latencies / LatencyMon - interrupt to process latency (max), Web, Youtube, Prime95 | |
| Asus ROG Strix Scar 16 G634JZR | |
| Asus ROG Strix G16 G614JZ | |
| Alienware m16 R2 | |
| MSI Vector 16 HX A14V | |
| Lenovo Legion Pro 7 16IRX9H | |
| HP Omen 16 (2024) | |
| Asus ROG Strix Scar 17 G733PYV-LL053X | |
* ... Meglio usare valori piccoli
Il nostro Classifica della latenza DPC offre una panoramica delle latenze misurate sui dispositivi recensiti.
Dispositivi di archiviazione
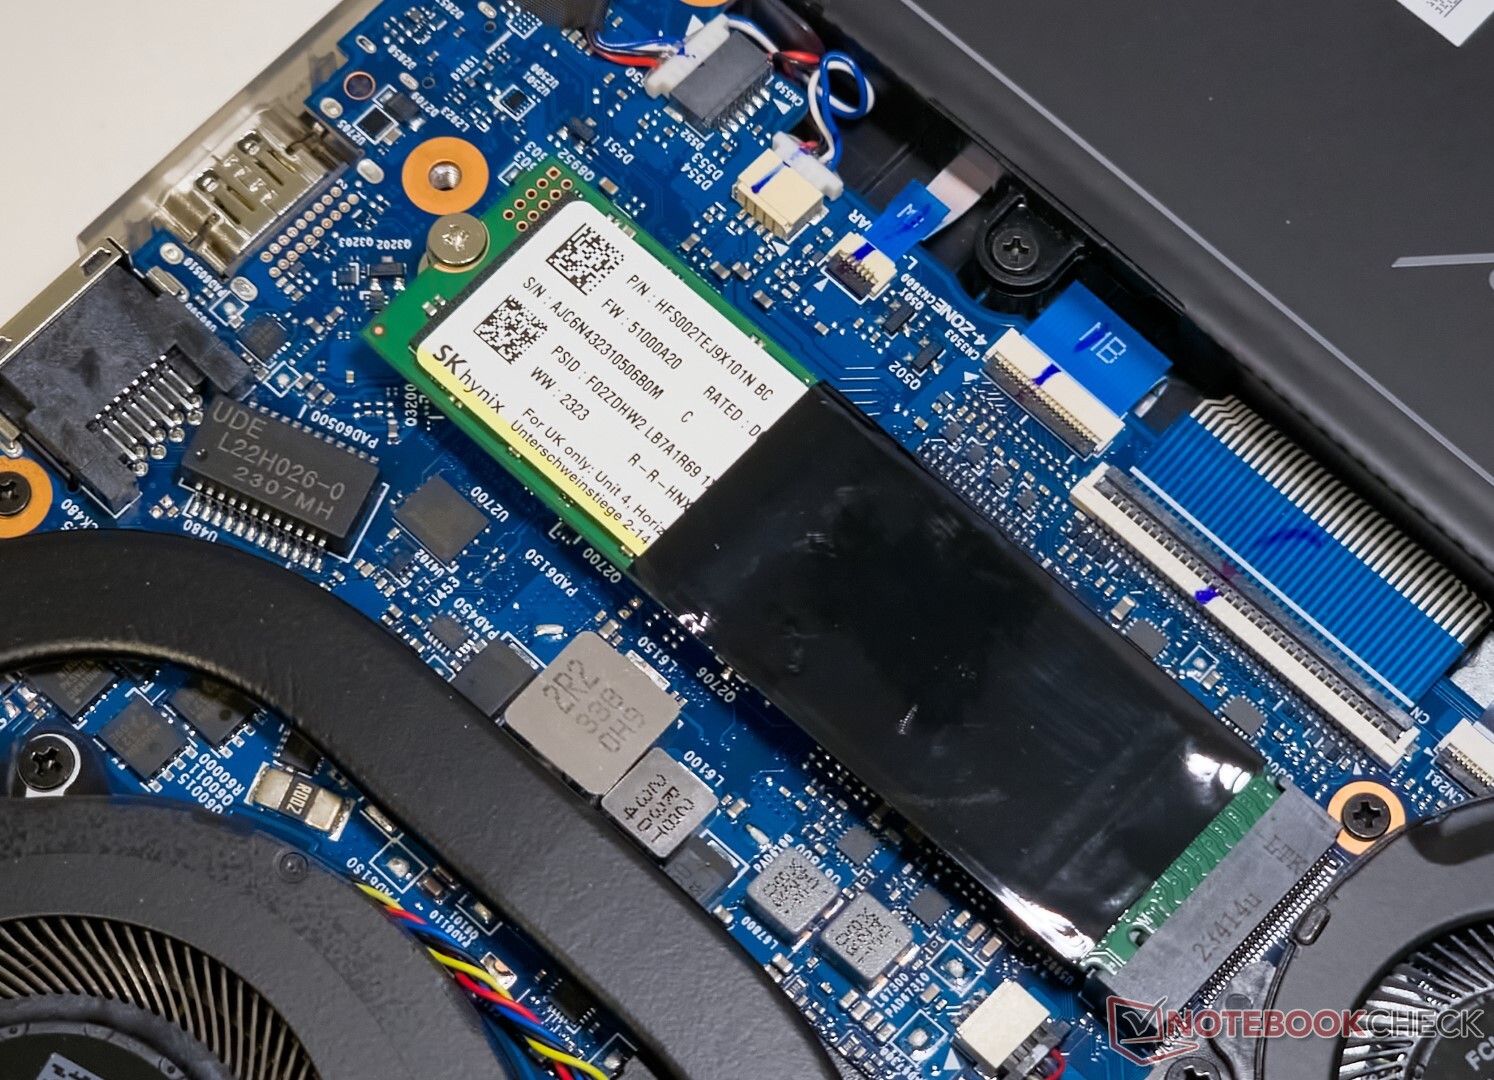
La nostra unità Scar 16 era dotata di un SSD Sk hynix PC801 2 TB PCIe Gen 4 NVMe.
Le prestazioni dell'SSD subiscono una battuta d'arresto nelle letture sequenziali e in diversi test 4k, ma le prestazioni cumulative sono alla portata dell' Alienware m16 R2di Samsung PM9A1.
È possibile aggiungere ulteriore spazio di archiviazione tramite uno slot di espansione per un'altra unità SSD M.2. Tuttavia, non è prevista l'installazione di unità SATA da 2,5 pollici.

* ... Meglio usare valori piccoli
Strozzatura del disco: DiskSpd Lettura in loop, Profondità coda 8
Le prestazioni dell'unità calano dopo la 14esima esecuzione durante un test di ciclo di lettura DiskSpd con una profondità di coda di 8, ma rimangono stabili in seguito.
Ulteriori confronti sulle prestazioni di archiviazione sono disponibili nei nostri Benchmark di SSD e HDD pagina.
Prestazioni della GPU
Lo Scar 16 è dotato di una GPU Nvidia GeForce RTX 4080 Laptop da 175 W. Le prestazioni complessive in 3DMark sono paragonabili a quelle di altri laptop dotati di questa scheda, ma sono inferiori a quelle di Lenovo Legion Pro 7 del 6%.
L'HP Omen 16 con una GPU RTX 4080 Laptop da 140 W subisce una battuta d'arresto più grande del previsto del 24% rispetto allo Strix Scar 16 nelle prestazioni cumulative di 3DMark.
L'RTX 4080 dello Scar 16 lo colloca appena dietro l'Asus ROG Strix Scar 17 Asus ROG Strix Scar 17 con una GPU RTX 4090 Laptop in Blender Classroom Optix, anche se con un margine del 15% - questo aumenta al 18% in Blender Classroom CUDA.
La CPU di Blender Classroom, d'altra parte, vede il Core i9-14900HX dello Scar 16 alla pari con quello di Legion Pro 7 e Vector 16 HX, ma il Core i9-14900HX dello Scar 17 AMD Ryzen 9 7945HX3D è in grado di completare il rendering il 20% più velocemente.
| 3DMark 11 Performance | 42772 punti | |
| 3DMark Ice Storm Standard Score | 284572 punti | |
| 3DMark Cloud Gate Standard Score | 64579 punti | |
| 3DMark Fire Strike Score | 32183 punti | |
| 3DMark Fire Strike Extreme Score | 21288 punti | |
| 3DMark Time Spy Score | 18822 punti | |
Aiuto | ||
| Blender / v3.3 Classroom OPTIX/RTX | |
| Alienware m16 R2 | |
| Media della classe Gaming (9 - 32, n=105, ultimi 2 anni) | |
| HP Omen 16 (2024) | |
| Media NVIDIA GeForce RTX 4080 Laptop GPU (13 - 20, n=22) | |
| Asus ROG Strix G16 G614JZ | |
| MSI Vector 16 HX A14V | |
| Lenovo Legion Pro 7 16IRX9H | |
| Asus ROG Strix Scar 16 G634JZR | |
| Asus ROG Strix Scar 17 G733PYV-LL053X | |
| Blender / v3.3 Classroom CUDA | |
| Alienware m16 R2 | |
| Media della classe Gaming (15 - 228, n=105, ultimi 2 anni) | |
| HP Omen 16 (2024) | |
| Media NVIDIA GeForce RTX 4080 Laptop GPU (21 - 28, n=23) | |
| Asus ROG Strix G16 G614JZ | |
| MSI Vector 16 HX A14V | |
| Asus ROG Strix Scar 16 G634JZR | |
| Lenovo Legion Pro 7 16IRX9H | |
| Asus ROG Strix Scar 17 G733PYV-LL053X | |
| Blender / v3.3 Classroom CPU | |
| Alienware m16 R2 | |
| HP Omen 16 (2024) | |
| Media della classe Gaming (122 - 565, n=101, ultimi 2 anni) | |
| Media NVIDIA GeForce RTX 4080 Laptop GPU (177 - 337, n=23) | |
| Asus ROG Strix G16 G614JZ | |
| Asus ROG Strix Scar 16 G634JZR | |
| Lenovo Legion Pro 7 16IRX9H | |
| MSI Vector 16 HX A14V | |
| Asus ROG Strix Scar 17 G733PYV-LL053X | |
* ... Meglio usare valori piccoli
Prestazioni di gioco
La differenza di prestazioni tra Legion Pro 7 e Strix Scar 16 scompare nelle prestazioni di gioco cumulative a 1080p Ultra.
Lo Scar 16 può facilmente superare i 100 fps a 1440p Ultra con i titoli più vecchi. Il portatile è in grado di gestire la maggior parte dei giochi AAA moderni a 60 fps in questa risoluzione, e si possono ottenere frame rate ancora più elevati con l'aiuto degli upscaler.
| The Witcher 3 - 1920x1080 Ultra Graphics & Postprocessing (HBAO+) | |
| Asus ROG Strix Scar 17 G733PYV-LL053X | |
| Media della classe Gaming (104.7 - 240, n=6, ultimi 2 anni) | |
| Lenovo Legion Pro 7 16IRX9H | |
| Asus ROG Strix Scar 16 G634JZR | |
| MSI Vector 16 HX A14V | |
| Asus ROG Strix G16 G614JZ | |
| HP Omen 16 (2024) | |
| Alienware m16 R2 | |
Il grafico FPS di Witcher 3
Il massiccio sistema di raffreddamento di Scar 16 è in grado di garantire prestazioni di gioco relativamente prive di strozzature. Non abbiamo osservato alcun calo drastico di frame durante lo stress con The Witcher 3 a 1080p Ultra.
| basso | medio | alto | ultra | QHD | |
|---|---|---|---|---|---|
| GTA V (2015) | 187.3 | 187.1 | 182.6 | 139 | 130.1 |
| The Witcher 3 (2015) | 581 | 513 | 365 | 185.6 | 140.1 |
| Dota 2 Reborn (2015) | 247 | 216 | 192.7 | 177.4 | |
| Final Fantasy XV Benchmark (2018) | 228 | 207 | 178 | 138.1 | |
| X-Plane 11.11 (2018) | 211 | 184.3 | 141.3 | ||
| Far Cry 5 (2018) | 183 | 168 | 164 | 157 | 157 |
| Strange Brigade (2018) | 499 | 402 | 373 | 337 | 240 |
| F1 22 (2022) | 323 | 334 | 287 | 117.1 | 76.6 |
| F1 23 (2023) | 310 | 326 | 295 | 111.3 | 70 |
| Cyberpunk 2077 (2023) | 170.4 | 159.8 | 141.3 | 123.1 | 77.6 |
| Avatar Frontiers of Pandora (2023) | 141.4 | 131.6 | 115.2 | 88.3 | 59.3 |
| Skull & Bones (2024) | 155 | 168 | 144 | 115 | 91 |
Faccia riferimento al nostro sito dedicato GPU Nvidia GeForce RTX 4080 Laptop per ulteriori prestazioni e benchmark di gioco.
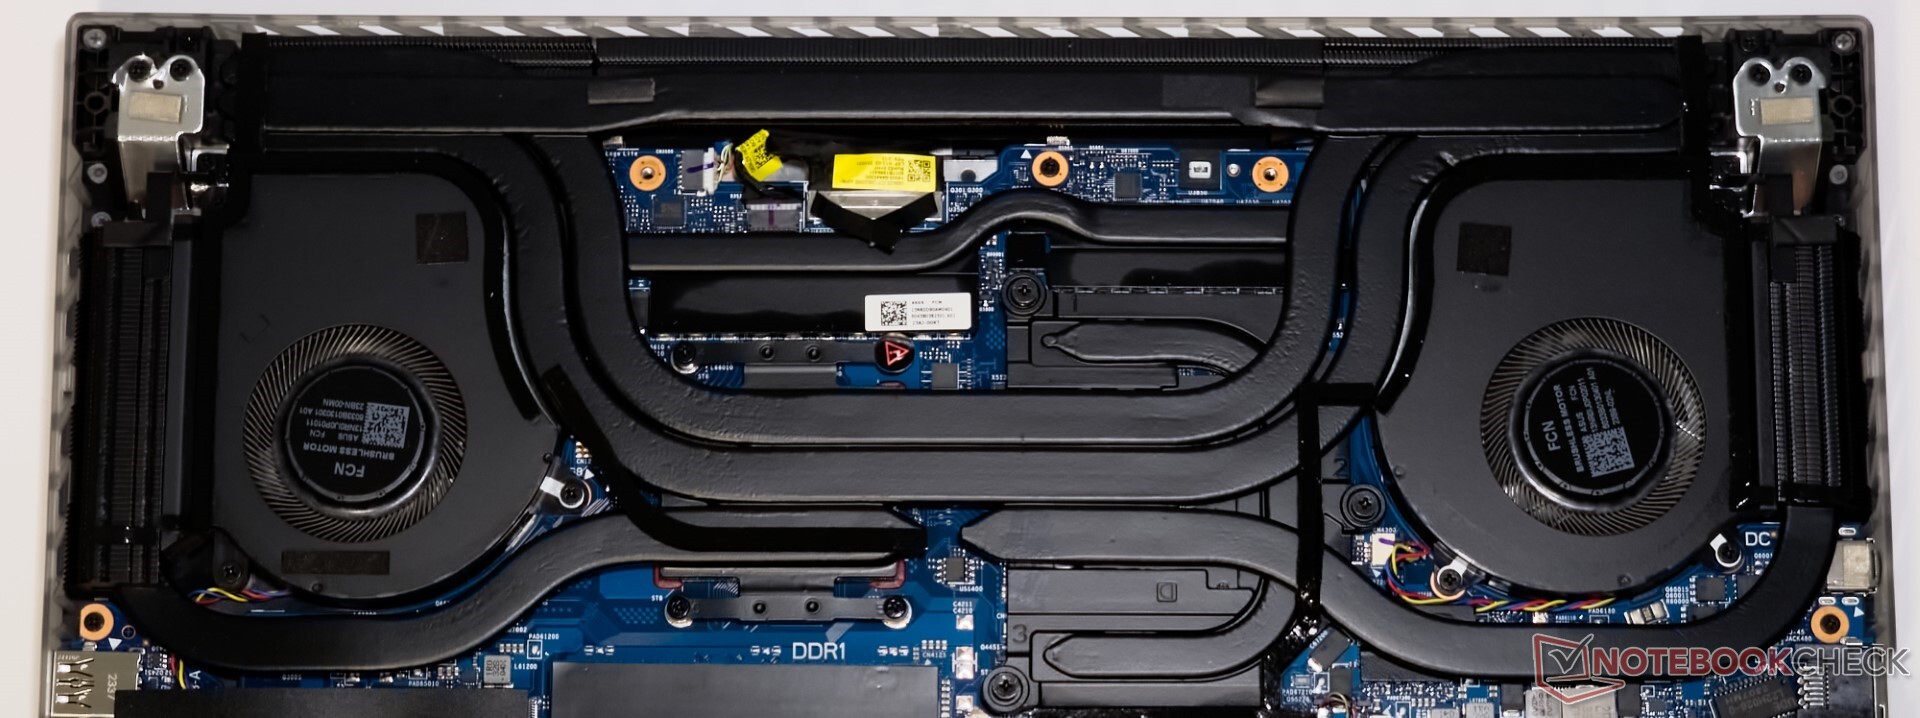
Emissioni: Temperature superficiali elevate e rumore, nonostante 3 ventole e 7 heatpipes
Rumore del sistema
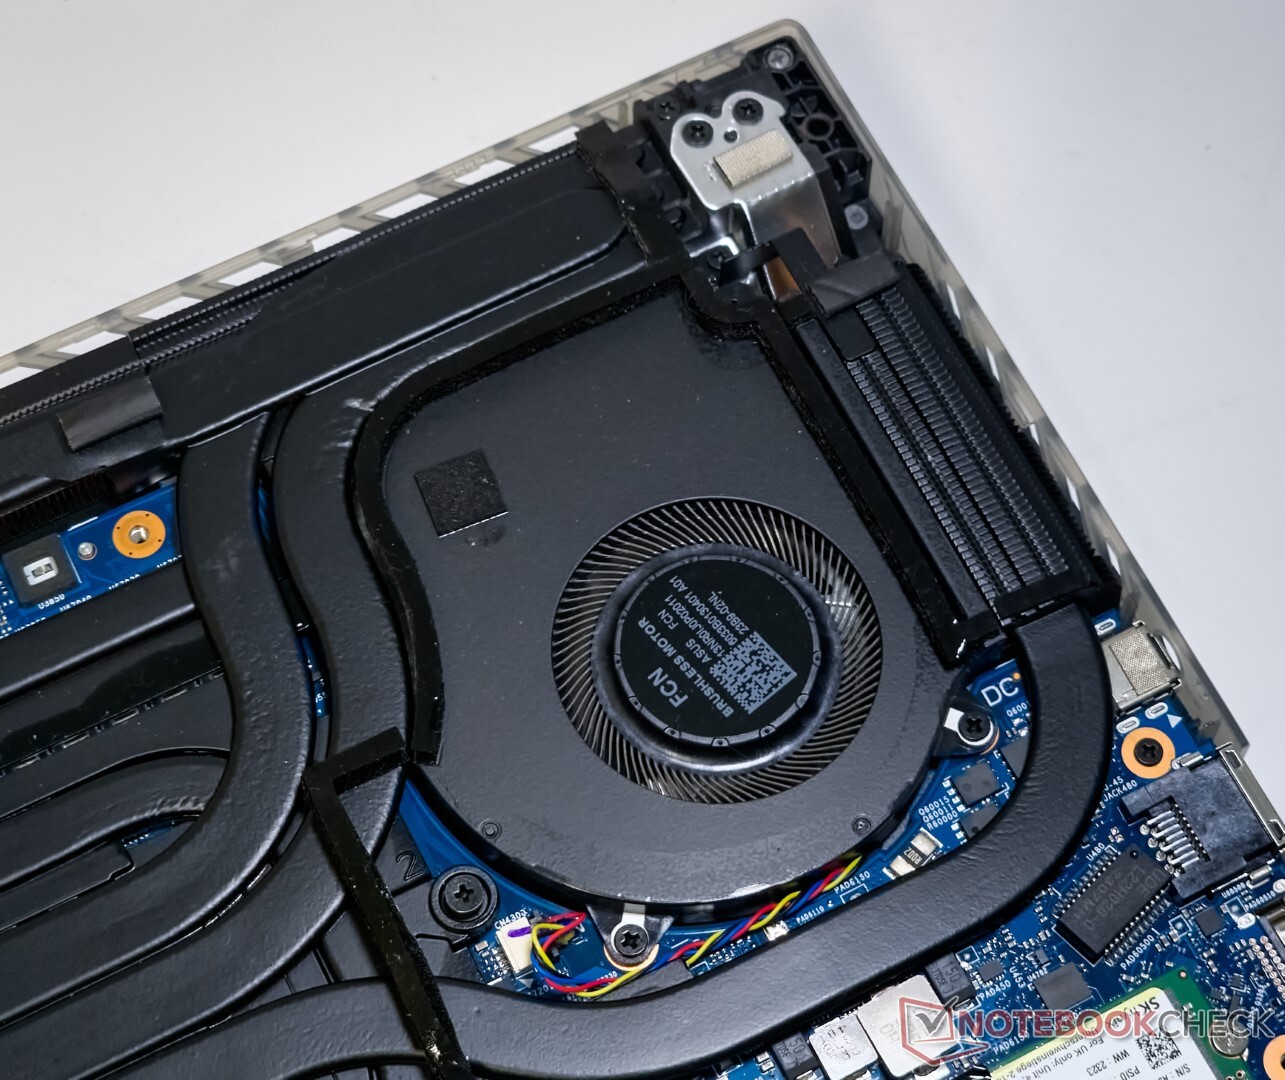
Asus, in modo interessante, include una terza ventola sulla VRAM, oltre a quelle collegate alla CPU e alla GPU.
Lo Scar 16 non sembra imporre limiti rigidi alle emissioni di rumore in ogni profilo di potenza. Di conseguenza, le emissioni acustiche della ventola in modalità Turbo possono raggiungere i 58 db(A) sotto carico massimo.
Anche la modalità Performance produce emissioni acustiche elevate. La modalità Silenziosa è relativamente più tollerabile, ma al costo di un notevole calo delle prestazioni di gioco.
Detto questo, le ventole sono completamente spente in modalità Silent quando sono inattive e durante i carichi di lavoro meno intensivi, come Office o la navigazione web occasionale.
Rumorosità
| Idle |
| 29.75 / 29.75 / 29.75 dB(A) |
| Sotto carico |
| 54.85 / 58 dB(A) |
 | ||
30 dB silenzioso 40 dB(A) udibile 50 dB(A) rumoroso |
||
min: | ||
| Modalità di prestazioni | Idle dB(A) | Load average dB(A) | Load maximum dB(A) | The Witcher 3 1080p Ultra dB(A) |
|---|---|---|---|---|
| Silenzioso | 21,07 | 37,50 | 46,56 | 46,32 / 133 fps |
| Prestazioni | 21,07 | 54,03 | 54,02 | 54,08 / 174 fps |
| Turbo | 29,75 | 54,85 | 58 | 57,75 / 177 fps |
| Asus ROG Strix Scar 16 G634JZR i9-14900HX, GeForce RTX 4080 Laptop GPU | Asus ROG Strix Scar 17 G733PYV-LL053X R9 7945HX3D, GeForce RTX 4090 Laptop GPU | Asus ROG Strix G16 G614JZ i9-13980HX, GeForce RTX 4080 Laptop GPU | Lenovo Legion Pro 7 16IRX9H i9-14900HX, GeForce RTX 4080 Laptop GPU | HP Omen 16 (2024) i9-14900HX, GeForce RTX 4080 Laptop GPU | MSI Vector 16 HX A14V i9-14900HX, GeForce RTX 4080 Laptop GPU | Alienware m16 R2 Ultra 7 155H, GeForce RTX 4070 Laptop GPU | |
|---|---|---|---|---|---|---|---|
| Noise | 3% | 5% | -4% | 5% | -8% | 10% | |
| off /ambiente * (dB) | 21.07 | 23 -9% | 25 -19% | 24 -14% | 25 -19% | 23.2 -10% | 24.7 -17% |
| Idle Minimum * (dB) | 29.75 | 23 23% | 26 13% | 25 16% | 29 3% | 33.5 -13% | 25.3 15% |
| Idle Average * (dB) | 29.75 | 27.7 7% | 28 6% | 30 -1% | 30 -1% | 33.5 -13% | 25.3 15% |
| Idle Maximum * (dB) | 29.75 | 34.7 -17% | 30 -1% | 45 -51% | 31 -4% | 33.5 -13% | 25.3 15% |
| Load Average * (dB) | 54.85 | 53.4 3% | 48 12% | 50 9% | 46 16% | 52.1 5% | 31.7 42% |
| Witcher 3 ultra * (dB) | 57.8 | 53.4 8% | 49 15% | 54 7% | 47 19% | 62 -7% | 53.8 7% |
| Load Maximum * (dB) | 58 | 53.4 8% | 52 10% | 56 3% | 47 19% | 62 -7% | 62 -7% |
* ... Meglio usare valori piccoli
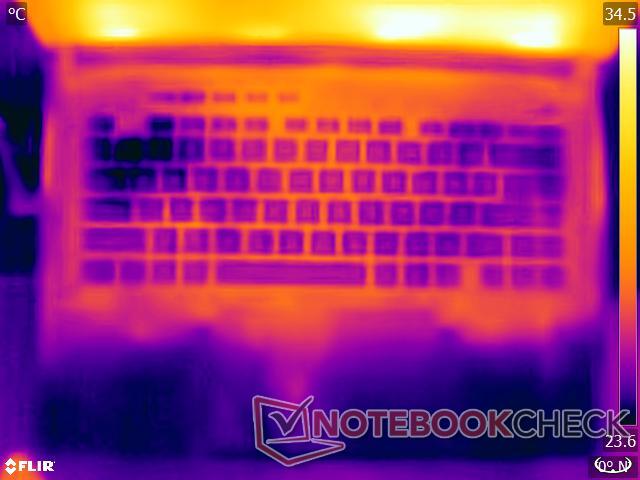
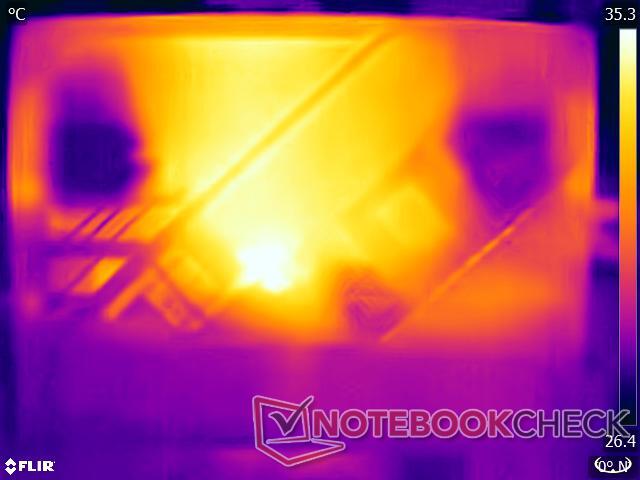
Temperatura
ROG Strix Scar 16 è dotato di sette heatpipes e di un sistema di raffreddamento a tre ventole. Questa volta, Asus ha scelto di utilizzare il metallo liquido Conductonaut Extreme sia per la CPU che per la GPU.
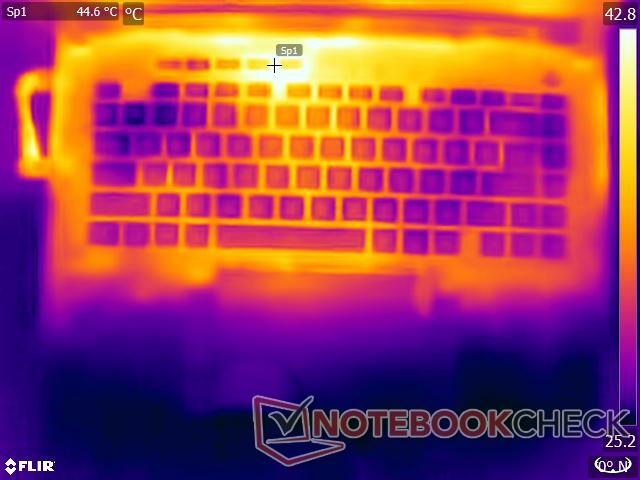
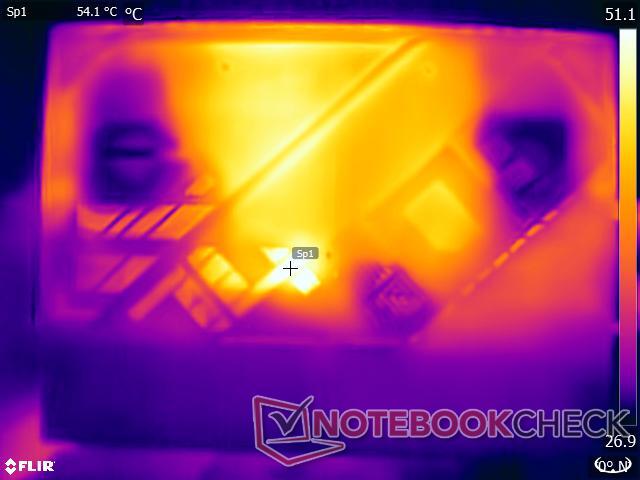
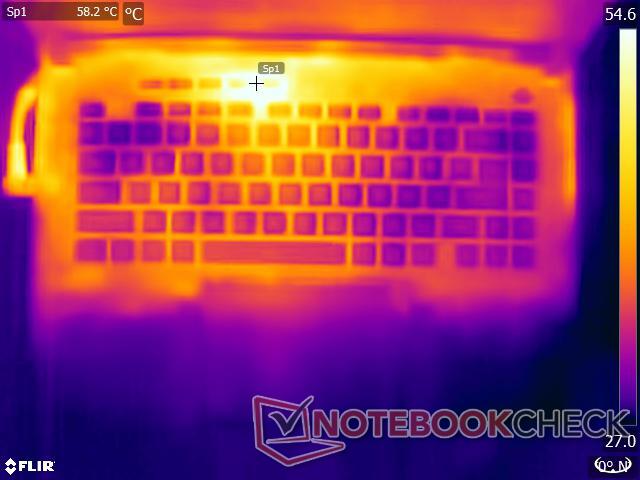
Se da un lato il robusto apparato di raffreddamento e la presenza di prese d'aria di scarico su tre lati favoriscono un raffreddamento efficace dei componenti, dall'altro comportano una maggiore dissipazione di calore, come evidenziato dalle letture di temperature superficiali elevate sotto carico.
Abbiamo notato alcuni punti caldi oltre i 55 °C sul lato superiore durante lo stress test con The Witcher 3 a 1080p Ultra.
In termini pratici, dato il peso e le temperature superficiali, lo Scar 16 è più adatto come macchina da scrivania. Detto questo, il portatile non dovrebbe causare molto fastidio se utilizzato in grembo nel profilo Silent, a condizione che non sia sottoposto a carichi di lavoro pesanti.
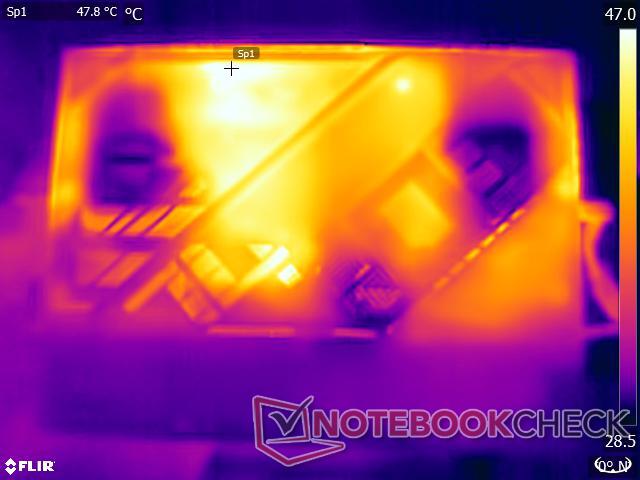
(-) La temperatura massima sul lato superiore è di 47.8 °C / 118 F, rispetto alla media di 40.4 °C / 105 F, che varia da 21.2 a 68.8 °C per questa classe Gaming.
(-) Il lato inferiore si riscalda fino ad un massimo di 52.2 °C / 126 F, rispetto alla media di 43.2 °C / 110 F
(+) In idle, la temperatura media del lato superiore è di 30.9 °C / 88 F, rispetto alla media deld ispositivo di 33.9 °C / 93 F.
(-) Riproducendo The Witcher 3, la temperatura media per il lato superiore e' di 42.9 °C / 109 F, rispetto alla media del dispositivo di 33.9 °C / 93 F.
(±) I poggiapolsi e il touchpad possono diventare molto caldi al tatto con un massimo di 39.2 °C / 102.6 F.
(-) La temperatura media della zona del palmo della mano di dispositivi simili e'stata di 28.8 °C / 83.8 F (-10.4 °C / -18.8 F).
| Asus ROG Strix Scar 16 G634JZR i9-14900HX, GeForce RTX 4080 Laptop GPU | Asus ROG Strix Scar 17 G733PYV-LL053X R9 7945HX3D, GeForce RTX 4090 Laptop GPU | Asus ROG Strix G16 G614JZ i9-13980HX, GeForce RTX 4080 Laptop GPU | Lenovo Legion Pro 7 16IRX9H i9-14900HX, GeForce RTX 4080 Laptop GPU | HP Omen 16 (2024) i9-14900HX, GeForce RTX 4080 Laptop GPU | MSI Vector 16 HX A14V i9-14900HX, GeForce RTX 4080 Laptop GPU | Alienware m16 R2 Ultra 7 155H, GeForce RTX 4070 Laptop GPU | |
|---|---|---|---|---|---|---|---|
| Heat | 15% | -2% | -5% | 9% | 23% | -7% | |
| Maximum Upper Side * (°C) | 47.8 | 40.1 16% | 54 -13% | 46 4% | 47 2% | 36.4 24% | 44.8 6% |
| Maximum Bottom * (°C) | 52.2 | 46.7 11% | 55 -5% | 49 6% | 57 -9% | 35.6 32% | 48 8% |
| Idle Upper Side * (°C) | 32.4 | 26.5 18% | 29 10% | 38 -17% | 25 23% | 26.6 18% | 37.2 -15% |
| Idle Bottom * (°C) | 33 | 27.7 16% | 33 -0% | 37 -12% | 26 21% | 27 18% | 42 -27% |
* ... Meglio usare valori piccoli
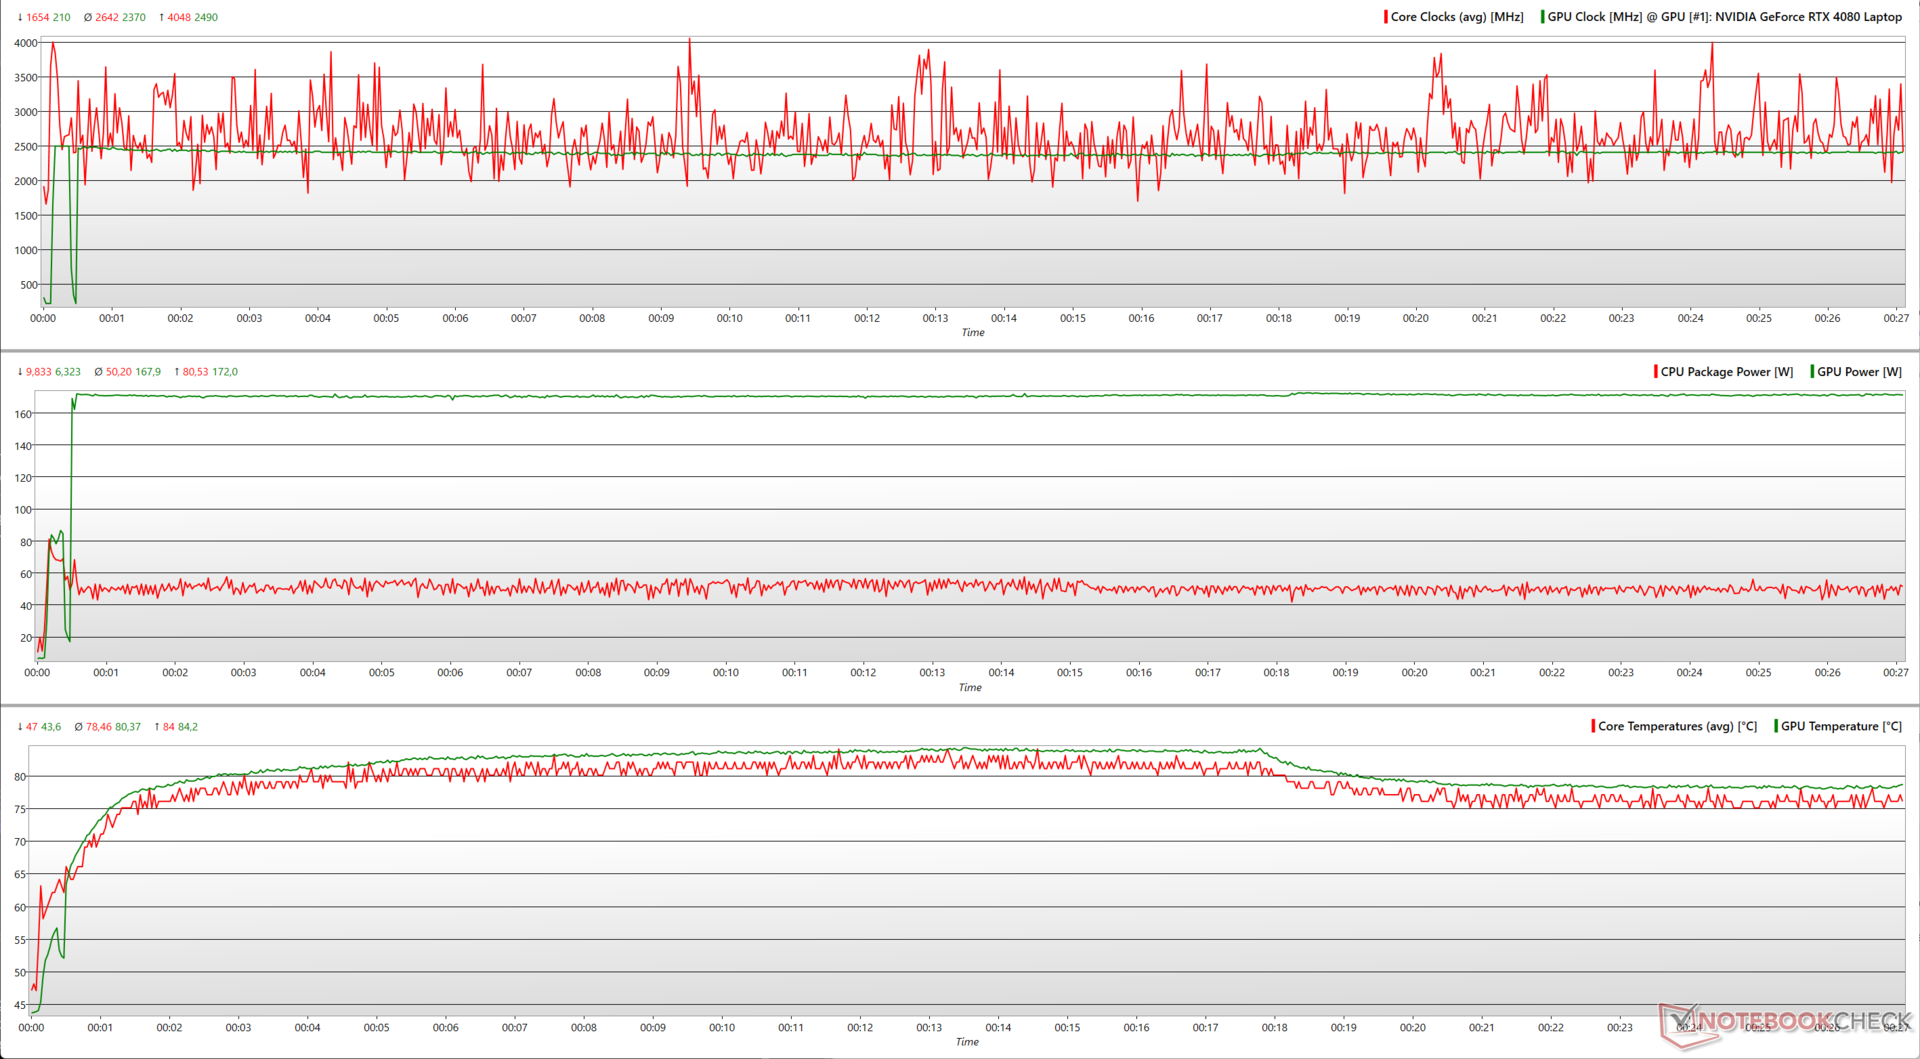
Test da sforzo
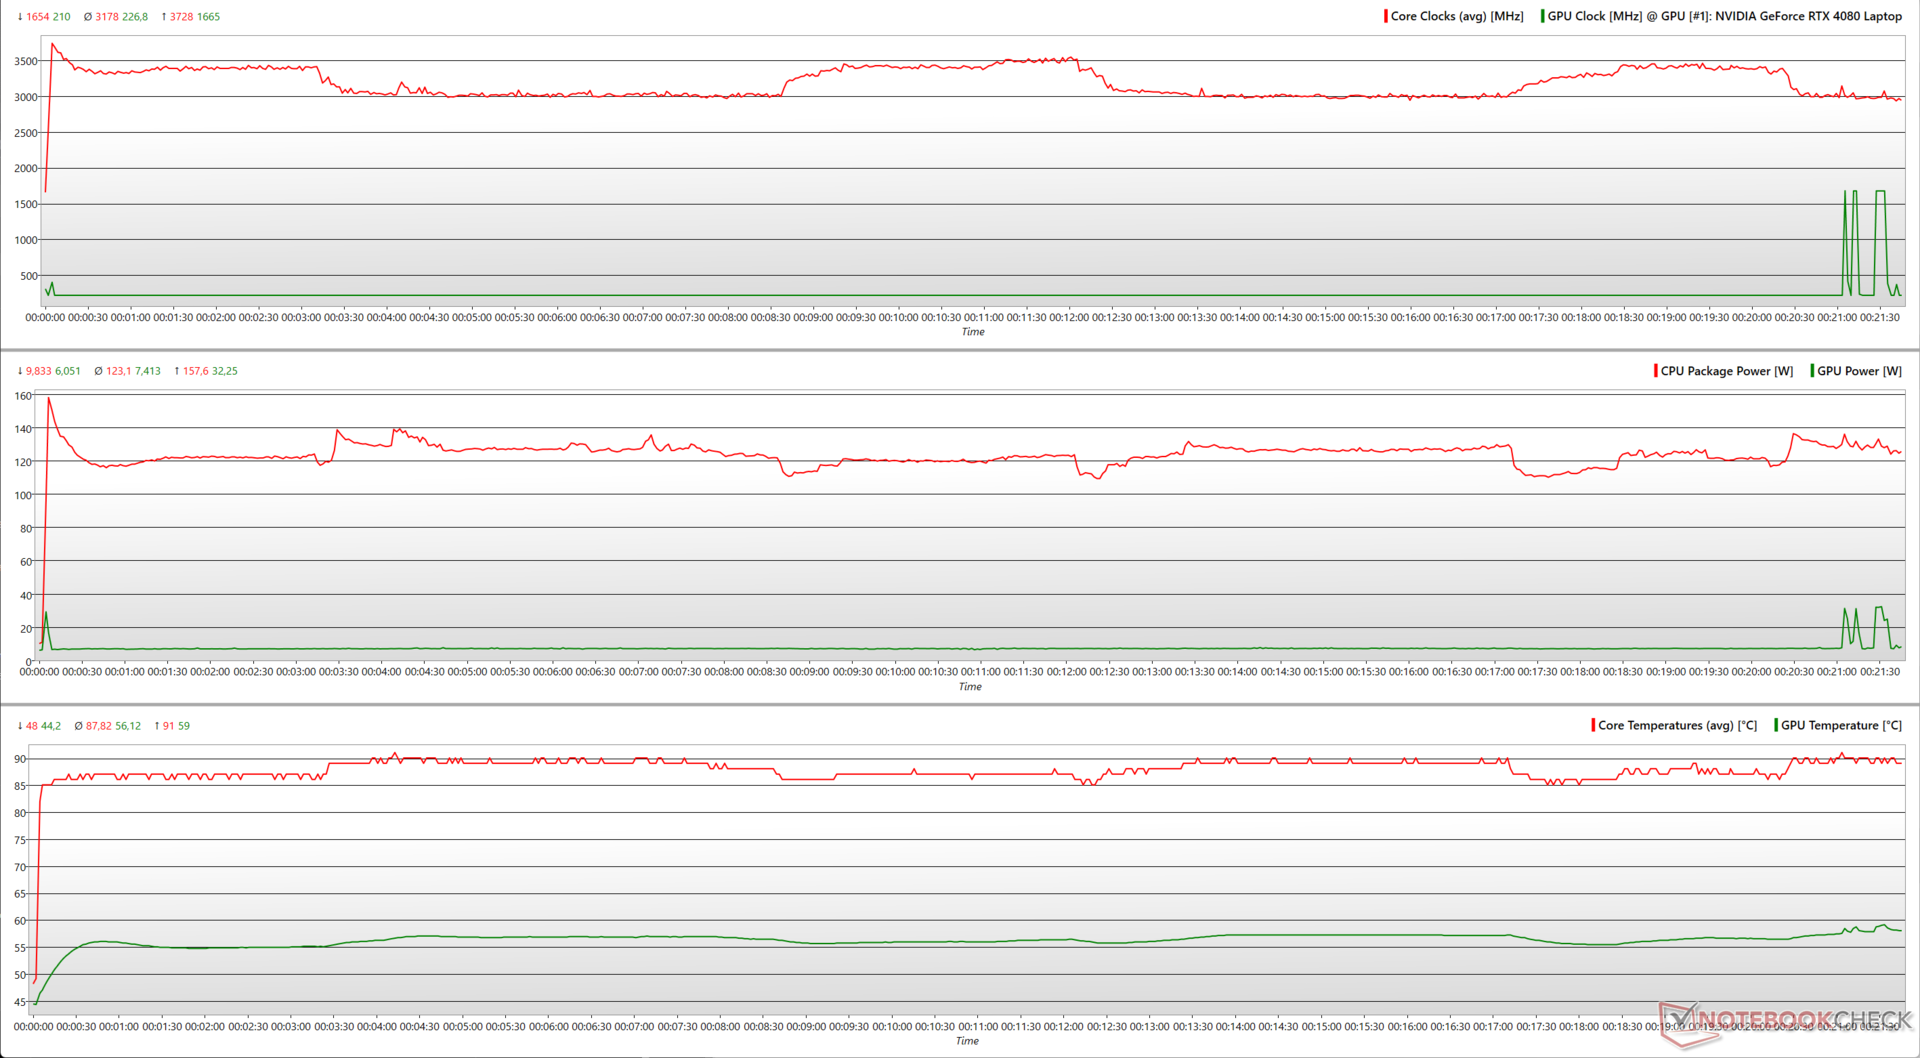
Sollecitando lo Scar 16 con Prime95 in-place large FFT da solo, il Core i9-14900HX utilizza fino a 158 W con un picco di clock a 3,7 GHz, ma non può essere mantenuto a lungo. La frequenza scende a ~3 GHz quando le temperature del core raggiungono i 90 °C. I core hanno un po' di respiro e sono in grado di aumentare fino a 3,5 GHz quando le temperature scendono a ~87 °C.
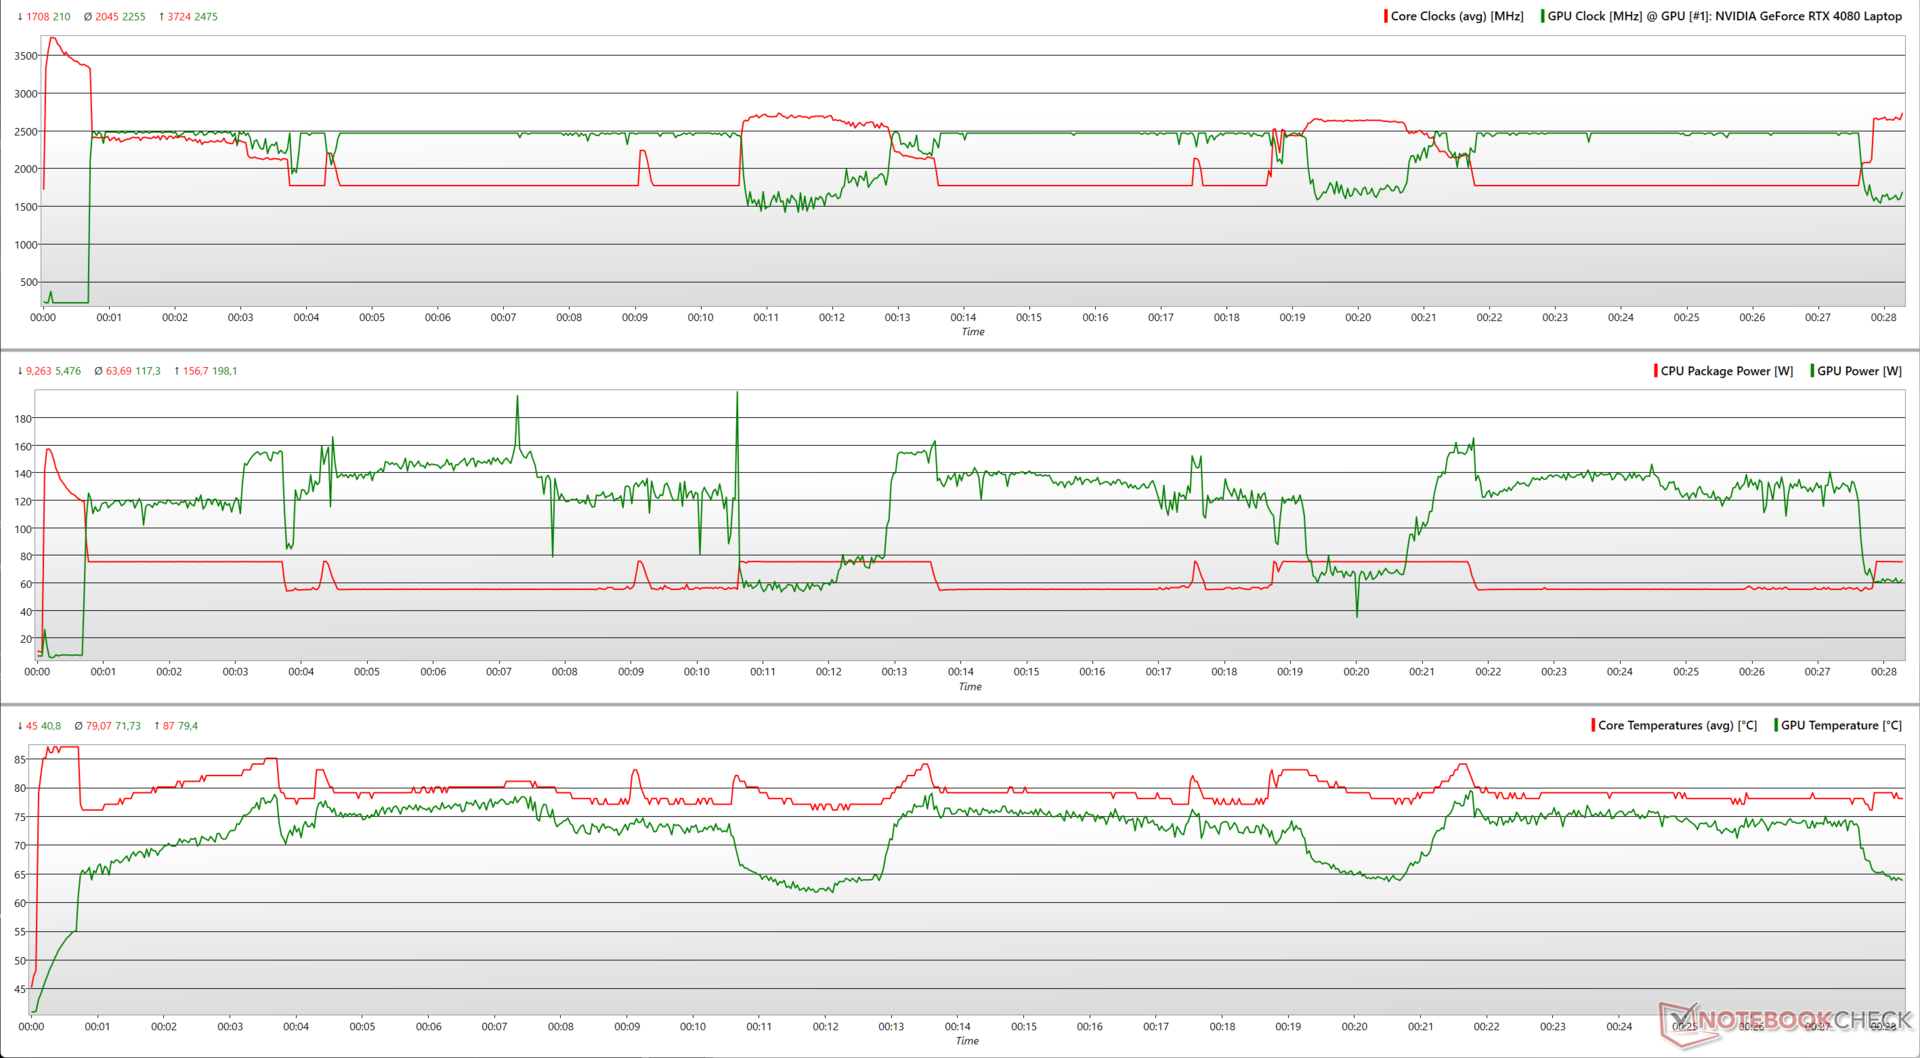
L'aggiunta di FurMark (1280 x 720, senza AA) vede la RTX 4080 dello Scar 16 assorbire momentaneamente 198 W. Il portatile può utilizzare una potenza totale combinata di 181 W in media sia con la CPU che con la GPU.
Tuttavia, abbiamo osservato una lotta per la potenza, in quanto la CPU doveva abbassarsi per consentire alla GPU di aumentare la potenza e viceversa.
| Stress Test | Clock CPU (GHz) | Clock GPU (MHz) | Temperatura media CPU (°C) | Temperatura media GPU (°C) |
| Sistema inattivo | 1,6 | 210 | 41 | 37,5 |
| Prime95 | 3,0 | 210 | 87 | 56 |
| Prime95 + FurMark | 2,7 | 1.500 | 78 | 70,4 |
| Il Witcher 3 1080p Ultra | 2,4 | 2.460 | 78 | 80,2 |
Sollecitando lo Scar 16 con The Witcher 3 a 1080p Ultra, il comportamento è più reale. Il Core i9-14900HX può raggiungere boost di 4 GHz a volte, consumando 81 W. La RTX 4080, d'altra parte, opera a 2.500 MHz ben sostenuti, utilizzando un consumo costante di ~170 W.
Altoparlanti
Lo Scar 16 utilizza un array di altoparlanti quadruplo con due tweeter vicino alla base del coperchio e due woofer che sparano verso il basso. Asus specifica il supporto per Hi-Res Audio e Dolby Atmos.
Il volume di 79 db(A) è sufficiente per una stanza di medie dimensioni. La risposta dei bassi è passabile, ma avrebbe potuto essere migliore considerando la presenza di woofer dedicati. I medi e gli alti sono riprodotti abbastanza bene.
La presenza di un jack audio combo da 3,5 mm e del Bluetooth 5.3 consente agli utenti di collegare dispositivi audio esterni molto più capaci.
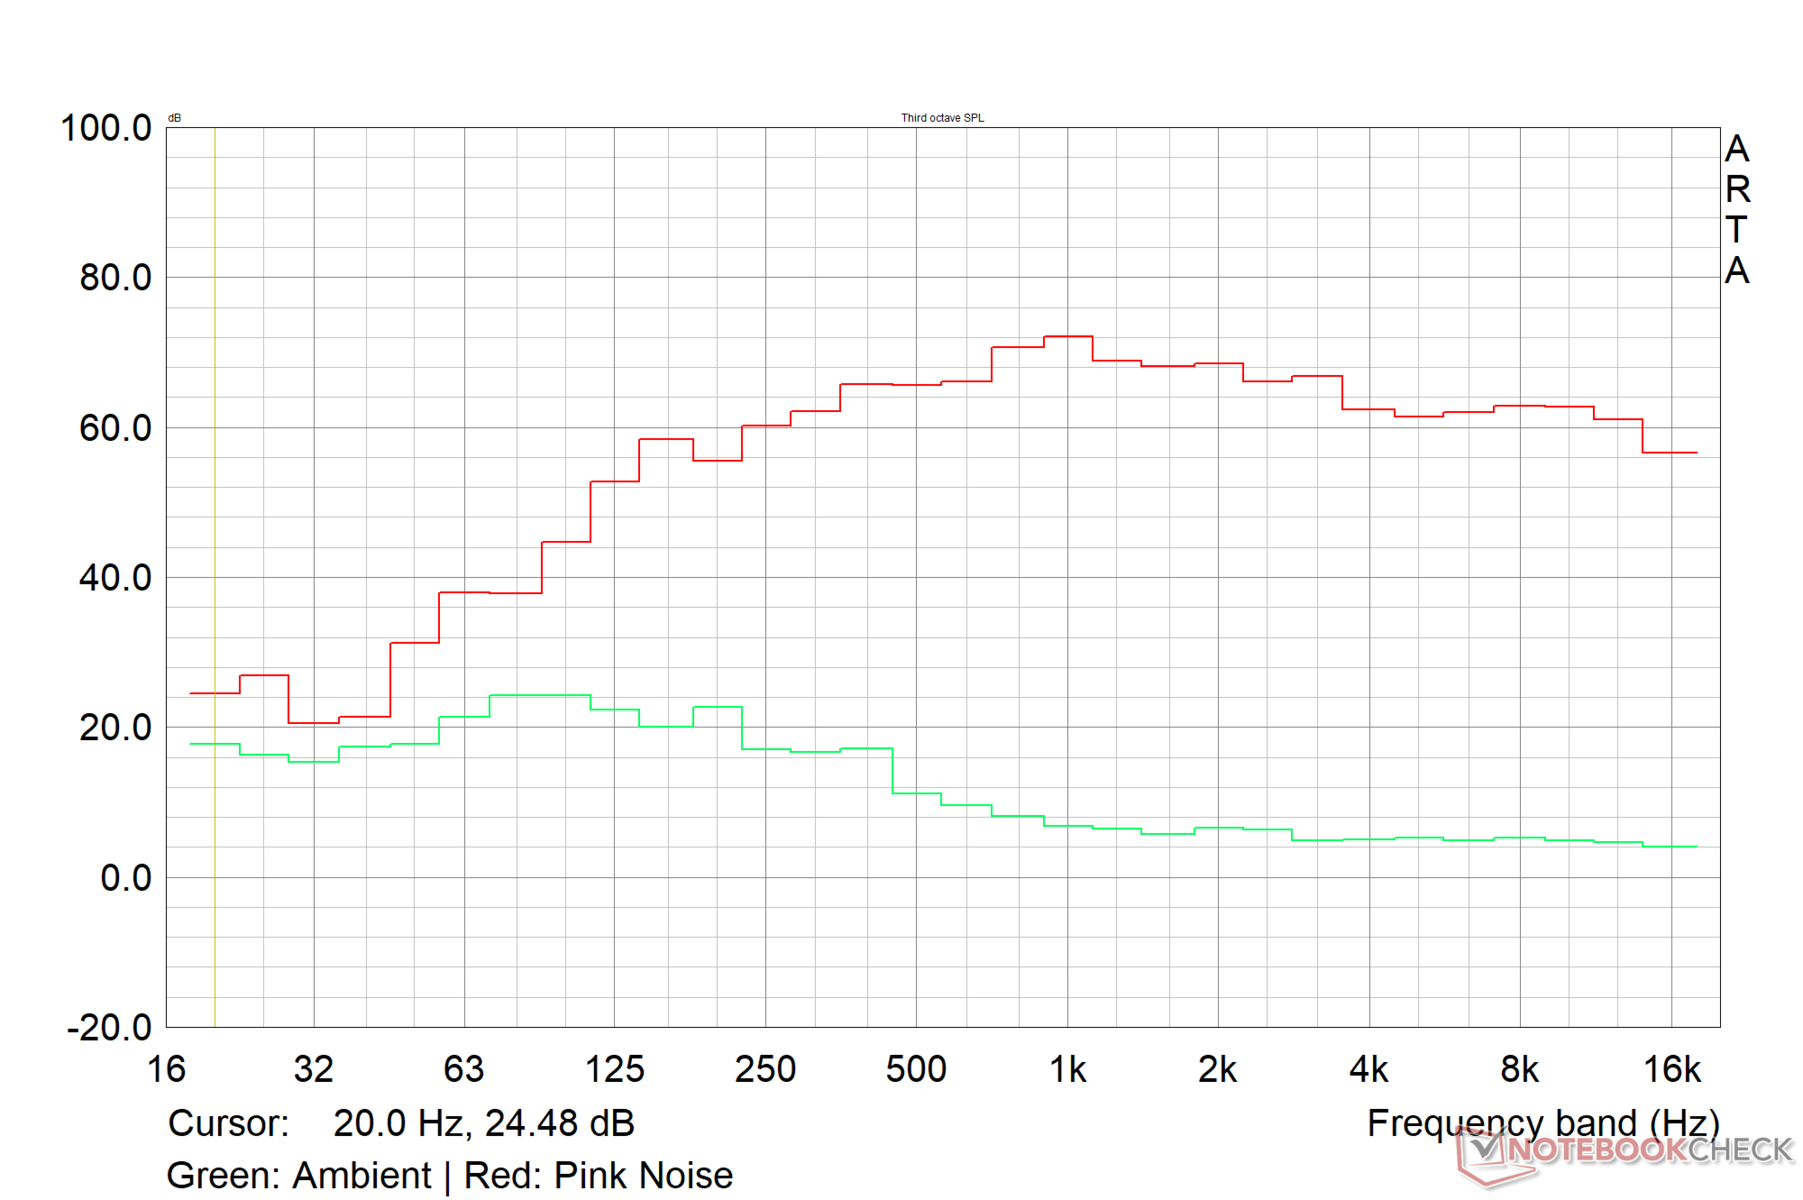
Asus ROG Strix Scar 16 G634JZR analisi audio
(±) | potenza degli altiparlanti media ma buona (79 dB)
Bassi 100 - 315 Hz
(±) | bassi ridotti - in media 7.1% inferiori alla media
(±) | la linearità dei bassi è media (9% delta rispetto alla precedente frequenza)
Medi 400 - 2000 Hz
(±) | medi elevati - circa 5.5% superiore alla media
(+) | medi lineari (3.3% delta rispetto alla precedente frequenza)
Alti 2 - 16 kHz
(+) | Alti bilanciati - appena 1.4% dalla media
(+) | alti lineari (2.6% delta rispetto alla precedente frequenza)
Nel complesso 100 - 16.000 Hz
(+) | suono nel complesso lineare (9.8% differenza dalla media)
Rispetto alla stessa classe
» 5% di tutti i dispositivi testati in questa classe è stato migliore, 1% simile, 94% peggiore
» Il migliore ha avuto un delta di 6%, medio di 18%, peggiore di 132%
Rispetto a tutti i dispositivi testati
» 4% di tutti i dispositivi testati in questa classe è stato migliore, 1% similare, 95% peggiore
» Il migliore ha avuto un delta di 4%, medio di 23%, peggiore di 134%
Apple MacBook Pro 16 2021 M1 Pro analisi audio
(+) | gli altoparlanti sono relativamente potenti (84.7 dB)
Bassi 100 - 315 Hz
(+) | bassi buoni - solo 3.8% dalla media
(+) | bassi in lineaa (5.2% delta rispetto alla precedente frequenza)
Medi 400 - 2000 Hz
(+) | medi bilanciati - solo only 1.3% rispetto alla media
(+) | medi lineari (2.1% delta rispetto alla precedente frequenza)
Alti 2 - 16 kHz
(+) | Alti bilanciati - appena 1.9% dalla media
(+) | alti lineari (2.7% delta rispetto alla precedente frequenza)
Nel complesso 100 - 16.000 Hz
(+) | suono nel complesso lineare (4.6% differenza dalla media)
Rispetto alla stessa classe
» 0% di tutti i dispositivi testati in questa classe è stato migliore, 0% simile, 100% peggiore
» Il migliore ha avuto un delta di 5%, medio di 17%, peggiore di 45%
Rispetto a tutti i dispositivi testati
» 0% di tutti i dispositivi testati in questa classe è stato migliore, 0% similare, 100% peggiore
» Il migliore ha avuto un delta di 4%, medio di 23%, peggiore di 134%
Gestione dell'energia: Sulle linee previste per l'hardware a bordo
Consumo di energia
La Scar 16 consuma leggermente di più rispetto alla ROG Strix G16 con un Core i9-13980HX. L'Omen 16 con una configurazione simile è circa l'8% più economico dello Scar 16 in generale, grazie alla CPU e alla GPU a basso wattaggio.
Il Vector 16 HX ha un consumo energetico identico sotto carico, anche se mostra un consumo energetico in idle notevolmente superiore.
L'alimentatore da 330 W in dotazione è in grado di mantenere il laptop adeguatamente alimentato in condizioni di massimo stress.
| Off / Standby | |
| Idle | |
| Sotto carico |
|
Leggenda:
min: | |
| Asus ROG Strix Scar 16 G634JZR i9-14900HX, GeForce RTX 4080 Laptop GPU, Mini LED, 2560x1600, 16" | Asus ROG Strix Scar 17 G733PYV-LL053X R9 7945HX3D, GeForce RTX 4090 Laptop GPU, IPS, 2560x1440, 17.3" | Asus ROG Strix G16 G614JZ i9-13980HX, GeForce RTX 4080 Laptop GPU, IPS, 2560x1600, 16" | Lenovo Legion Pro 7 16IRX9H i9-14900HX, GeForce RTX 4080 Laptop GPU, IPS, 2560x1600, 16" | HP Omen 16 (2024) i9-14900HX, GeForce RTX 4080 Laptop GPU, IPS, 2560x1440, 16.1" | MSI Vector 16 HX A14V i9-14900HX, GeForce RTX 4080 Laptop GPU, IPS, 2560x1600, 16" | Alienware m16 R2 Ultra 7 155H, GeForce RTX 4070 Laptop GPU, IPS, 2560x1600, 16" | Media NVIDIA GeForce RTX 4080 Laptop GPU | Media della classe Gaming | |
|---|---|---|---|---|---|---|---|---|---|
| Power Consumption | -8% | 3% | -20% | 8% | -16% | 16% | -21% | 1% | |
| Idle Minimum * (Watt) | 10.71 | 15.4 -44% | 10 7% | 16 -49% | 9 16% | 15.8 -48% | 8.1 24% | 16.9 ? -58% | 13 ? -21% |
| Idle Average * (Watt) | 14.75 | 21.6 -46% | 16 -8% | 21 -42% | 16 -8% | 23.3 -58% | 13 12% | 22 ? -49% | 18.7 ? -27% |
| Idle Maximum * (Watt) | 30 | 22.2 26% | 27 10% | 36 -20% | 35 -17% | 30 -0% | 40.3 -34% | 34.1 ? -14% | 24.3 ? 19% |
| Load Average * (Watt) | 135 | 116.7 14% | 129 4% | 132 2% | 129 4% | 123.9 8% | 79 41% | 117.9 ? 13% | 110.2 ? 18% |
| Witcher 3 ultra * (Watt) | 286 | 262 8% | 247 14% | 267 7% | 150.8 47% | 285 -0% | 188.1 34% | ||
| Load Maximum * (Watt) | 307 | 327.1 -7% | 342 -11% | 360 -17% | 285 7% | 306 -0% | 254.9 17% | 297 ? 3% | 258 ? 16% |
| Cyberpunk 2077 ultra external monitor * (Watt) | 272 |
* ... Meglio usare valori piccoli
Power Consumption: The Witcher 3 / Stress test
Power Consumption: External monitor
Durata della batteria
Nel profilo Silent con MSHybrid abilitato e una frequenza di aggiornamento di 60 Hz, lo Scar 16 dura fino a 7:14 ore nel nostro test standardizzato di navigazione web Wi-Fi con una luminosità di 150 nits. La durata sale a 7,5 ore nel test H.264 1080p in loop allo stesso livello di luminosità, con tutte le radio disattivate.
Giocare per molte ore a batteria con lo Scar 16 è un sogno irrealizzabile, poiché il portatile dura a malapena un'ora giocando a The Witcher 3 1080p Ultra a 150 nits.
| Asus ROG Strix Scar 16 G634JZR i9-14900HX, GeForce RTX 4080 Laptop GPU, 90 Wh | Asus ROG Strix Scar 17 G733PYV-LL053X R9 7945HX3D, GeForce RTX 4090 Laptop GPU, 90 Wh | Asus ROG Strix G16 G614JZ i9-13980HX, GeForce RTX 4080 Laptop GPU, 90 Wh | Lenovo Legion Pro 7 16IRX9H i9-14900HX, GeForce RTX 4080 Laptop GPU, 99.9 Wh | HP Omen 16 (2024) i9-14900HX, GeForce RTX 4080 Laptop GPU, 83 Wh | MSI Vector 16 HX A14V i9-14900HX, GeForce RTX 4080 Laptop GPU, 90 Wh | Alienware m16 R2 Ultra 7 155H, GeForce RTX 4070 Laptop GPU, 90 Wh | Media della classe Gaming | |
|---|---|---|---|---|---|---|---|---|
| Autonomia della batteria | -22% | 29% | -14% | -18% | 16% | 12% | 27% | |
| H.264 (h) | 7.5 | 5 -33% | 8.64 ? 15% | |||||
| WiFi v1.3 (h) | 7.2 | 4.8 -33% | 9.7 35% | 6.2 -14% | 5.9 -18% | 5.5 -24% | 8.1 13% | 7.15 ? -1% |
| Witcher 3 ultra (h) | 1 | |||||||
| Load (h) | 0.9 | 0.9 0% | 1.1 22% | 1.4 56% | 1 11% | 1.502 ? 67% | ||
| Reader / Idle (h) | 10.7 | 12.6 | 8.71 ? |
Pro
Contro
Verdetto: Il consueto aggiornamento iterativo per i giocatori appassionati
Asus si attiene alla formula collaudata che distingue lo Scar 16 dalla concorrenza. In questo senso, l'Asus ROG Strix Scar 16 di quest'anno è solo un aggiornamento evolutivo ma non rivoluzionario rispetto alla generazione precedente.
Con lo Scar 16, Asus offre un display mini LED G-Sync HDR di qualità superiore. Il display ad alta frequenza PWM da 240 Hz presenta eccellenti caratteristiche cromatiche ed è perfettamente adatto anche ai flussi di lavoro critici dal punto di vista del colore, sebbene nella modalità di retroilluminazione a zona singola. Purtroppo, questo non è ben documentato.
L'Asus ROG Strix Scar 16 soddisfa quasi tutte le esigenze di un computer portatile da 16 pollici per appassionati di giochi nel 2024. I suoi colleghi, tuttavia, offrono caratteristiche e prestazioni simili a un prezzo inferiore.
Dal punto di vista delle prestazioni, il ROG Strix Scar 16 è in grado di competere con altri portatili con Core i9-14900HX e RTX 4080.
Le modifiche apportate da Asus al raffreddamento consentono allo Scar 16 di utilizzare 180 W combinati da CPU e GPU sotto carico. Tuttavia, spingendo il laptop così in là si ottengono inevitabilmente temperature superficiali elevate ed emissioni di rumore della ventola.
Alcuni problemi che vorremmo venissero affrontati includono migliori prestazioni del Wi-Fi 5 e una distribuzione più equa delle porte su entrambi i lati. Inoltre, l'inclusione di una webcam a 1080p in questo modello non dovrebbe essere troppo impegnativa per Asus nel 2024.
Se sta cercando una potenza di gioco da 16 pollici con circa ₹3,00,00 (~US$3.000) da spendere, l'Asus ROG Strix Scar 16 si adatta quasi perfettamente alla situazione. Tuttavia, non è l' affare più ideale.
Lenovo Legion Pro 7 ha un profilo più sottile, una batteria più grande (con un tempo di esecuzione inferiore) e una webcam 1080p nettamente superiore, pur avendo prestazioni leggermente migliori dal punto di vista della CPU.
MSI Vector 16 HX, pur non avendo alcune delle caratteristiche RGB e G-Sync aggiunte, ha un prezzo leggermente inferiore e corrisponde alle prestazioni dello Scar 16 nella maggior parte degli aspetti.
Prezzo e disponibilità
In India, l'Asus ROG Strix Scar 16 (2024) con RTX 4080 ha un prezzo ufficiale di ₹2.89.990, ma attualmente è in vendita a ₹3.04.490 su Amazon India, mentre la versione RTX 4090 è disponibile al prezzo designato di ₹3.29.990.
La ROG Strix Scar 16 (2024) testata con un SSD da 1 TB e RTX 4080 può essere acquistata a 2.900 dollari su Amazon US e Best Buy US, mentre la variante RTX 4090 le costerà 3.625 dollari.
Asus ROG Strix Scar 16 G634JZR
- 04/22/2024 v7 (old)
Vaidyanathan Subramaniam
Transparency
La selezione dei dispositivi da recensire viene effettuata dalla nostra redazione. Il campione di prova è stato fornito all'autore come prestito dal produttore o dal rivenditore ai fini di questa recensione. L'istituto di credito non ha avuto alcuna influenza su questa recensione, né il produttore ne ha ricevuto una copia prima della pubblicazione. Non vi era alcun obbligo di pubblicare questa recensione. In quanto società mediatica indipendente, Notebookcheck non è soggetta all'autorità di produttori, rivenditori o editori.
Ecco come Notebookcheck esegue i test
Ogni anno, Notebookcheck esamina in modo indipendente centinaia di laptop e smartphone utilizzando procedure standardizzate per garantire che tutti i risultati siano comparabili. Da circa 20 anni sviluppiamo continuamente i nostri metodi di prova e nel frattempo stabiliamo gli standard di settore. Nei nostri laboratori di prova, tecnici ed editori esperti utilizzano apparecchiature di misurazione di alta qualità. Questi test comportano un processo di validazione in più fasi. Il nostro complesso sistema di valutazione si basa su centinaia di misurazioni e parametri di riferimento ben fondati, che mantengono l'obiettività.Price comparison

