
Il verdetto
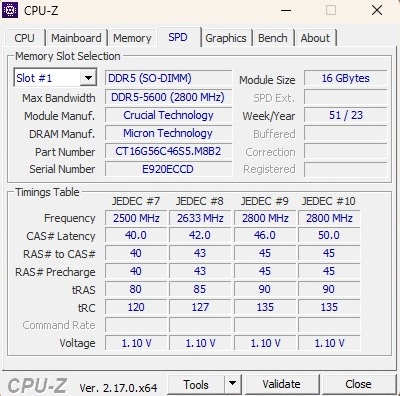
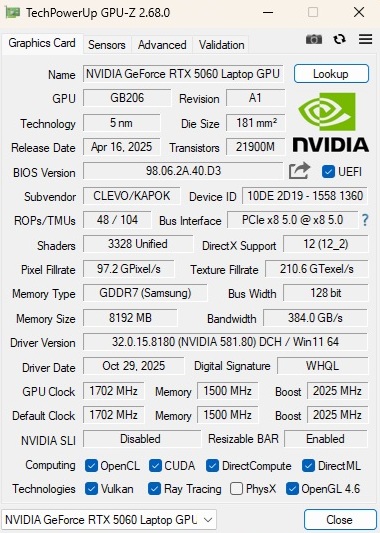
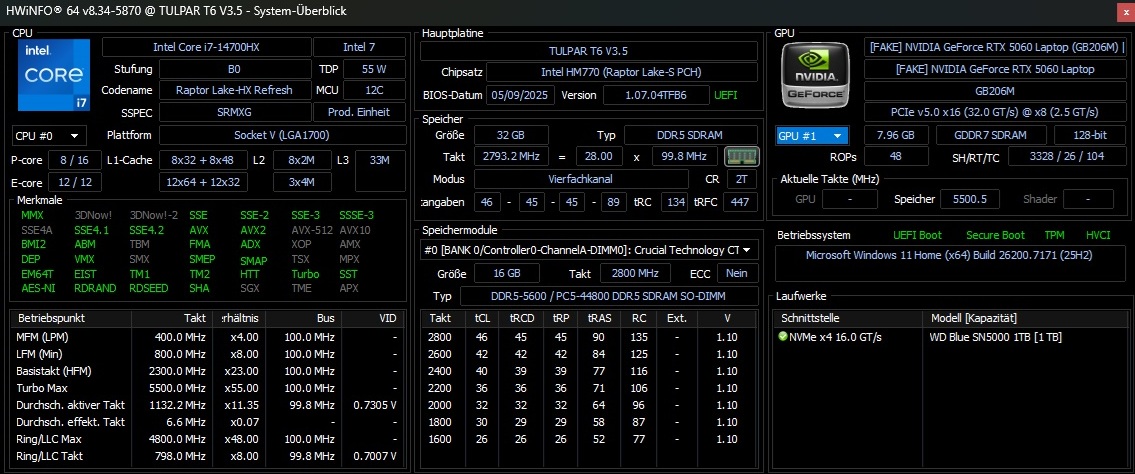
Se sta cercando un portatile da gioco attuale nella fascia dei 1.000 euro, il T6 V3.5 di Tulpar Notebook potrebbe fare al caso suo. Con la RTX 5060 di GeForce, il modello da 16 pollici offre una solida GPU di fascia media abbinata a un veloce Core i7-14700HX (che però perde un po' di prestazioni sotto carico sostenuto). La nostra unità di prova comprendeva anche 32 GB di RAM DDR5 (2×16 GB) e un SSD NVMe da 1 TB.
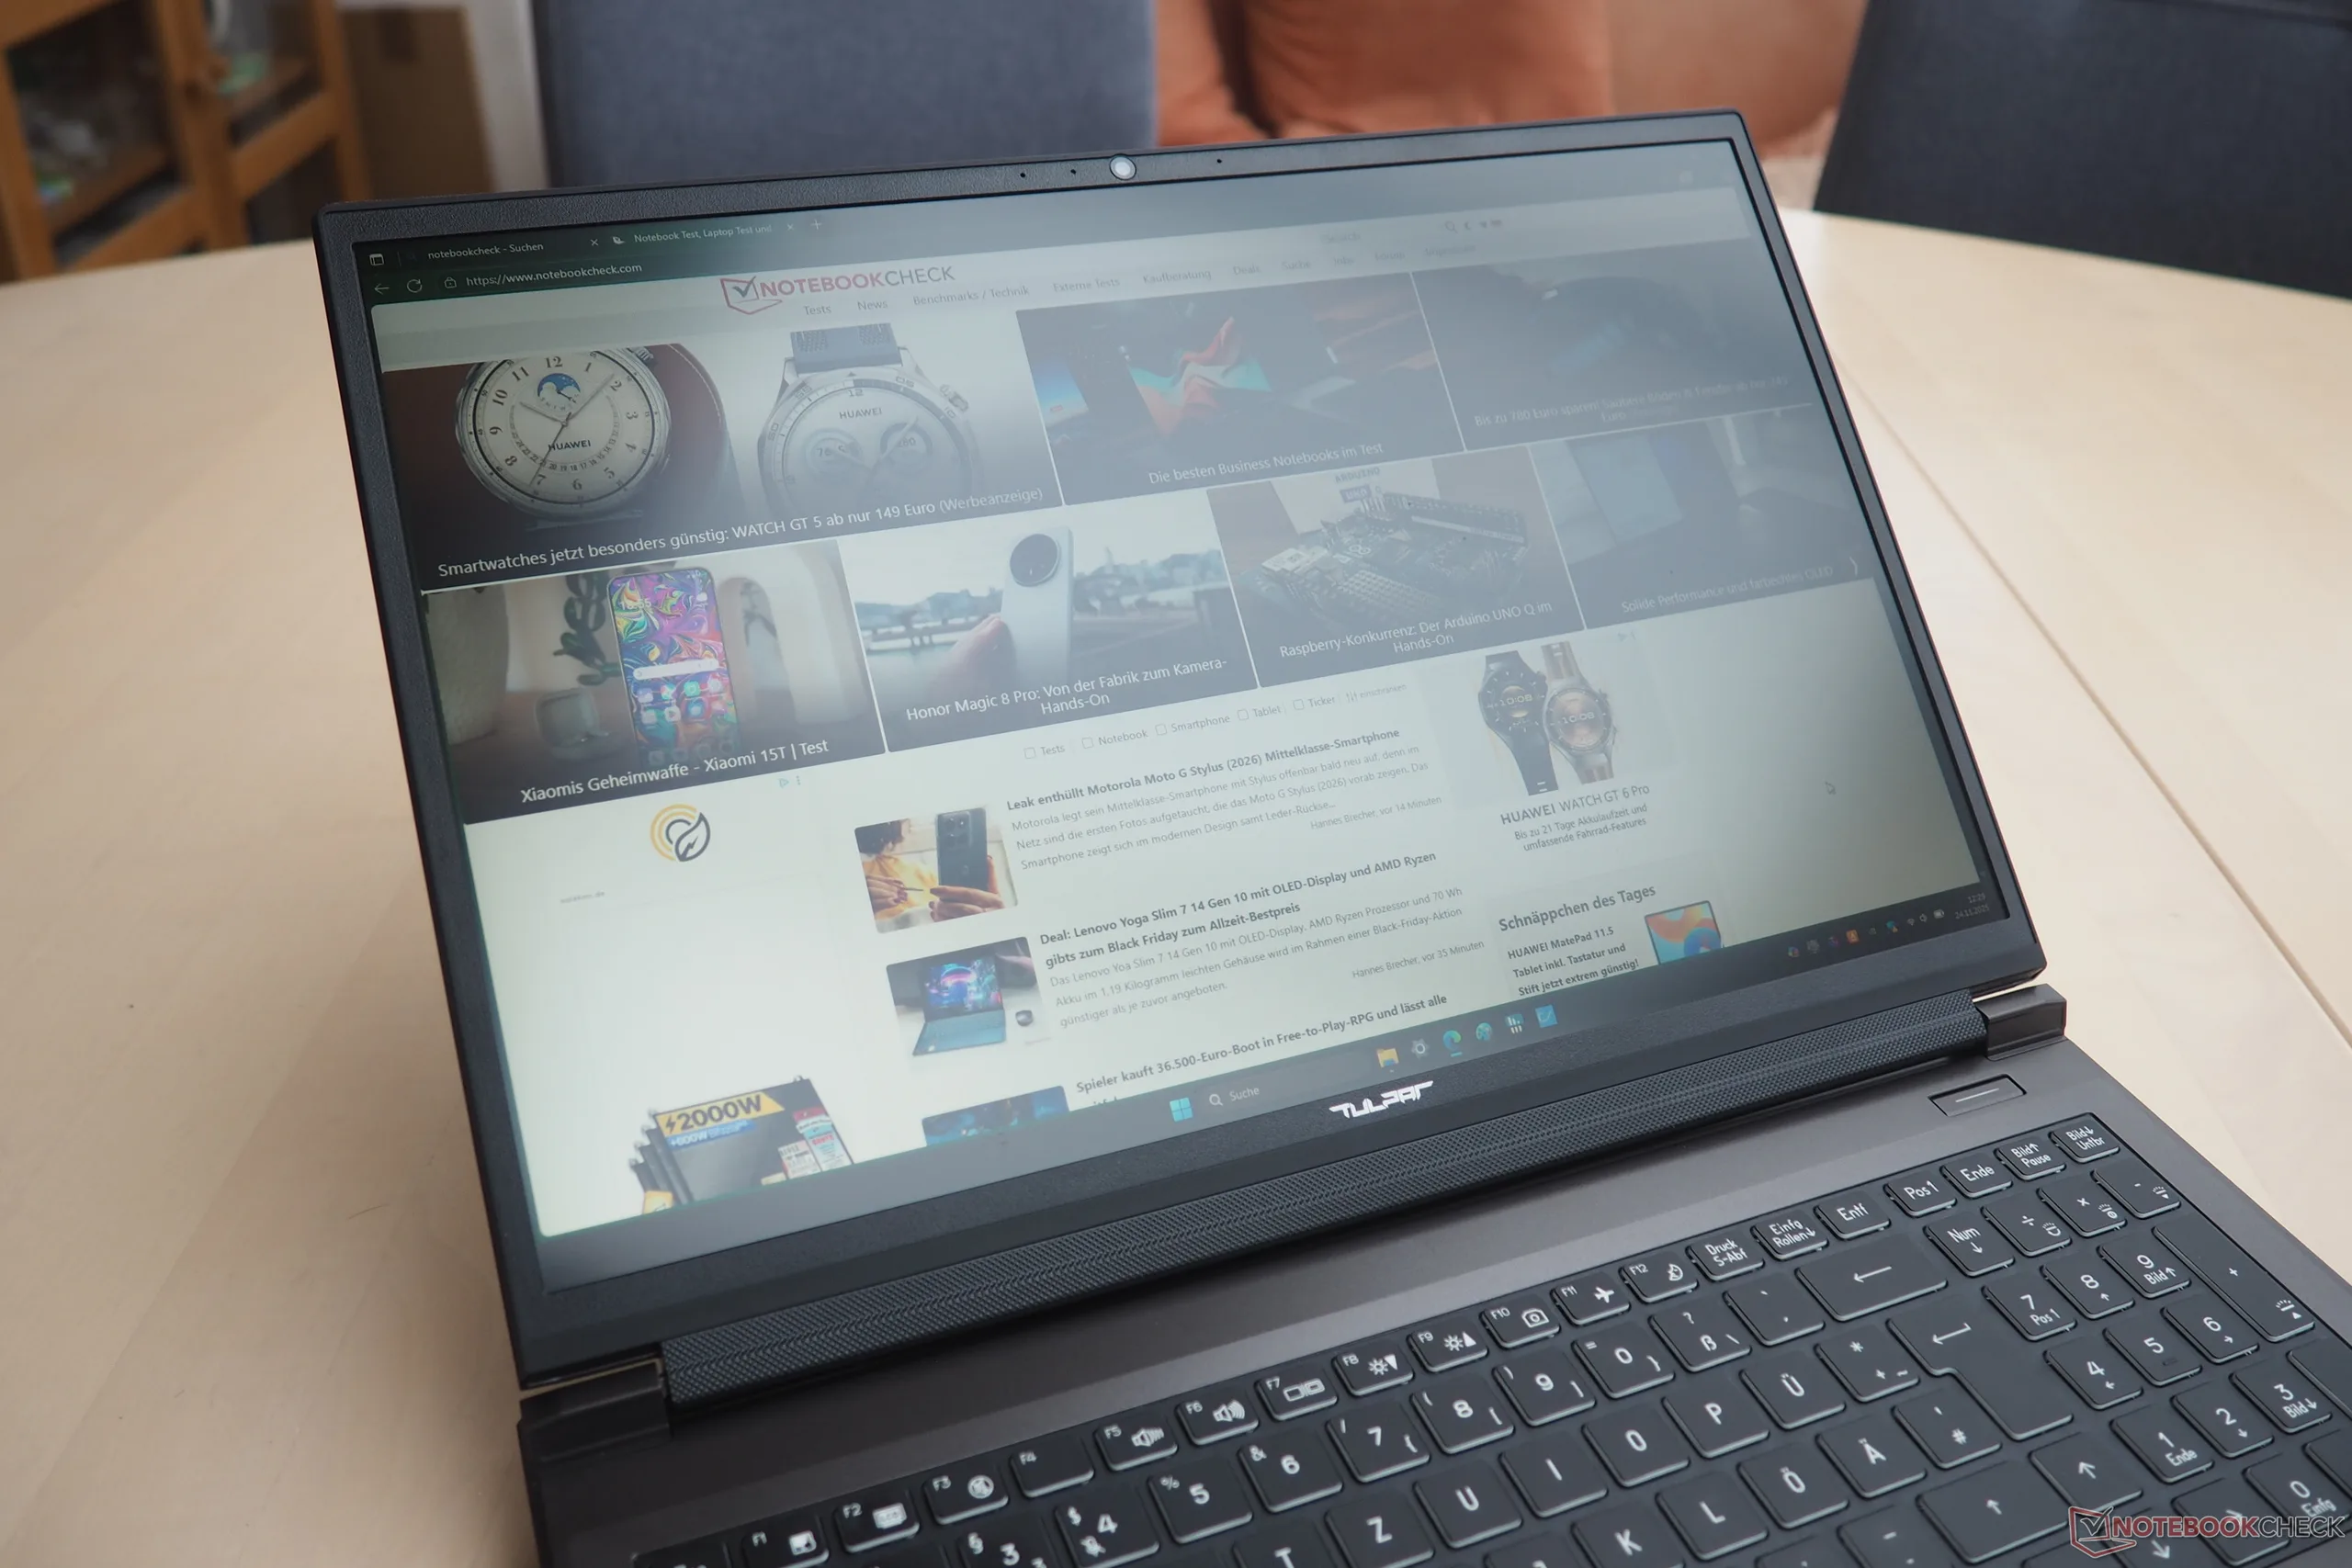
Gli acquirenti possono aspettarsi una dotazione standard per quanto riguarda l'involucro. Il telaio è interamente in plastica e ha un design piuttosto sobrio. C'è spazio per miglioramenti anche in termini di connettività (niente lettore di schede, niente USB4). Il display soddisfa le aspettative per questo segmento di prezzo. Il pannello IPS da 165 Hz (1.920 × 1.200 pixel) offre una luminosità utilizzabile e una copertura dello spazio colore abbastanza buona, cosa che non tutti i concorrenti possono vantare (ne parleremo tra poco). Le emissioni, compresi i livelli di temperatura e di rumore, sono generalmente in linea con altri computer portatili da gioco, anche se il controllo della ventola potrebbe essere migliore.
Nel complesso, il Tulpar T6 V3.5 rimane competitivo con i marchi più noti e vale la pena prenderlo in considerazione.
Pro
Contro
Prezzo e disponibilità
Il Tulpar T6 V3.5 è attualmente disponibile a partire da circa 1.160 euro (circa 1.345 dollari) sul sito web del produttore.
Nota del traduttore: i computer portatili di Monster non sono ancora ufficialmente disponibili in Nord America.
I concorrenti del Tulpar T6 V3.5 comprendono il Acer Nitro V 16 AIe l'Alienware 16 Aurora Alienware 16 Aurora e il HP Omen 16, tutti con un prezzo ragionevole. Il modello leggermente più costoso Gigabyte Gaming A16 con una RTX 5070 e l'attuale modello di riferimento RTX 5060, il modello Lenovo Legion 5, compaiono anche nelle nostre tabelle di confronto.
Specifiche
Caso
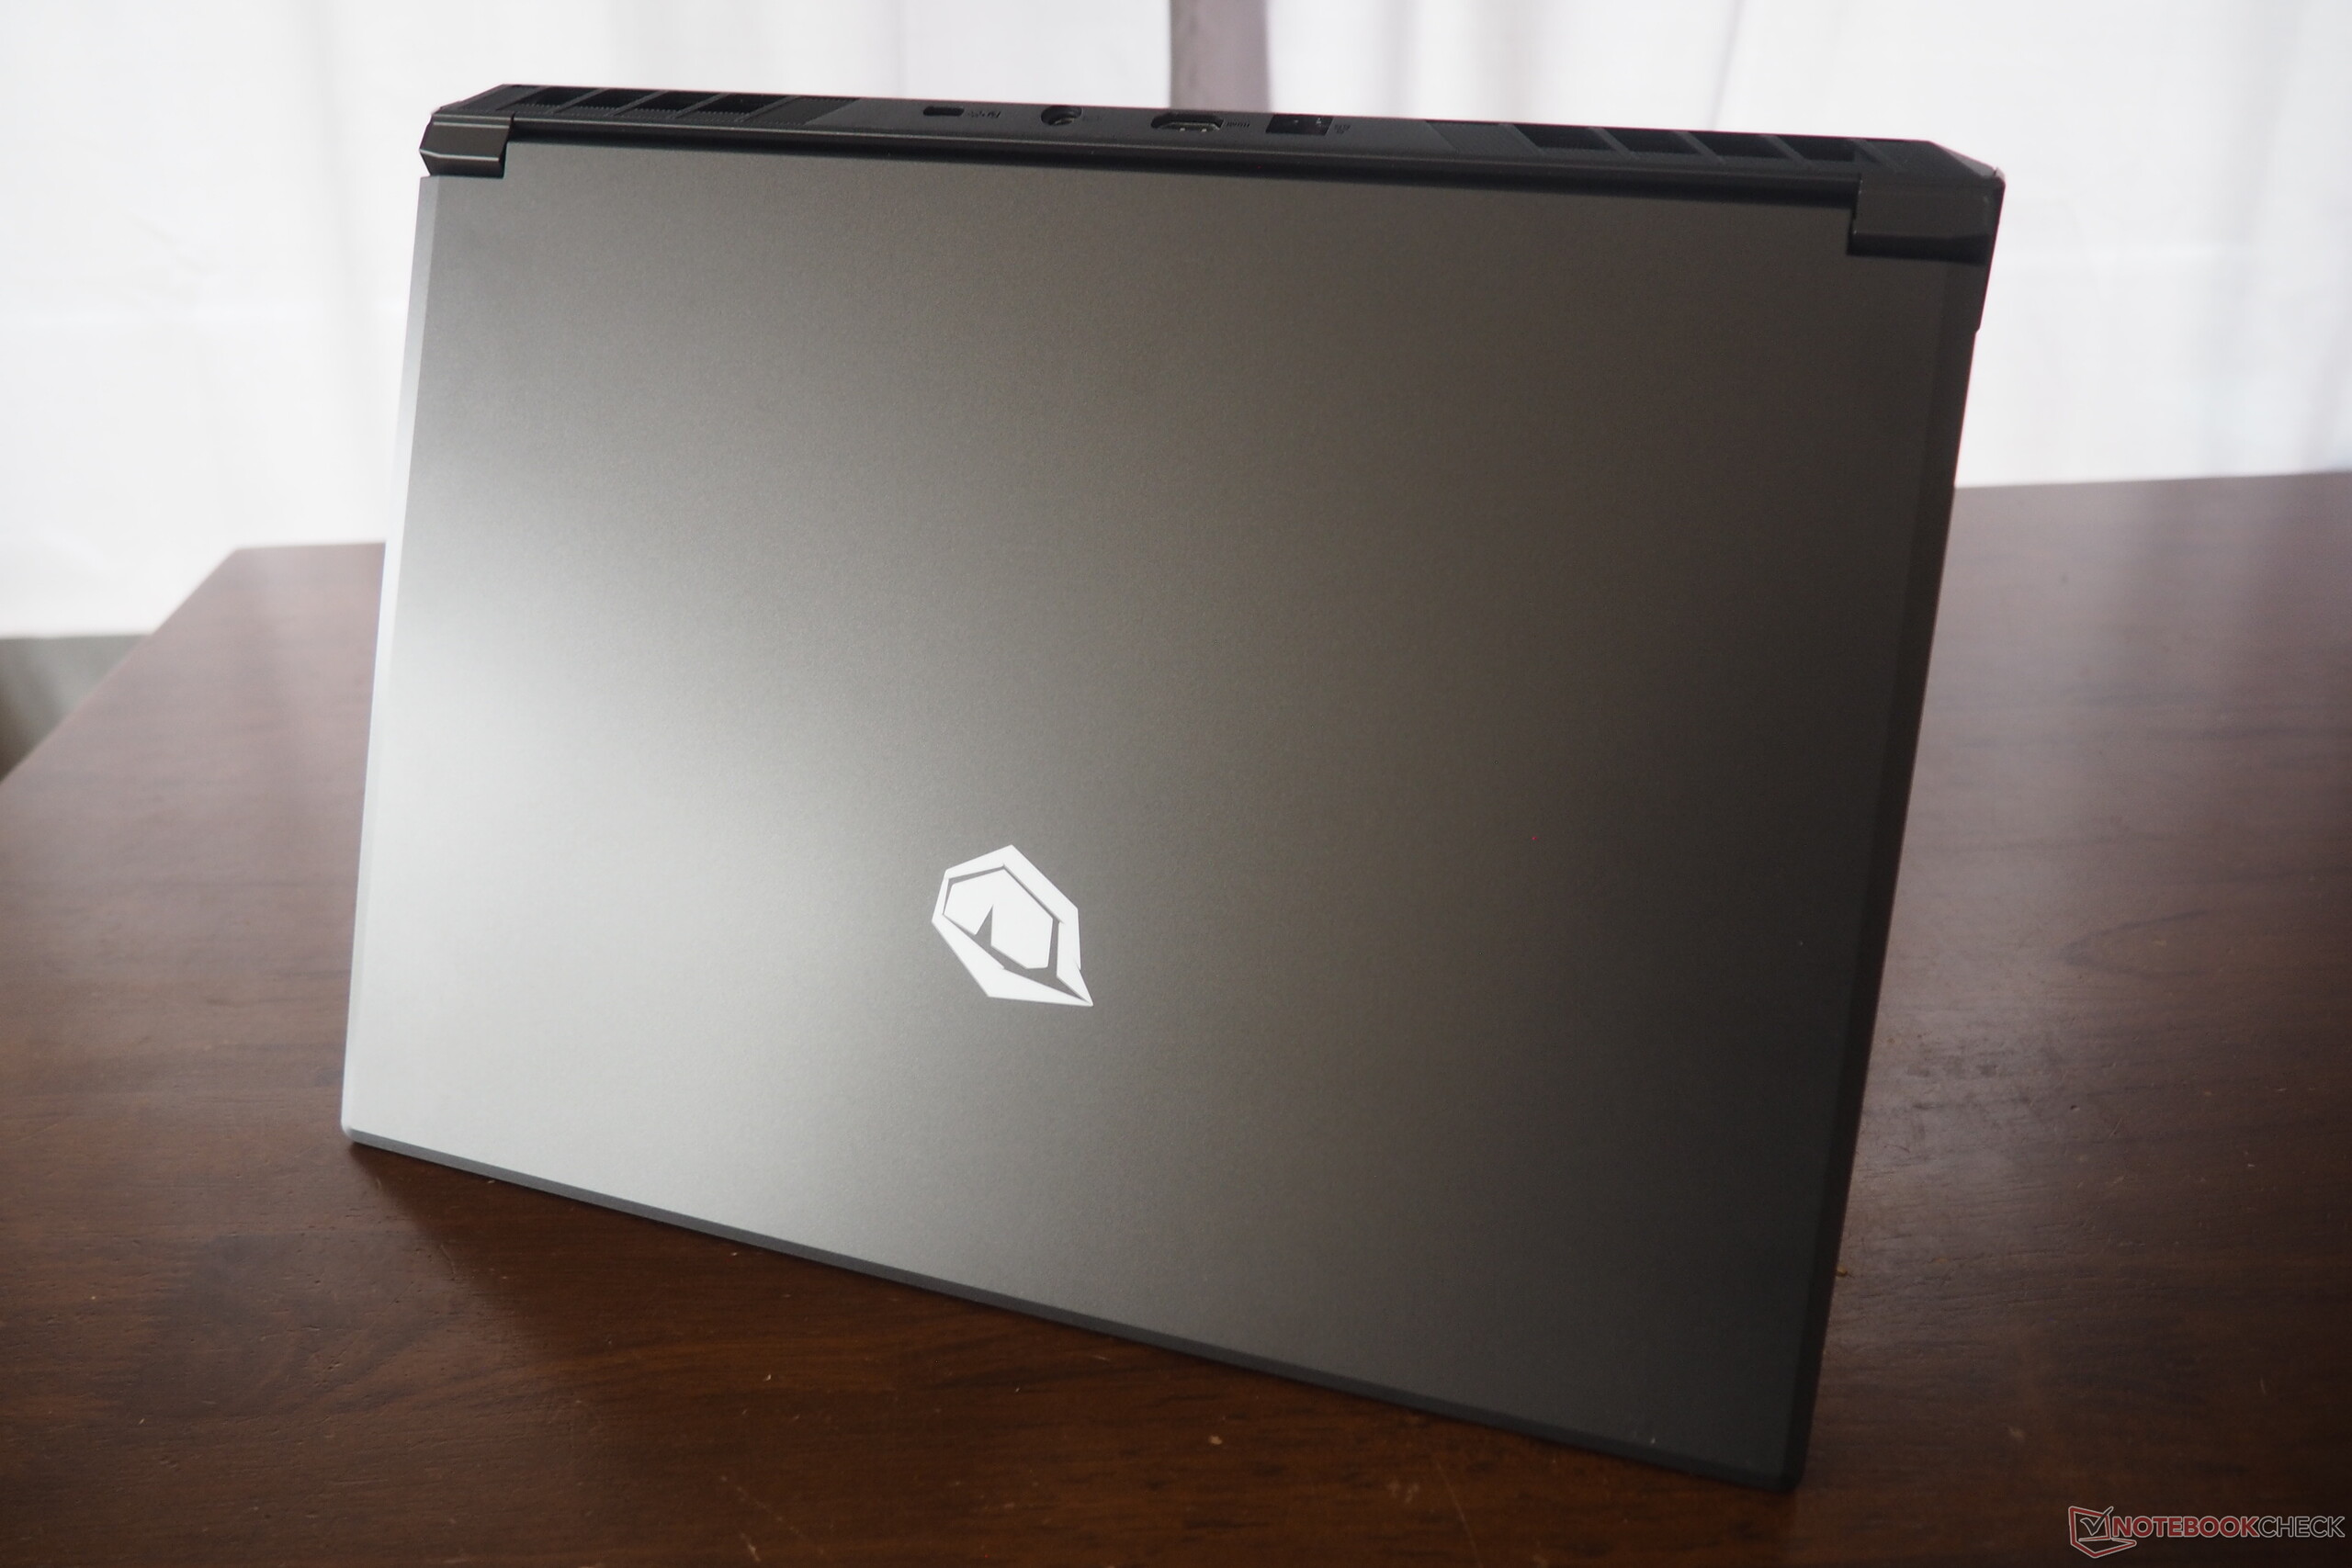
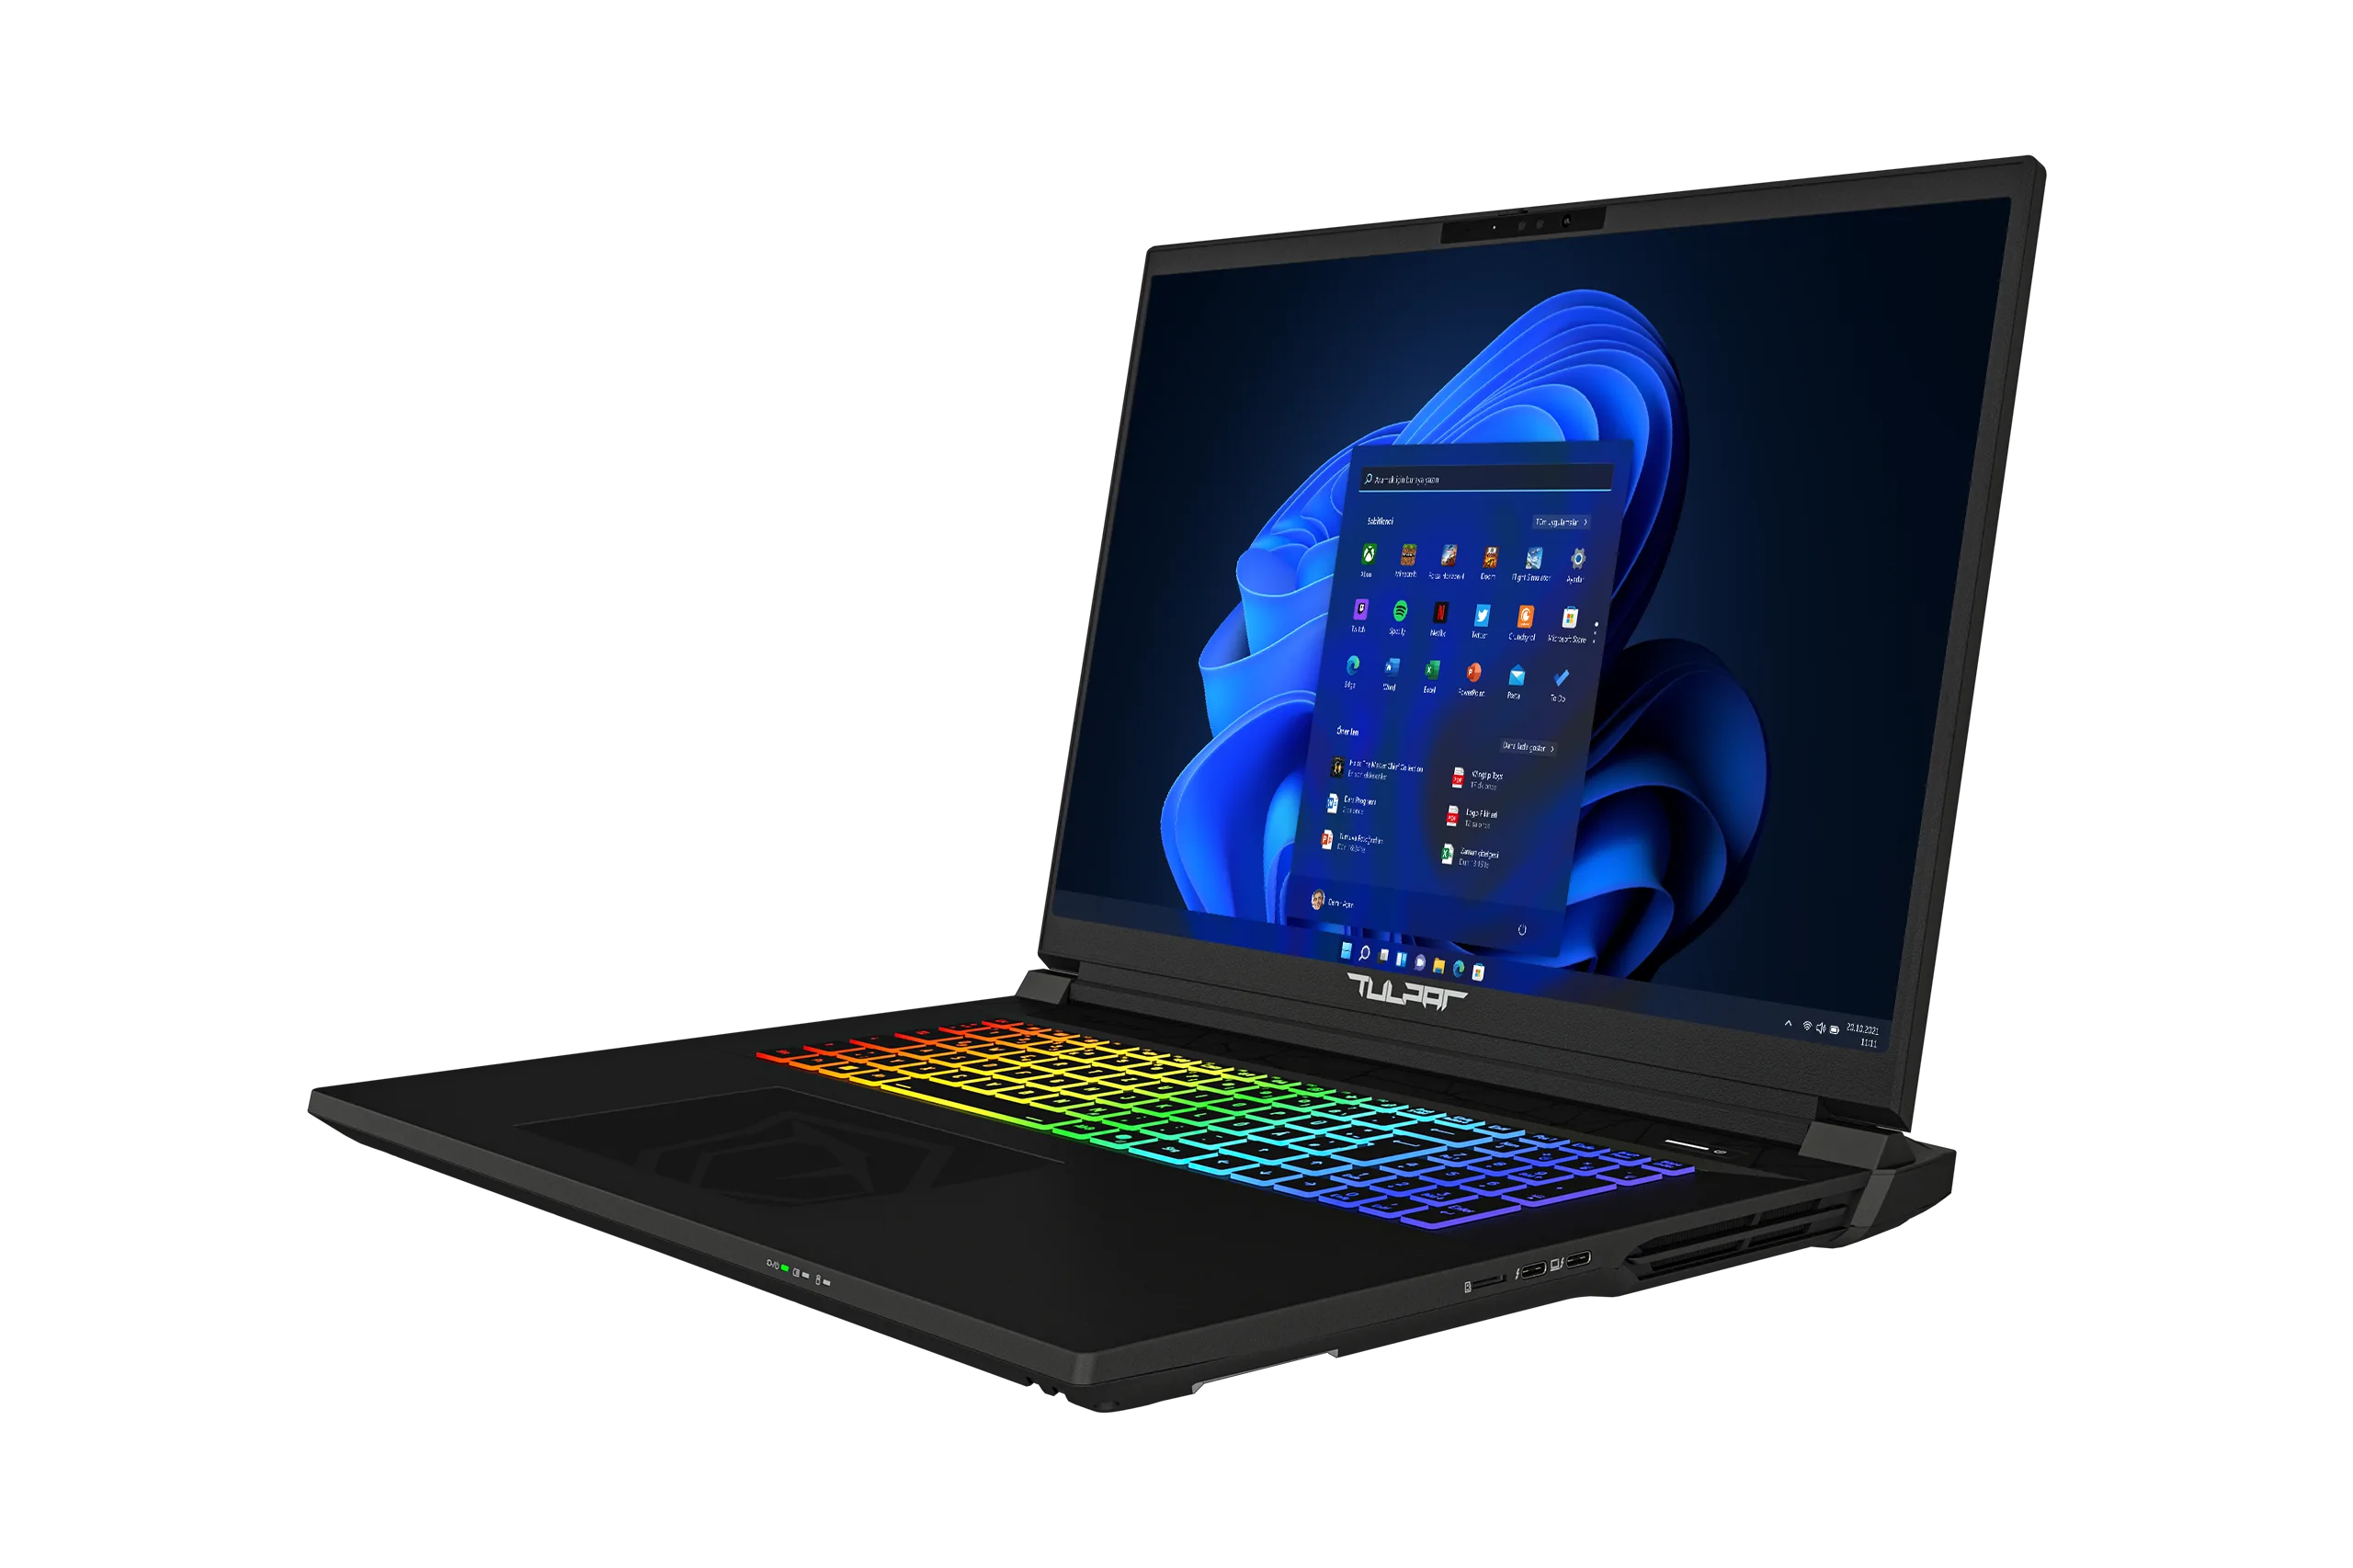
L'alloggiamento in plastica offre una stabilità più che dignitosa ed è rifinito con cura nella maggior parte delle aree. Le cerniere funzionano per lo più in modo discreto, anche se l'angolo di apertura massimo di circa 135° non è particolarmente generoso. Le superfici grigio scuro conferiscono al portatile un aspetto abbastanza discreto, se la retroilluminazione della tastiera è disattivata.
Con un peso di 2,4 kg, il T6 V3.5 è in linea con gli altri concorrenti da 16 pollici, che variano da 2,3 a 2,6 kg, a parte il più leggero Legion 5. Anche lo spessore di 2,5 cm è tipico di questa classe.
Attrezzatura
Connessioni
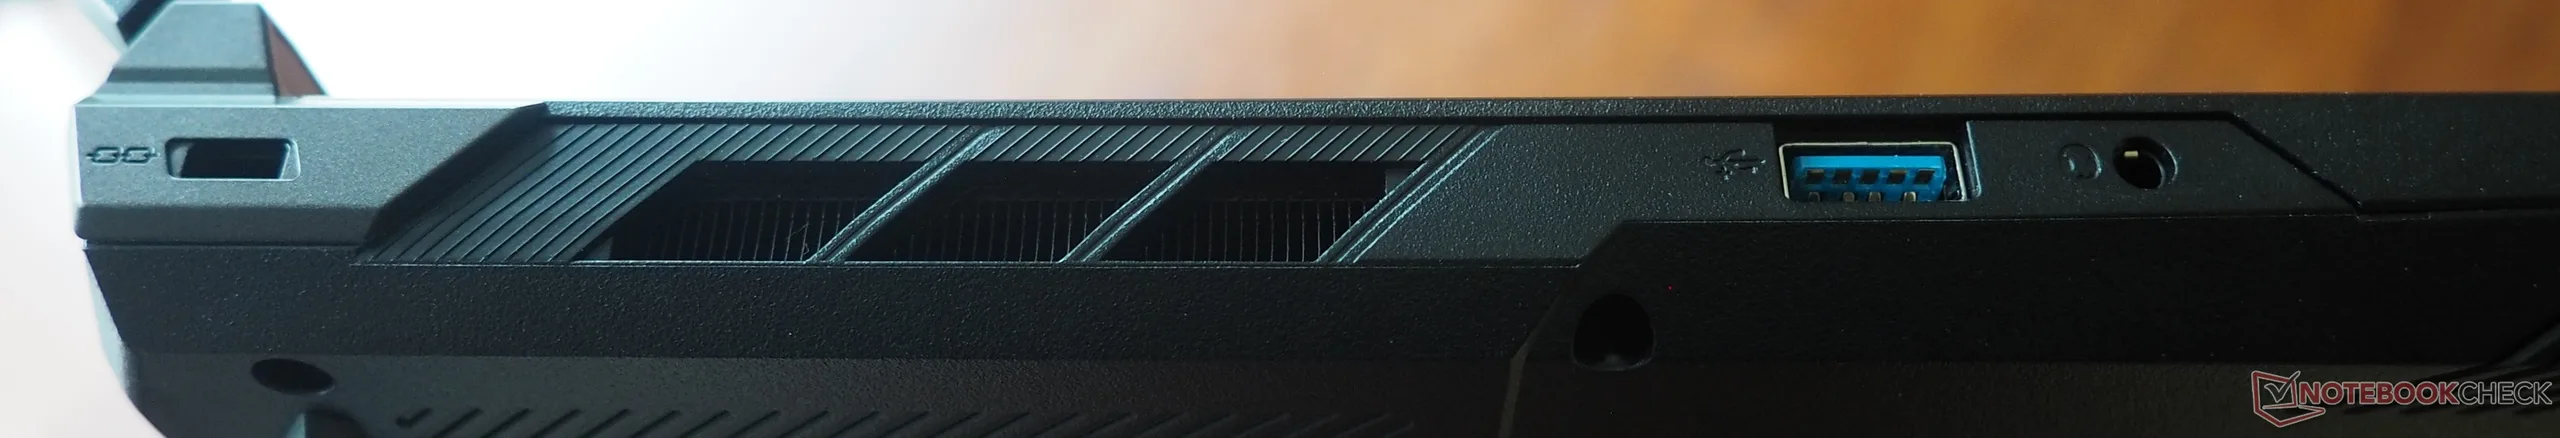
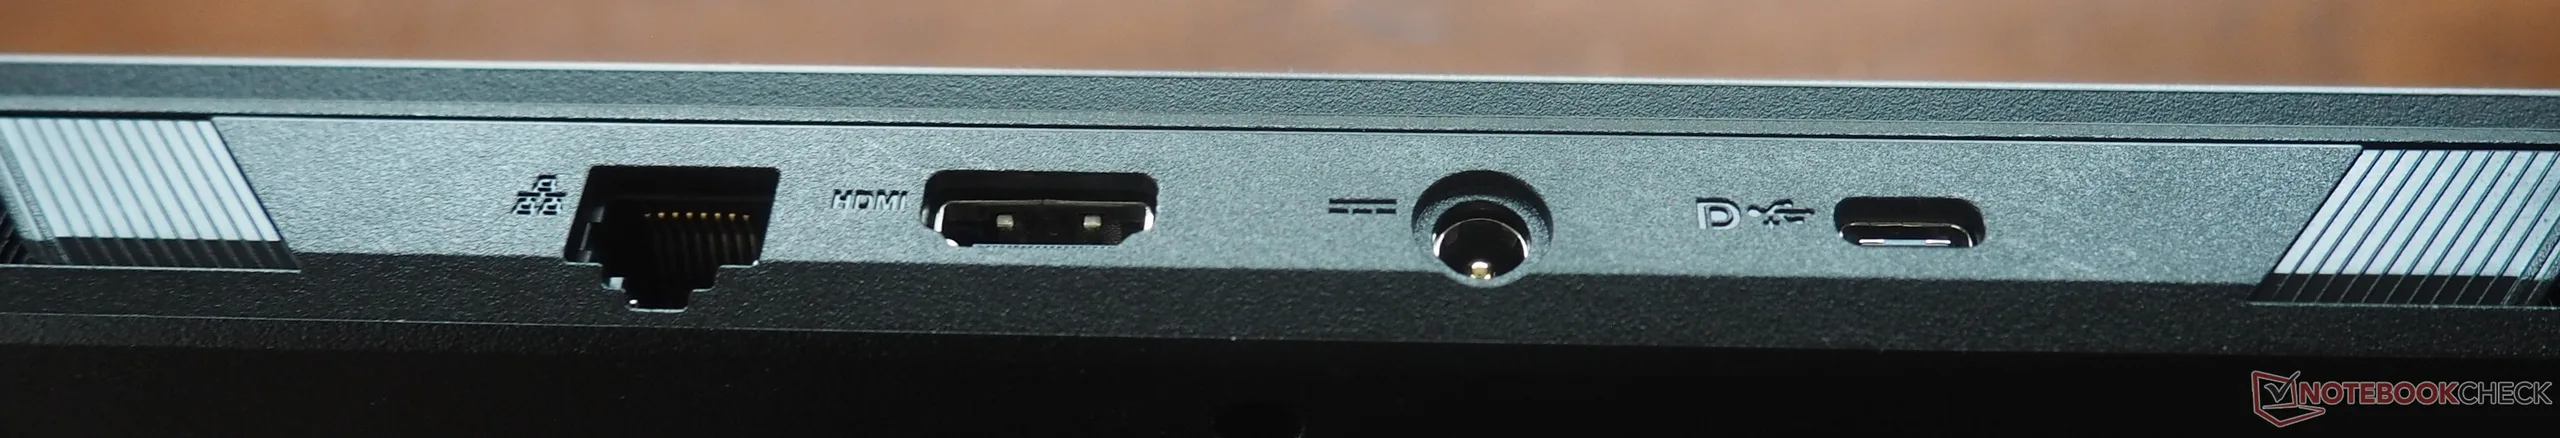
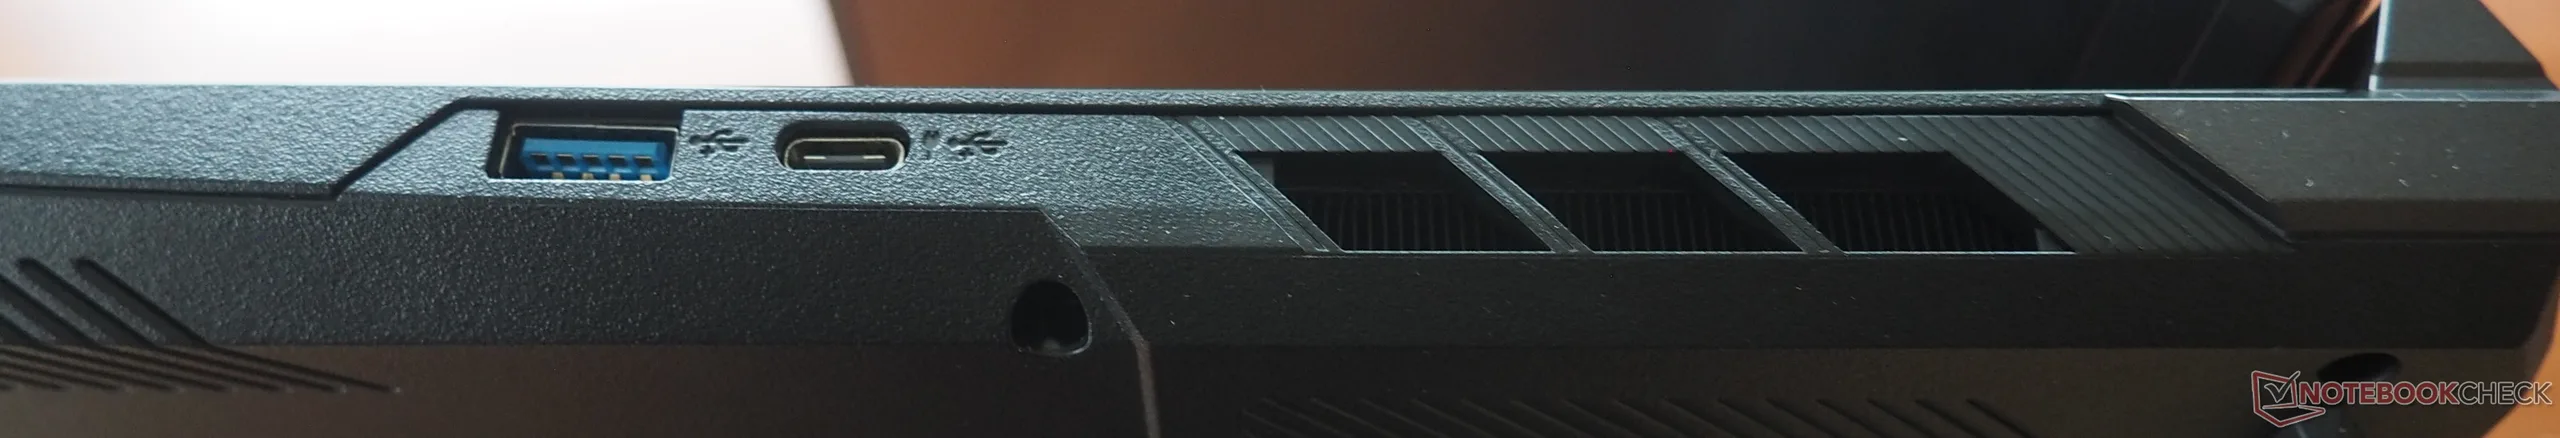
Le porte sono distribuite su quasi tutti i lati dello chassis. Sebbene manchi di USB 4 o Thunderbolt, il sistema offre comunque quattro porte USB (due di tipo-A e due di tipo-C). I display esterni si collegano più facilmente tramite HDMI. Sono inclusi anche una porta LAN Gigabit, un jack per cuffie e uno slot per il lucchetto Kensington.
Comunicazione
Il modulo wireless integrato è un'opzione più veloce. Il Wi-Fi 6E AX211 di Intel offre prestazioni da solide a eccellenti nei test di trasmissione e ricezione.
Webcam
La qualità dell'immagine della webcam è meno impressionante, che - come per molti computer portatili - avrebbe potuto essere migliorata con una risoluzione più elevata.


Accessori
Il notebook viene fornito con alcuni opuscoli informativi, un panno per la pulizia e un alimentatore di medie dimensioni da 230 watt.
Manutenzione
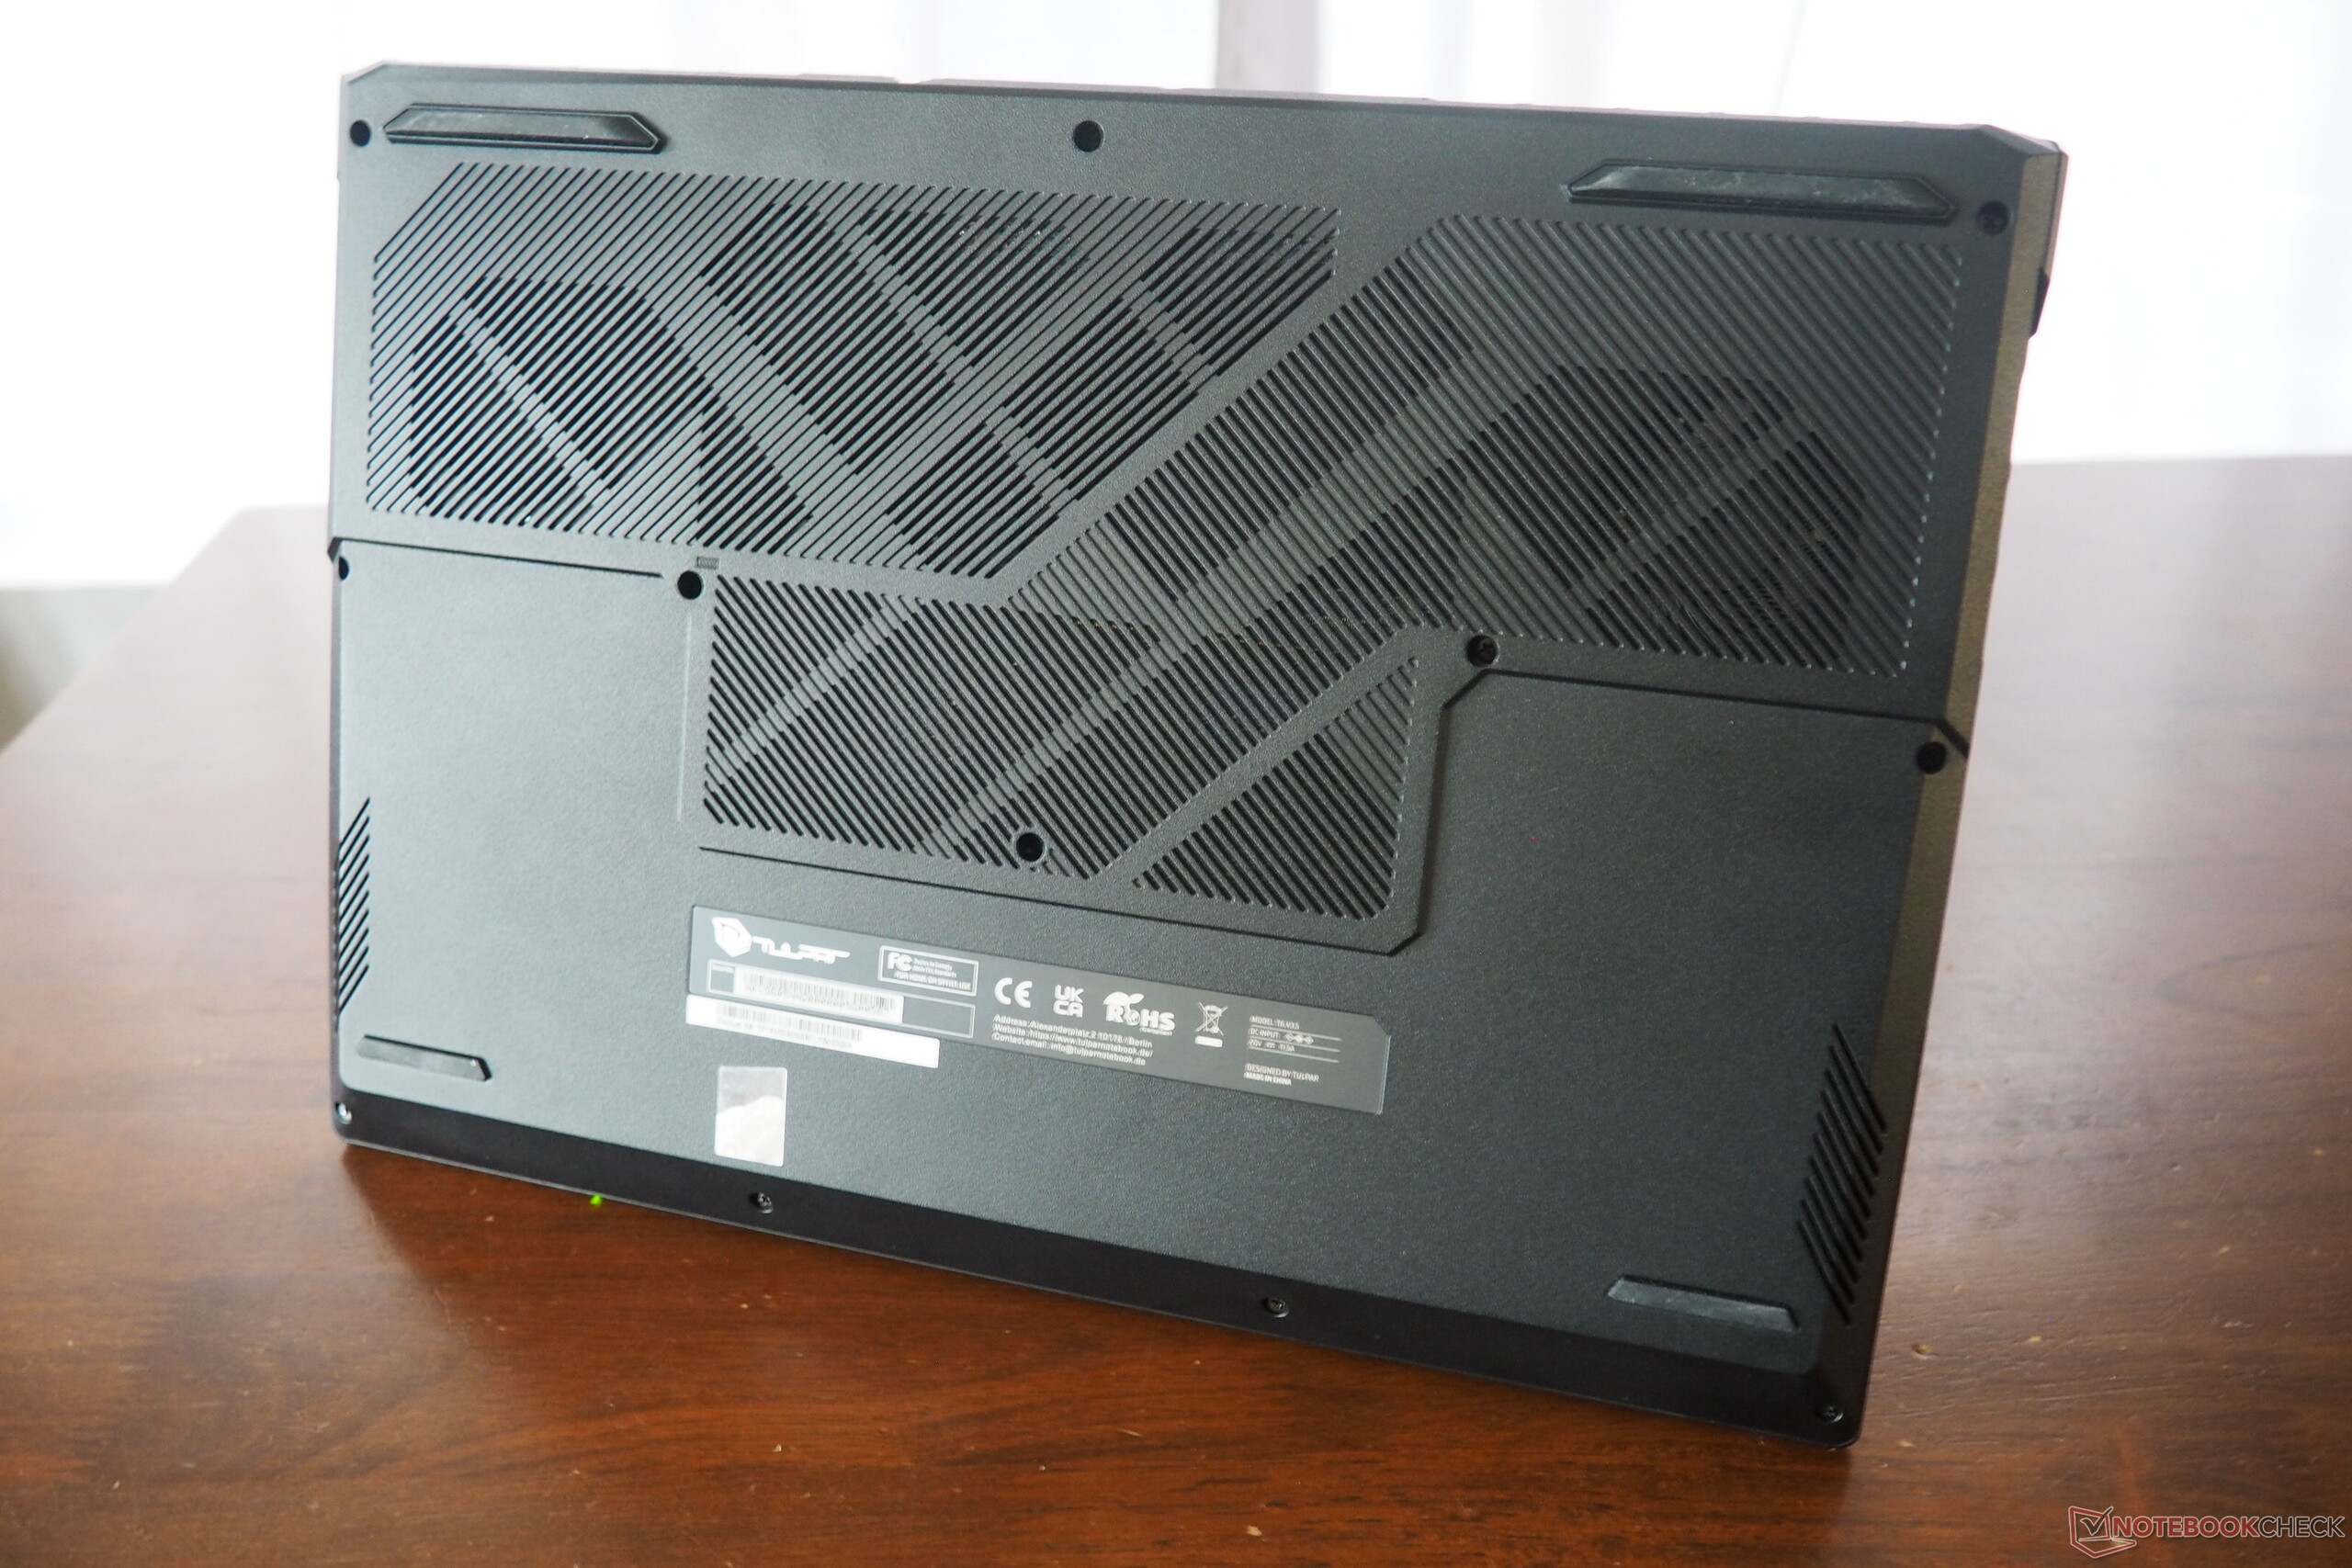
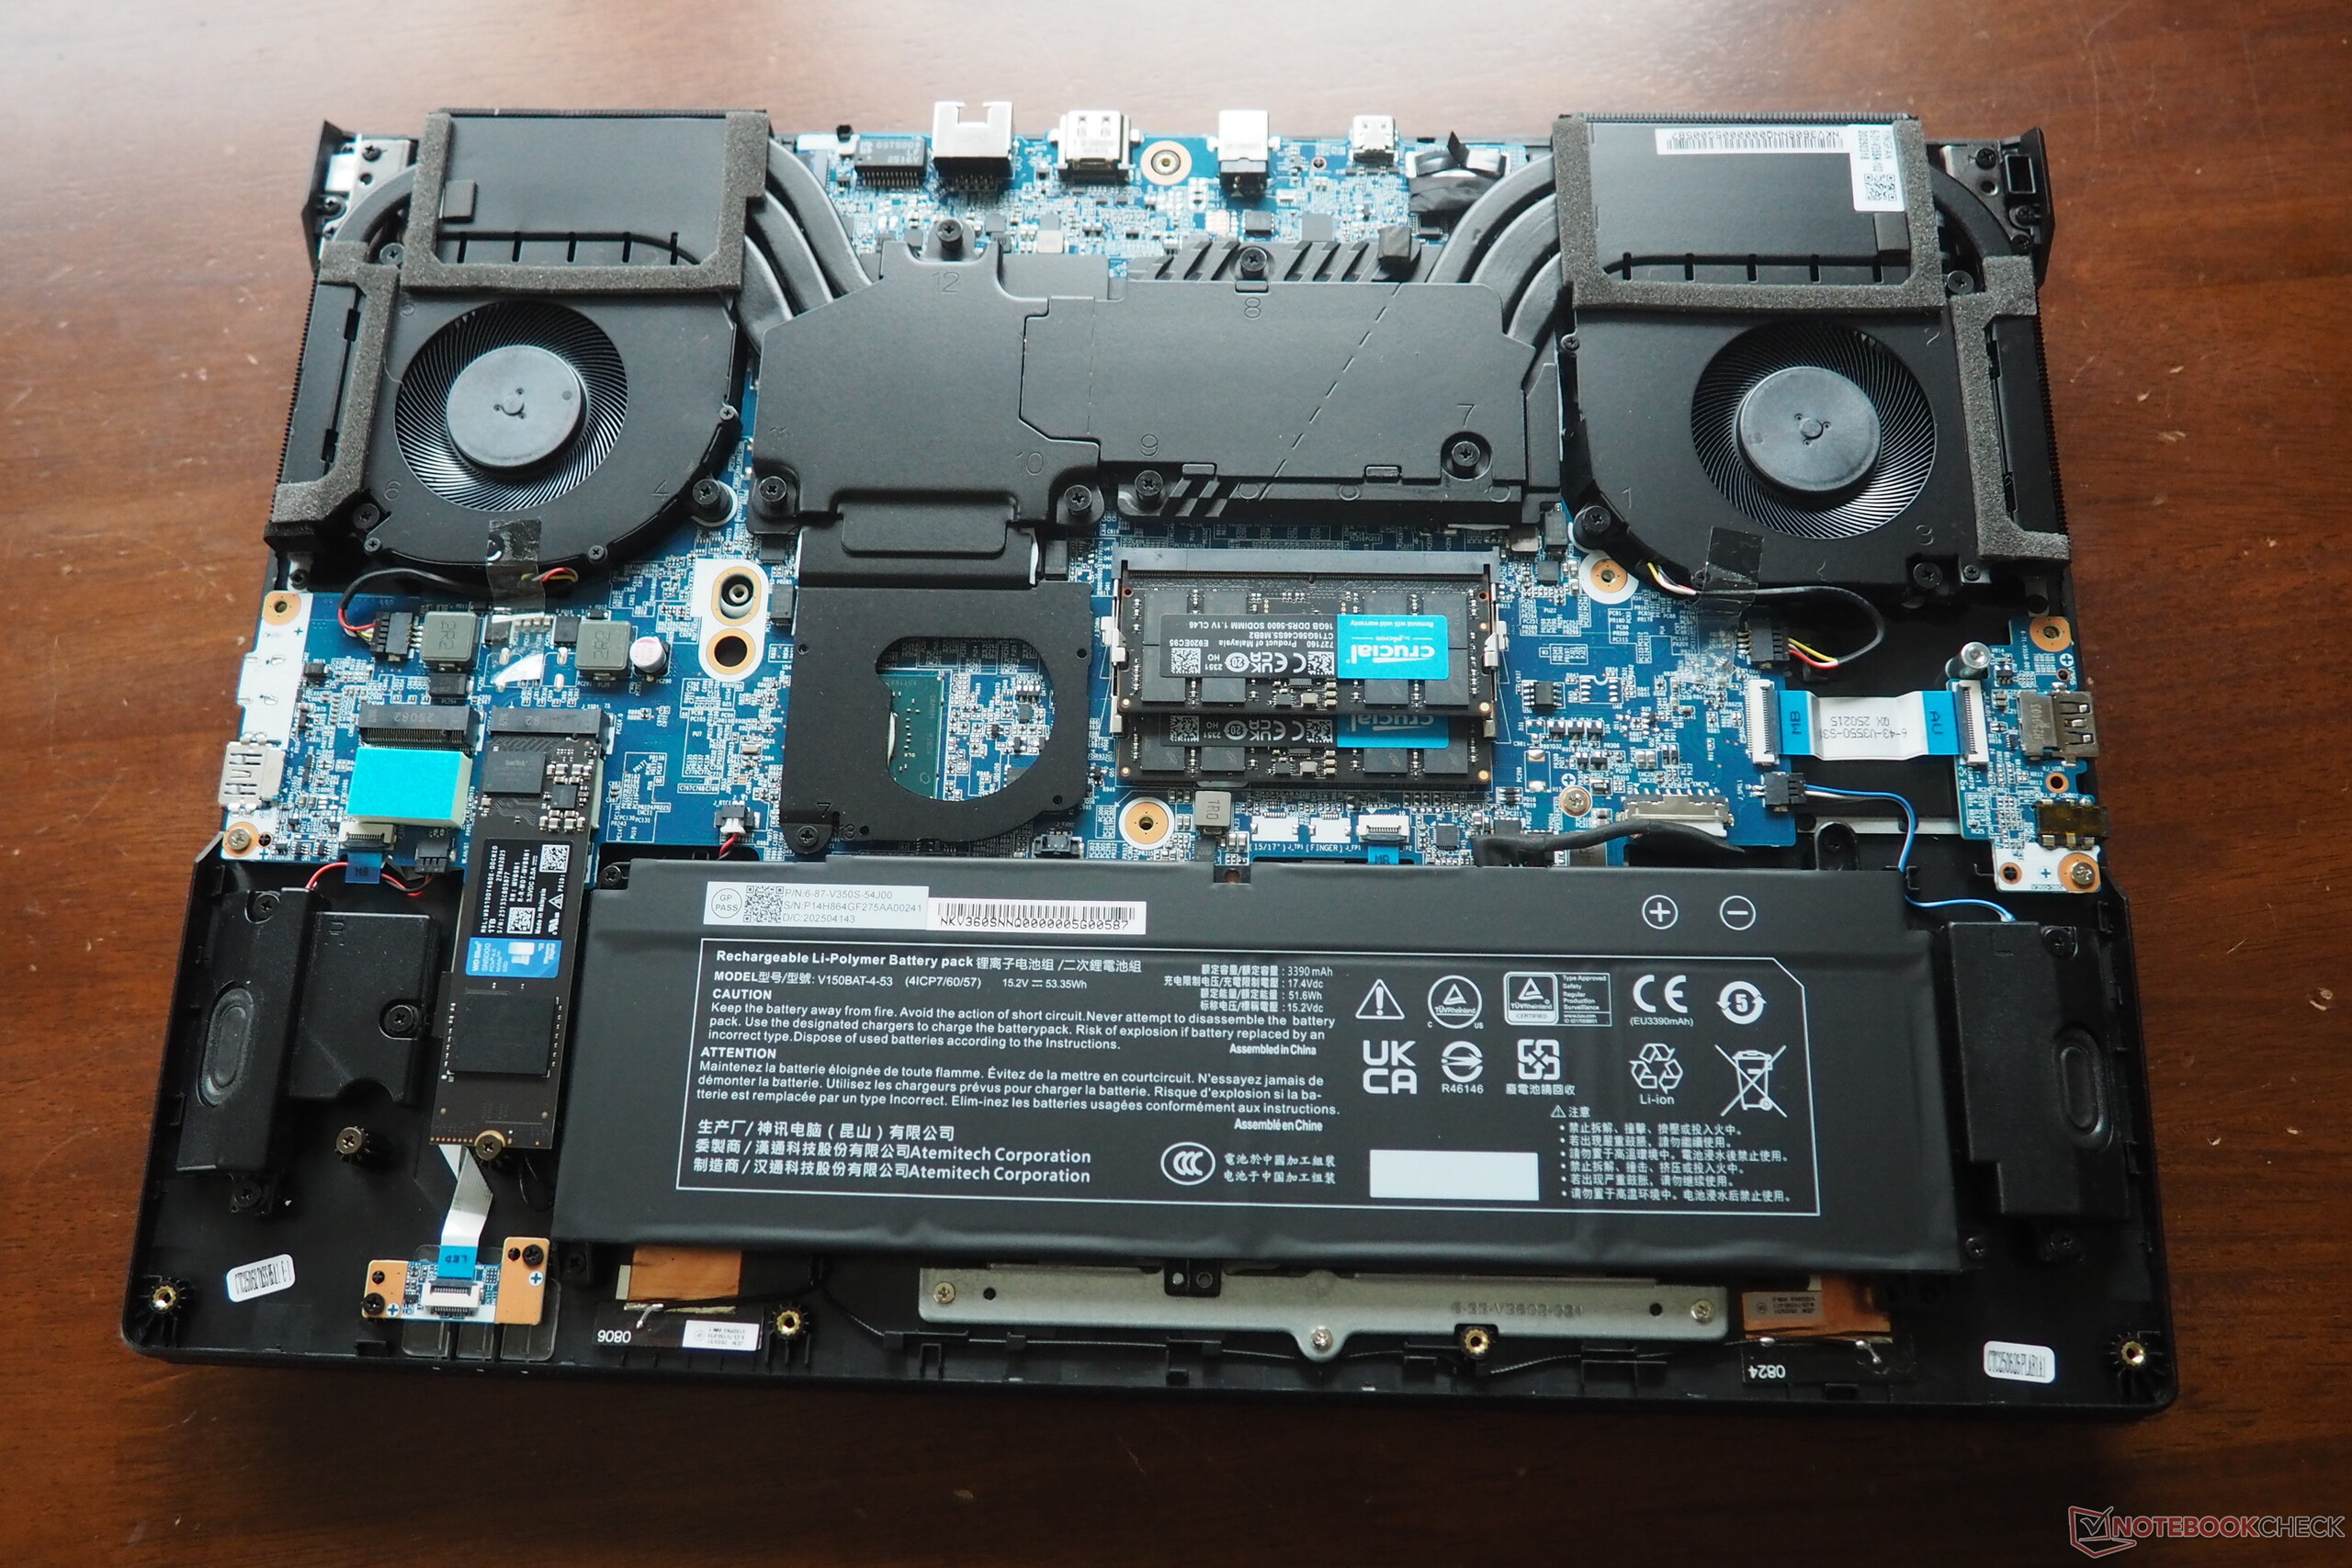
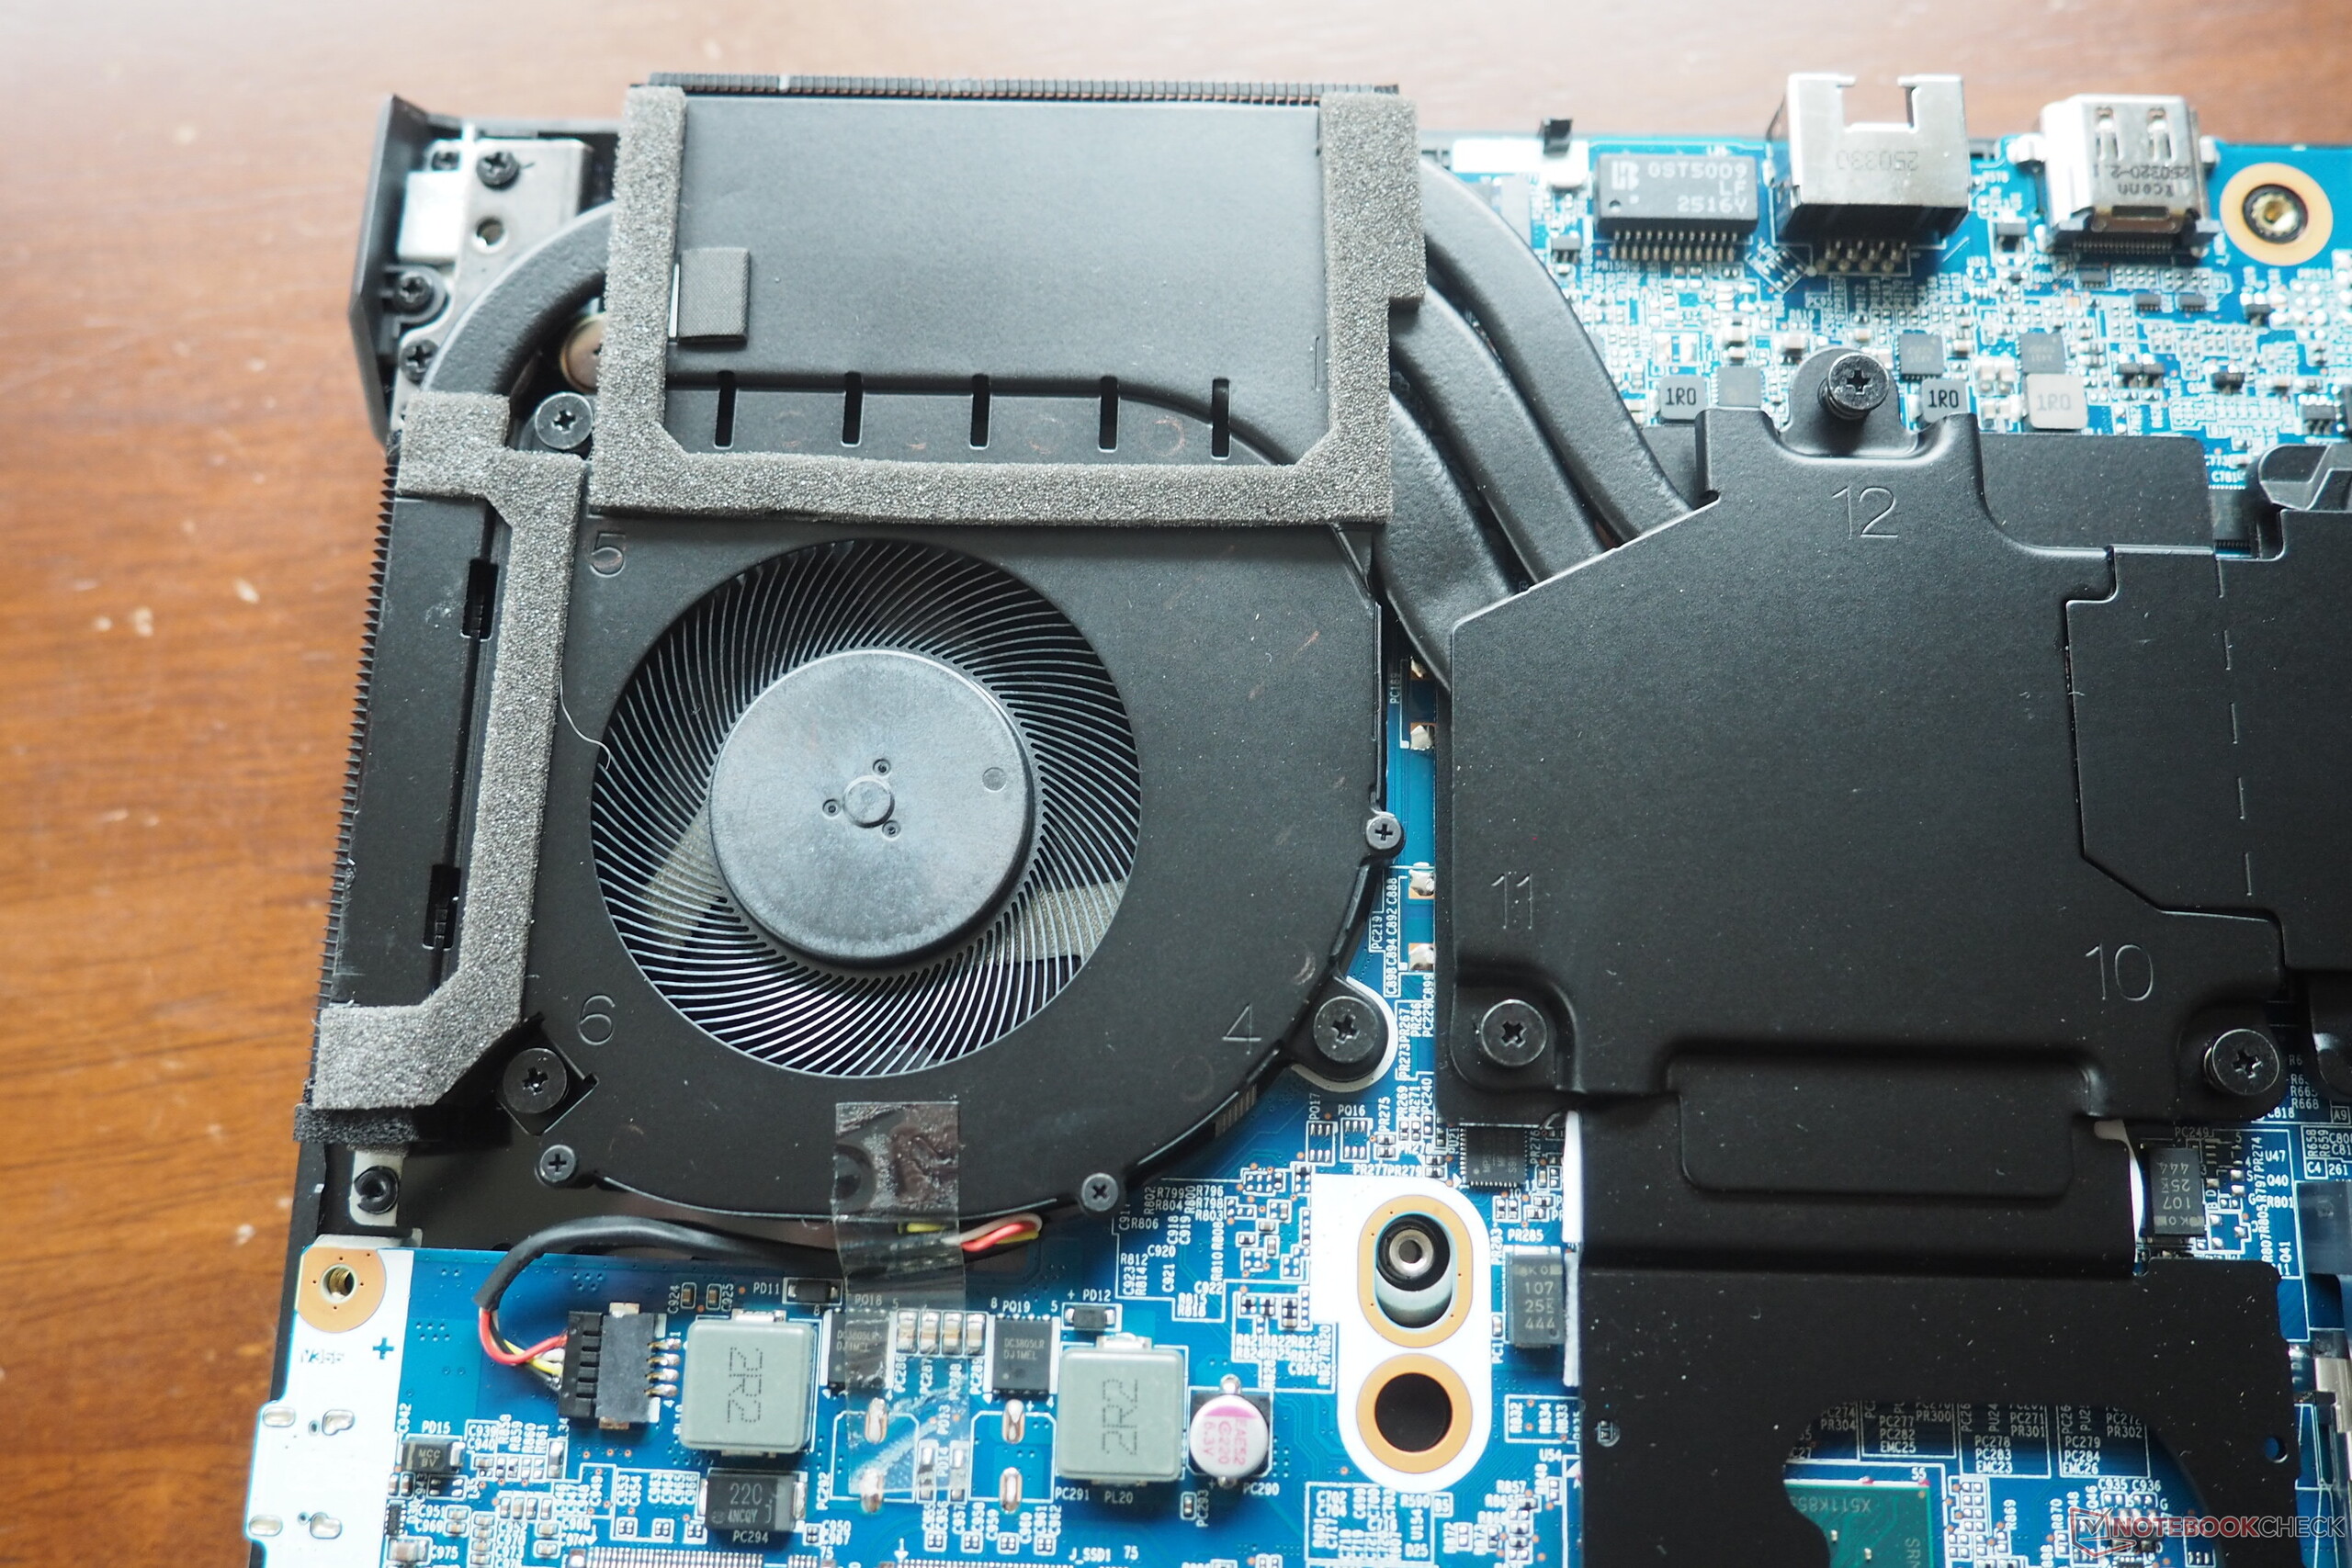
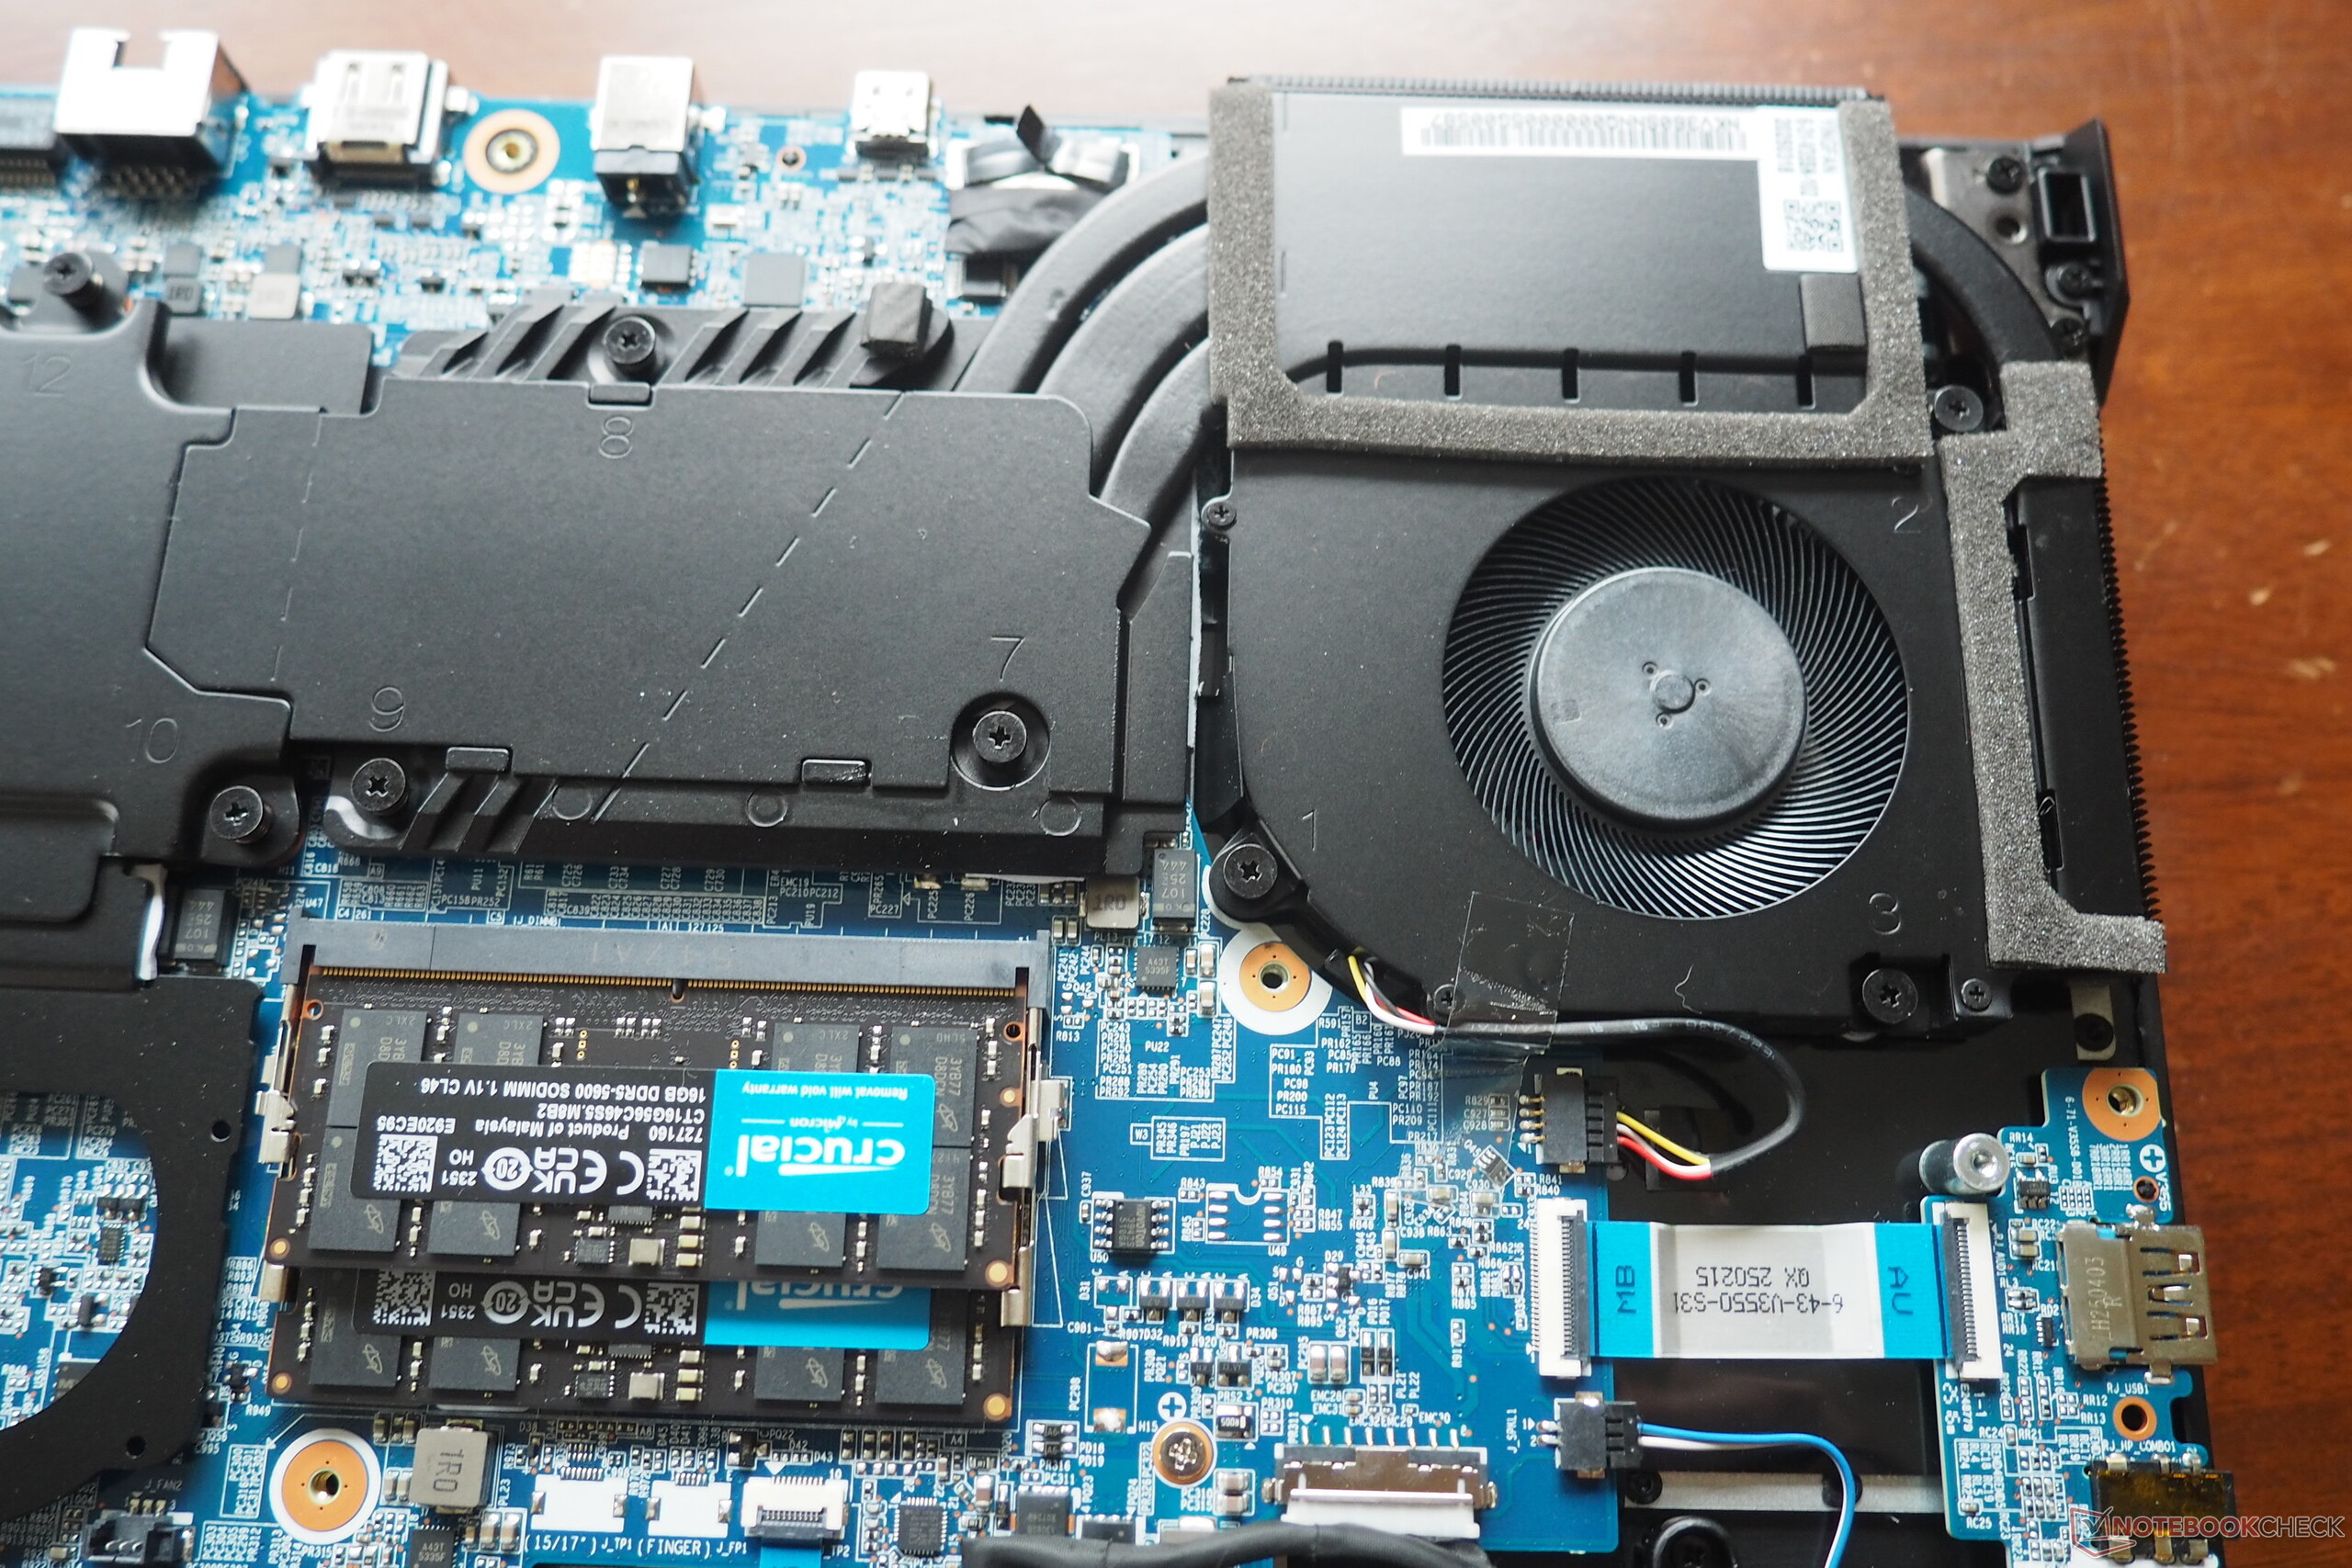
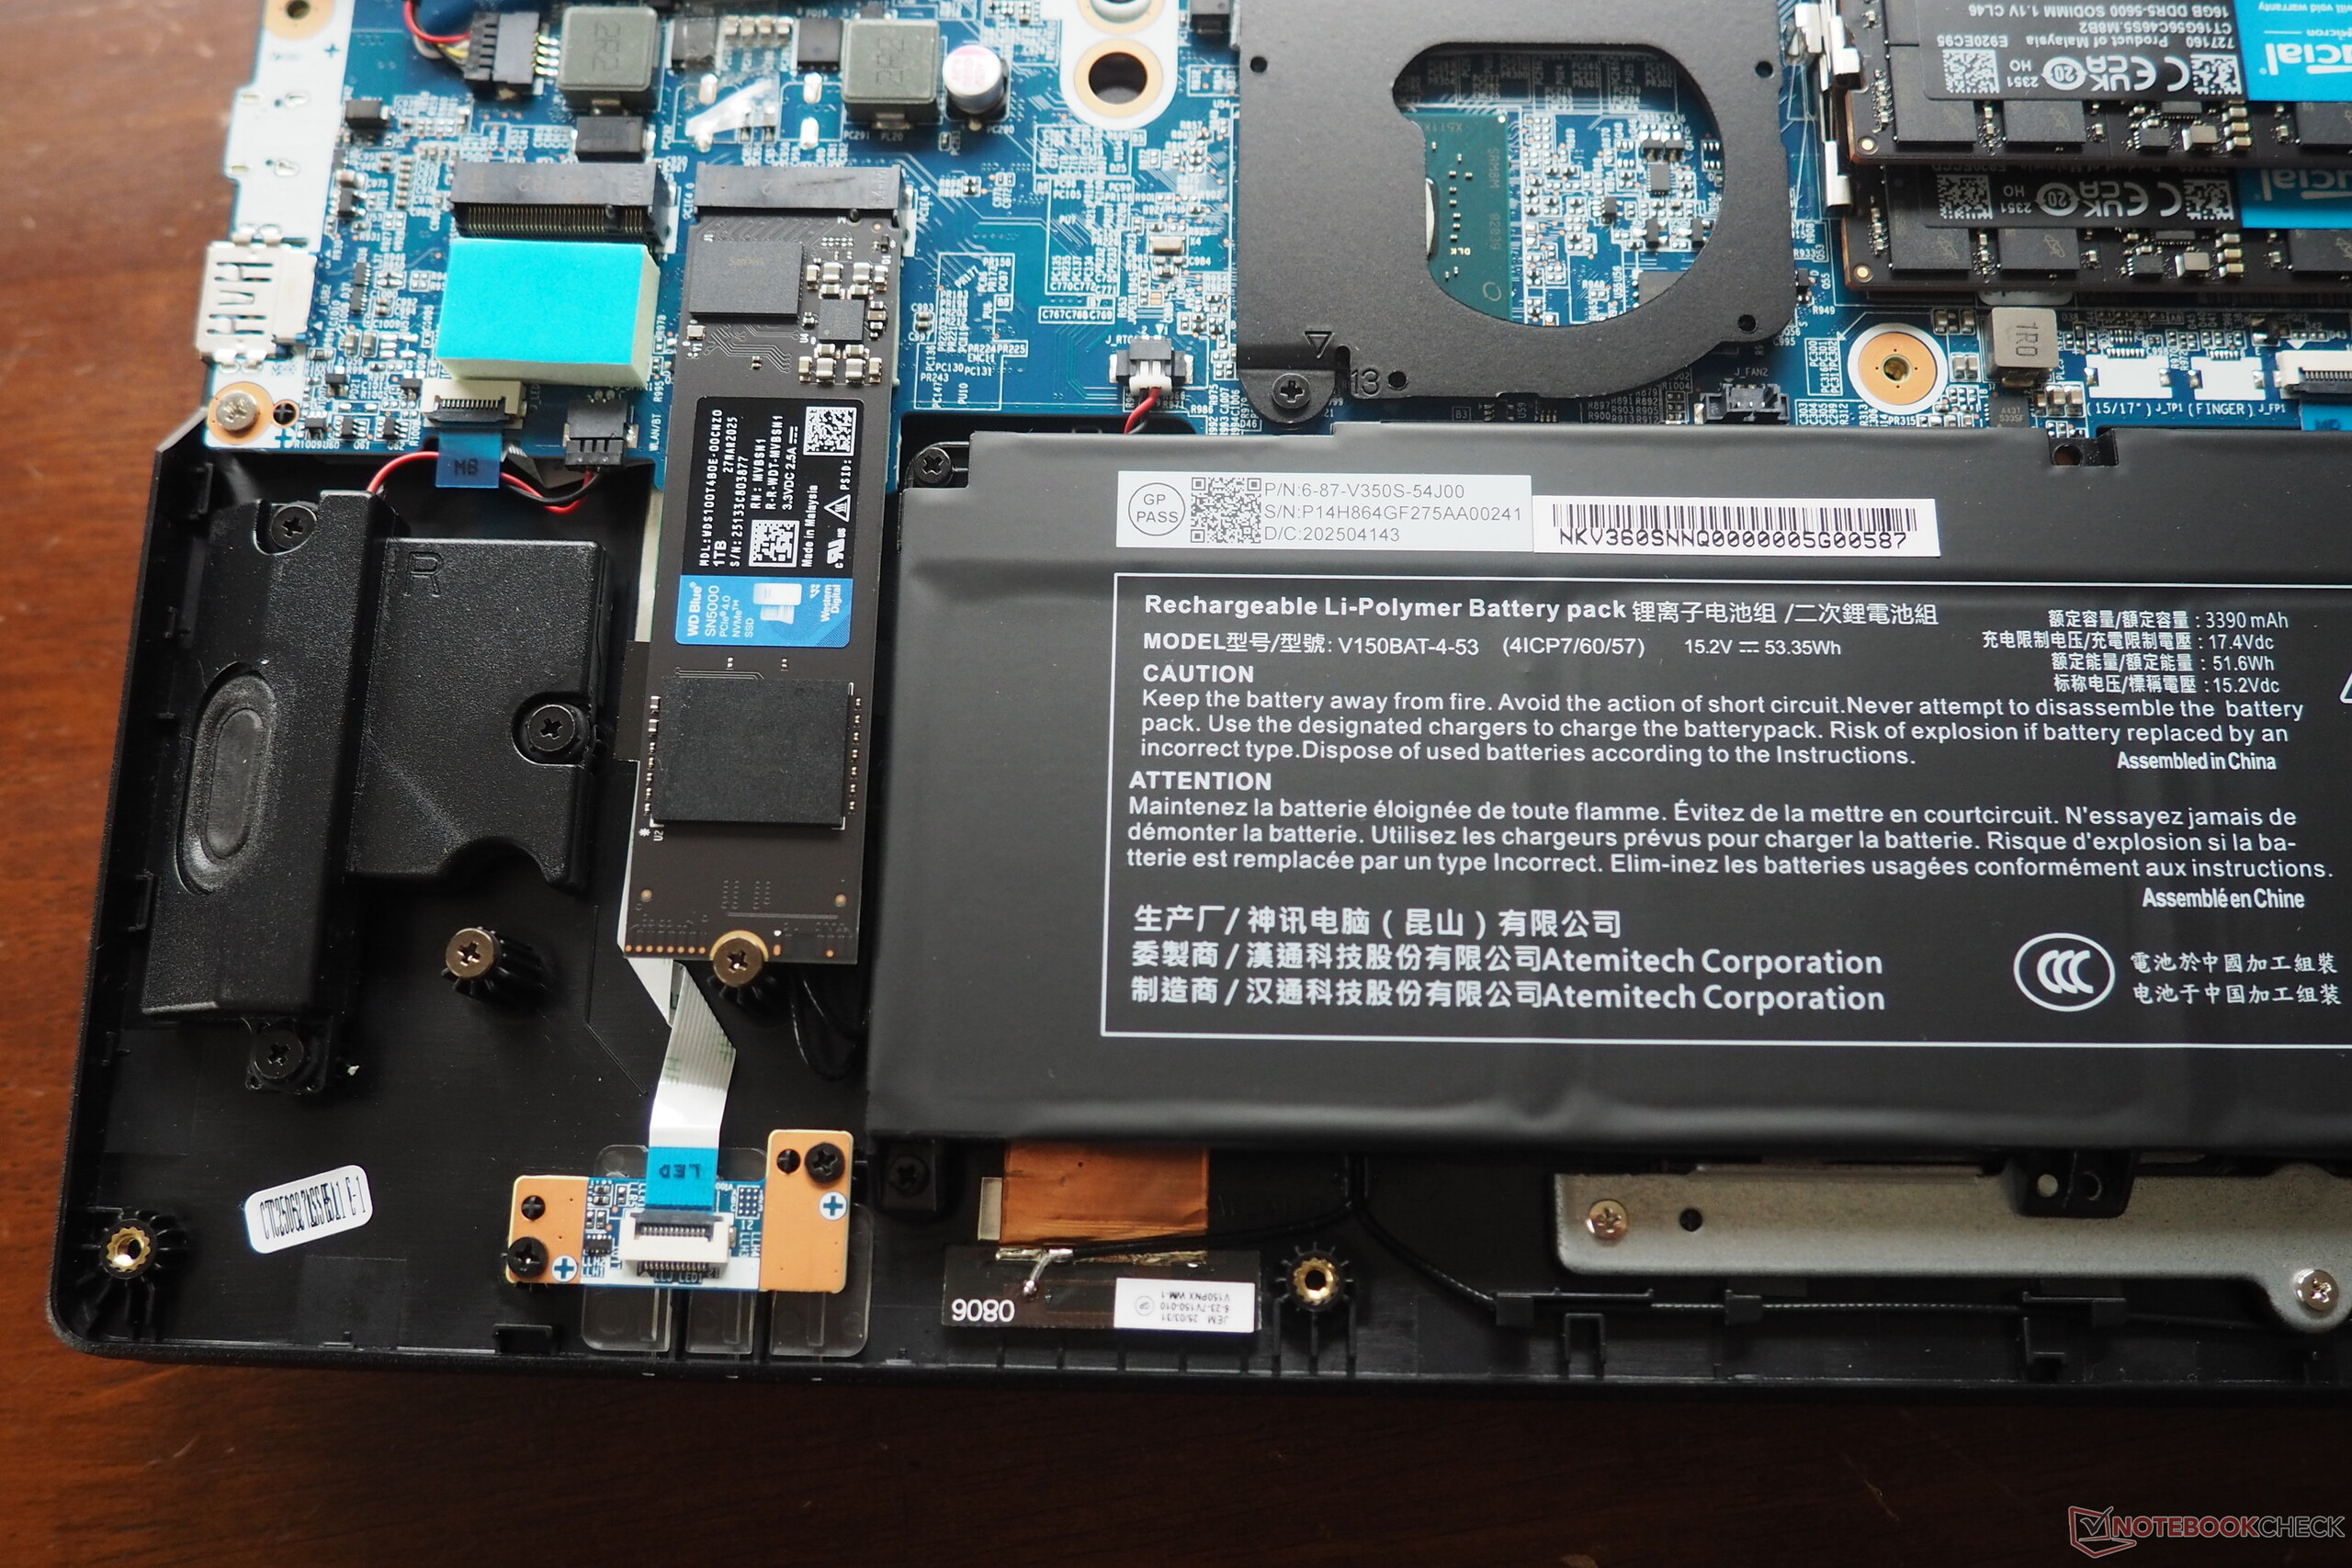
È necessario rimuovere un totale di dodici viti Phillips prima di poter estrarre il coperchio inferiore dai suoi supporti. Sotto il cofano, troverà un sistema di raffreddamento con due ventole, oltre a due slot per la RAM e due slot per SSD. Anche la batteria è accessibile da qui.
Sostenibilità
Purtroppo, la confezione utilizza una grande quantità di plastica.
Garanzia
Tulpar Notebook offre una garanzia di 24 mesi sul dispositivo e pubblicizza un "servizio di manutenzione gratuito a vita" Abbiamo visitato il produttore a Berlino qualche tempo fa, e il relativo articolo tratta in dettaglio questo servizio di manutenzione.
Tulpar S8 V1.1 laptop da gioco da 18 pollici: Potenza pura per un'esperienza di gioco senza precedenti
Tulpar S8 V1.1 è un computer portatile da gioco di fascia alta in cui le prestazioni eccezionali incontrano un'ampia serie di funzionalità e un enorme display da 18 pollici. La combinazione di una NVIDIA GeForce RTX 5080 e di un Intel Core Ultra 9 275HX offre la massima potenza per i giochi e i carichi di lavoro più impegnativi. Un robusto sistema di raffreddamento assicura prestazioni sempre stabili e senza compromessi.
Una caratteristica distintiva di Tulpar S8 V1.1 è il suo pannello IPS LED, progettato specificamente per i giocatori. Con una risoluzione di 2560×1600 e una frequenza di aggiornamento di 240 Hz, l'enorme schermo da 18 pollici offre un gameplay vivido e ultra-liscio. Il display supporta anche NVIDIA G-SYNC e copre il 100% dello spazio colore DCI-P3, rendendolo adatto ai professionisti della creatività.
Completamente equipaggiato come un PC desktop, Tulpar S8 V1.1 supporta fino a 192 GB di RAM DDR5-4400 e offre quattro slot SSD M.2, eliminando qualsiasi preoccupazione sui limiti di memoria o di archiviazione. Il portatile include anche due porte RJ45, HDMI 2.1 e due porte Thunderbolt 5 (DisplayPort 2.1). Un potente sistema audio a cinque altoparlanti completa l'esperienza premium.
Il Tulpar S8 V1.1 può essere completamente personalizzato nel negozio online Tulpar, per soddisfare i suoi requisiti esatti.
Dispositivi di ingresso
Tastiera
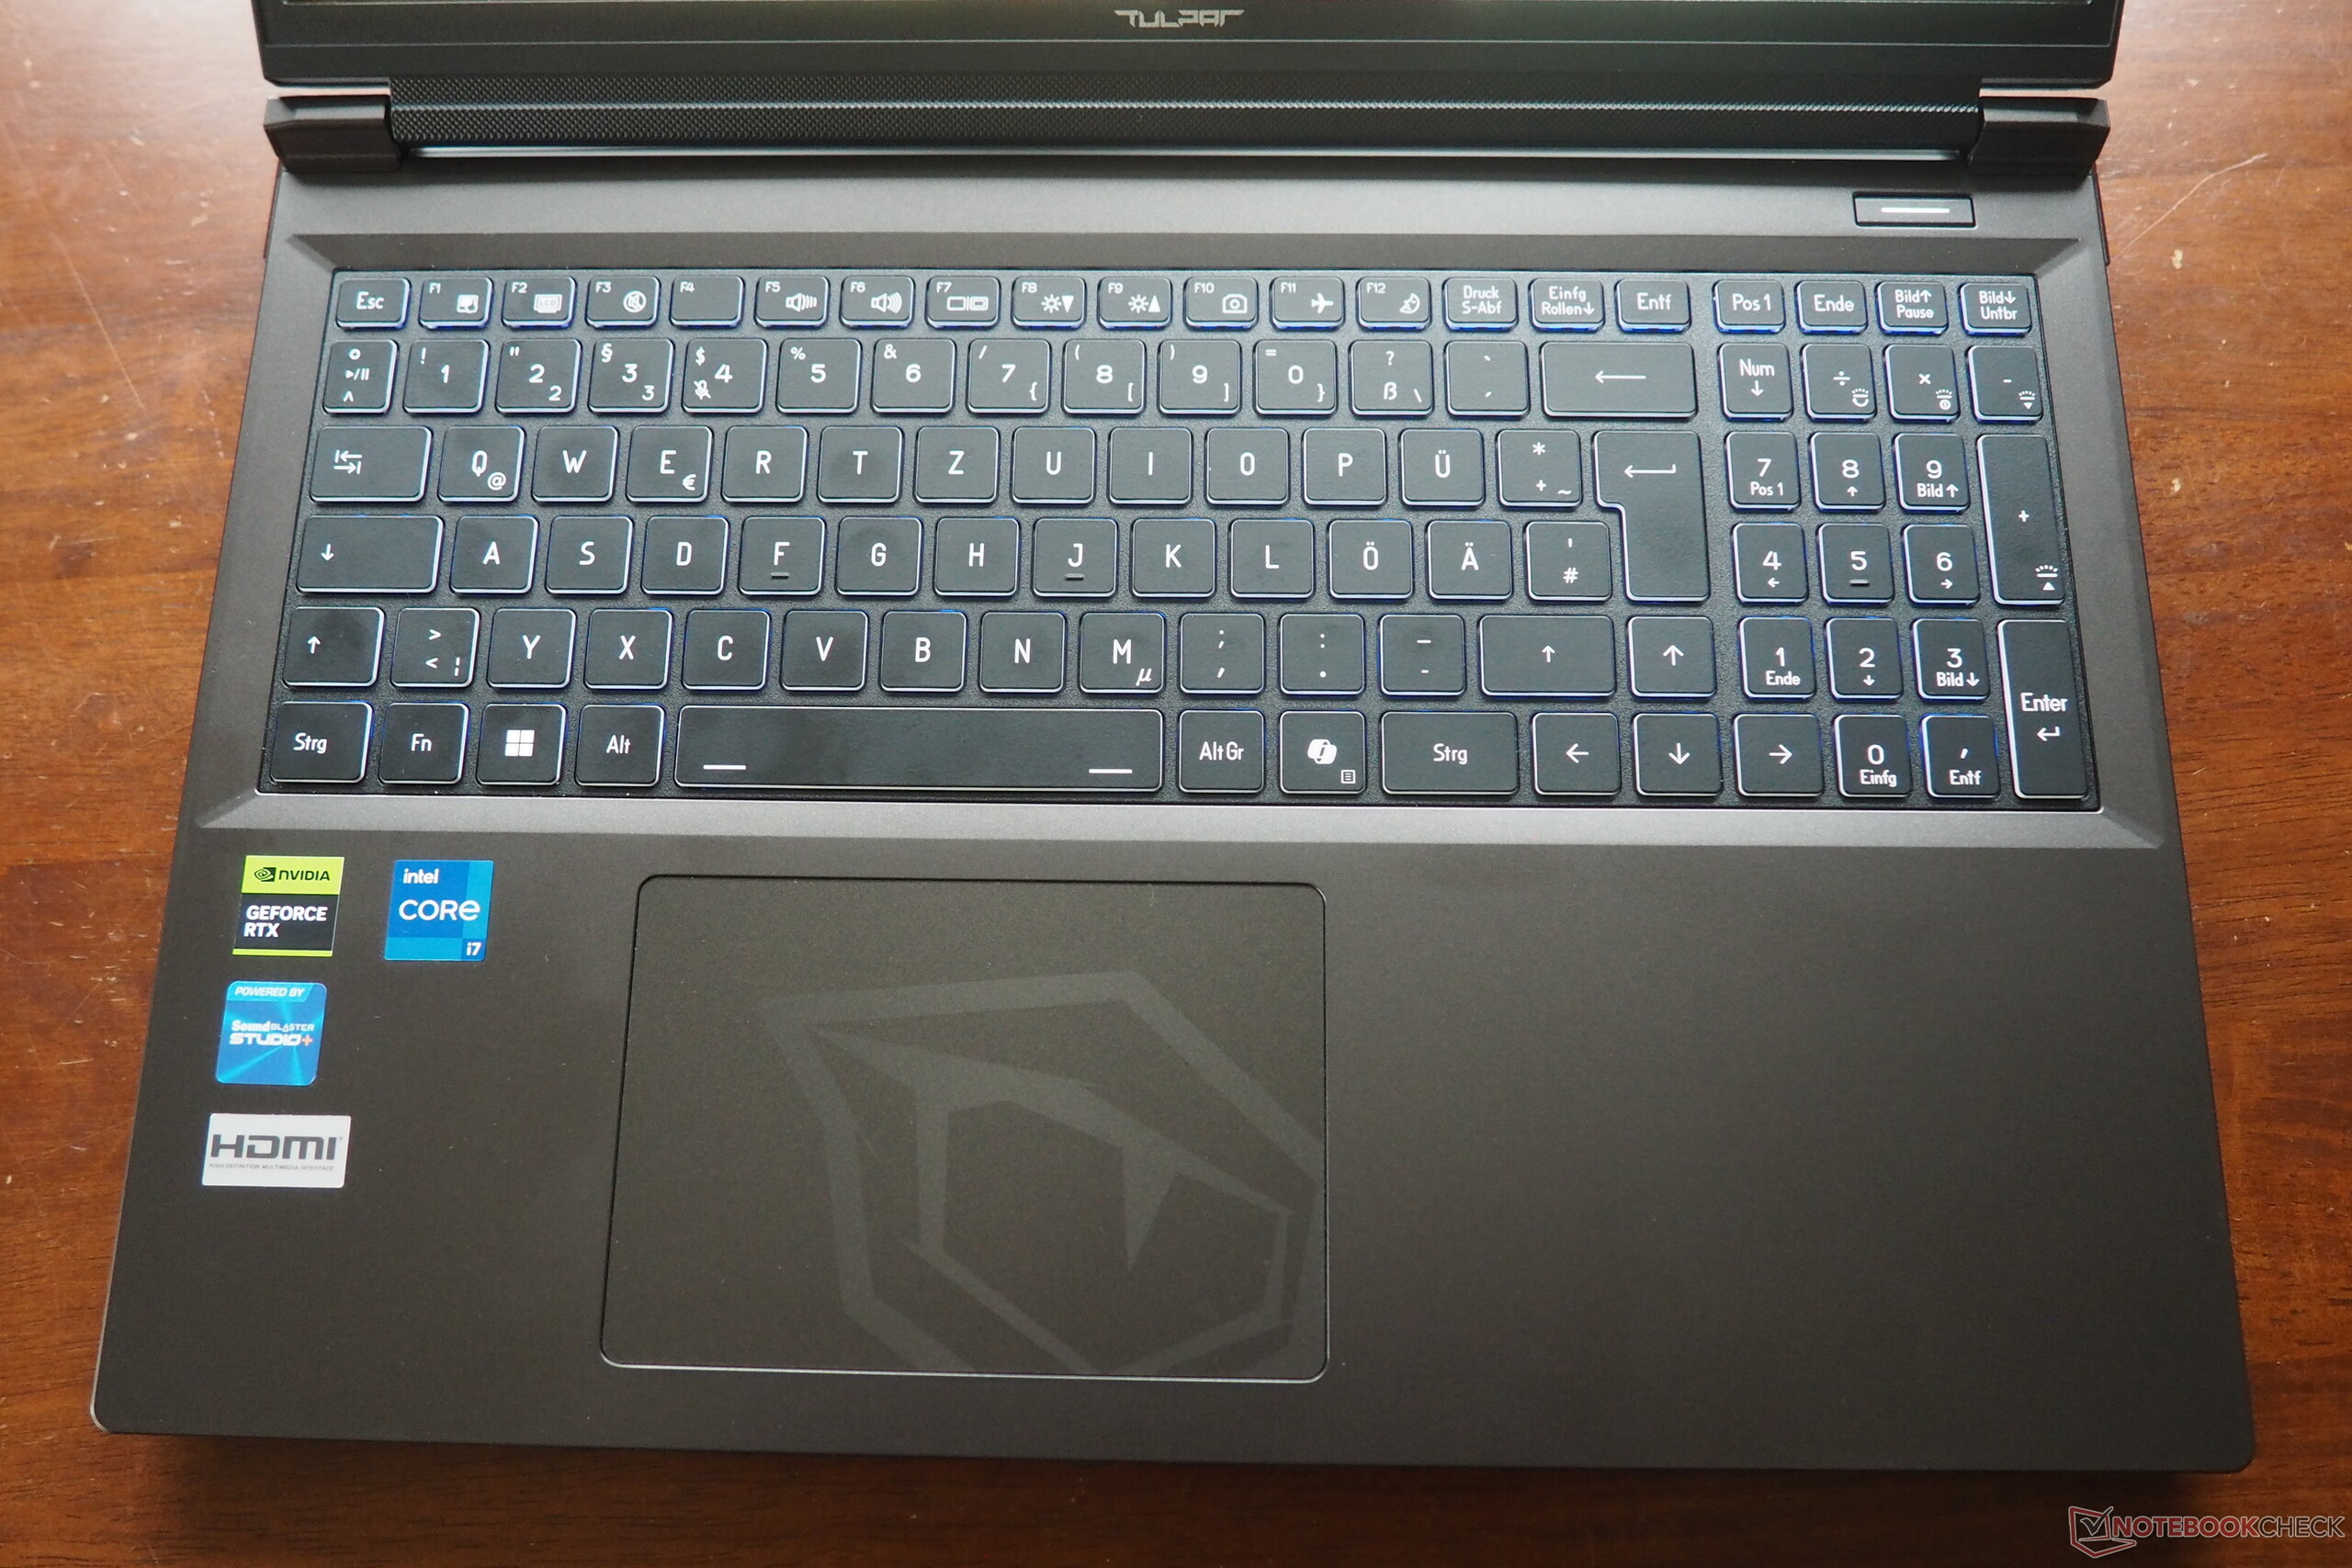
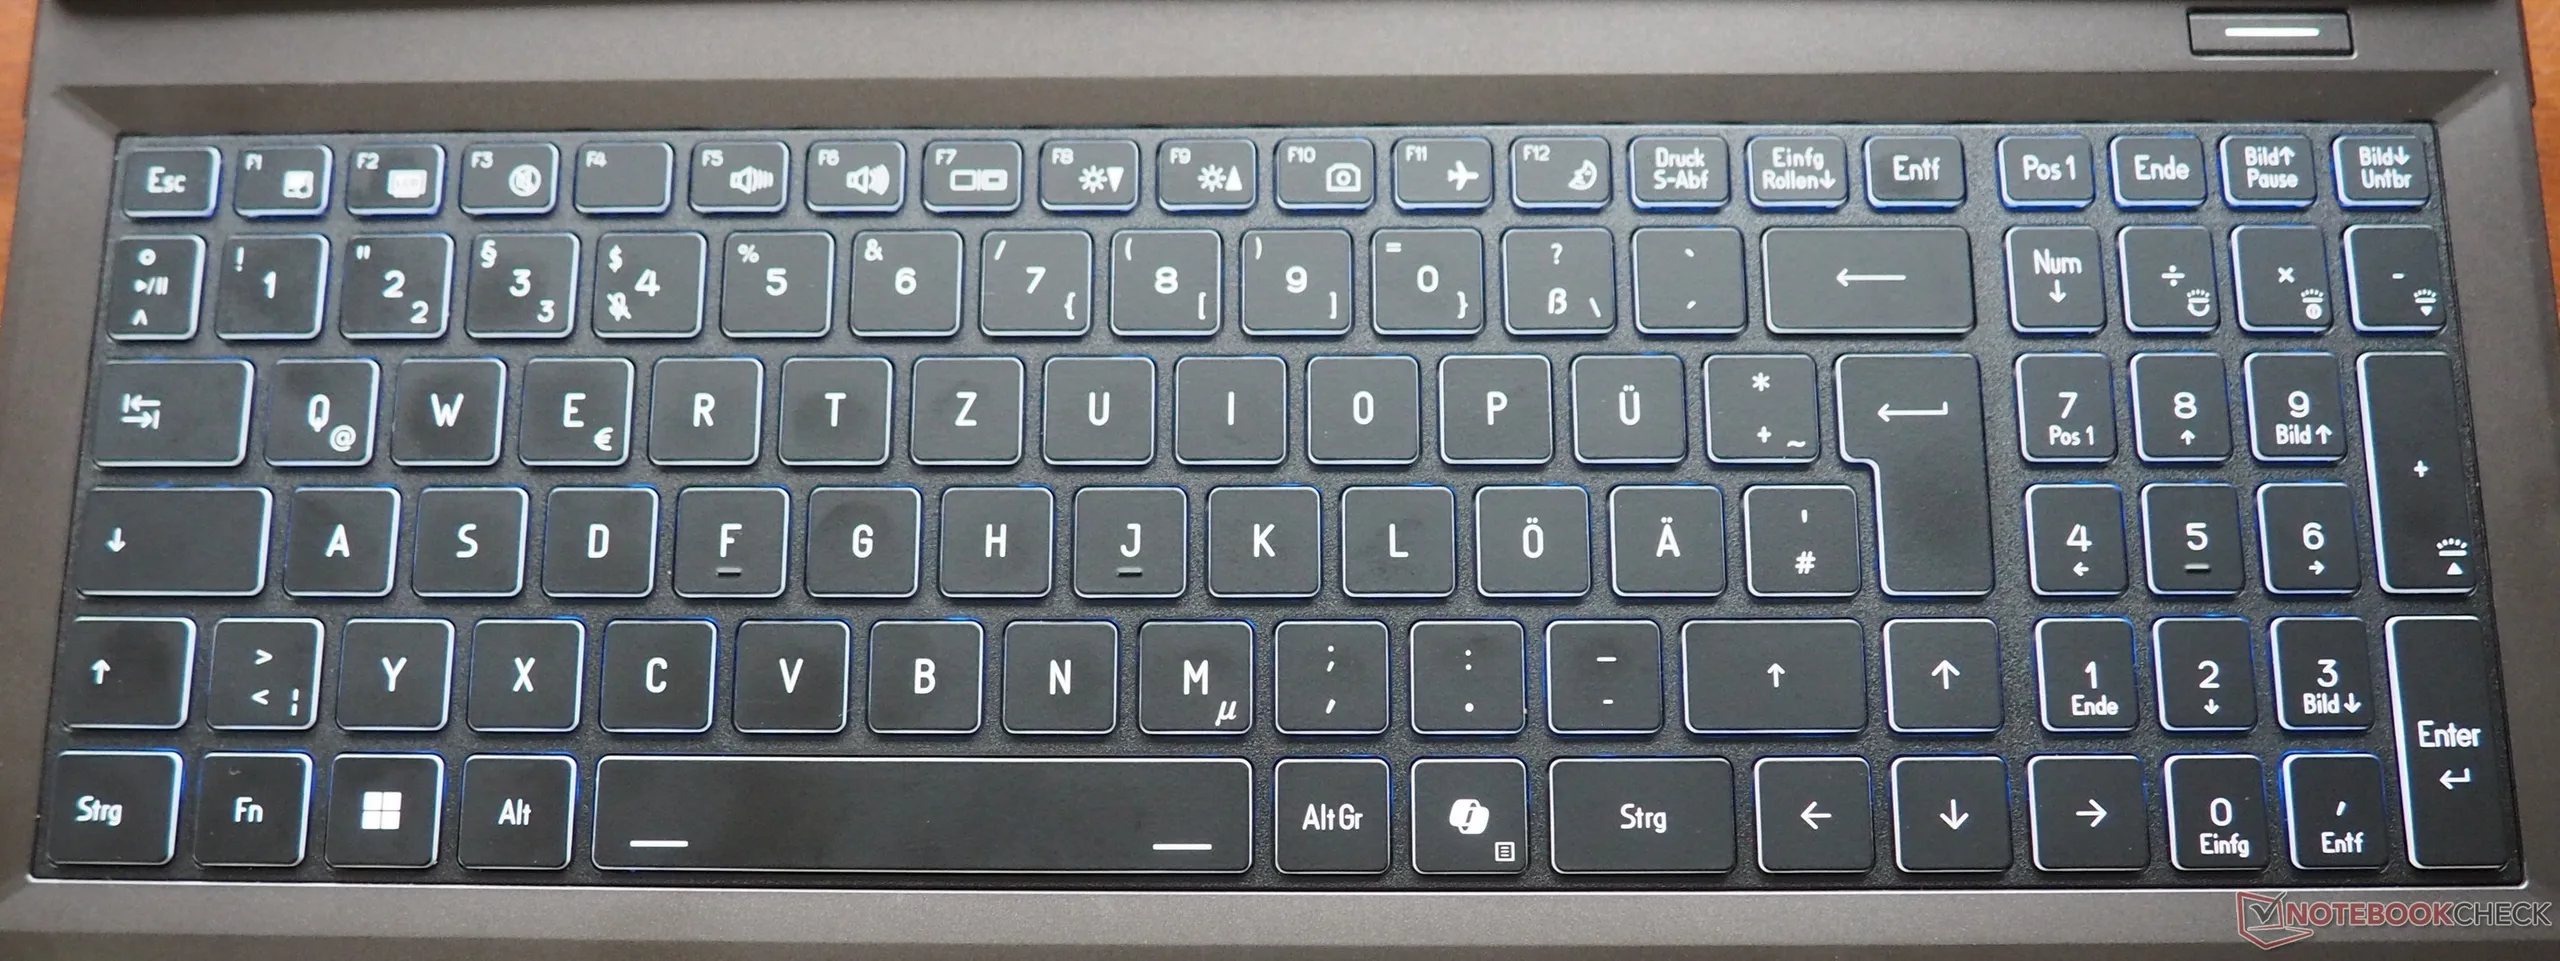
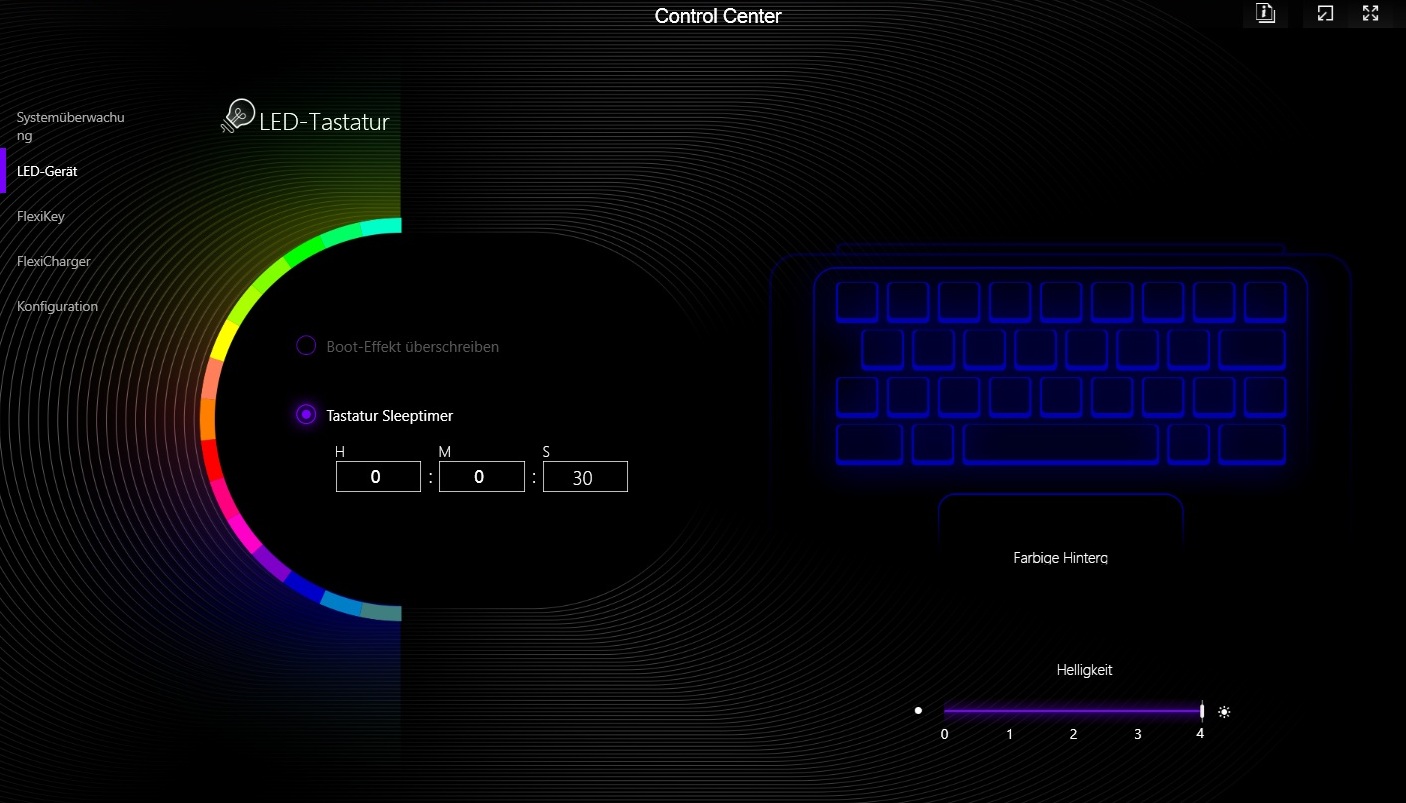
La tastiera non spicca nella maggior parte delle aree, nel bene e nel male. Il layout è comunque un punto di forza, in quanto si attiene strettamente a una disposizione standard e offre tasti freccia ben dimensionati. La sensazione di digitazione è accettabile, ma la retroilluminazione potrebbe essere più luminosa anche con l'impostazione più alta.
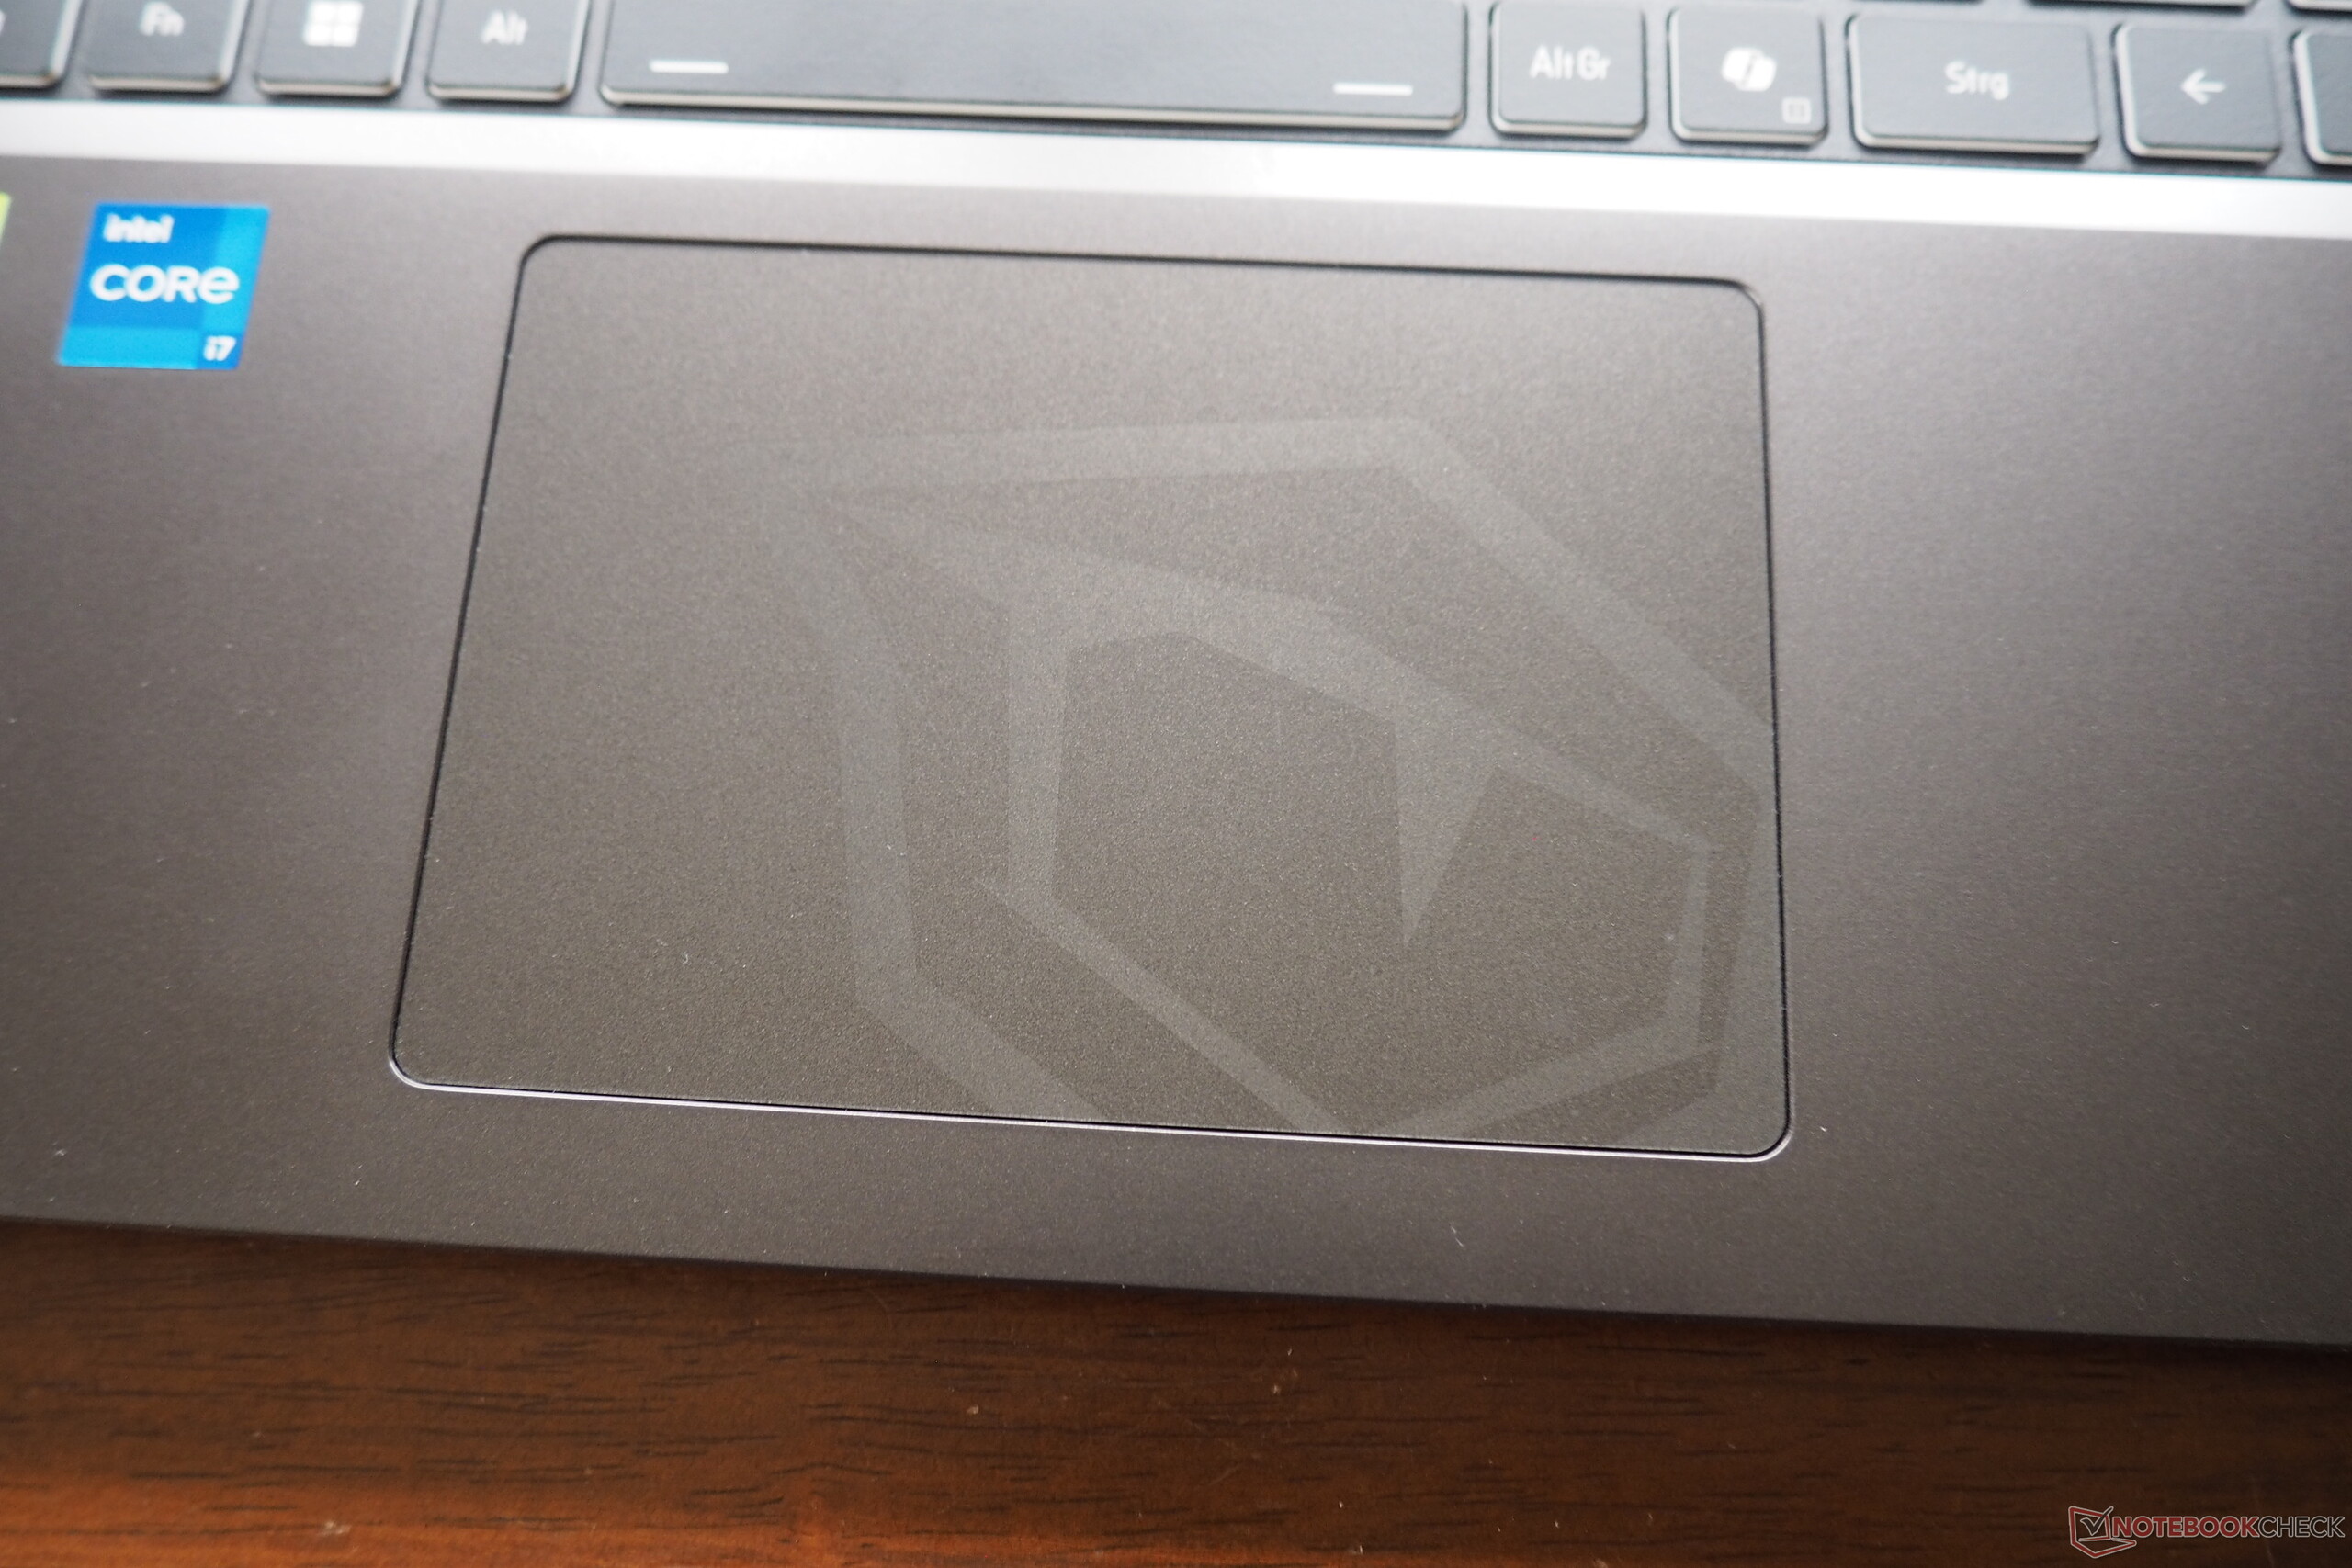
Touchpad
C'è ancora spazio per migliorare il touchpad, in quanto il riconoscimento dei gesti non è sempre affidabile. Per il resto, offre una solida precisione e uno scorrimento fluido. La superficie di circa 12,1 x 8,3 cm è più che adeguata per un portatile da 16 pollici. Come nel caso di molti concorrenti, i meccanismi di clic suonano un po' rumorosi.
Display
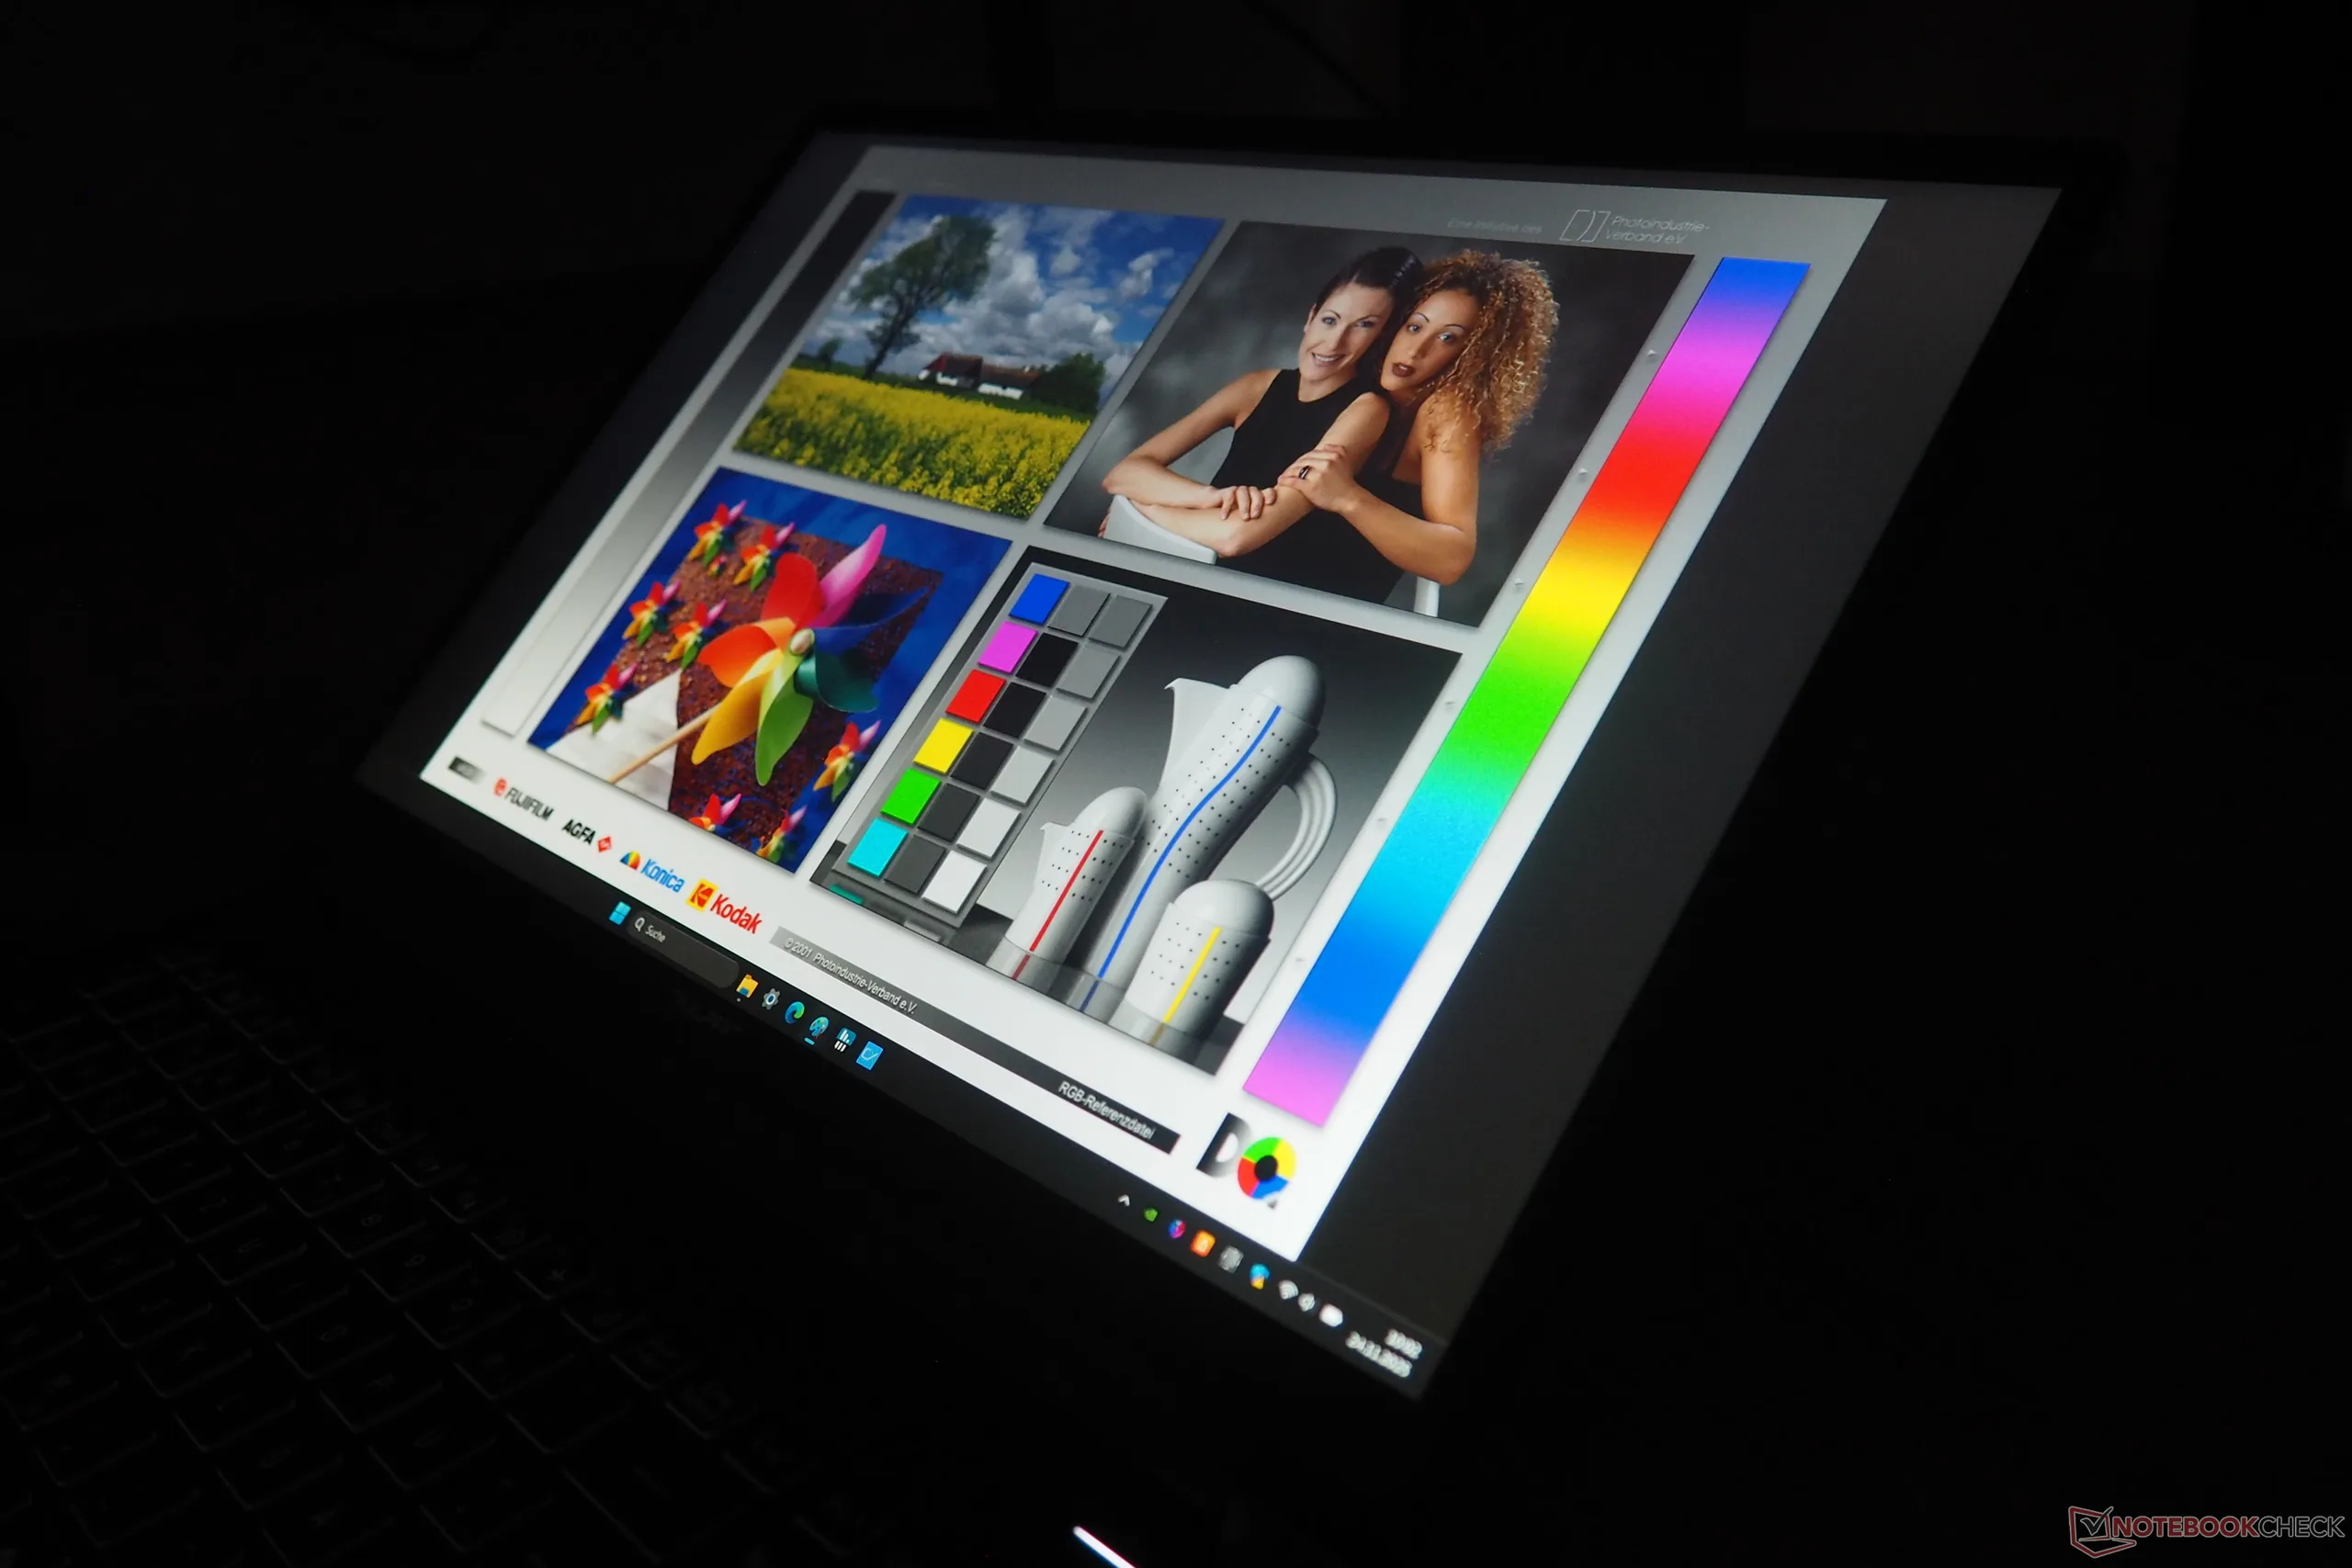
Il T6 V3.5 presenta un pannello opaco da 165 Hz. La sua luminosità media di 403 cd/m² è solida per un display IPS e rende il portatile utilizzabile negli ambienti più luminosi, a condizione che la luce solare non sia troppo forte o colpisca direttamente lo schermo.
| |||||||||||||||||||||||||
Distribuzione della luminosità: 79 %
Al centro con la batteria: 456 cd/m²
Contrasto: 1169:1 (Nero: 0.39 cd/m²)
ΔE ColorChecker Calman: 3.05 | ∀{0.5-29.43 Ø4.76}
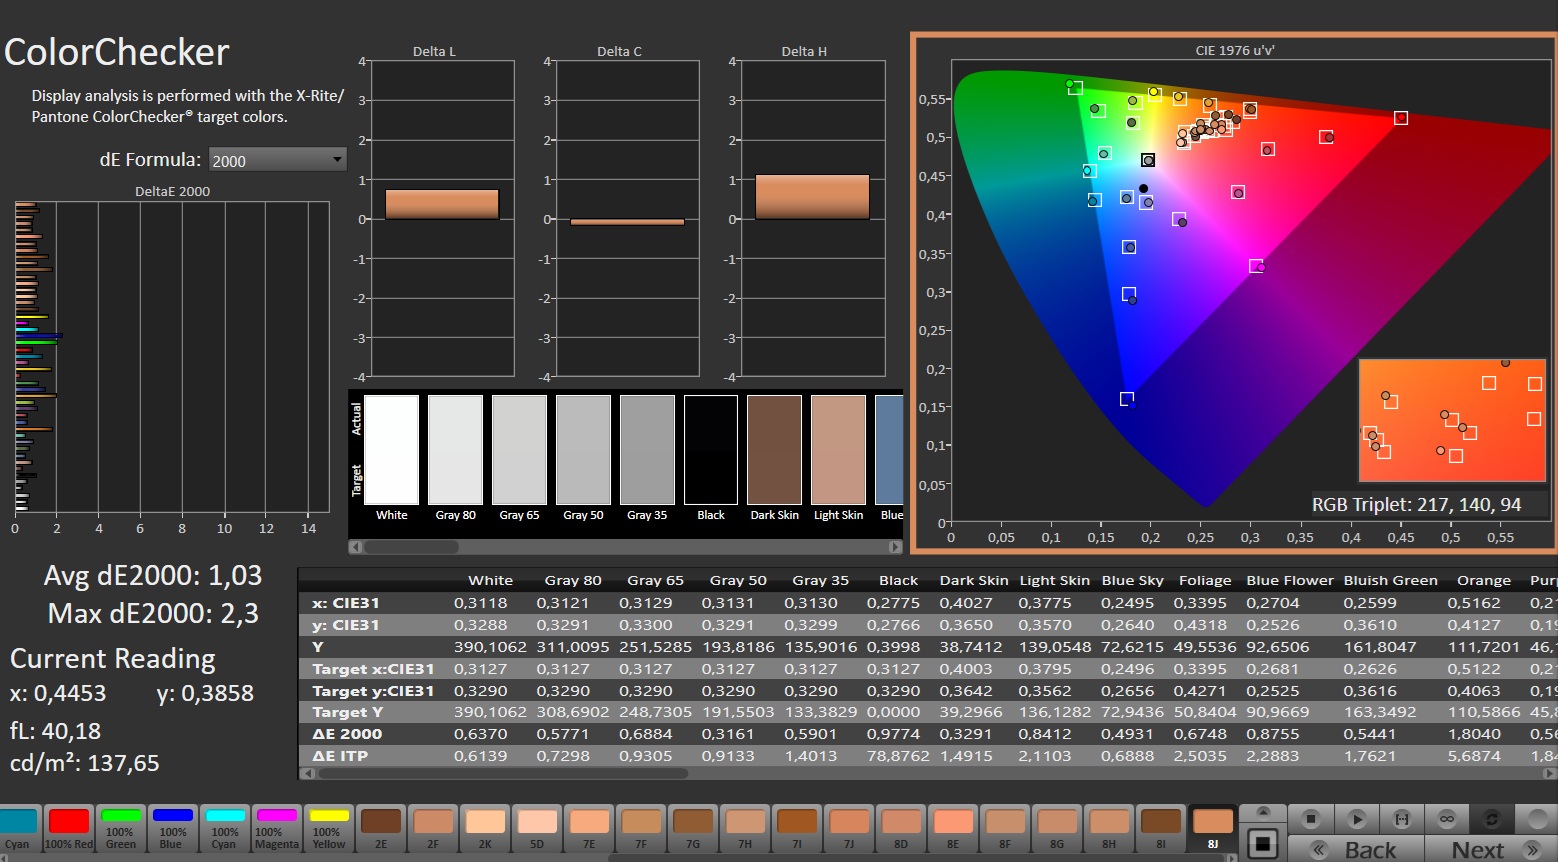
calibrated: 1.03
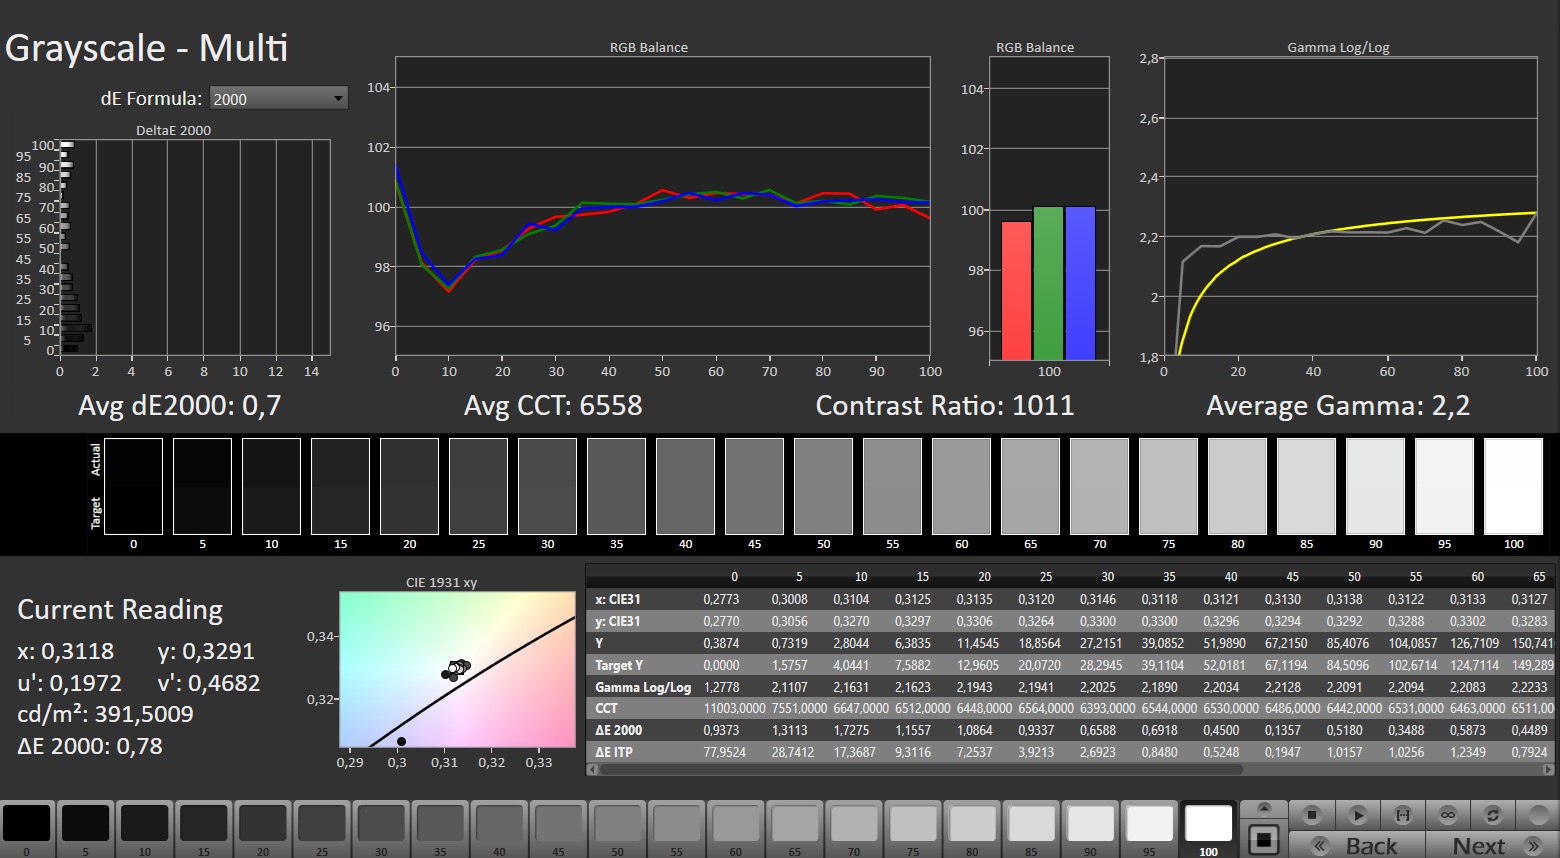
ΔE Greyscale Calman: 3.9 | ∀{0.09-98 Ø5}
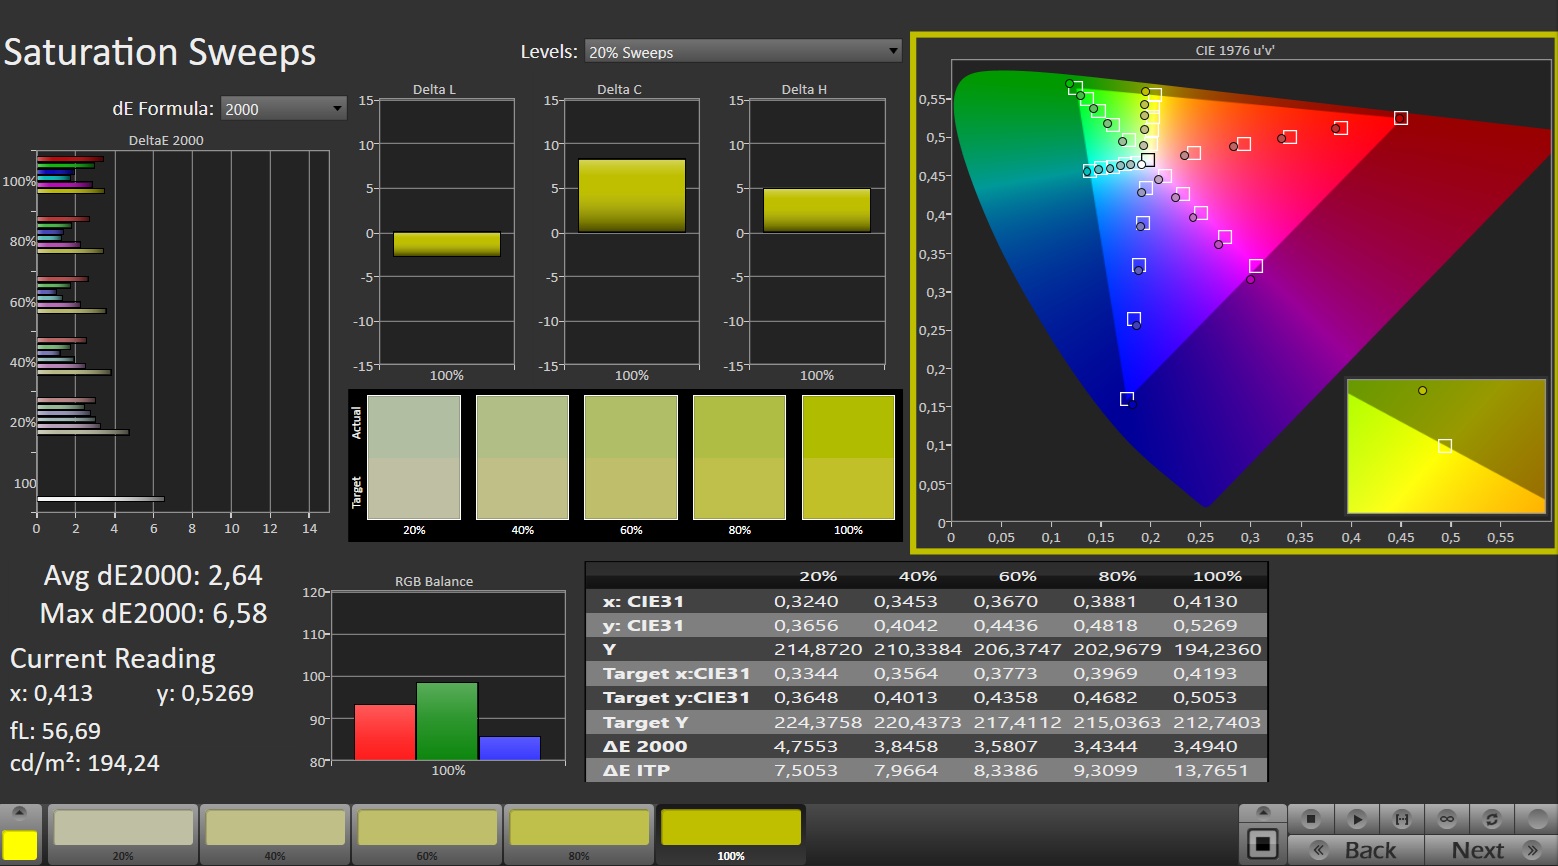
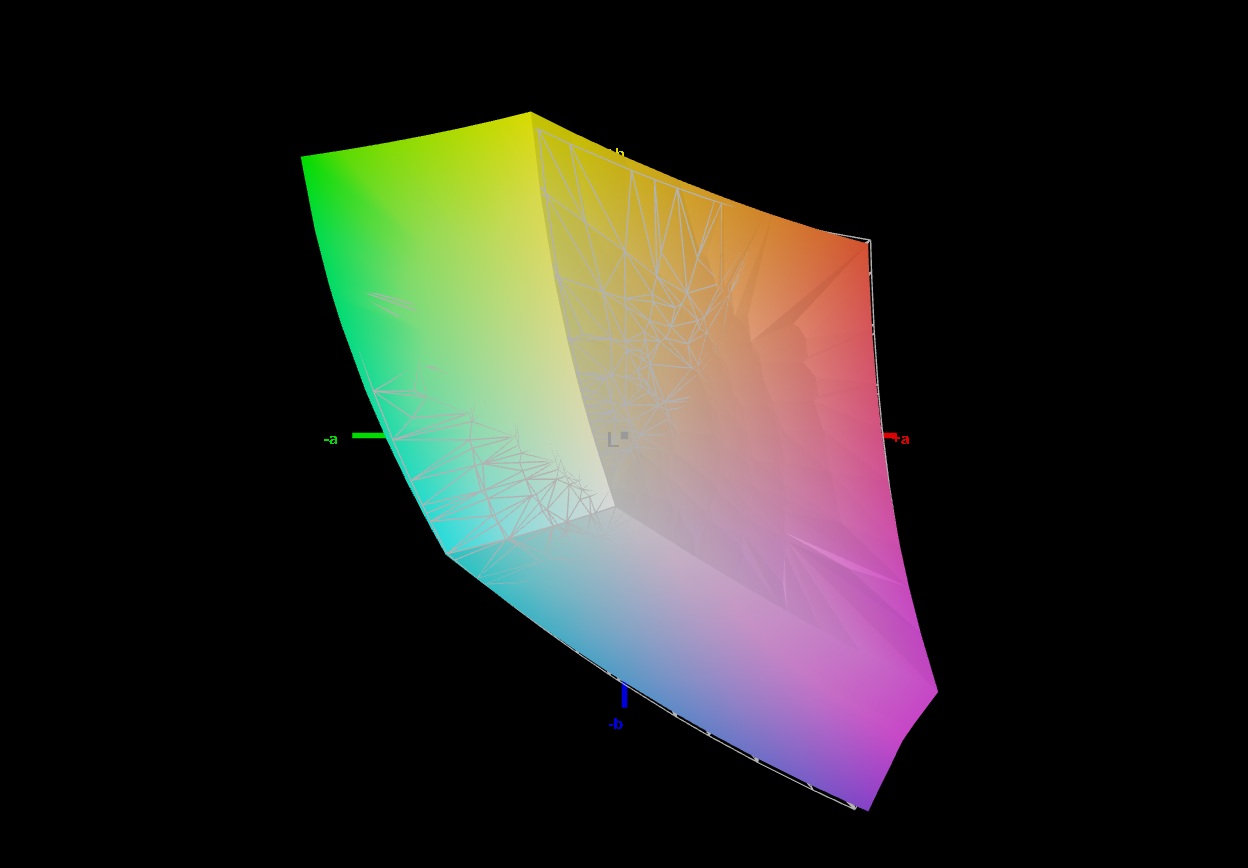
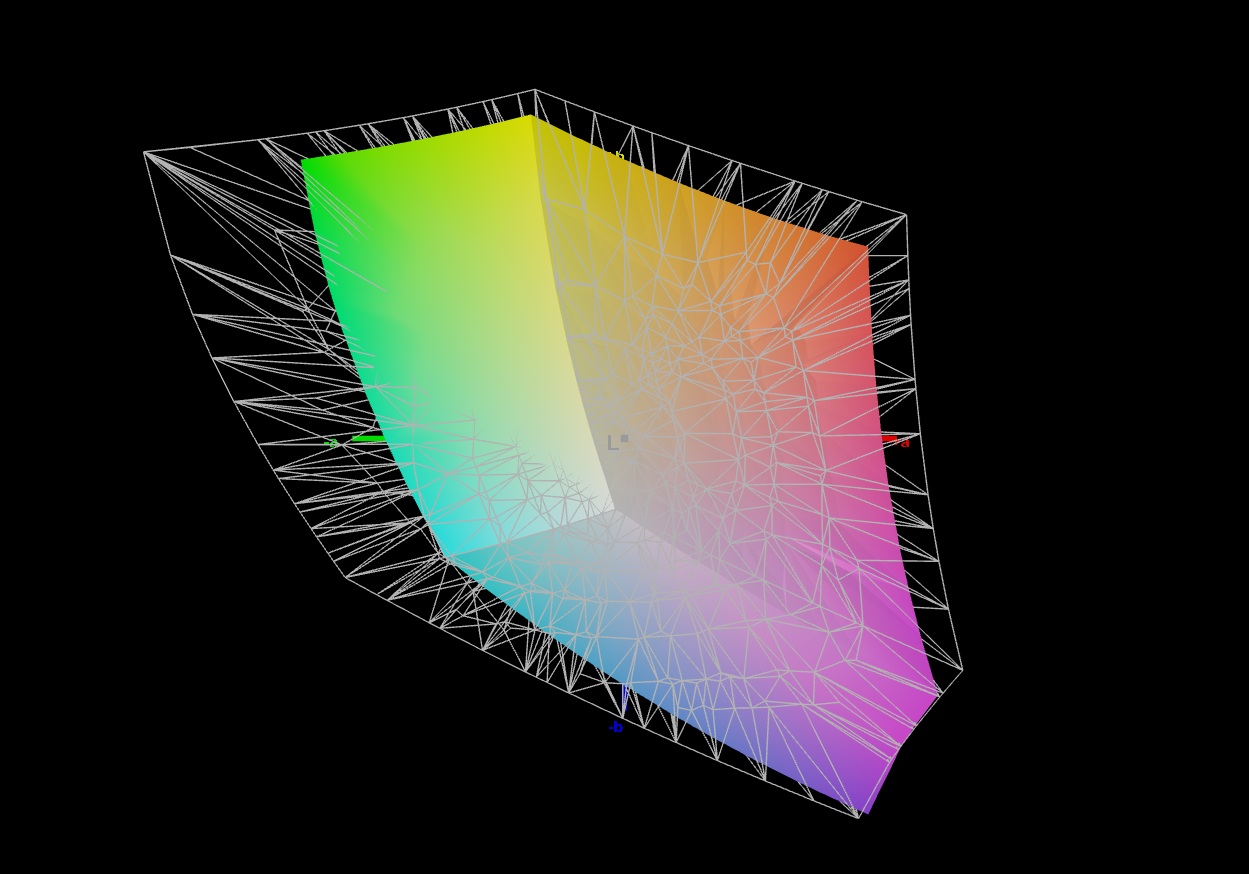
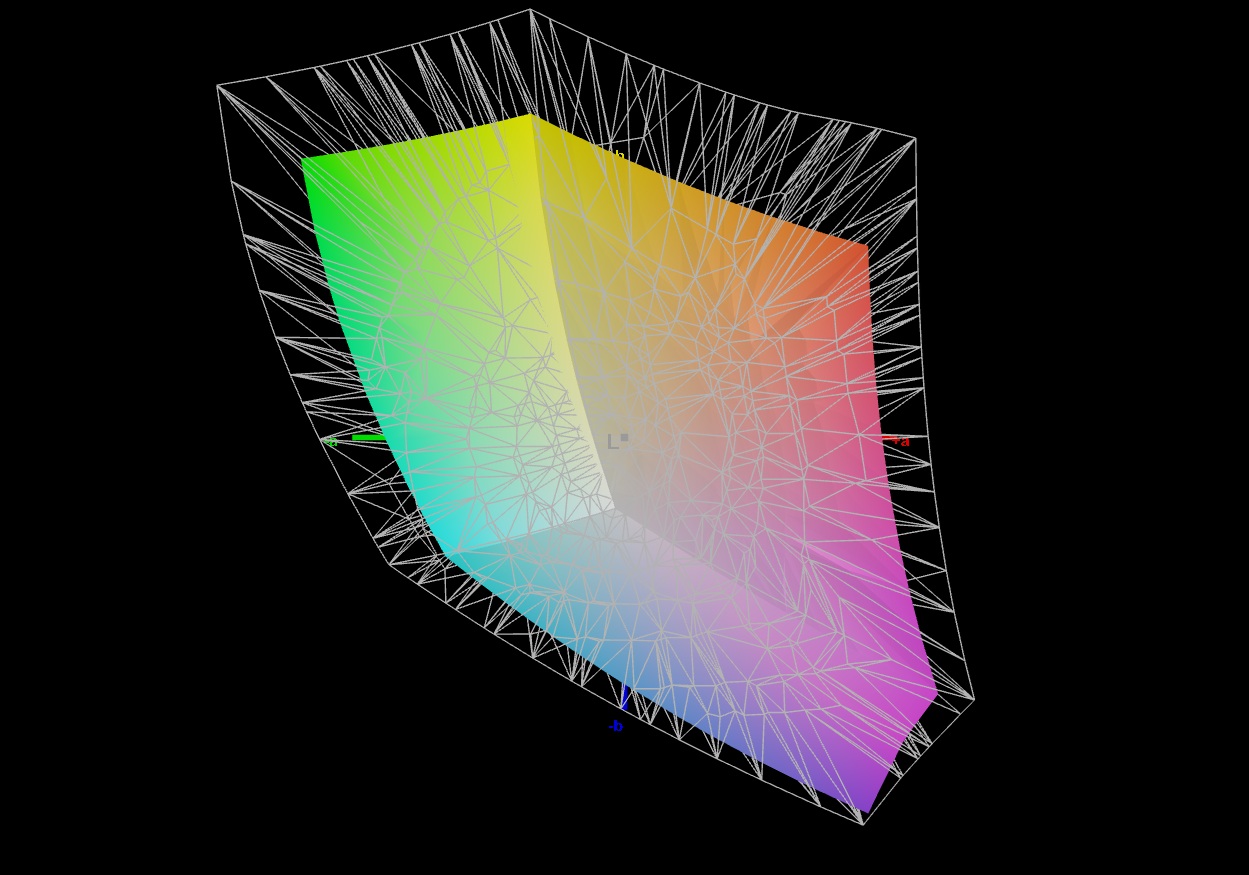
70.6% AdobeRGB 1998 (Argyll 3D)
98.7% sRGB (Argyll 3D)
68.6% Display P3 (Argyll 3D)
Gamma: 2.279
CCT: 7198 K
| Tulpar T6 V3.5 B160UANAC.J (AUO33B7), IPS, 1920x1200, 16", 165 Hz | Acer Nitro V 16 AI ANV16-42-R860 B160UAN08.3 (AUO2CB8), IPS, 1920x1200, 16", 180 Hz | Alienware 16 Aurora BOE NE16N41, IPS, 2560x1600, 16", 120 Hz | HP Omen 16-ap0091ng AUODBB2, IPS, 1920x1200, 16", 144 Hz | Lenovo Legion 5 15AHP G10 LEN151WQXGA, OLED, 2560x1600, 15.1", 165 Hz | Gigabyte Gaming A16 GA6H NE160QDM-NYJ (BOE0C80), IPS, 2560x1600, 16", 165 Hz | |
|---|---|---|---|---|---|---|
| Display | -42% | 2% | -43% | 29% | 1% | |
| Display P3 Coverage (%) | 68.6 | 39.2 -43% | 70.8 3% | 40 -42% | 99.9 46% | 69.4 1% |
| sRGB Coverage (%) | 98.7 | 58.2 -41% | 99.9 1% | 58.1 -41% | 100 1% | 99.5 1% |
| AdobeRGB 1998 Coverage (%) | 70.6 | 40.5 -43% | 72.1 2% | 38.7 -45% | 98.3 39% | 71.6 1% |
| Response Times | 8% | -281% | -132% | 96% | -1% | |
| Response Time Grey 50% / Grey 80% * (ms) | 12.4 ? | 11.6 ? 6% | 49.5 ? -299% | 27.6 ? -123% | 0.42 ? 97% | 14.3 ? -15% |
| Response Time Black / White * (ms) | 8.1 ? | 7.4 ? 9% | 29.3 ? -262% | 19.4 ? -140% | 0.4 ? 95% | 7 ? 14% |
| PWM Frequency (Hz) | 1152 ? | |||||
| PWM Amplitude * (%) | 11 | |||||
| Screen | -70% | 4% | -53% | 43% | -16% | |
| Brightness middle (cd/m²) | 456 | 384 -16% | 345.3 -24% | 328 -28% | 492 8% | 432 -5% |
| Brightness (cd/m²) | 403 | 372 -8% | 324 -20% | 313 -22% | 495 23% | 425 5% |
| Brightness Distribution (%) | 79 | 92 16% | 88 11% | 91 15% | 92 16% | 91 15% |
| Black Level * (cd/m²) | 0.39 | 0.36 8% | 0.23 41% | 0.26 33% | 0.37 5% | |
| Contrast (:1) | 1169 | 1067 -9% | 1501 28% | 1262 8% | 1168 0% | |
| Colorchecker dE 2000 * | 3.05 | 5.82 -91% | 3.22 -6% | 4.73 -55% | 0.9 70% | 4.76 -56% |
| Colorchecker dE 2000 max. * | 6.56 | 20.34 -210% | 5.68 13% | 17.47 -166% | 1.8 73% | 8.59 -31% |
| Colorchecker dE 2000 calibrated * | 1.03 | 3.95 -283% | 0.93 10% | 4.22 -310% | 1.18 -15% | |
| Greyscale dE 2000 * | 3.9 | 5.4 -38% | 4.5 -15% | 2.05 47% | 1.2 69% | 6.2 -59% |
| Gamma | 2.279 97% | 2.174 101% | 2.1 105% | 2.63 84% | 2.16 102% | 2.079 106% |
| CCT | 7198 90% | 6067 107% | 7041 92% | 6718 97% | 6291 103% | 6690 97% |
| Media totale (Programma / Settaggio) | -35% /
-53% | -92% /
-37% | -76% /
-62% | 56% /
49% | -5% /
-10% |
* ... Meglio usare valori piccoli
Sebbene il display da 16 pollici sia inferiore alla copertura AdobeRGB e DCI-P3, copre quasi completamente lo spazio sRGB, che è quello che conta per la maggior parte dei giocatori. Fuori dalla scatola, c'è una tinta blu evidente, ma la calibrazione la risolve facilmente.
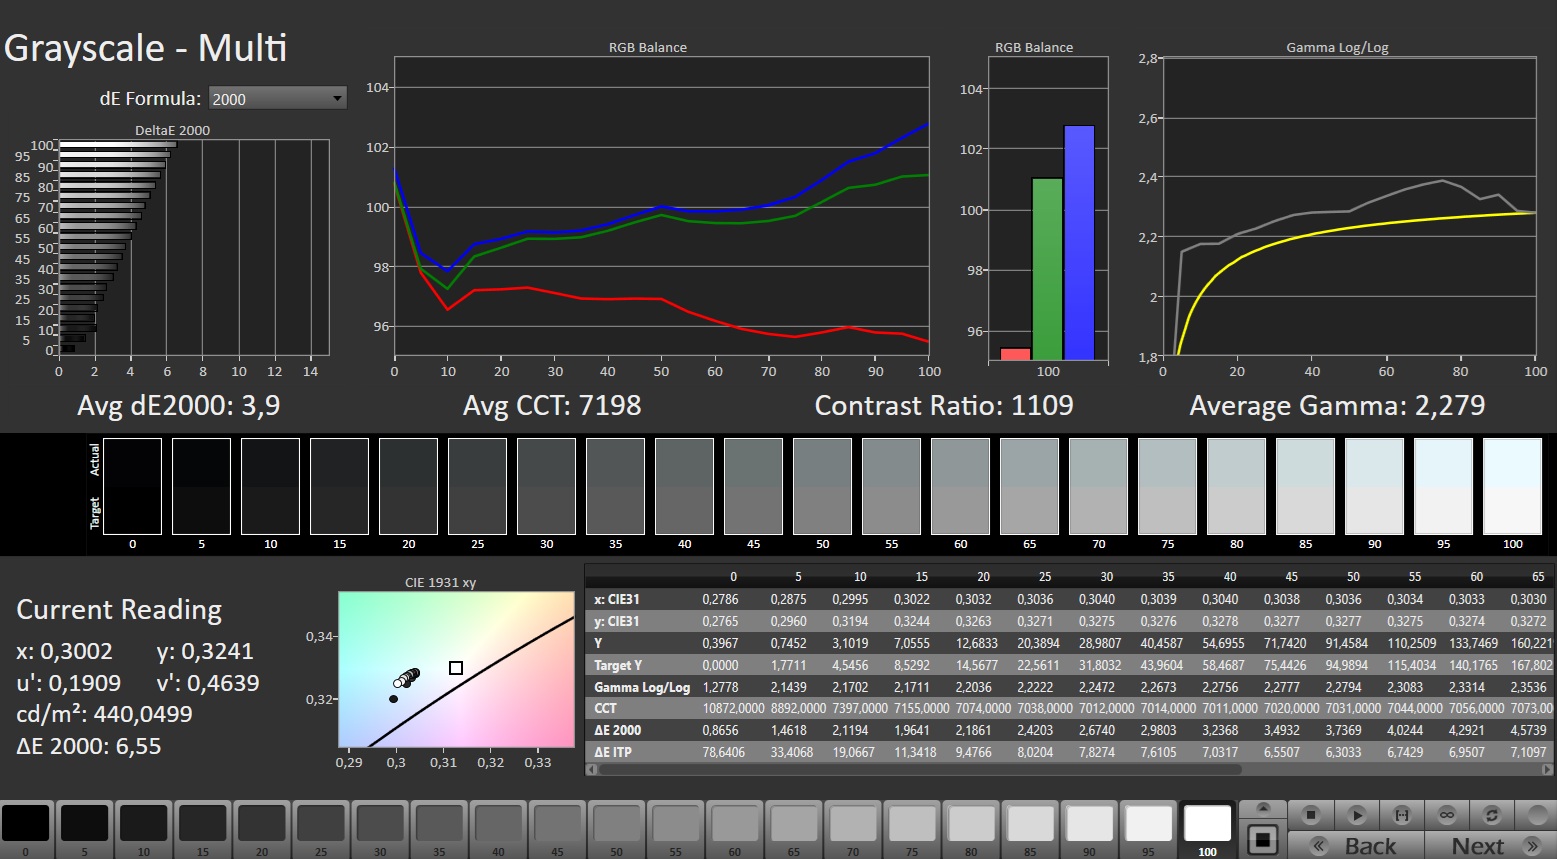
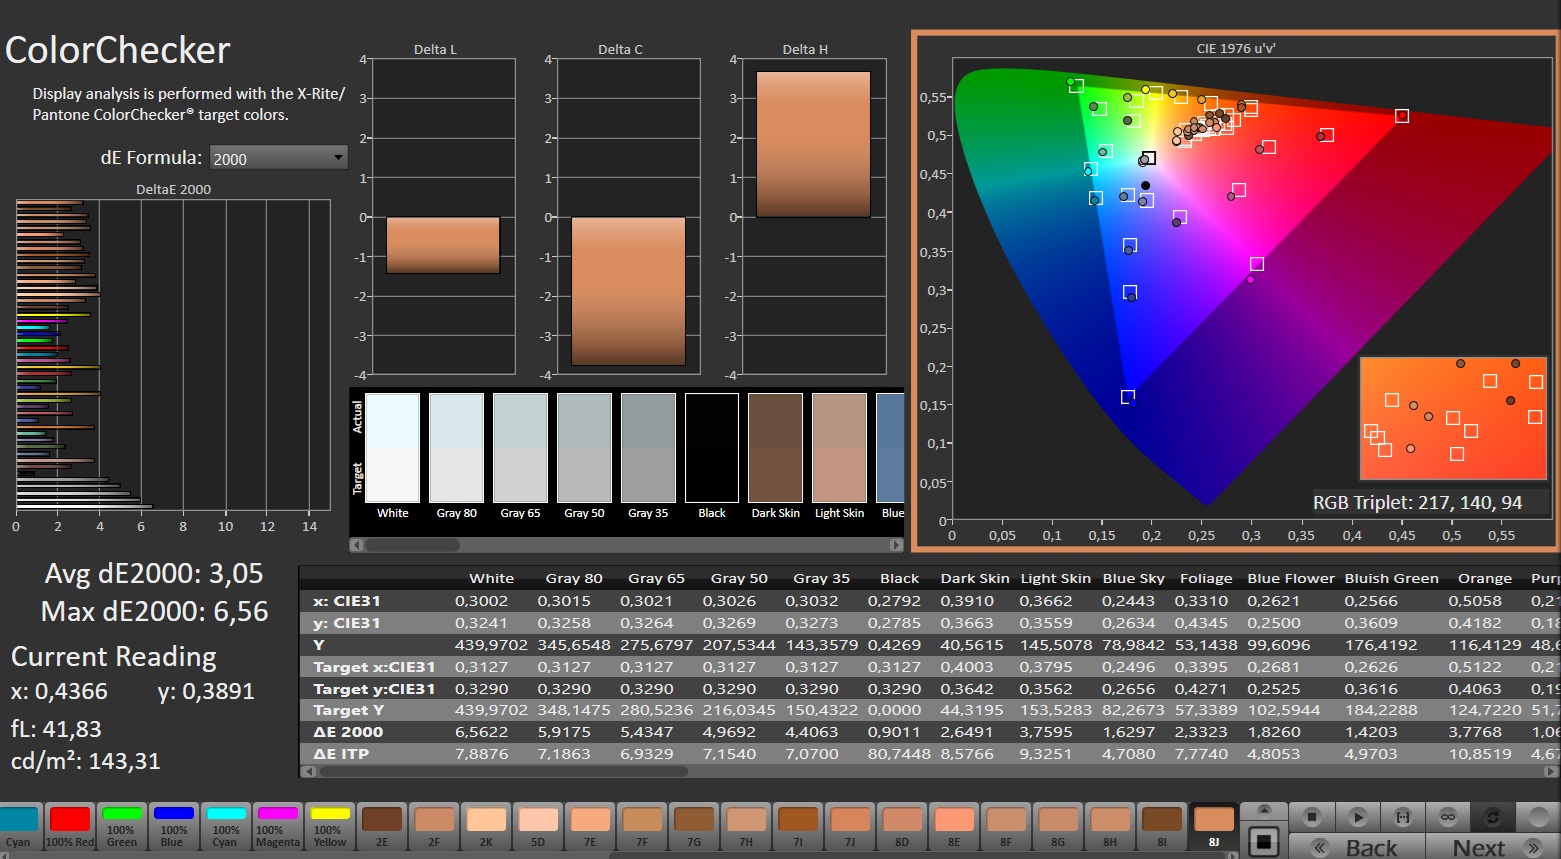
Il livello del nero potrebbe essere migliore, con 0,39 cd/m², ma il contrasto supera comunque 1.000:1, tipico di questa classe.
Anche i tempi di risposta sono buoni rispetto ai modelli concorrenti. Tuttavia, la nostra unità di prova ha mostrato un evidente bleeding dello schermo, soprattutto lungo i lati e negli angoli.
Tempi di risposta del Display
| ↔ Tempi di risposta dal Nero al Bianco | ||
|---|---|---|
| 8.1 ms ... aumenta ↗ e diminuisce ↘ combinato | ↗ 4.7 ms Incremento | 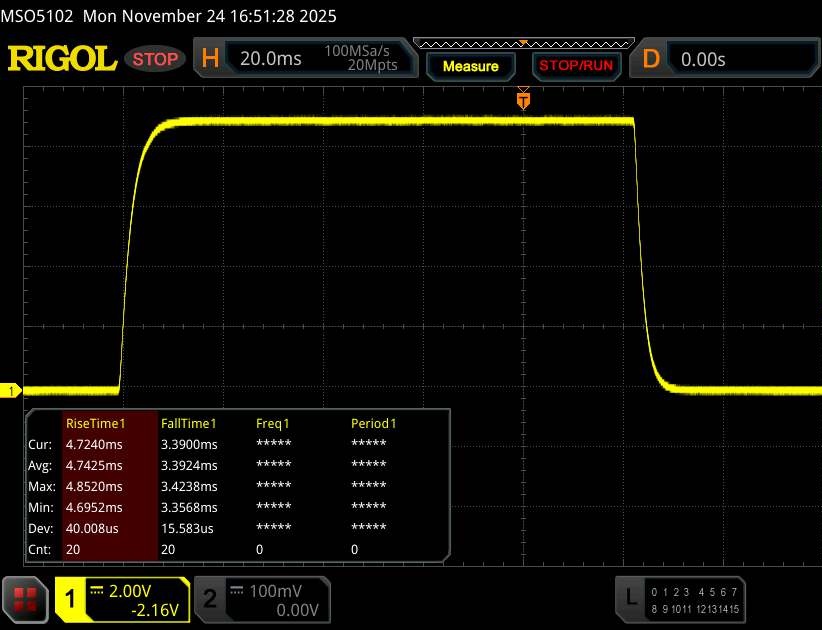 |
| ↘ 3.4 ms Calo | ||
| Lo schermo mostra veloci tempi di risposta durante i nostri tests e dovrebbe esere adatto al gaming In confronto, tutti i dispositivi di test variano da 0.1 (minimo) a 240 (massimo) ms. » 23 % di tutti i dispositivi è migliore. Questo significa che i tempi di risposta rilevati sono migliori rispettto alla media di tutti i dispositivi testati (20.1 ms). | ||
| ↔ Tempo di risposta dal 50% Grigio all'80% Grigio | ||
| 12.4 ms ... aumenta ↗ e diminuisce ↘ combinato | ↗ 6.2 ms Incremento | 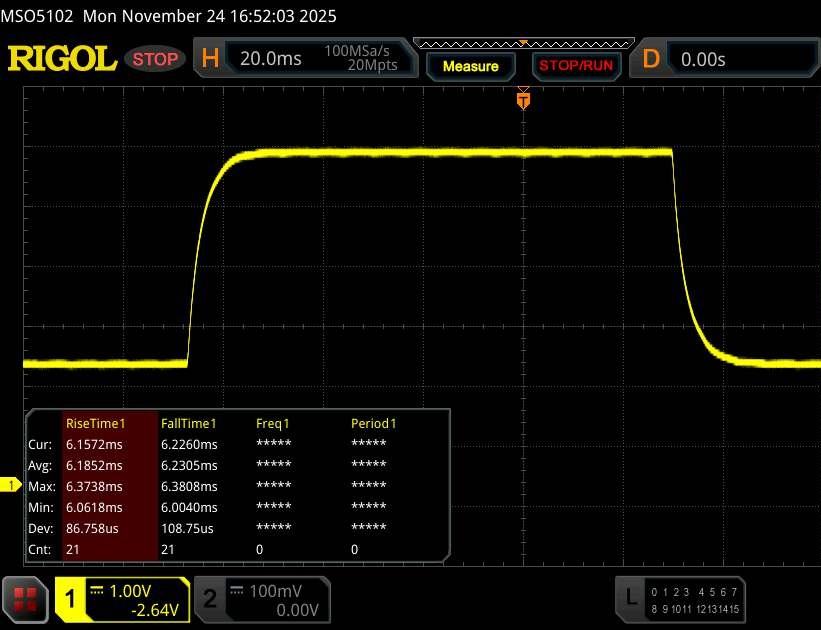 |
| ↘ 6.2 ms Calo | ||
| Lo schermo mostra buoni tempi di risposta durante i nostri tests, ma potrebbe essere troppo lento per i gamers competitivi. In confronto, tutti i dispositivi di test variano da 0.165 (minimo) a 636 (massimo) ms. » 25 % di tutti i dispositivi è migliore. Questo significa che i tempi di risposta rilevati sono migliori rispettto alla media di tutti i dispositivi testati (31.4 ms). | ||
Sfarfallio dello schermo / PWM (Pulse-Width Modulation)
| flickering dello schermo / PWM non rilevato | 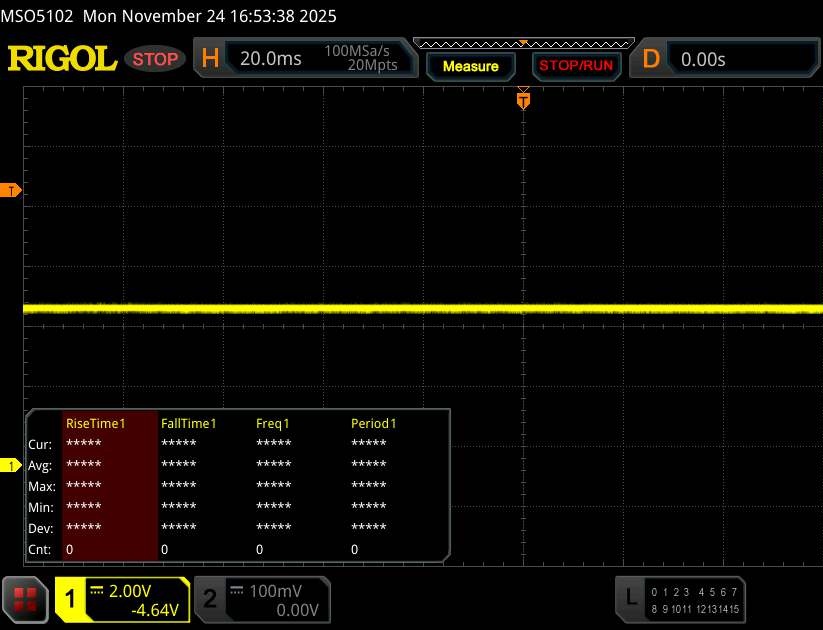 | ||
In confronto: 53 % di tutti i dispositivi testati non utilizza PWM per ridurre la luminosita' del display. Se è rilevato PWM, una media di 8002 (minimo: 5 - massimo: 343500) Hz è stata rilevata. | |||
Prestazioni
Tulpar T6 V3.5 è un sistema di fascia media in grado di gestire quasi tutti i compiti. A parte il sistema operativo, la capacità della RAM e la configurazione dello storage M.2, il sito web del produttore non offre ulteriori opzioni di personalizzazione.
Condizioni del test
Il Control Center preinstallato offre tre modalità operative. Poiché nei nostri test la modalità Performance non ha aumentato in modo significativo la potenza della CPU o della GPU, ma ha aumentato il rumore, tutti i nostri benchmark sono stati eseguiti in modalità Entertainment.
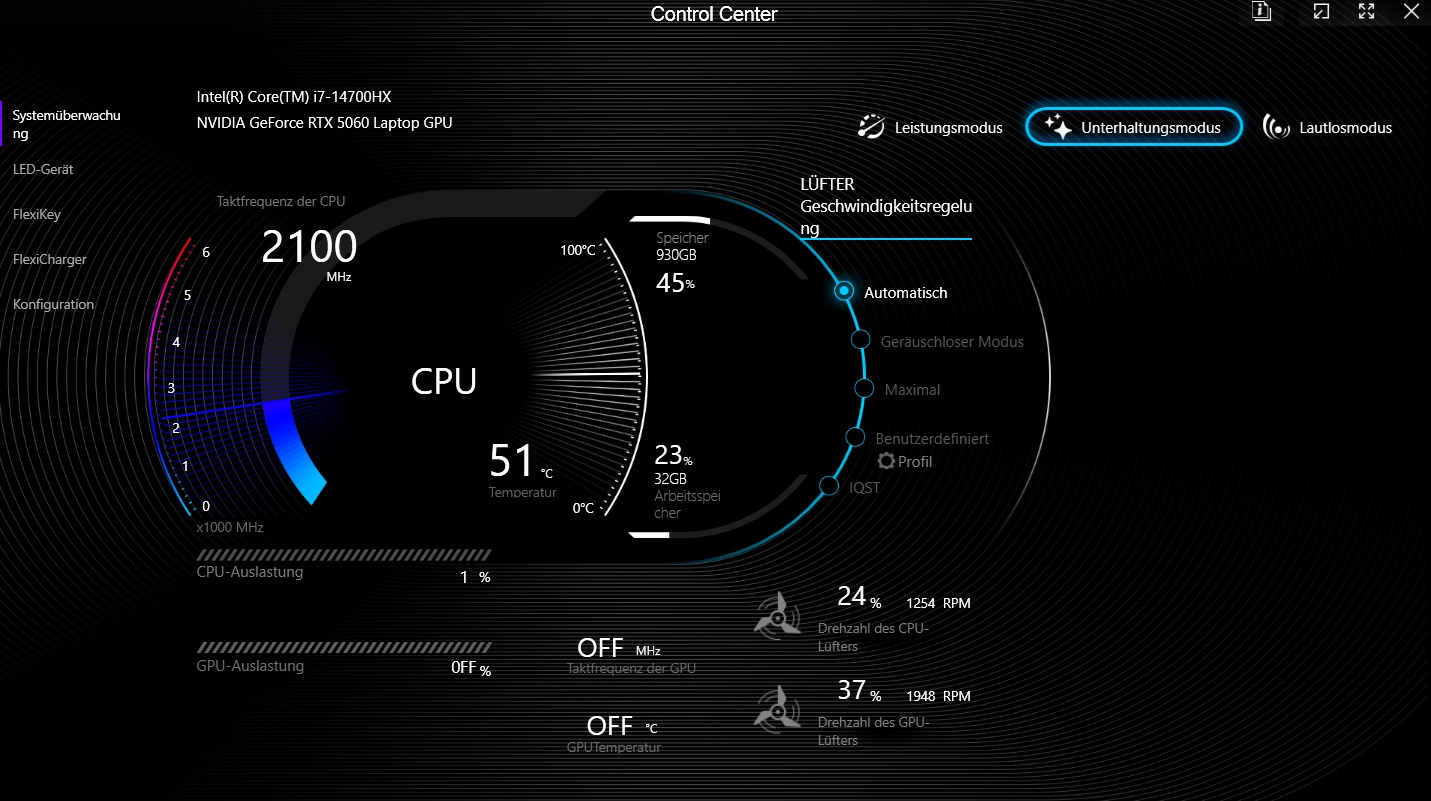
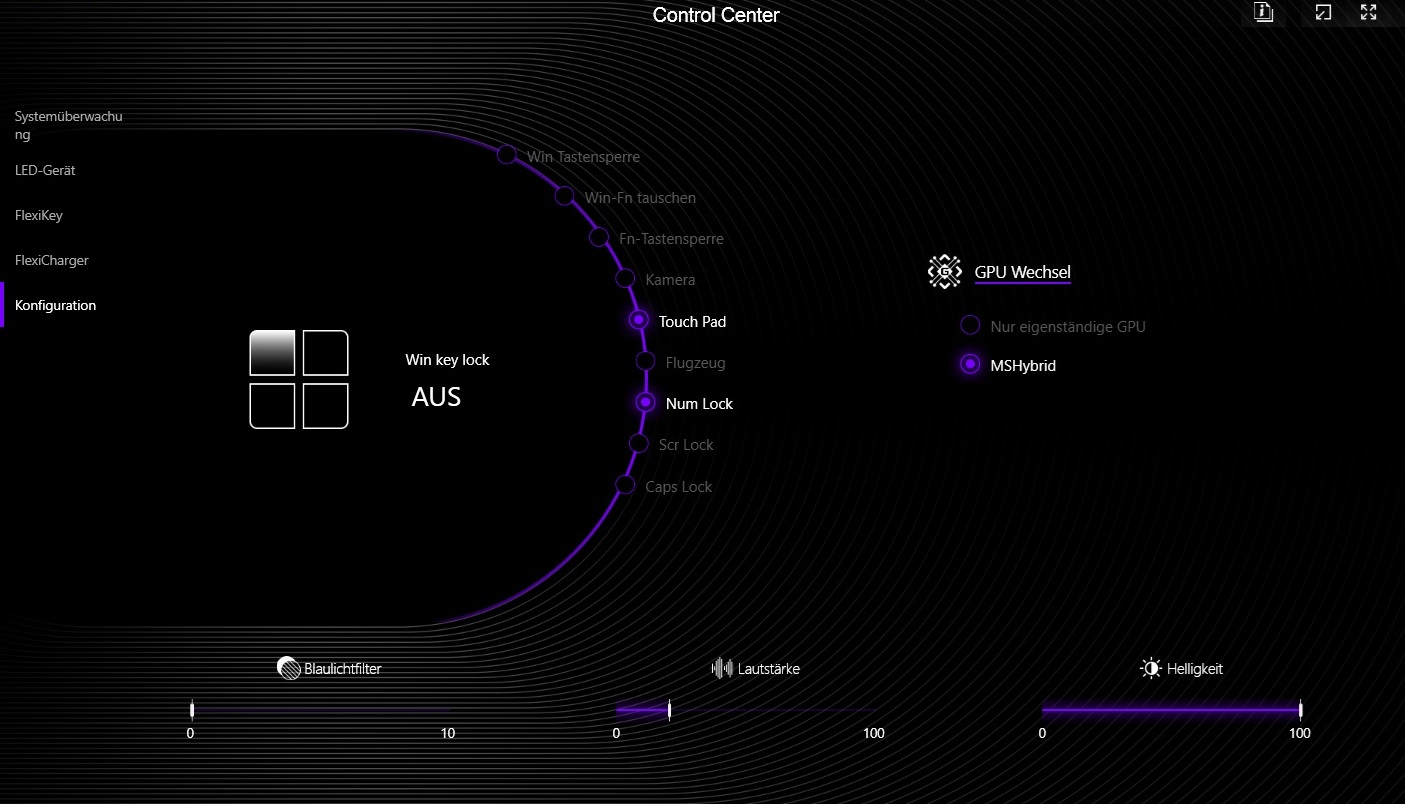
| Modalità | Silenzioso | Intrattenimento | Prestazioni |
| Cyberpunk 2077 Rumore | 34 dB(A) | 52 dB(A) | 56 dB(A) |
| Frequenza fotogrammi Cyberpunk 2077 (FHD/Ultra) | 62,4 fps | 81,8 fps | 82,3 fps |
| CPU PL1 | 28 W | 46 W | 55 W |
| CPU PL2 | 30 W | 115 W | 155 W |
| Cinebench R15 Multi Score | 1441 Punti | 3743 Punti | 3794 Punti |
Processore
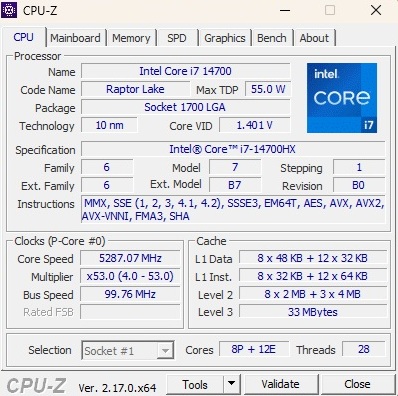
Il Core i7-14700HX è un processore veloce della ormai nota generazione Raptor Lake (10 nm). Offre otto core di prestazioni con Hyper-Threading e dodici core di efficienza senza, per un totale di 28 thread paralleli. Nei nostri benchmark, il T6 V3.5 ha ottenuto prestazioni leggermente inferiori alla media tipica di questa CPU. Ancora più preoccupante è il fatto che nel ciclo Cinebench, le prestazioni sono calate bruscamente dopo pochi cicli. Questo non si riflette bene sulla gestione dell'energia o sulle prestazioni di raffreddamento del sistema, e il problema persisteva anche in modalità Performance.
Test di resistenza multipla Cinebench R15
* ... Meglio usare valori piccoli
AIDA64: FP32 Ray-Trace | FPU Julia | CPU SHA3 | CPU Queen | FPU SinJulia | FPU Mandel | CPU AES | CPU ZLib | FP64 Ray-Trace | CPU PhotoWorxx
| Performance rating | |
| HP Omen 16-ap0091ng | |
| Media della classe Gaming | |
| Lenovo Legion 5 15AHP G10 | |
| Media Intel Core i7-14700HX | |
| Acer Nitro V 16 AI ANV16-42-R860 | |
| Tulpar T6 V3.5 | |
| Alienware 16 Aurora | |
| Gigabyte Gaming A16 GA6H | |
| AIDA64 / FP32 Ray-Trace | |
| HP Omen 16-ap0091ng | |
| Media della classe Gaming (10227 - 85542, n=128, ultimi 2 anni) | |
| Lenovo Legion 5 15AHP G10 | |
| Acer Nitro V 16 AI ANV16-42-R860 | |
| Media Intel Core i7-14700HX (14147 - 23676, n=9) | |
| Alienware 16 Aurora | |
| Tulpar T6 V3.5 | |
| Gigabyte Gaming A16 GA6H | |
| AIDA64 / FPU Julia | |
| HP Omen 16-ap0091ng | |
| Media della classe Gaming (51376 - 238426, n=128, ultimi 2 anni) | |
| Lenovo Legion 5 15AHP G10 | |
| Media Intel Core i7-14700HX (71875 - 116556, n=9) | |
| Acer Nitro V 16 AI ANV16-42-R860 | |
| Alienware 16 Aurora | |
| Tulpar T6 V3.5 | |
| Gigabyte Gaming A16 GA6H | |
| AIDA64 / CPU SHA3 | |
| HP Omen 16-ap0091ng | |
| Media della classe Gaming (2180 - 9817, n=128, ultimi 2 anni) | |
| Lenovo Legion 5 15AHP G10 | |
| Media Intel Core i7-14700HX (3388 - 5567, n=9) | |
| Acer Nitro V 16 AI ANV16-42-R860 | |
| Tulpar T6 V3.5 | |
| Alienware 16 Aurora | |
| Gigabyte Gaming A16 GA6H | |
| AIDA64 / CPU Queen | |
| HP Omen 16-ap0091ng | |
| Media Intel Core i7-14700HX (129134 - 152200, n=9) | |
| Tulpar T6 V3.5 | |
| Lenovo Legion 5 15AHP G10 | |
| Media della classe Gaming (49785 - 173351, n=128, ultimi 2 anni) | |
| Acer Nitro V 16 AI ANV16-42-R860 | |
| Alienware 16 Aurora | |
| Gigabyte Gaming A16 GA6H | |
| AIDA64 / FPU SinJulia | |
| HP Omen 16-ap0091ng | |
| Lenovo Legion 5 15AHP G10 | |
| Media della classe Gaming (4424 - 33636, n=128, ultimi 2 anni) | |
| Media Intel Core i7-14700HX (10266 - 14434, n=9) | |
| Acer Nitro V 16 AI ANV16-42-R860 | |
| Tulpar T6 V3.5 | |
| Alienware 16 Aurora | |
| Gigabyte Gaming A16 GA6H | |
| AIDA64 / FPU Mandel | |
| HP Omen 16-ap0091ng | |
| Media della classe Gaming (25115 - 128721, n=128, ultimi 2 anni) | |
| Lenovo Legion 5 15AHP G10 | |
| Media Intel Core i7-14700HX (35155 - 58380, n=9) | |
| Acer Nitro V 16 AI ANV16-42-R860 | |
| Alienware 16 Aurora | |
| Tulpar T6 V3.5 | |
| Gigabyte Gaming A16 GA6H | |
| AIDA64 / CPU AES | |
| HP Omen 16-ap0091ng | |
| Media della classe Gaming (39258 - 247074, n=128, ultimi 2 anni) | |
| Media Intel Core i7-14700HX (68616 - 113157, n=9) | |
| Tulpar T6 V3.5 | |
| Lenovo Legion 5 15AHP G10 | |
| Acer Nitro V 16 AI ANV16-42-R860 | |
| Alienware 16 Aurora | |
| Gigabyte Gaming A16 GA6H | |
| AIDA64 / CPU ZLib | |
| HP Omen 16-ap0091ng | |
| Media della classe Gaming (574 - 2531, n=128, ultimi 2 anni) | |
| Media Intel Core i7-14700HX (1003 - 1682, n=9) | |
| Lenovo Legion 5 15AHP G10 | |
| Tulpar T6 V3.5 | |
| Alienware 16 Aurora | |
| Acer Nitro V 16 AI ANV16-42-R860 | |
| Gigabyte Gaming A16 GA6H | |
| AIDA64 / FP64 Ray-Trace | |
| HP Omen 16-ap0091ng | |
| Media della classe Gaming (5509 - 45446, n=128, ultimi 2 anni) | |
| Lenovo Legion 5 15AHP G10 | |
| Acer Nitro V 16 AI ANV16-42-R860 | |
| Media Intel Core i7-14700HX (7585 - 12928, n=9) | |
| Alienware 16 Aurora | |
| Tulpar T6 V3.5 | |
| Gigabyte Gaming A16 GA6H | |
| AIDA64 / CPU PhotoWorxx | |
| Tulpar T6 V3.5 | |
| Media della classe Gaming (10805 - 62916, n=128, ultimi 2 anni) | |
| Media Intel Core i7-14700HX (24276 - 49671, n=9) | |
| Lenovo Legion 5 15AHP G10 | |
| Alienware 16 Aurora | |
| Acer Nitro V 16 AI ANV16-42-R860 | |
| Gigabyte Gaming A16 GA6H | |
| HP Omen 16-ap0091ng | |
Prestazioni del sistema
Le prestazioni del sistema, invece, non sono degne di nota. A parte l'SSD relativamente lento, di cui parleremo tra poco, non c'è nulla di particolarmente degno di nota.
PCMark 10: Score | Essentials | Productivity | Digital Content Creation
CrossMark: Overall | Productivity | Creativity | Responsiveness
WebXPRT 3: Overall
WebXPRT 4: Overall
Mozilla Kraken 1.1: Total
| Performance rating | |
| Media della classe Gaming | |
| HP Omen 16-ap0091ng | |
| Lenovo Legion 5 15AHP G10 | |
| Tulpar T6 V3.5 | |
| Media Intel Core i7-14700HX, NVIDIA GeForce RTX 5060 Laptop | |
| Alienware 16 Aurora -4! | |
| Gigabyte Gaming A16 GA6H | |
| Acer Nitro V 16 AI ANV16-42-R860 | |
| PCMark 10 / Score | |
| Lenovo Legion 5 15AHP G10 | |
| Media della classe Gaming (5828 - 10060, n=110, ultimi 2 anni) | |
| HP Omen 16-ap0091ng | |
| Tulpar T6 V3.5 | |
| Media Intel Core i7-14700HX, NVIDIA GeForce RTX 5060 Laptop (n=1) | |
| Acer Nitro V 16 AI ANV16-42-R860 | |
| Gigabyte Gaming A16 GA6H | |
| PCMark 10 / Essentials | |
| Lenovo Legion 5 15AHP G10 | |
| Media della classe Gaming (8810 - 12600, n=114, ultimi 2 anni) | |
| HP Omen 16-ap0091ng | |
| Tulpar T6 V3.5 | |
| Media Intel Core i7-14700HX, NVIDIA GeForce RTX 5060 Laptop (n=1) | |
| Gigabyte Gaming A16 GA6H | |
| Acer Nitro V 16 AI ANV16-42-R860 | |
| PCMark 10 / Productivity | |
| Lenovo Legion 5 15AHP G10 | |
| Media della classe Gaming (6662 - 16716, n=112, ultimi 2 anni) | |
| HP Omen 16-ap0091ng | |
| Acer Nitro V 16 AI ANV16-42-R860 | |
| Tulpar T6 V3.5 | |
| Media Intel Core i7-14700HX, NVIDIA GeForce RTX 5060 Laptop (n=1) | |
| Gigabyte Gaming A16 GA6H | |
| PCMark 10 / Digital Content Creation | |
| Lenovo Legion 5 15AHP G10 | |
| Media della classe Gaming (7505 - 19351, n=112, ultimi 2 anni) | |
| HP Omen 16-ap0091ng | |
| Tulpar T6 V3.5 | |
| Media Intel Core i7-14700HX, NVIDIA GeForce RTX 5060 Laptop (n=1) | |
| Gigabyte Gaming A16 GA6H | |
| Acer Nitro V 16 AI ANV16-42-R860 | |
| CrossMark / Overall | |
| Alienware 16 Aurora | |
| Media della classe Gaming (1247 - 2344, n=110, ultimi 2 anni) | |
| HP Omen 16-ap0091ng | |
| Tulpar T6 V3.5 | |
| Media Intel Core i7-14700HX, NVIDIA GeForce RTX 5060 Laptop (n=1) | |
| Gigabyte Gaming A16 GA6H | |
| Lenovo Legion 5 15AHP G10 | |
| Acer Nitro V 16 AI ANV16-42-R860 | |
| CrossMark / Productivity | |
| Alienware 16 Aurora | |
| Media della classe Gaming (1299 - 2211, n=110, ultimi 2 anni) | |
| HP Omen 16-ap0091ng | |
| Gigabyte Gaming A16 GA6H | |
| Lenovo Legion 5 15AHP G10 | |
| Tulpar T6 V3.5 | |
| Media Intel Core i7-14700HX, NVIDIA GeForce RTX 5060 Laptop (n=1) | |
| Acer Nitro V 16 AI ANV16-42-R860 | |
| CrossMark / Creativity | |
| Tulpar T6 V3.5 | |
| Media Intel Core i7-14700HX, NVIDIA GeForce RTX 5060 Laptop (n=1) | |
| Media della classe Gaming (1275 - 2729, n=110, ultimi 2 anni) | |
| Alienware 16 Aurora | |
| HP Omen 16-ap0091ng | |
| Lenovo Legion 5 15AHP G10 | |
| Gigabyte Gaming A16 GA6H | |
| Acer Nitro V 16 AI ANV16-42-R860 | |
| CrossMark / Responsiveness | |
| Alienware 16 Aurora | |
| Gigabyte Gaming A16 GA6H | |
| Media della classe Gaming (1030 - 2330, n=110, ultimi 2 anni) | |
| Lenovo Legion 5 15AHP G10 | |
| HP Omen 16-ap0091ng | |
| Acer Nitro V 16 AI ANV16-42-R860 | |
| Tulpar T6 V3.5 | |
| Media Intel Core i7-14700HX, NVIDIA GeForce RTX 5060 Laptop (n=1) | |
| WebXPRT 3 / Overall | |
| HP Omen 16-ap0091ng | |
| Media della classe Gaming (237 - 532, n=113, ultimi 2 anni) | |
| Lenovo Legion 5 15AHP G10 | |
| Tulpar T6 V3.5 | |
| Media Intel Core i7-14700HX, NVIDIA GeForce RTX 5060 Laptop (n=1) | |
| Alienware 16 Aurora | |
| Acer Nitro V 16 AI ANV16-42-R860 | |
| Gigabyte Gaming A16 GA6H | |
| WebXPRT 4 / Overall | |
| Tulpar T6 V3.5 | |
| Media Intel Core i7-14700HX, NVIDIA GeForce RTX 5060 Laptop (n=1) | |
| Media della classe Gaming (176.4 - 345, n=111, ultimi 2 anni) | |
| Lenovo Legion 5 15AHP G10 | |
| Alienware 16 Aurora | |
| Gigabyte Gaming A16 GA6H | |
| HP Omen 16-ap0091ng | |
| Acer Nitro V 16 AI ANV16-42-R860 | |
| Mozilla Kraken 1.1 / Total | |
| Acer Nitro V 16 AI ANV16-42-R860 | |
| Alienware 16 Aurora | |
| Gigabyte Gaming A16 GA6H | |
| HP Omen 16-ap0091ng | |
| Lenovo Legion 5 15AHP G10 | |
| Media della classe Gaming (397 - 674, n=120, ultimi 2 anni) | |
| Tulpar T6 V3.5 | |
| Media Intel Core i7-14700HX, NVIDIA GeForce RTX 5060 Laptop (n=1) | |
* ... Meglio usare valori piccoli
| PCMark 10 Score | 7269 punti | |
Aiuto | ||
| AIDA64 / Memory Copy | |
| Tulpar T6 V3.5 | |
| Media della classe Gaming (21750 - 108104, n=128, ultimi 2 anni) | |
| Lenovo Legion 5 15AHP G10 | |
| Media Intel Core i7-14700HX (41617 - 78742, n=9) | |
| Alienware 16 Aurora | |
| Acer Nitro V 16 AI ANV16-42-R860 | |
| Gigabyte Gaming A16 GA6H | |
| HP Omen 16-ap0091ng | |
| AIDA64 / Memory Read | |
| Tulpar T6 V3.5 | |
| Media Intel Core i7-14700HX (46627 - 86175, n=9) | |
| Media della classe Gaming (22956 - 104349, n=128, ultimi 2 anni) | |
| Alienware 16 Aurora | |
| Acer Nitro V 16 AI ANV16-42-R860 | |
| Lenovo Legion 5 15AHP G10 | |
| HP Omen 16-ap0091ng | |
| Gigabyte Gaming A16 GA6H | |
| AIDA64 / Memory Write | |
| Lenovo Legion 5 15AHP G10 | |
| Acer Nitro V 16 AI ANV16-42-R860 | |
| Tulpar T6 V3.5 | |
| Media della classe Gaming (22297 - 133486, n=128, ultimi 2 anni) | |
| Media Intel Core i7-14700HX (39155 - 76976, n=9) | |
| Alienware 16 Aurora | |
| HP Omen 16-ap0091ng | |
| Gigabyte Gaming A16 GA6H | |
| AIDA64 / Memory Latency | |
| Alienware 16 Aurora | |
| Gigabyte Gaming A16 GA6H | |
| Media della classe Gaming (75.3 - 259, n=128, ultimi 2 anni) | |
| Acer Nitro V 16 AI ANV16-42-R860 | |
| Lenovo Legion 5 15AHP G10 | |
| Media Intel Core i7-14700HX (82.7 - 96.4, n=9) | |
| Tulpar T6 V3.5 | |
| HP Omen 16-ap0091ng | |
* ... Meglio usare valori piccoli
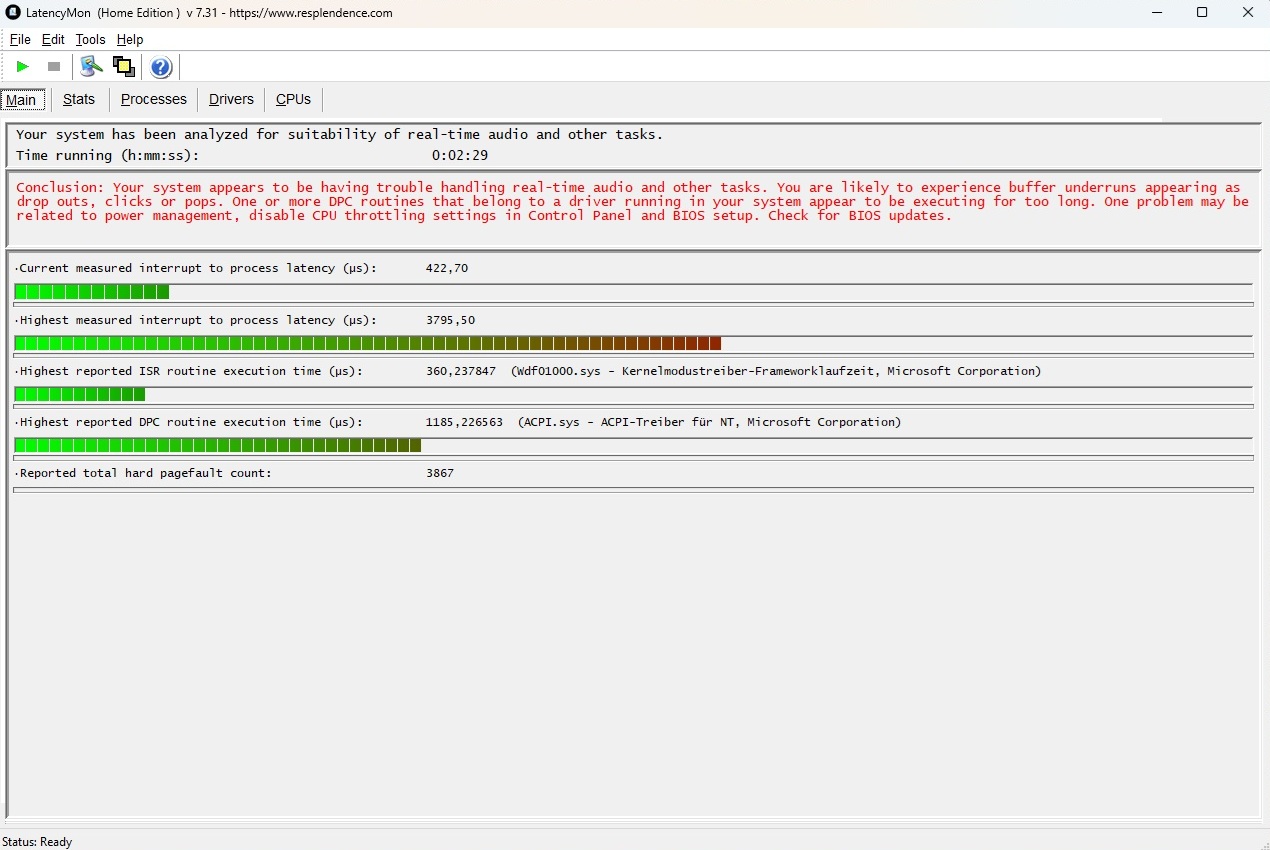
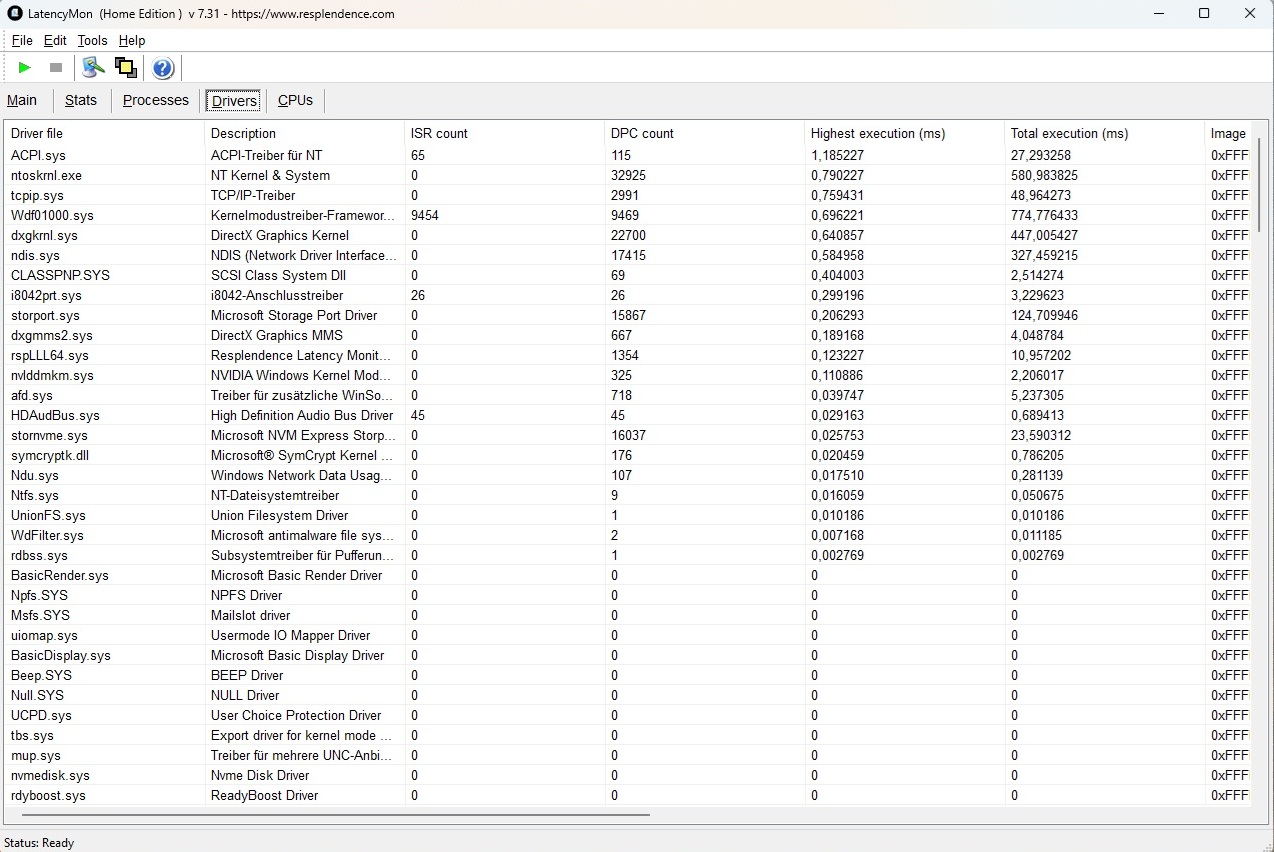
Latenze DPC
I risultati relativi alla latenza potrebbero essere migliori, ma si collocano nella stessa fascia dei modelli comparabili di Gigabyte e Acer.
| DPC Latencies / LatencyMon - interrupt to process latency (max), Web, Youtube, Prime95 | |
| Gigabyte Gaming A16 GA6H | |
| Acer Nitro V 16 AI ANV16-42-R860 | |
| Tulpar T6 V3.5 | |
| Lenovo Legion 5 15AHP G10 | |
| HP Omen 16-ap0091ng | |
* ... Meglio usare valori piccoli
Dispositivi di archiviazione
A differenza della CPU, il sistema di archiviazione mantiene le sue prestazioni complete nel tempo, cosa che non si può dire di tutti i concorrenti. Tuttavia, l'unità Western Digital da 1 TB integrata si colloca nella fascia bassa dei benchmark SSD, con velocità di scrittura particolarmente deboli.

* ... Meglio usare valori piccoli
Prestazioni in lettura continua: Loop di lettura DiskSpd, profondità della coda 8
Prestazioni della GPU
Anche la scheda grafica non riesce a raggiungere il suo pieno potenziale. Anche se la GeForce RTX 5060 è valutata per il suo TGP completo di 115 watt sulla carta (compresi 15 watt di Dynamic Boost), le prestazioni reali sono leggermente inferiori alla media tipica di RTX 5060 e si collocano all'incirca al livello dell'Alienware 16 Aurora.
| 3DMark 11 Performance | 31398 punti | |
| 3DMark Cloud Gate Standard Score | 47731 punti | |
| 3DMark Fire Strike Score | 26286 punti | |
| 3DMark Time Spy Score | 11164 punti | |
Aiuto | ||
* ... Meglio usare valori piccoli
Prestazioni di gioco
Nei benchmark di gioco, il divario di prestazioni si riduce e il Tulpar T6 V3.5 offre generalmente ciò che ci si aspetta. I titoli più vecchi o meno esigenti funzionano molto bene con le impostazioni massime, ma i giochi più recenti e pesanti per la CPU come Borderlands 4 a volte richiedono un upscaling anche alla risoluzione nativa Full HD+.
Con DLSS Balanced Transformer abilitato, ad esempio, Black Ops 7 è migliorato da 32 a 49 fps con il preset Extreme e un elevato ray tracing. Con l'aggiunta della generazione quadrupla di fotogrammi, il sistema ha raggiunto 141 fps, anche se il miglioramento percepito non è una corrispondenza diretta 1:1 con i numeri.
| basso | medio | alto | ultra | |
|---|---|---|---|---|
| GTA V (2015) | 178.9 | 176.1 | 123.8 | |
| Dota 2 Reborn (2015) | 168.2 | 163.6 | 150.6 | |
| Final Fantasy XV Benchmark (2018) | 143.7 | 110 | ||
| X-Plane 11.11 (2018) | 118.3 | 102.8 | ||
| Strange Brigade (2018) | 288 | 227 | 195 | |
| Baldur's Gate 3 (2023) | 95 | 93 | 90 | |
| Cyberpunk 2077 (2023) | 107.4 | 93.2 | 81.8 | |
| Borderlands 4 (2025) | 40.3 | 31.6 | 16.3 | |
| The Outer Worlds 2 (2025) | 82.1 | 65 | 35.7 | |
| ARC Raiders (2025) | 118.4 | 93.5 | 59.8 | |
| Anno 117: Pax Romana (2025) | 73.8 | 55.4 | 28.4 | |
| Call of Duty Black Ops 7 (2025) | 130 | 95 | 32 |
| The Outer Worlds 2 | |
| 1920x1080 High Preset AA:T | |
| Media NVIDIA GeForce RTX 5060 Laptop (58.3 - 72.7, n=4) | |
| Tulpar T6 V3.5 | |
| Media della classe Gaming (51.1 - 82.3, n=8, ultimi 2 anni) | |
| Acer Nitro V 16 AI ANV16-42-R860 | |
| 1920x1080 Very High Preset AA:T | |
| Media NVIDIA GeForce RTX 5060 Laptop (31.1 - 40.9, n=4) | |
| Tulpar T6 V3.5 | |
| Media della classe Gaming (26.4 - 49.9, n=8, ultimi 2 anni) | |
| Acer Nitro V 16 AI ANV16-42-R860 | |
| Borderlands 4 | |
| 1920x1080 High Preset AA:FX | |
| Media della classe Gaming (28.7 - 76.6, n=10, ultimi 2 anni) | |
| Media NVIDIA GeForce RTX 5060 Laptop (28.7 - 39.3, n=4) | |
| Tulpar T6 V3.5 | |
| Acer Nitro V 16 AI ANV16-42-R860 | |
| 1920x1080 Badass Preset AA:FX | |
| Media della classe Gaming (16 - 54, n=10, ultimi 2 anni) | |
| Media NVIDIA GeForce RTX 5060 Laptop (16.3 - 24.8, n=4) | |
| Acer Nitro V 16 AI ANV16-42-R860 | |
| Tulpar T6 V3.5 | |
| Call of Duty Black Ops 7 | |
| 1920x1080 Ultra Preset | |
| Media della classe Gaming (70 - 151, n=9, ultimi 2 anni) | |
| Media NVIDIA GeForce RTX 5060 Laptop (95 - 103, n=4) | |
| Tulpar T6 V3.5 | |
| 1920x1080 Extreme Preset + Raytracing | |
| Media della classe Gaming (24 - 60, n=9, ultimi 2 anni) | |
| Media NVIDIA GeForce RTX 5060 Laptop (32 - 38, n=4) | |
| Tulpar T6 V3.5 | |
| ARC Raiders | |
| 1920x1080 High Preset AA:TSR | |
| Tulpar T6 V3.5 | |
| Media NVIDIA GeForce RTX 5060 Laptop (79.9 - 104.9, n=4) | |
| Media della classe Gaming (64.5 - 114.5, n=8, ultimi 2 anni) | |
| 1920x1080 Epic Preset + Epic Raytracing AA:TSR | |
| Media NVIDIA GeForce RTX 5060 Laptop (55 - 70.2, n=4) | |
| Tulpar T6 V3.5 | |
| Media della classe Gaming (43.5 - 79.8, n=8, ultimi 2 anni) | |
In uno stress test di 30 minuti di Cyberpunk 2077, la frequenza dei fotogrammi è rimasta ampiamente stabile.
Cyberpunk 2077 grafico FPS ultra
Emissioni
Rumore del sistema
Il controllo delle ventole potrebbe richiedere un po' di lavoro. Anche quando il sistema è inattivo, le ventole di tanto in tanto aumentano, il che può essere irritante. Sotto carico, il portatile da 16 pollici diventa chiaramente udibile, con livelli di rumore da 52 a 53 dB(A) che rendono le cuffie la scelta più sensata.
Rumorosità
| Idle |
| 26 / 29 / 31 dB(A) |
| Sotto carico |
| 52 / 53 dB(A) |
 | ||
30 dB silenzioso 40 dB(A) udibile 50 dB(A) rumoroso |
||
min: | ||
| Tulpar T6 V3.5 i7-14700HX, GeForce RTX 5060 Laptop | Acer Nitro V 16 AI ANV16-42-R860 R5 240, GeForce RTX 5050 Laptop | Alienware 16 Aurora Core 7 240H, GeForce RTX 5060 Laptop | HP Omen 16-ap0091ng R9 8940HX, GeForce RTX 5060 Laptop | Lenovo Legion 5 15AHP G10 R7 260, GeForce RTX 5060 Laptop | Gigabyte Gaming A16 GA6H i7-13620H, GeForce RTX 5070 Laptop | |
|---|---|---|---|---|---|---|
| Noise | 4% | 7% | 8% | 9% | 2% | |
| off /ambiente * (dB) | 24 | 25 -4% | 22.9 5% | 23 4% | 25.5 -6% | 24 -0% |
| Idle Minimum * (dB) | 26 | 25 4% | 24 8% | 23 12% | 25.5 2% | 25 4% |
| Idle Average * (dB) | 29 | 30 -3% | 25.6 12% | 23 21% | 25.5 12% | 26 10% |
| Idle Maximum * (dB) | 31 | 33 -6% | 25.6 17% | 27.64 11% | 26.9 13% | 27 13% |
| Load Average * (dB) | 52 | 38 27% | 46.8 10% | 49.5 5% | 34.6 33% | 54 -4% |
| Cyberpunk 2077 ultra * (dB) | 52 | 49 6% | 49.9 4% | 49.5 5% | 50.1 4% | 54 -4% |
| Load Maximum * (dB) | 53 | 50 6% | 55.6 -5% | 52.73 1% | 50.1 5% | 55 -4% |
* ... Meglio usare valori piccoli
Temperatura
Le temperature di superficie restano ragionevoli nei carichi di lavoro 3D, con la parte superiore che raggiunge un massimo di 40 °C. Tuttavia, la parte inferiore può riscaldarsi fino a 47 °C. In idle, lo chassis si assesta su una temperatura moderata tra i 24 e i 35 °C.
(±) La temperatura massima sul lato superiore è di 40 °C / 104 F, rispetto alla media di 40.4 °C / 105 F, che varia da 21.2 a 68.8 °C per questa classe Gaming.
(-) Il lato inferiore si riscalda fino ad un massimo di 47 °C / 117 F, rispetto alla media di 43.3 °C / 110 F
(+) In idle, la temperatura media del lato superiore è di 27.4 °C / 81 F, rispetto alla media deld ispositivo di 33.9 °C / 93 F.
(±) 3: The average temperature for the upper side is 34.8 °C / 95 F, compared to the average of 33.9 °C / 93 F for the class Gaming.
(+) I poggiapolsi e il touchpad sono piu' freddi della temperatura della pelle con un massimo di 27 °C / 80.6 F e sono quindi freddi al tatto.
(±) La temperatura media della zona del palmo della mano di dispositivi simili e'stata di 28.8 °C / 83.8 F (+1.8 °C / 3.2 F).
| Tulpar T6 V3.5 i7-14700HX, GeForce RTX 5060 Laptop | Acer Nitro V 16 AI ANV16-42-R860 R5 240, GeForce RTX 5050 Laptop | Alienware 16 Aurora Core 7 240H, GeForce RTX 5060 Laptop | HP Omen 16-ap0091ng R9 8940HX, GeForce RTX 5060 Laptop | Lenovo Legion 5 15AHP G10 R7 260, GeForce RTX 5060 Laptop | Gigabyte Gaming A16 GA6H i7-13620H, GeForce RTX 5070 Laptop | |
|---|---|---|---|---|---|---|
| Heat | -10% | 10% | 2% | -11% | ||
| Maximum Upper Side * (°C) | 40 | 45 -13% | 36 10% | 42.2 -6% | 50 -25% | |
| Maximum Bottom * (°C) | 47 | 59 -26% | 37 21% | 51.7 -10% | 49 -4% | |
| Idle Upper Side * (°C) | 30 | 29 3% | 30 -0% | 28.5 5% | 35 -17% | |
| Idle Bottom * (°C) | 35 | 36 -3% | 32 9% | 29.2 17% | 34 3% |
* ... Meglio usare valori piccoli
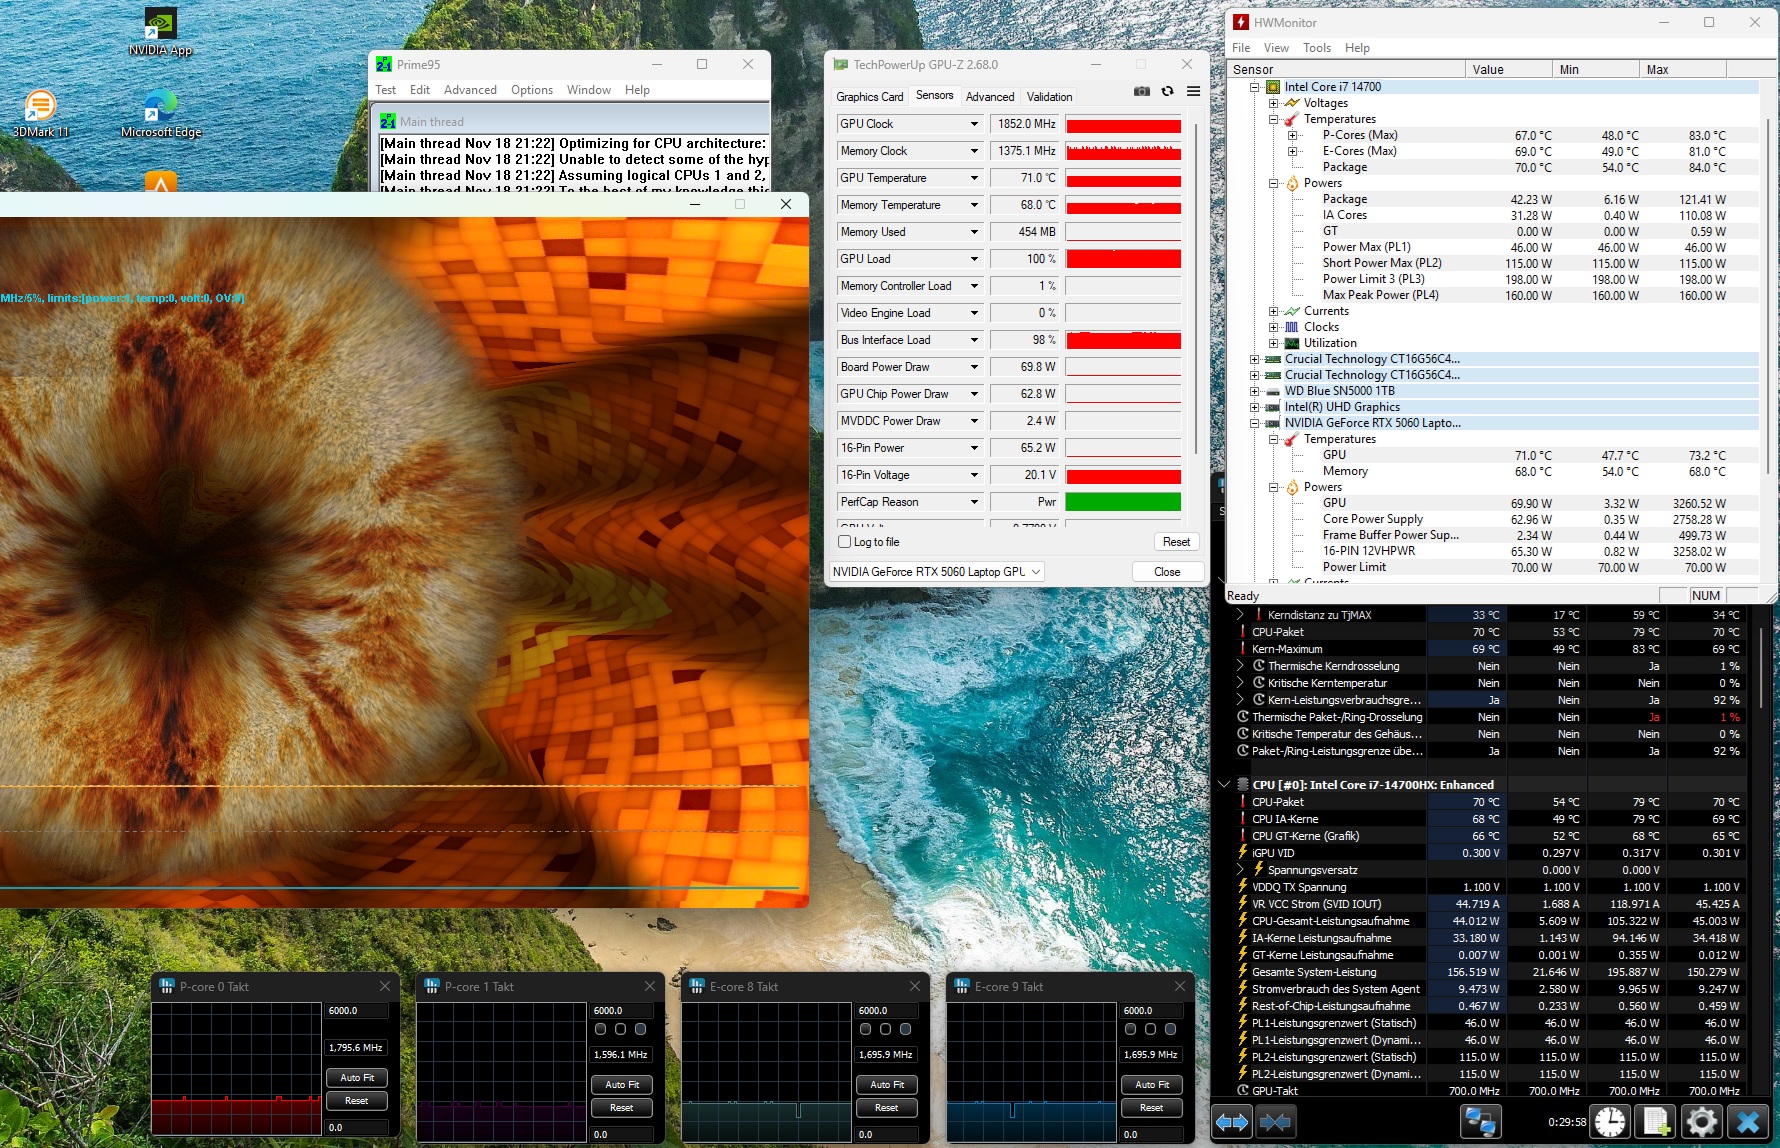
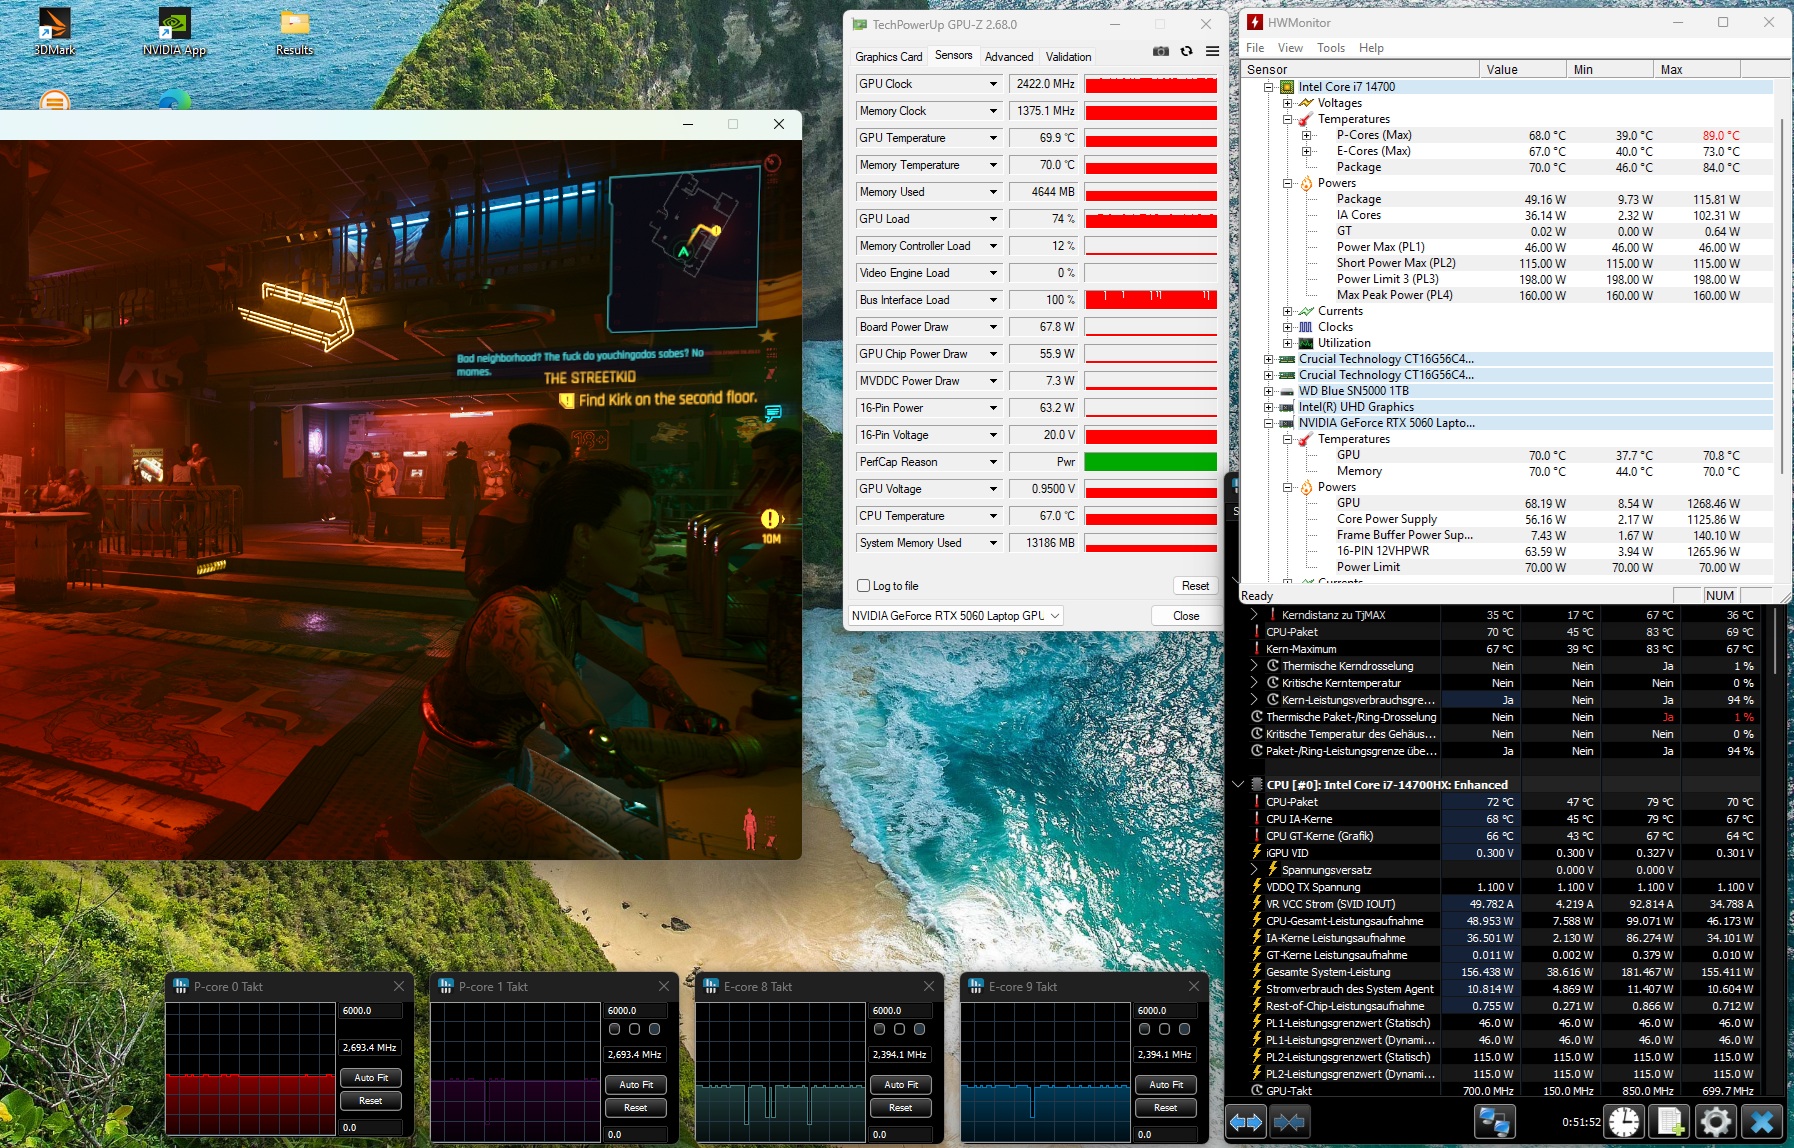
Test da sforzo
Il Core i7-14700HX con throttling ha completato il test di stress combinato Furmark e Prime95 a circa 70 °C, che è del tutto innocuo. Anche la RTX 5060 di GeForce si è stabilizzata a circa 70 °C.
.jpg)
.jpg)
.jpg)
.jpg)
#0 could not convert image to webp (convert_image_webp function, file: /Notebooks/Tulpar/T6_V3.5/temp_tulpar-(1).jpg, status:2), tried cmd /usr/local/bin/magick /var/www/notebookcheck/fileadmin/Notebooks/Tulpar/T6_V3.5/temp_tulpar-(1).jpg -resize 227x -quality 82 -auto-orient /var/www/notebookcheck/fileadmin/_processed_/webp/Notebooks/Tulpar/T6_V3.5/temp_tulpar-(1)-q82-w227-h.webp +0.001s ... 0.006s
#1 cant get getimagesize for webp image. +0s ... 0.006s
#2 could not convert image to webp (convert_image_webp function, file: /Notebooks/Tulpar/T6_V3.5/temp_tulpar-(1).jpg, status:2), tried cmd /usr/local/bin/magick /var/www/notebookcheck/fileadmin/Notebooks/Tulpar/T6_V3.5/temp_tulpar-(1).jpg -resize 454x -quality 82 -auto-orient /var/www/notebookcheck/fileadmin/_processed_/webp/Notebooks/Tulpar/T6_V3.5/temp_tulpar-(1)-q82-w454-h.webp +0.001s ... 0.009s
#3 cant get getimagesize for webp image. +0s ... 0.009s
#4 could not convert image to webp (convert_image_webp function, file: /Notebooks/Tulpar/T6_V3.5/temp_tulpar-(2).jpg, status:2), tried cmd /usr/local/bin/magick /var/www/notebookcheck/fileadmin/Notebooks/Tulpar/T6_V3.5/temp_tulpar-(2).jpg -resize 227x -quality 82 -auto-orient /var/www/notebookcheck/fileadmin/_processed_/webp/Notebooks/Tulpar/T6_V3.5/temp_tulpar-(2)-q82-w227-h.webp +0.001s ... 0.012s
#5 cant get getimagesize for webp image. +0s ... 0.012s
#6 could not convert image to webp (convert_image_webp function, file: /Notebooks/Tulpar/T6_V3.5/temp_tulpar-(2).jpg, status:2), tried cmd /usr/local/bin/magick /var/www/notebookcheck/fileadmin/Notebooks/Tulpar/T6_V3.5/temp_tulpar-(2).jpg -resize 454x -quality 82 -auto-orient /var/www/notebookcheck/fileadmin/_processed_/webp/Notebooks/Tulpar/T6_V3.5/temp_tulpar-(2)-q82-w454-h.webp +0.001s ... 0.014s
#7 cant get getimagesize for webp image. +0s ... 0.014s
#8 could not convert image to webp (convert_image_webp function, file: /Notebooks/Tulpar/T6_V3.5/temp_tulpar-(3).jpg, status:2), tried cmd /usr/local/bin/magick /var/www/notebookcheck/fileadmin/Notebooks/Tulpar/T6_V3.5/temp_tulpar-(3).jpg -resize 226x -quality 82 -auto-orient /var/www/notebookcheck/fileadmin/_processed_/webp/Notebooks/Tulpar/T6_V3.5/temp_tulpar-(3)-q82-w226-h.webp +0.001s ... 0.019s
#9 cant get getimagesize for webp image. +0s ... 0.019s
#10 could not convert image to webp (convert_image_webp function, file: /Notebooks/Tulpar/T6_V3.5/temp_tulpar-(3).jpg, status:2), tried cmd /usr/local/bin/magick /var/www/notebookcheck/fileadmin/Notebooks/Tulpar/T6_V3.5/temp_tulpar-(3).jpg -resize 452x -quality 82 -auto-orient /var/www/notebookcheck/fileadmin/_processed_/webp/Notebooks/Tulpar/T6_V3.5/temp_tulpar-(3)-q82-w452-h.webp +0.001s ... 0.022s
#11 cant get getimagesize for webp image. +0s ... 0.022s
#12 could not convert image to webp (convert_image_webp function, file: /Notebooks/Tulpar/T6_V3.5/temp_tulpar-(4).jpg, status:2), tried cmd /usr/local/bin/magick /var/www/notebookcheck/fileadmin/Notebooks/Tulpar/T6_V3.5/temp_tulpar-(4).jpg -resize 226x -quality 82 -auto-orient /var/www/notebookcheck/fileadmin/_processed_/webp/Notebooks/Tulpar/T6_V3.5/temp_tulpar-(4)-q82-w226-h.webp +0.001s ... 0.025s
#13 cant get getimagesize for webp image. +0s ... 0.025s
#14 could not convert image to webp (convert_image_webp function, file: /Notebooks/Tulpar/T6_V3.5/temp_tulpar-(4).jpg, status:2), tried cmd /usr/local/bin/magick /var/www/notebookcheck/fileadmin/Notebooks/Tulpar/T6_V3.5/temp_tulpar-(4).jpg -resize 452x -quality 82 -auto-orient /var/www/notebookcheck/fileadmin/_processed_/webp/Notebooks/Tulpar/T6_V3.5/temp_tulpar-(4)-q82-w452-h.webp +0.001s ... 0.027s
#15 cant get getimagesize for webp image. +0s ... 0.027s
Altoparlanti
Poiché gli altoparlanti 2.0 integrati offrono una qualità audio limitata, soprattutto nella gamma dei bassi, si consiglia di utilizzare un sistema audio esterno per un uso a lungo termine.
Tulpar T6 V3.5 analisi audio
(+) | gli altoparlanti sono relativamente potenti (82 dB)
Bassi 100 - 315 Hz
(-) | quasi nessun basso - in media 22.4% inferiori alla media
(±) | la linearità dei bassi è media (14.4% delta rispetto alla precedente frequenza)
Medi 400 - 2000 Hz
(±) | medi elevati - circa 10.7% superiore alla media
(+) | medi lineari (6.6% delta rispetto alla precedente frequenza)
Alti 2 - 16 kHz
(+) | Alti bilanciati - appena 3.5% dalla media
(±) | la linearità degli alti è media (7.4% delta rispetto alla precedente frequenza)
Nel complesso 100 - 16.000 Hz
(±) | la linearità complessiva del suono è media (24% di differenza rispetto alla media
Rispetto alla stessa classe
» 86% di tutti i dispositivi testati in questa classe è stato migliore, 4% simile, 9% peggiore
» Il migliore ha avuto un delta di 6%, medio di 18%, peggiore di 132%
Rispetto a tutti i dispositivi testati
» 72% di tutti i dispositivi testati in questa classe è stato migliore, 6% similare, 22% peggiore
» Il migliore ha avuto un delta di 4%, medio di 24%, peggiore di 134%
HP Omen 16-ap0091ng analisi audio
(±) | potenza degli altiparlanti media ma buona (79.91 dB)
Bassi 100 - 315 Hz
(-) | quasi nessun basso - in media 18% inferiori alla media
(±) | la linearità dei bassi è media (11.1% delta rispetto alla precedente frequenza)
Medi 400 - 2000 Hz
(±) | medi elevati - circa 6.9% superiore alla media
(±) | linearità dei medi adeguata (7.5% delta rispetto alla precedente frequenza)
Alti 2 - 16 kHz
(+) | Alti bilanciati - appena 2.1% dalla media
(±) | la linearità degli alti è media (7.5% delta rispetto alla precedente frequenza)
Nel complesso 100 - 16.000 Hz
(±) | la linearità complessiva del suono è media (17.8% di differenza rispetto alla media
Rispetto alla stessa classe
» 53% di tutti i dispositivi testati in questa classe è stato migliore, 10% simile, 38% peggiore
» Il migliore ha avuto un delta di 6%, medio di 18%, peggiore di 132%
Rispetto a tutti i dispositivi testati
» 35% di tutti i dispositivi testati in questa classe è stato migliore, 8% similare, 57% peggiore
» Il migliore ha avuto un delta di 4%, medio di 24%, peggiore di 134%
Gestione dell'energia
Consumo di energia
Il consumo energetico è complessivamente ragionevole, anche se il T6 V3.5 potrebbe essere un po' più efficiente rispetto ad alcuni modelli concorrenti. Il suo alimentatore da 230 watt viene raramente spinto vicino al suo limite.
| Off / Standby | |
| Idle | |
| Sotto carico |
|
Leggenda:
min: | |
| Tulpar T6 V3.5 i7-14700HX, GeForce RTX 5060 Laptop | Acer Nitro V 16 AI ANV16-42-R860 R5 240, GeForce RTX 5050 Laptop | Alienware 16 Aurora Core 7 240H, GeForce RTX 5060 Laptop | HP Omen 16-ap0091ng R9 8940HX, GeForce RTX 5060 Laptop | Lenovo Legion 5 15AHP G10 R7 260, GeForce RTX 5060 Laptop | Gigabyte Gaming A16 GA6H i7-13620H, GeForce RTX 5070 Laptop | Media della classe Gaming | |
|---|---|---|---|---|---|---|---|
| Power Consumption | 38% | 17% | 1% | 15% | 10% | -30% | |
| Idle Minimum * (Watt) | 6.7 | 4.2 37% | 4.4 34% | 7.8 -16% | 6.9 -3% | 9 -34% | 13.6 ? -103% |
| Idle Average * (Watt) | 13.7 | 6.8 50% | 18 -31% | 8.8 36% | 10.7 22% | 11 20% | 19.3 ? -41% |
| Idle Maximum * (Watt) | 21.8 | 9.8 55% | 18.2 17% | 21.5 1% | 11.3 48% | 23 -6% | 25.1 ? -15% |
| Load Average * (Watt) | 127 | 62 51% | 87.1 31% | 119 6% | 69.7 45% | 91 28% | 110.3 ? 13% |
| Cyberpunk 2077 ultra external monitor * (Watt) | 151.9 | 129.6 15% | 120.6 21% | 164.5 -8% | 165 -9% | 130 14% | |
| Cyberpunk 2077 ultra * (Watt) | 156.7 | 130.3 17% | 123 22% | 192 -23% | 162.6 -4% | 132.5 15% | |
| Load Maximum * (Watt) | 242 | 135 44% | 183 24% | 208 14% | 233.6 3% | 155 36% | 257 ? -6% |
* ... Meglio usare valori piccoli
consumo energetico Cyberpunk / Stress test
consumo energetico con monitor esterno
Durata della batteria
Nel nostro test Wi-Fi con la luminosità del display impostata a 150 cd/m², la batteria da 53 Wh è durata poco meno di 4,5 ore, un risultato mediocre. A titolo di confronto, i concorrenti con batterie più grandi da 70 a 96 Wh hanno una durata che va da circa 5 ore (HP Omen 16) a 11 ore (Acer Nitro V 16 AI).
| Tulpar T6 V3.5 i7-14700HX, GeForce RTX 5060 Laptop, 53.35 Wh | Acer Nitro V 16 AI ANV16-42-R860 R5 240, GeForce RTX 5050 Laptop, 76 Wh | Alienware 16 Aurora Core 7 240H, GeForce RTX 5060 Laptop, 96 Wh | HP Omen 16-ap0091ng R9 8940HX, GeForce RTX 5060 Laptop, 70 Wh | Lenovo Legion 5 15AHP G10 R7 260, GeForce RTX 5060 Laptop, 80 Wh | Gigabyte Gaming A16 GA6H i7-13620H, GeForce RTX 5070 Laptop, 76 Wh | Media della classe Gaming | |
|---|---|---|---|---|---|---|---|
| Autonomia della batteria | 155% | 70% | 14% | 120% | 75% | 52% | |
| WiFi v1.3 (h) | 4.4 | 11.2 155% | 7.5 70% | 5 14% | 9.7 120% | 7.7 75% | 6.7 ? 52% |
| H.264 (h) | 5.1 | 11.5 | 7.93 ? | ||||
| Load (h) | 1.3 | 1.2 | 1.502 ? | ||||
| Cyberpunk 2077 ultra 150cd (h) | 0.9 |
Valutazione complessiva di Notebookcheck
Nel complesso, Tulpar T6 V3.5 è un solido computer portatile da gioco con RTX 5060 e un rapporto prezzo-prestazioni equilibrato.
Tulpar T6 V3.5
- 11/25/2025 v8
Florian Glaser
 Total Sustainability Score:
 Possibili alternative a confronto
Immagine | Modello | Prezzo | Peso | Altezza | Schermo |
|---|---|---|---|---|---|
1. 77.8% 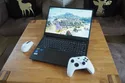 | Tulpar T6 V3.5 Intel Core i7-14700HX ⎘ NVIDIA GeForce RTX 5060 Laptop ⎘ 32 GB Memoria, 1000 GB SSD | Amazon: Prezzo di listino: 1160 EUR | 2.4 kg | 25 mm | 16.00" 1920x1200 142 PPI IPS |
2. 77.5% 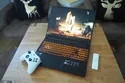 | Acer Nitro V 16 AI ANV16-42-R860 AMD Ryzen 5 240 ⎘ NVIDIA GeForce RTX 5050 Laptop ⎘ 16 GB Memoria, 1024 GB SSD | Amazon: 1. $649.00 acer Nitro V 16 AI WUXGA (19... 2. $819.00 acer Nitro V 16 AI Gaming La... 3. $19.99 180W/135W AC Adapter Compati... Prezzo di listino: 1100 EUR | 2.4 kg | 24.5 mm | 16.00" 1920x1200 142 PPI IPS |
3. 76.2%  | Alienware 16 Aurora Intel Core 7 240H ⎘ NVIDIA GeForce RTX 5060 Laptop ⎘ 32 GB Memoria | Amazon: Prezzo di listino: 1100 USD | 2.6 kg | 15.2 mm | 16.00" 2560x1600 189 PPI IPS |
4. 82.5% 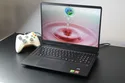 | HP Omen 16-ap0091ng AMD Ryzen 9 8940HX ⎘ NVIDIA GeForce RTX 5060 Laptop ⎘ 16 GB Memoria, 1000 GB SSD | Amazon: Prezzo di listino: 1500 Euro | 2.4 kg | 23.7 mm | 16.00" 1920x1200 162 PPI IPS |
5. 87.2% 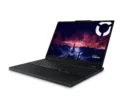 | Lenovo Legion 5 15AHP G10 AMD Ryzen 7 260 ⎘ NVIDIA GeForce RTX 5060 Laptop ⎘ 32 GB Memoria, 1024 GB SSD | Prezzo di listino: 1449€ | 1.9 kg | 21.5 mm | 15.10" 2560x1600 200 PPI OLED |
6. 80.1%  | Gigabyte Gaming A16 GA6H Intel Core i7-13620H ⎘ NVIDIA GeForce RTX 5070 Laptop ⎘ 16 GB Memoria, 1024 GB SSD | Prezzo di listino: 1700 EUR | 2.3 kg | 23 mm | 16.00" 2560x1600 189 PPI IPS |
Transparency
La selezione dei dispositivi da recensire viene effettuata dalla nostra redazione. Il campione di prova è stato fornito all'autore come prestito dal produttore o dal rivenditore ai fini di questa recensione. L'istituto di credito non ha avuto alcuna influenza su questa recensione, né il produttore ne ha ricevuto una copia prima della pubblicazione. Non vi era alcun obbligo di pubblicare questa recensione. In quanto società mediatica indipendente, Notebookcheck non è soggetta all'autorità di produttori, rivenditori o editori.
Ecco come Notebookcheck esegue i test
Ogni anno, Notebookcheck esamina in modo indipendente centinaia di laptop e smartphone utilizzando procedure standardizzate per garantire che tutti i risultati siano comparabili. Da circa 20 anni sviluppiamo continuamente i nostri metodi di prova e nel frattempo stabiliamo gli standard di settore. Nei nostri laboratori di prova, tecnici ed editori esperti utilizzano apparecchiature di misurazione di alta qualità. Questi test comportano un processo di validazione in più fasi. Il nostro complesso sistema di valutazione si basa su centinaia di misurazioni e parametri di riferimento ben fondati, che mantengono l'obiettività.