Recensione del Lenovo Legion 5 15IAH7H: il portatile Core i7-12700H più veloce che si possa acquistare
Il modello 2022 Legion 5 15 rappresenta un importante aggiornamento rispetto al modello 2021 Legion 5 15. Utilizza la stessa GPU, anche se con un obiettivo TGP più elevato (140 W contro 130 W) e aggiorna la CPU all'ultima serie Alder Lake-H di 12a generazione. Anche lo chassis esterno è stato aggiornato per ottenere un look più nuovo ed elegante.
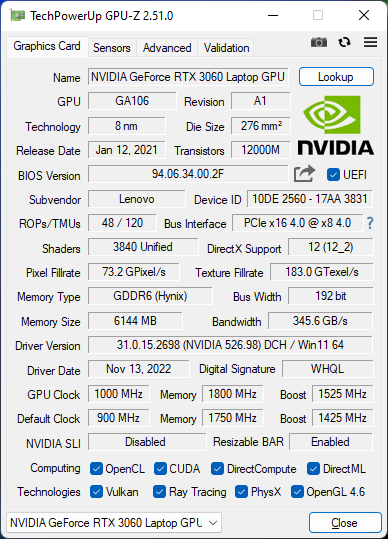
La nostra configurazione in esame è una configurazione di fascia media con Core i7-12700H, GPU GeForce RTX 3060 e display IPS 1080p165 al prezzo di circa 1600 dollari al dettaglio. Sono disponibili altre SKU con CPU Core i5-12500H, display a 144 Hz o la più veloce GeForce RTX 3070 Ti.
Tra i concorrenti del Legion 5 15 ci sono altri portatili da gioco da 15,6 pollici di fascia media come Razer Blade 15 Base Edition, Asus TUF Gaming F15, MSI Bravo 15, o Acer Aspire Nitro 5. Il Legion 5 15 non deve essere confuso con il Legion 5 Pro che è un modello più grande da 16 pollici.
Tutte le specifiche sono disponibili nel PDF ufficiale di Lenovo qui.
Altre recensioni Lenovo:
Potenziali concorrenti a confronto
Punteggio | Data | Modello | Peso | Altezza | Dimensione | Risoluzione | Prezzo |
|---|---|---|---|---|---|---|---|
| 87.5 % v7 (old) | 11/2022 | Lenovo Legion 5 15IAH7H 82RB i7-12700H, GeForce RTX 3060 Laptop GPU | 2.4 kg | 19.99 mm | 15.60" | 1920x1080 | |
| 83.4 % v7 (old) | 09/2021 | Lenovo Legion 5 15ACH-82JU00C6GE-FL R7 5800H, GeForce RTX 3060 Laptop GPU | 2.5 kg | 26 mm | 15.60" | 1920x1080 | |
| 78.2 % v7 (old) | 04/2022 | MSI Bravo 15 B5DD-010US R5 5600H, Radeon RX 5500M | 2.3 kg | 24.95 mm | 15.60" | 1920x1080 | |
| 87.2 % v7 (old) | 03/2022 | Asus TUF Gaming F15 FX507ZM i7-12700H, GeForce RTX 3060 Laptop GPU | 2.1 kg | 24.95 mm | 15.60" | 1920x1080 | |
| 80.5 % v7 (old) | 05/2021 | Acer Aspire Nitro 5 AN515-55-57GF i5-10300H, GeForce RTX 3060 Laptop GPU | 2.3 kg | 23.9 mm | 15.60" | 1920x1080 | |
| 85.5 % v7 (old) | 03/2021 | Razer Blade 15 Base Edition 2021, i7-10750H RTX 3060 i7-10750H, GeForce RTX 3060 Laptop GPU | 2.1 kg | 19.9 mm | 15.60" | 1920x1080 |
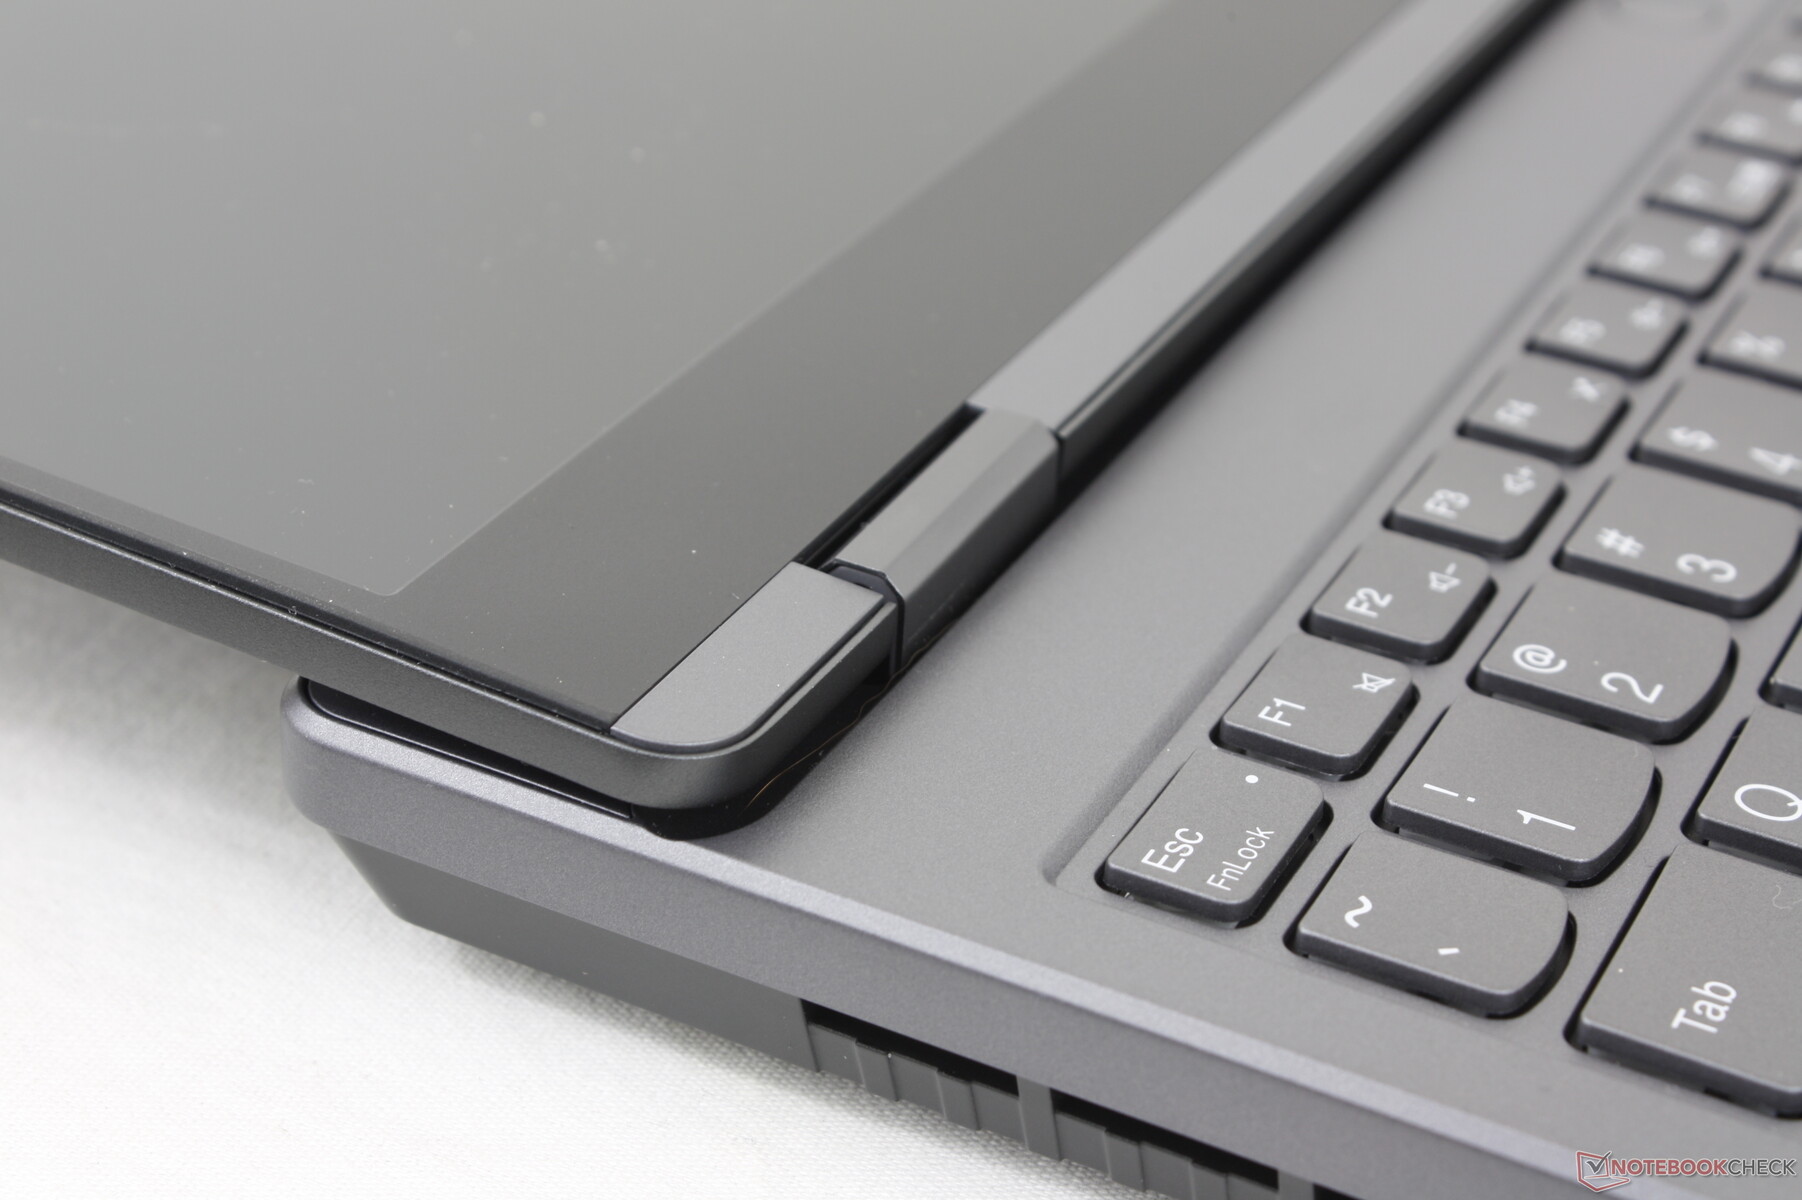
Caso - Legion con un pizzico di ThinkBook
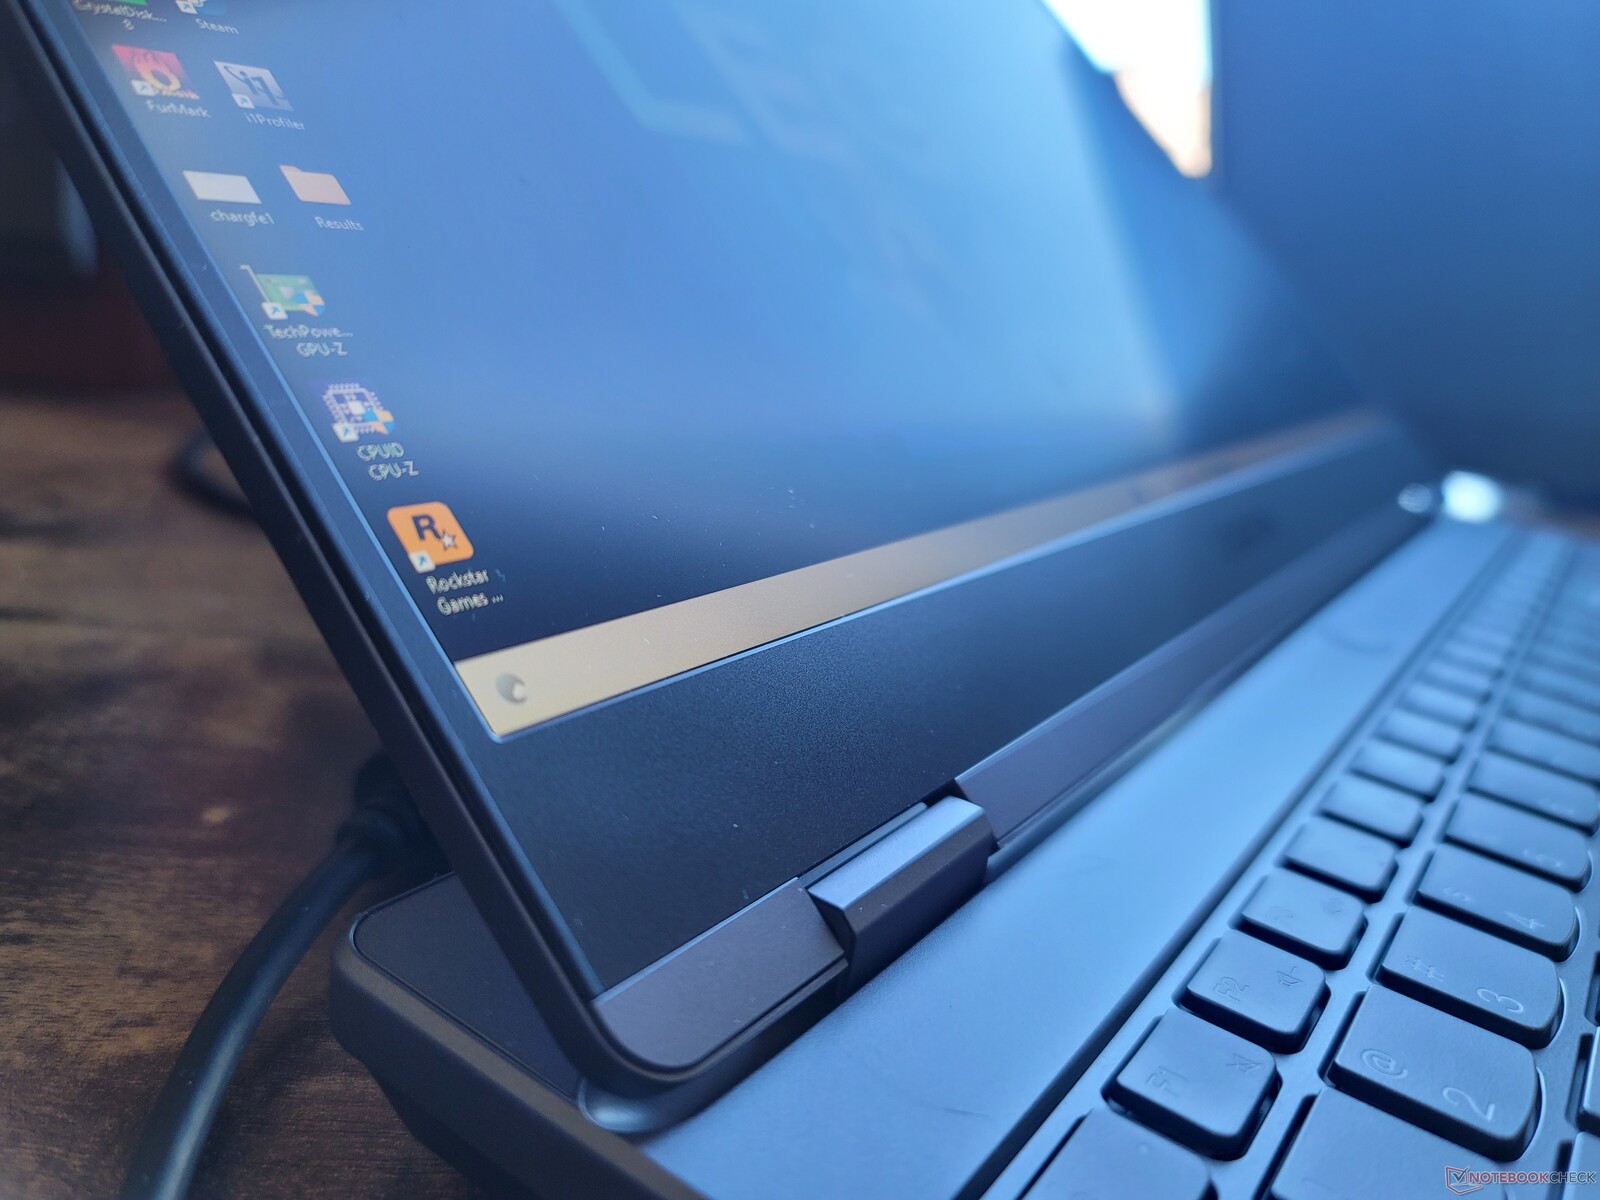
Il telaio mantiene l'estetica generale del modello dello scorso anno, ma con angoli arrotondati su tutti i lati e griglie di ventilazione ridisegnate. L'aspetto più pulito ricorda più da vicino la Serie ThinkBook che probabilmente non è una coincidenza. Se confrontato con la serie concorrente Asus TUF/ROG o con la serie MSI, il nuovo Legion 5 15 ha un aspetto molto meno da gamer e più da semi-professionale.
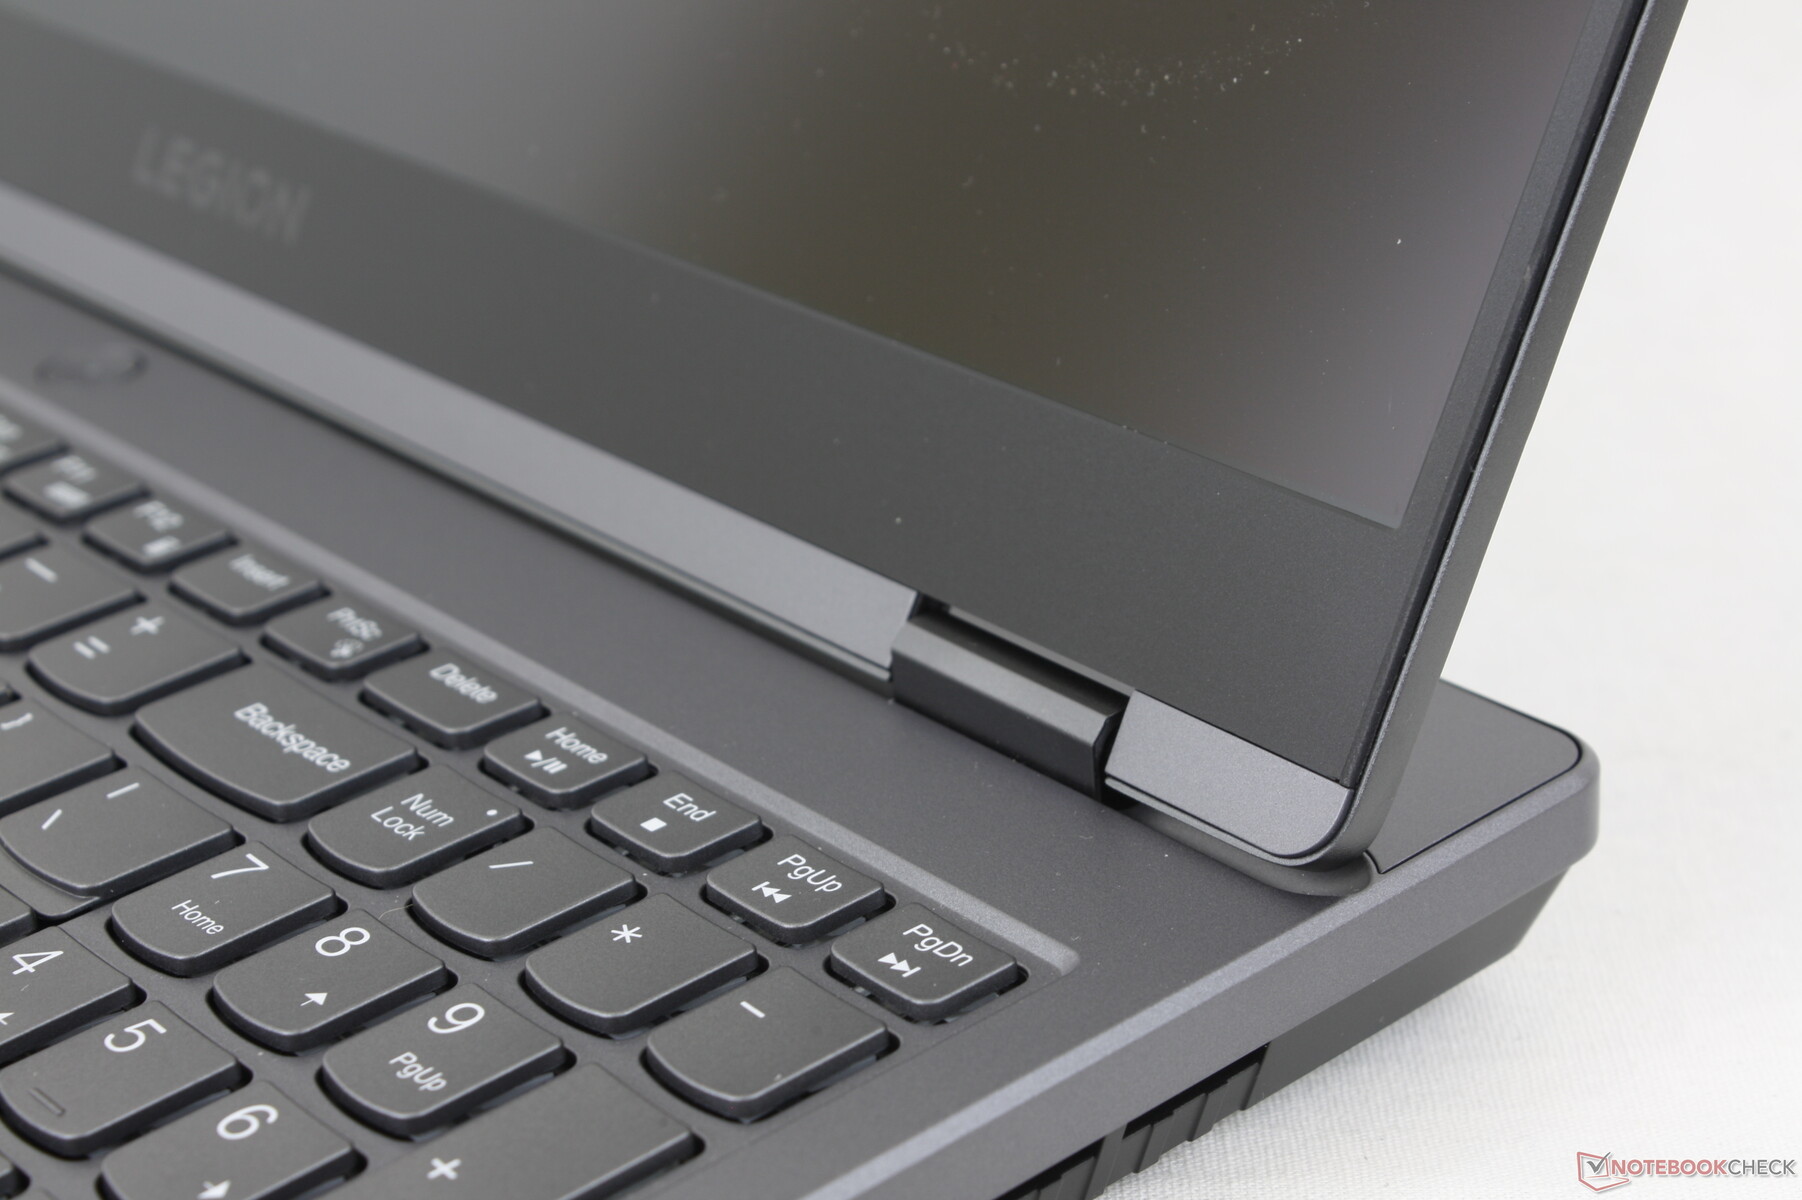
La rigidità del telaio è forte, ma non è all'altezza di quella del Razer Blade serie Razer Blade. Quando si tenta di ruotare la base, ad esempio, il Lenovo mostra una deformazione e uno scricchiolio leggermente maggiori e lo stesso si può dire per il suo display. Le cerniere sono soddisfacenti, ma non così forti come le cerniere sovradimensionate della serie Asus TUF.
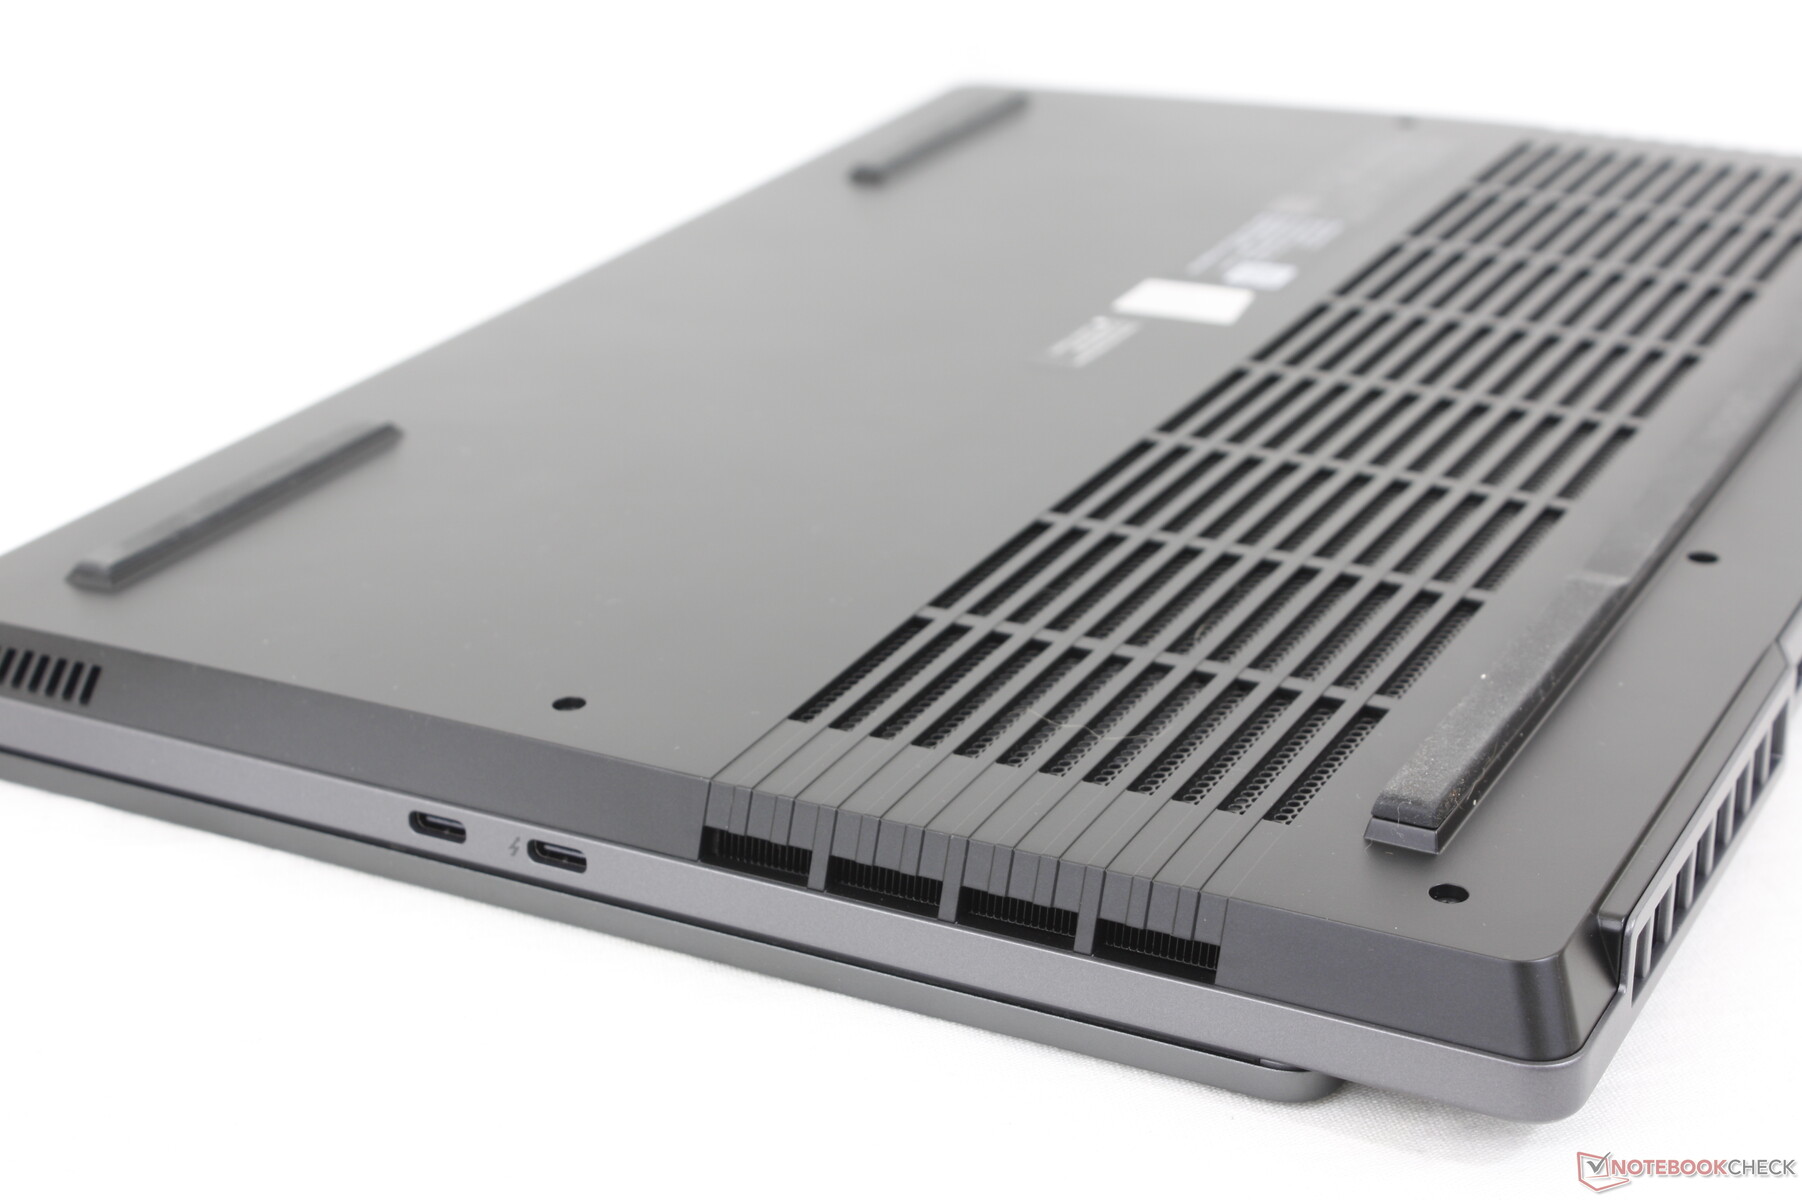
Il modello è più largo e quindi più pesante di molti altri portatili da gioco da 15,6 pollici a causa dell'ampia sporgenza posteriore del design Legion. Sebbene questo aiuti il raffreddamento e le prestazioni, lo svantaggio è un portatile più goffo che non è adatto ai viaggi come molte alternative come il Razer Blade 15 Base Edition.
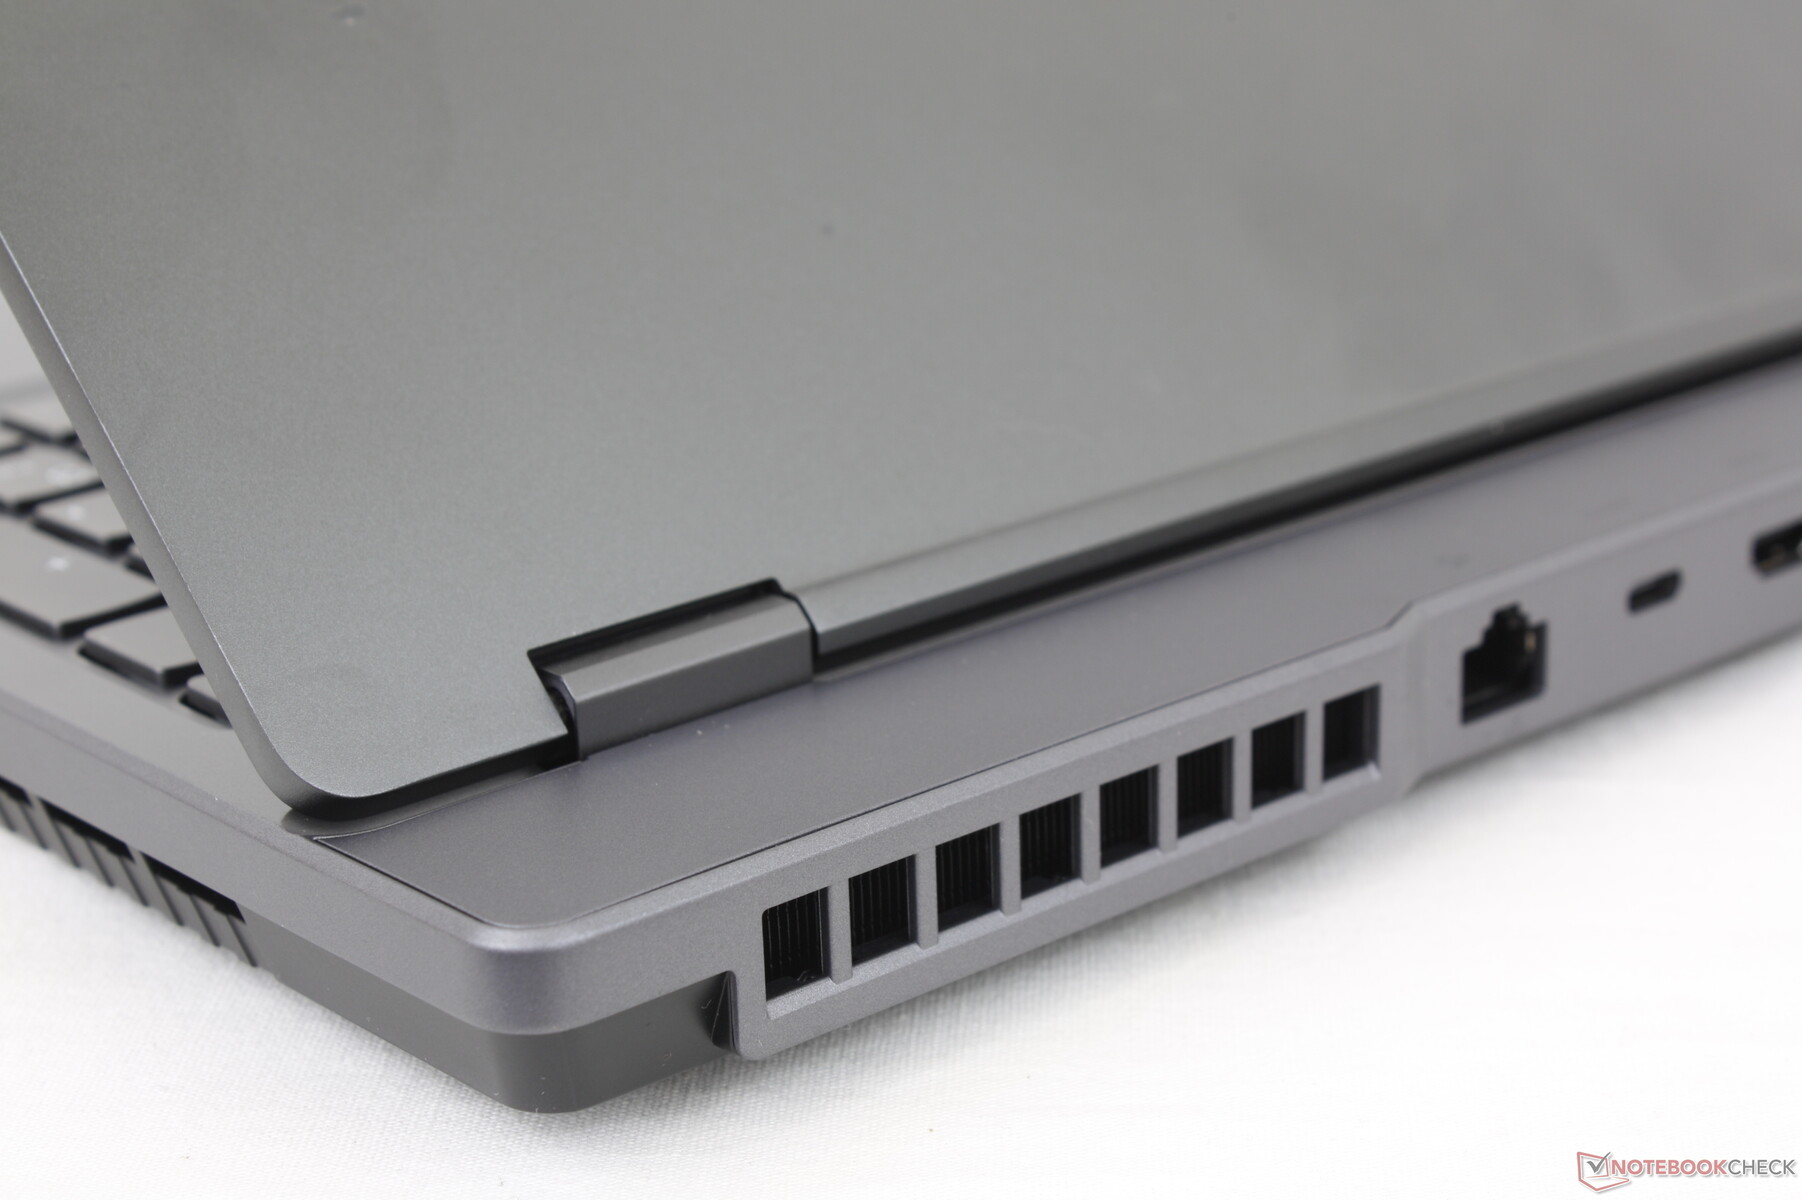
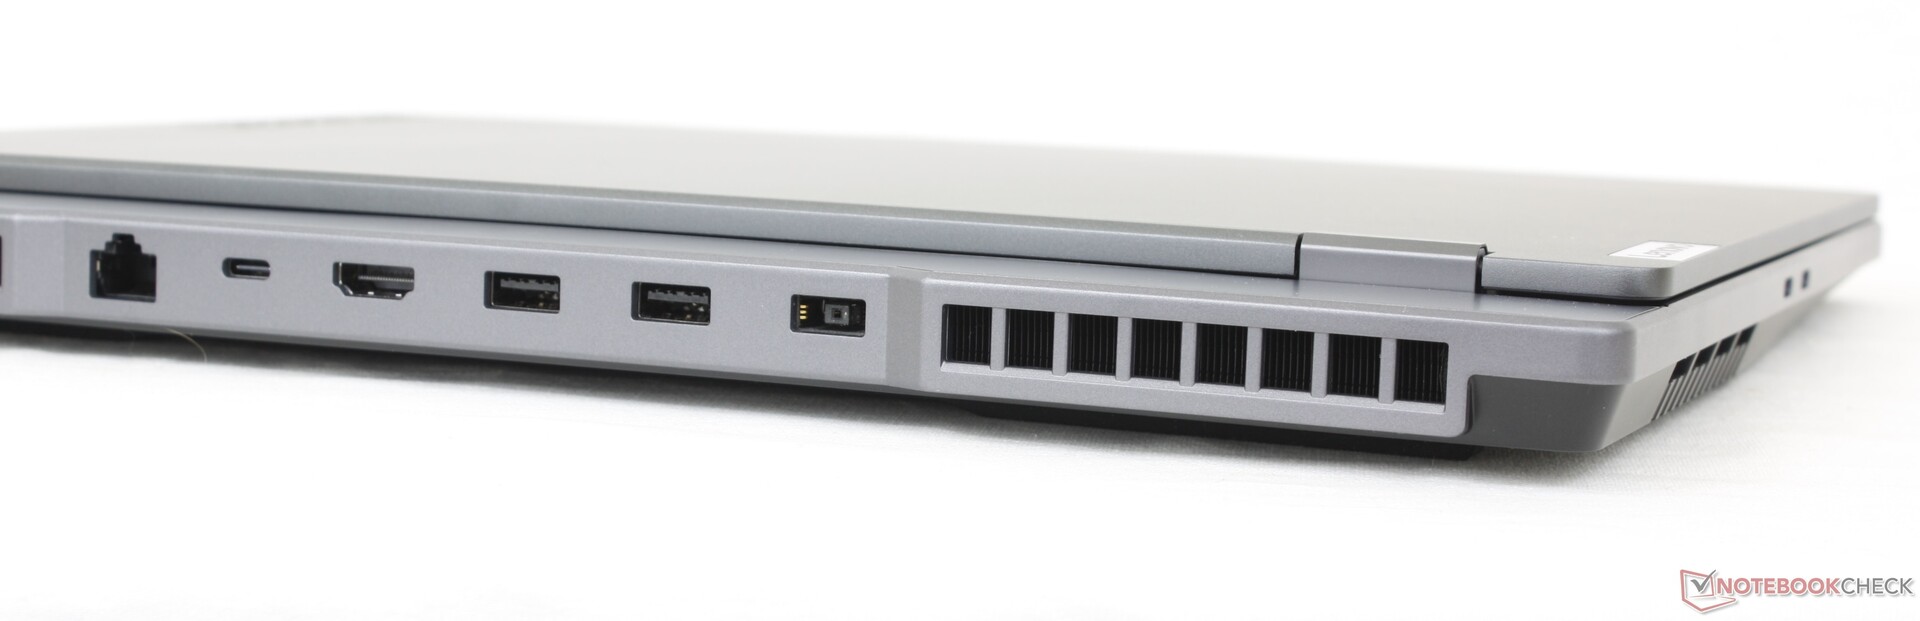
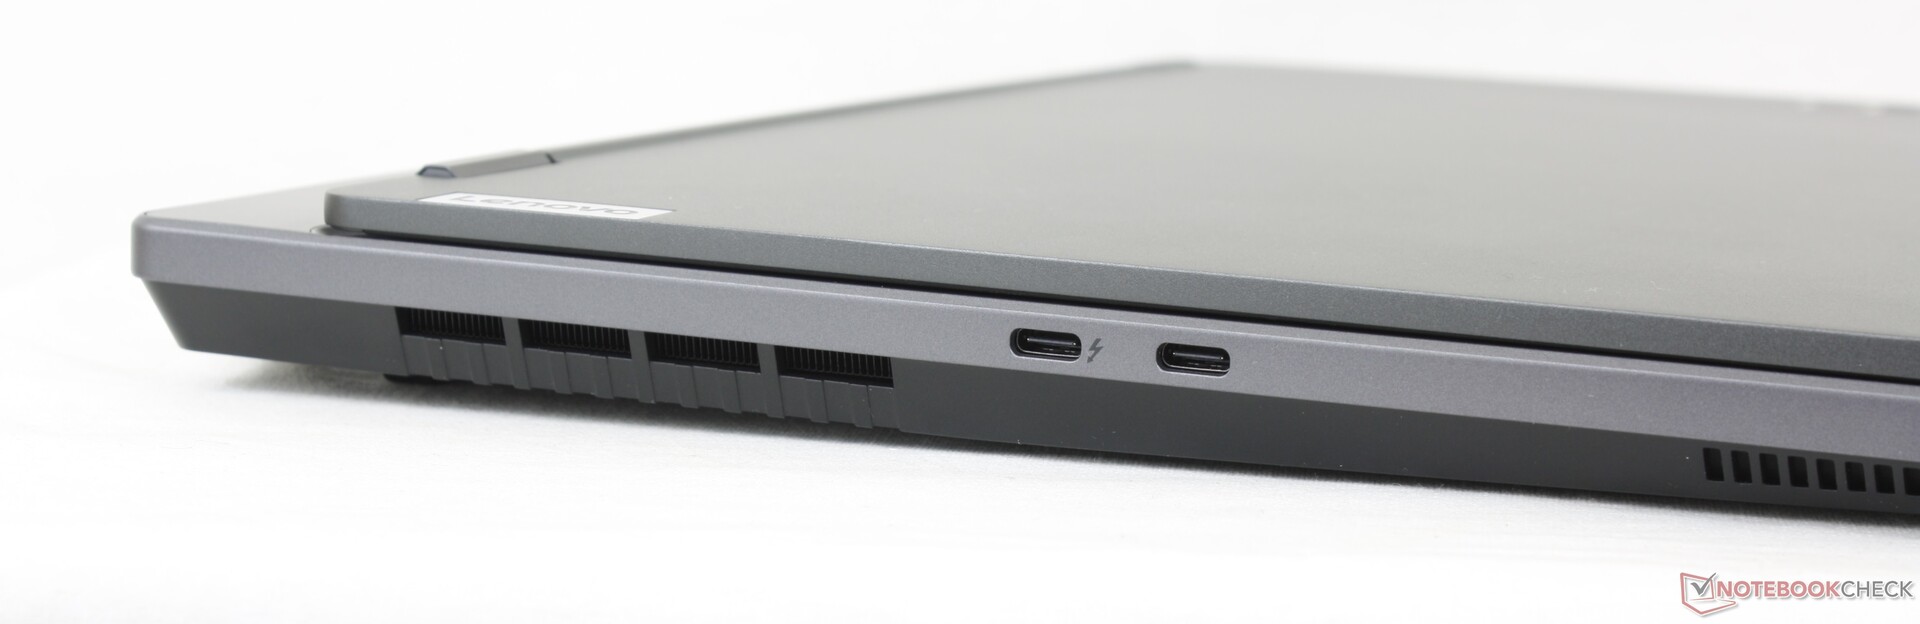
Connettività - Supporto Thunderbolt 4
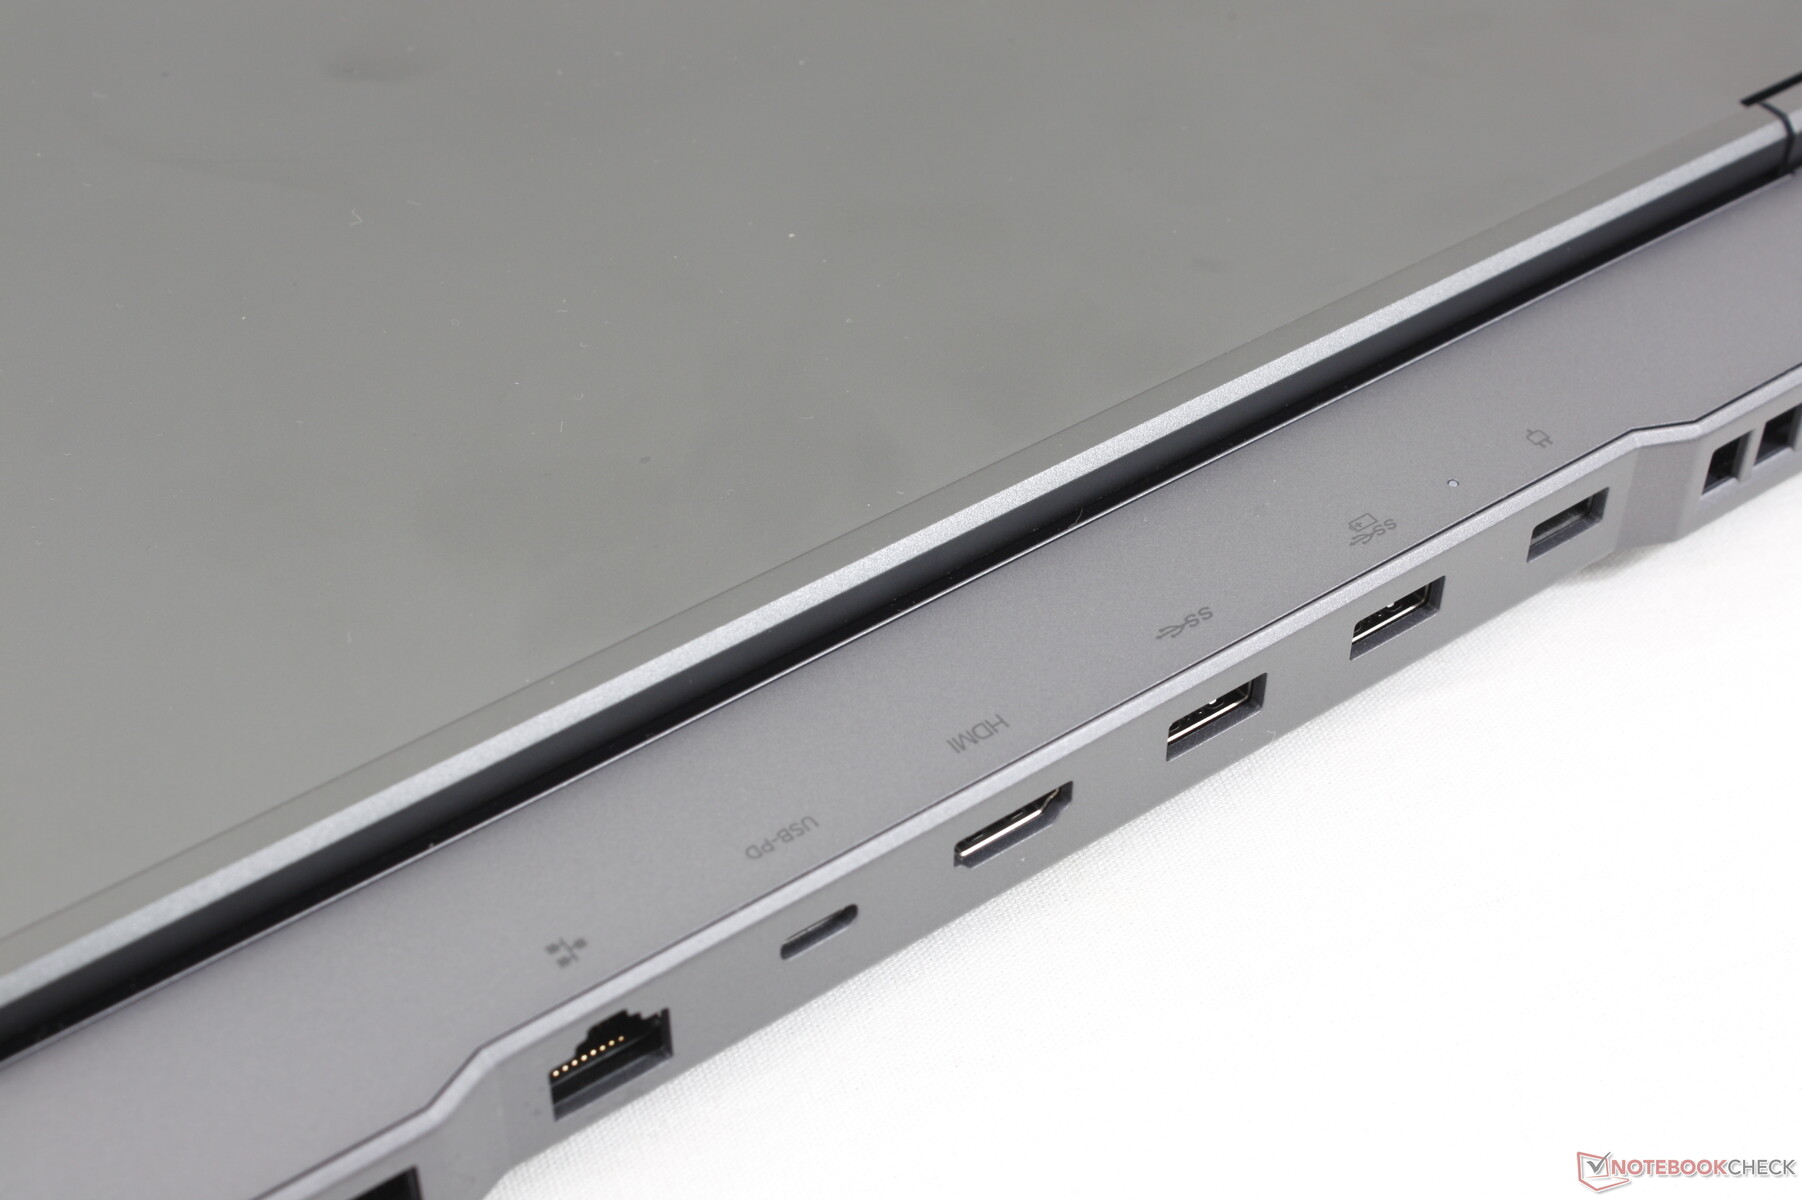
Rispetto al modello 2021 basato su AMD, il nostro modello Intel sostituisce una porta USB-A con una porta USB-C. Per il resto, le porte sono identiche tra i due modelli, anche se con un posizionamento diverso. La maggior parte delle porte si trova lungo la parte posteriore, a differenza della maggior parte degli altri portatili da gioco, nel bene e nel male.
La Thunderbolt 4 è supportata solo dalla porta USB-C etichettata lungo il bordo sinistro.
Comunicazione
L'Intel AX211 è presente di serie nella maggior parte delle SKU per la compatibilità con Wi-Fi 6E e Bluetooth 5.2. Non abbiamo riscontrato alcun problema quando è stato accoppiato alla nostra rete a 6 GHz.
| Networking | |
| iperf3 transmit AX12 | |
| Razer Blade 15 Base Edition 2021, i7-10750H RTX 3060 | |
| Acer Aspire Nitro 5 AN515-55-57GF | |
| MSI Bravo 15 B5DD-010US | |
| Asus TUF Gaming F15 FX507ZM | |
| Lenovo Legion 5 15ACH-82JU00C6GE-FL | |
| iperf3 receive AX12 | |
| Razer Blade 15 Base Edition 2021, i7-10750H RTX 3060 | |
| Asus TUF Gaming F15 FX507ZM | |
| MSI Bravo 15 B5DD-010US | |
| Lenovo Legion 5 15ACH-82JU00C6GE-FL | |
| Acer Aspire Nitro 5 AN515-55-57GF | |
| iperf3 receive AXE11000 6GHz | |
| Lenovo Legion 5 15IAH7H 82RB | |
| iperf3 receive AXE11000 | |
| Lenovo Legion 5 15IAH7H 82RB | |
| iperf3 transmit AXE11000 | |
| Lenovo Legion 5 15IAH7H 82RB | |
| iperf3 transmit AXE11000 6GHz | |
| Lenovo Legion 5 15IAH7H 82RB | |
Webcam - Qualità bassa da 1 MP
La qualità della fotocamera è scadente grazie alla webcam da 720p. Anche Windows Hello non è supportato.


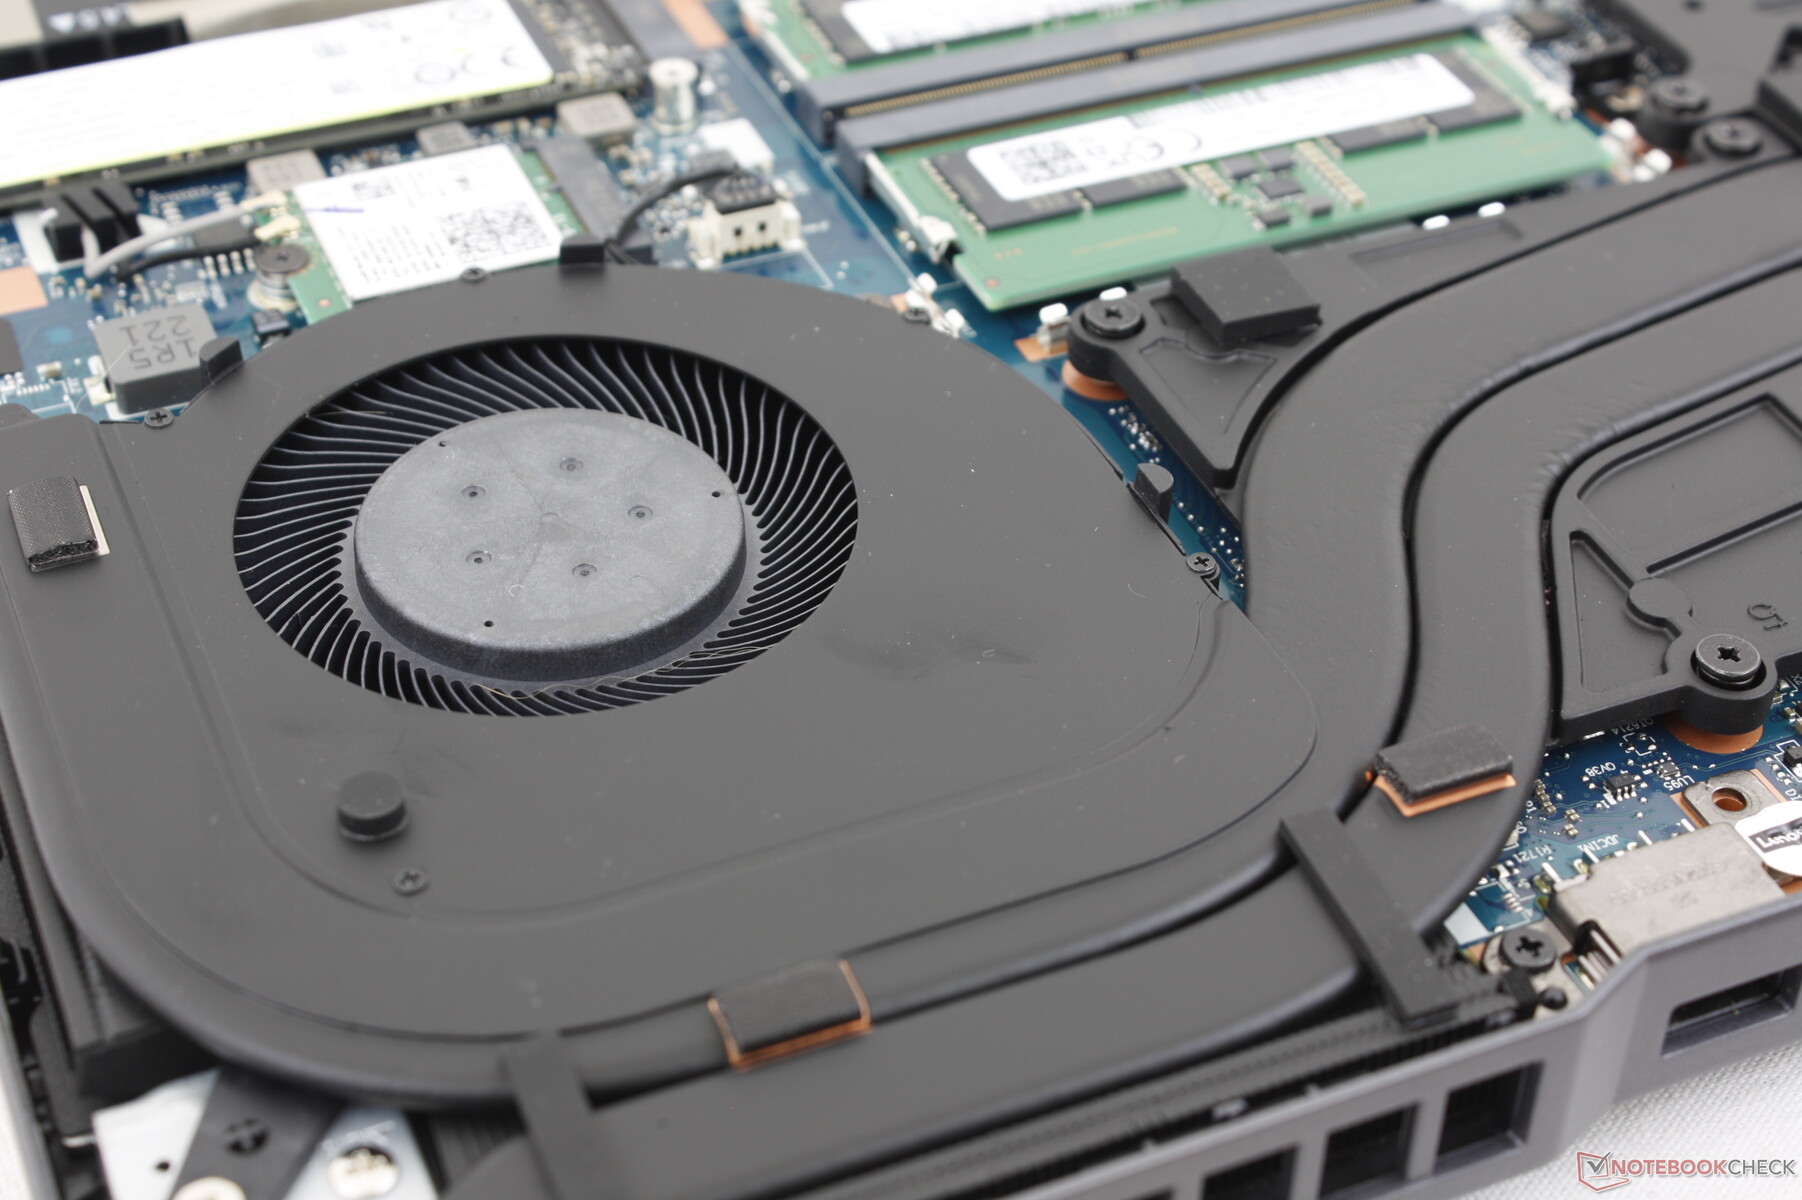
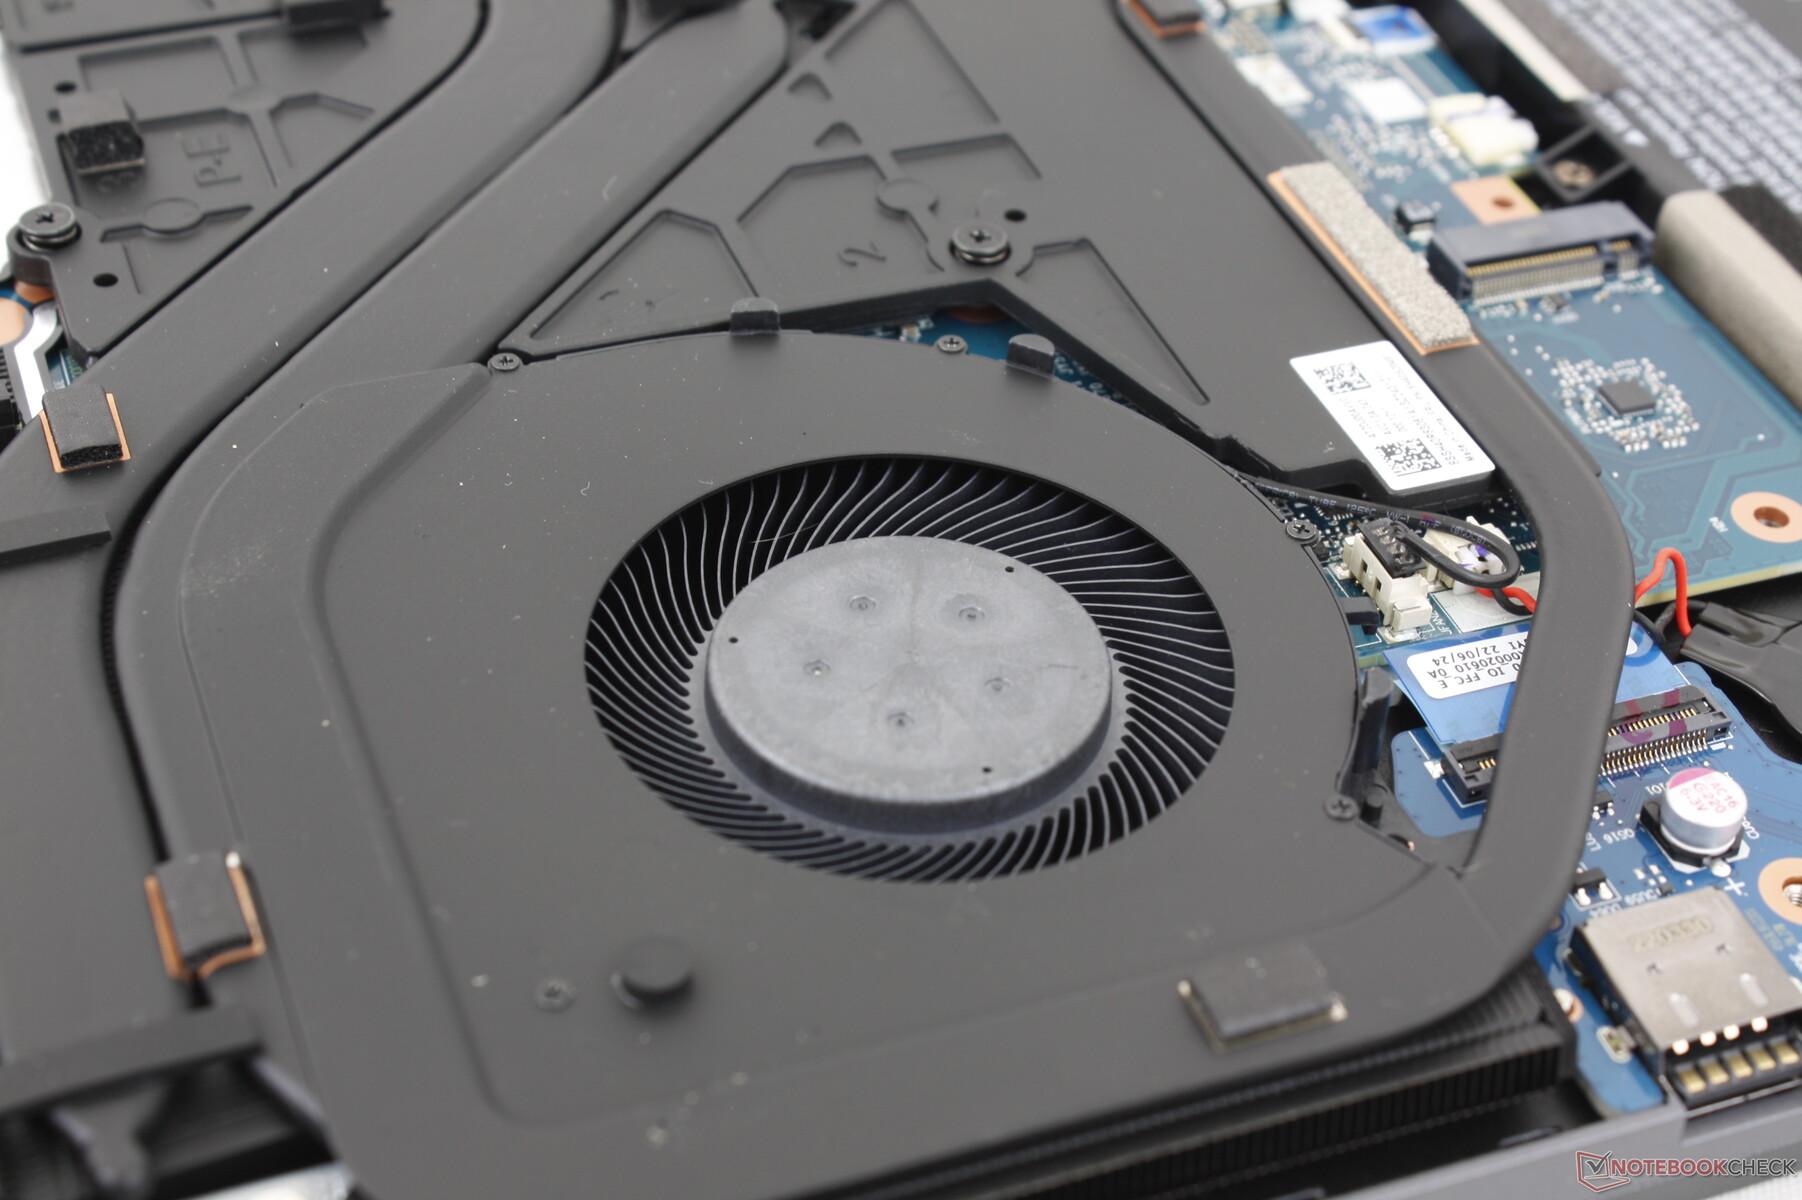
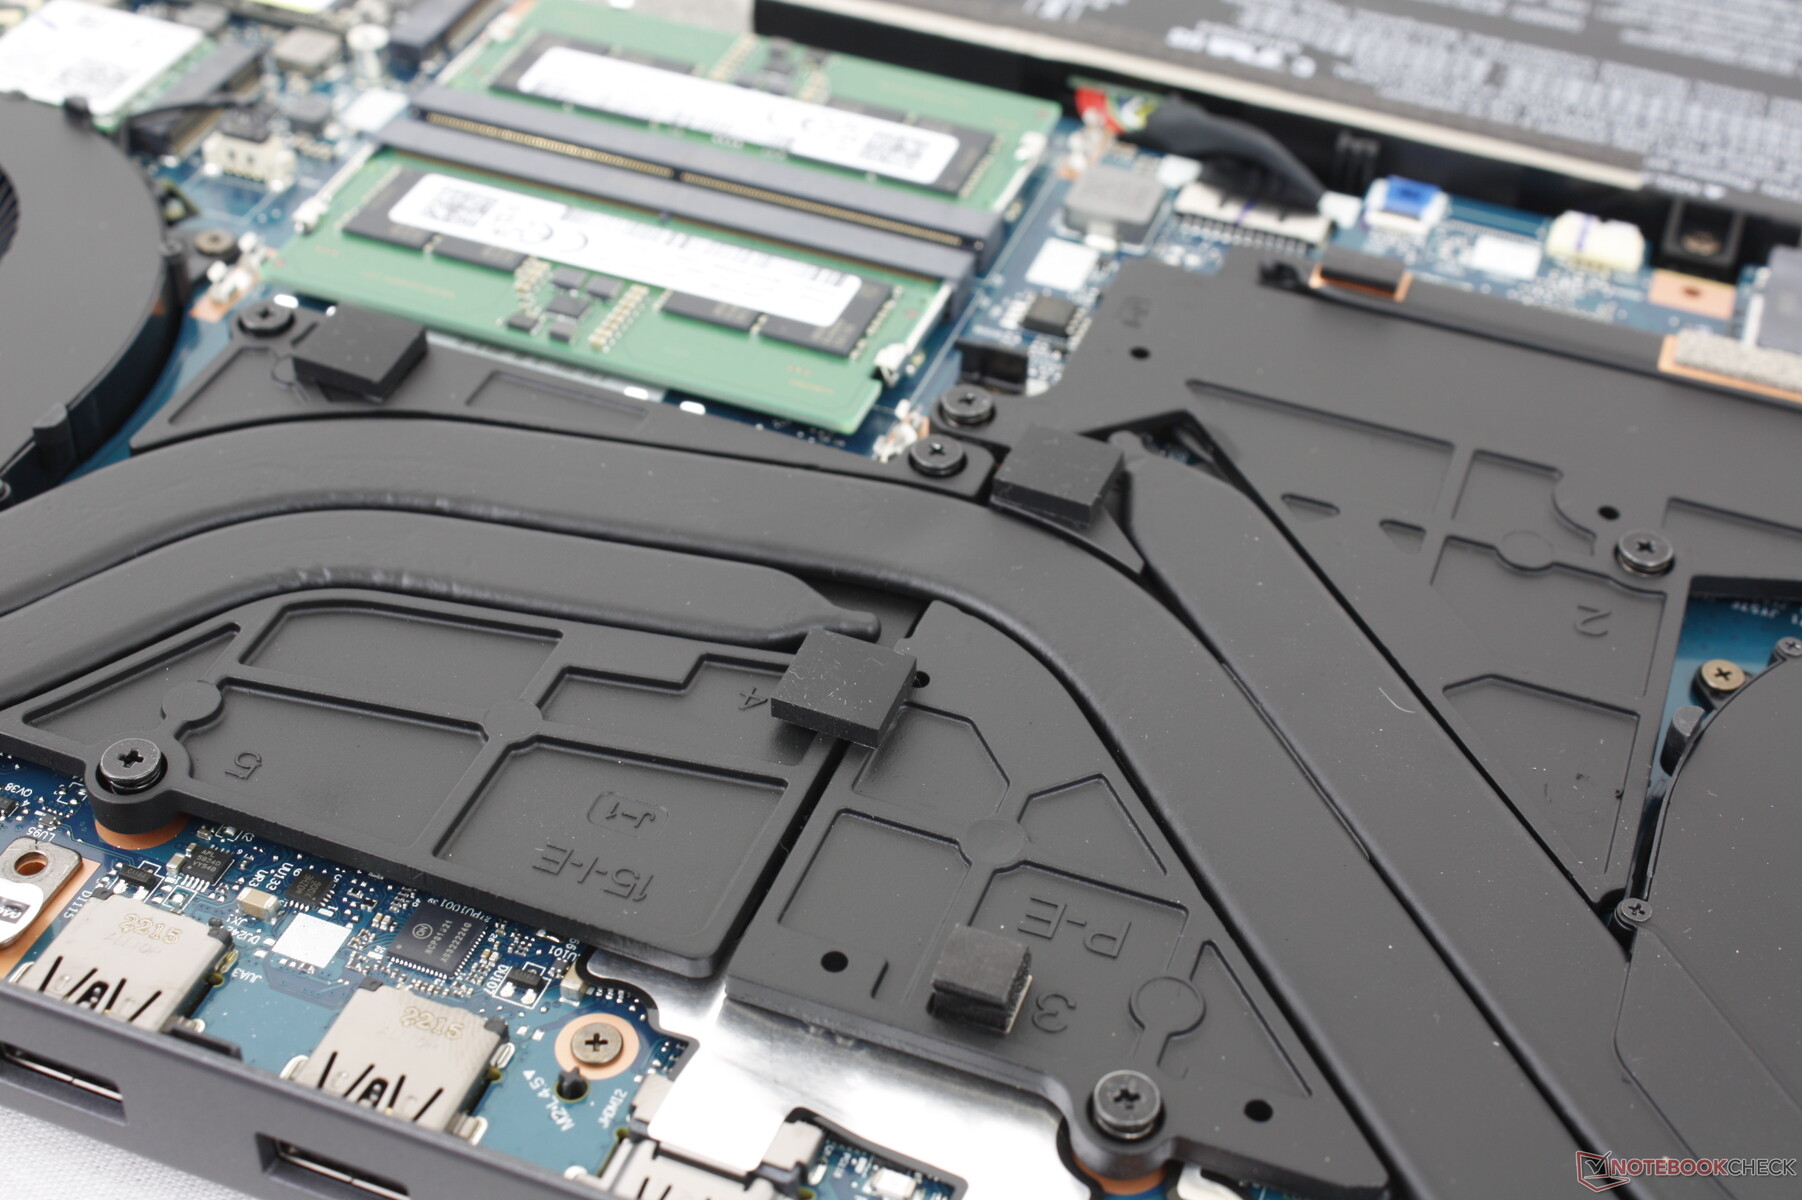
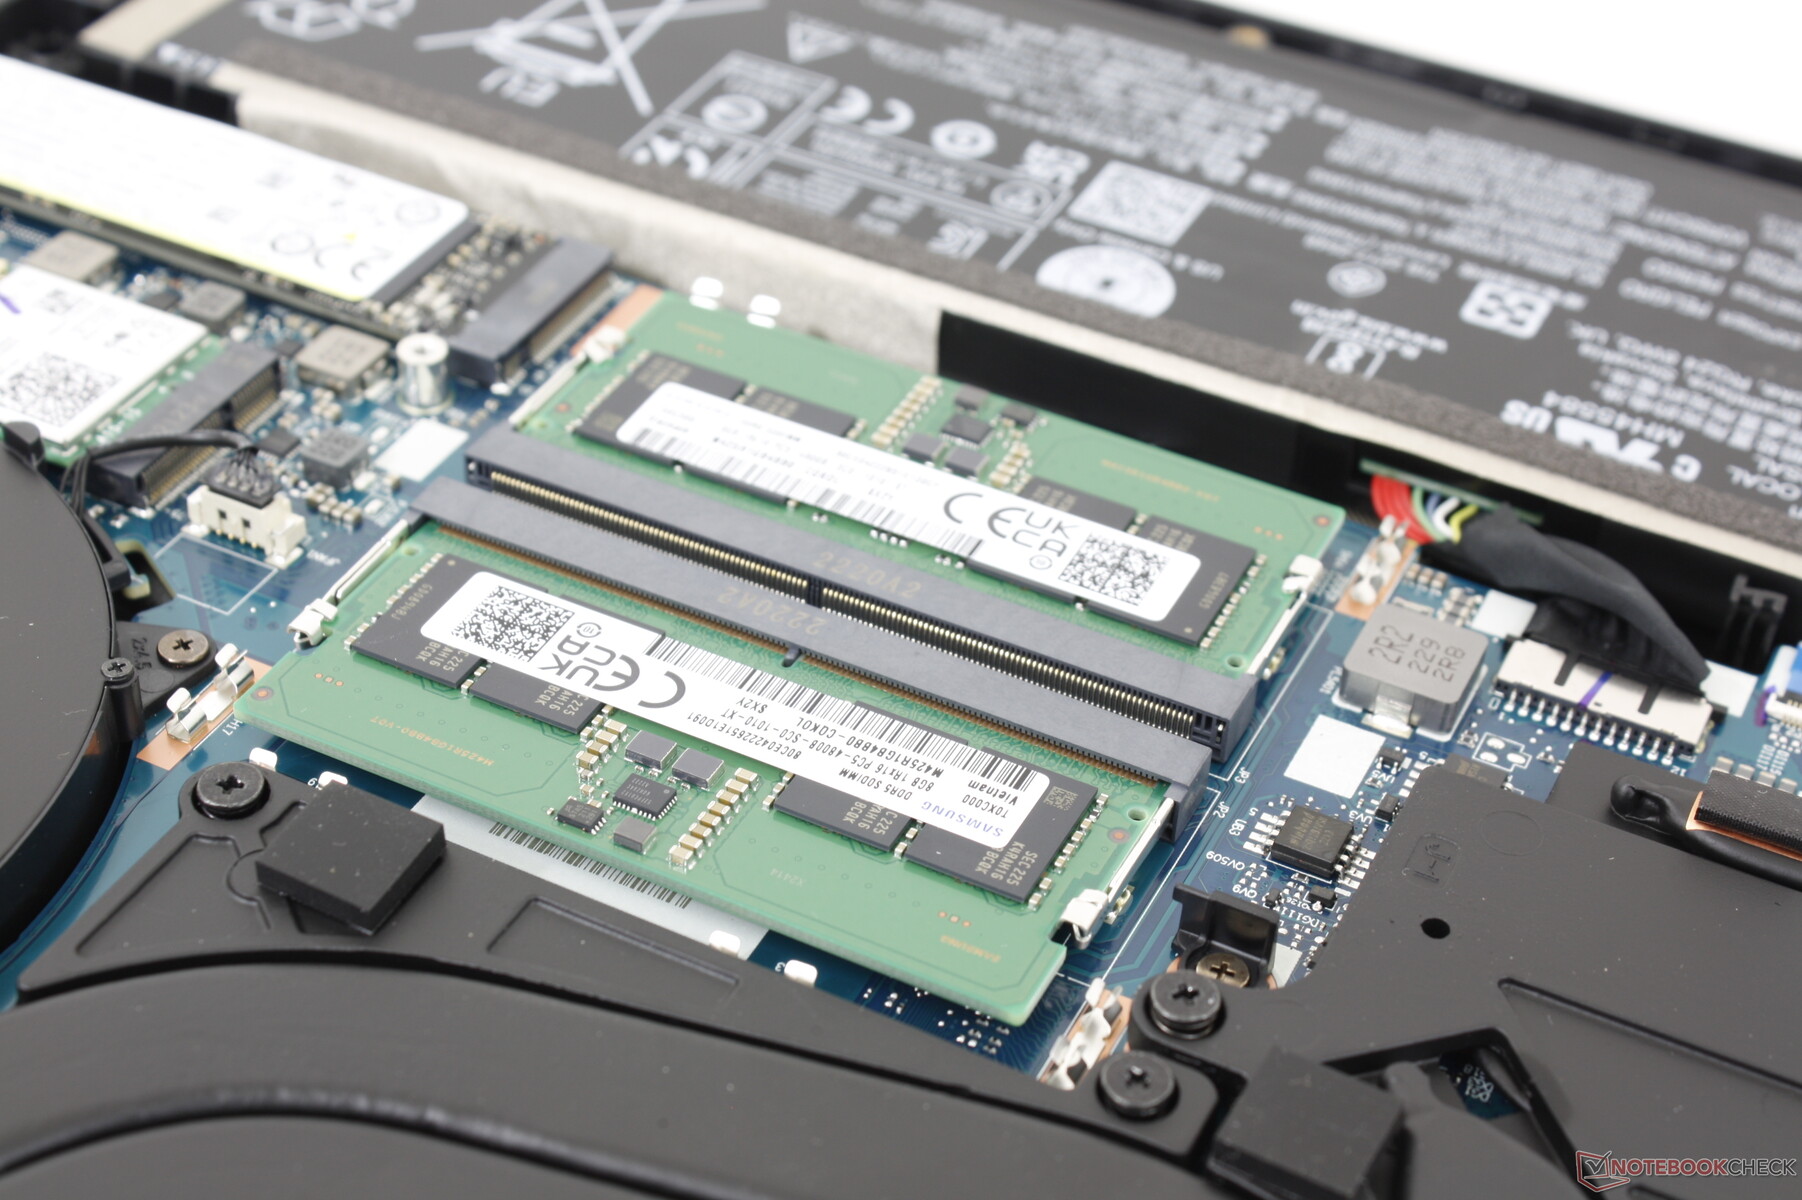
Manutenzione
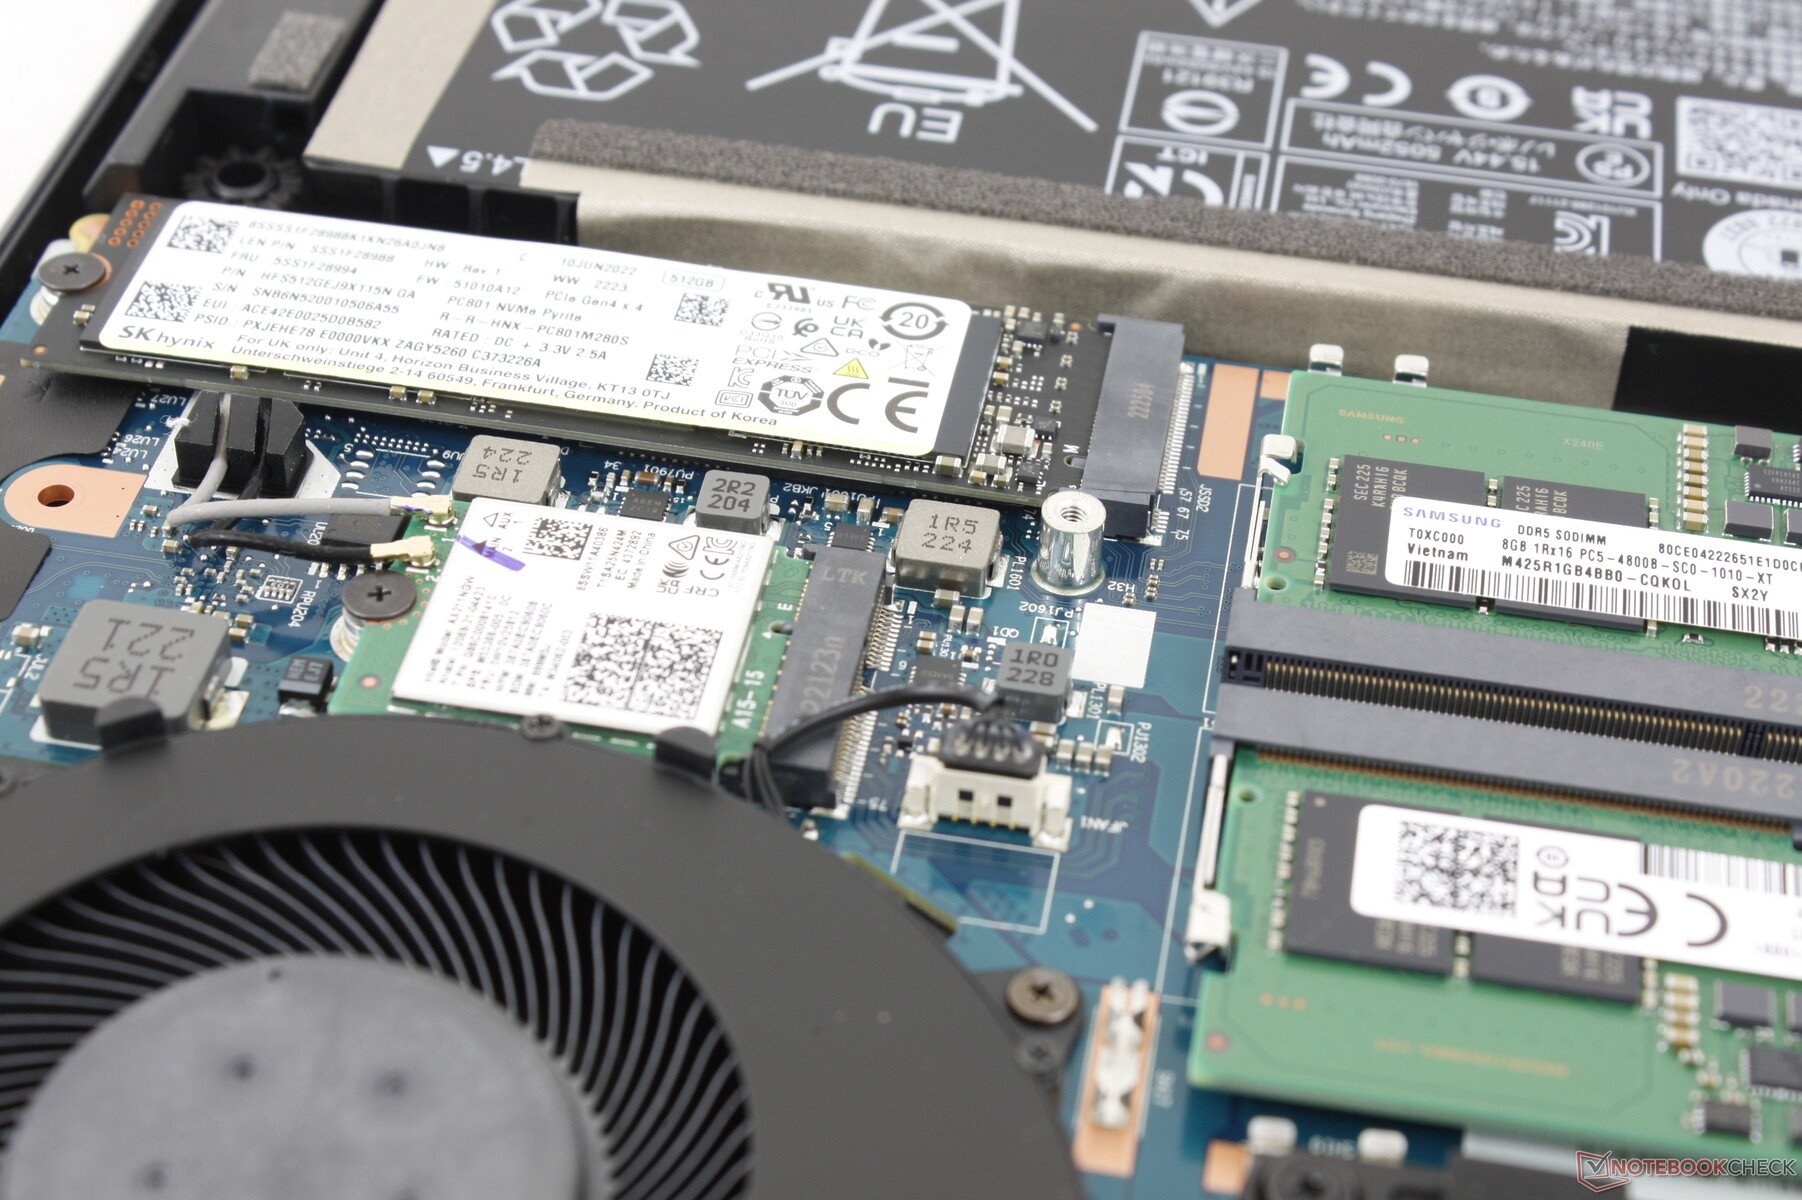
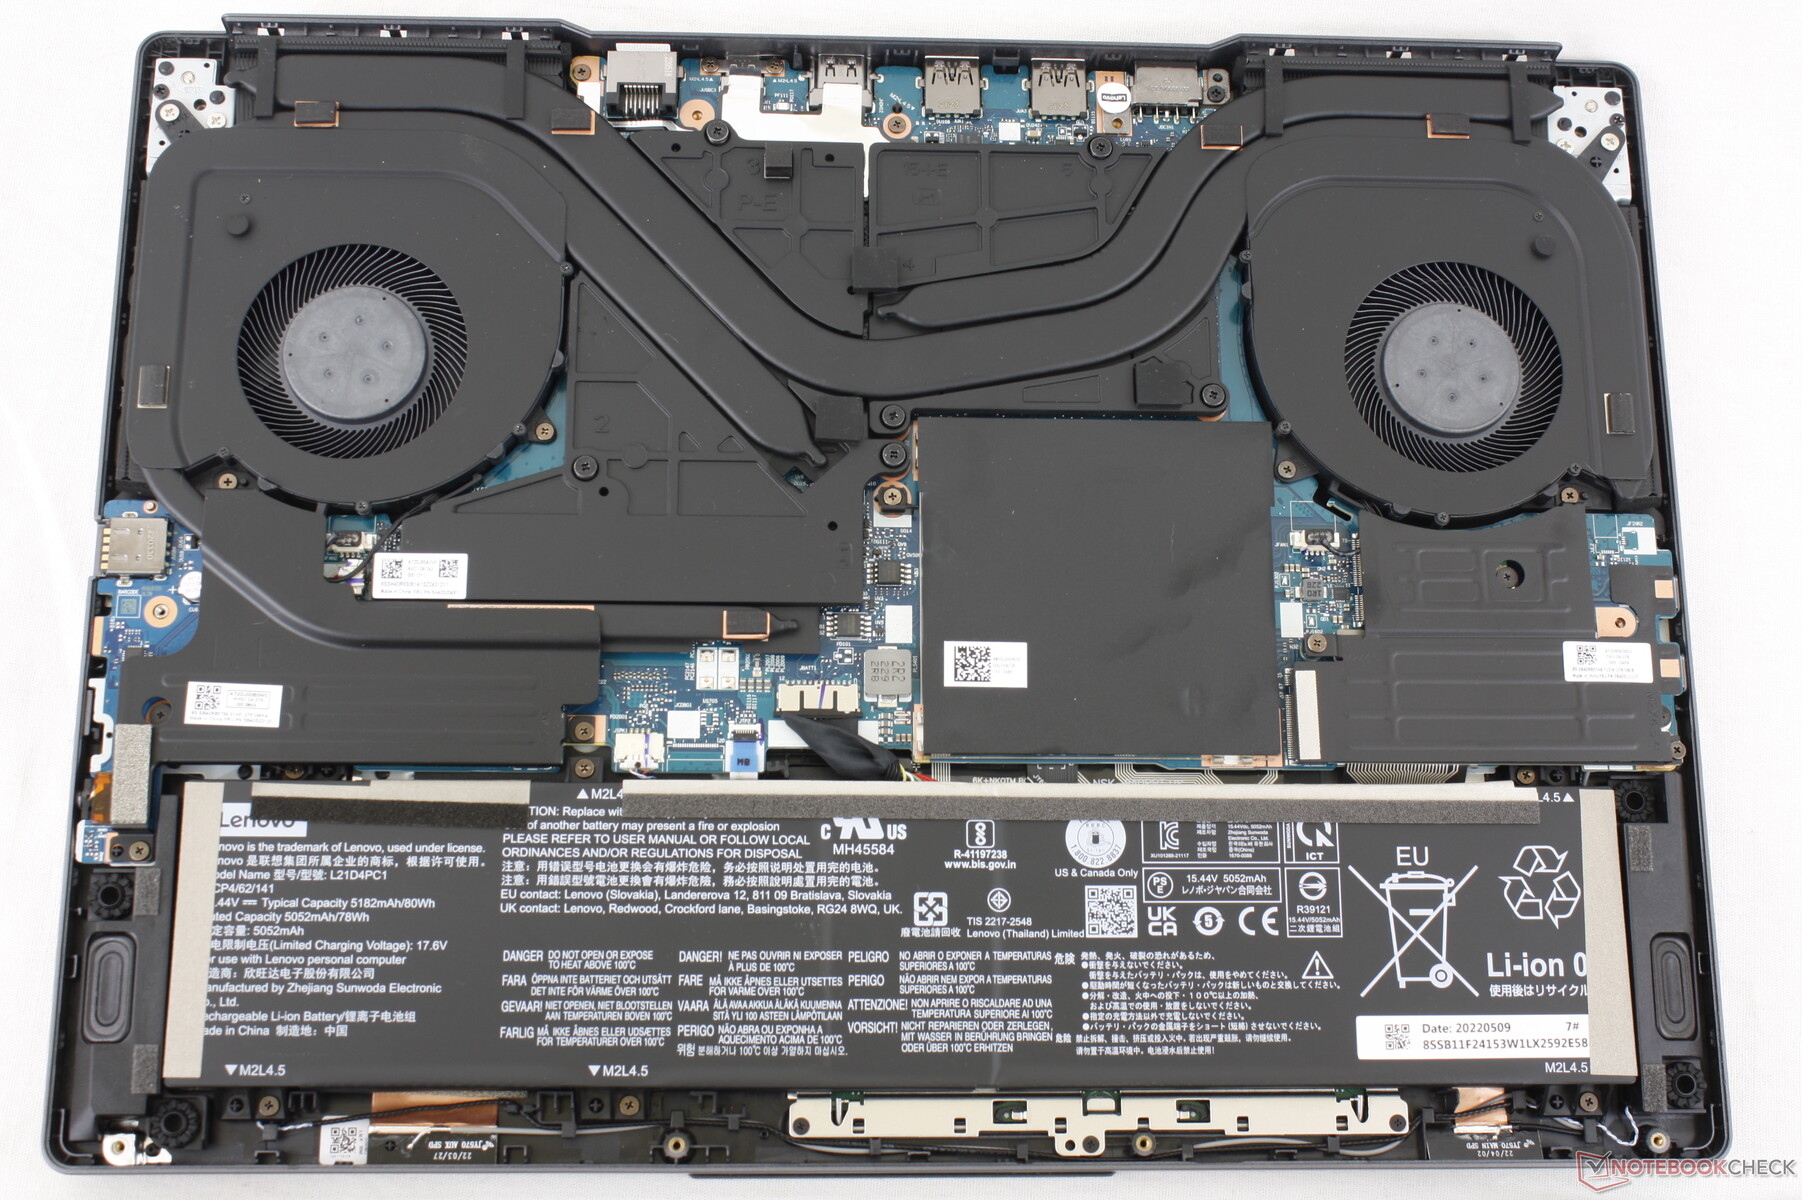
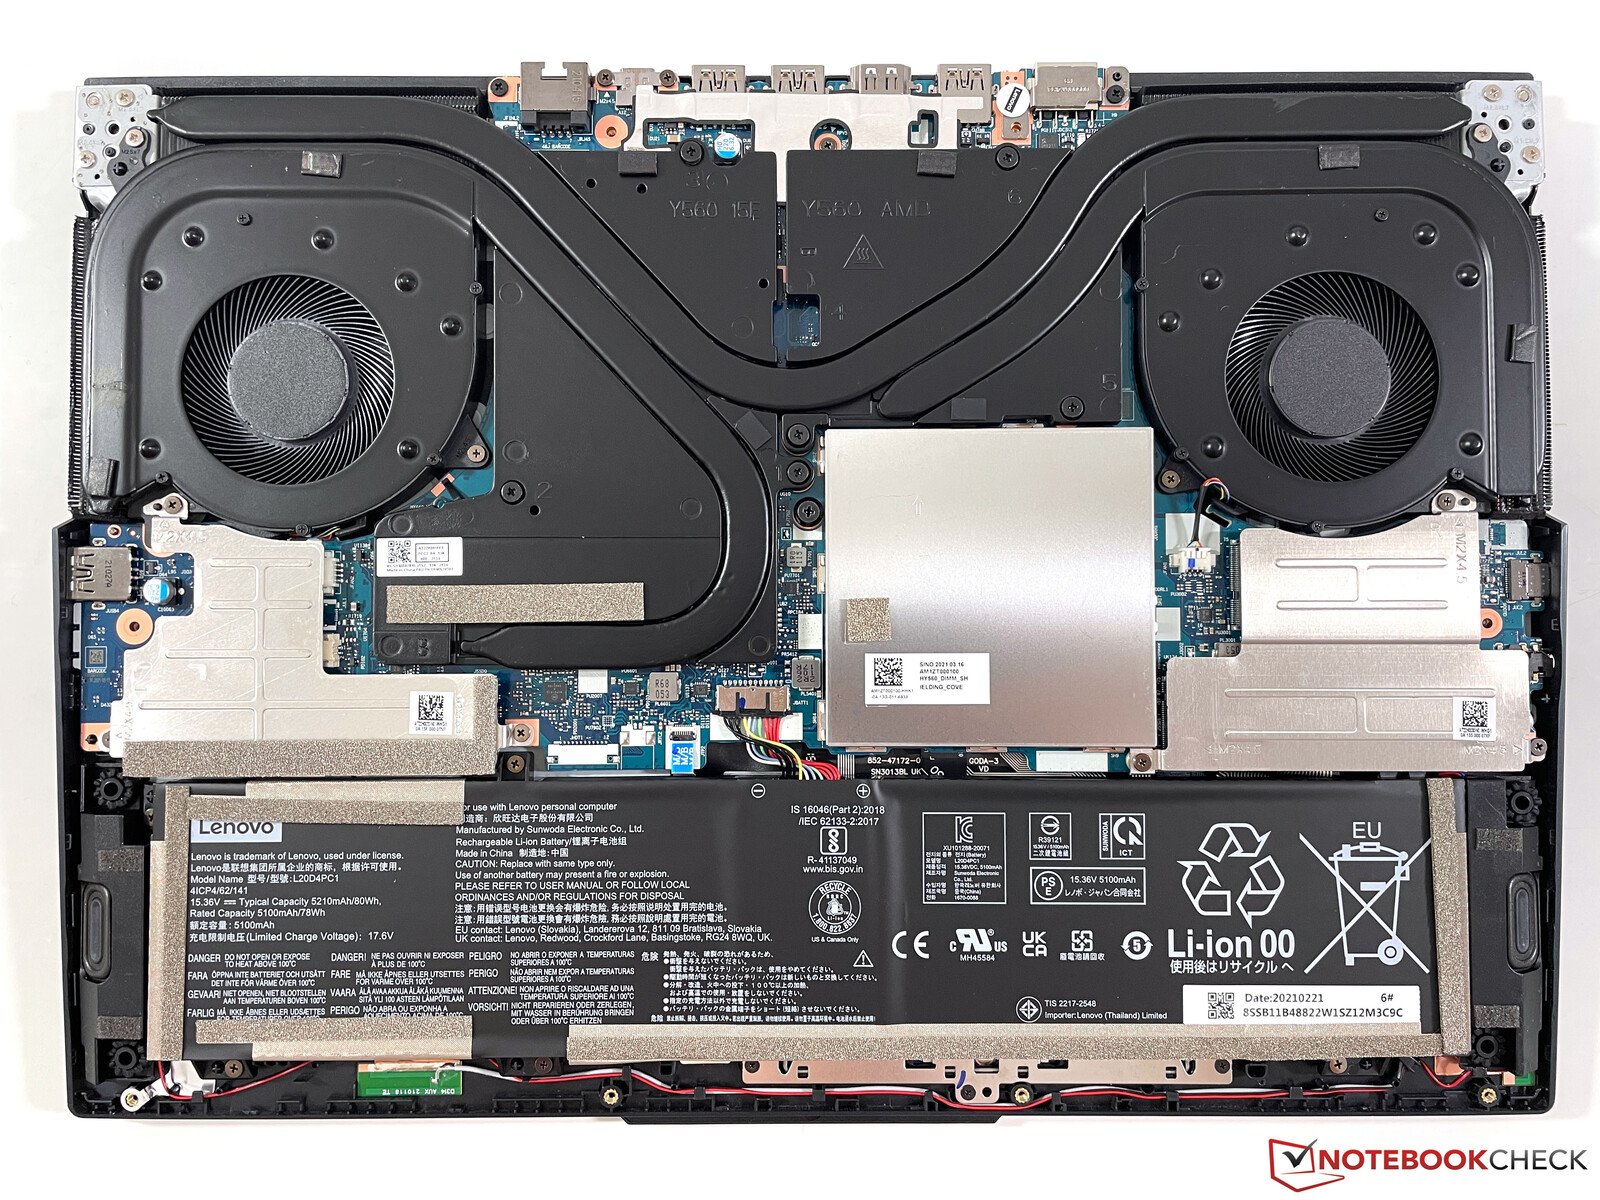
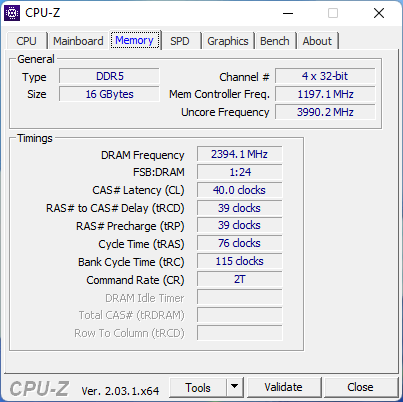
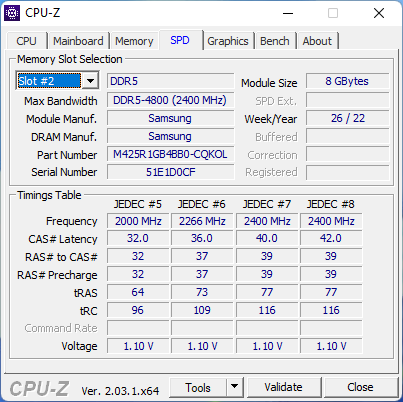
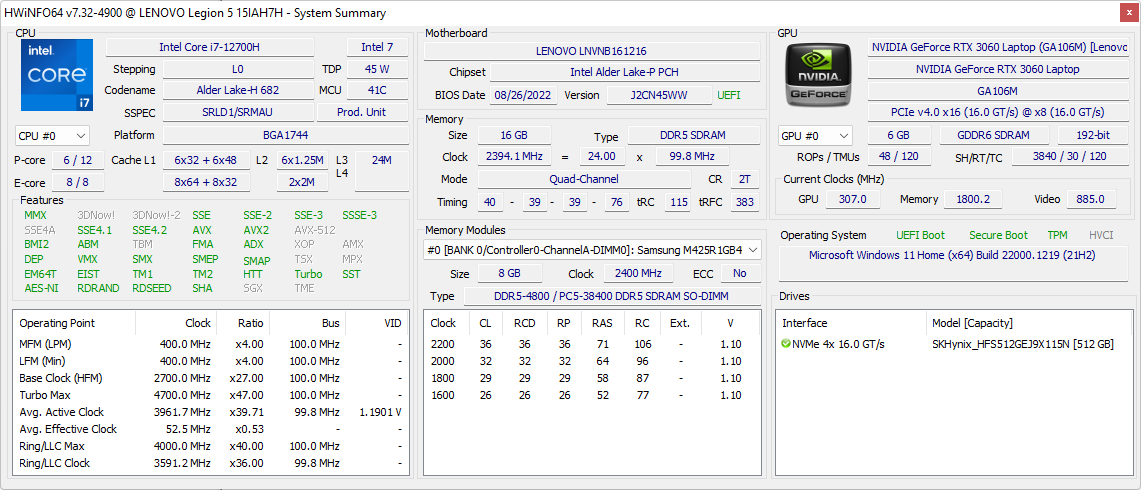
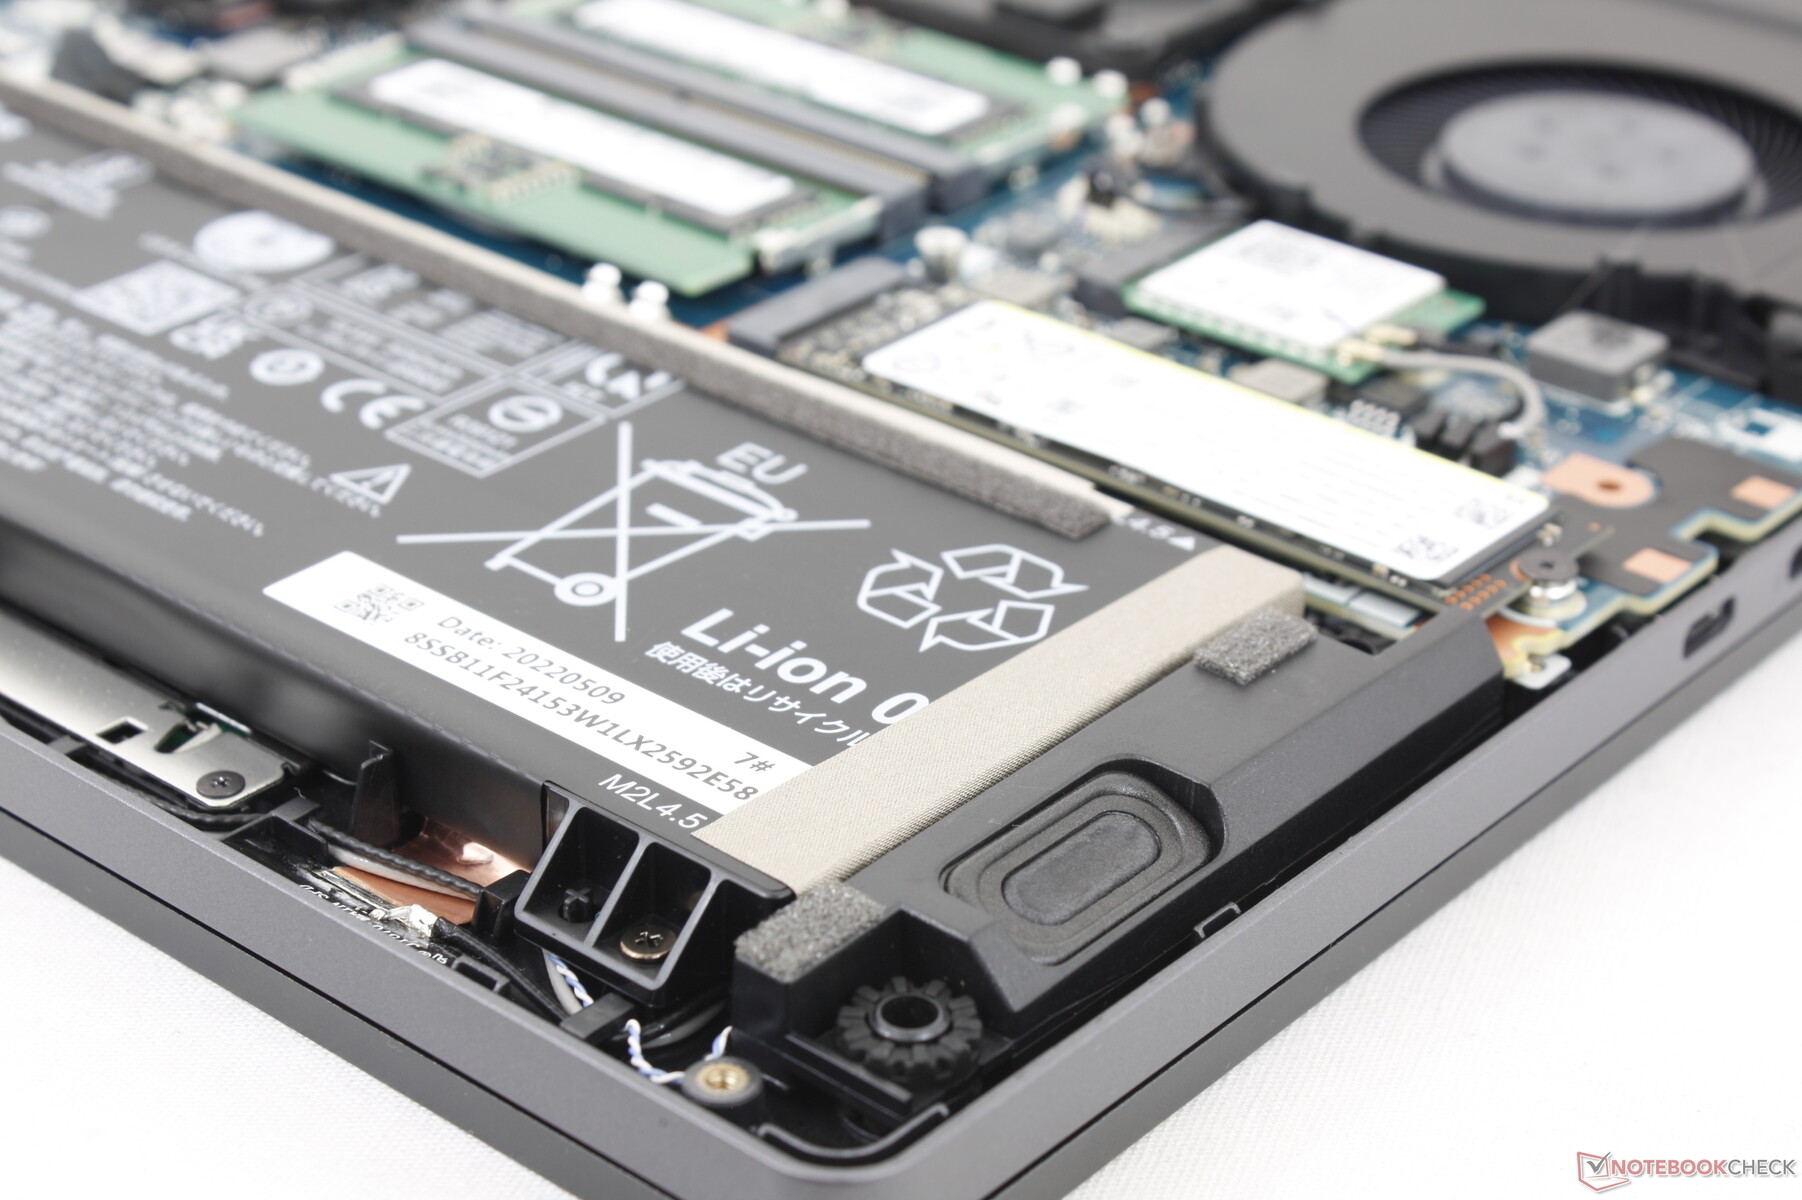
Per rimuovere il pannello inferiore è sufficiente un cacciavite Philips. Gli utenti possono aggiungere/rimuovere fino a due moduli SODIMM DDR5, due SSD M.2 PCIe4 x4 2280 e un modulo M.2 WLAN.
Accessori e garanzia
La confezione non contiene altri extra oltre all'adattatore CA e alla documentazione. Si applica la garanzia limitata standard di un anno del produttore.
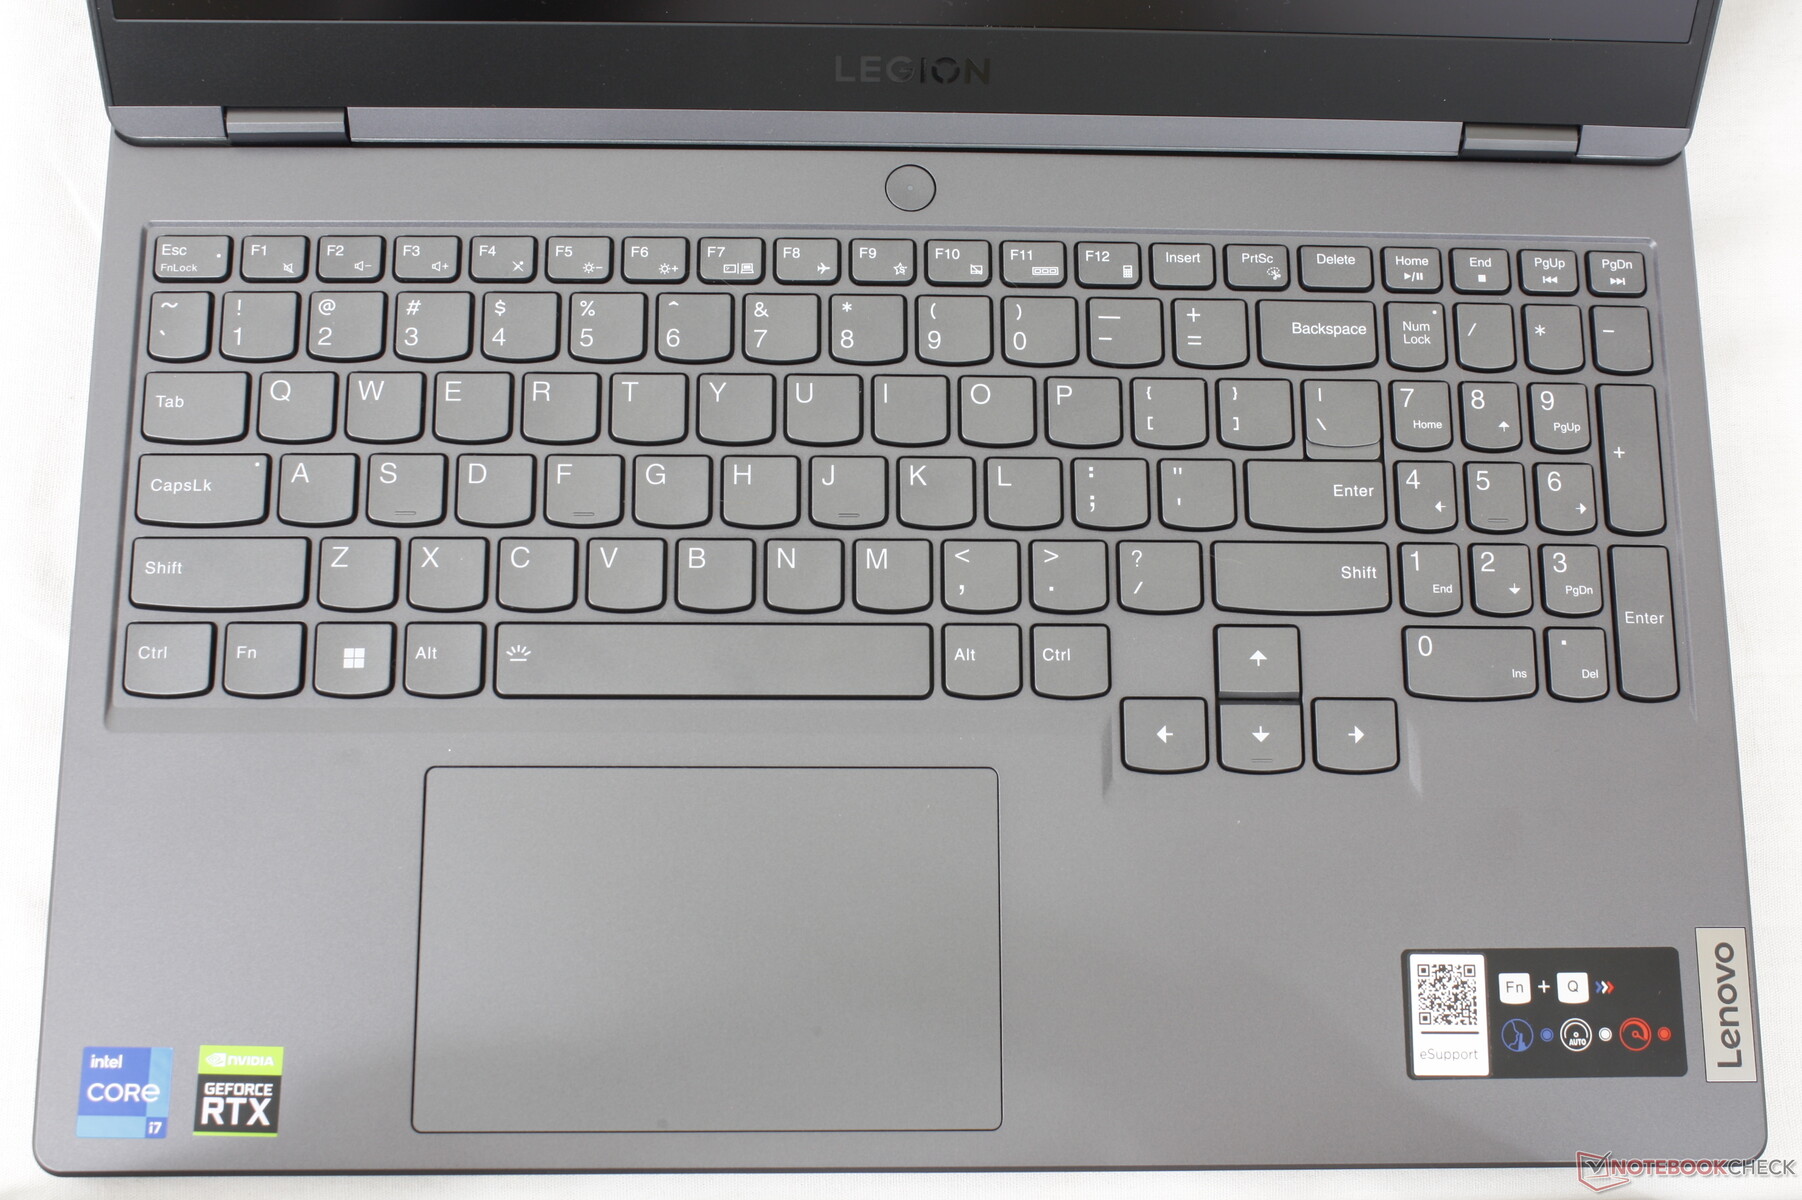
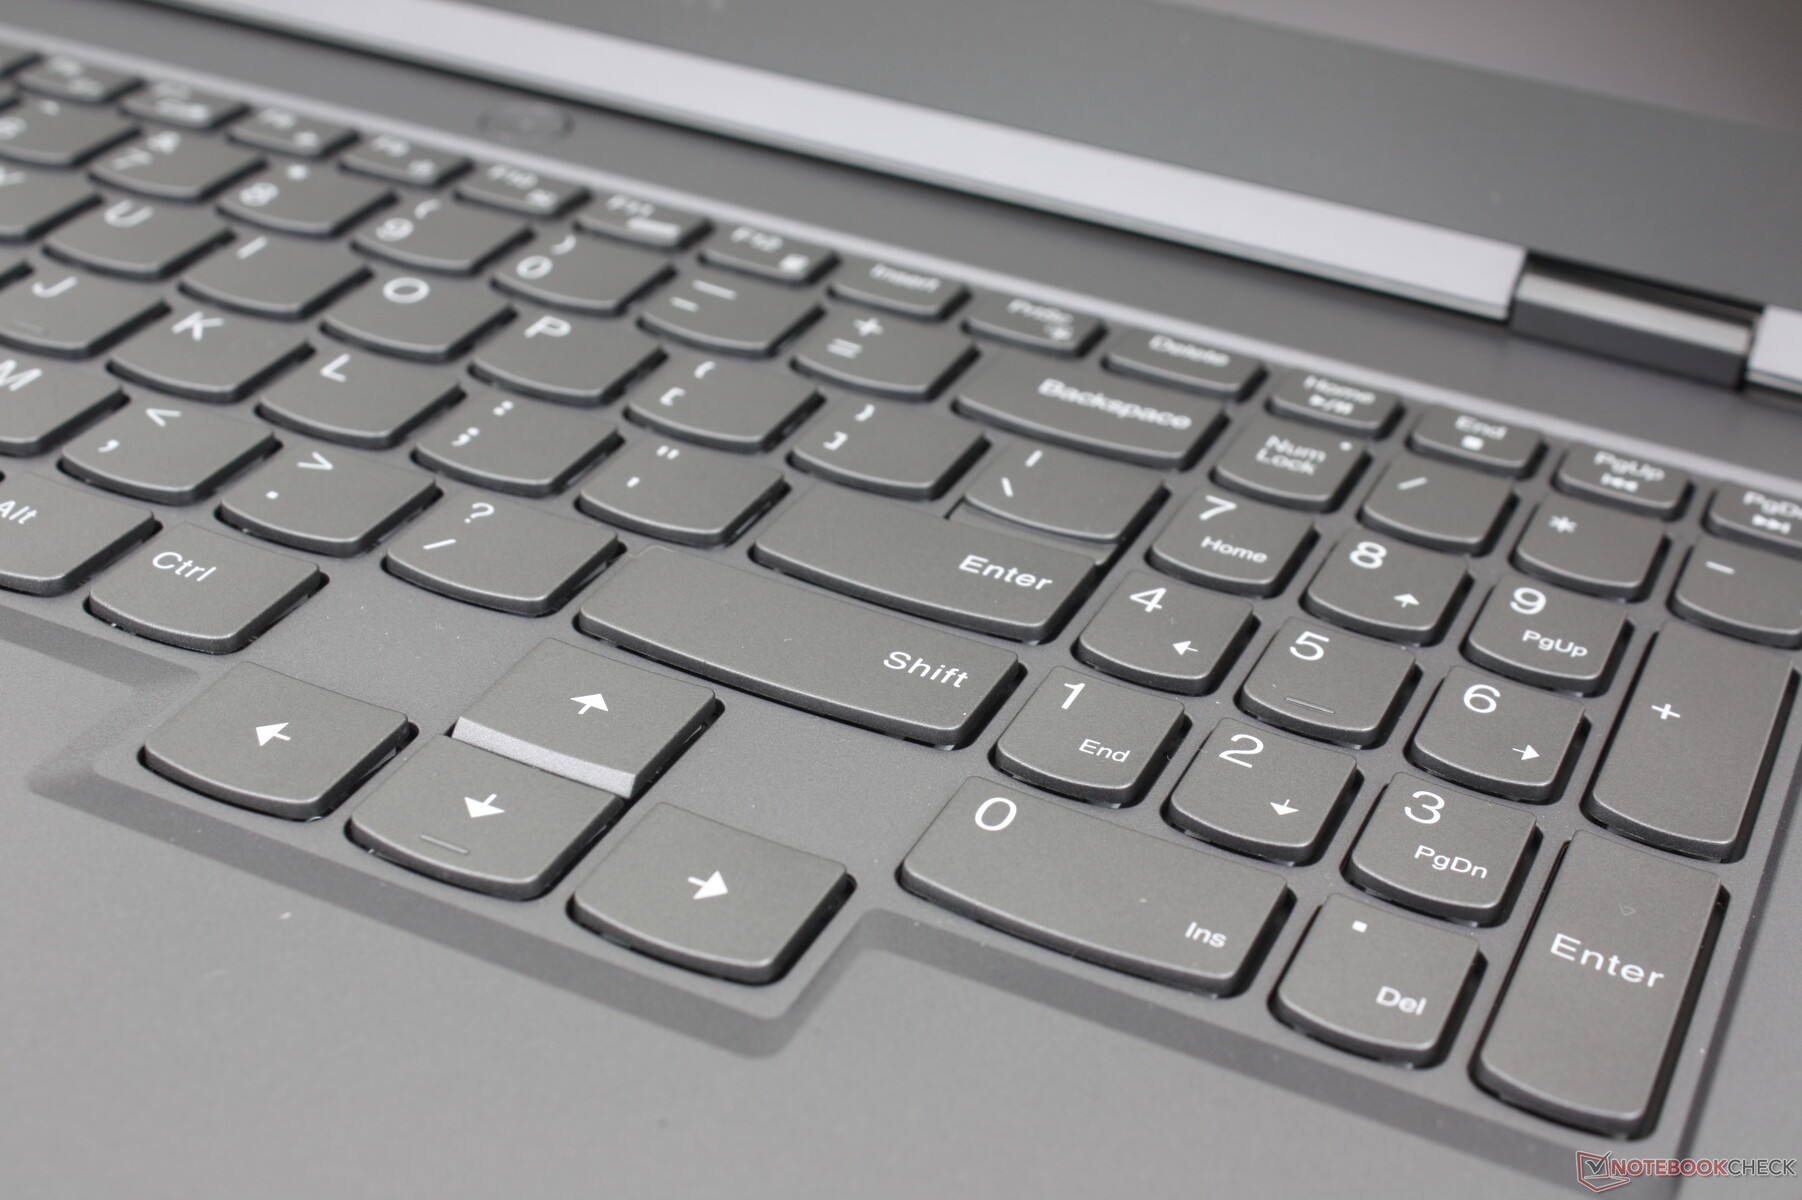
Dispositivi di input - Ottima tastiera, clickpad spugnoso
Tastiera
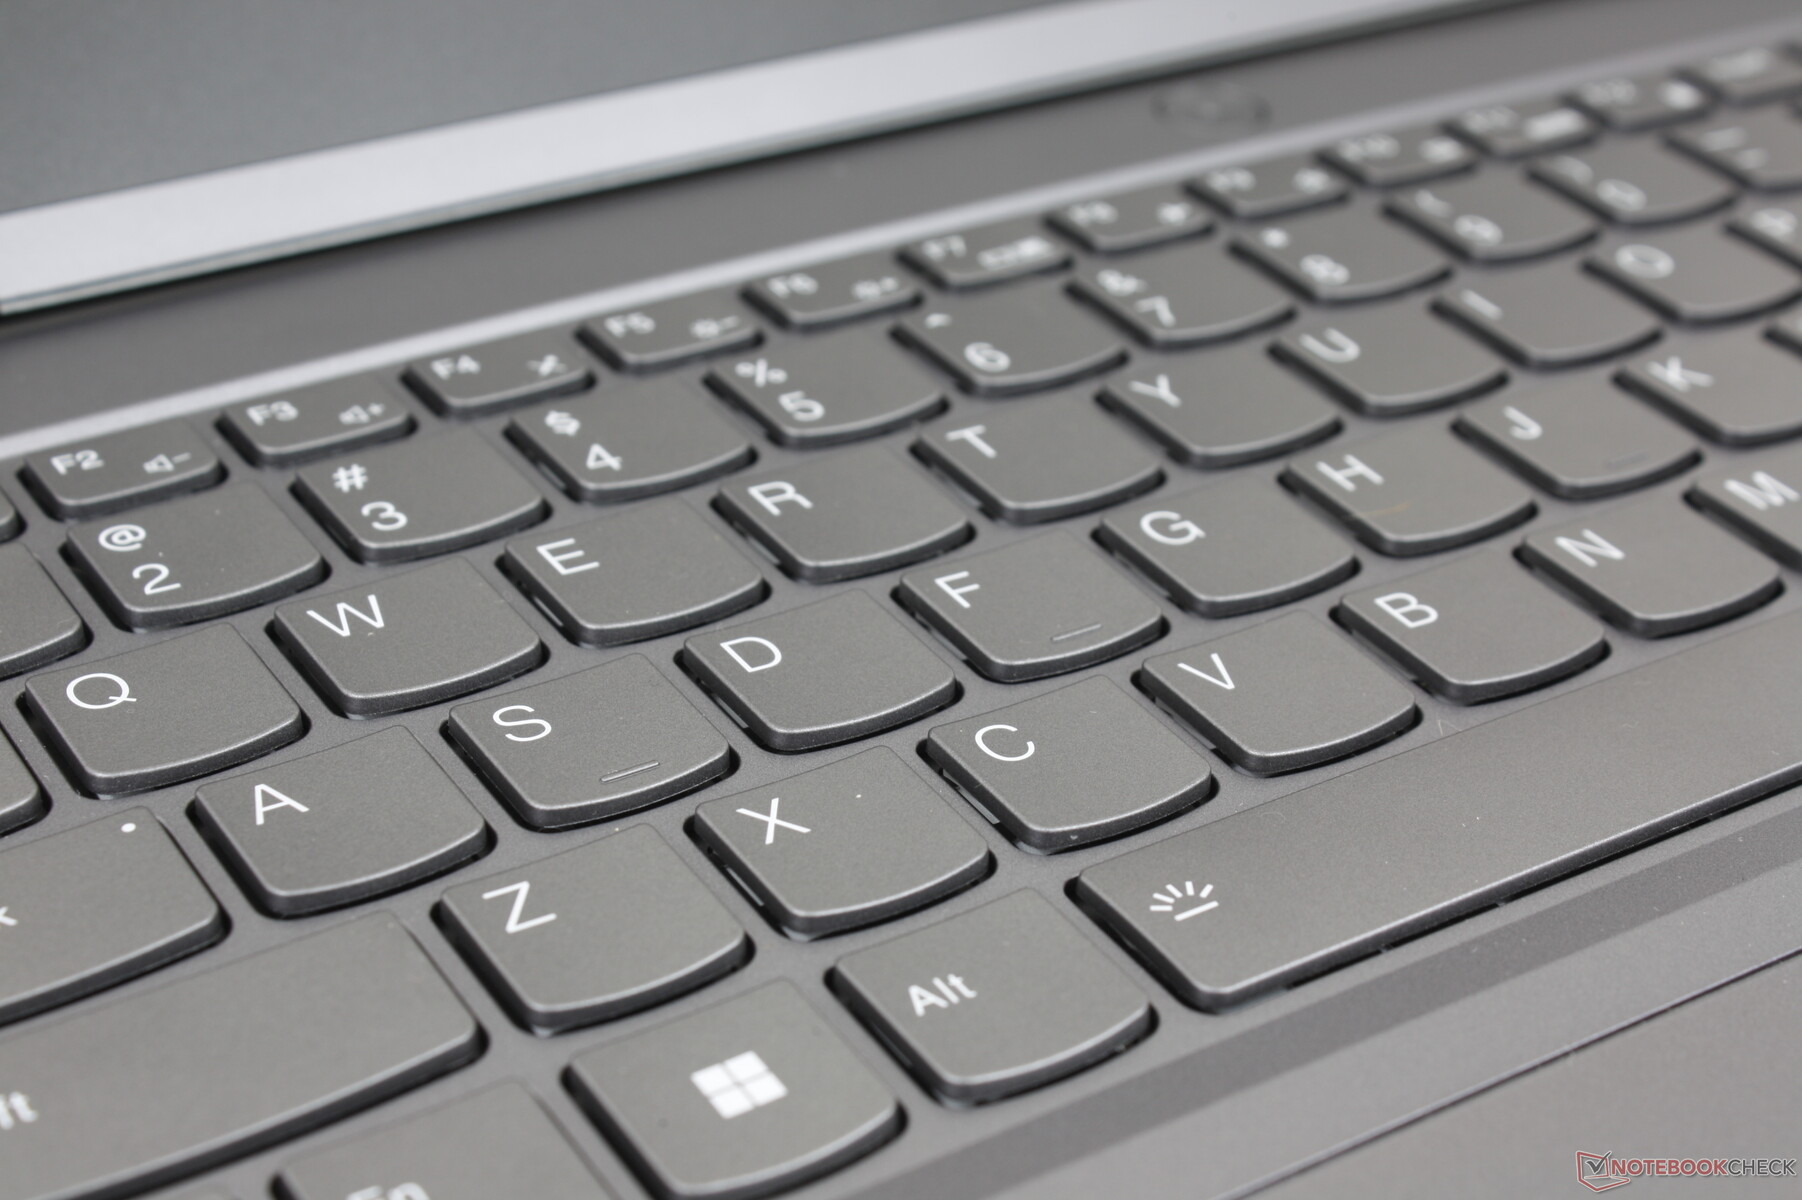
Il Legion 5 15 utilizza i tradizionali tasti a membrana invece di quelli meccanici come si trovano su alcuni modelli di fascia più alta come la Alienware serie m15. Ciononostante, il feedback e la corsa dei tasti sono più nitidi e profondi su Legion rispetto ai tasti dei normali Ultrabook. Se si scrive molto, la tastiera potrebbe essere più comoda per le attività d'ufficio rispetto a quella di un IdeaPad o di un Dell Inspiron più economici
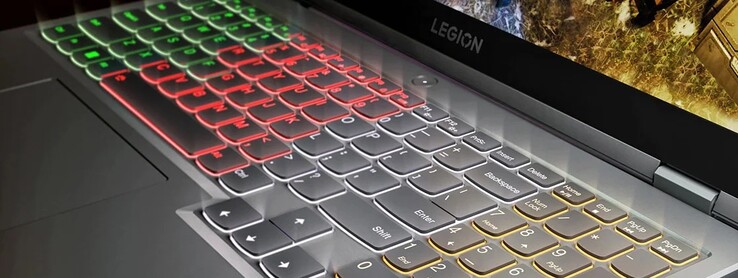
La retroilluminazione della tastiera è inclusa in tutte le configurazioni, ma alcune sono solo a zona singola bianca mentre altre sono a quattro zone RGB. Non c'è un'opzione RGB per tasto, probabilmente per risparmiare sui costi. Tutti i tasti e i simboli si illuminano.
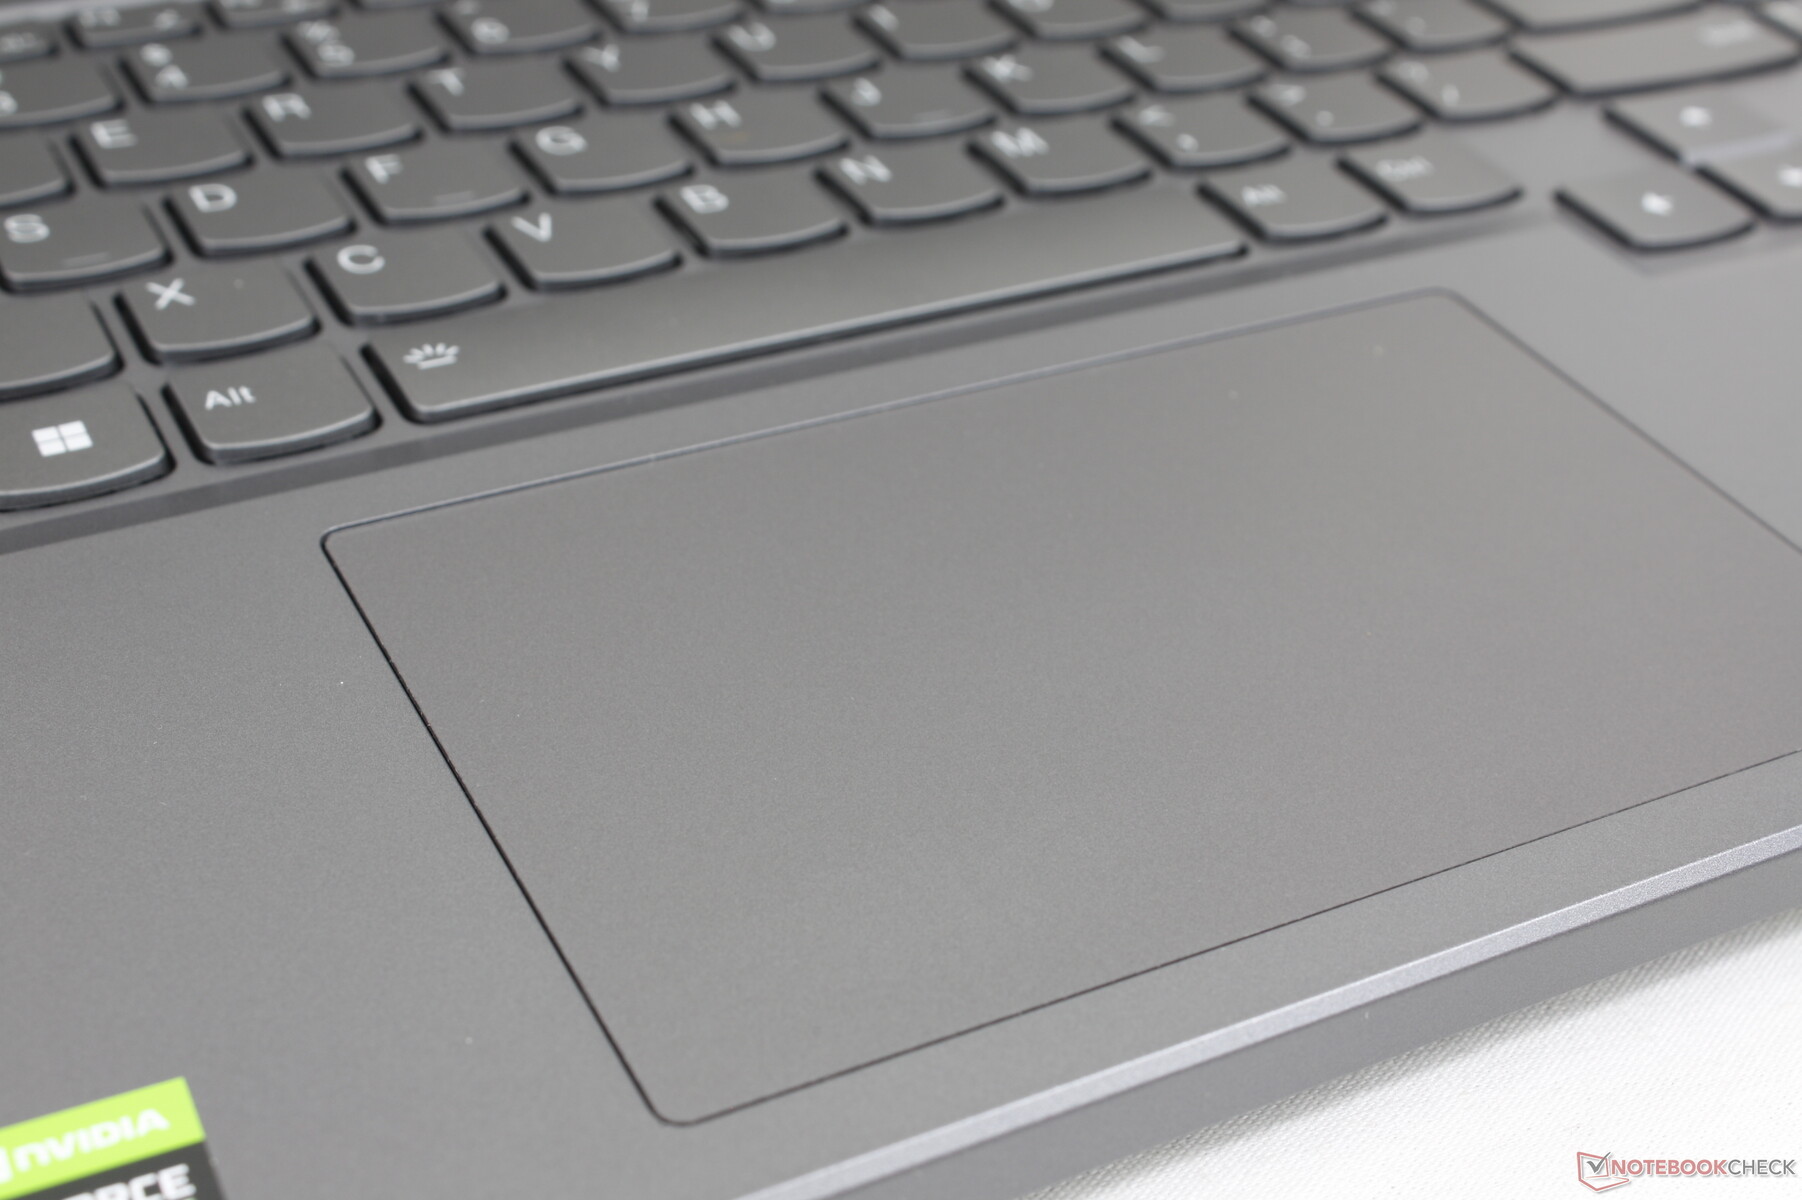
Touchpad
Il clickpad è identico per dimensioni a quello del più costoso Legion 7 16 con dimensioni di 12 x 7,5 cm. Anche il feedback è identico e quindi gli utenti possono aspettarsi un clic un po' spugnoso e insoddisfacente quando viene premuto. La superficie del clickpad è liscia come quella dei palm rest circostanti, ma consigliamo di utilizzare un mouse esterno per facilitare i clic e i trascinamenti.
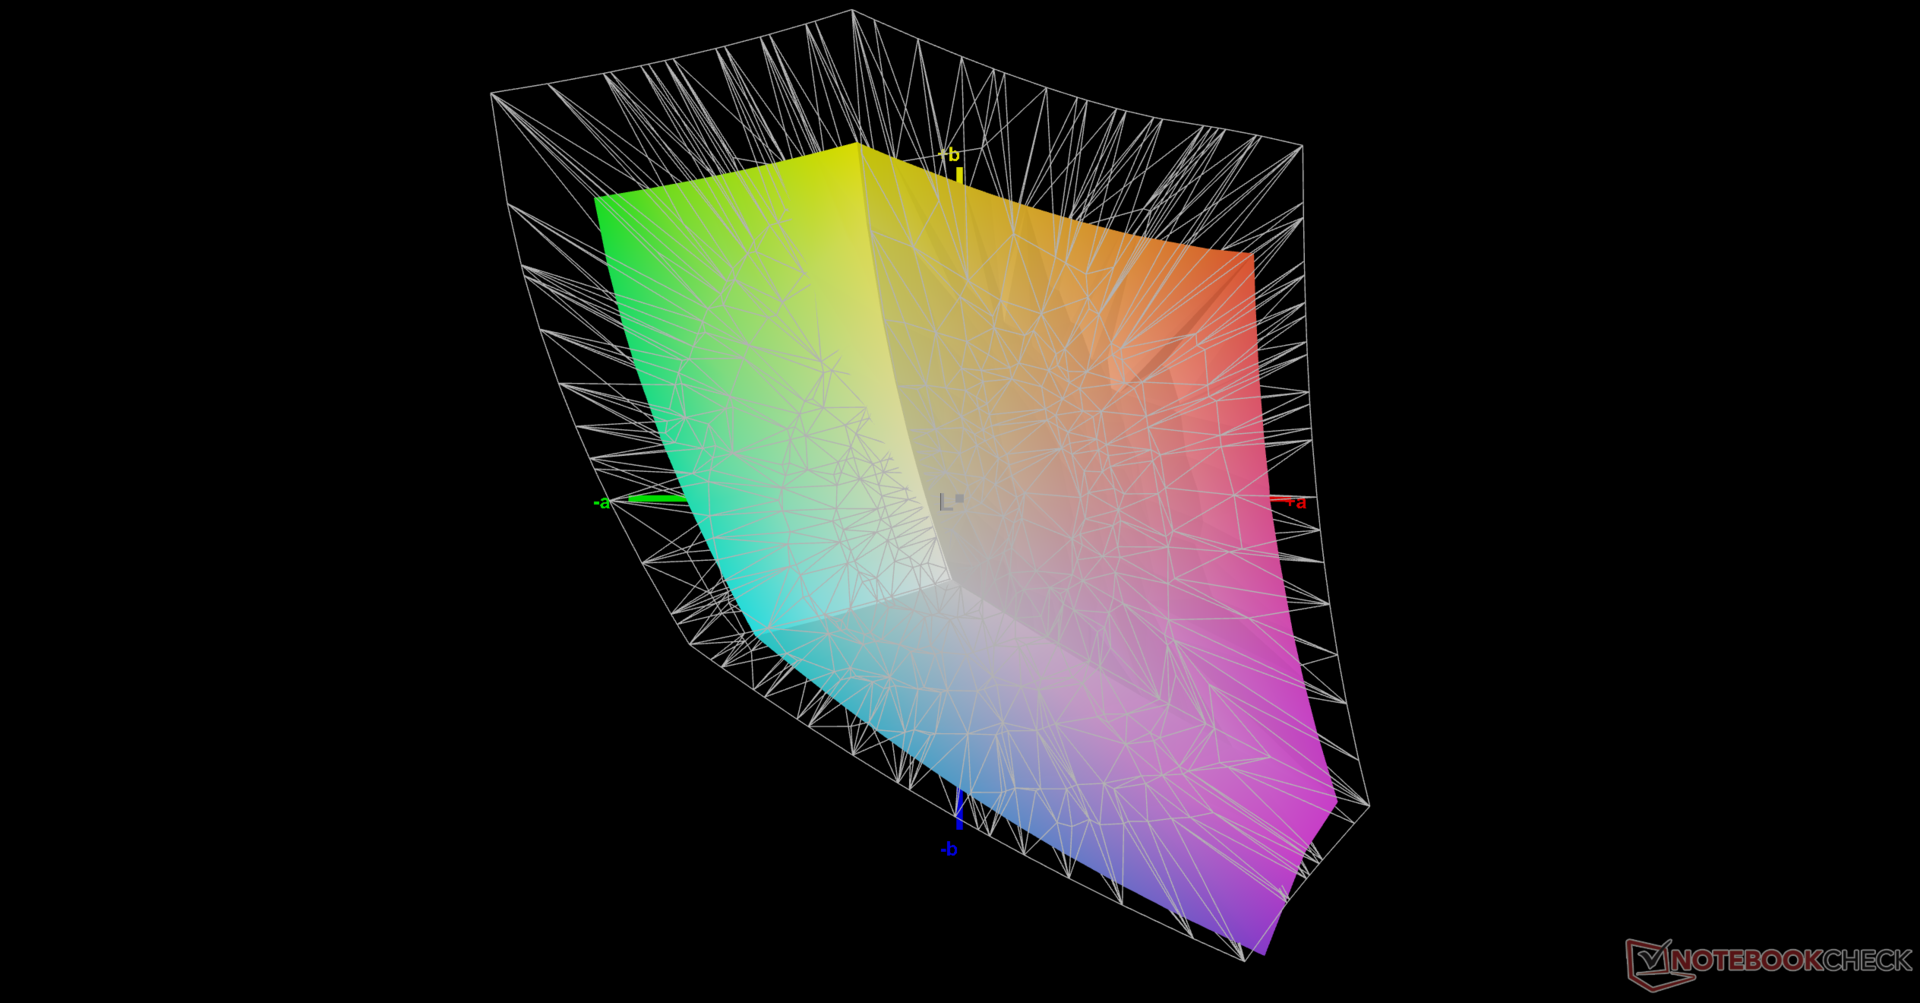
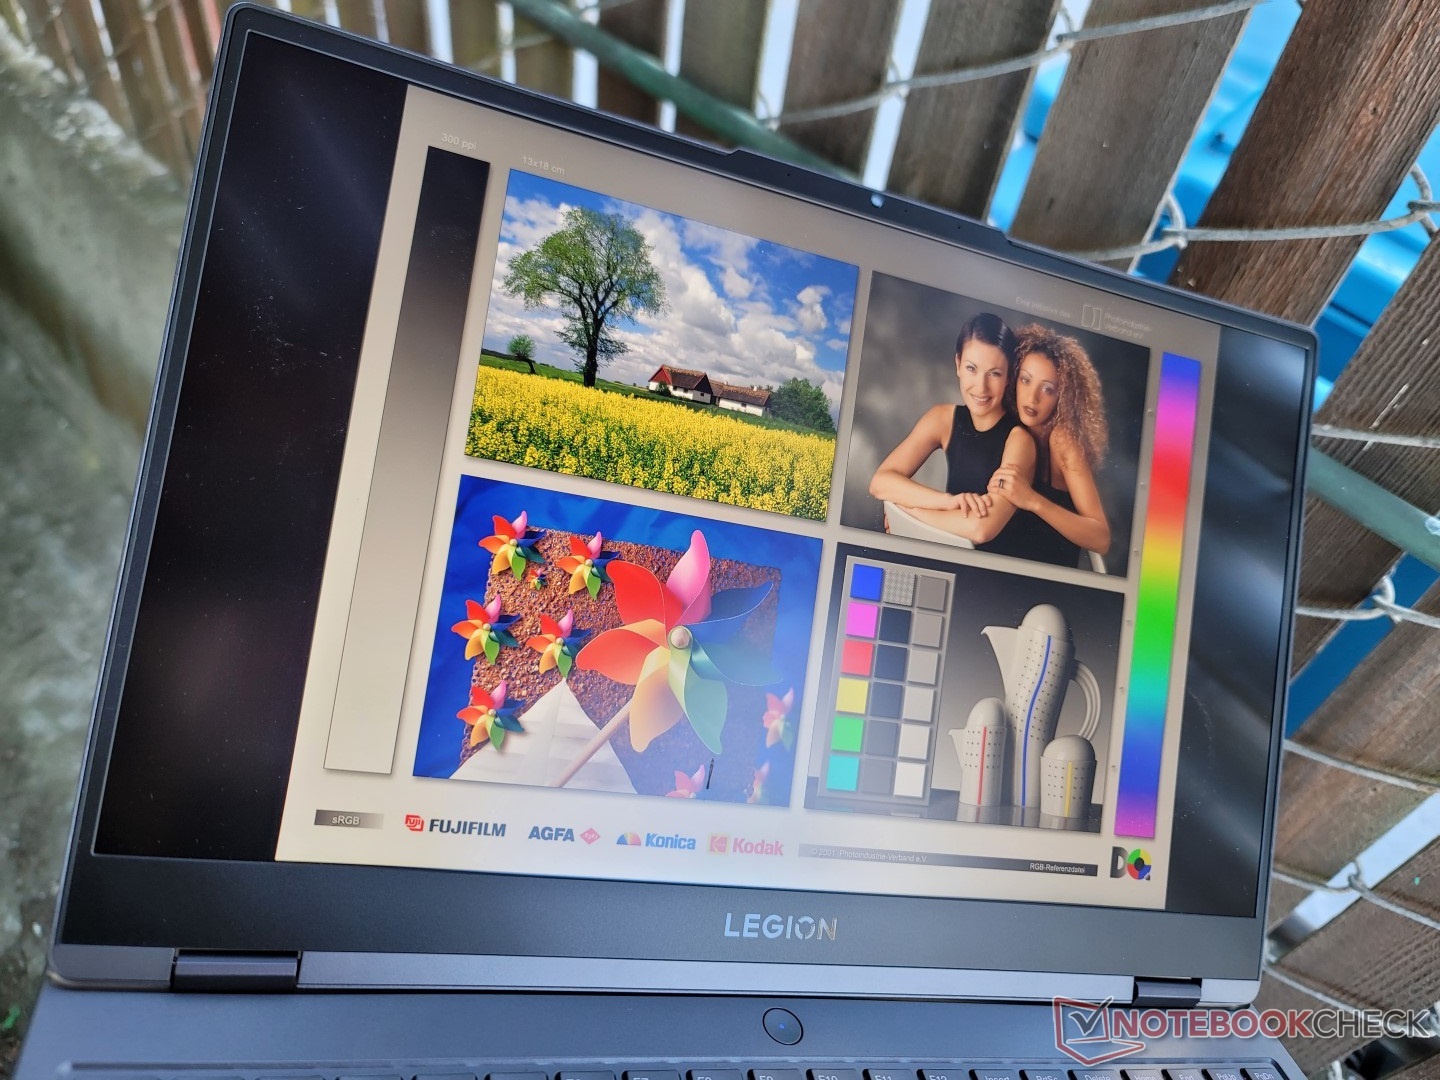
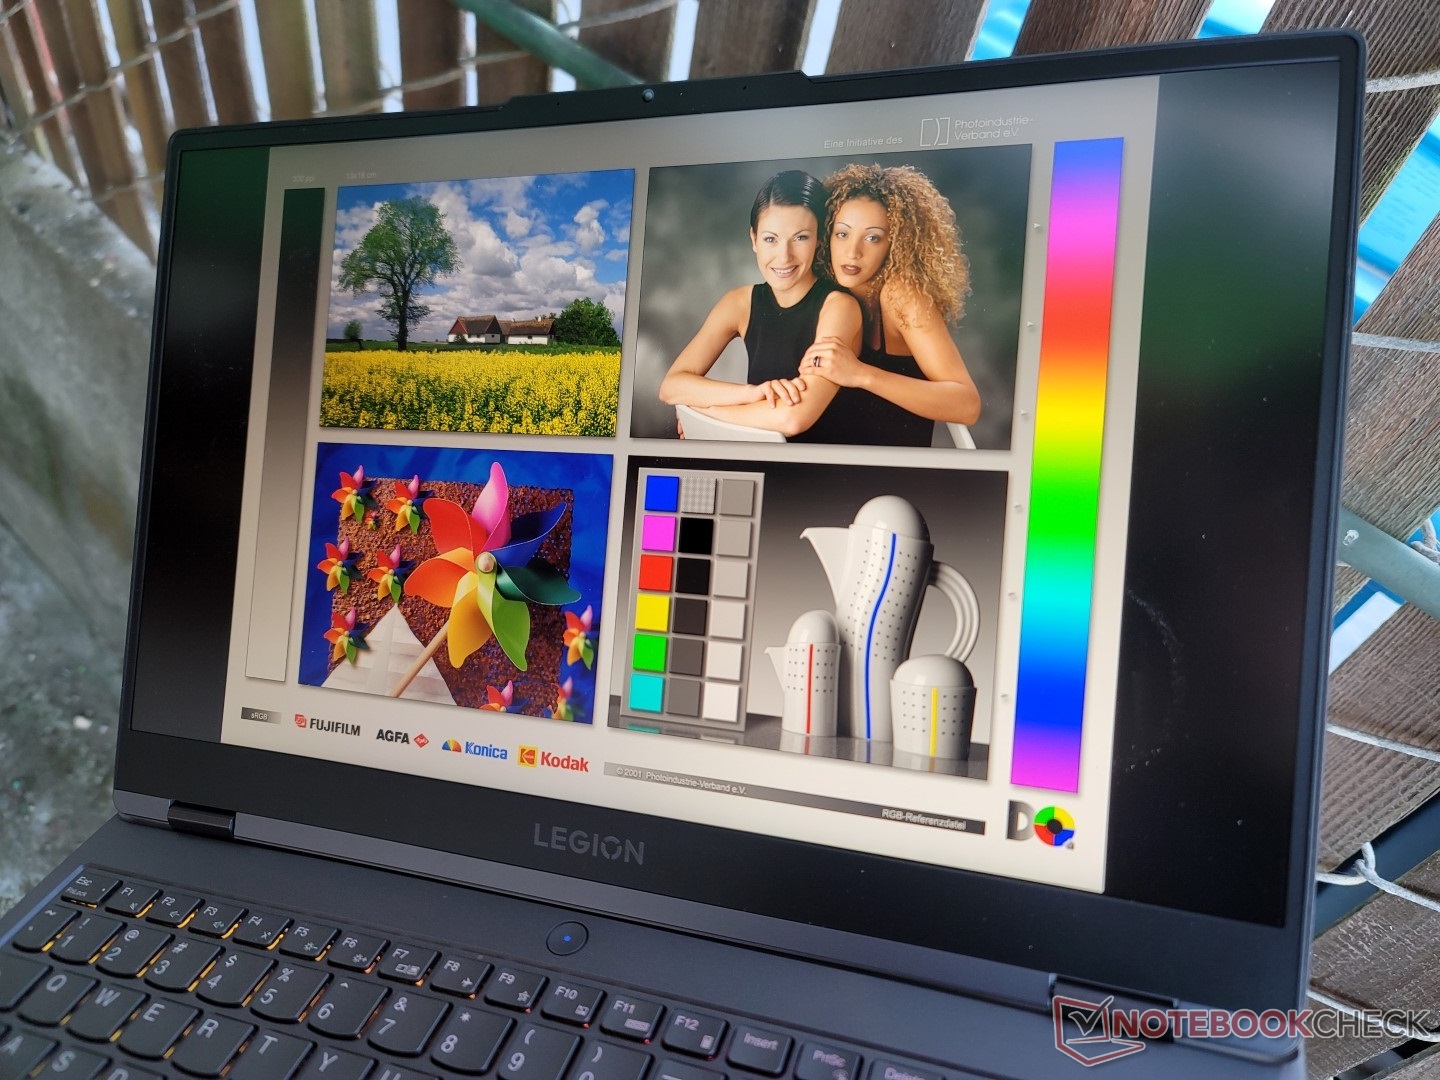
Schermo - 165 Hz, G-Sync, 100% sRGB, IPS
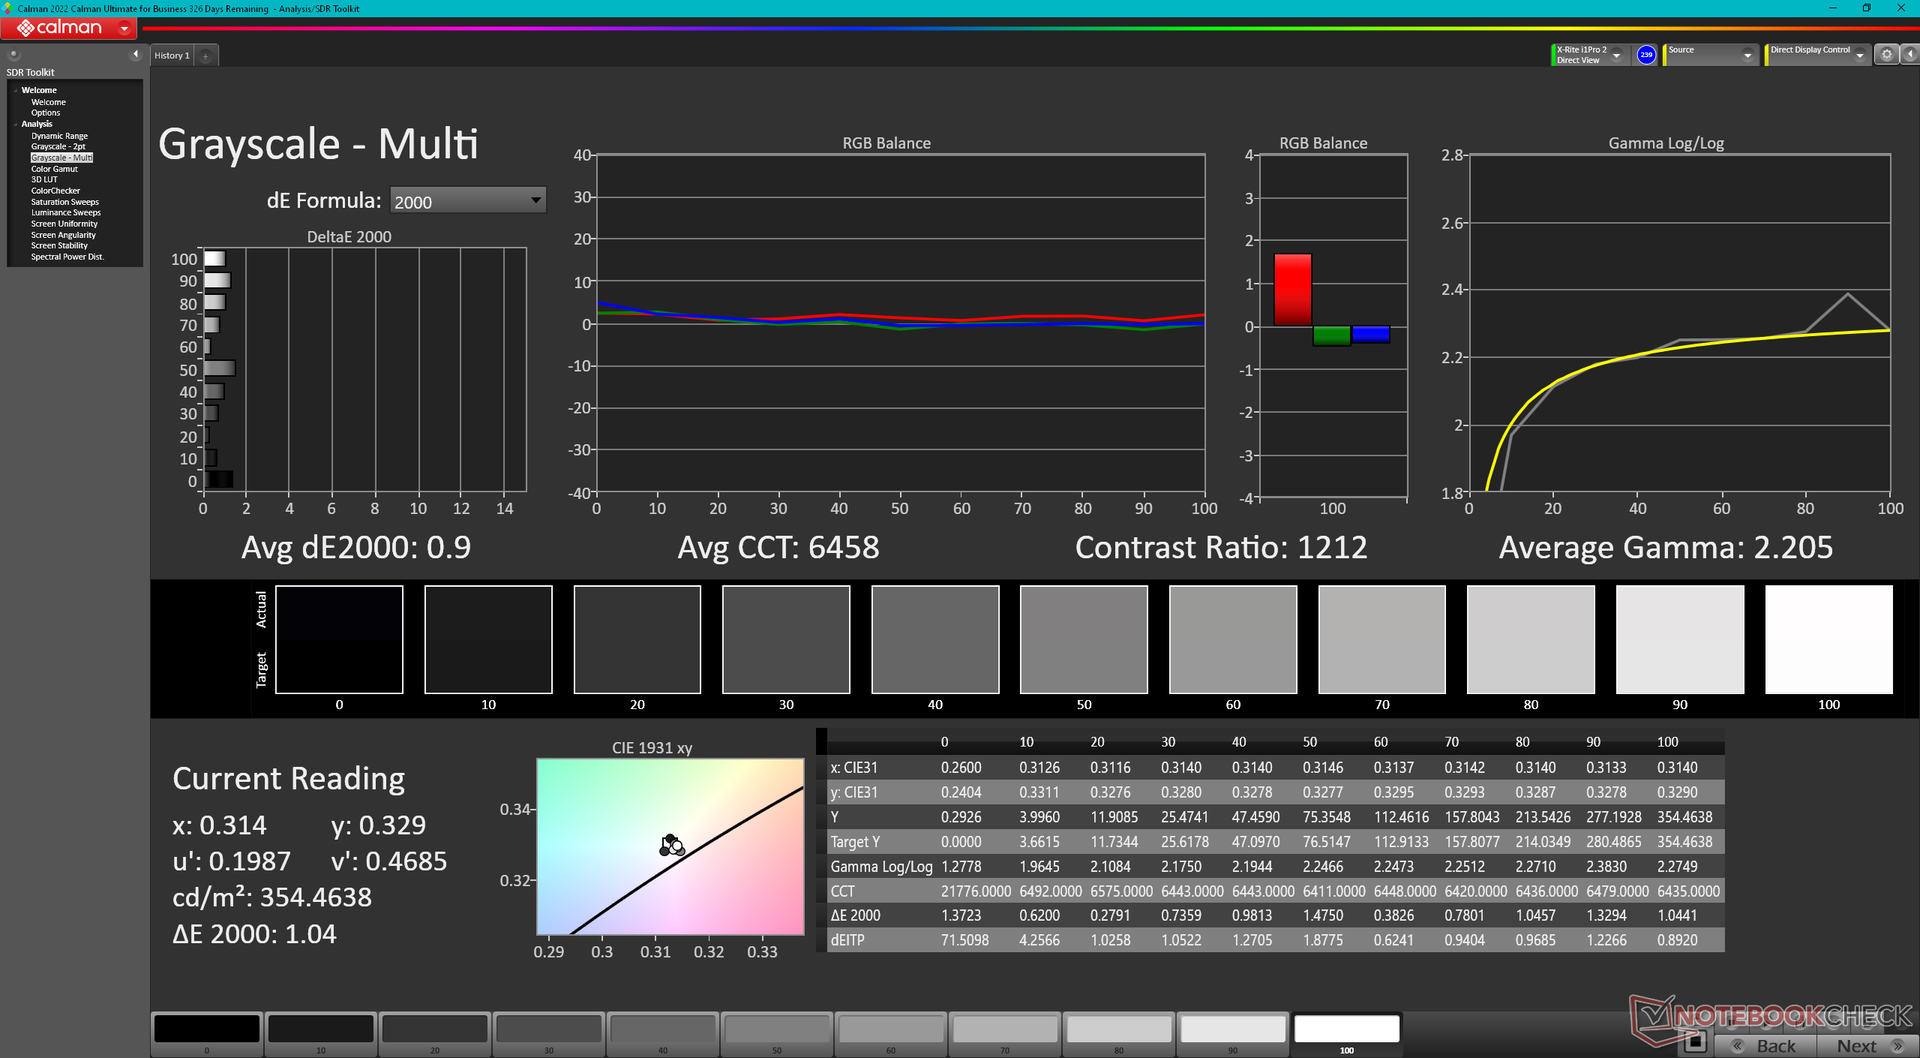
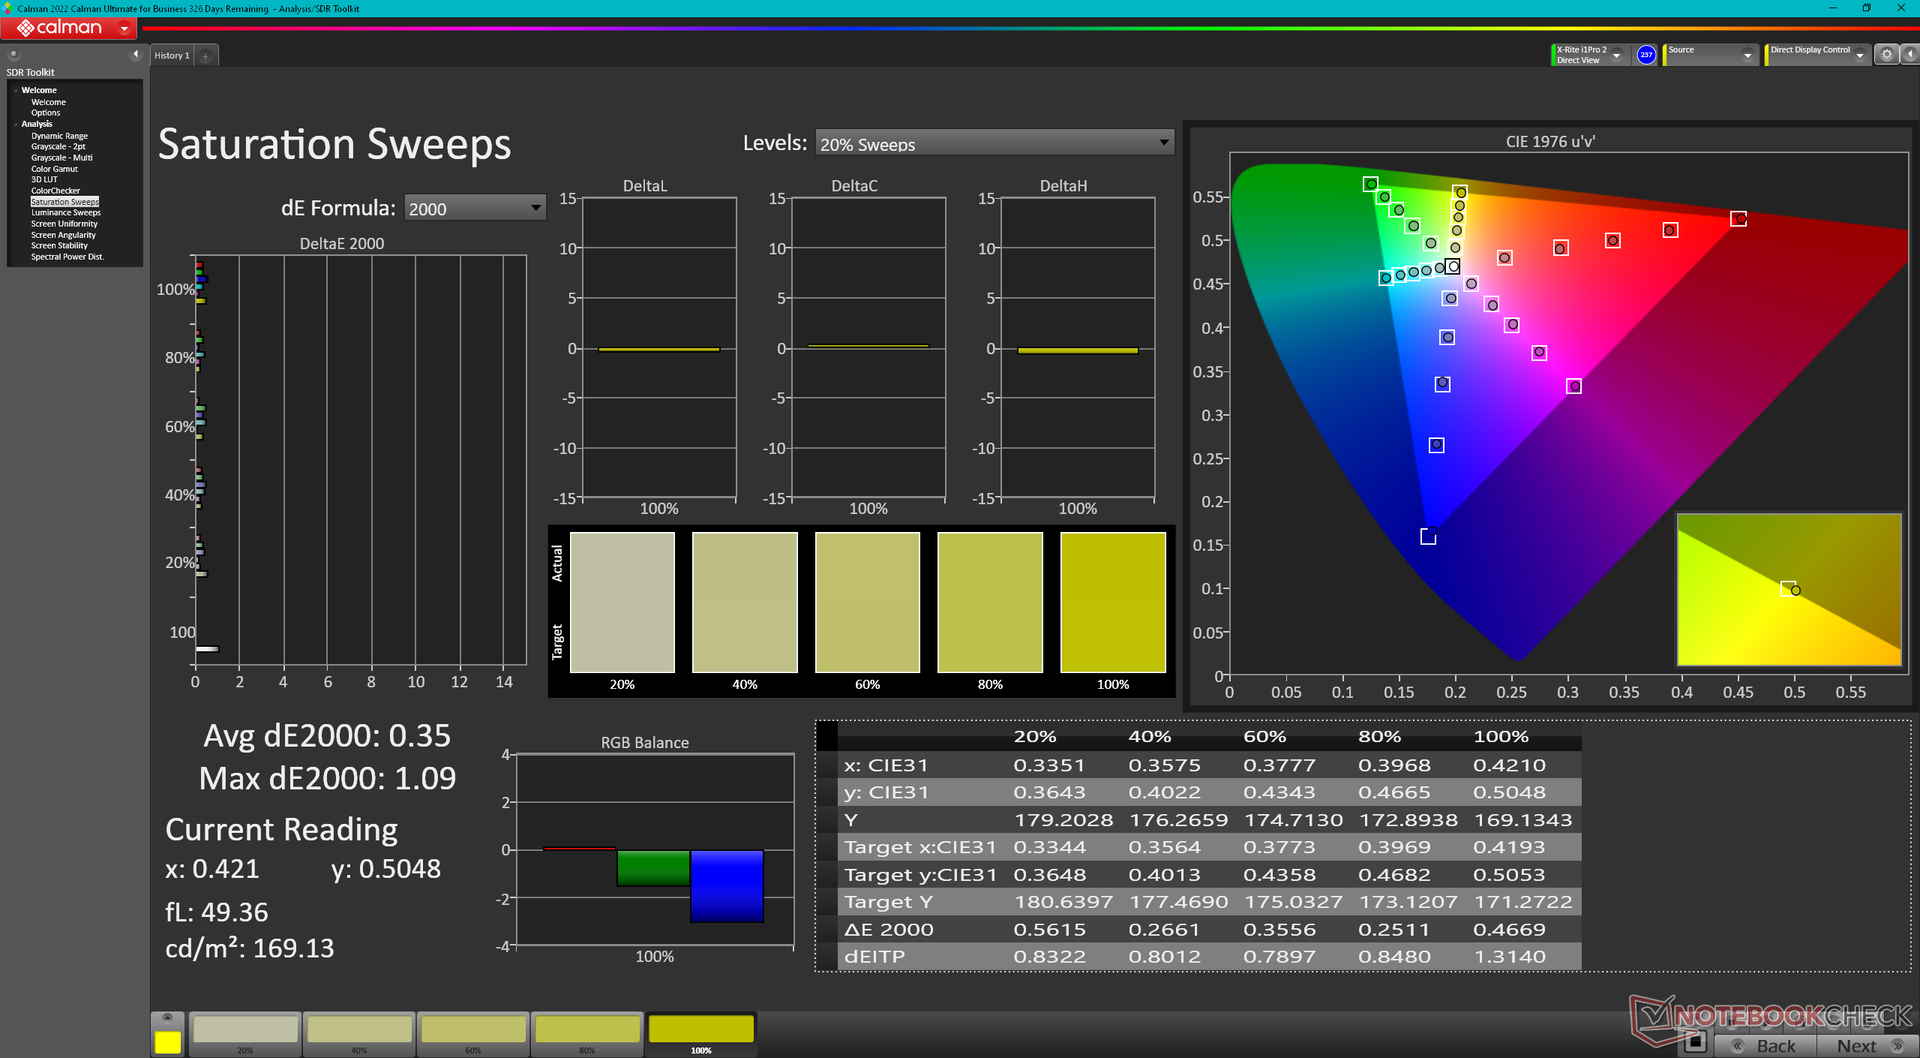
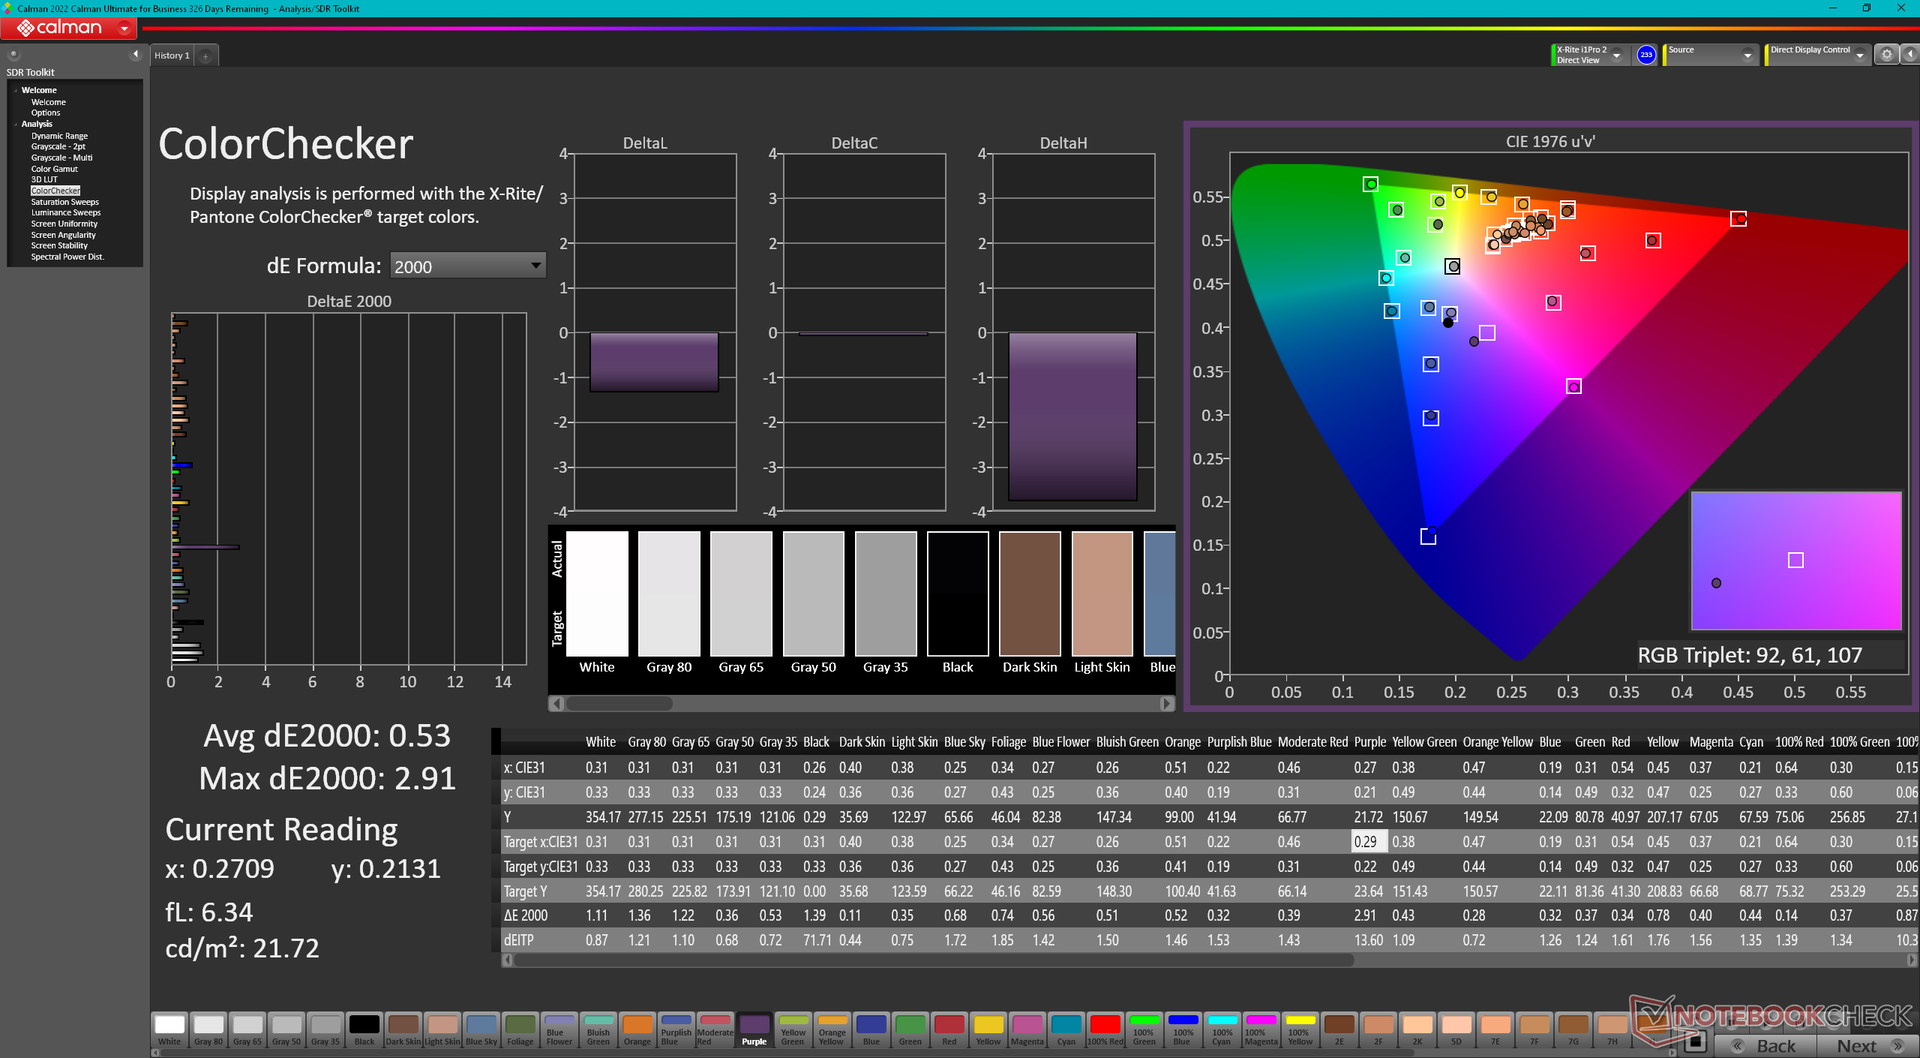
Rispetto al modello dello scorso anno, Lenovo ha cambiato fornitore di pannelli IPS, passando da AUO a CSOT. Tuttavia, la maggior parte degli attributi rimane pressoché invariata per un'esperienza visiva simile. Gli utenti hanno ancora a disposizione G-Sync, copertura sRGB al 100%, frequenza di aggiornamento nativa di 165 Hz, tempi di risposta rapidi, retroilluminazione luminosa da 350 nit e un rapporto di contrasto decente di ~1000:1. Alcune SKU possono includere un pannello più economico da 1080p a 144 Hz, che consigliamo di evitare a causa del suo spazio colore più ristretto.


| |||||||||||||||||||||||||
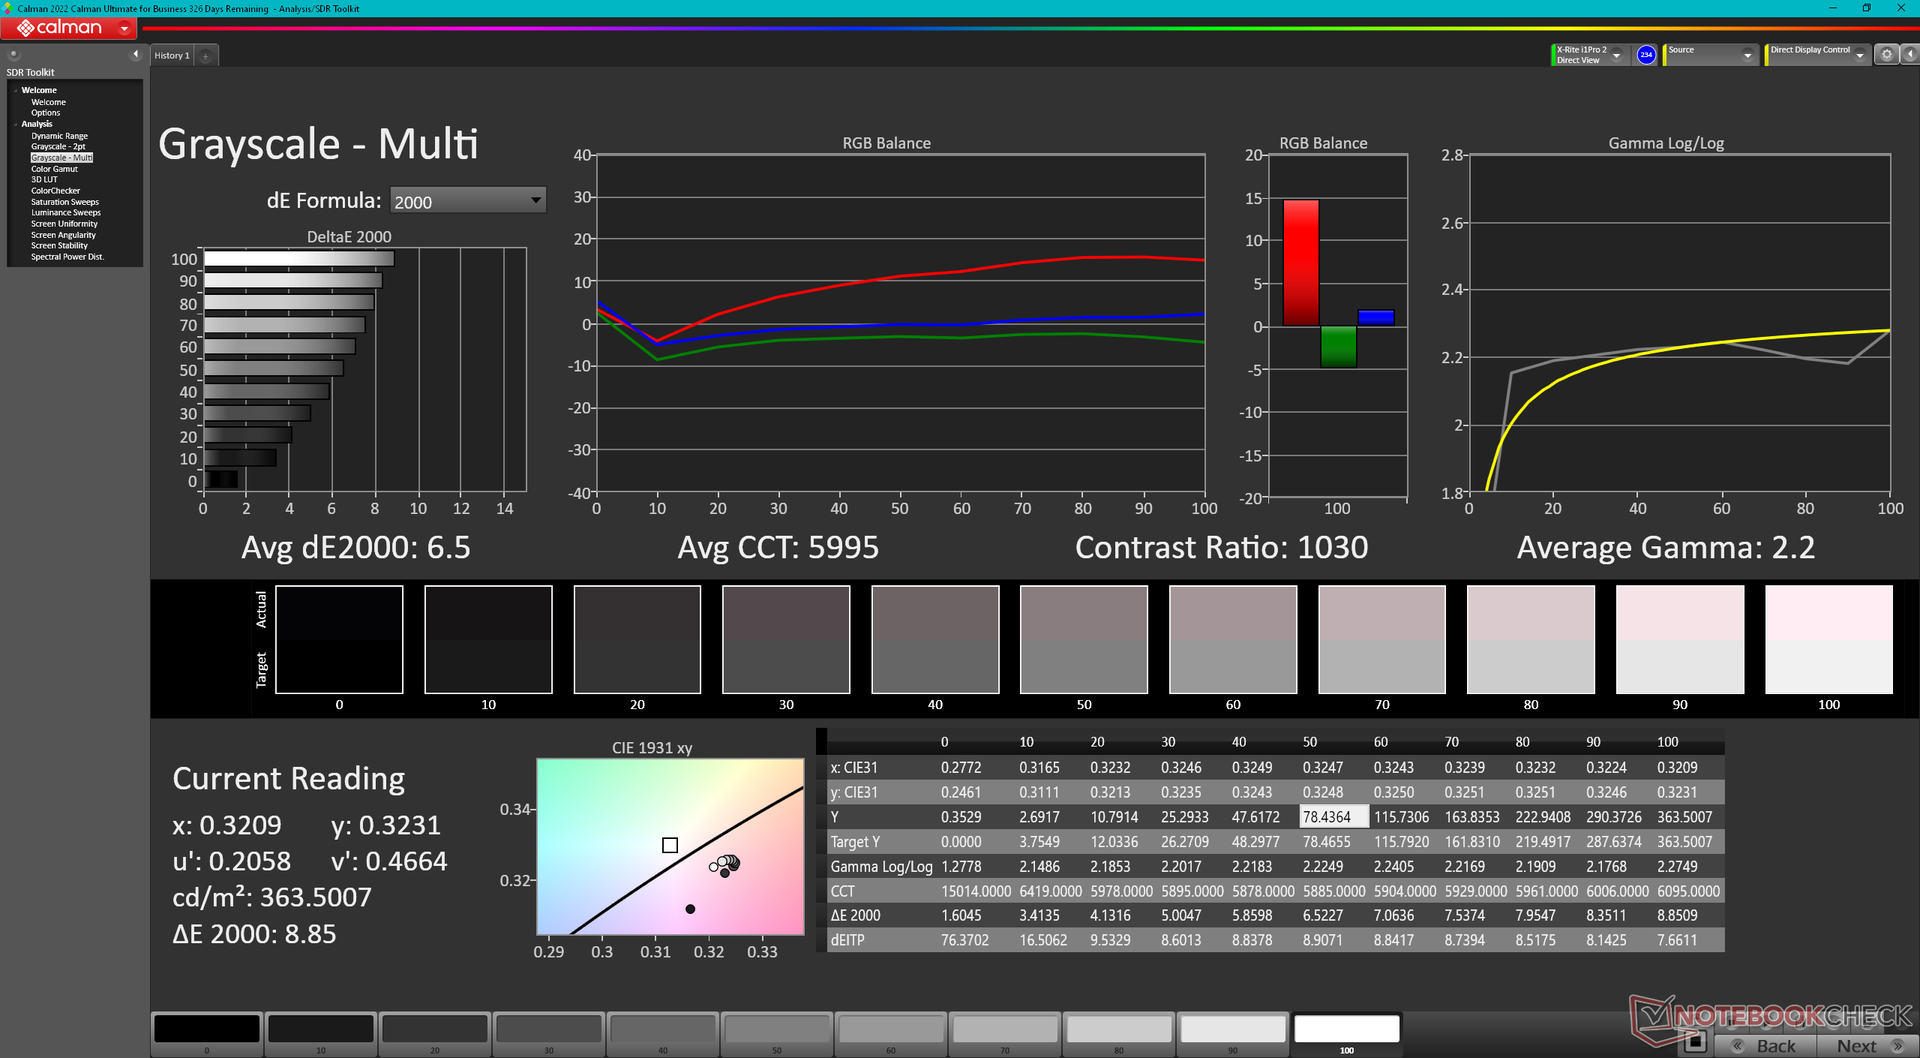
Distribuzione della luminosità: 89 %
Al centro con la batteria: 363.5 cd/m²
Contrasto: 932:1 (Nero: 0.39 cd/m²)
ΔE ColorChecker Calman: 3.68 | ∀{0.5-29.43 Ø4.72}
calibrated: 0.53
ΔE Greyscale Calman: 6.5 | ∀{0.09-98 Ø4.97}
70% AdobeRGB 1998 (Argyll 3D)
99.5% sRGB (Argyll 3D)
69.1% Display P3 (Argyll 3D)
Gamma: 2.2
CCT: 5995 K
| Lenovo Legion 5 15IAH7H 82RB CSOT MNF601CA1-3, IPS, 1920x1080, 15.6" | Lenovo Legion 5 15ACH-82JU00C6GE-FL B156HAN12.H, , 1920x1080, 15.6" | MSI Bravo 15 B5DD-010US Chi Mei N156HRA-EA1, IPS, 1920x1080, 15.6" | Asus TUF Gaming F15 FX507ZM TL156VDXP0101, IPS, 1920x1080, 15.6" | Acer Aspire Nitro 5 AN515-55-57GF Chi Mei CMN N156HRA-EA1, IPS, 1920x1080, 15.6" | Razer Blade 15 Base Edition 2021, i7-10750H RTX 3060 BOE NV156FHM-N4K, IPS, 1920x1080, 15.6" | |
|---|---|---|---|---|---|---|
| Display | -4% | -38% | -3% | -37% | -7% | |
| Display P3 Coverage (%) | 69.1 | 65.4 -5% | 42.1 -39% | 66.4 -4% | 42.54 -38% | 64.3 -7% |
| sRGB Coverage (%) | 99.5 | 96.3 -3% | 62.8 -37% | 97 -3% | 63.5 -36% | 91.8 -8% |
| AdobeRGB 1998 Coverage (%) | 70 | 67.5 -4% | 43.6 -38% | 68.5 -2% | 44.02 -37% | 65.5 -6% |
| Response Times | 16% | -82% | 28% | -111% | 29% | |
| Response Time Grey 50% / Grey 80% * (ms) | 14.8 ? | 13.6 ? 8% | 25.6 ? -73% | 5.6 ? 62% | 33.8 ? -128% | 8.8 ? 41% |
| Response Time Black / White * (ms) | 12 ? | 9.2 ? 23% | 22.8 ? -90% | 12.8 ? -7% | 23.2 ? -93% | 10 ? 17% |
| PWM Frequency (Hz) | 1000 ? | |||||
| Screen | -15% | -87% | 23% | -53% | -40% | |
| Brightness middle (cd/m²) | 363.5 | 350 -4% | 265.1 -27% | 353.7 -3% | 288 -21% | 317.2 -13% |
| Brightness (cd/m²) | 350 | 350 0% | 245 -30% | 340 -3% | 262 -25% | 306 -13% |
| Brightness Distribution (%) | 89 | 96 8% | 87 -2% | 89 0% | 88 -1% | 89 0% |
| Black Level * (cd/m²) | 0.39 | 0.3 23% | 0.35 10% | 0.34 13% | 0.21 46% | 0.31 21% |
| Contrast (:1) | 932 | 1167 25% | 757 -19% | 1040 12% | 1371 47% | 1023 10% |
| Colorchecker dE 2000 * | 3.68 | 3.9 -6% | 4.68 -27% | 1.74 53% | 3.61 2% | 4.37 -19% |
| Colorchecker dE 2000 max. * | 8.92 | 8.2 8% | 19.96 -124% | 3.63 59% | 18.07 -103% | 6.62 26% |
| Colorchecker dE 2000 calibrated * | 0.53 | 1.6 -202% | 3.7 -598% | 0.5 6% | 3.12 -489% | 2.67 -404% |
| Greyscale dE 2000 * | 6.5 | 5.5 15% | 4.5 31% | 2.1 68% | 2.4 63% | 4.5 31% |
| Gamma | 2.2 100% | 2.15 102% | 2.22 99% | 2.3 96% | 2.216 99% | 2.4 92% |
| CCT | 5995 108% | 7414 88% | 6632 98% | 6257 104% | 6675 97% | 7418 88% |
| Color Space (Percent of AdobeRGB 1998) (%) | 44 | 59.2 | ||||
| Color Space (Percent of sRGB) (%) | 62 | 91.4 | ||||
| Media totale (Programma / Settaggio) | -1% /
-8% | -69% /
-76% | 16% /
18% | -67% /
-58% | -6% /
-23% |
* ... Meglio usare valori piccoli
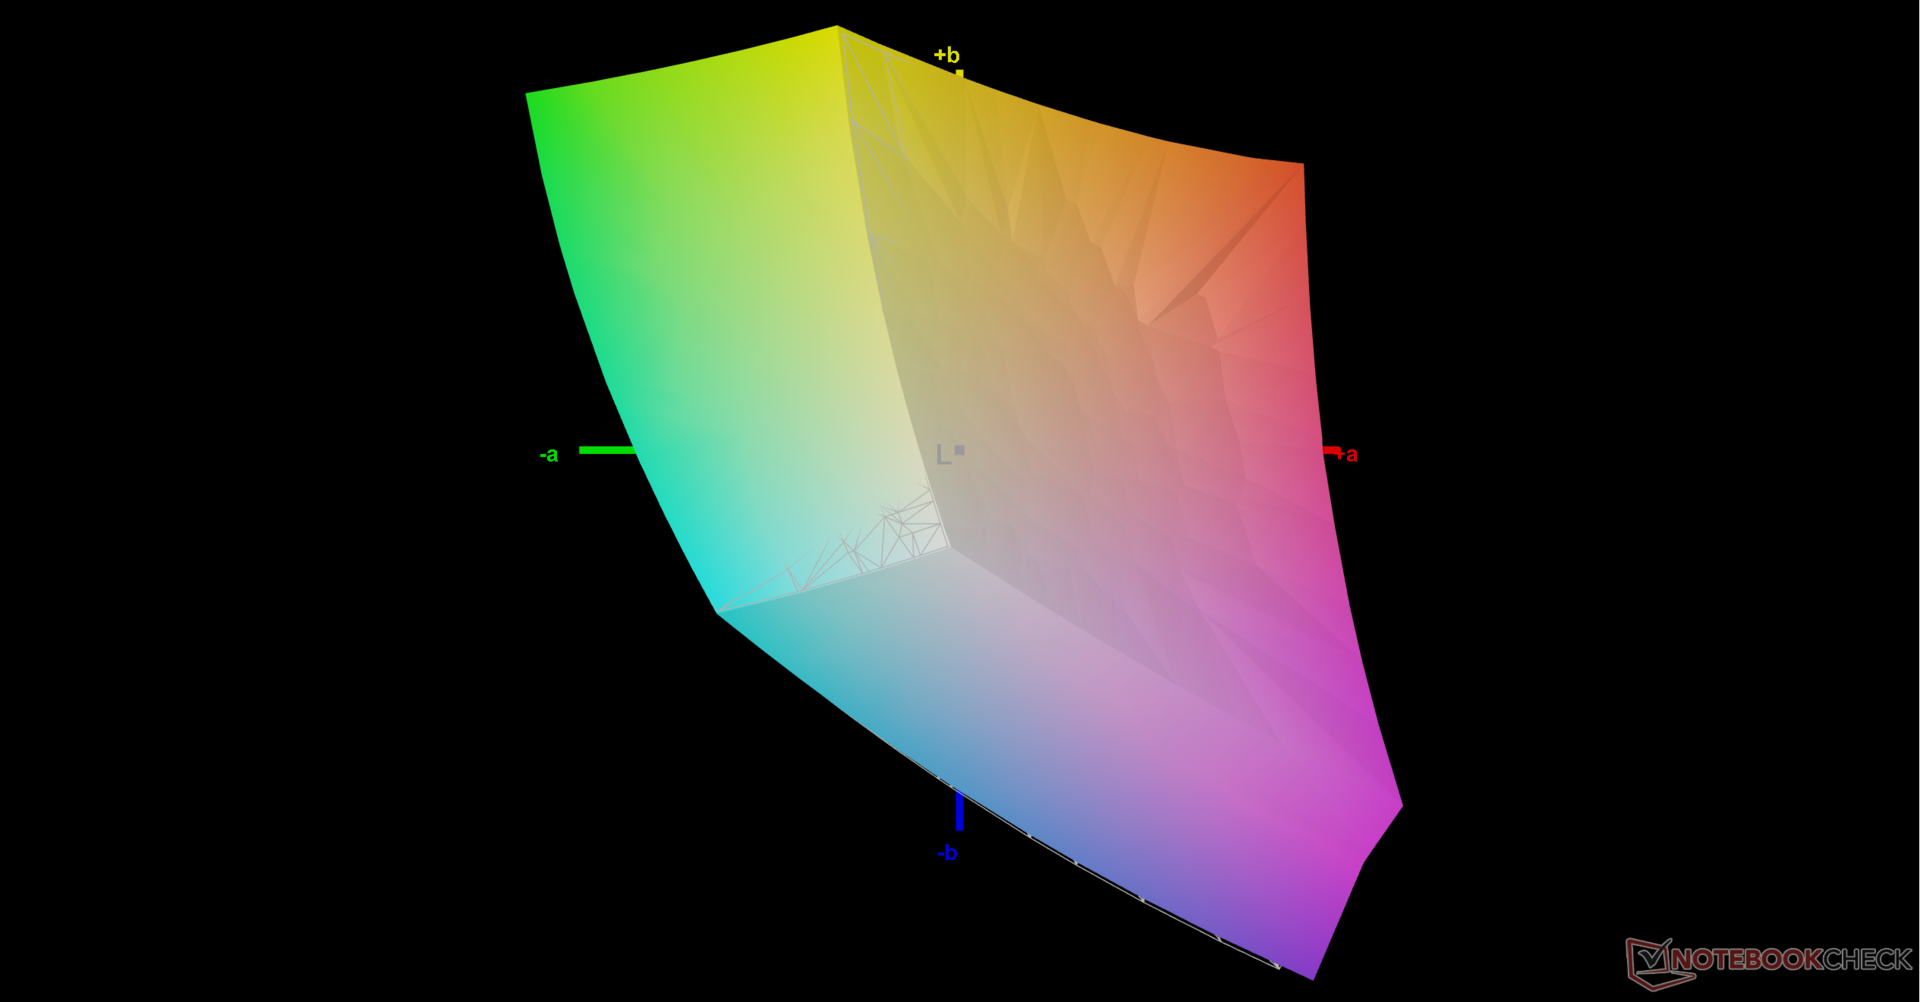
Il display non viene fornito pre-calibrato, come dimostrano i risultati del nostro colorimetro X-Rite, dove i valori medi deltaE della scala di grigi e del colore raggiungono rispettivamente 6,5 e 3,68. Una corretta calibrazione può ridurre tali medie rispettivamente a 0,9 e 0,53, poiché il pannello copre l'intero sRGB. Consigliamo di applicare il nostro profilo ICM calibrato sopra per sfruttare al meglio gli ampi colori sRGB del pannello.
Tempi di risposta del Display
| ↔ Tempi di risposta dal Nero al Bianco | ||
|---|---|---|
| 12 ms ... aumenta ↗ e diminuisce ↘ combinato | ↗ 6.8 ms Incremento | 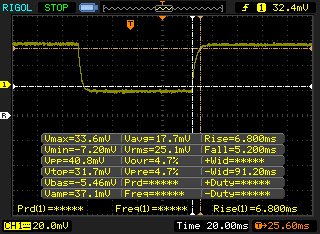 |
| ↘ 5.2 ms Calo | ||
| Lo schermo mostra buoni tempi di risposta durante i nostri tests, ma potrebbe essere troppo lento per i gamers competitivi. In confronto, tutti i dispositivi di test variano da 0.1 (minimo) a 240 (massimo) ms. » 32 % di tutti i dispositivi è migliore. Questo significa che i tempi di risposta rilevati sono migliori rispettto alla media di tutti i dispositivi testati (19.8 ms). | ||
| ↔ Tempo di risposta dal 50% Grigio all'80% Grigio | ||
| 14.8 ms ... aumenta ↗ e diminuisce ↘ combinato | ↗ 8 ms Incremento | 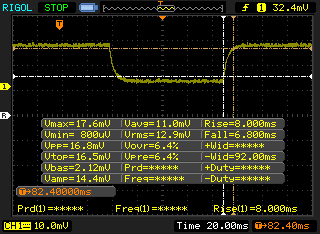 |
| ↘ 6.8 ms Calo | ||
| Lo schermo mostra buoni tempi di risposta durante i nostri tests, ma potrebbe essere troppo lento per i gamers competitivi. In confronto, tutti i dispositivi di test variano da 0.165 (minimo) a 636 (massimo) ms. » 29 % di tutti i dispositivi è migliore. Questo significa che i tempi di risposta rilevati sono migliori rispettto alla media di tutti i dispositivi testati (31 ms). | ||
Sfarfallio dello schermo / PWM (Pulse-Width Modulation)
| flickering dello schermo / PWM non rilevato | 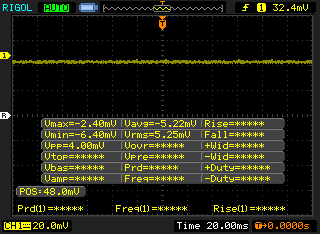 | ||
In confronto: 52 % di tutti i dispositivi testati non utilizza PWM per ridurre la luminosita' del display. Se è rilevato PWM, una media di 7763 (minimo: 5 - massimo: 343500) Hz è stata rilevata. | |||
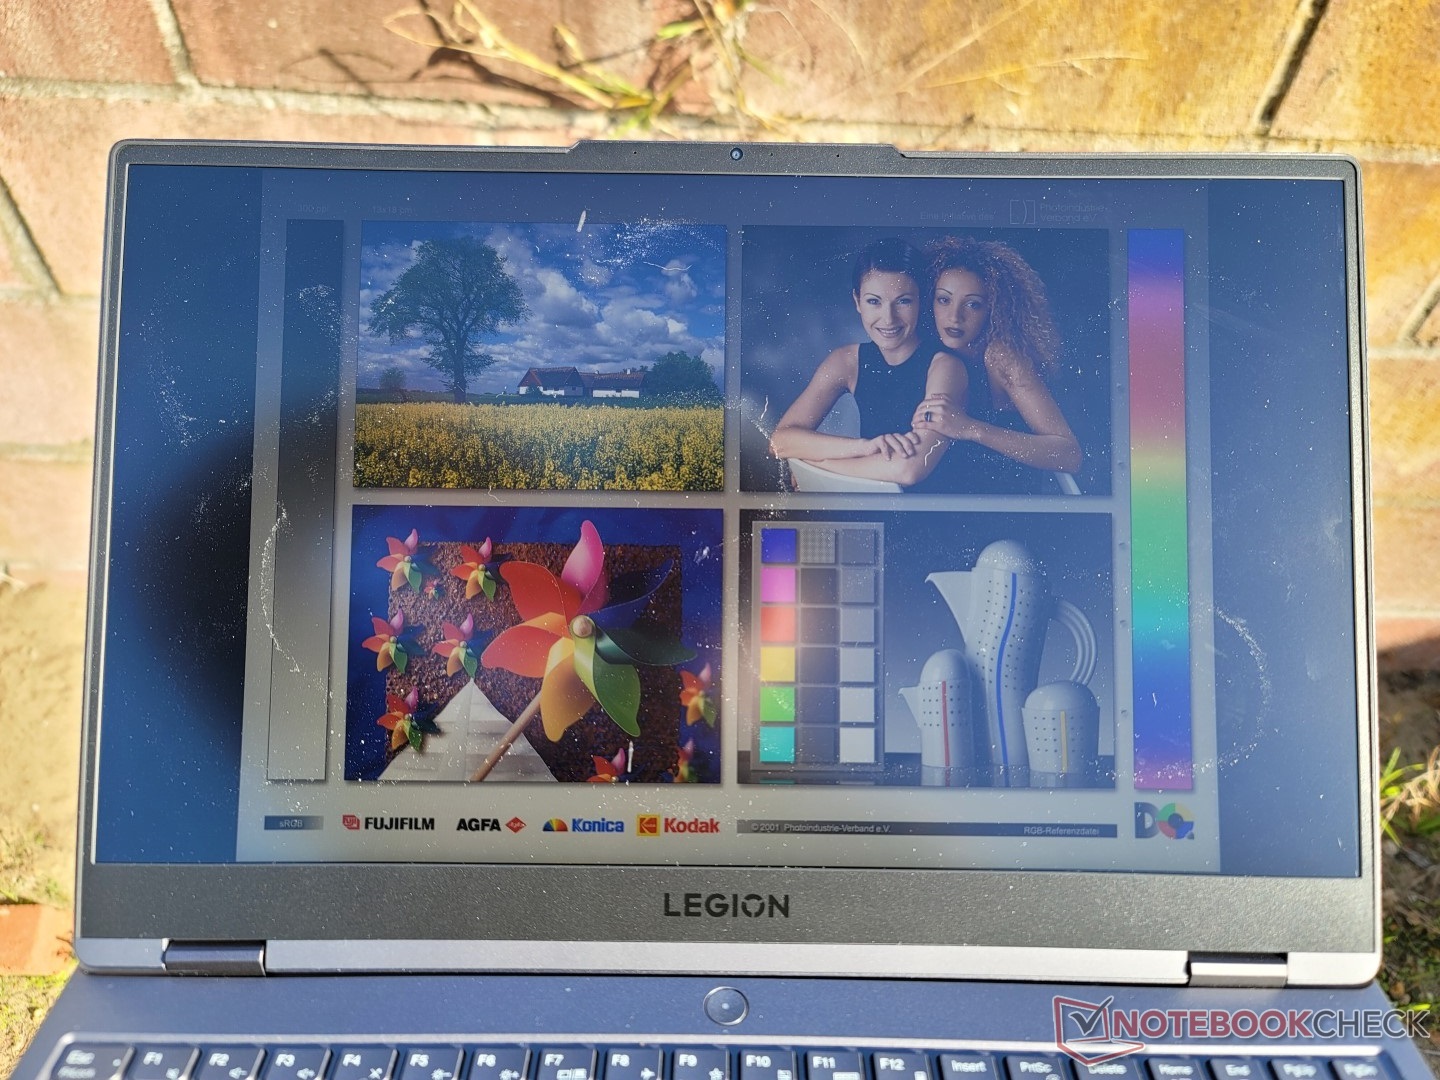
Con 350 nits, il display è solo leggermente più luminoso rispetto alla media dei portatili da gioco, dove i 300 nits sono comuni. Lo schermo è comodo per la visione all'aperto all'ombra e il rivestimento opaco aiuta a ridurre i riflessi, ma tutto diventa sbiadito in condizioni di maggiore luminosità.
Prestazioni - Supporto MUX
Condizioni di test
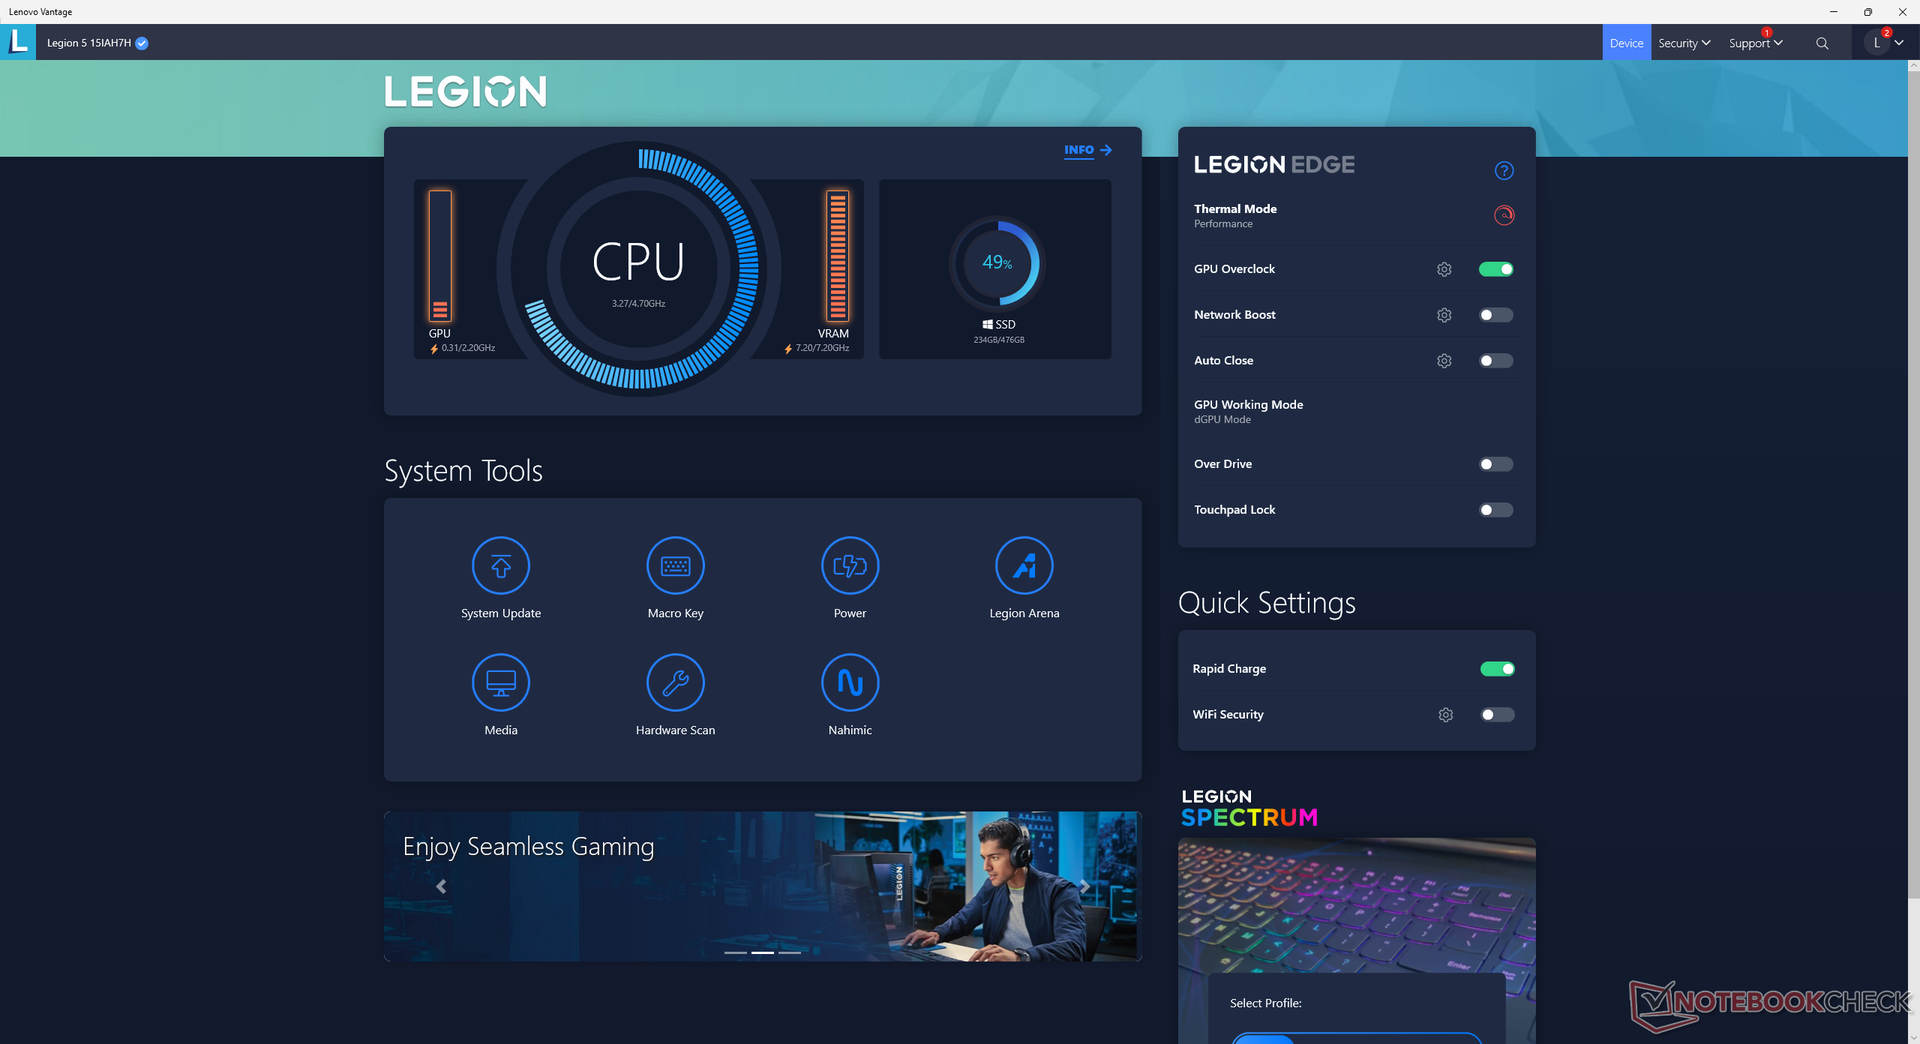
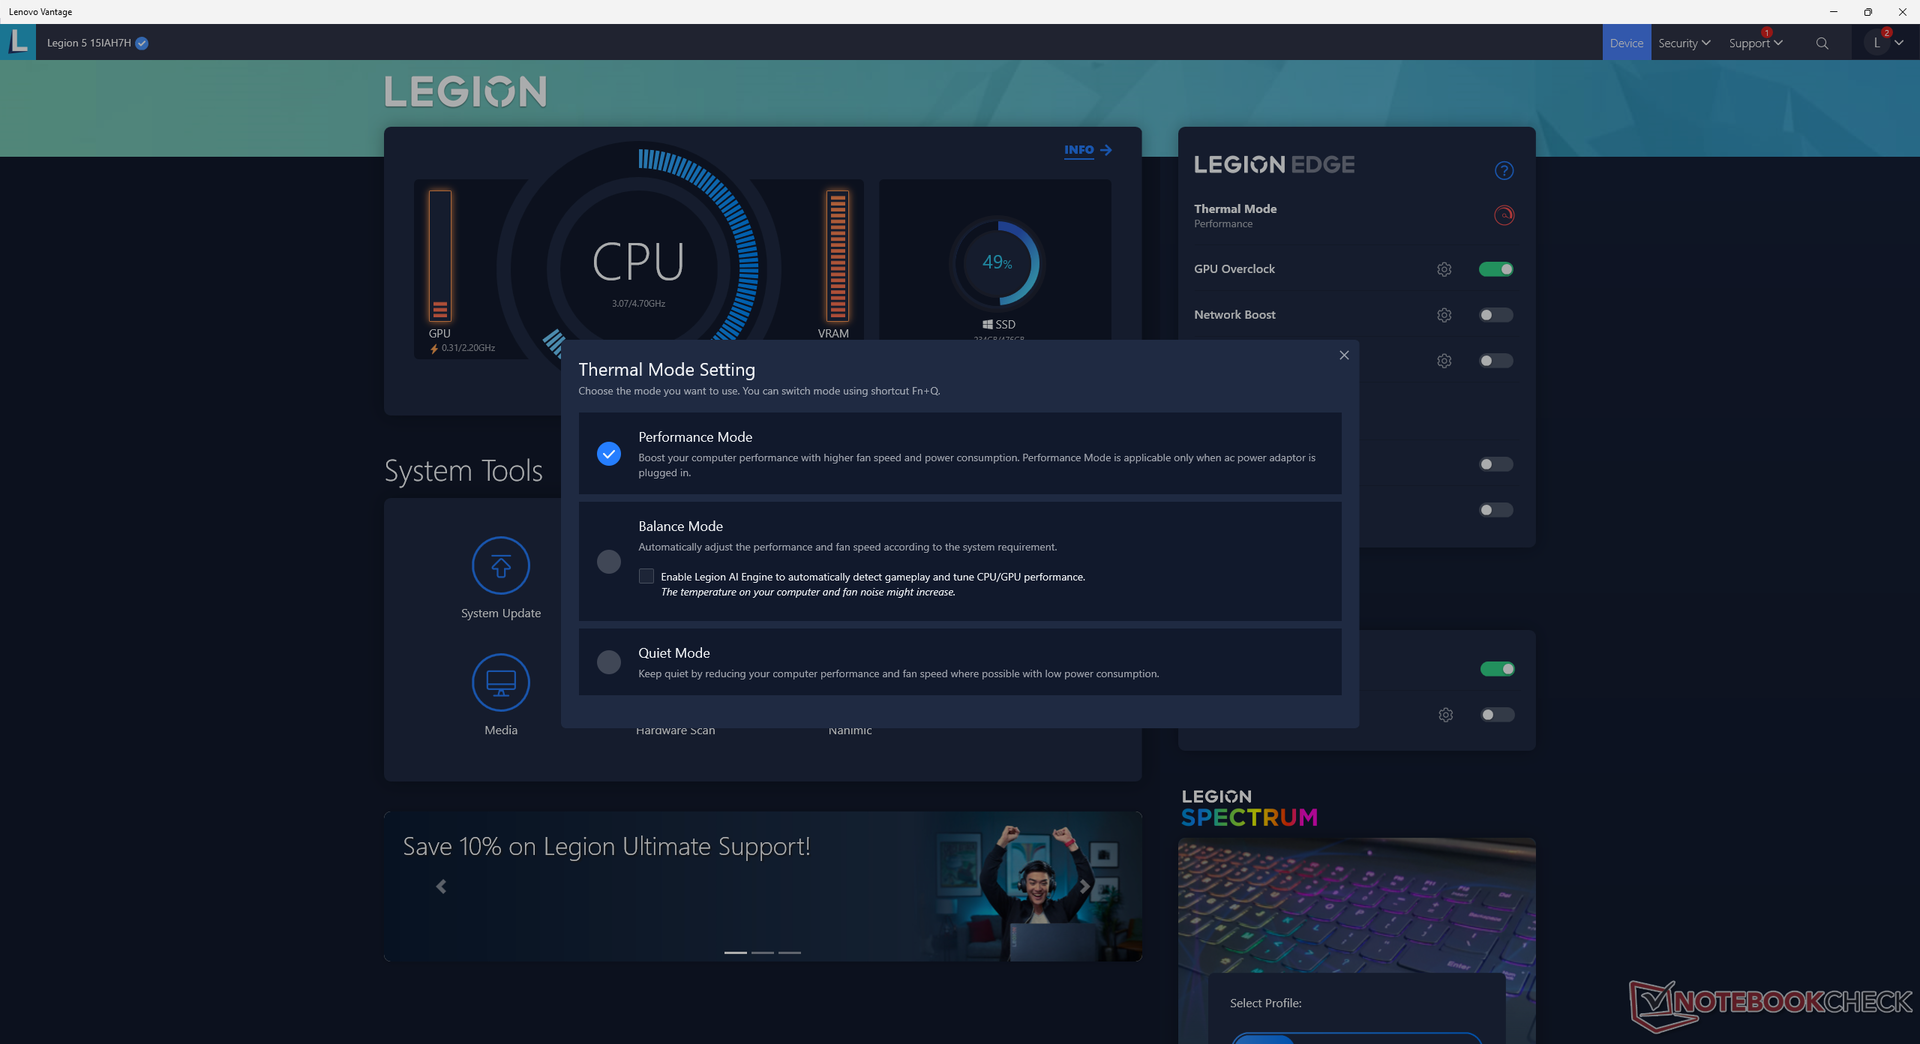
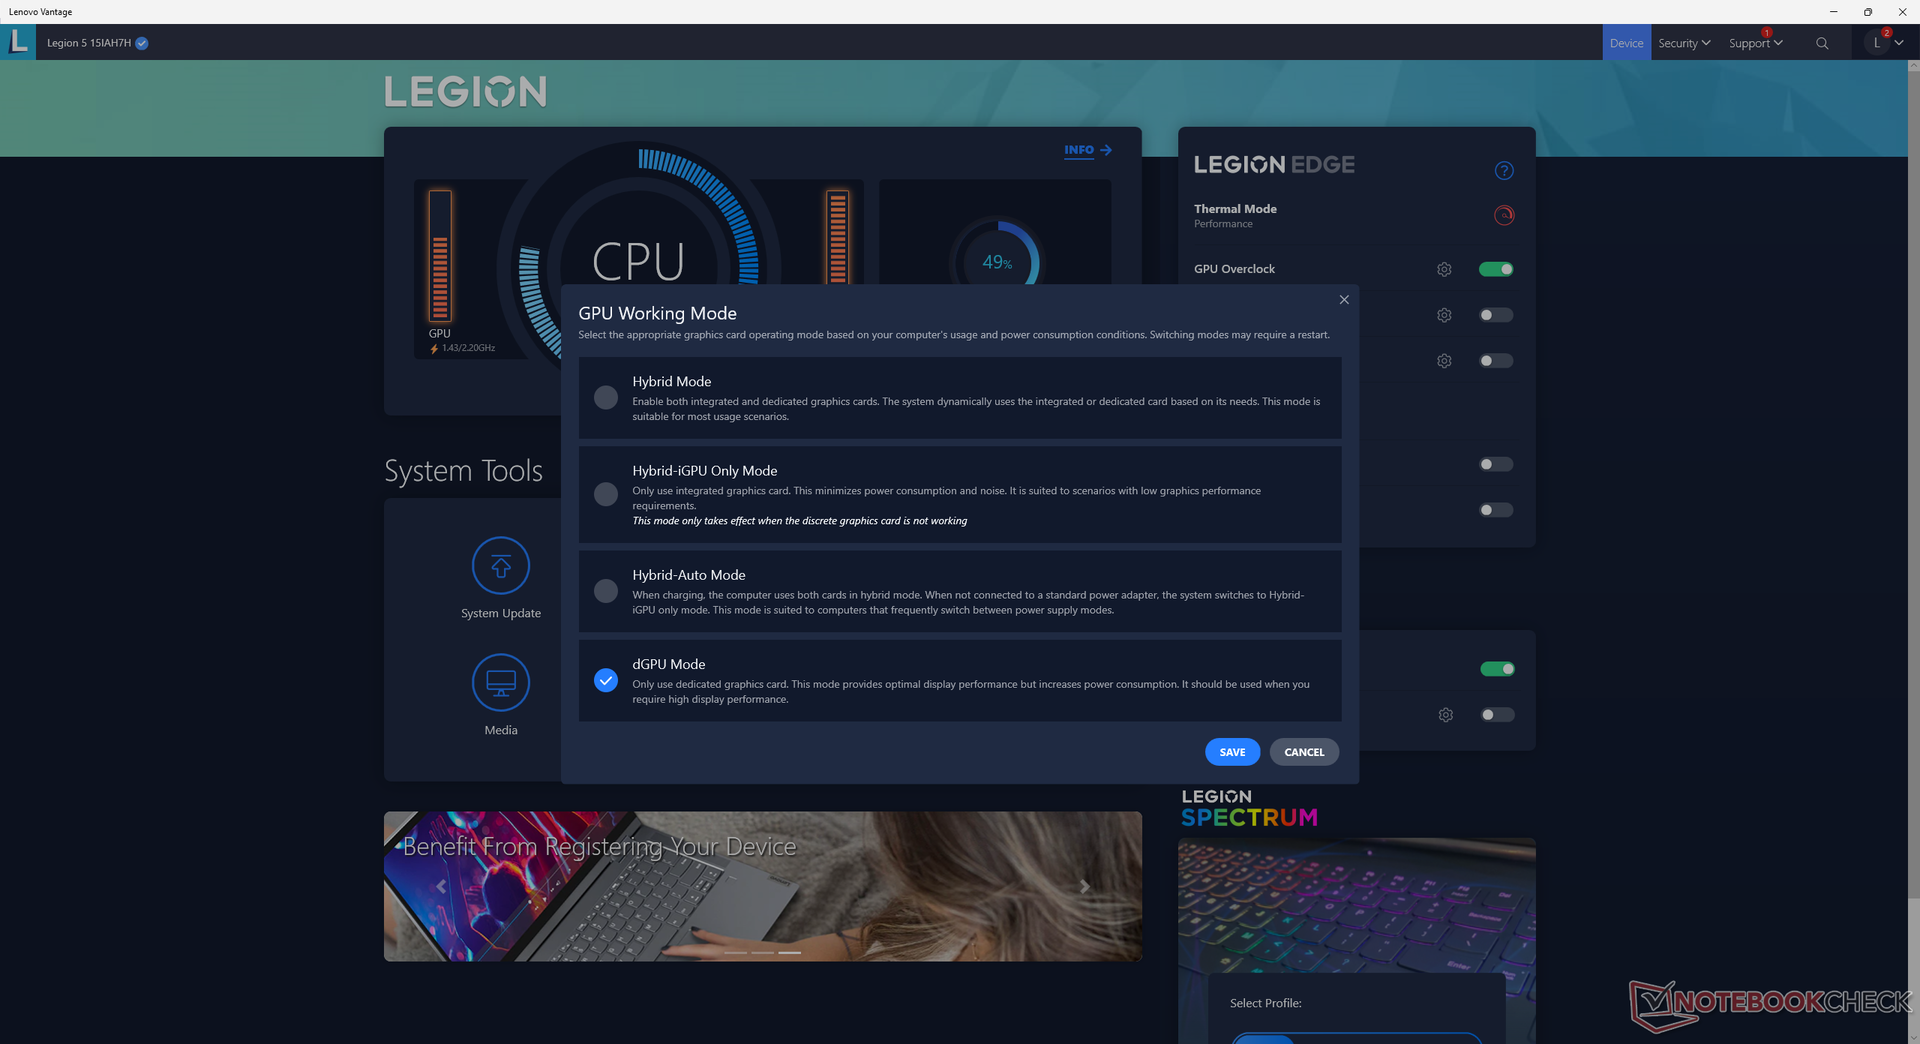
Abbiamo impostato il nostro sistema in modalità Performance e la GPU in modalità discreta tramite Lenovo Vantage prima di eseguire i benchmark delle prestazioni riportati di seguito. Si consiglia vivamente agli utenti di familiarizzare con il software Vantage preinstallato, in quanto è l'hub per gli aggiornamenti del sistema, le modalità grafiche MUX o ibride, il comportamento di ricarica e altro ancora, come mostrano gli screenshot qui sotto.
Processore
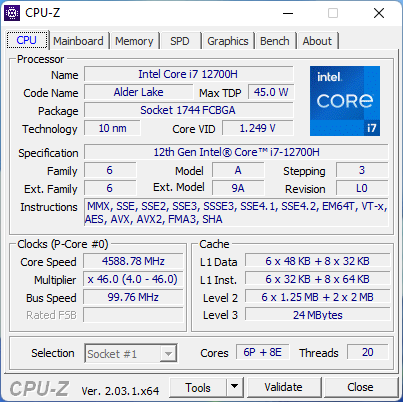
Le prestazioni della CPU sono più rapide del previsto, con risultati dal 15 al 25% più veloci rispetto alla media dei laptop del nostro database equipaggiati con lo stesso Core i7-12700H e lo stesso processore Core i7-12700H. In effetti, il Legion 5 15 è uno dei modelli più veloci che si possono ottenere con il Core i7-12700H. Le prestazioni grezze superano quelle del Core i7-12800H nel più costoso 2022 Razer Blade 15 con margini notevoli
Il declassamento a un minore Core i5-12500H comporta un calo del 5% e del 25% nelle prestazioni single-thread e multi-thread, rispettivamente.
Cinebench R15 Multi Loop
Cinebench R23: Multi Core | Single Core
Cinebench R15: CPU Multi 64Bit | CPU Single 64Bit
Blender: v2.79 BMW27 CPU
7-Zip 18.03: 7z b 4 | 7z b 4 -mmt1
Geekbench 5.5: Multi-Core | Single-Core
HWBOT x265 Benchmark v2.2: 4k Preset
LibreOffice : 20 Documents To PDF
R Benchmark 2.5: Overall mean
* ... Meglio usare valori piccoli
AIDA64: FP32 Ray-Trace | FPU Julia | CPU SHA3 | CPU Queen | FPU SinJulia | FPU Mandel | CPU AES | CPU ZLib | FP64 Ray-Trace | CPU PhotoWorxx
| Performance rating | |
| Lenovo Legion 5 15IAH7H 82RB | |
| Lenovo Legion 5 15ACH-82JU00C6GE-FL | |
| Media Intel Core i7-12700H | |
| Asus TUF Gaming F15 FX507ZM | |
| MSI Bravo 15 B5DD-010US | |
| Acer Aspire Nitro 5 AN515-55-57GF | |
| AIDA64 / FP32 Ray-Trace | |
| Lenovo Legion 5 15IAH7H 82RB | |
| Lenovo Legion 5 15ACH-82JU00C6GE-FL | |
| Media Intel Core i7-12700H (2585 - 17957, n=64) | |
| MSI Bravo 15 B5DD-010US | |
| Asus TUF Gaming F15 FX507ZM | |
| Acer Aspire Nitro 5 AN515-55-57GF | |
| AIDA64 / FPU Julia | |
| Lenovo Legion 5 15ACH-82JU00C6GE-FL | |
| Lenovo Legion 5 15IAH7H 82RB | |
| MSI Bravo 15 B5DD-010US | |
| Media Intel Core i7-12700H (12439 - 90760, n=64) | |
| Asus TUF Gaming F15 FX507ZM | |
| Acer Aspire Nitro 5 AN515-55-57GF | |
| AIDA64 / CPU SHA3 | |
| Lenovo Legion 5 15IAH7H 82RB | |
| Asus TUF Gaming F15 FX507ZM | |
| Lenovo Legion 5 15ACH-82JU00C6GE-FL | |
| Media Intel Core i7-12700H (833 - 4242, n=64) | |
| MSI Bravo 15 B5DD-010US | |
| Acer Aspire Nitro 5 AN515-55-57GF | |
| AIDA64 / CPU Queen | |
| Lenovo Legion 5 15IAH7H 82RB | |
| Asus TUF Gaming F15 FX507ZM | |
| Media Intel Core i7-12700H (57923 - 103202, n=63) | |
| Lenovo Legion 5 15ACH-82JU00C6GE-FL | |
| MSI Bravo 15 B5DD-010US | |
| Acer Aspire Nitro 5 AN515-55-57GF | |
| AIDA64 / FPU SinJulia | |
| Lenovo Legion 5 15ACH-82JU00C6GE-FL | |
| Lenovo Legion 5 15IAH7H 82RB | |
| Asus TUF Gaming F15 FX507ZM | |
| MSI Bravo 15 B5DD-010US | |
| Media Intel Core i7-12700H (3249 - 9939, n=64) | |
| Acer Aspire Nitro 5 AN515-55-57GF | |
| AIDA64 / FPU Mandel | |
| Lenovo Legion 5 15ACH-82JU00C6GE-FL | |
| Lenovo Legion 5 15IAH7H 82RB | |
| MSI Bravo 15 B5DD-010US | |
| Media Intel Core i7-12700H (7135 - 44760, n=64) | |
| Asus TUF Gaming F15 FX507ZM | |
| Acer Aspire Nitro 5 AN515-55-57GF | |
| AIDA64 / CPU AES | |
| Lenovo Legion 5 15IAH7H 82RB | |
| Lenovo Legion 5 15ACH-82JU00C6GE-FL | |
| MSI Bravo 15 B5DD-010US | |
| Media Intel Core i7-12700H (31839 - 144360, n=64) | |
| Asus TUF Gaming F15 FX507ZM | |
| Acer Aspire Nitro 5 AN515-55-57GF | |
| AIDA64 / CPU ZLib | |
| Asus TUF Gaming F15 FX507ZM | |
| Lenovo Legion 5 15IAH7H 82RB | |
| Media Intel Core i7-12700H (305 - 1171, n=64) | |
| Lenovo Legion 5 15ACH-82JU00C6GE-FL | |
| MSI Bravo 15 B5DD-010US | |
| Acer Aspire Nitro 5 AN515-55-57GF | |
| AIDA64 / FP64 Ray-Trace | |
| Lenovo Legion 5 15IAH7H 82RB | |
| Lenovo Legion 5 15ACH-82JU00C6GE-FL | |
| Media Intel Core i7-12700H (1437 - 9692, n=64) | |
| MSI Bravo 15 B5DD-010US | |
| Asus TUF Gaming F15 FX507ZM | |
| Acer Aspire Nitro 5 AN515-55-57GF | |
| AIDA64 / CPU PhotoWorxx | |
| Lenovo Legion 5 15IAH7H 82RB | |
| Asus TUF Gaming F15 FX507ZM | |
| Media Intel Core i7-12700H (12863 - 52207, n=64) | |
| Acer Aspire Nitro 5 AN515-55-57GF | |
| MSI Bravo 15 B5DD-010US | |
| Lenovo Legion 5 15ACH-82JU00C6GE-FL | |
Prestazioni del sistema
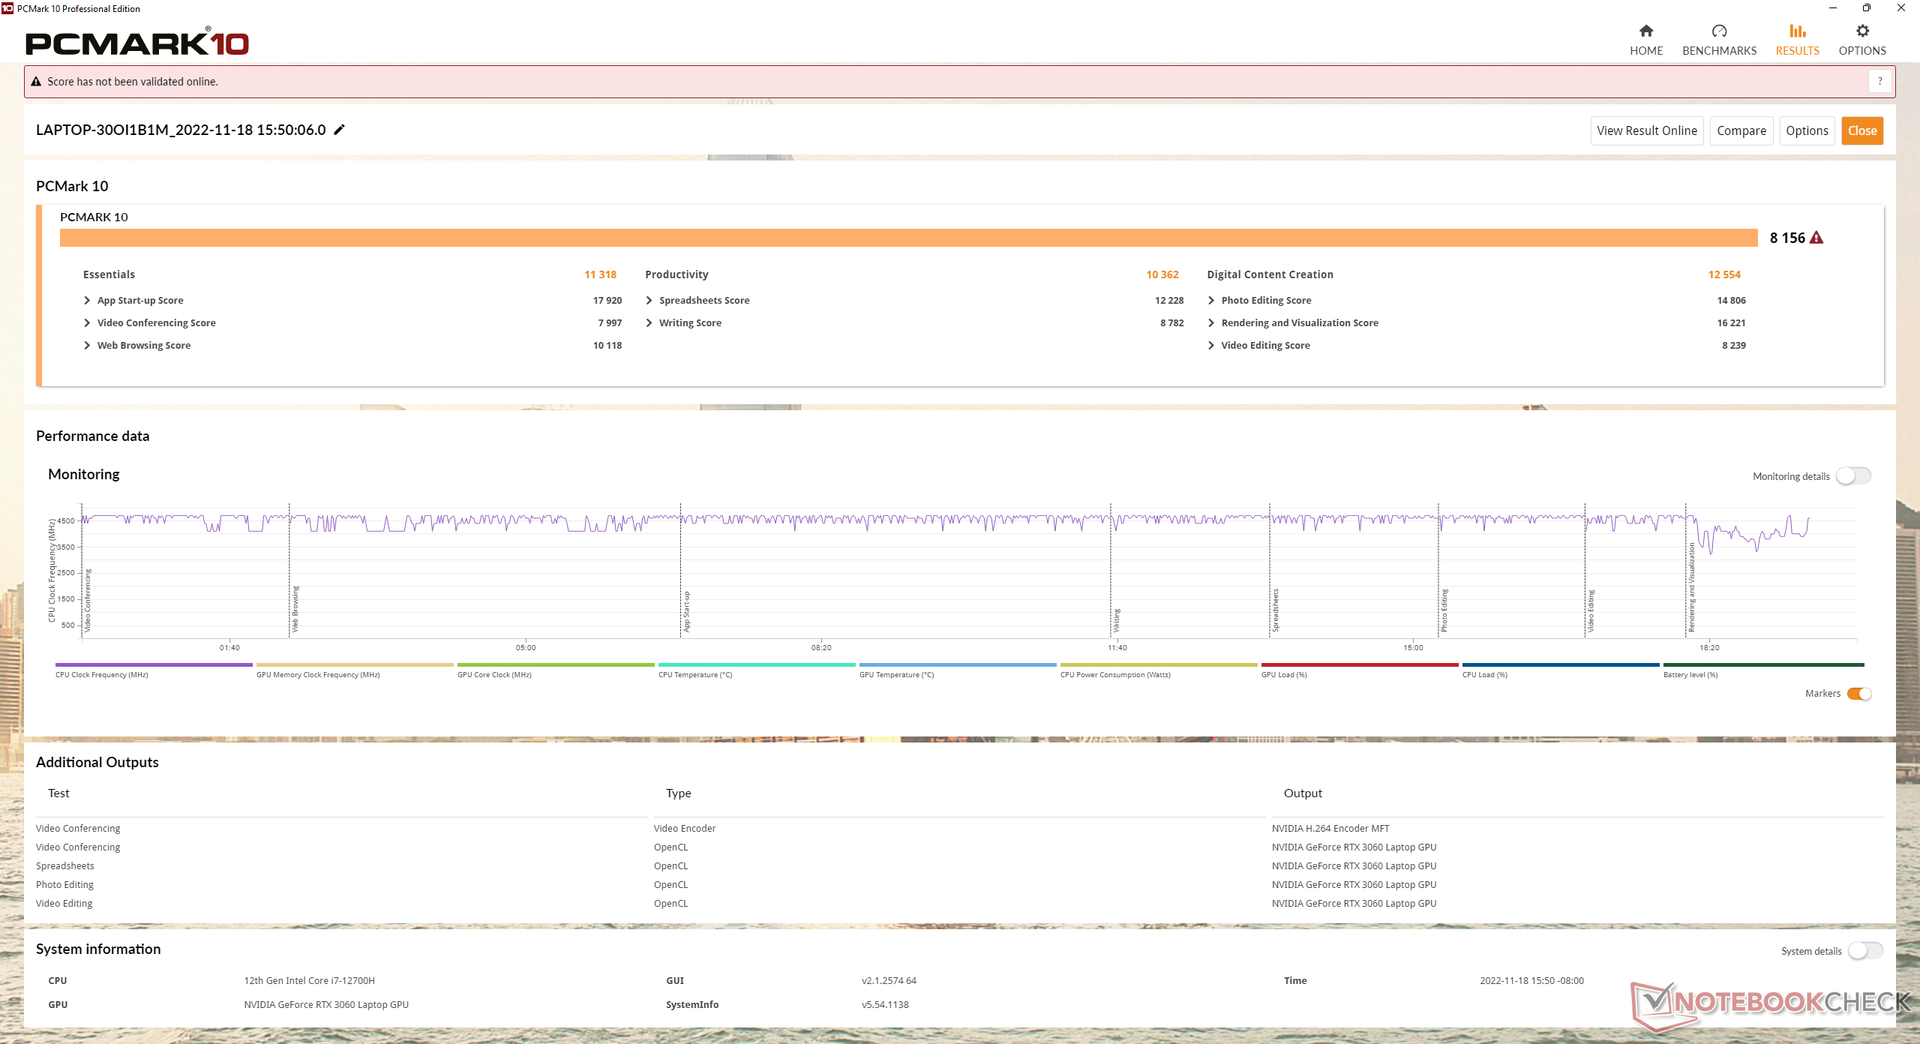
I risultati di PCMark sono costantemente superiori a quelli del modello dello scorso anno e sono tra i più alti di qualsiasi altro portatile con la stessa CPU Core i7-12700H e la GPU RTX 3060. Questo dato è in linea con i risultati superiori alla media delle prestazioni di CPU e GPU della nostra unità di test.
CrossMark: Overall | Productivity | Creativity | Responsiveness
| PCMark 10 / Score | |
| Lenovo Legion 5 15IAH7H 82RB | |
| Asus TUF Gaming F15 FX507ZM | |
| Media Intel Core i7-12700H, NVIDIA GeForce RTX 3060 Laptop GPU (5986 - 8156, n=12) | |
| Lenovo Legion 5 15ACH-82JU00C6GE-FL | |
| Razer Blade 15 Base Edition 2021, i7-10750H RTX 3060 | |
| MSI Bravo 15 B5DD-010US | |
| Acer Aspire Nitro 5 AN515-55-57GF | |
| PCMark 10 / Essentials | |
| Lenovo Legion 5 15IAH7H 82RB | |
| Media Intel Core i7-12700H, NVIDIA GeForce RTX 3060 Laptop GPU (9289 - 12144, n=12) | |
| Asus TUF Gaming F15 FX507ZM | |
| Lenovo Legion 5 15ACH-82JU00C6GE-FL | |
| Razer Blade 15 Base Edition 2021, i7-10750H RTX 3060 | |
| MSI Bravo 15 B5DD-010US | |
| Acer Aspire Nitro 5 AN515-55-57GF | |
| PCMark 10 / Productivity | |
| Lenovo Legion 5 15IAH7H 82RB | |
| Lenovo Legion 5 15ACH-82JU00C6GE-FL | |
| Media Intel Core i7-12700H, NVIDIA GeForce RTX 3060 Laptop GPU (6161 - 10362, n=12) | |
| Asus TUF Gaming F15 FX507ZM | |
| MSI Bravo 15 B5DD-010US | |
| Razer Blade 15 Base Edition 2021, i7-10750H RTX 3060 | |
| Acer Aspire Nitro 5 AN515-55-57GF | |
| PCMark 10 / Digital Content Creation | |
| Lenovo Legion 5 15IAH7H 82RB | |
| Asus TUF Gaming F15 FX507ZM | |
| Media Intel Core i7-12700H, NVIDIA GeForce RTX 3060 Laptop GPU (8950 - 12554, n=12) | |
| Razer Blade 15 Base Edition 2021, i7-10750H RTX 3060 | |
| Lenovo Legion 5 15ACH-82JU00C6GE-FL | |
| MSI Bravo 15 B5DD-010US | |
| Acer Aspire Nitro 5 AN515-55-57GF | |
| CrossMark / Overall | |
| Lenovo Legion 5 15IAH7H 82RB | |
| Media Intel Core i7-12700H, NVIDIA GeForce RTX 3060 Laptop GPU (1649 - 2017, n=11) | |
| CrossMark / Productivity | |
| Lenovo Legion 5 15IAH7H 82RB | |
| Media Intel Core i7-12700H, NVIDIA GeForce RTX 3060 Laptop GPU (1536 - 1958, n=11) | |
| CrossMark / Creativity | |
| Lenovo Legion 5 15IAH7H 82RB | |
| Media Intel Core i7-12700H, NVIDIA GeForce RTX 3060 Laptop GPU (1816 - 2084, n=11) | |
| CrossMark / Responsiveness | |
| Lenovo Legion 5 15IAH7H 82RB | |
| Media Intel Core i7-12700H, NVIDIA GeForce RTX 3060 Laptop GPU (1210 - 2207, n=11) | |
| PCMark 10 Score | 8156 punti | |
Aiuto | ||
| AIDA64 / Memory Copy | |
| Media Intel Core i7-12700H (25615 - 80511, n=64) | |
| Asus TUF Gaming F15 FX507ZM | |
| Lenovo Legion 5 15IAH7H 82RB | |
| MSI Bravo 15 B5DD-010US | |
| Lenovo Legion 5 15ACH-82JU00C6GE-FL | |
| Acer Aspire Nitro 5 AN515-55-57GF | |
| AIDA64 / Memory Read | |
| Lenovo Legion 5 15IAH7H 82RB | |
| Asus TUF Gaming F15 FX507ZM | |
| Media Intel Core i7-12700H (25586 - 79442, n=64) | |
| MSI Bravo 15 B5DD-010US | |
| Lenovo Legion 5 15ACH-82JU00C6GE-FL | |
| Acer Aspire Nitro 5 AN515-55-57GF | |
| AIDA64 / Memory Write | |
| Lenovo Legion 5 15IAH7H 82RB | |
| Asus TUF Gaming F15 FX507ZM | |
| Media Intel Core i7-12700H (23679 - 88660, n=64) | |
| Acer Aspire Nitro 5 AN515-55-57GF | |
| MSI Bravo 15 B5DD-010US | |
| Lenovo Legion 5 15ACH-82JU00C6GE-FL | |
| AIDA64 / Memory Latency | |
| Lenovo Legion 5 15IAH7H 82RB | |
| Lenovo Legion 5 15ACH-82JU00C6GE-FL | |
| Media Intel Core i7-12700H (76.2 - 133.9, n=62) | |
| MSI Bravo 15 B5DD-010US | |
| Acer Aspire Nitro 5 AN515-55-57GF | |
| Asus TUF Gaming F15 FX507ZM | |
* ... Meglio usare valori piccoli
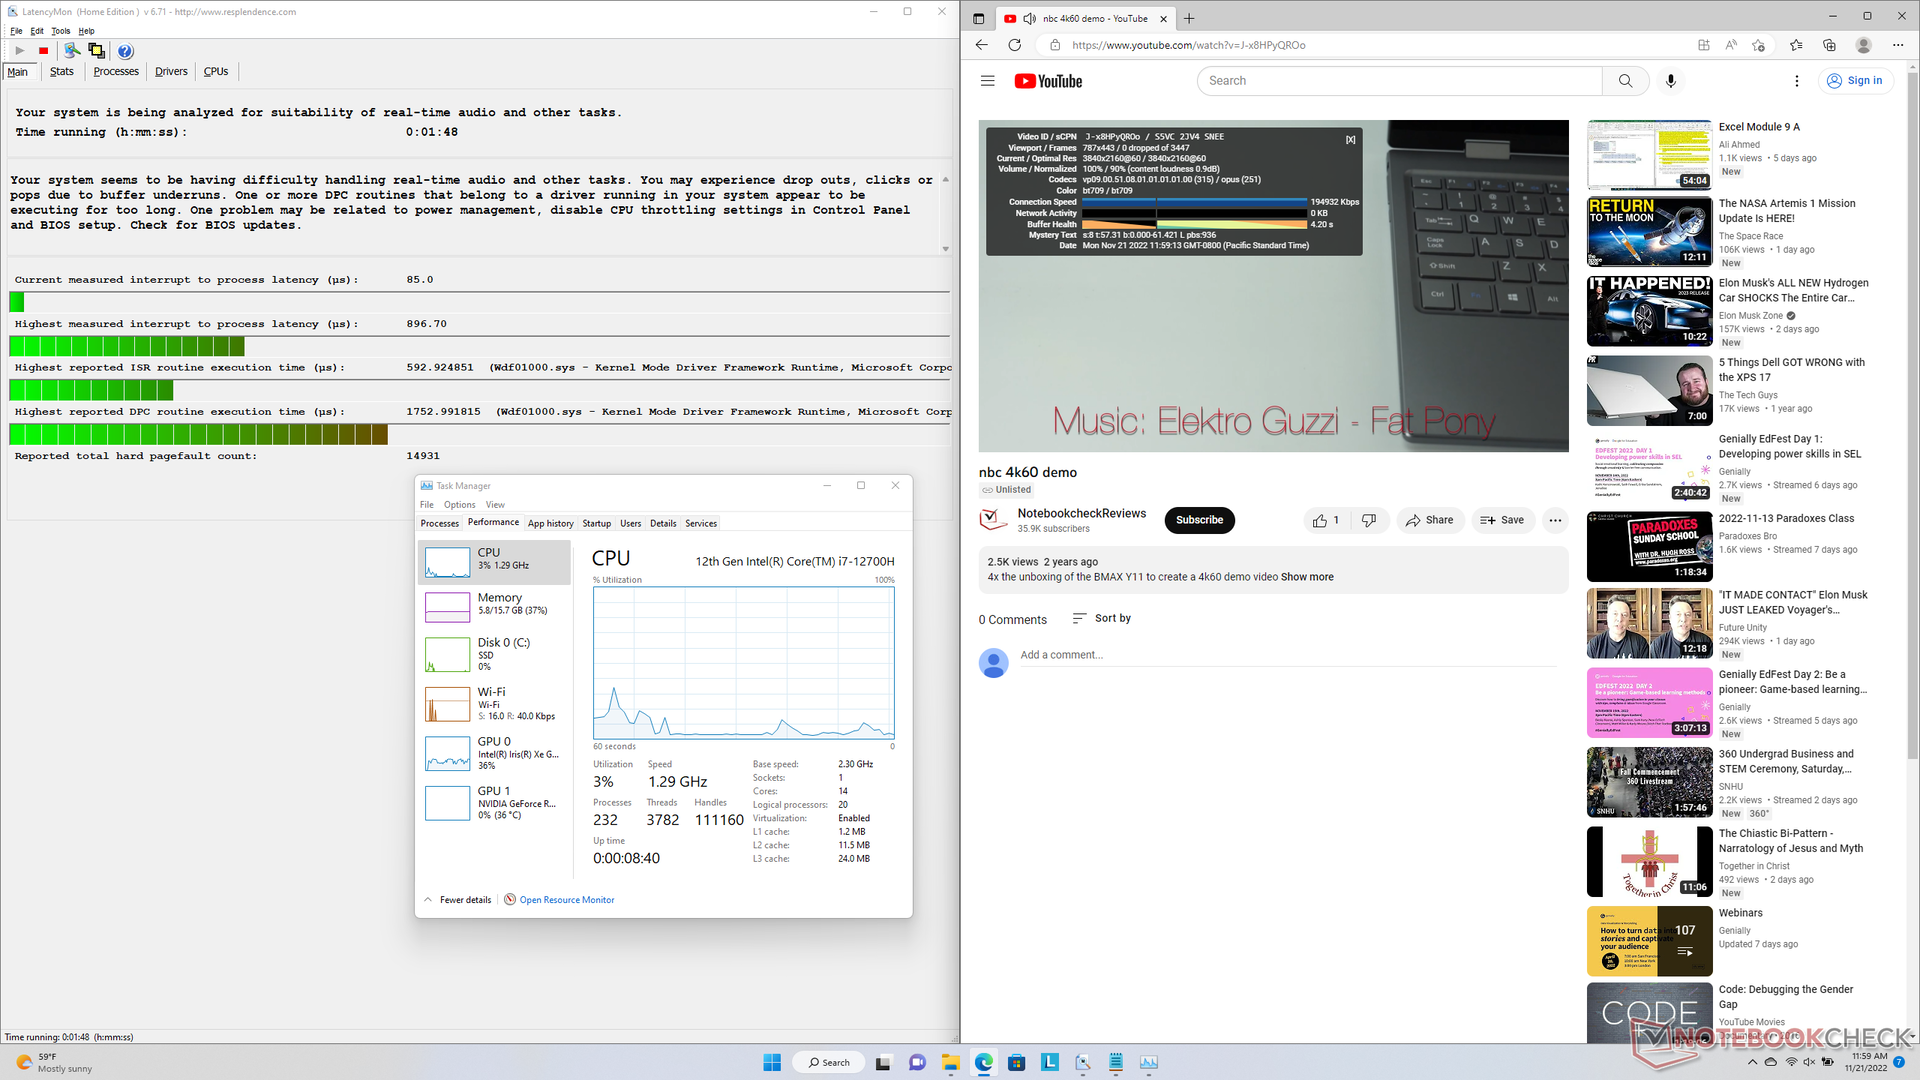
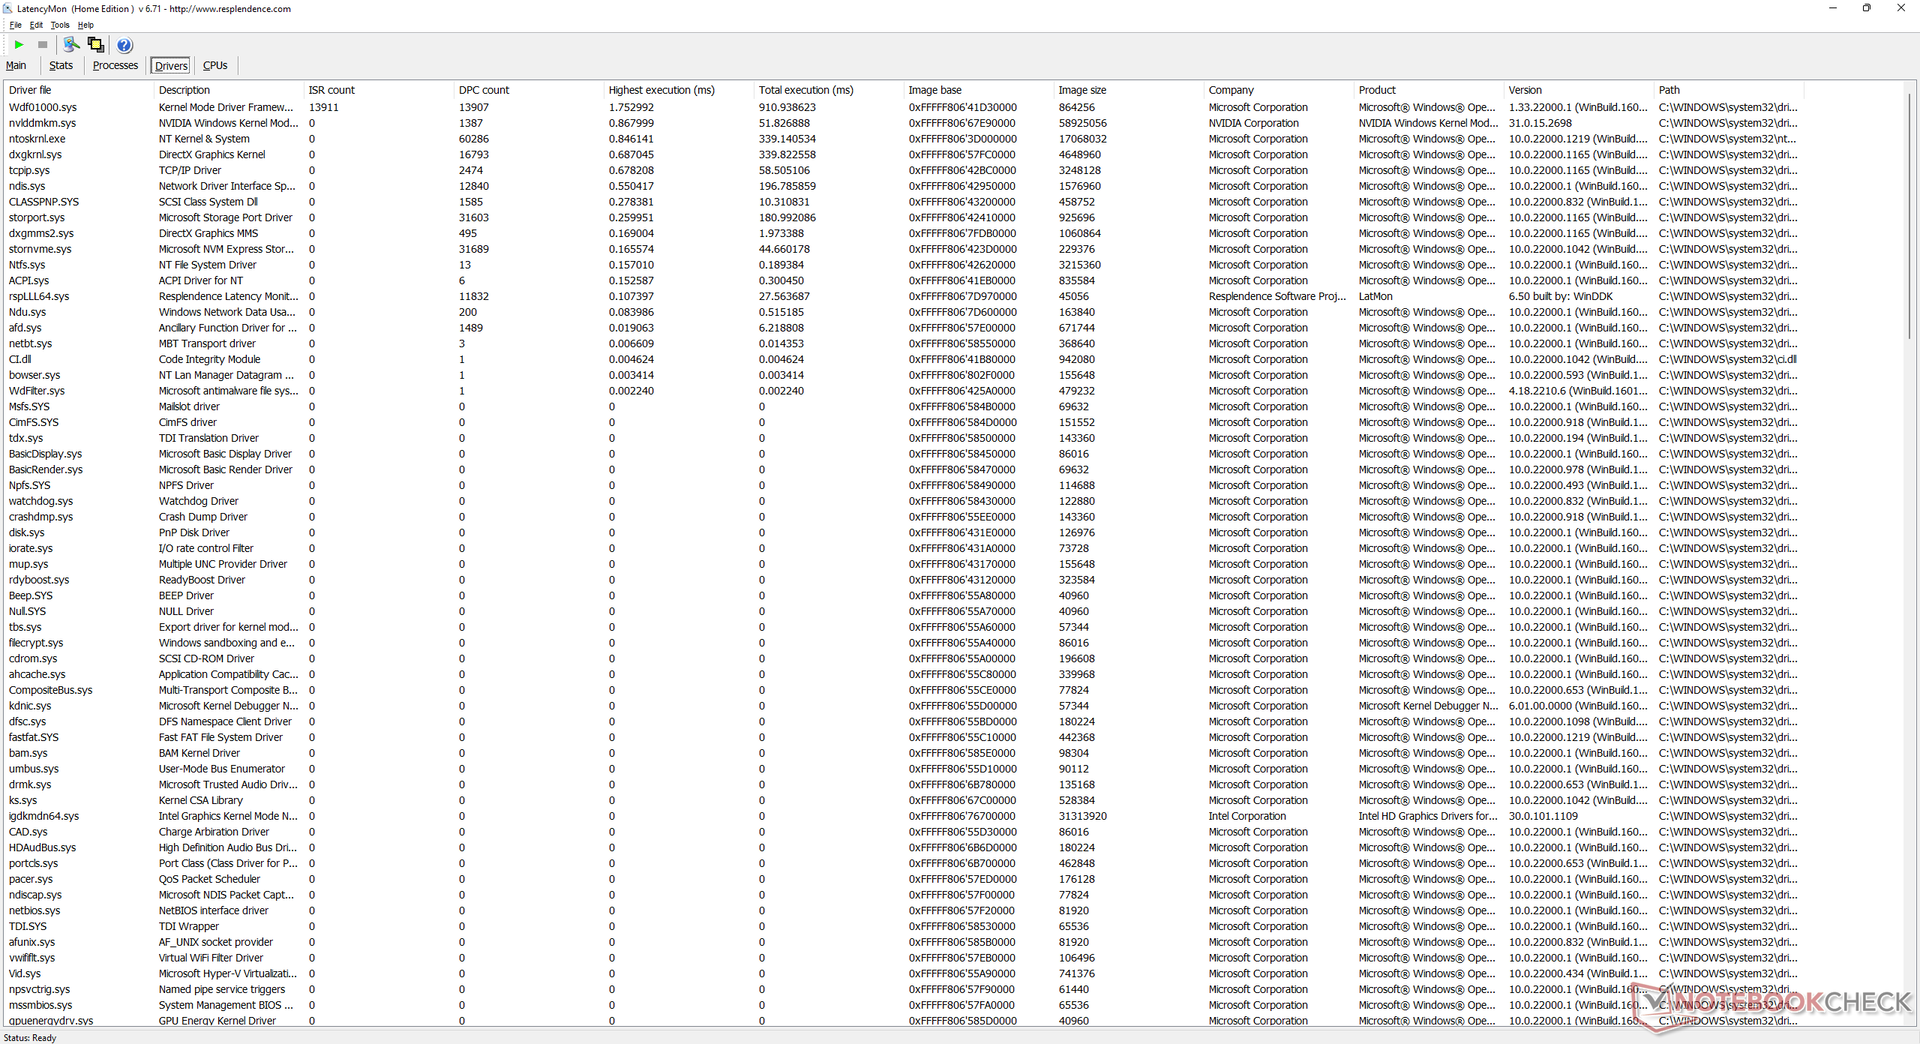
Latenza DPC
LatencyMon rivela lievi problemi di DPC quando si aprono più schede del browser sulla nostra homepage. la riproduzione di video 4K a 60 FPS è invece perfetta, senza cadute di fotogrammi.
| DPC Latencies / LatencyMon - interrupt to process latency (max), Web, Youtube, Prime95 | |
| MSI Bravo 15 B5DD-010US | |
| Lenovo Legion 5 15IAH7H 82RB | |
| Asus TUF Gaming F15 FX507ZM | |
| Lenovo Legion 5 15ACH-82JU00C6GE-FL | |
| Razer Blade 15 Base Edition 2021, i7-10750H RTX 3060 | |
| Acer Aspire Nitro 5 AN515-55-57GF | |
* ... Meglio usare valori piccoli
Dispositivi di archiviazione - Supporto 2x PCIe4 x4
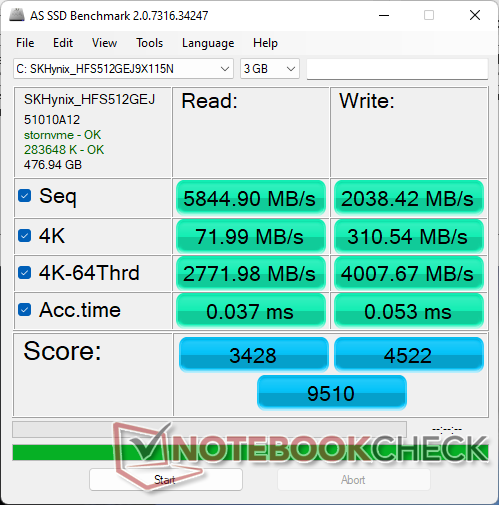
Gli utenti possono installare fino a due unità SSD M.2 2280. Ogni slot include un proprio pad termico e un diffusore di calore per favorire il raffreddamento. L'unità da 512 GB SK Hynix da 512 GB nella nostra unità è stata in grado di mantenere la velocità massima di lettura di 7000 MB/s senza alcun problema di throttling
Se si installa una seconda unità, assicurarsi che non sia a doppia faccia, altrimenti potrebbe non entrare nel suo slot. La nostra immagine qui sotto mostra che la batteria del BIOS sta occupando lo spazio di una potenziale unità SSD M.2 2280.

* ... Meglio usare valori piccoli
Disk Throttling: DiskSpd Read Loop, Queue Depth 8
Prestazioni della GPU - TGP alto da 140 W
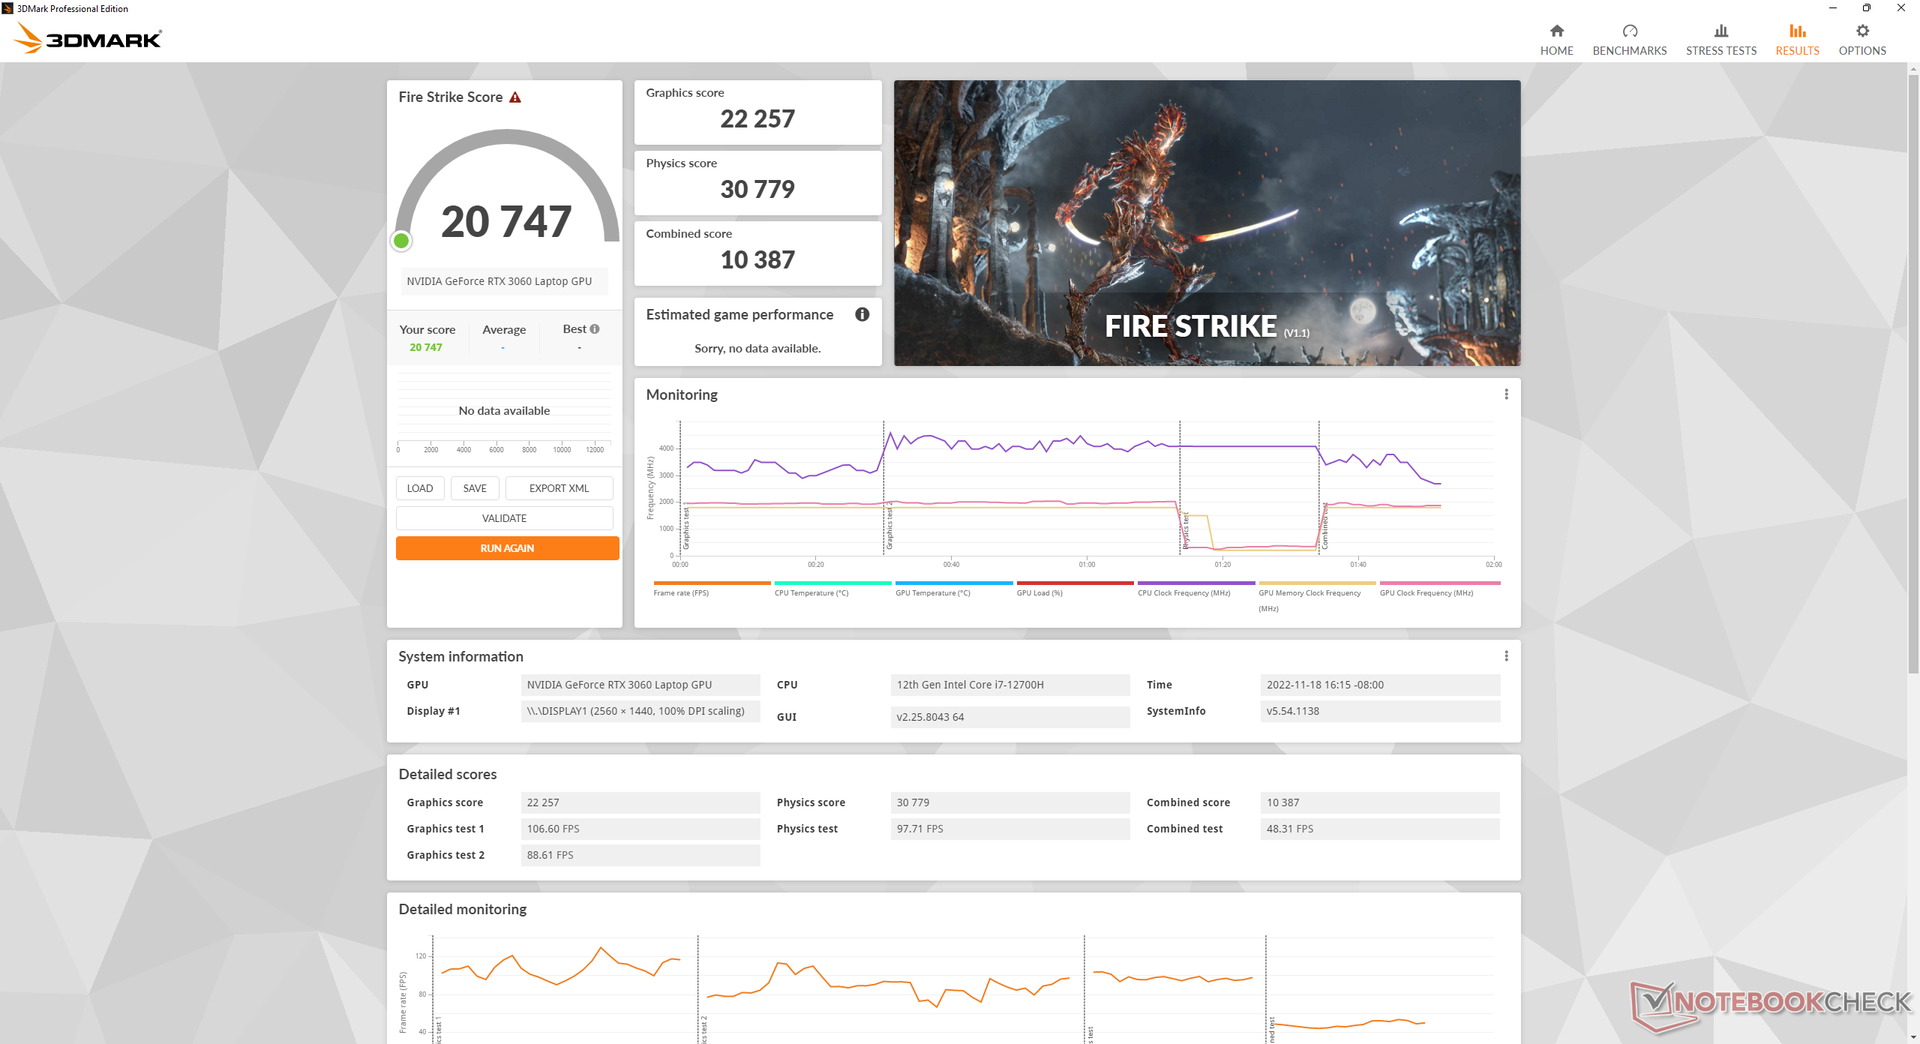
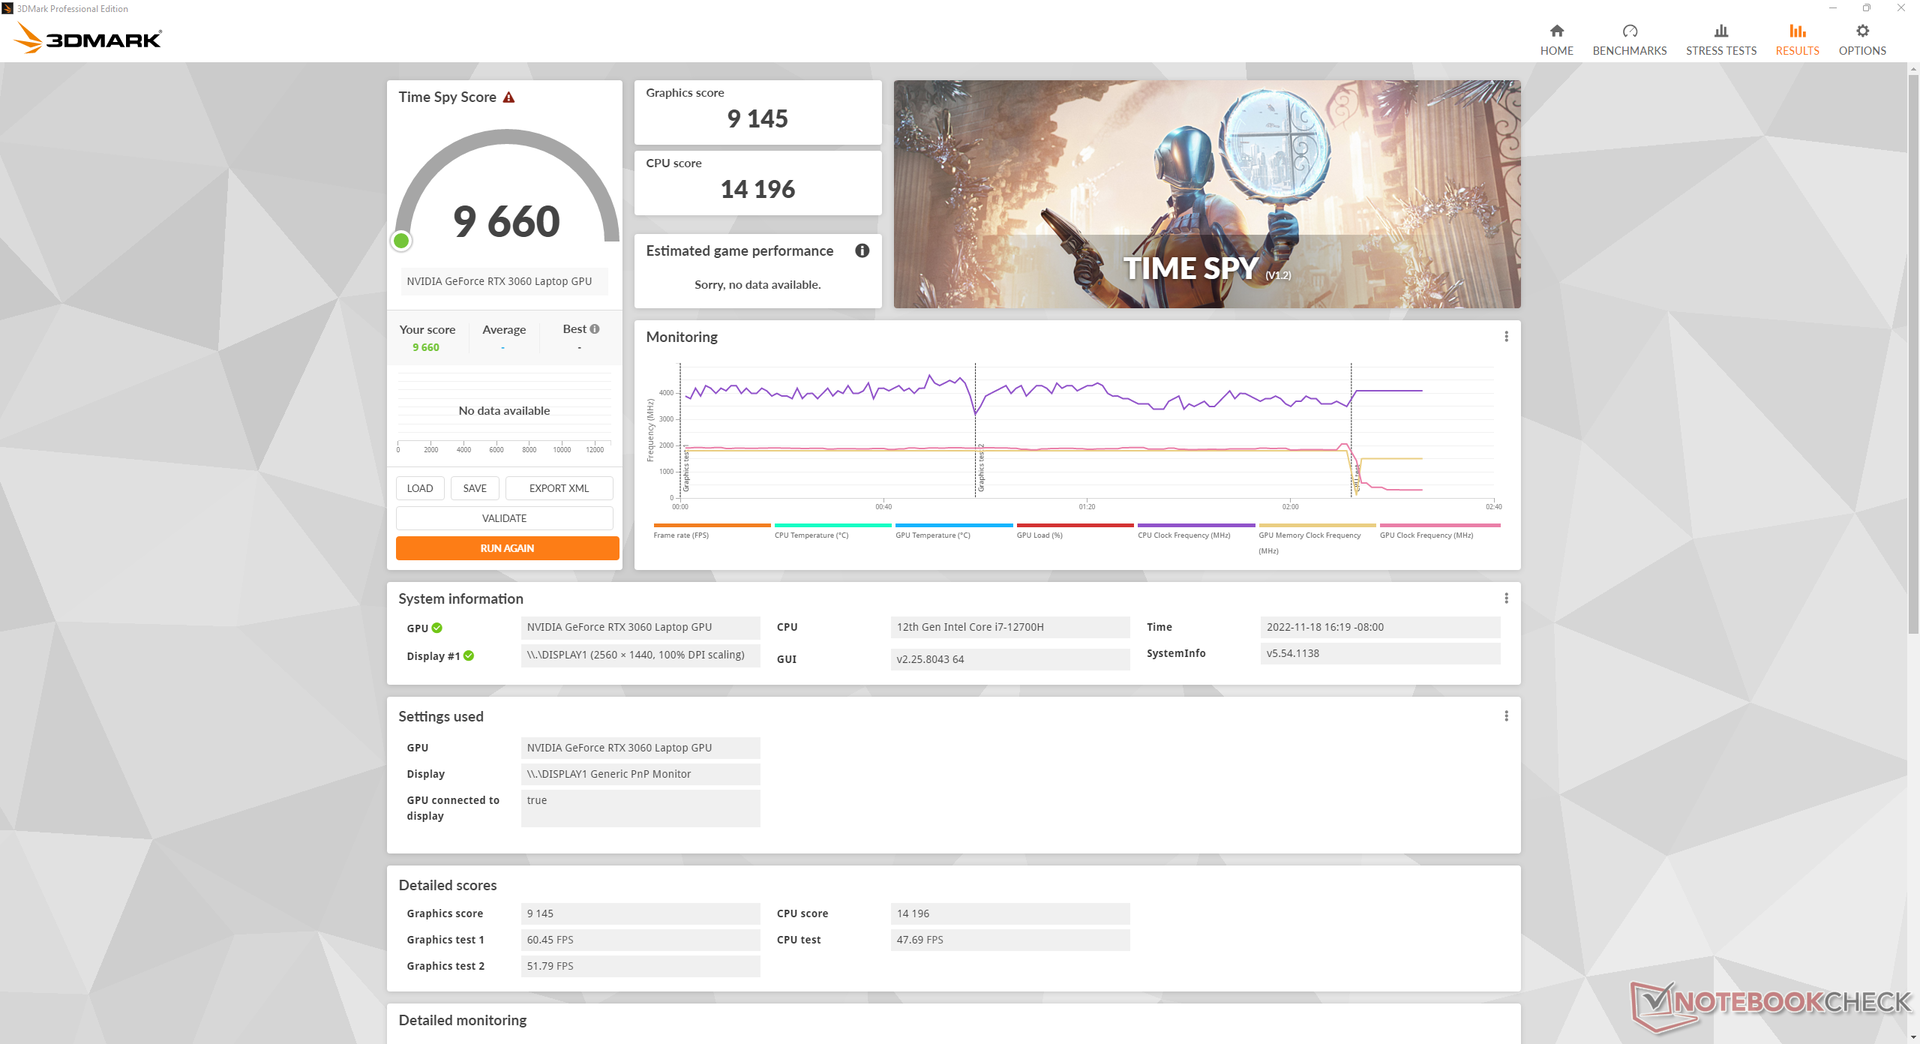
Le prestazioni grafiche sono eccellenti, con risultati 3DMark dal 10 al 15% più veloci rispetto alla media dei laptop del nostro database dotati della stessa scheda RTX60 GeForce RTX 3060 GPU. Le prestazioni superiori alla media possono essere in parte attribuite all'obiettivo TGP di 140 W, superiore a quello della maggior parte dei portatili da gioco.
Il sistema deve essere impostato sulla modalità Performance per sfruttare appieno la GPU. Se si utilizza la modalità Balanced, ad esempio, le prestazioni grafiche diminuiscono di circa il 10%, come mostrano i risultati di Fire Strike.

| 3DMark 11 Performance | 28345 punti | |
| 3DMark Fire Strike Score | 20747 punti | |
| 3DMark Time Spy Score | 9660 punti | |
Aiuto | ||
| Blender | |
| v3.3 Classroom OPTIX/RTX | |
| Media NVIDIA GeForce RTX 3060 Laptop GPU (30 - 56, n=15) | |
| Lenovo Legion 5 15IAH7H 82RB | |
| v3.3 Classroom CUDA | |
| Media NVIDIA GeForce RTX 3060 Laptop GPU (51 - 89, n=15) | |
| Lenovo Legion 5 15IAH7H 82RB | |
| v3.3 Classroom CPU | |
| Media NVIDIA GeForce RTX 3060 Laptop GPU (291 - 508, n=15) | |
| Lenovo Legion 5 15IAH7H 82RB | |
* ... Meglio usare valori piccoli
| Performance rating - Percent | |
| Media della classe Gaming | |
| Lenovo Legion 5 15IAH7H 82RB | |
| The Witcher 3 - 1920x1080 Ultra Graphics & Postprocessing (HBAO+) | |
| Media della classe Gaming (95 - 240, n=7, ultimi 2 anni) | |
| Lenovo Legion 5 15IAH7H 82RB | |
| GTA V - 1920x1080 Highest AA:4xMSAA + FX AF:16x | |
| Media della classe Gaming (48.3 - 186.9, n=97, ultimi 2 anni) | |
| Lenovo Legion 5 15IAH7H 82RB | |
| Final Fantasy XV Benchmark - 1920x1080 High Quality | |
| Media della classe Gaming (41 - 215, n=98, ultimi 2 anni) | |
| Lenovo Legion 5 15IAH7H 82RB | |
| Strange Brigade - 1920x1080 ultra AA:ultra AF:16 | |
| Media della classe Gaming (76.3 - 456, n=88, ultimi 2 anni) | |
| Lenovo Legion 5 15IAH7H 82RB | |
| Dota 2 Reborn - 1920x1080 ultra (3/3) best looking | |
| Lenovo Legion 5 15IAH7H 82RB | |
| Media della classe Gaming (84.8 - 248, n=110, ultimi 2 anni) | |
| X-Plane 11.11 - 1920x1080 high (fps_test=3) | |
| Lenovo Legion 5 15IAH7H 82RB | |
| Media della classe Gaming (52.1 - 143.5, n=113, ultimi 2 anni) | |
Witcher 3 FPS Chart
| basso | medio | alto | ultra | QHD | |
|---|---|---|---|---|---|
| GTA V (2015) | 186.8 | 183.4 | 179.4 | 109.8 | 83.6 |
| The Witcher 3 (2015) | 448.6 | 295.6 | 181.1 | 89.2 | |
| Dota 2 Reborn (2015) | 180.1 | 168.2 | 161.9 | 154.8 | |
| Final Fantasy XV Benchmark (2018) | 214 | 133.5 | 100.9 | 73.7 | |
| X-Plane 11.11 (2018) | 157.1 | 138.3 | 109.3 | ||
| Strange Brigade (2018) | 471 | 242 | 192.1 | 166.3 | 118.4 |
| Cyberpunk 2077 1.6 (2022) | 135.7 | 113.4 | 87.7 | 73.7 | 45.8 |
Emissioni
Rumore del sistema
Le ventole interne rimangono più silenziose più a lungo prima di dover aumentare la potenza rispetto alle ventole del modello 2021 modello 2021. Quando si esegue la prima scena di benchmark di 3DMark 06, ad esempio, il rumore delle ventole raggiunge un massimo di soli 29,3 dB(A) rispetto ai 54 dB(A) del modello precedente. Ciò significa che è possibile eseguire carichi medio-bassi come la navigazione web o lo streaming video per periodi più lunghi prima che le ventole diventino udibili.
L'utilizzo Witcher 3 in modalità Balanced si ottiene un livello di rumore della ventola compreso tra 43 e 48 dB(A), rispetto ai 51,4 dB(A) della modalità Performance. Pertanto, gli utenti devono sopportare ventole più rumorose se vogliono sfruttare appieno la GPU. La rumorosità complessiva delle ventole è superiore a quella del Razer Blade 15 Base Edition, ma più silenziosa di quella dell'Asus TUF Gaming F15.Asus TUF Gaming F15 ciascuno con la stessa GPU RTX 3060 di GeForce.
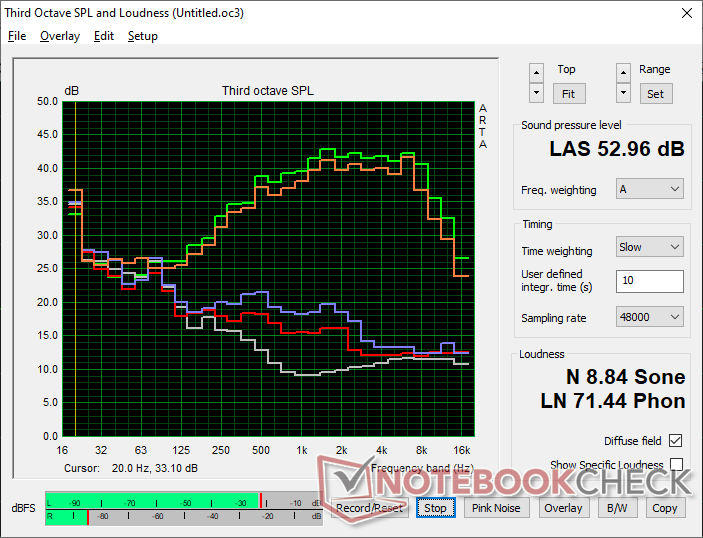
Rumorosità
| Idle |
| 23.5 / 23.5 / 26.8 dB(A) |
| Sotto carico |
| 29.3 / 53 dB(A) |
 | ||
30 dB silenzioso 40 dB(A) udibile 50 dB(A) rumoroso |
||
min: | ||
| Lenovo Legion 5 15IAH7H 82RB GeForce RTX 3060 Laptop GPU, i7-12700H | Lenovo Legion 5 15ACH-82JU00C6GE-FL GeForce RTX 3060 Laptop GPU, R7 5800H, Micron 2300 512GB MTFDHBA512TDV | MSI Bravo 15 B5DD-010US Radeon RX 5500M, R5 5600H, Kingston OM8PCP3512F-AB | Asus TUF Gaming F15 FX507ZM GeForce RTX 3060 Laptop GPU, i7-12700H, SK Hynix HFM001TD3JX013N | Acer Aspire Nitro 5 AN515-55-57GF GeForce RTX 3060 Laptop GPU, i5-10300H, WDC PC SN530 SDBPNPZ-512G | Razer Blade 15 Base Edition 2021, i7-10750H RTX 3060 GeForce RTX 3060 Laptop GPU, i7-10750H, Samsung SSD PM981a MZVLB512HBJQ | |
|---|---|---|---|---|---|---|
| Noise | -21% | -12% | -5% | -15% | -6% | |
| off /ambiente * (dB) | 23.3 | 24.2 -4% | 24.5 -5% | 23.2 -0% | 25 -7% | 25.3 -9% |
| Idle Minimum * (dB) | 23.5 | 29 -23% | 24.5 -4% | 23.6 -0% | 25 -6% | 25.4 -8% |
| Idle Average * (dB) | 23.5 | 29 -23% | 32.8 -40% | 23.6 -0% | 30 -28% | 25.4 -8% |
| Idle Maximum * (dB) | 26.8 | 29 -8% | 32.8 -22% | 25.4 5% | 33 -23% | 25.4 5% |
| Load Average * (dB) | 29.3 | 53.5 -83% | 34.5 -18% | 38 -30% | 46 -57% | 42.5 -45% |
| Witcher 3 ultra * (dB) | 51.4 | 53.5 -4% | 42.5 17% | 54.1 -5% | 47 9% | 42 18% |
| Load Maximum * (dB) | 53 | 53.5 -1% | 58.5 -10% | 57.2 -8% | 50 6% | 52.2 2% |
* ... Meglio usare valori piccoli
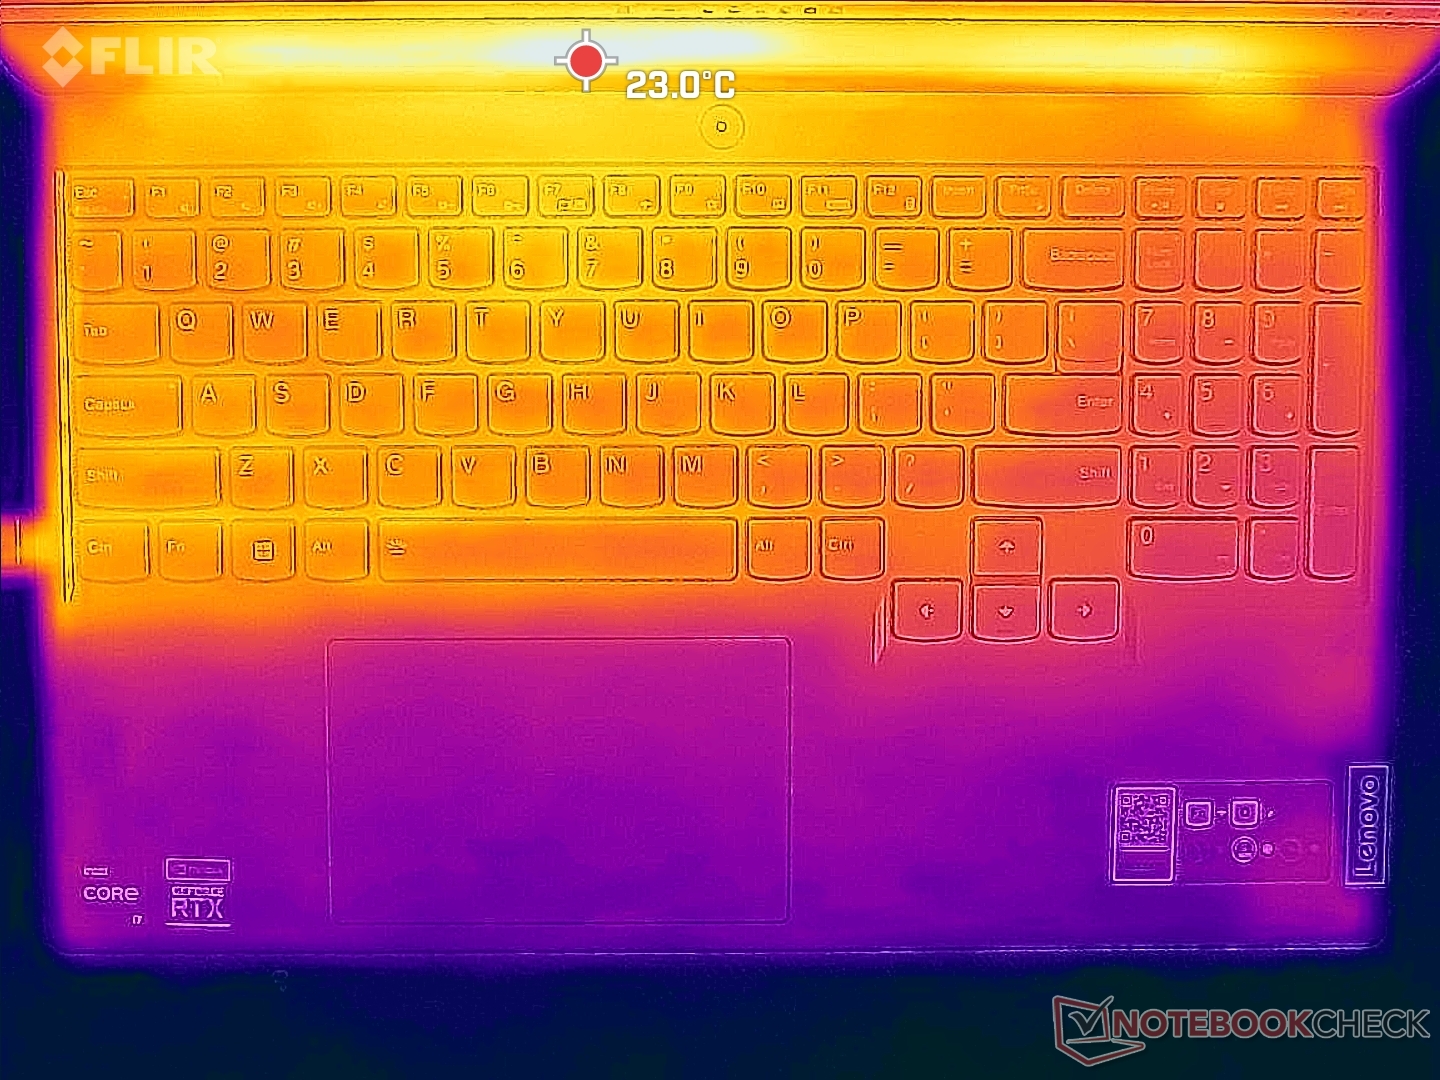
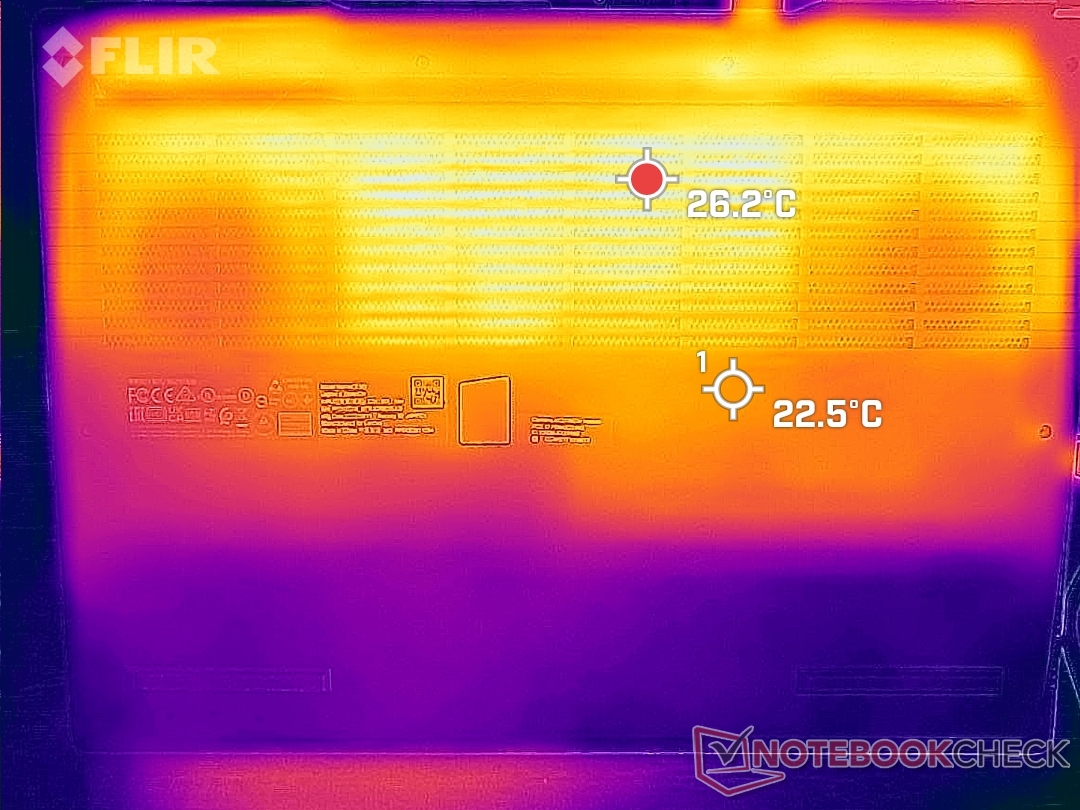
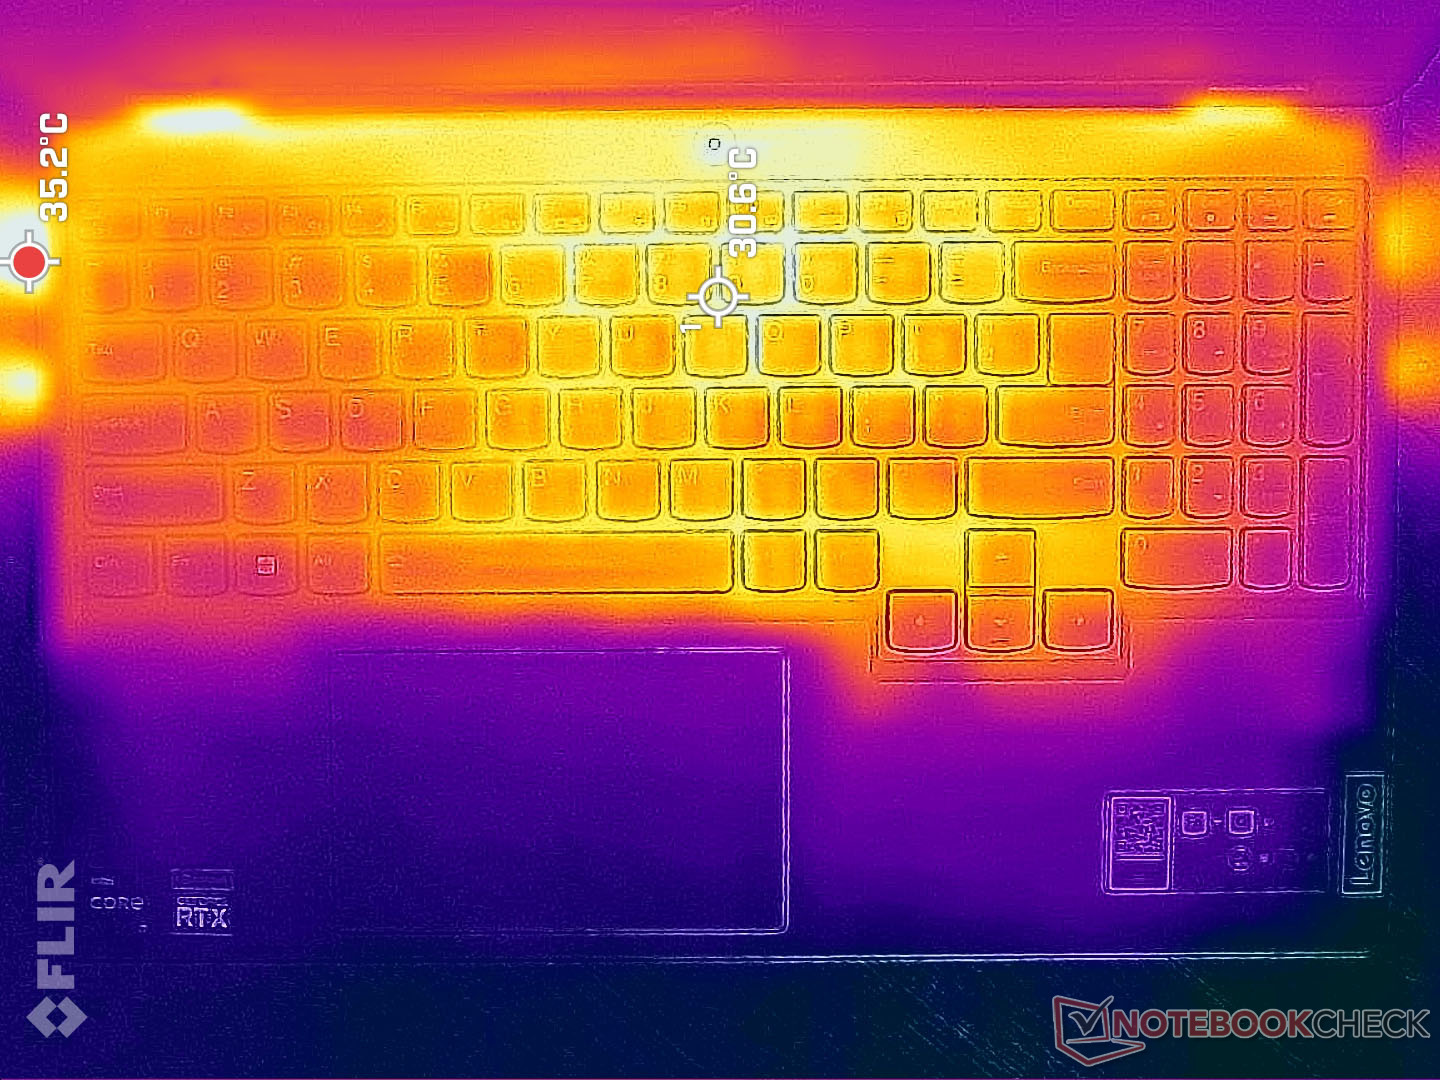
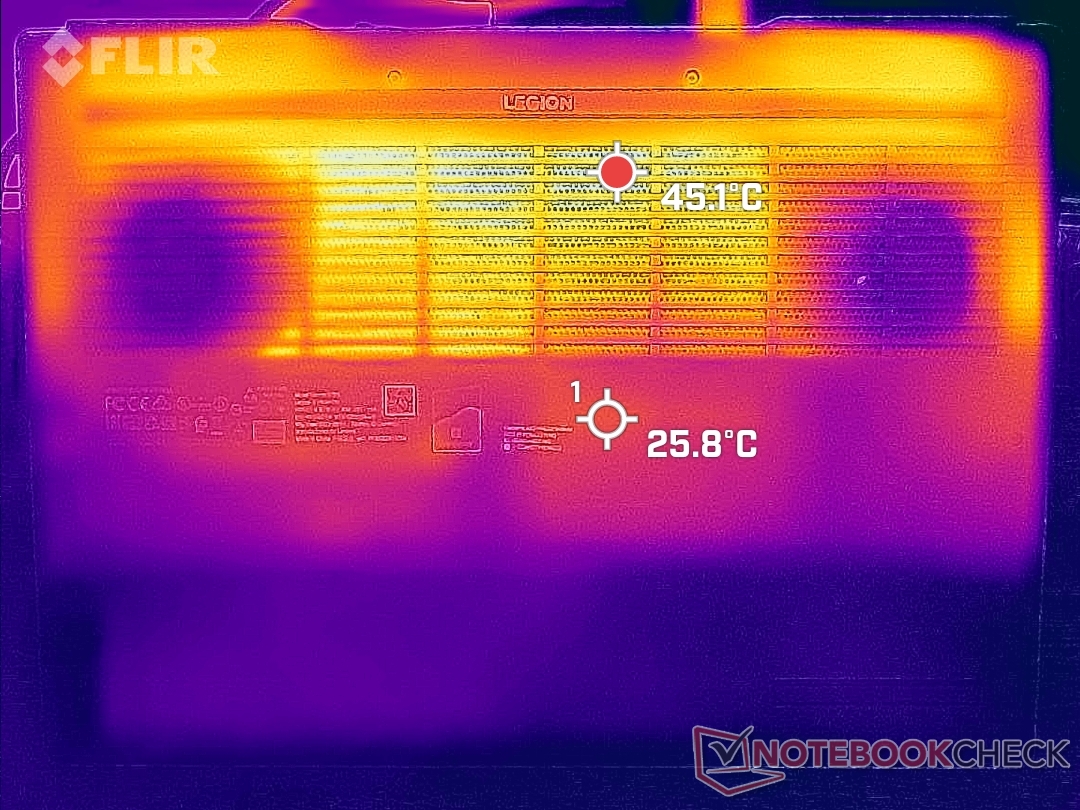
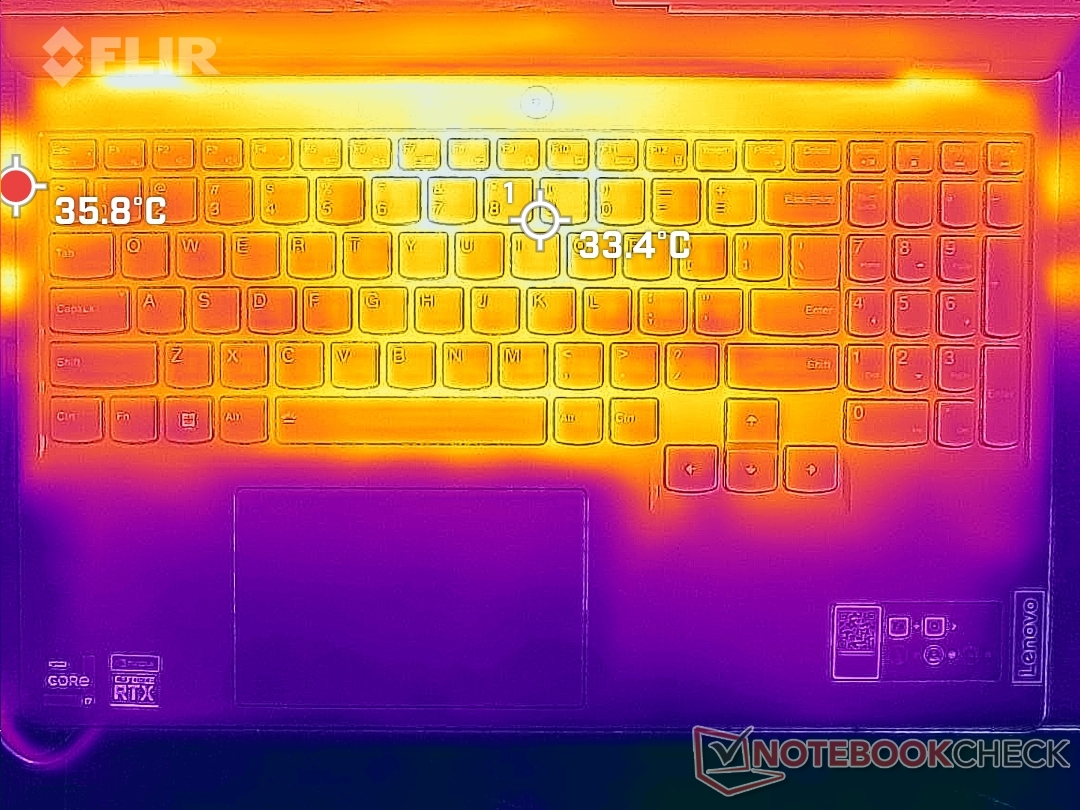
Temperatura
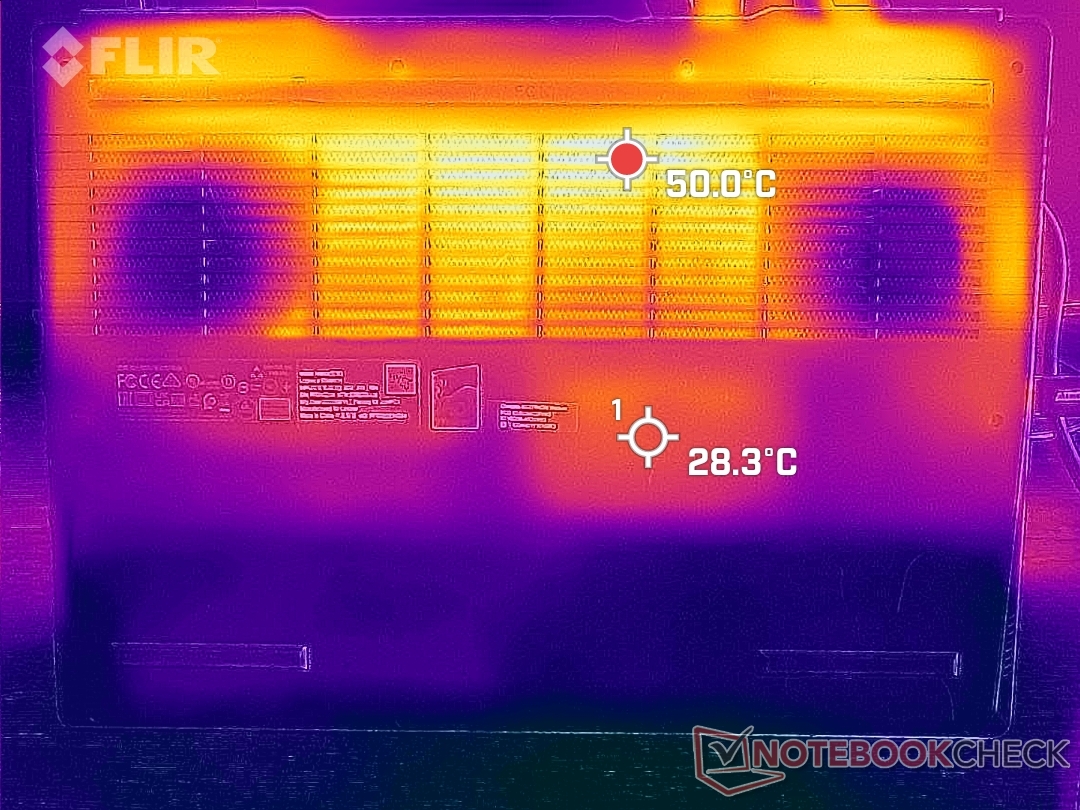
Le temperature di superficie sono molto più calde nella parte inferiore, dove i punti caldi possono raggiungere oltre 50 C, rispetto ai soli 36 C della parte superiore quando si eseguono carichi impegnativi. Si tratta comunque di un miglioramento rispetto al modello dello scorso anno, in cui le temperature potevano raggiungere oltre 40 C sulla maggior parte della tastiera durante i giochi.
I punti caldi sono verso il bordo posteriore dello chassis, dove è improbabile il contatto con la pelle. Le griglie di ventilazione sono presenti su quasi metà della superficie dello chassis e gli utenti devono fare attenzione a non bloccare il flusso d'aria.
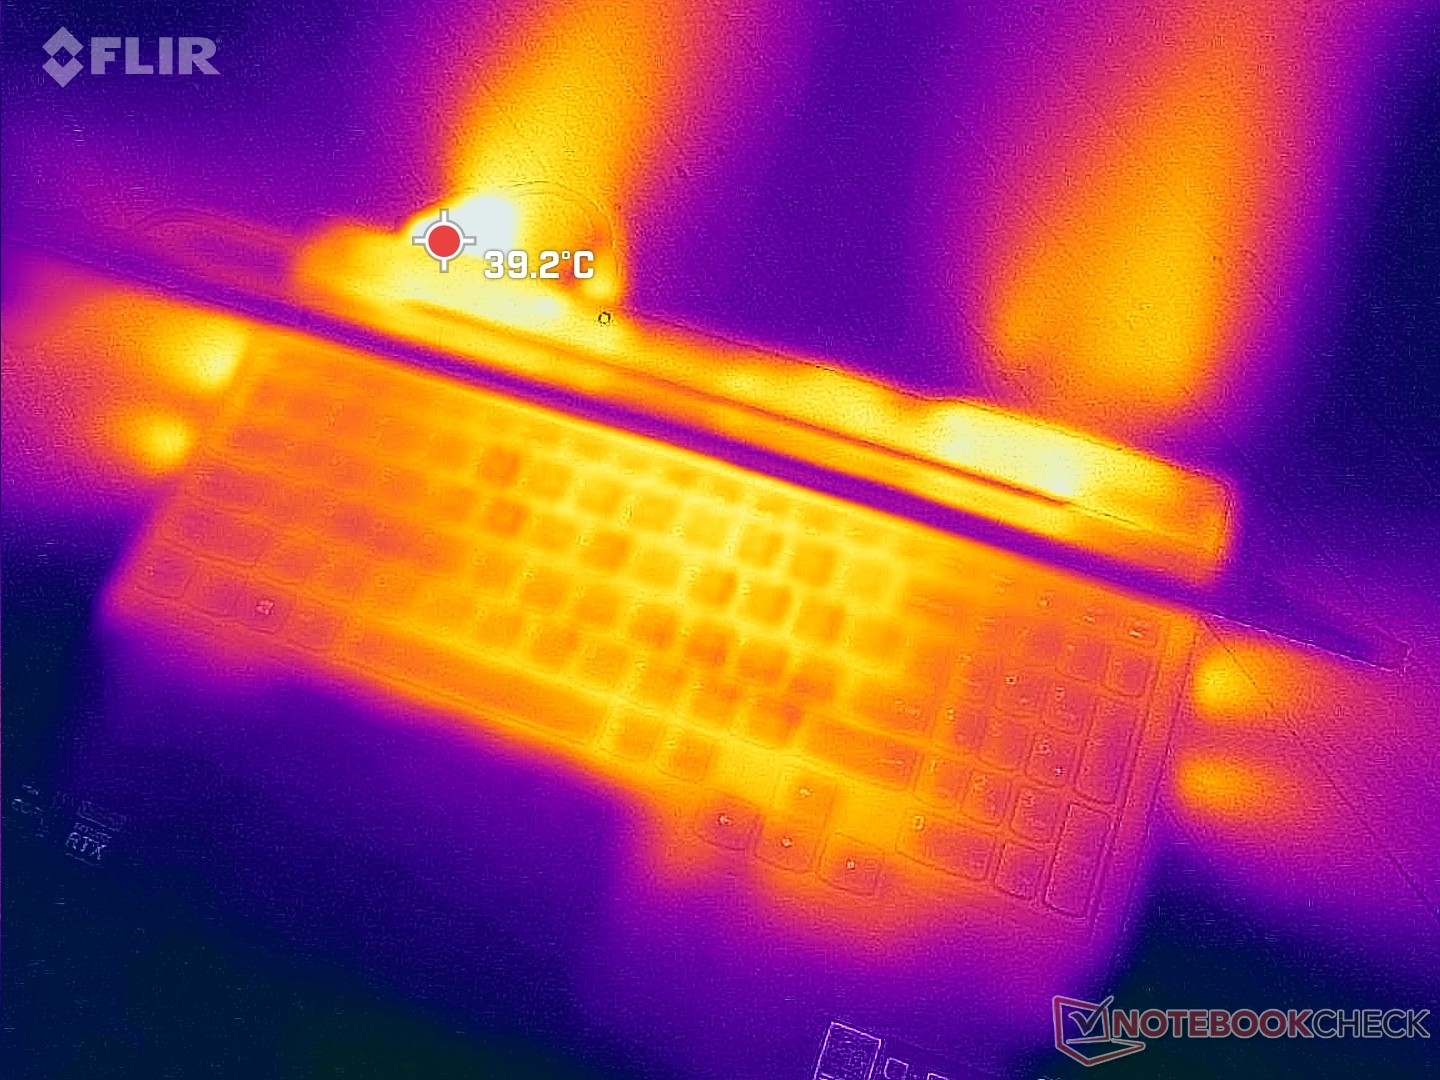
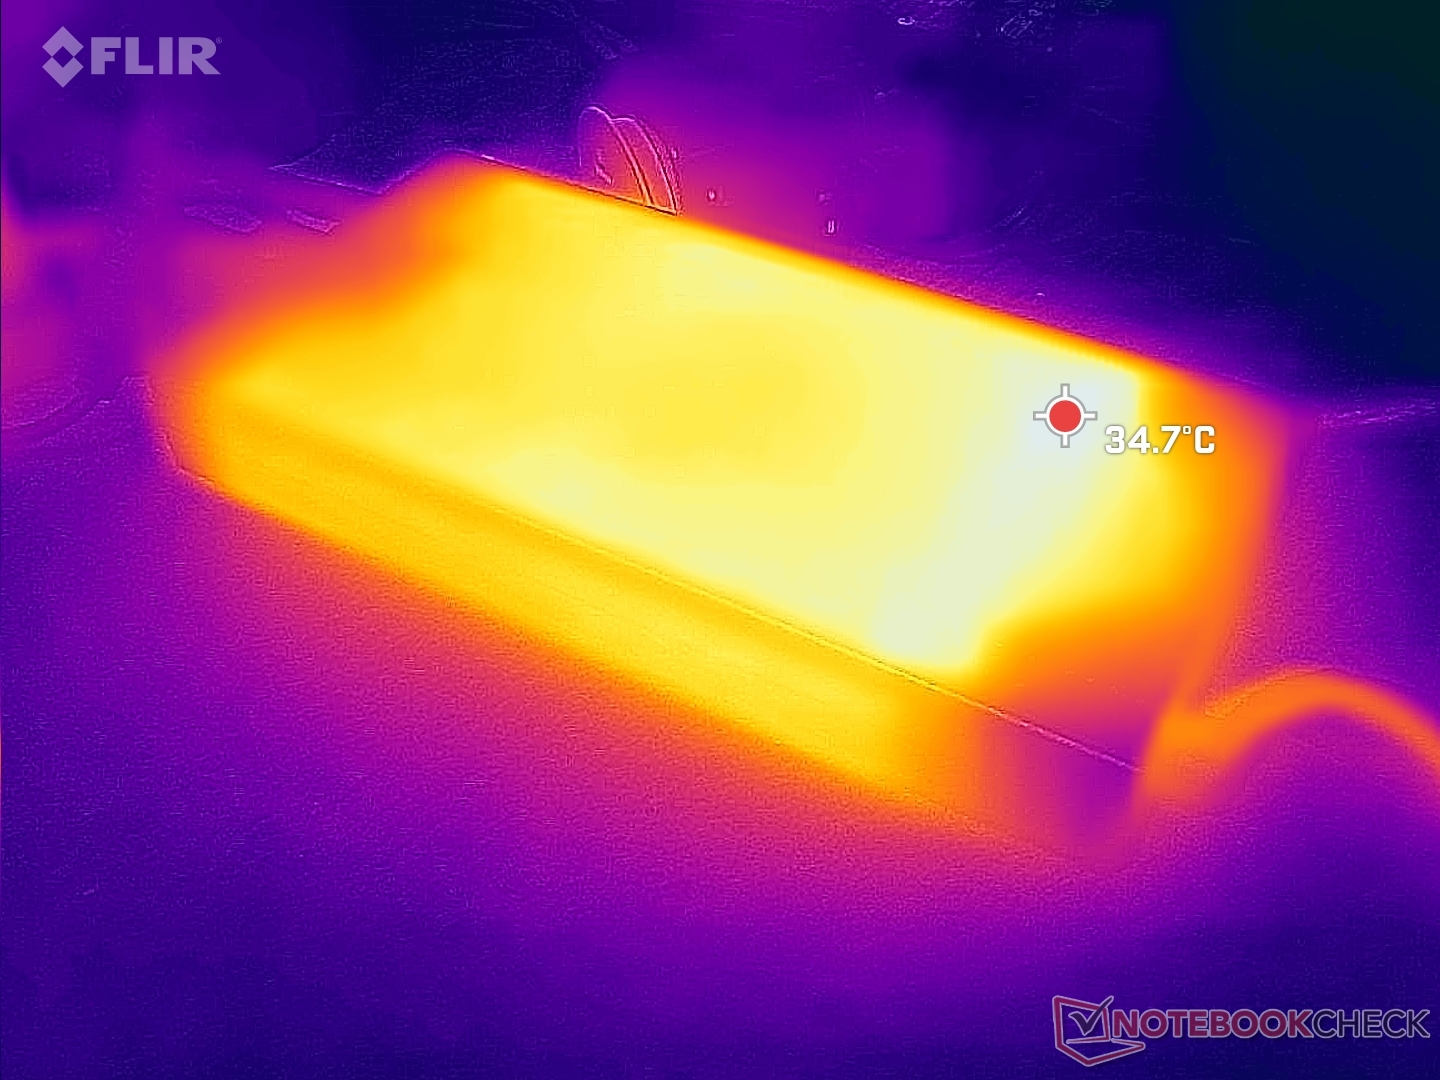
(+) La temperatura massima sul lato superiore è di 37.8 °C / 100 F, rispetto alla media di 40.4 °C / 105 F, che varia da 21.2 a 68.8 °C per questa classe Gaming.
(-) Il lato inferiore si riscalda fino ad un massimo di 51 °C / 124 F, rispetto alla media di 43.2 °C / 110 F
(+) In idle, la temperatura media del lato superiore è di 23.8 °C / 75 F, rispetto alla media deld ispositivo di 33.9 °C / 93 F.
(+) Riproducendo The Witcher 3, la temperatura media per il lato superiore e' di 27.3 °C / 81 F, rispetto alla media del dispositivo di 33.9 °C / 93 F.
(+) I poggiapolsi e il touchpad sono piu' freddi della temperatura della pelle con un massimo di 23.8 °C / 74.8 F e sono quindi freddi al tatto.
(+) La temperatura media della zona del palmo della mano di dispositivi simili e'stata di 28.8 °C / 83.8 F (+5 °C / 9 F).
| Lenovo Legion 5 15IAH7H 82RB Intel Core i7-12700H, NVIDIA GeForce RTX 3060 Laptop GPU | Lenovo Legion 5 15ACH-82JU00C6GE-FL AMD Ryzen 7 5800H, NVIDIA GeForce RTX 3060 Laptop GPU | MSI Bravo 15 B5DD-010US AMD Ryzen 5 5600H, AMD Radeon RX 5500M | Asus TUF Gaming F15 FX507ZM Intel Core i7-12700H, NVIDIA GeForce RTX 3060 Laptop GPU | Acer Aspire Nitro 5 AN515-55-57GF Intel Core i5-10300H, NVIDIA GeForce RTX 3060 Laptop GPU | Razer Blade 15 Base Edition 2021, i7-10750H RTX 3060 Intel Core i7-10750H, NVIDIA GeForce RTX 3060 Laptop GPU | |
|---|---|---|---|---|---|---|
| Heat | 0% | -20% | -25% | -6% | -19% | |
| Maximum Upper Side * (°C) | 37.8 | 42.6 -13% | 52.2 -38% | 44.4 -17% | 49 -30% | 45.2 -20% |
| Maximum Bottom * (°C) | 51 | 52.2 -2% | 48.6 5% | 48.8 4% | 51 -0% | 48 6% |
| Idle Upper Side * (°C) | 25.8 | 24.9 3% | 38 -47% | 37.8 -47% | 26 -1% | 34.4 -33% |
| Idle Bottom * (°C) | 28.8 | 25.3 12% | 28.4 1% | 39.6 -38% | 27 6% | 37.2 -29% |
* ... Meglio usare valori piccoli
Stress test
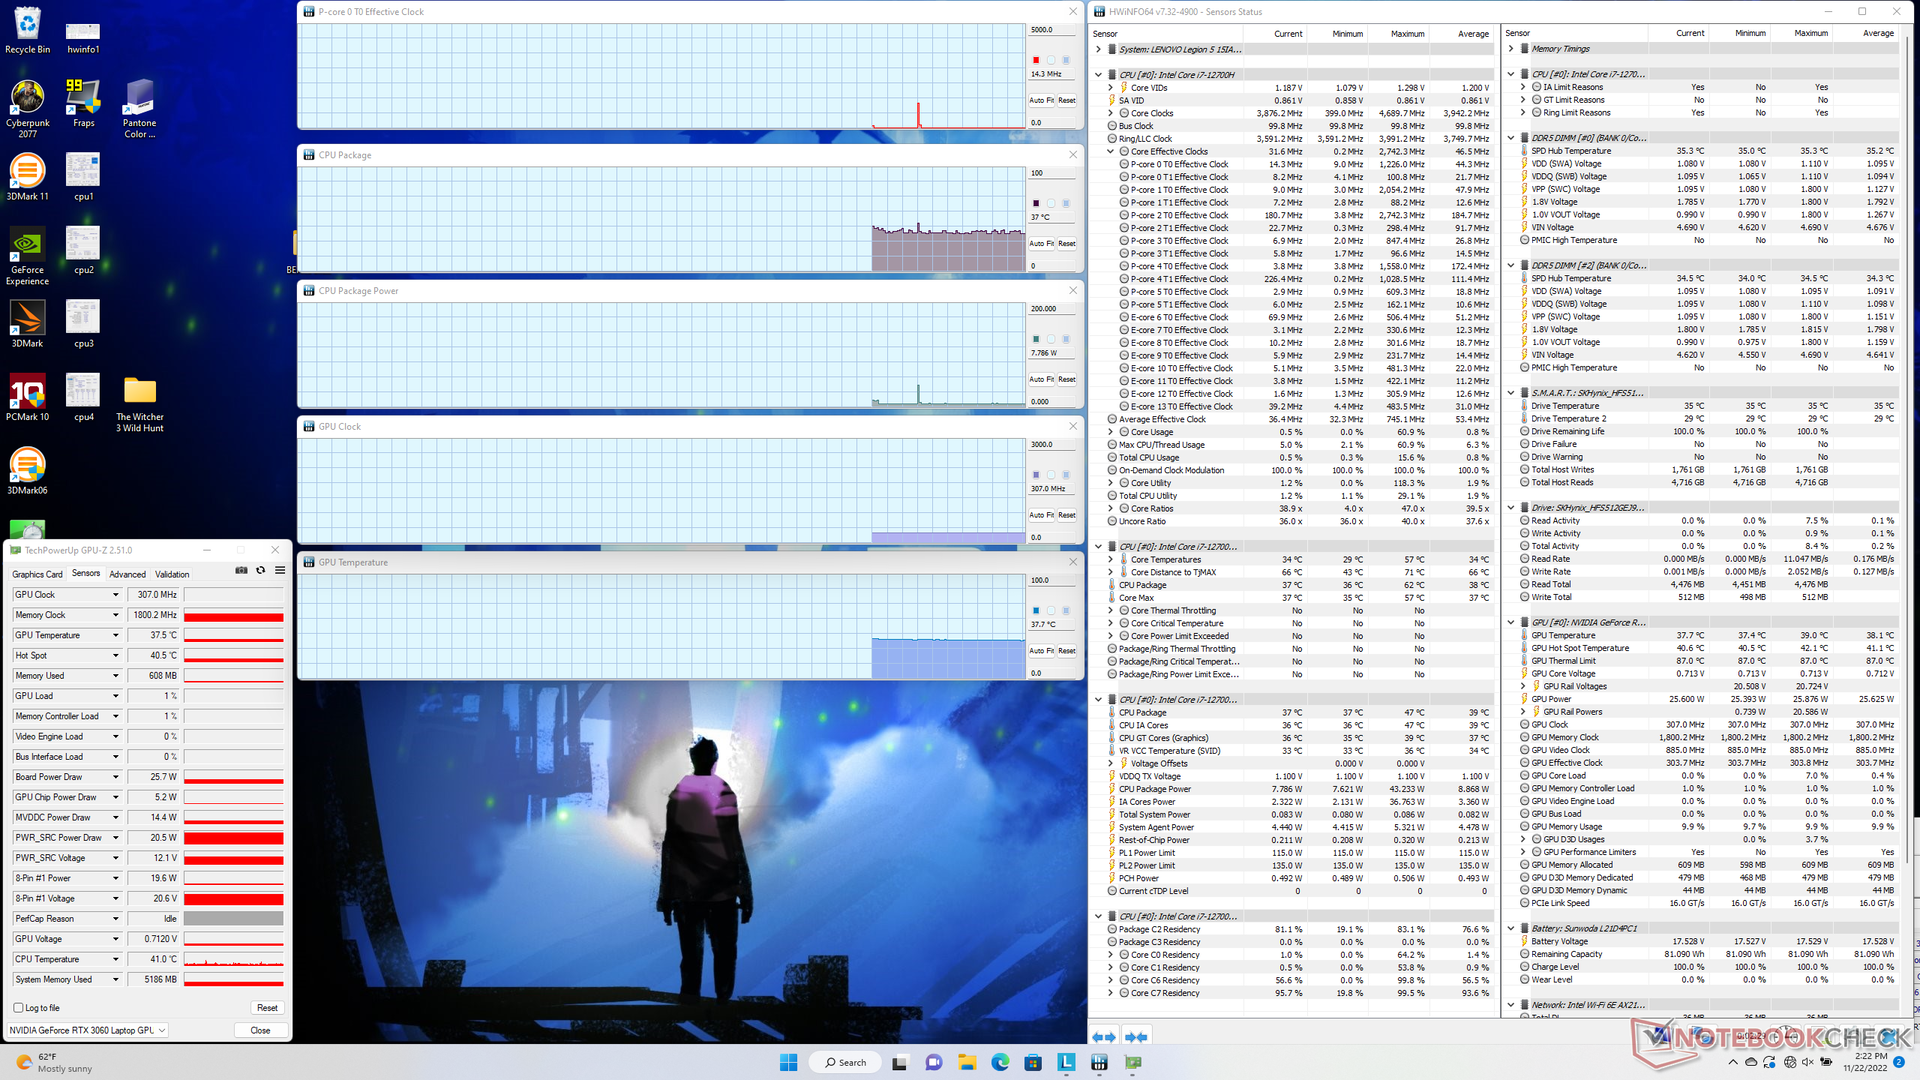
Quando si esegue Prime95 per stressare la CPU, la velocità di clock e l'assorbimento di potenza della scheda raggiungono rispettivamente 4,1 GHz e 110 W, con una durata di circa un minuto. La CPU si stabilizzava quindi a 3,6 GHz, 101 W e 97 C. La temperatura molto calda del core suggerisce che il processore sta spingendo i limiti della soluzione di raffreddamento più che in altri portatili da gioco per ottenere prestazioni aggiuntive. Il HP Envy 16 con la stessa CPU Core i7-12700H, ad esempio, si stabilizza a soli 2,1 GHz e 66 C in condizioni di test simili.
Eseguendo Witcher 3 in modalità Performance, per rappresentare i carichi di gioco tipici, la GPU Nvidia si stabilizzerebbe a 1972 MHz, 134 W di potenza assorbita dalla scheda e 76 C. In modalità Balanced, la GPU si stabilizzerebbe invece a 1665 MHz, 95 W e 70 C, con un deficit di prestazioni del 10%, come illustrato nella sezione sulle prestazioni della GPU. Gli utenti devono quindi attivare la modalità Performance attraverso il software Vantage se vogliono sfruttare al massimo la GPU.
Il funzionamento a batteria limita le prestazioni. Un test di Fire Strike a batteria restituisce punteggi di Fisica e Grafica rispettivamente di 23698 e 12906 punti, rispetto a 30779 e 22257 punti con l'alimentazione di rete.
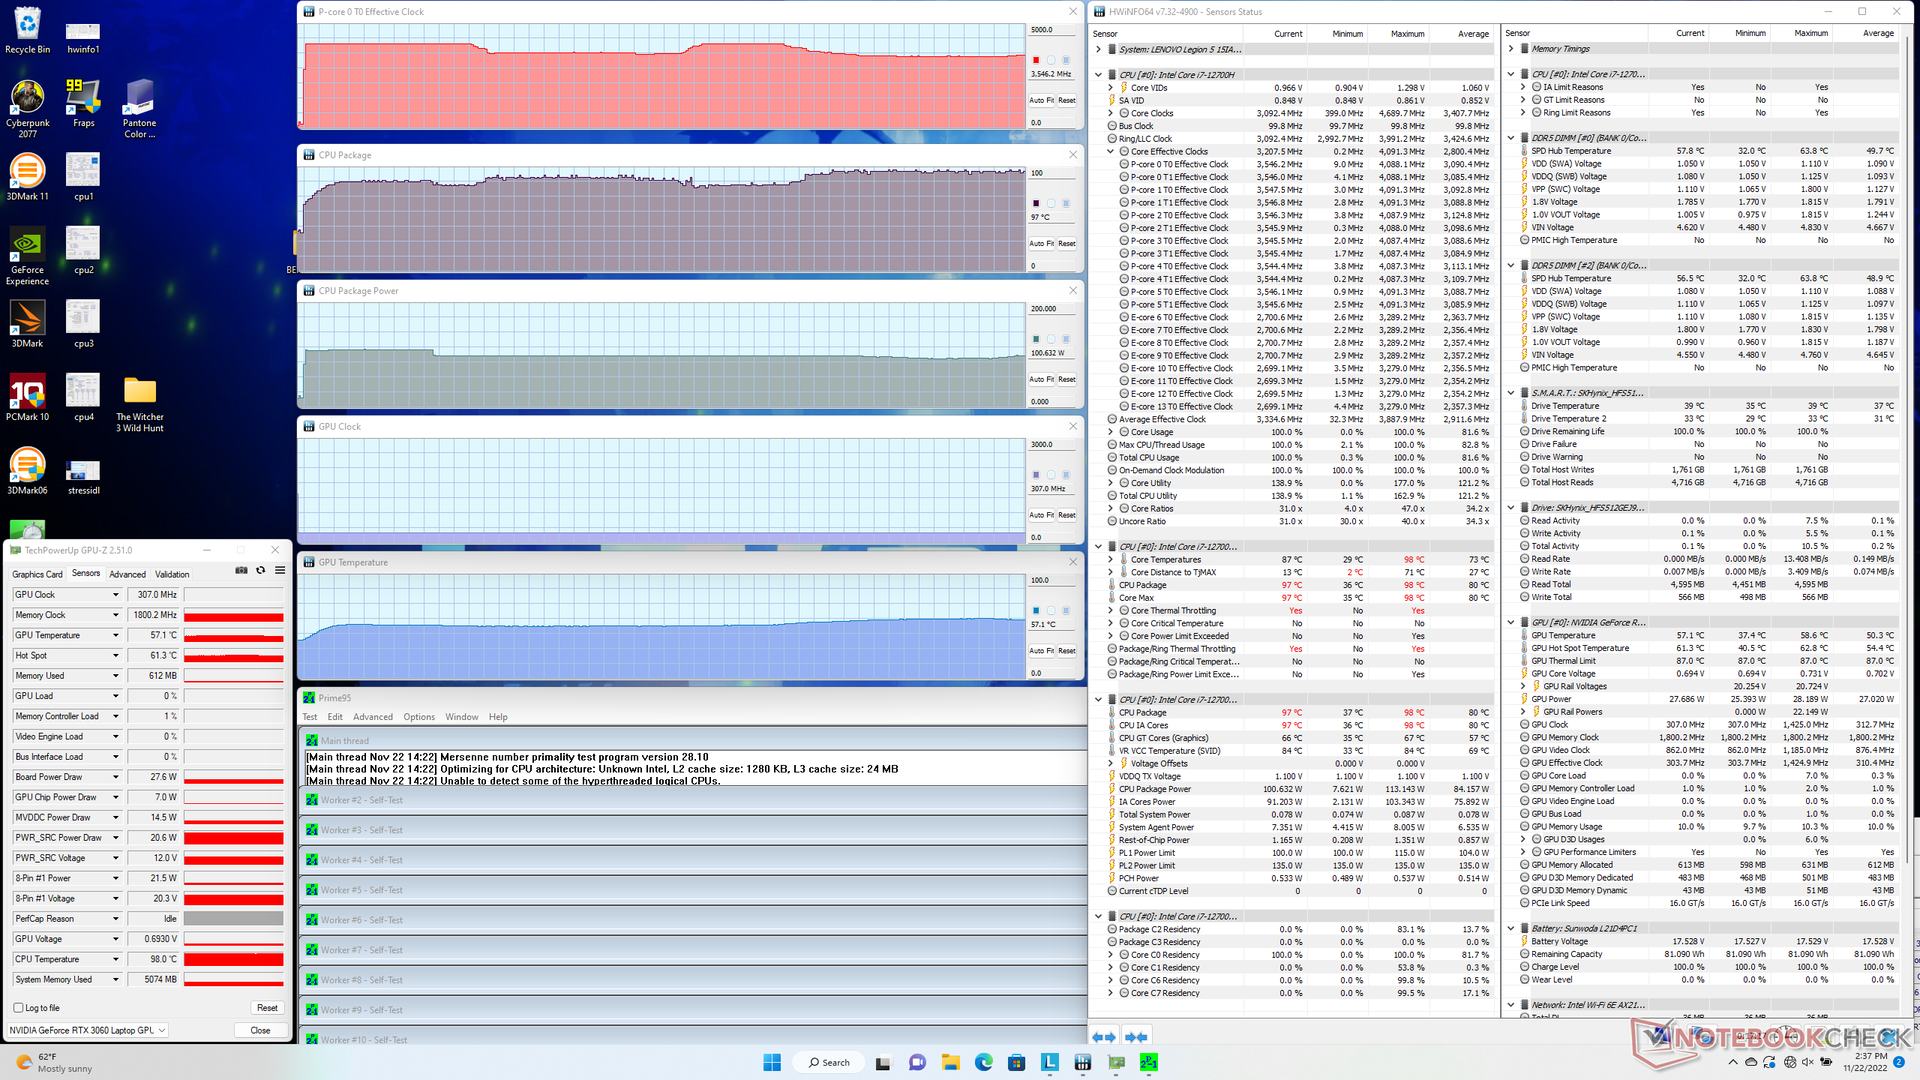
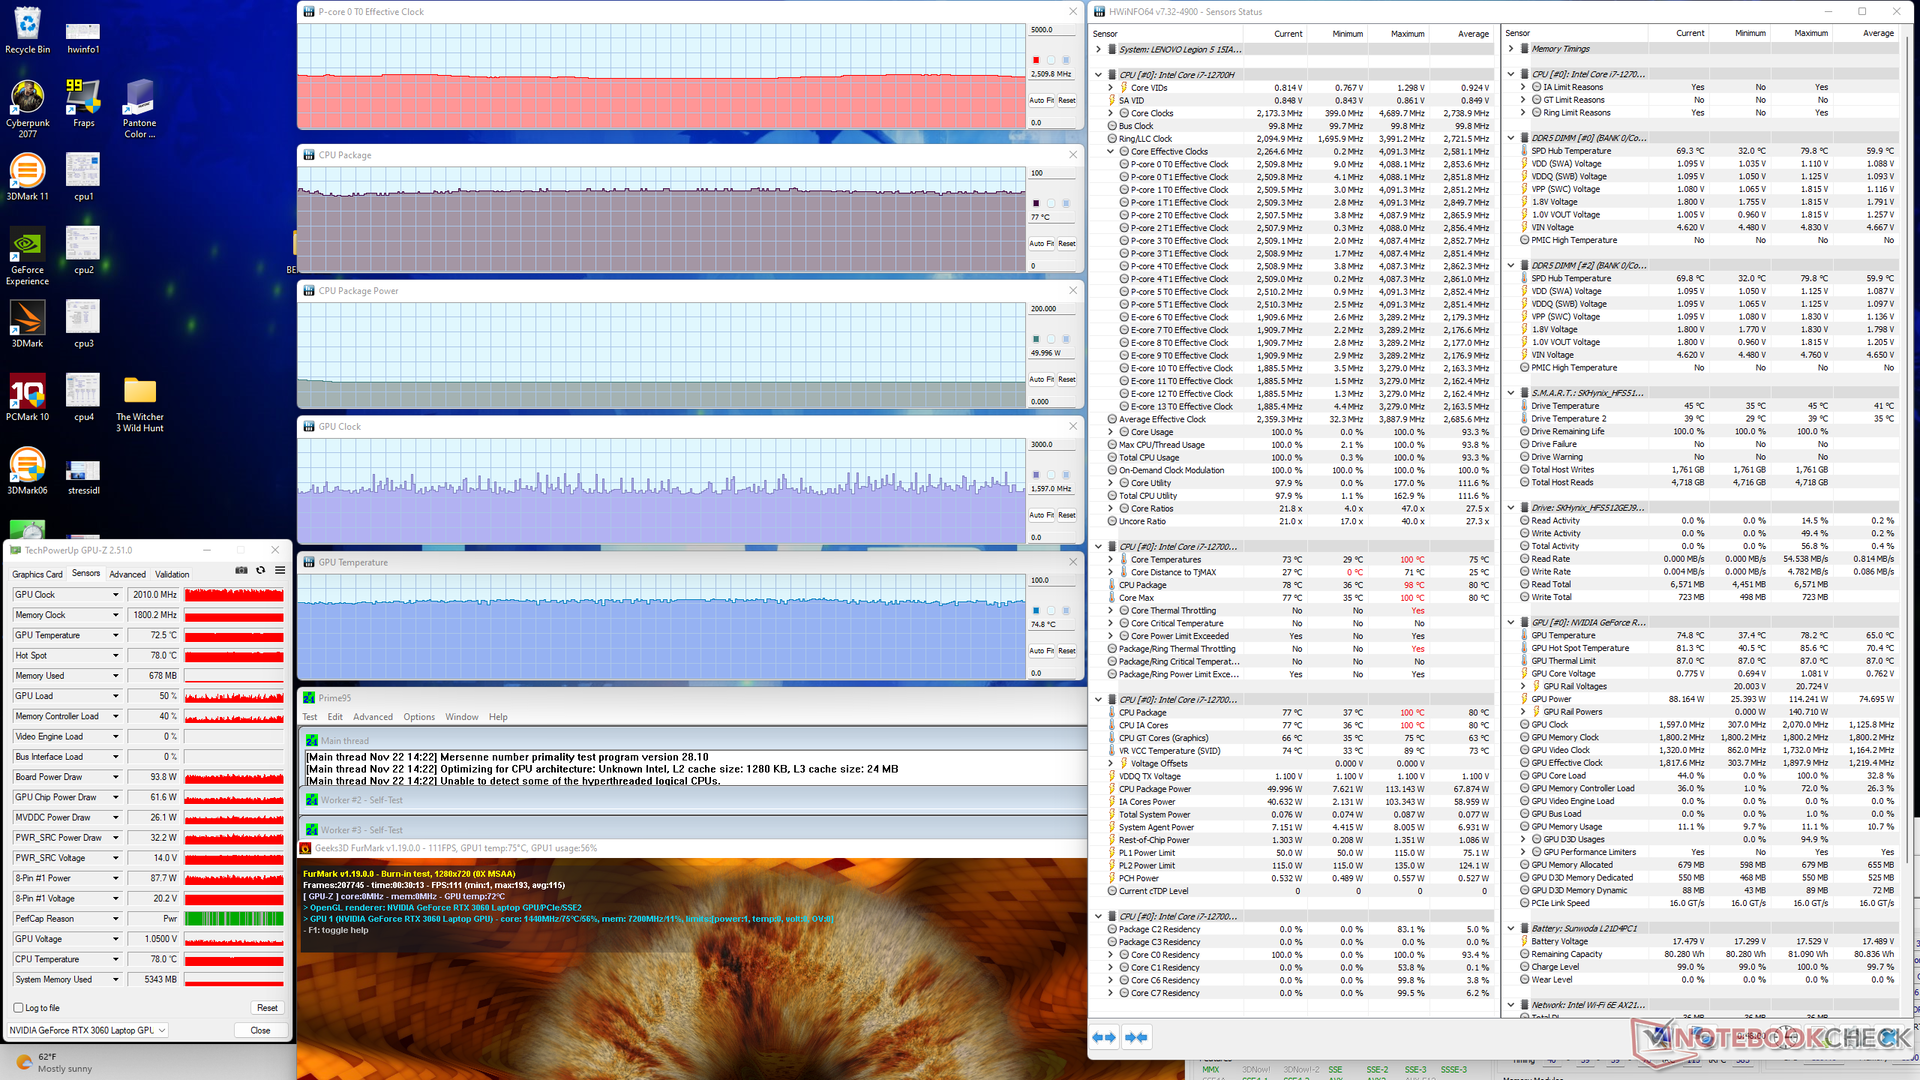
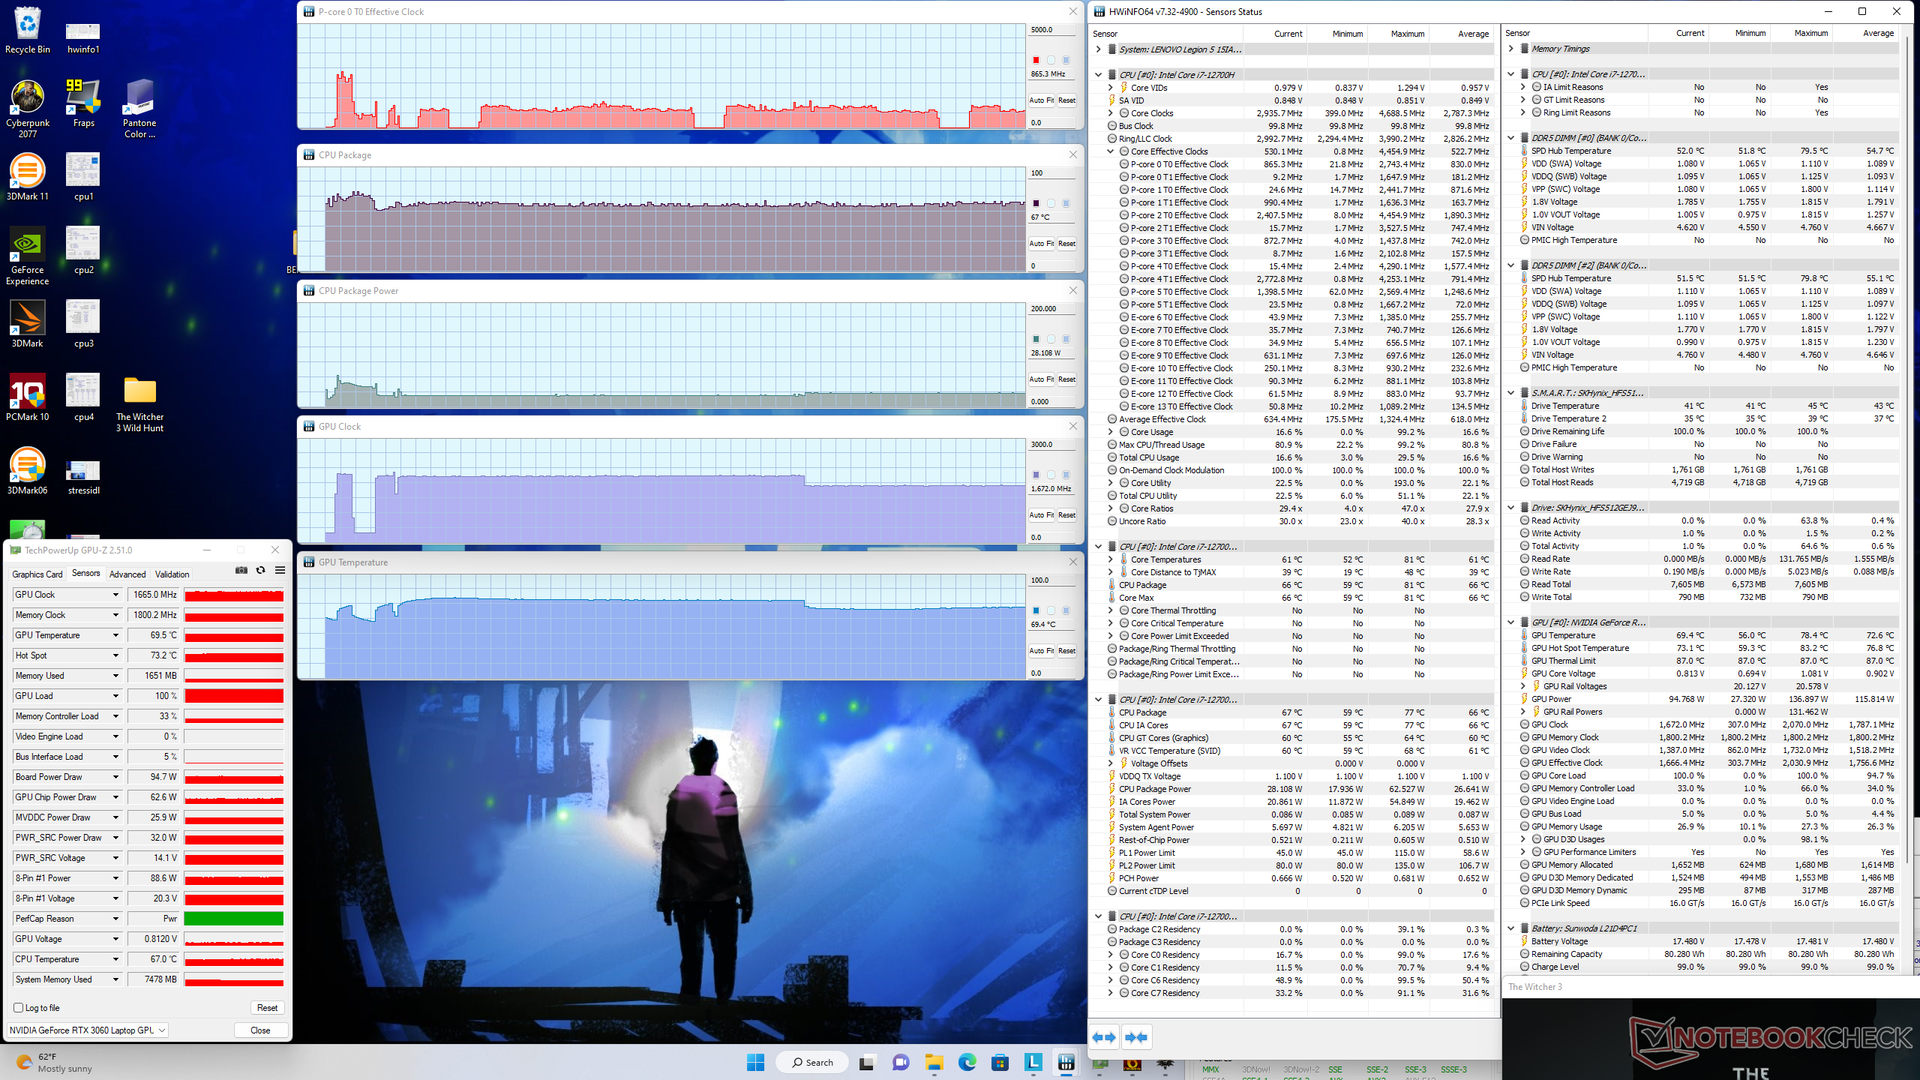
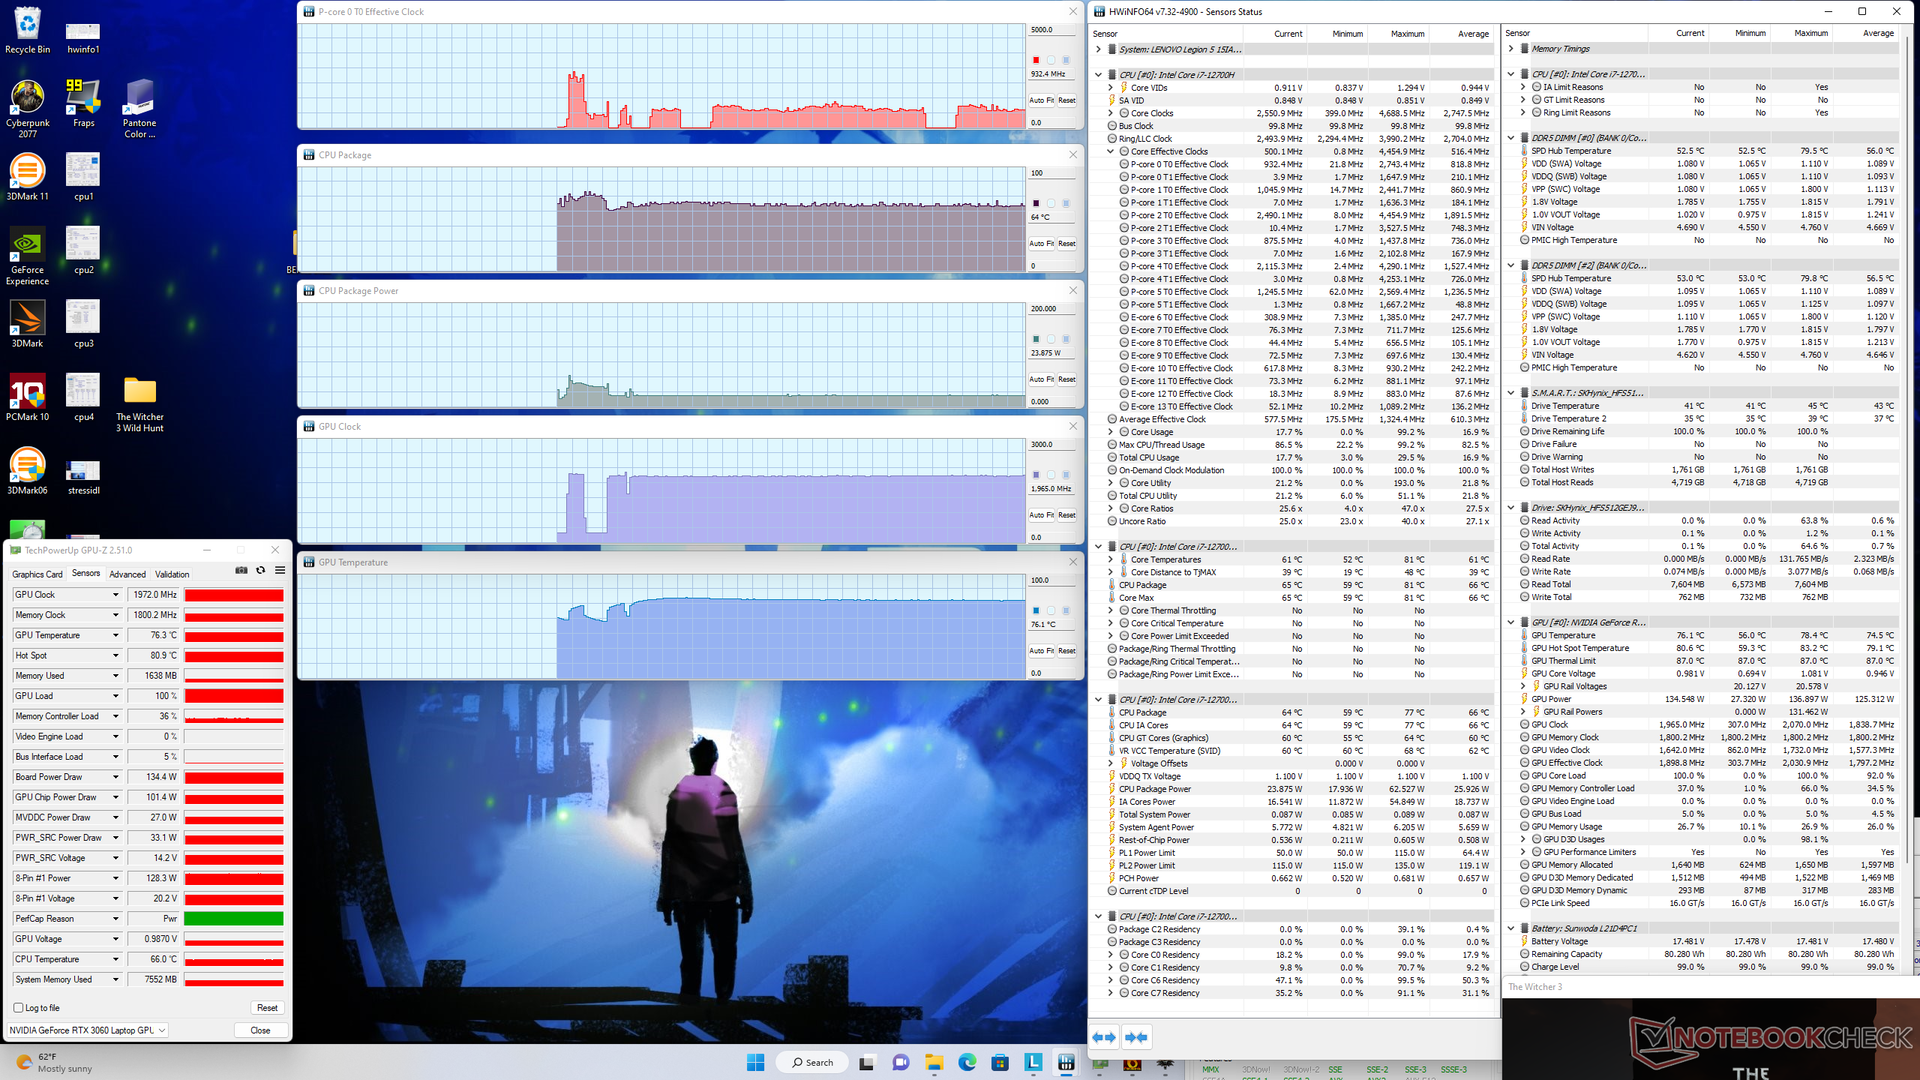
| Clock della CPU (GHz) | Clock della GPU (MHz) | Temperatura media della CPU (°C) | Temperatura media della GPU (°C) | |
| Sistema inattivo | -- | -- | 37 | 38 |
| Stress Prime95 | 3,6 - 3,8 | -- | 97 | 57 |
| StressPrime95 + FurMark | 2,5 | 1597 - 2010 | 77 | 75 |
| Witcher 3 Stress (modalità bilanciata) | ~0,9 | 1665 | 67 | 70 |
| Witcher 3 Stress (modalità Performance) | ~0,9 | 1972 | 64 | 76 |
Altoparlanti
Lenovo Legion 5 15IAH7H 82RB analisi audio
(+) | gli altoparlanti sono relativamente potenti (83.3 dB)
Bassi 100 - 315 Hz
(-) | quasi nessun basso - in media 28.2% inferiori alla media
(±) | la linearità dei bassi è media (12.9% delta rispetto alla precedente frequenza)
Medi 400 - 2000 Hz
(±) | medi elevati - circa 5.7% superiore alla media
(±) | linearità dei medi adeguata (7.4% delta rispetto alla precedente frequenza)
Alti 2 - 16 kHz
(+) | Alti bilanciati - appena 3.3% dalla media
(+) | alti lineari (6.4% delta rispetto alla precedente frequenza)
Nel complesso 100 - 16.000 Hz
(±) | la linearità complessiva del suono è media (23.6% di differenza rispetto alla media
Rispetto alla stessa classe
» 86% di tutti i dispositivi testati in questa classe è stato migliore, 4% simile, 10% peggiore
» Il migliore ha avuto un delta di 6%, medio di 18%, peggiore di 132%
Rispetto a tutti i dispositivi testati
» 71% di tutti i dispositivi testati in questa classe è stato migliore, 6% similare, 23% peggiore
» Il migliore ha avuto un delta di 4%, medio di 23%, peggiore di 134%
Apple MacBook Pro 16 2021 M1 Pro analisi audio
(+) | gli altoparlanti sono relativamente potenti (84.7 dB)
Bassi 100 - 315 Hz
(+) | bassi buoni - solo 3.8% dalla media
(+) | bassi in lineaa (5.2% delta rispetto alla precedente frequenza)
Medi 400 - 2000 Hz
(+) | medi bilanciati - solo only 1.3% rispetto alla media
(+) | medi lineari (2.1% delta rispetto alla precedente frequenza)
Alti 2 - 16 kHz
(+) | Alti bilanciati - appena 1.9% dalla media
(+) | alti lineari (2.7% delta rispetto alla precedente frequenza)
Nel complesso 100 - 16.000 Hz
(+) | suono nel complesso lineare (4.6% differenza dalla media)
Rispetto alla stessa classe
» 0% di tutti i dispositivi testati in questa classe è stato migliore, 0% simile, 100% peggiore
» Il migliore ha avuto un delta di 5%, medio di 17%, peggiore di 45%
Rispetto a tutti i dispositivi testati
» 0% di tutti i dispositivi testati in questa classe è stato migliore, 0% similare, 100% peggiore
» Il migliore ha avuto un delta di 4%, medio di 23%, peggiore di 134%
Gestione dell'energia - Esigente con carichi di CPU elevati
Consumo di energia
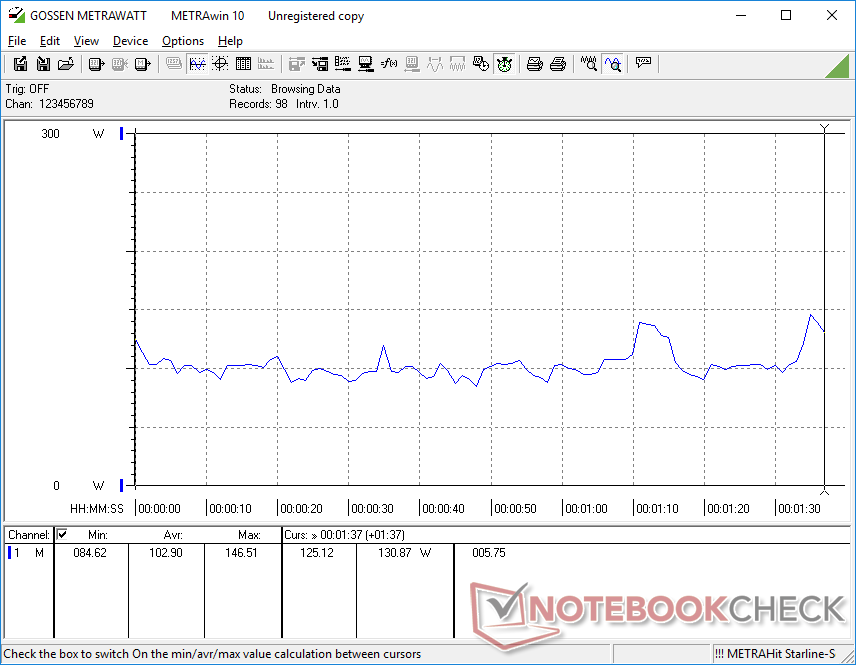
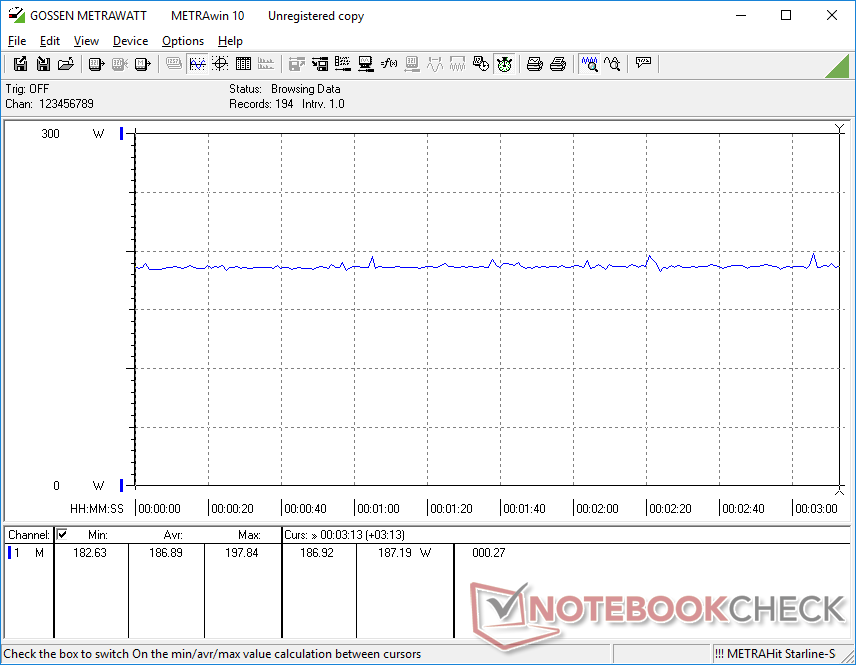
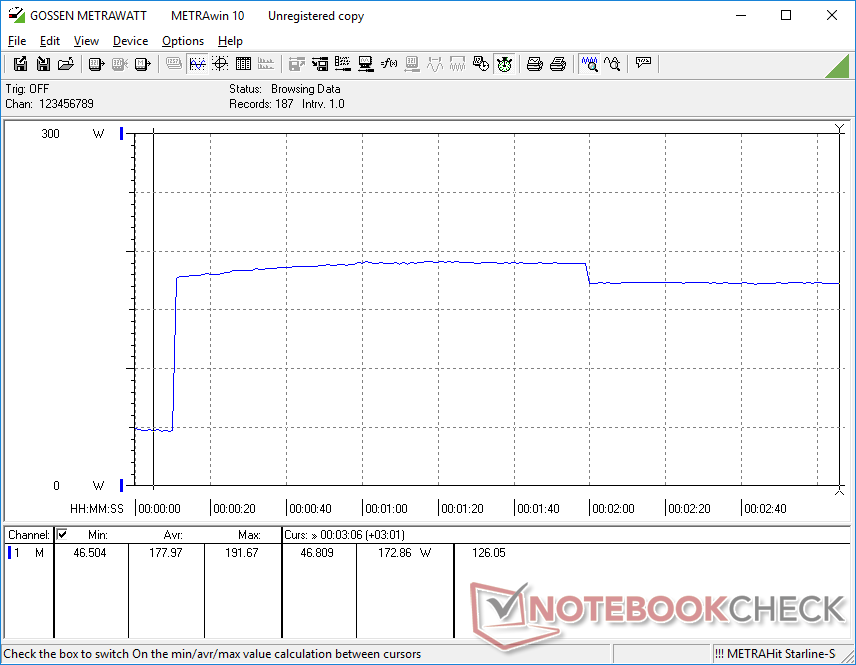
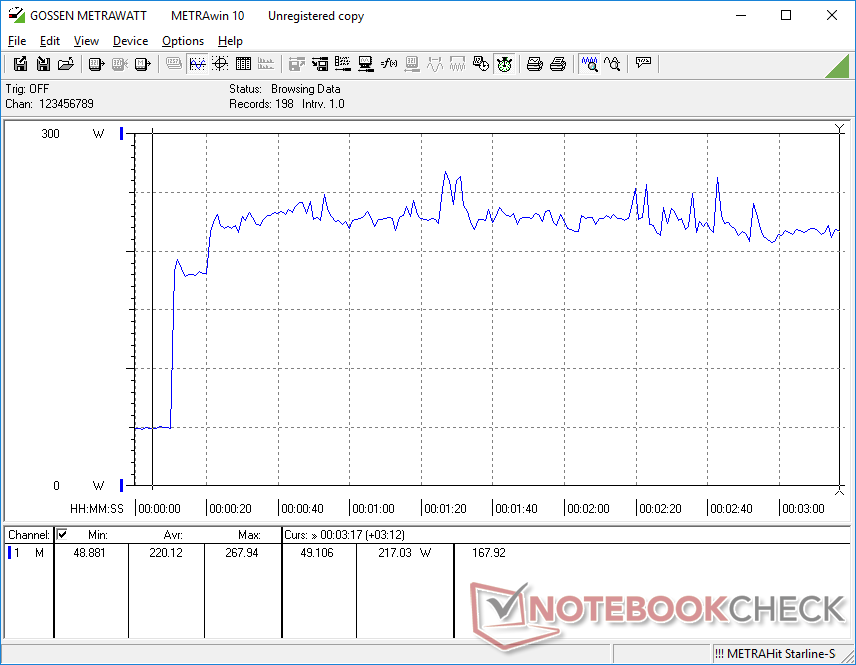
Il sistema è insolitamente esigente quando è al minimo sul desktop. Il consumo energetico oscilla tra i 20 W con l'impostazione di luminosità e il profilo energetico più bassi con grafica ibrida e i 49 W con l'impostazione di luminosità e il profilo energetico più alti con la dGPU attiva. Il modello 2021, invece, avrebbe un consumo compreso tra 7 e 16 W.
L'esecuzione Witcher 3 richiede circa 187 W rispetto ai 175 W del modello dell'anno scorso, il che è strettamente correlato all'obiettivo TGP di 10 W superiore del nostro modello 2022.
Siamo riusciti a registrare un consumo massimo di 268 W dall'adattatore CA da 300 W di grandi dimensioni (~19,8 x 9,8 x 2,5 cm) quando sia la CPU che la GPU sono al 100% di utilizzo. Questo valore massimo è superiore a quello della maggior parte dei portatili da gioco con piattaforma AMD o Intel di 10°/11° generazione, poiché la serie Core di 12° generazione è molto più esigente.
| Off / Standby | |
| Idle | |
| Sotto carico |
|
Leggenda:
min: | |
| Lenovo Legion 5 15IAH7H 82RB i7-12700H, GeForce RTX 3060 Laptop GPU, , IPS, 1920x1080, 15.6" | Lenovo Legion 5 15ACH-82JU00C6GE-FL R7 5800H, GeForce RTX 3060 Laptop GPU, Micron 2300 512GB MTFDHBA512TDV, , 1920x1080, 15.6" | MSI Bravo 15 B5DD-010US R5 5600H, Radeon RX 5500M, Kingston OM8PCP3512F-AB, IPS, 1920x1080, 15.6" | Asus TUF Gaming F15 FX507ZM i7-12700H, GeForce RTX 3060 Laptop GPU, SK Hynix HFM001TD3JX013N, IPS, 1920x1080, 15.6" | Acer Aspire Nitro 5 AN515-55-57GF i5-10300H, GeForce RTX 3060 Laptop GPU, WDC PC SN530 SDBPNPZ-512G, IPS, 1920x1080, 15.6" | Razer Blade 15 Base Edition 2021, i7-10750H RTX 3060 i7-10750H, GeForce RTX 3060 Laptop GPU, Samsung SSD PM981a MZVLB512HBJQ, IPS, 1920x1080, 15.6" | |
|---|---|---|---|---|---|---|
| Power Consumption | 34% | 53% | 31% | 49% | 29% | |
| Idle Minimum * (Watt) | 19.8 | 7.3 63% | 6.6 67% | 6.3 68% | 5 75% | 11.7 41% |
| Idle Average * (Watt) | 26.2 | 10.5 60% | 9.8 63% | 9.8 63% | 9 66% | 16 39% |
| Idle Maximum * (Watt) | 48.2 | 15.7 67% | 10.8 78% | 26.5 45% | 13 73% | 29.3 39% |
| Load Average * (Watt) | 102.9 | 108 -5% | 70.5 31% | 103.8 -1% | 84 18% | 95.6 7% |
| Witcher 3 ultra * (Watt) | 186.7 | 175 6% | 103.2 45% | 189 -1% | 125 33% | 141.3 24% |
| Load Maximum * (Watt) | 268 | 228 15% | 175 35% | 241.9 10% | 190 29% | 197 26% |
* ... Meglio usare valori piccoli
Power Consumption Witcher 3 / Stresstest
Power Consumption external Monitor
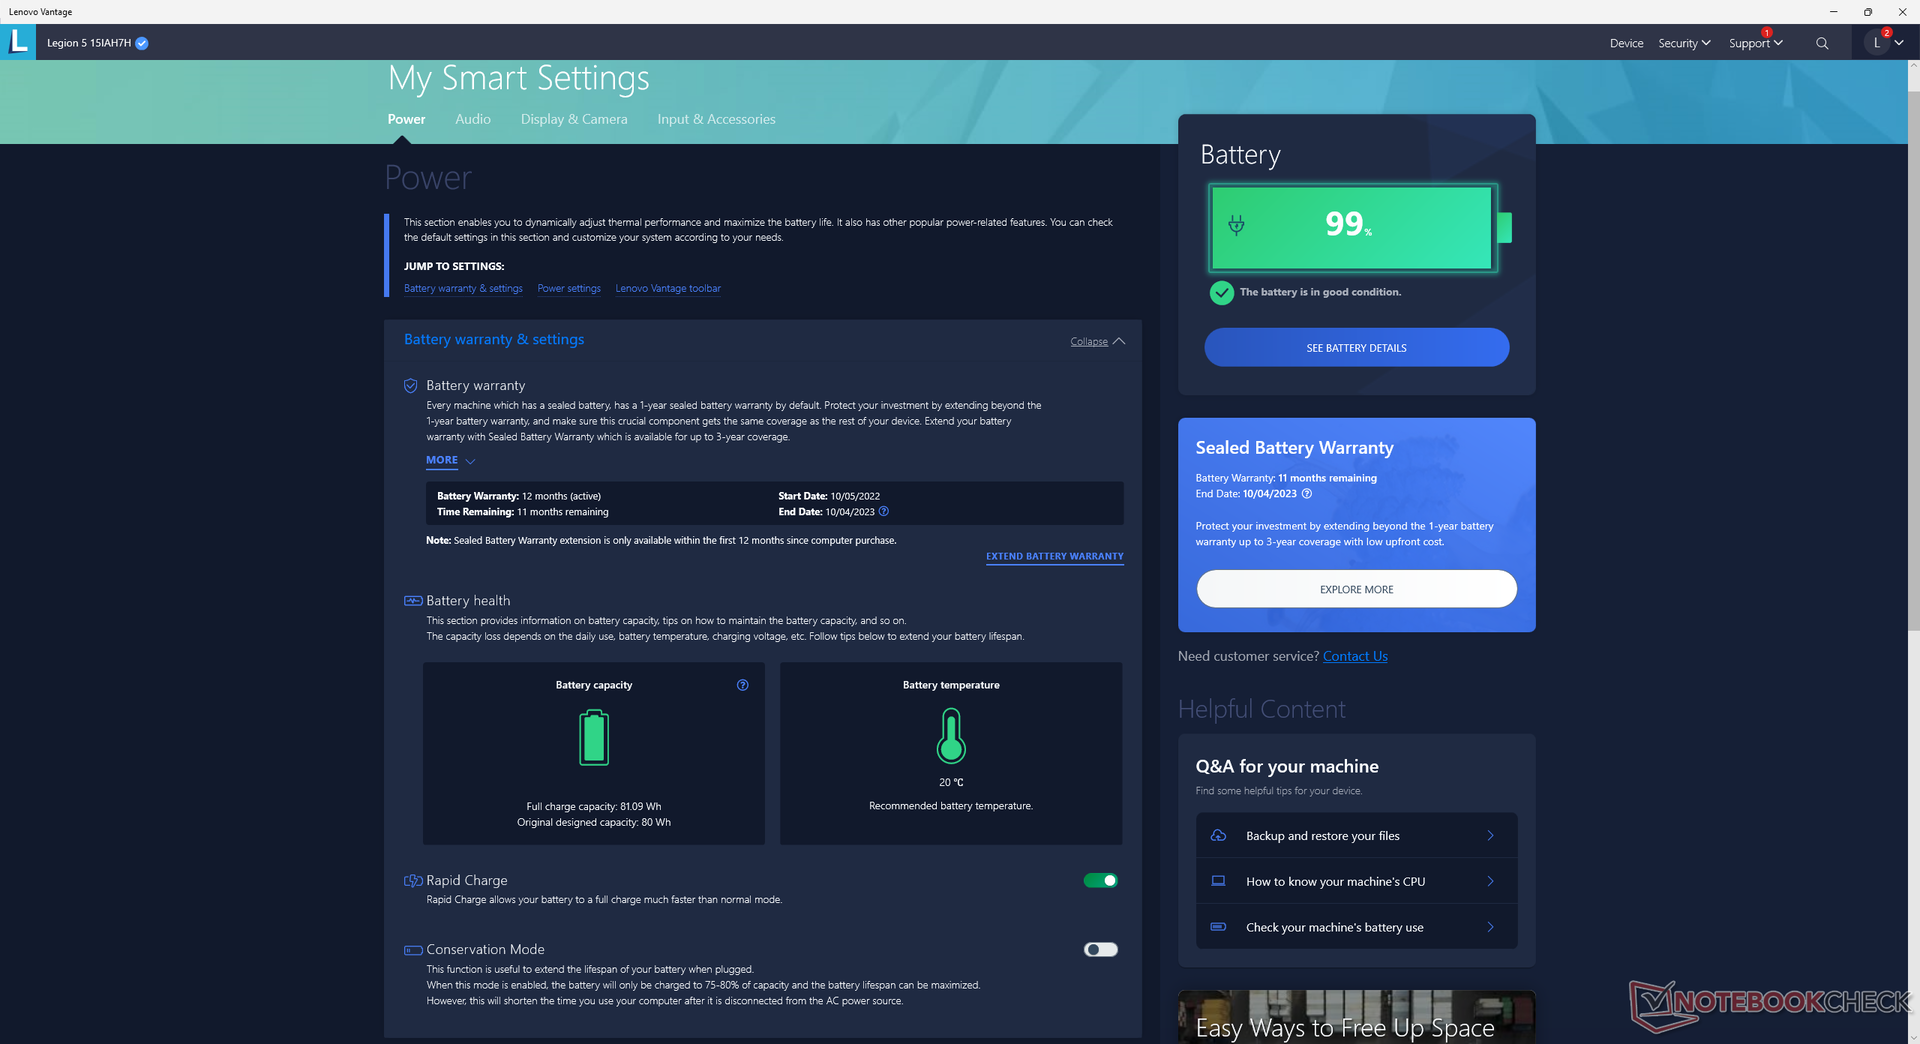
Durata della batteria
L'autonomia WLAN è circa la stessa del modello dell'anno scorso, poiché la capacità della batteria è ancora di 80 Wh. La ricarica da vuoto a pieno richiede solo 35 minuti quando si attiva la carica rapida, rispetto alle 1,5-2 ore della maggior parte degli altri portatili.
La ricarica USB-C è supportata solo dalla porta USB-C posteriore. Tuttavia, la ricarica potrebbe essere compatibile solo con il caricatore USB-C opzionale di Lenovo e non con la maggior parte dei caricatori di terze parti. Abbiamo provato tre diversi caricatori USB-C (30 W, 100 W e 130 W), ma solo quello da 130 W di Lenovo ha funzionato.
Alcune SKU sono dotate di una batteria più piccola da 60 Wh invece della nostra da 80 Wh.
| Lenovo Legion 5 15IAH7H 82RB i7-12700H, GeForce RTX 3060 Laptop GPU, 80 Wh | Lenovo Legion 5 15ACH-82JU00C6GE-FL R7 5800H, GeForce RTX 3060 Laptop GPU, 80 Wh | MSI Bravo 15 B5DD-010US R5 5600H, Radeon RX 5500M, 53 Wh | Asus TUF Gaming F15 FX507ZM i7-12700H, GeForce RTX 3060 Laptop GPU, 90 Wh | Acer Aspire Nitro 5 AN515-55-57GF i5-10300H, GeForce RTX 3060 Laptop GPU, 57.5 Wh | Razer Blade 15 Base Edition 2021, i7-10750H RTX 3060 i7-10750H, GeForce RTX 3060 Laptop GPU, 65 Wh | |
|---|---|---|---|---|---|---|
| Autonomia della batteria | 30% | 10% | 30% | 25% | 9% | |
| Reader / Idle (h) | 8.1 | 9.2 14% | 15.8 95% | 7.8 -4% | ||
| WiFi v1.3 (h) | 5 | 4.8 -4% | 6.3 26% | 4.8 -4% | 5.7 14% | 4.8 -4% |
| Load (h) | 1.1 | 1.8 64% | 1 -9% | 1.1 0% | 1.5 36% | 1.5 36% |
| H.264 (h) | 4.3 | 6.2 |
Pro
Contro
Verdetto - Grandi dimensioni, grandi prestazioni
L'aspetto più sorprendente del 2022 Legion 5 15 è la sua velocità superiore alla media. Anche se abbiamo già testato molti portatili per il gaming con il Core i7-12700H Core i7-12700H e GeForce RTX 3060 GPU, questo modello Lenovo funziona con frequenze di clock sensibilmente più elevate, per prestazioni superiori a quelle di molti concorrenti dotati dello stesso hardware. Se siete preoccupati di acquistare per sbaglio un portatile con hardware sottocloccato, il modello Legion 5 15 eliminerà ogni preoccupazione.
Il Lenovo Legion 5 15 eccelle nel massimizzare le prestazioni in uno chassis quasi semi-professionale con luci RGB minime. Tuttavia, è piuttosto grande e pesante e alcuni aspetti ausiliari potrebbero essere migliorati.
Le prestazioni extra si ottengono al costo di uno chassis più pesante e più grande. La grande sporgenza posteriore è difficile da ignorare e i concorrenti come l'Asus TUF Gaming F15 FX507ZM o il Razer Blade 15 Base Model sono notevolmente più leggeri. Se si viaggia molto, le prestazioni più elevate potrebbero non valere il peso maggiore. Anche l'ingombrante adattatore CA da 300 W non rende il Lenovo molto adatto ai viaggi.
Per i modelli futuri, vorremmo vedere miglioramenti al clickpad spugnoso, alla qualità della webcam pixelata, allo scarso supporto alla ricarica USB-C di terze parti e alle cerniere piccole. Quest'ultimo aspetto in particolare aiuterebbe a giustificare il telaio più pesante rispetto alla concorrenza.
Prezzo e disponibilità
Lenovo sta distribuendo la serie Legion 5 15 ad un prezzo compreso tra 1100 e 1900 dollari, a seconda della configurazione. La nostra configurazione specifica per la recensione viene attualmente spedita a 1350 dollari.
Lenovo Legion 5 15IAH7H 82RB
- 11/25/2022 v7 (old)
Allen Ngo
Price comparison

