 Deutsch
 English
 Español
 Français
 Italiano
 Nederlands
 Polski
 Português
 Русский
 Türkçe
 Svenska
 Chinese
 Magyar
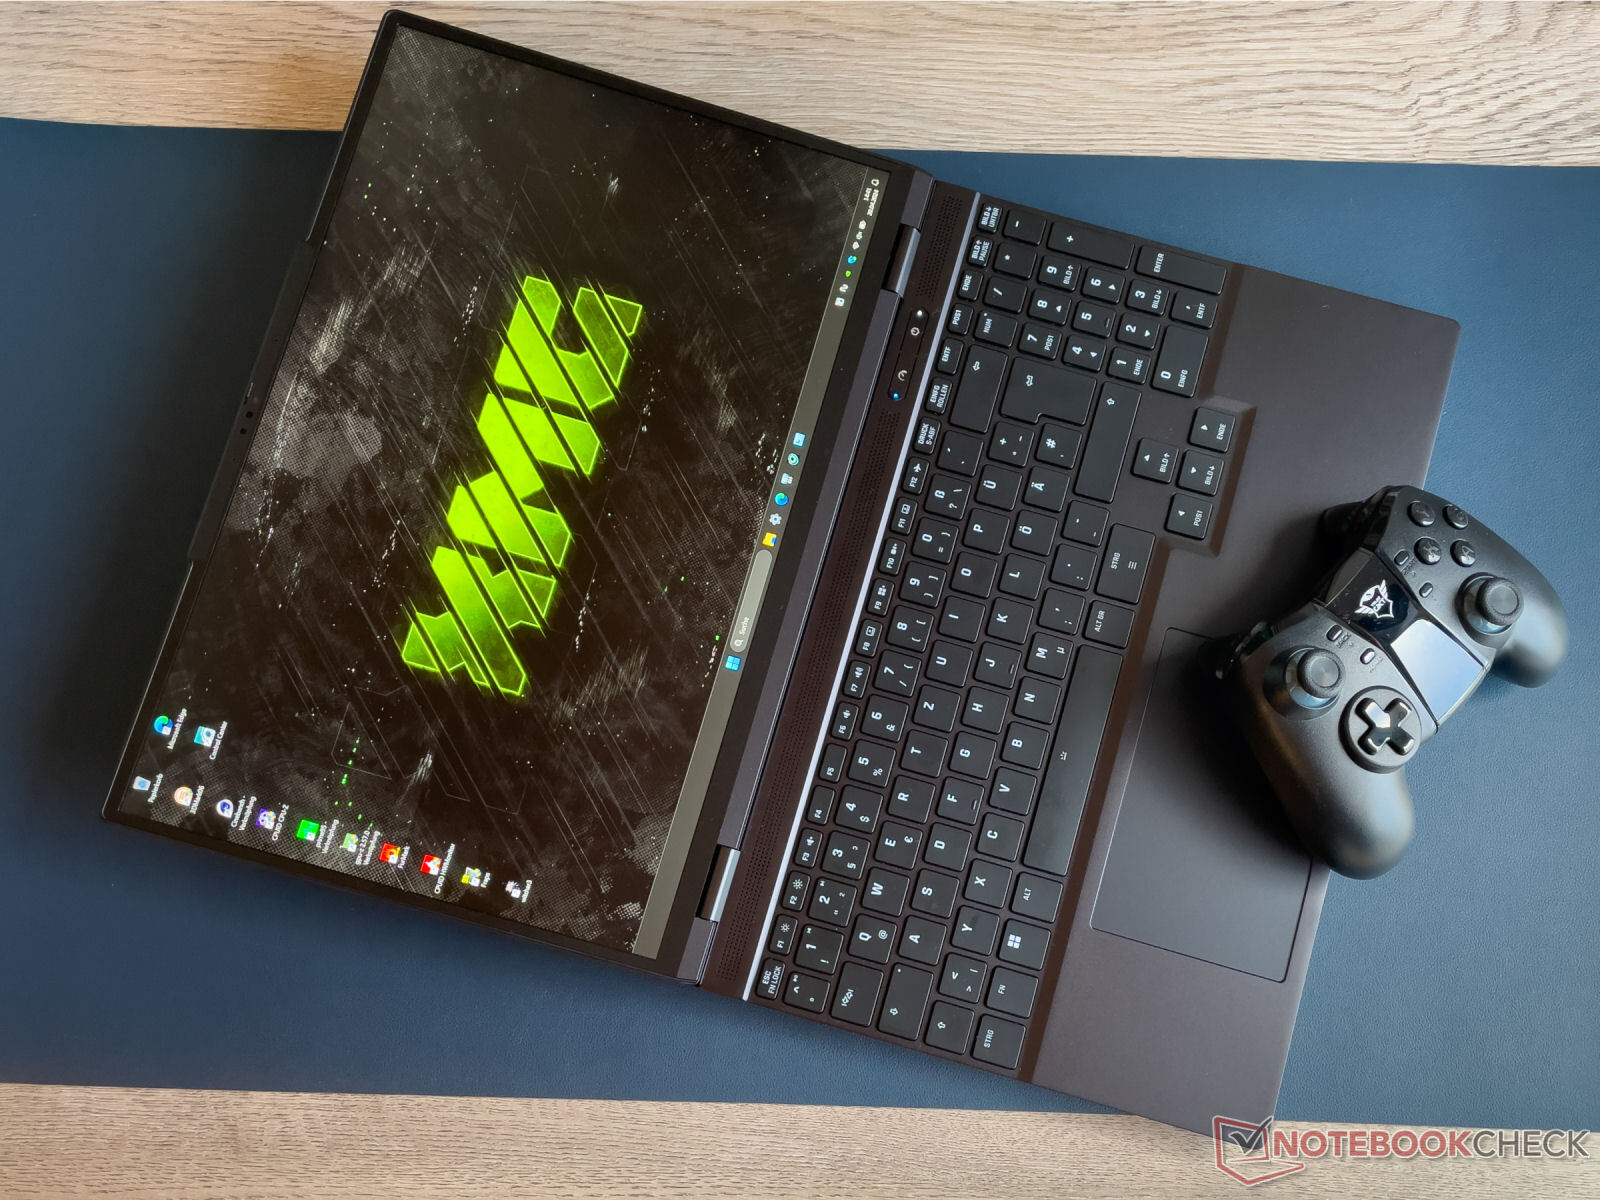
Recensione dell'XMG Fusion 15 (Early 24): Un portatile RTX 4070 compatto per gamers e creators
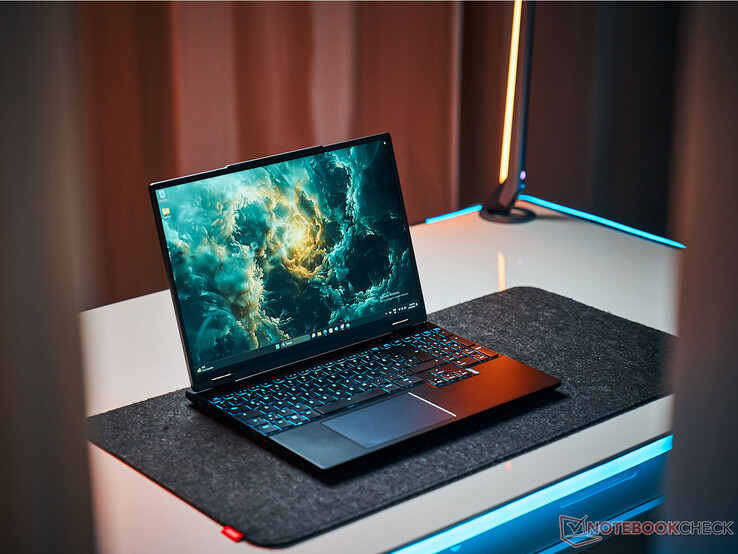
XMG Fusion 15 (Early 24) - un laptop da 15,3 pollici per giocatori e creatori - si basa su un barebone (GM5IX7A) del produttore Tongfang. Raptor Lake, Ada Lovelace e 32 GB di RAM equipaggiano il laptop per lo streaming, il rendering e il gioco. La variante attuale può essere acquistata per circa 2.500 dollari. I concorrenti includono dispositivi come Aorus 16X (2024), Alienware m16 R2, HP Omen Transcend 16 e il Lenovo Legion Pro 5 16IRX9.
Potenziali concorrenti a confrontos
Punteggio | Data | Modello | Peso | Altezza | Dimensione | Risoluzione | Miglior Prezzo |
|---|---|---|---|---|---|---|---|
| 88.9 % | 05/2024 | SCHENKER XMG Fusion 15 (Early 24) i9-14900HX, NVIDIA GeForce RTX 4070 Laptop GPU | 2.1 kg | 21.9 mm | 15.30" | 2560x1600 | |
| 87.4 % | 04/2024 | Aorus 16X 2024 i9-14900HX, NVIDIA GeForce RTX 4070 Laptop GPU | 2.3 kg | 20 mm | 16.00" | 2560x1600 | |
| 90.2 % | 03/2024 | Alienware m16 R2 Ultra 7 155H, NVIDIA GeForce RTX 4070 Laptop GPU | 2.5 kg | 23.5 mm | 16.00" | 2560x1600 | |
| 88.4 % | 02/2024 | HP Omen Transcend 16-u1095ng i9-14900HX, NVIDIA GeForce RTX 4070 Laptop GPU | 2.3 kg | 20 mm | 16.00" | 2560x1600 | |
| 89.3 % | 04/2024 | Lenovo Legion Pro 5 16IRX9 i9-14900HX, NVIDIA GeForce RTX 4070 Laptop GPU | 2.5 kg | 26.95 mm | 16.00" | 2560x1600 |
Custodia - Il computer portatile XMG con una custodia in alluminio
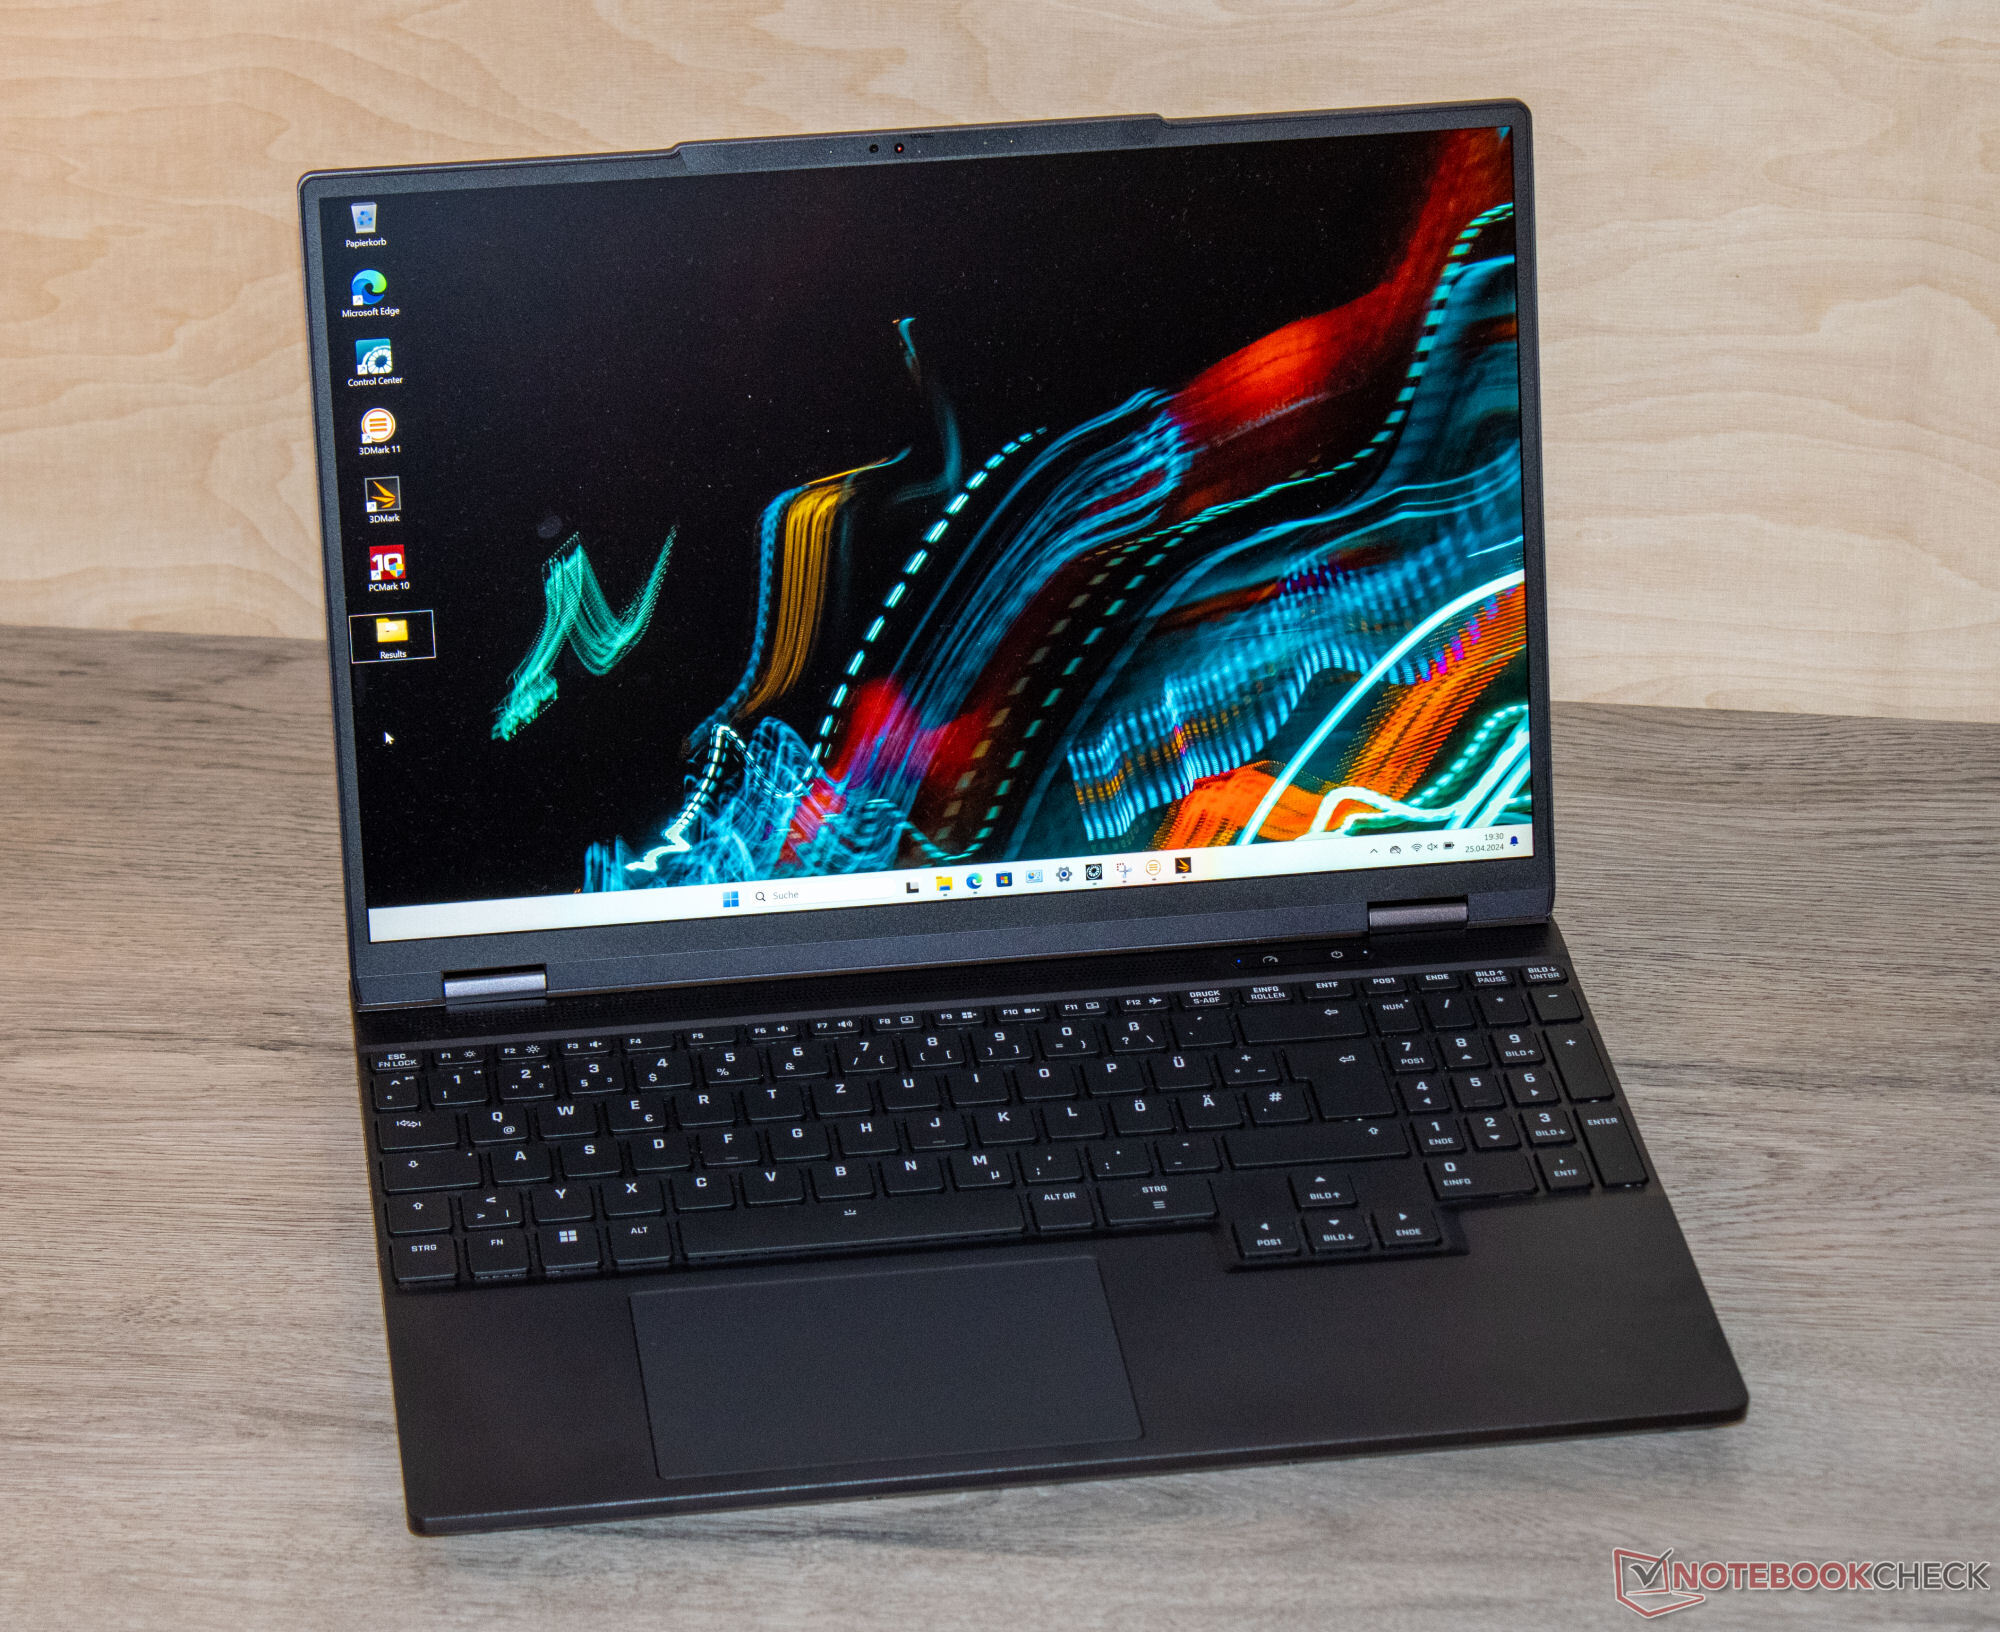
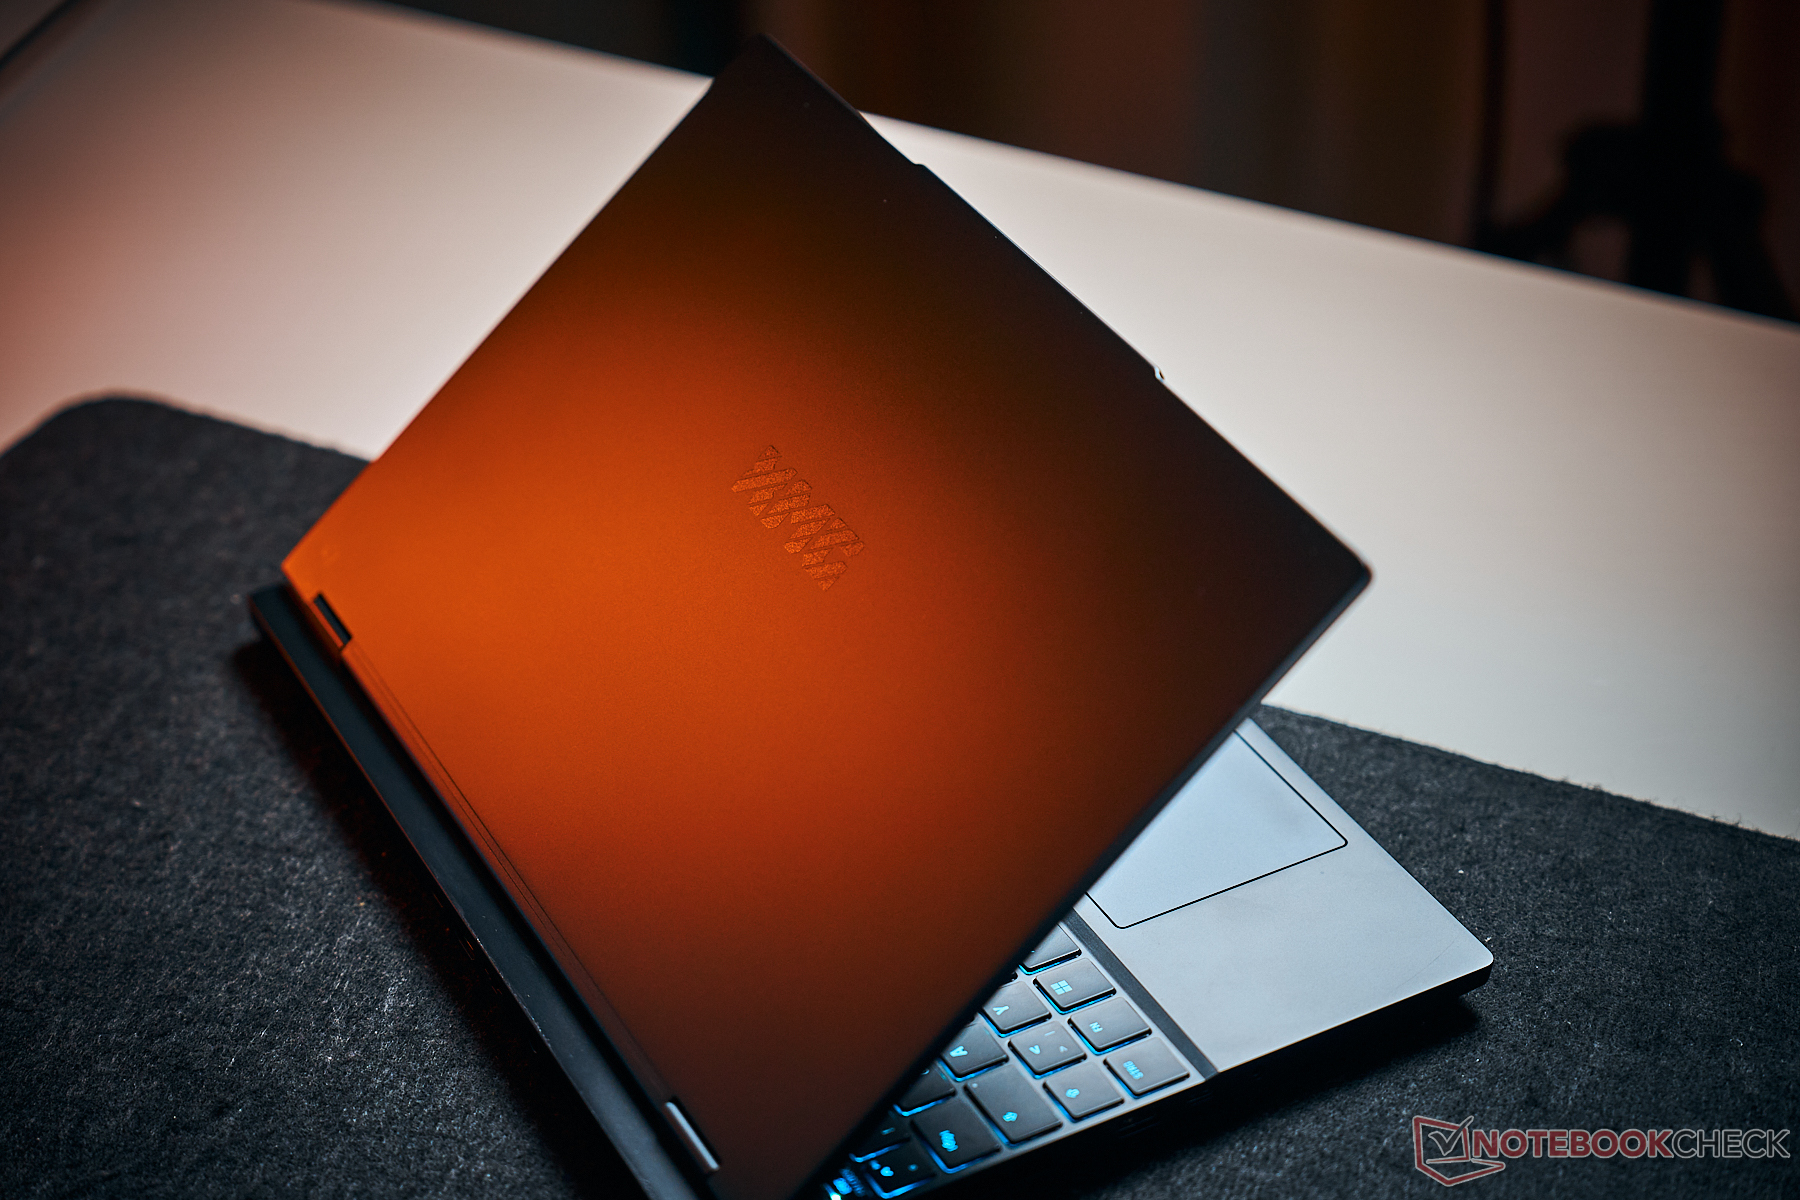
Schenker ha scelto un elegante case in alluminio nero opaco con superfici lisce. Il portatile non presenta elementi di design o strisce LED che attirino l'attenzione, solo la retroilluminazione della tastiera (RGB) dà un po' di colore al dispositivo. Il portatile si distinguerebbe a malapena in ambienti professionali.
Non abbiamo notato sporgenze di materiale e tutti gli spazi sono perfettamente allineati. L'unità base e il coperchio possono essere leggermente ruotati, ma non è nulla di eccezionale. Premendo sul retro del coperchio non si ottiene alcun cambiamento di immagine. Le cerniere rigide consentono un angolo di apertura massimo di 180 gradi. È possibile aprirlo con una sola mano.
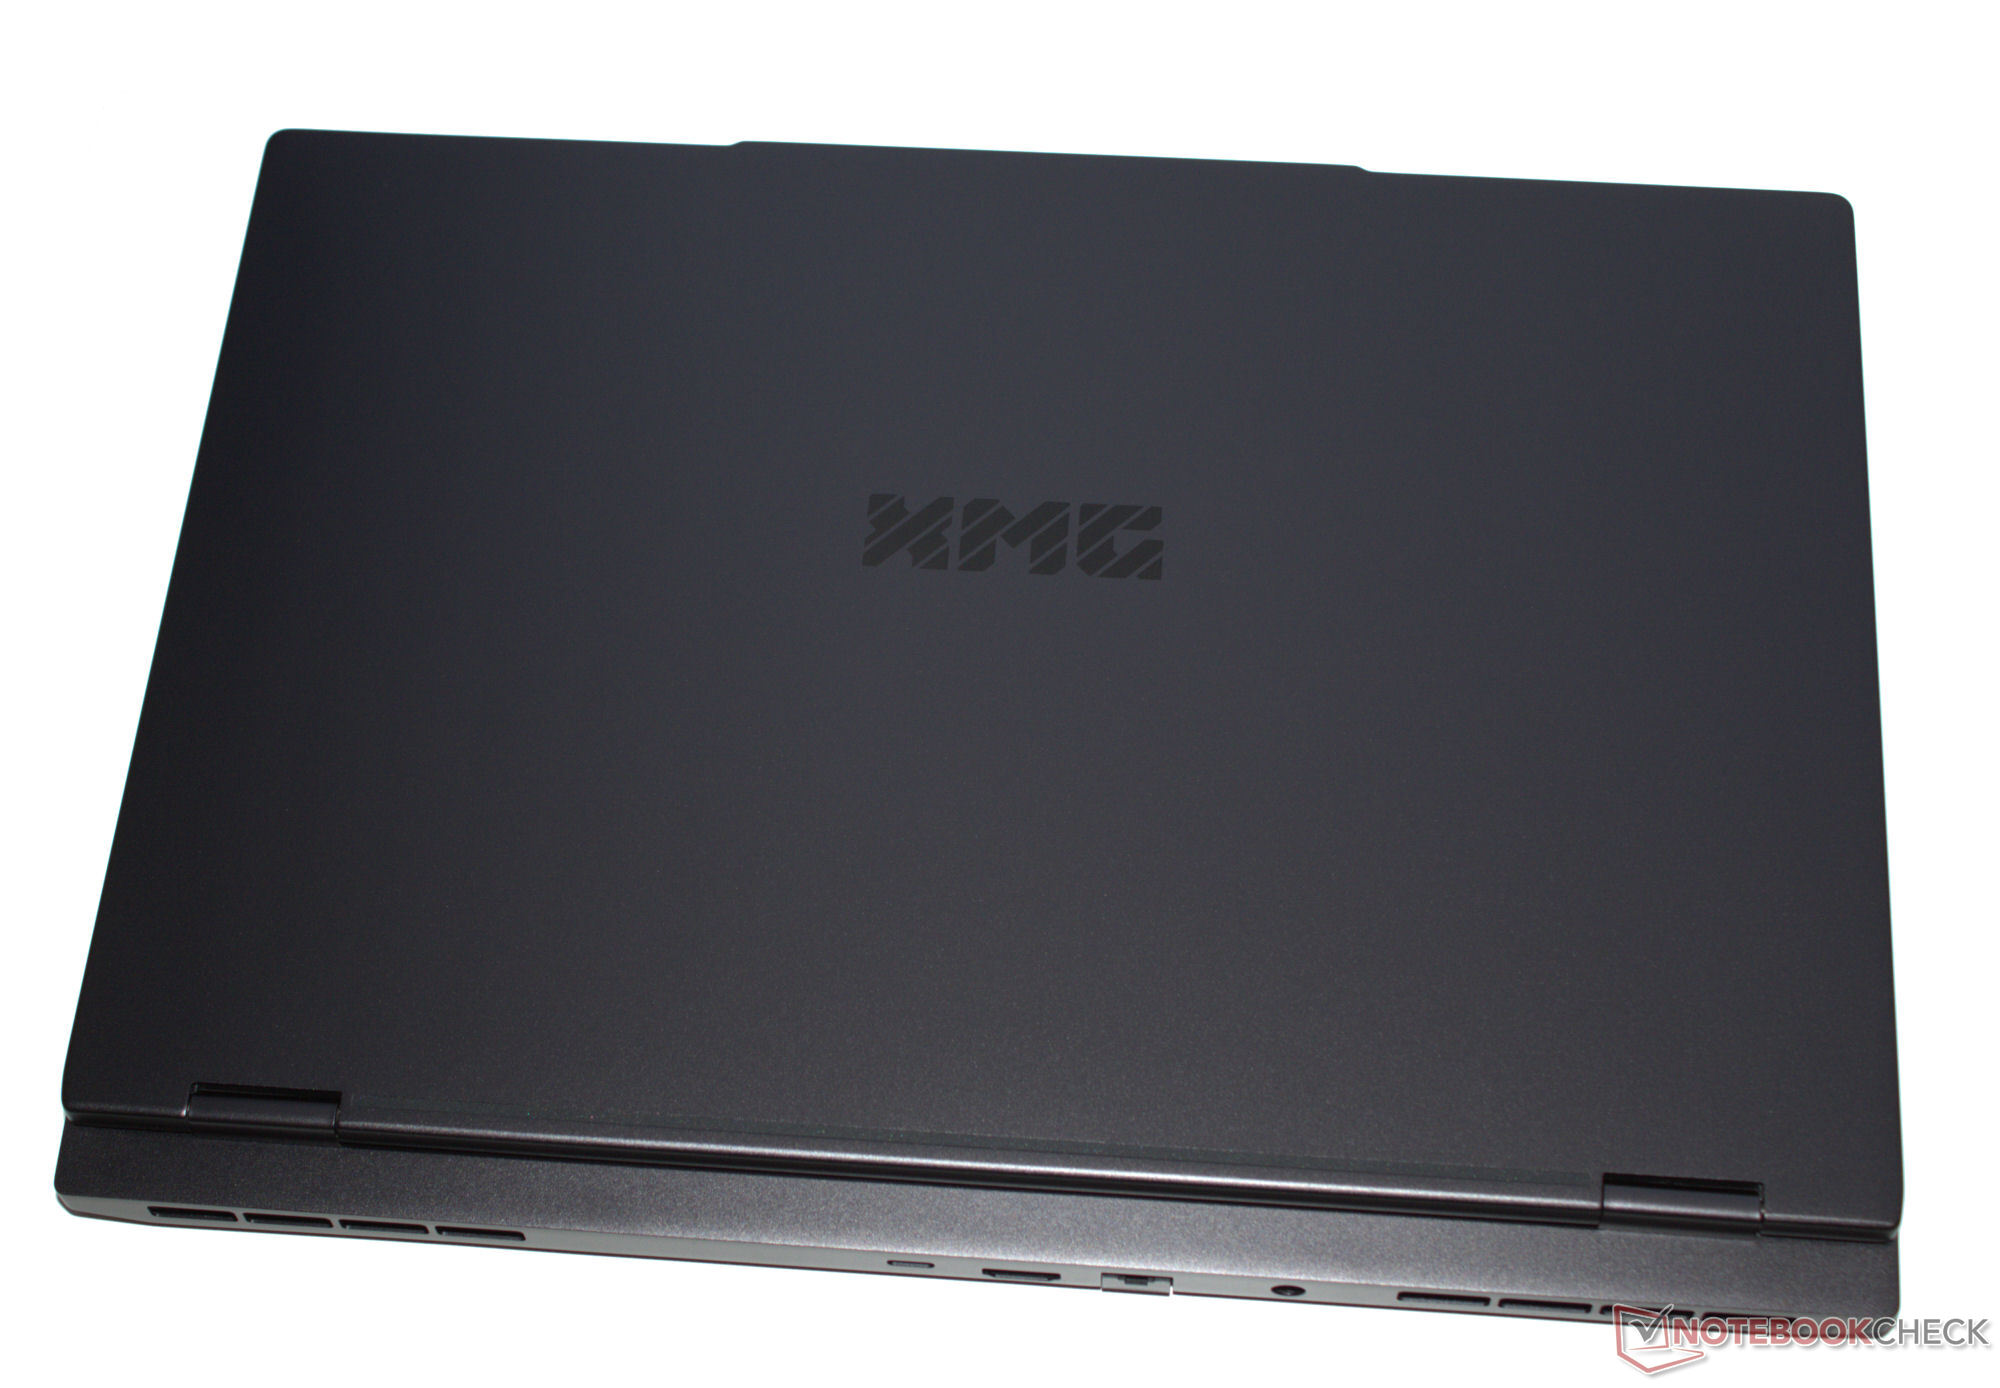
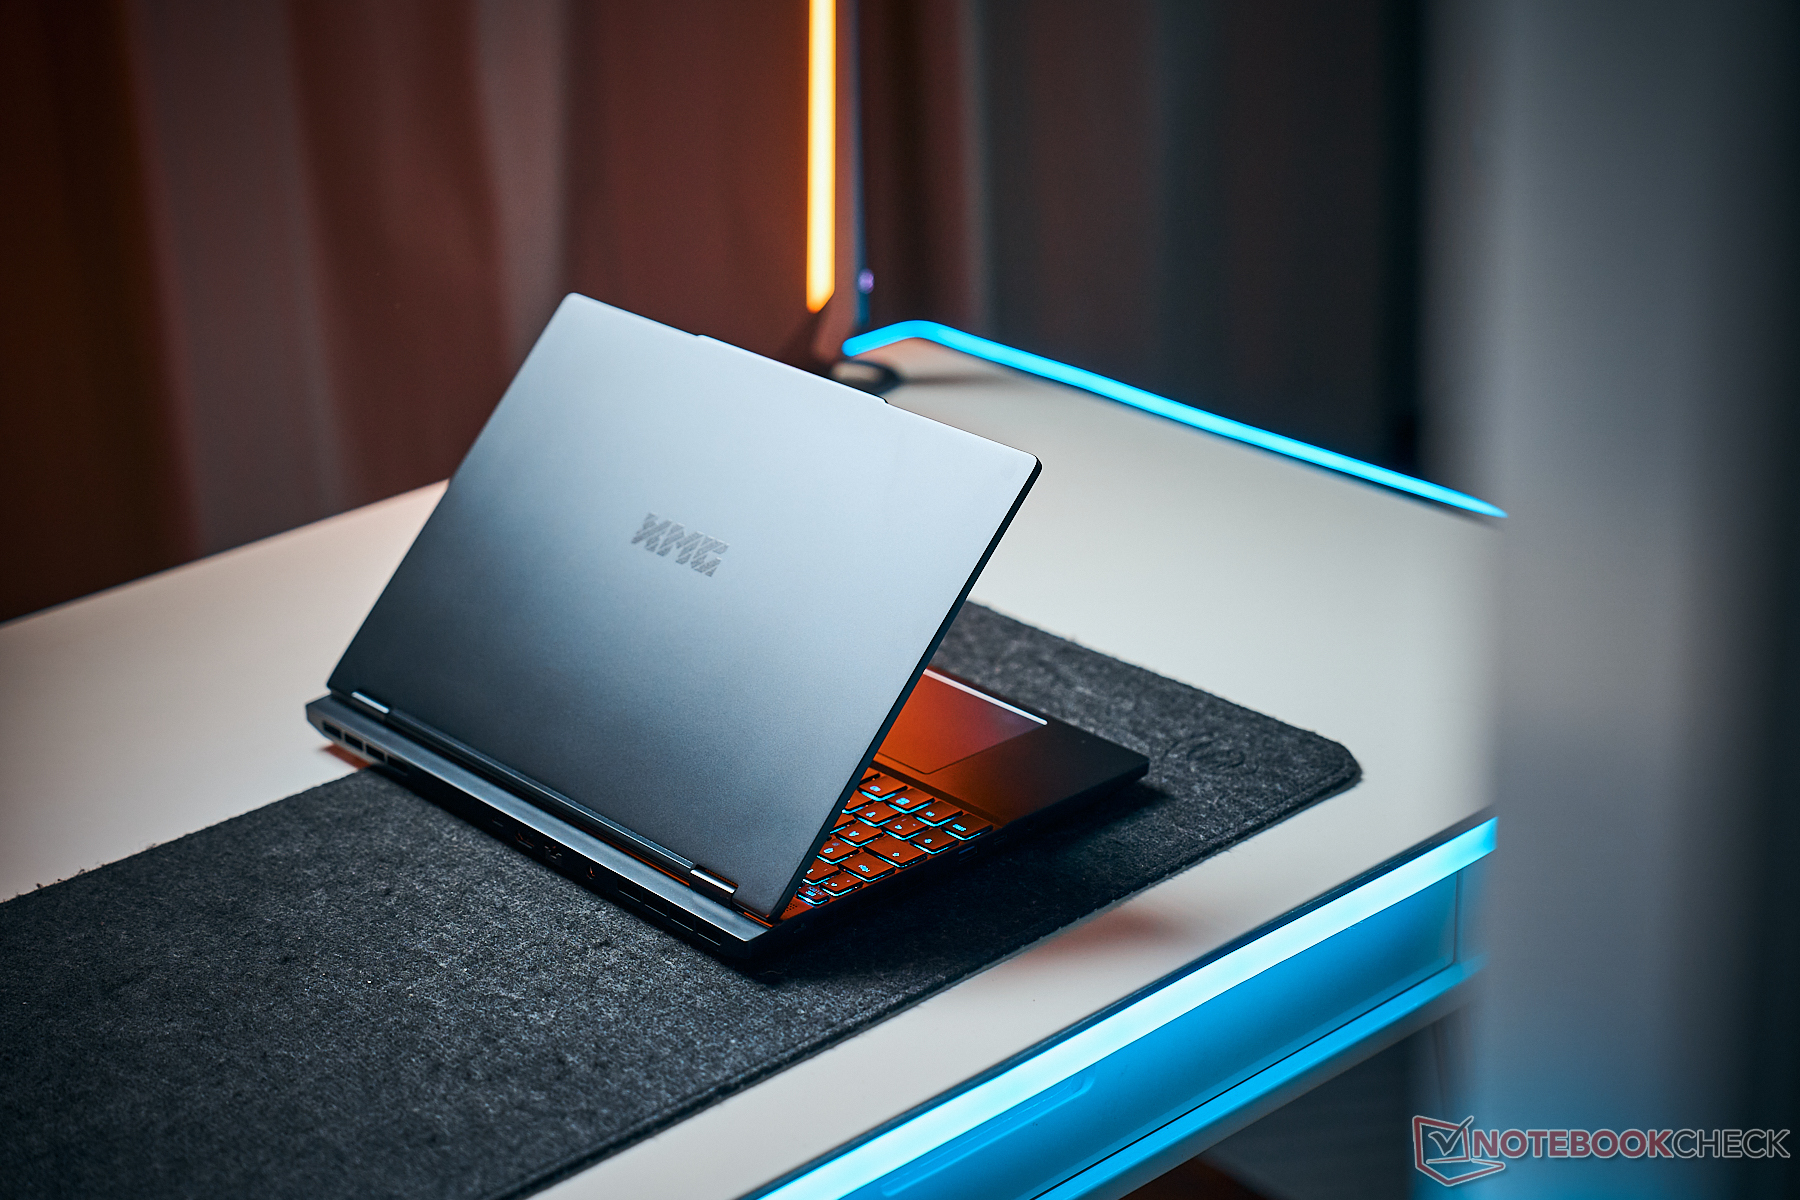
Non c'è da sorprendersi: Nel campo del confronto, il Fusion è il dispositivo più compatto, con il display più piccolo. Allo stesso tempo, è anche il più leggero di tutti.
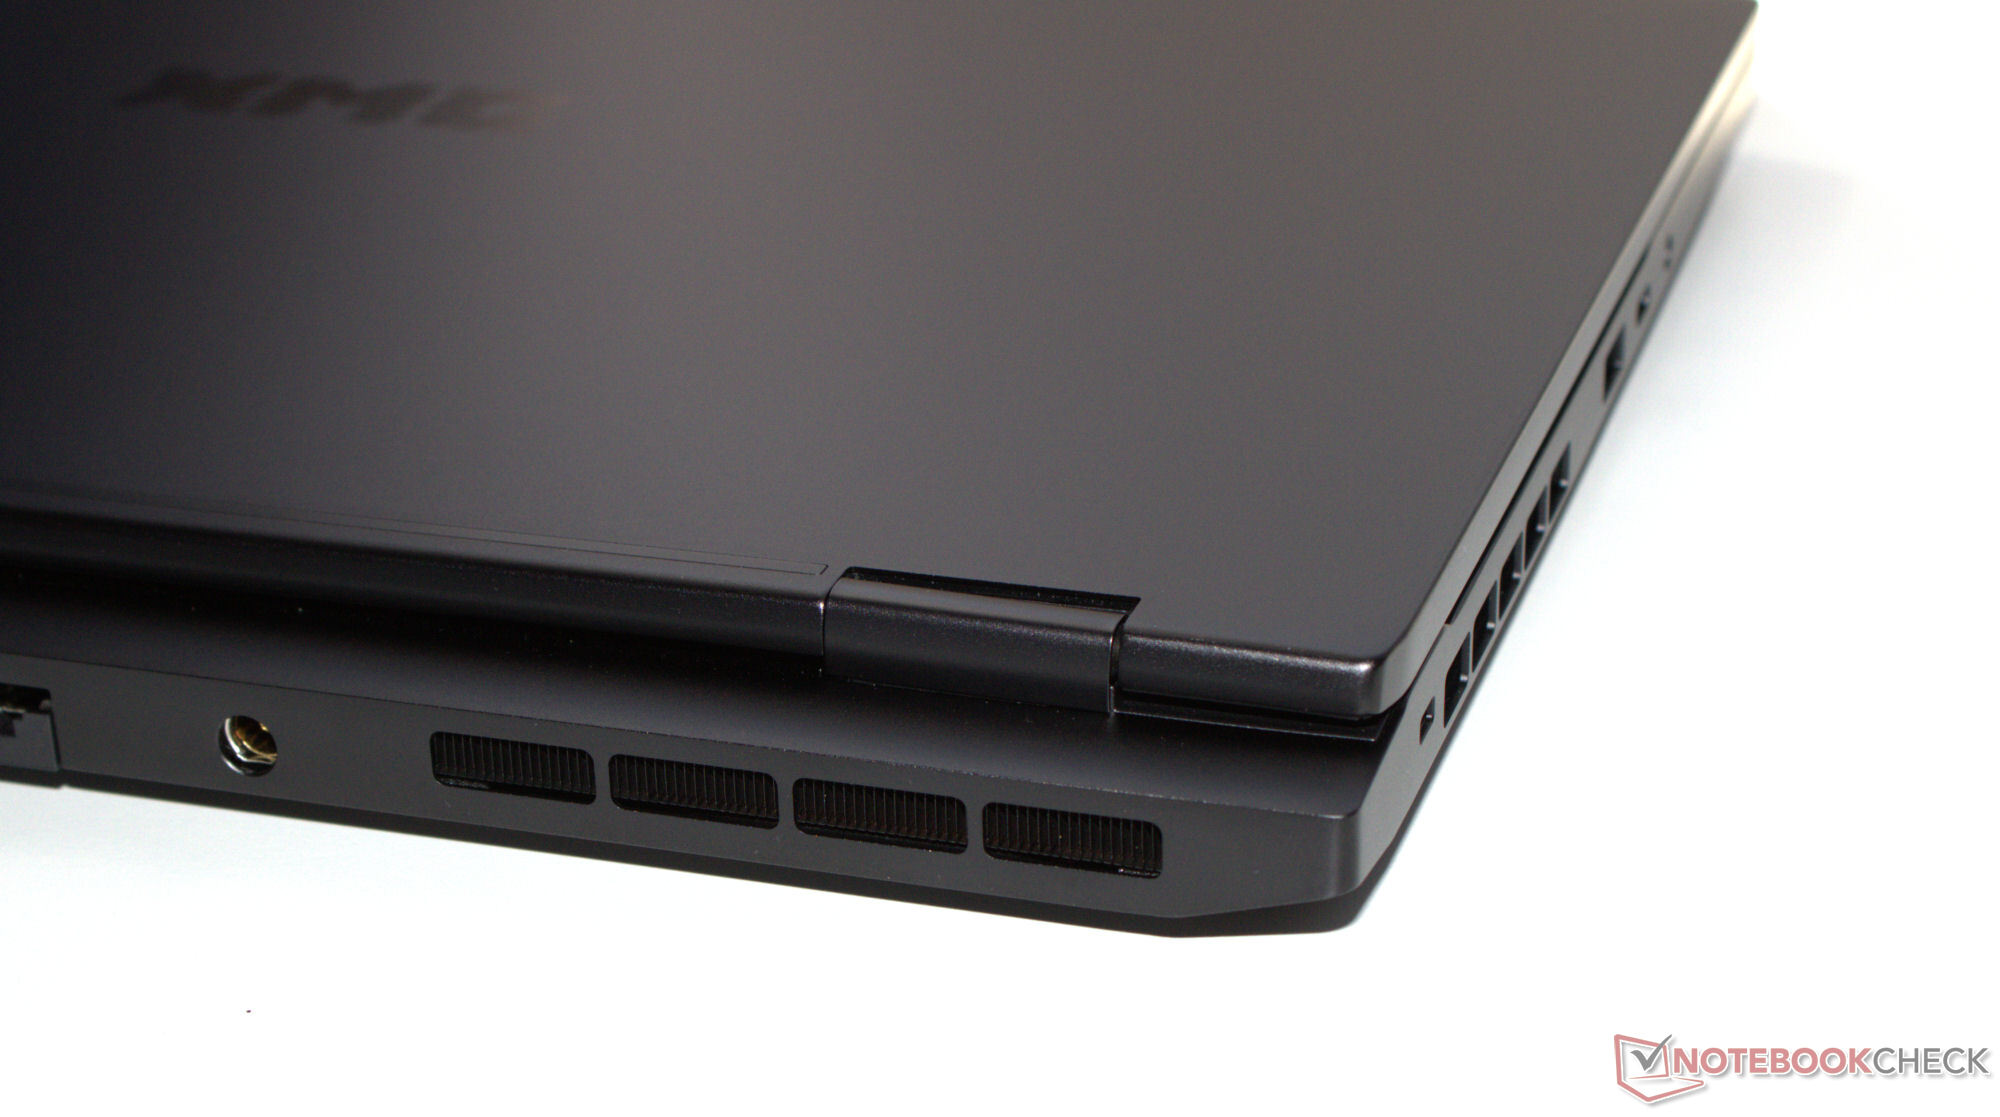
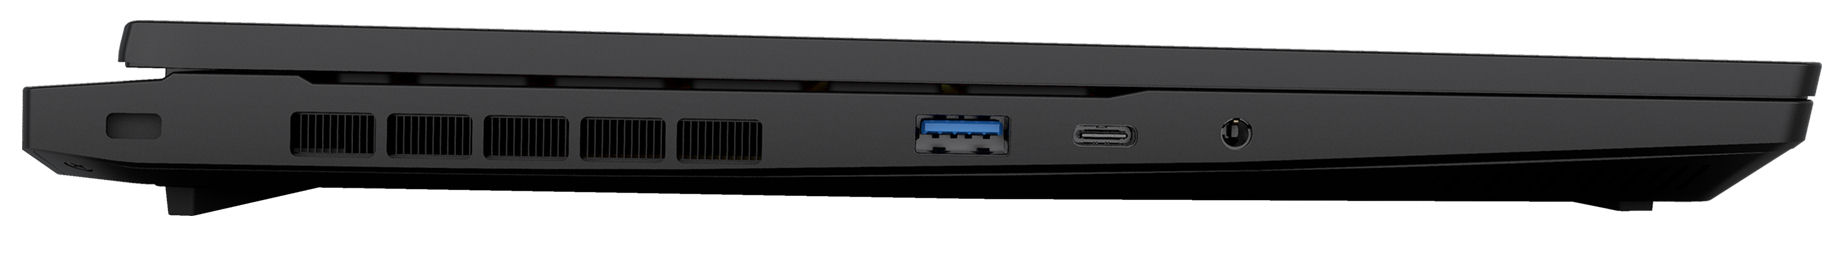
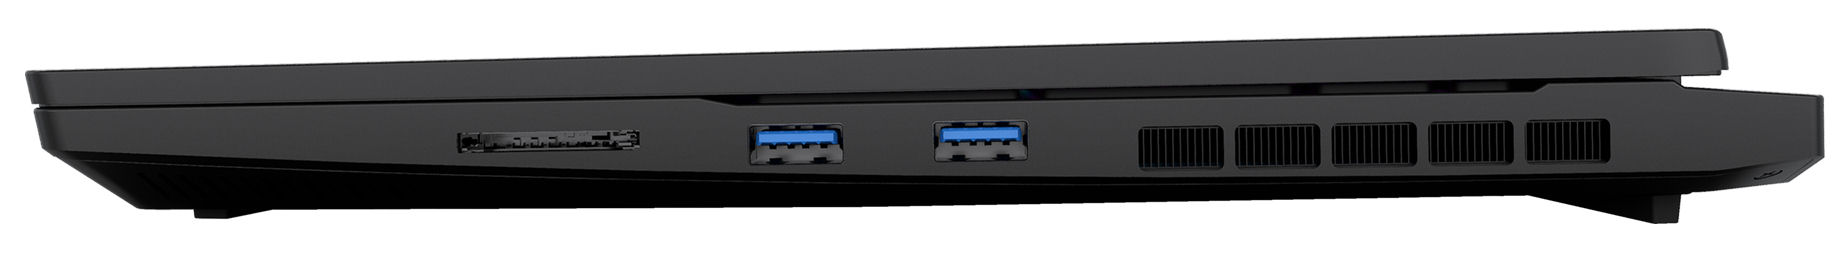
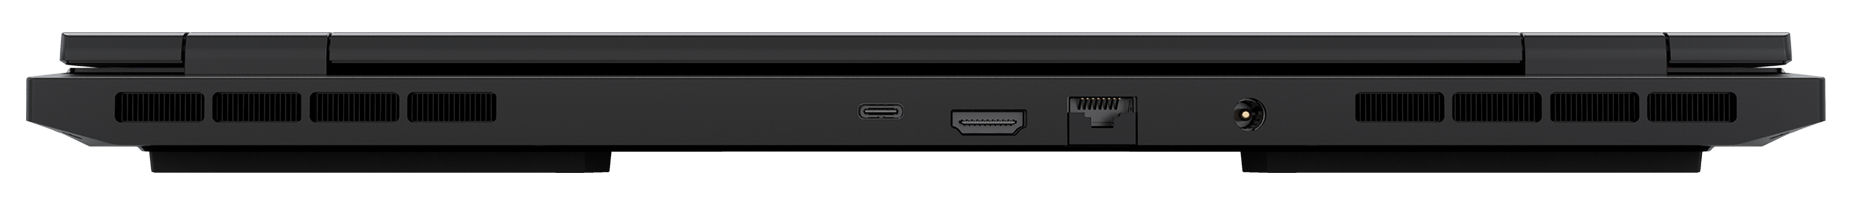
Connettività - Il Fusion 15 con Thunderbolt 4
Fusion dispone di tre porte USB-A (USB 3.2 Gen 1) e due porte USB-C (1x USB 3.2 Gen 1, 1x Thunderbolt 4). La porta TB4 supporta Power Delivery e può emettere un segnale DisplayPort. In totale, il portatile dispone di due uscite video (1x HDMI, 1x DP). Un jack audio e una porta Gigabit Ethernet completano le opzioni di connettività. Le uscite video e la connessione di alimentazione si trovano sul retro del dispositivo. I cavi corrispondenti escono dal retro, in modo da non essere d'intralcio.
Lettore di schede SD
Con velocità di trasferimento di 81 MB/s (trasferimento di 250 immagini jpg, ciascuna di 5 MB) e 82 MB/s (copia di grandi blocchi di dati), il lettore di schede SD (scheda di riferimento: AV PRO microSD 128 GB V60) è di velocità media. La concorrenza offre in gran parte lettori più veloci.
| SD Card Reader | |
| average JPG Copy Test (av. of 3 runs) | |
| Aorus 16X 2024 (AV PRO microSD 128 GB V60) | |
| Media della classe Gaming (19 - 202, n=96, ultimi 2 anni) | |
| SCHENKER XMG Fusion 15 (Early 24) (AV PRO microSD 128 GB V60) | |
| Alienware m16 R2 (AV PRO microSD 128 GB V60) | |
| maximum AS SSD Seq Read Test (1GB) | |
| Alienware m16 R2 (AV PRO microSD 128 GB V60) | |
| Aorus 16X 2024 (AV PRO microSD 128 GB V60) | |
| Media della classe Gaming (25.8 - 269, n=91, ultimi 2 anni) | |
| SCHENKER XMG Fusion 15 (Early 24) (AV PRO microSD 128 GB V60) | |
Comunicazione
Fusion utilizza un chip WiFi 6E (Intel AX211) che, nel migliore dei casi (nessun dispositivo WiFi nelle vicinanze, breve distanza tra il portatile e il server), raggiunge velocità di trasmissione dati molto buone. Le connessioni cablate sono gestite da un controller Gigabit Ethernet (YT6801) di Motorcomm, un produttore che non abbiamo mai incontrato prima.
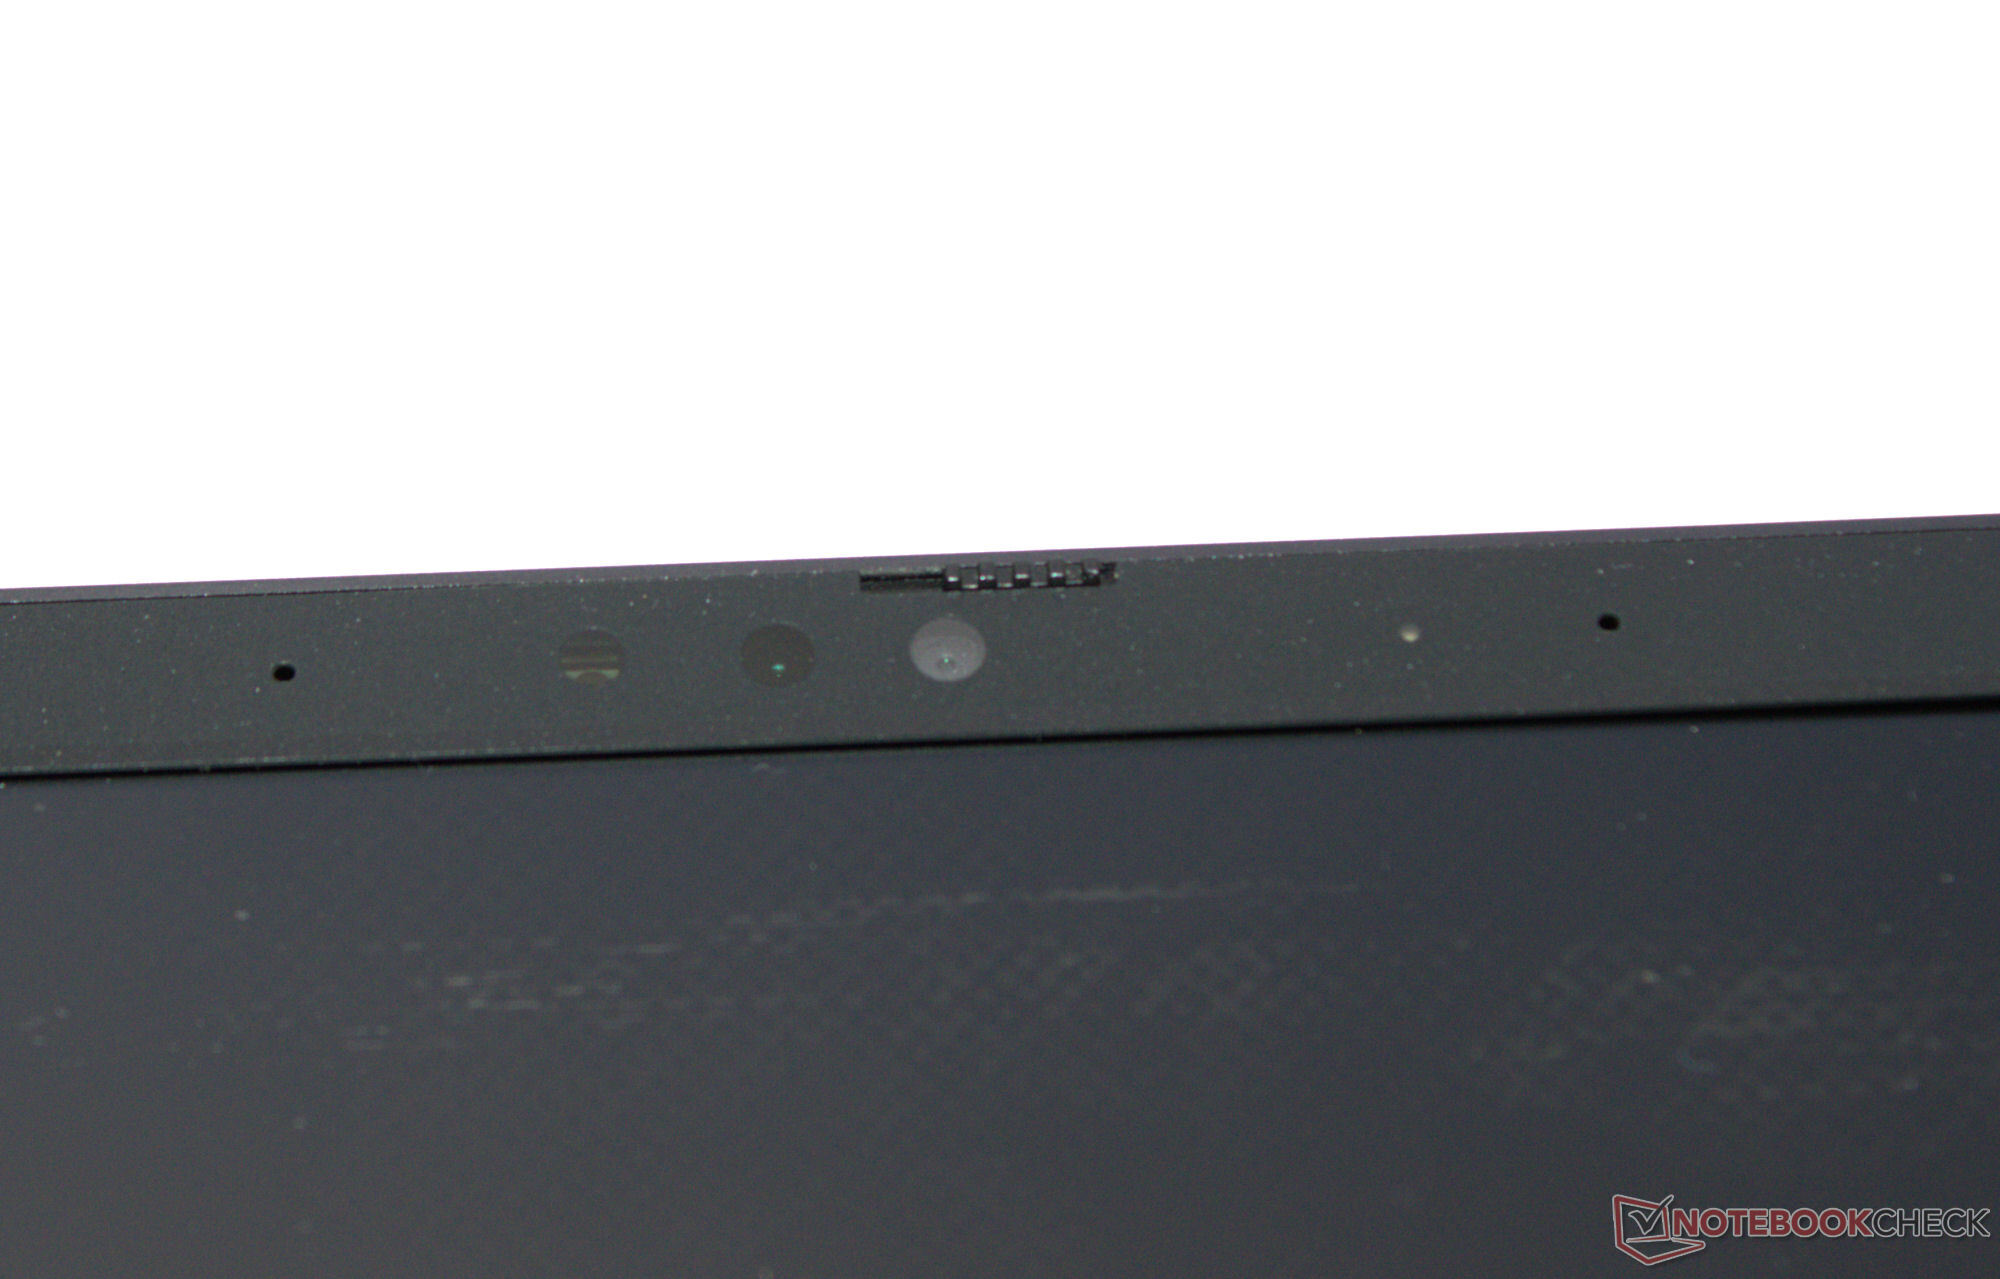
Webcam
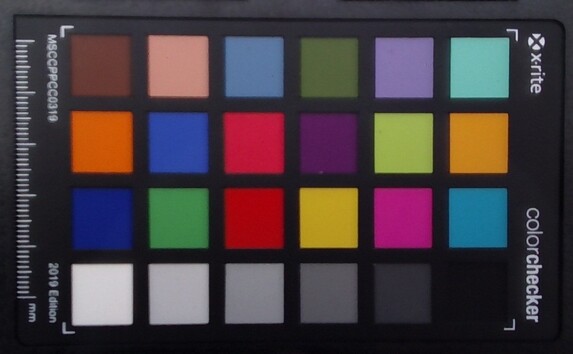
La sua webcam (2,1 MP) è di qualità media. Fallisce quando si tratta di accuratezza del colore: Con una deviazione di circa 9, il valore target (DeltaE<3) è stato mancato. Tuttavia, supporta Windows Hello. Inoltre, è dotato di una cover meccanica.
 NVIDIA GeForce RTX 4070 Laptop GPU, i9-14900HX, Samsung 990 Pro 1 TB")
 NVIDIA GeForce RTX 4070 Laptop GPU, i9-14900HX, Samsung 990 Pro 1 TB")
Accessori
Il portatile viene consegnato con una chiavetta USB (driver, manuali), adesivi e un mousepad.
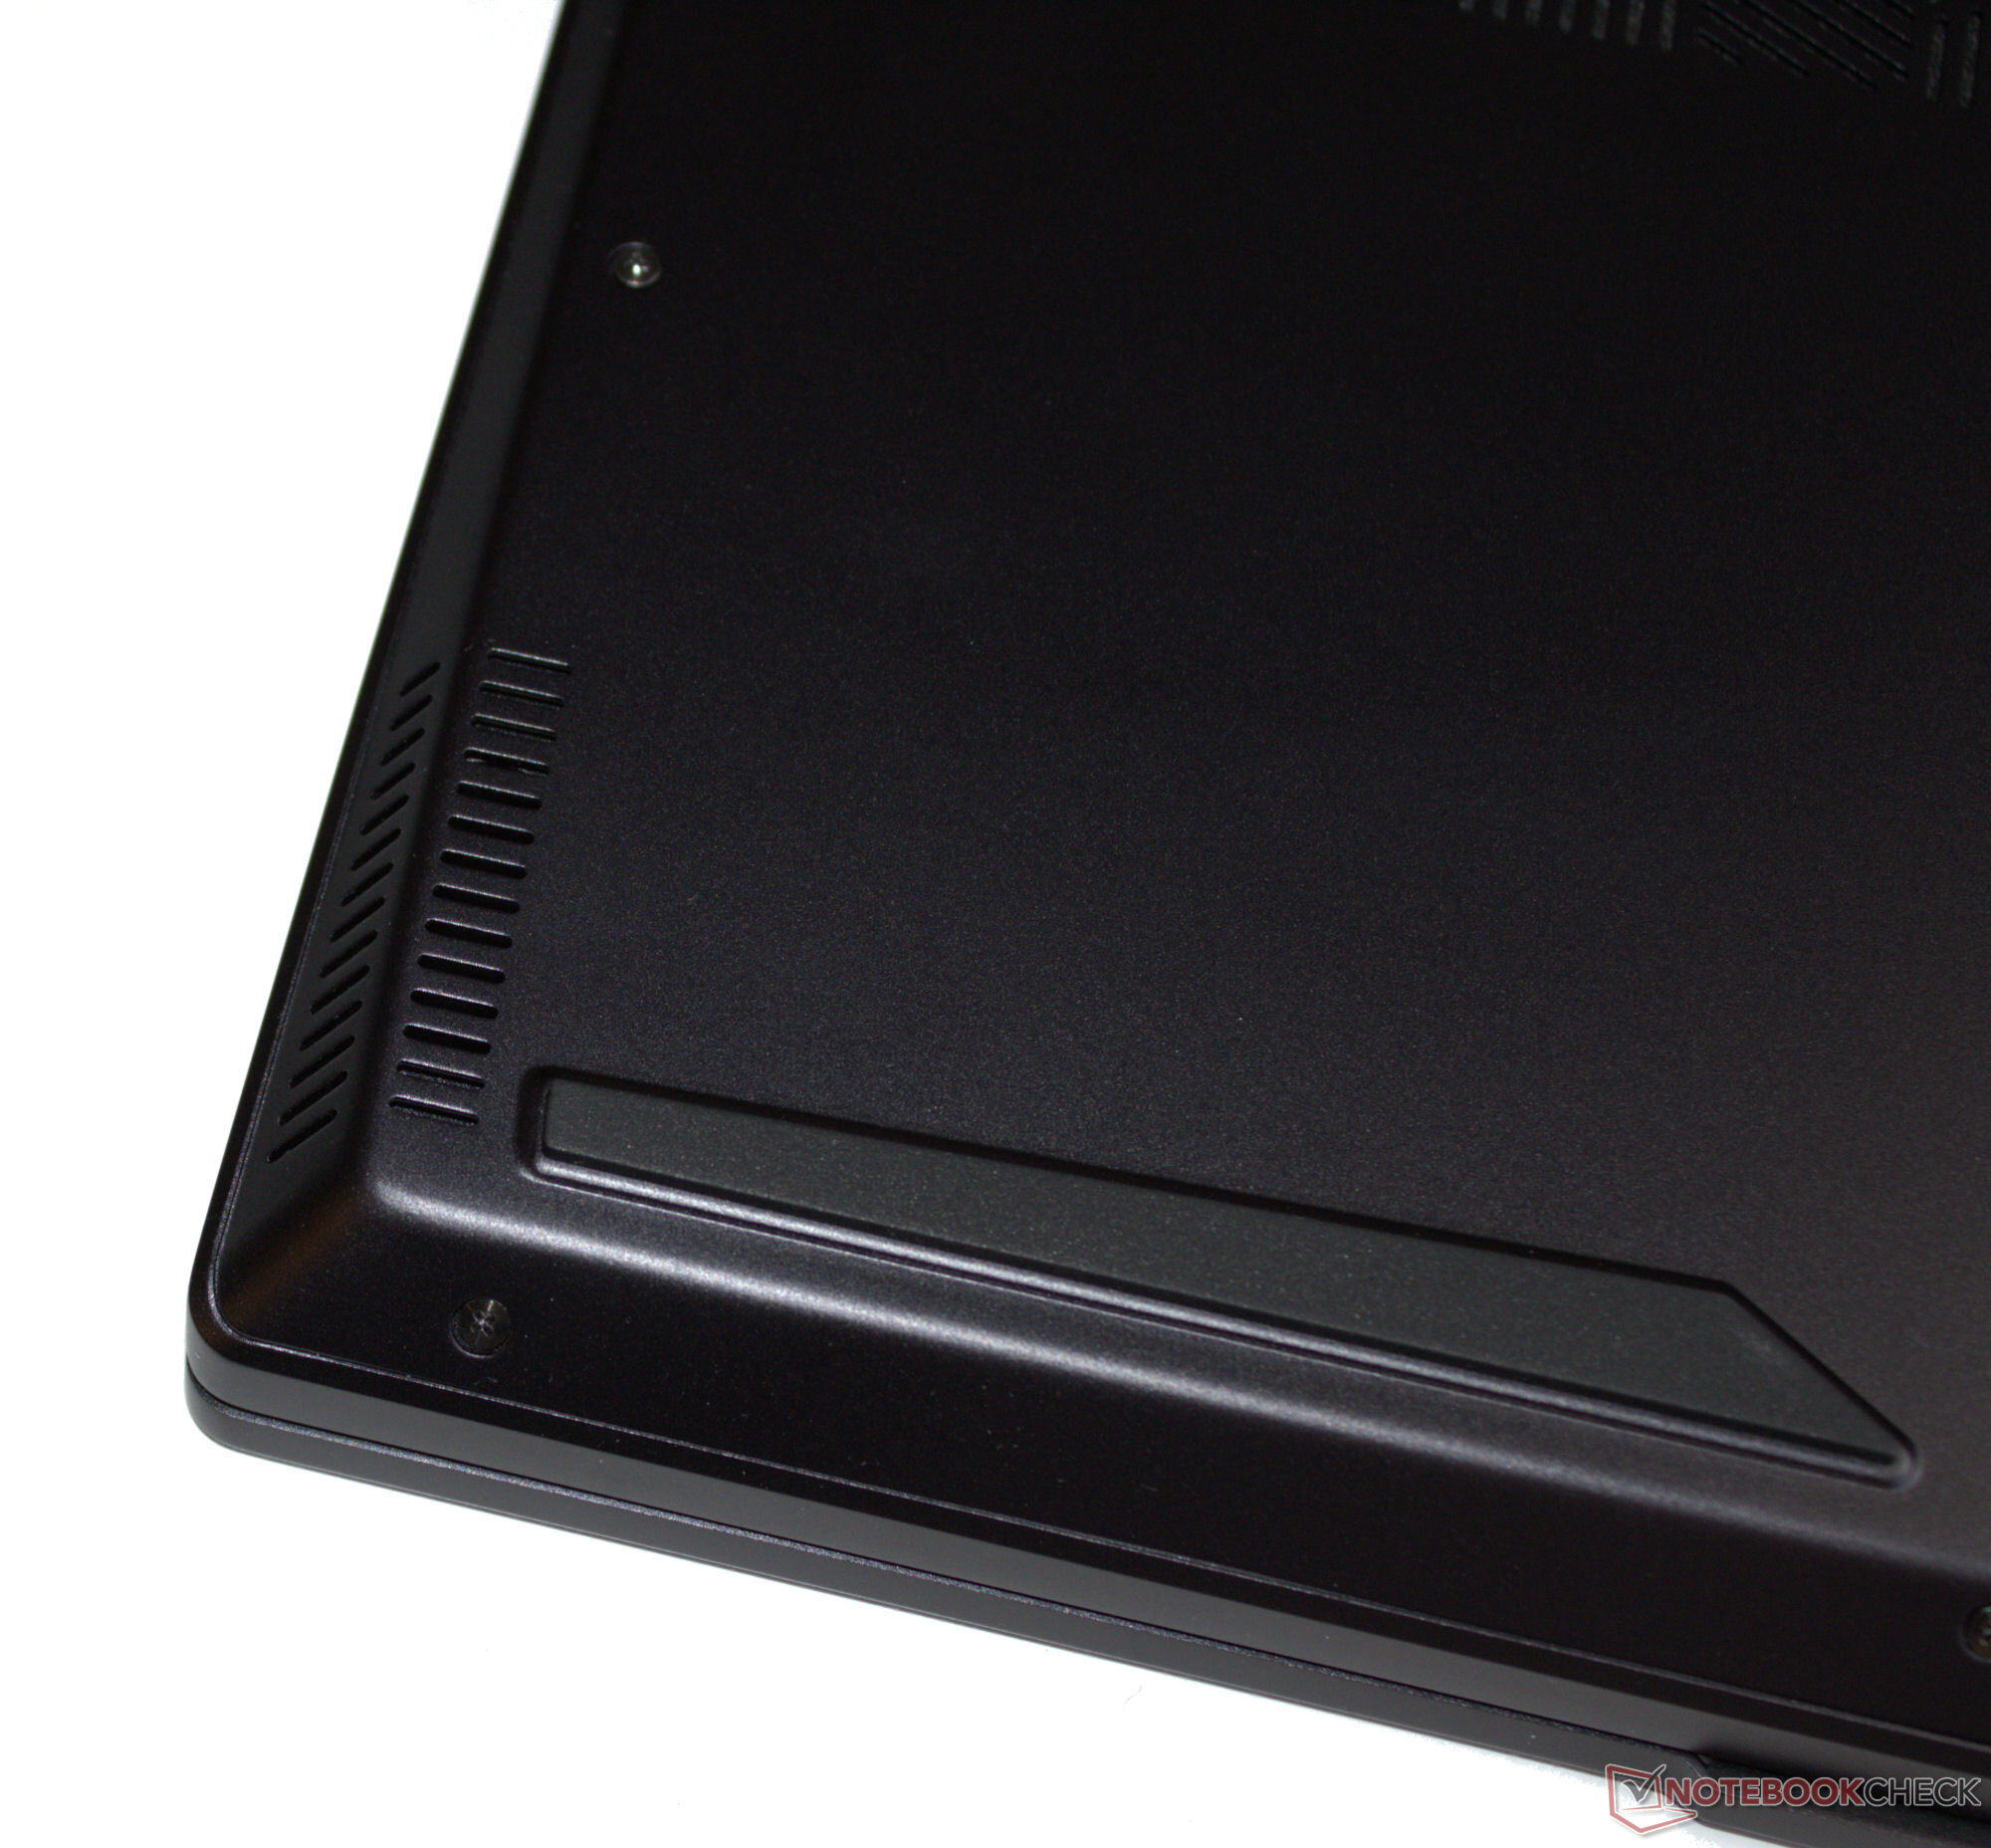
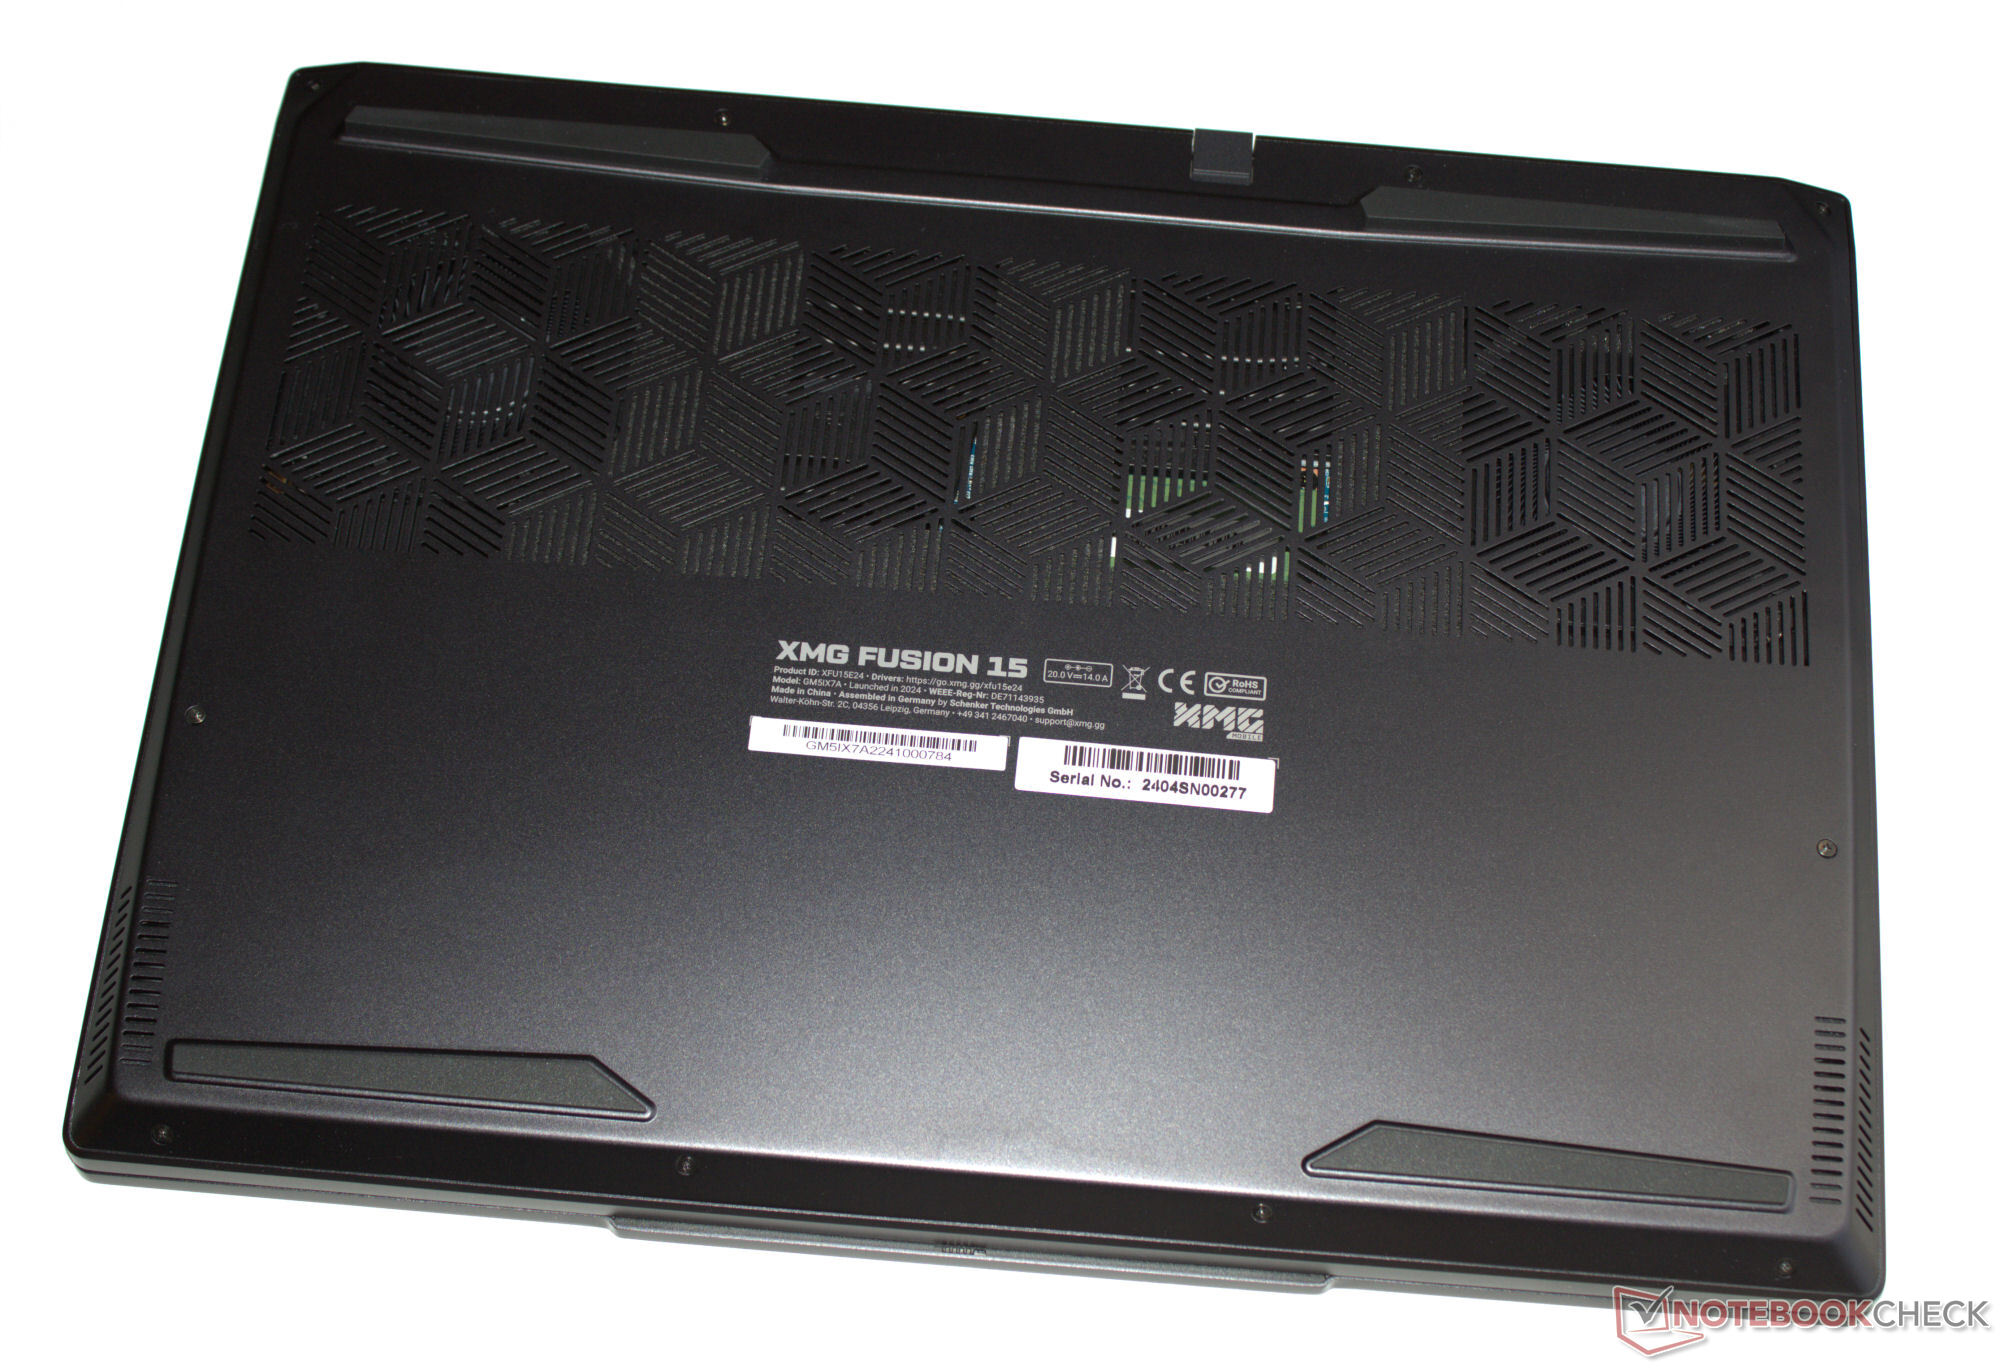
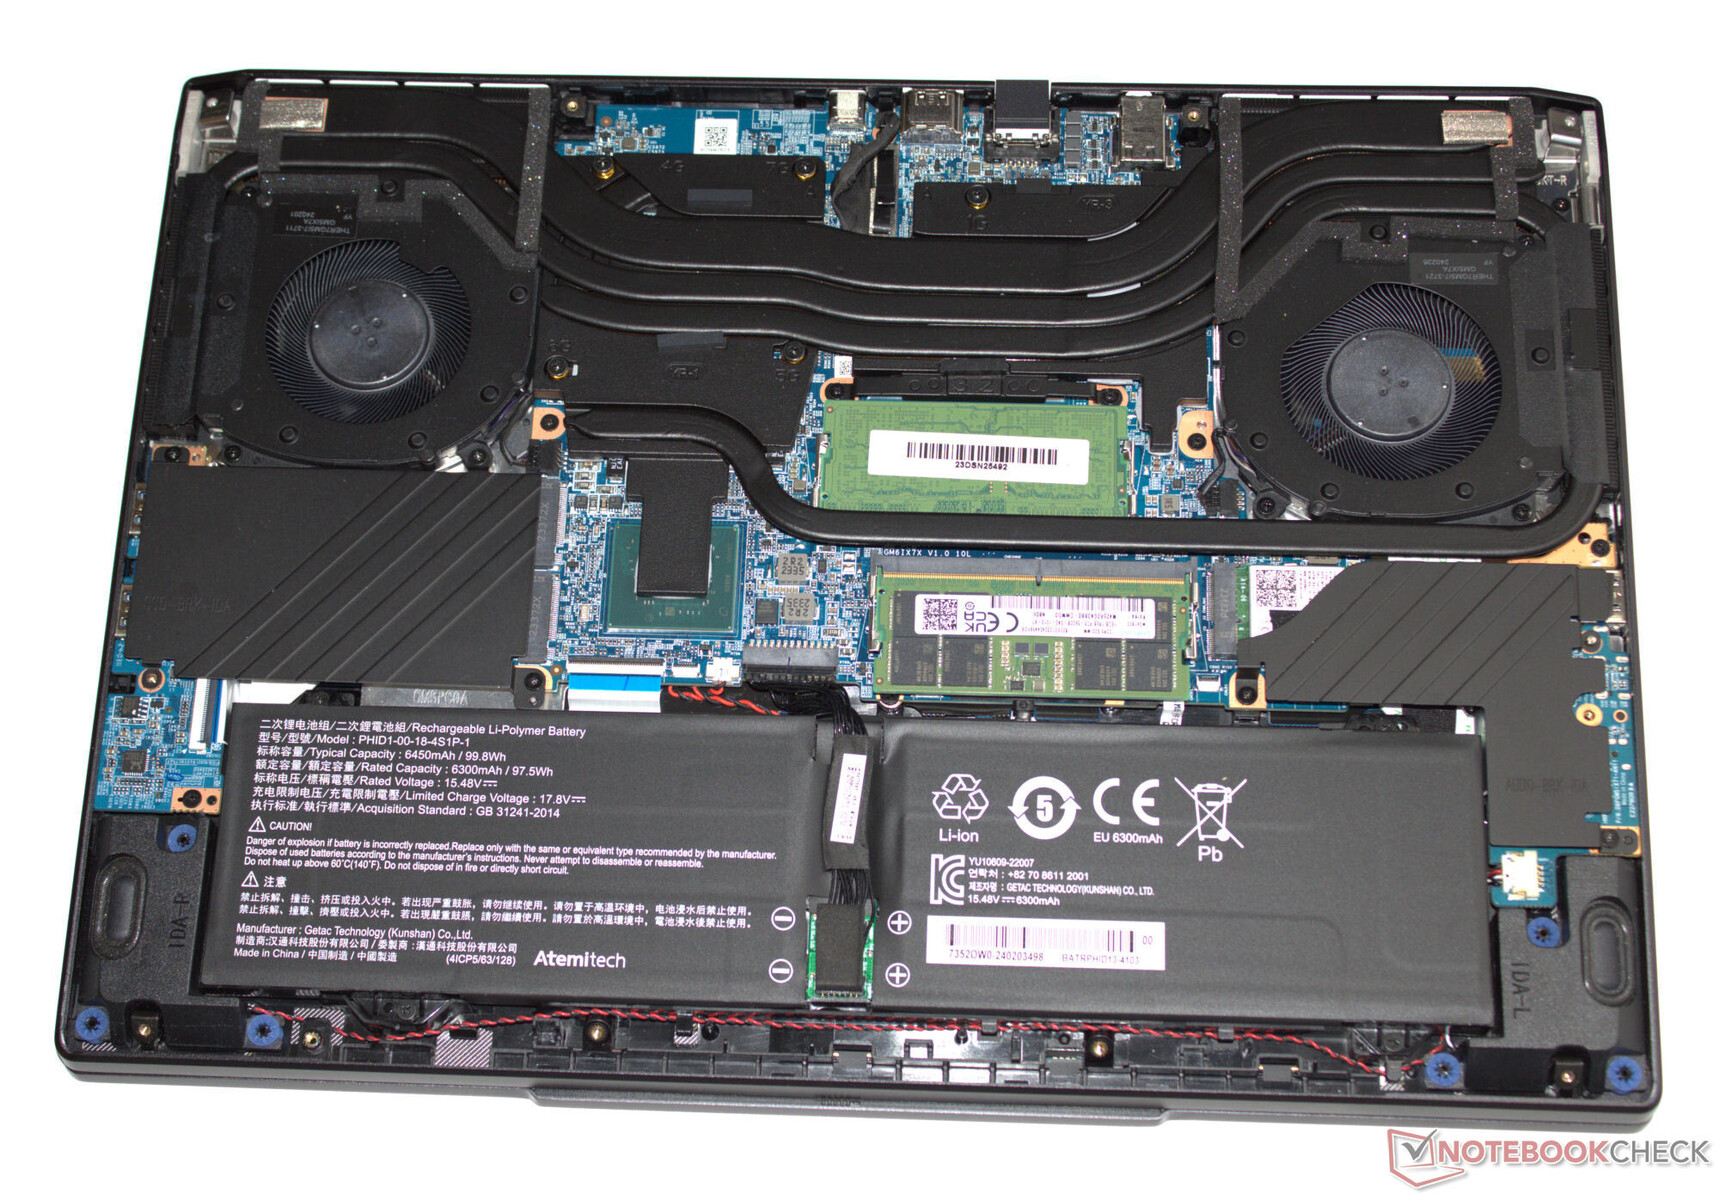
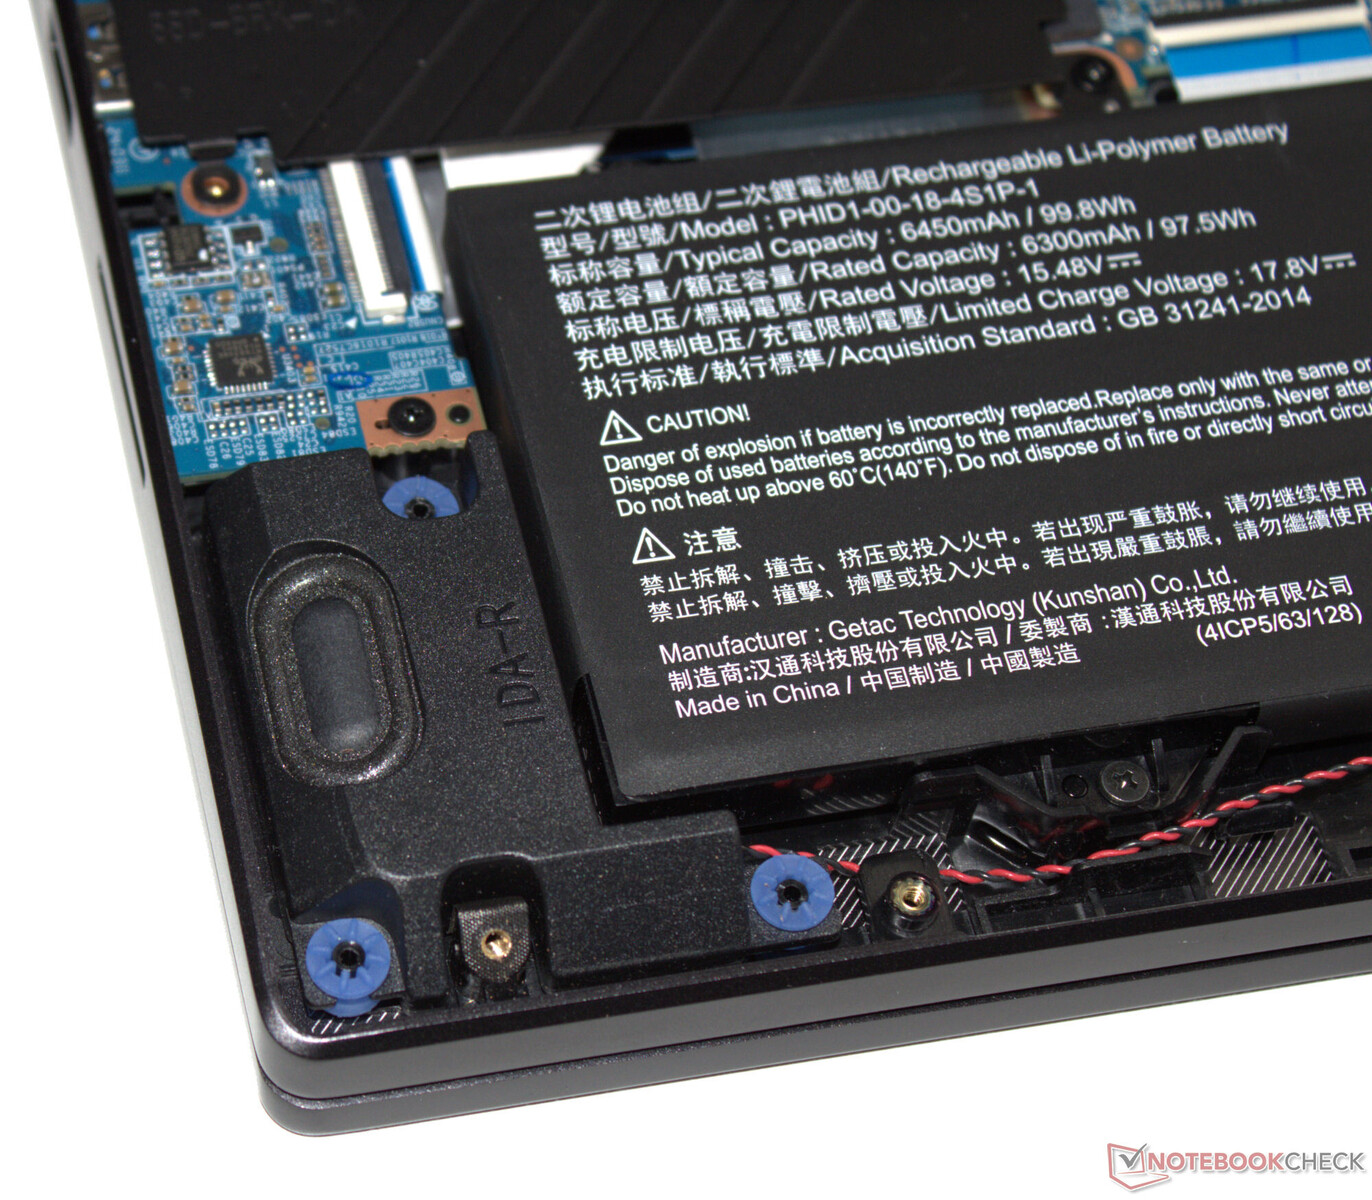
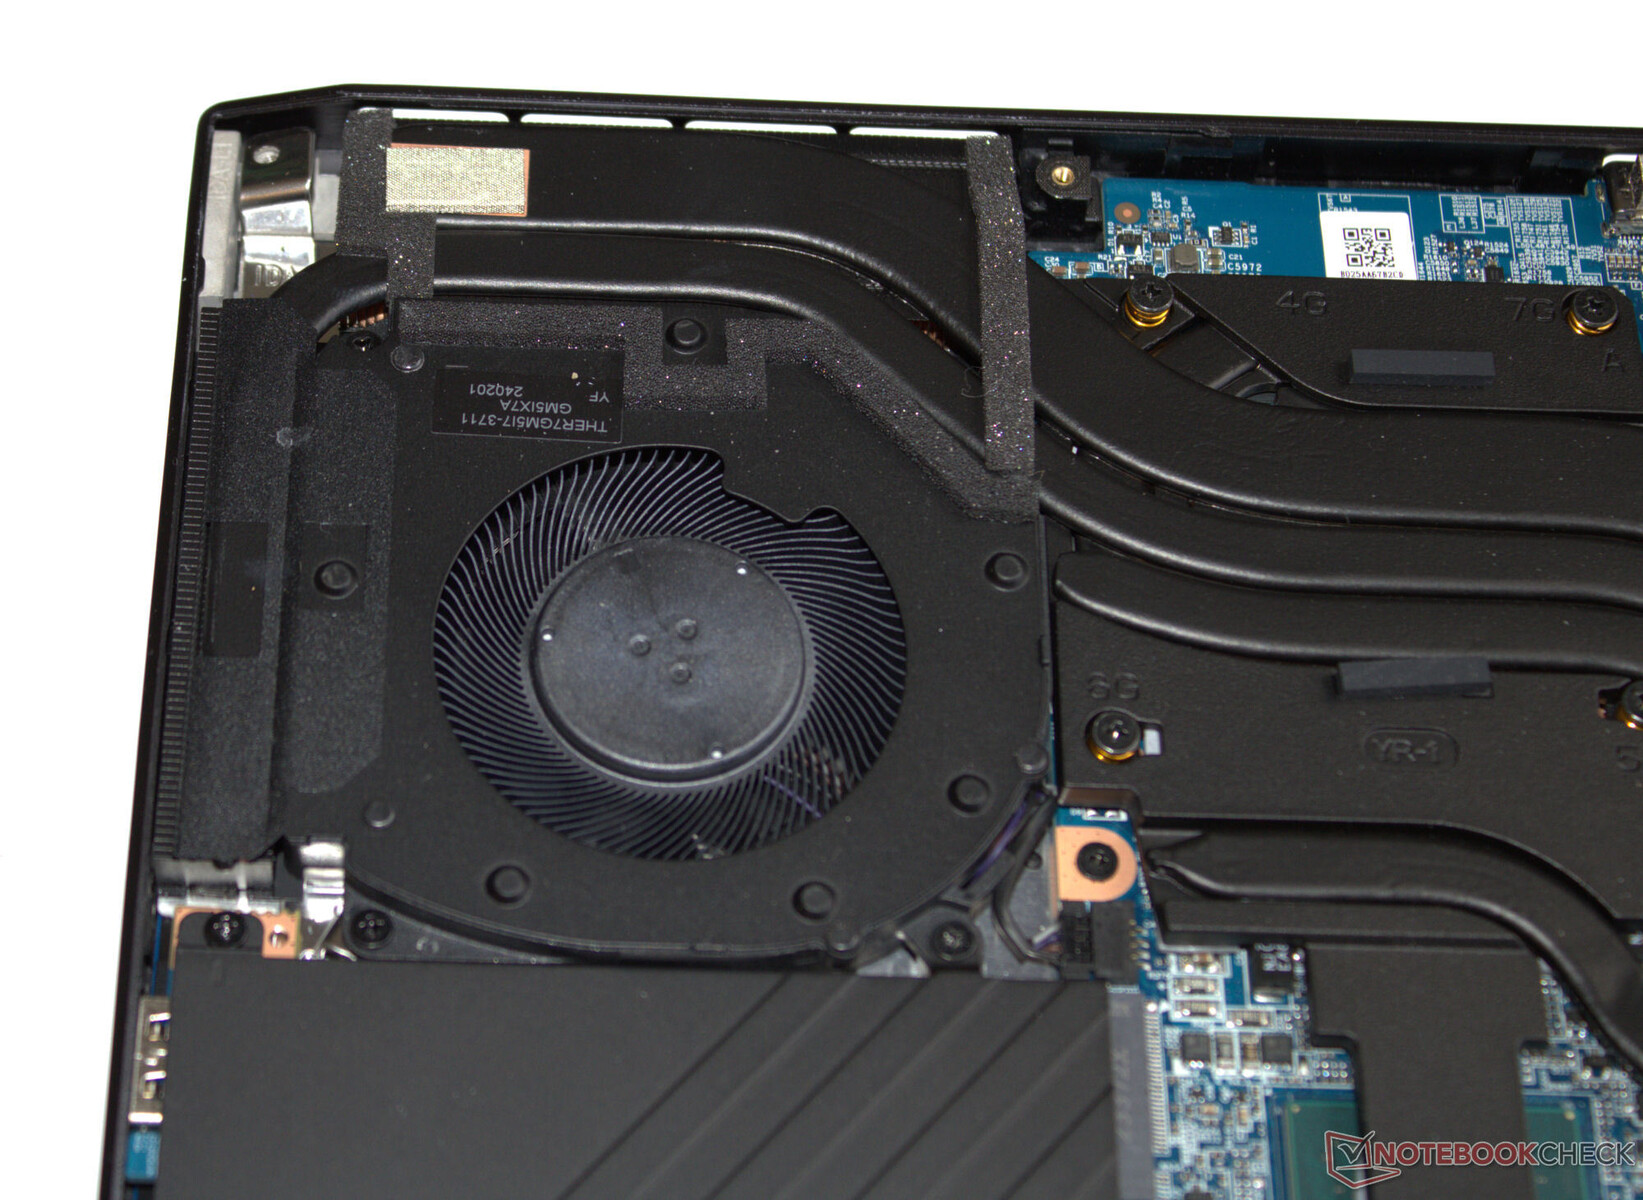
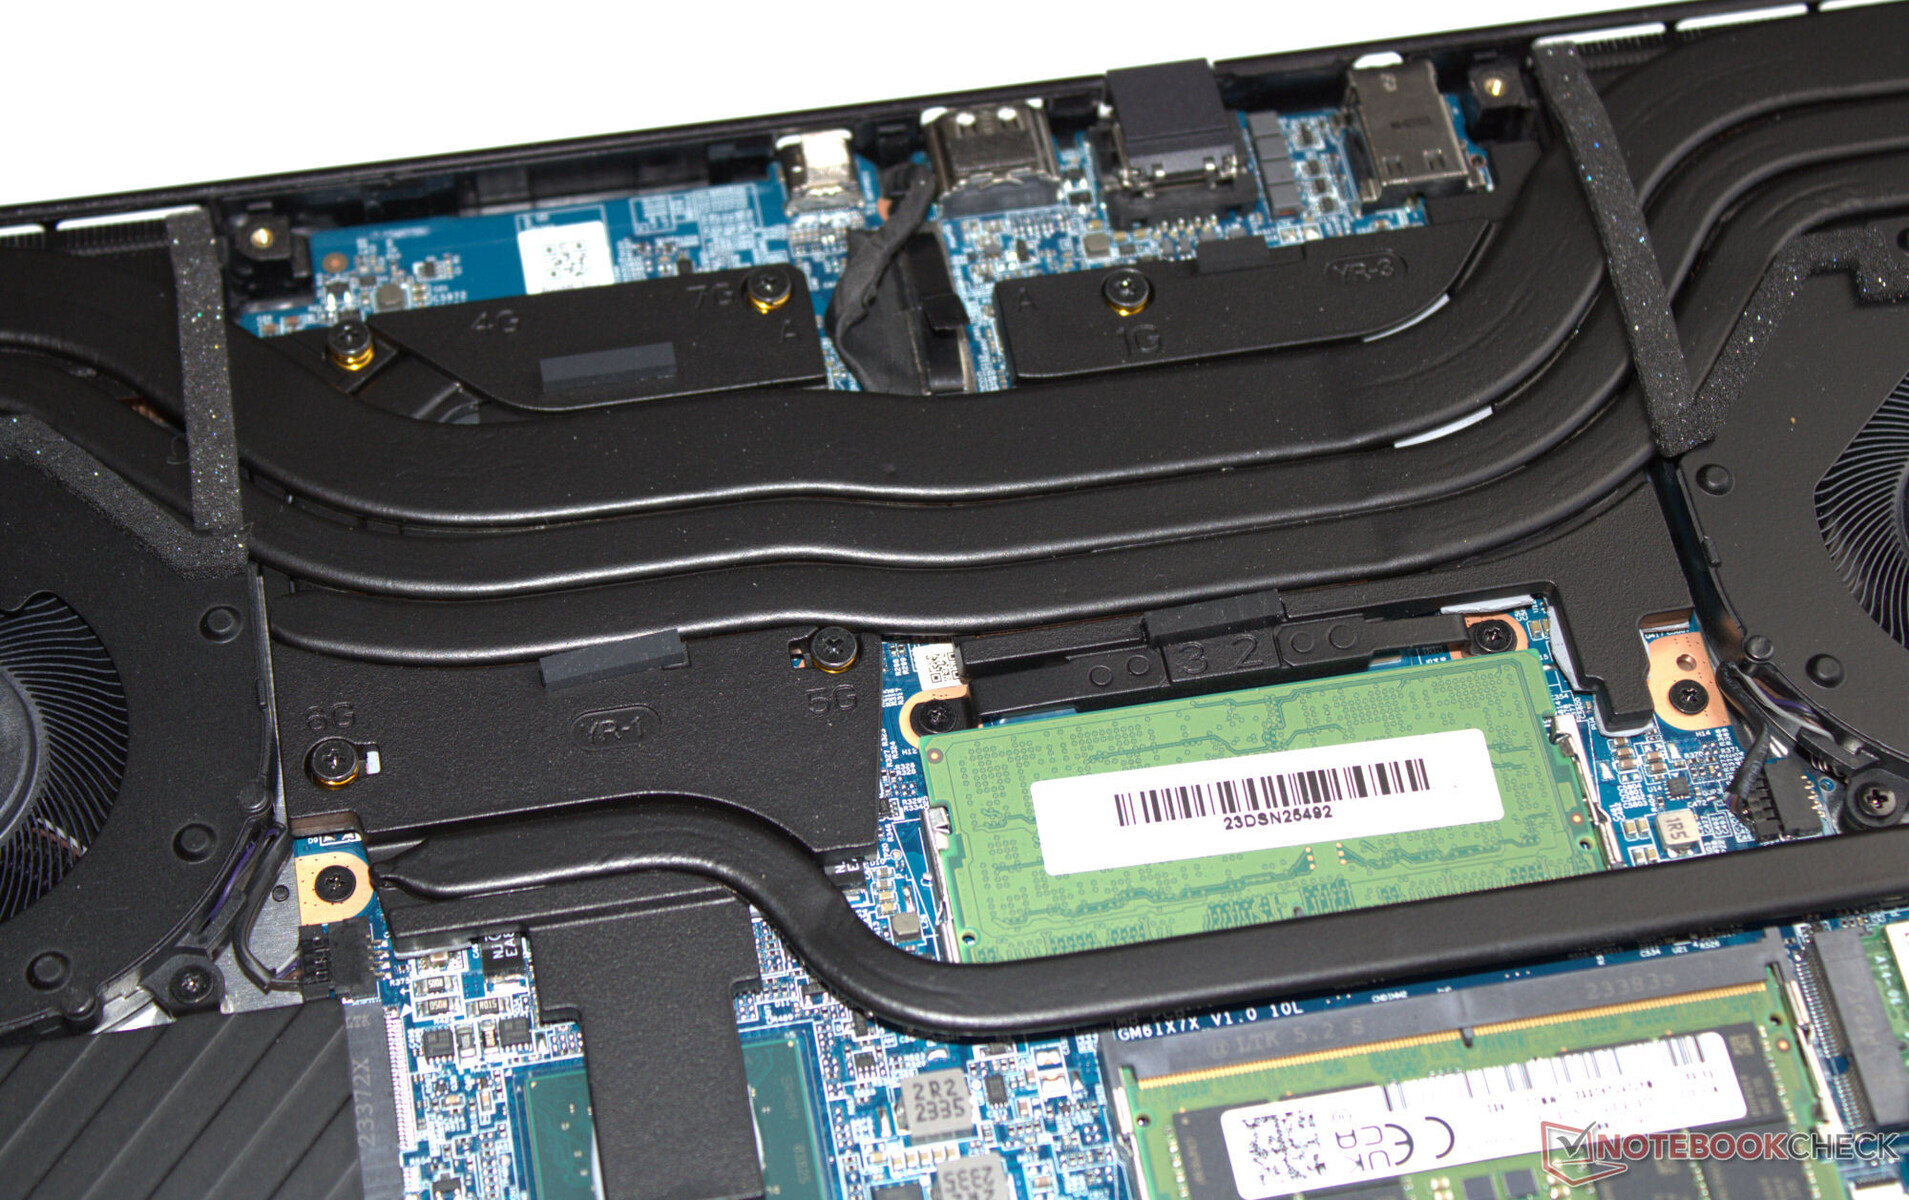
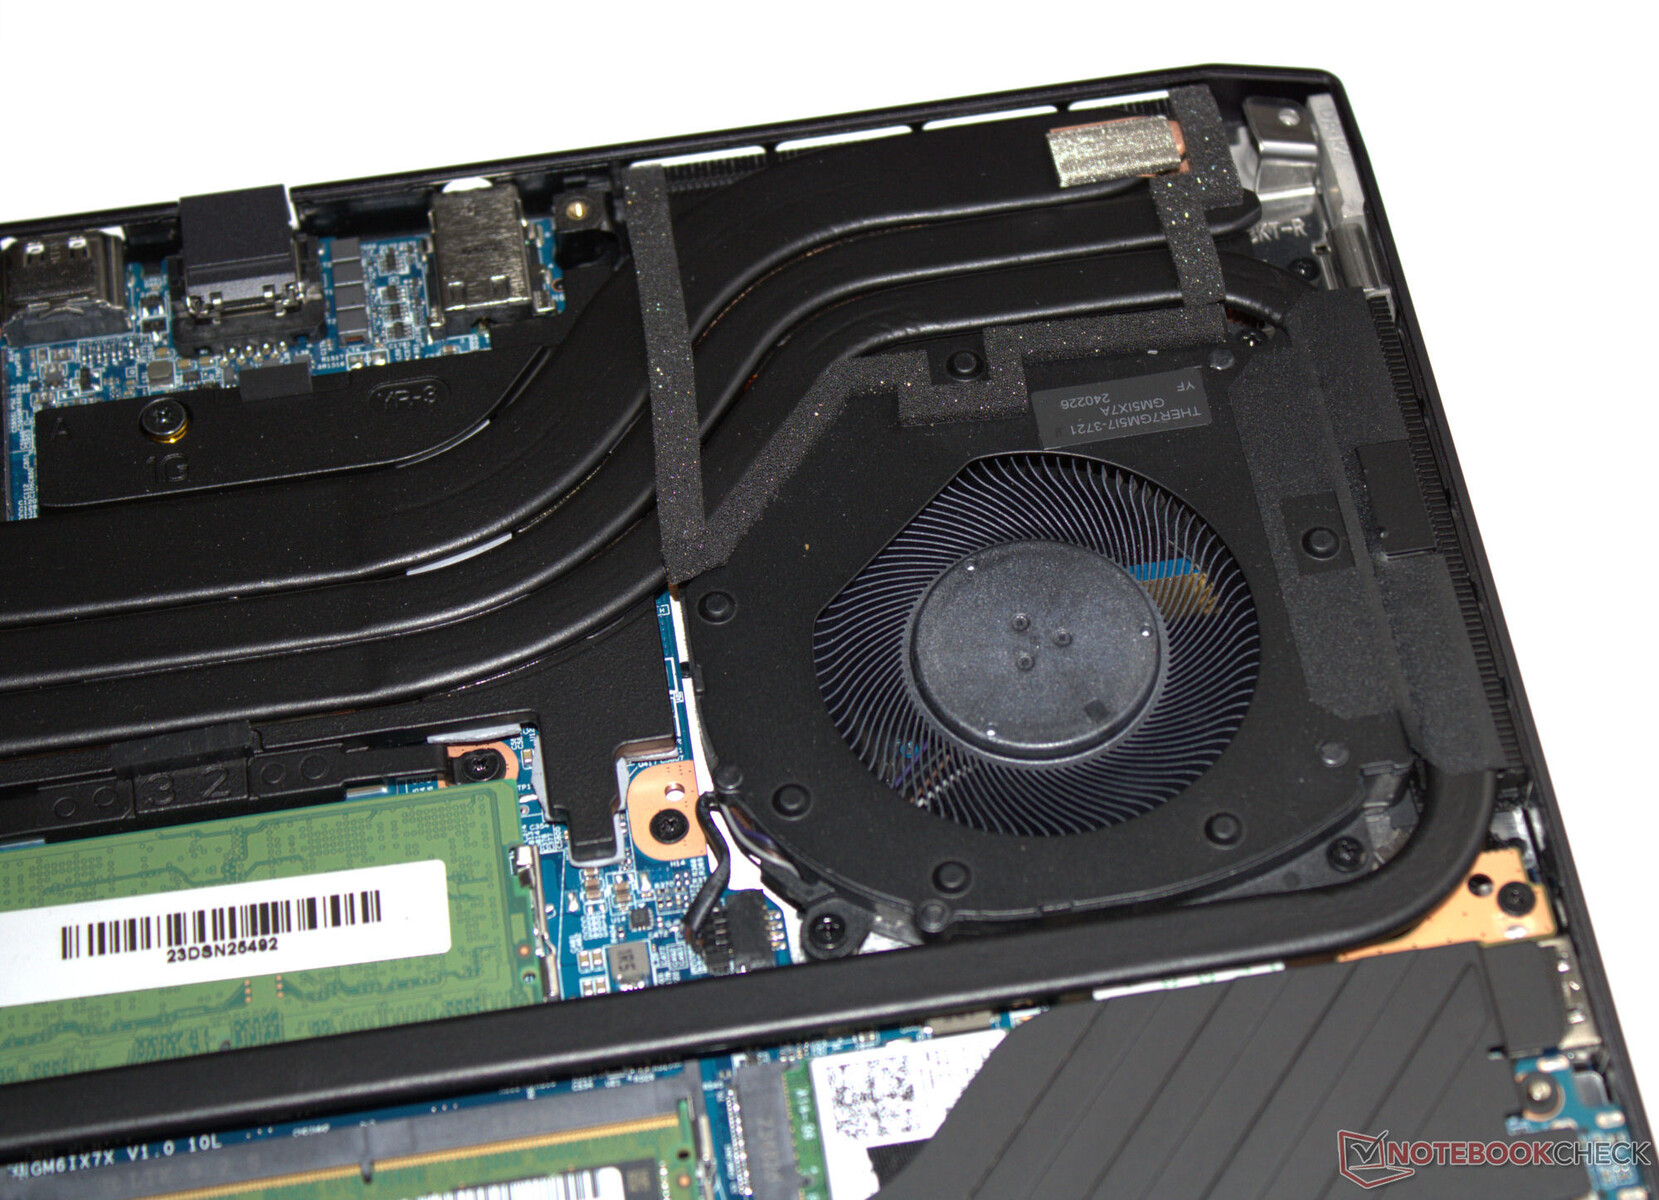
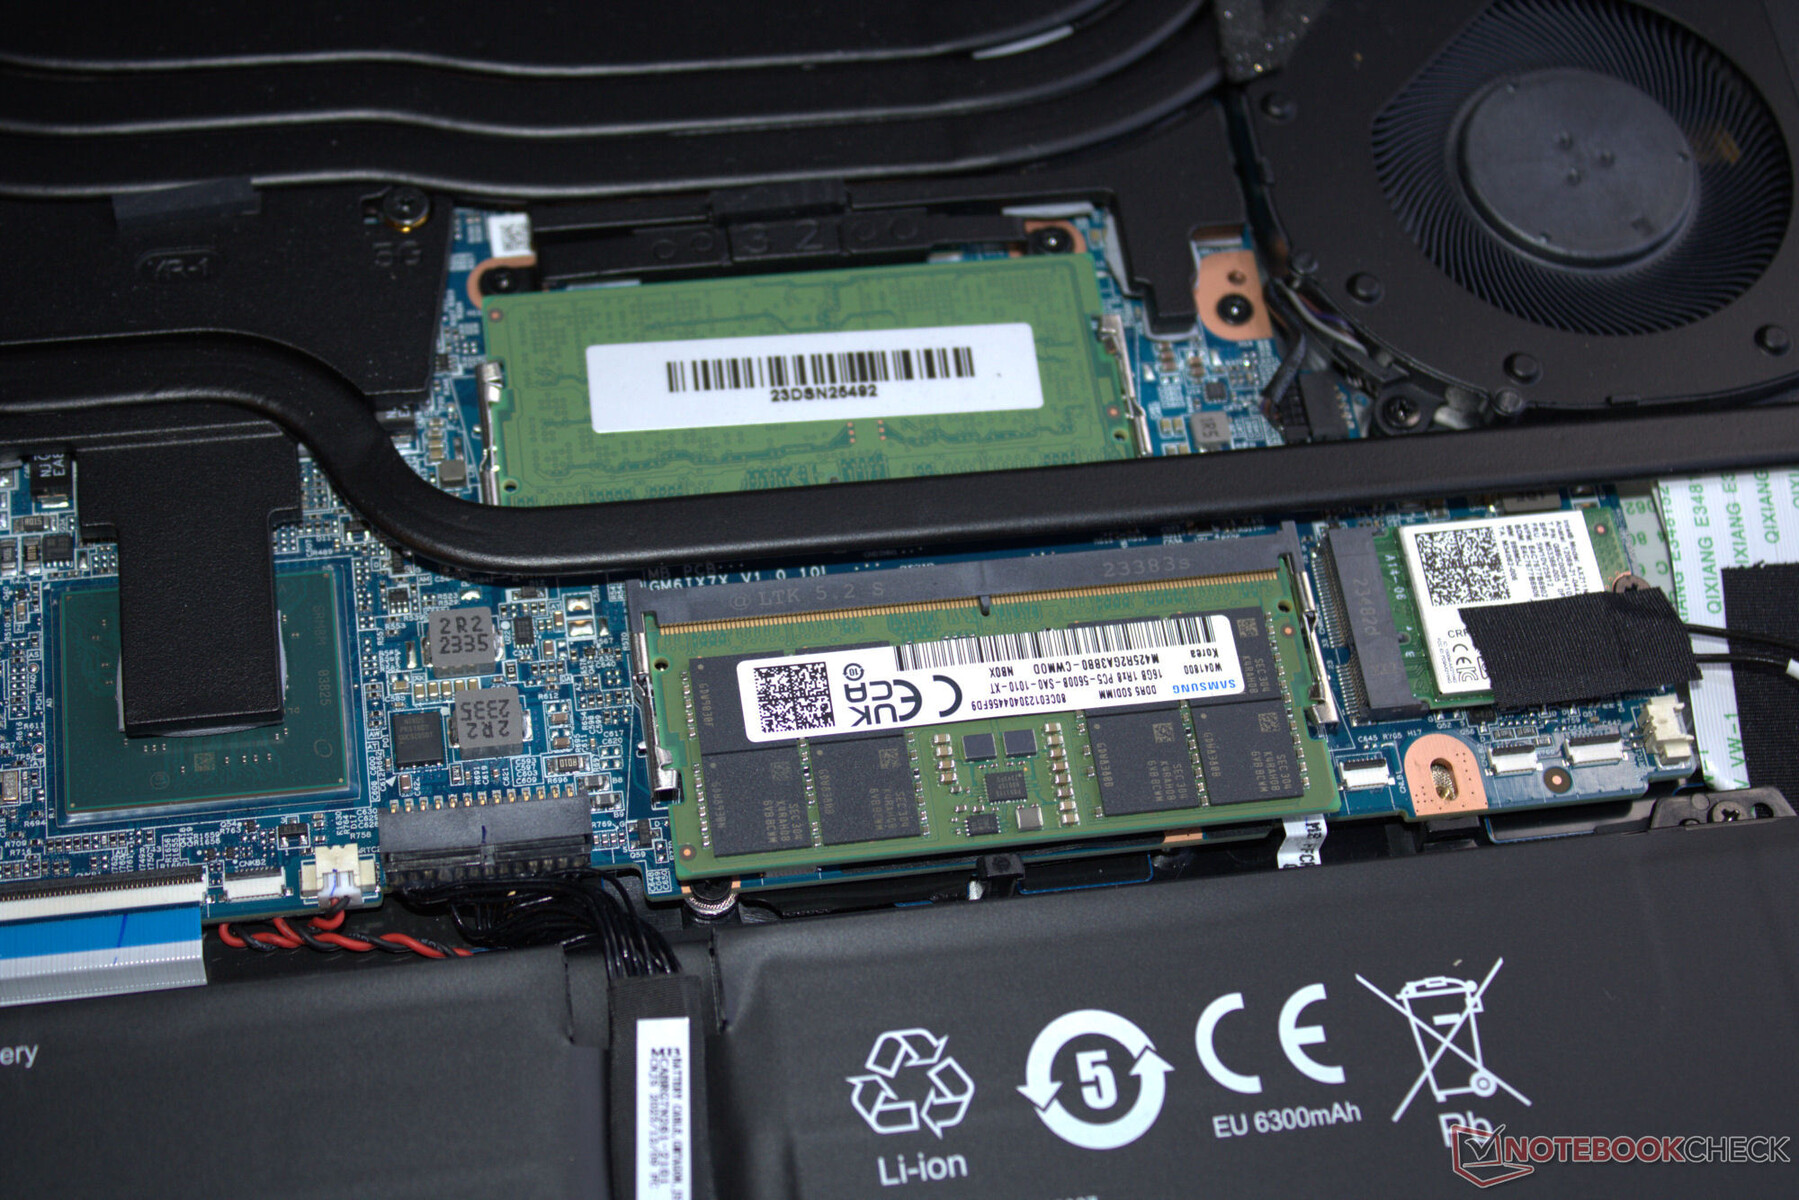
Manutenzione
Dopo aver rimosso tutte le viti sul fondo del dispositivo, la parte inferiore del case può essere tolta abbastanza facilmente - potrebbe essere necessario un plettro o una spatola piatta per aiutarla in questa operazione. Successivamente, è possibile accedere ai banchi di RAM (entrambi occupati), SSD (PCIe 4, M.2-2280), secondo slot SSD (PCIe 4, M.2-2280), modulo WLAN, ventole, batteria del BIOS e batteria del portatile.
Garanzia
Il dispositivo è coperto da una garanzia base di due anni, che include il servizio di ritiro e un servizio di riparazione rapida di 6 mesi (riparazione entro 48 ore). È possibile estendere questa garanzia a 36 mesi a pagamento.
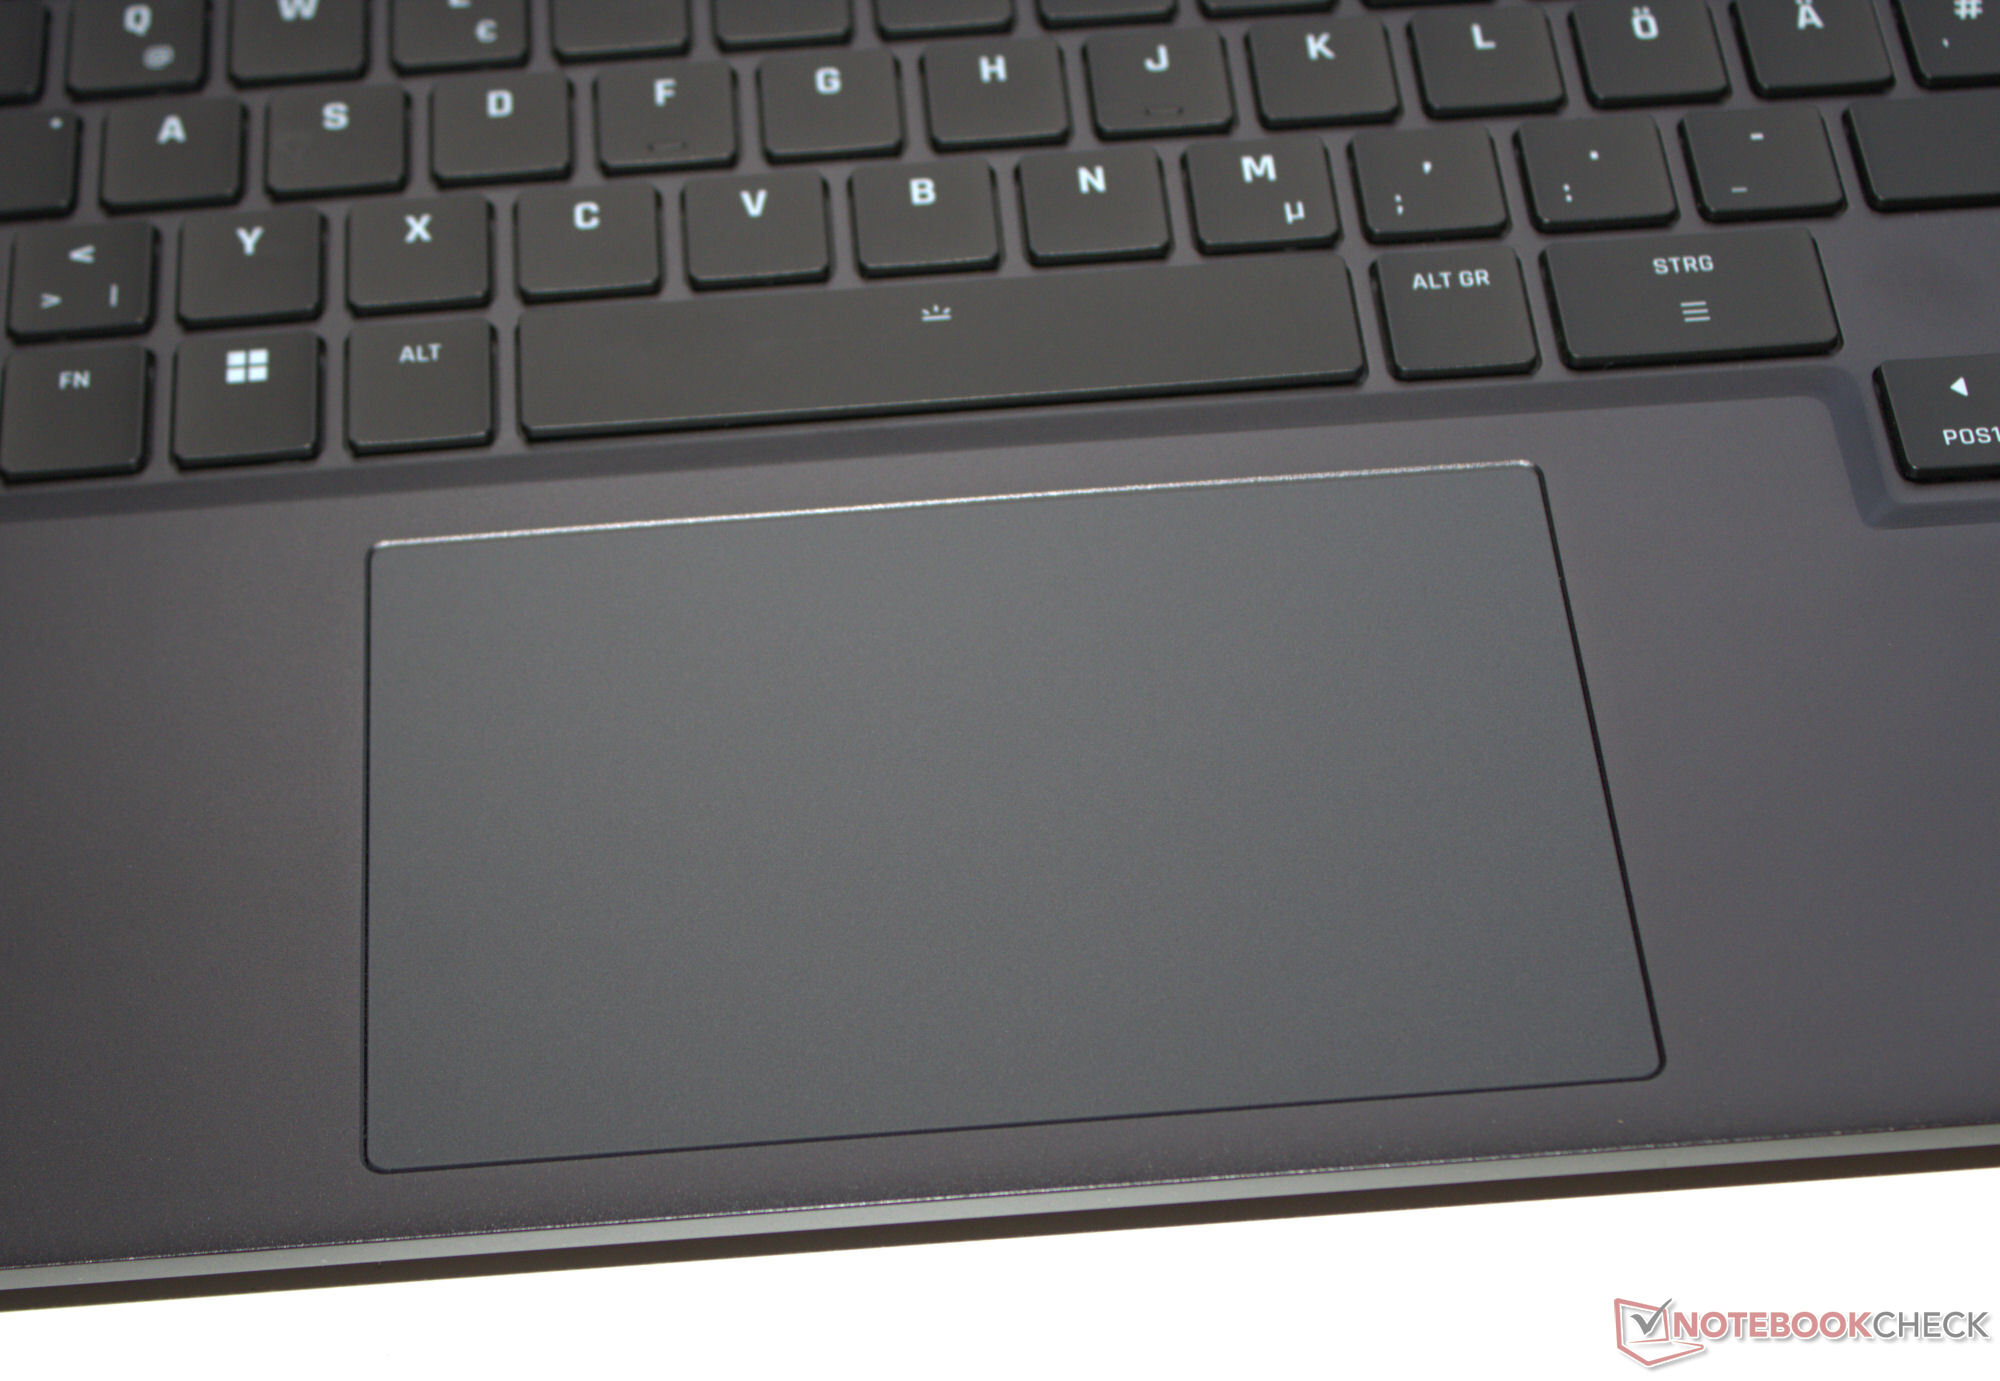
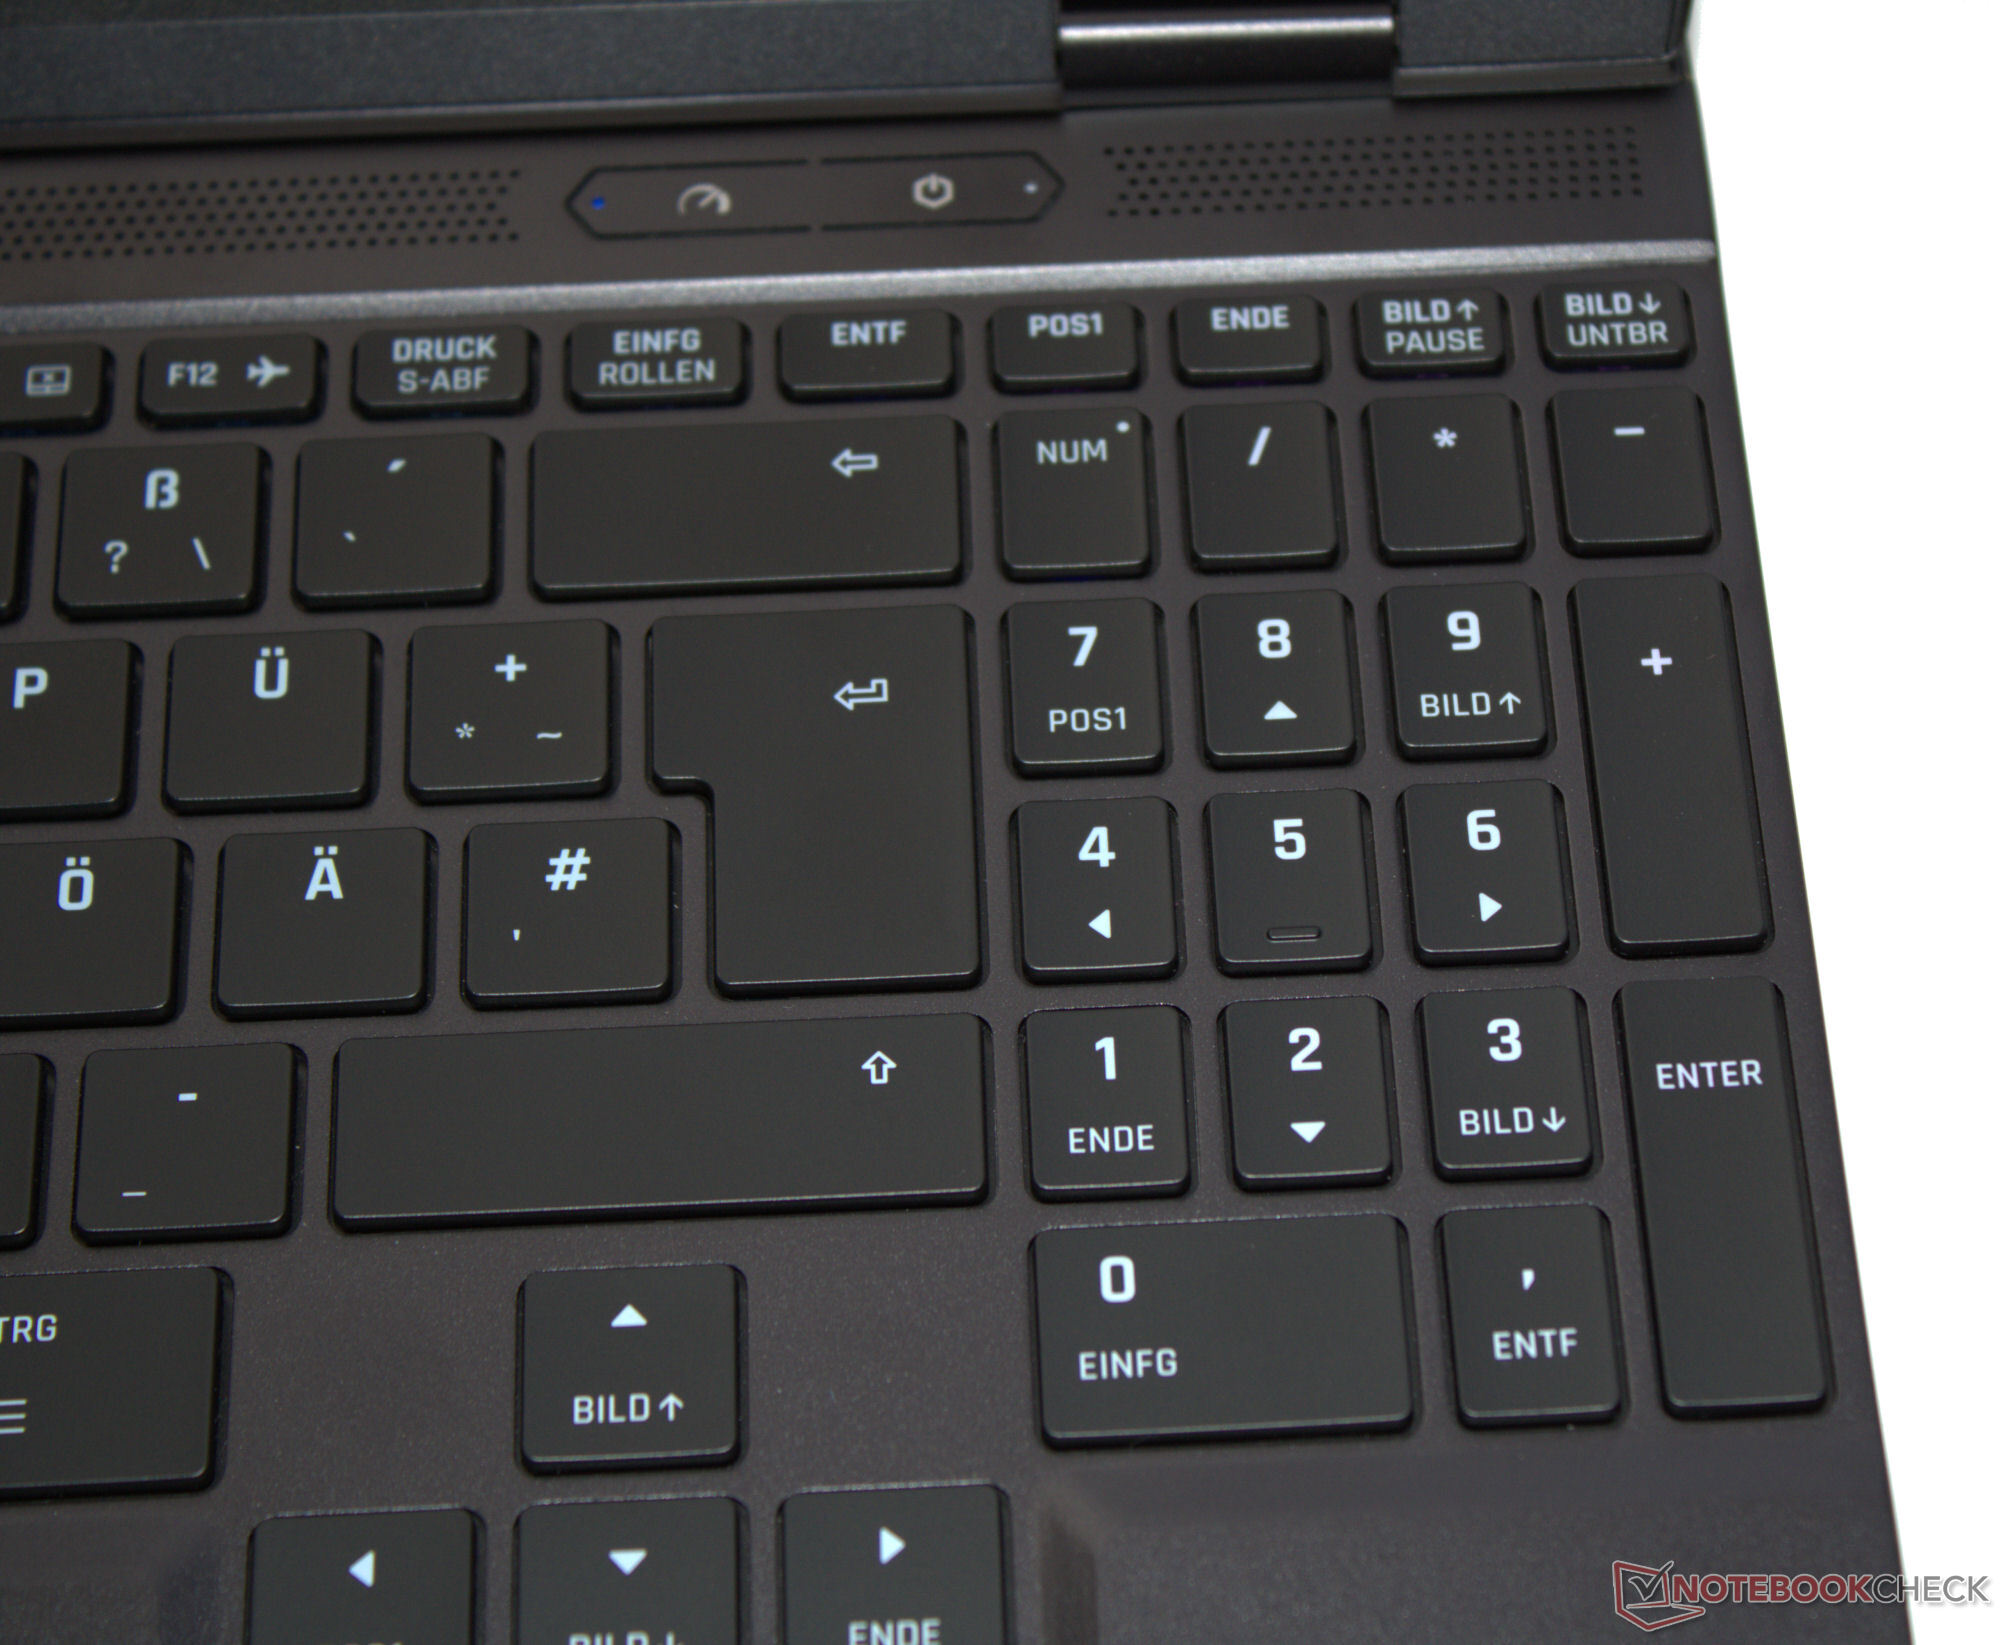
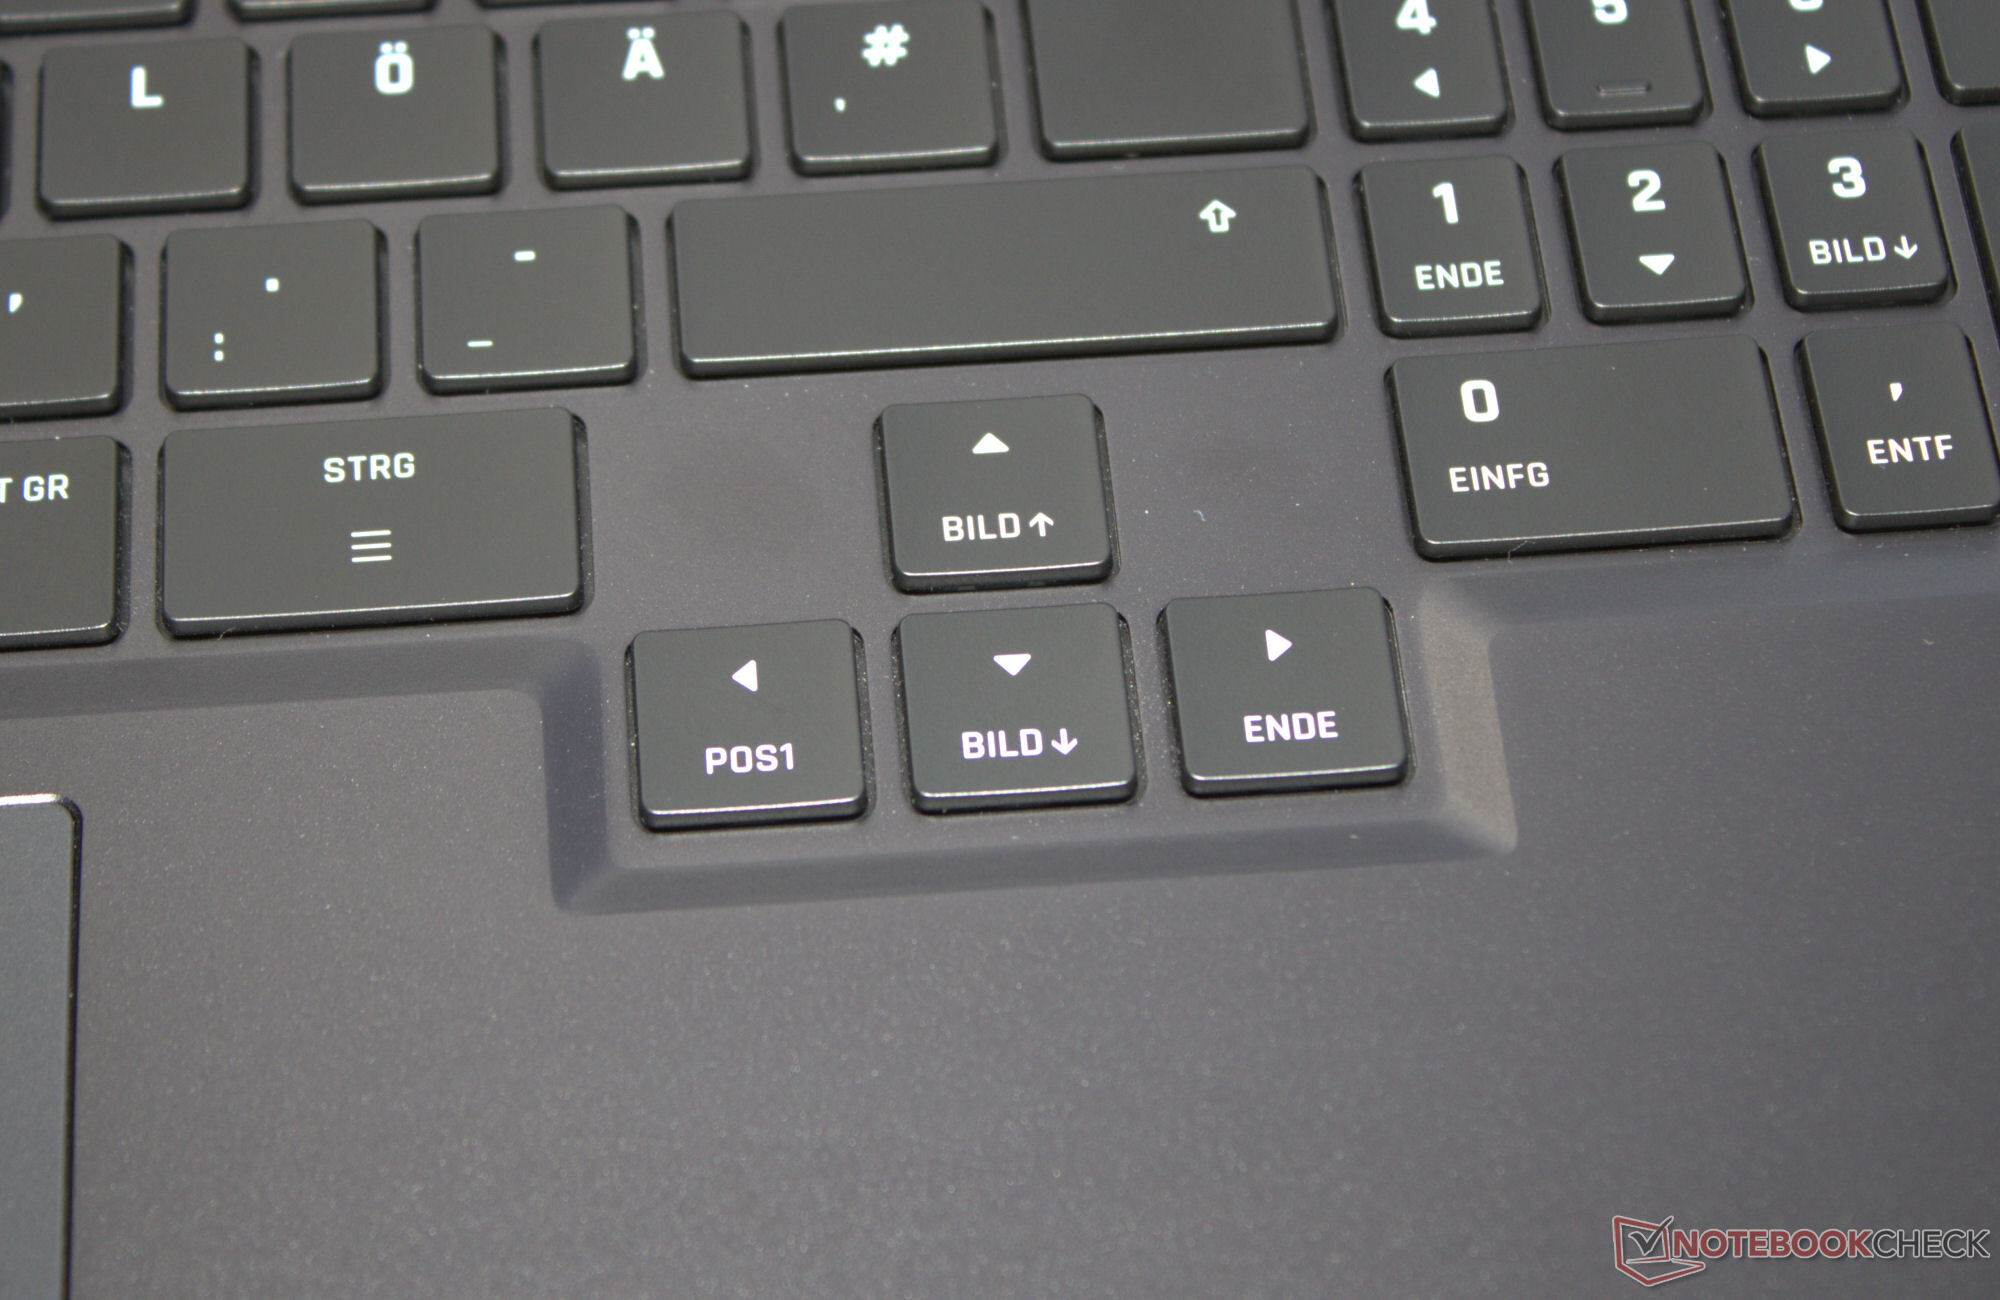
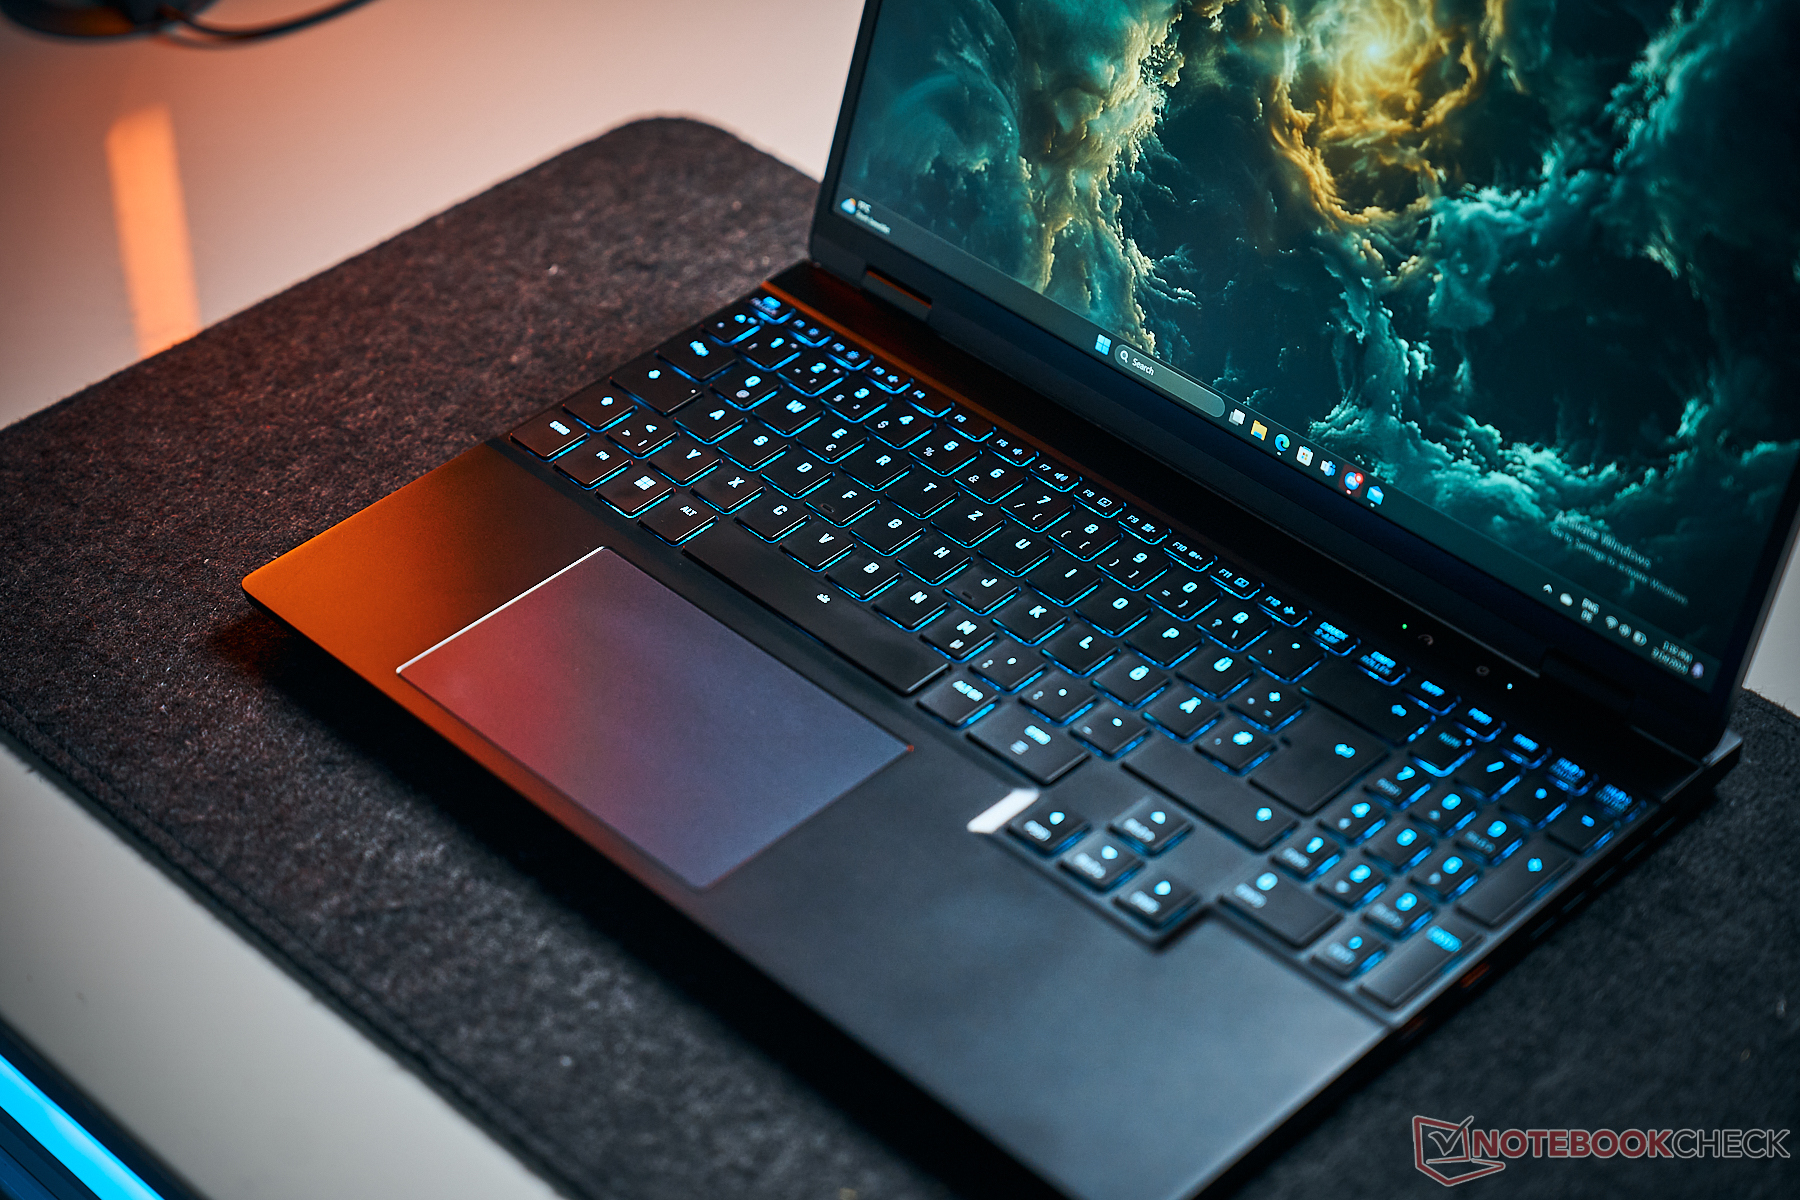
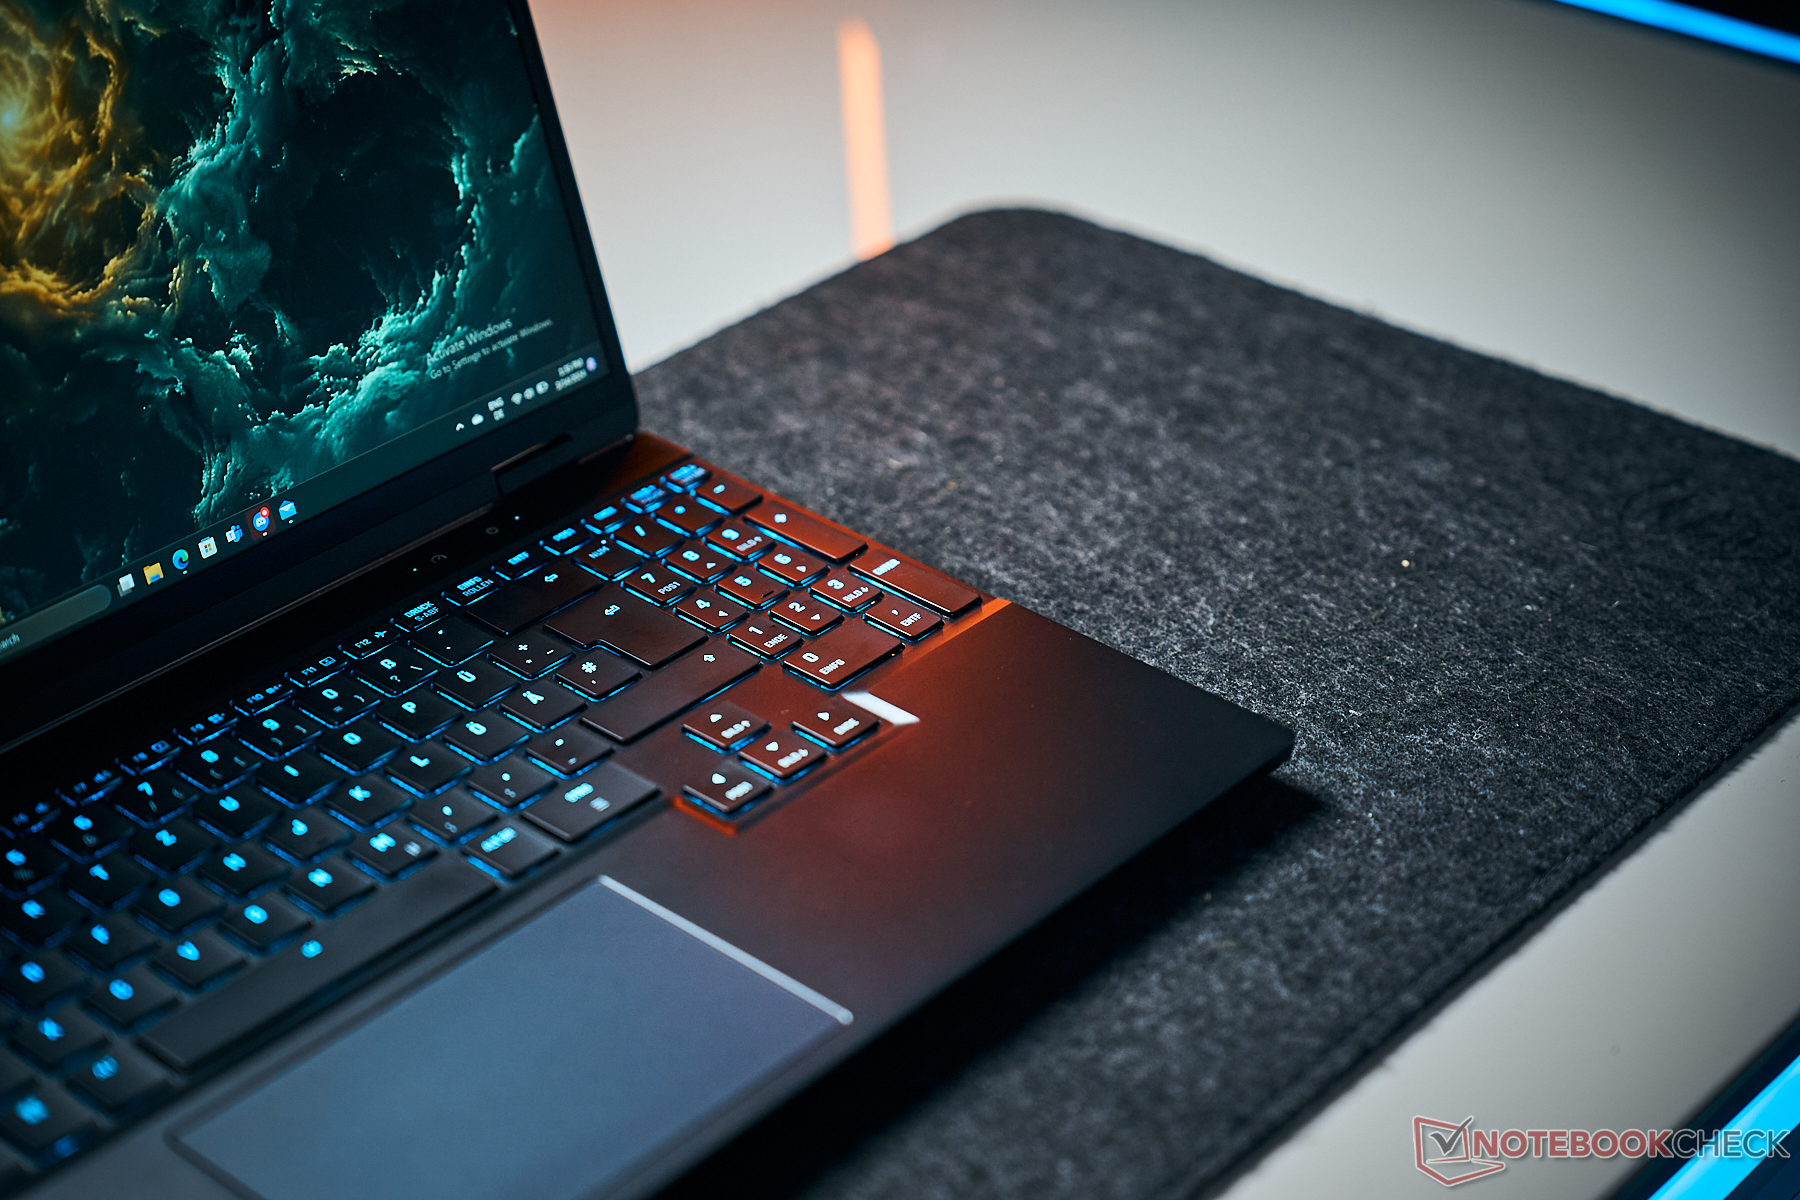
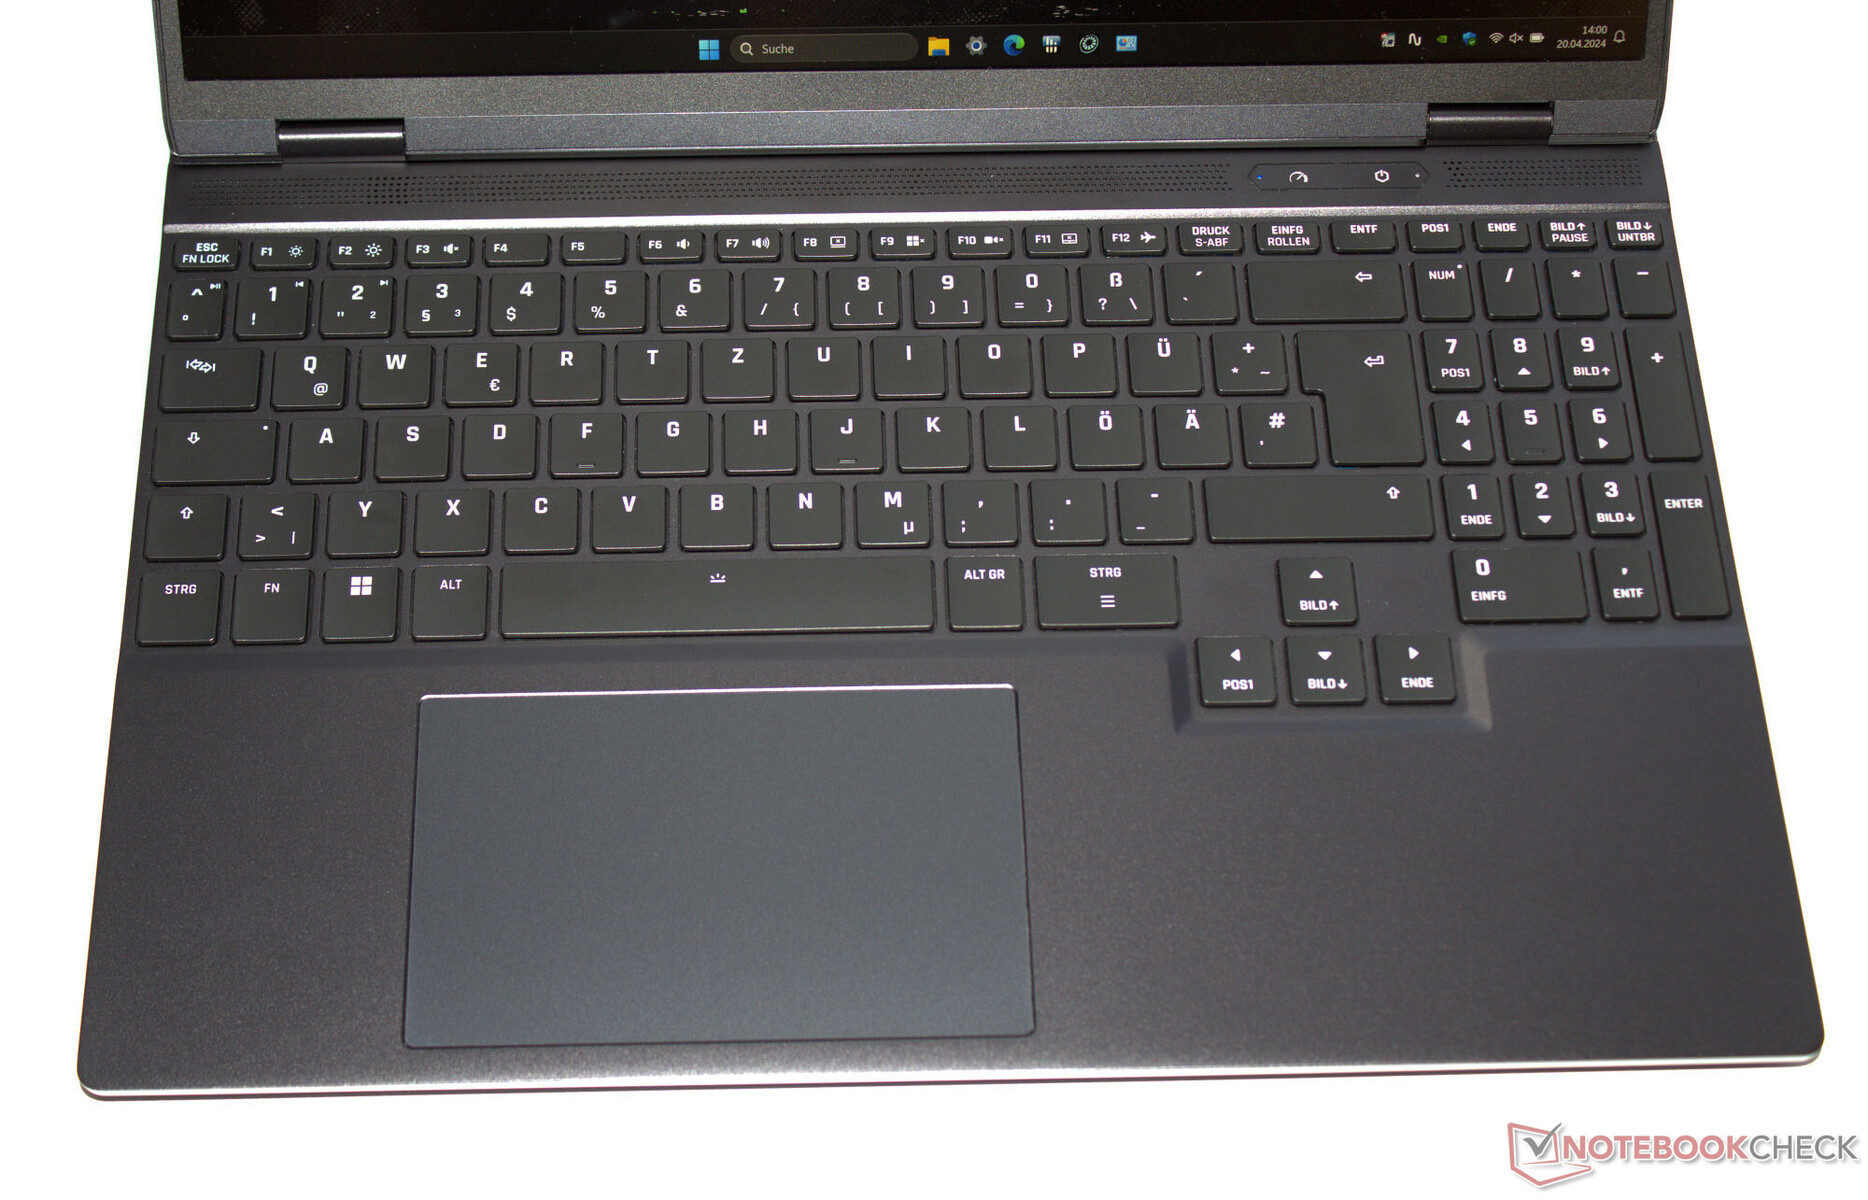
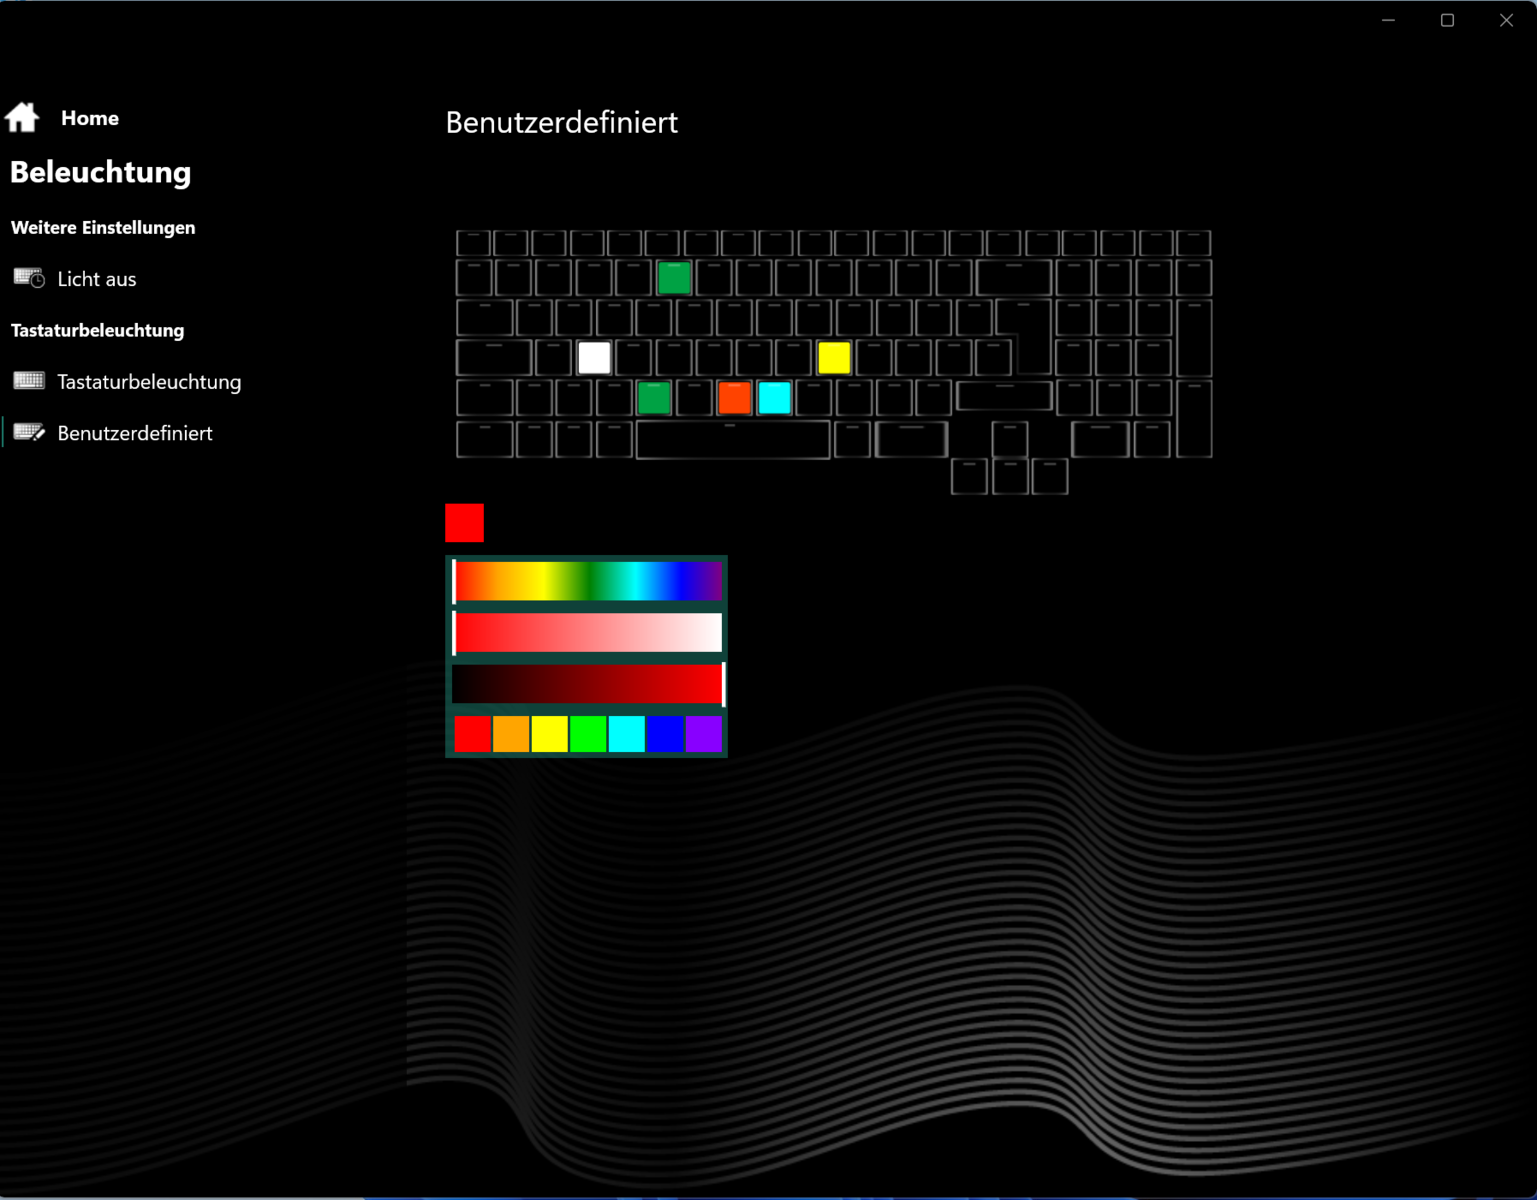
Dispositivi di input - Retroilluminazione RGB a tasto singolo
Tastiera
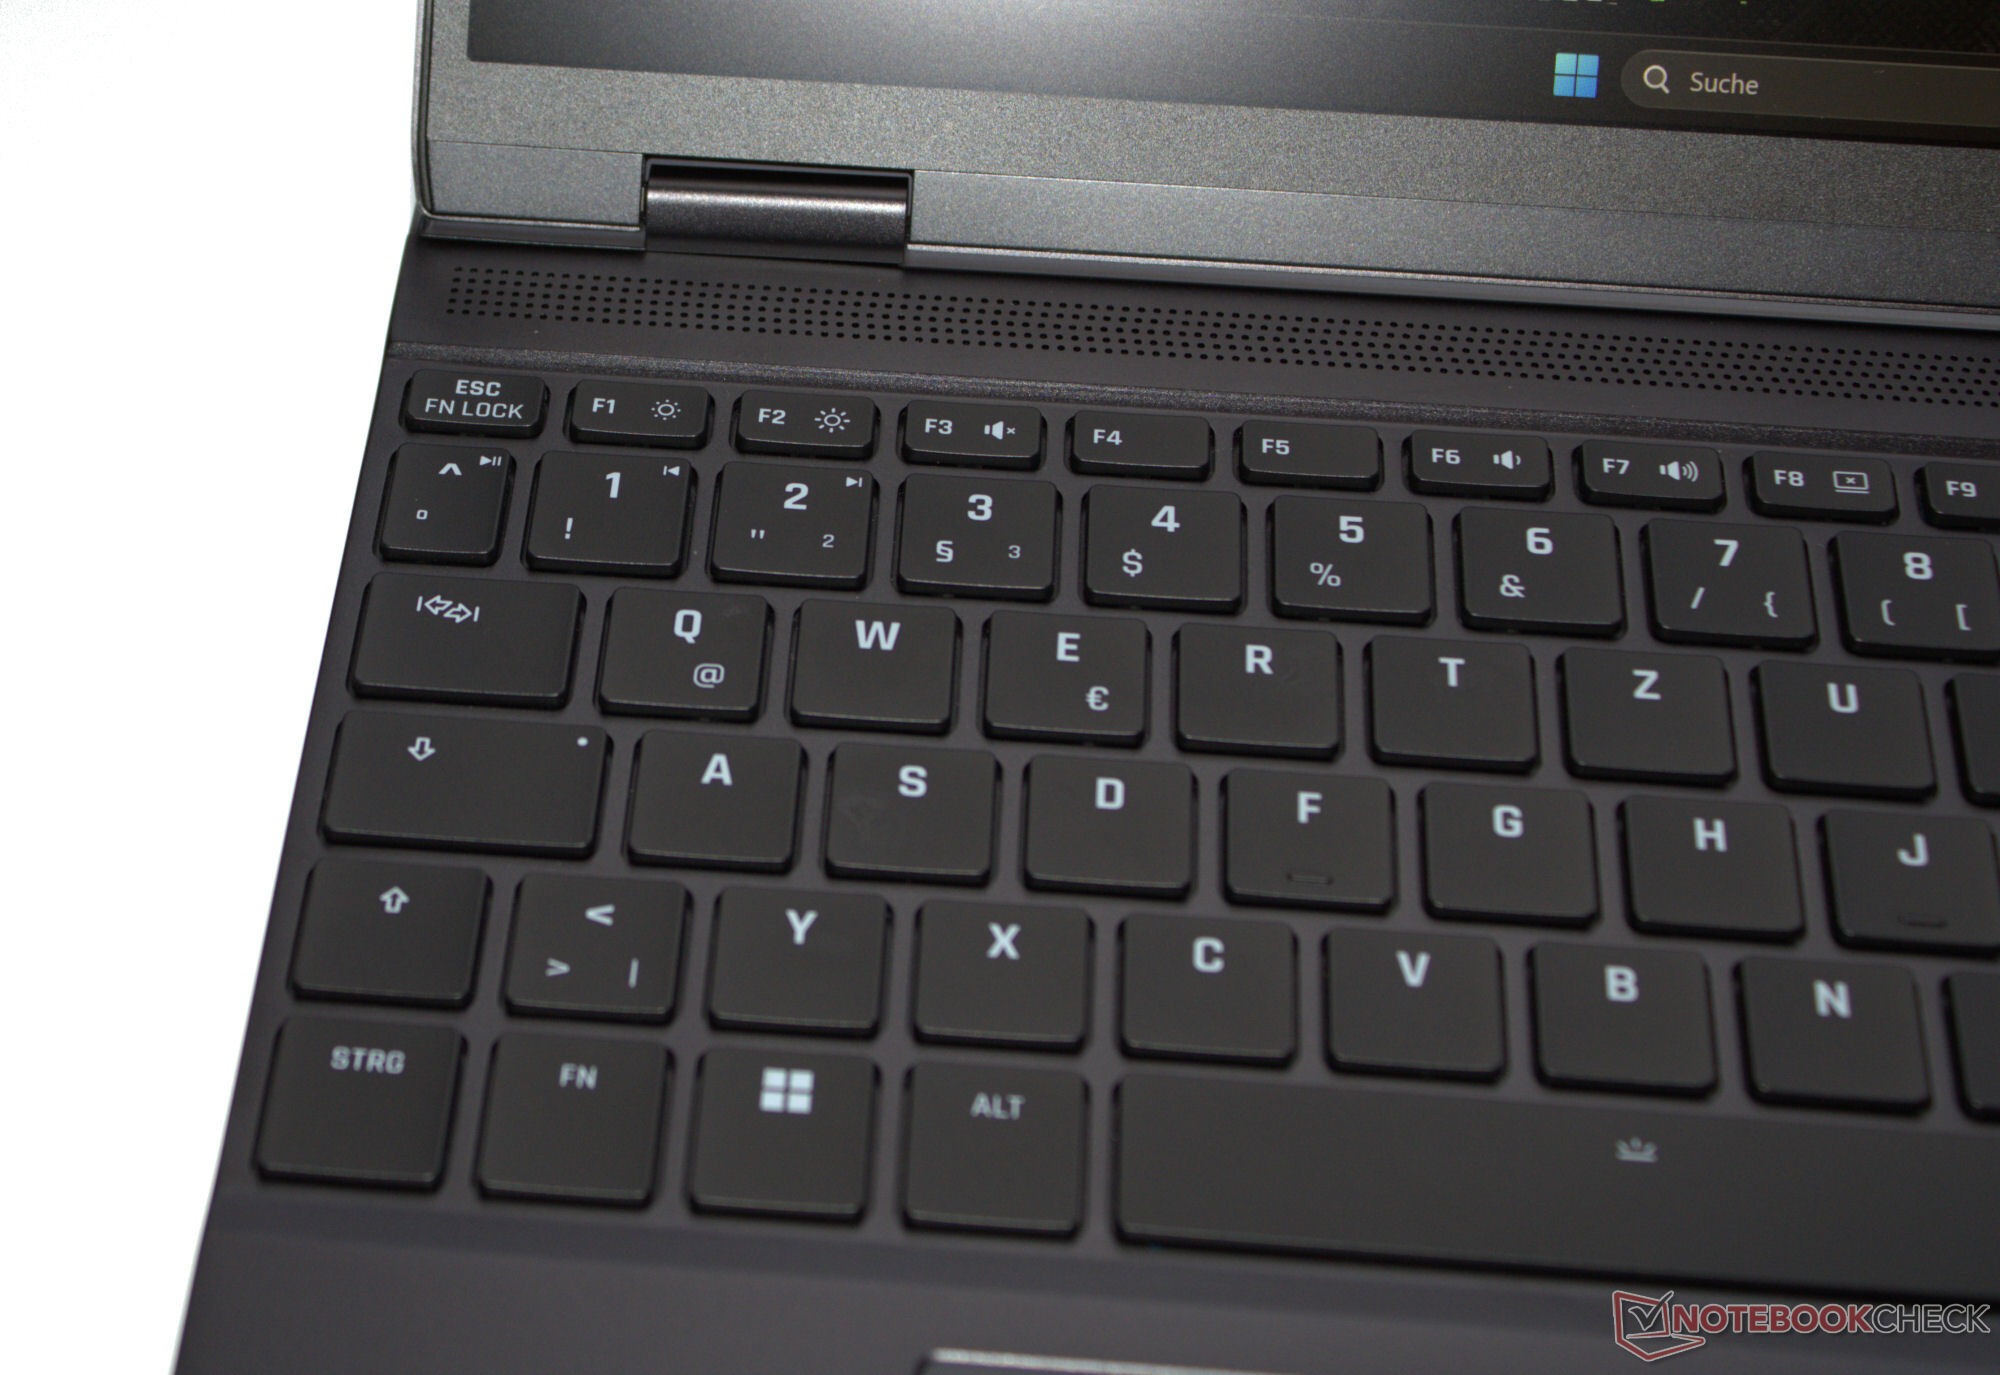
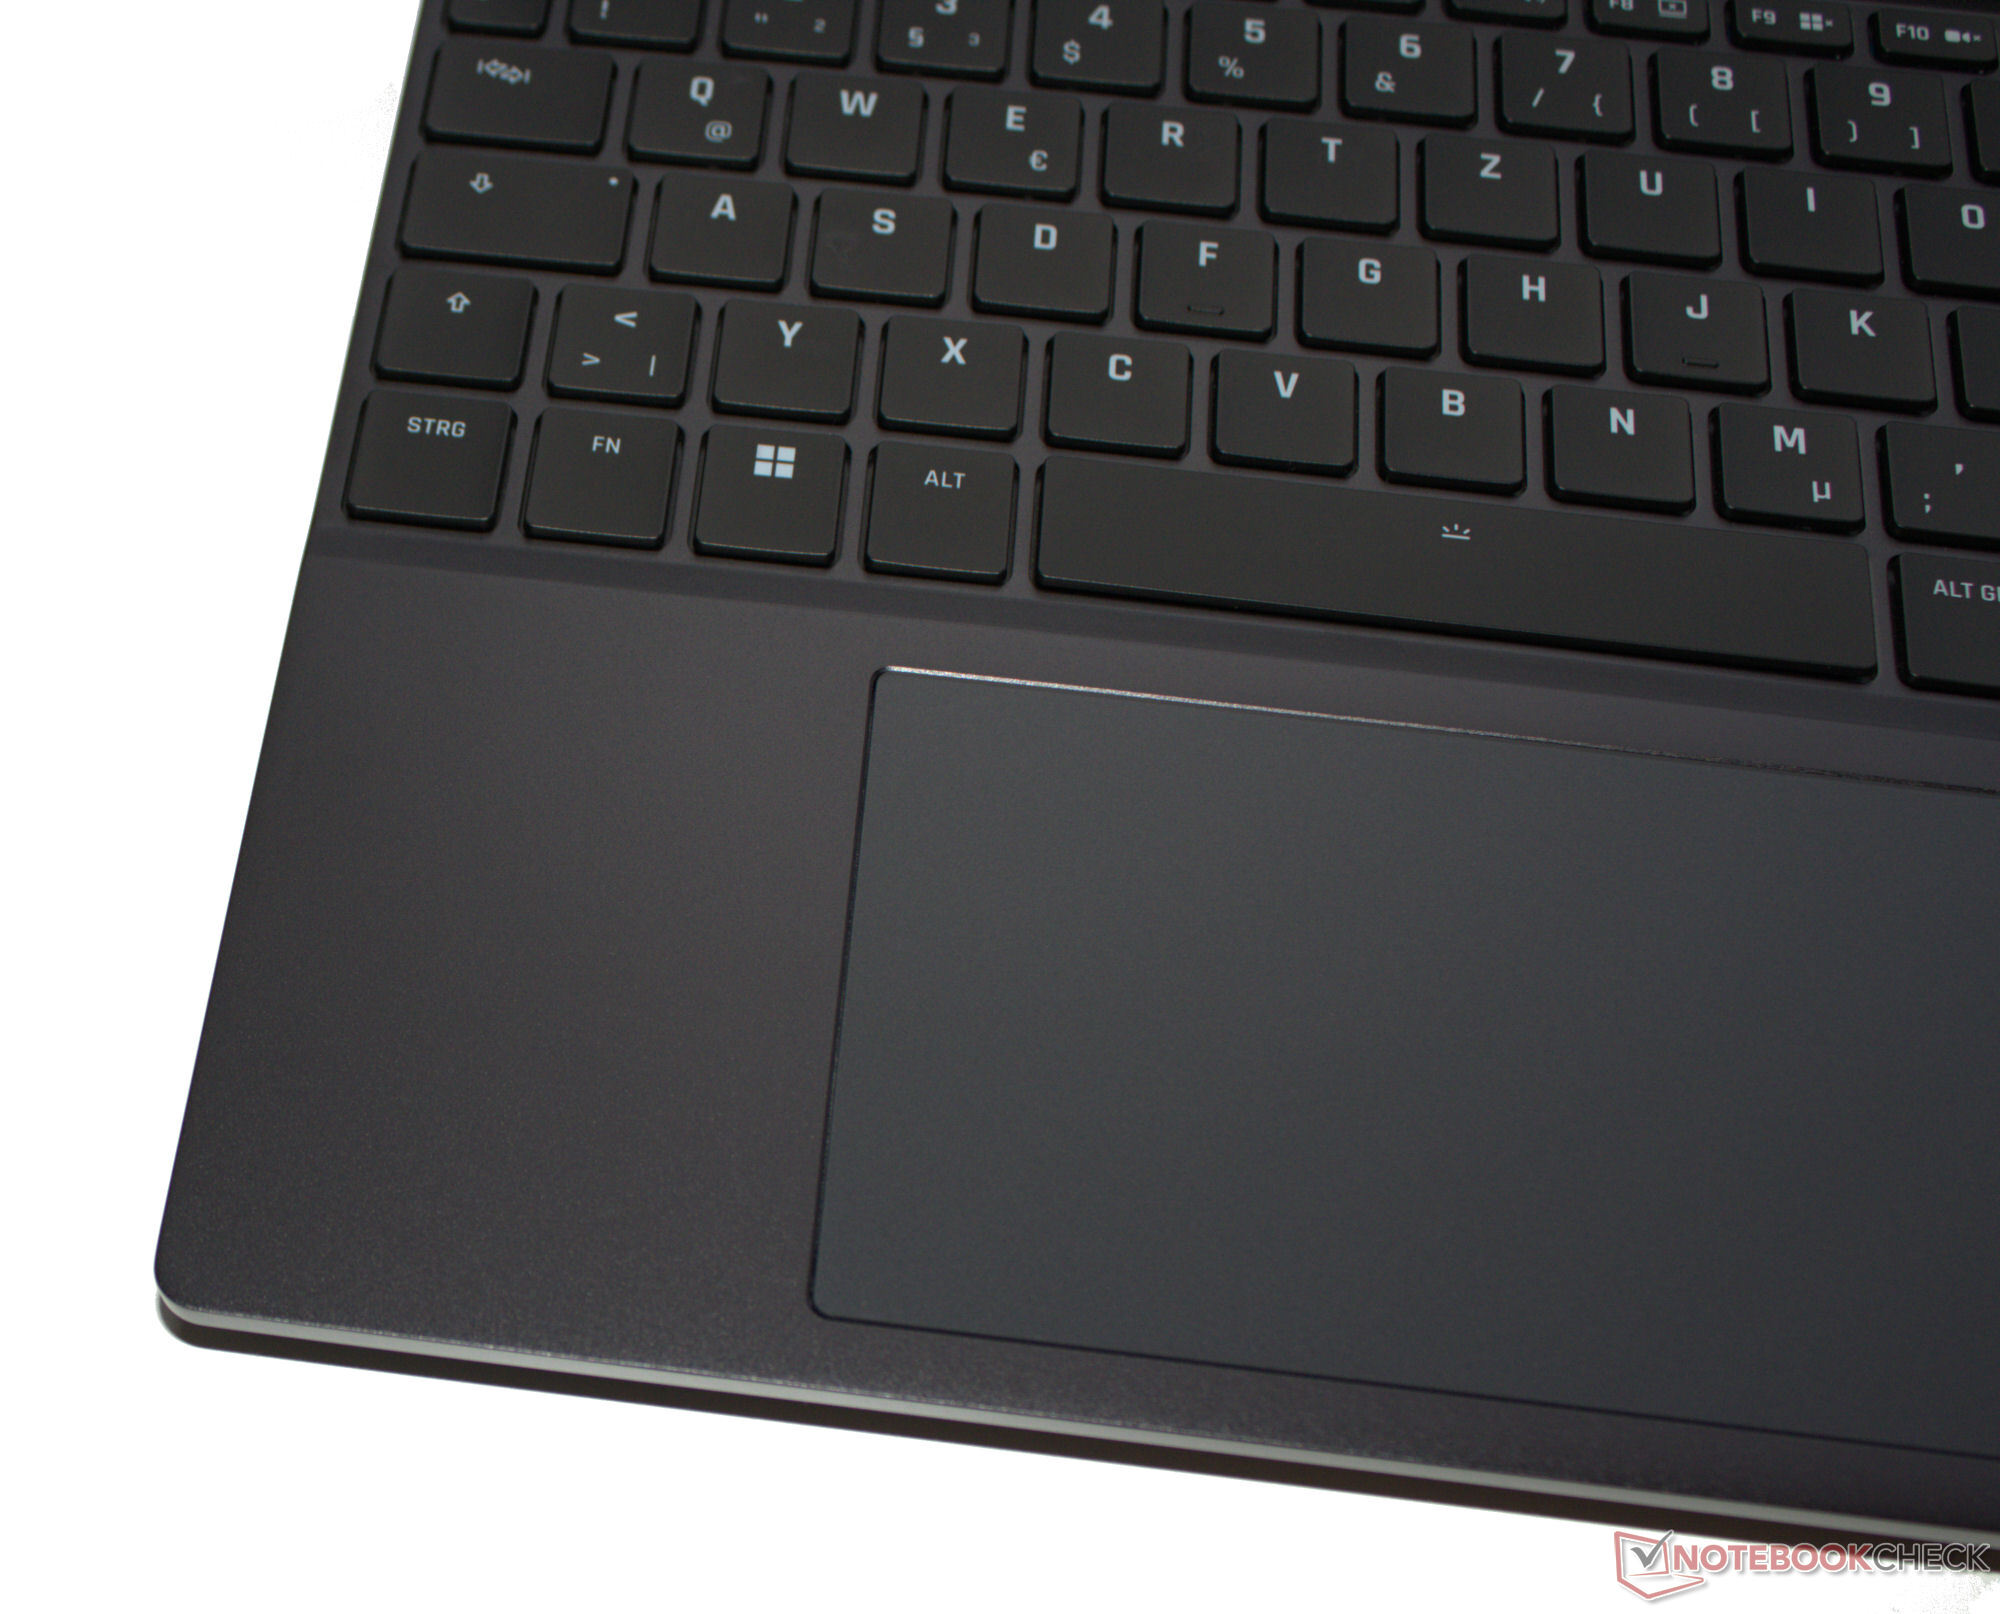
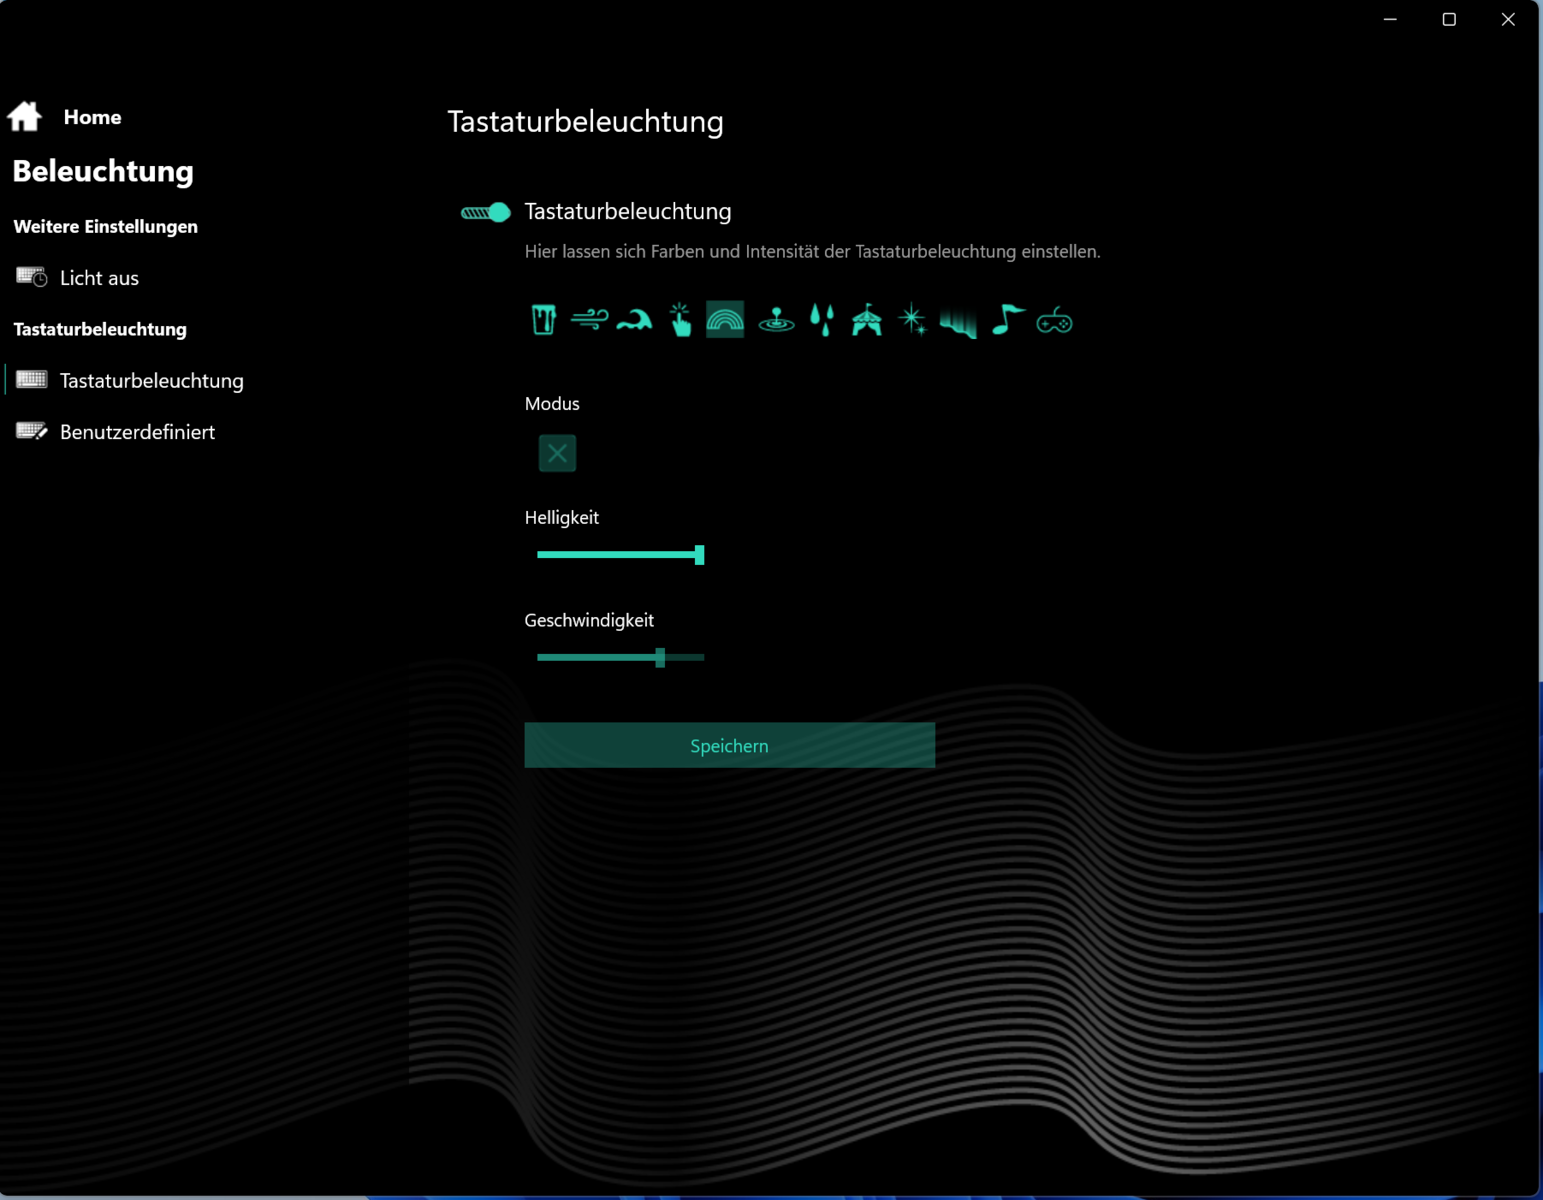
I tasti della tastiera chiclet (retroilluminazione RGB a quattro livelli) hanno un'inclinazione media e un punto di pressione chiaro. La loro resistenza potrebbe essere un po' più nitida, ma è una questione di gusti. La tastiera cede minimamente durante la digitazione, ma non si è rivelata fastidiosa durante il nostro test. Positivo: I quattro tasti freccia non solo sono completamente dimensionati, ma sono anche separati dagli altri tasti.
Touchpad
Un clickpad multi-touch (circa 12,3 x 7,8 cm) sostituisce la necessità di un mouse e la sua superficie liscia facilita lo scorrimento delle dita. Presenta un'alzata breve e un chiaro punto di pressione.
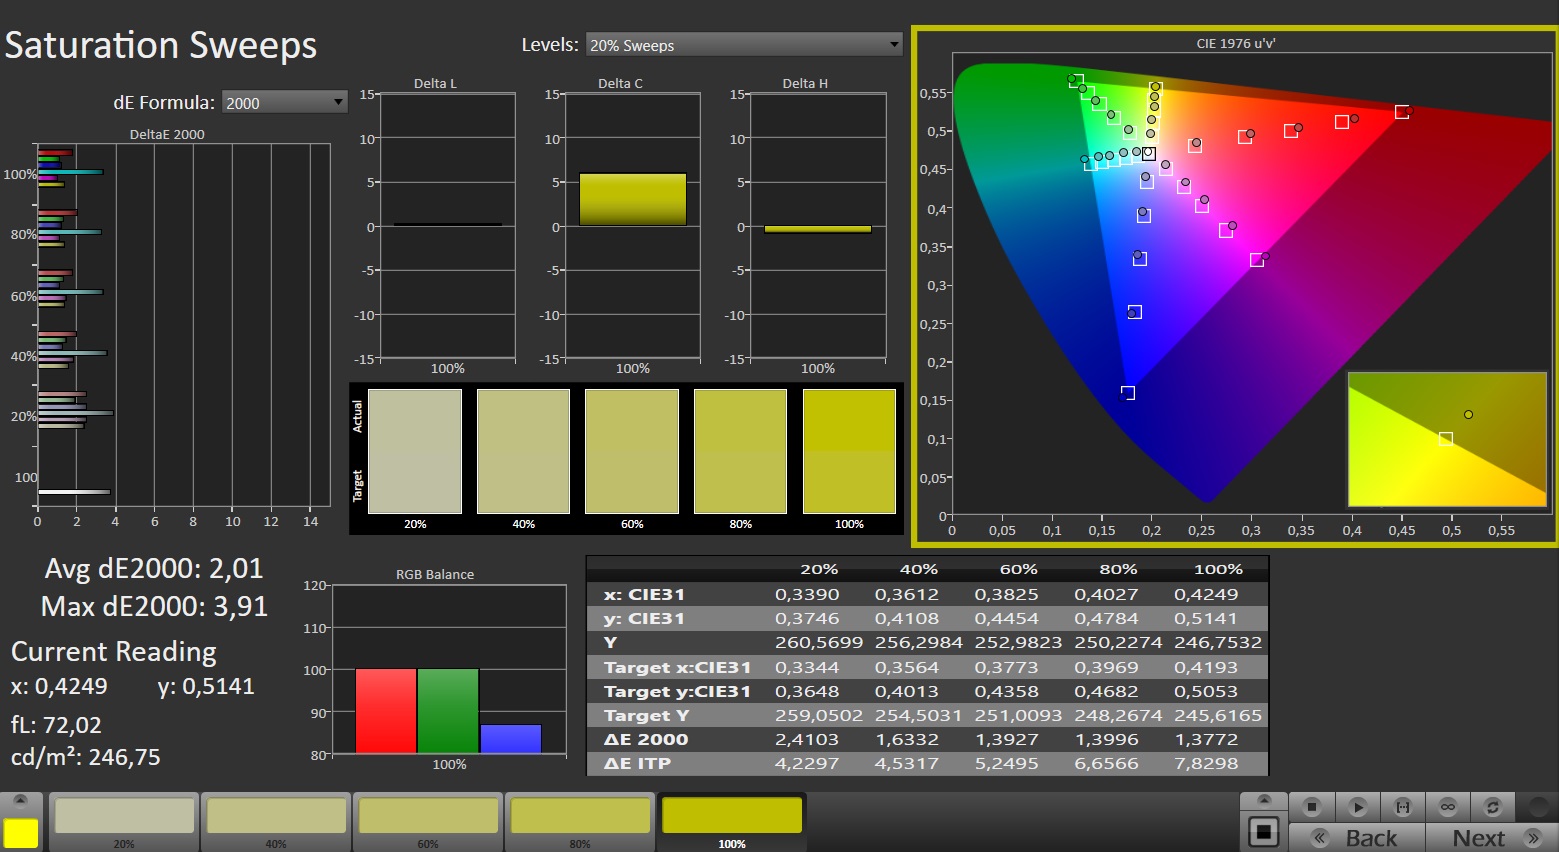
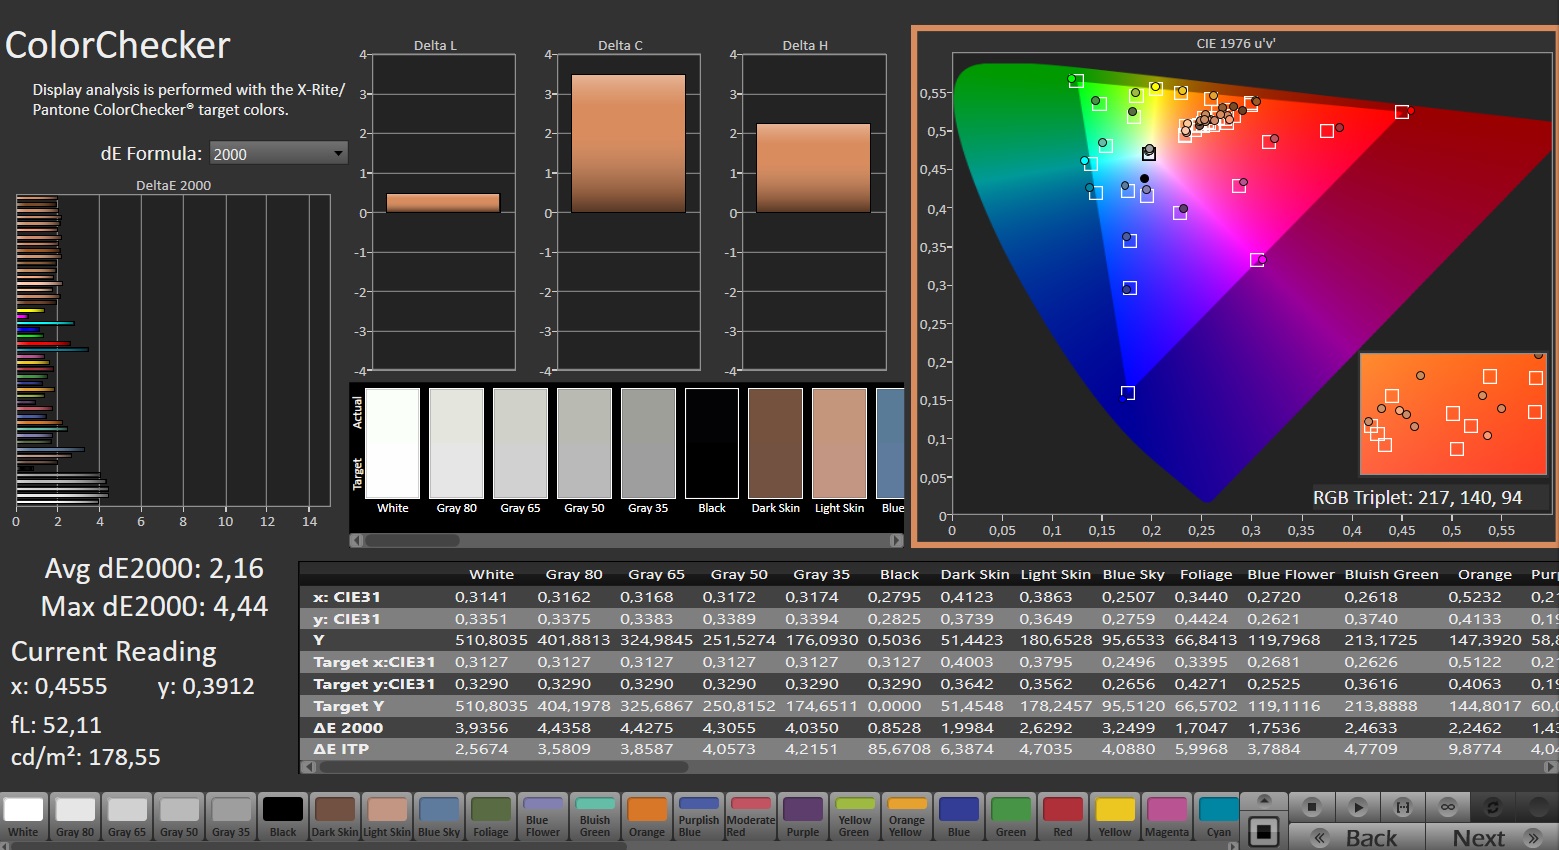
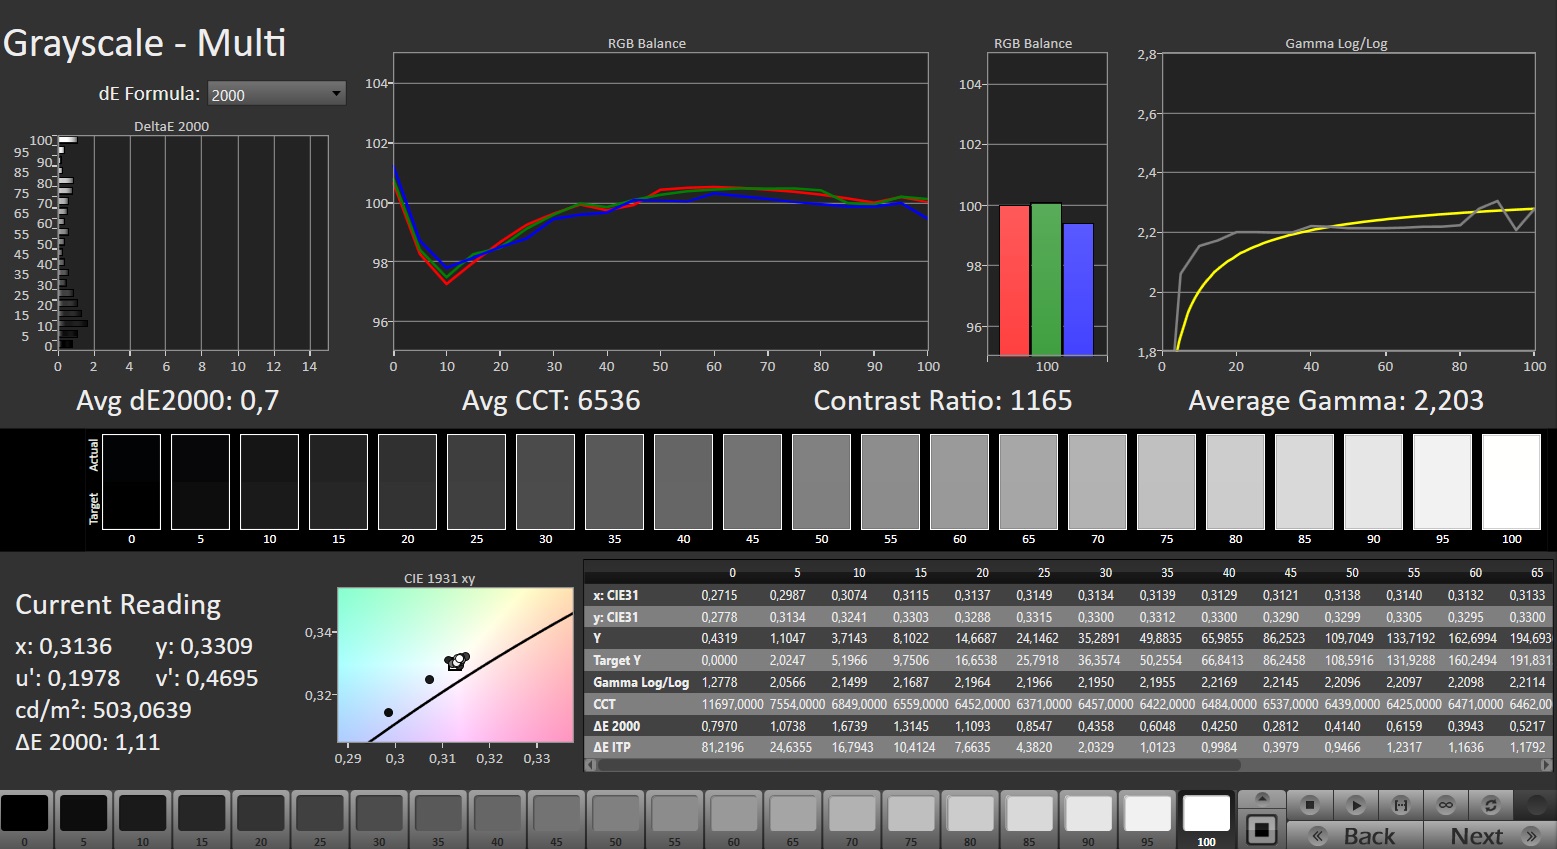
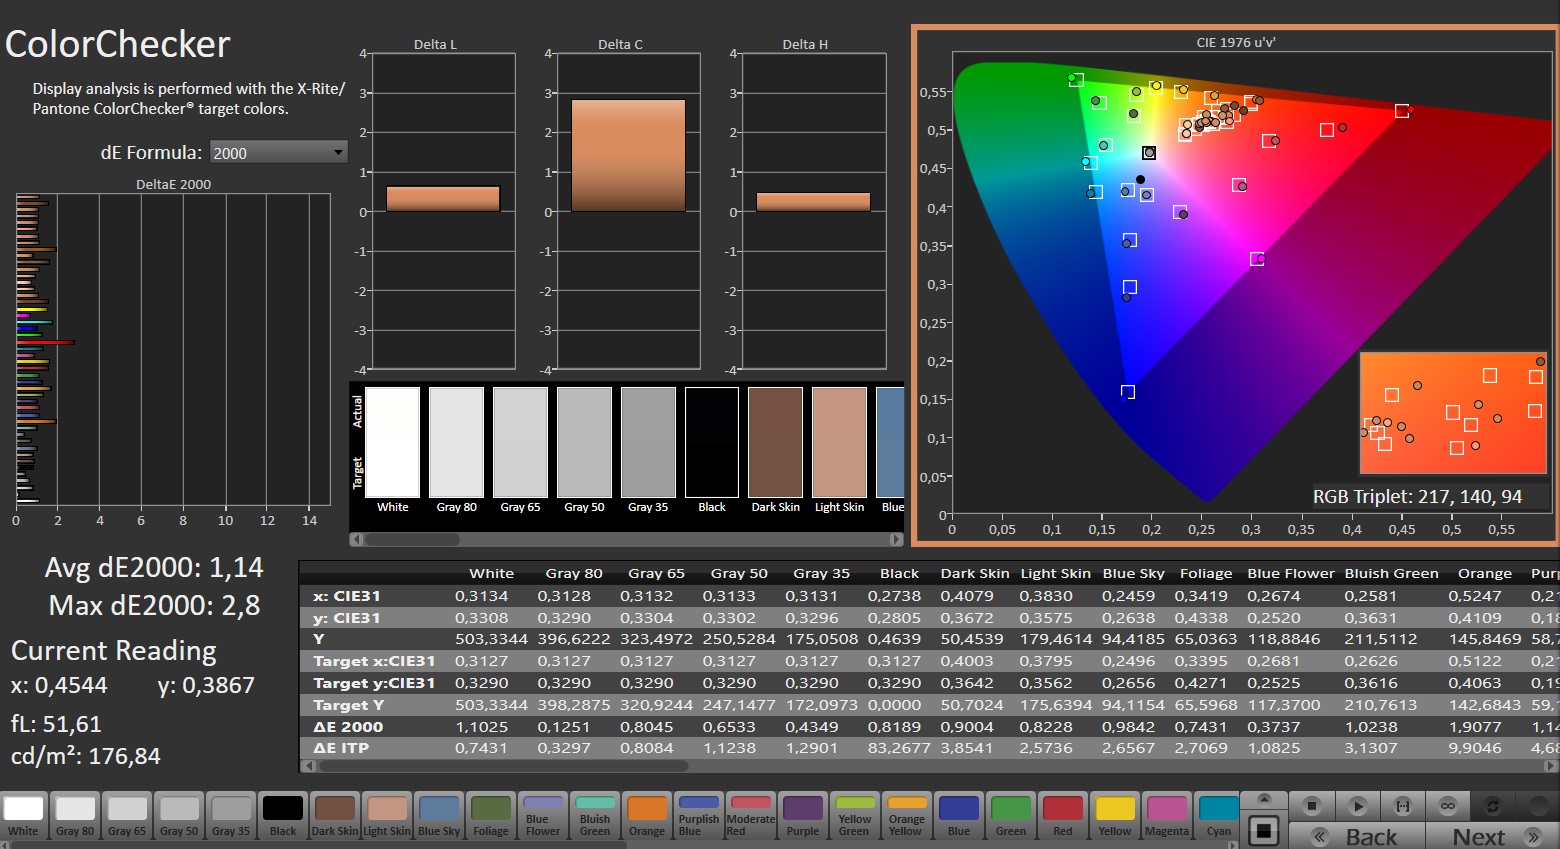
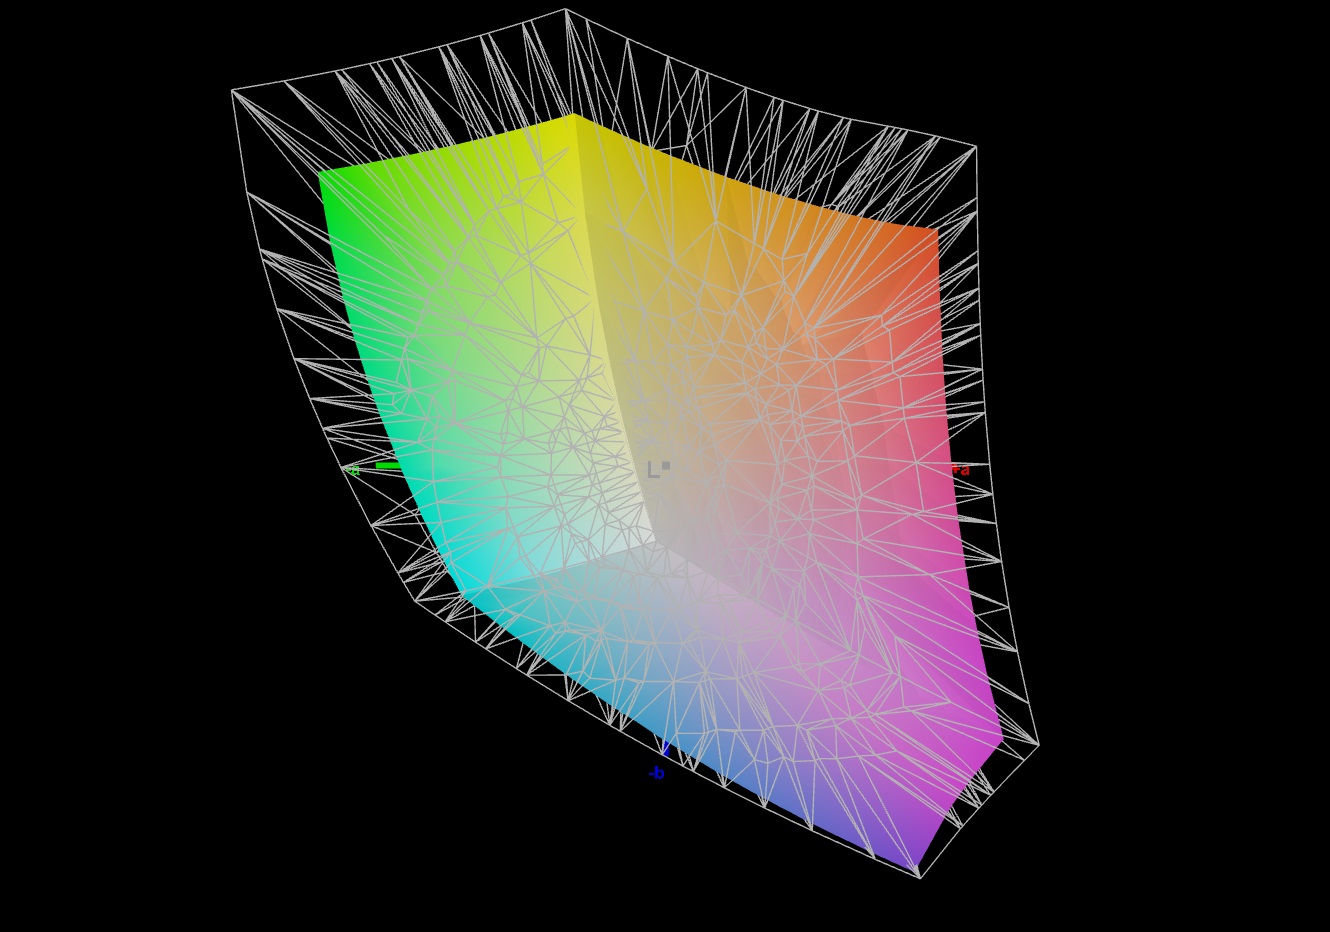
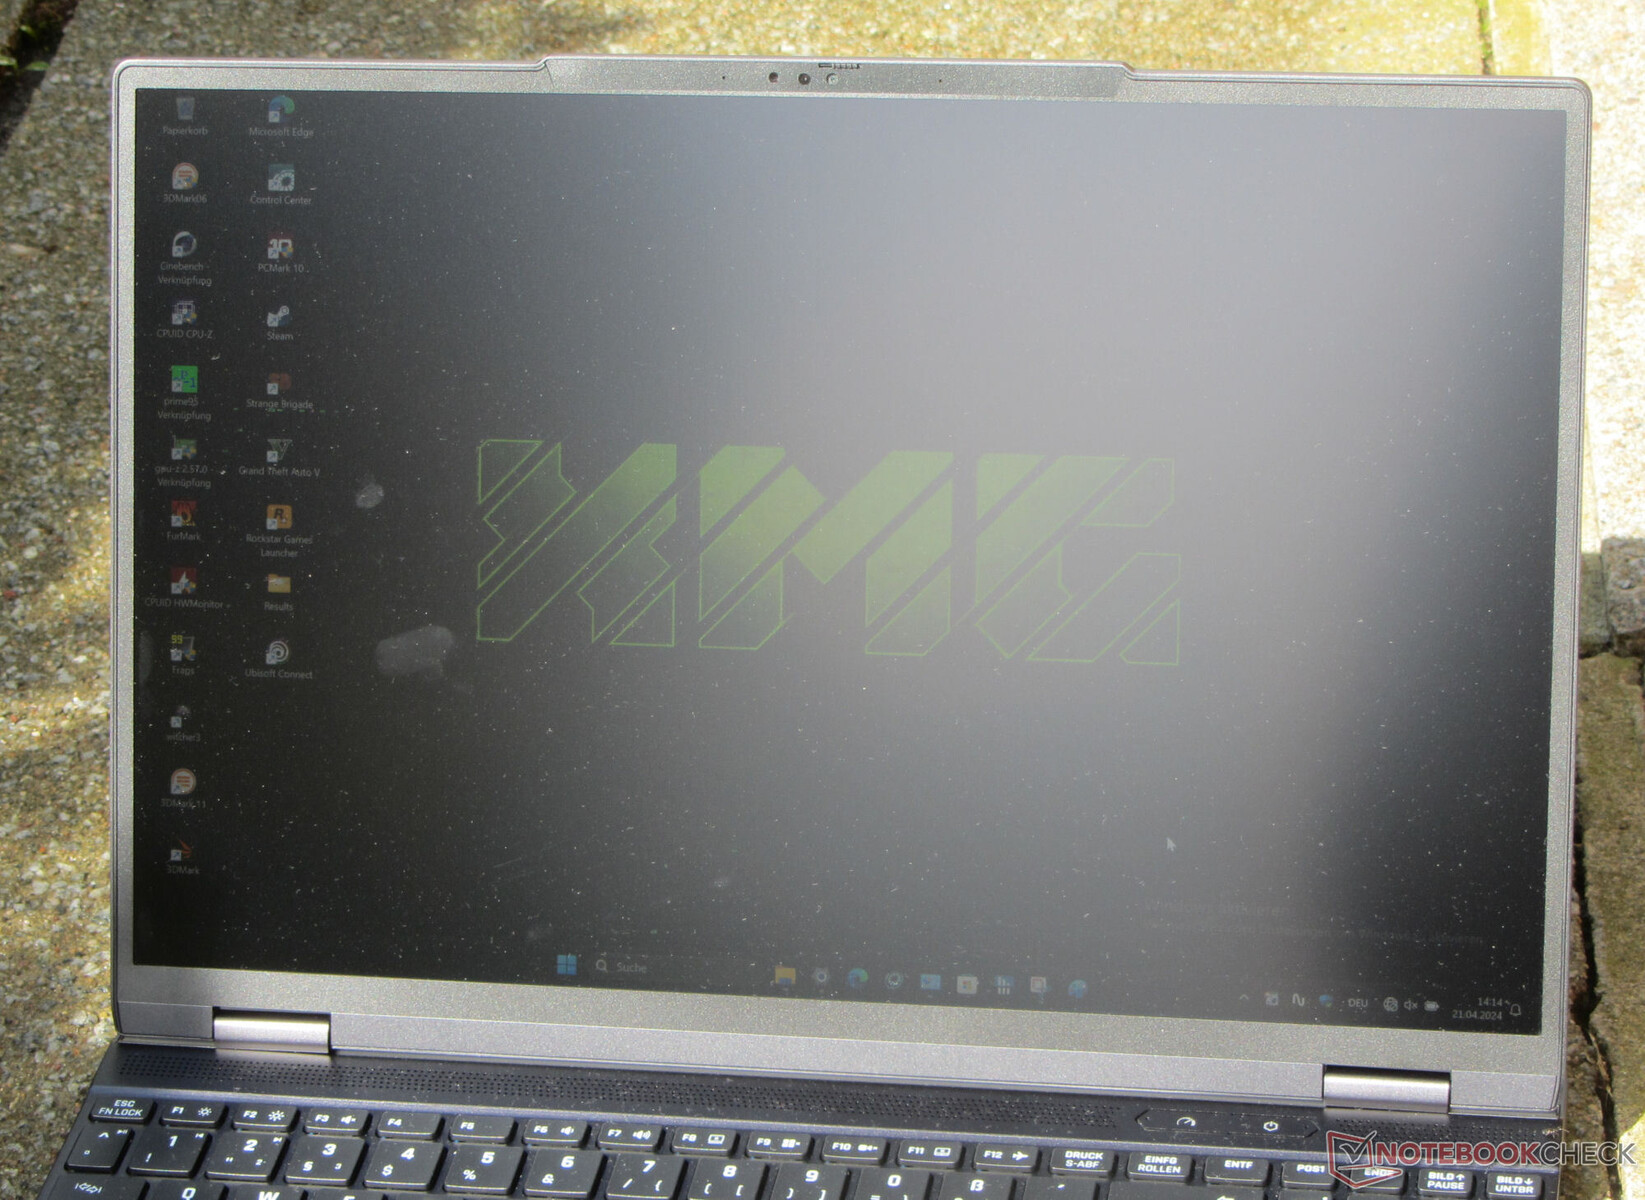
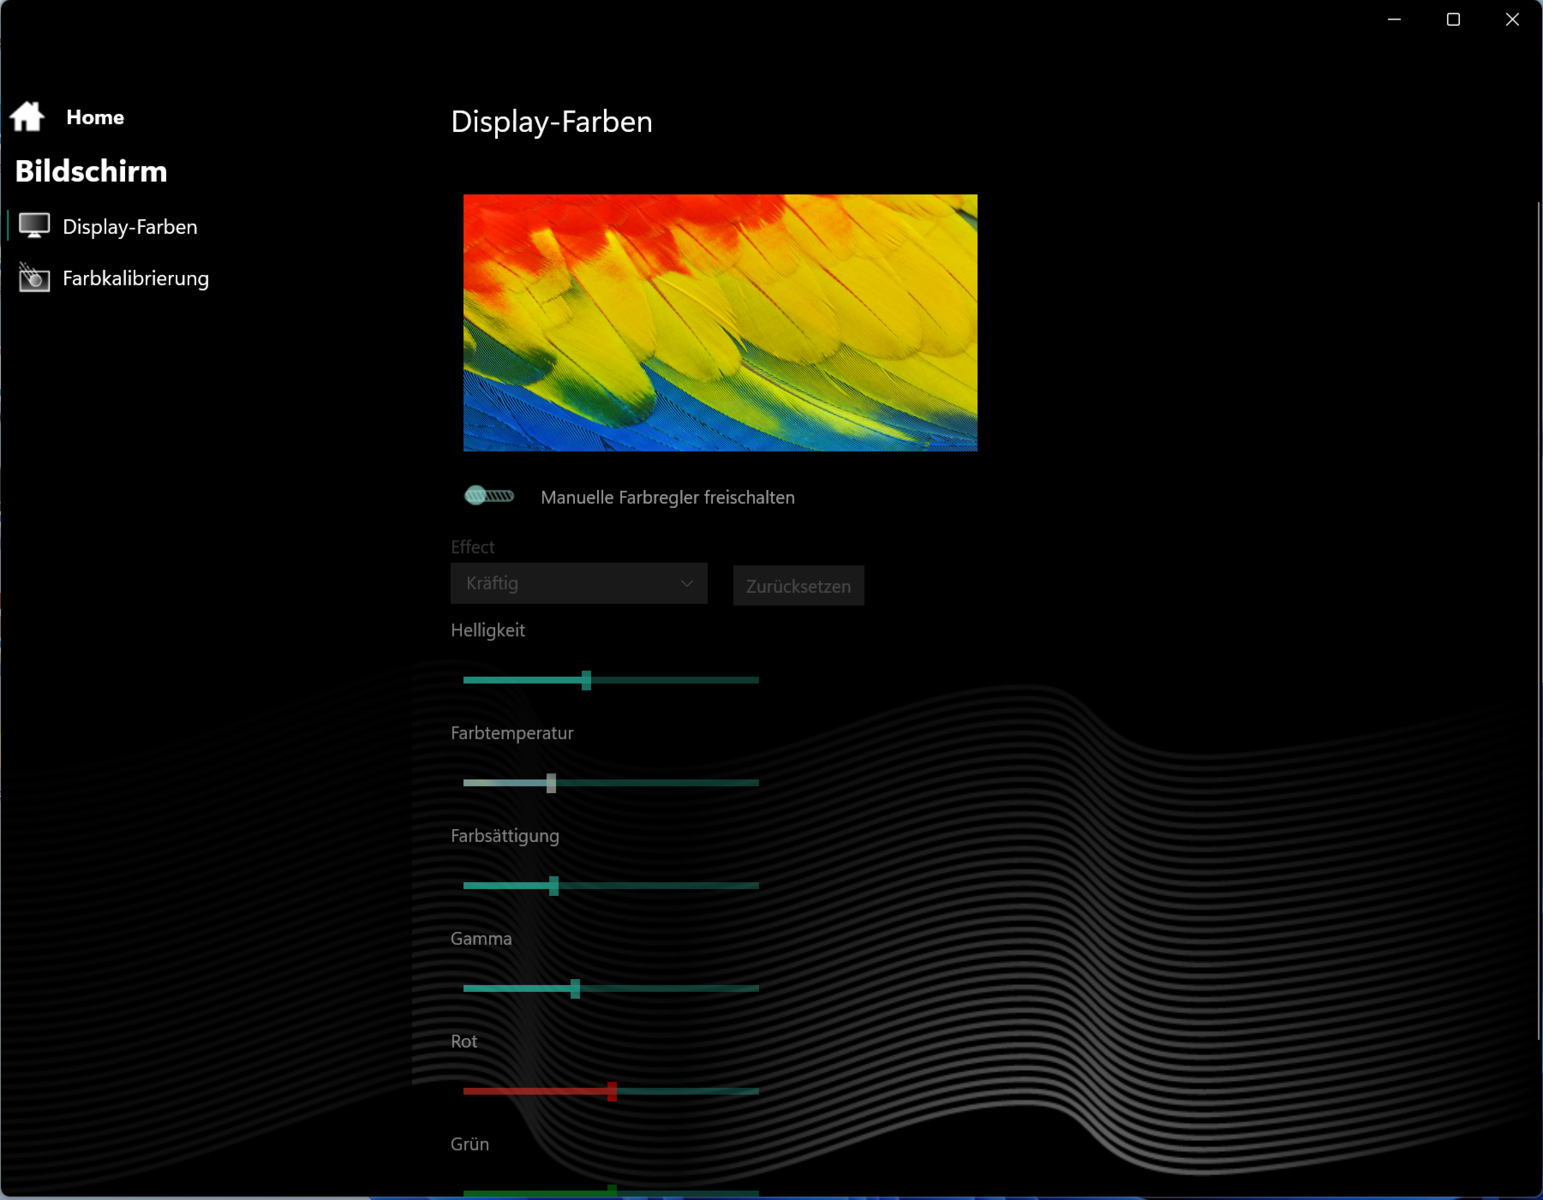
Display - Pannello luminoso con copertura sRGB
Schenker ha equipaggiato Fusion con uno schermo da 15,3 pollici (2.560 x 1.600 pixel) con un rapporto d'aspetto di 16:10. Il pannello opaco a 240 Hz vanta Adaptive Sync, assenza di sfarfallio PWM, tempi di risposta brevi e grande luminosità. Non sono disponibili display alternativi.

| |||||||||||||||||||||||||
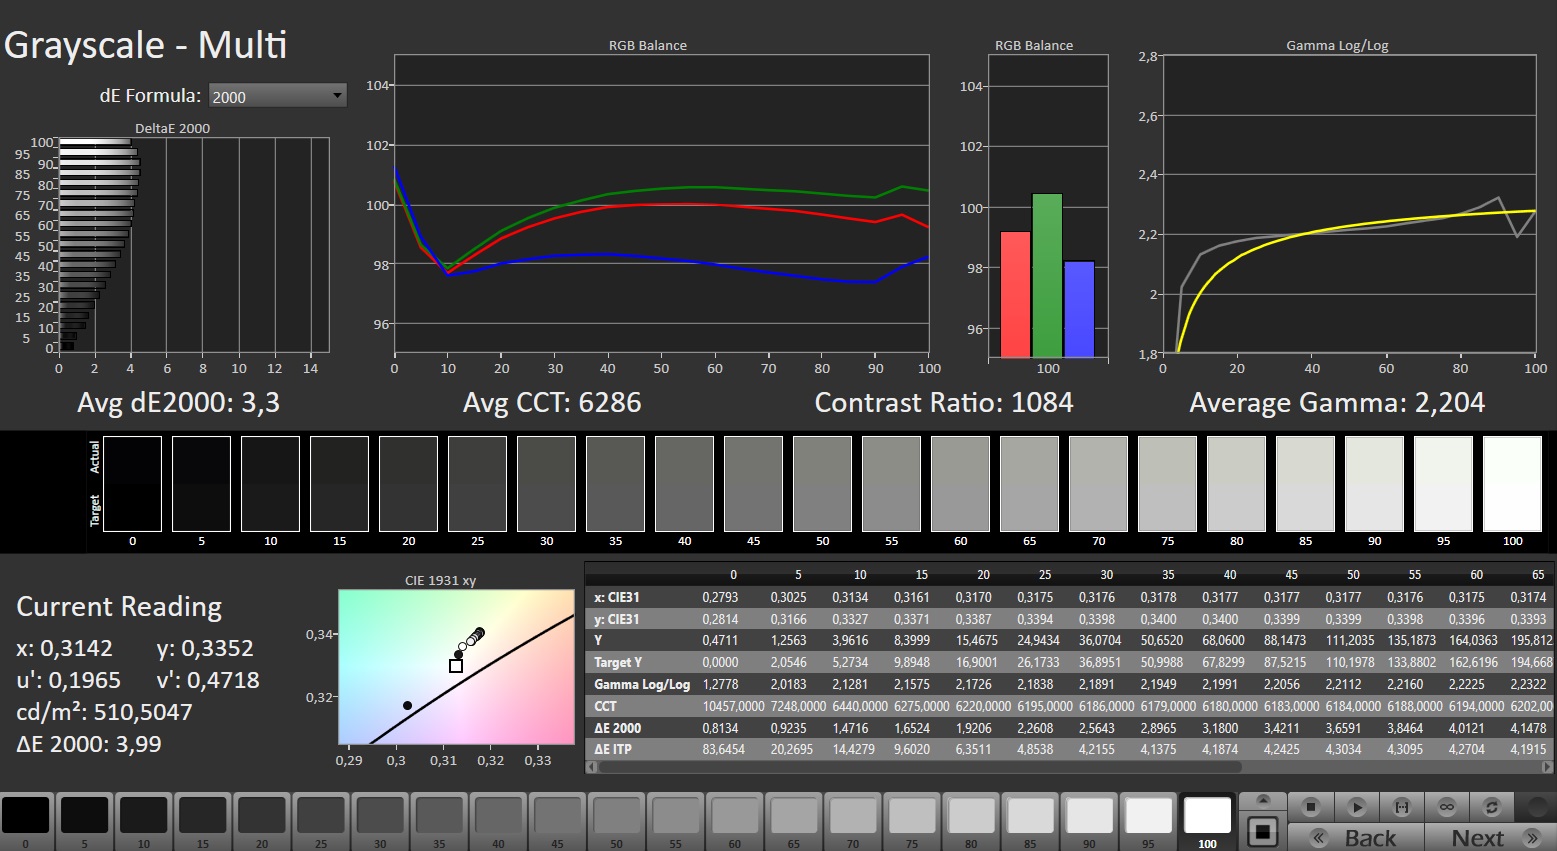
Distribuzione della luminosità: 89 %
Al centro con la batteria: 491 cd/m²
Contrasto: 1045:1 (Nero: 0.47 cd/m²)
ΔE Color 2.16 | 0.5-29.43 Ø5, calibrated: 1.14
ΔE Greyscale 3.3 | 0.57-98 Ø5.3
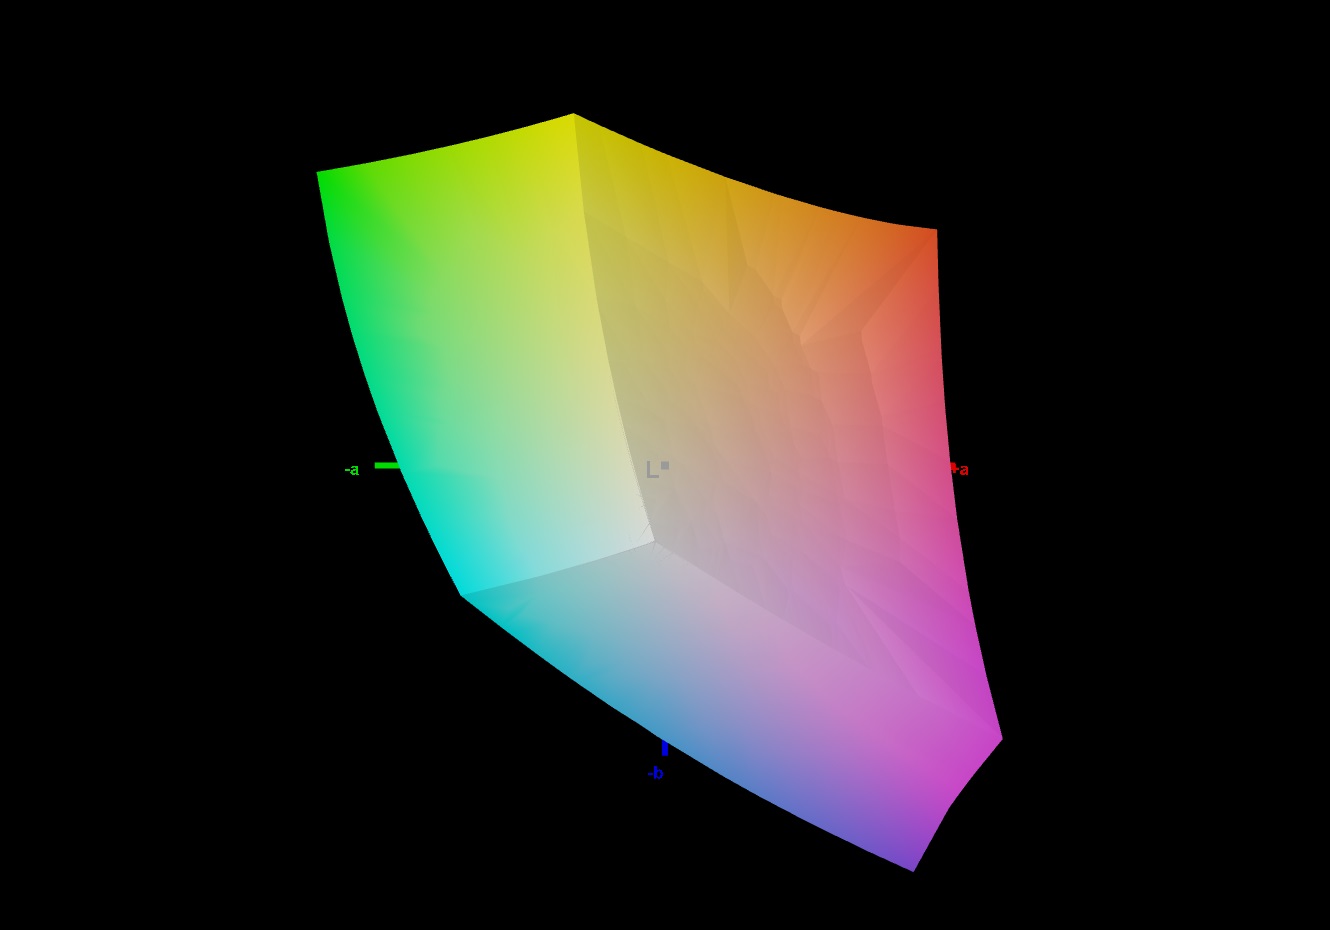
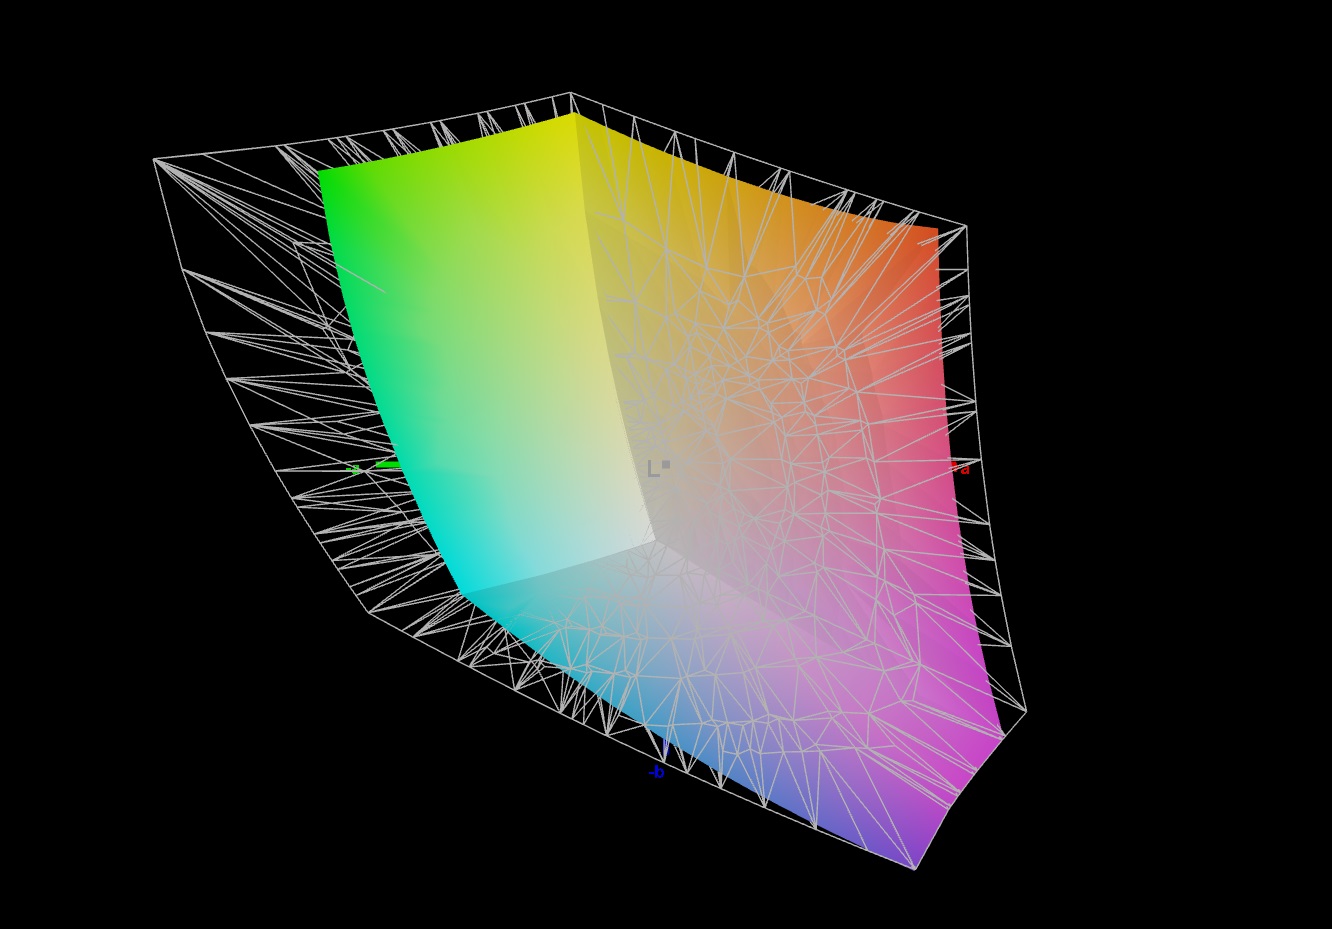
75% AdobeRGB 1998 (Argyll 2.2.0 3D)
100% sRGB (Argyll 2.2.0 3D)
73.5% Display P3 (Argyll 2.2.0 3D)
Gamma: 2.204
| SCHENKER XMG Fusion 15 (Early 24) BOE NJ NE153QDM-NZ1, IPS, 2560x1600, 15.30 | Aorus 16X 2024 BOE CQ NE160QDM-NY1, IPS, 2560x1600, 16.00 | Alienware m16 R2 BOE NE16NYH, IPS, 2560x1600, 16.00 | HP Omen Transcend 16-u1095ng ATNA60DL02-0 (SDC41A4), OLED, 2560x1600, 16.00 | Lenovo Legion Pro 5 16IRX9 BOE NE160QDM-NYC, IPS, 2560x1600, 16.00 | |
|---|---|---|---|---|---|
| Display | -7% | -3% | 22% | -5% | |
| Display P3 Coverage | 73.5 | 67.2 -9% | 71 -3% | 99.8 36% | 69.3 -6% |
| sRGB Coverage | 100 | 96.7 -3% | 100 0% | 100 0% | 99.4 -1% |
| AdobeRGB 1998 Coverage | 75 | 69.3 -8% | 71.4 -5% | 97 29% | 70.1 -7% |
| Response Times | -27% | -41% | 96% | -105% | |
| Response Time Grey 50% / Grey 80% * | 5 ? | 7.5 ? -50% | 5.7 ? -14% | 0.2 ? 96% | 11.9 ? -138% |
| Response Time Black / White * | 5.2 ? | 5.4 ? -4% | 8.7 ? -67% | 0.2 ? 96% | 8.9 ? -71% |
| PWM Frequency | 120 ? | ||||
| Screen | -1% | 11% | 182% | 17% | |
| Brightness middle | 491 | 542 10% | 345.8 -30% | 390 -21% | 384 -22% |
| Brightness | 460 | 504 10% | 337 -27% | 392 -15% | 366 -20% |
| Brightness Distribution | 89 | 86 -3% | 87 -2% | 98 10% | 91 2% |
| Black Level * | 0.47 | 0.45 4% | 0.3 36% | 0.02 96% | 0.35 26% |
| Contrast | 1045 | 1204 15% | 1153 10% | 19500 1766% | 1097 5% |
| Colorchecker dE 2000 * | 2.16 | 2.73 -26% | 1.99 8% | 1.94 10% | 0.97 55% |
| Colorchecker dE 2000 max. * | 4.44 | 5.29 -19% | 3.52 21% | 4.26 4% | 3.57 20% |
| Colorchecker dE 2000 calibrated * | 1.14 | 1.32 -16% | 0.62 46% | 4.21 -269% | 0.77 32% |
| Greyscale dE 2000 * | 3.3 | 2.9 12% | 2.1 36% | 1.5 55% | 1.5 55% |
| Gamma | 2.204 100% | 2.192 100% | 2.32 95% | 2.221 99% | 2.24 98% |
| CCT | 6286 103% | 6173 105% | 6369 102% | 6395 102% | 6709 97% |
| Media totale (Programma / Settaggio) | -12% /
-6% | -11% /
1% | 100% /
135% | -31% /
-5% |
* ... Meglio usare valori piccoli
Il display mostrava già una buona rappresentazione dei colori subito dopo l'acquisto: Con una deviazione di circa 2,2, è stato raggiunto il valore target (DeltaE < 3). La calibrazione del display abbassa la sua deviazione a 1,14 e si traduce in toni di grigio più equilibrati. Il pannello è in grado di coprire completamente lo spazio colore sRGB, ma non gli spazi colore AdobeRGB o DCI P3. Questo non è diverso dalla maggior parte degli schermi della concorrenza.

Tempi di risposta del Display
| ↔ Tempi di risposta dal Nero al Bianco | ||
|---|---|---|
| 5.2 ms ... aumenta ↗ e diminuisce ↘ combinato | ↗ 1.5 ms Incremento | 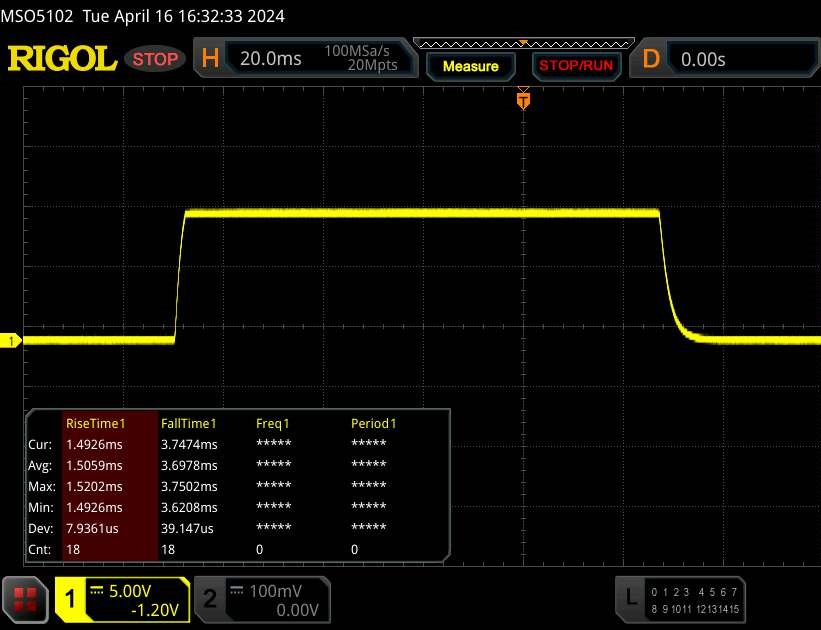 |
| ↘ 3.7 ms Calo | ||
| Lo schermo ha mostrato valori di risposta molto veloci nei nostri tests ed è molto adatto per i gaming veloce. In confronto, tutti i dispositivi di test variano da 0.1 (minimo) a 240 (massimo) ms. » 12 % di tutti i dispositivi è migliore. Questo significa che i tempi di risposta rilevati sono migliori rispettto alla media di tutti i dispositivi testati (21.4 ms). | ||
| ↔ Tempo di risposta dal 50% Grigio all'80% Grigio | ||
| 5 ms ... aumenta ↗ e diminuisce ↘ combinato | ↗ 2.3 ms Incremento | 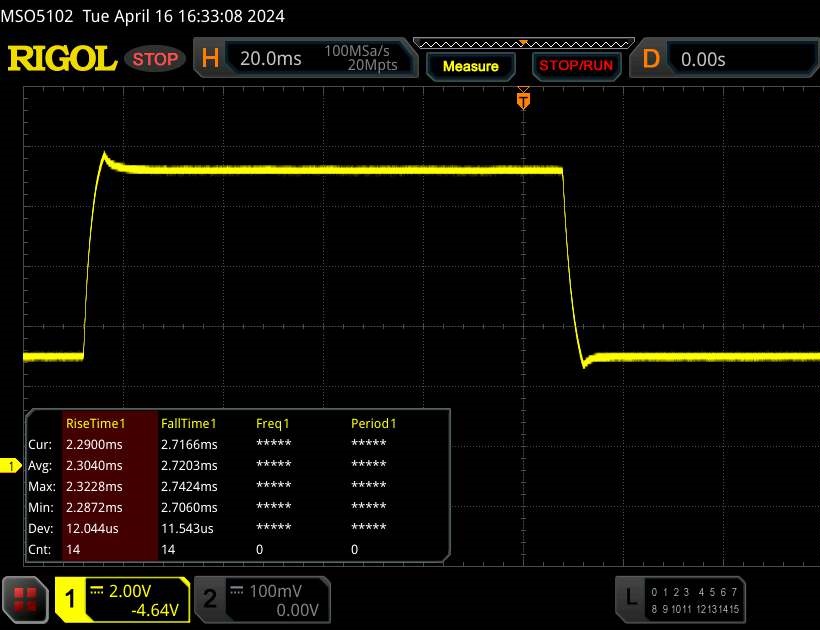 |
| ↘ 2.7 ms Calo | ||
| Lo schermo ha mostrato valori di risposta molto veloci nei nostri tests ed è molto adatto per i gaming veloce. In confronto, tutti i dispositivi di test variano da 0.2 (minimo) a 636 (massimo) ms. » 12 % di tutti i dispositivi è migliore. Questo significa che i tempi di risposta rilevati sono migliori rispettto alla media di tutti i dispositivi testati (33.7 ms). | ||
Sfarfallio dello schermo / PWM (Pulse-Width Modulation)
| flickering dello schermo / PWM non rilevato | 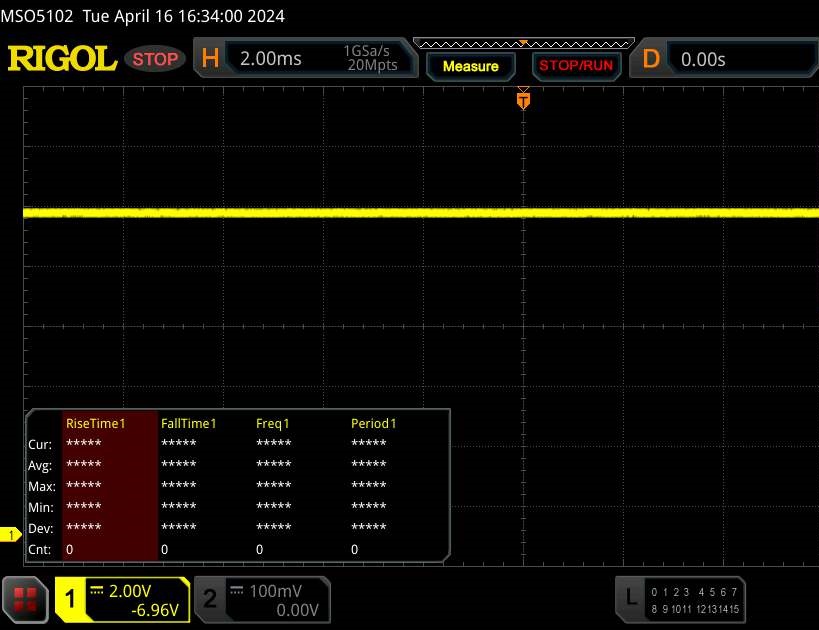 | ||
In confronto: 53 % di tutti i dispositivi testati non utilizza PWM per ridurre la luminosita' del display. Se è rilevato PWM, una media di 17812 (minimo: 5 - massimo: 3846000) Hz è stata rilevata. | |||
Il pannello IPS stabile nell'angolo di visione del dispositivo rimane leggibile da ogni angolazione. All'esterno, può leggere dal display a condizione che il sole non sia troppo luminoso.

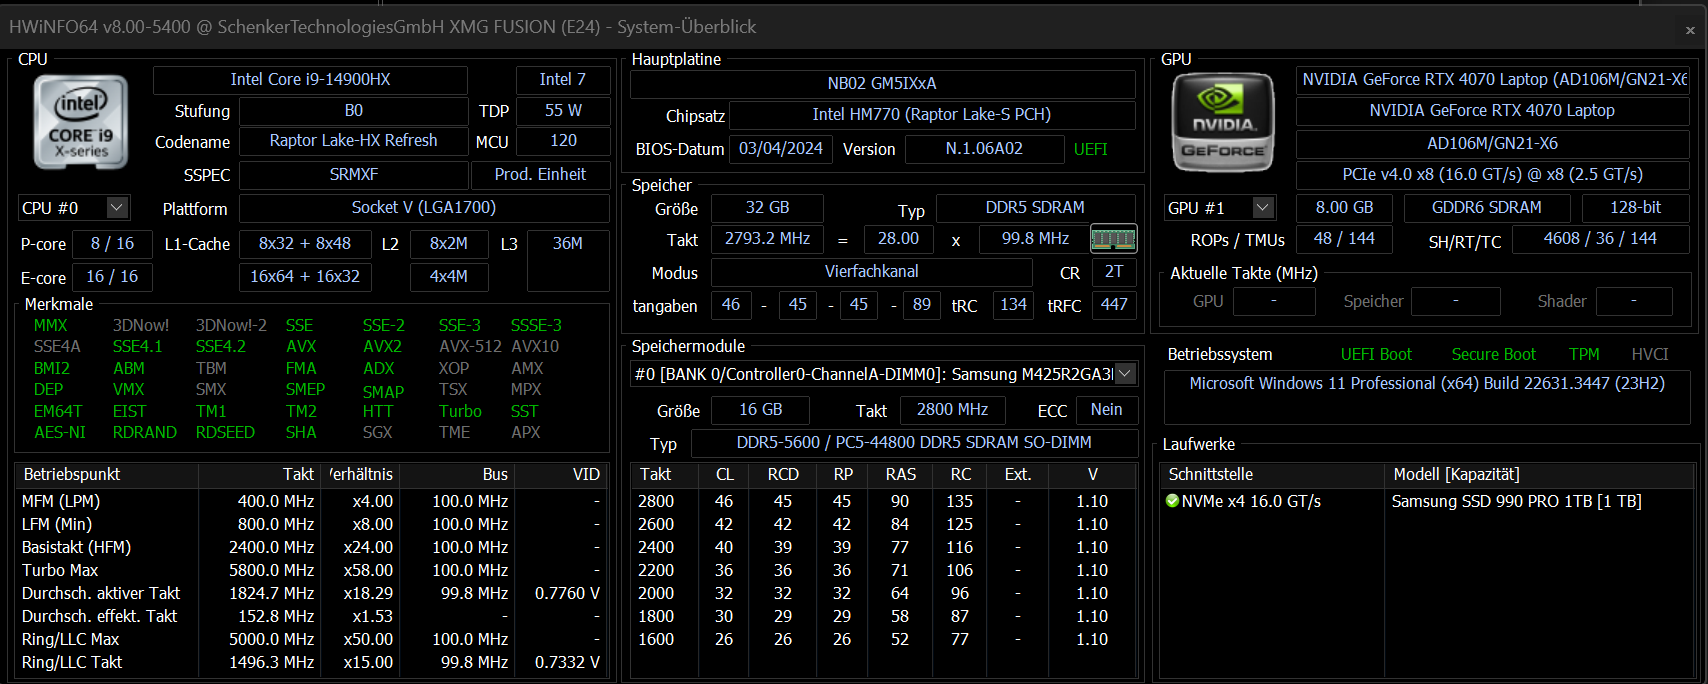
Prestazioni - Raptor Lake e Ada Lovelace alimentano il computer portatile
La potente e compatta XMG Fusion 15 (Early 24) è rivolta ai giocatori e ai creatori. Raptor Lake e Ada Lovelace garantiscono le prestazioni necessarie. Il computer portatile può essere configurato individualmente tramite il negozio online Schenker. La variante attuale costa circa 2.500 dollari. I modelli più economici partono da circa 1.700 dollari.
Condizioni di test
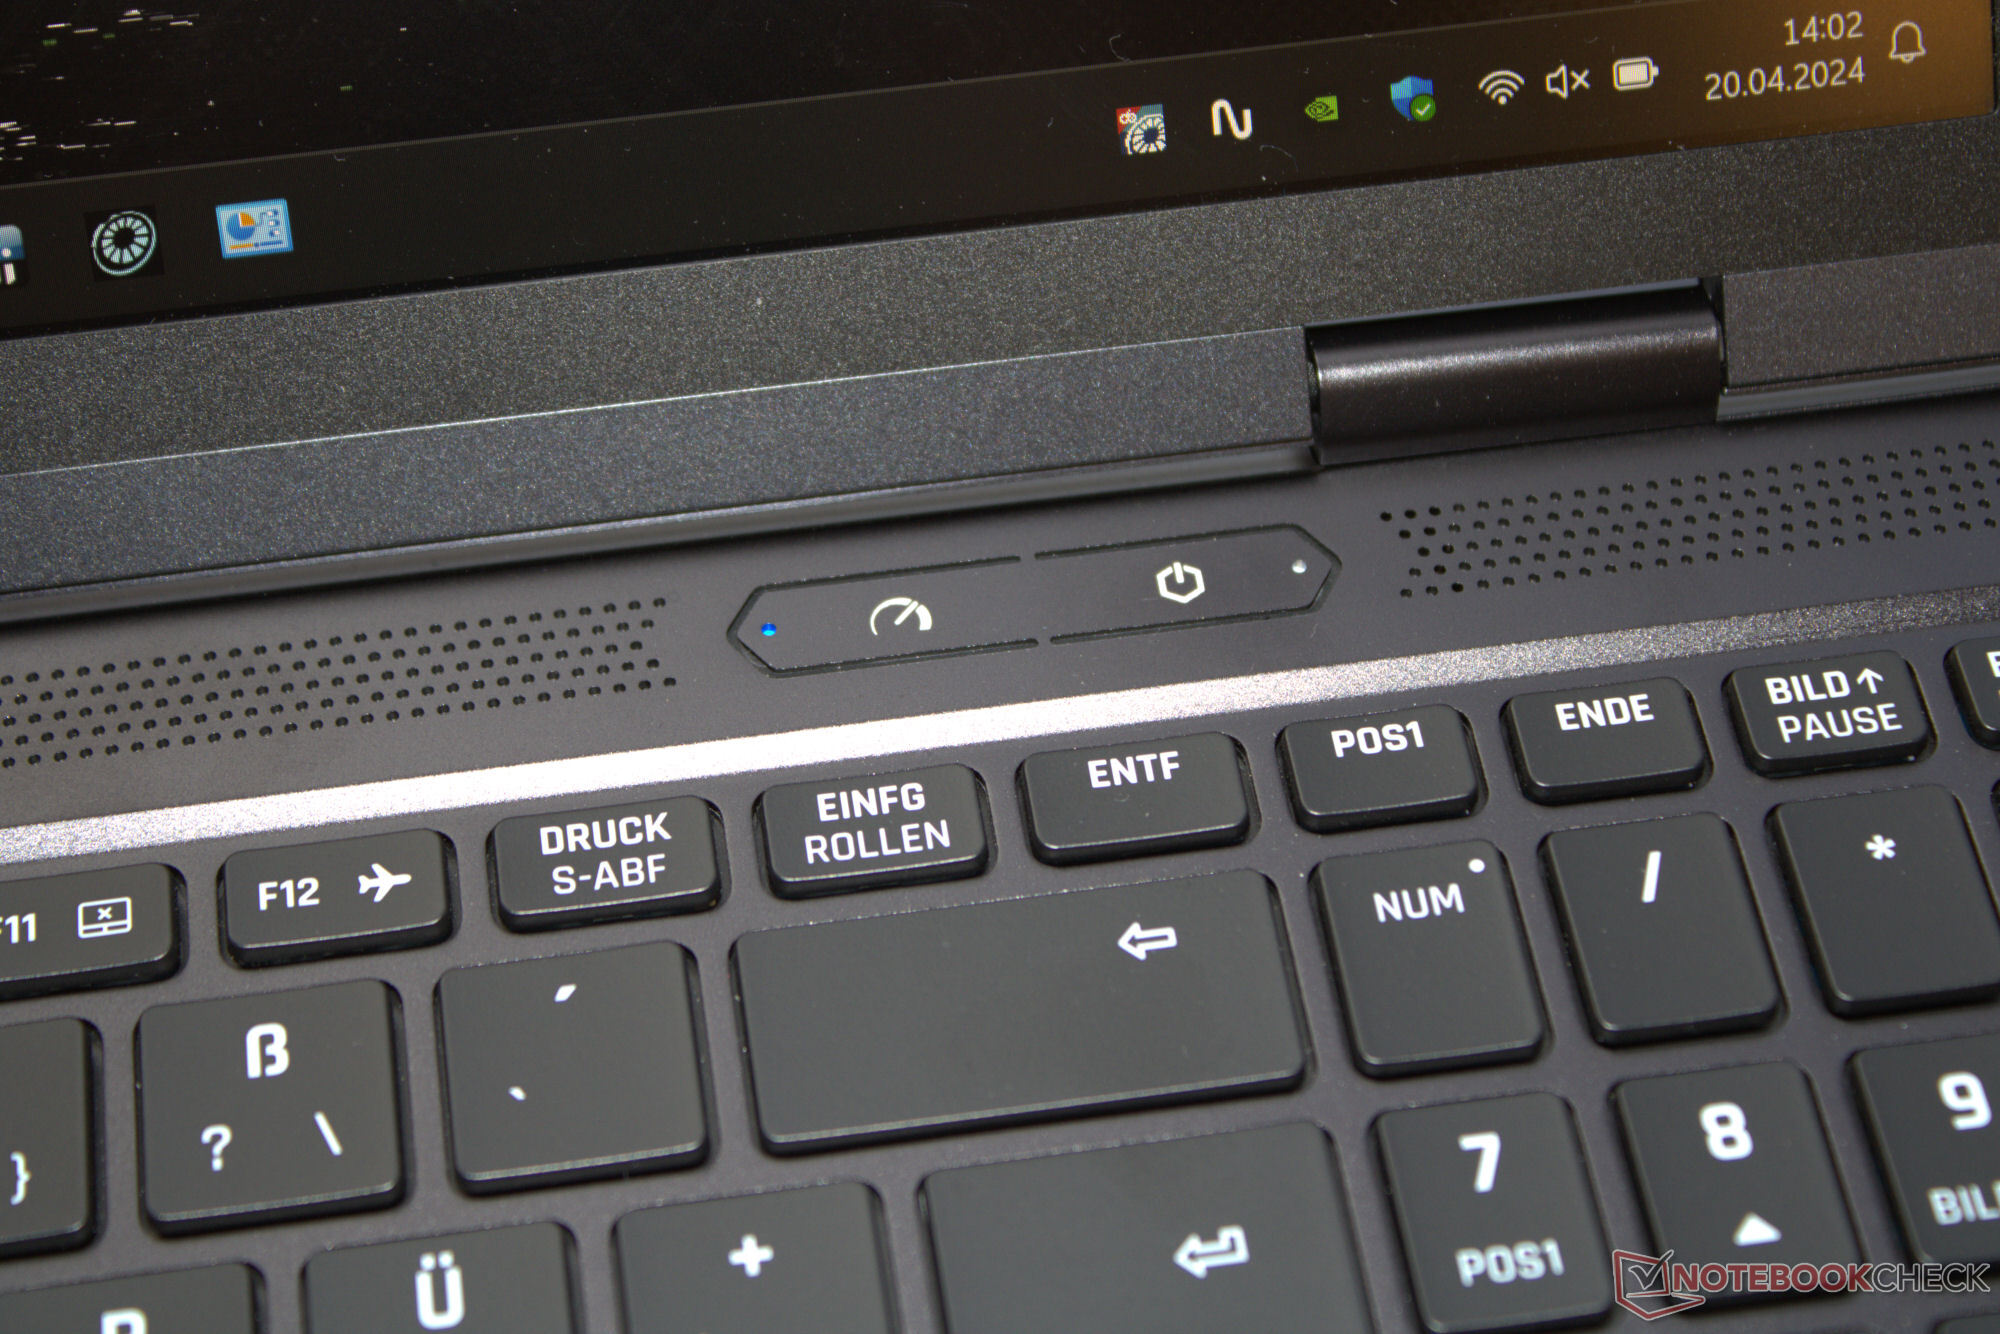
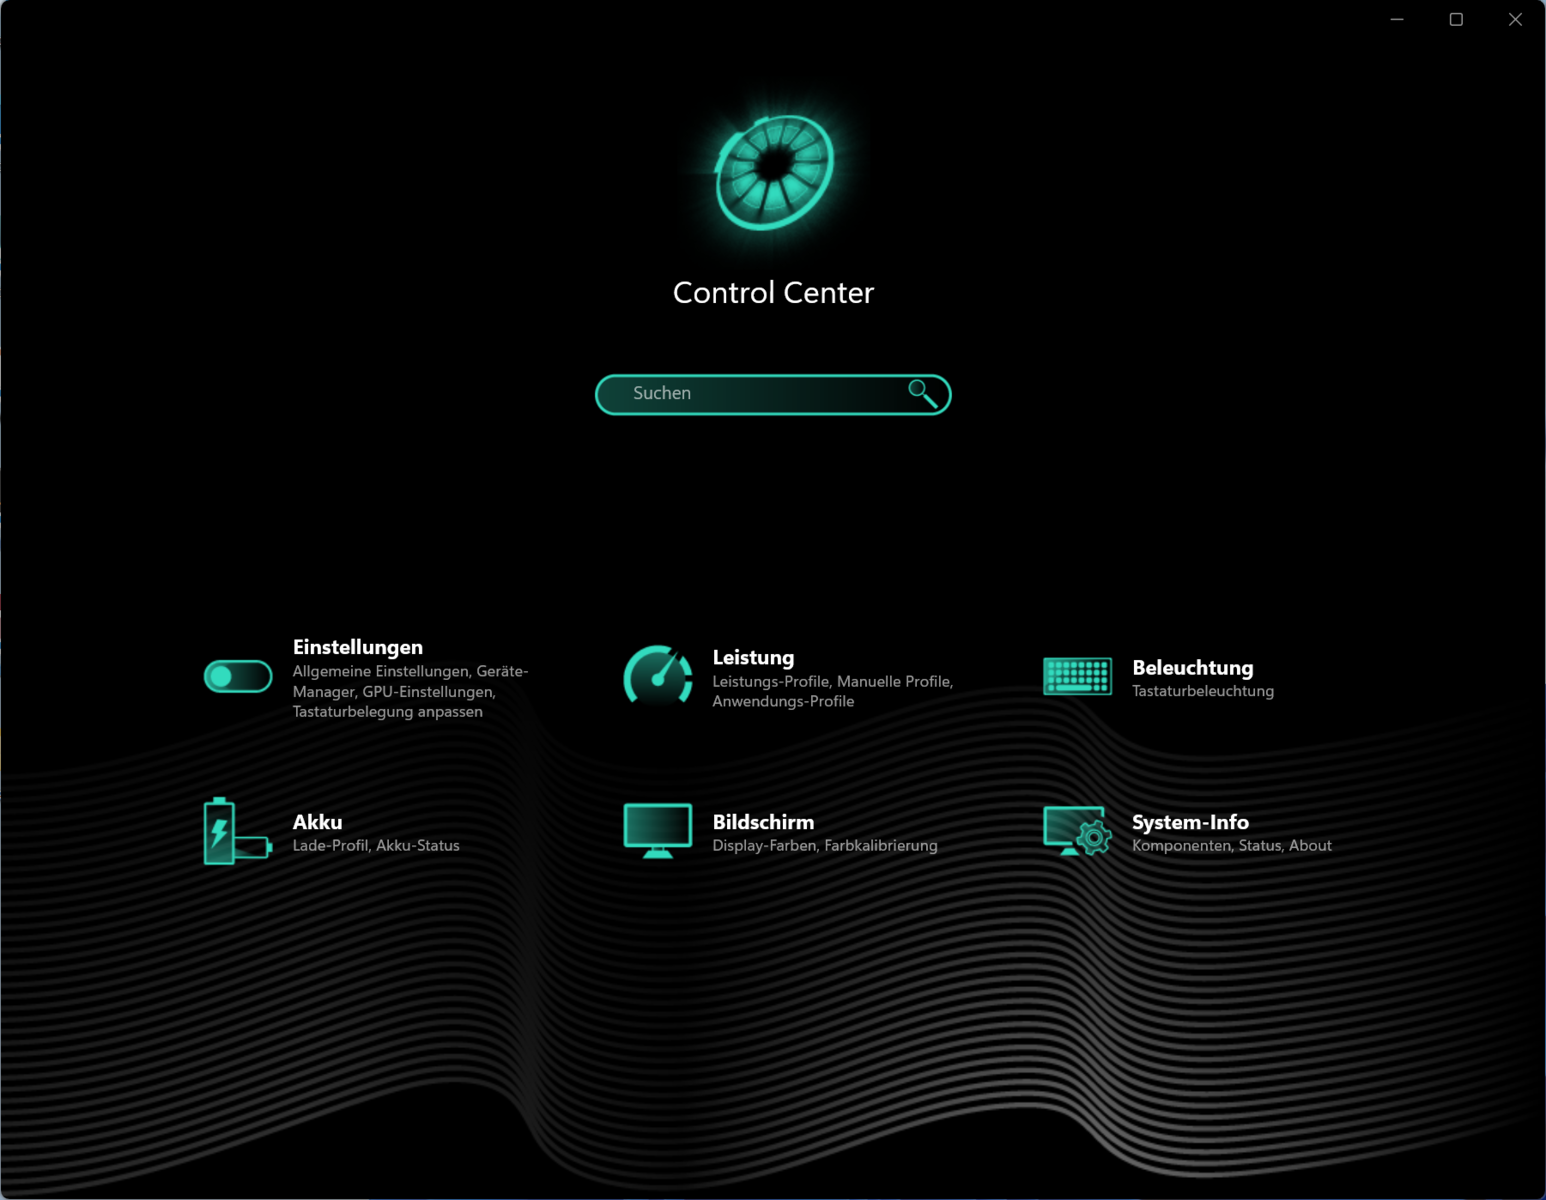
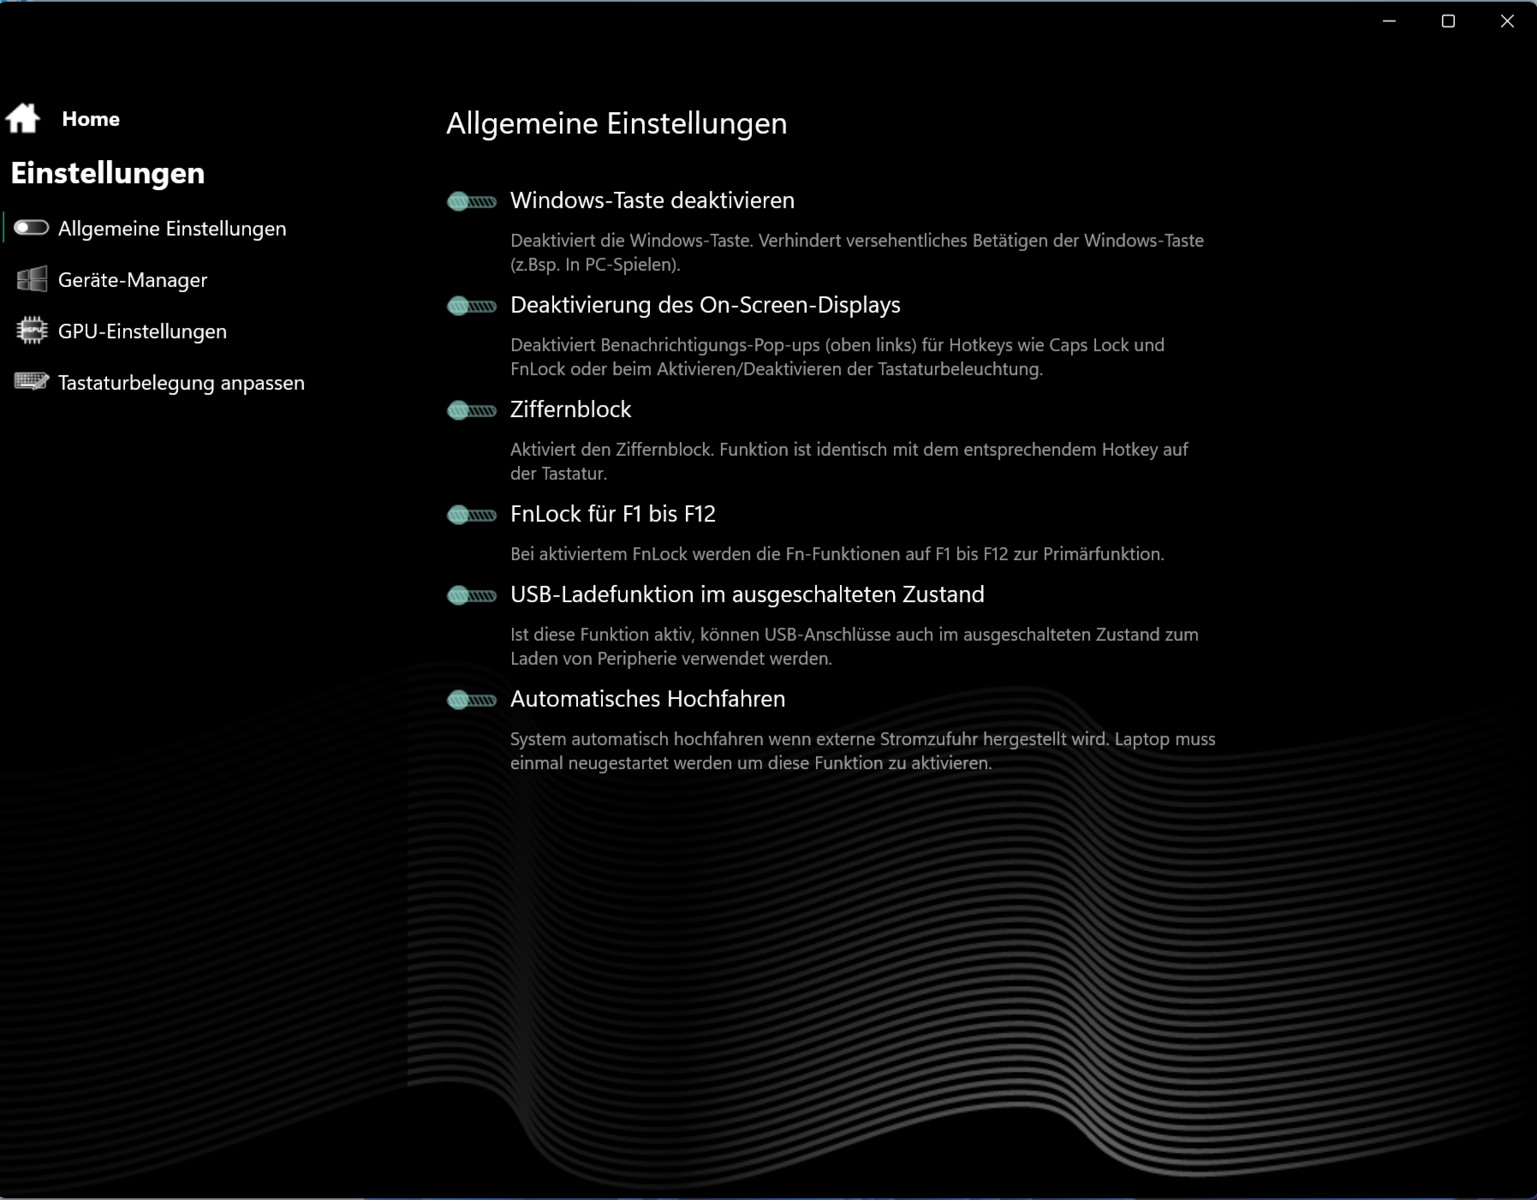
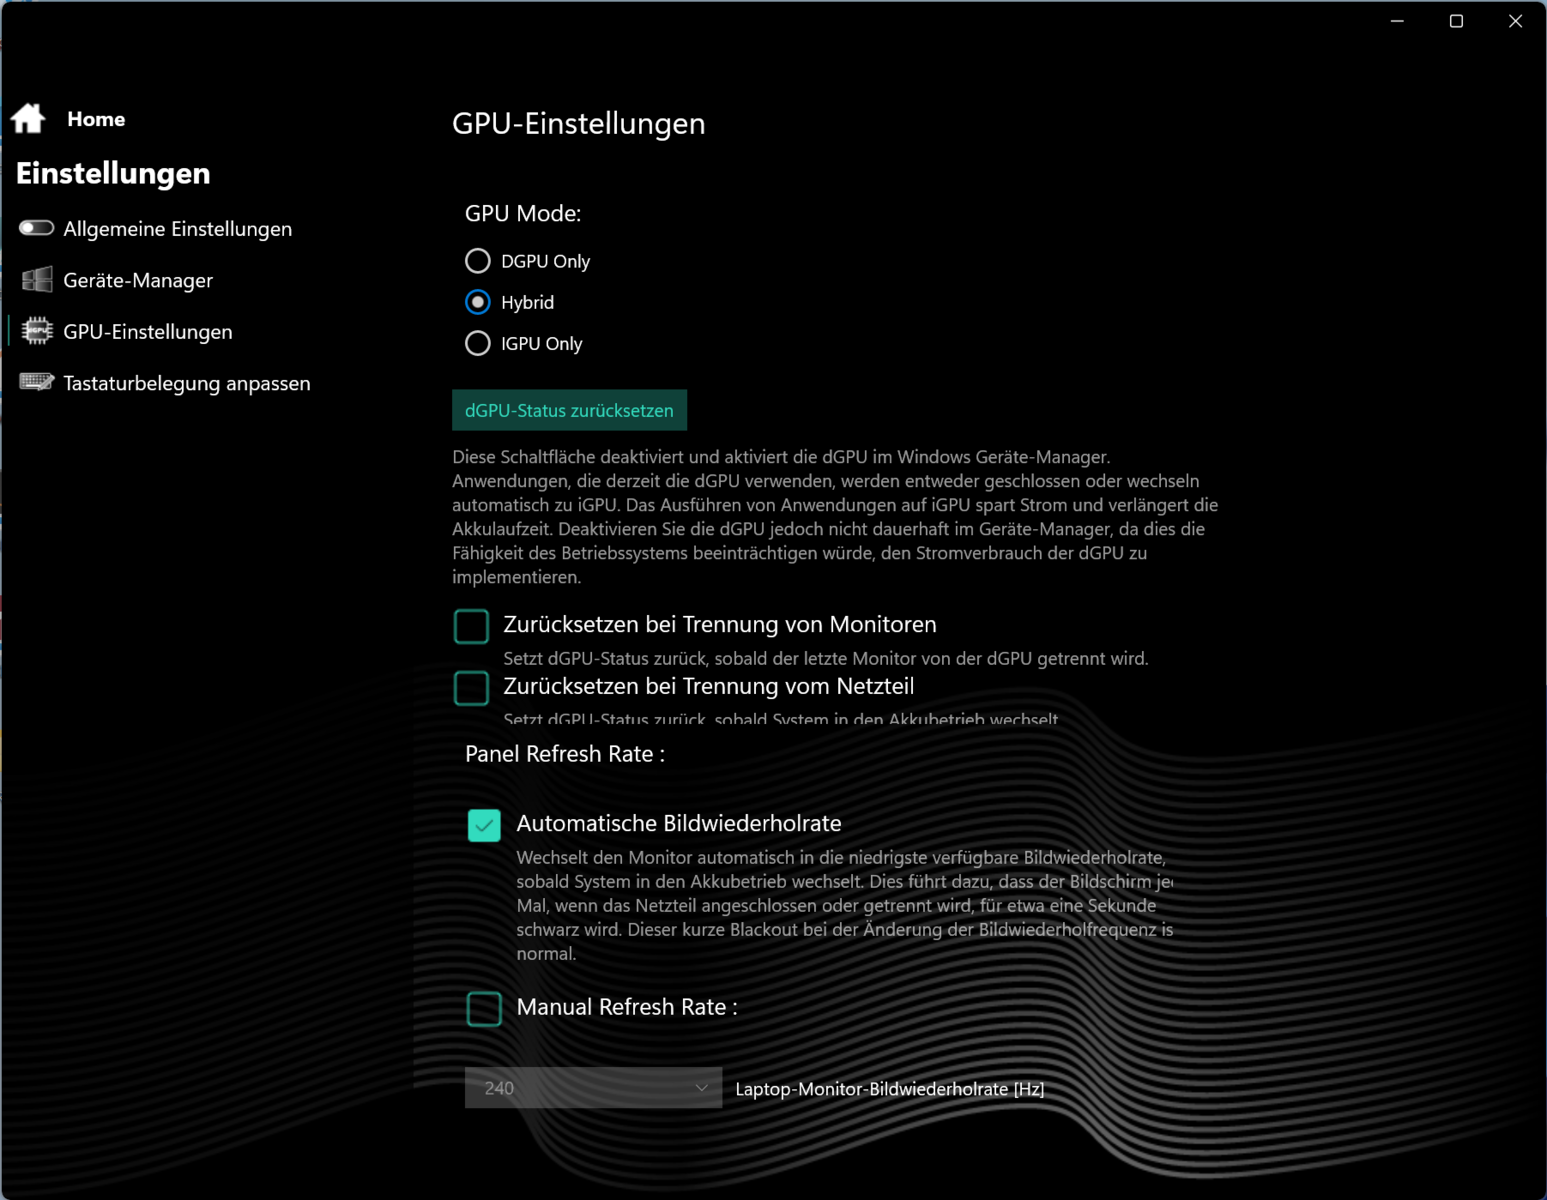
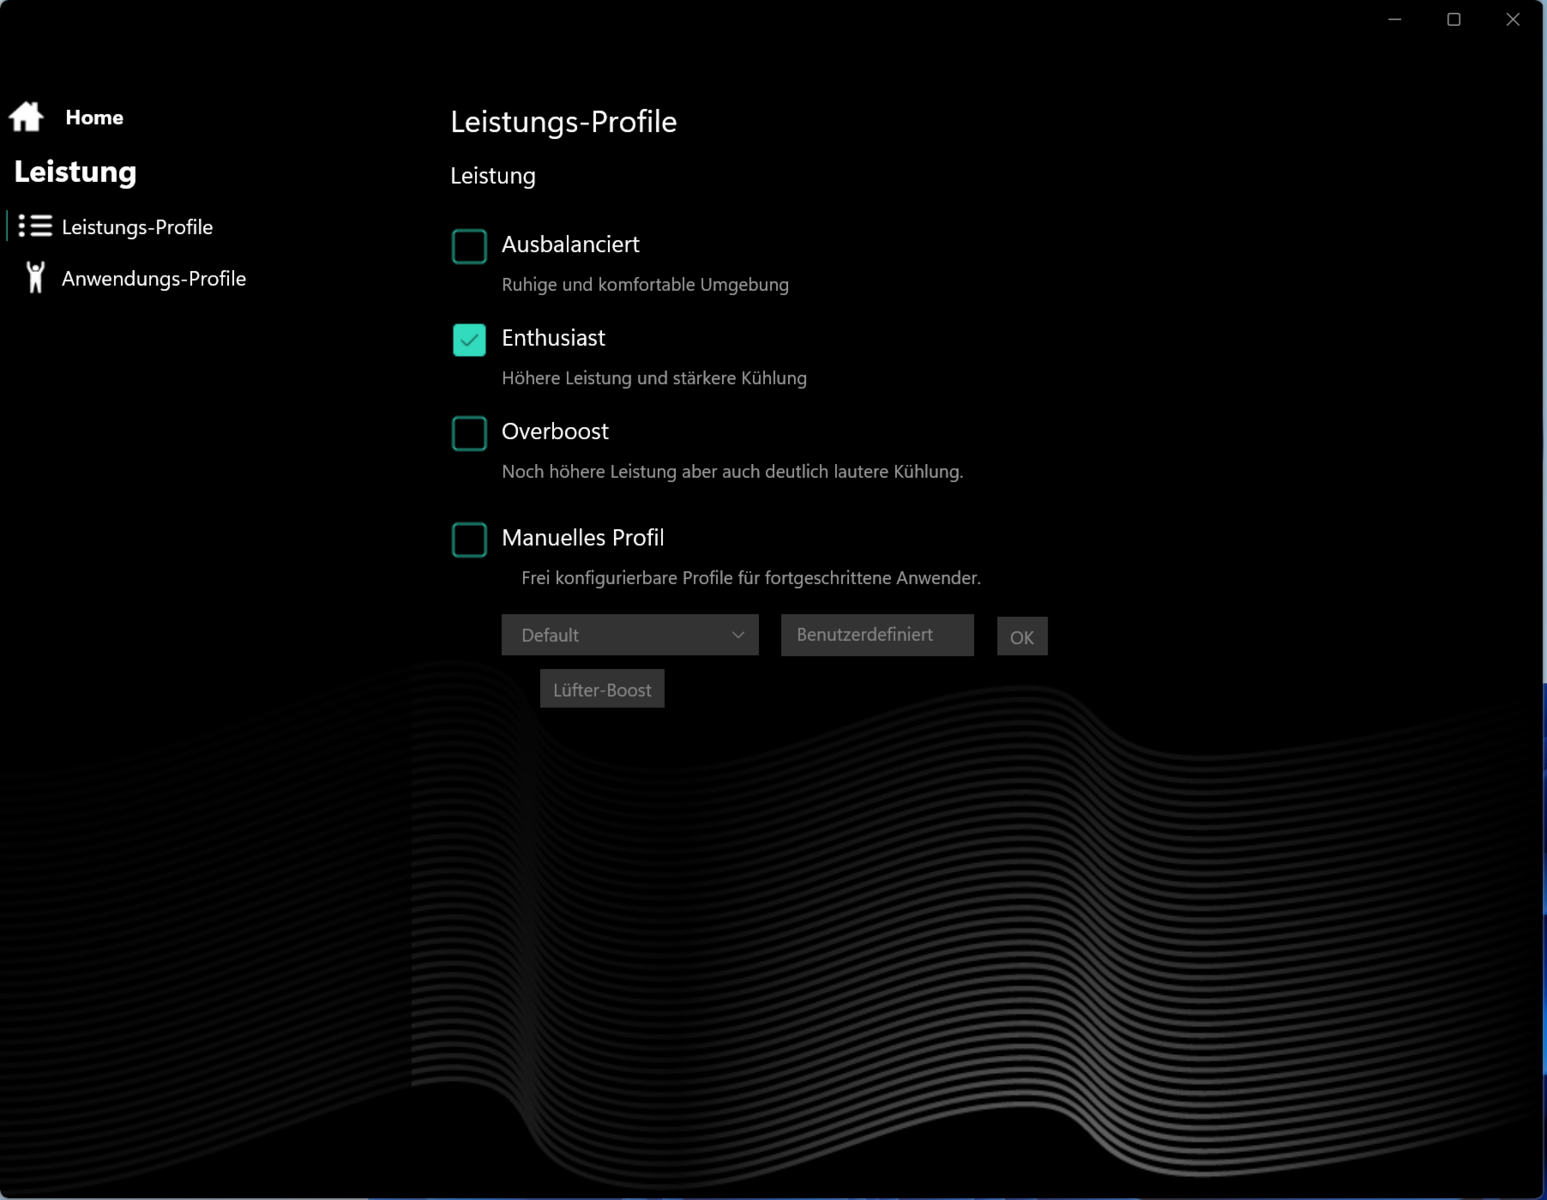
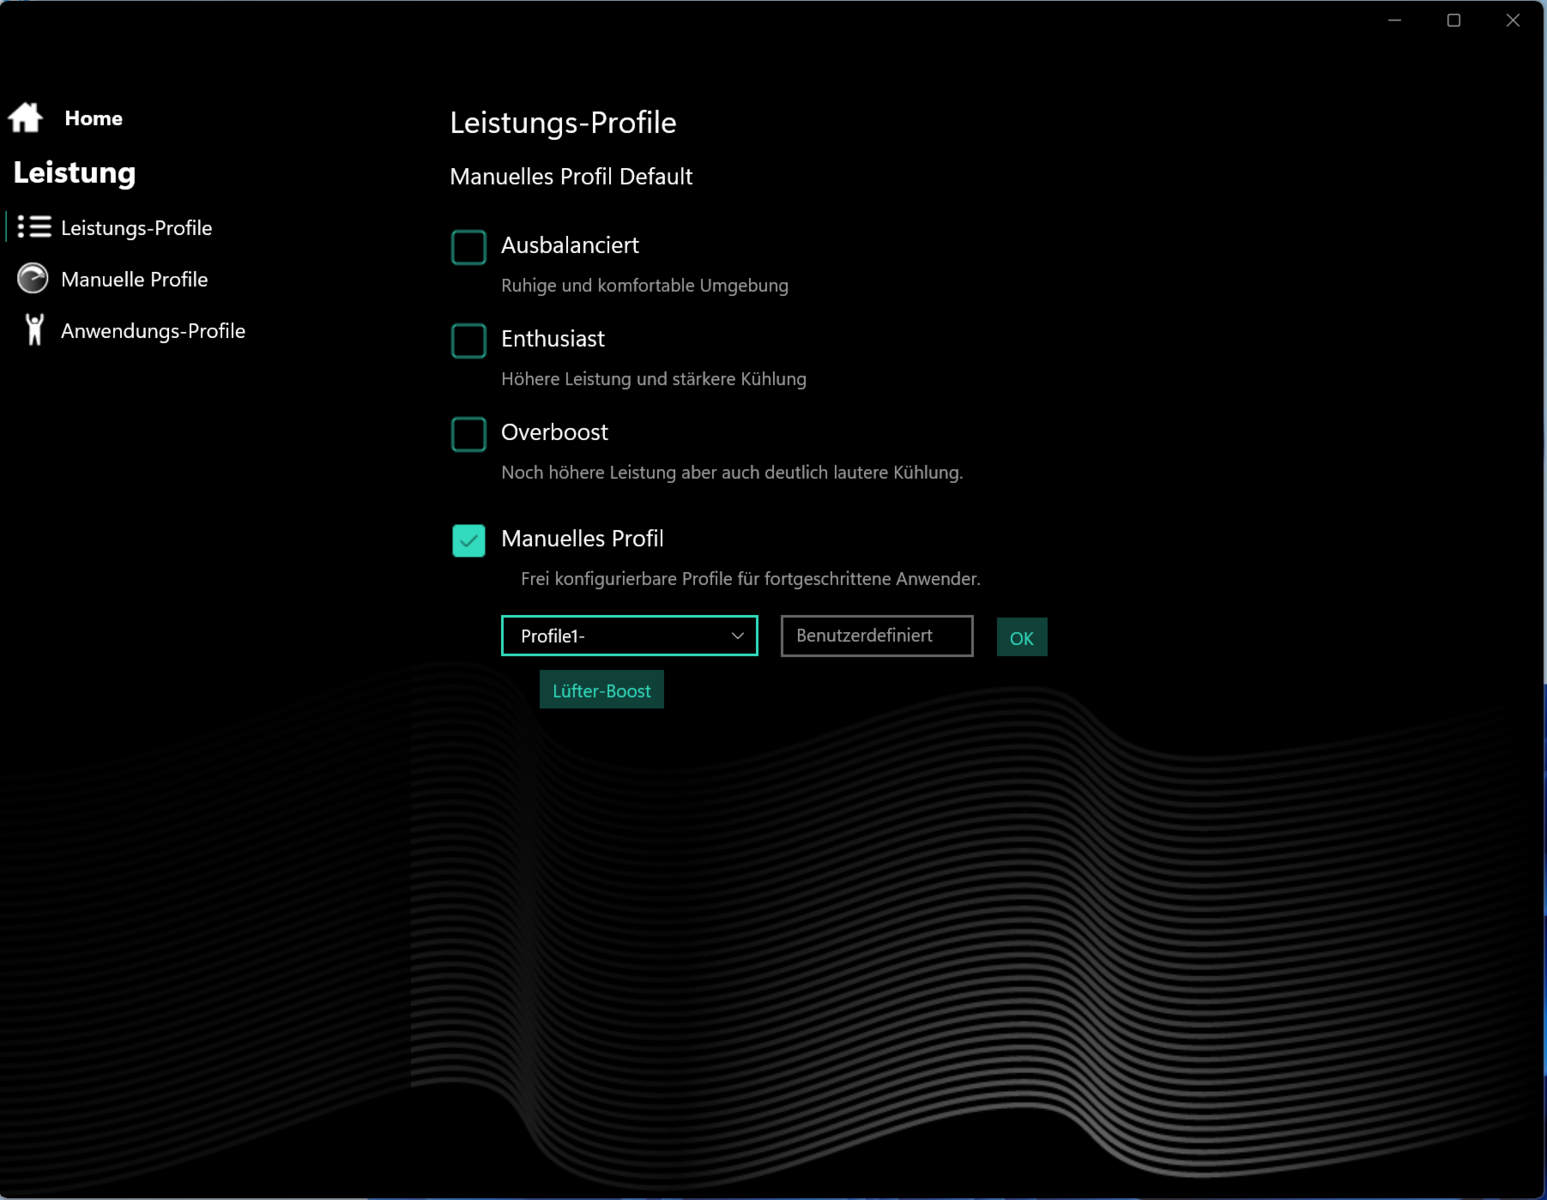
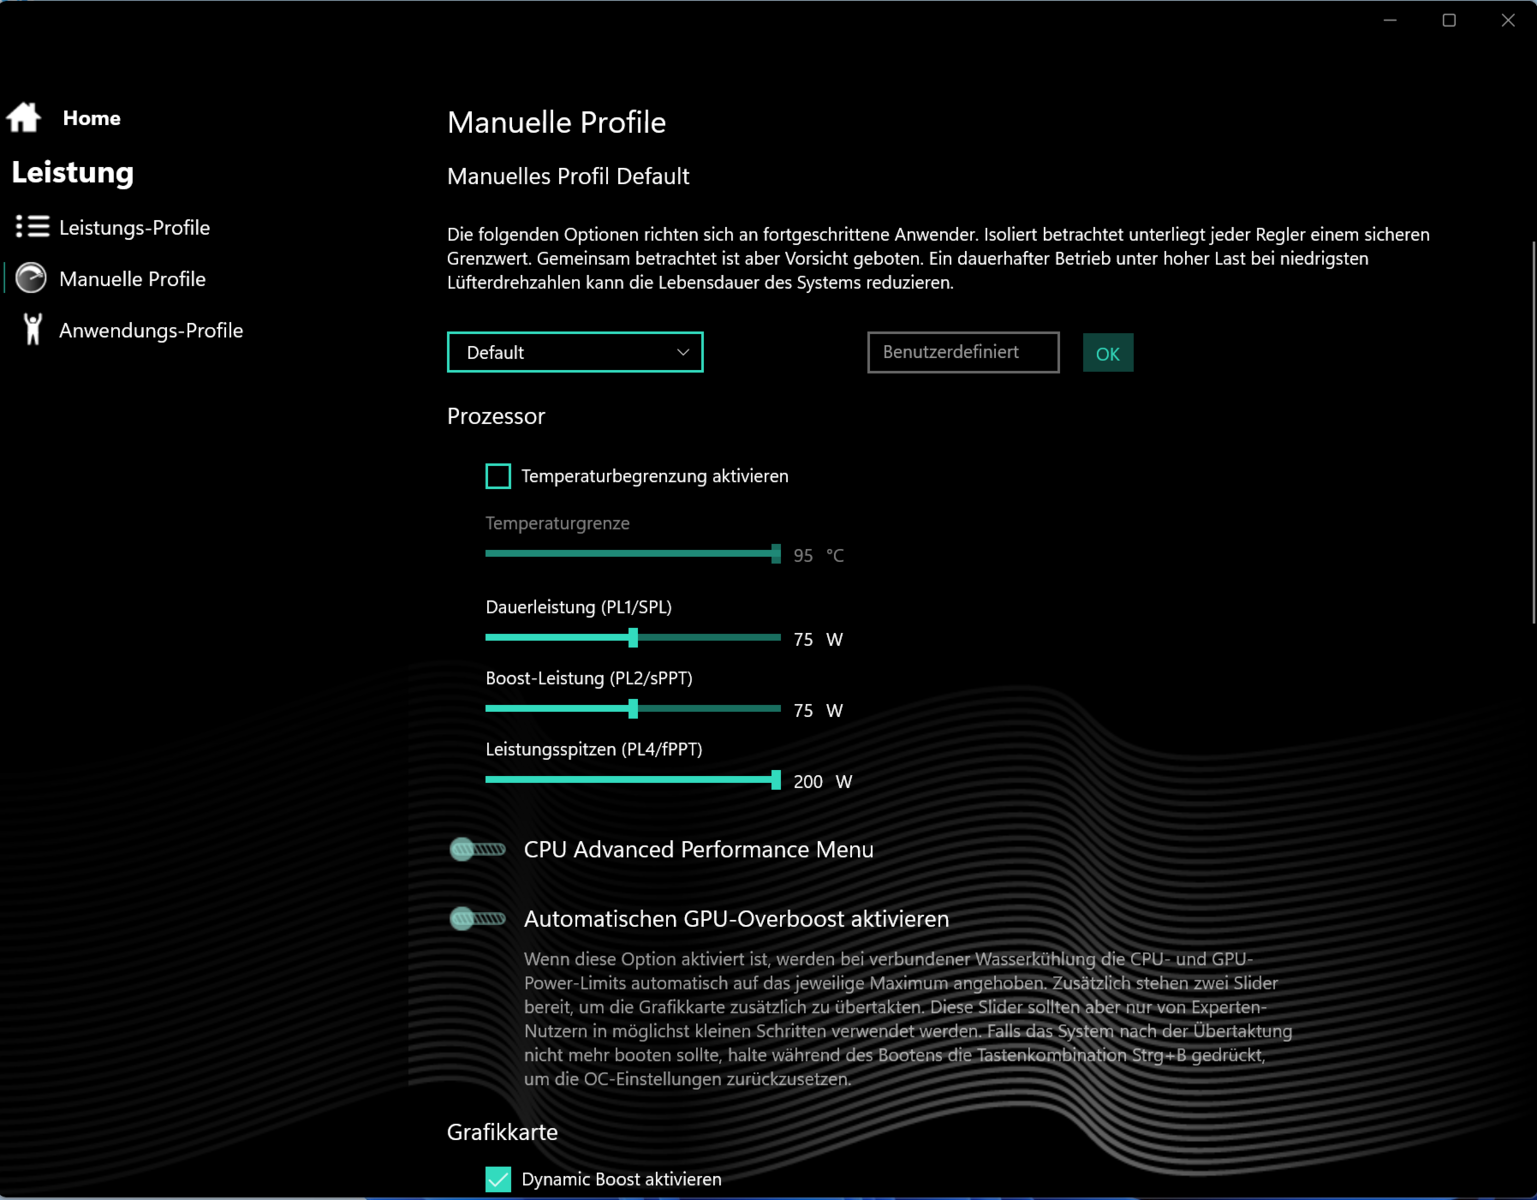
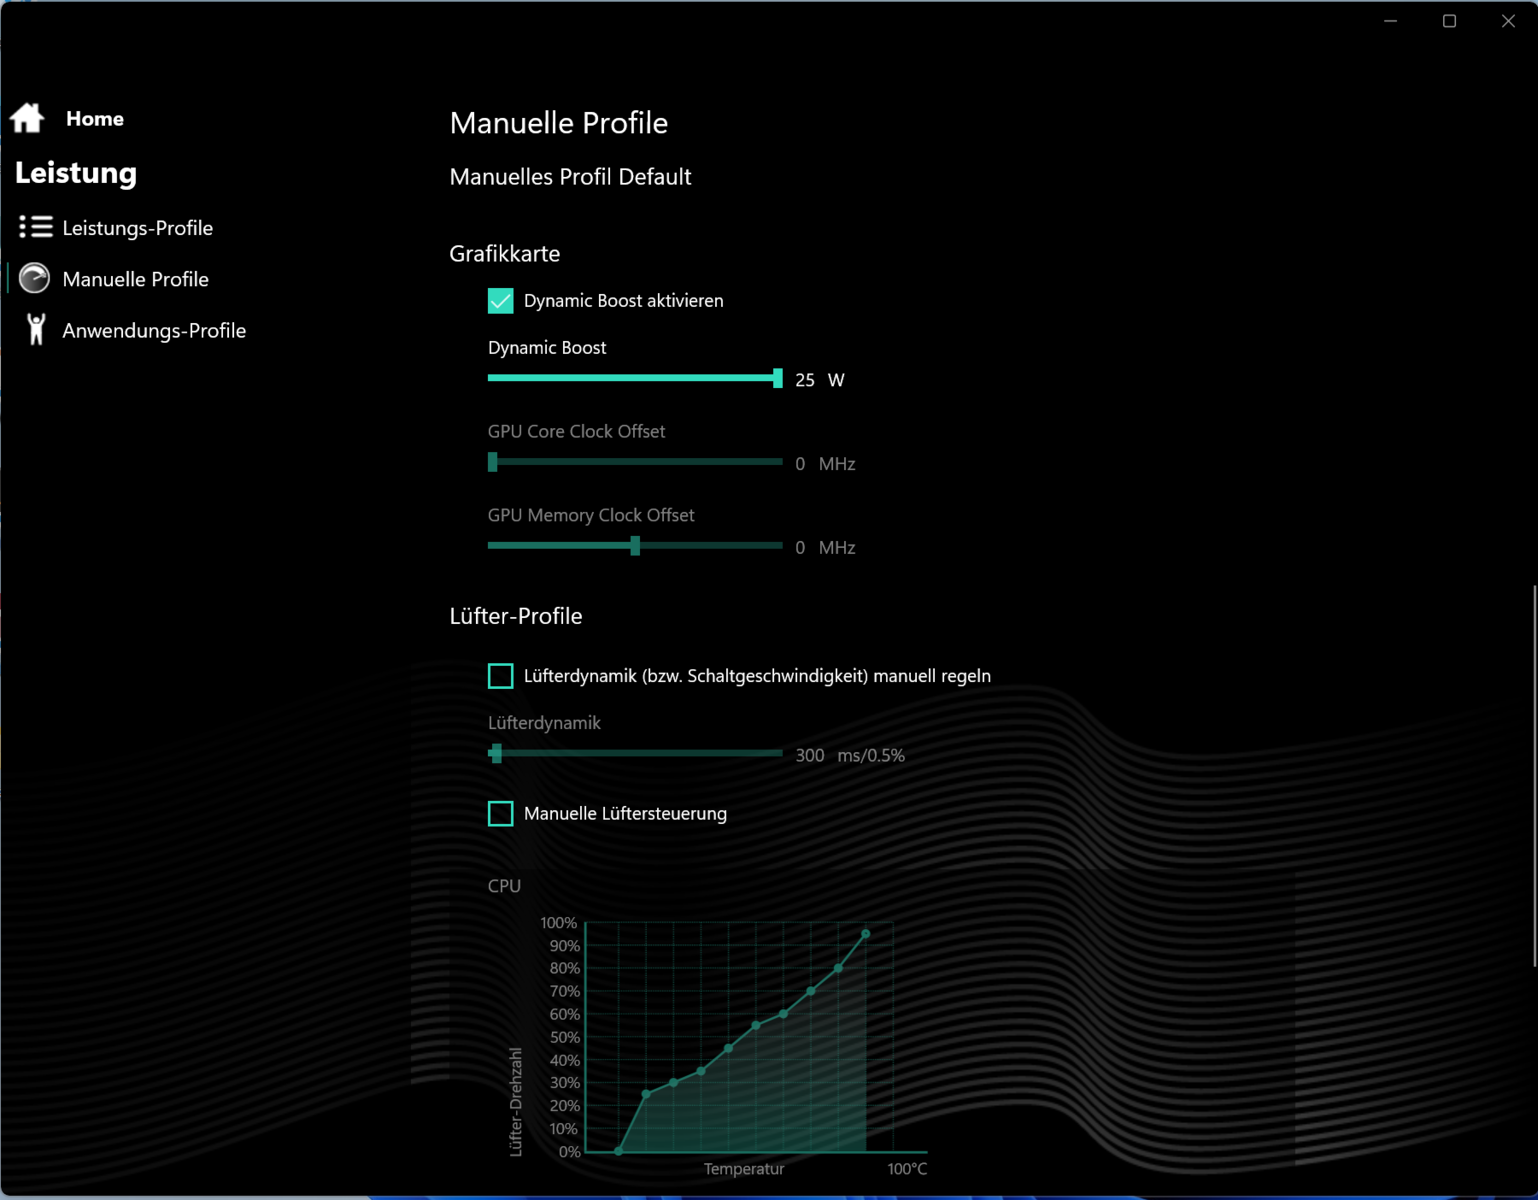
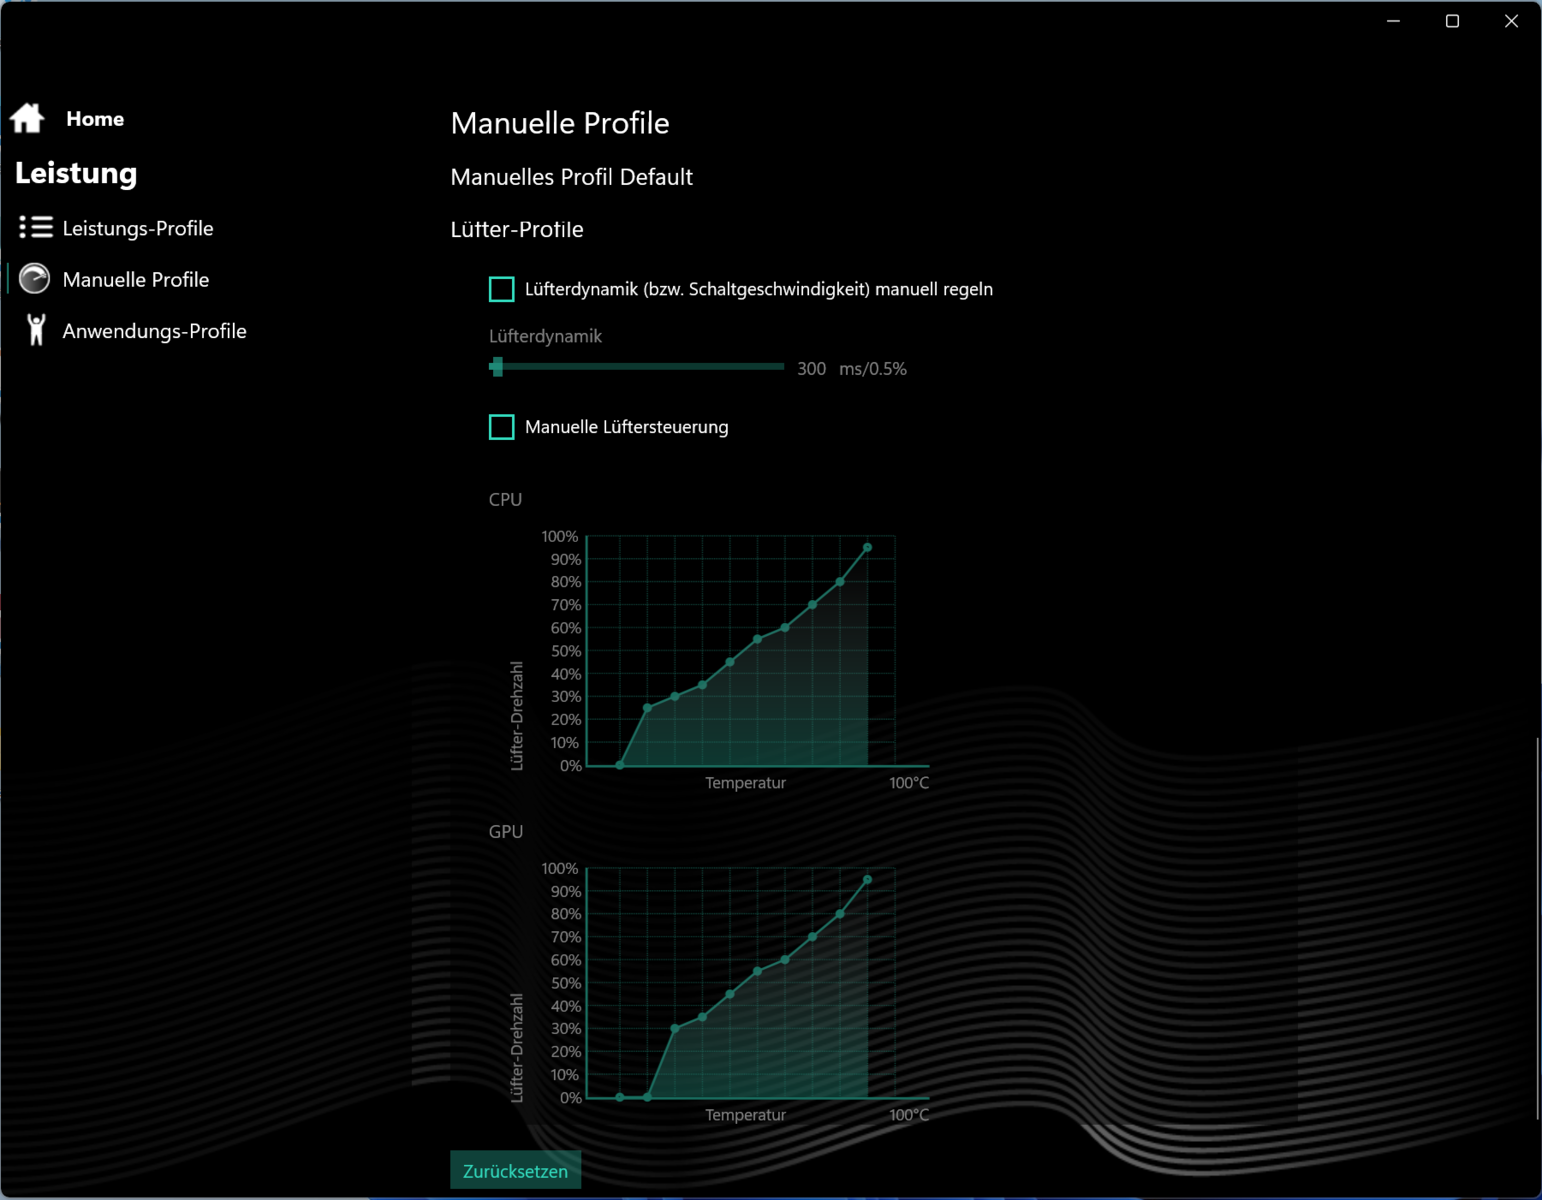
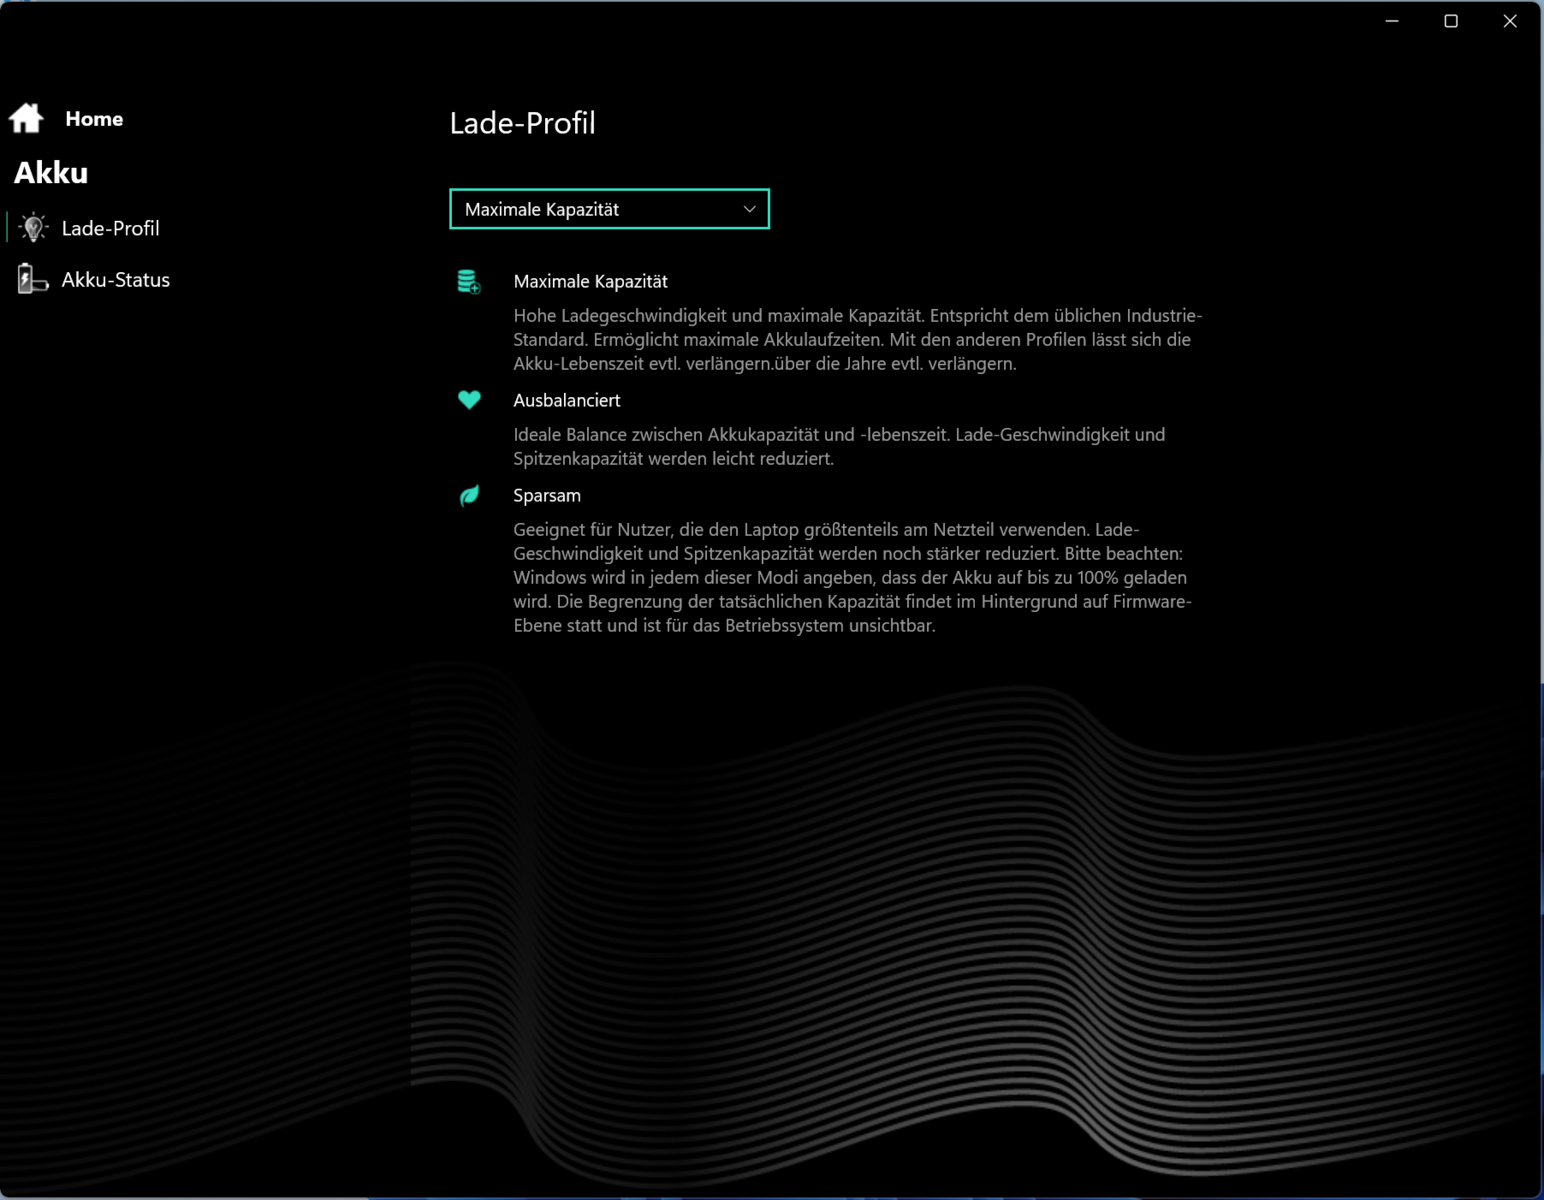
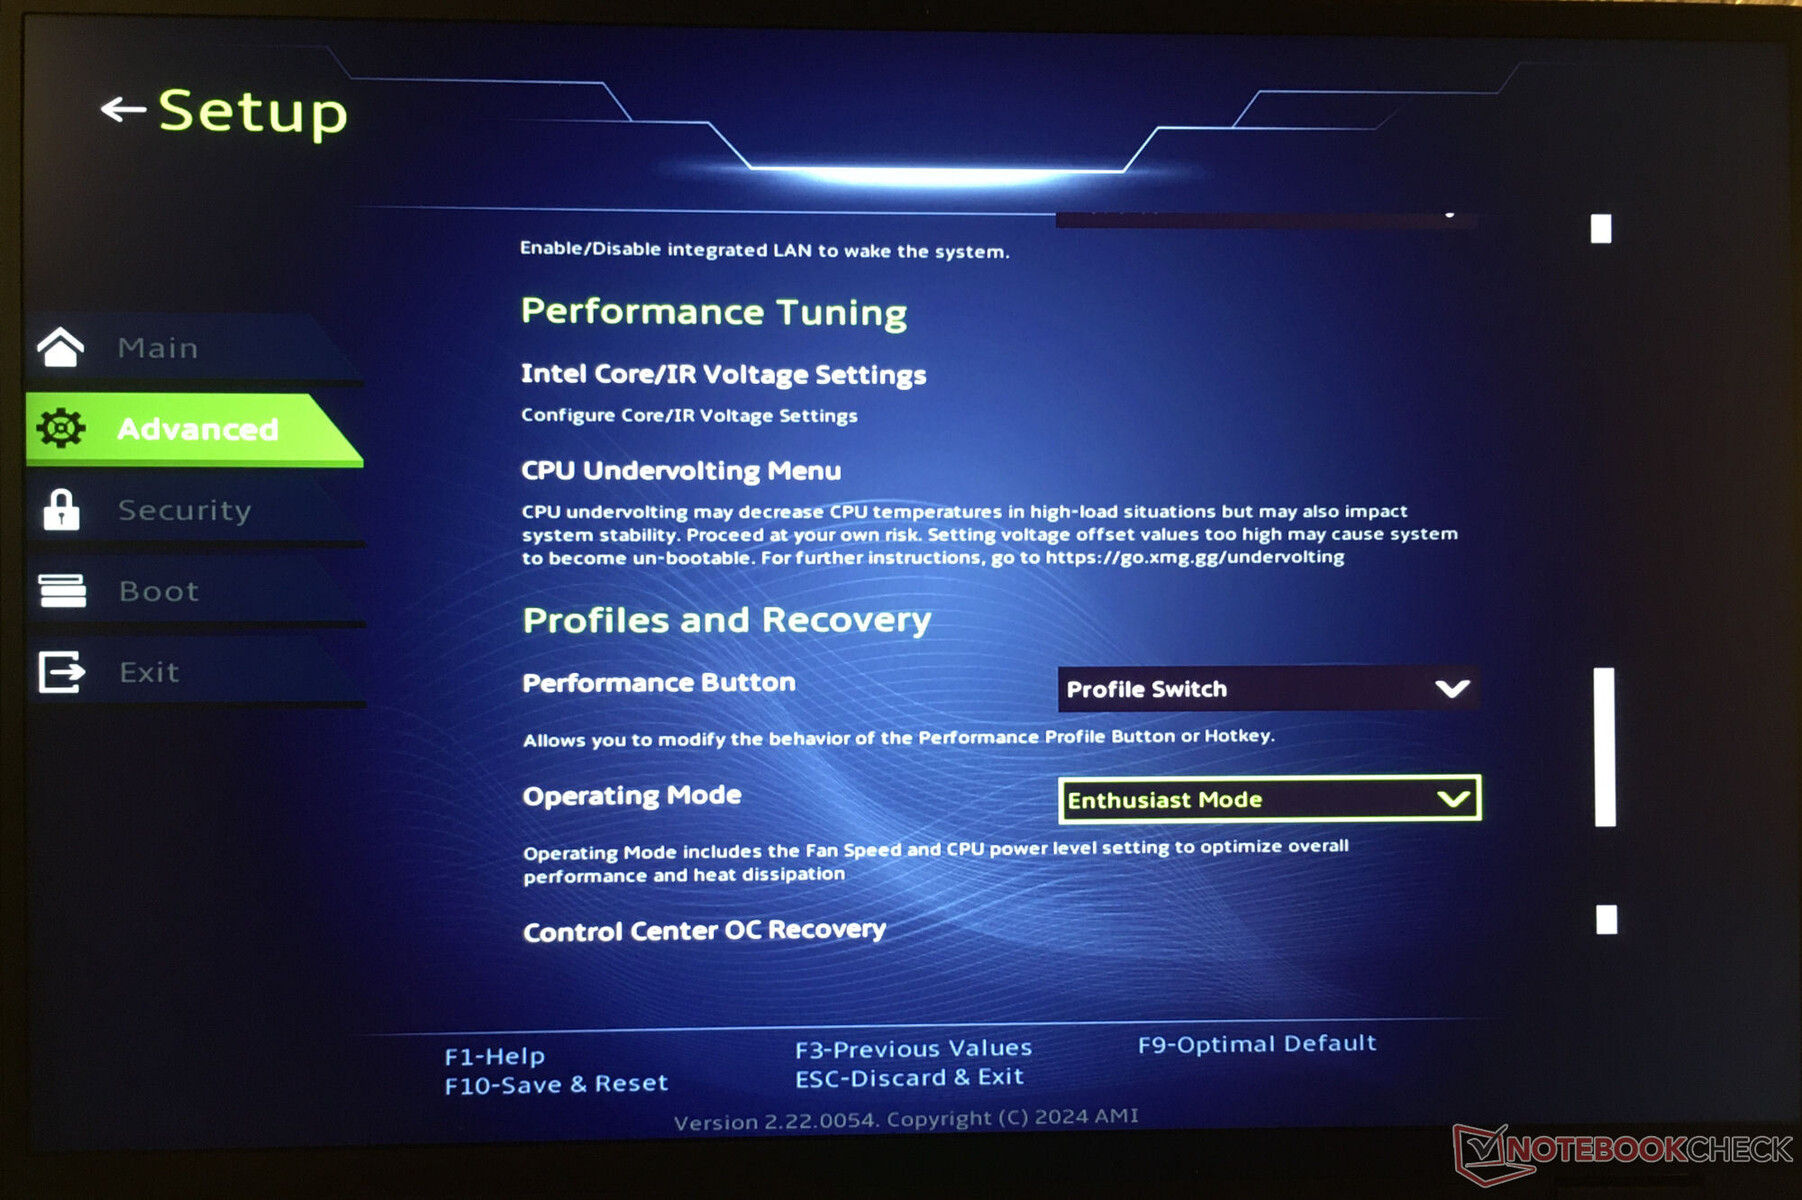
Il portatile offre tre modalità di prestazioni specifiche del produttore (vedere tabella), che possono essere rapidamente commutate tra loro utilizzando un pulsante separato (accanto al pulsante di accensione). È possibile creare profili individuali utilizzando il software Control Center preinstallato. Ad esempio, è possibile regolare i limiti di potenza della CPU, il TGP della GPU e/o i limiti di temperatura superiore del dispositivo.
Durante il nostro test sono state utilizzate le modalità Enthusiast (benchmark) e Balanced (test della batteria). La modalità GPU era impostata su Hybrid (= Optimus).
| Enthusiast | Overboost | Bilanciato | |
|---|---|---|---|
| Limite di potenza 1 (HWInfo) | 160 watt | 160 watt | 160 watt |
| Limite di potenza 2 (HWInfo) | 170 watt | 170 watt | 170 watt |
| Rumore (Witcher 3) | 51 dB(A) | 53 dB(A) | 39 dB(A) |
| Prestazioni (Witcher 3) | 128 fps | 130 fps | 14-128 fps |

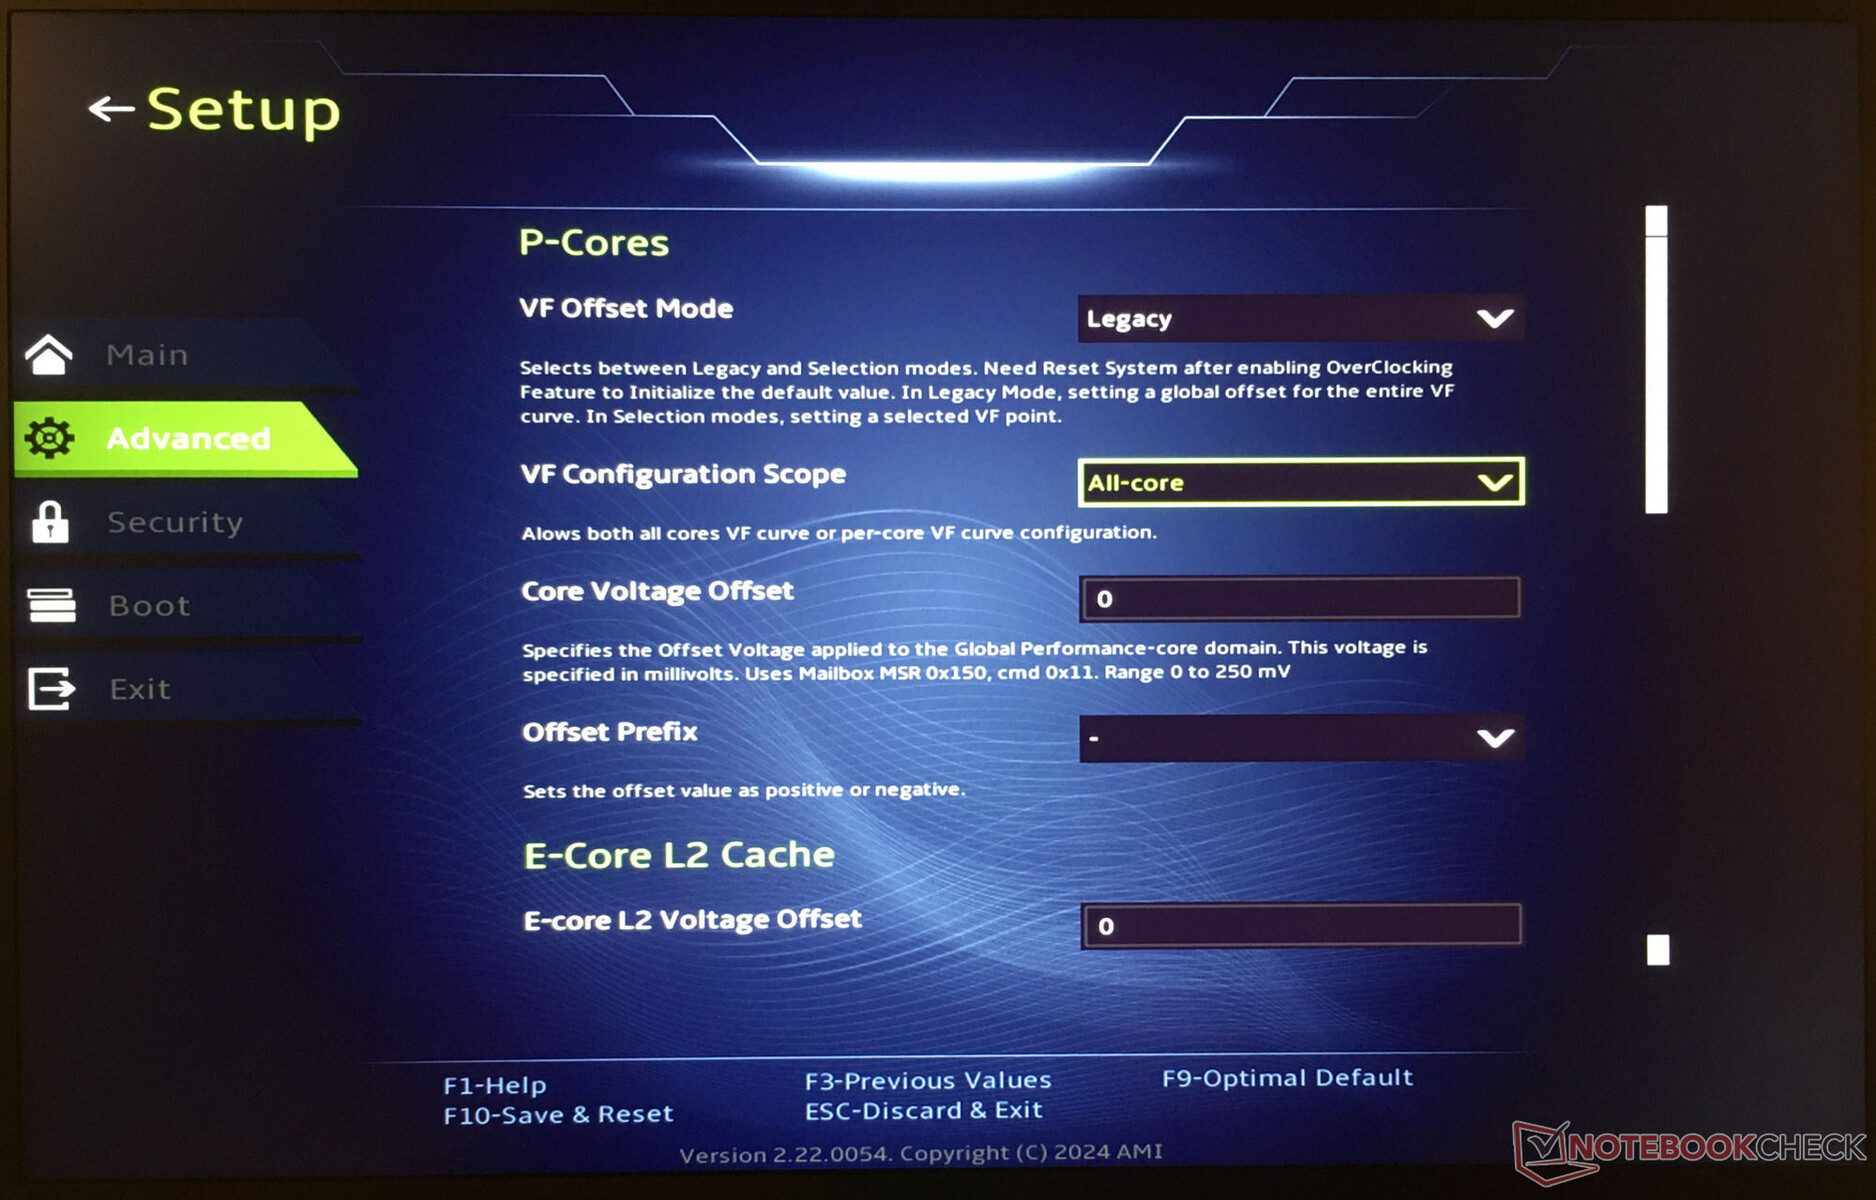
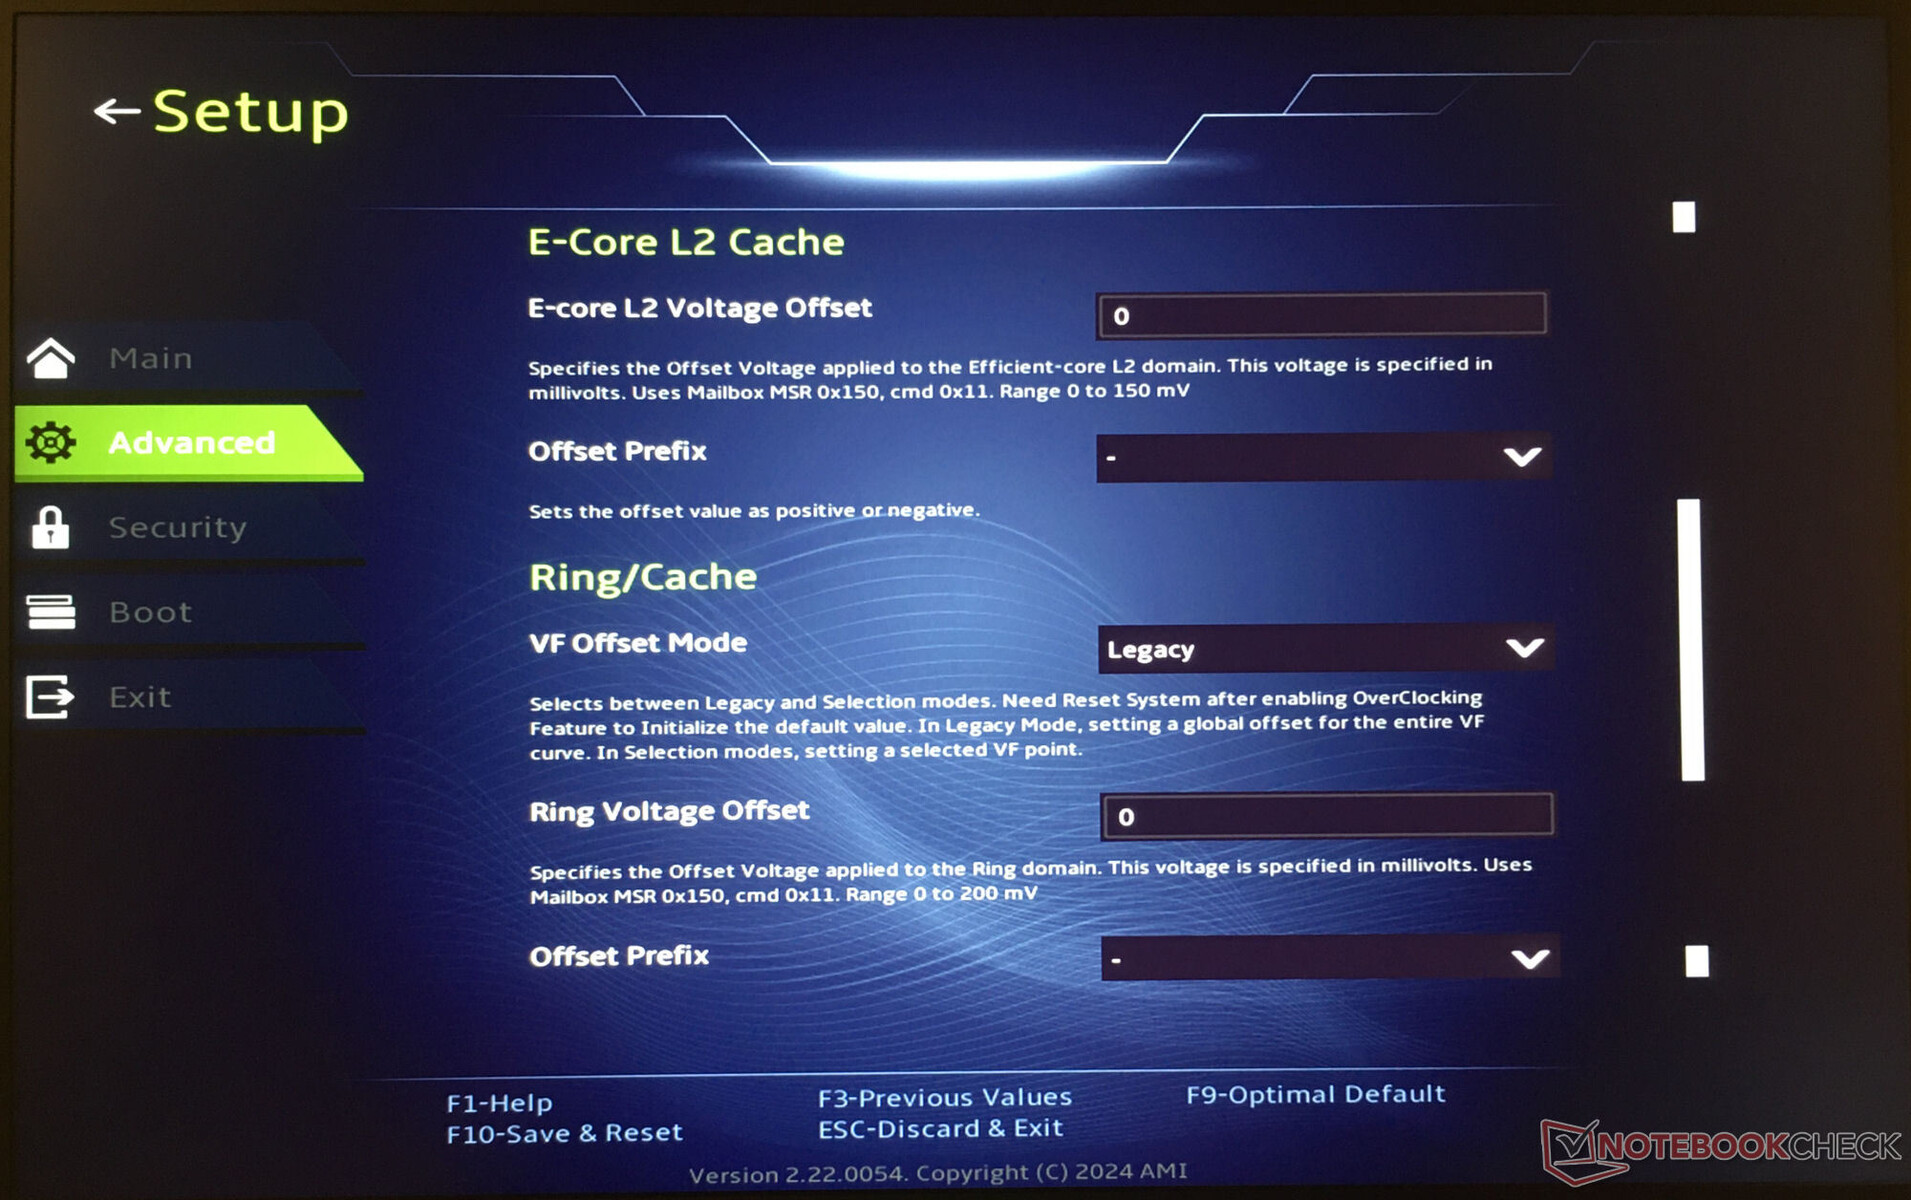
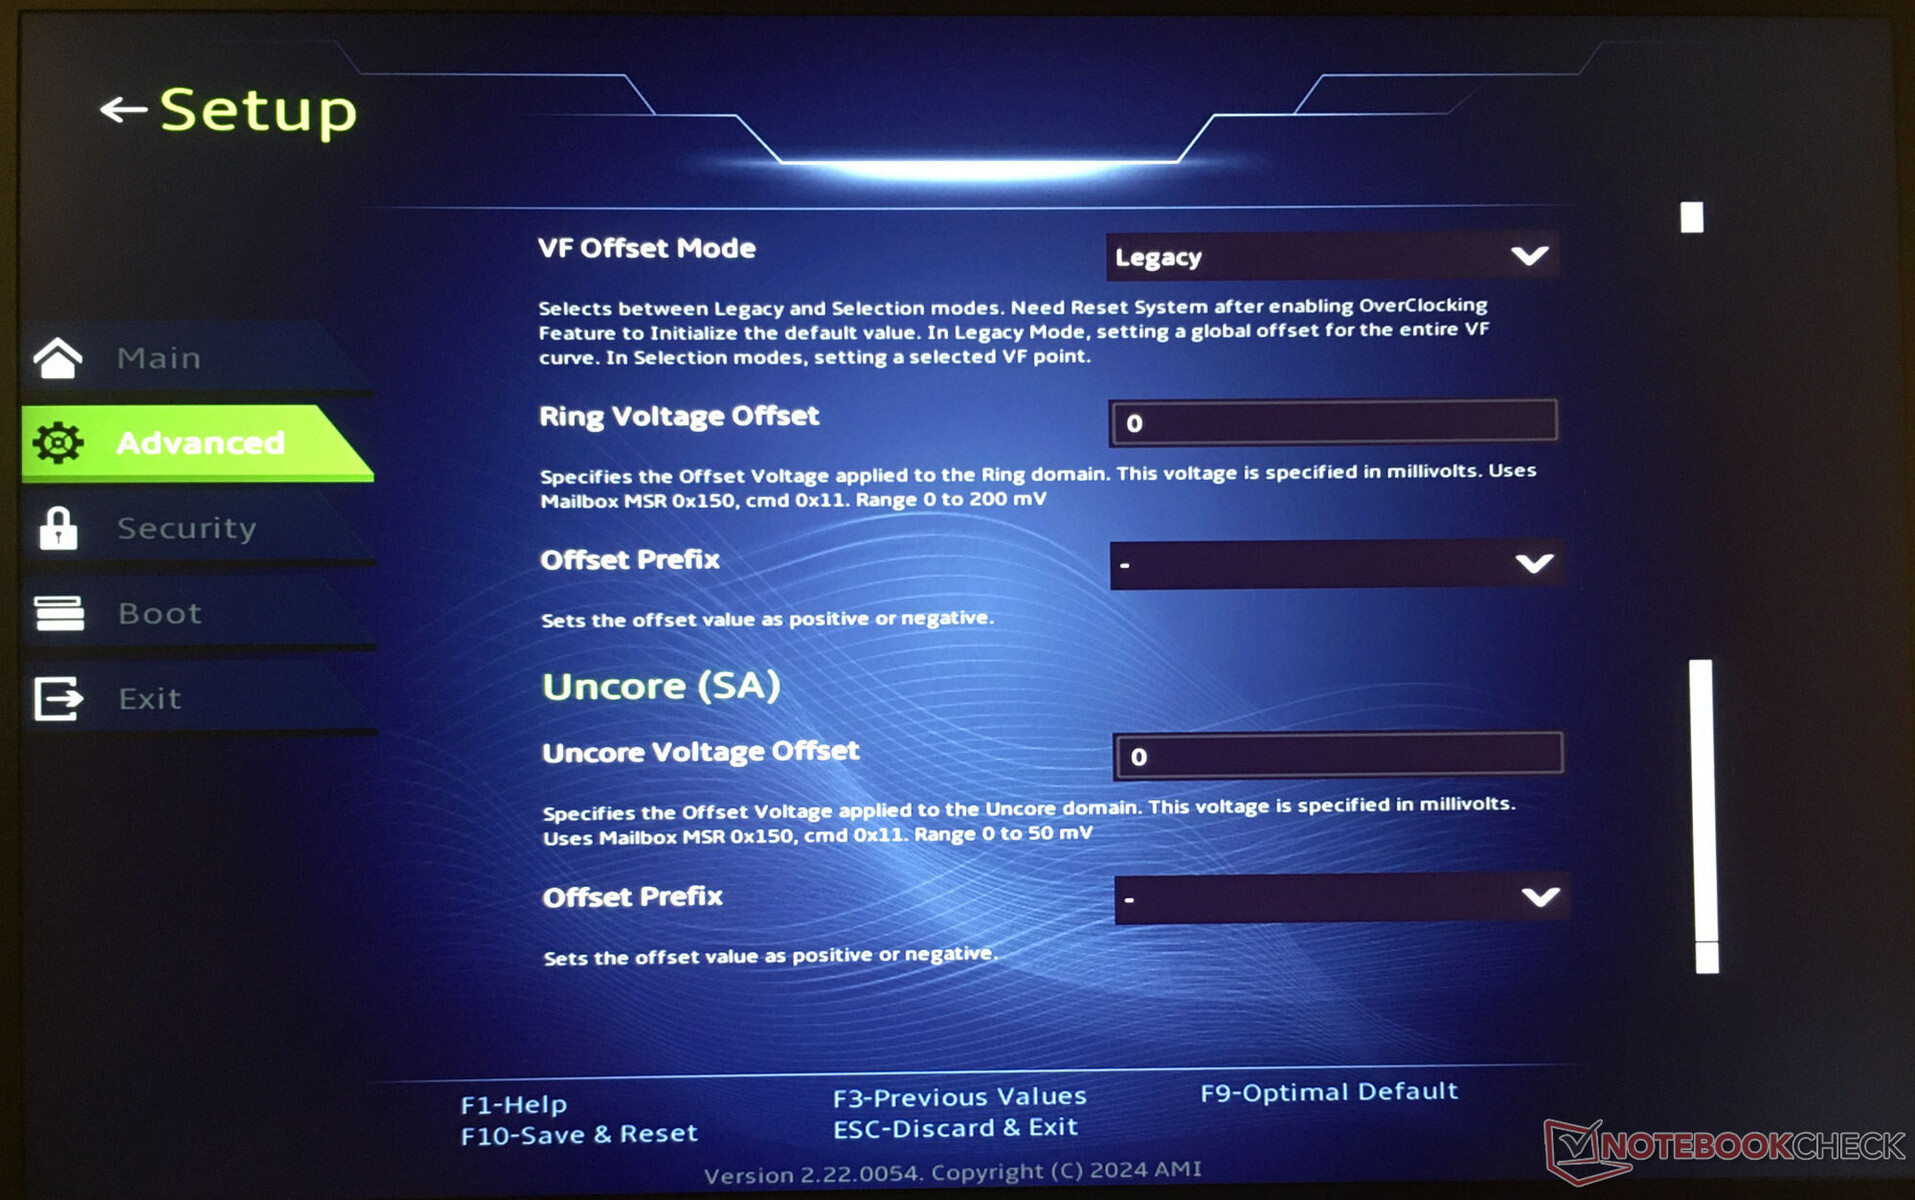
Undervolting
Il processore può funzionare con tensioni inferiori a quelle previste dal produttore (undervolting). Di conseguenza, il consumo di energia e le emissioni di calore del dispositivo si riducono. Ma faccia attenzione: Un abbassamento eccessivo della tensione può portare a un sistema instabile o difettoso. In questo caso, le modifiche devono essere invertite: l'undervolting deve essere effettuato a proprio rischio e pericolo.
Processore
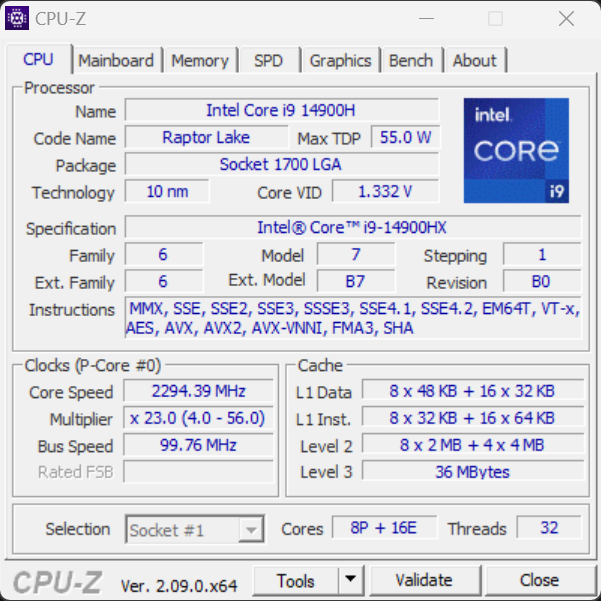
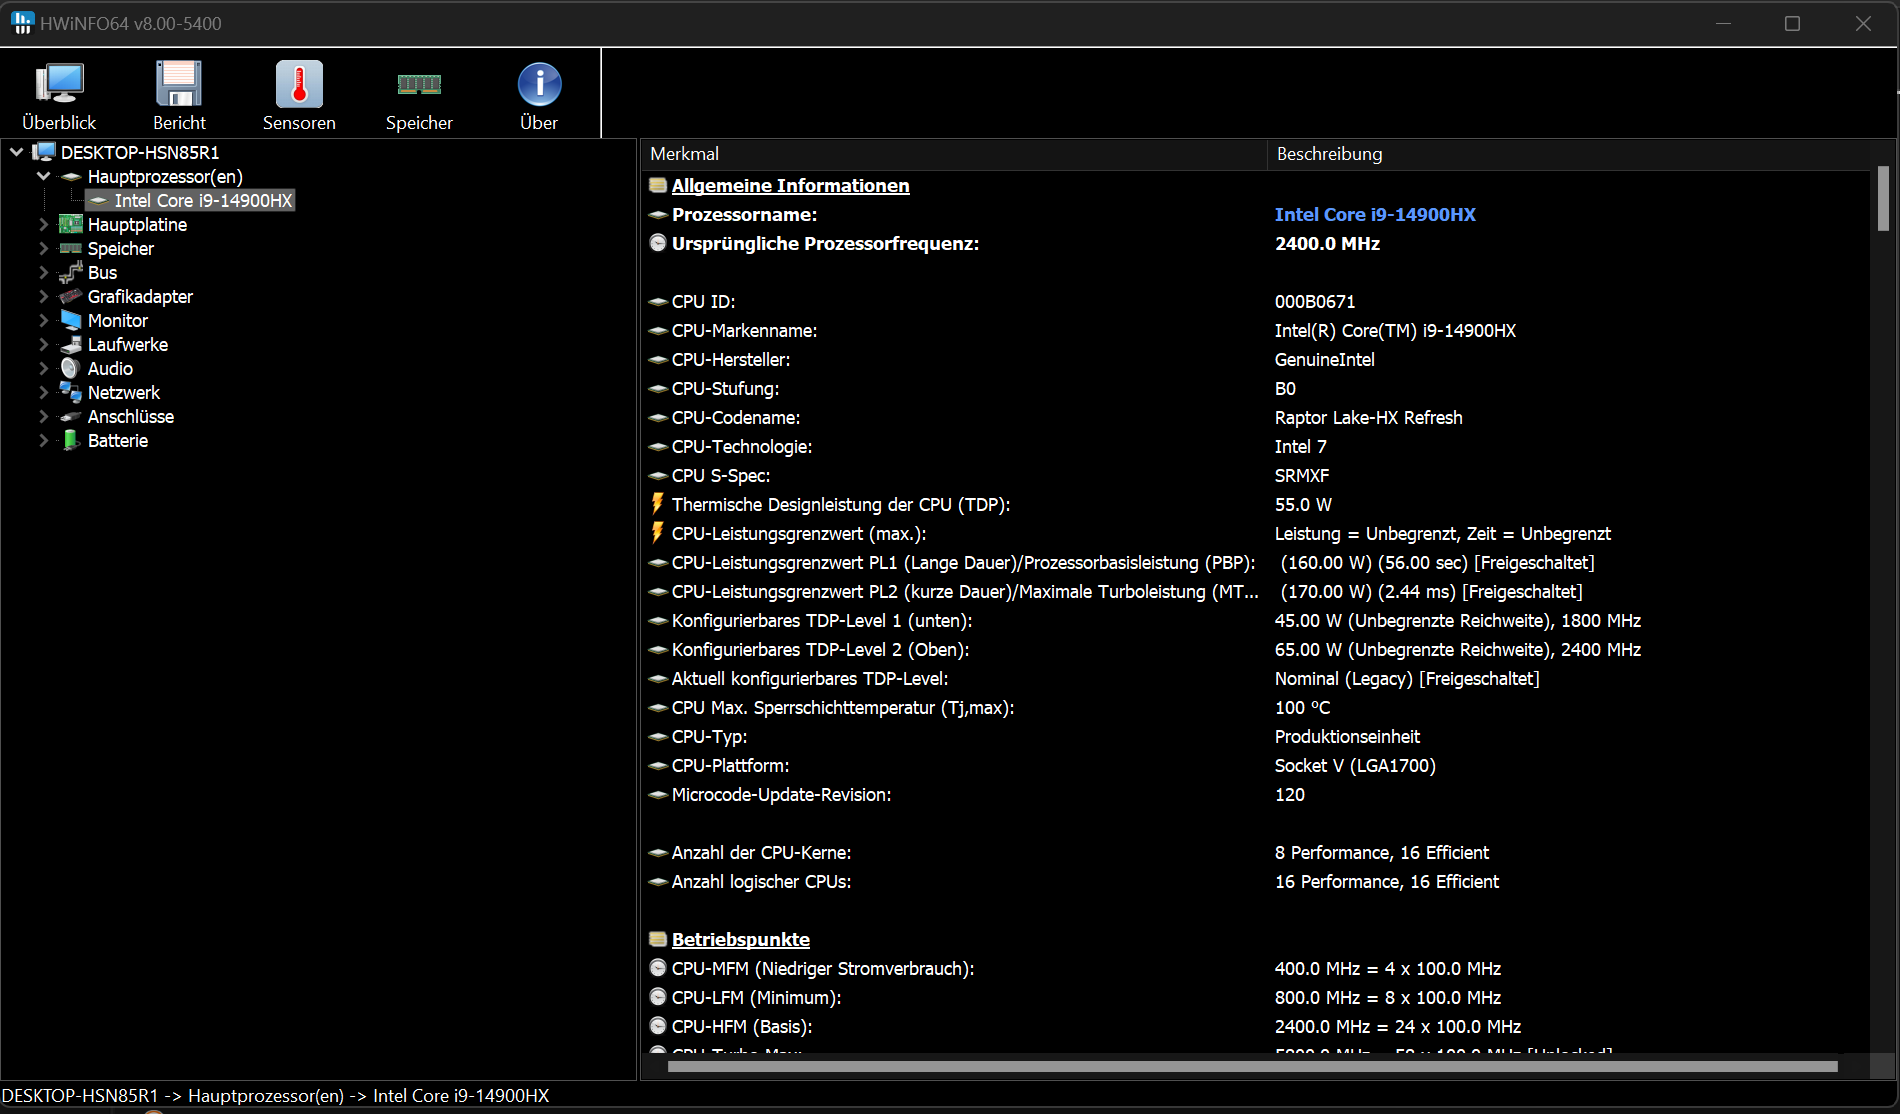
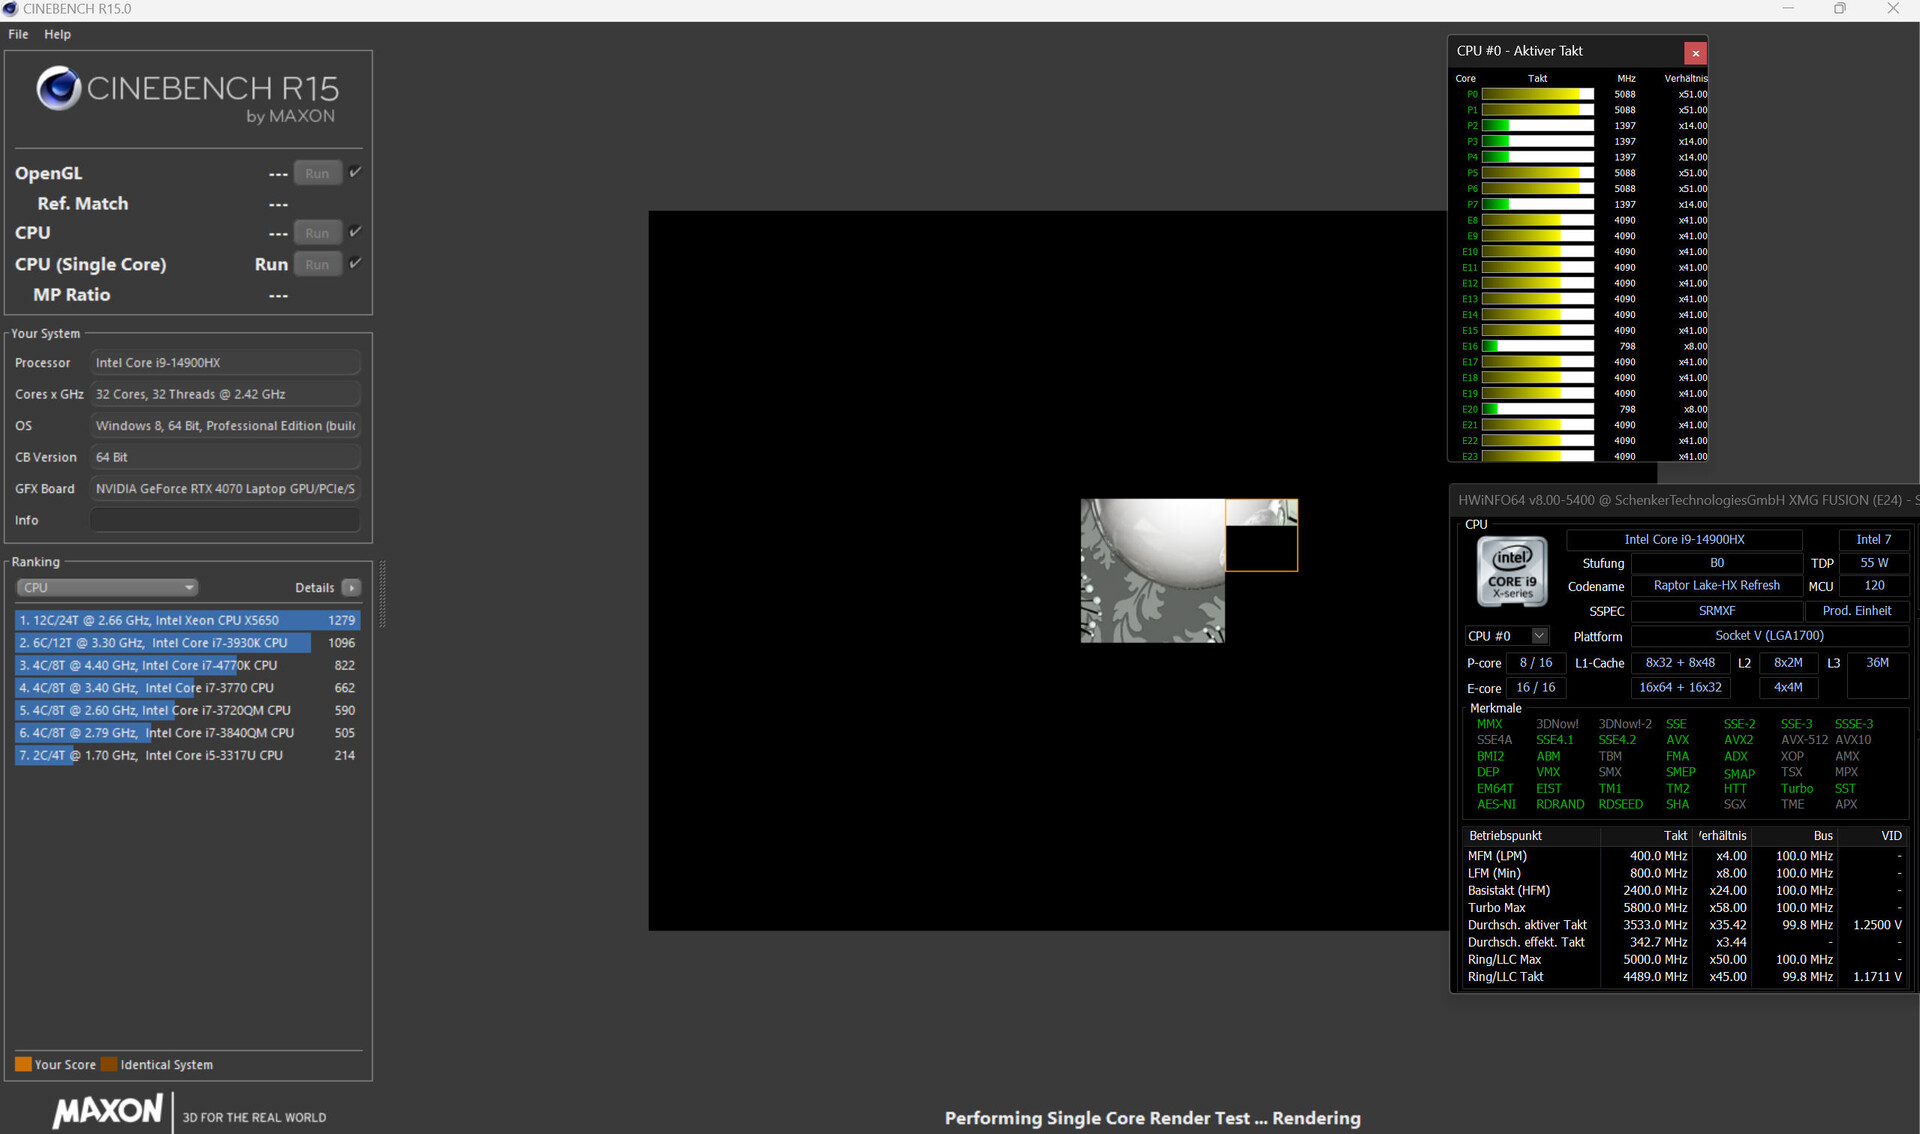
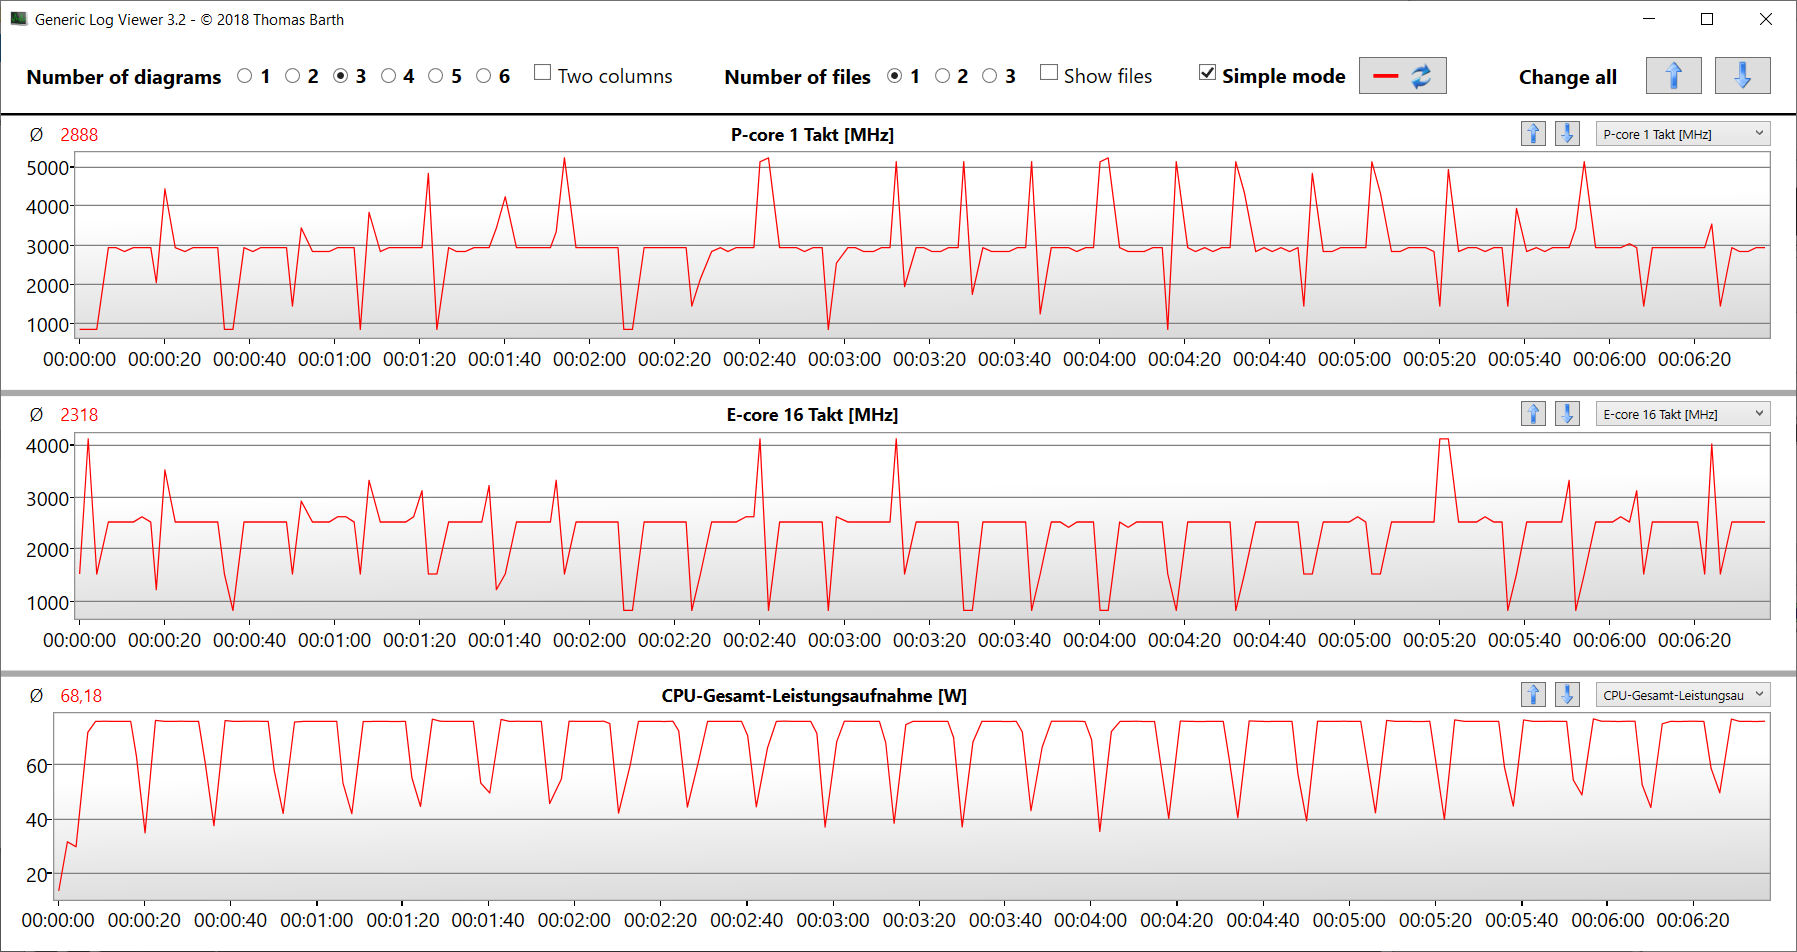
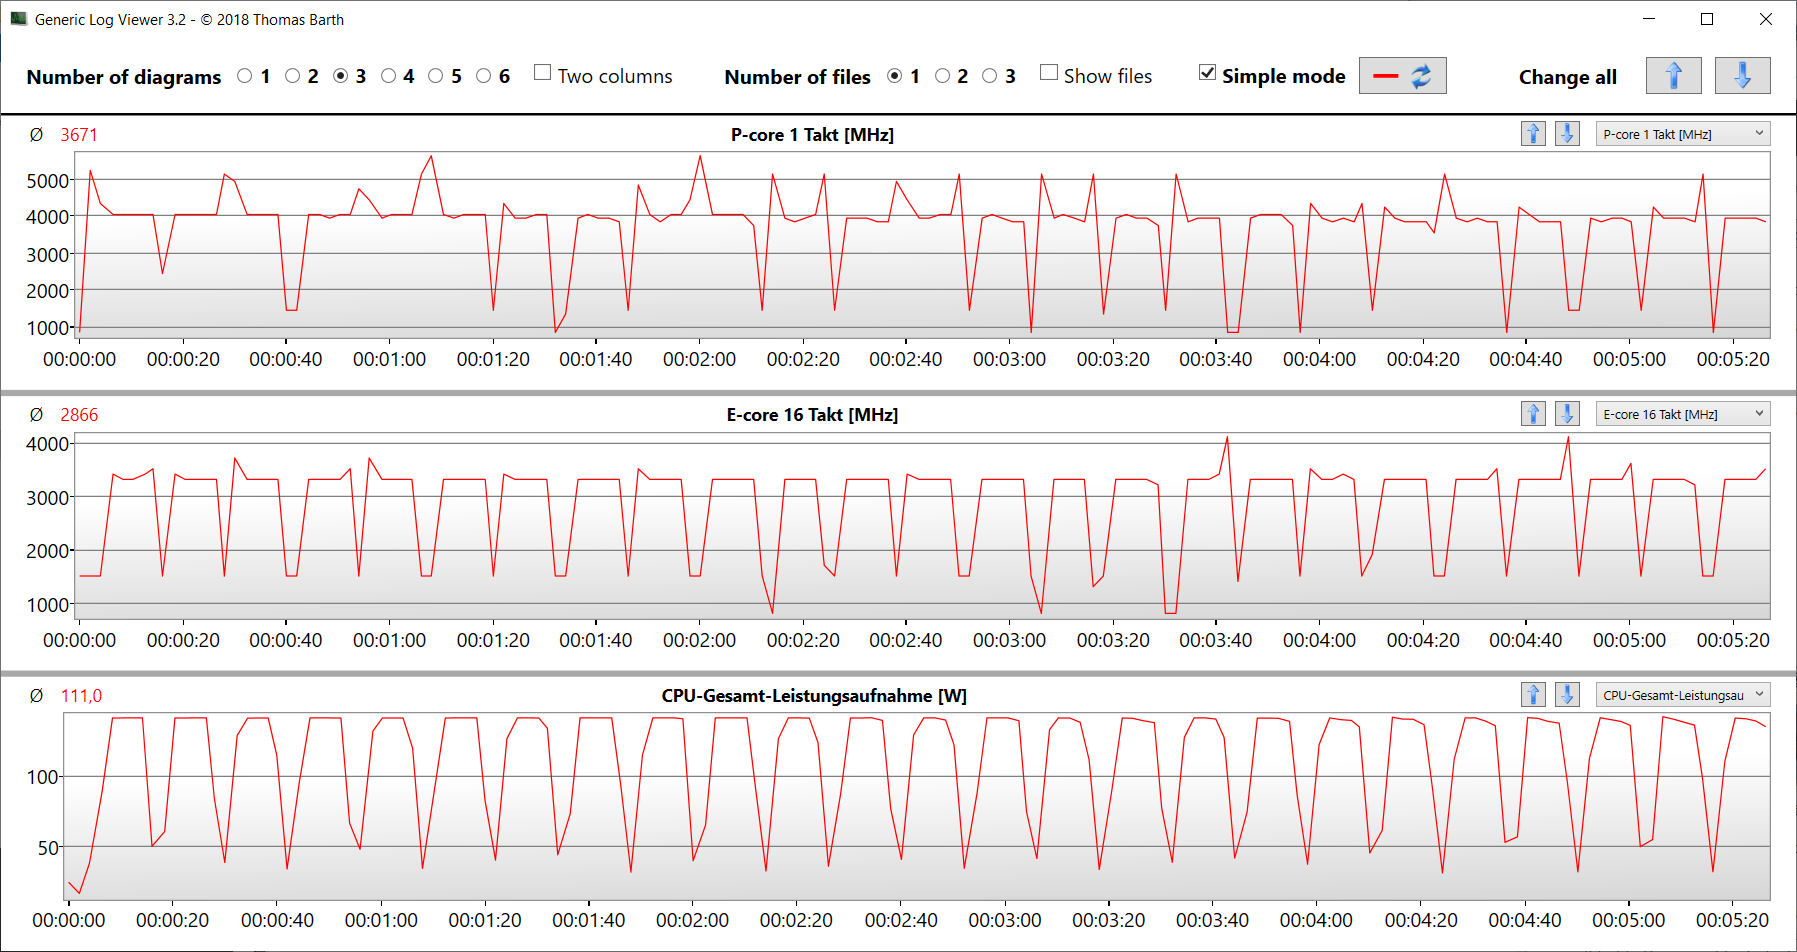
Il Core i9-14900HX (Raptor Lake), i 24 core della CPU (8P + 16E = 32 thread) raggiungono velocità di clock massime di 5,8 GHz (P) e 4,1 GHz (E). Il carico permanente multi-thread (CB15 Loop) comporta tassi di clock stabili - il livello dipende dalla modalità di alimentazione selezionata.
Enthusiast offre valori di benchmark inferiori alla media della CPU, mentre Overboost li innalza significativamente al di sopra della media; questo vale soprattutto per le prestazioni multi-thread del portatile. Le sue prestazioni single-thread si attestano su un livello elevato e molto simile quando si utilizzano tutti e tre i profili.
Maggiori informazioni sul Core i9 sono disponibili nel nostro articolo di analisiAnalisi dell'aggiornamento Intel Raptor Lake-HX - Core i9-14900HX con maggiori prestazioni single-core .
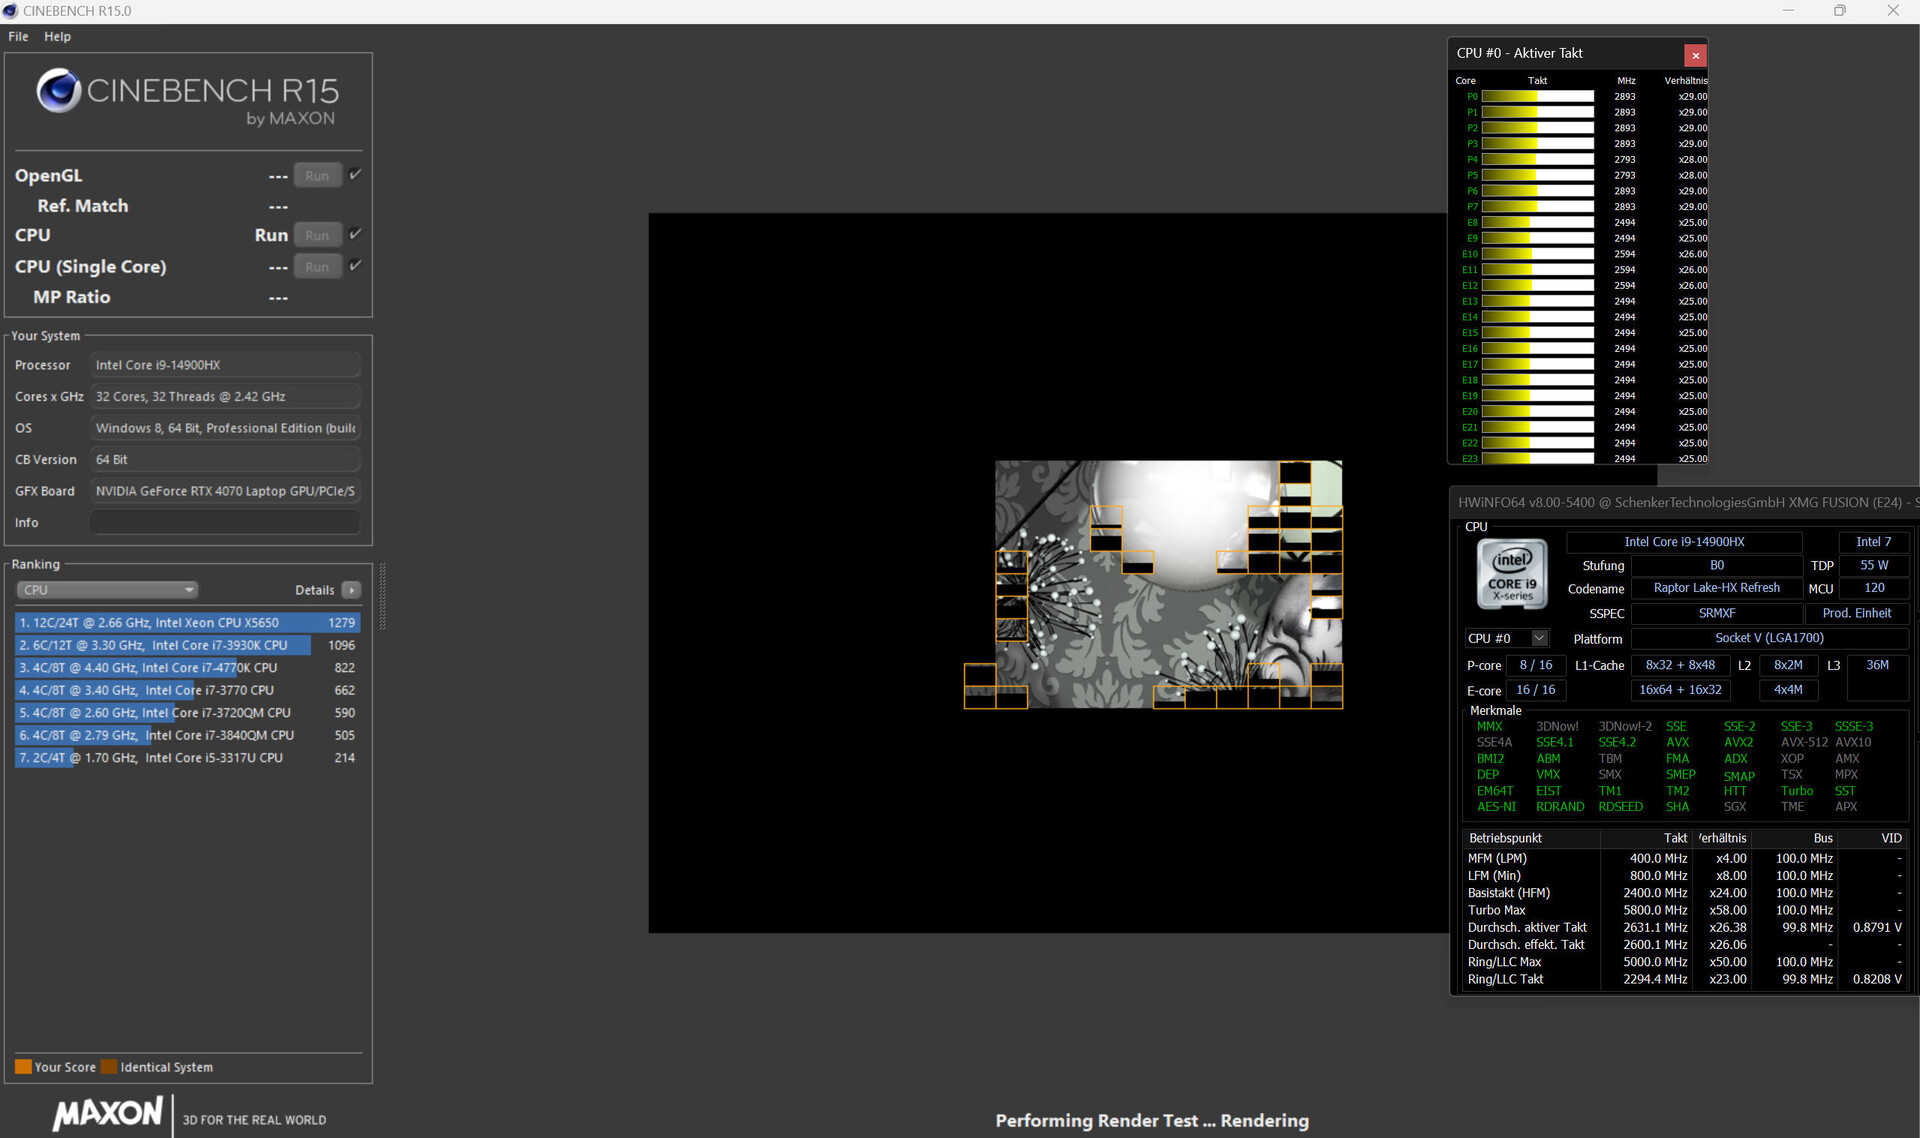
Cinebench R15 Multi continuous test
| CPU Performance Rating - Percent | |
| SCHENKER XMG Fusion 15 (Early 24) | |
| Lenovo Legion Pro 5 16IRX9 | |
| Media Intel Core i9-14900HX | |
| Aorus 16X 2024 | |
| SCHENKER XMG Fusion 15 (Early 24) | |
| HP Omen Transcend 16-u1095ng | |
| Media della classe Gaming | |
| Alienware m16 R2 -1! | |
| Cinebench R23 | |
| Multi Core | |
| SCHENKER XMG Fusion 15 (Early 24) (Overboost) | |
| Lenovo Legion Pro 5 16IRX9 | |
| Media Intel Core i9-14900HX (20702 - 32996, n=23) | |
| Aorus 16X 2024 | |
| SCHENKER XMG Fusion 15 (Early 24) | |
| HP Omen Transcend 16-u1095ng | |
| Media della classe Gaming (2435 - 34613, n=222, ultimi 2 anni) | |
| Alienware m16 R2 | |
| Single Core | |
| SCHENKER XMG Fusion 15 (Early 24) (Overboost) | |
| Aorus 16X 2024 | |
| HP Omen Transcend 16-u1095ng | |
| Media Intel Core i9-14900HX (2043 - 2235, n=23) | |
| Lenovo Legion Pro 5 16IRX9 | |
| SCHENKER XMG Fusion 15 (Early 24) | |
| Media della classe Gaming (527 - 2235, n=220, ultimi 2 anni) | |
| Alienware m16 R2 | |
| Cinebench R20 | |
| CPU (Multi Core) | |
| SCHENKER XMG Fusion 15 (Early 24) (Overboost) | |
| Lenovo Legion Pro 5 16IRX9 | |
| Media Intel Core i9-14900HX (8427 - 12419, n=23) | |
| Aorus 16X 2024 | |
| SCHENKER XMG Fusion 15 (Early 24) | |
| HP Omen Transcend 16-u1095ng | |
| Media della classe Gaming (930 - 13769, n=220, ultimi 2 anni) | |
| Alienware m16 R2 | |
| CPU (Single Core) | |
| SCHENKER XMG Fusion 15 (Early 24) (Overboost) | |
| Aorus 16X 2024 | |
| HP Omen Transcend 16-u1095ng | |
| Media Intel Core i9-14900HX (779 - 859, n=23) | |
| Lenovo Legion Pro 5 16IRX9 | |
| SCHENKER XMG Fusion 15 (Early 24) | |
| Media della classe Gaming (169 - 855, n=220, ultimi 2 anni) | |
| Alienware m16 R2 | |
| Cinebench R15 | |
| CPU Multi 64Bit | |
| Lenovo Legion Pro 5 16IRX9 | |
| SCHENKER XMG Fusion 15 (Early 24) (Overboost) | |
| Media Intel Core i9-14900HX (3263 - 4875, n=23) | |
| Aorus 16X 2024 | |
| HP Omen Transcend 16-u1095ng | |
| SCHENKER XMG Fusion 15 (Early 24) | |
| Media della classe Gaming (400 - 5663, n=225, ultimi 2 anni) | |
| Alienware m16 R2 | |
| CPU Single 64Bit | |
| Aorus 16X 2024 | |
| SCHENKER XMG Fusion 15 (Early 24) (Overboost) | |
| Media Intel Core i9-14900HX (287 - 320, n=23) | |
| Lenovo Legion Pro 5 16IRX9 | |
| HP Omen Transcend 16-u1095ng | |
| SCHENKER XMG Fusion 15 (Early 24) | |
| Media della classe Gaming (79.2 - 318, n=224, ultimi 2 anni) | |
| Alienware m16 R2 | |
| Blender - v2.79 BMW27 CPU | |
| Media della classe Gaming (87 - 1259, n=217, ultimi 2 anni) | |
| HP Omen Transcend 16-u1095ng | |
| SCHENKER XMG Fusion 15 (Early 24) | |
| Aorus 16X 2024 | |
| Media Intel Core i9-14900HX (102 - 164, n=23) | |
| Lenovo Legion Pro 5 16IRX9 | |
| SCHENKER XMG Fusion 15 (Early 24) (Overboost) | |
| 7-Zip 18.03 | |
| 7z b 4 | |
| SCHENKER XMG Fusion 15 (Early 24) (Overboost) | |
| Lenovo Legion Pro 5 16IRX9 | |
| Media Intel Core i9-14900HX (87555 - 127108, n=23) | |
| Aorus 16X 2024 | |
| SCHENKER XMG Fusion 15 (Early 24) | |
| HP Omen Transcend 16-u1095ng | |
| Media della classe Gaming (11386 - 140932, n=219, ultimi 2 anni) | |
| Alienware m16 R2 | |
| 7z b 4 -mmt1 | |
| SCHENKER XMG Fusion 15 (Early 24) | |
| SCHENKER XMG Fusion 15 (Early 24) (Overboost) | |
| Aorus 16X 2024 | |
| HP Omen Transcend 16-u1095ng | |
| Media Intel Core i9-14900HX (6206 - 7508, n=23) | |
| Lenovo Legion Pro 5 16IRX9 | |
| Media della classe Gaming (2685 - 7581, n=219, ultimi 2 anni) | |
| Alienware m16 R2 | |
| Geekbench 6.2 | |
| Multi-Core | |
| Lenovo Legion Pro 5 16IRX9 (6.2.1) | |
| SCHENKER XMG Fusion 15 (Early 24) (6.2.1, Overboost) | |
| Media Intel Core i9-14900HX (15849 - 18643, n=23) | |
| Aorus 16X 2024 (6.2.1) | |
| SCHENKER XMG Fusion 15 (Early 24) (6.2.1) | |
| HP Omen Transcend 16-u1095ng (6.2.1) | |
| Media della classe Gaming (5340 - 18590, n=79, ultimi 2 anni) | |
| Alienware m16 R2 (6.2.1) | |
| Single-Core | |
| SCHENKER XMG Fusion 15 (Early 24) (6.2.1) | |
| Aorus 16X 2024 (6.2.1) | |
| SCHENKER XMG Fusion 15 (Early 24) (6.2.1, Overboost) | |
| Media Intel Core i9-14900HX (2800 - 3095, n=23) | |
| Lenovo Legion Pro 5 16IRX9 (6.2.1) | |
| HP Omen Transcend 16-u1095ng (6.2.1) | |
| Media della classe Gaming (1599 - 3095, n=79, ultimi 2 anni) | |
| Alienware m16 R2 (6.2.1) | |
| Geekbench 5.5 | |
| Multi-Core | |
| Lenovo Legion Pro 5 16IRX9 | |
| SCHENKER XMG Fusion 15 (Early 24) (Overboost) | |
| Aorus 16X 2024 | |
| Media Intel Core i9-14900HX (8618 - 21606, n=23) | |
| HP Omen Transcend 16-u1095ng | |
| SCHENKER XMG Fusion 15 (Early 24) | |
| Media della classe Gaming (1946 - 22200, n=224, ultimi 2 anni) | |
| Alienware m16 R2 | |
| Single-Core | |
| Aorus 16X 2024 | |
| SCHENKER XMG Fusion 15 (Early 24) (Overboost) | |
| SCHENKER XMG Fusion 15 (Early 24) | |
| Media Intel Core i9-14900HX (1669 - 2210, n=23) | |
| HP Omen Transcend 16-u1095ng | |
| Lenovo Legion Pro 5 16IRX9 | |
| Media della classe Gaming (158 - 2210, n=224, ultimi 2 anni) | |
| Alienware m16 R2 | |
| HWBOT x265 Benchmark v2.2 - 4k Preset | |
| SCHENKER XMG Fusion 15 (Early 24) (Overboost) | |
| Lenovo Legion Pro 5 16IRX9 | |
| Media Intel Core i9-14900HX (22.7 - 34.4, n=23) | |
| Aorus 16X 2024 | |
| SCHENKER XMG Fusion 15 (Early 24) | |
| HP Omen Transcend 16-u1095ng | |
| Media della classe Gaming (3 - 37.6, n=220, ultimi 2 anni) | |
| Alienware m16 R2 | |
| LibreOffice - 20 Documents To PDF | |
| HP Omen Transcend 16-u1095ng (6.3.4.2) | |
| Alienware m16 R2 (6.3.4.2) | |
| Media della classe Gaming (32.8 - 332, n=216, ultimi 2 anni) | |
| Media Intel Core i9-14900HX (33.9 - 85.1, n=23) | |
| Lenovo Legion Pro 5 16IRX9 (6.3.4.2) | |
| SCHENKER XMG Fusion 15 (Early 24) (6.3.4.2) | |
| Aorus 16X 2024 (6.3.4.2) | |
| SCHENKER XMG Fusion 15 (Early 24) (6.3.4.2, Overboost) | |
| R Benchmark 2.5 - Overall mean | |
| Alienware m16 R2 | |
| Media della classe Gaming (0.3609 - 4.47, n=219, ultimi 2 anni) | |
| HP Omen Transcend 16-u1095ng | |
| Lenovo Legion Pro 5 16IRX9 | |
| Media Intel Core i9-14900HX (0.3609 - 0.4225, n=23) | |
| Aorus 16X 2024 | |
| SCHENKER XMG Fusion 15 (Early 24) (Overboost) | |
| SCHENKER XMG Fusion 15 (Early 24) | |
* ... Meglio usare valori piccoli
AIDA64: FP32 Ray-Trace | FPU Julia | CPU SHA3 | CPU Queen | FPU SinJulia | FPU Mandel | CPU AES | CPU ZLib | FP64 Ray-Trace | CPU PhotoWorxx
| Performance Rating | |
| SCHENKER XMG Fusion 15 (Early 24) | |
| Lenovo Legion Pro 5 16IRX9 | |
| Media Intel Core i9-14900HX | |
| Aorus 16X 2024 | |
| SCHENKER XMG Fusion 15 (Early 24) | |
| Media della classe Gaming | |
| HP Omen Transcend 16-u1095ng | |
| Alienware m16 R2 | |
| AIDA64 / FP32 Ray-Trace | |
| SCHENKER XMG Fusion 15 (Early 24) (v6.92.6600, Overboost) | |
| Media Intel Core i9-14900HX (17244 - 29351, n=22) | |
| Lenovo Legion Pro 5 16IRX9 (v6.92.6600) | |
| Aorus 16X 2024 (v6.92.6600) | |
| SCHENKER XMG Fusion 15 (Early 24) (v6.92.6600) | |
| Media della classe Gaming (3069 - 60169, n=215, ultimi 2 anni) | |
| Alienware m16 R2 (v6.92.6600) | |
| HP Omen Transcend 16-u1095ng (v6.92.6600) | |
| AIDA64 / FPU Julia | |
| SCHENKER XMG Fusion 15 (Early 24) (v6.92.6600, Overboost) | |
| Lenovo Legion Pro 5 16IRX9 (v6.92.6600) | |
| Media Intel Core i9-14900HX (88537 - 148888, n=22) | |
| Aorus 16X 2024 (v6.92.6600) | |
| SCHENKER XMG Fusion 15 (Early 24) (v6.92.6600) | |
| Media della classe Gaming (18567 - 252486, n=215, ultimi 2 anni) | |
| Alienware m16 R2 (v6.92.6600) | |
| HP Omen Transcend 16-u1095ng (v6.92.6600) | |
| AIDA64 / CPU SHA3 | |
| SCHENKER XMG Fusion 15 (Early 24) (v6.92.6600, Overboost) | |
| Lenovo Legion Pro 5 16IRX9 (v6.92.6600) | |
| Media Intel Core i9-14900HX (4267 - 7229, n=22) | |
| Aorus 16X 2024 (v6.92.6600) | |
| SCHENKER XMG Fusion 15 (Early 24) (v6.92.6600) | |
| Media della classe Gaming (629 - 10389, n=215, ultimi 2 anni) | |
| HP Omen Transcend 16-u1095ng (v6.92.6600) | |
| Alienware m16 R2 (v6.92.6600) | |
| AIDA64 / CPU Queen | |
| Lenovo Legion Pro 5 16IRX9 (v6.92.6600) | |
| SCHENKER XMG Fusion 15 (Early 24) (v6.92.6600, Overboost) | |
| Aorus 16X 2024 (v6.92.6600) | |
| Media Intel Core i9-14900HX (118405 - 148773, n=22) | |
| SCHENKER XMG Fusion 15 (Early 24) (v6.92.6600) | |
| HP Omen Transcend 16-u1095ng (v6.92.6600) | |
| Media della classe Gaming (15371 - 200651, n=215, ultimi 2 anni) | |
| Alienware m16 R2 (v6.92.6600) | |
| AIDA64 / FPU SinJulia | |
| SCHENKER XMG Fusion 15 (Early 24) (v6.92.6600, Overboost) | |
| Lenovo Legion Pro 5 16IRX9 (v6.92.6600) | |
| Media Intel Core i9-14900HX (12217 - 18256, n=22) | |
| Aorus 16X 2024 (v6.92.6600) | |
| SCHENKER XMG Fusion 15 (Early 24) (v6.92.6600) | |
| Media della classe Gaming (2137 - 32988, n=215, ultimi 2 anni) | |
| HP Omen Transcend 16-u1095ng (v6.92.6600) | |
| Alienware m16 R2 (v6.92.6600) | |
| AIDA64 / FPU Mandel | |
| SCHENKER XMG Fusion 15 (Early 24) (v6.92.6600, Overboost) | |
| Lenovo Legion Pro 5 16IRX9 (v6.92.6600) | |
| Media Intel Core i9-14900HX (43302 - 72594, n=22) | |
| Aorus 16X 2024 (v6.92.6600) | |
| SCHENKER XMG Fusion 15 (Early 24) (v6.92.6600) | |
| Media della classe Gaming (10291 - 134044, n=215, ultimi 2 anni) | |
| Alienware m16 R2 (v6.92.6600) | |
| HP Omen Transcend 16-u1095ng (v6.92.6600) | |
| AIDA64 / CPU AES | |
| SCHENKER XMG Fusion 15 (Early 24) (v6.92.6600, Overboost) | |
| SCHENKER XMG Fusion 15 (Early 24) (v6.92.6600) | |
| Media Intel Core i9-14900HX (86964 - 241777, n=22) | |
| Lenovo Legion Pro 5 16IRX9 (v6.92.6600) | |
| Aorus 16X 2024 (v6.92.6600) | |
| Media della classe Gaming (19065 - 328679, n=215, ultimi 2 anni) | |
| HP Omen Transcend 16-u1095ng (v6.92.6600) | |
| Alienware m16 R2 (v6.92.6600) | |
| AIDA64 / CPU ZLib | |
| SCHENKER XMG Fusion 15 (Early 24) (v6.92.6600, Overboost) | |
| Lenovo Legion Pro 5 16IRX9 (v6.92.6600) | |
| Media Intel Core i9-14900HX (1265 - 2149, n=22) | |
| Aorus 16X 2024 (v6.92.6600) | |
| SCHENKER XMG Fusion 15 (Early 24) (v6.92.6600) | |
| HP Omen Transcend 16-u1095ng (v6.92.6600) | |
| Media della classe Gaming (150.9 - 2409, n=215, ultimi 2 anni) | |
| Alienware m16 R2 (v6.92.6600) | |
| AIDA64 / FP64 Ray-Trace | |
| SCHENKER XMG Fusion 15 (Early 24) (v6.92.6600, Overboost) | |
| Lenovo Legion Pro 5 16IRX9 (v6.92.6600) | |
| Media Intel Core i9-14900HX (9170 - 16128, n=22) | |
| Aorus 16X 2024 (v6.92.6600) | |
| SCHENKER XMG Fusion 15 (Early 24) (v6.92.6600) | |
| Media della classe Gaming (1518 - 31796, n=215, ultimi 2 anni) | |
| Alienware m16 R2 (v6.92.6600) | |
| HP Omen Transcend 16-u1095ng (v6.92.6600) | |
| AIDA64 / CPU PhotoWorxx | |
| Lenovo Legion Pro 5 16IRX9 (v6.92.6600) | |
| HP Omen Transcend 16-u1095ng (v6.92.6600) | |
| Aorus 16X 2024 (v6.92.6600) | |
| Media Intel Core i9-14900HX (33960 - 51118, n=22) | |
| SCHENKER XMG Fusion 15 (Early 24) (v6.92.6600, Overboost) | |
| SCHENKER XMG Fusion 15 (Early 24) (v6.92.6600) | |
| Alienware m16 R2 (v6.92.6600) | |
| Media della classe Gaming (10805 - 60161, n=216, ultimi 2 anni) | |
Prestazioni del sistema
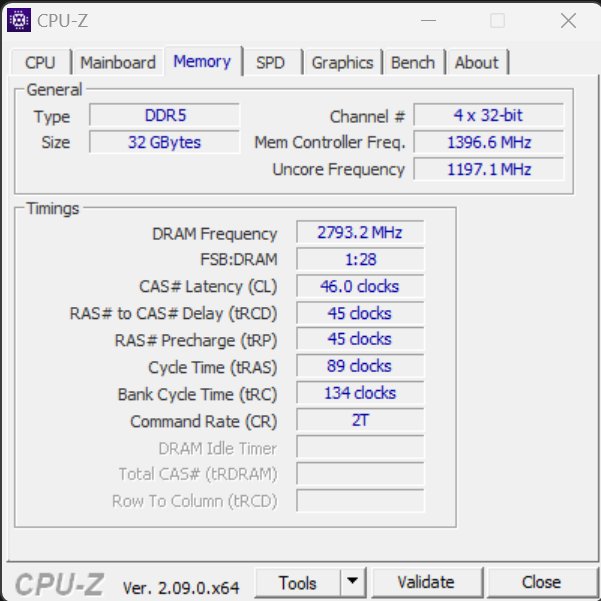
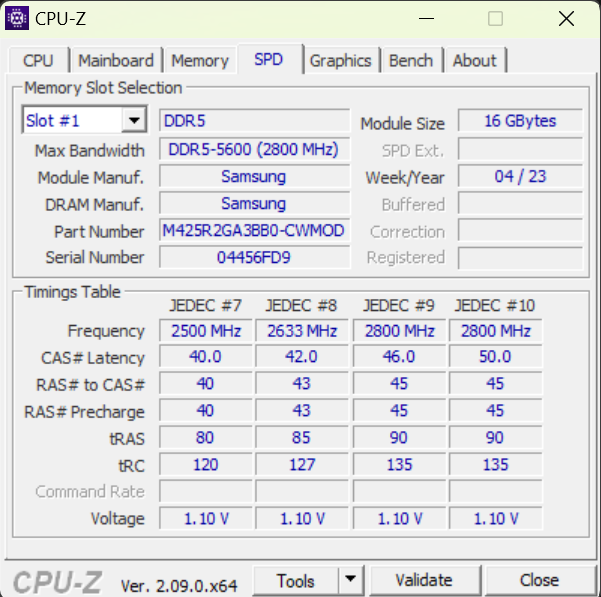
Il sistema fluido non manca di potenza di calcolo. Il gioco, lo streaming e il rendering non rappresentano una sfida importante per il portatile. Le velocità di trasferimento della RAM rientrano in un livello normale per una RAM DDR5-5600. Anche i risultati di PCMark sono buoni.
CrossMark: Overall | Productivity | Creativity | Responsiveness
WebXPRT 3: Overall
WebXPRT 4: Overall
Mozilla Kraken 1.1: Total
| PCMark 10 / Score | |
| Lenovo Legion Pro 5 16IRX9 | |
| SCHENKER XMG Fusion 15 (Early 24) | |
| Aorus 16X 2024 | |
| Media Intel Core i9-14900HX, NVIDIA GeForce RTX 4070 Laptop GPU (7866 - 8550, n=5) | |
| HP Omen Transcend 16-u1095ng | |
| Alienware m16 R2 | |
| Media della classe Gaming (5235 - 9852, n=191, ultimi 2 anni) | |
| PCMark 10 / Essentials | |
| SCHENKER XMG Fusion 15 (Early 24) | |
| Lenovo Legion Pro 5 16IRX9 | |
| Media Intel Core i9-14900HX, NVIDIA GeForce RTX 4070 Laptop GPU (10621 - 11815, n=5) | |
| Aorus 16X 2024 | |
| Media della classe Gaming (8300 - 12334, n=190, ultimi 2 anni) | |
| HP Omen Transcend 16-u1095ng | |
| Alienware m16 R2 | |
| PCMark 10 / Productivity | |
| Aorus 16X 2024 | |
| SCHENKER XMG Fusion 15 (Early 24) | |
| Media Intel Core i9-14900HX, NVIDIA GeForce RTX 4070 Laptop GPU (9701 - 11103, n=5) | |
| HP Omen Transcend 16-u1095ng | |
| Lenovo Legion Pro 5 16IRX9 | |
| Media della classe Gaming (6662 - 11833, n=190, ultimi 2 anni) | |
| Alienware m16 R2 | |
| PCMark 10 / Digital Content Creation | |
| Lenovo Legion Pro 5 16IRX9 | |
| Media Intel Core i9-14900HX, NVIDIA GeForce RTX 4070 Laptop GPU (12114 - 14827, n=5) | |
| SCHENKER XMG Fusion 15 (Early 24) | |
| Aorus 16X 2024 | |
| Alienware m16 R2 | |
| HP Omen Transcend 16-u1095ng | |
| Media della classe Gaming (6462 - 18475, n=190, ultimi 2 anni) | |
| CrossMark / Overall | |
| Aorus 16X 2024 | |
| Media Intel Core i9-14900HX, NVIDIA GeForce RTX 4070 Laptop GPU (2002 - 2312, n=4) | |
| SCHENKER XMG Fusion 15 (Early 24) | |
| Lenovo Legion Pro 5 16IRX9 | |
| Media della classe Gaming (1247 - 2334, n=164, ultimi 2 anni) | |
| Alienware m16 R2 | |
| CrossMark / Productivity | |
| Aorus 16X 2024 | |
| SCHENKER XMG Fusion 15 (Early 24) | |
| Media Intel Core i9-14900HX, NVIDIA GeForce RTX 4070 Laptop GPU (1827 - 2191, n=4) | |
| Lenovo Legion Pro 5 16IRX9 | |
| Media della classe Gaming (1299 - 2204, n=164, ultimi 2 anni) | |
| Alienware m16 R2 | |
| CrossMark / Creativity | |
| Aorus 16X 2024 | |
| Media Intel Core i9-14900HX, NVIDIA GeForce RTX 4070 Laptop GPU (2287 - 2458, n=4) | |
| SCHENKER XMG Fusion 15 (Early 24) | |
| Lenovo Legion Pro 5 16IRX9 | |
| Media della classe Gaming (1275 - 2514, n=164, ultimi 2 anni) | |
| Alienware m16 R2 | |
| CrossMark / Responsiveness | |
| Aorus 16X 2024 | |
| Media Intel Core i9-14900HX, NVIDIA GeForce RTX 4070 Laptop GPU (1769 - 2330, n=4) | |
| SCHENKER XMG Fusion 15 (Early 24) | |
| Lenovo Legion Pro 5 16IRX9 | |
| Media della classe Gaming (1030 - 2330, n=164, ultimi 2 anni) | |
| Alienware m16 R2 | |
| WebXPRT 3 / Overall | |
| HP Omen Transcend 16-u1095ng | |
| SCHENKER XMG Fusion 15 (Early 24) | |
| Media Intel Core i9-14900HX, NVIDIA GeForce RTX 4070 Laptop GPU (322 - 342, n=5) | |
| Aorus 16X 2024 | |
| Lenovo Legion Pro 5 16IRX9 | |
| Media della classe Gaming (215 - 480, n=189, ultimi 2 anni) | |
| Alienware m16 R2 | |
| WebXPRT 4 / Overall | |
| SCHENKER XMG Fusion 15 (Early 24) | |
| Media Intel Core i9-14900HX, NVIDIA GeForce RTX 4070 Laptop GPU (291 - 301, n=3) | |
| Lenovo Legion Pro 5 16IRX9 | |
| Media della classe Gaming (157.9 - 328, n=164, ultimi 2 anni) | |
| Alienware m16 R2 | |
| Mozilla Kraken 1.1 / Total | |
| Alienware m16 R2 | |
| Media della classe Gaming (421 - 824, n=202, ultimi 2 anni) | |
| Lenovo Legion Pro 5 16IRX9 | |
| Media Intel Core i9-14900HX, NVIDIA GeForce RTX 4070 Laptop GPU (431 - 449, n=5) | |
| HP Omen Transcend 16-u1095ng | |
| Aorus 16X 2024 | |
| SCHENKER XMG Fusion 15 (Early 24) | |
* ... Meglio usare valori piccoli
| PCMark 10 Score | 8522 punti | |
Aiuto | ||
| AIDA64 / Memory Copy | |
| Lenovo Legion Pro 5 16IRX9 | |
| Aorus 16X 2024 | |
| HP Omen Transcend 16-u1095ng | |
| SCHENKER XMG Fusion 15 (Early 24) | |
| Media Intel Core i9-14900HX (56992 - 83392, n=22) | |
| Alienware m16 R2 | |
| Media della classe Gaming (21842 - 92565, n=215, ultimi 2 anni) | |
| AIDA64 / Memory Read | |
| Aorus 16X 2024 | |
| Lenovo Legion Pro 5 16IRX9 | |
| SCHENKER XMG Fusion 15 (Early 24) | |
| HP Omen Transcend 16-u1095ng | |
| Media Intel Core i9-14900HX (54443 - 87507, n=22) | |
| Alienware m16 R2 | |
| Media della classe Gaming (24879 - 90647, n=215, ultimi 2 anni) | |
| AIDA64 / Memory Write | |
| HP Omen Transcend 16-u1095ng | |
| Aorus 16X 2024 | |
| Lenovo Legion Pro 5 16IRX9 | |
| Media Intel Core i9-14900HX (51387 - 78199, n=22) | |
| SCHENKER XMG Fusion 15 (Early 24) | |
| Alienware m16 R2 | |
| Media della classe Gaming (21619 - 103259, n=215, ultimi 2 anni) | |
| AIDA64 / Memory Latency | |
| Alienware m16 R2 | |
| Media della classe Gaming (59.5 - 152.5, n=211, ultimi 2 anni) | |
| HP Omen Transcend 16-u1095ng | |
| Media Intel Core i9-14900HX (79.7 - 105, n=22) | |
| Lenovo Legion Pro 5 16IRX9 | |
| SCHENKER XMG Fusion 15 (Early 24) | |
| Aorus 16X 2024 | |
* ... Meglio usare valori piccoli
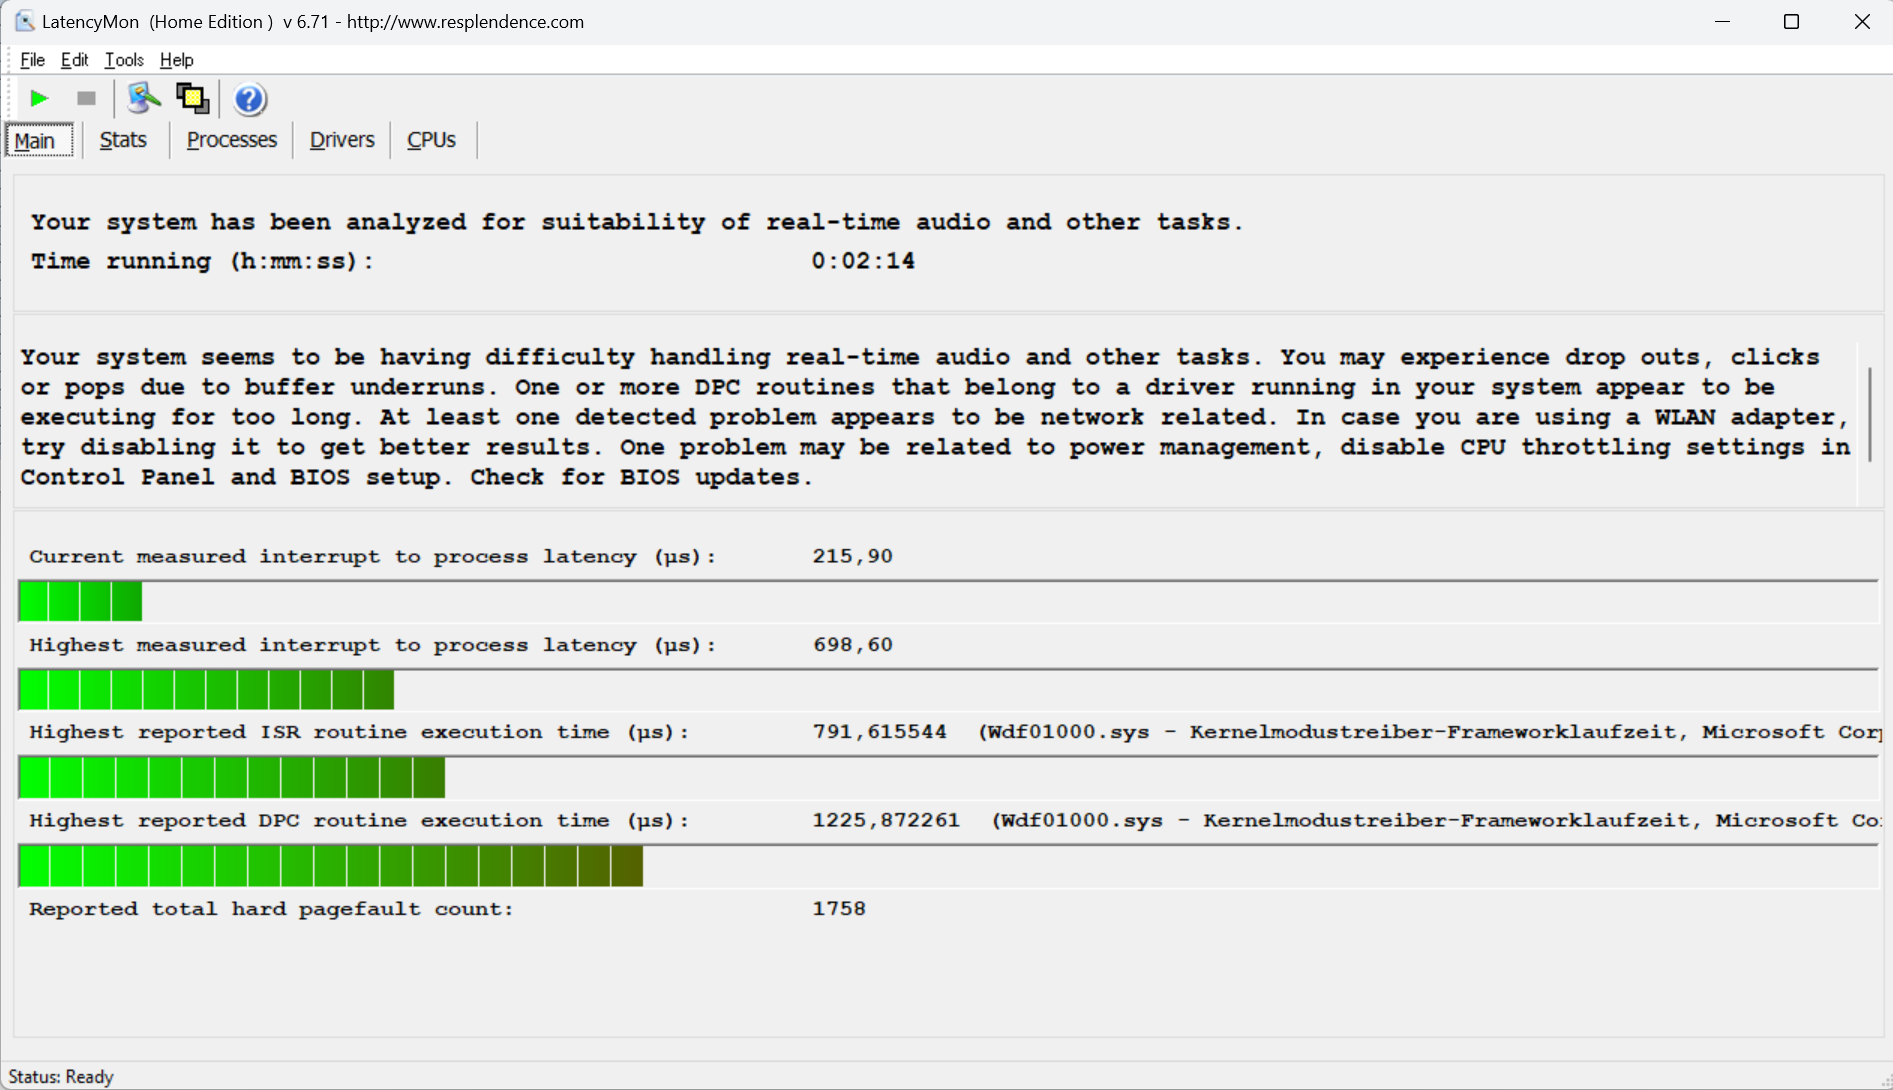
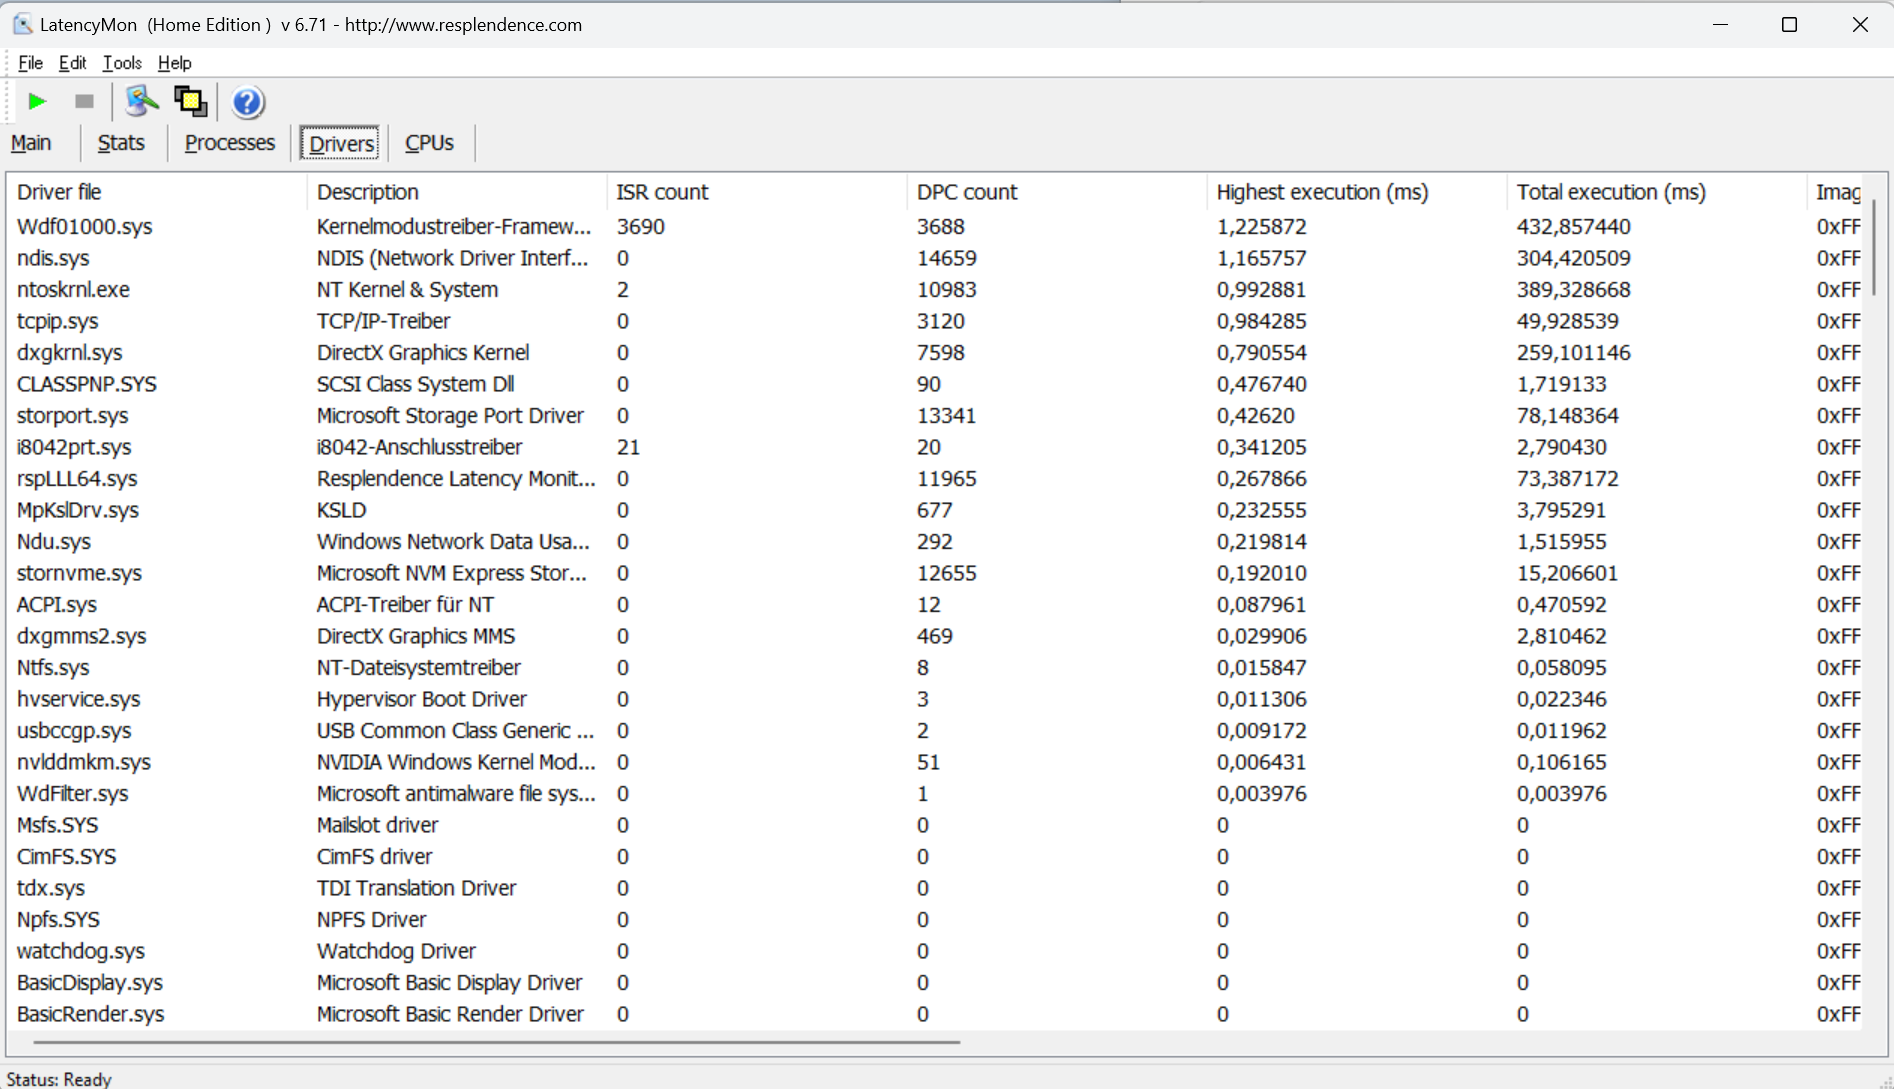
Latenze DPC
Il test standardizzato di monitoraggio della latenza (navigazione sul web, riproduzione di video 4k, Prime95 ad alto carico) ha rivelato alcune anomalie. Il sistema non sembra essere adatto all'editing video e audio in tempo reale. I futuri aggiornamenti del software potrebbero portare a miglioramenti o addirittura a peggioramenti.
| DPC Latencies / LatencyMon - interrupt to process latency (max), Web, Youtube, Prime95 | |
| Alienware m16 R2 | |
| HP Omen Transcend 16-u1095ng | |
| Aorus 16X 2024 | |
| Lenovo Legion Pro 5 16IRX9 | |
| SCHENKER XMG Fusion 15 (Early 24) | |
* ... Meglio usare valori piccoli
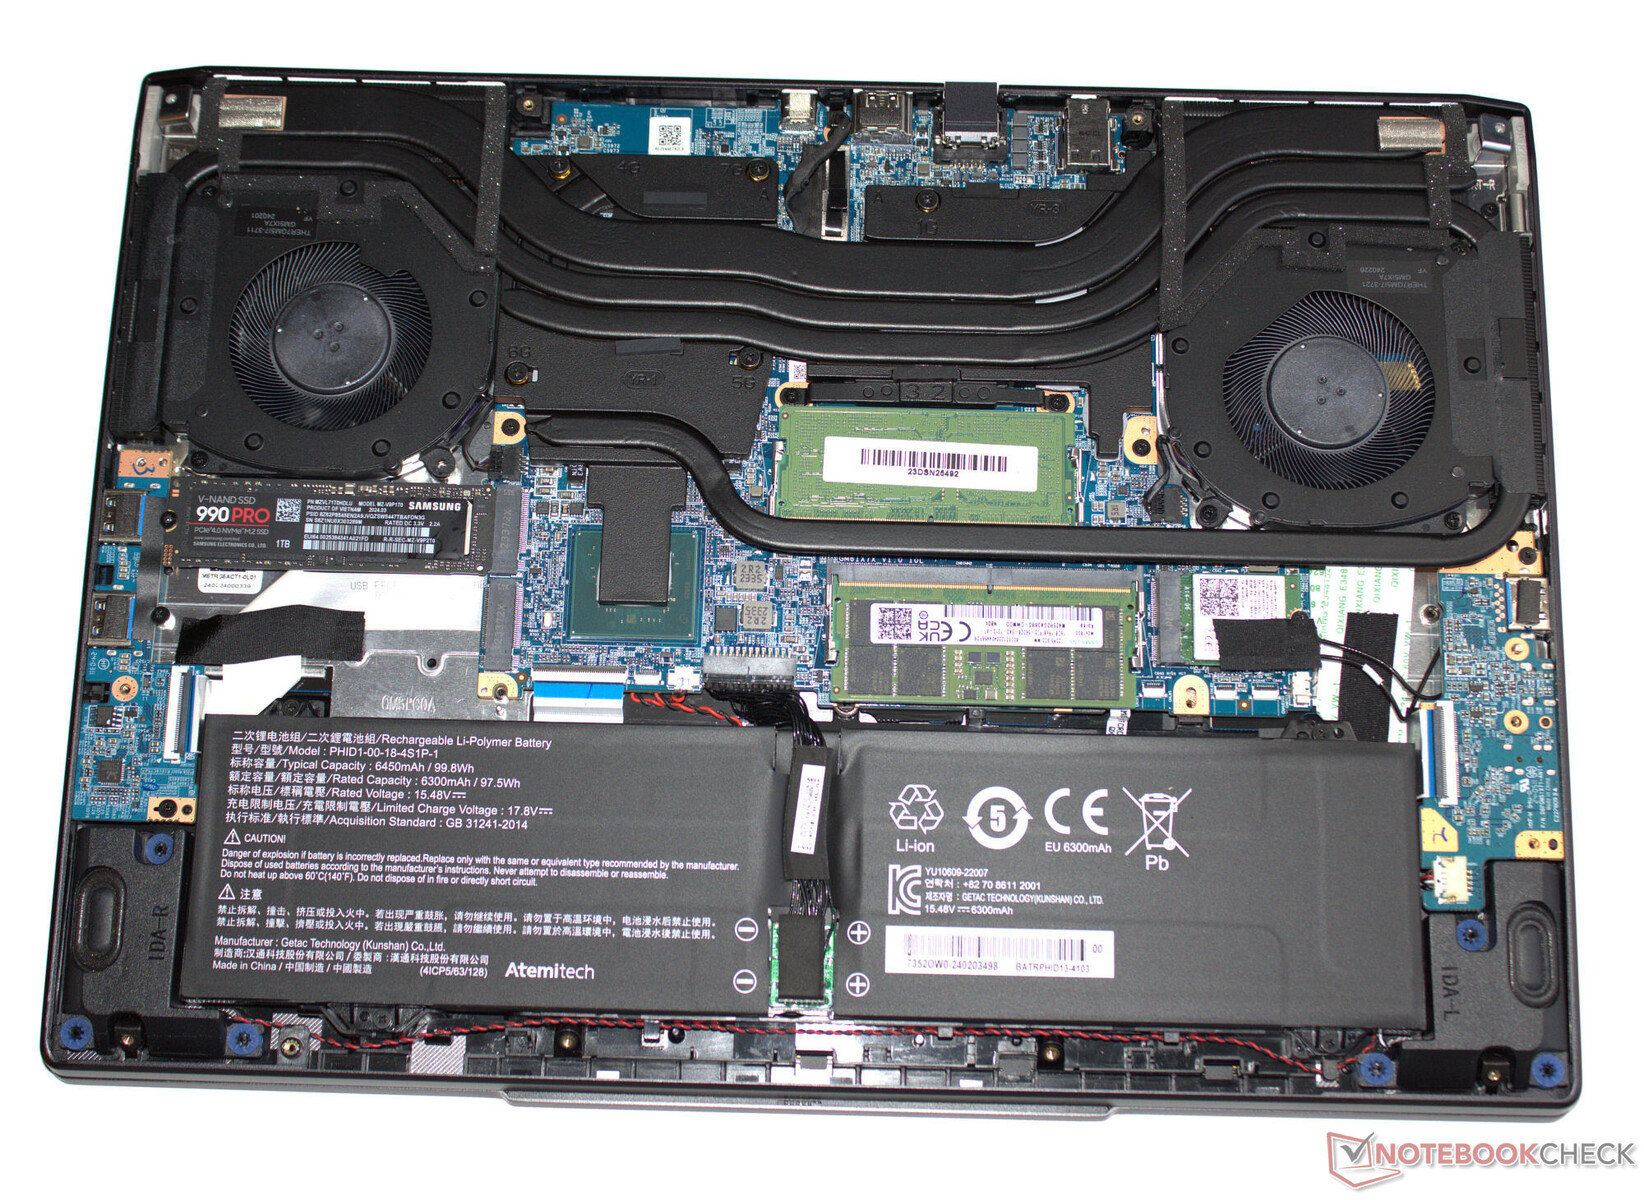
Dispositivi di archiviazione
Fusion può ospitare un totale di due SSD PCIe-4 in formato M.2-2280. È supportato il RAID-0/1. L'SSD Samsung (1TB) del nostro dispositivo di prova ha fornito velocità di trasferimento dati eccellenti. Positivo: Non abbiamo notato alcun throttling termico.


* ... Meglio usare valori piccoli
Reading continuous performance: DiskSpd Read Loop, Queue Depth 8
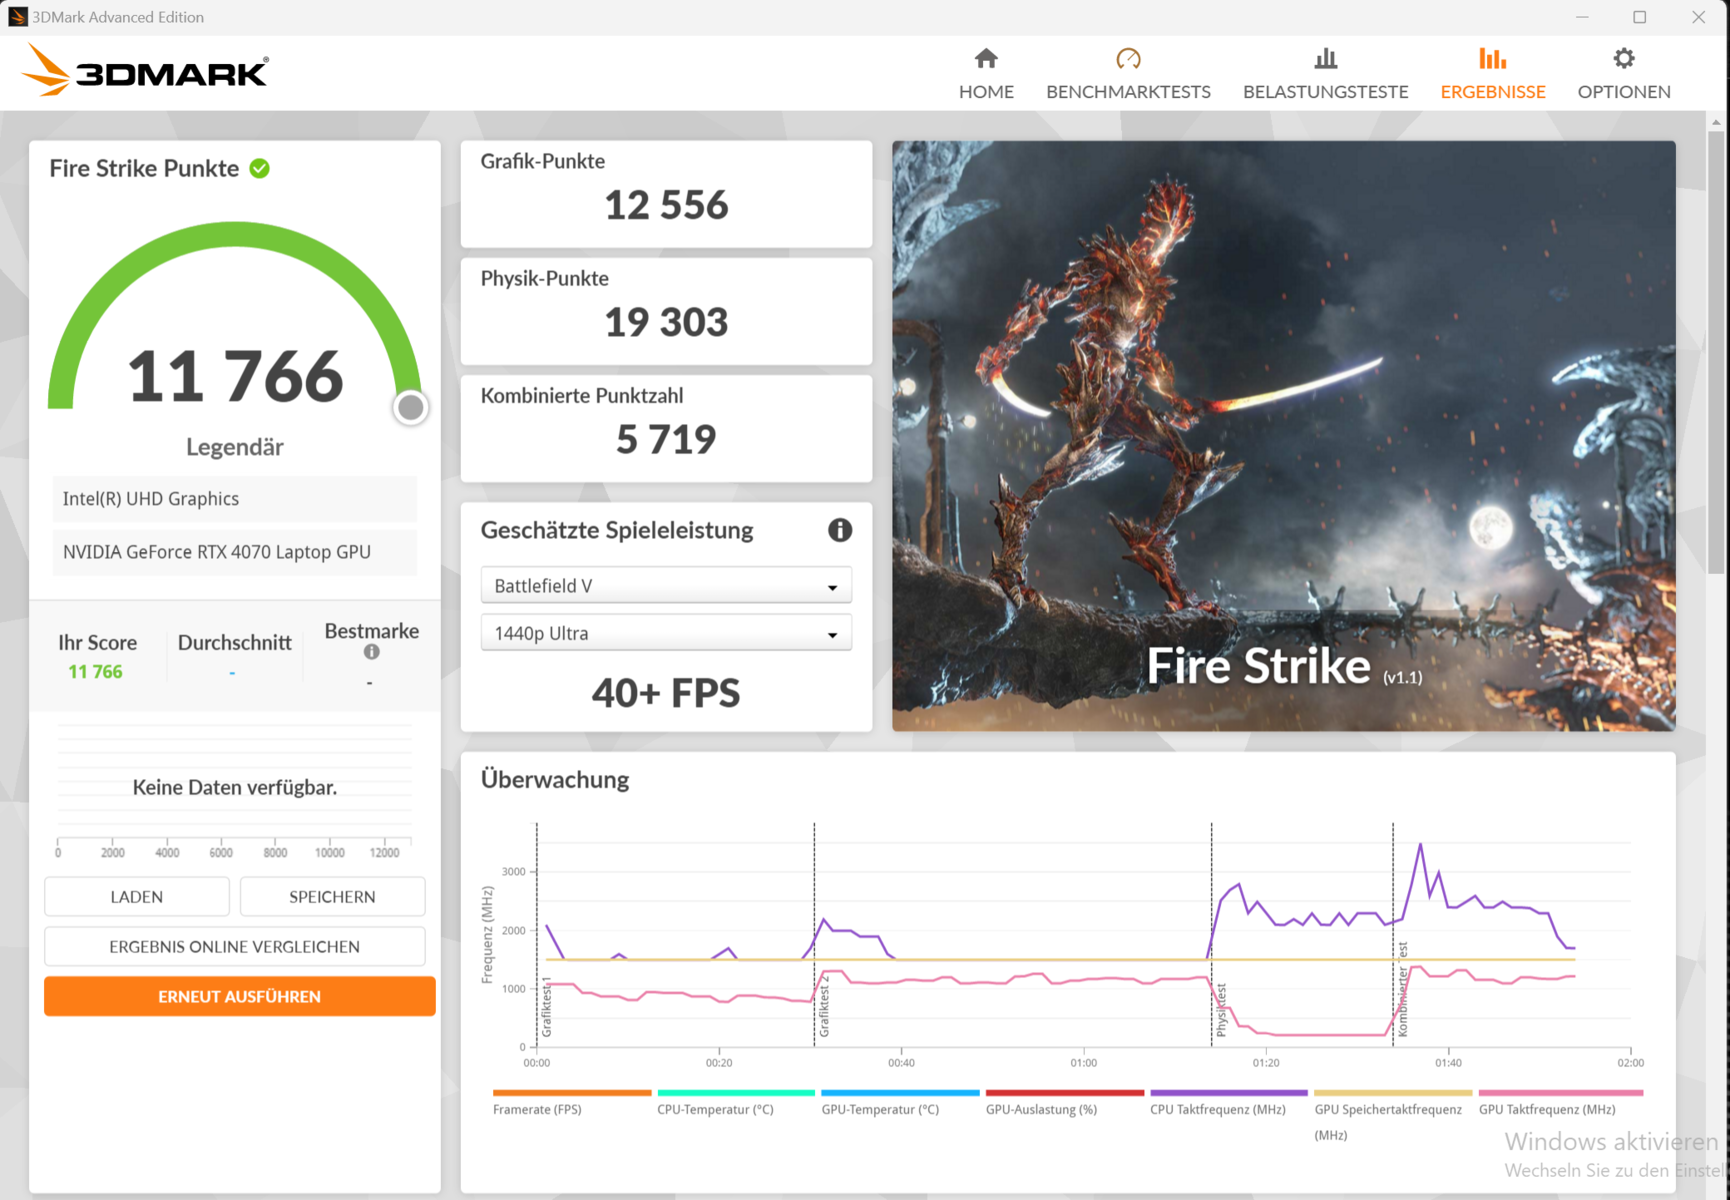
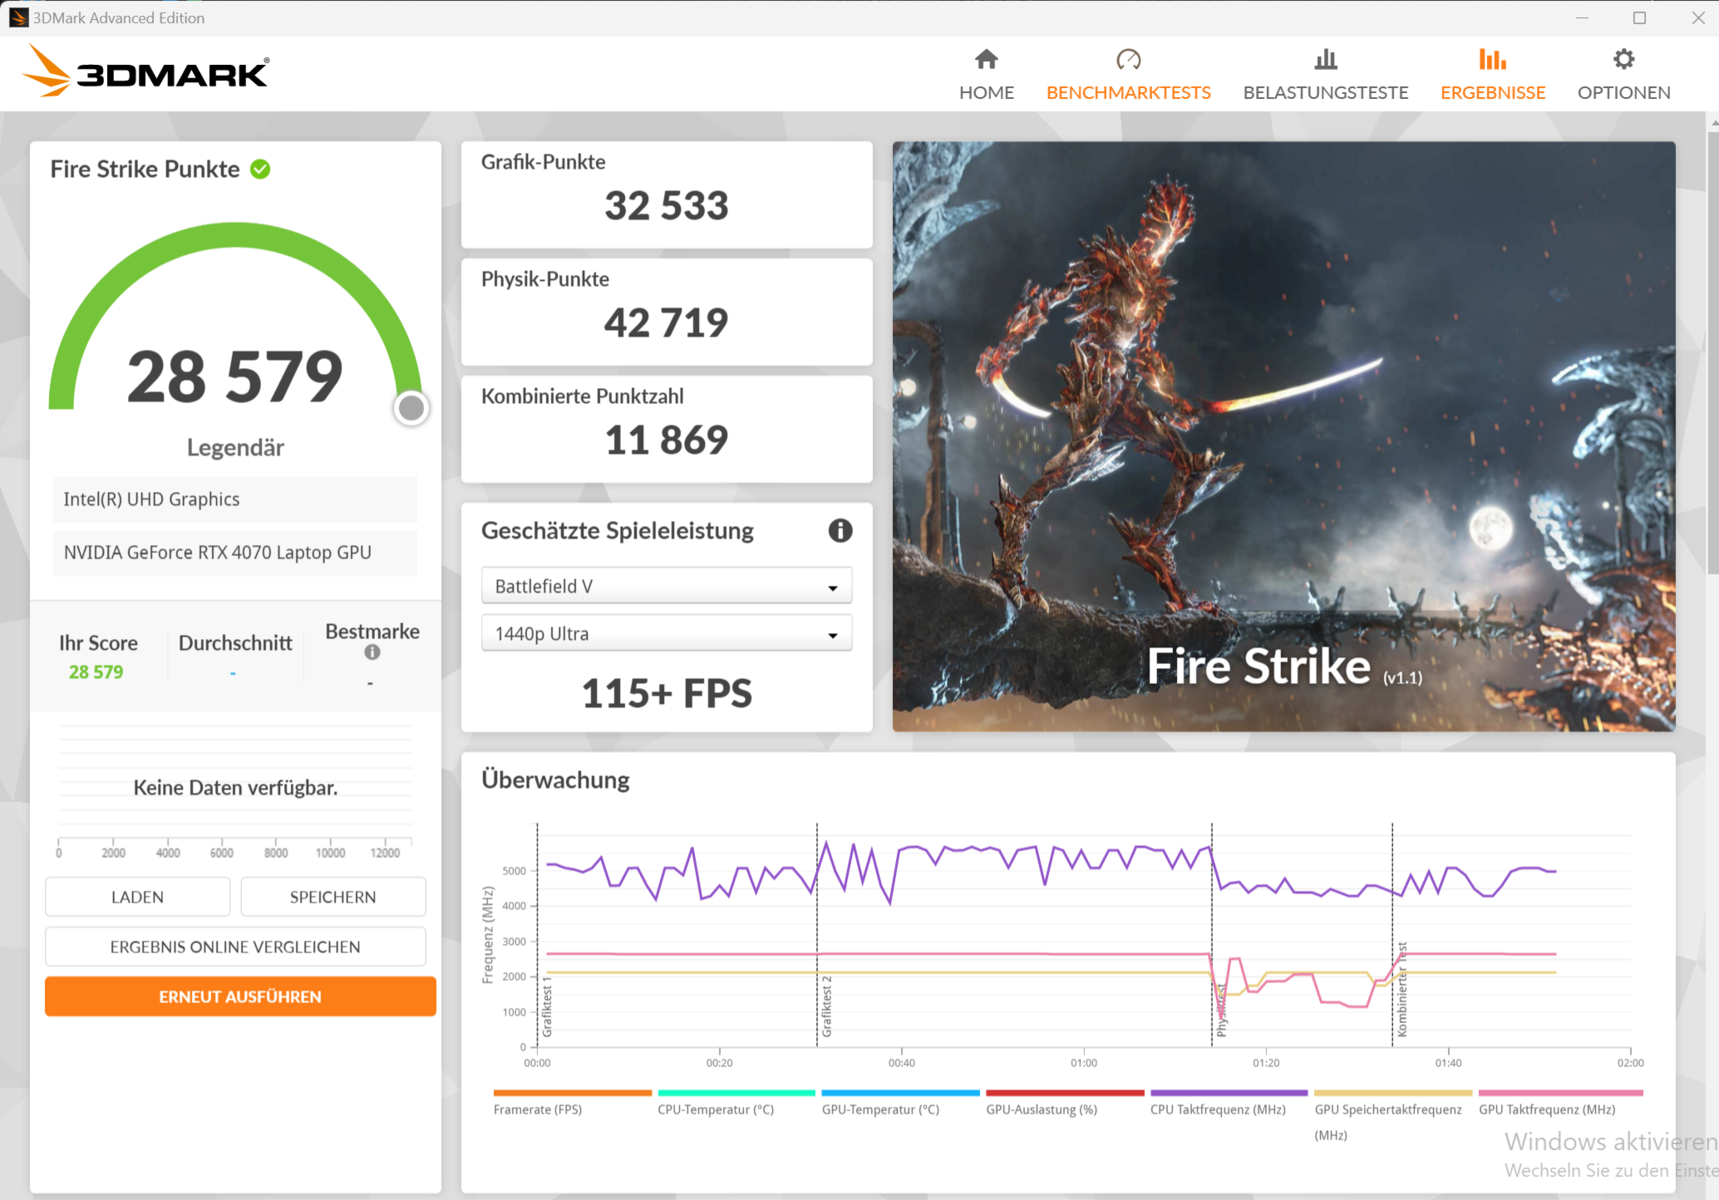
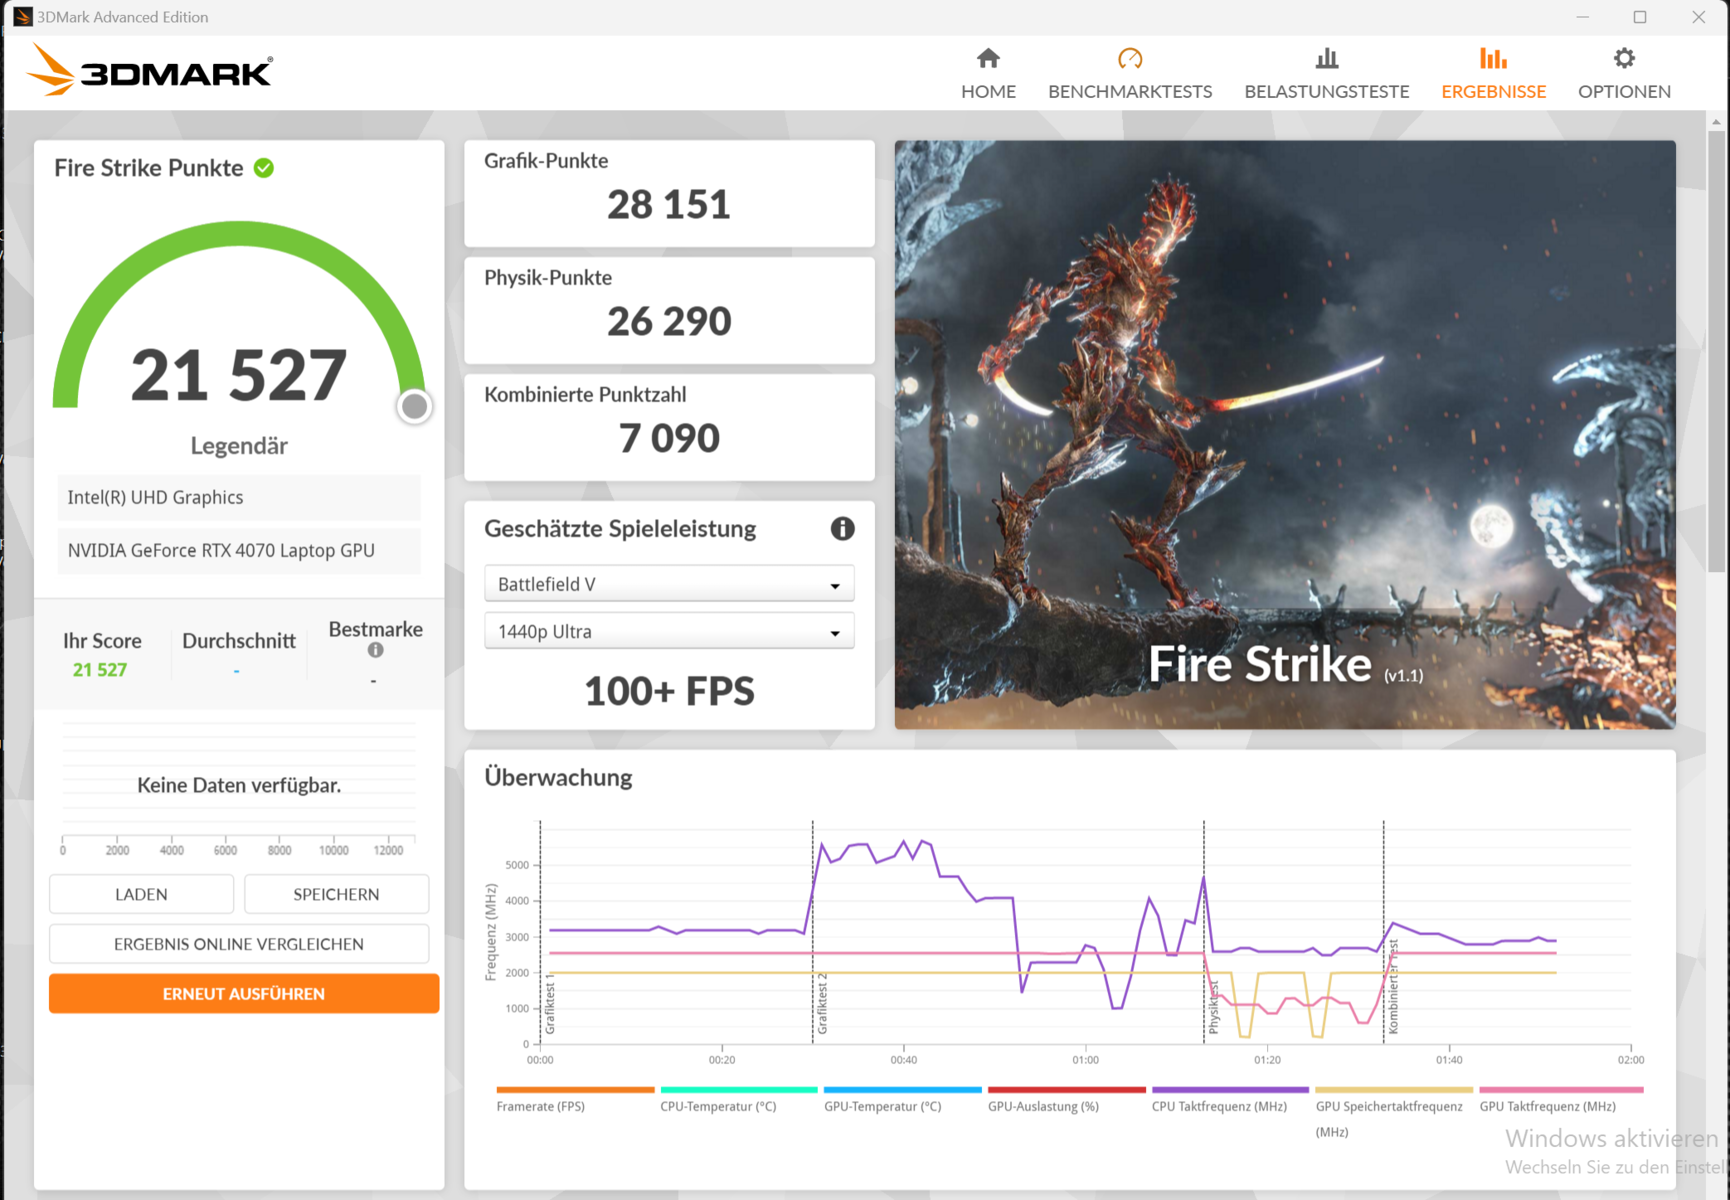
Scheda grafica
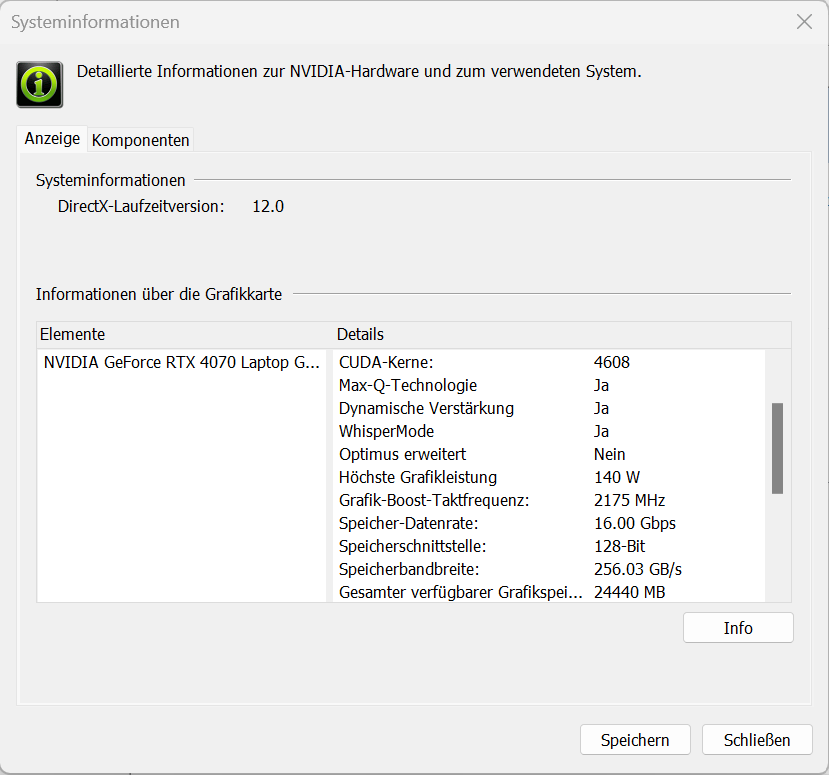
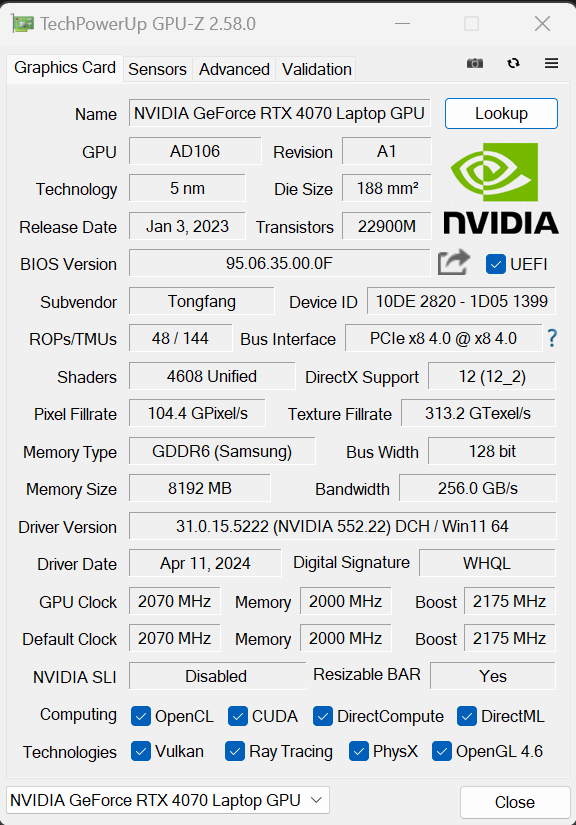
Schenker ha permesso che la GeForce RTX 4070 un TGP massimo di 140 watt (115 watt + 25 watt Dynamic Boost) - un valore superiore non è raccomandato da Nvidia. La GPU ha accesso a 8 GB di VRAM (GDDR6) - un po' poco per le esigenze attuali. I benchmark hanno fornito risultati superiori alla media della RTX-4070(Enthusiast) e Overboost ha portato solo un piccolo vantaggio. Il passaggio tra la dGPU e Optimus richiede un riavvio.

| 3DMark Performance Rating - Percent | |
| SCHENKER XMG Fusion 15 (Early 24) | |
| Lenovo Legion Pro 5 16IRX9 | |
| SCHENKER XMG Fusion 15 (Early 24) | |
| Alienware m16 R2 | |
| Media della classe Gaming | |
| Aorus 16X 2024 | |
| Media NVIDIA GeForce RTX 4070 Laptop GPU | |
| HP Omen Transcend 16-u1095ng | |
| 3DMark 11 - 1280x720 Performance GPU | |
| SCHENKER XMG Fusion 15 (Early 24) (Overboost) | |
| SCHENKER XMG Fusion 15 (Early 24) | |
| Lenovo Legion Pro 5 16IRX9 | |
| Alienware m16 R2 | |
| Aorus 16X 2024 | |
| Media della classe Gaming (1029 - 72070, n=219, ultimi 2 anni) | |
| Media NVIDIA GeForce RTX 4070 Laptop GPU (24229 - 46434, n=50) | |
| HP Omen Transcend 16-u1095ng | |
| 3DMark | |
| 1920x1080 Fire Strike Graphics | |
| SCHENKER XMG Fusion 15 (Early 24) (Overboost) | |
| SCHENKER XMG Fusion 15 (Early 24) | |
| Lenovo Legion Pro 5 16IRX9 | |
| Alienware m16 R2 | |
| Media della classe Gaming (781 - 53059, n=224, ultimi 2 anni) | |
| Media NVIDIA GeForce RTX 4070 Laptop GPU (16212 - 33451, n=50) | |
| Aorus 16X 2024 | |
| HP Omen Transcend 16-u1095ng | |
| 2560x1440 Time Spy Graphics | |
| SCHENKER XMG Fusion 15 (Early 24) (Overboost) | |
| Lenovo Legion Pro 5 16IRX9 | |
| Alienware m16 R2 | |
| SCHENKER XMG Fusion 15 (Early 24) | |
| Media della classe Gaming (224 - 22547, n=221, ultimi 2 anni) | |
| Aorus 16X 2024 | |
| Media NVIDIA GeForce RTX 4070 Laptop GPU (6241 - 13391, n=49) | |
| HP Omen Transcend 16-u1095ng | |
| 3DMark 06 Standard Score | 63892 punti | |
| 3DMark 11 Performance | 36008 punti | |
| 3DMark Fire Strike Score | 26661 punti | |
| 3DMark Time Spy Score | 13067 punti | |
Aiuto | ||
| Geekbench 5.5 | |
| OpenCL Score | |
| SCHENKER XMG Fusion 15 (Early 24) | |
| SCHENKER XMG Fusion 15 (Early 24) (Overboost) | |
| Aorus 16X 2024 | |
| Media della classe Gaming (5039 - 226512, n=223, ultimi 2 anni) | |
| HP Omen Transcend 16-u1095ng | |
| Lenovo Legion Pro 5 16IRX9 | |
| Media NVIDIA GeForce RTX 4070 Laptop GPU (17391 - 129366, n=49) | |
| Alienware m16 R2 | |
| Vulkan Score | |
| SCHENKER XMG Fusion 15 (Early 24) (Overboost) | |
| Aorus 16X 2024 | |
| SCHENKER XMG Fusion 15 (Early 24) | |
| Alienware m16 R2 | |
| Lenovo Legion Pro 5 16IRX9 | |
| Media della classe Gaming (1952 - 160279, n=219, ultimi 2 anni) | |
| Media NVIDIA GeForce RTX 4070 Laptop GPU (4898 - 93339, n=48) | |
| Geekbench 6.2 | |
| GPU OpenCL | |
| SCHENKER XMG Fusion 15 (Early 24) (6.2.1) | |
| SCHENKER XMG Fusion 15 (Early 24) (6.2.1, Overboost) | |
| HP Omen Transcend 16-u1095ng (6.2.1) | |
| Aorus 16X 2024 (6.2.1) | |
| Media della classe Gaming (4321 - 207373, n=79, ultimi 2 anni) | |
| Media NVIDIA GeForce RTX 4070 Laptop GPU (101474 - 129836, n=26) | |
| Lenovo Legion Pro 5 16IRX9 (6.2.1) | |
| Alienware m16 R2 (6.2.1) | |
| GPU Vulkan | |
| SCHENKER XMG Fusion 15 (Early 24) (6.2.1, Overboost) | |
| Alienware m16 R2 (6.2.1) | |
| Lenovo Legion Pro 5 16IRX9 (6.2.1) | |
| SCHENKER XMG Fusion 15 (Early 24) (6.2.1) | |
| Aorus 16X 2024 (6.2.1) | |
| Media della classe Gaming (4286 - 196201, n=76, ultimi 2 anni) | |
| Media NVIDIA GeForce RTX 4070 Laptop GPU (9035 - 120033, n=24) | |
| V-Ray 5 Benchmark | |
| GPU RTX | |
| Media della classe Gaming (171 - 3824, n=122, ultimi 2 anni) | |
| Lenovo Legion Pro 5 16IRX9 (5.0.1) | |
| SCHENKER XMG Fusion 15 (Early 24) (5.0.1, Overboost) | |
| SCHENKER XMG Fusion 15 (Early 24) (5.0.1) | |
| Alienware m16 R2 (5.0.1) | |
| Aorus 16X 2024 (5.0.1) | |
| Media NVIDIA GeForce RTX 4070 Laptop GPU (171 - 1872, n=28) | |
| GPU CUDA | |
| Media della classe Gaming (120 - 2797, n=126, ultimi 2 anni) | |
| Lenovo Legion Pro 5 16IRX9 (5.0.1) | |
| SCHENKER XMG Fusion 15 (Early 24) (5.0.1, Overboost) | |
| SCHENKER XMG Fusion 15 (Early 24) (5.0.1) | |
| Alienware m16 R2 (5.0.1) | |
| Aorus 16X 2024 (5.0.1) | |
| Media NVIDIA GeForce RTX 4070 Laptop GPU (120 - 1333, n=28) | |
| CPU | |
| SCHENKER XMG Fusion 15 (Early 24) (5.0.1, Overboost) | |
| Lenovo Legion Pro 5 16IRX9 (5.0.1) | |
| Aorus 16X 2024 (5.0.1) | |
| SCHENKER XMG Fusion 15 (Early 24) (5.0.1) | |
| Media NVIDIA GeForce RTX 4070 Laptop GPU (10005 - 20388, n=27) | |
| Media della classe Gaming (1690 - 26944, n=136, ultimi 2 anni) | |
| Alienware m16 R2 (5.0.1) | |
| V-Ray Benchmark Next 4.10 | |
| GPU | |
| Lenovo Legion Pro 5 16IRX9 (v4.10.07 ) | |
| SCHENKER XMG Fusion 15 (Early 24) (v4.10.07, Overboost) | |
| Media della classe Gaming (54 - 1334, n=177, ultimi 2 anni) | |
| Media NVIDIA GeForce RTX 4070 Laptop GPU (500 - 686, n=35) | |
| SCHENKER XMG Fusion 15 (Early 24) (v4.10.07 ) | |
| HP Omen Transcend 16-u1095ng (v4.10.07 ) | |
| Aorus 16X 2024 (v4.10.07 ) | |
| CPU | |
| SCHENKER XMG Fusion 15 (Early 24) (v4.10.07, Overboost) | |
| Lenovo Legion Pro 5 16IRX9 (v4.10.07 ) | |
| Aorus 16X 2024 (v4.10.07 ) | |
| SCHENKER XMG Fusion 15 (Early 24) (v4.10.07 ) | |
| HP Omen Transcend 16-u1095ng (v4.10.07 ) | |
| Media NVIDIA GeForce RTX 4070 Laptop GPU (12638 - 35173, n=35) | |
| Media della classe Gaming (2741 - 37629, n=177, ultimi 2 anni) | |
* ... Meglio usare valori piccoli
Prestazioni di gioco
L'hardware è destinato ai giochi QHD con impostazioni elevate o massime. Utilizzando DLSS 3 e Frame Generation, è possibile giocare a risoluzioni più elevate e impostazioni massime, compreso il ray tracing, ma solo con i giochi che supportano queste funzioni. Abbiamo notato frame rate superiori alla media della RTX-4070(Enthusiast) e l'Overboost ha portato a un piccolo vantaggio.
| Performance Rating - Percent | |
| SCHENKER XMG Fusion 15 (Early 24) | |
| Lenovo Legion Pro 5 16IRX9 | |
| SCHENKER XMG Fusion 15 (Early 24) | |
| Aorus 16X 2024 | |
| Alienware m16 R2 -1! | |
| HP Omen Transcend 16-u1095ng | |
| Media NVIDIA GeForce RTX 4070 Laptop GPU | |
| Media della classe Gaming | |
| The Witcher 3 - 1920x1080 Ultra Graphics & Postprocessing (HBAO+) | |
| Lenovo Legion Pro 5 16IRX9 | |
| SCHENKER XMG Fusion 15 (Early 24) (Overboost) | |
| SCHENKER XMG Fusion 15 (Early 24) | |
| Aorus 16X 2024 | |
| Alienware m16 R2 | |
| Media della classe Gaming (8.61 - 216, n=215, ultimi 2 anni) | |
| HP Omen Transcend 16-u1095ng | |
| Media NVIDIA GeForce RTX 4070 Laptop GPU (69.8 - 133.7, n=52) | |
| GTA V - 1920x1080 Highest Settings possible AA:4xMSAA + FX AF:16x | |
| SCHENKER XMG Fusion 15 (Early 24) (Overboost) | |
| SCHENKER XMG Fusion 15 (Early 24) | |
| Lenovo Legion Pro 5 16IRX9 | |
| HP Omen Transcend 16-u1095ng | |
| Media NVIDIA GeForce RTX 4070 Laptop GPU (63.5 - 140.5, n=44) | |
| Media della classe Gaming (6.38 - 167.7, n=207, ultimi 2 anni) | |
| Aorus 16X 2024 | |
| Final Fantasy XV Benchmark - 1920x1080 High Quality | |
| SCHENKER XMG Fusion 15 (Early 24) (1.3, Overboost) | |
| Lenovo Legion Pro 5 16IRX9 (1.3) | |
| SCHENKER XMG Fusion 15 (Early 24) (1.3) | |
| Alienware m16 R2 (1.3) | |
| Media NVIDIA GeForce RTX 4070 Laptop GPU (66 - 131.9, n=47) | |
| Media della classe Gaming (9.13 - 194.9, n=217, ultimi 2 anni) | |
| Aorus 16X 2024 (1.3) | |
| HP Omen Transcend 16-u1095ng (1.3) | |
| Strange Brigade - 1920x1080 ultra AA:ultra AF:16 | |
| Lenovo Legion Pro 5 16IRX9 (1.47.22.14 D3D12) | |
| SCHENKER XMG Fusion 15 (Early 24) (1.47.22.14 D3D12, Overboost) | |
| Alienware m16 R2 (1.47.22.14 D3D12) | |
| SCHENKER XMG Fusion 15 (Early 24) (1.47.22.14 D3D12) | |
| Media della classe Gaming (14.6 - 421, n=214, ultimi 2 anni) | |
| Aorus 16X 2024 (1.47.22.14 D3D12) | |
| Media NVIDIA GeForce RTX 4070 Laptop GPU (117.7 - 234, n=47) | |
| HP Omen Transcend 16-u1095ng (1.47.22.14 D3D12) | |
| Dota 2 Reborn - 1920x1080 ultra (3/3) best looking | |
| SCHENKER XMG Fusion 15 (Early 24) (Overboost) | |
| Lenovo Legion Pro 5 16IRX9 | |
| SCHENKER XMG Fusion 15 (Early 24) | |
| Aorus 16X 2024 | |
| HP Omen Transcend 16-u1095ng | |
| Media NVIDIA GeForce RTX 4070 Laptop GPU (89.7 - 187.5, n=48) | |
| Media della classe Gaming (26.9 - 220, n=226, ultimi 2 anni) | |
| Alienware m16 R2 | |
| X-Plane 11.11 - 1920x1080 high (fps_test=3) | |
| SCHENKER XMG Fusion 15 (Early 24) (Overboost) | |
| Lenovo Legion Pro 5 16IRX9 | |
| SCHENKER XMG Fusion 15 (Early 24) | |
| Aorus 16X 2024 | |
| HP Omen Transcend 16-u1095ng | |
| Media NVIDIA GeForce RTX 4070 Laptop GPU (72.2 - 144.4, n=50) | |
| Media della classe Gaming (12.4 - 166.2, n=232, ultimi 2 anni) | |
| Alienware m16 R2 | |
| Alone in the Dark | |
| 1920x1080 Cinematic Preset | |
| SCHENKER XMG Fusion 15 (Early 24) | |
| Aorus 16X 2024 | |
| Media NVIDIA GeForce RTX 4070 Laptop GPU (114 - 126, n=3) | |
| Media della classe Gaming (13.6 - 176.4, n=4, ultimi 2 anni) | |
| 2560x1440 Cinematic Preset | |
| Media della classe Gaming (64.7 - 91.6, n=3, ultimi 2 anni) | |
| SCHENKER XMG Fusion 15 (Early 24) | |
| Media NVIDIA GeForce RTX 4070 Laptop GPU (64.7 - 76.6, n=3) | |
| Aorus 16X 2024 | |
| The Witcher 3 v4.00 | |
| 1920x1080 Ultra Preset / On AA:FX | |
| Media della classe Gaming (25.7 - 150, n=17, ultimi 2 anni) | |
| SCHENKER XMG Fusion 15 (Early 24) | |
| Media NVIDIA GeForce RTX 4070 Laptop GPU (85 - 86.5, n=2) | |
| 1920x1080 RT Ultra Preset / On AA:FX | |
| Media della classe Gaming (12.9 - 66, n=11, ultimi 2 anni) | |
| SCHENKER XMG Fusion 15 (Early 24) | |
| Media NVIDIA GeForce RTX 4070 Laptop GPU (36 - 40.4, n=2) | |
Per verificare se i suoi tassi di frame rimangono stabili per un periodo di tempo più lungo, abbiamo fatto girare il gioco The Witcher 3 per circa 60 minuti in Full HD e con le impostazioni impostate al massimo. Non abbiamo spostato il personaggio del gioco. Non abbiamo notato un crollo della frequenza dei fotogrammi, tuttavia sono scesi di qualche punto percentuale dopo circa 50 minuti(Enthusiast). Con il profilo Overboost attivato, questo comportamento non si è verificato.
Witcher 3 FPS diagram
| basso | medio | alto | ultra | QHD | |
| GTA V (2015) | 187.8 | 187 | 186.4 | 137.6 | 98.2 |
| The Witcher 3 (2015) | 603.3 | 418.4 | 246.2 | 128 | 92.2 |
| Dota 2 Reborn (2015) | 234 | 207 | 196.5 | 182.1 | |
| Final Fantasy XV Benchmark (2018) | 226 | 175.5 | 124.6 | 90.5 | |
| X-Plane 11.11 (2018) | 205 | 173.3 | 136.9 | ||
| Far Cry 5 (2018) | 204 | 176 | 166 | 157 | 124 |
| Strange Brigade (2018) | 558 | 313 | 245 | 214 | 139.2 |
| The Witcher 3 v4.00 (2023) | 271 | 215 | 176.2 | 86.5 | |
| Baldur's Gate 3 (2023) | 157.2 | 121.2 | 106.1 | 105 | 82.1 |
| Cyberpunk 2077 2.0 Phantom Liberty (2023) | 156.6 | 124.5 | 103.6 | 87 | 52.6 |
| Alan Wake 2 (2023) | 74.3 | 71.4 | 70.1 | 42.8 | |
| Alone in the Dark (2024) | 222 | 209 | 196.5 | 126 | 76.6 |
| Dragon's Dogma 2 (2024) | 83.9 | 80 | 61.3 |
Emissioni - Il portatile Schenker diventa piuttosto caldo
Emissioni di rumore
Nell'uso quotidiano e quando è al minimo, il portatile funziona in modo molto silenzioso. Sebbene le ventole siano attivate in modo permanente (possono essere disattivate tramite il BIOS), si sentono solo in ambienti molto silenziosi. Sotto carico, le cose cambiano rapidamente: Abbiamo notato emissioni nasali fino a 53 dB(A)(Enthusiast). La modalità Overboost ha prodotto valori ancora più elevati. Il dispositivo funziona in modo notevolmente più silenzioso quando utilizza la modalità Bilanciata, acosto di alcune prestazioni.
Rumorosità
| Idle |
| 27 / 28 / 33 dB(A) |
| Sotto carico |
| 52 / 53 dB(A) |
 | ||
30 dB silenzioso 40 dB(A) udibile 50 dB(A) rumoroso |
||
min: | ||
| SCHENKER XMG Fusion 15 (Early 24) i9-14900HX, NVIDIA GeForce RTX 4070 Laptop GPU | Aorus 16X 2024 i9-14900HX, NVIDIA GeForce RTX 4070 Laptop GPU | Alienware m16 R2 Ultra 7 155H, NVIDIA GeForce RTX 4070 Laptop GPU | HP Omen Transcend 16-u1095ng i9-14900HX, NVIDIA GeForce RTX 4070 Laptop GPU | Lenovo Legion Pro 5 16IRX9 i9-14900HX, NVIDIA GeForce RTX 4070 Laptop GPU | |
|---|---|---|---|---|---|
| Noise | -5% | 8% | 5% | 6% | |
| off /ambiente * | 25 | 26 -4% | 24.7 1% | 24 4% | 23.9 4% |
| Idle Minimum * | 27 | 26 4% | 25.3 6% | 29 -7% | 24.3 10% |
| Idle Average * | 28 | 32 -14% | 25.3 10% | 30 -7% | 24.3 13% |
| Idle Maximum * | 33 | 38 -15% | 25.3 23% | 31 6% | 28.9 12% |
| Load Average * | 52 | 54 -4% | 31.7 39% | 45 13% | 45.8 12% |
| Witcher 3 ultra * | 51 | 50 2% | 53.8 -5% | 44 14% | 51 -0% |
| Load Maximum * | 53 | 55 -4% | 62 -17% | 47 11% | 56.6 -7% |
* ... Meglio usare valori piccoli
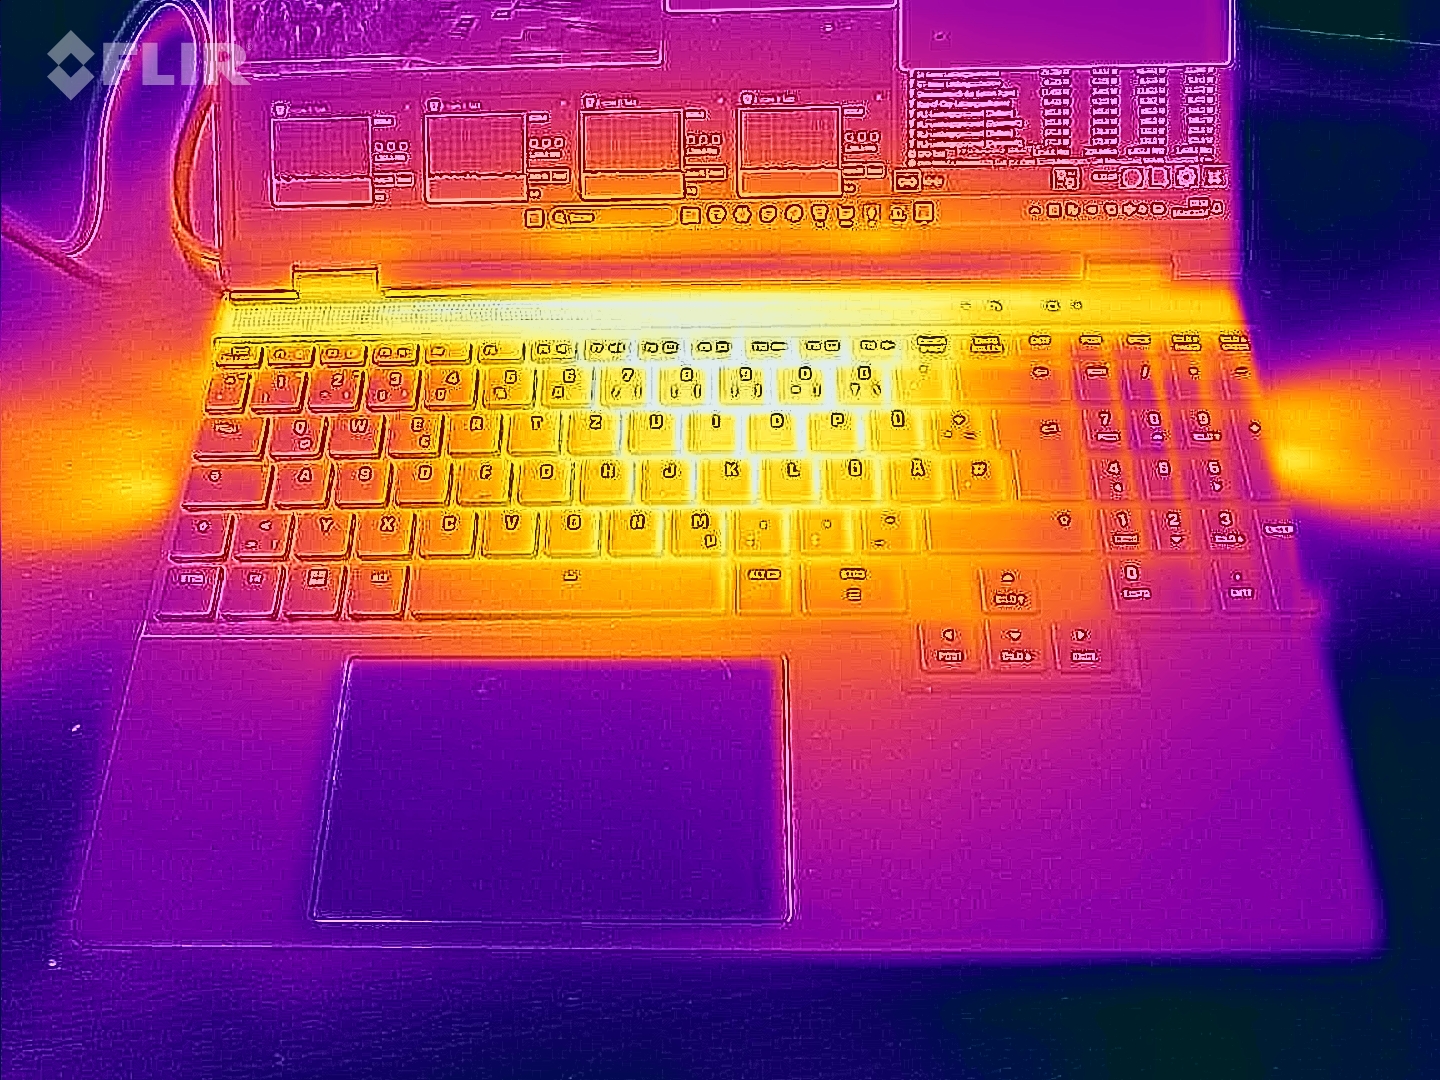
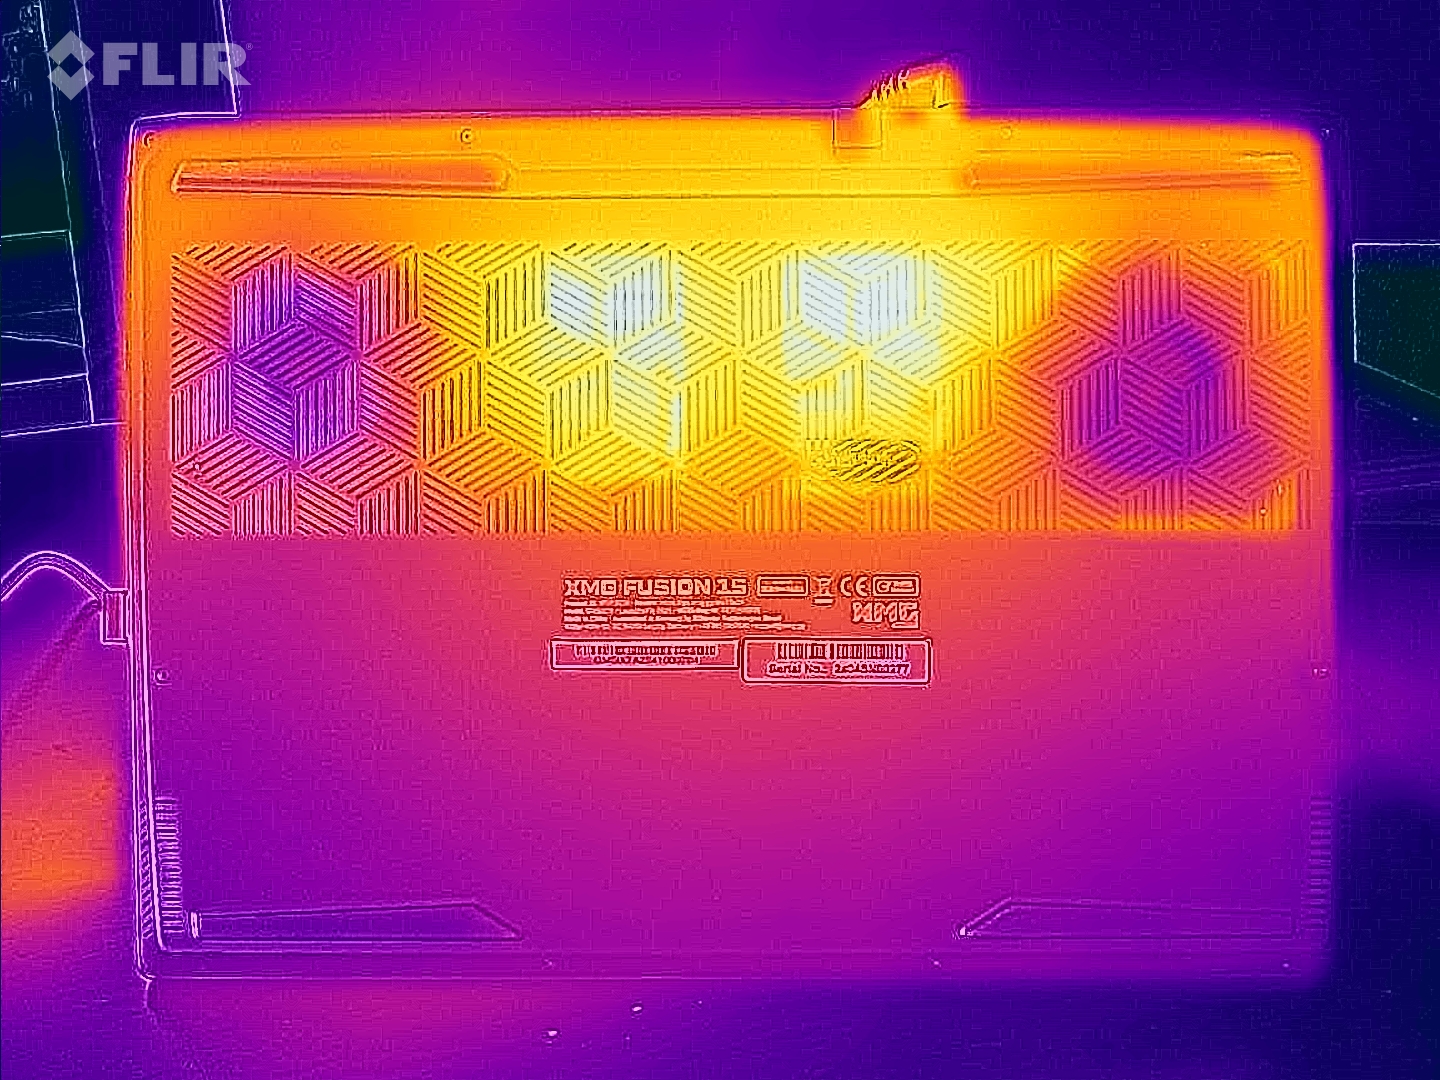
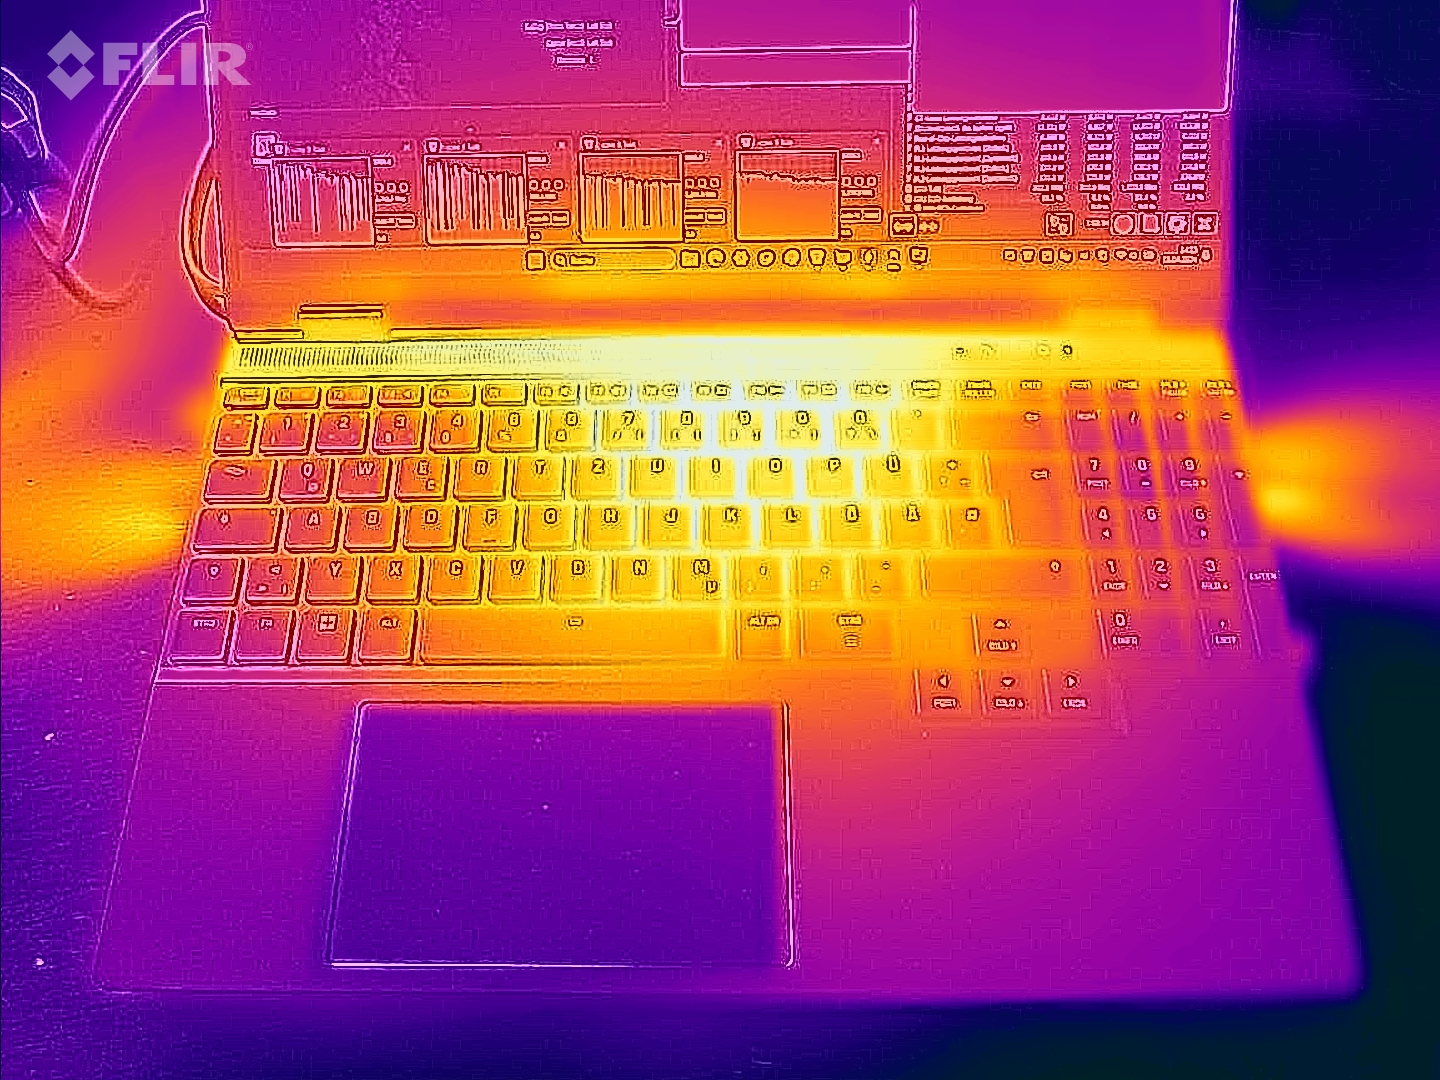
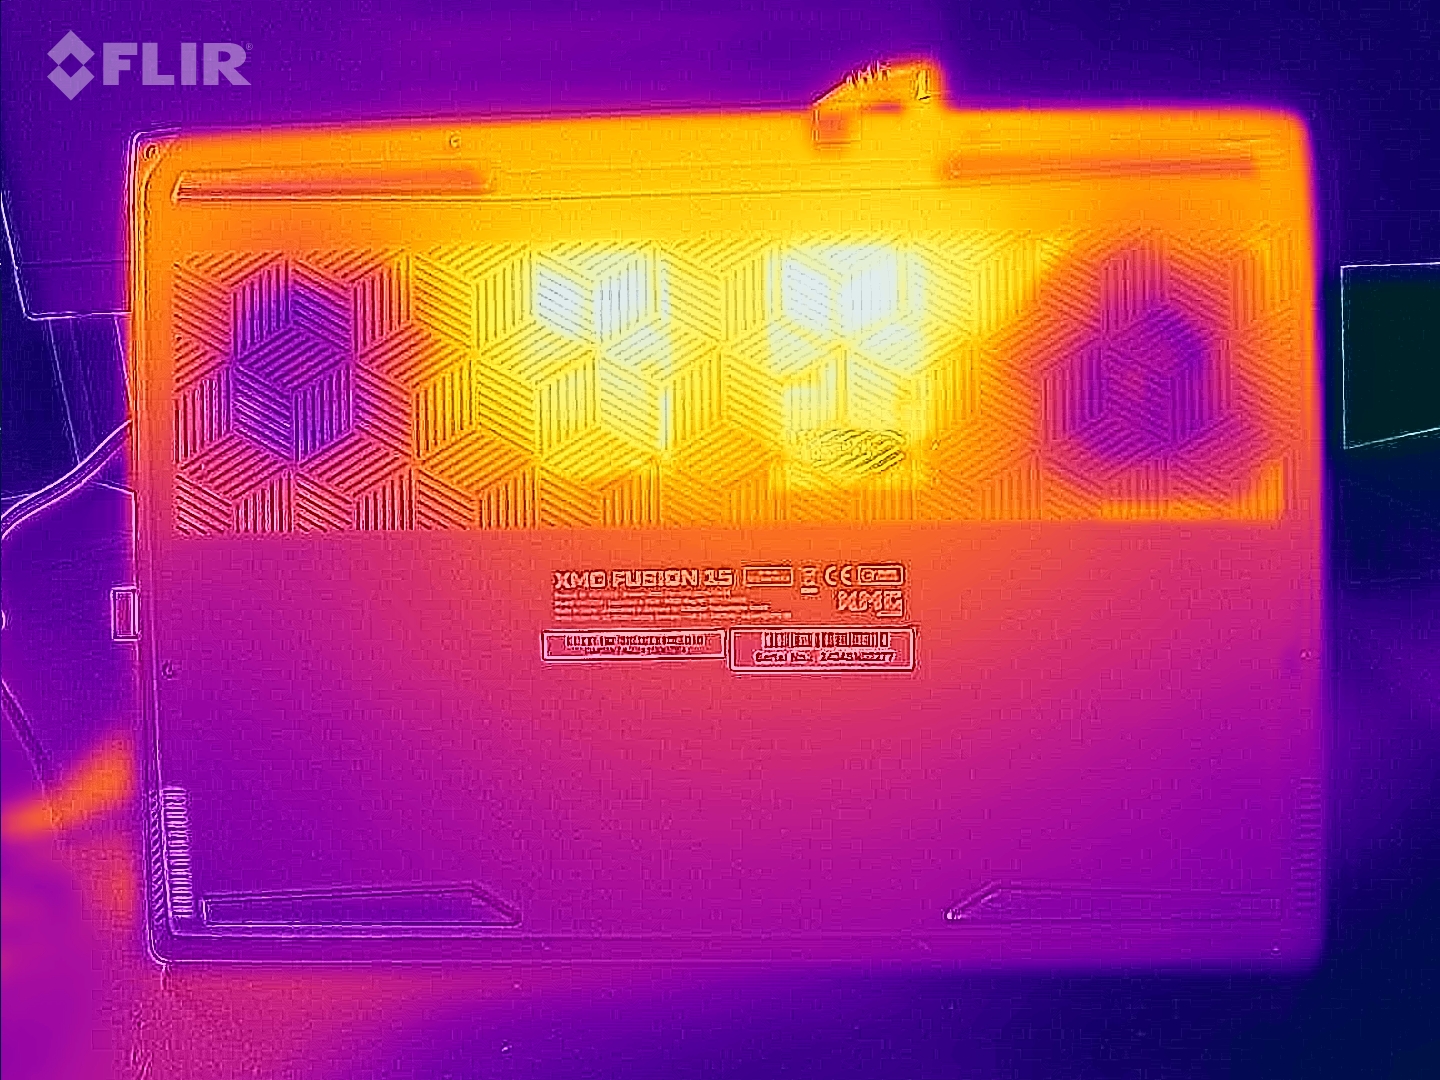
Temperatura
Lo stress test e il Witcher 3 test hanno portato il portatile a riscaldarsi notevolmente. A volte, ha raggiunto valori nella fascia superiore dei 50 gradi Celsius. Nell'uso quotidiano (ufficio, internet), i valori rimangono generalmente nella zona verde.
(-) La temperatura massima sul lato superiore è di 48 °C / 118 F, rispetto alla media di 40.4 °C / 105 F, che varia da 21.2 a 68.8 °C per questa classe Gaming.
(-) Il lato inferiore si riscalda fino ad un massimo di 56 °C / 133 F, rispetto alla media di 43.2 °C / 110 F
(+) In idle, la temperatura media del lato superiore è di 26.6 °C / 80 F, rispetto alla media deld ispositivo di 33.8 °C / 93 F.
(-) Riproducendo The Witcher 3, la temperatura media per il lato superiore e' di 40.4 °C / 105 F, rispetto alla media del dispositivo di 33.8 °C / 93 F.
(+) I poggiapolsi e il touchpad raggiungono la temperatura massima della pelle (34 °C / 93.2 F) e quindi non sono caldi.
(-) La temperatura media della zona del palmo della mano di dispositivi simili e'stata di 28.9 °C / 84 F (-5.1 °C / -9.2 F).
| SCHENKER XMG Fusion 15 (Early 24) Intel Core i9-14900HX, NVIDIA GeForce RTX 4070 Laptop GPU | Aorus 16X 2024 Intel Core i9-14900HX, NVIDIA GeForce RTX 4070 Laptop GPU | Alienware m16 R2 Intel Core Ultra 7 155H, NVIDIA GeForce RTX 4070 Laptop GPU | HP Omen Transcend 16-u1095ng Intel Core i9-14900HX, NVIDIA GeForce RTX 4070 Laptop GPU | Lenovo Legion Pro 5 16IRX9 Intel Core i9-14900HX, NVIDIA GeForce RTX 4070 Laptop GPU | |
|---|---|---|---|---|---|
| Heat | -5% | -14% | -6% | -8% | |
| Maximum Upper Side * | 48 | 41 15% | 44.8 7% | 49 -2% | 43.8 9% |
| Maximum Bottom * | 56 | 41 27% | 48 14% | 63 -13% | 55.4 1% |
| Idle Upper Side * | 28 | 37 -32% | 37.2 -33% | 30 -7% | 32.8 -17% |
| Idle Bottom * | 29 | 38 -31% | 42 -45% | 29 -0% | 36 -24% |
* ... Meglio usare valori piccoli
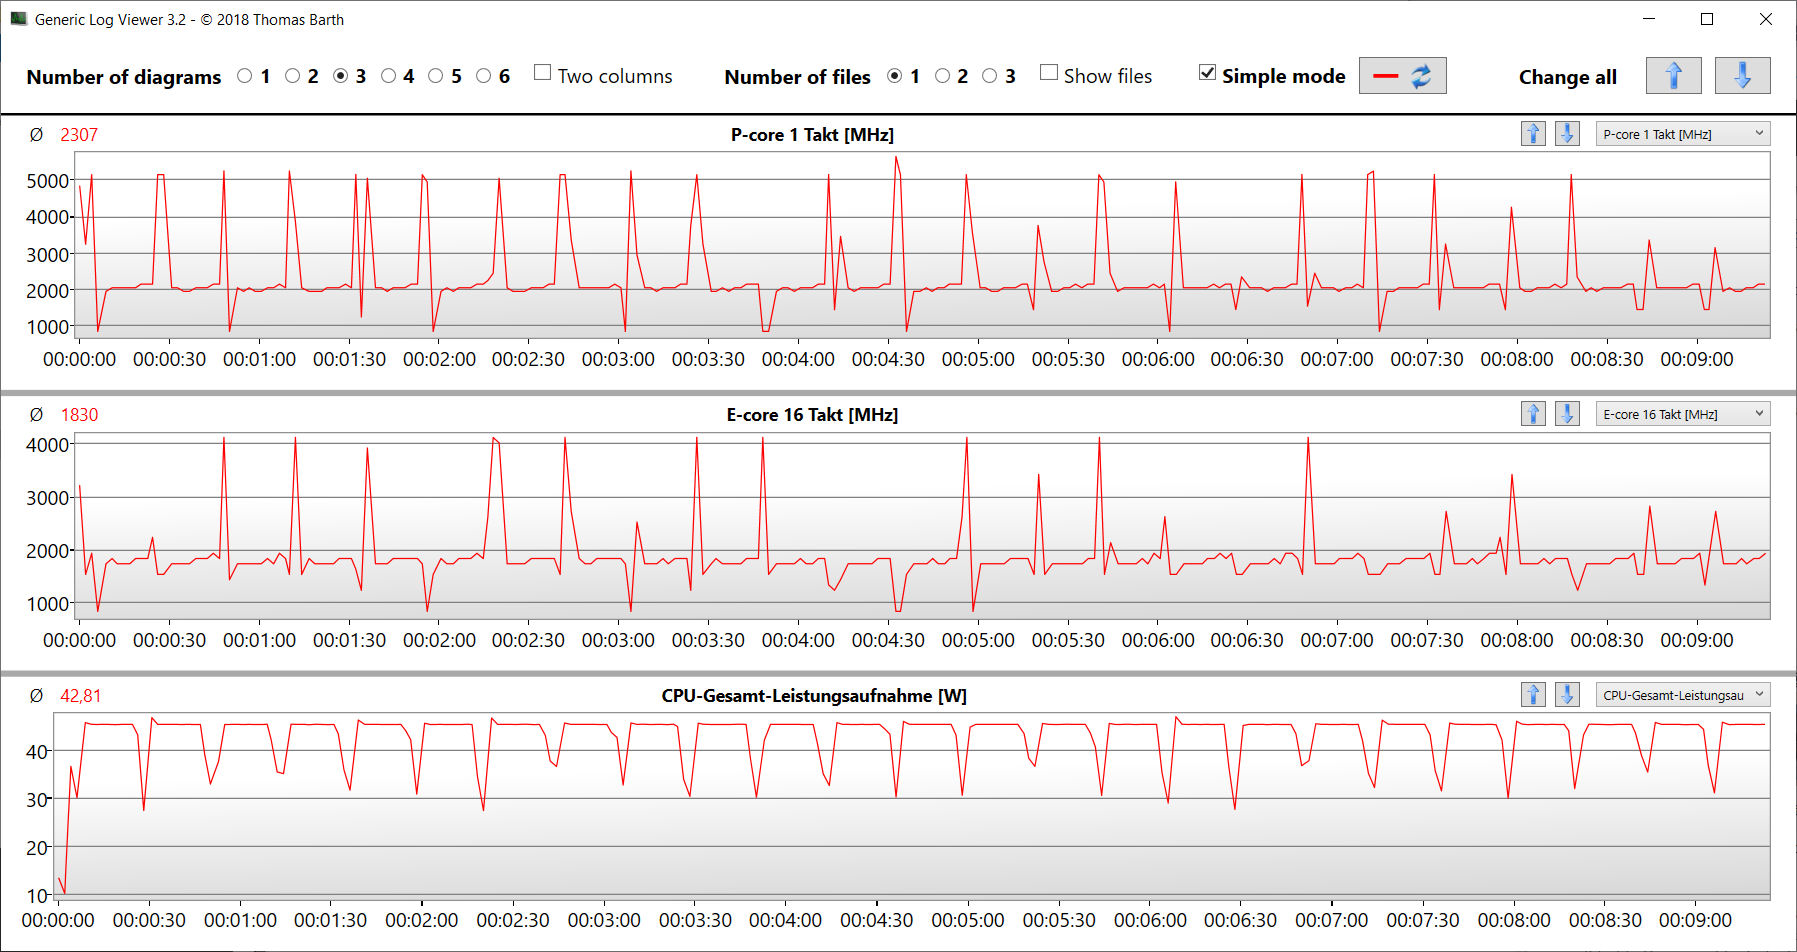
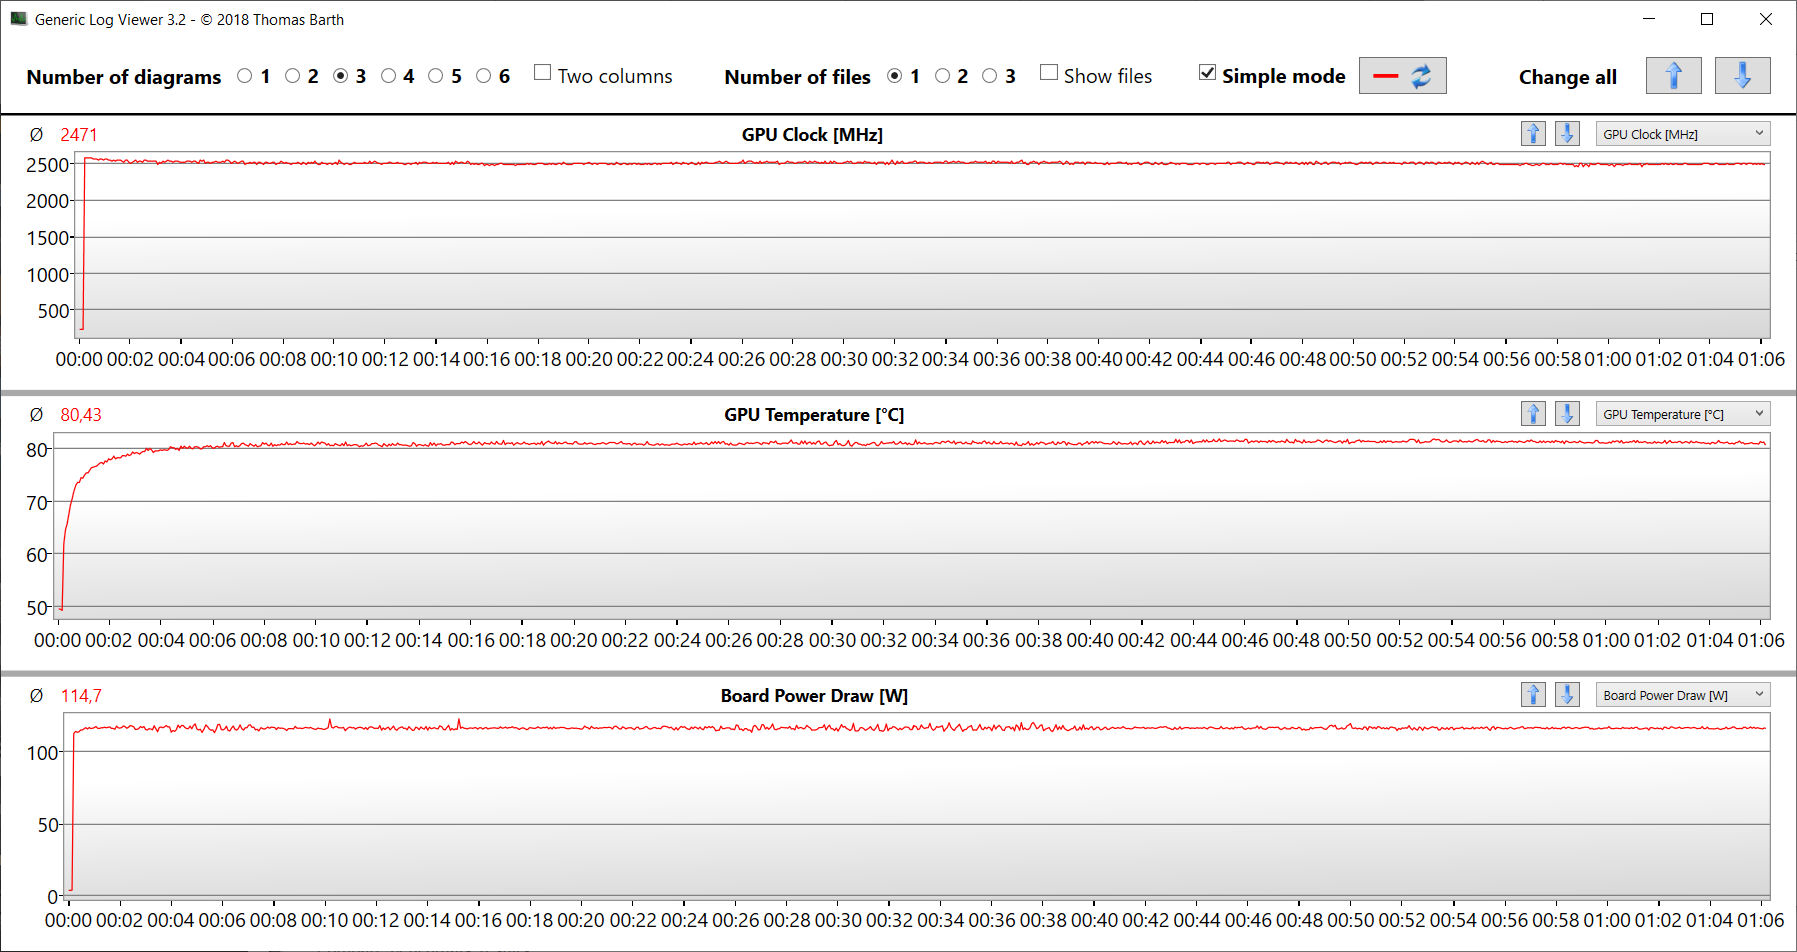
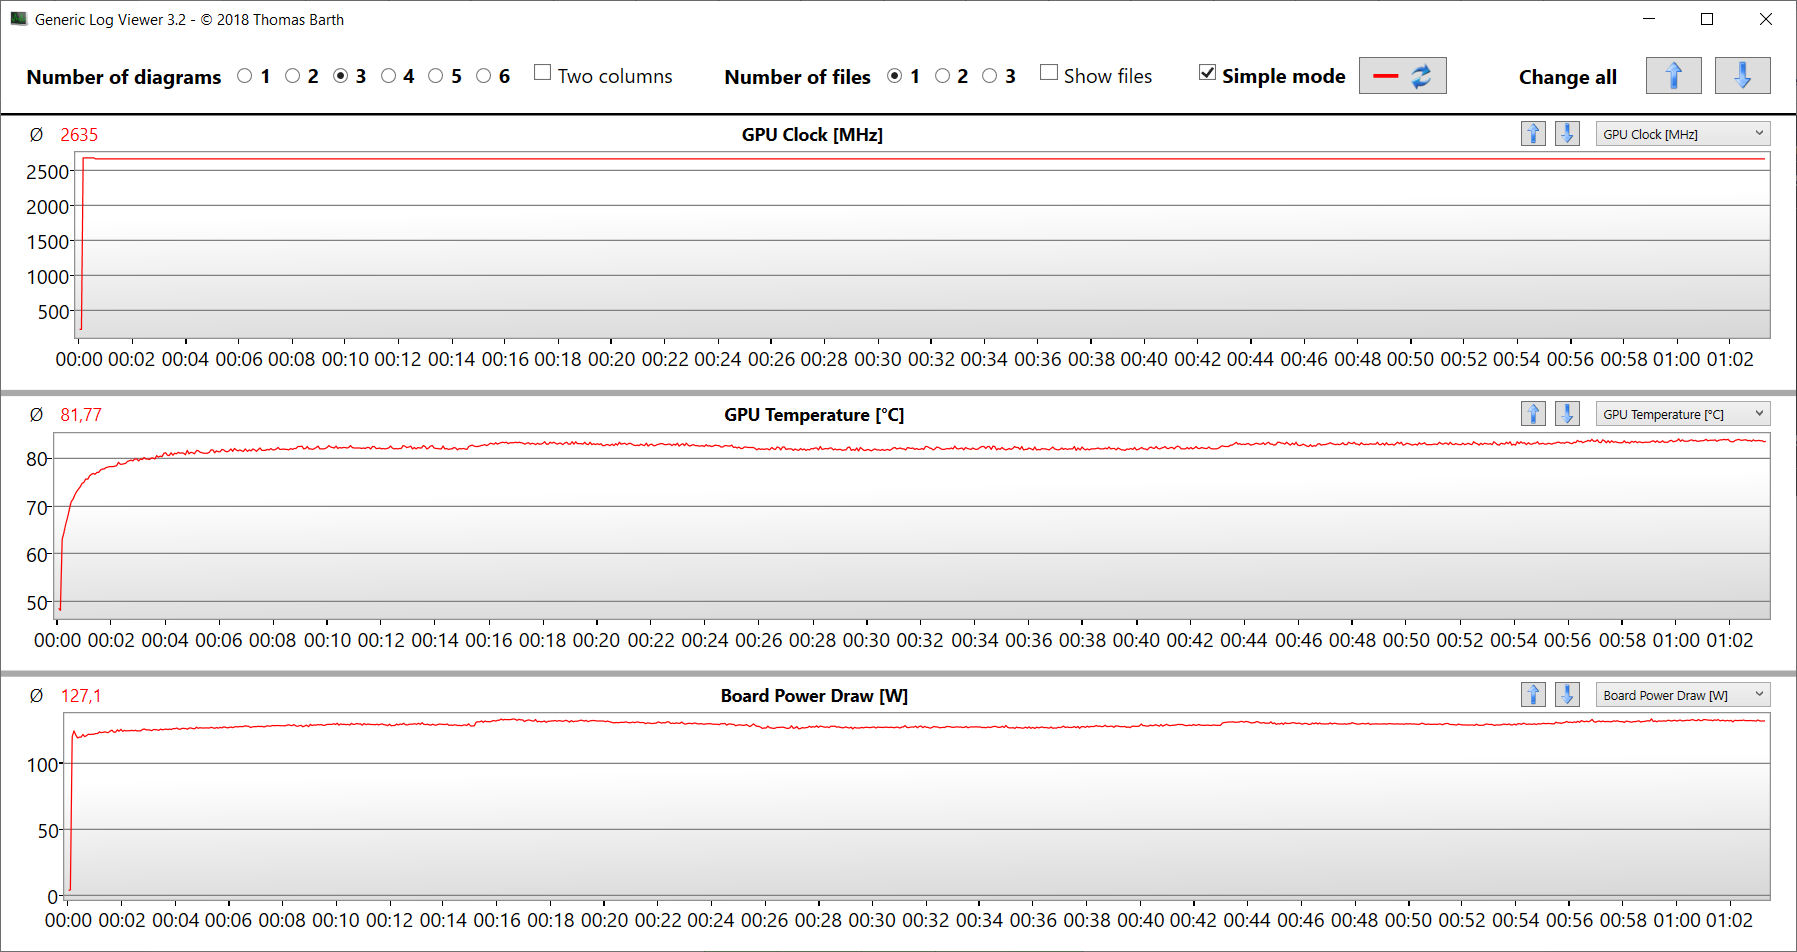
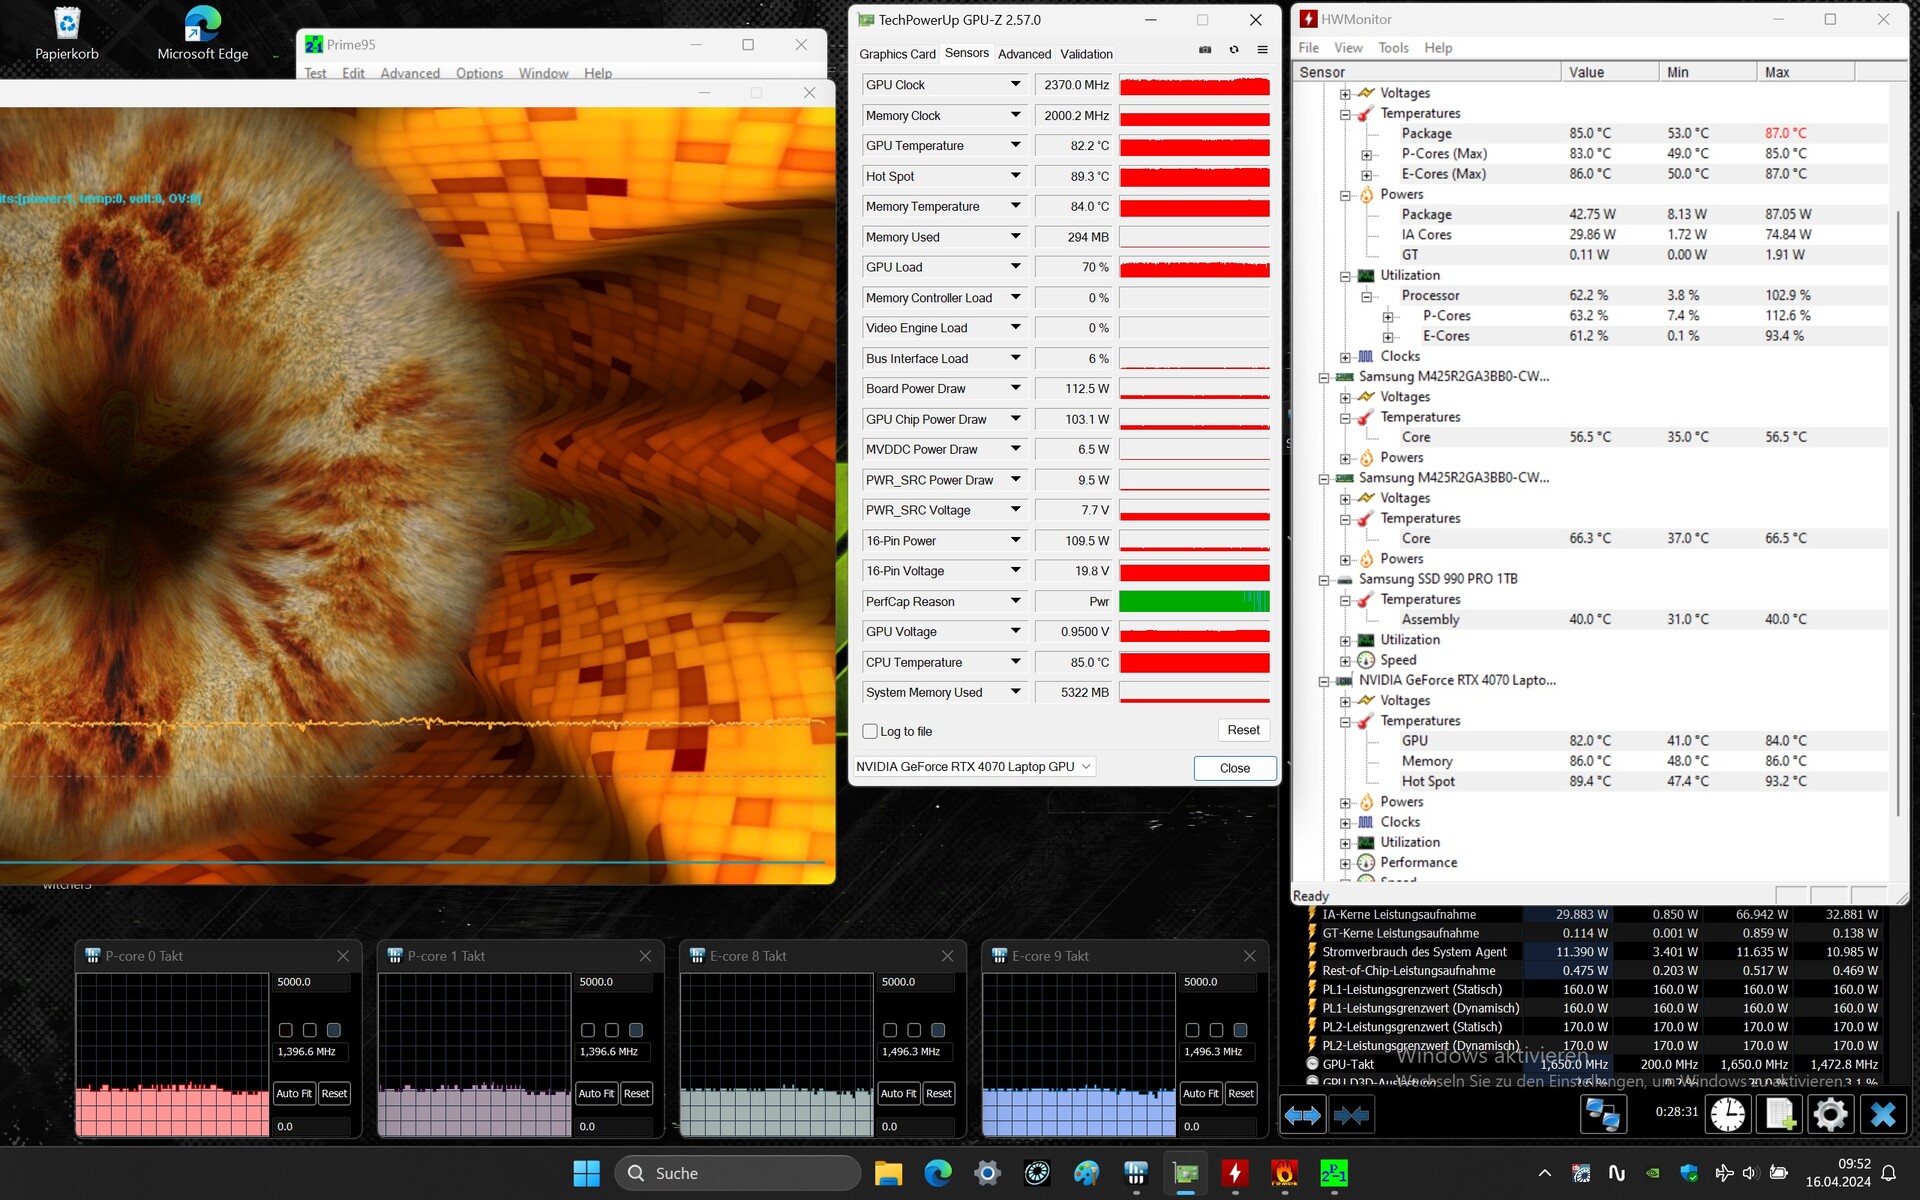
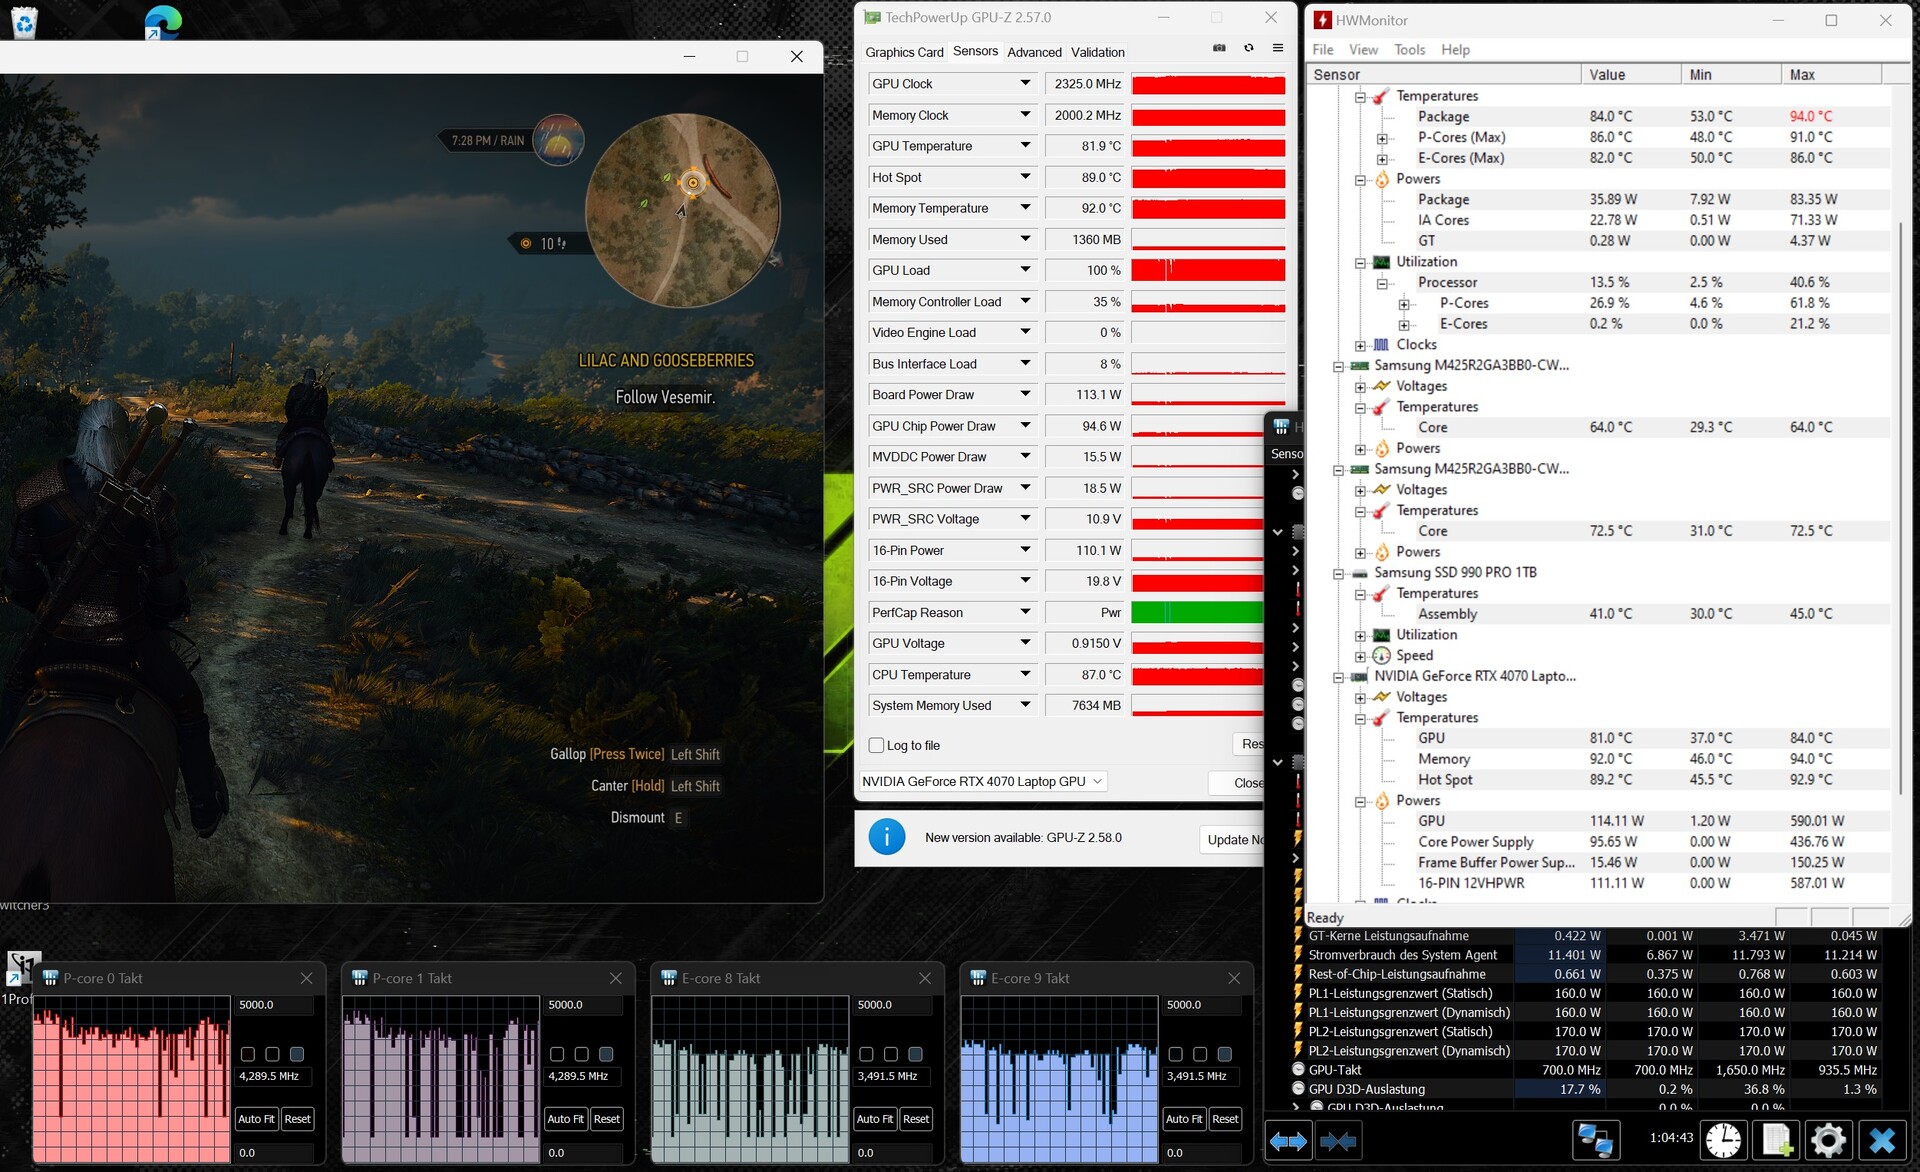
Test da sforzo
Lo scenario estremo simulato dallo stress test (Prime95 e Furmark in funzionamento continuo) verifica la stabilità del sistema a pieno carico. Il clock della CPU è sceso lentamente e continuamente da valori leggermente superiori alla velocità di clock di base a valori inferiori. Il core grafico ha funzionato ad alta velocità per tutto il tempo.
Altoparlanti
Gli altoparlanti stereo del portatile producono un suono decente, ma mancano di bassi. Un'esperienza sonora migliore potrebbe essere ottenuta collegando delle cuffie o degli altoparlanti esterni.
SCHENKER XMG Fusion 15 (Early 24) analisi audio
(+) | gli altoparlanti sono relativamente potenti (85 dB)
Bassi 100 - 315 Hz
(-) | quasi nessun basso - in media 15.8% inferiori alla media
(±) | la linearità dei bassi è media (12.5% delta rispetto alla precedente frequenza)
Medi 400 - 2000 Hz
(+) | medi bilanciati - solo only 4.4% rispetto alla media
(+) | medi lineari (5.9% delta rispetto alla precedente frequenza)
Alti 2 - 16 kHz
(+) | Alti bilanciati - appena 2% dalla media
(+) | alti lineari (4.8% delta rispetto alla precedente frequenza)
Nel complesso 100 - 16.000 Hz
(+) | suono nel complesso lineare (11.5% differenza dalla media)
Rispetto alla stessa classe
» 9% di tutti i dispositivi testati in questa classe è stato migliore, 2% simile, 89% peggiore
» Il migliore ha avuto un delta di 6%, medio di 18%, peggiore di 132%
Rispetto a tutti i dispositivi testati
» 6% di tutti i dispositivi testati in questa classe è stato migliore, 2% similare, 93% peggiore
» Il migliore ha avuto un delta di 4%, medio di 25%, peggiore di 134%
Aorus 16X 2024 analisi audio
(+) | gli altoparlanti sono relativamente potenti (85 dB)
Bassi 100 - 315 Hz
(±) | bassi ridotti - in media 8.5% inferiori alla media
(±) | la linearità dei bassi è media (8.3% delta rispetto alla precedente frequenza)
Medi 400 - 2000 Hz
(+) | medi bilanciati - solo only 3.1% rispetto alla media
(+) | medi lineari (5.8% delta rispetto alla precedente frequenza)
Alti 2 - 16 kHz
(+) | Alti bilanciati - appena 2.5% dalla media
(±) | la linearità degli alti è media (7% delta rispetto alla precedente frequenza)
Nel complesso 100 - 16.000 Hz
(+) | suono nel complesso lineare (8.4% differenza dalla media)
Rispetto alla stessa classe
» 1% di tutti i dispositivi testati in questa classe è stato migliore, 1% simile, 98% peggiore
» Il migliore ha avuto un delta di 6%, medio di 18%, peggiore di 132%
Rispetto a tutti i dispositivi testati
» 1% di tutti i dispositivi testati in questa classe è stato migliore, 0% similare, 98% peggiore
» Il migliore ha avuto un delta di 4%, medio di 25%, peggiore di 134%
Gestione dell'energia - Il Fusion 15 offre ottimi tempi di esecuzione
Consumo di energia
Il suo fabbisogno energetico è ampiamente normale per l'hardware installato. Eccezione: Nonostante una batteria completamente carica, abbiamo misurato un valore di consumo energetico di circa 20 watt con il portatile spento. Probabilmente si tratta di un bug. Il Witcher 3 test e lo stress test sono stati eseguiti con valori di consumo energetico leggermente in calo. L'alimentatore (280 watt) è sufficiente in termini di potenza.
| Idle | |
| Sotto carico |
|
Leggenda:
min: Attualmente utilizziamo il Metrahit Energy, un multimetro digitale professionale per la misurazione della qualità della potenza e dell'energia monofase, per le nostre misurazioni. | |
| SCHENKER XMG Fusion 15 (Early 24) i9-14900HX, NVIDIA GeForce RTX 4070 Laptop GPU | Aorus 16X 2024 i9-14900HX, NVIDIA GeForce RTX 4070 Laptop GPU | Alienware m16 R2 Ultra 7 155H, NVIDIA GeForce RTX 4070 Laptop GPU | HP Omen Transcend 16-u1095ng i9-14900HX, NVIDIA GeForce RTX 4070 Laptop GPU | Media della classe Gaming | |
|---|---|---|---|---|---|
| Power Consumption | -21% | -3% | -10% | -23% | |
| Idle Minimum * | 8 | 13 -63% | 8.1 -1% | 10 -25% | 13.9 ? -74% |
| Idle Average * | 14 | 18 -29% | 13 7% | 18 -29% | 19.3 ? -38% |
| Idle Maximum * | 26 | 35 -35% | 40.3 -55% | 32 -23% | 27.2 ? -5% |
| Load Average * | 118 | 138 -17% | 79 33% | 128 -8% | 110.6 ? 6% |
| Witcher 3 ultra * | 192.7 | 172.6 10% | 188.1 2% | 148.4 23% | |
| Load Maximum * | 244 | 222 9% | 254.9 -4% | 242 1% | 251 ? -3% |
* ... Meglio usare valori piccoli
Power consumption Witcher 3 / stress test
Power consumption with external monitor
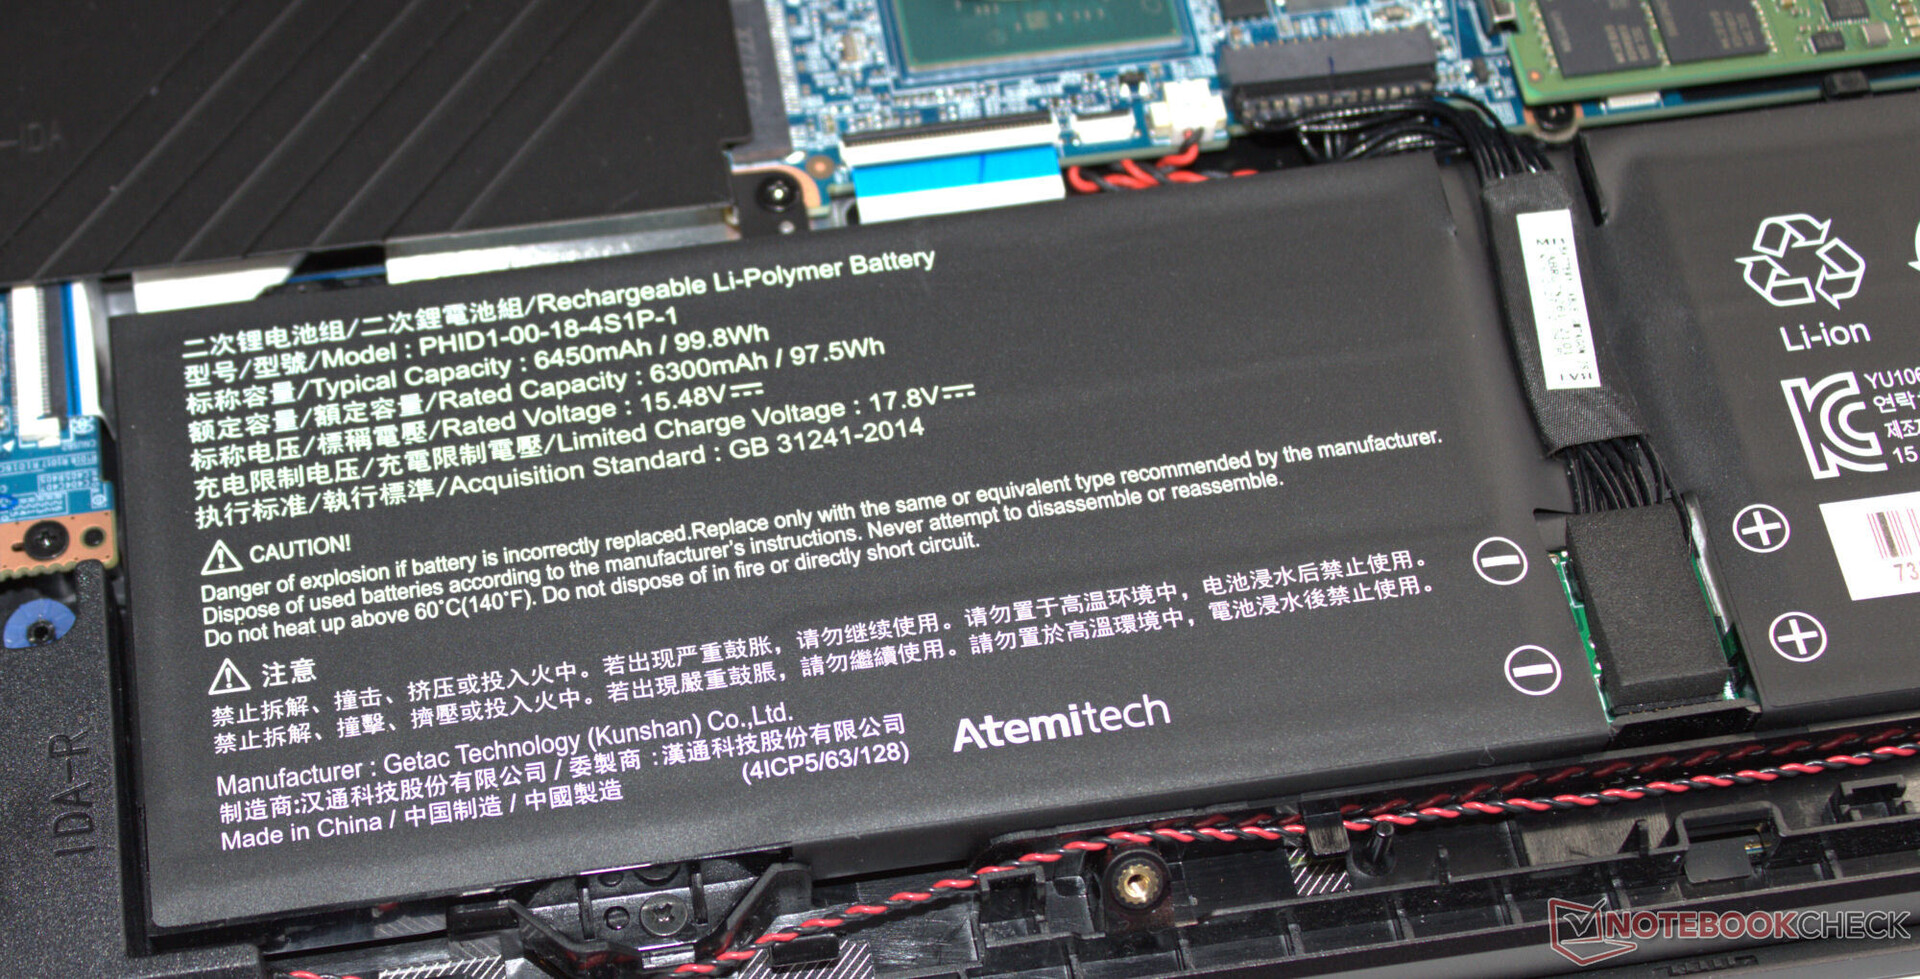
Tempi di esecuzione
Durante il nostro test WiFi (caricamento di siti web tramite uno script) e il test video (cortometraggio Big Buck Bunny (codifica H.264, FHD) in loop), abbiamo misurato tempi di esecuzione rispettivamente di 8:00 ore e 10:02 ore. Si tratta di valori molto buoni.
| SCHENKER XMG Fusion 15 (Early 24) i9-14900HX, NVIDIA GeForce RTX 4070 Laptop GPU, 99.8 Wh | Aorus 16X 2024 i9-14900HX, NVIDIA GeForce RTX 4070 Laptop GPU, 99 Wh | Alienware m16 R2 Ultra 7 155H, NVIDIA GeForce RTX 4070 Laptop GPU, 90 Wh | HP Omen Transcend 16-u1095ng i9-14900HX, NVIDIA GeForce RTX 4070 Laptop GPU, 97 Wh | Lenovo Legion Pro 5 16IRX9 i9-14900HX, NVIDIA GeForce RTX 4070 Laptop GPU, 80 Wh | Media della classe Gaming | |
|---|---|---|---|---|---|---|
| Autonomia della batteria | -17% | -26% | -39% | -52% | -36% | |
| Reader / Idle | 911 | 753 -17% | 758 -17% | 403 -56% | 545 ? -40% | |
| H.264 | 602 | 541 -10% | 397 ? -34% | |||
| WiFi v1.3 | 480 | 481 0% | 483 1% | 292 -39% | 290 -40% | 369 ? -23% |
| Load | 164 | 100 -39% | 60 -63% | 65 -60% | 84.8 ? -48% |
Pro
Contro
Verdetto - Portatile, potente, perseverante
Le dimensioni compatte e il peso ridotto (circa 2,1 kg) non sono al prezzo di una riduzione delle prestazioni hardware. Il Core i9 e l'RTX 4070 GeForce RTX 4070 sono in grado di lavorare con velocità di clock costantemente elevate. La fusione di prestazioni e portabilità del portatile può essere considerata un successo.
XMG Fusion 15 (Early 24) - un portatile potente e portatile per giocatori e creatori.
Il portatile si scalda molto sotto carico e, nel farlo, produce un discreto rumore. Emissioni più moderate richiedono di sacrificare un po' di potenza di calcolo. Il suo schermo da 15,3 pollici (2.560 x 1.600 pixel, IPS, 240 Hz, Adaptive Sync) con un rapporto di aspetto 16:10 è complessivamente impressionante. La sua elevata luminosità è degna di nota.
Una carica completa (99,8 Wh) è sufficiente per un'autonomia pratica di circa 8 - 10 ore, valori molto buoni. Positivo: La batteria può essere caricata tramite un alimentatore USB-C (min. 100 watt, 20 V) - la porta TB4 del portatile supporta Power Delivery. Di conseguenza, non deve necessariamente portare sempre con sé l'alimentatore proprietario (280 watt).
Un'alternativa potrebbe essere l'alimentatore Aorus 16X (2024). Questo portatile offre una potenza di calcolo paragonabile e tempi di esecuzione altrettanto buoni.
Prezzo e disponibilità
L'XMG Fusion 15 (Early 24) può essere configurato e ordinato direttamente tramite il negozio online di Schenker. L'attuale dispositivo di prova costa circa 2.500 dollari USA. I prezzi partono da circa 1.700 dollari.
SCHENKER XMG Fusion 15 (Early 24)
-
05/01/2024 v7
Sascha Mölck
Transparency
The present review sample was made available to the author as a loan by the manufacturer or a shop for the purposes of review. The lender had no influence on this review, nor did the manufacturer receive a copy of this review before publication. There was no obligation to publish this review.
Pricecompare

