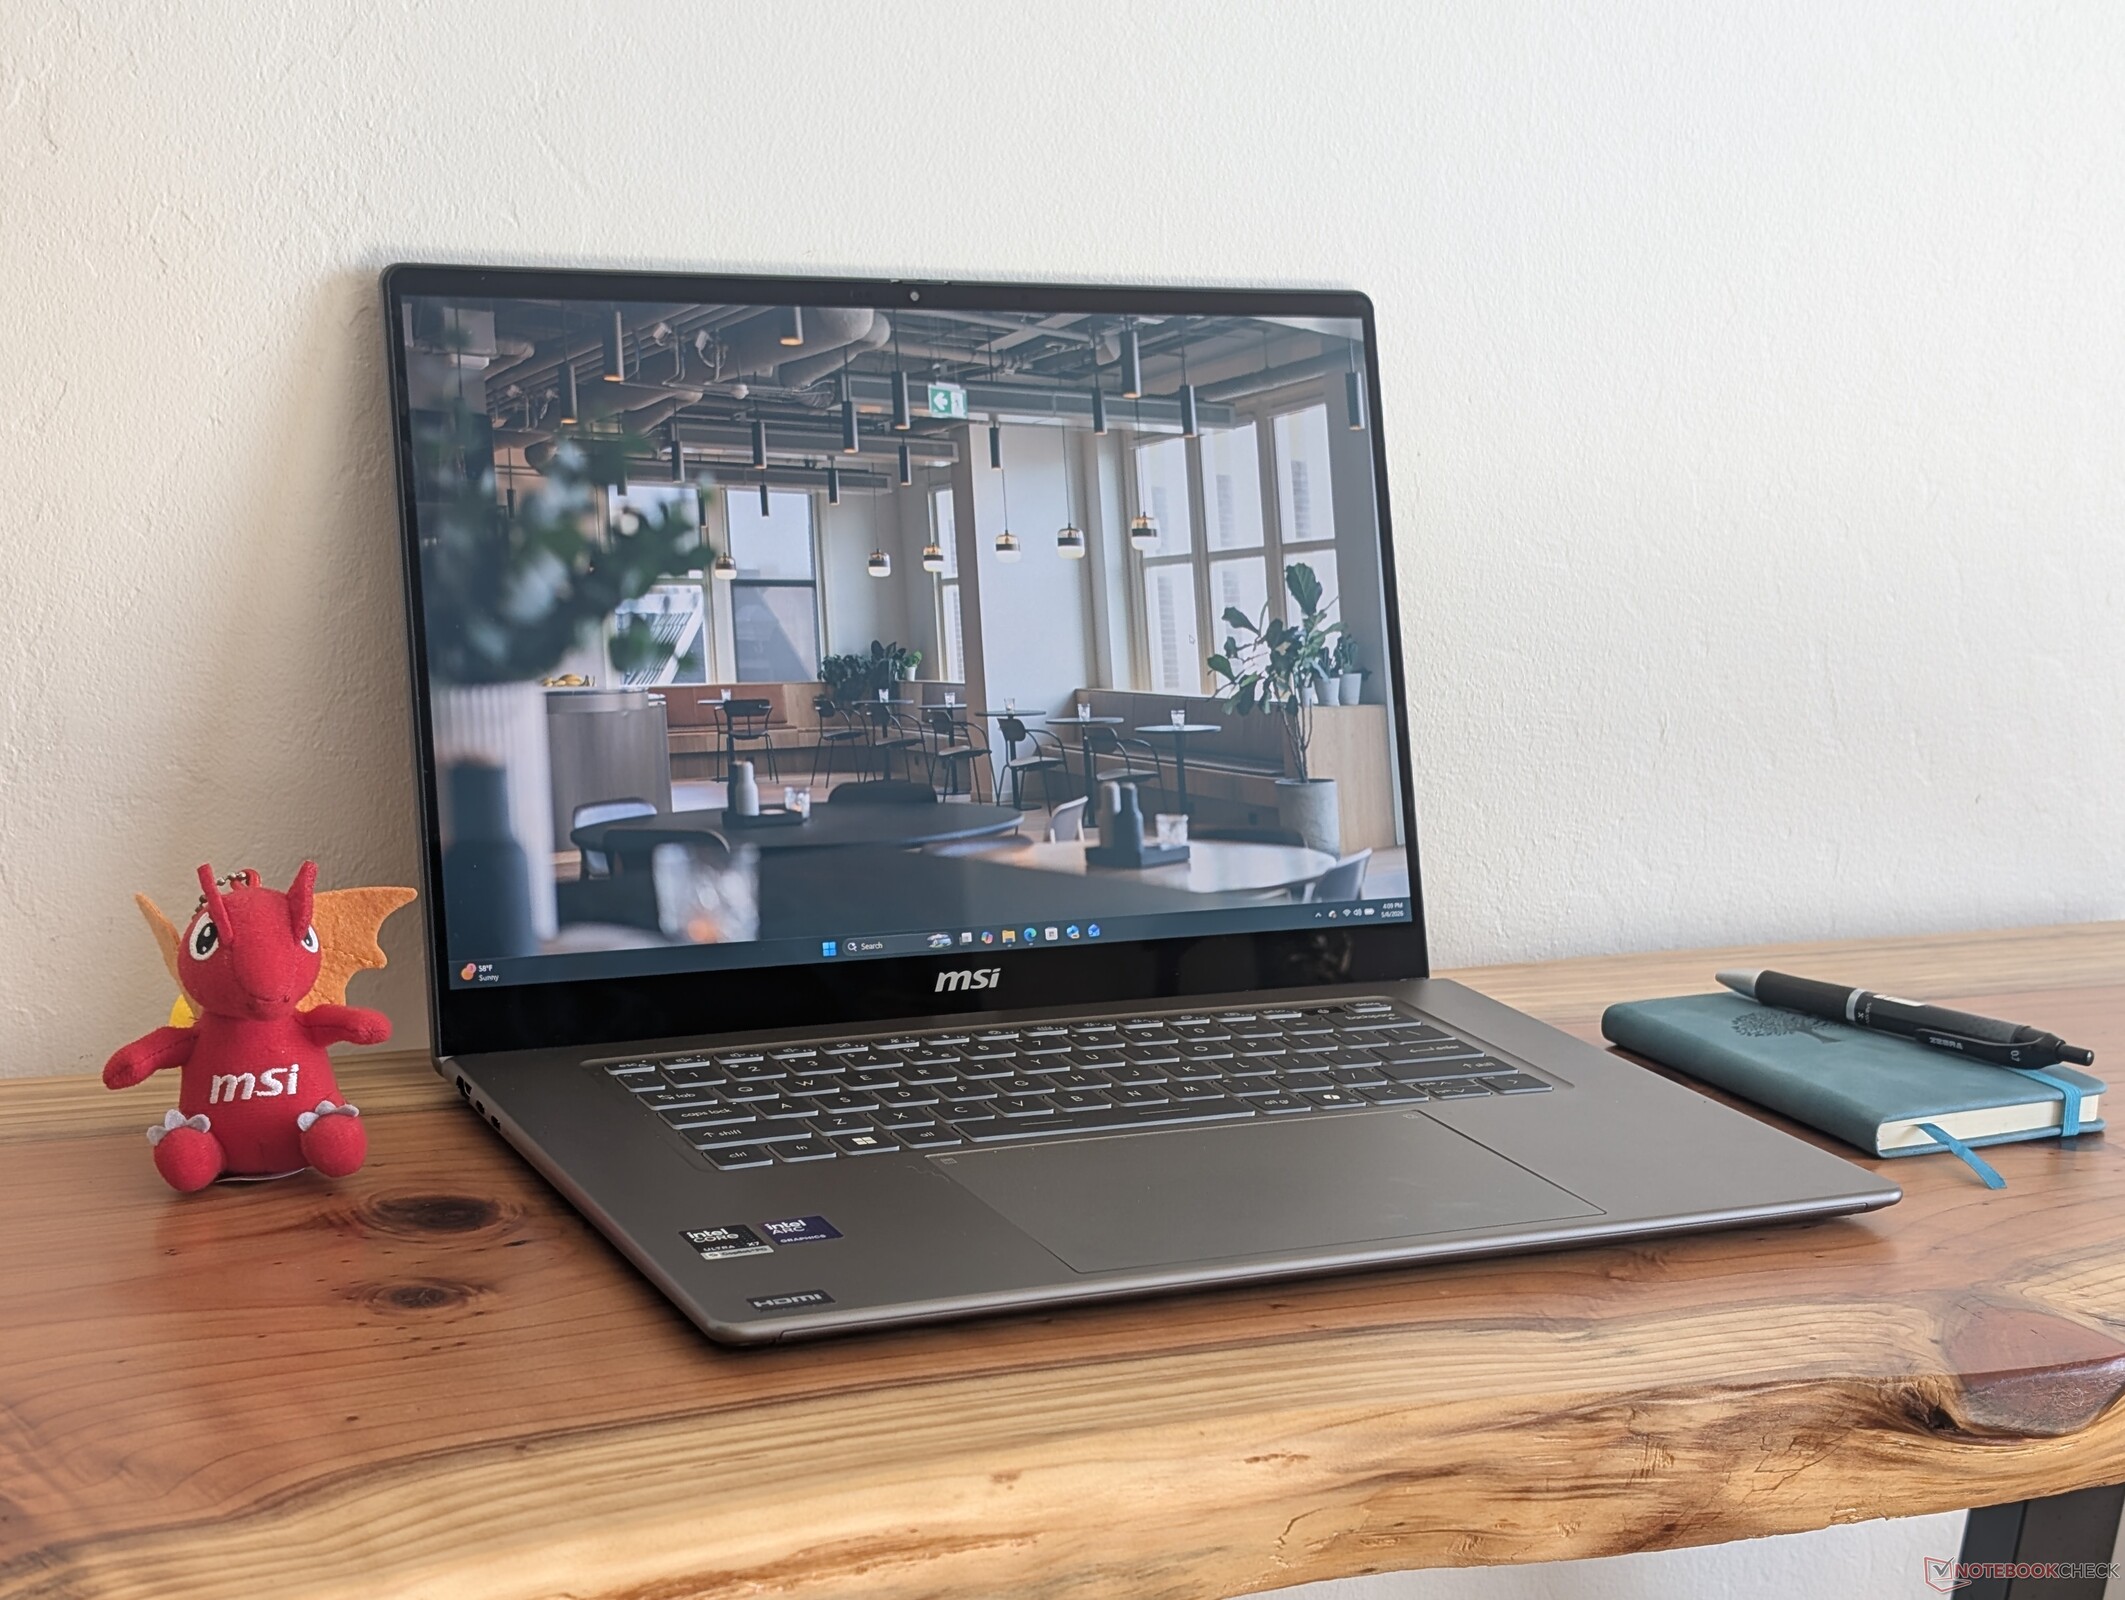
Verdetto - Il computer portatile più sottile e più professionale di MSI
Proprio come la trasformazione dal 2025 Dell 16 Premium al modello 2026 XPS 16il Prestige 16 del 2026 è una macchina più snella, più elegante e più efficiente del Prestige 16 del 2025 2025 Prestige 16. Gran parte di questo è dovuto al passaggio a Intel Panther Lake X7, che offre guadagni significativi in termini di prestazioni per watt rispetto alla generazione precedente. Le prestazioni della GPU, in particolare, sono impressionanti, visto che MSI è più sottile della maggior parte degli altri laptop da 16 pollici con opzioni di processore simili.
Oltre alla CPU, MSI ha introdotto cambiamenti significativi quest'anno, dalle porte al display. La maggior parte di essi rappresenta un salto in avanti, tra cui il pannello OLED a 120 Hz e l'estetica più professionale, ma le porte abbandonate e la batteria più piccola sono un misto. La temperatura del core è più calda rispetto ai concorrenti, mentre l'adattatore CA USB-C da 65 W frena le prestazioni Turbo Boost e le velocità di ricarica in determinate condizioni.
Gli utenti che non si preoccupano di un sistema leggermente più spesso e pesante troveranno nell'XPS 16 una valida alternativa, in quanto offre uno schermo touchscreen e una webcam di risoluzione ancora più elevata, anche se con meno opzioni di porte e una durata della batteria inferiore. Nel frattempo, il modello AMD Asus Zenbook S16 è ancora più leggero e più piccolo, con prestazioni della CPU e opzioni di pannello simili, ma le sue ventole sono più rumorose e le prestazioni grafiche sono peggiori. Un modello può essere migliore dell'altro, a seconda delle sue esigenze specifiche.
Pro
Contro
Prezzo e disponibilità
Il clamshell MSI Prestige 16 AI+ C3MTG non è ancora ampiamente disponibile al momento della pubblicazione. Tuttavia, il Prestige 16 Flip AI+ C3MTG è ora in spedizione a partire da 2150 dollari.
Il Prestige 16 AI+ C3MG a conchiglia è stato presentato al CES 2026 insieme a una serie di altri modelli Prestige, tutti dotati di CPU Intel Panther Lake. Quest'ultimo Prestige 16 è stato completamente ridisegnato rispetto al modello Arrow Lake dello scorso anno, per un'esperienza utente rinnovata.
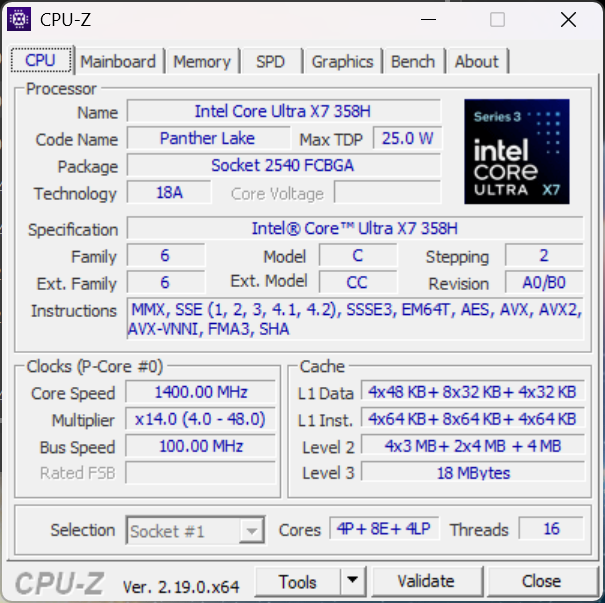
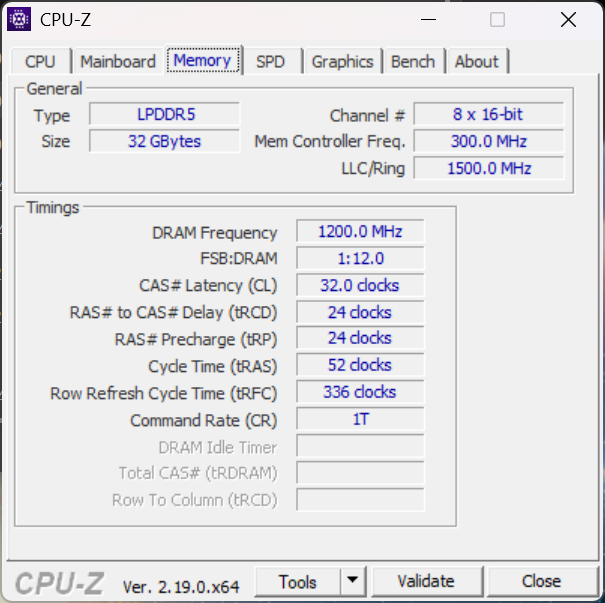
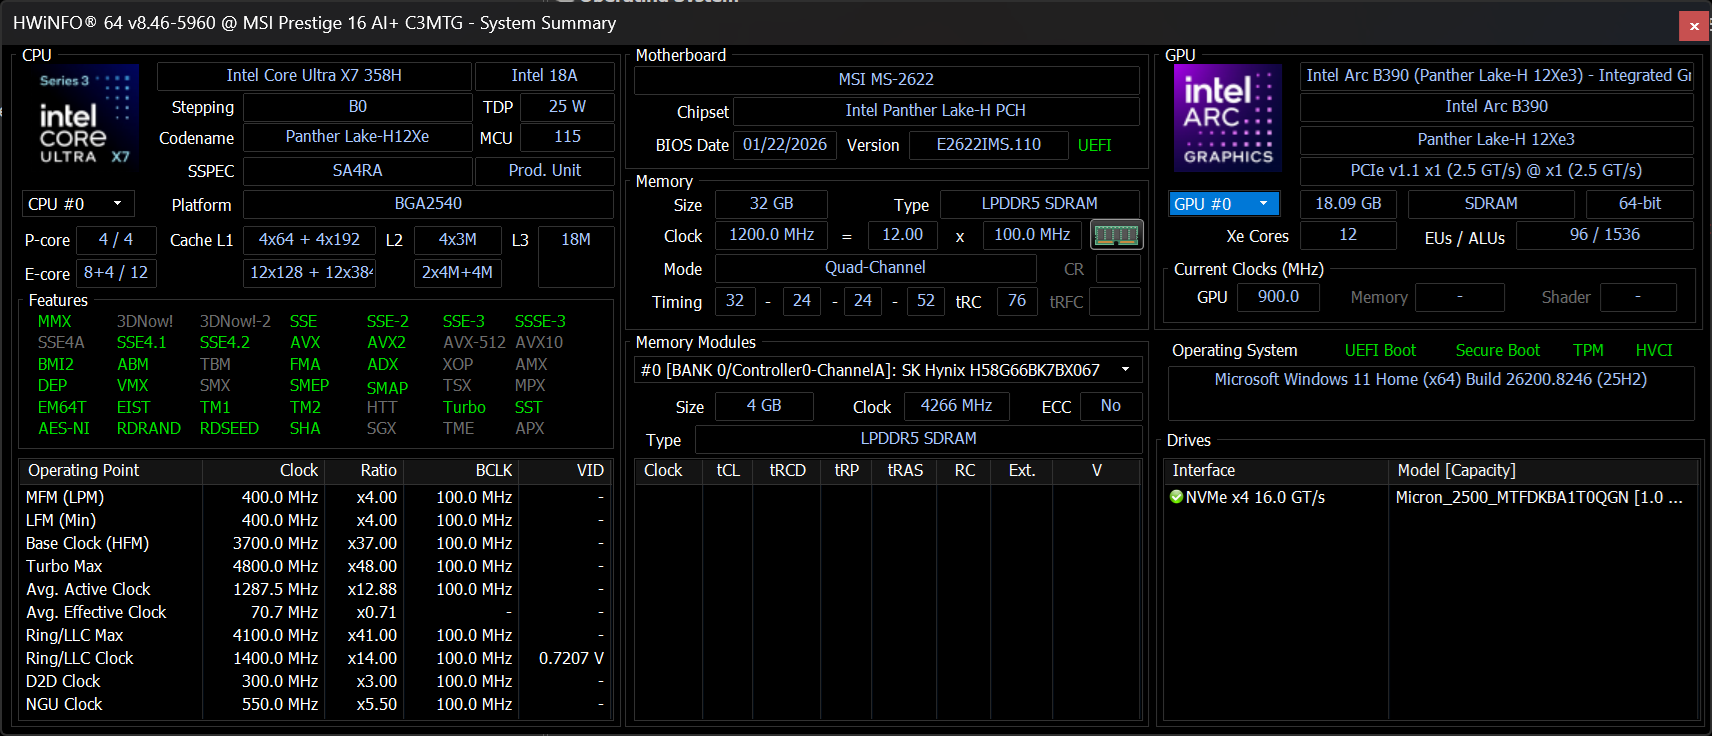
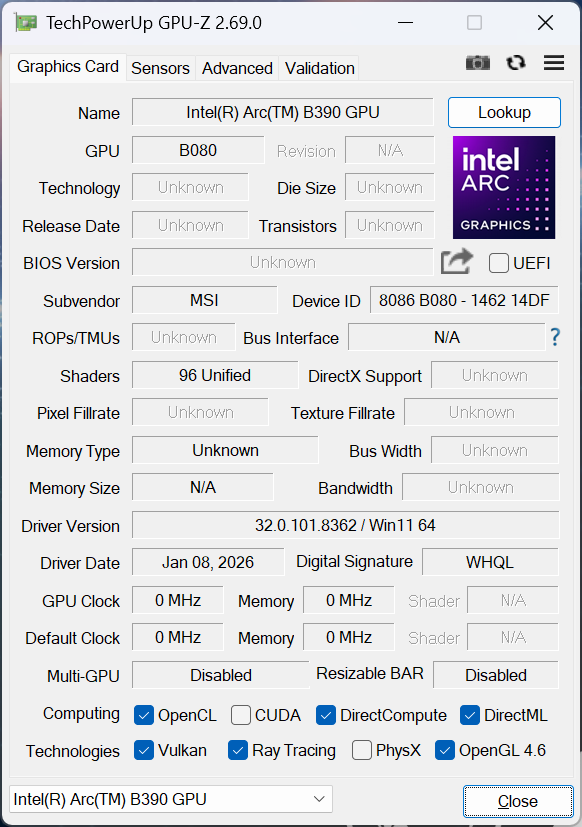
La nostra unità di prova è configurata con la CPU Core Ultra X7 358H, 32 GB di RAM e touchscreen OLED da 1800p per circa 2100 dollari. Altre SKU possono essere fornite con il Core Ultra X9 388H, ma l'OLED da 1800p e la GPU Arc B390 rimangono costanti.
I modelli concorrenti includono altri computer portatili prosumer di fascia alta come il modello Dell XPS 16, Lenovo Pro 9i 16 Aurao l' Asus ZenBook S16 serie. È disponibile anche una versione convertibile con cerniere a 360 gradi, chiamata Prestige 16 Flip AI+ C3MG.
Altre recensioni di MSI:
Specifiche
Caso
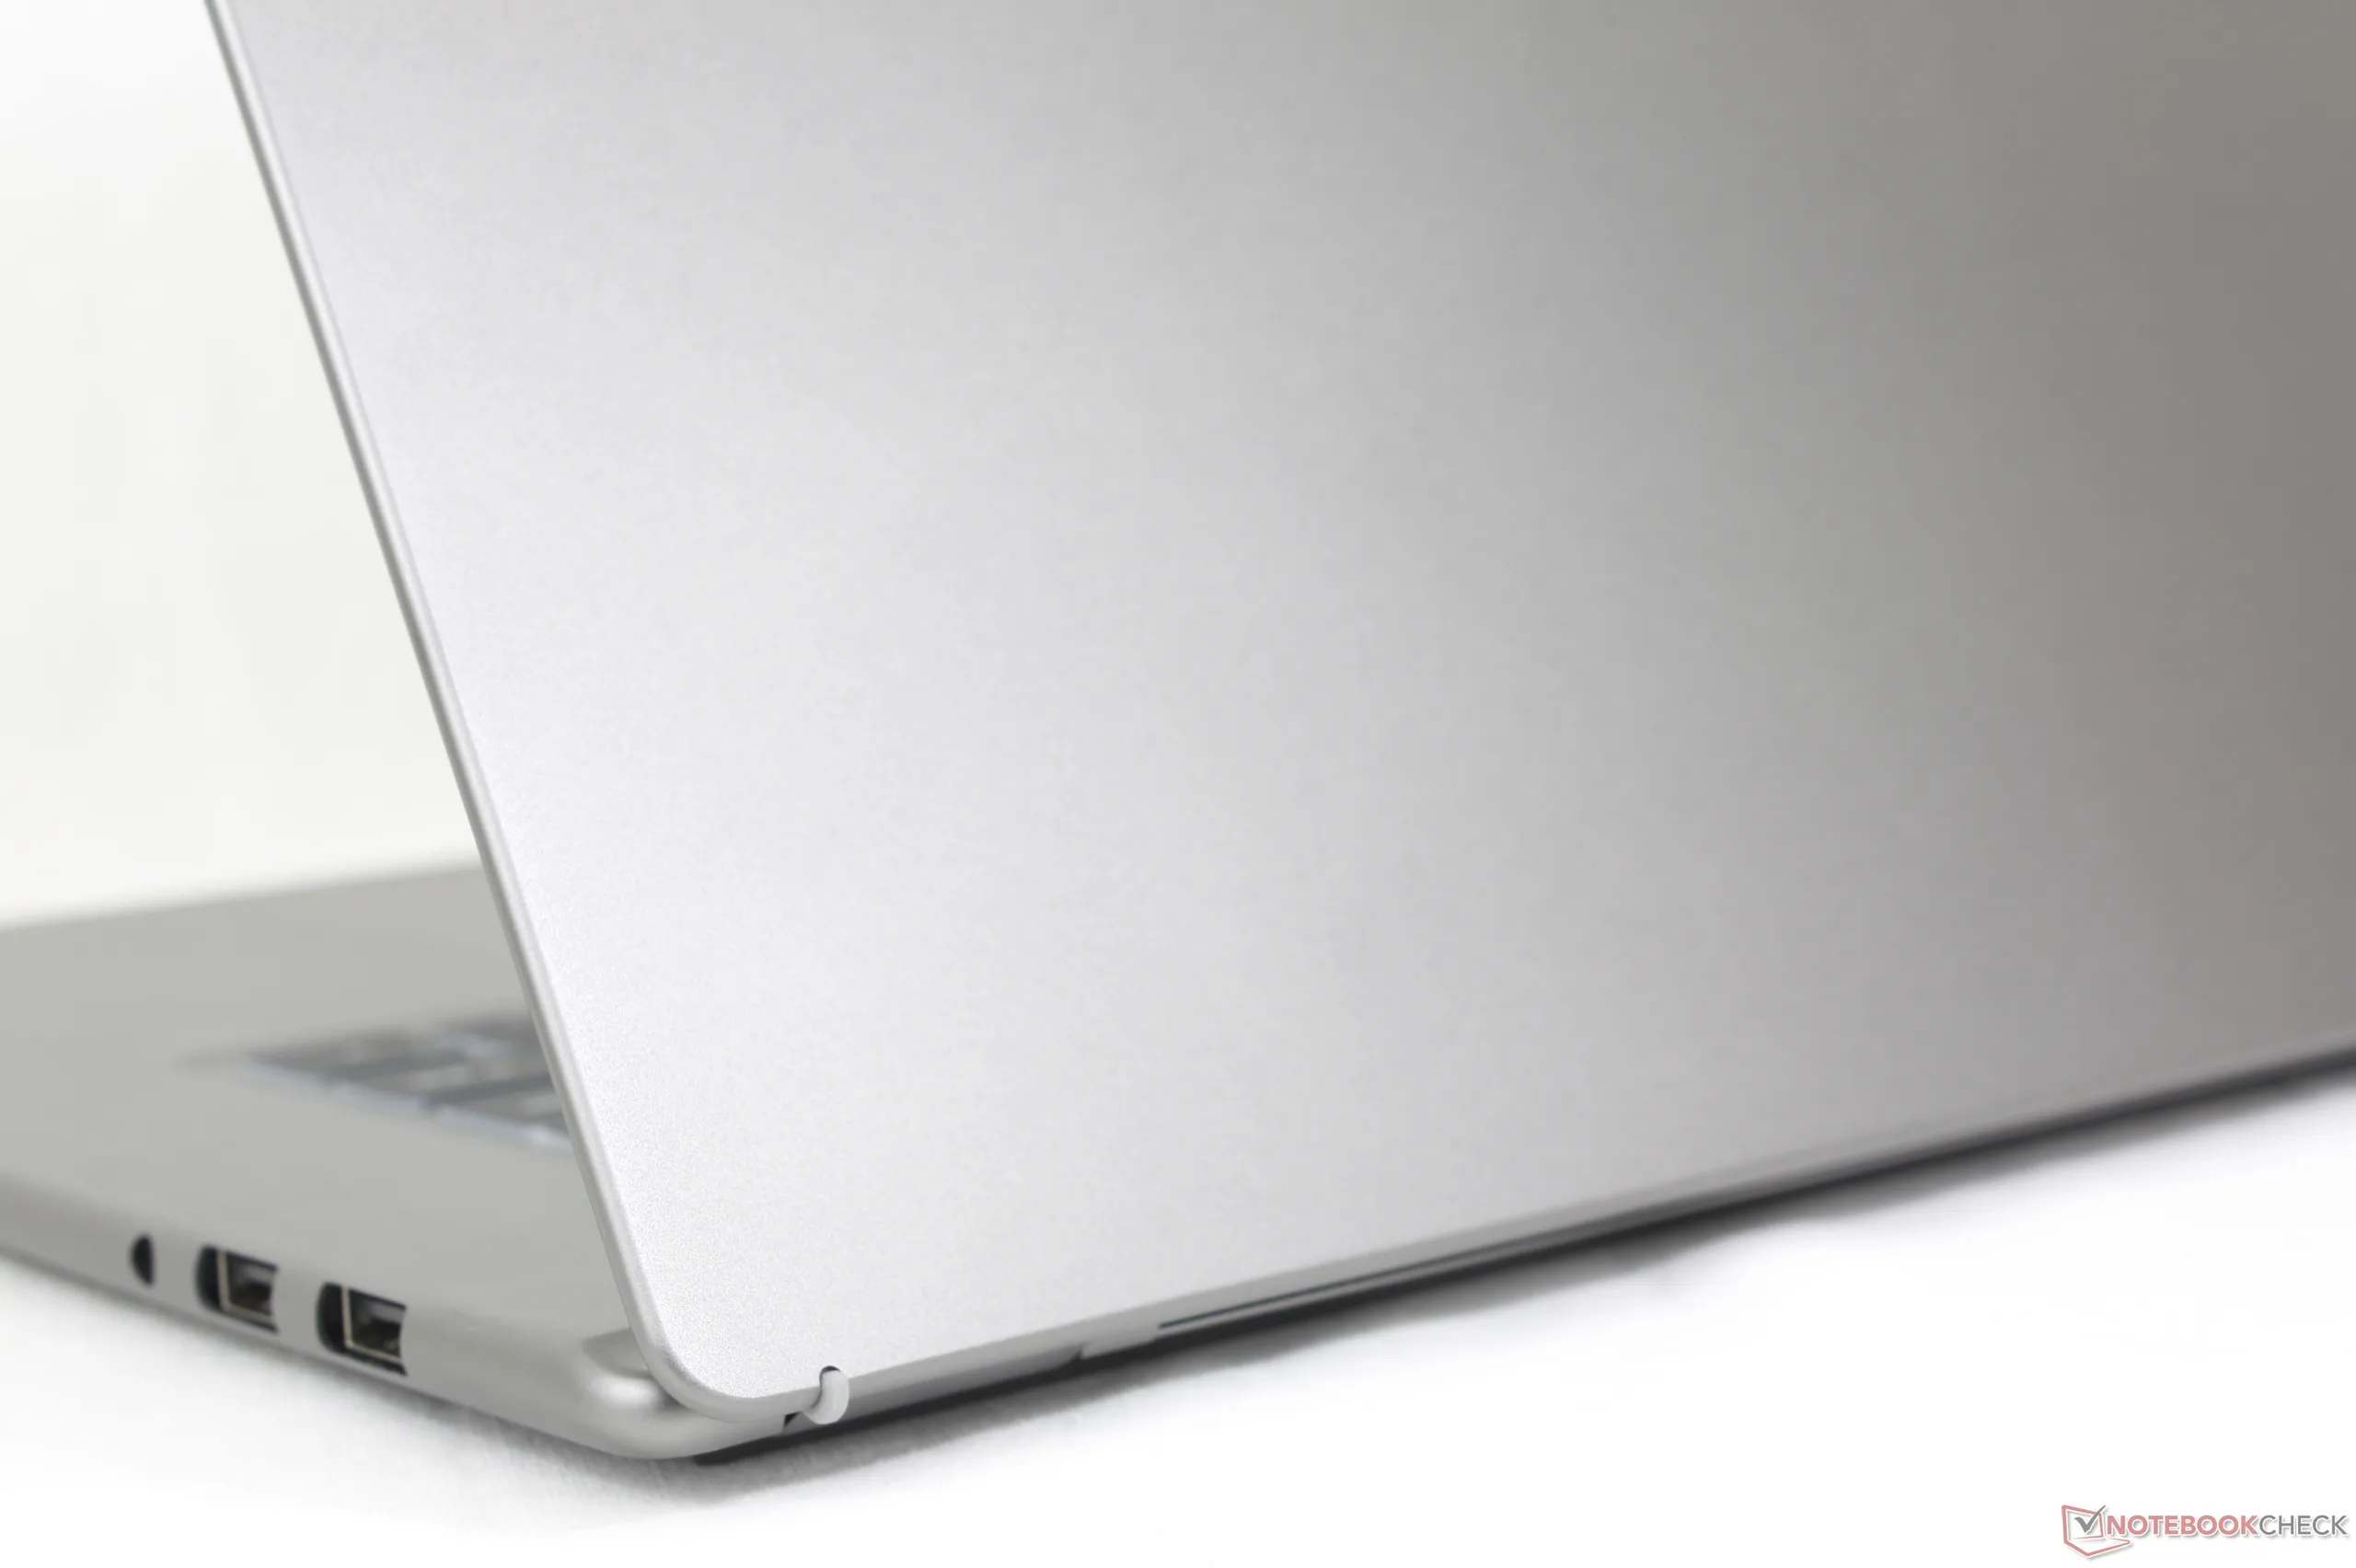
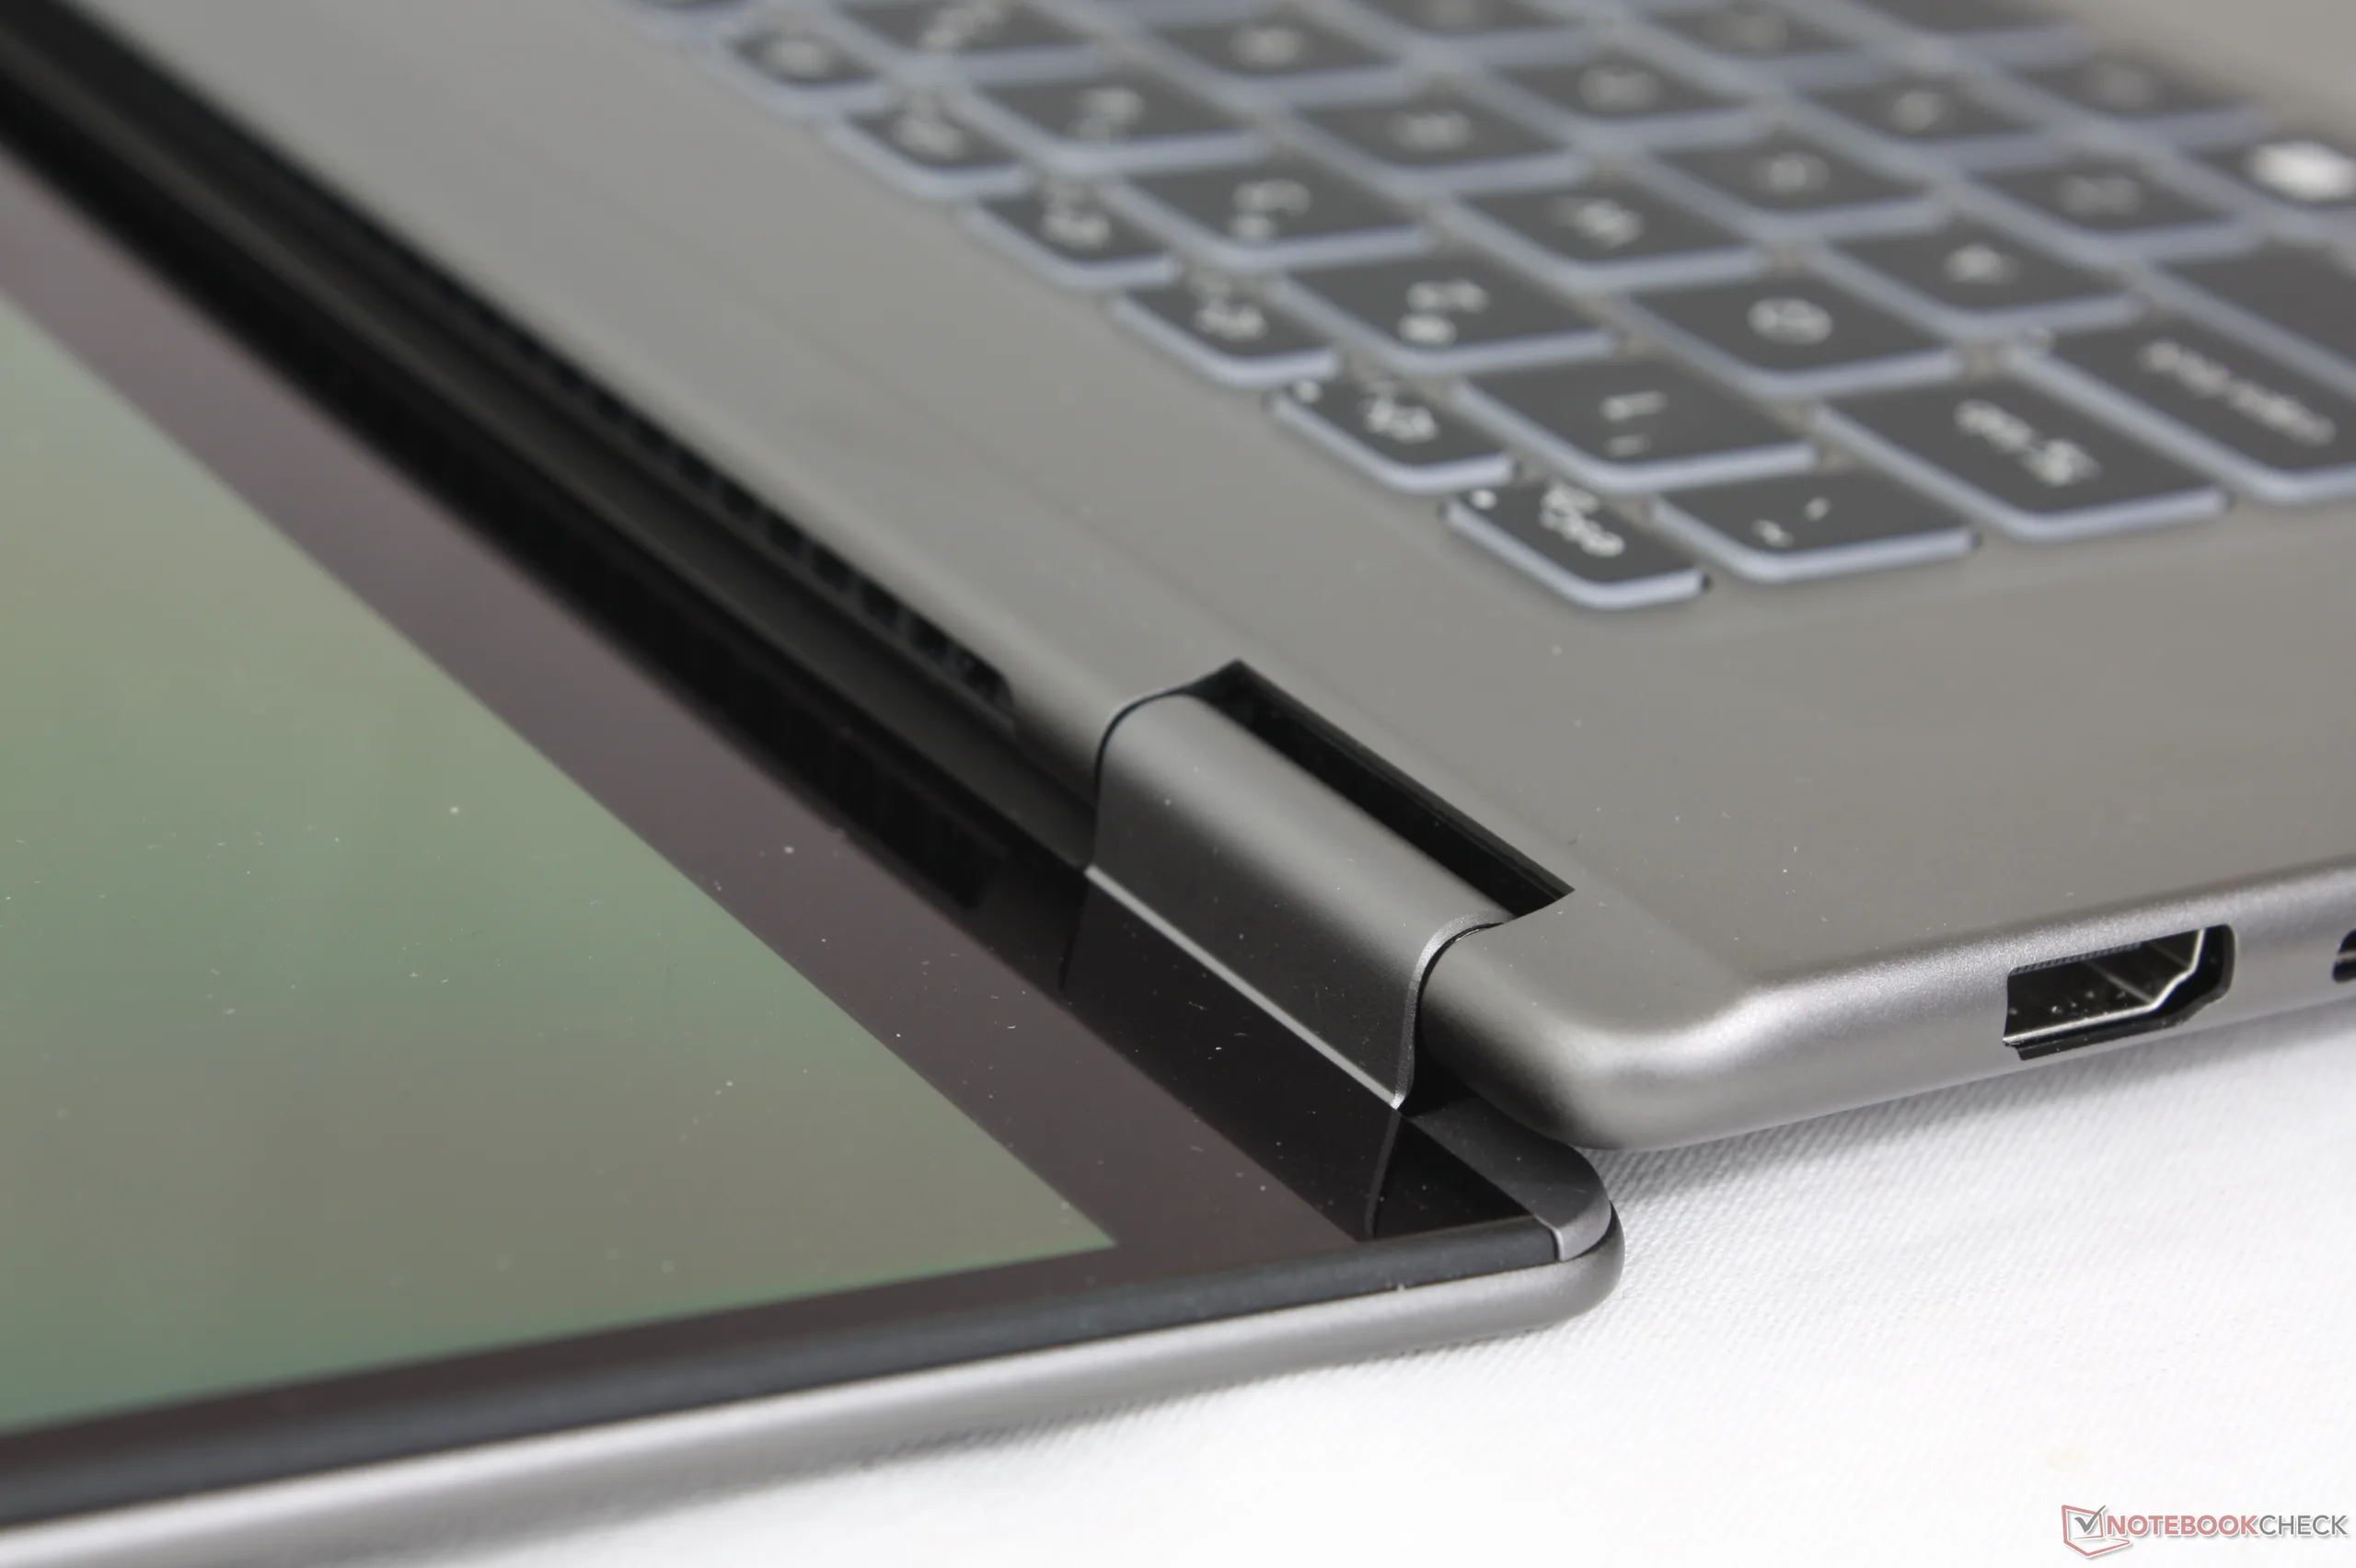
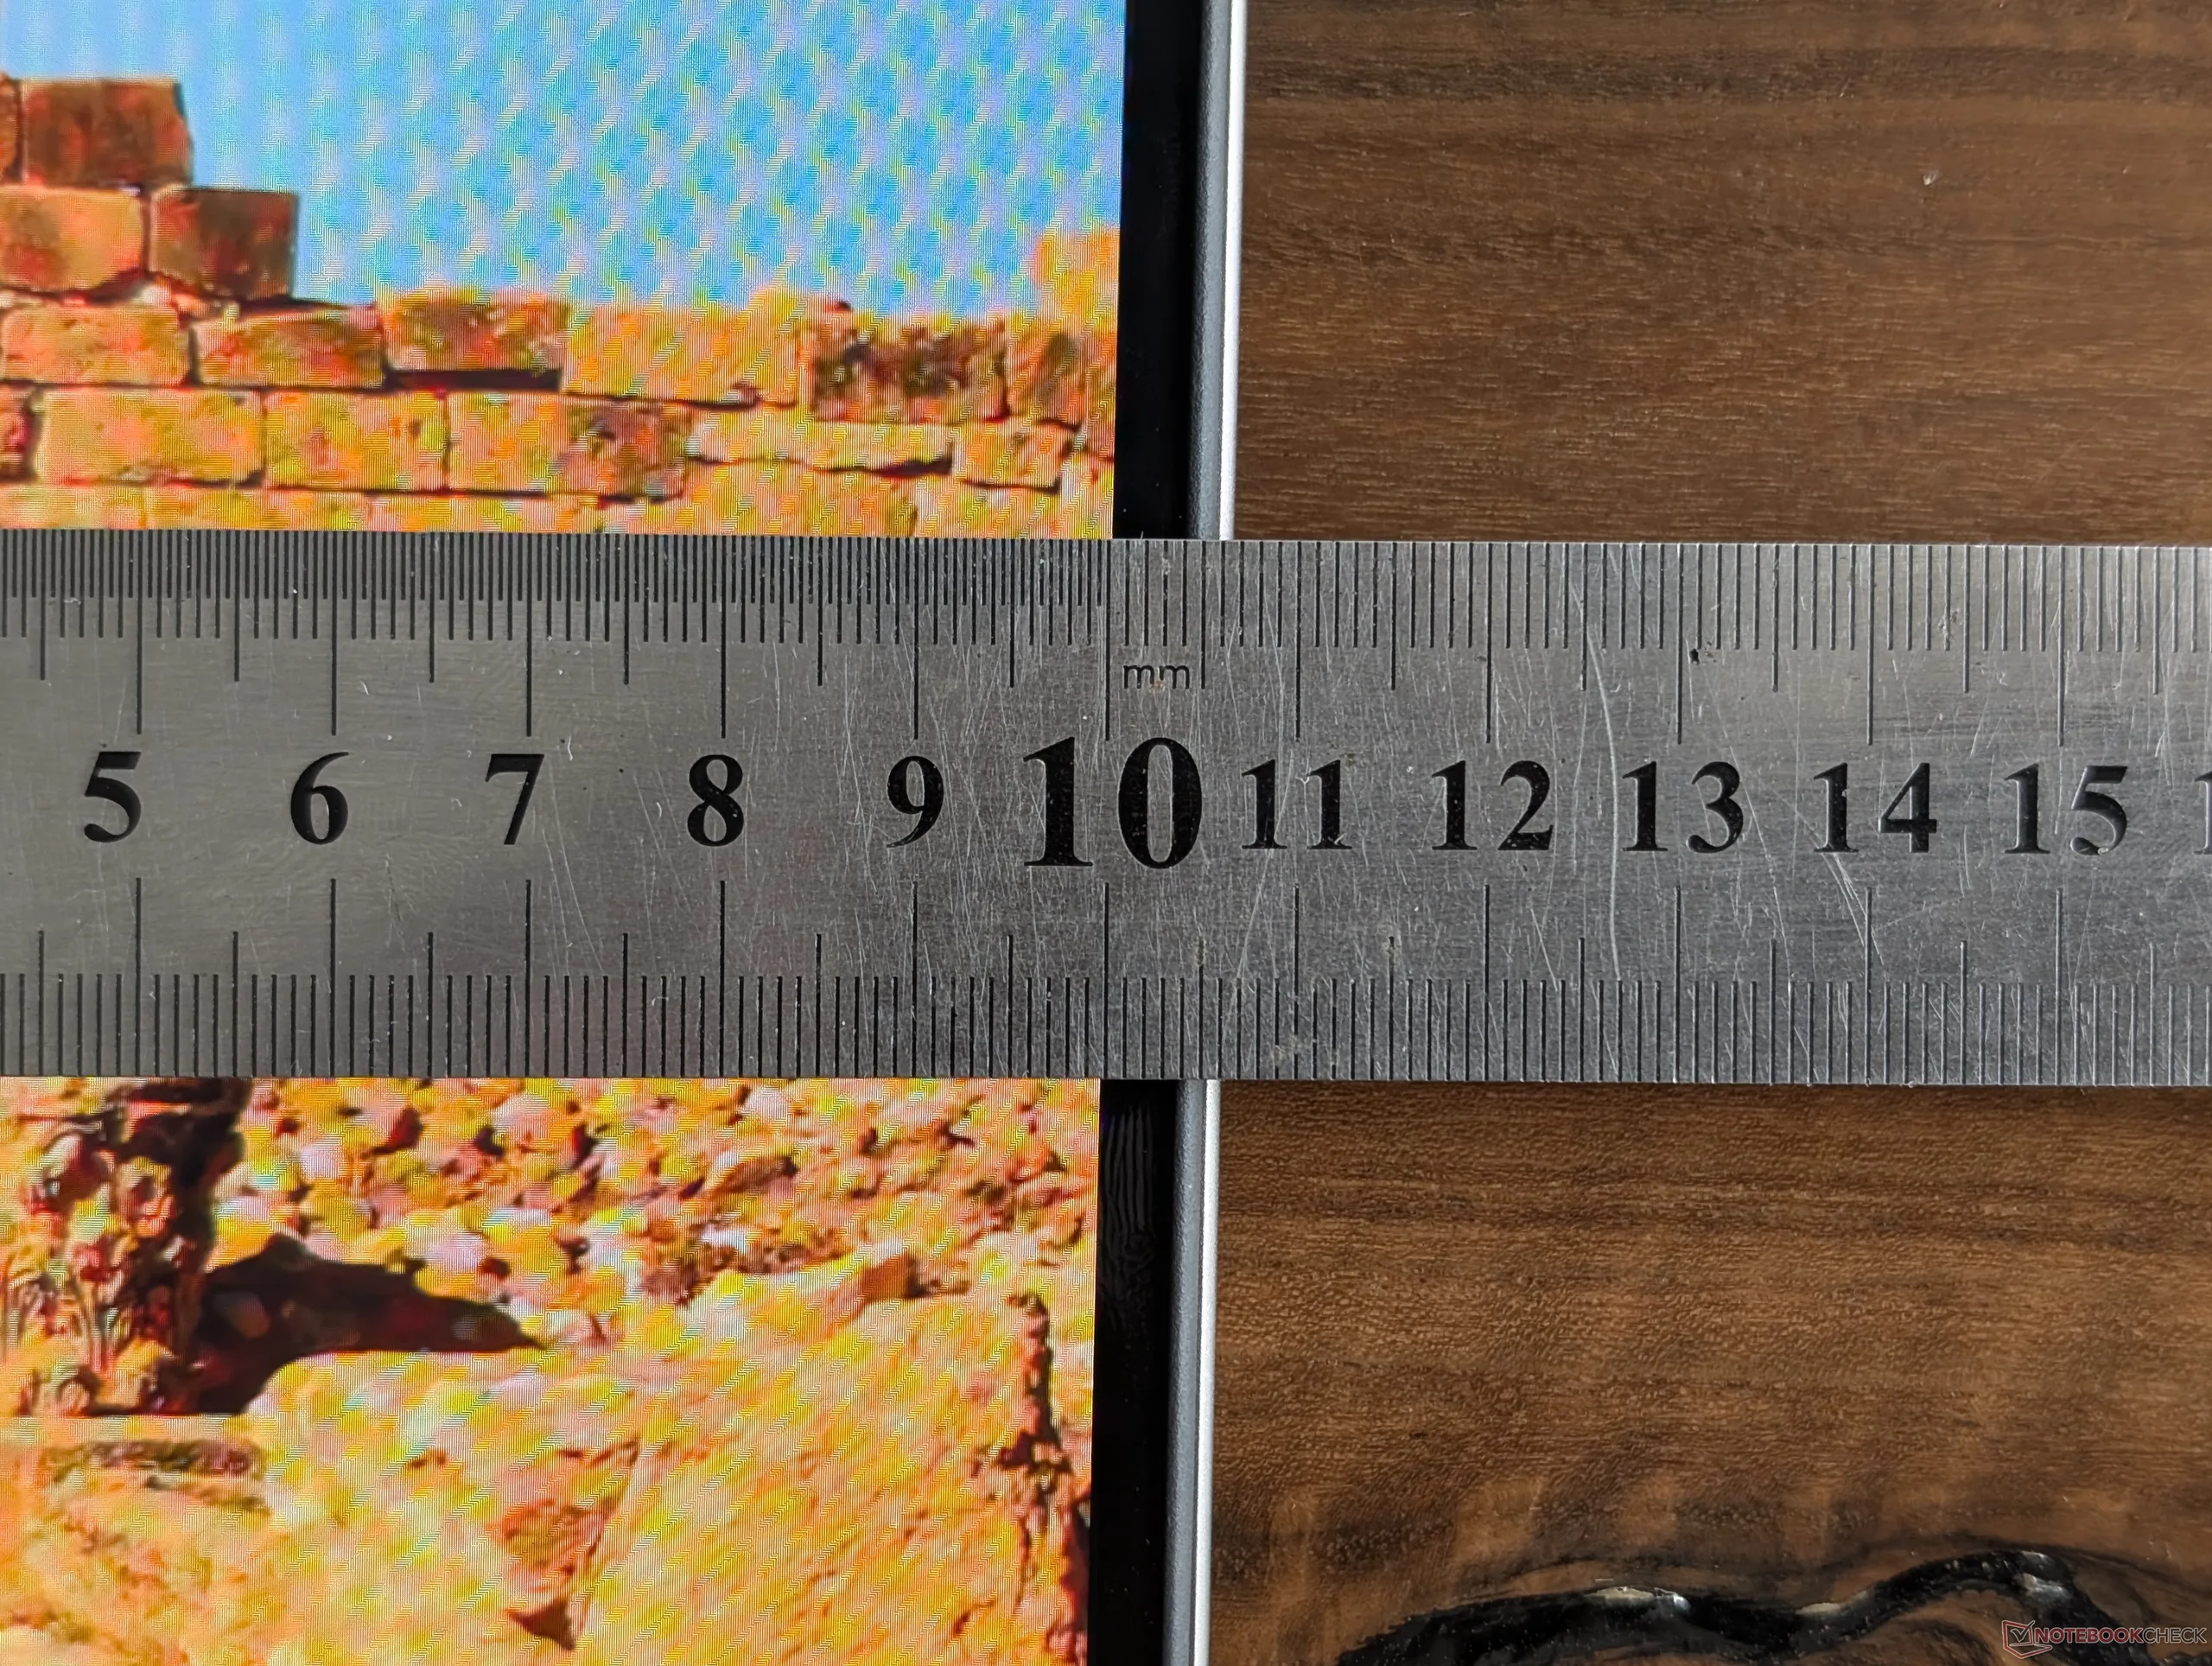
Il telaio in lega di alluminio è ora più sottile e con meno angoli e linee superficiali, per una sensazione più professionale. In effetti, se confrontato con il modello uscente, il 2026 Prestige 16 è probabilmente più elegante senza sembrare troppo noioso o minimalista.
La rigidità del telaio è forte, anche se con una flessione leggermente maggiore rispetto al più spesso XPS 16 o al Lenovo Pro 9i 16 Aura.
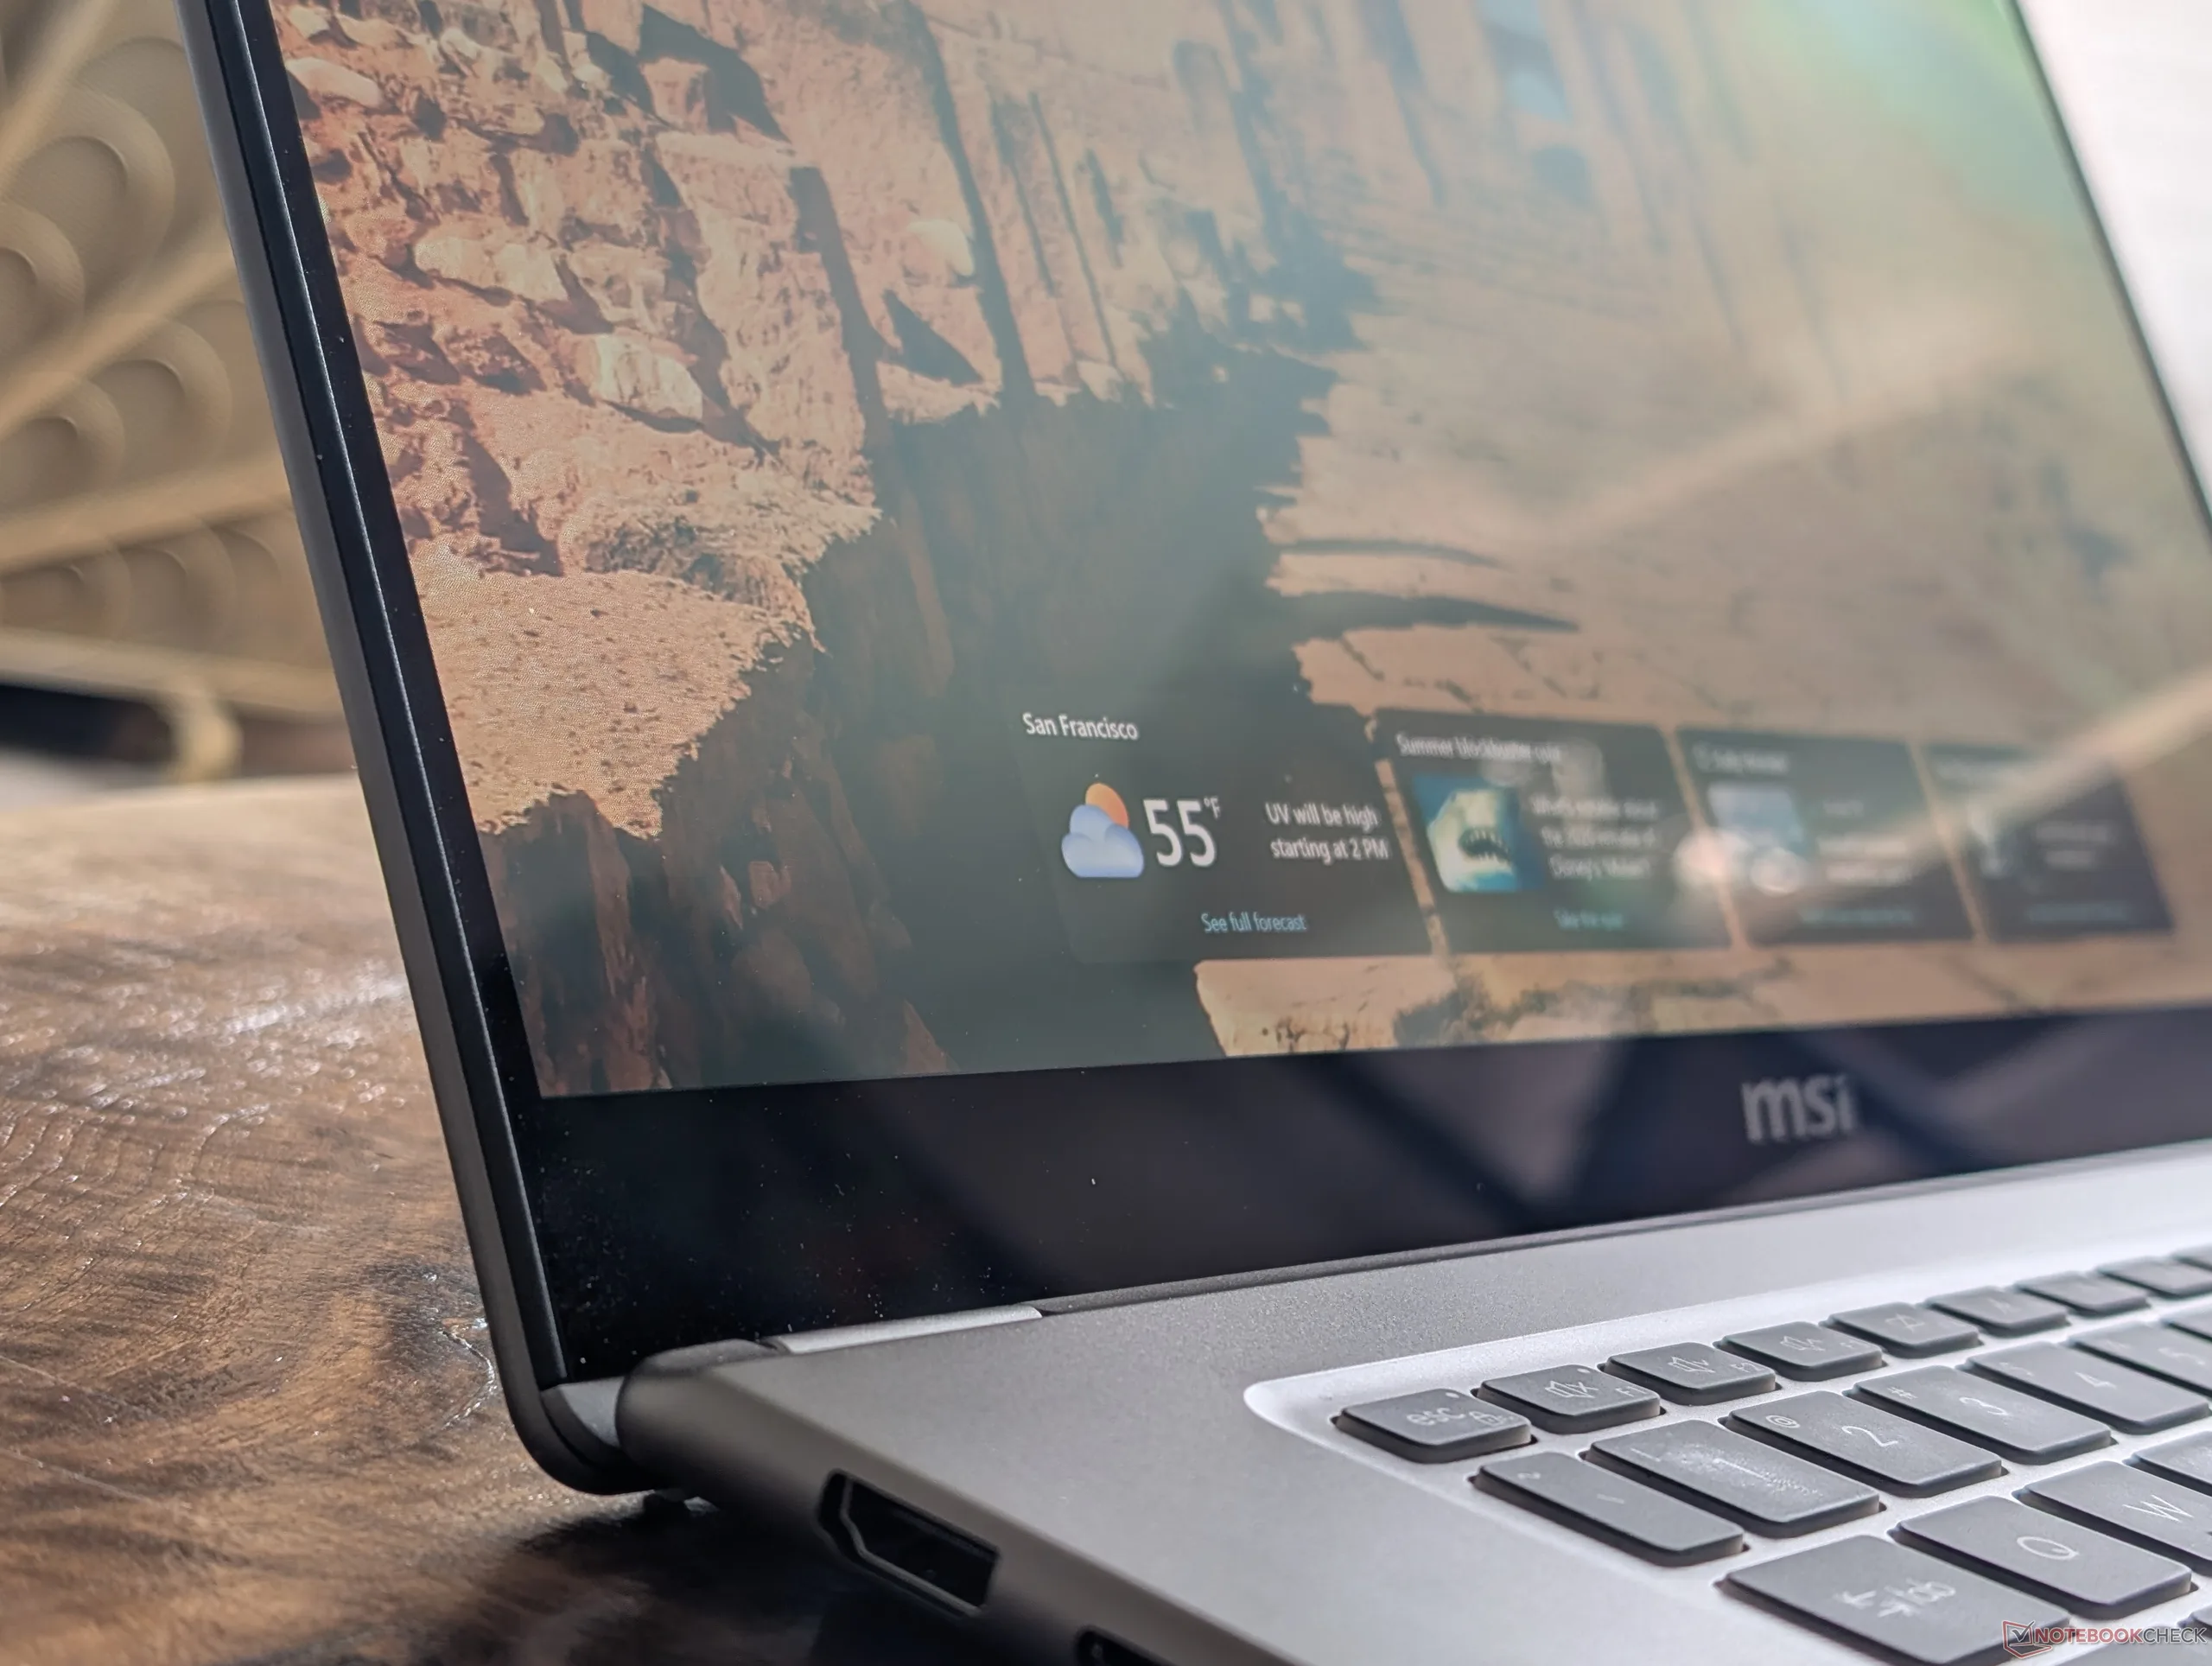
MSI introduce quest'anno anche un logo aggiornato sul coperchio esterno, a partire dalla linea 2026 Prestige. Secondo il produttore, l'elegante incisione al laser potrebbe apparire su altri modelli business premier nel prossimo futuro, per separarli meglio dalle soluzioni MSI incentrate sul gioco.
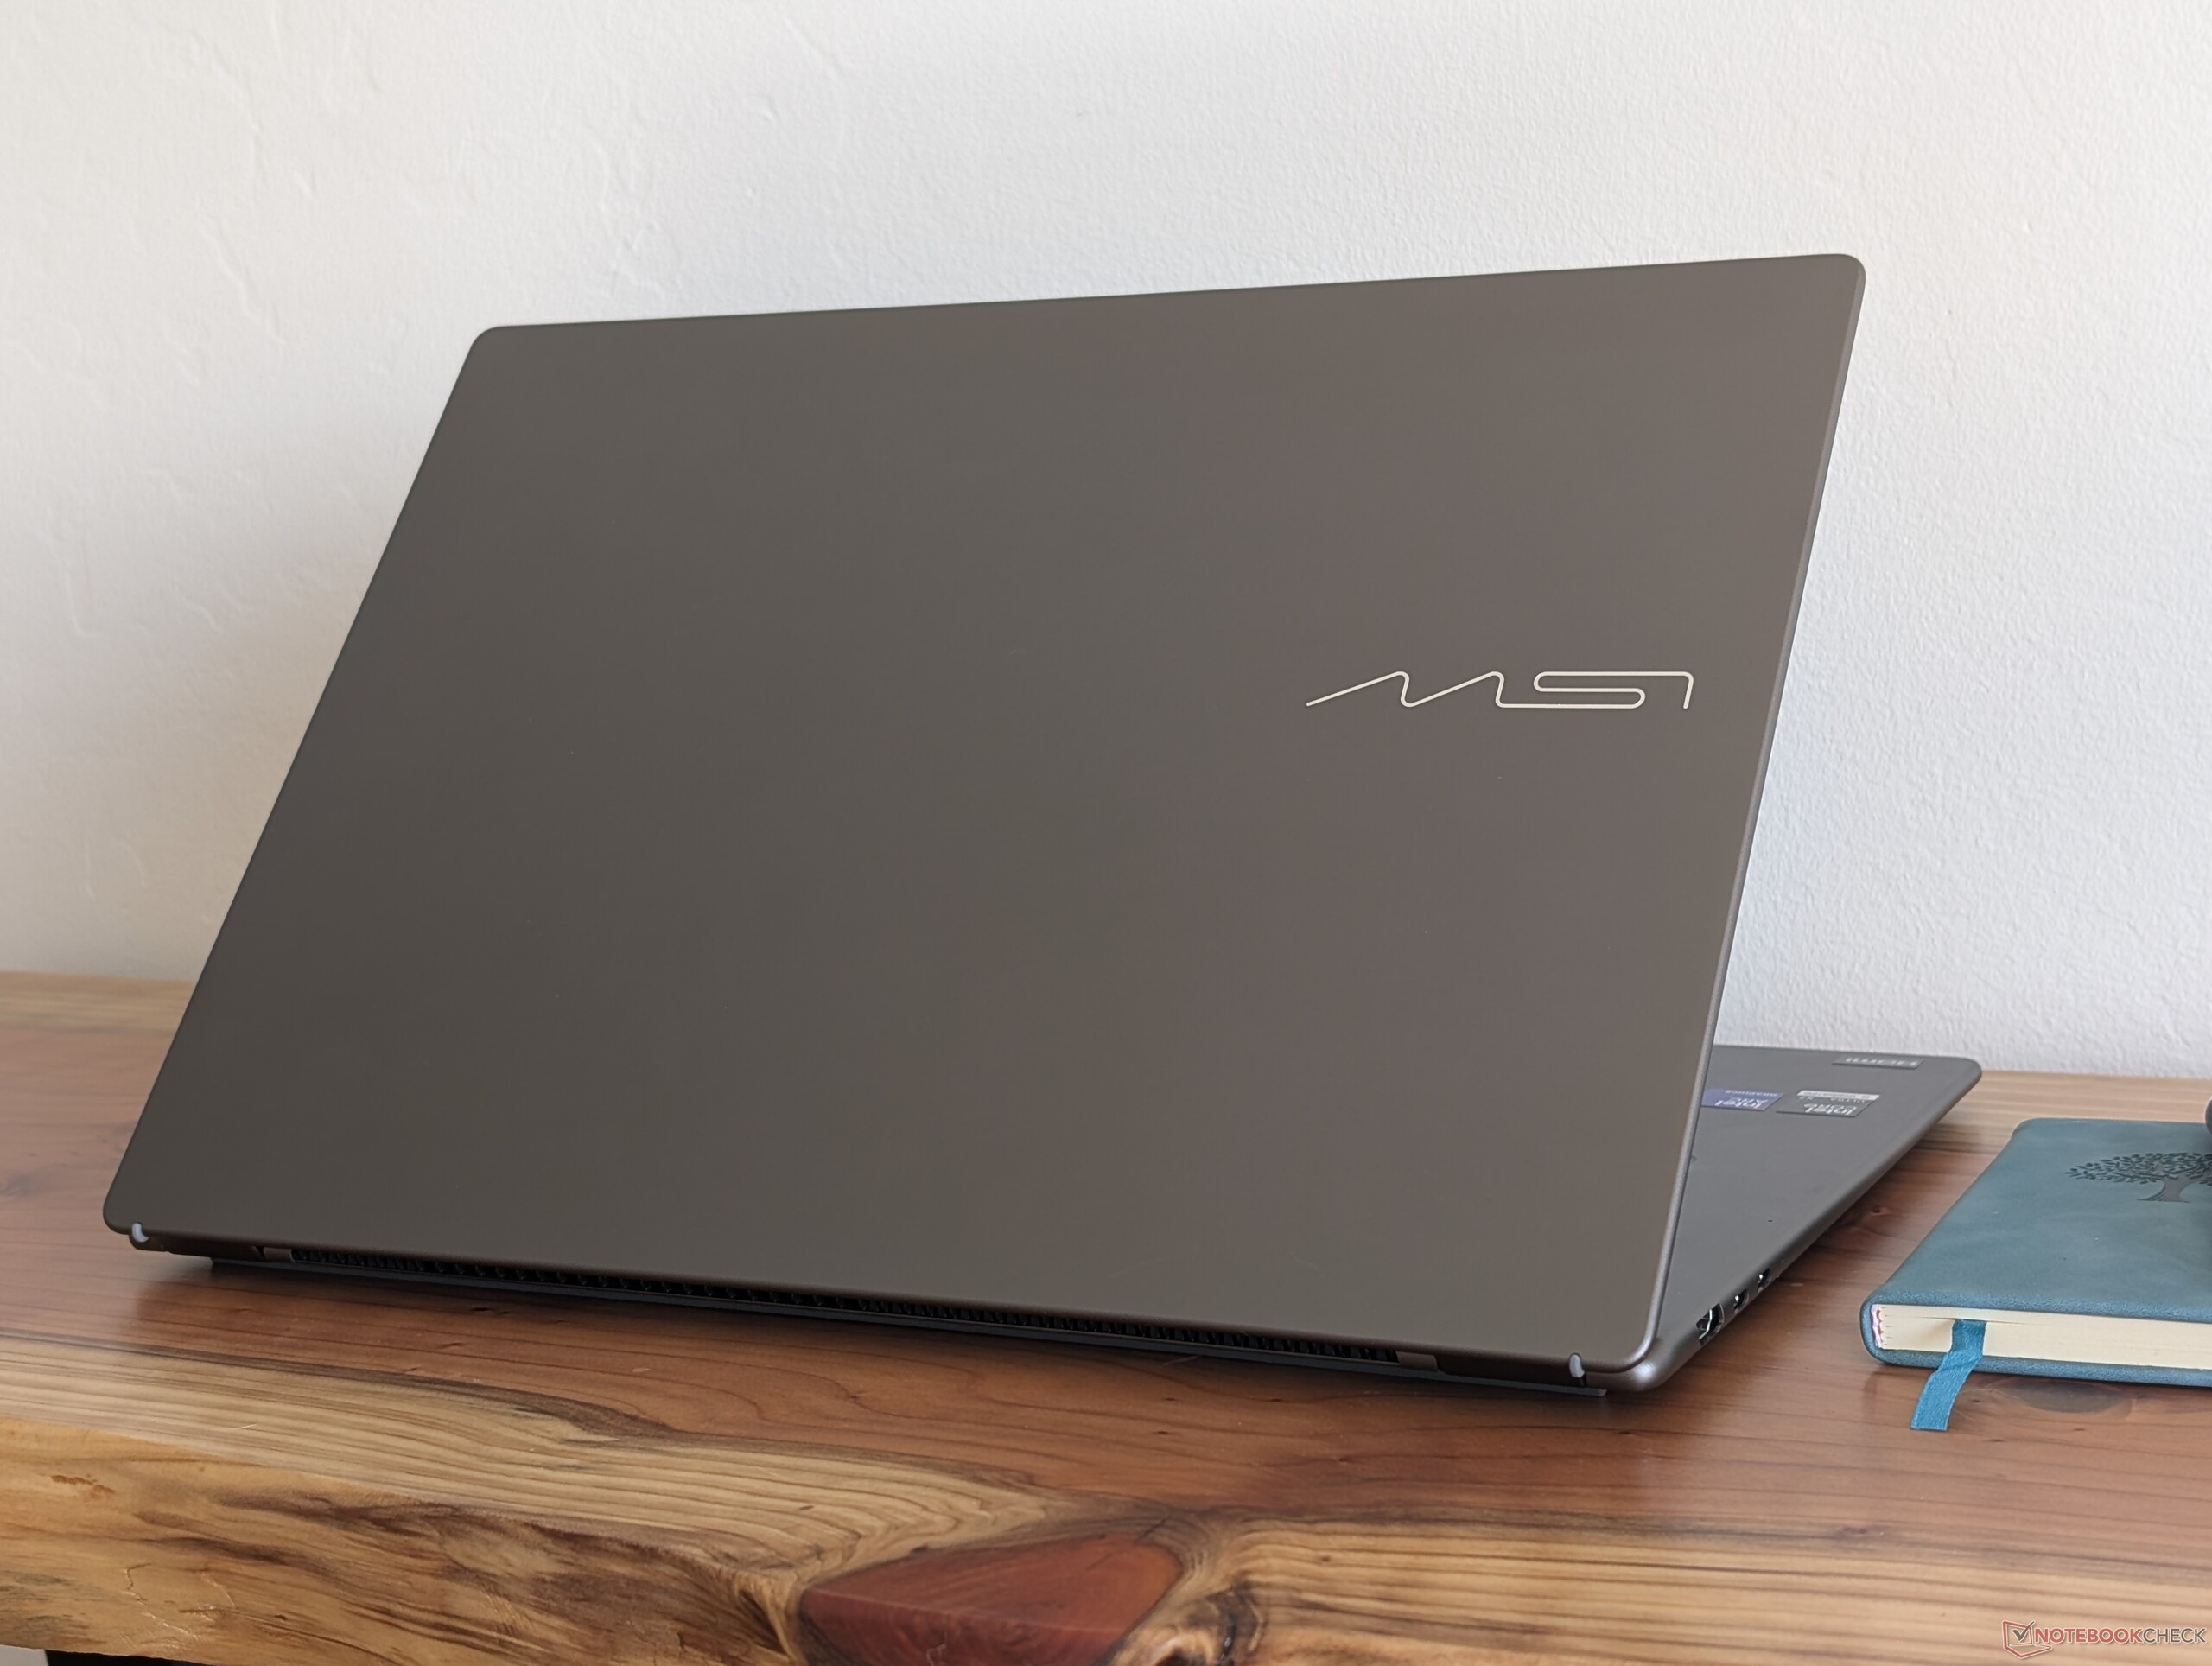
Il sistema è sensibilmente più sottile rispetto al design dello scorso anno, ma con una variazione di peso quasi nulla, per una sensazione di maggiore densità. Si colloca comodamente tra l'XPS 16 e lo ZenBook S16 per quanto riguarda il peso, pur essendo leggermente più grande di entrambi in termini di ingombro.
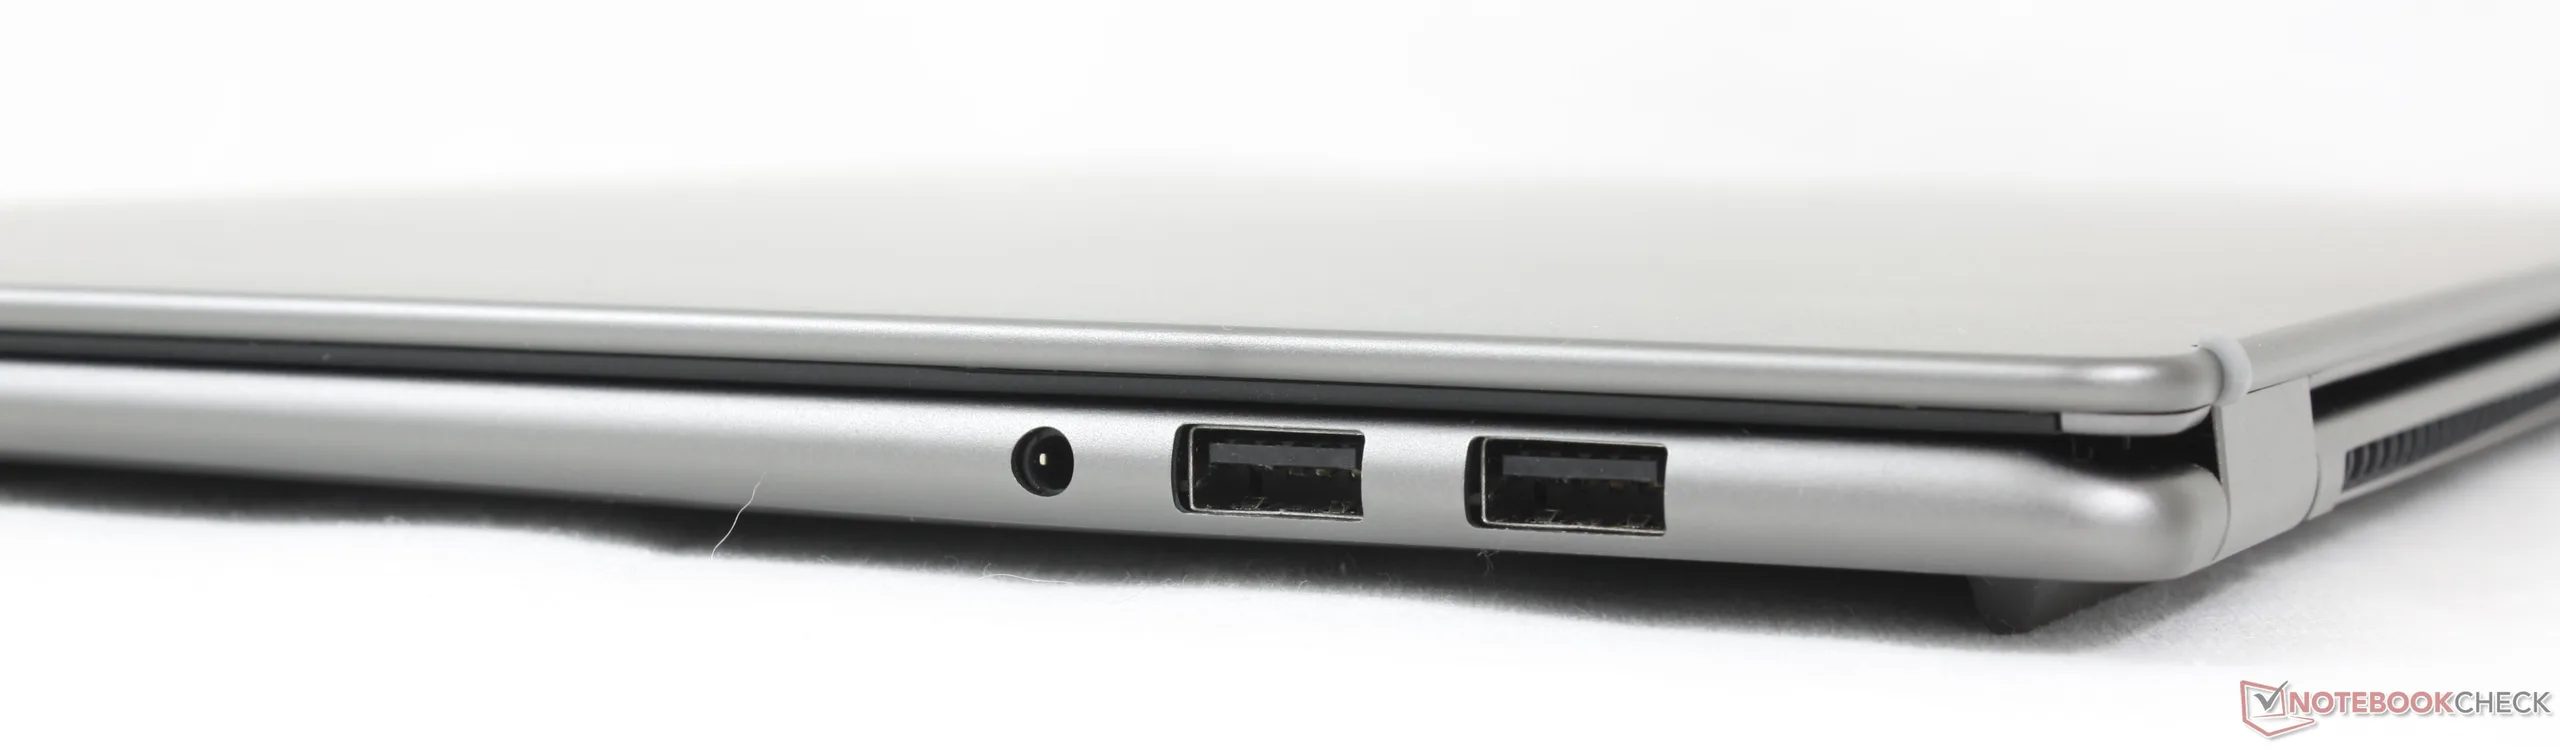
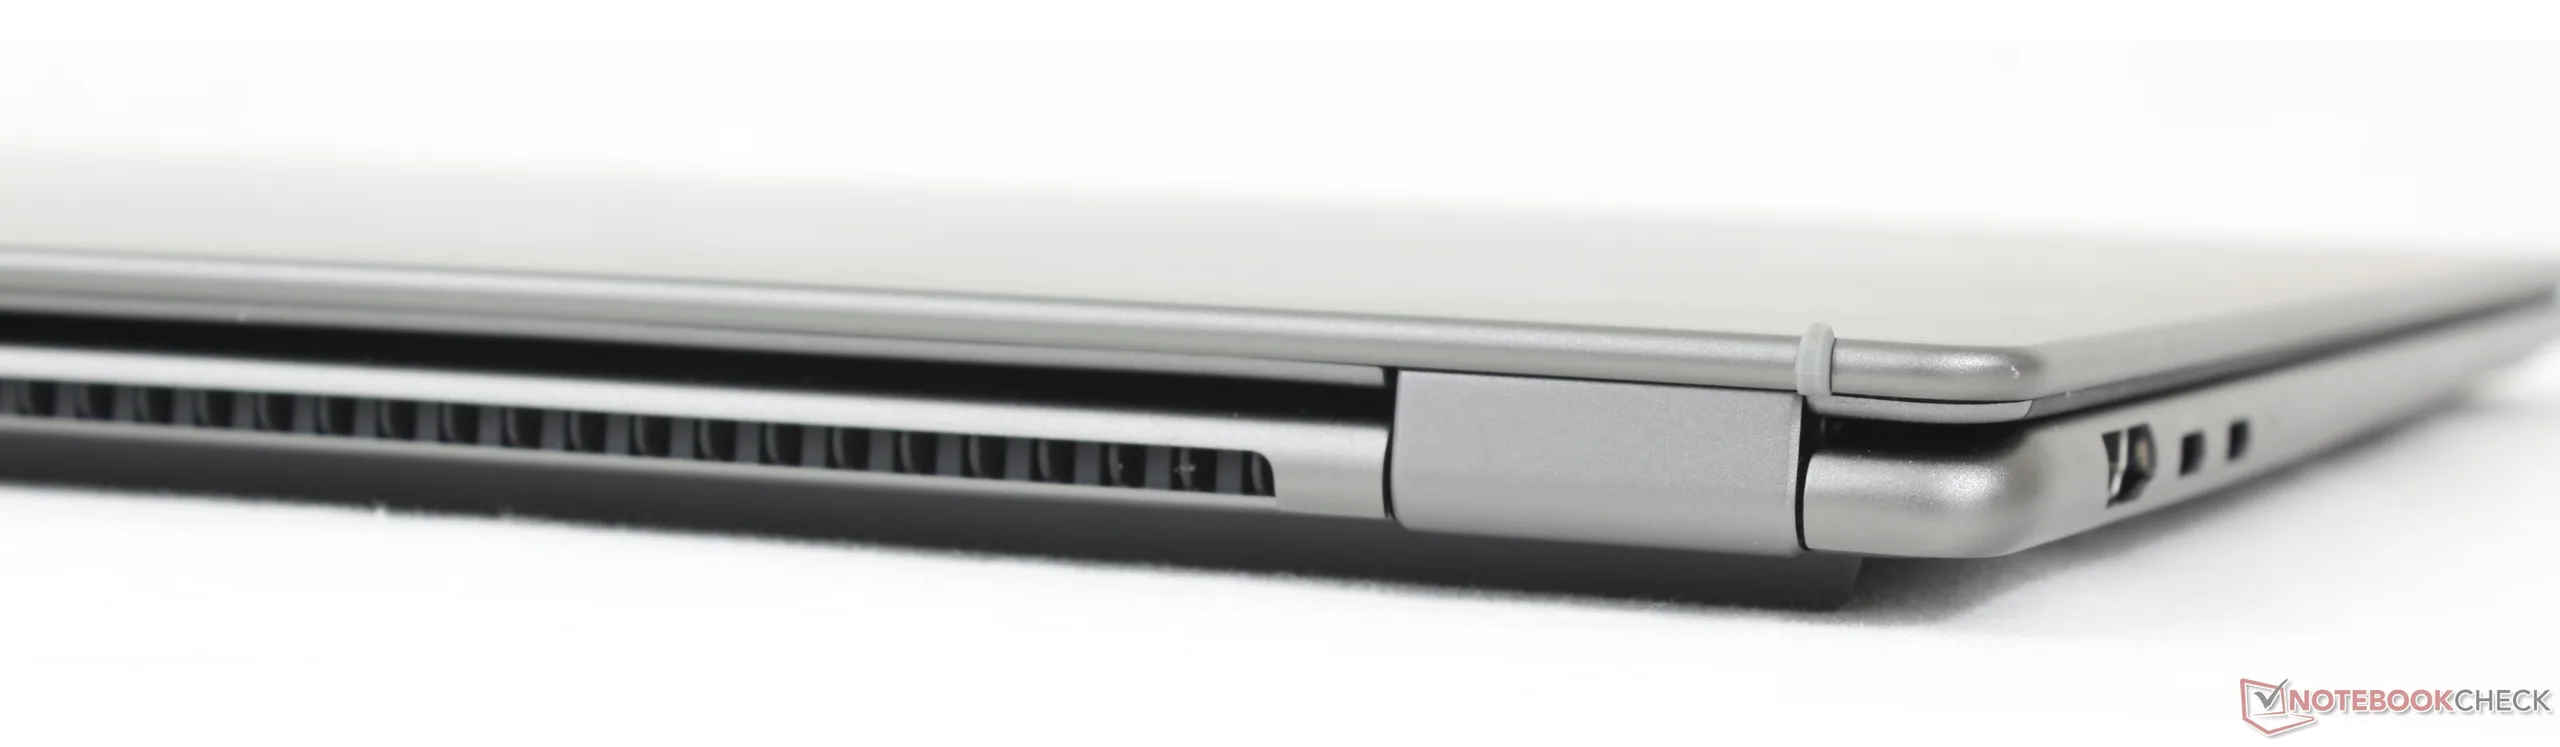
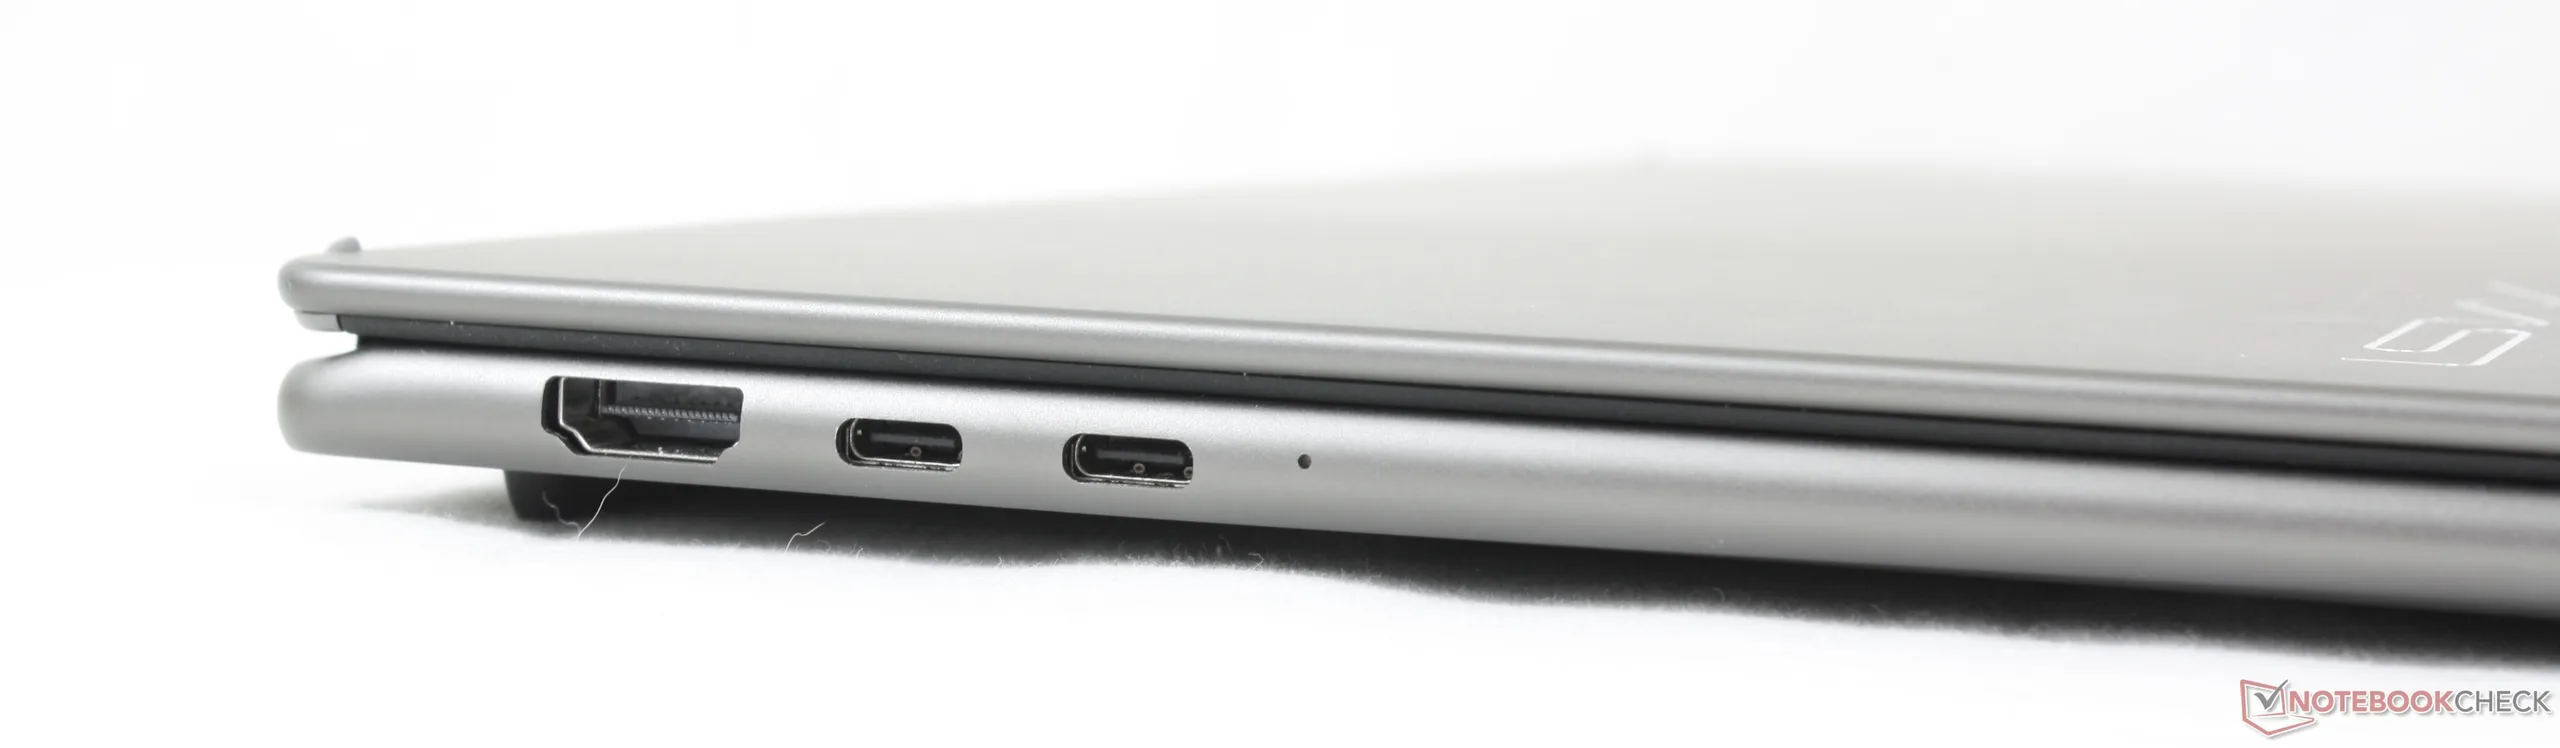
Connettività
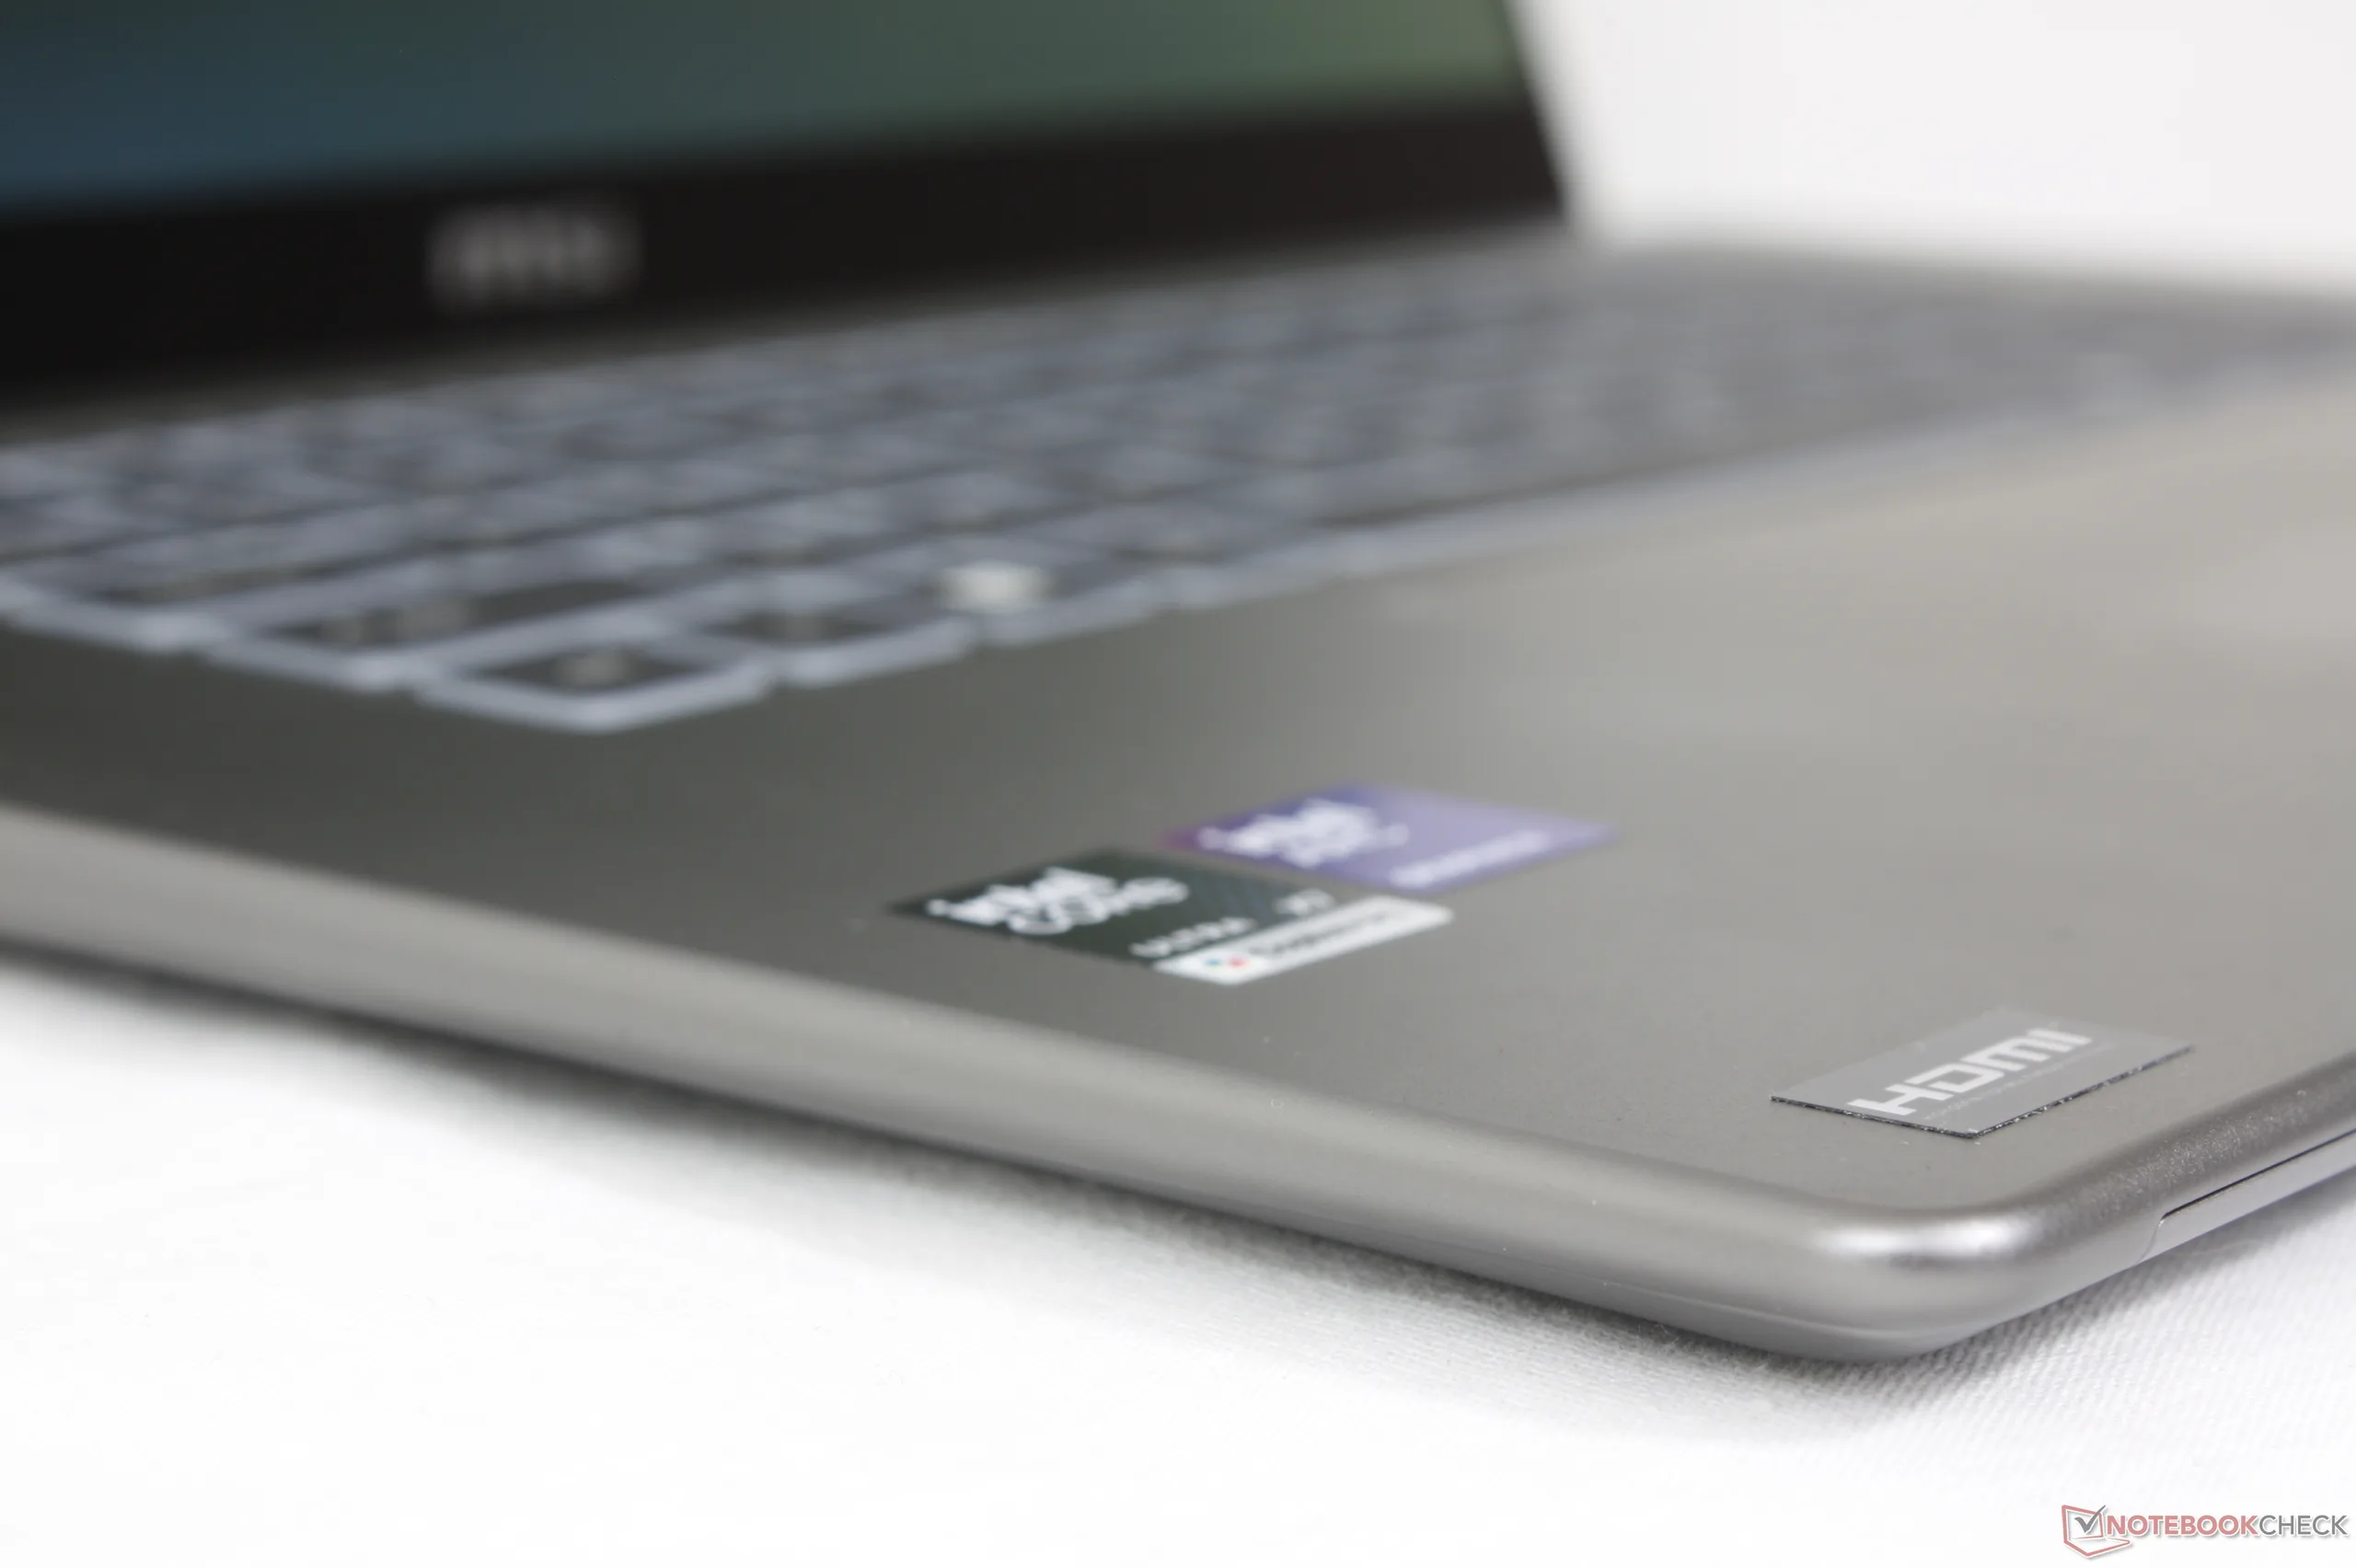
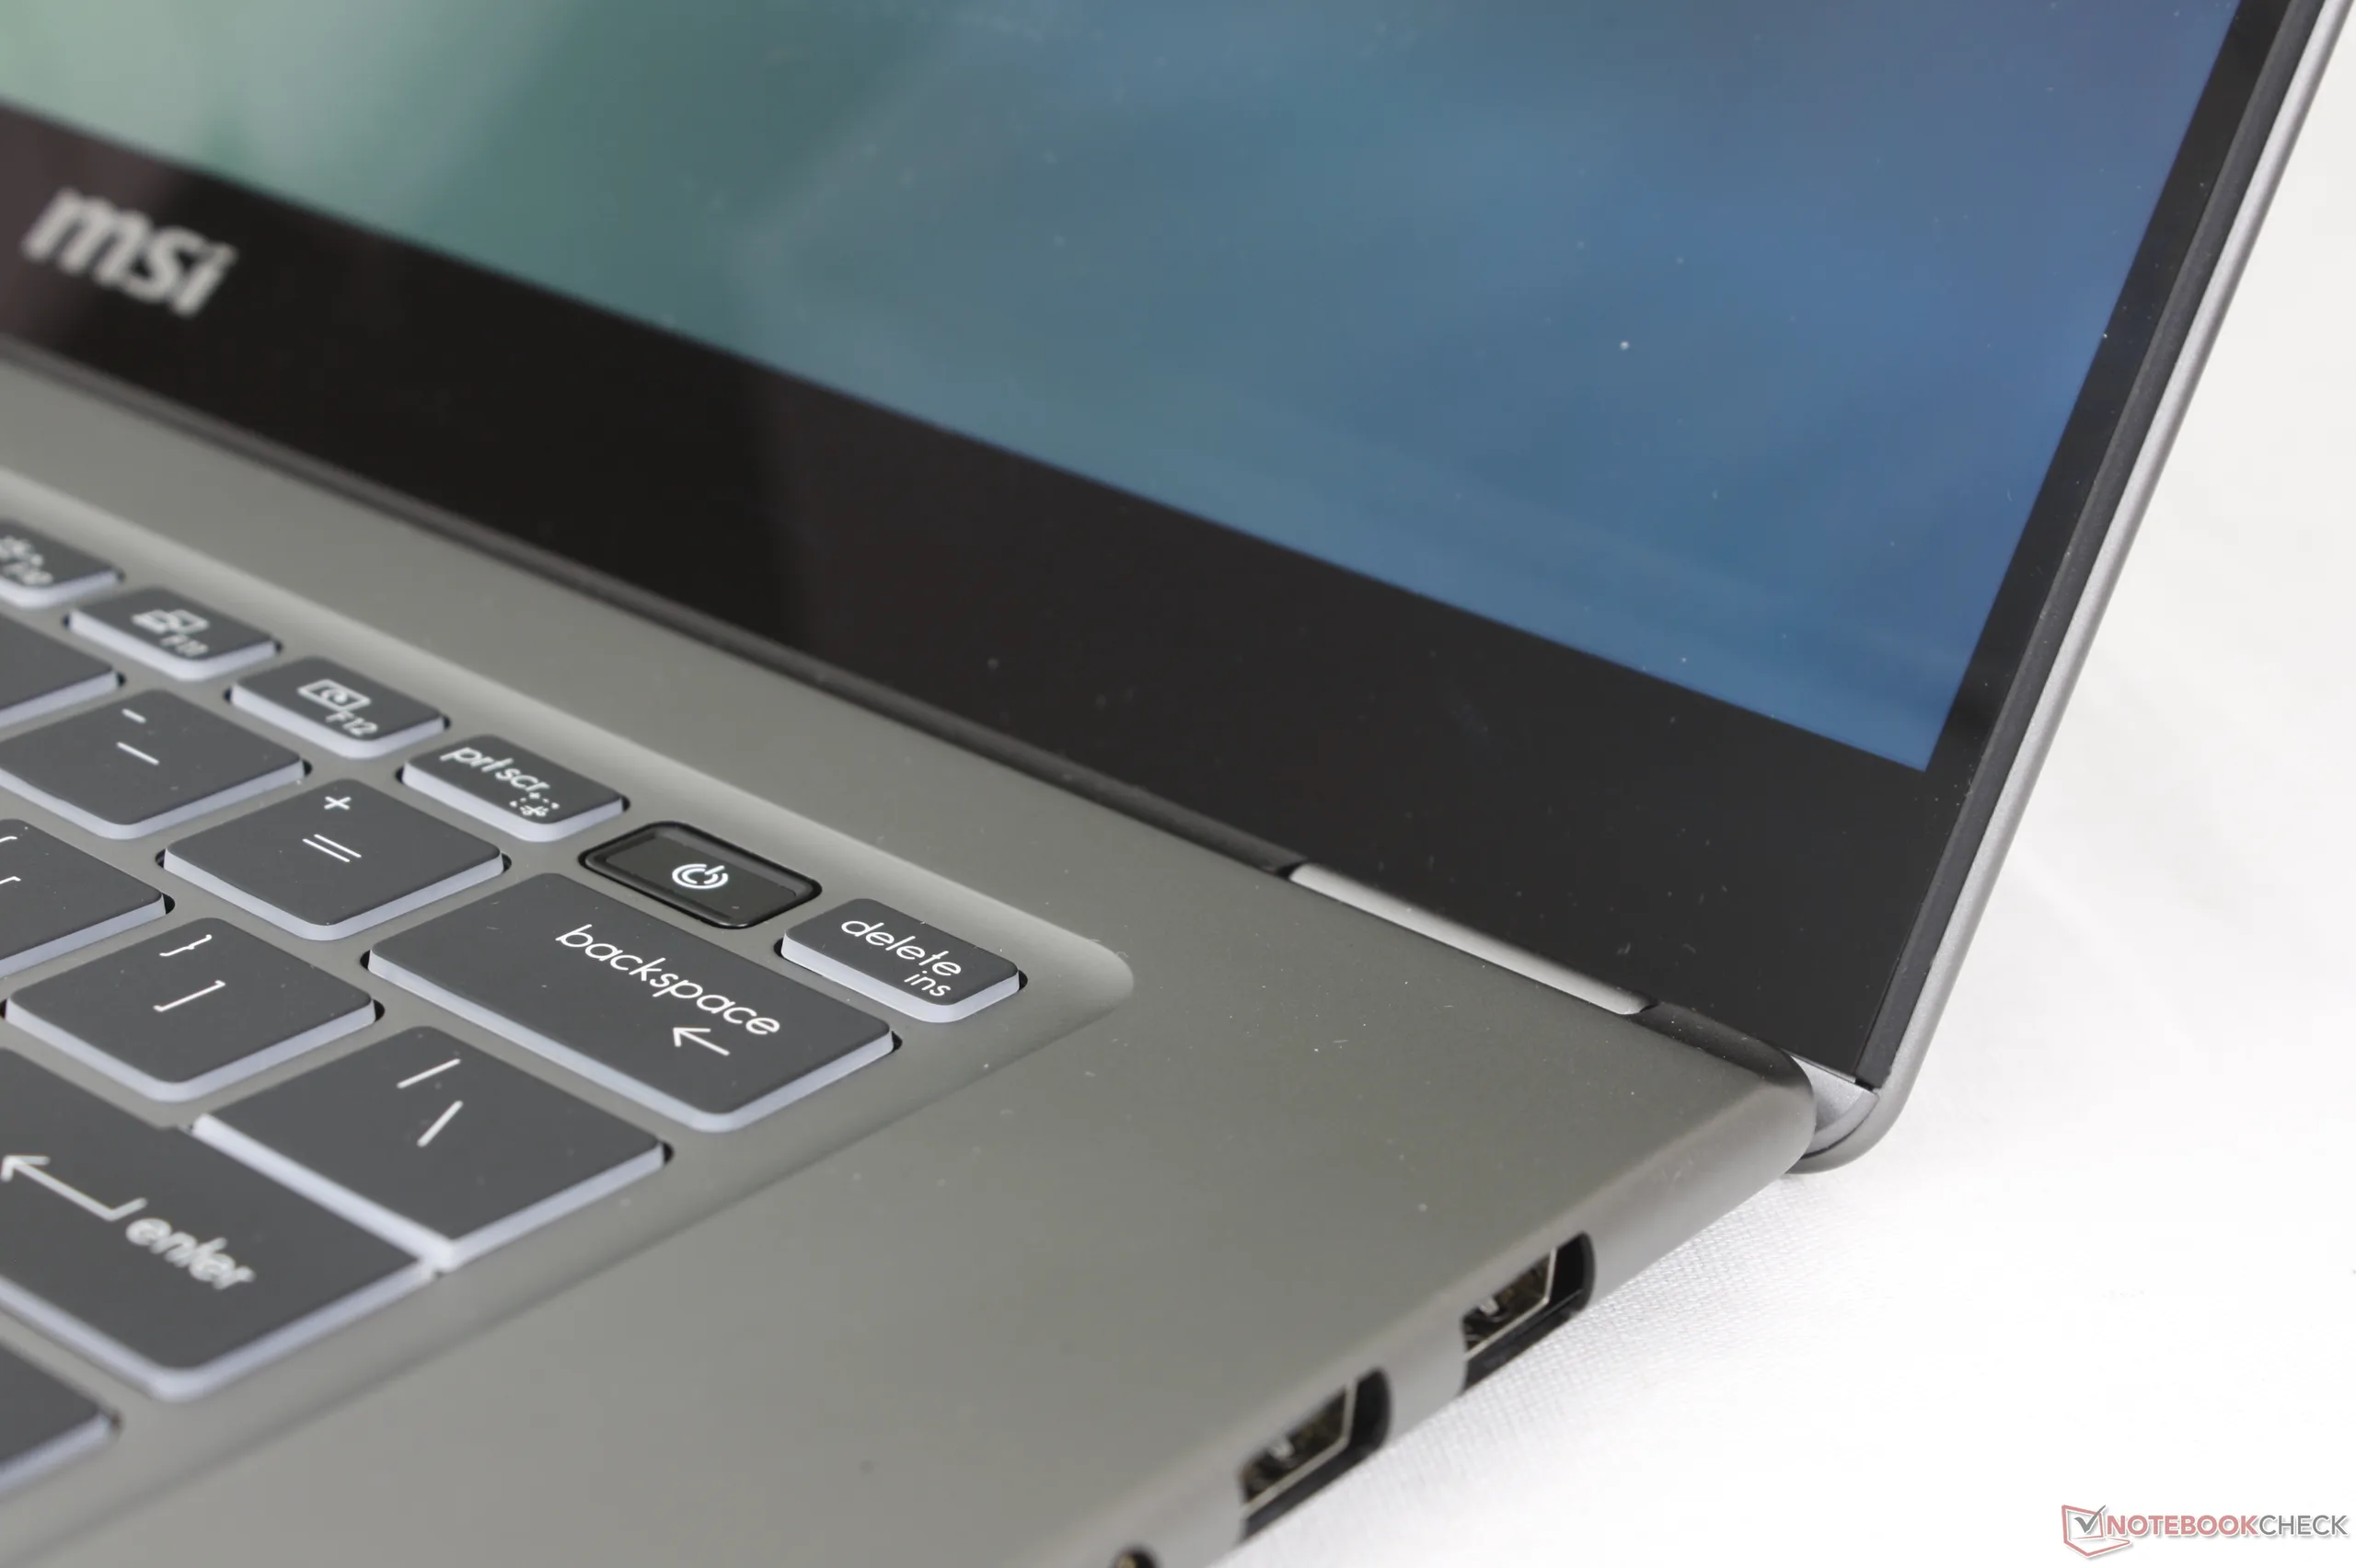
Le opzioni delle porte sono cambiate rispetto al modello 2025. MSI ha eliminato la porta RJ-45, il lettore di schede SD e il blocco Kensington, mentre ha aggiunto una seconda porta USB-A. Le modifiche sono un misto di cose, a seconda delle preferenze dell'utente.
Anche il posizionamento delle porte avrebbe potuto essere migliore, dato che la ricarica USB-C è limitata al solo lato sinistro del sistema.

Comunicazione
Webcam
La webcam da 2 MP è dotata di serie sia di IR che di un otturatore fisico per la privacy.


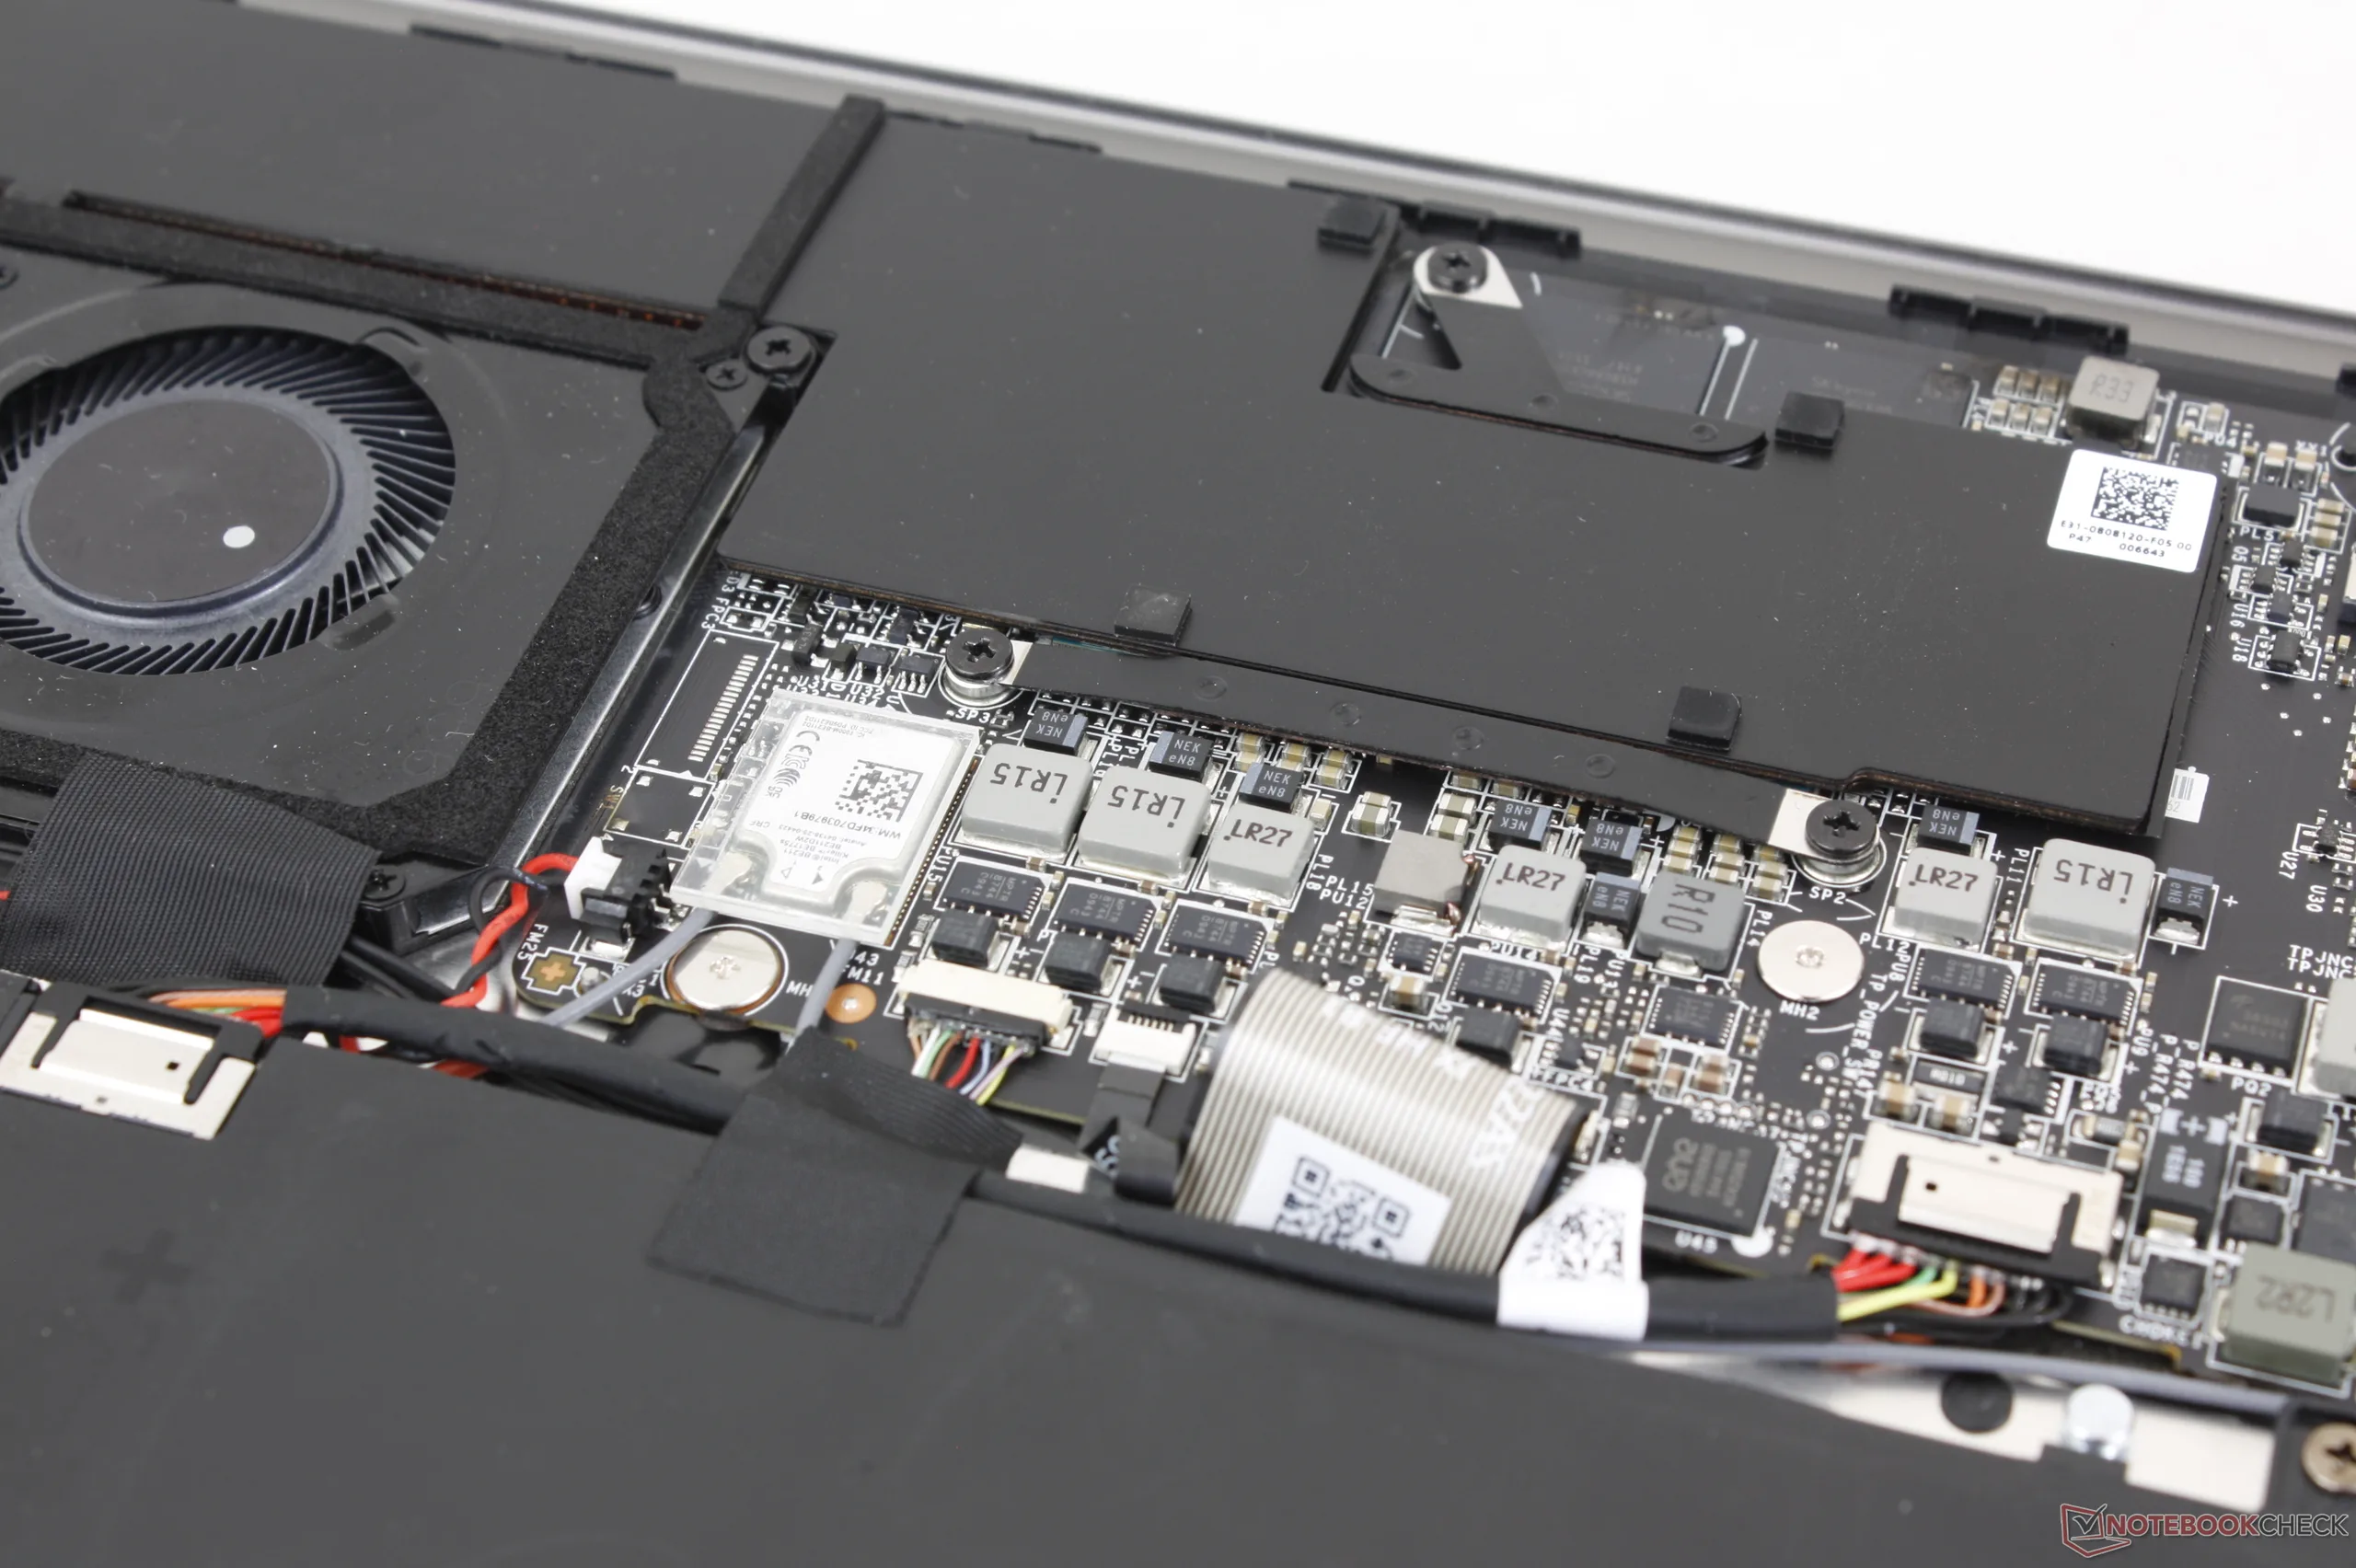
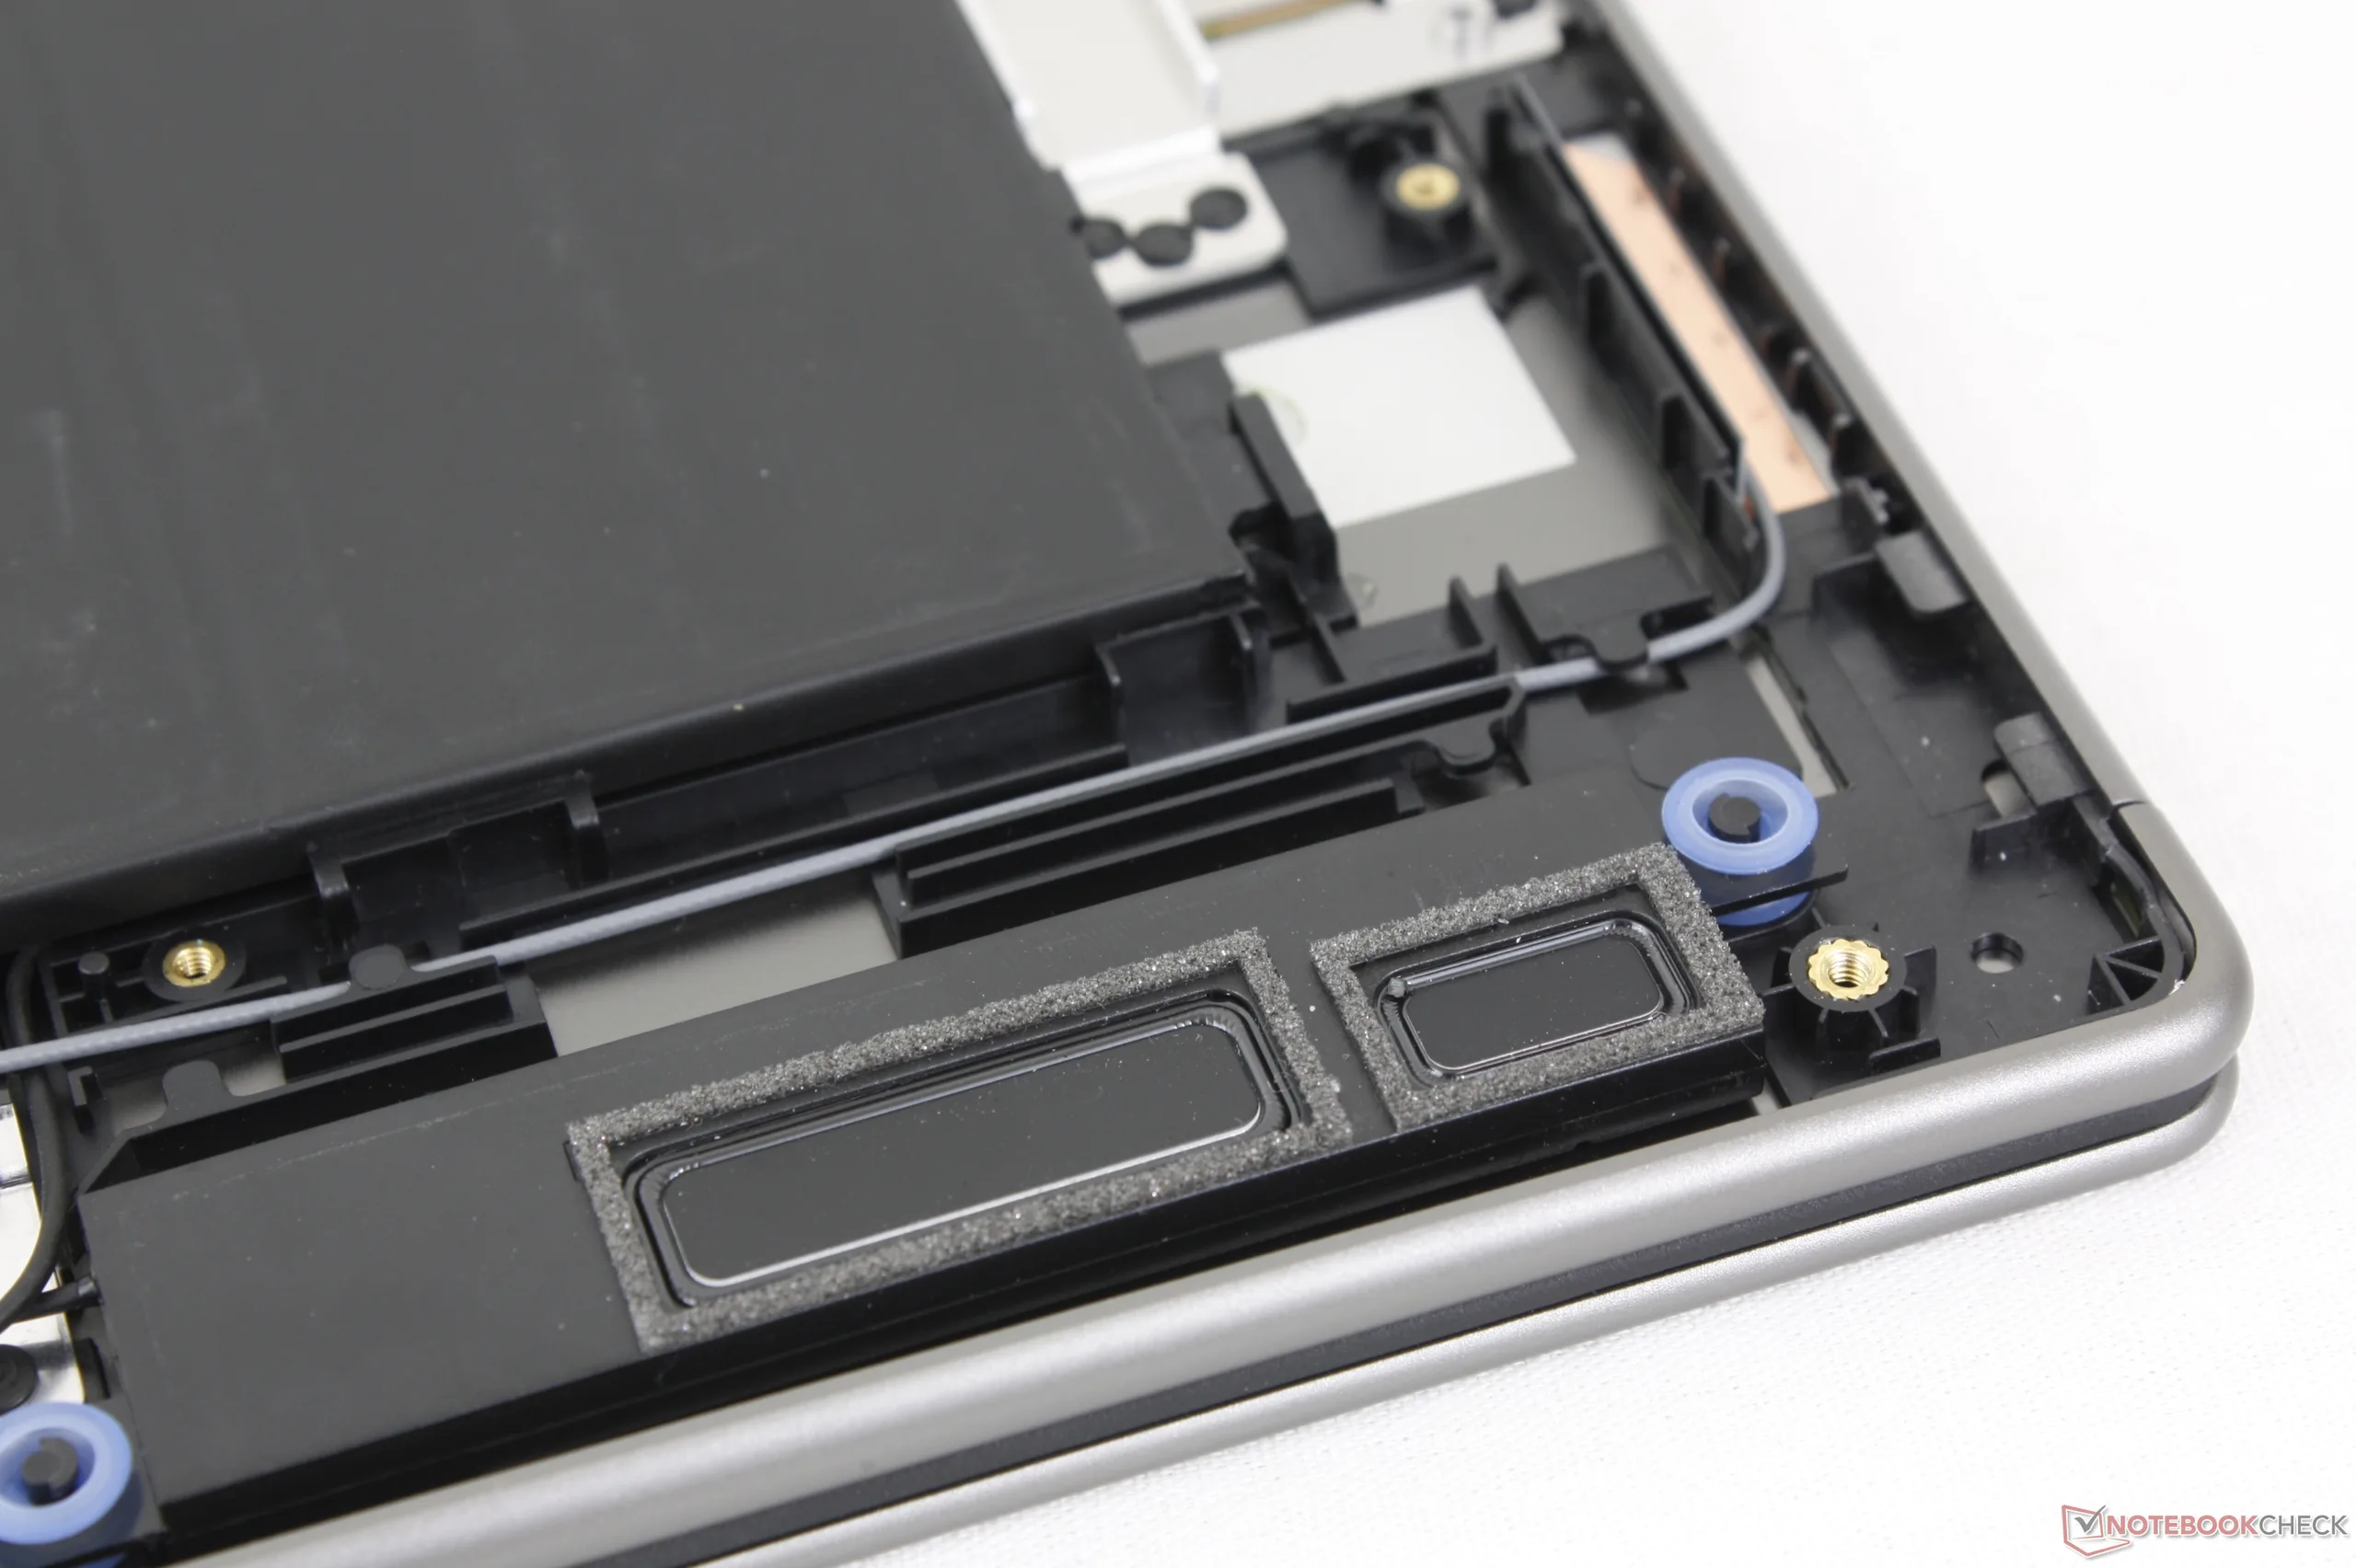
Manutenzione
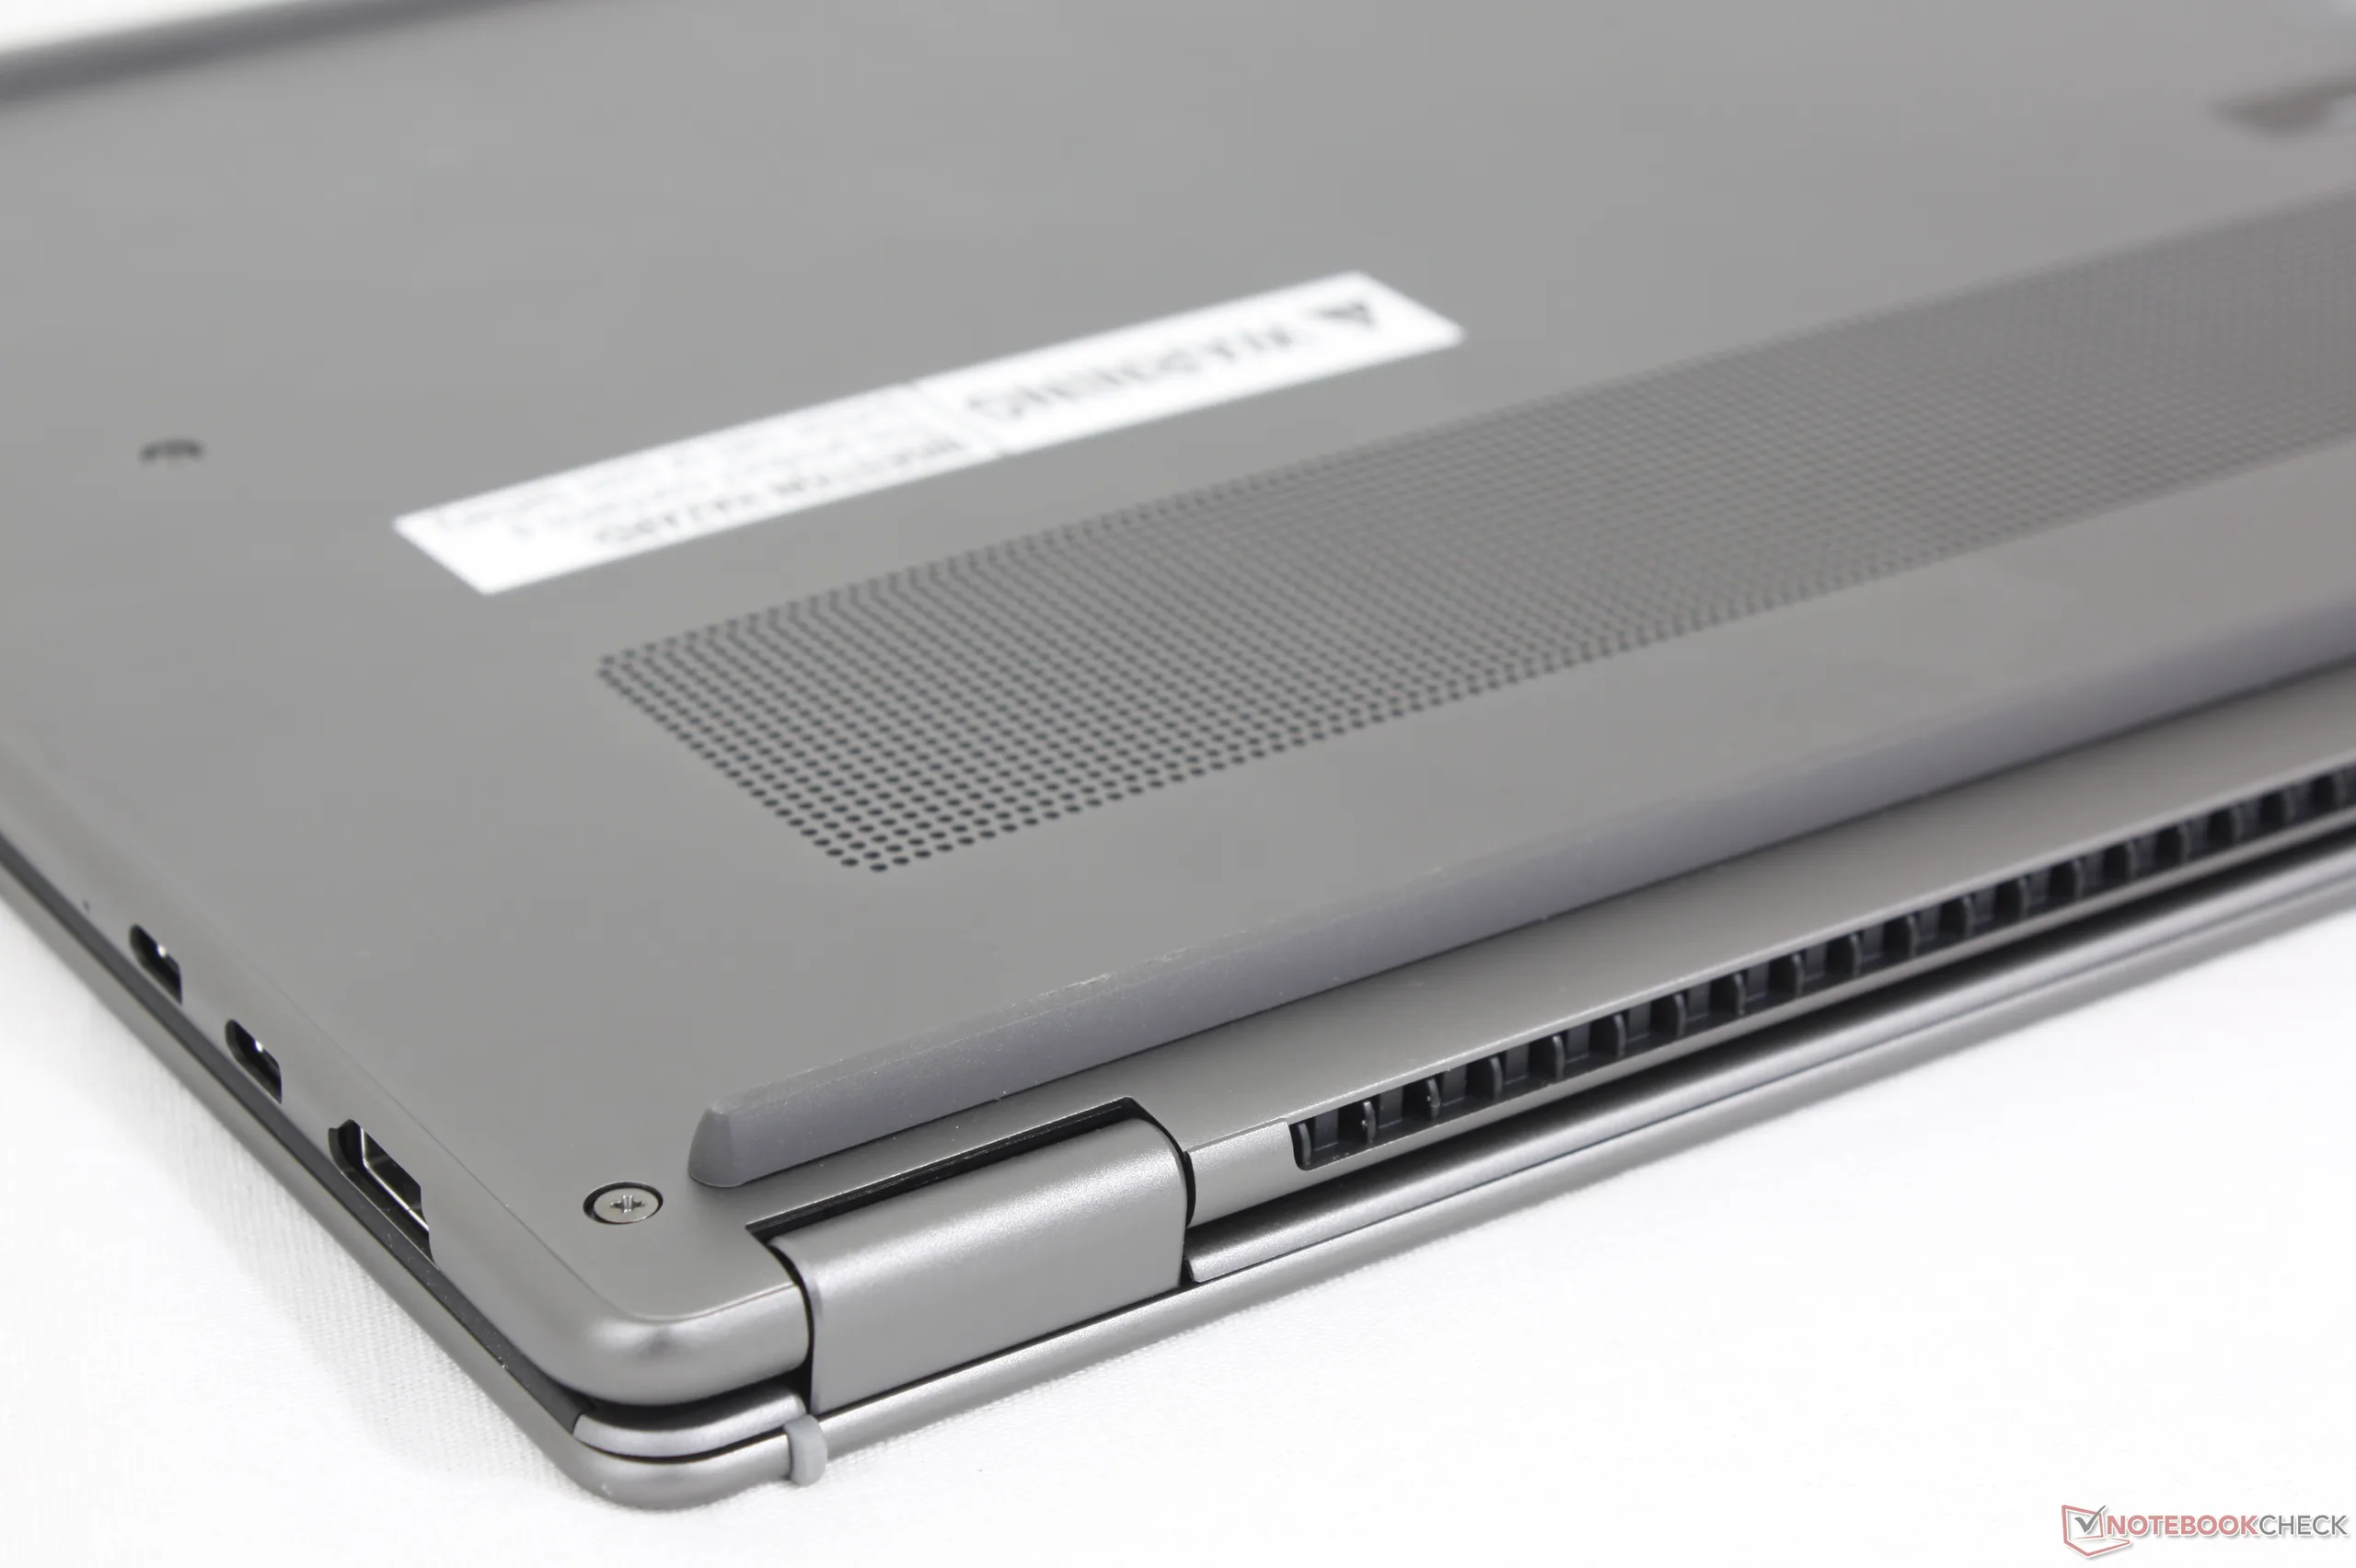
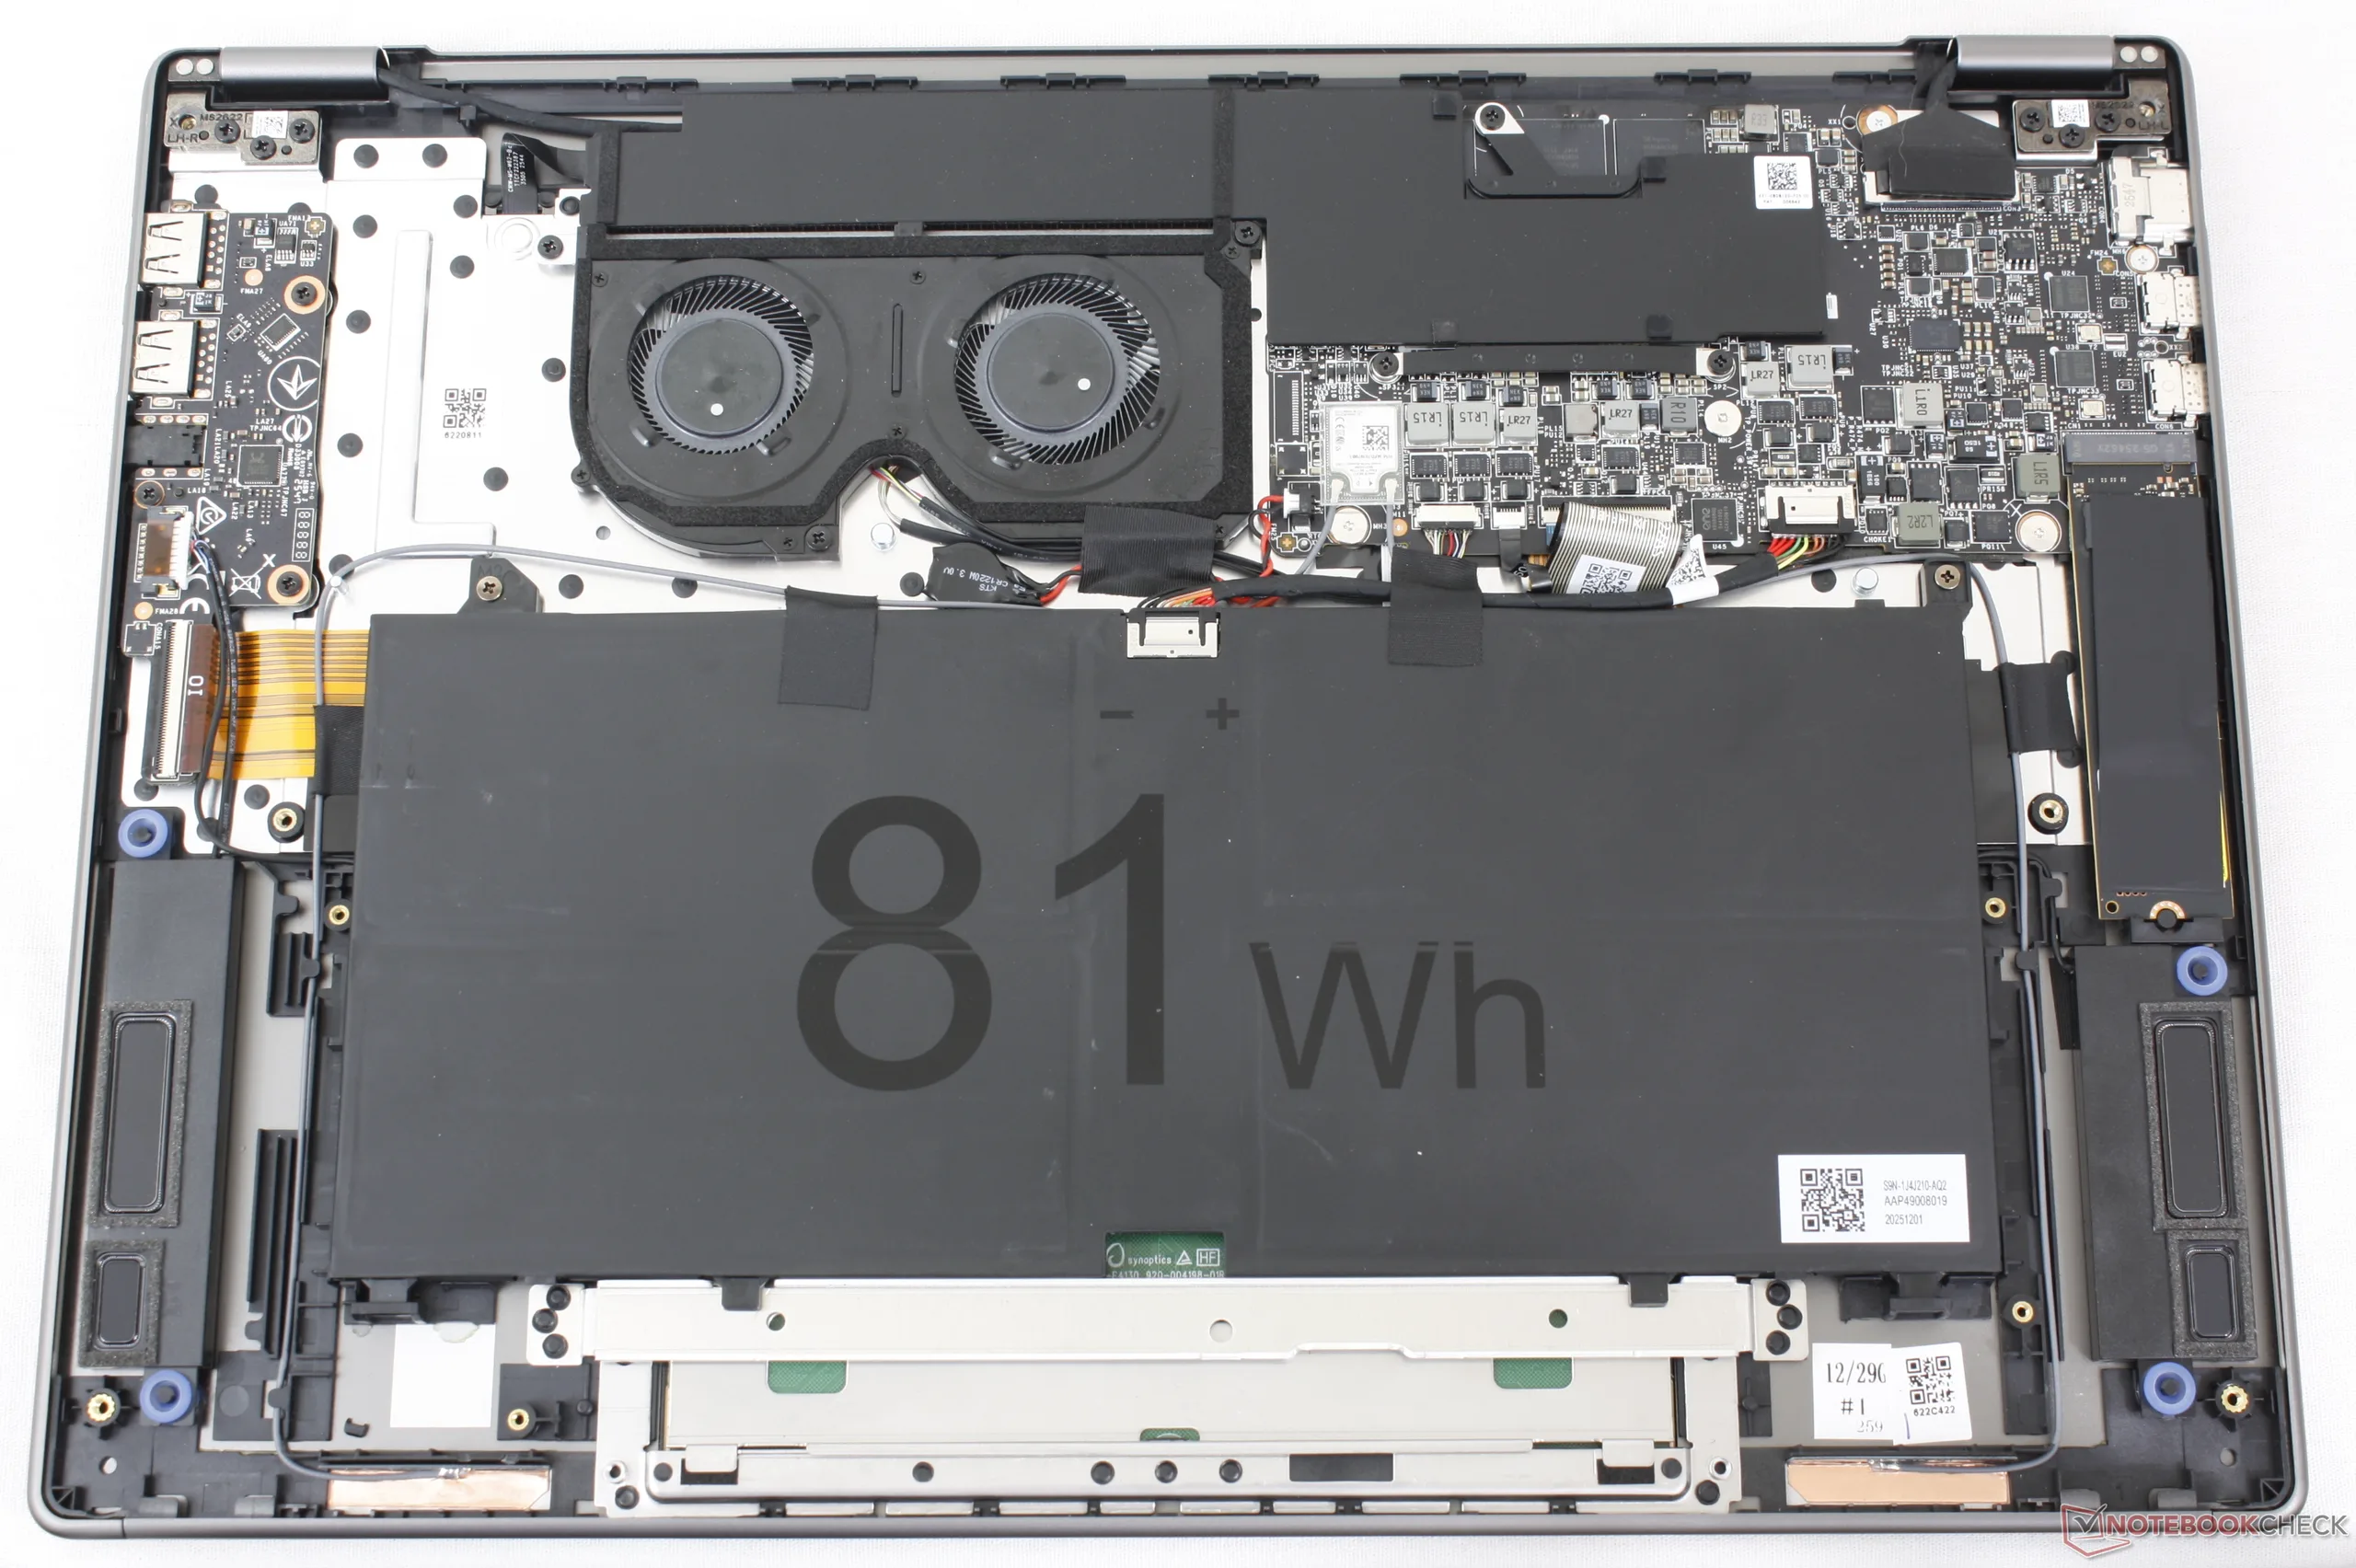
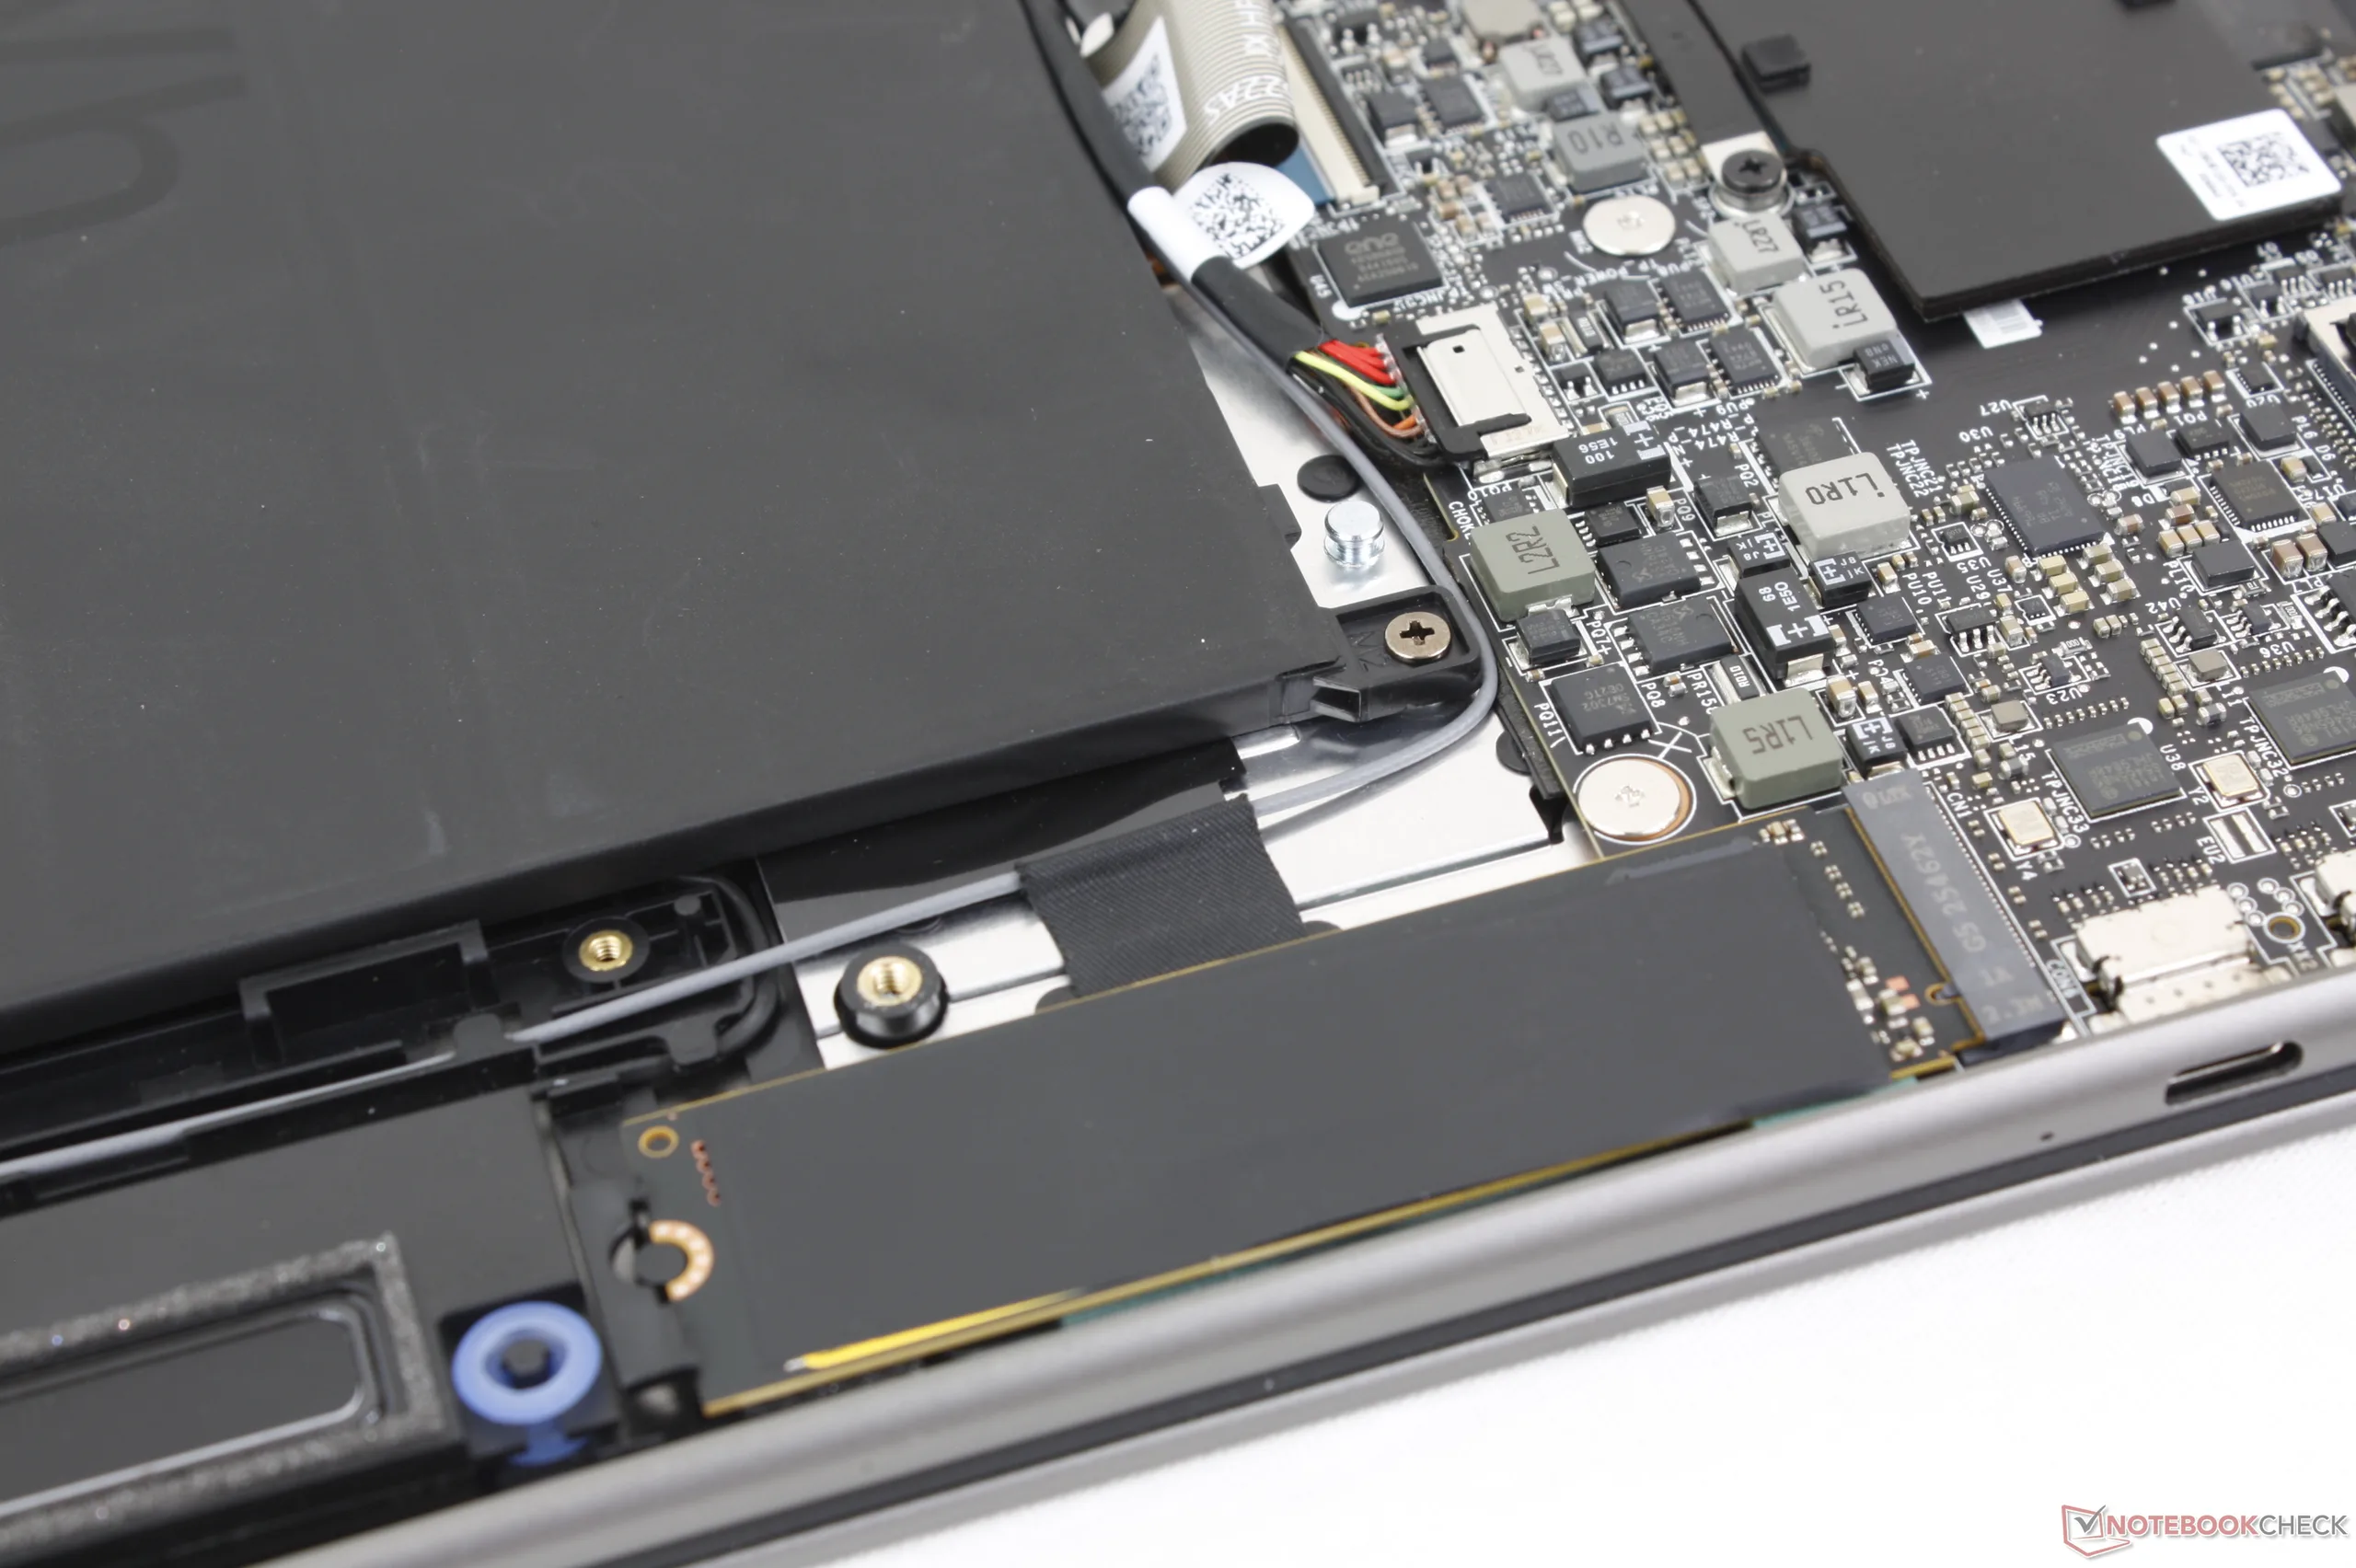
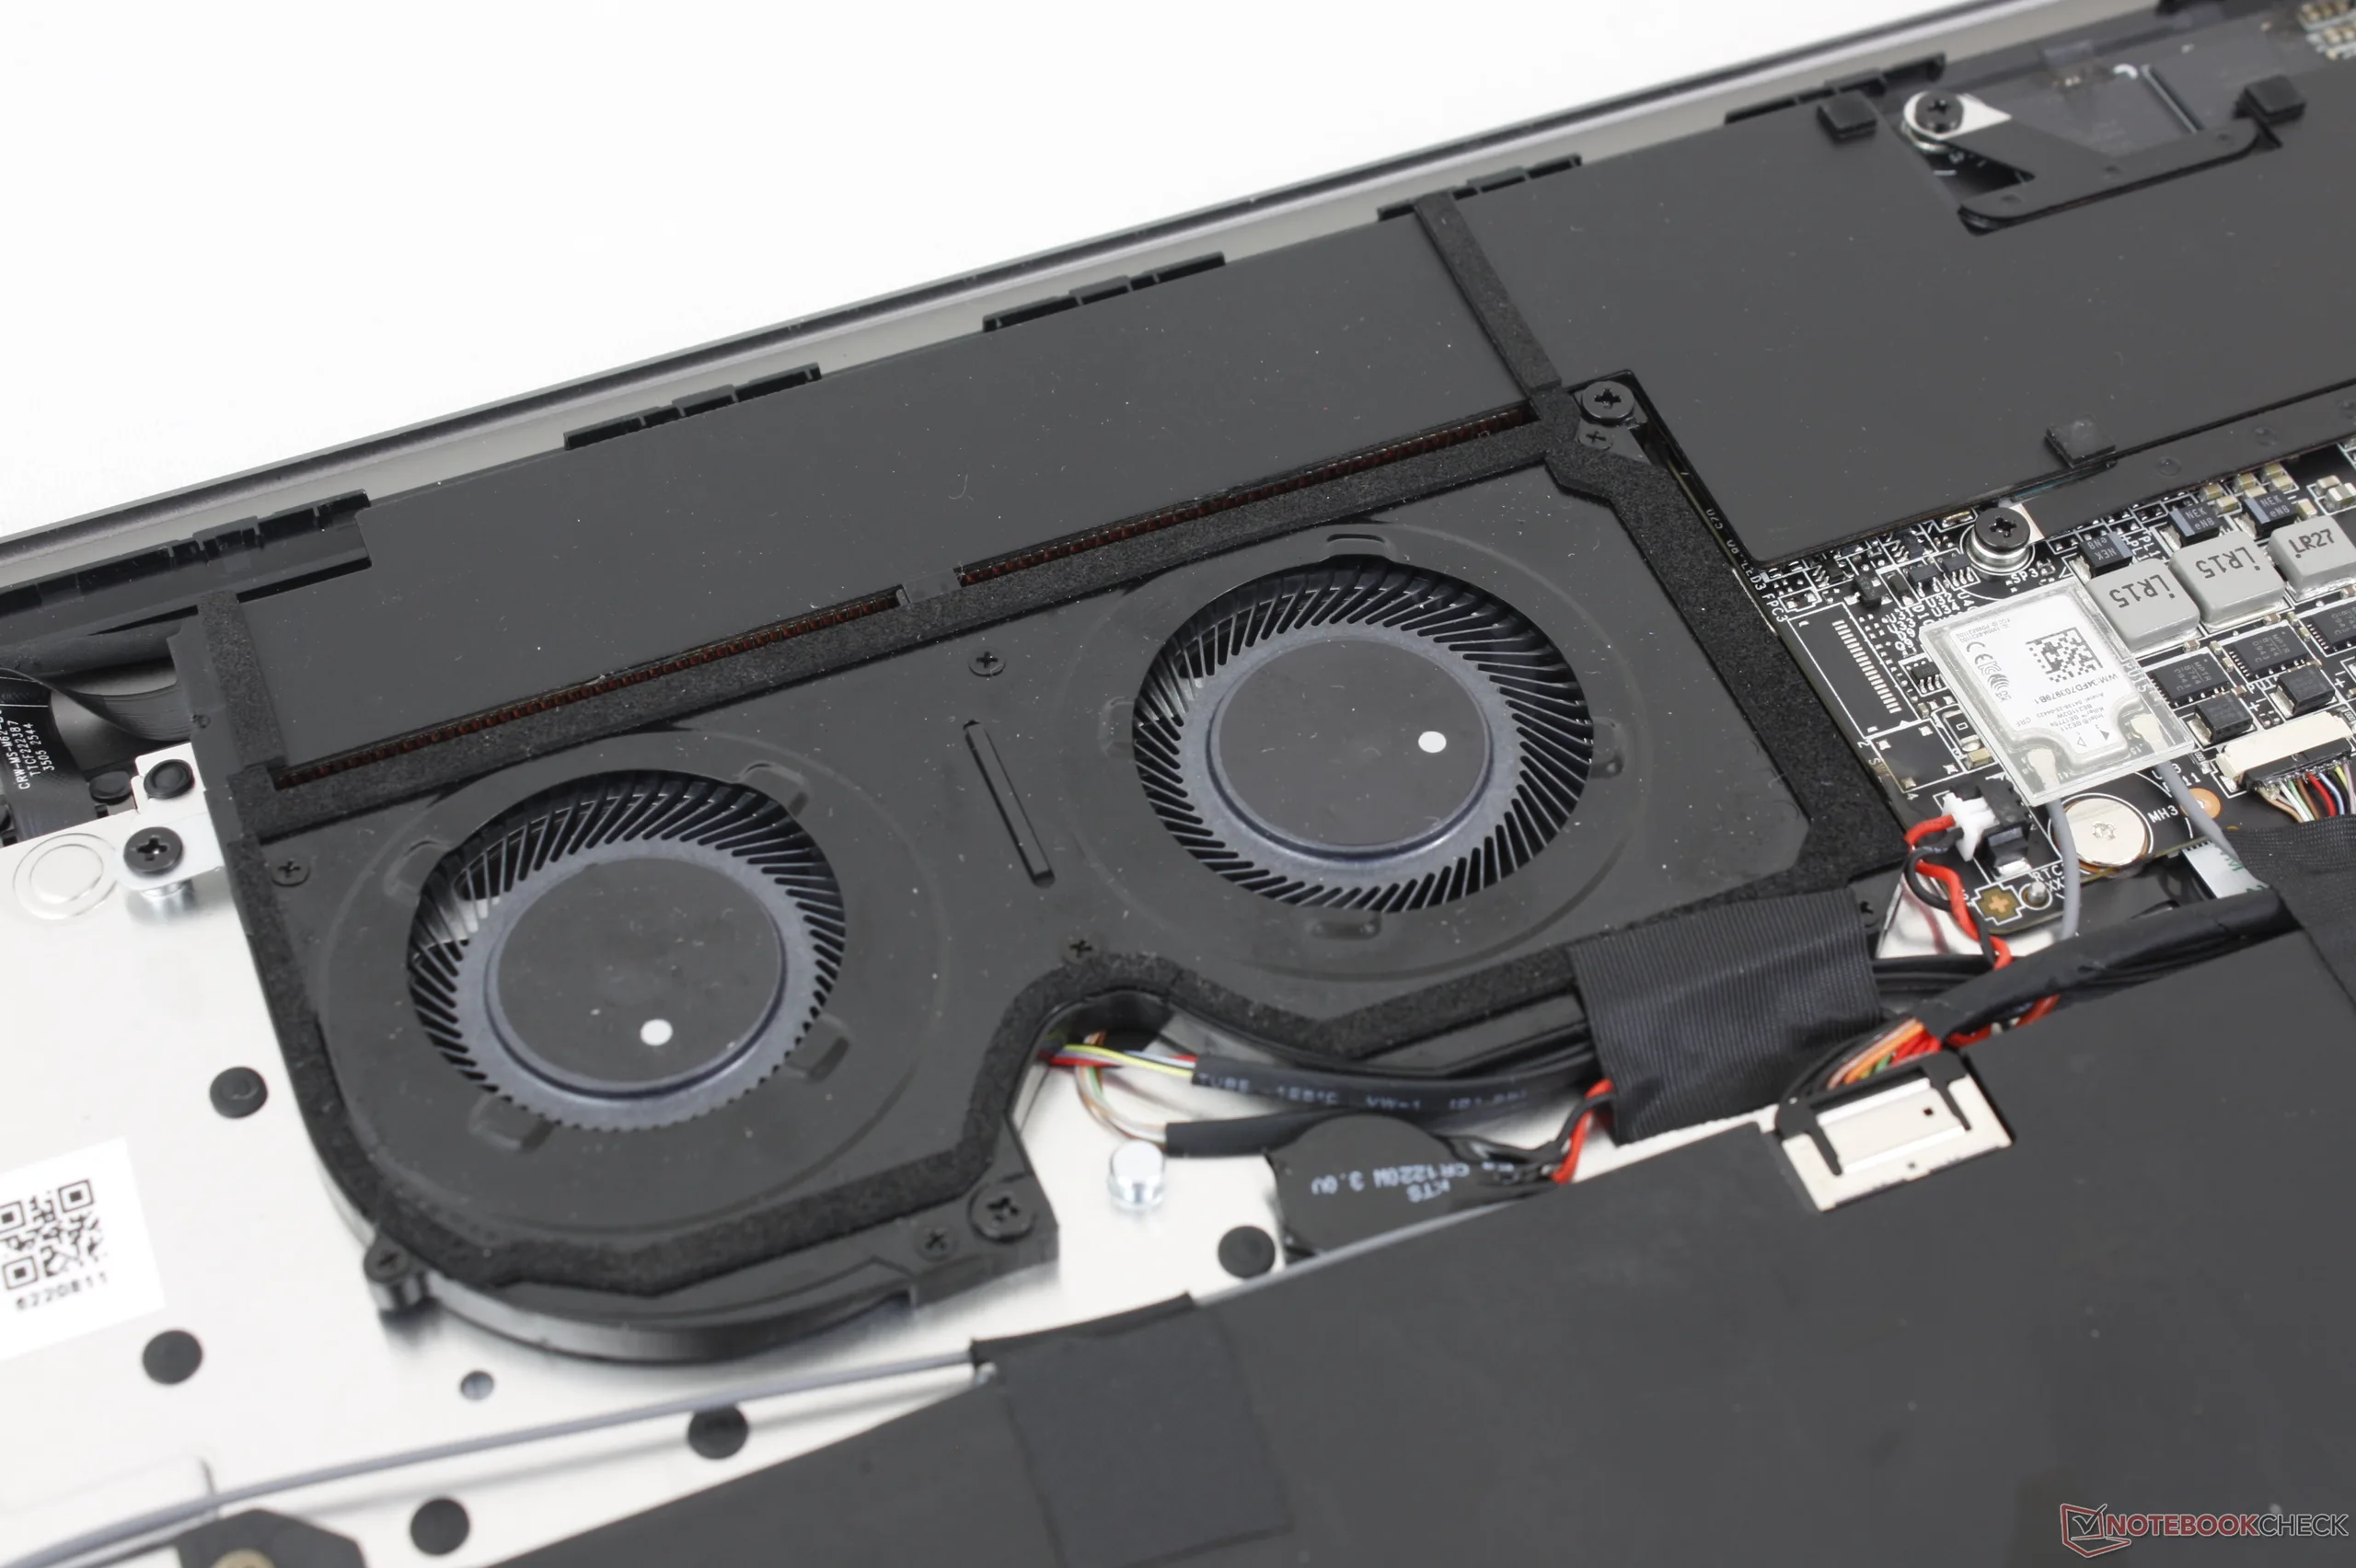
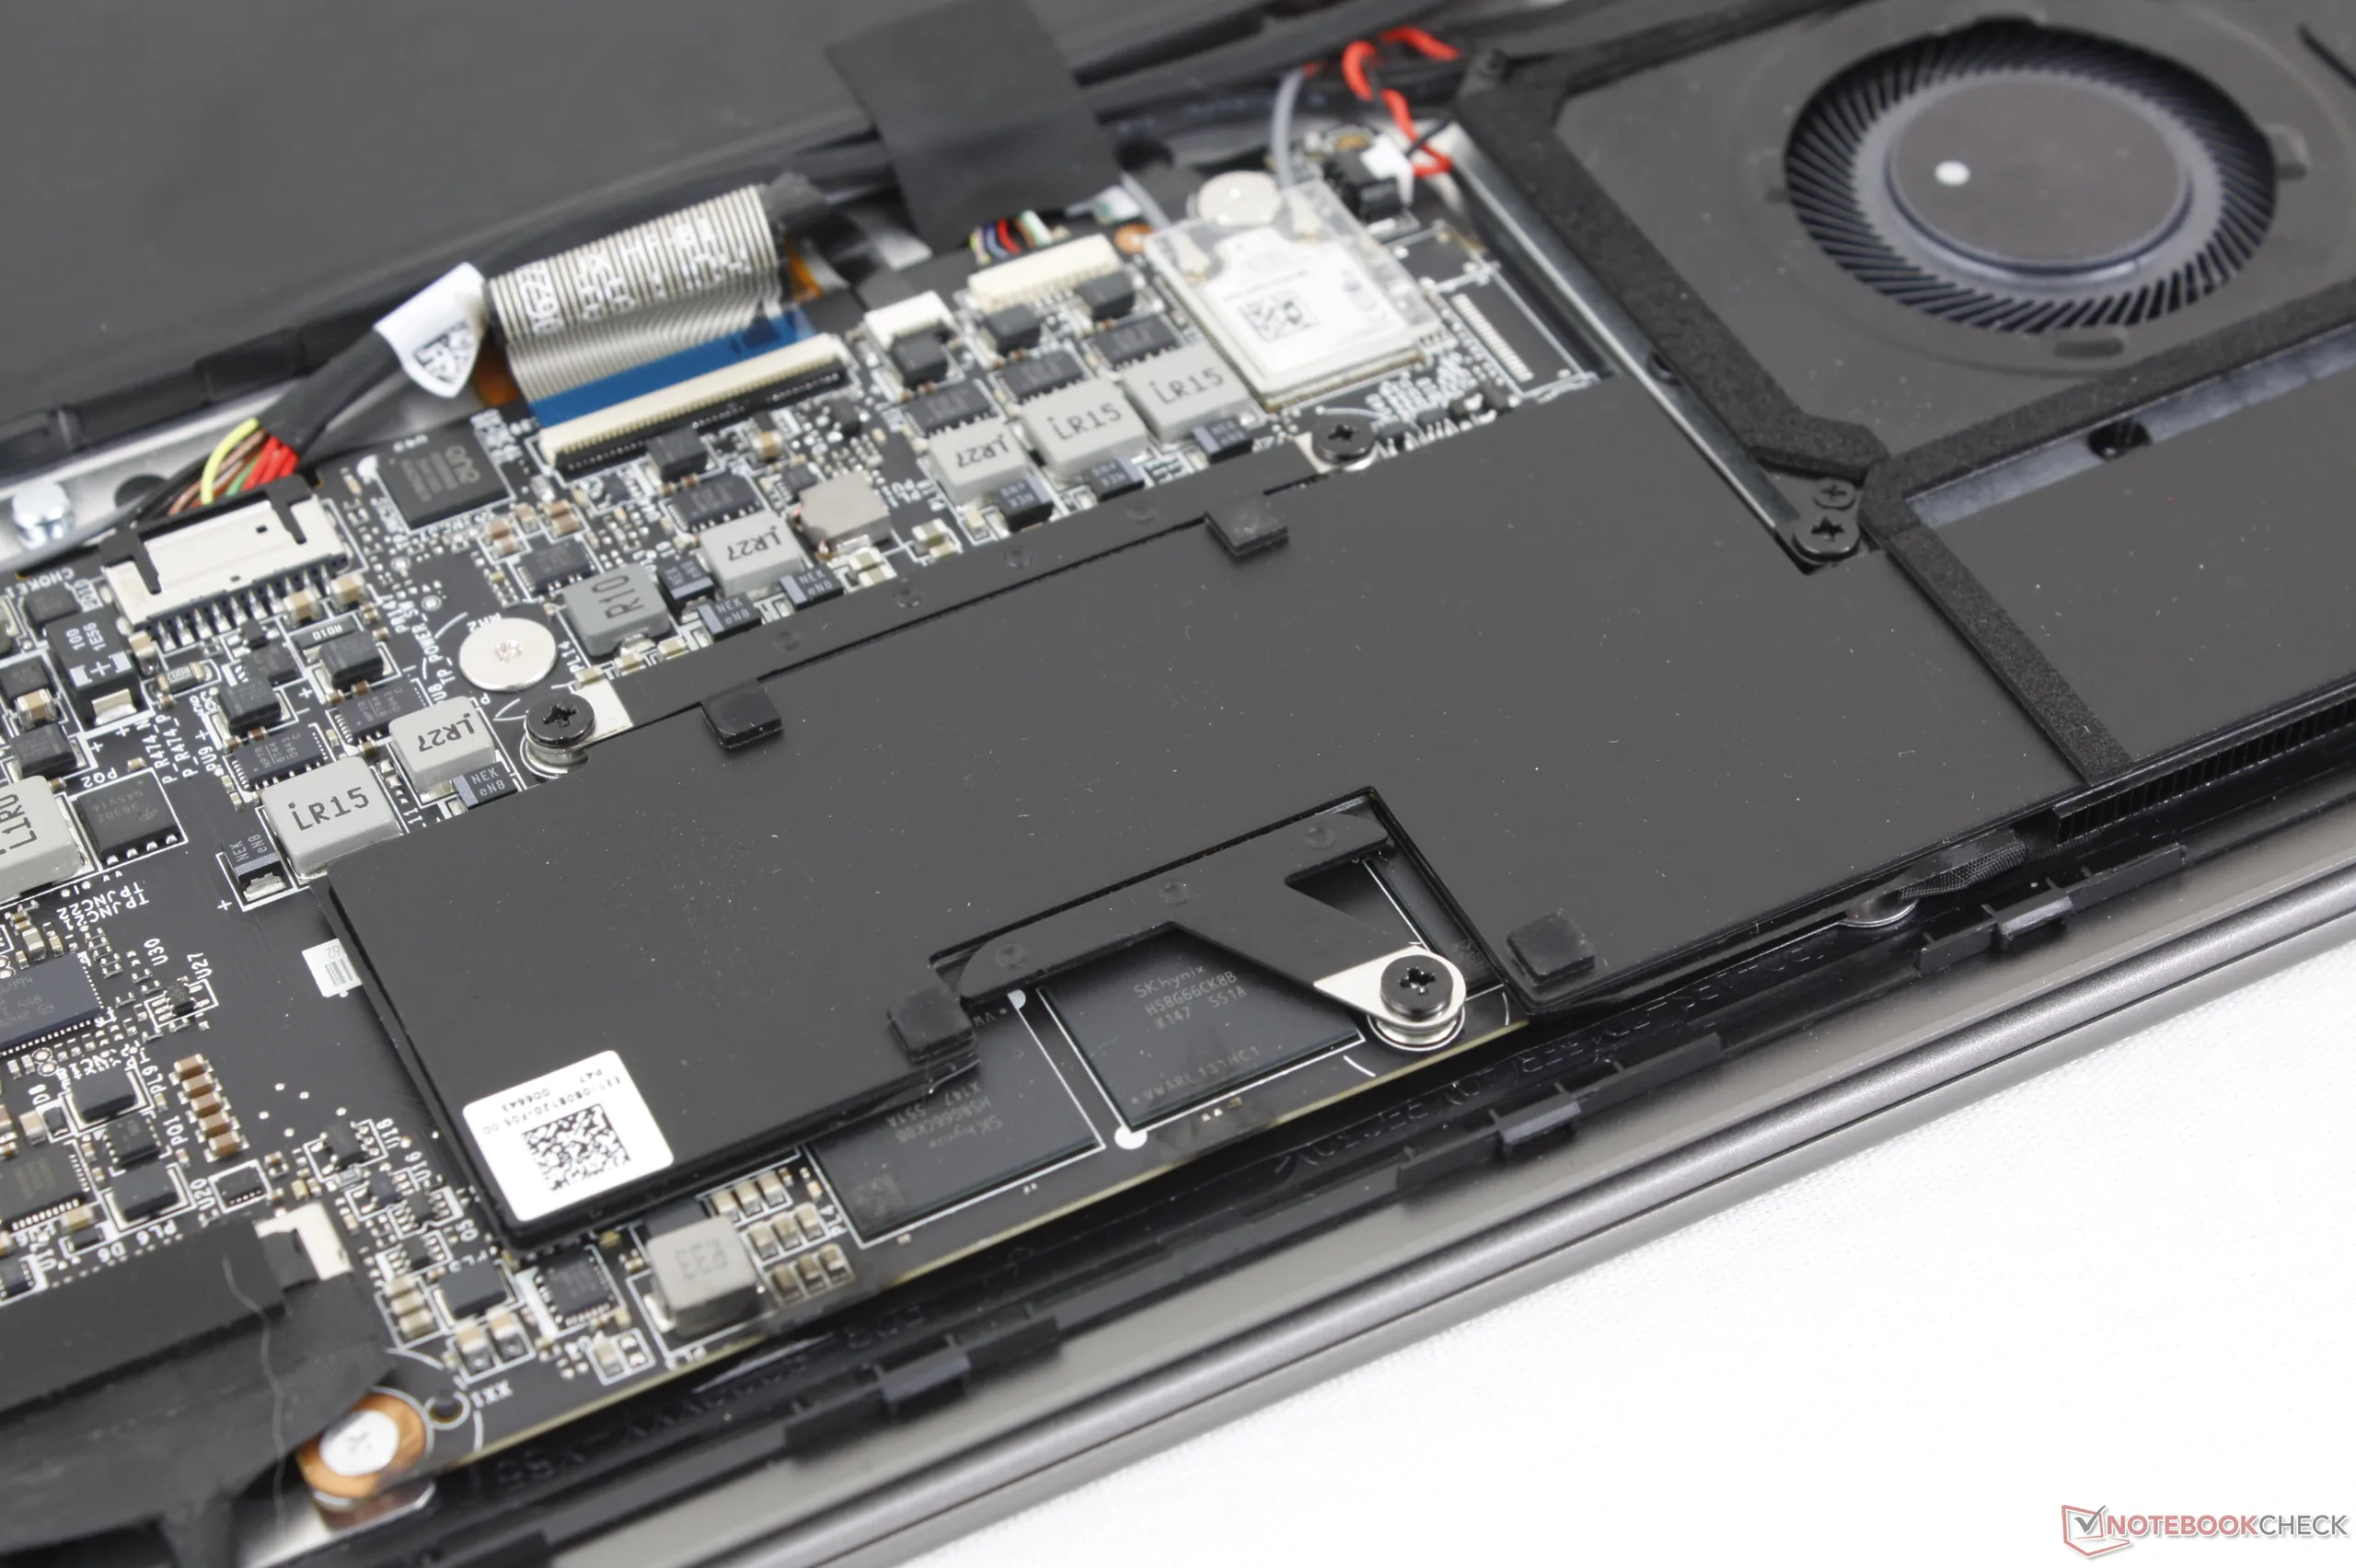
Il pannello inferiore è facilmente rimovibile con un cacciavite Phillips e una lama affilata. La scheda madre è stata completamente rivista rispetto al modello 2025, come mostrato di seguito. In particolare, il modello ora supporta solo un SSD M.2 invece di due, mentre la capacità della batteria si è ridotta probabilmente per risparmiare sul peso.

Sostenibilità
L'uso di materiali riciclati durante la produzione non è esplicitamente dichiarato dal produttore. Nel frattempo, l'imballaggio è certificato FSC ed è composto sia da carta che da plastica.
Accessori e garanzia
La confezione non contiene altri extra oltre all'adattatore CA e alla documentazione cartacea. Si applica la consueta garanzia limitata di un anno del produttore, se acquistata negli Stati Uniti.
Dispositivi di ingresso
Tastiera
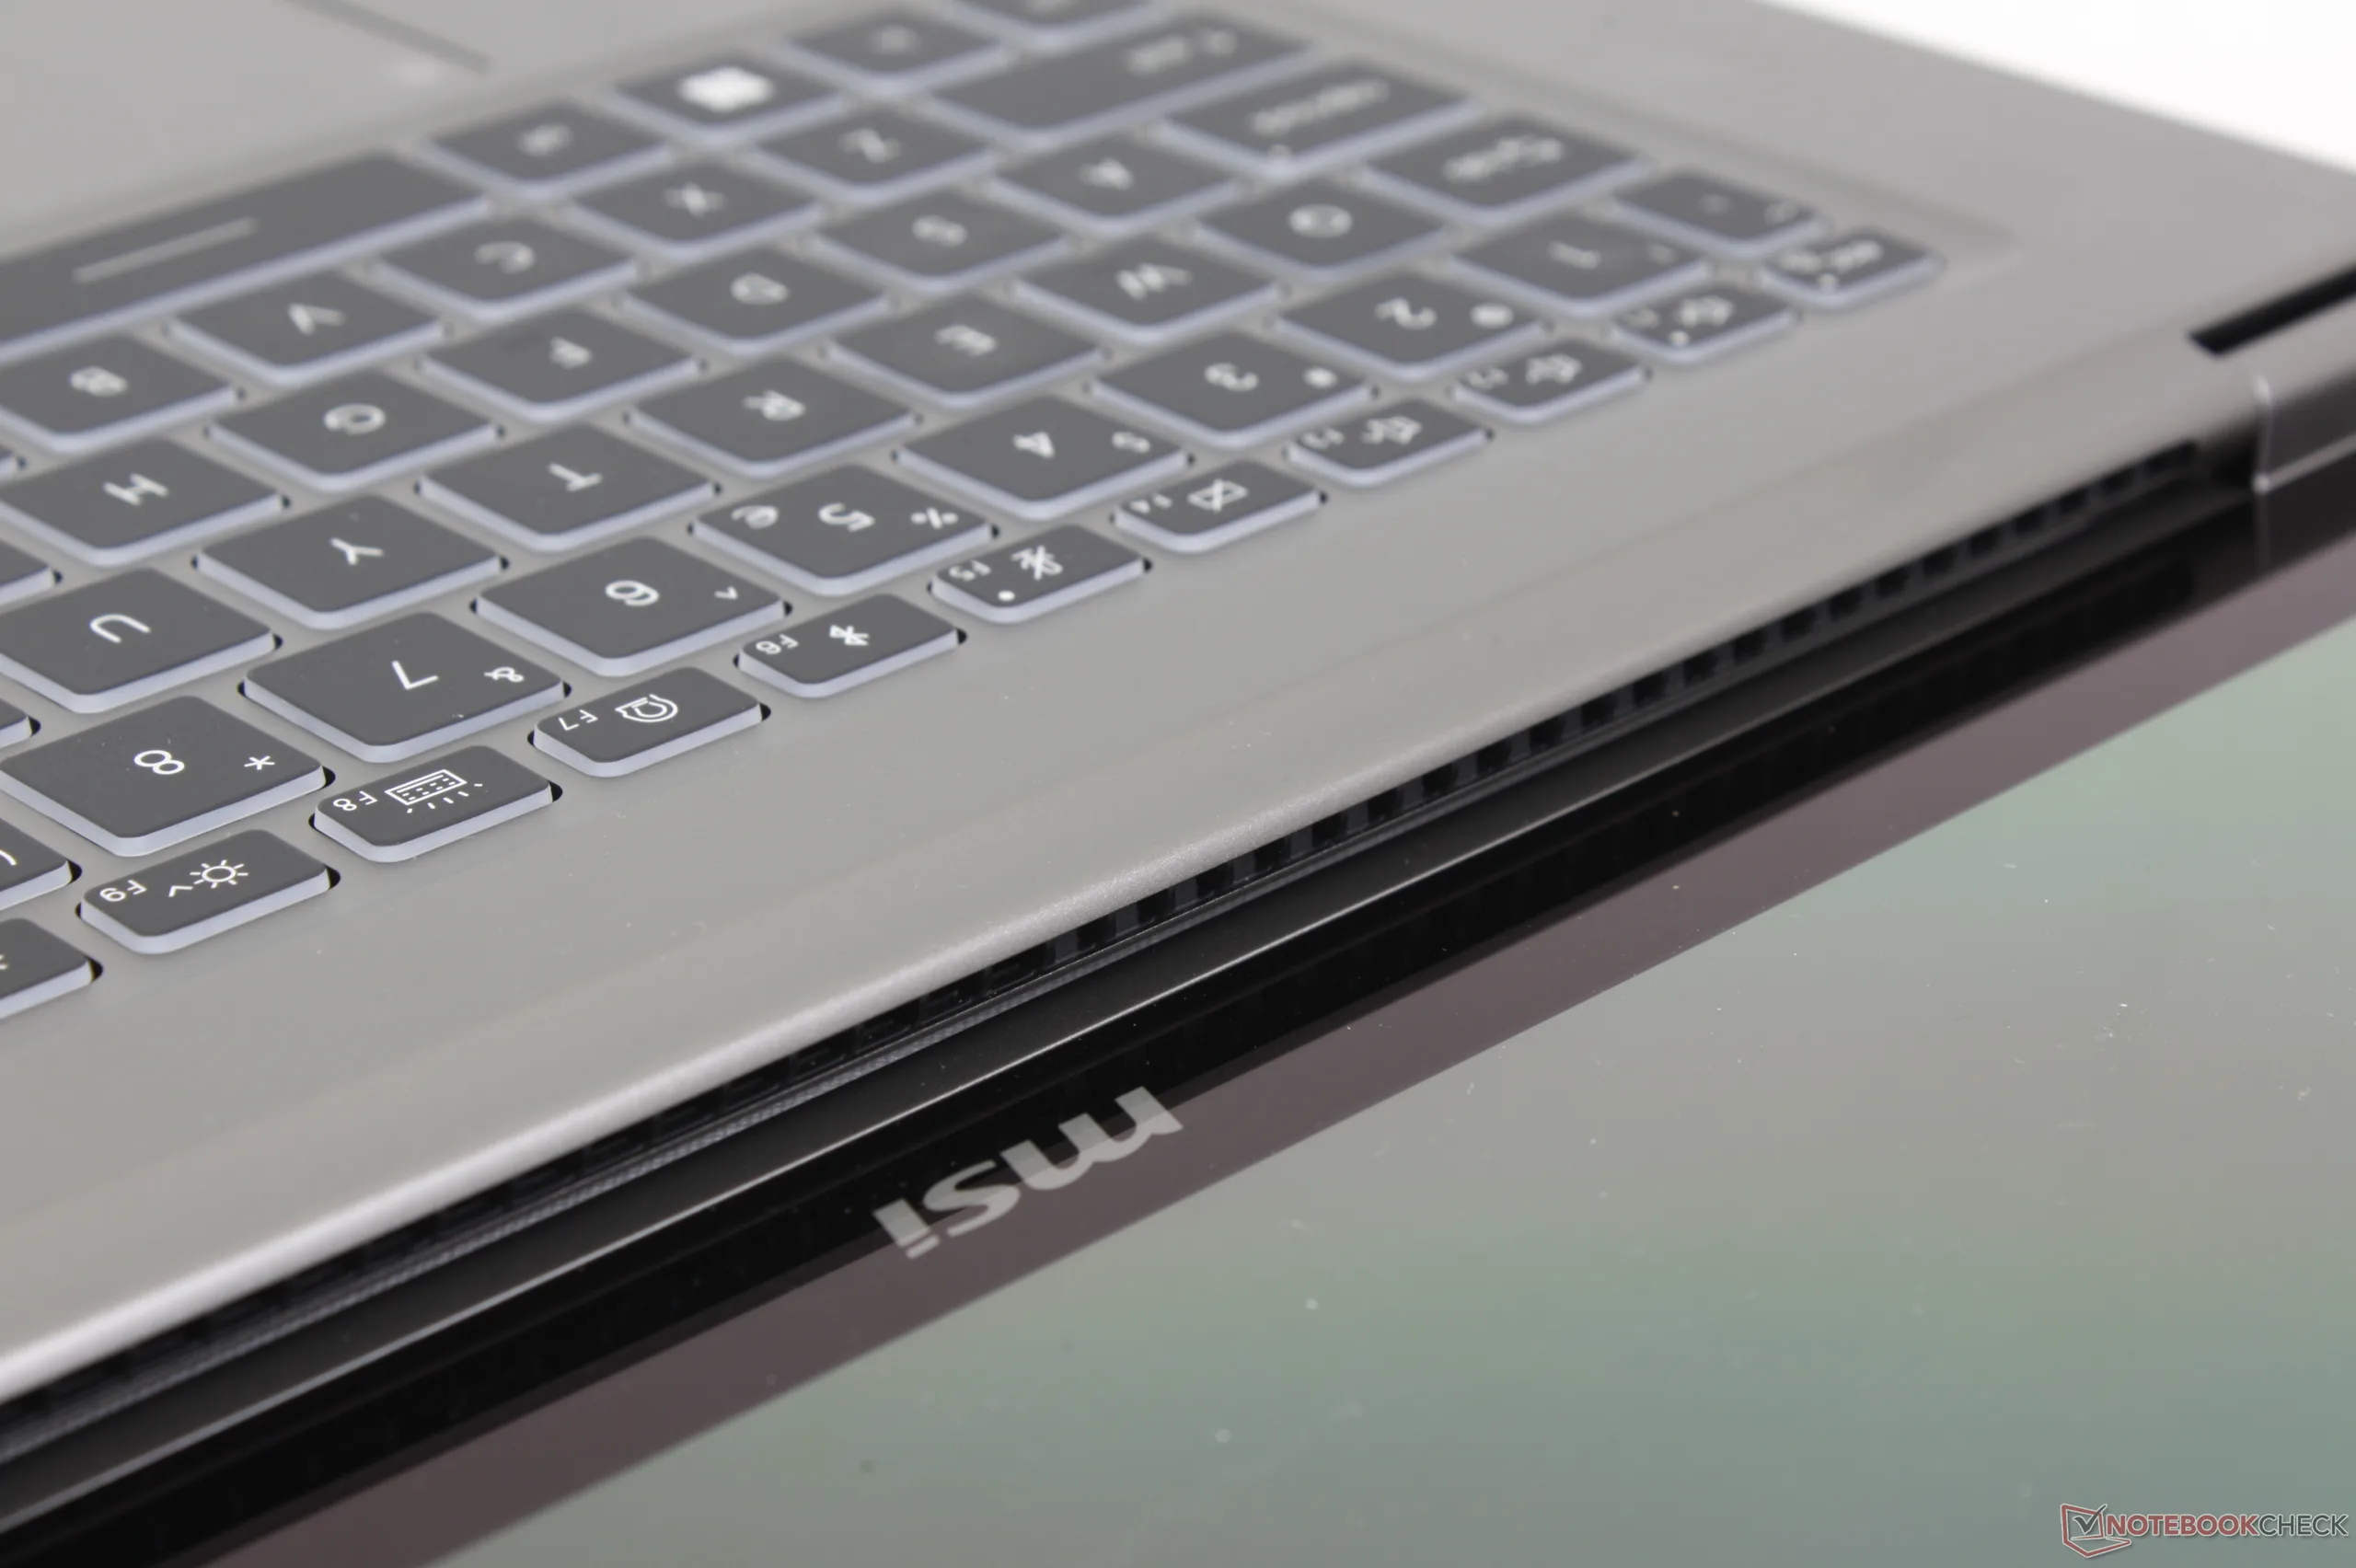
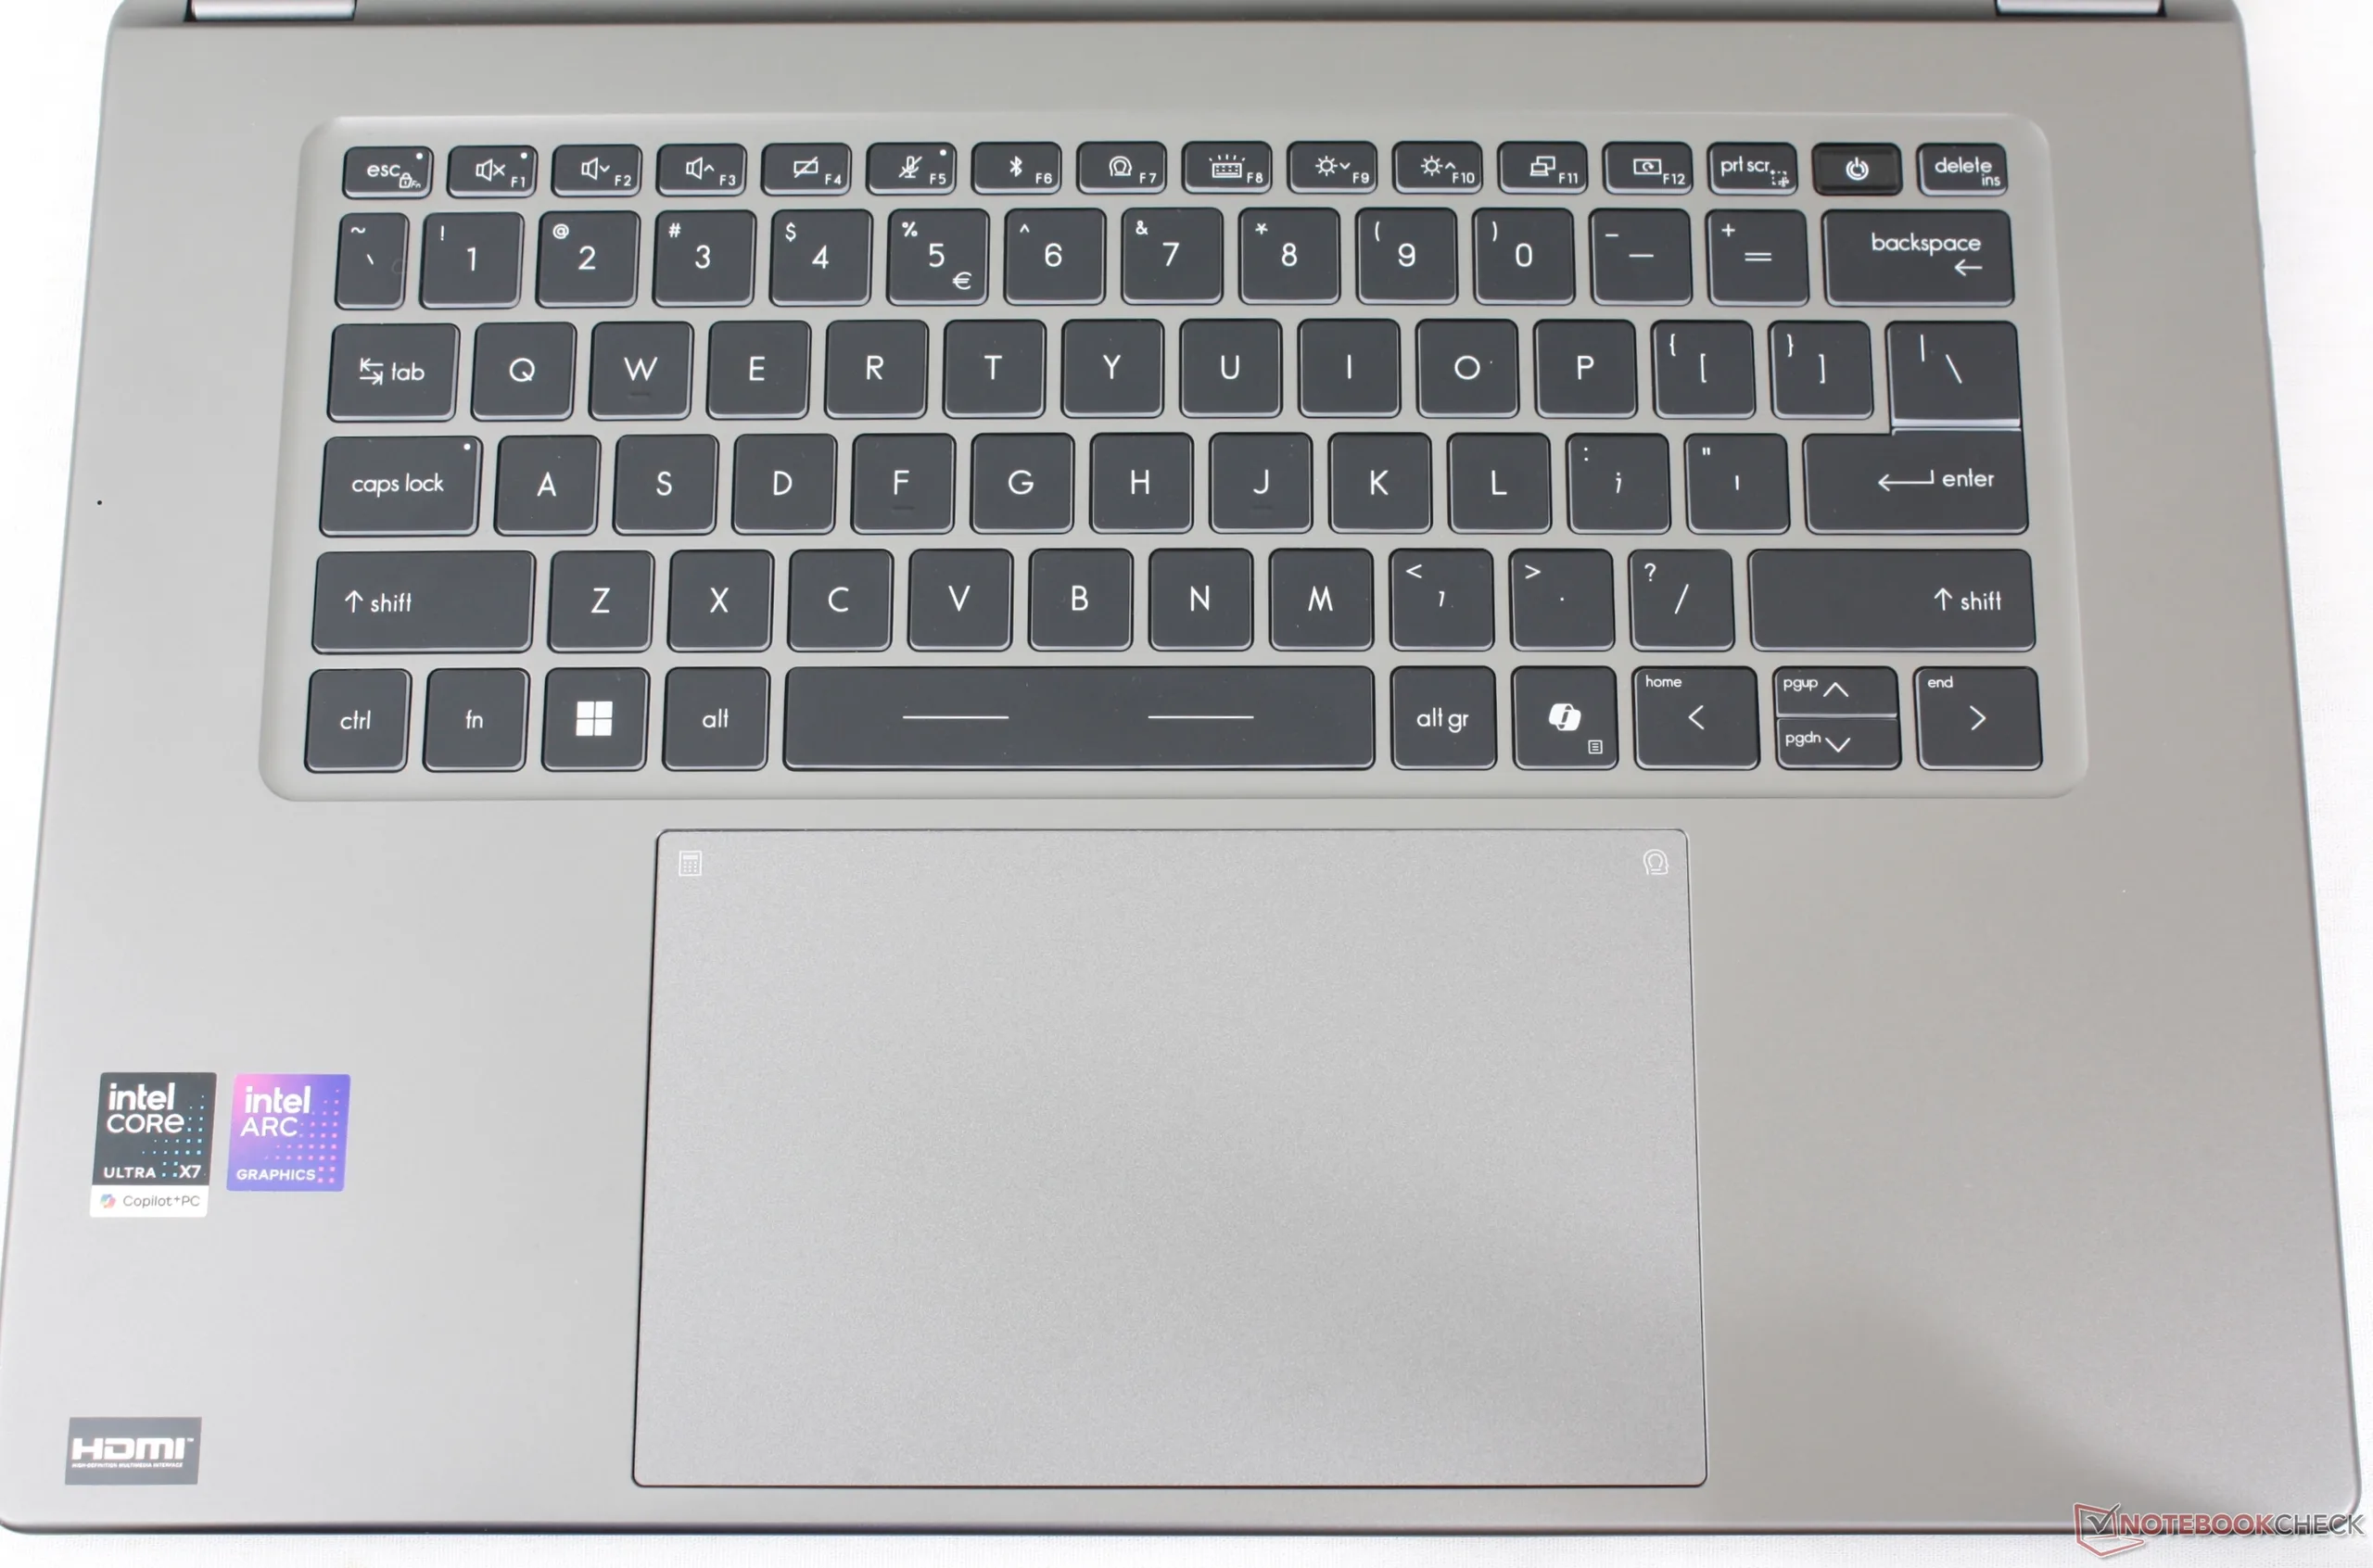
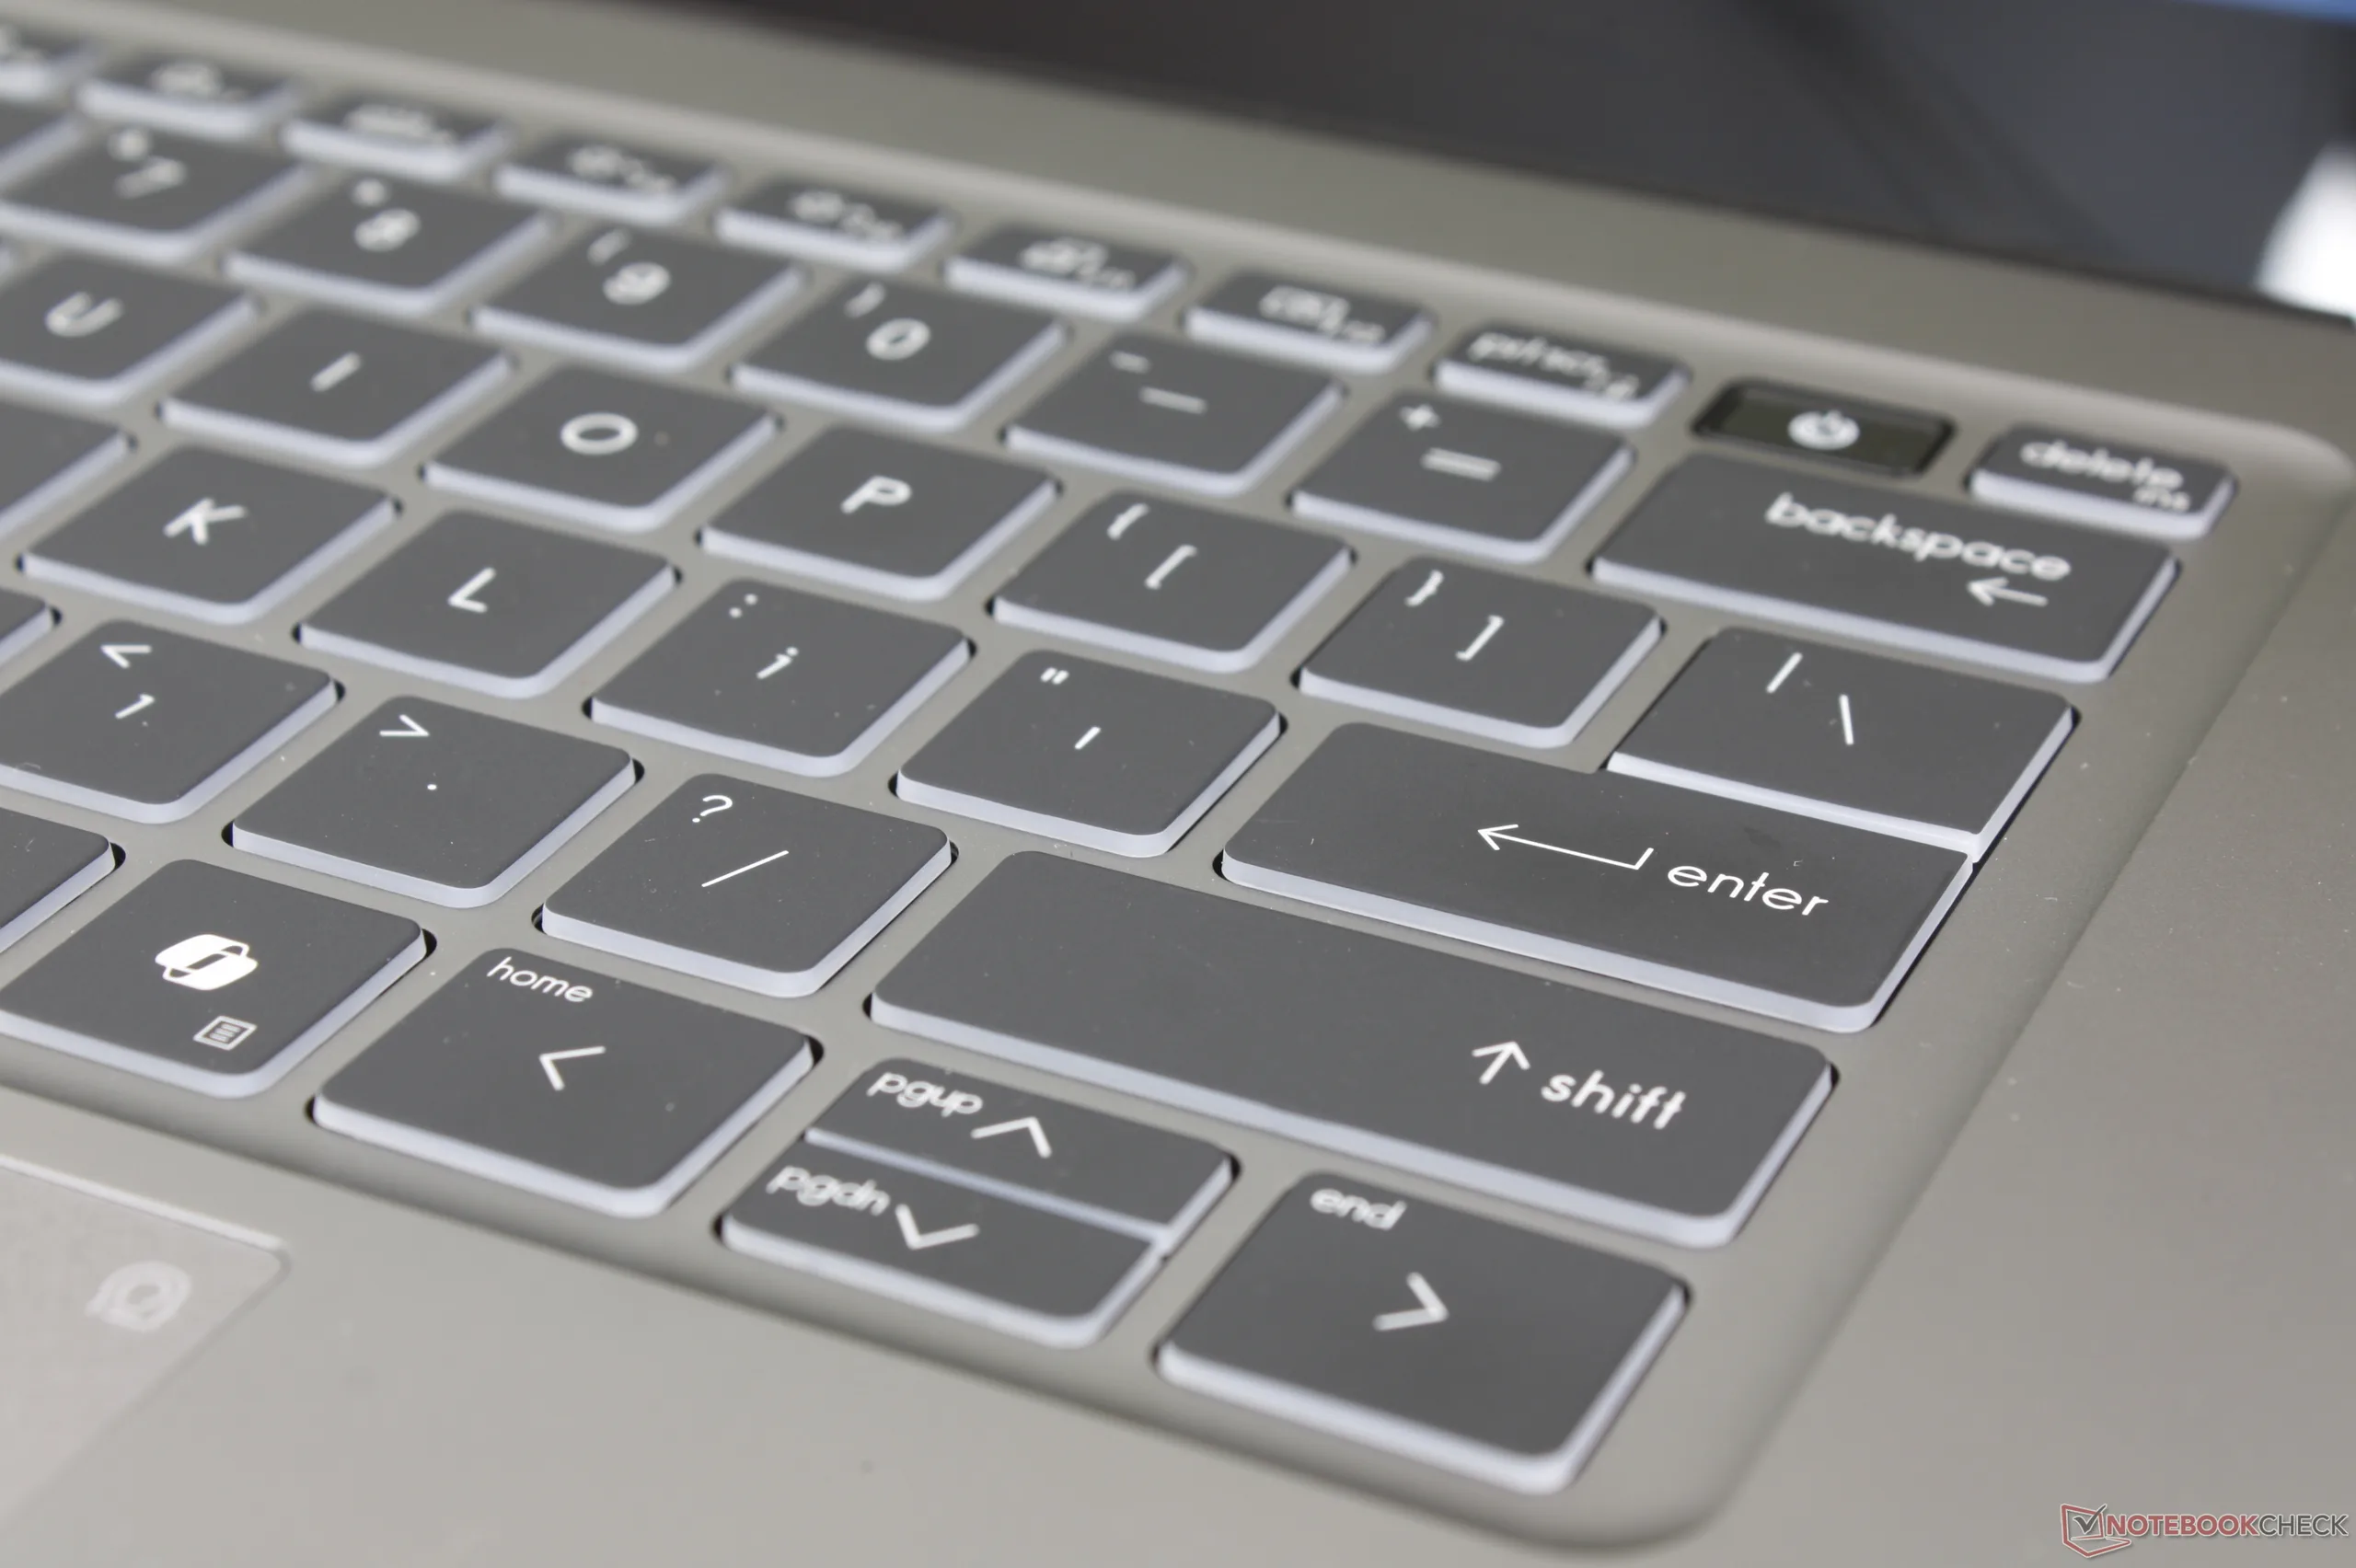
Il tastierino numerico è sparito, nel bene e nel male. Per il resto, l'esperienza di digitazione è più leggera e con una corsa meno profonda rispetto ai classici computer portatili da ufficio della serie Thinkpad T o EliteBook. La digitazione sul molto più economico Venture 16per esempio, la sensazione è più o meno la stessa di quella che si prova con la linea Prestige, la più importante. Mentre MSI ha azzeccato il design generale del nuovo chassis Prestige, la sua tastiera non è stata all'altezza.
Touchpad
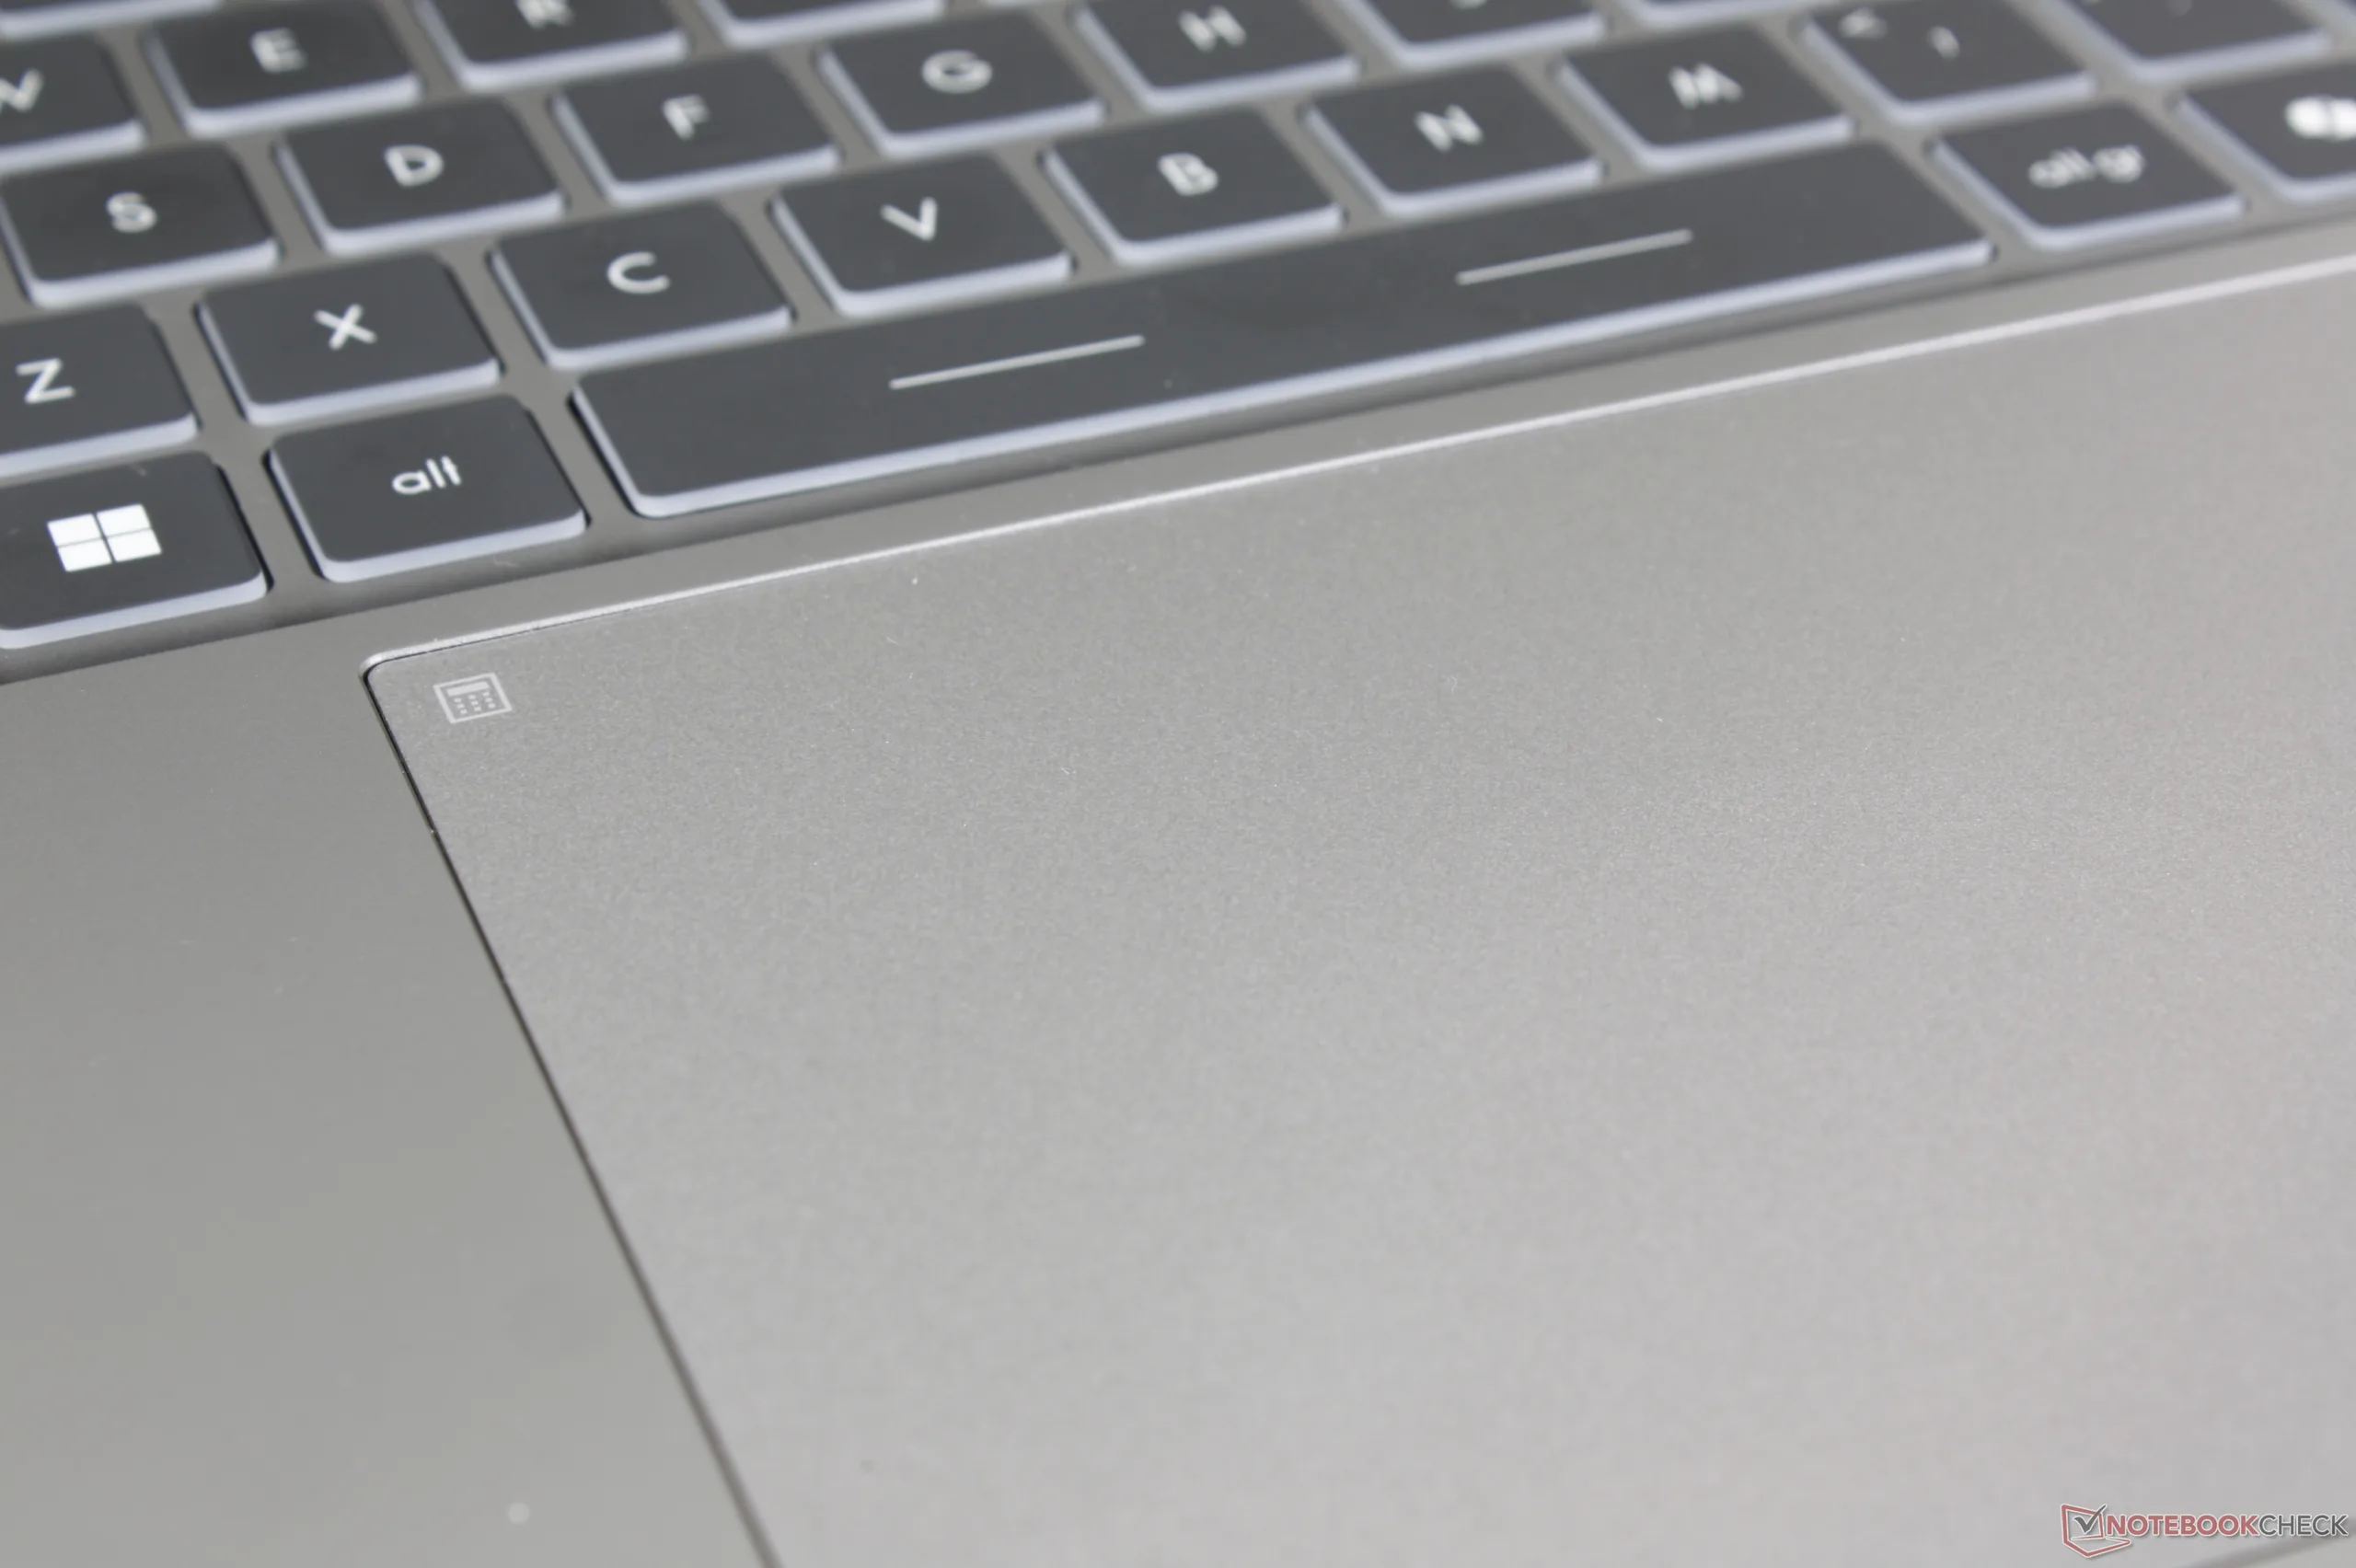
Il clickpad è ancora più grande di prima, da 15 x 9 cm a 16 x 10 cm sul modello più recente. La trazione è fluida e precisa, indipendentemente dalla velocità di scorrimento, ma il feedback quando fa clic rimane relativamente debole. Inoltre, i clic sono confortevoli solo in prossimità dei due angoli inferiori, dove la superficie del clickpad si deprime molto più facilmente.

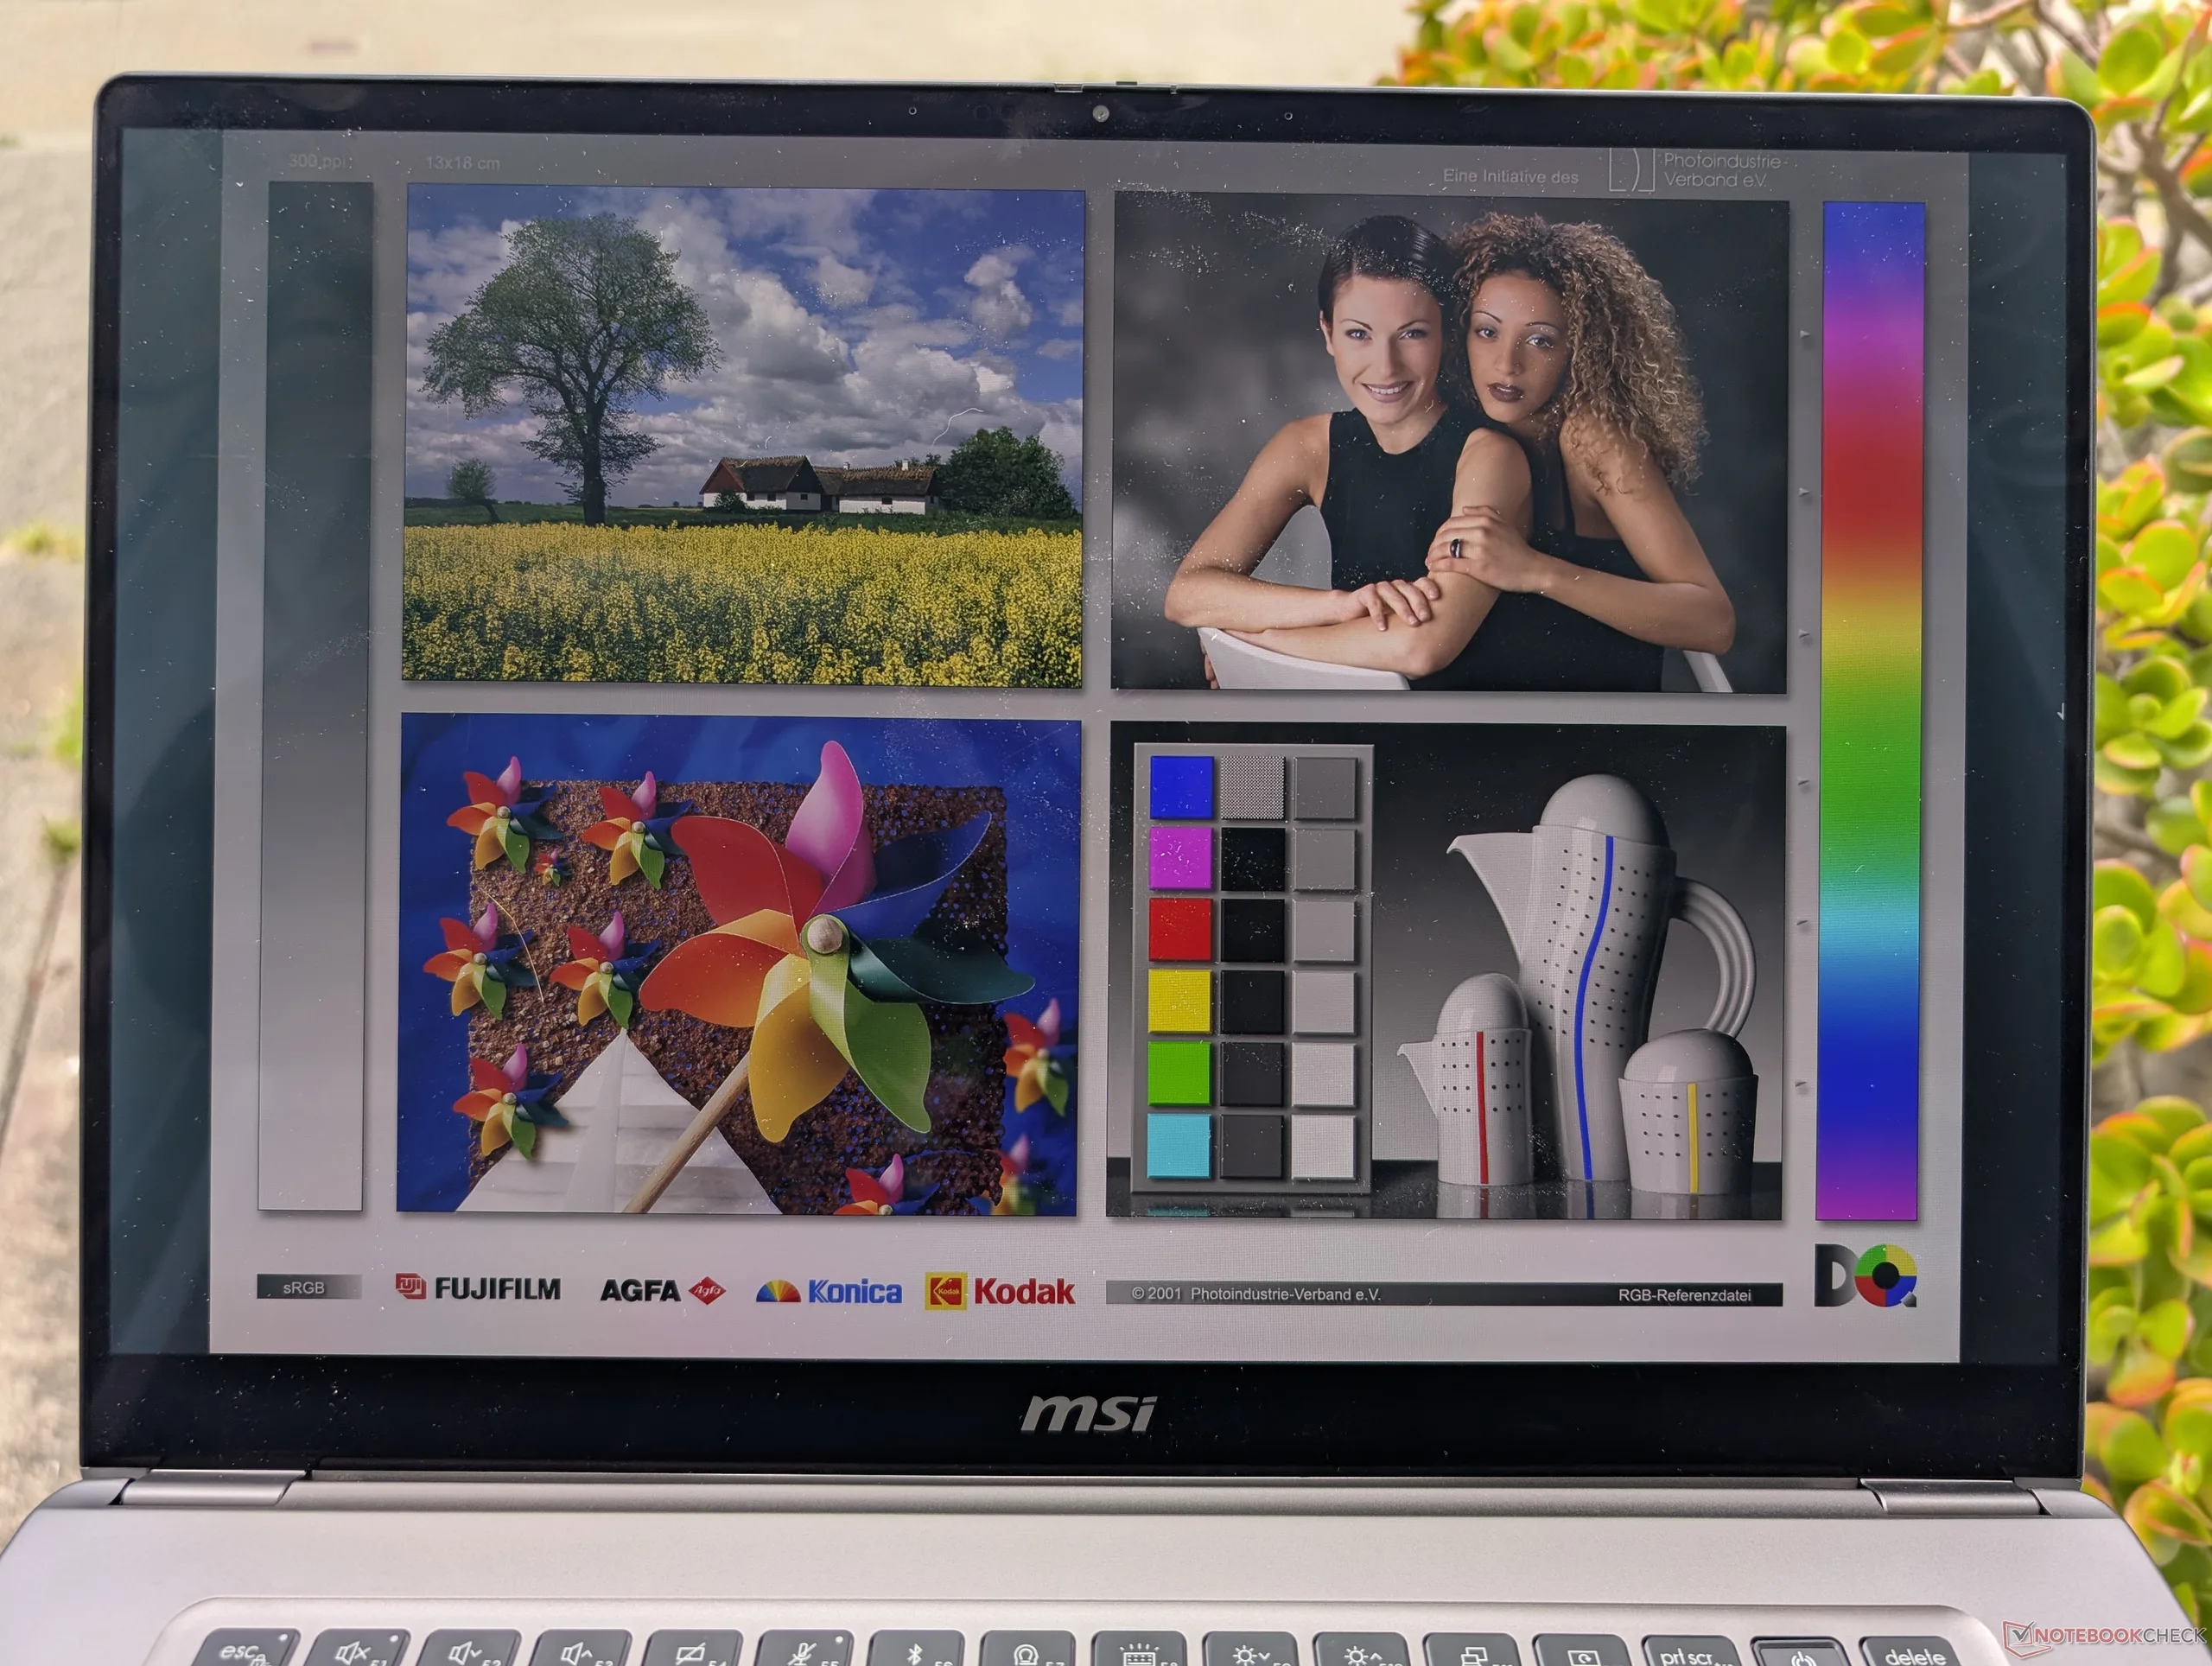
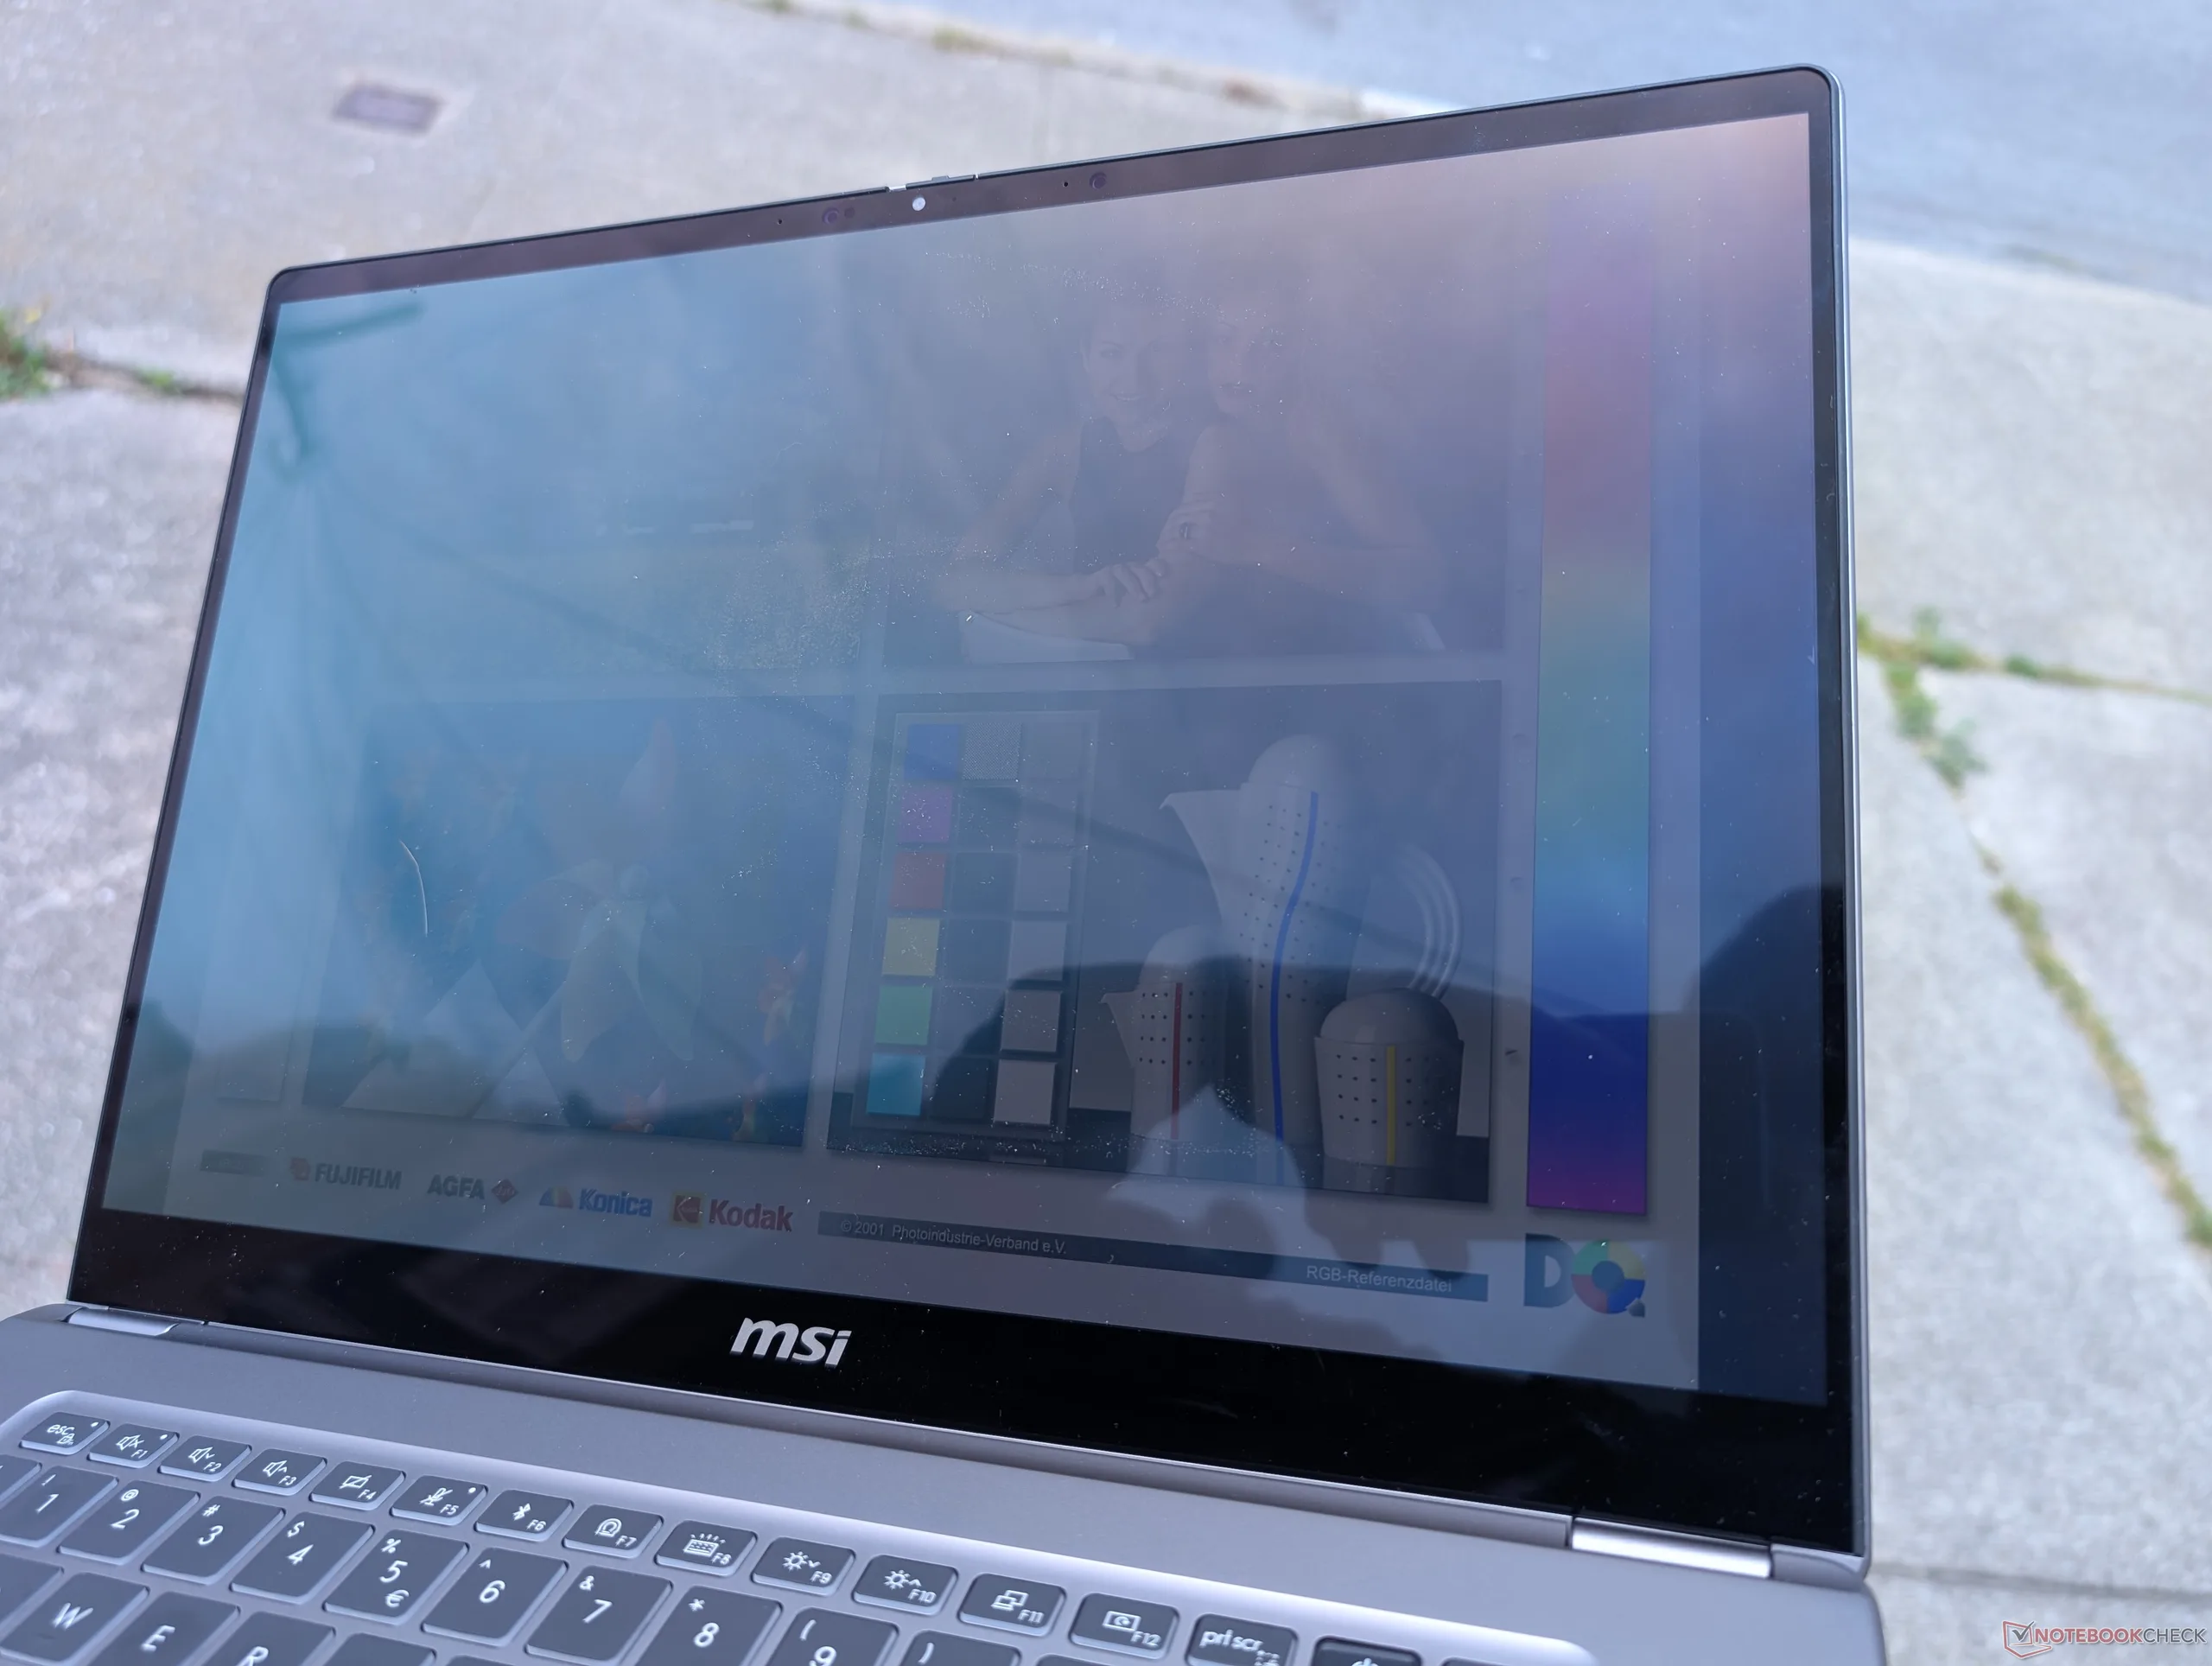
Display
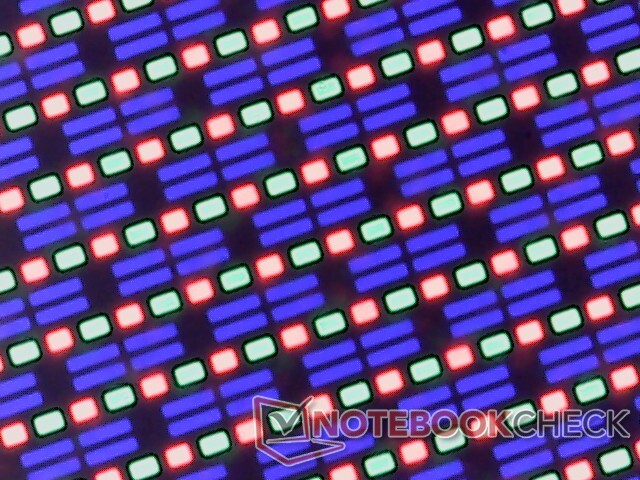
Il pannello OLED Samsung ATNA60CL11-0 è molto simile al pannello ATNA60CL10-0 che si trova sullo ZenBook S16. La frequenza di aggiornamento di 120 Hz e la risoluzione nativa di 1800p sono un miglioramento rispetto al pannello IPS del modello dello scorso anno. In effetti, non ci sono più opzioni IPS di cui parlare, il che sposta la serie Prestige 16 nella categoria degli appassionati.
La luminosità, pur rimanendo eccellente, è più debole rispetto al display IPS del modello 2025 Prestige 16. I nostri test dimostrano una luminosità massima di 20,5 milioni di euro. I nostri test mostrano una luminosità massima di soli 383 nits e 422 nits in modalità SDR e HDR, rispettivamente, rispetto ai 471 nits del modello dello scorso anno. Alcune configurazioni supportano DisplayHDR1000 per ottenere massime più luminose, qualora fossero disponibili, ma la nostra unità di prova non è una di queste.
| |||||||||||||||||||||||||
Distribuzione della luminosità: 98 %
Al centro con la batteria: 375 cd/m²
Contrasto: ∞:1 (Nero: 0 cd/m²)
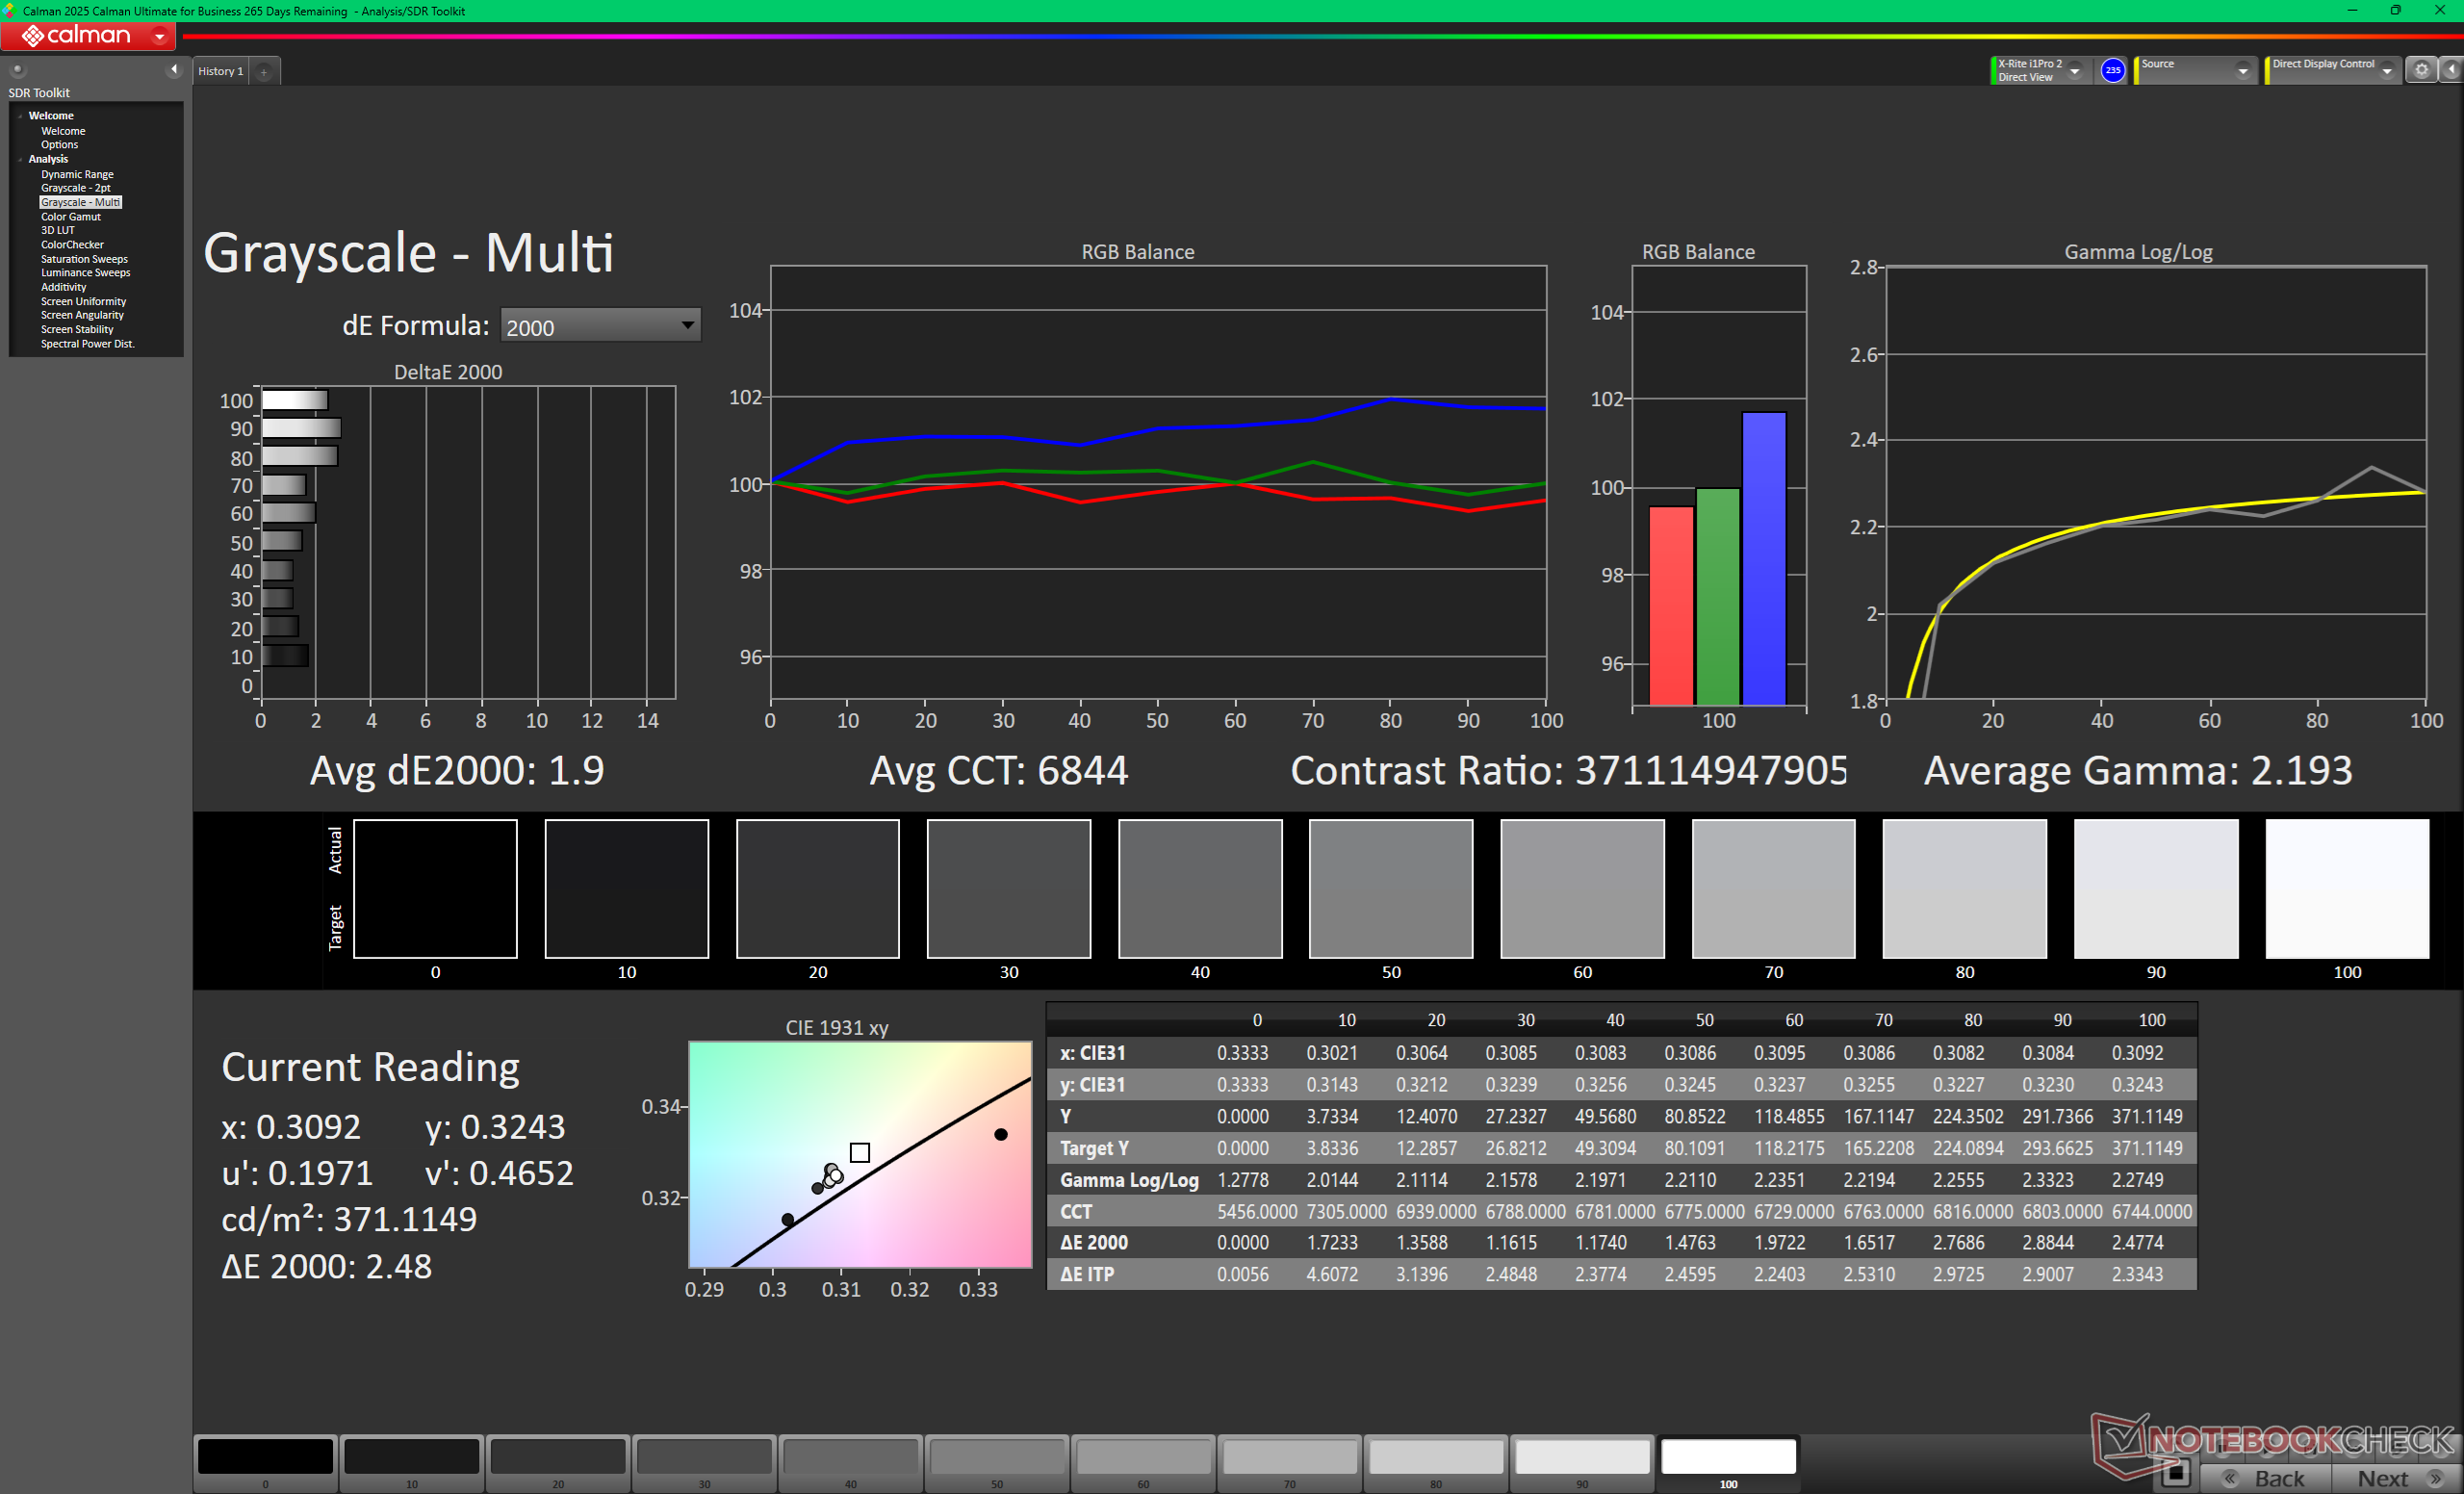
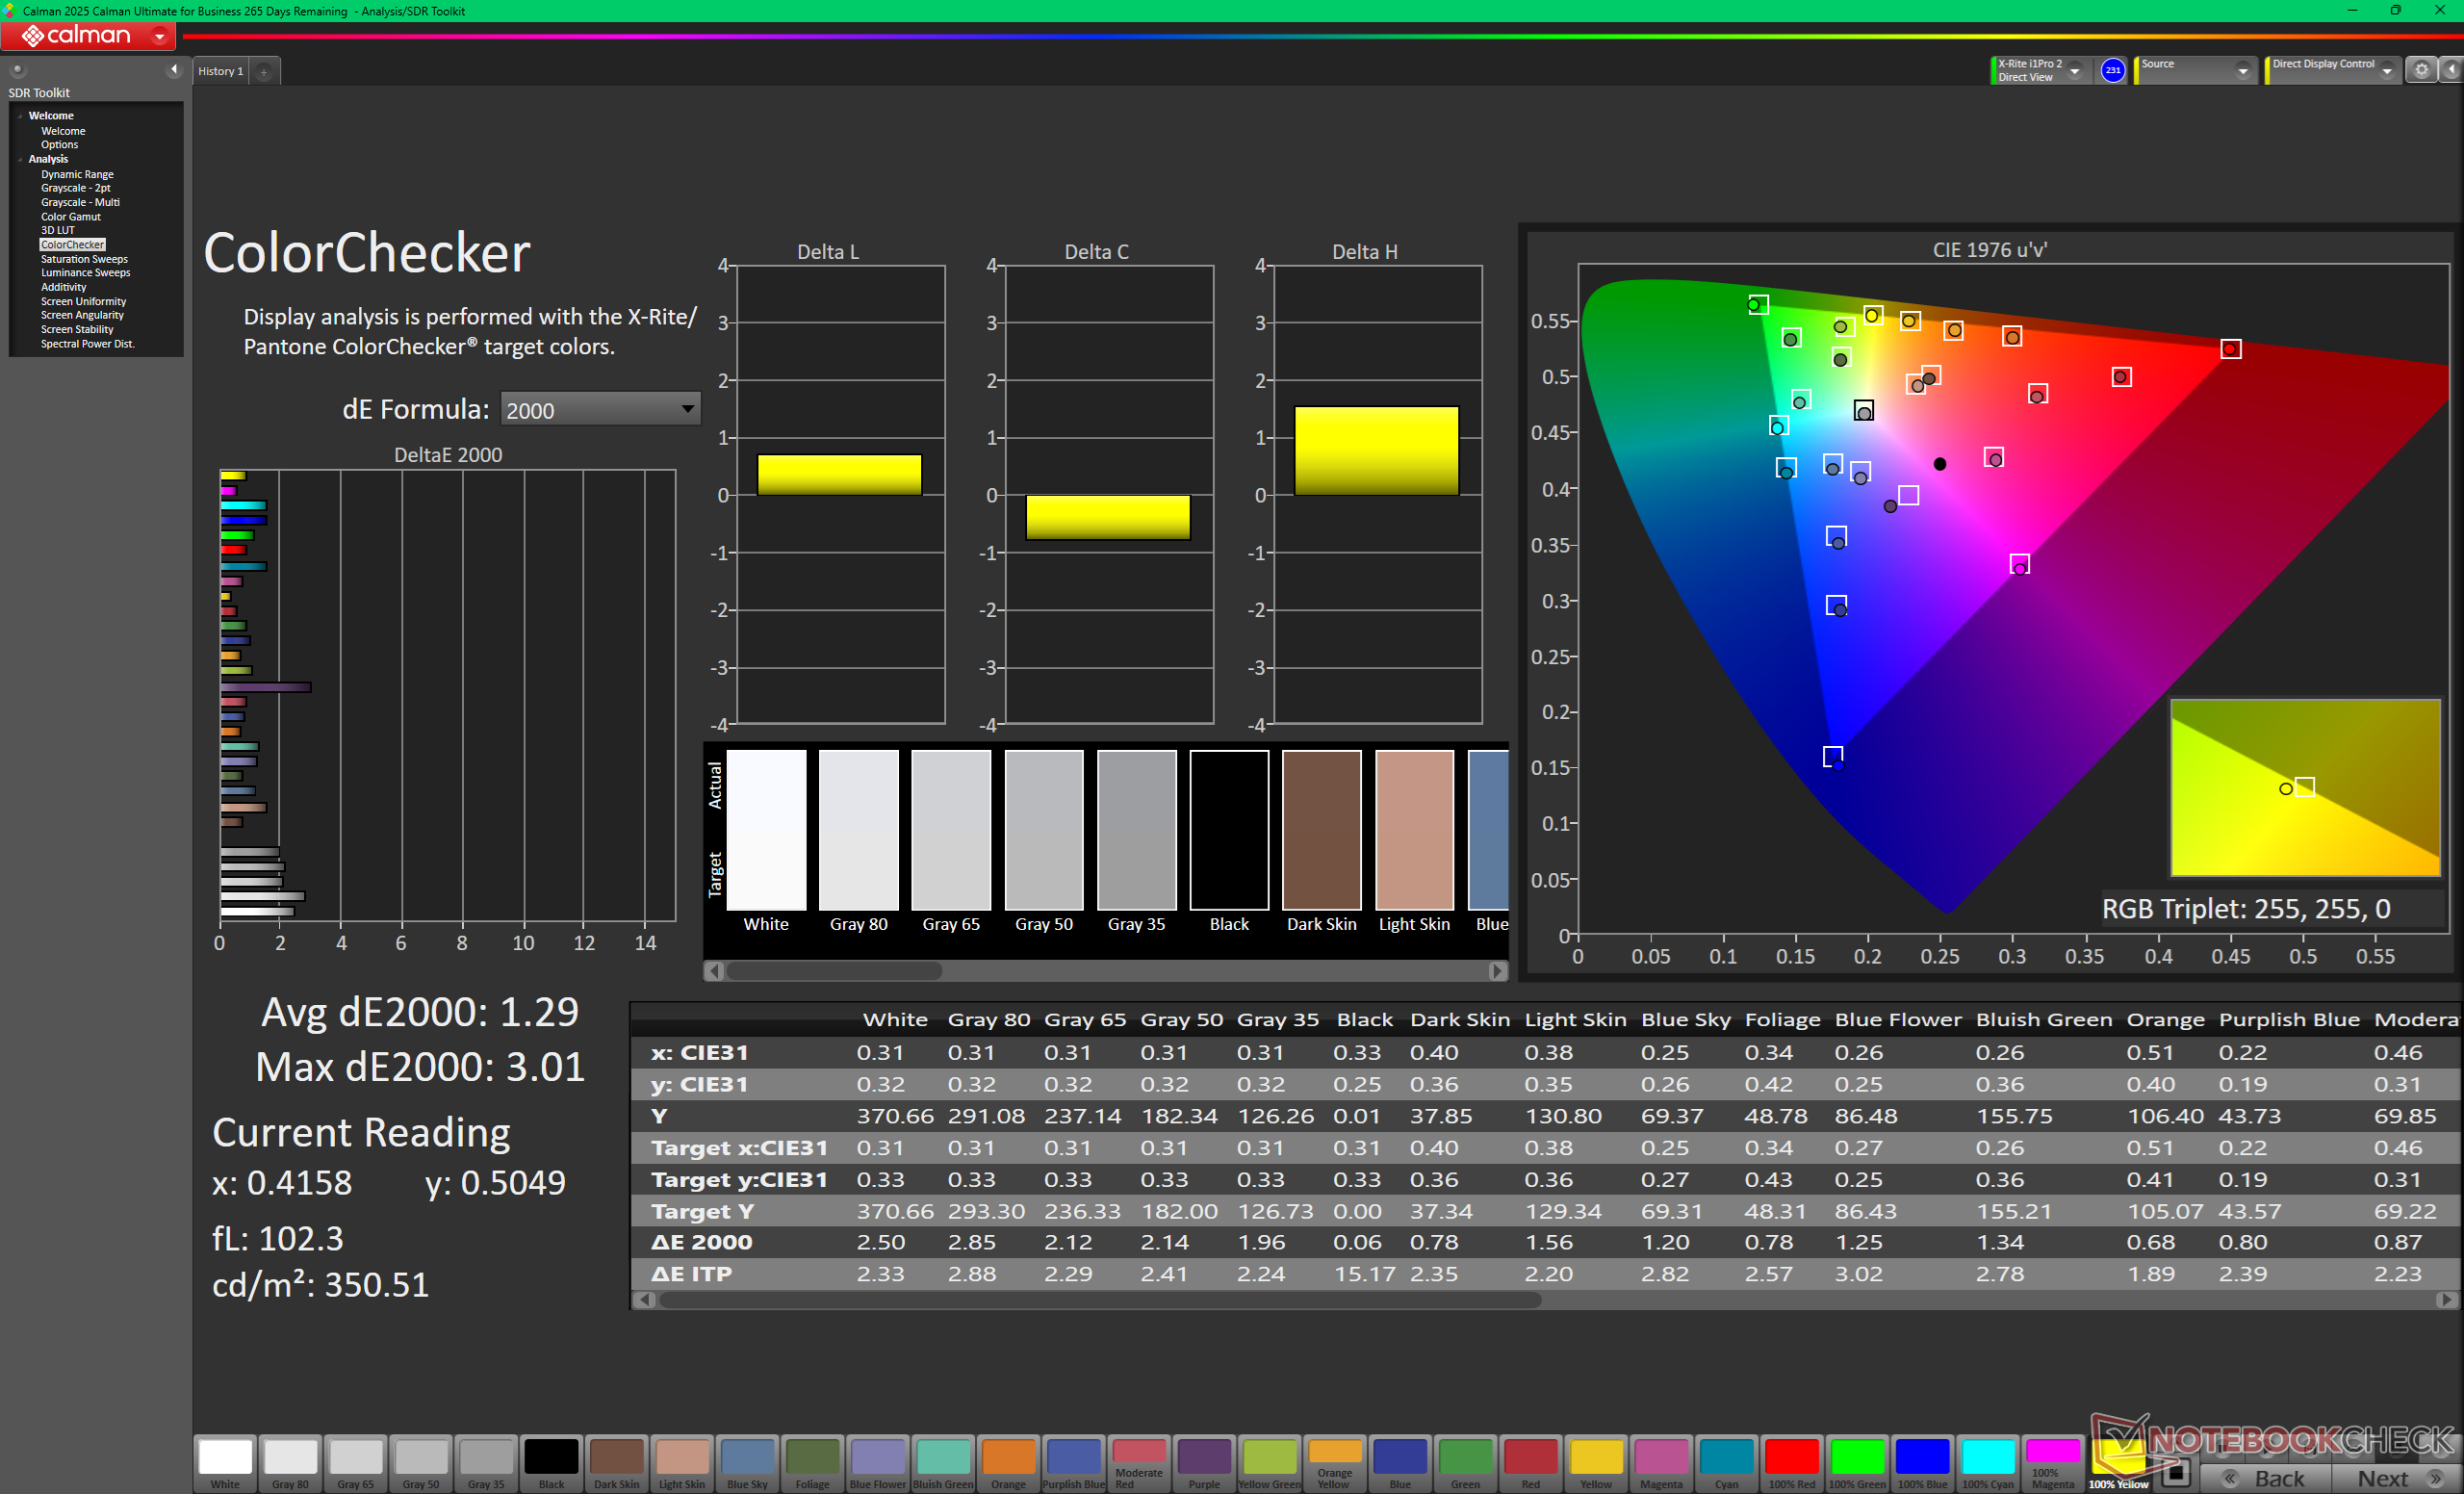
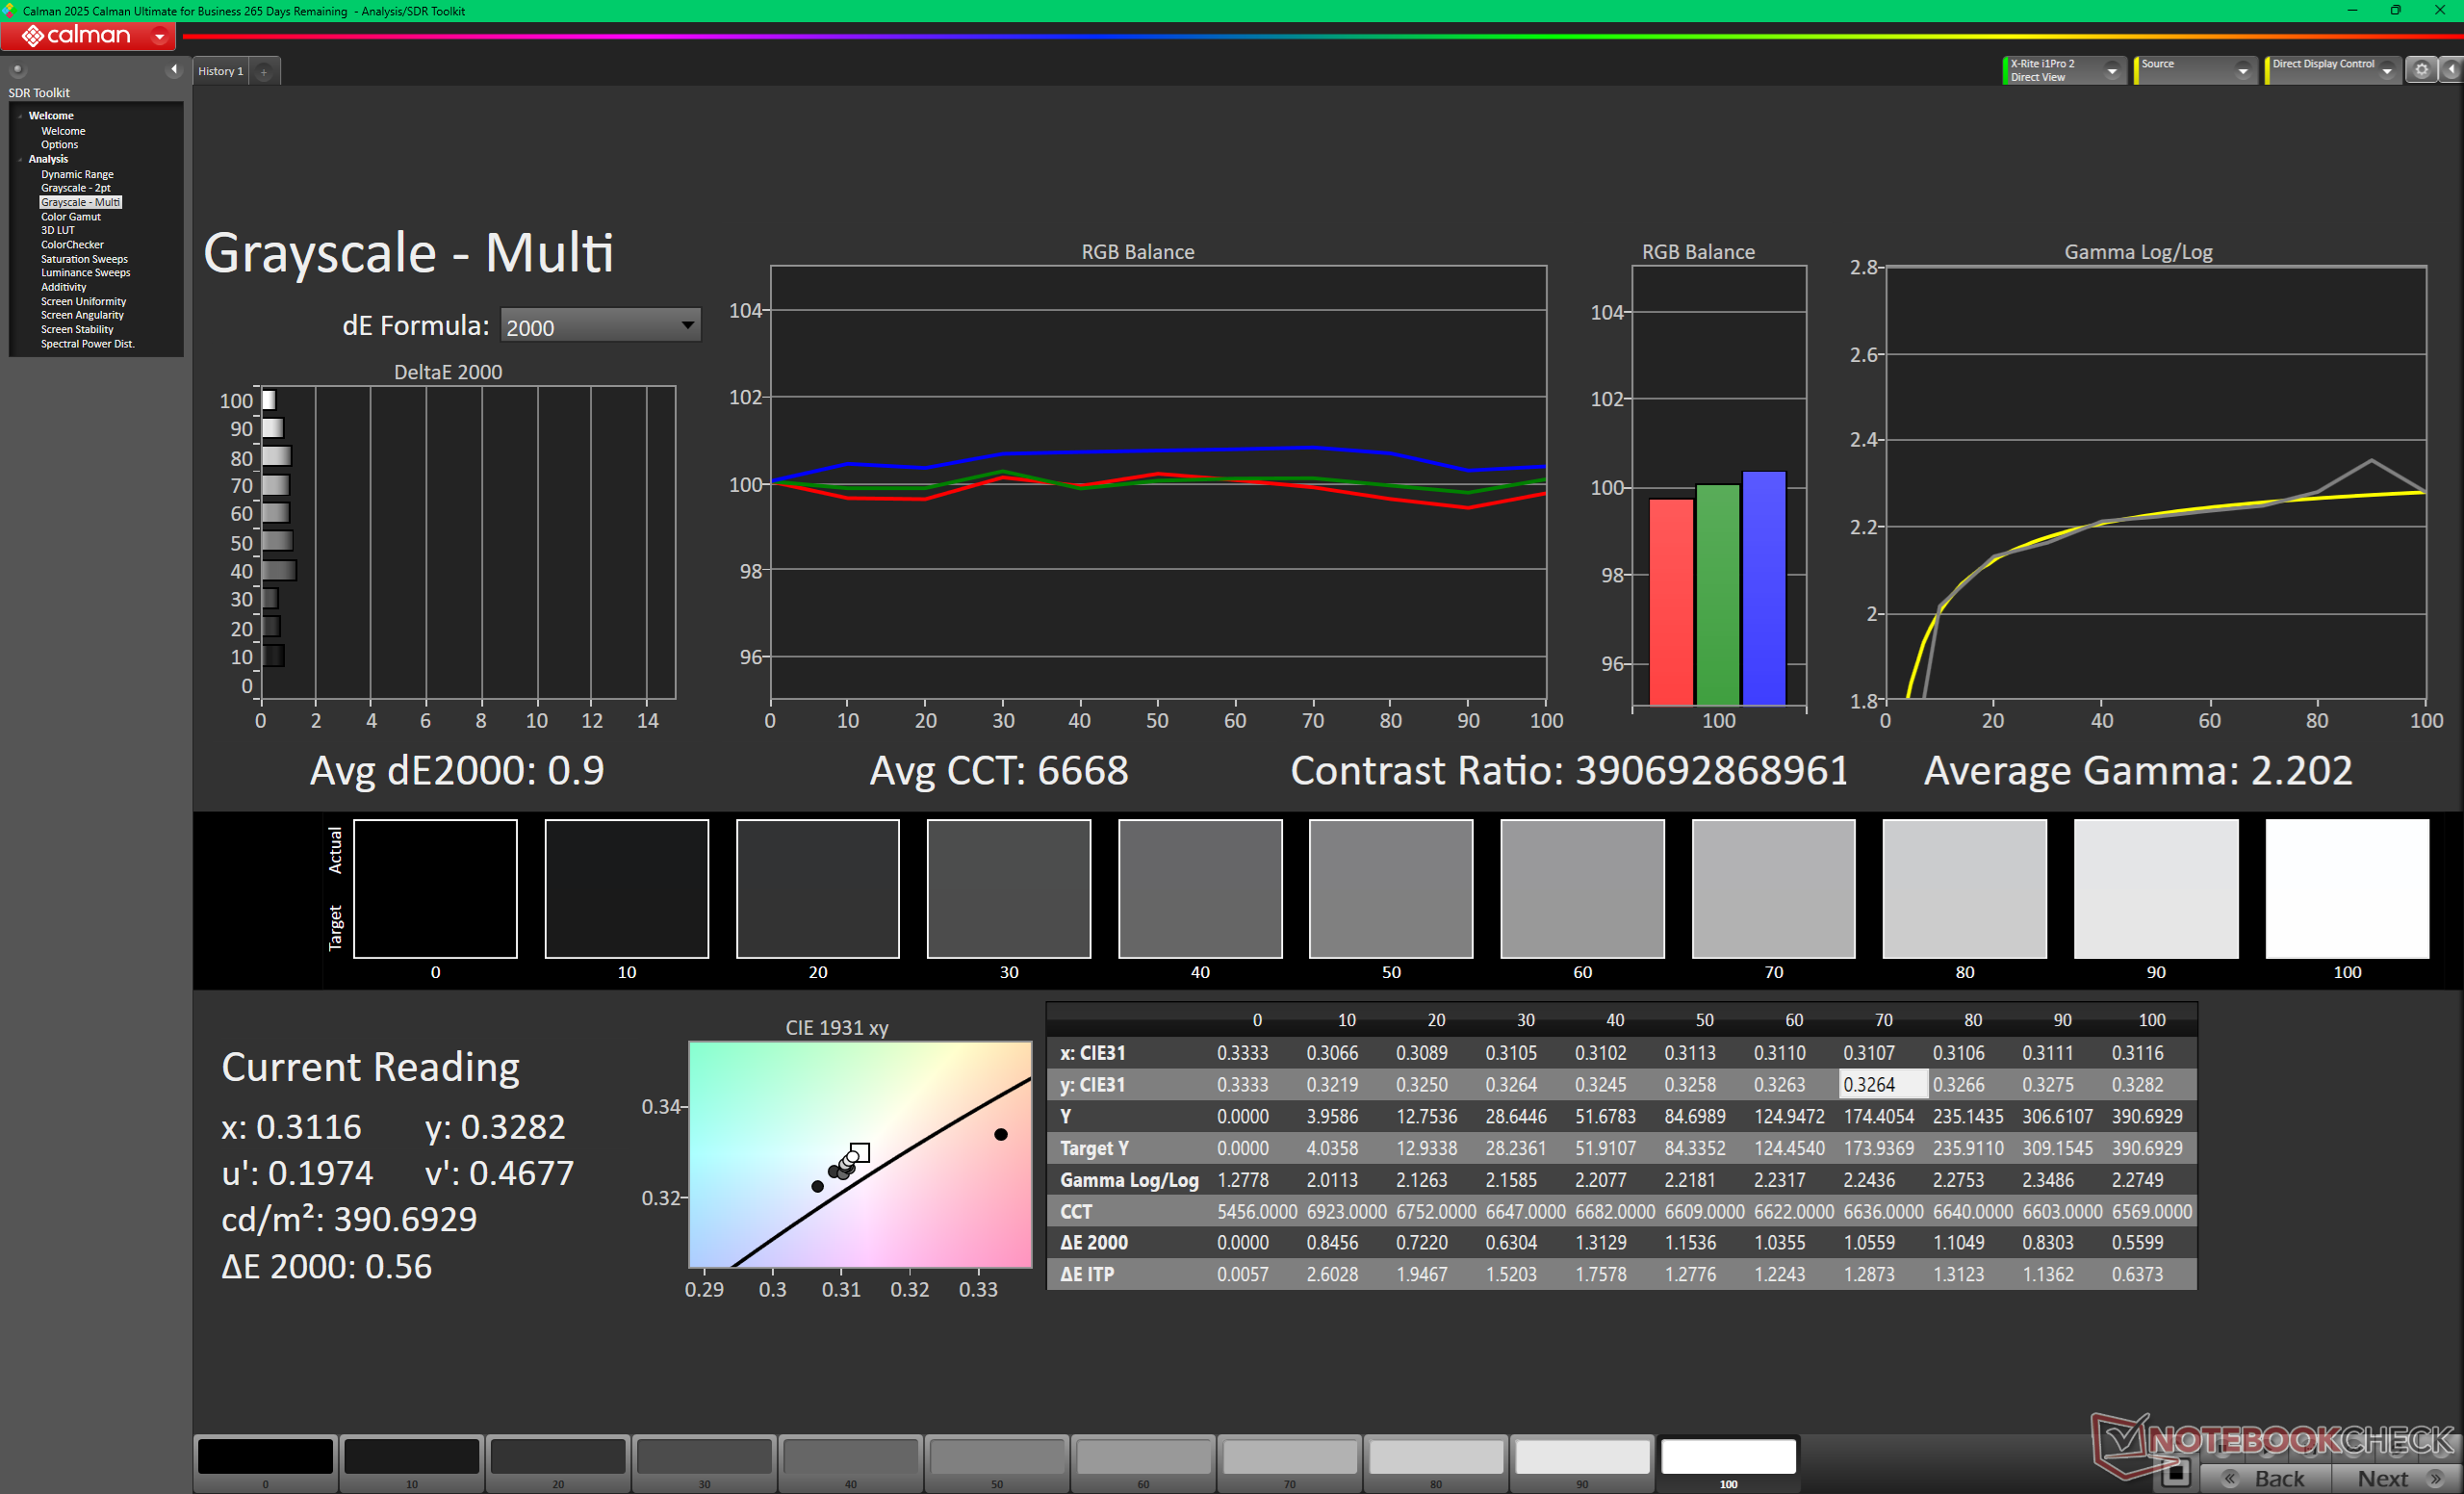
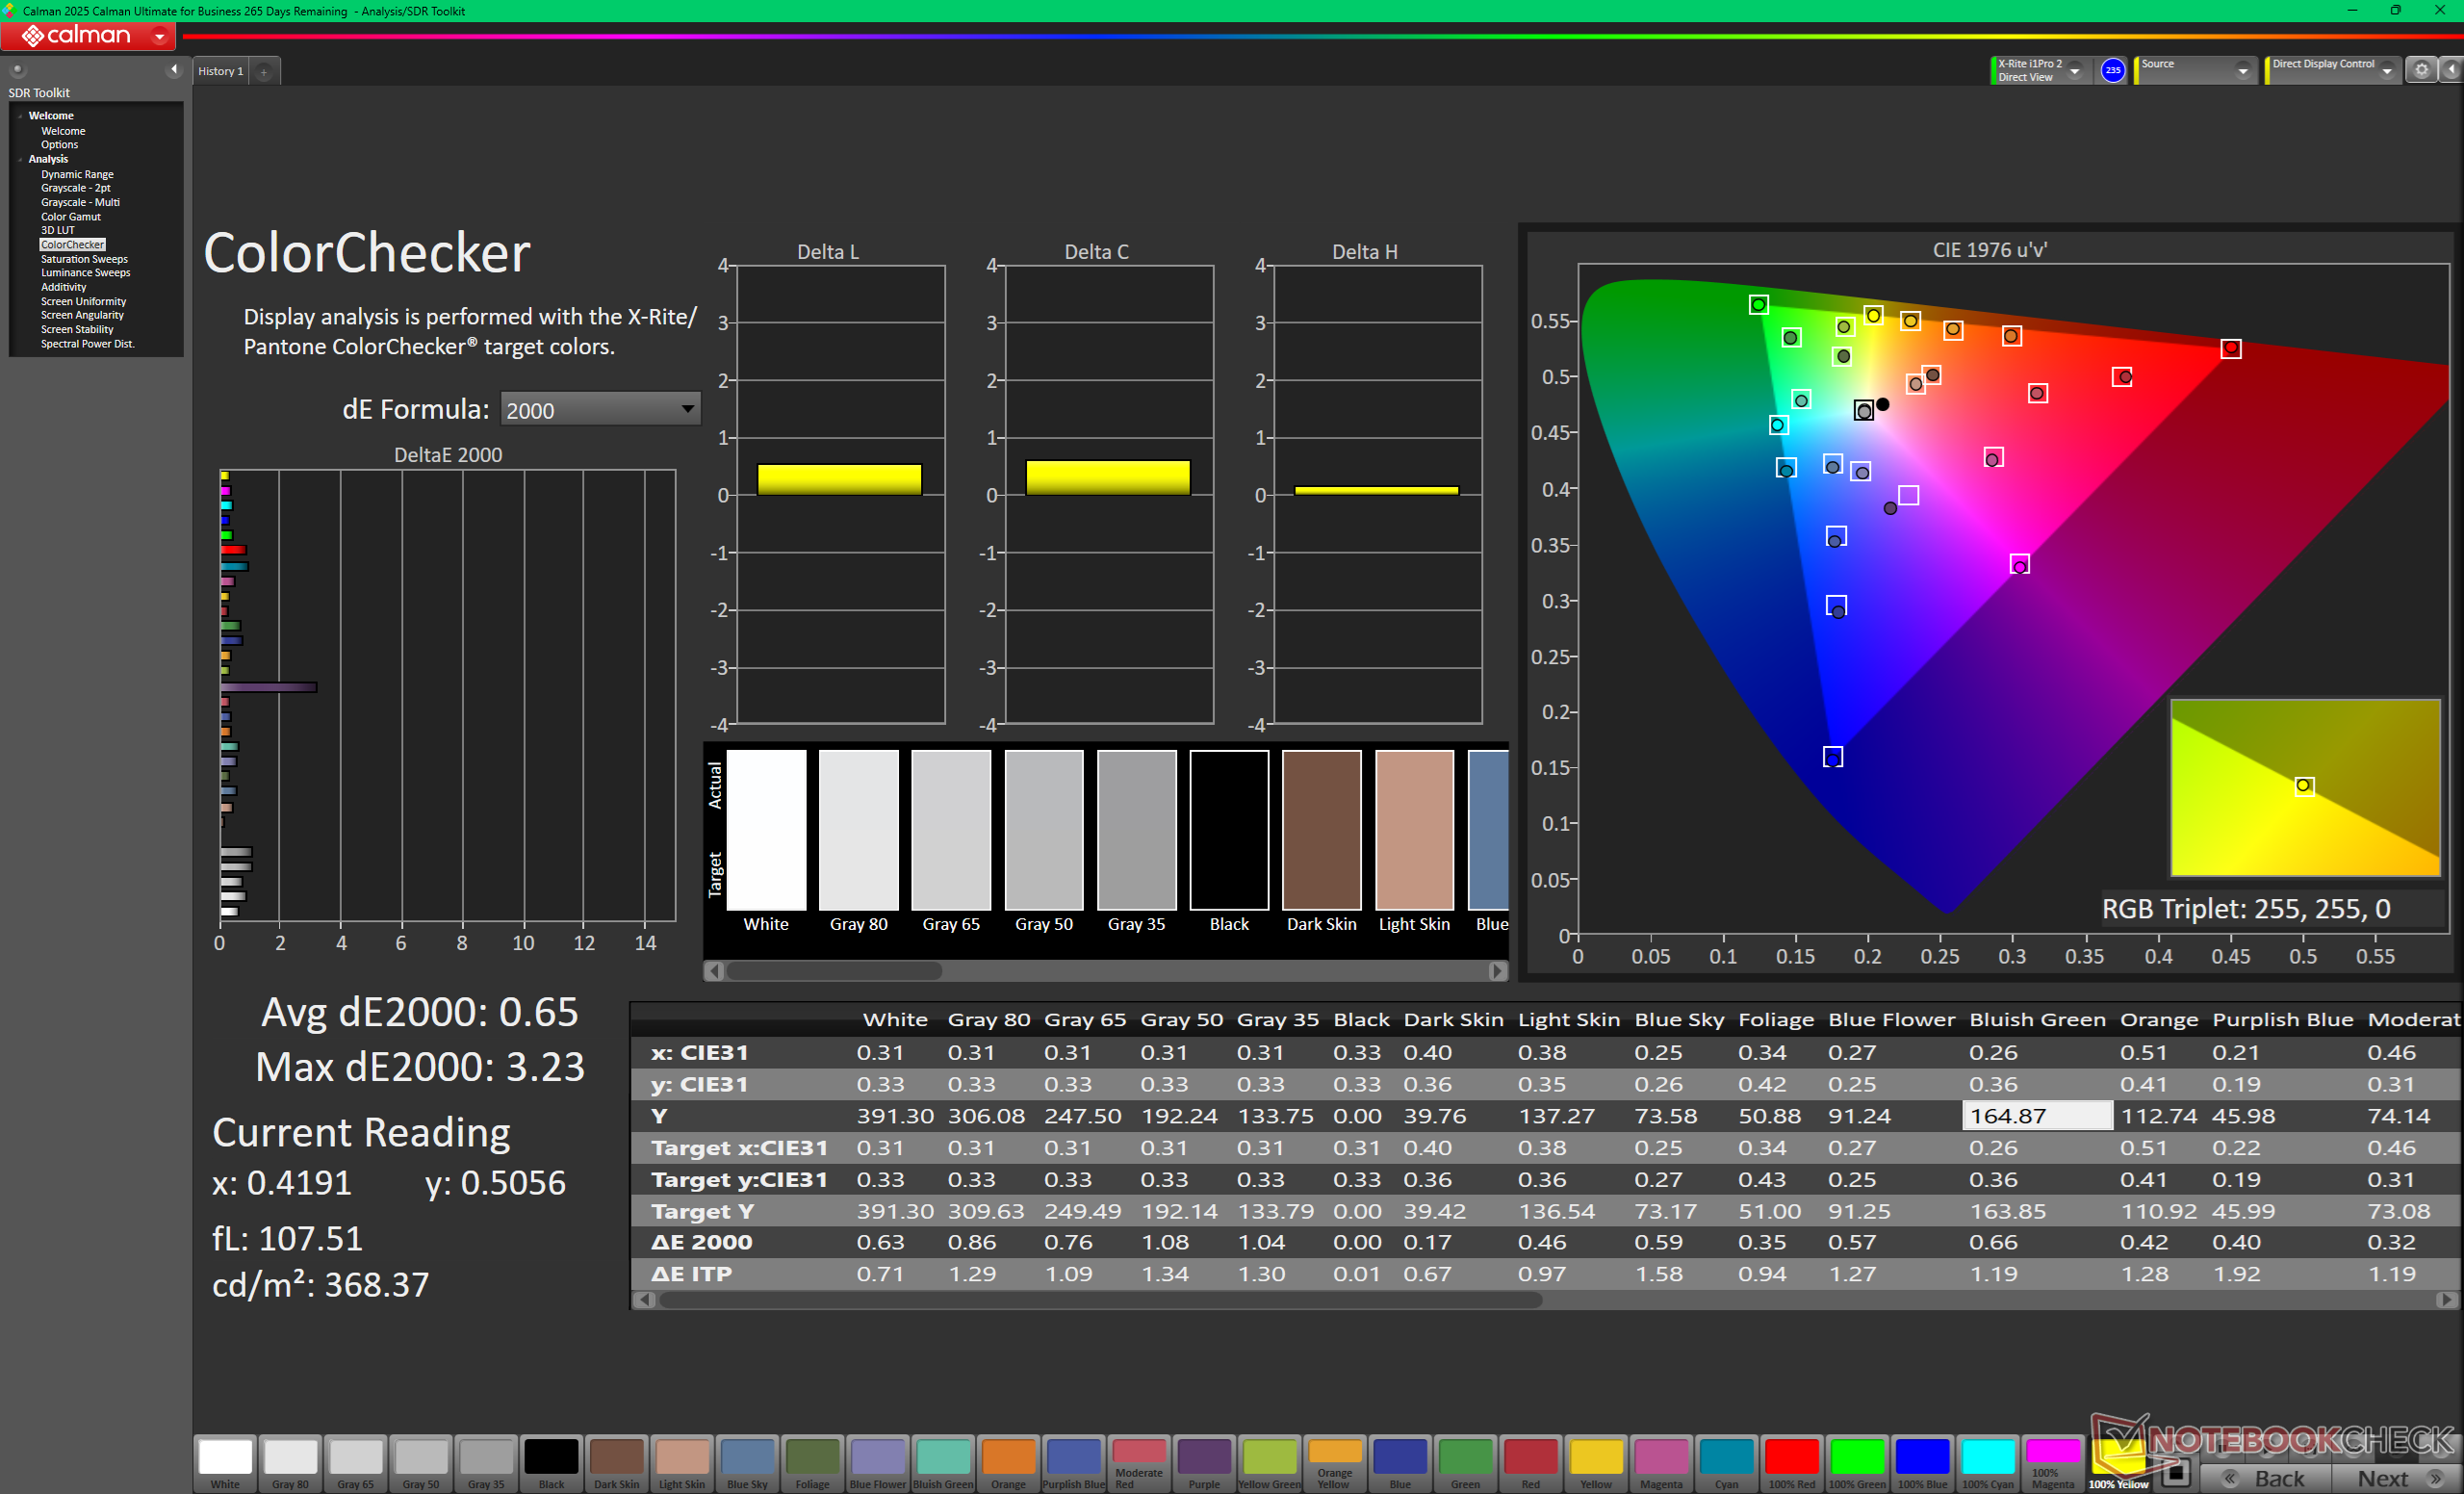
ΔE ColorChecker Calman: 1.29 | ∀{0.5-29.43 Ø4.74}
calibrated: 0.65
ΔE Greyscale Calman: 1.9 | ∀{0.09-98 Ø4.98}
98% AdobeRGB 1998 (Argyll 3D)
100% sRGB (Argyll 3D)
99.8% Display P3 (Argyll 3D)
Gamma: 2.19
CCT: 6844 K
| MSI Prestige 16 AI C3MTG Samsung ATNA60CL11-0, OLED, 2880x1800, 16", 120 Hz | MSI Prestige 16 AI Evo B2HMG B160QAN03_R, IPS, 2560x1600, 16", 60 Hz | Dell XPS 16 Core Ultra X7 358H LG Philips 160WV1, OLED, 3200x2000, 16", 120 Hz | Asus ZenBook S16 UM5606GA ATNA60HR07-0, OLED, 2880x1800, 16", 120 Hz | Lenovo ThinkBook 16 G7+ AMD LEN160-3.2K, IPS, 3200x2000, 16", 165 Hz | HP Envy x360 2-in-1 16-ad0097nr Samsung SDC41A6, OLED, 2880x1800, 16", 120 Hz | |
|---|---|---|---|---|---|---|
| Display | -6% | -1% | -1% | -5% | -1% | |
| Display P3 Coverage (%) | 99.8 | 96.4 -3% | 99.5 0% | 99.8 0% | 96.3 -4% | 99.6 0% |
| sRGB Coverage (%) | 100 | 99.7 0% | 100 0% | 100 0% | 100 0% | 100 0% |
| AdobeRGB 1998 Coverage (%) | 98 | 84.3 -14% | 96.5 -2% | 94 -4% | 86.9 -11% | 96.5 -2% |
| Response Times | -4924% | -21% | -80% | -1241% | -8% | |
| Response Time Grey 50% / Grey 80% * (ms) | 0.71 ? | 51.5 ? -7154% | 0.65 ? 8% | 1.27 ? -79% | 13.9 ? -1858% | 0.8 ? -13% |
| Response Time Black / White * (ms) | 0.87 ? | 24.3 ? -2693% | 0.87 ? -0% | 0.43 ? 51% | 6.3 ? -624% | 0.89 ? -2% |
| PWM Frequency (Hz) | 460.46 ? | 240.2 ? | 960 ? | 491.8 ? | ||
| PWM Amplitude * (%) | 18 | 31 -72% | 56 -211% | |||
| Screen | -153% | -50% | 12% | -9% | -48% | |
| Brightness middle (cd/m²) | 375 | 471 26% | 395.4 5% | 465 24% | 422 13% | 399.4 7% |
| Brightness (cd/m²) | 380 | 455 20% | 392 3% | 466 23% | 403 6% | 405 7% |
| Brightness Distribution (%) | 98 | 92 -6% | 95 -3% | 99 1% | 93 -5% | 98 0% |
| Black Level * (cd/m²) | 0.2 | 0.3 | ||||
| Colorchecker dE 2000 * | 1.29 | 5.8 -350% | 3.69 -186% | 1 22% | 1.7 -32% | 4.05 -214% |
| Colorchecker dE 2000 max. * | 3.01 | 10.8 -259% | 7.94 -164% | 3 -0% | 3.4 -13% | 6.69 -122% |
| Colorchecker dE 2000 calibrated * | 0.65 | 1.9 -192% | 0.68 -5% | 0.7 -8% | 1.02 -57% | |
| Greyscale dE 2000 * | 1.9 | 7.8 -311% | 1.9 -0% | 1.9 -0% | 2.4 -26% | 1.1 42% |
| Gamma | 2.19 100% | 2.07 106% | 2.28 96% | 2.19 100% | 2.19 100% | 2.27 97% |
| CCT | 6844 95% | 7262 90% | 6274 104% | 6458 101% | 6989 93% | 6419 101% |
| Contrast (:1) | 2355 | 1407 | ||||
| Media totale (Programma / Settaggio) | -1694% /
-911% | -24% /
-32% | -23% /
-14% | -418% /
-214% | -19% /
-30% |
* ... Meglio usare valori piccoli
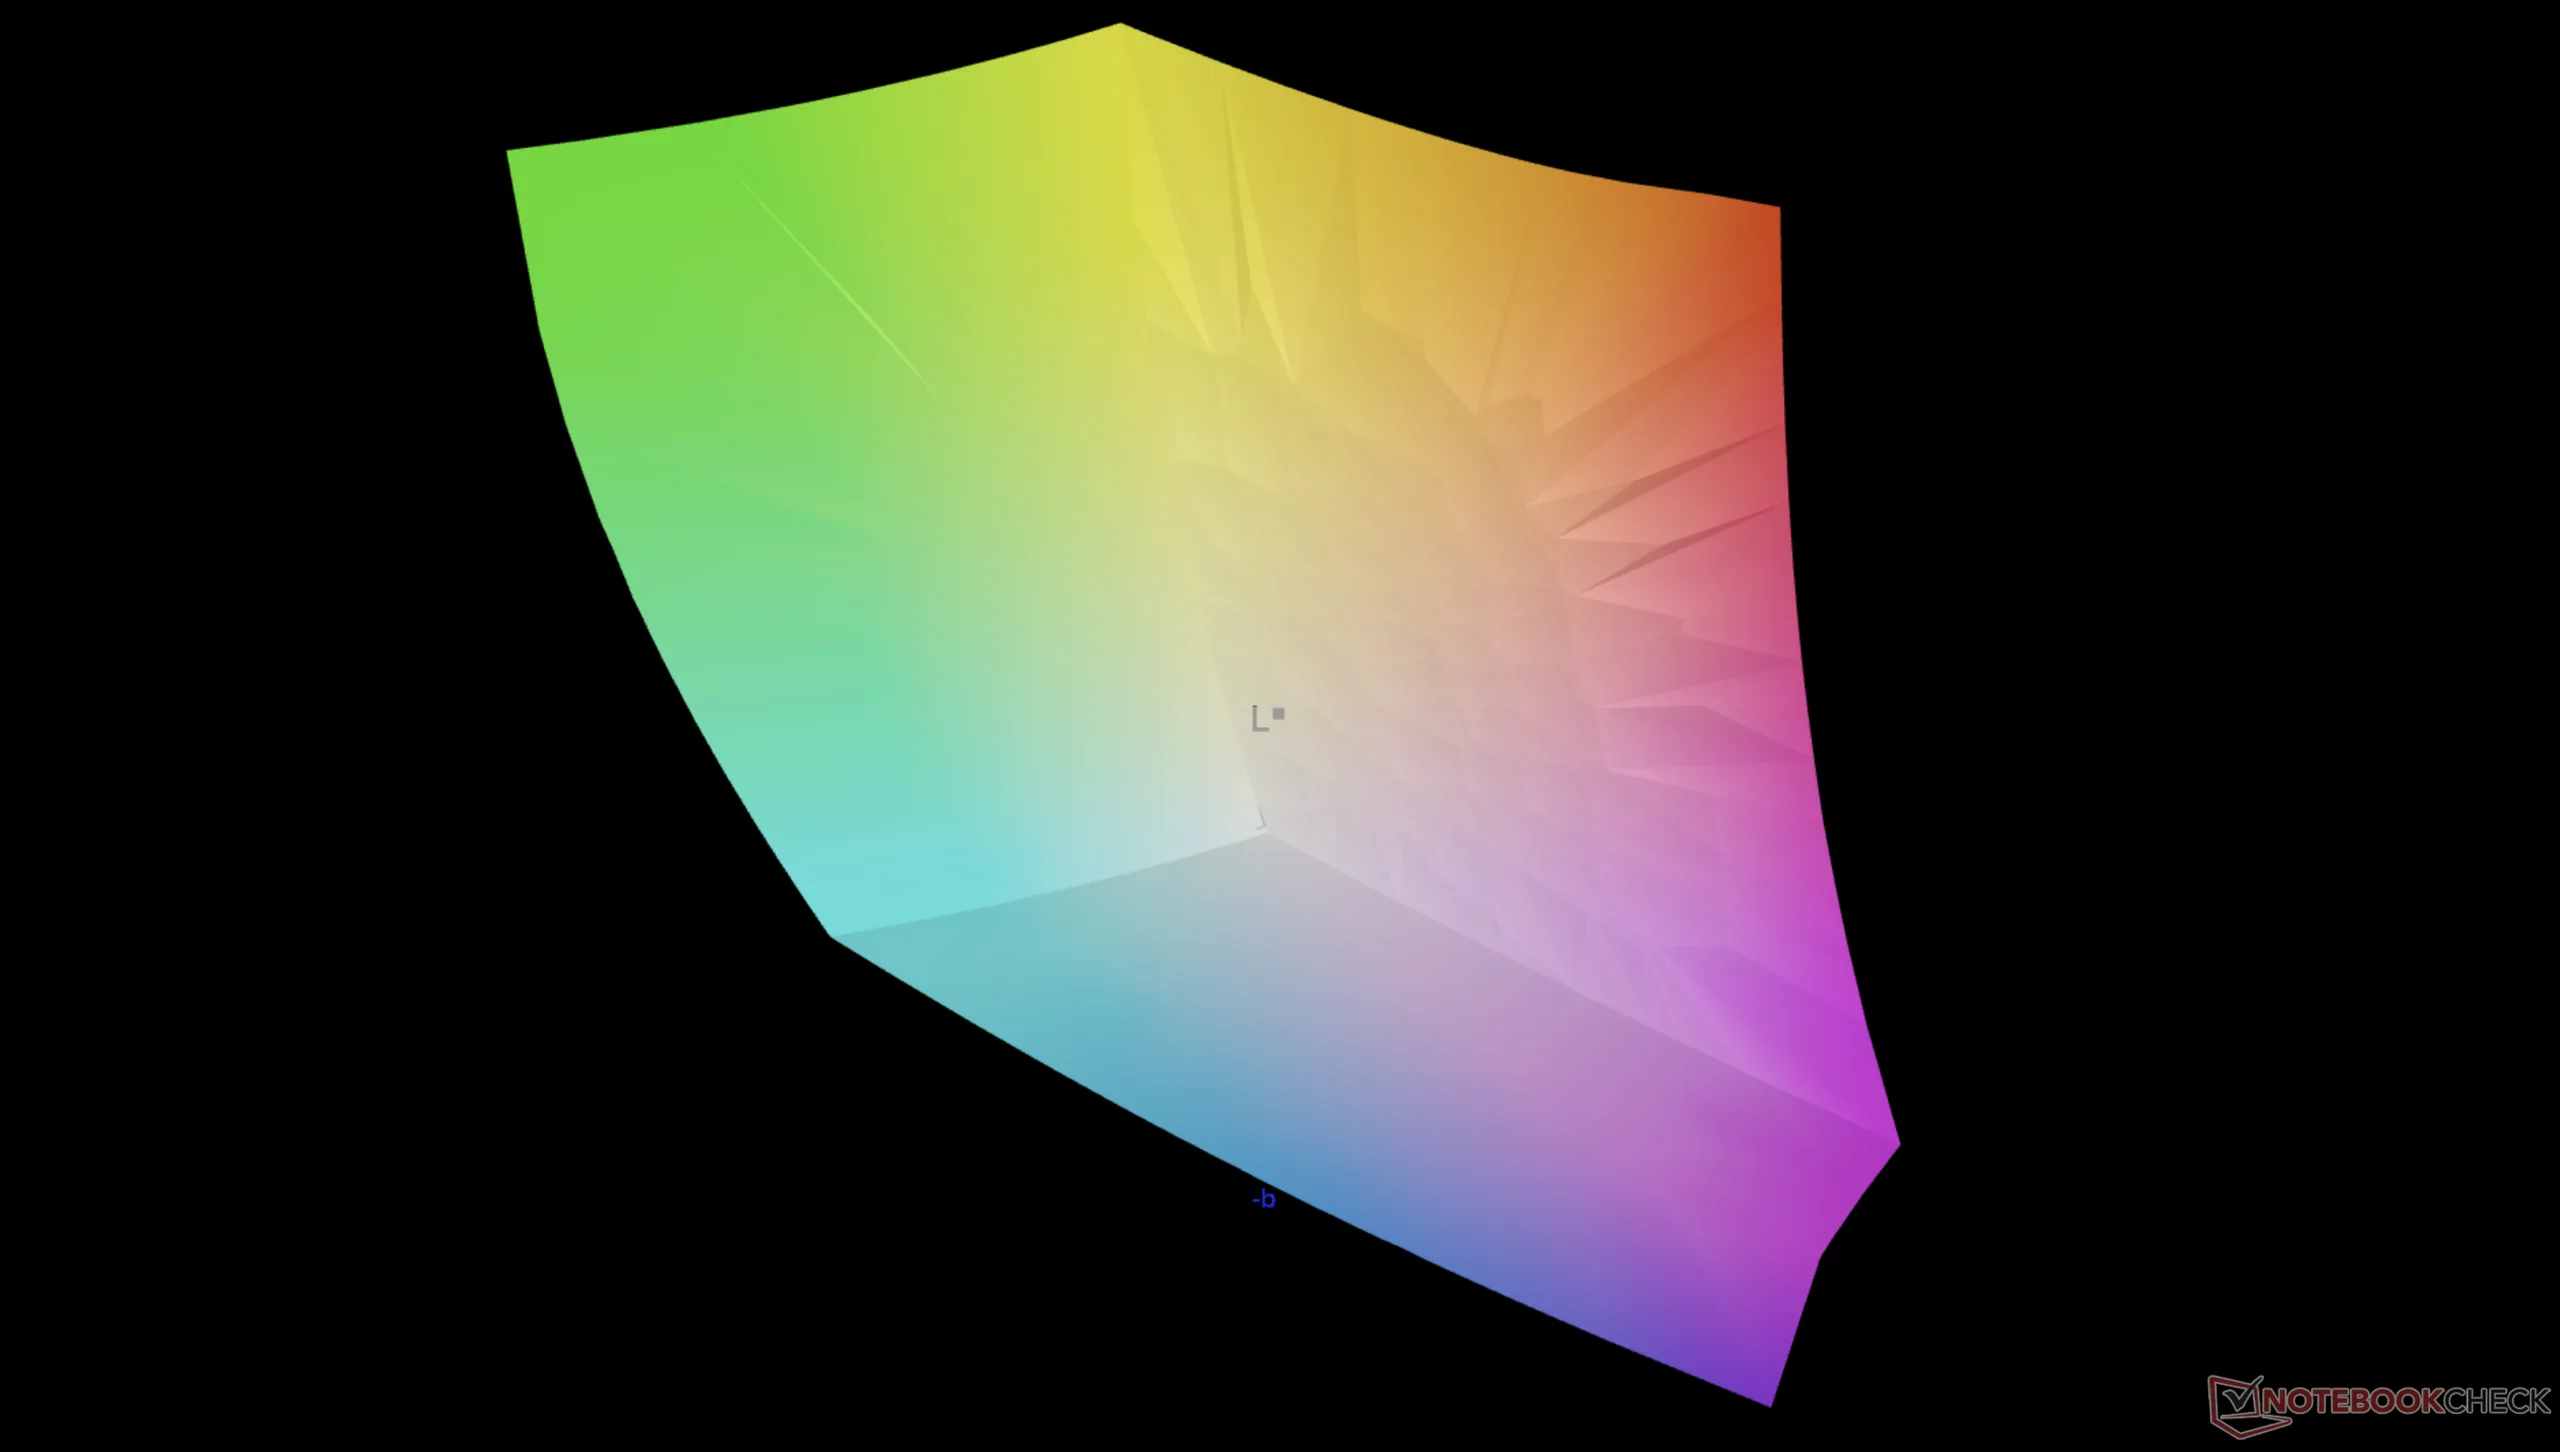
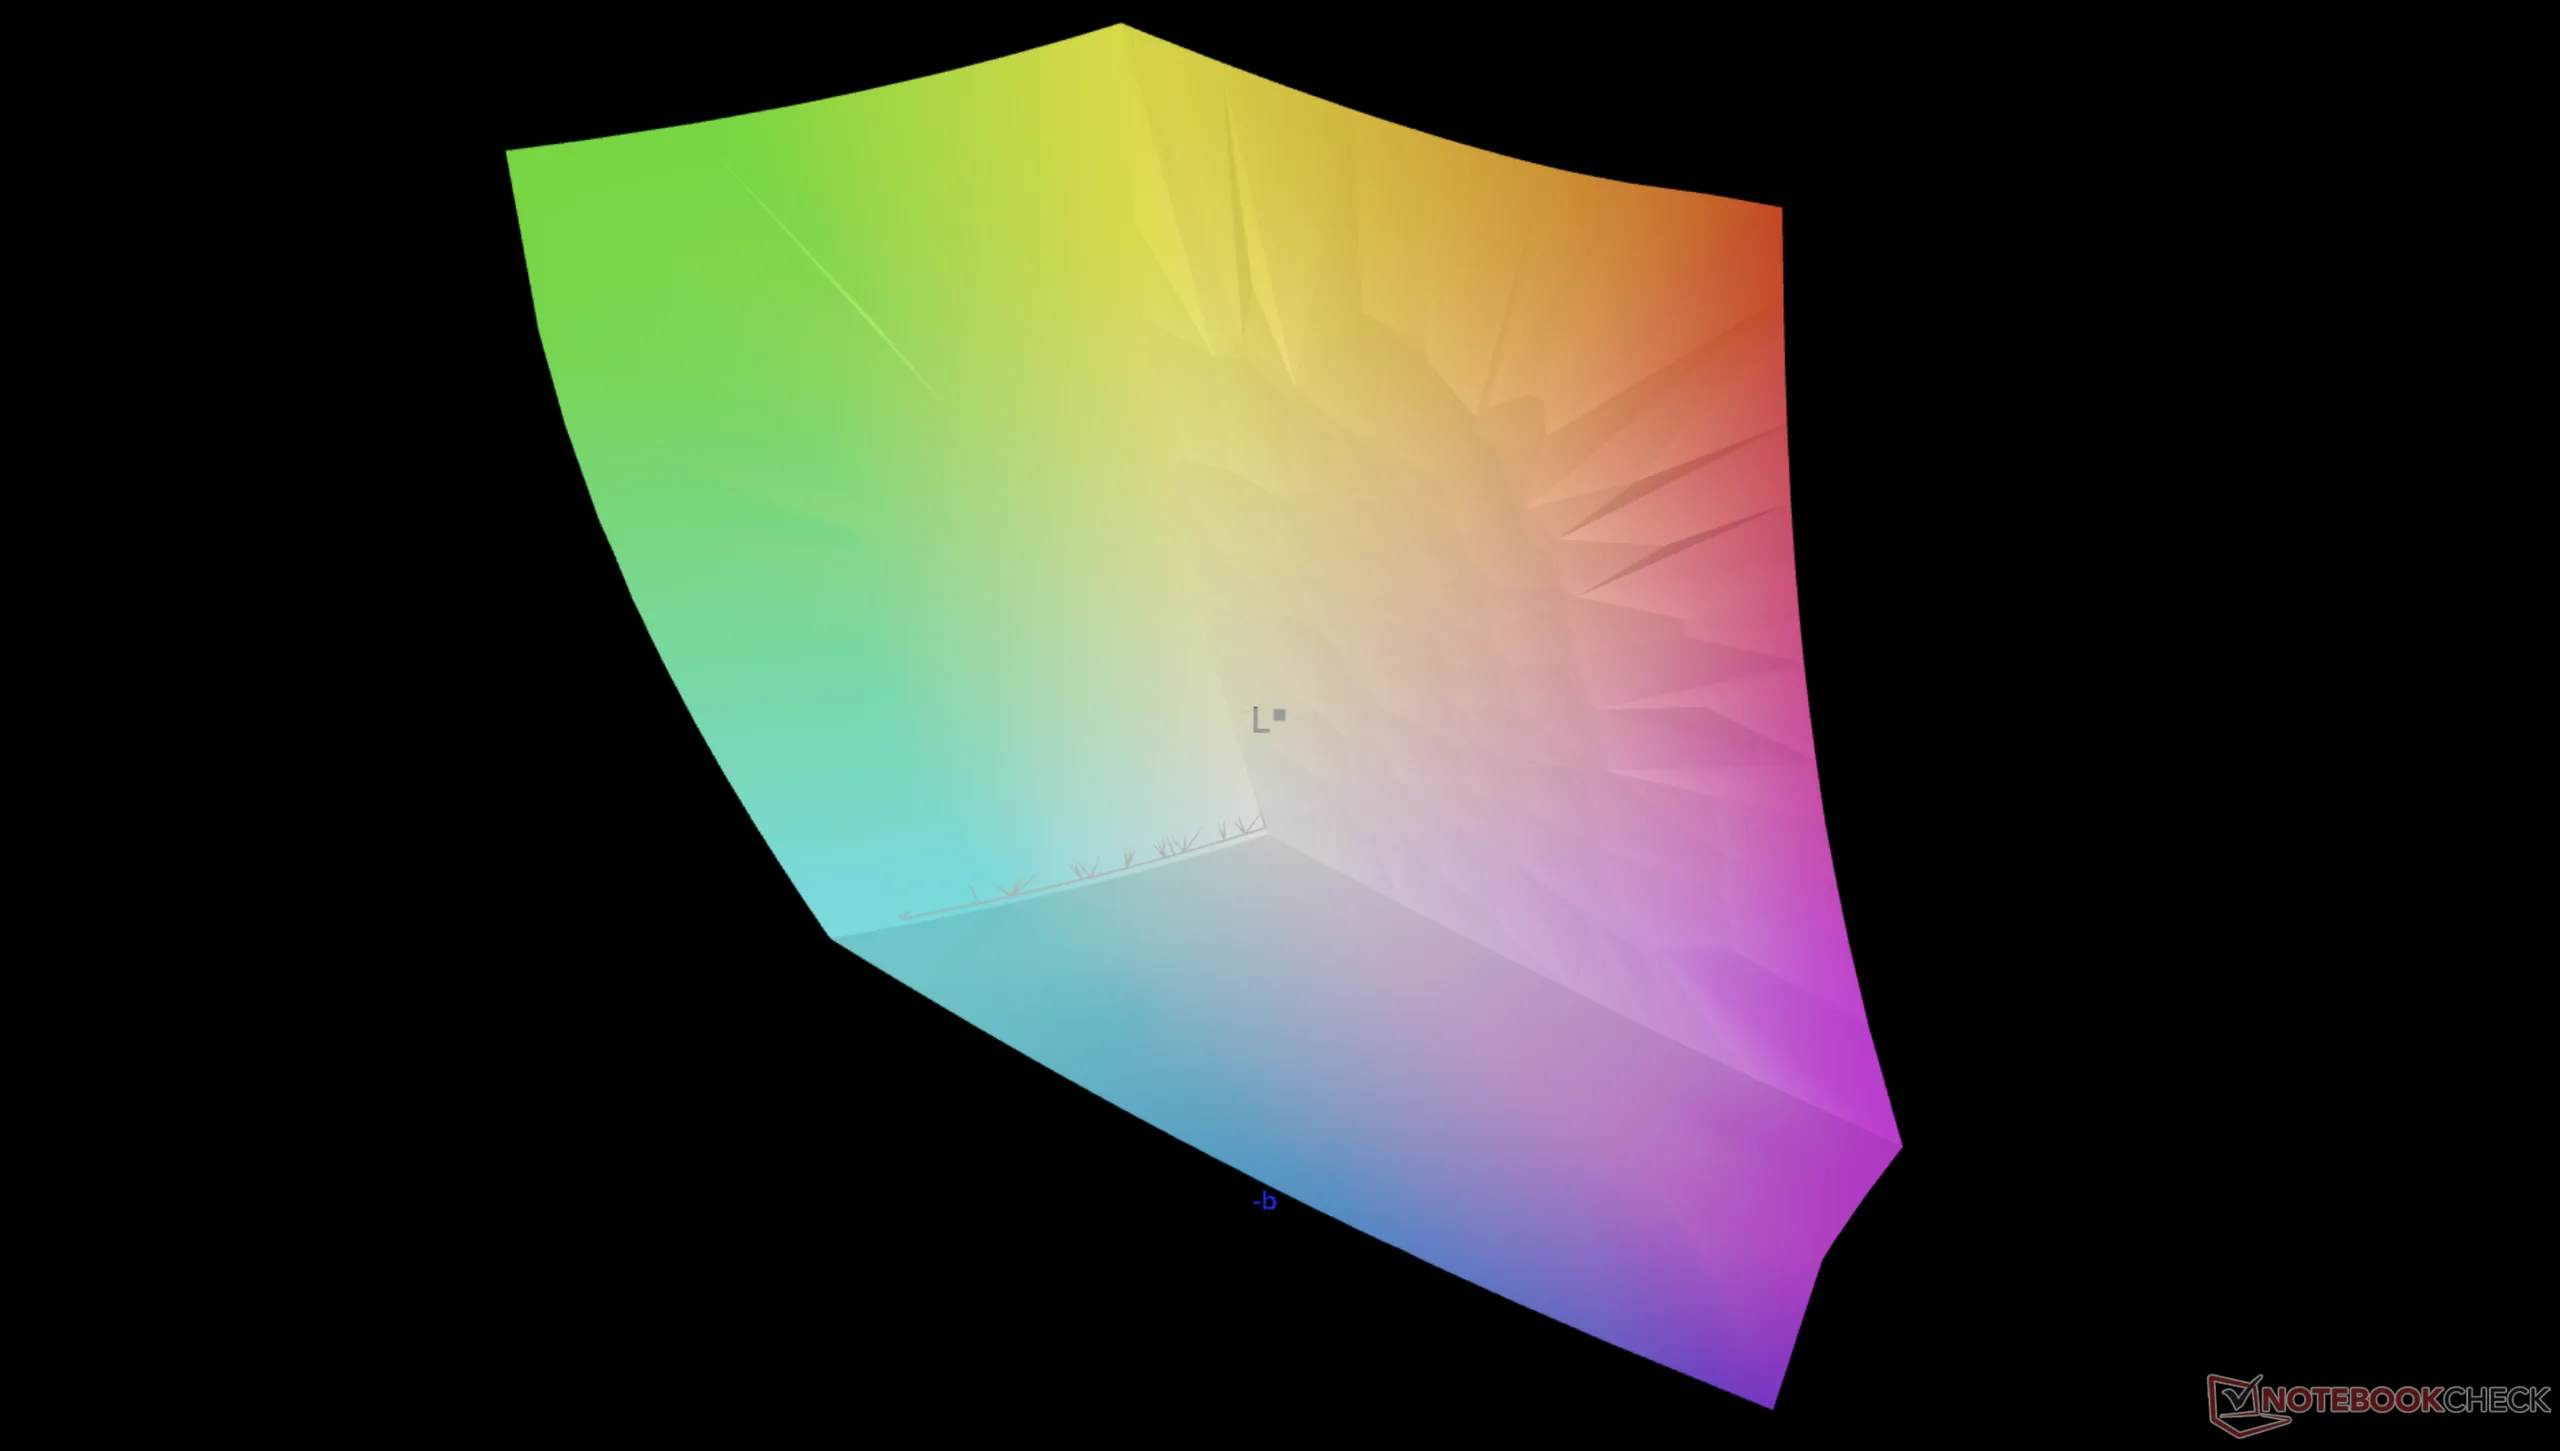
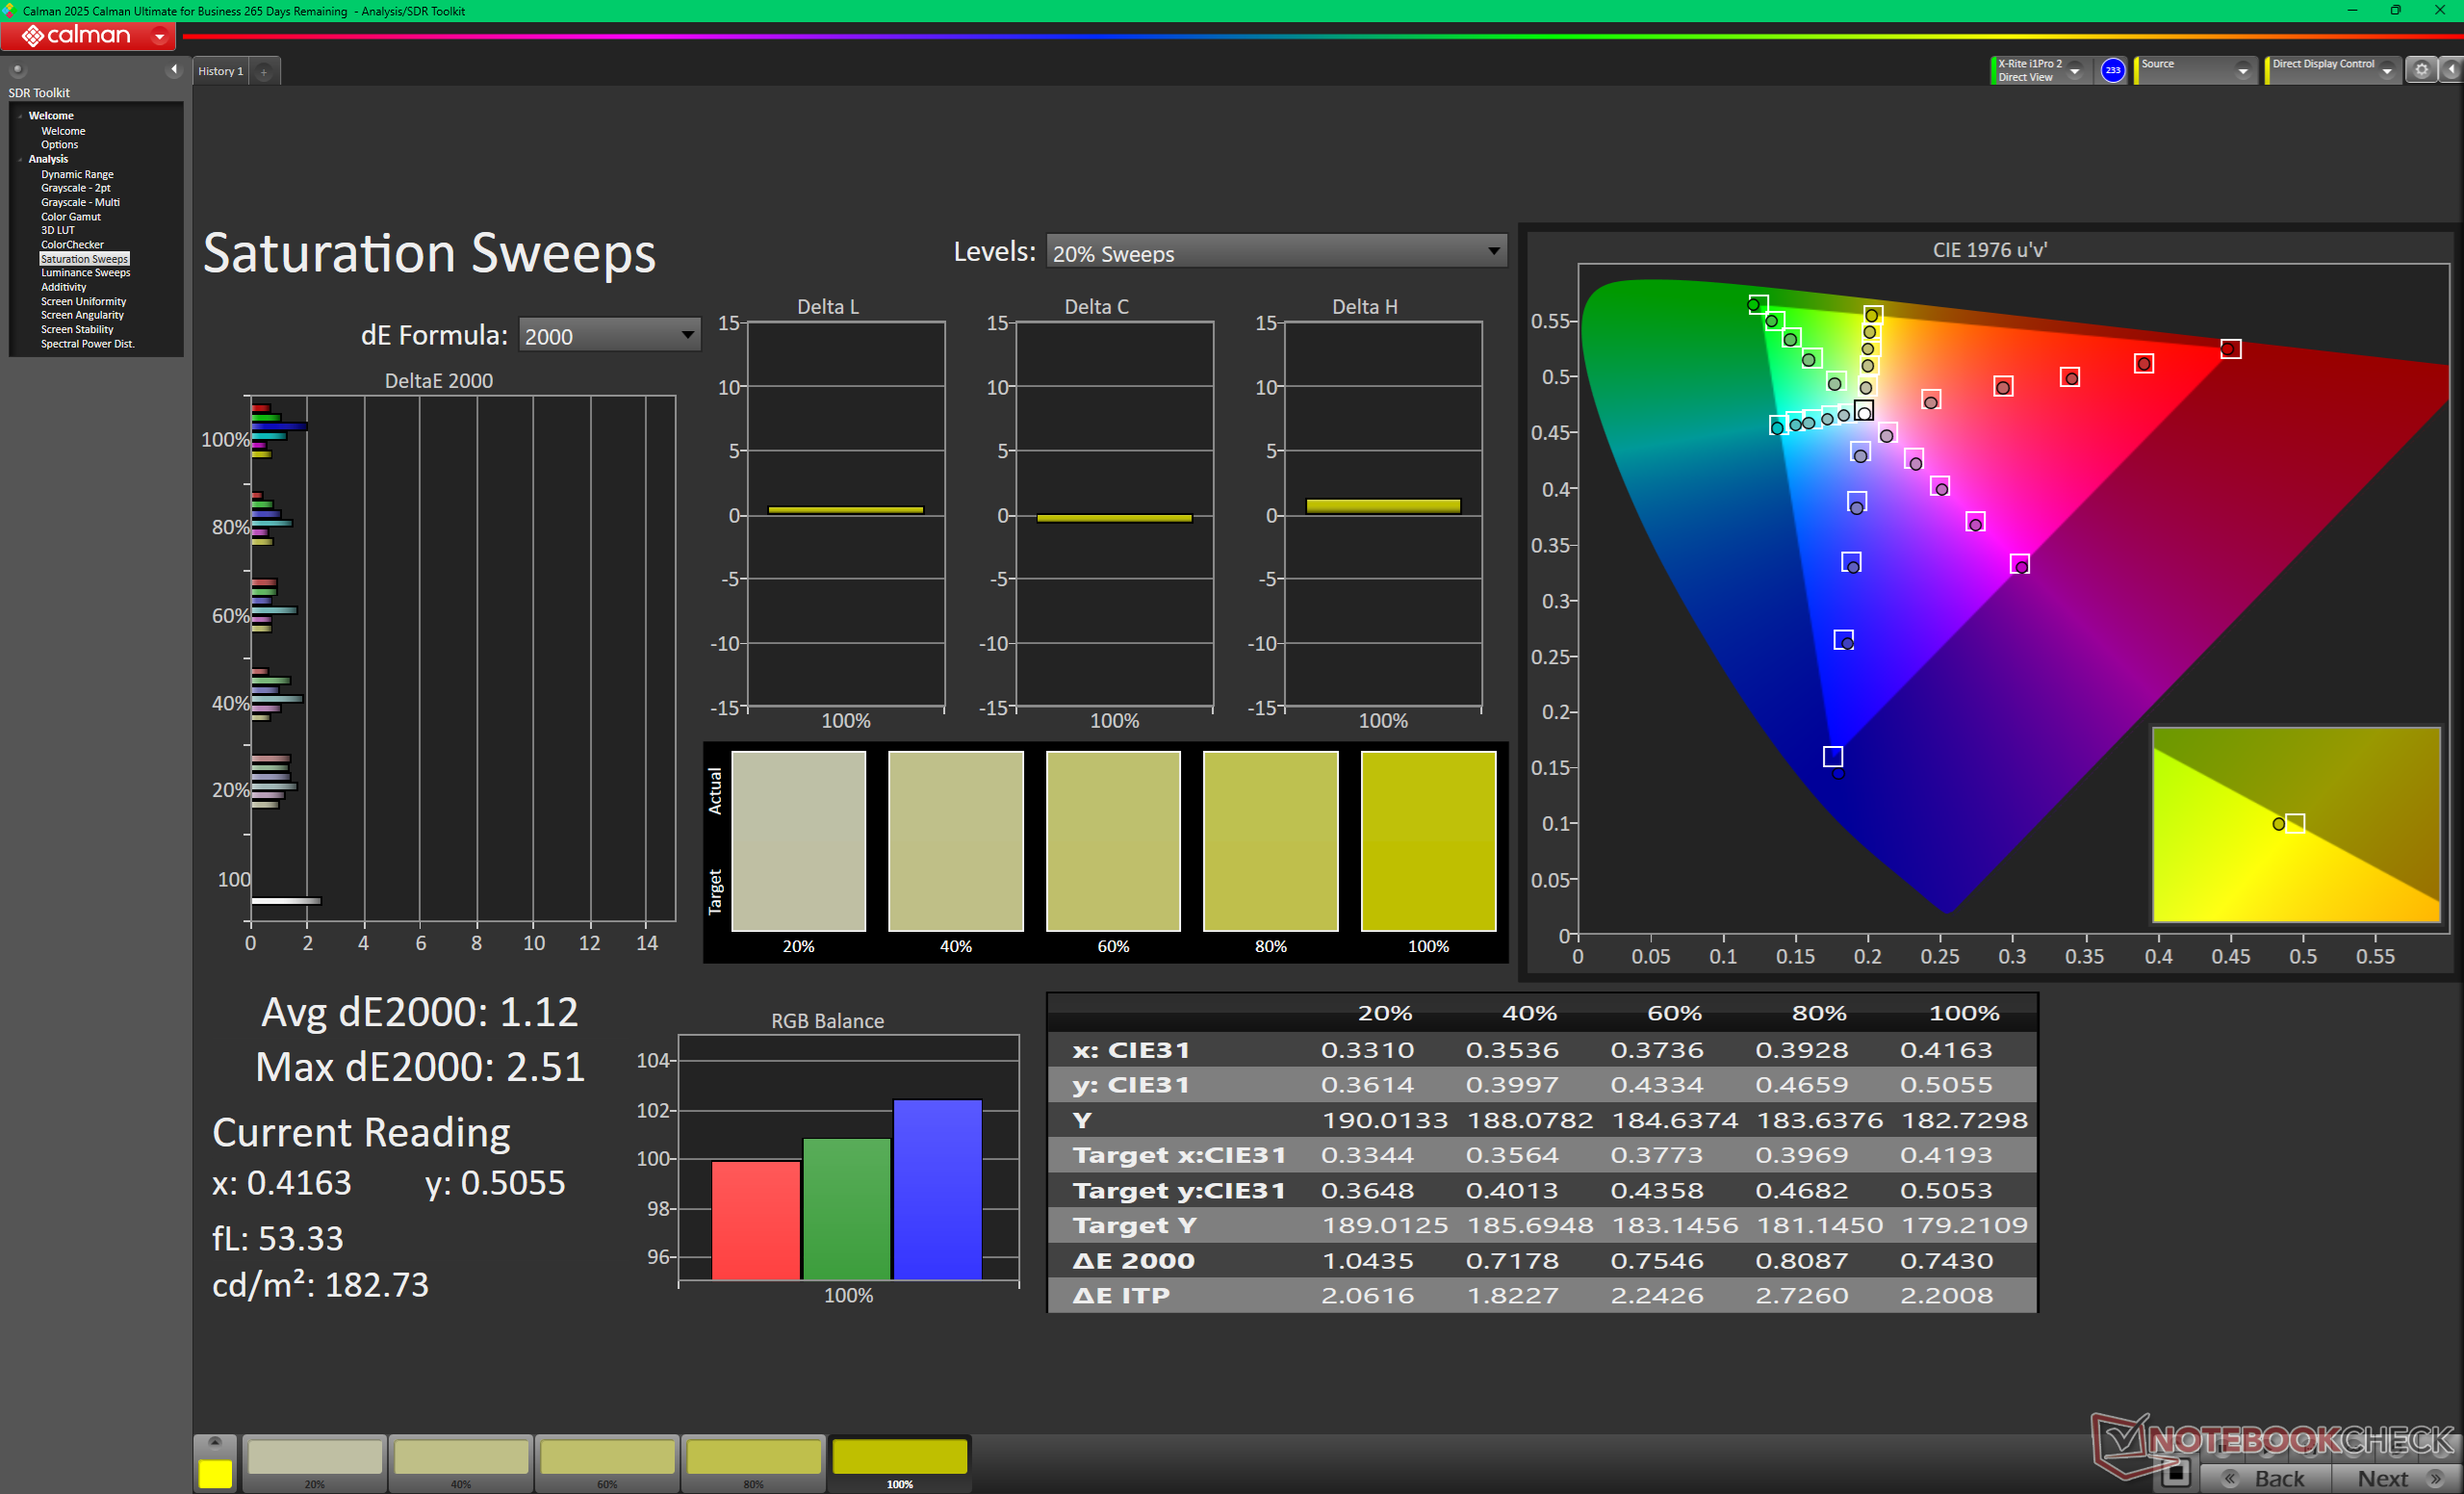
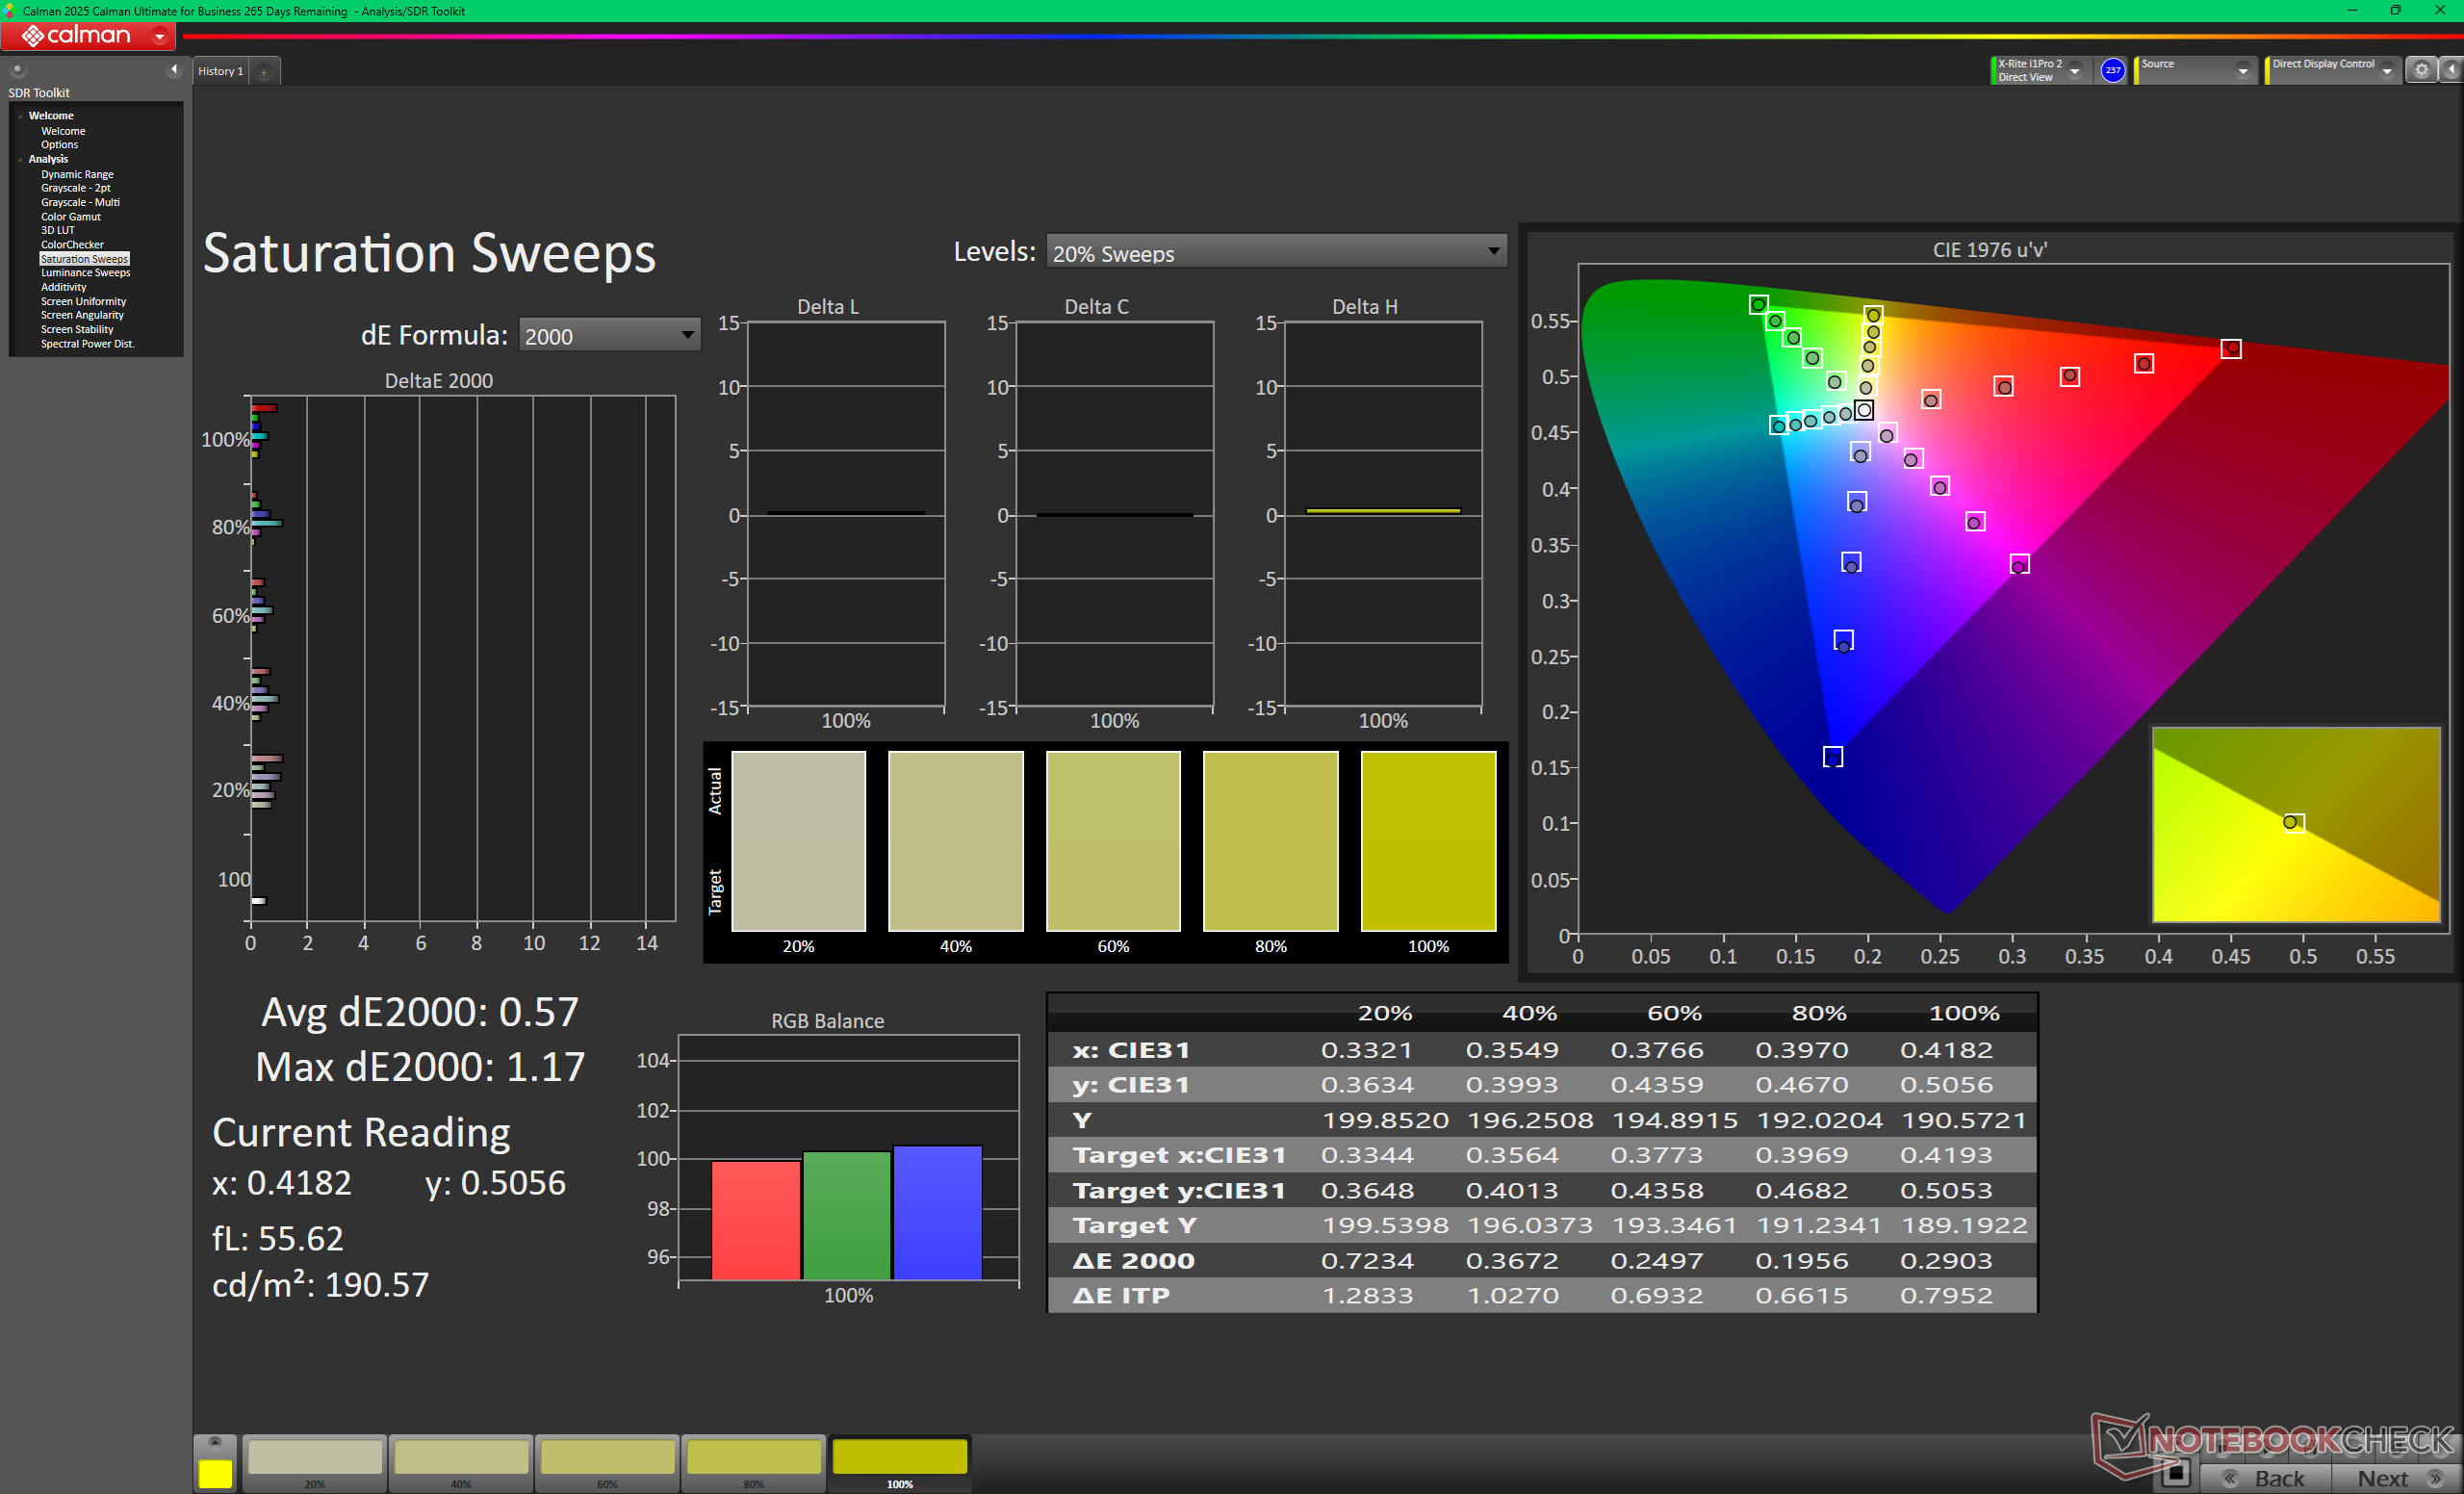
Il sistema è preimpostato e pre-calibrato su sRGB, anche se il display OLED supporta i colori P3 completi. I valori medi deltaE della scala di grigi e del colore sono già molto precisi, rispettivamente solo 1,9 e 1,29, prima di qualsiasi sforzo di calibrazione.
Tempi di risposta del Display
| ↔ Tempi di risposta dal Nero al Bianco | ||
|---|---|---|
| 0.87 ms ... aumenta ↗ e diminuisce ↘ combinato | ↗ 0.41 ms Incremento | 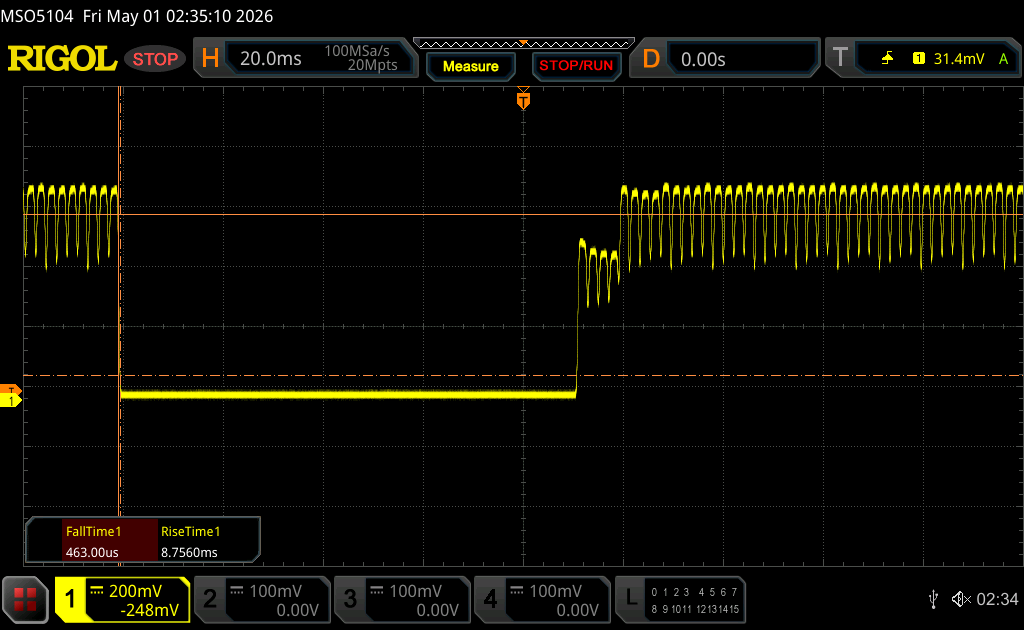 |
| ↘ 0.46 ms Calo | ||
| Lo schermo ha mostrato valori di risposta molto veloci nei nostri tests ed è molto adatto per i gaming veloce. In confronto, tutti i dispositivi di test variano da 0.1 (minimo) a 240 (massimo) ms. » 3 % di tutti i dispositivi è migliore. Questo significa che i tempi di risposta rilevati sono migliori rispettto alla media di tutti i dispositivi testati (19.9 ms). | ||
| ↔ Tempo di risposta dal 50% Grigio all'80% Grigio | ||
| 0.71 ms ... aumenta ↗ e diminuisce ↘ combinato | ↗ 0.38 ms Incremento | 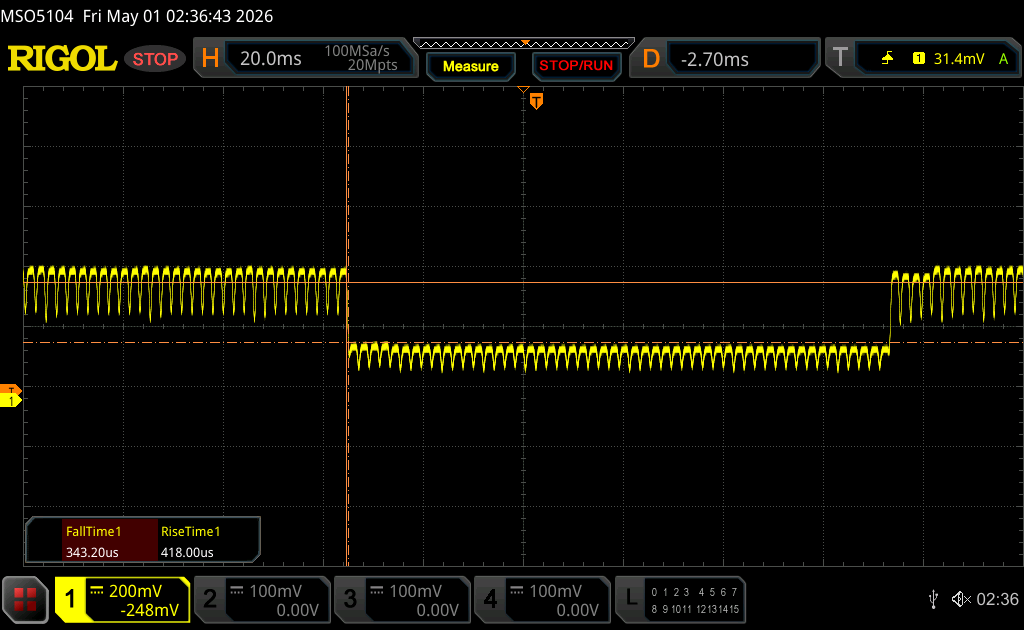 |
| ↘ 0.33 ms Calo | ||
| Lo schermo ha mostrato valori di risposta molto veloci nei nostri tests ed è molto adatto per i gaming veloce. In confronto, tutti i dispositivi di test variano da 0.165 (minimo) a 636 (massimo) ms. » 2 % di tutti i dispositivi è migliore. Questo significa che i tempi di risposta rilevati sono migliori rispettto alla media di tutti i dispositivi testati (31.2 ms). | ||
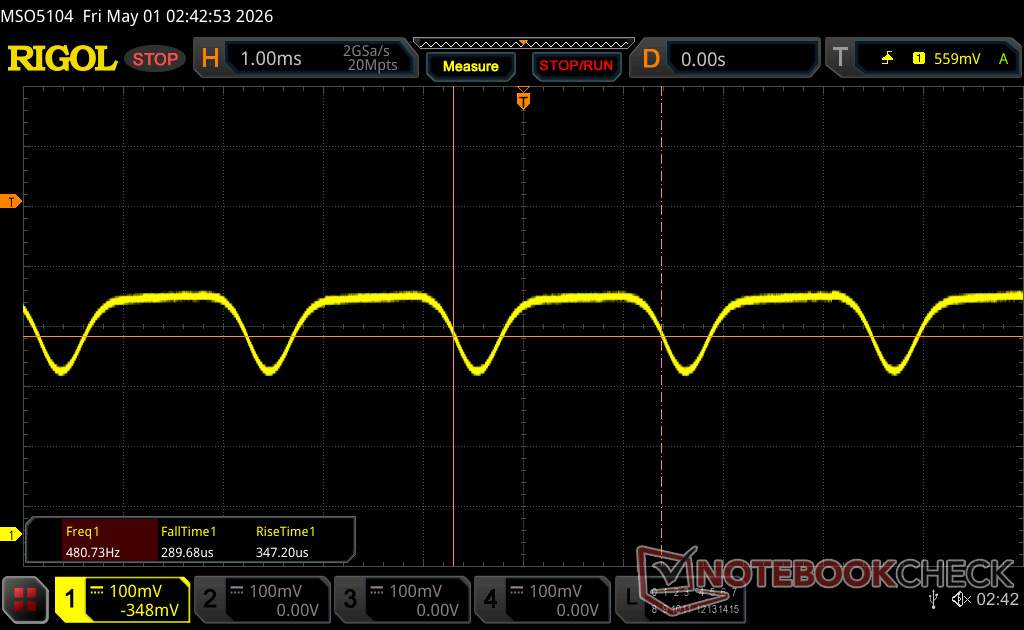
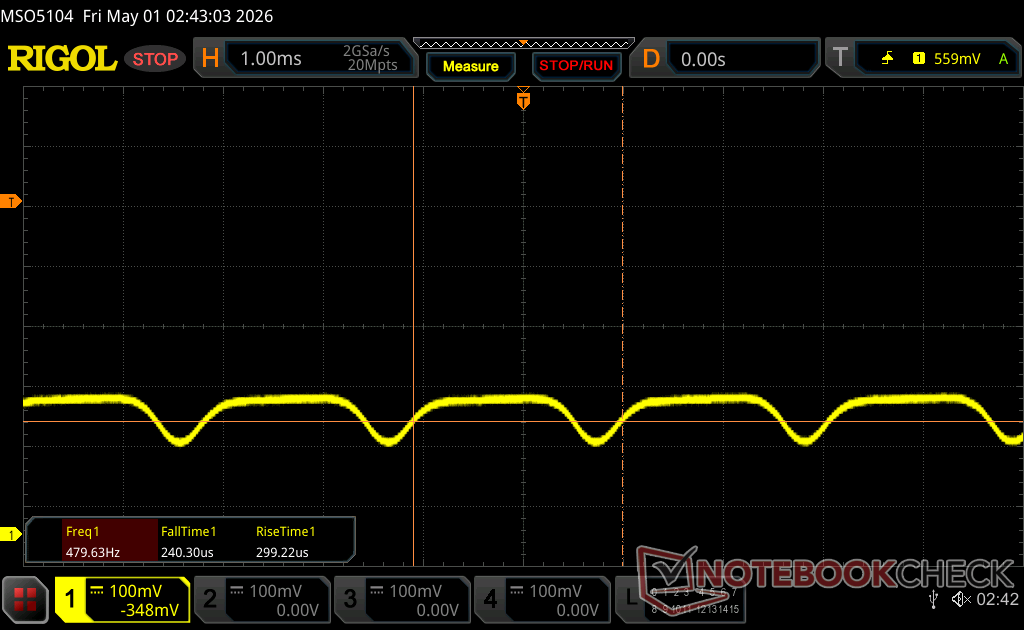
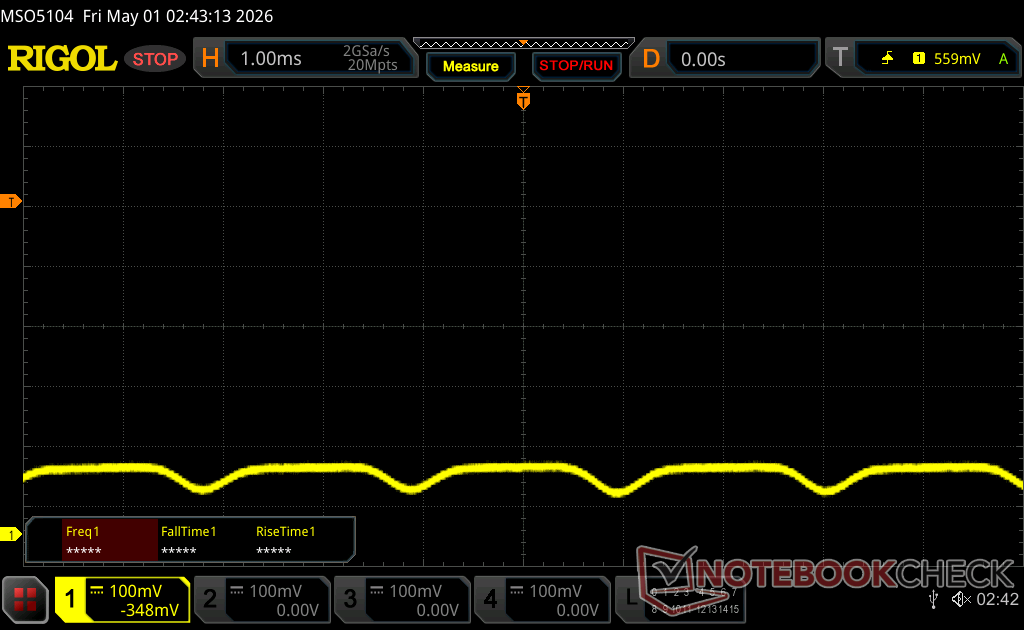
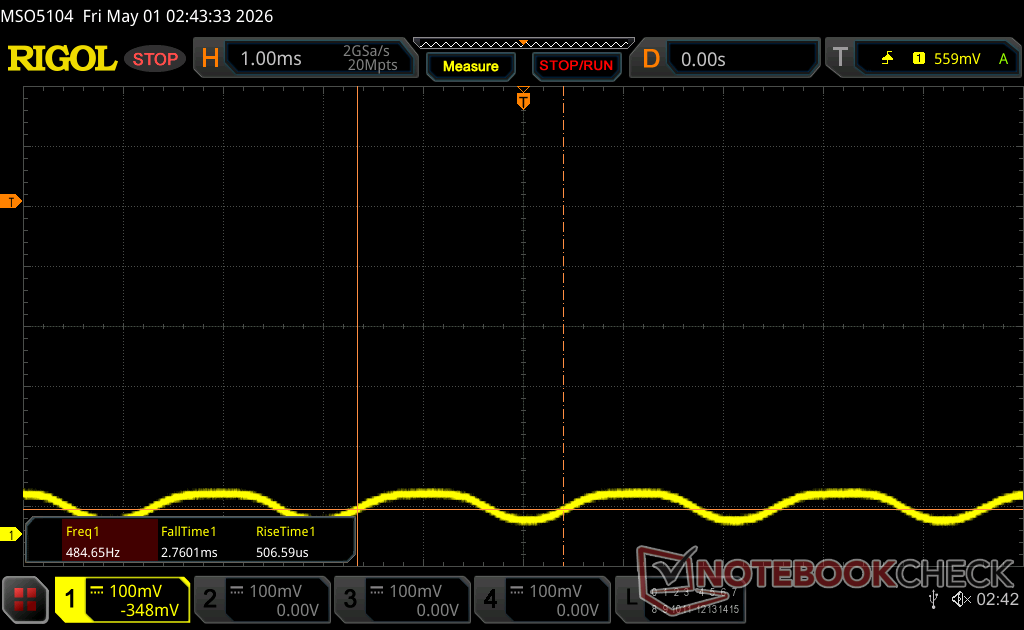
Sfarfallio dello schermo / PWM (Pulse-Width Modulation)
| flickering dello schermo / PWM rilevato | 460.46 Hz Amplitude: 18 % | ≤ 100 % settaggio luminosita' | 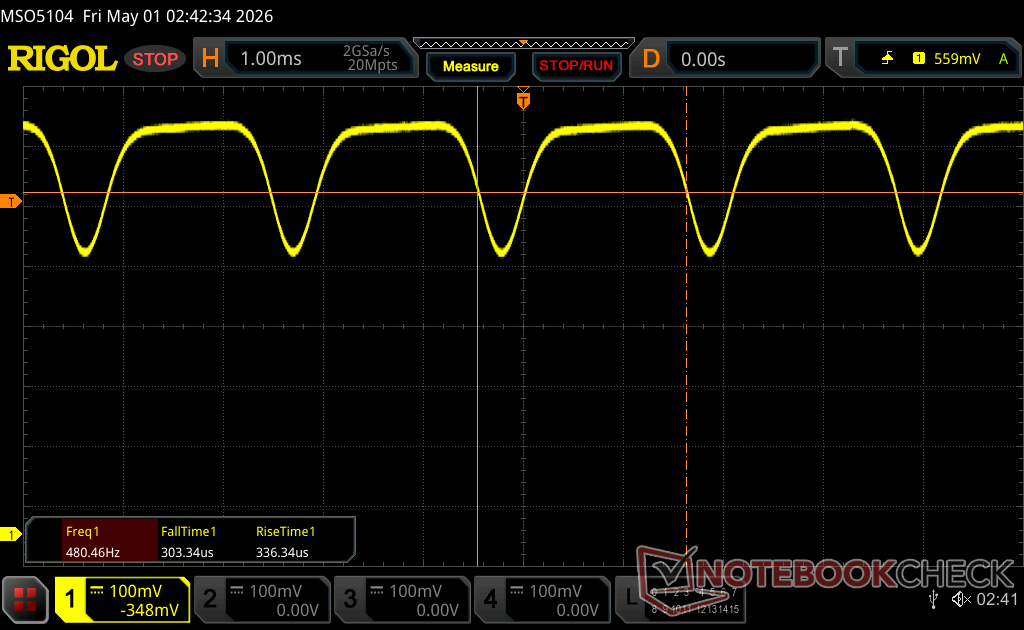 |
Il display sfarfalla a 460.46 Hz (Probabilmente a causa dell'uso di PWM) Flickering rilevato ad una luminosita' di 100 % o inferiore. Non dovrebbe verificarsi flickering o PWM sopra questo valore di luminosita'. La frequenza di 460.46 Hz è relativamente elevata, quindi la maggioranza degli utenti sensibili al PWM non dovrebbe notare alcun flickering. Tuttavia, è stato segnalato che alcuni utenti sono sensibili al PWM a 500 Hz ed oltre, quindi prestate attenzione. In confronto: 52 % di tutti i dispositivi testati non utilizza PWM per ridurre la luminosita' del display. Se è rilevato PWM, una media di 7873 (minimo: 5 - massimo: 343500) Hz è stata rilevata. | |||


Prestazioni
Condizioni del test
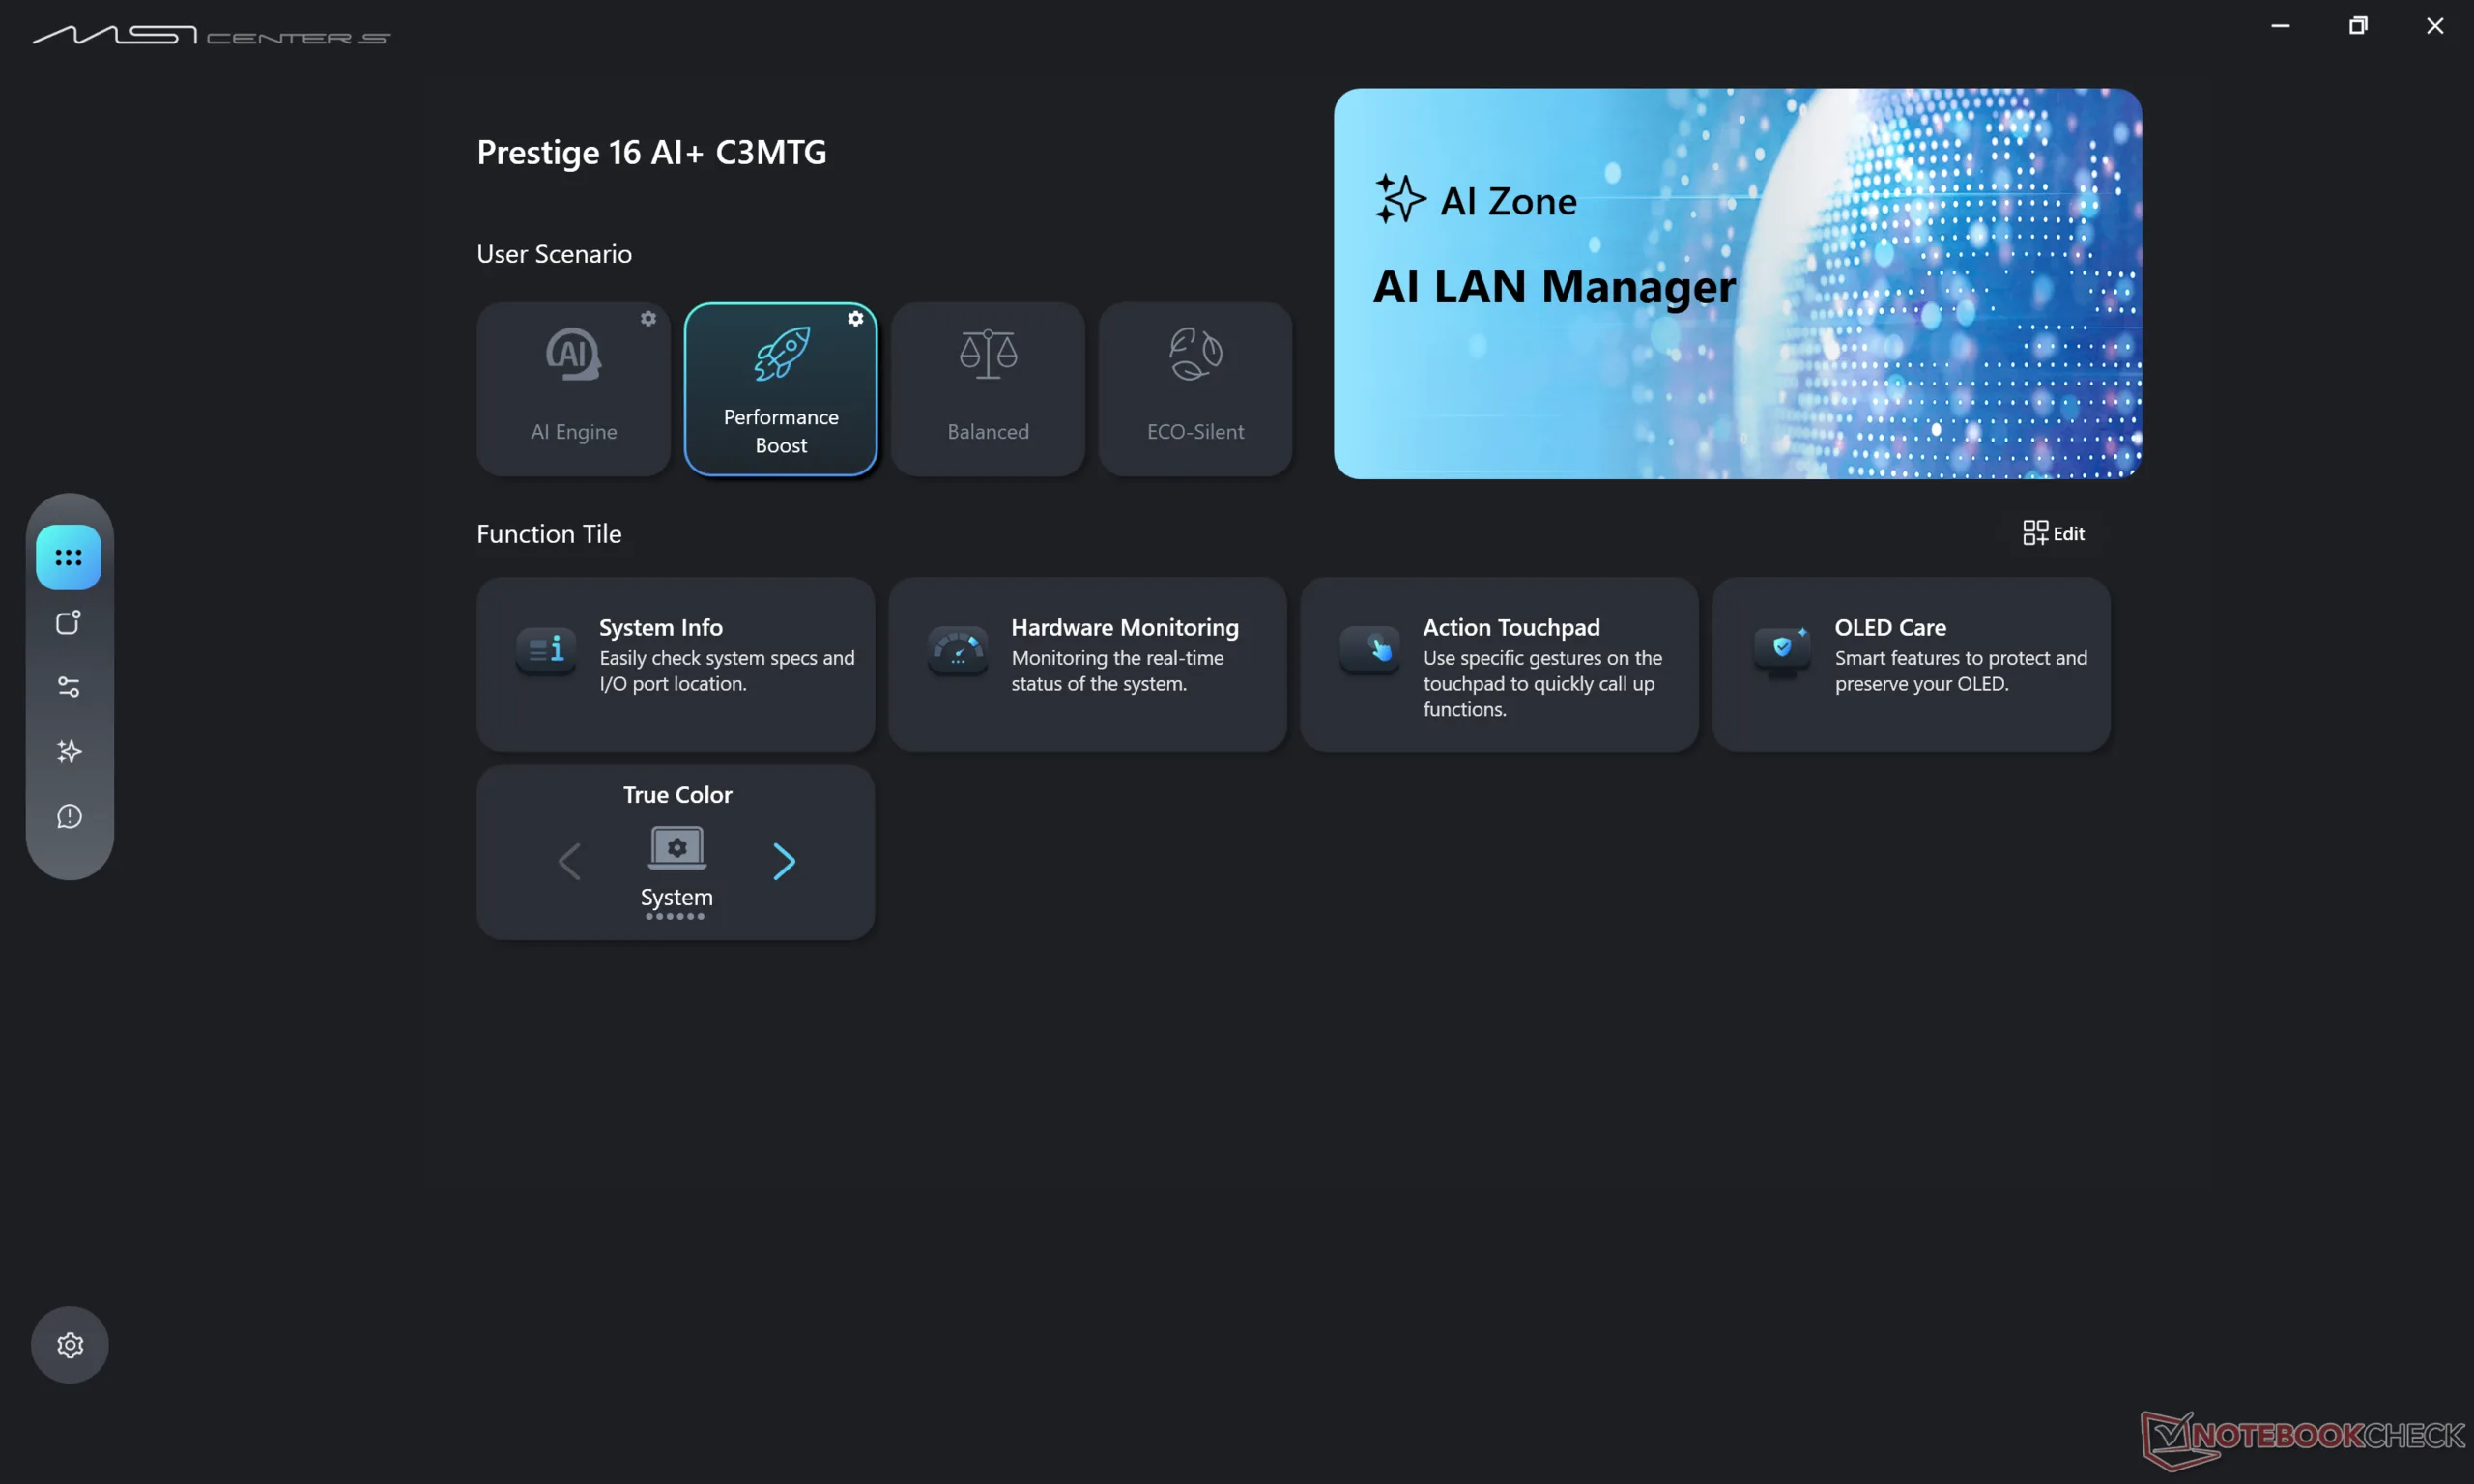
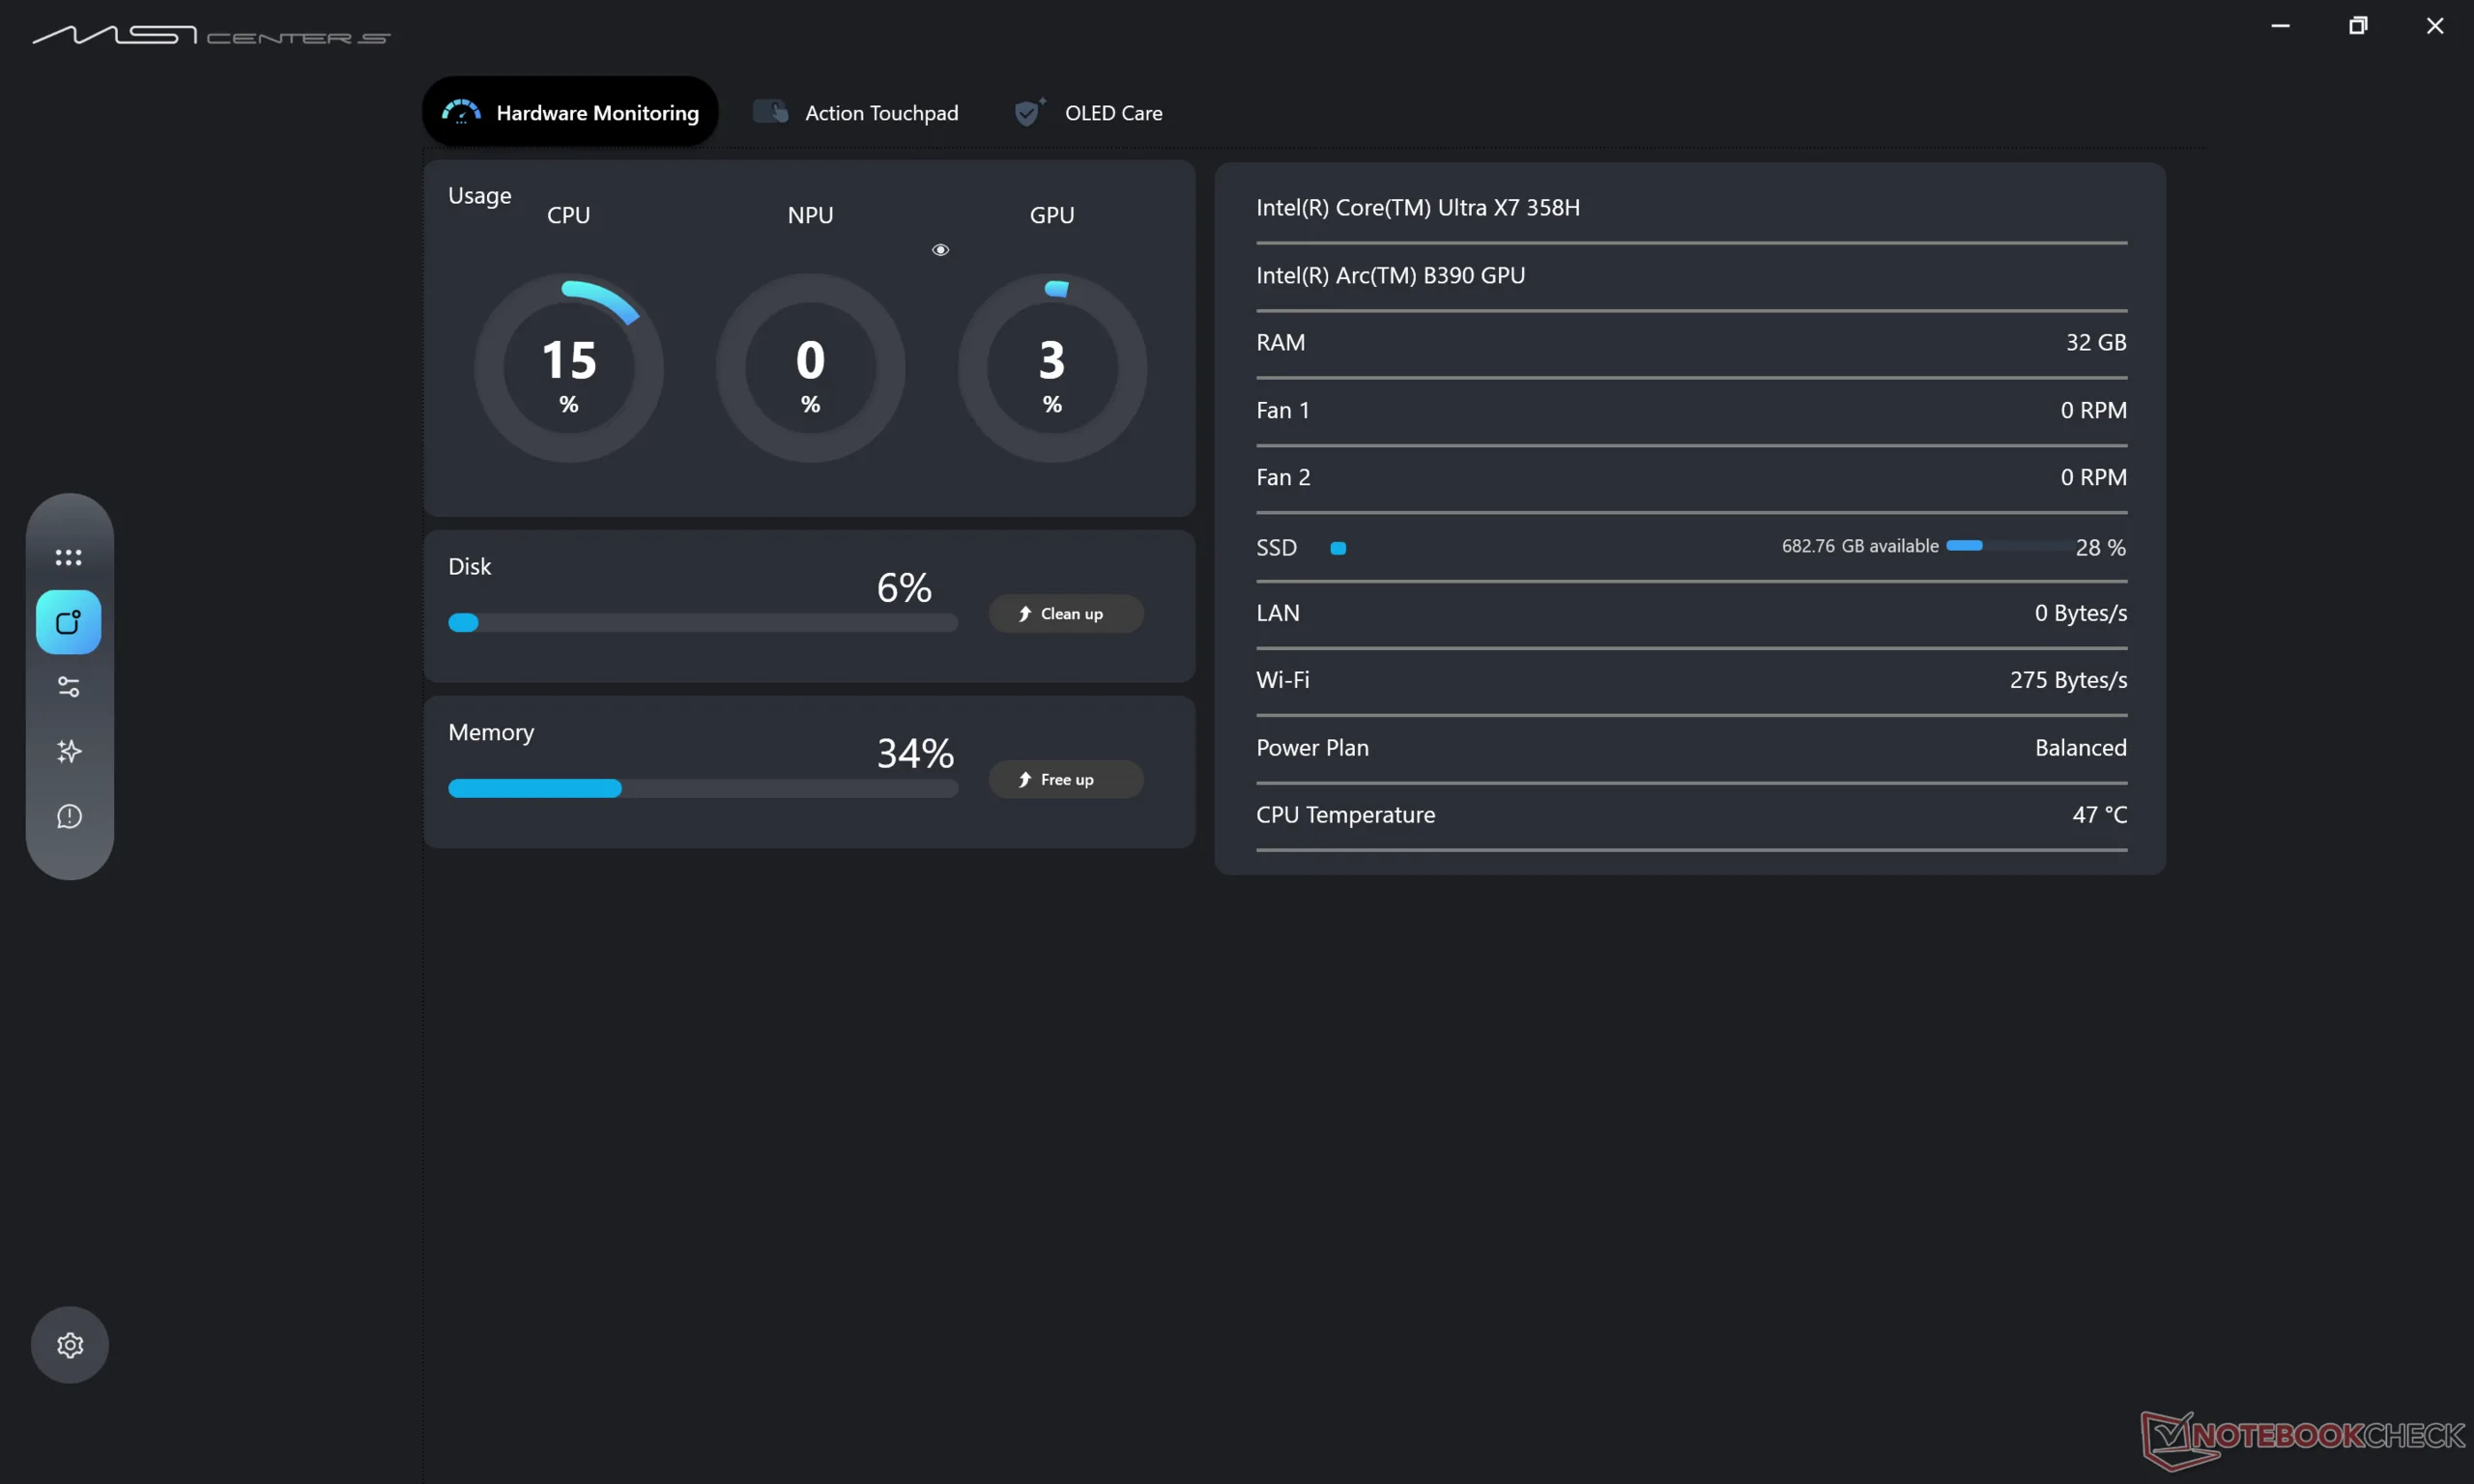
Abbiamo impostato MSI Center S e Windows in modalità Prestazioni prima di eseguire i benchmark qui sotto.
Processore
Il Core Ultra X7 358H offre prestazioni più costanti rispetto al Core Ultra 9 285H nel modello 2025 Prestige 16. Mentre quest'ultimo può essere fino al 10% più veloce quando il Turbo Boost è più efficace, il contrario è vero dopo che il Turbo Boost si è stabilizzato. Lo si può notare eseguendo CineBench R15 xT in un ciclo in cui la Prestige 16 2025 è la macchina più veloce solo per il primo minuto circa, prima che la nostra Prestige 16 2026 la superi in seguito.
L'aggiornamento al Core Ultra X9 388H dovrebbe aumentare le prestazioni multi-thread fino al 10%, in base al tempo trascorso con l'Asus ZenBook Duo UX8407AA.
Cinebench R15 Multi Loop
Cinebench R23: Multi Core | Single Core
Cinebench R20: CPU (Multi Core) | CPU (Single Core)
Cinebench R15: CPU Multi 64Bit | CPU Single 64Bit
Blender: v2.79 BMW27 CPU
7-Zip 18.03: 7z b 4 | 7z b 4 -mmt1
Geekbench 6.6: Multi-Core | Single-Core
Geekbench 5.5: Multi-Core | Single-Core
HWBOT x265 Benchmark v2.2: 4k Preset
LibreOffice : 20 Documents To PDF
R Benchmark 2.5: Overall mean
* ... Meglio usare valori piccoli
AIDA64: FP32 Ray-Trace | FPU Julia | CPU SHA3 | CPU Queen | FPU SinJulia | FPU Mandel | CPU AES | CPU ZLib | FP64 Ray-Trace | CPU PhotoWorxx | CPU CheckMate
| Performance rating | |
| Asus ZenBook S16 UM5606GA -1! | |
| Lenovo ThinkBook 16 G7+ AMD -1! | |
| Dell XPS 16 Core Ultra X7 358H -1! | |
| HP Envy x360 2-in-1 16-ad0097nr -1! | |
| MSI Prestige 16 AI C3MTG -1! | |
| MSI Prestige 16 AI Evo B2HMG -1! | |
| Media Intel Core Ultra X7 358H | |
| AIDA64 / FP32 Ray-Trace | |
| Lenovo ThinkBook 16 G7+ AMD (v6.92.6600) | |
| Asus ZenBook S16 UM5606GA (v6.92.6600) | |
| HP Envy x360 2-in-1 16-ad0097nr (v6.92.6600) | |
| MSI Prestige 16 AI Evo B2HMG (v6.92.6600) | |
| MSI Prestige 16 AI C3MTG (v8.20.8100) | |
| Dell XPS 16 Core Ultra X7 358H (v8.20.8100) | |
| Media Intel Core Ultra X7 358H (12221 - 17932, n=7) | |
| AIDA64 / FPU Julia | |
| Lenovo ThinkBook 16 G7+ AMD (v6.92.6600) | |
| Asus ZenBook S16 UM5606GA (v6.92.6600) | |
| MSI Prestige 16 AI Evo B2HMG (v6.92.6600) | |
| HP Envy x360 2-in-1 16-ad0097nr (v6.92.6600) | |
| MSI Prestige 16 AI C3MTG (v8.20.8100) | |
| Dell XPS 16 Core Ultra X7 358H (v8.20.8100) | |
| Media Intel Core Ultra X7 358H (29930 - 95525, n=7) | |
| AIDA64 / CPU SHA3 | |
| Lenovo ThinkBook 16 G7+ AMD (v6.92.6600) | |
| Asus ZenBook S16 UM5606GA (v6.92.6600) | |
| Media Intel Core Ultra X7 358H (3910 - 4911, n=7) | |
| MSI Prestige 16 AI Evo B2HMG (v6.92.6600) | |
| Dell XPS 16 Core Ultra X7 358H (v8.20.8100) | |
| MSI Prestige 16 AI C3MTG (v8.20.8100) | |
| HP Envy x360 2-in-1 16-ad0097nr (v6.92.6600) | |
| AIDA64 / CPU Queen | |
| HP Envy x360 2-in-1 16-ad0097nr (v6.92.6600) | |
| Asus ZenBook S16 UM5606GA (v6.92.6600) | |
| Lenovo ThinkBook 16 G7+ AMD (v6.92.6600) | |
| MSI Prestige 16 AI Evo B2HMG (v6.92.6600) | |
| Media Intel Core Ultra X7 358H (63425 - 63827, n=2) | |
| AIDA64 / FPU SinJulia | |
| Lenovo ThinkBook 16 G7+ AMD (v6.92.6600) | |
| Asus ZenBook S16 UM5606GA (v6.92.6600) | |
| HP Envy x360 2-in-1 16-ad0097nr (v6.92.6600) | |
| MSI Prestige 16 AI Evo B2HMG (v6.92.6600) | |
| Dell XPS 16 Core Ultra X7 358H (v8.20.8100) | |
| MSI Prestige 16 AI C3MTG (v8.20.8100) | |
| Media Intel Core Ultra X7 358H (4735 - 7038, n=7) | |
| AIDA64 / FPU Mandel | |
| Lenovo ThinkBook 16 G7+ AMD (v6.92.6600) | |
| Asus ZenBook S16 UM5606GA (v6.92.6600) | |
| MSI Prestige 16 AI Evo B2HMG (v6.92.6600) | |
| HP Envy x360 2-in-1 16-ad0097nr (v6.92.6600) | |
| Dell XPS 16 Core Ultra X7 358H (v8.20.8100) | |
| MSI Prestige 16 AI C3MTG (v8.20.8100) | |
| Media Intel Core Ultra X7 358H (14716 - 50734, n=7) | |
| AIDA64 / CPU AES | |
| Asus ZenBook S16 UM5606GA (v6.92.6600) | |
| HP Envy x360 2-in-1 16-ad0097nr (v6.92.6600) | |
| Lenovo ThinkBook 16 G7+ AMD (v6.92.6600) | |
| MSI Prestige 16 AI Evo B2HMG (v6.92.6600) | |
| MSI Prestige 16 AI C3MTG (v8.20.8100) | |
| Dell XPS 16 Core Ultra X7 358H (v8.20.8100) | |
| Media Intel Core Ultra X7 358H (5127 - 67510, n=7) | |
| AIDA64 / CPU ZLib | |
| Lenovo ThinkBook 16 G7+ AMD (v6.92.6600) | |
| Asus ZenBook S16 UM5606GA (v6.92.6600) | |
| Media Intel Core Ultra X7 358H (932 - 1179, n=7) | |
| MSI Prestige 16 AI Evo B2HMG (v6.92.6600) | |
| MSI Prestige 16 AI C3MTG (v8.20.8100) | |
| Dell XPS 16 Core Ultra X7 358H (v8.20.8100) | |
| HP Envy x360 2-in-1 16-ad0097nr (v6.92.6600) | |
| AIDA64 / FP64 Ray-Trace | |
| Lenovo ThinkBook 16 G7+ AMD (v6.92.6600) | |
| Asus ZenBook S16 UM5606GA (v6.92.6600) | |
| HP Envy x360 2-in-1 16-ad0097nr (v6.92.6600) | |
| MSI Prestige 16 AI Evo B2HMG (v6.92.6600) | |
| MSI Prestige 16 AI C3MTG (v8.20.8100) | |
| Dell XPS 16 Core Ultra X7 358H (v8.20.8100) | |
| Media Intel Core Ultra X7 358H (6506 - 9447, n=7) | |
| AIDA64 / CPU PhotoWorxx | |
| Dell XPS 16 Core Ultra X7 358H (v8.20.8100) | |
| MSI Prestige 16 AI C3MTG (v8.20.8100) | |
| Media Intel Core Ultra X7 358H (30538 - 88154, n=7) | |
| MSI Prestige 16 AI Evo B2HMG (v6.92.6600) | |
| Asus ZenBook S16 UM5606GA (v6.92.6600) | |
| Lenovo ThinkBook 16 G7+ AMD (v6.92.6600) | |
| HP Envy x360 2-in-1 16-ad0097nr (v6.92.6600) | |
| AIDA64 / CPU CheckMate | |
| Media Intel Core Ultra X7 358H (4261 - 4475, n=6) | |
| Dell XPS 16 Core Ultra X7 358H (v8.20.8100) | |
| MSI Prestige 16 AI C3MTG (v8.20.8100) | |
Prestazioni del sistema
PCMark 10: Score | Essentials | Productivity | Digital Content Creation
CrossMark: Overall | Productivity | Creativity | Responsiveness
WebXPRT 3: Overall
WebXPRT 4: Overall
Mozilla Kraken 1.1: Total
Geekbench AI: Quantized GPU 1.7 | Half Precision GPU 1.7 | Single Precision GPU 1.7
| Performance rating | |
| Dell XPS 16 Core Ultra X7 358H | |
| MSI Prestige 16 AI C3MTG | |
| Media Intel Core Ultra X7 358H, Intel Arc B390 12 Xe3 Panther Lake iGPU | |
| MSI Prestige 16 AI Evo B2HMG -3! | |
| Asus ZenBook S16 UM5606GA -3! | |
| Lenovo ThinkBook 16 G7+ AMD -3! | |
| HP Envy x360 2-in-1 16-ad0097nr -3! | |
| PCMark 10 / Score | |
| Dell XPS 16 Core Ultra X7 358H | |
| MSI Prestige 16 AI C3MTG | |
| Media Intel Core Ultra X7 358H, Intel Arc B390 12 Xe3 Panther Lake iGPU (8834 - 9880, n=8) | |
| Asus ZenBook S16 UM5606GA | |
| MSI Prestige 16 AI Evo B2HMG | |
| Lenovo ThinkBook 16 G7+ AMD | |
| HP Envy x360 2-in-1 16-ad0097nr | |
| PCMark 10 / Essentials | |
| MSI Prestige 16 AI Evo B2HMG | |
| Dell XPS 16 Core Ultra X7 358H | |
| Media Intel Core Ultra X7 358H, Intel Arc B390 12 Xe3 Panther Lake iGPU (10282 - 11263, n=7) | |
| MSI Prestige 16 AI C3MTG | |
| Lenovo ThinkBook 16 G7+ AMD | |
| HP Envy x360 2-in-1 16-ad0097nr | |
| Asus ZenBook S16 UM5606GA | |
| PCMark 10 / Productivity | |
| MSI Prestige 16 AI C3MTG | |
| Dell XPS 16 Core Ultra X7 358H | |
| Asus ZenBook S16 UM5606GA | |
| Media Intel Core Ultra X7 358H, Intel Arc B390 12 Xe3 Panther Lake iGPU (13908 - 16780, n=7) | |
| Lenovo ThinkBook 16 G7+ AMD | |
| HP Envy x360 2-in-1 16-ad0097nr | |
| MSI Prestige 16 AI Evo B2HMG | |
| PCMark 10 / Digital Content Creation | |
| Dell XPS 16 Core Ultra X7 358H | |
| Media Intel Core Ultra X7 358H, Intel Arc B390 12 Xe3 Panther Lake iGPU (13082 - 13893, n=7) | |
| MSI Prestige 16 AI C3MTG | |
| MSI Prestige 16 AI Evo B2HMG | |
| Lenovo ThinkBook 16 G7+ AMD | |
| Asus ZenBook S16 UM5606GA | |
| HP Envy x360 2-in-1 16-ad0097nr | |
| CrossMark / Overall | |
| MSI Prestige 16 AI Evo B2HMG | |
| Dell XPS 16 Core Ultra X7 358H | |
| MSI Prestige 16 AI C3MTG | |
| Media Intel Core Ultra X7 358H, Intel Arc B390 12 Xe3 Panther Lake iGPU (1884 - 2114, n=7) | |
| Lenovo ThinkBook 16 G7+ AMD | |
| Asus ZenBook S16 UM5606GA | |
| HP Envy x360 2-in-1 16-ad0097nr | |
| CrossMark / Productivity | |
| MSI Prestige 16 AI Evo B2HMG | |
| Dell XPS 16 Core Ultra X7 358H | |
| MSI Prestige 16 AI C3MTG | |
| Media Intel Core Ultra X7 358H, Intel Arc B390 12 Xe3 Panther Lake iGPU (1678 - 1898, n=7) | |
| Asus ZenBook S16 UM5606GA | |
| HP Envy x360 2-in-1 16-ad0097nr | |
| Lenovo ThinkBook 16 G7+ AMD | |
| CrossMark / Creativity | |
| Dell XPS 16 Core Ultra X7 358H | |
| MSI Prestige 16 AI C3MTG | |
| Media Intel Core Ultra X7 358H, Intel Arc B390 12 Xe3 Panther Lake iGPU (2241 - 2529, n=7) | |
| MSI Prestige 16 AI Evo B2HMG | |
| Lenovo ThinkBook 16 G7+ AMD | |
| Asus ZenBook S16 UM5606GA | |
| HP Envy x360 2-in-1 16-ad0097nr | |
| CrossMark / Responsiveness | |
| MSI Prestige 16 AI Evo B2HMG | |
| Dell XPS 16 Core Ultra X7 358H | |
| Media Intel Core Ultra X7 358H, Intel Arc B390 12 Xe3 Panther Lake iGPU (1560 - 1707, n=7) | |
| MSI Prestige 16 AI C3MTG | |
| HP Envy x360 2-in-1 16-ad0097nr | |
| Lenovo ThinkBook 16 G7+ AMD | |
| Asus ZenBook S16 UM5606GA | |
| WebXPRT 3 / Overall | |
| MSI Prestige 16 AI Evo B2HMG | |
| MSI Prestige 16 AI C3MTG | |
| Lenovo ThinkBook 16 G7+ AMD | |
| Media Intel Core Ultra X7 358H, Intel Arc B390 12 Xe3 Panther Lake iGPU (293 - 338, n=7) | |
| Dell XPS 16 Core Ultra X7 358H | |
| HP Envy x360 2-in-1 16-ad0097nr | |
| Asus ZenBook S16 UM5606GA | |
| WebXPRT 4 / Overall | |
| MSI Prestige 16 AI Evo B2HMG | |
| MSI Prestige 16 AI C3MTG | |
| Dell XPS 16 Core Ultra X7 358H | |
| Media Intel Core Ultra X7 358H, Intel Arc B390 12 Xe3 Panther Lake iGPU (278 - 305, n=7) | |
| Lenovo ThinkBook 16 G7+ AMD | |
| HP Envy x360 2-in-1 16-ad0097nr | |
| Asus ZenBook S16 UM5606GA | |
| Mozilla Kraken 1.1 / Total | |
| HP Envy x360 2-in-1 16-ad0097nr | |
| Asus ZenBook S16 UM5606GA | |
| MSI Prestige 16 AI C3MTG | |
| Media Intel Core Ultra X7 358H, Intel Arc B390 12 Xe3 Panther Lake iGPU (445 - 460, n=7) | |
| Dell XPS 16 Core Ultra X7 358H | |
| Lenovo ThinkBook 16 G7+ AMD | |
| MSI Prestige 16 AI Evo B2HMG | |
| Geekbench AI / Quantized GPU 1.7 | |
| Dell XPS 16 Core Ultra X7 358H | |
| MSI Prestige 16 AI C3MTG | |
| Media Intel Core Ultra X7 358H, Intel Arc B390 12 Xe3 Panther Lake iGPU (6908 - 8011, n=6) | |
| Geekbench AI / Half Precision GPU 1.7 | |
| MSI Prestige 16 AI C3MTG | |
| Dell XPS 16 Core Ultra X7 358H | |
| Media Intel Core Ultra X7 358H, Intel Arc B390 12 Xe3 Panther Lake iGPU (16188 - 21963, n=6) | |
| Geekbench AI / Single Precision GPU 1.7 | |
| MSI Prestige 16 AI C3MTG | |
| Dell XPS 16 Core Ultra X7 358H | |
| Media Intel Core Ultra X7 358H, Intel Arc B390 12 Xe3 Panther Lake iGPU (9783 - 12255, n=6) | |
* ... Meglio usare valori piccoli
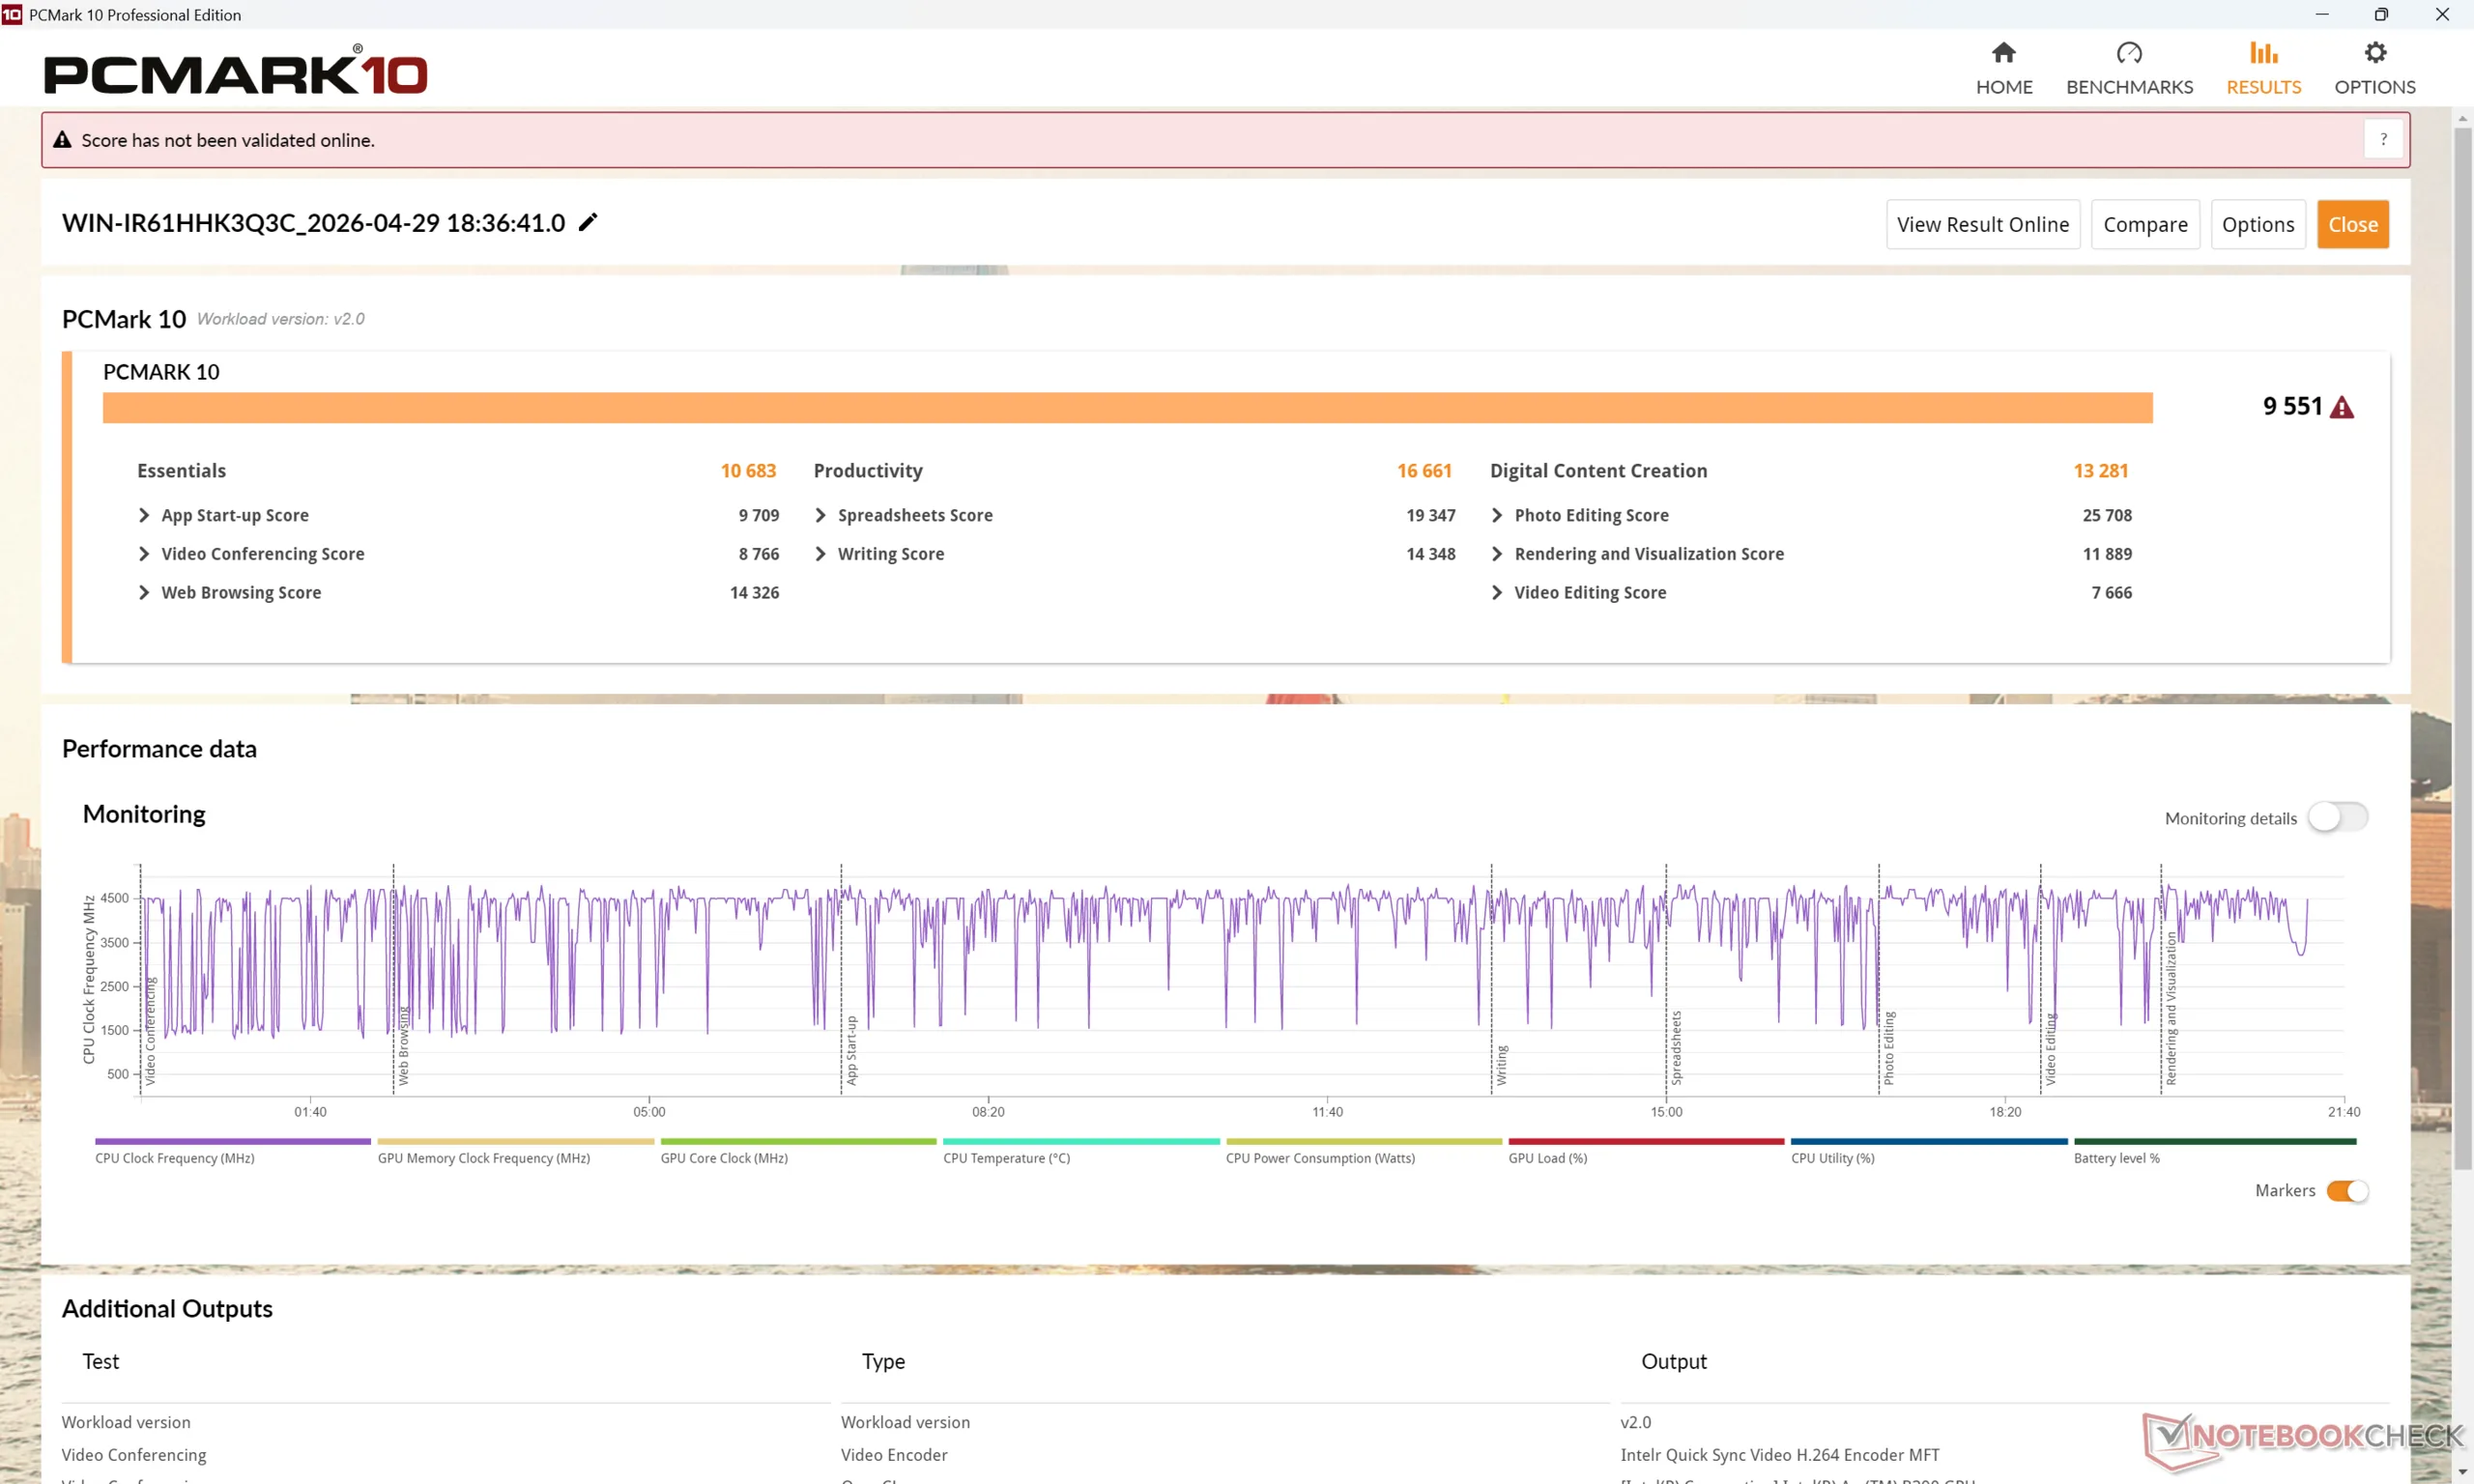
| PCMark 10 Score | 9551 punti | |
Aiuto | ||
| AIDA64 / Memory Copy | |
| Dell XPS 16 Core Ultra X7 358H | |
| MSI Prestige 16 AI C3MTG | |
| Media Intel Core Ultra X7 358H (102745 - 132135, n=6) | |
| MSI Prestige 16 AI Evo B2HMG | |
| Asus ZenBook S16 UM5606GA | |
| Lenovo ThinkBook 16 G7+ AMD | |
| HP Envy x360 2-in-1 16-ad0097nr | |
| AIDA64 / Memory Read | |
| Dell XPS 16 Core Ultra X7 358H | |
| Media Intel Core Ultra X7 358H (97755 - 118888, n=7) | |
| MSI Prestige 16 AI C3MTG | |
| Asus ZenBook S16 UM5606GA | |
| Lenovo ThinkBook 16 G7+ AMD | |
| MSI Prestige 16 AI Evo B2HMG | |
| HP Envy x360 2-in-1 16-ad0097nr | |
| AIDA64 / Memory Write | |
| Dell XPS 16 Core Ultra X7 358H | |
| Media Intel Core Ultra X7 358H (105984 - 134998, n=7) | |
| MSI Prestige 16 AI C3MTG | |
| Asus ZenBook S16 UM5606GA | |
| Lenovo ThinkBook 16 G7+ AMD | |
| HP Envy x360 2-in-1 16-ad0097nr | |
| MSI Prestige 16 AI Evo B2HMG | |
| AIDA64 / Memory Latency | |
| MSI Prestige 16 AI Evo B2HMG | |
| HP Envy x360 2-in-1 16-ad0097nr | |
| Lenovo ThinkBook 16 G7+ AMD | |
| Asus ZenBook S16 UM5606GA | |
| MSI Prestige 16 AI C3MTG | |
| Dell XPS 16 Core Ultra X7 358H | |
| Media Intel Core Ultra X7 358H (84.6 - 101.9, n=7) | |
* ... Meglio usare valori piccoli
Latenza DPC
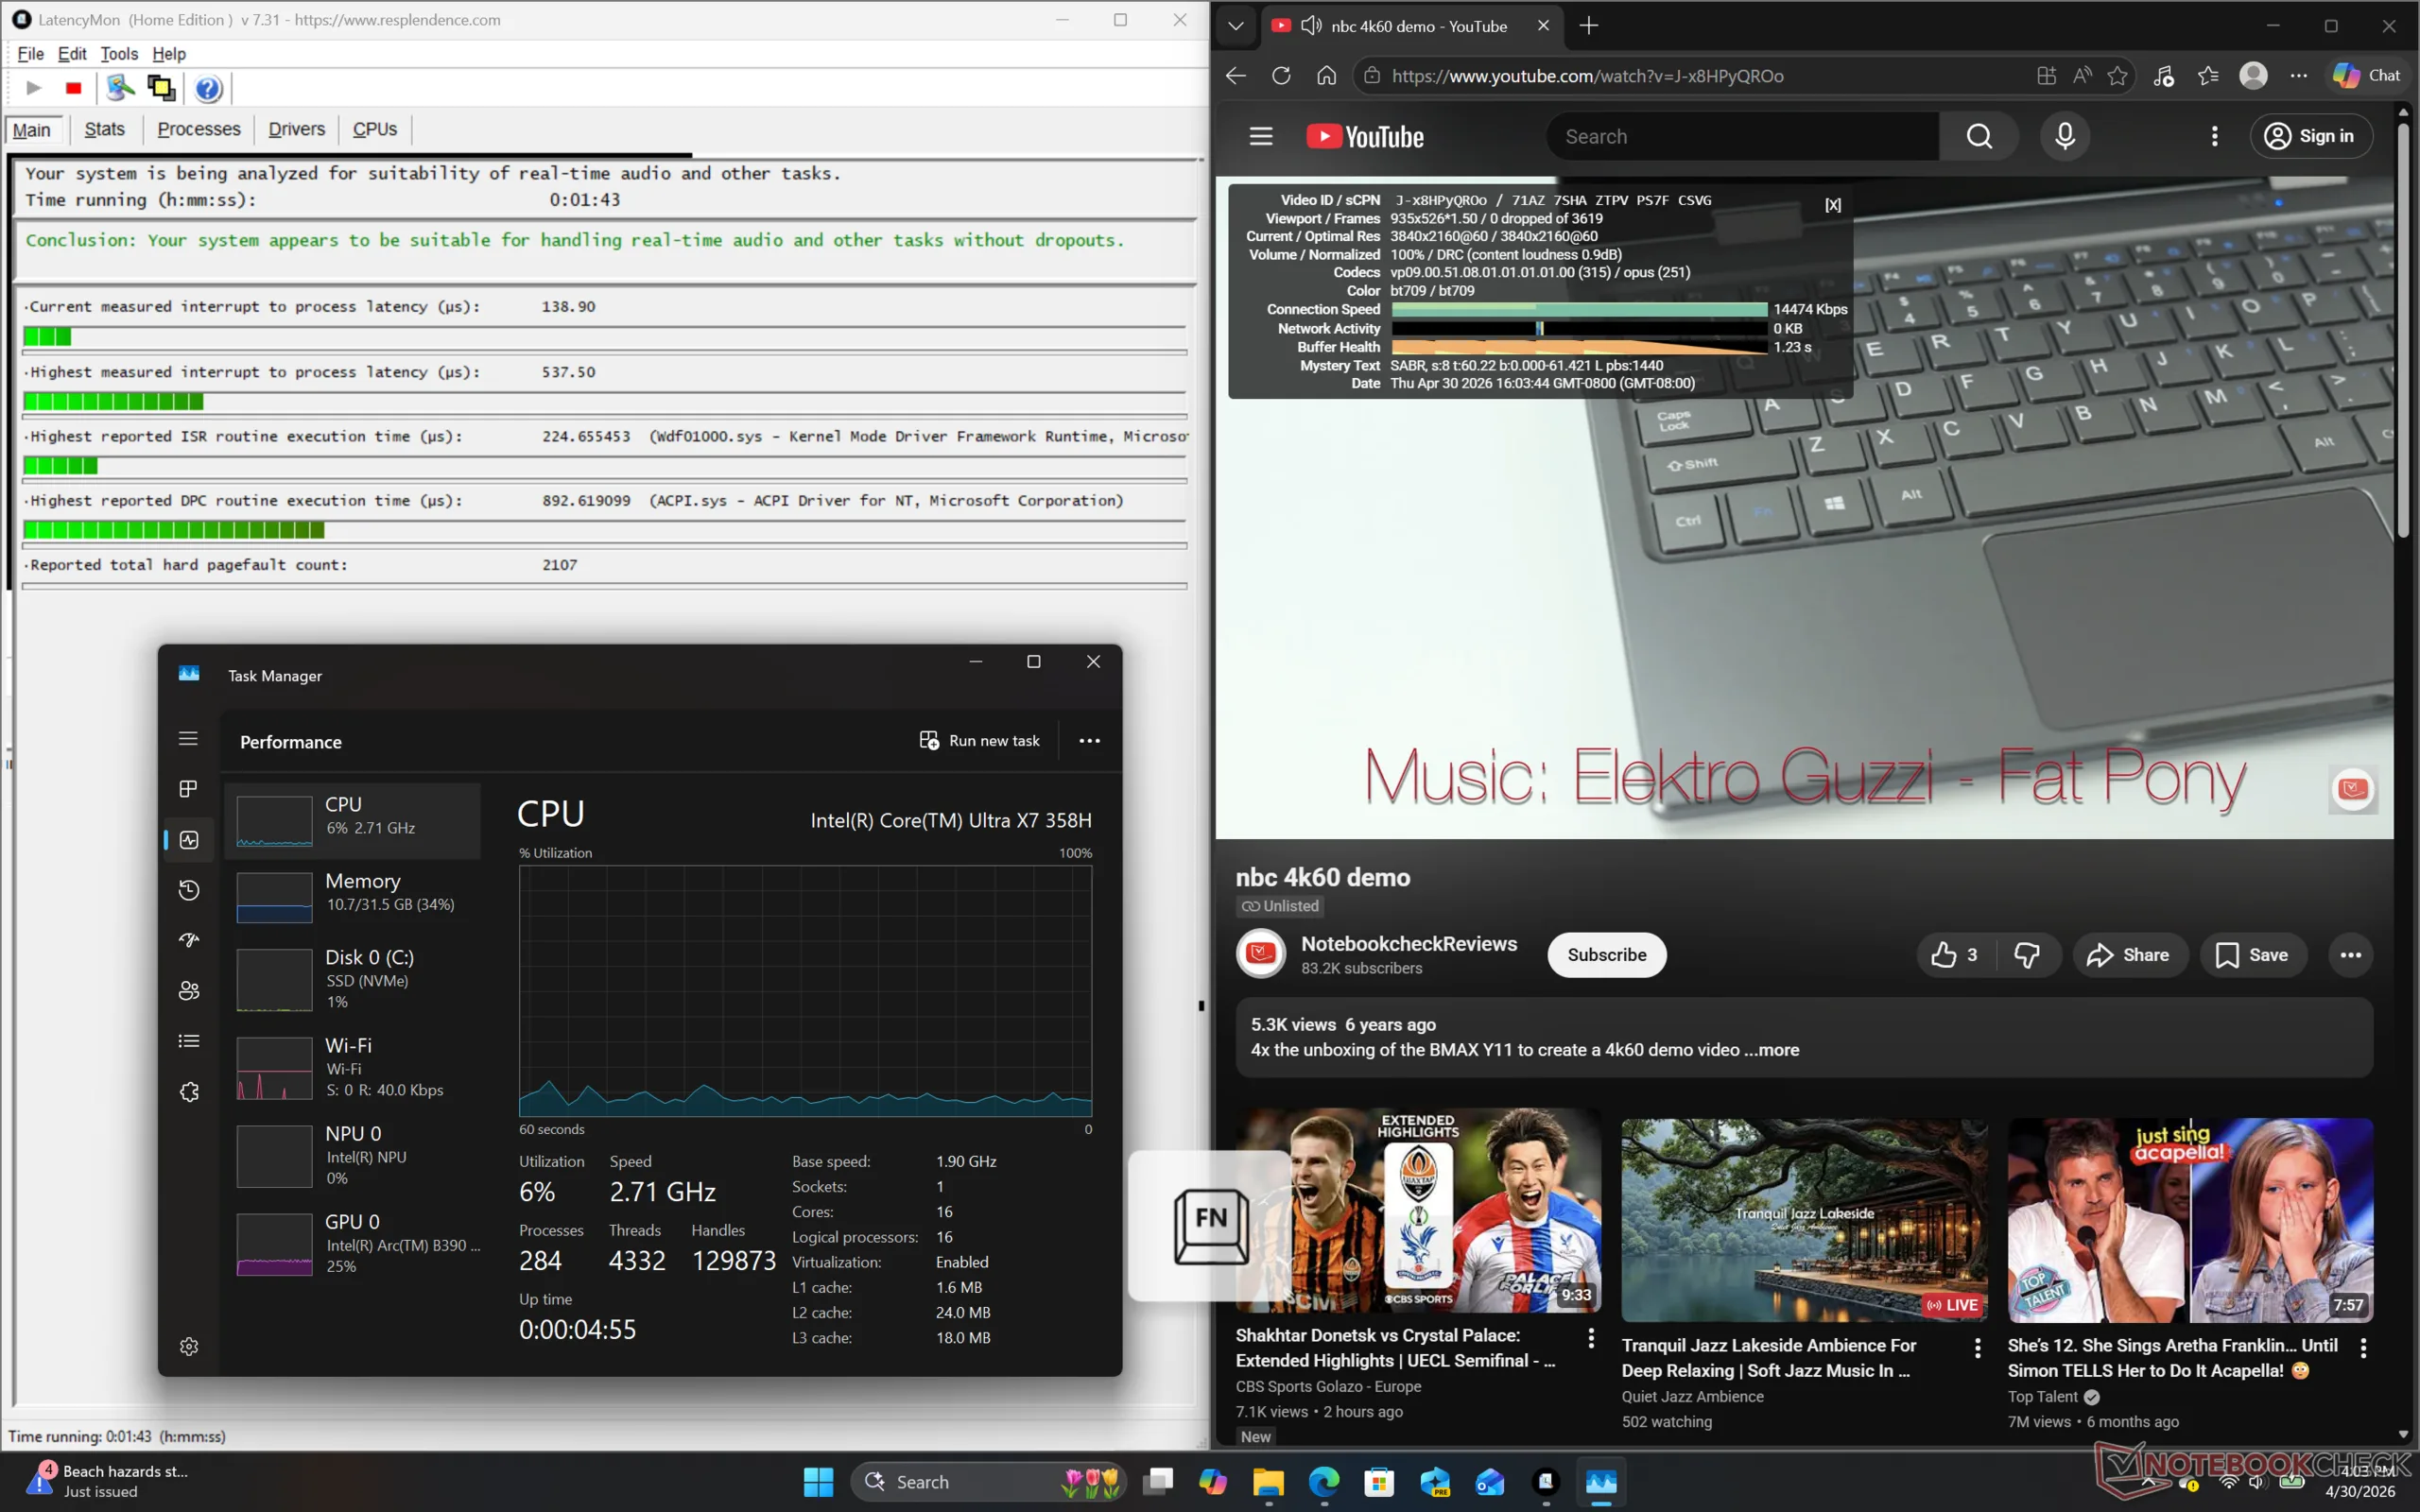
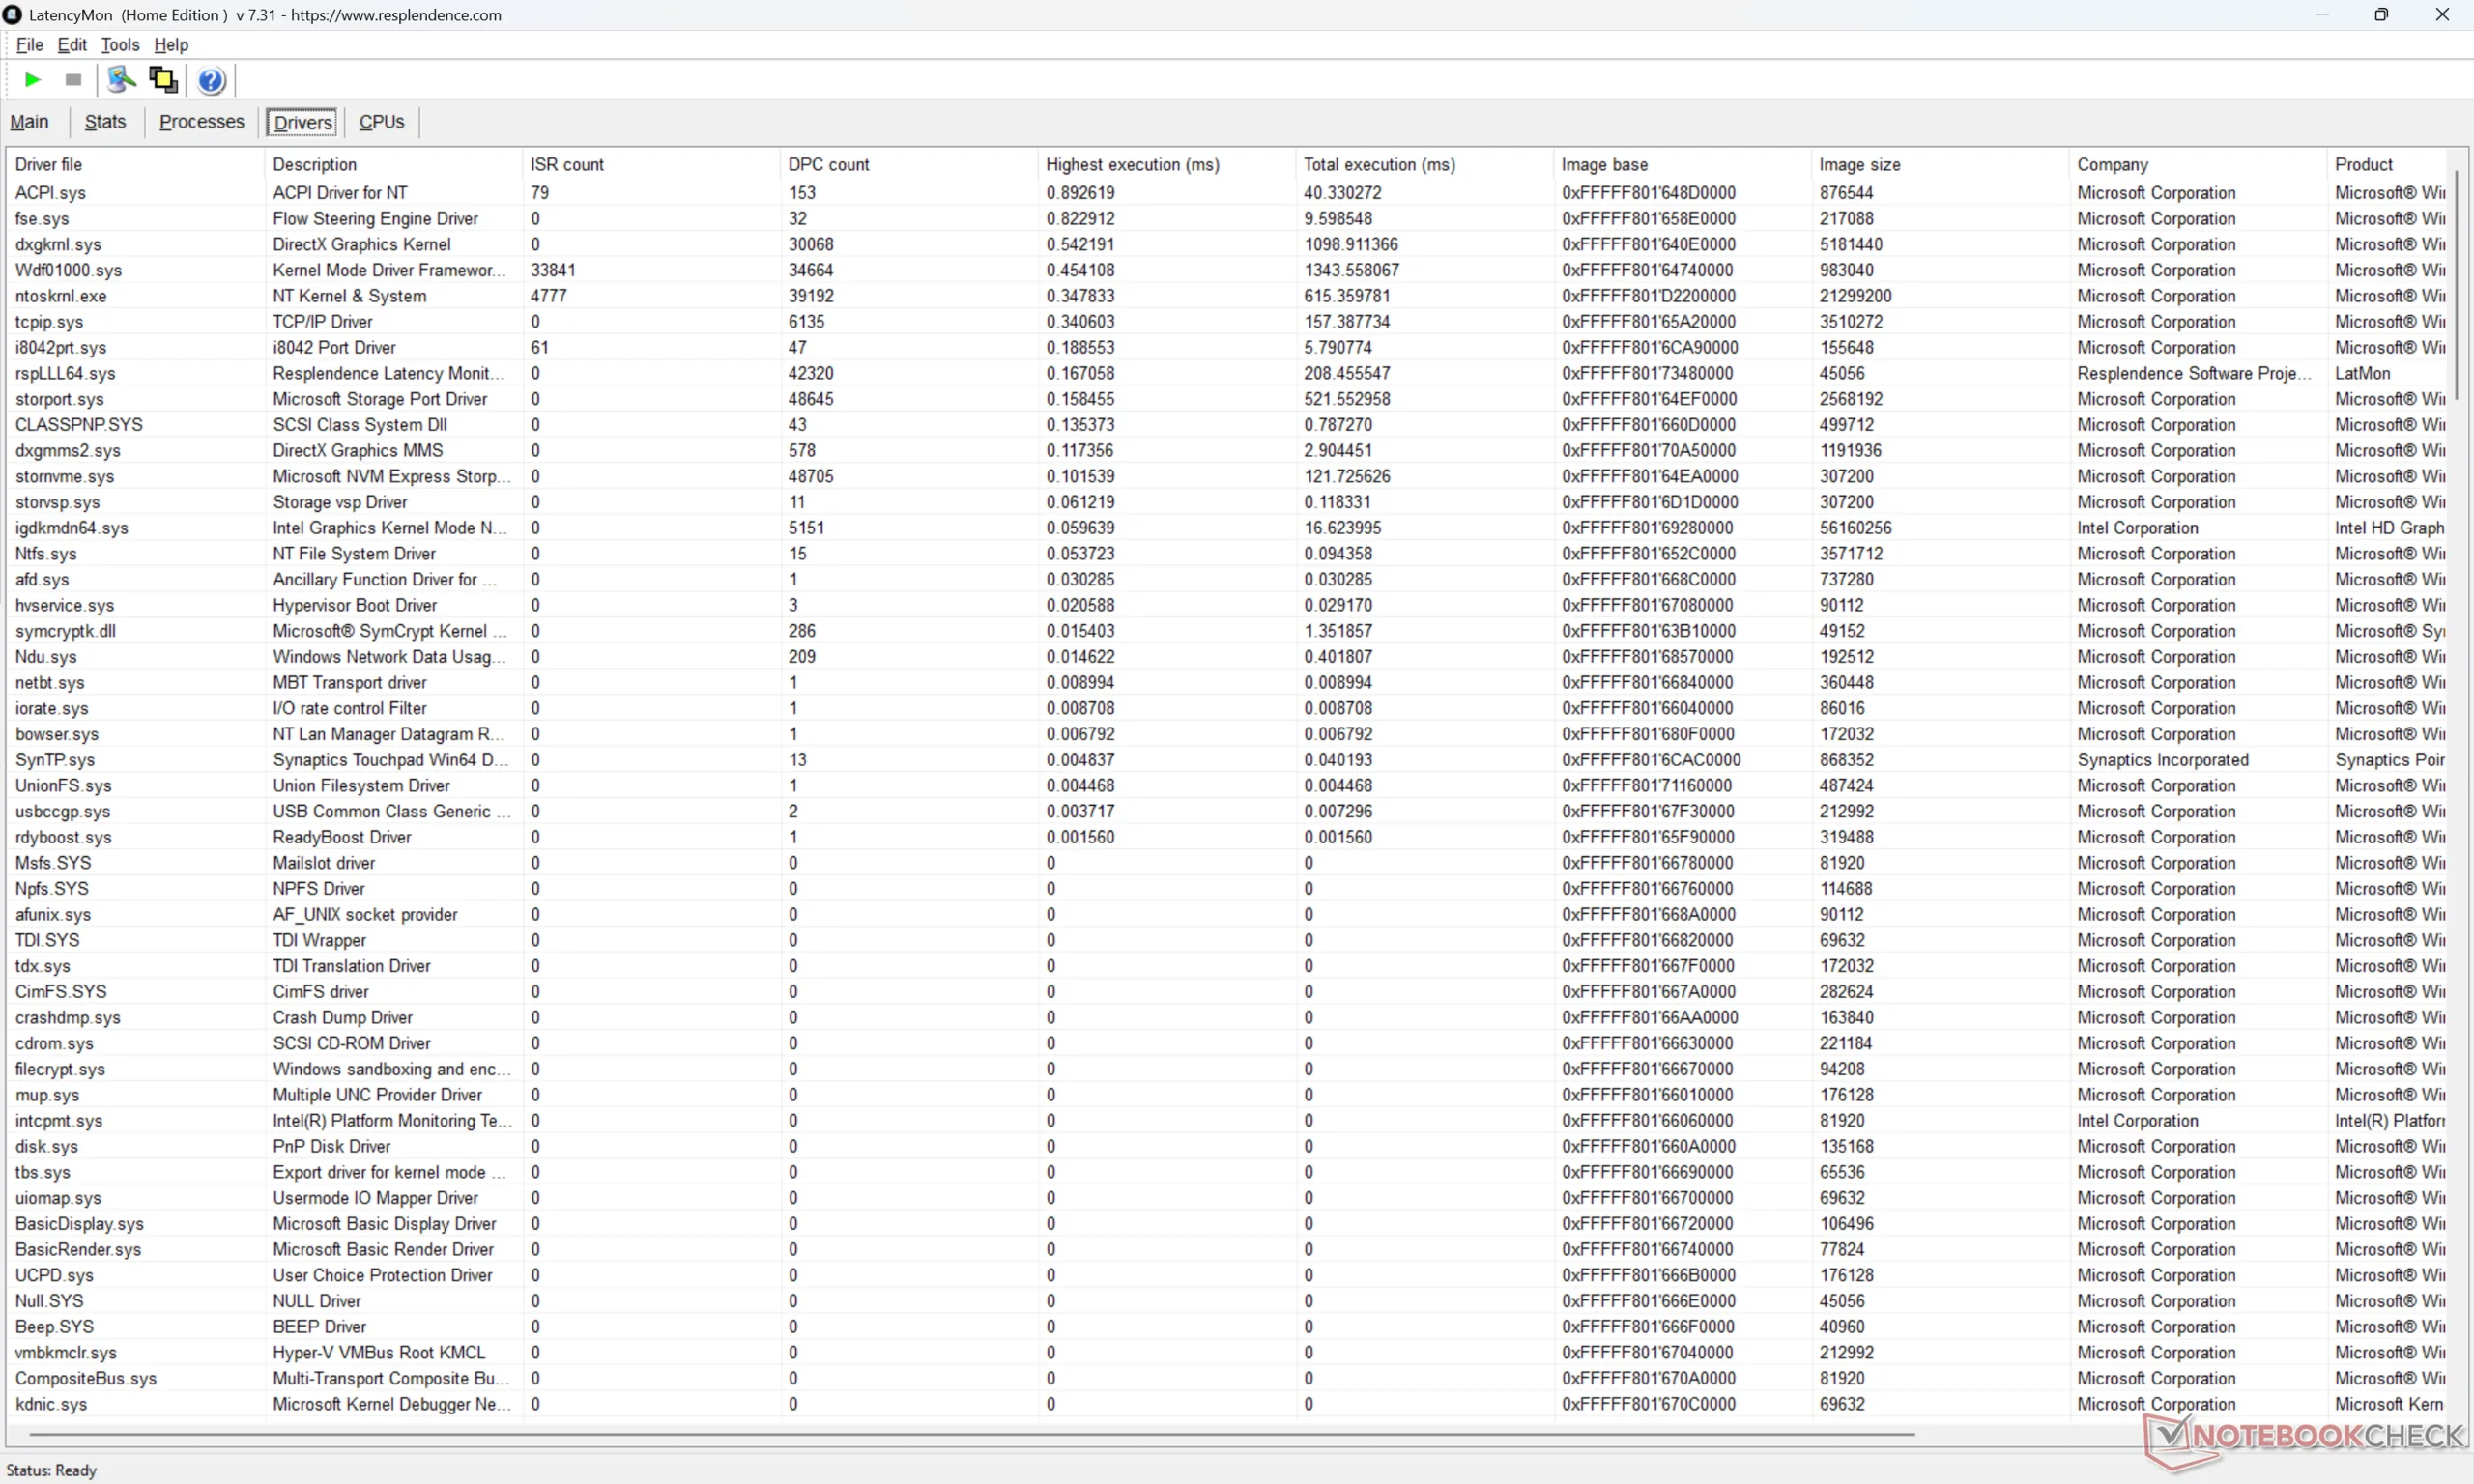
| DPC Latencies / LatencyMon - interrupt to process latency (max), Web, Youtube, Prime95 | |
| MSI Prestige 16 AI Evo B2HMG | |
| HP Envy x360 2-in-1 16-ad0097nr | |
| Lenovo ThinkBook 16 G7+ AMD | |
| Asus ZenBook S16 UM5606GA | |
| MSI Prestige 16 AI C3MTG | |
| Dell XPS 16 Core Ultra X7 358H | |
* ... Meglio usare valori piccoli
Dispositivi di archiviazione
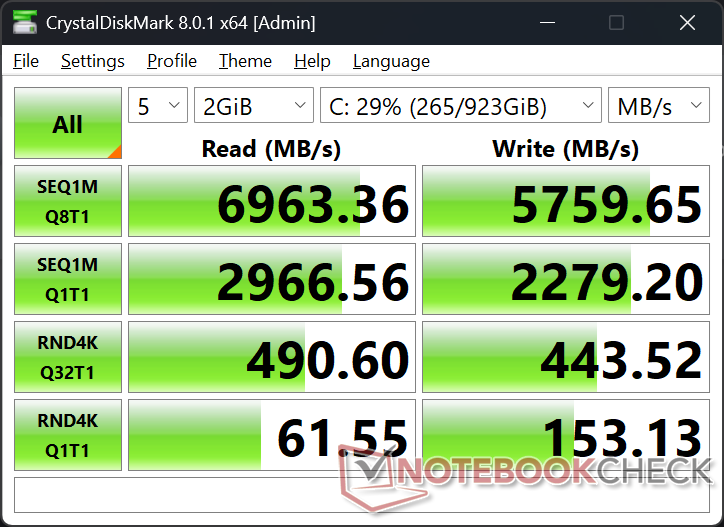
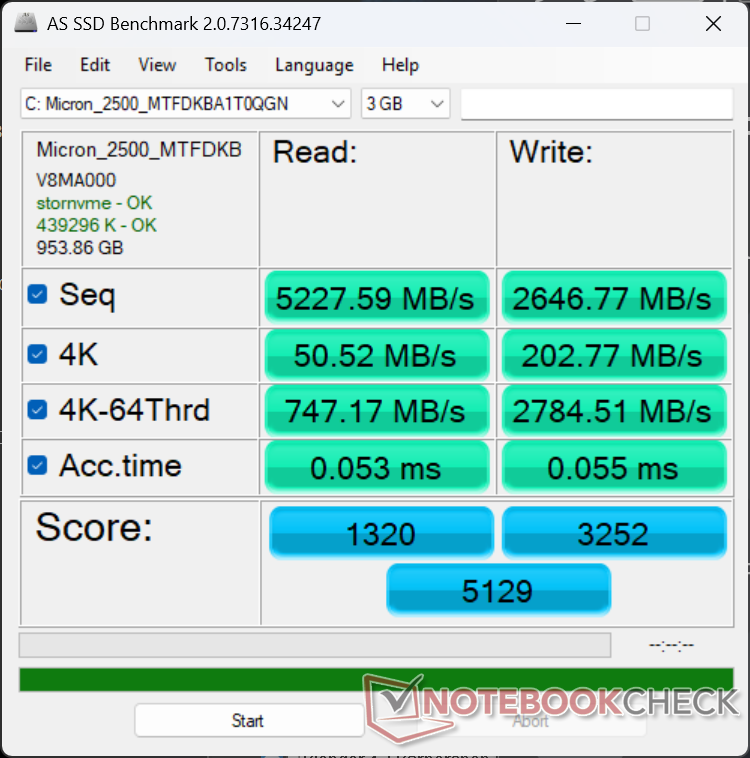
La nostra unità di prova viene fornita con lo stesso 1 TB Micron 2500 PCIe4 x4 NVMe del modello dello scorso anno, con livelli di prestazioni simili e nessun comportamento di throttling degno di nota. Non c'è più il supporto per le unità SSD M.2 secondarie, che sembra essere una tendenza dei laptop da 16 pollici più recenti, come l'XPS 16 o l'Asus Zenbook S16 Asus Zenbook S16.

* ... Meglio usare valori piccoli
Strozzatura del disco: DiskSpd Lettura in loop, Profondità coda 8
Prestazioni della GPU
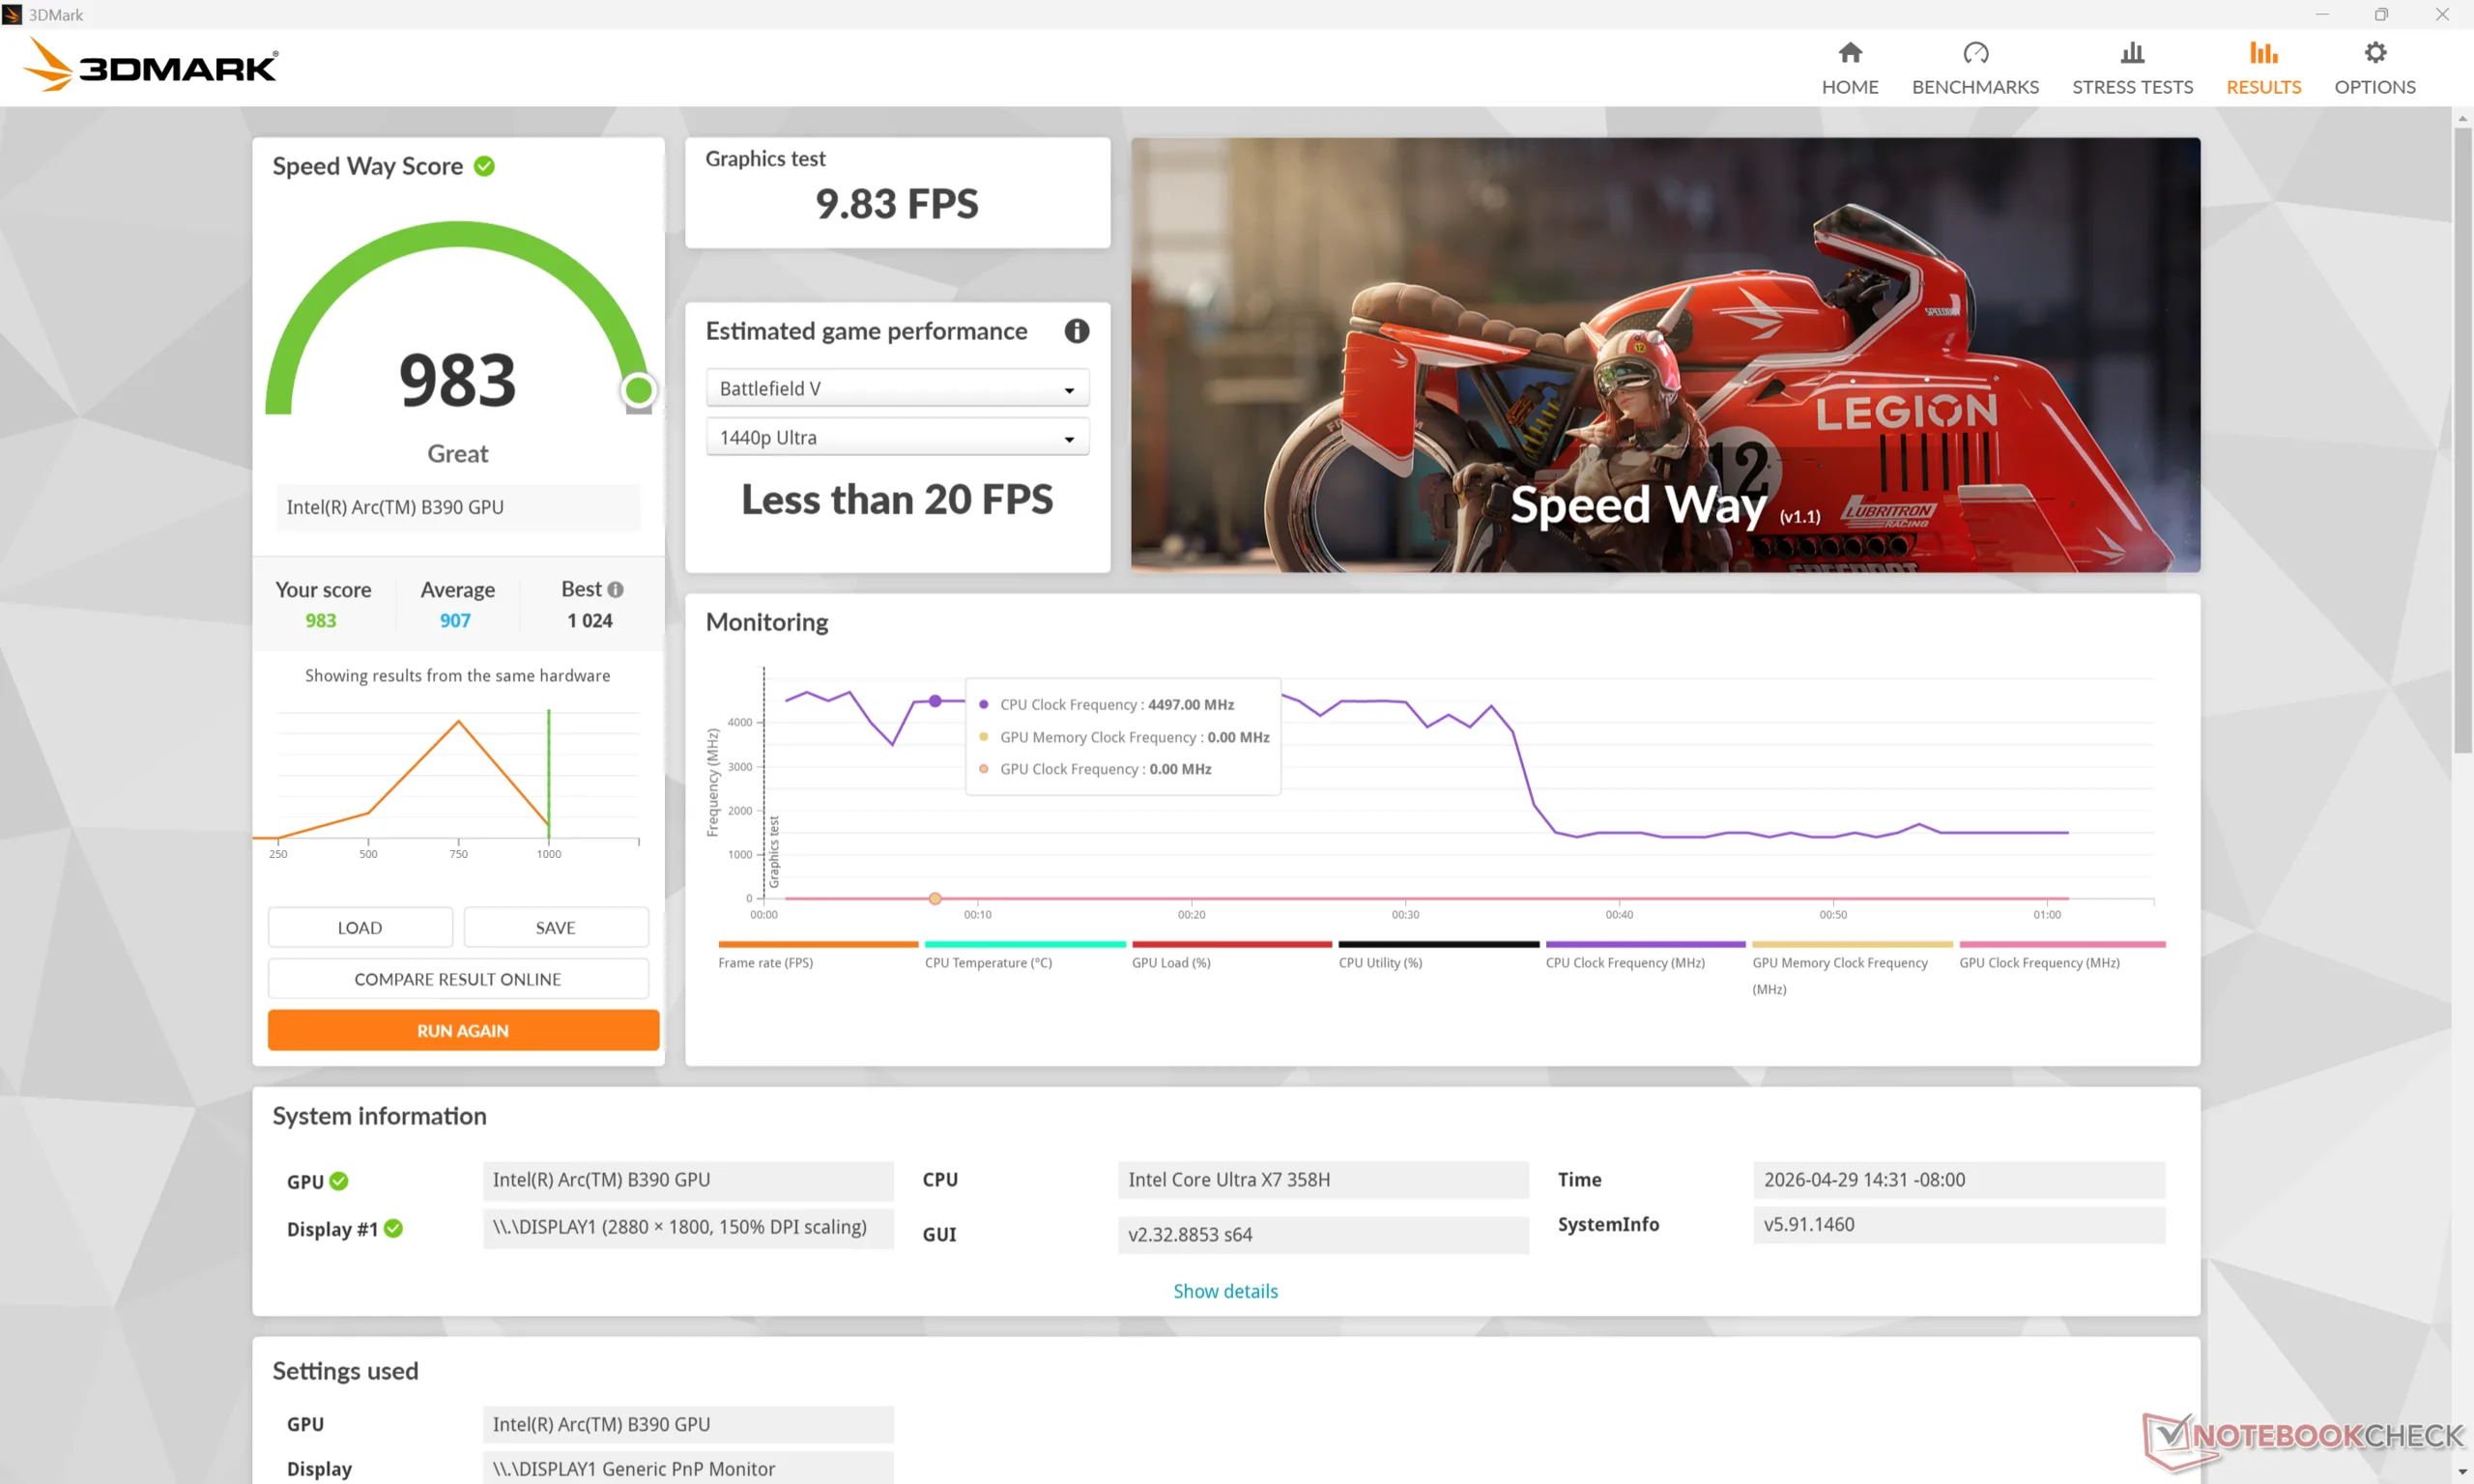
Le prestazioni grafiche sono quelle che ci aspettiamo rispetto ad altri PC con le stesse caratteristiche Arc B390 GPU, se non leggermente più lento di qualche punto percentuale. L'Arc B390 è significativamente più veloce dell' Arc 140T sul Prestige 16 dell'anno scorso, fino al 50-80%, ed è uno dei motivi principali per passare a Panther Lake.
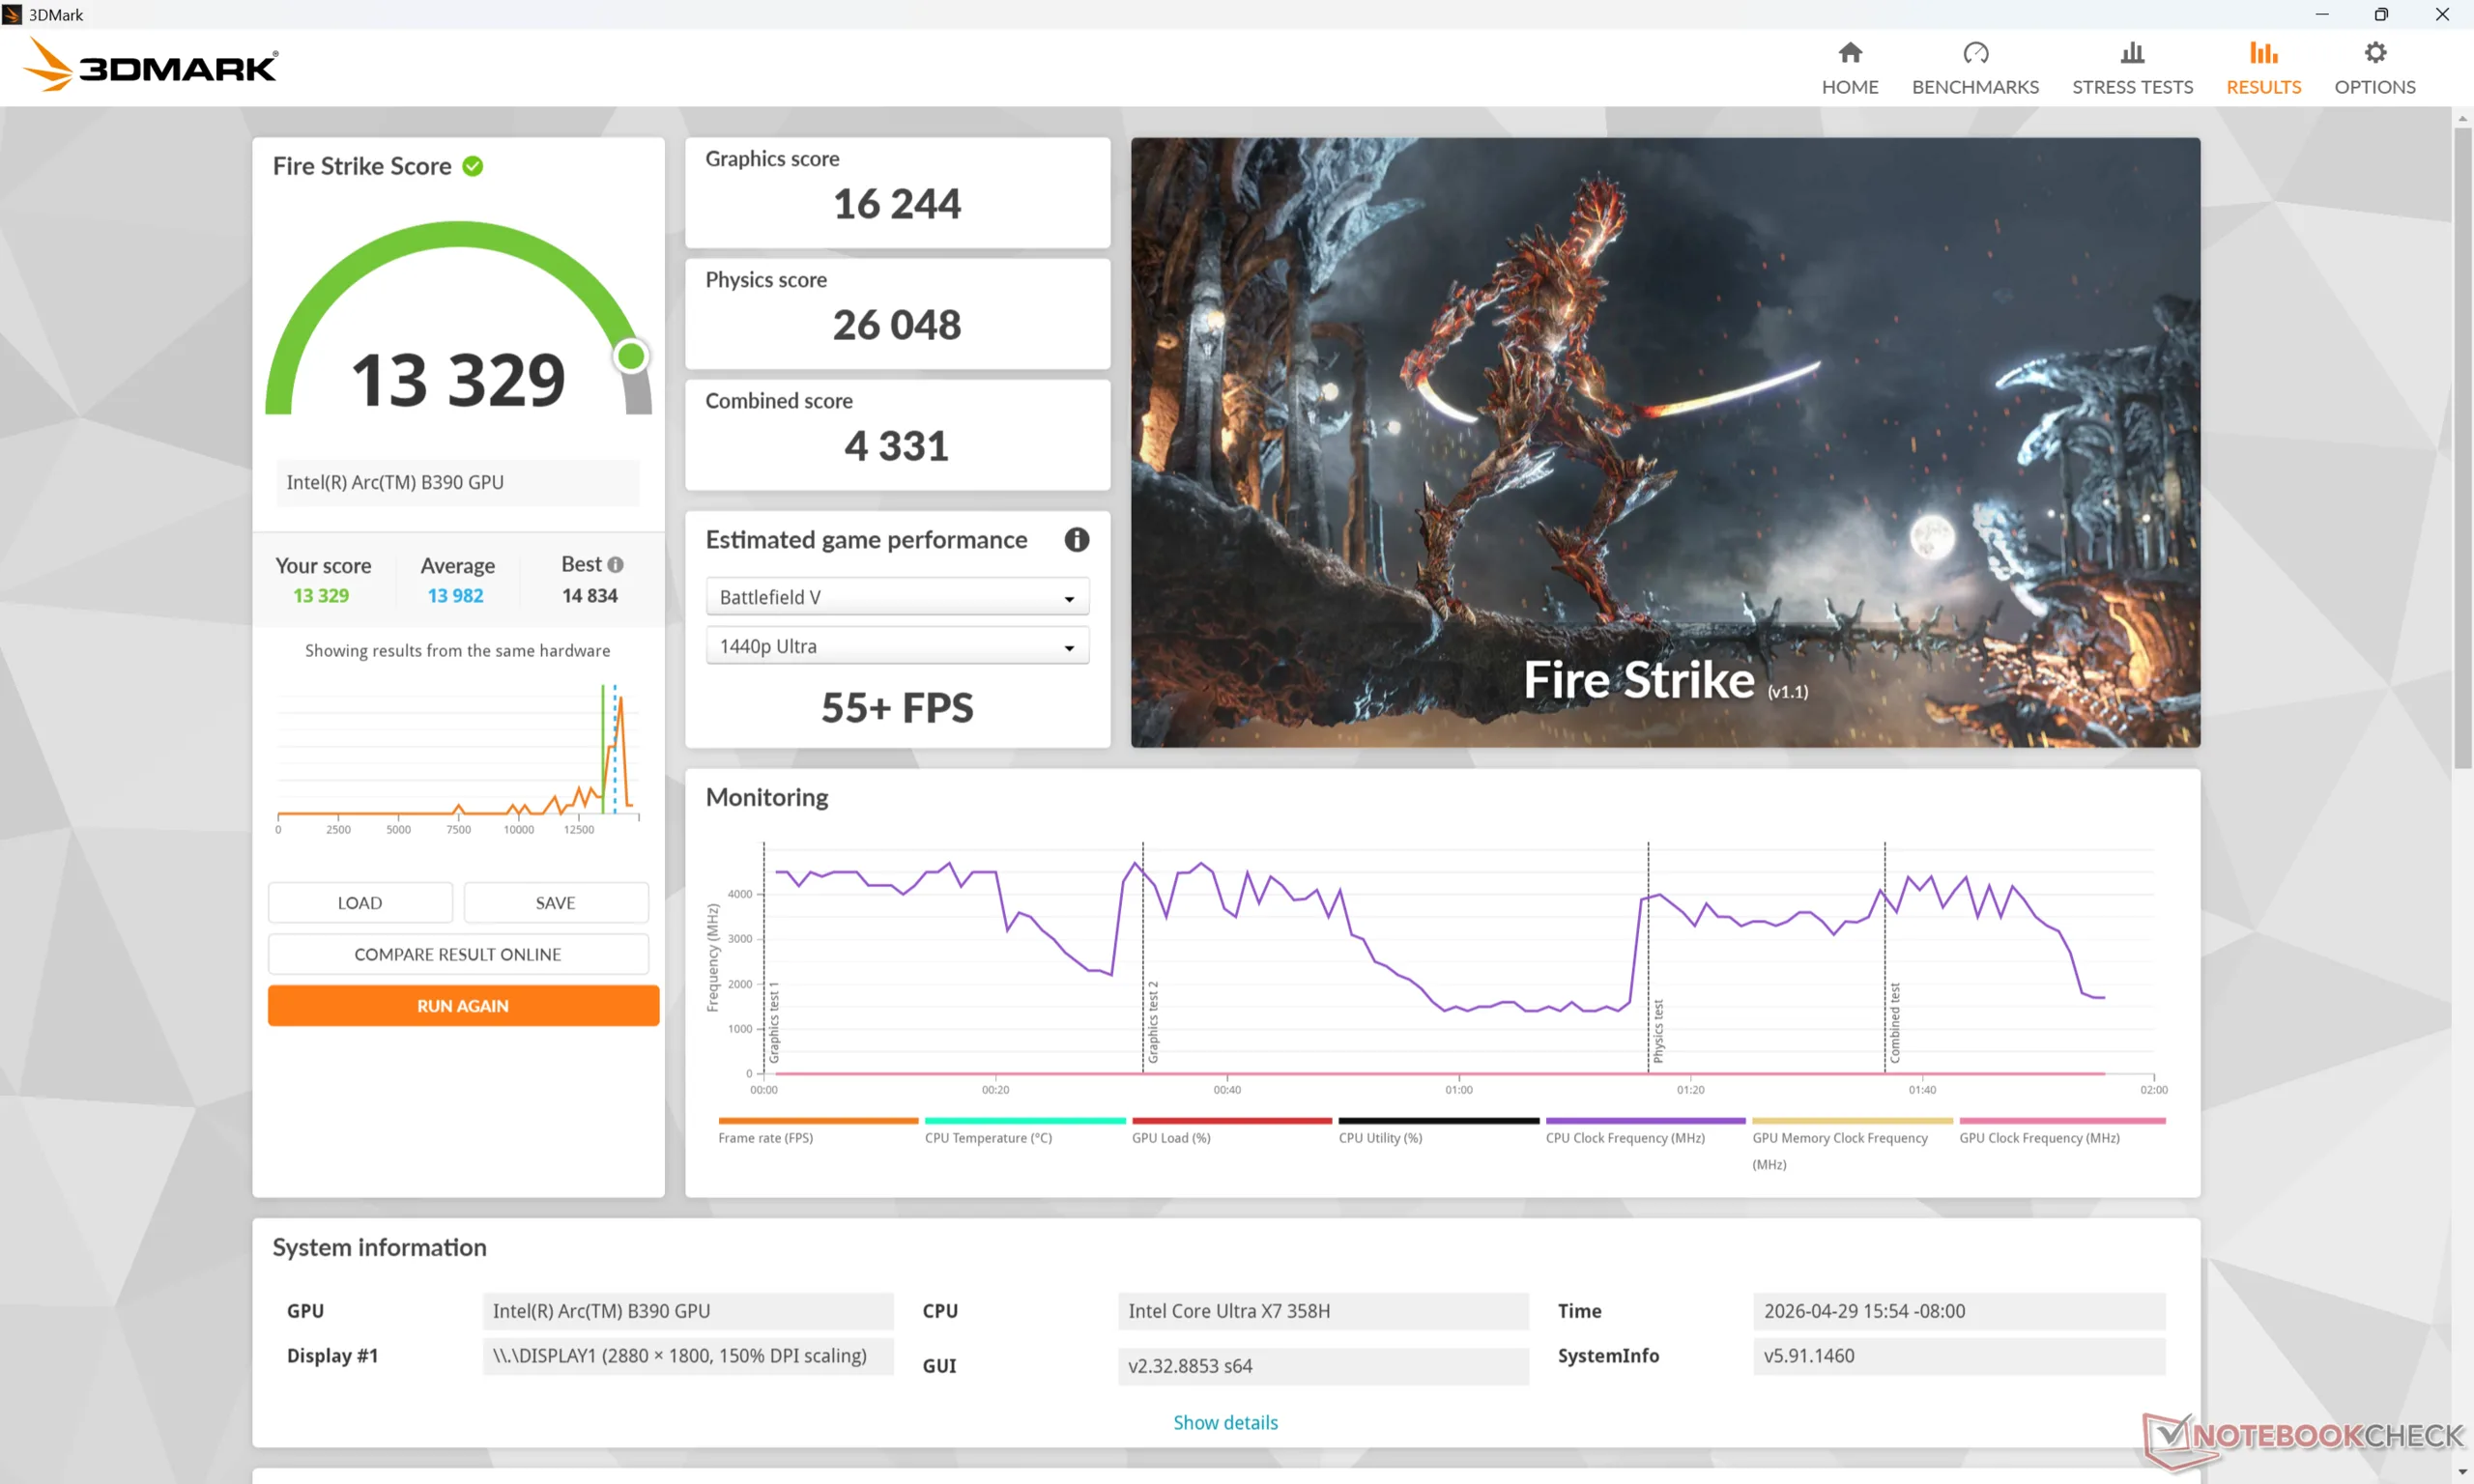
L'esecuzione in modalità Bilanciata invece che in modalità Prestazioni avrebbe un impatto sulle prestazioni più significativo del previsto, fino al 25 percento, come mostra la nostra tabella dei risultati Fire Strike qui sotto. Ciò influirebbe successivamente sulla rumorosità della ventola e sulle prestazioni di gioco, come dimostreranno le nostre sezioni sottostanti.
| Profilo energetico | Punteggio grafico | Punteggio Fisica | Punteggio combinato |
| Modalità Prestazioni | 16244 | 26048 | 4331 |
| Modalità equilibrata | 15684 (-3%) | 19912 (-24%) | 4476 (-0%) |
| Alimentazione a batteria | 16481 (-0%) | 20729 (-20%) | 4794 (-0%) |
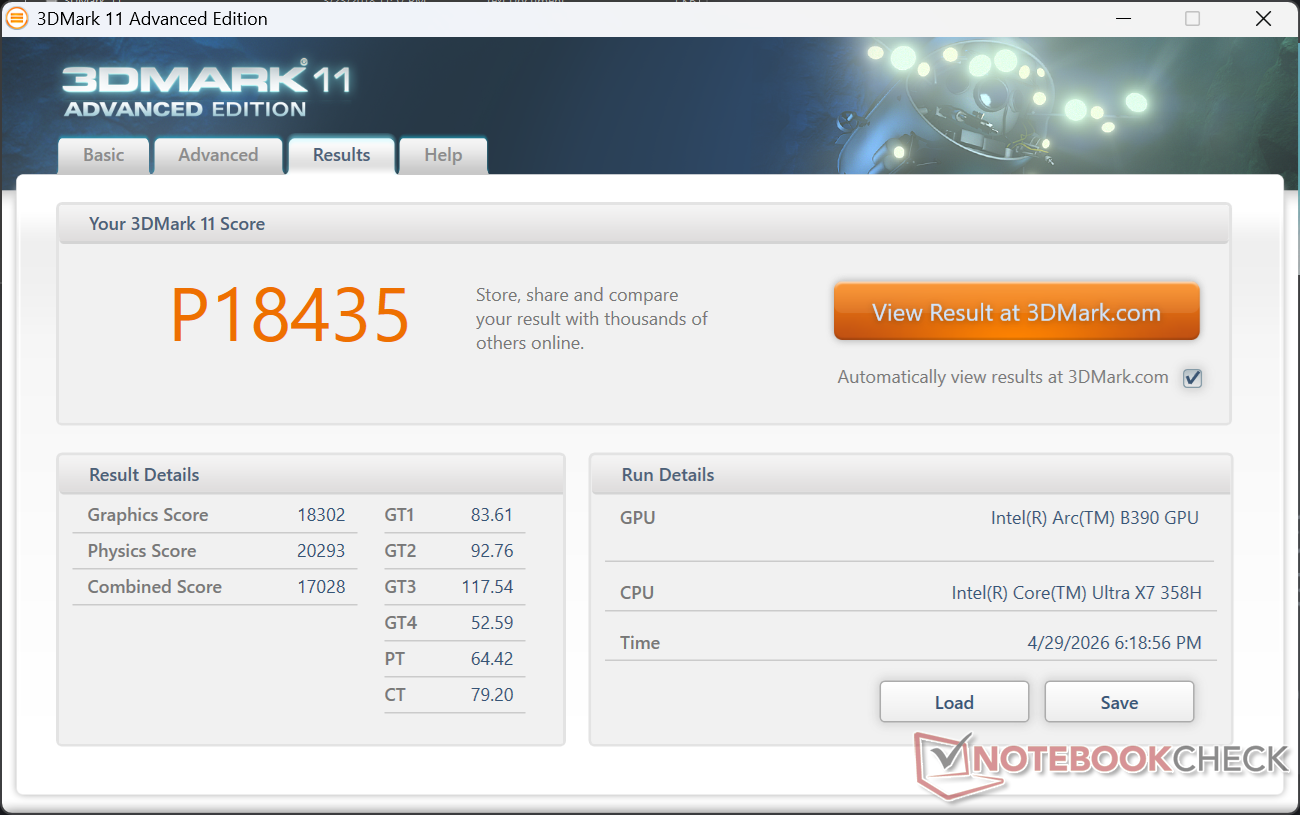
| 3DMark 11 Performance | 18435 punti | |
| 3DMark Cloud Gate Standard Score | 35193 punti | |
| 3DMark Fire Strike Score | 13329 punti | |
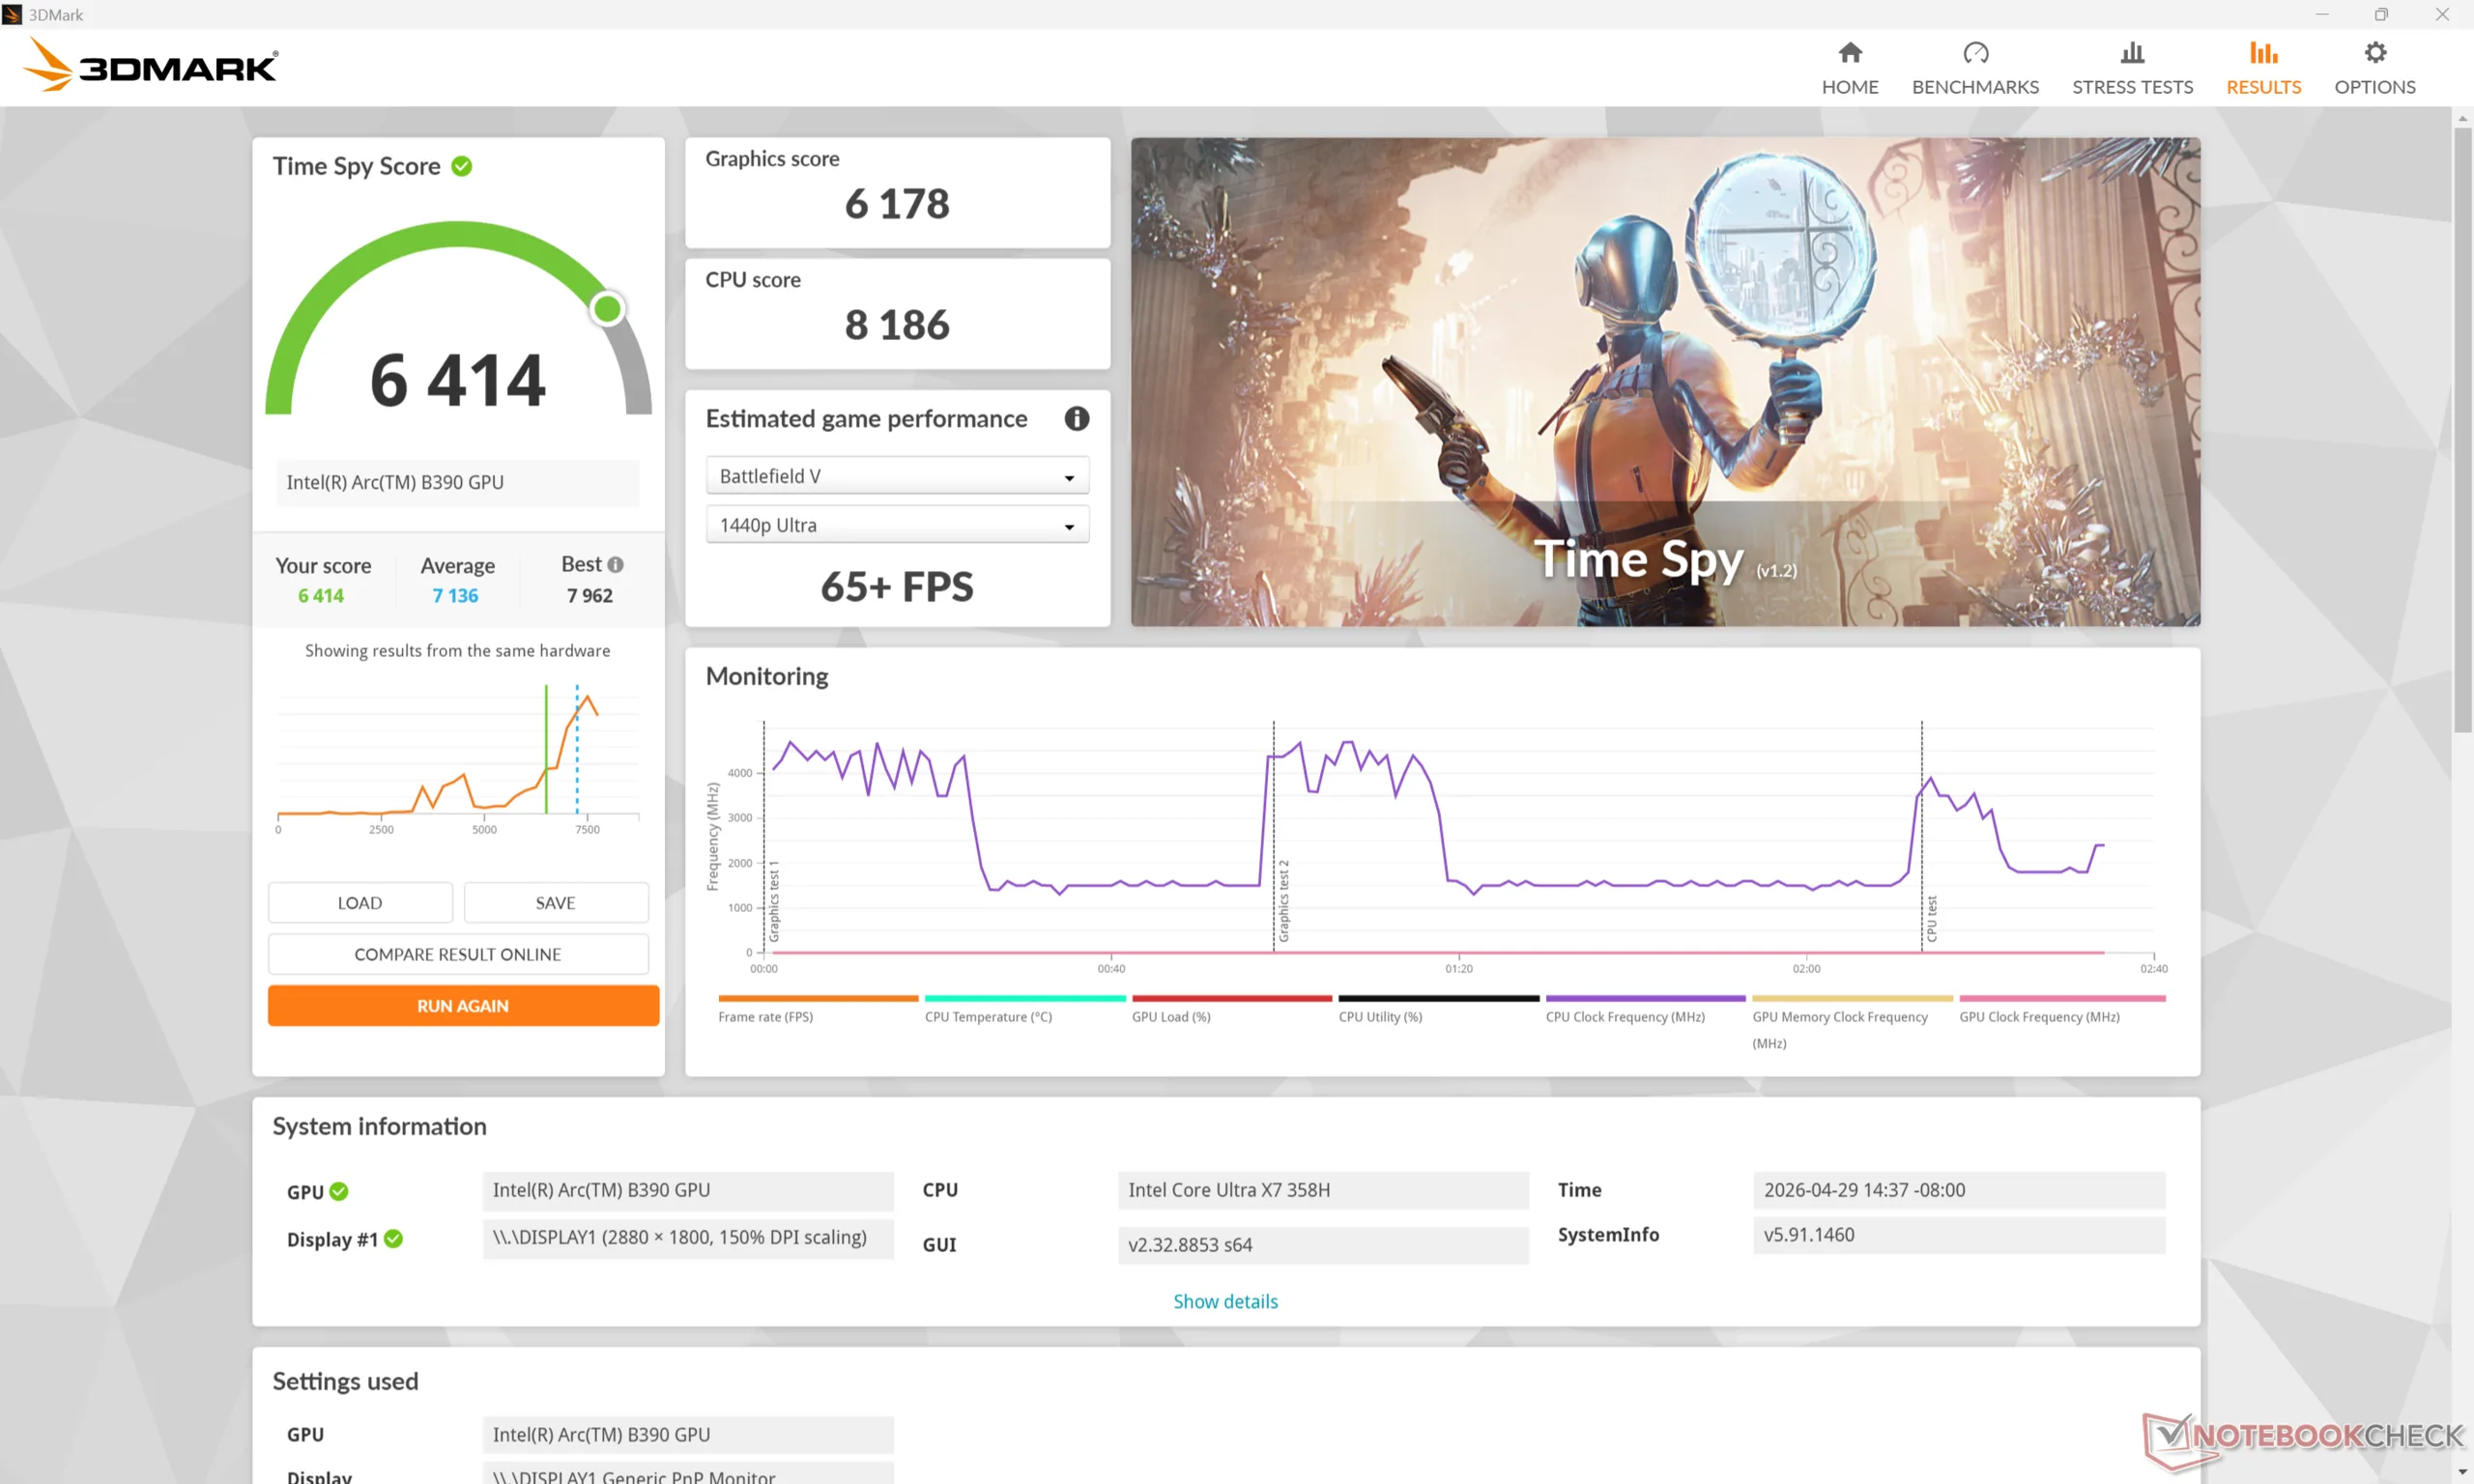
| 3DMark Time Spy Score | 6414 punti | |
Aiuto | ||
* ... Meglio usare valori piccoli
Prestazioni di gioco
Pur non essendo principalmente una macchina da gioco, i portatili con Arc B390 sono del tutto in grado di eseguire anche i titoli più impegnativi con impostazioni e frame rate decenti a 1080p. Cyberpunk 2077, ad esempio, ha una media di 45 FPS con impostazioni Ultra a 1080p, prima di applicare qualsiasi upscaling XeSS.
Il G-Sync non è supportato sul display interno.
| Performance rating - Percent | |
| MSI Prestige 16 AI C3MTG | |
| Dell XPS 16 Core Ultra X7 358H | |
| Lenovo ThinkBook 16 G7+ AMD | |
| Asus ZenBook S16 UM5606GA | |
| MSI Prestige 16 AI Evo B2HMG | |
| HP Envy x360 2-in-1 16-ad0097nr -1! | |
| Cyberpunk 2077 - 1920x1080 Ultra Preset (FSR off) | |
| Dell XPS 16 Core Ultra X7 358H | |
| MSI Prestige 16 AI C3MTG | |
| MSI Prestige 16 AI Evo B2HMG | |
| Lenovo ThinkBook 16 G7+ AMD | |
| Asus ZenBook S16 UM5606GA | |
| HP Envy x360 2-in-1 16-ad0097nr | |
| Baldur's Gate 3 - 1920x1080 Ultra Preset AA:T | |
| Dell XPS 16 Core Ultra X7 358H | |
| MSI Prestige 16 AI C3MTG | |
| Lenovo ThinkBook 16 G7+ AMD | |
| Asus ZenBook S16 UM5606GA | |
| MSI Prestige 16 AI Evo B2HMG | |
| HP Envy x360 2-in-1 16-ad0097nr | |
| GTA V - 1920x1080 Highest AA:4xMSAA + FX AF:16x | |
| Dell XPS 16 Core Ultra X7 358H | |
| MSI Prestige 16 AI C3MTG | |
| Lenovo ThinkBook 16 G7+ AMD | |
| Asus ZenBook S16 UM5606GA | |
| MSI Prestige 16 AI Evo B2HMG | |
| Final Fantasy XV Benchmark - 1920x1080 High Quality | |
| Dell XPS 16 Core Ultra X7 358H | |
| MSI Prestige 16 AI C3MTG | |
| Lenovo ThinkBook 16 G7+ AMD | |
| MSI Prestige 16 AI Evo B2HMG | |
| Asus ZenBook S16 UM5606GA | |
| HP Envy x360 2-in-1 16-ad0097nr | |
| Strange Brigade - 1920x1080 ultra AA:ultra AF:16 | |
| Dell XPS 16 Core Ultra X7 358H | |
| MSI Prestige 16 AI C3MTG | |
| MSI Prestige 16 AI Evo B2HMG | |
| Lenovo ThinkBook 16 G7+ AMD | |
| Asus ZenBook S16 UM5606GA | |
| HP Envy x360 2-in-1 16-ad0097nr | |
| Dota 2 Reborn - 1920x1080 ultra (3/3) best looking | |
| MSI Prestige 16 AI C3MTG | |
| Dell XPS 16 Core Ultra X7 358H | |
| Lenovo ThinkBook 16 G7+ AMD | |
| Asus ZenBook S16 UM5606GA | |
| MSI Prestige 16 AI Evo B2HMG | |
| HP Envy x360 2-in-1 16-ad0097nr | |
| X-Plane 11.11 - 1920x1080 high (fps_test=3) | |
| Lenovo ThinkBook 16 G7+ AMD | |
| Asus ZenBook S16 UM5606GA | |
| MSI Prestige 16 AI C3MTG | |
| Dell XPS 16 Core Ultra X7 358H | |
| MSI Prestige 16 AI Evo B2HMG | |
| HP Envy x360 2-in-1 16-ad0097nr | |
Grafico Cyberpunk 2077 ultra FPS
| basso | medio | alto | ultra | |
|---|---|---|---|---|
| GTA V (2015) | 174.7 | 164.7 | 97.9 | 43 |
| Dota 2 Reborn (2015) | 122.1 | 98.4 | 104.3 | 111.8 |
| Final Fantasy XV Benchmark (2018) | 124.3 | 73.9 | 53.4 | |
| X-Plane 11.11 (2018) | 61.7 | 52.4 | 44.5 | |
| Strange Brigade (2018) | 304 | 118.7 | 98.5 | 88.5 |
| Baldur's Gate 3 (2023) | 69.4 | 58.5 | 52.6 | 51.7 |
| Cyberpunk 2077 (2023) | 77.2 | 62.3 | 53.8 | 44.8 |
| F1 24 (2024) | 144.9 | 135.3 | 104.3 | 37.4 |
Emissioni
Rumore del sistema
La soluzione di raffreddamento è molto più piccola di quella dell'XPS 16, il che contribuisce alle notevoli differenze di temperatura del nucleo tra i due modelli. Sebbene le ventole di MSI possano rimanere più silenziose per un periodo più lungo prima di dover aumentare, tuttavia si stabilizzano su valori massimi simili dopo che è passato un po' di tempo. Il rumore della ventola durante l'esecuzione di Cyberpunk 2077 in modalità Performance, ad esempio, si stabilizza a 41 dB(A) rispetto ai 42 dB(A) del Dell.
Si noti che il rumore della ventola diminuisce in modo significativo se si gioca in modalità Bilanciata invece che in modalità Prestazioni. In questo caso, le ventole si fermerebbero a poco meno di 30 dB(A), il che potrebbe giustificare il deficit di prestazioni del 20 percento menzionato sopra, a seconda delle preferenze dell'utente.
Rumorosità
| Idle |
| 23.3 / 23.3 / 25.9 dB(A) |
| Sotto carico |
| 30.1 / 44.7 dB(A) |
 | ||
30 dB silenzioso 40 dB(A) udibile 50 dB(A) rumoroso |
||
min: | ||
| MSI Prestige 16 AI C3MTG Ultra X7 358H, Arc B390 Panther Lake iGPU | MSI Prestige 16 AI Evo B2HMG Ultra 9 285H, Arc 140T | Dell XPS 16 Core Ultra X7 358H Ultra X7 358H, Arc B390 Panther Lake iGPU | Asus ZenBook S16 UM5606GA Ryzen AI 9 465, Radeon 880M | Lenovo ThinkBook 16 G7+ AMD Ryzen AI 9 365, Radeon 880M | HP Envy x360 2-in-1 16-ad0097nr R7 8840HS, Radeon 780M | |
|---|---|---|---|---|---|---|
| Noise | -4% | -4% | -15% | -3% | 6% | |
| off /ambiente * (dB) | 23.1 | 23.6 -2% | 23.3 -1% | 24.9 -8% | 24.5 -6% | 22.9 1% |
| Idle Minimum * (dB) | 23.3 | 23.6 -1% | 23.4 -0% | 24.9 -7% | 24.5 -5% | 23 1% |
| Idle Average * (dB) | 23.3 | 23.6 -1% | 23.4 -0% | 24.9 -7% | 24.5 -5% | 23 1% |
| Idle Maximum * (dB) | 25.9 | 26.2 -1% | 25.8 -0% | 24.9 4% | 25.9 -0% | 23 11% |
| Load Average * (dB) | 30.1 | 37.1 -23% | 38 -26% | 45.7 -52% | 36.2 -20% | 23.8 21% |
| Cyberpunk 2077 ultra * (dB) | 40.8 | 42.1 -3% | 38.1 7% | 49 -20% | 40.1 2% | |
| Load Maximum * (dB) | 44.7 | 42.1 6% | 48.6 -9% | 50.4 -13% | 40.1 10% | 43.8 2% |
| Witcher 3 ultra * (dB) | 43.8 |
* ... Meglio usare valori piccoli
Temperatura
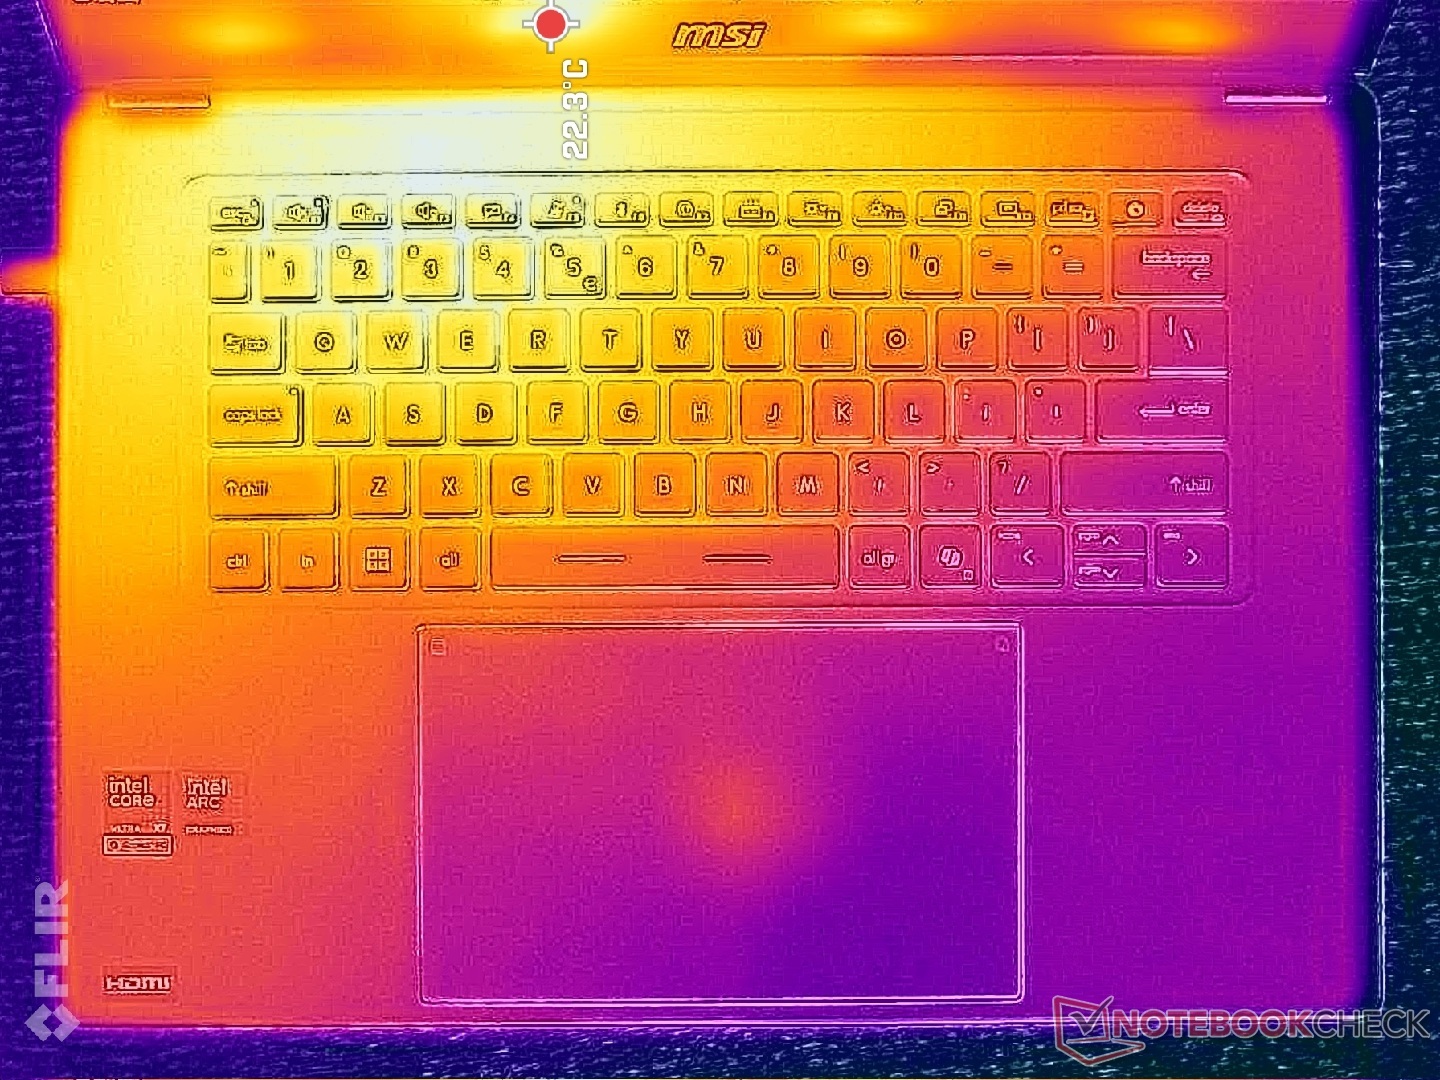
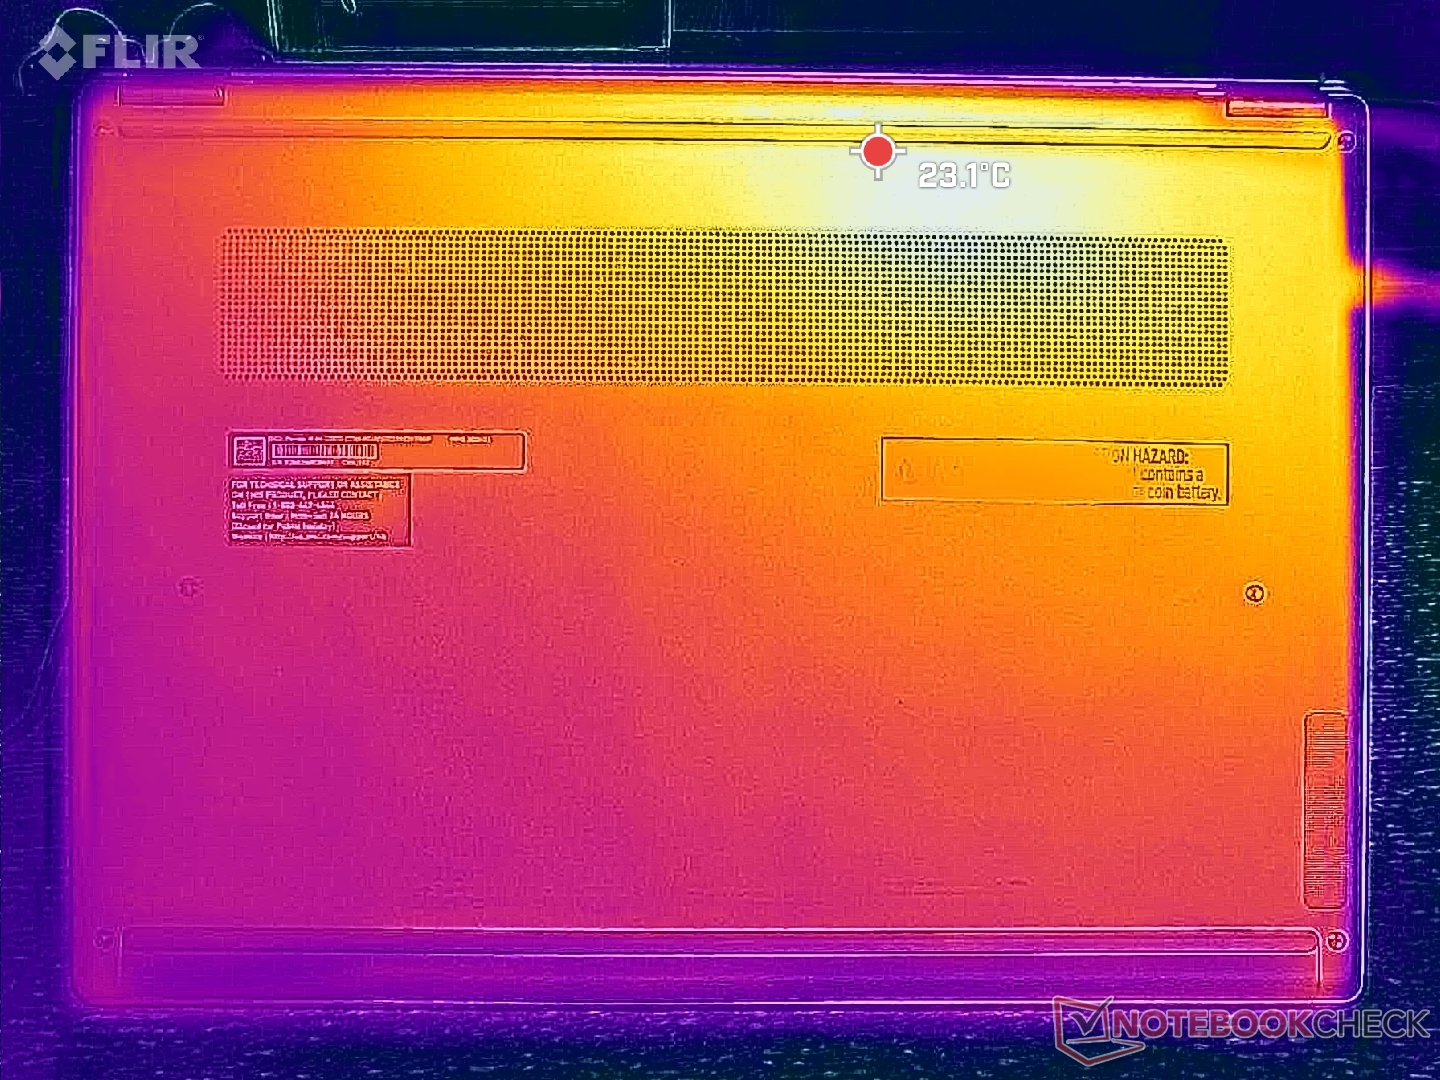
Le temperature di superficie sono migliorate rispetto alla generazione precedente. Mentre la Prestige 16 del 2025 raggiungeva temperature comprese tra i 47 C e i 52 C, il modello più recente si attesta tra i 40 C e i 47 C. I punti caldi si trovano vicino all'angolo posteriore dello chassis, dove il contatto con la pelle è ridotto al minimo.
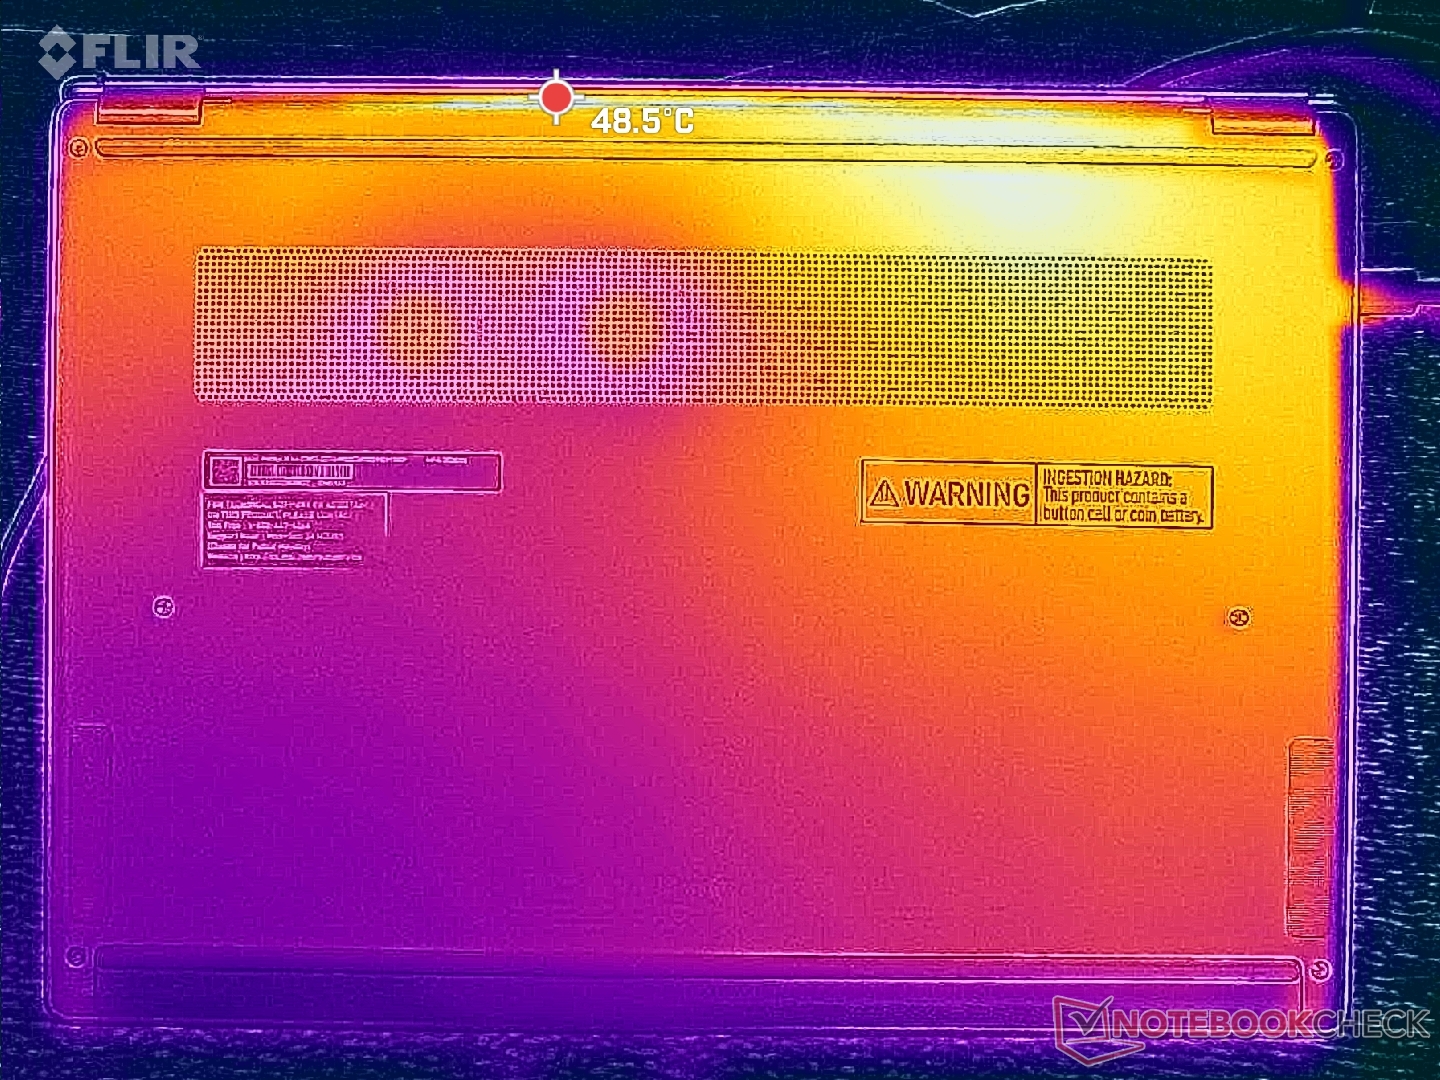
Tuttavia, le temperature superficiali sono ancora più calde rispetto al concorrente XPS 16 dove i punti caldi raggiungerebbero solo 41 C indipendentemente dal lato, per una media più fresca.
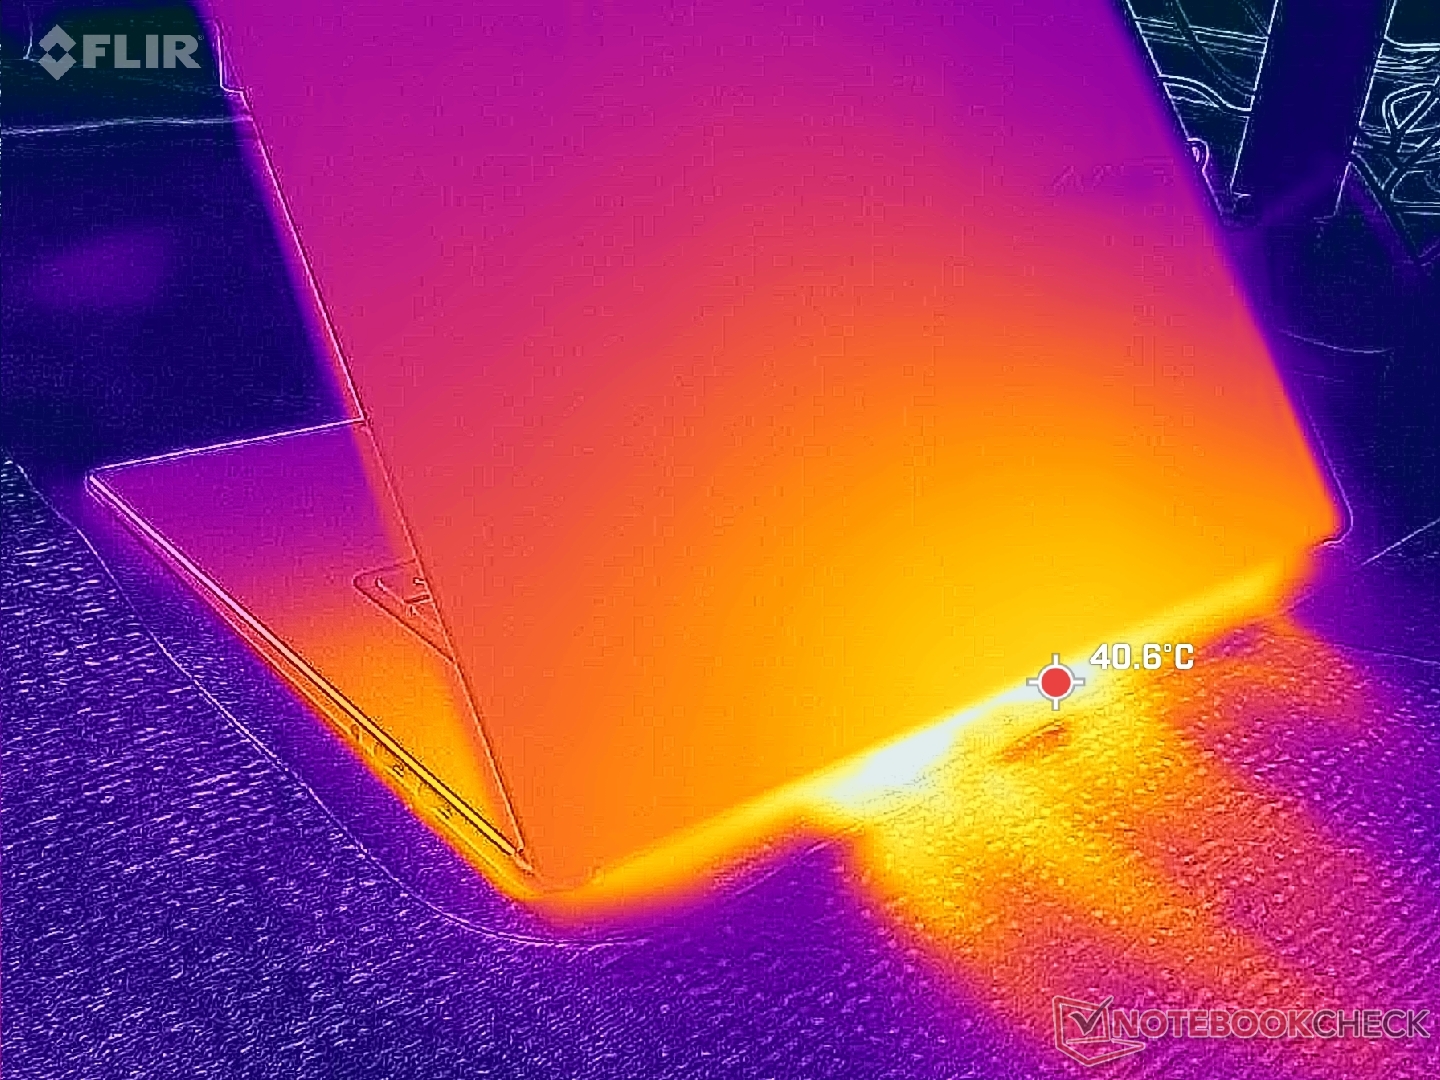
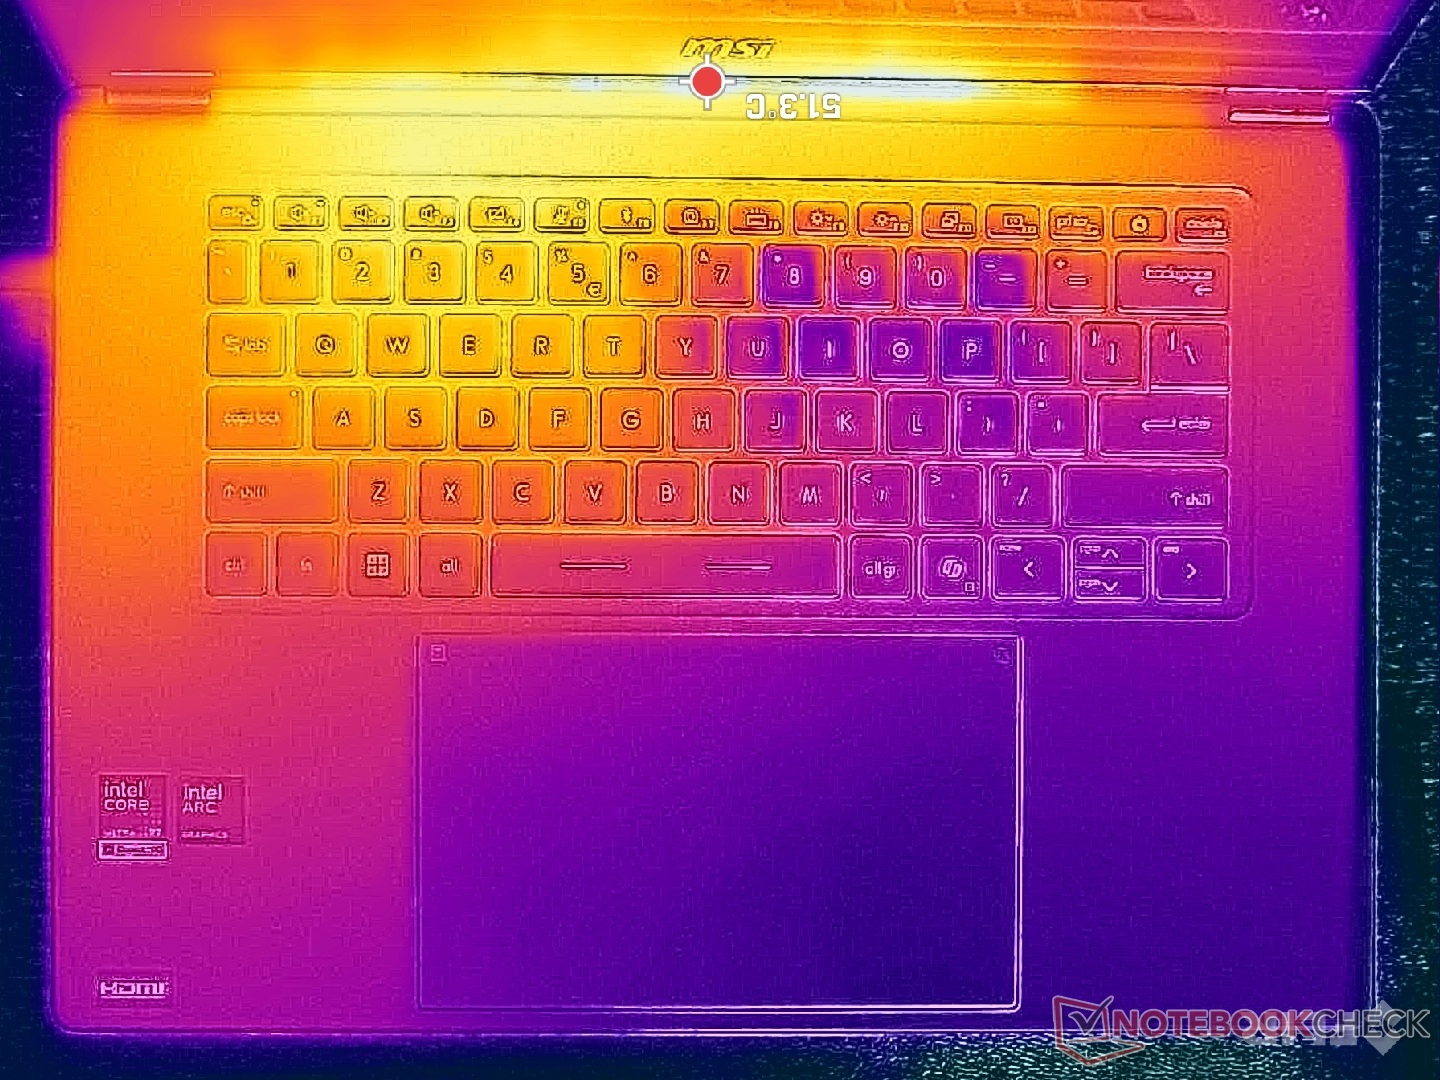
(-) La temperatura massima sul lato superiore è di 47 °C / 117 F, rispetto alla media di 36.8 °C / 98 F, che varia da 21 a 71 °C per questa classe Multimedia.
(±) Il lato inferiore si riscalda fino ad un massimo di 40 °C / 104 F, rispetto alla media di 39.1 °C / 102 F
(+) In idle, la temperatura media del lato superiore è di 24.8 °C / 77 F, rispetto alla media deld ispositivo di 31.3 °C / 88 F.
(+) I poggiapolsi e il touchpad sono piu' freddi della temperatura della pelle con un massimo di 30.4 °C / 86.7 F e sono quindi freddi al tatto.
(±) La temperatura media della zona del palmo della mano di dispositivi simili e'stata di 28.7 °C / 83.7 F (-1.7 °C / -3 F).
| MSI Prestige 16 AI C3MTG Ultra X7 358H, Arc B390 Panther Lake iGPU | MSI Prestige 16 AI Evo B2HMG Ultra 9 285H, Arc 140T | Dell XPS 16 Core Ultra X7 358H Ultra X7 358H, Arc B390 Panther Lake iGPU | Asus ZenBook S16 UM5606GA Ryzen AI 9 465, Radeon 880M | Lenovo ThinkBook 16 G7+ AMD Ryzen AI 9 365, Radeon 880M | HP Envy x360 2-in-1 16-ad0097nr R7 8840HS, Radeon 780M | |
|---|---|---|---|---|---|---|
| Heat | -5% | 11% | -1% | 9% | -3% | |
| Maximum Upper Side * (°C) | 47 | 48.1 -2% | 40.6 14% | 43.4 8% | 38.2 19% | 42.6 9% |
| Maximum Bottom * (°C) | 40 | 51.6 -29% | 39.8 1% | 46.2 -16% | 37.9 5% | 47.8 -19% |
| Idle Upper Side * (°C) | 27.4 | 25.9 5% | 23.2 15% | 26.5 3% | 25.4 7% | 27.4 -0% |
| Idle Bottom * (°C) | 27.4 | 25.2 8% | 23.8 13% | 27 1% | 25.7 6% | 27.8 -1% |
* ... Meglio usare valori piccoli
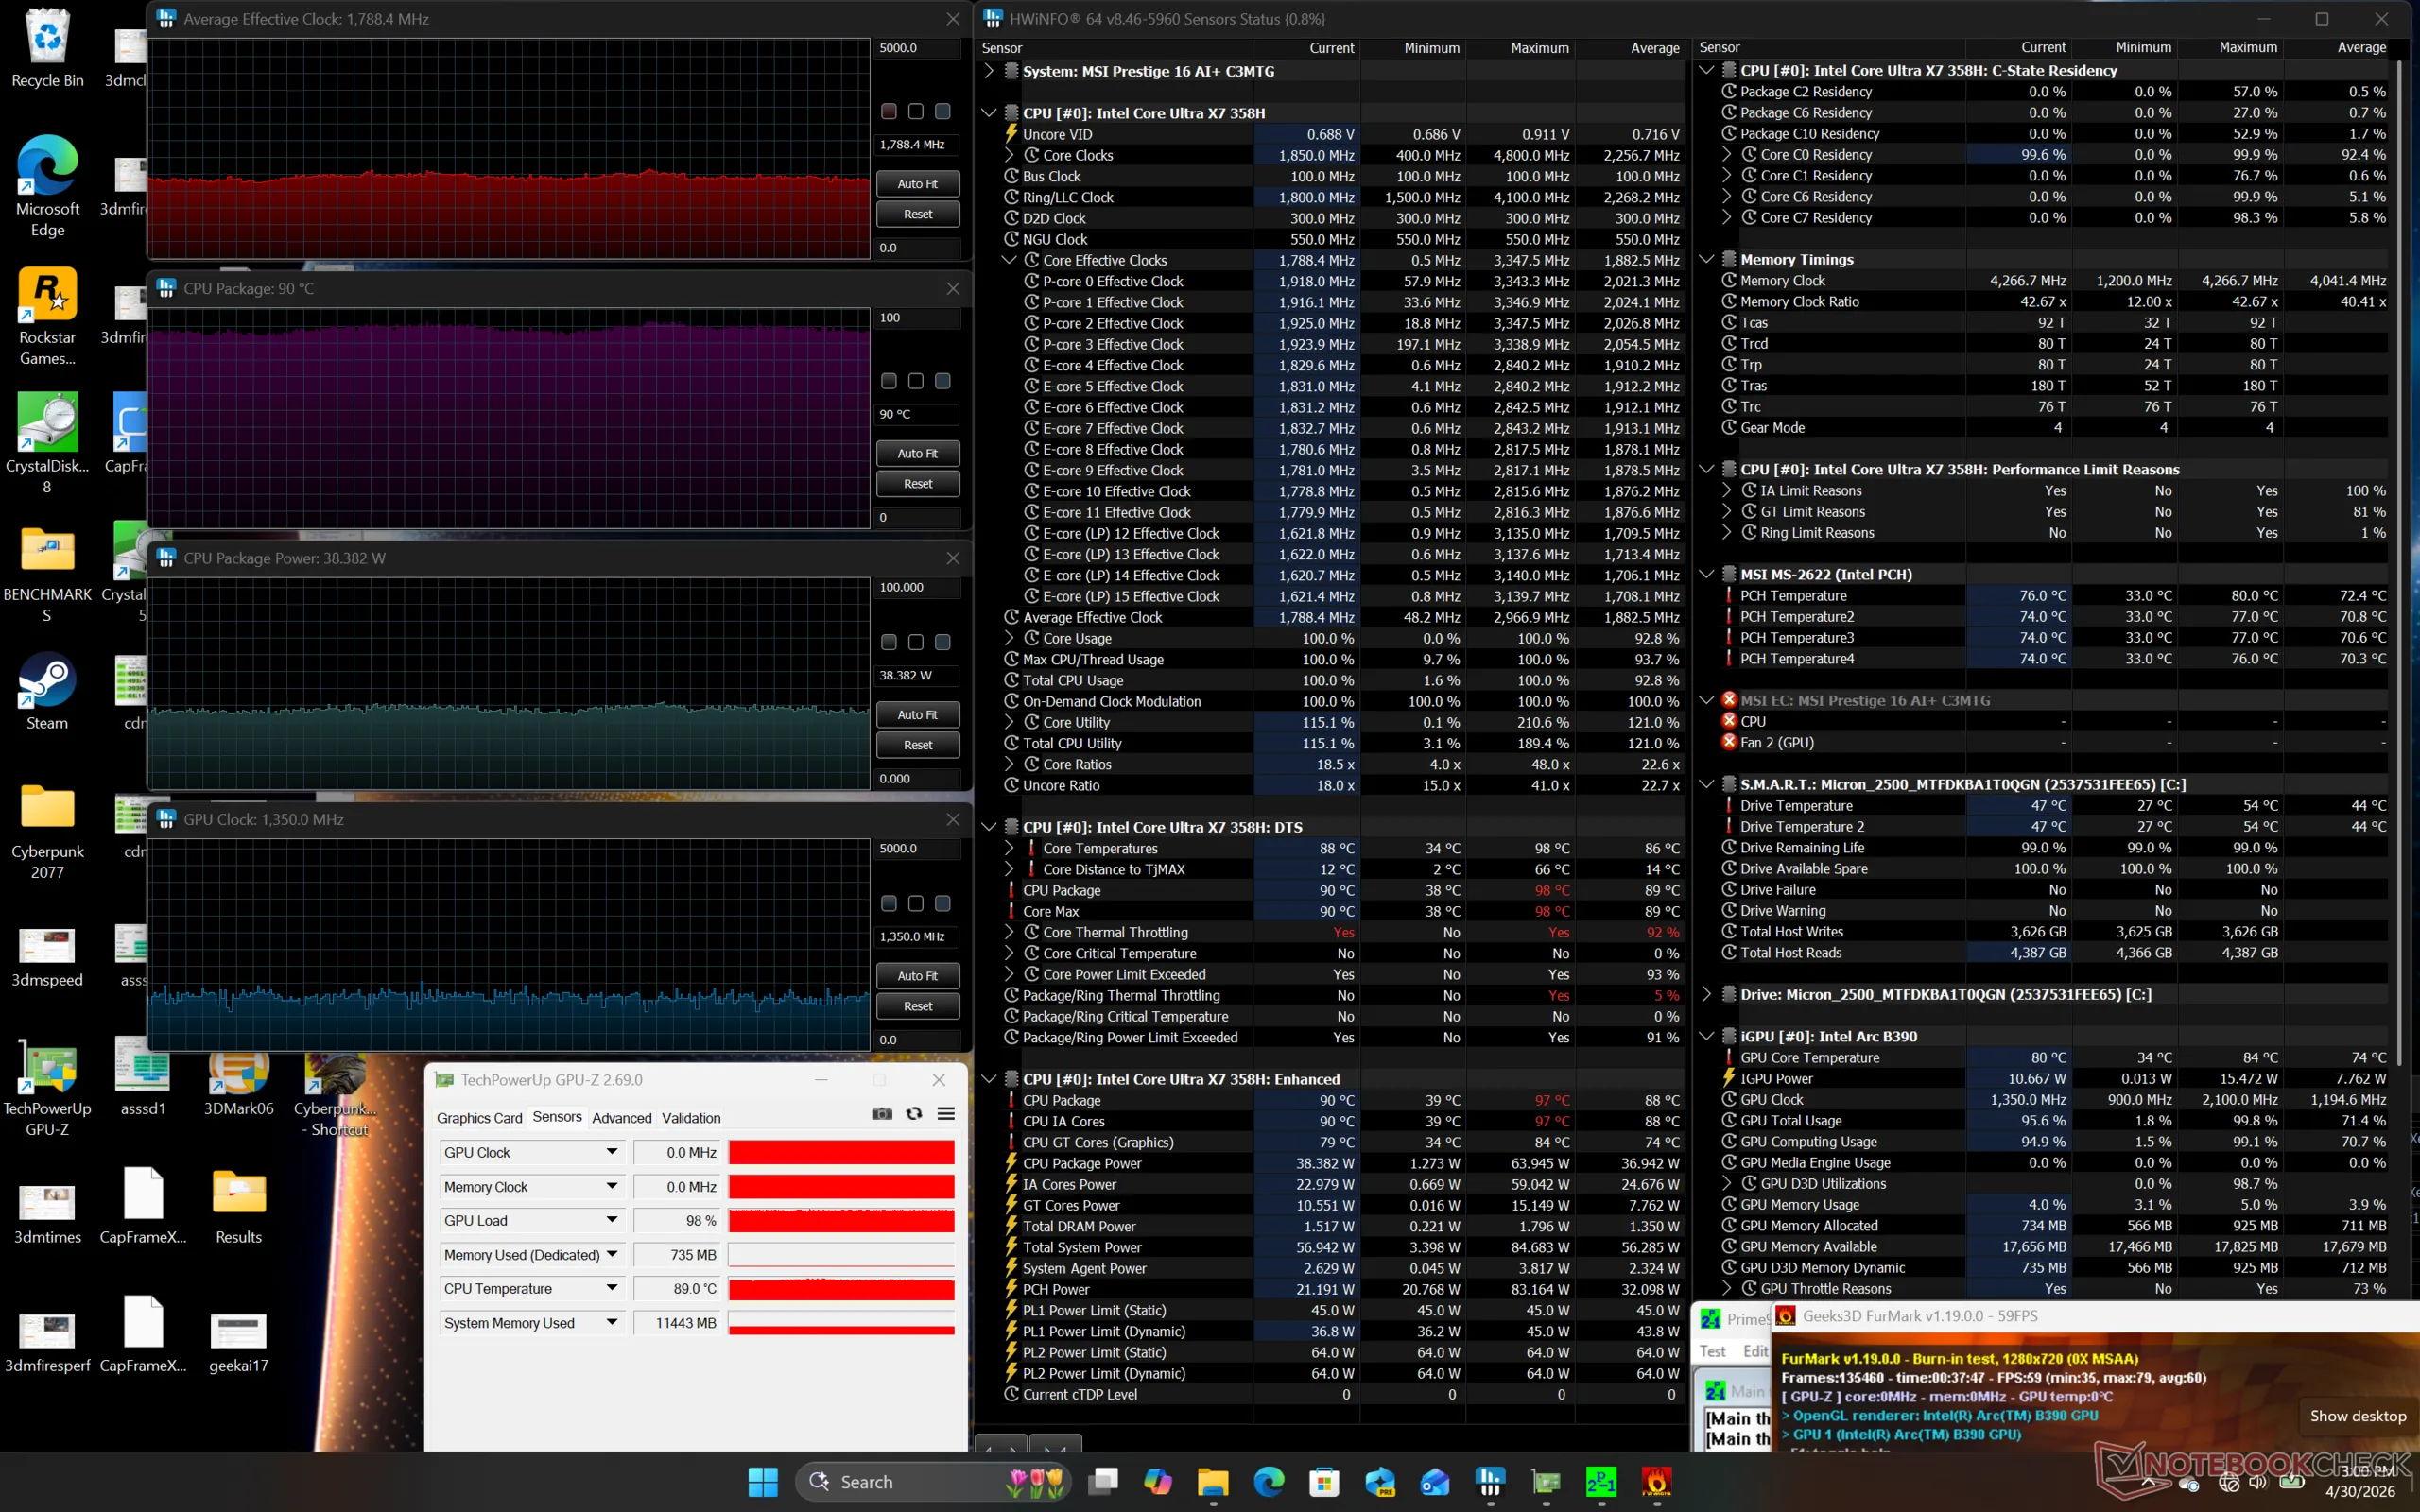
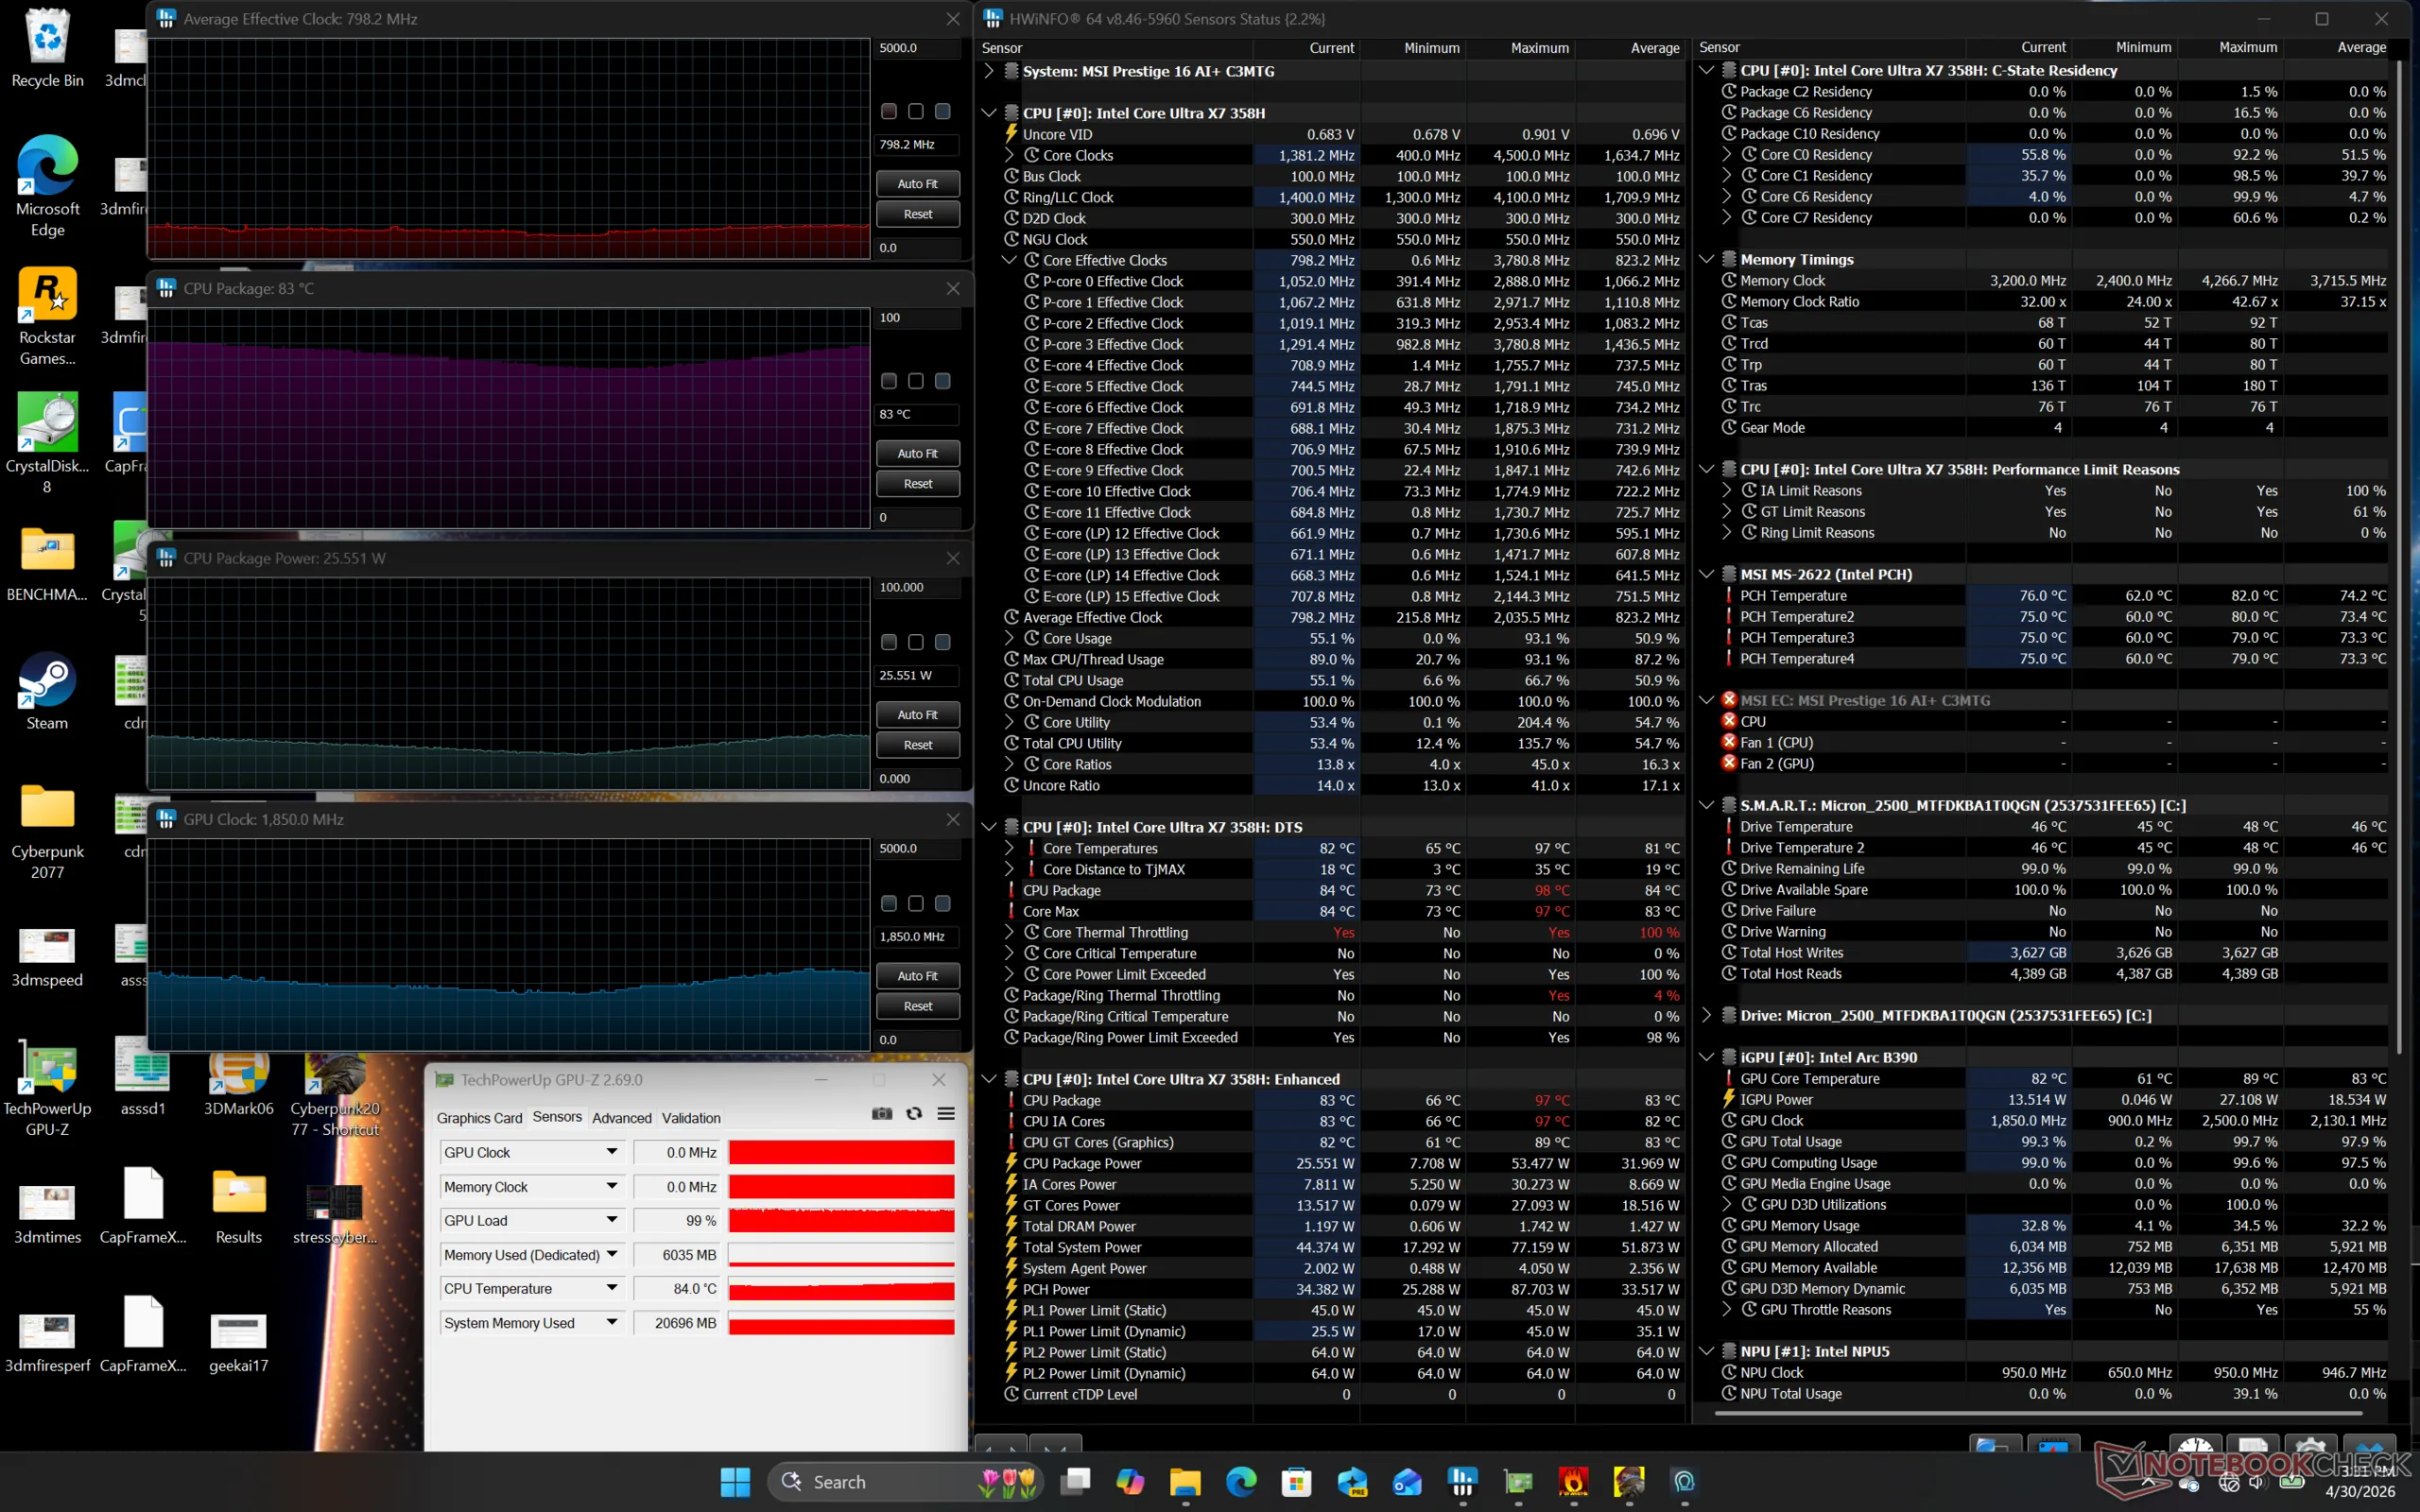
Test da sforzo
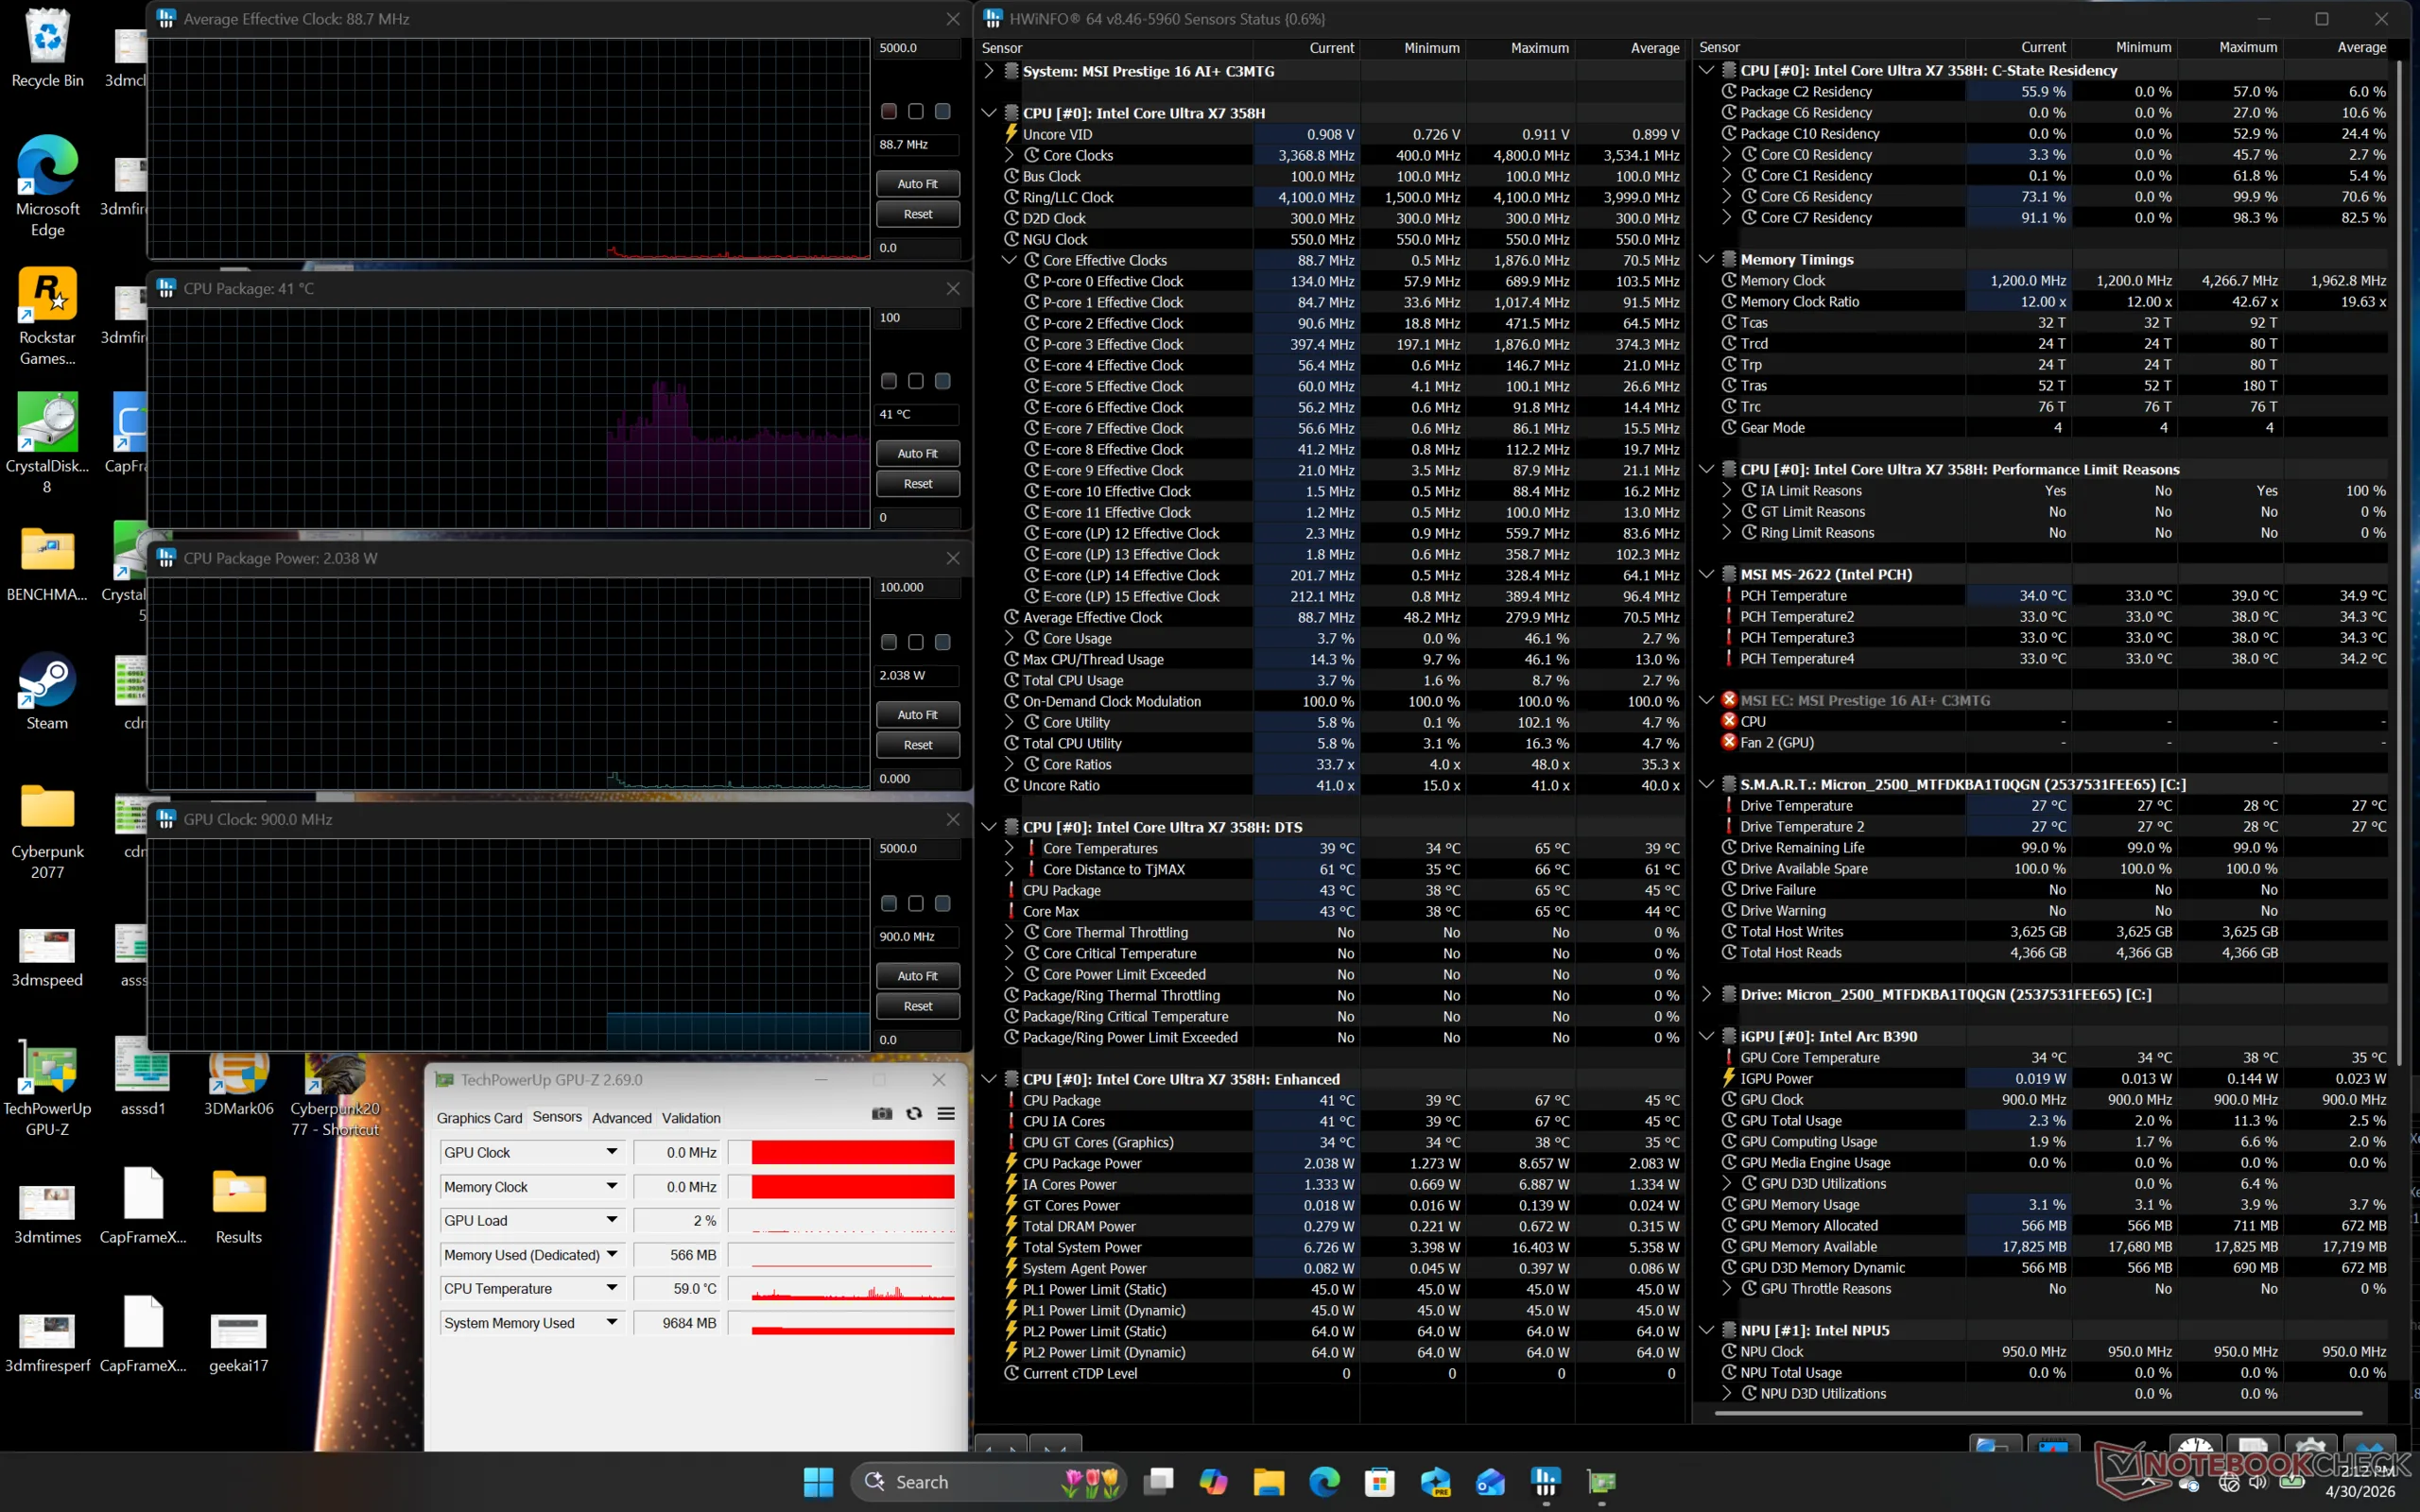
Quando si esegue lo stress Prime95, la CPU sale a 3 GHz, 64 W e 97 C, prima di scendere rapidamente a 2,3 GHz e 39 W per mantenere una temperatura stabile del nucleo di 90 C. I risultati sono più caldi di quelli che abbiamo registrato sull'XPS 16 con la stessa CPU, dove la temperatura del nucleo si stabilizzava a soli 78 C in confronto.
Quando si esegue Cyberpunk 2077 in modalità Performance per rappresentare lo stress del gioco, la GPU si stabilizza a 2500 MHz, 38 W e 86 C, che è ancora una volta molto più calda di oltre 20 C rispetto al Dell citato in precedenza. Se si abbassa il sistema alla modalità Bilanciata, la GPU si sposta tra i 1220 MHz e i 1850 MHz e tra i 16 W e i 26 W, il che corrisponde sia alle prestazioni grafiche più lente menzionate in precedenza che al rumore più silenzioso della ventola.
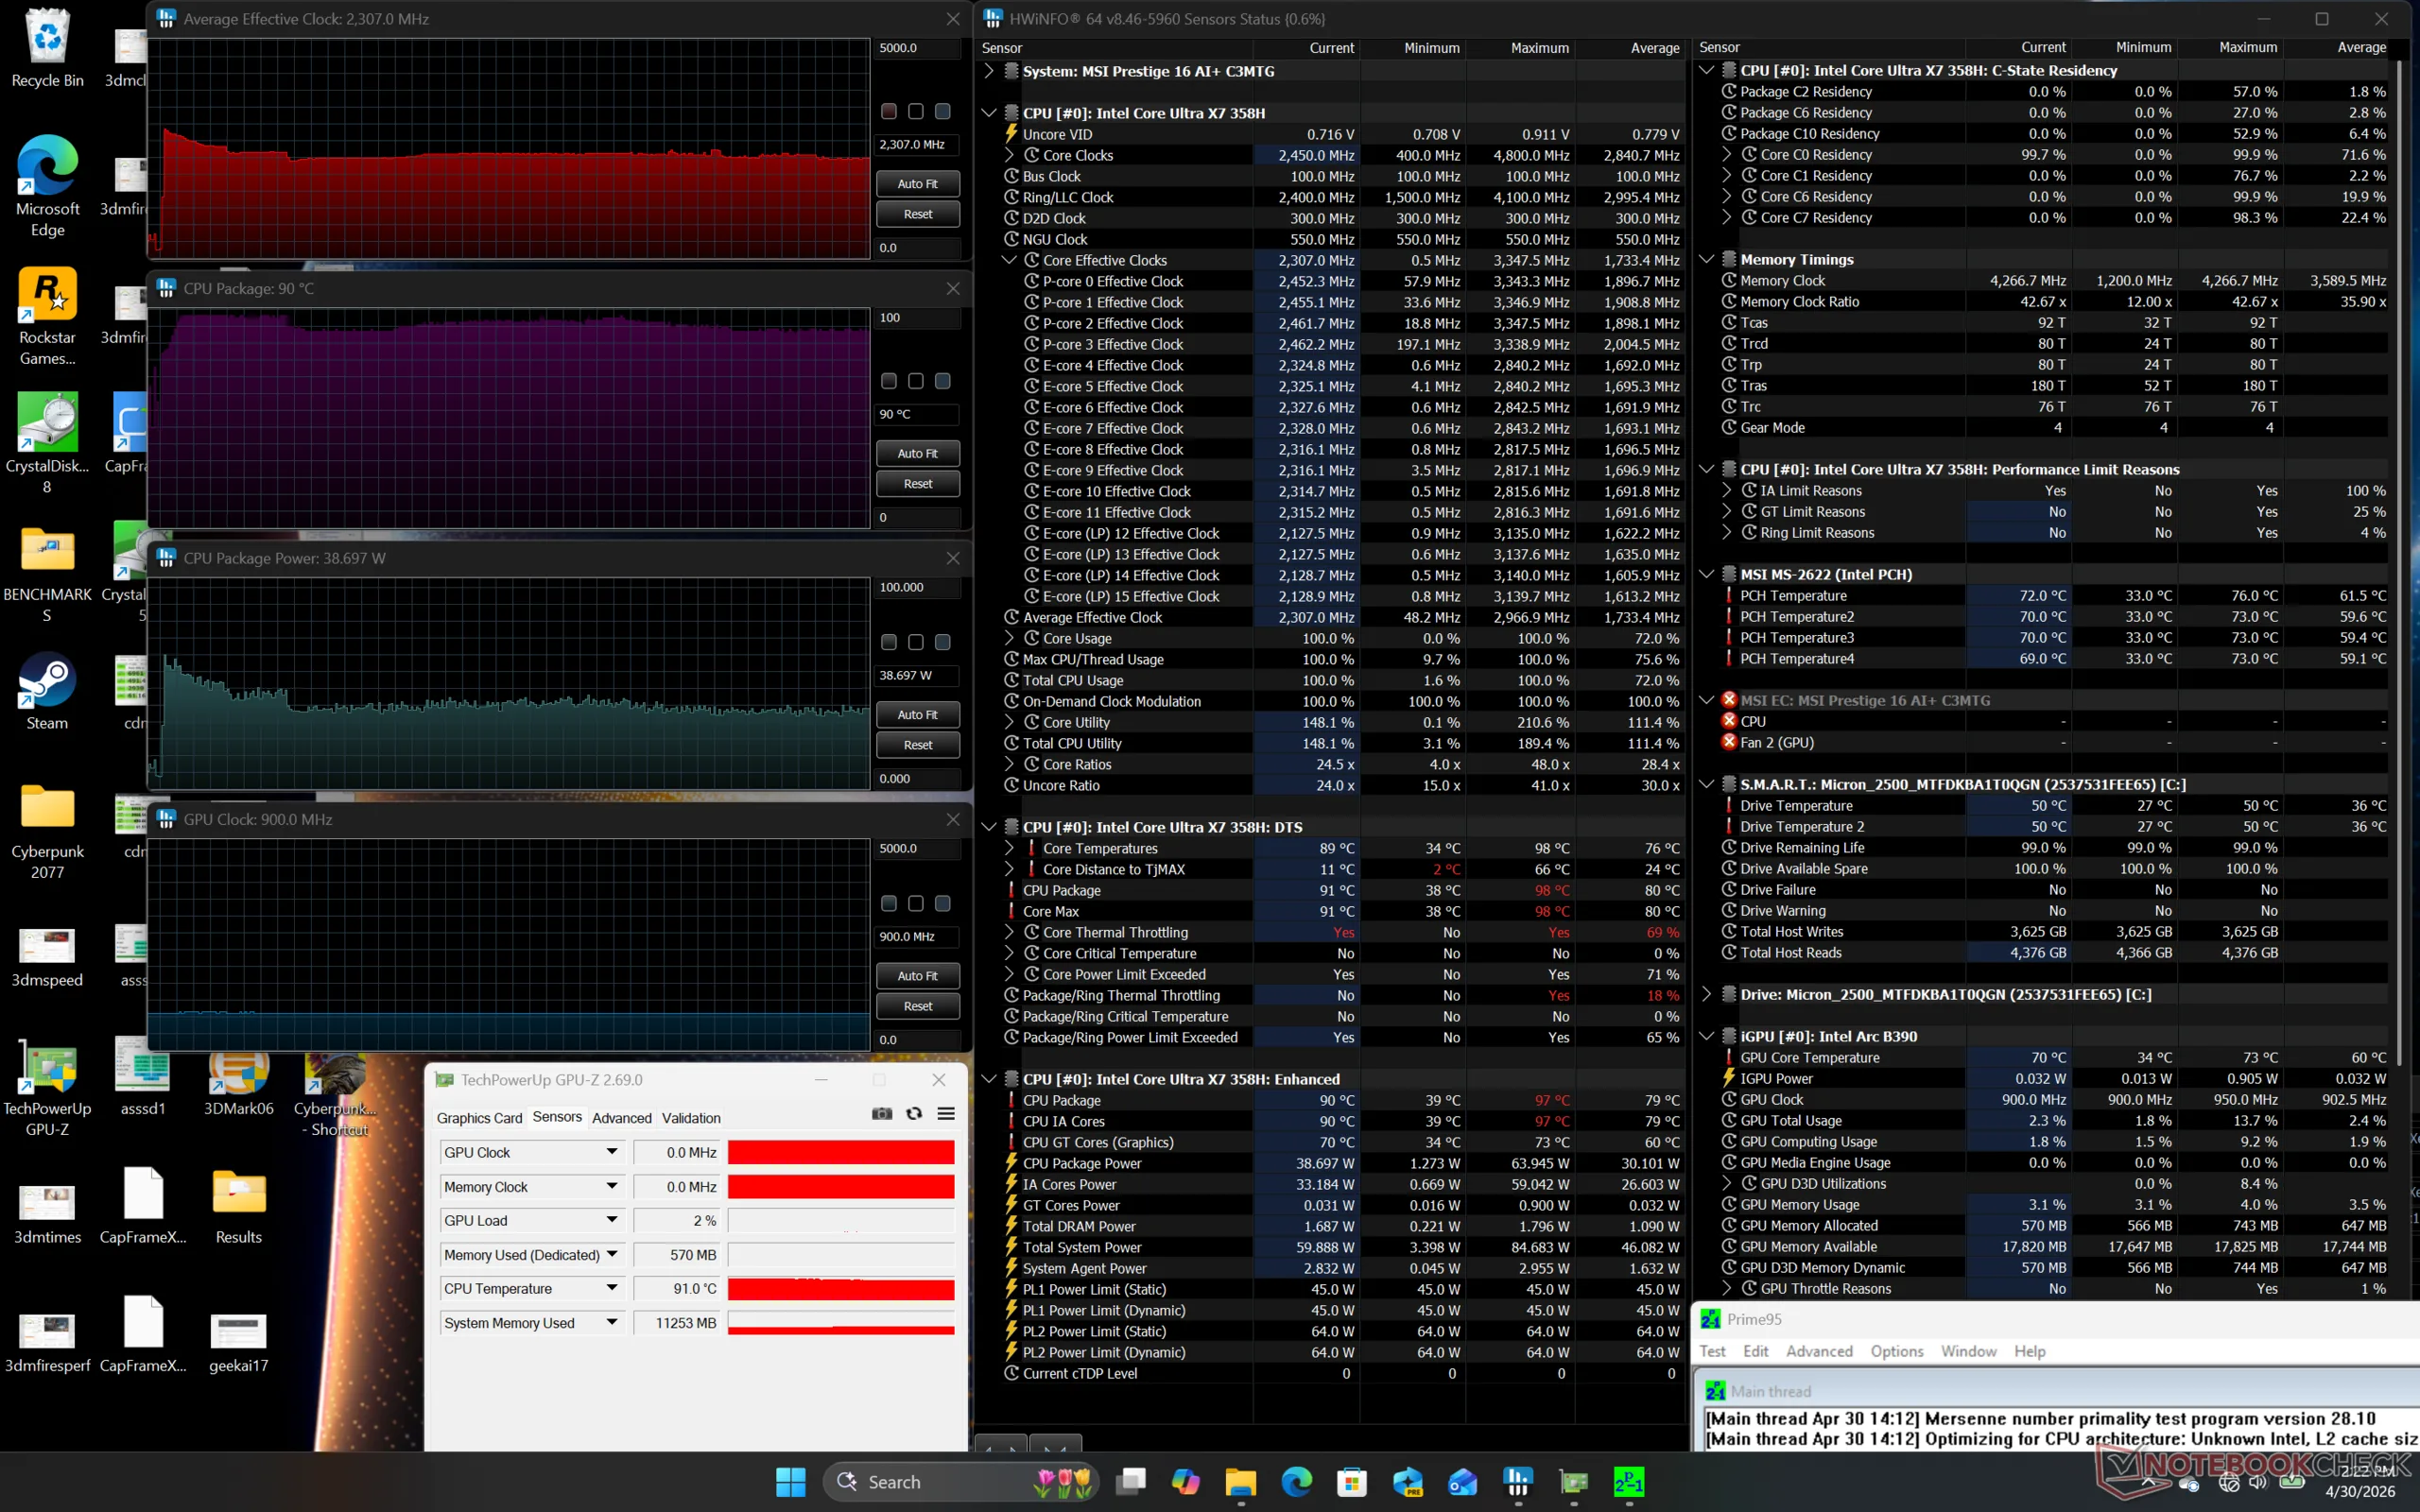
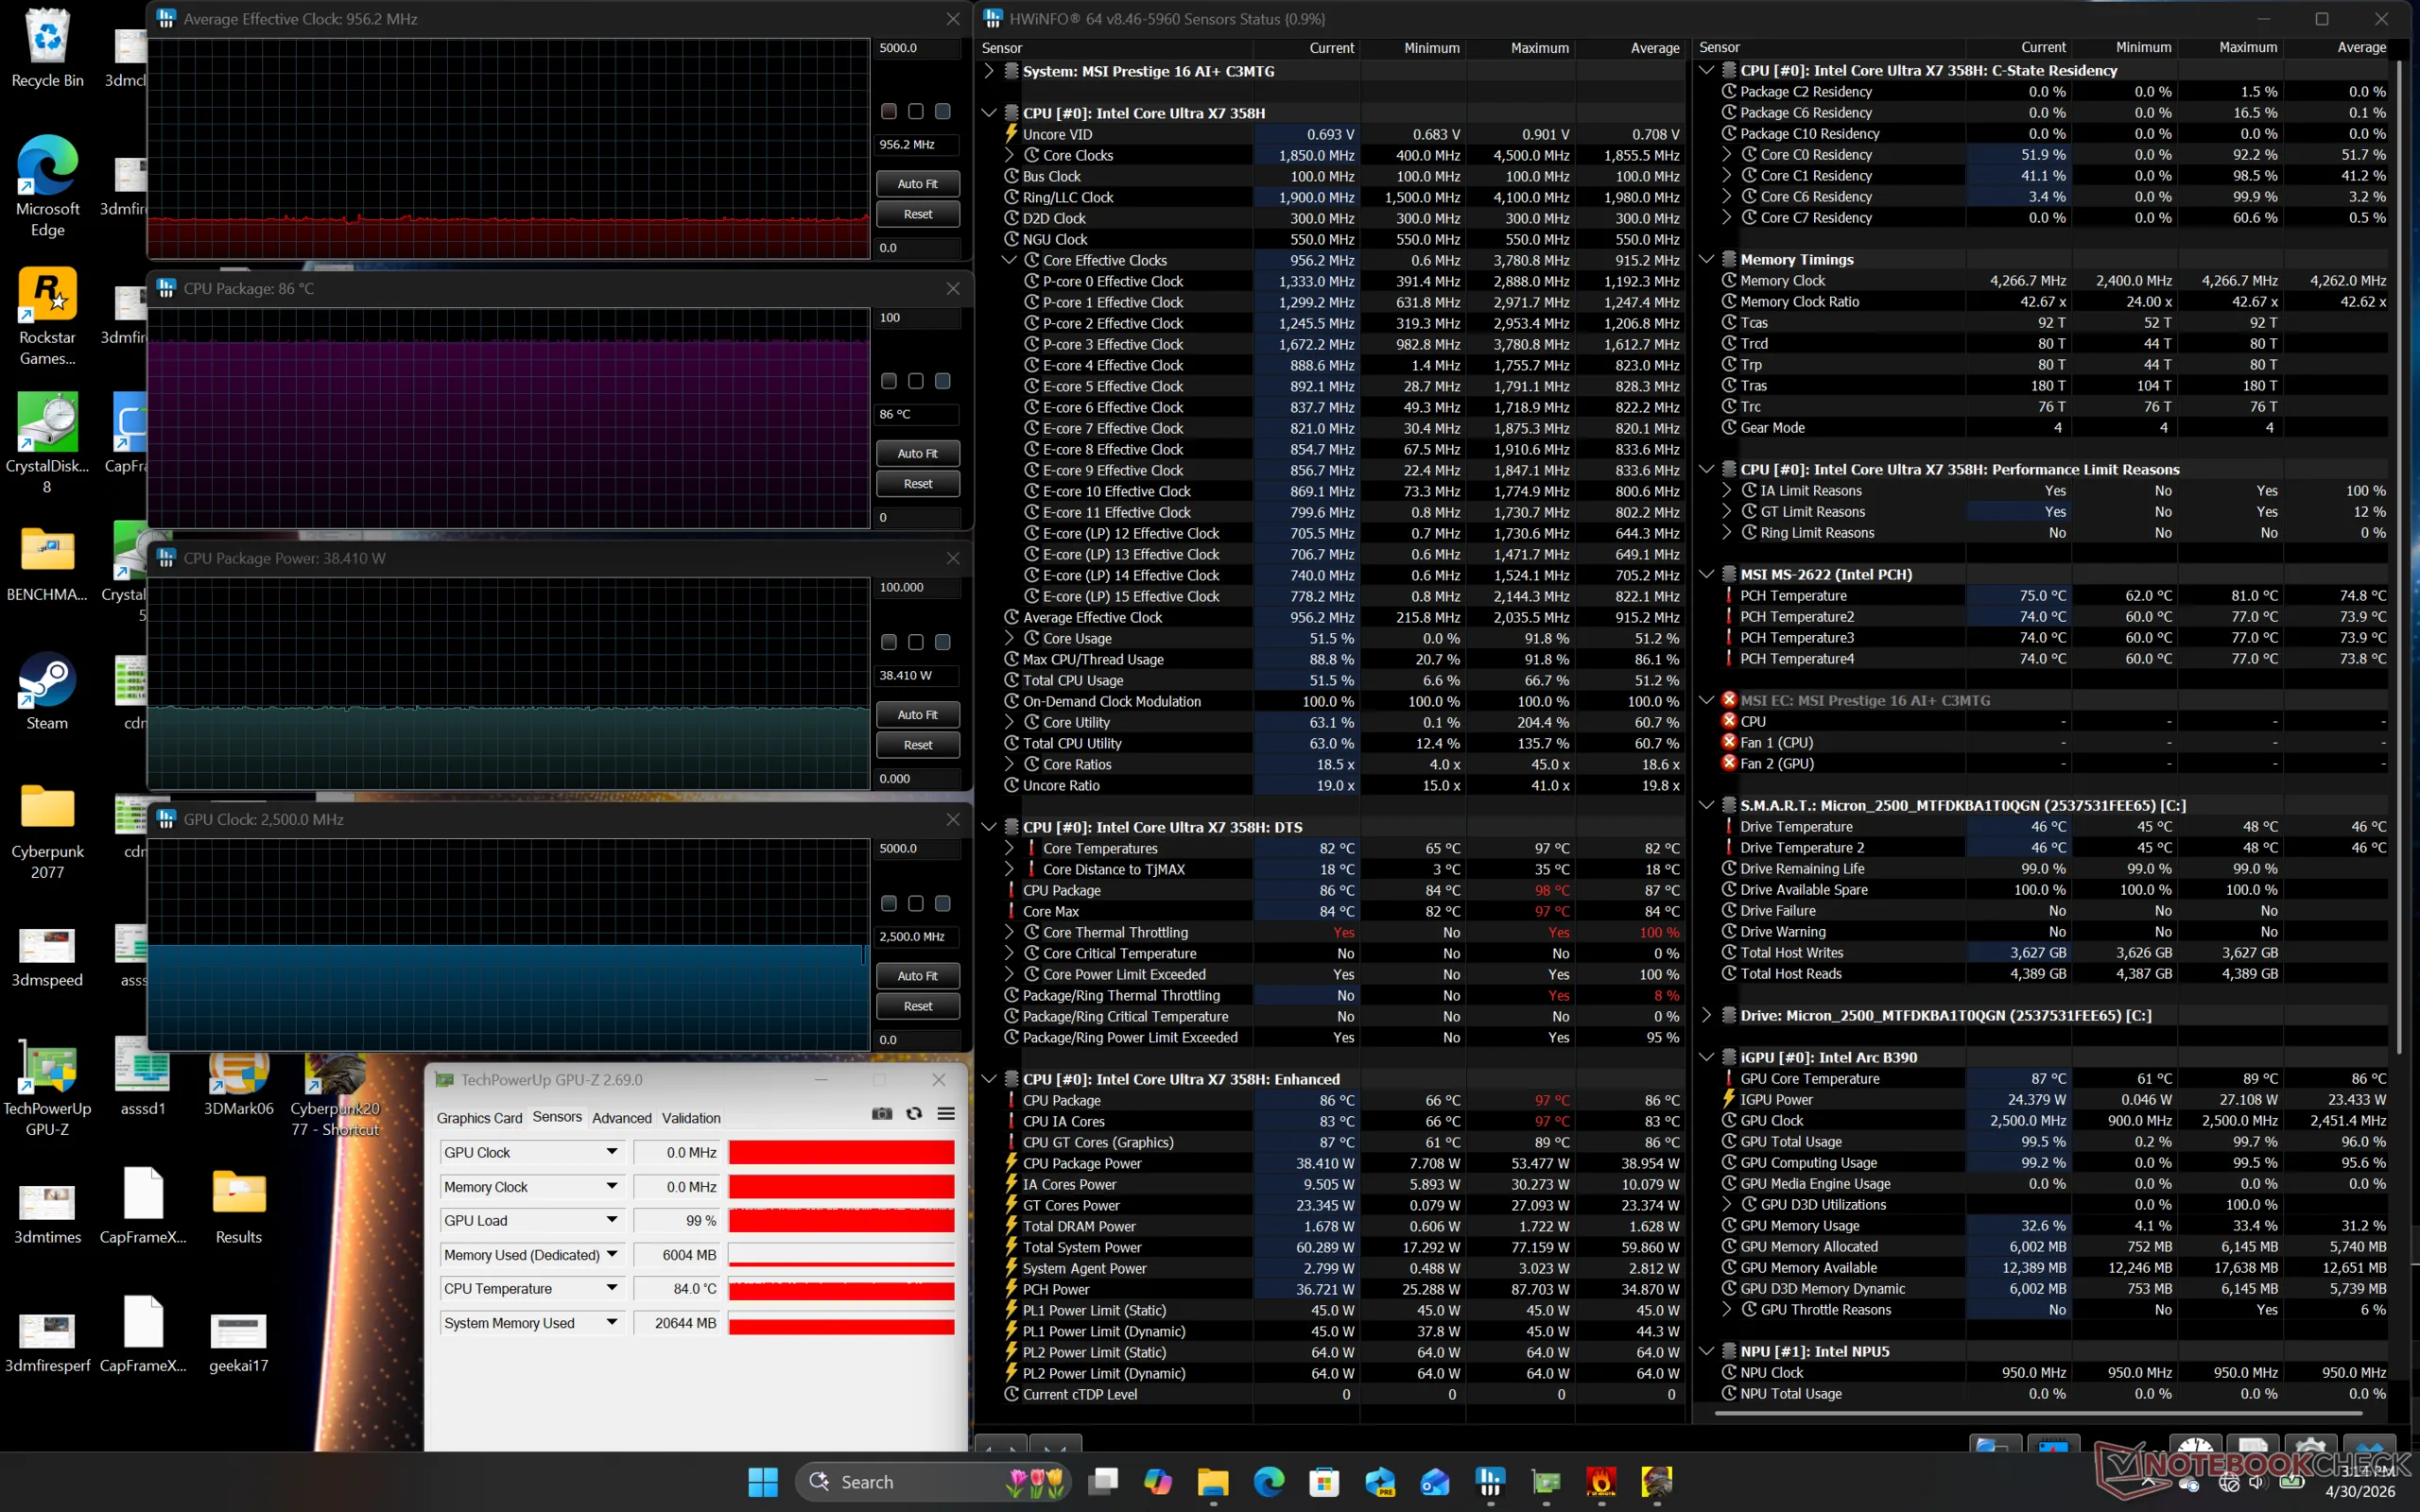
| Clock medio della CPU (GHz) | Clock della GPU (MHz) | Temperatura media della CPU (°C) | |
| Sistema inattivo | -- | 900 | 41 |
| Prime95 Stress | 2,3 | -- | 90 |
| Prime95 + FurMark Stress | 1,8 | ~1350 | 90 |
| Cyberpunk 2077 Stress (modalità bilanciata) | 0,8 | 1220 - 1850 | 83 |
| Cyberpunk 2077 Stress (modalità Performance) | 1.0 | 2500 | 86 |
Altoparlanti
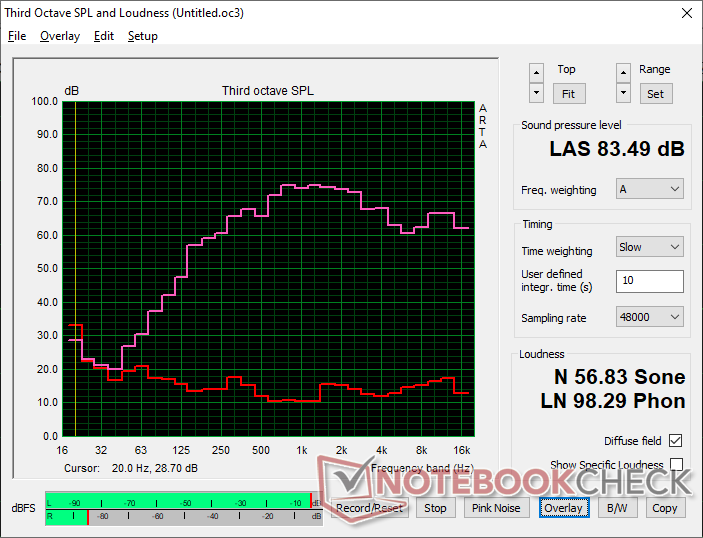
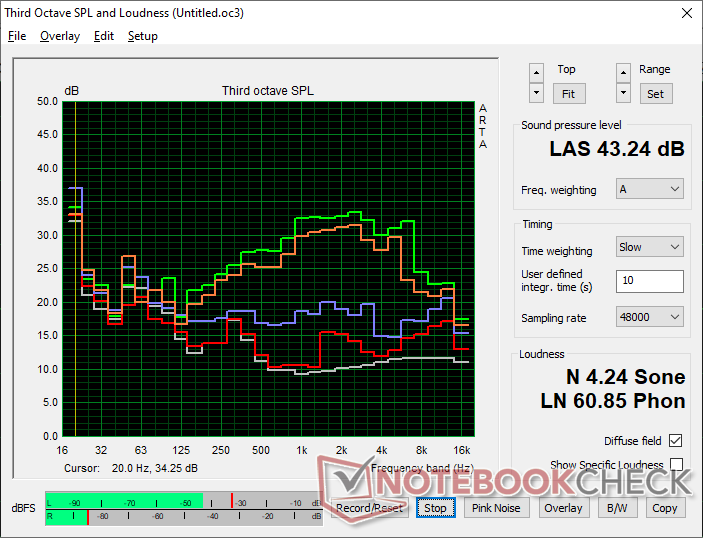
MSI Prestige 16 AI C3MTG analisi audio
(+) | gli altoparlanti sono relativamente potenti (83.5 dB)
Bassi 100 - 315 Hz
(±) | bassi ridotti - in media 11.2% inferiori alla media
(±) | la linearità dei bassi è media (9% delta rispetto alla precedente frequenza)
Medi 400 - 2000 Hz
(±) | medi elevati - circa 5.9% superiore alla media
(+) | medi lineari (4% delta rispetto alla precedente frequenza)
Alti 2 - 16 kHz
(+) | Alti bilanciati - appena 3.3% dalla media
(+) | alti lineari (5.4% delta rispetto alla precedente frequenza)
Nel complesso 100 - 16.000 Hz
(+) | suono nel complesso lineare (12.8% differenza dalla media)
Rispetto alla stessa classe
» 24% di tutti i dispositivi testati in questa classe è stato migliore, 5% simile, 71% peggiore
» Il migliore ha avuto un delta di 5%, medio di 17%, peggiore di 45%
Rispetto a tutti i dispositivi testati
» 12% di tutti i dispositivi testati in questa classe è stato migliore, 3% similare, 86% peggiore
» Il migliore ha avuto un delta di 4%, medio di 24%, peggiore di 134%
Apple MacBook Pro 16 2021 M1 Pro analisi audio
(+) | gli altoparlanti sono relativamente potenti (84.7 dB)
Bassi 100 - 315 Hz
(+) | bassi buoni - solo 3.8% dalla media
(+) | bassi in lineaa (5.2% delta rispetto alla precedente frequenza)
Medi 400 - 2000 Hz
(+) | medi bilanciati - solo only 1.3% rispetto alla media
(+) | medi lineari (2.1% delta rispetto alla precedente frequenza)
Alti 2 - 16 kHz
(+) | Alti bilanciati - appena 1.9% dalla media
(+) | alti lineari (2.7% delta rispetto alla precedente frequenza)
Nel complesso 100 - 16.000 Hz
(+) | suono nel complesso lineare (4.6% differenza dalla media)
Rispetto alla stessa classe
» 0% di tutti i dispositivi testati in questa classe è stato migliore, 0% simile, 100% peggiore
» Il migliore ha avuto un delta di 5%, medio di 17%, peggiore di 45%
Rispetto a tutti i dispositivi testati
» 0% di tutti i dispositivi testati in questa classe è stato migliore, 0% similare, 100% peggiore
» Il migliore ha avuto un delta di 4%, medio di 24%, peggiore di 134%
Gestione dell'energia
Consumo di energia
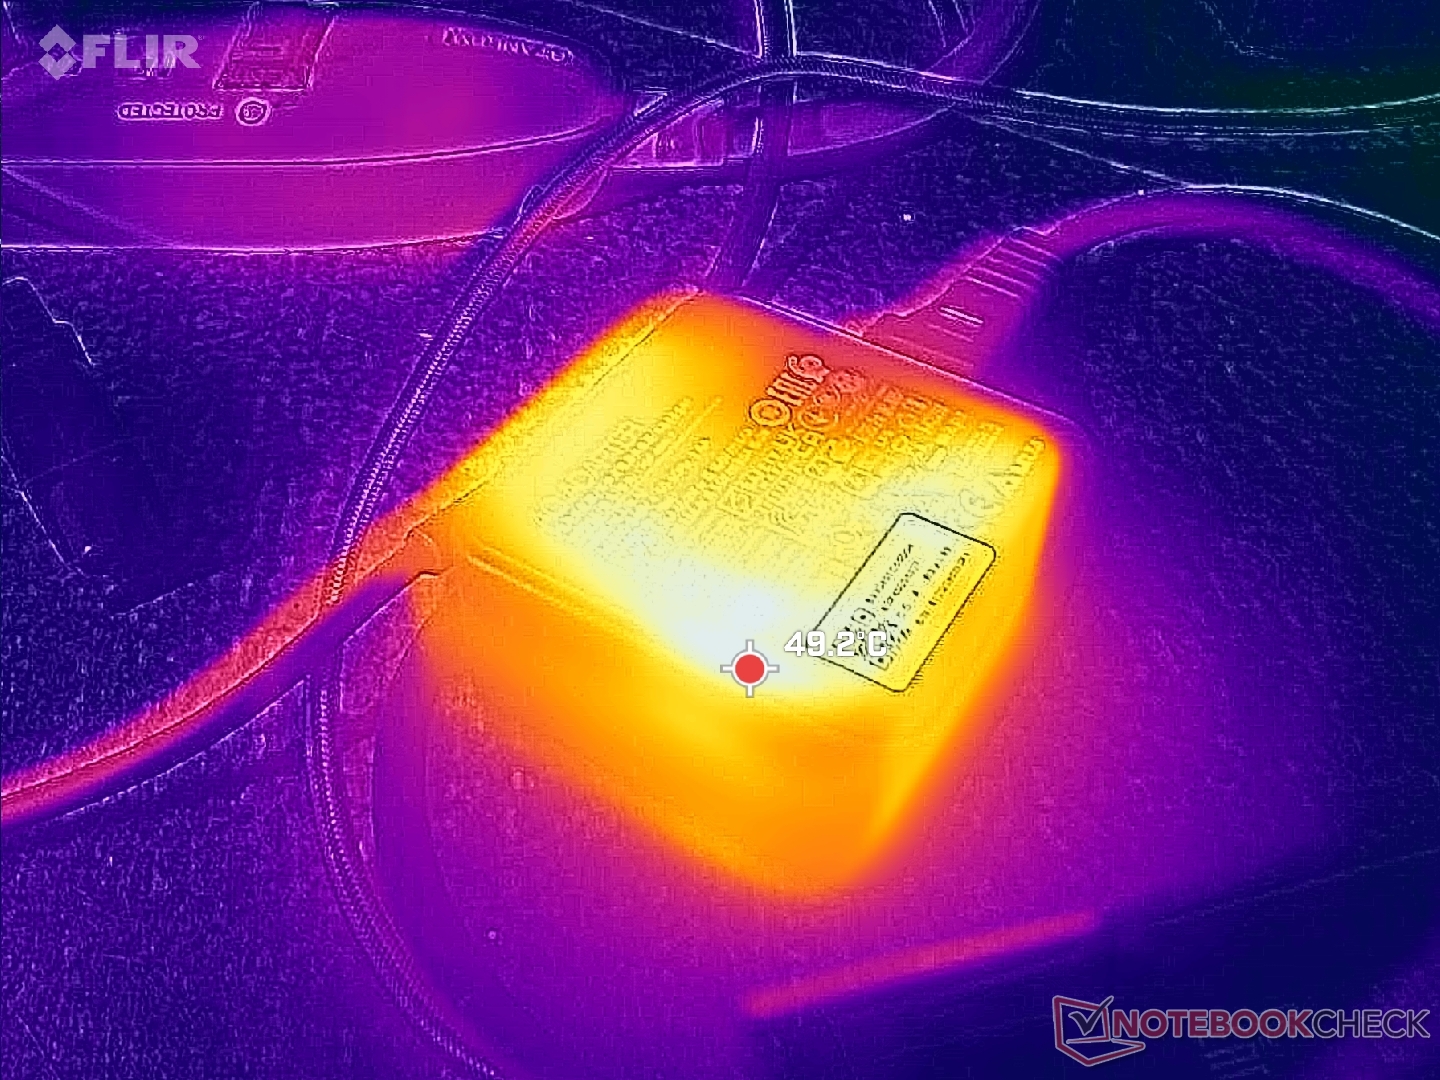
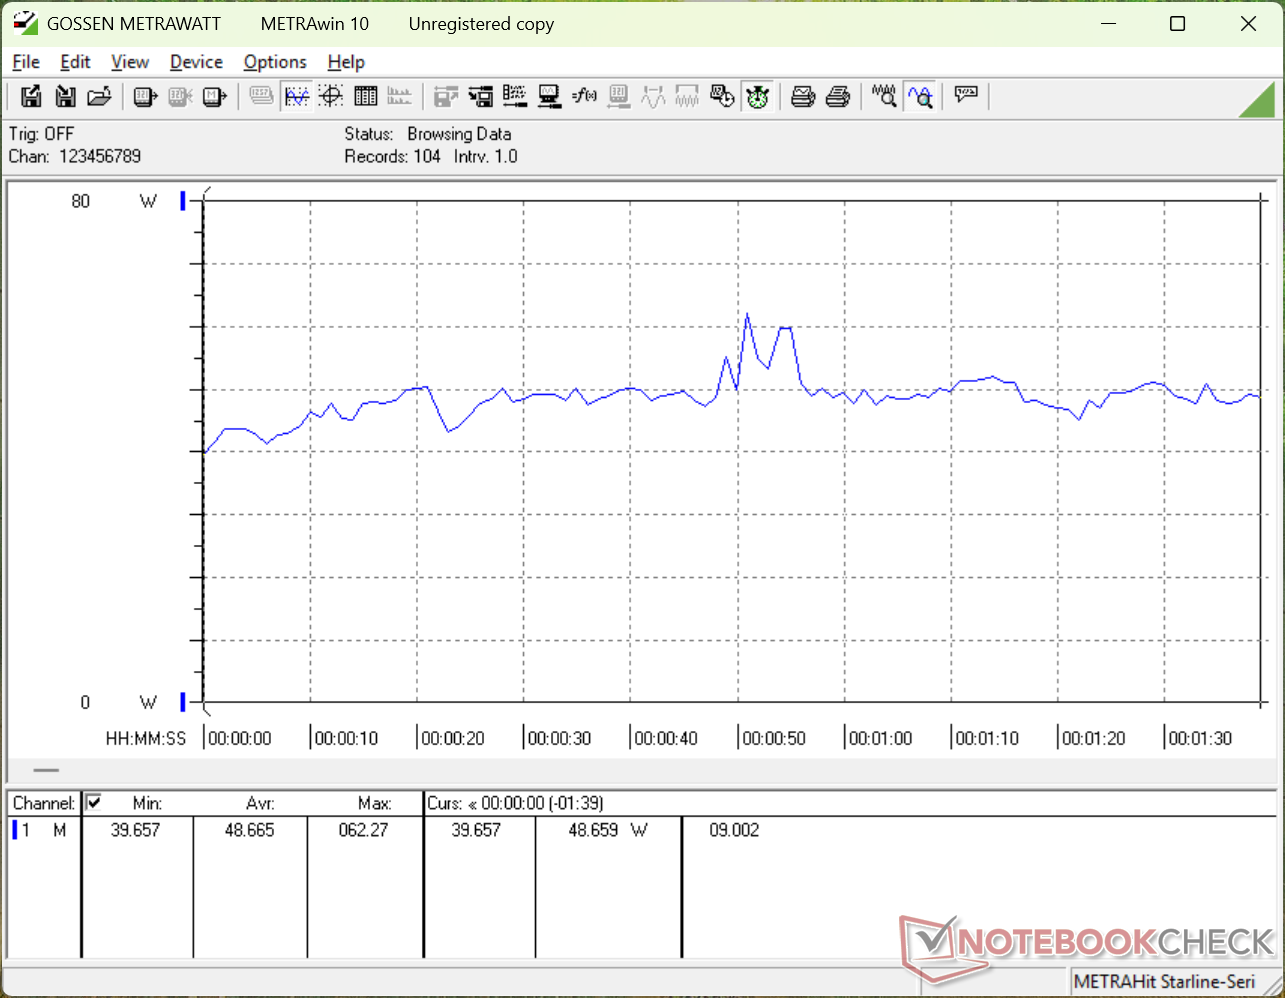
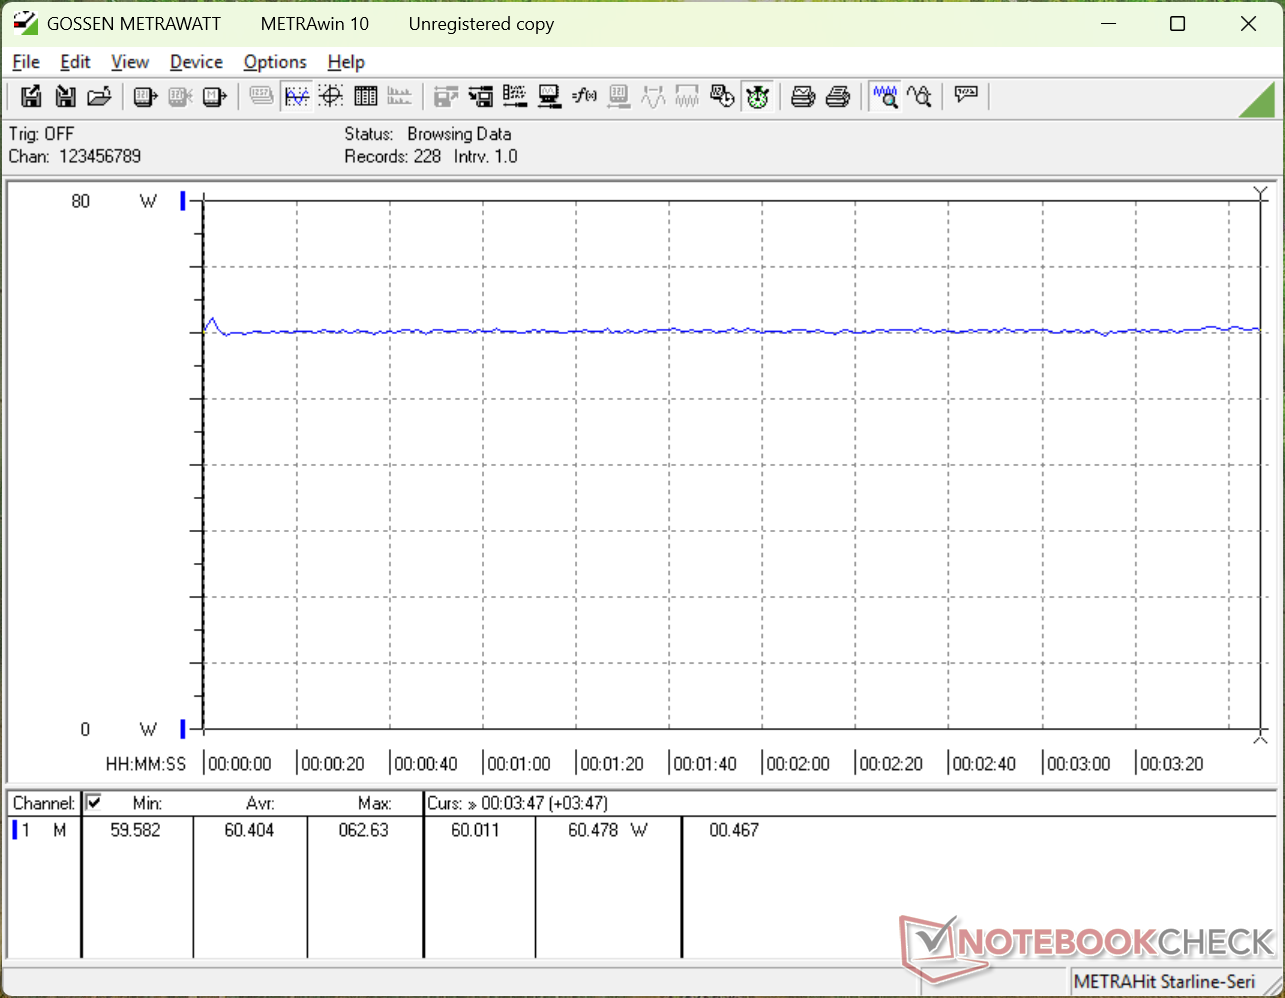
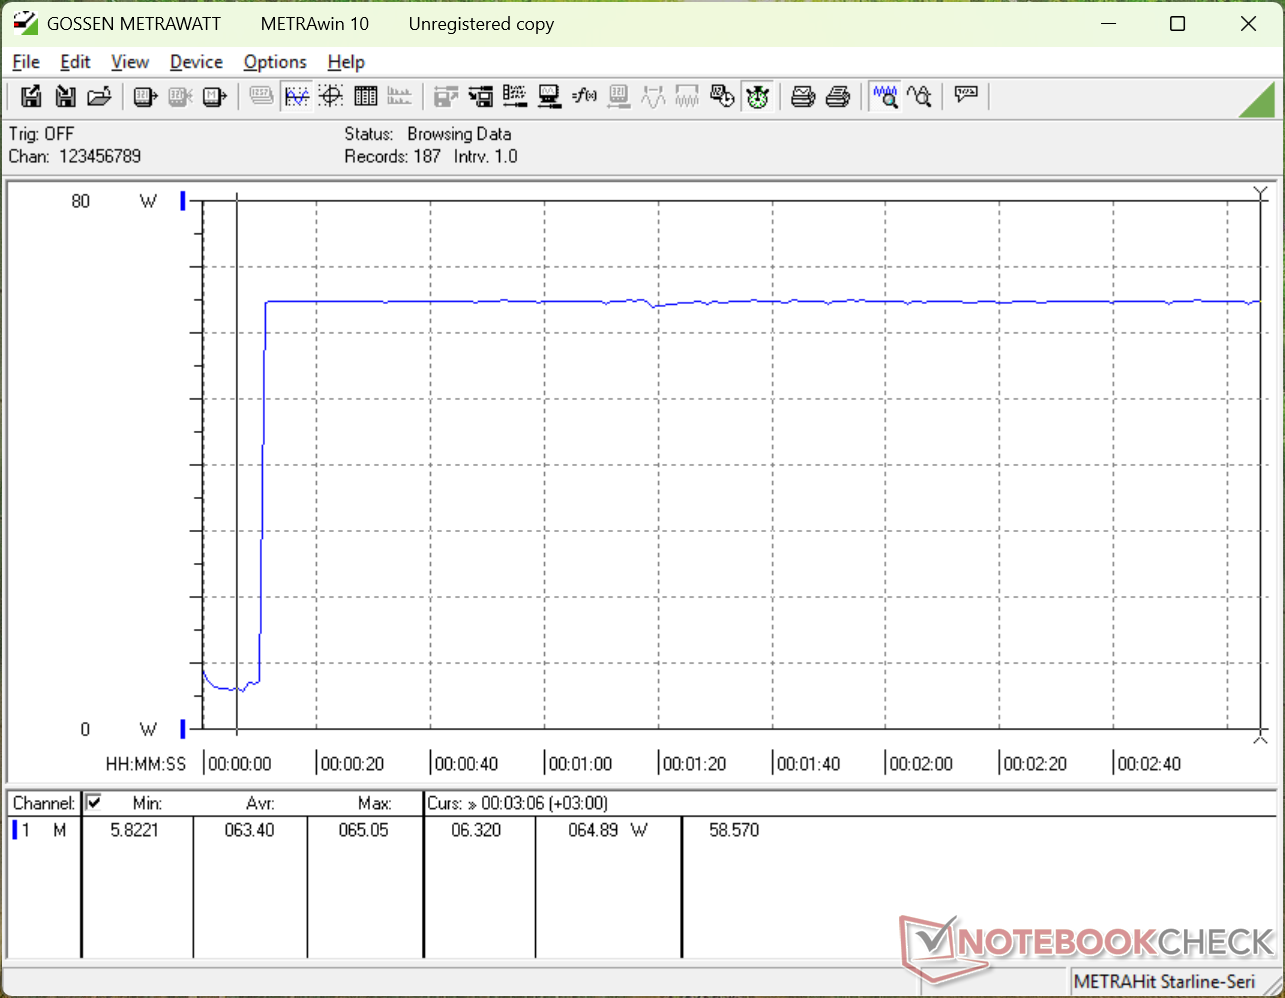
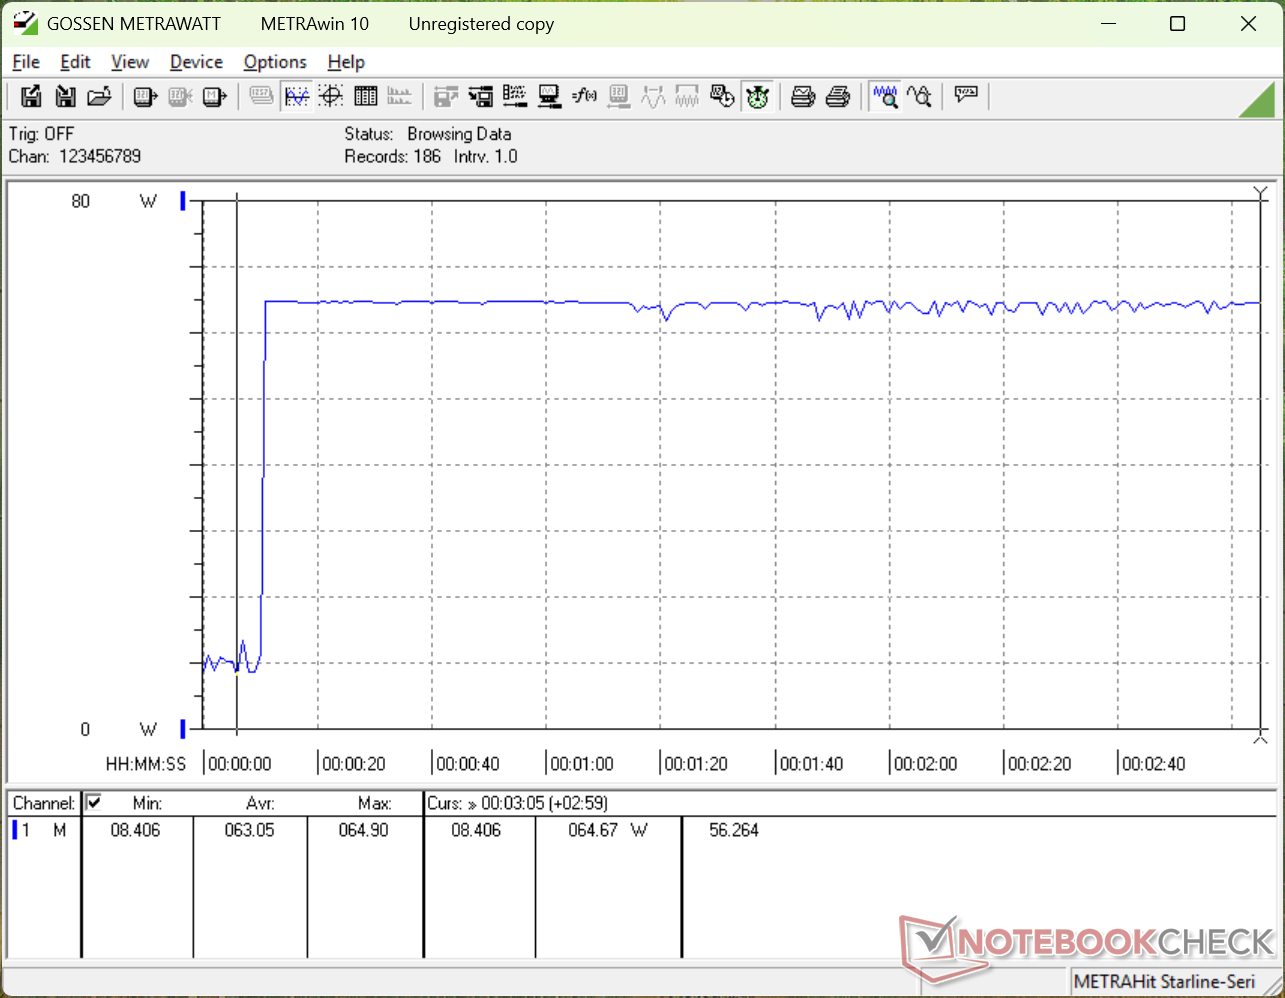
Il modello viene fornito con un adattatore CA USB-C più piccolo da 65 W (~6,5 x 6,5 x 3,0 cm) invece dell'adattatore da 100 W fornito con il modello 2025. Nonostante questo, il consumo complessivo tra i due modelli è abbastanza simile, come mostrano i grafici sottostanti. Le prestazioni per watt sono aumentate notevolmente quando si tratta di grafica, poiché la nuova Prestige 16 è fino all'80% più veloce, pur assorbendo quasi la stessa energia.
Una conseguenza dell'adattatore CA più piccolo da 65 W sono le prestazioni Turbo Boost inferiori. Quando si esegue lo stress Prime95, ad esempio, la Prestige 16 2025 potrebbe assorbire temporaneamente 103 W, rispetto ai soli 66 W della nostra Prestige 16 2026. Il modello più vecchio potrebbe quindi superare leggermente il modello più recente in termini di prestazioni grezze della CPU durante il primo minuto circa dello stress test, quando il Turbo Boost è più efficace.
Tenga presente che i tassi di ricarica rallentano in modo significativo se si eseguono carichi impegnativi contemporaneamente, poiché l'adattatore CA da 65 W è probabilmente sottopotenziato; la semplice esecuzione di Cyberpunk 2077 assorbe già più di 60 W da sola.
| Off / Standby | |
| Idle | |
| Sotto carico |
|
Leggenda:
min: | |
| MSI Prestige 16 AI C3MTG Ultra X7 358H, Arc B390 Panther Lake iGPU, Micron 2500 1TB MTFDKBA1T0QGN, OLED, 2880x1800, 16" | MSI Prestige 16 AI Evo B2HMG Ultra 9 285H, Arc 140T, Micron 2500 1TB MTFDKBA1T0QGN, IPS, 2560x1600, 16" | Dell XPS 16 Core Ultra X7 358H Ultra X7 358H, Arc B390 Panther Lake iGPU, , OLED, 3200x2000, 16" | Asus ZenBook S16 UM5606GA Ryzen AI 9 465, Radeon 880M, SanDisk PC SN5100S, OLED, 2880x1800, 16" | Lenovo ThinkBook 16 G7+ AMD Ryzen AI 9 365, Radeon 880M, Samsung PM9C1a MZAL81T0HDLB, IPS, 3200x2000, 16" | HP Envy x360 2-in-1 16-ad0097nr R7 8840HS, Radeon 780M, KIOXIA BG5 KBG50ZNV1T02, OLED, 2880x1800, 16" | |
|---|---|---|---|---|---|---|
| Power Consumption | -22% | -0% | -2% | -55% | -10% | |
| Idle Minimum * (Watt) | 3.3 | 4.4 -33% | 4 -21% | 3.7 -12% | 6.4 -94% | 5 -52% |
| Idle Average * (Watt) | 7.4 | 9.2 -24% | 4.4 41% | 7.4 -0% | 14.1 -91% | 6.2 16% |
| Idle Maximum * (Watt) | 13 | 9.5 27% | 10.2 22% | 9.5 27% | 14.3 -10% | 14.7 -13% |
| Load Average * (Watt) | 48.7 | 66.9 -37% | 44.2 9% | 57.9 -19% | 83.4 -71% | 49.9 -2% |
| Cyberpunk 2077 ultra * (Watt) | 60.4 | 68.8 -14% | 62.6 -4% | 58.5 3% | 79.8 -32% | |
| Cyberpunk 2077 ultra external monitor * (Watt) | 60.4 | 67.4 -12% | 62.4 -3% | 57 6% | 77.5 -28% | |
| Load Maximum * (Watt) | 64.8 | 102.9 -59% | 94.6 -46% | 76.9 -19% | 102.9 -59% | 65 -0% |
| Witcher 3 ultra * (Watt) | 54.5 |
* ... Meglio usare valori piccoli
Consumo di energia Cyberpunk / Stress Test
Consumo di energia del monitor esterno
Durata della batteria
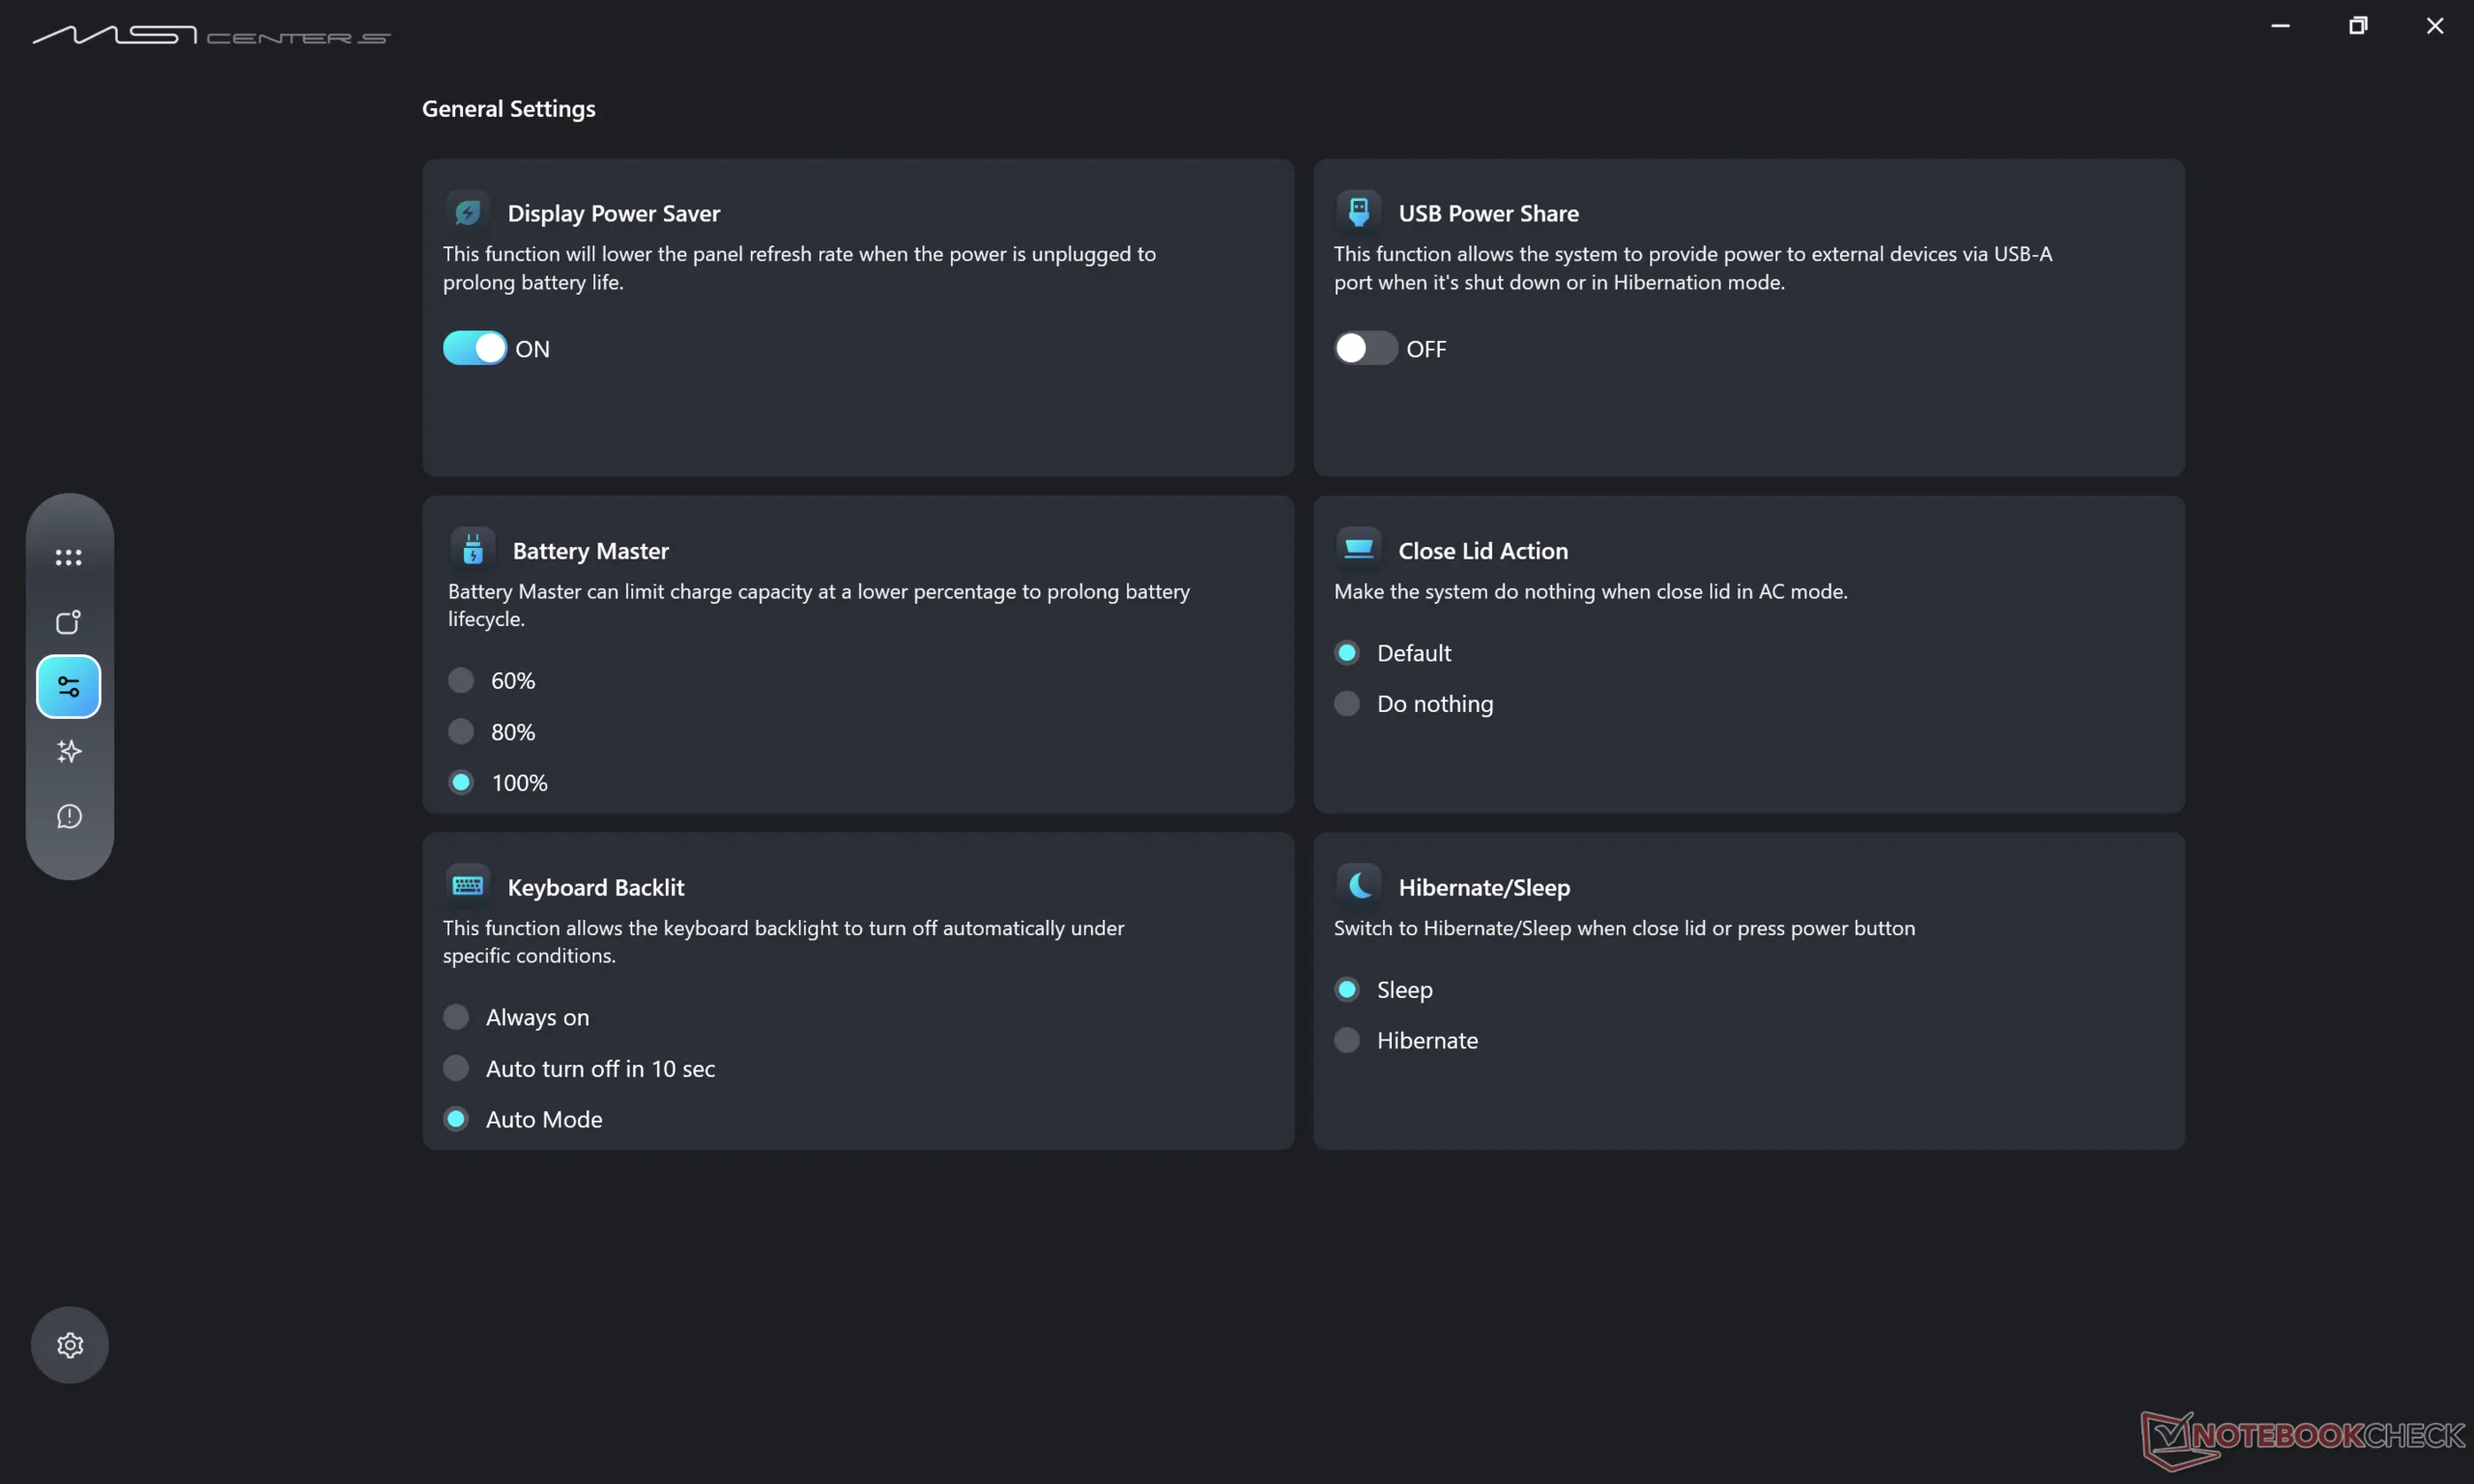
I tempi di esecuzione sono più brevi quest'anno, in parte a causa della batteria più piccola (99 Wh contro 81 Wh) e del passaggio da IPS a OLED. Tuttavia, l'impatto è leggermente compensato dai guadagni di efficienza realizzati in altre parti del sistema. Siamo in grado di registrare un'autonomia WLAN di quasi 13 ore, da 3 a 4 ore in meno rispetto al modello 2025.
| MSI Prestige 16 AI C3MTG Ultra X7 358H, Arc B390 Panther Lake iGPU, 81 Wh | MSI Prestige 16 AI Evo B2HMG Ultra 9 285H, Arc 140T, 99.9 Wh | Dell XPS 16 Core Ultra X7 358H Ultra X7 358H, Arc B390 Panther Lake iGPU, 70 Wh | Asus ZenBook S16 UM5606GA Ryzen AI 9 465, Radeon 880M, 83 Wh | Lenovo ThinkBook 16 G7+ AMD Ryzen AI 9 365, Radeon 880M, 85 Wh | HP Envy x360 2-in-1 16-ad0097nr R7 8840HS, Radeon 780M, 68 Wh | |
|---|---|---|---|---|---|---|
| Autonomia della batteria | 31% | -18% | 4% | -14% | -39% | |
| WiFi v1.3 (h) | 12.6 | 16.5 31% | 10.3 -18% | 13.1 4% | 10.8 -14% | 7.7 -39% |
| H.264 (h) | 20.8 | 13.9 | ||||
| Load (h) | 2.4 | 1.9 | ||||
| Reader / Idle (h) | 15.6 |
Valutazione Notebookcheck
MSI Prestige 16 2026 è uno dei portatili prosumer più sottili disponibili con Intel Panther Lake, ma la concorrenza è agguerrita per quanto riguarda la risoluzione della webcam, le opzioni di visualizzazione e le porte integrate.
MSI Prestige 16 AI C3MTG
- 05/07/2026 v8
Allen Ngo
 Total Sustainability Score:
 Potenziali concorrenti a confronto
Immagine | Modello | Prezzo | Peso | Altezza | Schermo |
|---|---|---|---|---|---|
1. 86.4%  | MSI Prestige 16 AI C3MTG Intel Core Ultra X7 358H ⎘ Intel Arc B390 12 Xe3 Panther Lake iGPU ⎘ 32 GB Memoria, 1024 GB SSD | Amazon: Prezzo di listino: 2100 USD | 1.6 kg | 13.9 mm | 16.00" 2880x1800 212 PPI OLED |
2. 82.8%  | MSI Prestige 16 AI Evo B2HMG Intel Core Ultra 9 285H ⎘ Intel Arc Graphics 140T ⎘ 32 GB Memoria, 1024 GB SSD | Amazon: 1. $1,484.99 MSI Prestige 16 AI+ Evo 16" ... 2. $1,595.00 MSI Prestige 16 AI Evo Lapto... 3. $2,197.99 MSI Prestige 16 AI Evo 16" N... | 1.6 kg | 18.95 mm | 16.00" 2560x1600 189 PPI IPS |
3. 87.2%  | Dell XPS 16 Core Ultra X7 358H Intel Core Ultra X7 358H ⎘ Intel Arc B390 12 Xe3 Panther Lake iGPU ⎘ 32 GB Memoria | Amazon: 1. $2,699.99 Dell XPS 16 9640 Laptop | In... 2. $2,999.00 Dell Premium 16 (Previously ... 3. $1,295.00 Dell 16 Plus Laptop 16" WUXG... Prezzo di listino: 2350 USD | 1.7 kg | 14.62 mm | 16.00" 3200x2000 236 PPI OLED |
4. 86.6%  | Asus ZenBook S16 UM5606GA AMD Ryzen AI 9 465 ⎘ AMD Radeon 880M ⎘ 32 GB Memoria, 1024 GB SSD | Prezzo di listino: 1799€ | 1.5 kg | 12.9 mm | 16.00" 2880x1800 212 PPI OLED |
5. 86.6%  | Lenovo ThinkBook 16 G7+ AMD AMD Ryzen AI 9 365 ⎘ AMD Radeon 880M ⎘ 32 GB Memoria, 1024 GB SSD | Prezzo di listino: 1399€ | 1.9 kg | 16.9 mm | 16.00" 3200x2000 236 PPI IPS |
6. 87.2% v7 (old)  | HP Envy x360 2-in-1 16-ad0097nr AMD Ryzen 7 8840HS ⎘ AMD Radeon 780M ⎘ 16 GB Memoria, 1024 GB SSD | Prezzo di listino: 1300 USD | 1.8 kg | 18.3 mm | 16.00" 2880x1800 212 PPI OLED |
Transparency
La selezione dei dispositivi da recensire viene effettuata dalla nostra redazione. Il campione di prova è stato fornito all'autore come prestito dal produttore o dal rivenditore ai fini di questa recensione. L'istituto di credito non ha avuto alcuna influenza su questa recensione, né il produttore ne ha ricevuto una copia prima della pubblicazione. Non vi era alcun obbligo di pubblicare questa recensione. In quanto società mediatica indipendente, Notebookcheck non è soggetta all'autorità di produttori, rivenditori o editori.
Ecco come Notebookcheck esegue i test
Ogni anno, Notebookcheck esamina in modo indipendente centinaia di laptop e smartphone utilizzando procedure standardizzate per garantire che tutti i risultati siano comparabili. Da circa 20 anni sviluppiamo continuamente i nostri metodi di prova e nel frattempo stabiliamo gli standard di settore. Nei nostri laboratori di prova, tecnici ed editori esperti utilizzano apparecchiature di misurazione di alta qualità. Questi test comportano un processo di validazione in più fasi. Il nostro complesso sistema di valutazione si basa su centinaia di misurazioni e parametri di riferimento ben fondati, che mantengono l'obiettività.
