 Deutsch
 English
 Español
 Français
 Italiano
 Nederlands
 Polski
 Português
 Русский
 Türkçe
 Svenska
 Chinese
 Magyar
Recensione del portatile Lenovo Legion 7 16 G9 - Una macchina gaming con display 3.2K, CPU HX e RTX 4070 overcloccata
Il sito Legion 7 16 è il Legion Pro 7 16 fratello più economico e più sottile, che abbiamo recensito solo di recente. Le differenze ci sono, soprattutto per quanto riguarda le schede grafiche: la GPU massima disponibile del normale Legion 7 è la RTX 4070 del laptop. Tuttavia, in termini di processore, vengono utilizzati gli stessi chip Intel HX e, oltre ai pannelli WQHD, è disponibile un pannello IPS opzionale ad alta risoluzione, 165 Hz 3.2K.
Il nostro dispositivo in prova è la variante Campus da 2.249 dollari, che viene fornita con un Core i9-14900HXGeForce RTX 4070, 32 GB di RAM, un SSD da 1 TB e un pannello 3.2K. Attualmente, non esistono ancora varianti corrispondenti per i clienti abituali, ma il prezzo dovrebbe essere superiore di circa 250-300 dollari.
Potenziali concorrenti a confrontos
Punteggio | Data | Modello | Peso | Altezza | Dimensione | Risoluzione | Miglior Prezzo |
|---|---|---|---|---|---|---|---|
| 90.8 % | 04/2024 | Lenovo Legion 7 16 IRX G9 i9-14900HX, NVIDIA GeForce RTX 4070 Laptop GPU | 2.3 kg | 19.8 mm | 16.00" | 3200x2000 | |
| 89.3 % | 04/2024 | Lenovo Legion Pro 5 16IRX9 i9-14900HX, NVIDIA GeForce RTX 4070 Laptop GPU | 2.5 kg | 26.95 mm | 16.00" | 2560x1600 | |
| 87.4 % | 04/2024 | Aorus 16X 2024 i9-14900HX, NVIDIA GeForce RTX 4070 Laptop GPU | 2.3 kg | 20 mm | 16.00" | 2560x1600 | |
| 88.4 % | 02/2024 | HP Omen Transcend 16-u1095ng i9-14900HX, NVIDIA GeForce RTX 4070 Laptop GPU | 2.3 kg | 20 mm | 16.00" | 2560x1600 | |
| 90.2 % | 03/2024 | Alienware m16 R2 Ultra 7 155H, NVIDIA GeForce RTX 4070 Laptop GPU | 2.5 kg | 23.5 mm | 16.00" | 2560x1600 | |
| 89.2 % | 10/2023 | SCHENKER XMG CORE 16 (L23) R7 7840HS, NVIDIA GeForce RTX 4070 Laptop GPU | 2.4 kg | 26.1 mm | 16.00" | 2560x1600 | |
| 89.5 % | 03/2024 | Lenovo Legion Pro 7 16IRX9H i9-14900HX, NVIDIA GeForce RTX 4080 Laptop GPU | 2.7 kg | 21.95 mm | 16.00" | 2560x1600 |
Custodia - Un magnete per le impronte digitali in alluminio nero
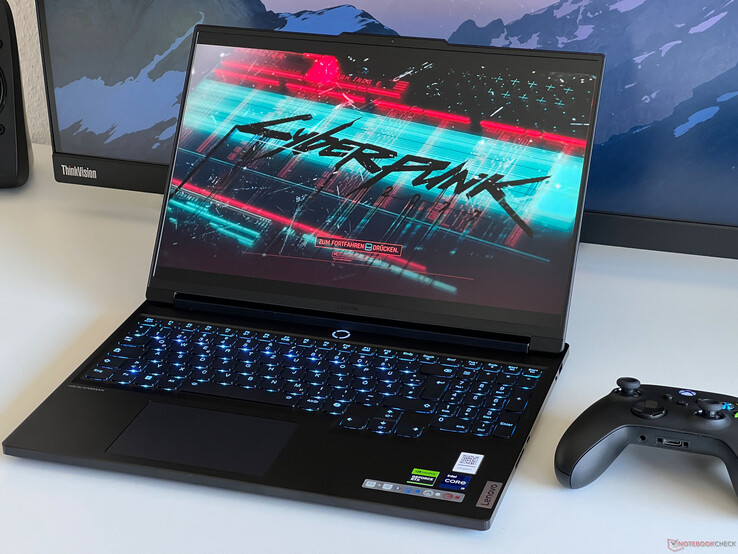
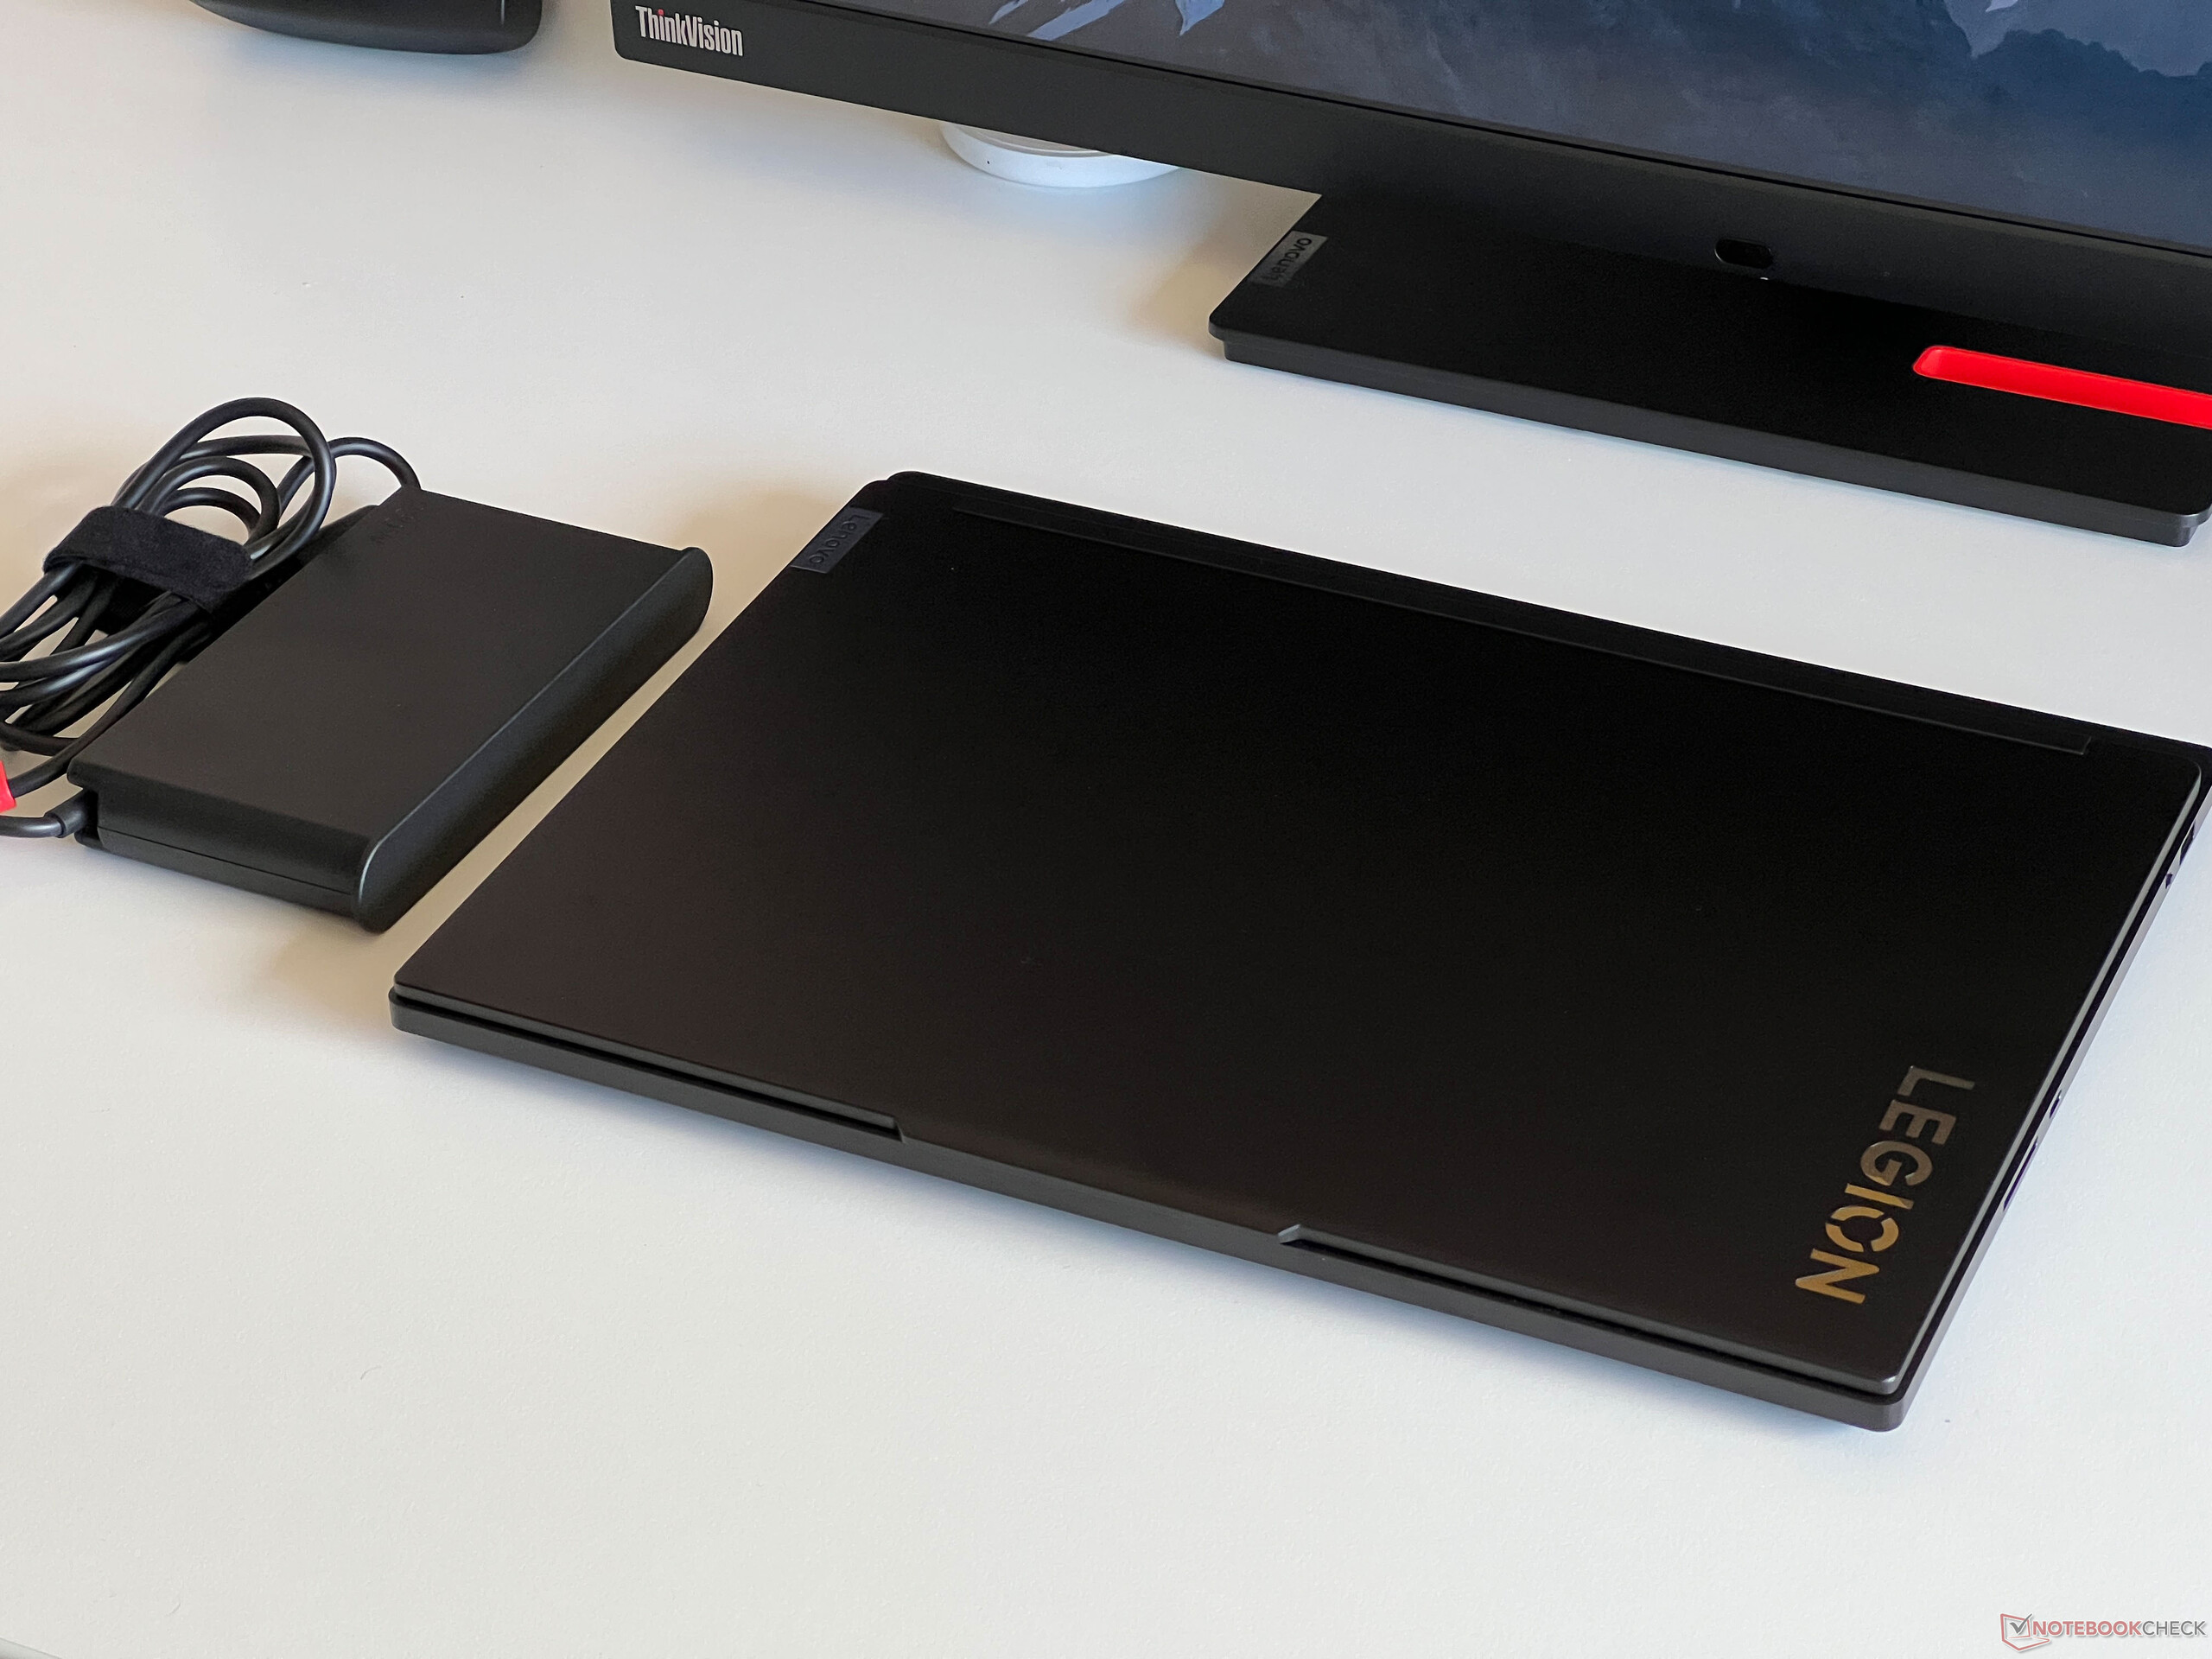
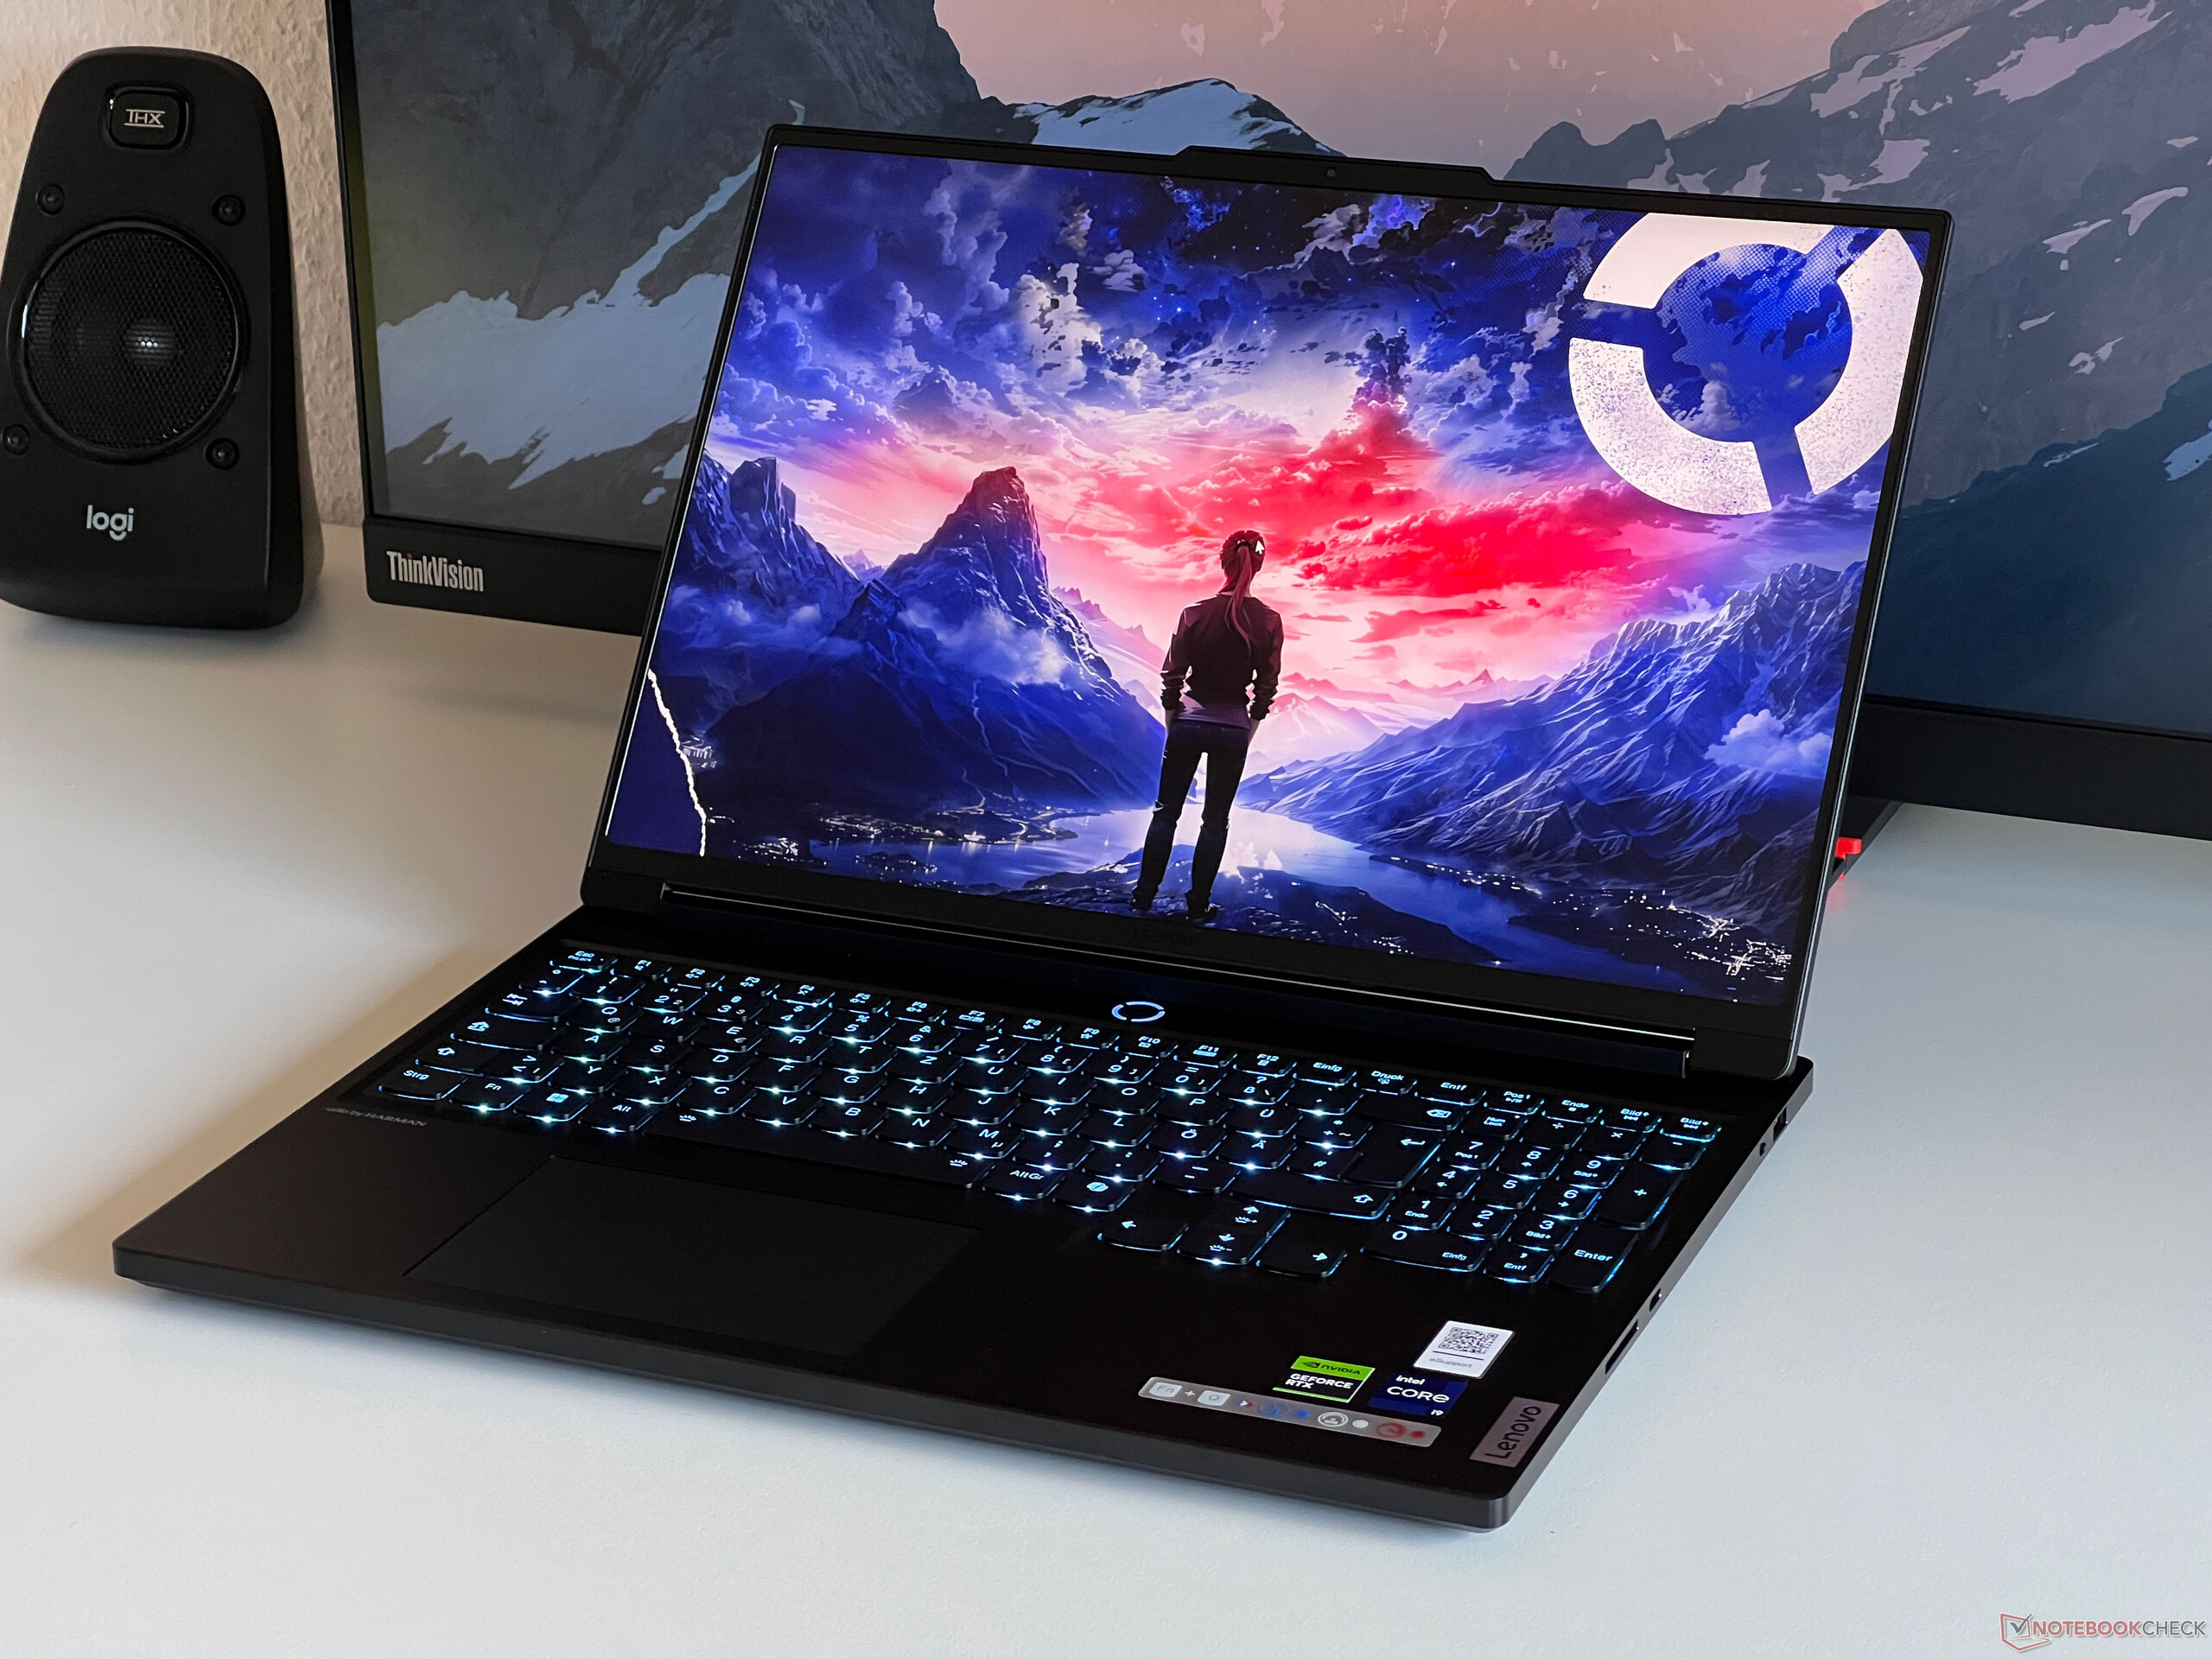
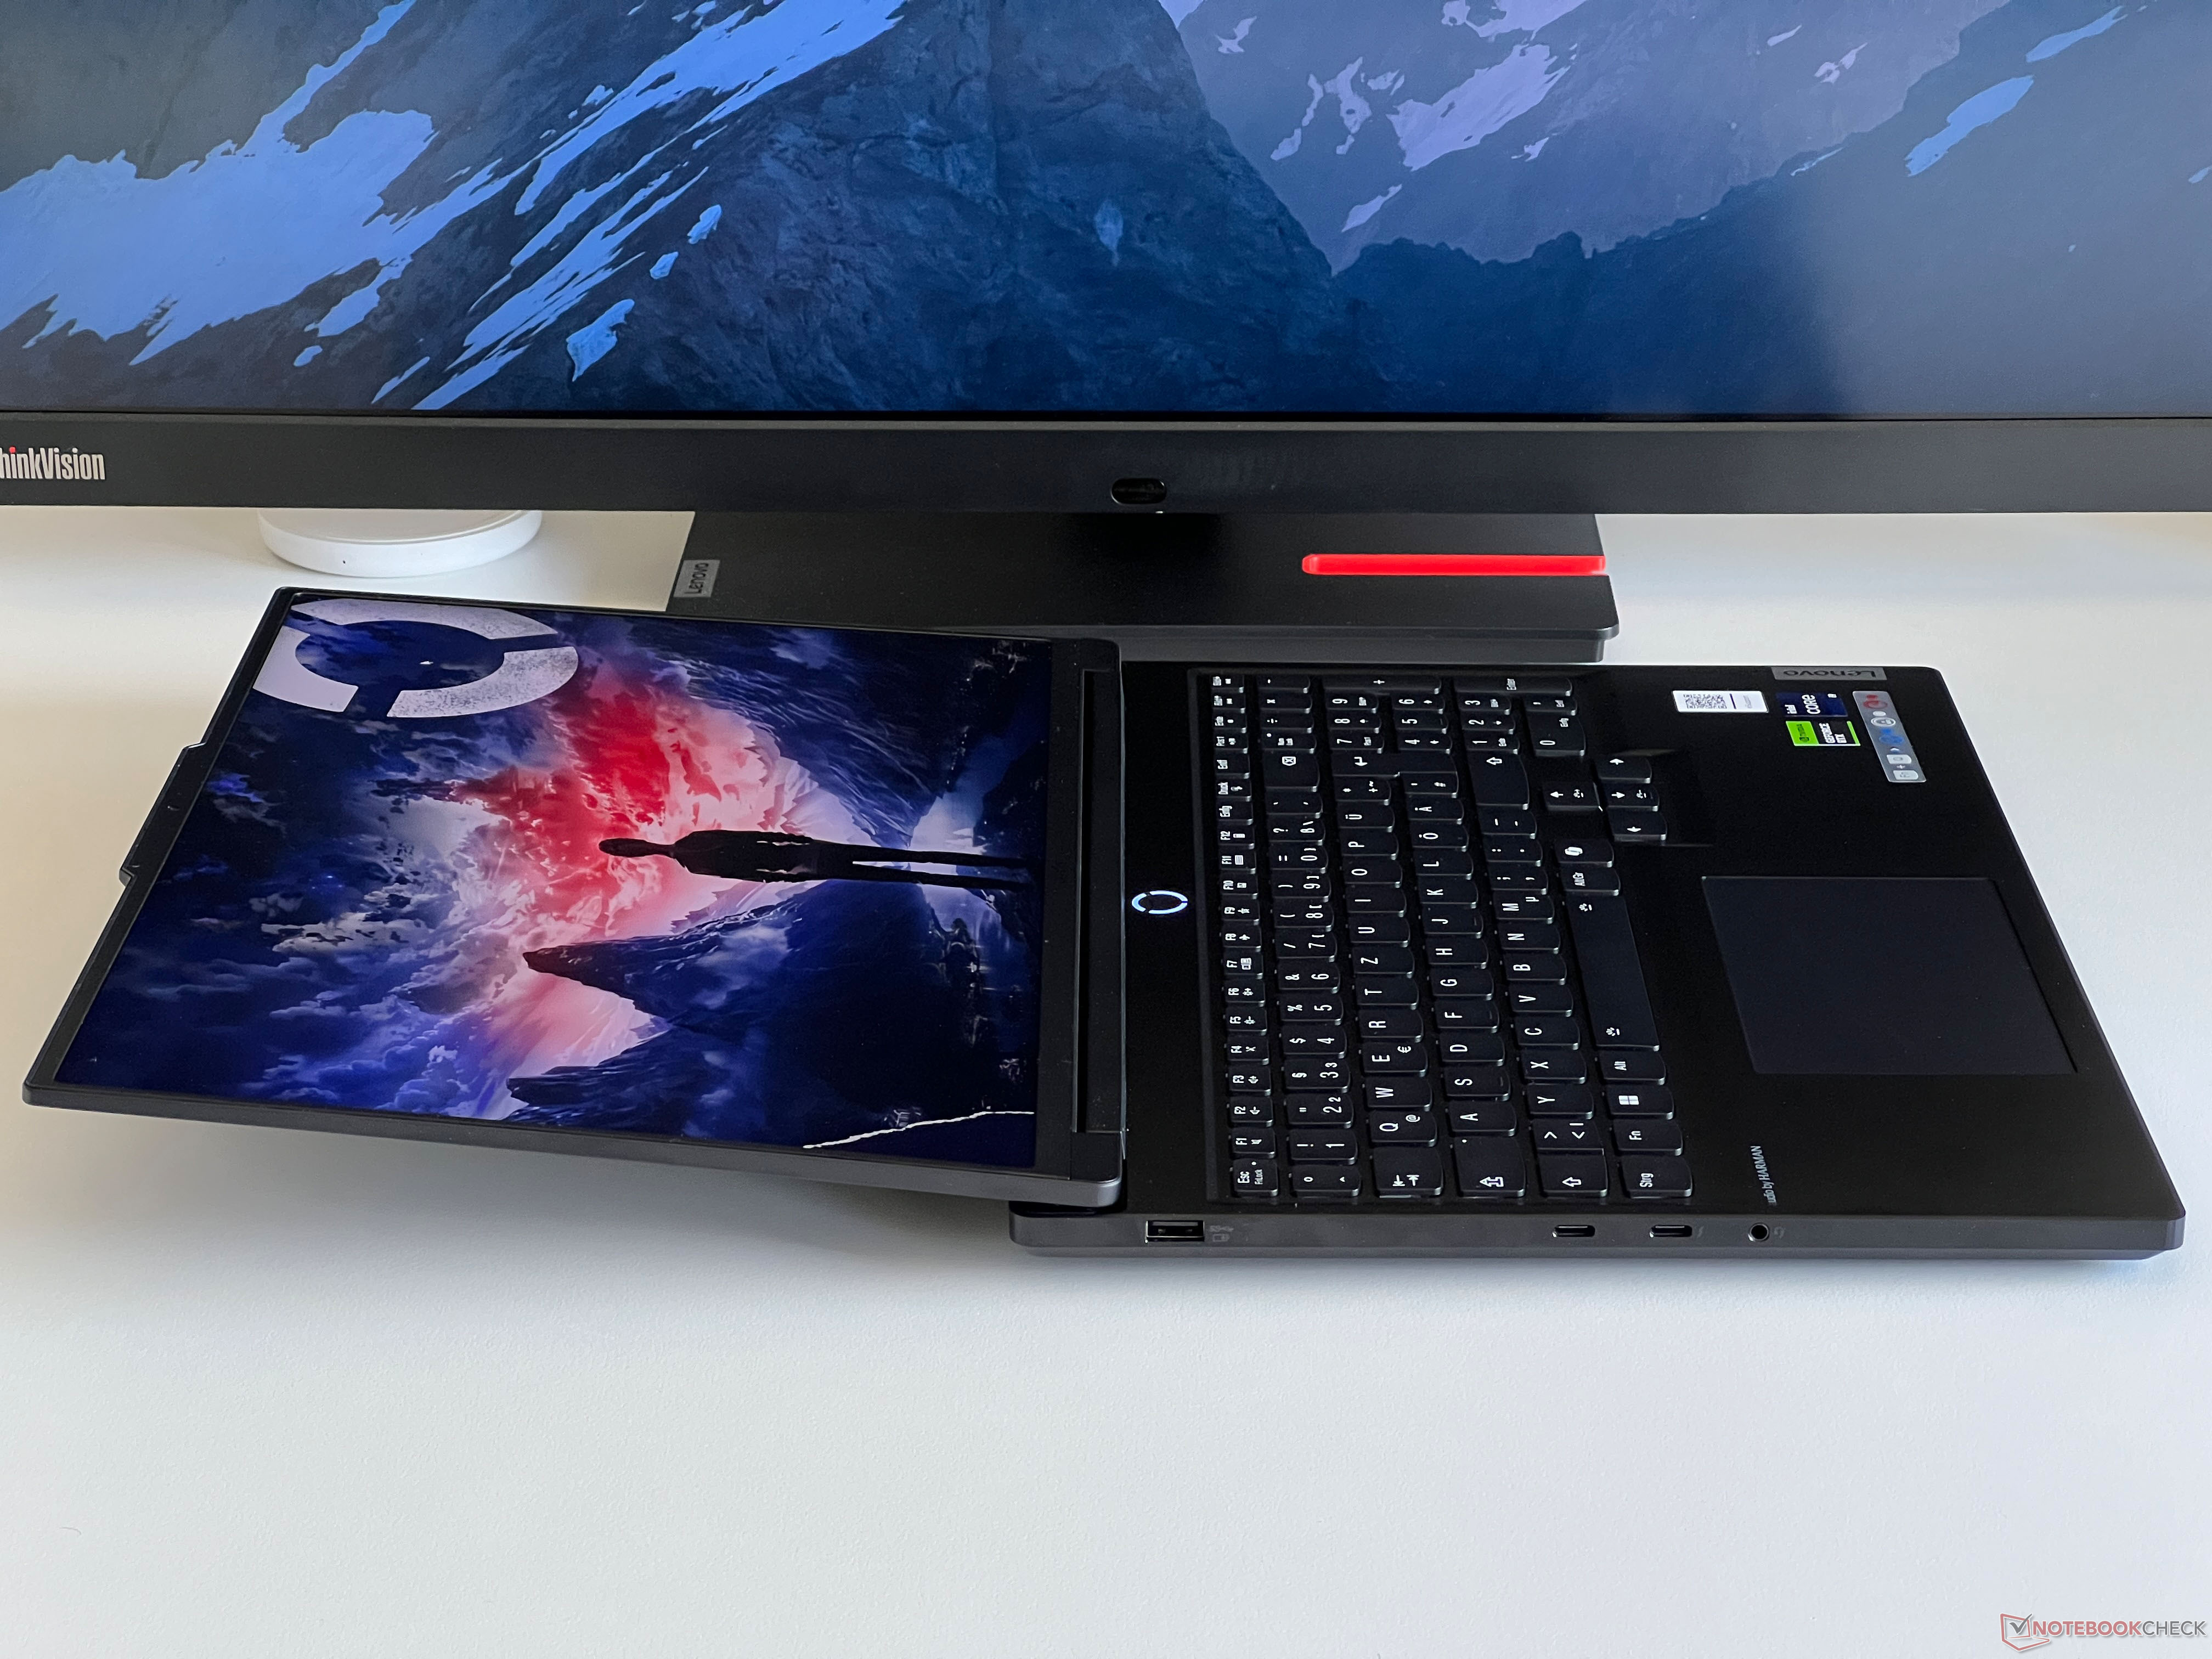
Legion 7 16 è un computer portatile da gioco relativamente sottile e molto sobrio grazie al suo telaio in alluminio nero. A differenza di Legion Pro 7, non ci sono elementi di raffreddamento sporgenti sui lati del dispositivo. Visivamente, il case è molto bello, ma solo per poco tempo, poiché le superfici lisce attirano magicamente le impronte digitali. Per questo motivo, dovrebbe sempre avere un panno a portata di mano per pulire la custodia. Le cornici dello schermo sono molto sottili e solo la protuberanza della fotocamera rovina l'aspetto, anche se questo rende più facile l'apertura della custodia.
Sia la stabilità che la qualità costruttiva della custodia sono molto buone e non siamo riusciti a provocare scricchiolii di alcun tipo. Inoltre, è praticamente impossibile flettere la tastiera quando si esercita una pressione. Il sottile coperchio del display è un po' più flessibile, ma anche in questo caso non siamo riusciti a provocare alcuna distorsione dell'immagine. Per i nostri gusti, le cerniere potrebbero essere un po' più solide, perché c'è un visibile movimento di oscillazione quando si regola l'angolo di apertura (massimo ~170 gradi).
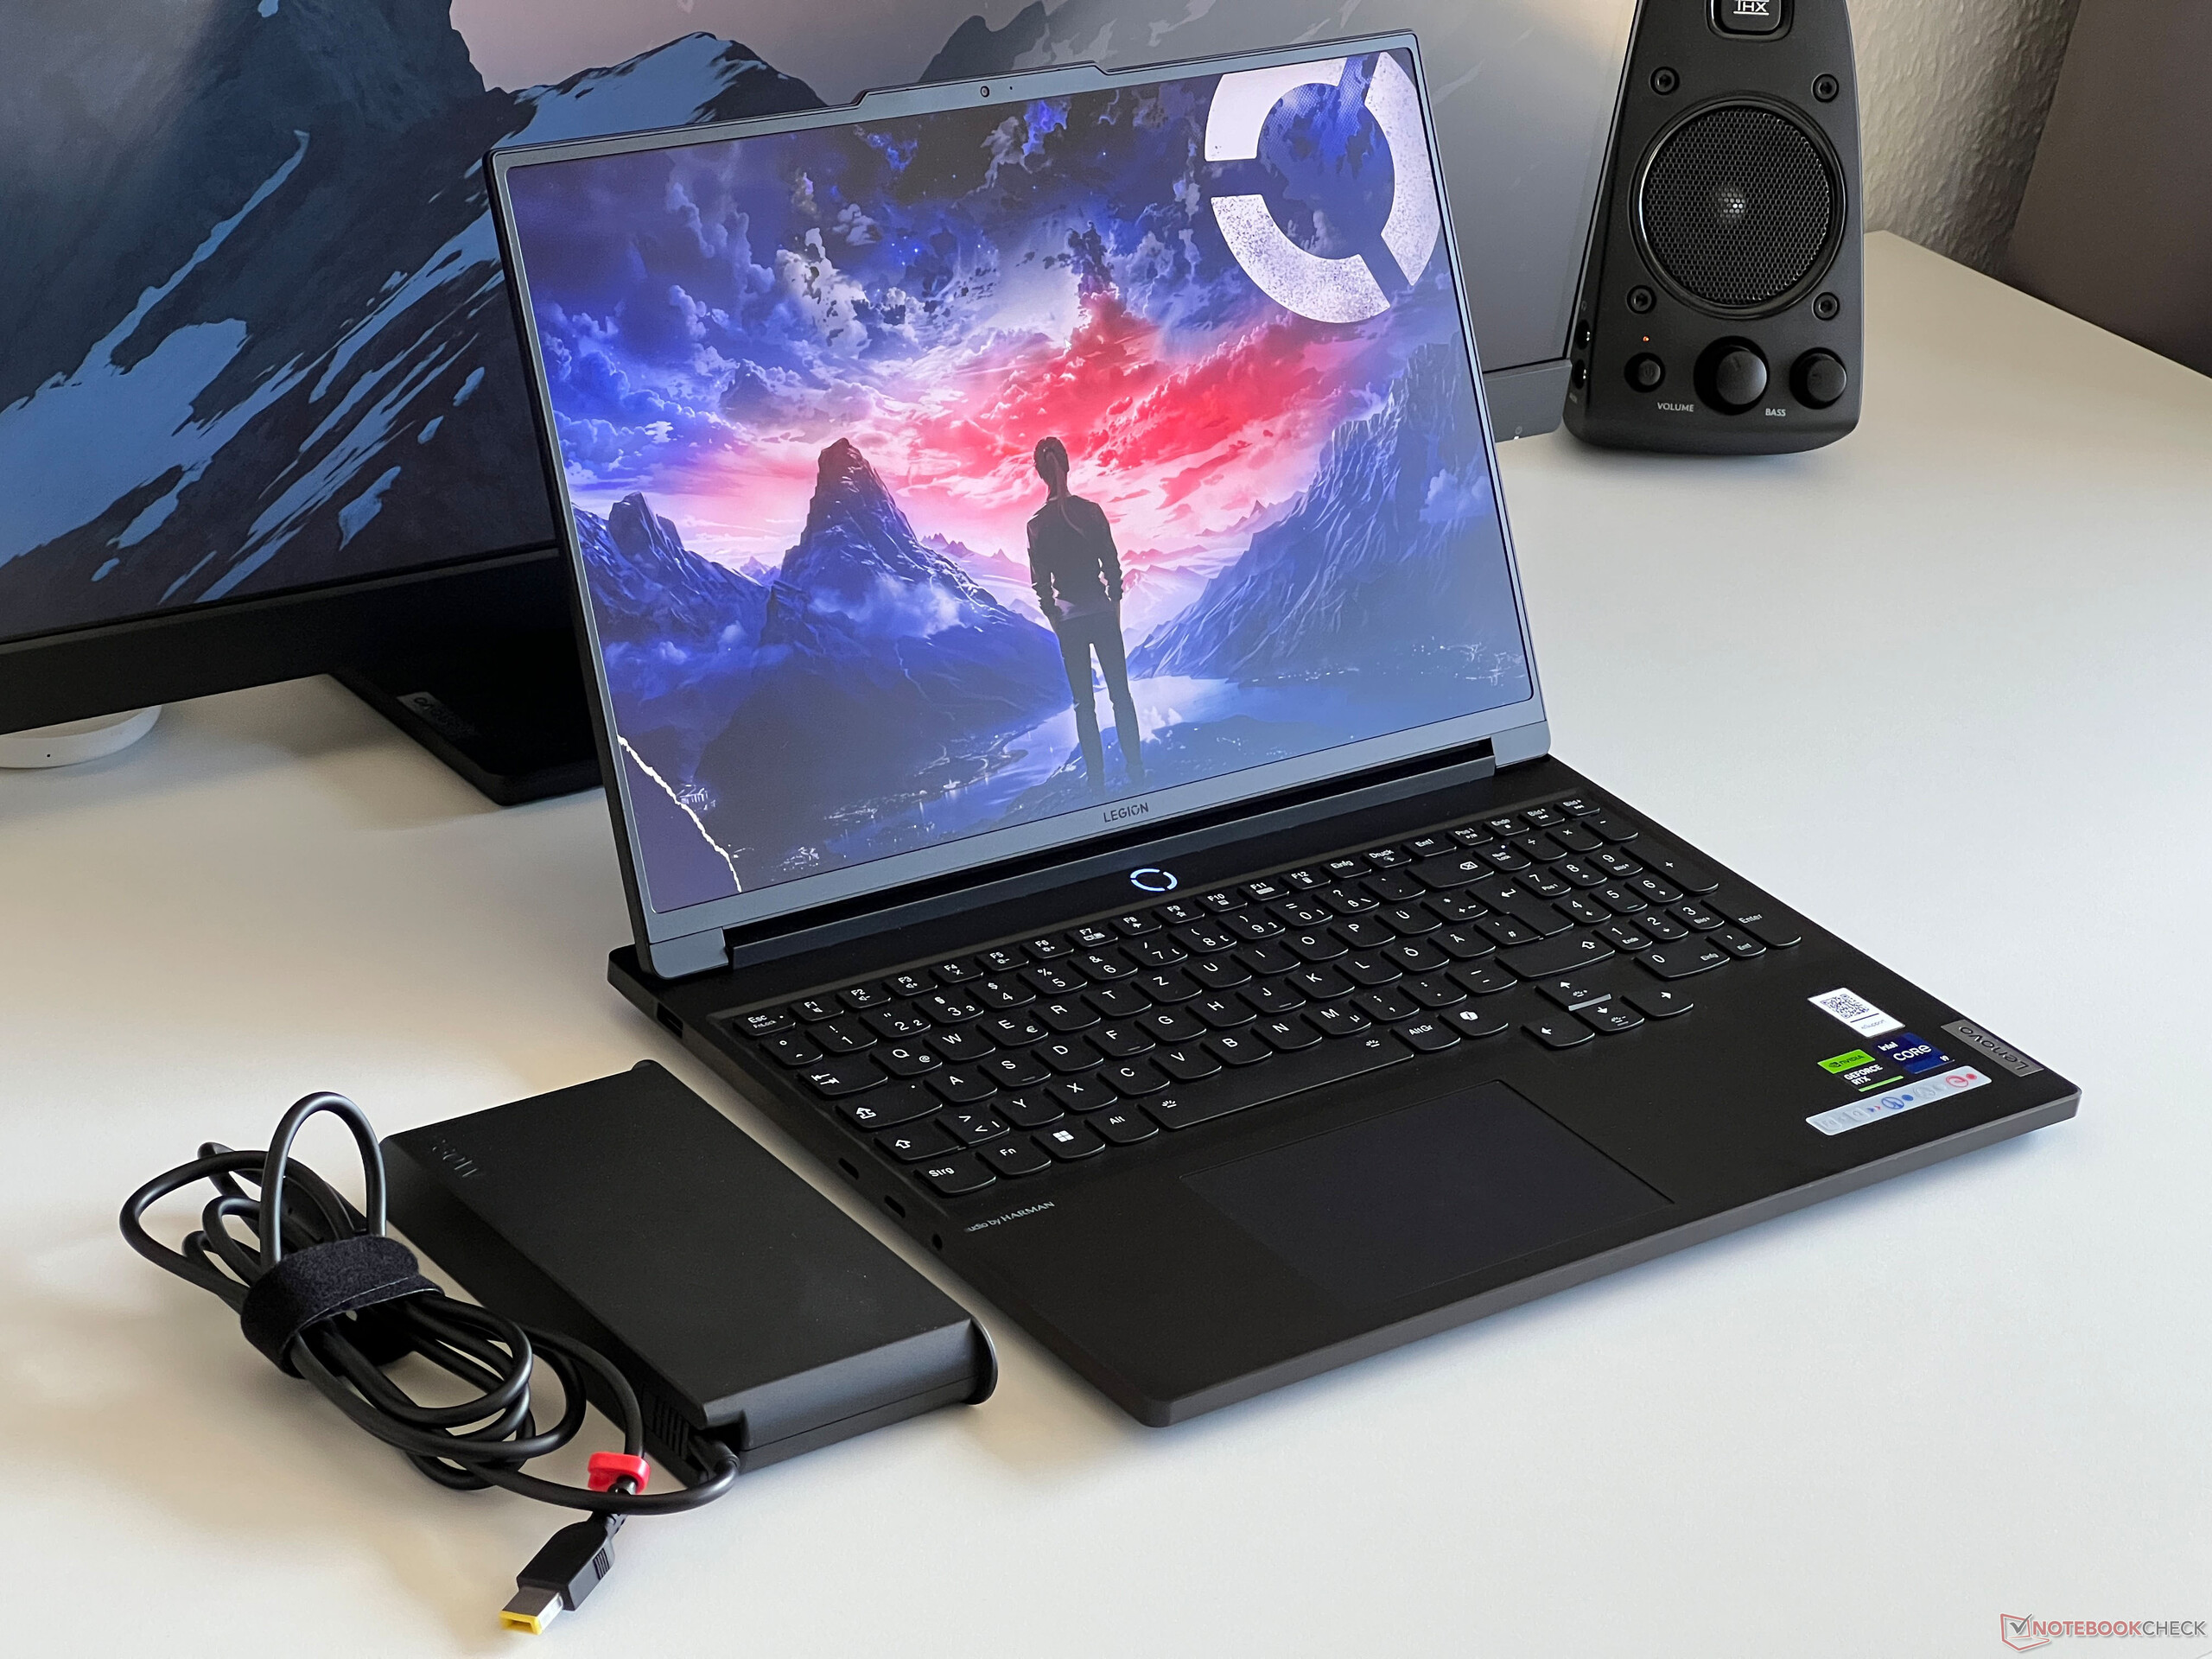
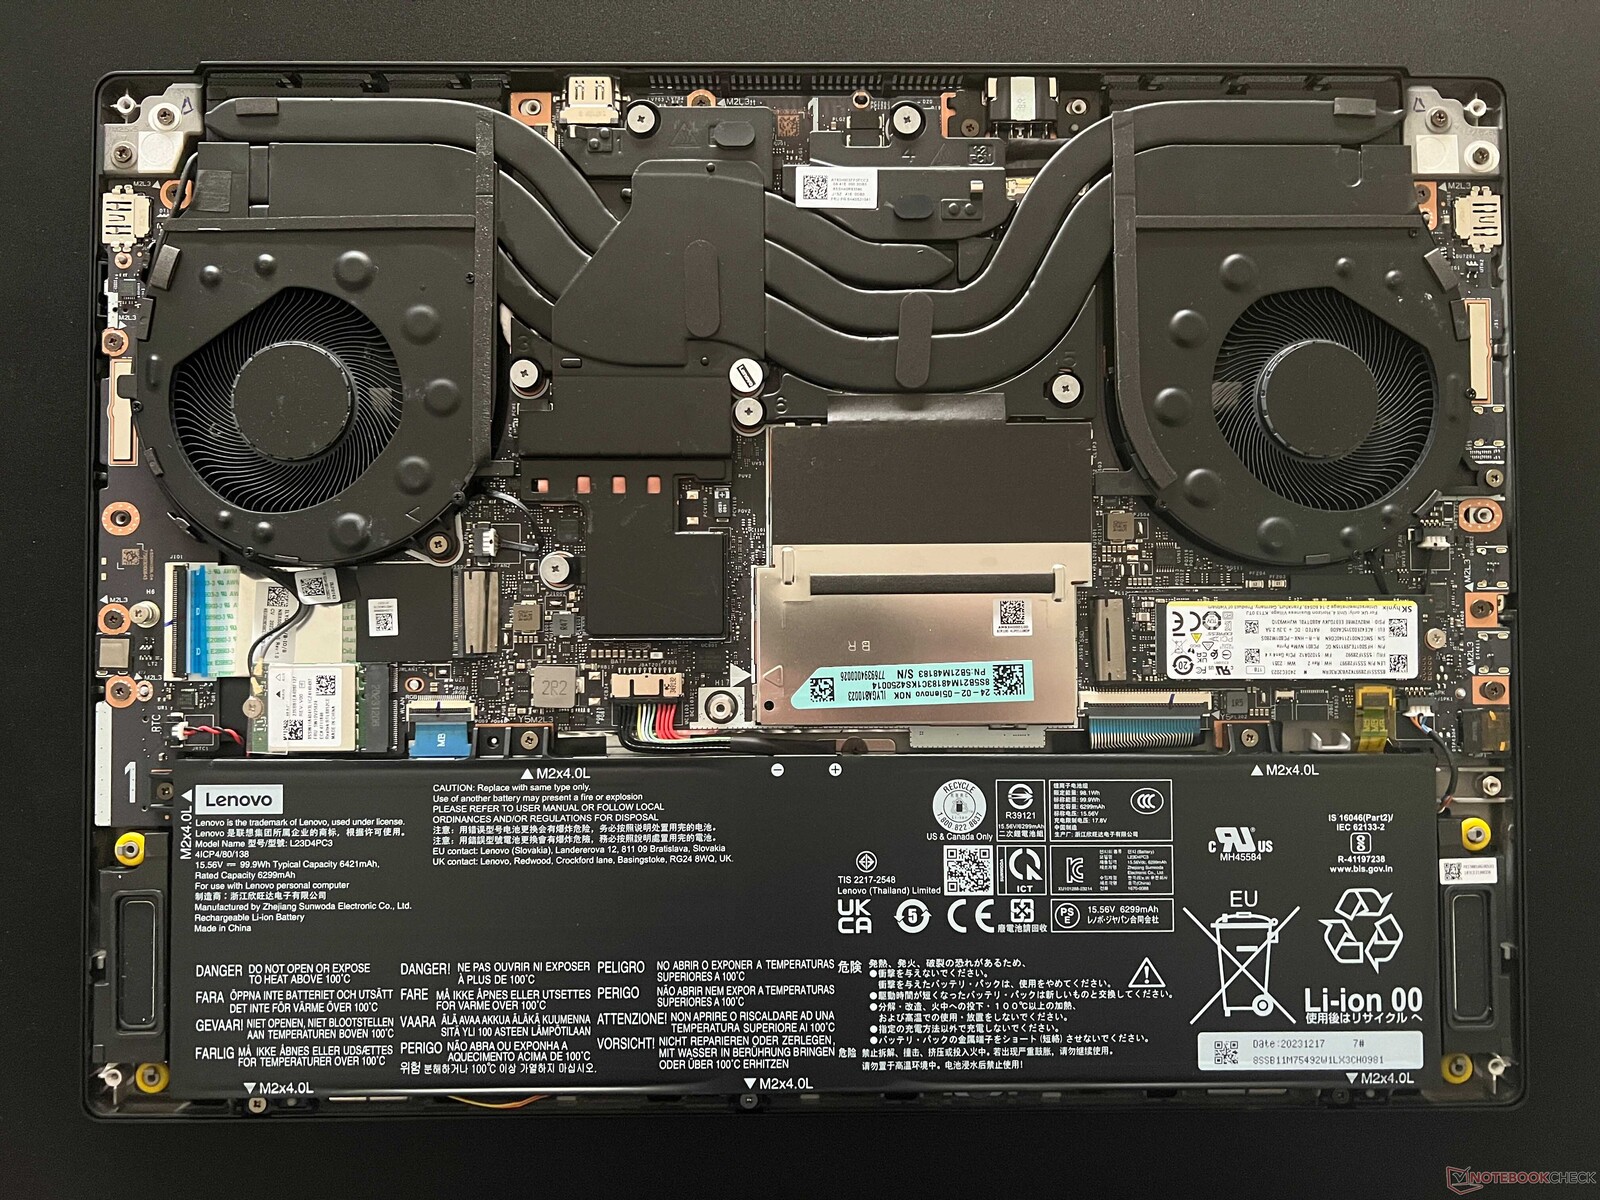
Legion 7 16 è uno dei dispositivi più sottili del nostro gruppo di confronto, tuttavia, in termini di peso e ingombro complessivo, non ci sono differenze enormi. L'alimentatore da 230 watt pesa 948 grammi.
Caratteristiche - Thunderbolt ma senza Ethernet
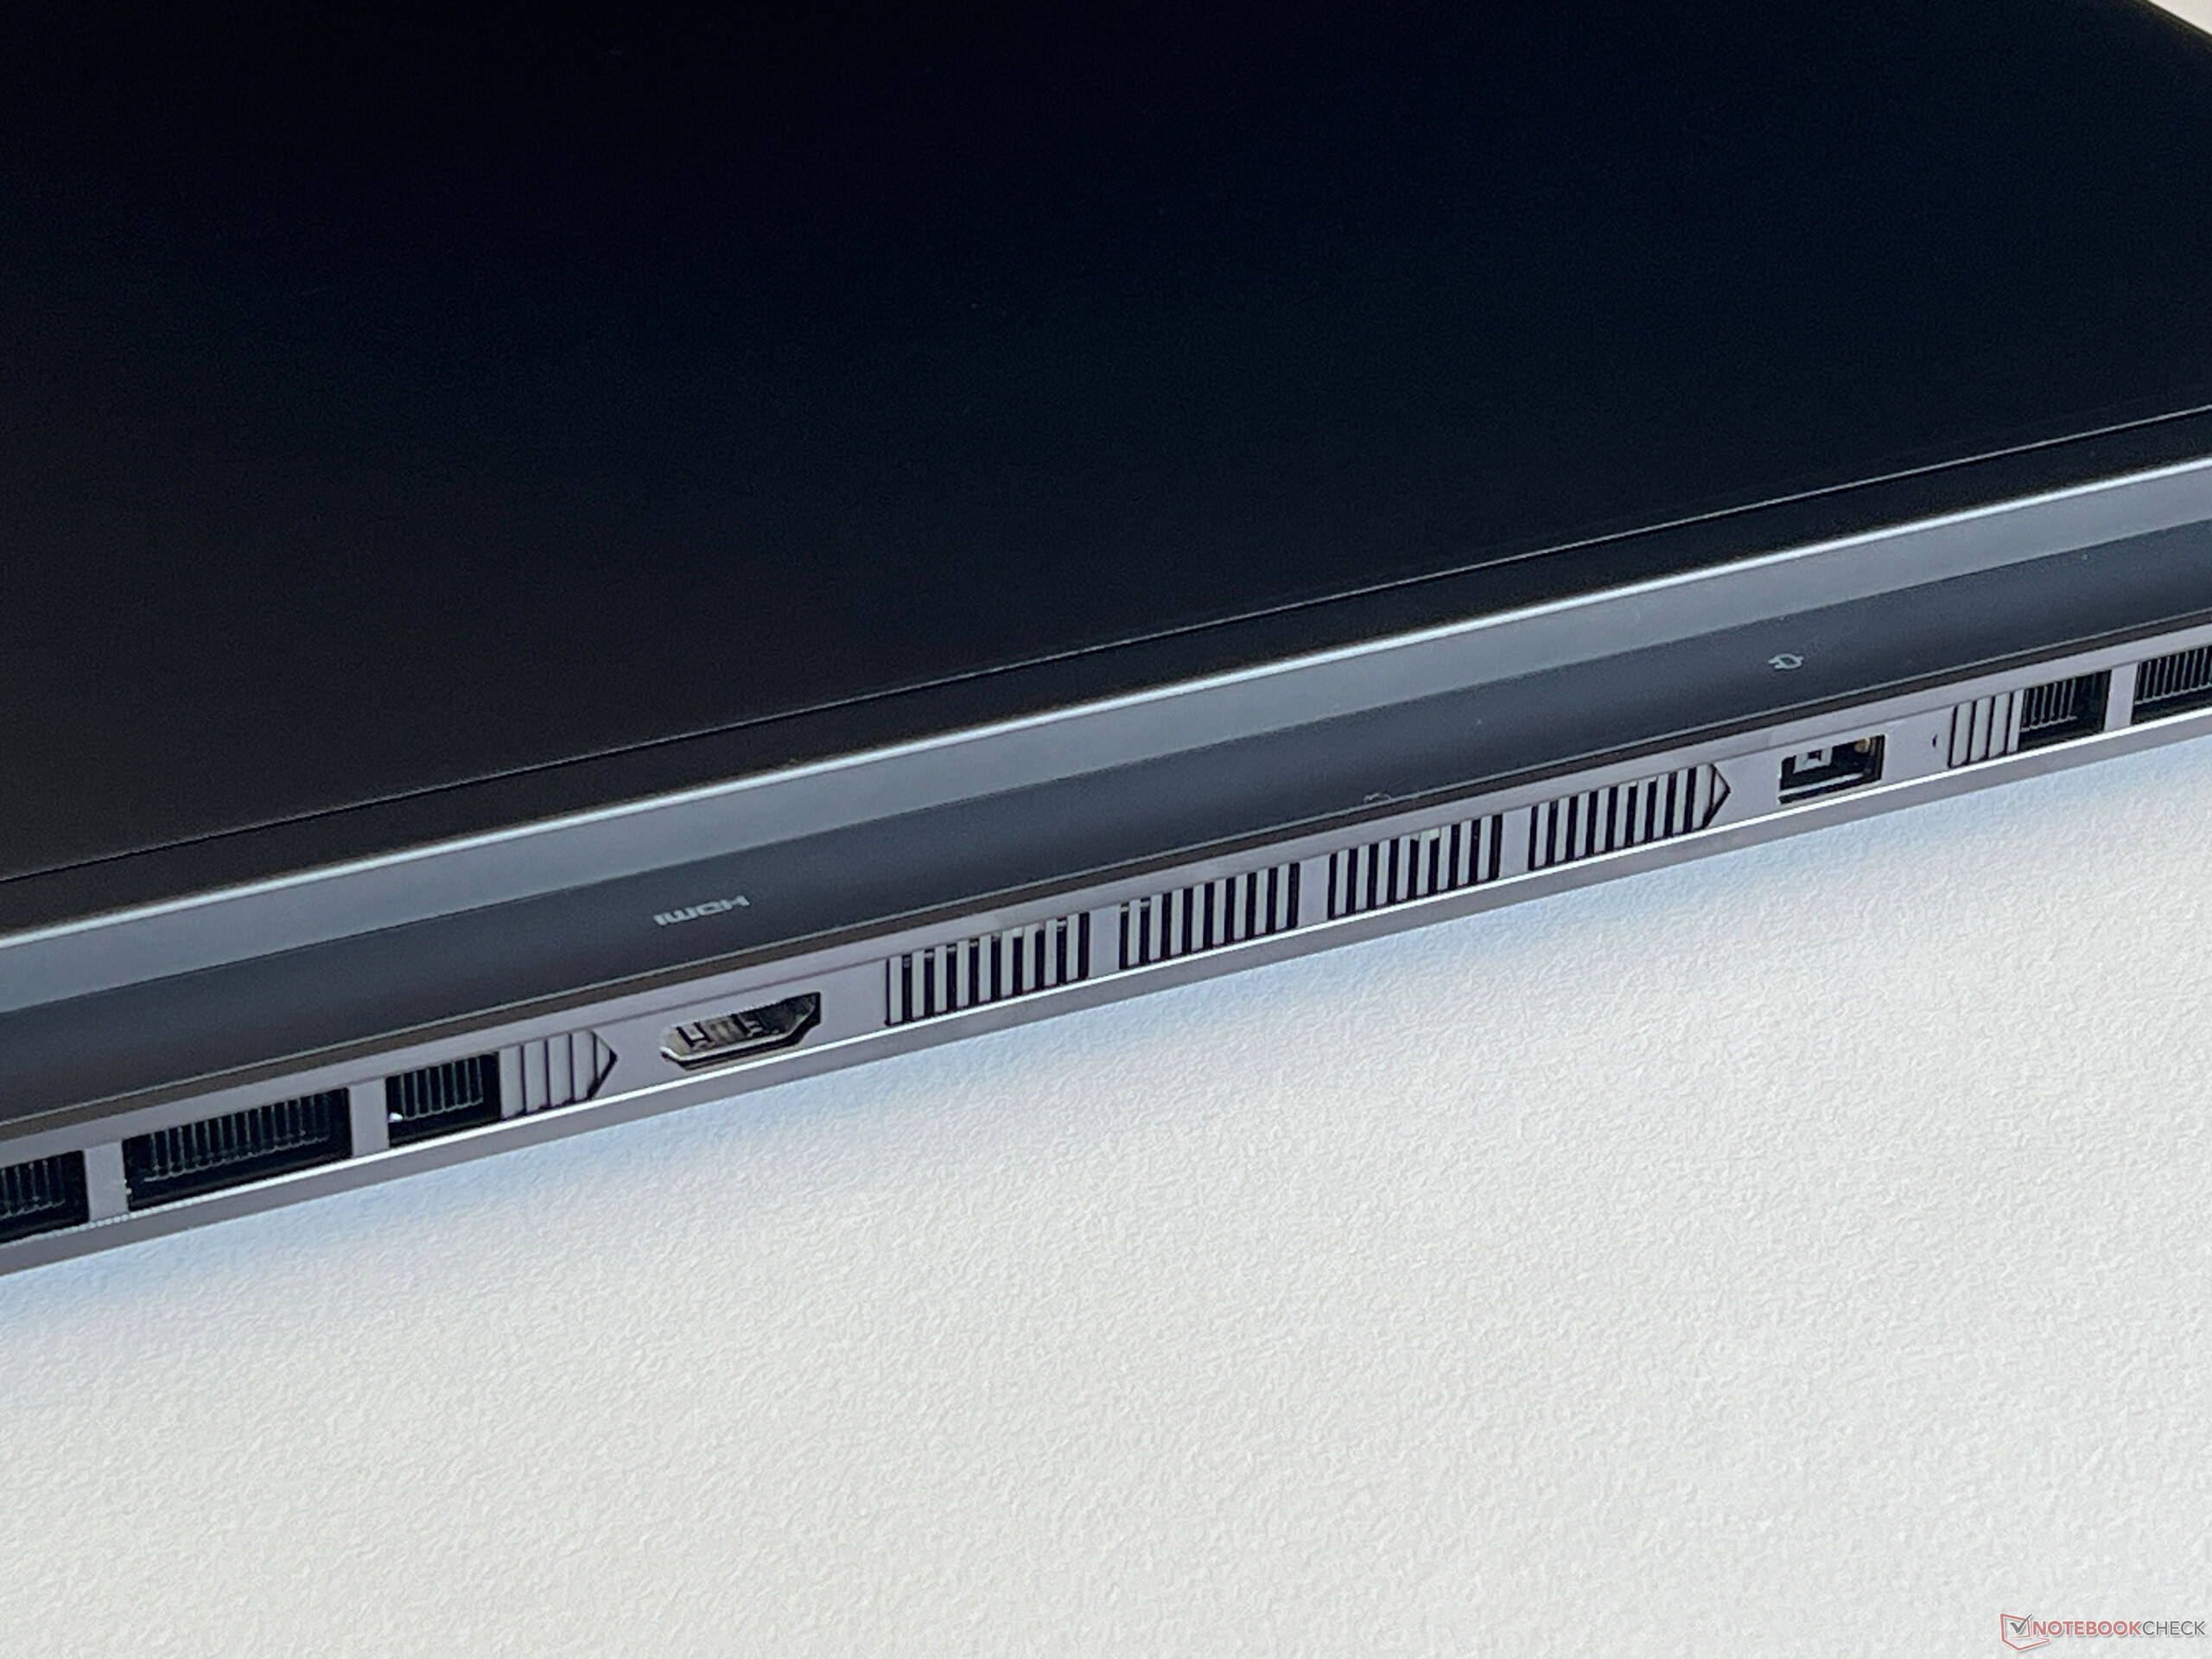
Le porte sono distribuite sia ai lati che sul retro del portatile. In quest'area, il normale Legion 7 fa un po' meglio del più costoso Legion Pro 7, perché le prese d'aria di raffreddamento si trovano solo sul retro. Tutti gli standard importanti sono qui, a parte la porta Ethernet, che non è ideale per i giocatori. La porta Thunderbolt è collegata tramite l'iGPU e questo significa che quando si collega un display esterno, la GPU Nvidia non deve essere sempre attiva. Tutte le altre uscite video funzionano direttamente tramite la dGPU.
Lettore di schede SD
Abbinato alla nostra scheda di riferimento (Angelbird AV Pro V60), il lettore di schede sul lato destro è in grado di raggiungere velocità di trasferimento medie di 75-90 MB/s. Tuttavia, le schede inserite sporgono chiaramente dal telaio.
| SD Card Reader | |
| average JPG Copy Test (av. of 3 runs) | |
| Aorus 16X 2024 (AV PRO microSD 128 GB V60) | |
| Media della classe Gaming (19 - 202, n=101, ultimi 2 anni) | |
| Lenovo Legion 7 16 IRX G9 (Angelbird AV Pro V60) | |
| Alienware m16 R2 (AV PRO microSD 128 GB V60) | |
| SCHENKER XMG CORE 16 (L23) | |
| maximum AS SSD Seq Read Test (1GB) | |
| Alienware m16 R2 (AV PRO microSD 128 GB V60) | |
| Aorus 16X 2024 (AV PRO microSD 128 GB V60) | |
| Media della classe Gaming (25.8 - 269, n=95, ultimi 2 anni) | |
| Lenovo Legion 7 16 IRX G9 (Angelbird AV Pro V60) | |
| SCHENKER XMG CORE 16 (L23) | |
Comunicazione
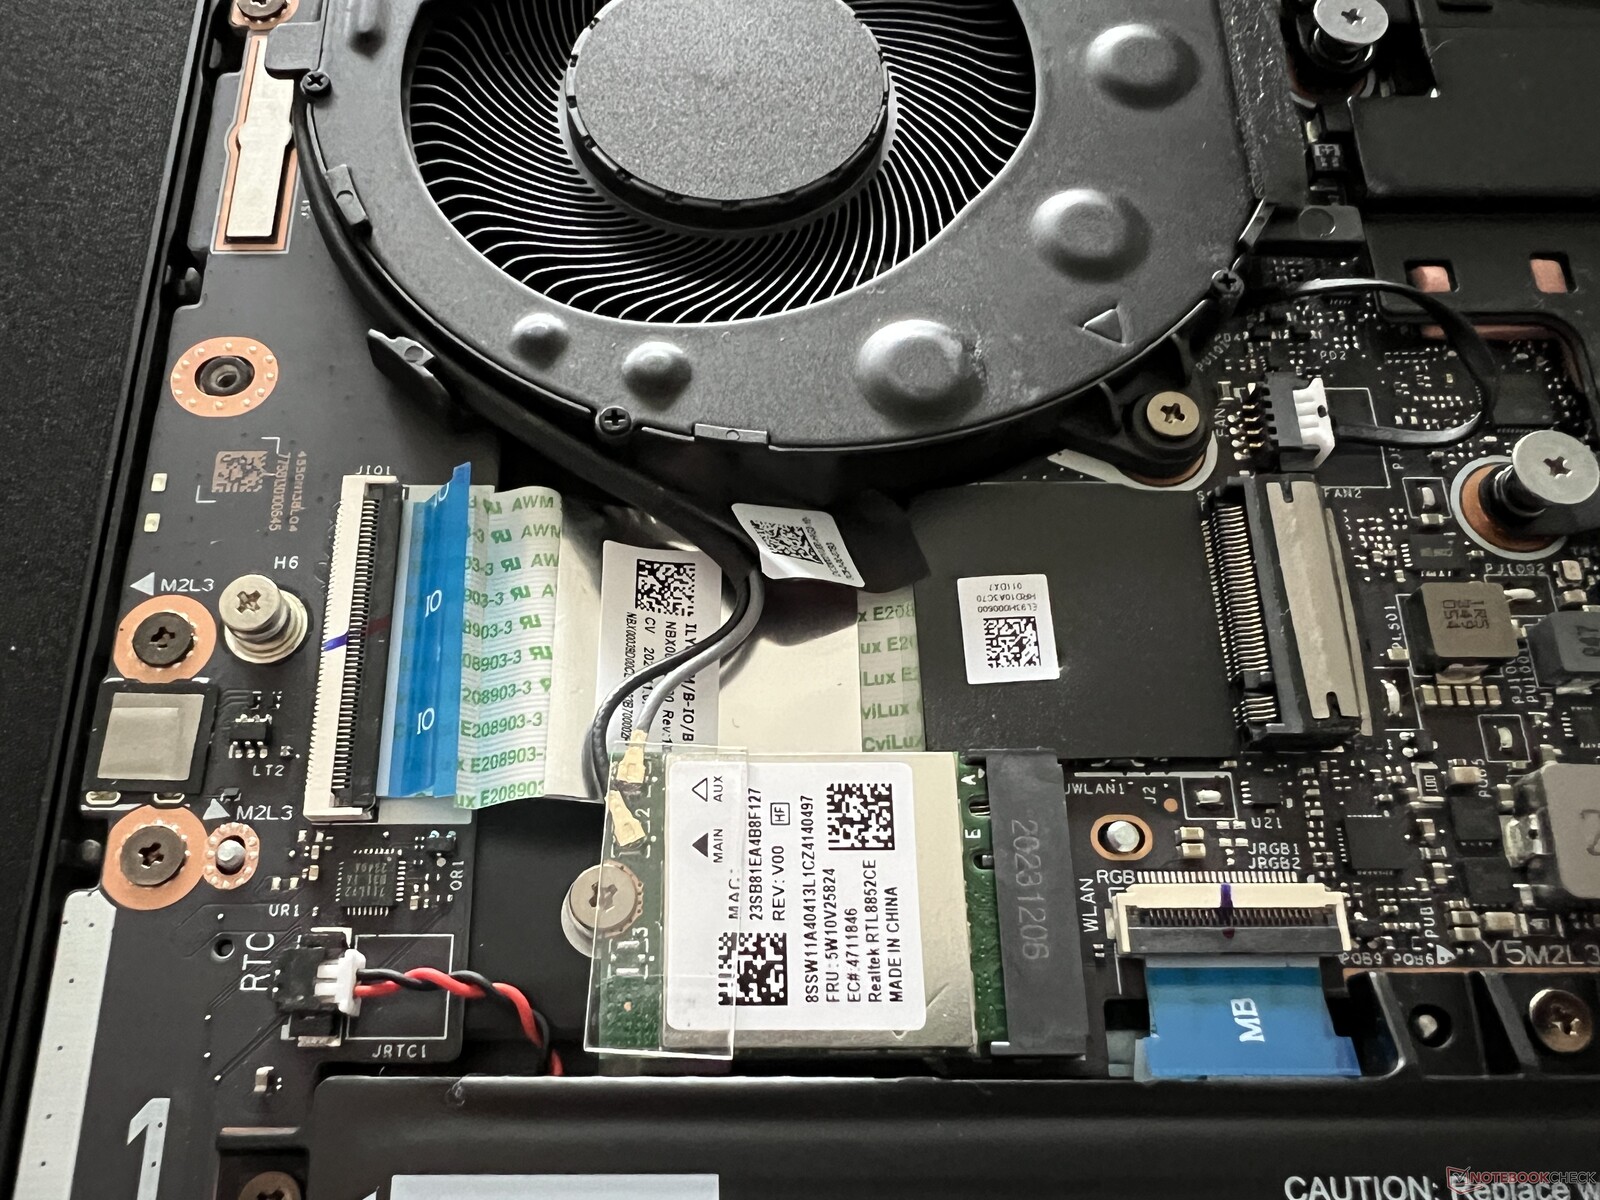
All'interno di Legion è installato un modulo Realtek Wi-Fi 6E. Si comporta bene e, in combinazione con il nostro router di riferimento Asus, ha gestito velocità di trasferimento elevate e stabili. Il Bluetooth 5.1 è supportato, ma il portatile non offre una porta Ethernet.
| Networking | |
| Lenovo Legion 7 16 IRX G9 | |
| iperf3 transmit AXE11000 |
|
| iperf3 receive AXE11000 |
|
| Lenovo Legion Pro 5 16IRX9 | |
| iperf3 transmit AXE11000 |
|
| iperf3 receive AXE11000 |
|
| iperf3 transmit AXE11000 6GHz |
|
| iperf3 receive AXE11000 6GHz |
|
| Aorus 16X 2024 | |
| iperf3 transmit AXE11000 |
|
| iperf3 receive AXE11000 |
|
| HP Omen Transcend 16-u1095ng | |
| iperf3 transmit AXE11000 |
|
| iperf3 receive AXE11000 |
|
| Alienware m16 R2 | |
| iperf3 transmit AXE11000 |
|
| iperf3 receive AXE11000 |
|
| iperf3 transmit AXE11000 6GHz |
|
| iperf3 receive AXE11000 6GHz |
|
| SCHENKER XMG CORE 16 (L23) | |
| iperf3 transmit AXE11000 |
|
| iperf3 receive AXE11000 |
|
| Lenovo Legion Pro 7 16IRX9H | |
| iperf3 transmit AXE11000 |
|
| iperf3 receive AXE11000 |
|
Webcam
La webcam da 1080p è alloggiata all'interno della cornice superiore dello schermo e offre un otturatore elettronico (l'interruttore si trova sul lato destro) ma, anche in condizioni di buona illuminazione, cattura solo immagini medie. La webcam non supporta Windows Studio Effects, a differenza degli attuali dispositivi Meteor Lake.


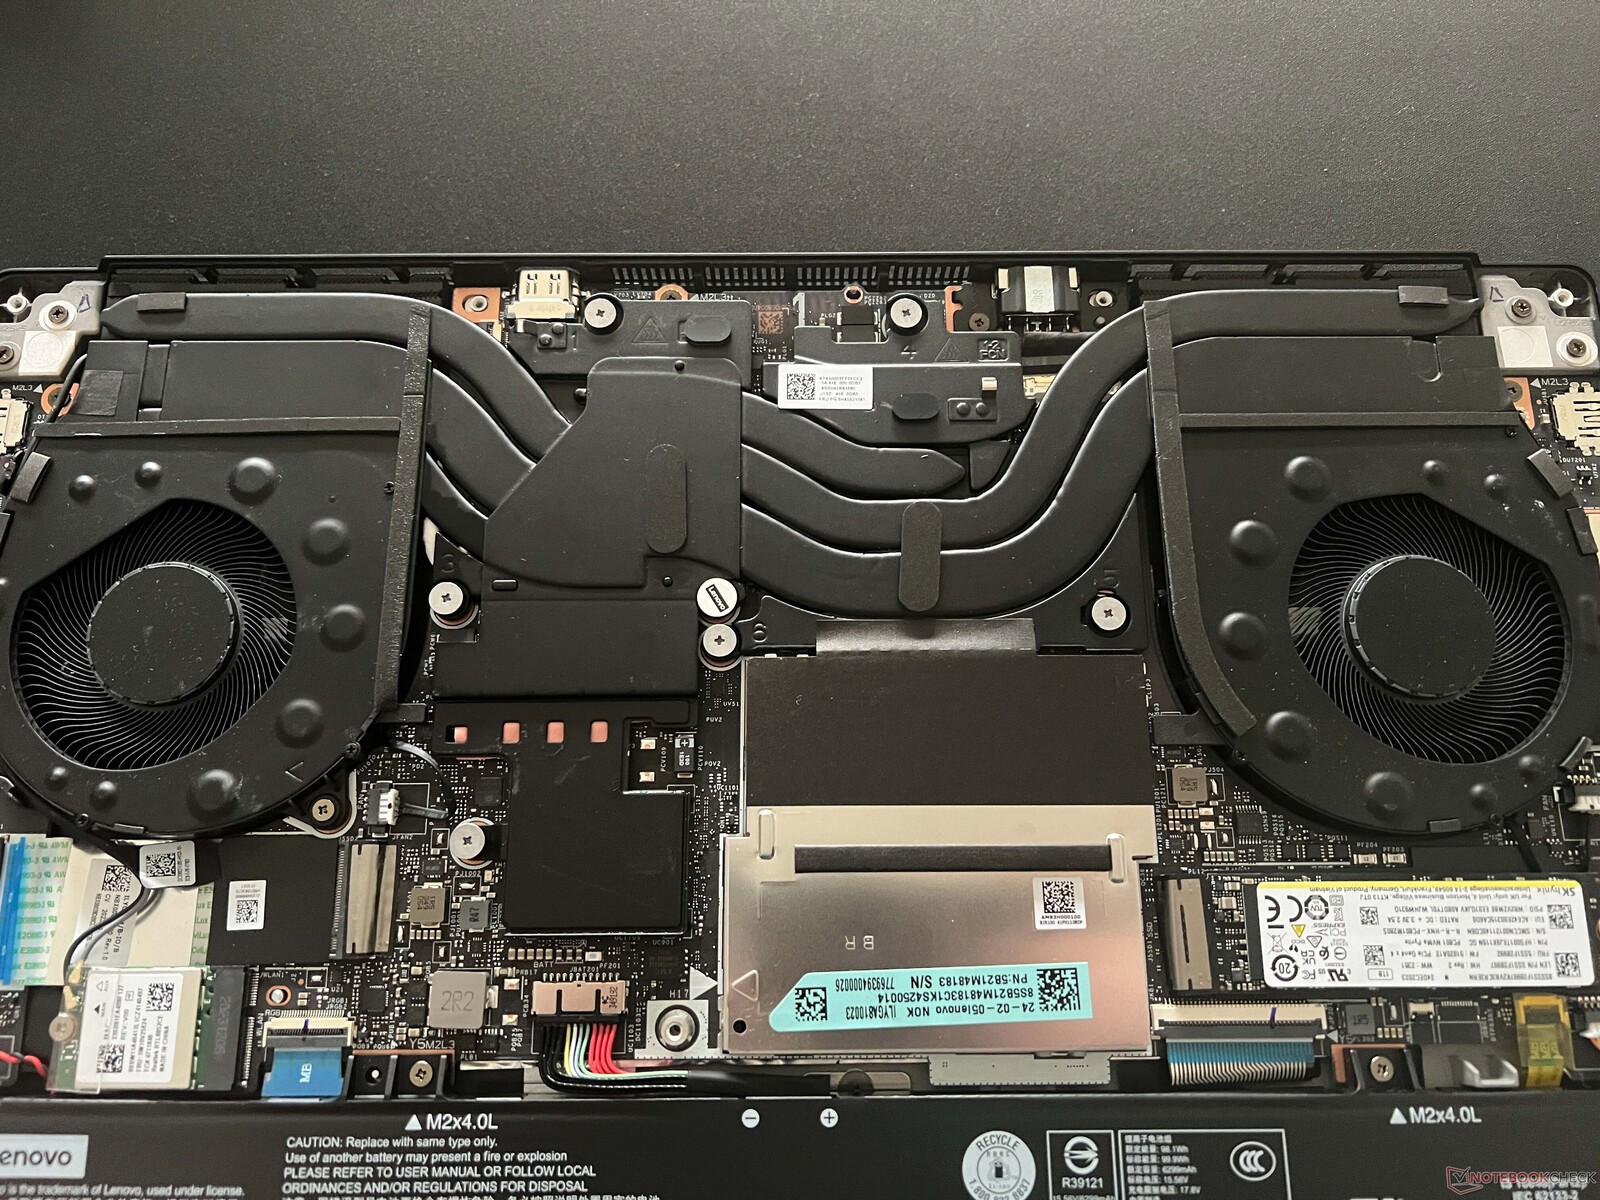
Manutenzione
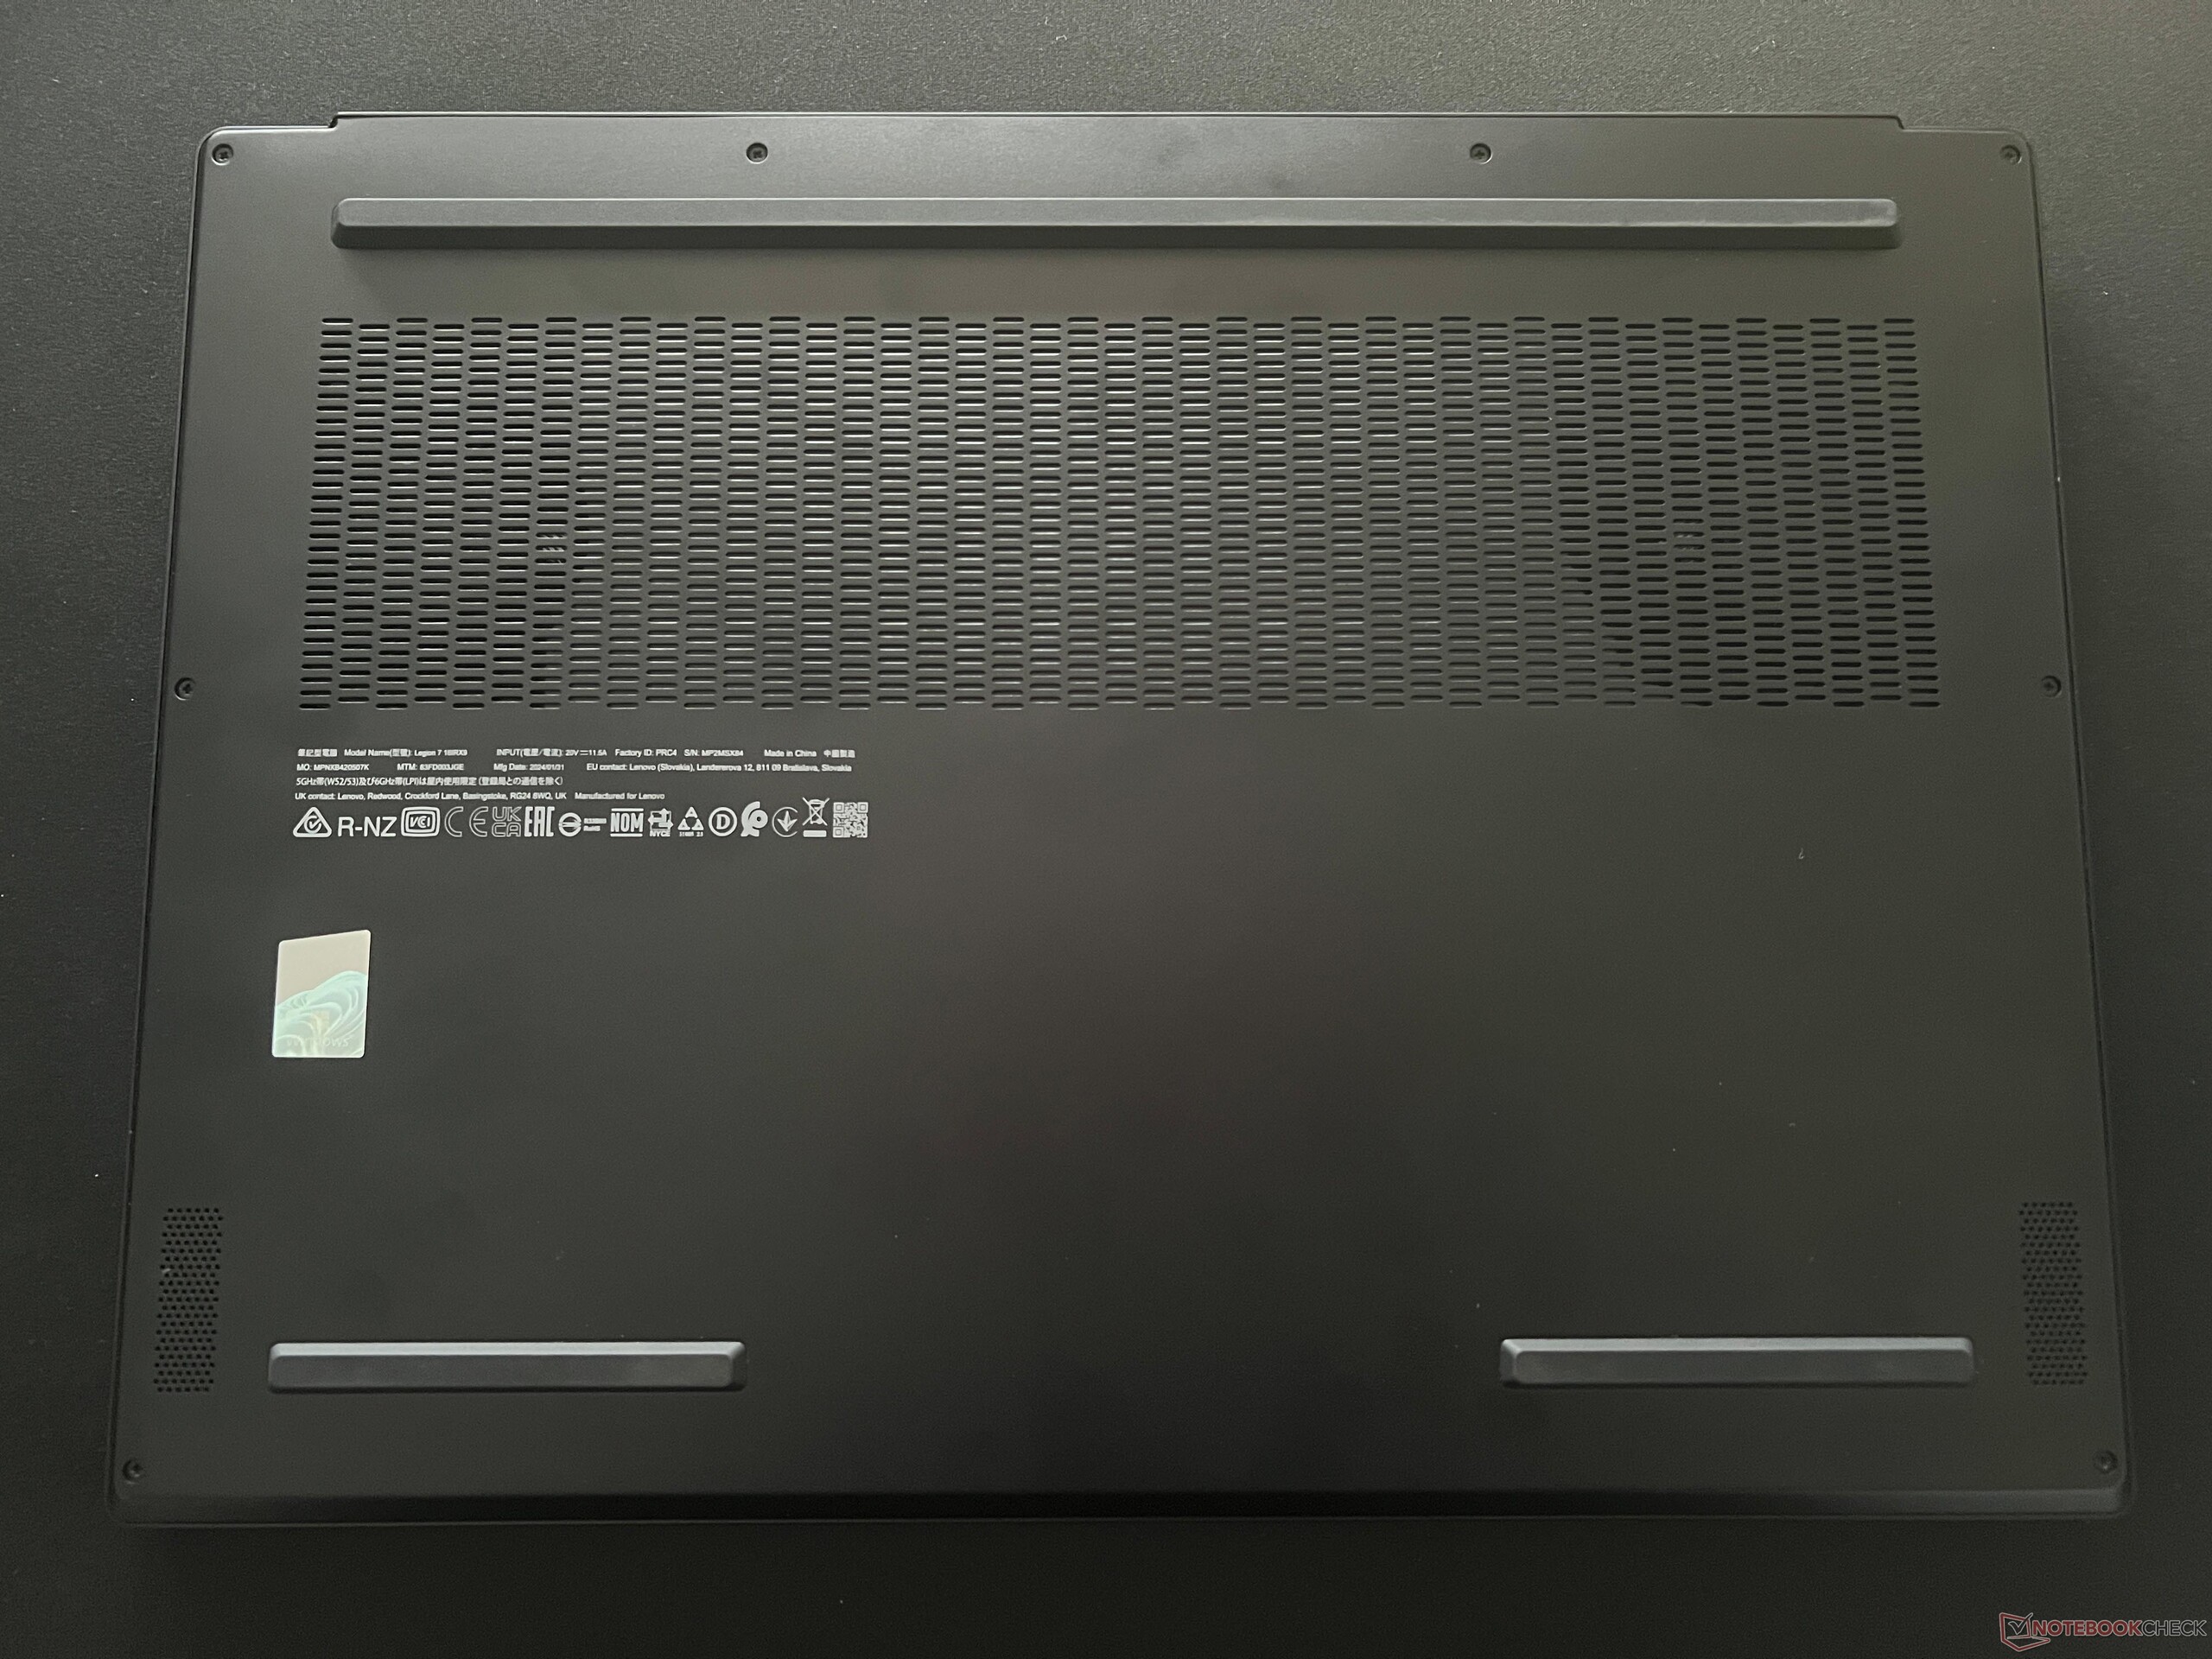
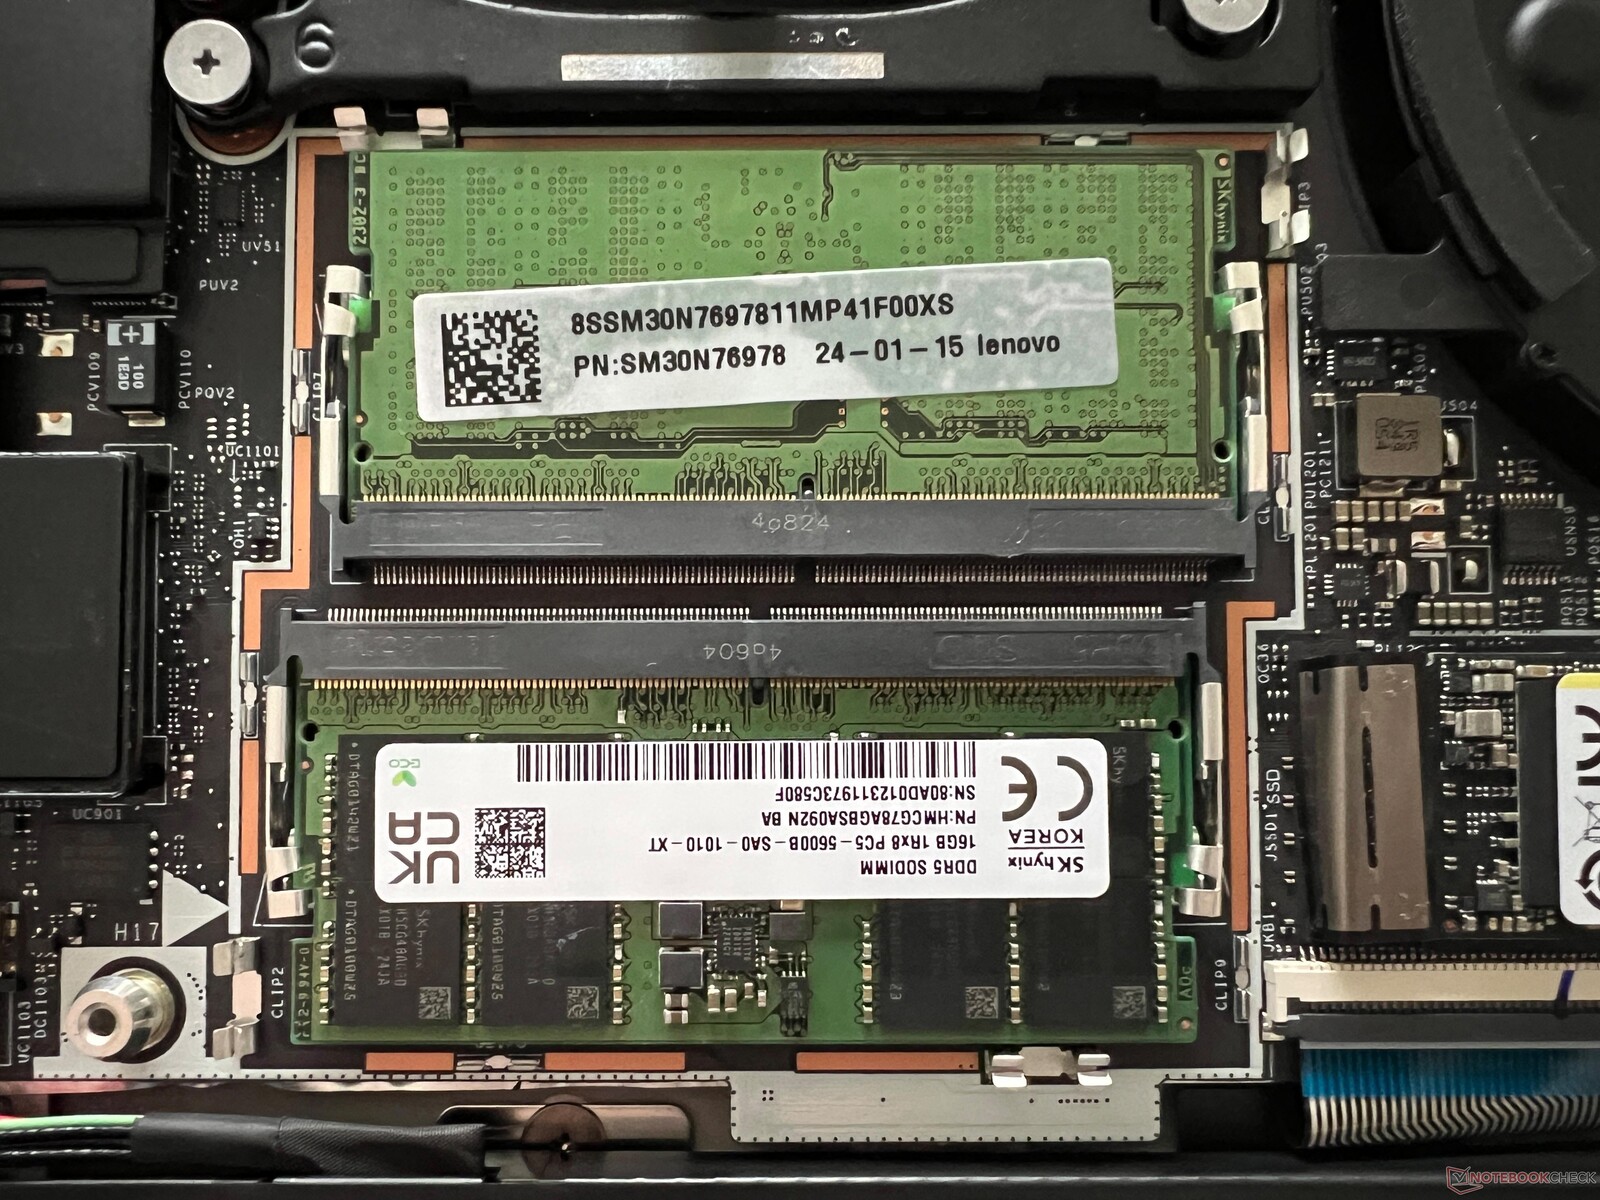
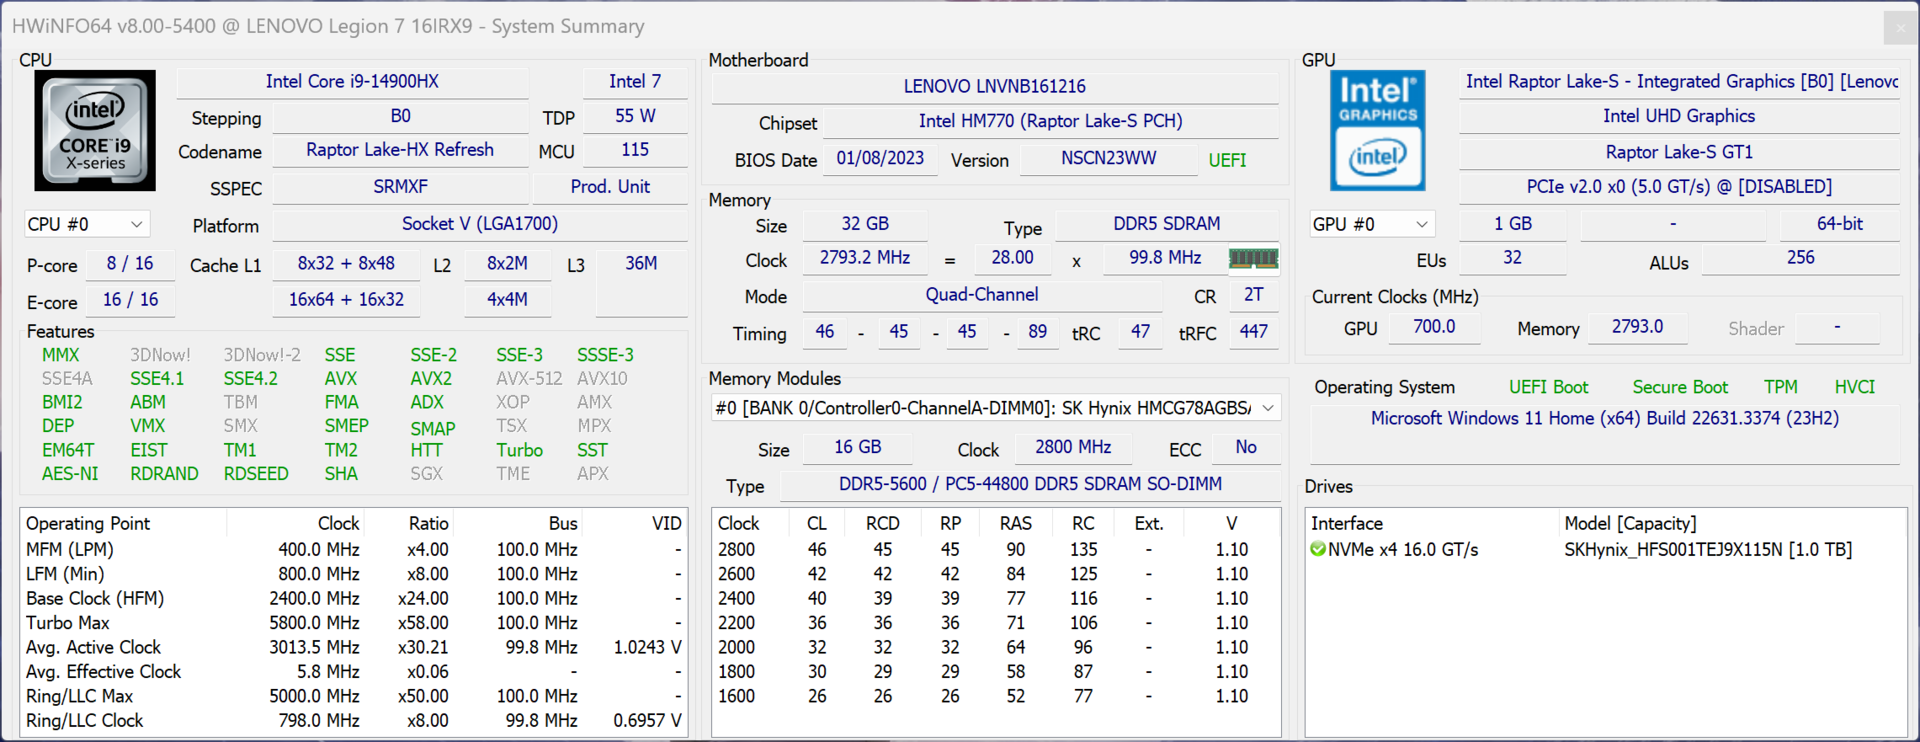
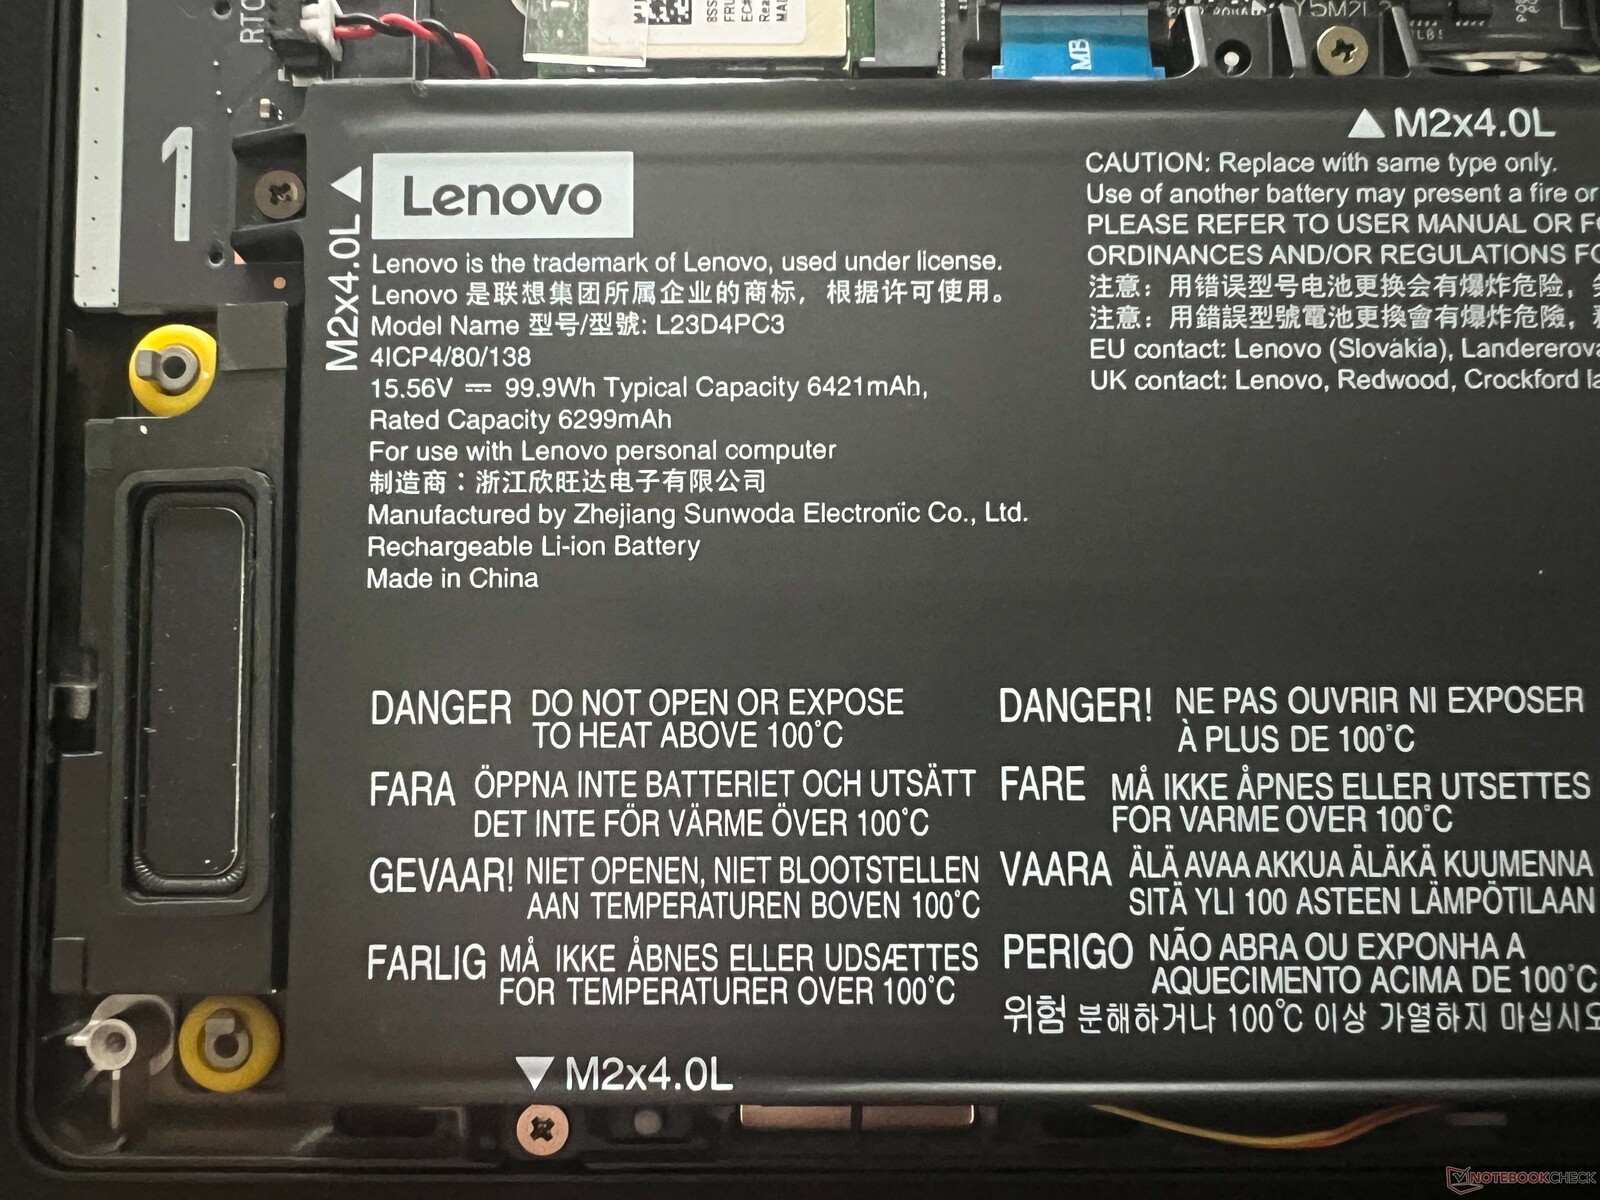
Il coperchio della base è fissato da normali viti a croce ed è molto facile da rimuovere. Oltre ai due moduli RAM, ci sono anche due slot M.2 2280, anche se l'accesso al secondo slot è un po' ostacolato dal cavo Wi-Fi. Allo stesso modo, sia il modulo Wi-Fi che la batteria possono essere sostituiti.
Dispositivi di input - Pad numerico e illuminazione dei singoli tasti
Lenovo ha dotato Legion 7 16 di una tastiera a membrana molto confortevole, completa di tastierino numerico dedicato e illuminazione individuale dei tasti. Nel complesso, la pressione dei tasti, precisa e piacevolmente silenziosa, non dà adito a lamentele. Anche i testi più lunghi possono essere digitati senza fatica. I tasti del tastierino numerico sono un po' più stretti, ma questo non comporta alcun problema nelle situazioni reali. I tasti freccia sono piacevolmente grandi e il lettore di impronte digitali è integrato nel pulsante di accensione.
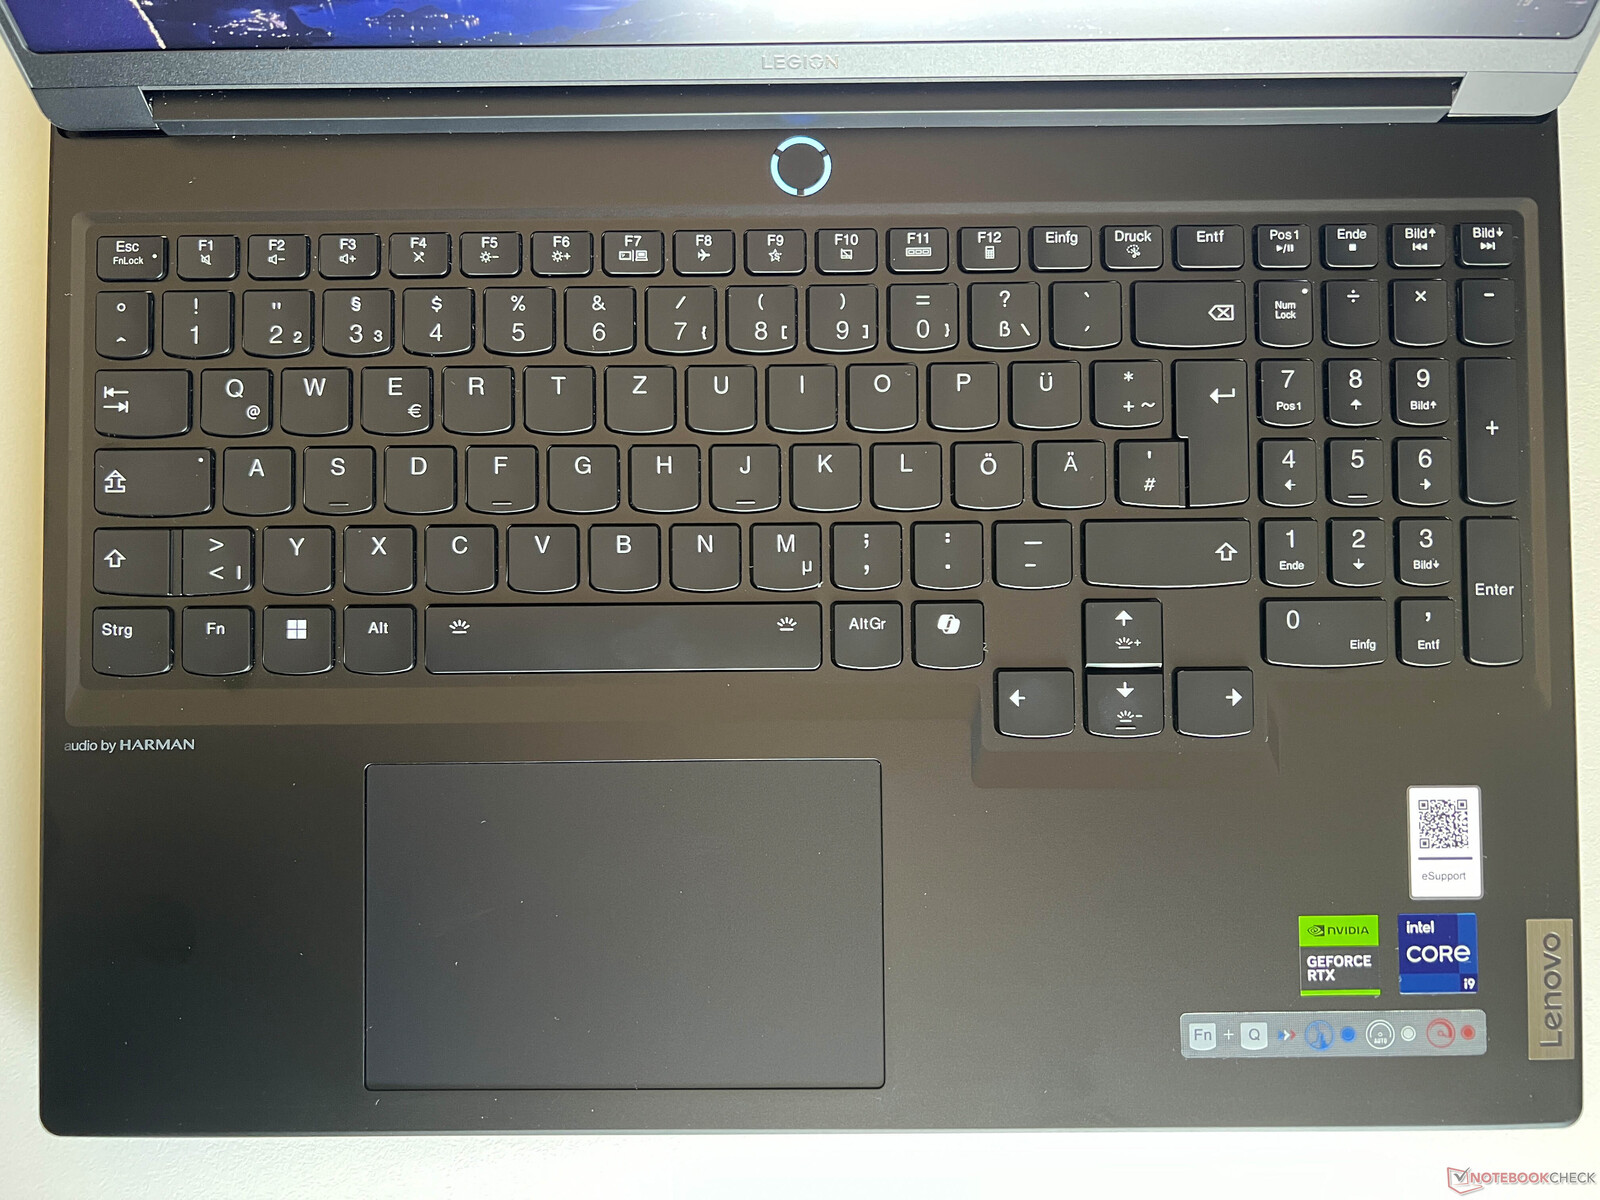
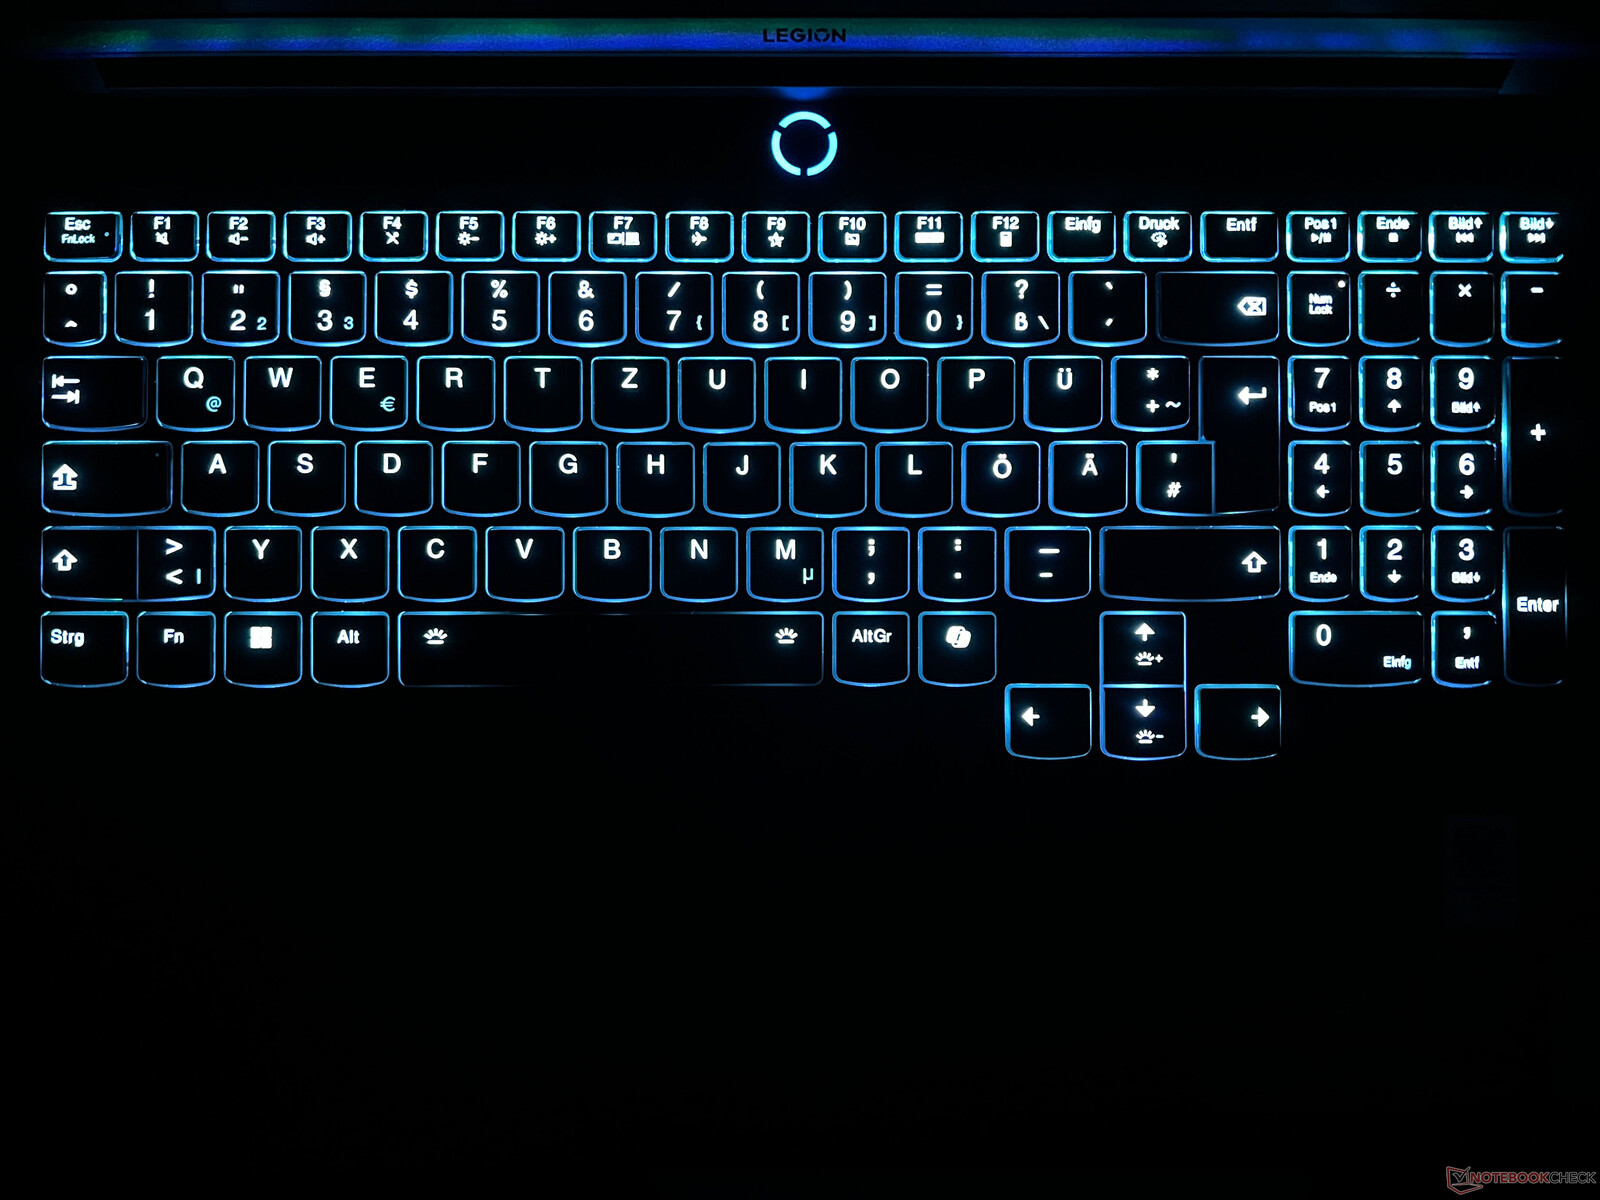
Il clickpad è posizionato leggermente a sinistra rispetto al centro e, con dimensioni di 12 x 7,5 cm, è ben proporzionato. Le azioni di scorrimento sono tradotte molto bene e l'area inferiore del pad può essere cliccata - anche se in modo piuttosto rumoroso. Per questo motivo, dovrebbe toccare il pad solo leggermente. È incluso anche lo Speed Mouse Mad M di Legion.
Display - Un pannello IPS da 3,2K, 165 Hz, e G-Sync
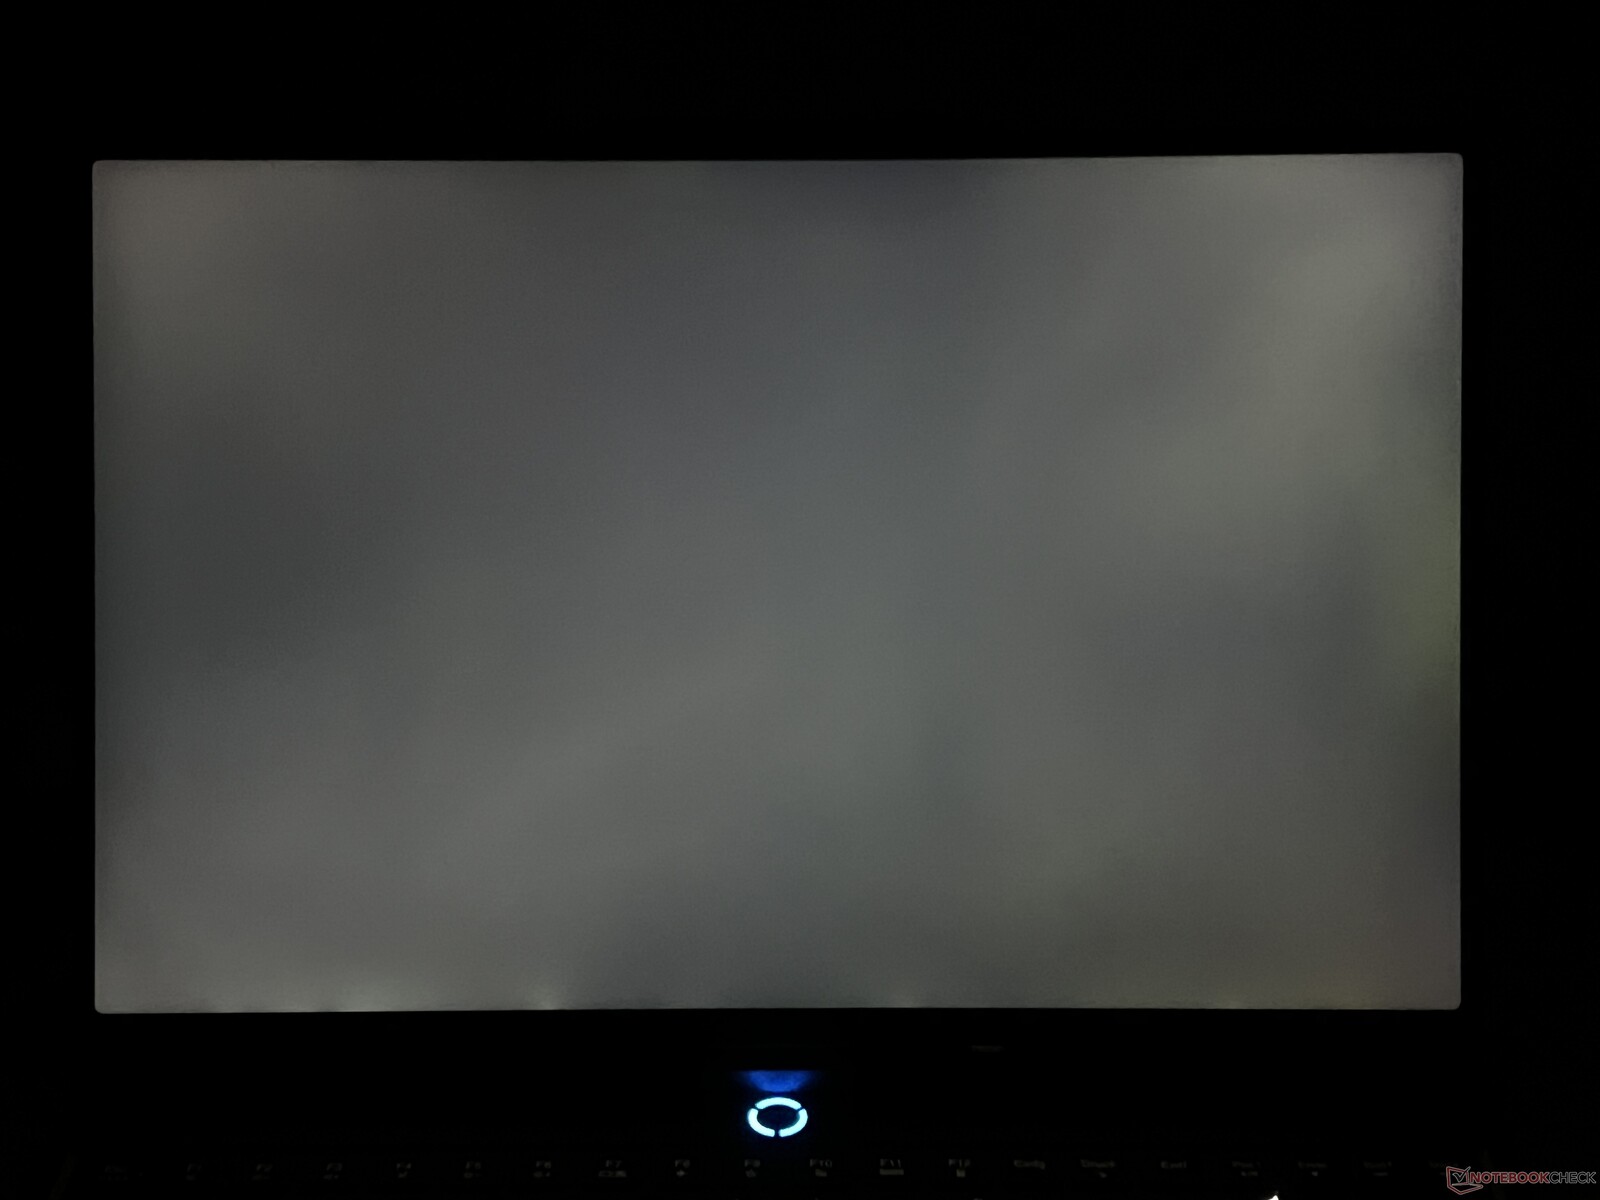
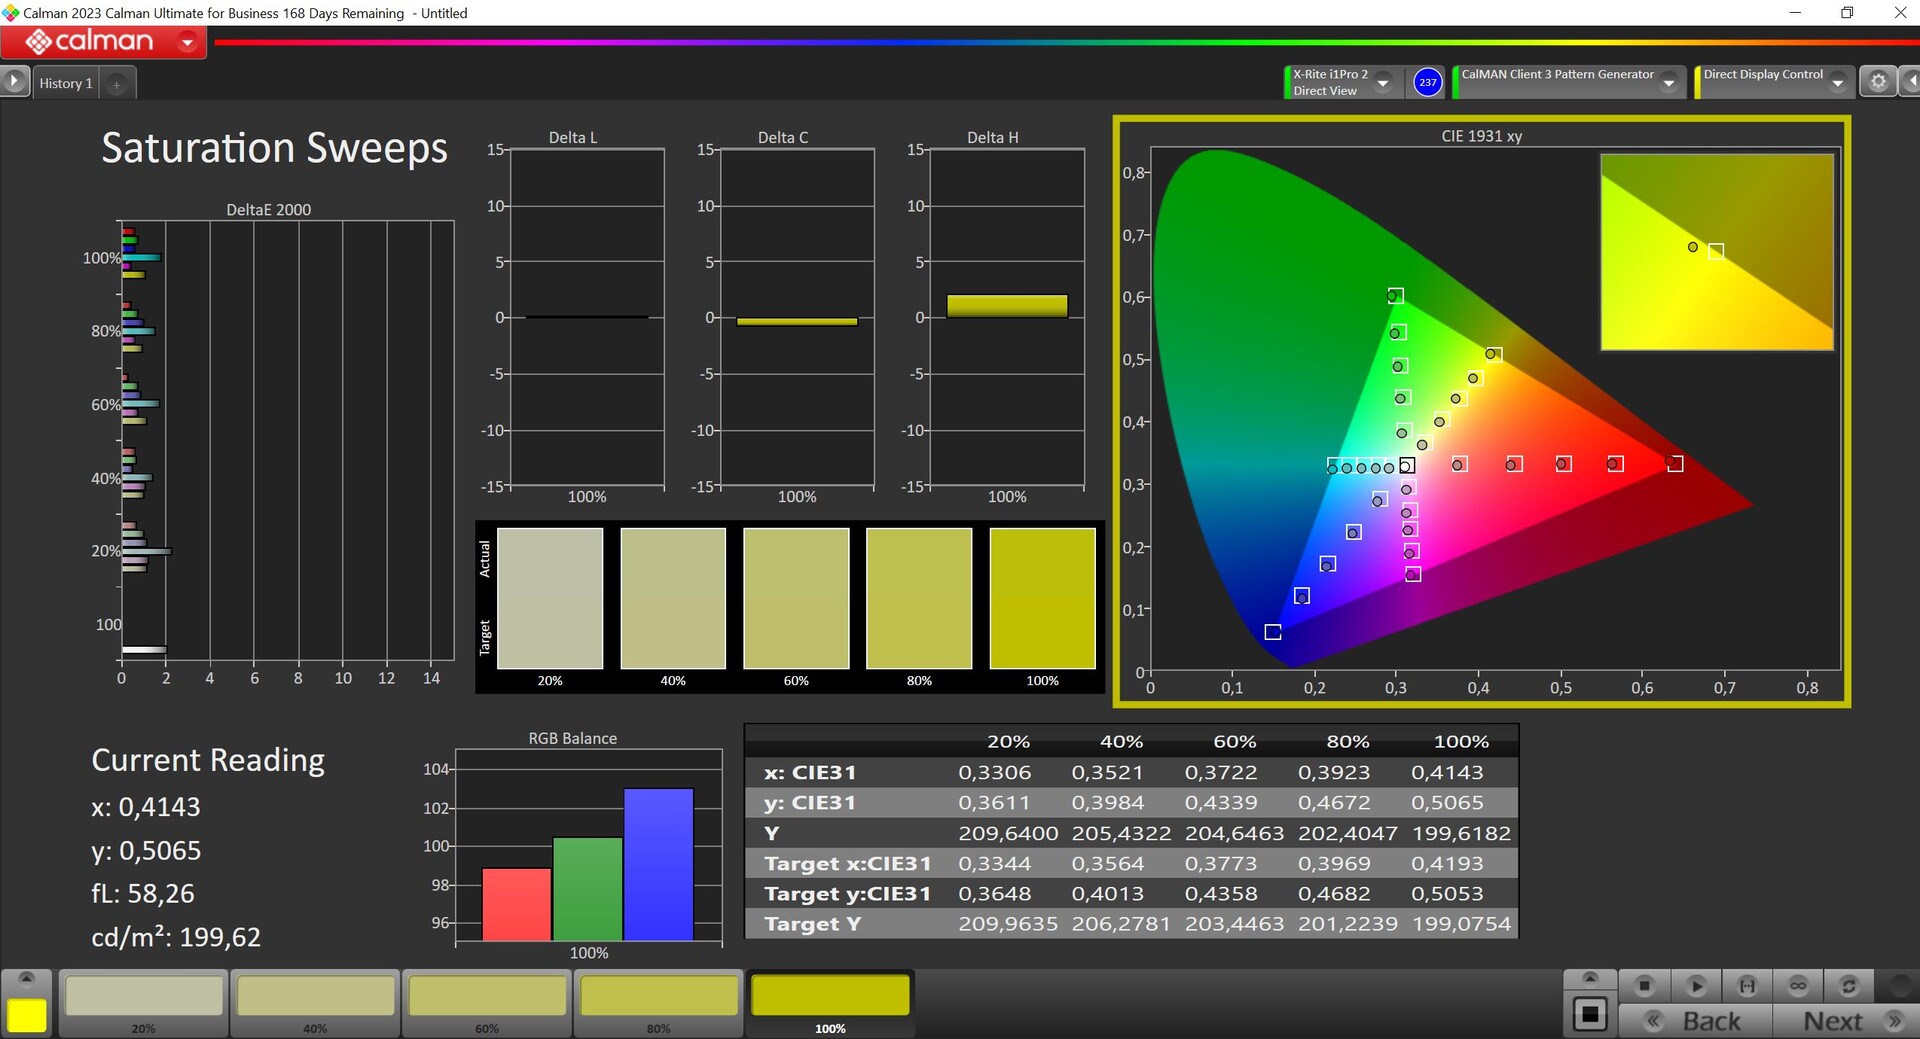
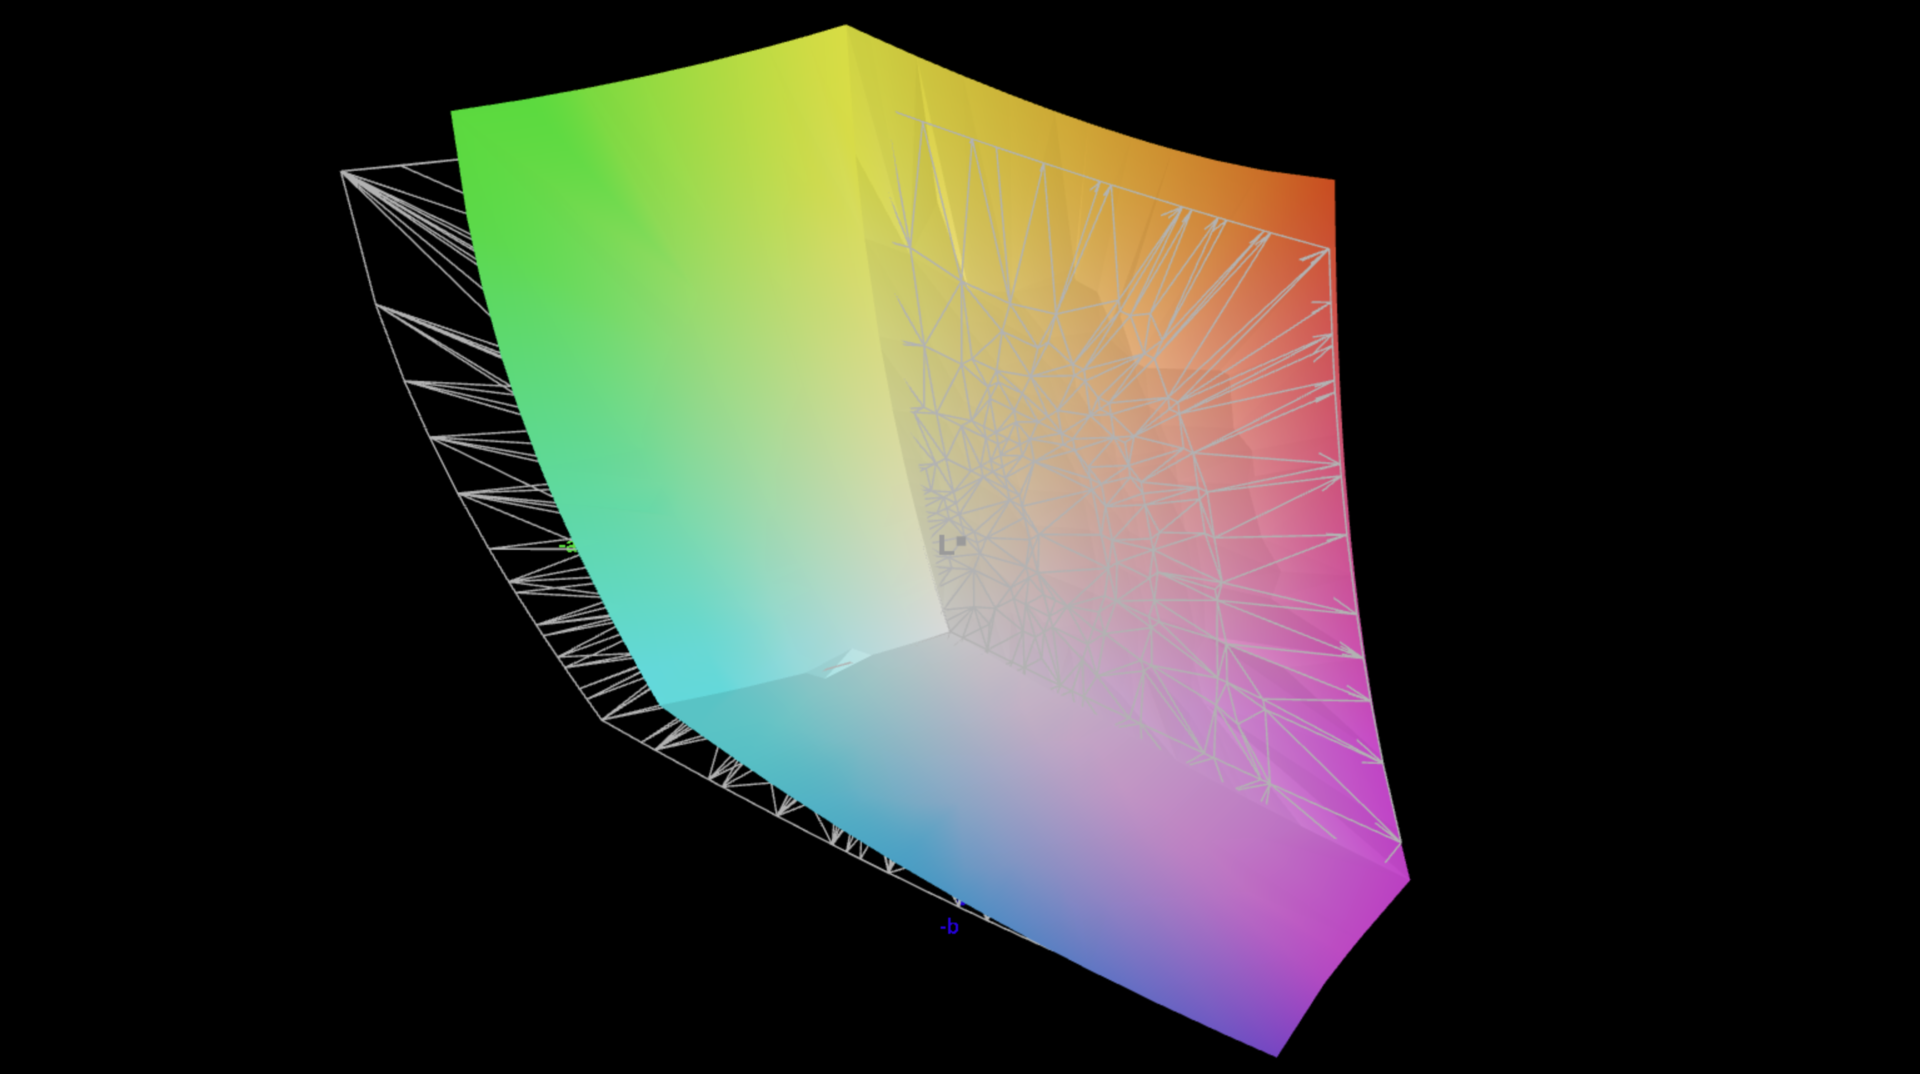
Il nostro dispositivo di recensione Legion 7 16 è dotato di un display IPS ad alta risoluzione, con rapporto di aspetto 16:10 (3.200 x 2.000 pixel). La qualità dell'immagine soggettiva è buona e i contenuti appaiono molto nitidi grazie all'alta risoluzione del display. Allo stesso modo, anche i colori sono vivaci, ma gli attuali pannelli OLED offrono immagini più vivaci. Quando si tratta di contenuti più luminosi, le superfici appaiono leggermente sgranate; tuttavia, Lenovo riesce per lo più a evitare questo problema utilizzando la modalità scura di Windows come standard. I movimenti sono molto fluidi grazie alla frequenza di aggiornamento di 165 Hz e i tempi di risposta sono rapidi. Lo sfarfallio PWM non viene utilizzato.
La luminosità media si attesta intorno ai 400 cd/m², ma, con 0,43 cd/m², il valore del nero è piuttosto alto e spiega perché il rapporto di contrasto massimo è appena inferiore a 1.000:1. Inoltre, alla massima luminosità, il valore del nero è molto basso. Inoltre, alla massima luminosità e con contenuti scuri, si nota un visibile light bleed.
| |||||||||||||||||||||||||
Distribuzione della luminosità: 89 %
Al centro con la batteria: 412 cd/m²
Contrasto: 958:1 (Nero: 0.43 cd/m²)
ΔE Color 0.9 | 0.5-29.43 Ø5, calibrated: 0.6
ΔE Greyscale 1.4 | 0.57-98 Ø5.3
87.2% AdobeRGB 1998 (Argyll 2.2.0 3D)
100% sRGB (Argyll 2.2.0 3D)
95% Display P3 (Argyll 2.2.0 3D)
Gamma: 2.23
| Lenovo Legion 7 16 IRX G9 MNG007ZA1-2, IPS, 3200x2000, 16.00 | Lenovo Legion Pro 7 16IRX9H BOE CQ NE16QDM-NZB, IPS, 2560x1600, 16.00 | Lenovo Legion Pro 5 16IRX9 BOE NE160QDM-NYC, IPS, 2560x1600, 16.00 | Aorus 16X 2024 BOE CQ NE160QDM-NY1, IPS, 2560x1600, 16.00 | HP Omen Transcend 16-u1095ng ATNA60DL02-0 (SDC41A4), OLED, 2560x1600, 16.00 | Alienware m16 R2 BOE NE16NYH, IPS, 2560x1600, 16.00 | SCHENKER XMG CORE 16 (L23) BOE0AF0 (), IPS, 2560x1600, 16.00 | |
|---|---|---|---|---|---|---|---|
| Display | 1% | -16% | -18% | 5% | -14% | -16% | |
| Display P3 Coverage | 95 | 98.5 4% | 69.3 -27% | 67.2 -29% | 99.8 5% | 71 -25% | 68.3 -28% |
| sRGB Coverage | 100 | 99.9 0% | 99.4 -1% | 96.7 -3% | 100 0% | 100 0% | 98.6 -1% |
| AdobeRGB 1998 Coverage | 87.2 | 86.7 -1% | 70.1 -20% | 69.3 -21% | 97 11% | 71.4 -18% | 69.6 -20% |
| Response Times | 16% | -4% | 37% | 98% | 20% | 8% | |
| Response Time Grey 50% / Grey 80% * | 14.4 ? | 12.6 ? 12% | 11.9 ? 17% | 7.5 ? 48% | 0.2 ? 99% | 5.7 ? 60% | 13.2 ? 8% |
| Response Time Black / White * | 7.2 ? | 5.8 ? 19% | 8.9 ? -24% | 5.4 ? 25% | 0.2 ? 97% | 8.7 ? -21% | 6.6 ? 8% |
| PWM Frequency | 120 ? | ||||||
| Screen | 3% | -11% | -58% | 133% | -26% | -69% | |
| Brightness middle | 412 | 487 18% | 384 -7% | 542 32% | 390 -5% | 345.8 -16% | 376 -9% |
| Brightness | 396 | 460 16% | 366 -8% | 504 27% | 392 -1% | 337 -15% | 358 -10% |
| Brightness Distribution | 89 | 88 -1% | 91 2% | 86 -3% | 98 10% | 87 -2% | 88 -1% |
| Black Level * | 0.43 | 0.42 2% | 0.35 19% | 0.45 -5% | 0.02 95% | 0.3 30% | 0.33 23% |
| Contrast | 958 | 1160 21% | 1097 15% | 1204 26% | 19500 1935% | 1153 20% | 1139 19% |
| Colorchecker dE 2000 * | 0.9 | 1.12 -24% | 0.97 -8% | 2.73 -203% | 1.94 -116% | 1.99 -121% | 2.74 -204% |
| Colorchecker dE 2000 max. * | 2 | 2.26 -13% | 3.57 -79% | 5.29 -165% | 4.26 -113% | 3.52 -76% | 6.78 -239% |
| Colorchecker dE 2000 calibrated * | 0.6 | 0.54 10% | 0.77 -28% | 1.32 -120% | 4.21 -602% | 0.62 -3% | 0.88 -47% |
| Greyscale dE 2000 * | 1.4 | 1.4 -0% | 1.5 -7% | 2.9 -107% | 1.5 -7% | 2.1 -50% | 3.57 -155% |
| Gamma | 2.23 99% | 2.242 98% | 2.24 98% | 2.192 100% | 2.221 99% | 2.32 95% | 2.4 92% |
| CCT | 6731 97% | 6809 95% | 6709 97% | 6173 105% | 6395 102% | 6369 102% | 7246 90% |
| Media totale (Programma / Settaggio) | 7% /
5% | -10% /
-11% | -13% /
-36% | 79% /
101% | -7% /
-17% | -26% /
-47% |
* ... Meglio usare valori piccoli
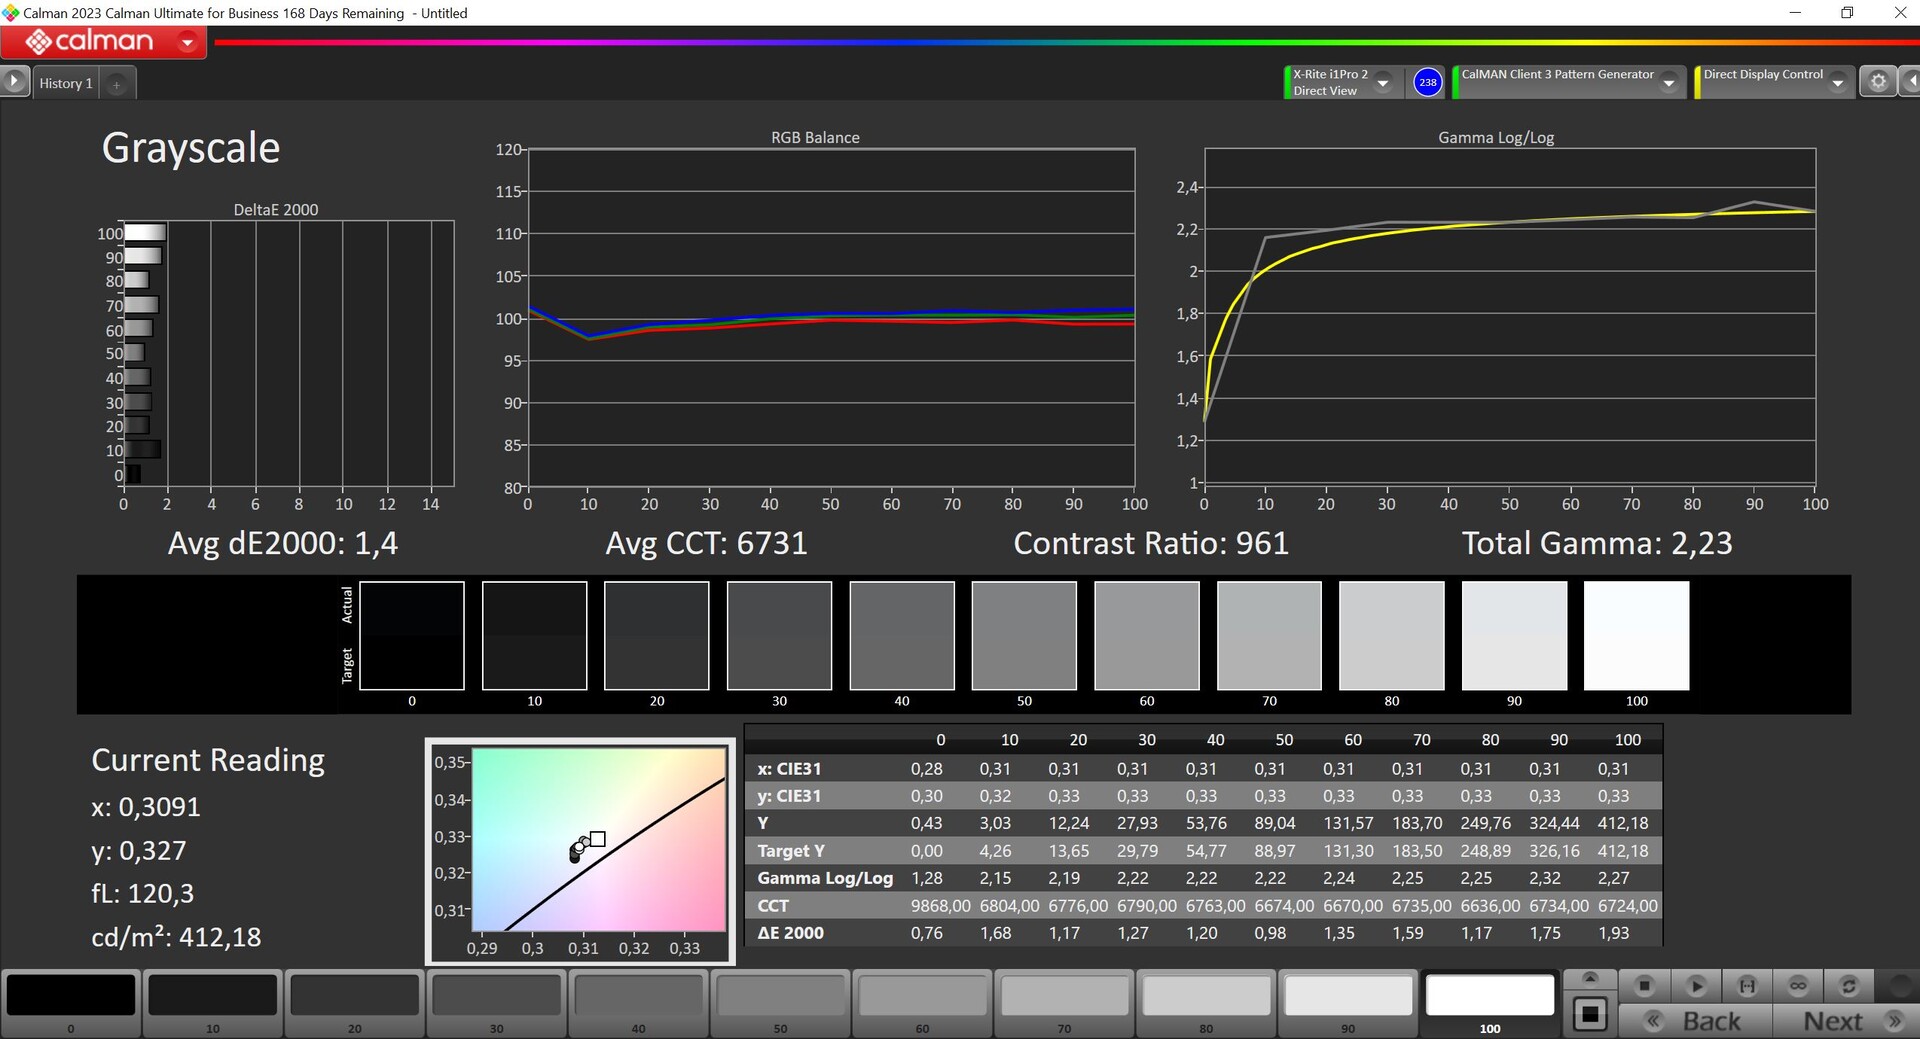
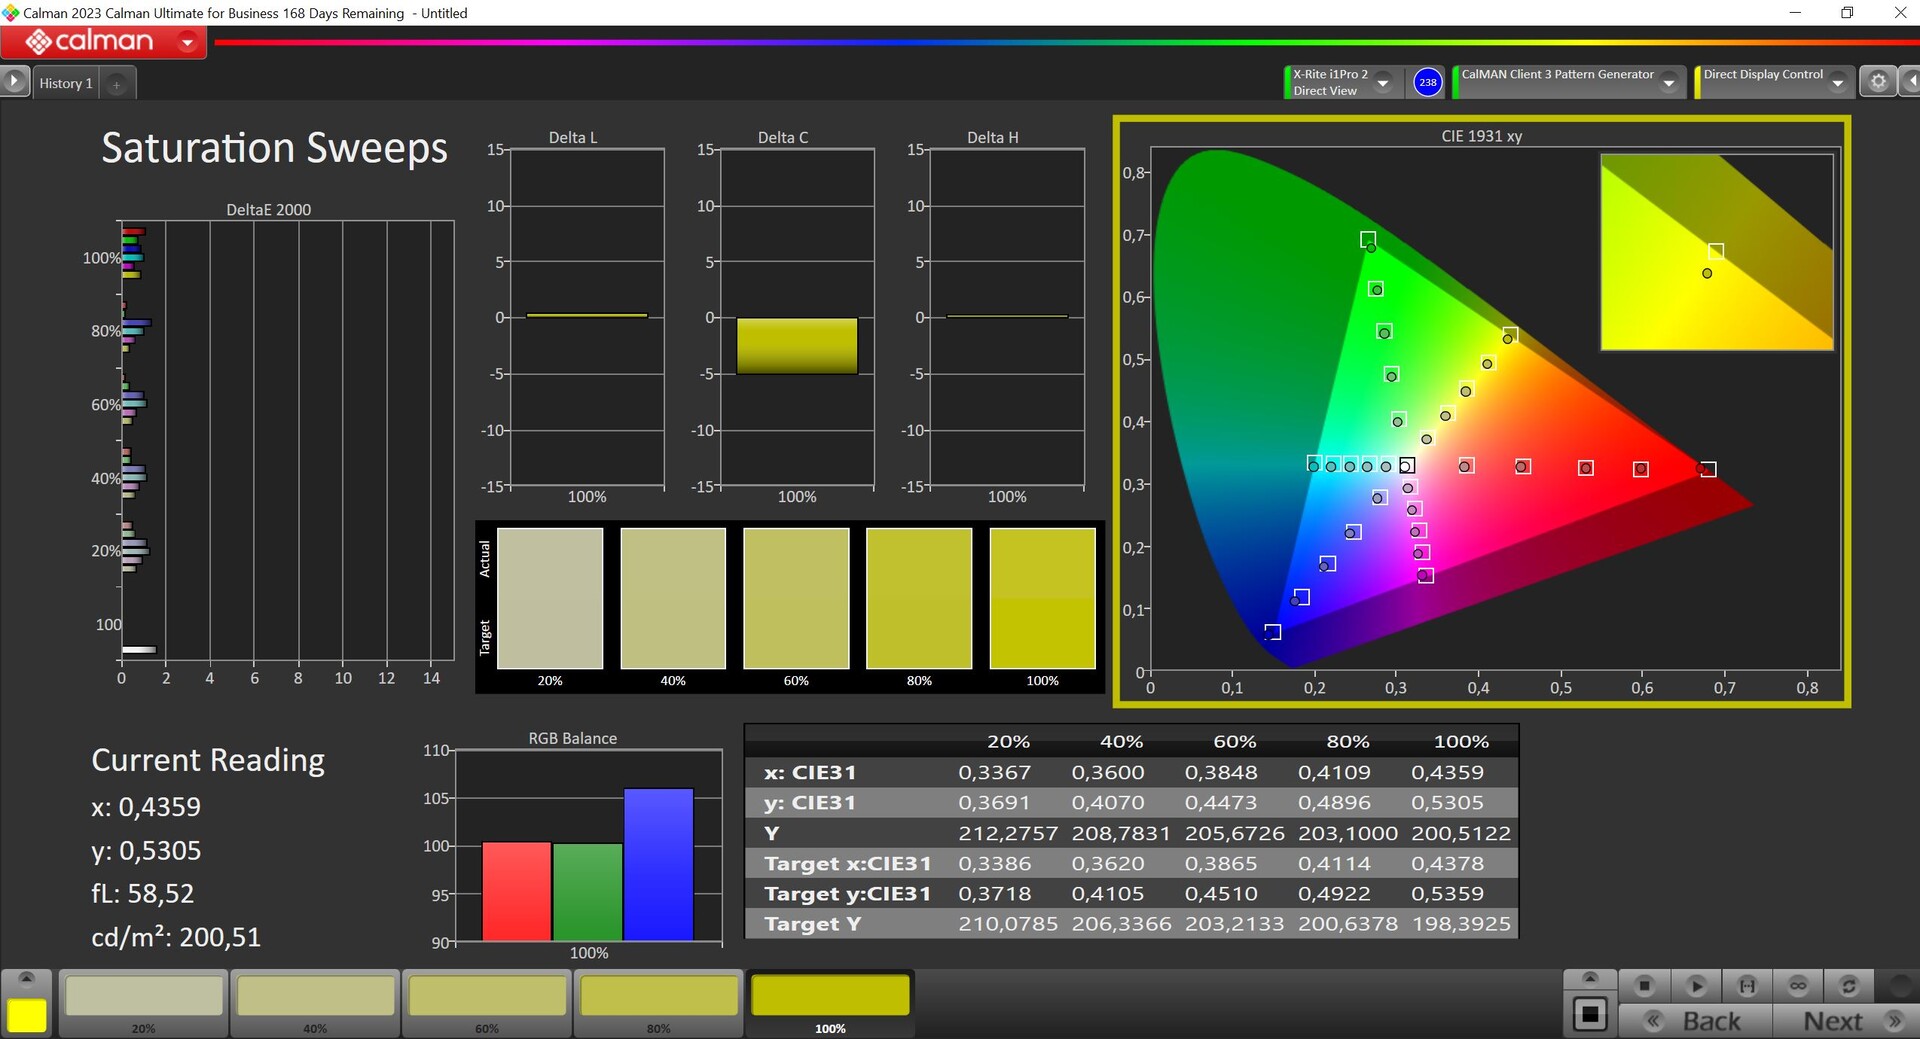


Abbiamo analizzato il pannello utilizzando il software professionale CalMAN (X-Rite i1 Pro 2). Lenovo offre diversi profili e, a partire dalla scatola, il profilo predefinito offre immagini accurate. Opzionalmente, è disponibile anche un profilo nativo con una luminosità massima più elevata (~455 cd/m²), ma anche una temperatura del colore troppo calda e con deviazioni cromatiche più elevate. Con la nostra calibrazione, siamo riusciti a migliorare ulteriormente le immagini e il download gratuito del profilo corrispondente è disponibile qui sopra. Allo stesso modo, Lenovo offre una modalità sRGB molto accurata, particolarmente importante per l'editing delle immagini. Lo spazio di colore sRGB è coperto completamente; P3 al 95 %.


Tempi di risposta del Display
| ↔ Tempi di risposta dal Nero al Bianco | ||
|---|---|---|
| 7.2 ms ... aumenta ↗ e diminuisce ↘ combinato | ↗ 2.9 ms Incremento | 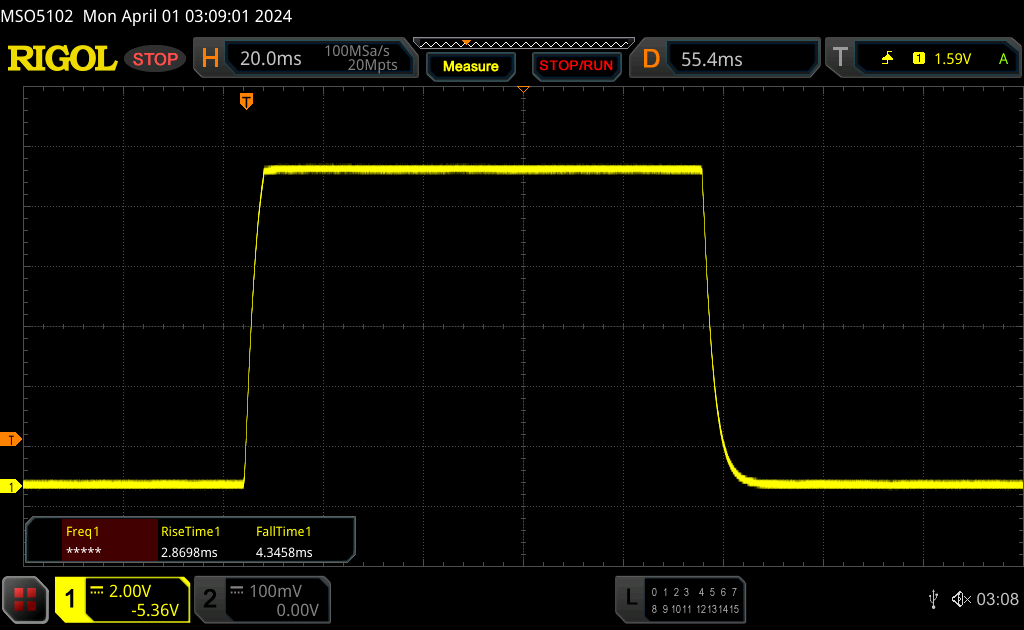 |
| ↘ 4.3 ms Calo | ||
| Lo schermo ha mostrato valori di risposta molto veloci nei nostri tests ed è molto adatto per i gaming veloce. In confronto, tutti i dispositivi di test variano da 0.1 (minimo) a 240 (massimo) ms. » 16 % di tutti i dispositivi è migliore. Questo significa che i tempi di risposta rilevati sono migliori rispettto alla media di tutti i dispositivi testati (21.5 ms). | ||
| ↔ Tempo di risposta dal 50% Grigio all'80% Grigio | ||
| 14.4 ms ... aumenta ↗ e diminuisce ↘ combinato | ↗ 6.9 ms Incremento | 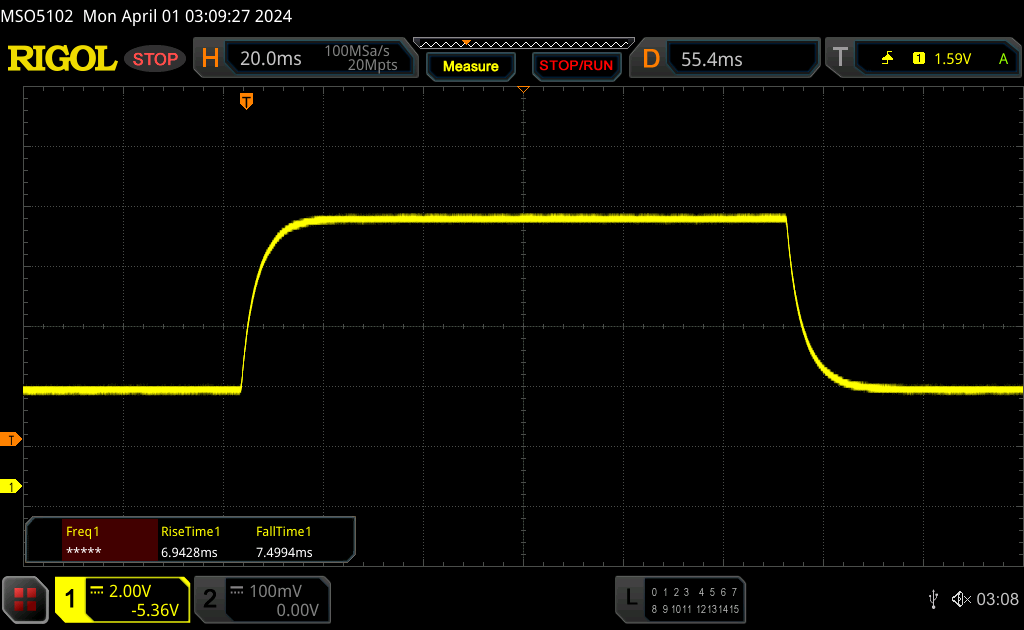 |
| ↘ 7.5 ms Calo | ||
| Lo schermo mostra buoni tempi di risposta durante i nostri tests, ma potrebbe essere troppo lento per i gamers competitivi. In confronto, tutti i dispositivi di test variano da 0.2 (minimo) a 636 (massimo) ms. » 23 % di tutti i dispositivi è migliore. Questo significa che i tempi di risposta rilevati sono migliori rispettto alla media di tutti i dispositivi testati (33.7 ms). | ||
Sfarfallio dello schermo / PWM (Pulse-Width Modulation)
| flickering dello schermo / PWM non rilevato | 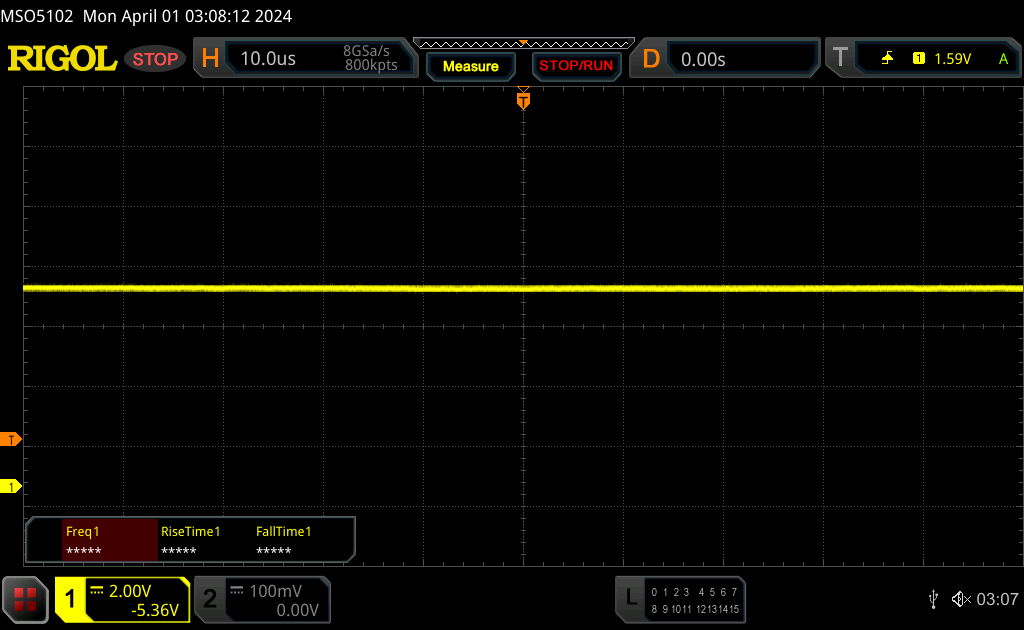 | ||
In confronto: 53 % di tutti i dispositivi testati non utilizza PWM per ridurre la luminosita' del display. Se è rilevato PWM, una media di 17898 (minimo: 5 - massimo: 3846000) Hz è stata rilevata. | |||


Grazie al display opaco, il pannello può essere utilizzato anche all'aperto ma, nelle giornate luminose, la luminosità potrebbe essere ancora più elevata. La stabilità dell'angolo di visione del pannello IPS è molto buona.

Prestazioni - Raptor Lake HX e un portatile RTX 4070 overcloccato
Condizioni del test
Come di consueto, Lenovo offre diversi profili energetici e abbiamo compilato un elenco riassuntivo dei dati relativi alle prestazioni nella tabella seguente. Il profilo attuale viene visualizzato anche tramite il LED del pulsante di accensione. Abbiamo eseguito i benchmark e le misurazioni in modalità prestazioni, in cui la GPU viene automaticamente leggermente overcloccata (+100 MHz core, +200 MHz VRAM). La modalità prestazioni non è disponibile utilizzando la modalità batteria.
| Profilo energetico | Carico della CPU | CB R23 Multi | Carico della GPU | Time Spy Grafica | Cyberpunk 2077 QHD Ultra |
volume massimo del faan |
|---|---|---|---|---|---|---|
| Modalità silenziosa | 65 -> 54 watt | 20.203 punti | 65 watt | 8.239 punti | 35 FPS | 38,4 dB(A) |
| Bilanciata | 120 -> 85 watt | 24.142 punti | 95 watt | 9.853 punti | 41,5 FPS | 50,7 dB(A) |
| Modalità Performance | 154 -> 90 watt | 31.127 punti | 115 watt | 12.174 punti | 51,4 FPS | 54,1 dB(A) |
Nota: senza successo, abbiamo provato ad aggiornare i driver Nvidia. Il driver ufficiale ha terminato l'installazione con un problema di compatibilità. Finora, Lenovo stessa ha reso disponibile solo il driver 537.70 preinstallato, che è quello che abbiamo inevitabilmente utilizzato.
Processore - Core i9-14900HX
Lenovo ha anche equipaggiato il normale Legion 7 16 con il Core i9-14900HXil processore mobile Raptor Lake più veloce, che si trova anche nel più costoso Legion Pro 7. Rispetto ad entrambi i modelli più spessi Legion Pro 7/5 16, il case più sottile ha un impatto sui limiti di potenza, scendendo a 90 watt dopo aver toccato brevemente i 154 watt. Nel complesso, le prestazioni sono state eccellenti sia nei test multi-core che in quelli single-core. In modalità batteria, il processore può consumare un massimo di 60 watt, motivo per cui le prestazioni multi-core sono inferiori di circa il 40%. Ulteriori benchmark della CPU sono disponibili nella la nostra sezione tecnologia.
Cinebench R15 Multi Continuous Test
Cinebench R23: Multi Core | Single Core
Cinebench R20: CPU (Multi Core) | CPU (Single Core)
Cinebench R15: CPU Multi 64Bit | CPU Single 64Bit
Blender: v2.79 BMW27 CPU
7-Zip 18.03: 7z b 4 | 7z b 4 -mmt1
Geekbench 6.2: Multi-Core | Single-Core
Geekbench 5.5: Multi-Core | Single-Core
HWBOT x265 Benchmark v2.2: 4k Preset
LibreOffice : 20 Documents To PDF
R Benchmark 2.5: Overall mean
| CPU Performance Rating | |
| Lenovo Legion Pro 7 16IRX9H | |
| Lenovo Legion 7 16 IRX G9 | |
| Lenovo Legion Pro 5 16IRX9 | |
| Media Intel Core i9-14900HX | |
| Aorus 16X 2024 | |
| HP Omen Transcend 16-u1095ng | |
| Media della classe Gaming | |
| Alienware m16 R2 -1! | |
| SCHENKER XMG CORE 16 (L23) | |
| Cinebench R23 / Multi Core | |
| Lenovo Legion Pro 7 16IRX9H | |
| Lenovo Legion 7 16 IRX G9 | |
| Lenovo Legion Pro 5 16IRX9 | |
| Media Intel Core i9-14900HX (20702 - 32996, n=23) | |
| Aorus 16X 2024 | |
| HP Omen Transcend 16-u1095ng | |
| Media della classe Gaming (2435 - 34613, n=233, ultimi 2 anni) | |
| Alienware m16 R2 | |
| SCHENKER XMG CORE 16 (L23) | |
| Cinebench R23 / Single Core | |
| Lenovo Legion Pro 7 16IRX9H | |
| Lenovo Legion 7 16 IRX G9 | |
| Aorus 16X 2024 | |
| HP Omen Transcend 16-u1095ng | |
| Media Intel Core i9-14900HX (2043 - 2235, n=23) | |
| Lenovo Legion Pro 5 16IRX9 | |
| Media della classe Gaming (527 - 2235, n=231, ultimi 2 anni) | |
| SCHENKER XMG CORE 16 (L23) | |
| Alienware m16 R2 | |
| Cinebench R20 / CPU (Multi Core) | |
| Lenovo Legion Pro 7 16IRX9H | |
| Lenovo Legion 7 16 IRX G9 | |
| Lenovo Legion Pro 5 16IRX9 | |
| Media Intel Core i9-14900HX (8427 - 12419, n=23) | |
| Aorus 16X 2024 | |
| HP Omen Transcend 16-u1095ng | |
| Media della classe Gaming (930 - 13769, n=231, ultimi 2 anni) | |
| Alienware m16 R2 | |
| SCHENKER XMG CORE 16 (L23) | |
| Cinebench R20 / CPU (Single Core) | |
| Lenovo Legion 7 16 IRX G9 | |
| Aorus 16X 2024 | |
| HP Omen Transcend 16-u1095ng | |
| Media Intel Core i9-14900HX (779 - 859, n=23) | |
| Lenovo Legion Pro 7 16IRX9H | |
| Lenovo Legion Pro 5 16IRX9 | |
| Media della classe Gaming (169 - 855, n=231, ultimi 2 anni) | |
| SCHENKER XMG CORE 16 (L23) | |
| Alienware m16 R2 | |
| Cinebench R15 / CPU Multi 64Bit | |
| Lenovo Legion Pro 7 16IRX9H | |
| Lenovo Legion 7 16 IRX G9 | |
| Lenovo Legion Pro 5 16IRX9 | |
| Media Intel Core i9-14900HX (3263 - 4875, n=23) | |
| Aorus 16X 2024 | |
| HP Omen Transcend 16-u1095ng | |
| Media della classe Gaming (400 - 5663, n=235, ultimi 2 anni) | |
| Alienware m16 R2 | |
| SCHENKER XMG CORE 16 (L23) | |
| Cinebench R15 / CPU Single 64Bit | |
| Lenovo Legion Pro 7 16IRX9H | |
| Aorus 16X 2024 | |
| Lenovo Legion 7 16 IRX G9 | |
| Media Intel Core i9-14900HX (287 - 320, n=23) | |
| Lenovo Legion Pro 5 16IRX9 | |
| HP Omen Transcend 16-u1095ng | |
| SCHENKER XMG CORE 16 (L23) | |
| Media della classe Gaming (79.2 - 318, n=234, ultimi 2 anni) | |
| Alienware m16 R2 | |
| Blender / v2.79 BMW27 CPU | |
| Media della classe Gaming (87 - 1259, n=229, ultimi 2 anni) | |
| SCHENKER XMG CORE 16 (L23) | |
| HP Omen Transcend 16-u1095ng | |
| Aorus 16X 2024 | |
| Lenovo Legion 7 16 IRX G9 | |
| Media Intel Core i9-14900HX (102 - 164, n=23) | |
| Lenovo Legion Pro 5 16IRX9 | |
| Lenovo Legion Pro 7 16IRX9H | |
| 7-Zip 18.03 / 7z b 4 | |
| Lenovo Legion Pro 7 16IRX9H | |
| Lenovo Legion Pro 5 16IRX9 | |
| Media Intel Core i9-14900HX (87555 - 127108, n=23) | |
| Lenovo Legion 7 16 IRX G9 | |
| Aorus 16X 2024 | |
| HP Omen Transcend 16-u1095ng | |
| Media della classe Gaming (11386 - 140932, n=230, ultimi 2 anni) | |
| SCHENKER XMG CORE 16 (L23) | |
| Alienware m16 R2 | |
| 7-Zip 18.03 / 7z b 4 -mmt1 | |
| Lenovo Legion Pro 7 16IRX9H | |
| Aorus 16X 2024 | |
| Lenovo Legion 7 16 IRX G9 | |
| HP Omen Transcend 16-u1095ng | |
| Media Intel Core i9-14900HX (6206 - 7508, n=23) | |
| Lenovo Legion Pro 5 16IRX9 | |
| SCHENKER XMG CORE 16 (L23) | |
| Media della classe Gaming (2685 - 7581, n=230, ultimi 2 anni) | |
| Alienware m16 R2 | |
| Geekbench 6.2 / Multi-Core | |
| Lenovo Legion Pro 7 16IRX9H | |
| Lenovo Legion Pro 5 16IRX9 | |
| Lenovo Legion 7 16 IRX G9 | |
| Media Intel Core i9-14900HX (15849 - 18643, n=23) | |
| Aorus 16X 2024 | |
| HP Omen Transcend 16-u1095ng | |
| Media della classe Gaming (5340 - 18590, n=77, ultimi 2 anni) | |
| SCHENKER XMG CORE 16 (L23) | |
| Alienware m16 R2 | |
| Geekbench 6.2 / Single-Core | |
| Aorus 16X 2024 | |
| Lenovo Legion Pro 7 16IRX9H | |
| Media Intel Core i9-14900HX (2800 - 3095, n=23) | |
| Lenovo Legion 7 16 IRX G9 | |
| Lenovo Legion Pro 5 16IRX9 | |
| HP Omen Transcend 16-u1095ng | |
| SCHENKER XMG CORE 16 (L23) | |
| Media della classe Gaming (1599 - 3095, n=77, ultimi 2 anni) | |
| Alienware m16 R2 | |
| Geekbench 5.5 / Multi-Core | |
| Lenovo Legion Pro 5 16IRX9 | |
| Lenovo Legion Pro 7 16IRX9H | |
| Lenovo Legion 7 16 IRX G9 | |
| Aorus 16X 2024 | |
| Media Intel Core i9-14900HX (8618 - 21606, n=23) | |
| HP Omen Transcend 16-u1095ng | |
| Media della classe Gaming (1946 - 22200, n=235, ultimi 2 anni) | |
| Alienware m16 R2 | |
| SCHENKER XMG CORE 16 (L23) | |
| Geekbench 5.5 / Single-Core | |
| Aorus 16X 2024 | |
| Lenovo Legion Pro 7 16IRX9H | |
| Media Intel Core i9-14900HX (1669 - 2210, n=23) | |
| Lenovo Legion 7 16 IRX G9 | |
| HP Omen Transcend 16-u1095ng | |
| Lenovo Legion Pro 5 16IRX9 | |
| SCHENKER XMG CORE 16 (L23) | |
| Media della classe Gaming (158 - 2210, n=235, ultimi 2 anni) | |
| Alienware m16 R2 | |
| HWBOT x265 Benchmark v2.2 / 4k Preset | |
| Lenovo Legion Pro 7 16IRX9H | |
| Lenovo Legion Pro 5 16IRX9 | |
| Media Intel Core i9-14900HX (22.7 - 34.4, n=23) | |
| Lenovo Legion 7 16 IRX G9 | |
| Aorus 16X 2024 | |
| HP Omen Transcend 16-u1095ng | |
| SCHENKER XMG CORE 16 (L23) | |
| Media della classe Gaming (3 - 37.6, n=233, ultimi 2 anni) | |
| Alienware m16 R2 | |
| LibreOffice / 20 Documents To PDF | |
| SCHENKER XMG CORE 16 (L23) | |
| HP Omen Transcend 16-u1095ng | |
| Alienware m16 R2 | |
| Media della classe Gaming (32.8 - 332, n=227, ultimi 2 anni) | |
| Lenovo Legion 7 16 IRX G9 | |
| Media Intel Core i9-14900HX (33.9 - 85.1, n=23) | |
| Lenovo Legion Pro 5 16IRX9 | |
| Aorus 16X 2024 | |
| Lenovo Legion Pro 7 16IRX9H | |
| R Benchmark 2.5 / Overall mean | |
| Alienware m16 R2 | |
| Media della classe Gaming (0.3609 - 4.47, n=230, ultimi 2 anni) | |
| SCHENKER XMG CORE 16 (L23) | |
| HP Omen Transcend 16-u1095ng | |
| Lenovo Legion 7 16 IRX G9 | |
| Lenovo Legion Pro 5 16IRX9 | |
| Lenovo Legion Pro 7 16IRX9H | |
| Media Intel Core i9-14900HX (0.3609 - 0.4225, n=23) | |
| Aorus 16X 2024 | |
* ... Meglio usare valori piccoli
AIDA64: FP32 Ray-Trace | FPU Julia | CPU SHA3 | CPU Queen | FPU SinJulia | FPU Mandel | CPU AES | CPU ZLib | FP64 Ray-Trace | CPU PhotoWorxx
| Performance Rating | |
| Lenovo Legion Pro 7 16IRX9H | |
| Lenovo Legion Pro 5 16IRX9 | |
| Media Intel Core i9-14900HX | |
| Aorus 16X 2024 | |
| Lenovo Legion 7 16 IRX G9 | |
| SCHENKER XMG CORE 16 (L23) | |
| Media della classe Gaming | |
| HP Omen Transcend 16-u1095ng | |
| Alienware m16 R2 | |
| AIDA64 / FP32 Ray-Trace | |
| Lenovo Legion Pro 7 16IRX9H | |
| SCHENKER XMG CORE 16 (L23) | |
| Lenovo Legion 7 16 IRX G9 | |
| Media Intel Core i9-14900HX (17244 - 29351, n=22) | |
| Lenovo Legion Pro 5 16IRX9 | |
| Aorus 16X 2024 | |
| Media della classe Gaming (3069 - 60169, n=226, ultimi 2 anni) | |
| Alienware m16 R2 | |
| HP Omen Transcend 16-u1095ng | |
| AIDA64 / FPU Julia | |
| Lenovo Legion Pro 7 16IRX9H | |
| Lenovo Legion Pro 5 16IRX9 | |
| Media Intel Core i9-14900HX (88537 - 148888, n=22) | |
| SCHENKER XMG CORE 16 (L23) | |
| Lenovo Legion 7 16 IRX G9 | |
| Aorus 16X 2024 | |
| Media della classe Gaming (18567 - 252486, n=226, ultimi 2 anni) | |
| Alienware m16 R2 | |
| HP Omen Transcend 16-u1095ng | |
| AIDA64 / CPU SHA3 | |
| Lenovo Legion Pro 7 16IRX9H | |
| Lenovo Legion Pro 5 16IRX9 | |
| Media Intel Core i9-14900HX (4267 - 7229, n=22) | |
| Aorus 16X 2024 | |
| Lenovo Legion 7 16 IRX G9 | |
| SCHENKER XMG CORE 16 (L23) | |
| Media della classe Gaming (629 - 10389, n=226, ultimi 2 anni) | |
| HP Omen Transcend 16-u1095ng | |
| Alienware m16 R2 | |
| AIDA64 / CPU Queen | |
| Lenovo Legion Pro 7 16IRX9H | |
| Lenovo Legion Pro 5 16IRX9 | |
| Lenovo Legion 7 16 IRX G9 | |
| Aorus 16X 2024 | |
| Media Intel Core i9-14900HX (118405 - 148773, n=22) | |
| HP Omen Transcend 16-u1095ng | |
| Media della classe Gaming (15371 - 200651, n=226, ultimi 2 anni) | |
| SCHENKER XMG CORE 16 (L23) | |
| Alienware m16 R2 | |
| AIDA64 / FPU SinJulia | |
| Lenovo Legion Pro 7 16IRX9H | |
| Lenovo Legion Pro 5 16IRX9 | |
| Media Intel Core i9-14900HX (12217 - 18256, n=22) | |
| SCHENKER XMG CORE 16 (L23) | |
| Aorus 16X 2024 | |
| Lenovo Legion 7 16 IRX G9 | |
| Media della classe Gaming (2137 - 32988, n=226, ultimi 2 anni) | |
| HP Omen Transcend 16-u1095ng | |
| Alienware m16 R2 | |
| AIDA64 / FPU Mandel | |
| Lenovo Legion Pro 7 16IRX9H | |
| SCHENKER XMG CORE 16 (L23) | |
| Lenovo Legion Pro 5 16IRX9 | |
| Media Intel Core i9-14900HX (43302 - 72594, n=22) | |
| Aorus 16X 2024 | |
| Media della classe Gaming (10291 - 134044, n=226, ultimi 2 anni) | |
| Alienware m16 R2 | |
| Lenovo Legion 7 16 IRX G9 | |
| HP Omen Transcend 16-u1095ng | |
| AIDA64 / CPU AES | |
| Media Intel Core i9-14900HX (86964 - 241777, n=22) | |
| Lenovo Legion Pro 7 16IRX9H | |
| Lenovo Legion Pro 5 16IRX9 | |
| Aorus 16X 2024 | |
| Lenovo Legion 7 16 IRX G9 | |
| Media della classe Gaming (19065 - 328679, n=226, ultimi 2 anni) | |
| SCHENKER XMG CORE 16 (L23) | |
| HP Omen Transcend 16-u1095ng | |
| Alienware m16 R2 | |
| AIDA64 / CPU ZLib | |
| Lenovo Legion Pro 7 16IRX9H | |
| Lenovo Legion Pro 5 16IRX9 | |
| Media Intel Core i9-14900HX (1265 - 2149, n=22) | |
| Aorus 16X 2024 | |
| Lenovo Legion 7 16 IRX G9 | |
| HP Omen Transcend 16-u1095ng | |
| Alienware m16 R2 | |
| Media della classe Gaming (150.9 - 2409, n=226, ultimi 2 anni) | |
| SCHENKER XMG CORE 16 (L23) | |
| AIDA64 / FP64 Ray-Trace | |
| Lenovo Legion Pro 7 16IRX9H | |
| SCHENKER XMG CORE 16 (L23) | |
| Lenovo Legion Pro 5 16IRX9 | |
| Media Intel Core i9-14900HX (9170 - 16128, n=22) | |
| Lenovo Legion 7 16 IRX G9 | |
| Aorus 16X 2024 | |
| Media della classe Gaming (1518 - 31796, n=226, ultimi 2 anni) | |
| Alienware m16 R2 | |
| HP Omen Transcend 16-u1095ng | |
| AIDA64 / CPU PhotoWorxx | |
| Lenovo Legion Pro 5 16IRX9 | |
| HP Omen Transcend 16-u1095ng | |
| Aorus 16X 2024 | |
| Lenovo Legion 7 16 IRX G9 | |
| Media Intel Core i9-14900HX (33960 - 51118, n=22) | |
| Lenovo Legion Pro 7 16IRX9H | |
| SCHENKER XMG CORE 16 (L23) | |
| Alienware m16 R2 | |
| Media della classe Gaming (10805 - 60161, n=227, ultimi 2 anni) | |
Prestazioni del sistema
L'impressione soggettiva delle prestazioni è eccellente e anche i benchmark non hanno evidenziato alcun problema. Si sono verificati solo saltuari balbettii quando si passava da una modalità grafica all'altra, ad esempio durante l'avvio di un gioco. Questa è la norma per i portatili che utilizzano Advanced Optimus.
CrossMark: Overall | Productivity | Creativity | Responsiveness
WebXPRT 3: Overall
WebXPRT 4: Overall
Mozilla Kraken 1.1: Total
| PCMark 10 / Score | |
| Lenovo Legion Pro 7 16IRX9H | |
| Lenovo Legion Pro 5 16IRX9 | |
| Aorus 16X 2024 | |
| Media Intel Core i9-14900HX, NVIDIA GeForce RTX 4070 Laptop GPU (7866 - 8550, n=5) | |
| SCHENKER XMG CORE 16 (L23) | |
| Lenovo Legion 7 16 IRX G9 | |
| HP Omen Transcend 16-u1095ng | |
| Alienware m16 R2 | |
| Media della classe Gaming (5235 - 9852, n=199, ultimi 2 anni) | |
| PCMark 10 / Essentials | |
| Lenovo Legion Pro 7 16IRX9H | |
| Lenovo Legion Pro 5 16IRX9 | |
| Media Intel Core i9-14900HX, NVIDIA GeForce RTX 4070 Laptop GPU (10621 - 11815, n=5) | |
| Aorus 16X 2024 | |
| Lenovo Legion 7 16 IRX G9 | |
| SCHENKER XMG CORE 16 (L23) | |
| Media della classe Gaming (8300 - 12334, n=198, ultimi 2 anni) | |
| HP Omen Transcend 16-u1095ng | |
| Alienware m16 R2 | |
| PCMark 10 / Productivity | |
| Lenovo Legion Pro 7 16IRX9H | |
| Aorus 16X 2024 | |
| SCHENKER XMG CORE 16 (L23) | |
| Media Intel Core i9-14900HX, NVIDIA GeForce RTX 4070 Laptop GPU (9701 - 11103, n=5) | |
| HP Omen Transcend 16-u1095ng | |
| Lenovo Legion Pro 5 16IRX9 | |
| Media della classe Gaming (6662 - 11833, n=198, ultimi 2 anni) | |
| Lenovo Legion 7 16 IRX G9 | |
| Alienware m16 R2 | |
| PCMark 10 / Digital Content Creation | |
| Lenovo Legion Pro 5 16IRX9 | |
| Lenovo Legion Pro 7 16IRX9H | |
| Media Intel Core i9-14900HX, NVIDIA GeForce RTX 4070 Laptop GPU (12114 - 14827, n=5) | |
| Lenovo Legion 7 16 IRX G9 | |
| Aorus 16X 2024 | |
| Alienware m16 R2 | |
| SCHENKER XMG CORE 16 (L23) | |
| HP Omen Transcend 16-u1095ng | |
| Media della classe Gaming (6462 - 18475, n=198, ultimi 2 anni) | |
| CrossMark / Overall | |
| Lenovo Legion Pro 7 16IRX9H | |
| Aorus 16X 2024 | |
| Lenovo Legion 7 16 IRX G9 | |
| Media Intel Core i9-14900HX, NVIDIA GeForce RTX 4070 Laptop GPU (2002 - 2312, n=4) | |
| Lenovo Legion Pro 5 16IRX9 | |
| Media della classe Gaming (1247 - 2334, n=171, ultimi 2 anni) | |
| Alienware m16 R2 | |
| SCHENKER XMG CORE 16 (L23) | |
| CrossMark / Productivity | |
| Lenovo Legion Pro 7 16IRX9H | |
| Aorus 16X 2024 | |
| Lenovo Legion 7 16 IRX G9 | |
| Media Intel Core i9-14900HX, NVIDIA GeForce RTX 4070 Laptop GPU (1827 - 2191, n=4) | |
| Lenovo Legion Pro 5 16IRX9 | |
| Media della classe Gaming (1299 - 2204, n=171, ultimi 2 anni) | |
| Alienware m16 R2 | |
| SCHENKER XMG CORE 16 (L23) | |
| CrossMark / Creativity | |
| Lenovo Legion Pro 7 16IRX9H | |
| Aorus 16X 2024 | |
| Lenovo Legion 7 16 IRX G9 | |
| Media Intel Core i9-14900HX, NVIDIA GeForce RTX 4070 Laptop GPU (2287 - 2458, n=4) | |
| Lenovo Legion Pro 5 16IRX9 | |
| Media della classe Gaming (1275 - 2514, n=171, ultimi 2 anni) | |
| Alienware m16 R2 | |
| SCHENKER XMG CORE 16 (L23) | |
| CrossMark / Responsiveness | |
| Lenovo Legion 7 16 IRX G9 | |
| Aorus 16X 2024 | |
| Lenovo Legion Pro 7 16IRX9H | |
| Media Intel Core i9-14900HX, NVIDIA GeForce RTX 4070 Laptop GPU (1769 - 2330, n=4) | |
| Lenovo Legion Pro 5 16IRX9 | |
| Media della classe Gaming (1030 - 2330, n=171, ultimi 2 anni) | |
| Alienware m16 R2 | |
| SCHENKER XMG CORE 16 (L23) | |
| WebXPRT 3 / Overall | |
| Lenovo Legion Pro 7 16IRX9H | |
| HP Omen Transcend 16-u1095ng | |
| Lenovo Legion 7 16 IRX G9 | |
| Media Intel Core i9-14900HX, NVIDIA GeForce RTX 4070 Laptop GPU (322 - 342, n=5) | |
| Aorus 16X 2024 | |
| Lenovo Legion Pro 5 16IRX9 | |
| Media della classe Gaming (215 - 480, n=195, ultimi 2 anni) | |
| Alienware m16 R2 | |
| SCHENKER XMG CORE 16 (L23) | |
| WebXPRT 4 / Overall | |
| Lenovo Legion Pro 7 16IRX9H | |
| Lenovo Legion 7 16 IRX G9 | |
| Media Intel Core i9-14900HX, NVIDIA GeForce RTX 4070 Laptop GPU (291 - 301, n=3) | |
| Lenovo Legion Pro 5 16IRX9 | |
| Media della classe Gaming (157.9 - 328, n=163, ultimi 2 anni) | |
| Alienware m16 R2 | |
| Mozilla Kraken 1.1 / Total | |
| Alienware m16 R2 | |
| SCHENKER XMG CORE 16 (L23) | |
| Media della classe Gaming (421 - 824, n=210, ultimi 2 anni) | |
| Lenovo Legion Pro 5 16IRX9 | |
| Lenovo Legion 7 16 IRX G9 | |
| Lenovo Legion Pro 7 16IRX9H | |
| Media Intel Core i9-14900HX, NVIDIA GeForce RTX 4070 Laptop GPU (431 - 449, n=5) | |
| HP Omen Transcend 16-u1095ng | |
| Aorus 16X 2024 | |
* ... Meglio usare valori piccoli
| PCMark 10 Score | 8023 punti | |
Aiuto | ||
| AIDA64 / Memory Copy | |
| Lenovo Legion Pro 5 16IRX9 | |
| Lenovo Legion 7 16 IRX G9 | |
| Aorus 16X 2024 | |
| Lenovo Legion Pro 7 16IRX9H | |
| HP Omen Transcend 16-u1095ng | |
| Media Intel Core i9-14900HX (56992 - 83392, n=22) | |
| SCHENKER XMG CORE 16 (L23) | |
| Alienware m16 R2 | |
| Media della classe Gaming (21842 - 92565, n=226, ultimi 2 anni) | |
| AIDA64 / Memory Read | |
| Aorus 16X 2024 | |
| Lenovo Legion Pro 5 16IRX9 | |
| Lenovo Legion Pro 7 16IRX9H | |
| Lenovo Legion 7 16 IRX G9 | |
| HP Omen Transcend 16-u1095ng | |
| Media Intel Core i9-14900HX (54443 - 87507, n=22) | |
| Alienware m16 R2 | |
| Media della classe Gaming (24879 - 90647, n=226, ultimi 2 anni) | |
| SCHENKER XMG CORE 16 (L23) | |
| AIDA64 / Memory Write | |
| SCHENKER XMG CORE 16 (L23) | |
| HP Omen Transcend 16-u1095ng | |
| Aorus 16X 2024 | |
| Lenovo Legion Pro 5 16IRX9 | |
| Media Intel Core i9-14900HX (51387 - 78199, n=22) | |
| Lenovo Legion 7 16 IRX G9 | |
| Lenovo Legion Pro 7 16IRX9H | |
| Alienware m16 R2 | |
| Media della classe Gaming (21619 - 103259, n=226, ultimi 2 anni) | |
| AIDA64 / Memory Latency | |
| Alienware m16 R2 | |
| SCHENKER XMG CORE 16 (L23) | |
| Media della classe Gaming (59.5 - 152.5, n=223, ultimi 2 anni) | |
| HP Omen Transcend 16-u1095ng | |
| Media Intel Core i9-14900HX (79.7 - 105, n=22) | |
| Lenovo Legion 7 16 IRX G9 | |
| Lenovo Legion Pro 5 16IRX9 | |
| Aorus 16X 2024 | |
| Lenovo Legion Pro 7 16IRX9H | |
* ... Meglio usare valori piccoli
Latenze DPC
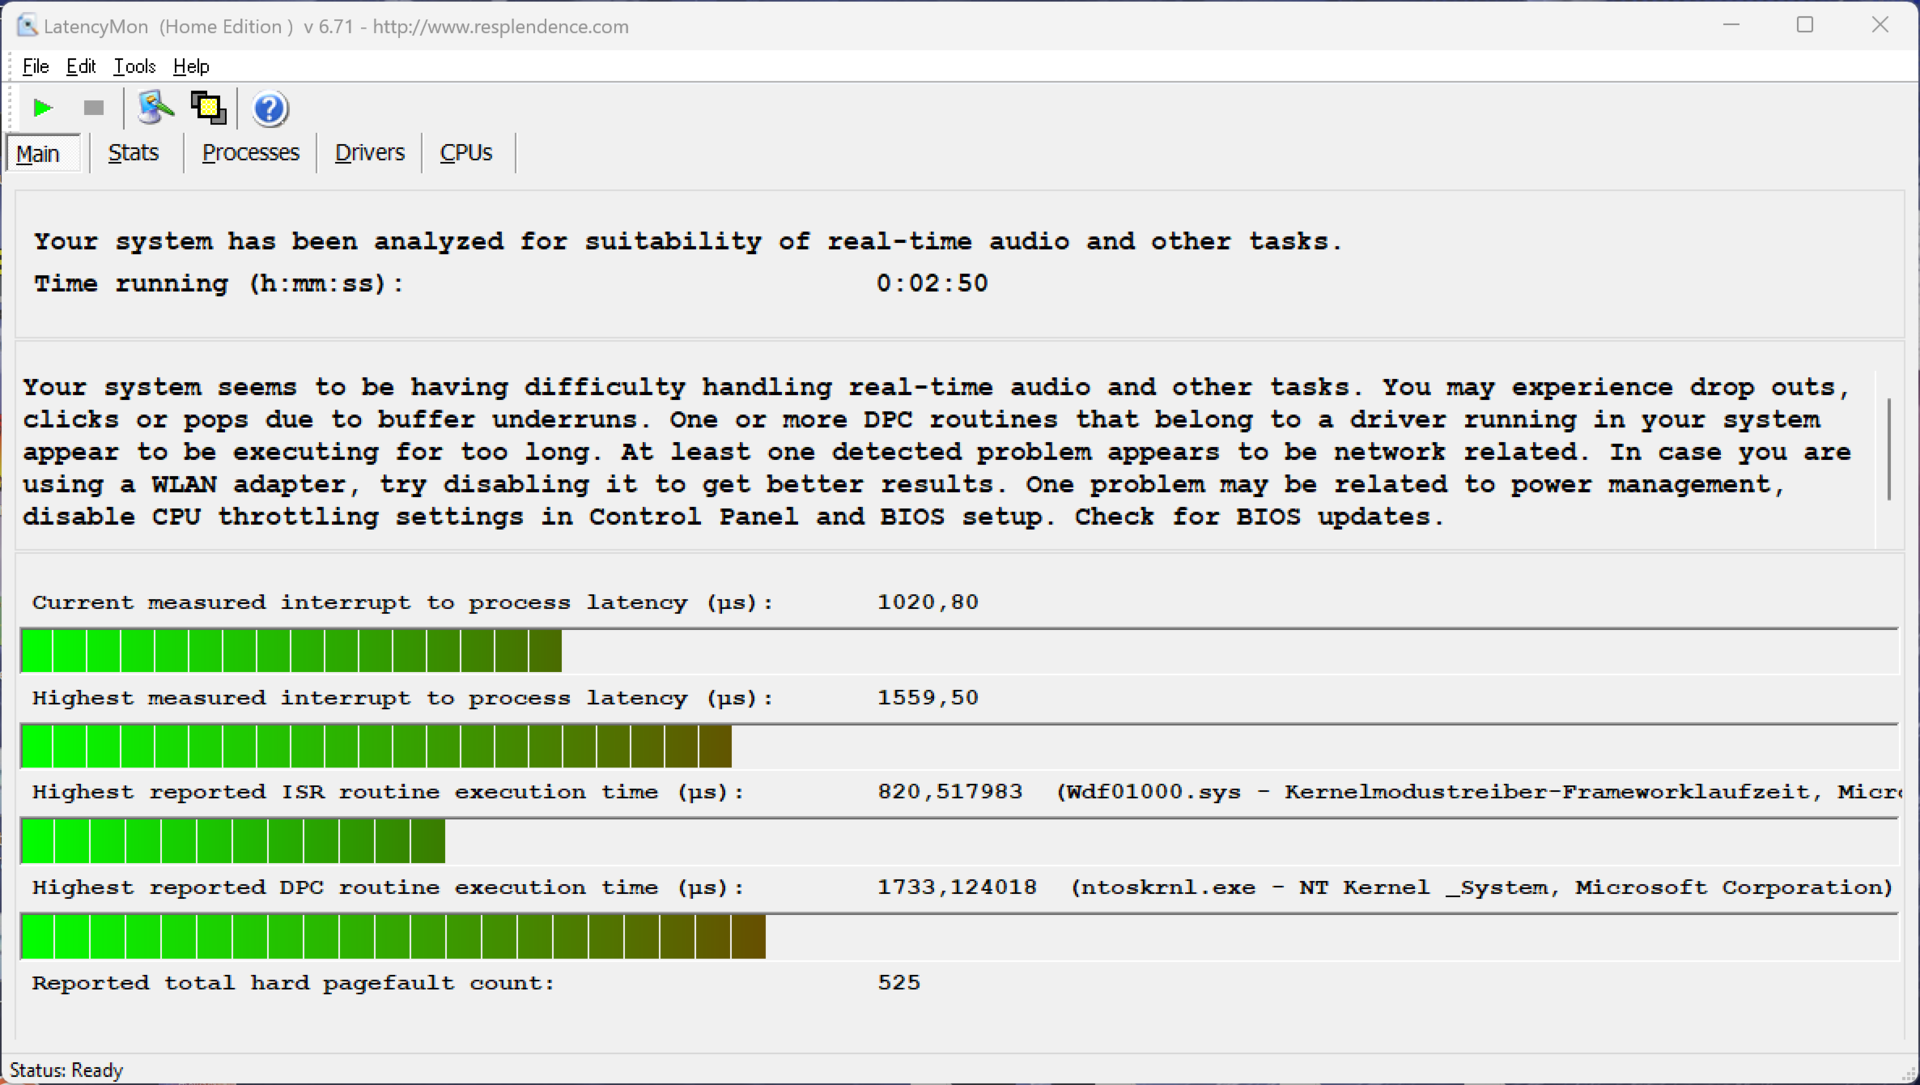
Nel nostro test di latenza standardizzato (navigazione in Internet, riproduzione di YouTube in 4K, carico della CPU) utilizzando l'attuale versione del BIOS, il dispositivo recensito ha mostrato alcune limitazioni quando si tratta di utilizzare applicazioni audio in tempo reale.
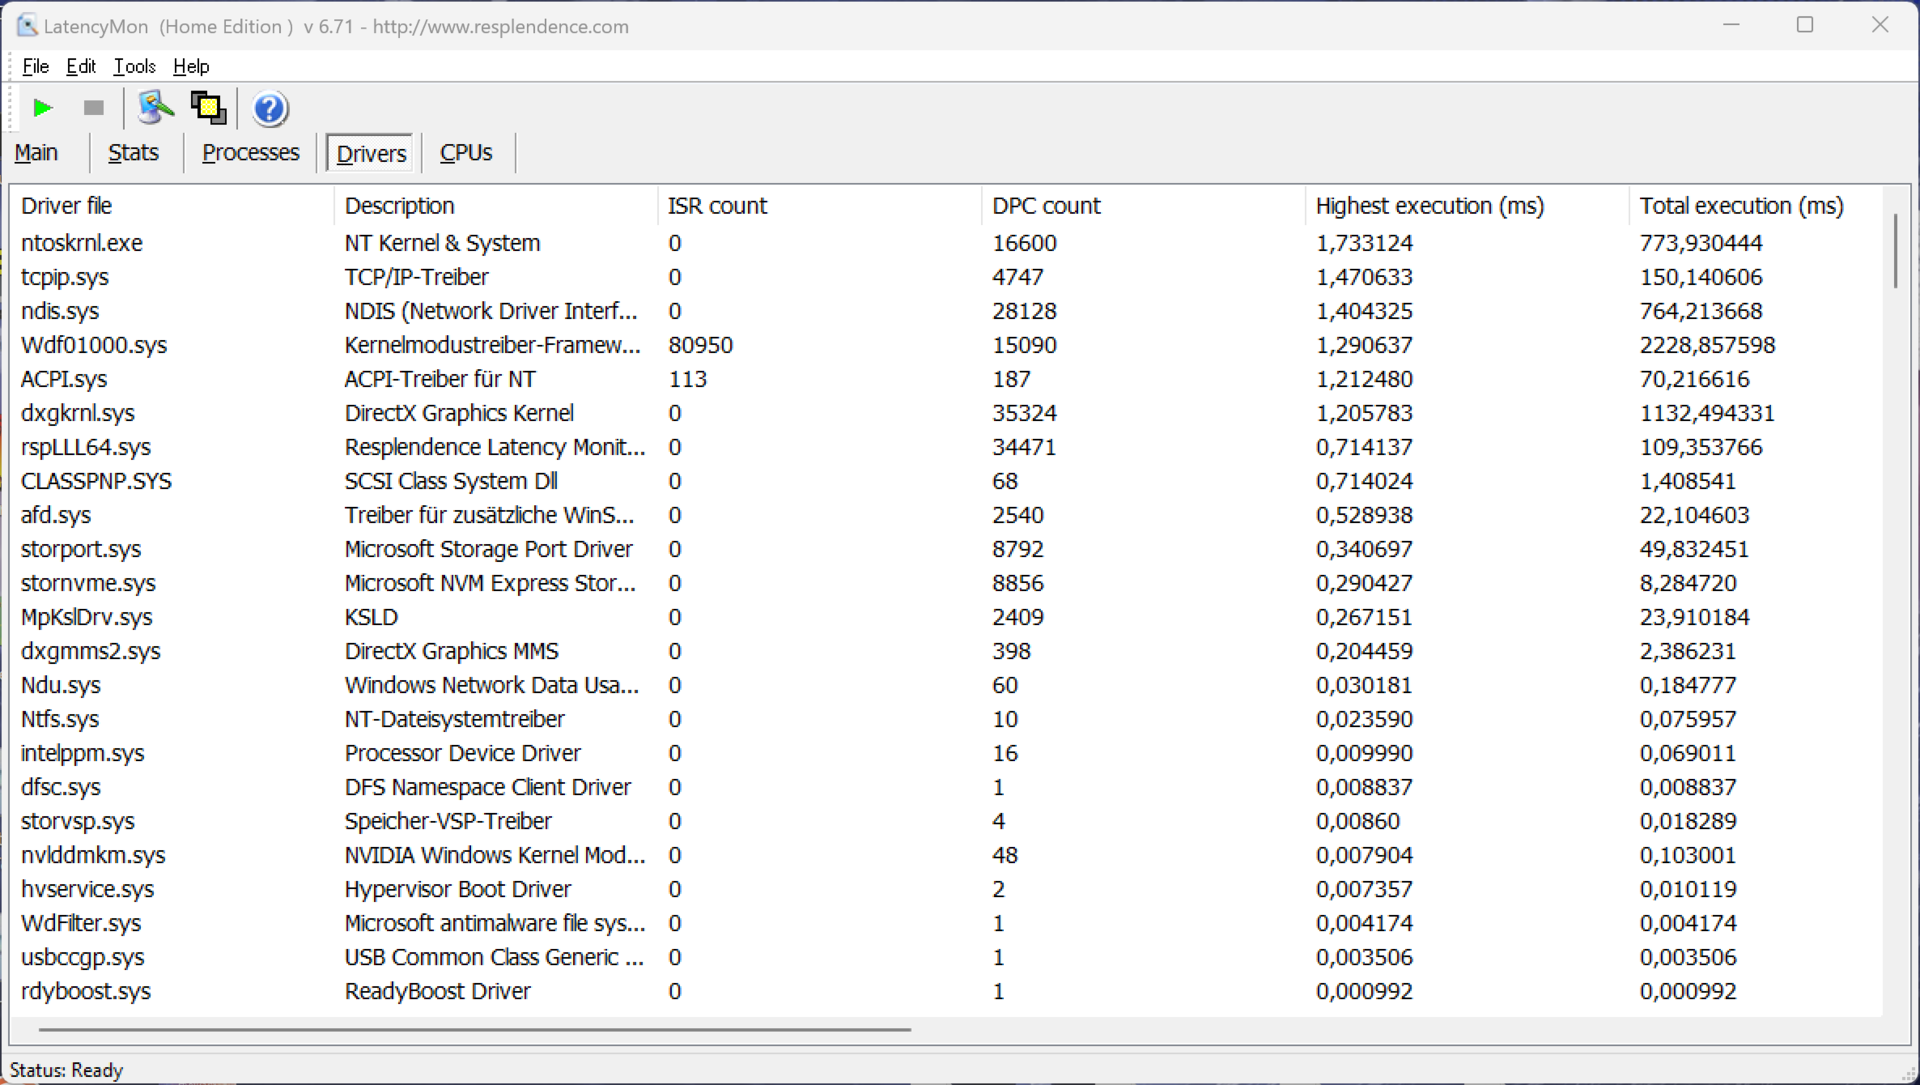
| DPC Latencies / LatencyMon - interrupt to process latency (max), Web, Youtube, Prime95 | |
| Alienware m16 R2 | |
| HP Omen Transcend 16-u1095ng | |
| Lenovo Legion 7 16 IRX G9 | |
| Lenovo Legion Pro 7 16IRX9H | |
| Aorus 16X 2024 | |
| Lenovo Legion Pro 5 16IRX9 | |
| SCHENKER XMG CORE 16 (L23) | |
* ... Meglio usare valori piccoli
Memoria di massa
Nel dispositivo oggetto della recensione, Lenovo ha installato un'unità SSD PCIe 4.0 da 1 TB di SK Hynix, ma, dopo il primo avvio, sono disponibili 877 GB per l'utente. Con un massimo di 7 GB/s, le velocità di trasferimento sono molto elevate e, nel complesso, l'SSD è un po' più veloce della concorrenza. Tuttavia, sebbene le prestazioni non rimangano sempre stabili in caso di carico prolungato, questo non è un aspetto che noterà nelle situazioni quotidiane. Altri benchmark dell'SSD sono elencati qui.

* ... Meglio usare valori piccoli
Continuous Performance Read: DiskSpd Read Loop, Queue Depth 8
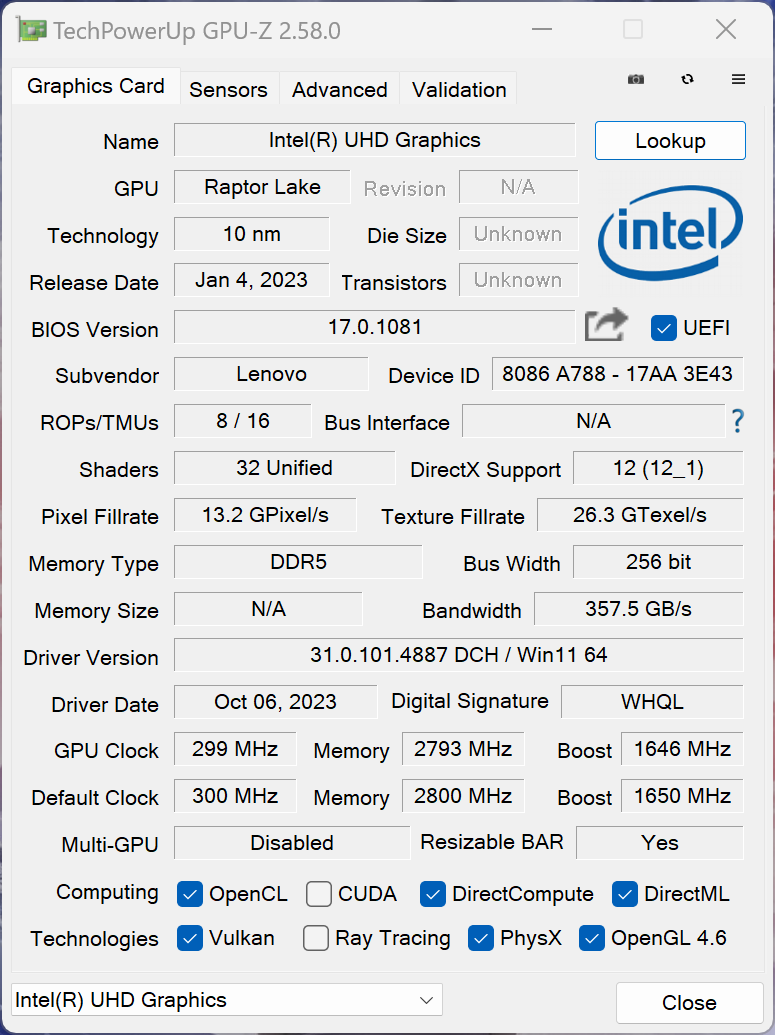
Scheda grafica - GeForce RTX 4070 laptop
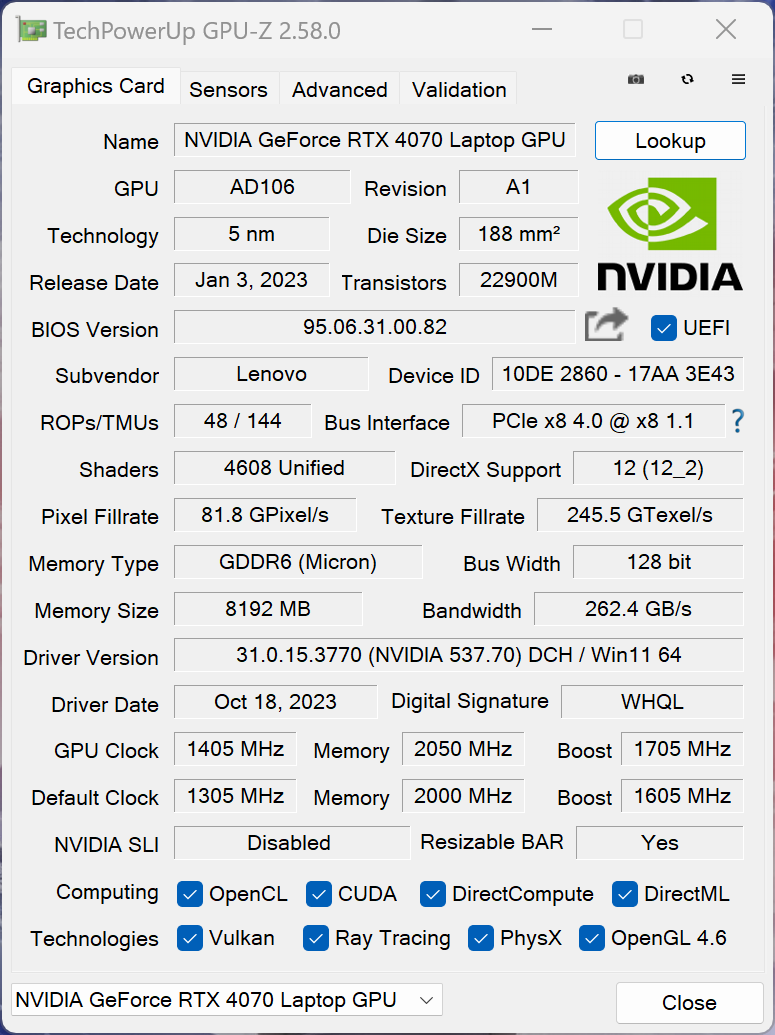
Il nostro dispositivo per la recensione è dotato di RTX 4070 anche se in realtà abbiamo a che fare con la versione da 115 watt. Inoltre, in modalità prestazioni, la GPU è leggermente overcloccata. Nei benchmark sintetici, con la sua variante da 140 watt, Legion 7 16 rimane un po' indietro rispetto alla concorrenza. Tuttavia, come stiamo per vedere, questo non è rilevante per i benchmark di gioco, poiché il laptop RTX 4070 non è in grado di consumare tutti i 140 watt. Legion supporta l'interruttore grafico Advanced Optimus.
Sotto carico sostenuto, la GPU rimane completamente stabile e, in modalità batteria, il consumo energetico è limitato a 50 watt. Per questo motivo, le prestazioni in questo caso sono inferiori di circa il 35%. Altri benchmark della GPU sono elencati qui.
| 3DMark 11 Performance | 35070 punti | |
| 3DMark Fire Strike Score | 25692 punti | |
| 3DMark Time Spy Score | 12844 punti | |
Aiuto | ||
| Blender / v3.3 Classroom OPTIX/RTX | |
| Media della classe Gaming (9 - 142, n=182, ultimi 2 anni) | |
| HP Omen Transcend 16-u1095ng | |
| Media NVIDIA GeForce RTX 4070 Laptop GPU (18 - 28, n=49) | |
| SCHENKER XMG CORE 16 (L23) | |
| Alienware m16 R2 | |
| Aorus 16X 2024 | |
| Lenovo Legion 7 16 IRX G9 | |
| Lenovo Legion Pro 5 16IRX9 | |
| Lenovo Legion Pro 7 16IRX9H | |
| Blender / v3.3 Classroom CUDA | |
| Media della classe Gaming (16 - 175, n=189, ultimi 2 anni) | |
| Media NVIDIA GeForce RTX 4070 Laptop GPU (32 - 142, n=52) | |
| HP Omen Transcend 16-u1095ng | |
| Alienware m16 R2 | |
| SCHENKER XMG CORE 16 (L23) | |
| Lenovo Legion Pro 5 16IRX9 | |
| Aorus 16X 2024 | |
| Lenovo Legion 7 16 IRX G9 | |
| Lenovo Legion Pro 7 16IRX9H | |
| Blender / v3.3 Classroom CPU | |
| Media della classe Gaming (138 - 962, n=202, ultimi 2 anni) | |
| SCHENKER XMG CORE 16 (L23) | |
| HP Omen Transcend 16-u1095ng | |
| Alienware m16 R2 | |
| Media NVIDIA GeForce RTX 4070 Laptop GPU (158 - 428, n=49) | |
| Aorus 16X 2024 | |
| Lenovo Legion 7 16 IRX G9 | |
| Lenovo Legion Pro 5 16IRX9 | |
| Lenovo Legion Pro 7 16IRX9H | |
* ... Meglio usare valori piccoli
Prestazioni di gioco
Le prestazioni di gioco di Legion 7 16 sono molto buone e tutti i titoli moderni possono essere giocati senza problemi con risoluzione QHD e dettagli massimi. Anche con la risoluzione nativa, le prestazioni dovrebbero essere sufficienti e, se lo si desidera, è possibile attivare l'upscaling DLSS. Nel confronto dei test di gioco, il dispositivo recensito ha ottenuto un punteggio leggermente migliore rispetto ai test sintetici e le prestazioni sono rimaste totalmente stabili anche durante le sessioni di gioco più lunghe. Ulteriori benchmark di gioco sono disponibili qui.
| The Witcher 3 - 1920x1080 Ultra Graphics & Postprocessing (HBAO+) | |
| Lenovo Legion Pro 7 16IRX9H | |
| Lenovo Legion Pro 5 16IRX9 | |
| Aorus 16X 2024 | |
| Alienware m16 R2 | |
| SCHENKER XMG CORE 16 (L23) | |
| Media della classe Gaming (8.61 - 216, n=228, ultimi 2 anni) | |
| HP Omen Transcend 16-u1095ng | |
| Lenovo Legion 7 16 IRX G9 | |
| GTA V - 1920x1080 Highest Settings possible AA:4xMSAA + FX AF:16x | |
| Lenovo Legion Pro 7 16IRX9H | |
| Lenovo Legion Pro 5 16IRX9 | |
| Lenovo Legion 7 16 IRX G9 | |
| SCHENKER XMG CORE 16 (L23) | |
| HP Omen Transcend 16-u1095ng | |
| Media della classe Gaming (6.38 - 167.7, n=219, ultimi 2 anni) | |
| Aorus 16X 2024 | |
| Horizon Forbidden West | |
| 1920x1080 Very High Preset AA:T | |
| Lenovo Legion Pro 7 16IRX9H | |
| Aorus 16X 2024 | |
| Media della classe Gaming (30.2 - 103.5, n=5, ultimi 2 anni) | |
| Media NVIDIA GeForce RTX 4070 Laptop GPU (53.2 - 76.7, n=6) | |
| Lenovo Legion 7 16 IRX G9 | |
| 2560x1440 Very High Preset AA:T | |
| Lenovo Legion Pro 7 16IRX9H | |
| Aorus 16X 2024 | |
| Media della classe Gaming (24.1 - 83.7, n=5, ultimi 2 anni) | |
| Media NVIDIA GeForce RTX 4070 Laptop GPU (40.3 - 59.1, n=6) | |
| Lenovo Legion 7 16 IRX G9 | |
Witcher 3 FPS diagram
| basso | medio | alto | ultra | QHD | |
| GTA V (2015) | 182.4 | 124.1 | 94.2 | ||
| The Witcher 3 (2015) | 246 | 113.1 | 92 | ||
| Dota 2 Reborn (2015) | 230 | 205 | 193.4 | 179.5 | |
| Final Fantasy XV Benchmark (2018) | 223 | 166.8 | 119.8 | 89.1 | |
| X-Plane 11.11 (2018) | 198 | 180.6 | 138.2 | ||
| Far Cry 5 (2018) | 193 | 166 | 157 | 146 | 115 |
| Strange Brigade (2018) | 436 | 311 | 250 | 220 | 143 |
| F1 23 (2023) | 287 | 284 | 222 | 70.1 | 43.9 |
| Baldur's Gate 3 (2023) | 155.6 | 127.9 | 115.7 | 115 | 71.9 |
| Cyberpunk 2077 2.0 Phantom Liberty (2023) | 129.7 | 117.1 | 99.6 | 85.2 | 51.4 |
| Horizon Forbidden West (2024) | 107.1 | 103.4 | 73.2 | 64.4 | 49.9 |
Emissioni - Raffreddamento rumoroso ma efficace
Emissioni di rumore
Quando si tratta di attività semplici, il raffreddamento di Legion 7 16 rimane spesso disattivato, anche in modalità prestazioni e nelle situazioni quotidiane può tranquillamente passare alla modalità silenziosa per ridurre al minimo il rumore della ventola. Con un massimo di 38,4 dB(A) in modalità silenziosa, è ancora possibile giocare senza cuffie, tuttavia, in entrambe le altre modalità, 50 e 54 dB(A) sono troppo alti. Nonostante questo, entrambi i modelli Legion Pro 5 e il Legion Pro 7 sono addirittura un po' più rumorosi. Dopo periodi di carico, anche le ventole riducono rapidamente la loro velocità. Nel dispositivo oggetto della recensione non erano presenti altri rumori elettronici.
Rumorosità
| Idle |
| 24.5 / 24.5 / 24.5 dB(A) |
| Sotto carico |
| 34.8 / 54.1 dB(A) |
 | ||
30 dB silenzioso 40 dB(A) udibile 50 dB(A) rumoroso |
||
min: | ||
| Lenovo Legion 7 16 IRX G9 NVIDIA GeForce RTX 4070 Laptop GPU, i9-14900HX, SK Hynix HFS001TEJ9X115N | Lenovo Legion Pro 5 16IRX9 NVIDIA GeForce RTX 4070 Laptop GPU, i9-14900HX, Samsung PM9A1 MZVL21T0HCLR | Aorus 16X 2024 NVIDIA GeForce RTX 4070 Laptop GPU, i9-14900HX, Gigabyte AG450E1024-SI | HP Omen Transcend 16-u1095ng NVIDIA GeForce RTX 4070 Laptop GPU, i9-14900HX, Kioxia XG8 KXG80ZNV1T02 | Alienware m16 R2 NVIDIA GeForce RTX 4070 Laptop GPU, Ultra 7 155H, Samsung PM9A1 MZVL21T0HCLR | SCHENKER XMG CORE 16 (L23) NVIDIA GeForce RTX 4070 Laptop GPU, R7 7840HS, Samsung 990 Pro 1 TB | Lenovo Legion Pro 7 16IRX9H NVIDIA GeForce RTX 4080 Laptop GPU, i9-14900HX, SK Hynix HFS001TEJ9X115N | |
|---|---|---|---|---|---|---|---|
| Noise | -6% | -21% | -9% | -2% | -1% | -22% | |
| off /ambiente * | 24.5 | 23.9 2% | 26 -6% | 24 2% | 24.7 -1% | 23 6% | 24 2% |
| Idle Minimum * | 24.5 | 24.3 1% | 26 -6% | 29 -18% | 25.3 -3% | 23 6% | 25 -2% |
| Idle Average * | 24.5 | 24.3 1% | 32 -31% | 30 -22% | 25.3 -3% | 28.48 -16% | 30 -22% |
| Idle Maximum * | 24.5 | 28.9 -18% | 38 -55% | 31 -27% | 25.3 -3% | 28.48 -16% | 45 -84% |
| Load Average * | 34.8 | 45.8 -32% | 54 -55% | 45 -29% | 31.7 9% | 30 14% | 50 -44% |
| Witcher 3 ultra * | 54.1 | 51 6% | 50 8% | 44 19% | 53.8 1% | 54.12 -0% | 54 -0% |
| Load Maximum * | 54.1 | 56.6 -5% | 55 -2% | 47 13% | 62 -15% | 54.12 -0% | 56 -4% |
* ... Meglio usare valori piccoli
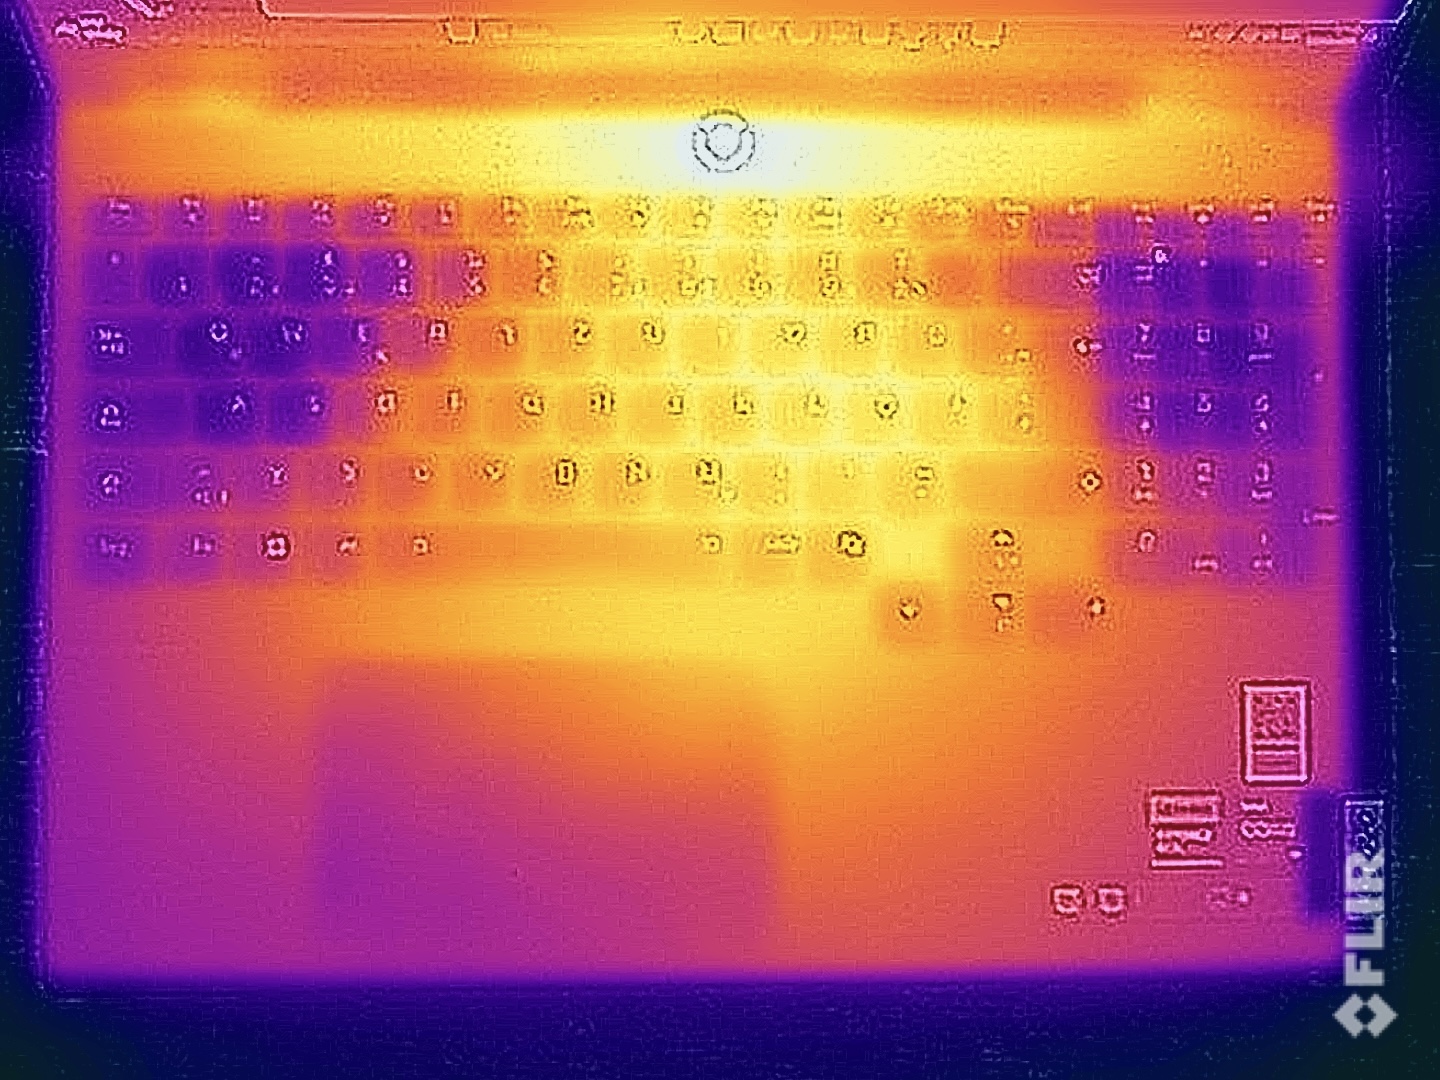
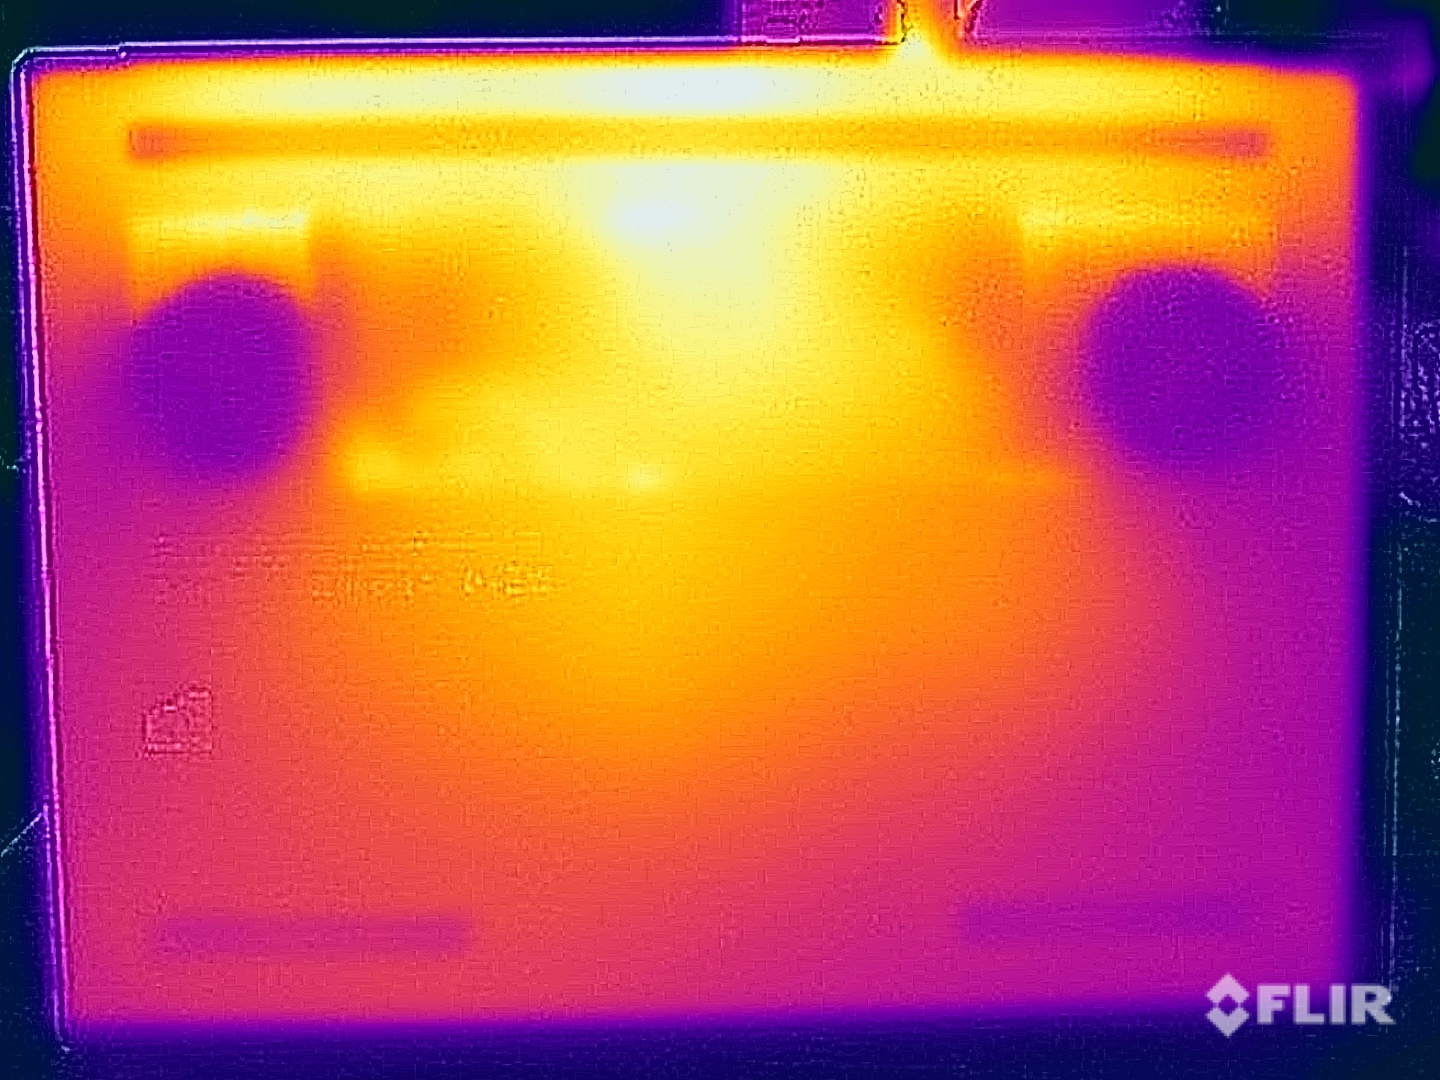
Temperatura
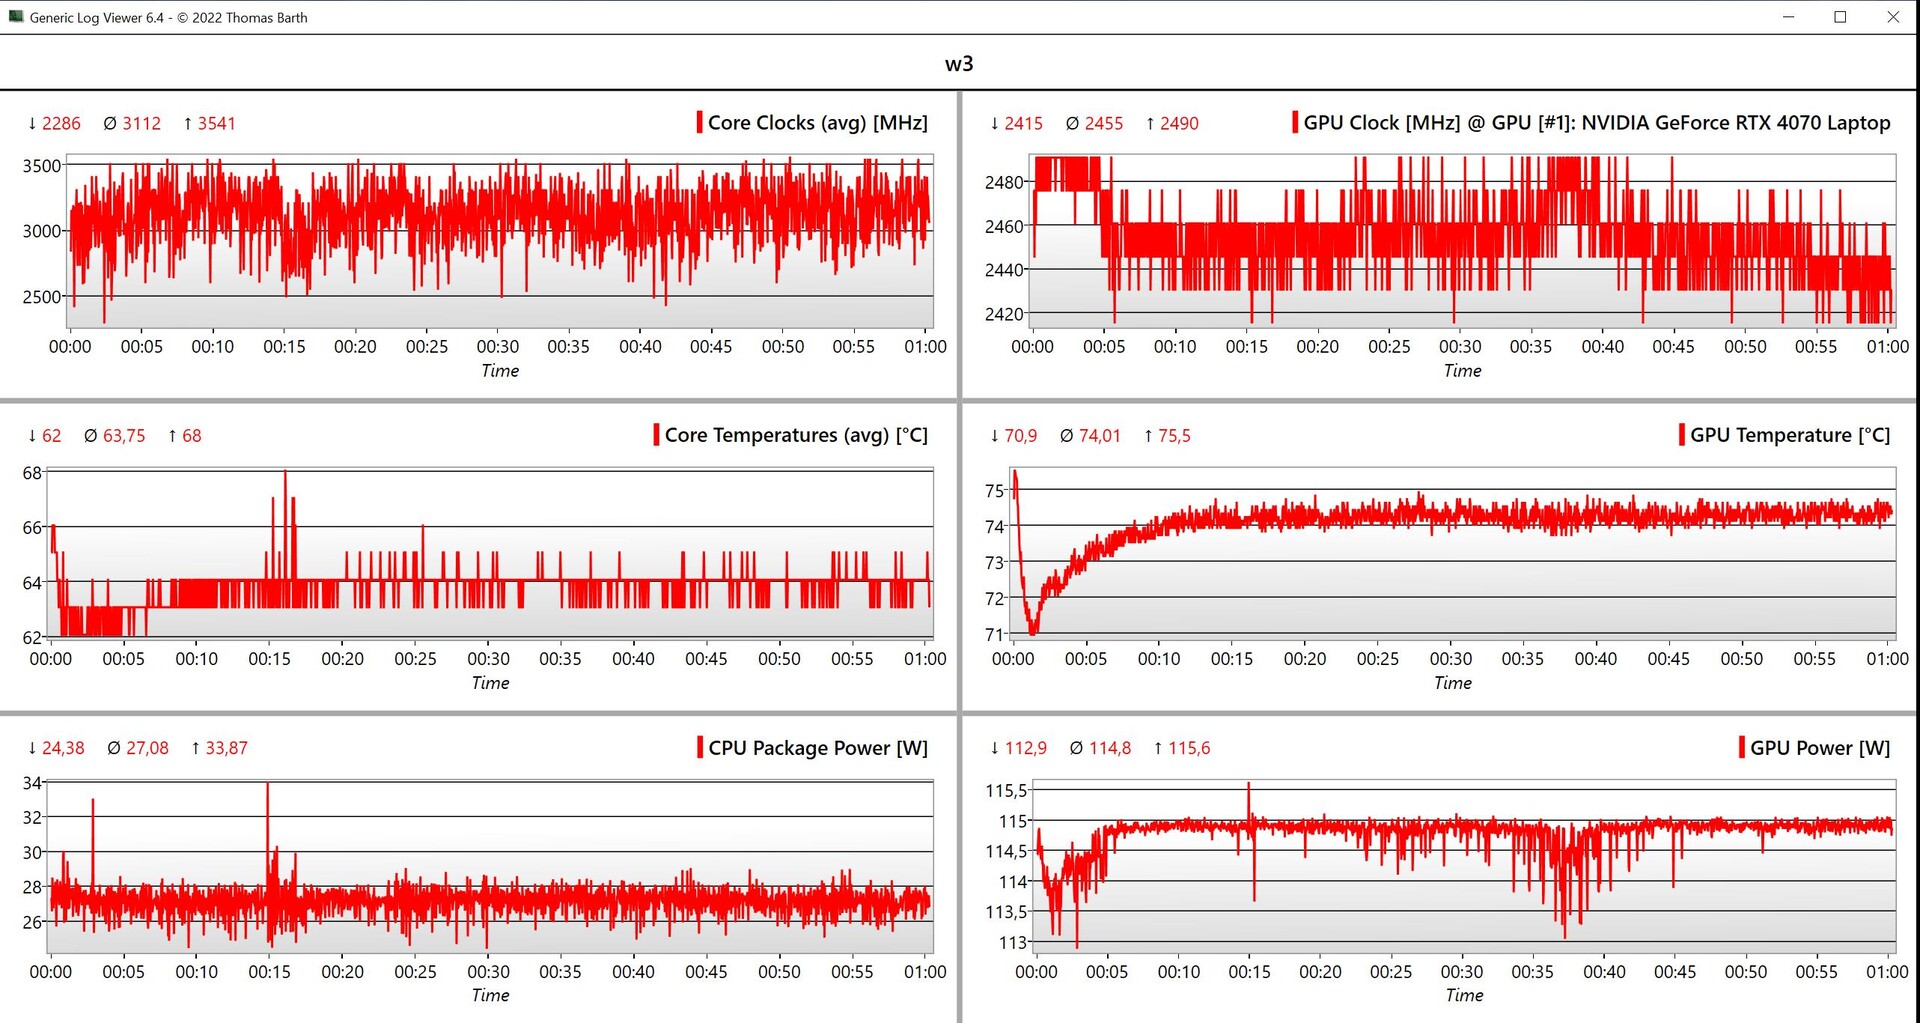
In condizioni di funzionamento al minimo e di basso carico, il case in alluminio rimane piacevolmente fresco e anche durante i giochi si comporta meglio del previsto. In alcuni punti, abbiamo misurato valori compresi tra 42 e 43 °C e, sebbene questo si noti anche quando si usa la tastiera, non comporta un'esperienza utente limitata e, ancora una volta, Legion 7 si comporta meglio di entrambi i modelli pro concorrenti, nonostante l'unità base più sottile. Nel test di stress con carico combinato CPU/GPU, la GPU funziona a 90 watt e la CPU a circa 54 watt.
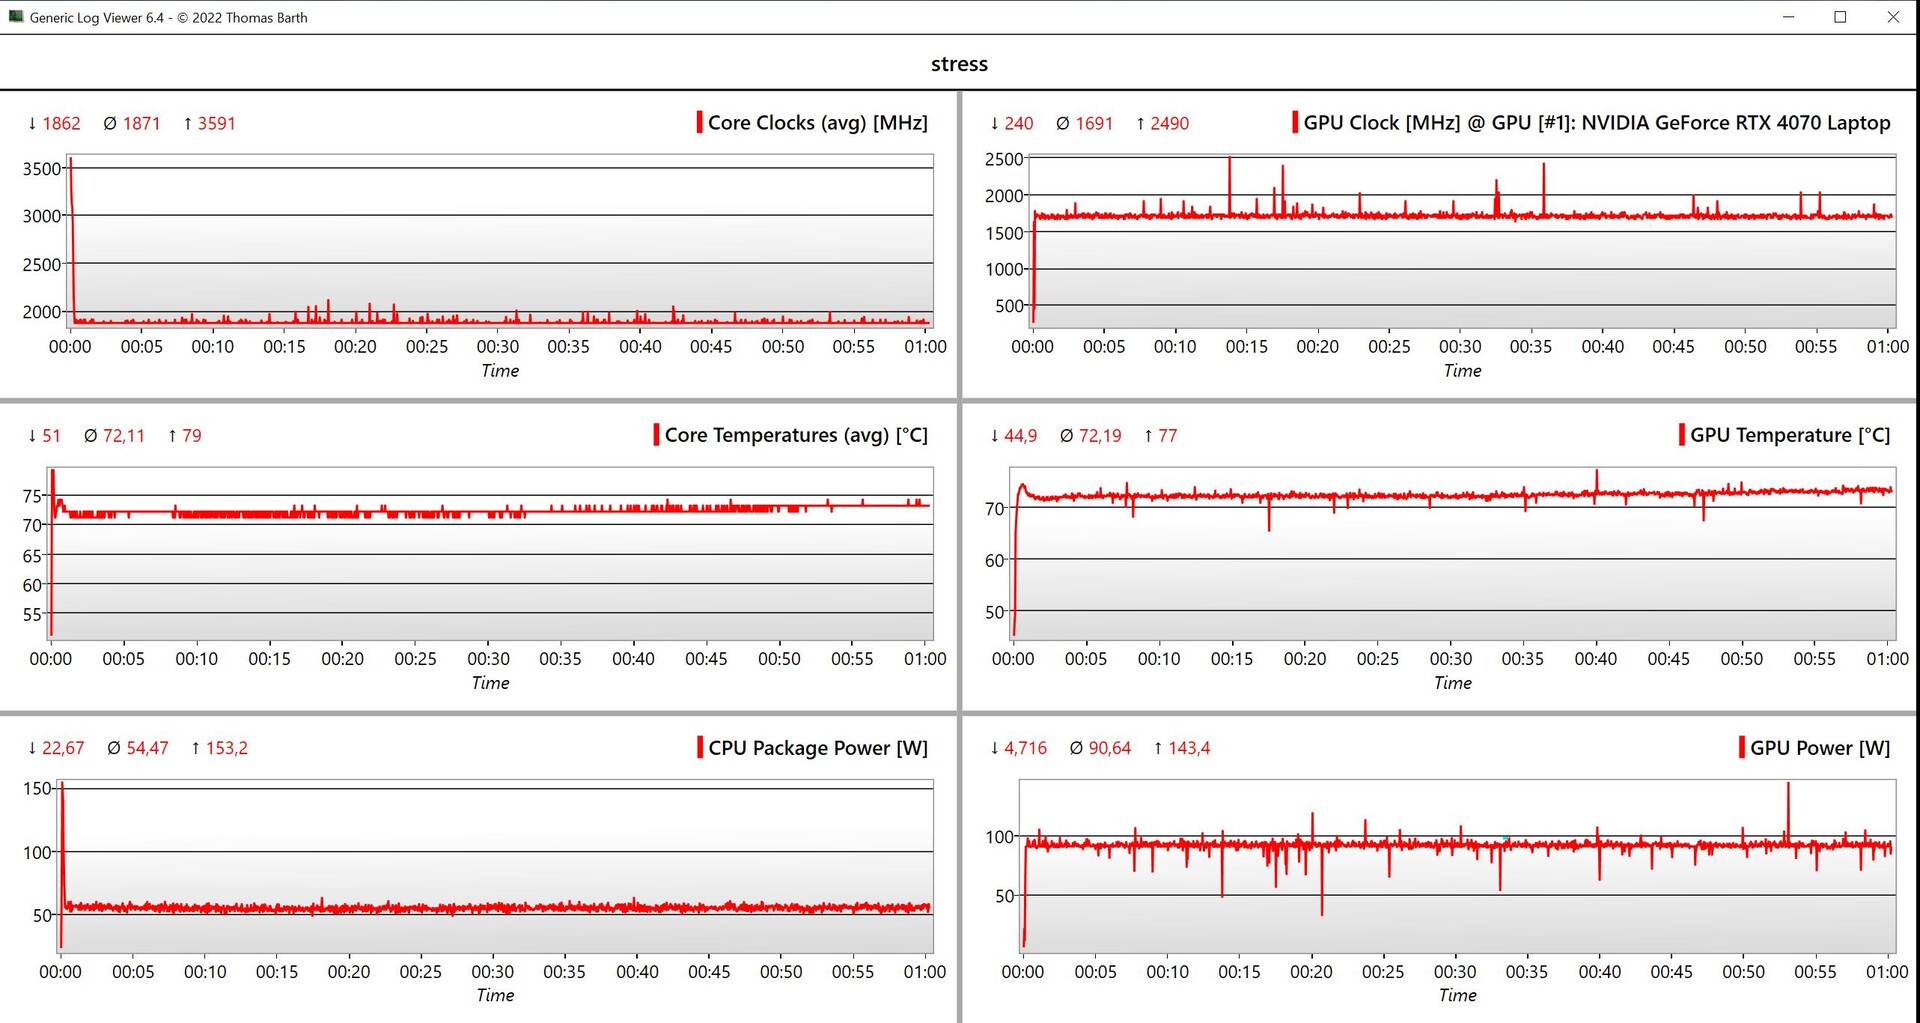
(±) La temperatura massima sul lato superiore è di 43.7 °C / 111 F, rispetto alla media di 40.4 °C / 105 F, che varia da 21.2 a 68.8 °C per questa classe Gaming.
(±) Il lato inferiore si riscalda fino ad un massimo di 42.9 °C / 109 F, rispetto alla media di 43.2 °C / 110 F
(+) In idle, la temperatura media del lato superiore è di 27 °C / 81 F, rispetto alla media deld ispositivo di 33.8 °C / 93 F.
(±) Riproducendo The Witcher 3, la temperatura media per il lato superiore e' di 37.2 °C / 99 F, rispetto alla media del dispositivo di 33.8 °C / 93 F.
(±) I poggiapolsi e il touchpad possono diventare molto caldi al tatto con un massimo di 38.7 °C / 101.7 F.
(-) La temperatura media della zona del palmo della mano di dispositivi simili e'stata di 28.9 °C / 84 F (-9.8 °C / -17.7 F).
| Lenovo Legion 7 16 IRX G9 Intel Core i9-14900HX, NVIDIA GeForce RTX 4070 Laptop GPU | Lenovo Legion Pro 5 16IRX9 Intel Core i9-14900HX, NVIDIA GeForce RTX 4070 Laptop GPU | Aorus 16X 2024 Intel Core i9-14900HX, NVIDIA GeForce RTX 4070 Laptop GPU | HP Omen Transcend 16-u1095ng Intel Core i9-14900HX, NVIDIA GeForce RTX 4070 Laptop GPU | Alienware m16 R2 Intel Core Ultra 7 155H, NVIDIA GeForce RTX 4070 Laptop GPU | SCHENKER XMG CORE 16 (L23) AMD Ryzen 7 7840HS, NVIDIA GeForce RTX 4070 Laptop GPU | Lenovo Legion Pro 7 16IRX9H Intel Core i9-14900HX, NVIDIA GeForce RTX 4080 Laptop GPU | |
|---|---|---|---|---|---|---|---|
| Heat | -15% | -10% | -14% | -20% | -7% | -18% | |
| Maximum Upper Side * | 43.7 | 43.8 -0% | 41 6% | 49 -12% | 44.8 -3% | 46 -5% | 46 -5% |
| Maximum Bottom * | 42.9 | 55.4 -29% | 41 4% | 63 -47% | 48 -12% | 44 -3% | 49 -14% |
| Idle Upper Side * | 29.1 | 32.8 -13% | 37 -27% | 30 -3% | 37.2 -28% | 32 -10% | 38 -31% |
| Idle Bottom * | 30.6 | 36 -18% | 38 -24% | 29 5% | 42 -37% | 33 -8% | 37 -21% |
* ... Meglio usare valori piccoli
Altoparlanti
Entrambi i diffusori stereo fanno un lavoro decente, ma c'è una differenza notevole tra loro e il più costoso Legion Pro 7 16. Tuttavia, i moduli sono abbastanza buoni per film/serie occasionali o musica di sottofondo. Quando si gioca, consigliamo di utilizzare una cuffia a causa del volume elevato delle ventole.
Lenovo Legion 7 16 IRX G9 analisi audio
(+) | gli altoparlanti sono relativamente potenti (82.1 dB)
Bassi 100 - 315 Hz
(±) | bassi ridotti - in media 13.1% inferiori alla media
(±) | la linearità dei bassi è media (9.7% delta rispetto alla precedente frequenza)
Medi 400 - 2000 Hz
(+) | medi bilanciati - solo only 2.8% rispetto alla media
(+) | medi lineari (3.7% delta rispetto alla precedente frequenza)
Alti 2 - 16 kHz
(+) | Alti bilanciati - appena 4.7% dalla media
(±) | la linearità degli alti è media (7% delta rispetto alla precedente frequenza)
Nel complesso 100 - 16.000 Hz
(+) | suono nel complesso lineare (12.6% differenza dalla media)
Rispetto alla stessa classe
» 14% di tutti i dispositivi testati in questa classe è stato migliore, 3% simile, 82% peggiore
» Il migliore ha avuto un delta di 6%, medio di 18%, peggiore di 132%
Rispetto a tutti i dispositivi testati
» 9% di tutti i dispositivi testati in questa classe è stato migliore, 2% similare, 89% peggiore
» Il migliore ha avuto un delta di 4%, medio di 25%, peggiore di 134%
Lenovo Legion Pro 7 16IRX9H analisi audio
(+) | gli altoparlanti sono relativamente potenti (84 dB)
Bassi 100 - 315 Hz
(±) | bassi ridotti - in media 9% inferiori alla media
(±) | la linearità dei bassi è media (7.4% delta rispetto alla precedente frequenza)
Medi 400 - 2000 Hz
(+) | medi bilanciati - solo only 2.8% rispetto alla media
(+) | medi lineari (4% delta rispetto alla precedente frequenza)
Alti 2 - 16 kHz
(+) | Alti bilanciati - appena 3% dalla media
(+) | alti lineari (5% delta rispetto alla precedente frequenza)
Nel complesso 100 - 16.000 Hz
(+) | suono nel complesso lineare (8.4% differenza dalla media)
Rispetto alla stessa classe
» 1% di tutti i dispositivi testati in questa classe è stato migliore, 1% simile, 98% peggiore
» Il migliore ha avuto un delta di 6%, medio di 18%, peggiore di 132%
Rispetto a tutti i dispositivi testati
» 1% di tutti i dispositivi testati in questa classe è stato migliore, 0% similare, 98% peggiore
» Il migliore ha avuto un delta di 4%, medio di 25%, peggiore di 134%
Gestione dell'energia - Tempi medi di funzionamento della batteria
Consumo di energia
Nelle misurazioni del consumo, il dispositivo in esame non ci ha sorpreso e, nell'uso inattivo, abbiamo registrato un massimo di quasi 22 watt. In modalità prestazioni, l'alimentatore da 230 watt è stato per breve tempo il fattore limitante, ma si è rapidamente stabilizzato e il consumo si è rapidamente assestato a 200 watt. Nel complesso, l'alimentatore da 230 watt è ben dimensionato. Tuttavia, Lenovo potrebbe migliorare il consumo in standby di oltre 1,1 watt.
| Off / Standby | |
| Idle | |
| Sotto carico |
|
Leggenda:
min: Attualmente utilizziamo il Metrahit Energy, un multimetro digitale professionale per la misurazione della qualità della potenza e dell'energia monofase, per le nostre misurazioni. | |
| Lenovo Legion 7 16 IRX G9 i9-14900HX, NVIDIA GeForce RTX 4070 Laptop GPU, SK Hynix HFS001TEJ9X115N, IPS, 3200x2000, 16.00 | Aorus 16X 2024 i9-14900HX, NVIDIA GeForce RTX 4070 Laptop GPU, Gigabyte AG450E1024-SI, IPS, 2560x1600, 16.00 | HP Omen Transcend 16-u1095ng i9-14900HX, NVIDIA GeForce RTX 4070 Laptop GPU, Kioxia XG8 KXG80ZNV1T02, OLED, 2560x1600, 16.00 | Alienware m16 R2 Ultra 7 155H, NVIDIA GeForce RTX 4070 Laptop GPU, Samsung PM9A1 MZVL21T0HCLR, IPS, 2560x1600, 16.00 | SCHENKER XMG CORE 16 (L23) R7 7840HS, NVIDIA GeForce RTX 4070 Laptop GPU, Samsung 990 Pro 1 TB, IPS, 2560x1600, 16.00 | Lenovo Legion Pro 7 16IRX9H i9-14900HX, NVIDIA GeForce RTX 4080 Laptop GPU, SK Hynix HFS001TEJ9X115N, IPS, 2560x1600, 16.00 | Media NVIDIA GeForce RTX 4070 Laptop GPU | Media della classe Gaming | |
|---|---|---|---|---|---|---|---|---|
| Power Consumption | -4% | 4% | 6% | 20% | -27% | 12% | 1% | |
| Idle Minimum * | 15.4 | 13 16% | 10 35% | 8.1 47% | 11 29% | 16 -4% | 12.1 ? 21% | 13.9 ? 10% |
| Idle Average * | 21.2 | 18 15% | 18 15% | 13 39% | 15.2 28% | 21 1% | 16.9 ? 20% | 19.2 ? 9% |
| Idle Maximum * | 21.9 | 35 -60% | 32 -46% | 40.3 -84% | 16 27% | 36 -64% | 24.1 ? -10% | 27 ? -23% |
| Load Average * | 128.5 | 138 -7% | 128 -0% | 79 39% | 64 50% | 132 -3% | 99.5 ? 23% | 111.4 ? 13% |
| Witcher 3 ultra * | 188.4 | 172.6 8% | 148.4 21% | 188.1 -0% | 179 5% | 267 -42% | ||
| Load Maximum * | 239.1 | 222 7% | 242 -1% | 254.9 -7% | 280 -17% | 360 -51% | 220 ? 8% | 251 ? -5% |
* ... Meglio usare valori piccoli
Power consumption Witcher 3 / stress test
Power consumption with an external monitor
Durata della batteria
Lenovo ha installato una batteria da 99,9 Wh nel suo Legion 7 16 e, nel complesso, i tempi di esecuzione possono essere considerati abbastanza medi. A 150 cd/m² (che rappresenta il 63% della luminosità massima del dispositivo recensito) e 60 Hz, il nostro test Wi-Fi ha funzionato per oltre 7 ore (~6,5 ore a 165 Hz) e circa 5,5 ore a piena luminosità e 60 Hz (~5 ore a 165 Hz). Nel test video a 150 cd/m², abbiamo registrato poco più di 10 ore, e sotto carico, nel caso peggiore, le luci si spengono dopo 50 minuti.
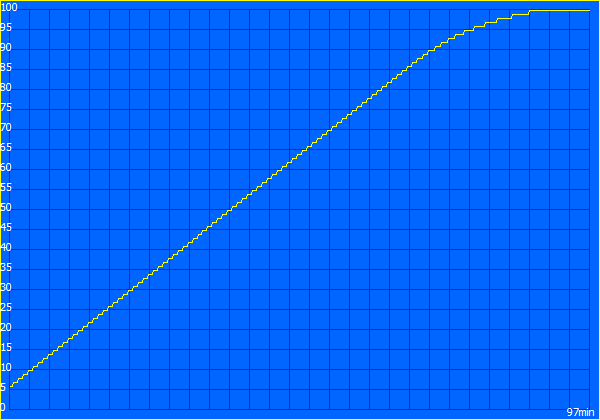
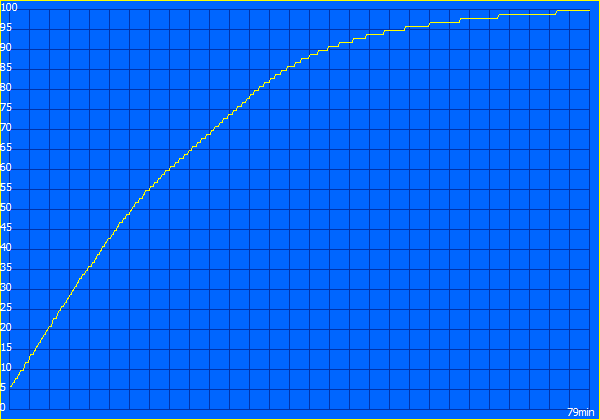
Il sito Legion offre due modalità di ricarica, con un ciclo di ricarica completo che richiede 97 minuti (80 % dopo ~64 minuti) utilizzando la modalità normale. Con la modalità express, occorrono 79 minuti (80 % dopo soli 34 minuti).
| Lenovo Legion 7 16 IRX G9 i9-14900HX, NVIDIA GeForce RTX 4070 Laptop GPU, 99.9 Wh | Lenovo Legion Pro 5 16IRX9 i9-14900HX, NVIDIA GeForce RTX 4070 Laptop GPU, 80 Wh | Aorus 16X 2024 i9-14900HX, NVIDIA GeForce RTX 4070 Laptop GPU, 99 Wh | HP Omen Transcend 16-u1095ng i9-14900HX, NVIDIA GeForce RTX 4070 Laptop GPU, 97 Wh | Alienware m16 R2 Ultra 7 155H, NVIDIA GeForce RTX 4070 Laptop GPU, 90 Wh | SCHENKER XMG CORE 16 (L23) R7 7840HS, NVIDIA GeForce RTX 4070 Laptop GPU, 99 Wh | Lenovo Legion Pro 7 16IRX9H i9-14900HX, NVIDIA GeForce RTX 4080 Laptop GPU, 99.9 Wh | Media della classe Gaming | |
|---|---|---|---|---|---|---|---|---|
| Autonomia della batteria | 0% | 34% | -33% | 17% | 69% | -14% | 7% | |
| H.264 | 620 | 541 -13% | 609 -2% | 400 ? -35% | ||||
| WiFi v1.3 | 433 | 290 -33% | 481 11% | 292 -33% | 483 12% | 501 16% | 373 -14% | 367 ? -15% |
| Load | 49 | 65 33% | 100 104% | 60 22% | 143 192% | 84.3 ? 72% | ||
| Reader / Idle | 403 | 753 | 758 | 543 ? |
Pro
Contro
Verdetto - Un portatile da gioco sobrio e performante

Con il nuovo Legion 7i 16 G9, Lenovo offre un portatile da gioco relativamente sottile che non ha rivelato alcun punto debole evidente durante i test. Rispetto al più costoso Legion Pro 7bisogna accettare delle limitazioni quando si tratta di lunghi periodi di prestazioni della CPU e della GPU equipaggiata ( Legion 7 raggiunge il massimo del laptop RTX 4070) ma, rispetto al Pro, il case in alluminio rimane più fresco e, nel complesso, il raffreddamento fa un ottimo lavoro. Le ventole sono ancora problematiche perché è necessaria una cuffia quando si gioca, utilizzando una delle due modalità a energia rapida. Tuttavia, questo vale anche per la concorrenza e, utilizzando la modalità silenziosa, è possibile avere livelli sonori tollerabili a scapito di alcune prestazioni.
Inoltre, il case più sottile è molto meno evidente rispetto a Legion Pro. Chi è a caccia di ampie opzioni di illuminazione rimarrà deluso ma, d'altra parte, questo rende Legion 7 16 adatto anche ad altri gruppi target. L'unico aspetto fastidioso sono le superfici sensibili alle impronte digitali. A parte la porta Ethernet mancante, tutti i connettori importanti sono a bordo e non ci sono problemi per quanto riguarda i dispositivi di input.
Il nuovo Lenovo Legion 7i 16 G9 è un notebook da gioco accattivante con prestazioni elevate e un buon set di funzioni. Il display IPS ad alta risoluzione è adatto anche per la visualizzazione e l'editing di immagini e non è implementato il PWM.
Nel complesso, il display IPS opzionale e la sua risoluzione di 3.200 x 2.000 pixel fanno un buon lavoro, anche se l'impressione soggettiva dell'immagine e i tempi di risposta non riescono a tenere il passo con i pannelli OLED. Il lato positivo è la mancanza di PWM e l'assenza di fastidiosi riflessi. Allo stesso modo, i tempi di esecuzione della batteria sono solo nella media, con la piattaforma e il processore HX che richiedono semplicemente troppa energia.
Il nuovo Legion 7 16 si comporta bene anche quando viene messo a confronto con i suoi colleghi. In particolare, Legion Pro 7 è adatto se si desidera una GPU più veloce del laptop RTX 4070. Con una potenza paragonabile, il Legion Pro 5 è invece molto più ingombrante e offre anche uno schermo più scadente. Il HP Omen Transcend è dotato di un OLED da 240 Hz, ma offre anche prestazioni leggermente inferiori e un prezzo più elevato.
Prezzo e disponibilità
Legion 7i 16 G9 può essere acquistato direttamente da Lenovo per circa 2.099 dollari.
Lenovo Legion 7 16 IRX G9
-
04/13/2024 v7
Andreas Osthoff
Transparency
The present review sample was made available to the author as a loan by the manufacturer or a shop for the purposes of review. The lender had no influence on this review, nor did the manufacturer receive a copy of this review before publication. There was no obligation to publish this review.
Pricecompare

