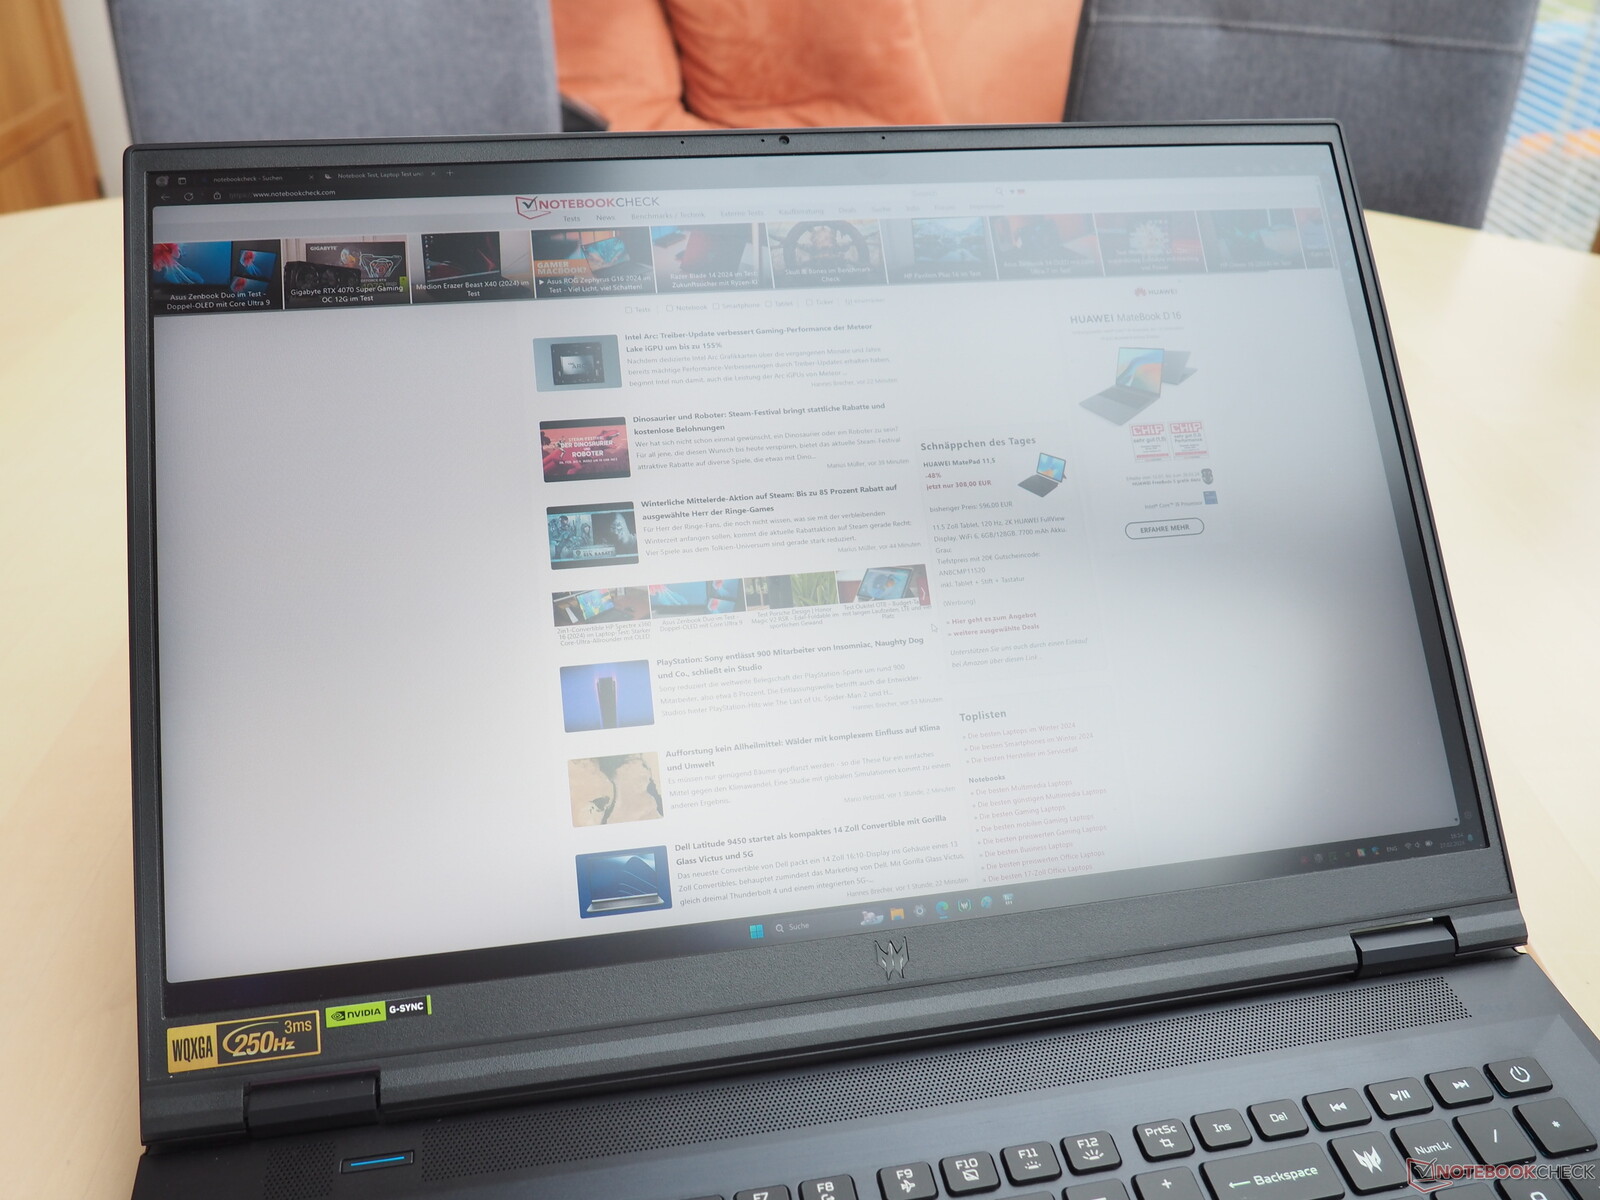
Recensione del computer portatile Acer Predator Helios 18 2024: Un nuovo hardware per i gamers da 18 pollici

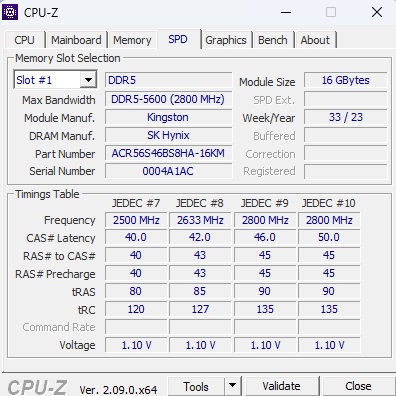
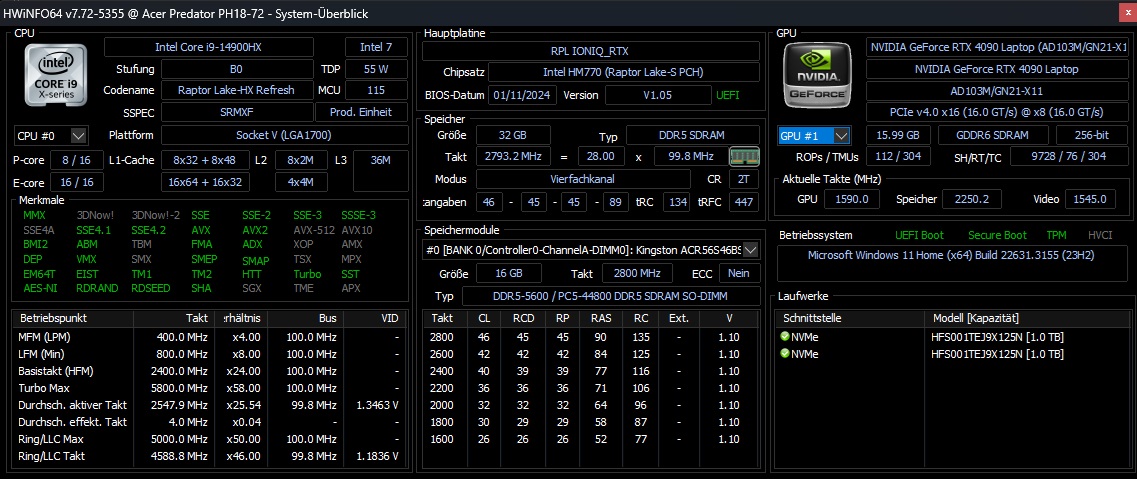
Nel 2023, Acer ha iniziato a vendere computer portatili da 18 pollici. Mentre il nostro primo dispositivo di prova era dotato di un Core i9-13900HX e una GeForce RTX 4080la configurazione di prova del modello successivo vanta un Core i9-14900HX e una GeForce RTX 4090. Una cosa che è rimasta invariata è il potente pannello Mini-LED del portatile, che impressiona quasi completamente senza compromessi (ne parleremo tra poco). Acer ha installato 2x 16 GB di RAM DDR5-5600 e due NVMe-SSD in formato RAID-0 (M.2 2280) con 1 TB di memoria ciascuno. Al momento del test, il portatile non è ancora disponibile negli Stati Uniti, quindi non possiamo ancora fornire informazioni sul suo MRSP.
Tra i concorrenti di Predator Helios 18 ci sono gamer da 18 pollici, come ad esempio MSI Titan 18 HX A14e l'Asus ROG Strix Scar 18 G834 Asus ROG Strix Scar 18 G834 e il Alienware m18 R1-tutti elencati nelle tabelle come dispositivi di confronto.
Potenziali concorrenti a confrontos
Punteggio | Data | Modello | Peso | Altezza | Dimensione | Risoluzione | Prezzo |
|---|---|---|---|---|---|---|---|
| 87.1 % v7 (old) | 03/2024 | Acer Predator Helios 18 PH18-72-98MW i9-14900HX, GeForce RTX 4090 Laptop GPU | 3.3 kg | 29.5 mm | 18.00" | 2560x1600 | |
| 88.8 % v7 (old) | 01/2024 | MSI Titan 18 HX A14VIG i9-14900HX, GeForce RTX 4090 Laptop GPU | 3.6 kg | 32.1 mm | 18.00" | 3840x2400 | |
| 88.3 % v7 (old) | 02/2024 | Asus ROG Strix Scar 18 G834JYR (2024) i9-14900HX, GeForce RTX 4090 Laptop GPU | 3.1 kg | 30.8 mm | 18.00" | 2560x1600 | |
| 88.3 % v7 (old) | 10/2023 | Acer Predator Helios 18 N23Q2 i9-13900HX, GeForce RTX 4080 Laptop GPU | 3.2 kg | 29.15 mm | 18.00" | 2560x1600 | |
| 89.2 % v7 (old) | 11/2023 | Alienware m18 R1 AMD R9 7945HX, Radeon RX 7900M | 3.9 kg | 26.7 mm | 18.00" | 1920x1200 |
Caso
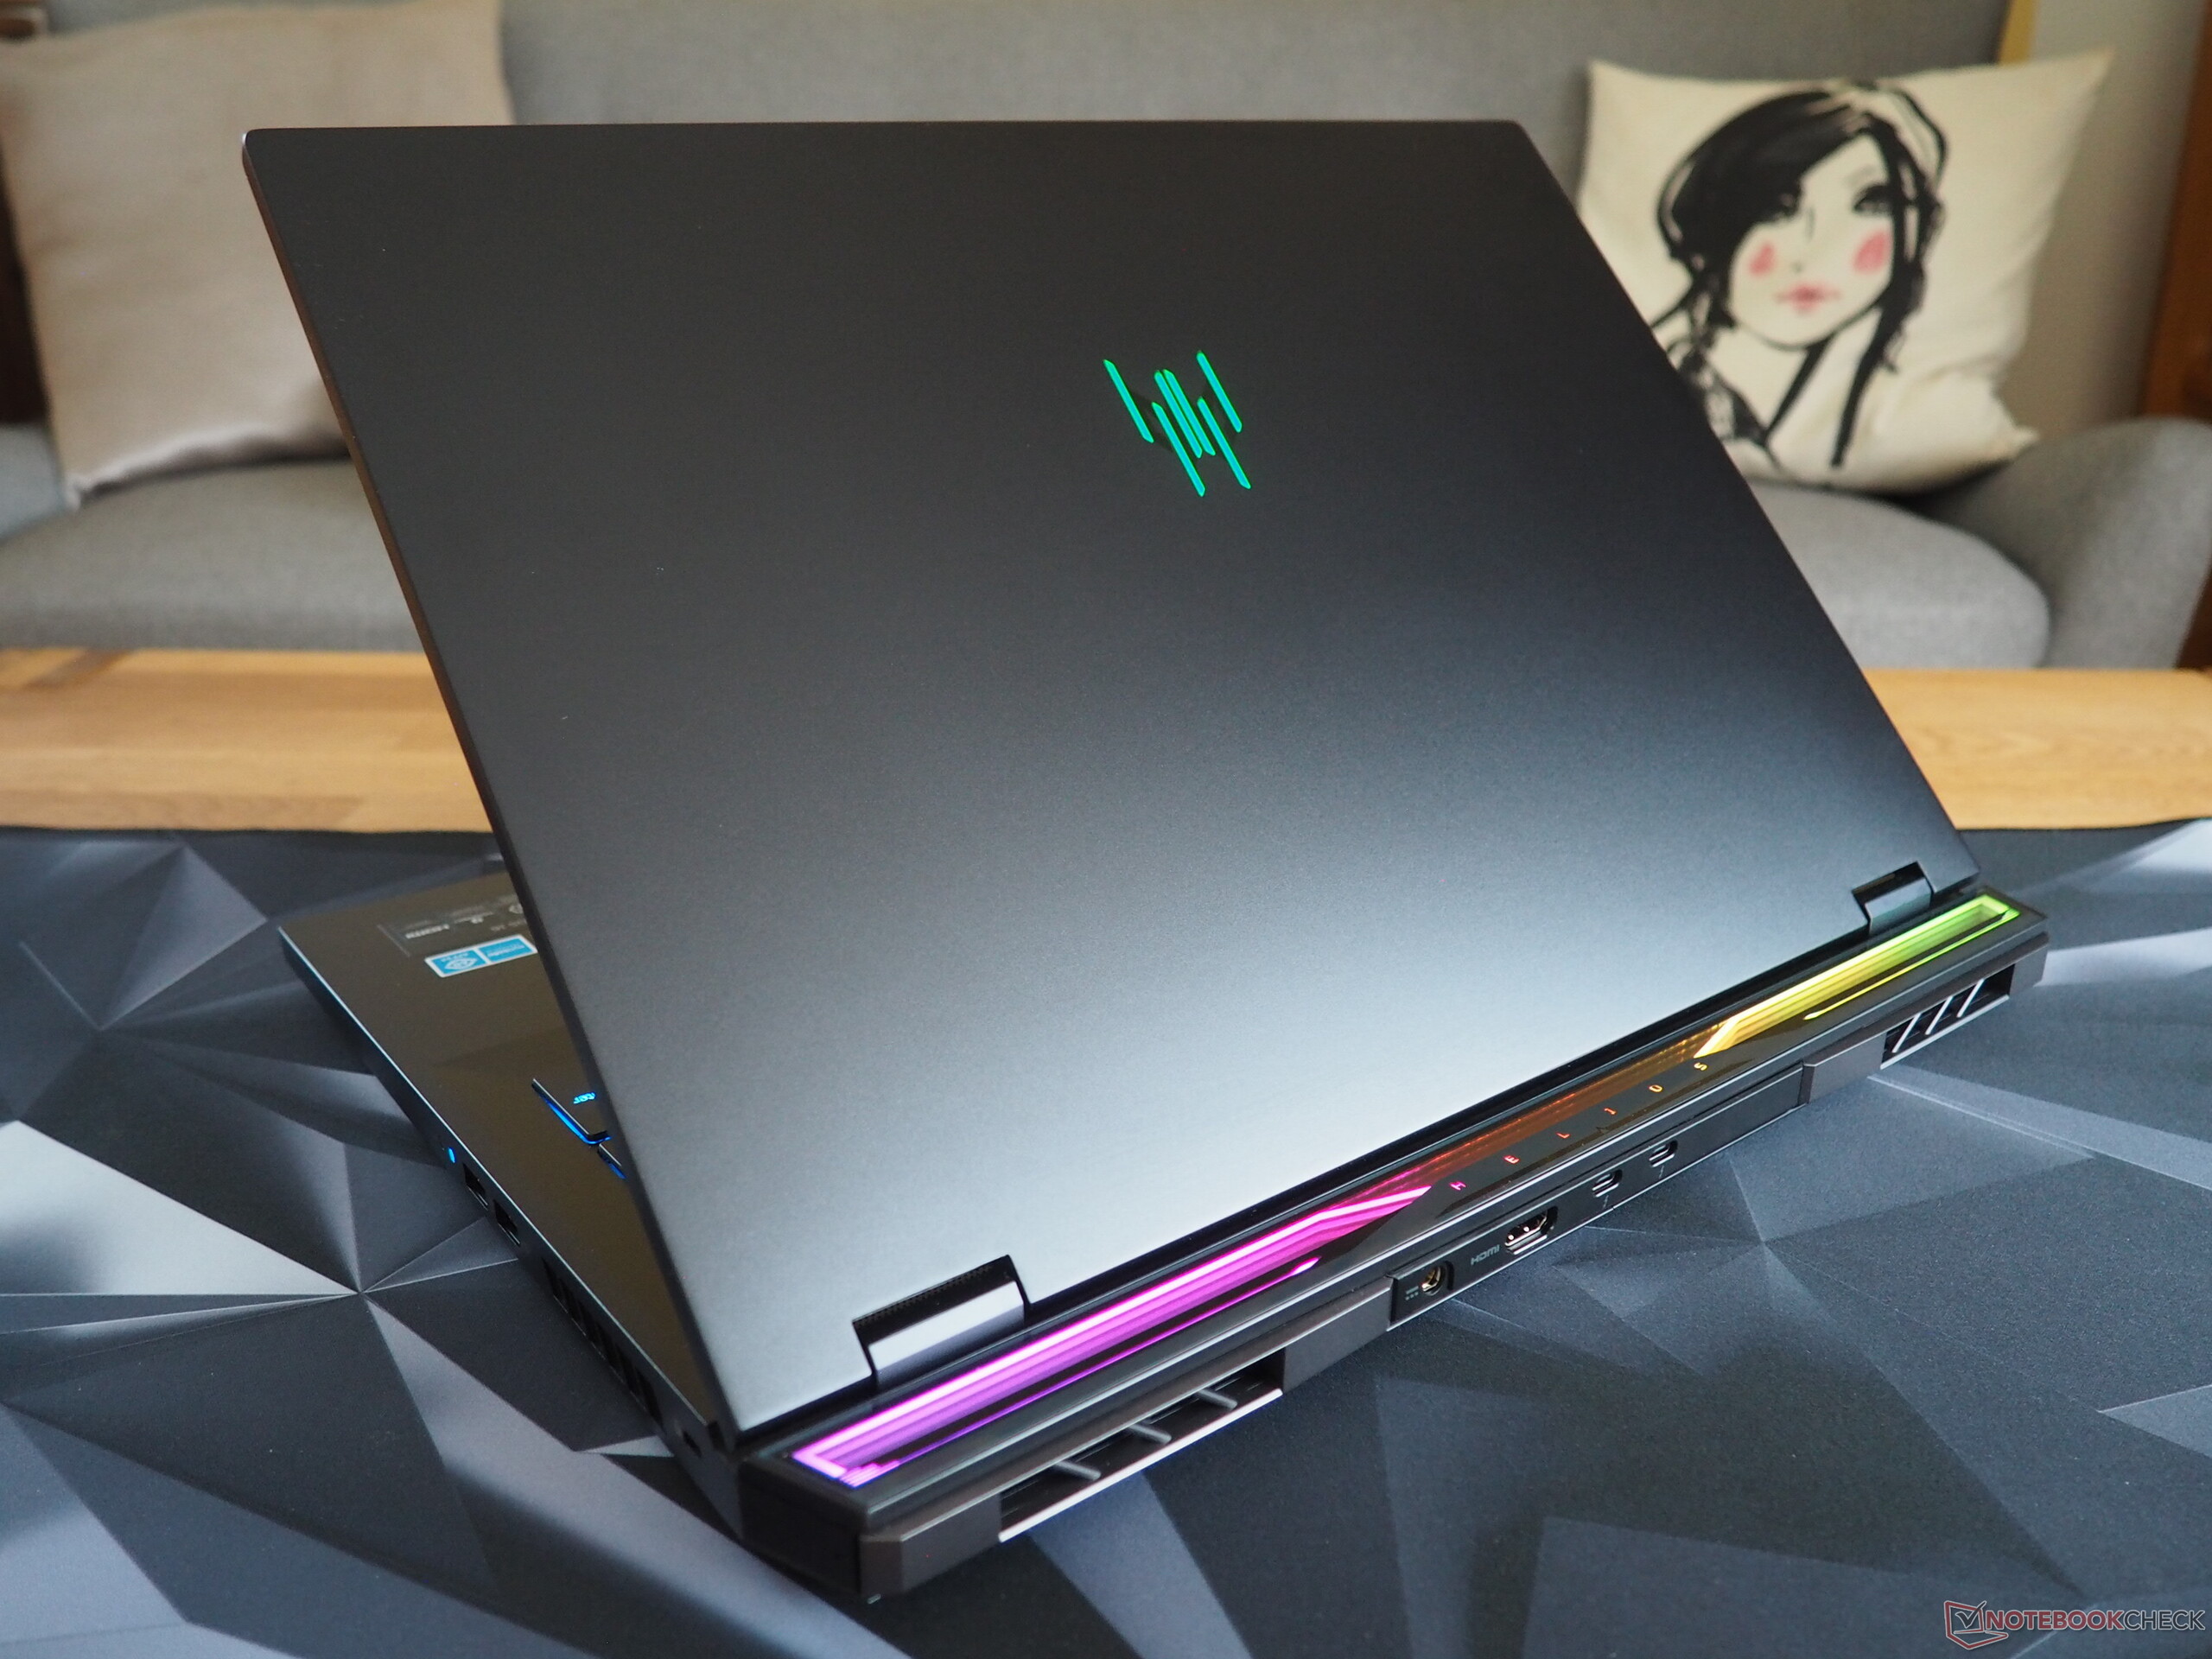
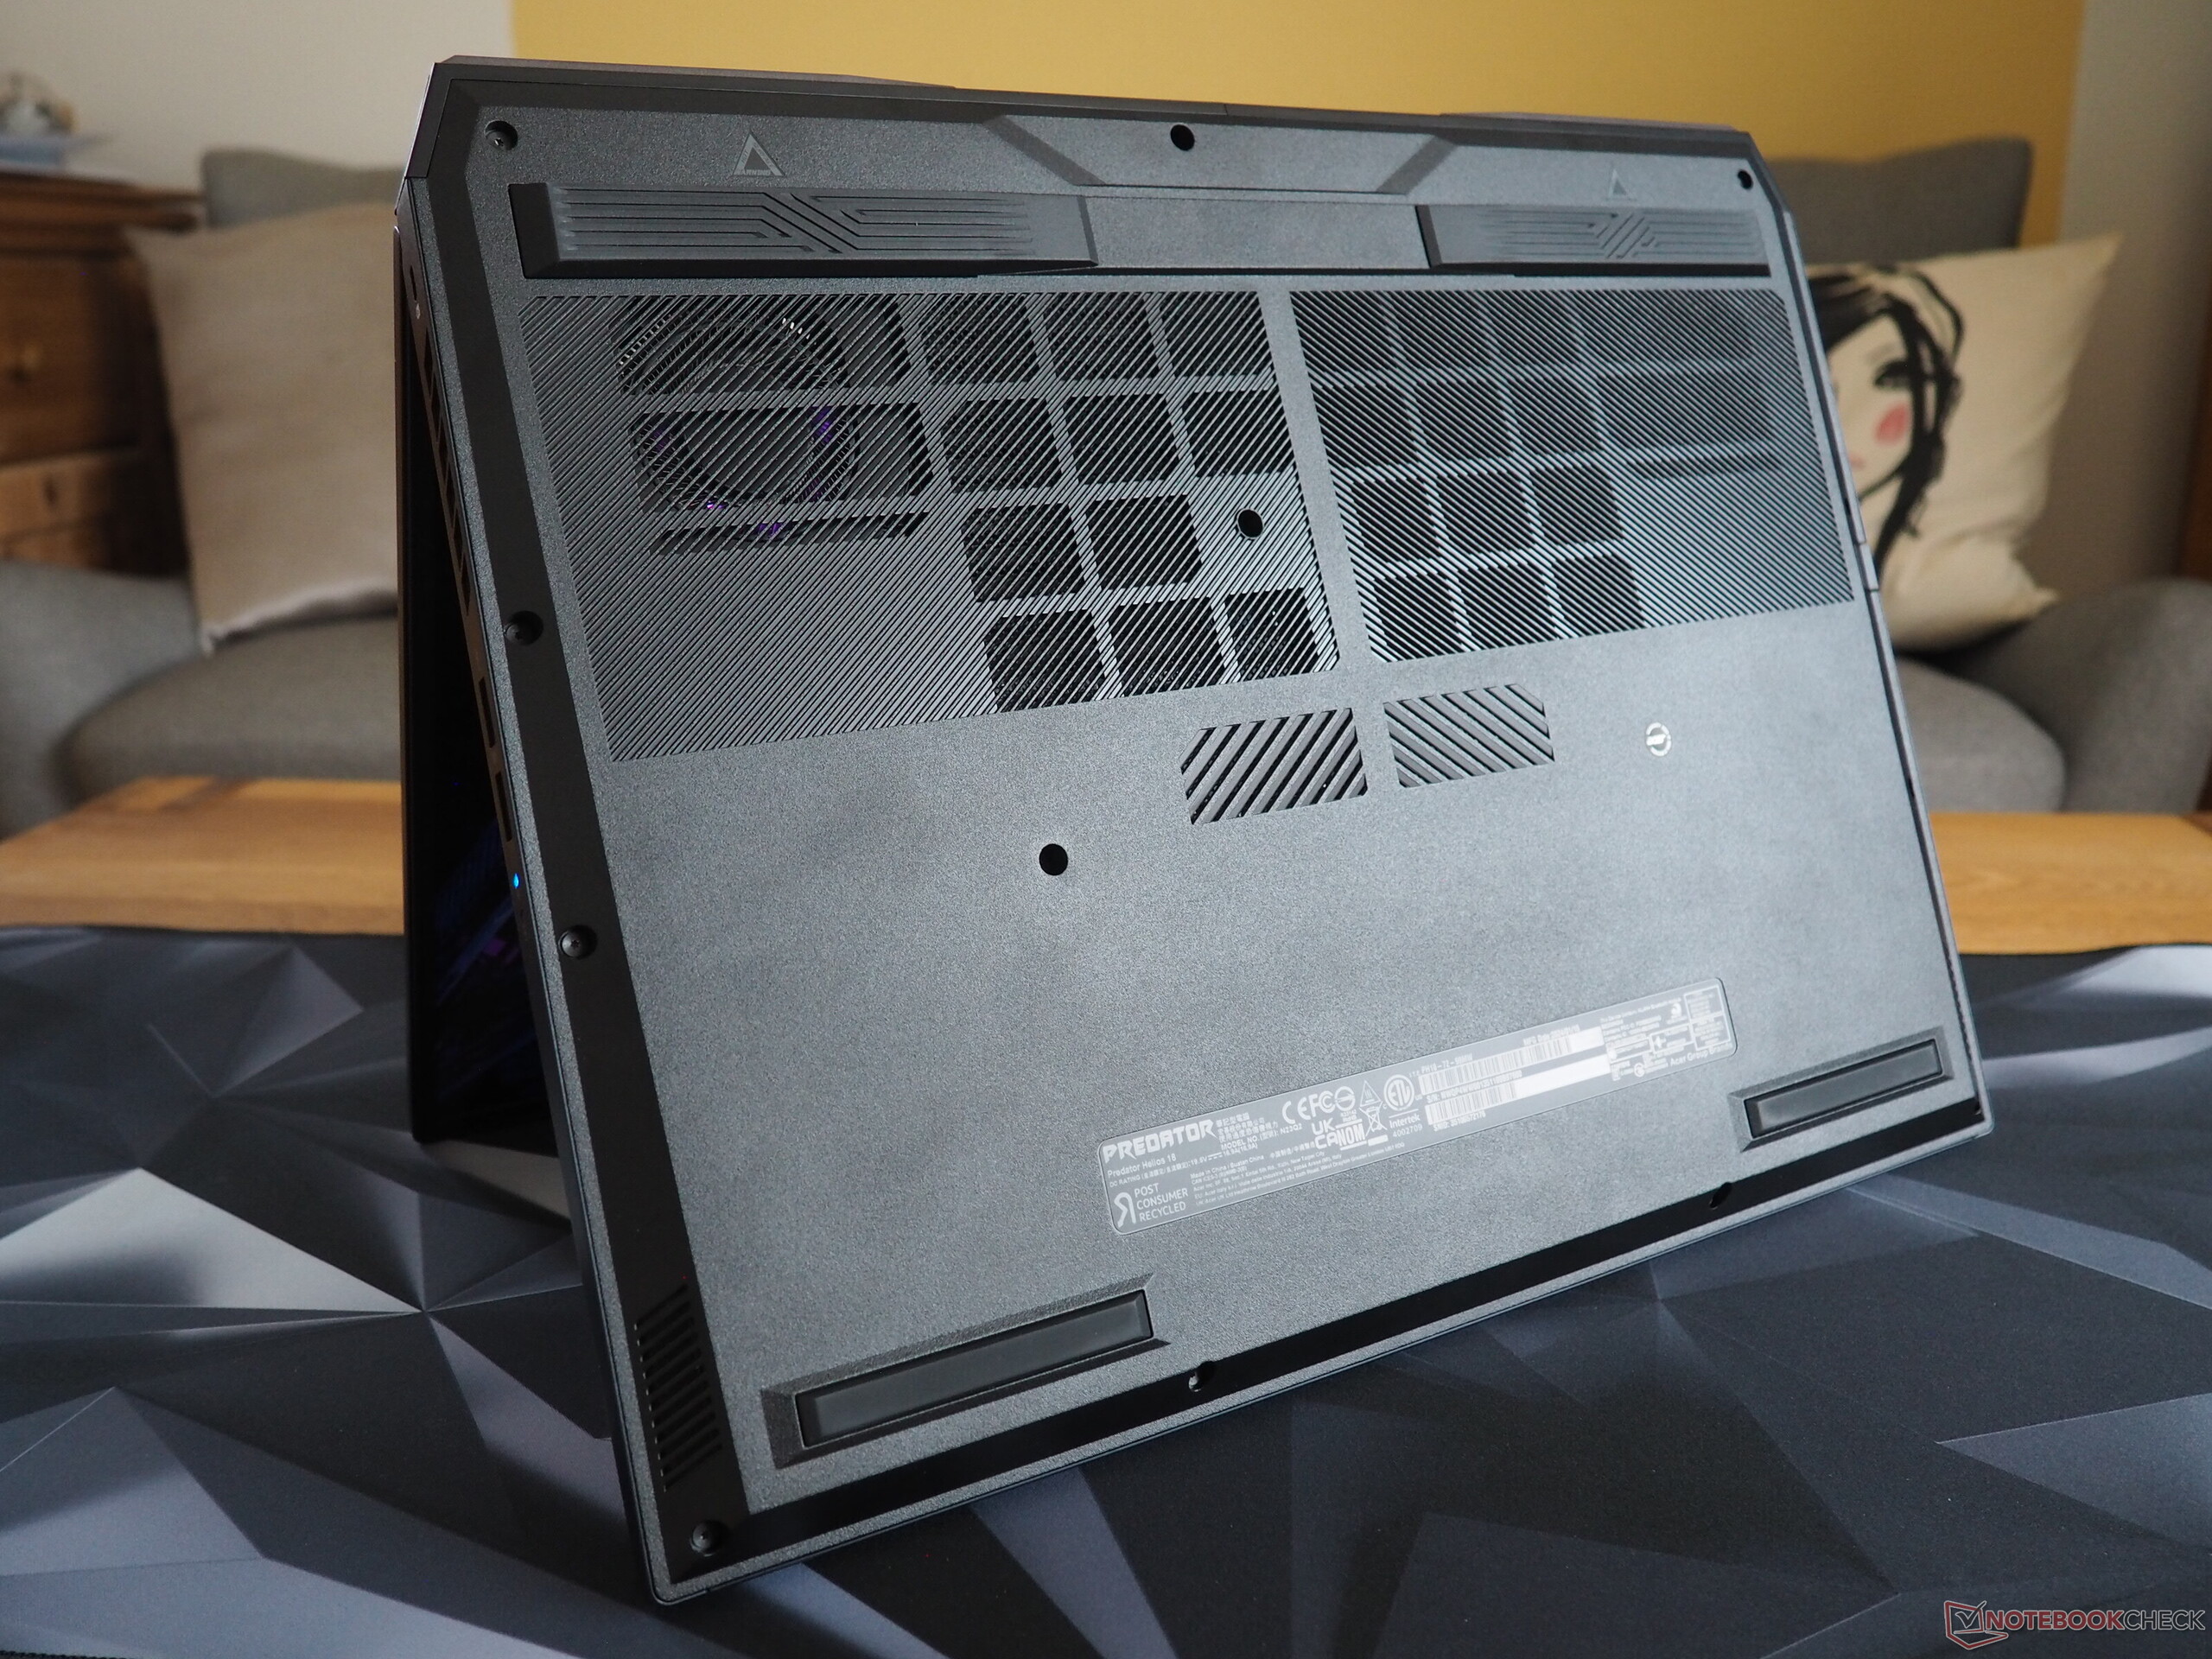
Per quanto riguarda l'involucro del dispositivo, Acer è rimasta fedele al suo predecessore, anche se osservando più da vicino si notano alcuni cambiamenti. Il produttore ha sostituito il modello di tastiera e ha ridisegnato l'elegante striscia luminosa lungo la parte posteriore. Il portatile continua a dare una sensazione di alta qualità, in quanto il suo coperchio e la parte superiore dell'unità di base sono entrambi realizzati in metallo. Inoltre, non abbiamo nulla di negativo da segnalare sulla costruzione del dispositivo. Semmai, Acer potrebbe migliorare le cerniere del portatile, che a volte sono un po' traballanti. Anche se il coperchio potrebbe essere più stabile e alcune parti della tastiera possono essere spinte verso l'interno quando si preme abbastanza, valutiamo comunque la sua struttura come stabile. Il suo design non è né noioso né eccessivamente giocoso.

Per quanto riguarda il peso, Predator Helios 18 è nella media. I suoi 3,3 kg sono superiori a quelli di Asus ROG Strix Scar 18, ma inferiori a quelli di MSI Titan 18 e Alienware m18.
Connettività
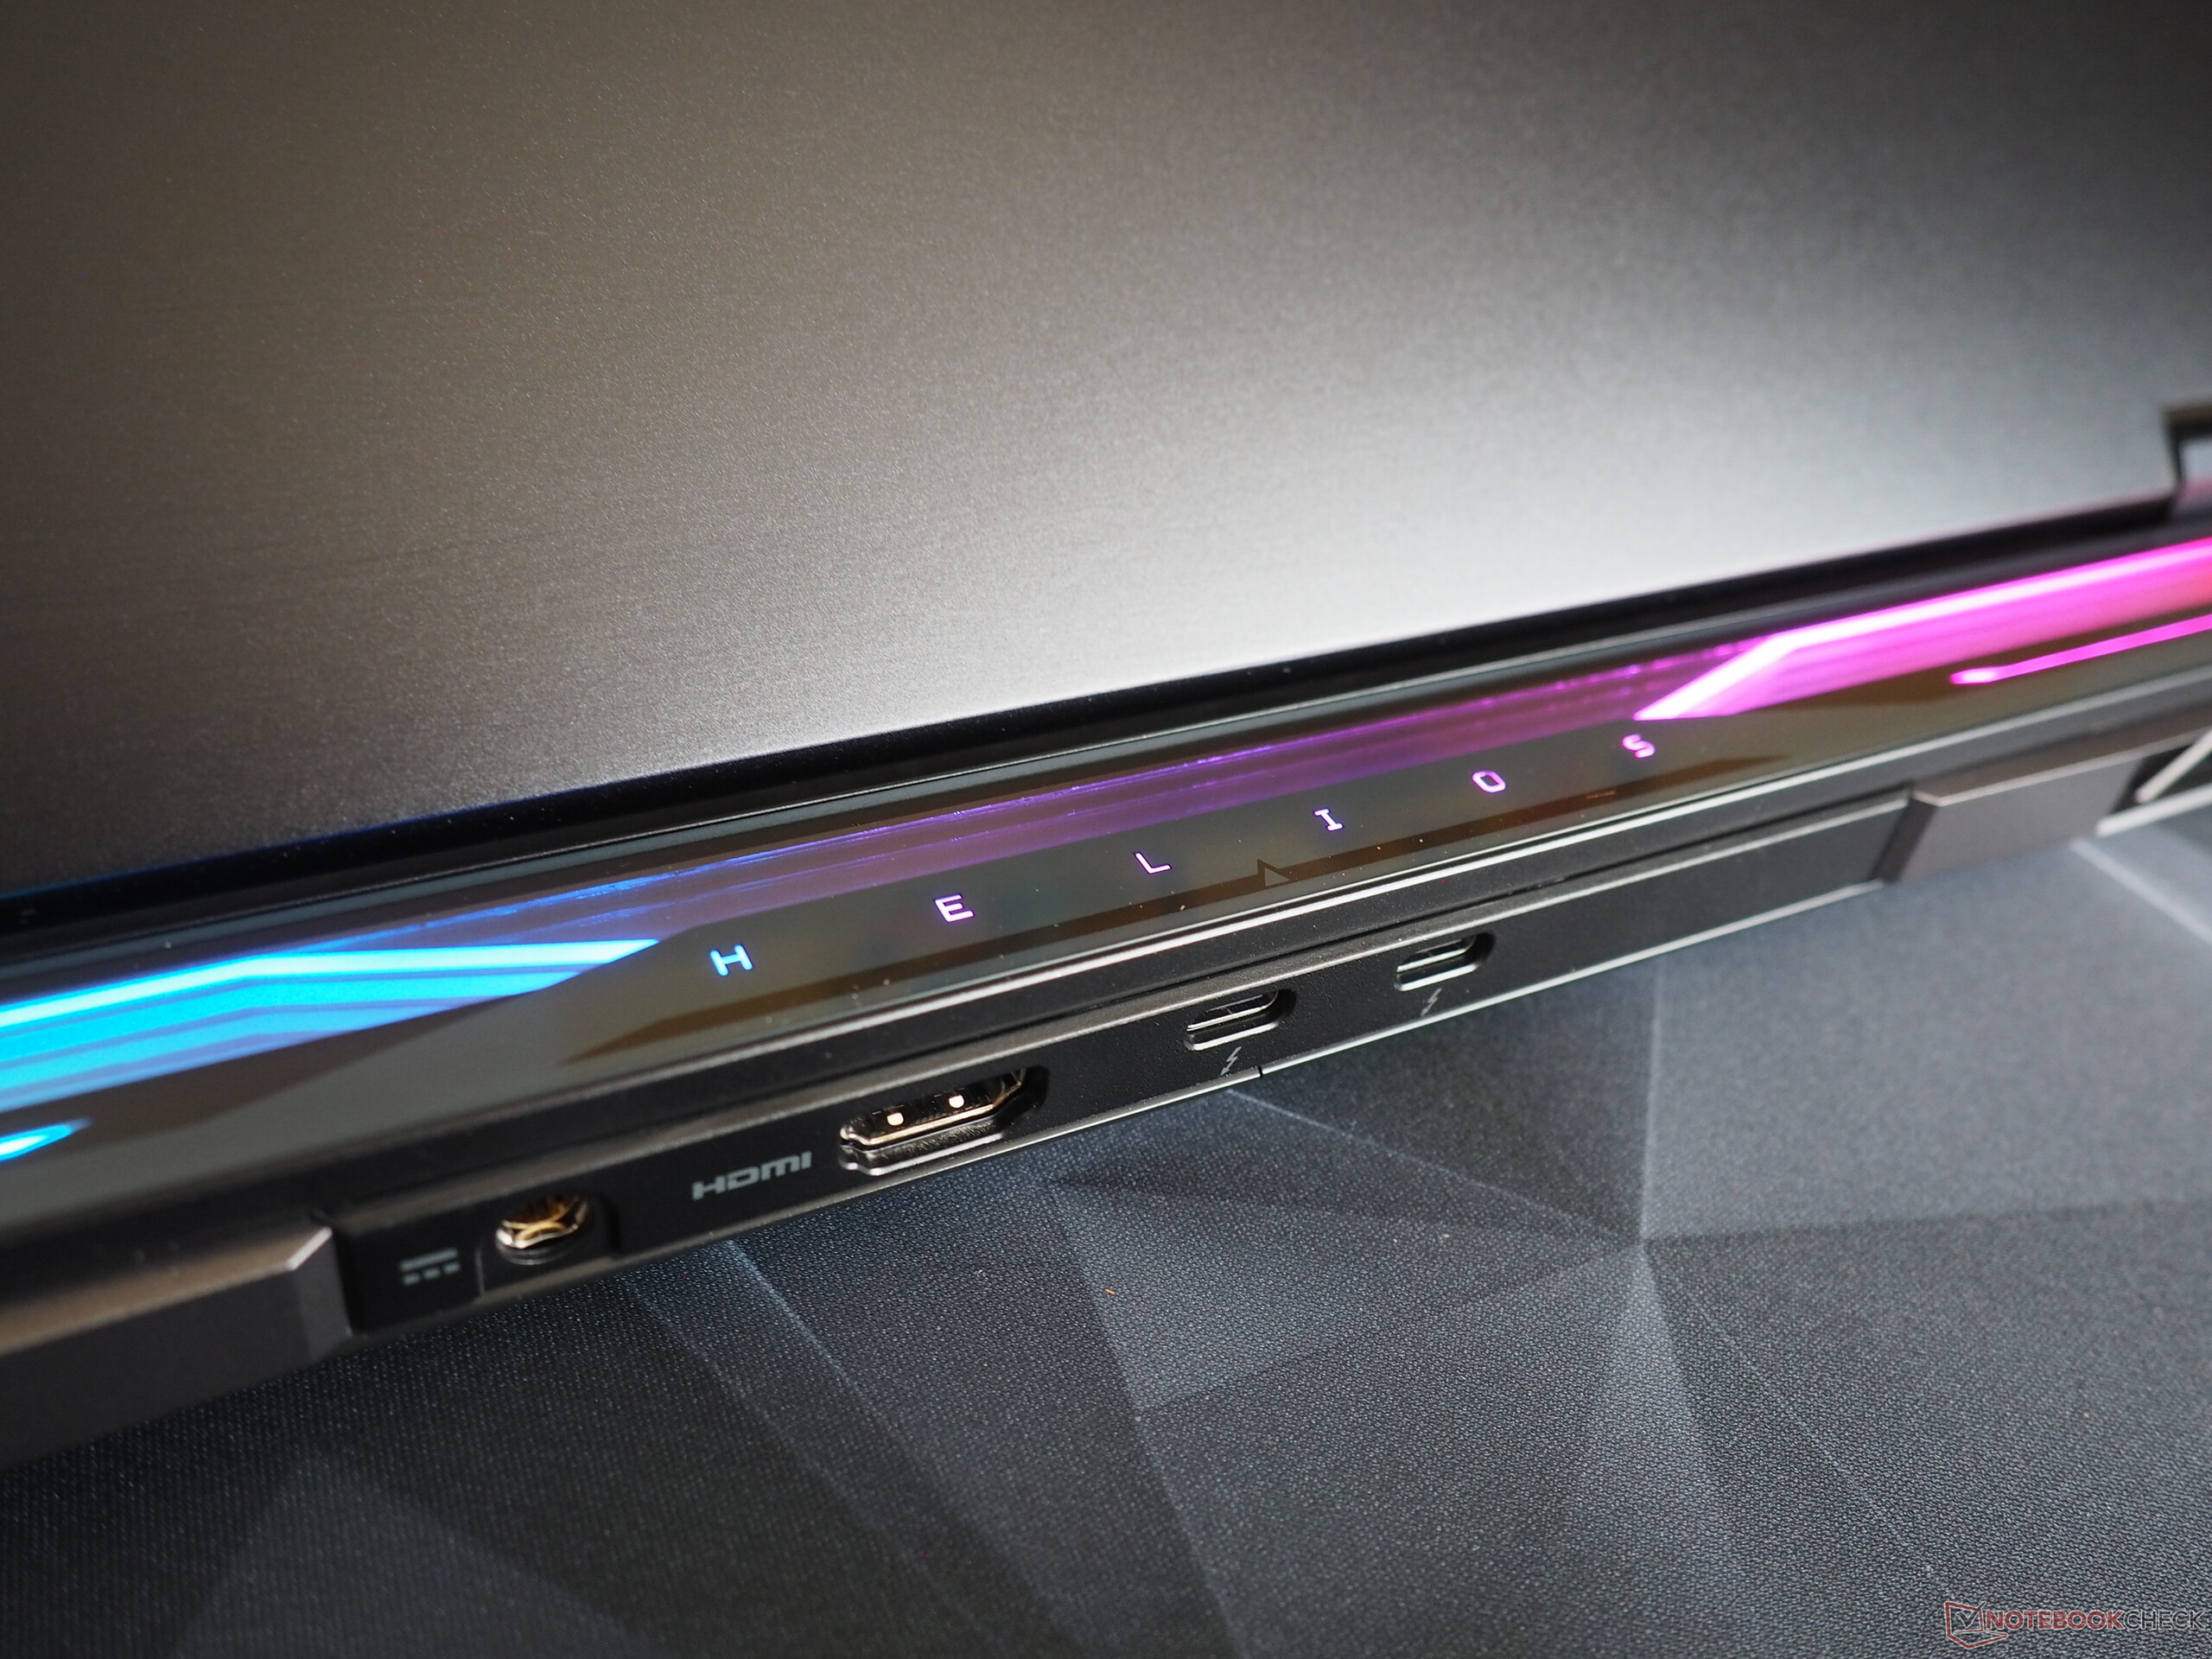
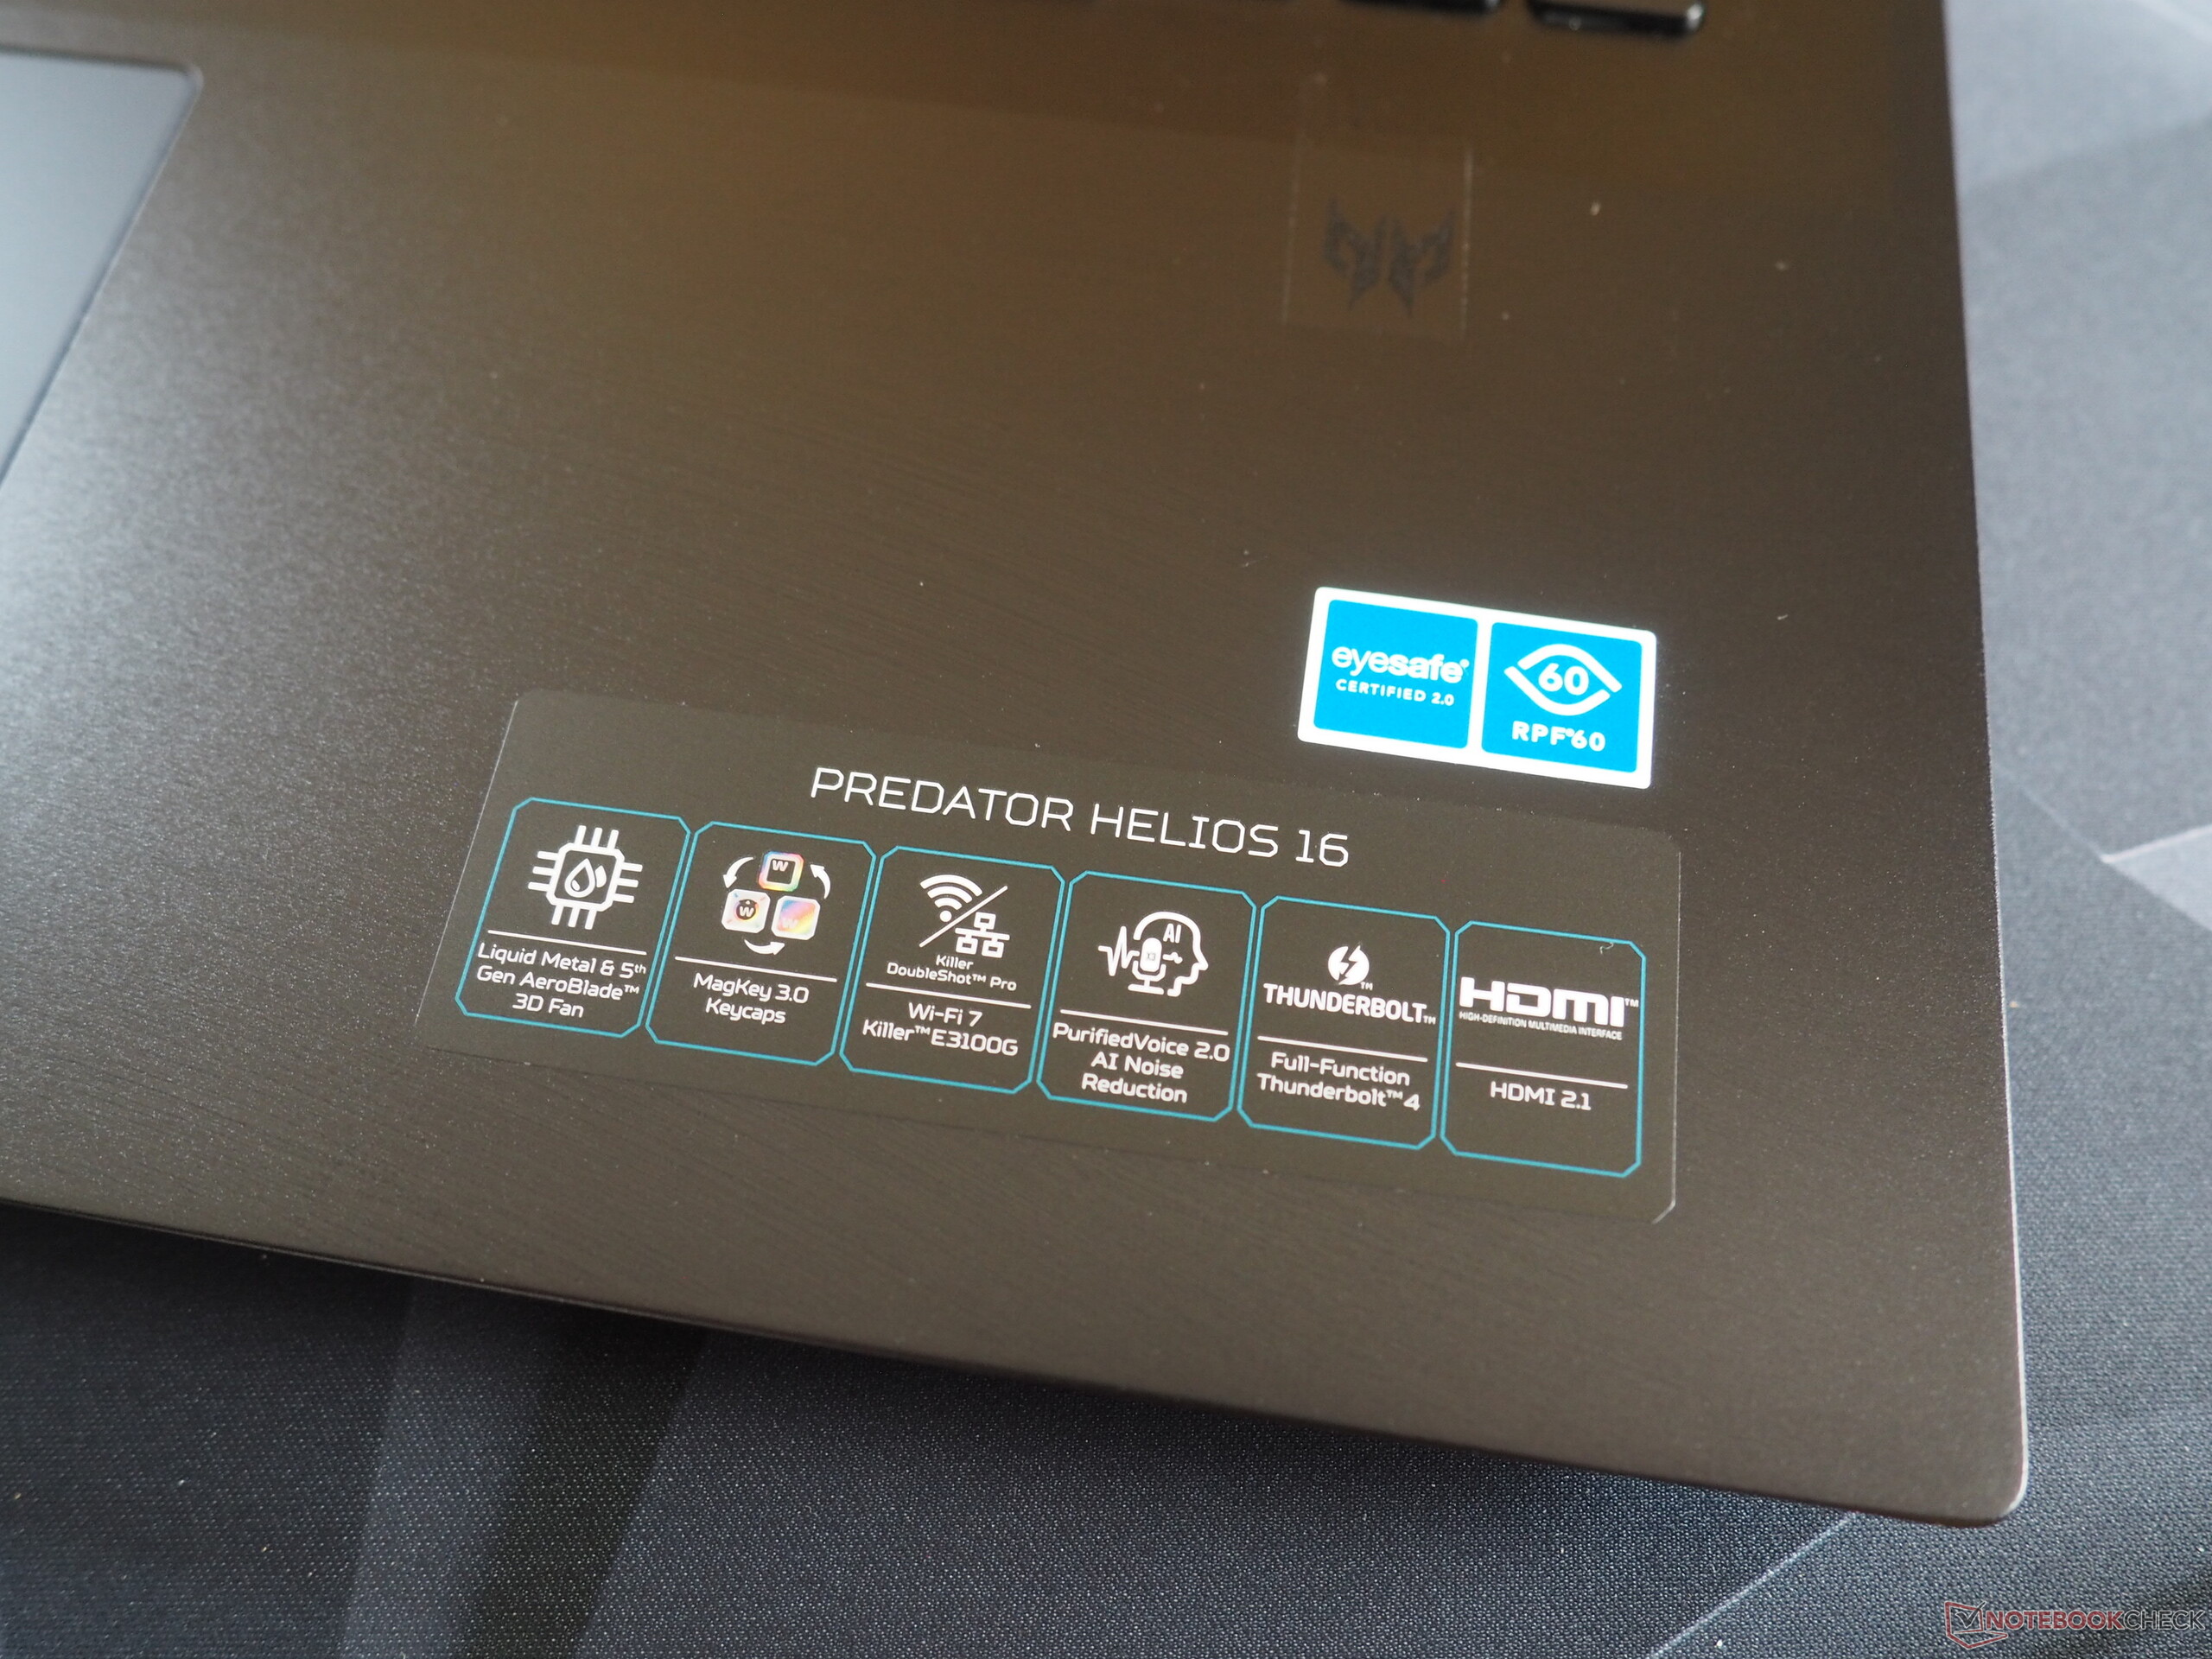
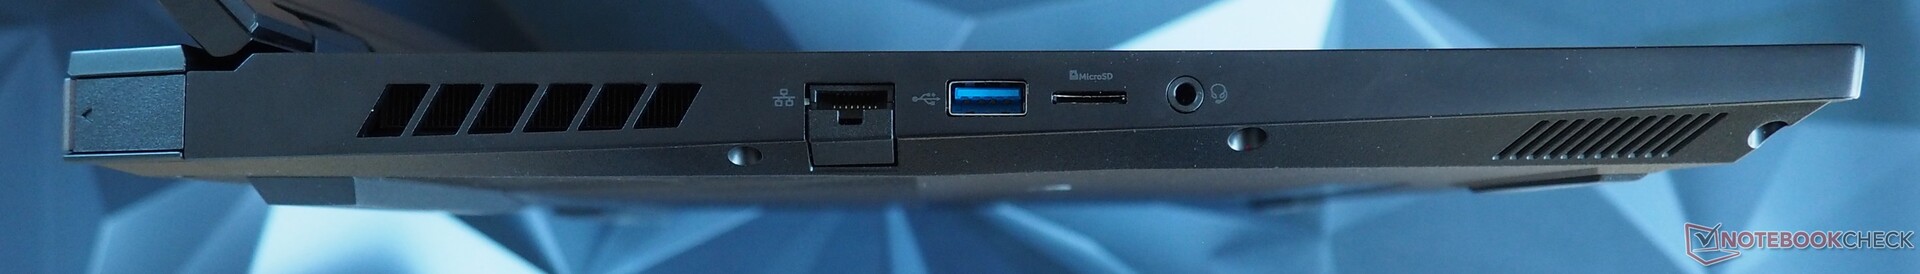
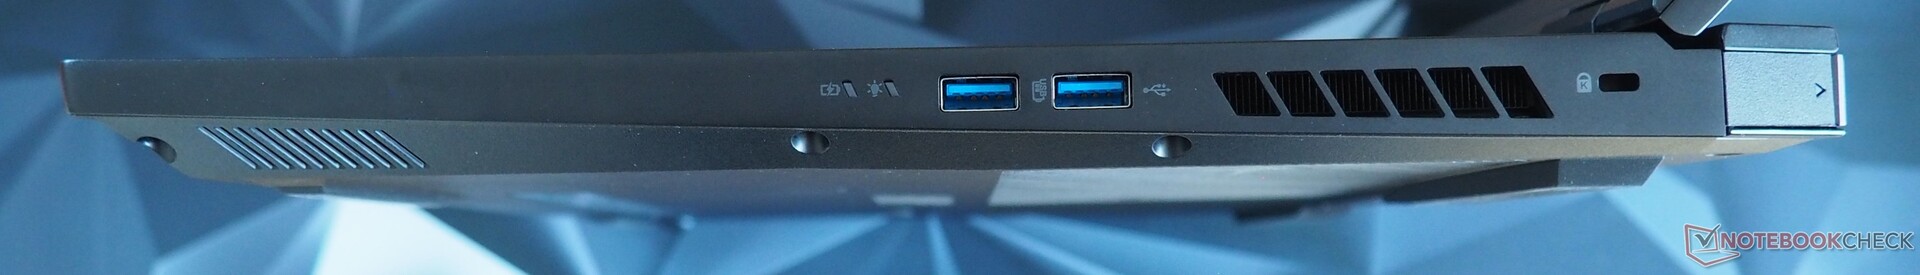
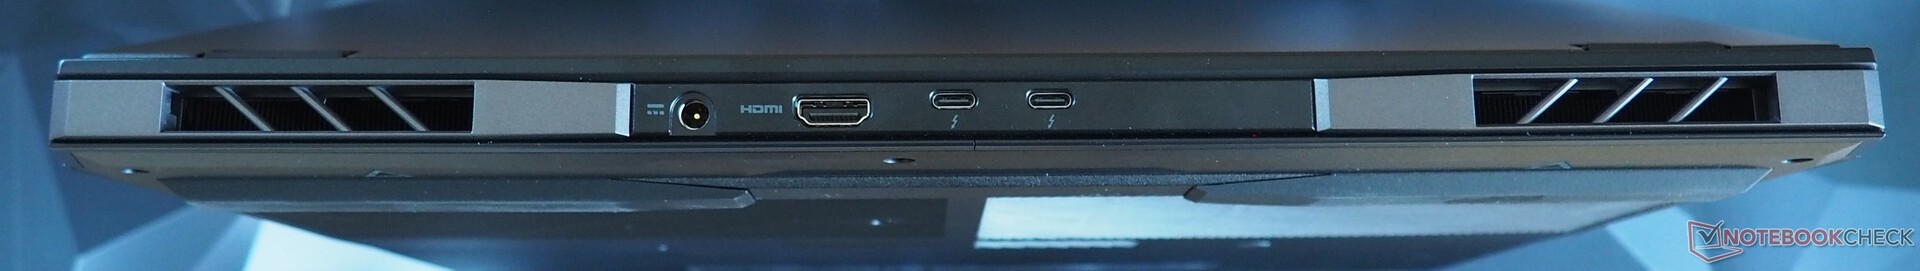
Le opzioni di connettività del dispositivo sono moderne. Mentre il retro ospita un'uscita HDMI 2.1 e due porte Thunderbolt 4 (incluse DisplayPort e Power Delivery), il lato destro presenta due porte USB 3.2 Gen-2 (Tipo A) e uno slot per un lucchetto Kensington. Il pacchetto è completato da una porta RJ45, una porta USB 3.0 (Tipo A), un lettore di schede microSD e un jack audio sul lato sinistro.
Lettore di schede SD
Il lettore di schede installato raggiunge velocità mediocri. Solo l'Alienware m18, che è stato in grado di utilizzare la nostra scheda di riferimento in una certa misura, ci ha impressionato sotto questo aspetto.
| SD Card Reader | |
| average JPG Copy Test (av. of 3 runs) | |
| Alienware m18 R1 AMD (Toshiba Exceria Pro SDXC 64 GB UHS-II) | |
| Media della classe Gaming (20.9 - 210, n=54, ultimi 2 anni) | |
| Acer Predator Helios 18 PH18-72-98MW (AV PRO microSD 128 GB V60) | |
| MSI Titan 18 HX A14VIG (Toshiba Exceria Pro SDXC 64 GB UHS-II) | |
| Acer Predator Helios 18 N23Q2 | |
| maximum AS SSD Seq Read Test (1GB) | |
| Alienware m18 R1 AMD (Toshiba Exceria Pro SDXC 64 GB UHS-II) | |
| Media della classe Gaming (25.5 - 261, n=51, ultimi 2 anni) | |
| MSI Titan 18 HX A14VIG (Toshiba Exceria Pro SDXC 64 GB UHS-II) | |
| Acer Predator Helios 18 PH18-72-98MW (AV PRO microSD 128 GB V60) | |
| Acer Predator Helios 18 N23Q2 | |
Comunicazione
Il nuovo Helios 18 dispone di un chip Wi-Fi 7 all'avanguardia, che possiamo testare solo in misura limitata a causa della mancanza di un hardware adeguato. Nei nostri test standard, il suo modulo Wi-Fi ha fornito prestazioni solide (invio) fino a prestazioni molto buone (ricezione).
Webcam
Grazie alla risoluzione Full HD, la webcam installata è un po' più nitida rispetto alla maggior parte dei computer portatili, ma come spesso accade, c'è ancora margine di miglioramento per quanto riguarda la precisione dei colori.

")
")
Accessori
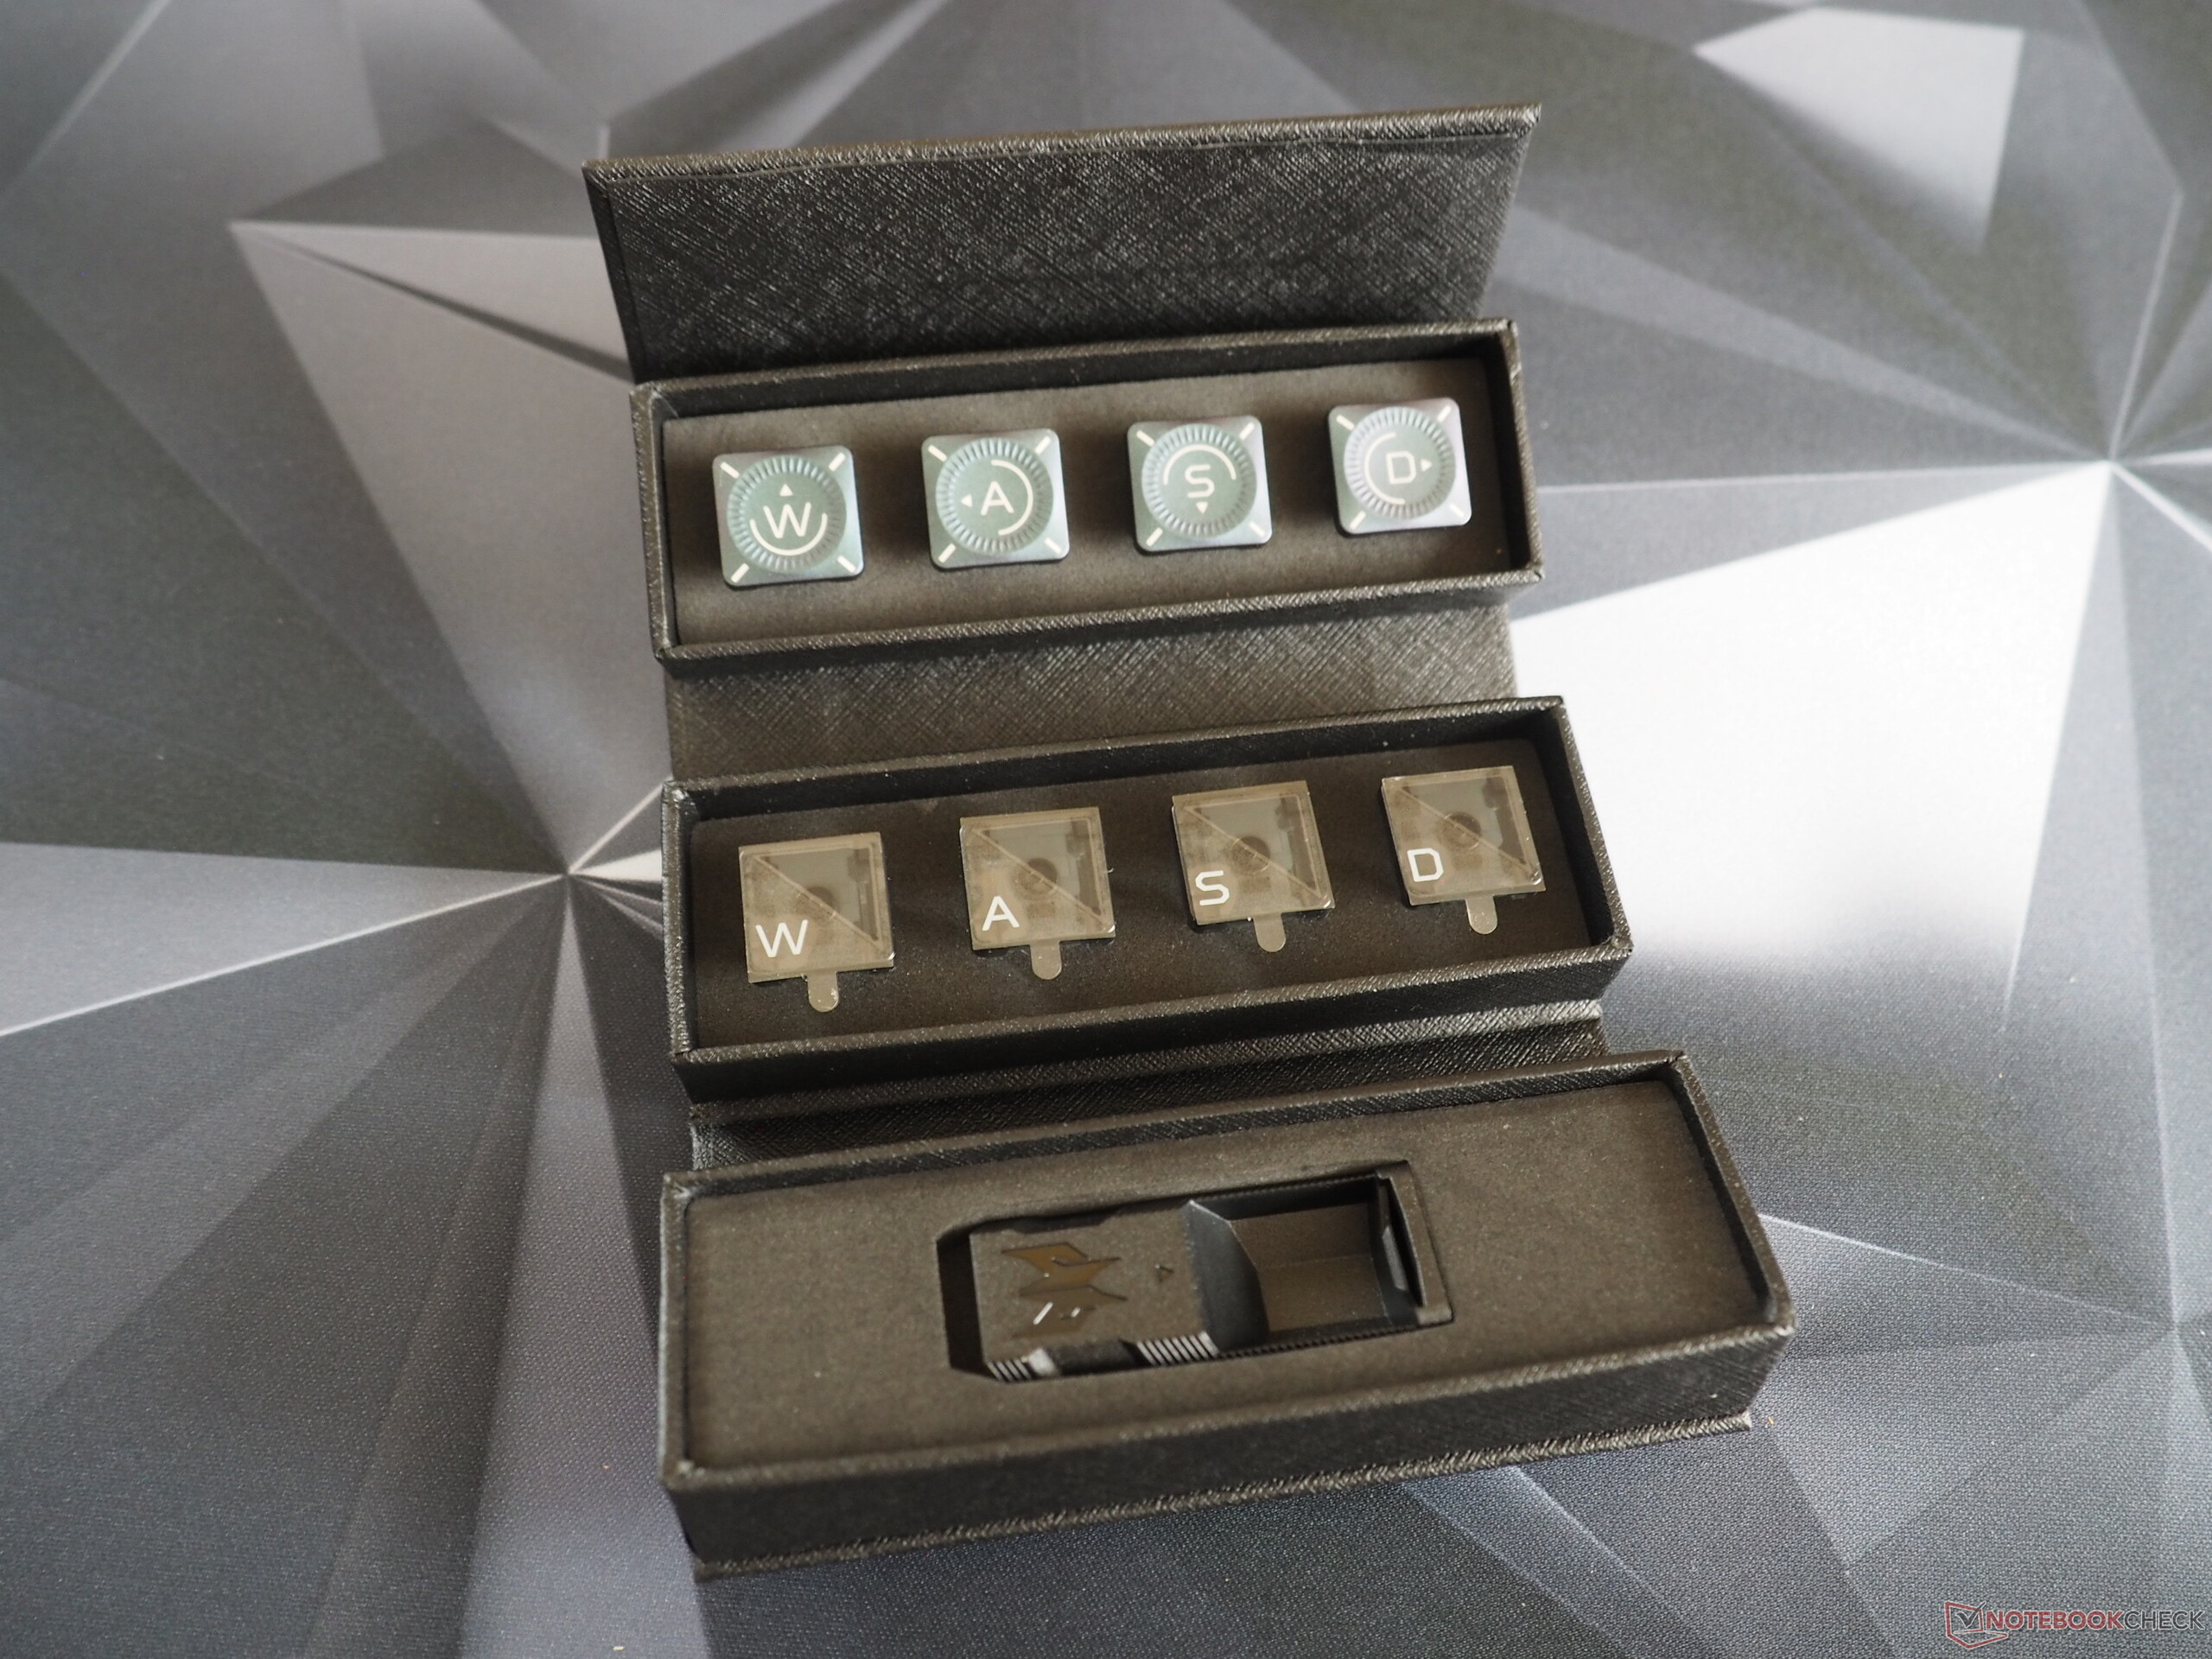
Predator Helios 18 vanta un'interessante caratteristica speciale: La sua scatola non solo contiene griglie della ventola sostituibili per il retro del dispositivo, ma riceve anche due set di tasti WASD diversi e alcune leve per i tasti. Come previsto, l'alimentatore da 330 watt in dotazione è piuttosto ingombrante.
Manutenzione
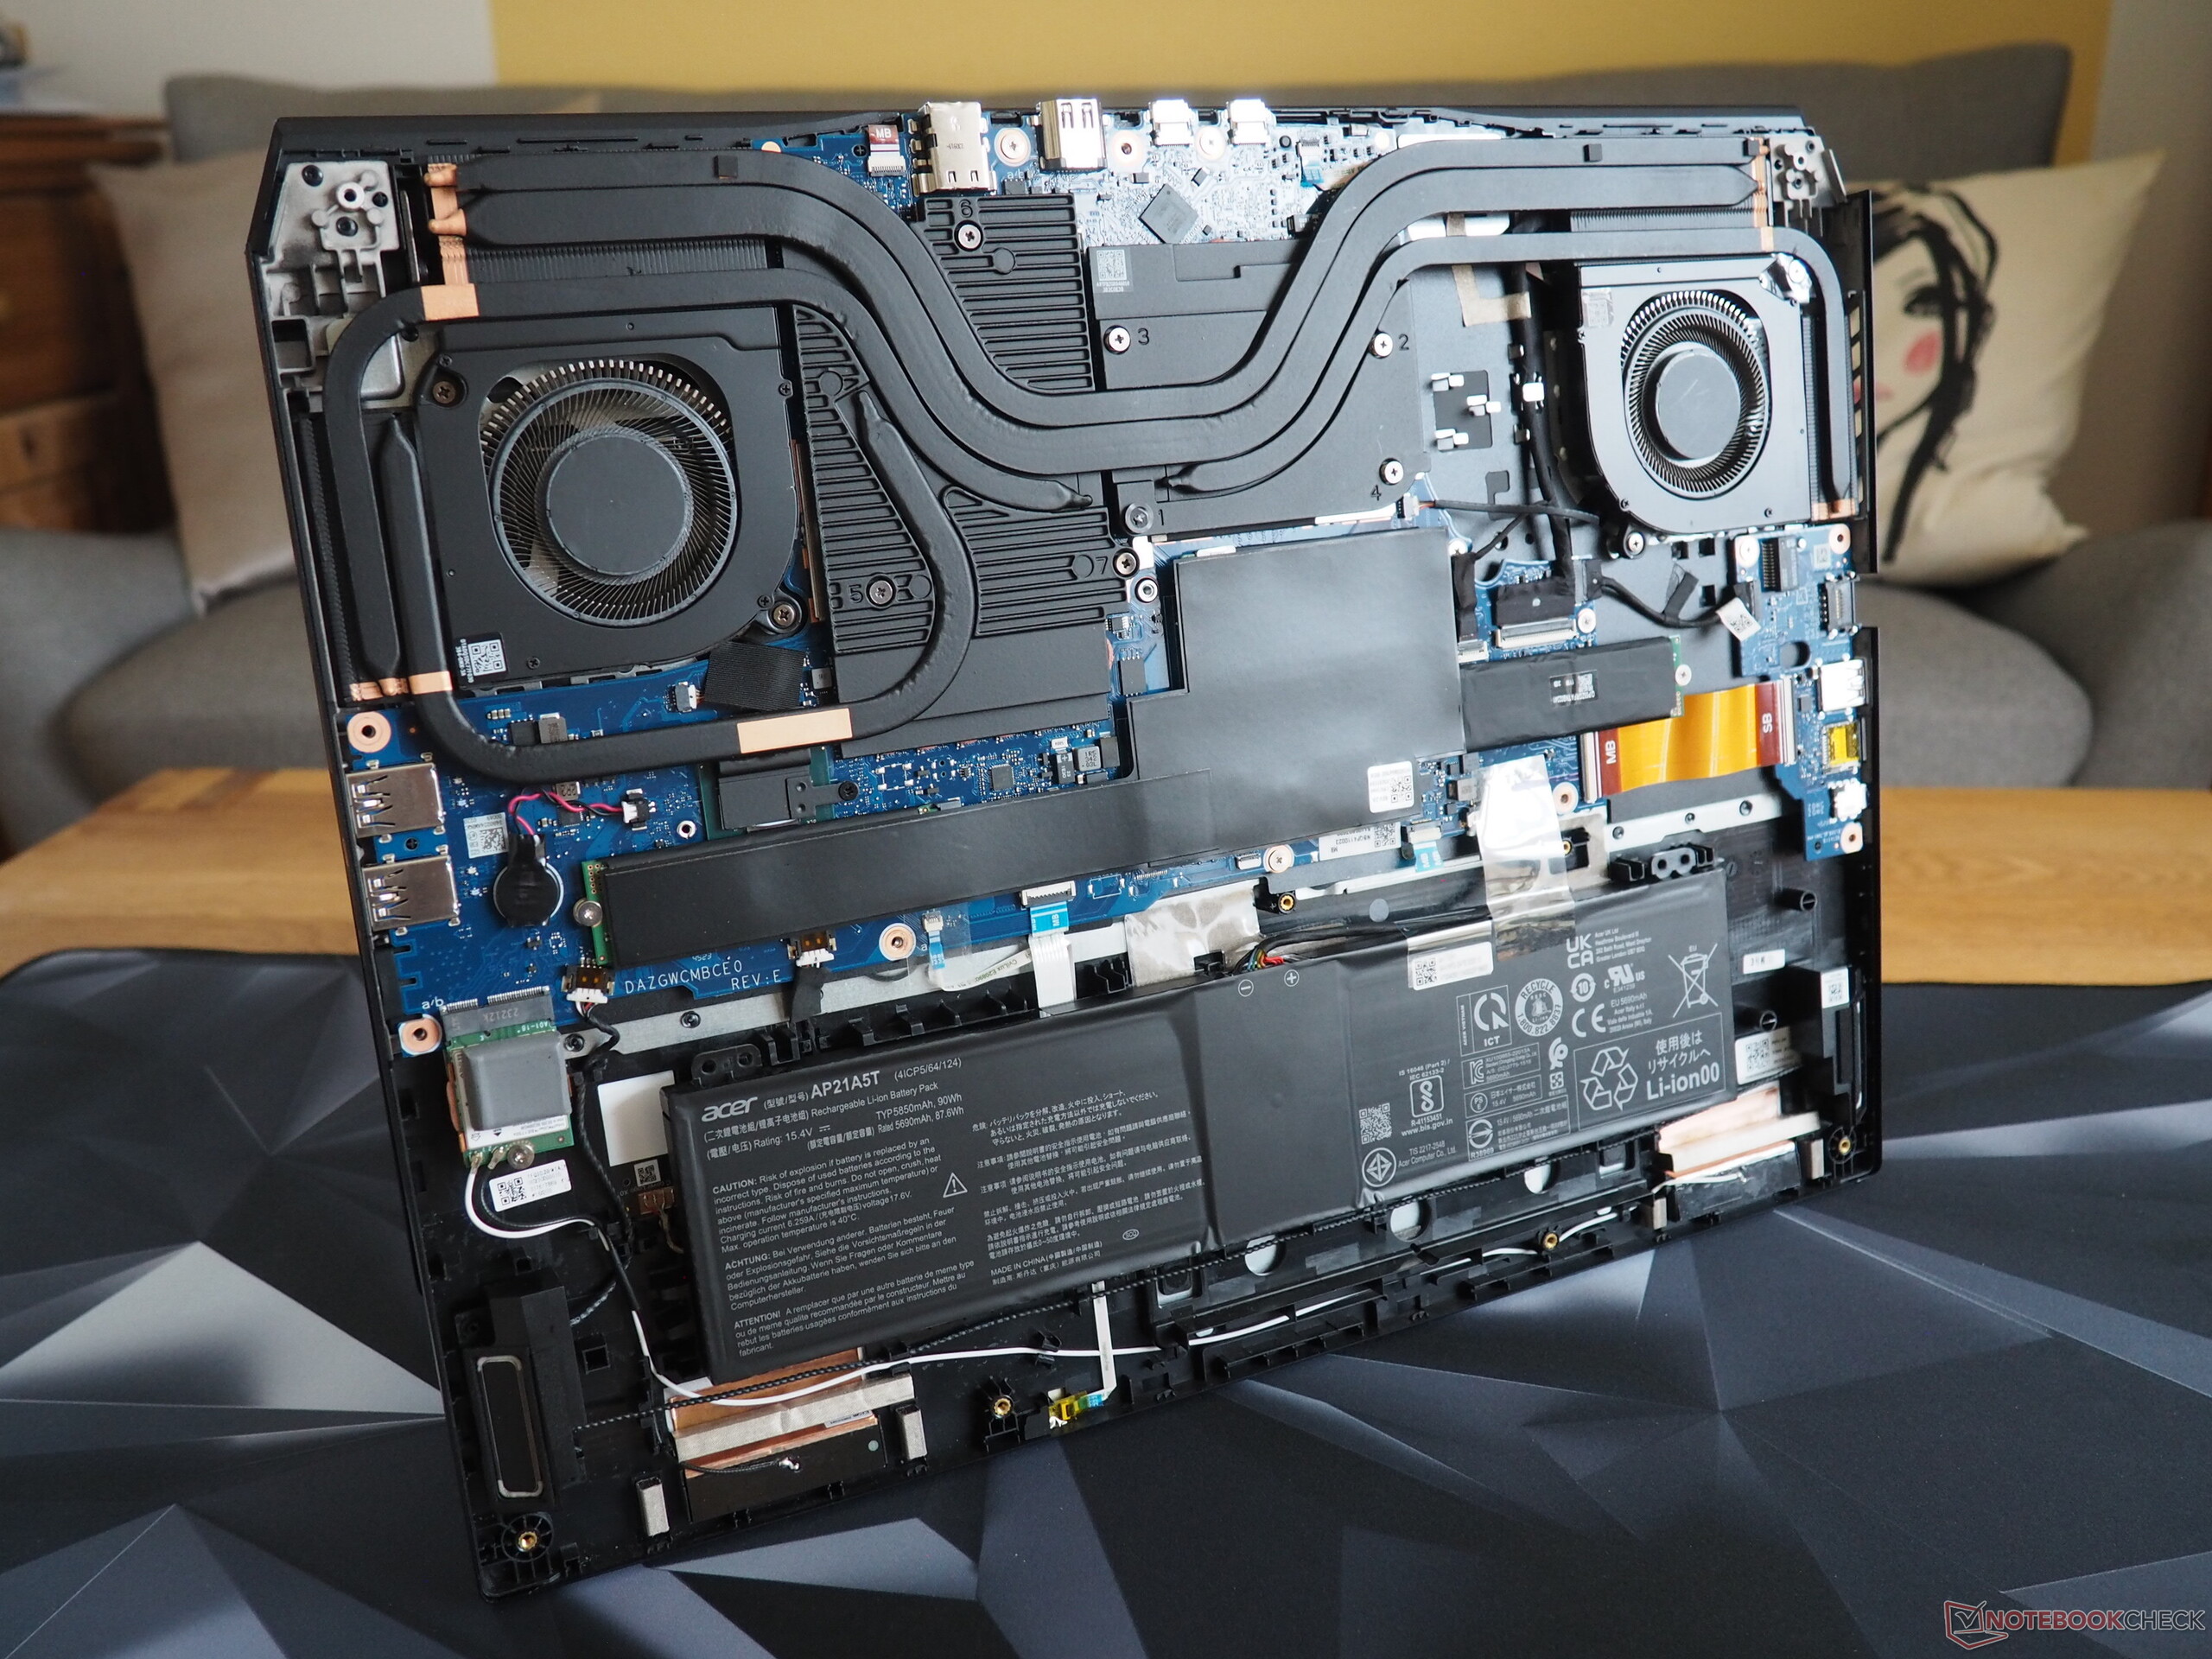
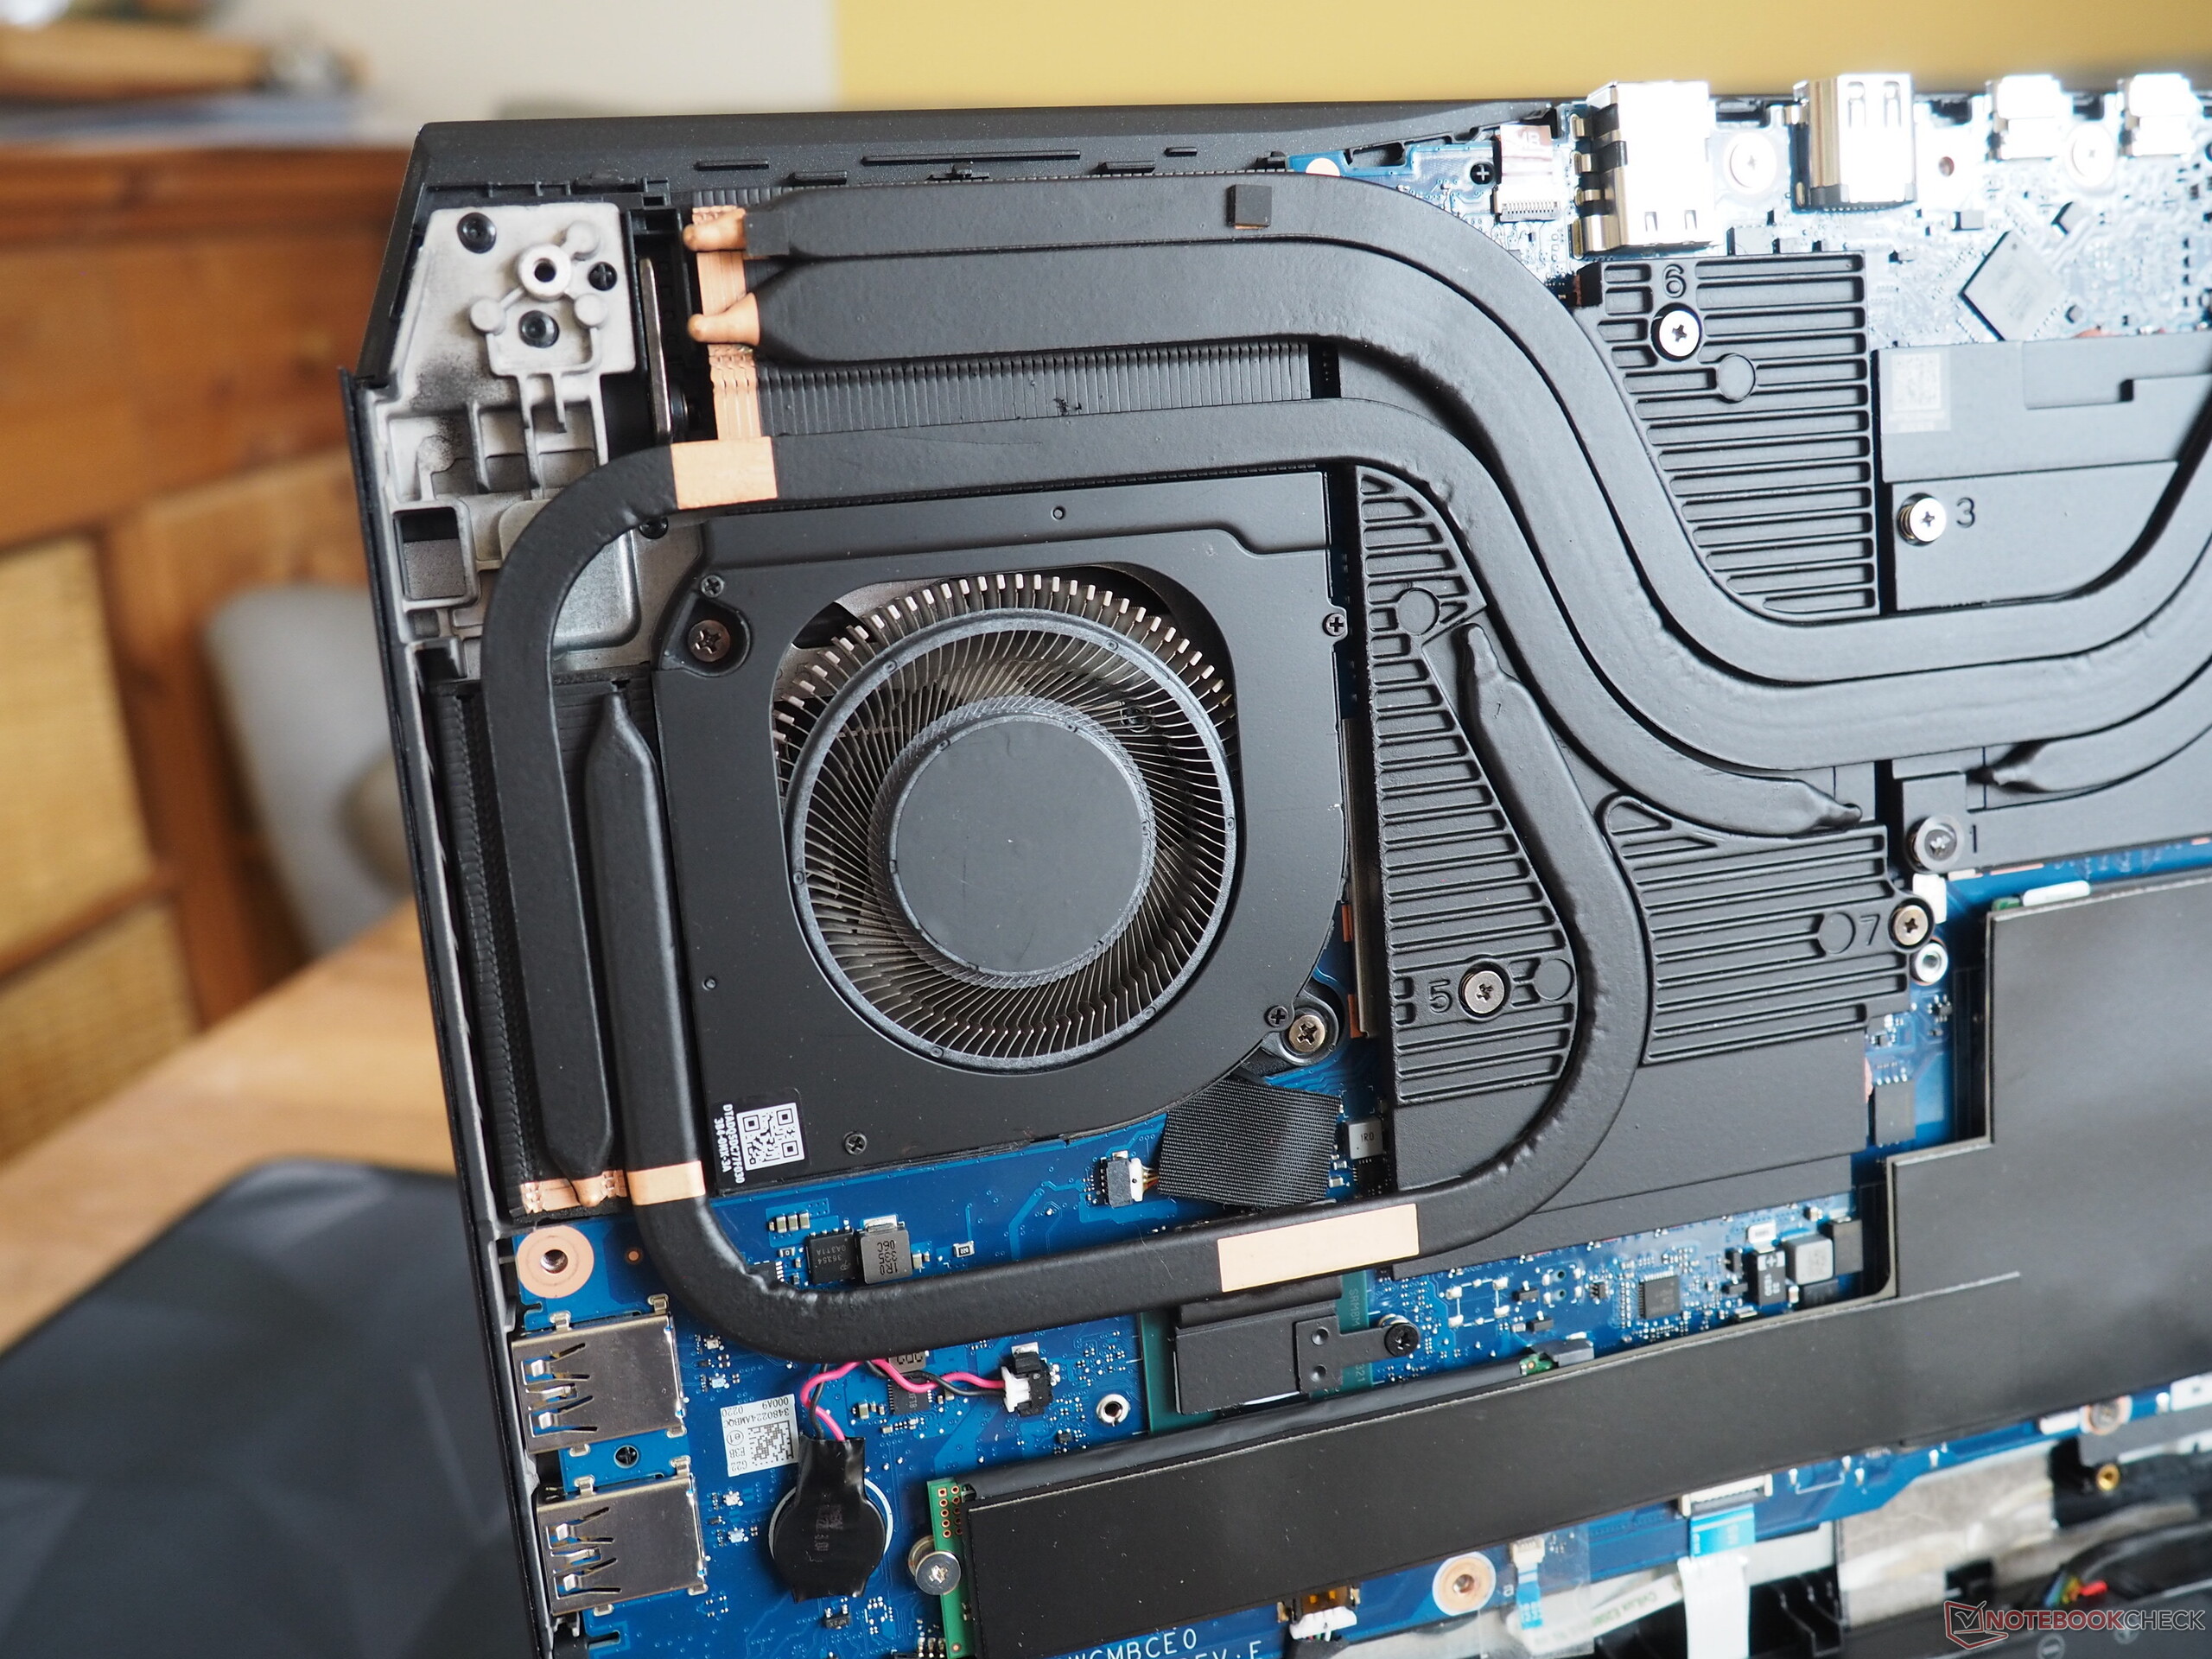
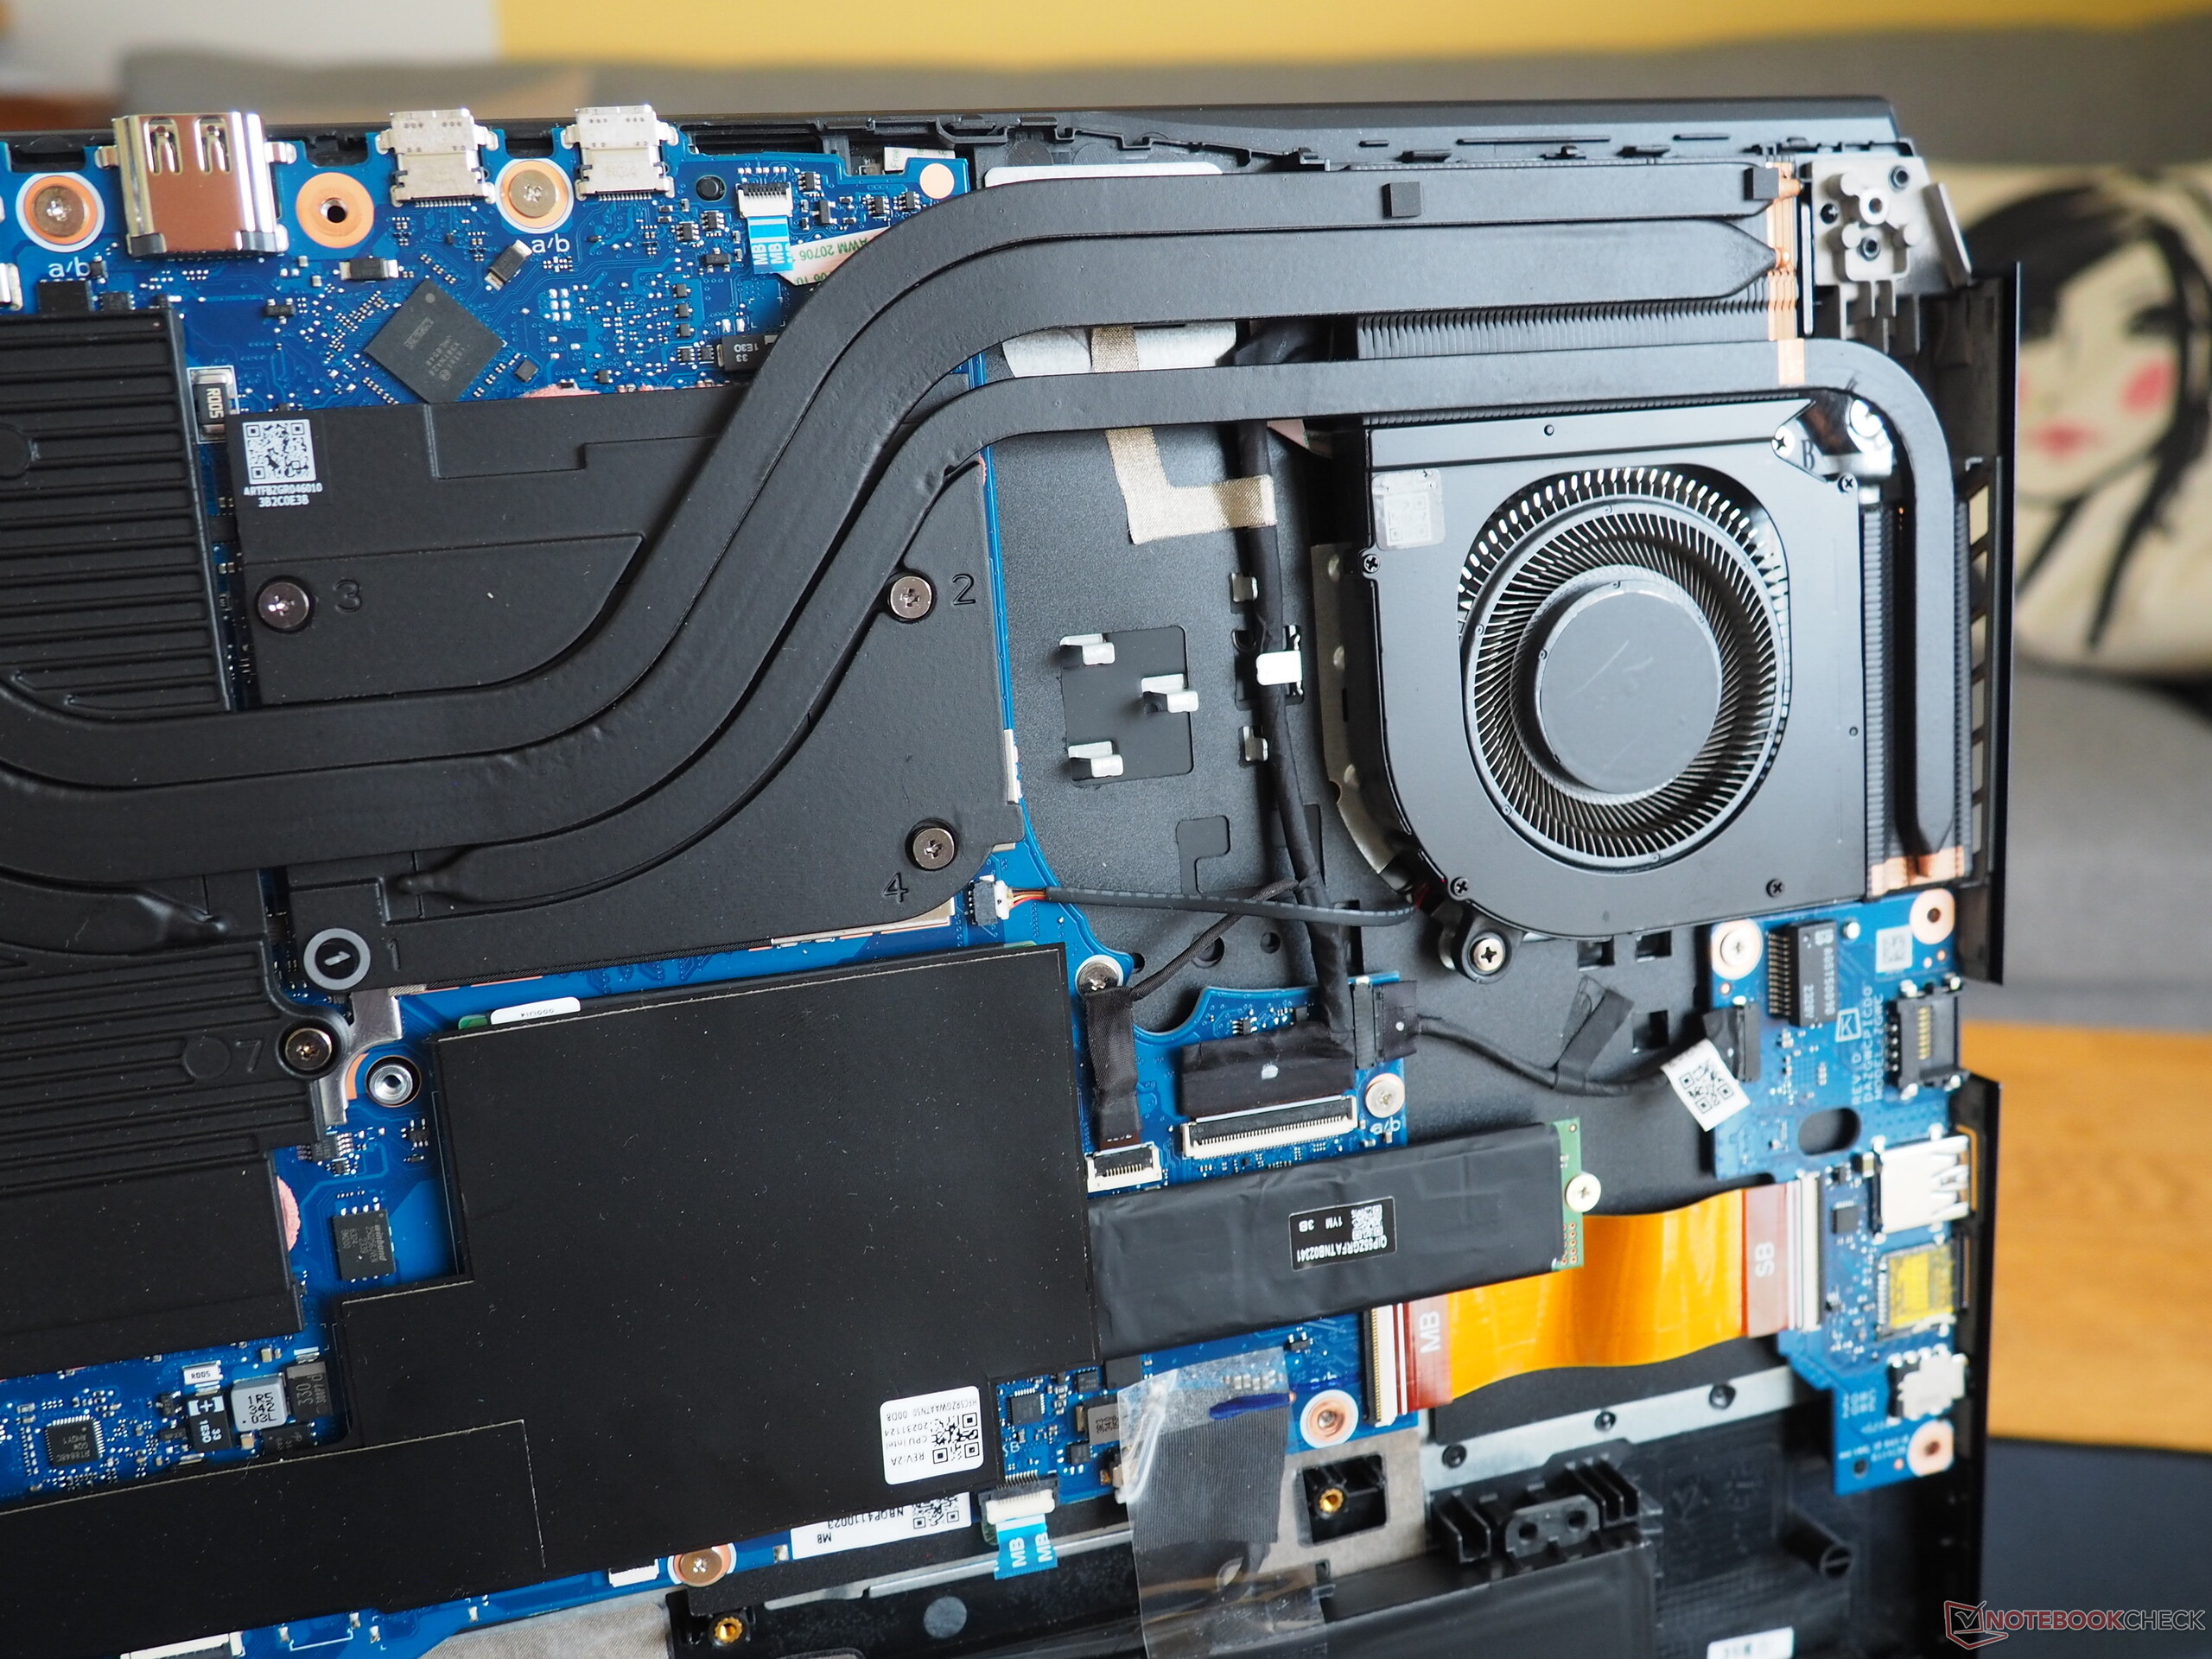
Le sue opzioni di manutenzione ci hanno lasciato sentimenti contrastanti. Ci vuole un bel po' di tempo per svitare le 14 viti Torx e fare leva sulla piastra inferiore; inoltre, Acer potrebbe anche spaventare molti utenti grazie all'uso di un sigillo di garanzia (che copre una vite). All'interno, è possibile accedere al sistema di raffreddamento, alla batteria, al modulo WLAN, alla RAM e all'SSD. Tuttavia, questi ultimi due sono coperti da pellicole e cuscinetti, il che non li rende facili da sostituire.
Garanzia
Il portatile è coperto da una garanzia di 24 mesi.
Dispositivi di ingresso
Tastiera
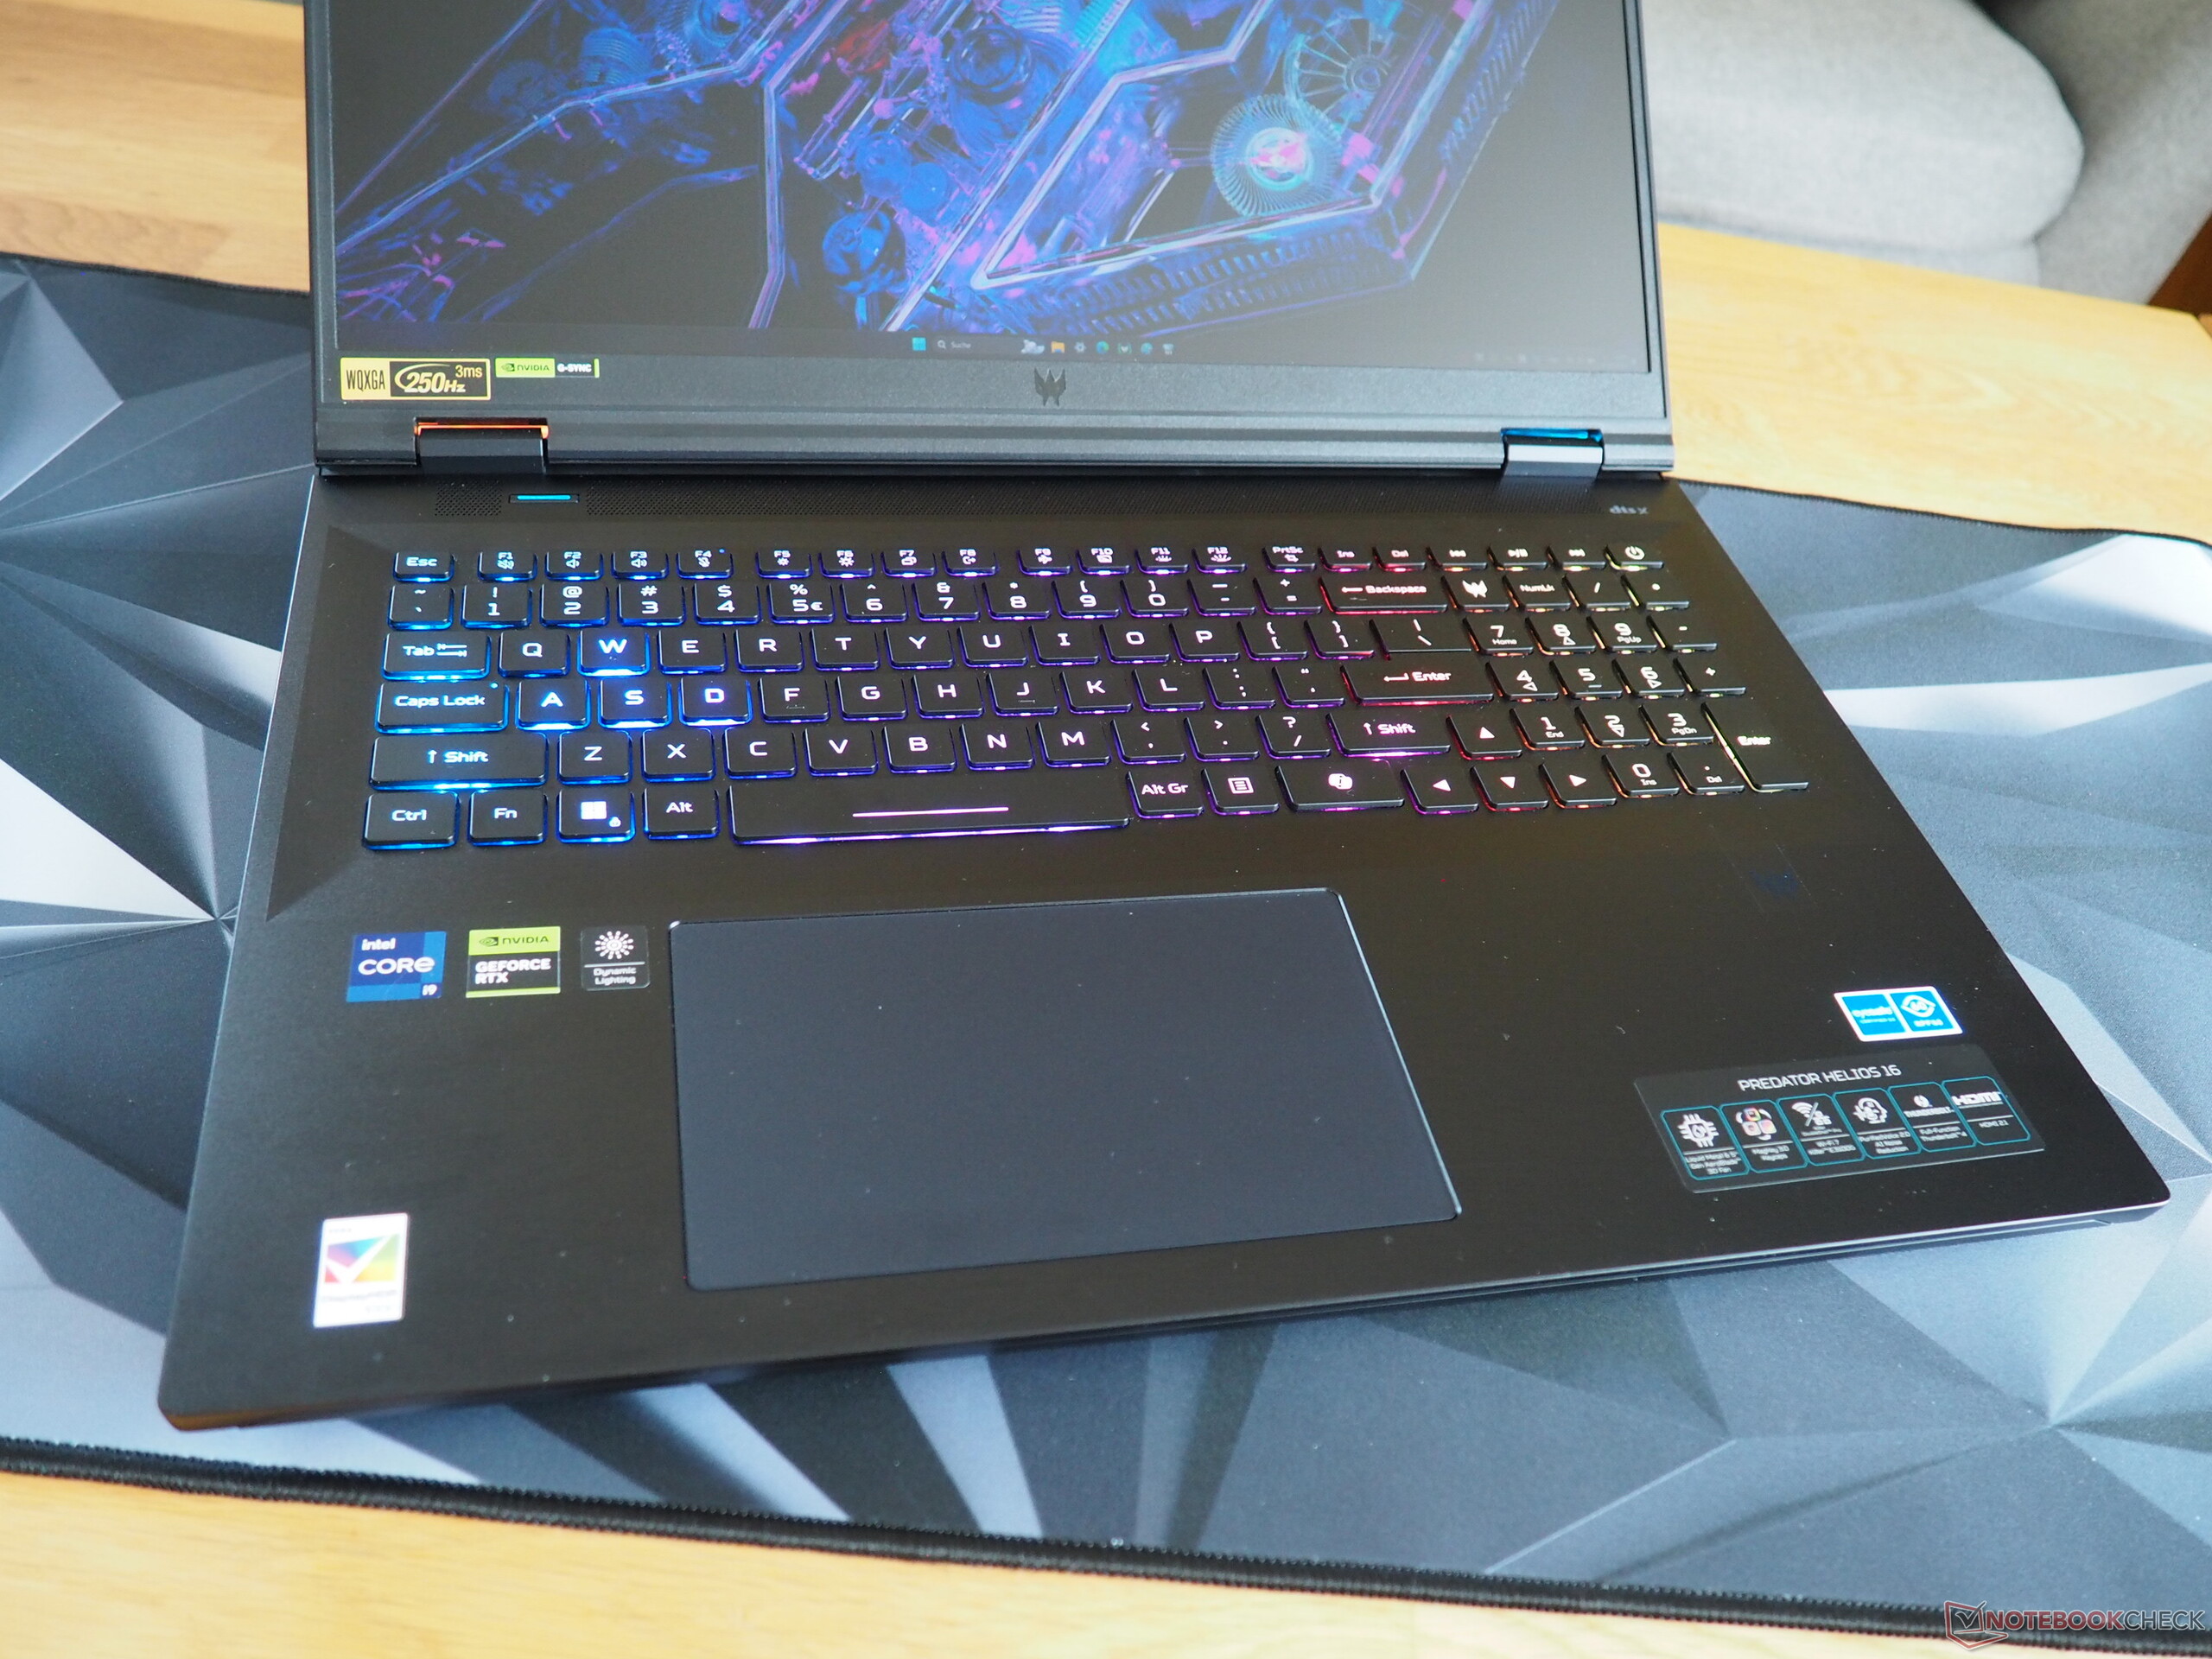
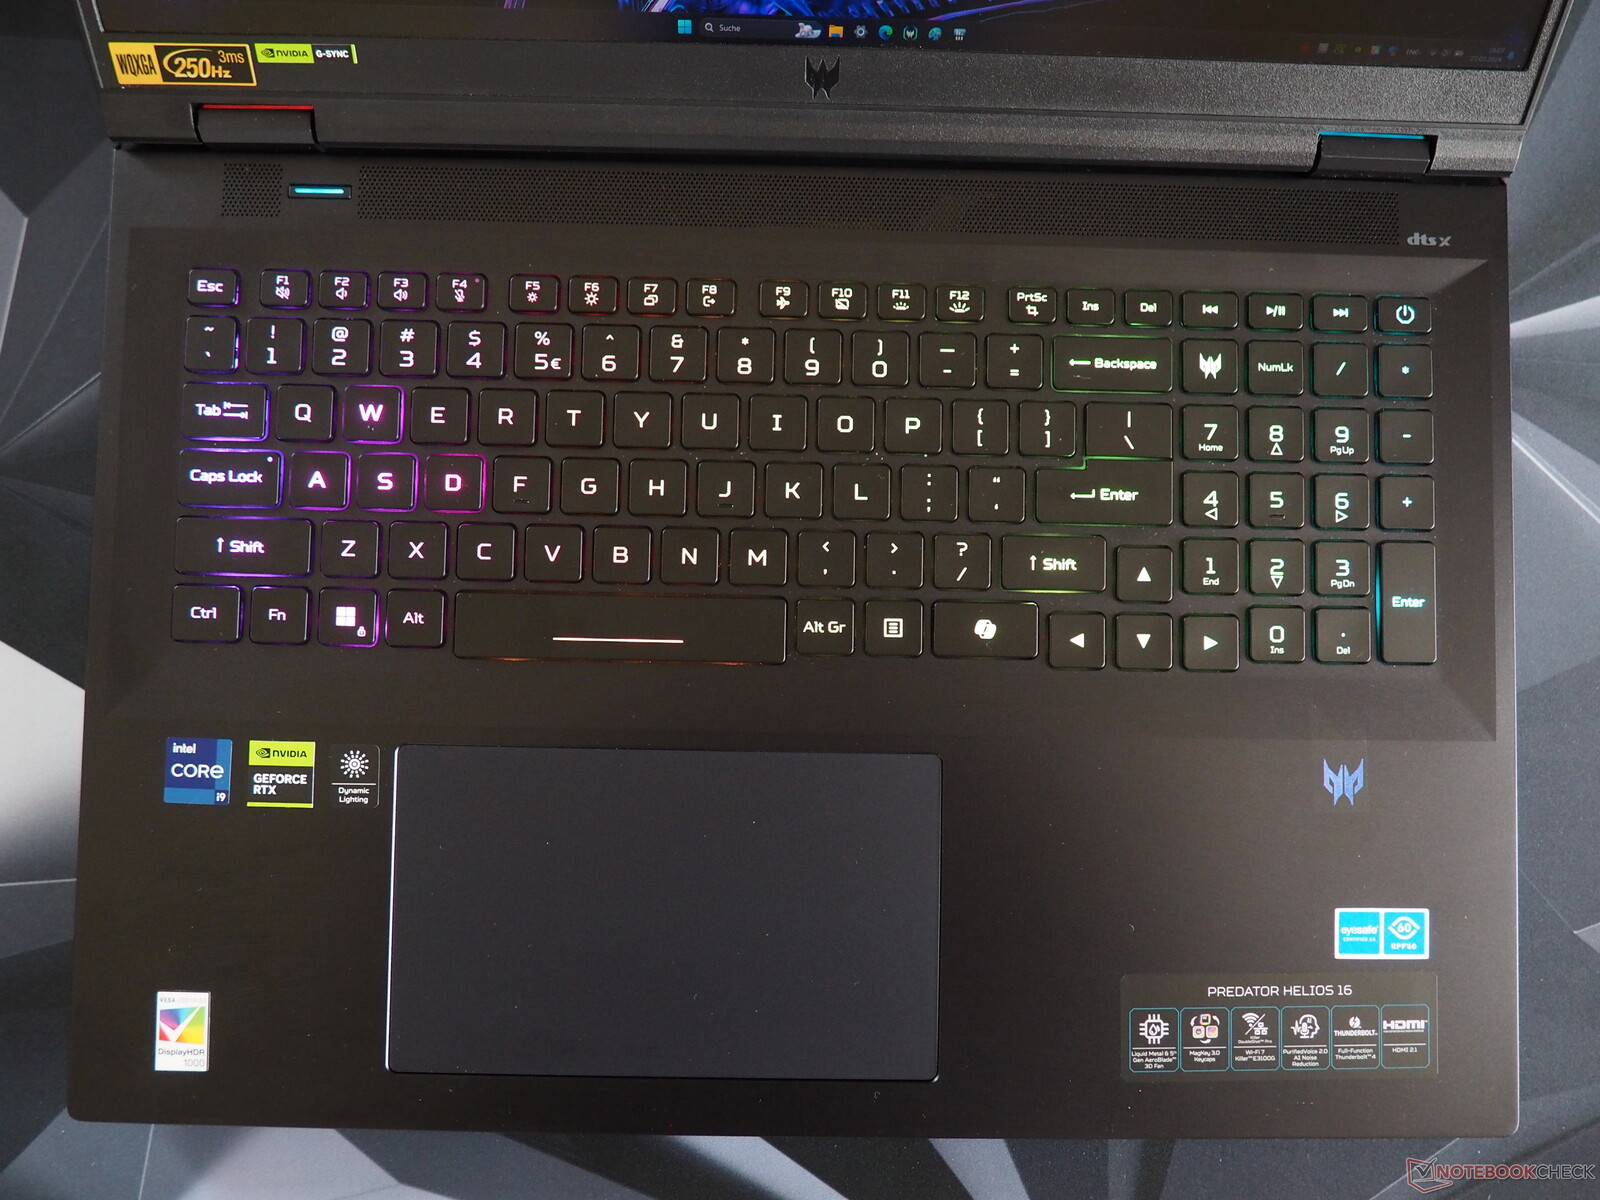
I giocatori saranno entusiasti di vedere in particolare l'illuminazione estesa del portatile (RGB a tasto singolo) che, a nostro avviso, potrebbe essere un po' più uniforme. Per essere una classica tastiera con cupola in gomma, è sorprendentemente buona da digitare - è solo un po' rumorosa. A parte alcuni dettagli (tastierino numerico modificato), il suo layout è buono. A differenza di altri produttori, Acer non ha fatto molti esperimenti e la maggior parte delle funzioni sono utili. Il produttore merita un elogio anche per le dimensioni generose dei tasti del portatile (ad esempio, i tasti freccia ben dimensionati).
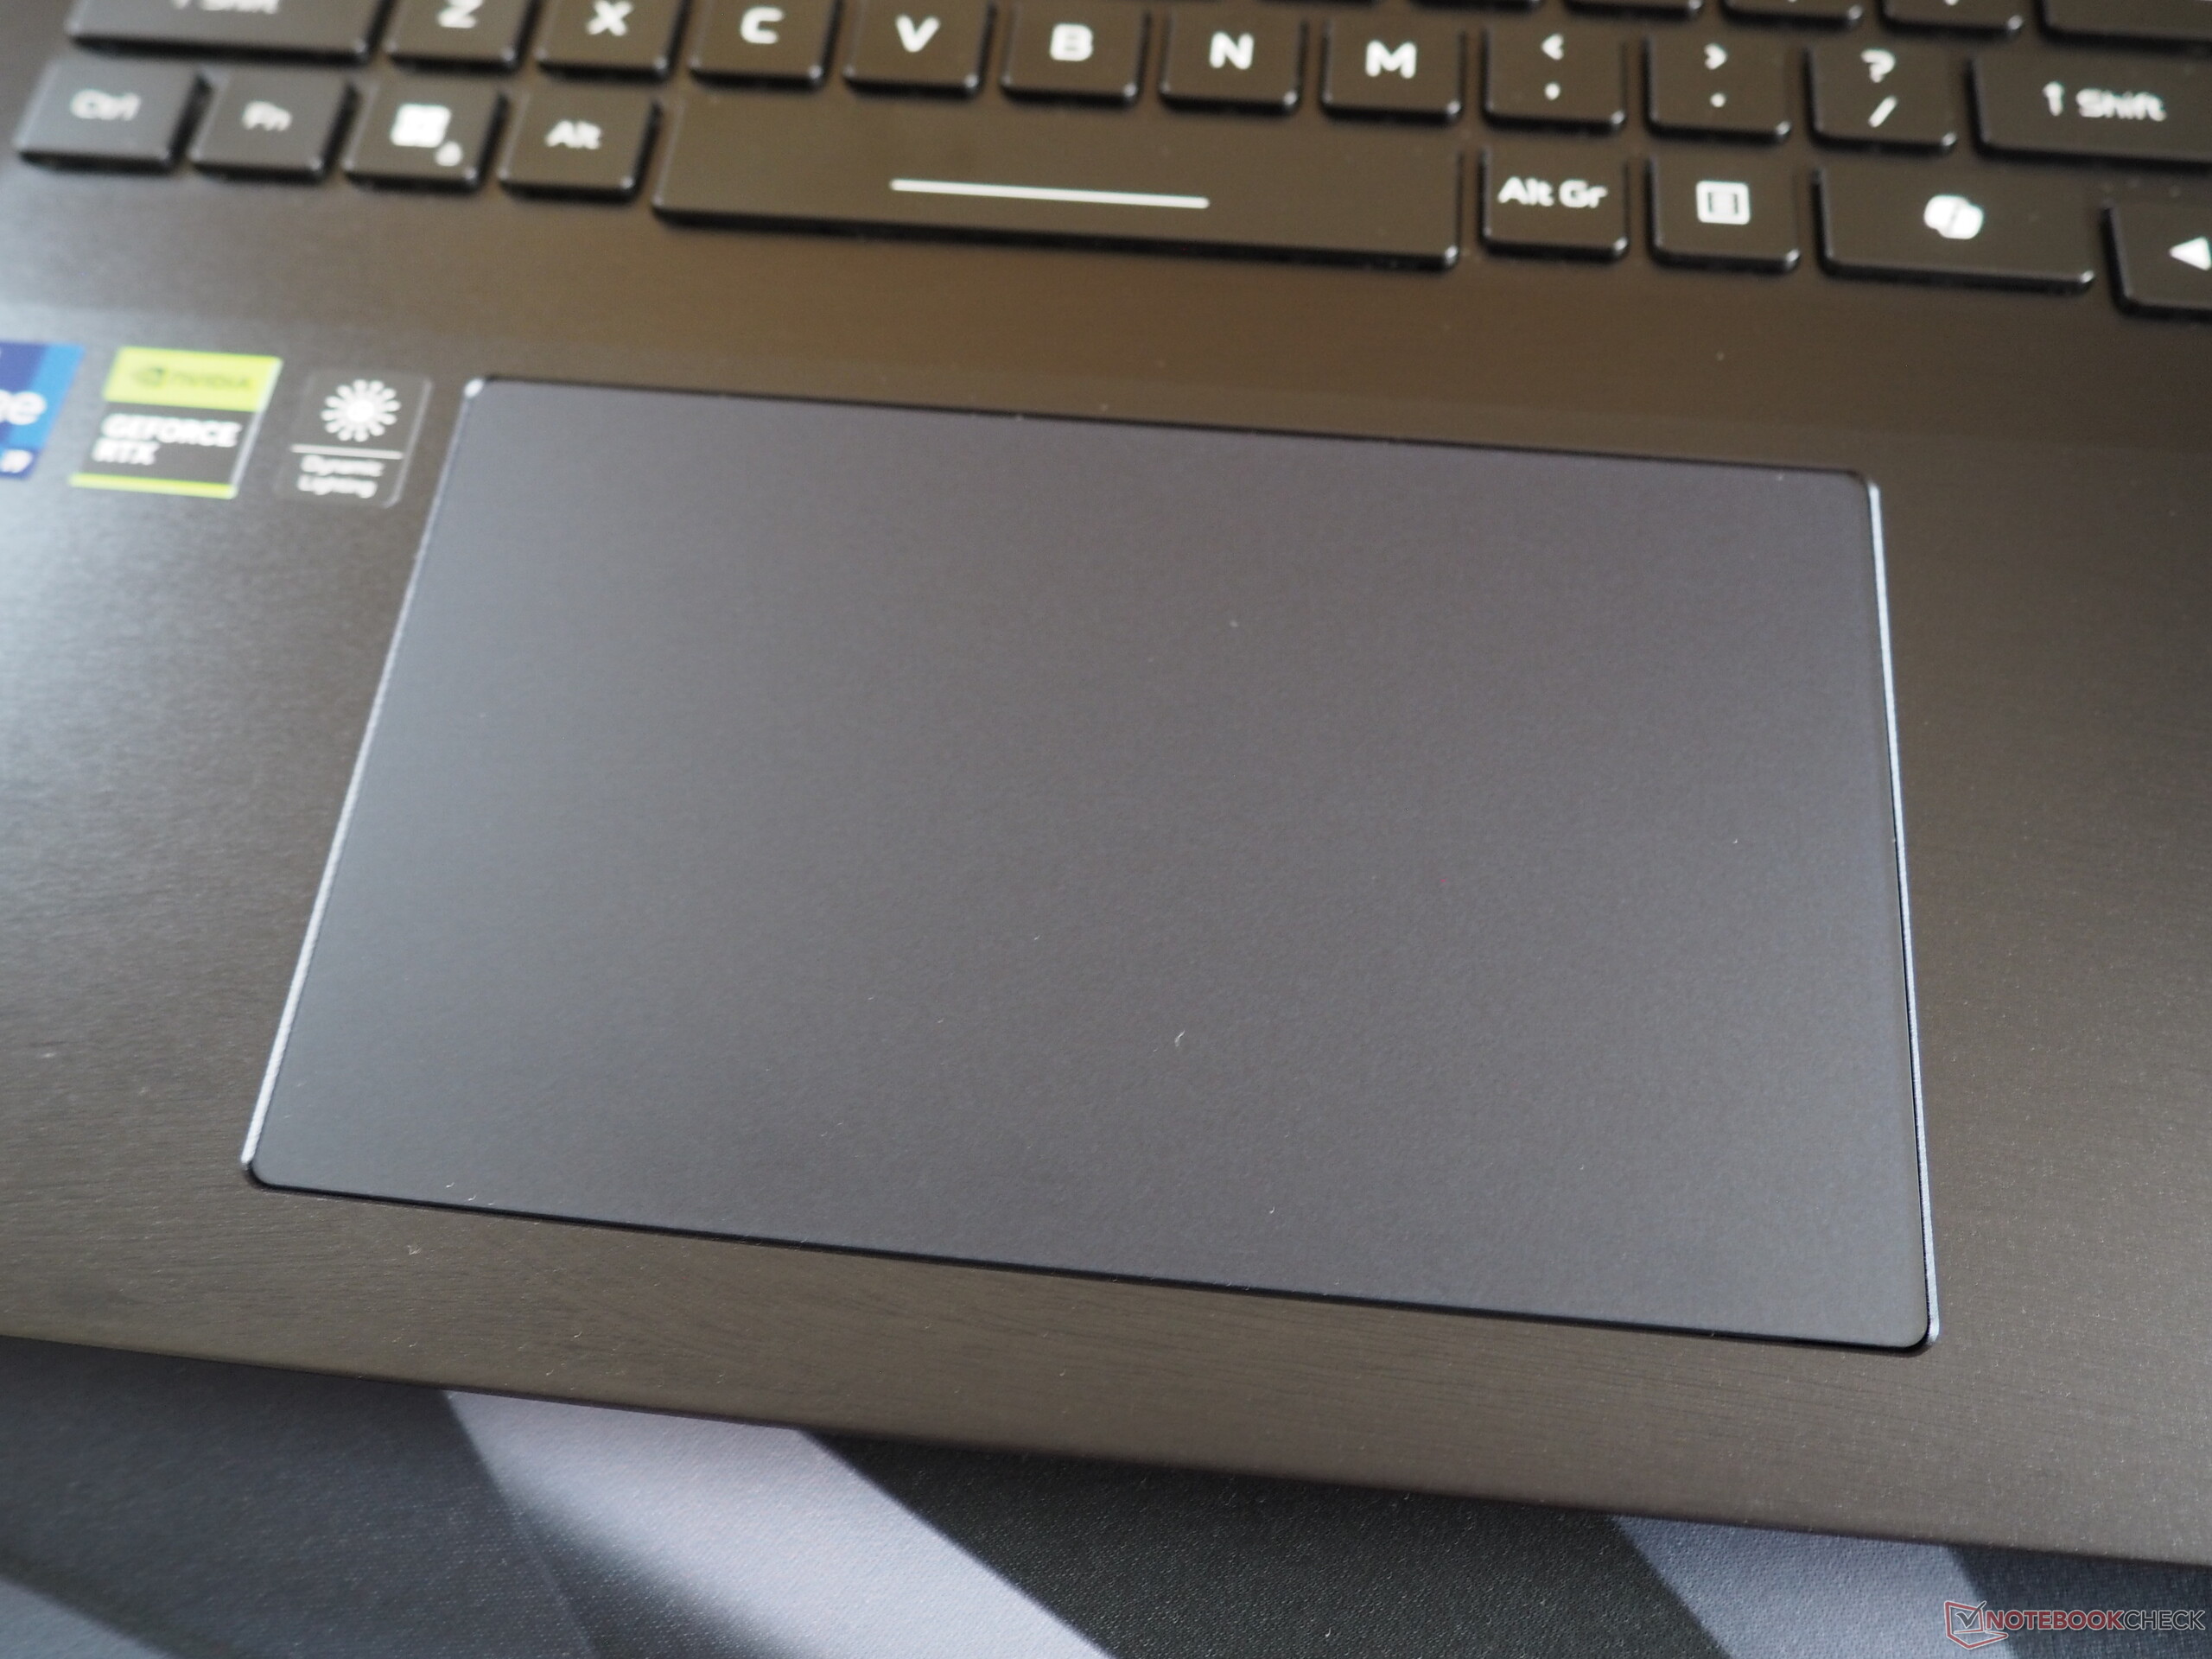
Touchpad
Anche il suo touchpad è quasi impeccabile. Le sue dimensioni di 15 x 9 cm sono generose e consentono di effettuare lunghi movimenti senza dover sollevare il dito. Inoltre, la sua superficie liscia assicura che le dita scivolino bene sul pad. Non abbiamo notato nulla di strano per quanto riguarda il supporto dei gesti e la precisione.
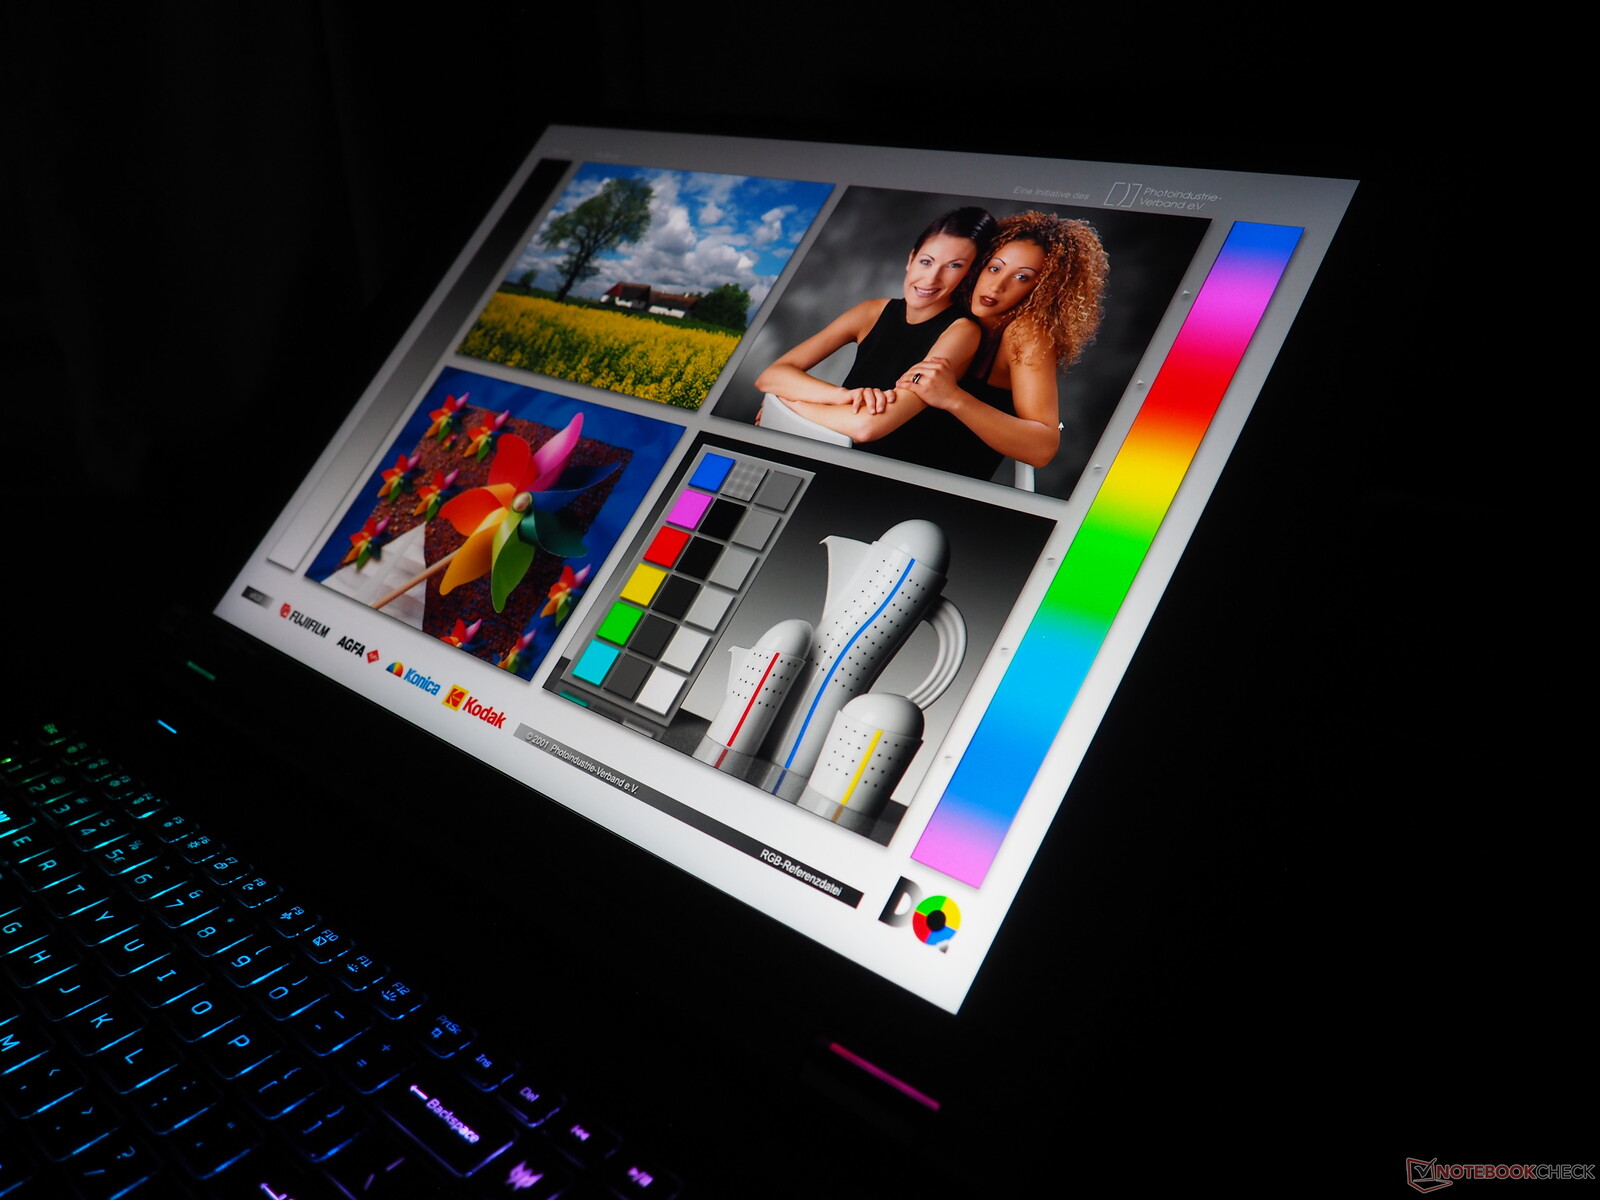
Display
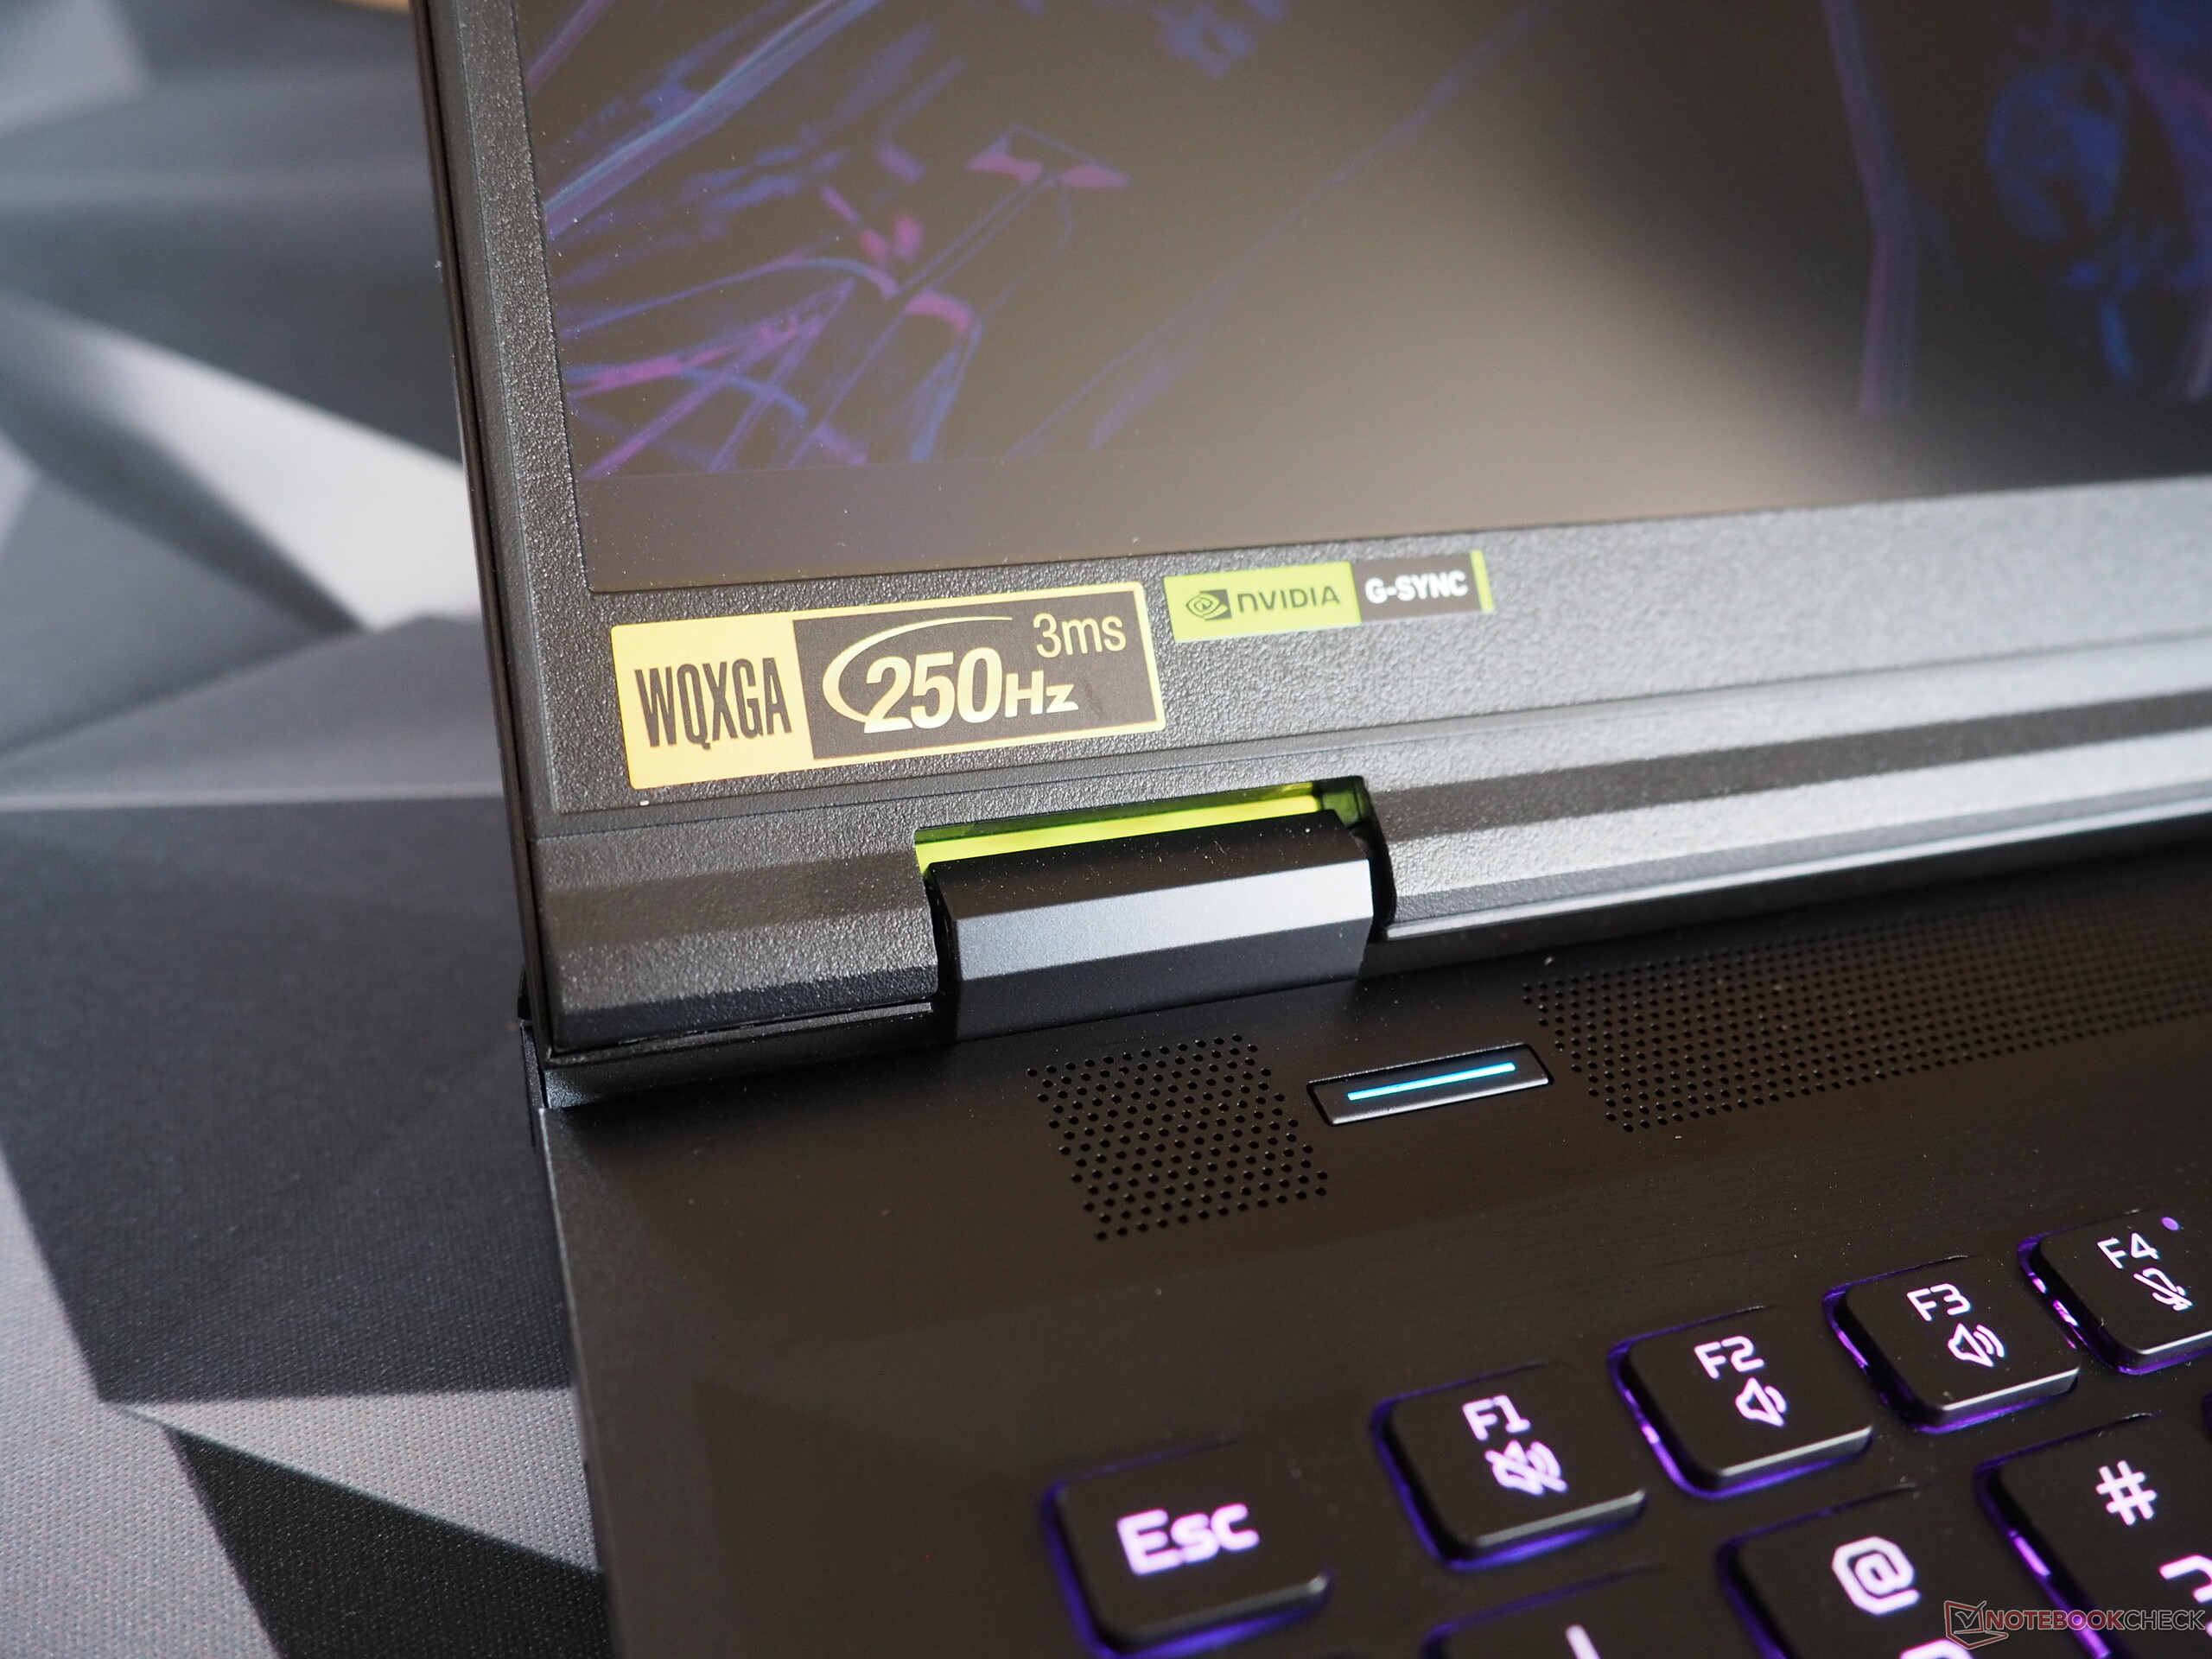
La versione 2024 ha ereditato il display Mini-LED del suo predecessore (WQXGA, 16:10, 250 Hz, HDR1000). Se non si tiene conto del suo sfarfallio a tutti i livelli di luminosità (che fortunatamente dovrebbe rivelarsi un problema solo per gli utenti sensibili), questa tecnologia presenta chiari vantaggi rispetto a un pannello IPS standard.
| |||||||||||||||||||||||||
Distribuzione della luminosità: 93 %
Al centro con la batteria: 722 cd/m²
Contrasto: 18050:1 (Nero: 0.04 cd/m²)
ΔE ColorChecker Calman: 3.4 | ∀{0.5-29.43 Ø4.71}
calibrated: 1.6
ΔE Greyscale Calman: 3.8 | ∀{0.09-98 Ø4.96}
91.6% AdobeRGB 1998 (Argyll 3D)
100% sRGB (Argyll 3D)
99.7% Display P3 (Argyll 3D)
Gamma: 2.383
CCT: 7051 K
| Acer Predator Helios 18 PH18-72-98MW B180QAN01.2 (AUO45A8), Mini-LED, 2560x1600, 18" | MSI Titan 18 HX A14VIG AU Optronics B180ZAN01.0, Mini-LED, 3840x2400, 18" | Asus ROG Strix Scar 18 G834JYR (2024) BOE NE180QDM-NM1, Mini LED, 2560x1600, 18" | Acer Predator Helios 18 N23Q2 AUO45A8 (B180QAN01.2), IPS, 2560x1600, 18" | Alienware m18 R1 AMD BOE NE18NZ1, IPS, 1920x1200, 18" | |
|---|---|---|---|---|---|
| Display | -3% | -1% | 0% | -1% | |
| Display P3 Coverage (%) | 99.7 | 98.1 -2% | 99.9 0% | 99.8 0% | 98.5 -1% |
| sRGB Coverage (%) | 100 | 99.8 0% | 100 0% | 100 0% | 99.7 0% |
| AdobeRGB 1998 Coverage (%) | 91.6 | 86.2 -6% | 90 -2% | 91.8 0% | 88.7 -3% |
| Response Times | -187% | -6% | 2% | 55% | |
| Response Time Grey 50% / Grey 80% * (ms) | 8 ? | 8.6 ? -8% | 12 ? -50% | 7.6 ? 5% | 2.8 ? 65% |
| Response Time Black / White * (ms) | 17.6 ? | 81.8 ? -365% | 10.7 ? 39% | 17.8 ? -1% | 9.6 ? 45% |
| PWM Frequency (Hz) | 4832 ? | 2592 ? | 5733 ? | 2509 | |
| Screen | -24% | 17% | -82% | -54% | |
| Brightness middle (cd/m²) | 722 | 467.5 -35% | 937 30% | 360 -50% | 319.6 -56% |
| Brightness (cd/m²) | 724 | 459 -37% | 934 29% | 355 -51% | 304 -58% |
| Brightness Distribution (%) | 93 | 90 -3% | 89 -4% | 92 -1% | 87 -6% |
| Black Level * (cd/m²) | 0.04 | 0.066 -65% | 0.21 -425% | 0.25 -525% | |
| Contrast (:1) | 18050 | 14197 -21% | 1714 -91% | 1278 -93% | |
| Colorchecker dE 2000 * | 3.4 | 3.77 -11% | 1.52 55% | 3.82 -12% | 1.22 64% |
| Colorchecker dE 2000 max. * | 5.32 | 6.12 -15% | 2.82 47% | 7.38 -39% | 3.1 42% |
| Colorchecker dE 2000 calibrated * | 1.6 | 2.94 -84% | 1.21 24% | 2.24 -40% | 0.47 71% |
| Greyscale dE 2000 * | 3.8 | 3.2 16% | 1.7 55% | 5.06 -33% | 0.8 79% |
| Gamma | 2.383 92% | 2.43 91% | 2.042 108% | 2.52 87% | 2.23 99% |
| CCT | 7051 92% | 6478 100% | 6578 99% | 5657 115% | 6471 100% |
| Media totale (Programma / Settaggio) | -71% /
-46% | 3% /
10% | -27% /
-53% | 0% /
-27% |
* ... Meglio usare valori piccoli
A cominciare dalla sua impressionante luminosità: Una media di 724 cd/m² significa che può utilizzare il dispositivo anche in ambienti super luminosi (cioè all'aperto). In combinazione con il suo valore di nero estremamente basso, pari a circa 0,04 cd/m², lo schermo offre un ottimo contrasto di circa 18.000:1. A questo si aggiunge un'ampia copertura dello spazio colore: sebbene non riesca a coprire AdobeRGB nella sua interezza, riesce a coprire il 100% di sRGB e DCI-P3, il che è impressionante.
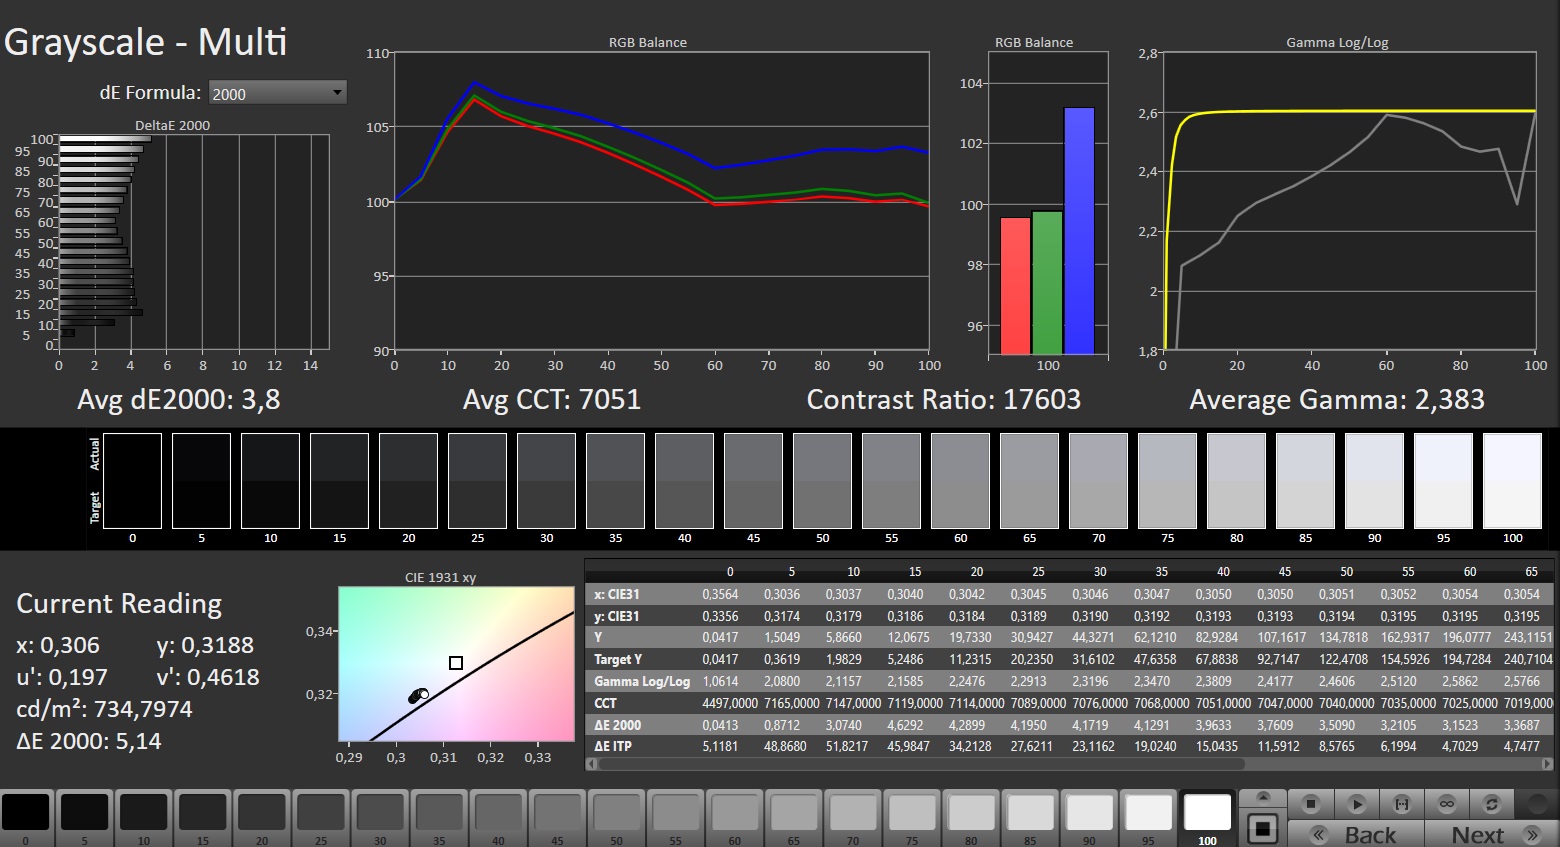
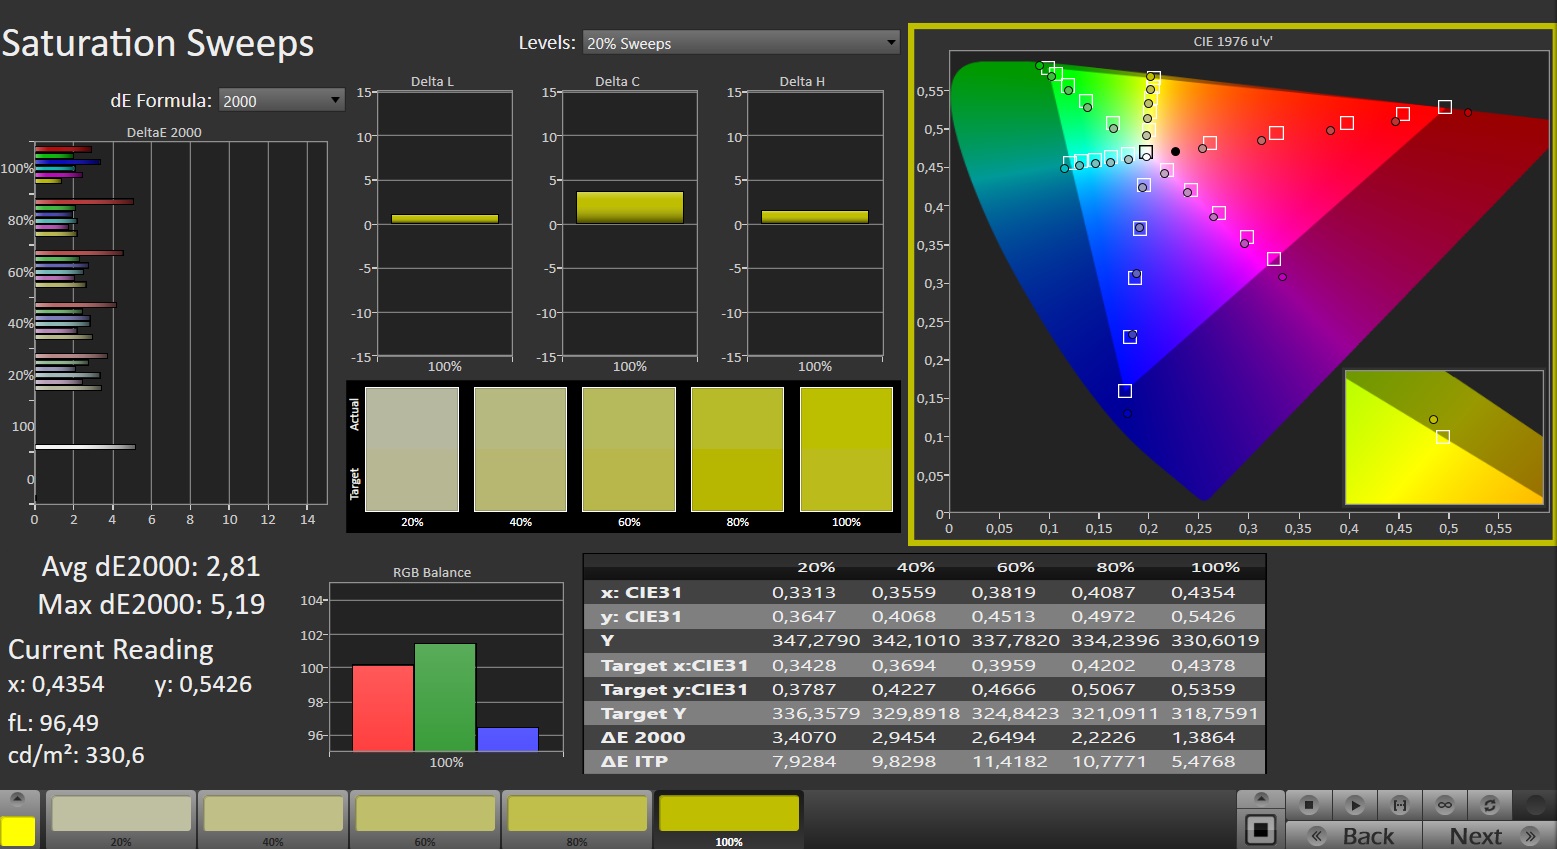
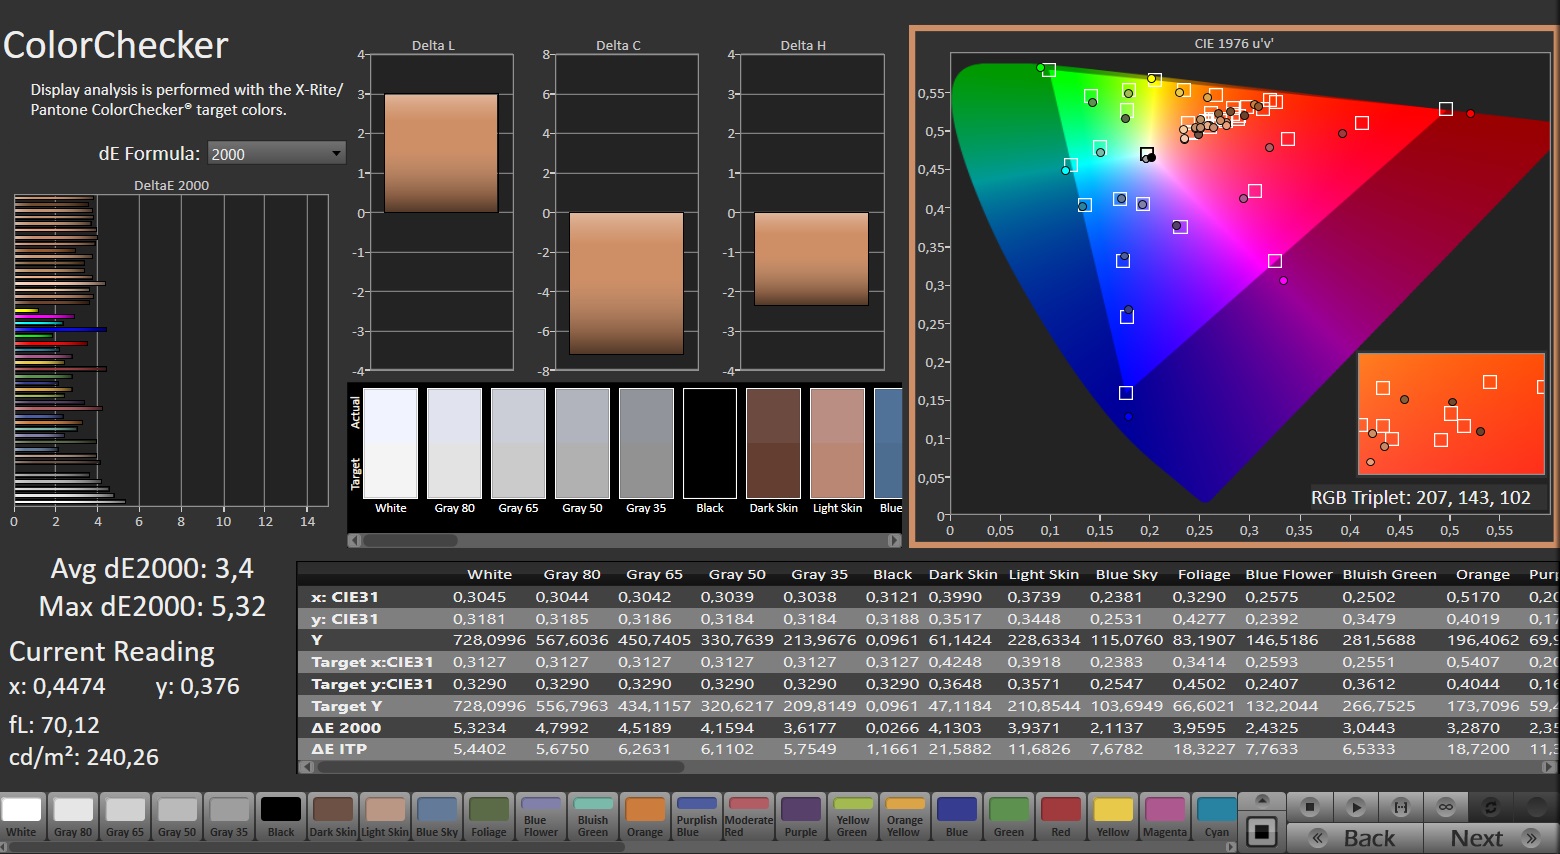
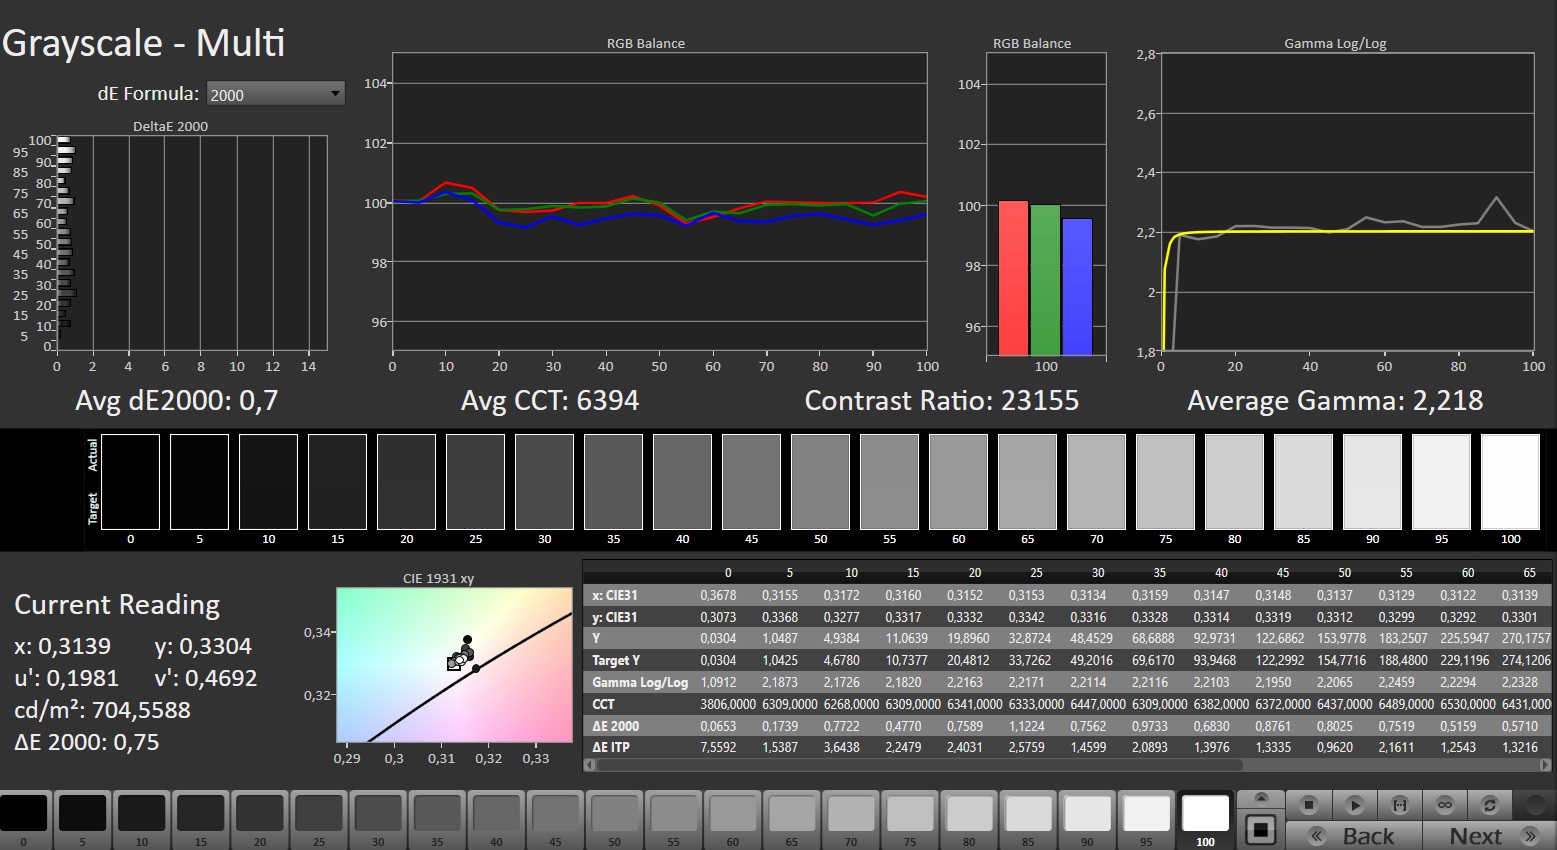
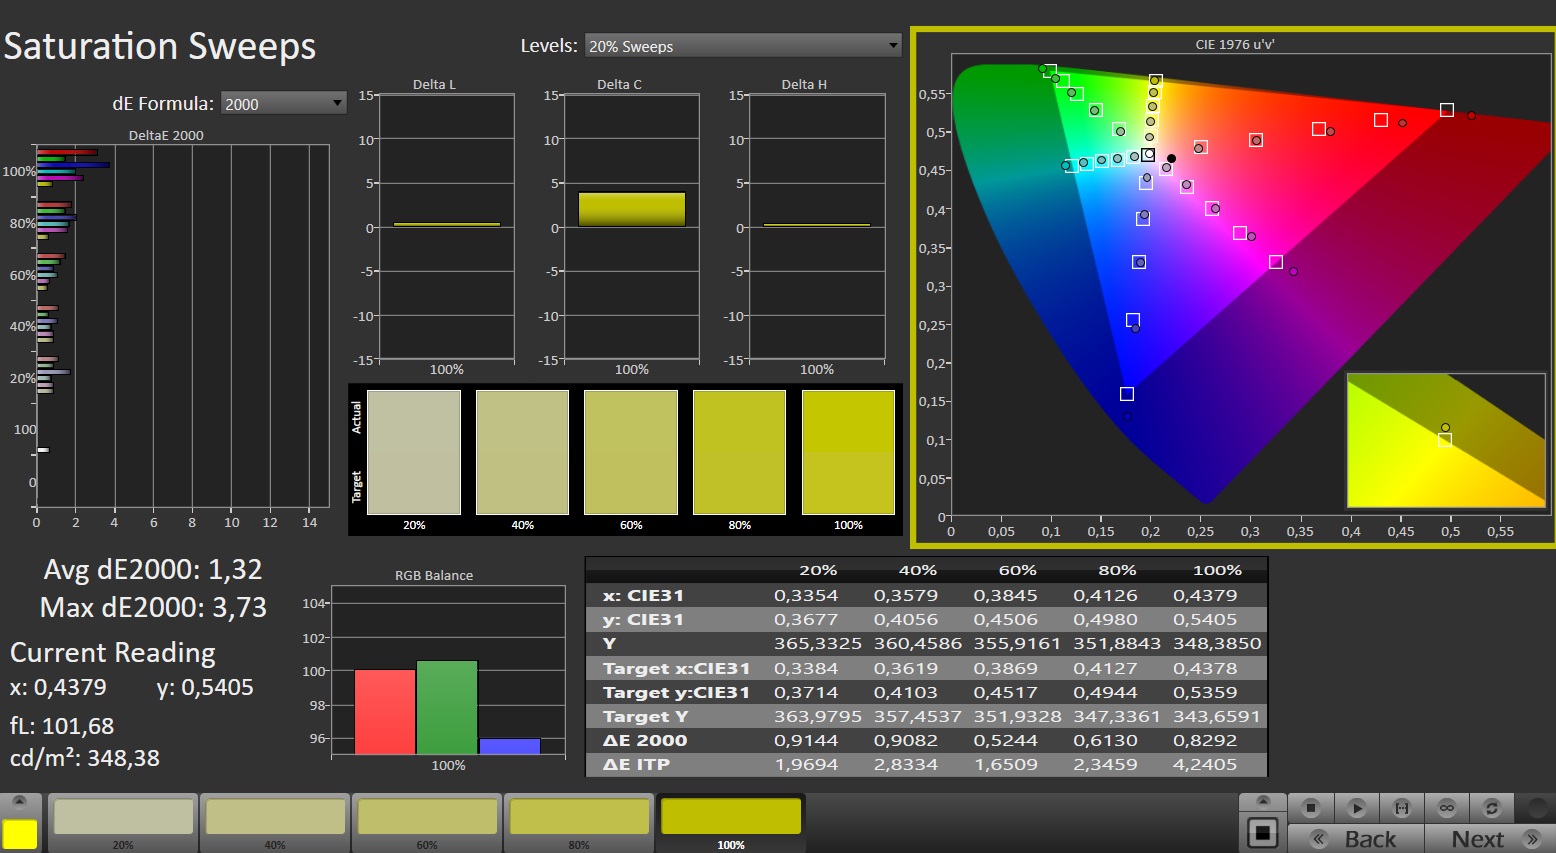
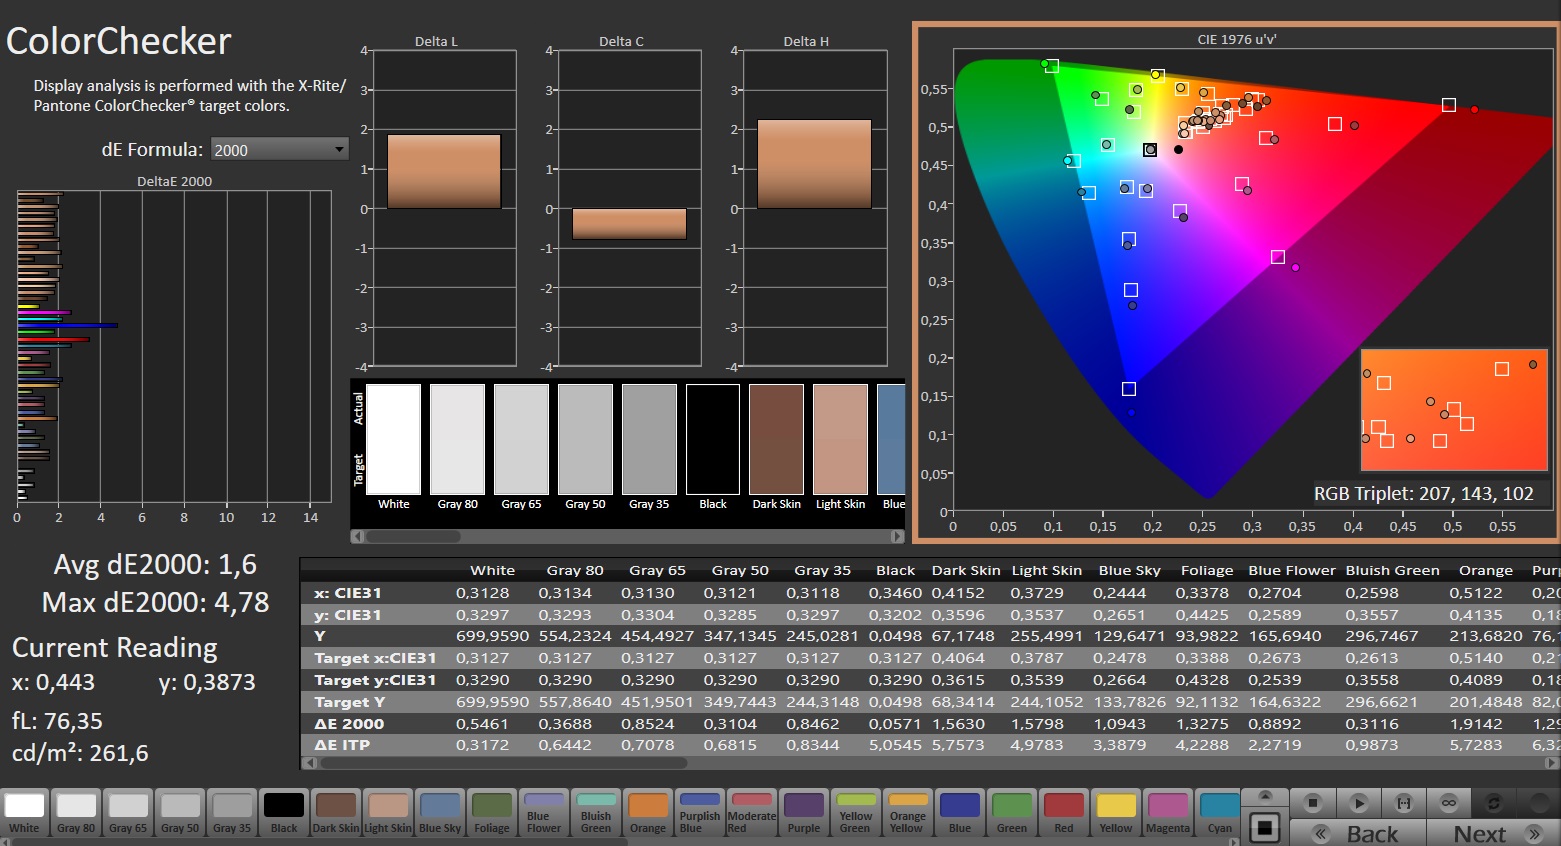
Sfortunatamente, la sua precisione cromatica non è la migliore in assoluto, quindi gli utenti professionali dovrebbero effettuare una calibrazione dopo l'acquisto (il nostro file ICC è linkato sopra).


I suoi tempi di risposta sono da discreti a buoni, ma non sono all'altezza di quelli dei pannelli OLED che, inoltre, offrono contrasti e valori di nero ancora migliori. D'altra parte, hanno anche i loro punti deboli (ad esempio, di solito hanno una superficie riflettente).
Tempi di risposta del Display
| ↔ Tempi di risposta dal Nero al Bianco | ||
|---|---|---|
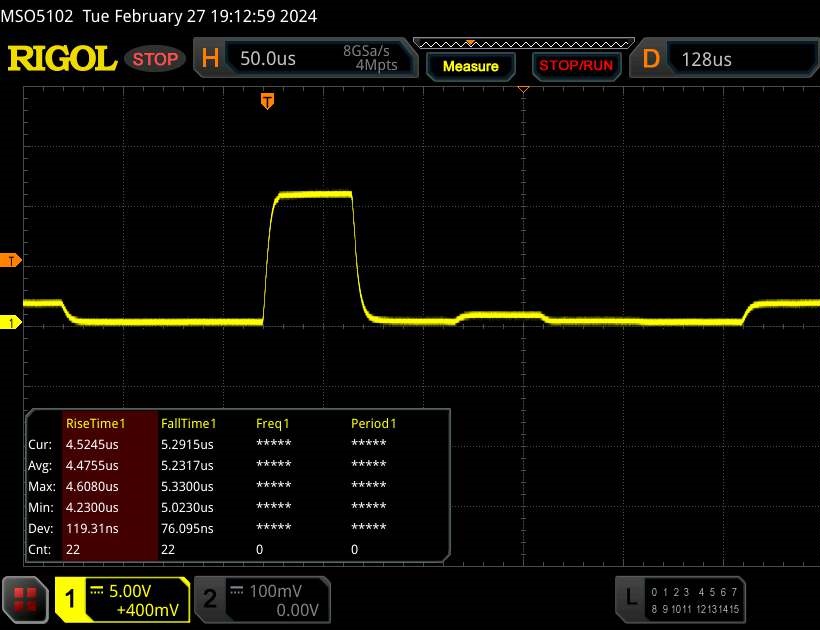
| 17.6 ms ... aumenta ↗ e diminuisce ↘ combinato | ↗ 15.2 ms Incremento | 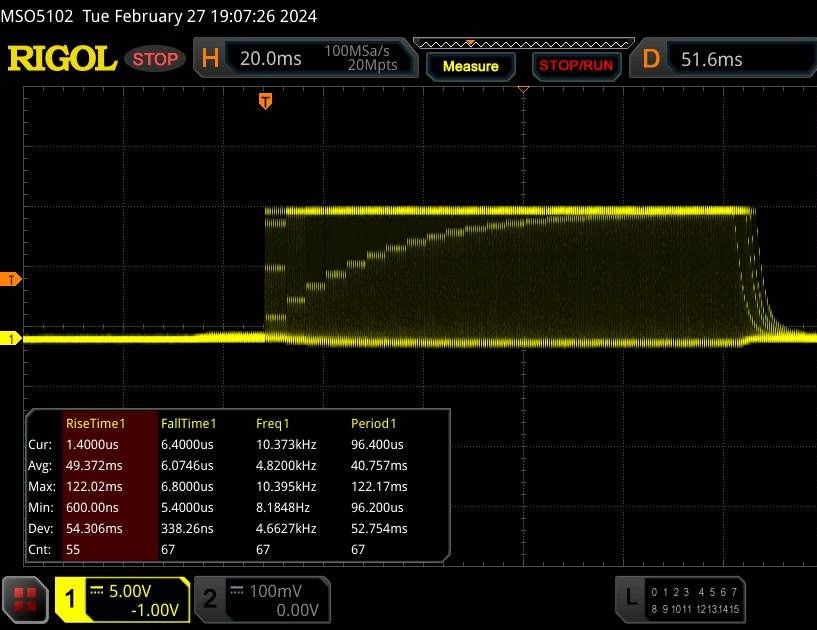 |
| ↘ 2.4 ms Calo | ||
| Lo schermo mostra buoni tempi di risposta durante i nostri tests, ma potrebbe essere troppo lento per i gamers competitivi. In confronto, tutti i dispositivi di test variano da 0.1 (minimo) a 240 (massimo) ms. » 40 % di tutti i dispositivi è migliore. Questo significa che i tempi di risposta rilevati sono migliori rispettto alla media di tutti i dispositivi testati (19.8 ms). | ||
| ↔ Tempo di risposta dal 50% Grigio all'80% Grigio | ||
| 8 ms ... aumenta ↗ e diminuisce ↘ combinato | ↗ 4.9 ms Incremento | 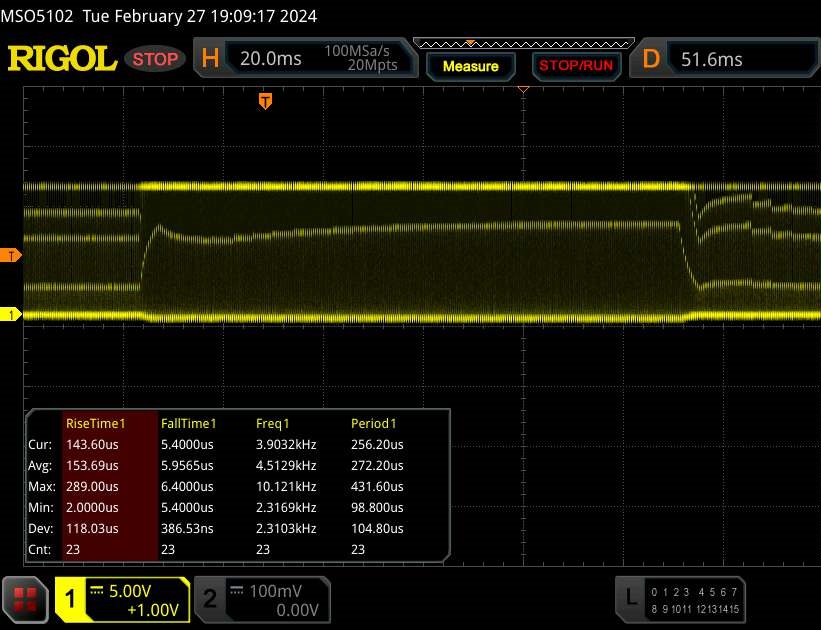 |
| ↘ 3.1 ms Calo | ||
| Lo schermo mostra veloci tempi di risposta durante i nostri tests e dovrebbe esere adatto al gaming In confronto, tutti i dispositivi di test variano da 0.165 (minimo) a 636 (massimo) ms. » 21 % di tutti i dispositivi è migliore. Questo significa che i tempi di risposta rilevati sono migliori rispettto alla media di tutti i dispositivi testati (31 ms). | ||
Sfarfallio dello schermo / PWM (Pulse-Width Modulation)
| flickering dello schermo / PWM rilevato | 4832 Hz | ≤ 100 % settaggio luminosita' |  |
Il display sfarfalla a 4832 Hz (Probabilmente a causa dell'uso di PWM) Flickering rilevato ad una luminosita' di 100 % o inferiore. Non dovrebbe verificarsi flickering o PWM sopra questo valore di luminosita'. La frequenza di 4832 Hz è abbastanza alta, quindi la maggioranza degli utenti sensibili al PWM non dovrebbero notare alcun flickering. In confronto: 52 % di tutti i dispositivi testati non utilizza PWM per ridurre la luminosita' del display. Se è rilevato PWM, una media di 7747 (minimo: 5 - massimo: 343500) Hz è stata rilevata. | |||

Prestazioni
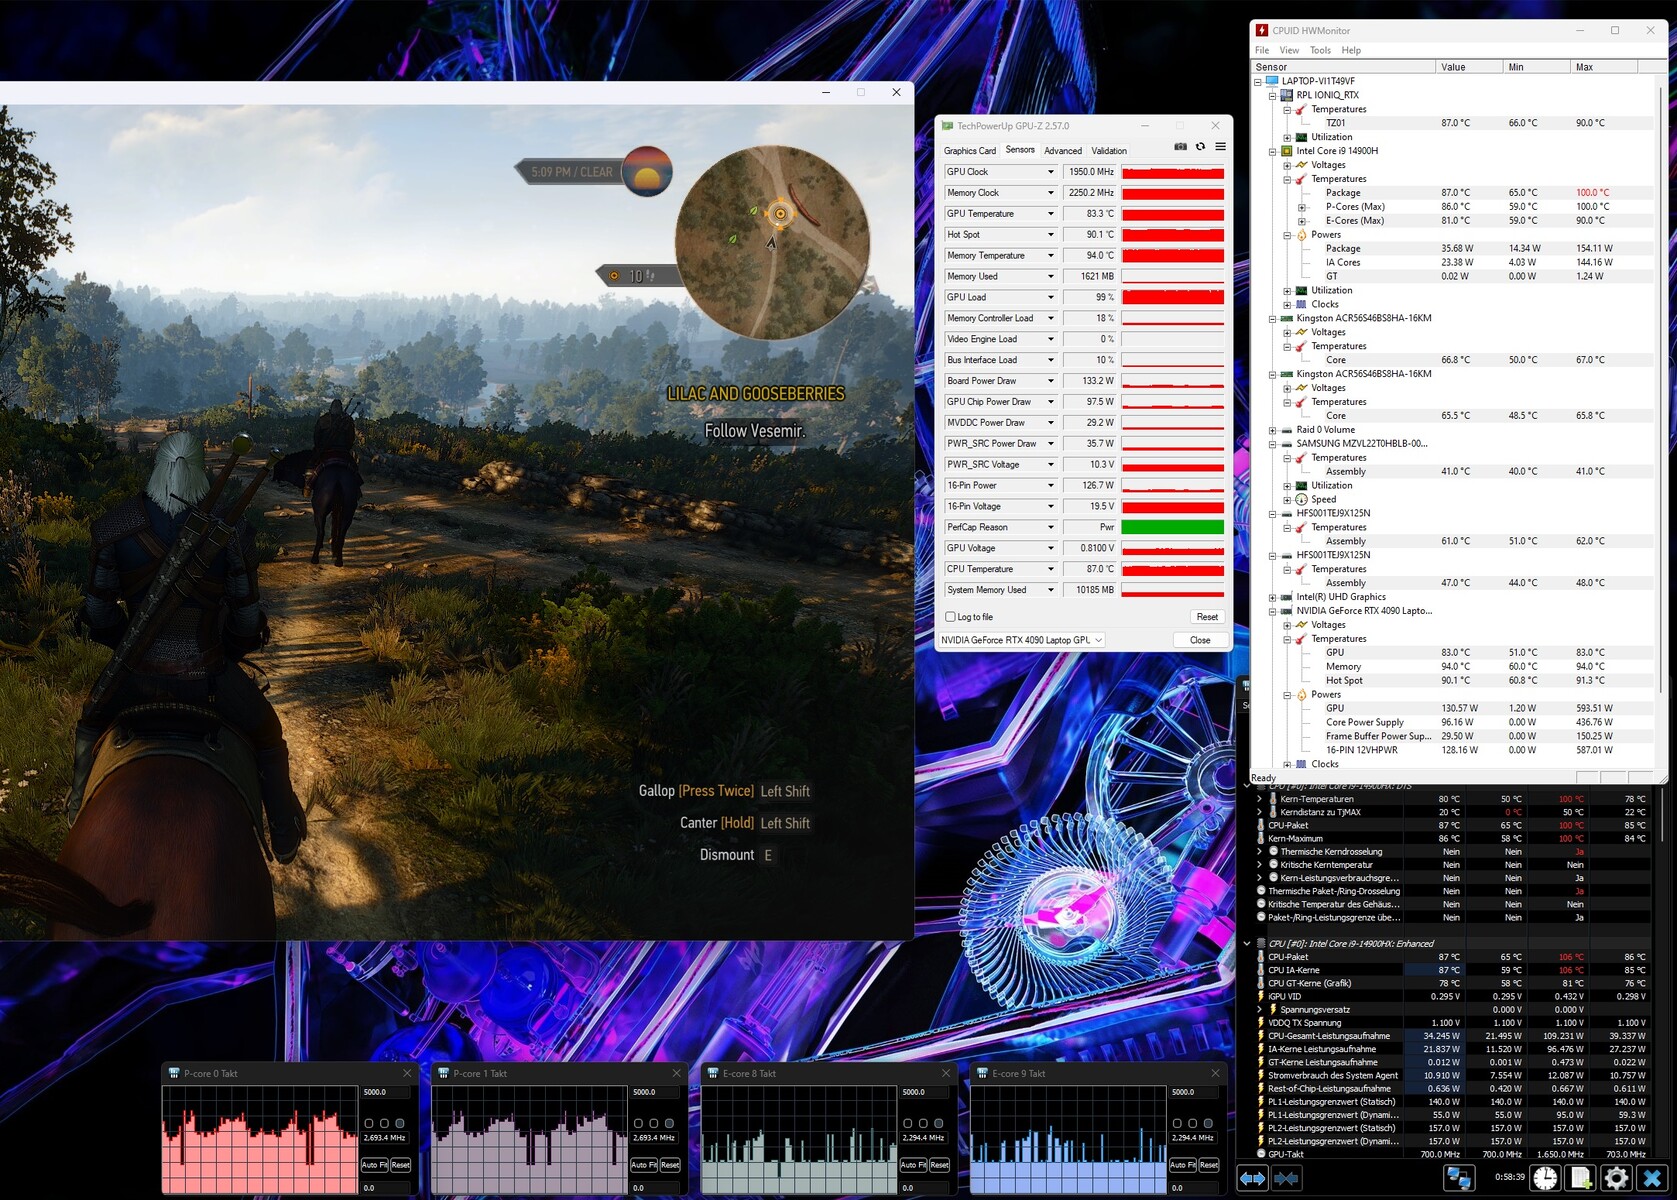
I componenti di Predator Helios 18 sono modelli top di gamma quando si tratta di computer portatili da gioco. 32 GB di RAM e 2 TB di storage dovrebbero essere sufficienti per la maggior parte degli utenti nei prossimi anni. Lo stesso si può dire per la potenza della CPU e della GPU, che non hanno ancora raggiunto i loro limiti grazie alla risoluzione moderata del display di 2.560 x 1.600 pixel.
Condizioni di test
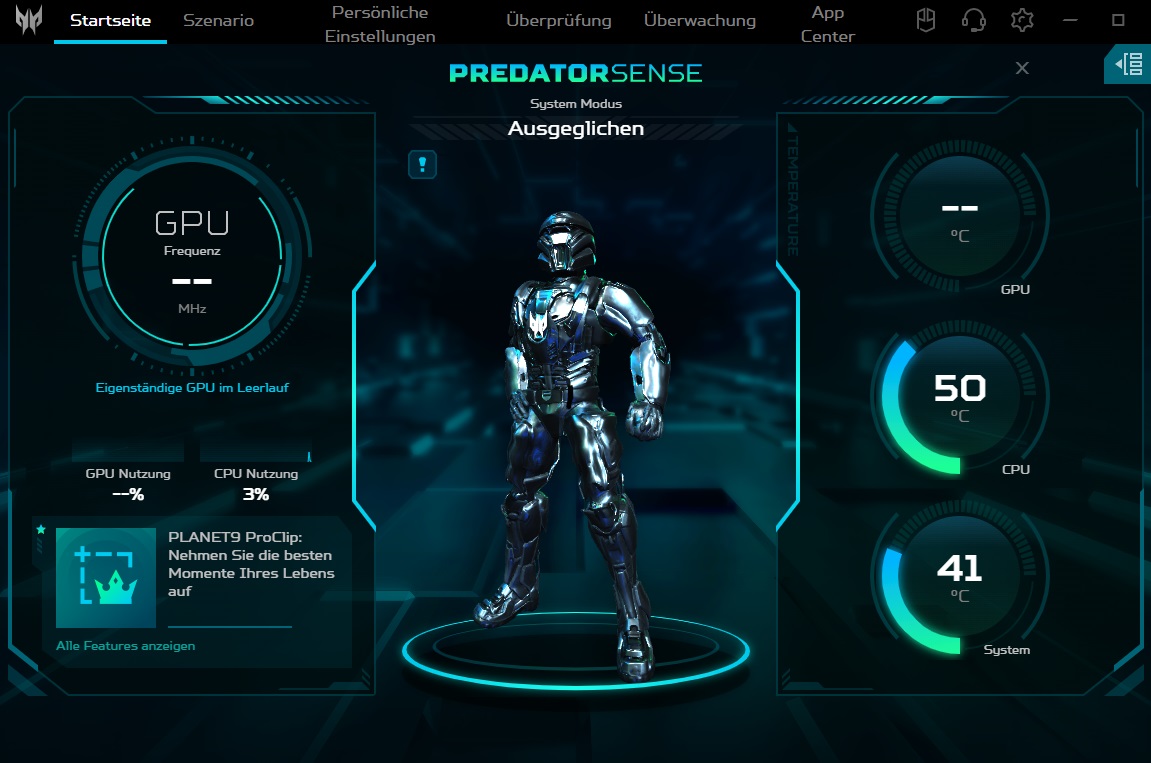
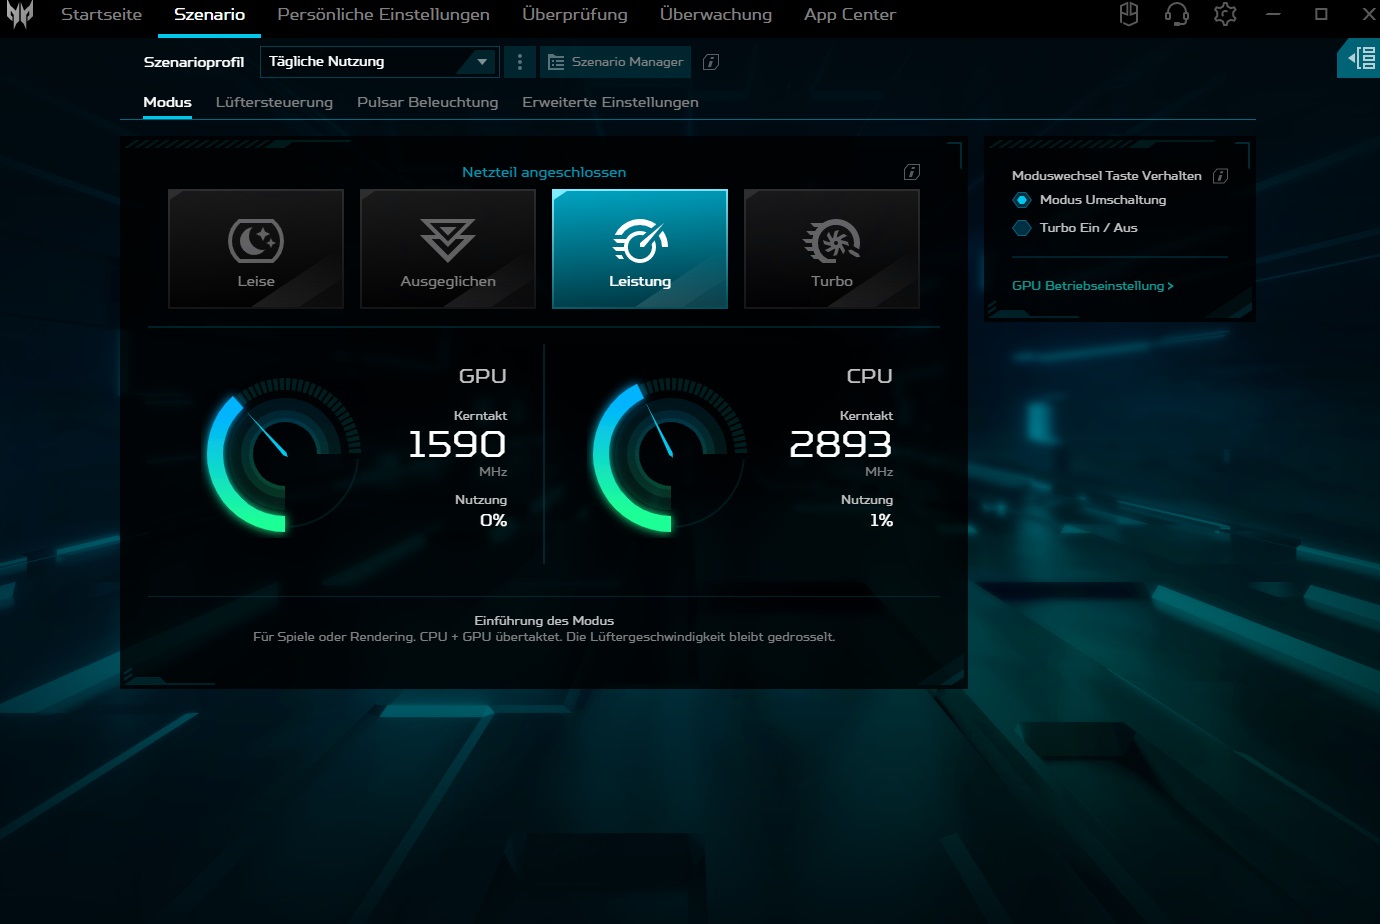
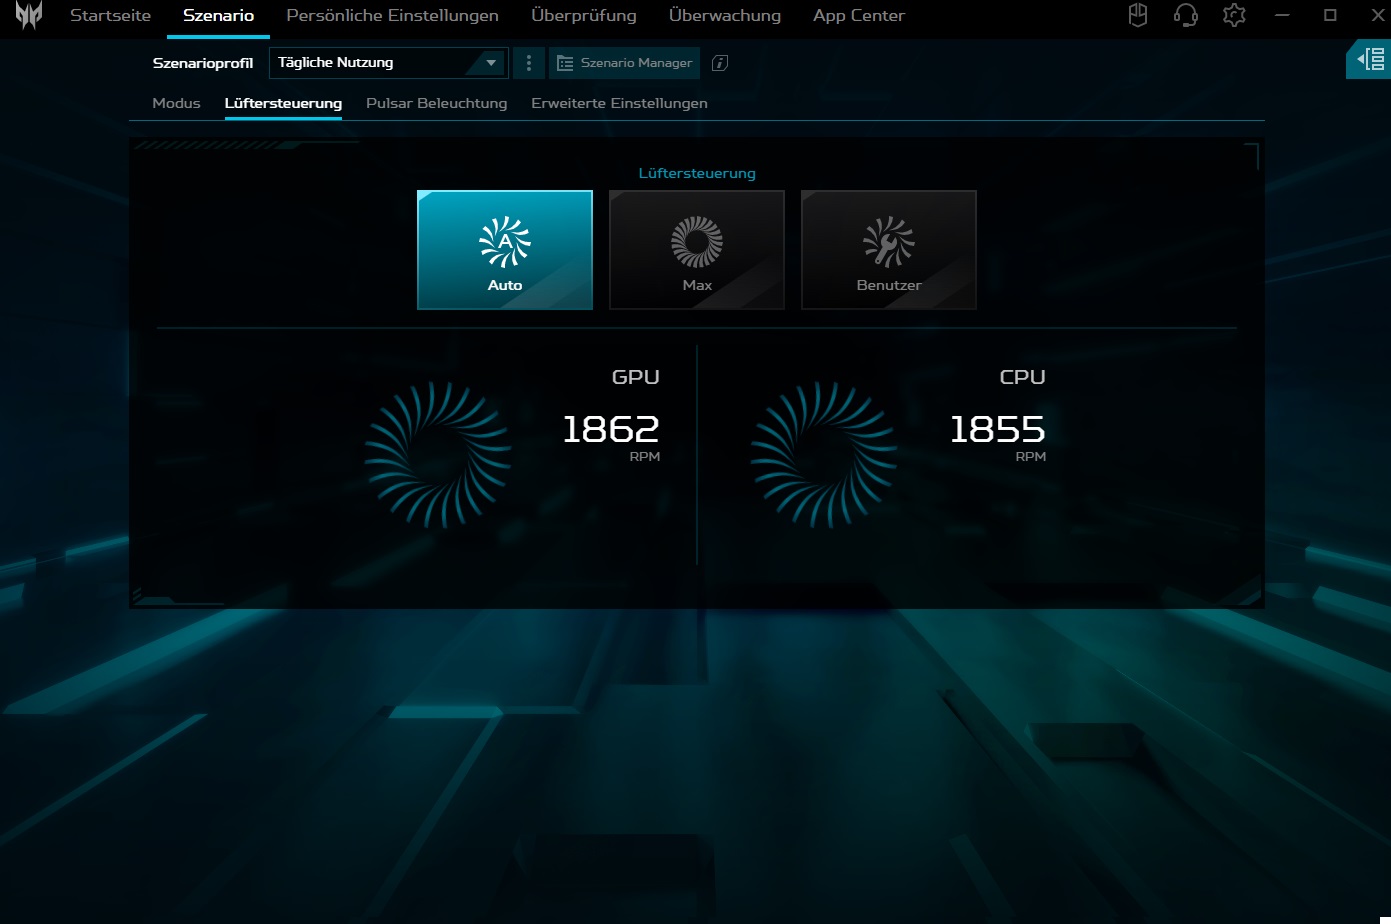
All'interno del software preinstallato del produttore (Predator Sense), ci sono diverse modalità operative elencate sotto la voce Scenario, che hanno una grande influenza sulle prestazioni e sulle emissioni acustiche. Poiché il portatile da 18 pollici è estremamente rumoroso in modalità turbo (>60 dB durante il gioco), tutte le misurazioni sono state effettuate in modalità prestazioni. I valori di velocità e di emissioni determinati sono quindi comparabili con il suo predecessore solo in misura limitata.
| Witcher 3 (FHD/Ultra) | Silenzioso | Bilanciato | Prestazioni | Turbo |
| Rumore | 38 dB(A) | 43 dB(A) | 49 dB(A) | 61 dB(A) |
| Prestazioni | 130 fps | 160 fps | 180 fps | 200 fps |
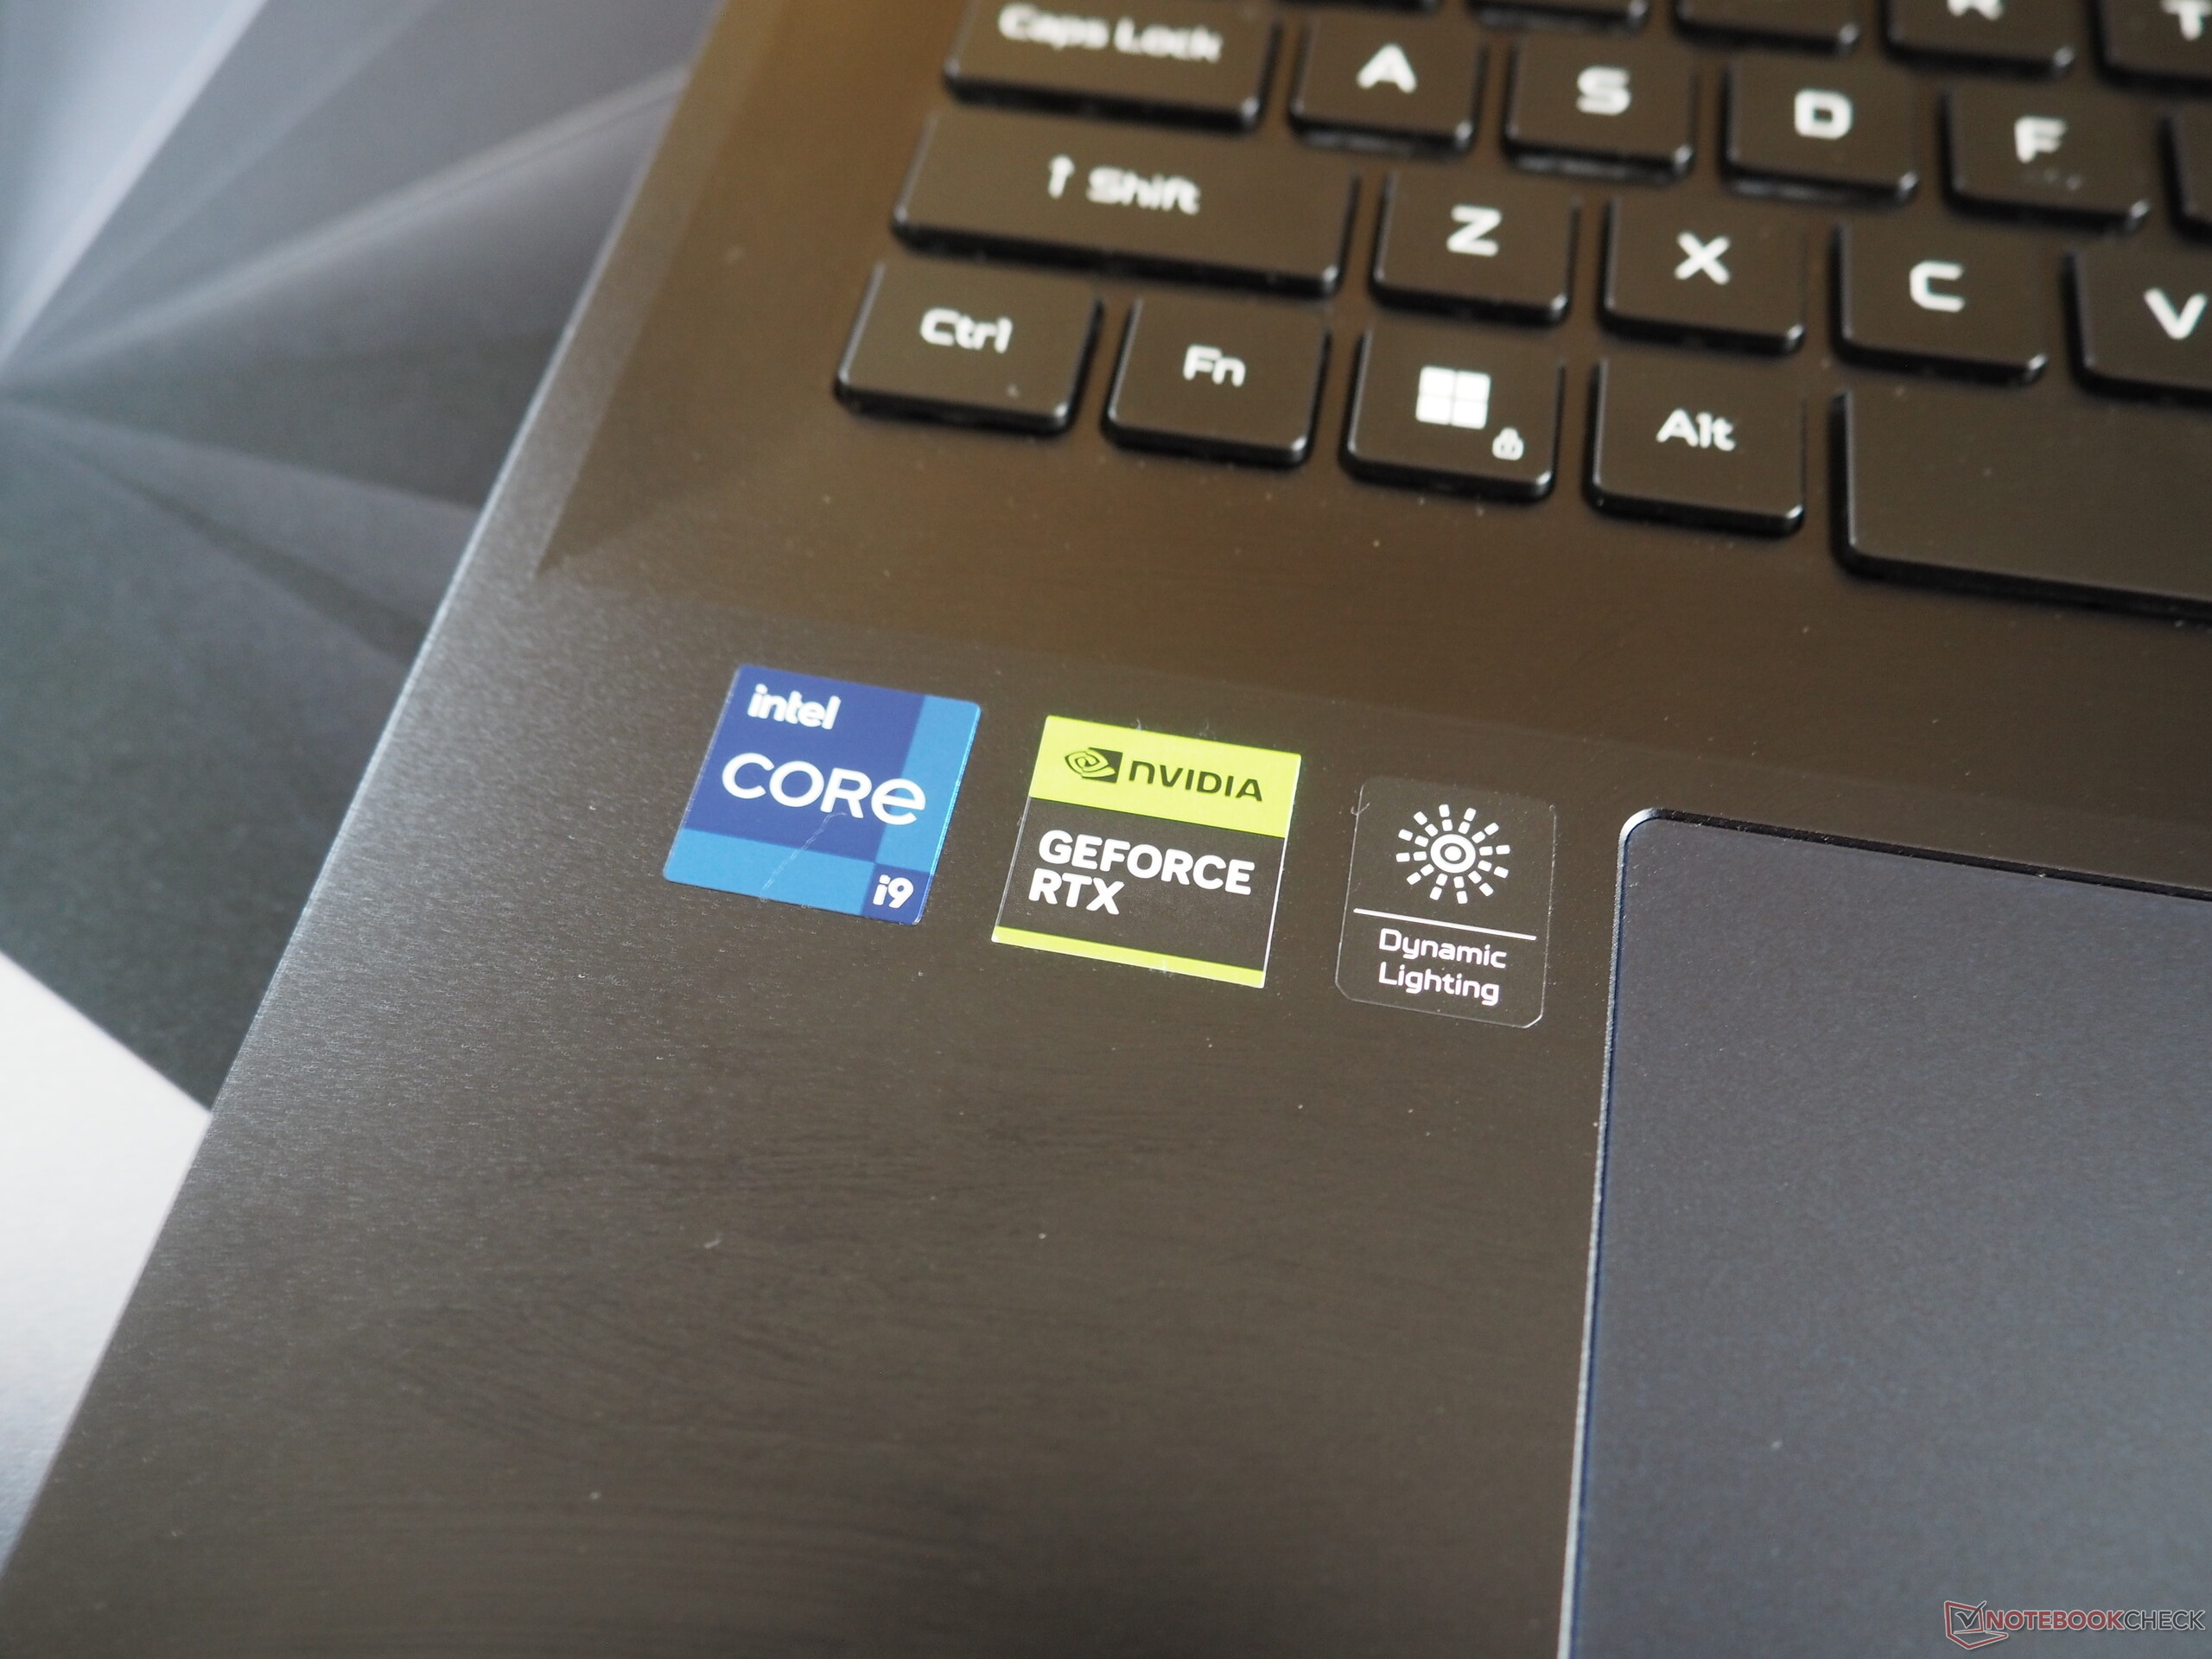
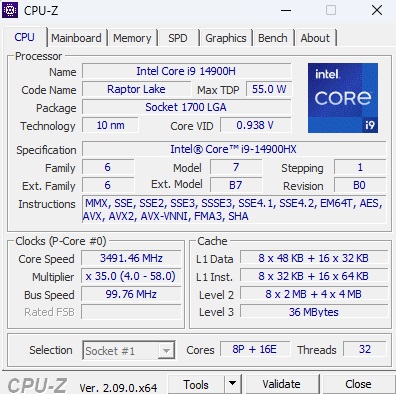
Processore
Il Core i9-14900HX è un modello top di gamma della serie Raptor Lake di Intel e, sebbene abbia un consumo elevato, offre grandi prestazioni. Intel utilizza 8 core di prestazioni con hyper threading e 16 core di efficienza senza HT, con il risultato di 32 thread paralleli. In modalità prestazioni, la CPU ha ottenuto risultati leggermente inferiori alla media (-6% rispetto alla media precedente). Inoltre, le sue prestazioni calano durante i periodi di carico più lunghi, come ha rivelato il nostro ciclo Cinebench (vedere il grafico). Questo non si è verificato con nessuno dei dispositivi concorrenti.
Cinebench R15 Multi continuous test
* ... Meglio usare valori piccoli
AIDA64: FP32 Ray-Trace | FPU Julia | CPU SHA3 | CPU Queen | FPU SinJulia | FPU Mandel | CPU AES | CPU ZLib | FP64 Ray-Trace | CPU PhotoWorxx
| Performance rating | |
| Alienware m18 R1 AMD | |
| Acer Predator Helios 18 N23Q2 | |
| MSI Titan 18 HX A14VIG | |
| Asus ROG Strix Scar 18 G834JYR (2024) | |
| Media della classe Gaming | |
| Media Intel Core i9-14900HX | |
| Acer Predator Helios 18 PH18-72-98MW | |
| AIDA64 / FP32 Ray-Trace | |
| Alienware m18 R1 AMD | |
| Media della classe Gaming (10227 - 85542, n=105, ultimi 2 anni) | |
| MSI Titan 18 HX A14VIG | |
| Acer Predator Helios 18 N23Q2 | |
| Asus ROG Strix Scar 18 G834JYR (2024) | |
| Media Intel Core i9-14900HX (13098 - 33474, n=36) | |
| Acer Predator Helios 18 PH18-72-98MW | |
| AIDA64 / FPU Julia | |
| Alienware m18 R1 AMD | |
| MSI Titan 18 HX A14VIG | |
| Media della classe Gaming (51376 - 238426, n=105, ultimi 2 anni) | |
| Acer Predator Helios 18 N23Q2 | |
| Asus ROG Strix Scar 18 G834JYR (2024) | |
| Media Intel Core i9-14900HX (67573 - 166040, n=36) | |
| Acer Predator Helios 18 PH18-72-98MW | |
| AIDA64 / CPU SHA3 | |
| Alienware m18 R1 AMD | |
| MSI Titan 18 HX A14VIG | |
| Acer Predator Helios 18 N23Q2 | |
| Media della classe Gaming (2180 - 10115, n=105, ultimi 2 anni) | |
| Asus ROG Strix Scar 18 G834JYR (2024) | |
| Media Intel Core i9-14900HX (3589 - 7979, n=36) | |
| Acer Predator Helios 18 PH18-72-98MW | |
| AIDA64 / CPU Queen | |
| Alienware m18 R1 AMD | |
| MSI Titan 18 HX A14VIG | |
| Asus ROG Strix Scar 18 G834JYR (2024) | |
| Acer Predator Helios 18 PH18-72-98MW | |
| Media Intel Core i9-14900HX (118405 - 148966, n=36) | |
| Acer Predator Helios 18 N23Q2 | |
| Media della classe Gaming (49785 - 173351, n=90, ultimi 2 anni) | |
| AIDA64 / FPU SinJulia | |
| Alienware m18 R1 AMD | |
| MSI Titan 18 HX A14VIG | |
| Asus ROG Strix Scar 18 G834JYR (2024) | |
| Acer Predator Helios 18 N23Q2 | |
| Media Intel Core i9-14900HX (10475 - 18517, n=36) | |
| Acer Predator Helios 18 PH18-72-98MW | |
| Media della classe Gaming (4424 - 33636, n=105, ultimi 2 anni) | |
| AIDA64 / FPU Mandel | |
| Alienware m18 R1 AMD | |
| Media della classe Gaming (25115 - 128721, n=105, ultimi 2 anni) | |
| MSI Titan 18 HX A14VIG | |
| Acer Predator Helios 18 N23Q2 | |
| Asus ROG Strix Scar 18 G834JYR (2024) | |
| Media Intel Core i9-14900HX (32543 - 83662, n=36) | |
| Acer Predator Helios 18 PH18-72-98MW | |
| AIDA64 / CPU AES | |
| Acer Predator Helios 18 N23Q2 | |
| Alienware m18 R1 AMD | |
| Media Intel Core i9-14900HX (86964 - 241777, n=36) | |
| MSI Titan 18 HX A14VIG | |
| Asus ROG Strix Scar 18 G834JYR (2024) | |
| Acer Predator Helios 18 PH18-72-98MW | |
| Media della classe Gaming (39258 - 247074, n=105, ultimi 2 anni) | |
| AIDA64 / CPU ZLib | |
| Alienware m18 R1 AMD | |
| MSI Titan 18 HX A14VIG | |
| Acer Predator Helios 18 N23Q2 | |
| Media Intel Core i9-14900HX (1054 - 2292, n=36) | |
| Asus ROG Strix Scar 18 G834JYR (2024) | |
| Acer Predator Helios 18 PH18-72-98MW | |
| Media della classe Gaming (574 - 2531, n=105, ultimi 2 anni) | |
| AIDA64 / FP64 Ray-Trace | |
| Alienware m18 R1 AMD | |
| Media della classe Gaming (5509 - 45446, n=105, ultimi 2 anni) | |
| MSI Titan 18 HX A14VIG | |
| Acer Predator Helios 18 N23Q2 | |
| Asus ROG Strix Scar 18 G834JYR (2024) | |
| Media Intel Core i9-14900HX (6809 - 18349, n=36) | |
| Acer Predator Helios 18 PH18-72-98MW | |
| AIDA64 / CPU PhotoWorxx | |
| Acer Predator Helios 18 N23Q2 | |
| Asus ROG Strix Scar 18 G834JYR (2024) | |
| Acer Predator Helios 18 PH18-72-98MW | |
| Media Intel Core i9-14900HX (23903 - 54702, n=36) | |
| Media della classe Gaming (12271 - 89891, n=105, ultimi 2 anni) | |
| Alienware m18 R1 AMD | |
| MSI Titan 18 HX A14VIG | |
Prestazioni del sistema
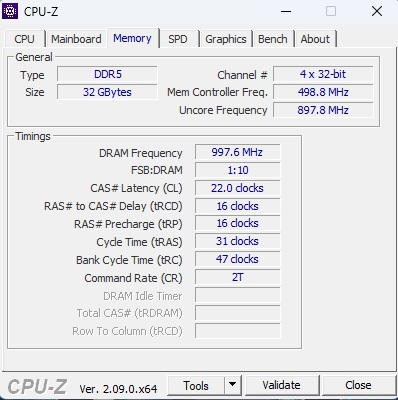
Anche le sue prestazioni di sistema non sono state sufficienti per il primo posto. Il suo punteggio totale PCMark 10 è paragonabile a quello del suo predecessore. La RAM del dispositivo offre livelli di prestazioni tipici della RAM DDR5-5600.
CrossMark: Overall | Productivity | Creativity | Responsiveness
WebXPRT 3: Overall
WebXPRT 4: Overall
Mozilla Kraken 1.1: Total
| PCMark 10 / Score | |
| Alienware m18 R1 AMD | |
| MSI Titan 18 HX A14VIG | |
| Asus ROG Strix Scar 18 G834JYR (2024) | |
| Media Intel Core i9-14900HX, NVIDIA GeForce RTX 4090 Laptop GPU (8230 - 9234, n=13) | |
| Acer Predator Helios 18 N23Q2 | |
| Media della classe Gaming (5828 - 12414, n=93, ultimi 2 anni) | |
| Acer Predator Helios 18 PH18-72-98MW | |
| PCMark 10 / Essentials | |
| Alienware m18 R1 AMD | |
| MSI Titan 18 HX A14VIG | |
| Asus ROG Strix Scar 18 G834JYR (2024) | |
| Media Intel Core i9-14900HX, NVIDIA GeForce RTX 4090 Laptop GPU (10778 - 11628, n=13) | |
| Acer Predator Helios 18 PH18-72-98MW | |
| Acer Predator Helios 18 N23Q2 | |
| Media della classe Gaming (8810 - 11935, n=97, ultimi 2 anni) | |
| PCMark 10 / Productivity | |
| Alienware m18 R1 AMD | |
| Media della classe Gaming (6845 - 25323, n=95, ultimi 2 anni) | |
| Media Intel Core i9-14900HX, NVIDIA GeForce RTX 4090 Laptop GPU (9458 - 11759, n=13) | |
| Asus ROG Strix Scar 18 G834JYR (2024) | |
| Acer Predator Helios 18 N23Q2 | |
| MSI Titan 18 HX A14VIG | |
| Acer Predator Helios 18 PH18-72-98MW | |
| PCMark 10 / Digital Content Creation | |
| Alienware m18 R1 AMD | |
| MSI Titan 18 HX A14VIG | |
| Asus ROG Strix Scar 18 G834JYR (2024) | |
| Media Intel Core i9-14900HX, NVIDIA GeForce RTX 4090 Laptop GPU (13219 - 16462, n=13) | |
| Acer Predator Helios 18 N23Q2 | |
| Media della classe Gaming (7602 - 19954, n=95, ultimi 2 anni) | |
| Acer Predator Helios 18 PH18-72-98MW | |
| CrossMark / Overall | |
| Asus ROG Strix Scar 18 G834JYR (2024) | |
| Acer Predator Helios 18 N23Q2 | |
| Media Intel Core i9-14900HX, NVIDIA GeForce RTX 4090 Laptop GPU (1877 - 2344, n=10) | |
| Media della classe Gaming (1366 - 2409, n=94, ultimi 2 anni) | |
| Alienware m18 R1 AMD | |
| MSI Titan 18 HX A14VIG | |
| CrossMark / Productivity | |
| Acer Predator Helios 18 N23Q2 | |
| Asus ROG Strix Scar 18 G834JYR (2024) | |
| Media Intel Core i9-14900HX, NVIDIA GeForce RTX 4090 Laptop GPU (1738 - 2162, n=10) | |
| Media della classe Gaming (1386 - 2254, n=94, ultimi 2 anni) | |
| Alienware m18 R1 AMD | |
| MSI Titan 18 HX A14VIG | |
| CrossMark / Creativity | |
| Asus ROG Strix Scar 18 G834JYR (2024) | |
| Acer Predator Helios 18 N23Q2 | |
| Media Intel Core i9-14900HX, NVIDIA GeForce RTX 4090 Laptop GPU (2195 - 2660, n=10) | |
| Media della classe Gaming (1343 - 2786, n=94, ultimi 2 anni) | |
| Alienware m18 R1 AMD | |
| MSI Titan 18 HX A14VIG | |
| CrossMark / Responsiveness | |
| Acer Predator Helios 18 N23Q2 | |
| Asus ROG Strix Scar 18 G834JYR (2024) | |
| Media Intel Core i9-14900HX, NVIDIA GeForce RTX 4090 Laptop GPU (1478 - 2327, n=10) | |
| Media della classe Gaming (1226 - 2334, n=94, ultimi 2 anni) | |
| Alienware m18 R1 AMD | |
| MSI Titan 18 HX A14VIG | |
| WebXPRT 3 / Overall | |
| Alienware m18 R1 AMD | |
| MSI Titan 18 HX A14VIG | |
| Media Intel Core i9-14900HX, NVIDIA GeForce RTX 4090 Laptop GPU (279 - 339, n=10) | |
| Asus ROG Strix Scar 18 G834JYR (2024) | |
| Acer Predator Helios 18 N23Q2 | |
| Media della classe Gaming (220 - 532, n=98, ultimi 2 anni) | |
| WebXPRT 4 / Overall | |
| Asus ROG Strix Scar 18 G834JYR (2024) | |
| Alienware m18 R1 AMD | |
| Media Intel Core i9-14900HX, NVIDIA GeForce RTX 4090 Laptop GPU (246 - 309, n=8) | |
| MSI Titan 18 HX A14VIG | |
| Media della classe Gaming (165 - 354, n=98, ultimi 2 anni) | |
| Mozilla Kraken 1.1 / Total | |
| Alienware m18 R1 AMD | |
| Media della classe Gaming (391 - 590, n=100, ultimi 2 anni) | |
| Acer Predator Helios 18 N23Q2 | |
| Media Intel Core i9-14900HX, NVIDIA GeForce RTX 4090 Laptop GPU (428 - 535, n=11) | |
| MSI Titan 18 HX A14VIG | |
| Asus ROG Strix Scar 18 G834JYR (2024) | |
| Acer Predator Helios 18 PH18-72-98MW | |
* ... Meglio usare valori piccoli
| PCMark 10 Score | 8230 punti | |
Aiuto | ||
| AIDA64 / Memory Copy | |
| Asus ROG Strix Scar 18 G834JYR (2024) | |
| Acer Predator Helios 18 N23Q2 | |
| Acer Predator Helios 18 PH18-72-98MW | |
| Media Intel Core i9-14900HX (38028 - 83392, n=36) | |
| Media della classe Gaming (21750 - 129946, n=105, ultimi 2 anni) | |
| MSI Titan 18 HX A14VIG | |
| Alienware m18 R1 AMD | |
| AIDA64 / Memory Read | |
| Asus ROG Strix Scar 18 G834JYR (2024) | |
| Acer Predator Helios 18 N23Q2 | |
| Acer Predator Helios 18 PH18-72-98MW | |
| Media Intel Core i9-14900HX (43306 - 87568, n=36) | |
| Media della classe Gaming (22956 - 118858, n=105, ultimi 2 anni) | |
| Alienware m18 R1 AMD | |
| MSI Titan 18 HX A14VIG | |
| AIDA64 / Memory Write | |
| Asus ROG Strix Scar 18 G834JYR (2024) | |
| Media della classe Gaming (22297 - 135096, n=105, ultimi 2 anni) | |
| Acer Predator Helios 18 N23Q2 | |
| Media Intel Core i9-14900HX (37146 - 80589, n=36) | |
| Acer Predator Helios 18 PH18-72-98MW | |
| Alienware m18 R1 AMD | |
| MSI Titan 18 HX A14VIG | |
| AIDA64 / Memory Latency | |
| Media della classe Gaming (75.3 - 259, n=105, ultimi 2 anni) | |
| MSI Titan 18 HX A14VIG | |
| Alienware m18 R1 AMD | |
| Media Intel Core i9-14900HX (76.1 - 105, n=36) | |
| Acer Predator Helios 18 N23Q2 | |
| Acer Predator Helios 18 PH18-72-98MW | |
| Asus ROG Strix Scar 18 G834JYR (2024) | |
* ... Meglio usare valori piccoli
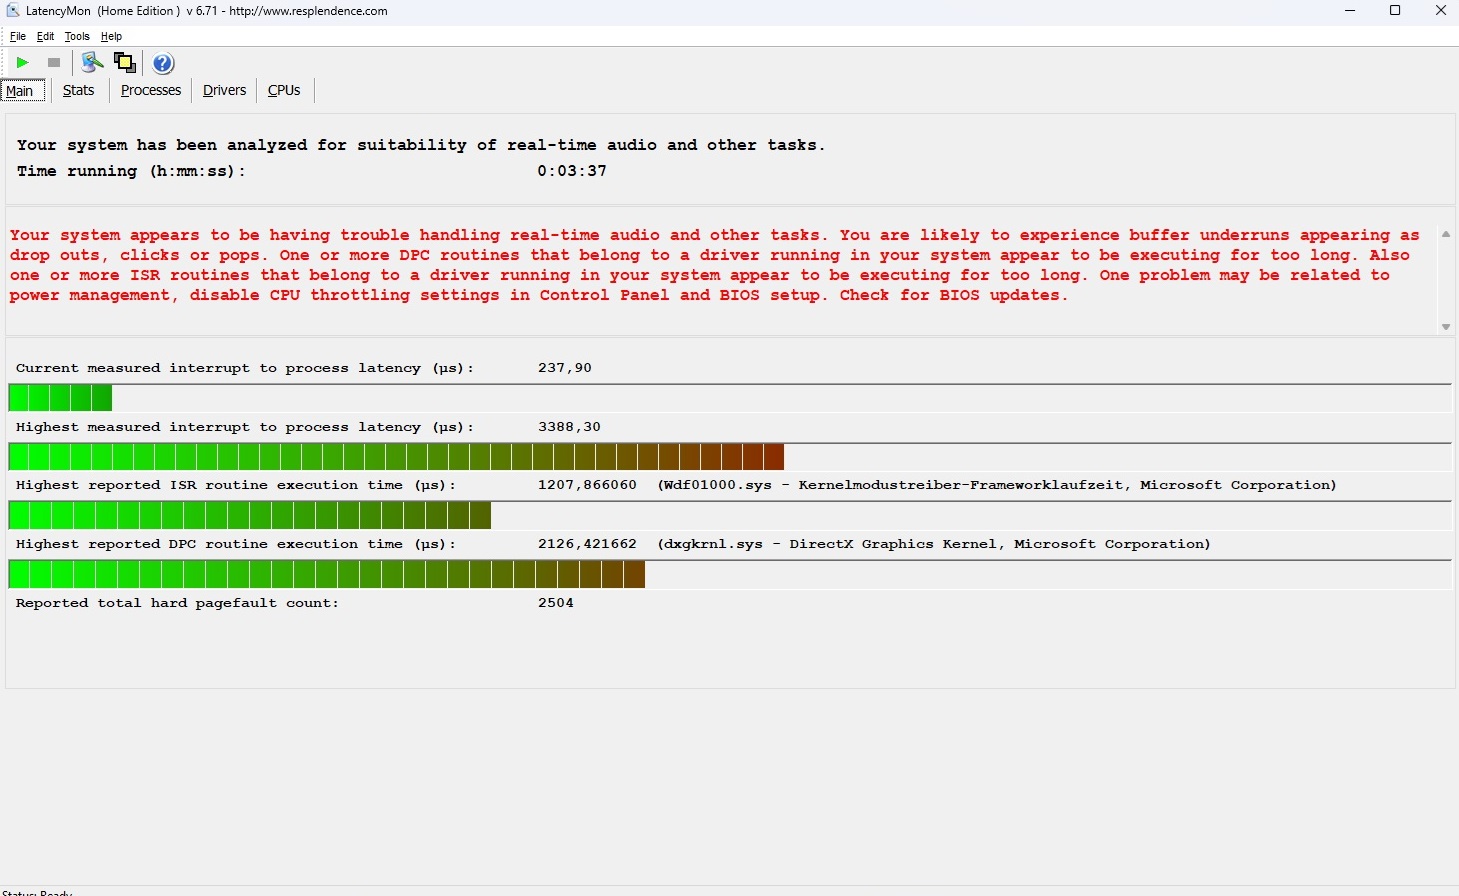
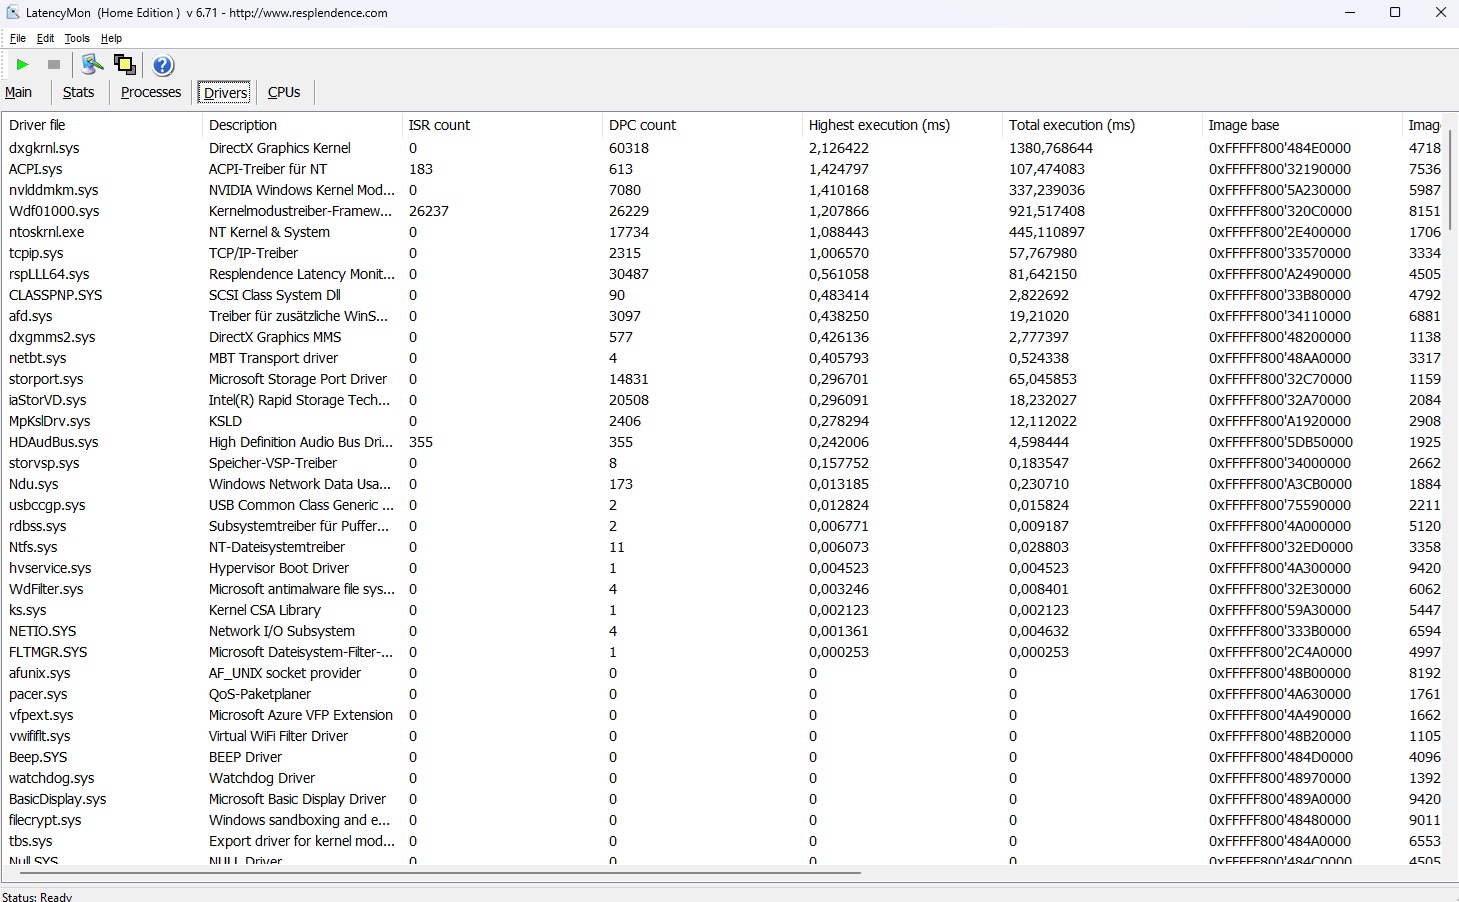
Latenza DPC
Le latenze del portatile possono essere notevolmente più basse rispetto al vecchio Helios 18, ma secondo lo strumento LatencyMon, sono ancora troppo elevate per alcuni campi di utilizzo (editing audio e video in tempo reale).
| DPC Latencies / LatencyMon - interrupt to process latency (max), Web, Youtube, Prime95 | |
| Acer Predator Helios 18 N23Q2 | |
| Acer Predator Helios 18 PH18-72-98MW | |
| MSI Titan 18 HX A14VIG | |
| Alienware m18 R1 AMD | |
| Asus ROG Strix Scar 18 G834JYR (2024) | |
* ... Meglio usare valori piccoli
Dispositivi di archiviazione
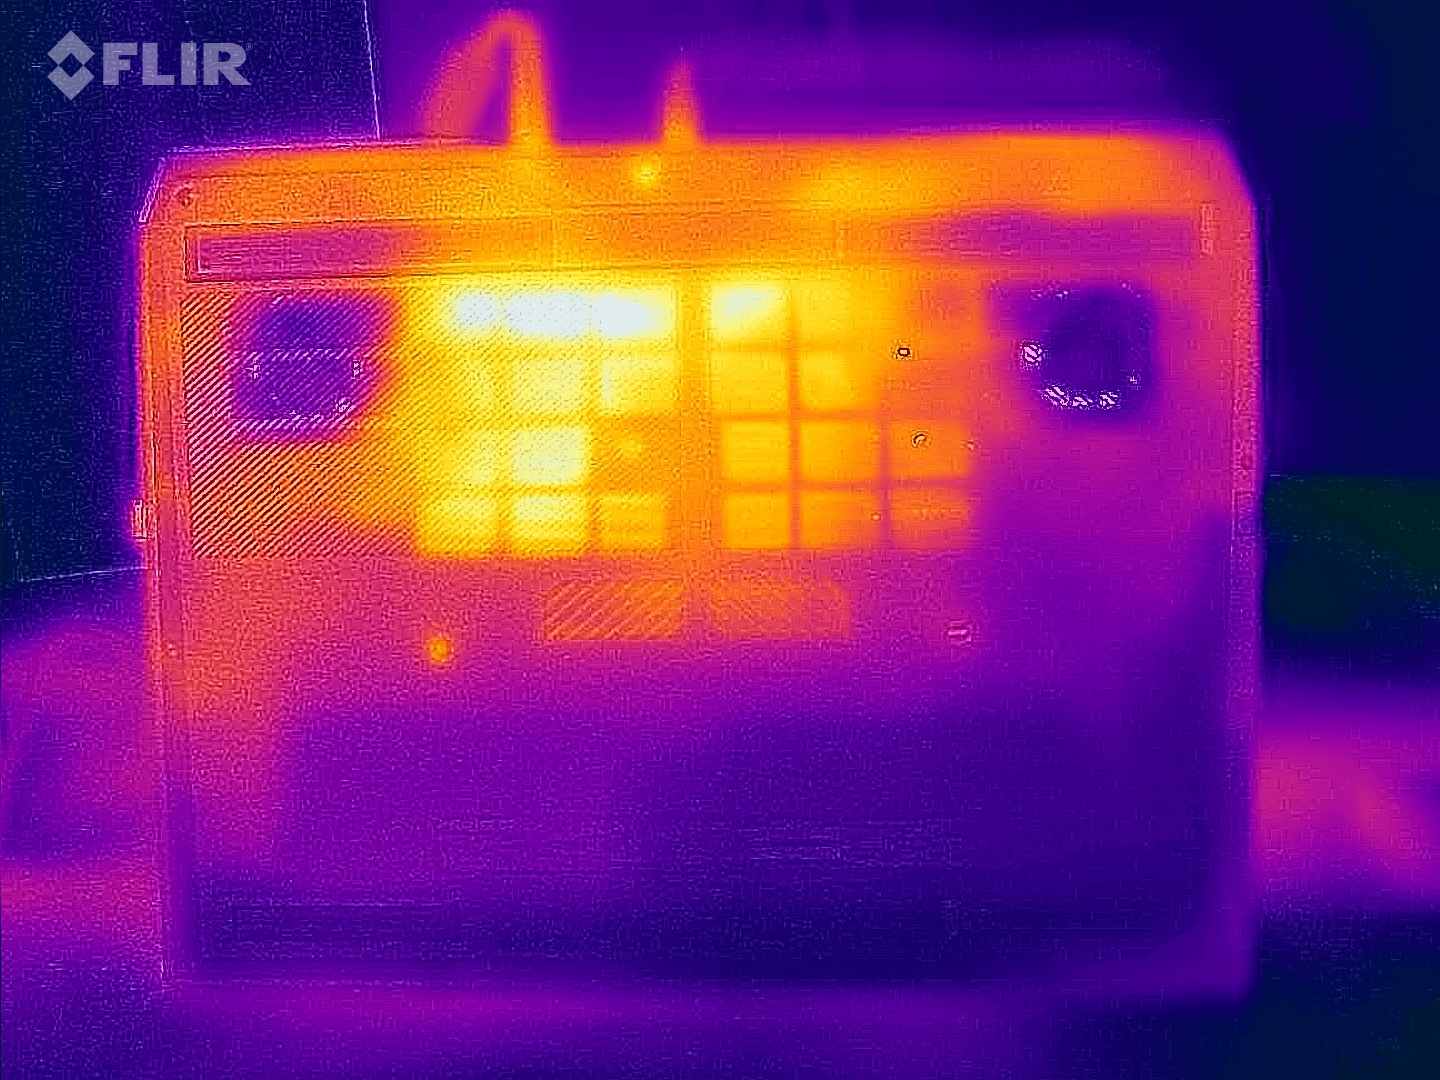
Come accennato nella nostra introduzione, Acer ha combinato due SSD NVMe in un array Raid 0. A prima vista, questo offre risultati di prima classe quando si tratta di velocità di lettura e scrittura sequenziale. Tuttavia, il raffreddamento del portatile sembra non essere ideale, in quanto abbiamo notato alcune fluttuazioni occasionali delle prestazioni dopo un po' di tempo durante il nostro loop test.

* ... Meglio usare valori piccoli
Reading continuous performance: DiskSpd Read Loop, Queue Depth 8
Scheda grafica
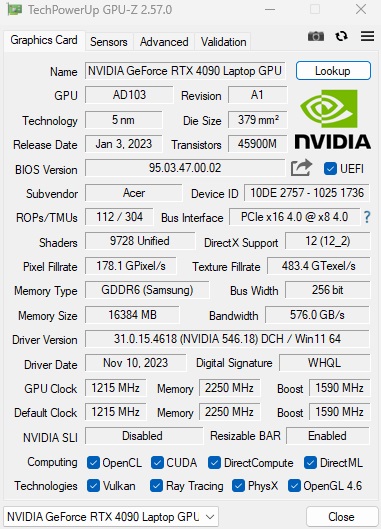
La RTX 4090 di GeForce, basata sull'architettura Ada Lovelace, è attualmente la scheda grafica per laptop più potente di Nvidia. Le sue 9.728 unità shader sono generose quanto i suoi 16 GB di VRAM GDDR6, soprattutto perché Acer ha selezionato il massimo di 175 watt come TGP. Tuttavia, le prestazioni della GPU in modalità performance sono inferiori a quelle possibili. Analogamente ai test della CPU, ha ottenuto il 6% in meno rispetto alla media precedente della RTX 4090.
| 3DMark 11 Performance | 44065 punti | |
| 3DMark Cloud Gate Standard Score | 59876 punti | |
| 3DMark Fire Strike Score | 33907 punti | |
| 3DMark Time Spy Score | 18542 punti | |
Aiuto | ||
* ... Meglio usare valori piccoli
Prestazioni di gioco
I benchmark di gioco dipingono un quadro simile. Anche in questo caso, la RTX 4090 non è stata in grado di sfruttare tutto il suo potenziale. Tuttavia, è stata sufficiente per eseguire tutti i giochi moderni con tutti i dettagli nella sua risoluzione nativa di 2.560 x 1.600 pixel. Le cose si fanno difficili solo quando si gioca a giochi estremamente esigenti o poco ottimizzati come Lords of the Fallen. Il DLSS può aiutare in questo caso, con quest'ultimo gioco che gira a 72fps invece di 43fps (impostazione di qualità) in QHD/Ultra, per esempio. Spesso, la RTX 4090 avrebbe anche riserve sufficienti per uno schermo 4K (vedi Pagina GPU).
| The Witcher 3 - 1920x1080 Ultra Graphics & Postprocessing (HBAO+) | |
| MSI Titan 18 HX A14VIG | |
| Media NVIDIA GeForce RTX 4090 Laptop GPU (139.2 - 216, n=35) | |
| Media della classe Gaming (104.7 - 240, n=6, ultimi 2 anni) | |
| Asus ROG Strix Scar 18 G834JYR (2024) | |
| Acer Predator Helios 18 PH18-72-98MW | |
| Acer Predator Helios 18 N23Q2 | |
| Alienware m18 R1 AMD | |
| Skull & Bones - 2560x1440 Ultra High Preset AA:T | |
| Media NVIDIA GeForce RTX 4090 Laptop GPU (85 - 98, n=3) | |
| Asus ROG Zephyrus M16 | |
| Acer Predator Helios 18 PH18-72-98MW | |
| Prince of Persia The Lost Crown - 2560x1440 Ultra Preset AA:SM | |
| Asus ROG Zephyrus M16 | |
| Media NVIDIA GeForce RTX 4090 Laptop GPU (355 - 356, n=2) | |
| Acer Predator Helios 18 PH18-72-98MW | |
| Media della classe Gaming (352 - 357, n=4, ultimi 2 anni) | |
| Lords of the Fallen - 2560x1440 Ultra Preset | |
| XMG Neo 17 E23 | |
| Media NVIDIA GeForce RTX 4090 Laptop GPU (43 - 51.9, n=2) | |
| Acer Predator Helios 18 PH18-72-98MW | |
| Counter-Strike 2 - 2560x1440 Very High Preset | |
| XMG Neo 17 E23 | |
| Media NVIDIA GeForce RTX 4090 Laptop GPU (156.6 - 188.7, n=2) | |
| Acer Predator Helios 18 PH18-72-98MW | |
| Media della classe Gaming (15.7 - 224, n=5, ultimi 2 anni) | |
| Lies of P - 2560x1440 Best Preset | |
| XMG Neo 17 E23 | |
| Media NVIDIA GeForce RTX 4090 Laptop GPU (136.4 - 173.1, n=2) | |
| Acer Predator Helios 18 PH18-72-98MW | |
| EA Sports WRC - 2560x1440 Ultra Preset AA:Epic AF:16x | |
| XMG Neo 17 E23 | |
| Media NVIDIA GeForce RTX 4090 Laptop GPU (97.9 - 103, n=2) | |
| Acer Predator Helios 18 PH18-72-98MW | |
| Armored Core 6 - 2560x1440 Maximum Preset | |
| XMG Neo 17 E23 | |
| Media NVIDIA GeForce RTX 4090 Laptop GPU (92 - 114.7, n=2) | |
| Acer Predator Helios 18 PH18-72-98MW | |
| Media della classe Gaming (n=1ultimi 2 anni) | |
| Atlas Fallen - 2560x1440 Very High Preset | |
| XMG Neo 17 E23 | |
| Media NVIDIA GeForce RTX 4090 Laptop GPU (128.3 - 171.1, n=2) | |
| Acer Predator Helios 18 PH18-72-98MW | |
Per verificare come si comportano le prestazioni della GPU in un periodo di tempo più lungo, abbiamo messo Helios 18 a confronto con il gioco di ruolo Il Witcher 3 per circa 60 minuti. Il risultato: Non abbiamo notato assolutamente alcun calo della frequenza dei fotogrammi.
Witcher 3 FPS diagram
| basso | medio | alto | ultra | QHD | |
|---|---|---|---|---|---|
| GTA V (2015) | 180.4 | 134 | 126.4 | ||
| The Witcher 3 (2015) | 180 | ||||
| Dota 2 Reborn (2015) | 226 | 205 | 192.8 | 178.3 | |
| Final Fantasy XV Benchmark (2018) | 157.1 | 131.9 | |||
| X-Plane 11.11 (2018) | 183.7 | 148.3 | 114.5 | ||
| Far Cry 5 (2018) | 146 | 123 | 115 | ||
| Strange Brigade (2018) | 329 | 305 | 243 | ||
| Atlas Fallen (2023) | 182 | 161 | 128.3 | ||
| Armored Core 6 (2023) | 109.3 | 103.5 | 92 | ||
| The Crew Motorfest (2023) | 60 | 60 | 60 | ||
| Lies of P (2023) | 208 | 187 | 136.4 | ||
| Counter-Strike 2 (2023) | 234 | 189.7 | 156.6 | ||
| Lords of the Fallen (2023) | 87.3 | 64.2 | 43 | ||
| EA Sports WRC (2023) | 135.2 | 115.1 | 97.9 | ||
| Prince of Persia The Lost Crown (2024) | 357 | 356 | 355 | ||
| Skull & Bones (2024) | 133 | 106 | 85 | ||
| Last Epoch (2024) | 203 | 190 | 145.5 |
Emissioni
Emissioni di rumore
Uno dei maggiori punti deboli di Predator Helios 18 è il controllo scarso delle ventole. In modalità bilanciata, le ventole a volte iniziano a girare inutilmente quando il portatile è al minimo. In modalità prestazioni e turbo, questo comportamento si verifica ancora più frequentemente e intensamente. Sotto carico, il dispositivo da 18 pollici non si comporta in modo anomalo. Nell'uso in 3D, la modalità performance comporta valori udibili ma non esagerati di 48-51 dB(A).
Rumorosità
| Idle |
| 30 / 36 / 44 dB(A) |
| Sotto carico |
| 48 / 51 dB(A) |
 | ||
30 dB silenzioso 40 dB(A) udibile 50 dB(A) rumoroso |
||
min: | ||
| Acer Predator Helios 18 PH18-72-98MW i9-14900HX, GeForce RTX 4090 Laptop GPU | MSI Titan 18 HX A14VIG i9-14900HX, GeForce RTX 4090 Laptop GPU | Asus ROG Strix Scar 18 G834JYR (2024) i9-14900HX, GeForce RTX 4090 Laptop GPU | Acer Predator Helios 18 N23Q2 i9-13900HX, GeForce RTX 4080 Laptop GPU | Alienware m18 R1 AMD R9 7945HX, Radeon RX 7900M | |
|---|---|---|---|---|---|
| Noise | 12% | 8% | 12% | 15% | |
| off /ambiente * (dB) | 25 | 22.8 9% | 24 4% | 23 8% | 22.4 10% |
| Idle Minimum * (dB) | 30 | 23.8 21% | 27 10% | 23 23% | 23 23% |
| Idle Average * (dB) | 36 | 23.8 34% | 28 22% | 23 36% | 23.4 35% |
| Idle Maximum * (dB) | 44 | 28 36% | 32 27% | 23 48% | 33.5 24% |
| Load Average * (dB) | 48 | 38 21% | 50 -4% | 45.26 6% | 33.5 30% |
| Witcher 3 ultra * (dB) | 49 | 57.3 -17% | 50 -2% | 59.82 -22% | 53.6 -9% |
| Load Maximum * (dB) | 51 | 62.8 -23% | 52 -2% | 59.94 -18% | 53.6 -5% |
* ... Meglio usare valori piccoli
Temperatura
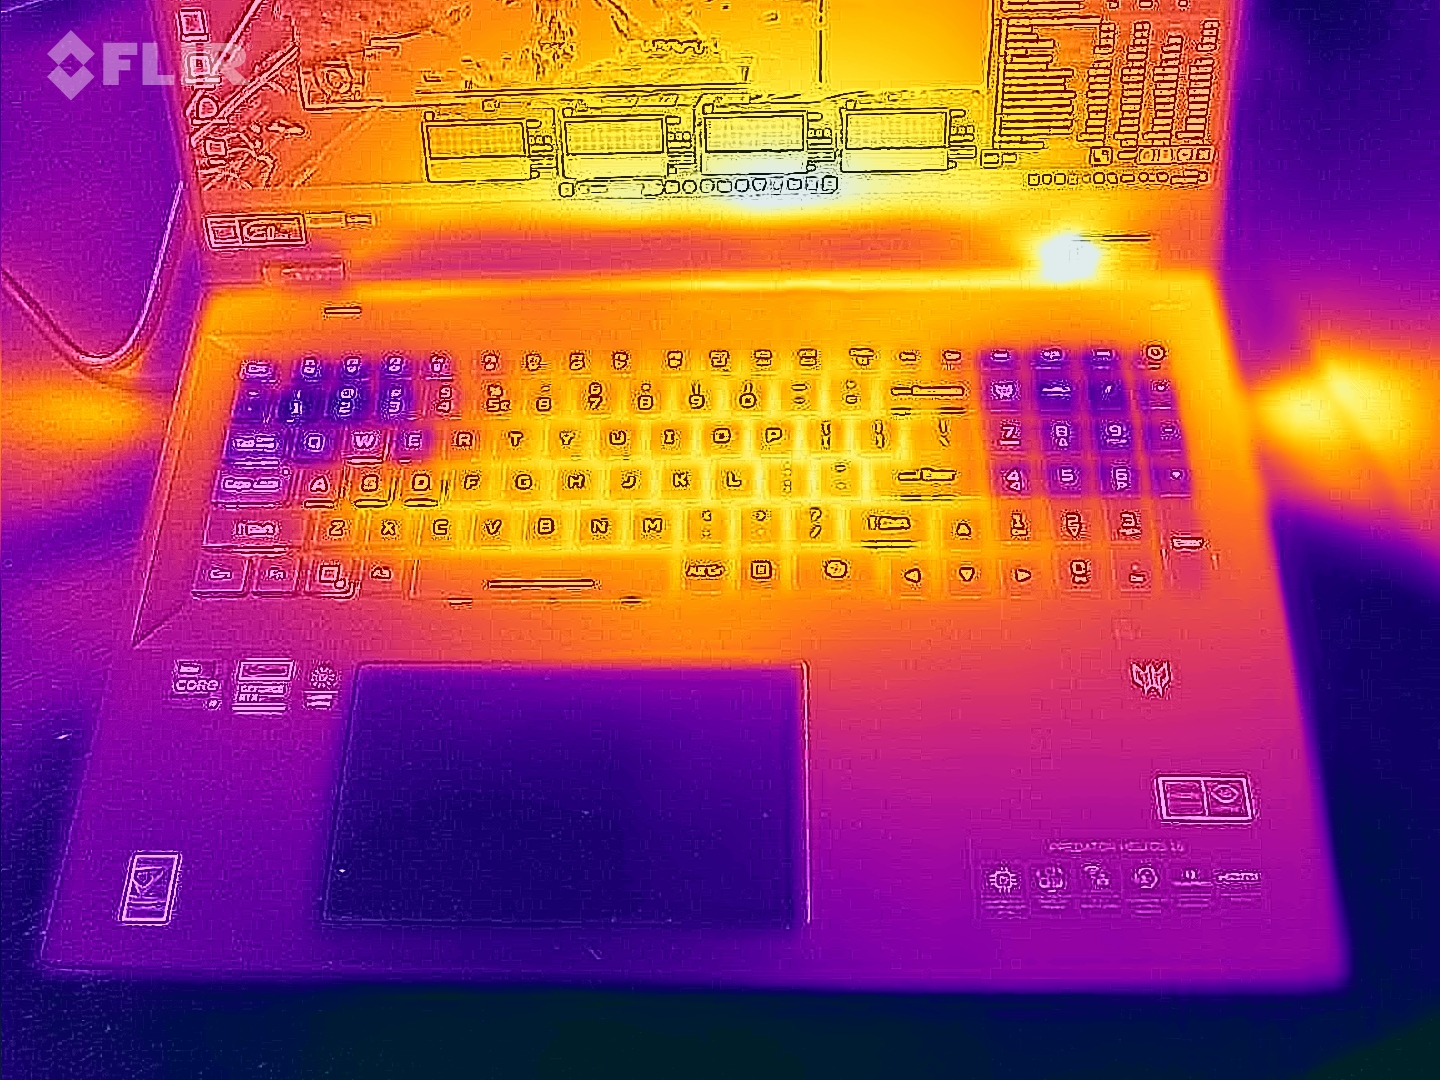
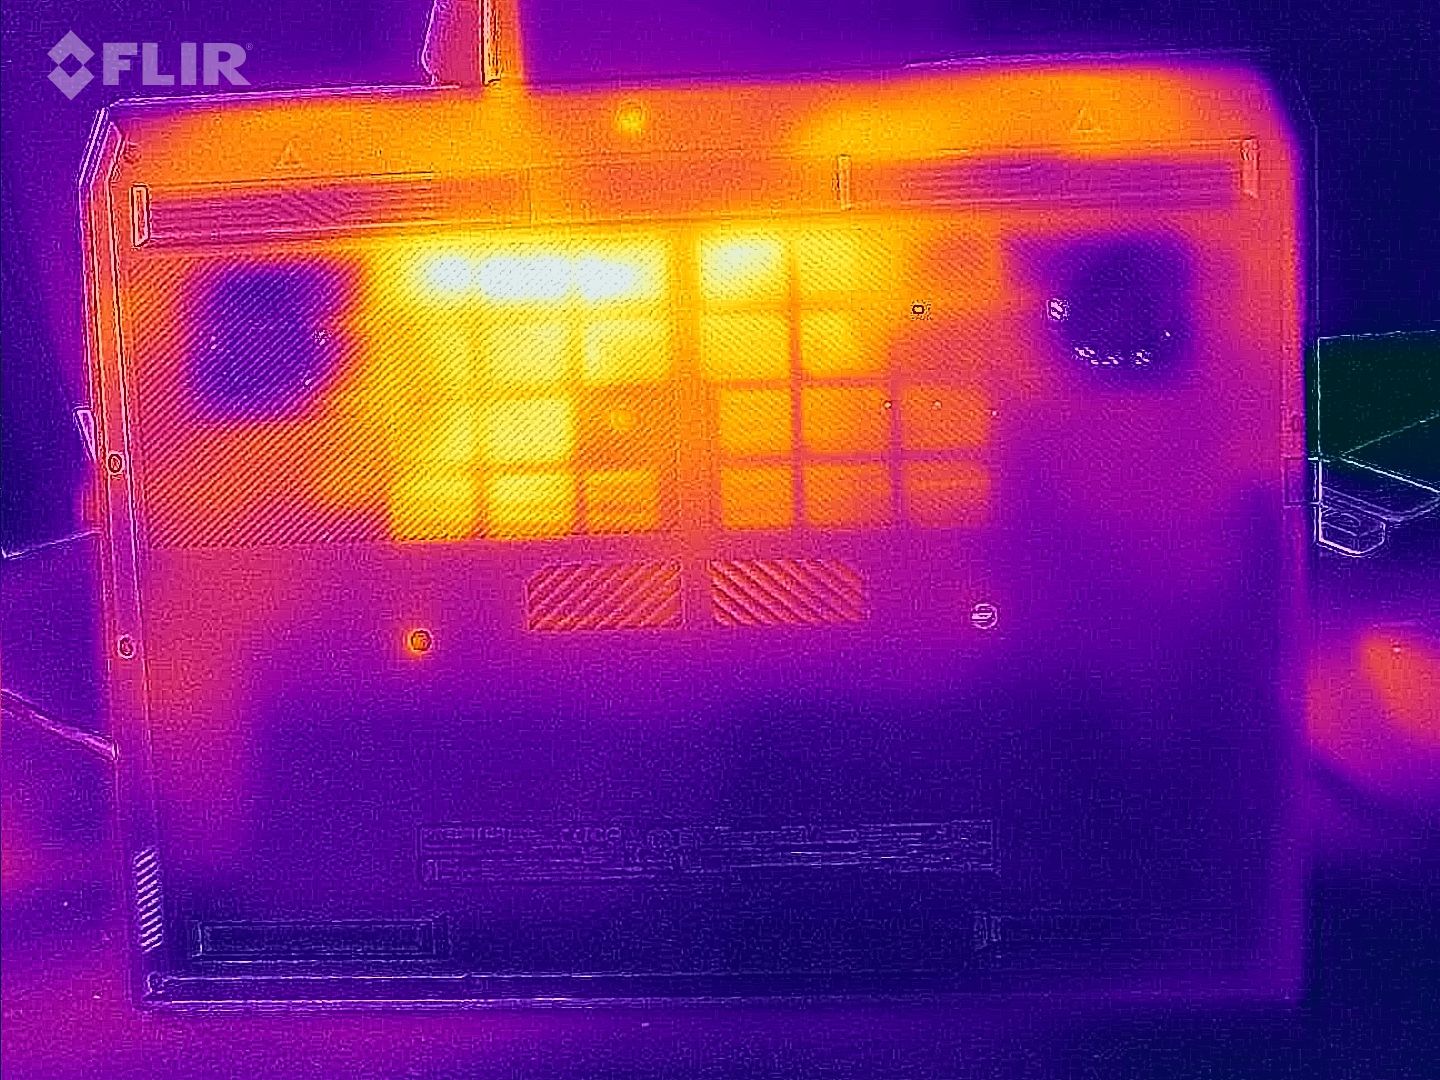
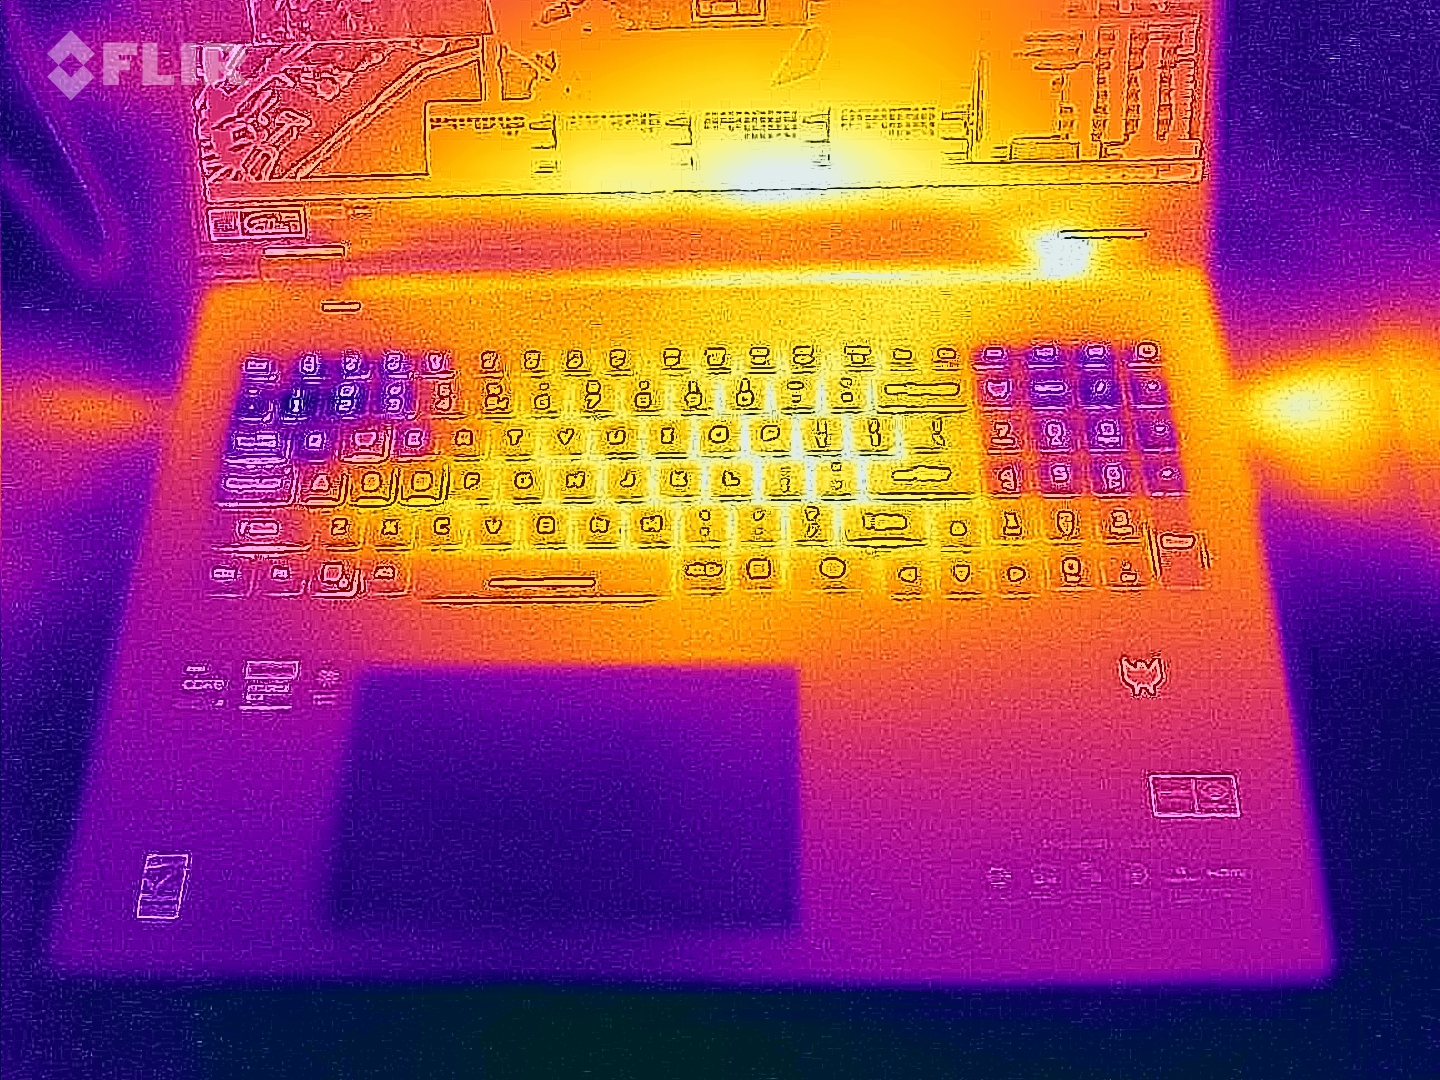
La parte inferiore della superficie del case del portatile si riscalda maggiormente. Dopo 60 minuti di stress test, abbiamo misurato oltre 50 °C su alcune parti, il che significa che non potrà giocare con il dispositivo seduto sulle ginocchia. La parte superiore rimane molto più fredda, con valori che raggiungono i 43 °C. Quando è inattivo, i valori sono piuttosto moderati: abbiamo notato una media di 29 C° (in alto) e 30 °C (in basso), che va assolutamente bene.
(±) La temperatura massima sul lato superiore è di 43 °C / 109 F, rispetto alla media di 40.4 °C / 105 F, che varia da 21.2 a 68.8 °C per questa classe Gaming.
(-) Il lato inferiore si riscalda fino ad un massimo di 59 °C / 138 F, rispetto alla media di 43.2 °C / 110 F
(+) In idle, la temperatura media del lato superiore è di 29.2 °C / 85 F, rispetto alla media deld ispositivo di 33.9 °C / 93 F.
(-) Riproducendo The Witcher 3, la temperatura media per il lato superiore e' di 38.9 °C / 102 F, rispetto alla media del dispositivo di 33.9 °C / 93 F.
(+) I poggiapolsi e il touchpad raggiungono la temperatura massima della pelle (33 °C / 91.4 F) e quindi non sono caldi.
(-) La temperatura media della zona del palmo della mano di dispositivi simili e'stata di 28.8 °C / 83.8 F (-4.2 °C / -7.6 F).
| Acer Predator Helios 18 PH18-72-98MW i9-14900HX, GeForce RTX 4090 Laptop GPU | MSI Titan 18 HX A14VIG i9-14900HX, GeForce RTX 4090 Laptop GPU | Asus ROG Strix Scar 18 G834JYR (2024) i9-14900HX, GeForce RTX 4090 Laptop GPU | Acer Predator Helios 18 N23Q2 i9-13900HX, GeForce RTX 4080 Laptop GPU | Alienware m18 R1 AMD R9 7945HX, Radeon RX 7900M | |
|---|---|---|---|---|---|
| Heat | 8% | 6% | 1% | 14% | |
| Maximum Upper Side * (°C) | 43 | 37.8 12% | 49 -14% | 35 19% | 40.2 7% |
| Maximum Bottom * (°C) | 59 | 37.6 36% | 47 20% | 56 5% | 37.4 37% |
| Idle Upper Side * (°C) | 32 | 34.8 -9% | 29 9% | 34 -6% | 31.6 1% |
| Idle Bottom * (°C) | 34 | 36 -6% | 31 9% | 39 -15% | 30.6 10% |
* ... Meglio usare valori piccoli
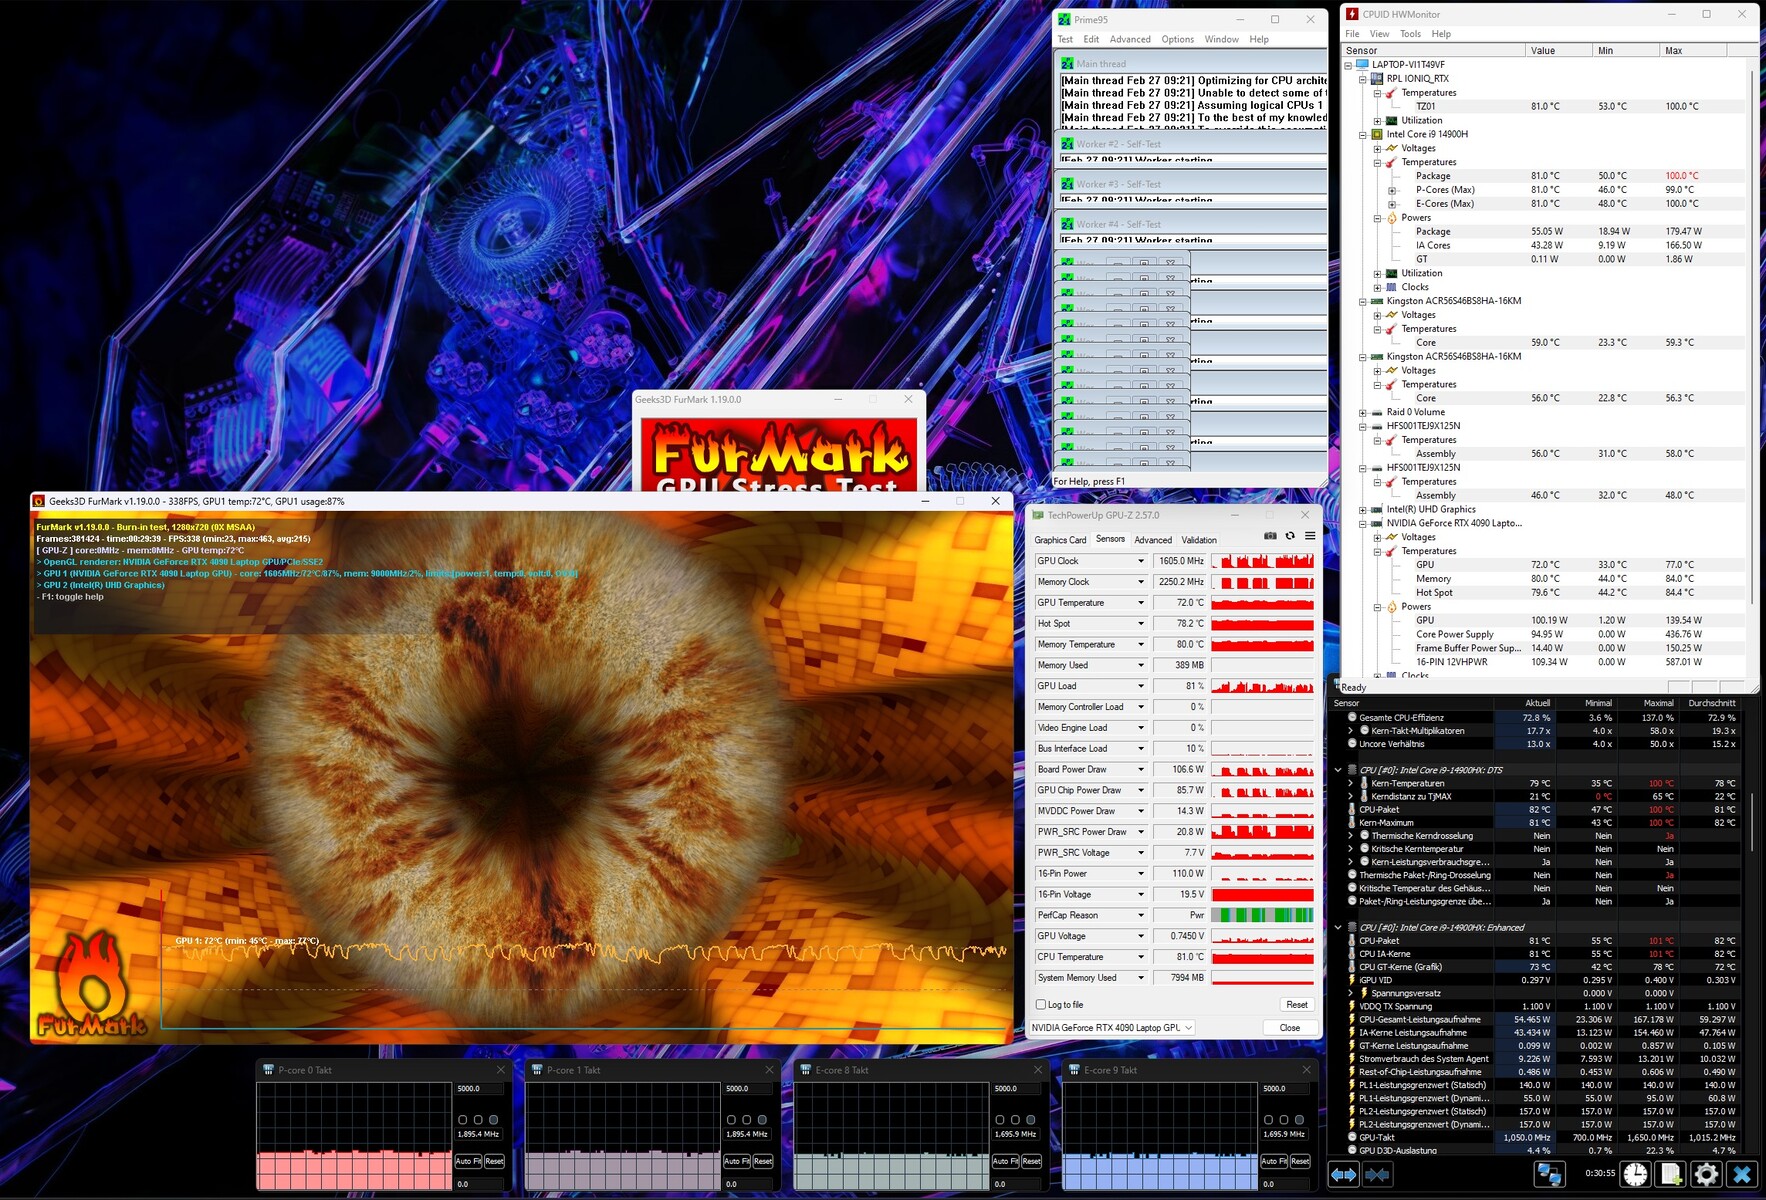
Test da sforzo
Il nostro test di stress utilizzando gli strumenti Furmark e Prime95 non ha spinto i componenti ai loro limiti. Mentre il Core i9-14900HX si è stabilizzato a circa 81 °C, la RTX 4090 di GeForce ha raggiunto circa 72 °C (hotspot 78 °C). Tuttavia, l'hardware può surriscaldarsi in modalità di gioco, grazie alle sue velocità di clock più elevate. In The Witcher 3, i nostri strumenti hanno misurato circa 87 °C (CPU) e 83 °C (GPU).
Altoparlanti
La nostra analisi audio ha confermato che il nuovo Predator Helios 18 suona meglio del suo predecessore. Anche se i bassi potrebbero essere più potenti, i medi e gli alti sono ora più pronunciati. Anche il volume massimo di 85 dB(A) dovrebbe essere sufficiente per la maggior parte degli utenti.
Acer Predator Helios 18 PH18-72-98MW analisi audio
(+) | gli altoparlanti sono relativamente potenti (85 dB)
Bassi 100 - 315 Hz
(-) | quasi nessun basso - in media 21.1% inferiori alla media
(±) | la linearità dei bassi è media (10.7% delta rispetto alla precedente frequenza)
Medi 400 - 2000 Hz
(+) | medi bilanciati - solo only 2.9% rispetto alla media
(+) | medi lineari (5.6% delta rispetto alla precedente frequenza)
Alti 2 - 16 kHz
(+) | Alti bilanciati - appena 2.7% dalla media
(+) | alti lineari (3.6% delta rispetto alla precedente frequenza)
Nel complesso 100 - 16.000 Hz
(+) | suono nel complesso lineare (13.6% differenza dalla media)
Rispetto alla stessa classe
» 20% di tutti i dispositivi testati in questa classe è stato migliore, 7% simile, 73% peggiore
» Il migliore ha avuto un delta di 6%, medio di 18%, peggiore di 132%
Rispetto a tutti i dispositivi testati
» 15% di tutti i dispositivi testati in questa classe è stato migliore, 4% similare, 82% peggiore
» Il migliore ha avuto un delta di 4%, medio di 23%, peggiore di 134%
MSI Titan 18 HX A14VIG analisi audio
(+) | gli altoparlanti sono relativamente potenti (89.2 dB)
Bassi 100 - 315 Hz
(-) | quasi nessun basso - in media 17.6% inferiori alla media
(±) | la linearità dei bassi è media (8% delta rispetto alla precedente frequenza)
Medi 400 - 2000 Hz
(+) | medi bilanciati - solo only 1.8% rispetto alla media
(+) | medi lineari (3.7% delta rispetto alla precedente frequenza)
Alti 2 - 16 kHz
(+) | Alti bilanciati - appena 1.2% dalla media
(+) | alti lineari (2% delta rispetto alla precedente frequenza)
Nel complesso 100 - 16.000 Hz
(+) | suono nel complesso lineare (9.9% differenza dalla media)
Rispetto alla stessa classe
» 5% di tutti i dispositivi testati in questa classe è stato migliore, 2% simile, 94% peggiore
» Il migliore ha avuto un delta di 6%, medio di 18%, peggiore di 132%
Rispetto a tutti i dispositivi testati
» 4% di tutti i dispositivi testati in questa classe è stato migliore, 1% similare, 95% peggiore
» Il migliore ha avuto un delta di 4%, medio di 23%, peggiore di 134%
Asus ROG Strix Scar 18 G834JYR (2024) analisi audio
(+) | gli altoparlanti sono relativamente potenti (82 dB)
Bassi 100 - 315 Hz
(±) | bassi ridotti - in media 5.6% inferiori alla media
(+) | bassi in lineaa (6.8% delta rispetto alla precedente frequenza)
Medi 400 - 2000 Hz
(±) | medi elevati - circa 5.7% superiore alla media
(+) | medi lineari (2.8% delta rispetto alla precedente frequenza)
Alti 2 - 16 kHz
(±) | alti ridotti - circa 7.2% inferiori alla media
(±) | la linearità degli alti è media (7.2% delta rispetto alla precedente frequenza)
Nel complesso 100 - 16.000 Hz
(+) | suono nel complesso lineare (13% differenza dalla media)
Rispetto alla stessa classe
» 18% di tutti i dispositivi testati in questa classe è stato migliore, 3% simile, 79% peggiore
» Il migliore ha avuto un delta di 6%, medio di 18%, peggiore di 132%
Rispetto a tutti i dispositivi testati
» 13% di tutti i dispositivi testati in questa classe è stato migliore, 3% similare, 85% peggiore
» Il migliore ha avuto un delta di 4%, medio di 23%, peggiore di 134%
Acer Predator Helios 18 N23Q2 analisi audio
(+) | gli altoparlanti sono relativamente potenti (82.74 dB)
Bassi 100 - 315 Hz
(-) | quasi nessun basso - in media 17.6% inferiori alla media
(±) | la linearità dei bassi è media (9.8% delta rispetto alla precedente frequenza)
Medi 400 - 2000 Hz
(±) | medi elevati - circa 9.1% superiore alla media
(±) | linearità dei medi adeguata (8.8% delta rispetto alla precedente frequenza)
Alti 2 - 16 kHz
(±) | alti elevati - circa 5.3% superiori alla media
(+) | alti lineari (6.4% delta rispetto alla precedente frequenza)
Nel complesso 100 - 16.000 Hz
(±) | la linearità complessiva del suono è media (20.3% di differenza rispetto alla media
Rispetto alla stessa classe
» 72% di tutti i dispositivi testati in questa classe è stato migliore, 6% simile, 23% peggiore
» Il migliore ha avuto un delta di 6%, medio di 18%, peggiore di 132%
Rispetto a tutti i dispositivi testati
» 53% di tutti i dispositivi testati in questa classe è stato migliore, 8% similare, 39% peggiore
» Il migliore ha avuto un delta di 4%, medio di 23%, peggiore di 134%
Alienware m18 R1 AMD analisi audio
(+) | gli altoparlanti sono relativamente potenti (84.2 dB)
Bassi 100 - 315 Hz
(-) | quasi nessun basso - in media 22.7% inferiori alla media
(-) | bassi non lineari (15.8% delta rispetto alla precedente frequenza)
Medi 400 - 2000 Hz
(+) | medi bilanciati - solo only 1.5% rispetto alla media
(+) | medi lineari (3.8% delta rispetto alla precedente frequenza)
Alti 2 - 16 kHz
(+) | Alti bilanciati - appena 3.6% dalla media
(+) | alti lineari (5.5% delta rispetto alla precedente frequenza)
Nel complesso 100 - 16.000 Hz
(±) | la linearità complessiva del suono è media (16.5% di differenza rispetto alla media
Rispetto alla stessa classe
» 42% di tutti i dispositivi testati in questa classe è stato migliore, 7% simile, 51% peggiore
» Il migliore ha avuto un delta di 6%, medio di 18%, peggiore di 132%
Rispetto a tutti i dispositivi testati
» 28% di tutti i dispositivi testati in questa classe è stato migliore, 6% similare, 66% peggiore
» Il migliore ha avuto un delta di 4%, medio di 23%, peggiore di 134%
Gestione dell'energia
Consumo di energia
Acer avrebbe potuto regolare un po' meglio il consumo energetico del dispositivo. Nonostante la commutazione attiva della grafica, il portatile da 18 pollici richiede molta energia in modalità idle, ossia da 31 a 43 watt. La maggior parte dei concorrenti e il vecchio Helios fanno molto meglio in questo senso. Potrebbe anche esserci stato un bug nel nostro dispositivo di prova.
| Off / Standby | |
| Idle | |
| Sotto carico |
|
Leggenda:
min: | |
| Acer Predator Helios 18 PH18-72-98MW i9-14900HX, GeForce RTX 4090 Laptop GPU | MSI Titan 18 HX A14VIG i9-14900HX, GeForce RTX 4090 Laptop GPU | Asus ROG Strix Scar 18 G834JYR (2024) i9-14900HX, GeForce RTX 4090 Laptop GPU | Acer Predator Helios 18 N23Q2 i9-13900HX, GeForce RTX 4080 Laptop GPU | Alienware m18 R1 AMD R9 7945HX, Radeon RX 7900M | Media della classe Gaming | |
|---|---|---|---|---|---|---|
| Power Consumption | -3% | 24% | 22% | -34% | 38% | |
| Idle Minimum * (Watt) | 31 | 13.2 57% | 14 55% | 16 48% | 30.3 2% | 13 ? 58% |
| Idle Average * (Watt) | 35 | 25.4 27% | 17 51% | 19 46% | 55.6 -59% | 18.7 ? 47% |
| Idle Maximum * (Watt) | 43 | 53.5 -24% | 24 44% | 21.3 50% | 101.1 -135% | 24.3 ? 43% |
| Load Average * (Watt) | 144 | 151.4 -5% | 143 1% | 124 14% | 160.3 -11% | 110.2 ? 23% |
| Witcher 3 ultra * (Watt) | 228 | 336 -47% | 251 -10% | 289 -27% | 216 5% | |
| Load Maximum * (Watt) | 318 | 395.2 -24% | 302 5% | 319 -0% | 332.1 -4% | 258 ? 19% |
* ... Meglio usare valori piccoli
Power consumption Witcher 3 / stress test
Power consumption with external monitor
Tempi di esecuzione
Il suo elevato fabbisogno energetico comporta una durata della batteria molto modesta. Nel nostro test WLAN con la luminosità ridotta a 150 cd/m², il Predator Helios 18 è durato solo poco più di 3 ore. In confronto, il ROG Strix Scar 18 ha superato le 7 ore. In generale, la batteria da 90 Wh non è affatto piccola.
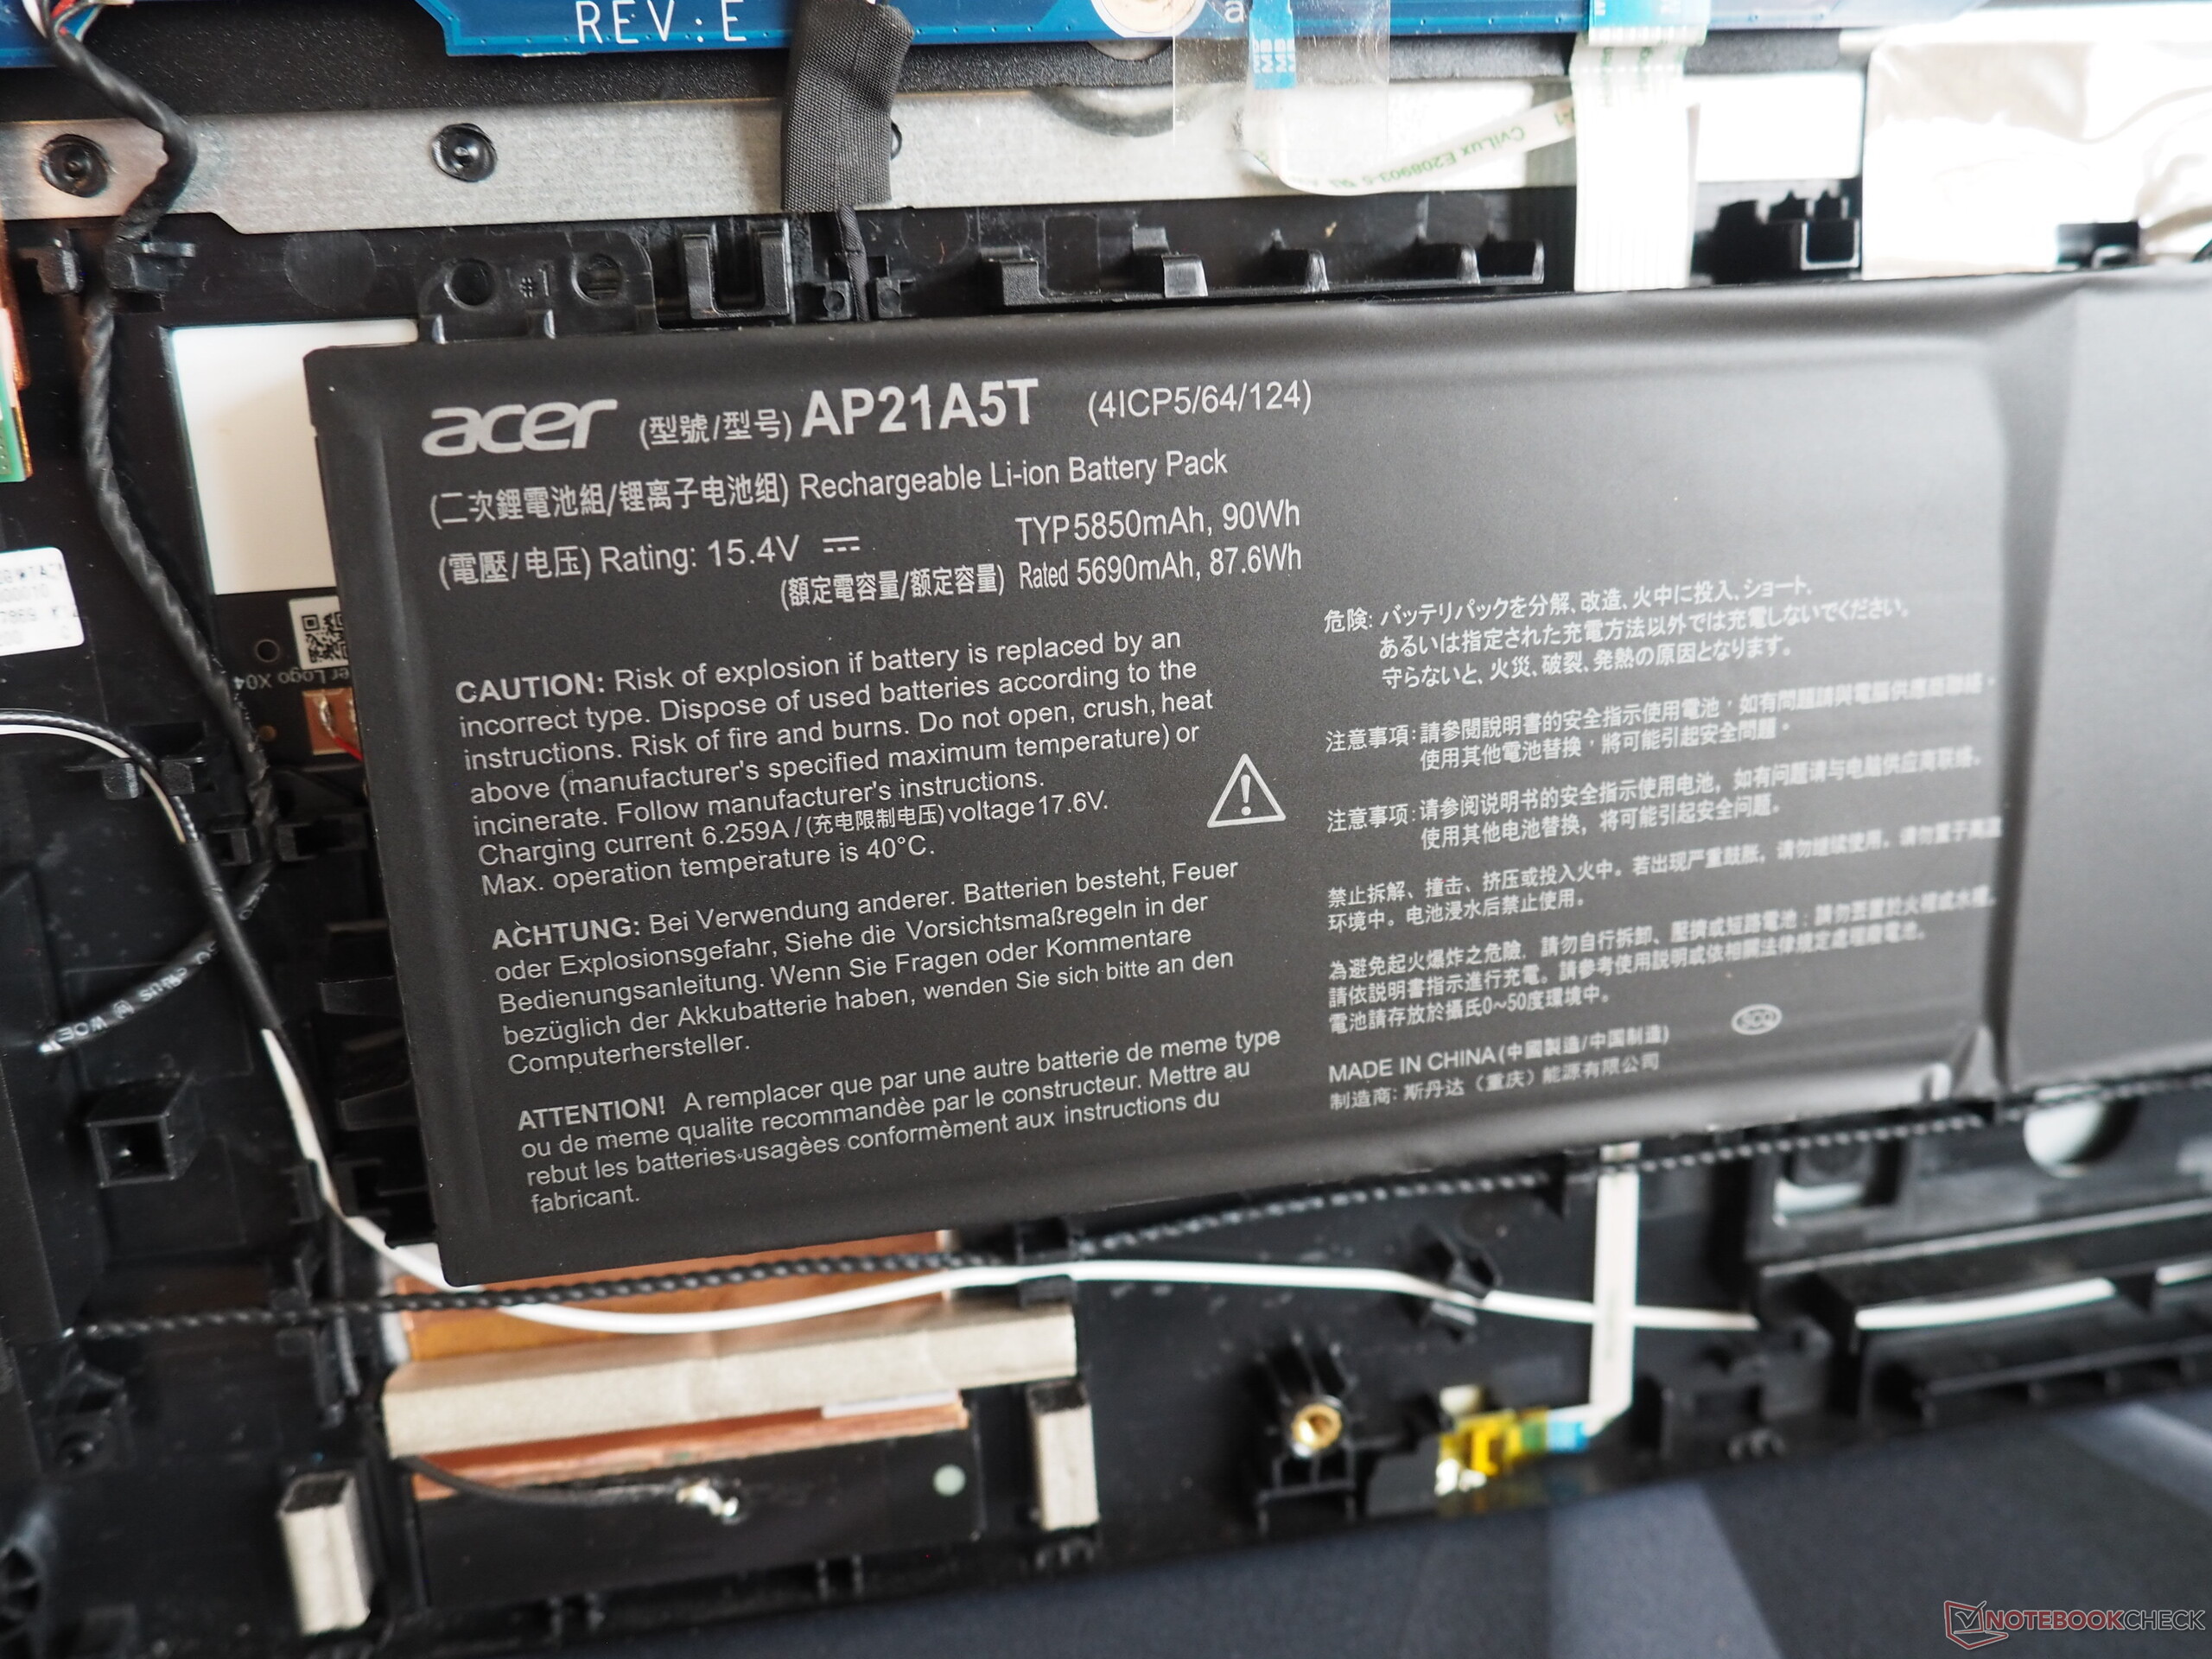
| Acer Predator Helios 18 PH18-72-98MW i9-14900HX, GeForce RTX 4090 Laptop GPU, 90 Wh | MSI Titan 18 HX A14VIG i9-14900HX, GeForce RTX 4090 Laptop GPU, 99.9 Wh | Asus ROG Strix Scar 18 G834JYR (2024) i9-14900HX, GeForce RTX 4090 Laptop GPU, 90 Wh | Acer Predator Helios 18 N23Q2 i9-13900HX, GeForce RTX 4080 Laptop GPU, 90 Wh | Alienware m18 R1 AMD R9 7945HX, Radeon RX 7900M, 97 Wh | Media della classe Gaming | |
|---|---|---|---|---|---|---|
| Autonomia della batteria | 20% | 80% | 47% | -46% | 80% | |
| WiFi v1.3 (h) | 3.2 | 4.2 31% | 7.7 141% | 4.4 38% | 1.4 -56% | 7.11 ? 122% |
| Load (h) | 1.1 | 1.2 9% | 1.3 18% | 1.7 55% | 0.7 -36% | 1.502 ? 37% |
| Reader / Idle (h) | 5.9 | 10.2 | 4.5 | 8.16 ? | ||
| H.264 (h) | 7.5 | 4.8 | 8.32 ? |
Pro
Contro
Il verdetto
La versione 2024 è più che altro un sottile aggiornamento dell'attuale Predator Helios 18.
Dal punto di vista delle prestazioni, il suo Core i9-14900HX e GeForce RTX 4090 non differiscono molto dal vecchio Core i9-13900HX e GeForce RTX 4080. D'altra parte, il suo display WQXGA-MiniLED con un rapporto d'aspetto di 16:10 continua a offrire una qualità d'immagine impressionante (luminosità, contrasto, spazio colore, ecc.). A questo si aggiungono gli ottimi dispositivi di input e le moderne opzioni di connettività (2x Thunderbolt 4).
I giocatori esigenti con il giusto budget saranno sicuri di ricevere un pacchetto completo e senza preoccupazioni.
Nel suo stato attuale, tuttavia, il Predator Helios 18 ha mancato di poco la valutazione "molto buono". A parte il controllo della ventola (che a volte provoca fastidiosi giri), Acer potrebbe anche rivedere il consumo di energia in idle del portatile, che attualmente porta ancora a tempi di esecuzione magri.
Molti concorrenti potrebbero non essere attualmente sul mercato, ma sono almeno alla pari con il dispositivo, sia che si tratti dell'MSI Titan 18 che dell'MSI Titan 18 MSI Titan 18 o la Asus ROG Strix Scar 18.
Prezzo e disponibilità
Al momento in cui scriviamo, il Predator Helios 18 con un Core i9-14900HX e una GeForce RTX 4090 non è ancora disponibile per l'acquisto negli Stati Uniti.
Acer Predator Helios 18 PH18-72-98MW
- 02/27/2024 v7 (old)
Florian Glaser
Transparency
La selezione dei dispositivi da recensire viene effettuata dalla nostra redazione. Il campione di prova è stato fornito all'autore come prestito dal produttore o dal rivenditore ai fini di questa recensione. L'istituto di credito non ha avuto alcuna influenza su questa recensione, né il produttore ne ha ricevuto una copia prima della pubblicazione. Non vi era alcun obbligo di pubblicare questa recensione. In quanto società mediatica indipendente, Notebookcheck non è soggetta all'autorità di produttori, rivenditori o editori.
Ecco come Notebookcheck esegue i test
Ogni anno, Notebookcheck esamina in modo indipendente centinaia di laptop e smartphone utilizzando procedure standardizzate per garantire che tutti i risultati siano comparabili. Da circa 20 anni sviluppiamo continuamente i nostri metodi di prova e nel frattempo stabiliamo gli standard di settore. Nei nostri laboratori di prova, tecnici ed editori esperti utilizzano apparecchiature di misurazione di alta qualità. Questi test comportano un processo di validazione in più fasi. Il nostro complesso sistema di valutazione si basa su centinaia di misurazioni e parametri di riferimento ben fondati, che mantengono l'obiettività.Price comparison

