Recensione breve del portatile Asus ROG Strix GL702ZC (Ryzen 5 1600, Radeon RX 580, FHD)
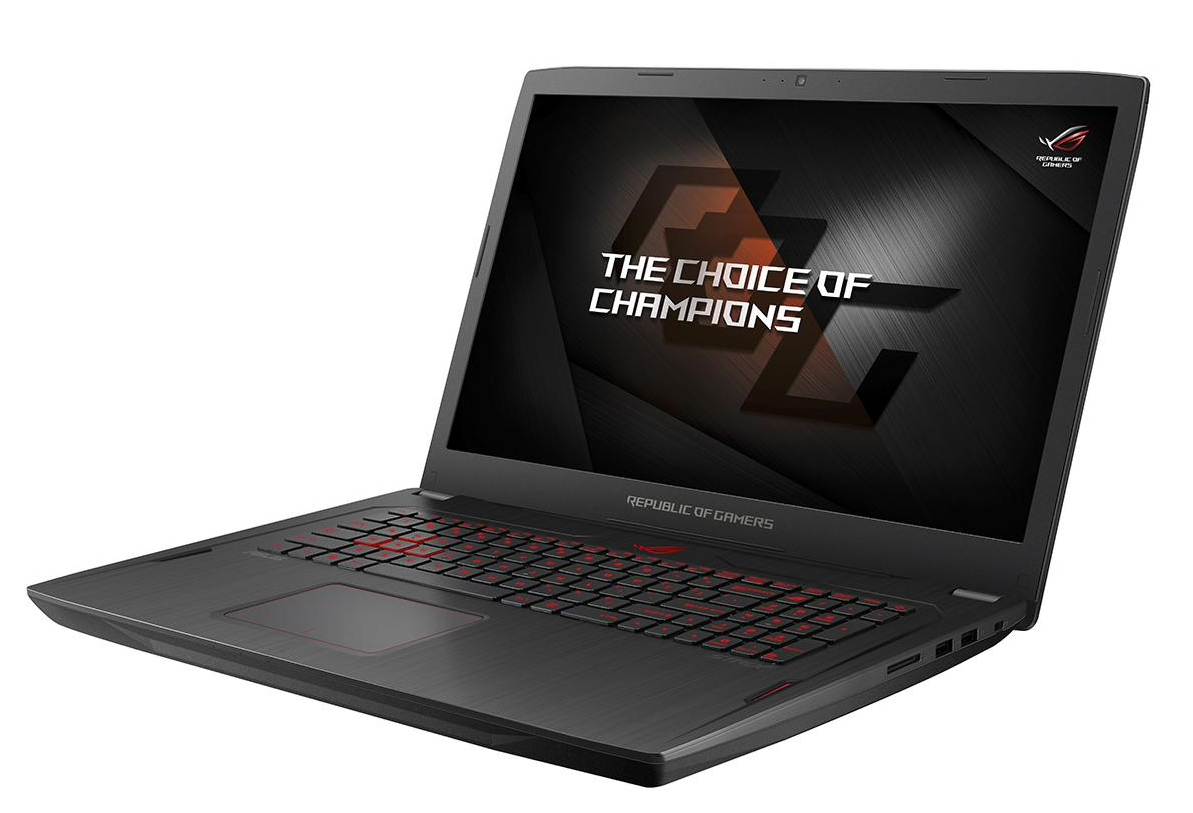
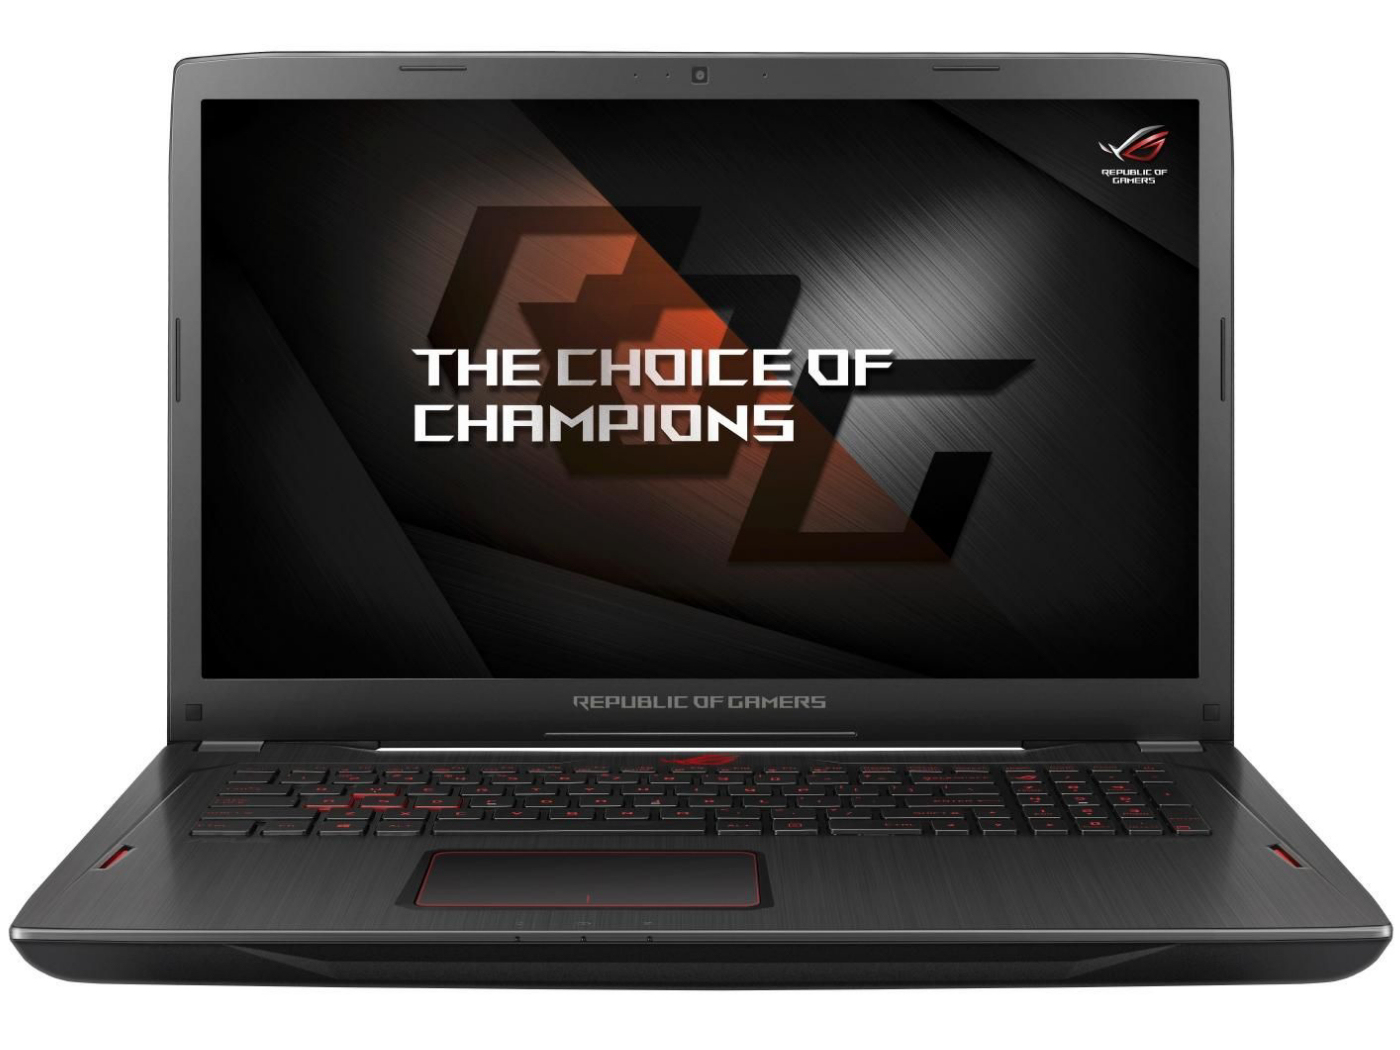
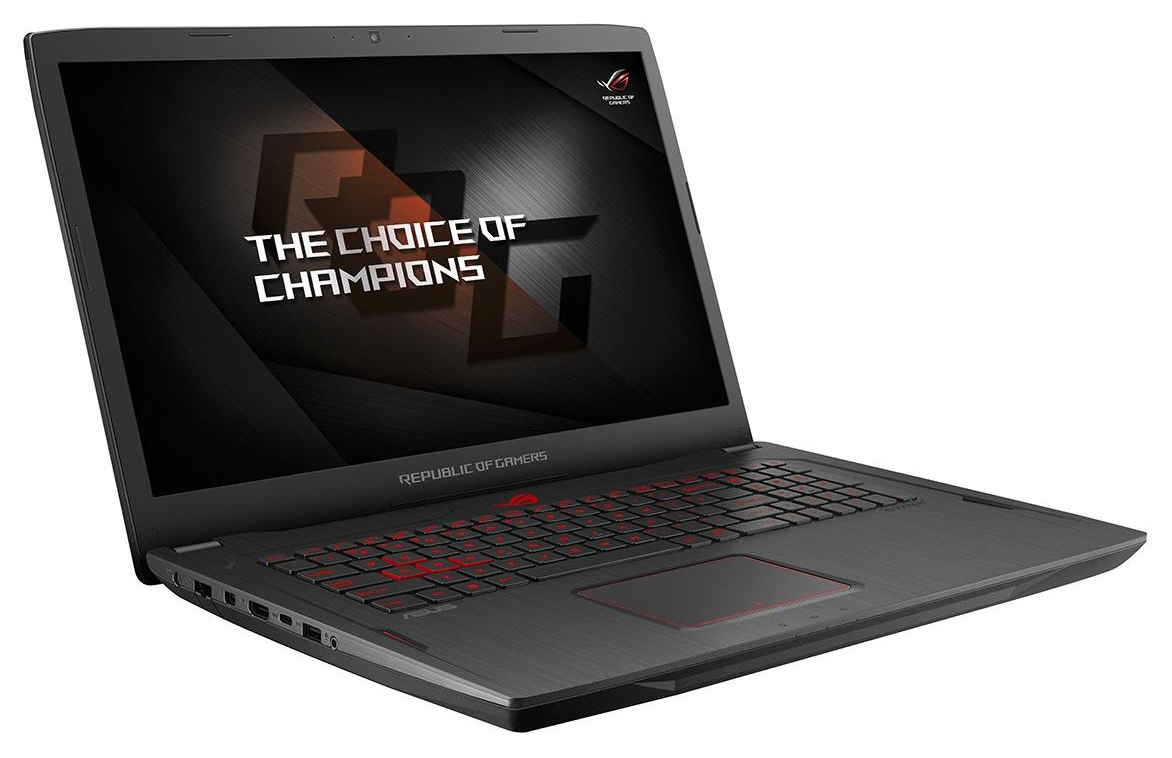
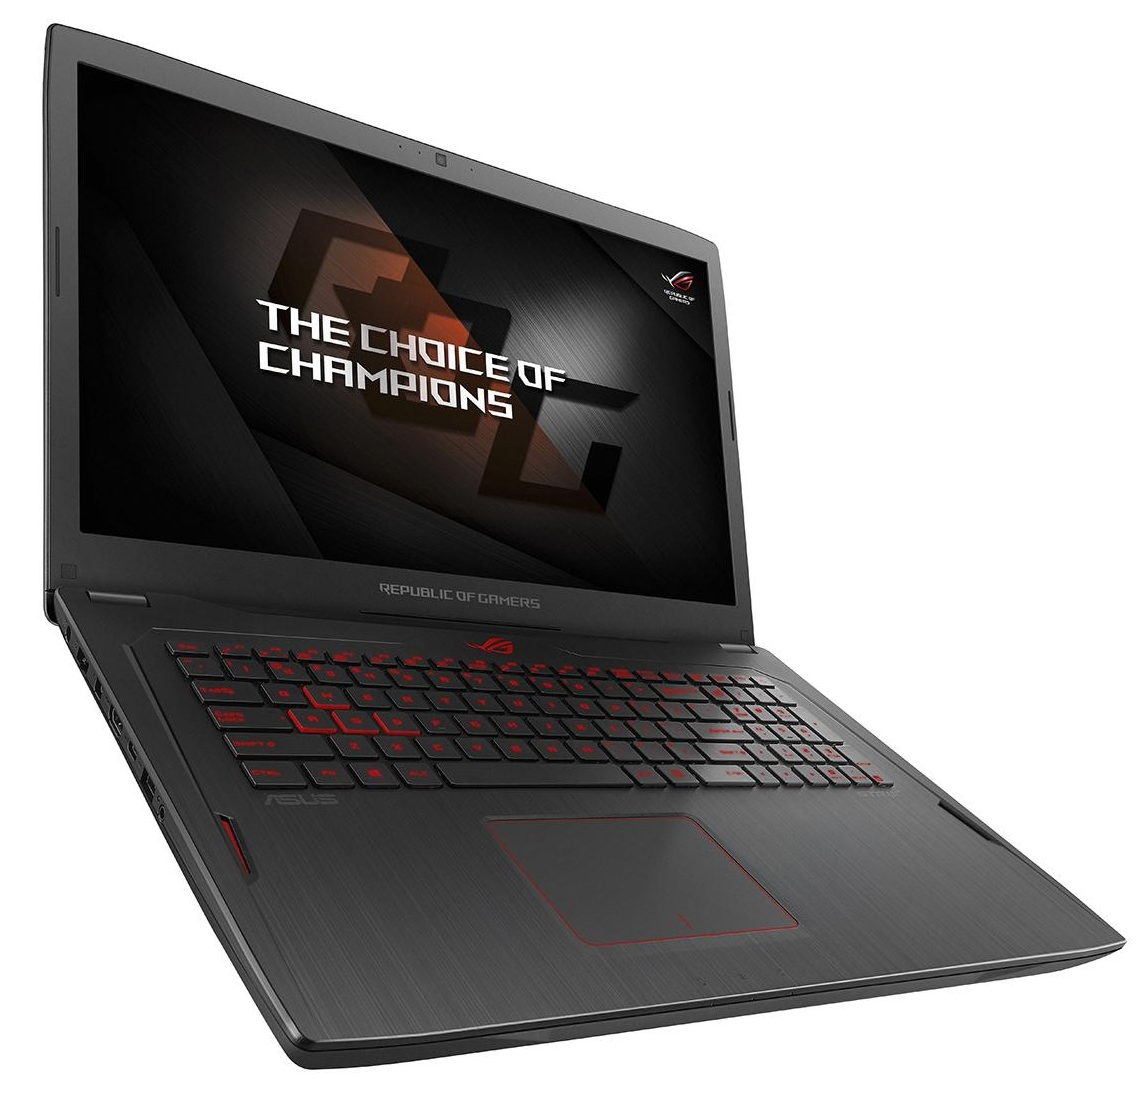
Con il GL702ZC, Asus realizza un portatile gaming da 17,3", che usa una CPU desktop removibile. Il processore AMD Ryzen 5 1600 hexa-core è stato scelto per questo portatile. Il dispositivo che abbiamo testato rappresenta il modello entry-level della serie. Il portatile non ci è nuovo: abbiamo già recensito il modello gemello (Asus GL702ZC-GC104T). I competitors includono: Acer Predator Helios 300, HP Omen 17, MSI GL72 7RDX-602 ed Acer Aspire V17 Nitro BE VN7-793G.
Poiché entrambi i modelli GL702ZC hanno la stessa costruzione, salteremo le sezioni che riguardano il case, la connettività, i dispositivi di input e le casse. Potete trovare tutte le informazioni utili nella recensione dell'Asus GL702ZC-GC104T.
| SD Card Reader | |
| average JPG Copy Test (av. of 3 runs) | |
| Acer Predator Helios 300 (Toshiba Exceria Pro SDXC 64 GB UHS-II) | |
| Nexoc G739 (Toshiba Exceria Pro SDXC 64 GB UHS-II) | |
| HP Omen 17-w206ng (Toshiba Exceria Pro SDXC 64 GB UHS-II) | |
| Asus GL702ZC-GC104T (Toshiba Exceria Pro SDXC 64 GB UHS-II) | |
| Asus ROG Strix GL702ZC-GC204T (Toshiba Exceria Pro SDXC 64 GB UHS-II) | |
| MSI GF72VR 7RF (Toshiba Exceria Pro SDXC 64 GB UHS-II) | |
| MSI GL72 7RDX-602 (Toshiba Exceria Pro SDXC 64 GB UHS-II) | |
| maximum AS SSD Seq Read Test (1GB) | |
| Asus ROG Strix GL702ZC-GC204T (Toshiba Exceria Pro SDXC 64 GB UHS-II) | |
| Asus GL702ZC-GC104T (Toshiba Exceria Pro SDXC 64 GB UHS-II) | |
| Nexoc G739 (Toshiba Exceria Pro SDXC 64 GB UHS-II) | |
| HP Omen 17-w206ng (Toshiba Exceria Pro SDXC 64 GB UHS-II) | |
| Acer Predator Helios 300 (Toshiba Exceria Pro SDXC 64 GB UHS-II) | |
| MSI GF72VR 7RF (Toshiba Exceria Pro SDXC 64 GB UHS-II) | |
| MSI GL72 7RDX-602 (Toshiba Exceria Pro SDXC 64 GB UHS-II) | |
Display

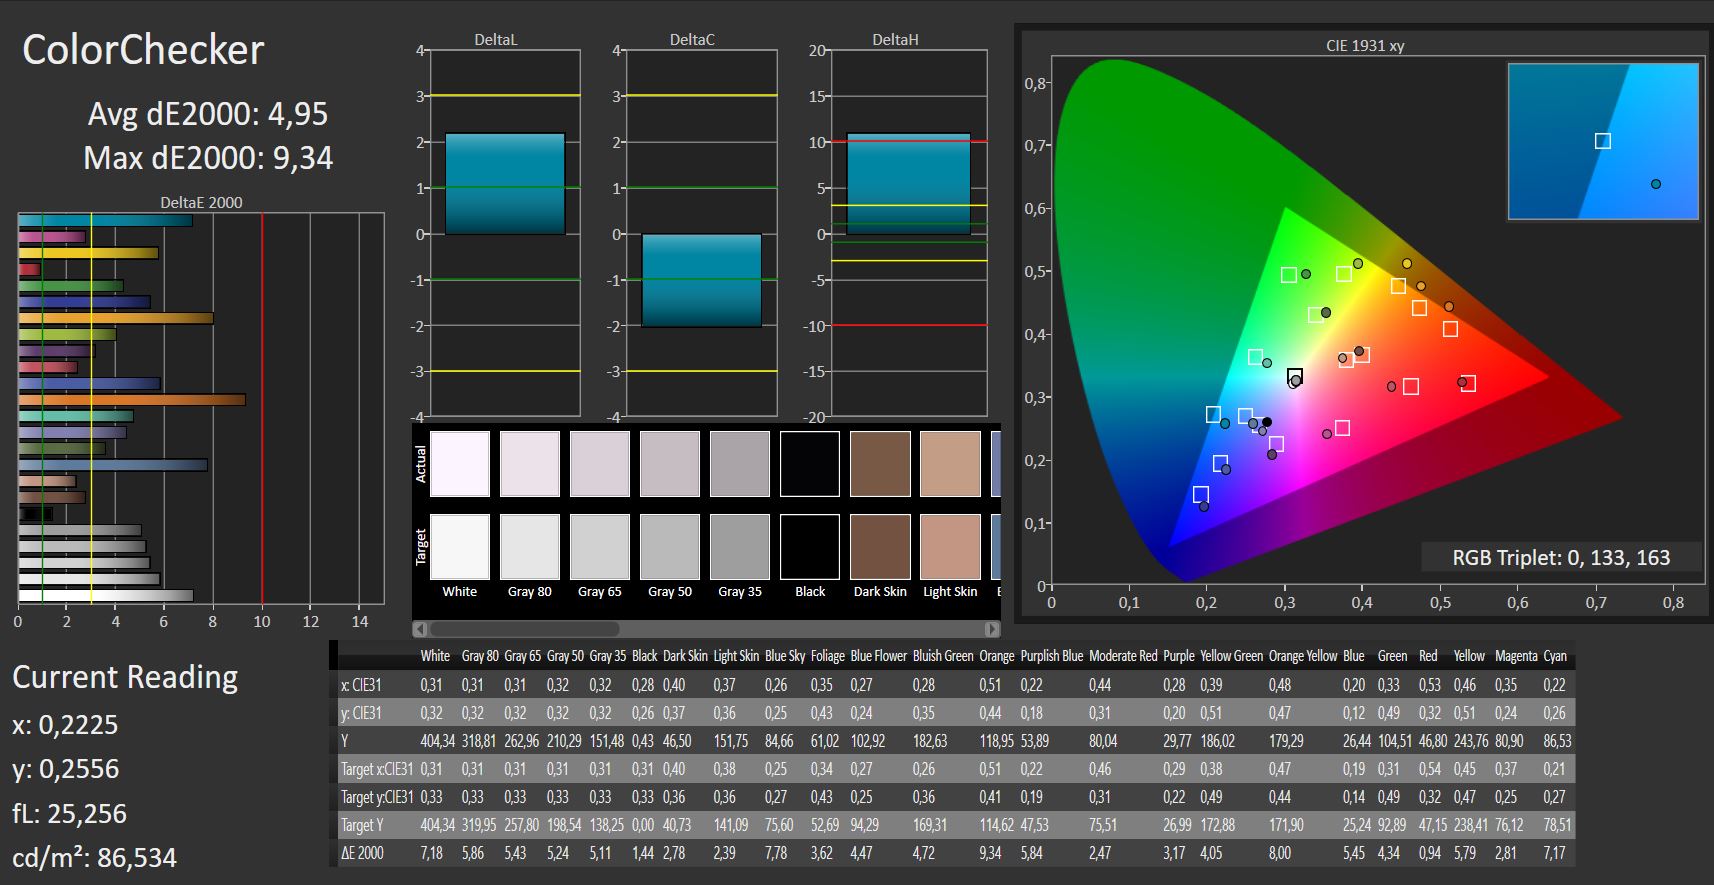
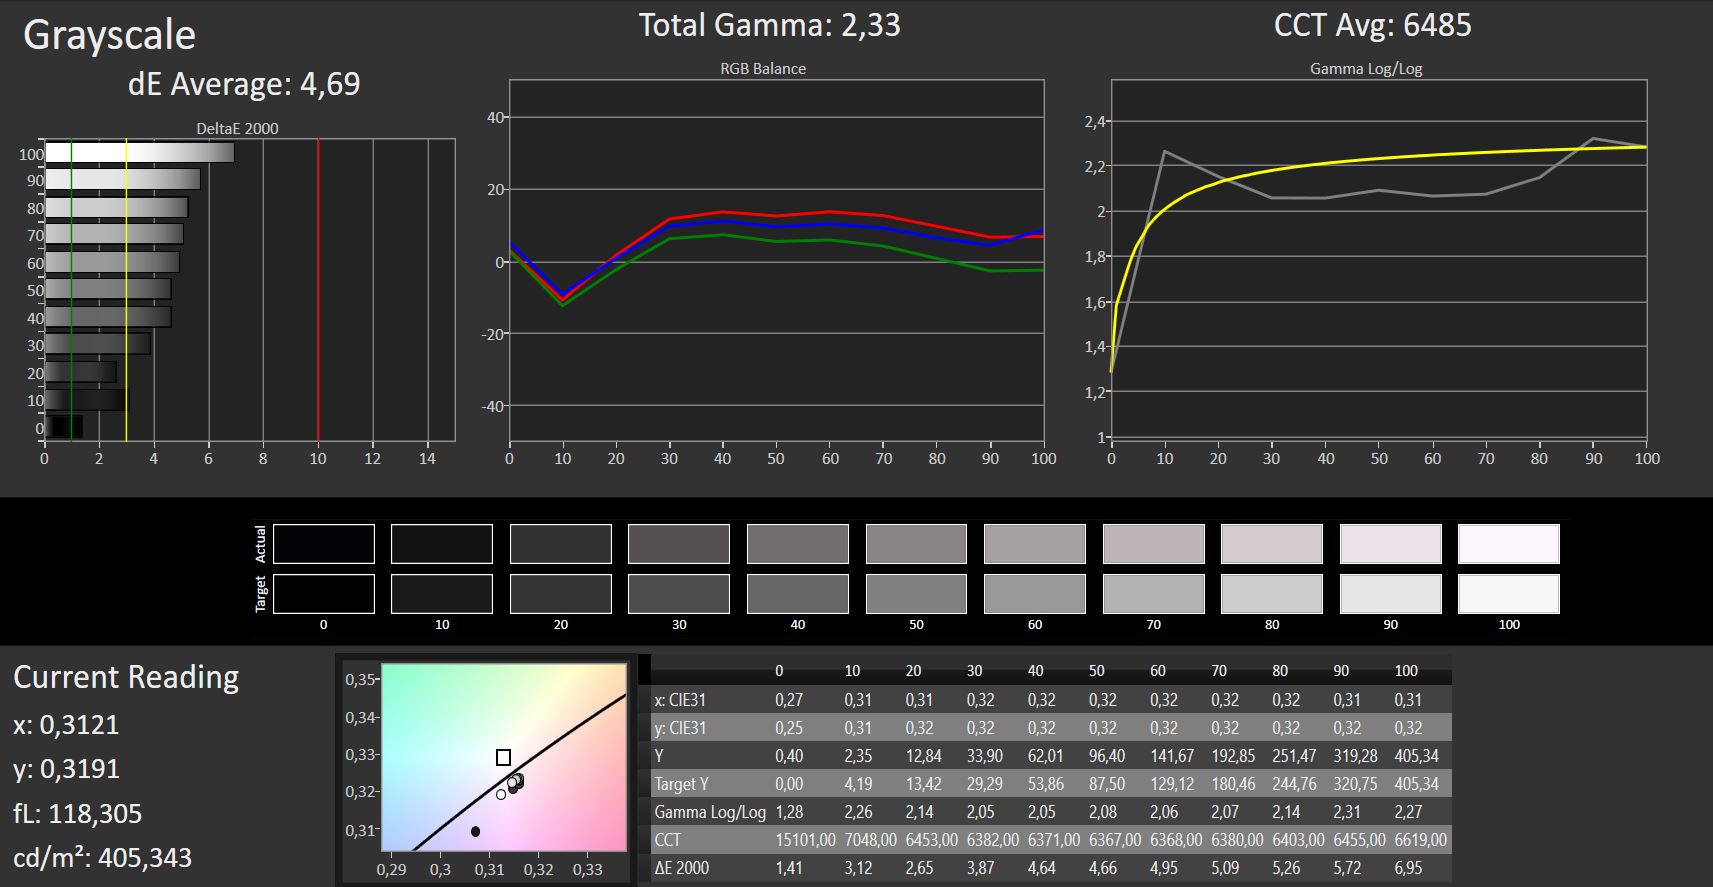
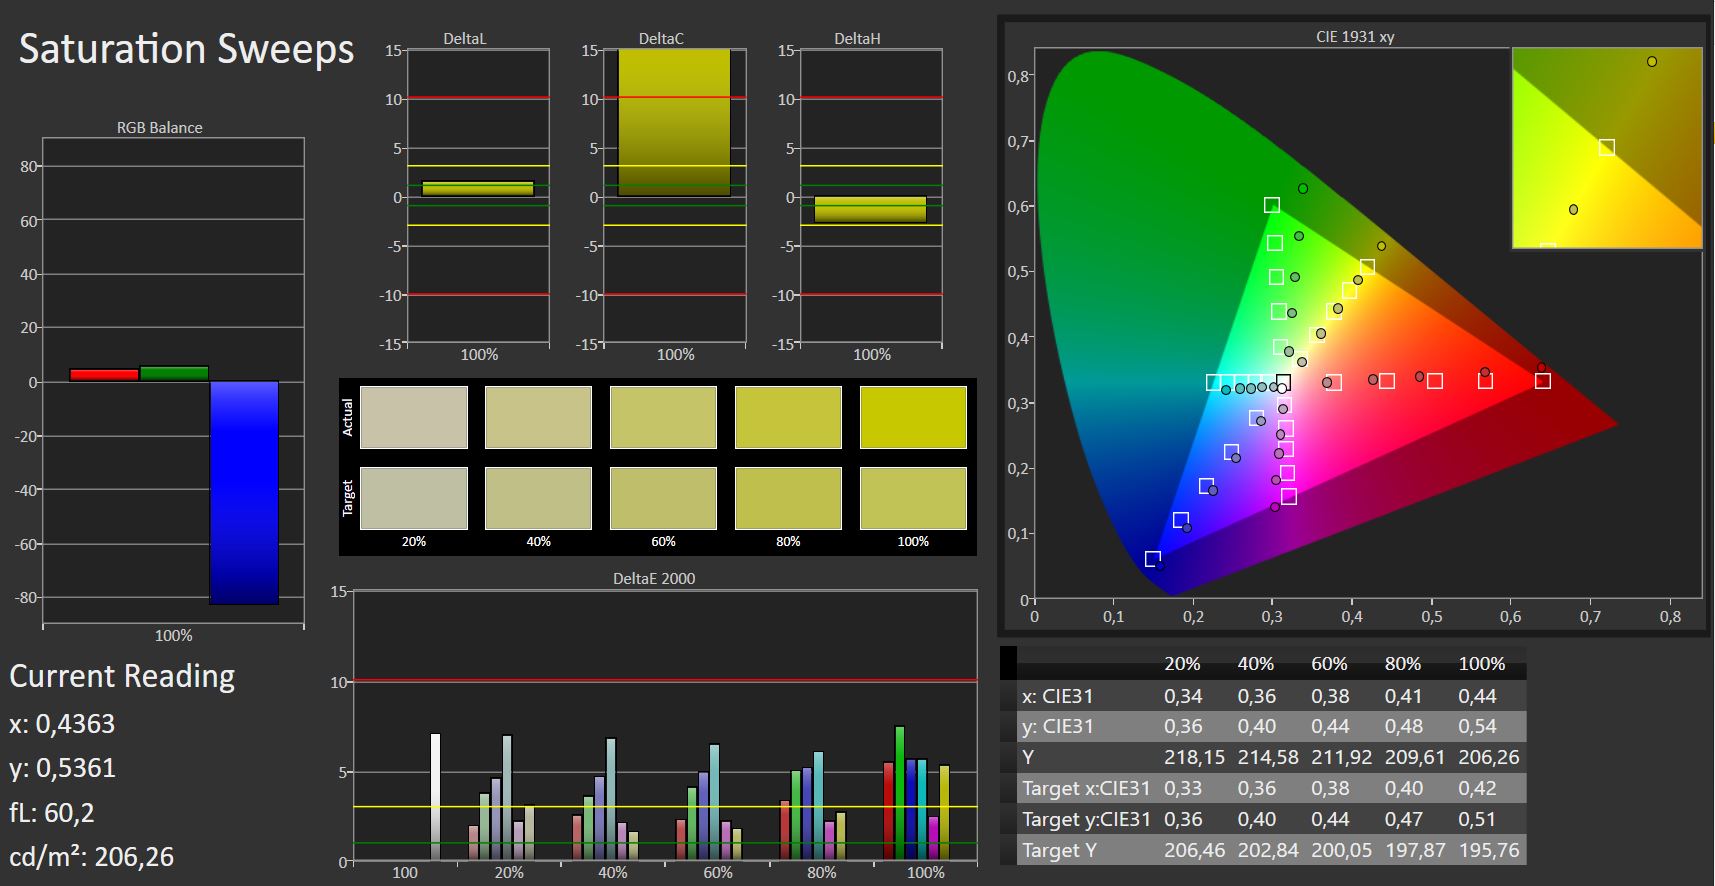
Il GL702ZC ha lo stesso chermo Full HD del modello gemello già recensito. In questo caso si tratta di un display IPS luminoso, con ottimi angoli di visuale. I valori rilevati sono leggermente diversi, ma è abbastanza normale. Due pannelli identici non hanno mai risultati uguali a 100%.
Nota positiva: il display non mostra PWM-flickering. In questo caso Asus rinuncia al controllo della luminosità tramite PWM. Le cose vanno diversamente con il modelo gemello.
Lo schermo supporta la tecnologia AMD FreeSync. Questa tecnologia consente la sincronizzazione del frame del display e della GPU. Di conseguenza - specialmente durante il gaming - avrete un'immagine molto fluida. senza errori di rendering. Possono essere collegati anche monitors esterni FreeSync-enabled tramite HDMI o Mini DisplayPort.
| |||||||||||||||||||||||||
Distribuzione della luminosità: 82 %
Al centro con la batteria: 415 cd/m²
Contrasto: 988:1 (Nero: 0.42 cd/m²)
ΔE ColorChecker Calman: 4.95 | ∀{0.5-29.43 Ø4.72}
ΔE Greyscale Calman: 4.69 | ∀{0.09-98 Ø4.97}
82% sRGB (Argyll 1.6.3 3D)
54% AdobeRGB 1998 (Argyll 1.6.3 3D)
60.4% AdobeRGB 1998 (Argyll 3D)
82.6% sRGB (Argyll 3D)
65.4% Display P3 (Argyll 3D)
Gamma: 2.33
CCT: 6485 K
| Asus ROG Strix GL702ZC-GC204T IPS, 1920x1080, 17.3" | Asus GL702ZC-GC104T IPS, 1920x1080, 17.3" | MSI GF72VR 7RF TN LED, 1920x1080, 17.3" | Acer Predator Helios 300 AH-IPS, WLED, 1920x1080, 17.3" | MSI GL72 7RDX-602 TN LED, 1920x1080, 17.3" | Nexoc G739 IPS, 1920x1080, 17.3" | HP Omen 17-w206ng IPS, 1920x1080, 17.3" | |
|---|---|---|---|---|---|---|---|
| Display | 3% | 34% | 3% | 8% | 7% | 9% | |
| Display P3 Coverage (%) | 65.4 | 67.1 3% | 90.8 39% | 66.8 2% | 65.2 0% | 66.7 2% | 67.2 3% |
| sRGB Coverage (%) | 82.6 | 85.4 3% | 99.8 21% | 85.8 4% | 94.3 14% | 91 10% | 93.1 13% |
| AdobeRGB 1998 Coverage (%) | 60.4 | 62.5 3% | 85.6 42% | 62.8 4% | 65.6 9% | 66.4 10% | 67.4 12% |
| Response Times | -4% | 39% | 7% | 3% | -24% | -10% | |
| Response Time Grey 50% / Grey 80% * (ms) | 36 ? | 39.2 ? -9% | 24.4 ? 32% | 36 ? -0% | 29 ? 19% | 45 ? -25% | 38 ? -6% |
| Response Time Black / White * (ms) | 23 ? | 22.8 ? 1% | 12.6 ? 45% | 20 ? 13% | 26 ? -13% | 28 ? -22% | 26 ? -13% |
| PWM Frequency (Hz) | 122000 ? | 25000 ? | 119000 ? | 961 | 450 ? | 200 ? | |
| Screen | 9% | -13% | 4% | -42% | 11% | 5% | |
| Brightness middle (cd/m²) | 415 | 379 -9% | 329.2 -21% | 384 -7% | 299 -28% | 312 -25% | 318 -23% |
| Brightness (cd/m²) | 365 | 354 -3% | 318 -13% | 373 2% | 274 -25% | 304 -17% | 295 -19% |
| Brightness Distribution (%) | 82 | 89 9% | 92 12% | 93 13% | 80 -2% | 85 4% | 79 -4% |
| Black Level * (cd/m²) | 0.42 | 0.31 26% | 0.4 5% | 0.35 17% | 0.25 40% | 0.23 45% | 0.25 40% |
| Contrast (:1) | 988 | 1223 24% | 823 -17% | 1097 11% | 1196 21% | 1357 37% | 1272 29% |
| Colorchecker dE 2000 * | 4.95 | 4.32 13% | 6.4 -29% | 4.81 3% | 12.92 -161% | 4.19 15% | 4.7 5% |
| Colorchecker dE 2000 max. * | 9.34 | 8.56 8% | 11.7 -25% | 8.69 7% | 19.91 -113% | 8.7 7% | 8.8 6% |
| Greyscale dE 2000 * | 4.69 | 4 15% | 9.2 -96% | 5.33 -14% | 13.16 -181% | 3.72 21% | 5 -7% |
| Gamma | 2.33 94% | 2.47 89% | 2.18 101% | 2.45 90% | 2.36 93% | 2.29 96% | 2.28 96% |
| CCT | 6485 100% | 6984 93% | 10484 62% | 7137 91% | 15046 43% | 7104 91% | 7374 88% |
| Color Space (Percent of AdobeRGB 1998) (%) | 54 | 56 4% | 76 41% | 56 4% | 60 11% | 59 9% | 61 13% |
| Color Space (Percent of sRGB) (%) | 82 | 85 4% | 92 12% | 86 5% | 94 15% | 91 11% | 93 13% |
| Media totale (Programma / Settaggio) | 3% /
6% | 20% /
3% | 5% /
4% | -10% /
-26% | -2% /
5% | 1% /
4% |
* ... Meglio usare valori piccoli
Sfarfallio dello schermo / PWM (Pulse-Width Modulation)
| flickering dello schermo / PWM non rilevato | ||
In confronto: 52 % di tutti i dispositivi testati non utilizza PWM per ridurre la luminosita' del display. Se è rilevato PWM, una media di 7772 (minimo: 5 - massimo: 343500) Hz è stata rilevata. | ||
Tempi di risposta del Display
| ↔ Tempi di risposta dal Nero al Bianco | ||
|---|---|---|
| 23 ms ... aumenta ↗ e diminuisce ↘ combinato | ↗ 14 ms Incremento | 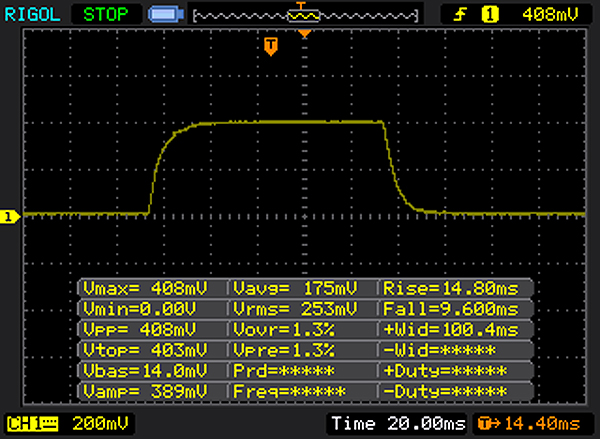 |
| ↘ 9 ms Calo | ||
| Lo schermo mostra buoni tempi di risposta durante i nostri tests, ma potrebbe essere troppo lento per i gamers competitivi. In confronto, tutti i dispositivi di test variano da 0.1 (minimo) a 240 (massimo) ms. » 52 % di tutti i dispositivi è migliore. Questo significa che i tempi di risposta rilevati sono peggiori rispetto alla media di tutti i dispositivi testati (19.8 ms). | ||
| ↔ Tempo di risposta dal 50% Grigio all'80% Grigio | ||
| 36 ms ... aumenta ↗ e diminuisce ↘ combinato | ↗ 18 ms Incremento | 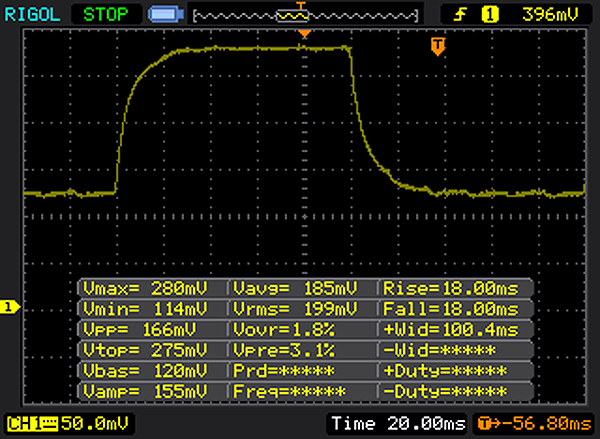 |
| ↘ 18 ms Calo | ||
| Lo schermo mostra tempi di risposta lenti nei nostri tests e sarà insoddisfacente per i gamers. In confronto, tutti i dispositivi di test variano da 0.165 (minimo) a 636 (massimo) ms. » 50 % di tutti i dispositivi è migliore. Questo significa che i tempi di risposta rilevati sono peggiori rispetto alla media di tutti i dispositivi testati (31 ms). | ||
Performance
Con il GL702ZC, Asus inserisce un portatile gaming da 17.3" nella sua offerta. Riesce a gestire tutti i giochi recenti in modo fluido. Il nostro dispositivo rappresenta il modello entry-level della serie e costa 1200 Euros (~$1485). Sono disponibili anche altre configurazioni hardware.
Processore
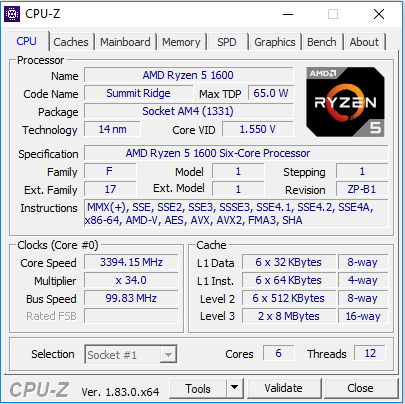
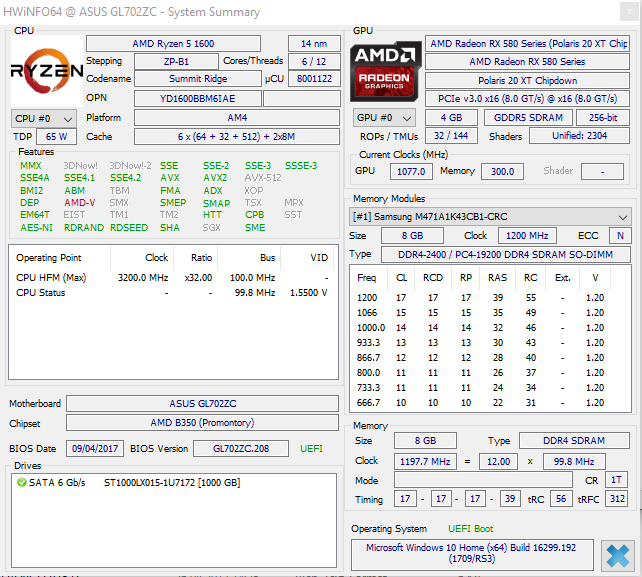
Il GL702ZC monta un processore Ryzen 5 1600 AMD. Il CPU è collegato ad un socket e può essere sostituito, se necessario. Stiamo parlando di una CPU desktop con un TDP da 65 watts. Il processore ha sei cores, che supportano il multithreading simultaneo (un core può processare due threads contemporaneamente). Il processore ha un clock base da 3.2 GHz. Per quanto riguarda il Turbo, il clock rate può salire fino a 3.4 GHz per sei cores e 3.7 GHz per due cores.
Una volta collegato alla rete elettrica, il processore gira a 3.4 GHz nei benchmarks multi-core e da 3.4 a 3.7 GHz nei benchmarks single-core. Usando la batteria, la CPU è limitata ad un clock rate di 548 MHz.
Abbiamo testato se la tecnologia Turbo boost possa essere usata sempre lanciando la sezione multi-core del benchmark Cinebench R15 per 30 minuti in loop continuo. I risultati restano sempre allo stesso livello. Il Turbo boost funziona a velocità massima.
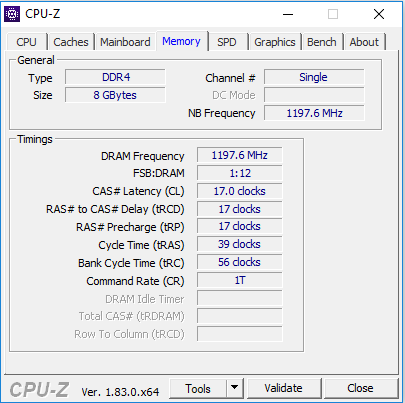
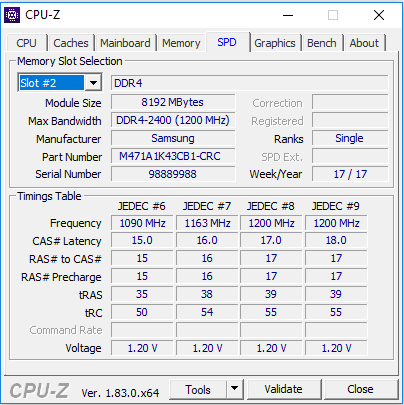
Le prestazioni single-core della CPU sono allo stesso livello di un processore Intel Core i5-7300HQ. Tuttavia, con le applicazioni multi-core, il processore AMD offre maggiore potenza rispetto alla maggioranza di CPUs Intel. Quindi le CPUs Kaby Lake non reggono il confronto con la Ryzen 5 1600. Solo i modelli Coffee Lake possono tentare l'assalto. Inoltre, le prestazioni della CPU Ryzen possono essere incrementate ulteriormente, in quanto il benchmark Geekbench beneficia della RAM che funziona in modalità dual-channel. In altre parole: se al GL702ZC si aggiunge un modulo RAM, i risultati dei benchmarks Geekbench migliorano.
| Geekbench 4.0 | |
| 64 Bit Multi-Core Score | |
| no name | |
| Asus ROG Strix GL702ZC-GC204T | |
| Gigabyte Aero 15X | |
| Acer Aspire Nitro BE VN7-793G-5811 | |
| Acer Aspire VX15 VX5-591G-589S | |
| 64 Bit Single-Core Score | |
| no name | |
| Gigabyte Aero 15X | |
| Acer Aspire Nitro BE VN7-793G-5811 | |
| Asus ROG Strix GL702ZC-GC204T | |
| Acer Aspire VX15 VX5-591G-589S | |
| Geekbench 4.4 | |
| 64 Bit Multi-Core Score | |
| no name | |
| Asus GL702ZC-GC104T | |
| Asus ROG Strix GL702ZC-GC204T | |
| Gigabyte Aero 15X | |
| Acer Aspire Nitro BE VN7-793G-5811 | |
| Acer Aspire VX15 VX5-591G-589S | |
| 64 Bit Single-Core Score | |
| no name | |
| Gigabyte Aero 15X | |
| Acer Aspire Nitro BE VN7-793G-5811 | |
| Asus GL702ZC-GC104T | |
| Asus ROG Strix GL702ZC-GC204T | |
| Acer Aspire VX15 VX5-591G-589S | |
| Mozilla Kraken 1.1 - Total | |
| Asus GL702ZC-GC104T (Edge 15) | |
| MSI GF72VR 7RF (Microsoft Edge 40.15063.674.0) | |
| Asus ROG Strix GL702ZC-GC204T (Edge 41) | |
| Acer Predator Helios 300 (Edge 40.15063.0.0) | |
| MSI GL72 7RDX-602 (EDGE 38.14393.1066.0) | |
| Gigabyte Aero 15X (Edge 41) | |
| Nexoc G739 (Edge 38.14393.0.0) | |
| Eurocom Sky X9C (Edge 41.16299.15.0) | |
| Octane V2 - Total Score | |
| Eurocom Sky X9C (Edge 41.16299.15.0) | |
| Nexoc G739 (Edge 38.14393.0.0) | |
| MSI GL72 7RDX-602 (EDGE 38.14393.1066.0) | |
| Gigabyte Aero 15X (Edge 41) | |
| Acer Predator Helios 300 (Edge 40.15063.0.0) | |
| Asus GL702ZC-GC104T (Edge 15) | |
| Asus ROG Strix GL702ZC-GC204T (Edge 41) | |
| JetStream 1.1 - 1.1 Total | |
| Eurocom Sky X9C (Edge 41.16299.15.0) | |
| Gigabyte Aero 15X (Edge 41) | |
| Nexoc G739 (Edge 38.14393.0.0) | |
| MSI GF72VR 7RF (Microsoft Edge 40.15063.674.0) | |
| MSI GL72 7RDX-602 (EDGE 38.14393.1066.0) | |
| HP Omen 17-w206ng | |
| Acer Predator Helios 300 (Edge 40.15063.0.0) | |
| Acer Aspire Nitro BE VN7-793G-5811 (Edge 40) | |
| Acer Aspire VX15 VX5-591G-589S (Edge 38) | |
| Asus GL702ZC-GC104T (Edge 15) | |
| Asus ROG Strix GL702ZC-GC204T (Edge 41) | |
* ... Meglio usare valori piccoli
Prestazioni di sistema
Con il GL702ZC, Asus rinuncia da un SSD e punta su un drive ibrido. L'assenza di un SSD si nota durante il boot e i caricamenti. In altre parole: il sistema non è reattivo come ci saremmo aspettati da un dispositivo così potente. Il prestante processore hexa-core e la scheda grafica Radeon dedicata offrono potenza di calcolo sufficiente per scenari pesanti come il gaming, e l'editing video e immagini. Questo è confermato da ottimi risultati dei benchmarks PCMark.
Tuttavia, non si raggiunge il limite massimo. Le prestazioni del portatile possono essere incrementate ancora. Installando un secondo modulo RAM si aumentano le performance del portatile grazie alla RAM che funziona in modalità dual-channel. Ma questo richiede olio di gomito; in quanto l'installazione di un modulo RAM richiede la rimozione del dissipatore. Coloro che vogliono evitarlo dovrebbero prendere un modello GL702ZC che monta due moduli RAM. Inoltre, installando un SSD e d usandolo come drive di sistema si aumenta molto la reattività del dispositivo.
| PCMark 7 Score | 5444 punti | |
| PCMark 8 Home Score Accelerated v2 | 4186 punti | |
| PCMark 8 Creative Score Accelerated v2 | 5608 punti | |
| PCMark 8 Work Score Accelerated v2 | 4988 punti | |
| PCMark 10 Score | 4440 punti | |
Aiuto | ||
| PCMark 8 - Home Score Accelerated v2 | |
| Acer Predator Helios 300 | |
| Nexoc G739 | |
| HP Omen 17-w206ng | |
| Asus ROG Strix GL702ZC-GC204T | |
| Asus GL702ZC-GC104T | |
| MSI GF72VR 7RF | |
| MSI GL72 7RDX-602 | |
Dispositivi di archiviazione
In drive ibrido Seagate funziona come disco di sistema. Gira a 5400 RPM ed ha una capacità di 1 TB. Il drive ha una cache SSD da 8 GB, che consente un avvio veloce delle applicazioni che sono usate più spesso. I valori di trasferimento sono a livello normale per questo tipo di HDD.
C'è uno slot M.2-2280 vuoto nel dispositivo. Supporta sia SSDs SATA-III che NVMe.

| Asus ROG Strix GL702ZC-GC204T Seagate Mobile HDD 1TB ST1000LX015-1U7172 | Acer Predator Helios 300 Intel SSD 600p SSDPEKKW512G7 | MSI GL72 7RDX-602 HGST Travelstar 7K1000 HTS721010A9E630 | Nexoc G739 Samsung PM961 MZVLW256HEHP | HP Omen 17-w206ng Samsung PM961 MZVLW256HEHP | |
|---|---|---|---|---|---|
| CrystalDiskMark 3.0 | 37802% | 119% | 50561% | 47936% | |
| Read Seq (MB/s) | 92.5 | 899 872% | 135.3 46% | 1666 1701% | 1606 1636% |
| Write Seq (MB/s) | 105.1 | 569 441% | 127 21% | 1192 1034% | 1176 1019% |
| Read 512 (MB/s) | 37.67 | 580 1440% | 45.57 21% | 857 2175% | 846 2146% |
| Write 512 (MB/s) | 101.8 | 425.9 318% | 58.3 -43% | 827 712% | 805 691% |
| Read 4k (MB/s) | 0.484 | 34.29 6985% | 0.582 20% | 60.7 12441% | 59.9 12276% |
| Write 4k (MB/s) | 0.169 | 125.5 74160% | 1.022 505% | 154.5 91320% | 155.6 91971% |
| Read 4k QD32 (MB/s) | 1.294 | 457.7 35271% | 1.068 -17% | 636 49050% | 588 45340% |
| Write 4k QD32 (MB/s) | 0.221 | 404.5 182932% | 1.102 399% | 544 246054% | 505 228407% |
Scheda grafica
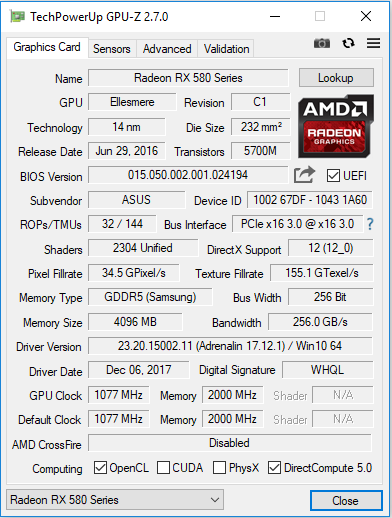
Il GL702ZC usa una scheda grafica dedicata Radeon RX 580. E' un modello entry-level tra le GPUs high-end. Si basa sull'architettura AMD Polaris. La GPU supporta DirectX 12 ed ha un clock core massimo di 1077 MHz. Il chip grafico ha 4096 MB di memoria video GDDR5 a disposizione. I risultati nei benchmarks 3DMark sono paragonabili a quelli della Nvidia GeForce GTX 1060.
Questo portatile Asus non supporta lo switching automatico tra scheda dedicata ed integrata. La GPU dedicata Radeon è sempre attiva.
| 3DMark 06 Standard Score | 28909 punti | |
| 3DMark 11 Performance | 12626 punti | |
| 3DMark Cloud Gate Standard Score | 28295 punti | |
| 3DMark Fire Strike Score | 9866 punti | |
| 3DMark Time Spy Score | 3718 punti | |
Aiuto | ||
| 3DMark 11 - 1280x720 Performance GPU | |
| Eurocom Sky X9C | |
| Guru Mars K | |
| Smart7 Karme GX17E G2 | |
| MSI GS63VR 7RG-005 | |
| Acer Predator Helios 300 | |
| Asus GL702ZC-GC104T | |
| Asus ROG Strix GL702ZC-GC204T | |
| MSI GF72VR 7RF | |
| HP Omen 15t-ce000 | |
| Acer Aspire Nitro BE VN7-793G-5811 | |
| HP Omen 17-w206ng | |
| MSI GL72 7RDX-602 | |
| 3DMark | |
| 1920x1080 Fire Strike Score | |
| Eurocom Sky X9C | |
| no name | |
| Guru Mars K | |
| Smart7 Karme GX17E G2 | |
| MSI GS63VR 7RG-005 | |
| Acer Predator Helios 300 | |
| MSI GF62VR 7RF-877 | |
| Asus ROG Strix GL702ZC-GC204T | |
| Asus GL702ZC-GC104T | |
| MSI GF72VR 7RF | |
| HP Omen 15t-ce000 | |
| Acer Aspire Nitro BE VN7-793G-5811 | |
| MSI GL72 7RDX-602 | |
| 2560x1440 Time Spy Score | |
| no name | |
| MSI GS63VR 7RG-005 | |
| Acer Predator Helios 300 | |
| Asus ROG Strix GL702ZC-GC204T | |
| Asus GL702ZC-GC104T | |
| Acer Aspire Nitro BE VN7-793G-5811 | |
Prestazioni Gaming
La combinazione GPU-CPU di questo portatile Asus riesce a gestire in modo fluido tutti i giochi attuali. La maggioranza di questi giochi può essere usata con risoluzione Full HD e con settaggi grafici elevati o massimi. Qualche titolo può essere usato solo con risoluzione e dettagli più bassi. Questa scheda grafica non è adatta a a risoluzioni superiori a 1080p.
Usiamo il video game The Witcher 3 per verificare se i frame rates sono costanti a lungo termine. Per questo scopo abbiamo lanciato il gioco con settaggi grafici massimi a risoluzione Full HD (1920x1080) per un'ora. Per tutta la durata del gioco, il personaggio del gioco resta fluido. Non ci sono cali di prestazioni da evidenziare.
| basso | medio | alto | ultra | |
|---|---|---|---|---|
| X-Plane 10.25 (2013) | 72 | 42.2 | 21.8 | 20.6 |
| Dragon Age: Inquisition (2014) | 163.5 | 102.6 | 81.3 | 54.1 |
| GTA V (2015) | 120.4 | 115.5 | 83.4 | 39.6 |
| The Witcher 3 (2015) | 173 | 121 | 68.9 | 36 |
| Dota 2 Reborn (2015) | 86 | 77 | 76.3 | 69 |
| World of Warships (2015) | 135.1 | 115 | 101 | 95.9 |
| Anno 2205 (2015) | 98.6 | 95.4 | 65.5 | 25.7 |
| XCOM 2 (2016) | 82 | 66 | 51.1 | 24.5 |
| Hitman 2016 (2016) | 56.2 | 54.4 | 49.8 | 47.7 |
| Ashes of the Singularity (2016) | 35.3 | 30 | 29.2 | |
| Overwatch (2016) | 276.3 | 276 | 191.1 | 96.2 |
| Mafia 3 (2016) | 55.9 | 45.9 | 35 | |
| Civilization 6 (2016) | 105.6 | 84.8 | 69.8 | 63.5 |
| Mass Effect Andromeda (2017) | 38.2 | 33.6 | 27.1 | 25.1 |
| Warhammer 40.000: Dawn of War III (2017) | 106.7 | 72.3 | 69.4 | 53.4 |
| Team Fortress 2 (2017) | 108 | 105 | 102 | 101 |
| FIFA 18 (2017) | 242.9 | 242.2 | 218.1 | 215.4 |
| Middle-earth: Shadow of War (2017) | 117 | 85 | 66 | 49 |
| The Evil Within 2 (2017) | 56.4 | 47.1 | 45.4 | 44.3 |
| ELEX (2017) | 117.1 | 80 | 63.5 | 48.6 |
| Destiny 2 (2017) | 97.6 | 91.4 | 83.3 | 69.7 |
| Assassin´s Creed Origins (2017) | 50 | 44 | 43 | 37 |
| Call of Duty WWII (2017) | 132.3 | 128.8 | 68 | 39.1 |
| Need for Speed Payback (2017) | 92.8 | 86 | 78.5 | 75.6 |
| Star Wars Battlefront 2 (2017) | 62 | 53.9 | 45.6 | 45.7 |
| Fortnite (2018) | 238.5 | 183.1 | 80.6 | 59.5 |
| Middle-earth: Shadow of War - 1920x1080 Ultra Preset AA:T | |
| Eurocom Sky X9C | |
| Gigabyte Aero 15X | |
| MSI GS63VR 7RG-005 | |
| PC Zentrum Defiance IV | |
| Asus ROG Strix GL702ZC-GC204T | |
| HP Omen 15t-ce000 | |
| The Witcher 3 - 1920x1080 High Graphics & Postprocessing (Nvidia HairWorks Off) | |
| Eurocom Sky X9C | |
| Guru Mars K | |
| Gigabyte Aero 15X | |
| MSI GS63VR 7RG-005 | |
| Saelic Vidi G771D | |
| Acer Aspire V17 Nitro BE VN7-793G-706L | |
| PC Zentrum Defiance IV | |
| Acer Predator Helios 300 | |
| Asus ROG Strix GL702ZC-GC204T | |
| HP Omen 15t-ce000 | |
| MSI GF62VR 7RF-877 | |
| Asus GL702ZC-GC104T | |
| Schenker XMG P507 | |
| Nexoc G739 | |
| HP Omen 17-w206ng | |
| Acer Nitro 5 AN515-51-788E | |
| Acer Aspire Nitro BE VN7-793G-5811 | |
| MSI GL72 7RDX-602 | |
| World of Warships - 1920x1080 Very High Preset AA:High FX AF:16x | |
| Asus ROG Strix GL702ZC-GC204T | |
| Acer Aspire V17 Nitro BE VN7-793G-706L | |
| Need for Speed Payback - 1920x1080 Ultra Preset | |
| MSI GS63VR 7RG-005 | |
| Asus ROG Strix GL702ZC-GC204T | |
| PC Zentrum Defiance IV | |
| Call of Duty WWII - 1920x1080 High / On AA:Filmic 1X SM | |
| MSI GS63VR 7RG-005 | |
| PC Zentrum Defiance IV | |
| Asus ROG Strix GL702ZC-GC204T | |
| Civilization 6 - 1920x1080 Ultra Preset AA:4xMS | |
| Asus ROG Strix GL702ZC-GC204T | |
| MSI GS73VR 7RF | |
| HP Omen 17-w100ng | |
| GTA V - 1920x1080 Highest AA:4xMSAA + FX AF:16x | |
| Asus GL702VM-GC102D | |
| Asus ROG Strix GL702ZC-GC204T | |
| Hitman 2016 - 1920x1080 Ultra / On AA:SM AF:16x | |
| MSI GS73VR 7RF | |
| Asus Strix GL502VM-FY039T | |
| MSI GF62VR 7RF-877 | |
| Schenker XMG P507 | |
| Asus ROG Strix GL702ZC-GC204T | |
| MSI GF72VR 7RF | |
| Mafia 3 - 1366x768 Medium Preset | |
| Eurocom Sky X9C | |
| Saelic Vidi G771D | |
| MSI GF62VR 7RF-877 | |
| Asus GL702VM-GC102D | |
| Asus ROG Strix GL702ZC-GC204T | |
| Star Wars Battlefront 2 - 1920x1080 Ultra Preset | |
| PC Zentrum Defiance IV | |
| Asus ROG Strix GL702ZC-GC204T | |
| Overwatch - 1920x1080 Epic (Render Scale 100 %) AA:SM AF:16x | |
| Eurocom Sky X9C | |
| Schenker XMG P507 | |
| Asus ROG Strix GL702ZC-GC204T | |
| Destiny 2 - 1920x1080 Highest Preset AA:SM AF:16x | |
| Eurocom Sky X9C | |
| PC Zentrum Defiance IV | |
| Asus ROG Strix GL702ZC-GC204T | |
Emissioni & Gestione Energetica
Rumorosità
In modalità idle, le ventole del GL702ZC sono ferme. L'unico rumore che si sente proviene dall'hard drive. Tuttavia, anche in idle, le ventole ogni tanto possono partire, e si fanno sentire. Durante il gaming, abbiamo rilevato una rumorosità di 38.9 dB(A). La rumorosità della ventola è elevata sotto carico massimo. Durante lo stress test, la rumorosità della ventola è salita a 50.6 dB(A). Nel complesso, il nostro dispositivo è molto meno rumoroso rispetto al modello gemello. Tuttavia, comunque non parliamo di un portatile silenzioso.
Rumorosità
| Idle |
| 30.6 / 32.7 / 32.7 dB(A) |
| HDD |
| 31.2 dB(A) |
| Sotto carico |
| 38.9 / 50.6 dB(A) |
 | ||
30 dB silenzioso 40 dB(A) udibile 50 dB(A) rumoroso |
||
min: | ||
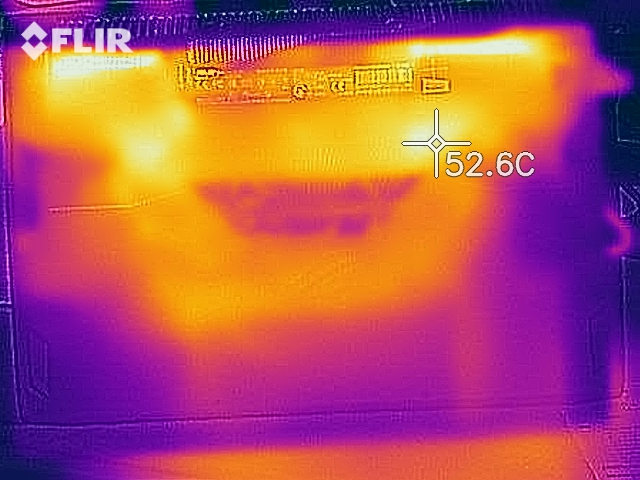
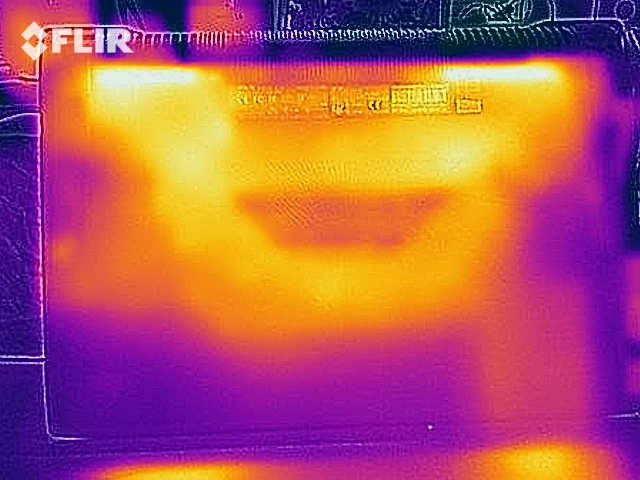
Temperature
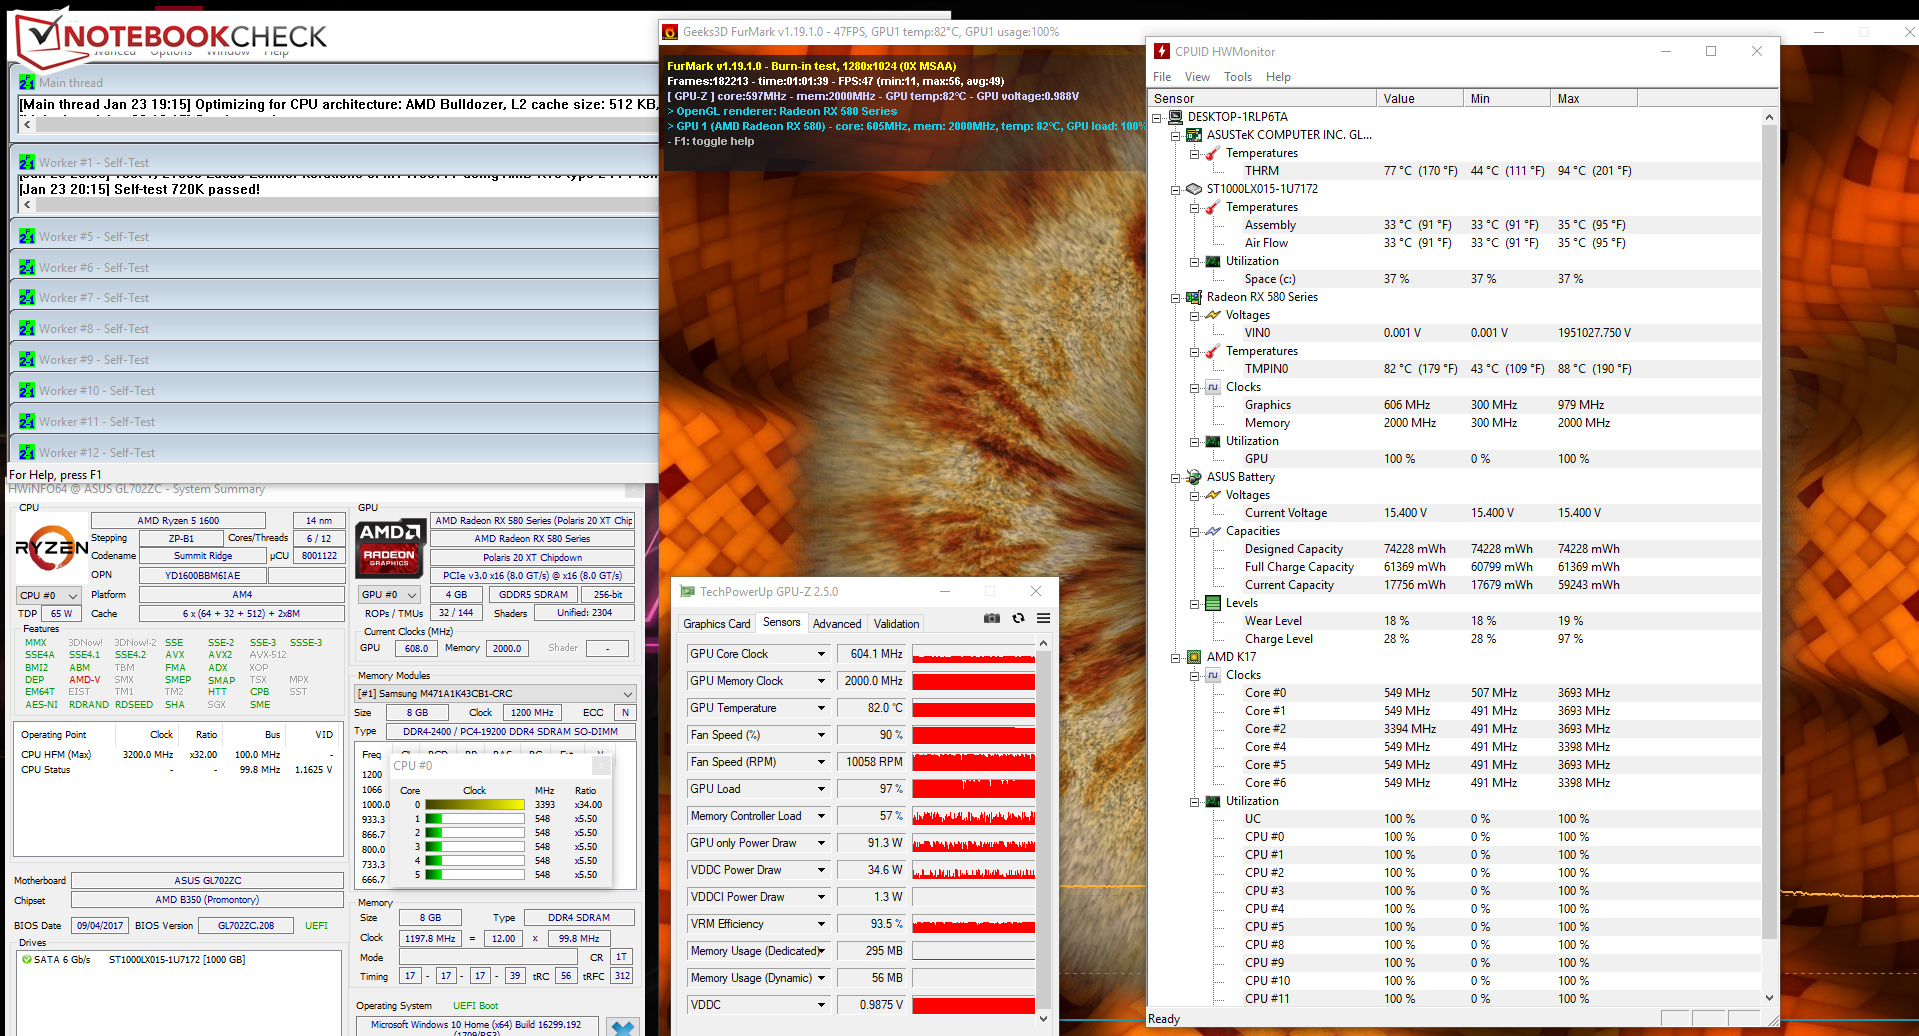
Nello stress test (Prime95 e FurMark lanciati per almeno un'ora), il GL702ZC si comporta diversamente a seconda che sia collegato alla rete elettrica o usato con la batteria. Quando è collegato, il processore gira a 3.4 GHz. In un seguente benchmark, la CPU cores è limitata a 548 MHz di tanto in tanto. Il core clock della GPU fluttua tra 600 e 700 MHz. Usando la batteria, la CPU (548 MHz) e la GPU (300 MHz) sono limitate alle loro velocità clock minime.
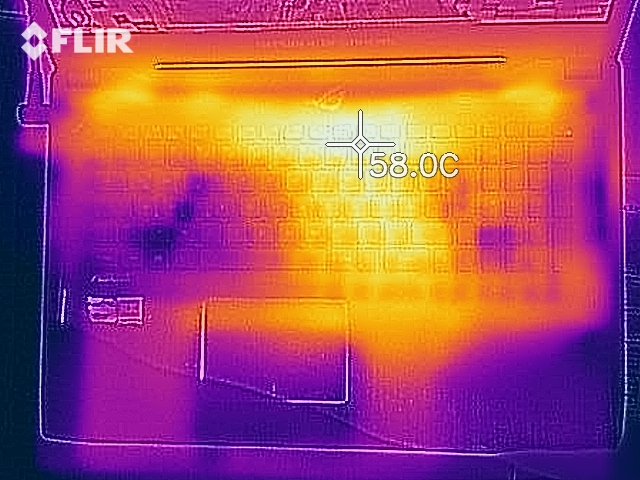
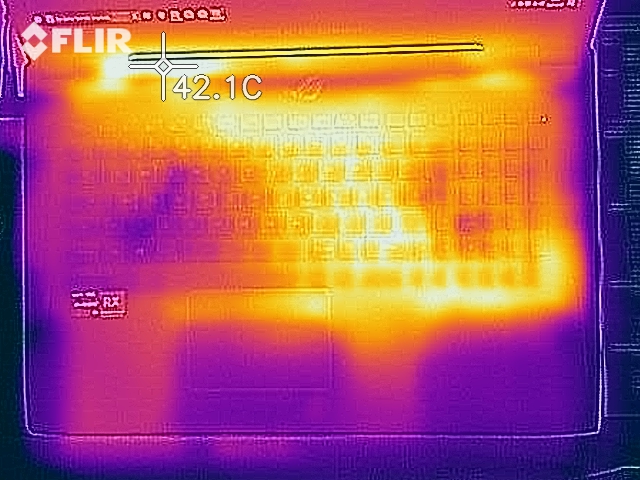
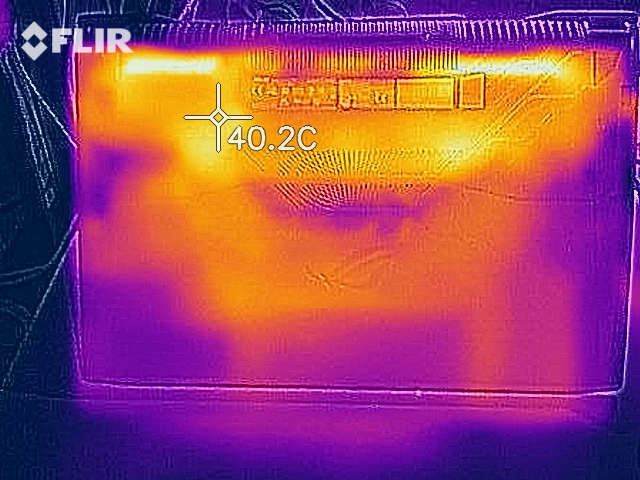
Il portatile non si scalda molto. Durante lo stress test, non si superano i 50 °C (122 °F) solo in un punto. Le temperature sono inferiori con lo stress test The Witcher 3, effettuato con il gioco in funzione per un'ora con risoluzione Full HD e settaggi grafici massimi.
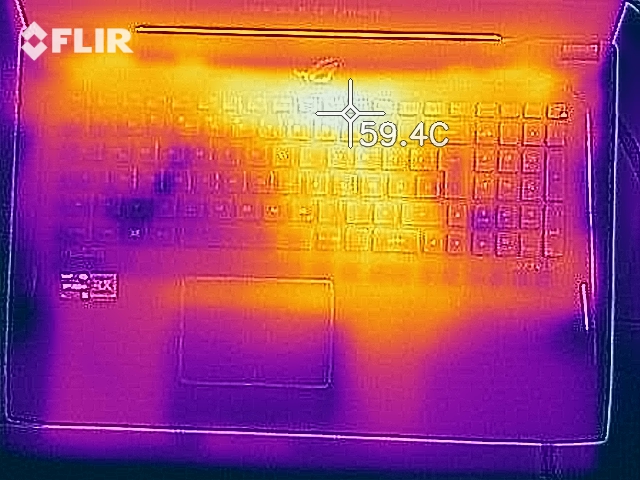
(-) La temperatura massima sul lato superiore è di 54.3 °C / 130 F, rispetto alla media di 40.4 °C / 105 F, che varia da 21.2 a 68.8 °C per questa classe Gaming.
(-) Il lato inferiore si riscalda fino ad un massimo di 51 °C / 124 F, rispetto alla media di 43.2 °C / 110 F
(+) In idle, la temperatura media del lato superiore è di 4 °C / 39 F, rispetto alla media deld ispositivo di 33.9 °C / 93 F.
(+) Riproducendo The Witcher 3, la temperatura media per il lato superiore e' di 6.2 °C / 43 F, rispetto alla media del dispositivo di 33.9 °C / 93 F.
(+) I poggiapolsi e il touchpad raggiungono la temperatura massima della pelle (34 °C / 93.2 F) e quindi non sono caldi.
(-) La temperatura media della zona del palmo della mano di dispositivi simili e'stata di 28.8 °C / 83.8 F (-5.2 °C / -9.4 F).
Casse
Asus ROG Strix GL702ZC-GC204T analisi audio
(-) | altoparlanti non molto potenti (70.2 dB)
Bassi 100 - 315 Hz
(+) | bassi buoni - solo 3.9% dalla media
(±) | la linearità dei bassi è media (7.5% delta rispetto alla precedente frequenza)
Medi 400 - 2000 Hz
(+) | medi bilanciati - solo only 4.4% rispetto alla media
(+) | medi lineari (4.6% delta rispetto alla precedente frequenza)
Alti 2 - 16 kHz
(+) | Alti bilanciati - appena 3.2% dalla media
(±) | la linearità degli alti è media (7.7% delta rispetto alla precedente frequenza)
Nel complesso 100 - 16.000 Hz
(+) | suono nel complesso lineare (13.5% differenza dalla media)
Rispetto alla stessa classe
» 20% di tutti i dispositivi testati in questa classe è stato migliore, 7% simile, 73% peggiore
» Il migliore ha avuto un delta di 6%, medio di 18%, peggiore di 132%
Rispetto a tutti i dispositivi testati
» 14% di tutti i dispositivi testati in questa classe è stato migliore, 4% similare, 82% peggiore
» Il migliore ha avuto un delta di 4%, medio di 24%, peggiore di 134%
Apple MacBook 12 (Early 2016) 1.1 GHz analisi audio
(+) | gli altoparlanti sono relativamente potenti (83.6 dB)
Bassi 100 - 315 Hz
(±) | bassi ridotti - in media 11.3% inferiori alla media
(±) | la linearità dei bassi è media (14.2% delta rispetto alla precedente frequenza)
Medi 400 - 2000 Hz
(+) | medi bilanciati - solo only 2.4% rispetto alla media
(+) | medi lineari (5.5% delta rispetto alla precedente frequenza)
Alti 2 - 16 kHz
(+) | Alti bilanciati - appena 2% dalla media
(+) | alti lineari (4.5% delta rispetto alla precedente frequenza)
Nel complesso 100 - 16.000 Hz
(+) | suono nel complesso lineare (10.2% differenza dalla media)
Rispetto alla stessa classe
» 7% di tutti i dispositivi testati in questa classe è stato migliore, 2% simile, 91% peggiore
» Il migliore ha avuto un delta di 5%, medio di 18%, peggiore di 53%
Rispetto a tutti i dispositivi testati
» 5% di tutti i dispositivi testati in questa classe è stato migliore, 1% similare, 94% peggiore
» Il migliore ha avuto un delta di 4%, medio di 24%, peggiore di 134%
Frequency diagram in comparison (checkboxes can be checked and unchecked!)
Gestione Energetica
Asus usa una CPU desktop con TDP da 65 watts. Inoltre il portatile ha una potente GPU dedicata, che è sempre attiva. Non ci sono GPU ad efficienza energetica su questo portatile (il tipo di GPU che può essere usata con applicazioni meno pesanti e quando si usa la batteria). Ne consegue che anche in idle, il portatile consuma molto. I consumi possono fluttuare tra 49 e 68 watts. Durante lo stress test, il consumo ha avuto un picco di 262 watts. Durante il gaming, il consumo risulta inferiore (fluttua tra 100 e 200 watts). L'alimentatore in dotazione ha una potenza nominale di 330 watts.
| Off / Standby | |
| Idle | |
| Sotto carico |
|
Leggenda:
min: | |
Autonomia della batteria
Il nostro test pratico Wi-Fi test simula carichi pesanti con navigazione web. Abbiamo selezionato la modalità energetica "bilanciata", con le funzioni di risparmio energetico disattivate e la luminosità del display fissata a 150 cd/m². IL GL702ZC raggiunge un'autonomia di 1 ora e 20 minuti.
| Battery Runtime - WiFi Websurfing | |
| HP Omen 17-w206ng | |
| Nexoc G739 | |
| Acer Predator Helios 300 | |
| MSI GL72 7RDX-602 | |
| MSI GF72VR 7RF | |
| Asus GL702ZC-GC104T | |
| Asus ROG Strix GL702ZC-GC204T | |
Pro
Contro
Giudizio Complessivo
Questo portatile gaming Asus riesce a gestire in maniera fluida la maggioranza di portatili con risoluzione Full HD e con dettagli grafici alti. Solo qualche titolo richiede una riduzione di risoluzione e settaggi grafici. La tecnologia AMD FreeSync crea un'esperienza gaming fluida sullo schermo da 60Hz. Il display matto IPS delizia con un elevato contrasto, buona luminosità e angoli di visuale stabili.
Il processore hexa-core ha fatto una buona impressione.
Offre molta potenza per tutte le applicazioni moderne. In termini di prestazioni multi-core, la CPU si comporta meglio rispetto alla concorrenza Intel - ed attualmente è superata solo dal Core i7-8700K. Tuttavia, il Core i7-8700K è un chip da 95-watt, che non compete direttamente con il processore Ryzen. Inoltre, il Core i7-8700K costa molto più della CPU Ryzen.
Il portatile offre molto spazio di archiviazione. Asus ha scelto un drive ibrido da 1 TB. Per tenere basso il prezzo, Asus ha deciso di rinunciare ad un SSD. Tuttavia, è possibile acquistarlo a parte, in quanto c'è uno slot M.2-2280 libero.
Poiché il portatile ha una GPU dedicata, assorbe molta energia, anche in idle. Pertanto, gli utenti che vogliono stare spesso in giro devono rinunciare. Asus ha rinunciato ad una GPU integrata ad efficienza energetica. Inoltre, il portatile è molto rumoroso per essere usato in ufficio.
Asus richiede 1200 Euro (~$1485) per il modello entry-level della linea GL702ZC. Pertanto, per quanto riguarda il prezzo è paragonabile a portatili che montano processore Intel Core e scheda grafica Nvidia GeForce GTX 1060. Tuttavia, questi dispositivo sono utilizzabili in scenari quotidiani, in quanto possono sfruttare sia la GPU dedicata che quella integrata. Ne consegue che i loro consumi sono nettamente inferiori in idle così come la rumorosità, ad esempio citiamo l'Acer Aspire V17 Nitro BE VN7-793G. Pertanto, il GL702ZC è per coloro che vogliono elevate prestazioni multi-core ad un prezzo relativamente basso e si riservano la possibilità di sostituire la CPU.
Asus ROG Strix GL702ZC-GC204T
- 02/02/2018 v6 (old)
Sascha Mölck